Hall, I.R., Hemming, S.R., LeVay, L.J., and the Expedition 361 Scientists
Proceedings of the International Ocean Discovery Program Volume 361
publications.iodp.org
doi:10.14379/iodp.proc.361.104.2017
Site U14751
I.R. Hall, S.R. Hemming, L.J. LeVay, S. Barker, M.A. Berke, L. Brentegani, T. Caley, A. Cartagena-Sierra, C.D. Charles, J.J. Coenen, J.G. Crespin, A.M. Franzese, J. Gruetzner, X. Han, S.K.V. Hines, F.J. Jimenez Espejo, J. Just, A. Koutsodendris, K. Kubota, N. Lathika, R.D. Norris, T. Periera dos Santos, R. Robinson, J.M. Rolinson, M.H. Simon, D. Tangunan, J.J.L. van der Lubbe, M. Yamane, and H. Zhang2
Keywords: International Ocean Discovery Program, IODP, JOIDES Resolution, Expedition 361, Site U1475, Agulhas Current, Agulhas Leakage, Agulhas Plateau, Agulhas Retroflection, Agulhas Return Current, Agulhas Rings, Agulhas Undercurrent, Atlantic Meridional Overturning Circulation, boundary current, Cape Basin, Circumpolar Deep Water, Congo Air Boundary, Delagoa Bight, East Madagascar Current, human evolution, Indian Ocean, Indonesian Throughflow, interocean exchange, Intertropical Convergence Zone, Last Glacial Maximum, Limpopo River, Middle Pleistocene Transition, Miocene, Mozambique Channel, Natal Valley, North Atlantic Deep Water, ocean circulation, paleoceanography, paleoclimate, Pleistocene, Pliocene, salinity, southern Africa, Southern Ocean, Subantarctic Zone, Subtropical Front, Subtropical Gyre, thermohaline circulation, Warm Water Route, Western Boundary Current, Zambezi River
MS 361-104: Published 30 September 2017
Background and objectives
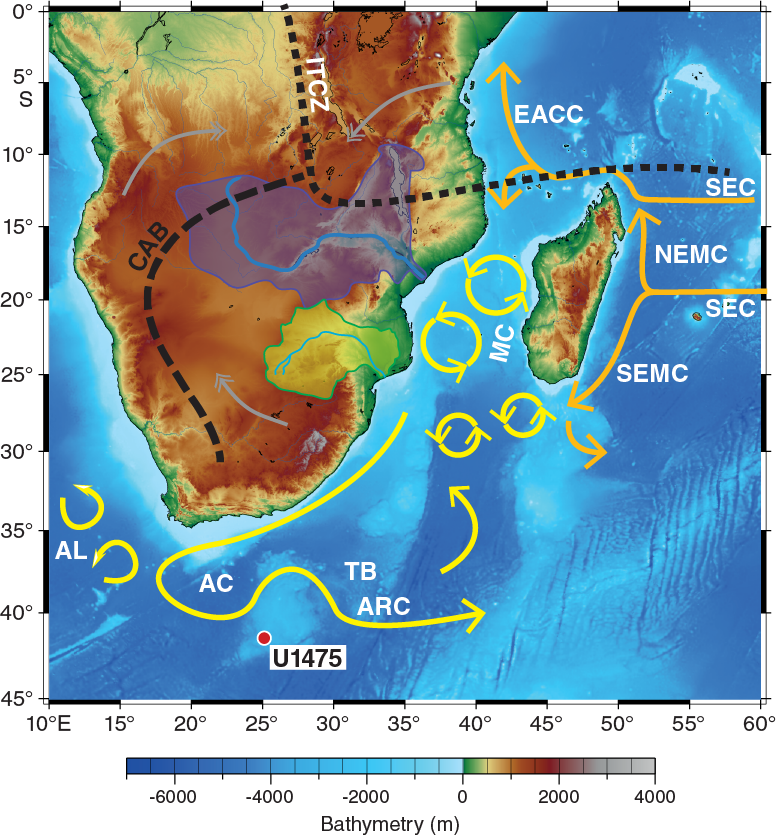
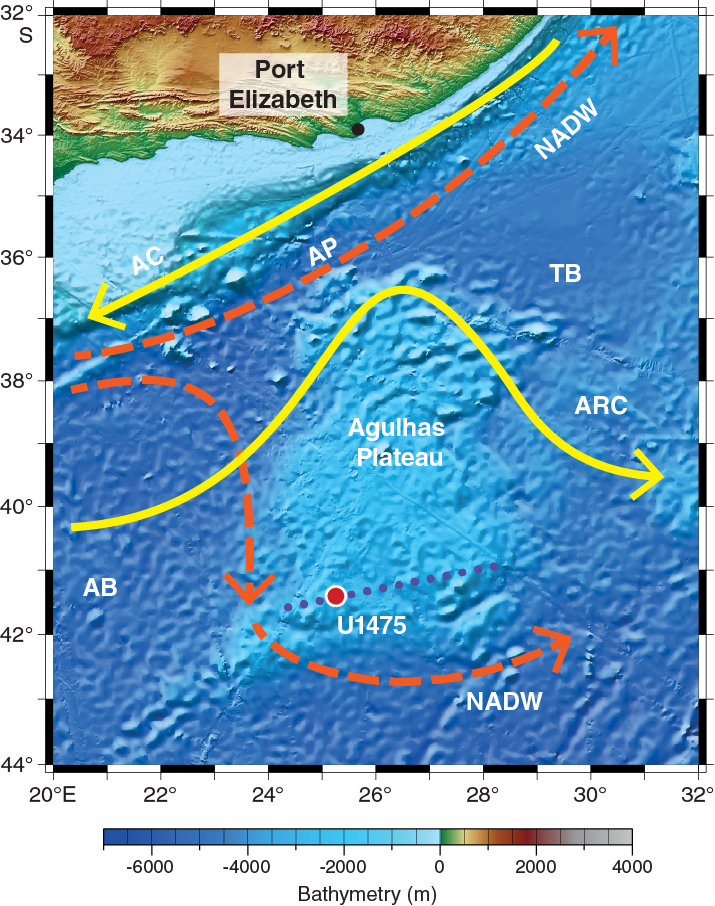
Site U1475 is located on the southwestern flank of the Agulhas Plateau (41°25.61′S; 25°15.64′E) ~450 nmi south of Port Elizabeth, South Africa (Figures F1, F2), in a water depth of 2669 m.
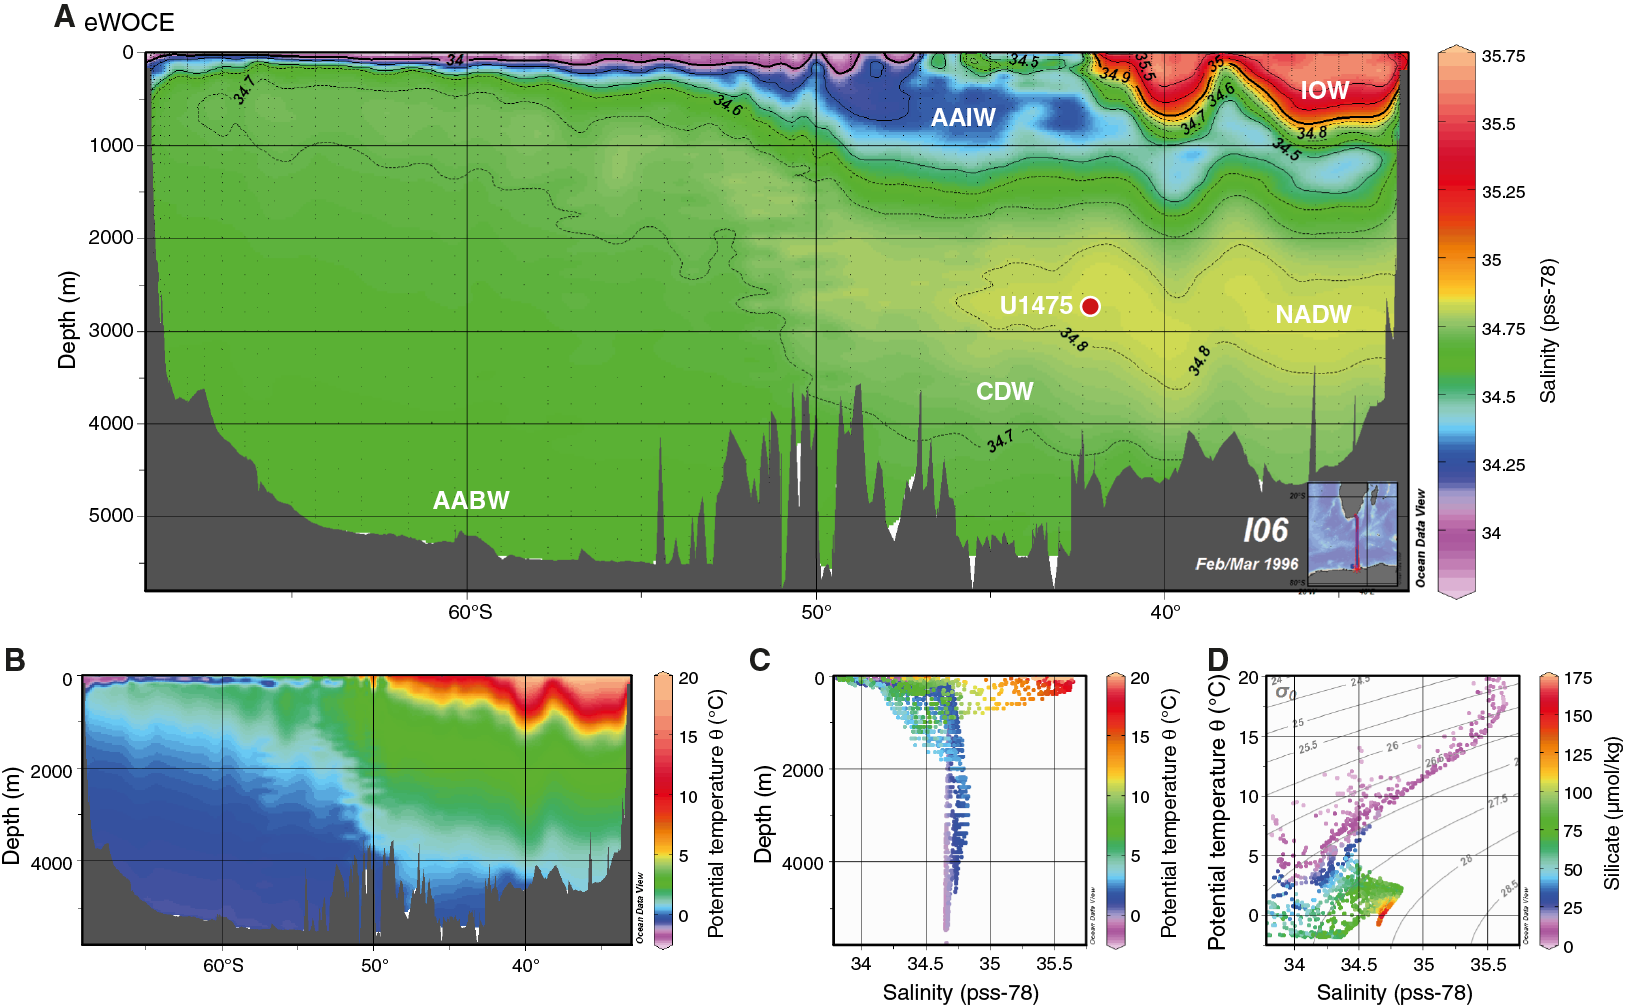
A number of water masses are found here: Indian Ocean Water (IOW), Upper and Lower Circumpolar Deep Water (CDW), Antarctic Bottom Water (AABW), Antarctic Intermediate Water (AAIW), and North Atlantic Deep Water (NADW) (Figure F3).
The Agulhas Plateau, which was formed during the early stages of the opening of the South Atlantic Ocean ~90 my ago (Parsiegla et al., 2008), is a major bathymetric high that is variably coated with sediment (Uenzelmann-Neben et al., 2001). The 230,000 km2 plateau, which ascends to ~2500 m above the adjacent seafloor, is bounded on the north by the 4700 m deep Agulhas Passage and flanked by Agulhas Basin to the west and Transkei Basin to the northeast (Figure F2). The northern part of the plateau is characterized by rugged topography, whereas the central and southern parts of the plateau exhibit a rather smooth topography (Allen and Tucholke, 1981) and have greater sediment thickness (Uenzelmann-Neben et al., 2001).
A strong water mass transport flows across the Agulhas Plateau region (Macdonald, 1999), which involves the water column from the surface to the Upper Circumpolar Deep Water. The hydrography of the upper ocean is dominated by the Agulhas Return Current, which comprises the component of the Agulhas Current that is not leaked to the South Atlantic Ocean but rather flows eastward from the retroflection (Lutjeharms and Ansorge, 2001). During its return to the southwest Indian Ocean, the Agulhas Return Current crosses the Agulhas Plateau, which deflects the deep-reaching current toward the Equator (Harris, 1970). The northward deflection causes meanders in the Agulhas Return Current that may, on occasion, persist far to the east before gradually loosing meridional amplitude (Lutjeharms, 2006). The Agulhas Return Current typically occurs in close association with the Southern Ocean Subtropical Front (STF). However, recent observations by Graham and De Boar (2013) show that the STF water mass boundary in the Indian Ocean is composed of zonally distinct and unrelated frontal features. In the Agulhas Return Current sector of the Indian-Atlantic Ocean gateway these authors identify the presence of a single dynamical STF (DSTF) characterized by strong sea-surface temperature and sea-surface height gradients, indicating large transport without a significant seasonal cycle. This DSTF originates from the Agulhas Return Current, effectively marking the southern boundary of the subtropical gyre circulation in the southwestern Indian Ocean.
Because of the variability in water masses and wind dynamics, the Indian-Atlantic Ocean gateway is also a region of complex biogeochemistry (Orsi et al., 1995), with significant spatial variability of phytoplankton distribution and productivity (Read et al., 2000) associated with the shift between the subtropical and subantarctic domains (Romero et al., 2015). Highest surface chlorophyll-a concentrations (0.5–0.8 mg/m3) are found between the STF and Subantarctic Front (SAF), reaching a maximum (1.25 mg/m3) at the strongest convergence (Romero et al., 2015).
The Agulhas Plateau is also well located to capture records of deep-water variability. Deep-water circulation in this area is primarily characterized by interactions between southward-propagating NADW and northward-flowing southern-sourced water, notably AAIW and AABW (Reid, 1989, 2005). Site U1475 is located within NADW (Figure F3). The transition between NADW and Lower Circumpolar Deep Water is near 3000 m below sea level (mbsl) in the deeper basins close to this site. The interocean exchange of NADW into the South Indian Ocean from the South Atlantic Ocean occurs mainly in the Agulhas Passage, located between the Agulhas Plateau and South Africa (Figure F2). However, some of the NADW flow also extends around the southern flank of the Agulhas Plateau, leading to deposition of a suite of contourite sediment drifts (Tucholke and Carpenter, 1977; Uenzelmann-Neben, 2001, 2002).
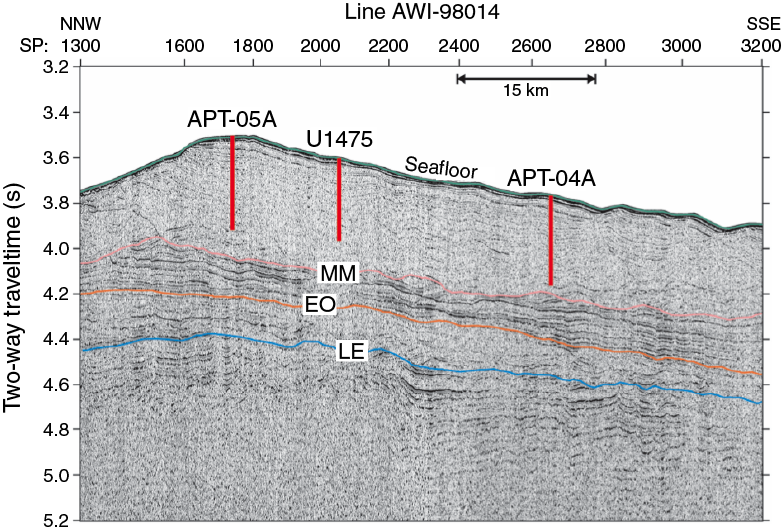
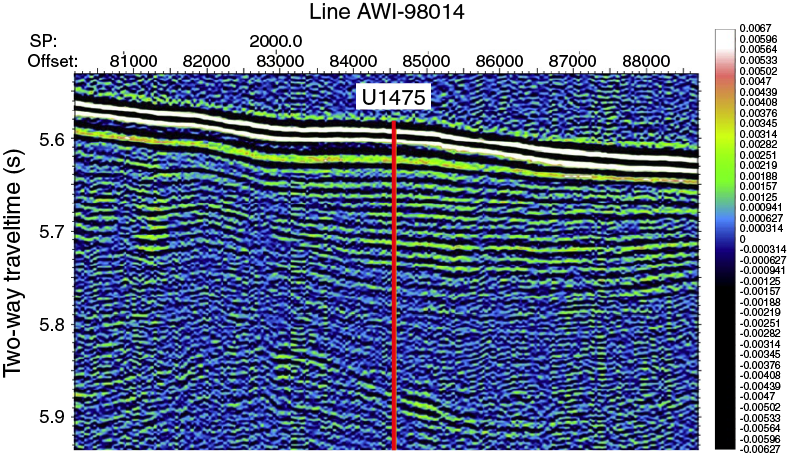
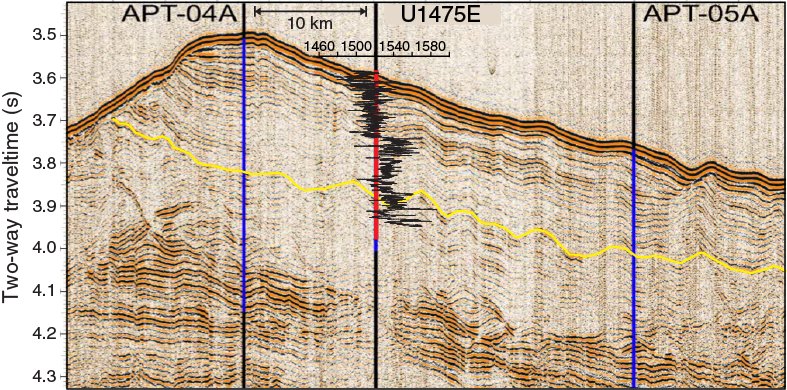
Site survey data collected during a seismic cruise with the R/V Petr Kottsov in 1998 (Uenzelmann-Neben, 1998) and R/V Marion Dufresne in 2002 show that Site U1475 is located on a sediment drift (Uenzelmann-Neben, 2001, 2002) (Figure F4) that is plastered on the southwestern flank of the Agulhas Plateau by NADW exiting the South Atlantic Ocean to the Indian Ocean. The wedge-shaped sediment drift widens to the west, shoaling to ~2510 mbsl at its crest (Figure F4). The wavy character of the seafloor topography is visible in the seismo-acoustic reflection pattern of the subsurface, reflecting sediment wave structures that are further indication of the hydraulically active near-bottom deep-water flow. Site U1475 is located at 2669 mbsl, near the drift crest where minor buried depressions offer a locally expanded sequence (Figure F5).
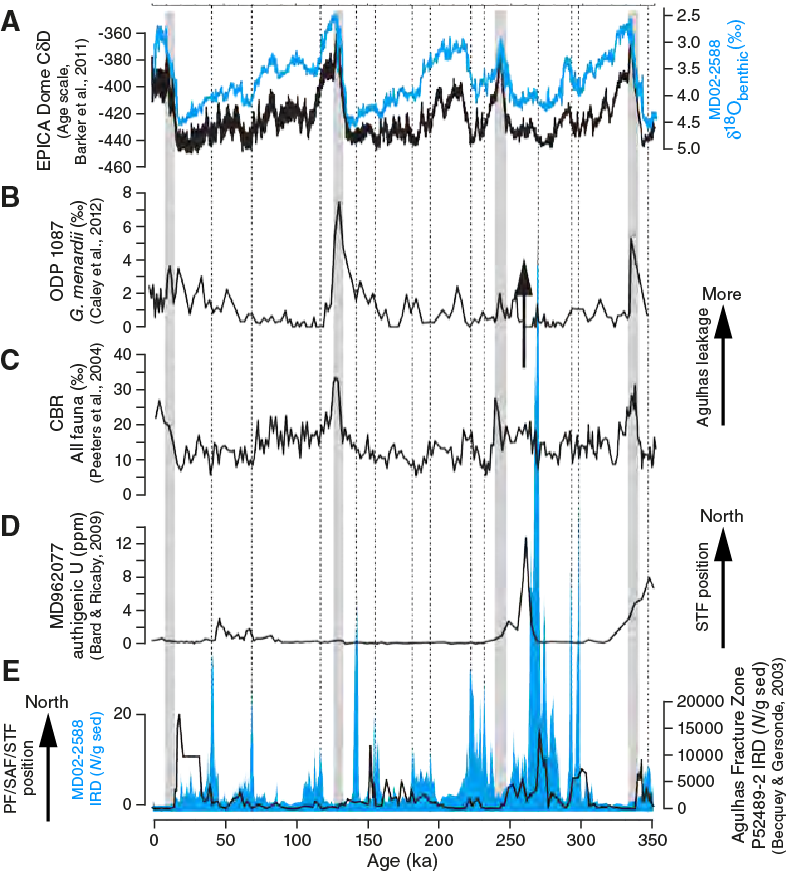
Millennial-scale multiproxy records of the past 350 ky at this location (Figure F6) highlight the synchrony of the regional ocean climatology and Antarctic climate variability. Evidence for regional ocean paleoclimatology includes latitudinal migrations of the Southern Ocean fronts and deposition of ice-rafted debris (IRD) as an indicator of sporadic expansions of subantarctic conditions to the Agulhas Plateau (e.g., Molyneux et al., 2007; Ziegler et al., 2013; Diz et al., 2007; Martínez-Méndez et al., 2010; Marino et al., 2013; Simon et al., 2013; Romero et al., 2015). These data serve as evidence for possible meridional shifts in the SAF that borders the Agulhas leakage corridor and may exert control on Agulhas leakage.
Paleoceanographic studies of the past 350 ky combined with seismic surveys support the suitability of Site U1475 to achieve our primary objectives, which are to
- Recover a complete Pliocene–Pleistocene sedimentary succession, including the early Pliocene warm period, mid-Pliocene expansion of Northern Hemisphere ice sheets, and the mid-Pleistocene transition, from a high-accumulation sediment drift located within the southern Agulhas Return Current sector of the Indian-Atlantic Ocean gateway;
- Assess the linking between Antarctic climate variations, circumpolar ocean front instability, and connections with Agulhas leakage into the South Atlantic Ocean;
- Assess the vigor and hydrography of NADW (or its precursors) exported to CDW and the southwest Indian Ocean at a location proximal to the entrance of NADW to the Southern Ocean and South Indian Ocean; and
- Evaluate the possibility of advective salinity feedbacks between Agulhas leakage and Atlantic Meridional Overturning Circulation variability, notably the possible role of leakage in modulating surface-to-deep-ocean coupling in the North Atlantic Ocean during the transitions between climatic states.
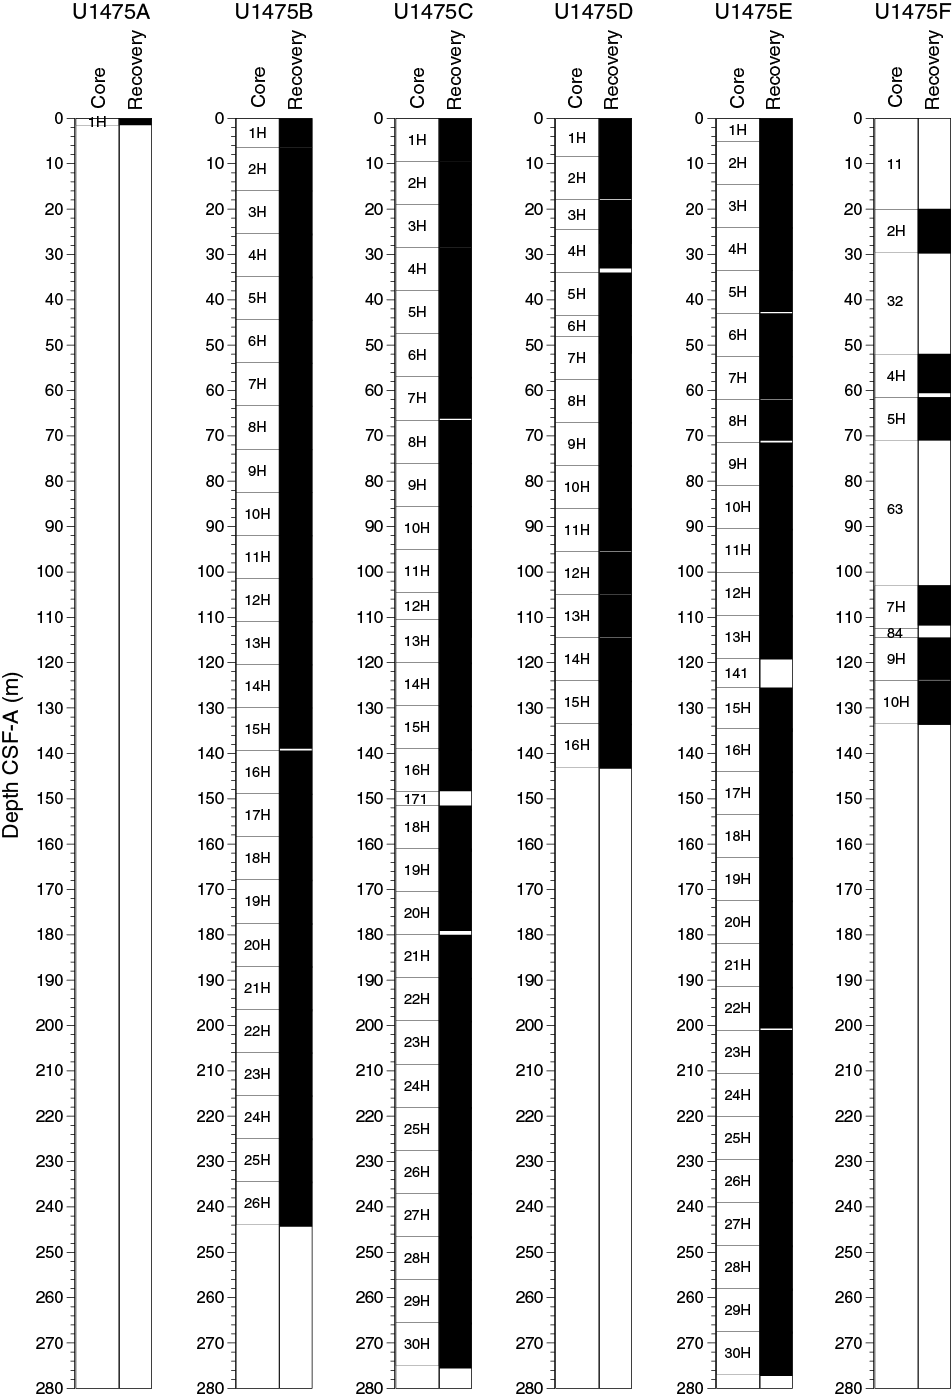
Site U1475 was occupied on 23 February 2016. Six holes were drilled and cored using the advanced piston corer (APC), achieving a depth of 277.0 m drilling depth below seafloor (DSF) in Hole U1475E. The total cored interval at Site U1475 was 987.9 m, and total recovery was 1015.92 m (103%).
Operations
Transit to Site U1475
The vessel was under way at full speed for proposed Site APT-01B (Site U1475) when the ship’s doctor informed the Captain of a medical emergency requiring evacuation. The ship’s heading was changed at 0820 h on 20 February 2016 to meet a helicopter for evacuation near Port Elizabeth, South Africa. At ~1200 h on 21 February, the vessel was in position for a helicopter transfer. By 1230 h, the helicopter departed with the patient, and the vessel resumed the transit to Site U1475. After a 433 nmi transit from the medical evacuation point, the vessel arrived at Site U1475 at 1500 h on 23 February.
Site U1475
Site U1475 consisted of 6 holes, ranging in depth from 1.5 to 277.0 m DSF (Table T1). Overall, 107 cores were recorded for the site. A total of 1015.92 m of core over a 987.9 m interval was recovered using the APC system (103% core recovery). Six intervals were advanced without coring over 86.0 m. The total time spent at Site U1475 was 5.7 days.
Table T1. Site U1475 core summary. Download table in .csv format. View PDF table.
Hole U1475A
The vessel arrived at Site U1475 at 1500 h on 23 February 2016. Core 361-U1475A-1H was recovered with 1.48 m of sediment, and sea level was determined to be 2670.4 m above the sediment surface. The science party decided that a longer, well-preserved mudline core was necessary, and Hole U1475A was concluded. One APC core was taken over a 1.5 m interval with a total recovery of 1.48 m of core (99% core recovery).
Hole U1475B
Hole U1475B began at 0330 h on 24 February. The APC was deployed for Cores 361-U1475B-1H through 26H from the seafloor to 243.9 m DSF. The drill string was pulled out of the hole, and operations in Hole U1475B ended when the bit cleared the seafloor at 0430 h on 25 February. A total of 26 APC cores were taken over a 243.9 m interval with 250.31 m of sediment recovered (103%). Cores 1H through 6H (0–54.13 m core depth below seafloor [CSF-A]) are extremely disturbed as a result of high seas.
Hole U1475C
The vessel was moved 20 m north of Hole U1475B. APC coring in Hole U1475C started at 0625 h on 25 February and extended from the seafloor (2669.3 mbsl) to 275.0 m DSF. Cores 361-U1475C-1H through 30H were taken over a 272.0 m cored interval with 280.7 m of sediment recovered (103%). While taking Cores 3H and 12H, the shear pins on the core barrel sheared early due to rough sea conditions. A short interval from 148.5 to 151.5 m DSF was advanced without coring as requested by the stratigraphic correlation specialists to cover coring gaps. After reaching 275.0 m DSF, the drill string was pulled out of the hole and operations in Hole U1475C ended when the bit cleared the seafloor at 0935 h on 26 February.
Hole U1475D
The vessel was moved 20 m east of Hole U1475B. Coring in Hole U1475D began at 1155 h on 26 February and extended from the seafloor to 143.0 m DSF. Cores 361-U1475D-1H through 16H were taken over a 143.0 m interval with 150.86 m of sediment recovered (105%). Interstitial water samples were collected from every core section for postcruise research. After concluding coring operations in Hole U1475D, the drill string was pulled out of the hole, with the bit clearing the seafloor at 0425 h on 27 February.
Hole U1475E
The vessel was offset 20 m south of Hole U1475B, and Hole U1475E began at 0550 h on 27 February. APC coring in Hole U1475E extended from the seafloor (2671.8 mbsl) to 277.0 m DSF. Cores 361-U1475E-1H through 30H were taken over a 270.5 m interval with 277.20 m of sediment recovered (102%). One interval was advanced without coring from 119.0 to 125.5 m DSF as requested by the stratigraphic correlation specialists to offset coring gaps. After reaching 277.0 m DSF, the drill string was pulled out of the hole, and operations in Hole U1475E ended when the bit cleared the seafloor at 1335 h on 28 February.
Hole U1475F
The vessel was offset 20 m west of Hole U1475B, and operations in Hole U1475F began at 1450 h on 28 February. The stratigraphic correlation specialists devised a spot-coring plan in Hole U1475F to cover large coring gaps. The hole was washed down from the seafloor (2669.3 mbsl) to 20 m DSF. Hole U1475F contained four intervals that were advanced without coring over 76.5 m. Six APC cores were recovered over a 57.0 m interval using nonmagnetic core barrels in Hole U1475F, with 55.37 m of sediment recovered (97% core recovery). After reaching 133.5 m DSF, the drill sting was pulled from the hole, with the bit clearing the seafloor at 0235 h on 29 February. The beacon was recovered at 0451 h, and the drill floor was secured for transit. At 0930 h the vessel began the voyage to Site U1477, ending Site U1475.
Sedimentology
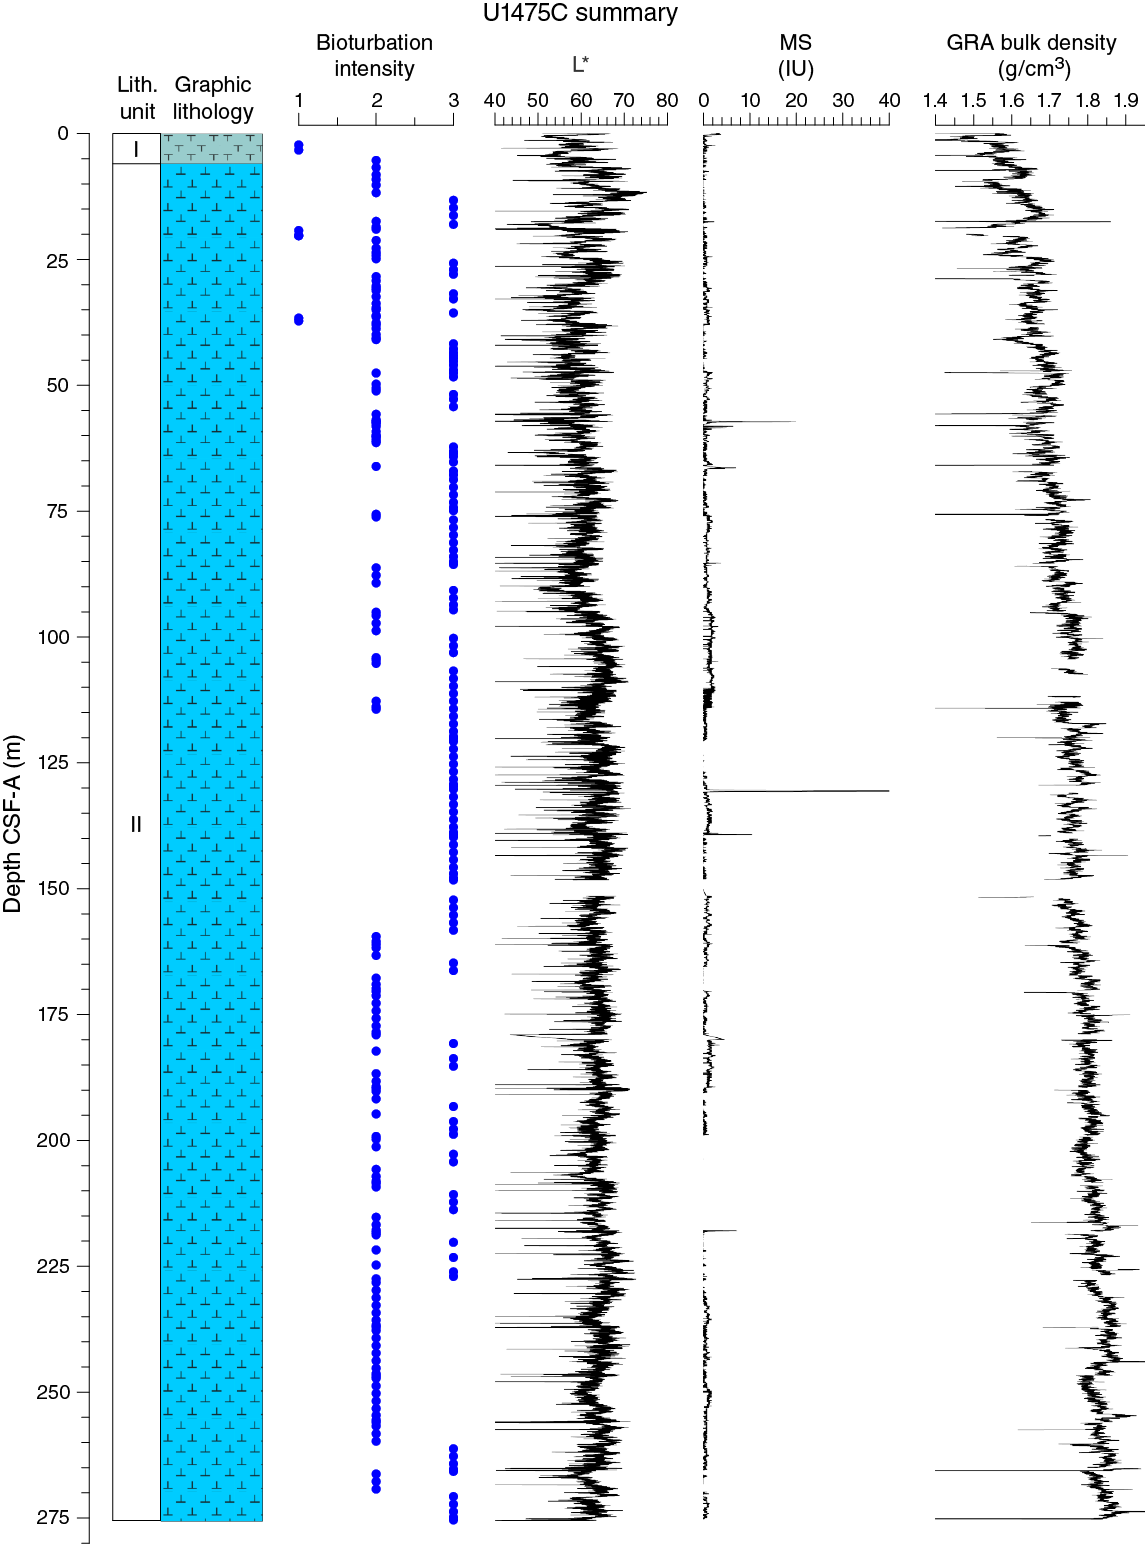
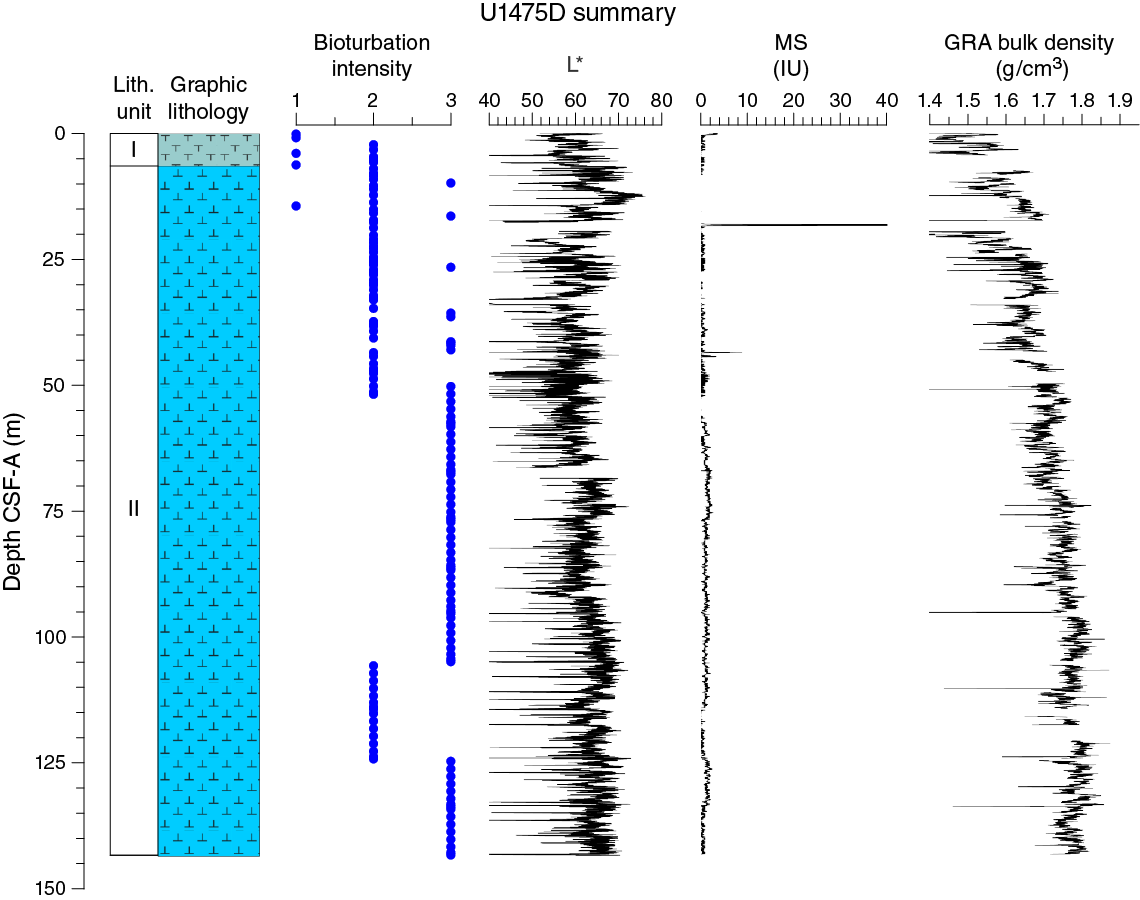
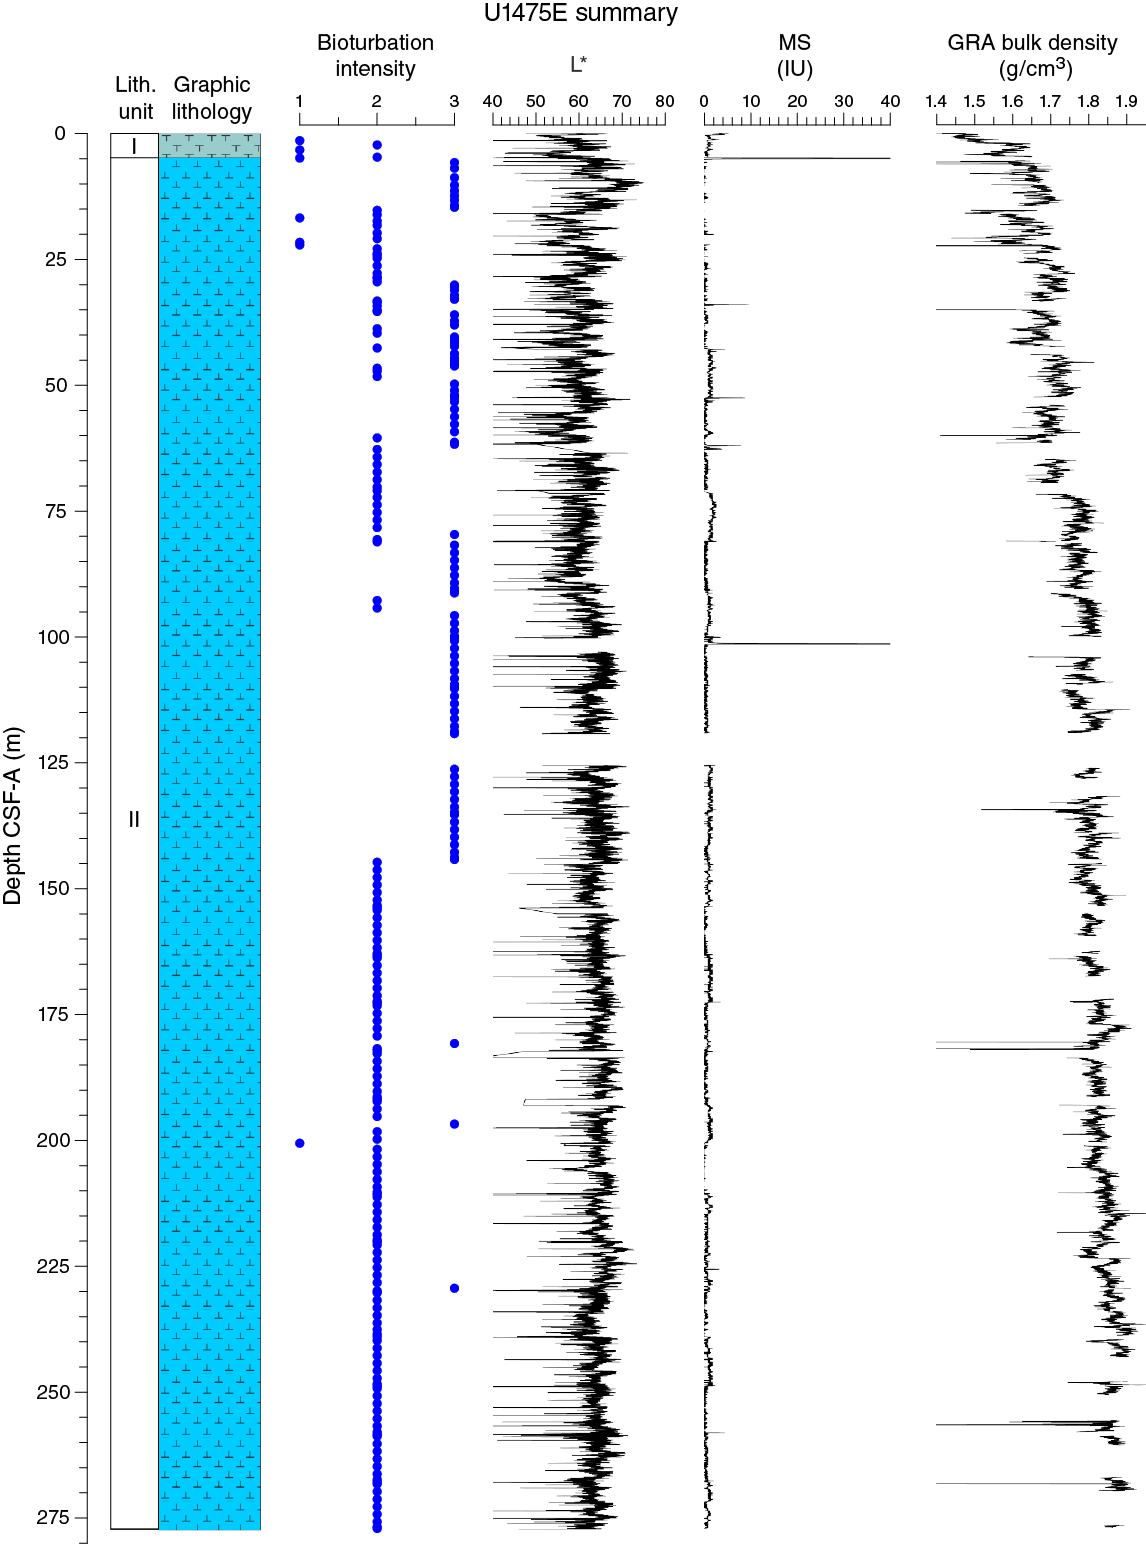
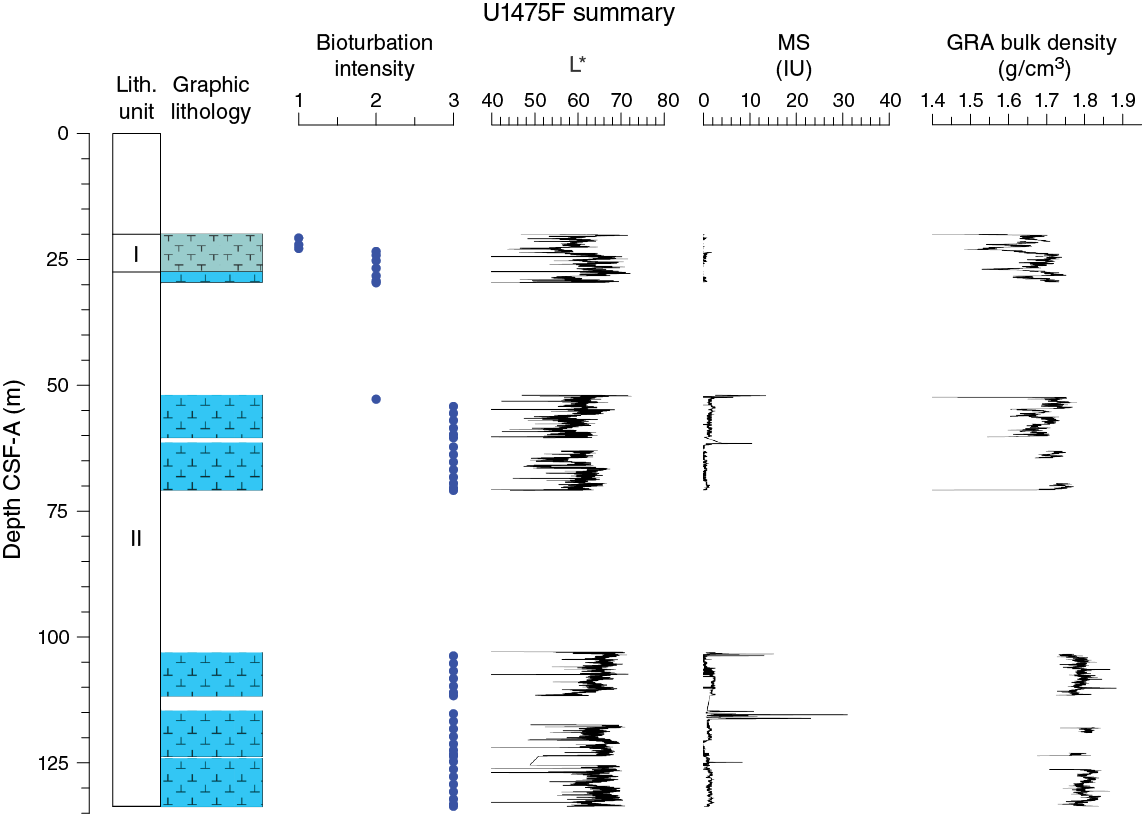
Drilling at Site U1475 recovered a total of ~1016 m of sediment from six holes (Figures F7, F8; also see Operations). Hole U1475A was cored to 1.48 m CSF-A, Hole U1475B to 244.33 m CSF-A, Hole U1475C to 275.57 m CSF-A, Hole U1475D to 143.38 m CSF-A, Hole U1475E to 277.22 m CSF-A, and Hole U1475F to 133.68 m CSF-A. The APC system was applied in all holes. Six intervals totaling 86 m were advanced without coring: one interval in Holes U1475C (148.33–151.50 m CSF-A) and U1475E (119.27–125.50 m CSF-A) and four intervals in Hole U1475F (0–20.00, 29.72–52.00, 70.95–103.00 and 111.75–114.50 m CSF-A). Visual description of all cores was performed and recorded using the shipboard lithostratigraphic DESClogik program, which involves visual assessment of average grain size, sediment color, sedimentary structures, and bioturbation intensity. Disturbances induced by drilling were also described. Lithologic characteristics were further determined using smear slide analyses, and a total of 813 shipboard samples were collected from the working halves of the cores for paleontological, physical property, paleomagnetic, and geochemical analyses (Table T2).
Table T2. Overview of shipboard sampling, Holes U1475A–U1475F. Download table in .csv format.
Lithostratigraphic unit description
Unit I
- Intervals: 361-U1475A-1H-1, 0 cm, through 1H-CC, 12 cm; 361-U1475B-1H-1, 0 cm, through 1H-4, 25 cm; 361-U1475C-1H-1, 0 cm, through 1H-4, 150 cm; 361-U1475D-1H-1, 0 cm, through 1H-5, 45 cm; 361-U1475E-1H-1, 0 cm, through 1H-4, 81 cm; 361-U1475F-2H-1, 0 cm, through 2H-5, 150 cm.
- Depths: Hole U1475A = 0–1.48 m CSF-A; Hole U1475B = 0–4.75 m CSF-A; Hole U1475C = 0–6.00 m CSF-A; Hole U1475D = 0–6.45 m CSF-A; Hole U1475E = 0–4.81 m CSF-A; Hole U1475F = 20– 27.5 m CSF-A.
- Age: Middle/Late Pleistocene to Holocene
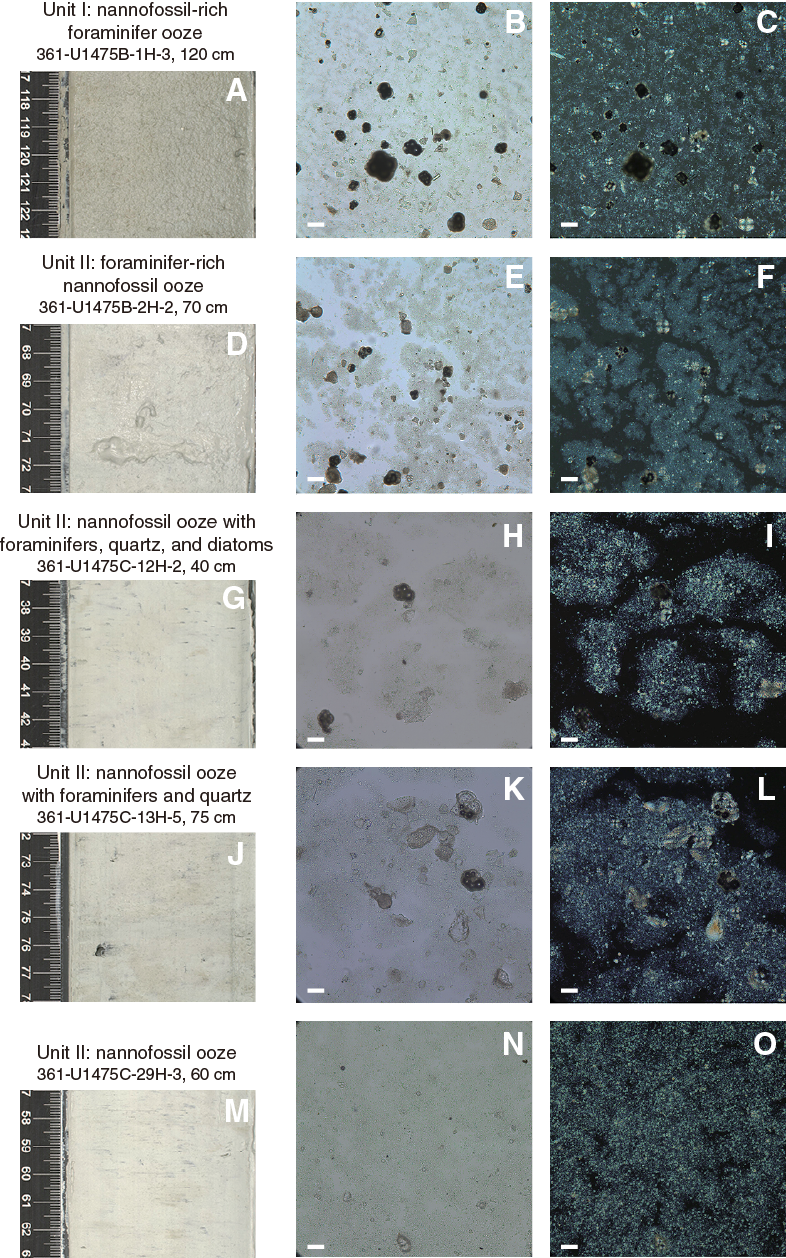
Unit I is composed of pale brown (10 Y 6/3) to light greenish or olive-gray (GLEY 1 7/10Y; 5Y 6/2) and white-gray (GLEY 1 8/N) nannofossil-rich foraminifer ooze (Figure F9).
Unit II
- Intervals: 361-U1475B-1H-4, 25 cm, through 26H-CC, 28 cm; 361-U1475C-1H-4, 150 cm, through 30H-CC, 22.5 cm; 361-U1475D-1H-5, 45 cm, through 16H-CC, 14 cm; 361-U1475E-1H-5, 81 cm, through 30H-CC, 17 cm; 361-U1475F-2H-5, 150 cm, through 10H-CC, 12 cm.
- Depths: Hole U1475B = 4.75–244.33 m CSF-A; Hole U1475C = 6.00–275.57 m CSF-A; Hole U1475D = 6.45–143.38 m CSF-A; Hole U1475E = 4.81–277.22 m CSF-A; Hole U1475F = 27.5–133.68 m CSF-A.
- Age: Miocene to Middle/Late Pleistocene
Unit II is composed of light greenish or pale gray (GLEY 1 7/10Y; 10 6/2) to white-gray (GLEY 1 8/N) nannofossil ooze. Alternations between foraminifer-bearing or foraminifer-rich nannofossil ooze and nannofossil ooze with fine sand (foraminifers, quartz, and occasionally diatoms) were observed.
Drilling disturbance
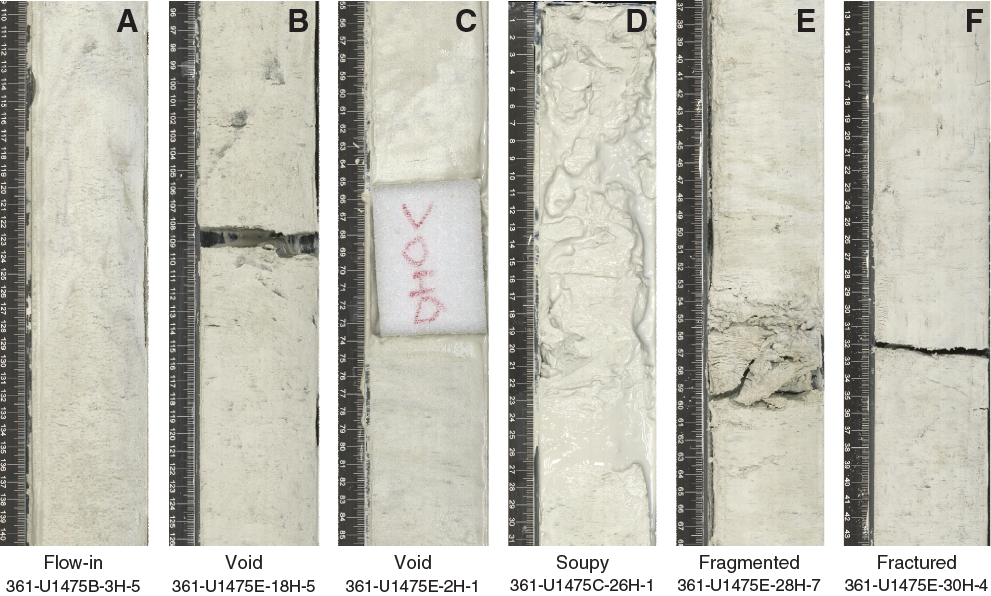
Different types of drilling disturbance were observed in the cores from Site U1475 (Figure F10). The uppermost 1 or 2 sections of most cores from all holes are often soupy, whereas fractures or flow-in disturbance were occasionally observed in the middle to bottom sections of all cores. Fragmented sediment and voids were also occasionally observed. For Hole U1475F, which was advanced to 20 m CSF-A, it is likely that drilling disturbance may have caused the recovery of younger sediment from the advanced interval (i.e., 0–20 m CSF-A) within the upper parts of Core 361-U1475F-2H.
Lithologies and composition
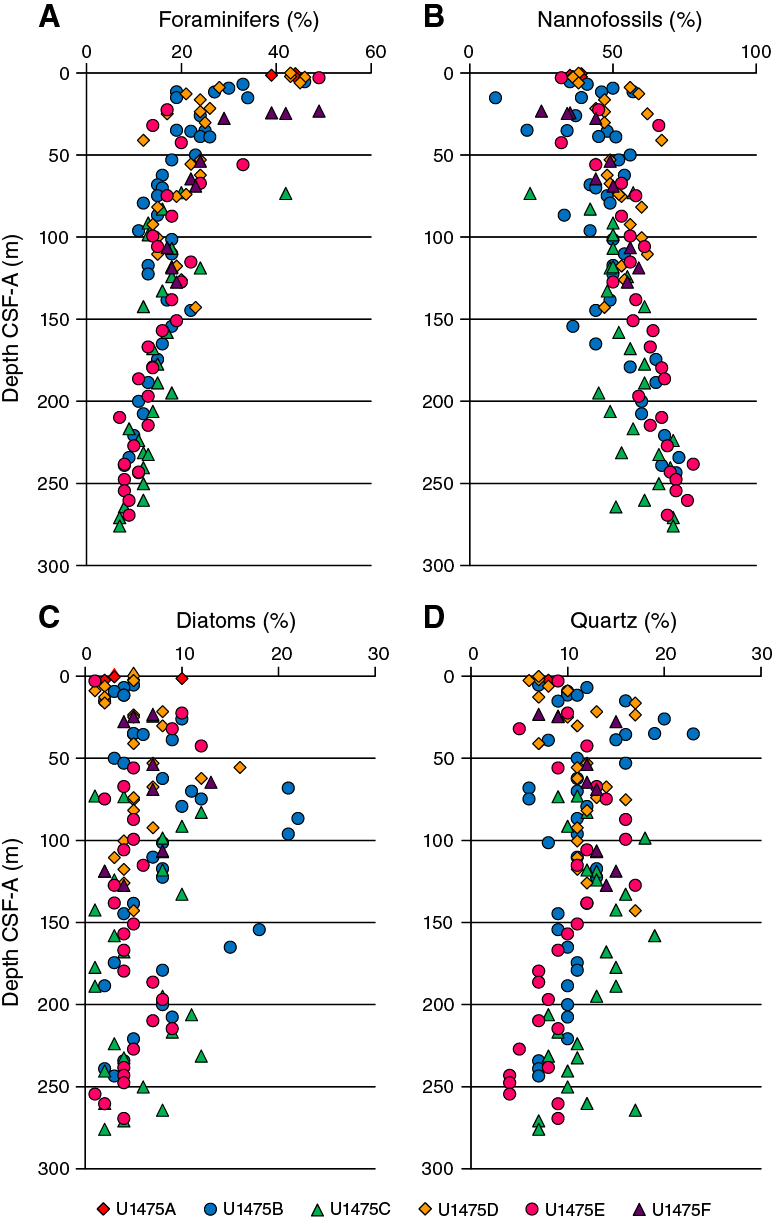
Smear slide observations show that biogenic materials (80% ± 6% on average) are the principal component of the sediment (Table T3; Figure F11). The biogenic fraction is dominated by foraminifers (45% ± 5% on average), nannofossils (33% ± 7%), and diatoms (5% ± 2%) in Unit I. In Unit II, the biogenic fraction is dominated by nannofossils (55% ± 11% on average), foraminifers (17% ± 6%), and diatoms (6% ± 4%).
Table T3. Smear slide textures, compositions, and lithologic names, Holes U1475A–U1475F. Download table in .csv format.
Sediment grain sizes consist of 43% ± 8% sand on average, 24% ± 6% silt, and 33% ± 7% clay in Unit I and 9% ± 7% sand, 23% ± 7% silt, and 67% ± 10% clay in Unit II. The composition of the terrigenous component is dominated by quartz (11% ± 4% on average) and clay minerals (3% ± 2%) in both units, with common presence of pyrite and rarely glauconite and feldspar. Thin green layers occur at irregular intervals. These color bands may be associated with the presence of glauconite, although they may also be related to a slight degree of carbonate recrystallization, potentially reflecting siderite formation (Fe carbonate).
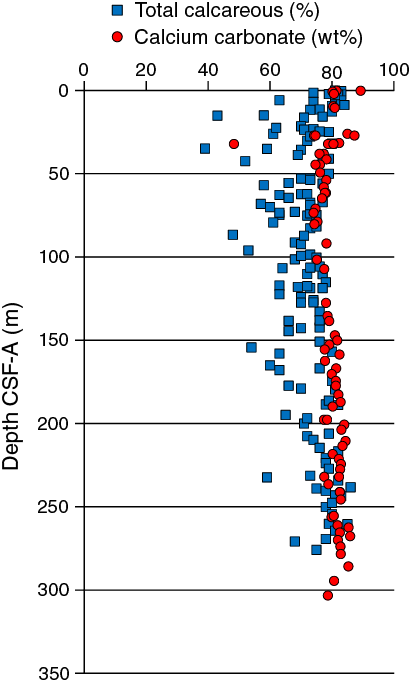
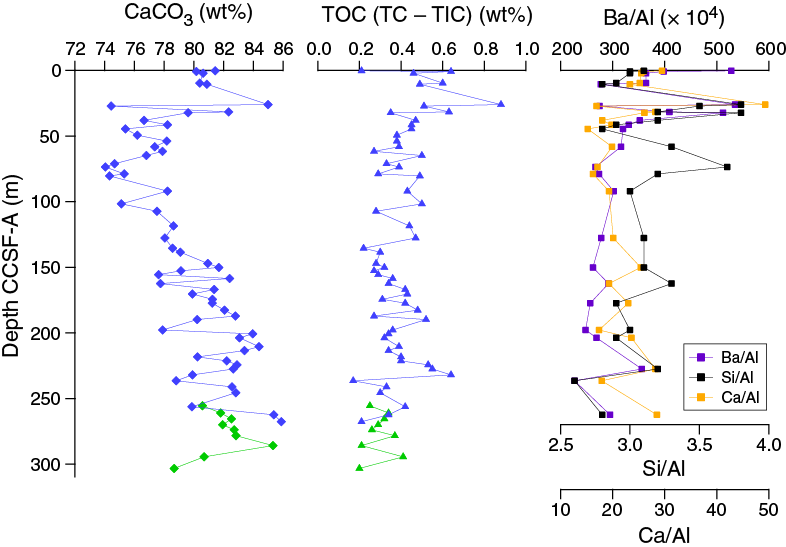
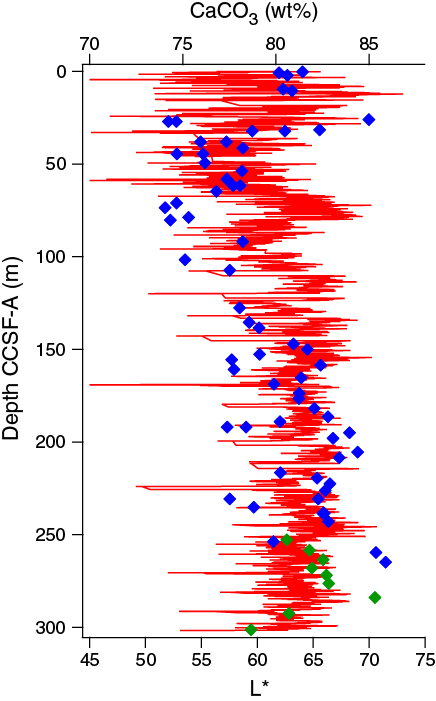
The average abundance of total biogenic carbonate in the sediment of Hole U1475B was estimated to ~69% ± 11% based on smear slide descriptions (Table T3). This result is in broad agreement with geochemical analyses (see Geochemistry), which reveals an average carbonate content of ~80 wt% (range = 74–89 wt%) (Figure F12).
Structures
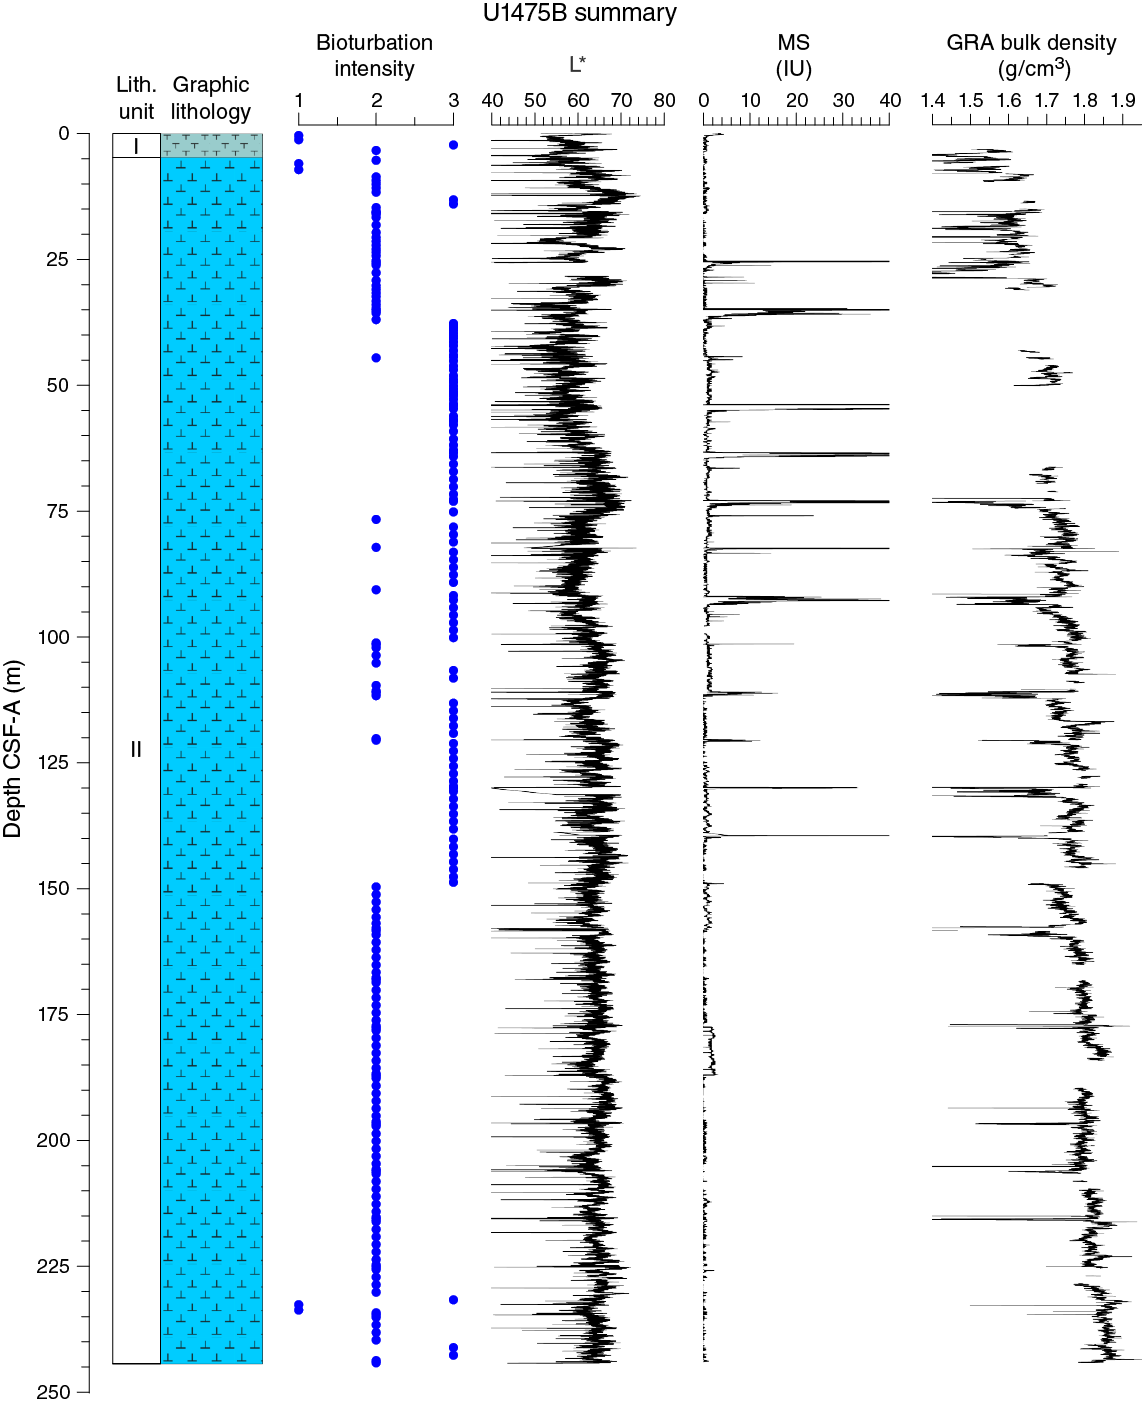
No primary sedimentary structures were observed. Bioturbation is the only secondary sedimentary structure and is widespread throughout the sequence. The most common indicator of bioturbation is centimeter-scale diffuse mottling. Discrete ichnofossil burrows (Planolites) are commonly observed. Thin darker bands commonly surround burrows, and macroscopic pyritized burrows are also common. Bioturbation intensity ranges from slight to strong and is at a maximum between ~50 and ~150 m CSF-A in all holes (Figure F8).
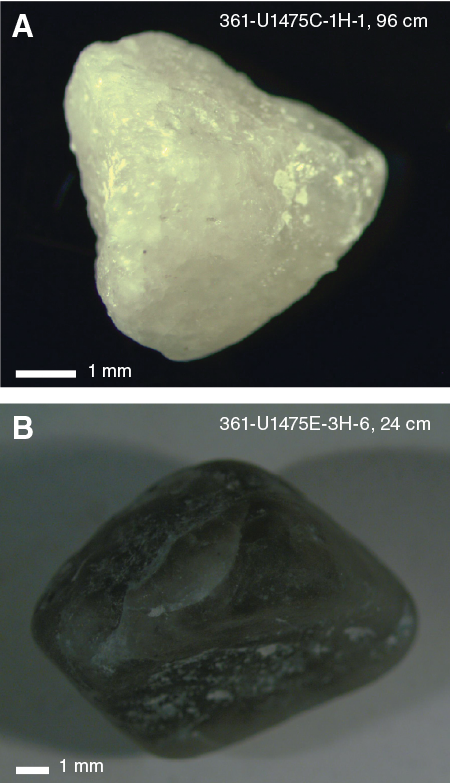
Three dropstones (coarse sand to granule fraction in size) were observed (Figure F13): a 0.5 cm long quartz clast in Section 361-U1475C-1H-1, 96 cm; a 1.4 cm long clast in Section 5H-2, 82 cm; and a 0.7 cm long volcanic glass clast in Section 361-U1475E-3H-6, 24 cm.
Color
The color of foraminifer ooze in Unit I ranges from pale brown (10 Y 6/3; uppermost ~20–25 cm of the first core in all holes) to light greenish or olive-gray (GLEY 1 7/10Y; 5Y 6/2) and white-gray (GLEY 1 8/N). Light greenish or pale gray (GLEY 1 7/10Y; 10 6/2) to white-gray (GLEY 1 8/N) nannofossil ooze is found in Unit II.
Discussion
Site U1475 is located on a sediment drift on the southwestern flank of the Agulhas Plateau, a regional bathymetric high that rises 2500 m above the adjacent seafloor in the southwest Indian Ocean. The alternating greenish gray and light gray beds in the uppermost part of all holes (Cores 1H through 7H) may document variations in the relative input of biogenic versus terrigenous sediment. This could possibly represent the sedimentological response to glacial–interglacial changes, with decreased terrigenous input and/or enhanced biogenic carbonate production and preservation during interglacial periods and vice versa.
Given the location of Site U1475, the continuous presence of terrigenous quartz grains (5%–15% in all holes; Figure F11) suggest that the dominant transport mechanism for terrigenous sediment supply is either as wind-blown dust and/or derived from bottom or surface currents (Diekmann et al., 1996; Petschick et al., 1996; Kuhn and Diekmann, 2002; Molyneux et al., 2007; Franzese et al., 2009). The occurrence of macroscopically visible dropstones, probably corresponding to IRD (Marino et al., 2013) during the Middle–Late Pleistocene (see Age model), suggests that terrigenous material may also be delivered by ice rafting from glacial icebergs or sea ice originating from Antarctica or the Sandwich Islands, respectively (Kanfoush et al., 2000, 2002; Nielsen et al., 2007; Nielsen and Hodell, 2007). More detailed lithologic/grain size analyses may provide evidence for a more common presence of finer IRD (i.e., >150 μm but not visible in the split cores [Marino et al., 2013]) and thus allow documenting the influence of sea ice/iceberg sediment deposition.
Diatoms are continuously present in the sediment at Site U1475, ranging from trace to 10% (Figure F11). Variability in diatom abundance may indicate changes in the productivity of the surface water at Site U1475. This could be linked to changes in nutrient supply associated with orbital timescale variability in climate (e.g., glacial–interglacial changes) and/or variability in diatom transport by deep water masses (Molyneux et al., 2007; Romero et al., 2015). The gradual increase of foraminifer abundances in parallel with the decrease of nannofossil abundances from the base of the sequence to the surface could represent major shifts in sedimentation processes related to long-term climate change. The shift from Unit I (foraminifer ooze) to II (nannofossil ooze) occurs at ~8 m CSF-A, which corresponds to ~0.2 Ma (see Age model).
The extensive bioturbation and diagenetic alterations in the sediment at Site U1475 suggest an oxygen-rich deep-sea environment. This could be potentially attributed to the presence of ventilated deep water masses (presently interactions between NADW and CDW) (Reid, 1989, 2005), although deep-water property changes might be expected at glacial–interglacial timescales. Pyrite forms when bacterial processes couple organic carbon oxidation with the reduction of sulfate. This reaction creates sulfide that can in turn react with dissolved or mineral iron to produce pyrite (Canfield and Raiswell, 1991; Schoonen, 2004). The presence of pyrite in Units I and II points to the presence of available Fe in the sediment, probably associated with the terrigenous dust and/or sediment supply by bottom currents, which would enhance early diagenesis processes at Site U1475.
Physical properties
Physical property measurements were completed on whole-round sections and section halves from cores collected in Holes U1475A–U1475F. Gamma ray attenuation (GRA) density, magnetic susceptibility (MS), P-wave velocity (VP), and natural gamma radiation (NGR) measurements were made on all whole-round sections using the Special Task Multisensor Logger (STMSL), the Whole-Round Multisensor Logger (WRMSL), and the Natural Gamma Radiation Logger (NGRL). In all cases, STMSL and WRMSL sampling resolution was set to 2.5 cm, and the NGRL sampling resolution was set to 10 cm. All sections were first logged using the STMSL without waiting for thermal equilibration, generating a first set of GRA density estimates and magnetic susceptibility data. Following thermal equilibration (after the cores reached 19°C), the sections were logged using the WRMSL, generating VP and a second set of GRA density and magnetic susceptibility data, and then logged using the NGRL. In some cases, NGR logging was done prior to thermal equilibration and WRMSL measurements in order to provide NGR data as quickly as possible for initial stratigraphic correlation.
Following core splitting, samples were taken for moisture and density (MAD) measurements from the working-half sections. The MAD (index) properties determined at Site U1475 include bulk density, dry density, grain density, porosity, void ratio, and water content. Three samples per core from the working-half sections of Holes U1475B (2.5–242.9 m CSF-A) and U1475C (232.0–276.0 m CSF-A) were taken for MAD measurements. The samples (91 in total) were taken typically from Sections 2, 4, and 6, with few exceptions based on visual inspection. Spectral color reflectance was measured at a resolutions of 0.5 or 1 cm on the archive-half sections using the Section Half Multisensor Logger (SHMSL). During most of these measurements, the magnetic susceptibility point sensor on the SHMSL was switched off to save time because the high-carbonate and low-terrigenous fraction contents gave a diamagnetic signal that was not usable for correlation. Red, green, and blue (RGB) were measured on the Section Half Imaging Logger (SHIL). In this summary we focus on the deepest hole (U1475E) for presentation of data.
Diffuse reflectance spectrometry and digital color image
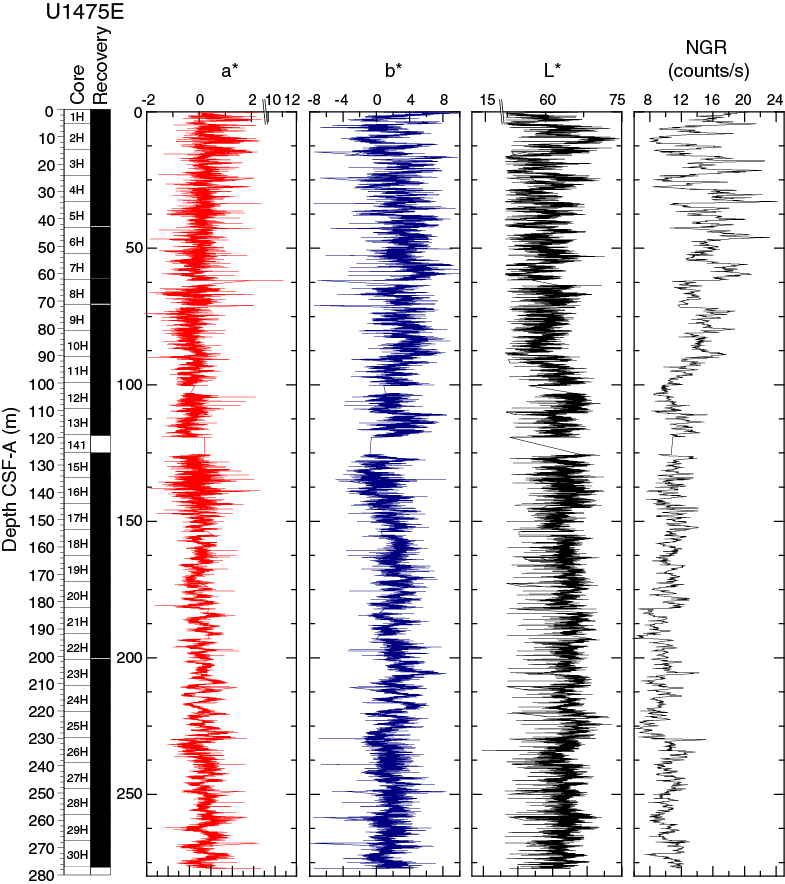
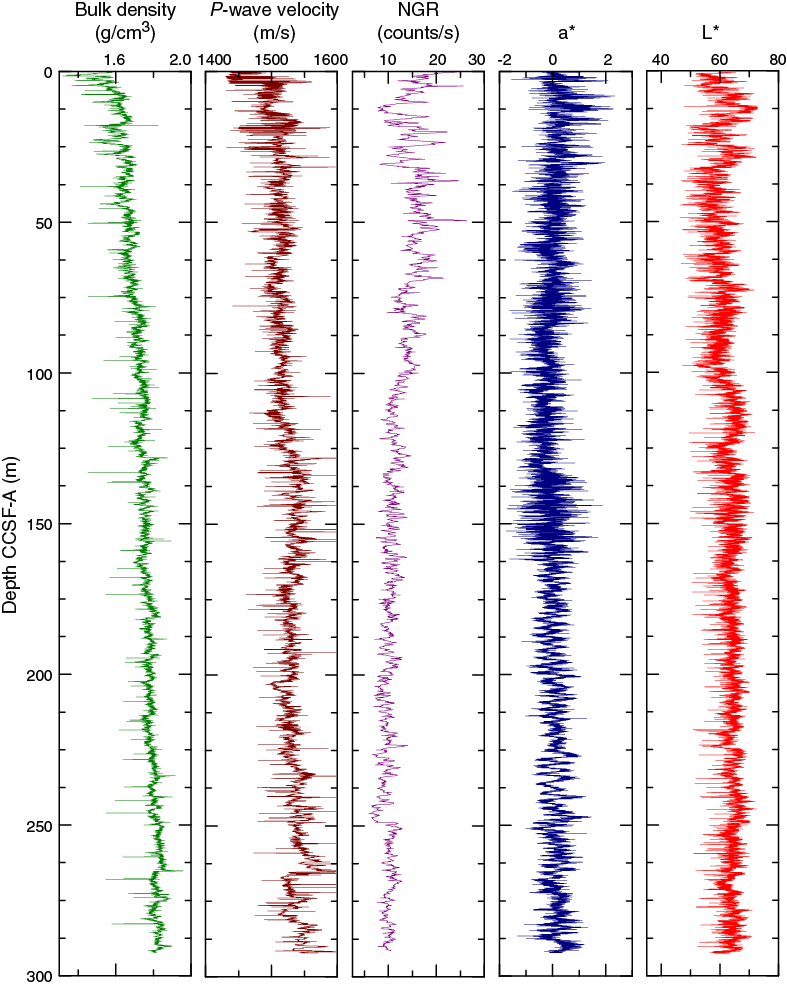
In general, L* ranges from 29 to 74 and shows marked cyclic variability with changing wavelengths throughout the record. Values for a* range, in general, between 4 and –2, and values for b* range between 10 and –8. These cycles have higher amplitude, and so are more pronounced, shallower than 60 m CSF-A in Hole U1475E (Figure F14).
Maximum amplitude cycles in L* are observed around 10 m CSF-A. This sediment depth does not correspond with the lower boundary of lithostratigraphic Unit I, located between 0 and 4.81 m CSF-A in Hole U1475E (see Sedimentology). Maxima in a* values were observed in the upper cores in Hole U1475E. A significant change in the character of L*, a*, and b* data occurs at ~225 and ~110 m CSF-A that could be due to change in sedimentation rates, nature of the cyclicity, or other environmental forcing. The color reflectance variations, in general, are likely due to compositional changes (e.g., foraminifer/nannofossil ooze concentration versus terrigenous content). Spectral reflectance data are very similar between holes; deviations are likely due to drilling disturbances.
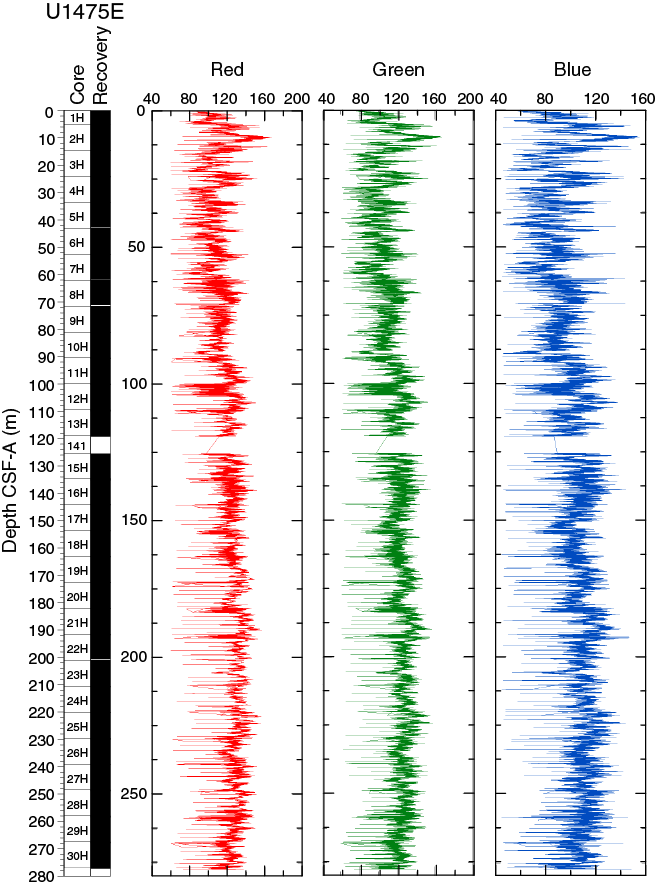
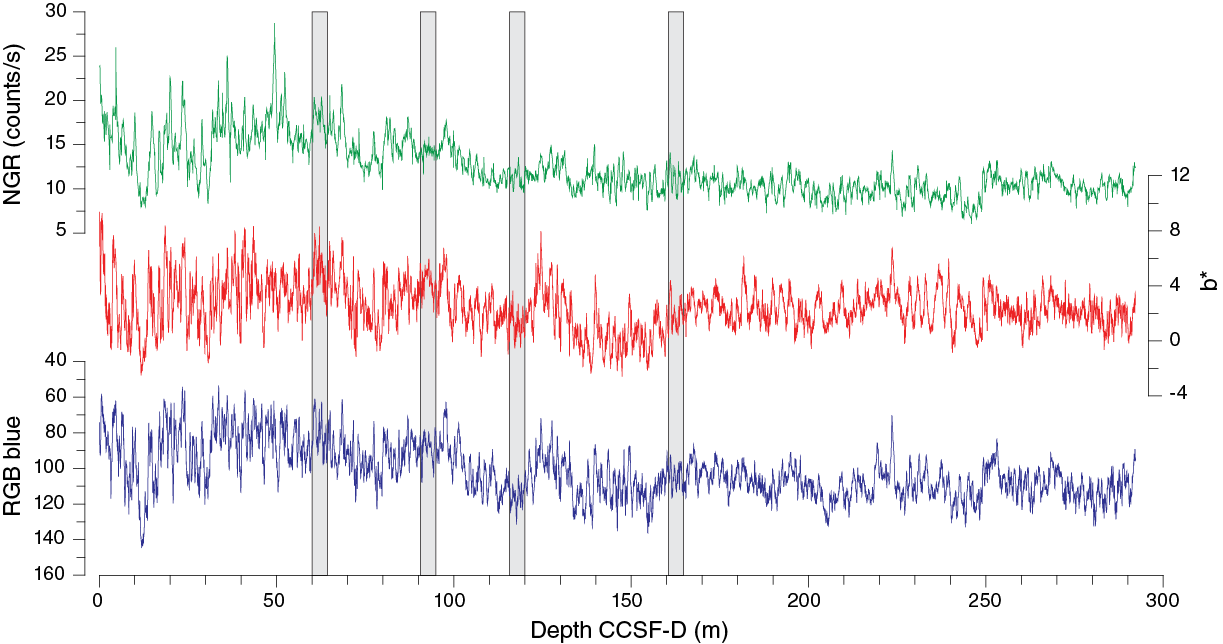
SHIL records of RGB color were taken from the moist surface of the archive halves of split cores. RGB data have average values of R = 120 ± 15, G = 118 ± 15, and B = 102 ± 16 (Figure F15). RGB data broadly correspond with L* and display the highest amplitude variability in the upper 60 m CSF-A. They also show a marked cyclic pattern below ~100 m CSF-A and an increase in average values at this depth.
Natural gamma radiation
Changes in NGR represent the total variation in activity of the radioactive elements uranium, thorium, and potassium. NGR values range from 6 to 24 counts/s with an average of 12 counts/s in Hole U1475E (Figure F14). In the upper 60 m CSF-A, NGR values show the most pronounced variations, with an apparently cyclic character. From 60 to 110 m CSF-A, NGR variations have longer wavelength and appear smoothed; this interval is broadly coincident with common to abundant reworked nannofossil contents (see Micropaleontology). From 110 m CSF-A to the bottom of the hole, NGR values change from 6 to 15 counts/s in a marked harmonic mode that we infer to be related to the variable amount and nature of carbonates (proportion of foraminifers and nannofossils) or amount of terrigenous/reworked components. An interval of relatively low average NGR (9 counts/s) was recognized in Hole U1475E between 175 and 225 m CSF-A. This zone of low NGR values also appears in other holes.
Magnetic susceptibility
At Site U1475, magnetic susceptibility values from whole-round core (STMSL and WRMSL) measurements are always at or close to the detection limit of the Bartington susceptibility meter, consistent with the high biogenic carbonate contents and low terrigenous sediment fraction (mostly <20%) that contains very low concentrations of magnetic minerals. Maxima in magnetic susceptibility are often observed at the tops of the cores, possibly indicating the entrainment of magnetic particles during coring. Occasional maxima in magnetic susceptibility (typically 1–5 instrument units [IU]) above the detection limit of the sensor occur within individual sections and may be related to the natural input of slightly higher amounts of magnetic minerals, but careful processing of the data will be necessary to extract this information.
Compressional wave velocity
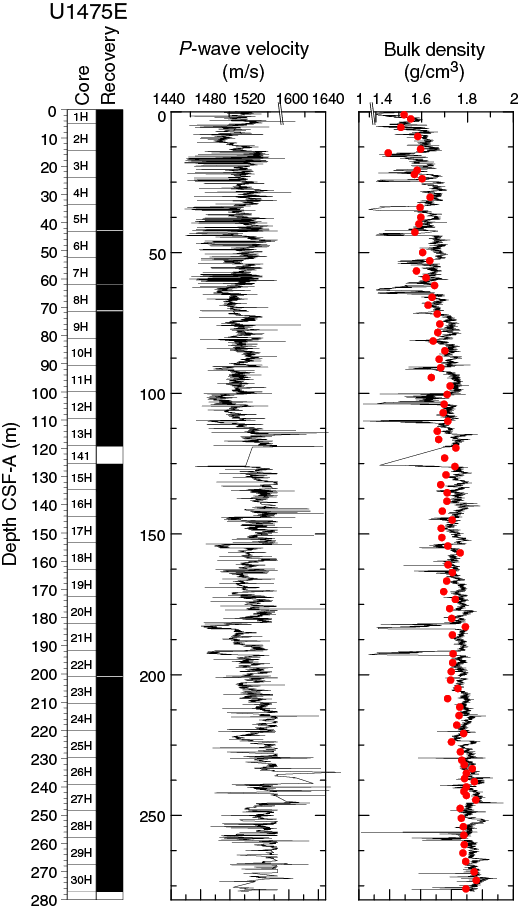
P-wave velocity data measured with the WRMSL (Figure F16) was cleaned of outliers caused by section breaks. Velocities average 1520 m/s in the uppermost 4 m CSF-A of the site and drop to an average of ~1490 m/s in the 4–11 m CSF-A interval. From 11 to 110 m CSF-A, velocities vary between 1450 and 1650 m/s with an average of 1525 m/s. At 110 m CSF-A, a step-like increase to higher average velocities of 1540 m/s is observed. From 110 to 220 m CSF-A, velocities fluctuate around this average value, with a low of 1490 m/s and a high of 1650 m/s. At 220 m CSF-A, another increase in velocity averages 1560 m/s, which is also characteristic for the lowermost part (260–275 m CSF-A) of Site U1475. A zone of lower average velocities (1540 m/s) is observed at 245–260 m CSF-A.
Moisture and density
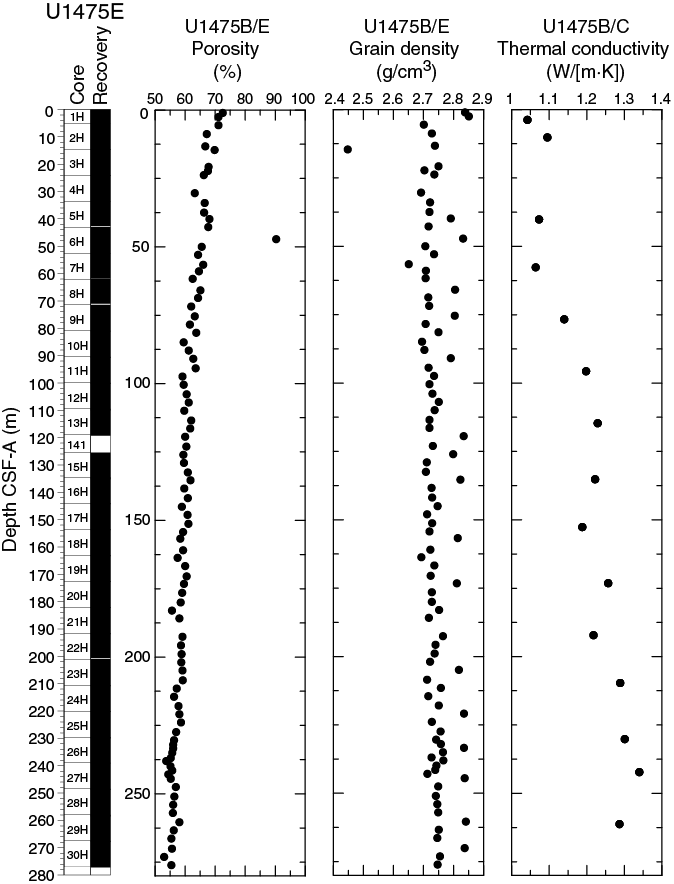
Bulk density at Site U1475 was determined on whole-core sections using the STMSL and WRMSL (GRA density) and on discrete MAD samples. Changes in GRA and MAD bulk densities are well correlated throughout Site U1475 (Figure F16). Grain densities (Figure F17) vary between 2.45 and 2.85 g/cm3. GRA bulk density values vary from 1.21 to 1.96 g/cm3 and are consistent, with an average MAD bulk density of 1.7 g/cm3 and an average grain density of 2.74 g/cm3. Bulk densities generally increase downhole, revealing a compaction trend that can be divided into two units. In Unit 1, from the top of the hole to ~110 m CSF-A, densities increase from 1.5 to 1.75 g/cm3 (average = 1.6 g/cm3) and show a higher gradient compared to Unit 2 (110–275 m CSF-A), where densities increase from 1.75 to 1.85 g/cm3 (Figure F16).
Overall, porosities (Figure F17) gradually decrease downhole at Site U1475 with small variations except for one notable outlier. Porosities except for this outlier vary between 53% and 72.5%. A clear compaction trend occurs in the uppermost 110 m CSF-A, where porosities decrease from 72.5% to 60%. Deeper than 110 m CSF-A, porosities decrease from 60% to 55%.
Thermal conductivity
Thermal conductivity measurements were performed on every other core in Holes U1474B and U1474E (Figure F17). The full-space needle probe was used, usually near the middle of Section 4. Overall, thermal conductivity values increase downhole from 1.04 to 1.34 W/(m·K).
Summary
Despite the quite homogeneous lithology, different physical parameters show relevant along-core trends as well as cyclic variations along the sediment column. The spliced records of Site U1475 (Figure F18) reveal a marked change in physical sediment properties at 125 m core composite depth below seafloor (CCSF-A), corresponding to ~110 m CSF-A in Hole U1475E. Above this depth, a change from quasi-regular short and lower amplitude cycles to longer, higher amplitude, and more irregular cyclic variation was observed. This change is most clearly displayed in NGR data and in the color reflectance parameter a*. At the same depth level, P-wave velocities increase and bulk densities indicate a change in the compaction trend. Prominent changes in P-wave velocity at Site U1475 can be clearly linked to seismic reflectors present in the site survey profiles (Figure F19).
Micropaleontology
Site U1475 spans the Late Pleistocene to late Miocene based on the combined analysis of calcareous nannofossils, planktonic foraminifers, and diatoms. The sequence is biostratigraphically complete at the biozone level for planktonic foraminifers and calcareous nannofossils. For calcareous fossils, biozonation is based on sampling at a resolution of 1 sample every 1.5–3.0 m in Hole U1475B and in Cores 361-U1475E-1H through 8H and 27H through 30H. Diatoms were studied in core catcher samples from the same cores. We also identified biozones from core catcher samples of cores 361-U1475C-26H through 30H in order to provide age assessments during drilling. Calcareous microfossils are moderately to well preserved throughout the sequence, and diatoms are poorly to moderately preserved. The assemblages of all three microfossil groups include temperate to subpolar elements mixed with tropical to subtropical forms.
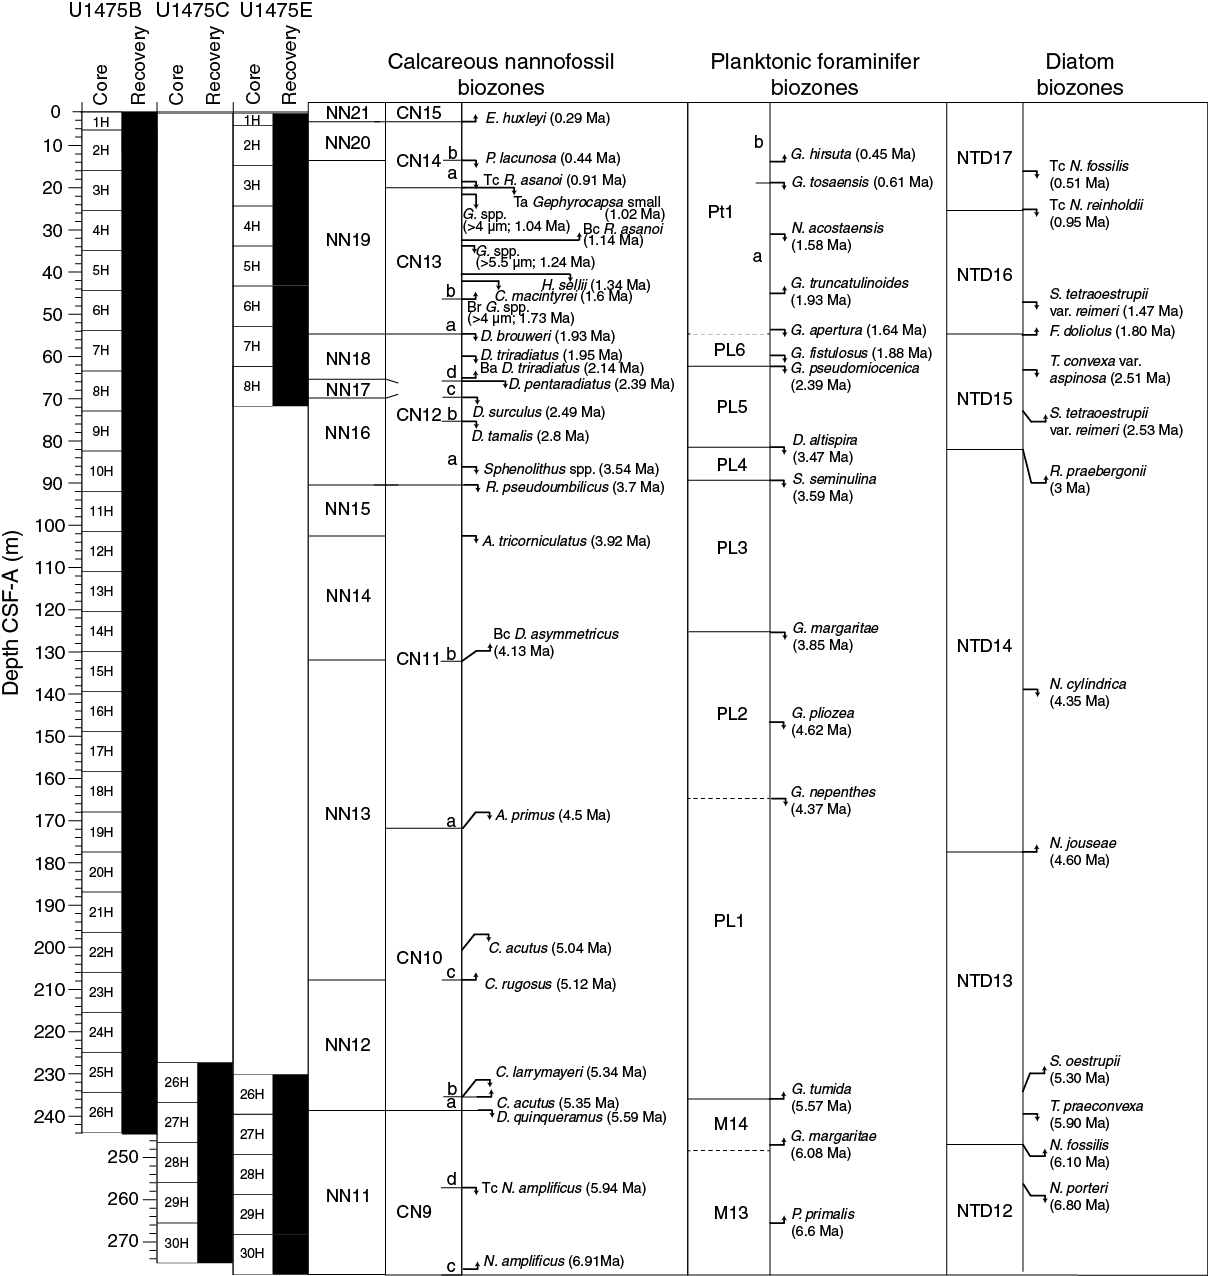
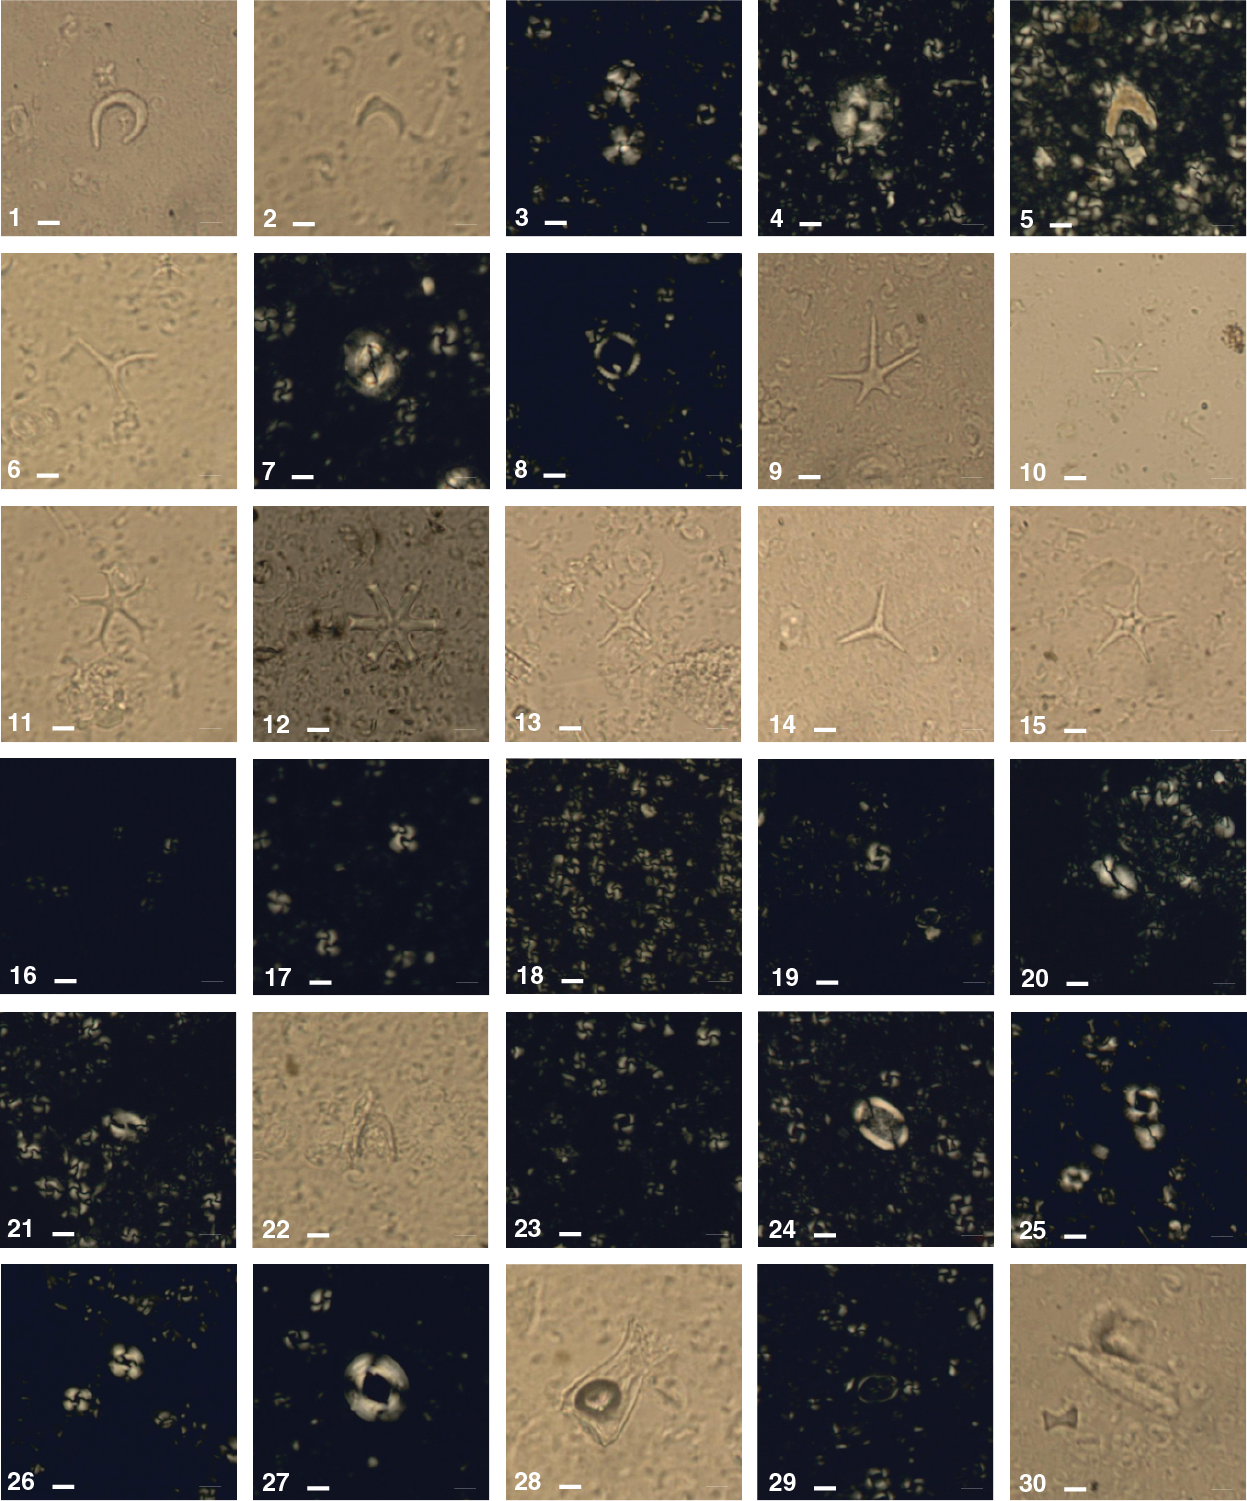
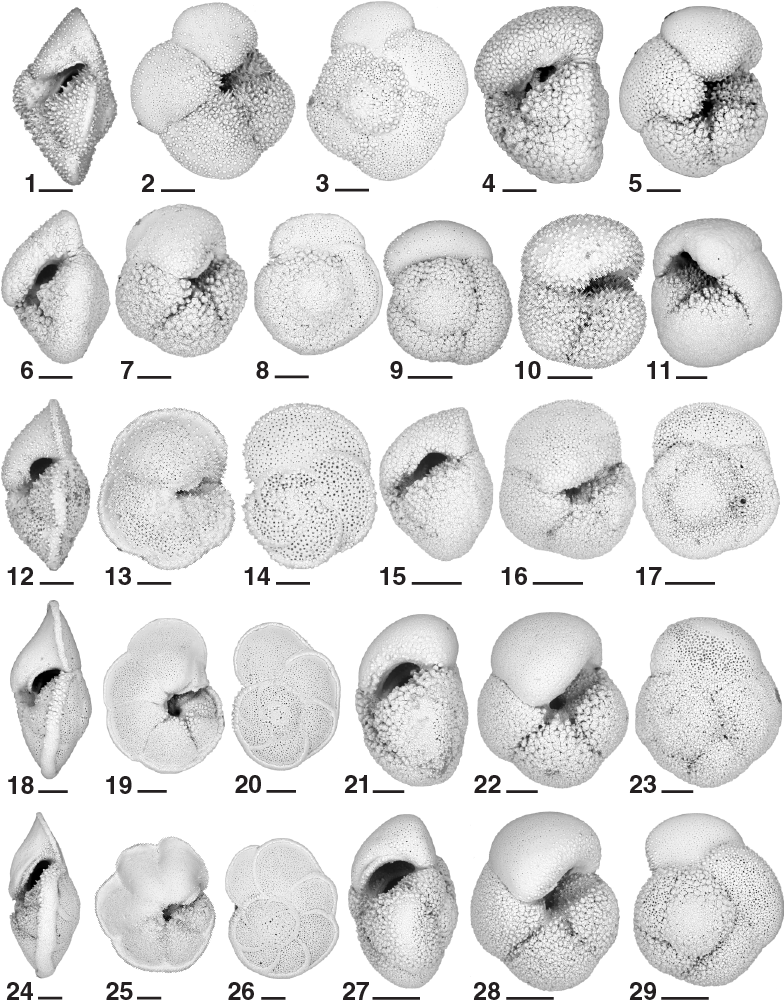
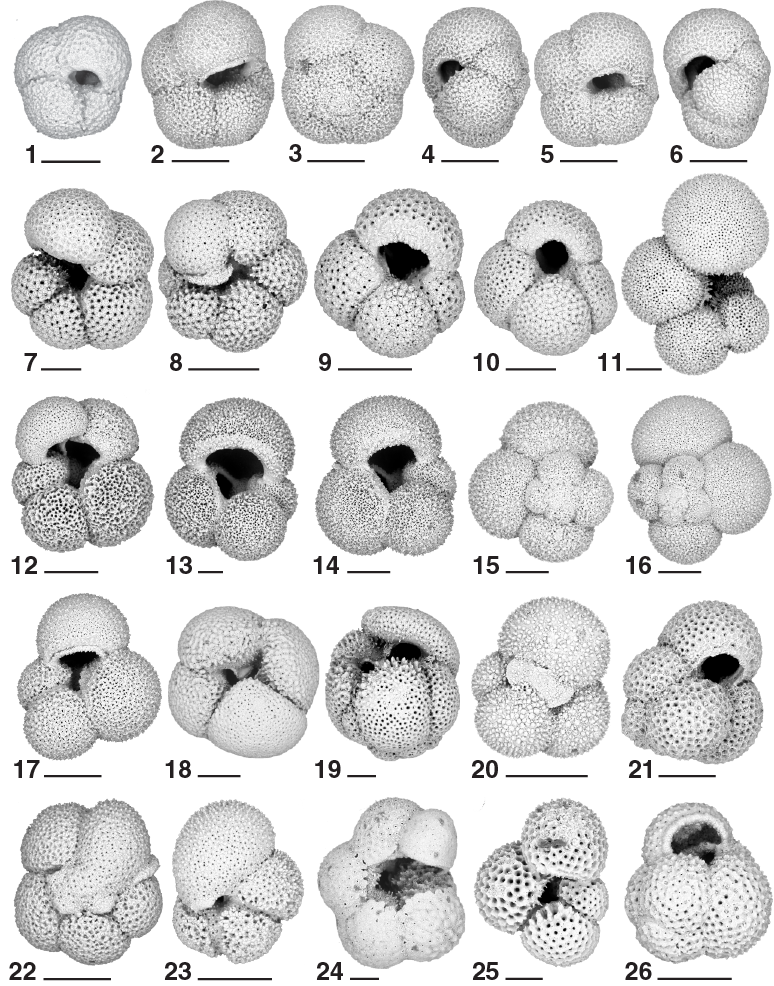
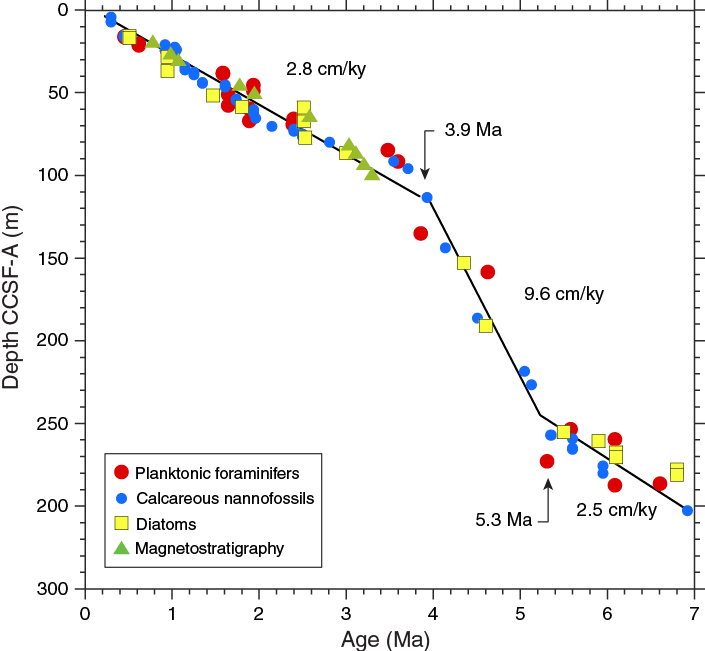
The calcareous nannofossil, planktonic foraminifer, and diatom age assignments are in broad agreement with each other and with the magnetostratigraphic time estimates within 0.5 my (see Age model). The integrated calcareous microfossil zonation is shown in Figure F20, and microfossil datums are reported in Tables T4, T5, and T6. Calcareous nannofossil occurrences are presented in Table T7, planktonic foraminifer occurrences in Table T8, and diatom occurrences in Table T9. Typical examples of calcareous nannofossils at Site U1475 are presented in Figure F21. Representative species of planktonic foraminifers at Site U1475 are shown in Figures F22 and F23. The age-depth plot including the biochronology and magnetostratigraphic datums is discussed in Age model and is shown in Figure F38.
Table T4. Biostratigraphic calcareous nannofossil datums, Site U1475. Download table in .csv format.
Table T5. Biostratigraphic planktonic foraminifer datums, Site U1475. Download table in .csv format.
Table T6. Biostratigraphic diatom datums, Site U1475. Download table in .csv format.
Table T7. Calcareous nannofossil occurrences, Site U1475. Download table in .csv format.
Table T8. Planktonic foraminifer occurrence, Site U1475. Download table in .csv format.
Table T9. Diatom and other siliceous microfossil occurrences, Site U1475. Download table in .csv format.
Calcareous nannofossils
Calcareous nannofossil assemblages were analyzed in core catcher and split-core sections from Holes U1475B, U1475C, and U1475E (199 samples). In detail, Hole U1475B (132 samples) was examined from Samples 361-U1475B-1H-1, 75 cm (0.75 m CSF-A), to 26H-CC (244.33 m CSF-A) at intervals of 1.5–3 m. Core catchers from Hole U1475C (5 samples) were analyzed from Samples 361-U1475C-26H-CC (237.25 m CSF-A) to 30H-CC (275.57 m CSF-A). Hole U1475E (62 samples) was examined at a resolution of 1.5–3 m from Samples 361-U1475E-1H-2, 75 cm (2.25 m CSF-A), to 8H-CC (70.93 m CSF-A) and Samples 26H-1, 75 cm (230.25 m CSF-A), to 30H-CC (277.05 m CSF-A). Calcareous nannofossil abundances of discrete taxa were recorded from the core catcher samples, whereas split-core section samples were analyzed only for marker species abundances. Twenty-eight nannofossil datums calibrated by Lourens et al. (2004) and Gradstein et al. (2012) extending from the late Miocene to the Holocene were identified at Site U1475 (Table T7). A total of 53 tropical, subtropical, and temperate species belonging to 20 genera were classified (for examples, see Figure F21).
One remarkable observation at Site U1475 is the presence of several species of the nannofossil genus Scyphosphaera throughout the sequence. In this report, they are referred to as Scyphosphaera spp. Although these species are observed throughout the entire sequence, some of them may have short stratigraphic ranges. Knowledge of the distribution of this genus is limited, and although Scyphosphaera species have been proposed as zonal markers (e.g., Hay et al., 1967; Jafar, 1975), they are not calibrated. Site U1475 has a high-resolution age model from the magnetostratigraphy and combined biostratigraphy from the three microfossil groups; therefore, it is an ideal location to characterize these species and elevate their value as biostratigraphic markers.
Calcareous nannofossil assemblages are abundant (>50% of sediment particles) throughout the recovered sequence. Preservation is good for the small placoliths (<5 μm) especially in the Pleistocene sequence. Discoasteraceae and Ceratolithaceae are poorly to moderately preserved with, at times, severe fragmentation and recrystallization. Moreover, we consistently observed well-preserved reworked species from the Eocene to the middle Miocene such as Chiasmolithus spp., Cyclicargolithus abisectus, Cyclicargolithus floridanus, Dictyococcites bisecta, Discoaster barbadiensis, Discoaster deflandrei, Discoaster loeblichii, Isthmolithus recurvus, Reticulofenestra umbilica, Sphenolithus predistentus, and Tribrachiatus orthostylus in all holes.
Biostratigraphic datums from calcareous nannofossils were found at similar depths within the three holes with a maximum discrepancy of ~8 m between Samples 361-U1475B-26H-4, 75 cm (239.65 m CSF-A), and 361-U1475C-27H-CC (247 m CSF-A). This difference may be attributed to the reworking of Discoaster quinqueramus, whose top occurrence (5.59 Ma) is used as an index marker. Additionally, offsets between the holes during coring operations and the sampling resolution (1.5–3 m) must be taken into account.
The base occurrence of Emiliania huxleyi (0.29 Ma), which marks the base of Biozones NN21 and CN15 (Late Pleistocene to Holocene) was observed in Samples 361-U1475B-1H-CC (6.42 m CSF-A) and 361-U1475E-1H-3, 30 cm (3.3 m CSF-A). Split-core samples from the top of Holes U1475B and U1475E were analyzed under the scanning electron microscope (SEM) to determine the presence/absence of E. huxleyi. Downcore, calcareous nannofossil Biozone NN20 and Subzone CN14b extend to Samples 361-U1475B-2H-CC (16.07 m CSF-A) and 361-U1475E-2H-6, 75 cm (13.25 m CSF-A), where the top occurrence of Pseudoemiliania lacunosa (0.44 Ma) defines the transition to Biozone NN19 and Subzone CN14a (Late Pleistocene). These biozones are also characterized by the top common occurrence of Reticulofenestra asanoi (0.91 Ma) in Samples 361-U1475B-3H-4, 75 cm (21.15 m CSF-A), and 361-U1475E-3H-3, 75 cm (18.25 m CSF-A), and the top common occurrence of small Gephyrocapsa spp. (1.02 Ma) in Samples 361-U1475B-3H-5, 75 cm (22.65 m CSF-A), and 361-U1475E-3H-4, 75 cm (19.75 m CSF-A). The Biozone CN14/CN13 boundary is marked by the base reentrance of Gephyrocapsa spp. (>4 µm; 1.04 Ma) in Sample 361-U1475E-3H-5, 75 cm (21.25 m CSF-A). The top of Subzone CN13b contains the base common occurrence of R. asanoi (1.14 Ma) in Samples 361-U1475B-4H-CC (35.28 m CSF-A) and 361-U1475E-4H-6, 75 cm (32.25 m CSF-A). Biozone NN19 and Subzone CN13b are determined by three subsequent events: the top occurrence of Gephyrocapsa spp. (>5.5 µm; 1.24 Ma) in Samples 361-U1475B-5H-2, 75 cm (37.15 m CSF-A), and 361-U1475E-4H-CC (33.63 m CSF-A); the top occurrence of Helicosphaera sellii (1.34 Ma) in Samples 361-U1475B-5H-5, 75 cm (41.65 m CSF-A), and 361-U1475E-5H-5, 75 cm (40.25 m CSF-A); and the top occurrence of Calcidiscus macintyrei (1.6 Ma) in Samples 361-U1475B-5H-6, 75 cm (43.15 m CSF-A), and 361-U1475E-5H-CC (42.7 m CSF-A). Finally, the base occurrence of Gephyrocapsa spp. (>4 µm; 1.73 Ma) marks the Subzone CN13b/CN13a boundary in Samples 361-U1475B-6H-4, 75 cm (49.65 m CSF-A), and 361-U1475E-6H-3, 75 cm (46.75 m CSF-A). Despite the rarity of discoasters and ceratoliths, representatives of these two groups are considered valuable markers of both Pleistocene and Pliocene sequences. The Biozone NN19/NN18 and CN13/CN12 boundaries are determined by the top occurrence of Discoaster brouweri (1.93 Ma) observed in Samples 361-U1475B-7H-3, 75 cm (57.65 m CSF-A), and 361-U1475E-7H-2, 75 cm (54.75 m CSF-A). The top occurrence (1.95 Ma) and base common occurrence (2.14 Ma) of Discoaster triradiatus, which defines Biozone NN18 and Subzone CN12d, were identified only in Samples 361-U1475B-7H-5, 75 cm (60.65 m CSF-A), and 8H-2, 75 cm (65.65 m CSF-A), respectively. Successively, the Biozone NN18/NN17 and Subzone CN12d/CN12c boundaries are marked by the top occurrence of Discoaster pentaradiatus (2.39 Ma) in Samples 361-U1475B-8H-4, 75 cm (68.65 m CSF-A), and 361-U1475E-8H-3, 75 cm (65.75 m CSF-A). The top occurrence of Discoaster surculus (2.49 Ma), which occurs in Samples 361-U1475B-8H-6, 75 cm (71.65 m CSF-A), and 361-U1475E-8H-5, 75 cm (68.75 m CSF-A), defines the Biozone NN17/NN16 or Subzone CN12c/CN12b boundaries. All of these Pleistocene biomarkers have clear, continuous records in the two holes. Other nannofossil assemblages in the Pleistocene sequence are rare to few specimens of Calcidiscus leptoporus, Calciosolenia murrayi, Helicosphaera carteri, Pontosphaera multipora, Pontosphaera spp., Rhabdosphaera clavigera, Scyphosphaera spp., Syracosphaera spp., and Umbilicosphaera spp. and few to common specimens of Coccolithus pelagicus, Gephyrocapsa caribbeanica, and Gephyrocapsa oceanica.
Preceeding the Pliocene/Pleistocene boundary, the top occurrence of Discoaster tamalis (2.8 Ma) in Sample 361-U1475B-9H-2, 75 cm (75.15 m CSF-A), is identified, marking the upper boundary of Subzone CN12a within Biozone NN16. The persistent occurrence of D. tamalis in the samples prior to its disappearance makes it a reliable marker of this zone. Below the Subzone CN12b/CN12a boundary, the top occurrence of Sphenolithus spp. (3.54 Ma) is recorded in Sample 361-U1475B-10H-3, 75 cm (86.15 m CSF-A), which is within Subzone CN12a (late Pliocene). The Biozone NN16/NN15 and CN12/CN11 boundaries are identified based on the top occurrence of Reticulofenestra pseudoumbilicus (3.7 Ma) in Sample 361-U1475B-10H-6, 75 cm (90.65 m CSF-A). The middle Pliocene sequence is characterized by consistent occurrences of this species together with large forms of Coccolithus pelagicus and Calcidiscus leptoporus, all of which are typical of cold-water conditions and temperate regions. Occurrences of both Sphenolithus spp. and R. pseudoumbilicus persist upcore as reworked specimens, the latter being seen with the slightly smaller Quaternary form. The Biozone NN15/NN14 boundary and Subzone CN11b are identified based on the top occurrence of Amaurolithus tricorniculatus (3.92 Ma) in Sample 361-U1475B-12H-2, 75 cm (103.65 m CSF-A). Rare abundance of Discoaster asymmetricus is recorded in Sample 17H-CC (158.48 m CSF-A) before its base common occurrence (4.13 Ma) in Sample 15H-2, 75 cm (132.15 m CSF-A), approximating the top of Biozone NN13 and Subzone CN11a. The top occurrence of Amaurolithus primus (4.5 Ma) in Sample 19H-4, 75 cm (173.15 m CSF-A), occurs in Biozone NN13 and marks the transition from Biozone CN10 to CN11. Although this species is rare in the sample, its consistent occurrence throughout the sequence makes it a reliable marker of this zone. Biozone NN13 and Subzone CN10c are defined by the top occurrence of Ceratolithus acutus (5.04 Ma) in Sample 22H-4, 75 cm (201.65 m CSF-A). Ceratolithus acutus is only observed in two samples near its top and has no record downcore. The lowermost Pliocene marker in the sequence is Ceratolithus rugosus, whose base is found in Sample 23H-2, 75 cm (208.15 m CSF-A), and represents the Biozone NN13/NN12 and Subzone CN10c/CN10b boundaries. Aside from the marker species, the nannofossils identified in the Pliocene sequence are Amaurolithus delicatus, Discoaster blackstockae, Discoaster calcaris, Discoaster challengeri, Discoaster variabilis, Scyphosphaera globulata, Scyphosphaera pulcherrima, Scyphosphaera spp., Sphenolithus abies, and Umbilicosphaera rotula.
The Miocene/Pliocene boundary is set above the top occurrence of Ceratolithus larrymayeri (5.34 Ma) in Sample 361-U1475E-26H-5, 75 cm (236.25 m CSF-A). The integrity of this marker species is somewhat questionable because of its presence in only one sample and its subsequent absence in the section above its first occurrence. The base occurrence of Ceratolithus acutus (5.35 Ma) is identified in the same sample, assigning the interval to Biozone NN12 and Subzone CN10b. The base occurrence of this species is not observed in Holes U1475B and U1475C, as both holes seem to have penetrated the sediment below the Miocene/Pliocene boundary. Discoaster quinqueramus shows a reliable record in defining the top of Biozone NN11 and Subzone CN9d for Holes U1475B, U1475C, and U1475E. Its top occurrence is observed in Samples 361-U1475B-26H-4, 75 cm (239.65 m CSF-A); 361-U1475C-27H-CC (247.0 m CSF-A); and 361-U1475E-27H-4, 75 cm (244.25 m CSF-A). The youngest Miocene sediment is marked by the top common occurrence of Nicklithus amplificus (5.94 Ma) in Samples 361-U1475C-28H-CC (256.17 m CSF-A) and 361-U1475E-28H-6, 75 cm (256.75 m CSF-A), and determines the Biozone NN11 and Subzone CN9d/CN9c boundaries. This bioevent is considered a reliable marker because of its regular occurrence in the sequence. In contrast, the base occurrence of N. amplificus (6.91 Ma) is recorded only in Sample 361-U1475E-30H-6, 75 cm (275.75 m CSF-A). The bottom of the Site U1475 is younger than 7.42 Ma based on the occurrences of marker taxa A. primus and Amaurolithus spp. and the absence of N. amplificus in Samples 361-U1475C-30H-CC (275.28 m CSF-A) and 361-U1475E-30H-CC (277.22 m CSF-A).
Planktonic foraminifers
Planktonic foraminifers were examined in core catcher samples from Holes U1475B, U1475C, and U1475E. Core catcher samples were supplemented with 10 cm3 samples taken from split core halves in Holes U1475B and U1475E at a sample density of every other section, for a total of 155 samples. At times the presence of core disturbance prevented sampling at regular intervals. We were able to dry the samples from section halves before washing, greatly improving the quality of the resulting foraminifer residues compared to the rapidly processed core catcher samples. Examples of the major foraminifer taxa present at Site U1475 are illustrated in Figures F22 and F23. Foraminifer residues (>63 µm) typically constitute 10%–15% of the total sediment volume throughout the recovered sequence. Foraminifer preservation varies from semi-glassy, translucent specimens to samples with moderate levels of fragmentation (typically much less than 20%) and chalky cementation of nannofossils to the chamber interiors and outside surfaces.
A notable feature of the planktonic foraminifer biota at Site U1475 is the abundance of species typical of the subtropical convergence mixed with subordinate abundances of species from subtropical and polar settings. Indeed, Site U1475 has a rich biota of subtropical convergence species, typified by Globorotalia inflata, Globorotalia puncticulata, Globorotalia sphericomiozea, Globorotalia pliozea, and Globorotalia praehirsuta in the Pliocene–Pleistocene. We also found multiple members of the Globorotalia conomiozea group in the Miocene sections of Site U1475, including such forms as Globorotalia mons, Globorotalia crassicarinata, and Globorotalia puncticuloides. Site U1475, with its promise of a high-resolution age model based on cyclostratigraphy, magnetic stratigraphy, and biostratigraphy, offers an unprecedented opportunity to calibrate subtropical convergence taxa and stabilize their taxonomy.
The Pleistocene Biozone Pt1 sequence (0–1.88 Ma) extends from the mudline to Sample 361-U1475B-7H-CC (63.4 m CSF-A). Globorotalia hirsuta (0.45 Ma) has its base occurrence in Sample 4H-CC (35.2 m CSF-A) but is not considered a reliable datum because of its very episodic occurrence above this point. The top occurrence of Globorotalia tosaensis occurs in Sample 3H-2, 70–72 cm (18.2 m CSF-A), marking the Subzone Pt1b/Pt1a boundary at 0.61 Ma. Globorotalia tosaensis is rare at Site U1475 but has a consistent occurrence in samples prior to its extinction datum, suggesting this species is a reliable biozone marker. Below this, we find the top occurrence of Neogloboquadrina acostaensis (1.58 Ma) in Sample 5H-2, 70–72 cm (37.1 m CSF-A), and top occurrence of Globoturborotalita apertura (1.64 Ma) in Sample 6H-7, 70–72 cm (53.8 m CSF-A). The record of the base occurrence of Globorotalia truncatulinoides (1.93 Ma; Sample 6H-1, 70–72 cm; 44.9 m CSF-A) is shallower in the sequence than expected from the occurrences of N. acostaensis and G. apertura, suggesting that G. truncatulinoides may be unusually rare near its first appearance. The biozone marker for the base of Subzone Pt1a, Globigerinoides fistulosus (1.88 Ma), is present as a single specimen in Sample 7H-CC (63.4 m CSF-A). The rarity of G. fistulosus suggests that lower Subzone Pt1a is better approximated by the top occurrence of G. apertura and the top occurrence of The top occurrence of Globigerinoides extremus is found in Sample 5H-2, 70–72 cm (37.1 m CSF-A), but this species is also very rare throughout its range with irregular occurrences, suggesting it is not a useful datum at Site U1475. Finally, the Biozone PL5/PL6 boundary is marked by the top occurrence of Globorotalia pseudomiocenica (2.39 Ma) in Sample 7H-6, 70–72 cm (62.1 m CSF-A); this datum is usually closely associated with that of the top occurrence of Globoturborotalita woodi (2.30 Ma), but at Site U1475 neither datum is well defined due to spotty occurrences of both species before their extinctions.
The Pleistocene foraminifer assemblage is dominated by G. inflata, which typically constitutes 30%–50% of each sample. Other common species are Globorotalia crassaformis, Globorotalia puncticulata, Globigerina bulloides, Neogloboquadrina dutertrei, and Neogloboquadrina pachyderma. The latter includes roughly equal parts of dextral and sinistral individuals. Some of them are heavily encrusted sinistral forms in which the aperture opens over the umbilicus—a pattern typical of some subpolar varieties of N. pachyderma (sinistral) (Figure F23). Minor elements of the Pleistocene biota include Globigerina falconensis, Globigerina obesa, G. truncatulinoides, Globigerinella siphonifera, and Globigerinoides ruber.
The upper and middle parts of the Pliocene sequence are defined by the top occurrence datums of a series of subtropical taxa. The top occurrence of Dentoglobigerina altispira (3.47 Ma), which marks the top of Biozone PL4, is securely placed in Sample 361-U1475B-9H-6, 70–72 cm (81.1 m CSF-A), because this species has a regular occurrence throughout Biozones PL4, PL3, and PL2. The top of Biozone PL3 is defined on the top occurrence of Sphaeroidinellopsis seminulina (3.59 Ma) that occurs in Sample 10H-4, 70–72 cm (87.6 m CSF-A). Unfortunately, although we regularly found rare juvenile spheroidinellids in the sequence, they lack the distinctive cortex of the adult forms that would make our identification of the upper bounds of Biozone PL3 more secure at Site U1475.
Biozones PL5 through PL3 are marked by the frequent occurrences of subtropical species in the assemblage, albeit typically in low numbers. These subtropical species include G. pseudomiocenica, Globigerinoides conglobatus, G. ruber, Sphaeroidinella dehiscens, and S. seminulina. These taxa are found with species representing the subtropical convergence fauna such as G. inflata (often as a dominant taxon), G. bulloides, G. puncticulata, G. sphericomiozea, Globorotalia crassula, and G. crassaformis. The late and middle Pliocene biota also include abundant neogloboquadrinids such as N. pachyderma (sinistral and dextral) and frequent occurrences of G. falconensis, G. obesa, and (in Biozone PL3) Globorotalia triangula.
The early Pliocene is a very expanded sequence between the top of Biozone PL3 in Sample 361-U1475B-10H-4, 70–72 cm (87.6 m CSF-A), and the base of the Pliocene approximated by the origination of Globorotalia tumida in Sample 26H-1, 70–72 cm (235.1 m CSF-A). The top of Biozone PL2 occurs in Sample 14H-2, 70–72 cm (122.6 m CSF-A), with the top occurrence of Globorotalia margaritae (3.85 Ma). Globorotalia margaritae is a regular component of the foraminifer assemblage throughout Biozones PL2 and PL1, suggesting that the top and base occurrences of this species are reliable time markers at this site. In contrast, the top occurrence of Globoturborotalita nepenthes (4.37 Ma) is not reliable because this species was found only twice in Hole U1475B, with the uppermost of these occurrences in Sample 18H-4, 70–72 cm (163.6 m CSF-A), being used to provisionally place a lower boundary on the top of Biozone PL1. Finally, the base of Biozone PL1 is placed at the base occurrence of G. tumida (5.57 Ma) in Sample 361-U1475B-26H-1, 70–72 cm (235.1 m CSF-A). Like G. nepenthes, the lower range of G. tumida is marked by episodic occurrences and the frequent occurrence of juvenile forms, rendering this zone marker somewhat unreliable. However, the lower boundary of Biozone PL1 is probably not far off its true position because it is placed only a little above the base occurrence of G. margaritae (6.08 Ma), a datum that occurs close to the base of Biozone M14, in Sample 26H-5, 70–72 cm (241.1 m CSF-A).
The foraminifer biota of the early Pliocene is similar to that of the late Pliocene, with a notable decrease in the abundance of N. pachyderma (sinistral), the downhole decrease in abundance of G. crassaformis in the upper part of Biozone PL1, and the reduction in abundance of G. inflata to rare individuals from the dominance of this taxon in the Pleistocene and late Pliocene. Globorotalia plesiotumida appears episodically in the early Pliocene, as does the subtropical convergence taxon G. pliozea. The highest occurrence of G. pliozea (4.62 Ma) occurs in Sample 361-U1475B-16H-6, 70–72 cm (147.7 m CSF-A)—a position that places this datum far off the age-depth profile defined by other foraminifer, nannofossil, and diatom events. We suspect that the calibration of G. pliozea is not secure or that we are confusing the younger occurrences of this species with another closely related taxon, so we have not used the top occurrence of G. pliozea datum in our age model.
The oldest sediment at Site U1475 is not well dated with foraminifers. We were unable to find the marker for the base of Biozone M14 (Globorotalia lenguaensis), although this event is close to that of the base occurrence of G. margaritae found in Sample 361-U1475B-26H-5, 70–72 cm (241.1 m CSF-A), which appears to be a reliable datum as argued above. We note that the Miocene sequence at Site U1475 generally has a good to moderate preservation with little dissolution, suggesting that the absence of G. lenguaensis is likely due to ecological exclusion rather than preservation. We also find the base occurrence of Pulleniatina primalis in Sample 361-U1475C-29H-CC (265.9 m CSF-A), suggesting that this sample is younger than 6.6 Ma. Finally, we have the abundant occurrence of Globorotalia conomiozea in Sample 361-U1475C-30H-CC, 70–72 cm (275.5 m CSF-A), suggesting an age younger than 7.89 Ma. Globorotalia conomiozea is used here somewhat as a “garbage bag” taxon that includes high conical forms with nearly flat spires such as G. mons, Globorotalia miotumida, and Globorotalia crassaconica. Unfortunately, none of these datums are last occurrences that might provide more secure upper limits for the age of the oldest sediment at Site U1475.
Siliceous microfossils
Diatom biostratigraphy is based on the analysis of the mudline sample, core catcher samples (26 samples), and selected intervals in the split-core section (3 samples) from Hole U1475B. Additionally, core catcher samples from Holes U1475C (5 samples) and U1475E (11 samples) were analyzed to constrain biostratigraphic ages and relate all three holes to each other. Abundances and preservation were described from smear slide samples, and sieved and strewn slides were used to identify markers and enhance species level identification because of high carbonate concentrations at this site. Diatoms are trace to common (~5%–10% of the sediment) in abundance and exhibit poor to moderate preservation. Although diatom sample resolution was not as high as that for calcareous microfossils, results are in broad agreement with datums observed in the planktonic foraminifer and calcareous nannofossil reports. The assemblage at this site is a mix of Southern Ocean and subtropical species. The presence of other siliceous microfossils such as sponge spicules, phytoliths, silicoflagellates, and radiolarians is noted here for postcruise studies.
Diatom Biozone NTD17 spans from the mudline sample to Samples 361-U1475B-3H-CC (25.82 m CSF-A) and 361-U1475E-4H-CC (33.63 m CSF-A), the base of which is marked by the top occurrence of Nitzschia reinholdii (0.95 Ma). Within this biozone is the top occurrence of Nitzschia fossilis (0.51 Ma) in Samples 361-U1475B-2H-CC (16.07 m CSF-A) and 361-U1475E-2H-CC (14.76 m CSF-A). This biozone consists of subtropical taxa such as Actinocyclus ellipticus, Azpeitia nodulifera, Azpeitia tabularis, Fragilariopsis doliolus, Hemidiscus cuneiformis, N. fossilis, Nitzschia marina, N. reinholdii, Rhizosolenia bergonii, Shionodiscus oestrupii, and Thalassionema nitzschioides. Also present are Southern Ocean taxa such as Fragilariopsis kerguelensis, Thalassiosira lentiginosa, and Thalassiosira antarctica.
The base of Pleistocene diatom Biozone NTD16 is defined by the top occurrence of F. doliolus at ~1.8 Ma, which extends through Sample 361-U1475B-6H-CC (54.13 CSF-A). Fragilariopsis doliolus was not observed in Hole U1475E, making identification of the Biozone NTD15/NTD16 boundary difficult. The differences between Holes U1475B and U1475E are likely a result of the coarse sample resolution using only core catchers for diatoms. Other markers present in this biozone are the top occurrence of the Southern Ocean taxa Shionodiscus tetraoestrupii var. reimeri in Sample 361-U1475B-6H-2, 106–107 cm (46.97 m CSF-A), at ~1.47 Ma. This biozone consists of subtropical taxa such as A. ellipticus, Azpeitia africana, A. nodulifera, Chaetoceros resting spores, H. cuneiformis, N. fossilis, N. reinholdii, Rhizosolenia praebergonii, S. oestrupii, Thalassionema sp., T. nitzschioides, Thalassiosira plicata, and Thalassiothrix sp. Additionally, Southern Ocean diatoms are represented by F. kerguelensis and T. lentiginosa.
The early Pleistocene/late Pliocene diatom Biozone NTD15 is defined by the base occurrence of R. praebergonii at ~3 Ma, which extends through Samples 361-U1475B-9H-CC (82.55 m CSF-A) and 361-U1475E-6H-CC (52.66 m CSF-A). Two other bioevents are observed in Biozone NTD15 in samples from Site U1475. The first bioevent is the top occurrence of Thalassiosira convexa var. aspinosa at ~2.51 Ma, a tropical diatom event that occurs in Samples 361-U1475B-7H-CC (63.53 m CSF-A) and 361-U1475E-6H-CC (52.66 m CSF-A). The next event is the base occurrence of the Southern Ocean diatom S. tetraoestrupii var. reimeri at ~2.53 Ma (Cody et al., 2008), which occurs in Sample 361-U1475B-8H-CC (73.14 m CSF-A). Other tropical diatoms species that occur in this zone are A. ellipticus, Actinocyclus sp., Actinoptychus senarius, A. nodulifera, H. cuneiformis, N. fossilis, N. marina, N. reinholdii, T. nitzschioides, Thalassionema sp., T. convexa, T. convexa var. aspinosa, and Thalassiothrix sp. Southern Ocean components include F. kerguelensis and Thalassiosira inura.
The Pliocene diatom Biozone NTD14 extends from Sample 361-U1475B-9H-CC (82.55 m CSF-A) to 19H-CC (177.64 m CSF-A) and is marked by the base occurrence of Nitzschia jouseae, which is at ~4.6 Ma. Deeper than Sample 11H-CC (101.52 m CSF-A), the diatom assemblage is almost exclusively subtropical. Another subtropical diatom datum that occurs in Biozone NTD14 is the top occurrence of Nitzschia cylindrica in Sample 15H-CC (138.94 m CSF-A; 4.35 Ma). We are cautious to use this taxa as a marker because the preservation of this taxa is usually poor and abundance is trace to rare in the sediment. The assemblage for this zone is similar to the taxa seen in Biozone NTD15.
The early Pliocene/late Miocene Biozone NTD13 has a base in Samples 361-U1475C-27H-CC (247.0 m CSF-A) and 361-U1475E-27H-CC (248.87 m CSF-A), which is marked by the base occurrence of N. fossilis at ~6.1 Ma. The base occurrence of S. oestrupii (5.3 Ma) also takes place in Biozone NTD13 in Sample 361-U1475B-25H-CC (234.78 m CSF-A). The assemblage of this zone is very similar to Biozone NTD14 with the addition of A. nodulifera var. cyclops, Thalassiosira antiqua, and Thalassiosira praeconvexa. However, Southern Ocean taxa are not present in this interval.
We were not able to find the marker for the base of the Biozone NTD13/NTD12 boundary. However, late Miocene Biozone NTD12 is recognized by the top occurrence of Nitzschia porteri in Samples 361-U1475C-28H-CC (256.17 m CSF-A) and 361-U1475E-28H-CC (258.51 m CSF-A). This datum is in Biozone NTD12 and dates the earliest sediment for this site at ~6.8 Ma. N. reinholdii also occurs with N. porteri to the bottom of Holes U1475C and U1475E, giving a maximum age of 7.3 Ma for the base of these holes.
Paleomagnetism
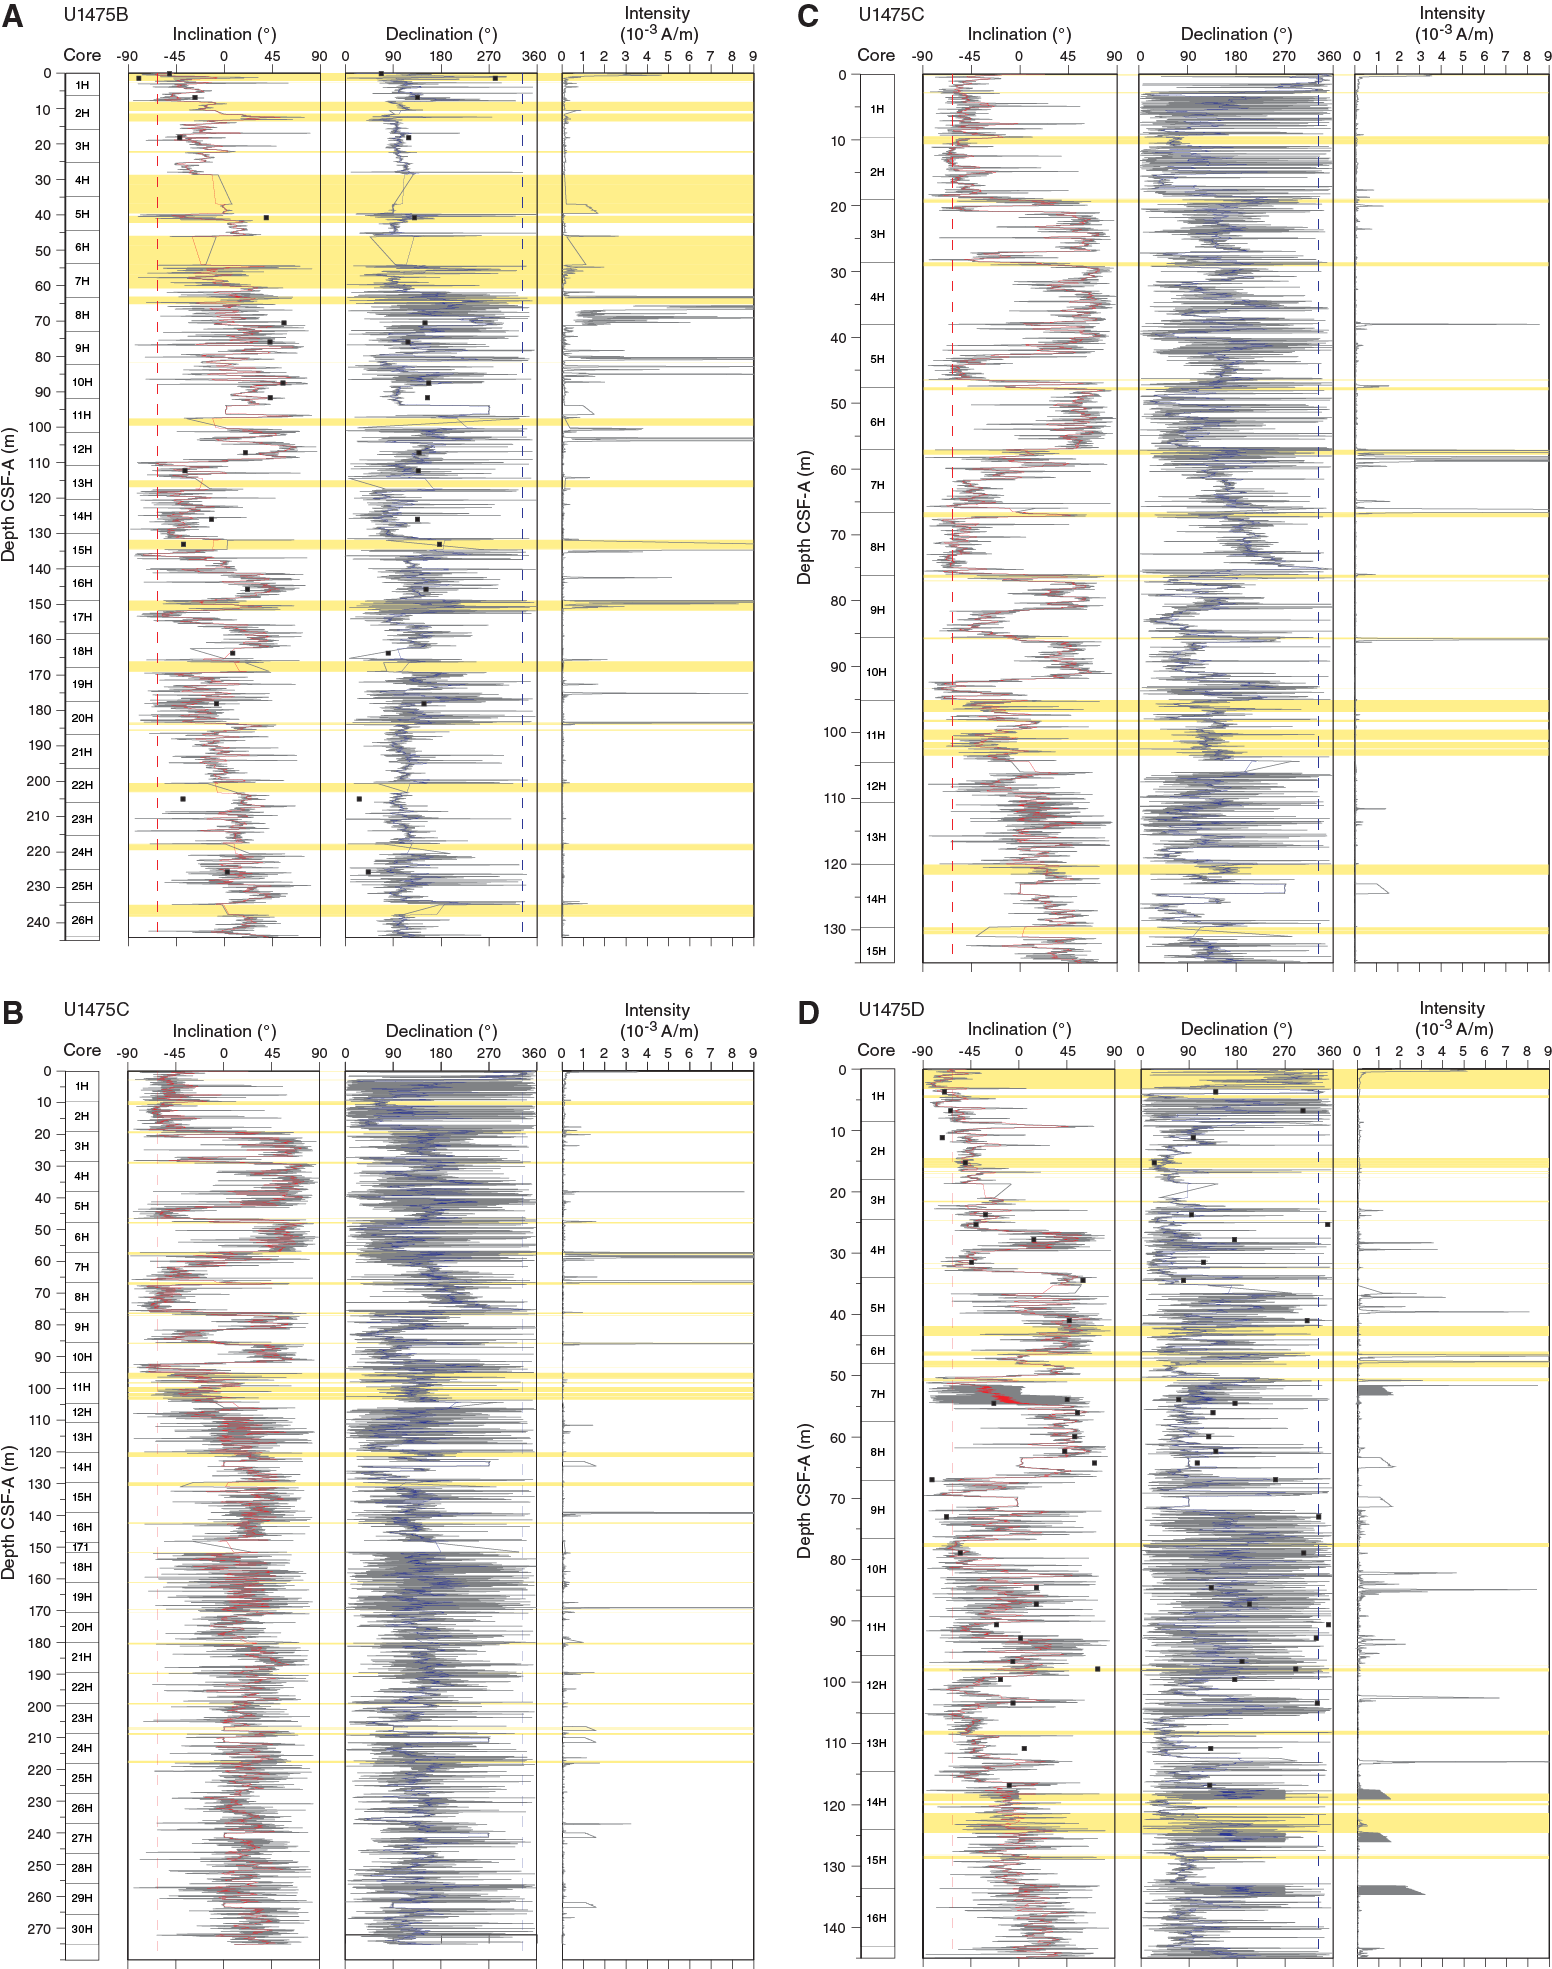
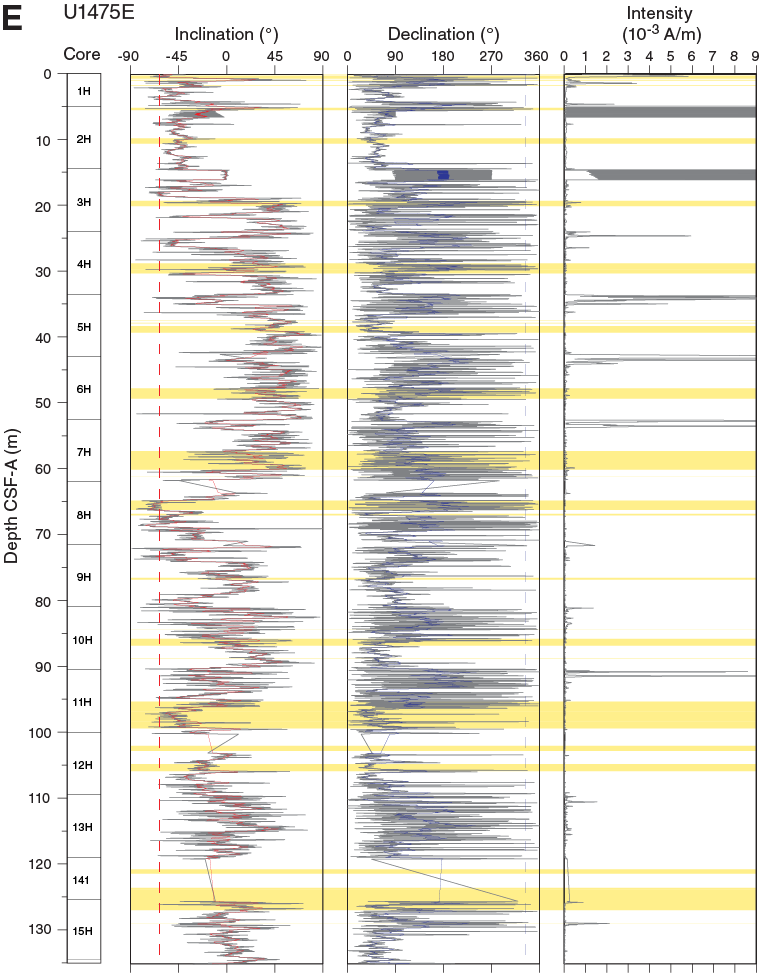
All archive halves from Holes U1475B, U1475C, and U1475F were analyzed for natural remanent magnetization (NRM) and remanence intensities after demagnetization steps of 15 and 25 mT, except in Hole U1475E, in which only the upper 15 cores were measured because the signal was not reliable in the deeper parts. The orientation of these cores was not measured because polarity zones at the latitude of Site U1475 can be easily identified by variation of inclination. For most of the recovered interval, magnetic susceptibility indicates that the sediment is diamagnetic in character and below the detection limit of the whole-round and point magnetic susceptibility instruments (see Physical properties). Nonetheless, taken together, the inclination records of all individual holes provide a consistent and detailed magnetostratigraphy for the upper 100 m CSF-A at Site U1475. In total, 98 discrete cube samples (Table T10) were taken from Holes U1475A, U1475B, and U1475D and subjected to progressive NRM demagnetization. Additionally, analyses of isothermal remanent magnetization (IRM) acquisition were performed on 49 discrete samples from Holes U1475A and U1475D.
Table T10. Analyzed discrete paleomagnetic cube samples, Site U1475. Download table in .csv format.
Discrete sample measurements
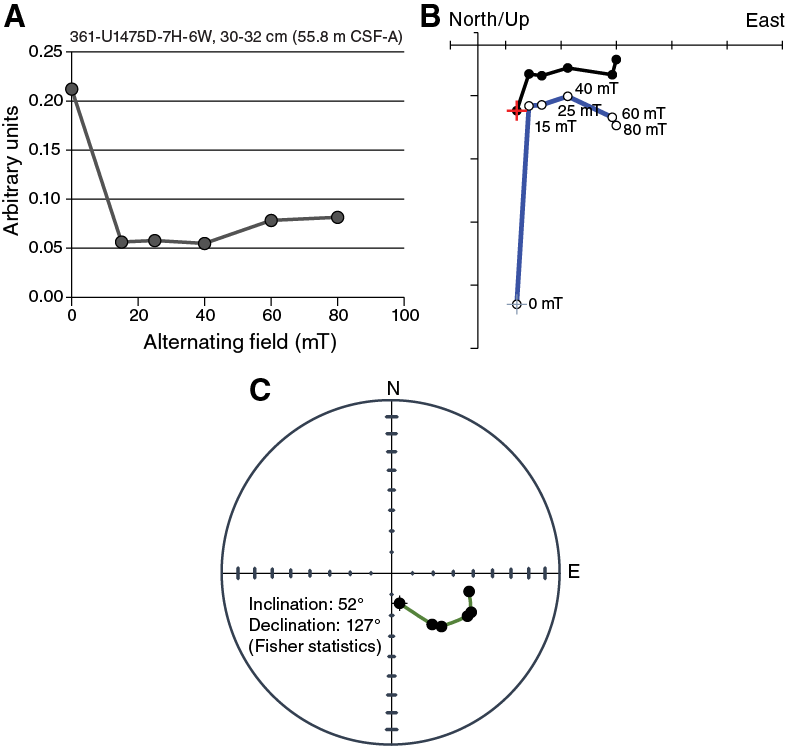
For the discrete samples, NRM intensities are 10–5 to 10–4 A/m, and ~50% of the remanence was removed after the 15 mT alternating field demagnetization step (Figure F24A). Magnetic measurements performed after each subsequent demagnetization step of 25, 40, 60, and 80 mT have relatively stable magnetizations and do not show demagnetization trends toward the origin of Zijderveld diagrams (Figure F24B). Instead, samples from the uppermost ~100 m CSF-A display inclination and declination signals that are modulated around a certain direction (Figure F24C). For those samples, the declination and inclination signals were estimated by Fisher statistics using the Bremen Data Wizard software package. Statistical analysis was only applied to those samples for which at least three subsequent demagnetization steps had consistent directions and for which the circles of 95% confidence around the mean (α95) were <35°.
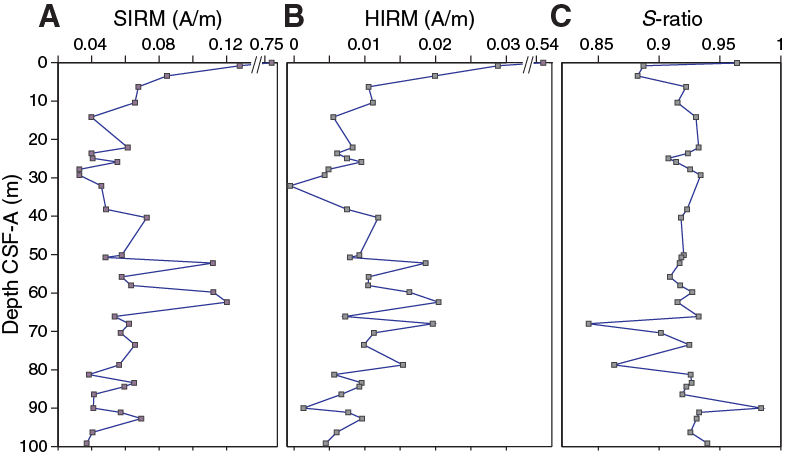
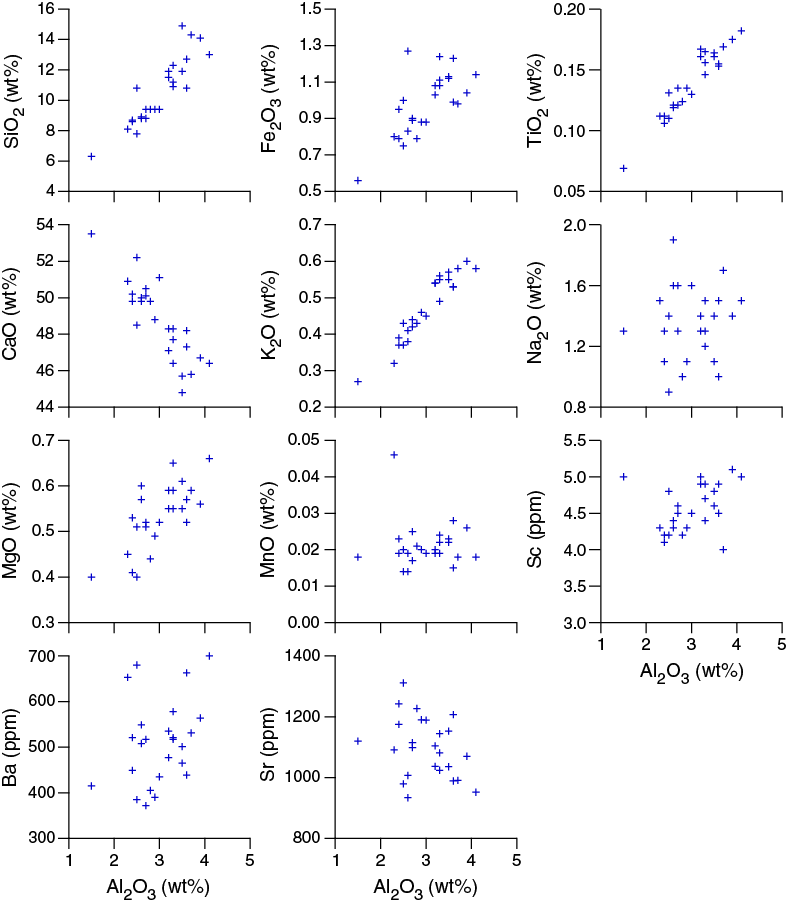
Discrete samples from Holes U1475A and U1475D (N = 49; Table T10) were further subjected to IRM experiments to characterize the concentration and composition of the magnetic mineral assemblages. Saturation IRM (SIRM) is at its maximum value of 0.7 A/m in the uppermost sample from 10 cm CSF-A (Hole U1475A), whereas the rest of the samples only yield 10% to 5% of the SIRM of the top sample (Figure F25A). In contrast, hard IRM (HIRM), an indicator of the presence of high-coercivity magnetic minerals (e.g., titanomagnetite, hematite, and goethite) decreases by only 80%–90% (Figure F25B) from its initial value. This is also expressed by the S-ratio, indicative of the relative proportions of low- to high-coercivity minerals, which drops from 0.96 to 0.88–0.92 (Figure F25C). The relatively stronger loss of SIRM compared to HIRM could be related to a preferential dissolution of (fine) magnetite since titanomagnetite and hematite are more resistant to reductive diagenesis (Bloemendal et al., 1993; Emiroglu et al., 2004; Nowaczyk, 2011). However, sulfate concentrations (see Geochemistry) indicate that sulfidic conditions are not established within the uppermost ~100 m CSF-A at Site U1475, and therefore it is unlikely that the steep decrease is related to the presence of a diagenetic front. Alternatively, magnetic enhancement in subsurface sediment could also be related to the presence of magnetosomes produced by magnetotactic bacteria, which can be abundant in carbonate-rich pelagic sediment (Vali et al., 1989; von Dobeneck et al., 1987). The addition of bacterial magnetite would mostly be expressed in SIRM and would increase the S-ratio. Further studies are needed to distinguish the imprint of reductive dissolution of magnetic minerals from the presence of bacterial magnetite. Between ~40 and 80 m CSF-A in Holes U1475A and U1475C, SIRM and HIRM have elevated values. These higher values could be associated with a higher detrital contribution to sediment accumulation at Site U1475, which is consistent with elevated natural gamma radiation (see Physical properties) and Al2O3 concentrations within this interval (see Geochemistry).
Archive-half measurements
After determination of NRM, step-wise demagnetization at 15 and 25 mT was applied to archive halves. The inclination and declination signals that were obtained from the discrete samples from Holes U1475A, U1475B, and U1475D are in agreement with the high-resolution downhole records (Figure F26). The 25 mT demagnetization step appeared to be sufficient to remove the overprint of the drill string on the inclinations. NRM intensities of the archive-half magnetic measurements are generally low at 10–4 A/m. However, high intensities are measured in the uppermost meter of Holes U1475B–U1475E and in intervals disturbed by drilling, which mainly occur at the core tops. For some cores, Section 1 was not analyzed when it was obviously disturbed by the drilling process (e.g., soupy). Despite the low magnetic mineral content, downhole measurements provide periods of normal and reversed polarity for the uppermost ~100 m CSF-A. Below ~100 m CSF-A, inclinations oscillate around 0°, and therefore it was not possible to establish a magnetostratigraphic record for the lower part of the recovered sequence (Figures F26, F27). Note that SO4 concentrations have already diminished to low levels at this depth, and NRM was likely affected by early diagenetic processes.
Magnetostratigraphy
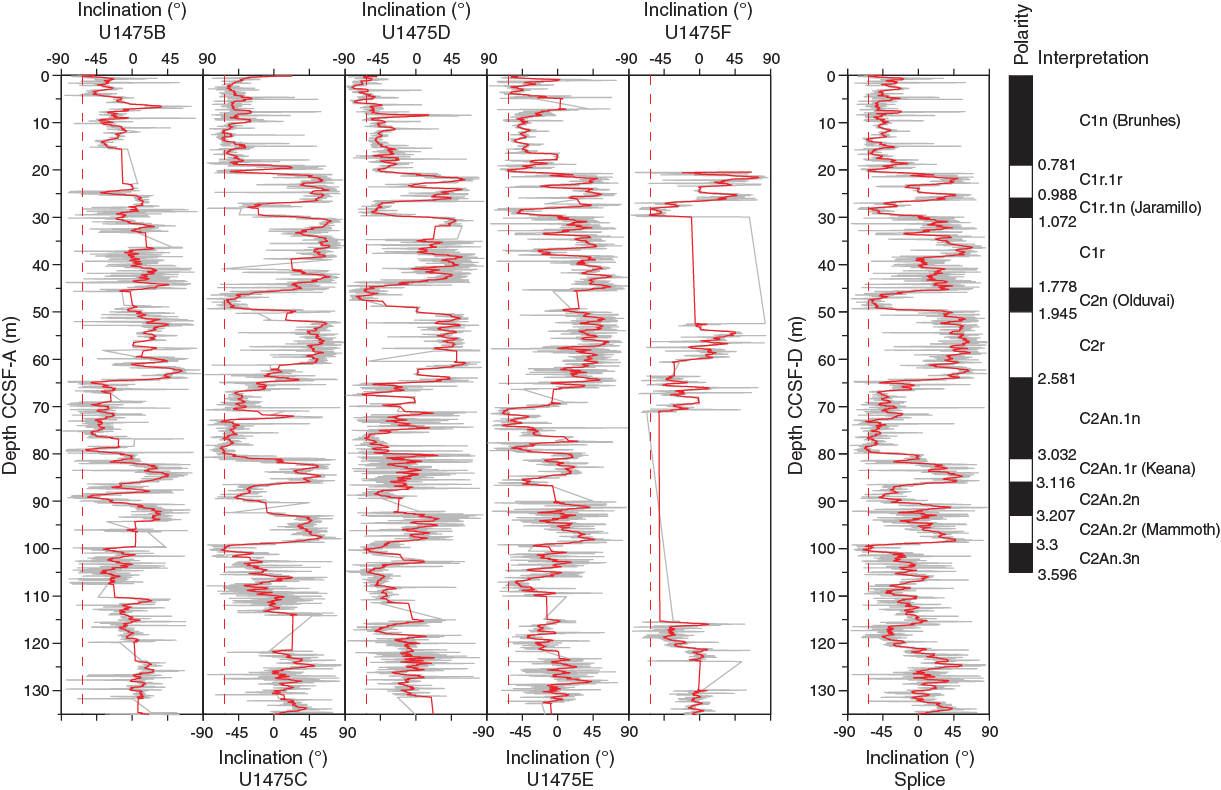
Inclination records in Holes U1475C, U1475D, U1475E, and U1475F show distinct polarity zones, which are summarized in Table T11. The record from Hole U1475B does not produce a stable polarity pattern, especially within the upper 100 m. The Brunhes/Matuyama boundary (0.781 Ma) is documented in Holes U1475C–U1475E. The Jaramillo Subchron (1.072–0.988 Ma) is present in Holes U1475C–U1475F, whereas the Olduvai Subchron (1.945–1.778 Ma) was only recovered in Holes U1475C and U1475D. The base of the Matuyama and reversed polarities associated with the Gauss Chron (C2An.1n; 3.032–2.581 Ma) can be identified in Holes U1475B–U1475E (Figure F26). The Kaena (3.116–3.032 Ma) and Mammoth (3.207–3.116 Ma) reversed subchrons that also occur within the Gauss Chron are visible in the records of Hole U1475B–U1475E, but their expressions vary among the different holes. The lower boundary of the Gauss Chron cannot be documented at this site because below ~100 m CCSF-A the inclination records tend toward 0° on average. In summary, the inclination data of the spliced record are free of drilling disturbances, core overlaps, and gaps, and they provide a clear inclination record that constrains the chronology of Site U1475 for the last 3.3 my (Figure F27). Broadly, the inferred polarity zones are in line with the biostratigraphy; however, some discrepancies between the established magnetostratigraphy and the biostratigraphy might be explained by the relatively low occurrence of subtropical species, fossil preservation, and ecological preferences (see Micropaleontology) as well as remagnetization and neo-formation of magnetic minerals. However, our shipboard results do not provide any evidence for a significant diagenetic overprint shallower than 100 m CSF-A. Based on the paleomagnetic data of the spliced record, accumulation rates vary between 2 and 5 cm/ky over the last 3 my, whereas higher rates are suggested before 3 Ma (Table T11; also see Age model).
Table T11. Polarity zone boundaries, Site U1475. Download table in .csv format.
Stratigraphic correlation
Detailed stratigraphic correlation at depth scales less than a meter was especially challenging at Site U1475, for several reasons. First, the generally high carbonate and low terrigenous content of the sediment precluded the possibility for real-time stratigraphic correlation as a guide for drilling because sediment was almost entirely diamagnetic below the uppermost meters below seafloor; thus, there were no means to circumvent possible core gap alignment a priori. In fact, drilling was spot-targeted in the final hole drilled (Hole U1475F) to patch potential core gaps. Second, the signals ultimately used for stratigraphic correlation were NGR and spectral reflectance and color (primarily RGB blue and b*), and because all these variables are probably monitoring aspects of the carbonate fraction within the sediment, they could not serve as completely independent cross-checks of the stratigraphic ties. Third, color variability below the upper 40 m CSF-A of each hole tended toward repeated, relatively featureless cycles spanning depth scales of 1–2 m, thus making the signals especially prone to miscorrelation through repeated or skipped cycles. Finally, weather conditions led to generally poor quality top sections of most cores, and the occasional weather-related APC misfires led to confusing stratigraphic overlaps.
Notwithstanding these challenges, a plausible case can be made that a stratigraphically complete section was obtained from the seafloor (mudline) to the base of Hole U1475C at ~292 m CCSF-A (see Stratigraphic correlation in the Expedition 361 methods chapter [Hall et al., 2017a] for an explanation of depth scales). Although several depth intervals (described in more detail below) proved to be especially difficult to correlate among holes with the available shipboard imaging tools, a continuous spliced sequence spanning the entire cored succession was constructed.
The spliced sequence comprises correlated sections of Holes U1475C (which provides the mudline anchor), U1475E, and, to a lesser extent Hole U1475B. Two cores from Hole U1475F (2H and 7H) were used in the spliced sequence to patch what would otherwise have been core gaps. Hole U1475C was generally used as the basis for the spliced sequence because core quality was optimal and shipboard sampling was minimal. Cores from Hole U1475D were placed on the CCSF-A depth scale but did not contribute to the splice because this hole was dedicated to whole-round interstitial water samples.
Compositing of holes
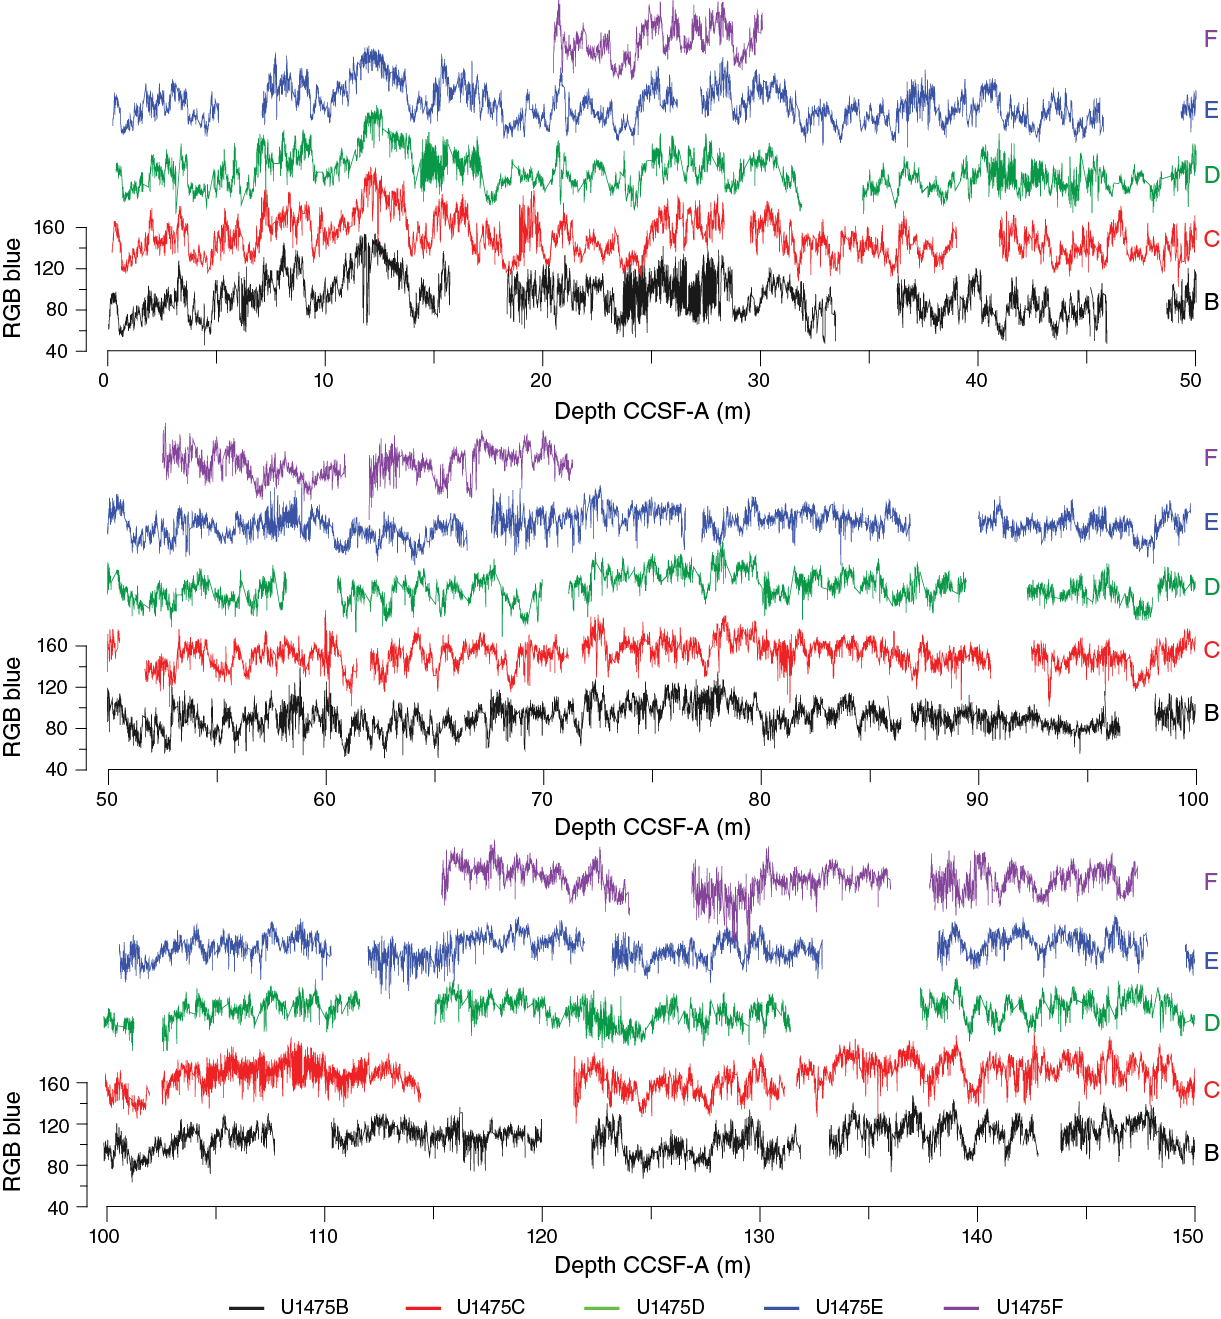
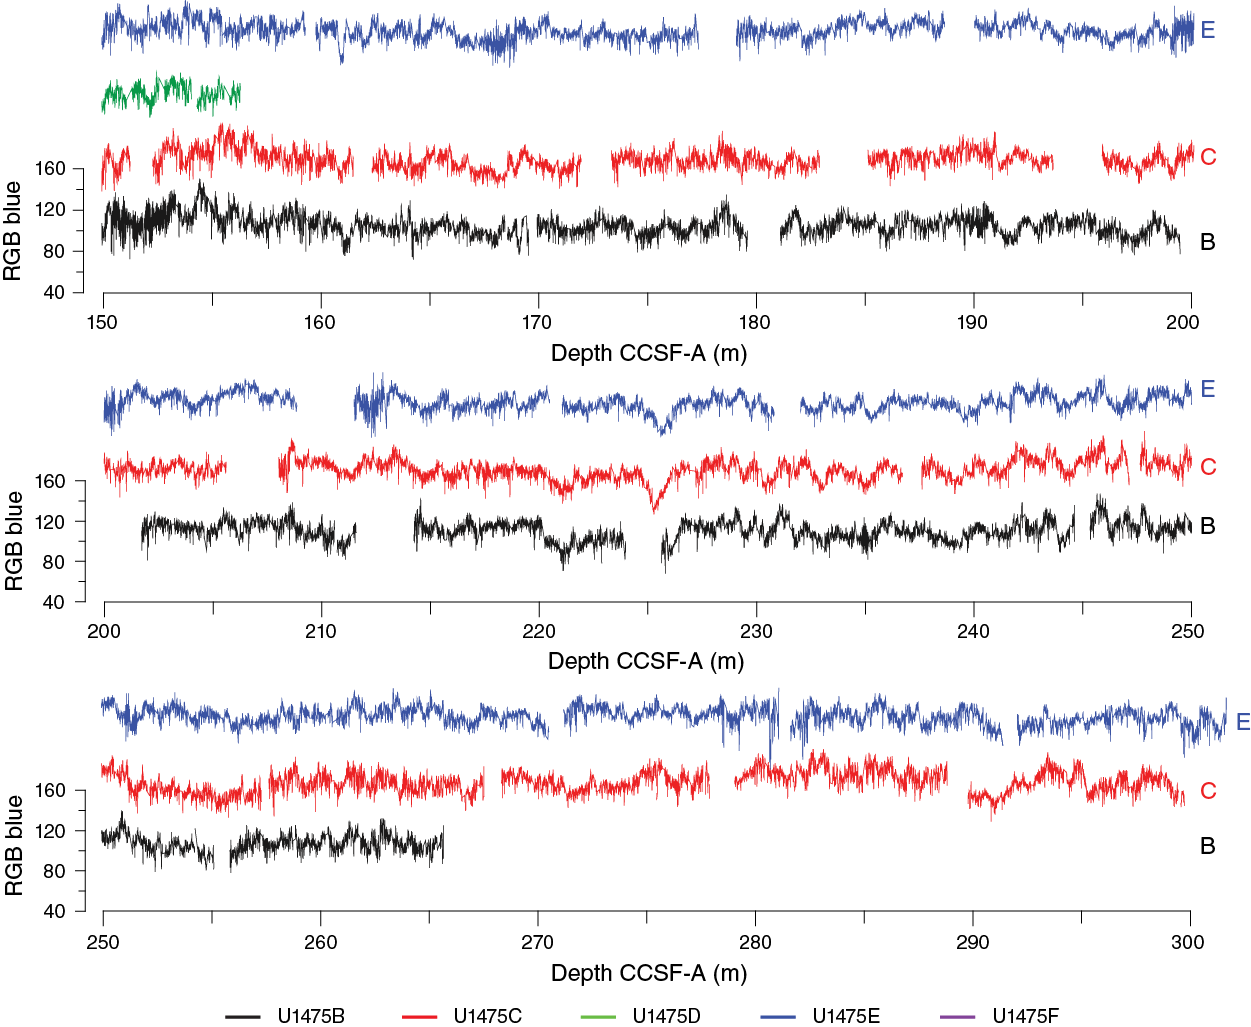
Compositing of sequences was accomplished primarily by correlating distinctive features in the RGB blue record, given that (1) there was no detectable magnetic susceptibility signal on either the STMSL or WRMSL and (2) the GRA density measured by the STMSL and WRMSL was significantly affected by variable core quality. NGR traces were checked for consistency of the stratigraphic ties, but this variable did not feature prominently in the final determination of core depth offsets because of its lower resolution. Core depth offsets were determined systematically, working from the mudline anchor. The average growth rate of the CCSF-A depth scale, relative to CSF-A, is ~5%–10% for all holes. This expansion is somewhat lower than is typical for APC-recovered sequences (see Stratigraphic correlation in the Site U1474 chapter [Hall et al., 2017b]), but it is the consequence of the frequent soupy, disturbed top sections and occasional APC misfires, both of which imply the sampling of sediment fall-in lacking stratigraphic integrity (leading to overlaps and locally negative growth rates of the CCSF-A scale).
In some intervals, the compositing was relatively straightforward. For example, the stratigraphic ties in the uppermost 40 m CCSF-A of all holes were obvious, and, therefore, confidence in the composite depth scale in this interval is high (Figure F28). The interval from ~200 to 260 m CCSF-A was similarly easy to correlate among holes because of clear, high-amplitude cycles in sediment color (Figure F28). On the other hand, several intervals hindered an orderly progression of robust stratigraphic ties from the top to the base of the recovered sequence. These intervals include the sections surrounding ~60, 90, 115, and 160 m CCSF-A. These intervals cannot necessarily be considered as coring gaps because overlapping sections among holes almost certainly exist. However, the generally poor quality of the core material within these overlapping sections (and/or the lack of distinct variability that could be imaged with the shipboard instruments) prevented a precise estimate of core offsets adjacent to these intervals. Our attempt to overcome these problematic intervals uses several guiding assumptions: (1) overlapping intervals on the CCSF-A scale between cores in the same hole generally only occur when there is clear evidence for drilling disturbance in the upper sections of adjacent cores or when APC misfires were noted by the drillers, (2) core gaps between adjacent cores exceeding 5 m (total ship heave) are unlikely, and (3) core disturbance can smooth away cyclical variability within a core section, but the longer wavelength (>2 m) trends among holes should still remain intact. With these assumptions—and we stress that they are still assumptions at this stage—the affine Table T12 compiling offsets for all cores has been constructed, including through the problematic intervals. It should be noted, however, that without further stratigraphic information (e.g., from shore-based scanning X-ray fluorescence or stable isotopic analyses), there is no uniquely identifiable solution to the detailed stratigraphic relationships across the problematic intervals.
Table T12. Affine table, Site U1475. Download table in .csv format.
Construction of the splice
Once the composite depth scale was created, select sequences from Holes U1475B, U1475C, U1475E, and U1475F were spliced together to create the most complete and representative section possible (Figure F29). Sedimentological logs were consulted meticulously in the process of constructing the splice to avoid inclusion of any obviously disturbed sections and/or sections with completely unique features (relative to the other holes). The result is reported in the splice interval Table T13. The splice constitutes a continuous sequence with a total length of ~292 m. Splice ties were checked to ensure that there were no major jumps across the splices in the variables used for correlation (spliced RGB blue, b*, and NGR). However, for the reasons outlined above, confidence in the splice is low surrounding the problematic intervals. Thus, the splice can effectively be considered “floating” (to a probably small but nevertheless uncertain extent) below all of these intervals. Shore-based users who are interested in the sedimentary sequences at these depth intervals are advised to check the splice ties across the relevant holes, using variables that are truly independent of the signals used onboard the ship. In the upper 150 m CCSF-A, the cores in Hole U1475D (not included in the splice) might be especially useful in this regard.
Table T13. Splice interval table, Site U1475. Download table in .csv format.
In any case, the prominent features of the entire spliced record (e.g., the large changes in sedimentation rate and the strong expression of cyclical color variability) cannot be an artifact of the splicing procedure, given that these features appear both within and between holes on depth scales that are longer than the (approximately meter scale) uncertainties in the stratigraphy.
Geochemistry
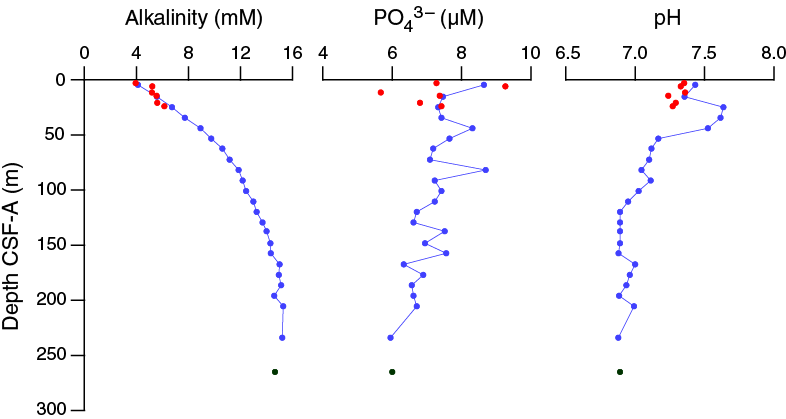
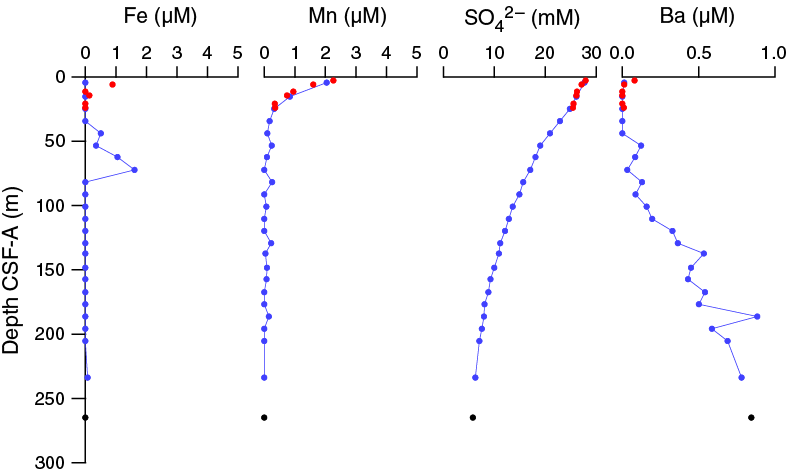
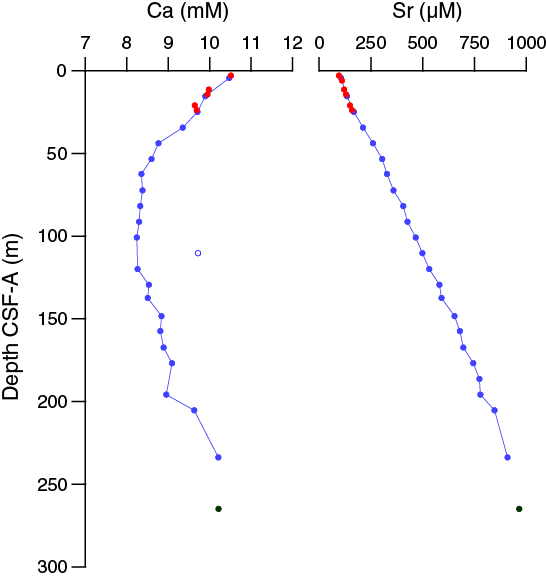
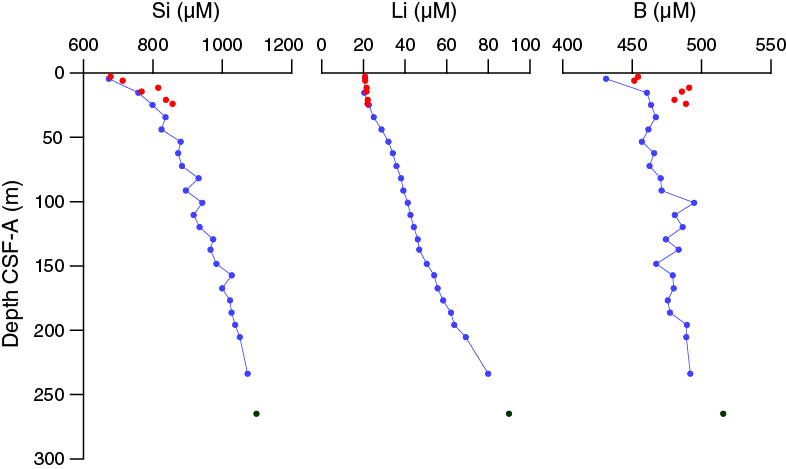
The chemical composition of the headspace gases, interstitial waters, and bulk sediments were investigated at Site U1475. Sampling for shipboard analyses largely focused in Hole U1475B. A dedicated high-resolution interstitial water sampling campaign was conducted in Hole U1475D. Downhole profiles of interstitial water chemistry largely reflect postdepositional microbially mediated reactions driven by the relatively modest deposition of organic carbon. Sedimentary carbonate contents range from 74 to 89 wt%, with an average of 80 wt%.
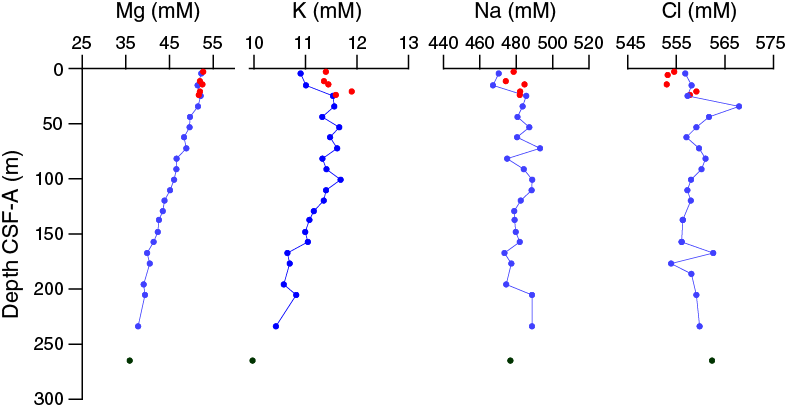
Interstitial water was squeezed from 5 cm whole rounds at ~3 m resolution from 0 to 24.85 m CSF-A from Holes U1475B and U1475D, ~9.5 m resolution between 24.85 and 205.35 m CSF-A in Hole U1475B, and ~30 m resolution from 205.35 to 264.95 m CSF-A, also from Holes U1475B and U1475C. In total, 25 samples were collected from Hole U1475B, 1 sample from Hole U1475C, and 6 samples from Hole U1475D for shipboard analysis of interstitial water chemistry (Table T14). An additional 106 interstitial water samples from Hole U1475D (50 cm × 5 cm whole rounds and 56 cm × 10 cm whole rounds) were collected for shore-based analysis of δ18O and Cl– to accomplish the objectives of the ancillary project letter (APL-845). Drilling disturbance compromised three of the 5 cm whole-round samples from Hole U1475D, and these samples were archived rather than squeezed. Rhizon samplers were used to collect interstitial water at 25 cm intervals in Core 361-U1475D-1H. These samples were split for shipboard nitrate measurements and shore-based work. Bulk sediment samples from Holes U1475B and U1475E were measured for total organic carbon (TOC) and total inorganic carbon (TIC) content, as well as major and trace element concentrations at variable resolutions.
Table T14. Interstitial water geochemistry data, Holes U1475B, U1475C, and U1475D. Download table in .csv format.
Sedimentary hydrocarbon gases
Headspace gas samples were collected from each core in Holes U1475A and U1475B and Cores 361-U1475C-27H through 30H. In total, 31 samples were measured. In all samples, CH4 was the dominant hydrocarbon and it remained near background concentrations throughout the cored sequence. Cores 361-U1475B-12H through 24H contained slightly elevated CH4, between 4 and 5 ppmv, below which concentrations decrease to background values at the base of the cored interval.
Interstitial water chemistry
Salinity, chlorinity, sodium, magnesium, and potassium
Salinity, chloride, and sodium are relatively constant and near seawater values in all samples (Figure F30). Average values (±1σ) are 558 ± 3 mM chloride, 476 ± 27 mM sodium, 46 ± 5 mM magnesium, and 11 ± 0.8 mM potassium. Magnesium is the only major cation that decreases significantly downhole, from a maximum of 52.70 mM in the uppermost sample (361-U1475D-1H-2, 140–145 cm) to a minimum of 35.87 mM in the deepest sample (361-U1475C-29H-6, 145–150 cm). Potassium is also relatively constant over the upper ~100 m CSF-A and then decreases by ~1 mM toward the deepest sample.
Alkalinity, phosphate, nitrate, and pH
Alkalinity in the uppermost sample (361-U1475D-1H-2, 140–145 cm) is 3.94 mM, below which it increases to a maximum of 15.3 mM at 205.35 m CSF-A in Hole U1475B and then decreases slightly downhole to 14.6 mM in the deepest sample (361-U1475C-29H-6, 145–150 cm) at 264.95 m CSF-A (Figure F31). The phosphate concentrations appear to decrease slightly downhole with a large amount of variability. The average phosphate concentration (±1σ) is 7.2 ± 0.8 µM, with a maximum of 9.3 µM at 5.9 m CSF-A in Hole U1475D and a minimum of 6.0 µM in the bottom two samples (233.85 m CSF-A in Hole U1475B and 264.95 m CSF-A in Hole U1475C). Nitrate concentrations are 2.5 µM at 0.25 m CSF-A (Sample 361-U1475D-1H-1, 25 cm), and they decrease to below detection limits by Sample 1H-2, 75 cm (not shown).
In the upper 23.9 m CSF-A, pH is somewhat variable, scattered around an average of 7.33 ± 0.06. pH abruptly increases to a maximum value of 7.64 at 24.85 m CSF-A and then decreases to 7.17 at 53.35 m CSF-A. From there, pH decreases more gradually downhole to ~100 m CSF-A. Below ~100 m CSF-A, pH varies around 6.93 ± 0.05 (Figure F31).
Iron and manganese
Concentrations of dissolved iron and manganese are very low at this site. Dissolved iron concentrations are below detection limits in all but seven samples, with a maximum of 1.6 µM at 72.35 m CSF-A in Hole U1475B. Manganese concentrations are at a maximum of 2.26 µM in the uppermost sample (361-U1475D-1H-2, 140–145 cm) and then decrease to values near zero (0.14 ± 0.08 µM) at ~34 m CSF-A (Figure F32). The low and decreasing dissolved manganese concentrations with depth likely reflect its combination with HCO3– and formation of manganese carbonate minerals (Calvert and Pedersen, 1994). The low dissolved iron most likely reflects the formation of iron sulfides. Abundant black sulfide streaks are apparent on the surface of the cores throughout, likely as a result of accelerated sulfate reduction within the lining of burrows from bioturbating organisms. The distinctive odor of hydrogen sulfides was observed during sampling.
Sulfate and barium
Sulfate concentrations are 27.3 mM in the first sample (361-U1475D-1H-2, 140–145 cm), near average seawater concentration. Sulfate decreases steadily in a concave profile downhole to 5.81 mM in Hole U1475C 264.95 m CSF-A (Figure F32). This is likely the result of microbial sulfate reduction, in which sulfate is used as an electron receptor in the anaerobic oxidation of organic matter:
53 SO42– + (CH2O)106(NH3)16(H3PO4) → 39 CO2 + 67 HCO3– + 16 NH4+ + 53 HS– + 39 H2O + HPO42–.
In sediment where sulfate reduction is rapid and intense, barite (BaSO4) will dissolve. At Site U1475, barium concentrations are below detection limits in all but four samples from the uppermost 50 m of Holes U1475B and U1475D. Below 50 m CSF-A, barium increases with depth to a maximum concentration of <0.9 μM in even the deepest sample at 264.95 m CSF-A, implying no significant barite dissolution (Figure F32).
Calcium and strontium
The dissolved calcium profile at Site U1475 is very similar to that observed at Site U1474 (see Geochemistry in the Site U1474 chapter [Hall et al., 2017b]). The concentration of calcium in interstitial water decreases from 10.5 mM in the uppermost sediment, which is near average seawater values, to a minimum concentration of 8.2 mM at 100.85 m CSF-A in Hole U1475B and then increases to a maximum of 10.2 mM in the deepest sample collected (264.95 m CSF-A) (Figure F33). Removal of dissolved calcium is likely due to the precipitation of calcium carbonate in the upper 100 m CSF-A of Hole U1475B as a result of the high alkalinity. Below ~100 m CSF-A, the increase in calcium concentration is likely caused by the dissolution of carbonates despite the relatively minor decrease in pH at these depths (Figure F31). Strontium concentrations increase linearly with depth from 96 μM (2.9 m CSF-A) to a maximum concentration of 966 μM at 264.95 m CSF-A (Figure F33).
Silicon, lithium, and boron
The concentrations of silicon, lithium, and boron in interstitial water all generally increase with depth in the sediment. Lithium and boron concentrations are 20 µM and 431 μM in the upper 10 m CSF-A, respectively, which is near average seawater values, and increase with depth to maximum concentrations of 89.9 and 516 μM, respectively, in the deepest sample at 264.95 m CSF-A (Figure F34). We note that there is an offset of ~5% in the boron concentrations of samples from Hole U1475B relative to those from Hole U1475D in the upper ~25 m CSF-A. As was discussed for Site U1474 (see Geochemistry in the Site U1474 chapter [Hall et al., 2017b]), this is within the analytical precision of boron concentration measurement. However, as all samples were collected, processed, and analyzed identically, it is difficult to ascribe this offset purely to an analytical artifact. Natural environmental variability in boron concentrations may also be partly responsible for the observed offset.
Silicon concentrations are significantly above average seawater values and increase steadily with depth. The minimum dissolved silicon concentration is ~675 μM in the upper ~5 m CSF-A and increases to a maximum of 1099 μM in the deepest sample at 264.95 m CSF-A (Figure F34). The increase is likely caused by the dissolution of siliceous microfossils. We note that silicon concentrations in three samples from Hole U1475D appear to be ~7%–8% higher than the rest of the data. This probably reflects some spatial heterogeneity in the interstitial water between holes.
Bulk sediment geochemistry
Total organic carbon
Total organic carbon varies from ~0.04 to 0.88 wt%, with an average of 0.39 wt% for all samples measured (Figure F35). Values decrease downhole from ~0.55 wt% at 0 m CCSF-A to 0.30 wt% at 303.28 m CCSF-A (Figure F35; Table T15).
Table T15. Carbonate, total organic carbon, and total nitrogen data, Holes U1475B and U1475E. Download table in .csv format.
Calcium carbonate
Calcium carbonate ranges between 74 and 86 wt% with an average of ~80 wt% at Site U1475 (Figure F35). Measurements were reproducible, with six samples from Hole U1475B measured in duplicate (27.1, 32.2, 38.0, 44.5, 61.6, 230.7, and 238.4 m CCSF-A), with an observed average difference for these replicates of ~0.7 wt%. Carbonate contents are ~80 wt% in the upper 10 m CCSF-A and then decrease to a minimum value of 74.1 wt% at 73.5 m CCSF-A. Values increase again between ~75 and 150 m CCSF-A and are ~85 wt% near the base of the section, with peak values of 86 wt% at 264.8 m CCSF-A (Table T15).
Variability in carbonate content and L* are broadly similar downhole (Figure F36), likely because carbonate dominates observed lithologic variations at Site U1475. One notable exception exists, around 75 m CCSF-A, where low carbonate values correspond with higher L* (Figure F36). This deviation could indicate an interval rich in biogenic silica or other silicon-bearing phases, which may also be light in color.
Major and trace elements
Major and trace element concentrations were measured for 25 of the samples taken for calcium carbonate analyses from Hole U1475B (Table T16). Most elements show a positive correlation with aluminum and near-zero intercept, consistent with the dilution of lithogenic material, with a composition near average upper crust, by calcium carbonate (Figure F37). After normalizing for calcium carbonate dilution by dividing the measured concentrations by [100 – CaCO3 (wt%)], the concentrations of all elements except barium, calcium, and strontium are close to those of average upper continental crust (Taylor and McLennan, 1985). Manganese and sodium oxides show no correlation with aluminum oxide content, indicating that they are controlled by processes other than simple two-end-member mixing. Manganese is likely impacted by the dissolution and reprecipitation of authigenic phases, as discussed above in the section on interstitial water chemistry. Sodium concentrations may be variably affected by adsorption of sodium from seawater onto clay minerals and by salts from the dried interstitial water. Barium is weakly correlated with aluminum, presumably due to the presence of barite. Strontium displays an inverse relationship with aluminum and is enriched above average crustal values, likely due to the incorporation of strontium into biogenic carbonates.
Table T16. Sediment geochemistry data, Hole U1475B. Download table in .csv format.
The ratios of purely lithogenic elements (e.g., Fe/K, Al/K, and Ti/Al) show little variability downhole and are especially stable between ~100 and 170 m CCSF-A (Table T16). When normalized to Al, moderate to strong correlations exist between the elements typically associated with mafic rocks (i.e., Fe, Mg, and Sc as well as Ba and Na) (Table T17). The elements enriched in felsic rocks (K, Si, and Ti) are reasonably well correlated with each other and not highly correlated with any other elements measured here. There are strong correlations among Sr, Mn, Sc, and Ca, presumably related to biogenic and authigenic sedimentary phases. A strong correlation between Na and Mg may indicate that Mg adsorption or presence as a salt in the unrinsed samples is important.
Table T17. Correlation coefficients between sedimentary element/Al ratios, Hole U1475B. Download table in .csv format.
Coincident measurements of major and trace element concentrations with organic and inorganic carbon provide an opportunity to validate chemical proxies for biological productivity. The ratio of barium to aluminum shows a strong correlation with measured organic carbon content as a result of barite formation associated with sinking organic matter (Figure F35). Low Ba/Al and TOC values toward the base of the composite section suggest that the corresponding high carbonate values are a reflection of enhanced preservation rather than production. The increase in the upper 75 m CCSF-A in all three parameters may indicate overall greater export production in the Pleistocene (Figure F35). Si/Al are decoupled from Ba/Al and Ca/Al between ~50–80 and 150–177 m CCSF-A. In the interval between 50 and 80 m CCSF-A, there is a peak in Si/Al values, which is not apparent in either Ca/Al, Ba/Al, or TOC content and coincides with a drop in percent calcium carbonate. This is the same interval in which low carbonate values correspond with high L* values mentioned above (Figure F36). In the interval from 150 to 177 m CCSF-A, Ba/Al values correlate with the peak in Si/Al, but Ca/Al values show an inverse relationship, and there is no significant trend in TOC or percent carbonate. Both of these intervals also have above average diatom percentages (see Micropaleontology). The biological system may have shifted from being dominated by carbonate producers to silica producers with little to no change in total primary production during these time intervals.
Age model
A 272 m long sequence of late Miocene to Late Pleistocene sediment was recovered from Site U1475. The age model for this site is based on magnetostratigraphy and biochronologies of calcareous nannofossils, planktonic foraminifers, and diatoms. Paleomagnetic data are best developed in Holes U1475C–U1475E and are based on the interpretation of pass-through paleomagnetic data and discrete samples. Biostratigraphic sampling in Hole U1475B includes 26 core catcher samples and working-half samples collected every 1.5–3.0 m. Biostratigraphy in Hole U1475C concentrated on five core catchers from near the base of the hole (Cores 361-U1475C-26H through 30H; 237.2–275.5 m CSF-A). For Hole U1475E, biochronology was determined from both 13 core catcher samples and samples from every other section for the top part (Samples 361-U1475E-1H-2, 70–72 cm, through 8H-CC; 2.2–70.9 m CSF-A) and bottom part (Samples 26H-1, 70–72 cm, through 30H-CC; 230.2–277 m CSF-A) of the hole. Biostratigraphic events are shown in Tables T4, T5, and T6, and magnetostratigraphic events are shown in Table T11. Major age-depth trends are illustrated in Figure F38.
The biochronology is of variable quality. Most of our biostratigraphic datums are based on calibrations for low-latitude species that are partly or largely outside of their typical biogeographic ranges in the subtropical convergence location of Site U1475. Hence, the discontinuous ranges or infrequent occurrences of some markers limits their utility and may cause top occurrences to be placed deeper in the sequence than the actual age of the sediment and base occurrences to be placed shallower than the true sedimentary age. Compounding the often discontinuous occurrences of species is the relatively low resolution sampling of many biostratigraphic markers, which are typically derived from core catchers (e.g., all diatom events and all biostratigraphy in Hole U1475C) and every other section in Holes U1475B and U1475E. For example, some markers such as the top occurrences of G. fistulosus (1.88 Ma; marker for the base of Subzone Pt1a) and G. nepenthes (4.37 Ma; marker for the base of Biozone PL2) are found only once or up to a few times in a given hole, rendering these markers the only identification of these biozones. Preservation is also an issue as well, with the nannoplankton record plagued by fragmented or overgrown discoasters and placoliths missing their central areas. Finally, whereas the biozonation is based mostly on Hole U1475B, the paleomagnetic data are largely derived from other holes, making direct comparisons across all time markers dependent upon the quality of the spliced record. Given these constraints, we have qualitatively estimated the reliability of the various biostratigraphic age markers in Tables T4, T5, and T6 based upon four criteria: frequency of occurrence of the marker before or after a datum event, preservation, reworking, and overall abundance in samples.
The Site U1475 sequence appears to preserve an unbroken record extending from the Late Pleistocene to the late Miocene (~7.5 Ma). Sedimentation rates are approximately linear between the recent and 3.9 Ma with a long-term average rate of 2.8 cm/ky. Sedimentation rates triple to 9.6 cm/ky between ~3.9 and 5.3 Ma. Between 5.3 Ma and the bottom of the recovered sequence at ~7.5 Ma, sedimentation rates are ~2.5 cm/ky. All of these estimates are based upon linear fits of the entire suite of identified biostratigraphic and magnetostratigraphic events without regard to their estimated quality. The fits of linear models to the available data are r2 = 0.94 (0–3.9 Ma), r2 = 0.92 (3.9–5.3 Ma), and r2 = 0.68 (5.3–7.5 Ma), suggesting that linear sedimentation rates represent a good approximation of deposition rates for at least the Pliocene and Pleistocene parts of the record. The results are consistent with relatively modest pelagic sedimentation on the Agulhas Plateau during the late Miocene that gives way to major drift development starting about 5.3 Ma and ending, at least at Site U1475, by ~3.9 Ma. Thereafter, sedimentation rates revert to similar late Miocene sedimentation rates for the late Pliocene and Pleistocene.
Examination of the Pliocene–Pleistocene sequence of chronological events since 3.9 Ma shows modest but consistent mismatches between datums. Nannofossil datums, most of which are top occurrences, tend to be found below equivalent-age magnetochron events in the interval between ~1.8 and 2.3 Ma, whereas foraminifer and diatom events show broad scatter in this interval. In the interval between ~5.5 and 7 Ma, both foraminifer and nannofossil datums tend to occur lower in the sequence than equivalent-age diatom events. We suggest that these mismatches reveal the general level of uncertainty in the biostratigraphic datums. Particular factors are likely to be the 1-sample-per-core resolution for diatoms; the use of top occurrences of nannofossil and foraminifer datums, which can reflect the difficulty in finding the youngest occurrences in material with low abundance and low-resolution sampling; and the possibility that biostratigraphic datums are aliased because most are based on tropical taxa that may only be present at Site U1475 during interglacial periods. For all these reasons, we are skeptical about interpreting the details of the sedimentation rate history based on the shipboard observations. However, we do want to emphasize the nearly unique nature of the Site U1475 record in the Southern Ocean for the high sedimentation rates in the early Pliocene, the absence of any obvious hiatuses, and the generally good to moderate preservation of calcareous plankton, all of which should make this site a classic for the Pliocene–Pleistocene.
References
Allen, R.B., and Tucholke, B.E., 1981. Petrography and implications of continental rocks from the Agulhas Plateau, southwest Indian Ocean. Geology, 9(10):463–468. http://dx.doi.org/10.1130/0091-7613(1981)9<463:PAIOCR>2.0.CO;2
Bard, E., and Rickaby, R.E.M., 2009. Migration of the Subtropical Front as a modulator of glacial climate. Nature, 460(7253):380–383. http://dx.doi.org/10.1038/nature08189
Barker, S., Knorr, G., Edwards, R.L., Parrenin, F., Putnam, A.E., Skinner, L.C., Wolff, E., and Ziegler, M., 2011. 800,000 years of abrupt climate variability. Science, 334(6054):347–351. http://dx.doi.org/10.1126/science.1203580
Caley, T., Giraudeau, J., Malaizé, B., Rossignol, L., and Pierre, C., 2012. Agulhas leakage as a key process in the modes of Quaternary climate changes. Proceedings of the National Academy of Sciences of the United States of America, 109(18):6835–6839. http://dx.doi.org/10.1073/pnas.1115545109
Calvert, S.E., and Pedersen, T.F., 1994. Sedimentary geochemistry of manganese; implications for the environment of formation of manganiferous black shales. Economic Geology, 91(1):36–47. http://dx.doi.org/10.2113/gsecongeo.91.1.36
Canfield, D.E., and Raiswell, R., 1992. Pyrite formation and fossil preservation. In Allison, P.A., and Briggs, D.E.G. (Eds.), Topics in Geobiology (Volume 9): Taphonomy: Releasing the Data from the Fossil Record: New York (Plenum Press), 337–387.
Cody, R.D., Levy, R.H., Harwood, D.M., and Sadler, P.M., 2008. Thinking outside the zone: high-resolution quantitative diatom biochronology for the Antarctic Neogene. Palaeogeography, Palaeoclimatology, Palaeoecology, 260(1–2):92–121. http://dx.doi.org/10.1016/j.palaeo.2007.08.020
Diekmann, B., Petschick, R., Gingele, F.X., Fütterer, D.K., Abelmann, A., Brathauer, U., Gersonde, R., and Mackensen, A., 1996. Clay mineral fluctuations in late Quaternary sediments of the southeastern South Atlantic: implications for past changes of deep water advection. In Wefer, G., Berger, W.H., Siedler, G., and Webb, D.J. (Eds.), The South Atlantic Present and Past Circulation: Berlin (Springer-Verlag), 621–644. http://dx.doi.org/10.1007/978-3-642-80353-6_31
Diz, P., Hall, I.R., Zahn, R., and Molyneux, E.G., 2007. Paleoceanography of the southern Agulhas Plateau during the last 150 ka: inferences from benthic foraminiferal assemblages and multispecies epifaunal carbon isotopes. Paleoceanography, 22(4):PA4218. http://dx.doi.org/10.1029/2007PA001511
Gersonde, R., Abelmann, A., Brathauer, U., Becquey, S., Bianchi, C., Cortese, G., Grobe, H., Kuhn, G., Niebler, H.-S., Segl, M., Sieger, R., Zielinski, U., and Fütterer, D.K., 2003. Last glacial sea surface temperatures and sea-ice extent in the Southern Ocean (Atlantic-Indian sector): a multiproxy approach. Paleoceanography, 18(3):1061. http://dx.doi.org/10.1029/2002PA000809
Gradstein, F.M., Ogg, J.G., Schmitz, M.D., and Ogg, G.M. (Eds.), 2012. The Geological Time Scale 2012: Amsterdam (Elsevier).
Graham, R.M., and De Boer, A.M., 2013. The dynamical Subtropical Front. Journal of Geophysical Research: Oceans, 118(10):5676–5685. http://dx.doi.org/10.1002/jgrc.20408
Hall, I.R., Hemming, S.R., LeVay, L.J., Barker, S., Berke, M.A., Brentegani, L., Caley, T., Cartagena-Sierra, A., Charles, C.D., Coenen, J.J., Crespin, J.G., Franzese, A.M., Gruetzner, J., Han, X., Hines, S.K.V., Jimenez Espejo, F.J., Just, J., Koutsodendris, A., Kubota, K., Lathika, N., Norris, R.D., Periera dos Santos, T., Robinson, R., Rolinson, J.M., Simon, M.H., Tangunan, D., van der Lubbe, J.J.L., Yamane, M., and Zhang, H., 2017a. Expedition 363 methods. In Hall, I.R., Hemming, S.R., LeVay, L.J., and the Expedition 361 Scientists, South African Climates (Agulhas LGM Density Profile). Proceedings of the International Ocean Discovery Program, 361: College Station, TX (International Ocean Discovery Program). http://dx.doi.org/10.14379/iodp.proc.361.101.2017
Hall, I.R., Hemming, S.R., LeVay, L.J., Barker, S., Berke, M.A., Brentegani, L., Caley, T., Cartagena-Sierra, A., Charles, C.D., Coenen, J.J., Crespin, J.G., Franzese, A.M., Gruetzner, J., Han, X., Hines, S.K.V., Jimenez Espejo, F.J., Just, J., Koutsodendris, A., Kubota, K., Lathika, N., Norris, R.D., Periera dos Santos, T., Robinson, R., Rolinson, J.M., Simon, M.H., Tangunan, D., van der Lubbe, J.J.L., Yamane, M., and Zhang, H., 2017b. Site U1474. In Hall, I.R., Hemming, S.R., LeVay, L.J., and the Expedition 361 Scientists, South African Climates (Agulhas LGM Density Profile). Proceedings of the International Ocean Discovery Program, 361: College Station, TX (International Ocean Discovery Program). http://dx.doi.org/10.14379/iodp.proc.361.103.2017
Harris, T.F.W., 1970. Planetary-type waves in the south west Indian Ocean. Nature, 227(5262):1043–1044. http://dx.doi.org/10.1038/2271043a0
Hay, W.W., Mohler, H.P., Roth, P.H., Schmidt, R.R., and Boudreaux, J.E., 1967. Calcareous nannoplankton zonation of the Cenozoic of the Gulf Coast and Caribbean-Antillean area, and transoceanic correlation. Transactions - Gulf Coast Association of Geological Societies, 17:428–480. http://archives.datapages.com/data/gcags/data/017/017001/pdfs/0428.pdf
Jafar, S.A., 1975. Some comments on the calcareous nannoplankton genus Scyphosphaera and the neotypes of Scyphosphaera species from Rotti, Indonesia. Senckenbergiana Lethaea, 56:365–379.
Kanfoush, S.L., Hodell, D.A., Charles, C.D., Guilderson, T.P., Mortyn, P.G., and Ninnemann, U.S., 2000. Millennial-scale instability of the Antarctic ice sheet during the last glaciation. Science, 288(5472):1815–1819. http://dx.doi.org/10.1126/science.288.5472.1815
Kanfoush, S.L., Hodell, D.A., Charles, C.D., Janecek, T.R., and Rack, F.R., 2002. Comparison of ice-rafted debris and physical properties in ODP Site 1094 (South Atlantic) with the Vostok ice core over the last four climate cycles. Palaeogeography, Palaeoclimatology, Palaeoecology, 182(3–4):329–349. http://dx.doi.org/10.1016/S0031-0182(01)00502-8
Kuhn, G., and Diekmann, B., 2002. Late Quaternary variability of ocean circulation in the southeastern South Atlantic inferred from the terrigenous sediment record of a drift deposit in the southern Cape Basin (ODP Site 1089). Palaeogeography, Palaeoclimatology, Palaeoecology, 182(3–4):287–303. http://dx.doi.org/10.1016/S0031-0182(01)00500-4
Lourens, L., Hilgen, F., Shackleton, N.J., Laskar, J., and Wilson, D., 2004. The Neogene period. In Gradstein, F.M., Ogg, J.G., and Smith, A. (Eds.), A Geologic Time Scale 2004: Cambridge, United Kingdom (Cambridge University Press), 409–440. http://dx.doi.org/10.1017/CBO9780511536045.022
Lutjeharms, J.R.E., 1996. The exchange of water between the South Indian and South Atlantic Oceans. In Wefer, G., Berger, W.H., Siedler, G., and Webb, D.J. (Eds.), The South Atlantic: Present and Past Circulation: Berlin (Springer-Verlag), 125–162.
Lutjeharms, J.R.E., 2006. The Agulhas Current: Berlin (Springer-Verlag). http://dx.doi.org/10.1007/3-540-37212-1
Lutjeharms, J.R.E., and Ansorge, I., 2001. The Agulhas Return Current. Journal of Marine Systems, 30(1–2):115–138. http://dx.doi.org/10.1016/S0924-7963(01)00041-0
Macdonald, A.M., 1993. Property fluxes at 30°S and their implications for the Pacific-Indian throughflow and the global heat budget. Journal of Geophysical Research: Oceans, 98(C4):6851–6868. http://dx.doi.org/10.1029/92JC02964
Marino, G., Zahn, R., Ziegler, M., Purcell, C., Knorr, G., Hall, I.R., Ziveri, P., and Elderfield, H., 2013. Agulhas salt-leakage oscillations during abrupt climate changes of the Late Pleistocene. Paleoceanography, 28(3):599–606. http://dx.doi.org/10.1002/palo.20038
Martínez-Méndez, G., Zahn, R., Hall, I.R., Peeters, F.J.C., Pena, L.D., Cacho, I., and Negre, C., 2010. Contrasting multiproxy reconstructions of surface ocean hydrography in the Agulhas Corridor and implications for the Agulhas leakage during the last 345,000 years. Paleoceanography, 25(4):PA4227. http://dx.doi.org/10.1029/2009PA001879
Molyneux, E.G., Hall, I.R., Zahn, R., and Diz, P., 2007. Deep water variability on the southern Agulhas Plateau: interhemispheric links over the past 170 ka. Paleoceanography, 22(4):PA4209. http://dx.doi.org/10.1029/2006PA001407
Nielsen, S.H.H., and Hodell, D.A., 2007. Antarctic ice-rafted detritus (IRD) in the South Atlantic: indicators of iceshelf dynamics or ocean surface conditions? In Cooper, A., Raymond, C., and the 10th ISAES Editorial Team (Eds.), Antarctica: A Keystone in a Changing World—Online Proceedings for the 10th International Symposium on Antarctic Earth Sciences. U.S. Geological Survey Open File Report 2007-1047, Short Research Paper 020. http://dx.doi.org/10.3133/of2007-1047.srp020
Nielsen, S.H.H., Hodell, D.A., Kamenov, G., Guilderson, T., and Perfit, M.R., 2007. Origin and significance of ice-rafted detritus in the Atlantic sector of the Southern Ocean. Geochemistry, Geophysics, Geosystems, 8(12):Q12005. http://dx.doi.org/10.1029/2007GC001618
Orsi, A.H., Johnson, G.C., and Bullister, J.L., 1999. Circulation, mixing, and production of Antarctic bottom water. Progress in Oceanography, 43(1):55–109. http://dx.doi.org/10.1016/S0079-6611(99)00004-X
Orsi, A.H., Whitworth, III, T., and Nowlin, W.D., Jr., 1995. On the meridional extent and fronts of the Antarctic Circumpolar Current. Deep-Sea Research, Part I, 42(5):641–673. http://dx.doi.org/10.1016/0967-0637(95)00021-W
Peeters, F.J.C., Acheson, R., Brummer, G.-J.A., de Ruijter, W.P.M., Schneider, R.R., Ganssen, G.M., Ufkes, E., and Kroon, D., 2004. Vigorous exchange between the Indian and Atlantic Oceans at the end of the past five glacial periods. Nature, 430(7000):661–665. http://dx.doi.org/10.1038/nature02785
Petschick, R., Kuhn, G., and Gingele, F., 1996. Clay mineral distribution in surface sediments of the South Atlantic: sources, transport, and relation to oceanography. Marine Geology, 130(3–4):203–229. http://dx.doi.org/10.1016/0025-3227(95)00148-4
Read, J.F., Lucas, M.I., Holley, S.E., and Pollard, R.T., 2000. Phytoplankton, nutrients and hydrography in the frontal zone between the Southwest Indian Subtropical gyre and the Southern Ocean. Deep Sea Research Part I: Oceanographic Research Papers, 47(12):2341–2368. http://dx.doi.org/10.1016/S0967-0637(00)00021-2
Reason, C.J.C., Landman, W., and Tennant, W., 2006. Seasonal to decadal prediction of southern African climate and its links with variability of the Atlantic Ocean. Bulletin of the American Meteorological Society, 87(7):941–955. http://dx.doi.org/10.1175/BAMS-87-7-941
Reid, J.L., 1989. On the total geostrophic circulation of the South Atlantic Ocean: flow patterns, tracers, and transports. Progress in Oceanography, 23(3):149–244. http://dx.doi.org/10.1016/0079-6611(89)90001-3
Reid, J.L., 2005. On the world-wide circulation of the deep water from the North Atlantic Ocean. Journal of Marine Research, 63(1):187–201. http://dx.doi.org/10.1357/0022240053693833
Romero, O.E., Kim, J.-H., Bárcena, M.A., Hall, I.R., Zahn, R., and Schneider, R., 2015. High-latitude forcing of diatom productivity in the southern Agulhas Plateau during the past 350 kyr. Paleoceanography, 30(2):118–132. http://dx.doi.org/10.1002/2014PA002636
Schlitzer, R., 2000. Electronic atlas of WOCE hydrographic and tracer data now available. Eos, Transactions American Geophysical Union, 81(5):45. http://dx.doi.org/10.1029/00EO00028
Schoonen, M.A.A., 2004. Mechanisms of sedimentary pyrite formation. In Amend, J.P., Edwards, K.J., and Lyons, T.W. (Eds.), Sulfur Biogeochemistry: Past and Present. Special Paper - Geological Society of America, 379:117–134. http://dx.doi.org/10.1130/0-8137-2379-5.117
Simon, M.H., Arthur, K.L, Hall, I.R, Peeters, F.J.C., Loveday, B.R., Barker, S., Ziegler, M., and Zahn, R., 2013. Millennial-scale Agulhas Current variability and its implications for salt-leakage through the Indian–Atlantic ocean gateway. Earth and Planetary Science Letters, 383:101–112. http://dx.doi.org/10.1016/j.epsl.2013.09.035
Taylor, R.S., and McLennan, S.M., 1985. The Continental Crust: Its Composition and Evolution: Oxford, United Kingdom (Blackwell Scientific Publications, Ltd.).
Tucholke, B.E., and Carpenter, G.B., 1977. Sediment distribution and Cenozoic sedimentation patterns on the Agulhas Plateau. Geological Society of America Bulletin, 88(9):1337–1346. http://dx.doi.org/10.1130/0016-7606(1977)88<1337:SDACSP>2.0.CO;2
Uenzelmann-Neben, G., 1998. Sedimentation and tectonics of Agulhas Ridge and Agulhas Plateau. Berichte zur Polar und Meeresforschung, 273:22.
Uenzelmann-Neben, G., 2001. Seismic characteristics of sediment drifts: an example from the Agulhas Plateau, southwest Indian Ocean. Marine Geophysical Research, 22(5):323–343. http://dx.doi.org/10.1023/A:1016391314547
Uenzelmann-Neben, G., 2002. Contourites on the Agulhas Plateau, SW Indian Ocean: indications for the evolution of currents since Palaeogene times. In Stow, D.A.V., Pudsey, C.J., Howe, J.A., Faugères, J.-C., and Viana, A.R. (Eds.), Deep-Water Contourite Systems: Modern Drifts and Ancient Series, Seismic and Sedimentary Characteristics. Memoirs - Geological Society of London, 22(1):271–288. http://dx.doi.org/10.1144/GSL.MEM.2002.022.01.20
Ziegler, M., Diz, P., Hall, I.R., and Zahn, R., 2013. Millennial-scale changes in atmospheric CO2 levels linked to the Southern Ocean carbon isotope gradient and dust flux. Nature Geoscience, 6(6):457–461. http://dx.doi.org/10.1038/ngeo1782
1 Hall, I.R., Hemming, S.R., LeVay, L.J., Barker, S., Berke, M.A., Brentegani, L., Caley, T., Cartagena-Sierra, A., Charles, C.D., Coenen, J.J., Crespin, J.G., Franzese, A.M., Gruetzner, J., Han, X., Hines, S.K.V., Jimenez Espejo, F.J., Just, J., Koutsodendris, A., Kubota, K., Lathika, N., Norris, R.D., Periera dos Santos, T., Robinson, R., Rolinson, J.M., Simon, M.H., Tangunan, D., van der Lubbe, J.J.L., Yamane, M., and Zhang, H., 2017. Site U1475. In Hall, I.R., Hemming, S.R., LeVay, L.J., and the Expedition 361 Scientists, South African Climates (Agulhas LGM Density Profile). Proceedings of the International Ocean Discovery Program, 361: College Station, TX (International Ocean Discovery Program). http://dx.doi.org/10.14379/iodp.proc.361.104.2017
2 Expedition 361 Scientists’ addresses.
This work is distributed under the Creative Commons Attribution 4.0 International (CC BY 4.0) license. 
- F1. Location map of Site U1475 with main surface currents in the southwest Indian Ocean.
- F2. Geomorphologic and oceanographic features near Site U1475.
- F3. Modern oceanographic data from the region surrounding Site U1475.
- F4. Precruise interpretation of seismic Line AWI-98014.
- F5. Zoomed view of seismic Line AWI-98014.
- F6. Millennial-scale multiproxy reconstruction of CASQ sediment Core MD02-2588.
- F7. Core recovery, Holes U1475A–U1475F.
- F8. Lithostratigraphic summary with selected physical property and geochemical data.
- F9. Representative lithologies per interval, Site U1475.
- F10. Sediment deformations and disturbances, Site U1475.
- F11. Relative percentages of major compositions of sediment determined by smear slide observation, Holes U1475A–U1475F.
- F12. Comparison of CaCO3 from discrete samples and biogenic carbonate estimated in smear slides, Holes U1475A–U1457F.
- F13. Clasts interpreted as IRD, Site U1475.
- F14. Color reflectance and NGR, Hole U1475E.
- F15. SHIL RGB color data, Hole U1475E.
- F16. P-wave velocity and bulk density, Site U1475.
- F17. Porosity, grain density, and thermal conductivity, Site U1475.
- F18. Spliced bulk density, P-wave velocity, NGR, and L* and a* color reflectance records, Site U1475.
- F19. Hole U1475E P-wave velocity converted to two-way traveltime compared to reflection seismic Profile AWI-98014.
- F20. Biochronology at Site U1475 with significant planktonic foraminifer, calcareous nannofossil, and diatom events.
- F21. Calcareous nannofossils, Site U1475.
- F22. Planktonic foraminifers of genus Globorotalia, Site U1475.
- F23. Planktonic foraminifers, Site U1475.
- F24. Alternating field demagnetization of a representative sample from Hole U1475D.
- F25. SIRM, HIRM, and S-ratio from discrete samples from Holes U1475A and U1475D.
- F26. Downhole inclination, declination, and intensity records, Site U1475.
- F27. Inclination summary, Site U1475.
- F28. RGB blue values, Site U1475.
- F29. Composite spliced records of RGB blue, b*, and NGR, Site U1475.
- F30. Dissolved magnesium, potassium, sodium, and chloride profiles, Holes U1475B–U1475D.
- F31. Alkalinity, dissolved phosphate, and pH profiles, Holes U1475B–U1475D.
- F32. Dissolved iron, manganese, sulfate, and barium profiles, Holes U1475B–U1475D.
- F33. Dissolved calcium and strontium profiles, Holes U1475B–U1475D.
- F34. Dissolved silicon, lithium, and boron profiles, Holes U1475B–U1475D.
- F35. Calcium carbonate and TOC in Holes U1475B and U1475E and biogenic indicators in Hole U1475B.
- F36. Downhole calcium carbonate content in Holes U1475B and U1475E with corresponding light reflectance data from Holes U1475B and U1475E.
- F37. Sedimentary major and trace element concentrations vs. aluminum oxide content, Hole U1475B.
- F38. Age-depth relationships between biostratigraphic and magnetostratigraphic events, Site U1475.
- T1. Site U1475 core summary.
- T2. Overview of shipboard sampling, Holes U1475A–U1475F.
- T3. Smear slide textures, compositions, and lithologic names, Holes U1475A–U1475F.
- T4. Biostratigraphic calcareous nannofossil datums, Site U1475.
- T5. Biostratigraphic planktonic foraminifer datums, Site U1475.
- T6. Biostratigraphic diatom datums, Site U1475.
- T7. Calcareous nannofossil occurrences, Site U1475.
- T8. Planktonic foraminifer occurrence, Site U1475.
- T9. Diatom and other siliceous microfossil occurrences, Site U1475.
- T10. Analyzed discrete paleomagnetic cube samples, Site U1475.
- T11. Polarity zone boundaries, Site U1475.
- T12. Affine table, Site U1475.
- T13. Splice interval table, Site U1475.
- T14. Interstitial water geochemistry data, Holes U1475B, U1475C, and U1475D.
- T15. Carbonate, total organic carbon, and total nitrogen data, Holes U1475B and U1475E.
- T16. Sediment geochemistry data, Hole U1475B.
- T17. Correlation coefficients between sedimentary element/Al ratios, Hole U1475B.
