Rosenthal, Y., Holbourn, A.E., Kulhanek, D.K., and the Expedition 363 Scientists
Proceedings of the International Ocean Discovery Program Volume 363
publications.iodp.org
https://doi.org/10.14379/iodp.proc.363.103.2018

Site U14821
Y. Rosenthal, A.E. Holbourn, D.K. Kulhanek, I.W. Aiello, T.L. Babila, G. Bayon, L. Beaufort, S.C. Bova, J.-H. Chun, H. Dang, A.J. Drury, T. Dunkley Jones, P.P.B. Eichler, A.G.S. Fernando, K.A. Gibson, R.G. Hatfield, D.L. Johnson, Y. Kumagai, T. Li, B.K. Linsley, N. Meinicke, G.S. Mountain, B.N. Opdyke, P.N. Pearson, C.R. Poole, A.C. Ravelo, T. Sagawa, A. Schmitt, J.B. Wurtzel, J. Xu, M. Yamamoto, and Y.G. Zhang2
Keywords: International Ocean Discovery Program, IODP, JOIDES Resolution, Expedition 363, Site U1482, Northwest Australian margin, Scott Plateau, Browse Basin, Sunda arc, Neogene, late Miocene, Pliocene, Pleistocene, Indonesian Throughflow, Leeuwin Current, West Australian Current, eastern Indian Ocean, Timor Sea, Timor Strait, Australian monsoon, hydroclimate (or precipitation reconstruction), southwestern sector Indo-Pacific Warm Pool, orbital-scale climate variability, carbonate accumulation, chalk, clay, soft sediment deformation, exceptional foraminifer and nannofossil preservation, stratigraphic intercalibration and cyclostratigraphy, downhole logging, anaerobic methane oxidation, sulfate–methane transition zone (SMTZ)
MS 363-103: Published 8 June 2018
Background and objectives
International Ocean Discovery Program (IODP) Site U1482 (proposed Site WP-12D) is located on the northwest Australian margin at 15°3.32ʹS, 120°26.10ʹE in 1466 m water depth (Figure F1). The site is situated at Shotpoint 440 on seismic Line HBR2000A-3032, ~581 m northwest of the crosspoint of seismic Lines HBR2000A-3032 and BR98-84 (Figures F2, F3). The top of the first prominent reflector, originally interpreted as the middle Miocene sequence boundary (Mi-3; 13.8 Ma), is 0.55 s two-way traveltime (TWT) below the seafloor, equivalent to ~500 meters below seafloor (mbsf) (Rosenthal et al., 2016) (Figure F3). Site U1482 is on the Scott Plateau, which corresponds to a subsided platform area that forms the northwestern flank of the northeast-trending Browse Basin (Keep et al., 2007; Hall, 2012) (Figure F1). This region, which is adjacent to some of the oldest ocean crust still in the world’s ocean (Argo Abyssal Plain), has remained a stable passive margin since the breakup of Gondwanaland and the separation of northwest Australia from the Tethyan landmass (Gradstein, 1992). As a result of the northward movement of the Australian plate, continuous Neogene deformation along the normal faults that bound the Scott Plateau has led to the amplification of relief between the Browse Basin and the Scott Plateau and may have resulted in some of the downslope transport seen in the seismic profiles (Keep et al., 2007) and sediment deformation in the cores recovered at this site.
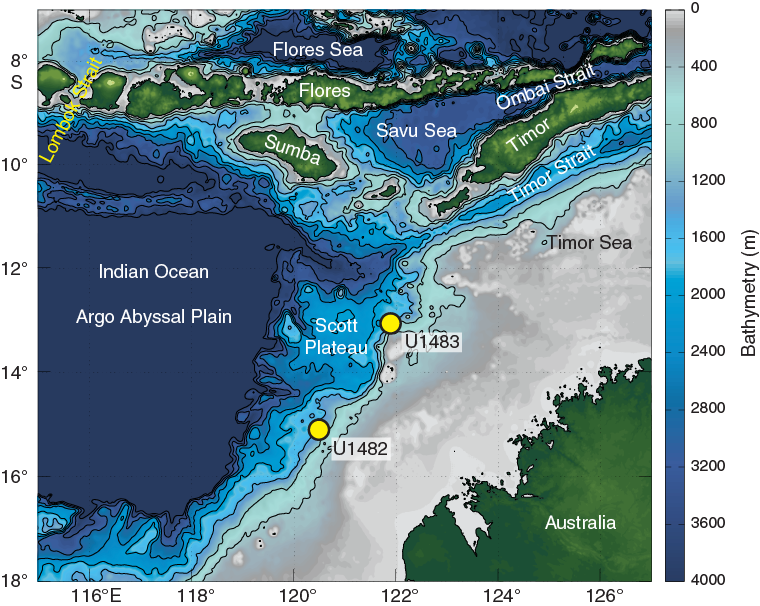
Figure F1. Northwest Australian and location of Sites U1482 and U1483.
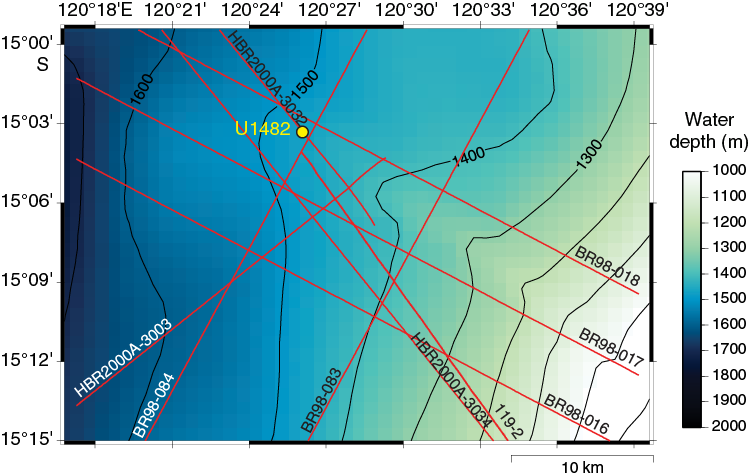
Figure F2. Contoured bathymetric map and site location.
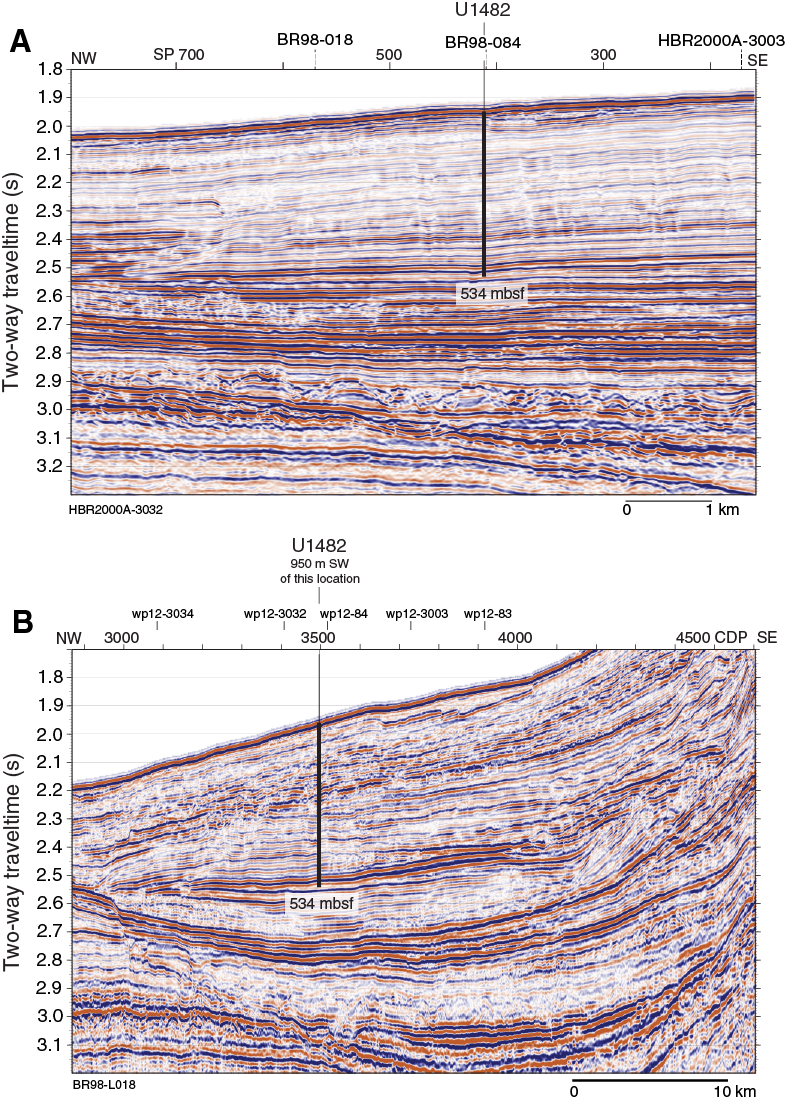
Figure F3. Seismic Lines HBR2000A-3032 and BR98_L018 with site location.
The Mesozoic section beneath the Scott Plateau is strongly influenced by breakup-related tectonics that form the acoustic basement through much of the Scott Plateau area (Stagg and Exon, 1981). The postbreakup sedimentary succession forms an ~2000 m thick, relatively uniform blanket over the Scott Plateau and the northeastern margin of the Browse Basin. The extended Miocene to recent sedimentary succession recovered at Site U1482 provides an ideal archive to reconstruct the climate and circulation history at the southwestern edge of the Indo-Pacific Warm Pool (IPWP) at a higher resolution than at nearby deep-sea Ocean Drilling Program sites (e.g., Site 761 on the Wombat Plateau; Holbourn et al., 2004).
The location of Site U1482 within the prominent hydrographic front separating tropical and subtropical water masses makes it suitable to monitor changes in the southern extent of tropical warm water related to circulation and/or global climate trends. The site is situated close to the oceanographic front between relatively cool, nutrient-rich water carried northward in the Eastern Indian Ocean by the West Australian Current and warm, oligotrophic Leeuwin Current waters, which results in a steep north–south sea-surface temperature (SST) gradient (Figure F4). This strategic location will allow reconstruction of the southwestern extent of the IPWP and monitoring of the Indonesian Throughflow (ITF) outflow into the Indian Ocean since the early late Miocene.

Figure F4. Mean annual SST off Northwest Australia.
The extended sediment archive recovered at Site U1482 will enable reconstruction of climate variability on orbital timescales over the past ~10 My, which will complement high-resolution records from the Pacific, Atlantic, and Southern Oceans and will be crucial for constraining regional and global circulation modes and Miocene ice volume variations. The new Pliocene record from Site U1482 is also ideally suited to test the hypothesis of a major restriction of warm water throughflow originating from the South Pacific Ocean between 3 and 5 Ma due to the northward movement of Papua New Guinea, which may have been a key factor in the aridification of East Africa and hominid evolution (Cane and Molnar, 2001).
Operations
Port call
Expedition 363 (Western Pacific Warm Pool) officially began with the first line ashore at Jetty 2A of the Loyang Offshore Supply Base, Singapore, at 0848 h (all times are local ship time; UTC + 8 h) on 6 October 2016. The Co-Chief Scientists, JOIDES Resolution Science Operator (JRSO) staff, and Expedition Project Manager boarded the vessel at 0930 h on the first day of port call. The Siem Offshore crew change occurred at 0730 h on the second day of port call (7 October), and the Expedition 363 Science Party boarded the vessel at 1000 h. One member of the science party was delayed until the evening of 8 October.
Bulk loading began on the first day of port call with 40 short tons of Class G cement. Bulk loading continued through the third day of port call with 40 short tons of barite and 120 short tons of sepiolite. In addition, 12 joints of 10¾ inch screened casing were loaded and stored in the riser hold for use on an upcoming expedition. A derrick inspection to determine maintenance requirements began on the third day and continued through the port call. Logistical operations during the remainder of the port call included bunkering 2100 metric tons of marine gas oil and loading the remaining freight shipments, expedition stores, and food. The Number 3 crane was also repaired, and a derrick inspection was completed before departure. The vessel was made ready, and the passage plan was prepared.
Transit to Site U1482
Customs and immigration cleared the vessel, and the pilot boarded at 0635 h on 11 October 2016. The last line was released at 0705 h, and the pilot was away at 0831 h, beginning the voyage to Site U1482. The 1514 nmi transit from Singapore to Site U1482 was completed in 128.3 h at an average speed of 11.8 kt.
Operations summary
The vessel stabilized over Site U1482 at 1524 h on 16 October 2016. We cored four holes at Site U1482 (Table T1). The original operations plan called for three holes, the first to advanced piston corer (APC) refusal, followed by two APC holes with extended core barrel (XCB) coring to 490 mbsf (our approved depth of penetration for the site). The plan was modified to core to total depth (490 mbsf) in the first hole to determine the operations plan for the remaining holes.
Table T1. Core summary. Download table in CSV format. View PDF table.
We reached APC refusal at ~345 mbsf in Hole U1482A, which was cored using nonmagnetic hardware and the Icefield MI-5 core orientation tool. The advanced piston corer temperature tool (APCT-3) was deployed on Cores 4H (31.4 mbsf), 7H (59.9 mbsf), 10H (88.4 mbsf), and 13H (116.9 mbsf). We opted to deepen the hole with the half-length APC (HLAPC) system, which reached 380 mbsf before refusal. We then switched to the XCB system to core to the total approved depth of 490 mbsf. Hole U1482B was APC cored to 343.6 mbsf and then HLAPC cored to 366.6 mbsf. This hole included five intervals drilled without coring to avoid core gap alignment for stratigraphic correlation. Because the age of the sediment at the bottom of Hole U1482A was several million years younger than anticipated, we requested and received permission to core deeper at the site. Hole U1482C was APC cored to 335.4 mbsf and then XCB cored to 534.1 mbsf. We opted to terminate drilling at that depth due to deteriorating calcareous microfossil preservation deeper than 500 mbsf and the increasing length of time required to cut cores.
After conditioning the hole for logging, we conducted two downhole logging runs using the triple combination (triple combo) and Formation MicroScanner (FMS)-sonic tool strings in Hole U1482C. The triple combo tool string reached the bottom of the hole at 533.4 m wireline depth below seafloor (WSF). The FMS-sonic tool string encountered a slurry of fine-grained fill and reached only 517 m WSF. Two upward passes were conducted with the FMS-sonic tool string. Following logging, we opted to core Hole U1482D to target three core gaps in the stratigraphic section. We took one core at the seafloor to establish the seafloor depth before drilling ahead to 137.0 mbsf. We then took eight APC cores to 213.0 mbsf, successfully covering the targeted core gaps. We then terminated the hole, ending operations at Site U1482 at 1800 h on 25 October. Total time spent at Site U1482 was 218.5 h (9.1 days).
A total of 163 cores were collected at this site. The APC coring system was deployed 115 times, collecting 1128.0 m of sediment over 1077.3 m of penetration (104.7% recovery). The HLAPC coring system was deployed 13 times, recovering 57.01 m of sediment over 55.3 m of penetration (103.1% recovery). The XCB coring system was deployed 35 times, collecting 305.32 m of sediment over 304 m of penetration (100.4% recovery). Total recovery for Site U1482 was 1490.33 m of sediment over 1436.6 m of coring (103.7%).
Hole U1482A
We deployed the positioning beacon for Site U1482 at 1535 h on 16 October 2016. Initial operations consisted of making up and spacing out the bottom-hole assembly (BHA), which included an APC/XCB coring assembly with two stands of drill collars. During deployment of the drill string, the drill pipe was drifted (checked to ensure that the interior was clear) and strapped (measured). The seafloor depth was measured at 1478.6 meters below rig floor (mbrf) using the precision depth recorder (PDR). After the drill string appeared to take weight at 1475 mbrf, we decided to shoot the first core from 1472 mbrf. Hole U1482A was spudded at 0035 h on 17 October with Core 1H recovering 2.98 m of core, establishing a seafloor depth of 1467.7 meters below sea level (mbsl). The hole was originally planned as an APC hole to refusal (estimated at 250 mbsf), but we decided to use the APC system to refusal and then the XCB system to the total depth approved for the site (490 mbsf) to better guide drilling decisions for subsequent holes.
Oriented APC coring using the Icefield MI-5 core orientation tool with nonmagnetic hardware continued from the seafloor to 344.9 mbsf (Core 37H). The APCT-3 was deployed on Cores 4H (31.4 mbsf), 7H (59.9 mbsf), 10H (88.4 mbsf), and 13H (116.9 mbsf). The APCT-3 obtained good temperature measurements on three of the four deployments (the initial measurement showed movement in the core shoe). After the liners of Cores 31H and 32H partially imploded, followed by a partial stroke and shattered core liner on Core 37H, we switched to the HLAPC system. HLAPC coring continued for Cores 38F through 45F (344.9–380.2 mbsf). Partial strokes occurred on Cores 42F, 43F, and 45F. The core liner of Core 45F shattered upon recovery, so we then switched to the XCB system to continue deepening the hole to the maximum approved depth of 490 mbsf. XCB coring was slow, but recovery was excellent. Hole U1482A reached 490 mbsf with Core 58X. The drill string was pulled out of the hole, and the bit cleared the seafloor at 1610 h on 19 October. Total time spent in the hole was 72.75 h (3.0 days).
Hole U1482A consisted of 37 APC cores recovering 360.28 m of core over 344.9 m (104.5% recovery), 8 HLAPC cores recovering 36.65 m of core over 35.3 m (103.8% recovery), and 13 XCB cores recovering 108.96 m of core over 109.8 m (99.2% recovery). Total core recovery for Hole U1482A was 505.88 m over 490.0 m (103.2%).
Hole U1482B
The vessel was offset 20 m at 320° from Hole U1482A, the drill string was spaced out so that the bit was at 1472 mbrf, and Hole U1482B was spudded at 1905 h on 19 October 2016. The seafloor was calculated at 1475.4 mbrf (1464.5 mbsl) based on 6.13 m of recovery in the mudline core. Oriented APC coring using the Icefield MI-5 core orientation tool with nonmagnetic hardware penetrated to 343.6 mbsf (Cores 1H through 39H). Three intervals were drilled without coring for stratigraphic correlation purposes. After a partial stroke on Core 39H, we drilled ahead 3.0 m before switching to the HLAPC system. Cores 41F through 45F penetrated to 366.6 mbsf, and the hole was terminated at that depth to initiate the next hole at a similar tidal phase to Hole U1482A due to the very large tidal range (~4 m) at this site. The drill string cleared the seafloor at 0000 h on 21 October, ending Hole U1482B. Total time spent in the hole was 31.75 h (1.3 days).
Hole U1482B consisted of 35 APC cores recovering 345.47 m of core over 329.1 m (105.0% recovery) and 5 HLAPC cores recovering 20.36 m of core over 20.0 m (101.8% recovery). In addition, five drilled intervals advanced the bit a total of 17.5 m without coring to offset core gaps for stratigraphic correlation. Total core recovery for Hole U1482B was 365.83 m over 349.1 m (104.8%).
Hole U1482C
The vessel was offset 20 m at 140° to Hole U1482A. The drill string was then spaced out so that the bit was at 1476 mbrf. Hole U1482C was spudded at 0440 h on 21 October 2016. A seafloor depth of 1476.1 mbrf (1465.2 mbsl) was established based on 9.43 m of recovery in the mudline core. Oriented APC coring using the Icefield MI-5 core orientation tool with nonmagnetic hardware continued to 335.4 mbsf (Cores 1H through 37H). Three intervals (12.5 m total) were drilled without coring for stratigraphic correlation. Prior to switching to the XCB system, we drilled ahead an additional 4.5 m to offset the core gaps.
XCB coring in Hole U1482C penetrated from 339.9 to 534.1 mbsf (Cores 39X through 60X). Because of very slow penetration rates, Core 59X (7.2 m advance) was pulled after 105 rotating minutes and Core 60X (6.1 m advance) was pulled after 120 rotating minutes. Because of poor preservation of microfossils and the increasing length of time to cut cores, we terminated coring operations in Hole U1482C after Core 60X (534.1 mbsf).
We then pumped a 50 bbl mud sweep to remove cuttings from the hole and pumped a go-devil to open the lockable float valve (LFV) in preparation for logging. The top drive was set back, and the drill string was pulled to set the end-of-pipe at 74.7 m drilling depth below seafloor (DSF). The triple combo tool string was prepared and lowered into the drill string at 0443 h on 24 October and reached the bottom of the hole at 533.4 m WSF, and an upward pass was completed before the tool string was retrieved to the rig floor at 1040 h. The FMS-sonic tool string was then prepared and lowered into the drill string at 1355 h. The FMS-sonic tool string reached only to 517 m WSF. The hole was logged with two upward passes to provide increased coverage of the borehole wall with the FMS. The end-of-pipe was raised to 67.7 m DSF at the end of the second run to log that portion of the hole as well. The FMS-sonic tool string was then returned to the rig floor by 2100 h on 24 October. Both tool strings experienced difficulty being pulled through the LFV. After concluding logging operations, the Schlumberger equipment was rigged down, and the drill string was recovered with the bit clearing the seafloor at 2300 h on 24 October, ending Hole U1482C. Total time in Hole U1482C was 95 h (4.0 days).
Hole U1482C consisted of 34 APC cores recovering 339.50 m of core over 322.9 m of coring (105.1% recovery), 22 XCB cores recovering 196.36 m of core over 194.2 m of coring (101.1% recovery), and 4 drilled intervals (17 m). In total, we recovered 535.86 m of sediment over 517.1 m of coring (103.6%).
Hole U1482D
The vessel was offset 20 m at 230° from Hole U1482A. The drill string was spaced out to 1472 mbrf, and Hole U1482D was spudded at 0055 h on 25 October 2016. Core 1H recovered 4.4 m of sediment, establishing a seafloor depth of 1466.1 mbsl. We then drilled ahead without coring to 137.0 mbsf before continuing to core with the APC system to fill gaps in the composite stratigraphic section. Cores 3H through 10H penetrated from 137.0 to 213.0 mbsf and successfully recovered cores across the three gaps in the stratigraphy. Core orientation was not conducted in Hole U1482D. The drill string was recovered to the rig floor at 1745 h. The positioning beacon was recovered while pulling the drill string and was on deck at 1419 h. After the rig floor was secured, the thrusters were pulled, and the vessel was under way to Site U1483 at 1800 h on 25 October, ending operations in Hole U1482D and at Site U1482. Total time spent in Hole U1482D was 19 h (0.8 days).
Hole U1482D consisted of 9 APC cores recovering 82.77 m of sediment over 80.4 m (102.9%). A single drilled interval advanced the hole 132.6 m without coring.
Core description
Four holes were cored at Site U1482, with the deepest one penetrating to 535.05 mbsf (Hole U1482C). The sediments recovered at Site U1482 are a mix of biogenic (mainly calcareous nannofossils and foraminifers), siliciclastic (mainly clay minerals), and volcanogenic (dominantly ash) sediments. Authigenic barite and sulfide precipitates also occur as accessories. In general, the color of the sediment reflects its lithologic characteristics; sediment composed mainly of nannofossil and foraminifer ooze are generally light greenish gray, whereas mixed lithologies (e.g., nannofossils and clay) tend to be dark greenish gray. In general, clay mineral content is positively correlated with natural gamma radiation (NGR) and magnetic susceptibility and inversely correlated with the luminosity (L*) color reflectance parameter. Bioturbation is moderate to heavy throughout the site. Intervals showing soft-sediment deformation (e.g., folding and microfaulting) were also observed, with the thickest packages occurring between ~85 and 90 mbsf and between ~165 and 175 mbsf in Hole U1482A. One lithologic unit and four subunits were defined at Site U1482 based on a combination of visual core description, microscopic examination of smear slides, magnetic susceptibility, color spectral observations, and bulk mineralogical analysis by X-ray diffraction (XRD) (see Core description and Physical properties in the Expedition 363 methods chapter [Rosenthal et al., 2018a]). The major characteristics of the sediment sequence at Site U1482 are illustrated in Figure F5.

Figure F5. Lithologic summary.
Unit descriptions
Unit I
- Intervals: 363-U1482A-1H-1, 0 cm, to 58X-CC, 35 cm;
363-U1482B-1H-1, 0 cm, to 45F-CC, 27 cm;
363-U1482C-1H-1, 0 cm, to 60X-CC, 40 cm;
363-U1482D-1H-1, 0 cm, to 10H-CC, 32 cm - Depths: Hole U1482A = 0–490.48 mbsf, Hole U1482B = 0–366.97 mbsf, Hole U1482C = 0–535.05 mbsf, Hole U1482D = 0–213.53 mbsf
- Thickness: Hole U1482A = 490.48 m, Hole U1482B = 366.97 m, Hole U1482C = 535.05 m, Hole U1482D = 213.53 m
- Age: late Miocene to recent
- Lithology: nannofossil ooze, foraminifer-rich nannofossil ooze, clay-bearing foraminifer-rich nannofossil ooze, clay-rich nannofossil ooze, and clay- and foraminifer-rich chalk
Unit I is composed of 535.05 m of upper Miocene to Pleistocene nannofossil ooze and chalk with varying amounts of clay and foraminifers (Figures F5, F6, F7, F8, F9, F10). The unit is divided into four subunits based on downhole changes in the abundance of clay minerals (and hence the sediment color and physical properties such as NGR), cyclic alternations between lithologies, and diagenetic maturation of the biogenic carbonates from nannofossil ooze to chalk. Subunit IA is dominated by light greenish gray clay-rich and foraminifer-rich nannofossil ooze with fragments of pteropods. Clay mineral content increases in the middle of the subunit and then declines again toward the bottom of Subunit IB, which is primarily greenish gray nannofossil ooze with common authigenic sulfide (Figure F11). Subunit IC is light greenish gray nannofossil ooze with varying proportions of foraminifers and clay. This subunit shows strong color cyclicity at the section scale (~1.5 m). Subunit ID marks a transition to light greenish gray chalk with low abundances of clay. Bioturbation is generally moderate to heavy throughout Unit I. Soft-sediment deformation is present over short intervals in Subunits IA and IB (Figure F12).
Figure F6. Characteristic lithology and color alternations in Subunit IA.
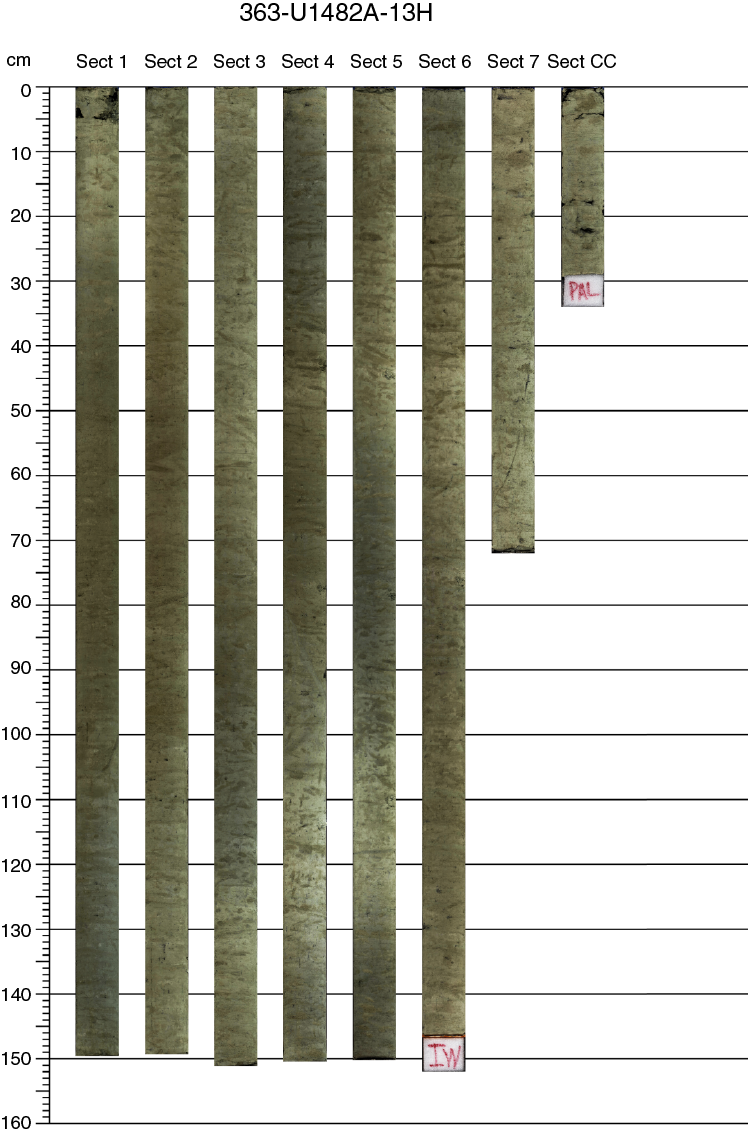
Figure F7. Characteristic lithology and color alternations at Subunit IA/IB boundary.
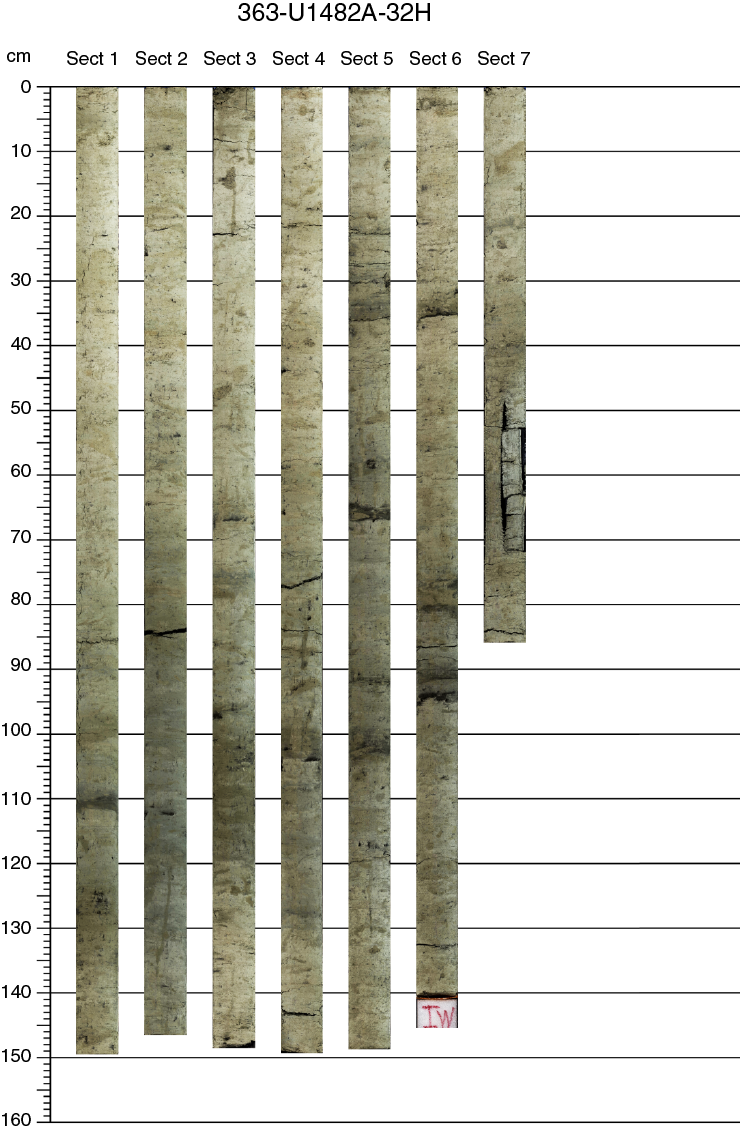
Figure F8. Characteristic lithology and strong color alternations in Subunit IC.
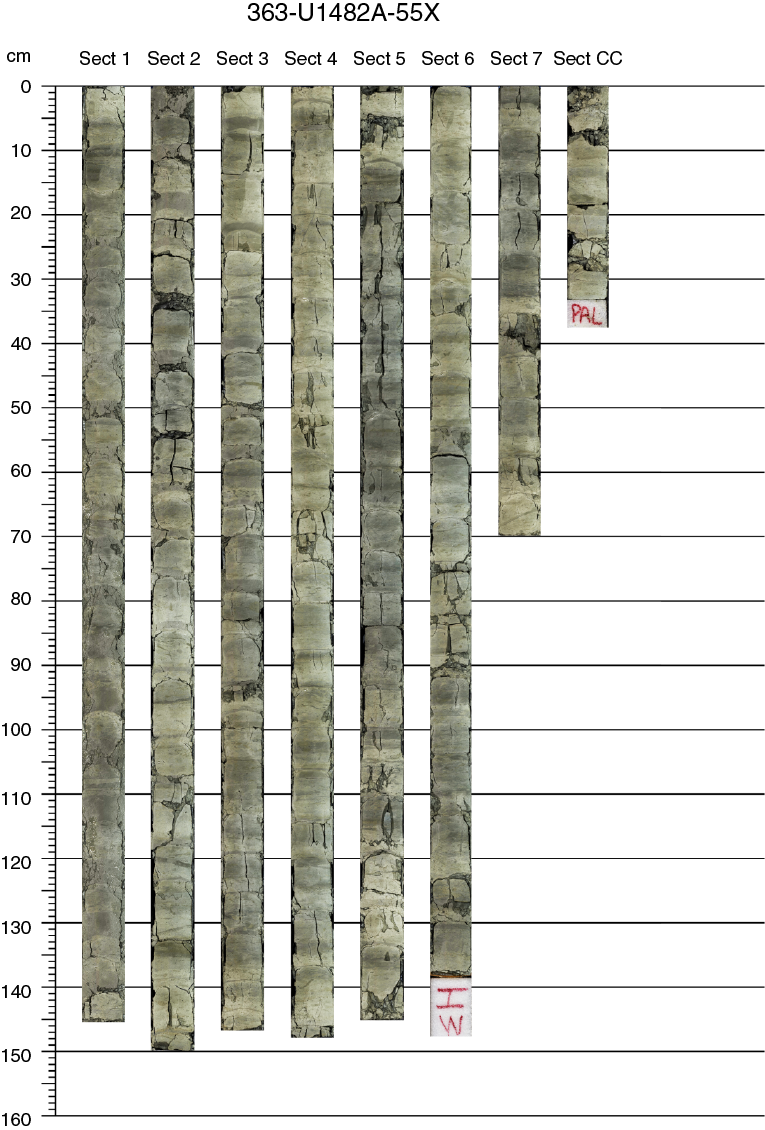
Figure F9. Biscuited chalk, Subunit ID.
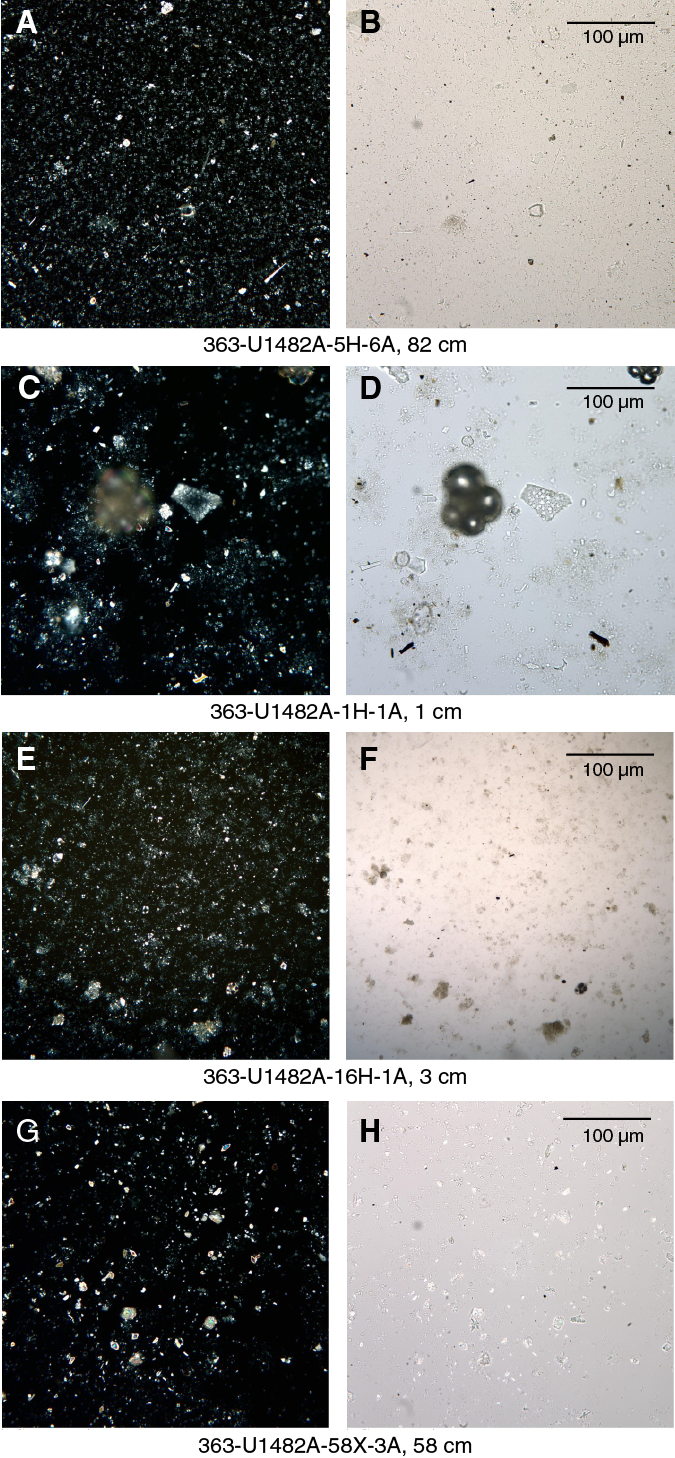
Figure F10. Main sedimentary components.

Figure F11. SEM photomicrographs of sulfides, Subunit IB.
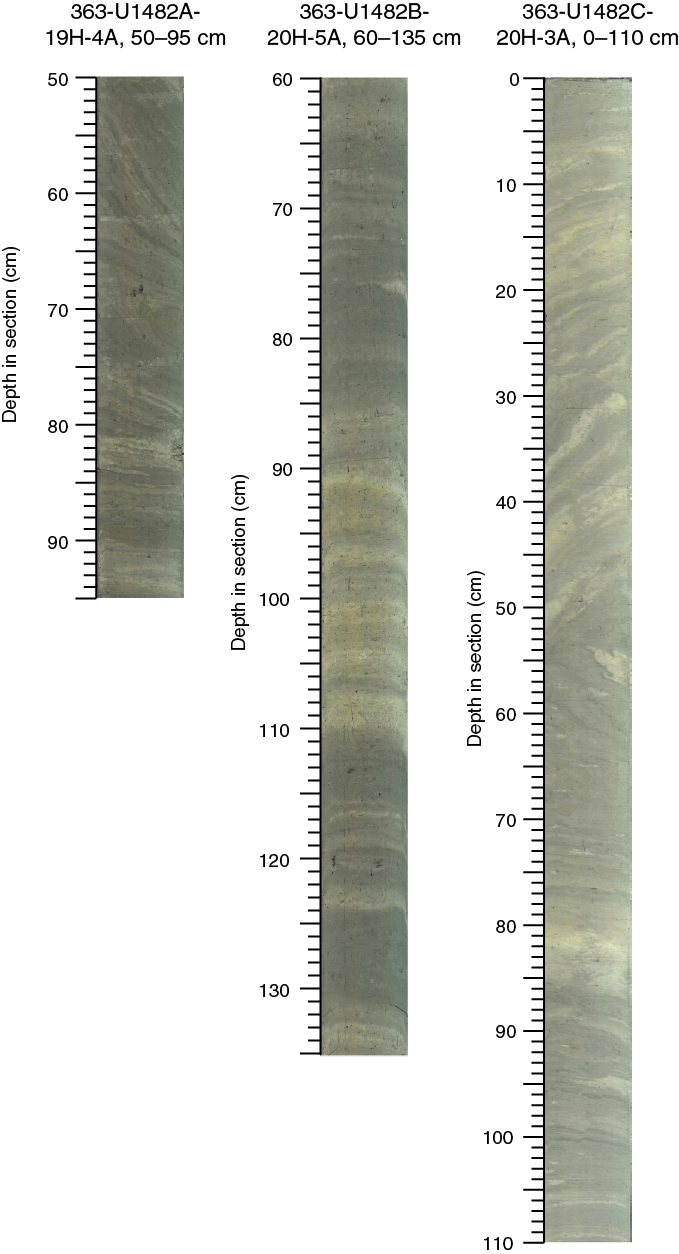
Figure F12. Soft-sediment deformation, Subunit IB.
Subunit IA
- Intervals: 363-U1482A-1H-1, 0 cm, to 13H-7, 0 cm;
363-U1482B-1H-1, 0 cm, to 14H-4, 0 cm;
363-U1482C-1H-1, 0 cm, to 14H-3, 120 cm;
363-U1482D-1H-1, 0 cm, to 1H-CC, 19 cm - Depths: Hole U1482A = 0–116.46 mbsf, Hole U1482B = 0–119.49 mbsf, Hole U1482C = 0–120.44 mbsf, Hole U1482D = 0–4.41 mbsf
- Thickness: Hole U1482A = 116.46 m, Hole U1482B = 119.49 m, Hole U1482C = 120.44 m, Hole U1482D = 4.41 m (minimum thickness)
- Age: Pleistocene to recent
- Lithology: foraminifer-rich nannofossil ooze and clay-bearing foraminifer-rich nannofossil ooze
Subunit IA is composed mainly of light greenish gray nannofossil ooze with variable amounts of foraminifers and clay (Figures F6, F10). Pteropod fragments were found on the split core surface, especially in the upper 30 mbsf. Bioturbation is moderate to heavy with visible burrows on the split core surface. From 0 to 60 mbsf, the sediments show subtle light–dark color alternation at a decimeter to meter scale. Below ~60 mbsf, the light–dark alternations become more evident. The lighter beds are typically foraminifer-rich nannofossil ooze, whereas the darker layers have higher clay content. Subunit IA contains intervals of significant sediment deformation in some of the cores, with features such as folding identified in Cores 363-U1482A-2H, 9H, and 10H; 363-U1482B-1H and 8H; and 363-U1482C-1H and 8H (Figure F12).
The lithologic boundary between Subunits IA and IB is located at intervals 363-U1482A-13H-7, 0 cm (116.46 mbsf), 363-U1482B-14H-4, 0 cm (119.49 mbsf), and 363-U1482C-14H-3, 120 cm (120.44 mbsf). The subunit boundary lies within the drilled interval in Hole U1482D (363-U1482D-21). The boundary was chosen at a sharp transition between darker greenish gray clay-rich and foraminifer-rich nannofossil ooze above and dominantly light greenish gray nannofossil ooze below. This sharp transition is also visible in the NGR and color spectral data (Figure F5; see Physical properties), as well as in the carbonate content (see Geochemistry).
Subunit IB
- Intervals: 363-U1482A-13H-7, 0 cm, to 23H-3, 40 cm;
363-U1482B-14H-4, 0 cm, to 25H-2, 100 cm;
363-U1482C-14H-3, 120 cm, to 25H-1, 0 cm;
363-U1482D-3H-1, 0 cm, to 10H-CC, 32 cm - Depths: Hole U1482A = 116.46–205.80 mbsf, Hole U1482B = 119.49–210.02 mbsf, Hole U1482C = 120.44–211.90 mbsf, Hole U1482D = 137.00–213.53 mbsf (total depth)
- Thickness: Hole U1482A = 89.34 m, Hole U1482B = 90.53 m, Hole U1482C = 91.46 m, Hole U1482D = 76.53 m (minimum thickness)
- Age: early Pliocene to earliest Pleistocene
- Lithology: nannofossil ooze, clay-rich nannofossil ooze, foraminifer-rich nannofossil ooze, and clay-bearing foraminifer-rich nannofossil ooze
Subunit IB extends from ~120 to ~210 mbsf. The upper part of Subunit IB is nannofossil ooze (Sections 363-U1482A-13H-7 and 13H-CC in Figure F7), and the top of this subunit is defined by the top of a light greenish gray nannofossil ooze. Smear slide analysis supported by NGR and color reflectance indicates that the clay mineral content increases in the middle of the subunit and then declines toward the bottom (Figure F5). Subunit IB contains obvious soft-sediment deformation midway through the interval, with folds, inclined bedding, and microfaults present in Cores 363-U1482A-19H, 363-U1482B-20H and 21H, and 363-U1482C-19H and 20H (Figure F12). Sulfide specks and nodules are abundant starting at the top of the subunit and continue throughout the rest of the succession (Figure F11). Foraminifer content increases toward the bottom of the subunit. The section recovered between Cores 363-U1482D-3H and 10H is entirely contained within Subunit IB.
An ~40 mm diameter, subrounded concretion was recovered in interval 363-U1482A-14H-1, 105–109 cm (Figure F13). XRD analysis indicates that the concretion is roughly 50% barite (BaCO3) and 50% calcite (CaCO3) (Figure F14A). This interval corresponds to the sulfate–methane transition zone (SMTZ), where methane begins to increase, sulfate declines to <1 mM, and barium drops dramatically in interstitial waters (see Geochemistry).

Figure F13. Barite-calcite concretion.
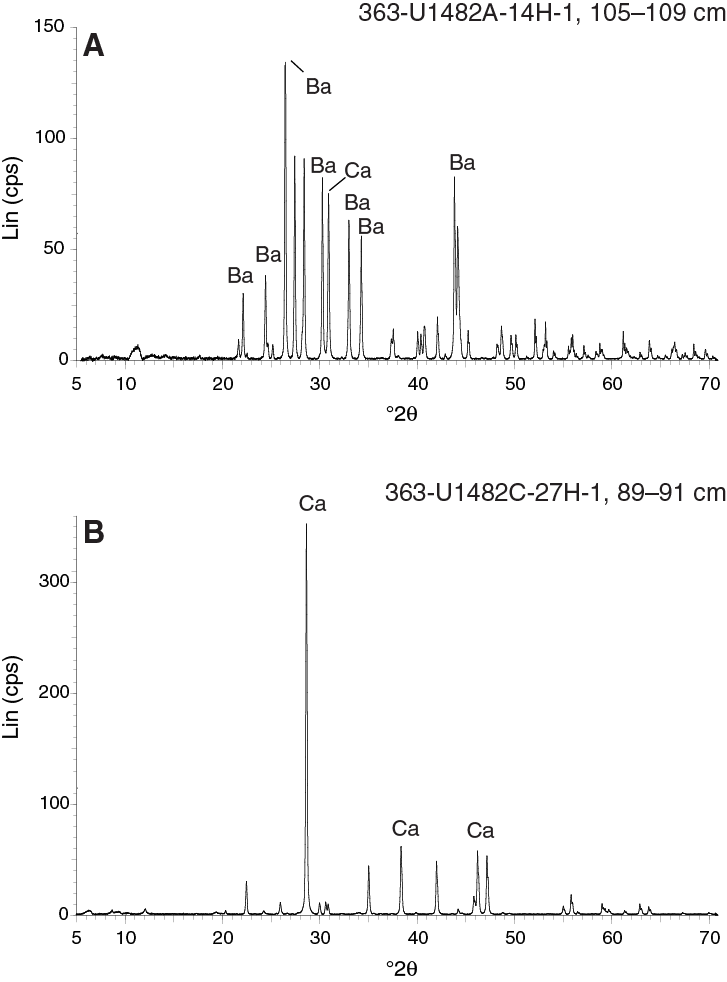
Figure F14. XRD results.
A gradual lithologic transition between Subunits IB and IC corresponds to an ~6 m interval characterized by the shift from darker greenish gray clay-rich nannofossil ooze to lighter greenish gray nannofossil ooze with less clay. The first downhole occurrence of well-defined light–dark cycles was selected as the base of Subunit IB, which is located at intervals 363-U1482A-23H-3, 40 cm (205.8 mbsf), 363-U1482B-25H-2, 100 cm (210.02 mbsf), and 363-U1482C-25H-1, 0 cm (211.9 mbsf).
Subunit IC
- Intervals: 363-U1482A-23H-3, 40 cm, to 46X-1, 0 cm;
363-U1482B-25H-2, 100 cm, to 45F-CC, 27 cm;
363-U1482C-25H-1, 0 cm, to 43X-1, 0 cm - Depths: Hole U1482A = 205.80–380.20 mbsf, Hole U1482B = 210.02–366.97 mbsf (total depth), Hole U1482C = 211.90–378.70 mbsf
- Thickness: Hole U1482A = 174.4 m, Hole U1482B = 156.95 m (minimum thickness), Hole U1482C = 166.80 m
- Age: late Miocene to early Pliocene.
- Lithology: clay-rich nannofossil ooze, clay-rich foraminifer–nannofossil ooze, foraminifer-rich nannofossil ooze, and clay-bearing foraminifer-rich nannofossil ooze
Subunit IC is late Miocene to earliest Pliocene in age, and the sediment consists mainly of nannofossil ooze containing varying abundances of foraminifers (Figure F8). Preservation of nannofossils and foraminifers decreases downhole, and smear slide analysis shows the presence of relatively small (a few micrometers) carbonate particles of unknown origin (probably recrystallized biogenic particles). XRD analysis confirms the predominance of calcite within this subunit (Figure F14B). Foraminifer abundance varies, and sulfide precipitates are abundant throughout.
Subunit IC exhibits strong color cyclicity at a decimeter to meter scale, with cycles largely reflecting changes in carbonate content (~80–50 wt%; see Geochemistry) (Figure F8). The color cycles result from alternation between layers of light greenish gray nannofossil ooze and dark greenish gray to dark gray clay-rich nannofossil ooze. The boundaries between the alternating layers are typically sharp (possibly erosional), and black sulfide bands and large burrows mark the bottoms of the clay-rich layers.
The lower boundary of Subunit IC is largely determined by a change in the stiffness and diagenetic maturity of the sediment, which changes rather abruptly from nannofossil ooze to chalk at intervals 363-U1482A-46X-1, 0 cm (380.20 mbsf), and 363-U1482C-43X-1, 0 cm (378.70 mbsf). The boundary also corresponds to the switch from the HLAPC to XCB coring system in Hole U1482A.
Subunit ID
- Intervals: 363-U1482A-46X-1, 0 cm, to 58X-CC, 35 cm;
363-U1482C-43X-1, 0 cm, to 60X-CC, 40 cm - Depths: Hole U1482A = 380.20–490.48 mbsf (total depth), Hole U1482C = 378.70–535.05 mbsf (total depth)
- Thickness: Hole U1482A = 110.28 m, Hole U1482C = 156.35 m
- Age: late Miocene
- Lithology: chalk with varying amounts of clay
Subunit ID is composed primarily of light greenish gray chalk (Figure F9). Dark–light cycles that are 1.5 to 2 m thick are dominant immediately below the subunit boundary. At ~460 mbsf, the cycles become more subtle and are generally lighter in color and richer in carbonate. Nannofossils and foraminifers are not as well preserved as in Subunit IC (see Biostratigraphy) and are recrystallized; very fine silt– to fine sand–sized carbonate particles occur frequently, occasionally dominating the sediment.
Clay content is typically low throughout this subunit. The dissolution of planktonic foraminifers has resulted in moldic porosity within the chalk. Foraminifers are occasionally concentrated into discrete graded layers (Figure F15).
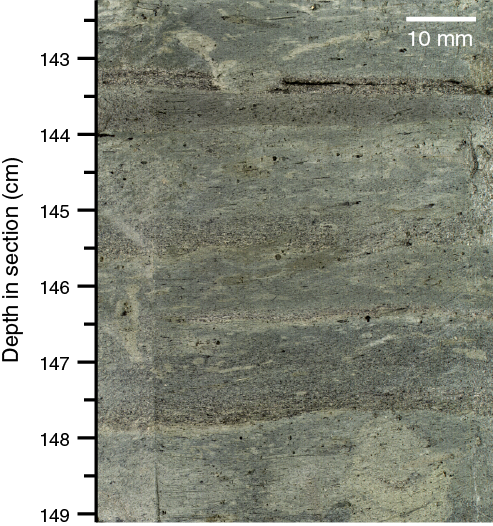
Figure F15. Graded bedding.
Discussion
The sediment at Site U1482 is primarily nannofossil ooze, transitioning to chalk below ~375 mbsf. Layers dominated by secondary lithologies with varying proportions of foraminifers and clay minerals alternate with the primary lithology, forming submeter-scale cycles. Often, the alternating layers show gradual rather than sharp boundaries as illustrated by the gradual transitions between sediment colors apparent in the core photographs (Figures F6, F7, F8, F9).
Subtle downhole lithologic variability has a prominent expression in all of the physical property parameters that were continuously logged at this site. For example, color reflectance (specifically L*) is highest in nannofossil oozes, which are almost entirely dominated by carbonates, whereas the presence of clay in the sediment is generally correlated to lower L* values (Figure F5). The presence of sulfides (sometimes very abundant) darkens the color, especially in Subunits IB and IC. During smear slide analysis and core description, we observed that the presence of foraminifers (especially when concentrated in small pockets created by bioturbation or local winnowing) corresponds to either darker or lighter hues when concentrated in sediment patches. Additionally, the presence of clay minerals seems to correlate with higher values in both NGR and magnetic susceptibility (see Physical properties). This is particularly prominent in the most clay rich subunits (IB and IC) (Figure F5).
Evidence of soft-sediment deformation was observed in different intervals, especially toward the top of Subunit IA and the middle of Subunit IB, which is the thickest deformed interval. Soft-sediment deformation is not uncommon in pelagic and hemipelagic sediments, especially along continental slopes where earthquakes can trigger the downslope movement of partially consolidated sediments even in the presence of very low slope angles. It is worth noting that the two intervals of soft-sediment deformation occur in parts of the record characterized by higher clay content, which is highlighted by small-scale dark–light cycles (e.g., Figure F12). This observation suggests that the presence of clay-rich intervals could have acted as lubricant to further facilitate downslope movement and sediment deformation.
Biostratigraphy
Coring at Site U1482 recovered a 535 m thick sequence of upper Miocene to Pleistocene foraminifer- and clay-rich nannofossil ooze and foraminifer-, clay-, and nannofossil-rich chalk. Nannofossils, planktonic foraminifers, and benthic foraminifers are present throughout the succession and generally show very good to excellent preservation. Preservation of both groups worsens at depth, with very minor overgrowth on foraminifers deeper than ~200 mbsf and more pronounced overgrowth and infilling deeper than ~370 mbsf. The results from each fossil group (calcareous nannofossils, planktonic foraminifers, and benthic foraminifers) are presented below, followed by a detailed characterization of both benthic and planktonic foraminifer preservation states using shipboard scanning electron microscope (SEM) observations. An integrated biomagnetostratigraphy is also presented. Shipboard taxon occurrence data are available to download from the Laboratory Information Management System (LIMS) database (http://web.iodp.tamu.edu/LORE).
Calcareous nannofossils
Calcareous nannofossil biostratigraphy is based on analysis of core catcher (CC) samples and additional samples from working-half sections, mostly in Holes U1482A and U1482B. Observations were undertaken using plane-polarized (PPL), cross-polarized (XPL), and circular-polarized light (CPL), and the shipboard desktop SEM (Hitachi TM3000) was used to confirm the presence of Emiliania huxleyi and to check preservation state. Depth positions and age estimates of key biohorizons are given in Table T2.
Table T2. Calcareous nannofossil bioevents. Download table in CSV format.
At Site U1482, the preservation of calcareous nannofossils is generally very good to excellent (Figure F16). Intact coccospheres were frequently observed, and dissolution-susceptible taxa are consistently present throughout this interval (e.g., Syracosphaera, Rhabdosphaera, Pontosphaera, and holococcoliths). In the lower Pliocene, a thin central area net is typically observed in specimens of Reticulofenestra pseudoumbilicus (XPL/CPL), whereas very small Gephyrocapsa spp. and E. huxleyi are abundant and well preserved in the middle to upper Pleistocene (SEM/CPL). In the Pliocene and lower Pleistocene, thin-rayed discoasters are somewhat fragmented but do not show any signs of overgrowth, with gracile ray-tip morphology and details of central-area bosses and knobs preserved (Figure F16). Deeper than ~370 mbsf, discoasters become progressively more overgrown with diagenetic calcite, coincident with the appearance of significant authigenic carbonate grains within smear slides. Although placoliths show limited overgrowth in this interval and were still easily identifiable to species level, SEM observations revealed patterns of dissolution and etching of heterococcoliths and etching and overgrowth of discoasters. This worsening of calcareous nannofossil preservation at depths greater than 370 mbsf is consistent with SEM observations of foraminifer overgrowth (see Foraminifer preservation) and the lithologic transition from ooze to chalk.
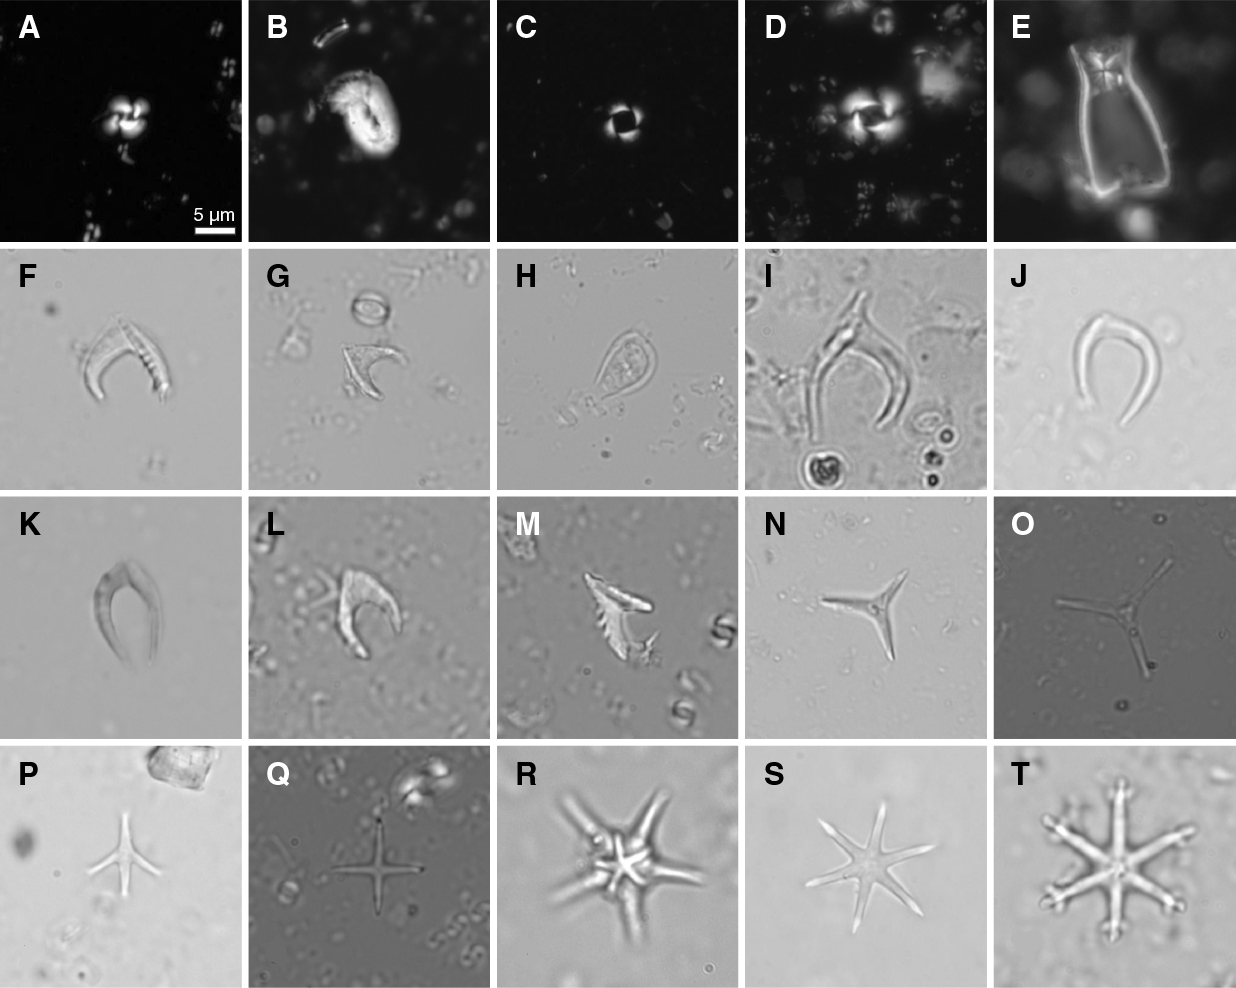
Figure F16. Calcareous nannofossils.
Pleistocene
Calcareous nannofossil assemblages from sediment in the uppermost three cores of Hole U1482A (1H through 3H) are dominated by Florisphaera profunda and Gephyrocapsa spp. (Gephyrocapsa ericsonii and Gephyrocapsa oceanica) with common E. huxleyi. The stratigraphy of the last ~0.5 My is well constrained by biohorizon base E. huxleyi (0.29 Ma; base Zone NN21) between Samples 363-U1482A-3H-CC and 4H-2, 75 cm (22.12–24.15 mbsf), and biohorizon top Pseudoemiliania lacunosa (0.44 Ma; base Zone NN20) between Samples 4H-4, 75 cm, and 4H-6, 75 cm (27.15–30.15 mbsf). Calcareous nannofossil biostratigraphy of the middle Pleistocene is complicated by significant reworking of early Pleistocene and, to a lesser extent, Cretaceous taxa. This first significant interval of reworking downhole is in Sample 3H-6, 75 cm (20.65 mbsf), and continues through Cores 4H and 5H (21.90–41.02 mbsf). Reworking is slightly reduced in Core 6H but is consistently present in Cores 7H through 11H (50.40–98.12 mbsf). The presence of reworked early Pleistocene taxa in this interval and the potential for more local mixing of remobilized middle Pleistocene sediment makes assignment of biohorizons difficult. Shipboard biostratigraphy places biohorizon base acme Gephyrocapsa caribbeanica (0.60 Ma) between Samples 5H-CC and 6H-2, 75 cm (40.97–43.15 mbsf). Biohorizon top Helicosphaera sellii (1.26 Ma) was placed between Samples 8H-4, 75 cm, and 8H-6, 75 cm (65.15–68.17 mbsf).
Biohorizon top Calcidiscus macintyrei (1.60 Ma) is also somewhat affected by reworking upsection. We placed this event at the first consistent downhole presence of C. macintyrei between Samples 363-U1482A-9H-CC and 10H-2, 75 cm (79.25–81.15 mbsf). The distinctive series of early Pleistocene discoaster extinctions is clearly recorded in Holes U1482A–U1482C. Biohorizon top Discoaster brouweri (base Zone NN19; 1.93 Ma) occurs between Samples 363-U1482A-11H-CC and 12H-2, 75 cm (98.07–100.16 mbsf), and marks the base of distinct reworking observed within Site U1482 cores, including the presence of reworked Cretaceous taxa. The base of Zone NN18 is recognized by biohorizon top Discoaster pentaradiatus (2.39 Ma) between Samples 12H-CC and 13H-2, 75 cm (107.79–109.65 mbsf), and the base of Zone NN17 is recognized by biohorizon top Discoaster surculus (2.49 Ma) between Samples 14H-2, 75 cm, and 14H-4, 75 cm (119.15–122.17 mbsf).
Pliocene to late Miocene
The Pliocene to late Miocene calcareous nannofossil biostratigraphy of the rest of the recovered succession appears continuous but with subtle variations in sedimentation rates. The base of Zone NN16 is placed at biohorizon top R. pseudoumbilicus (3.70 Ma), identified as the first downhole occurrence of elliptical reticulofenestrids >7 µm with a distinct open central area between Samples 363-U1482A-17H-6, 75 cm, and 17H-CC (153.69–155.32 mbsf).
The placement of biohorizon top Amaurolithus tricorniculatus (3.92 Ma), which denotes the base of Zone NN15, is consistently found deeper in the hole and within older sediment than expected from the general age-depth trend in Hole U1482A between Samples 363-U1482A-22H-4, 75 cm, and 22H-6, 75 cm (198.19–201.20 mbsf). In all three holes, the base of this zone is located just above the biohorizon top Ceratolithus armatus, which in Hole U1482A lies between Samples 23H-2, 75 cm, and 23H-4, 75 cm (204.65–207.66 mbsf), and has an age >1 My older (5.04 Ma).
The base of combined Zone NN13–NN14 is defined by biohorizon base Ceratolithus cristatus (5.12 Ma) between Samples 363-U1482A-23H-4, 75 cm, and 23H-6, 75 cm (207.66–210.67 mbsf). The base of Zone NN12 is marked by biohorizon top Discoaster quinqueramus (5.59 Ma), which is found between Samples 25H-CC and 26H-CC (231.48–240.92 mbsf). Biostratigraphy through Zone NN10 and the lower part of Zone NN11 relies on identification of 5- and 6-rayed discoaster marker species (bases of D. quinqueramus, Discoaster berggrenii, Discoaster loeblichii, and base of common D. pentaradiatus; tops of Discoaster bollii and Discoaster hamatus). Identification of all of these species proved problematic because of the extensive overgrowth of discoasters throughout this interval. The most reliable biohorizon was biohorizon base D. berggrenii (8.29 Ma), which marks the base of Zone NN11 between Samples 49X-CC and 50X-CC (410.80–418.90 mbsf). Below this, given the poor preservation of discoasters in this interval, the base of common D. pentaradiatus (9.38 Ma) was only recognized as a noticeable decrease in the abundance of 5-rayed morphotypes and was not considered robust enough to precisely define a usable biohorizon.
Minylitha convallis (upper Zones NN9–NN10) was not observed in any samples from Site U1482; it is not clear whether this absence is due to poor preservation or the absence of this species in this region. There is also no reentry of the larger (>7 µm) R. pseudoumbilicus in Zone NN10. The stratigraphy of the base of Hole U1482A is constrained by biohorizon top Catinaster coalitus (9.66 Ma) between Samples 53X-CC and 54X-2, 75 cm (448.43–448.80 mbsf). Hole U1482C was cored to a greater depth than Hole U1482A, and in the core catcher of the deepest core (Sample 363-U1482C-58X-CC; 520.33 mbsf), sediment was recovered that contained both D. brouweri (biohorizon base at 10.77 Ma) and Helicosphaera walbersdorfensis (biohorizon top common at 10.75 Ma). We interpret this sediment as representing a sediment depositional age of ~10.75 Ma at the base of Hole U1482C.
Planktonic foraminifers
We took three samples per core plus core catcher samples from most of Hole U1482B (fewer for HLAPC cores) to develop a detailed planktonic foraminifer biostratigraphy for the upper 357 mbsf of Site U1482. In Hole U1482A, which penetrated to 490 mbsf, core catcher samples were taken throughout, providing supporting information for the 0–357 mbsf interval, and then the sampling was extended to 490 mbsf. In Hole U1482C, only core catcher samples were taken for the lowermost part of the succession, providing data for 490–535 mbsf. No samples were taken from Hole U1482D. A list of biohorizons is given in Table T3.
Table T3. Planktonic foraminifer bioevents. Download table in CSV format.
Through much of the succession at Site U1482, planktonic foraminifers occur throughout the sediment but are concentrated in burrows and occasional thin horizons. Seafloor transport of foraminifer tests may have been common at this site, and certain restricted intervals include evidence of soft-sediment deformation (see Core description).
Pleistocene
The mudline sample from Hole U1482B contains a recent, diverse, and excellently preserved tropical assemblage that includes the delicate species Hastigerina pelagica, which was not observed in the sediment. Sample 363-U1482B-1H-2, 49–51 cm (1.98 mbsf), is assigned to the uppermost part of Subzone Pt1b (<0.12 Ma) based on the absence of Globigerinoides ruber (pink) and Globorotalia flexuosa, which are present in Sample 1H-4, 49–51 cm (4.98 mbsf), and deeper. We therefore infer that the last glacial cycle is recorded at Site U1482.
Globoconella inflata is present intermittently in Pleistocene samples, but it typically occurs as multiple individuals. G. inflata is regarded as a temperate species, with a modern distribution in subAntarctic to subtropical waters (Kennett and Srinivasan, 1983). Because it was not observed in the mudline sample, its presence at Site U1482 may reflect glacial episodes.
Biohorizon top Globorotalia tosaensis (0.61 Ma), which marks the base of Subzone PT1b, is found in Sample 363-U1482B-15H-4, 49–51 cm (39.59 mbsf). Distinguishing G. tosaensis from its descendant morphospecies Globorotalia truncatulinoides is based on the absence of a fine imperforate keel in G. tosaensis and was accomplished by observing specimens at high power, aided by the excellent preservation and translucency of the tests.
Two consecutive samples, 363-U1482B-5H-6, 49–51 cm (42.59 mbsf), and 5H-CC (44.54 mbsf), contain many pink specimens of a species of Globigerinoides that seems to exhibit a mosaic of characters that are otherwise associated with Globigerinoides conglobatus and G. ruber but is nevertheless distinct from both those species, with which it co-occurs (Figure F17). Like G. ruber, there are three chambers in the final whorl with the aperture situated over the suture between penultimate and antepenultimate chambers, but like G. conglobatus it is large with radially compressed chambers and a tendency to develop bullae. We refer to this as Globigerinoides sp. cf. conglobatus (pink). The coloration is identical to that seen in G. ruber and Globoturborotalita rubescens, albeit at shallower depths in the hole.
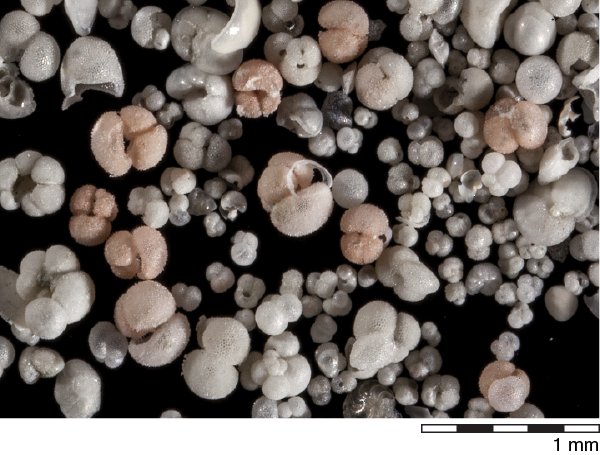
Figure F17. Foraminifer assemblage showing unusual planktonic foraminifer Globigerinoides sp. cf. conglobatus (pink).
The coiling direction of Pulleniatina, as pioneered by Saito (1976), may be a useful means of improving the biostratigraphic subdivision of the Pliocene and Pleistocene series. Shipboard coiling counts were typically based on 50 specimens with additional specimens measured in critical samples. The first horizon expected downcore was Saito’s L1 excursion, which correlates approximately with the Matuyama/Brunhes boundary worldwide (Saito, 1976; Wade et al., 2011). Unfortunately, our data (Tables T4, T5; Figure F18) are not clear-cut for either Hole U1482A or Hole U1482B, probably because the sampling is not at sufficiently high resolution. At neighboring Site U1483, we found a short sinistral excursion just below the level of pink G. sp. cf. conglobatus that corresponds to L1 (see Biostratigraphy in the Site U1483 chapter [Rosenthal et al., 2018c]).
Table T4. Coiling count data for Pulleniatina, Hole U1482A. Download table in CSV format.
Table T5. Coiling count data for Pulleniatina, Hole U1482B. Download table in CSV format.
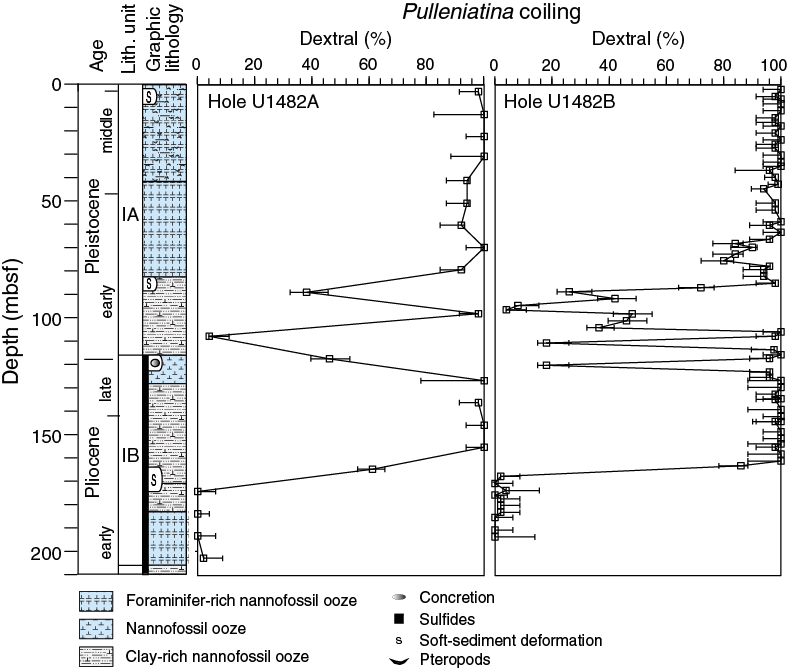
Figure F18. Coiling patterns in Pulleniatina.
Sample 363-U1482A-8H-CC (69.74 mbsf) contains reworked foraminifers from the early Pleistocene, including the distinctive species Globigerinoidesella fistulosa, but no equivalent horizon was found in Hole U1482B. This reworking coincides with an interval of soft-sediment deformation visible in the cores (see Core description). The “true” top of G. fistulosa is recorded in Hole U1482A between Samples 10H-CC and 11H-CC (88.19–98.07 mbsf) and in Hole U1482B between Samples 10H-6, 49–51 cm, and 10H-CC (84.9–86.79 mbsf). The latter sample contains G. fistulosa together with the presence of G. truncatulinoides and absence of Globorotalia pseudomiocenica and so is assigned to Zone PL6. It also contains the biohorizon top Globoturborotalita apertura, which is common in the 63–150 μm size fraction, and Globigerinoides obliquus, which is present in low numbers. Pulleniatina specimens are predominantly sinistral in this sample, as opposed to all samples above (Tables T4, T5; Figure F18). This may be a minor hiatus, but because all three biohorizons are top occurrences, this level might also be interpreted as the top of an interval of reworking or sediment mixing of material from Subzone Pt1a and Zone PL6.
Sample 363-U1482B-14H-CC (125.12 mbsf) is heavily contaminated by much younger material from near the top of the hole, including common G. ruber (pink) and G. truncatulinoides, and may be material sucked in to the core catcher during core recovery.
Another change in assemblage occurs between Samples 363-U1482B-12H-4, 50–52 cm, and 12H-6, 50–52 cm (100.99–103.93 mbsf). The latter sample contains biohorizons top G. pseudomiocenica (which marks the base of Zone PL6; 2.30 Ma) and top Globorotalia limbata (2.39 Ma). The co-occurrence of these biohorizons could indicate a minor hiatus across the Pliocene/Pleistocene boundary, although the biohorizons are top occurrences and could have been displaced upward by reworking.
Biohorizon base G. truncatulinoides occurs between Samples 363-U1482B-13H–6, 50–52 cm, and 13H-CC (113.32–115.52 mbsf). Although this base is estimated at 1.93 Ma (Wade et al., 2011; see Biostratigraphy in the Expedition 363 methods chapter [Rosenthal et al., 2018a]), the calibration comes from the Atlantic Ocean (Chaisson and Pearson, 1997), and various authors have found earlier occurrences elsewhere, the oldest of which is at ~2.58 Ma in the South Pacific Ocean (see discussion in Dowsett, 1988; Jenkins and Gamson, 1993). At Sites U1482 and U1483 on the northwest Australian continental margin (see Biostratigraphy in the Site U1483 chapter [Rosenthal et al., 2018c]), an intermediate age of ~2.47 Ma is more likely, given the trend of the age-depth plots, so we adopted that age in this study for both of these sites.
Pliocene
Biohorizon top Dentoglobigerina altispira (3.47 Ma) is clearly defined between Samples 363-U1482B-15H-2, 50–52 cm, and 15H-4, 50–52 cm (126.56–129.48 mbsf), marking the base of Zone PL5. The marker species is common and conspicuous up to its level of disappearance. The biohorizon occurs in a sample that contains G. tosaensis and frequent well-developed G. fistulosa. The overlap of these species with D. altispira is not expected in the Indo-Pacific province, where the top of D. altispira has been calibrated at a significantly older age (3.47 Ma; Shackleton et al., 1995) than in the Atlantic Ocean (3.13 Ma; Chaisson and Pearson, 1997; Wade et al., 2011; see Biostratigraphy in the Expedition 363 methods chapter [Rosenthal et al., 2018a]). Because of these observations, we suspect that the younger calibration may be correct worldwide.
Biohorizon base G. fistulosa (3.33 Ma) is between Samples 363U1482B-15H-4, 50–52 cm, and 15H-6, 50–52 cm (129.48–132.41 mbsf). Specimens exhibiting large, distinctive protuberances characteristic of this species are present in the former sample. In samples below the biohorizon, specimens with minor protuberances or lobate final chambers rarely occur, but they are not consistent with the strict G. fistulosa concept employed here because such minor protuberances often occur on specimens of Trilobatus sacculifer from the recent to much deeper in the section.
Biohorizon top Sphaeroidinellopsis seminulina (3.59 Ma) is found between Samples 363-U1482B-16H-4, 50–52 cm, and 16H-6, 50–52 cm (138.99–141.92 mbsf), marking the base of Zone PL4. Biohorizon top Globorotalia margaritae, marking the base of Zone PL3, is recorded between the same two samples. According to our preexpedition biochronology based on Wade et al. (2011), this bioevent is calibrated at 3.85 Ma at Ceara Rise in the tropical Atlantic Ocean (Chaisson and Pearson, 1997), although previously it was calibrated to around the Gauss/Gilbert Chron boundary (3.596 Ma on the timescale used in this study; see Berggren et al. [1995] for the previous calibration). The younger date fits much better to our data, so we suggest that the disappearance of G. margaritae on the Ceara Rise may have been a local event. If this is correct, that would mean that Zone PL3 (the stratigraphic interval between biohorizons top G. margaritae and top S. seminulina) may correspond to a very short period of time (<100 ky). Detailed sampling between Samples 16H-4, 60–62 cm, and 16H-6, 60–62 cm (138.99–141.92 mbsf), is required to establish whether Zone PL3 exists at this site.
The next firm biohorizon downhole is the initial sinistral to dextral coiling reversal in Pulleniatina (by this level, the morphospecies Pulleniatina primalis), denoted L9 by Saito (1976) and calibrated at 4.08 Ma. No protocol currently exists for defining the precise level of coiling reversal biohorizons in instances where intermediate values may be found within the reversal. As discussed in Biostratigraphy in the Expedition 363 methods chapter (Rosenthal et al., 2018a), we quote the sampling range that spans the reversal, although with additional data, greater resolution might be obtained by locating the top and base of each reversal interval. The reversal is very clearly recorded between Samples 363-U1482B-18H-6, 50–52 cm, and 20H-2, 50–52 cm (160.96–167.67 mbsf), with intermediate values in Sample 18H-CC (163.05 mbsf) and at the equivalent level in Hole U1482A (Table T5; Figure F18). Because it is a coiling reversal, it cannot easily be displaced by reworking. Pulleniatina is dominated by sinistral individuals from this level downward.
Biohorizon top Globoturborotalita nepenthes (4.37 Ma), which marks the base of Zone PL2, was observed between Samples 363-U1482B-21H-4, 49–51 cm, and 21H-6, 49–51 cm (179.99–182.96 mbsf). Biohorizon top Globorotalia cibaoensis (4.61 Ma) was observed between Samples 21H-CC and 23H-2, 50–52 cm (185.31–190.53 mbsf). Both morphospecies are rare below their disappearance levels. The top of Sphaeroidinellopsis kochi has been used elsewhere as a valuable marker around the same interval (see Biostratigraphy in the Expedition 363 methods chapter [Rosenthal et al., 2018a]); at Site U1482, however, this species seems to persist in much younger strata than was recorded elsewhere. Taxonomic investigation is required to establish whether these persistent morphotypes are true S. kochi or possibly a closely related form.
Miocene
Two closely spaced biohorizons are used to approximate the Miocene/Pliocene boundary (5.33 Ma): base Sphaeroidinella dehiscens (5.53 Ma) between Samples 363-U1482B-31H-6, 50–52 cm, and 32H-CC (265.84–268.28 cm) and base Globorotalia tumida (calibrated at 5.57 Ma and marking the base of Zone PL1) between Samples 31H-2, 50–52 cm, and 31H-4, 50–52 cm (260.01–262.90 cm). The evolutionary transition from Globorotalia plesiotumida to G. tumida follows the same general pattern that has been seen worldwide (Hull and Norris, 2009; Malmgren et al., 1984), consisting of a brief interval of accelerated change during which individuals become larger and noticeably more inflated. To distinguish S. dehiscens (sensu lato) from Sphaeroidinellopsis spp., we accept an individual with a minuscule sutural aperture that is clearly not just a pore abutting the suture. Several individuals fit this description in Sample 31H-6, 50–52 cm (265.84 mbsf), the lowermost sample in which S. dehiscens was observed. The G. tumida and S. dehiscens biohorizons are closely spaced in our samples but not in the expected order, although it is conceivable that a dedicated search for the lowest acceptable G. tumida might lower that biohorizon slightly.
Biohorizon top Globoquadrina dehiscens (5.92 Ma) was found between Samples 363-U1482B-33H-CC and 34H-2, 50–52 cm (287.53–288.54 mbsf). This marker species is rare in the upper part of its range and where large, inflated specimens predominate, although smaller, more typical forms are also present at the level of highest occurrence. Rare individuals were found reworked at higher levels in Hole U1482A.
In Core 363-U1482B-34H and especially Sample 34H-CC (296.48 mbsf), very large, thin Globorotalia with a petaloid outline resembling Globorotalia pertenuis were found, but from a much lower stratigraphic level than expected.
Biohorizon base G. margaritae is observed between Samples 363-U1482B-35H-2, 50–52 cm, and 35H-4, 50–52 cm (298.02–300.93 mbsf). The calibrated age is 6.08 Ma, although this biohorizon is found slightly below biohorizon top Globorotalia lenguaensis, which is calibrated at 6.13 Ma. The latter is found between Samples 34H-CC and 35H-2, 50–52 cm (296.48–298.02 mbsf). Biohorizon base P. primalis (6.60 Ma) is at the same level as base G. margaritae. This co-occurrence appears to indicate a substantial stratigraphic gap with at least 0.5 My missing between Samples 35H-2, 50–52 cm, and 35H-4, 50–52 cm (298.02–300.93 mbsf).
In the zonal scheme of Wade et al. (2011), following Srinivasan and Sinha (1992), two of the biohorizons in the upper part of Subzone M13b are coiling direction changes in Neogloboquadrina acostaensis: a sinistral to dextral change calibrated at 6.34 Ma and a dextral to sinistral change at 6.77 Ma. We measured coiling directions in N. acostaensis for an interval of ~40 m between Samples 363-U1482B-33H-6, 50–52 cm, and 37H-CC (284.93–324.86 mbsf). N. acostaensis is rare throughout this interval because shipboard sample sizes were small, but the data are sufficient to tentatively identify the lowermost biohorizon with confidence between Samples 36H-6, 50–52 cm, and 36H-CC (Table T6; Figure F19).
Table T6. Coiling count data for Neogloboquadrina acostaensis. Download table in CSV format.
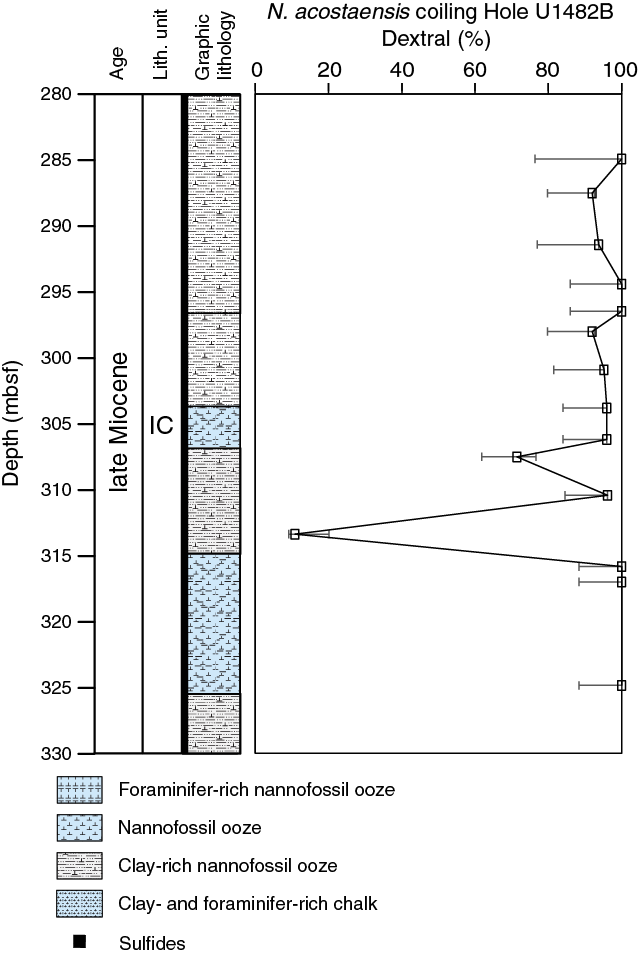
Figure F19. Coiling patterns in Neogloboquadrina acostaensis.
Below these samples is a long stratigraphic interval for which planktonic foraminifers give relatively poor age control. The next reliable biohorizons downhole are the closely spaced base Neogloboquadrina humerosa (8.56 Ma) and base G. plesiotumida (8.58 Ma, which marks the base of Subzone M13b). Both of these marker species are present to the bottom of Hole U1482B in Sample 45F-CC (366.97 mbsf). In the lower resolution sampling in Hole U1482A, biohorizon base N. humerosa is located between Samples 363-U1482A-50X-CC and 51X-CC (418.92–429.35 mbsf). Biohorizon base G. plesiotumida is placed more tentatively between Samples 53X-CC and 54X-CC (448.38–456.47 mbsf) because the morphological division between the ancestral form G. merotumida and G. plesiotumida is difficult without intensive sampling and measurement.
Biohorizon base N. acostaensis (9.83 Ma), marking the base of Subzone M13a, is placed tentatively between Samples 363-U1482A-57X-CC and 58X-CC (484.23–490.43 mbsf). This marker species is rare, and specimens transitional with Paragloborotalia continuosa occur. Moderate to poor preservation at this level also added to the difficulty of reliably placing the biohorizon.
The remainder of Hole U1482A is assigned to Zone M12. Coring continued in Hole U1482C to 535.05 mbsf, where we studied core catcher samples only from Cores 363-U1482C-54X through 60X. Preservation is moderate to poor throughout this interval because of extensive overgrowth and infilling of foraminifer tests, which were nevertheless internally well preserved (see Foraminifer preservation). All six cores are assigned to Zone M12 based on the absence of N. acostaensis and Paragloborotalia mayeri throughout; hence, no biohorizons were identified within the studied interval.
Benthic foraminifers
Benthic foraminifers were studied in all core catcher samples from Hole U1482A. The planktonic:benthic foraminifer ratio is about 99:1 throughout the hole. Calcareous and agglutinated benthic foraminifers were found in all samples, and the recorded numbers of each taxon are shown in Table T7, with selected SEM images shown in Figure F20. The assemblages are dominated by calcareous taxa with lower abundances of agglutinated forms, which typically represent <5% of the benthic foraminifer assemblages. The most common taxa are Pyrgo spp., Laevidentalina spp., Uvigerina spp., Planulina wuellerstorfi, and Hoeglundina elegans. The epifaunal species P. wuellerstorfi is found in all samples except for Sample 363-U1482A-56X-CC (474.85 mbsf). The infaunal genus Uvigerina is present in all samples except for Sample 57X-CC (484.23 mbsf). Within samples, the generic diversity ranges from 10 to 26 (Table T7). The highest species diversity is found in Sample 26H-CC (240.92 mbsf), and the lowest is found in Sample 57X-CC (484.23 mbsf). Paleodepth estimates based on the benthic foraminifer genera and species found in Hole U1482A indicate a bathyal bathymetric zone (van Morkhoven et al., 1986). Tests are generally very well preserved with rare evidence of abraded tests, mineral overgrowth, and recrystallization.
Table T7. Benthic foraminifer distribution. Download table in CSV format.
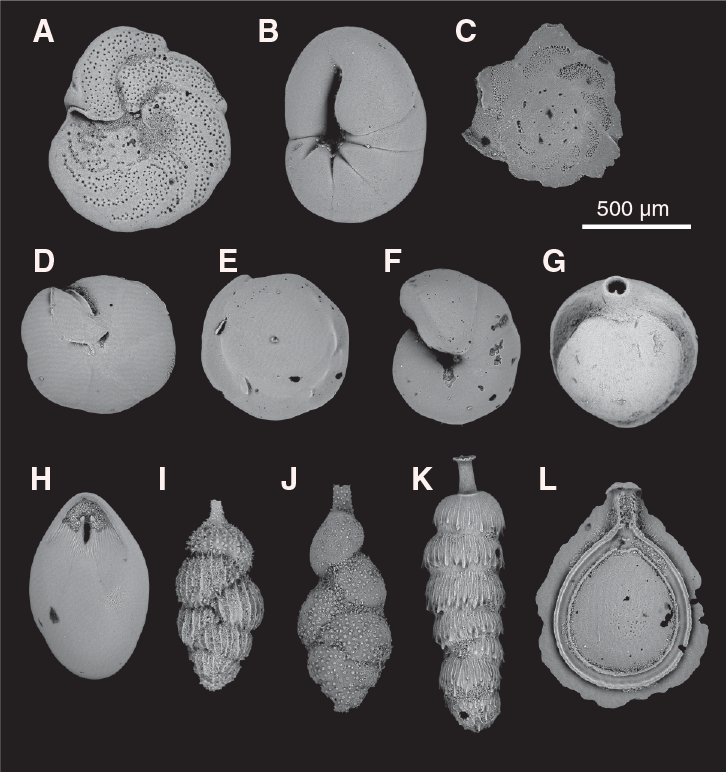
Figure F20. Benthic foraminifers.
Foraminifer preservation
Six core catcher samples from Hole U1482A and one from Hole U1482C were selected to assess foraminifer preservation and diagenesis. The samples are spaced at ~100 m intervals and range in age from latest Pleistocene (~0.01 Ma) to late Miocene (~10.9 Ma). Preservation is excellent and glassy for most of the site, possibly due to the relatively clay-rich sediment. Overgrowth and cementation become progressively more severe at greater depth, but only small-scale incipient recrystallization was observed even in the deepest part of the stratigraphy. Mineral overgrowth at depth includes calcite, pyrite, and dolomite. Images of selected specimens are shown in Figure F21. The full set of images is available online in the LIMS database.
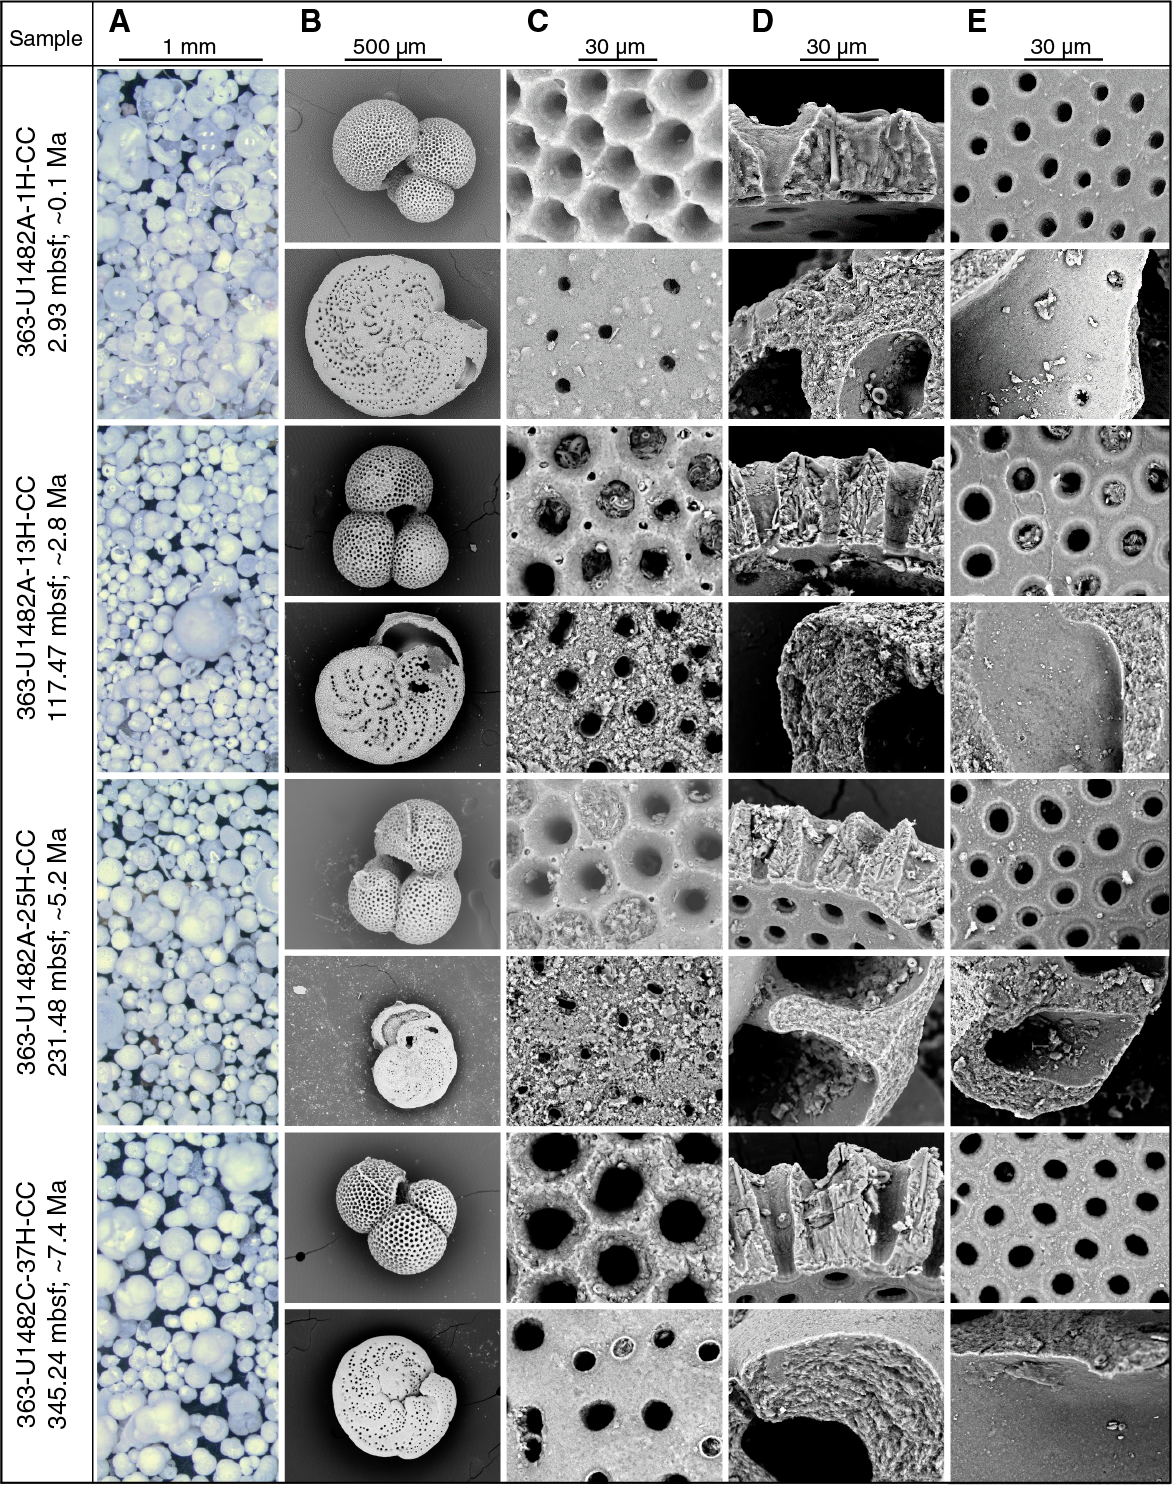
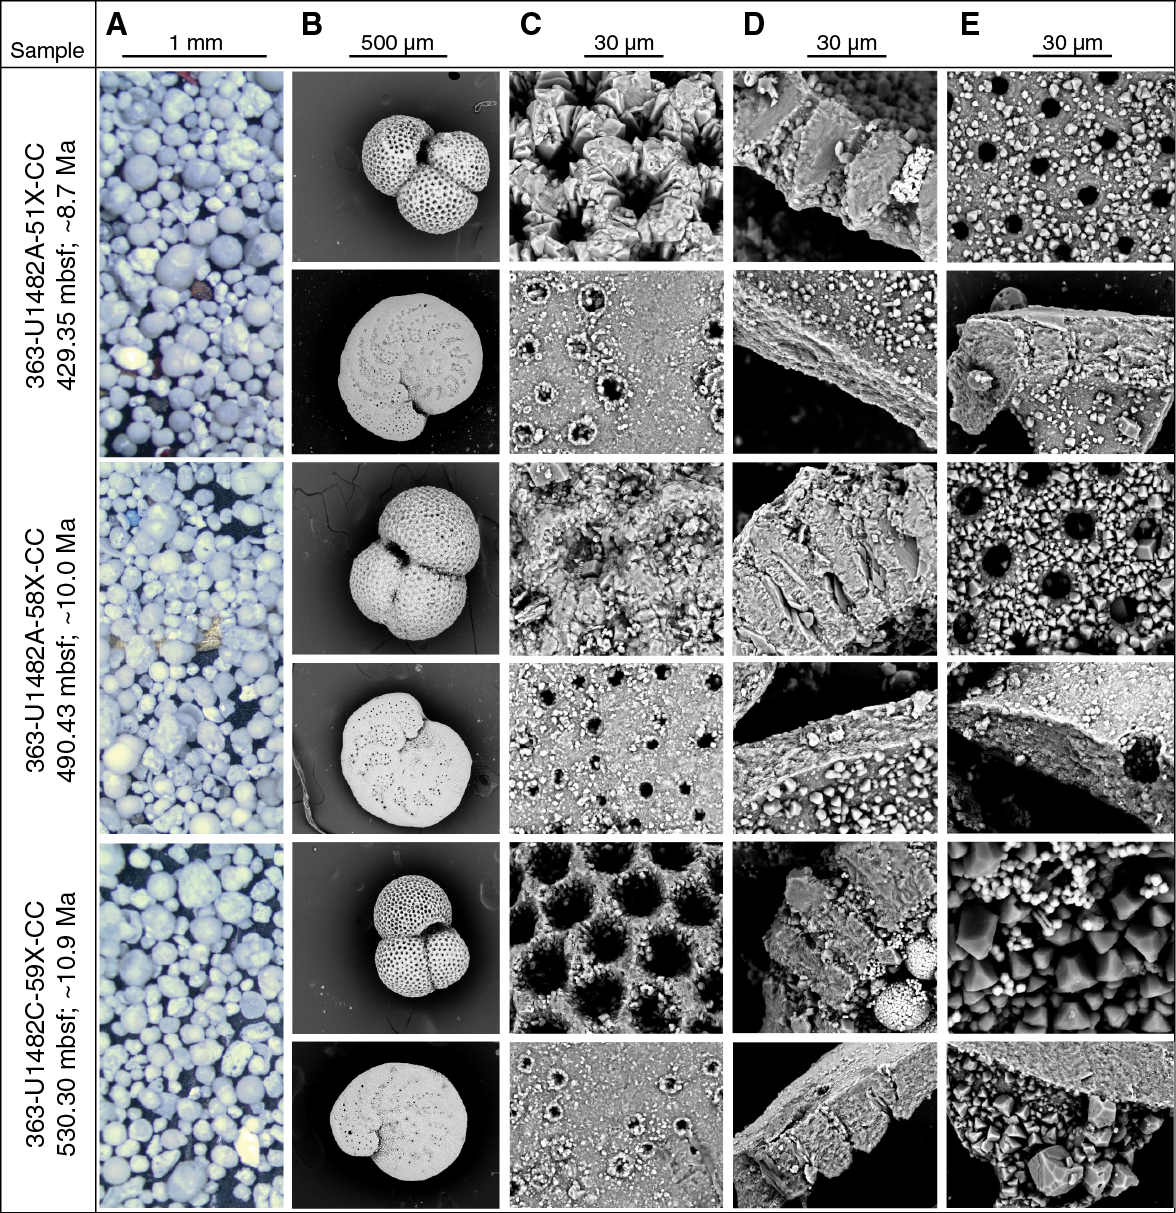
Figure F21. Downcore foraminifer test preservation states.
Sample 363-U1482A-1H-CC (2.93 mbsf; latest Pleistocene; ~0.01 Ma) shows excellent preservation. Foraminifers have a glassy appearance under the light microscope. In cross section, the wall of Trilobatus trilobus shows the platy microgranules typical of the species, and in some specimens the primary organic membrane, spines embedded in the wall, and gametogenic crust were observed. The wall cross section of P. wuellerstorfi shows microgranules throughout. The inner wall surface of both species is smooth. There is no evidence of recrystallization, dissolution, overgrowth, or cementation.
Sample 363-U1482A-13H-CC (117.47 mbsf; late Pliocene; ~2.8 Ma) shows excellent preservation. Foraminifers have a glassy appearance under the light microscope. Wall cross sections of both T. trilobus and P. wuellerstorfi show the biogenic microgranular textures typical of these species. T. trilobus shows embedded spines and gametogenic calcite. The inner wall surface of both species is smooth with very minor infilling of unconsolidated sediment (coccoliths) in some places. There is no evidence of recrystallization, dissolution, overgrowth, or cementation.
Sample 363-U1482A-25H-CC (231.48 mbsf; early Pliocene; ~5.2 Ma) shows excellent preservation. Foraminifers have a glassy appearance under the light microscope. Wall cross sections of both T. trilobus and P. wuellerstorfi show biogenic microgranular textures. T. trilobus shows embedded spines and gametogenic calcite. The inner wall surface of both species is smooth. Some specimens show very minor overgrowth of radially directed calcite crystals on the test interior, which can form a very thin frosting about 1 μm thick, but others show no overgrowth.
Sample 363-U1482A-37H-CC (345.24 mbsf; late Miocene; ~7.4 Ma) shows excellent preservation. Foraminifers have a glassy appearance under the light microscope. Wall cross sections of both T. trilobus and P. wuellerstorfi show biogenic microgranular textures. T. trilobus shows embedded spines in the wall cross section. Inner wall surfaces are smooth but generally show minor overgrowth of radially directed calcite crystals forming a layer about 1 μm thick. One specimen of T. trilobus contains pyrite framboids. There is no evidence of recrystallization or dissolution.
Sample 363-U1482A-51X-CC (429.35 mbsf; late Miocene; ~8.7 Ma) shows good preservation. Some foraminifers have a glassy appearance under the light microscope; others are more opaque because of overgrowth and cemented sediment. Wall cross sections show microgranular textures that, in T. trilobus, appear slightly degraded in places, forming localized more solid masses. P. wuellerstorfi shows unaltered microgranular texture. All specimens show calcite overgrowth on internal and external surfaces. On inner surfaces, this overgrowth generally consists of a thin layer ~1 mm thick upon which are more dispersed equant crystals up to 5 μm diameter. Pores in T. trilobus are frequently filled with diagenetic crystals; in places external surfaces are moderately to strongly overgrown.
Sample 58X-CC (490.43 mbsf; late Miocene; ~10.0 Ma) shows moderate preservation. Foraminifers are generally opaque under the light microscope and exhibit strong cementation and overgrowth layers as thick as 5 μm. SEM images show abundant evidence of strong infilling, overgrowth, and cementation. In both T. trilobus and P. wuellerstorfi, pore channels are sometimes completely filled with blocky inorganic calcite overgrowth, but the walls in cross section are generally well preserved, showing the typical microgranular textures of the species. In some places, however, both species show minor evidence of incipient recrystallization, with more solid patches developing within the wall.
Sample 363-U1482C-59X-CC (530.30 mbsf; late Miocene; ~10.9 Ma) shows moderate to poor preservation. Foraminifers are generally opaque under the light microscope and strongly overgrown and cemented. Chambers are often filled with pyrite, calcite, and/or dolomite. Even so, the wall interiors are generally well preserved, showing microgranular textures with evidence of patchy recrystallization into solid patches but without discrete diagenetic crystallites.
Shipboard age model
An age-depth plot including all biostratigraphic biohorizons is shown in Figure F22. There are minor discrepancies for the age assignment at the base of the recovered sediment succession: the absence of P. mayeri in the lowermost sample examined (Sample 363-U1482C-60X-CC; 534.65 mbsf) implies an age younger than 10.47 Ma, whereas biohorizon top H. walbersdorfensis (10.74 Ma) and biohorizon base Helicosphaera stalis (10.71 Ma) (both species found in Sample 58X-CC; 520.33 mbsf) indicate an older age (>10.75 Ma) at the base of the site. Throughout the upper Miocene and lower Pliocene interval, recovered calcareous nannofossil and planktonic foraminifer biohorizons are in generally good agreement and indicate sedimentation rates of ~5.9 cm/ky in the late Miocene decreasing to ~3.3 cm/ky in the early Pliocene. There is evidence for a questionable short hiatus at ~300 mbsf, which spans a series of planktonic foraminifer biohorizons from 6.08 to 6.60 Ma.
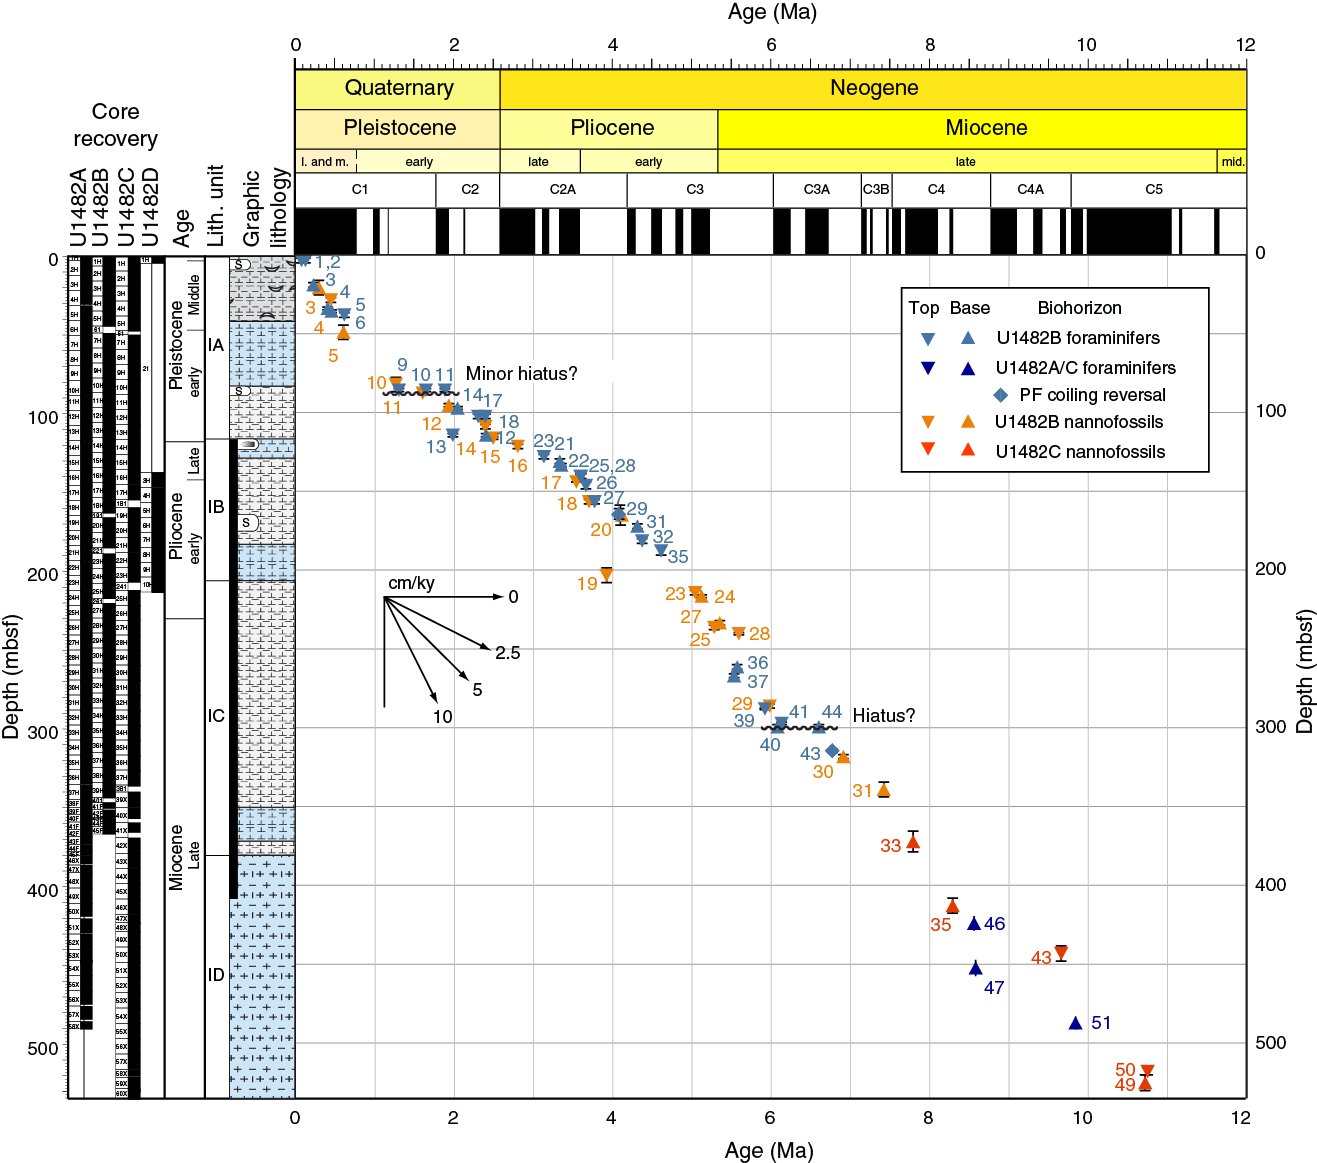
Figure F22. Age-depth plot for calcareous nannofossil and planktonic foraminifer biohorizons.
The bio- and magnetostratigraphy of the lower to lower middle Pleistocene interval (~0.6–1.5 Ma) are problematic. The concentration of planktonic foraminifer biohorizons at ~102–103 mbsf suggests the presence of a condensed interval, hiatus, or series of small hiatuses at this level (~2.30–2.40 Ma). There is also evidence for sedimentary disturbance and reworking in the lower Pleistocene, with potential mismatches in the cored successions between holes. Micropaleontological evidence of sediment reworking is present from ~20 to 100 mbsf, with reworked Pliocene discoasters and sphenoliths as the most useful tracers of reworking within calcareous nannofossil assemblages. Rare, well-preserved Cretaceous nannofossil taxa are also present in this interval, including specimens of Watznaueria, Prediscosphaera, and Micula spp. It is notable that Reticulofenestra asanoi was not recorded in calcareous nannofossil assemblages beyond rare and sporadic specimens in any of the holes. This species should be present between 1.14 Ma and its top occurrence at 0.91 Ma. Paleomagnetic data are also difficult to reconcile with biostratigraphy in this interval, where they record normal polarity in sediment downsection to at least ~50 mbsf in Hole U1482A and ~70 mbsf in Holes U1482B and U1482C (see Paleomagnetism). This polarity would require higher sedimentation rates in the middle to late Pleistocene and a condensed section or hiatus through to ~1.6 Ma. Sedimentation rates through the middle to late Pleistocene estimated from biostratigraphy are relatively high, up to ~7 cm/ky.
The middle Pleistocene is relatively well constrained by a series of foraminifer and nannofossil biohorizons, whereas the upper Pleistocene is approximated by the disappearance of the planktonic foraminifer G. ruber (pink) within Core 363-U1482A-1H, which confirms that the last glacial cycle is recorded at the site.
Paleomagnetism
Measurements summary
Paleomagnetic investigations at Site U1482 involved measurement of the natural remanent magnetization (NRM) of archive-half sections from Holes U1482A–U1482C before and after demagnetization in a peak alternating field (AF) of 15 mT. For Holes U1482A and U1482B, we measured all recovered material; for Hole U1482C, we only measured core sections recovered with the APC system. In addition to measuring 854 core sections, we took 50 discrete samples from Holes U1482A (31 samples), U1482B (13 samples), and U1482C (6 samples) to a maximum depth of 262 mbsf to characterize NRM demagnetization behavior and investigate the rock magnetic properties of the sediment. For discrete samples, NRM was measured before and after AF demagnetization in peak fields of 5, 10, 15, 20, 25, 30, 40, 60, and 80 mT; the 25 and 80 mT steps were dropped after Hole U1482A to speed up measurements. Rock magnetic investigations comprised measurements of magnetic susceptibility (χ), susceptibility of anhysteretic remanent magnetization (χARM) imparted (and normalized) using a 100 mT peak AF demagnetization and 0.05 mT direct current bias field, and isothermal remanent magnetization (IRM) acquired in 300 and 1000 mT (saturation IRM [SIRM]) fields. All sample measurements were mass corrected. The Icefield MI-5 core orientation tool was deployed with nonmagnetic hardware for all APC cores, which permitted azimuthal correction of declination. Azimuthally corrected declination is largely coherent between cores (see Paleomagnetic data and core orientation for specifics on Hole U1482A); however, absolute values in the upper 50 mbsf of sediment average ~150°–180° for a normal polarity interval, suggesting that the issues of a baseline offset experienced throughout Expedition 363 and during previous expeditions affected these measurements. McNeill et al. (2017) suggests a simple −180° correction could be applied to the corrected declination data to rotate them back to expected values. However, we leave declinations uncorrected for this additional offset in the plotted figures, so care should be employed for future calculations of virtual geomagnetic poles using these data.
Rock magnetic characterization
Whole-Round Multisensor Logger (WRMSL) magnetic susceptibility data average 5.8 × 10⁻⁵ SI (see Physical properties) and, when coupled with average χ values (3.2 × 10⁻⁸ ± 2 × 10⁻⁸ m3/kg as 2 standard deviations [2σ]) and SIRM values (3.2 × 10⁻⁵ ± 1.7 × 10⁻⁵ Am2/kg as 2σ), suggest relatively low (ferri)magnetic mineral concentration in the sediment deposited at Site U1482 (Figure F23). Aside from one sample from the top of Hole U1482A, all samples acquire >95% of their SIRM remanence in a field of 300 mT, suggesting that ferrimagnetic minerals (e.g., [titano]magnetite [FexTixO4], maghemite [γ-Fe2O3], and/or greigite [Fe3S4]) control the remanence-carrying properties of the sediment and that high-coercivity minerals (e.g., hematite [Fe2O3]) are relatively minor remanence-carrying phases. NRM15mT intensity is higher (~10−4 A/m) in the upper 40–60 m of each hole, decreases between 60 and 90 mbsf, and remains low (~10−5 A/m) below ~90 mbsf, where it approaches the measurement noise level of the magnetometer (see Paleomagnetism in the Expedition 363 methods chapter [Rosenthal et al., 2018a]). Downhole decreases in NRM intensity are accompanied by decreases in other ferrimagnetic concentration parameters (χARM and IRM) and slight coarsening of magnetic grain size (lower χARM/SIRM) (Figure F23). These changes occur around the depth where the interstitial water sulfate concentration decreases. Sulfate concentration is nearly zero at ~117 mbsf and methane concentration increases substantially (Figure F24), associated with the SMTZ and anaerobic oxidation of methane (see Geochemistry). Appearance of pyrite in the sediment below ~117 mbsf (see Core description) associated with the reduction of primary ferrimagnetic oxides and formation of secondary iron sulfides during early sediment diagenesis (e.g., Karlin, 1990; Rowan et al., 2009) (see Geochemistry) suggests alteration of the primary magnetic signal has occurred in sediments deposited at Site U1482.
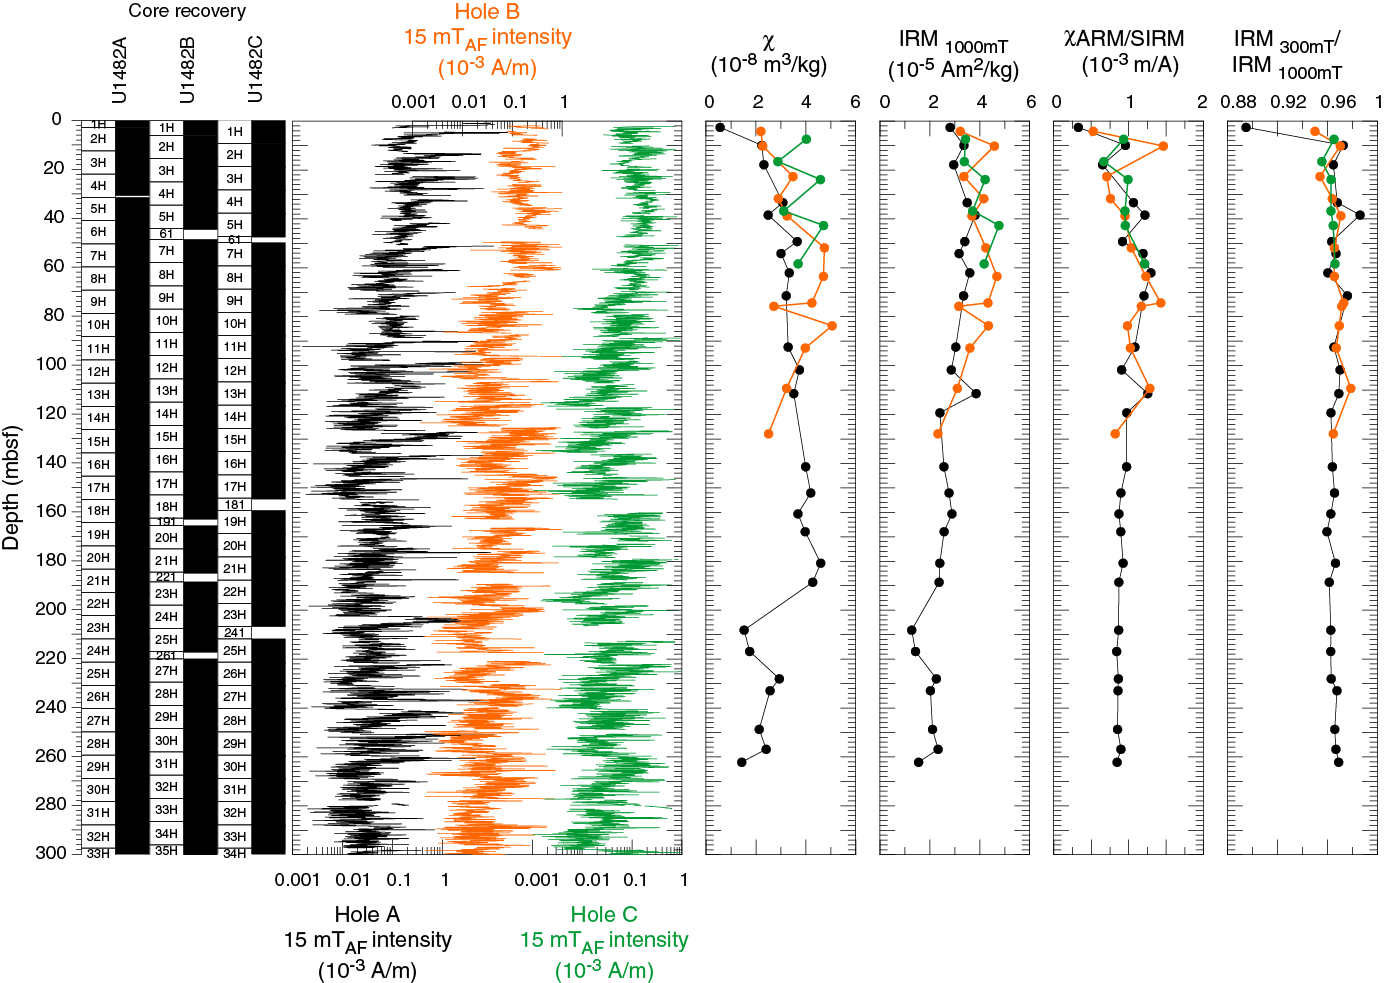
Figure F23. Archive-half section NRM intensity.
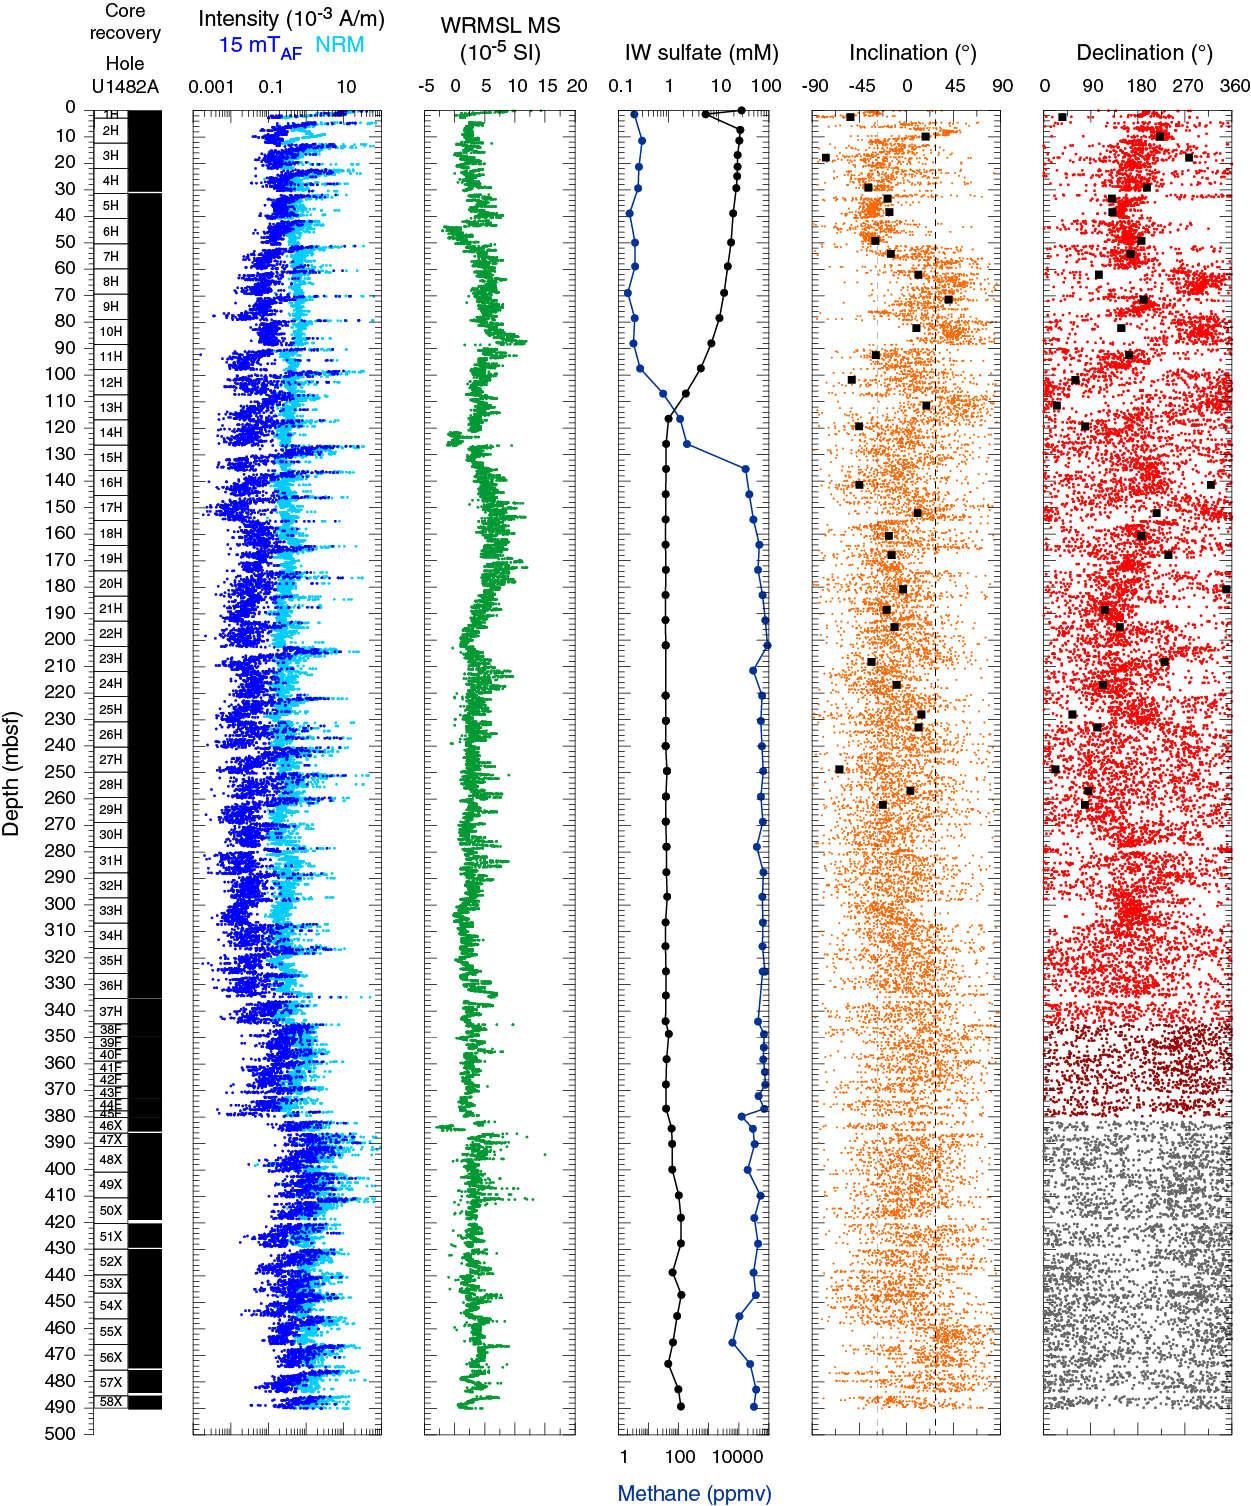
Figure F24. NRM, MS, IW sulfate and methane, inclination, and declination, Hole U1482A.
Paleomagnetic data and core orientation
In the upper ~70 m, the NRM demagnetization behavior and median destructive field of discrete samples are consistent with (titano)magnetite being the primary remanence-carrying mineral species in sediments deposited at Site U1482. The drill string overprint is effectively removed after AF demagnetization in a 5–15 mT field, and following exposure to higher AF demagnetization steps, inclination and declination trend to the origin on Zijderveld diagrams (Zijderveld, 1967), indicating a stable single component to the magnetization (Figure F25A–F25C). Maximum angular deviation values of the principal component analysis (PCA) calculated over the 15–40 mT range average 8° (range = 2°–20°), suggesting that these directions are fairly well resolved and should yield reliable estimates for magnetostratigraphy (Stoner and St-Onge, 2007). Samples recovered deeper than ~70 mbsf are less stable during NRM AF demagnetization, show more scattered directions on Zijderveld diagrams and stereoplots (Figure F25D–F25F), and result in higher maximum angular deviation values that average 21° (range = 5°–41°). Several samples acquired weak magnetization during exposure to higher AFs. This phenomenon may be noise in these weak samples or a gyroremanent magnetization that has been suggested to be a diagnostic property of authigenic greigite in sedimentary sequences (Snowball, 1997; Stephenson and Snowball, 2001). Paleomagnetic interpretation of these intervals may be more problematic than for the upper 50–70 mbsf.
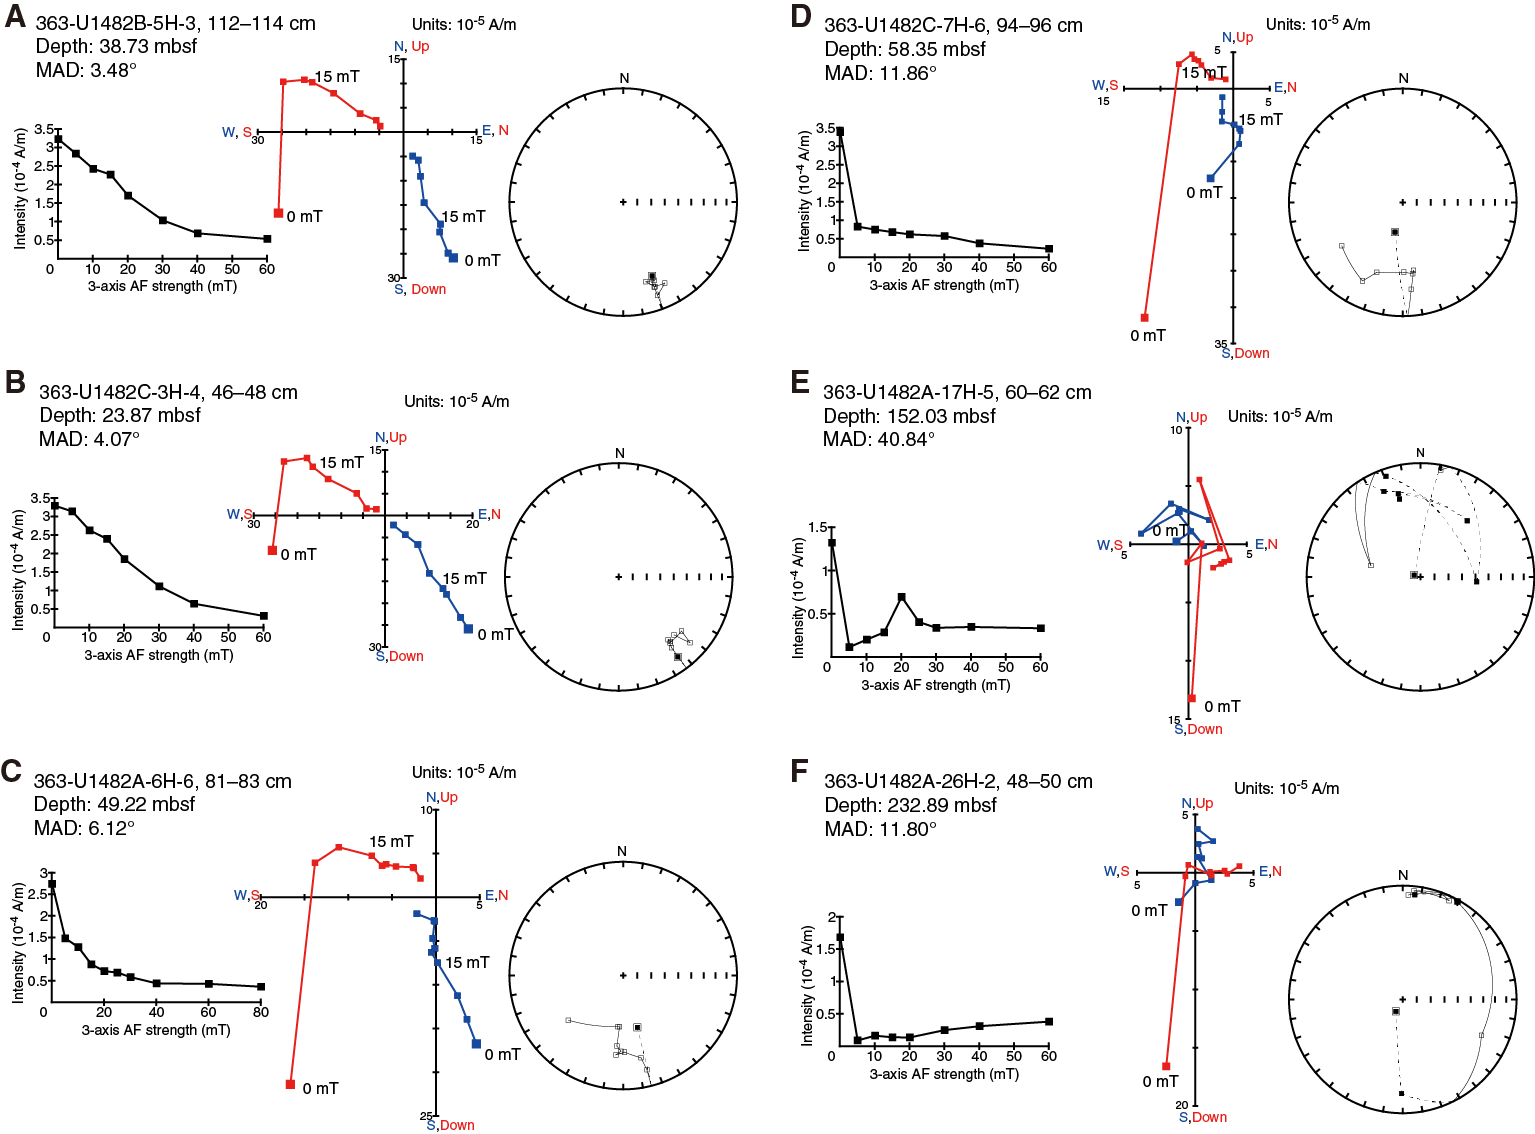
Figure F25. Discrete sample AF demagnetization results.
For all APC cores, declination was corrected using the Icefield MI-5 core orientation tool (see Operations). In the upper ~90 m of Holes U1482A–U1482C, azimuthally corrected declination generally clusters around ~180°. Assuming the uppermost sediment in each hole was deposited during normal polarity associated with the Brunhes Chron (see Biostratigraphy), declination values experience an offset of ~180° in absolute terms because declination should cluster around 0° (180°) during periods of normal (reversed) polarity. This phenomenon was a persistent issue during Expedition 363 and was also experienced during Expedition 362 (McNeill et al., 2017).
Azimuthally corrected declination for two cores from Hole U1482A (8H and 10H) cluster between 270° and 360° (Figure F24). These offsets are between successive cores and affect the whole core; they are not replicated in Holes U1482B or U1482C (Figures F26, F27), making it unlikely that these 90°–180° shifts in declination are geomagnetic in origin. The cause of this offset between successive cores is perplexing but likely related to imperfect magnetic tool face correction by the Icefield MI-5 core orientation tool.
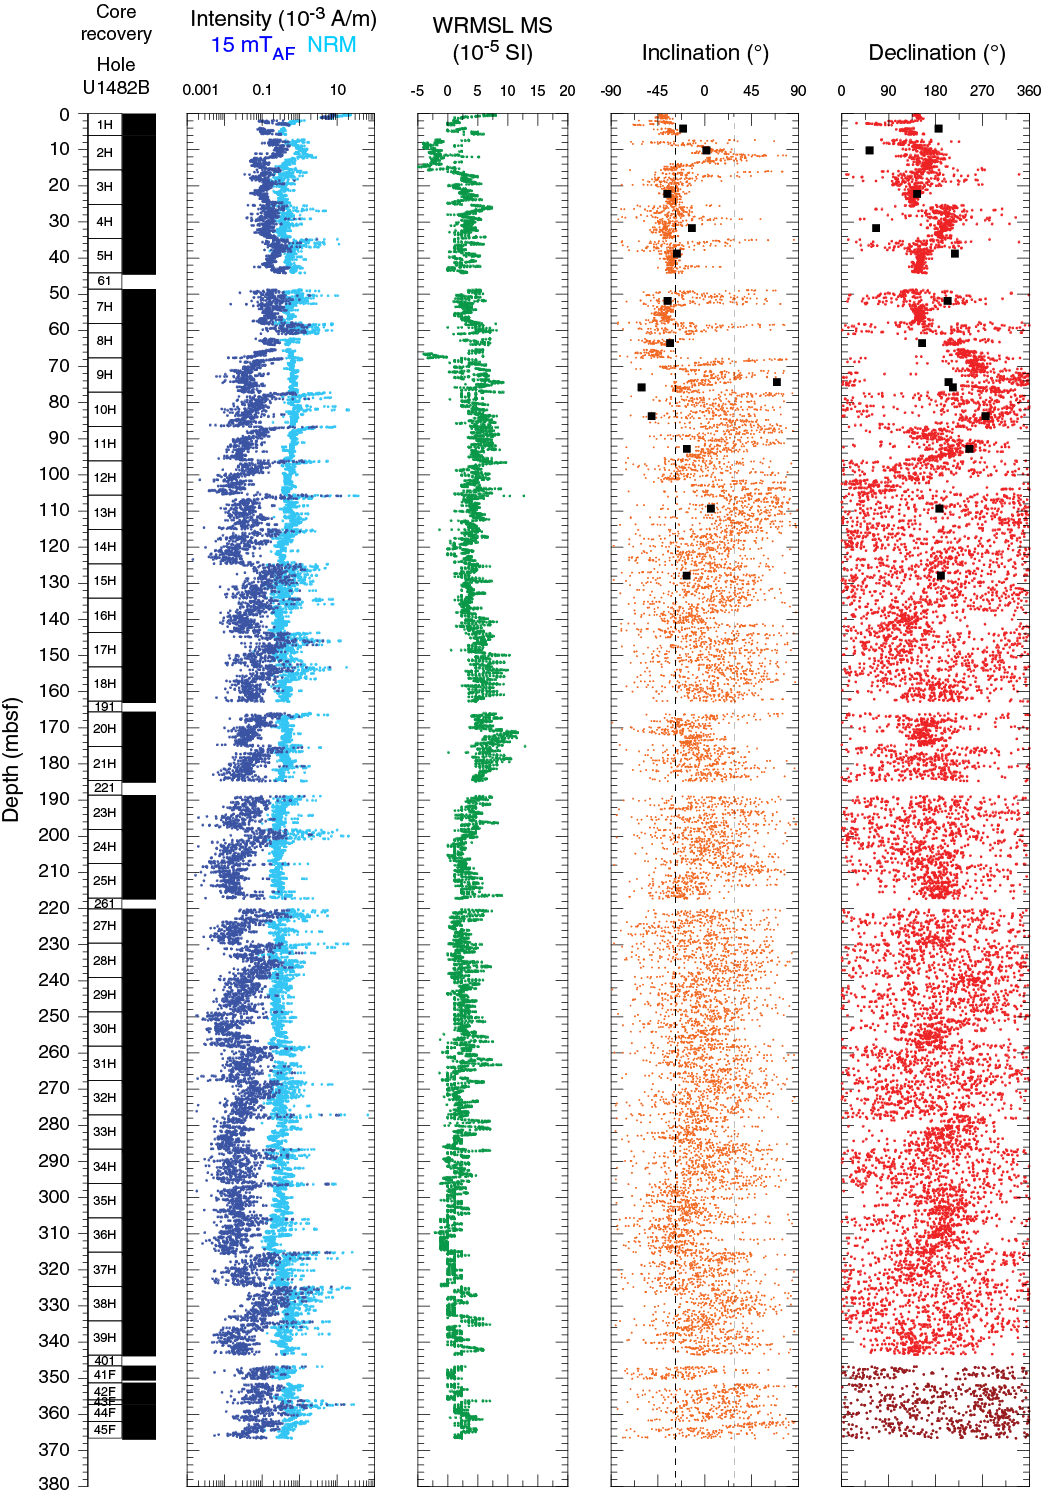
Figure F26. NRM, WRMSL MS, inclination, and declination, Hole U1482B.

Figure F27. NRM, WRMSL MS, inclination, and declination, Hole U1482C.
NRM intensity before and after 15 mT AF demagnetization, WRMSL magnetic susceptibility, and inclination and azimuthally corrected declination after 15 mT AF demagnetization are shown for Holes U1482A, U1482B, and U1482C in Figures F24, F26, and F27, respectively. Inclination and declination values were cleaned of visibly disturbed intervals and voids (see Paleomagnetism in the Expedition 363 methods chapter [Rosenthal et al., 2018a]). Inclination and declination measured on discrete samples are in good agreement with those measured on archive-half sections. Inclination in the upper ~50 mbsf of Hole U1482A and upper ~70–75 mbsf in Holes U1482B and U1482C plot around the expected values of approximately −28° for normal polarity at the site latitude assuming a geocentric axial dipole (GAD) field. Over the same depth range, azimuthally corrected declination is consistent between adjacent cores for Holes U1482B and U1482C. Of the four ~180° declination shifts in the uppermost 90 mbsf of Hole U1482A, only one is accompanied by a significant coeval shift in inclination (~90 mbsf), reinforcing the interpretation that these are unlikely to be geomagnetic in origin. Deeper than ~70 mbsf in all three holes, inclination and declination become increasingly less well-defined and show greater scatter in paleomagnetic directions associated with decreased ferrimagnetic content and the effects of early sediment diagenesis. These data make geomagnetic interpretation difficult and potentially stratigraphically erroneous if a chemical remanent magnetization (CRM) was acquired at depth (e.g., Rowan et al., 2009; Kodama, 2012), which could introduce a several hundred thousand–year offset. As a result, we restrict any geomagnetic interpretation to the ferrimagnetic oxide–dominated zone in the upper ~70 mbsf at Site U1482.
Magnetostratigraphy
Given expected values of inclination for normal polarity at the site latitude, relatively stable declination, and replication across multiple holes, we determined that sediment deposited shallower than ~50 mbsf in Hole U1482A and ~70 mbsf in Holes U1482B and U1482C has a normal polarity consistent with sediment deposition occurring during the Brunhes Chron (C1n). Biostratigraphic datums indicate sedimentation rates up to 7 cm/ky for the late Pleistocene (see Biostratigraphy), which would yield an approximate depth of 55 mbsf for the Matuyama/Brunhes reversal boundary. We do not see evidence for a geomagnetic reversal at this depth in Holes U1482B or U1482C. The positive inclination shift in Hole U1482A around this time occurs when the quality of the record begins to deteriorate, and it is not accompanied by a coeval shift in declination (Figure F24). The difference between the two observations could result from complex sediment packages at these depths at Site U1482 and/or acquisition of a secondary CRM overprint (e.g., Rowan et al., 2009) at depth sometime during the Brunhes Chron. As a result, we cannot offer a magnetostratigraphic interpretation of the sediments deposited at Site U1482.
Physical properties
Physical properties were measured on whole-round cores, split cores, and discrete samples from each of the four holes drilled at Site U1482 to provide basic information for characterizing the cored sections. Gamma ray attenuation (GRA) bulk density and magnetic susceptibility were measured on all core sections from Holes U1482B–U1482D with the Special Task Multisensor Logger (STMSL) immediately after the cores were brought on board. All core sections were measured with the GRA bulk densitometer, the magnetic susceptibility loop, and the P-wave logger (PWL) on the WRMSL. PWL measurements were stopped after Cores 363-U1482A-24H, 363-U1482B-28H, and 363-U1482C-23H when the data became unreliable due to frequent cracks in the core. After WRMSL scanning, whole-round sections were logged for NGR before splitting. Point-sensor magnetic susceptibility and color spectrophotometry (color reflectance) were measured on split core sections using the Section Half Multisensor Logger (SHMSL). Discrete P-wave measurements (x-, y-, and z-axis) were made for Hole U1482A using the P-wave caliper (PWC) on the Section Half Measurement Gantry (SHMG). Measurements on the y-axis bayonet were discontinued after Core 363-U1482A-5H due to time constraints and to limit the number of destructive measurements to preserve the quality of the working half for later sampling. Discrete z-axis measurements were discontinued after Core 15H and x-axis measurements were discontinued after Core 24H due to lack of a clear signal in the indurated and cracked sediment. Moisture and density (MAD) measurements were made on discrete samples from Hole U1482A and Cores 363-U1482C-56X through 60X. Preconditioning treatments were applied to aid interpretation of noisy or spiky data (see Physical properties in the Expedition 363 methods chapter [Rosenthal et al., 2018a]). All data in figures in this section are from the preconditioned data sets. Tables presented in this section contain raw and treated data for NGR, WRMSL GRA bulk density, magnetic susceptibility, and P-wave velocity. Raw data for all data sets are available from the LIMS database.
GRA bulk density
In WRMSL data from all holes, clear trends were observed in the GRA bulk density records (Figure F28; Tables T8, T9, T10, T11). The GRA bulk density data sets are consistent between the STMSL and WRMSL (Figure F29A). These trends generally correlate with the lithologic subunits defined for Site U1482 (see Core description). In the uppermost 5 mbsf, the lowest bulk density values of ~1.4–1.5 g/cm3 reflect the mudline and unconsolidated sediment recovered in the uppermost two cores in all holes. Between 5 and 117 mbsf, bulk density progressively increases from 1.5 to 1.7 g/cm3, coinciding with lithologic Subunit IA. In the upper ~117 mbsf, the submeter-scale variability in bulk density is very low. These data likely reflect very subtle compositional variations in the sediment and/or very low levels of expansion caused by the low methane content between 0 and 100 mbsf (see Geochemistry). Coincident with lithologic Subunit IB, bulk density exhibits a broad long-term maximum between 117 and 210 mbsf, with values increasing to 1.9 g/cm3 at ~170 mbsf before returning to 1.7 g/cm3 by 210 mbsf. The bulk density maximum at ~170 mbsf coincides with an interval of soft-sediment deformation observed in all holes (yellow shading in Figure F28). Short-term variability increases slightly in the 110–210 mbsf interval, sometimes due to more pronounced lithologic variations but likely also due to minor cracking related to gas expansion as a result of high methane concentration between ~120 and 200 mbsf (see Geochemistry).
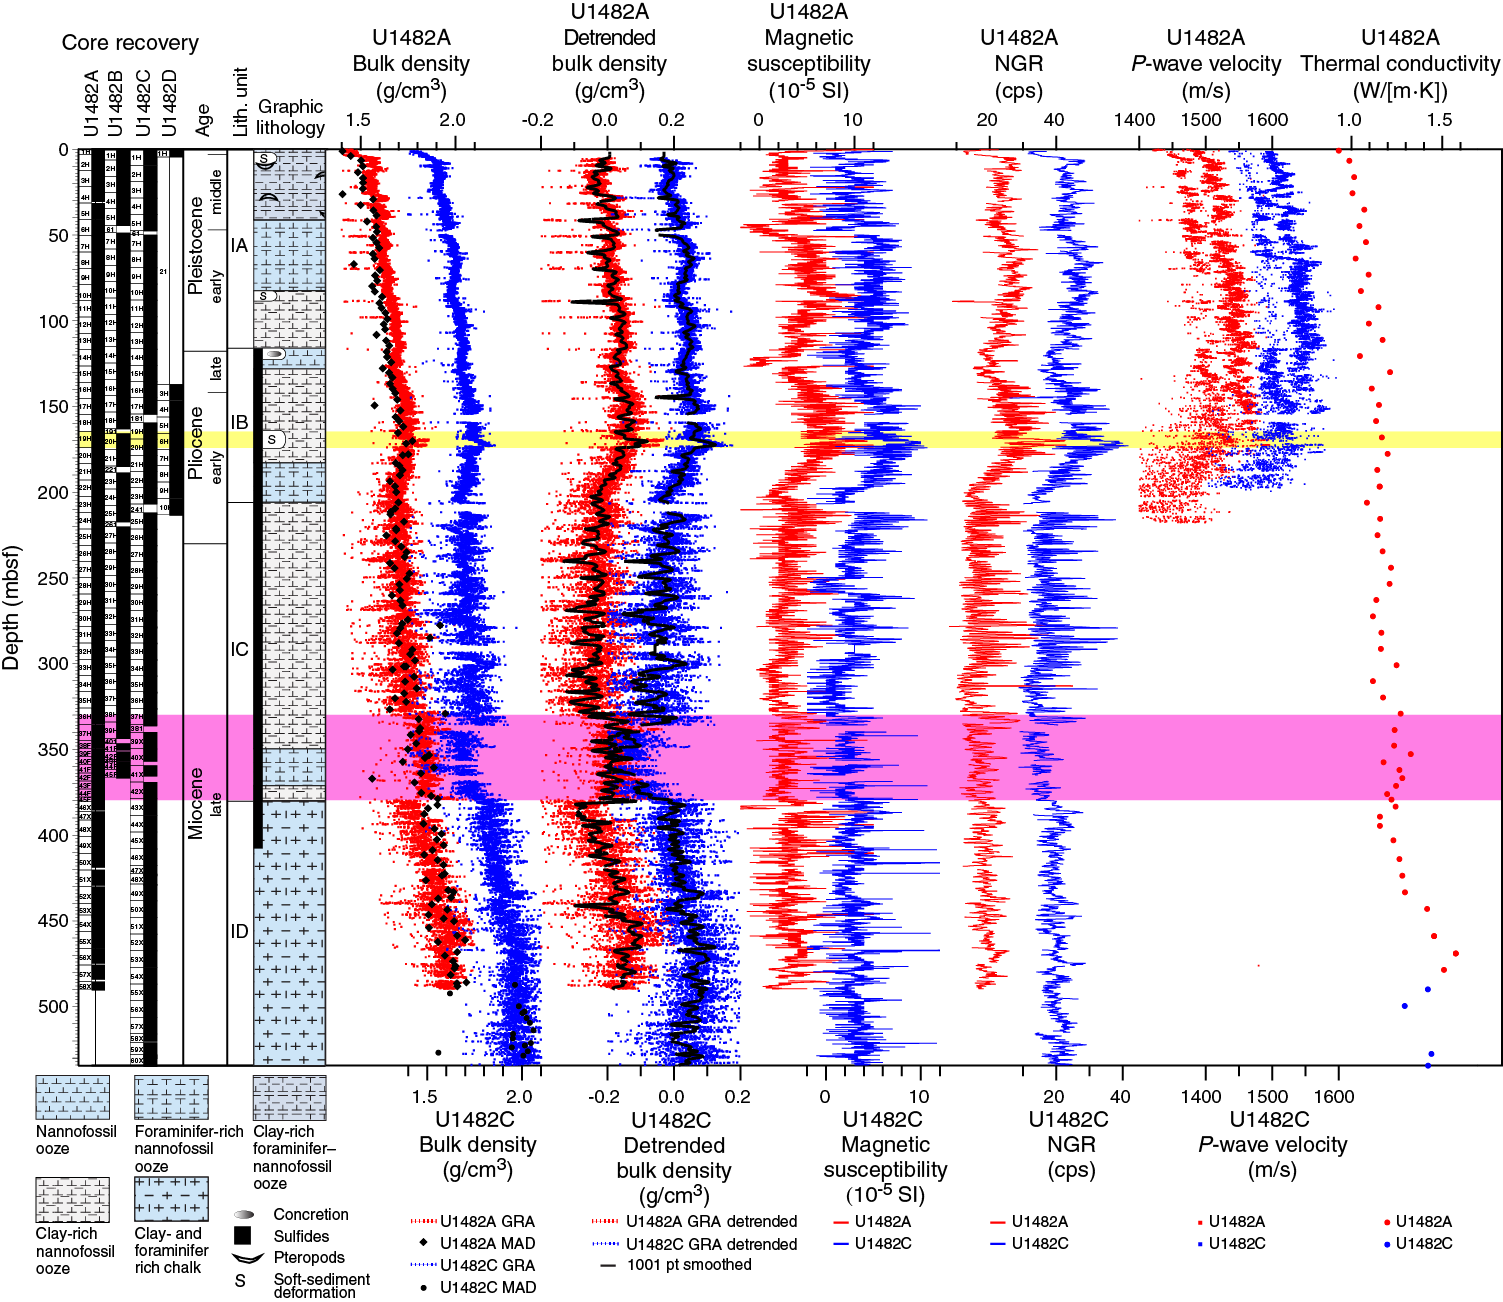
Figure F28. Representative physical property measurements.
Table T8. WRMSL GRA bulk density data, Hole U1482A. Download table in CSV format.
Table T9. WRMSL GRA bulk density data, Hole U1482B. Download table in CSV format.
Table T10. WRMSL GRA bulk density data, Hole U1482C. Download table in CSV format.
Table T11. WRMSL GRA bulk density data, Hole U1482D. Download table in CSV format.
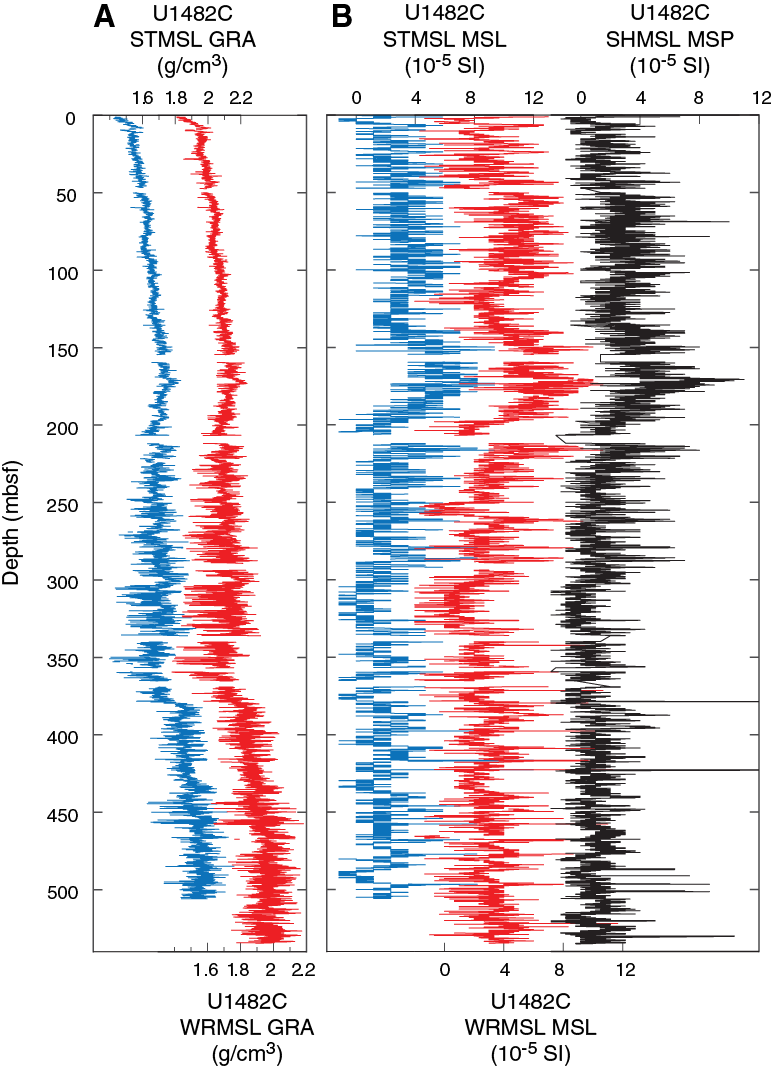
Figure F29. Comparison of cleaned GRA bulk density and MS data obtained using different measurement tracks.
Between 210 and 330 mbsf, a long-term trend in bulk density has average values that increase slightly from 1.7 to 1.85 g/cm3. This interval largely corresponds to lithologic Subunit IC. The variability in this interval is greater than that found in the upper ~210 mbsf. These higher amplitude density changes might reflect the more obvious alternations between darker clay-rich and lighter carbonate-rich layers observed in the sediment, which correlate strongly with variations in GRA and MAD bulk density, magnetic susceptibility, and NGR (Figure F30; Table T8) (see Magnetic susceptibility and Natural gamma radiation). Additionally, some variability could reflect increased cracking through gas expansion caused by high methane content (see Geochemistry), which is more noticeable in the lighter layers that have lower clay content (see Core description). Bulk density values in Holes U1482A and U1482B diverge from those in Hole U1482C between 330 and 380 mbsf in the lowermost part of lithologic Subunit IC (pink shading in Figure F28; Figure F31). This disparity in bulk density among the holes probably reflects a coring overprint because it coincides with the use of different coring techniques in different holes. A combination of the APC and HLAPC systems was used in Holes U1482A and U1482B in this interval, whereas the XCB system was used in Hole U1482C. The combination of APC and HLAPC systems near APC refusal may have additionally compressed the sediment, accounting for the higher density values in Holes U1482A and U1482B, whereas XCB coring within an interval where APC coring was still possible may have induced fracturing of the sediment, thereby reducing the overall bulk density in Hole U1482C. In the deepest part of the site (380 mbsf to the bottom), bulk density increases progressively to 2.0 g/cm3. Bulk density values derived from GRA measurements are more variable in this interval, which coincides with the use of the XCB system in Holes U1482A and U1482C. Density variations corresponding to sedimentary cycles can still be observed; the additional noise in the data could be due to XCB-related biscuiting and cracking in the sediment.
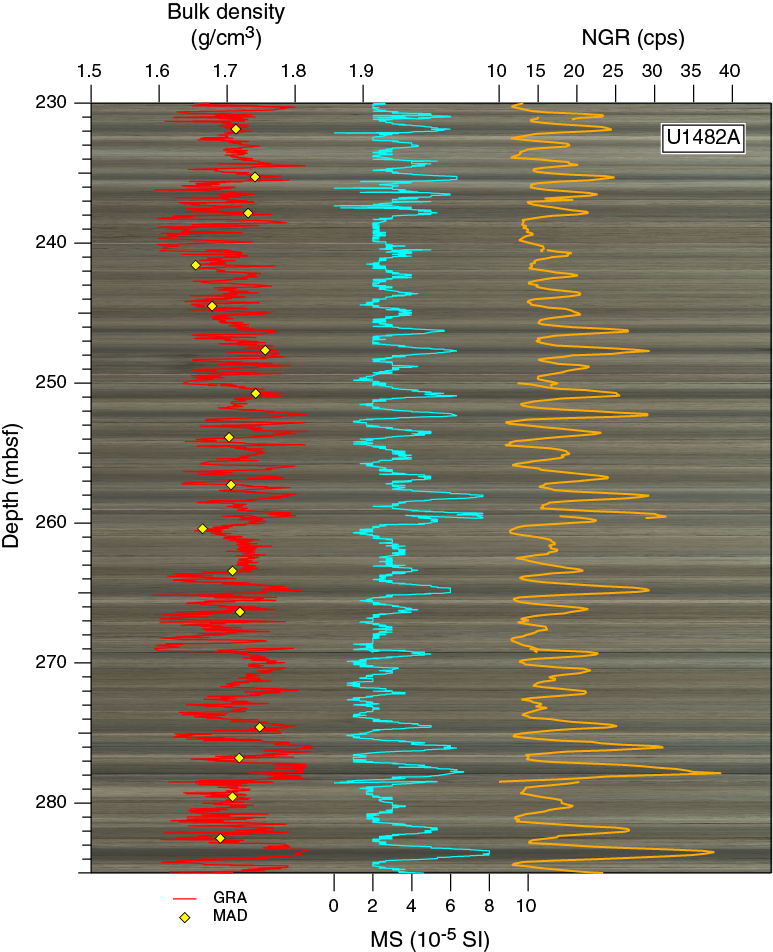
Figure F30. WRMSL GRA bulk density, MS, and NGR overlaid on core photos.

Figure F31. Uncorrected and XCB-corrected WRMSL GRA bulk density data.
GRA bulk density shows a strong long-term increasing trend from ~1.5 to 2.0 g/m3 at the base of the site due to downhole compaction, although this compaction does not seem to affect short-term cyclicity in GRA bulk density data. The initial compaction is likely strongest in lithologic Subunit IA because the increasing trend in GRA bulk density data in Subunit IA is greater than the trend observed in Subunits IB–ID (Figure F28). When GRA bulk density data are linearly detrended, they show broad features very similar to those in magnetic susceptibility and NGR data and also help to distinguish the lithologic subunits. Therefore, the GRA data may be more useful for identifying changes in lithology if they are detrended.
Previous IODP expeditions (e.g., Expedition 355; Pandey et al., 2016) applied a correction to GRA bulk density data measured on XCB cores by manually multiplying them by 1.138 to account for the difference in diameter between APC and XCB cores (66 and 58 mm, respectively). When we apply this method to the XCB GRA bulk density data from Holes U1482A and U1482C, the divergence observed between 330 and 380 mbsf (pink shading in Figure F28) is removed (Figure F31; Tables T8, T9, T10). However, the XCB correction also induces a large offset of ~0.3 g/cm3 between the GRA and MAD bulk densities. For this reason, we have chosen not to apply the XCB correction to the GRA bulk density data and instead assess the uncorrected data, taking offsets caused by drilling into account. The high methane content (see Geochemistry) and related gas expansion, which might cause the XCB core diameter to increase, could explain why the simple XCB correction based on core diameter overestimates the change in GRA bulk density in XCB cores, thereby accounting for the large offset between the corrected GRA and MAD bulk density data.
Magnetic susceptibility
Site U1482 has overall low magnetic susceptibility, with values ranging from −2 × 10⁻⁵ to 10 × 10−5 SI (Figure F28; Tables T12, T13, T14, T15). The median value in all three holes over the full length of the record is 3.33 × 10⁻⁵ SI with standard deviations of 2.03, 2.28, and 1.88 in Holes U1482A, U1482B, and U1482C, respectively. Comparison with core photos demonstrates that higher magnetic susceptibility values correspond to darker lithologic layers (Figure F30). In addition to long-term coherence with lithology, magnetic susceptibility also captures lithologic cycles at <1 m scale resolution. The weak positive magnetic signal suggests low abundances of ferrimagnetic minerals at this site (see Paleomagnetism).
Table T12. WRMSL MS data, Hole U1482A. Download table in CSV format.
Table T13. WRMSL MS data, Hole U1482B. Download table in CSV format.
Table T14. WRMSL MS data, Hole U1482C. Download table in CSV format.
Table T15. WRMSL MS data, Hole U1482D. Download table in CSV format.
All three holes demonstrate similar patterns over the complete stratigraphic succession. Magnetic susceptibility gradually increases over the uppermost 90 mbsf and then decreases to 130 mbsf. At 140 mbsf, it increases again to maximum values of 10 × 10−5 to 12 × 10−5 SI at ~180 mbsf and then decreases to a minimum at 200 mbsf. From 200 mbsf to the bottom of all holes, median values are ≤3 × 10⁻⁵ SI. As for GRA bulk density, the magnetic susceptibility data sets are consistent between the STMSL, WRMSL, and point-sensor (Figure F29B; Table T14).
Natural gamma radiation
NGR values vary between ~4 and 37 counts/s over the recovered sequence, although the variability changes quite abruptly at 200 mbsf in all holes (Figure F28; Tables T16, T17, T18, T19). NGR counts represent the total variation in the activity of the radioactive elements uranium, thorium, and potassium and are related to the variability in sediment clay content. Shallower than 200 mbsf, average values are higher, and there are two broad peaks centered at 90 and 170 mbsf. The highest NGR counts occur between 140 and 190 mbsf. Between 200 and 300 mbsf, average values are lower and variability is higher. Within this interval in Hole U1482A, corresponding approximately to lithologic Subunit IC, prominent cyclicity at the decimeter scale dominates the signal (Figure F30). In the other lithologic subunits, this decimeter-scale NGR cyclicity is reduced in amplitude and less dominant; in contrast to Subunit IC, variability in the upper and lower parts of the holes appears to occur over a larger range of depth scales and to be dominated by longer 3 m scale variability. Broad trends in the NGR record demonstrate coherent timing with changes in the magnetic susceptibility data and lithologic subunits, particularly in lithologic Subunit IB, where the highest values in NGR occur between 117 and 210 mbsf.
Table T16. NGRL data, Hole U1482A. Download table in CSV format.
Table T17. NGRL data, Hole U1482B. Download table in CSV format.
Table T18. NGRL data, Hole U1482C. Download table in CSV format.
Table T19. NGR data, Hole U1482D. Download table in CSV format.
P-wave velocity
P-wave measurements were performed on whole-round sections and discrete samples using the PWL and PWC, respectively (Figures F28, F32; Tables T20, T21, T22, T23). PWL velocity ranges from ~1400 to 1550 m/s. PWC velocity ranges from ~1320 to 1470 m/s in the y-axis, ~1450 to 1515 m/s in the z-axis, and ~1500 to 1590 m/s in the x-axis. Velocity measurements in the x-axis were consistently higher than in the z- and y-axes. Across the interval for which we have both measurements, both the x- and z-axes record a linearly increasing trend downhole to 130 mbsf.
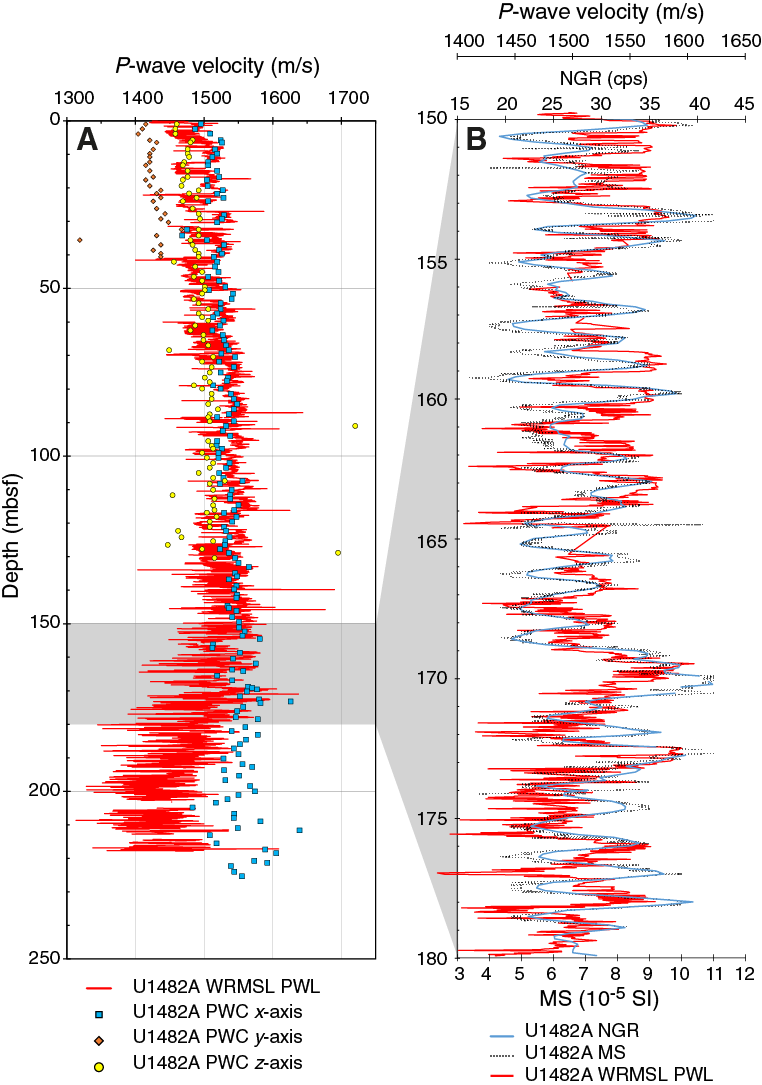
Figure F32. Discrete and whole-round P-wave measurements.
Table T20. WRMSL P-wave data, Hole U1482A. Download table in CSV format.
Table T21. WRMSL P-wave data, Hole U1482B. Download table in CSV format.
Table T22. WRMSL P-wave data, Hole U1482C. Download table in CSV format.
Table T23. WRMSL P-wave data, Hole U1482D. Download table in CSV format.
Both whole-round and discrete measurements were discontinued at ~200 mbsf in Hole U1482A, which corresponds to the transition from lithologic Subunit IB to IC (Figure F28). At this point, sediment becomes more clay rich, indurated, and fractured, making it difficult to obtain P-wave measurements. For the uppermost 150 mbsf, there is good agreement between the whole-round and discrete sample results, particularly in the x-axis measurements (Figure F32). Both the PWL and PWC record a linear increase for the upper 150 mbsf. However, below 150 mbsf, the records diverge: the PWL data decrease, whereas the PWC data continue to linearly increase downhole. The PWC data represent the expected linearly increasing model of decreasing porosity and increased compaction with depth. Despite the unusual decreasing trend in velocity observed in the PWL data at 150 mbsf, the high-resolution, submeter scale variability in this section agrees well with NGR and magnetic susceptibility cyclicity (e.g., between 150 and 180 mbsf). In these cycles, high P-wave velocities are associated with high NGR and magnetic susceptibility.
Moisture and density
Bulk density, dry density, grain density, and porosity were calculated from mass and volume measurements on discrete samples taken from the working halves of split cores from Hole U1482A (to 488 mbsf) and the deeper section of Hole U1482C (between 487 and 529 mbsf). MAD and GRA bulk density agree well, particularly in the long-term trends (Figures F28, F30, F33; Tables T8, T10). In the upper 150 mbsf, MAD bulk density is offset to lower values by ~0.04–0.06 g/cm3 from GRA bulk density; this offset is most likely due to water loss from the cores between measurement on the WRMSL and discrete sampling for MAD. Between 150 and 380 mbsf, bulk densities measured by GRA and MAD agree well, especially for short-term cycles (Figure F30). In this interval in particular, sedimentary light–dark cycles correspond well to the short-term cycles in GRA and MAD bulk densities, magnetic susceptibility, and NGR. Peaks in bulk density, magnetic susceptibility, and NGR data occur within the dark layers and most likely represent greater amounts of clay in these layers relative to the lighter layers, which contain more carbonate. Deeper than 380 mbsf, the agreement between MAD and GRA bulk densities is reduced, with MAD bulk density offset to slightly higher values than GRA bulk density (Figure F28). Because this lower interval was cored using the XCB system, GRA bulk density likely underestimates the true bulk density because the WRMSL approximates GRA bulk density based on the volume found within the whole-round sections, which includes cracks, sediment biscuits, and a mix of crushed sediment and water between the individual biscuits. The crushed sediment and water mix has a lower density than the surrounding sediment, which is reflected in the GRA bulk density records. Discrete MAD samples were always taken from within biscuits and therefore are less likely to be biased by XCB coring.
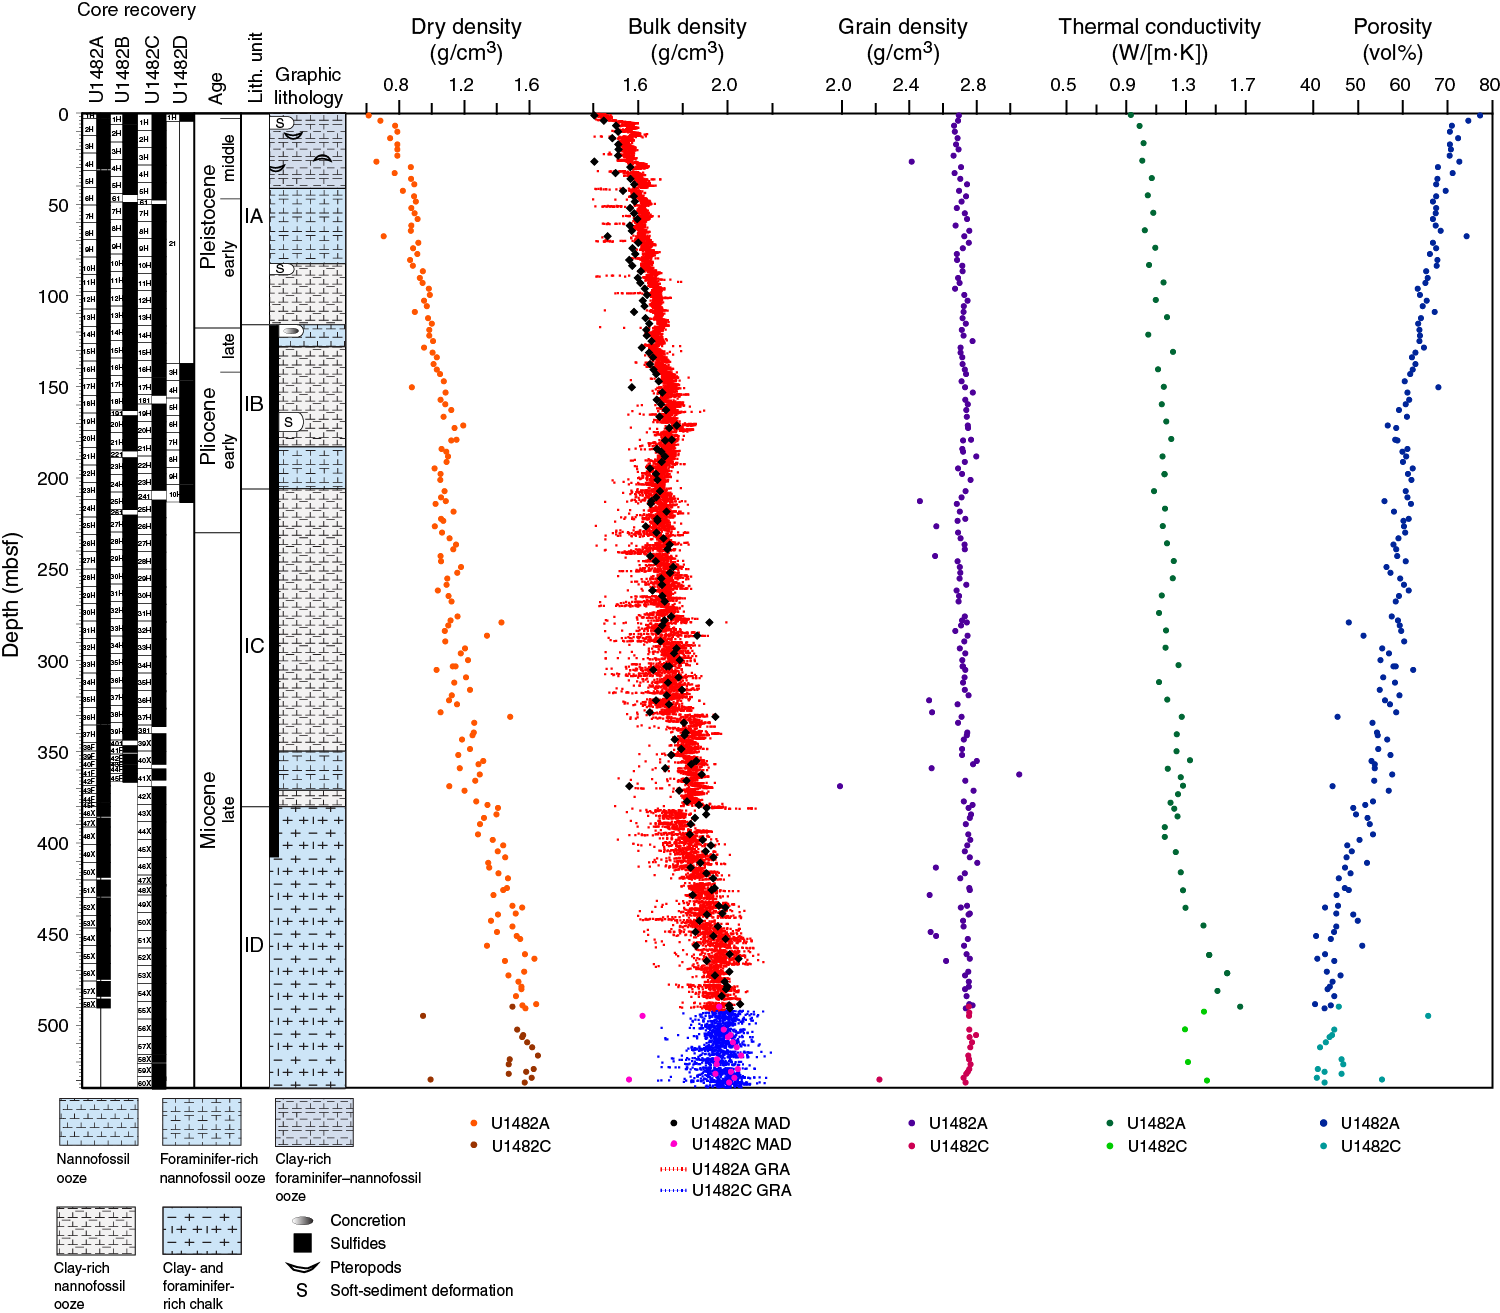
Figure F33. MAD dry, bulk, and grain densities and porosity, WRMSL GRA bulk density, and thermal conductivity.
In lithologic Subunit IA, MAD dry density increases from ~0.8 to 1.0 g/cm3 from the seafloor to 117 mbsf. Between 117 and 205 mbsf, dry density also displays a broad long-term maximum, with the highest value of ~1.2 g/cm3 occurring at ~170 mbsf (Figure F33). In lithologic Subunits IC and ID, dry density increases steadily downhole from ~1.1 to ~1.6 g/cm3. MAD bulk and dry densities converge with increasing depth, reflecting increasing downhole compaction, reduced porosity, and water content. Porosity (percent pore space in the wet sediment volume) generally decreases with depth from 70%–75% at the seafloor to ~45% at 489 mbsf. Grain density remains fairly constant between ~2.6 and 2.8 g/cm3 throughout the holes, and no large differences were observed between different lithologic subunits. Occasional low grain density values of ~2.4–2.5 g/cm3 occur; however, the cause of these low values is not immediately apparent because the corresponding bulk and dry densities do not show extreme values.
Thermal conductivity
A thermal conductivity profile was obtained at ~10 m resolution using a thermal conductivity needle on the whole-round cores. When the recovered material became too hard for the needle to penetrate (~400 mbsf, near the top of Subunit ID), a puck was used on split-core sections (see Physical properties in the Expedition 363 methods chapter [Rosenthal et al., 2018a]). Thermal conductivity increases with depth, and the data exhibit two distinct trends. Values in the upper part of the record increase progressively from the seafloor (0.93 W/[m·K]) to 400 mbsf (1.2 W/[m·K]) (Figures F28, F33). From 400 to 497 mbsf, values increase at a higher rate to 1.7 W/(m·K), corresponding to increasing downhole lithification. The transition between these trends corresponds to the change of thermal conductivity measurement method from the needle technique (accuracy ±2%) to the puck technique (accuracy ±5%). The overall variation in thermal conductivity with depth is small, and the data yield a mean and standard deviation of 1.15 and 0.03 W/(m·K), respectively. Thermal conductivity results correlate well with GRA bulk density data and are inversely correlated with porosity. These observations are associated with the compaction effect.
Downhole temperature measurements
Four downhole temperature measurements were collected using the advanced piston corer temperature tool (APCT-3) on Cores 363-U1482A-4H (31.4 mbsf), 7H (59.9 mbsf), 10H (88.4 mbsf), and 13H (116.9 mbsf). The first measurement on Core 4H was unreliable and probably caused by unstable drilling conditions (dashed blue line in Figure F34). An exponential decrease in temperature was observed between 60 and 600 s after penetration and was used to estimate ambient in situ temperature (see unshaded area in Figure F34). Values vary from 6.88°C at 59.9 mbsf to 9.62°C at 116.9 mbsf (Figure F34, F35), giving a geothermal gradient of 48°C/km.
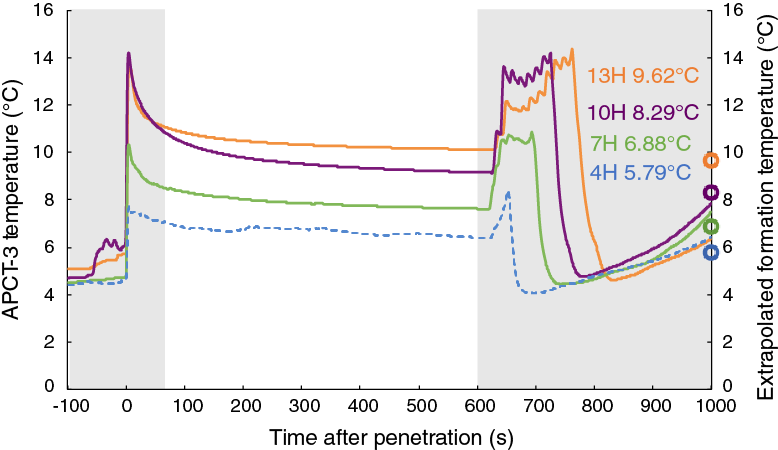
Figure F34. APCT-3 temperature-time series.

Figure F35. Heat flow calculations.
We estimated a thermal conductivity profile at ~10 m resolution using laboratory-determined thermal conductivity data (see Physical properties in the Expedition 363 methods chapter [Rosenthal et al., 2018a]). Thermal resistance was calculated using an average measured thermal conductivity of 1.15 W/(m·K) and a porosity fit at 0.945 following the “average approach” in Pribnow et al. (2000), which is based on the assumption that there are no systematic variations in thermal conductivity with depth (Figure F35). The slope of the linear fit between temperature and thermal resistance indicates the heat flow, which means that the decrease in the temperature gradient with depth can be related to an increase in thermal conductivity if the best fit for individual measurements is used. A heat flow value of 57 mW/m2 was derived using a linear regression of all data following the method described in Pribnow et al. (2000).
Stratigraphic correlation
Four holes were drilled at Site U1482 (see Operations); Holes U1482A and U1482C were deepened with XCB drilling, and the fourth hole (U1482D) was specifically drilled to target possible core gaps that we were not sure were covered with the first three holes. Correlations among holes at Site U1482 were accomplished using Correlator software (version 2.1). Tie points were established mainly with WRMSL magnetic susceptibility data, although some were based on WRMSL GRA bulk density and NGR data (Figures F36, F37, F38). Correlation was challenging due to intervals with very low amplitude variability in the WRMSL and NGR signals, the presence of deformed sedimentary intervals, and uneven core gaps resulting from a large tidal range of 3–4 m during the week we were drilling Site U1482. Although we show a splice from 0 to 451.2 m core composite depth below seafloor (CCSF) and a composite depth scale from 0 to 614.6 m CCSF (Tables T24, T25), we note three types of uncertain correlation: (1) intervals in split cores showing visible evidence of soft-sediment deformation, (2) features in the WRMSL and NGR data that do not correlate between holes, and (3) coring gaps. Consequently, the splice we constructed from 0 to 451.2 m CCSF (Table T25; Figures F39, F40) contains stratigraphic gaps, and below 451.2 m CCSF, where cores were recovered using the HLAPC and XCB systems, gaps are likely between many of the cores. We were able to tentatively identify correlations between some cores and determined offsets based on these correlations (as described below) but did not construct a splice for cores deeper than 451.2 m CCSF. Whether these cores can eventually be used to construct a partially spliced record should be investigated in postcruise research.
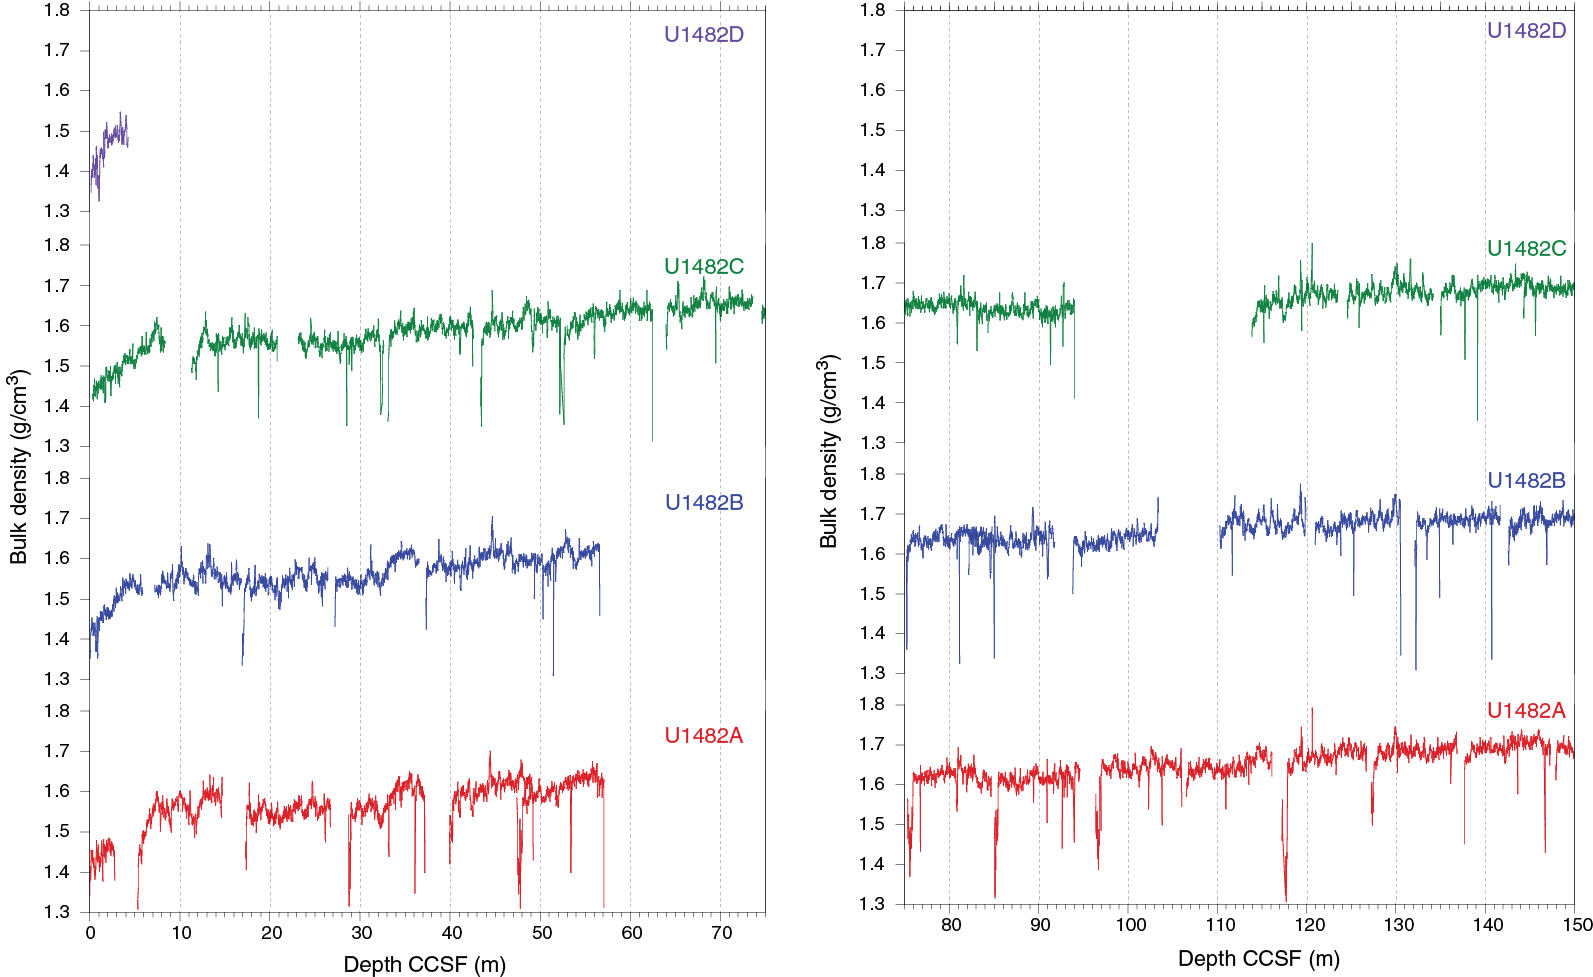
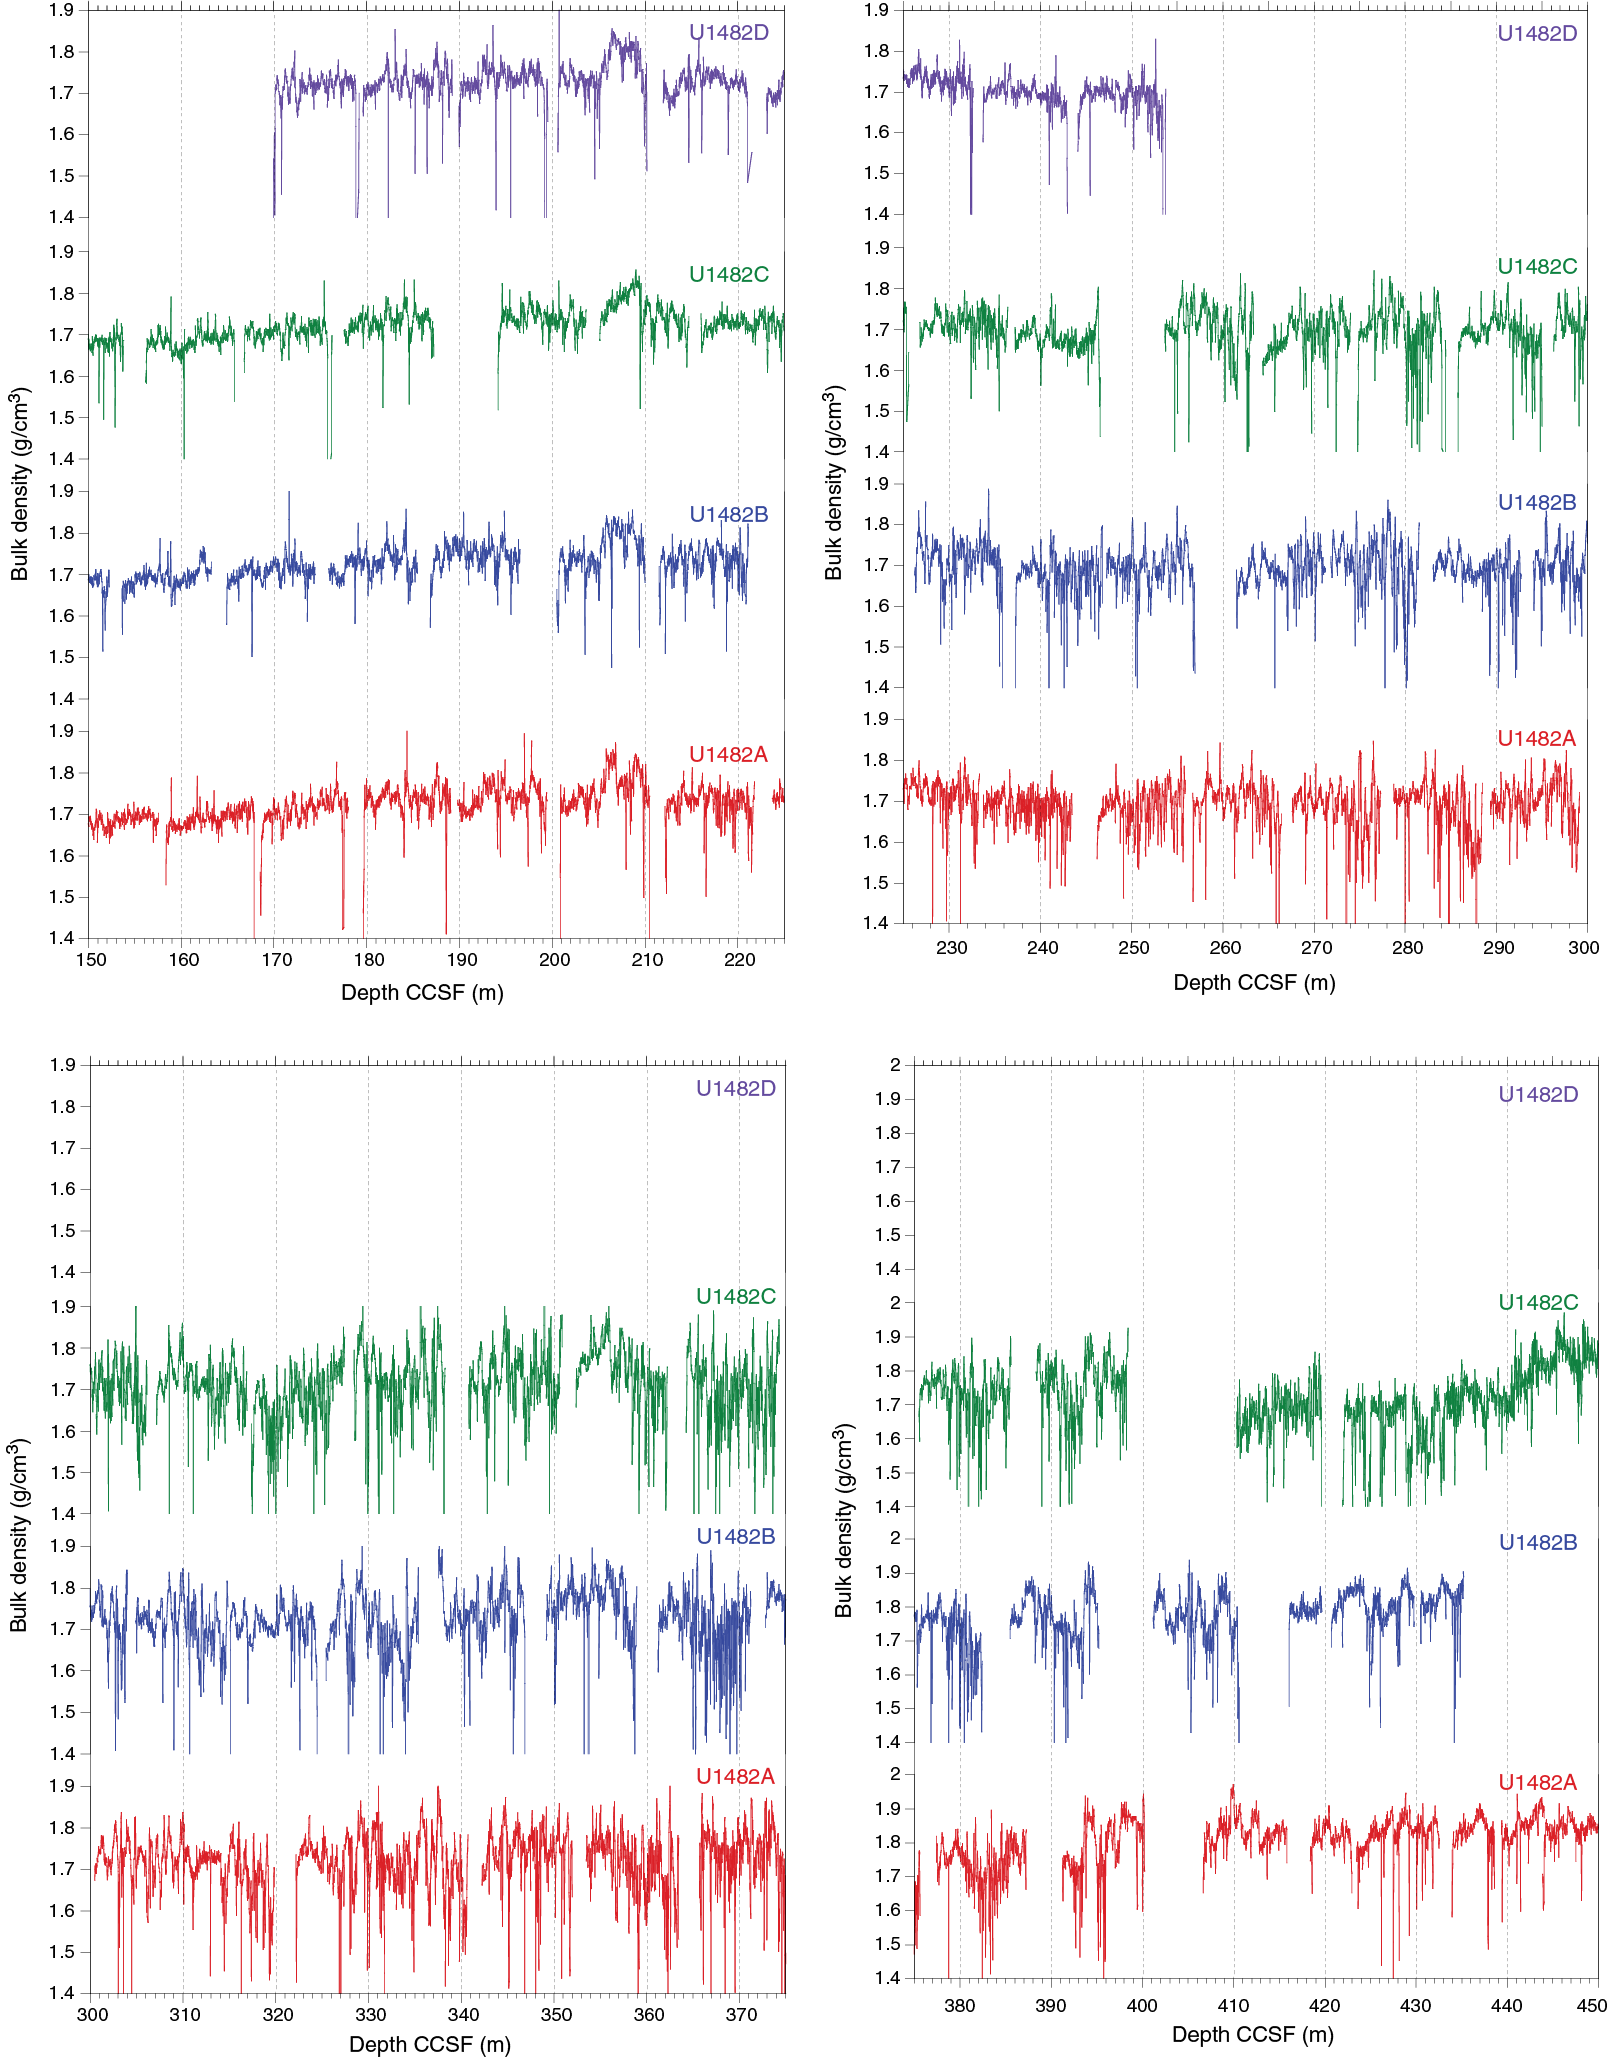

Figure F36. WRMSL GRA bulk density data.
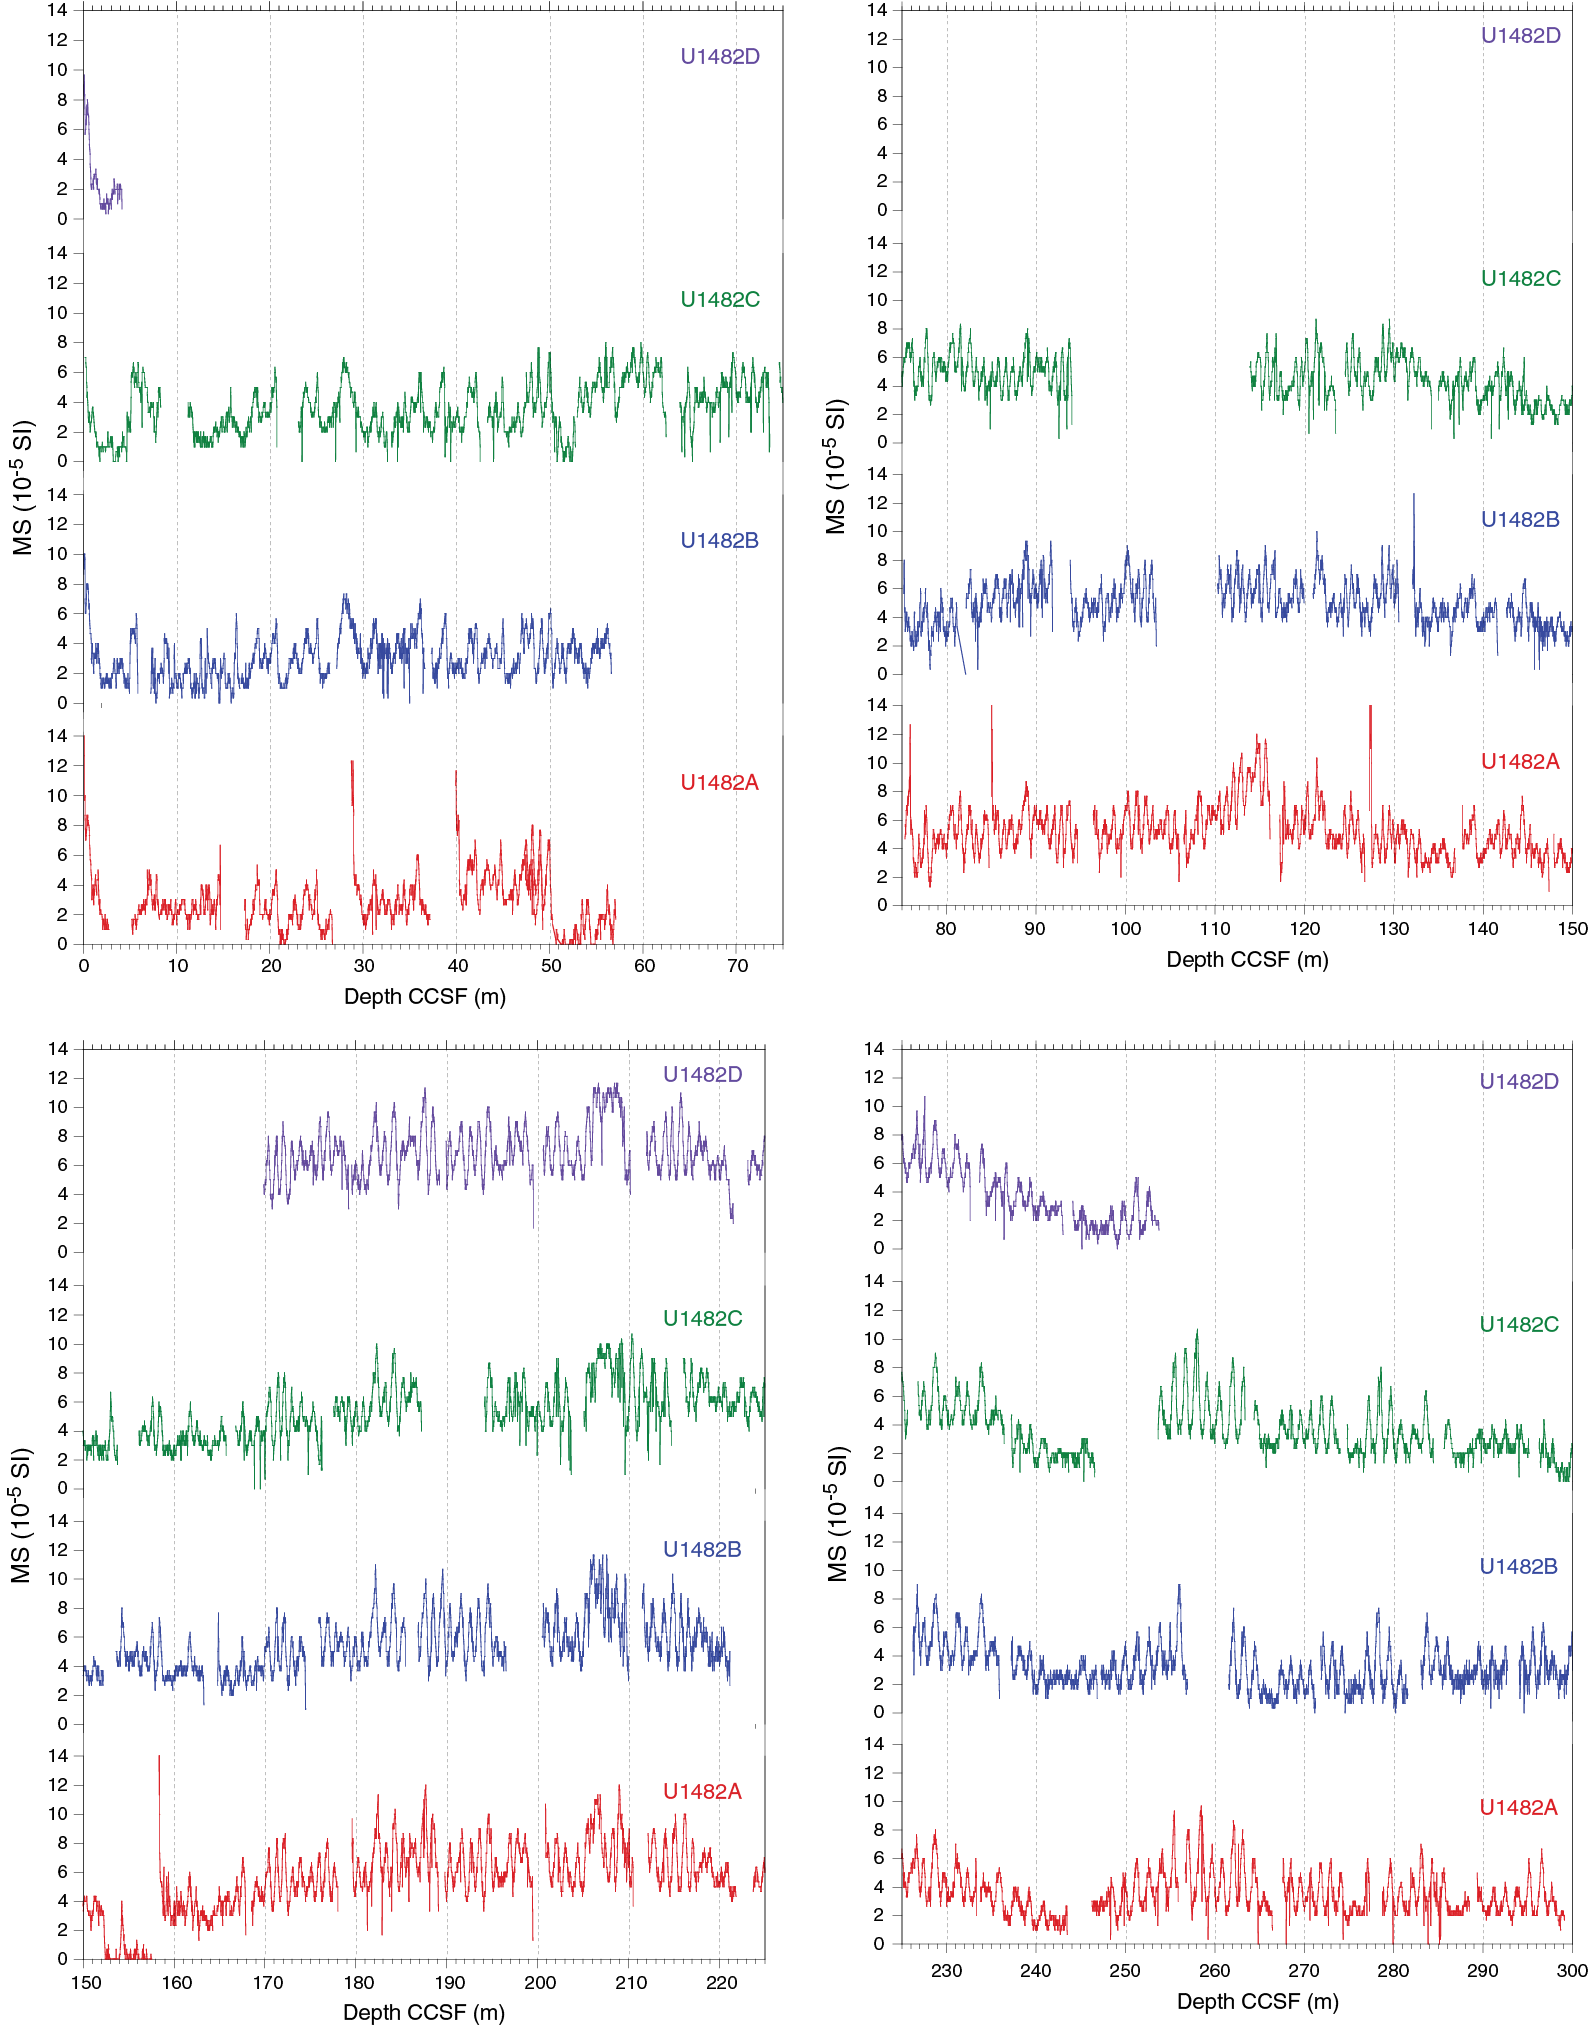
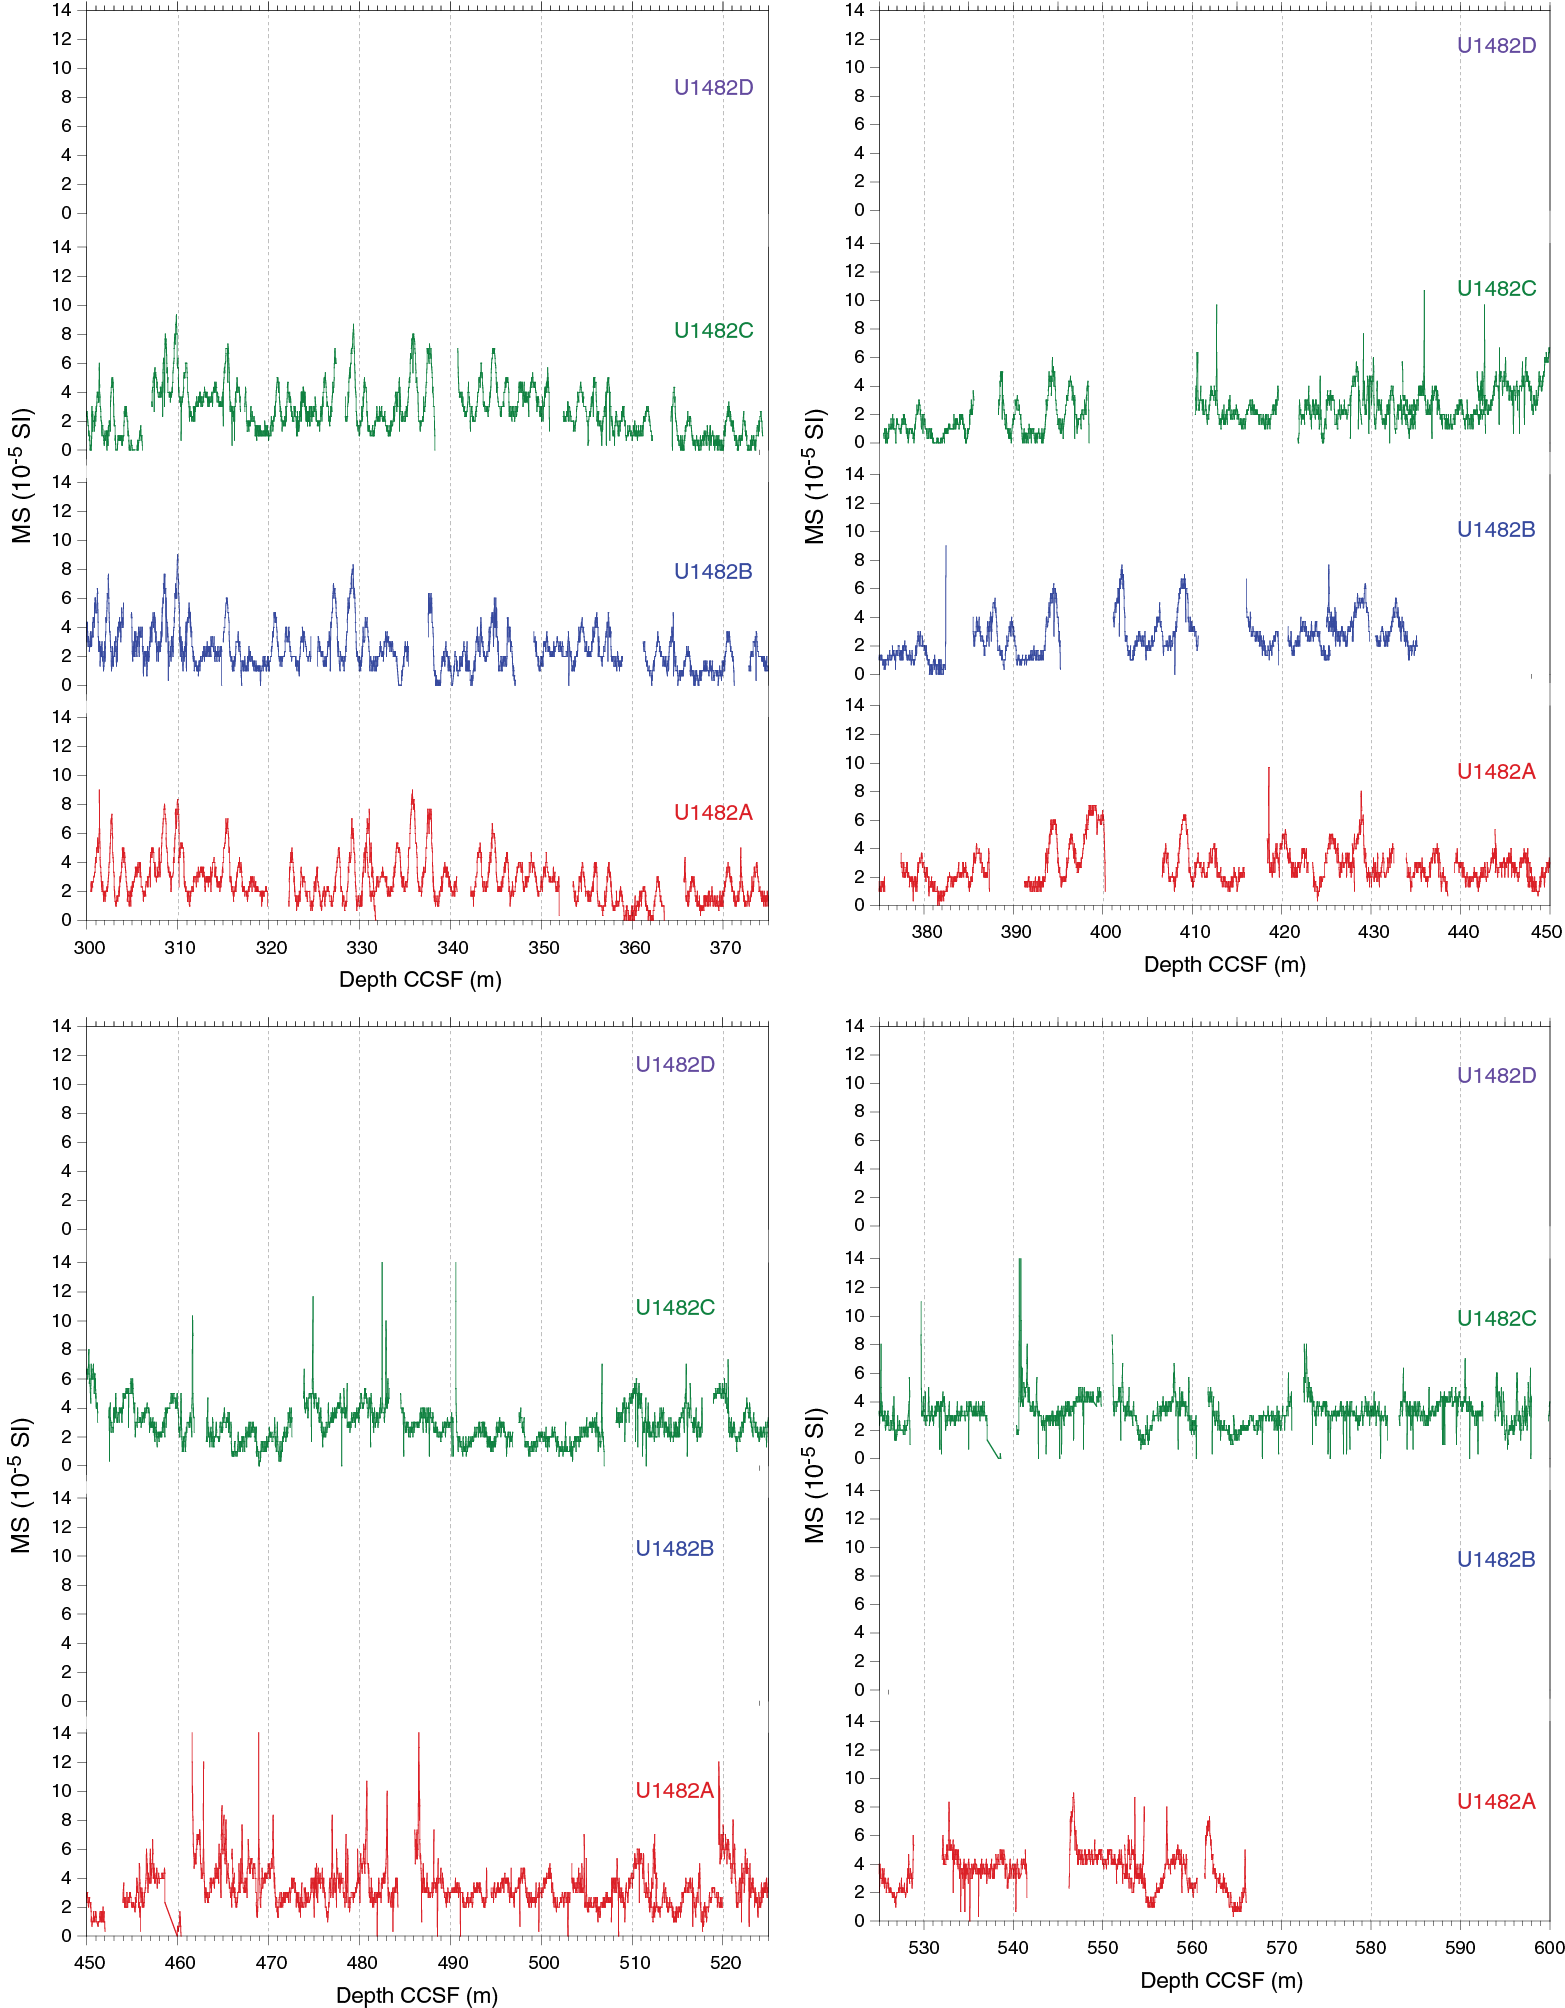
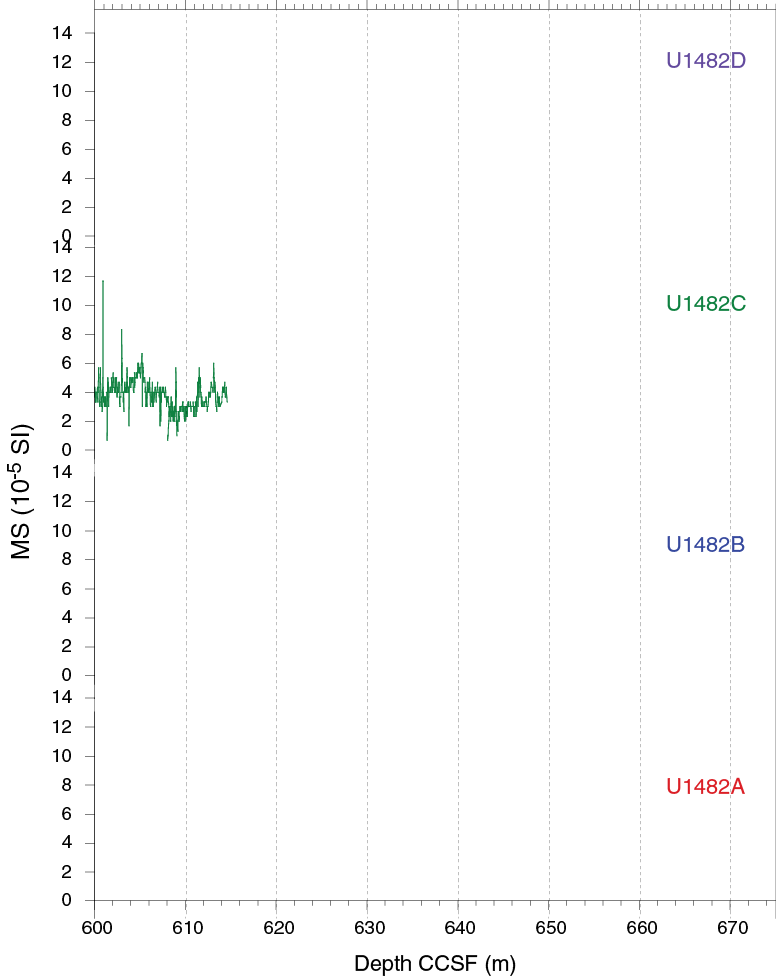
Figure F37. WRMSL MS data.
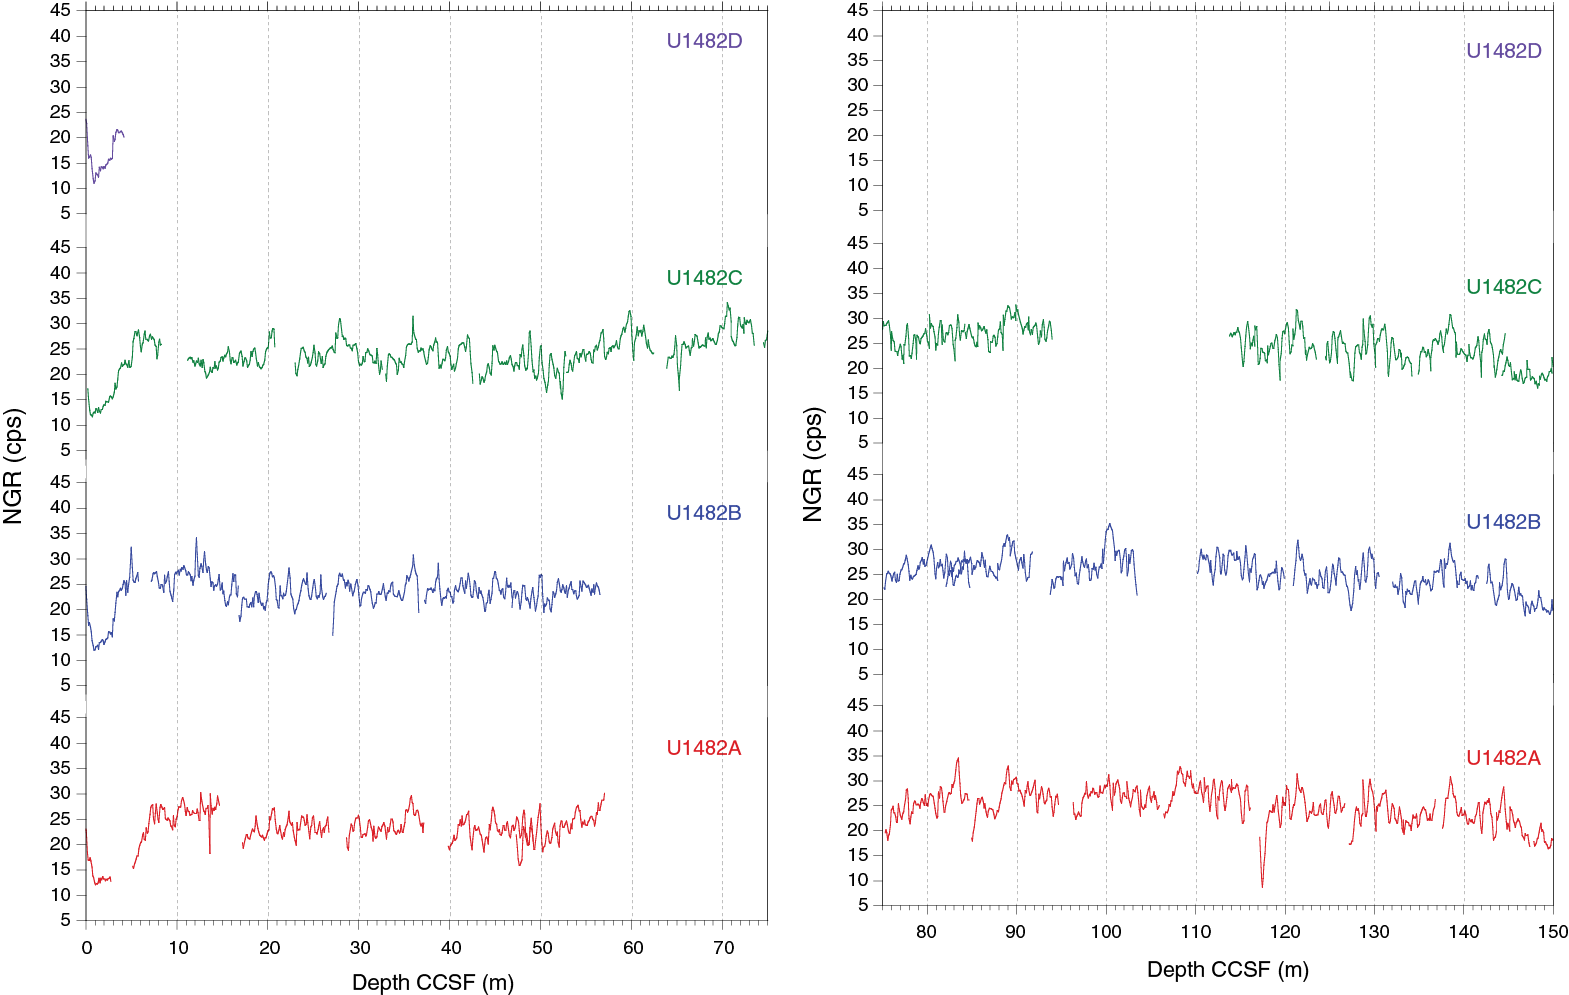
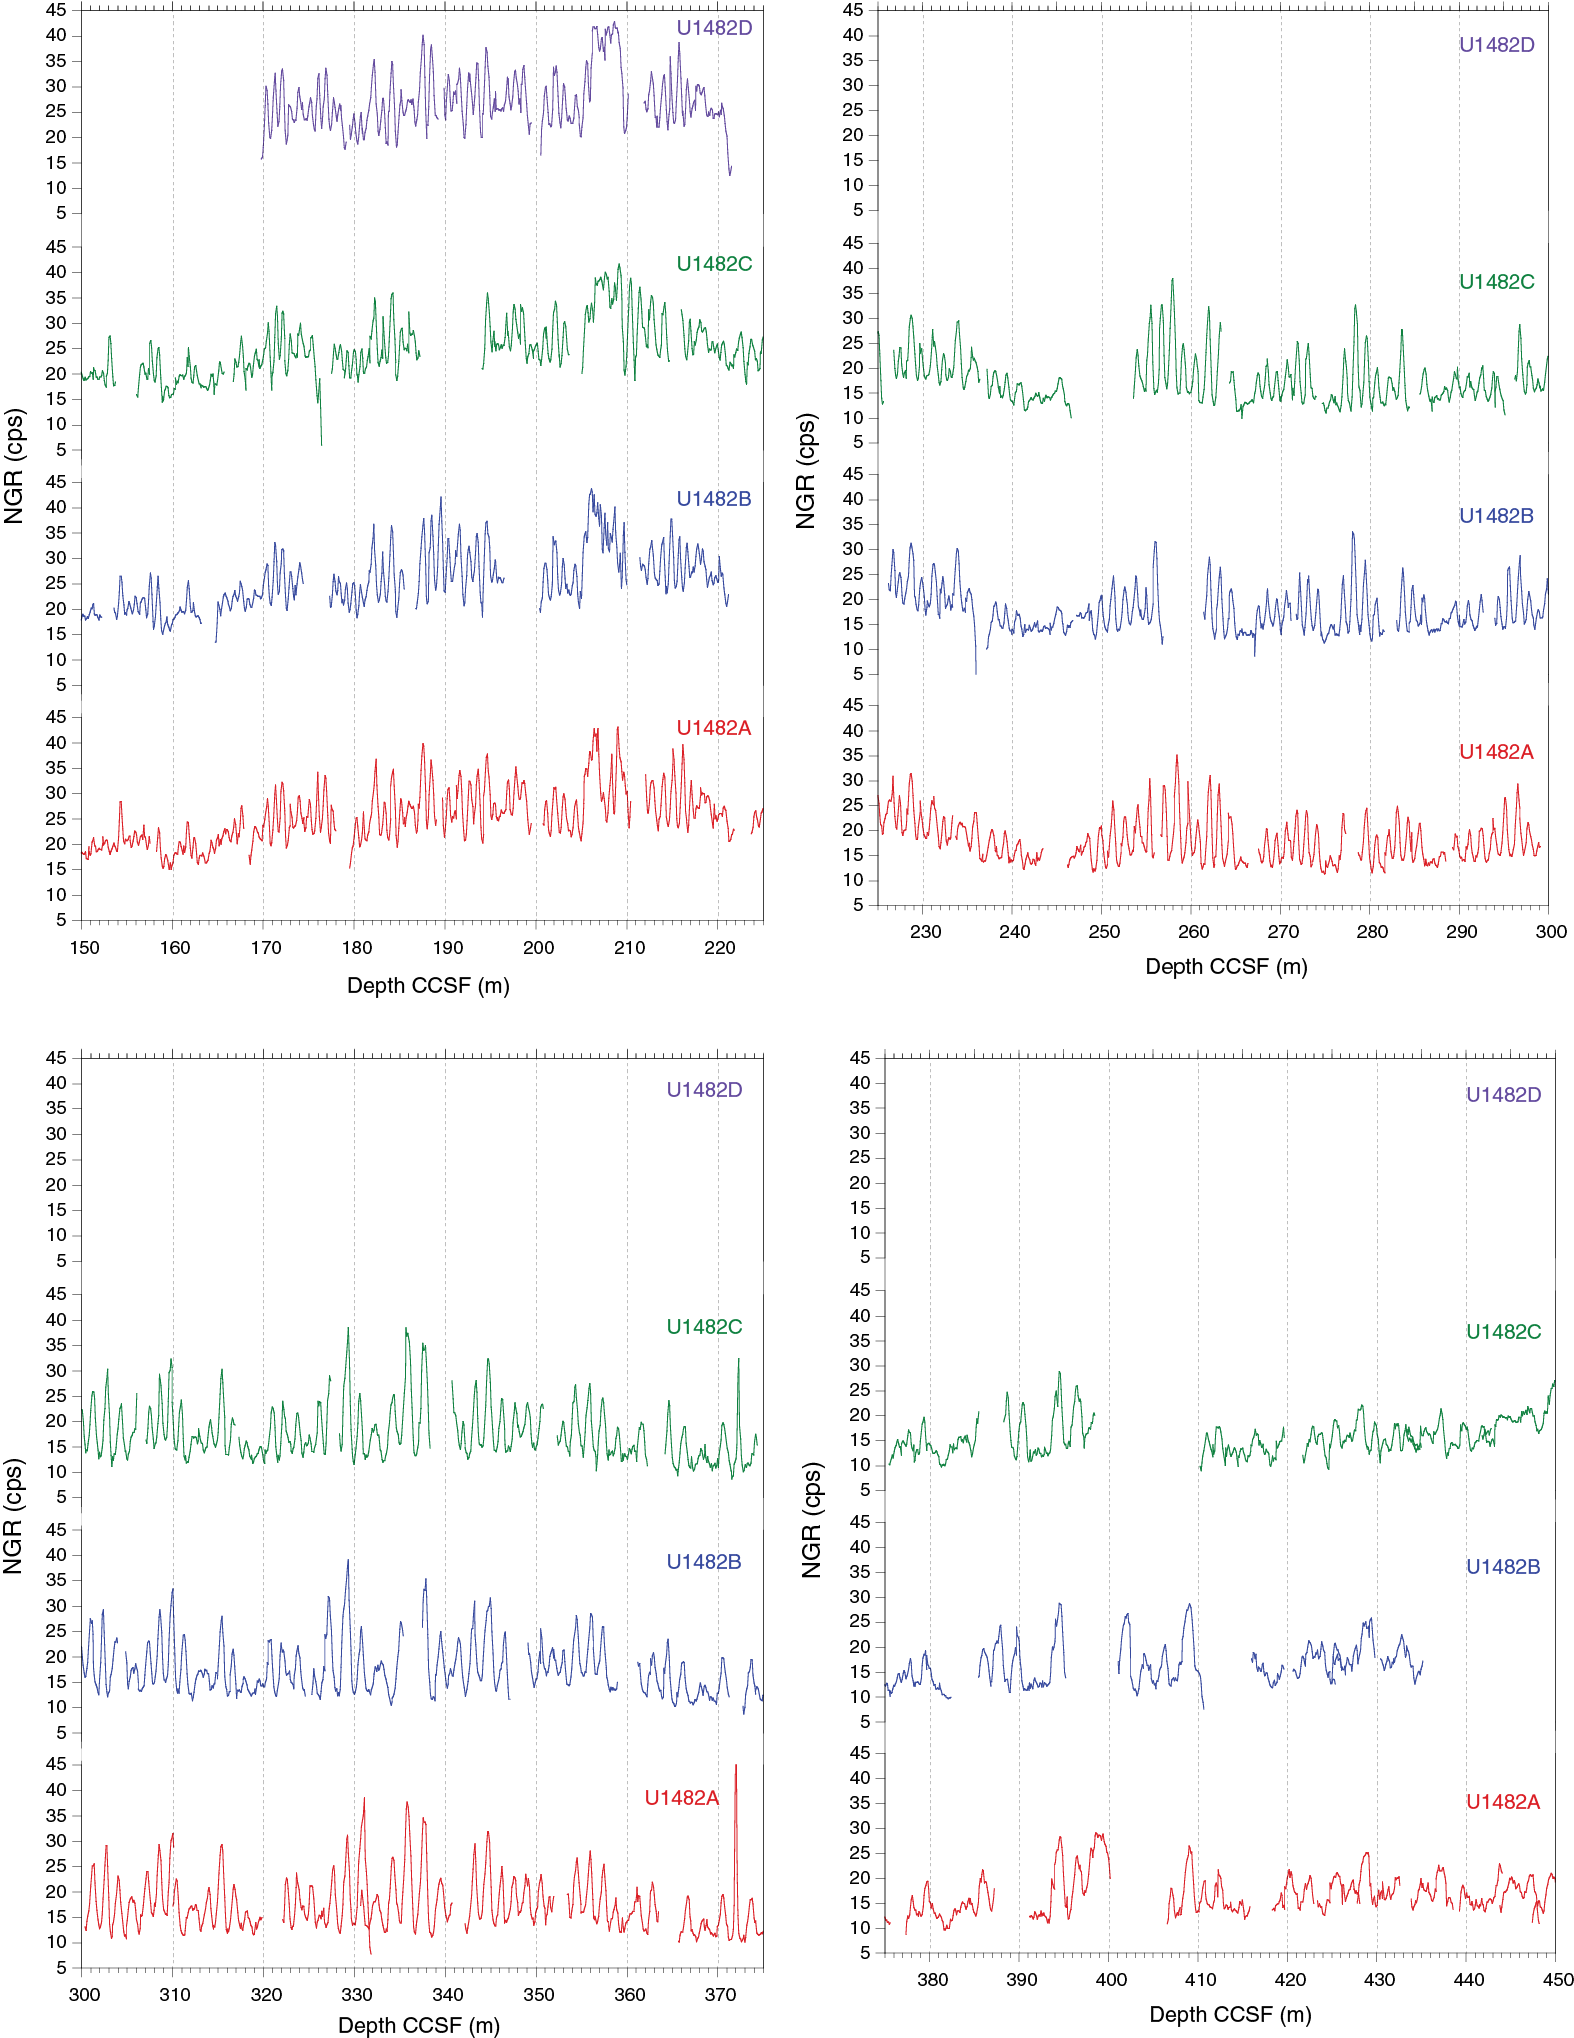
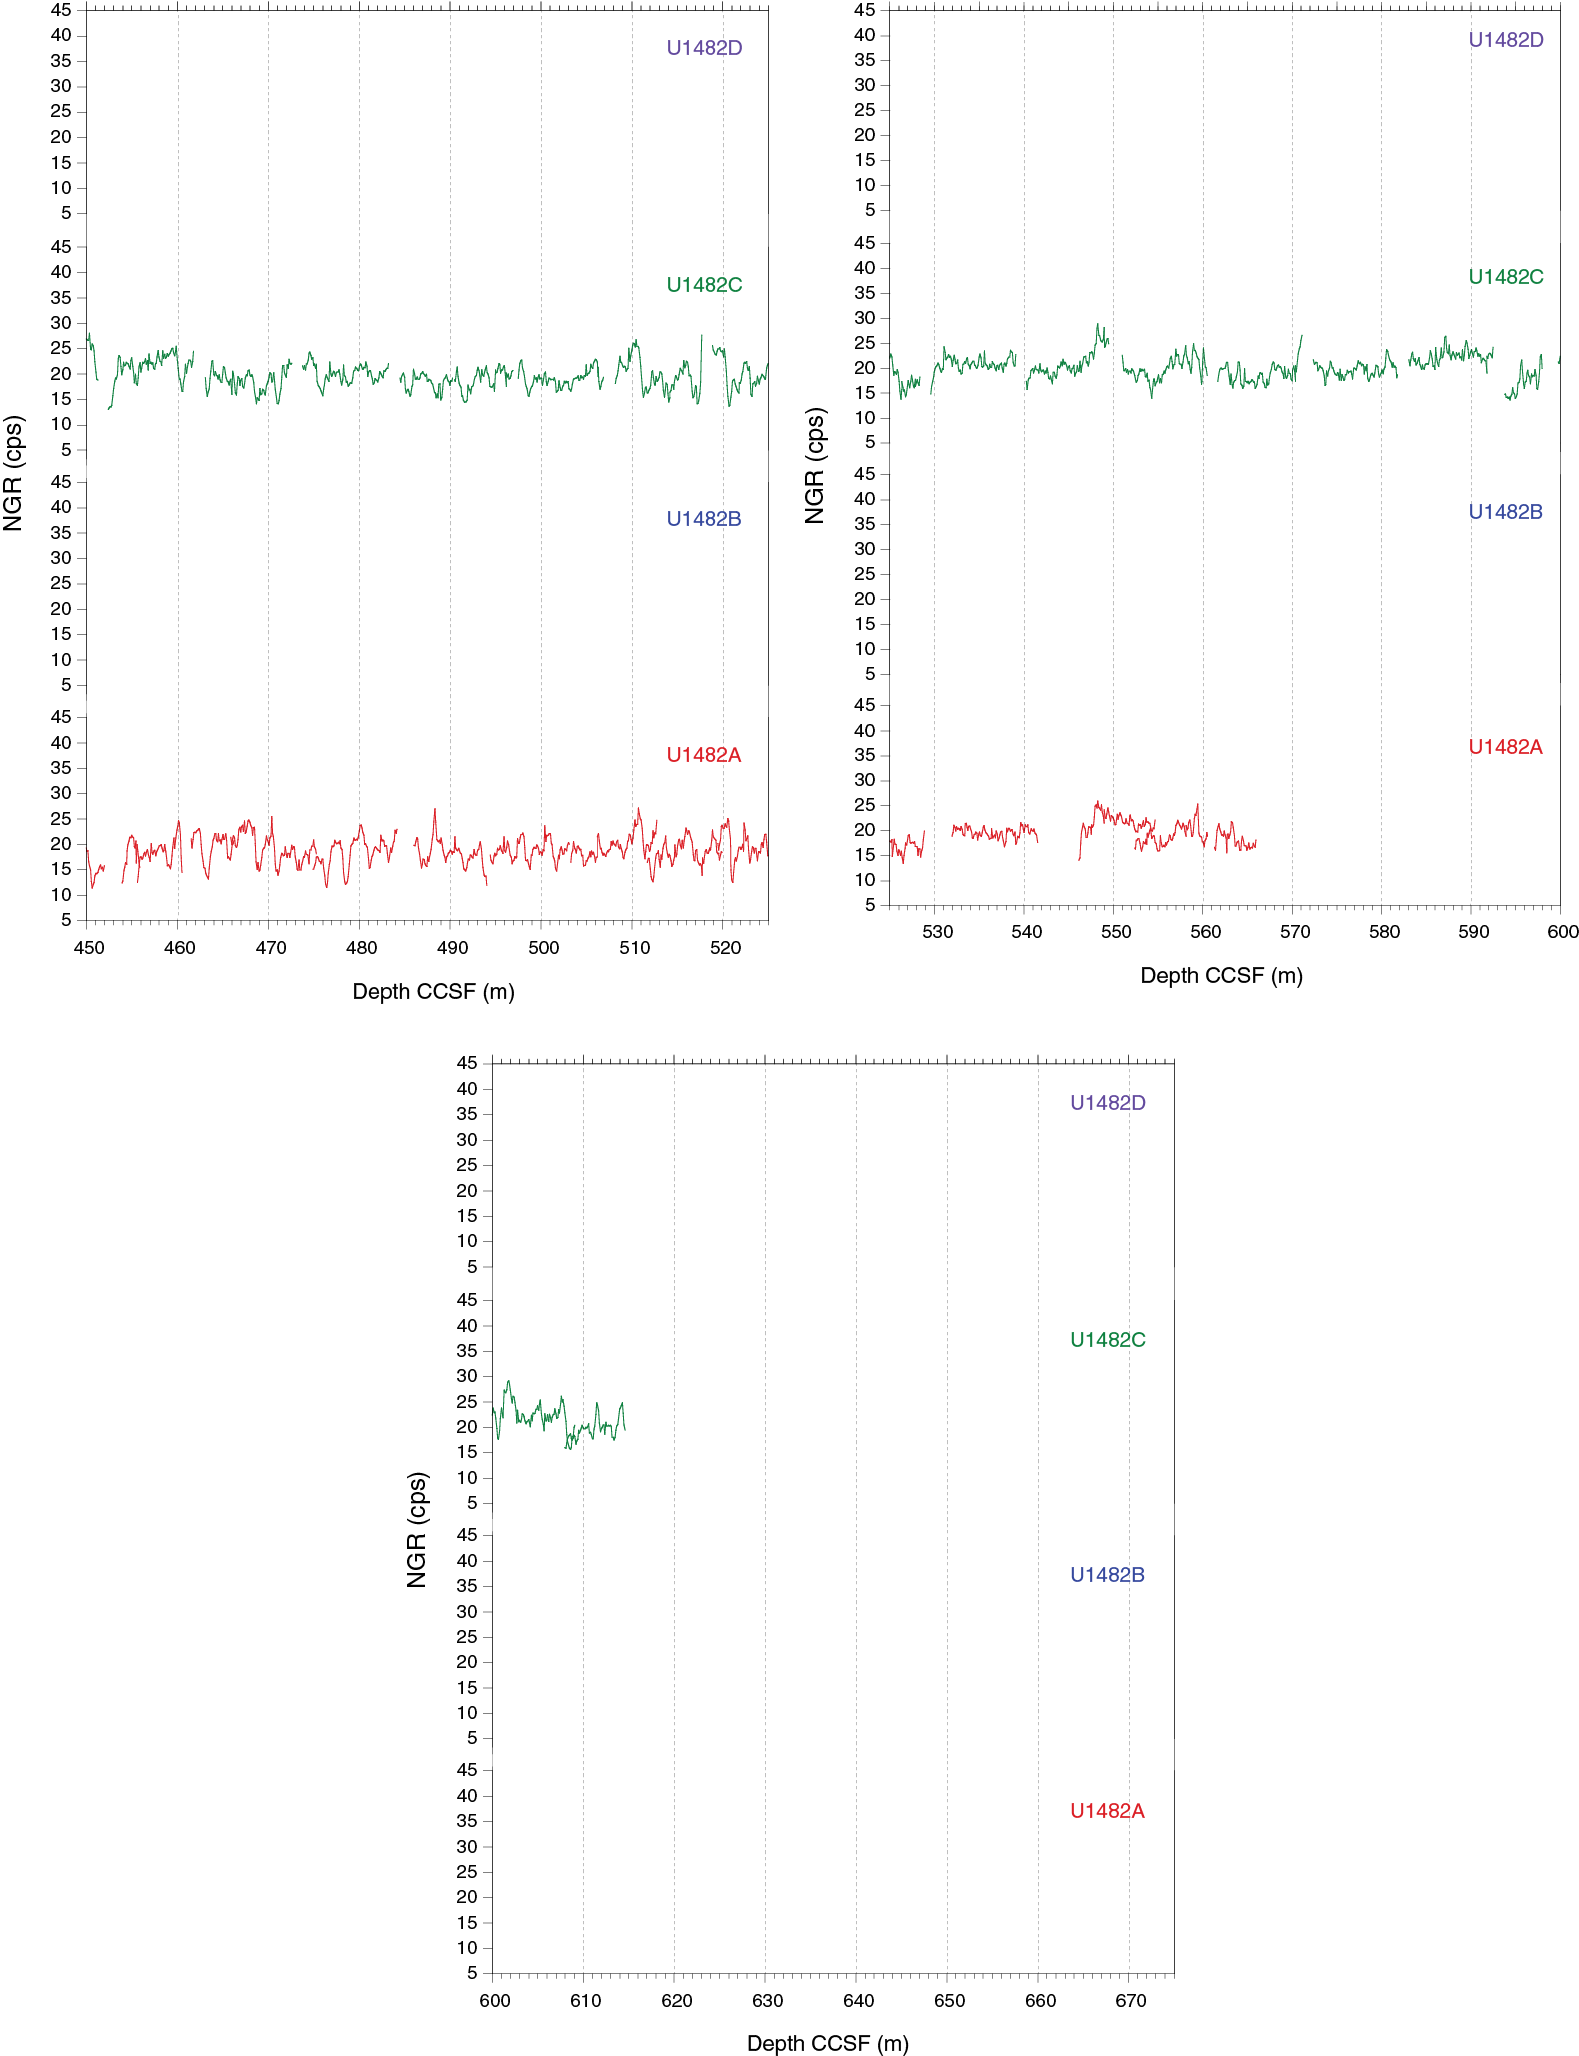
Figure F38. WRMSL NGR data.
Table T24. Affine table. Download table in CSV format.
Table T25. Splice intervals. Download table in CSV format.
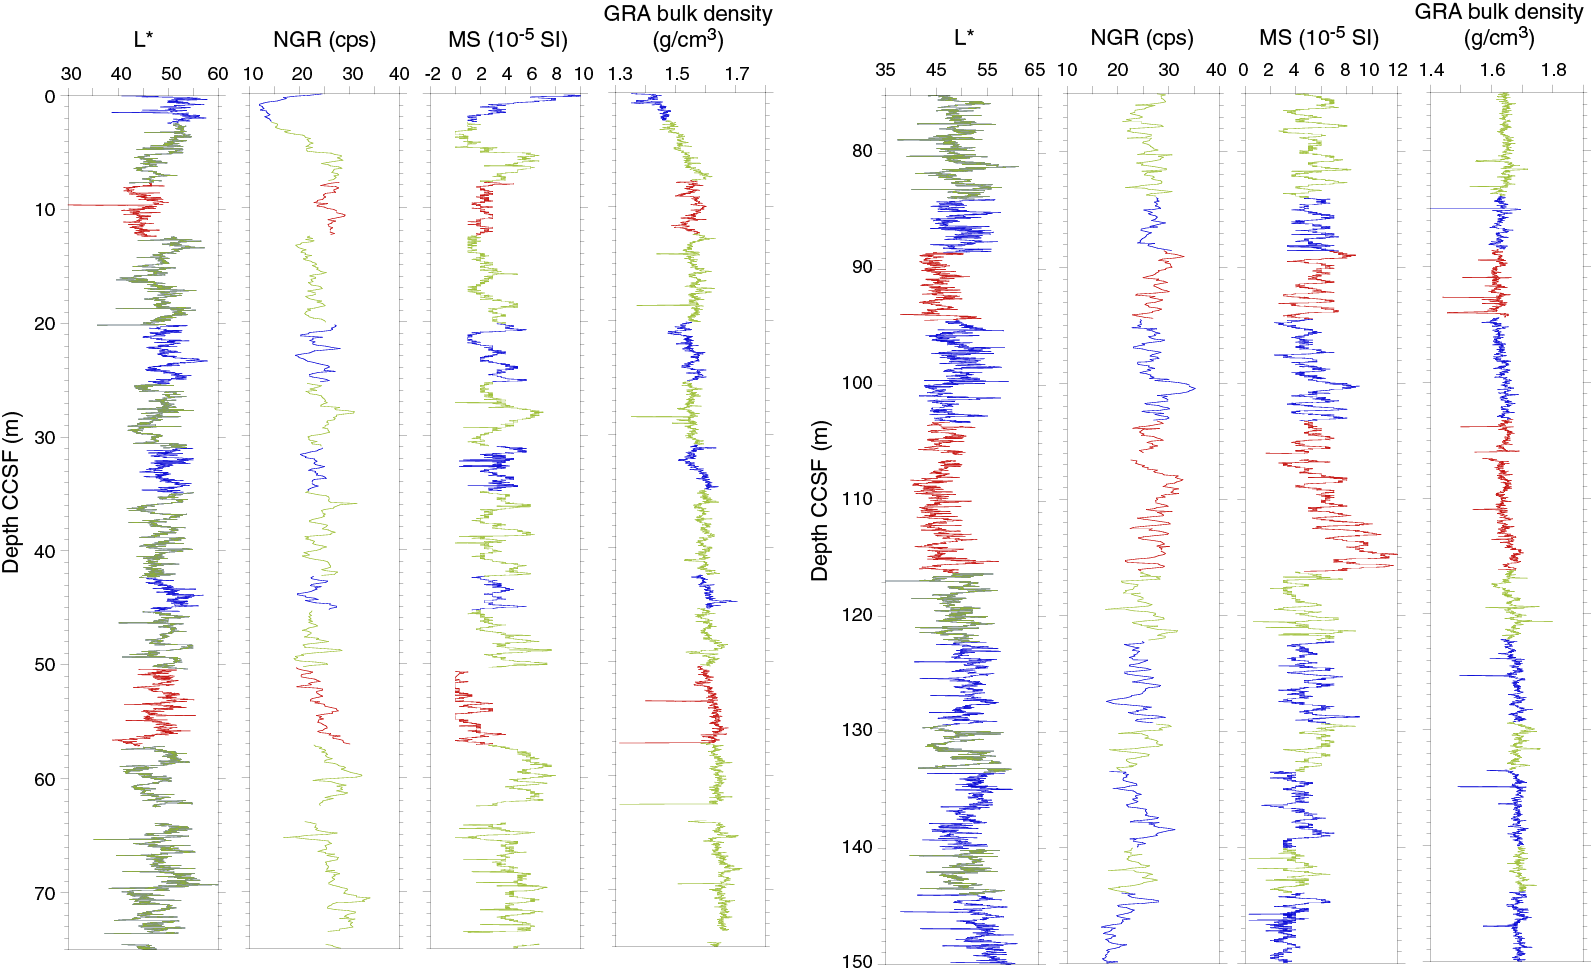
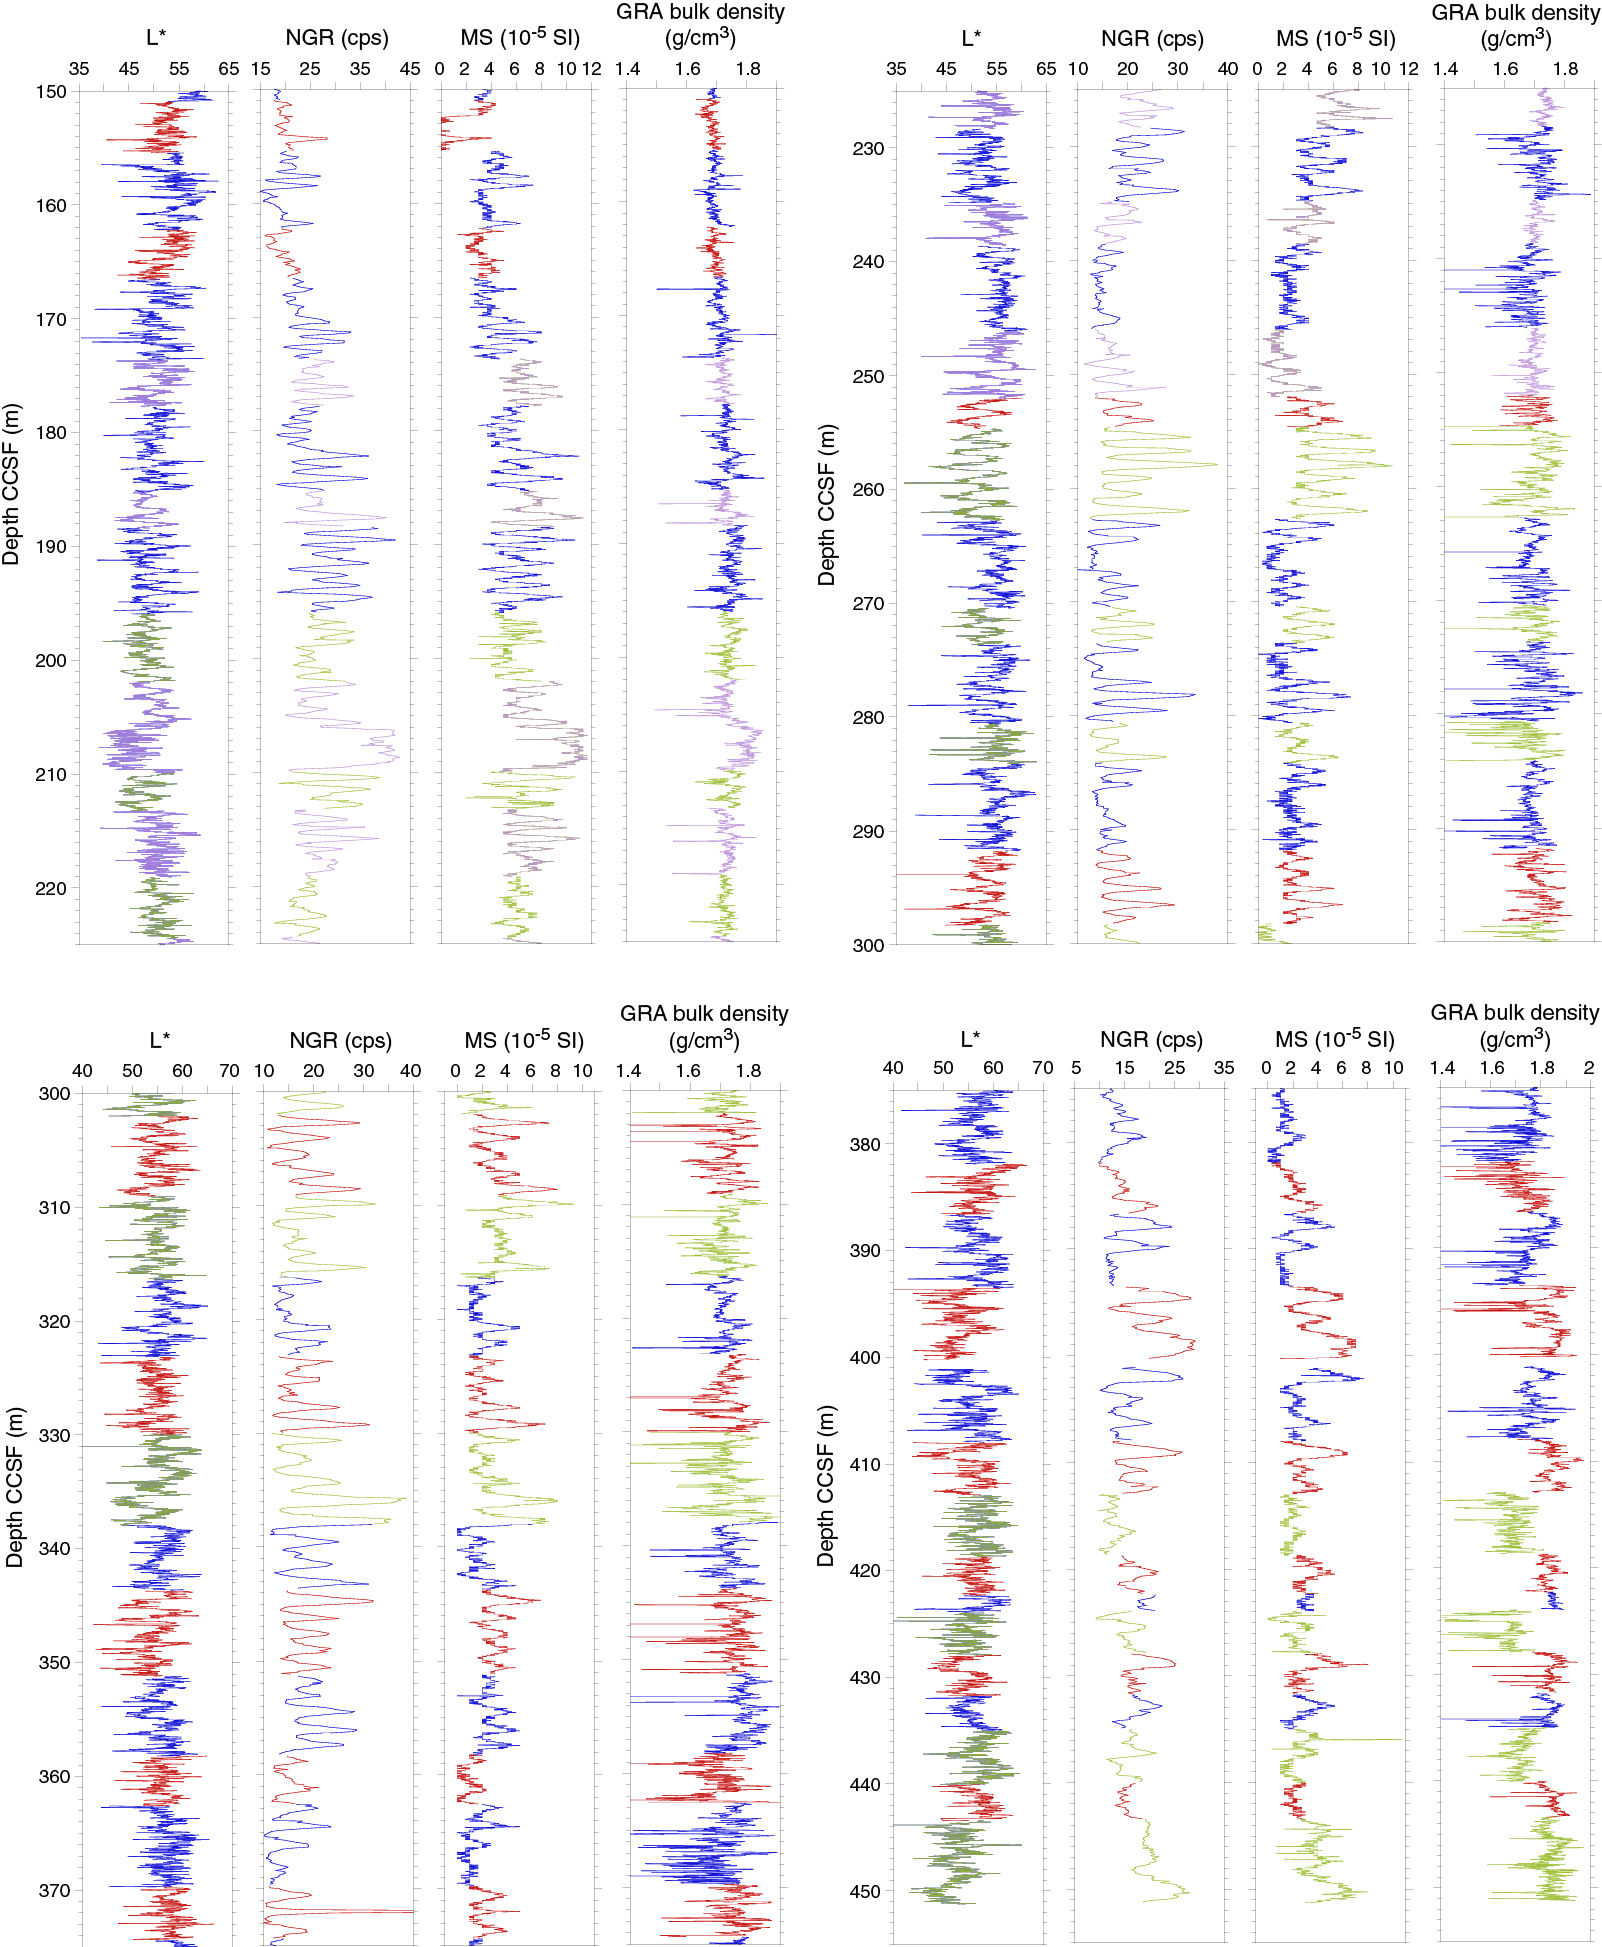
Figure F39. Spliced composite L*, NGR, and WRMSL MS and GRA bulk density data.
The CCSF scale is anchored to the mudline of Core 363-U1482B-1H, which is assigned a depth of 0 m CCSF. From this anchor, we worked downhole, using Correlator to establish a composite stratigraphy on a core-by-core basis. The match between the holes is well constrained except in two intervals of soft-sediment deformation observed by the sedimentologists (see Core description) and clearly visible in the core photos and in the interval deeper than 451.2 m CCSF, where cores were recovered with the HLAPC and XCB systems.
The shallowest interval of uncertain stratigraphic continuity caused by soft-sediment deformation (Table T25) is within Cores 363-U1482A-2H and 363-U1482C-1H and 2H, from 0 to 17 m CCSF (Figure F40). We found features in the WRMSL data that appear to correlate between holes and selected our tie points based on those features, but because of deformation the continuity of the stratigraphy in this upper portion of the splice is unclear.
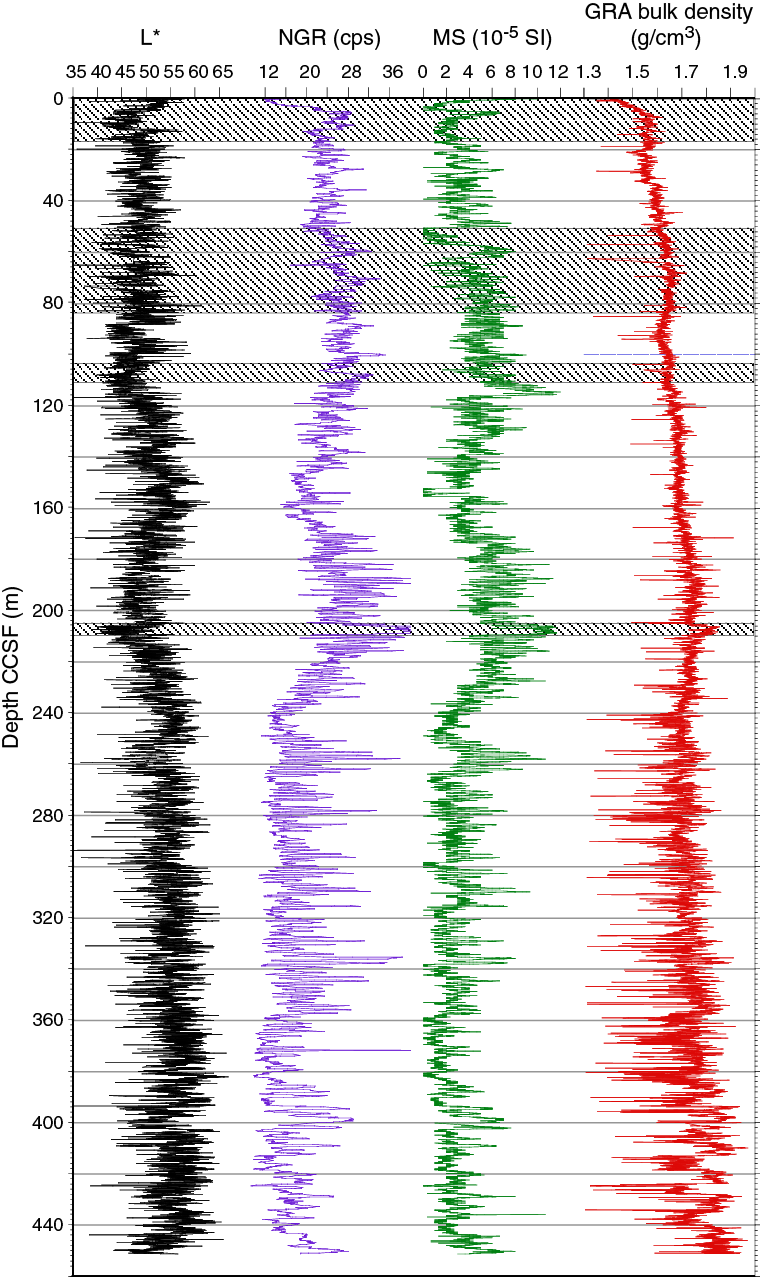
Figure F40. Spliced WRMSL GRA bulk density, MS, NGR, and L* data.
A second interval of sediment deformation causing uncertain stratigraphic continuity spans from 55 to 84 m CCSF (Figure F40). The WRMSL and NGR data from Cores 363-U1482C-7H and 8H and 363-U1482B-9H indicate some type of deformation and thickening of the sedimentary sequence in Hole U1482C. Some magnetic susceptibility features in Core 363-U1482C-7H appear to be repeated downcore in Cores 363-U1482A-7H, 363-U1482B-8H, and 363-U1482C-9H, indicating that folding may have occurred. The sediment in Core 363-U1482C-8H does not appear to correlate to any interval in the other holes, indicating that the sediment deformation was laterally heterogeneous at a scale of a few tens of meters (i.e., the distance between holes). To build the splice, offsets for Cores 363-U1482C-8H and 9H were set by adding a 1 m offset, and offsets for Cores 363-U1482A-8H and 363-U1482B-8H were adjusted downward because they correlated with features in Core 363-U1482C-9H. Good hole-to-hole correlations allowed us to construct a splice without core gaps from the lower portion of Core 363-U1482C-9H at 83.94 m CCSF to 103.52 m CCSF. However, the interval from 103.52 to 110.61 m CCSF in Hole U1482A does not correlate to the other holes, making it impossible to splice the core gap between Cores 363-U1482A-9H and 10H. We therefore offset the top of Core 10H by adding 1 m. Stratigraphic continuity improves below this point, and we were able to construct a complete splice from 110.61 to 400.30 m CCSF. This interval includes one deformed package of sediment from 207.21 to 209.70 m CCSF in Core 363-U1482D-6H; the thickness and position (in meters CCSF) of this deformed interval is not exactly the same in cores not included in the splice (363-U1482A-19H, 363-U1482B-20H, and 363-U1482C-20H). There is a core gap above Core 363-U1482B-39H, and thus the offset for that core was set by adding 1 m. Below this core, the splice represents a continuous stratigraphic interval from 401.10 to 451.26 m CCSF.
The third interval of uncertain stratigraphic continuity is deeper than 451.26 m CCSF, the depth at which the splice ends. Although we did not include this interval in the splice, we set a 1 m offset between every core from Hole U1482C in this interval (44X through 60X). We then used the WRMSL and NGR data to correlate cores from Hole U1482A to Hole U1482C. These correlations and resulting offsets (Table T24) are tentative and should be checked and adjusted as part of postcruise research.
The splice interval table (Table T25) is intended to provide a sampling plan that can be used to generate high-resolution continuous records with minimal gaps; however, an “off-splice” sampling plan was also designed mainly for low-resolution studies. An explanation of the strategy used to determine the off-splice sampling plan and a table of core intervals that should be used for off-splice sampling can be found in OFFSPLICE in Supplementary material.
The cumulative offset between mbsf and CCSF depth scales is not linear because of variations in offsets downhole (Figure F41). The affine growth factor (a measure of the fractional stretching of the composite section relative to the drilled interval; see Stratigraphic correlation in the Expedition 363 methods chapter [Rosenthal et al., 2018a]) is difficult to assess in the upper part of the site from 0 to 110 m CCSF because core offsets are strongly related to shifting cores relative to each other to correlate them within the deformed sediment sequence. In other words, the core offsets from 0 to 110 m CCSF and therefore the relationship between mbsf and CCSF depths are strongly affected by core-to-core differences in geologic postdepositional deformation in addition to the typical core expansion caused by depressurization and warming of the core when brought aboard the drillship. From ~110 m CCSF to the bottom of the splice at 451.26 m CCSF, the growth factor gradually decreases from ~1.27 to 1.19. The growth factor generally reflects expansion associated with the release of overburden, and the decrease in the growth factor downhole can be explained by methane gas expansion being more prominent near and above the SMTZ, which is at ~110 mbsf at this site (see Geochemistry). Calculation of mass accumulation rates based on the CCSF scale should account for the expansion by dividing apparent depth intervals by the appropriate growth factor.
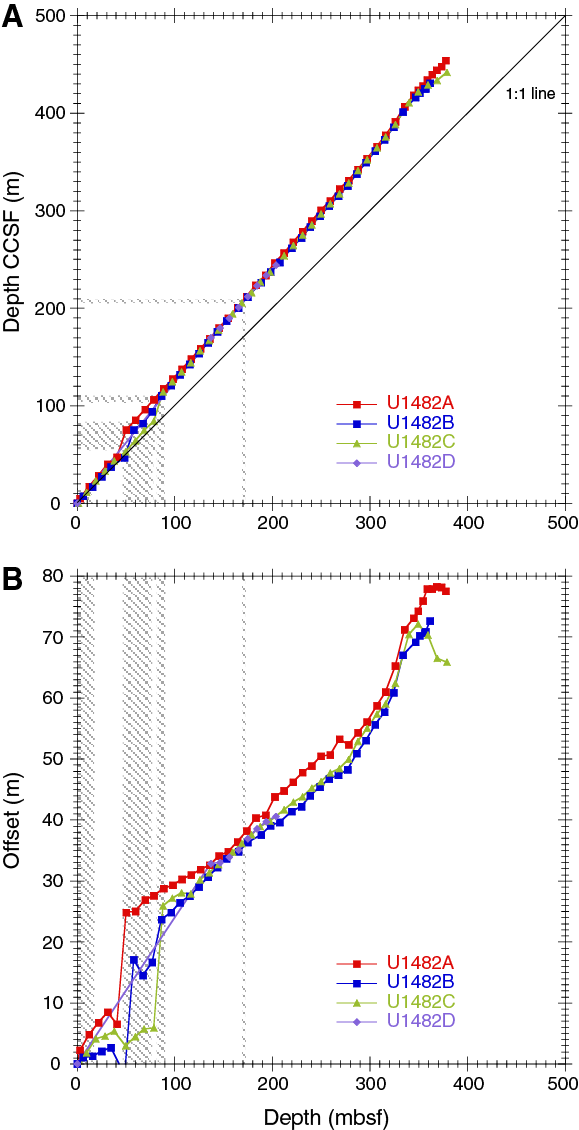
Figure F41. Comparison of mbsf and composite depth scales.
Geochemistry
Geochemical trends in the upper part of Site U1482 (above 120 mbsf) are largely controlled by remineralization of organic matter. Increases in alkalinity, manganese (Mn), sulfate (SO4), barium (Ba), and methane reflect the progression from suboxic organic matter degradation (Mn reduction) to anoxic organic matter degradation (SO4 reduction) in the upper 120 mbsf, followed by a switch to fermentation and anaerobic oxidation of methane (AOM) below that depth. In the deeper part of the site, ion exchange between interstitial water and carbonate and clay minerals influences the geochemical profiles. The high clay content at this site reduces permeability, leading to excellent preservation of strong interstitial water gradients that are often smoothed by diffusion in a comparable open-ocean, moderate sedimentation rate site.
High methane concentration was found in headspace gas samples. High methane/ethane ratios suggest that the methane is mostly of biogenic origin. Calcium carbonate (CaCO3) is the dominant biogenic sediment component (average = 67 wt%) throughout the entire record. The organic carbon content is >1 wt% in the uppermost 90 mbsf and <1 wt% deeper than 90 mbsf.
Background
Redox chemistry of organic matter remineralization
The remineralization of organic matter in sediment underlying oxygenated, open-ocean water columns with average-to-high primary productivity has been studied in detail (e.g., Bender et al., 1977; Froelich et al., 1979; Emerson et al., 1980) and is reviewed here following the general guides of Froelich et al. (1979) and Morel and Hering (1993) to provide background for the interpretations of Expedition 363 geochemical results. In brief, the oxidation of organic matter in marine sediment to dissolved inorganic carbon (DIC) proceeds through the progressive reduction of available electron acceptors in the local sedimentary environment. Oxidants are consumed sequentially based on the energy yield per mole of organic carbon oxidized such that remineralization reactions with higher energy yields occur prior to those with lower energy yields (i.e., at shallower depths within the sediment column). During remineralization, carbon (C), nitrogen (N), and phosphorus (P) are consistently released into interstitial water in a ratio close to 106:16:1 atoms per mole of organic matter (Redfield et al., 1963) regardless of the oxidant being consumed. However, the influence of remineralization reactions on alkalinity, pH, and the saturation states of minerals in sediment is variable.
Oxic respiration of organic matter is the most efficient remineralization reaction and occurs at the shallowest depths in sediment, adding DIC to interstitial water without any addition of alkalinity:
Here, CH2O represents a simplified stoichiometry for organic matter that emphasizes C and neglects the release of N and P during organic matter remineralization as weak acids or bases (i.e., NH3 and PO43−) that may consume or release H+. This simplification is reasonable for oxic respiration because nitrate (NO3−) is part of a strong acid-base pair and only PO43− species may contribute to alkalinity. However, during anaerobic remineralization processes, the production of NH3 and consumption of H+ to yield NH4+ through acid-base equilibrium adds alkalinity and effectively buffers the effect of concomitant increases in DIC on pH (Thomas et al., 2009).
At the depth where all dissolved oxygen has been consumed, anaerobic remineralization begins with the reduction of Mn oxide and oxyhydroxide phases:
Denitrification may occur within the same depth range as Mn reduction due to a similar yield in free energy:
Although this reaction acts to lower the pH of interstitial water under most sedimentary conditions, its effect on the saturation state of carbonate minerals is generally negligible.
Iron (Fe) oxide and oxyhydroxide minerals are reduced after the consumption of O2, MnO2, and NO3−, provided that sufficient labile organic C is available to be oxidized:
Here, hematite (Fe2O3) is used as an example Fe oxide mineral. This process may promote the precipitation of carbonate minerals by consuming protons and creating DIC in an 8:1 ratio.
After Fe-Mn oxyhydroxide phases are depleted, the degradation of any remaining labile organic compounds in the sediment mainly proceeds through the activity of sulfate-reducing bacteria that consume dissolved SO42– in interstitial water:
This reaction adds DIC through release of DIC and alkalinity by consumption of H+ during SO42– reduction to interstitial water in a 1:1 ratio and may lead to a decrease in interstitial water pH.
Finally, at depths where all other available reductants have been utilized, organic C may ferment to generate gaseous methane and DIC:
DIC generation exceeds increases in alkalinity during this process, lowering pH and potentially facilitating the dissolution or recrystallization of carbonate minerals.
In organic-rich sedimentary environments (or at locations influenced by advection of deep hydrocarbon fluids), SO42– reduction at depth is often coupled with AOM, mediated by a consortium of methanotrophic archaea and sulfate-reducing bacteria (Boetius et al., 2000):
The process of AOM generally results in quantitative SO42– consumption at a sediment depth referred to as the sulfate–methane transition zone (SMTZ). The depth of the SMTZ is primarily controlled by the upward flux of methane in underlying sediment (Niewhöner et al., 1998; Borowski et al., 1996). This process is accompanied by a pronounced increase of alkalinity and hydrogen sulfide (H2S) levels in interstitial water that typically leads to precipitation of authigenic carbonates and, in sediment with available reactive metals, sulfide mineral phases (e.g., pyrite [Fe2S]). When AOM proceeds in a SO42–-free environment away from the influence of bottom water, calcite, high-Mg calcite, and/or dolomite generally represent the dominant methane-derived carbonate phases, precipitating as nodules or cemented mudstones. In settings where SO42– is continually resupplied to the SMTZ (near the sediment/water interface) or in hydrate-bearing sediment, the authigenic carbonate mineral assemblages encountered within the sediment may also include aragonite (CaCO3), siderite (FeCO3), and ankerite (Ca[Fe,Mg,Mn][CO3]2) (Naehr et al., 2007).
The total depth range over which the remineralization reactions occur in a sedimentary sequence depends strongly on the concentration of organic matter in the environment. The concentration of sedimentary organic matter, in turn, is influenced by organic matter exposure time to oxygen (Hartnett et al., 1998), sedimentation rate (Toth and Lerman, 1977; Müller and Suess, 1979), and the productivity of the overlying water column (Müller and Suess, 1979; Suess, 1980). Although the zone of methanogenesis may be reached within several meters of the seafloor in areas with high productivity and/or high sedimentation rate (e.g., Murray et al., 1978), SO42– may remain present at depths of hundreds of meters in regions with low sedimentation rates (e.g., Ludden, Gradstein, et al., 1990). The range of depths and sedimentation rates at Expedition 363 sites (see the Expedition 363 summary chapter [Rosenthal et al., 2018b]) suggests that sedimentary organic matter concentration, and consequently, the depth scales over which different types of remineralization occur, is quite variable.
The effects of the aforementioned reactions on alkalinity and pH under typical marine sedimentary conditions are summarized in Table T26.
Table T26. Summary of sedimentary redox reactions. Download table in CSV format.
Clay mineral reactions during early diagenesis in marine sediment
Studies of the reactions and transformations experienced by clay minerals during early diagenesis at shallow (<1 km) burial depths have often relied upon inferences made from interstitial water profiles and analyses of solid-phase compositions. A few observations of in situ precipitation or reconstitution of such minerals have also been made (Michalopoulos and Aller, 1995), but available data are scarce. The difficulty of demonstrating the occurrence of clay mineral transformations during early diagenesis arises from the fact that minerals created during early diagenetic processes are also commonly created through terrestrial weathering (Chamley, 1997). The exact stoichiometry and mechanisms pertinent to clay mineral alteration in natural sediment are thus poorly known; however, a combination of studies of natural systems and the syntheses of various clay minerals in laboratory experiments provides some insight into the reactions and transformations that are likely occurring. Here, we provide a brief overview of the reactions most relevant to the main clay minerals (kaolinite, illite, and smectite) likely to be encountered from terrigenous sources near the Western Pacific Warm Pool (Gingele et al., 2001). A summary of these reactions and transformations can be found in Table T27.
Table T27. Example clay mineral transformations. Download table in CSV format.
Kaolinite is a clay mineral formed under the intense weathering regimes typical of tropical climates and is commonly transported to marine sediment as wind-blown dust or fluvial input. Upon deposition in marine settings, kaolinite may alter to one of several varieties of smectite- or illite-group clays. Of particular relevance is the alteration of kaolinite to Mg-smectite (e.g., vermiculite or saponite):
Ristvet (1978) also documents evidence for the conversion of kaolinite to a nontronite-like smectite clay by dissolution of iron oxyhydroxides and uptake of alkali and alkaline earth cations. The proposed stoichiometry, albeit complicated, is as follows:
Kaolinite may also react to form illite through uptake of potassium (K) and silica (Si):
Each of these transformations of kaolinite results in a decrease in interstitial water alkalinity through either the consumption of bicarbonate (HCO3−) or the release of protons. Consequently, changes in the degree to which these reactions occur globally may substantially alter the pH and DIC budget of the world’s oceans.
Illite and smectite commonly co-occur in marine sediment as mixed-layer illite-smectite and, if terrigenous, are commonly interpreted as products of weathering under temperate climates. These minerals typically degrade to kaolinite under more intensive weathering (e.g., Altschuler et al., 1963). Beyond the creation of these minerals from kaolinite through the representative reactions given above, Drever (1971) proposed that dissolved Mg2+ may replace nonexchangeable Fe3+ in the smectite mineral nontronite to effectively transform it to a saponite component in anoxic sediment with active SO42− reduction:
Here, X represents cations in traditionally exchangeable sites in the clay minerals. In calcium (Ca)- and magnesium (Mg)-rich environments, Ca-montmorillonite has also been found as an alteration product of silicate minerals, often in illite-smectite assemblages, and especially as a product of volcanic glass alteration (Steiner, 1967). Montmorillonite itself can be altered into illite, resulting in the exchange of K+ and Ca2+ ions.
Glauconite, an Fe- and K-rich form of illite-smectite, may also form in localized (as opposed to dispersed) concentration at or near the sediment/water interface through the uptake of K and Fe by existing clay minerals:
Although glauconite formation is most common in continental shelf and slope environments at intermediate water depths (150–300 m), it has been found as deep as 1000 m (Chamley, 1997) and could plausibly be found in material recovered during Expedition 363.
Additional diagenetic reactions, including the conversion of smectite to illite, may also occur in marine sediment. However, these reactions are generally thought to be significant only at burial temperatures that are much higher (60°C) than those encountered during Expedition 363. More information on these reactions and details on those mentioned above may be found in relevant literature (e.g., Curtis, 1985; Chamley, 1994, 1997).
Results
Volatile hydrocarbons
Headspace gas samples were taken at a frequency of one sample per core in Hole U1482A and from Cores 363-U1482C-55X through 60X as part of the routine environmental protection and safety-monitoring program (Tables T28, T29; Figure F42). Methane concentration varies between 3 and 6 ppmv from 1.5 to 97.4 mbsf, increases between 106.5 and 201.5 mbsf to a maximum of 89,775 ppmv, and then reaches a plateau with an average value of ~60,000 ppmv downhole to 380.0 mbsf. Deeper than 380.0 mbsf (cored using the XCB system), methane decreases to ~30,000 ppmv. Ethane and propane occur in trace amounts throughout the section and vary downhole similarly to methane. The methane/ethane (C1/C2) ratio abruptly increases from 106.5 mbsf to a peak at 230.5 mbsf and then gradually decreases downhole. The high methane/ethane ratio deeper than 106.5 mbsf suggests that the methane is mostly of biogenic origin rather than of thermogenic origin.
Table T28. Volatile hydrocarbon concentrations. Download table in CSV format.
Table T29. Volatile hydrocarbon concentrations. Download table in CSV format.
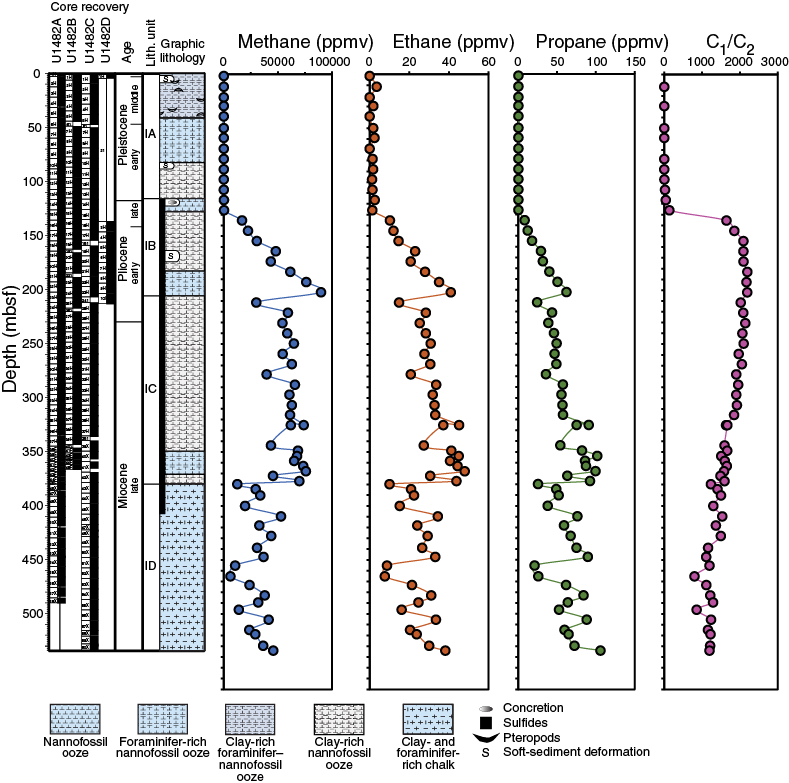
Figure F42. Methane, ethane, propane, and C1/C2 profiles.
In Hole U1482C, n-butane, iso-butane, n-pentane, and iso-pentane were also analyzed from 496.2 to 534.0 mbsf as an additional safety measurement (Table T29) and were found only in trace amounts. The calculated “gas wetness” (Haworth et al., 1985) ranges from 0.8 to 1.2, suggesting that the hydrocarbon profile at this site can be categorized as “dry gas” and imposes minimal risk to the drilling operations.
Bulk sediment geochemistry
CaCO3, inorganic carbon (IC), total organic carbon (TOC), and total nitrogen (TN) were measured on sediment samples from Holes U1482A, U1482C, and U1482D (Table T30; Figure F43). CaCO3 content ranges between 26 and 97 wt% with an average of 67 wt%. CaCO3 decreases between 0 and ~180 mbsf, with two minima identified at ~60 and ~180 mbsf. From ~200 mbsf, CaCO3 content increases downhole. The general correspondence between CaCO3 content and sediment physical properties such as color reflectance, dry bulk density, and magnetic susceptibility (see Physical properties) suggests that they all reflect variations between biogenic and terrigenous material in the Site U1482 sediment. Exceptionally low carbonate content (26.42 wt%) was found in one sample (363-U1482A-30H-6, 31–33 cm) characterized by a high abundance of detrital sand (see Core description). TOC ranges between 0.1 and 1.8 wt%, with higher values occurring in lithologic Subunit IA. Below Subunit IA, TOC decreases downhole throughout lithologic Subunit IB and then slightly increases in lithologic Subunits IC and ID. The ratio of TOC to TN (C/N ratio) ranges from 5 to 32 with an average of 15.
Table T30. Calcium carbonate and TOC contents. Download table in CSV format.
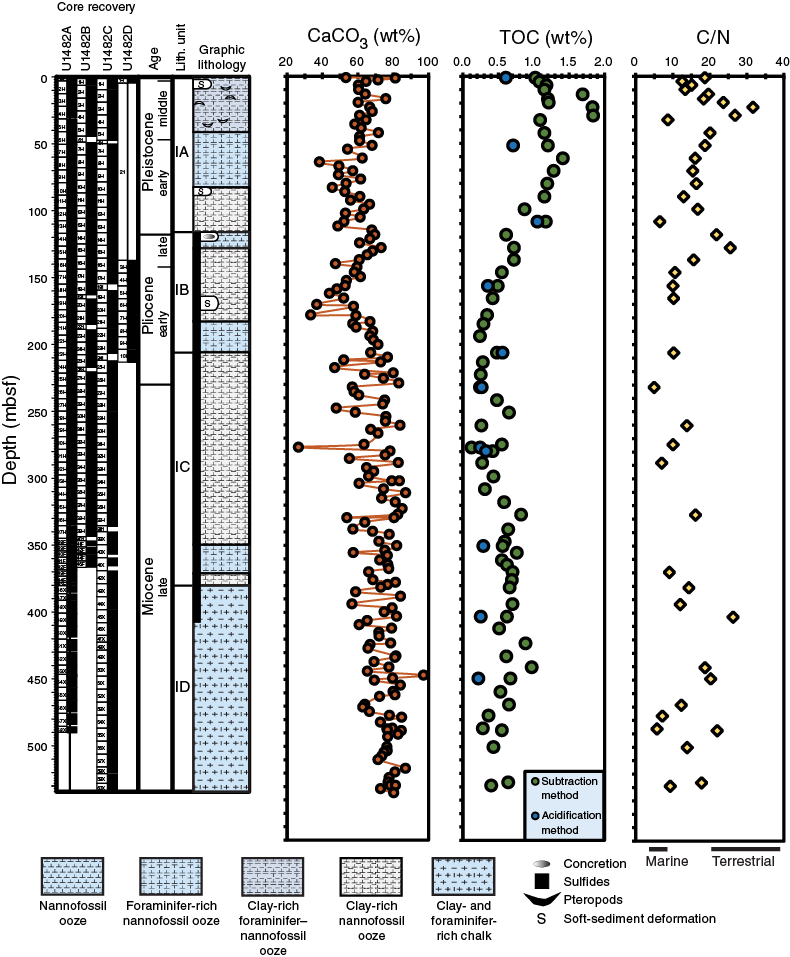
Figure F43. Calcium carbonate, TOC, and C/N profiles.
Because the standard IODP procedure of subtracting C associated with CaCO3 from the TC measured by the elemental analyzer to obtain TOC has relatively large errors when carbonate content is high (see Geochemistry in the Expedition 363 methods chapter [Rosenthal et al., 2018a]), we explored a method of acidifying the samples to remove CaCO3 and then analyzing the CaCO3-free residue to acquire TOC content. Test measurements on 11 samples show low TOC content (<1.1 wt%) throughout the hole and a gradual decrease in TOC with depth (Table T30). The discrepancies between the acidification experiment–derived TOC and the subtraction method–derived TOC could be a consequence of incomplete carbonate digestion during the coulometer measurements. The low organic matter content at Site U1482 can partially be explained by active methanogenesis and organic matter remineralization, as suggested by the methane and interstitial water geochemistry.
Interstitial water chemistry
A total of 61 interstitial water samples were analyzed at Site U1482, including 57 whole-round samples and a mudline sample from Hole U1482A, which was cored to ~490 mbsf. These samples were supplemented by four whole-round samples taken from Hole U1482C between 490 and 533 mbsf to achieve a complete interstitial water profile for the full stratigraphic succession at Site U1482. All interstitial water chemistry data are reported in Table T31.
Table T31. Interstitial water geochemical data. Download table in CSV format.
Chlorinity and salinity
Interstitial water chloride (Cl) concentration in Holes U1482A and U1482C varies by <2% from the mudline value of 553.7 mM with an average downhole value of ~556 mM (Figure F44). A shallow peak in Cl concentration was observed in the upper ~60 mbsf, followed by a decrease to 550 mM by 182.9 mbsf and a gradual increase over the remainder of the hole to ~556–562 mM. Salinity (not shown) decreases from 36 to 33 from the mudline to 116.5 mbsf, where it remains constant to the bottom of the hole. Although Cl and salinity are often closely linked, the presence of dissolved salt in interstitial water at a concentration above or below those typically found in seawater can influence interstitial water salinity profiles. The decreasing trend in salinity is thus likely driven by decreases in the SO4, Ca, K, and Mg concentrations between 0 and 116.5 mbsf. No appreciable changes in Cl or alkalinity were observed in analyses of Hole U1482C interstitial water samples compared to the values observed at the bottom of Hole U1482A.
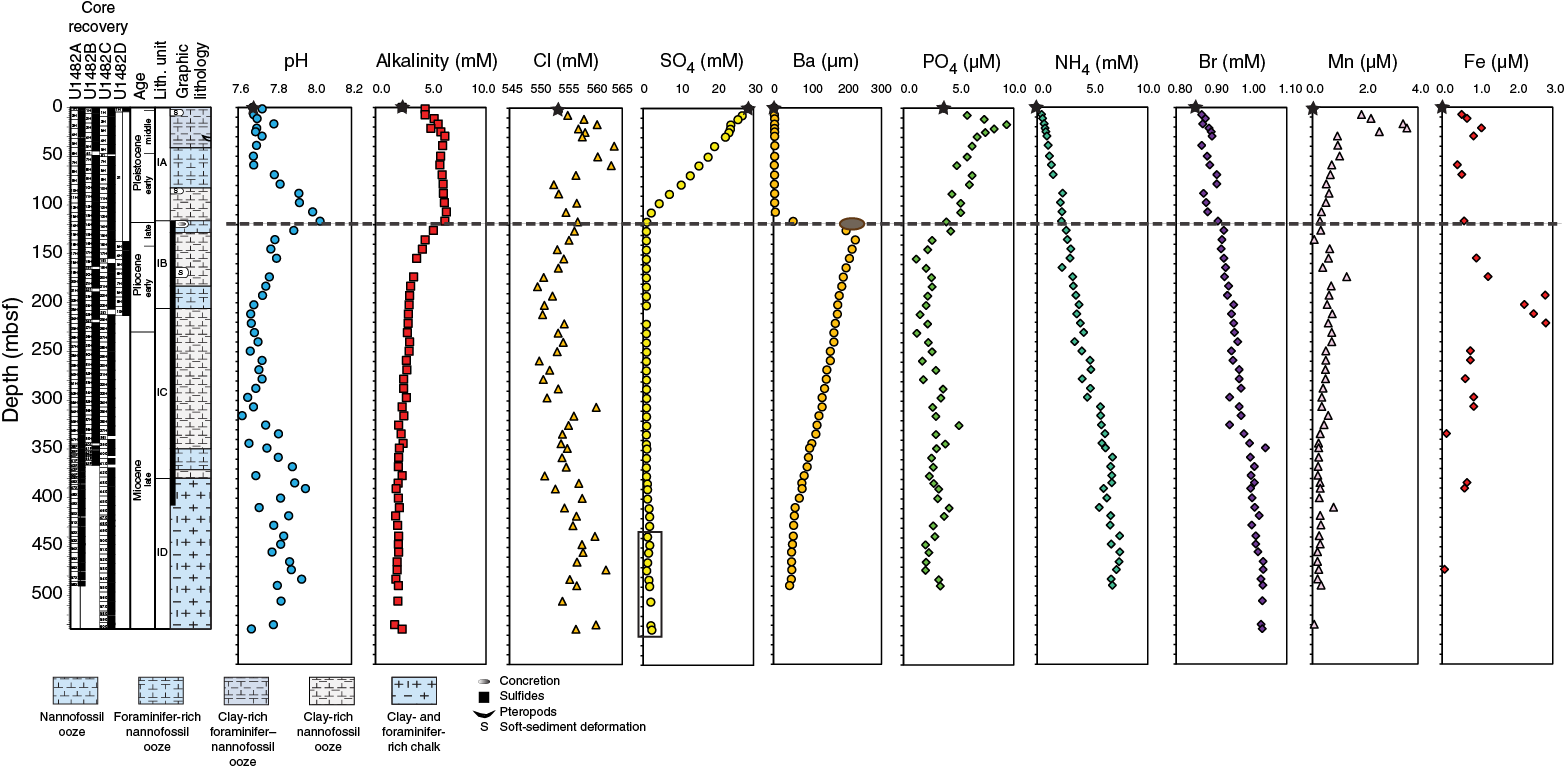
Figure F44. Interstitial water concentration profiles.
Alkalinity and pH
The alkalinity profile in Hole U1482A shows a sharp increase from the mudline value of 2.4 to 4.5 mM in the subsequent sample at 1.45 mbsf and continues to increase, reaching a peak of 6.3 mM at 29.4 mbsf (Figure F44). A small decrease in alkalinity to 5.8 mM occurs from 29.4 to 58.9 mbsf, followed by an increase to a second peak of 6.4 mM at 106.9 mbsf and finally a decrease to 3.7 mM between 116.4 and 154.4 mbsf. Between 154.4 and 367.7 mbsf, a more gradual decrease to ~2.0 mM is maintained until the bottom of the hole.
Interstitial water pH is ~7.7 in the uppermost ~59 mbsf and increases to a maximum value of 8.0 at ~106.9 mbsf, coincident with higher alkalinity values (>4.5 mM) and a steep increase in methane concentration, suggesting a change in organic matter remineralization reactions (Figure F44). pH decreases to 7.7 at 202.0 mbsf and varies between 7.7 and 7.9 to 489.3 mbsf, presumably as a consequence of methane fermentation. As with Cl and salinity, no significant changes were observed in Hole U1482C alkalinity and pH deeper than ~490 mbsf.
Sulfate and barium
SO4 concentration decreases almost linearly from a seawater-like value of ~28.6 mM at the mudline to an asymptotic value of <1 mM at 125.9 mbsf (Figure F44). The near-complete consumption of dissolved SO4 coincides with a sharp downhole increase in methane concentration (see Volatile hydrocarbons), marking this depth as the location of the SMTZ and onset of AOM (Niewhöner et al., 1998). Near-complete consumption of SO4 is also indicated by an abrupt increase in Ba concentration from 3.20 to 227.26 µM between ~107 and ~126 mbsf. The presence of dissolved Ba in anoxic interstitial water is typically controlled by dissolution of barite (BaSO4), a mineral that precipitates in highly productive surface water in the ocean (Dymond et al., 1992) and during diagenesis and hydrothermal activity in the sediment (Bolze et al., 1974; Feely et al., 1987; Torres et al., 1996; Paytan et al., 2002). In Hole U1482A, the rapid increase of dissolved Ba near the SMTZ marks the location of the barite front, above which the presence of SO4 facilitates retention of Ba in the solid phase (as barite) and below which barite dissolution occurs in the methanogenesis zone, leading to release of dissolved Ba in interstitial water (Dickens, 2001). Note that the SMTZ is marked by another unusual feature: a concretion, several centimeters in diameter, consisting of calcite and barite in nearly equal proportions (brown ellipse in Figure F44) (see Core description).
Phosphate, ammonium, and bromide
PO4 concentration increases from 3.6 µM at the mudline to a peak value of 9.4 µM at 16.9 mbsf and subsequently decreases to ~2.0 µM over the upper ~150 mbsf of Hole U1482A (Figure F44). A slight increase in SO4 concentration to a relatively constant value of ~3.0 µM occurs from ~250 to ~350 mbsf. The peak PO4 concentration in the upper 20 mbsf is likely associated with oxic and suboxic remineralization of sedimentary organic matter. Curvature at several points in the profile also indicates SO4 uptake, perhaps by adsorption to clay minerals (Pomeroy et al., 1965) or small amounts of diagenetic apatite precipitation (Froelich et al., 1988). Ammonium (NH4) and bromide (Br) concentrations both increase in a monotonic manner with depth (Figure F44) (r2 = 0.91), suggesting both of these ions are released during the progressive remineralization of organic matter (Price and Calvert, 1977).
Manganese and iron
Mn concentration abruptly increases from the mudline to a maximum of 3.58 µM at 21.3 mbsf within the zone of suboxic organic matter remineralization, sharply decreases to 0.95 µM at 29.4 mbsf, and then more gradually decreases to 0.07 µM at 135.4 mbsf, near the depth of the SMTZ (Figure F44). A small increase in Mn occurs between ~135 and ~173 mbsf, after which concentration decreases with depth. Fe exhibits very low background concentration (0 to ~1.0 µM) and small downhole variability. A small Fe increase to 1.06 µM at 21.3 mbsf, coincident with maximum Mn concentration, is most likely associated with dissolution of Fe-Mn oxyhydroxide phases. The low Fe concentration is attributable to pyritization; observations of pyrite in smear slides, as well as discrete grains observed in the coarse sediment fraction and as pyritization of foraminifer tests (see Core description and Biostratigraphy) suggest efficient scavenging of Fe2+ by H2S to form Fe2S at this site (black bar on the graphic lithology column in Figure F44).
Fe concentration increases to a maximum ~2.8 µM at ~225 mbsf, where a small change in lithium (Li) was also observed. Although small, the increase is coincident with a drop in methane and might indicate partial dissolution of detrital minerals under anoxic conditions and/or ion exchange with clay minerals. Soft-sediment deformation also observed near this depth (165–175 mbsf) in the cores (Figure F44) is described as a denser layer consisting of finer clay minerals relative to the sediment above and below the interval of soft-sediment deformation (see Core description and Physical properties). This change in lithology could introduce a disparate set of sediment and interstitial water to the in situ chemical environment, catalyzing a shift in chemical reaction rates or processes. Alternatively, the clay-rich layer could act as a “cap,” influencing reaction rates or interstitial water diffusion above/below the deformed layer.
Potassium, magnesium, and calcium
K and Mg follow similar trends with depth, gradually decreasing to ~20% of their initial values over the length of the sediment sequence (Figure F45). K concentration is higher than the seawater (mudline) concentration, indicating a source of K to the sediment, whereas Mg concentration falls at or below seawater Mg (Table T31). The downhole decrease of both K and Mg is steepest between ~50 and ~150 mbsf, and stoichiometric relationships between the concentrations of these ions suggest that a common process (e.g., clay mineral ion exchange; see Clay mineral reactions during early diagenesis in marine sediment) is affecting both.
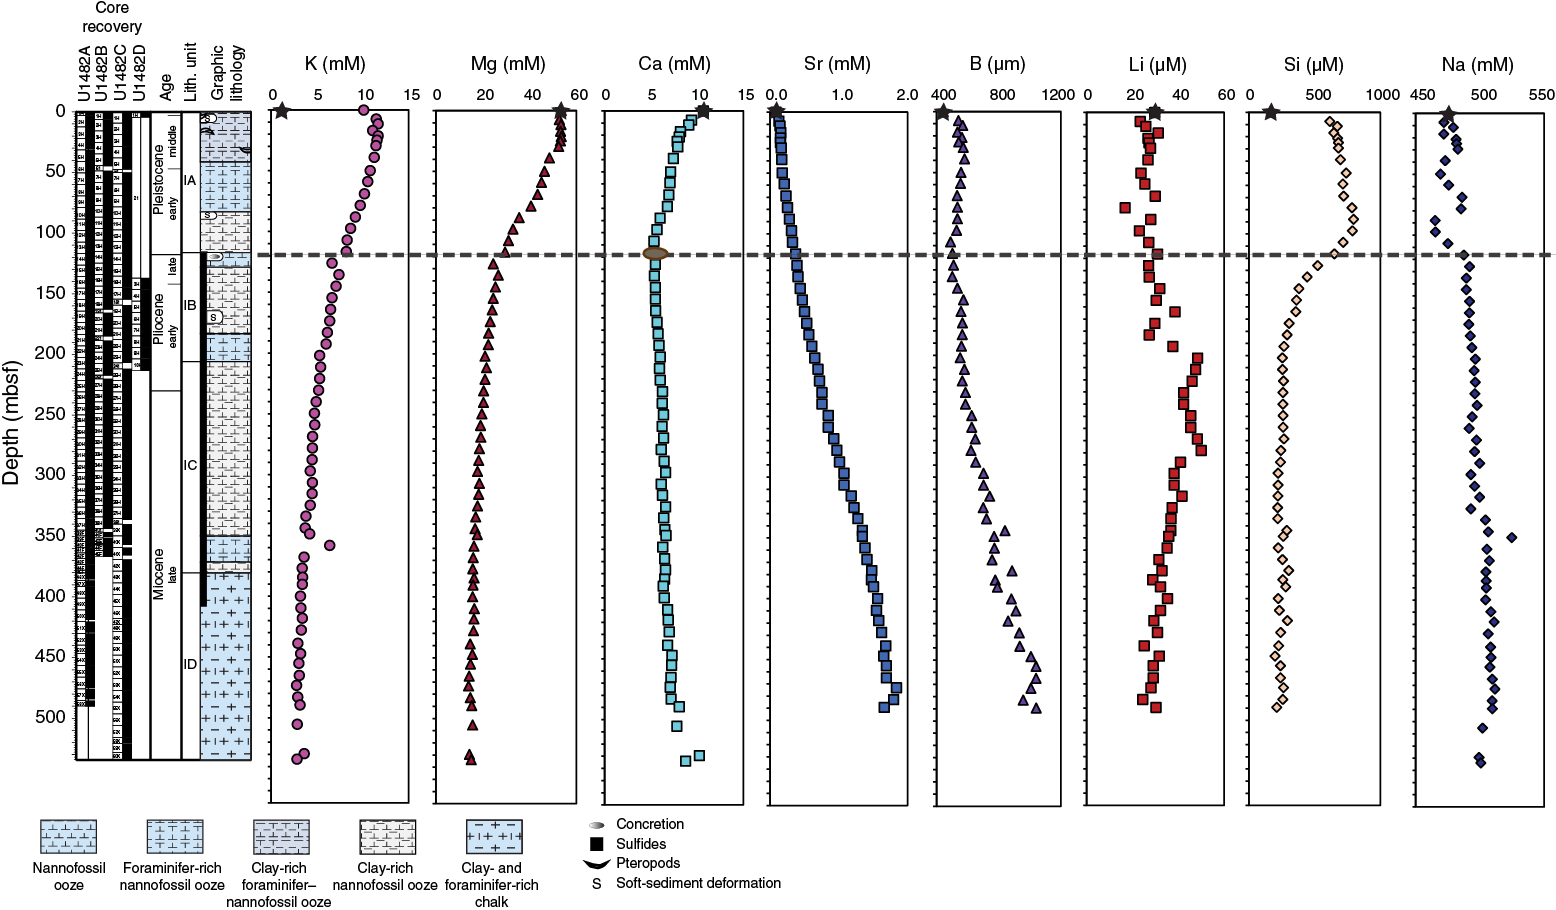
Figure F45. Interstitial water concentration profiles.
Ca concentration decreases from 10.66 to 7.83 mM in the upper ~25 mbsf with little to no change in Mg over the same interval (Figure F45), which may indicate that precipitation of diagenetic calcite driven by organic matter remineralization and/or preferential Ca uptake by clay mineral ion exchange are occurring in the uppermost sediment. Minimum Ca values of 5.32–5.30 mM were observed between 106.9 and 116.4 mbsf, indicating that active precipitation of authigenic calcium carbonate takes place near the SMTZ, supported by the presence of the calcite- and barite-bearing authigenic concretion at this depth. Deeper than 116.4 mbsf, Ca concentration steadily increases downhole to average values of 8.72 mM in the lower ~40 m of the hole coincident with the decreases in K and Mg.
Strontium and boron
Strontium (Sr) in interstitial water is often used as a qualitative indicator of CaCO3 preservation state (e.g., Edgar et al., 2015). Behavior of Sr is similar to Ca, and its mobility is mainly related to carbonate diagenesis. Sr is released from marine carbonates into interstitial water by calcite dissolution and readily excluded from inorganic calcite upon reprecipitation, resulting in an overall Sr increase in the interstitial water with depth (Baker et al., 1982; Richter and Liang, 1993); such an increase (from 0.09 mM to 1.84 mM) is observed here (Figure F45) and presumably relates to Sr exchange through CaCO3 dissolution and recrystallization. The Sr profile stabilizes near the base of Holes U1482A and U1482C, suggesting equilibrium between interstitial water and sediment is reached at depth and diagenetic alteration of foraminifers may be occurring.
Boron (B) in interstitial water relates to pH, carbonate and silica diagenesis, adsorption/desorption interactions with clay minerals, and basaltic alteration (Ishikawa and Nakamura, 1993; Spivack et al., 1987). B increases from ~440 µM at the mudline to a maximum of ~1040 µM at 489.3 mbsf (Figure F45), notably deeper than the maximum Sr concentration.
Lithium, silica, and sodium
Interstitial water Li concentration is relatively constant at ~27 µM with small variations up to 3 µM in magnitude to 135.4 mbsf (Figure F45). Li increases to ~50 µM at 202.0 mbsf and remains elevated to 278.0 mbsf, a trend that could reflect cation exchange with NH4 released during breakdown of organic matter and/or dissolution of reactive silicate minerals under anoxic conditions (Zhang et al., 1998; Wallmann et al., 2008). Deeper than 278.0 mbsf, Li gradually decreases to ~25 µM, possibly as a result of clay authigenesis during reverse weathering (Zhang et al., 1998). Si concentration progressively increases from 615.5 µM at 4.5 mbsf to 788.1 µM at 106.9 mbsf, reflecting early diagenetic release of dissolved silica under alkaline conditions associated with remineralization of organic matter (Figure F45). Deeper than 106.9 mbsf, Si concentration decreases to ~255 µM at 202 mbsf and then remains nearly constant to the base of Hole U1482A.
Discussion
The interstitial water profiles in the upper ~120 m of sediment are largely controlled by remineralization of organic matter. Increases in alkalinity, along with the Mn, SO4, Ba, and methane profiles, illustrate the progression from suboxic organic matter degradation (Mn reduction) to anoxic organic matter degradation (SO4 reduction) in the upper 120 mbsf, followed by a switch to fermentation and methane production at ~120 mbsf. Curvature in the SO4 and Mn concentration profiles (Figure F44) suggests that the first alkalinity peak at 29.4 mbsf is due to the combined effects of SO4 and Mn reduction, whereas the second peak at 106.9 mbsf is associated with intensified SO4 reduction at the SMTZ. The presence of a calcite-barite concretion suggests a Ba front at the SMTZ and precipitation of authigenic calcite.
Decreasing Ca and increasing Sr over the upper ~120 mbsf are suggestive of diagenetic calcium precipitation; however, excellent foraminifer and nannofossil preservation at this site argues against significant alteration of biogenic calcite for most of the collected sediment sequence (see Biostratigraphy). It is therefore possible that active calcite precipitation is minor to moderate, only becoming significant below 490 mbsf, and that the Ca interstitial water profile is also influenced by formation of Ca-bearing clay such as montmorillonite. Profiles of K, Mg, PO4, Si, and B also support clay mineral diagenesis and/or authigenesis as an influence on the profiles below the SMTZ.
Downhole measurements
Logging operations
Logging operations began at the completion of coring in Hole U1482C. The hole was flushed with seawater, and the end of the pipe was raised to 74.7 m DSF in preparation for two logging runs using the triple combo and FMS-sonic tool strings (see Downhole measurements in the Expedition 363 methods chapter [Rosenthal et al., 2018a]). The weather was calm with an average heave of ~0.5 m, so the wireline heave compensator was not used.
Triple combo tool string
The triple combo tool string consisted of the magnetic susceptibility sonde (MSS), High-Resolution Laterolog Array (HRLA), Hostile Environment Litho-Density Sonde (HLDS), Accelerator Porosity Sonde (APS), Hostile Environment Natural Gamma Ray Sonde (HNGS), and Enhanced Digital Telemetry Cartridge–logging equipment head-mud temperature (EDTC-LEHMT). The triple combo downlog began at 0443 h (all times are local ship time; UTC + 8 h) on 24 October 2016. Seafloor was verified at 1476.5 mbsl, and there was no difficulty passing the tool string out of the pipe and into the open hole. The tool string reached the bottom of the hole at 533.4 m wireline logging wireline depth below seafloor (WSF). An ~100 m uphole log run for instrument verification showed no issues, and after a return to bottom the second uplog run began with an increase in wire tension indicating lift off at 533 m WSF. The Lamont-Doherty Earth Observatory (LDEO) MSS measured the bottom-hole temperature at 16.9°C. Comparison with the 100 m section logged during the first test run showed good agreement for all tools, and the uphole log continued at 550 m/h without any issues other than three stops to clear wireline wraps on the logging reel. These stops, which called for closing the caliper while cable was spooled out, occurred at 345–344, 343–339, and 265–261 m WSF. Reentering the pipe took 2 h of working the winch, circulating seawater, and rotating the pipe; the latter procedure appeared to be the most successful. During that time, the active source in the APS continued to irradiate the formation and led to elevated gamma ray readings at this depth on the second tool string run. Difficulty reentering the BHA was also encountered at the end of that second logging deployment. The Schlumberger engineer concluded that drilling slurry at the base of the hole had probably stuck to the tools and restricted the centralizer bowsprings from closing completely. The tool string returned to the rig floor at 1040 h with no apparent damage.
FMS-sonic tool string
The FMS-sonic tool string consisted of the Formation-MicroScanner (FMS) and the Dipole Shear Sonic Imager (DSI). The FMS-sonic downlog began at 1400 h. The seafloor was identified at ~1476 m wireline depth below rig floor (WRF) and, following an uneventful passage through the BHA into open hole, the tool string was lowered to ~517 m WSF. The uplog started at 516.7 m WSF. The calipers were slow to open and appeared to have encountered dense mud over the lowermost 25 m of the logging run. Shortly off bottom, Pad A of the FMS tool started registering resistivity values out of range of the other three; this discrepancy continued for the remainder of the run. There were no other remarkable events other than the expected drop-out in both P- and S-wave detections in the soft sediment in the upper 150 m WSF of the hole. The tool string was lowered to the bottom, and a second uplog began at 510 m WSF, with Pad A of the FMS continuing to exhibit out-of-range values. As this second uplog run neared the end of the pipe, the latter was raised to 67.7 m DSF to extend the open hole for FMS-sonic logging as much as possible. Working the tool string into the pipe and past the BHA was again a 2 h effort. An electrical issue temporarily ended recording inside the pipe at 20.4 m WSF. The FMS-sonic tool string was retrieved to the rig floor at 2100 h and logging operations ended with the tool string rig down at 2215 h on 24 October.
Log quality
Shortly after all data were recorded and backed up and the observer’s log was completed, all logging data were uploaded to the processing facility at LDEO. There, the data were reviewed for quality assurance/quality control (QA/QC), the seafloor was identified at 1476.5 m WRF (detected through the drill pipe by the gamma ray log), all other logs were depth-matched to that gamma ray log, and the FMS data were processed. The data were then returned to the ship.
Caliper values, measuring the diameter of the borehole, provide a first-order measure of log quality (Figure F46). Hole U1482C was 12–16 inches in diameter from below the pipe to ~250 m wireline matched depth below seafloor (WMSF) with a few intervals (<1 m) of larger washouts. Below ~340 m WMSF, the borehole wall was uniform and only slightly larger than the bit (11⁷⁄₁₆ inches). Data from logging tools that required good contact with the borehole wall (e.g., neutron density, porosity, and FMS) were affected in the upper half of the borehole, but overall the hole was in good condition and the logging data are of good quality.
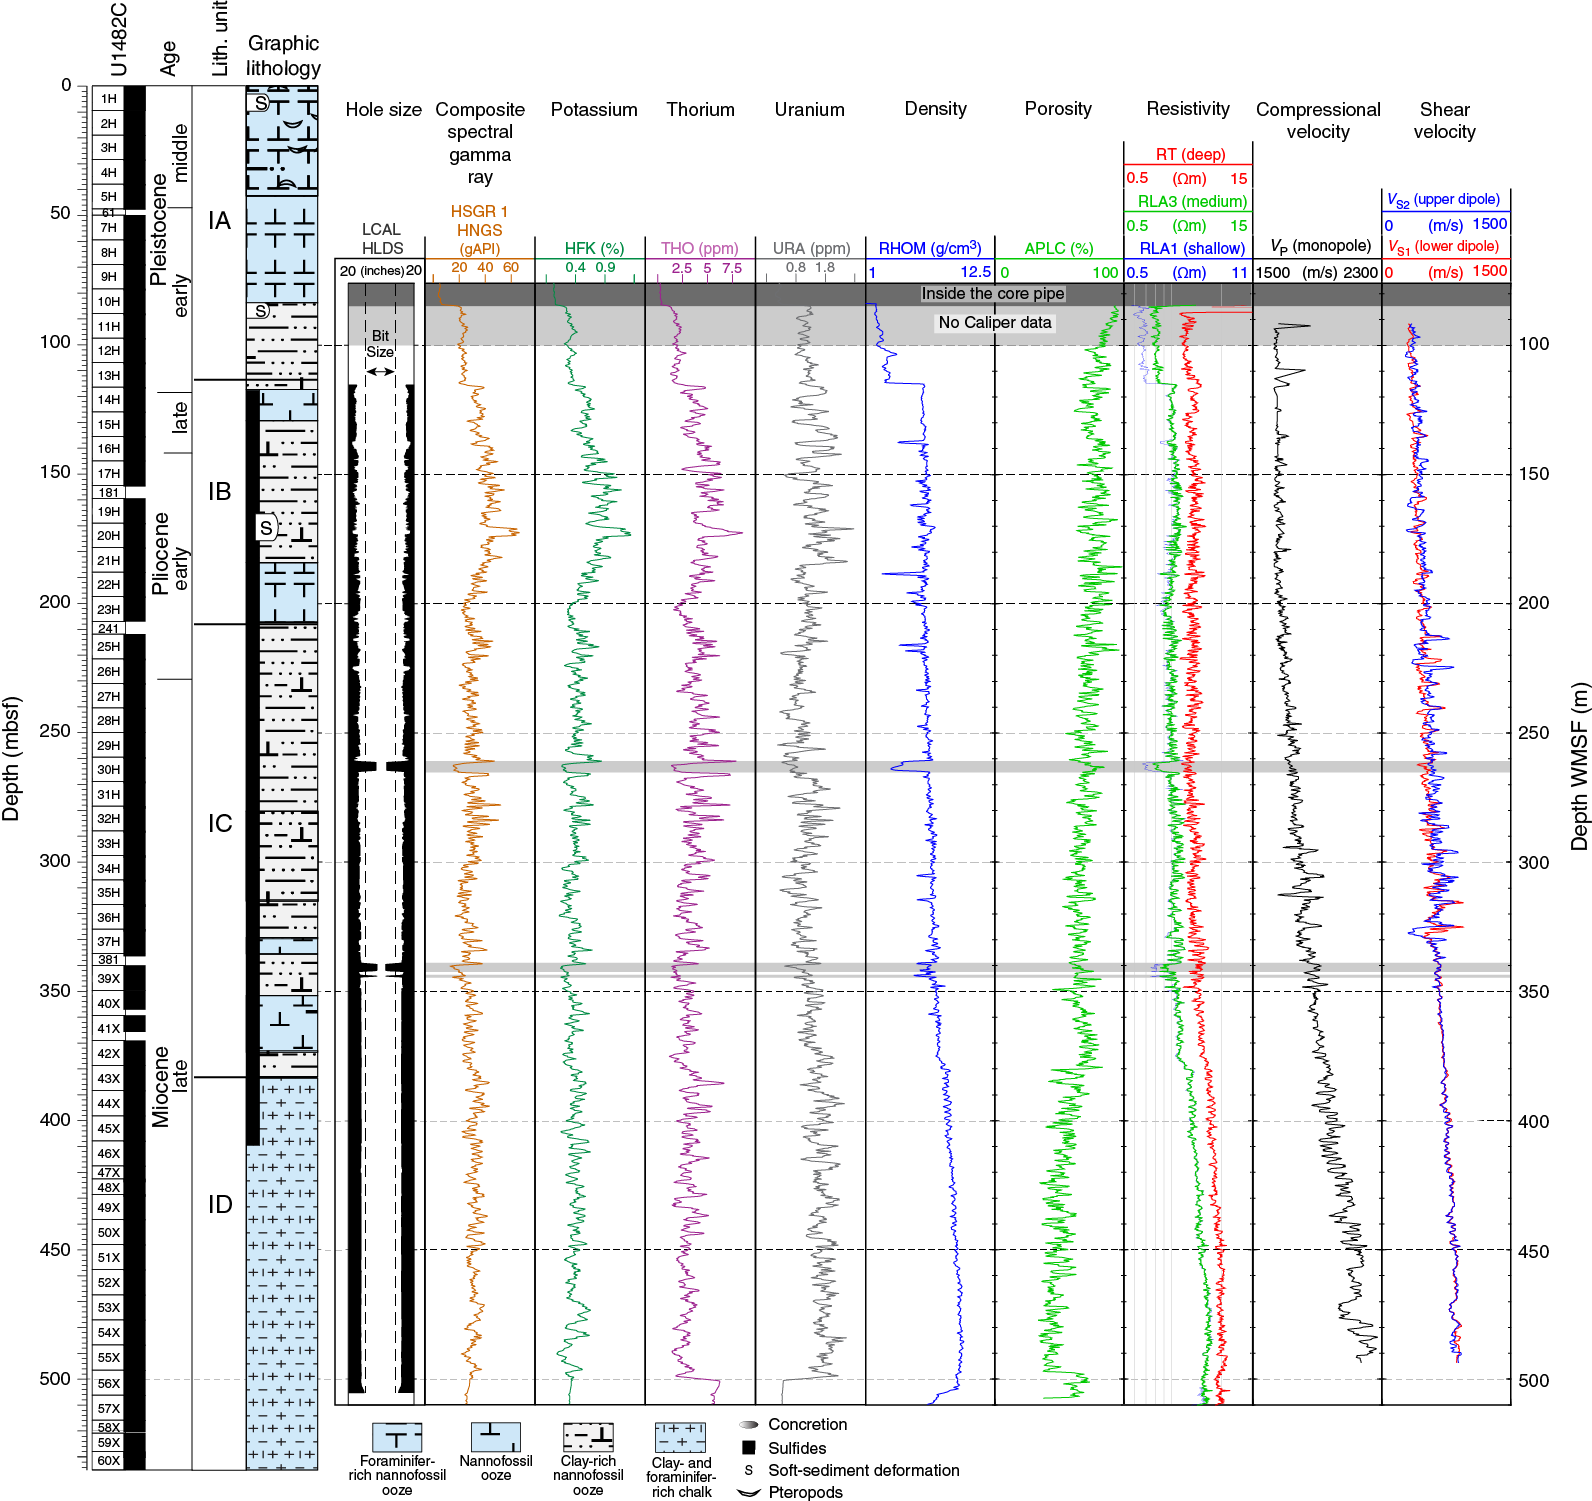
Figure F46. Logging summary.
Three specific issues affected data quality:
- FMS Pad A had electrical problems that caused readings to be far out of scale from the other three pads. Reliable data appear to have been recovered in shore-based processing at LDEO, but this issue should be taken into account when using the data.
- The extended time devoted to reentering the pipe at the end of the triple combo run resulted in slightly elevated NGR counts at that depth during the second FMS-sonic uplog.
- Three interruptions caused by bad wraps on the logging reel meant that the logging winch had to be stopped and unwound a few meters before triple combo uplog operations could resume.
The caliper arms had to be retracted during the downhole pay-out. This resulted in having to ignore measurements of neutron density, porosity, and resistivity (and perhaps other logs as well) at 261–265, 339–343, and 344–346 m WMSF. In all other respects, the logging tools performed well, and good wireline data were recorded largely without interruption.
Results
Caliper
As noted in Log quality, the borehole diameter from the end of the pipe to ~250 m WMSF was 12–16 inches and sometimes larger. The diameter decreased gradually over the next 100 m (to ~350 m WMSF) and remained slightly above gauge for the rest of the hole (Figure F46). Coring in Hole U1482C switched from APC to XCB recovery at 340 mbsf, where the borehole diameter abruptly becomes uniform. This change is within the lower part of lithologic Subunit IC, ~40 m above the top of lithologic Subunit ID (see Core description). The more indurated nature of Subunit ID is marked by an abrupt change in other log data at 380 m WMSF discussed below. The three zones of apparently 4 inch diameter borehole at ~261, 339, and 344 m WMSF are an artifact and represent intervals where the caliper arms had to be retracted while wire wraps on the take-up reel were adjusted.
Natural gamma radiation
The gamma log shows relatively low values (~5–70 gAPI) throughout Hole U1482C (Figure F46), consistent with the relatively high biogenic carbonate and lower clay content of the sediment cored at this site (see Core description). The interval from 118 to 207 m WMSF shows higher NGR values than the remainder of the hole, rising toward the highest values of the site near the middle of that interval from 170 to 174 m WMSF (Figure F46). The entire 89 m interval coincides with the more clay-rich lithologic Subunit IB, and the central peak value matches a unit of visibly deformed sediment (see Core description). The intervals from 212 to 220 and 275 to 288 m WMSF are the only other occurrences of notably elevated NGR values; both are in lithologic Subunit IC. Shipboard NGR measurements show patterns similar to the composite downhole NGR log (Figure F47).
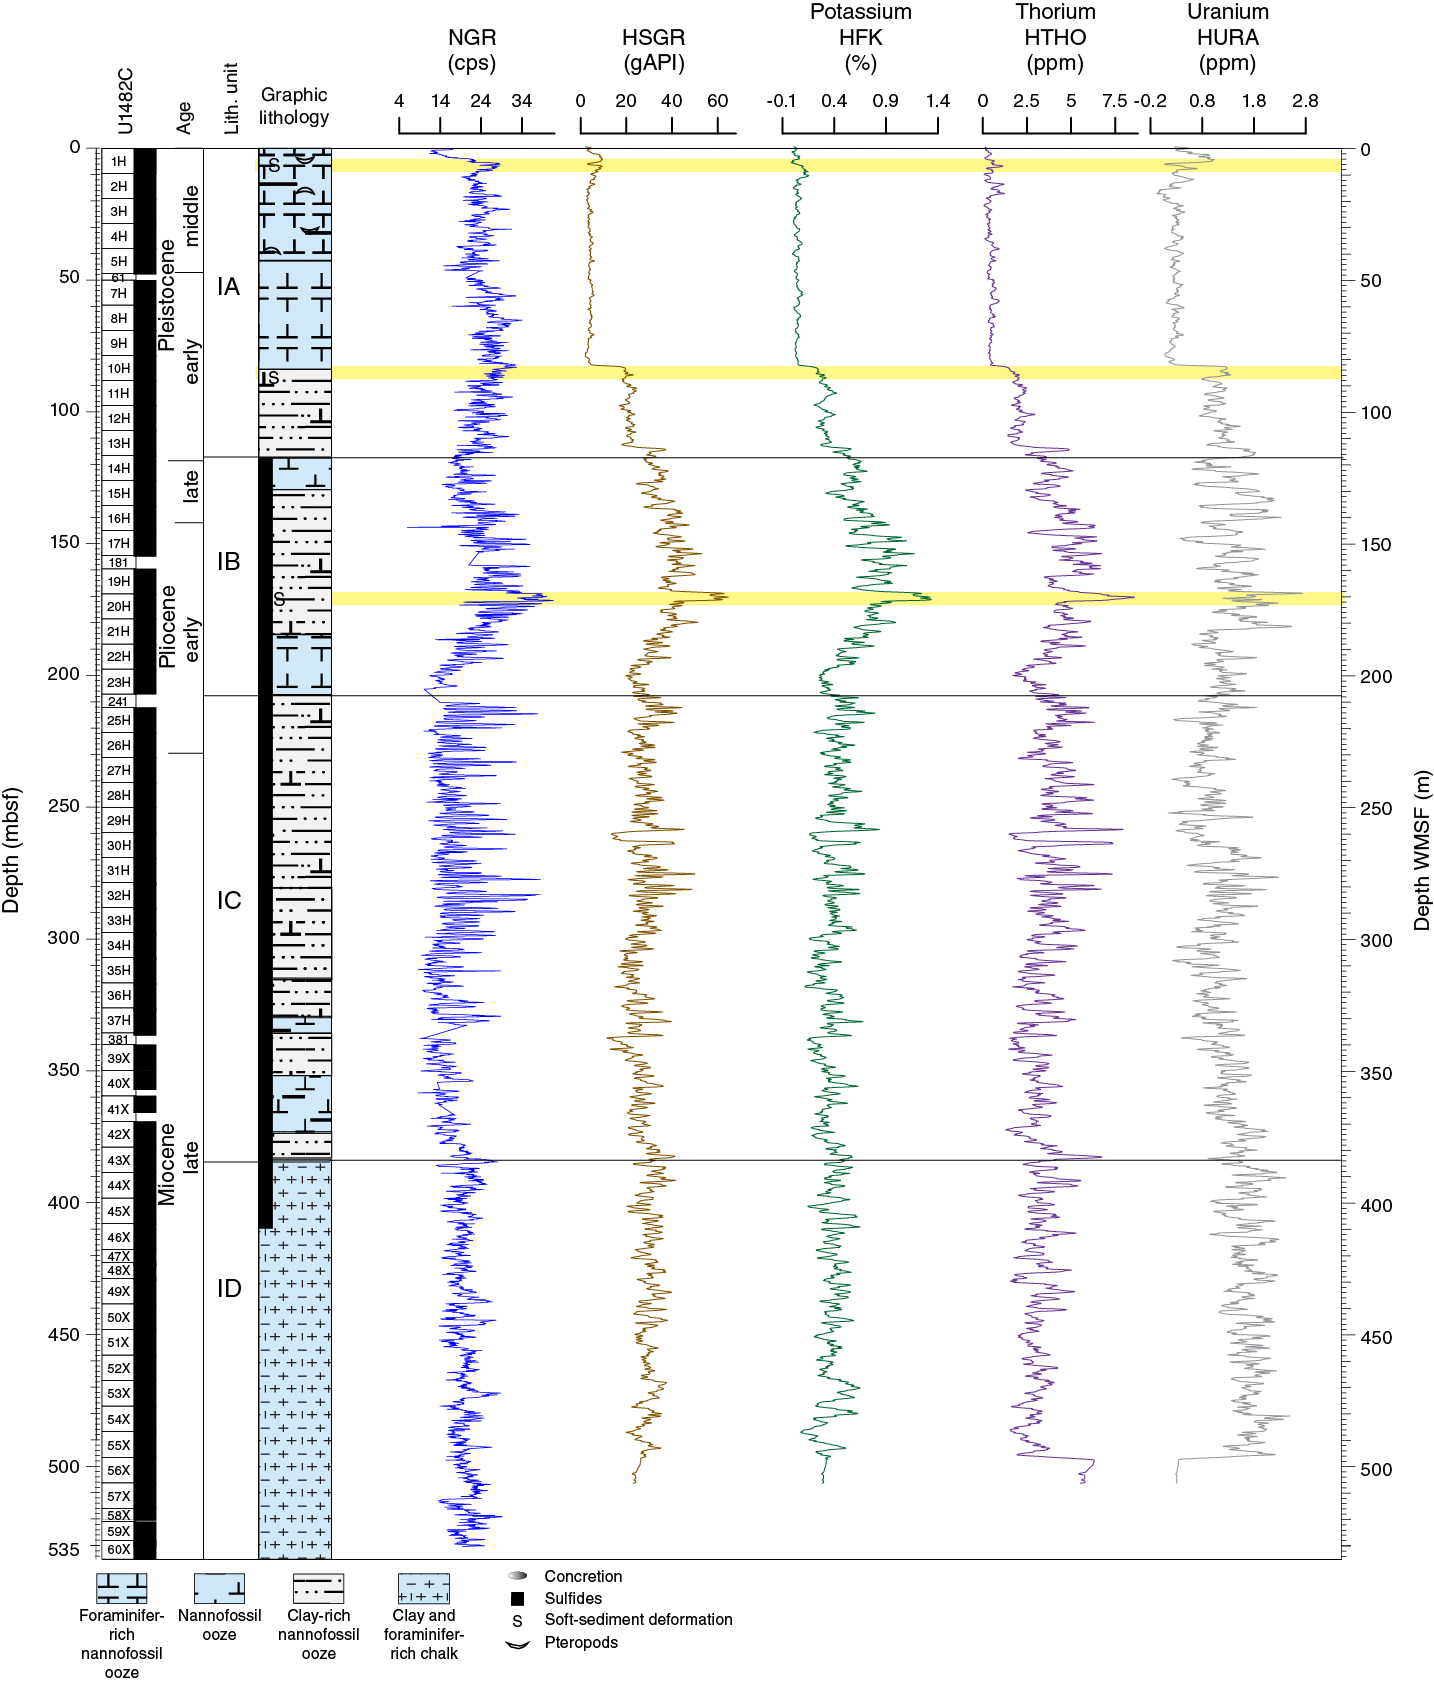
Figure F47. Natural gamma radiation.
Gamma ray detections were divided into three spectral ranges that distinguish the contributions of the naturally occurring radioactive isotopes of potassium, thorium, and uranium. Values in each spectral window are scaled independently in Figures F46 and F47, and all show the low values typical of carbonate-dominated sediment. However, a few trends are noted. The peak from 170 to 174 m WMSF (mentioned above) shared by K and Th suggests a clay-mineral concentration in the center of the deformed interval that spans from 118 to 207 mbsf, and the contribution of Th to the gamma ray peak at the base of Subunit IC (~370–385 m WMSF) suggests a change in clay type. There is a subtle downward increase in U values deeper than 300 m WMSF.
Density
Neutron density log values are degraded by an enlarged borehole, and this pattern can be seen downhole to ~340 m WMSF (Figure F46) in direct correspondence with the caliper record. Below this depth, where the XCB system was used, the caliper shows that the borehole was more consistently in-gauge and remained so to the bottom of the hole. Wireline log density is more uniform in the section cored with the XCB system. There is a stepwise increase in density and further decrease in density irregularities at 380 m WMSF, corresponding to the top of lithologic Subunit ID. This subunit is dominated by chalk (see Core description), and postdepositional precipitation of carbonate minerals likely reduced the porosity, leading to the observed downhole increase in density.
Figure F48 compares wireline density data to core GRA bulk density and discrete bulk density (MAD) measurements made on the ship (see Physical properties). Wireline log density shallower than 200 m WMSF is highly variable and more scattered than the two sets of shipboard measurements at corresponding depths. Both GRA density and MAD data become increasingly scattered from this depth to the base of the APC interval at 340 mbsf and then appear to be more stable when measured on cores collected using the XCB. However, in the interval from 340 mbsf to the base of the hole, both sets of shipboard-derived density values record lower density than the wireline log measurements. One other interval of interest is across the switch from APC to XCB coring (340–360 mbsf). In this depth range, the shipboard core-based measurements show a clear decrease in density, whereas the log values do not. This discrepancy is probably a result of slightly narrower gauge core and/or small amounts of drilling slurry surrounding fragments of core broken into biscuits in XCB cores (the GRA bulk density data were not corrected for the smaller diameter of XCB cores; see Physical properties).
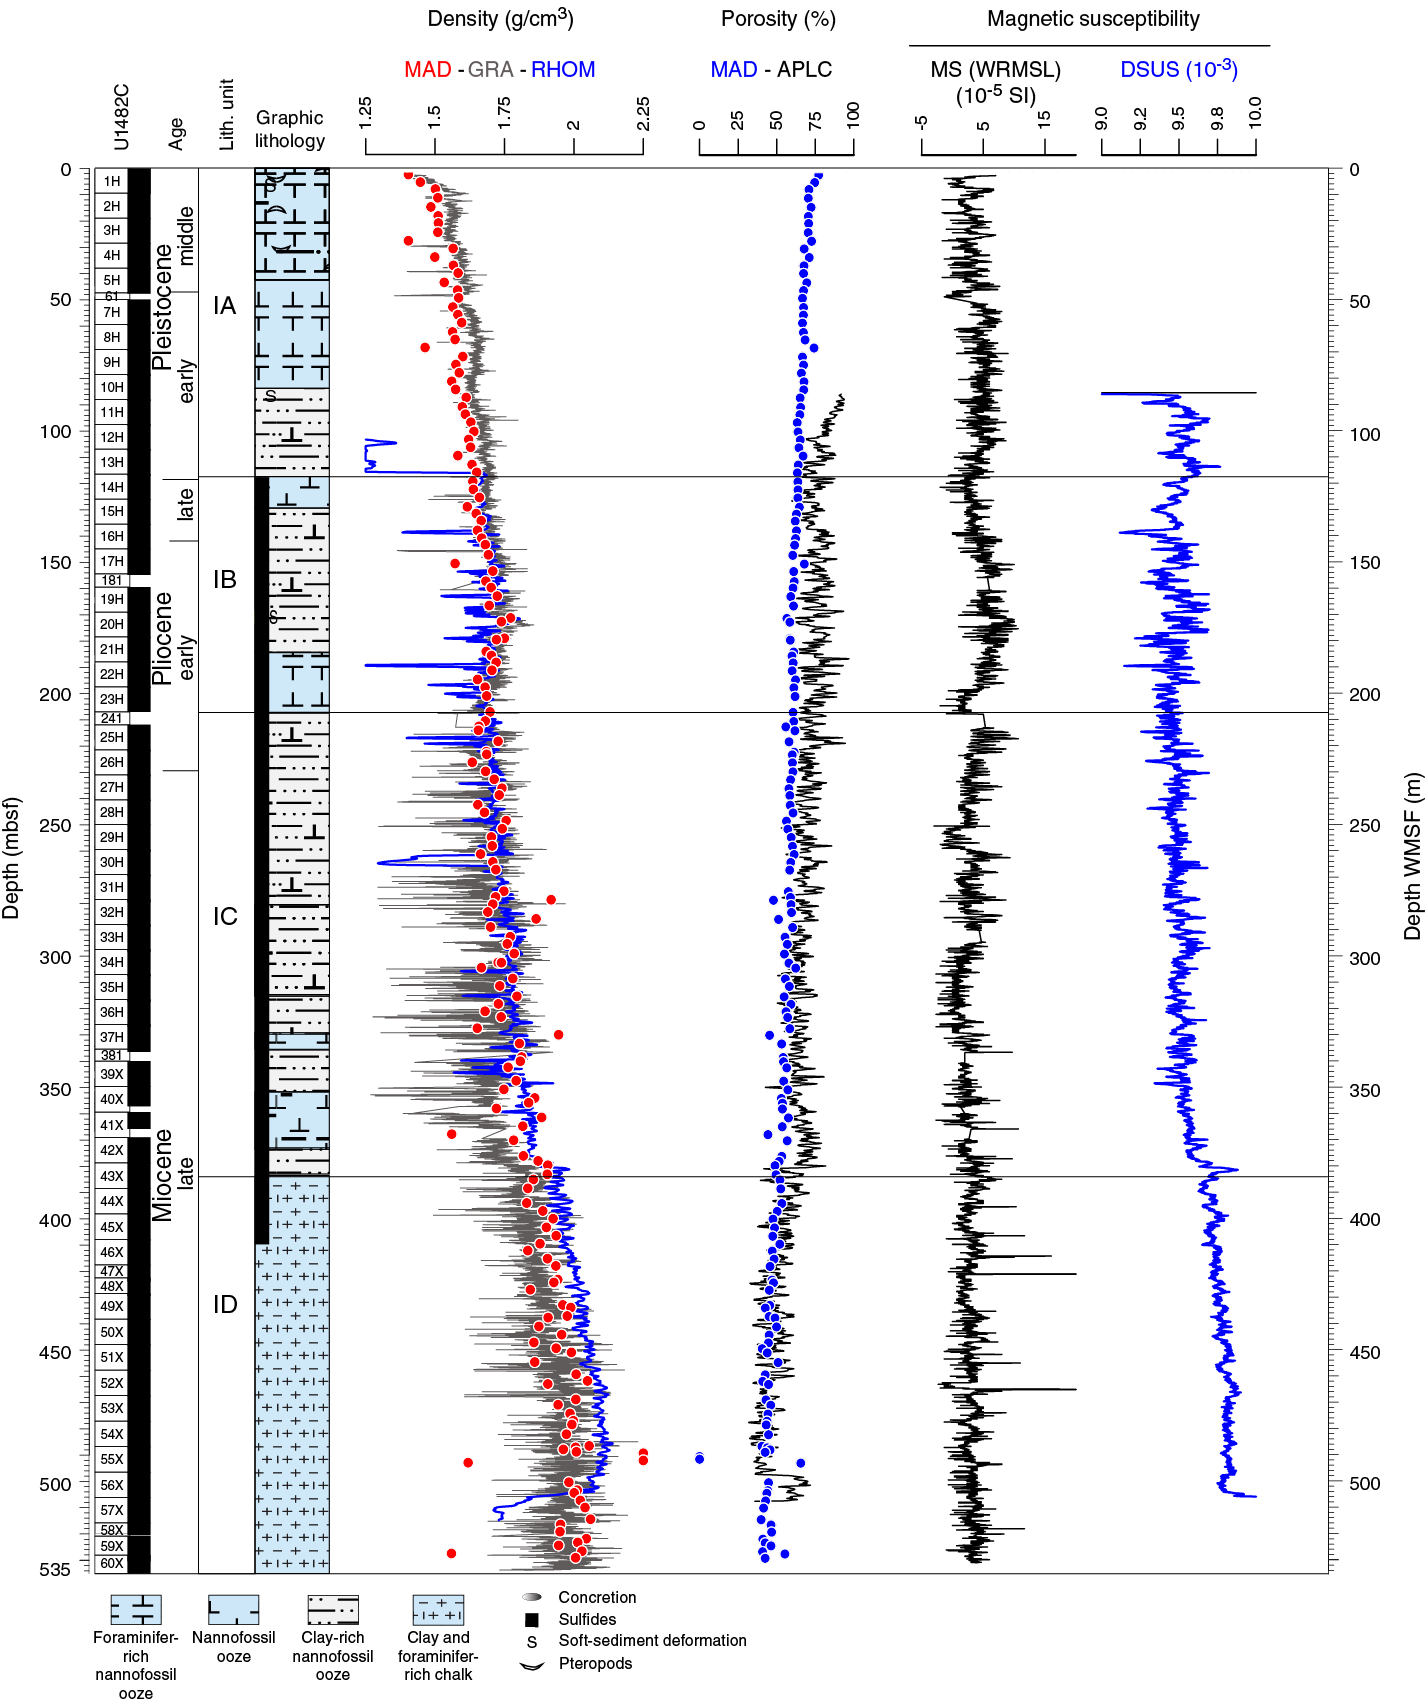
Figure F48. Wireline log measurements compared to sediment core measurements.
Porosity
Wireline log porosity data (Figure F46) mirror the trends of the wireline log density data, decreasing with increasing depth. The same step-wise change occurs at the top of lithologic Subunit ID. Log porosity data are compared to core-derived MAD porosity measurements in Figure F48. The latter reveal lower values than the wireline measurements, although the two nearly linear trends converge at ~400 mbsf and are in very close agreement below this depth. The lower values of the MAD data could be due to water loss following coring, the effect of which is more significant in the high-porosity sediment toward the top of the borehole.
Compressional wave velocity
P-wave velocities were measured by the sonic tool in the second tool string and are plotted with the triple combo tool data in Figure F46. There were four intervals with no detected pulse in the upper 140 m WMSF of the logged section; no interval was longer than 4 m, and each was filled with linearly interpolated values. Velocities increase with depth very gradually from the top of the log to 200 m WMSF and then show a steeper increase with depth and an increase in variability. The interval from 290 to 325 m WMSF shows several abrupt swings in velocities that have no match in other log measurements or core observations. There are many apparently cyclic variations, ±50 m/s in ~5 m cycles, in the 390–450 m WMSF interval that deserve careful postcruise comparison with other measures of physical properties in the cores. There are also several large and abrupt changes in velocity from ~425 m WMSF to the bottom of the hole that may contribute to the series of strong seismic reflections in profiles at the presumed base of our drill site.
Magnetic susceptibility
Magnetic susceptibility measured with the MSS is plotted in Figure F48 with WRMSL measurements made on whole-round cores. No temperature corrections were applied to the log values. Shore-based analysis is needed to bring these two data sets in line and provide meaningful comparisons.
Formation MicroScanner
FMS images can provide true strike and dip of fine-scale bedding and can be used to identify intervals or inclusions of markedly distinct conductivity. The quality of the images are susceptible to degradation in areas of enlarged borehole diameter. Hole U1482C proved challenging in two regards: there were (1) washouts in the upper part of the borehole and (2) structurally uniform, fine-grained deposits throughout the drilled interval with minimal indicators of bedding. As a result, the overall FMS data were of intermediate quality. Additional shore-based processing may enhance the features noted in our preliminary assessment and uncover others. A side-by-side comparison of the two uphole runs of FMS logging images shows remarkable similarities. The two runs show twists in the paths of the four pads that mimic one another so closely that for much of the logged interval the separate runs are nearly identical. This attests to the repeatability of FMS imaging but reveals that two runs may not provide significantly more coverage of the borehole wall than a single run.
Figure F49 shows close-up comparisons of two intervals of FMS data and core photos from Hole U1482C. The top panels show evidence of distinctive bedding at 172 m WMSF in two of the four FMS pads (blue rectangle in Figure F49B). Nearly horizontal features become more obvious at 173 m WMSF across all four pads. This contrasts with the absence of horizontal structures 1.5 m shallower, slightly below 170 m WMSF (red rectangle in Figure F49B). The line-scan image of three sections of Core 20H shows faint and nearly horizontal bedding in Section 20H-2 (blue rectangle in Figure F49A) and obviously folded and overturned bedding in Section 20H-1 (red rectangle in Figure F49A). The depths of these color-coded rectangles (one based on the mbsf depth scale and the other on the WMSF depth scale) are within 1 m of each other. Comparison of core photos to FMS data suggests that if additional FMS image improvement could be achieved postcruise, the FMS data may help to characterize features of the disturbed bedding encountered at Site U1482.
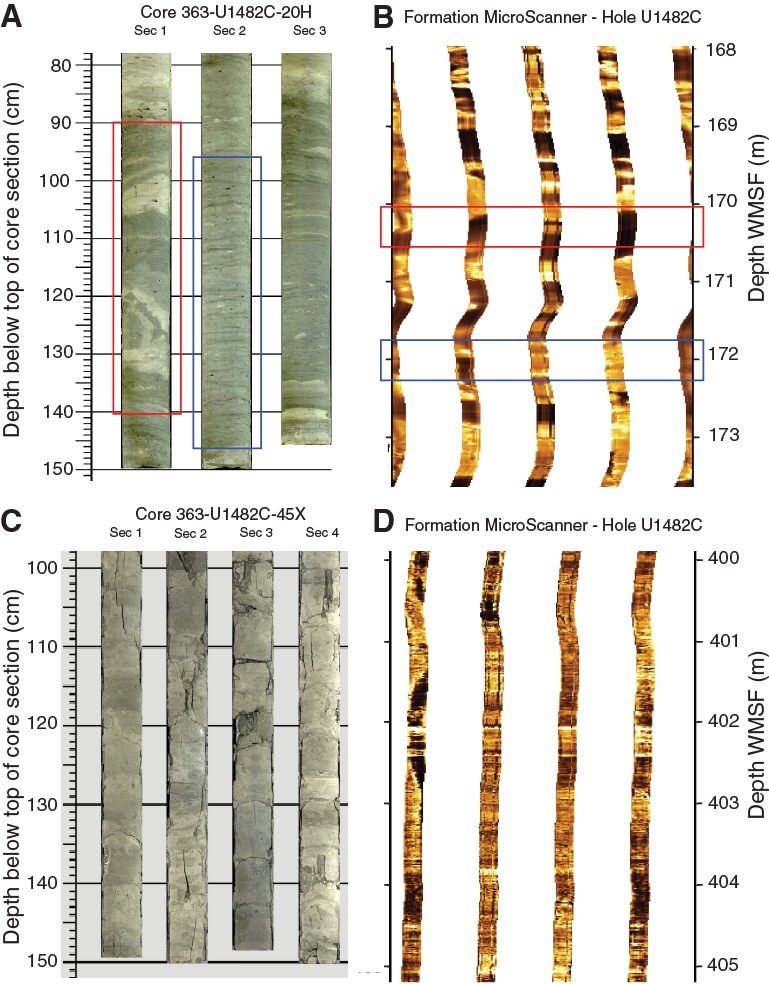
Figure F49. Processed FMS images and core photographs of sections from corresponding depths.
Figure F49C, F49D further demonstrates the potential value of FMS imaging. In this comparison, FMS images on the right clearly detect horizontal bedding from 400 to 405 m WMSF, a few tens of meters below the depth at which XCB coring began at this site. The formation was insufficiently indurated to withstand the impact and torque of the rotating core cutter at this transition zone a few meters below APC refusal. The resulting fracturing in the core formed biscuits of 2–10 cm intervals, often surrounded by deformed sediment or flow-in. This makes visual descriptions of the 2-D split core surface very challenging, particularly in intervals of faulted and/or dipping strata. The FMS images show the potential (with additional processing applied postcruise) of recovering good indications of in situ bedding characteristics in the formation prior to the disturbance caused by the XCB coring process.
FMS images from Hole U1482C show numerous “bright spots” that are either short intervals of unreliable data or actual concentration of low-resistivity/high-conductivity material. We note several that are isolated on one pad, centimeter scale in size, which could be pyrite-rich intervals. These are more prevalent in lithologic Subunit IB than elsewhere (118–207 m WMSF), which is consistent with core observations (see Core description).
References
Altschuler, Z.S., Dwornik, E.J., and Kramer, H., 1963. Transformation of montmorillonite to kaolinite during weathering. Science, 141(3576):148–152. https://doi.org/10.1126/science.141.3576.148
Baker, P.A., Gieskes, J.M., and Elderfield, H., 1982. Diagenesis of carbonates in deep-sea sediments: evidence from Sr/Ca ratios and interstitial dissolved Sr2+ data. Journal of Sedimentary Research, 52(1):71–82. https://doi.org/10.1306/212F7EE1-2B24-11D7-8648000102C1865D
Bender, M.L., Fanning, K.A., Froelich, P.N., Heath, G.R., and Maynard, V., 1977. Interstitial nitrate profiles and oxidation of sedimentary organic matter in the eastern equatorial Atlantic. Science, 198(4317):605–609. https://doi.org/10.1126/science.198.4317.605
Berggren, W.A., Kent, D.V., Swisher, C.C., III, and Aubry, M.-P., 1995. A revised Cenozoic geochronology and chronostratigraphy. In Berggren, W.A., Kent, D.V., Aubry, M.-P., and Hardenbol, J. (Eds.), Geochronology, Time Scales and Global Stratigraphic Correlation. Special Publication - SEPM (Society for Sedimentary Geology), 54:129–212. https://doi.org/10.2110/pec.95.04.0129
Boetius, A., Ravenschlag, K., Schubert, C.J., Rickert, D., Widdel, F., Gieseke, A., Amann, R., Jørgensen, B.B., Witte, U., and Pfannkuche, O., 2000. A marine microbial consortium apparently mediating anaerobic oxidation of methane. Nature, 407(6804):623–626. https://doi.org/10.1038/35036572
Bolze, C.E., Malone, P.G., and Smith, M.J., 1974. Microbial mobilization of barite. Chemical Geology, 13(2):141–143. https://doi.org/10.1016/0009-2541(74)90006-0
Borowski, W.S., Paull, C.K., and Ussler, W., III, 1996. Marine pore-water sulfate profiles indicate in situ methane flux from underlying gas hydrate. Geology, 24(7):655–658. https://doi.org/10.1130/0091-7613(1996)024<0655:MPWSPI>2.3.CO;2
Cane, M.A., and Molnar, P., 2001. Closing of the Indonesian Seaway as a precursor to East African aridification around 3–4 million years ago. Nature, 411(6834):157–162. https://doi.org/10.1038/35075500
Chaisson, W.P., and Pearson, P.N., 1997. Planktonic foraminifer biostratigraphy at Site 925: middle Miocene–Pleistocene. In Shackleton, N.J., Curry, W.B., Richter, C., and Bralower, T.J. (Eds.), Proceedings of the Ocean Drilling Program, Scientific Results, 154: College Station, TX (Ocean Drilling Program), 3–31. https://doi.org/10.2973/odp.proc.sr.154.104.1997
Chamley, H., 1994. Clay mineral diagenesis. In Parker, A., and Sellwood, B.W. (Eds.), Quantitative Diagenesis: Recent Developments and Applications to Reservoir Geology: Dordrecht, The Netherlands (Springer), 161–188. https://doi.org/10.1007/978-94-011-0189-9_5
Chamley, H., 1997. Clay mineral sedimentation in the ocean. In Paquet, H., and Clauer, N. (Eds.), Soils and Sediments: Mineralogy and Geochemistry: Berlin (Springer), 269–302. https://doi.org/10.1007/978-3-642-60525-3_13
Curtis, C.D., 1985. Geochemistry of buried sediments—clay mineral precipitation and transformation during burial diagenesis. Philosophical Transactions of the Royal Society, A: Mathematical, Physical and Engineering Sciences, 315(1531):91–105. https://doi.org/10.1098/rsta.1985.0031
Dickens, G.R., 2001. Sulfate profiles and barium fronts in sediment on the Blake Ridge: present and past methane fluxes through a large gas hydrate reservoir. Geochimica et Cosmochimica Acta, 65(4):529–543. https://doi.org/10.1016/S0016-7037(00)00556-1
Dowsett, H.J., 1988. Diachroneity of late Neogene microfossils in the southwest Pacific Ocean: application of the graphic correlation method. Paleoceanography, 3(2):209–222. https://doi.org/10.1029/PA003i002p00209
Drever, J.I., 1971. Magnesium-iron replacement in clay minerals in anoxic marine sediments. Science, 172(3990):1334–1336. https://doi.org/10.1126/science.172.3990.1334
Dymond, J., Suess, E., and Lyle, M., 1992. Barium in deep-sea sediment: a geochemical proxy for paleoproductivity. Paleoceanography, 7(2):163–181. https://doi.org/10.1029/92PA00181
Edgar, K.M., Anagnostou, E., Pearson, P.N., and Foster, G.L., 2015. Assessing the impact of diagenesis on δ11B, δ13C, δ18O, Sr/Ca and B/Ca values in fossil planktic foraminiferal calcite. Geochimica et Cosmochimica Acta, 166:189–209. https://doi.org/10.1016/j.gca.2015.06.018
Emerson, S., Jahnke, R., Bender, M., Froelich, P., Klinkhammer, G., Bowser, C., and Setlock, G., 1980. Early diagenesis in sediments from the eastern equatorial Pacific. I. Pore water nutrient and carbonate results. Earth and Planetary Science Letters, 49(1):57–80. https://doi.org/10.1016/0012-821X(80)90150-8
Feely, R.A., Lewison, M., Massoth, G.J., Robert-Baldo, G., Lavelle, J.W., Byrne, R.H., Von Damm, K.L., and Curl, H.C., Jr., 1987. Composition and dissolution of black smoker particulates from active vents on the Juan de Fuca Ridge. Journal of Geophysical Research: Solid Earth, 92(B11):11347–11363. https://doi.org/10.1029/JB092iB11p11347
Froelich, P.N., Arthur, M.A., Burnett, W.C., Deakin, M., Hensley, V., Jahnke, R., Kaul, L., Kim, K.H., Roe, K., Soutar, A., and Vathakanon, C., 1988. Early diagenesis of organic matter in Peru continental margin sediments: phosphorite precipitation. Marine Geology, 80(3–4):309–343. https://doi.org/10.1016/0025-3227(88)90095-3
Froelich, P.N., Klinkhammer, G.P., Bender, M.L., Luedtke, N.A., Heath, G.R., Cullen, D., Dauphin, P., Hammond, D., Hartman, B., and Maynard, V., 1979. Early oxidation of organic matter in pelagic sediments of the eastern equatorial Atlantic: suboxic diagenesis. Geochimica et Cosmochimica Acta, 43(7):1075–1090. https://doi.org/10.1016/0016-7037(79)90095-4
Gingele, F.X., De Deckker, P., and Hillenbrand, C.-D., 2001. Clay mineral distribution in surface sediment between Indonesia and NW Australia—source and transport by ocean currents. Marine Geology, 179(3–4):135–146. https://doi.org/10.1016/S0025-3227(01)00194-3
Gradstein, F.M., 1992. Legs 122 and 123, northwestern Australian margin—a stratigraphic and paleogeographic summary. In Gradstein, F.M., Ludden, J.N., et al., Proceedings of the Ocean Drilling Program, Scientific Results, 123: College Station, TX (Ocean Drilling Program), 801–816. https://doi.org/10.2973/odp.proc.sr.123.110.1992
Hall, R., 2012. Late Jurassic–Cenozoic reconstructions of the Indonesian region and the Indian Ocean. Tectonophysics, 570–571:1–41. https://doi.org/10.1016/j.tecto.2012.04.021
Hartnett, H.E., Keil, R.G., Hedges, J.I., and Devol, A.H., 1998. Influence of oxygen exposure time on organic carbon preservation in continental margin sediments. Nature, 391(6667):572–575. https://doi.org/10.1038/35351
Haworth, J.H., Sellens, M., and Whittaker, A., 1985. Interpretation of hydrocarbon shows using light (C1–C5) hydrocarbon gases from mud-log data. AAPG Bulletin, 69(8):1305–1310. http://archives.datapages.com/data/bulletns/1984-85/data/pg/0069/0008/1300/1305.htm
Holbourn, A., Kuhnt, W., Simo, J.A., and Li, Q., 2004. Middle Miocene isotope stratigraphy and paleoceanographic evolution of the northwest and southwest Australian margins (Wombat Plateau and Great Australian Bight). Palaeogeography, Palaeoclimatology, Palaeoecology, 208(1–2):1–22. https://doi.org/10.1016/j.palaeo.2004.02.003
Hull, P.M., and Norris, R.D., 2009. Evidence for abrupt speciation in a classic case of gradual evolution. Proceedings of the National Academy of Sciences of the United States of America, 106(50):21224–21229. https://doi.org/10.1073/pnas.0902887106
Ishikawa, T., and Nakamura, E., 1993. Boron isotope systematics of marine sediments. Earth and Planetary Science Letters, 117(3–4):567–580. https://doi.org/10.1016/0012-821X(93)90103-G
Jenkins, D.G., and Gamson, P., 1993. The late Cenozoic Globorotalia truncatulinoides datum-plane in the Atlantic, Pacific and Indian Oceans. In Hailwood, E.A., and Kidd, R.B. (Eds.), High Resolution Stratigraphy. Geological Society Special Publication, 70(1):127–130. https://doi.org/10.1144/GSL.SP.1993.070.01.08
Karlin, R., 1990. Magnetite mineral diagenesis in suboxic sediments at Bettis Site W-N, NE Pacific Ocean. Journal of Geophysical Research: Solid Earth, 95(B4):4421–4436. https://doi.org/10.1029/JB095iB04p04421
Karlin, R., and Levi, S., 1983. Diagenesis of magnetic minerals in recent hemipelagic sediments. Nature, 303(5915):327–330. https://doi.org/10.1038/303327a0
Keep, M., Harrowfield, M., and Crowe, W., 2007. The Neogene tectonic history of the North West shelf, Australia. Exploration Geophysics, 38(3):151–174. https://doi.org/10.1071/EG07022
Kennett, J.P., and Srinivasan, M.S., 1983. Neogene Planktonic Foraminifera: A Phylogenetic Atlas: Stroudsburg, PA (Hutchinson Ross).
Kodama, K., 2012. Paleomagnetism of Sedimentary Rocks: Process and Interpretation: London (Wiley-Blackwell). https://doi.org/10.1002/9781118384138
Kuhnt, W., Blümel, M., Boch, R., Dewi, K.T., da Costa Monteiro, F., Dürkop, A., Hanebuth, T., Heidemann, U., Holbourn, A., Jian, Z., van der Kaars, S., Kawamura, H., Kawohl, H., Nürnberg, D., Opdyke, B., Petersen, A., Regenberg, M., Rosenthal, Y., Rühlemann, C., Sadekov, A., Salomon, B., Tian, J., Xu, J., and Zuraida, R., 2005. Cruise Report SO185, VITAL–Variability of the Indonesian throughflow and Australasian climate history of the last 150000 years, Darwin–Jakarta, September 15 2005–October 06 2005. IFM-GEOMAR Reports. http://dx.doi.org/10.2312/cr_so185
Ludden, J.N., Gradstein, F.M., et al., 1990. Proceedings of the Ocean Drilling Program, Initial Reports, 123: College Station, TX (Ocean Drilling Program). https://doi.org/10.2973/odp.proc.ir.123.1990
Malmgren, B.A., Berggren, W.B., and Lohmann, G.P., 1984. Species formation through punctuated gradualism in planktonic foraminifera. Science, 225(4659):317–319. https://doi.org/10.1126/science.225.4659.317
McNeill, L.C., Dugan, B., Petronotis, K.E., Backman, J., Bourlange, S., Chemale, F., Chen, W., Colson, T.A., Frederik, M.C.G., Guèrin, G., Hamahashi, M., Henstock, T., House, B.M., Hüpers, A., Jeppson, T.N., Kachovich, S., Kenigsberg, A.R., Kuranaga, M., Kutterolf, S., Milliken, K.L., Mitchison, F.L., Mukoyoshi, H., Nair, N., Owari, S., Pickering, K.T., Pouderoux, H.F.A., Yehua, S., Song, I., Torres, M.E., Vannucchi, P., Vrolijk, P.J., Yang, T., and Zhao, X., 2017. Expedition 362 summary. In McNeill, L.C., Dugan, B., Petronotis, K.E., and the Expedition 362 Scientists, Sumatra Subduction Zone. Proceedings of the International Ocean Discovery Program, 362: College Station, TX (International Ocean Discovery Program). https://doi.org/10.14379/iodp.proc.362.101.2017
Michalopoulos, P., and Aller, R.C., 1995. Rapid clay mineral formation in Amazon delta sediments: reverse weathering and oceanic elemental cycles. Science, 270(5236):614–617. https://doi.org/10.1126/science.270.5236.614
Morel, F.M.M., and Hering, J.G., 1993. Principles and Applications of Aquatic Chemistry: New York (Wiley).
Müller, P.J., and Suess, E., 1979. Productivity, sedimentation rate, and sedimentary organic matter in the oceans—I. Organic carbon preservation. Deep-Sea Research, Part A. Oceanographic Research Papers, 26(12):1347–1362. https://doi.org/10.1016/0198-0149(79)90003-7
Murray, J.W., Grundmanis, V., and Smethie, W.M., 1978. Interstitial water chemistry in the sediments of Saanich Inlet. Geochimica et Cosmochimica Acta, 42(7):1011–1026. https://doi.org/10.1016/0016-7037(78)90290-9
Naehr, T.H., Eichhubl, P., Orphan, V.J., Hovland, M., Paull, C.K., Ussler, W., III, Lorenson, T.D., and Green, H.G., 2007. Authigenic carbonate formation at hydrocarbon seeps in continental margin sediments: a comparative study. Deep-Sea Research, Part II: Topical Studies in Oceanography, 54(11–13):1268–1291. https://doi.org/10.1016/j.dsr2.2007.04.010
Niewhöner, C., Hensen, C., Kasten, S., Zabel, M., and Schulz, H.D., 1998. Deep sulfate reduction completely mediated by anaerobic methane oxidation in sediments of the upwelling area off Namibia. Geochimica et Cosmochimica Acta, 62(3):455–464. https://doi.org/10.1016/S0016-7037(98)00055-6
Pandey, D.K., Clift, P.D., Kulhanek, D.K., Andò, S., Bendle, J.A.P., Bratenkov, S., Griffith, E.M., Gurumurthy, G.P., Hahn, A., Iwai, M., Khim, B.-K., Kumar, A., Kumar, A.G., Liddy, H.M., Lu, H., Lyle, M.W., Mishra, R., Radhakrishna, T., Routledge, C.M., Saraswat, R., Saxena, R., Scardia, G., Sharma, G.K., Singh, A.D., Steinke, S., Suzuki, K., Tauxe, L., Tiwari, M., Xu, Z., and Yu, Z., 2016. Expedition 355 methods. In Pandey, D.K., Clift, P.D., Kulhanek, D.K., and the Expedition 355 Scientists, Arabian Sea Monsoon. Proceedings of the International Ocean Discovery Program, 355: College Station, TX (International Ocean Discovery Program). https://doi.org/10.14379/iodp.proc.355.102.2016
Paytan, A., Mearon, S., Cobb, K., and Kastner, M., 2002. Origin of marine barite deposits: Sr and S isotope characterization. Geology, 30(8):747–750. https://doi.org/10.1130/0091-7613(2002)030<0747:OOMBDS>2.0.CO;2
Pomeroy, L.R., Smith, E.E., and Grant, C.M., 1965. The exchange of phosphate between estuarine water and sediments. Limnology and Oceanography, 10(2):167–172. https://doi.org/10.4319/lo.1965.10.2.0167
Pribnow, D., Kinoshita, M., and Stein, C., 2000. Thermal Data Collection and Heat Flow Recalculations for Ocean Drilling Program Legs 101–180: Hanover, Germany (Institute for Joint Geoscientific Research, Institut für Geowissenschaftliche Gemeinschaftsaufgaben [GGA]). http://www-odp.tamu.edu/publications/heatflow/ODPReprt.pdf
Price, N.B., and Calvert, S.E., 1977. The contrasting geochemical behaviours of iodine and bromine in recent sediments from the Namibian shelf. Geochimica et Cosmochimica Acta, 41(12):1769–1775. https://doi.org/10.1016/0016-7037(77)90209-5
Redfield, A.C., Ketchum, B.H., and Richards, F.A., 1963. The influence of organisms on the composition of seawater. In Hill, M.N. (Ed.), The Sea (Volume 2): New York (Wiley), 26–77.
Richter, F.M., and Liang, Y., 1993. The rate and consequences of Sr diagenesis in deep-sea carbonates. Earth and Planetary Science Letters, 117(3–4):553–565. https://doi.org/10.1016/0012-821X(93)90102-F
Ristvet, B.L., 1978. Reverse weathering reactions within recent nearshore marine sediments, Kaneohe Bay, Oahu [Ph.D. dissertation]. Northwestern University, Evanston, IL. https://scholarspace.manoa.hawaii.edu/handle/10125/18151
Rosenthal, Y., Holbourn, A., and Kulhanek, D.K., 2016. Expedition 363 Scientific Prospectus: Western Pacific Warm Pool. International Ocean Discovery Program. https://doi.org/10.14379/iodp.sp.363.2016
Rosenthal, Y., Holbourn, A.E., Kulhanek, D.K., Aiello, I.W., Babila, T.L., Bayon, G., Beaufort, L., Bova, S.C., Chun, J.-H., Dang, H., Drury, A.J., Dunkley Jones, T., Eichler, P.P.B., Fernando, A.G.S., Gibson, K.A., Hatfield, R.G., Johnson, D.L., Kumagai, Y., Li, T., Linsley, B.K., Meinicke, N., Mountain, G.S., Opdyke, B.N., Pearson, P.N., Poole, C.R., Ravelo, A.C., Sagawa, T., Schmitt, A., Wurtzel, J.B., Xu, J., Yamamoto, M., and Zhang, Y.G., 2018a. Expedition 363 methods. In Rosenthal, Y., Holbourn, A.E., Kulhanek, D.K., and the Expedition 363 Scientists, Western Pacific Warm Pool. Proceedings of the International Ocean Discovery Program, 363: College Station, TX (International Ocean Discovery Program). https://doi.org/10.14379/iodp.proc.363.102.2018
Rosenthal, Y., Holbourn, A.E., Kulhanek, D.K., Aiello, I.W., Babila, T.L., Bayon, G., Beaufort, L., Bova, S.C., Chun, J.-H., Dang, H., Drury, A.J., Dunkley Jones, T., Eichler, P.P.B., Fernando, A.G.S., Gibson, K.A., Hatfield, R.G., Johnson, D.L., Kumagai, Y., Li, T., Linsley, B.K., Meinicke, N., Mountain, G.S., Opdyke, B.N., Pearson, P.N., Poole, C.R., Ravelo, A.C., Sagawa, T., Schmitt, A., Wurtzel, J.B., Xu, J., Yamamoto, M., and Zhang, Y.G., 2018b. Expedition 363 summary. In Rosenthal, Y., Holbourn, A.E., Kulhanek, D.K., and the Expedition 363 Scientists, Western Pacific Warm Pool. Proceedings of the International Ocean Discovery Program, 363: College Station, TX (International Ocean Discovery Program). https://doi.org/10.14379/iodp.proc.363.101.2018
Rosenthal, Y., Holbourn, A.E., Kulhanek, D.K., Aiello, I.W., Babila, T.L., Bayon, G., Beaufort, L., Bova, S.C., Chun, J.-H., Dang, H., Drury, A.J., Dunkley Jones, T., Eichler, P.P.B., Fernando, A.G.S., Gibson, K.A., Hatfield, R.G., Johnson, D.L., Kumagai, Y., Li, T., Linsley, B.K., Meinicke, N., Mountain, G.S., Opdyke, B.N., Pearson, P.N., Poole, C.R., Ravelo, A.C., Sagawa, T., Schmitt, A., Wurtzel, J.B., Xu, J., Yamamoto, M., and Zhang, Y.G., 2018c. Site U1483. In Rosenthal, Y., Holbourn, A.E., Kulhanek, D.K., and the Expedition 363 Scientists, Western Pacific Warm Pool. Proceedings of the International Ocean Discovery Program, 363: College Station, TX (International Ocean Discovery Program). https://doi.org/10.14379/iodp.proc.363.104.2018
Rowan, C.J., Roberts, A.P., and Broadbent, T., 2009. Reductive diagenesis, magnetite dissolution, greigite growth and paleomagnetic smoothing in marine sediments: a new view. Earth and Planetary Science Letters, 277(1–2):223–235. https://doi.org/10.1016/j.epsl.2008.10.016
Saito, T., 1976. Geologic significance of coiling direction in the planktonic foraminifer Pulleniatina. Geology, 4(5):305–309. https://doi.org/10.1130/0091-7613(1976)4<305:GSOCDI>2.0.CO;2
Shackleton, N.J., Baldauf, J.G., Flores, J.-A., Iwai, M., Moore, T.C., Jr., Raffi, I., and Vincent, E., 1995. Biostratigraphic summary for Leg 138. In Pisias, N.G., Mayer, L.A., Janecek, T.R., Palmer-Julson, A., and van Andel, T.H. (Eds.), Proceedings of the Ocean Drilling Program, Scientific Results, 138: College Station, TX (Ocean Drilling Program), 517–536. https://doi.org/10.2973/odp.proc.sr.138.127.1995
Snowball, I.F., 1997. The detection of single-domain greigite (Fe3S4) using rotational remanent magnetization (RRM) and the effective gyro field (Bg): mineral magnetic and paleomagnetic applications. Geophysical Journal International, 130(3):704–716. https://doi.org/10.1111/j.1365-246X.1997.tb01865.x
Spivack, A.J., Palmer, M.R., and Edmond, J.M., 1987. The sedimentary cycle of the boron isotopes. Geochimica et Cosmochimica Acta, 51(7):1939–1949. https://doi.org/10.1016/0016-7037(87)90183-9
Srinivasan, M.S., and Sinha, D.K., 1992. Late Neogene planktonic foraminiferal events of the southwest Pacific and Indian Ocean: a comparison. In Tsuchi, R., and Ingle, J.C., Jr. (Eds.), Pacific Neogene: Environment, Evolution and Events: Tokyo (University Tokyo Press), 203–220.
Stagg, H.M.J., and Exon, N.F., 1981. Geology of the Scott Plateau and Rowley Terrace, off northwestern Australia. Bureau of Mineral Resources, Geology and Geophysics Bulletin, 213. http://www.ga.gov.au/corporate_data/62/Bull_213.pdf
Steiner, A., 1968. Clay minerals in hydrothermally altered rocks at Wairakei, New Zealand. Clays and Clay Minerals, 16(3):193–213. https://doi.org/10.1346/CCMN.1968.0160302
Stephenson, A., and Snowball, I.F., 2001. A large gyromagnetic effect in greigite. Geophysical Journal International, 145(2):570–575. https://doi.org/10.1046/j.0956-540x.2001.01434.x
Stoner, J.S., and St-Onge, G., 2007. Magnetic stratigraphy in paleooceanography: reversal, excursion, paleointensity and secular variation. In Hillaire-Marcel, C., and de Vernal, A. (Eds.), Proxies in Late Cenozoic Paleoceanography: Amsterdam (Elsevier Science), 99–138.
Suess, E., 1980. Particulate organic carbon flux in the oceans—surface productivity and oxygen utilization. Nature, 288(5788):260–263. https://doi.org/10.1038/288260a0
Thomas, H., Schiettecatte, L.-S., Suykens, K., Koné, Y.J.M., Shadwick, E.H., Prowe, A.E.F., Bozec, Y., de Baar, H.J.W., and Borges, A.V., 2009. Enhanced ocean carbon storage from anaerobic alkalinity generation in coastal sediments. Biogeosciences, 6(2):267–274. https://doi.org/10.5194/bg-6-267-2009
Torres, M.E., Bohrmann, G., and Suess, E., 1996. Authigenic barites and fluxes of barium associated with fluid seeps in the Peru subduction zone. Earth and Planetary Science Letters, 144(3–4):469–481. https://doi.org/10.1016/S0012-821X(96)00163-X
Toth, D.J., and Lerman, A., 1977. Organic matter reactivity and sedimentation rates in the ocean. American Journal of Science, 277(4):465–485. https://doi.org/10.2475/ajs.277.4.465
van Morkhoven, F.P.C.M., Berggren, W.A., Edwards, A.S., and Oertli, H.J., 1986. Cenozoic cosmopolitan deep-water benthic foraminifera. Bulletin des Centres de Recherches Exploration-Production Elf-Aquitaine, 11.
Wade, B.S., Pearson, P.N., Berggren, W.A., and Pälike, H., 2011. Review and revision of Cenozoic tropical planktonic foraminiferal biostratigraphy and calibration to the geomagnetic polarity and astronomical time scale. Earth-Science Reviews, 104(1–3):111–142. https://doi.org/10.1016/j.earscirev.2010.09.003
Wallmann, K., Aloisi, G., Haeckel, M., Tishchenko, P., Pavlova, G., Greinert, J., Kutterolf, S., and Eisenhauer, A., 2008. Silicate weathering in anoxic marine sediments. Geochimica et Cosmochimica Acta, 72(12):2895–2918. https://doi.org/10.1016/j.gca.2008.03.026
Wilkens, R.H., Westerhold, T., Drury, A.J., Lyle, M., Gorgas, T., and Tian, J., 2017. Revisiting the Ceara Rise, equatorial Atlantic Ocean: isotope stratigraphy of ODP Leg 154. Climate of the Past, 13:779–793. https://doi.org/10.5194/cp-13-779-2017
Zhang, L., Chan, L.-H., and Gieskes, J.M., 1998. Lithium isotope geochemistry of pore waters from Ocean Drilling Program Sites 918 and 919, Irminger Basin. Geochimica et Cosmochimica Acta, 62(14):2437–2450. http://dx.doi.org/10.1016/S0016-7037(98)00178-1
Zijderveld, J.D.A., 1967. AC demagnetization of rocks: analysis of results. In Collinson, D.W., Creer, K.M., and Runcorn, S.K. (Eds.), Methods in Palaeomagnetism: Amsterdam (Elsevier), 254–286.
1 Rosenthal, Y., Holbourn, A.E., Kulhanek, D.K., Aiello, I.W., Babila, T.L., Bayon, G., Beaufort, L., Bova, S.C., Chun, J.-H., Dang, H., Drury, A.J., Dunkley Jones, T., Eichler, P.P.B., Fernando, A.G.S., Gibson, K.A., Hatfield, R.G., Johnson, D.L., Kumagai, Y., Li, T., Linsley, B.K., Meinicke, N., Mountain, G.S., Opdyke, B.N., Pearson, P.N., Poole, C.R., Ravelo, A.C., Sagawa, T., Schmitt, A., Wurtzel, J.B., Xu, J., Yamamoto, M., and Zhang, Y.G., 2018. Site U1482. In Rosenthal, Y., Holbourn, A.E., Kulhanek, D.K., and the Expedition 363 Scientists, Western Pacific Warm Pool. Proceedings of the International Ocean Discovery Program, 363: College Station, TX (International Ocean Discovery Program). https://doi.org/10.14379/iodp.proc.363.103.2018
2 Expedition 363 Scientists’ addresses.
This work is distributed under the Creative Commons Attribution 4.0 International (CC BY 4.0) license. 
- F1. Northwest Australian and location of Sites U1482 and U1483.
- F2. Contoured bathymetric map and site location.
- F3. Seismic Lines HBR2000A-3032 and BR98_L018 with site location.
- F4. Mean annual SST off Northwest Australia.
- F5. Lithologic summary.
- F6. Characteristic lithology and color alternations in Subunit IA.
- F7. Characteristic lithology and color alternations at Subunit IA/IB boundary.
- F8. Characteristic lithology and strong color alternations in Subunit IC.
- F9. Biscuited chalk, Subunit ID.
- F10. Main sedimentary components.
- F11. SEM photomicrographs of sulfides, Subunit IB.
- F12. Soft-sediment deformation, Subunit IB.
- F13. Barite-calcite concretion.
- F14. XRD results.
- F15. Graded bedding.
- F16. Calcareous nannofossils.
- F17. Foraminifer assemblage showing unusual planktonic foraminifer Globigerinoides sp. cf. conglobatus (pink).
- F18. Coiling patterns in Pulleniatina.
- F19. Coiling patterns in Neogloboquadrina acostaensis.
- F20. Benthic foraminifers.
- F21. Downcore foraminifer test preservation states.
- F22. Age-depth plot for calcareous nannofossil and planktonic foraminifer biohorizons.
- F23. Archive-half section NRM intensity.
- F24. NRM, MS, IW sulfate and methane, inclination, and declination, Hole U1482A.
- F25. Discrete sample AF demagnetization results.
- F26. NRM, WRMSL MS, inclination, and declination, Hole U1482B.
- F27. NRM, WRMSL MS, inclination, and declination, Hole U1482C.
- F28. Representative physical property measurements.
- F29. Comparison of cleaned GRA bulk density and MS data obtained using different measurement tracks.
- F30. WRMSL GRA bulk density, MS, and NGR overlaid on core photos.
- F31. Uncorrected and XCB-corrected WRMSL GRA bulk density data.
- F32. Discrete and whole-round P-wave measurements.
- F33. MAD dry, bulk, and grain densities and porosity, WRMSL GRA bulk density, and thermal conductivity.
- F34. APCT-3 temperature-time series.
- F35. Heat flow calculations.
- F36. WRMSL GRA bulk density data.
- F37. WRMSL MS data.
- F38. WRMSL NGR data.
- F39. Spliced composite L*, NGR, and WRMSL MS and GRA bulk density data.
- F40. Spliced WRMSL GRA bulk density, MS, NGR, and L* data.
- F41. Comparison of mbsf and composite depth scales.
- F42. Methane, ethane, propane, and C1/C2 profiles.
- F43. Calcium carbonate, TOC, and C/N profiles.
- F44. Interstitial water concentration profiles.
- F45. Interstitial water concentration profiles.
- F46. Logging summary.
- F47. Natural gamma radiation.
- F48. Wireline log measurements compared to sediment core measurements.
- F49. Processed FMS images and core photographs of sections from corresponding depths.
- T1. Core summary.
- T2. Calcareous nannofossil bioevents.
- T3. Planktonic foraminifer bioevents.
- T4. Coiling count data for Pulleniatina, Hole U1482A.
- T5. Coiling count data for Pulleniatina, Hole U1482B.
- T6. Coiling count data for Neogloboquadrina acostaensis.
- T7. Benthic foraminifer distribution.
- T8. WRMSL GRA bulk density data, Hole U1482A.
- T9. WRMSL GRA bulk density data, Hole U1482B.
- T10. WRMSL GRA bulk density data, Hole U1482C.
- T11. WRMSL GRA bulk density data, Hole U1482D.
- T12. WRMSL MS data, Hole U1482A.
- T13. WRMSL MS data, Hole U1482B.
- T14. WRMSL MS data, Hole U1482C.
- T15. WRMSL MS data, Hole U1482D.
- T16. NGRL data, Hole U1482A.
- T17. NGRL data, Hole U1482B.
- T18. NGRL data, Hole U1482C.
- T19. NGR data, Hole U1482D.
- T20. WRMSL P-wave data, Hole U1482A.
- T21. WRMSL P-wave data, Hole U1482B.
- T22. WRMSL P-wave data, Hole U1482C.
- T23. WRMSL P-wave data, Hole U1482D.
- T24. Affine table.
- T25. Splice intervals.
- T26. Summary of sedimentary redox reactions.
- T27. Example clay mineral transformations.
- T28. Volatile hydrocarbon concentrations.
- T29. Volatile hydrocarbon concentrations.
- T30. Calcium carbonate and TOC contents.
- T31. Interstitial water geochemical data.