Rosenthal, Y., Holbourn, A.E., Kulhanek, D.K., and the Expedition 363 Scientists
Proceedings of the International Ocean Discovery Program Volume 363
publications.iodp.org
https://doi.org/10.14379/iodp.proc.363.104.2018

Site U14831
Y. Rosenthal, A.E. Holbourn, D.K. Kulhanek, I.W. Aiello, T.L. Babila, G. Bayon, L. Beaufort, S.C. Bova, J.-H. Chun, H. Dang, A.J. Drury, T. Dunkley Jones, P.P.B. Eichler, A.G.S. Fernando, K.A. Gibson, R.G. Hatfield, D.L. Johnson, Y. Kumagai, T. Li, B.K. Linsley, N. Meinicke, G.S. Mountain, B.N. Opdyke, P.N. Pearson, C.R. Poole, A.C. Ravelo, T. Sagawa, A. Schmitt, J.B. Wurtzel, J. Xu, M. Yamamoto, and Y.G. Zhang2
Keywords: International Ocean Discovery Program, IODP, JOIDES Resolution, Expedition 363, Site U1483, Northwest Australian margin, Scott Plateau, Browse Basin, Sunda arc, Neogene, Pliocene, Pleistocene, Indonesian Throughflow, Leeuwin Current, West Australian Current, eastern Indian Ocean, Timor Sea, Timor Strait, Australian monsoon, hydroclimate, precipitation reconstruction, southwestern sector Indo-Pacific Warm Pool, orbital-scale climate variability, carbonate accumulation, clay, tephra, soft-sediment deformation, exceptional foraminifer and nannofossil preservation, biosilica, stratigraphic intercalibration and cyclostratigraphy, anaerobic methane oxidation, sulfate–methane transition zone
MS 363-104: Published 8 June 2018
Background and objectives
International Ocean Discovery Program (IODP) Site U1483 is located on the northwest Australian margin at 13°5.24′S, 121°48.25′E in 1733 m water depth (Figures F1, F2). The site is situated on seismic Line BR98-117, 1300 m northeast of the intersection with seismic Line BR98-168 and ~0.8 nmi southeast of the ~40 m long piston Core MD01-2378 (Figure F3), which provides insights into late Pleistocene sedimentation and stratigraphy at this location (e.g., Holbourn et al., 2005; Kuhnt et al., 2015). The interpretation of Miocene seismic reflectors is based on comparison to the Australian Geological Survey Organisation regional seismic survey Line 119-04 (well control by Buffon 1 and Brewster 1A) and the BBHR Line 175/10 (well control by Argus 1). A major unconformity marks the top of the prograding sequence at 0.72 s two-way traveltime below seafloor and is interpreted as the middle Miocene sequence boundary corresponding to a major sea level drop associated with rapid expansion of the Antarctic Ice Sheet (Mi-3; 13.8 Ma) (Rosenthal et al., 2016) (Figure F4).
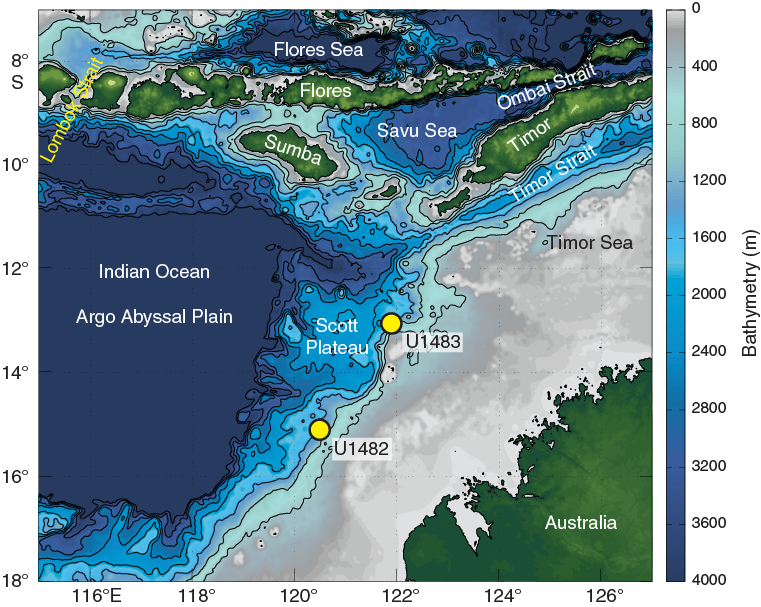
Figure F1. Northwest Australian margin and location of Sites U1482 and U1483.

Figure F2. Bathymetric map and site location.
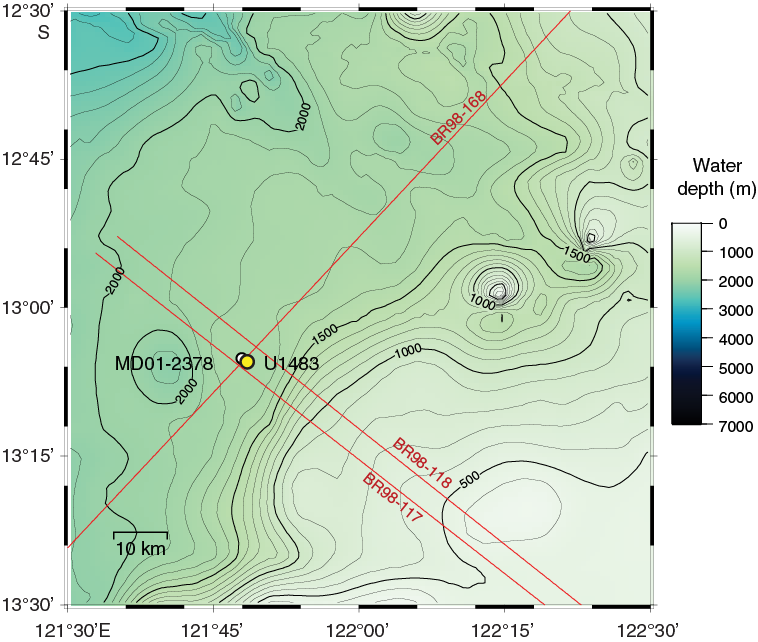
Figure F3. Contoured bathymetric map and site location.
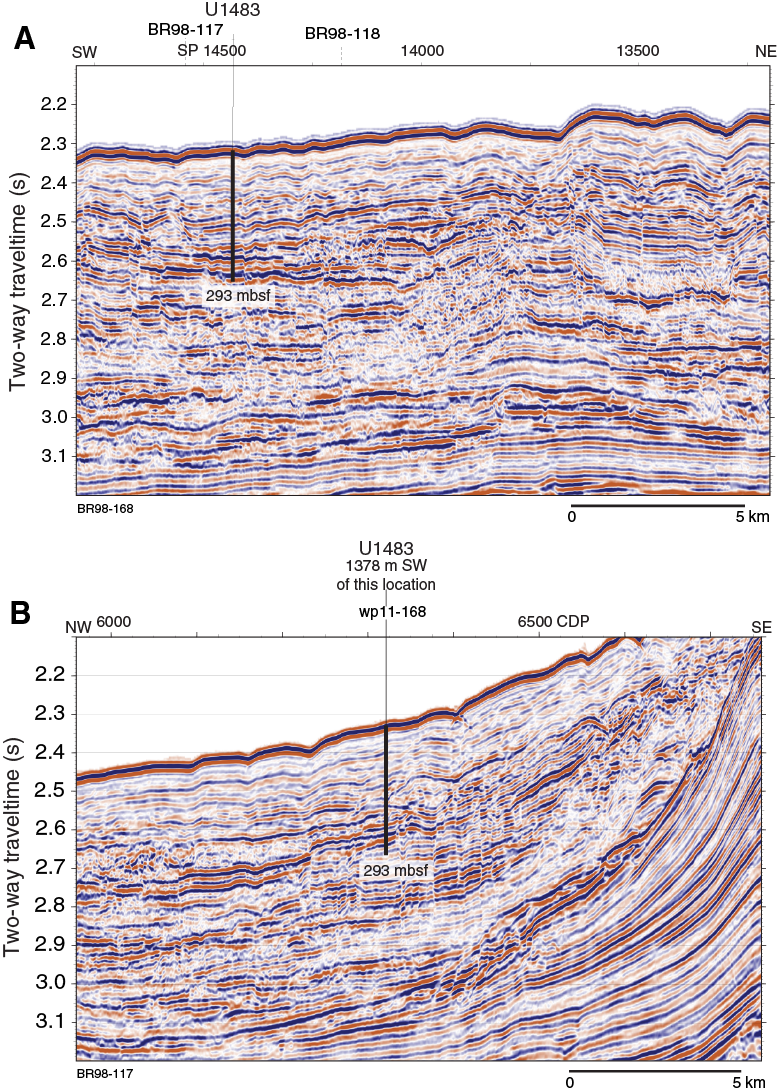
Figure F4. Seismic Line BR98-168 and site location.
Site U1483 is situated on the Scott Plateau at the northwestern margin of the northeast-trending Browse Basin, which underlies the Australian northwest margin between the onshore Kimberley Basin and the Scott Plateau (Symonds et al., 1994). This region, which is adjacent to some of the oldest ocean crust still in the world’s ocean (Argo Abyssal Plain), formed after the breakup of Gondwanaland and the separation of northwest Australia from the Tethyan landmass (Gradstein, 1992). The Mesozoic section beneath the Scott Plateau is strongly influenced by breakup-related tectonism and forms the acoustic basement through much of the Scott Plateau area (Stagg and Exon, 1981). The postbreakup sedimentary succession forms an ~2000 m thick, relatively uniform blanket over the Scott Plateau and the northeastern margin of Browse Basin. Site U1483 is located south of the Sunda arc, where ongoing collision between Australia and the Eurasia/Pacific arc system has occurred since the Miocene (Keep et al., 2007; Hall, 2012). However, intense Neogene faulting is mainly observed in the southernmost parts of the Browse Basin (Barcoo Subbasin), whereas the northern parts are relatively devoid of intense Neogene deformation (Keep et al., 2007).
Site U1483 is located ~142 nmi northeast of Site U1482. Both sites are within the hydrographic transition that separates the warm tropical water of the Indo-Pacific Warm Pool (IPWP) and subtropical water masses. Jointly, the two sites are suitable to monitor changes in the southward extent of tropical warm water related to circulation and/or global climate trends. Both sites are close to the oceanographic front between relatively cool, nutrient-rich water carried northward in the Eastern Indian Ocean by the West Australian Current and warm, oligotrophic Leeuwin Current water, which results in a steep north–south sea-surface temperature (SST) gradient (Figure F5).
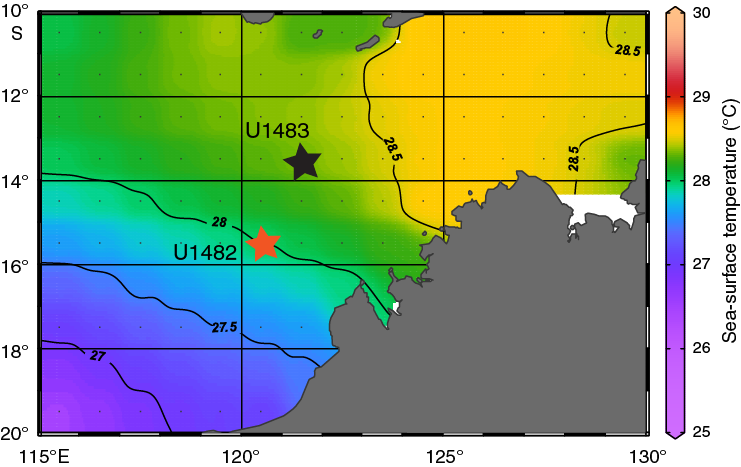
Figure F5. Mean annual SST off Northwest Australia.
The sedimentation rate at Site U1483 is ~9 cm/ky (Holbourn et al., 2005), about twice the rate at Site U1482, which will allow for the reconstruction of late Pliocene to recent paleoceanography at higher resolution than at Site U1482. Combined, the two sites will allow for reconstruction of the southwestern extent of the IPWP since the early late Miocene. Furthermore, the sites are located along the route of the Indonesian Throughflow (ITF) as it exits into the Indian Ocean through the Timor Strait between northwest Australia and Java (Figure F1). The Timor Strait is one of the three main exits of the ITF to the eastern Indian Ocean (Gordon, 2005). Thus, Sites U1482 and U1483 are ideally located to monitor changes in the intensity and thermal structure of ITF water masses entering the Eastern Indian Ocean (e.g., Xu et al., 2008).
Operations
Transit to Site U1483
The 142 nmi transit to Site U1483 was completed in 12.5 h at an average speed of 11.4 kt. The vessel began lowering thrusters at 0618 h (all times are local ship time; UTC + 8 h) on 26 October 2016, switching to dynamic positioning control at 0630 h. We deployed the positioning beacon at 0650 h on 26 October.
Operations summary
We cored three holes at Site U1483 (Table T1). The original operations plan called for coring to advanced piston corer (APC) refusal (estimated at 250 meters below seafloor [mbsf]), followed by two additional holes deepened to 350 mbsf using the extended core barrel (XCB). Instead, we cored three holes using the APC to ~290 mbsf, the depth at which we encountered APC refusal. We decided not to deepen the holes to the original planned total depth because we had already reached our primary age target.
Table T1. Core summary. Download table in CSV format. View PDF table.
Hole U1483A was cored with the APC using the Icefield MI-5 core orientation tool and nonmagnetic hardware to 293.3 mbsf (Cores 363-U1483A-1H through 31H), where a partial stroke indicated APC refusal. Downhole temperature measurements using the advanced piston corer temperature tool (APCT-3) were taken on Cores 4H (37.1 mbsf), 7H (65.6 mbsf), 10H (94.1 mbsf), and 13H (122.6 mbsf), obtaining reliable results on three of the four deployments. A total of 308.58 m of sediment was recovered over 293.3 m of coring (105% recovery) in Hole U1483A.
Hole U1483B was then cored with the APC using the Icefield MI-5 core orientation tool and nonmagnetic hardware to 287.0 mbsf (Cores 363-U1483B-1H through 31H). A total of 301.62 m of sediment was collected over this interval (105% recovery). Oriented APC coring using the Icefield MI-5 orientation tool with nonmagnetic hardware continued in Hole U1483C and reached 284.8 mbsf (Cores 363-U1483C-1H through 31H). One drilled interval (3 m) advanced the hole without coring to avoid alignment of core gaps for stratigraphic correlation. A total of 292.42 m of core was recovered over 281.8 m of coring (104% recovery). Operations at Site U1483 ended at 0800 h on 30 October 2016. Total time spent at the site was 97.5 h (4.1 days).
A total of 92 APC cores were recovered at this site, collecting 902.62 m of sediment over 862.1 m of penetration (105.2% recovery).
Hole U1483A
After deploying the positioning beacon, we prepared and spaced out the bottom-hole assembly (BHA), which consisted of an APC/XCB coring assembly with two stands of drill collars. During deployment of the drill string, the seafloor depth was measured at 1747.4 meters below rig floor (mbrf) with the precision depth recorder (PDR), and we decided to shoot the first core from a depth of 1743 mbrf.
Hole U1483A was spudded at 1250 h on 26 October 2016 with Core 363-U1483A-1H recovering 8.6 m of core, establishing a seafloor depth of 1732.9 meters below sea level (mbsl). Oriented APC coring using the Icefield MI-5 core orientation tool with nonmagnetic hardware continued to 236.6 mbsf (Core 25H). Downhole temperature measurements were taken with the APCT-3 on Cores 4H (37.1 mbsf), 7H (56.1 mbsf), 10H (84.6 mbsf), and 13H (113.1 mbsf), obtaining good measurements on three of the four deployments. While retrieving Core 26H, the forward core winch wire parted, leaving the core barrel in the hole. The core winch wire was restrung in the derrick and reheaded. We prepared a fishing spear and lowered it into the drill pipe. The core was retrieved and pulled to surface during the second fishing attempt. After Core 26H was laid out, APC coring continued to 293.3 mbsf (Core 31H), where we encountered a partial stroke, indicating APC refusal and ending Hole U1483A. Total time spent in Hole U1483A was 42.25 h (1.8 days).
A total of 31 APC cores were taken in Hole U1483A. We recovered 308.58 m of sediment over 293.3 m of coring for an average recovery of 105.2%.
Hole U1483B
The vessel was offset 20 m east of Hole U1483A, the drill string was spaced out to 1737.5 mbrf, and Hole U1483B was spudded at 0205 h on 28 October 2016. Core 363-U1483B-1H recovered 2.05 m of sediment, establishing a seafloor depth of 1734.0 mbsl. Oriented APC coring using the Icefield MI-5 core orientation tool with nonmagnetic hardware proceeded to 287.0 mbsf (Cores 1H through 31H). We terminated Hole U1483B just above where we reached APC refusal in Hole U1483A. Total time spent in Hole U1483B was 25.5 h (1.1 days).
A total of 31 APC cores were taken in Hole U1483B, recovering 301.62 m of sediment over 287.0 m of coring (105.1% recovery).
Hole U1483C
The vessel was offset 20 m south of Hole U1483B, the bit was set at 1739.0 mbrf, and Hole U1483C was spudded at 0330 h on 29 October 2016. Core 363-U1483C-1H recovered 6.3 m of sediment, establishing a seafloor depth of 1731.2 mbsl. Oriented APC coring using the Icefield MI-5 core orientation tool with nonmagnetic hardware penetrated to 284.8 mbsf (Cores 1H through 30H). One drilled interval advanced the bit 3 m to offset core gaps for stratigraphic correlation. After reaching our depth target, we retrieved the drill string to the vessel and secured the rig floor for transit. The thrusters were raised at 0740 h, and we departed for Site U1484 at 0754 h on 30 October, ending operations at Site U1483. Total time spent in Hole U1483C was 29.75 h (1.2 days).
Hole U1483C consisted of 30 APC cores recovering 292.42 m of sediment over 281.8 m of coring (103.8% recovery). A single drilled interval advanced the hole 3 m without coring.
Core description
We cored three holes at Site U1483, with the deepest hole penetrating to 293.37 mbsf (Hole U1483A). The succession recovered from Holes U1483A–U1483C is composed of pelagic and hemipelagic lower Pliocene to recent sediment. The sequence at Site U1483 is assigned to one lithologic unit and three subunits defined on the basis of a combination of visual core description, microscopic examination of smear slides, magnetic susceptibility, color spectral observations, and bulk mineralogical analysis by X-ray diffraction (XRD) (see Core description and Physical properties in the Expedition 363 methods chapter [Rosenthal et al., 2018a]). The major characteristics of the sedimentary sequence at Site U1483 are illustrated in Figure F6.
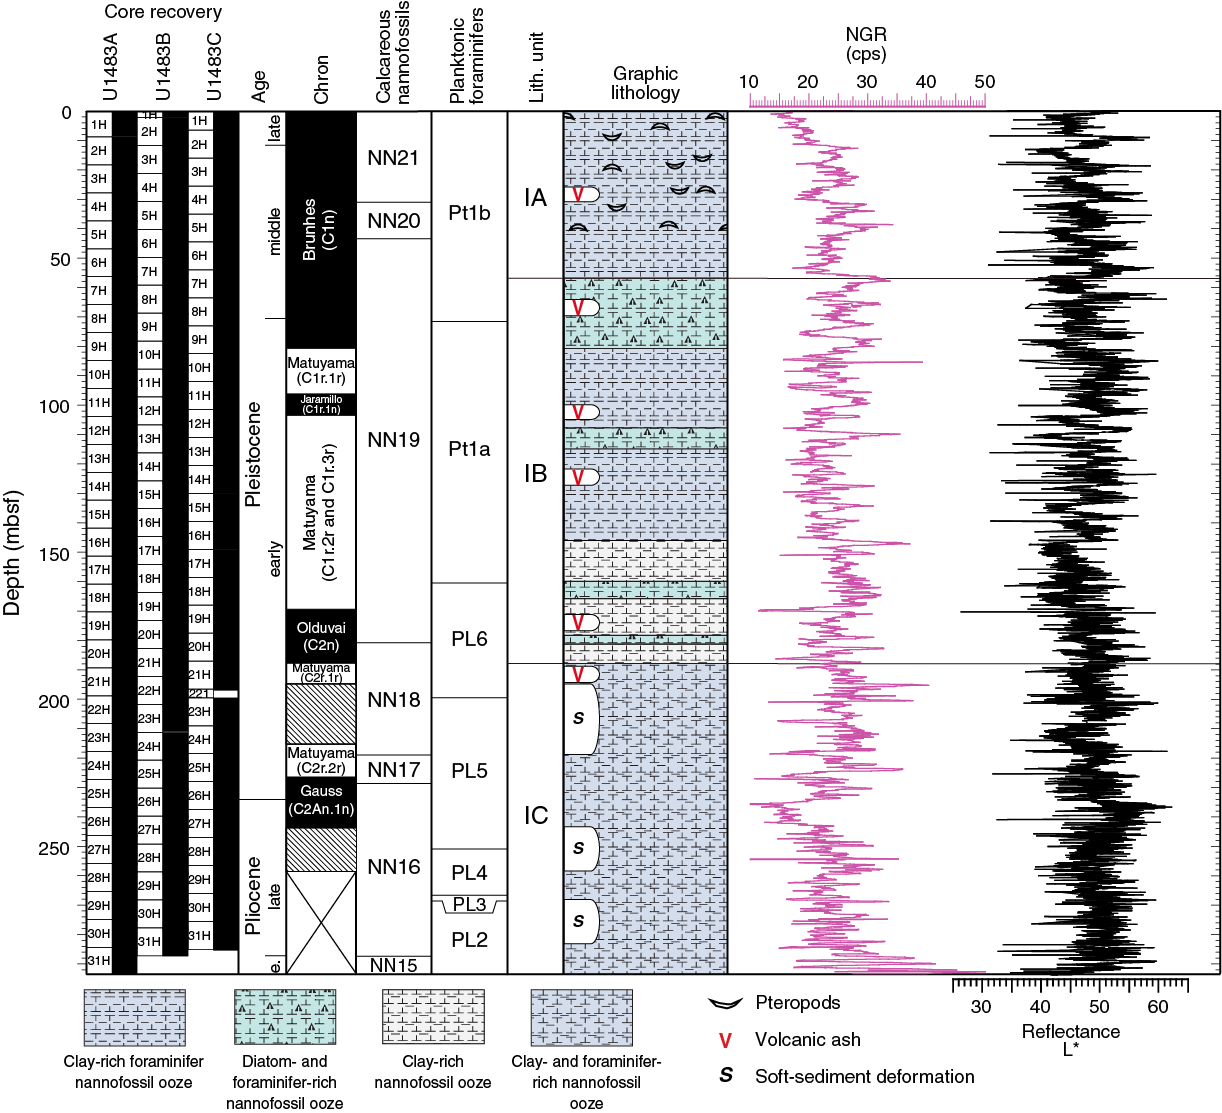
Figure F6. Lithologic summary.
Unit descriptions
Unit I
- Intervals: 363-U1483A-1H-1, 0 cm, through 31H-CC, 63 cm;
363-U1483B-1H-1, 0 cm, through 31H-CC, 17 cm;
363-U1483C-1H-1, 0 cm,
through 31H-CC, 22 cm - Depths: Hole U1483A = 0–293.37 mbsf, Hole U1483B = 0–287.12 mbsf, Hole U1483C = 0–285.14 mbsf
- Thickness: Hole U1483A = 293.37 m, Hole U1483B = 287.12 m, Hole U1483C = 285.14 m.
- Age: early Pliocene to recent
- Lithology: nannofossil ooze, clay-rich nannofossil ooze, nannofossil-rich clay, diatom-bearing clay-rich nannofossil ooze, diatom-rich nannofossil clay, clay-rich foraminifer nannofossil ooze, clay-rich diatom nannofossil ooze, nannofossil-bearing foraminifer-rich clay, foraminifer ooze, and ash
Unit I is mainly composed of greenish gray nannofossil ooze with variable amounts of clay, foraminifers, and siliceous microfossils. The unit is divided into three lithologic subunits based on minor changes in lithology and sedimentological features. Subunit IA is dominated by clay-bearing to clay-rich nannofossil ooze, whereas in Subunit IB diatoms become an important and occasionally major sedimentary component (Figure F7). Subunit IC is characterized by the occurrence of several intervals showing soft-sediment deformation with thicknesses that range between ~3 and 25 m (Figure F8; Table T2). Throughout Unit I, sediment color alternates from light greenish gray to dark greenish gray, with occasional brownish gray intervals. These cyclic variations occur on decimeter to meter scales and exhibit gradual transitions. The sediment is moderately to heavily bioturbated throughout, and several tephra layers are present within the sediment succession (Figures F9, F10; Table T3). XRD mineralogical analysis was performed on bulk sediment samples from the three dominant color intervals: darker greenish gray, lighter greenish gray, and brownish gray (Figure F11). Despite color differences, all analyses show similar mineral compositions with calcite as the dominant mineral.
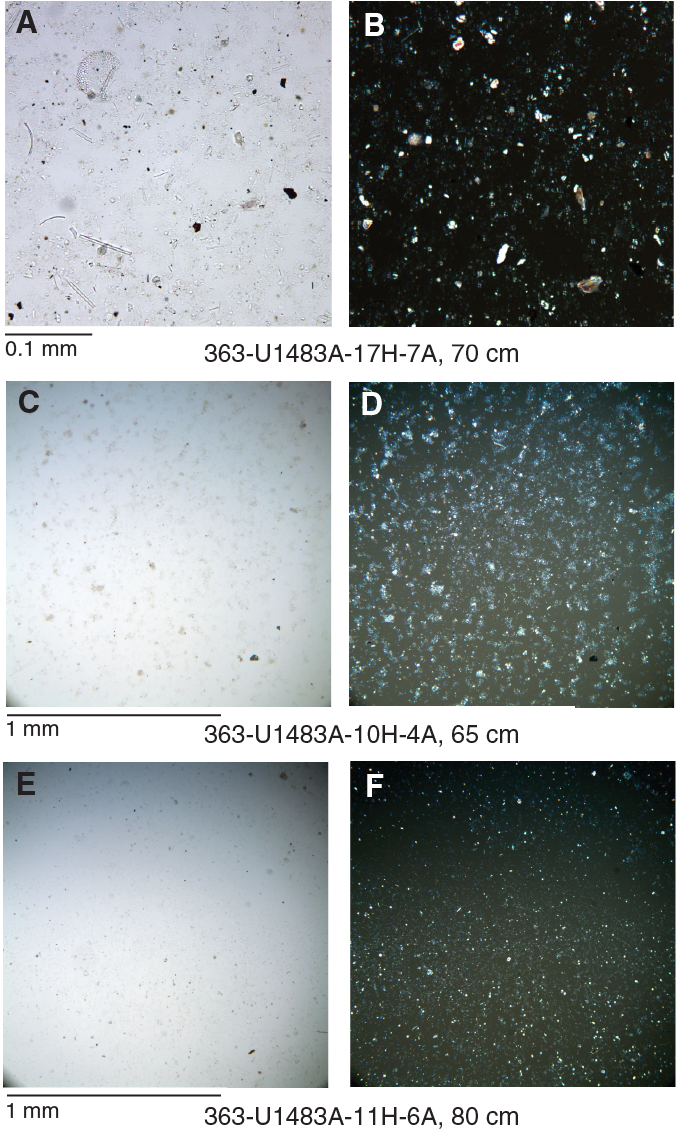
Figure F7. Main sedimentary components, Subunit IB.
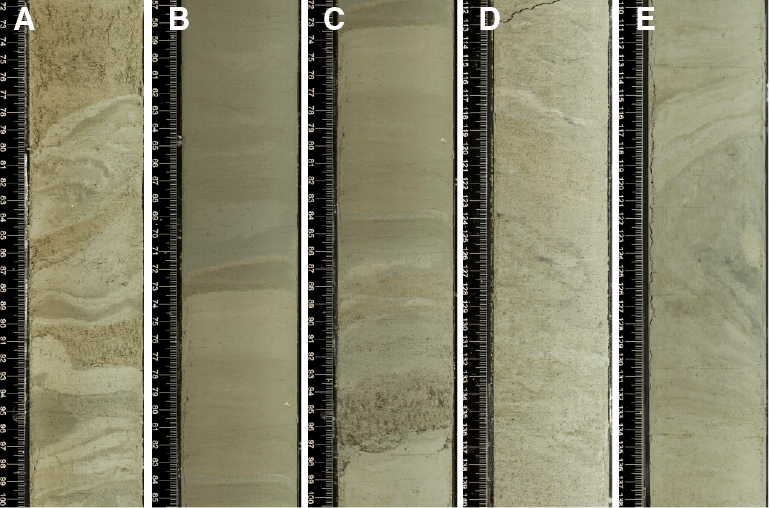
Figure F8. Soft-sediment deformation, Subunit IC.
Table T2. Intervals of soft-sediment deformation. Download table in CSV format.
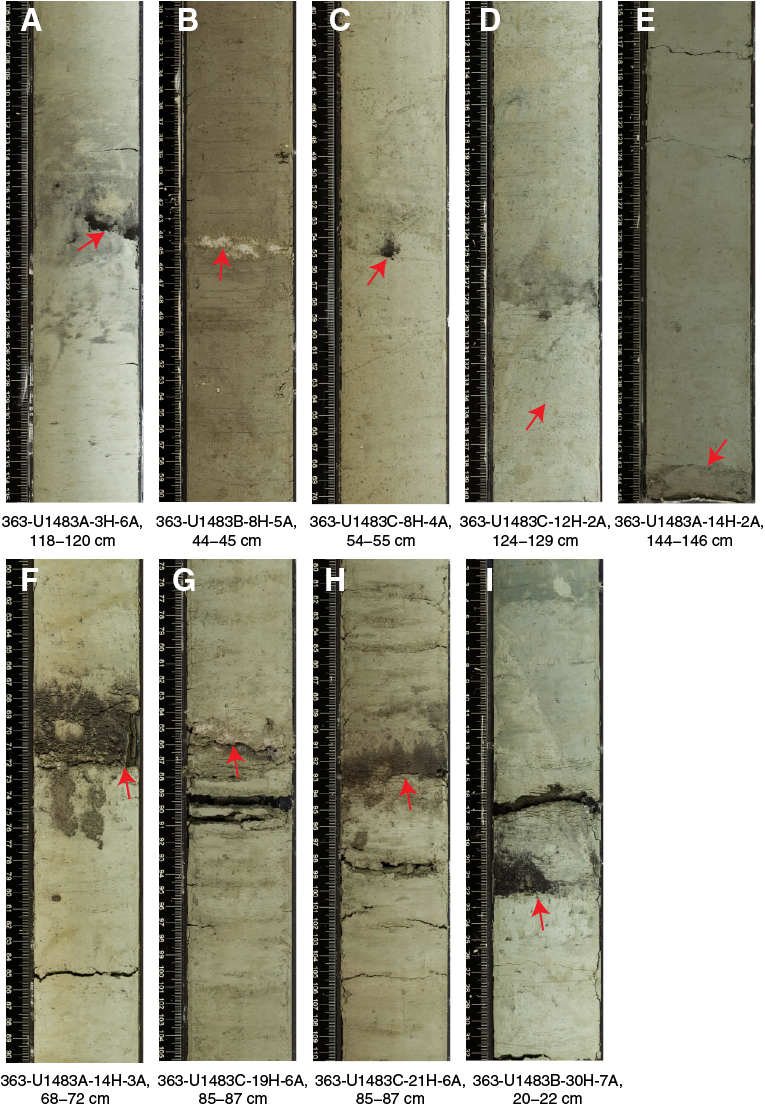
Figure F9. Tephra layers, Subunits IA–IC.
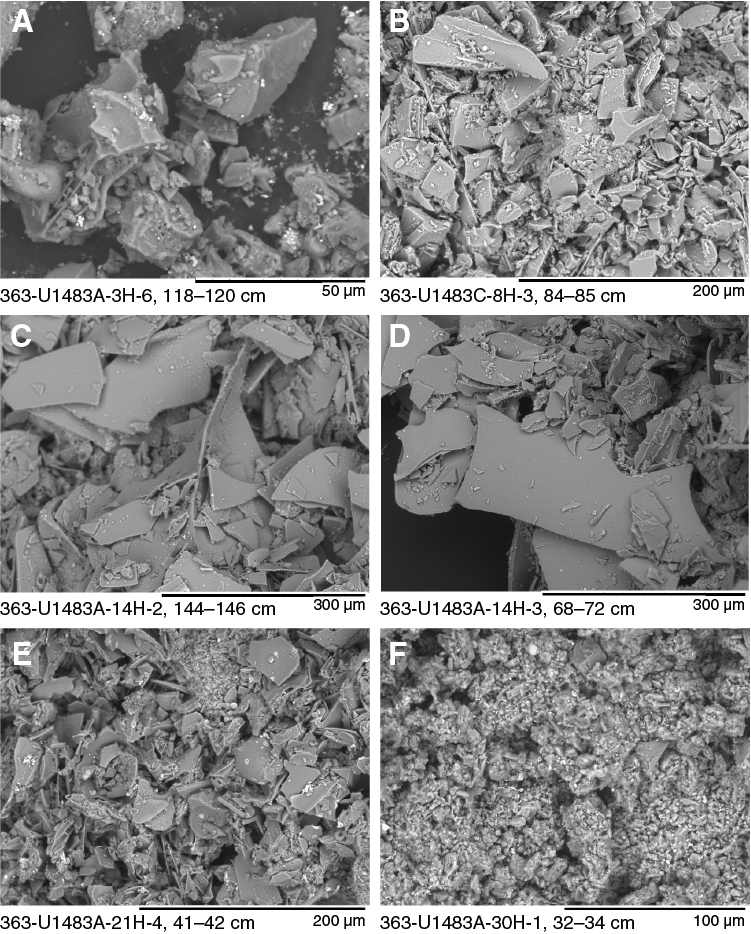
Figure F10. SEM photomicrographs of selected tephra samples.
Table T3. Tephra layers. Download table in CSV format.

Figure F11. XRD results from selected bulk sediment samples, Subunit IB.
Subunit IA
- Intervals: 363-U1483A-1H-1, 0 cm, through 7H-1, 45 cm; 363-U1483B-1H-1, 0 cm, through 7H-5, 79 cm; 363-U1483C-1H-1, 0 cm, through 7H-4, 62 cm
- Depths: Hole U1483A = 0–56.55 mbsf, Hole U1483B = 0–56.15 mbsf, Hole U1483C = 0–58.92 mbsf
- Thickness: Hole U1483A = 56.55 m, Hole U1483B = 56.15 m, Hole U1483C = 58.92 m
- Age: middle Pleistocene to recent
- Lithology: clay-rich foraminifer nannofossil ooze, clay-rich nannofossil ooze, clay-bearing foraminifer-rich nannofossil ooze, nannofossil-rich clay, diatom-bearing clay-rich nannofossil ooze, and ash
Subunit IA is mainly composed of greenish gray clay-bearing and clay-rich nannofossil ooze. The top of the subunit consists of ~3.5 cm of light brownish nannofossil-rich clay above a ~2–4 cm thick very dark brown nannofossil-rich clay layer, marking the redox transition. Below this interval, sediment color gradually changes to light greenish gray. This subunit shows multiple meter-scale alternations between dark greenish gray and light greenish gray layers (Figure F12). Color variations correspond to lithologic changes, which are also apparent in natural gamma radiation (NGR) and L* variations (Figure F6). Smear slide analysis suggests that higher NGR and lower L* values correspond to higher clay content in the sediment. The sediment is moderately to heavily bioturbated. Sponge spicules and molluscan shell fragments are common throughout the subunit, whereas pteropods are only observed in the upper ~40 mbsf. Dark green vertically elongated spots, which might be burrows filled with clay minerals, are observed in the uppermost ~20 mbsf. A 1.7–2.0 cm thick dark gray tephra layer consisting mostly of vesicular glass fragments (Figure F10A) corresponds to a distinct magnetic susceptibility peak (see Physical properties) in all holes (intervals 363-U1483A-3H-6, 118–120 cm; 363-U1483B-4H-3, 98–100 cm; and 363-U1483C-4H-2, 73–75 cm).
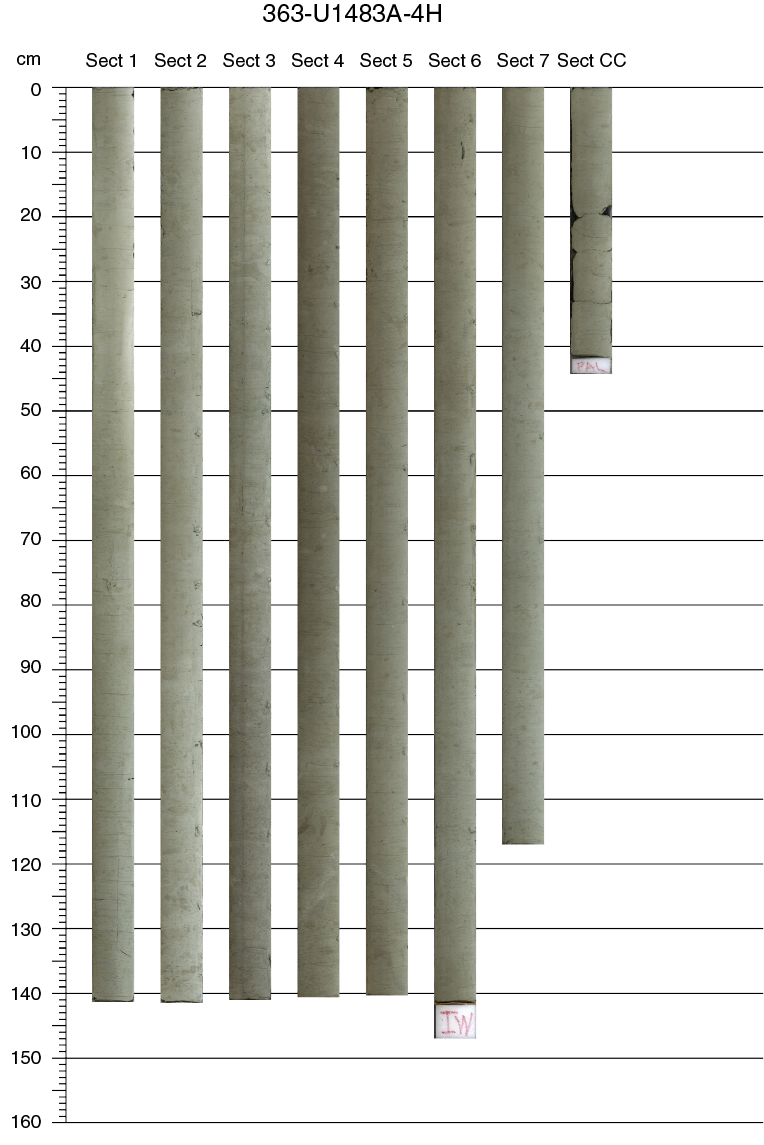
Figure F12. Characteristic lithology and color alternations, Hole U1483A.
The lithologic boundary between Subunits IA and IB is located at 363-U1483A-7H-1, 45 cm (56.55 mbsf); 363-U1483B-7H-5, 79 cm (56.15 mbsf); and 363-U1483C-7H-4, 62 cm (58.92 mbsf). The boundary is defined at the first downhole appearance of brownish gray diatom-rich nannofossil ooze, which becomes more abundant in Subunit IB.
Subunit IB
- Intervals: 363-U1483A-7H-1, 45 cm, through 20H-6, 80 cm; 363-U1483B-7H-5, 79 cm, through 21H-1, 0 cm; 363-U1483C-7H-4, 62 cm, through 21H-1, 0 cm
- Depths: Hole U1483A = 56.55–187.30 mbsf, Hole U1483B = 56.15–182.50 mbsf, Hole U1483C = 58.92–186.80 mbsf
- Thickness: Hole U1483A = 130.75 m, Hole U1483B = 126.35 m, Hole U1483C = 127.88 m
- Age: early to middle Pleistocene
- Lithology: clay-rich nannofossil ooze, diatom-rich nannofossil clay, clay-rich diatom nannofossil ooze, and ash
Subunit IB is mainly composed of greenish gray clay-rich nannofossil ooze, diatom-rich nannofossil clay, and clay-rich diatom-nannofossil ooze. This subunit is characterized by higher biosiliceous content than Subunit IA (Figure F7A, F7B), and the clay content increases in the lower part of the subunit (Figure F6). Gradual sediment color changes occur in cycles that have approximately the length of a section (~1.5 m) (Figure F13), which is of shorter amplitude than the color alternations observed in Subunit IA. We found a general correlation between higher abundances of diatoms in smear slides (as well as radiolarians, silicoflagellates, and organic debris) and olive-gray to dark greenish gray sediment color. Sediment that has lower abundances of diatoms is light greenish gray to greenish gray. The sediment is moderately to heavily bioturbated, and sponge spicules and shell fragments are common. Bulk XRD analyses indicate only small differences in mineralogical composition between sediment with different colors (Figure F11). Two ~3 cm thick layers with sharp erosional bases that contain higher concentrations of foraminifers were observed in intervals 363-U1483A-19H-5, 112–115 cm, and 363-U1483B-20H-1, 123–126 cm. In interval 363-U1483B-8H-7, 62–65 cm, we observed an ~2 cm × 2 cm large white concretion with large mineral faces visible to the unaided eye. The concretion is composed of two parts: (1) an intergrowth of euhedral gypsum crystals at the top and (2) a gray-brown nodule at the bottom with biotite and another unknown mineral (possibly barite) (Figure F14). Tephra layers of various colors with thicknesses of 1–5 cm occur within this subunit (Figure F9; Table T3).
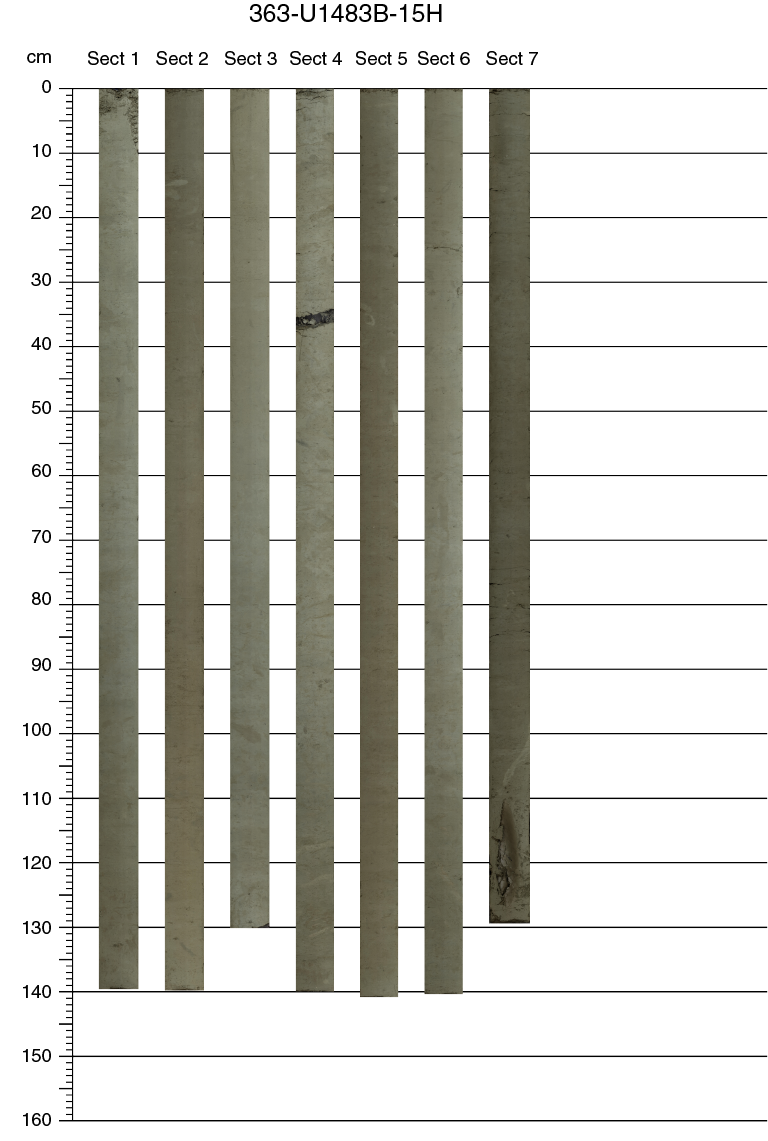
Figure F13. Characteristic lithology and color alternations, Hole U1483B.

Figure F14. Mineral concretion.
The lithologic boundary between Subunits IB and IC is located at 363-U1483A-20H-6, 80 cm (187.30 mbsf), 363-U1483B-21H-1, 0 cm (182.50 mbsf), and 363-U1483C-21H-1, 0 cm (186.80 mbsf). The boundary is defined by a significant reduction in the abundance of diatoms and radiolarians below these depths.
Subunit IC
- Intervals: 363-U1483A-20H-6, 80 cm, through 31H-CC, 63 cm (total depth); 363-U1483B-21H-1, 0 cm, through 31H-CC, 17 cm (total depth); 363-U1483C-21H-1, 0 cm, through 31H-CC, 22 cm (total depth)
- Depths: Hole U1483A = 187.30–293.37 mbsf (total depth), Hole U1483B = 182.50–287.12 mbsf (total depth), Hole U1483C = 186.80–285.14 mbsf (total depth)
- Thickness: Hole U1483A = 106.07 m, Hole U1483B = 104.62 m, Hole U1483C = 98.34 m
- Age: early Pliocene to early Pleistocene
- Lithology: foraminifer-rich nannofossil clay, clay- and foraminifer-rich nannofossil ooze, foraminifer-bearing clay-rich nannofossil ooze, nannofossil-bearing foraminifer-rich clay, foraminifer ooze, and ash
Subunit IC is mainly composed of greenish gray foraminifer-rich nannofossil clay and greenish gray foraminifer-bearing clay-rich nannofossil ooze (Figure F15). Large portions of this subunit show features such as folding, tilting, and fine-scale sediment foliation indicative of soft-sediment deformation (Figure F8; Table T2). Several distinct types of structures were observed in the deformed intervals, including inclined bedding, folding, microfaulting, foliation, and homogeneous sections (Figure F8), indicating complex deformational processes. Coarser grains are mainly planktonic foraminifers, and several layers with concentrations of foraminifers show sharp basal erosional contacts and fining-upward graded bedding. Overall, in the three holes cored at Site U1483, soft-sediment deformation is concentrated within two major intervals separated by a relatively undisturbed portion of sediment. The upper interval, which is about 24 m thick in all holes (Table T2), is topped by a prominent ash layer and contains mainly tilted and folded beds often outlined by a prominent dark gray, stiff clay layer. The lower deformed interval is less continuous between the holes and is thickest in Holes U1483B and U1483C. The main types of deformation include foliation and folding. Dark gray clay layers are also present, and some occur at a high angle relative to bedding. It is worth noting that the top and base of each deformed interval are not always clearly defined.
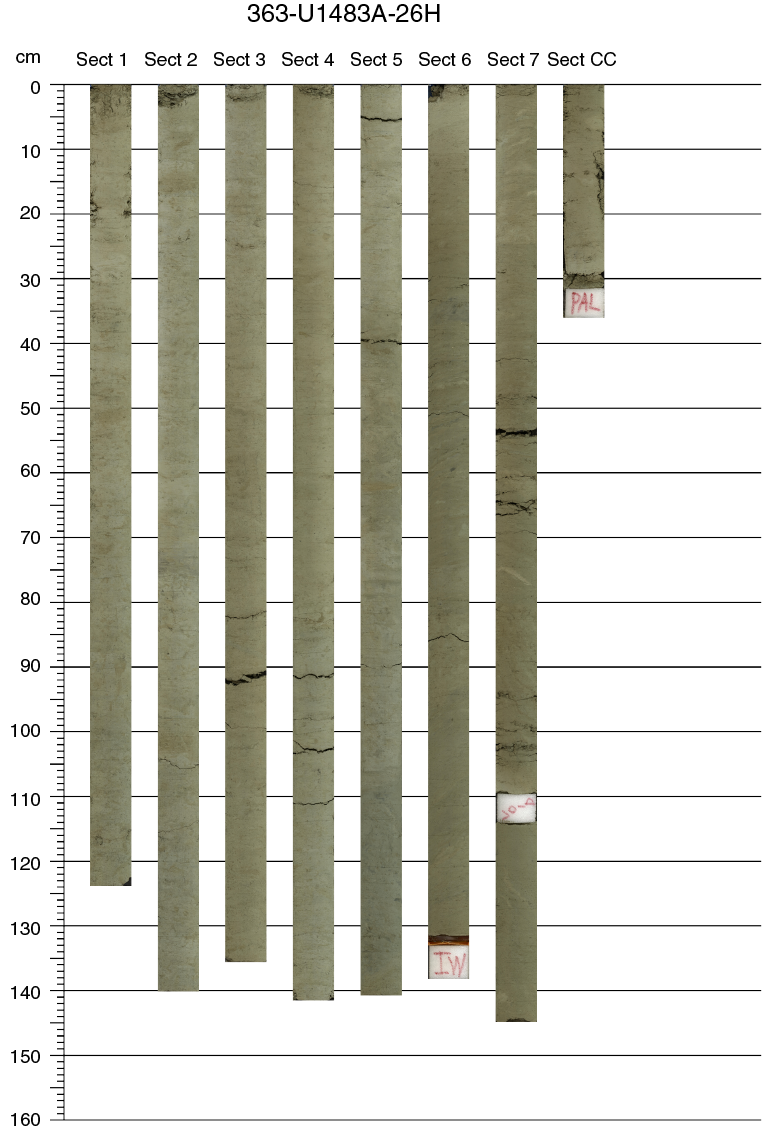
Figure F15. Characteristic lithology and color alternations, Subunit IC.
Two tephra layers 1–4 cm thick are found within Subunit IC (Figures F9, F10; Table T3). The upper tephra layer is located in intervals 363-U1483A-21H-4, 41–42 cm; 363-U1483B-21H-7, 123–127 cm; and 363-U1483C-21H-6, 91–94 cm, and is 2–20 cm above the uppermost deformed interval, whereas the lower tephra is located in intervals 363-U1483A-30H-1, 32–34 cm, and 363-U1483B-30H-7, 20–22 cm, and is within or below the lowermost deformed interval.
Discussion
Only one lithologic unit is defined at this site because the composition of the sediment does not change markedly throughout the sequence. To investigate clay mineral composition, we conducted XRD analysis of eight samples from the three different subunits. We analyzed the acidified residues from the samples previously analyzed for carbonate analysis (Figure F16). The results show differences in the proportions of clay minerals. A gradual decrease in the proportion of chlorite with depth suggests either changes in the source of the clay minerals, weathering processes, transportation of fine grains, and/or other processes relating to clay mineral deposition through the Pliocene–Pleistocene. The shipboard age model indicates a constant sedimentation rate of ~10 cm/ky for Subunits IA and IB (see Biostratigraphy), implying a relatively stable sedimentary environment at the site since the early Pleistocene. In contrast, multiple intervals of soft-sediment deformation in Subunit IC indicate sedimentary disturbances during the Pliocene to earliest Pleistocene. The erosional surfaces in some deformed intervals suggest depositional hiatuses in Subunit IC, which agrees with observations based on calcareous nannofossils and planktonic foraminifers (see Biostratigraphy).
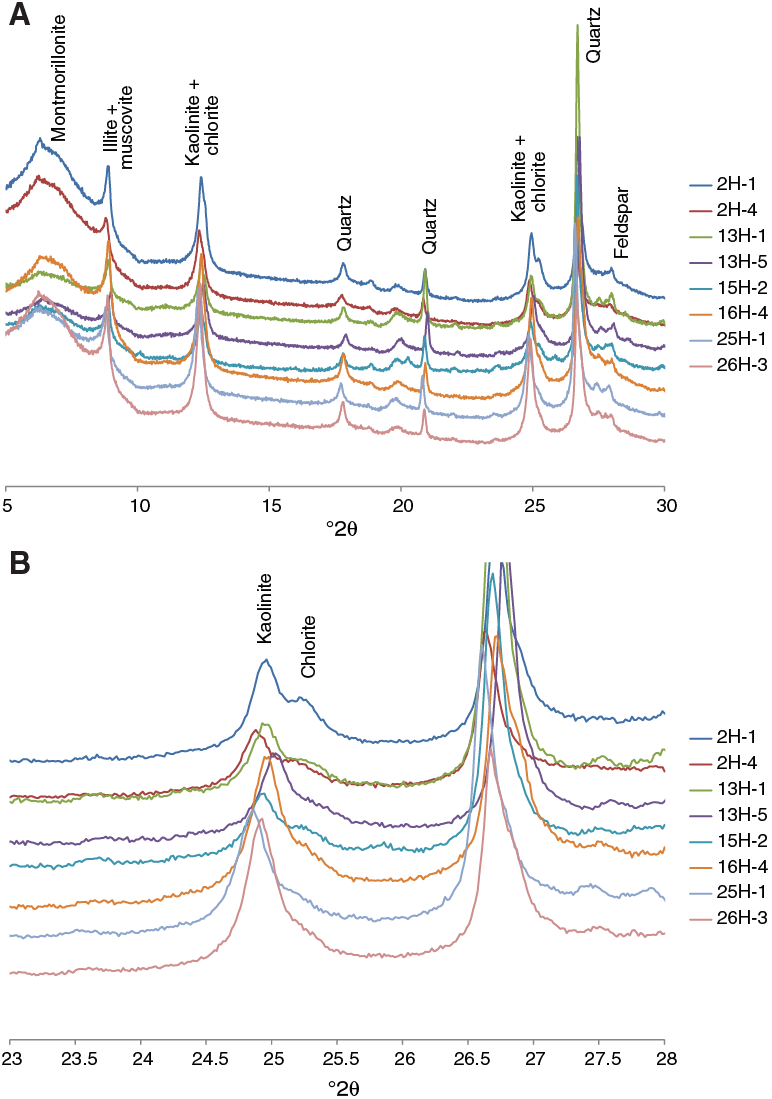
Figure F16. XRD results from carbonate residue analysis.
Spectrophotometry data (L*, a*, b*) measured at 2.5 cm intervals on the archive halves from Holes U1483A–U1483C using the Section Half Multisensor Logger (SHMSL) show distinct meter-scale variations downhole. In particular, L* displays well-defined cyclicity with clear correlations between L* data across the three holes. Downhole variations in L* appear to track biogenic carbonate concentration in the bulk sediment with lighter colored, carbonate-rich intervals corresponding to higher L* measurements. The frequency of the L* cyclicity changes at ~82 mbsf, which may be associated with the mid-Pleistocene transition. Color reflectance a* and b* data also display meter-scale variability, although the correlation between holes appears less consistent.
A relatively large portion of the sediment recovered in Subunit IC (as much as ~50 m in Hole U1483C) shows sediment deformation features including (1) “plastic” deformation such as inclined bedding and folding and (2) “brittle” deformation of the sediment fabric such as microfaulting and sediment foliation (Figure F8). The deformed sediment is concentrated in two intervals, with relatively undisturbed sediment in between. The two intervals record different types of deformation features, with plastic deformation primarily in the shallower interval and brittle deformation in the deeper interval, suggesting either multiple deformation events and/or a complex mechanism for sediment deformation that has disrupted and dislocated the originally undisturbed sediment after deposition. It is worth noting that thick clay layers were observed only in the disturbed intervals, suggesting a causal relationship between the occurrence of this lithology and the disturbance.
These disturbed intervals in Subunit IC contain mixtures of microfossil assemblages of different ages, and planktonic foraminifer biostratigraphy indicates probable hiatuses (see Biostratigraphy) of <200 ky for the shallower disturbed interval, whereas the hiatus is more significant in the deeper interval (~500 ky). By extrapolating the sedimentation rates from the undisturbed intervals, the total thickness of missing sediment can be estimated as ~100 m (see Biostratigraphy).
Based on sedimentologic and biostratigraphic observations, we suggest two possible mechanisms (not mutually exclusive) as potential cause(s) for the formation of these deformed intervals. The first hypothesis envisages the occurrence of two separate and unrelated events (at ~2.8 and ~2.1 Ma), which resulted in remobilization of sediment by mass gravity flow (e.g., slumping or debris flow) and concurrent soft-sediment deformation. Because of the presence of folded beds, the deformed sediment must have already experienced some degree of burial and early diagenesis (i.e., it was lithified enough to behave cohesively). According to this hypothesis, the sediment missing from Site U1483 must have slid and then accumulated in another location.
A second hypothesis interprets the two deformed intervals as the result of a single event that occurred at ~2.1 Ma. This hypothesis is based on the observation that the deeper disturbance (with the longer hiatus) shows the most evidence of brittle deformation, whereas the shallower disturbance exhibits mainly plastic deformation features. According to this hypothesis, the base of the lowermost disturbance acted as a “décollement” for one large detachment (either a submarine landslide and/or thrust fault) over which the entire interval encompassing the two disturbances slid, rafting relatively undisturbed sediment in between. The dark clay layers found as folded beds or dike-like structures within the disturbed interval could have facilitated the detachment. However, the biostratigraphic data suggest that the clay layers did not originate from a single layer prior to deformation (see Biostratigraphy).
This initial shipboard characterization does not allow us to establish which of the two hypotheses is most likely and whether the disturbances were formed during one or two events. However, the thickness of the sedimentary interval impacted by deformation and the potentially large amount of missing section indicate that the event(s) affected a large portion of the seafloor; therefore, this disturbance should be recorded in other locations. Site U1482 has a similar, although less extensive, disturbed portion of sediment dated to ~2 Ma, which might be correlative to the disturbed interval observed at Site U1483. Finally, the presence of clay beds in the deformed intervals indicates that clay lithologies occur at some depth at this site. This lithology is very different from the nannofossil ooze–dominated sediment recovered in the undisturbed sequence above the deformed intervals and represents a markedly different depositional environment that we have not documented.
Biostratigraphy
Site U1483 recovered a 293 m thick sequence of lower Pliocene to Pleistocene clay, nannofossil clay, and nannofossil ooze, with varying proportions of diatoms and foraminifers (see Core description). Planktonic foraminifers, benthic foraminifers, and calcareous nannofossils are present throughout the succession. In the >150 µm size fraction, planktonic foraminifers are the dominant sediment component (>90% of particles). Radiolarians are present in many of the residues, particularly in samples taken from the diatom-rich subunits (see Core description). Although a minor decline in preservation with depth is noted in calcareous nannofossils, planktonic foraminifers, and benthic foraminifers, the preservation is generally excellent to very good for each group through the whole succession. The results from each fossil group (calcareous nannofossils, planktonic foraminifers, and benthic foraminifers) are presented in sections below, followed by a detailed characterization of both benthic and planktonic foraminifer preservation state using shipboard scanning electron microscope (SEM) observations. An integrated bio- and magnetostratigraphy is presented in the final section. Shipboard taxon occurrence data are available for download from the Laboratory Information Management System (LIMS) database (http://web.iodp.tamu.edu/LORE).
Calcareous nannofossils
Calcareous nannofossil biostratigraphy is based on analysis of core catcher samples and three additional samples from working-half sections (usually 50–52 cm in Sections 2, 4, and 6 of each core) in Hole U1483A, providing a sampling resolution of ~3 m. Depth positions and age estimates of key biohorizons are given in Table T4. Observations were undertaken using plane- (PPL), cross- (XPL), and circular-polarized light (CPL), as well as the shipboard desktop SEM (Hitachi TM3000) to confirm the presence of Emiliania huxleyi and to check preservation state.
Table T4. Calcareous nannofossil bioevents. Download table in CSV format.
At Site U1483, the preservation of calcareous nannofossils is generally excellent to very good. Intact coccospheres are frequently observed, and dissolution-susceptible taxa are consistently present (Syracosphaera and Rhabdosphaera). In the lower Pliocene, a thin central-area net is typically observed in specimens of Reticulofenestra pseudoumbilicus (XPL/CPL), whereas very small Gephyrocapsa spp. and E. huxleyi are abundant and well preserved in the middle to upper Pleistocene (SEM/CPL). When thin-rayed discoasters are present, some are fragmented but do not show any signs of overgrowth, with gracile ray-tip morphology and details of central-area bosses and knobs preserved (Figure F17). To determine the biohorizon top of Discoaster brouweri, we rely only on specimens that are not fragmented in order to avoid misinterpretation due to reworked discoasters that are often partly broken and/or recrystallized. Reworked calcareous nannofossils represent, in most instances, less than 1/10,000 of the assemblage. For example in Sample 363-U1483A-3H-2, 75 cm (20.34 mbsf), 20 reworked Cretaceous and Paleogene taxa are present in one slide transect (40 mm long) containing more than 100,000 calcareous nannofossils (estimated from 4 fields of view). The reworked taxa belong to the following genera: Prediscosphaera, Watznaueria, Cretarhabdus, Micula, Sphenolithus, and Cyclicargolithus. This amount of reworking persists throughout the hole, except at two levels (around 215 and 250 mbsf) where it significantly increases (see discussion below).
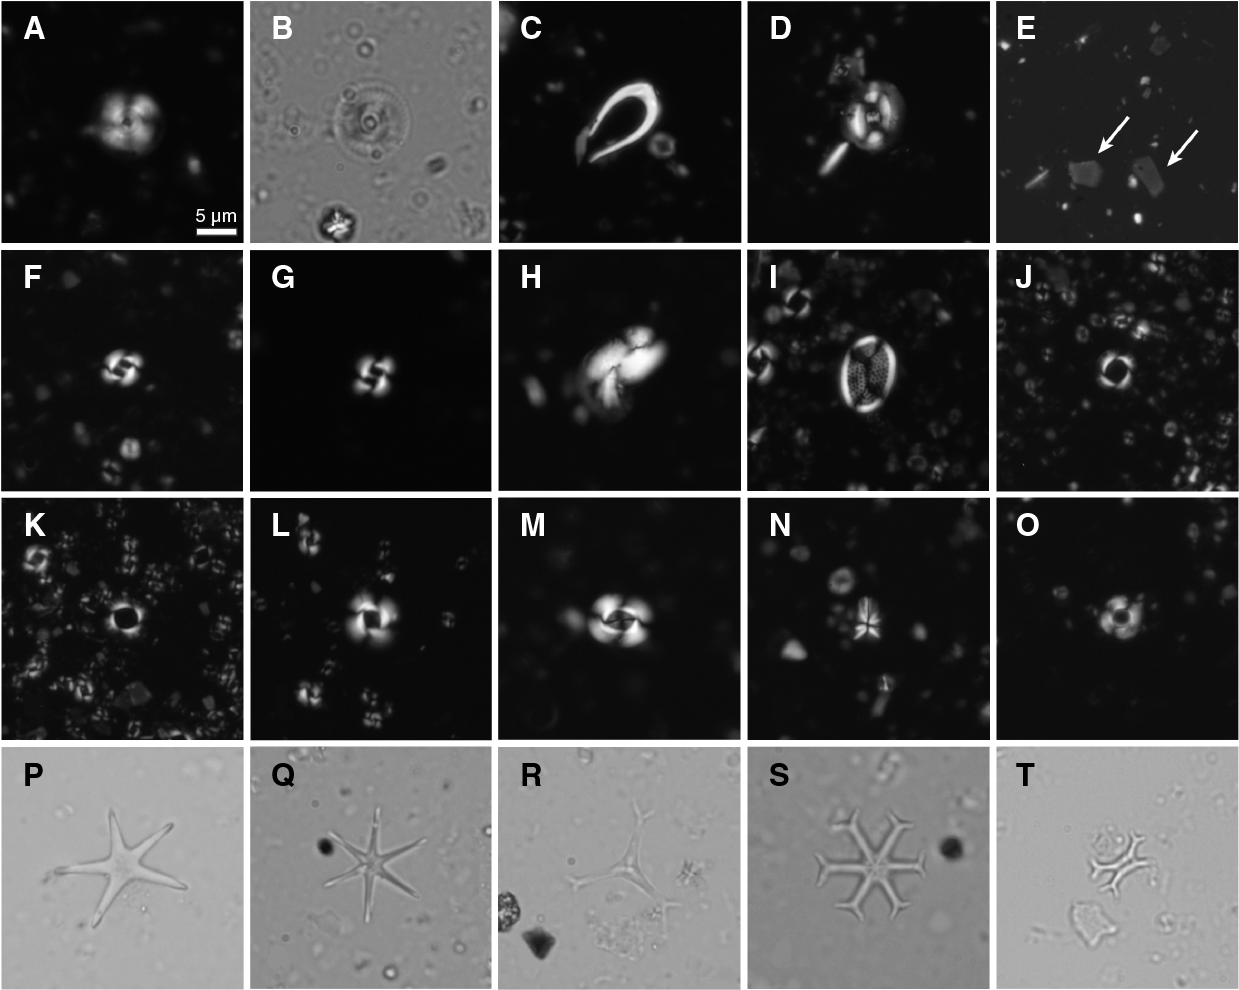
Figure F17. Calcareous nannofossils.
Calcareous nannofossil assemblages from Site U1483 are dominated by Florisphaera profunda (always extremely abundant) and the Noelaerhabdaceae (genera include Gephyrocapsa, Emiliania, Pseudoemiliania, and Reticulofenestra). In the Pleistocene succession, single Noelaerhabdaceae species often dominate within particular stratigraphic intervals, forming distinct, biostratigraphically useful acme events.
Pleistocene
The calcareous nannofossils provide a well-constrained biostratigraphy of the Pleistocene. Fourteen biohorizons have been identified with a sample resolution of about 1.5 m, and most of them are distributed along an age-depth line that indicates an almost constant sedimentation rate in the Pleistocene. The base of common E. huxleyi at 0.09 Ma occurs between Samples 363-U1483A-2H-2, 75 cm, and 2H-4, 75 cm (10.85–13.85 mbsf). This shift in abundance is well constrained, although E. huxleyi never dominates the assemblage. Besides F. profunda, Gephyrocapsa oceanica and Gephyrocapsa ericsonii are more abundant than E. huxleyi. The base of Zone NN21 is identified by biohorizon base E. huxleyi at 0.29 Ma between Samples 4H-2, 75 cm, and 4H-4, 75 cm (29.77–32.61 mbsf). The base of Zone NN20 is identified by biohorizon top Pseudoemiliania lacunosa (0.44 Ma) between Samples 5H-4, 75 cm, and 5H-6, 75 cm (42.08–44.90 mbsf). The base of Zone NN19 is identified by biohorizon top D. brouweri (1.93 Ma) between Samples 19H-CC and 20H-2, 50 cm (180.06–181.51 mbsf). This bioevent occurs ~10 m above a sharp drop in the abundance of discoasters between Samples 20H-CC and 21H-2, 51 cm (189.62–191.02 mbsf). Below this interval, the abundance of D. brouweri is similar to that of the reworked discoasters. Specimens of D. brouweri are considered in place when they have complete and well preserved rays.
Calcareous nannofossil biostratigraphy of the lower Pleistocene is complicated by reworking in an interval of disturbed sediment between Cores 21H and 23H (see Core description). Immediately above this disturbance (Sample 21H-4, 17 cm; 193.51 mbsf), the sediment age is constrained to >1.93 Ma by the consistent presence of D. brouweri. Twelve samples studied within this interval show variable abundances of species indicative of a component of significantly older, early Pliocene specimens, including Sphenolithus abies and Reticulofenestra pseudoumbilicus. In Cores 21H and 22H, the darker clay-rich clasts and horizons contain the greatest proportion of these early Pliocene taxa (Samples 21H-4, 82 cm, and 22H-2, 60 cm; 194.16 and 200.62 mbsf, respectively). Below the most heavily deformed intervals of Cores 21H and 22H, biohorizon top Discoaster pentaradiatus (2.49 Ma) is placed between Samples 23H-CC and 24H-2, 50 cm (217.97–219.44 mbsf), based on a marked increase in the abundance of this taxon, and a shift from fragmented forms, to more intact specimens. Given the intensity of reworking through this interval, this placement is somewhat uncertain. To trace the presence of reworking and disturbed, possibly mixed sediment, the abundance of Sphenolithus abies was quantified against the abundance of discoasters and Helicosphaera (Figure F18). In the upper Pliocene to lower Pleistocene interval of sediment disturbance, S. abies should be completely absent and so its presence in the sediment can be used to trace the presence of reworked early Pliocene material. This guides the interpretation of assemblages near the final extinction of the discoasters, where it is hard to distinguish primary discoaster assemblages from reworked, and so place biohorizon tops of D. pentaradiatus, D. triradiatus, and D. brouweri. It is important to note that below and above the disturbed sequence, reworked S. abies specimens are absent, and the calcareous nannofossil biohorizons are found in correct stratigraphic order. The biohorizon top Discoaster surculus (2.49 Ma) marks the base of Zone NN17 and occurs between Samples 24H-CC and 25H-2, 51 cm (227.88–229.01 mbsf).
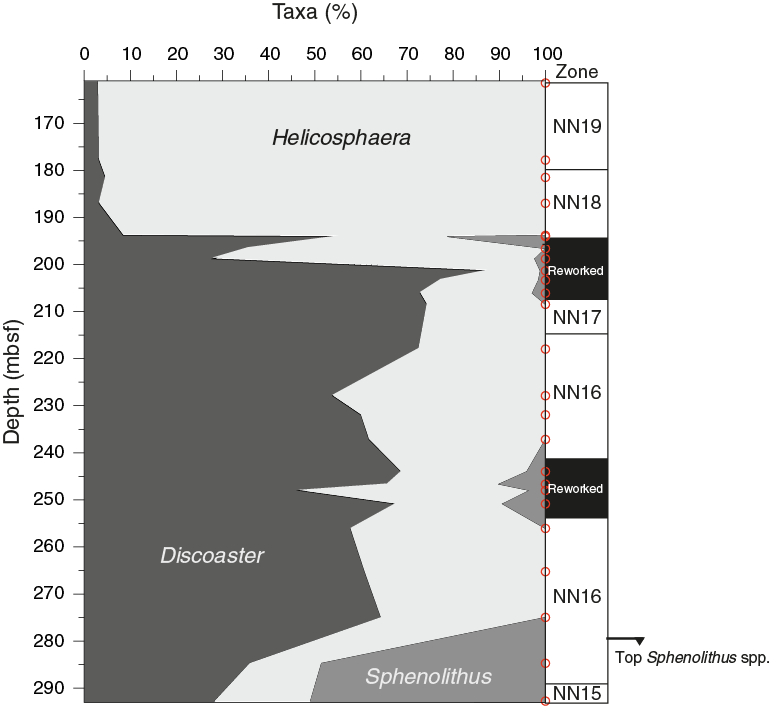
Figure F18. Relative abundances of Discoaster, Helicosphaera, and Sphenolithus.
Pliocene
The recovered Pliocene interval is 65 m thick and corresponds to Zone NN16, between biohorizon top D. surculus and biohorizon top R. pseudoumbilicus at 3.70 Ma, which marks the base of Zone NN16. The latter bioevent is found between Samples 363-U1483A-31H-2, 50 cm, and 31H-5, 50 cm (285.95–288.82 mbsf). The Pliocene calcareous nannofossil biohorizons, when shown as age-depth plots, are not aligned along the constant sedimentation rate of the Pleistocene. They rather indicate a substantially lower sedimentation rate or an unconformity. The abundance of reworked specimens of S. abies in the interval from Samples 26H-6, 50 cm (243.99 mbsf), to 27H-4, 50 cm (250.85 mbsf), indicates another disturbed interval, similar to the one identified at the base of Zone NN18 (~194–203 mbsf) (Figure F18).
Planktonic foraminifers
The most detailed planktonic foraminifer biostratigraphy was conducted in Hole U1483A, from which the core catcher sample and three additional samples per core were taken. Foraminifers occur throughout the sediment but are sometimes found concentrated in certain horizons and burrows. A mudline sample taken in Hole U1483A contains a recent, diverse, tropical assemblage, which is generally excellently preserved although minor iron oxide staining is evident on some tests.
Pleistocene
Sample 363-U1483A-1H-2, 75–77 cm (2.25 mbsf), is assigned to the uppermost part of Subzone Pt1b (<0.07 Ma) based on the absence of Globigerinoides ruber (pink) and Globorotalia flexuosa. Biohorizon base Globigerinella calida has a calibrated age of 0.22 Ma (Wade et al., 2011); however, this morphospecies is found deeper in the section than expected and is present in Sample 6H-6, 50–52 cm (54.20 mbsf), below biohorizon base G. flexuosa (found between Samples 5H-7, 50–52 cm, and 5H-CC; 44.65–47.03 mbsf), which has an older calibrated age of 0.40 Ma. Detailed investigation at other sites is required to determine whether there is a need for bioevent recalibration or whether this is a local discrepancy.
A single sample contains numerous Globigerinoides sp. cf. conglobatus (pink) (Sample 9H-2, 50–52 cm; 77.0 mbsf) (see Biostratigraphy in the Site U1482 chapter [Rosenthal et al., 2018b] for discussion of morphological characteristics). This correlates well with the short stratigraphic interval at Site U1482 (Samples 363-U1482B-5H-6, 49–51 cm, and 5H-CC; 42.59–44.54 mbsf) with similar G. sp. cf. conglobatus (pink), providing a useful tie point between the two sites. Both occurrences are found slightly below the base of Subzone Pt1b (black star in Figure F19) suggesting more widespread correlation potential.

Figure F19. Coiling patterns in Pulleniatina.
Biohorizon top Globorotalia tosaensis (0.61 Ma), marking the base of Subzone Pt1b, is found between Samples 363-U1483A-8H-4, 50–52 cm, and 8H-6, 50–52 cm (70.36–73.16 mbsf). This biohorizon is difficult to locate precisely during shipboard studies because many individuals need to be examined closely to find the top occurrence, and intergradation between G. tosaensis and Globorotalia truncatulinoides is common.
Saito’s (1976) L1 excursion of sinistral Pulleniatina occurs between Samples 363-U1483A-9H-2, 50–52 cm, and 9H-4, 50–52 cm (77.00–79.82 mbsf), just below the level with G. sp. cf. conglobatus (pink) (Table T5; Figure F19). Previous work (figure 2 in Saito, 1976) has shown that the L1 “event” is closely associated with the Matuyama/Brunhes magnetochron boundary (0.781 Ma), although it is not clear on which side of the boundary the event falls. The bioevent has previously been calibrated approximately to 0.80 Ma based on low-resolution sampling (Wade et al., 2011). The Matuyama/Brunhes boundary in Hole U1483A is located at 80.60 mbsf (see Paleomagnetism). The downhole transition between dominantly dextral and sinistral populations is located within the lowermost part of the Brunhes magnetochron, whereas the downhole return to dextral values is within the uppermost Matuyama magnetochron.
Table T5. Planktonic foraminifer bioevents. Download table in CSV format.
Biohorizon top Globigerinoidesella fistulosa (1.88 Ma), marking the base of Subzone Pt1a, is found between Samples 363-U1483A-17H-6, 49–51 cm, and 17H-CC (159.07–161.45 mbsf). Individuals of G. fistulosa are rare close to this biohorizon, but very distinctive and continuously present.
An interval of severe disturbance topped by a prominent ash layer was observed in Cores 363-U1483A-21H and 23H. Two samples were taken in Core 21H above the interval of disturbance, Samples 21H-2, 50–52 cm, and 21H-4, 16–18 cm (191.01 and 193.50 mbsf, respectively), the latter taken 20 cm above the first visible disturbance. These samples contain G. fistulosa and Pulleniatina finalis but no Globigerinoides extremus and are assigned to the upper part of Zone PL6 (corresponding to 1.98–2.04 Ma). Note that a single specimen of Globorotalia limbata in Sample 21H-2, 50–52 cm (191.01 mbsf), is interpreted as reworked. Both samples lack G. truncatulinoides, although that is interpreted as being due to the rarity of that marker, which also has an uncertain age calibration in the Indian Ocean and appears to be diachronous. Sample 22H-2, 130–132 cm (201.32 mbsf), was taken from about 20 cm below the disturbed interval. This contains a set of top biohorizon markers (disregarding the biostratigraphically mixed interval immediately above it, which is described below) that indicate a substantially older age: G. extremus (>1.98 Ma), Globorotalia pseudomiocenica (>2.30 Ma), and frequent G. limbata (>2.39 Ma). The absence of P. finalis and presence of rare G. fistulosa, G. tosaensis, and G. truncatulinoides locate this sample, and those that follow immediately below it, to the middle part of Zone PL5 (corresponding to 2.39–3.33 Ma). Within the disturbed interval itself, two samples were studied, Samples 21H-6, 50–52 cm, and 21H-CC (196.72 and 198.79 mbsf, respectively). These assemblages appear mixed, containing elements of both older material (including G. pseudomiocenica and G. limbata) and younger material (P. finalis). Coiling ratios of Pulleniatina in the disturbed interval are approximately 55% dextral, whereas the sediment above is <10% dextral and below is >90% dextral (Tables T5, T6; Figure F19). This may indicate thorough mixing between these two extremes on a grain by grain level or that an interval of mixed coiling existed in a missing time interval from which sediment has been redeposited. A summary of this evidence, considered in conjunction with nannofossil and other information, is presented in Shipboard age model.
Table T6. Coiling count data for Pulleniatina. Download table in CSV format.
Pliocene
Biohorizon base G. truncatulinoides is found between Samples 363-U1483A-23H-6, 50–52 cm, and 23H-CC (215.77–217.97 mbsf). As at Site U1482, this biohorizon is clearly within the upper part of the range of G. pseudomiocenica and G. limbata, implying that its correct calibration in this area is >2.39 Ma, as previously discussed (see Biostratigraphy in the Site U1482 chapter [Rosenthal et al., 2018b]). A local calibration of 2.47 Ma is adopted for both Indian Ocean sites following Dowsett (1988).
A second downcore interval of significant disturbance was found extending from the lower part of Section 363-U1483A-26H-5 through Section 28H-2 (see Core description). The sample above this, 26H-4, 50–52 cm (243.99 mbsf), contains the following markers: G. pseudomiocenica (indicating >2.30 Ma), G. limbata (>2.39 Ma), G. fistulosa (<3.33 Ma), and G. tosaensis (<3.35 Ma). Missing from the assemblages is the distinctive and generally frequent species Dentoglobigerina altispira (indicating <3.13 Ma based on the preferred Atlantic calibration; see Biostratigraphy in the Site U1482 chapter [Rosenthal et al., 2018b]). Hence, the age of the sediment above the disturbed interval is bracketed in the range 2.39–3.13 Ma. This is biostratigraphically similar to the level below the shallower interval of sediment disturbance discussed above, except for the absence of G. truncatulinoides, for which the age calibration is uncertain. The first sample below the disturbed interval, 28H-4, 49–51 cm (260.13 mbsf), contains D. altispira, the marker for Zone PL4 (indicating >3.13 Ma), in the absence of G. fistulosa (>3.33) and G. tosaensis (>3.35). The upper age limit for this sample is constrained by the absence of Sphaeroidinellopsis seminulina (indicating <3.59 Ma) and Globorotalia margaritae (<3.85 Ma). Hence, the age of the sediment below the disturbed interval appears to be in the range 3.35–3.59 Ma. Within the disturbed interval, seven samples were studied: 363-U1483A-26H-6, 50–52 cm (243.99 mbsf); 26H-CC (246.66 mbsf); 27H-2, 50–52 cm (248.00 mbsf); 27H-4, 50–52 cm (250.85 mbsf); 27H-7, 50–52 cm (255.16 mbsf); 27H-CC (256.70 mbsf); and 28H-2, 49–51 cm (257.31 mbsf). Interestingly, these samples are not homotaxial. The distinctive G. fistulosa and D. altispira can be used to identify relatively older and younger components; the former occurs only in the upper two samples studied from the disturbed interval, whereas the latter occurs throughout except in Sample 26H-CC (246.66 mbsf). Pulleniatina coiling is strongly dextral, as it is above and below the disturbed interval (Figure F19).
Within the disturbed interval are some prominent clay-rich layers (see Core description). Four additional samples from Hole U1483C were taken from these layers to test the hypothesis that the clay could have been from a single stratigraphic layer prior to deformation and may have acted as a décollement surface for downslope mass transport. Sample 363-U1483C-24H-3, 116–118 cm (212.72 mbsf), is excellently preserved and contains G. truncatulinoides, P. finalis, G. fistulosa, G. pseudomiocenica, and G. limbata but no D. altispira and therefore is assigned to Zone PL5 (2.39–3.13 Ma). Sample 29H-3, 34–36 cm (259.52 mbsf), has very good to good preservation with large amounts of pyrite in the residue and contains D. altispira in the absence of S. seminulina. It is therefore assigned to Zone PL4 (3.13–3.59 Ma), although a small component of younger material appears to have been mixed with it as evidenced by single specimens of P. finalis and G. truncatulinoides. Sample 29H-7, 47–49 cm (265.44 mbsf), has very good preservation and is also assigned to Zone PL4 (3.13–3.59 Ma) with no apparent evidence of mixing. Sample 31H-5, 70–72 cm (281.21 mbsf), has excellent preservation and contains D. altispira and several very well preserved specimens of G. margaritae but no Globoturborotalita nepenthes; it is assigned to Zone PL2. Pulleniatina coiling is dextral, so it probably belongs to the upper part of this zone (3.60–4.08 Ma). From these observations, it is clear that the clay layers did not originate from a single layer prior to deformation. This evidence is discussed further in conjunction with the nannofossil and paleomagnetic evidence in Shipboard age model.
Biohorizon top S. seminulina (3.59 Ma), denoting the base of Zone PL4, occurs between Samples 363-U1483A-28H-CC and 29H-2, 49–51 cm (265.32–266.99 mbsf). Problems with the calibration of biohorizon top G. margaritae were discussed for Site U1482 (see Biostratigraphy in the Site U1482 chapter [Rosenthal et al., 2018b]). In Hole U1483A this biohorizon, which denotes the base of Zone PL3, occurs between Samples 29H-2, 49–51 cm (266.99 mbsf), and 29H-4, 49–51 cm (269.91 mbsf), hence a very short stratigraphic interval corresponding to Zone PL3 implied by our preferred calibration (3.60 Ma following Berggren et al., 1995) appears to be present at this site. No further biohorizons were identified down to the lowermost sample examined, Sample 31H-CC (293.32 mbsf).
Benthic foraminifers
Benthic foraminifers were studied from assemblages recovered in all core catcher samples from Hole U1483A. The planktonic:benthic foraminifer ratio is about 99:1 throughout the hole. Calcareous and agglutinated benthic foraminifers occur in all core catcher samples at this site, with the recorded abundance of species and generic groups for each sample shown in Table T7. The assemblages are dominated by calcareous forms, with lower abundances of agglutinated forms; the latter typically represent <5% of the assemblages. The most common species are Pyrgo spp., Laevidentalina spp., Uvigerina spp., Planulina wuellerstorfi, and Hoeglundina elegans. The epifaunal species P. wuellerstorfi is recorded in all samples, but its abundance is generally low. The infaunal genus Uvigerina is also present in most samples, except for Samples 363-U1483A-12H-CC (113.76 mbsf), 13H-CC (123.39 mbsf), 15H-CC (142.27 mbsf), 22H-CC (208.47 mbsf), and 30H-CC (284.81 mbsf). Within samples, the generic diversity ranges from 10 to 26 (Table T7). The highest species diversity is found in Sample 10H-CC (94.60 mbsf) and the lowest diversity in Sample 20H-CC (189.57 mbsf). Paleodepth estimates generated from benthic foraminifer genera and species indicate a bathyal bathymetric zone. Tests are very well preserved with rare to no evidence of abraded tests (see Foraminifer preservation).
Table T7. Benthic foraminifer distribution. Download table in CSV format.
Foraminifer preservation
Four core catcher samples from Hole U1483A were selected to assess foraminifer preservation and diagenesis. The samples are spaced at ~90 m intervals and range in age from late Pleistocene (~0.1 Ma) to early Pliocene (~4.0 Ma). Foraminifer preservation is generally excellent and glassy, possibly due to the relatively clay rich sediment as at Site U1482 (see Biostratigraphy in the Site U1482 chapter [Rosenthal et al., 2018b]). However, there is evidence for minor dissolution on the outer walls of some planktonic foraminifer specimens, even at very shallow depth. Minor calcite overgrowth becomes progressively more evident at greater depth, but no recrystallization and cementation is observed, even in the deepest part of the stratigraphy. Images of selected specimens are shown in Figure F20. The full set of images is available online from the Laboratory Information Management System (LIMS) database (http://web.iodp.tamu.edu/LORE).

Figure F20. Downcore foraminifer preservation states.
Sample 363-U1483A-1H-CC (8.58 mbsf; late Pleistocene; ~0.1 Ma) shows excellent preservation. Foraminifers have a glassy appearance under the light microscope. In cross section, the wall of Trilobatus trilobus shows the platy microgranules typical of the species, and in some specimens spines embedded in the wall and the distinctive texture of the gametogenic crust was also observed. Minor superficial etching of the outer chamber surfaces of some specimens, especially the interpore ridges, suggests some dissolution. The wall cross section of P. wuellerstorfi shows microgranules throughout. The inner wall surface of both species is smooth. There is no evidence of recrystallization, overgrowth, infilling, or cementation.
Sample 10H-CC (94.60 mbsf; latest early Pleistocene; ~1.0 Ma) shows excellent preservation. Foraminifers have a glassy appearance under the light microscope. Wall cross sections of both T. trilobus and P. wuellerstorfi show the biogenic microgranular textures typical of the species. T. trilobus shows embedded spines and gametogenic calcite in some specimens, and the outer wall shows very minor evidence of dissolution. The inner wall surface of both species is generally smooth with minor overgrowth. There is no evidence of recrystallization, infilling, or cementation.
Sample 21H-CC (198.79 mbsf; early Pleistocene; ~2.0 Ma) shows excellent preservation. Foraminifers have a glassy appearance under the light microscope. Wall cross sections of both T. trilobus and P. wuellerstorfi show biogenic microgranular textures. T. trilobus shows embedded spines and gametogenic calcite, and the outer walls show evidence of minor dissolution. The inner wall surface of both species is generally smooth. Some specimens show minor overgrowth of calcite crystals on the test.
Sample 30H-CC (284.81 mbsf; early Pliocene; ~4.0 Ma) shows excellent preservation. Foraminifers have a glassy appearance under the light microscope. Wall cross sections of both T. trilobus and P. wuellerstorfi show biogenic microgranular textures. T. trilobus shows embedded spines in the wall cross section. The outer wall surface of some T. trilobus specimens show stronger evidence of dissolution etching than is present in shallower samples. Inner wall surfaces are generally smooth but usually show minor overgrowth of radially directed calcite crystals forming a layer about 1 μm thick. There is no evidence of recrystallization or cementation.
Shipboard age model
An age-depth plot including all biostratigraphic biohorizons and magnetostratigraphic horizons (see Paleomagnetism) is shown in Figure F21. Sedimentation rates through the middle to late Pleistocene were relatively high and constant at ~10 cm/ky, although this may have varied during shorter-term climate cycles. Calcareous nannofossil and planktonic foraminifer biohorizons show good agreement throughout this interval down to the middle part of Core 363-U1483A-21H (193.50 mbsf). The base of the hole is assigned an early Pliocene age, older than 3.70 Ma, based on the presence of Reticulofenestra pseudoumbilicus.
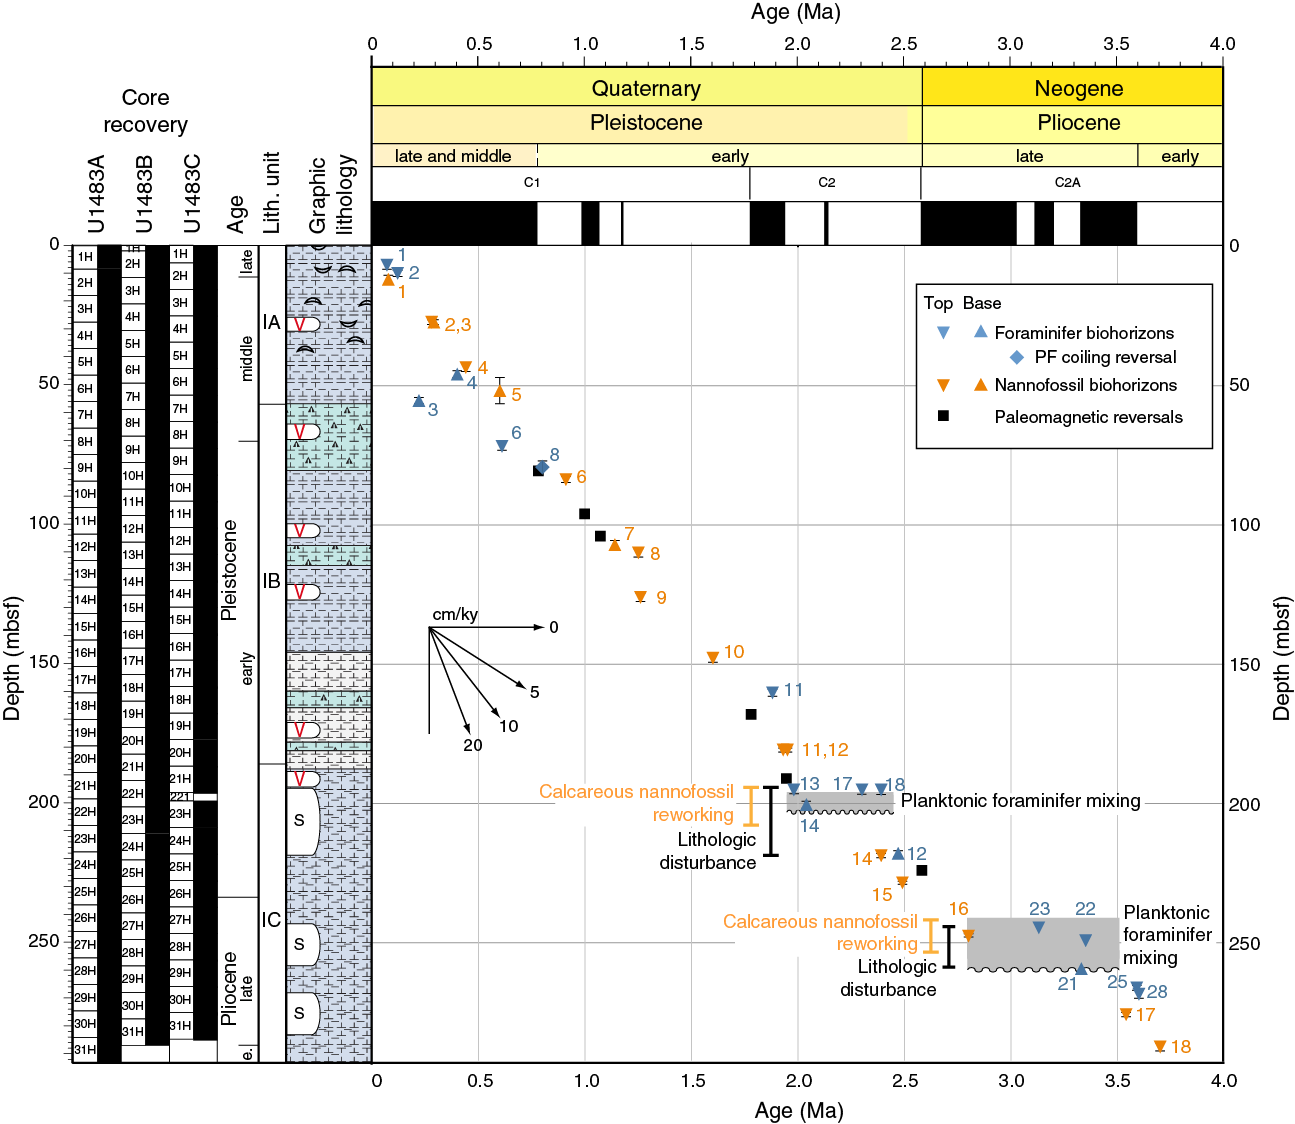
Figure F21. Age-depth plot.
Below 193.5 mbsf the stratigraphy is more disturbed, which includes biostratigraphic evidence (see especially Planktonic foraminifers) for two hiatuses, one minor and one of longer duration, above which there is physical mixing of different aged components. These biostratigraphically mixed intervals correspond to pulses of reworking of the late Pliocene species Sphenolithus abies into younger aged sediment (see Calcareous nannofossils) and severe disturbance in the sedimentary fabrics (see Core description). The intervals of microfossil mixing and reworking are shown on Figure F21, alongside the extent of lithologic disturbance. The age-depth plot shows the downhole trend in sediment age above and below the disturbed intervals. From this it can be inferred that there is likely a relatively short hiatus at the base of the top mixed interval (<200 ky) but a more significant hiatus at the base of the bottom mixed interval (with ~500 ky missing).
To reconcile all our observations with the evidence from core description we offer two alternative models. In the first model, the hiatuses represent erosional disconformities that were formed in the early phases of energetic downslope mass transport events which then deposited the biostratigraphically mixed sediment above them. Within each mixed interval, more sediment was stripped off at this site (and presumably exported downslope) than was deposited (presumably from upslope). The mass transport events would have occurred at ~2.8 Ma, producing the lower hiatus and mixed interval, and at ~2.1 Ma, producing the upper one. There may also have been other such events that produced disturbed sedimentary fabrics that were not resolved by our biostratigraphic data. The lower disturbed interval, in particular, could be a composite of more than one mass movement event because the biostratigraphically mixed sediment within it has older components in the lower part and younger, but still mixed, components in the upper part. The sediment between the disturbed intervals (~205–240 mbsf), which includes several biohorizons and the top Gauss magnetic reversal (226.15 mbsf), represents more coherent stratigraphy.
In the second model (see Core description) all of the observed disturbance at the site could be related to a single process in which the sedimentary pile moved and internally deformed, producing faulted dislocations that are observed as biostratigraphic hiatuses. In this interpretation the event occurred at ~2.1 Ma and involved a substantial thickness (possibly ~100 m of sediment). The slip may have involved one or more décollement surfaces on clay-rich beds, which could have been the progenitor for injected clay dikes observed at various levels in the three holes. The observed mixed and deformed intervals represent deformation within the lower and upper parts of the moving mass of sediment, whereas the less disturbed sedimentary succession between the hiatus levels may have rafted downslope without much physical disturbance. The biostratigraphic data cannot easily distinguish between these two explanatory models, although it is clear that the observed clay-rich intervals were not all derived from a single stratigraphic level.
A more readily interpretable biostratigraphy is observed beneath the lower disturbed interval (below ~260 mbsf) down to the base of Hole U1483A, with approximately the same sedimentation rate (~10 cm/ky) as above the disturbed intervals.
Paleomagnetism
Measurements summary
Paleomagnetic investigations at Site U1483 involved measurement of the natural remanent magnetization (NRM) of archive-half cores from Holes U1483A–U1483C before and after demagnetization in a peak alternating field (AF) of 15 mT. In addition to measuring 632 core sections, we took two discrete samples per core (typically in Sections 3 and 6) from Hole U1482A (62 samples) to characterize the NRM demagnetization behavior and to investigate the rock magnetic properties of the sediment. For one of the discrete samples from each core (typically those from Section 3), NRM was measured before and after AF demagnetization in peak fields of 5, 10, 15, 20, 30, 40, and 60 mT; the other samples were only demagnetized at 15 and 40 mT. Rock magnetic investigations comprised measurements of magnetic susceptibility (χ), susceptibility of anhysteretic remanent magnetization (χARM) imparted using a 100 mT AF demagnetization and 0.05 mT direct current bias field, and isothermal remanent magnetization (IRM) acquired in 300 and 1000 mT (saturation IRM [SIRM]) fields. All sample measurements were mass corrected. The Icefield MI-5 orientation tool was deployed with nonmagnetic hardware for all cores, which permitted azimuthal correction of declination. Azimuthally corrected declination is largely coherent between cores; however, absolute values in Holes U1483A and U1483B cluster around 180° for normal polarity and 0° for reversed polarity, suggesting that the issues of baseline offset in azimuthally corrected declination experienced throughout this expedition and during previous expeditions (McNeill et al., 2017) affected these measurements. In Hole U1483C, absolute values during normal (reversed) polarity intervals mainly cluster around the correct value of 0° (180°); however, declination values of some cores are 45°–60° offset to this in absolute terms. McNeill et al. (2017) suggest a simple −180° correction could be applied to the corrected declination data. This correction would rotate Holes U1483A and U1483B back to expected values for the respective polarity and match them up with data from Hole U1483C. However, we leave declination uncorrected for this additional offset in the plotted figures, so care should be employed for future calculations of virtual geomagnetic poles using these data.
Rock magnetic characterization
Whole-Round Multisensor Logger (WRMSL) magnetic susceptibility values average 3.8 × 10⁻⁵ SI (see Physical properties) and, when coupled with average χ (2.4 × 10⁻⁸ ± 1.9 × 10⁻⁸ m3/kg as 2 standard deviations [2σ]) and SIRM (5.4 × 10⁻⁵ ± 4.3 × 10⁻⁵ Am2/kg as 2σ) values, suggest relatively low (ferri)magnetic mineral concentration in the sediment deposited at Site U1483 (Figure F22). Aside from one sample from the top of Hole U1483A, all samples acquire >90% of their SIRM remanence in a field of 300 mT, suggesting that ferrimagnetic minerals (e.g., [titano]magnetite [FexTixO4] and/or maghemite [γ-Fe2O3]) control the remanence carrying properties of the sediment and that high-coercivity minerals (e.g., hematite [Fe2O3]) are relatively minor remanence carrying phases by comparison. Although average magnetic susceptibility values are lower than those at the other Northwest Australian margin site (U1482), SIRM values and χARM/SIRM ratios are higher, indicating greater concentrations of fine ferrimagnetic minerals at this site than at Site U1482. NRM15mT intensity is higher (~10−4 A/m) in the upper ~75 mbsf of each hole, decreases between 75 and 85 mbsf, and remains low (~10−4 to 10−5 A/m) and variable below ~85 mbsf, occasionally approaching the measurement noise level of the magnetometer (see Paleomagnetism in the Expedition 363 methods chapter [Rosenthal et al., 2018a]). These changes occur around the same time interstitial water sulfate concentration decreases to almost zero and methane concentration peaks (Figure F23), associated with the sulfate–methane transition zone (SMTZ) and anaerobic oxidation of methane (see Geochemistry), indicating that early sediment diagenesis (e.g., Karlin and Levi, 1983; Rowan et al., 2009) is likely influencing the magnetic assemblage deposited at Site U1483 below ~75 mbsf. All other things being equal, the higher χARM/SIRM ratios at Site U1483 than at Site U1482 suggest that alteration of the (assumed) primary detrital ferrimagnetic oxides at Site U1483 may not be as severe as that experienced at Site U1482 because the finest grains are usually the first to be lost from the magnetic assemblage during early sediment diagenesis.
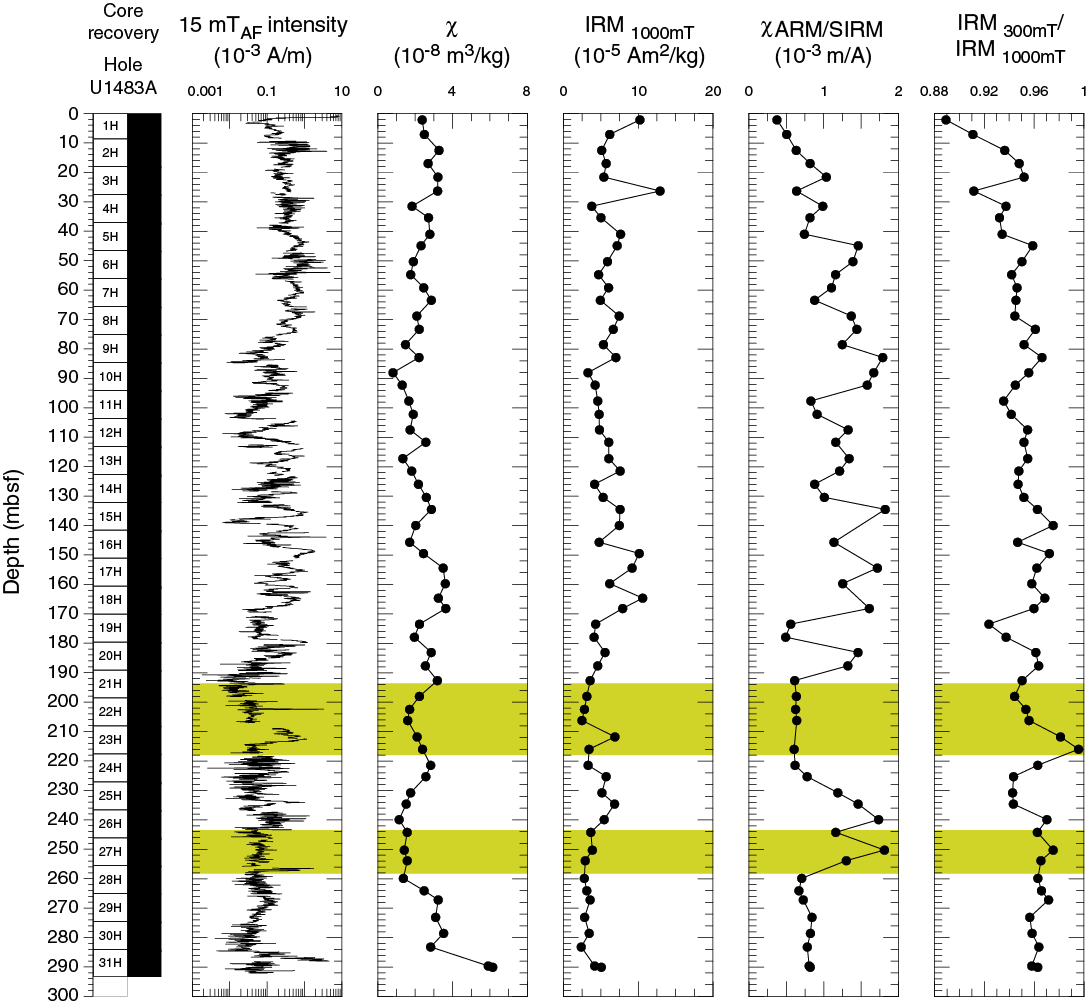
Figure F22. Archive-half section NRM intensity.

Figure F23. NRM, WRMSL MS, IW sulfate and methane, maximum angular deviation, and inclination.
Paleomagnetic data and core orientation
NRM demagnetization behavior and IRM300mT/IRM1000mT ratios in the upper ~92 mbsf of Site U1483 are consistent with (titano)magnetite being the primary remanence-carrying mineral species in sediments deposited at Site U1483 (Figure F22). The drill string overprint is effectively removed after AF demagnetization in a 5–15 mT field, and following exposure to higher AF demagnetization steps, inclination and declination trend to the origin on Zijderveld diagrams (Zijderveld, 1967), indicating a single component to the magnetization (Figure F24). Origin-anchored maximum angular deviation values of the principal component analysis (PCA) calculated over the 15–40 mT range average 4.5° (range = 1°–9°) for the upper ~92 mbsf (Figures F23, F24), suggesting paleomagnetic directions are relatively stable and should yield reliable estimates for magnetostratigraphy (Stoner and St-Onge, 2007). Lower NRM15mT intensity below ~92 mbsf is associated with higher average maximum angular deviation values (average = 13°; range = 2°–41°) and slightly more scattered directions on Zijderveld diagrams and stereoplots (Figure F24). Scatter in superconducting rock magnetometer (SRM) measurement directions is greatest and the maximum angular deviation values are highest during periods when NRM15mT intensity is less than ~5 × 10⁻⁵ (Figure F23), suggesting that higher maximum angular deviation values likely reflect lower signal-to-noise ratios and/or result from sedimentological variability rather than geomagnetic instability. During several intervals of relatively high NRM15mT intensity (particularly between 117 and 183 mbsf), maximum angular deviation values are relatively low, suggesting that paleomagnetic directions below ~92 mbsf can be as well resolved as those above ~92 mbsf (Figures F23, F24).

Figure F24. Discrete sample AF demagnetization results.
For all APC cores, declination was corrected using the Icefield MI-5 tool (see Operations). In Holes U1483A and U1483B, azimuthally corrected declination is consistent between adjacent cores within each hole and absolute values cluster around ~0° and ~180° (Figures F23, F25). However, assuming the uppermost sediment in each hole was deposited during normal polarity associated with the Brunhes Chron (see Biostratigraphy), declination values experience an offset of ~180° in absolute terms because declination should cluster around 0° (180°) during periods of normal (reversed) polarity. This phenomenon was a persistent issue during Expedition 363 and was also experienced during Expedition 362 (McNeill et al., 2017). In Hole U1483C, corrected declination values cluster between 270° and 360° for periods of normal polarity and between ~135° and 180° for periods of reversed polarity (Figure F26). Between-core offsets were not observed in the other holes at this site and likely result from incorrect correction from the Icefield MI-5 tool. Reevaluation of the Icefield MI-5 tool data for Hole U1483C revealed the original magnetic tool face picks to be robust. Consultation with the Operations Superintendent revealed that there was no difference in the hardware used (drill collars, core barrels, sinker bars, BHA, etc.) to recover sediment from Hole U1483C, and the Icefield MI-5 tool used (tool #2007) had previously given values of ~180° for periods of resolvable normal polarity in the upper ~70 mbsf of Hole U1482B. Although the origins of both the ~180° baseline offset in Holes U1483A and U1483B and the shallower 45°–90° offset in Hole U1483C are not immediately clear, they appear systematic (the two declination clusters are ~180° offset to each other during deployment of each tool respectively), and we assume that declination values rotated 180° relative to the uppermost sediment values reflect periods of reversed polarity.
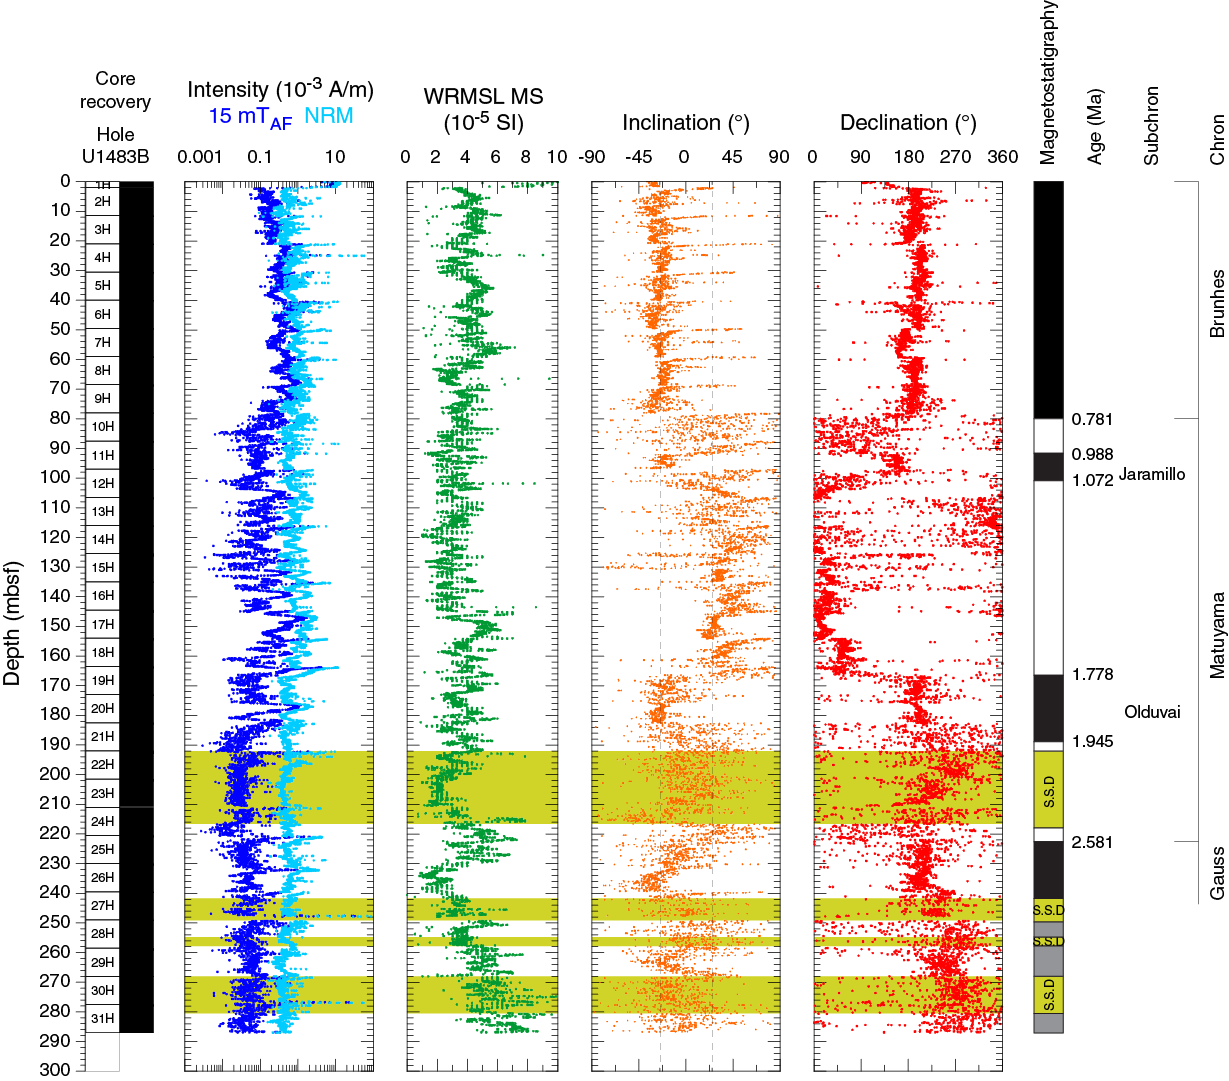
Figure F25. NRM, WRMSL MS, and inclination, Hole U1483B.
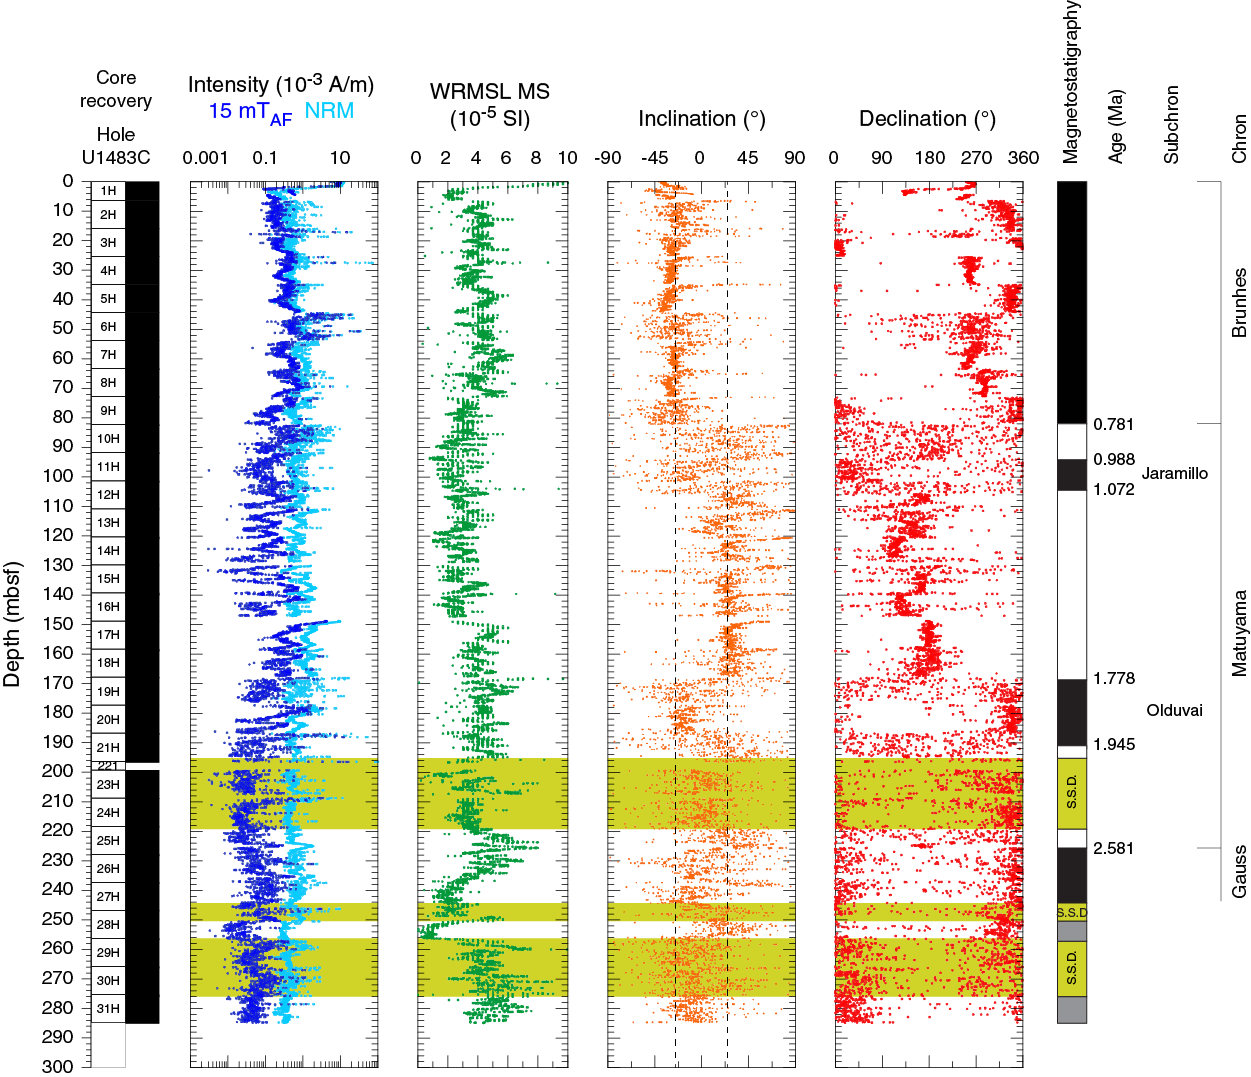
Figure F26. NRM, WRMSL MS, and inclination, Hole U1483C.
NRM intensity before and after 15 mT AF demagnetization, WRMSL magnetic susceptibility, and inclination and azimuthally corrected declination after 15 mT AF demagnetization are shown for Holes U1483A, U1483B, and U1483C in Figures F23, F25, and F26, respectively. Displayed inclination and declination values were cleaned of visibly disturbed intervals and voids (see Paleomagnetism in the Expedition 363 methods chapter [Rosenthal et al., 2018a]). Inclination and declination measured on discrete samples are in excellent agreement with those measured on the archive-half sections (Figure F23) and plot around the expected values of approximately ±25° for the site latitude assuming a geocentric axial dipole (GAD) field. Declination shows a similar, relatively stable pattern with data points clustering around values of inferred normal and reversed polarity, suggesting that paleomagnetic directions measured at Site U1483 are sensitive to geomagnetic field behavior.
Magnetostratigraphy
Sediment in all three holes appears to have been deposited (quasi)continuously with no major hiatus or erosional surfaces downhole to ~194–195 mbsf. Below this depth, a series of intervals of soft-sediment deformation and discontinuities affect the record (see Core description and Biostratigraphy). Because the depositional and stratigraphic history of the deformed intervals is unclear, we highlight these regions in Figures F23, F25, and F26 and exclude them from any geomagnetic interpretation. Low concentrations of ferrimagnetic minerals coupled with reduced geomagnetic field strength during the reversal process (e.g., Valet et al., 2005) result in transitional directions at Site U1483 that are often more scattered than stable polarity. Nevertheless, we observe five distinct ~50° shifts in inclination and five coeval ~180° changes in declination across all three holes in the interval above the deformation at ~194–195 mbsf. Interpretation of these horizons as reversals of the geomagnetic field allows correlation to the geomagnetic polarity timescale (GPTS; Cande and Kent, 1995) of the geologic timescale (Hilgen et al., 2012) and an assignment of age. The Matuyama/Brunhes boundary (0.781 Ma) is identified at 77.88–82.78 mbsf (note that these ranges encompass the minimum and maximum depths across all three holes; see Table T8 for the depths of each boundary in each hole). Below this depth, we observed the upper (89.67–97.32 mbsf; 0.988 Ma) and lower (96.32–103.72 mbsf; 1.072 Ma) boundaries of the Jaramillo normal and the upper (163.77–174.71 mbsf; 1.778 Ma) and lower (182.55–189.65 mbsf; 1.945 Ma) boundaries of the Olduvai normal, with the lower Olduvai occurring a few meters above the first interval of sediment deformation. These reversal horizons are in excellent agreement with both the calcareous nannofossil and planktonic foraminifer datums and yield a sedimentation rate of ~10 cm/ky since the middle Pleistocene (see Biostratigraphy). In sediment between the two deformed intervals in Hole U1483A, we observe a transition from reversed polarity to normal polarity in both inclination and declination between ~221.6 and 229.1 mbsf during a period of relatively high NRM15mT intensity (~10−4 A/m) and magnetic susceptibility (Figure F23). This same behavior is observed in Holes U1483B and U1483C, suggesting that it is the same stratigraphic horizon (Figures F25, F26). Biostratigraphic datums constrain this sediment package between the intervals of soft-sediment deformation to be ~2.4–2.8 Ma (see Biostratigraphy), and the only reversed-to-normal transition during this time frame is the Gauss/Matuyama boundary (2.581 Ma). Thus, guided by the biostratigraphic data, we can tentatively assign an age of 2.581 Ma to the reversal horizon between ~221.6 and 229.1 mbsf at Site U1483 (see Table T8 for the depths in each hole). Below this event, inclination and declination in all three holes are either normal polarity and/or highly scattered and difficult to interpret. Given evidence of postdepositional deformation and slumping deeper in the record at this site, it is difficult to make any further magnetostratigraphic interpretation. As such, the normal polarity signature of the lower part of the record should not be simply interpreted as Gauss Chron (C2An.1n) in age without further investigation.
Table T8. Depths of identified polarity reversal boundaries. Download table in CSV format.
Physical properties
Physical properties were measured on whole-round cores, split cores, and discrete samples from all three holes cored at Site U1483 to provide basic data for characterizing the core sections. Gamma ray attenuation (GRA) bulk density and magnetic susceptibility were measured on all core sections from Holes U1483B and U1483C with the Special Task Multisensor Logger (STMSL) immediately after the cores were brought on board. All core sections were measured with the GRA bulk densitometer, magnetic susceptibility loop, and P-wave logger (PWL) on the WRMSL. PWL measurements were discontinued after Cores 363-U1483A-14H, 363-U1483B-11H, and 363-U1483C-13H when the data became unreliable due to expansion cracks in the core. After WRMSL scanning, whole-round sections were logged for NGR before splitting. Point-sensor magnetic susceptibility and color spectrophotometry (color reflectance) were measured on split core sections using the Section Half Multisensor Logger (SHMSL). Discrete thermal conductivity, P-wave velocity, and moisture and density (MAD) measurements were made for Hole U1483A samples. Discrete P-wave measurements (z- and x-axes) were made using the P-wave caliper (PWC) system on the Section Half Measurement Gantry (SHMG). Discrete z-axis measurements were discontinued after Core 363-U1483A-7H and x-axis measurements after Core 11H due to lack of clear signals in the indurated and cracked sediment. Preconditioning treatments were applied to the data to aid in interpretation of noisy or spiky data (for details, see Physical properties in the Expedition 363 methods chapter [Rosenthal et al., 2018a]). All data shown in figures are from the preconditioned data sets. Tables presented in this section contain raw and treated data for NGR, WRMSL GRA bulk density, magnetic susceptibility, and P-wave velocity. Raw data for all data sets are available from the LIMS database.
GRA bulk density
GRA bulk density values were measured using the STMSL and the WRMSL on whole-round core sections (see Physical properties in the Expedition 363 methods chapter [Rosenthal et al., 2018a]). Long-term trends of GRA bulk density in Holes U1483A–U1483C (WRMSL) are comparable (Figure F27; Tables T9, T10, T11). For description purposes, we thus consider Hole U1483A as representative of all holes. GRA bulk density in Hole U1483A progressively increases with depth, which is in good agreement with long-term changes in MAD bulk density (Figure F27) and is consistent with compaction. GRA bulk density increases from ~1.37 g/cm3 at the seafloor to 1.5 g/cm3 at 20 mbsf with low-amplitude short-term variability. Between 20 and 50 mbsf, GRA bulk density remains stable at ~1.5 g/cm3. This interval mostly corresponds to lithologic Subunit IA. A second increase in GRA bulk density from 1.5 to 1.6 g/cm3 occurs at ~50 mbsf, below which the GRA bulk density values remain stable at 1.6 g/cm3 until 150 mbsf. At 150 mbsf, GRA bulk density drops to 1.5 g/cm3 and then progressively increases to 1.65 g/cm3 between 150 and 200 mbsf. These subtle variations in GRA bulk density between ~50 and 200 mbsf largely occur within lithologic Subunit IB. A broad maximum in GRA bulk density occurs from 200 to 225 mbsf with values of ~1.8 g/cm3. Values then decrease rapidly to 1.6 g/cm3 between 225 and 240 mbsf. Between 240 and 250 mbsf, GRA bulk density increases to 1.8 g/cm3 and then remains above this value until ~260 mbsf, where it decreases to 1.7 g/cm3. Between 260 mbsf and the base of the record at 292 mbsf, GRA bulk density increases from 1.7 to 1.8 g/cm3. The last core in Hole U1483A (31H) had to be pumped out of the core barrel. During this process, a small amount of heat was applied to the outside of the core barrel until the plastic core liner began to move. The core liner was heavily cracked during this process, and as a result, the first three sections of Core 31H could not be measured on the STMSL or WRMSL. The GRA bulk density, magnetic susceptibility, and NGR data obtained on Core 31H may have been affected during exposure of the core to heat and should be treated cautiously. In Subunit IC, two bulk density peaks centered at 215 and 250 mbsf deviate from the overall trend. These coincide with two distinct intervals of soft-sediment deformation observed in all holes (yellow shading in Figure F27) (see Core description).
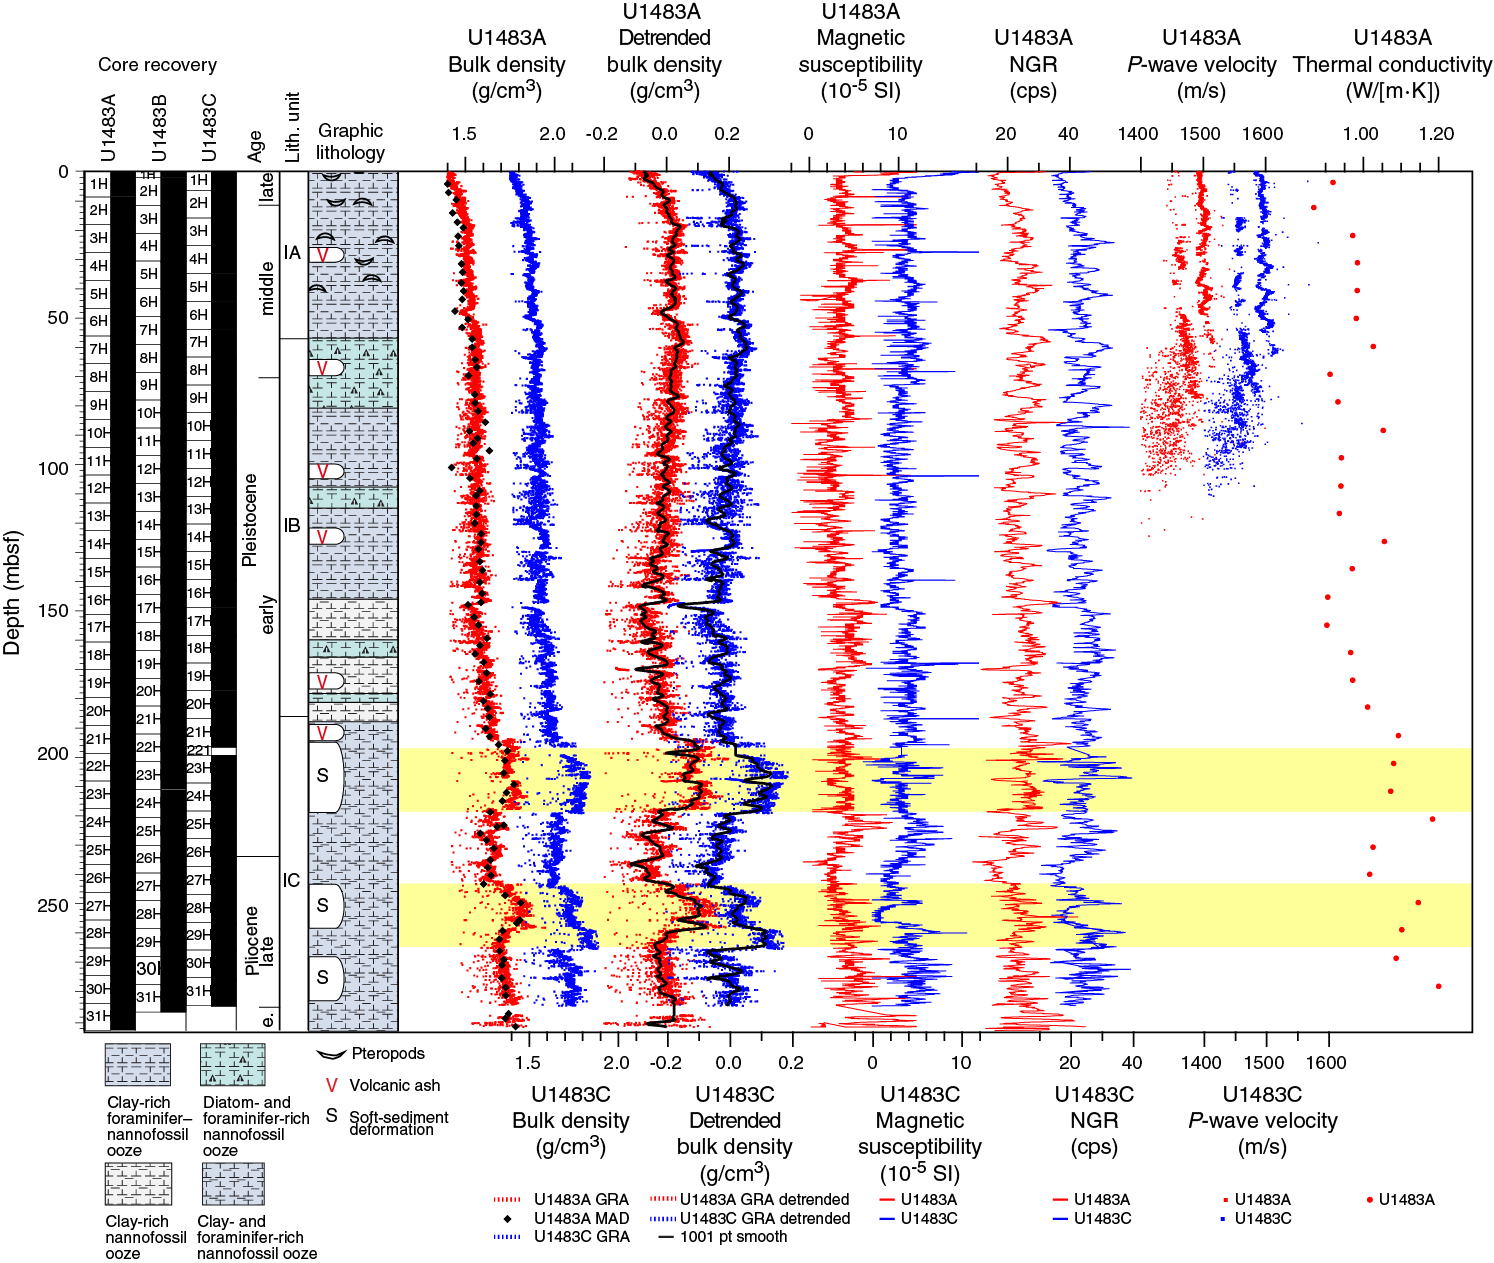
Figure F27. Physical property measurements.
Table T9. WRMSL GRA bulk density data, Hole U1483A. Download table in CSV format.
Table T10. WRMSL GRA bulk density data, Hole U1483B. Download table in CSV format.
Table T11. WRMSL GRA bulk density data, Hole U1483C. Download table in CSV format.
Linearly detrending the GRA bulk density record allows us to correct for the downhole compaction effect and highlight subtle variations in the record that may be due to lithology. The detrended record shows a change from values increasing downhole in Subunit IA to values decreasing downhole in Subunit IB, coinciding with a downhole change from nannofossil ooze to diatom-rich nannofossil ooze (Figure F27). Within Subunit IB, a change in the slope of the trend at ~150 mbsf coincides with a shift to clay-dominated sediment (see Core description). At Site U1483, the relationship among the short cycles in NGR, magnetic susceptibility, and GRA bulk density is different from that at Site U1482. The short-term meter-scale variations in bulk density at Site U1483 (Figure F28; Table T9; see also Magnetic susceptibility and Natural gamma radiation) are smaller in amplitude than those at Site U1482. In addition, in the upper 80 mbsf of Hole U1483A we did not observe the positive correlation between NGR, magnetic susceptibility, and GRA bulk density or the light–dark sedimentary cycles seen at Site U1482. This difference probably reflects the more complex lithology at Site U1483, with the presence of light greenish gray, greenish gray, and brown layers (see Core description). Below 80 mbsf in Hole U1483A, short wavelength variations in NGR, magnetic susceptibility, and sometimes GRA bulk density appear to be better correlated than in the interval above 80 mbsf (Figure F28).
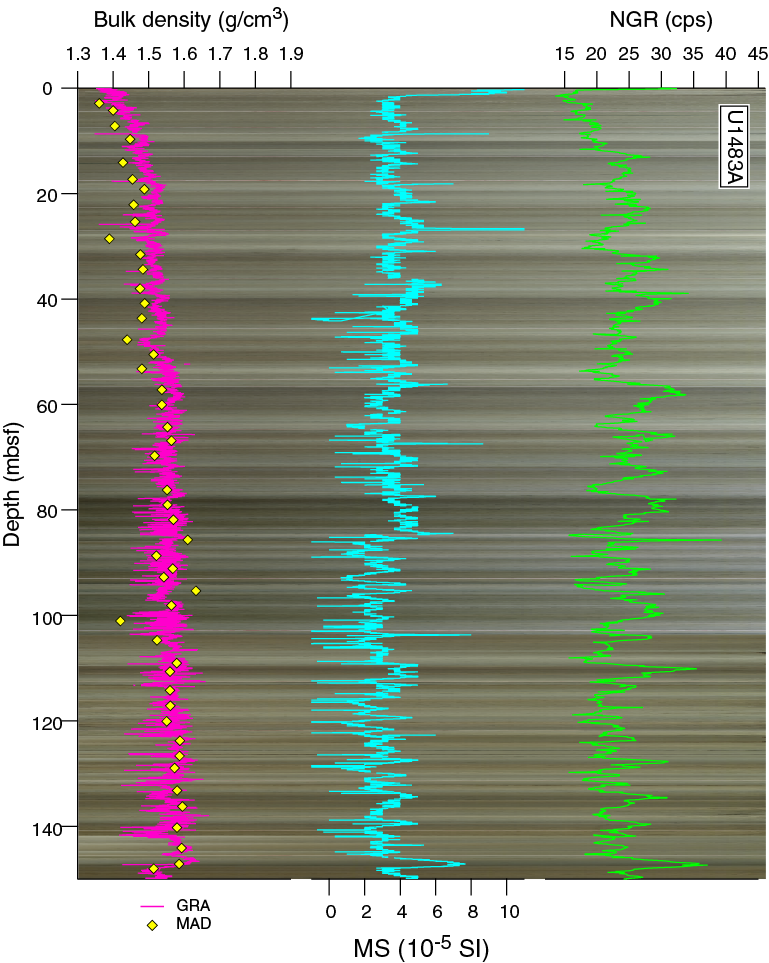
Figure F28. Bulk density, WRMSL MS, and NGR.
Magnetic susceptibility
Site U1483 has overall low magnetic susceptibility, with most values ranging from 0.3 × 10⁻⁵ to 8.3 × 10⁻⁵ SI (Figures F27, F29; Tables T12, T13, T14). Over the entire record, the median value in all three holes is 3.67 × 10⁻⁵ SI with standard deviations of 1.53, 1.41, and 1.40 in Holes U1483A, U1483B, and U1483C, respectively. Long-term WRMSL magnetic susceptibility variability among Holes U1483A, U1483B, and U1483C are comparable, so for description purposes we consider Hole U1483A representative of all holes. Between 0 and ~80 mbsf, average magnetic susceptibility is constant at ~3.7 × 10⁻⁵ SI. Between 80 and 140 mbsf, average magnetic susceptibility decreases slightly to ~2.9 × 10⁻⁵ SI. Between 140 and 175 mbsf, average magnetic susceptibility increases to ~4.3 × 10⁻⁵ SI. At 175 mbsf, average magnetic susceptibility decreases to ~3.7 × 10⁻⁵ SI, where it remains until ~210 mbsf. Between 210 and 235 mbsf, magnetic susceptibility displays a broad maximum, with values starting at ~4 × 10⁻⁵ and increasing to ~8 × 10⁻⁵ SI at ~222 mbsf before decreasing to ~2 × 10−5 SI by 235 mbsf. From 235 mbsf to the base of the record (292 mbsf), magnetic susceptibility progressively increases from ~2 × 10⁻⁵ to ~6 × 10⁻⁵ SI. The magnetic susceptibility values from the deepest core in Hole U1483A (Core 363-U1483A-31H) were probably affected by exposure to heat while pumping out the core liner after it became stuck in the core barrel (see GRA bulk density).
Short-term cycles are superimposed on the long-term trends described above (Figure F28). In the upper 80 mbsf, these magnetic susceptibility cycles are multiple meter–scale variations with amplitudes from ~2 × 10⁻⁵ to 3 × 10⁻⁵ SI. Deeper than 80 mbsf, the cycles become shorter, roughly 1–2 m in length, and display higher amplitudes from ~2 × 10⁻⁵ to 5 × 10⁻⁵ SI. Through the deformed intervals and in the deepest part of the record (250 mbsf and below), amplitudes are even higher, from ~5 × 10⁻⁵ to 8 × 10⁻⁵ SI (Figure F27). The magnetic susceptibility data do not delineate the intervals of soft-sediment deformation that are apparent in the GRA bulk density record (yellow shading in Figure F27).
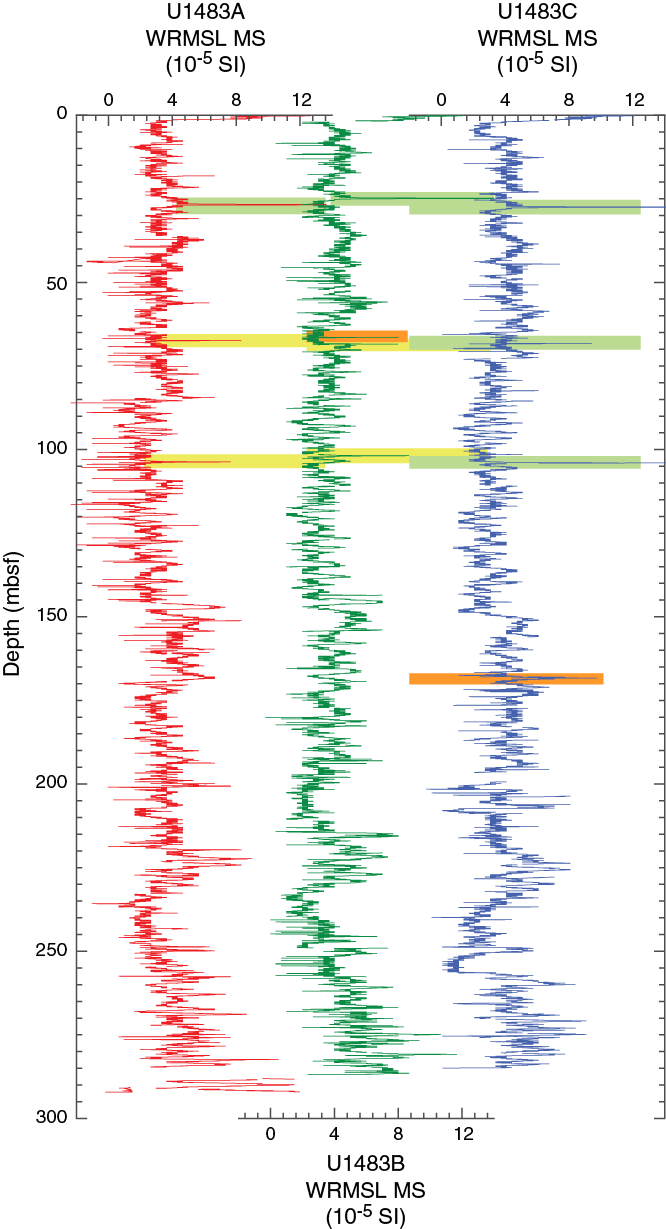
Figure F29. Comparison of despiked WRMSL MS data.
Table T12. WRMSL MS data, Hole U1483A. Download table in CSV format.
Table T13. WRMSL MS data, Hole U1483B. Download table in CSV format.
Table T14. WRMSL MS data, Hole U1483C. Download table in CSV format.
Magnetic susceptibility spikes at ~25–27 mbsf in all three holes correspond to a tephra layer (green bar in Figure F29). A peak in magnetic susceptibility in Hole U1483C (~68.3 mbsf; green bar in Figure F29) also corresponds to a tephra layer, and magnetic susceptibility spikes are noted at similar depths in Holes U1483A and U1483B (67.4 and 66.5 mbsf, respectively; yellow bars in Figure F29); however, tephra layers were not identified during visual examination of the cores at these depths. Similarly, another tephra layer visually identified in Hole U1483C was detected by magnetic susceptibility (104.0 mbsf; green bar in Figure F29) and may have corresponding peaks in Holes U1483A and U1483B (103.7 and 101.8 mbsf, respectively; yellow bars in Figure F29), although no tephra layers were visually identified at those depths in these holes. Two spikes unrelated to tephra layers are also identified (orange bars in Figure F29). The first of these peaks is found in Hole U1483B at 68.4 mbsf and corresponds to a concentration of gypsum associated with a concretion that may be composed of biotite and barite (see Core description; Figure F14). Based on the susceptibility of common minerals (Blum, 1997), gypsum has negative magnetic susceptibility values, but biotite is associated with very high magnetic susceptibility values, which may explain the high peak in the magnetic susceptibility data in Hole U1483B. The second magnetic susceptibility peak occurs in Hole U1483C at 168.3 mbsf. Although nothing is visible in the sediment to explain the presence of this peak, it may relate to sediment disturbance caused by gas expansion.
Natural gamma radiation
Both long-term trends and short-term variability in NGR records are similar among holes at Site U1483. In the uppermost 25 mbsf of all holes, NGR progressively increases from 15 to ~27 counts/s (Figure F27; Tables T15, T16, T17). Between 25 and 100 mbsf, distinct cyclicity, approximately 9–10 m in length, is observed and appears to be unrelated to core breaks (Figure F28), with NGR counts varying from 17 to 33 counts/s. From 100 to 185 mbsf, the cycles are shorter, ~2–5 m in length, and of lower amplitude, ~10 counts/s. Below 185 mbsf in Subunit IC, the cycles are even shorter, ~1–2 m in length, and although the variability of ~10 counts/s is similar to that in the interval above, the record from Subunit IC also occasionally shows prominent short-term variability up to 30 counts/s for higher peaks, which is present in the intervals of soft-sediment deformation. NGR data from Core 363-U1483A-31H also seem to be affected by the process used to extract the stuck core liner from the core barrel (see GRA bulk density).
Table T15. NGRL data, Hole U1483A. Download table in CSV format.
Table T16. NGRL data, Hole U1483B. Download table in CSV format.
Table T17. NGRL data, Hole U1483C. Download table in CSV format.
P-wave velocity
Compressional P-wave velocity measurements were performed on whole-round sections using the PWL for all of the holes cored at Site U1483. Outliers above 1750 m/s were removed from the PWL velocity data (Figures F27, F30; Tables T18, T19, T20). A downhole decrease in PWL velocity occurs at ~60 mbsf in all holes at Site U1483 (Figure F30), which is different from that at Site U1482, where the marked decrease in PWL velocity occurs at ~170 mbsf. The PWL data range between 1350 and 1530 m/s downhole for all holes (Figure F30). P-wave velocity increases from ~1500 to 1530 m/s between 0 and 60 mbsf and then decreases deeper than 60 mbsf, with the lowest values of ~1350 m/s at ~91 mbsf, possibly due to abundant cracks in the sediment. All of the holes have similar average P-wave velocity values. Differences in average values between the intervals shallower and deeper than 60 mbsf are in the range of 40–46 m/s. There are no apparent downhole cyclic variations and no obvious correlation between PWL velocity and NGR or magnetic susceptibility, which contrasts with the noticeable correlations at Site U1482 (see Figure F32B in the Site U1482 chapter [Rosenthal et al., 2018b]).
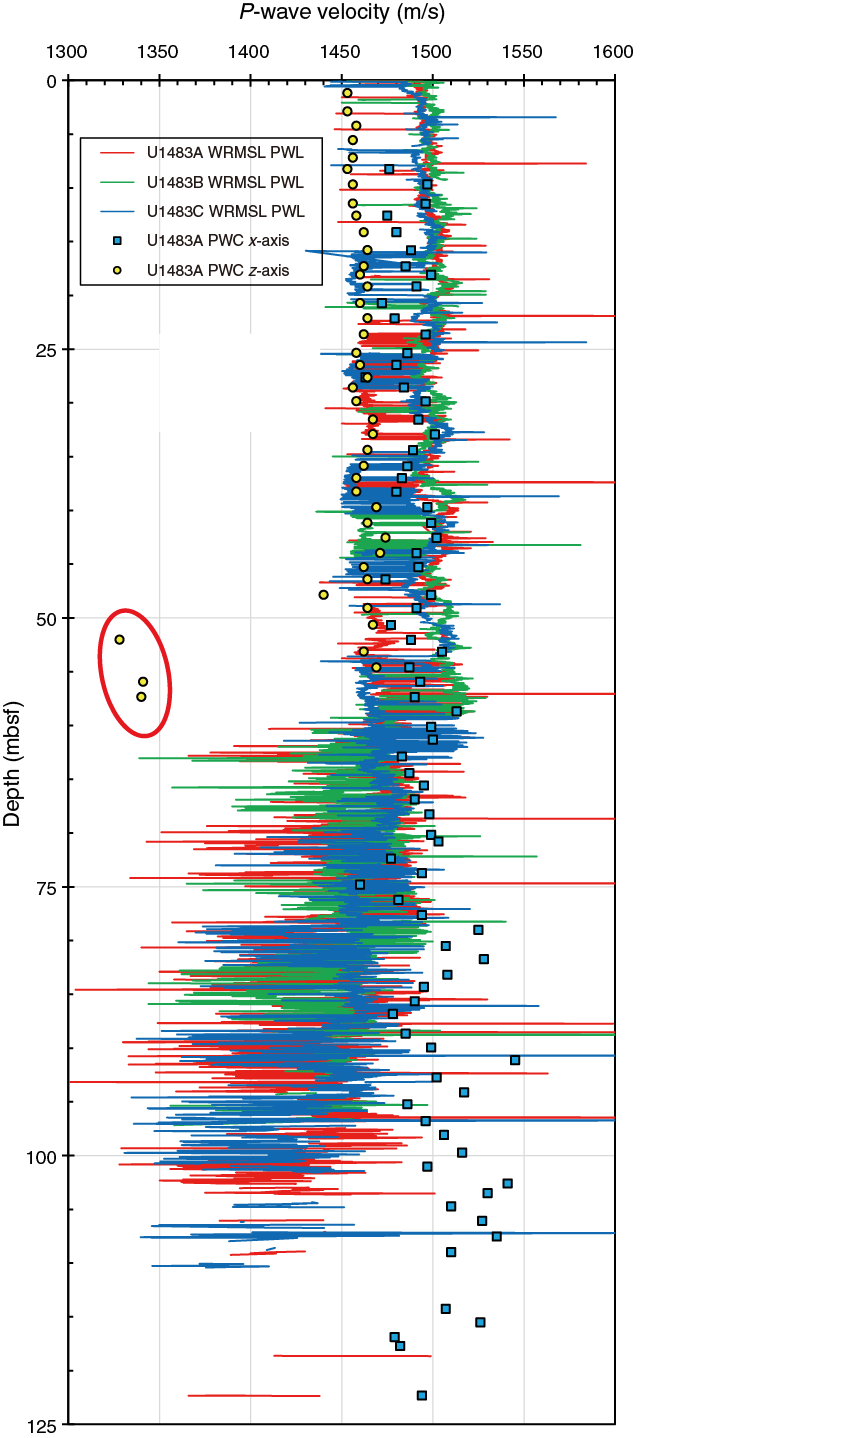
Figure F30. Discrete and whole-round P-wave measurements.
Table T18. WRMSL P-wave logger data, Hole U1483A. Download table in CSV format.
Table T19. WRMSL P-wave logger data, Hole U1483B. Download table in CSV format.
Table T20. WRMSL P-wave logger data, Hole U1483C. Download table in CSV format.
PWC x- and z-axes velocity values show a slight increasing trend with depth. PWC x-axis velocity values increase from 1476 m/s at 8 mbsf to 1526 m/s at 120 mbsf. The z-axis values range from 1450 m/s at the seafloor to 1470 at 60 mbsf and are offset to lower values by about 20 m/s from the x-axis values. The z-axis values also display less variability than the x-axis measurements, likely because the z-axis is measuring over a greater length of the core, effectively smoothing the measurement. Three z-axis measurements from ~50 to 60 mbsf were excluded as outliers (red circle in Figure F30). These data points were acquired shortly before the z-axis measurement was discontinued because the data quality had considerably decreased downhole.
Moisture and density
Bulk density, dry density, grain density, and porosity were calculated from mass and volume measurements on discrete samples taken from the working halves of split cores from Hole U1483A (downhole to ~292 mbsf). The bulk density calculated using the MAD method corresponds well with the bulk density estimated from GRA bulk density, including within the interval affected by sediment deformation (Figure F31). In the upper 50 mbsf, corresponding to Subunit IA, MAD bulk density is offset to lower values by an average of ~0.05 g/cm3 from the GRA bulk density. This offset is most likely due to water loss from the cores between measurement on the WRMSL and discrete sampling for MAD.
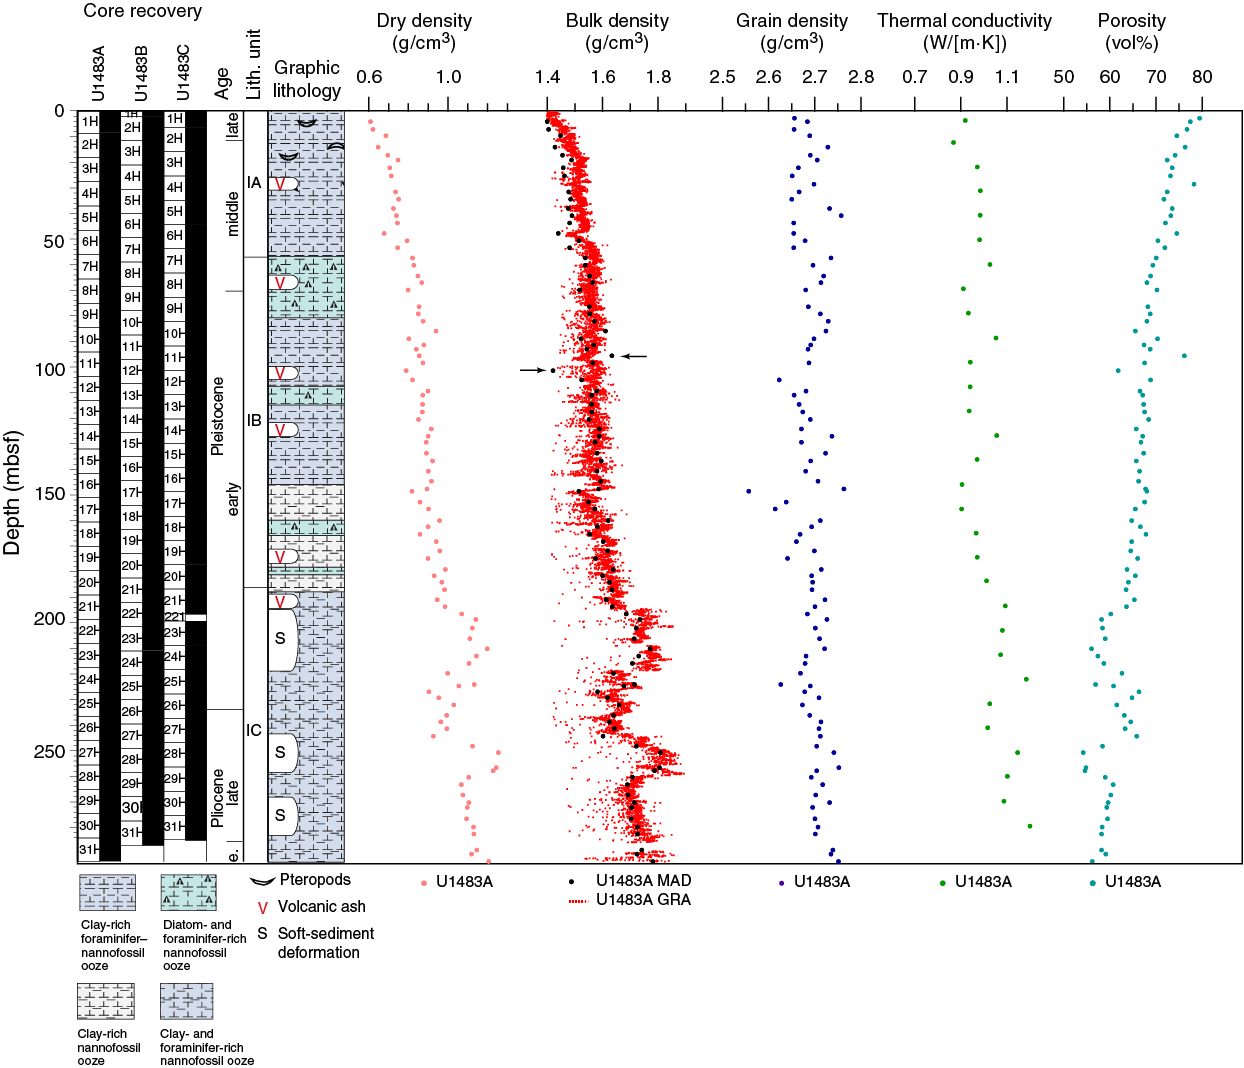
Figure F31. MAD dry, bulk, and grain densities and porosity, WRMSL GRA bulk density, and thermal conductivity.
MAD bulk density increases downhole in Hole U1483A due to compaction with a best-fit slope of 0.11 g/cm3/100 m. MAD dry density increases at a higher rate of 0.17 g/cm3/100 m from the seafloor to the bottom of the hole. These rates vary slightly within different lithologic subunits, with a steeper slope in Subunit IA than in Subunit IB. Rates were not calculated for Subunit IC because sediment deformation and compaction appears to cause the slope to increase. MAD bulk and dry densities converge at ~50 mbsf, reflecting the downhole increase in compaction and reduction in porosity and water content. Porosity (percent pore space in the wet sediment volume) generally decreases with depth from 80% at the seafloor to ~55% at ~300 mbsf, with the exception of the deformed intervals in Subunit IC. Grain density is fairly constant throughout the site, with only a slight downhole increase from 2.66 to 2.72 g/cm3.
Two outliers in MAD bulk density, one high and one low, occur at ~95 and 101 mbsf, respectively (black arrows on Figure F31). These values propagate through MAD calculations and appear as outliers in subsequent measurements and should be interpreted cautiously. Although the values have not been removed from the data set, figures have been scaled to maximize long-term trends and these outliers may not be visible in every panel.
Thermal conductivity
A thermal conductivity profile was obtained at ~10 m resolution using a thermal conductivity needle (Figures F27, F31). Thermal conductivity measurements increase with depth from 0.09 to 1.15 W/(m·K) with average values of ~1 W/(m·K) and standard deviation of 0.06 W/(m·K). The trend from the top of Hole U1483A to the bottom (~279 mbsf) is not really clear (R2 = 0.49), possibly because of variability in the lithology. Thermal conductivity results correlate well with the dry density values and are inversely correlated with porosity (Figure F31). This observation can be explained by the compaction effect. In comparison to Site U1482 at the same depth, thermal conductivity values are lower at Site U1483; however, the downhole trend in increasing thermal conductivity is steeper at Site U1483.
Downhole temperature measurements
Standard downhole temperature measurements were made on Cores 363-U1483A-4H (37.1 mbsf), 7H (65.6 mbsf), 10H (94.1 mbsf), and 13H (122.6 mbsf) using the APCT-3. The first measurement on Core 4H was unreliable, probably due to unstable hole conditions. An exponential decrease in temperature is observed between 60 and 600 s after penetration and was used to estimate ambient temperature (unshaded area in Figure F32). Formation temperature increases with depth from 7.4°C at 65.6 mbsf to 11.11°C at 122.6 mbsf. The correlation between downhole temperatures and depth is excellent (R2 = 0.99994). Using the slope of the temperature-depth relationship, we estimated that the bottom water temperature at Site U1483 is 3.1°C, yielding a geothermal gradient of 65°C/km (Figure F33).
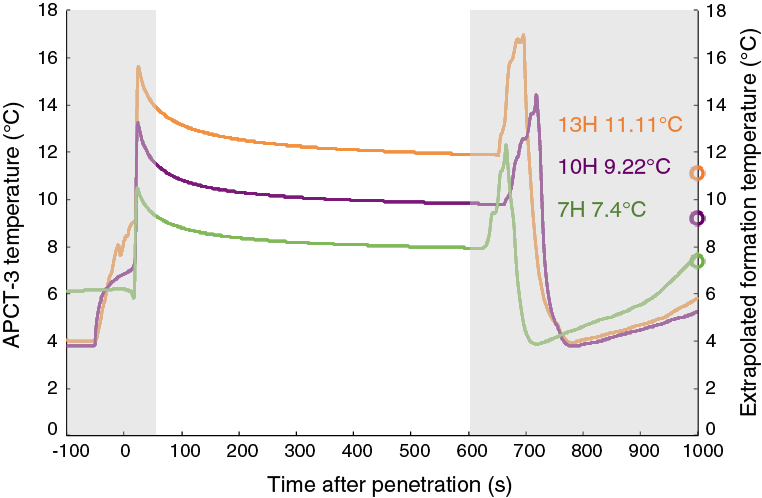
Figure F32. APCT-3 temperature-time series.
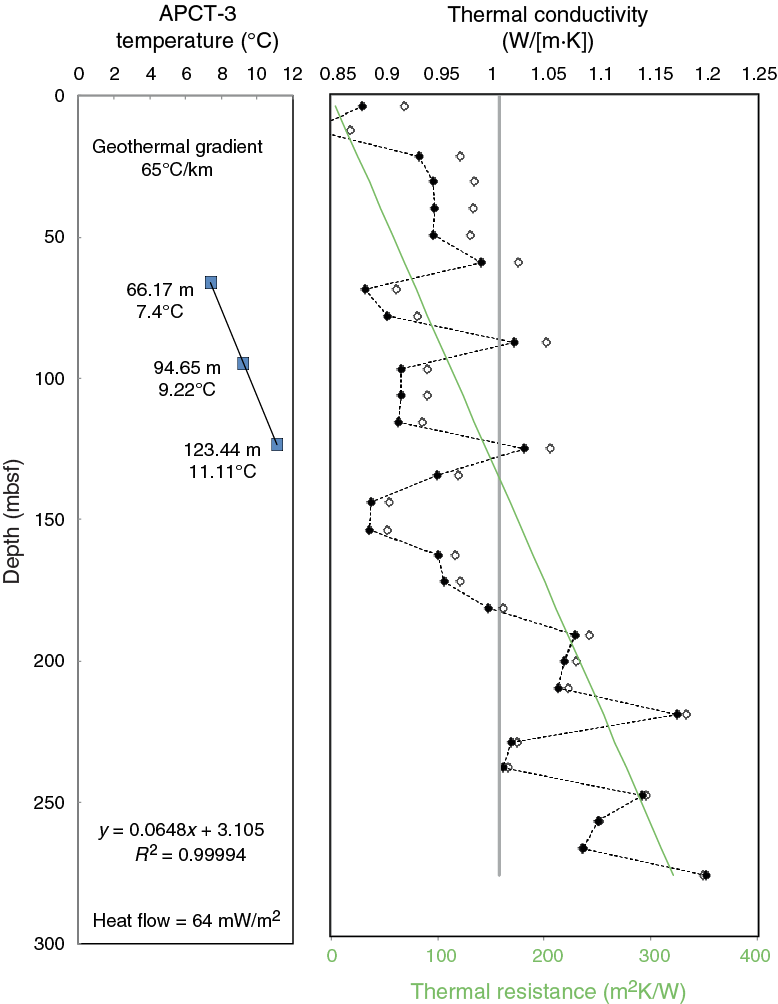
Figure F33. Heat flow calculations.
We estimated a thermal conductivity profile (with ~10 m resolution) (Figure F33) using laboratory-determined thermal conductivity data (see Physical properties in the Expedition 363 methods chapter [Rosenthal et al., 2018a]). Based on the in situ condition correction, thermal resistance was calculated using an average thermal conductivity of 0.99 W/(m·K) measured in Hole U1483A following the “average approach” outlined in Pribnow et al. (2000). The corrected thermal conductivity is lower relative to uncorrected values until ~200 mbsf, after which the corrected and uncorrected values converge. The offset between corrected and uncorrected values is greater at shallower depth and gradually decreases downhole. The slope of the linear fit between temperature and thermal resistance indicates a heat flow of 64 mW/m2 for Site U1483 (calculated using the method described in Pribnow et al., 2000).
Stratigraphic correlation
Correlations between holes at Site U1483 were accomplished using Correlator software (version 2.1). Tie points were established mainly with Whole-Round Multisensor Logger (WRMSL) magnetic susceptibility data, although some were based primarily on L* data (Table T21). WRMSL gamma ray attenuation (GRA) bulk density and NGR data were helpful in making correlations (e.g., Figure F34), but because magnetic susceptibility data provided the most consistent means of correlation, it is the only data type shown in Figure F35. We constructed two spliced intervals, one from 0 to 211.5 m core composite depth below seafloor (CCSF) and the other from 239.8 to 266.8 m CCSF (Figures F35, F36; Table T22). We did not construct splices in two intervals (211.5–239.8 m CCSF and deeper than 266.8 m CCSF) that had WRMSL data variations indicating there was no stratigraphic continuity between holes due to soft-sediment deformation. We estimated offsets for the cores within the deformed intervals, as explained below.
Table T21. Affine table. Download table in CSV format.
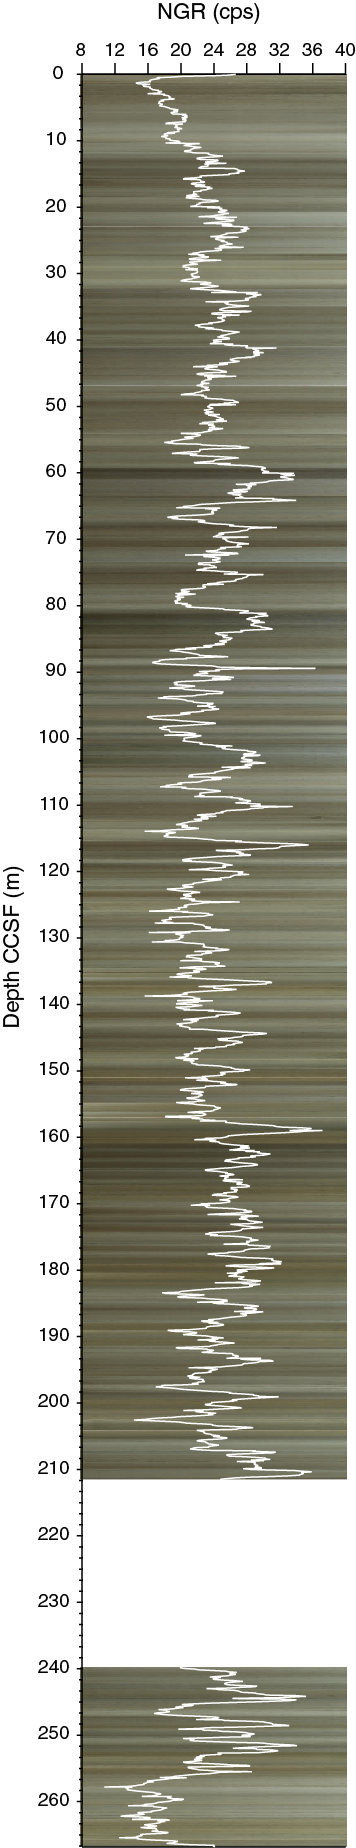
Figure F34. Spliced NGR data plotted on spliced core images.
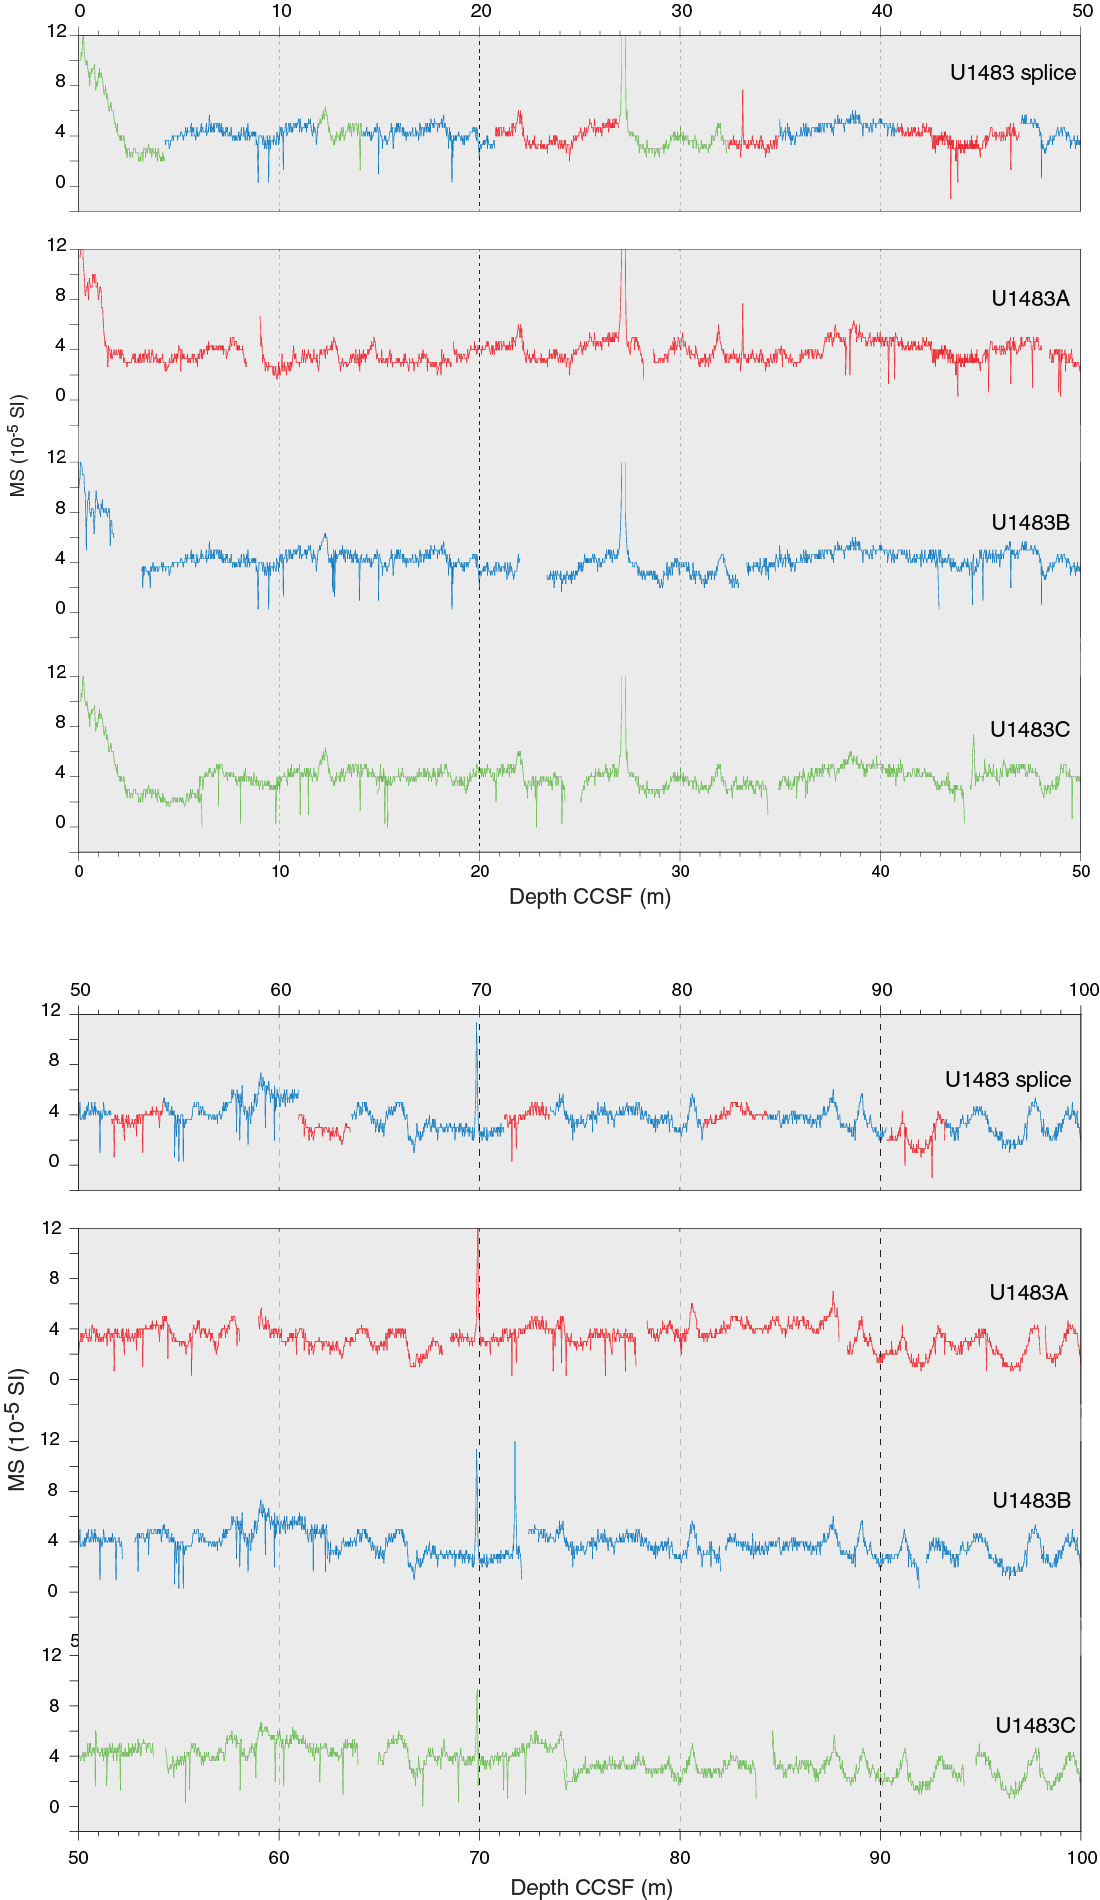
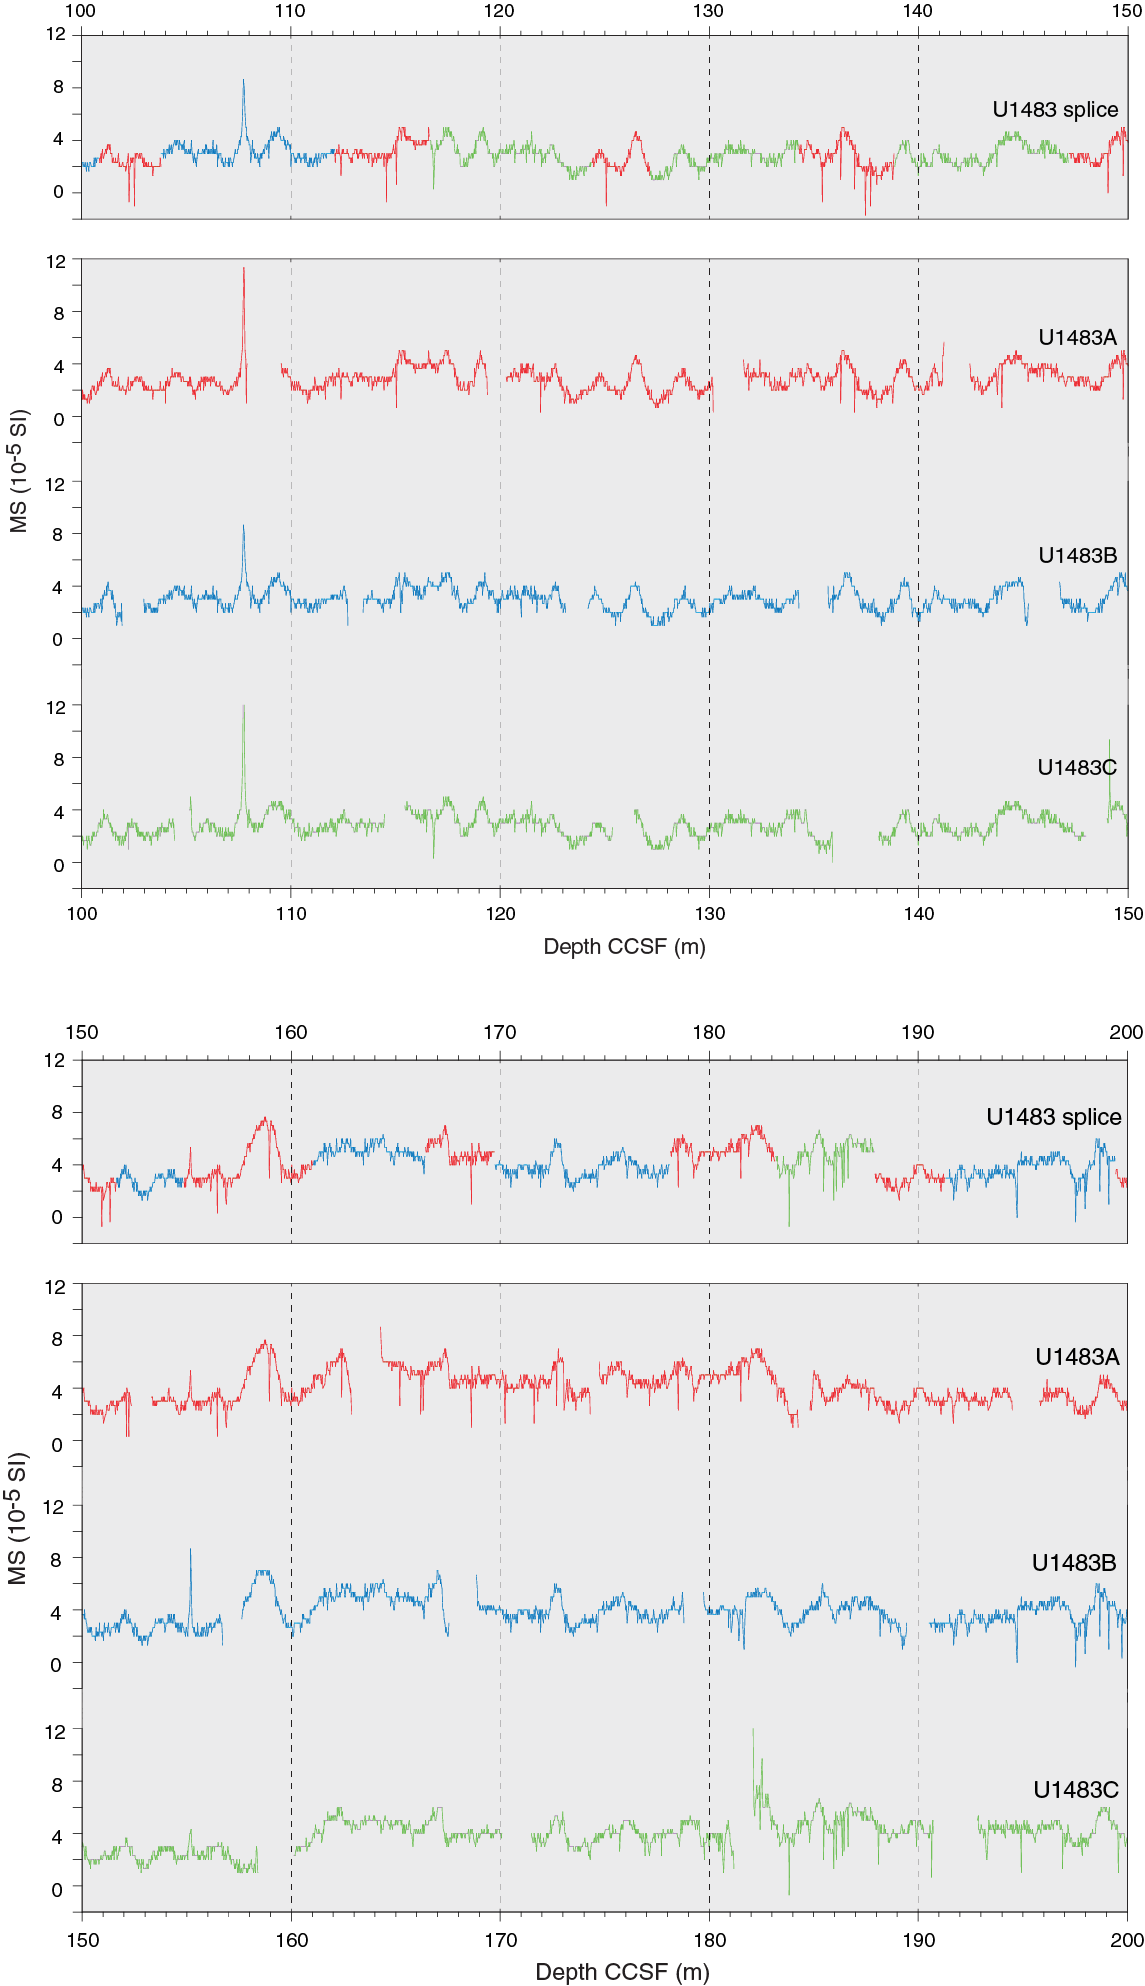
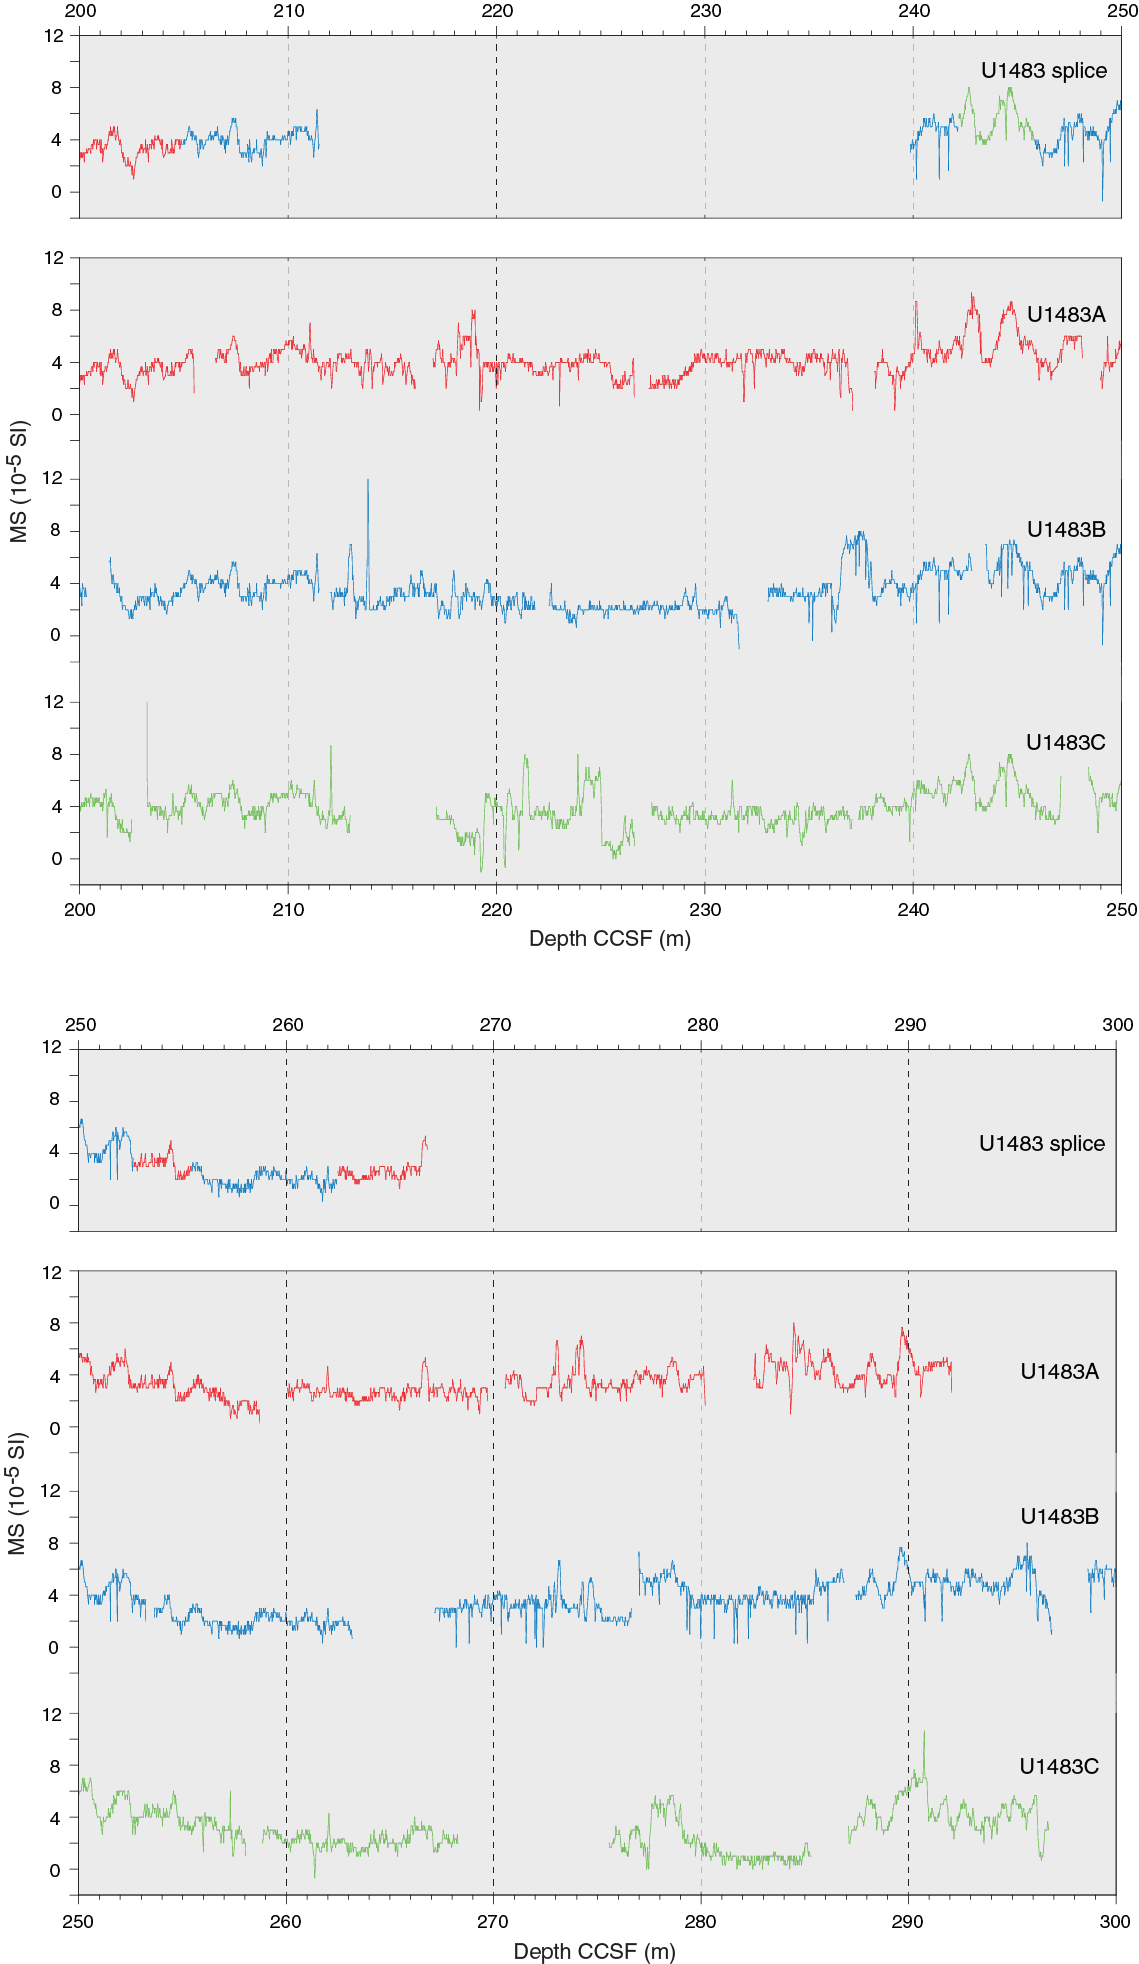
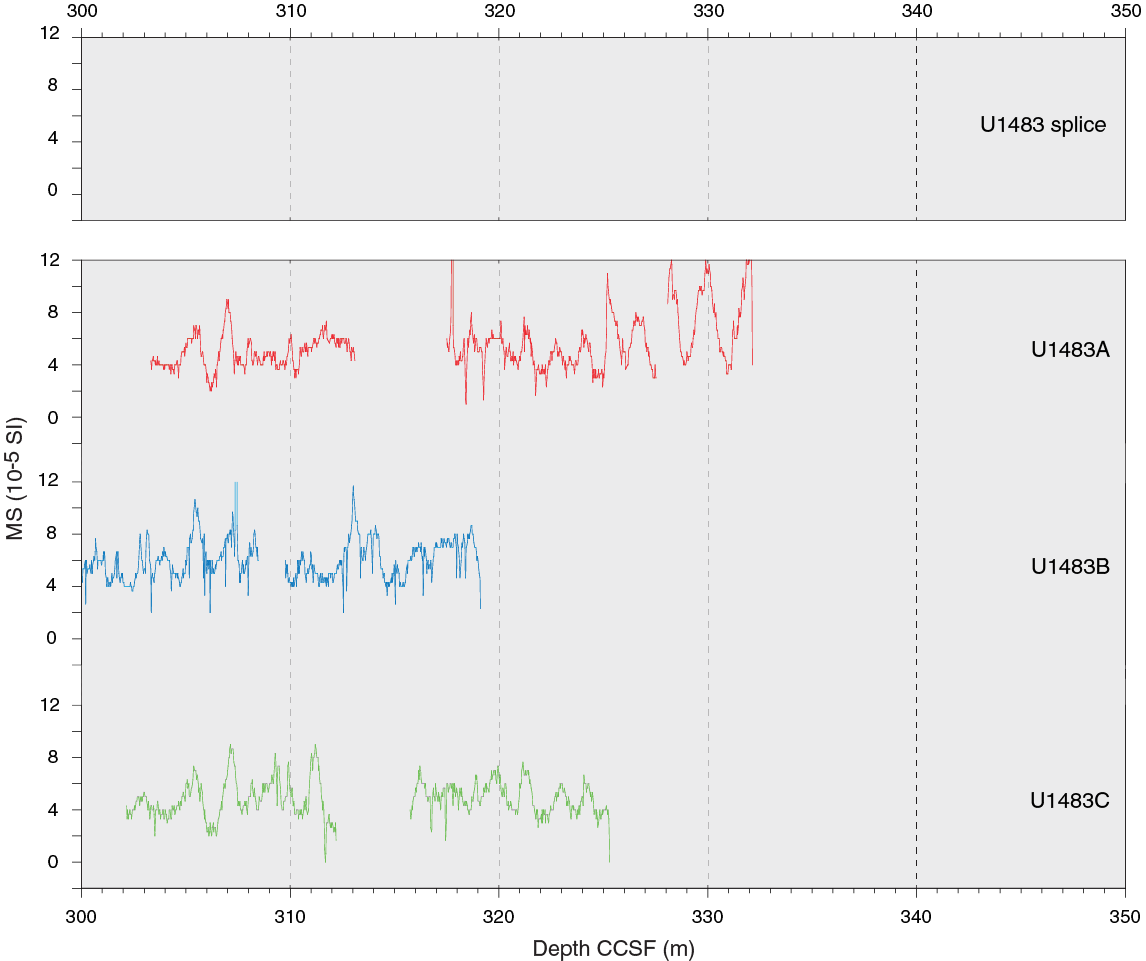
Figure F35. WRMSL MS for Holes U1483A–U1483C.
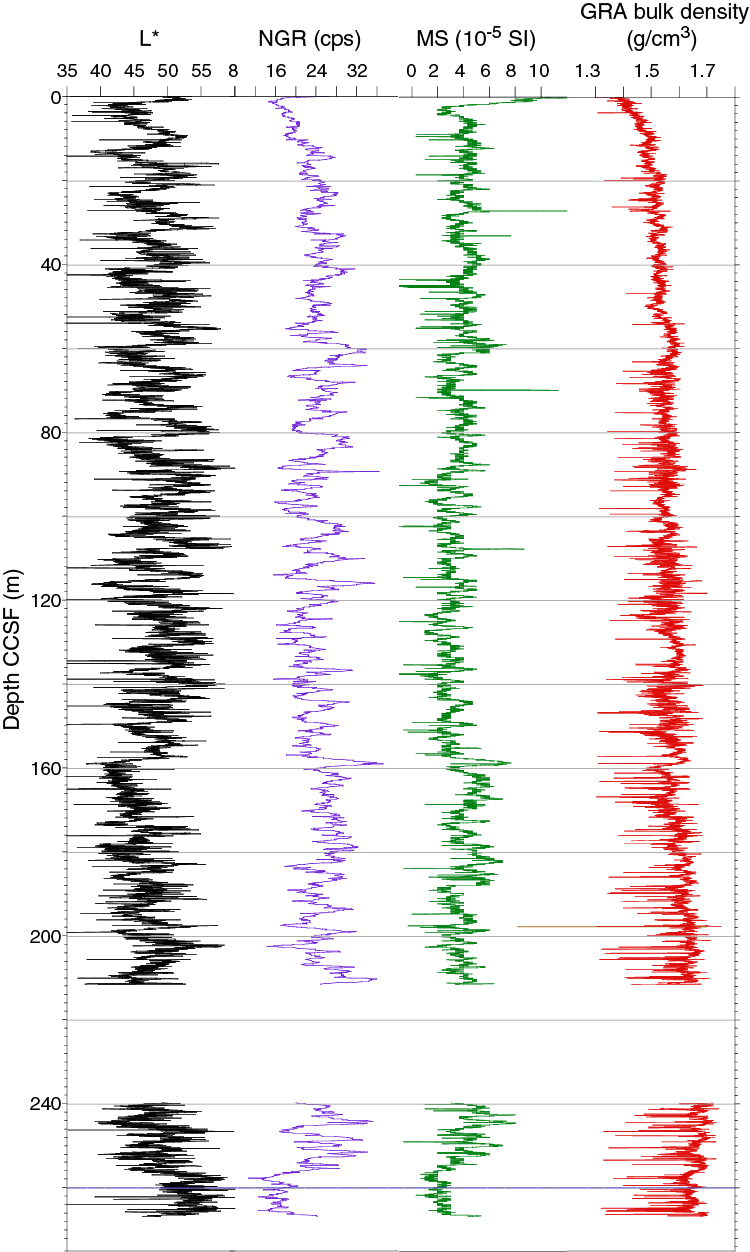
Figure F36. Spliced L*, NGR, and WRMSL MS and GRA bulk density data.
Table T22. Splice intervals. Download table in CSV format.
The CCSF scale is anchored to the mudline of Core 363-U1483C-1H, which is assigned a depth of 0 m CCSF. From this anchor, we worked downhole, using Correlator to establish a composite stratigraphy on a core-by-core basis. The match between holes is very well constrained within the spliced intervals (0–211.5 and 239.8–266.8 m CCSF). The most tentative splice tie points are those that connect Cores 363-U1483A-4H to 363-U1483B-5H and 363-U1483B-5H to 363-U1483A-5H because of the very low amplitude variations in all data available for correlation. We approached the construction of the splice mainly by using Hole U1483B as the “backbone” where possible (0–112.08, 151.6–211.5, and 239.8–266.4 m CCSF) and using Hole U1483A to fill the core gaps in most sections. However, there were a few places where we decided to use Hole U1483C for the splice because it provided the most definitive splice tie points. We did not have time to build a second splice, but it appears that, if needed, a nearly complete second splice that does not require material from the first splice could be constructed as part of postcruise research. We have provided the exact position of the tie points that we used to determine the offsets for cores that were not used in the splice (Table T21); this information will make it easier for studies that utilize samples from intervals outside the splice to compare data to records from the splice.
We constructed the splice only for the intervals with undeformed sediment (0.0–211.5 and 239.8–266.8 m CCSF). Within intervals of deformed sediment where we could not make correlations with confidence, we simply determined core-top offsets (211.5–239.8 m CCSF and deeper than 266.8 m CCSF). We ended the upper, longer splice at 211.5 m CCSF, the depth at the bottom of Core 363-U1483B-21H, because below this point visual confirmation of deformed structures in the sediment is evident (see Core description) and features detected in the WRMSL data could not be correlated between holes. Therefore, the offsets (Table T21) for the tops of the cores within this first deformed interval (211.5–239.8 m CCSF) were set using the growth factor from the previous core within the splice. The offsets for Cores 363-U1483B-22H, 23H, and 24H were set using 1.104, the growth factor of Core 363-U1483B-21H. The offsets for the tops of Cores 363-U1483A-22H and 23H were set using 1.092, the growth factor of Core 363-U1483A-21H. Offsets for Cores 363-U1483C-23H and 24H were set using 1.089, the growth factor of Core 363-U1483C-21H. The top of the next spliced interval occurs at 239.8 m CCSF, the point where the overlying deformed interval ends (Section 363-U1483B-24H-5, 143 cm). The bottom of this second, deeper spliced interval is at 266.8 m CCSF, the point where deformation begins again (Section 363-U1483A-26H-5, 134 cm).
Within the lowest deformed package of sediment (266.8 m CCSF to the bottom of recovered section) many intervals have WRMSL data features that do not correlate across holes, but there are a few features that do correlate. Thus, even though we did not construct a splice for this lowest deformed interval, we determined core offsets to place these cores on the CCSF scale. Our strategy was to use a growth factor to establish offsets for cores that did not correlate with cores in other holes and to use a tie point to establish offsets for cores that had some WRMSL data features that correlated to those in other holes. The offset for Cores 363-U1483A-27H and 28H was set using 1.100, the growth factor of Core 363-U1483A-26H. The offsets for Cores 363-U1483B-27H and 28H, as well as Core 363-U1483C-28H, were determined by correlating features in them to features in Core 363-U1483A-27H. The offsets for Cores 363-U1483B-29H and 363-U1483C-29H were determined using correlation tie points across holes. Core 363-U1483B-30H did not correlate to any other cores, so its offset was set using 1.114, the growth factor of Core 363-U1483B-29H. The offsets of Cores 363-U1483C-30H and 363-U1483A-29H were determined using correlation tie points across holes. We continued with this approach to the bottom of the holes; the offsets for Cores 363-U1483C-31H and 363-U1483A-30H were determined using correlation tie points across holes, and the offset for Cores 363-U1483B-31H and 363-U1483A-31H both had to be set using growth factors based on Cores 363-U1483B-30H and 363-U1483A-30H, respectively. More details are provided in the affine table (Table T21).
The splice interval table (Table T22) is intended to provide a sampling plan that can be used to generate high-resolution continuous records with minimal gaps; however, an “off-splice” sampling plan was also designed, mainly for low-resolution studies. An explanation of the strategy used to determine the off-splice sampling plan and a table of core intervals that should be used for off-splice sampling can be found in OFFSPLICE in Supplementary material.
The cumulative offset between the mbsf and CCSF depth scales is nearly linear (Figure F37A), but close inspection of the cumulative offset as a function of depth (mbsf) (Figure F37B) shows that, compared to the upper section (0 to ~60 mbsf), the lower section has a greater growth factor because of expansion associated with the release of overburden combined with methane gas expansion. This expansion is most prominent near the sulfate–methane transition zone (at ~55 mbsf at this site; see Geochemistry). The growth factors deeper than 243 mbsf are strongly affected by making hole-to-hole correlations within an interval of deformation where thinning and thickening of sediment packages, rather than core expansion, mainly affect the core offsets. Calculation of mass accumulation rates based on the CCSF scale should account for the expansion by dividing apparent depth intervals by the appropriate growth factor.
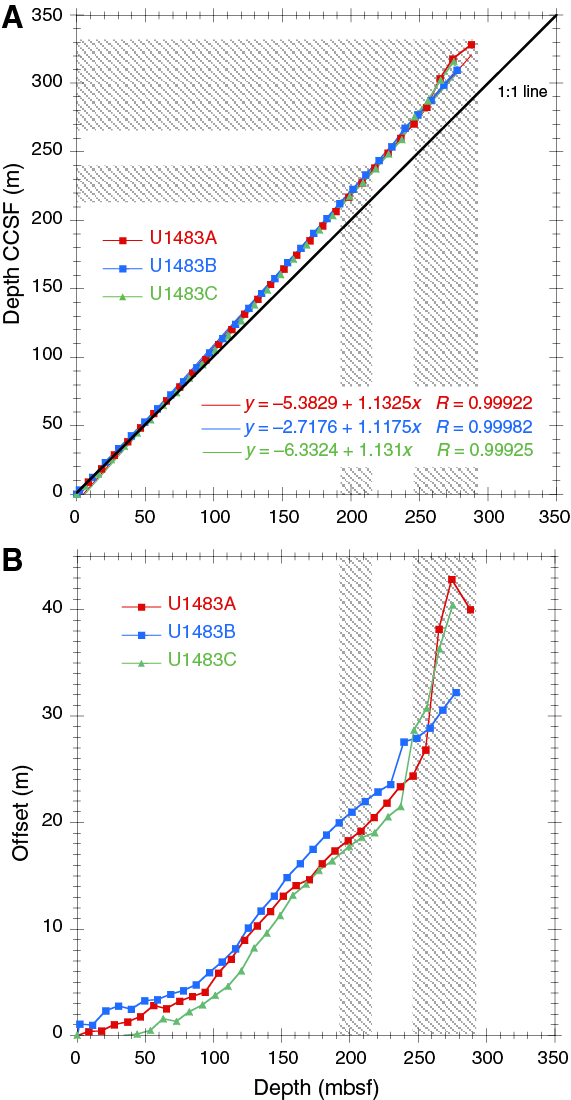
Figure F37. Comparison of mbsf and composite depth scales.
Geochemistry
Site U1483 was cored on the northwest Australian margin, ~260 km from Site U1482. The dominant processes that influence the interstitial water geochemistry at Site U1483 are similar to those observed at Site U1482, including sulfate (SO4) reduction and methanogenesis of organic matter and interactions with clay and biogenic minerals. As observed at Site U1482, the clay-rich sediment at Site U1483 reduces diffusion, leading to good preservation of reaction profiles. For detailed background on organic matter remineralization and clay mineral alteration, see Geochemistry in the Site U1482 chapter (Rosenthal et al., 2018b).
Elevated methane concentration was found in headspace gas samples at Site U1483. High methane/ethane ratios suggest that the methane is mostly of biogenic origin. Calcium carbonate (CaCO3) remains the dominant biogenic sediment component (average = 59 wt%) throughout the entire record. The total organic carbon (TOC) content of samples ranges from 0.4 to 1.4 wt%.
Results
Volatile hydrocarbons
Headspace gas samples were taken at a frequency of one sample per core in Hole U1483A as part of the routine environmental protection and safety-monitoring program (Table T23; Figure F38). Methane concentration varies between 9 and 53 ppmv from 7.5 to 36.2 mbsf, gradually increases between 45.6 and 140.8 mbsf to a maximum of 102,336 ppmv, and then decreases to ~11,200 ppmv at 289.7 mbsf. Ethane and propane occur in trace amounts throughout the cores. The C1/C2 ratio abruptly increases from 45.6 mbsf to a peak at 102.9 mbsf and then gradually decreases downhole with increasing maturity. The high C1/C2 ratios below 55.2 mbsf suggest that the methane is mostly of biogenic origin, rather than thermogenic.
Table T23. Volatile hydrocarbon concentrations. Download table in CSV format.
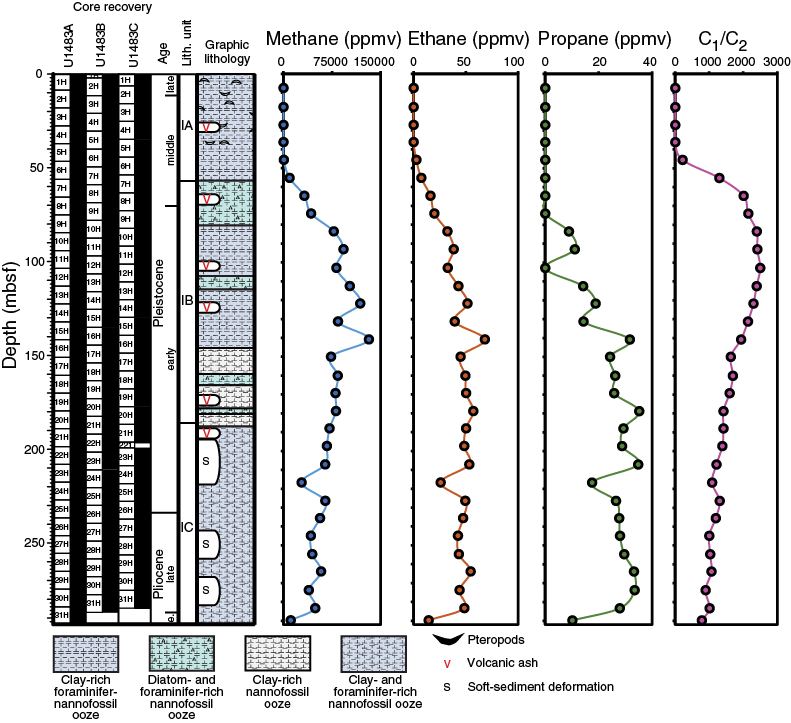
Figure F38. Methane, ethane, propane, and C1/C2 ratio profiles.
Bulk sediment geochemistry
CaCO3, inorganic carbon (IC), TOC, and total nitrogen (TN) were measured on sediment samples from Hole U1483A (Table T24; Figure F39). CaCO3 content ranges between 38 and 78 wt% with an average of 59 wt%. CaCO3 gradually increases downhole in lithologic Subunits IA and IB. This trend is punctuated by a slight drop in CaCO3 content from 53.6% to 44.0% at 147.1 mbsf and slightly lower values near the base of lithologic Subunit IB. The CaCO3 content increases in Subunit IC, with a slight decrease (38 wt%) at 228.4 mbsf, before decreasing again from ~250 mbsf to the bottom of the hole at ~290 mbsf. We observed a general correspondence between CaCO3 content and L* in the upper ~100 mbsf and with b* below ~200 mbsf.
Table T24. Carbon, nitrogen, and C/N. Download table in CSV format.
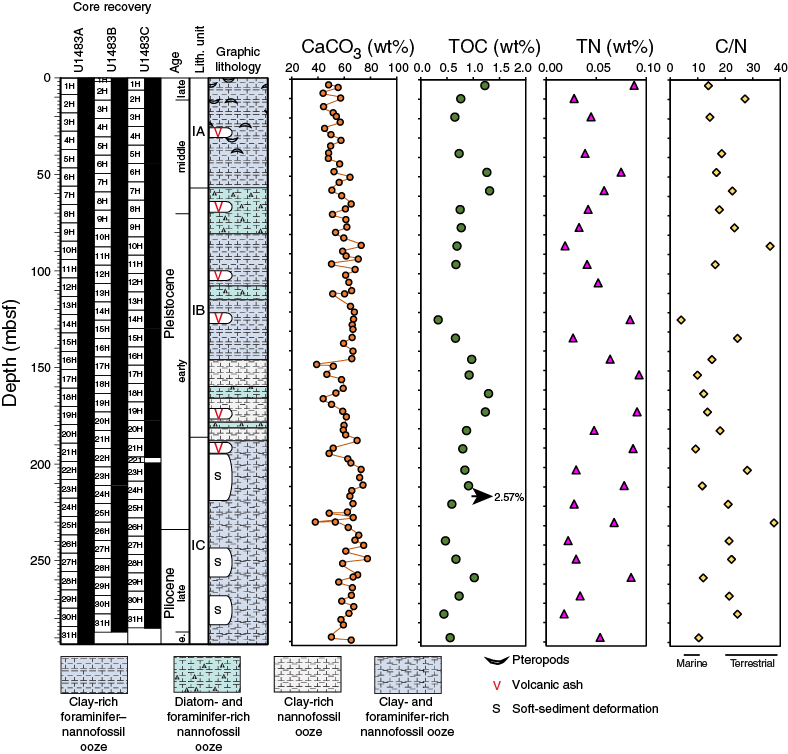
Figure F39. Calcium carbonate, TOC, TN, and C/N ratio profiles.
TOC ranges between ~0.3 and 1.3 wt% with an average of 0.88 wt%, showing no discernible downhole trend. However, one sample has relatively high TOC (2.6 wt%; 363-U1483A-25H-1, 125–127 cm; 28.35 mbsf) and very low CaCO3 content (38.0 wt%). The ratio of TOC to TN (C/N ratio) ranges from 4 to 38 with an average of 19 (Figure F39). The C/N ratio in most samples is higher than 10, possibly suggesting that the organic matter deposited at Site U1483 is predominately supplied by terrestrial input; however, caution should be taken when interpreting TOC and C/N data calculated from the subtraction method.
Interstitial water chemistry
A total of 35 whole-round samples and 1 mudline sample were taken from Hole U1483A for interstitial water analyses, spanning from 4.5 to 283.3 mbsf. For ammonium (NH4) analysis, a number of samples from Site U1482 had NH4 concentrations that fell above our standard curve. Because of concerns with the calibration curve linearity at concentrations >3.0 mM and evidence of high NH4 concentration from the ion chromatograph run, sample aliquots were diluted so that their concentrations would fall within the range of the calibration curve, and the total volume of the aliquots was sufficient for longer take-up times. This practice was adopted for the remainder of the expedition when ion chromatograph peaks indicated high NH4 at a site. Samples analyzed for phosphate (PO4) were not diluted. Interstitial water chemistry data are reported in Table T25.
Table T25. Interstitial water geochemical data. Download table in CSV format.
Chlorinity and salinity
Chloride (Cl) concentration increases steadily downhole from a mudline value of 557.4 mM to a local maximum of 567.4 mM at 55.1 mbsf and then decreases to 563.8 mM at 83.5 mbsf. Below that, Cl increases monotonically, reaching a maximum value of 597 mM at 238.3 mbsf (Figure F40). This 7% increase from the top of the hole to the bottom is larger than the 3% increase observed over the equivalent time interval at Site U1482. Water uptake through the alteration of kaolinite to illite may be responsible for the downhole increase in Cl, but upward diffusion of waters enriched in Cl from alteration of material at depth also likely influences the profile. Salinity has minor downhole variations (not shown), ranging from 36 to 34 between 0 and ~150 mbsf, and then remaining constant at 35 below ~150 mbsf, with one reading of 36 at 283.3 mbsf.
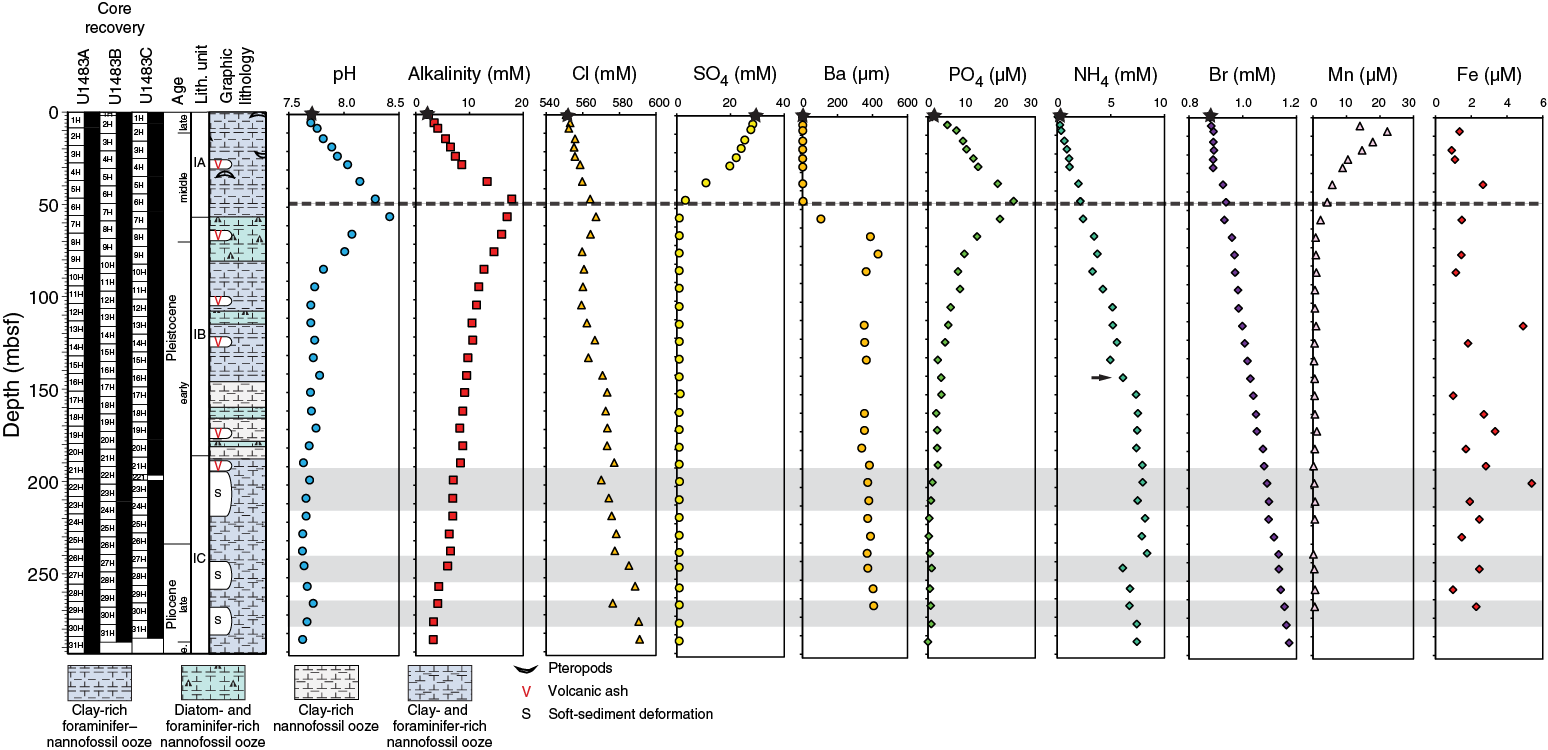
Figure F40. Interstitial water concentration profiles.
Alkalinity and pH
Site U1483 has downhole alkalinity and pH profiles that are similar to each other, particularly in the upper ~50 mbsf (Figure F40). The strong coupling of these two parameters can be explained in part by the rapid transitions through the stages of organic matter remineralization. Alkalinity increases from a mudline value of 2.4 mM to a maximum of 17.9 mM at 45.6 mbsf, whereas pH increases from 7.7 to 8.4 over the same range. The manganese (Mn) and sulfate (SO4) profiles over the same interval indicate transitions from suboxic to anoxic organic matter remineralization and nearly complete SO4 depletion by 55.1 mbsf. As observed at Site U1482, the sulfate–methane transition zone (SMTZ) is marked by peaks in alkalinity and pH. Alkalinity and pH gradually decrease over the remainder of the hole, reaching 3.3 and 7.6 mM, respectively, at the base of the hole (~283.3 mbsf).
Minor shifts in alkalinity and pH are observed at ~200 and ~245 mbsf (gray shading in Figure F40). These two depths coincide with the locations of two intervals of soft-sediment deformation (see Core description) where biostratigraphic evidence suggests that a substantial portion of the original sedimentary sequence has been removed (see Biostratigraphy). Changes in several other interstitial water profiles were observed at the same depths, indicating a tight link between lithology and interstitial water chemistry (see Discussion).
Sulfate and barium
SO4 concentration decreases from seawater-like values (29.1 mM) at the mudline to almost complete depletion at the SMTZ (55.1 mbsf). The convex shape of the SO4 profile indicates that anaerobic oxidation of methane is the dominant sink for interstitial water SO4 at Site U1483 (Figure F40). Similar to what was observed at Site U1482, barium (Ba) concentration increases sharply below the SMTZ downhole to 74.0 mbsf (maximum = 431.66 µM), indicating barite dissolution within the methanogenesis zone. An altered gypsum-bearing authigenic concretion possibly containing barite was found at the same depth as the peak of dissolved Ba (see Core description) and may correspond to a former barite front (i.e., related to a paleo-SMTZ) that is currently undergoing partial dissolution. Deeper than 74.1 mbsf, Ba concentration decreases to 352.64 µM at 112.4 mbsf, followed by a gradual increase downhole to 406.85 µM at the base of Hole U1483A.
Phosphate, ammonium, and bromide
Phosphate (PO4) concentration increases from 1.2 µM at the mudline to a peak of 24.0 µM at 45.6 mbsf (Figure F40), coincident with peaks in alkalinity and pH and depletion of SO4. In contrast to Site U1482, the trend in PO4 here mirrors changes in pH and alkalinity above the SMTZ, indicating that PO4 released into interstitial water during organic matter degradation is not concomitantly reprecipitated as extensively as is proposed for Site U1482 (see Geochemistry in the Site U1482 chapter [Rosenthal et al., 2018b]). Deeper than 45.6 mbsf, PO4 decreases sharply until ~103 mbsf and then more gradually to a value of 0.9 µM at 273.7 mbsf (PO4 in the deepest sample is below detection limit). The observed PO4 profile is influenced by remineralization of organic matter in the upper portion of the sedimentary sequence and diffusion in the lower portion of the sediment.
Ammonium (NH4) and bromide (Br) concentrations both increase with depth, consistent with their release from organic matter during remineralization (Figure F40); however, the NH4 profile shows two distinct features that appear to be related to changes in lithology rather than organic matter (see Core description). The first of these occurs at ~145 mbsf, where a shift in lithology from clay-rich and foraminifer-rich nannofossil ooze above to predominantly nannofossil clay or diatom-rich nannofossil clay below was observed. The higher slope in the NH4 profile deeper than ~145 mbsf suggests reduced diffusion rates related to higher clay content and decreased permeability. The Br profile is not characterized by a similar change at this depth, as would be expected if both parameters were controlled primarily by organic matter degradation. A second notable feature in the NH4 profile occurs at 243.5 mbsf, the location of one of the two prominent intervals of deformed sediment in the hole, where NH4 concentration drops abruptly from 8.4 to 6.1 µM (see Discussion).
Compared to the NH4 profile, the Br profile shows a far more monotonic increase over the entire hole, with the exception of the upper ~30 mbsf, where little to no change in concentration is observed (Figure F40). This could indicate that Br is hosted in the more refractory phases of organic matter, which is degraded after the fresh, labile compounds are remineralized (Henrichs, 1992).
Manganese and iron
Mn concentration increases from the mudline to a maximum of 22.2 µM at 7.5 mbsf within the zone of suboxic organic matter remineralization and then sharply decreases to 0.8 µM by 64.6 mbsf (Figure F40). As with PO4, Mn concentration is higher at Site U1483 relative to Site U1482, and the Mn peak and subsequent downhole depletion occur at shallower depths in the sediment sequence, in agreement with the trends observed in alkalinity, pH, SO4, and Ba. Deeper than 64.6 mbsf, Mn concentration is low and constant at <1.1 µM. The iron (Fe) profile is characterized by low concentration and a high degree of scatter, making quantitative or qualitative observations about Fe variability difficult (Figure F40). The sedimentologists did not observe pyrite in the Site U1483 cores, but some foraminifer samples from the deeper parts of the hole contained large amounts of pyrite (see Biostratigraphy). Hence, the low Fe concentration may not be due to extensive pyritization in the sediment as hypothesized for Site U1482.
Potassium, magnesium, and calcium
As at Site U1482, potassium (K) concentration at Site U1483 increases slightly from the mudline value of 10.6 mM to a concentration slightly higher than that of seawater (11.7 mM) in the uppermost ~10 mbsf, suggesting an input of K to the interstitial water from the shallowest sediments (Figure F41). As observed in the magnesium (Mg) and strontium (Sr) profiles, K concentration remains constant downhole to ~27 mbsf, where a steady linear decrease begins and continues to a minimum concentration of 6.0 mM at the bottom of Hole U1483A. As at Site U1482, stoichiometric relationships between Mg and K concentrations suggest a common process influencing their profiles, such as clay mineral ion exchange, clay authigenesis (e.g., conversion from kaolinite to illite), and/or a sink at a depth below the deepest material recovered from Site U1483.
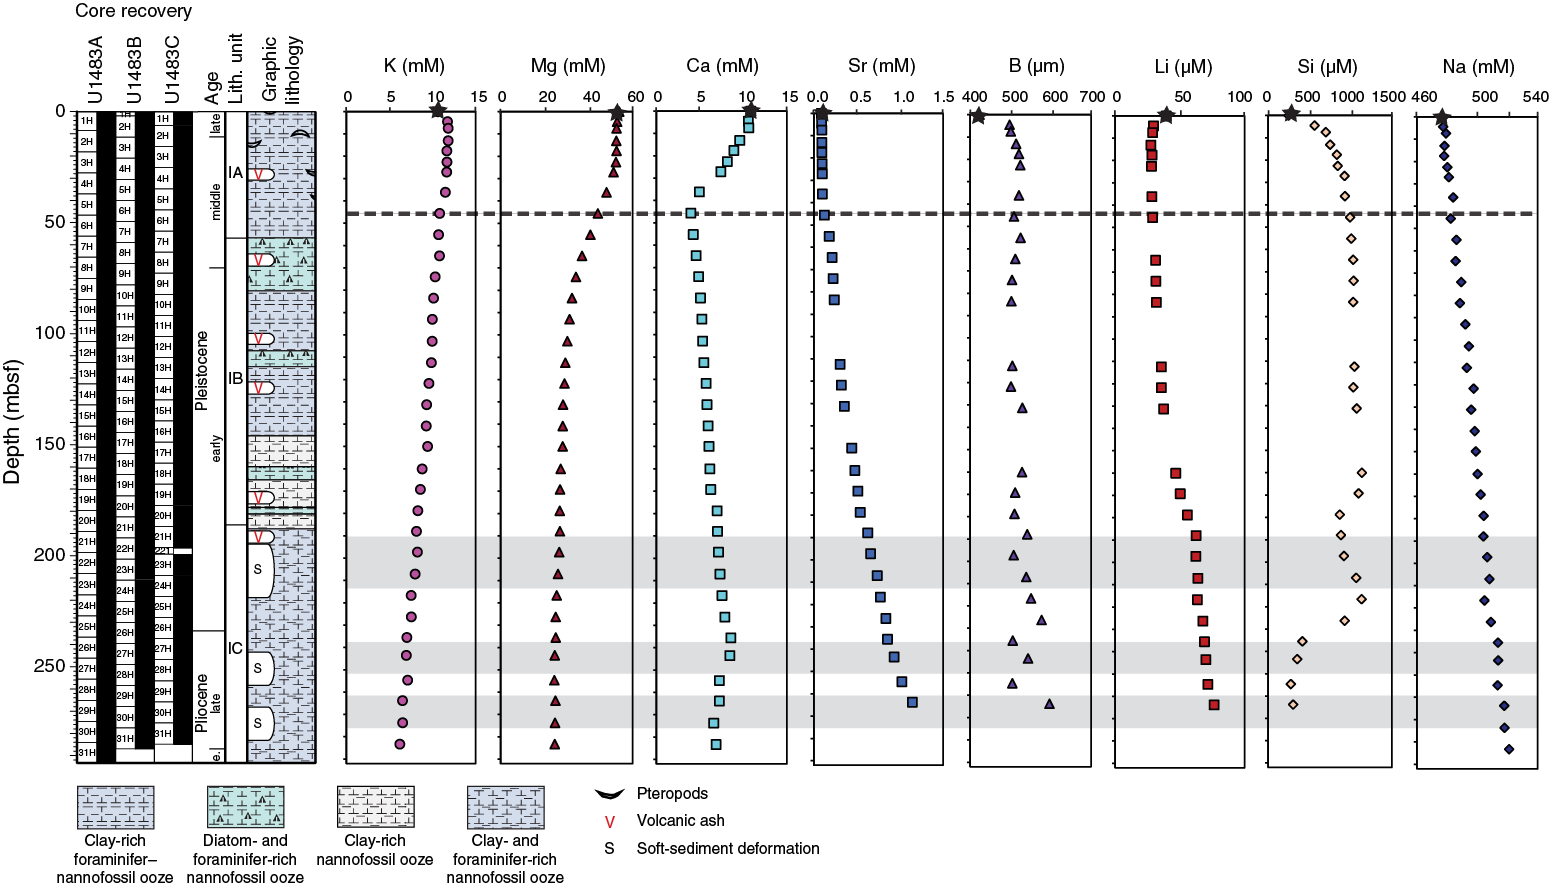
Figure F41. Interstitial water concentration profiles.
Mg concentration remains fairly constant (~52 mM) downhole to 27.0 mbsf (Figure F41). Below 27.0 mbsf, Mg concentration decreases throughout the sedimentary sequence to a minimum value of 24.6 mM at the bottom of Hole U1483A. Mg concentration decreases more steeply between 27.0 and 74.0 mbsf but stabilizes toward the base of the hole, suggesting a close balance between uptake and release of Mg or a diffusion-dominated signature over this depth interval.
The calcium (Ca) profile displays a decrease from seawater-like values at the mudline (10.8 mM) to ~4 mM just above the depth of the SMTZ (55.1 mbsf), which, together with alkalinity data, is suggestive of anaerobic oxidation of methane (AOM)-driven carbonate precipitation (Figure F41). Mg and Sr do not show any pronounced depletion or enrichment at the same depth, suggesting that calcite forms preferentially at the SMTZ, as opposed to high-Mg calcite, dolomite, or aragonite. Deeper than 45.6 mbsf, Ca concentration increases progressively to 8.5 mM between 235.5 and 243.5 mbsf before decreasing to 6.9 mM at the base of Hole U1483A. Calcareous microfossil preservation is excellent to very good throughout the recovered stratigraphy at Site U1483, with minor dissolution and overgrowth reported only below ~200 mbsf (see Biostratigraphy).
Strontium and boron
Sr concentration is approximately constant (average = 93.6 mM) between the mudline and 27.0 mbsf (Figure F41). Deeper than 27.0 mbsf, Sr progressively increases to a maximum concentration of 1143.5 mM at the bottom of Hole U1483A. This downhole trend is the inverse of that observed in the Mg profile. The continued increase of Sr with depth suggests an active source of Sr to the interstitial water, likely due to a combination of minor biogenic carbonate dissolution and diffusion from deeper, Sr-enriched sediment.
Although the boron (B) profile at Site U1483 appears less variable than that at Site U1482, the profiles are quite similar over an equivalent time interval. B increases modestly over that interval, from a value of 423.4 µM at the mudline to a maximum of 597 µM at 263.8 mbsf at Site U1483 (Figure F41). This is a 41% increase, similar to the 47% increase in interstitial water B concentration observed over the same range at Site U1482. Biogenic carbonate is well preserved throughout the sequence at Site U1483 (see Biostratigraphy), which is consistent with the observed moderate downhole increase in B.
Lithium, silica, and sodium
The overall trends in the lithium (Li) profile at Site U1483 (Figure F41) are similar to the observed trends in the equivalent depth interval (0–280 mbsf) at Site U1482. Following a slight decrease from a concentration of 39.4 µM at the mudline to 27.5 µM at 13.0 mbsf, Li concentration remains relatively constant over the upper ~30 mbsf, similar to profiles of K, Mg, and Sr. Deeper than ~30 mbsf, Li concentration increases somewhat gradually until 160.0 mbsf then more steeply between 160.0 and the base of the hole. The change of slope occurs near the top of the uppermost interval of soft-sediment deformation (see Core description and Discussion).
Distinct differences in silica (Si) evident between Sites U1482 and U1483 likely reflect sedimentological differences between the sites. At Site U1482, radiolarians were observed only in the uppermost cores from each hole (see Biostratigraphy and Core description in the Site U1482 chapter [Rosenthal et al., 2018b]), and the dissolved Si profile reaches a maximum value of 796.6 µM in the upper 100 mbsf before decreasing rapidly downhole to ~250 µM by approximately 200 mbsf. In stark contrast, biogenic silica is present throughout much of Site U1483 (see Biostratigraphy and Core description), and interstitial water Si concentration increases from 223.9 µM at the mudline to ~1000 µM by 55.1 mbsf (Figure F41). Below that, slight variability is observed, with Si concentration averaging ~1000 µM between 55.1 and 226.3 mbsf.
Although the high interstitial water Si at Site U1483 suggests active dissolution of biogenic silica, the appearance of diatoms and radiolarians throughout the entire sedimentary sequence suggests that equilibrium has been reached between the solid and liquid phases of Si at this site. The high interstitial water Si may also have implications for clay mineral alteration/authigenesis because dissolved Si is key for the formation or alteration of many clay minerals. If this type of clay mineral alteration is occurring at Site U1483, interstitial water Si would likely decrease without an additional input of Si (such as dissolution of biogenic silica). However, elevated interstitial water Si concentration throughout most of the record suggests clay mineral alteration and authigenesis may not be as pronounced at Site U1483 compared to Site U1482.
Sodium (Na) concentration decreases linearly from the mudline to the bottom of Hole U1483A (Figure F41). Although Na may be influenced by small amounts of clay mineral alteration (see Geochemistry in the Site U1482 chapter [Rosenthal et al., 2018b] for detailed background on clay mineral alteration), the linear nature of the increase suggests either uptake of sodium that nearly balances its release or the dominance of diffusion in shaping the profile.
Discussion
The dominant processes influencing the interstitial water profiles at this site include remineralization of organic matter, with rapid transitions through suboxic to anoxic and methanogenic organic matter remineralization, and diffusion. The clay-rich nature of the sediment may reduce the influence of diffusion, resulting in well-preserved gradients in downhole profiles, although trends in Cl and Na indicate a stronger influence of diffusion here than at Site U1482. Downhole trends in K, Ca, Mg, Sr, B, Li, and Si suggest moderate degrees of interaction between interstitial water and biogenic sediment, with clay mineral ion-exchange and diffusion having a more substantial influence at depth.
Several intervals of soft-sediment deformation are observed at Site U1483. In Hole U1483A, deformed sediment occurs at ~193–218 and ~243–258 mbsf. Although lithologically similar to the in situ sediment, the deformed sediment contains a higher percentage of clay (see Core description) and has higher bulk density (see Physical properties). Changes in several interstitial water profiles are observed at the depths of the deformed sediment intervals, including alkalinity, pH, NH4, Li, and Si (Figures F40, F41). Together, these profiles suggest that the denser clay layers influence the reaction/diffusion rates within the deformed intervals. The deformed layers may also act as a “cap,” decreasing the interaction between interstitial water above, within, and below the deformed layers and resulting in well-preserved interstitial water gradients that might otherwise have been smoothed out by diffusion.
References
Berggren, W.A., Kent, D.V., Swisher, C.C., III, and Aubry, M.-P., 1995. A revised Cenozoic geochronology and chronostratigraphy. In Berggren, W.A., Kent, D.V., Aubry, M.-P., and Hardenbol, J. (Eds.), Geochronology, Time Scales and Global Stratigraphic Correlation. Special Publication - SEPM (Society for Sedimentary Geology), 54:129–212. https://doi.org/10.2110/pec.95.04.0129
Blum, P., 1997. Technical Note 26: Physical Properties Handbook—A Guide to the Shipboard Measurement of Physical Properties of Deep-Sea Cores. Ocean Drilling Program. https://doi.org/10.2973/odp.tn.26.1997
Cande, S.C., and Kent, D.V., 1995. Revised calibration of the geomagnetic polarity timescale for the Late Cretaceous and Cenozoic. Journal of Geophysical Research: Solid Earth, 100(B4):6093–6095. https://doi.org/10.1029/94JB03098
Chaisson, W.P., and Pearson, P.N., 1997. Planktonic foraminifer biostratigraphy at Site 925: middle Miocene–Pleistocene. In Shackleton, N.J., Curry, W.B., Richter, C., and Bralower, T.J. (Eds.), Proceedings of the Ocean Drilling Program, Scientific Results, 154: College Station, TX (Ocean Drilling Program), 3–31. https://doi.org/10.2973/odp.proc.sr.154.104.1997
Dowsett, H.J., 1988. Diachroneity of late Neogene microfossils in the southwest Pacific Ocean: application of the graphic correlation method. Paleoceanography, 3(2):209–222. https://doi.org/10.1029/PA003i002p00209
Gordon, A.L., 2005. Oceanography of the Indonesian seas and their throughflow. Oceanography, 18(4):14–27. https://doi.org/10.5670/oceanog.2005.01
Gradstein, F.M., 1992. Legs 122 and 123, northwestern Australian margin—a stratigraphic and paleogeographic summary. In Gradstein, F.M., Ludden, J.N., et al., Proceedings of the Ocean Drilling Program, Scientific Results, 123: College Station, TX (Ocean Drilling Program), 801–816. https://doi.org/10.2973/odp.proc.sr.123.110.1992
Hall, R., 2012. Late Jurassic–Cenozoic reconstructions of the Indonesian region and the Indian Ocean. Tectonophysics, 570–571:1–41. https://doi.org/10.1016/j.tecto.2012.04.021
Henrichs, S.M., 1992. Early diagenesis of organic matter in marine sediments: progress and perplexity. Marine Chemistry, 39(1–3):119–149. https://doi.org/10.1016/0304-4203(92)90098-U
Hilgen, F.J., Lourens, L.J., and Van Dam, J.A., 2012. The Neogene period. With contributions by A.G. Beu, A.F. Boyes, R.A. Cooper, W. Krijgsman, J.G. Ogg, W.E. Piller, and D.S. Wilson. In Gradstein, F.M., Ogg, J.G., Schmitz, M.D., and Ogg, G.M. (Eds.), The Geologic Time Scale: Oxford, United Kingdom (Elsevier), 923–978. https://doi.org/10.1016/B978-0-444-59425-9.00029-9
Holbourn, A., Kuhnt, W., Kawamura, H., Jian, Z., Grootes, P., Erlenkeuser, H., and Xu, J., 2005. Orbitally paced paleoproductivity variations in the Timor Sea and Indonesian Throughflow variability during the last 460 kyr. Paleoceanography, 20(3):PA3002. https://doi.org/10.1029/2004PA001094
Karlin, R., and Levi, S., 1983. Diagenesis of magnetic minerals in recent hemipelagic sediments. Nature, 303(5915):327–330. https://doi.org/10.1038/303327a0
Keep, M., Harrowfield, M., and Crowe, W., 2007. The Neogene tectonic history of the North West shelf, Australia. Exploration Geophysics, 38(3):151–174. https://doi.org/10.1071/EG07022
Kuhnt, W., Blümel, M., Boch, R., Dewi, K.T., da Costa Monteiro, F., Dürkop, A., Hanebuth, T., Heidemann, U., Holbourn, A., Jian, Z., van der Kaars, S., Kawamura, H., Kawohl, H., Nürnberg, D., Opdyke, B., Petersen, A., Regenberg, M., Rosenthal, Y., Rühlemann, C., Sadekov, A., Salomon, B., Tian, J., Xu, J., and Zuraida, R., 2005. Cruise Report SO185, VITAL–Variability of the Indonesian Throughflow and Australasian climate history of the last 150000 years, Darwin–Jakarta, September 15 2005–October 06 2005. IFM-GEOMAR Reports. https://doi.org/10.2312/cr_so185
Kuhnt, W., Holbourn, A., Xu, J., Opdyke, B., De Deckker, P., Röhl, U., and Mudelsee, M., 2015. Southern Hemisphere control on Australian monsoon variability during the late deglaciation and Holocene. Nature Communications, 6:5916. https://doi.org/10.1038/ncomms6916
McNeill, L.C., Dugan, B., Petronotis, K.E., Backman, J., Bourlange, S., Chemale, F., Chen, W., Colson, T.A., Frederik, M.C.G., Guèrin, G., Hamahashi, M., Henstock, T., House, B.M., Hüpers, A., Jeppson, T.N., Kachovich, S., Kenigsberg, A.R., Kuranaga, M., Kutterolf, S., Milliken, K.L., Mitchison, F.L., Mukoyoshi, H., Nair, N., Owari, S., Pickering, K.T., Pouderoux, H.F.A., Yehua, S., Song, I., Torres, M.E., Vannucchi, P., Vrolijk, P.J., Yang, T., and Zhao, X., 2017. Expedition 362 summary. In McNeill, L.C., Dugan, B., Petronotis, K.E., and the Expedition 362 Scientists, Sumatra Subduction Zone. Proceedings of the International Ocean Discovery Program, 362: College Station, TX (International Ocean Discovery Program). https://doi.org/10.14379/iodp.proc.362.101.2017
Pribnow, D., Kinoshita, M., and Stein, C., 2000. Thermal Data Collection and Heat Flow Recalculations for Ocean Drilling Program Legs 101–180: Hanover, Germany (Institute for Joint Geoscientific Research, Institut für Geowissenschaftliche Gemeinschaftsaufgaben [GGA]). http://www-odp.tamu.edu/publications/heatflow/ODPReprt.pdf
Rosenthal, Y., Holbourn, A., and Kulhanek, D.K., 2016. Expedition 363 Scientific Prospectus: Western Pacific Warm Pool. International Ocean Discovery Program. https://doi.org/10.14379/iodp.sp.363.2016
Rosenthal, Y., Holbourn, A.E., Kulhanek, D.K., Aiello, I.W., Babila, T.L., Bayon, G., Beaufort, L., Bova, S.C., Chun, J.-H., Dang, H., Drury, A.J., Dunkley Jones, T., Eichler, P.P.B., Fernando, A.G.S., Gibson, K.A., Hatfield, R.G., Johnson, D.L., Kumagai, Y., Li, T., Linsley, B.K., Meinicke, N., Mountain, G.S., Opdyke, B.N., Pearson, P.N., Poole, C.R., Ravelo, A.C., Sagawa, T., Schmitt, A., Wurtzel, J.B., Xu, J., Yamamoto, M., and Zhang, Y.G., 2018a. Expedition 363 methods. In Rosenthal, Y., Holbourn, A.E., Kulhanek, D.K., and the Expedition 363 Scientists, Western Pacific Warm Pool. Proceedings of the International Ocean Discovery Program, 363: College Station, TX (International Ocean Discovery Program). https://doi.org/10.14379/iodp.proc.363.102.2018
Rosenthal, Y., Holbourn, A.E., Kulhanek, D.K., Aiello, I.W., Babila, T.L., Bayon, G., Beaufort, L., Bova, S.C., Chun, J.-H., Dang, H., Drury, A.J., Dunkley Jones, T., Eichler, P.P.B., Fernando, A.G.S., Gibson, K.A., Hatfield, R.G., Johnson, D.L., Kumagai, Y., Li, T., Linsley, B.K., Meinicke, N., Mountain, G.S., Opdyke, B.N., Pearson, P.N., Poole, C.R., Ravelo, A.C., Sagawa, T., Schmitt, A., Wurtzel, J.B., Xu, J., Yamamoto, M., and Zhang, Y.G., 2018b. Site U1482. In Rosenthal, Y., Holbourn, A.E., Kulhanek, D.K., and the Expedition 363 Scientists, Western Pacific Warm Pool. Proceedings of the International Ocean Discovery Program, 363: College Station, TX (International Ocean Discovery Program). https://doi.org/10.14379/iodp.proc.363.103.2018
Rowan, C.J., Roberts, A.P., and Broadbent, T., 2009. Reductive diagenesis, magnetite dissolution, greigite growth and paleomagnetic smoothing in marine sediments: a new view. Earth and Planetary Science Letters, 277(1–2):223–235. https://doi.org/10.1016/j.epsl.2008.10.016
Saito, T., 1976. Geologic significance of coiling direction in the planktonic foraminifer Pulleniatina. Geology, 4(5):305–309. https://doi.org/10.1130/0091-7613(1976)4<305:GSOCDI>2.0.CO;2
Stagg, H.M.J., and Exon, N.F., 1981. Geology of the Scott Plateau and Rowley Terrace, off northwestern Australia. Bureau of Mineral Resources, Geology and Geophysics Bulletin, 213. http://www.ga.gov.au/corporate_data/62/Bull_213.pdf
Stoner, J.S., and St-Onge, G., 2007. Magnetic stratigraphy in paleooceanography: reversal, excursion, paleointensity and secular variation. In Hillaire-Marcel, C., and de Vernal, A. (Eds.), Proxies in Late Cenozoic Paleoceanography: Amsterdam (Elsevier Science), 99–138.
Symonds, P.A., Collins, C.D.N., and Bradshaw, J., 1994. Deep structure of the Browse Basin: implications for basin development and petroleum exploration. In Purcell, P.G., and Purcell, R.R. (Eds.), The Sedimentary Basins of Western Australia: Proceedings of the West Australian Basins Symposium: Perth, Australia (Petroleum Exploration Society of Australia), 315–331.
Valet, J.-P., Meynadier, L., and Guyodo, Y., 2005. Geomagnetic dipole strength and reversal rate over the past two million years. Nature, 435(7043):802–805. https://doi.org/10.1038/nature03674
Wade, B.S., Pearson, P.N., Berggren, W.A., and Pälike, H., 2011. Review and revision of Cenozoic tropical planktonic foraminiferal biostratigraphy and calibration to the geomagnetic polarity and astronomical time scale. Earth-Science Reviews, 104(1–3):111–142. https://doi.org/10.1016/j.earscirev.2010.09.003
Wilkens, R.H., Westerhold, T., Drury, A.J., Lyle, M., Gorgas, T., and Tian, J., 2017. Revisiting the Ceara Rise, equatorial Atlantic Ocean: isotope stratigraphy of ODP Leg 154. Climate of the Past, 13:779–793. https://doi.org/10.5194/cp-13-779-2017
Xu, J., Holbourn, A., Kuhnt, W., Jian, Z., and Kawamura, H., 2008. Changes in the thermocline structure of the Indonesian outflow during Terminations I and II. Earth and Planetary Science Letters, 273(1–2):152–162. https://doi.org/10.1016/j.epsl.2008.06.029
Zijderveld, J.D.A., 1967. AC demagnetization of rocks: analysis of results. In Collinson, D.W., Creer, K.M., and Runcorn, S.K. (Eds.), Methods in Palaeomagnetism: Amsterdam (Elsevier), 254–286.
1 Rosenthal, Y., Holbourn, A.E., Kulhanek, D.K., Aiello, I.W., Babila, T.L., Bayon, G., Beaufort, L., Bova, S.C., Chun, J.-H., Dang, H., Drury, A.J., Dunkley Jones, T., Eichler, P.P.B., Fernando, A.G.S., Gibson, K.A., Hatfield, R.G., Johnson, D.L., Kumagai, Y., Li, T., Linsley, B.K., Meinicke, N., Mountain, G.S., Opdyke, B.N., Pearson, P.N., Poole, C.R., Ravelo, A.C., Sagawa, T., Schmitt, A., Wurtzel, J.B., Xu, J., Yamamoto, M., and Zhang, Y.G., 2018. Site U1483. In Rosenthal, Y., Holbourn, A.E., Kulhanek, D.K., and the Expedition 363 Scientists, Western Pacific Warm Pool. Proceedings of the International Ocean Discovery Program, 363: College Station, TX (International Ocean Discovery Program). https://doi.org/10.14379/iodp.proc.363.104.2018
2Expedition 363 Scientists’ addresses.
This work is distributed under the Creative Commons Attribution 4.0 International (CC BY 4.0) license. 
- F1. Northwest Australian margin and location of Sites U1482 and U1483.
- F2. Bathymetric map and site location.
- F3. Contoured bathymetric map and site location.
- F4. Seismic Line BR98-168 and site location.
- F5. Mean annual SST off Northwest Australia.
- F6. Lithologic summary.
- F7. Main sedimentary components, Subunit IB.
- F8. Soft-sediment deformation, Subunit IC.
- F9. Tephra layers, Subunits IA–IC.
- F10. SEM photomicrographs of selected tephra samples.
- F11. XRD results from selected bulk sediment samples, Subunit IB.
- F12. Characteristic lithology and color alternations, Hole U1483A.
- F13. Characteristic lithology and color alternations, Hole U1483B.
- F14. Mineral concretion.
- F15. Characteristic lithology and color alternations, Subunit IC.
- F16. XRD results from carbonate residue analysis.
- F17. Calcareous nannofossils.
- F18. Relative abundances of Discoaster, Helicosphaera, and Sphenolithus.
- F19. Coiling patterns in Pulleniatina.
- F20. Downcore foraminifer preservation states.
- F21. Age-depth plot.
- F22. Archive-half section NRM intensity.
- F23. NRM, WRMSL MS, IW sulfate and methane, maximum angular deviation, and inclination.
- F24. Discrete sample AF demagnetization results.
- F25. NRM, WRMSL MS, and inclination, Hole U1483B.
- F26. NRM, WRMSL MS, and inclination, Hole U1483C.
- F27. Physical property measurements.
- F28. Bulk density, WRMSL MS, and NGR.
- F29. Comparison of despiked WRMSL MS data.
- F30. Discrete and whole-round P-wave measurements.
- F31. MAD dry, bulk, and grain densities and porosity, WRMSL GRA bulk density, and thermal conductivity.
- F32. APCT-3 temperature-time series.
- F33. Heat flow calculations.
- F34. Spliced NGR data plotted on spliced core images.
- F35. WRMSL MS for Holes U1483A–U1483C.
- F36. Spliced L*, NGR, and WRMSL MS and GRA bulk density data.
- F37. Comparison of mbsf and composite depth scales.
- F38. Methane, ethane, propane, and C1/C2 ratio profiles.
- F39. Calcium carbonate, TOC, TN, and C/N ratio profiles.
- F40. Interstitial water concentration profiles.
- F41. Interstitial water concentration profiles.
- T1. Core summary.
- T2. Intervals of soft-sediment deformation.
- T3. Tephra layers.
- T4. Calcareous nannofossil bioevents.
- T5. Planktonic foraminifer bioevents.
- T6. Coiling count data for Pulleniatina.
- T7. Benthic foraminifer distribution.
- T8. Depths of identified polarity reversal boundaries.
- T9. WRMSL GRA bulk density data, Hole U1483A.
- T10. WRMSL GRA bulk density data, Hole U1483B.
- T11. WRMSL GRA bulk density data, Hole U1483C.
- T12. WRMSL MS data, Hole U1483A.
- T13. WRMSL MS data, Hole U1483B.
- T14. WRMSL MS data, Hole U1483C.
- T15. NGRL data, Hole U1483A.
- T16. NGRL data, Hole U1483B.
- T17. NGRL data, Hole U1483C.
- T18. WRMSL P-wave logger data, Hole U1483A.
- T19. WRMSL P-wave logger data, Hole U1483B.
- T20. WRMSL P-wave logger data, Hole U1483C.
- T21. Affine table.
- T22. Splice intervals.
- T23. Volatile hydrocarbon concentrations.
- T24. Carbon, nitrogen, and C/N.
- T25. Interstitial water geochemical data.