Hobbs, R.W., Huber, B.T., Bogus, K.A., and the Expedition 369 Scientists
Proceedings of the International Ocean Discovery Program Volume 369
publications.iodp.org

https://doi.org/10.14379/iodp.proc.369.204.2021
Data report: moisture and density analysis and ultrasonic velocity, Hole U1513E, IODP Expedition 3691
Eun Young Lee2 and Insun Song3
Keywords: International Ocean Discovery Program, IODP, JOIDES Resolution, Expedition 369, Australia Cretaceous Climate and Tectonics, Naturaliste Plateau, Site U1513, Hole U1513E, volcanic sequence, moisture and density, MAD, S-wave velocity, dynamic Poisson’s ratio
MS 369-204: Received 26 October 2020 · Accepted 9 December 2020 · Published 12 April 2021
Abstract
In this data report, we present postcruise petrophysical measurement results for Hole U1513E. During International Ocean Discovery Program (IODP) Expedition 369, five holes were drilled at Site U1513 on the Naturaliste Plateau offshore southwest Australia. The last and deepest hole, U1513E, recovered a volcanic sequence (Lithostratigraphic Unit VI) consisting of basalt flows, dolerite dikes, and volcaniclastic beds. Because of time constraints, moisture and density (MAD) measurements were not possible on board for Hole U1513E. To obtain bulk (wet), dry, and grain density and porosity data, we performed the MAD analysis on 25 core samples collected from Hole U1513E after the expedition. Among these samples, five were selected to measure ultrasonic velocity and dynamic Poisson’s ratio. Six additional samples from Hole U1513D were analyzed to compare with shipboard data to validate the postcruise measurements. The results are compatible with shipboard data in individual lithologic units. Samples of relatively fresh rocks show bulk and dry density values near 2.5 g/cm3 and porosity near 10%, whereas altered basalts and volcaniclastics exhibit lower values of bulk and dry density and higher values of porosity. Grain density varies between 2.6 and 3.3 g/cm3. S-wave velocity ranges from 934 to 3135 m/s, which accompanies variable dynamic Poisson’s ratio between 0.1 and 0.35.
Introduction
During International Ocean Discovery Program (IODP) Expedition 369, five holes (U1513A–U1513E) were drilled at Site U1513 on the eastern flank of the Naturaliste Plateau offshore southwest Australia (Figure F1A). The site is near Deep Sea Drilling Project (DSDP) Site 258, which was drilled during Leg 26 (Davies et al., 1974). The deepest hole, U1513E (33°47.6190′S, 112°29.1204′E), reached 770.27 m core depth below seafloor, Method A (CSF-A) (Huber et al., 2019b). Holes U1513E and U1513D penetrated through a volcaniclastic-rich sedimentary sequence (Lithostratigraphic Unit V) and recovered a volcanic sequence (Lithostratigraphic Unit VI) (Figure F1B). The volcaniclastic-rich sequence (235 m thick) consists of sandstone, siltstone, and silty claystone layers containing abundant volcanic clasts and lithic fragments (Lee et al., 2020). The volcanic sequence (cored thickness = 82.2 m) is composed of basaltic flows (Lithologic Units 1, 3, 5, 7, and 9) and volcaniclastic beds (Lithologic Units 2, 4, 6, and 8) cut by multiple dolerite dikes (Tejada et al., 2020).
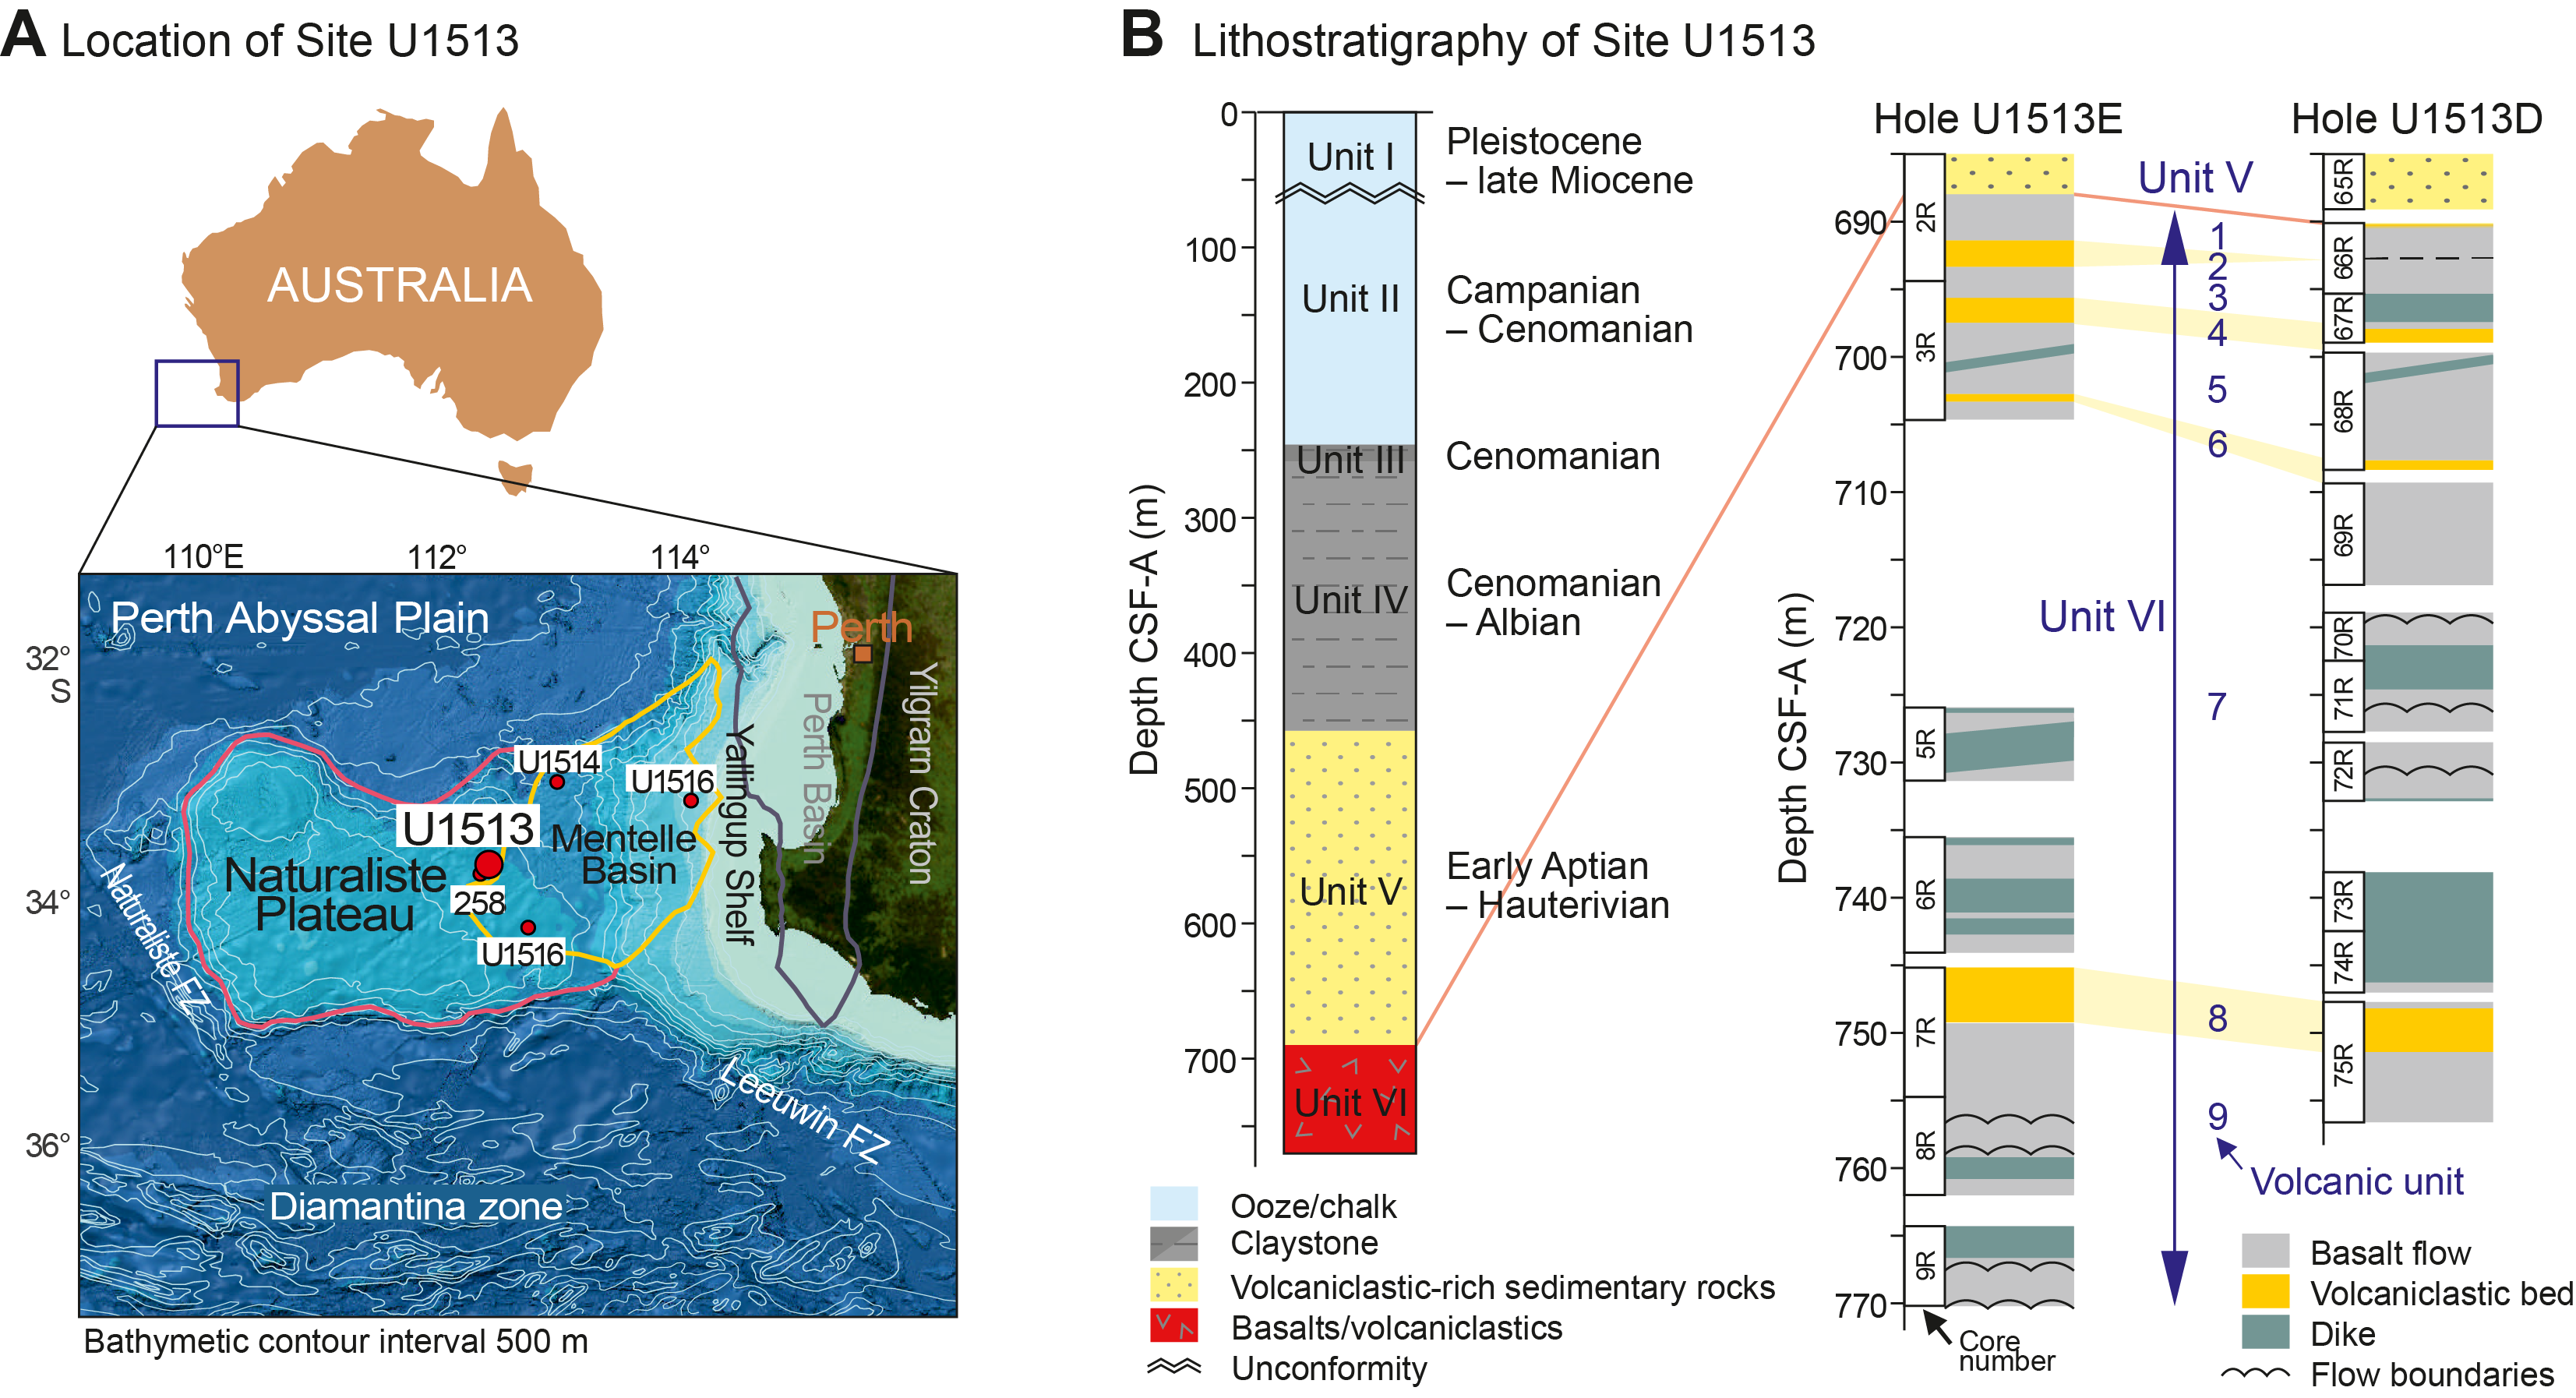
Figure F1. Location map and lithostratigraphy.
Because of time constraints during Expedition 369, it was not possible to finish shipboard core descriptions and the moisture and density (MAD) analysis for Hole U1513E. After the expedition, Cores 369-U1513E-2R through 9R were reexamined at the Kochi Core Center, Japan. A modified volcanic stratigraphy based on descriptions of petrological and mineralogical characteristics and lithologic boundaries was established for the volcanic sequence at Site U1513 (Figure F1B). The data were reported and studied in Lee et al. (2020) and Tejada et al. (2020). The studies helped us to select core samples that were used for the postcruise MAD analysis to obtain bulk (wet), dry, and grain density and porosity data for Hole U1513E. Among the samples, five were selected to measure ultrasonic velocity and dynamic Poisson’s ratio. Additional samples from Hole U1513D were also analyzed to compare with shipboard data to validate the postcruise measurements. In this data report, we present our postcruise petrophysical measurement results of the volcanic sequence in Hole U1513E.
Materials and methods
Moisture and density measurements
During Expedition 369, shipboard MAD measurements for the volcanic sequence (Lithostratigraphic Unit VI) in Hole U1513D were performed on 16 core samples collected from the working-half sections of Cores 369-U1513D-66R through 75R. The standard IODP MAD procedures (ASTM International, 1990; Blum, 1997) were applied to analyze the hard rock samples from Hole U1513D (Huber et al., 2019a). The measured wet mass, dry mass, and dry volume of each sample were used to determine bulk (wet) density, dry density, grain density, and porosity. Salt precipitation in pore space during the drying process was included in the wet mass and dry volume values. The shipboard MAD data were described in Huber et al. (2019b) and are available at https://web.iodp.tamu.edu/LORE.
The postcruise MAD analysis was completed at the Korea Institute of Geoscience and Mineral Resources (KIGAM), Republic of Korea. MAD instrumentation, measurements, and analysis followed shipboard procedures as much as possible, except for a few minor procedural differences. For saturation, we placed the samples in individual plastic vials that were filled with distilled water (density = ~1.0 g/cm3) instead of seawater (density = ~1.024 g/cm3). Thus, the mass and volume of salt were not evaluated and are not considered for MAD calculations in this report. Because of their very low values, however, only slight differences are observed, which is supported by a good comparison between shipboard and postcruise MAD data using samples from Hole U1513D (Table T1).
The vacuum chamber (Model OV-12; Figure F2A) was used to saturate pore spaces. The vacuum pump removed air from the chamber to a pressure of ~50 kPa below atmospheric pressure. These samples were kept under saturation for ~24 h with the vacuum maintained in the chamber. After removal from the saturator, the samples were patted dry with a paper towel, and their wet masses were immediately determined using the Mettler-Toledo electronic balance (Model XS404SV; Figure F2B). The samples were then dried in an oven for ~24 h at 100°–110°C and measured for dry mass using the electronic balance after cooling in a desiccator. Dry sample volume was determined with a five-celled helium gas pycnometer (Model Pentapyc 5200e; Figure F2C). Volume measurement was preceded by five purges of the sample chamber with helium. The data from the five measurement cycles of each sample were averaged to determine dry volume and grain density (see MAD_DATA in Supplementary material). The measured values were used to calculate bulk density, dry density, porosity, and other parameters (Table T1) following the standard IODP MAD calculations (Blum, 1997; Huber et al., 2019a).
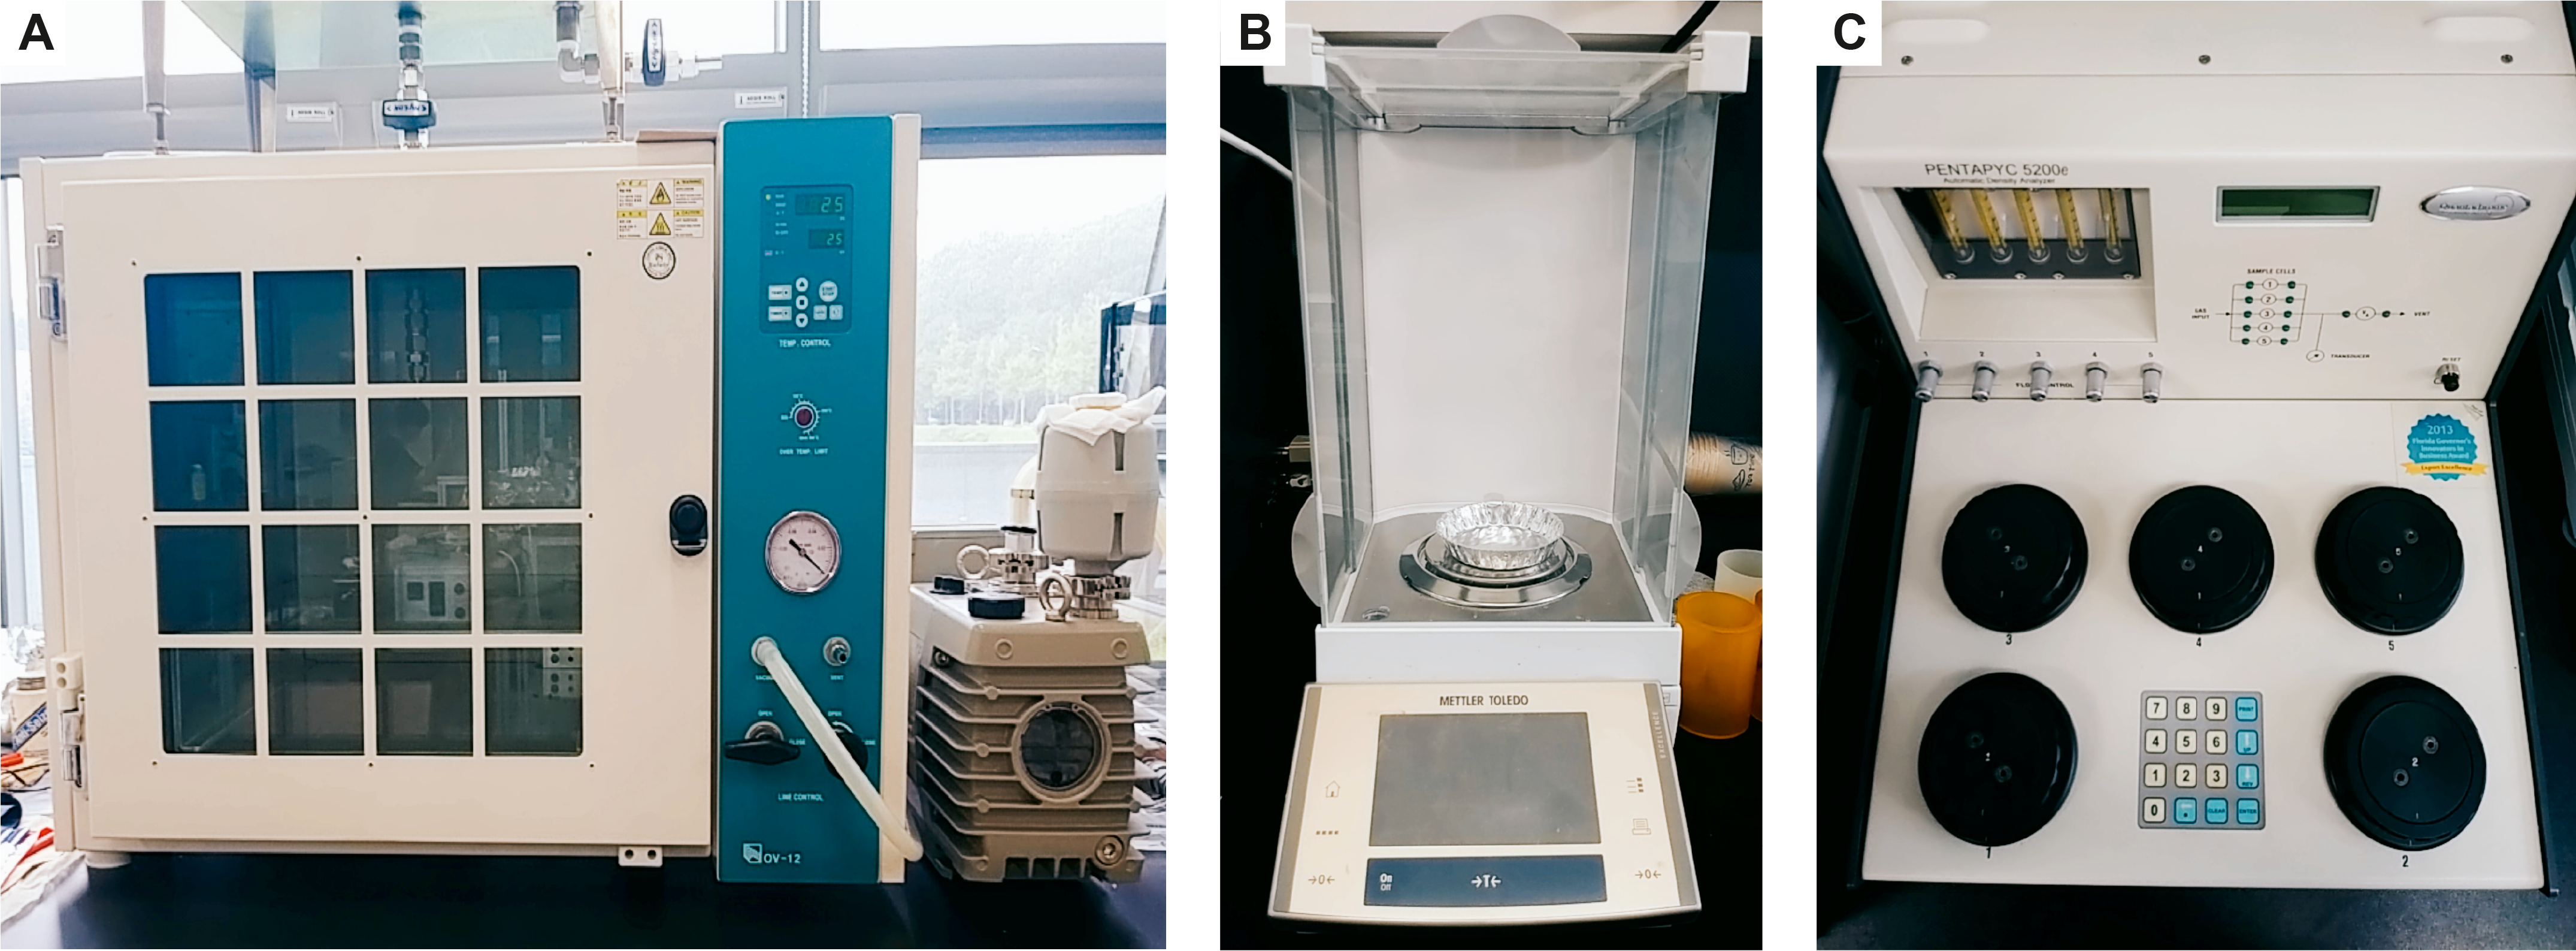
Figure F2. Instruments used for MAD measurements.
To conduct the postcruise MAD analysis for Hole U1513E, dozens of core samples were collected from Cores 396-U1513E-2R through 9R. Among them, 25 samples were carefully selected from what were deemed suitable conditions because shipping induced fragmentation of some samples. A total of 12 samples were from dolerite dikes, 9 samples were from basalt flows, 3 samples were from volcaniclastic beds in the volcanic sequence, and 1 sample was from the volcaniclastic-rich sequence (Table T1). Six samples from Hole U1513D were also analyzed alongside to compare with shipboard data.
Ultrasonic measurements
During Expedition 369, P-wave velocity was determined by measuring the time required for a compressional wave to travel a specific distance through a core section. The velocity measurement was performed using Panametrics-NDT Microscan delay line transducers for selected positions on the working-half sections (Huber et al., 2019a). A total of 27 data sets of P-wave velocity were acquired for the volcanic sequence in Hole U1513D (Figure F3E), and 99 data sets were acquired for Hole U1513E (Figure F4E), all of which can be accessed at https://web.iodp.tamu.edu/LORE.
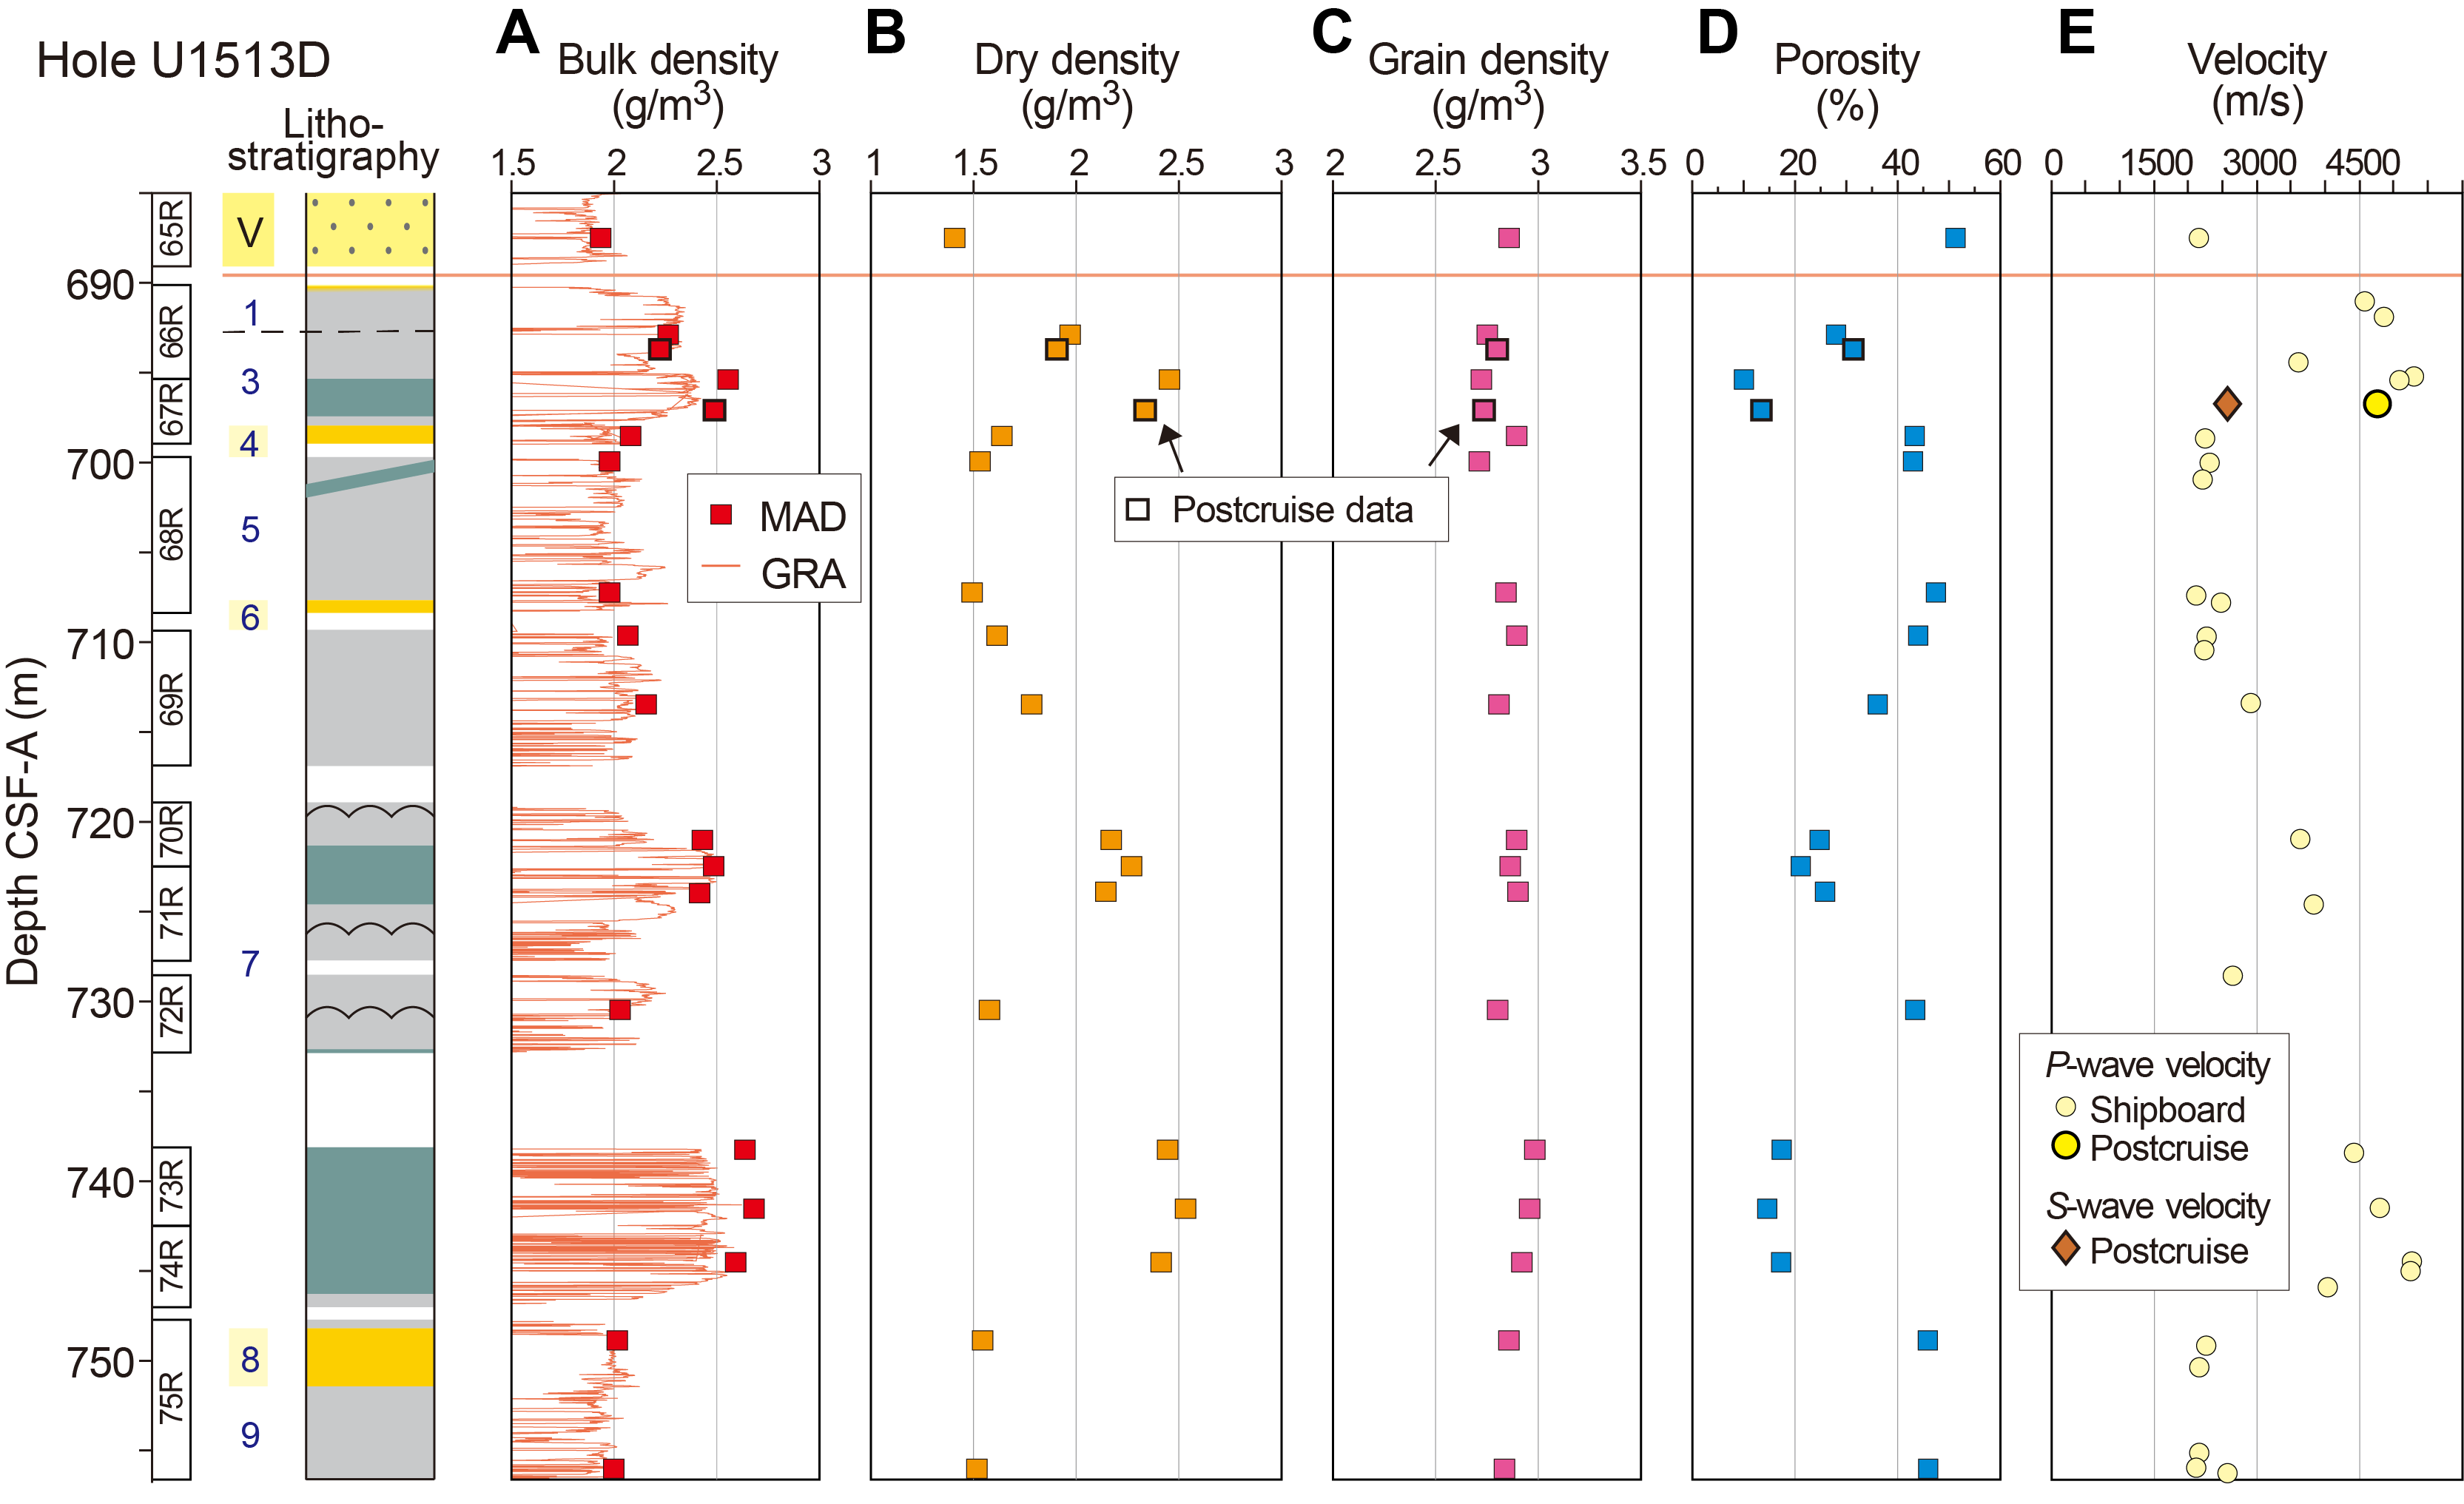
Figure F3. Density, porosity, and velocity, Hole U1513D.
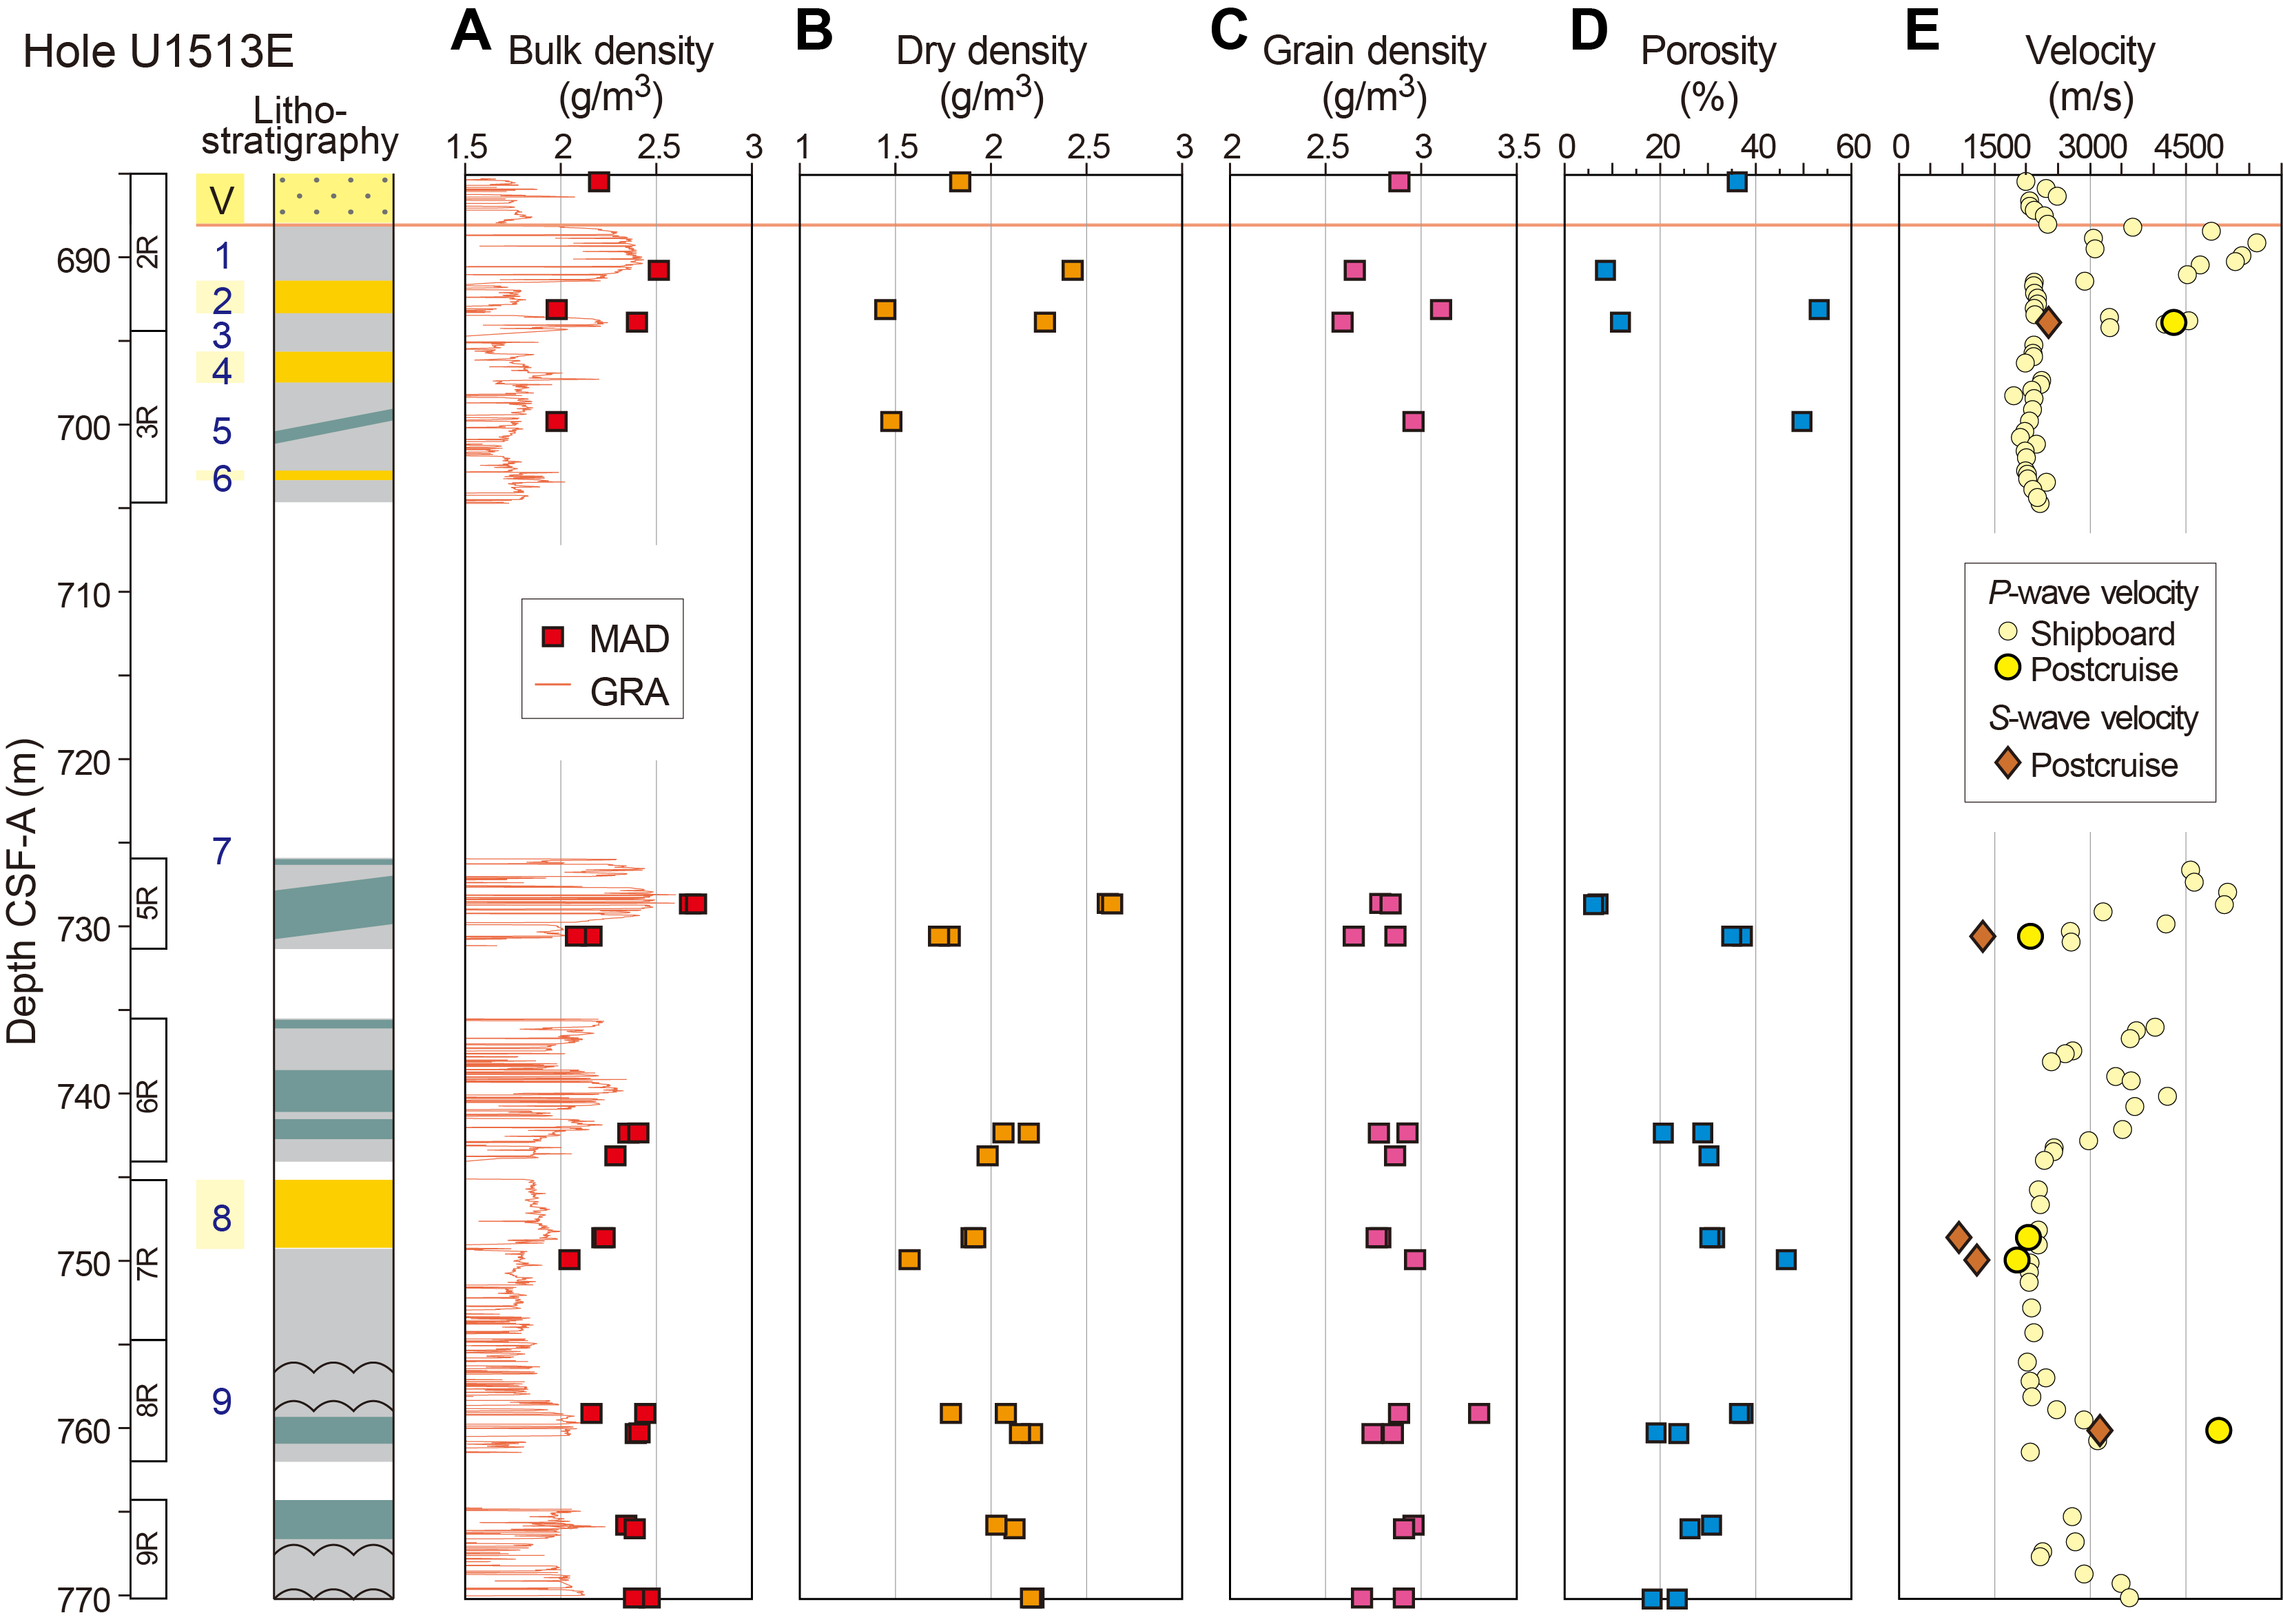
Figure F4. Density, porosity, and velocity, Hole U1513E.
The postcruise measurement of P-wave and S-wave velocity was conducted using a 5058PR high voltage ultrasonic pulser-receiver and a 12-bit 60 MHz digitizer at the KIGAM. Six core samples that were the least fractured and a suitable size were carefully selected; five samples were from Hole U1513E, and one sample was from Hole U1513D. Four samples were from basalt flows, one sample was from a dolerite dike, and one sample was from a volcaniclastic bed. Based on P-wave and S-wave velocity, dynamic Poisson’s ratio was evaluated for each sample (Table T2).
Results
Density and porosity
To compare postcruise data to shipboard data, six core samples from Hole U1513D were selected for MAD analysis, one of which was also measured for P-wave and S-wave velocity. The postcruise data show values similar to those from adjacent samples in individual basalt flow, dike, and sedimentary layers (Figure F3; Table T1). These comparisons indicate that the difference in measuring equipment had little impact on the results.
Bulk (wet) density for Hole U1513E ranges between 1.98 and 2.70 g/cm3. Dry density ranges between 1.45 and 2.63 g/cm3 (Figure F4A, F4B; Table T1). These ranges are similar to those from the volcanic sequence in Hole U1513D (Figure F3A, F3B). Variations in bulk and dry density values are attributed to lithologic changes and alteration degree (Tejada et al., 2020). Less altered basalt flows (e.g., Lithologic Unit 1) and dikes show relatively high bulk and dry density values near 2.5 g/cm3, whereas strongly altered basalt flows (e.g., Lithologic Unit 5) and volcaniclastic beds show lower values near 2.0 and 1.5 g/cm3, respectively. MAD bulk density values were generally higher than shipboard bulk density data from gamma ray attenuation (GRA) measurements (2.5 cm interval) on whole-round sections (Figures F3A, F4A). We assume that the difference results from a gap between the core section and liner as well as GRA measurement on fractured/fragmented sections (e.g., Planke et al., 1999).
Grain density for Hole U1513E ranges between 2.6 and 3.3 g/cm3 (Figure F4C; Table T1). Because the average grain density of fresh basalts is ~2.9 g/cm3 at other drilling sites (Broglia and Moos, 1998; Hamano, 1980; Hyndman and Drury, 1977), we infer that the grain density variation in the volcanic sequence at Site U1513 is likely due to the heterogeneous distribution of primary igneous and secondary alteration minerals (Tejada et al., 2020).
Porosity shows a wide variation in Hole U1513E, ranging from 6.3% to 53.5% (Figure F4D; Table T1). The scattered distribution is also observed in the volcanic sequence in Hole U1513D (Figure F3D). Low porosity values are observed in relatively fresh and less altered intervals of basalt flows and dolerite dikes, which correspond to fresh basalts’ porosity of 5%–10% and higher in vesicular condition (Broglia and Moos, 1998; Hamano, 1980; Hyndman and Drury, 1977; Planke et al., 1999). Altered basalts and volcaniclastics show higher porosity. The increase in porosity correlates well with the bulk density decrease (Figure F5A).
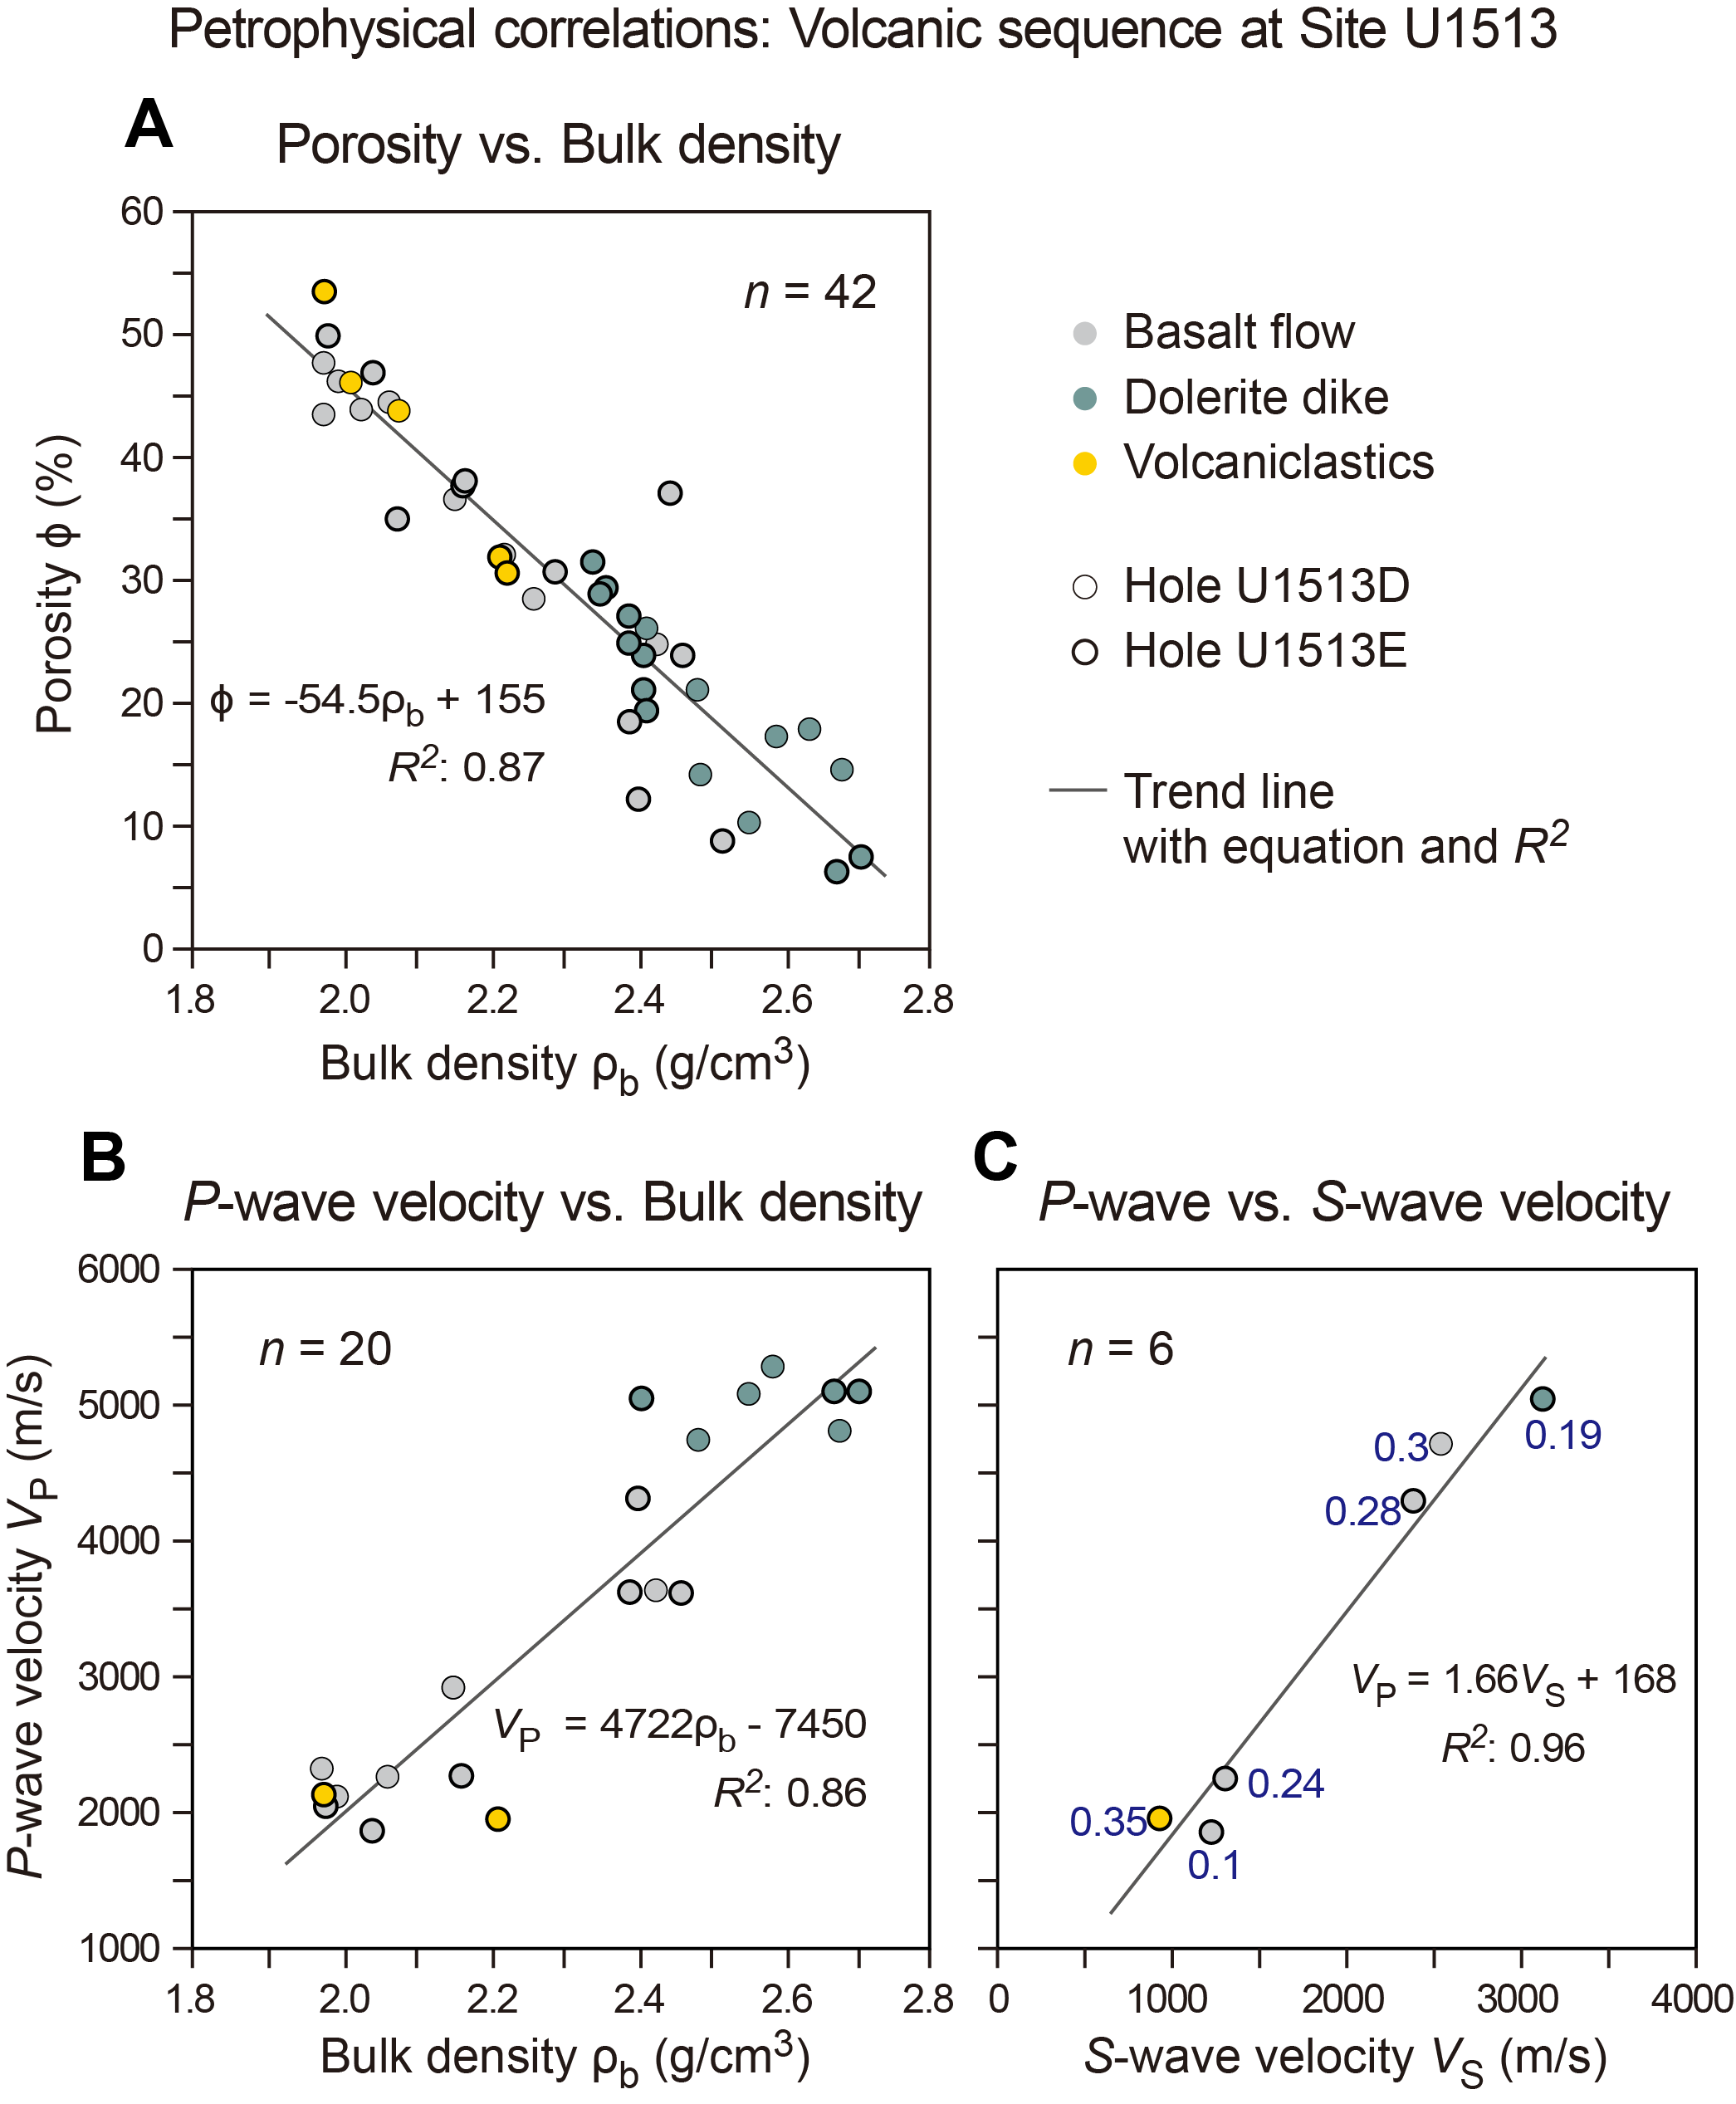
Figure F5. Petrophysical data correlations.
One sample from Hole U1513E was collected from the volcaniclastic-rich siltstone (685.4 m CSF-A) of Lithostratigraphic Unit V, and it has 2.21 g/cm3 bulk density, 1.85 g/cm3 dry density, 2.9 g/cm3 grain density, and 36.5% porosity (Figure F4A–F4D; Table T1).
Ultrasonic velocity and dynamic Poisson’s ratio
The postcruise measurements of P-wave velocity exhibit results similar to shipboard data (Figures F3E, F4E). Variations in P-wave velocity correspond closely to lithologic changes and alteration degree through the section (Tejada et al., 2020). Less-altered basalts (e.g., Lithologic Unit 1) and dikes show a high velocity of ~5000 m/s, whereas the velocities of strongly altered basalts (e.g., Lithologic Unit 5) and volcaniclastics are ~2000 m/s. The velocity decrease is associated with the bulk density decrease (Figure F5B). S-wave velocity ranges from 934 to 3135 m/s (Table T2). The lowest two values of S-wave velocity are from strongly altered samples of basalt and volcaniclastics, whereas the highest value is from a relatively fresh dike sample. Dynamic Poisson’s ratio varies between 0.1 and 0.35 without a clear relation with lithology (Figure F5C).
Acknowledgments
This research used data and samples provided by the International Ocean Discovery Program (IODP). We thank the shipboard scientists and technical staff of Expedition 369 and crew members of the R/V JOIDES Resolution for their critical contributions. Special thanks to the shipboard team of physical properties specialists D.L. Harry, M.M. Jones, M. Martinez, and L.T. White and to M.L.G. Tejada for collecting appropriate samples. We acknowledge financial support by K-IODP by the Ministry of Oceans and Fisheries to E.Y. Lee and I. Song and the Brain Pool Program through the National Research Foundation of Korea (NRF) funded by the Ministry of Science and Information and Communication Technology (ICT) (2017H1D3A1A01054745) to E.Y. Long. We thank Y. Kubo, S. Nigi, and R. Yamaoka of the Kochi Core Center for facilitating our visit, core descriptions, and sampling (Request No. 071241IODP). Comments and suggestions by R. Harris, M.L.G. Tejada, and B.T. Huber improved this manuscript.
References
ASTM International, 1990. Standard method for laboratory determination of water (moisture) content of soil and rock (Standard D2216–90). In Annual Book of ASTM Standards for Soil and Rock (Volume 04.08): Philadelphia (American Society for Testing Materials). [revision of D2216-63, D2216-80]
Blum, P., 1997. Technical Note 26: Physical Properties Handbook—A Guide to the Shipboard Measurement of Physical Properties of Deep-Sea Cores. Ocean Drilling Program. https://doi.org/10.2973/odp.tn.26.1997
Borissova, I., 2002. Geological Framework of the Naturaliste Plateau. Geoscience Australia, 2002/20. http://www.ga.gov.au/metadata-gateway/metadata/record/40535/
Broglia, C., and Moos, D., 1998. In-situ structure and properties of 110-Ma crust from geophysical logs in DSDP Hole 418. In Salisbury, M.H., Scott, J.H., et al., Proceedings of the Ocean Drilling Program, Scientific Results, 102: College Station, TX (Ocean Drilling Program), 29–47. https://doi.org/10.2973/odp.proc.sr.102.113.1988
Davies, T.A., Luyendyk, B.P., Rodolfo, K.S., Kempe, D.R.C., McKelvey, B.C., Leidy, R.D., et al., 1974. Site 258. In Davies, T.A., Luyendyk, B.P., et al., Initial Reports of the Deep Sea Drilling Project, 26: Washington, DC (U.S. Government Printing Office). https://doi.org/10.2973/dsdp.proc.26.111.1974
Hamano, Y., 1980. Physical properties of basalts from Holes 417D and 418A. In Donnelly, T., Francheteau, J., Bryan, W., Robinson, P., Flower, M., Salisbury, M., et al., Initial Reports of the Deep Sea Drilling Project, 51–53: Washington, DC (U.S. Government Printing Office). https://doi.org/10.2973/dsdp.proc.515253.166.1980
Huber, B.T., Hobbs, R.W., Bogus, K.A., Batenburg, S.J., Brumsack, H.-J., do Monte Guerra, R., Edgar, K.M., Edvardsen, T., Garcia Tejada, M.L., Harry, D.L., Hasegawa, T., Haynes, S.J., Jiang, T., Jones, M.M., Kuroda, J., Lee, E.Y., Li, Y.-X., MacLeod, K.G., Maritati, A., Martinez, M., O’Connor, L.K., Petrizzo, M.R., Quan, T.M., Richter, C., Riquier, L., Tagliaro, G.T., Wainman, C.C., Watkins, D.K., White, L.T., Wolfgring, E., and Xu, Z., 2019a. Expedition 369 methods. In Hobbs, R.W., Huber, B.T., Bogus, K.A., and the Expedition 369 Scientists, Australia Cretaceous Climate and Tectonics. Proceedings of the International Ocean Discovery Program, 369: College Station, TX (International Ocean Discovery Program). https://doi.org/10.14379/iodp.proc.369.102.2019
Huber, B.T., Hobbs, R.W., Bogus, K.A., Batenburg, S.J., Brumsack, H.-J., do Monte Guerra, R., Edgar, K.M., Edvardsen, T., Garcia Tejada, M.L., Harry, D.L., Hasegawa, T., Haynes, S.J., Jiang, T., Jones, M.M., Kuroda, J., Lee, E.Y., Li, Y.-X., MacLeod, K.G., Maritati, A., Martinez, M., O’Connor, L.K., Petrizzo, M.R., Quan, T.M., Richter, C., Riquier, L., Tagliaro, G.T., Wainman, C.C., Watkins, D.K., White, L.T., Wolfgring, E., and Xu, Z., 2019b. Site U1513. In Hobbs, R.W., Huber, B.T., Bogus, K.A., and the Expedition 369 Scientists, Australia Cretaceous Climate and Tectonics. Proceedings of the International Ocean Discovery Program, 369: College Station, TX (International Ocean Discovery Program). https://doi.org/10.14379/iodp.proc.369.104.2019
Hyndman, R.D., and Drury, M.J., 1977. Physical properties of basalts, gabbros, and ultramafic rocks from DSDP Leg 37. In Aumento, F., Melson, W.G., et al., Initial Reports of the Deep Sea Drilling Project, 37: Washington, DC (U.S. Government Printing Office), 395–401. https://doi.org/10.2973/dsdp.proc.37.113.1977
Lee, E.Y., and Song, I., 2021. Supplementary material, https://doi.org/10.14379/iodp.proc.369.204supp.2021. Supplement to Lee, E.Y., and Song, I., 2021. Data report: moisture and density analysis and ultrasonic velocity, Hole U1513E, IODP Expedition 369. In Hobbs, R.W., Huber, B.T., Bogus, K.A., and the Expedition 369 Scientists, Australia Cretaceous Climate and Tectonics. Proceedings of the International Ocean Discovery Program, 369: College Station, TX (International Ocean Discovery Program). https://doi.org/10.14379/iodp.proc.369.204.2021
Lee, E.Y., Wolfgring, E., Tejada, M.L.G., Harry, D.L., Wainman, C.C., Chun, S.S., Schnetger, B., et al., 2020. Early Cretaceous subsidence of the Naturaliste Plateau defined by a new record of volcaniclastic-rich sequence at IODP Site U1513. Gondwana Research, 82:1–11. https://doi.org/10.1016/j.gr.2019.12.007
Planke, S., Cerney, B., Bücker, C.J., and Nilsen, O., 1999. Alteration effects on petrophysical properties of subaerial flood basalts: Site 990, southeast Greenland margin. In Larsen, H.C., Duncan, R.A., Allan, J.F., Brooks, K. (Eds.), Proceedings of the Ocean Drilling Program, Scientific Results, 163: College Station, TX (Ocean Drilling Program), 17–28. https://doi.org/10.2973/odp.proc.sr.163.105.1999
Tejada, M.L.G., Lee, E.Y., Chun, S.S., Harry, D.L., Riquier, L., and Wainman, C.C., 2020. Data report: petrology and volcanic stratigraphy at Site U1513, IODP Expedition 369. In Hobbs, R.W., Huber, B.T., Bogus, K.A., and the Expedition 369 Scientists, Australia Cretaceous Climate and Tectonics. Proceedings of the International Ocean Discovery Program, 369: College Station, TX (International Ocean Discovery Program). https://doi.org/10.14379/iodp.proc.369.202.2020
1 Lee, E.Y., and Song, I., 2021. Data report: moisture and density analysis and ultrasonic velocity, Hole U1513E, IODP Expedition 369. In Hobbs, R.W., Huber, B.T., Bogus, K.A., and the Expedition 369 Scientists, Australia Cretaceous Climate and Tectonics. Proceedings of the International Ocean Discovery Program, 369: College Station, TX (International Ocean Discovery Program). https://doi.org/10.14379/iodp.proc.369.204.2021
2 Faculty of Earth Systems and Environmental Sciences, Chonnam National University, Republic of Korea. eun.y.lee@chonnam.ac.kr; eun.lee@univie.ac.at
3 Petroleum and Marine Division, Korea Institute of Geoscience and Mineral Resources (KIGAM), Republic of Korea.
This work is distributed under the Creative Commons Attribution 4.0 International (CC BY 4.0) license. 