Hobbs, R.W., Huber, B.T., Bogus, K.A., and the Expedition 369 Scientists
Proceedings of the International Ocean Discovery Program Volume 369
publications.iodp.org

https://doi.org/10.14379/iodp.proc.369.104.2019
Site U15131
B.T. Huber, R.W. Hobbs, K.A. Bogus, S.J. Batenburg, H.-J. Brumsack, R. do Monte Guerra, K.M. Edgar, T. Edvardsen, M.L. Garcia Tejada, D.L. Harry, T. Hasegawa, S.J. Haynes, T. Jiang, M.M. Jones, J. Kuroda, E.Y. Lee, Y.-X. Li, K.G. MacLeod, A. Maritati, M. Martinez, L.K. O’Connor, M.R. Petrizzo, T.M. Quan, C. Richter, L. Riquier, G.T. Tagliaro, C.C. Wainman, D.K. Watkins, L.T. White, E. Wolfgring, and Z. Xu2
Keywords: International Ocean Discovery Program, IODP, JOIDES Resolution, Expedition 369, Site U1513, Hot Cretaceous Greenhouse, oceanic anoxic events, Mentelle Basin, Naturaliste Plateau, Great Australian Bight, Gondwana breakup, Tasman Gateway, Indonesian Gateway, cyclostratigraphy, carbon isotope excursions, Paleocene/Eocene Thermal Maximum, Eocene greenhouse, Miocene, volcanic rifted margin, nonvolcanic rifted margin
MS 369-104: Published 25 May 2019
Background and objectives
International Ocean Discovery Program (IODP) Site U1513 (33°47.6084′S, 112°29.1338′E) lies at ~2800 m water depth on the western margin of the Mentelle Basin (Figure F1). This Cretaceous basin is probably underlain by synrift Permian to Jurassic sediment that is part of an early rifting event that extends along the western margin of Australia (Borissova et al., 2002). Following the separation of India from Australia/Antarctica in the Early Cretaceous, the basin underwent a period of rapid thermal subsidence with deposition of deltaic sediment, shale, and claystone sequences, followed by deep-water chalks and limestones. The current seabed is composed of Paleogene/Neogene/Quaternary oozes that sit unconformably on the Cretaceous (Maloney et al., 2011).
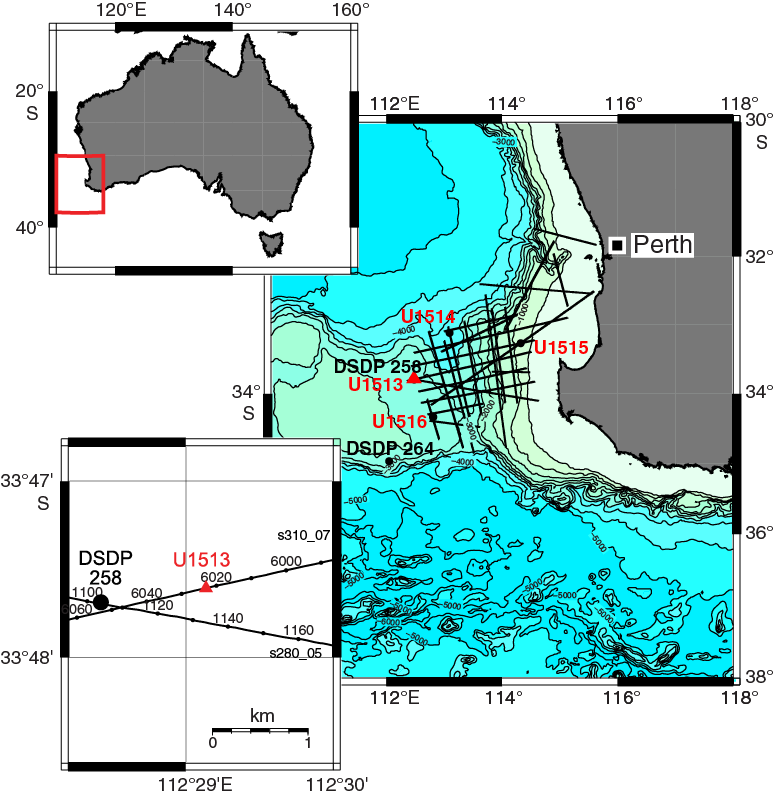
Figure F1. Site U1513 location.
Objectives for coring Site U1513 were as follows:
- Obtain a continuous Late Cretaceous sediment record in the Mentelle Basin (adjacent to the Naturaliste Plateau) to better document the rise and fall of the Cretaceous hot greenhouse climate at southern high paleolatitudes (~60°S),
- Characterize how oceanographic conditions changed during the Cenozoic opening of the Tasman Gateway and the restriction of the Indonesian Gateway, and
- Recover breakup-related volcanic rocks from the base of the sedimentary succession to provide age control on the onset and duration of volcanism in the Mentelle Basin.
An important goal was to obtain a complete Oceanic Anoxic Event (OAE) 2 sequence across the Cenomanian/Turonian boundary to characterize associated biotic, oceanographic, and climatic changes. The Site U1513 sequence will be compared with coeval Expedition 369 sections cored elsewhere in the Mentelle Basin and at Site U1512 from the Great Australian Bight. The sequence will also be compared with other IODP and industry data from the Western Australia margin and the Great Australian Bight to identify any regional differences in the geochemical and biological responses to the OAEs and Cretaceous and Neogene ocean circulation history.
Site U1513 is located 1.1 km east-northeast of Deep Sea Drilling Project (DSDP) Leg 26 Site 258 (Figure F2), which was spot-cored (20% recovery) in the Cretaceous section (Luyendyk and Davies, 1975). Site 258 failed to recover samples from the OAE 2 interval and stopped short of penetrating the basalts; however, it did provide valuable information about the lithologies and depths of expected key horizons. The goals at Site U1513 were to complete the gaps of Site 258, to recover a complete sequence of OAE 2, and to recover unaltered samples of the Naturaliste Plateau basalts. Coring in five holes achieved high recovery (80.8%), including a likely sequence from the OAE 2 interval, a nearly complete section of upper Neogene deposits, and samples of altered and possibly unaltered basaltic rocks. Recovered samples will provide new insights on the paleoceanographic evolution during the Cretaceous greenhouse at southern high paleolatitudes, on the timing of breakup of India from Australia/Antarctica, and on the processes of rifting formation and basin subsidence in magma-poor margins.
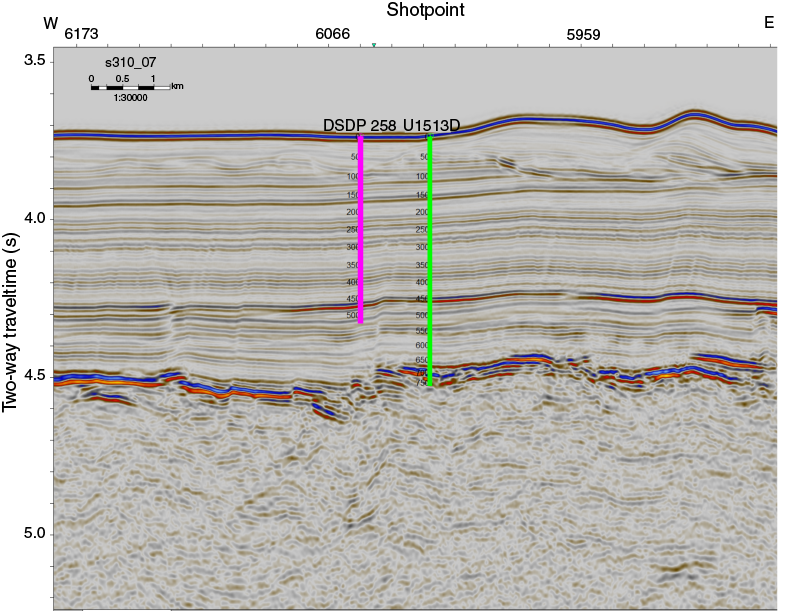
Figure F2. Seismic Profile s310_07 with site locations.
Operations
Site U1513 consisted of coring and logging operations in five holes. All of the coring systems were used: both the full-length advanced piston corer (APC) and half-length APC (HLAPC) systems in Holes U1513A–U1513C, the extended core barrel (XCB) system in Hole U1513A, and the rotary core barrel (RCB) system in Holes U1513D and U1513E (Table T1). Coring extended to 292.5 m drilling depth below seafloor (DSF) in Hole U1513A and crossed one of the critical boundaries for the expedition (Cenomanian/Turonian boundary). Coring in Hole U1513B (0–98.6 m DSF) was intended to fill in recovery gaps from the Neogene and latest Cretaceous section from Hole U1513A. Cores recovered from Hole U1513C (0–17.1 m DSF) were sectioned on the catwalk into 30 cm whole rounds for postexpedition analyses. Hole U1513D penetrated to 757.4 m DSF and accomplished the deep target of the expedition objectives by recovering basalt. Hole U1513E then extended the basalt penetration and recovery to 774 m DSF. Downhole logging runs were attempted in Holes U1513A, U1513D, and U1513E. After coring operations were completed in Hole U1513A, one downhole logging run was completed along the entire length of open borehole with a modified triple combination (triple combo) tool string (Quambo). In Hole U1513D, runs with the Quambo tool string were attempted, and a triple combo run was attempted in Hole U1513E. Seismic experiment and Formation MicroScanner (FMS) runs and seismic check shots were also conducted in Hole U1513E.
Overall, 15.5 days (18 October–2 November and 20–25 November 2017) were spent at Site U1513. A total of 18 APC, 13 HLAPC, 35 XCB, and 81 RCB cores were recovered, penetrating to a total depth of 774 m DSF. Of 1137.8 m cored, we recovered 777.07 m of material (80.8%).
Transits to Site U1513
The first transit to Site U1513 covered 795 nmi at an average speed of 9.1 kt. The ship arrived on site, lowered the thrusters, and ended the sea voyage at 1445 h (UTC + 11 h) on 18 October 2017. The acoustic positioning beacon was deployed at 1510 h.
After conducting operations at Site U1516, we transited for 4.1 h and returned to Site U1513 on 20 November.
Hole U1513A
After offsetting from the beacon, preparations for coring in Hole U1513A (33°47.6084′S, 112°29.1338′E) commenced. The APC/XCB system was assembled and included a lockable float valve to allow for downhole logging. Nonmagnetic drill collars and core barrels were used when coring with the APC system, and nonmagnetic sinker bars and the Icefield MI-5 core orientation tool were prepared. A core barrel was dressed with a core liner and dropped in preparation for beginning Hole U1513A. We started the hole at 0340 h on 19 October 2017. A 5.3 m long mudline core was recovered, and the water depth was calculated to be 2789.2 m.
We continued APC coring with orientation through Core 6H to 52.8 m DSF. Based on the recovery and depth of chert layers previously found at adjacent Site 258, we switched to the HLAPC system to recover Cores 7F and 8F. No chert was present, so we switched back to APC coring. Cores 9H and 10H were recovered to 80.6 m DSF. Partial strokes were recorded with the APC system, so APC refusal was called. We then used the HLAPC system to recover Cores 11F through 15F to 95.7 m DSF; Core 15F only advanced 0.01 m at over 3000 psi. Thus, piston coring refusal was reached, and we switched to coring with the XCB system, which began on 20 October. We recovered Cores 16X through 50X to 292.5 m DSF. The presence of interbedded chert layers in the upper cores (Cores 16X through about 40X) reduced the coring rate significantly (average of 10 m/h; as low as 1.5 m/h) and affected the core recovery. As a result, we predominantly cut half-length cores (~4.8 m) to improve recovery. With the recovery of Core 50X on 22 October, coring was completed in Hole U1513A. A total of 170.6 m of material from 292.5 m cored was recovered (58.3%). The APC system recovered 69.98 m of 71.2 m cored (98.3%), the HLAPC recovered 23.89 m of 24.5 m cored (97.5%), and the XCB system recovered 76.73 m of 196.8 m cored (39%).
At the conclusion of coring, the hole was circulated with high-viscosity mud to clean the hole of cuttings, and a go-devil was pumped through the drill string to open the lockable float valve. The hole was displaced with heavy mud, and the drill string was pulled back to logging depth (83.9 m DSF). The Quambo was assembled with the following tools:
- Hostile Environment Natural Gamma Ray Sonde (HNGS),
- High-Resolution Laterolog Array (HRLA),
- Dipole Sonic Imager (DSI),
- Hostile Environment Litho-Density Sonde (HLDS) with source,
- Enhanced Digital Telemetry Cartridge (EDTC),
- Logging equipment head-Q tension (LEH-QT), and
- A centralizer for centralizing the DSI and HRLA.
In this modified tool string, the HNGS was moved to the bottom and the DSI was added from the FMS tool string. These instruments measured density, downhole sonic velocity, resistivity, and natural gamma radiation (NGR) while the EDTC transmitted data upstring to the ship. The Quambo was deployed at 0500 h on 23 October. After the tool string exited the pipe, the active heave compensator was turned on. A complete log was accomplished from the end of the pipe to 289.8 m wireline depth below seafloor (WSF). The Quambo was back on the rig floor at 0950 h and was disassembled and stowed by 1130 h. The drill string cleared the seafloor at 1210 h on 23 October, ending Hole U1513A. The total time spent in Hole U1513A was 4.9 days.
Hole U1513B
After offsetting the vessel 20 m east, operations began in Hole U1513B (33°47.6087′S, 112°29.1471′E). Hole U1513B was started at 1425 h on 23 October 2017. The desired depth of the mudline core was corrected for recovery offset by the stratigraphic correlators. Based on the recovery of the mudline core (8.73 m), the seafloor depth was calculated to be 2787.2 m. Coring with the APC system continued through Core 8H to 72.3 m DSF. These cores were oriented with the Icefield MI-5 core orientation tool. In situ formation temperature measurements were attempted with the advanced piston corer temperature tool (APCT-3) on Cores 3H and 5H, but damage to the electronics ended the measurements after Core 5H. The core liner shattered while coring Core 4H, resulting in a significant loss of core quality. We switched to coring with the HLAPC system from Core 9F, following a partial stroke on Core 8H. We then recovered Cores 10F through 14F to 98.6 m DSF. In total, 102.06 m of material was recovered of 98.6 m cored (103.5%). The APC system recovered 75.07 m of 72.3 m cored (103.8%), and the HLAPC system recovered 26.99 m of 26.3 m cored (102.6%). The drill string was pulled clear of the seafloor, and Hole U1513B ended at 0625 h on 24 October. The total time spent in Hole U1513B was 0.8 days.
Hole U1513C
The vessel was offset 20 m south, and Hole U1513C (33°47.6190′S, 112°29.1468′E) was started at 0730 h on 24 October 2017. Core 1H recovered 7.6 m, and the seafloor was calculated to be 2788.3 meters below sea level (mbsl). Only two APC cores were taken, and they were completely sectioned into 30 cm whole rounds (stored in light-proof bags) on the catwalk for optically stimulated luminescence (OSL) analyses postexpedition. In total, we recovered 17.37 m of 17.1 m cored (101.6%). The drill string was then brought to the rig floor, with the bit crossing the rotary table at 1645 h on 24 October, which ended Hole U1513C. The total time spent in Hole U1513C was 0.4 days.
Hole U1513D
Preparations were made to core with the RCB system, and while the drill string was being lowered down to the seafloor, the vessel was offset 20 m west. Nonmagnetic RCB core barrels were dressed, and Hole U1531D (33°47.6196′S, 112°29.1339′E) was started at 0135 h on 25 October 2017. The water depth was determined by the offset at 2788.9 m. After a 95.0 m drilled interval, the center bit was pulled. Coring initiated with the recovery of Core 2R and continued through Core 15R to 229.4 m DSF. Half-length (4.8 m) advances were cut to recover Cores 16R though 19R to improve recovery across a critical boundary at ~240 m DSF. Full-length advances resumed, and Cores 20R through Core 56R (603.8 m DSF) were recovered by 1200 h on 28 October. The weather was forecast to deteriorate with a combined sea state of 9 m and winds gusting to +30 kt; thus, we decided to stop coring and drop a free-fall funnel (FFF) in case the ship could not hold position and the hole had to be abandoned. The FFF was assembled in the moonpool under rough conditions and dropped at 1437 h. An attempt was made to verify the FFF landing with the fiber optic camera (vibration isolated television [VIT]) system, but it was aborted at 700 mbsl due to the rough seas and a strong current pushing the VIT umbilical against the side of the hull. The VIT system was back on board at 1615 h. The end of the pipe was then set at 139.2 m DSF, and we waited for the weather to calm. At 1200 h on 29 October, a center bit was dropped, and the drill string was lowered back down to 466 m DSF, where the pipe encountered resistance. The top drive was picked up, and the drill pipe washed and reamed down. Another area of resistance was encountered at 495 m DSF. Additional sweeps with high-viscosity mud were pumped, and the pipe reached the bottom of the hole at 2215 h. The center bit was retrieved at midnight on 29 October; no fill was found at the bottom of the hole. RCB coring resumed with Core 57R at 603.8 m DSF. Cores 58R through 65R were then recovered. A sediment/basalt contact was encountered at 692 m DSF while cutting Core 66R. Cores 66R through 75R were recovered with coring rates varying from 2.6 to 12.8 m/h. Coring ended with the recovery of Core 75R to 757.4 m DSF at 1700 h on 31 October. In total, 437.05 m was recovered of 662.4 m cored (66%) with the RCB system.
After coring, the hole was circulated twice with high-viscosity mud and displaced with heavy mud. The RCB bit was then released to the bottom of the hole. The drill string was brought up to a logging depth of 146.32 m DSF at 0015 h on 1 November. This depth was chosen because it is below the depth the pipe was set while waiting on weather, and we wanted to avoid any possible hole enlargement or ledges from that period. The Quambo was then assembled, and the magnetic susceptibility sonde (MSS) was added to the bottom of the tool string. The tool string was deployed at 0200 h on 1 November but encountered an obstruction at 346 m WSF. Several attempts were made to move past the obstruction. The hole was logged upward, and the tool string was recovered to the rig floor. We then replaced the MSS with the hole-finder tool. The tool string was deployed again at 0955 h, but it encountered another obstruction at 337 m WSF. We decided to abort the logging run. The tool string was back on the rig floor at 1405 h and disassembled at 1545 h. The drill string was then pulled out of the hole, clearing the seafloor at 1637 h. The drill string was brought up to the rig floor at 0130 h on 2 November, which ended Hole U1513D. The rig floor was then secured for transit. In total, 8.4 days were spent in Hole U1513D.
While bringing the drill string back up to the rig floor, several attempts were made to release the acoustic positioning beacon. The beacon responded, recognizing the command to release, but the release mechanism malfunctioned. As a result, the beacon was abandoned. The thrusters were raised, and the transit to Site U1514 began at 0142 h on 2 November.
Hole U1513E
On 20 November 2017, we again arrived at Site U1513 after transiting from Site U1516 (4.1 h). We did not drop an acoustic positioning beacon because the one we abandoned here on the first visit was still functional. Hole U1413E (33°47.6190′S, 112°29.1204′E) was started at 1040 h. The hole was drilled to 685.2 m. The center bit was pulled, and Cores 2R and 3R were recovered to 704.4 m DSF. The center bit was again dropped, and drilling without coring began again. We had difficulty making progress, so the center bit was pulled after advancing 21.6 m, and coring resumed. Cores 5R through 9R were recovered to 774.0 m DSF. Coring terminated at 1615 h on 22 November. In total, seven RCB cores were taken, recovering 49.99 m of 67.2 m cored (74%). The hole was circulated twice with high-viscosity mud, and the bit was released to the bottom of the hole. The hole was then displaced with heavy mud. The drill pipe was pulled up to 426 m.
The Quambo was assembled and deployed at 0305 h on 23 November. The tool string reached 325 m WSF and was unable to pass the top of the drill collars in the bottom-hole assembly (BHA). The tool string was pulled back to the rig floor by 0710 h and inspected. No obvious malfunction in the tools or apparent obstruction in the drill pipe was found. We then assembled the Vertical Seismic Imager (VSI) tool string for the seismic experiment. The VSI tool string consists of the VSI, HNGS, EDTC, and LEH-QT. The VSI tool string was deployed at 0925 h on 23 November. The marine mammal and diving sea bird watch was started at 1100 h, 30 min prior to firing the air guns. Two 250 cubic inch G-type air guns were lowered to 7 mbsl (hydrophone at 9 mbsl), and the air pressure was ramped up gradually to an operating pressure of 2000 psi in accordance with soft-start procedure for marine acoustic sources. The VSI tool string encountered an obstruction at 637 m WSF. The survey was started at this depth, and stations were held every 25 m from the bottom of the hole. The final check shot was at 250 m WSF (inside the pipe). The VSI tool string run was completed at 1605 h.
Because of the issue running the Quambo tool string, we first checked the drill pipe by running a core barrel to 400 m DSF twice, which gave us a very good indication that the pipe and BHA were clear of obstructions. The Quambo was again assembled, without the hole-finder tool, and deployed at 2110 h. We were able to log from the end of the pipe to an obstruction at 614.0 m WSF. The logging run was completed at 0215 h on 24 November. We then assembled the FMS tool string with the Accelerator Porosity Sonde (APS). Specifically, the FMS contained a General Purpose Inclinometry Tool (GPIT), downhole toolbus adapter, HNGS, EDTC, and LEH-QT. The tool string was deployed at 0440 h. Two logs were completed from the end of the pipe to 611.0 m WSF by 1020 h.
We pulled the drill string to 119.3 m WSF. The final logging run for Hole U1513E was with the traditional configuration of the triple combo tool string: HRLA, HLDS, APS, HNGS, EDTC, LEH-QT, and two centralizers. The tool string was deployed at 1425 h, and the hole was logged to 610 m WSF, where an obstruction was encountered. The tools were back on the rig floor at 1930 h and dissembled by 2130 h. The drill string was then brought up to the rig floor at 0525 h on 25 November, ending Hole U1513E. The total time spent in the hole was 5.1 days.
We once again tried to recover the acoustic positioning beacon at this site, but the beacon would not release when commanded. As before, it appeared to register the command but would not release. The beacon was left behind.
Lithostratigraphy
The cored section at Site U1513 is divided into six lithostratigraphic units, five sedimentary units and one igneous unit, based on a combination of data from Holes U1513A, U1513B, U1513D, and U1513E (Figure F3; Table T2). The cores from Hole U1513C are dedicated for future OSL measurements; they were immediately preserved upon recovery and not described onboard (see Operations). Lithostratigraphic units and boundaries are defined by changes in lithology as identified by macroscopic core description, smear slide and thin section examination, and X-ray diffraction (XRD) and handheld portable X-ray fluorescence (pXRF) analyses. Unit I is a 64.93 m thick Pleistocene to late Miocene sequence of light gray to pale yellow calcareous ooze and nannofossil ooze with sponge spicules. Unit II is a 182.93 m thick Campanian to Cenomanian sequence of white to greenish gray calcareous and nannofossil ooze/chalk, clayey nannofossil chalk, and silicified limestone. Unit III is a 21.87 m thick Cenomanian sequence of alternating greenish gray, light gray, and black nannofossil-rich claystone. Unit IV is a 187.12 m thick Cenomanian to Albian sequence of black claystone and nannofossil-rich claystone. Unit V is a 234.25 m thick Aptian to Valanginian sequence of sandstone with siltstone and silty claystone. Unit VI is a 82.20 m thick alternation of basalt flows and breccia intruded by a dolerite dike, all with unknown ages.

Figure F3. Lithostratigraphic summary.
Unit I
- Intervals: 369-U1513A-1H-1, 0 cm, to 8F-CC, 19 cm; 369-U1513B-1H-1, 0 cm, to 8H-2, 42 cm
- Depths: Hole U1513A = 0–62.56 m core depth below seafloor, Method A (CSF-A); Hole U1513B = 0–64.93 m CSF-A
- Age: Pleistocene to late Miocene
- Lithology: calcareous ooze, nannofossil ooze, calcareous ooze with sponge spicules, nannofossil ooze with sponge spicules
- Drilling disturbance type and intensity: various (bowed, soupy, void, and flow-in); slight to destroyed
- Nature of top contact: seafloor
- Nature of bottom contact: sharp contact at the bottom of a 13 cm thick calcareous ooze bed containing abundant ferromanganese nodules (hardground)
Lithostratigraphic Unit I is a 64.93 m thick sequence of nannofossil to calcareous ooze that commonly contains siliceous sponge spicules (Figure F4A). This unit consists of medium and thick beds with no distinctive sedimentary structures. It also exhibits no bioturbation and is massive/structureless. The color of this unit progressively changes downhole from white, light gray, and light greenish gray in the upper intervals (Sections 369-U1513A-1H-1, 0 cm, to 6H-1, 0 cm; 0–43.30 m CSF-A) to pale yellow in the lower intervals (Sections 6H-1, 0 cm, to 8F-CC, 19 cm; 43.30–62.56 m CSF-A). Some thin and medium beds of gray to greenish gray calcareous ooze in Cores 369-U1513A-4H and 369-U1513B-4H have sharp bottom contacts and exhibit normal grading (Figure F4A). Disseminated sulfides are present in trace amounts throughout Unit I. Black, irregularly shaped manganese nodules are also common in the lowermost part of this unit (Sections 369-U1513A-8F-3 and 369-U1513B-8H-1). In smear slides, biogenic grains reveal that dominant calcareous nannofossils, abundant foraminifers, and common sponge spicules are the major constituents of this unit (Figure F5A; see Site U1513 smear slides in Core descriptions). XRD analyses reveal that the mineral assemblage is dominated by calcite, which is consistent with a Ca content of >36 wt% measured by pXRF (Table T3) and a carbonate content of >90 wt% measured by coulometry (see Geochemistry).
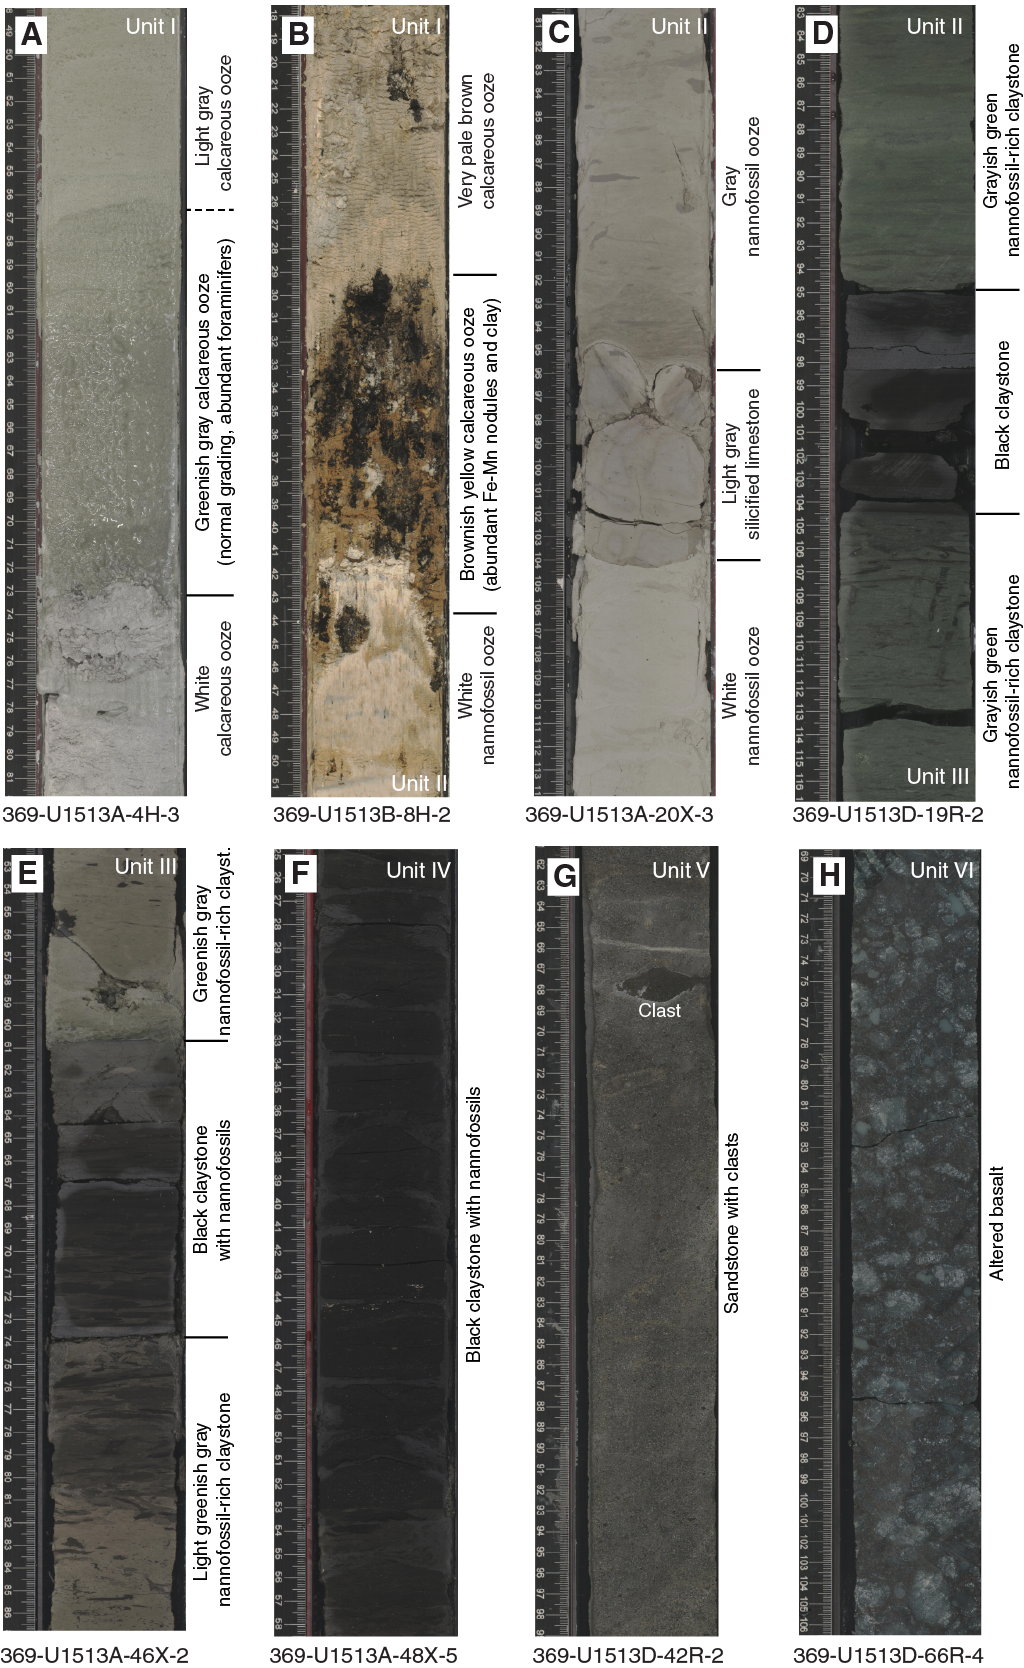
Figure F4. Lithologies and unit boundaries.

Figure F5. Sediment constituents.
At the bottom of Unit I, a 13 cm thick bed of brownish yellow calcareous ooze (interpreted as a hardground) marks a sharp boundary between Units I and II (Figure F4B) and contains abundant ferromanganese oxide nodules, apatite, and zeolitic clay. This hardground is most evident in interval 369-U1513B-8H-2, 29–42 cm (64.80–64.93 m CSF-A). Smear slide observation reveals common zeolite (including clinoptilolite) across the boundary between Units I and II. Shipboard micropaleontological investigation identified a significant age gap between Sections 369-U1513A-8H-CC (late Miocene) and 9H-CC (Late Cretaceous) (see Biostratigraphy and micropaleontology). XRD analyses reveal the presence of apatite, sulfates, clinoptilolite/heulandite and some traces of mica/illite, and interstratified clays in Sample 369-U1513A-9H-1, 10–11 cm (62.30–62.31 m CSF-A) (Figure F6A). This sample correlates with an interval ~10 cm below the hardground in Hole U1513D (see Stratigraphic correlation). Chemical compositional analyses with pXRF reveal high P, Mn, and Fe contents in this sample (Table T3), indicating the presence of phosphate and ferromanganese oxide.
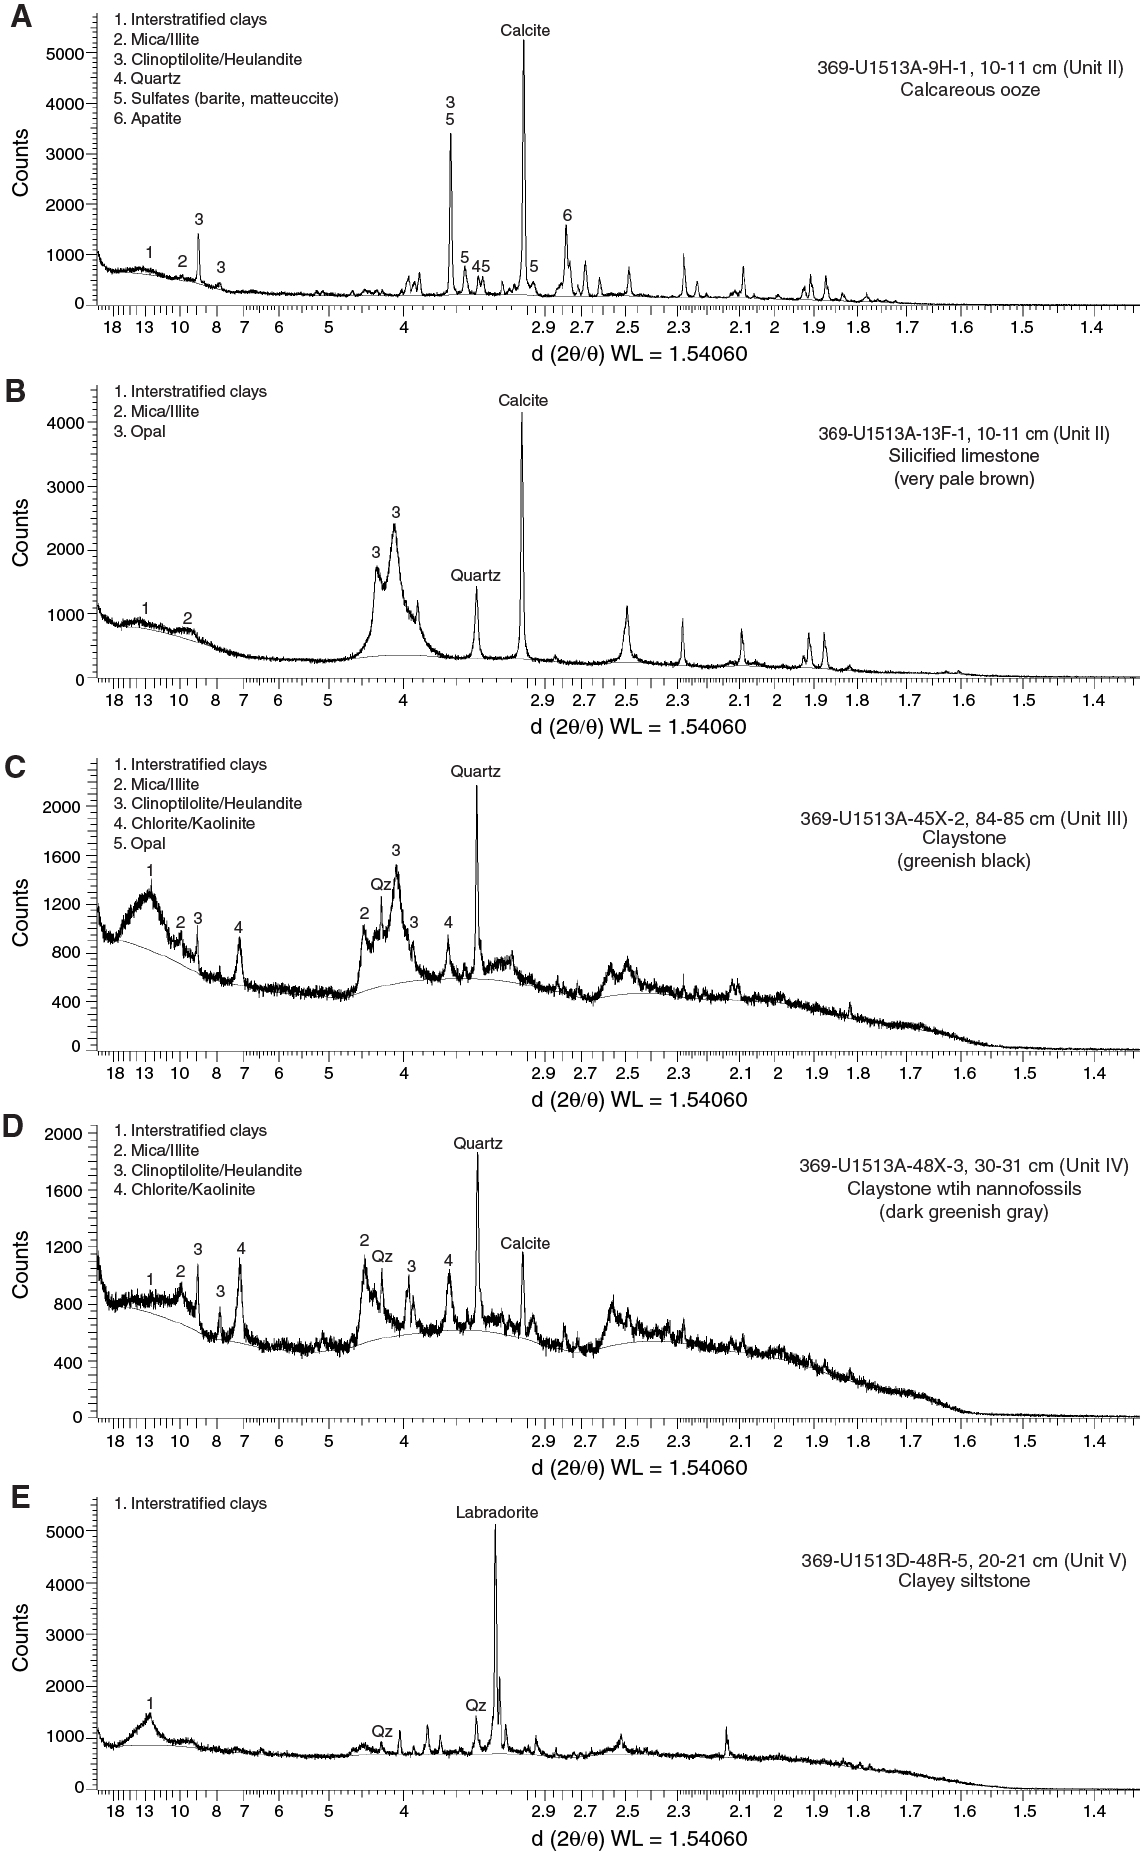
Figure F6. XRD results.
Unit II
- Intervals: 369-U1513A-9H-1, 0 cm, to 45X-2, 10 cm; 369-U1513B-8H-2, 42 cm, to 14F-CC, 18 cm (bottom of hole [BOH]); 369-U1513D-2R-1, 0 cm, to 19R-2, 96 cm
- Depths: Hole U1513A = 62.20–245.13 m CSF-A; Hole U1513B = 64.93–98.42 m CSF-A (BOH); Hole U1513D = 95.00–246.26 m CSF-A
- Age: Campanian to Cenomanian
- Lithology: nannofossil ooze, calcareous ooze, nannofossil chalk, clayey nannofossil chalk, nannofossil chalk with clay, nannofossil-rich claystone, silicified limestone (classified as mudstone, wackestone, and floatstone in thin sections), nannofossil-rich sandy claystone, claystone with zeolite, and nannofossil-rich claystone with shells
- Drilling disturbance type and intensity: various (bowed, fractured, biscuit, soupy, and fragmented); slight to destroyed
- Nature of top contact: sharp (hardground)
- Nature of bottom contact: sharp
Lithostratigraphic Unit II is a 182.93 m thick sequence of calcareous and nannofossil oozes that gradationally transitions into nannofossil chalk between 130 and 170 m CSF-A (Figure F4C). Clayey nannofossil chalk and nannofossil-rich claystone are present in the lower intervals of the unit. The color of this unit progressively changes downhole from pale yellow/light gray in the upper intervals (Sections 369-U1513A-9H-1, 0 cm, to 16X-CC, 10 cm; 62.20–96.82 m CSF-A) to light gray/greenish gray in the lower intervals (Sections 17X-1, 0 cm, to 45X-2, 10 cm; 98.70–245.13 m CSF-A). Bioturbation ranges from absent to intense. Trace shell fragments (including inoceramid shell fragments and disseminated prisms) are visible throughout this unit (see Site U1513 smear slides in Core descriptions). Smear slide observations reveal a mix of calcareous and siliceous bioclasts as well as siliciclastic grains. Biogenic grains consist of dominant calcareous nannofossils, rare to common foraminifers, and trace radiolarians (Figure F5B). Siliciclastic grains consist of dominant clay minerals and rare quartz. Some zeolitic minerals including clinoptilolite are present in smear slides (Figure F5C; see Site U1513 smear slides in Core descriptions). Clay content gradationally increases in the lower part of this unit. Whole-rock XRD analyses conducted on discrete samples confirm that calcite is the dominant mineral in this unit; other minerals include quartz, opal, clinoptilolite/heulandite, montmorillonite, and mica/illite.
Thin to medium beds with irregular nodules of white to gray silicified limestone are common from 68 to 205 m CSF-A (Figure F4C). The silicified limestones are classified as floatstone, wackestone, and mudstone in thin sections. A thin section from interval 369-U1513A-11F-2, 5–8 cm, shows silicified limestone with inoceramid prisms filled with diagenetic silica (Figure F7A). Whole-rock XRD analysis conducted on a silicified limestone bed (Sample 369-U1513A-13F-1, 10–11 cm) in Unit II highlight the presence of opal (cristobalite-tridymite) and quartz (Figure F6B). Furthermore, bulk-rock pXRF analyses reveal a high content of Si (33 wt%) in this interval (Table T3).

Figure F7. Rock features.
The lowermost portion of this unit is characterized by a 2.3 m thick bed of mottled grayish green claystone (Sections 369-U1513D-19R-1, 18 cm, to 19R-2, 96 cm; 243.98–246.26 m CSF-A). This bed has a sharp basal contact with a thin bed of black claystone at the top of Unit III (Figure F4D).
Unit III
- Intervals: 369-U1513A-45X-2, 10 cm, to 48X-3, 35 cm; 369-U1513D-19R-2, 96 cm, to 21R-CC, 10 cm
- Depths: Hole U1513A = 245.13–267.00 m CSF-A; Hole U1513D = 246.26–264.15 m CSF-A
- Age: Cenomanian
- Lithology: nannofossil-rich clay, nannofossil-rich claystone, claystone with nannofossils, clay, and claystone
- Drilling disturbance type and intensity: various (biscuit, fractured, soupy, and fragmented); slight to severe
- Nature of top contact: sharp
- Nature of bottom contact: gradational
Lithostratigraphic Unit III is a 21.87 m thick alternating sequence of medium to thick, sparsely to intensely bioturbated beds of green, gray, and black nannofossil-rich claystone and claystone with nannofossils. The top of this unit is defined by a distinctive thin bed of black claystone in intervals 369-U1513A-45X-2, 10–16 cm (245.13–245.19 m CSF-A), and 369-U1513D-19R-2, 96–106 cm (246.26–246.36 m CSF-A) with sharp top (Figure F4D) and bottom contacts. Alternations in the color of the claystone (light gray, greenish gray, and black) every 15–90 cm is a notable characteristic of this unit (Figure F4E). The ichnofacies in this unit consist of Planolites, Chondrites, and Zoophycos. Shell fragments (including inoceramid shells) are present in trace amounts throughout this unit. A faulted contact (~45° dip) is present in interval 369-U1513A-47X-2, 80–85 cm (256.40–256.45 m CSF-A). Smear slide observations reveal a mix of siliciclastics and biogenics, including dominant clay minerals, common to abundant calcareous nannofossils, rare foraminifers, rare quartz, and trace to rare plant debris (Figure F5D; see Site U1513 smear slides in Core descriptions). Opaque grains (likely pyrite) increase in abundance within the green and black claystone intervals.
Whole-rock XRD analyses on discrete samples confirm that calcite and quartz are the dominant minerals present in Unit III (Figure F6C). Other minerals include kaolinite/chlorite, clinoptilolite/heulandite, montmorillonite, interstratified clays, and mica/illite. Bulk-rock pXRF analyses (Table T3) reveal that Al and K contents are higher in Unit III than in Units I and II. Clinoptilolite was confirmed by scanning electron microscope (SEM) images (Figure F8).
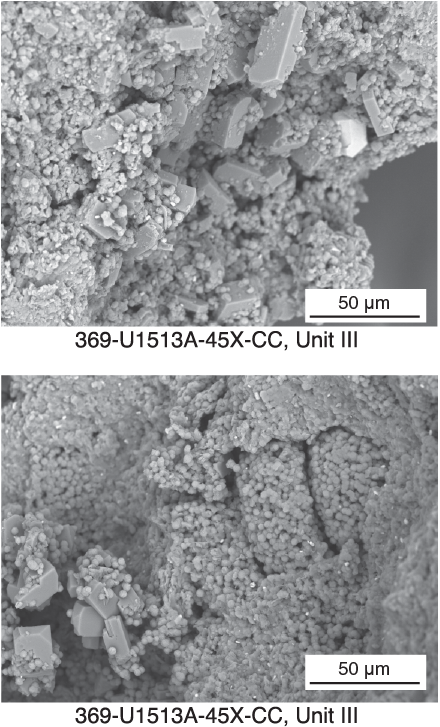
Figure F8. SEM images of clinoptilolite.
Unit IV
- Intervals: 369-U1513A-48X-3, 35 cm, to 50X-CC, 30 cm (BOH); 369-U1513D-22R-1, 0 cm, to 41R-4, 90 cm
- Depths: Hole U1513A = 267.00–284.34 m CSF-A (BOH); Hole U1513D = 267.80– 454.92 m CSF-A
- Age: Cenomanian to Albian
- Lithology: claystone with nannofossils, claystone, siderite claystone and nannofossil-rich claystone
- Drilling disturbance type and intensity: biscuit, fractured, and fragmented; slight to destroyed
- Nature of top contact: gradational
- Nature of bottom contact: sharp
Lithostratigraphic Unit IV is a 187.12 m thick sequence of massive to mottled black claystone with nannofossils, claystone, and nannofossil-rich claystone (Figure F4F). Bioturbation varies from absent to intense. Trace shell fragments (including inoceramid prisms) and pyrite nodules are present throughout this unit. A dark greenish gray claystone at interval 369-U1513A-49X-1, 4–6 cm (273.34–273.36 m CSF-A), is classified as chlorite claystone in thin section. Smear slide observations reveal that this unit is dominated by clay minerals with common calcareous nannofossils, rare opaque grains (likely pyrite), rare quartz, rare chlorite, and trace to rare plant debris (Figure F5E; see Site U1513 smear slides in Core descriptions). Pyritized radiolarian fragments are also present in trace amounts. Two medium beds of sideritic claystone are present in Sections 369-U1513D-38R-2 and 38R-CC. Several normal faults (~40°–60° dip) are present from 320 to 350 m CSF-A.
Whole-rock XRD analyses of discrete samples confirm that the mineral assemblage in Unit IV is dominated by quartz (Figure F6D). Other minerals in this unit include kaolinite/chlorite, clinoptilolite/heulandite, montmorillonite, interstratified clays, mica/illite, and calcite. Bulk-rock pXRF analyses (Table T3) reveal low Ca content (0.6–11 wt%) in Unit IV compared with that in the overlying units, indicating low abundance of carbonate minerals. Carbonate content increases in the middle part of Unit IV (308–360 m CSF-A), as indicated by the presence of rare to abundant nannofossils in smear slides, by calcite content from XRD analysis, and by the increase in Ca content (7–11 wt%) from pXRF analysis.
Unit V
- Intervals: 369-U1513D-41R-4, 90 cm, to 66R-1, 20 cm; 369-U1513E-2R-1, 0 cm, to 2R-3, 100 cm
- Depths: Hole U1513D = 454.92–690.25 m CSF-A; Hole U1513E = 685.20–688.07 m CSF-A
- Age: Aptian to Valanginian
- Lithology: volcanic-rich sandstone, glauconitic sandstone, sandstone with clasts, clayey sandstone, sandy siltstone, siltstone, clayey siltstone, and silty claystone; few dolerite sills
- Drilling disturbance type and intensity: various (fall-in, biscuit, fractured, fragmented, and brecciated); slight to destroyed
- Nature of top contact: sharp
- Nature of bottom contact: sharp
Lithostratigraphic Unit V is a 235.33 m thick sequence of greenish gray to black volcanic-rich sandstone interbedded with thin to medium dark gray siltstone and dark reddish gray silty claystone (Figure F4G). Faults are common throughout this unit, and minor offsets and slickensides are filled with calcite. Bioturbation is notably absent in the sandstone. Soft-sediment deformation structures are common at the interface between claystone and sandstone beds and include load casts and flame and dish structures. Sandstone beds with normal grading often have a mix of gradual and sharp bottom contacts. Pyrite nodules and shell fragments (including bivalves and belemnites) are present throughout this unit. Specific intervals (454.92–460, 500–580, and 640–690.25 m CSF-A) are cemented by calcite. From thin section analyses, sedimentary rocks in this unit are classified as volcanic-rich sandstone with lithics/clasts (Figure F7B), glauconitic sandstone, silty claystone, and lithic sandstone with shells. Smear slide observations reveal that this unit largely consists of volcanic grains, clay minerals, quartz, feldspars, opaque grains (likely to be pyrite), and plant debris (including fossilized wood) (Figure F5F; see Site U1513 smear slides in Core descriptions). A few dolerite sills were observed cutting through this unit in Hole U1513E (intervals 2R-1, 62–69 cm, and 2R-1, 101–114 cm).
Whole-rock XRD analyses conducted on selected sediment samples reveal that the mineral assemblage in Unit V is dominated by Ca- and Na-rich feldspar (e.g., labradorite) (Figure F6E). Other minerals present in this unit include quartz, montmorillonite, kaolinite/chlorite, interstratified clays, and mica/illite. Bulk-rock pXRF analyses (Table T3) reveal high Fe (>10 wt%) and Ti (>0.9 wt%) contents relative to those in Units I–IV, indicating a high abundance of mafic volcaniclastic grains in Unit V.
Unit VI
- Intervals: 369-U1513D-66R-1, 0 cm, to 75R-7, 130 cm (BOH); 369-U1513E-2R-4, 0 cm, to 9R-5, 62 cm (BOH)
- Depths: Hole U1513D = 690.25–756.69 m CSF-A; Hole U1513E = 688.07–770.27 m CSF-A
- Age: unknown
- Lithology: basalts, breccias, and dolerite dike
- Drilling disturbance type and intensity: biscuited, fractured, and fragmented; slight to destroyed
- Nature of top contact: sharp
- Nature of bottom contact: none (BOH)
Lithostratigraphic Unit VI is an igneous sequence recovered from the top of Section 369-U1513D-66R-1 to Section 75R-7, 130 cm (690.25–756.69 m CSF-A) and from Section 369-U1513E-2R-4 to Section 9R-5, 62 cm (688.7–770.27 m CSF-A) (Figures F4H, F9, F10, F11, F12). Some fall-in material from the reddish brown siltstone of Unit V is present at the top of Core 369-U1513D-66R and might represent the ~1 m thick unrecovered interval from Core 65R. This interval was recovered in Hole U1513E, with a sharp boundary between Units V and VI and intrusion by a dolerite sill. Unit VI is an 82.20 m sequence of black to greenish gray basalt with varying degrees of green, brown, and red alteration overprint in Hole U1513D. The sequence was spot-cored from 694.8 to 704.4 m DSF and cored from 726.0 to 774.0 m DSF in Hole U1513E. The recovered cores show a good correlation with lithologic units in Hole U1513D. Combining Holes U1513D and U1513E, Unit VI has a a total recovered thickness of 82.2 m.
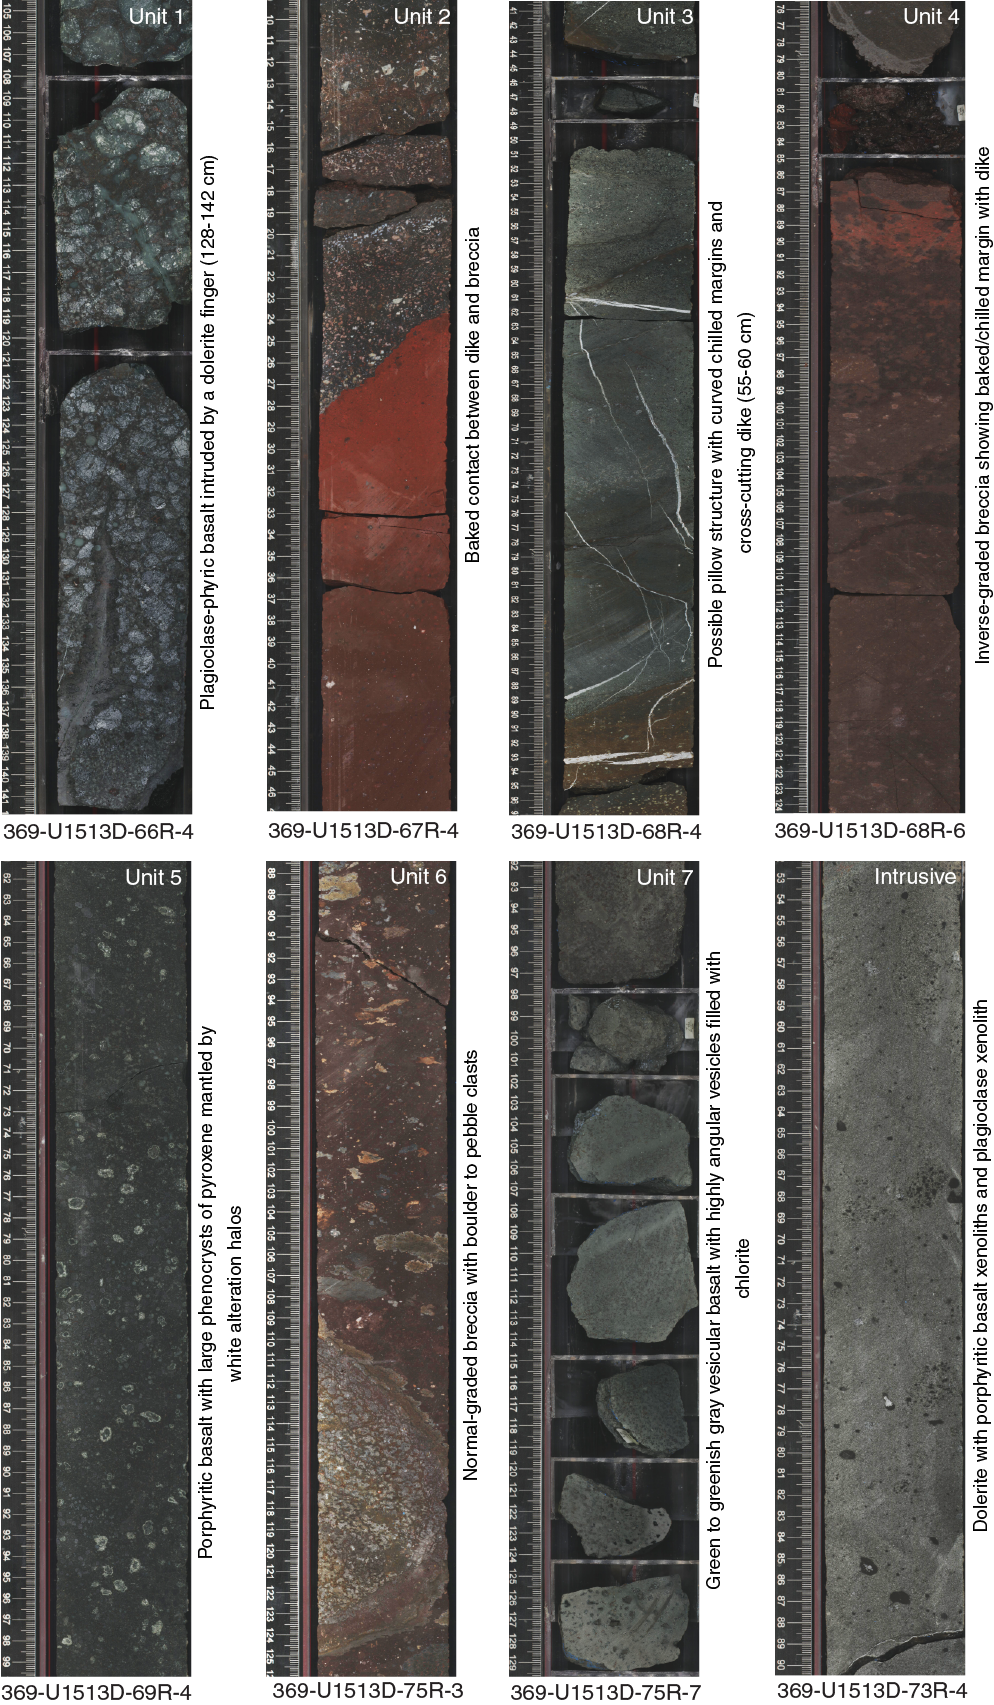
Figure F9. Igneous Units 1–7, Hole U1513D.

Figure F10. Igneous Units 1–7, Hole U1513E.
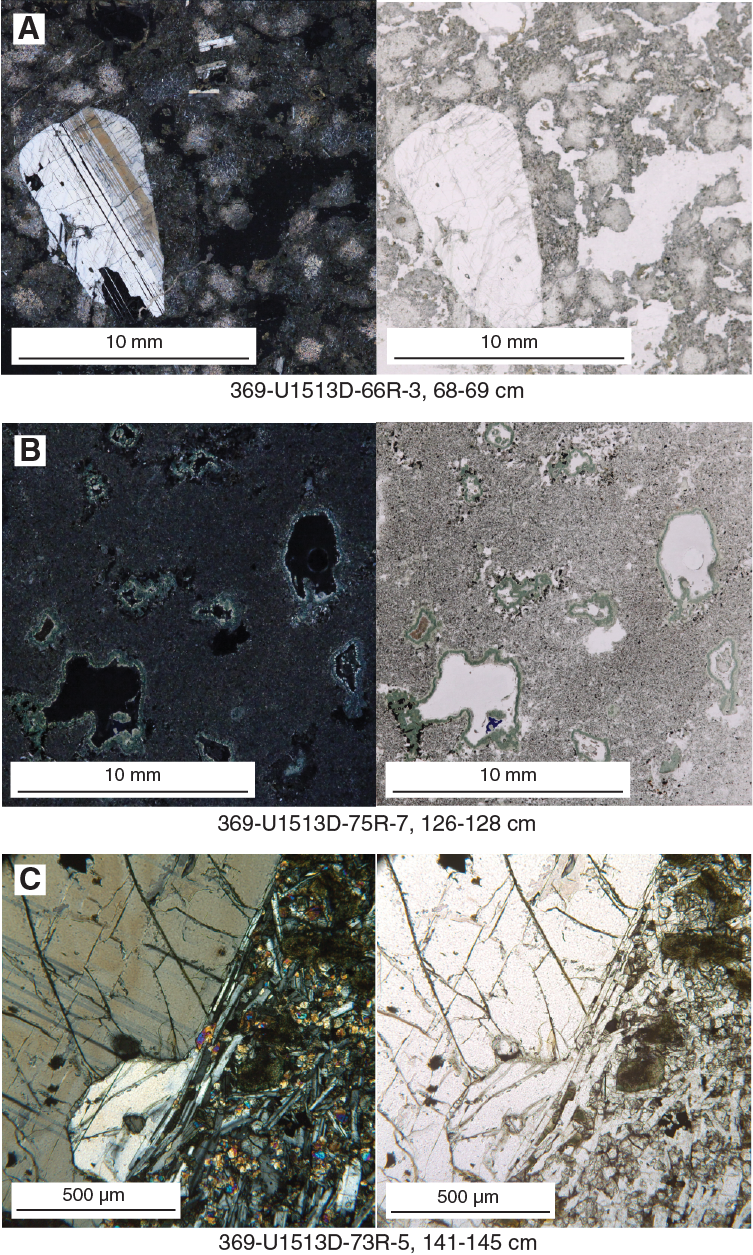
Figure F11. Textural features.
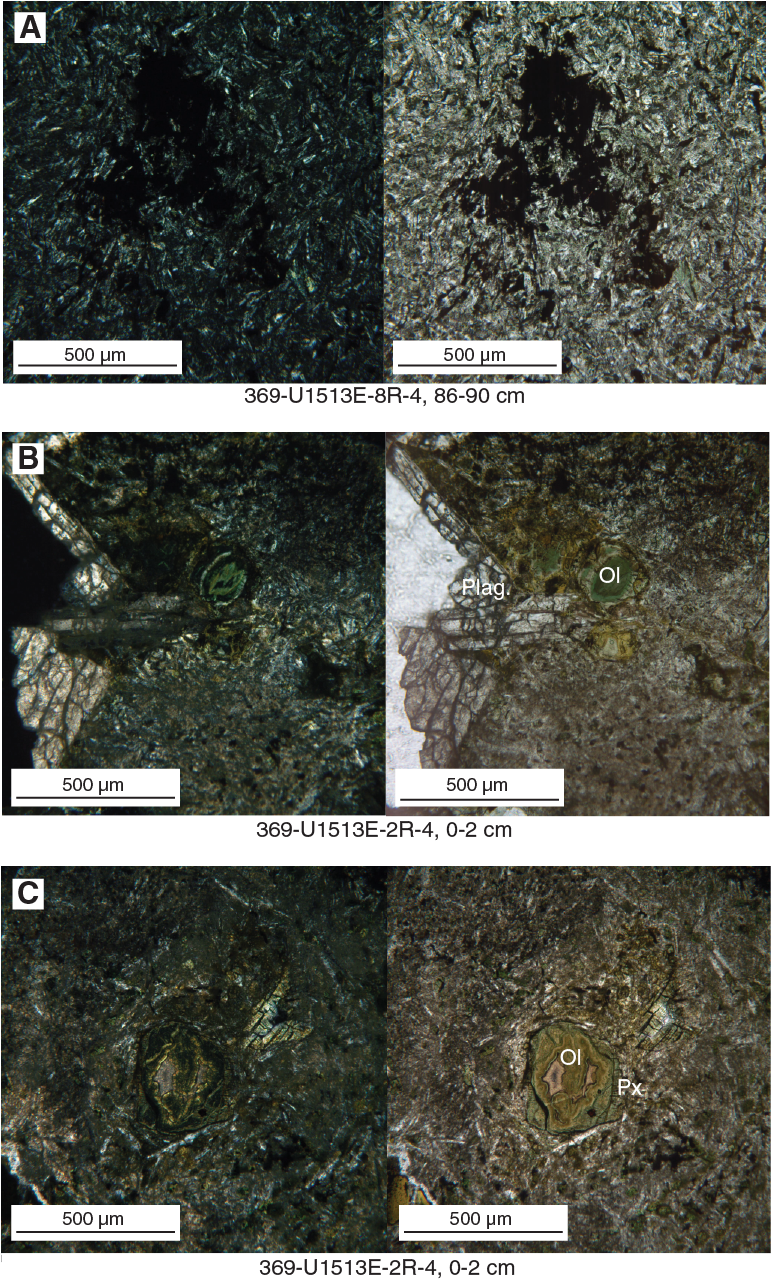
Figure F12. Original igneous textures.
The top of Unit VI is defined by a flow-top breccia with an altered matrix grading downhole to a massive plagioclase-phyric basalt flow in Hole U1513D. The unit is further divided into lithologic Units 1–7 (Figures F9, F10), which are defined by extrusive sequences intercalated with volcaniclastic breccia beds with graded structures. Each extrusive sequence is divided into 0.35–5.74 m thick discrete flow units generally bounded by chilled margins but also by faults or textural and color changes. Most discrete flows appear to be massive, thin sheets of olivine ± pyroxene- or plagioclase-phyric (some megacrystic) basalt, but some curved chilled margins between aphyric, sparsely vesicular basalt flows in igneous Unit 3 may indicate pillow structures. The least-altered portions of the lowermost sequence (Unit 7) show a higher degree of vesicularity and highly angular vesicles (Figure F11B), possibly indicating subaerial to very shallow eruption depths. A xenolith-bearing dolerite dike intrudes the flow sequences in Cores 369-U1513D-67R through 74R and 369-U1513E-2R through 6R. The contacts between the xenolith-bearing dolerite dike and the extrusives are defined by either faulted or chilled margins with alteration halos.
Faults infilled with calcite are present throughout Unit VI. Calcite veins and calcite/zeolite cementation and hematite dissemination in the matrix are also common. Hydrothermal alteration is most intense near faults and intrusive contacts, and intensity gradually decreases with distance from these structures. In well-developed alteration intervals (Cores 369-U1513D-68R and 75R), the color grades from red-brown hematite–dominated to brown iron oxide clay–dominated to green chlorite–dominated zones. Alteration overprint often enhances grain size, creating a pseudoporphyritic texture. Superimposition or overprinting of different alteration halos was also observed.
In Hole U1513D, thin section observation reveals that most flows have an alteration overprint in the groundmass, including the megacrystic plagioclase-phyric basalts dominating igneous Unit 1 (Figure F11A). However, the dolerite dike is relatively fresher, with large plagioclase phenocrysts in a groundmass consisting of plagioclase, chlorite, clinopyroxene (both fresh and altered), and hematite (Figure F11C). All of the intercalated volcaniclastic breccia have matrixes that are completely replaced by hematite (Figure F7C). In contrast, flows recovered from Hole U1513E are less altered, and preliminary megascopic and thin section observations (Figure F12) reveal the original porphyritic, microcrystalline, or vesicular textures, with some of the bottom flows showing a crisscrossing lineation pattern. These textures are affected to a lesser degree by intrusions in comparison with Hole U1513D.
Whole-rock XRD analyses conducted on selected samples confirm that the mineral assemblage in Unit VI of Hole U1513D is dominated by plagioclase feldspars and pyroxene. Other minerals in this unit include alteration minerals such as chlorite, sericite, hematite, magnetite, and interstratified clays. Bulk-rock pXRF analyses (Table T3; see Geochemistry) reveal high Mg (7.6–8.4 wt%) and Ni (>100 ppm) and lower Ti (<0.3 wt%) contents in the uppermost flow sequence of plagioclase-phyric basalts relative to the other flow sequences and the dolerite dike.
Biostratigraphy and micropaleontology
Core catcher samples from Hole U1513A and U1513D and selected samples from Hole U1513B were analyzed for calcareous nannofossils, planktonic foraminifers, and benthic foraminifers. In addition, samples from split core sections and thin sections were evaluated for calcareous nannofossils and/or planktonic foraminiferal assemblages as necessary. The presence of planktonic and benthic foraminifers and calcareous nannofossils and observations of other distinctive and potentially age-diagnostic or environmentally diagnostic microfossil groups, including organic-walled dinoflagellate cysts (dinocysts), radiolarians, ostracods, fish debris, bryozoans, small corals, and inoceramid prisms, are documented in Table T4. In addition to inoceramid fragments, whole bivalve shells were found in Sample 369-U1513D-52R-CC. Calcareous nannofossil and planktonic foraminiferal datums form the chronologic framework shallower than 450 m CSF-A at Site U1513, spanning the Pleistocene through Albian (Tables T5, T6).
Sediment accumulation rates average ~13 m/My in the Albian through Coniacian but drop appreciably in the Santonian and lower Campanian to only 8 m/My, with an apparent rate of only 3 m/My in the Santonian (Figure F13A). Alternatively, part of the Santonian may be missing because of a sediment accumulation hiatus. Sediment accumulation rates deeper than 450 m CSF-A are based on the paleomagnetic record (Table T7; Figure F13B). Sediment accumulation rates for the Barremian to upper Hauterivian (Chron M0 to base Chron Mr8) average ~10 m/My, whereas estimated rates for the lower Hauterivian and Valanginian (Chrons M9 to M10) are ~132 m/My.
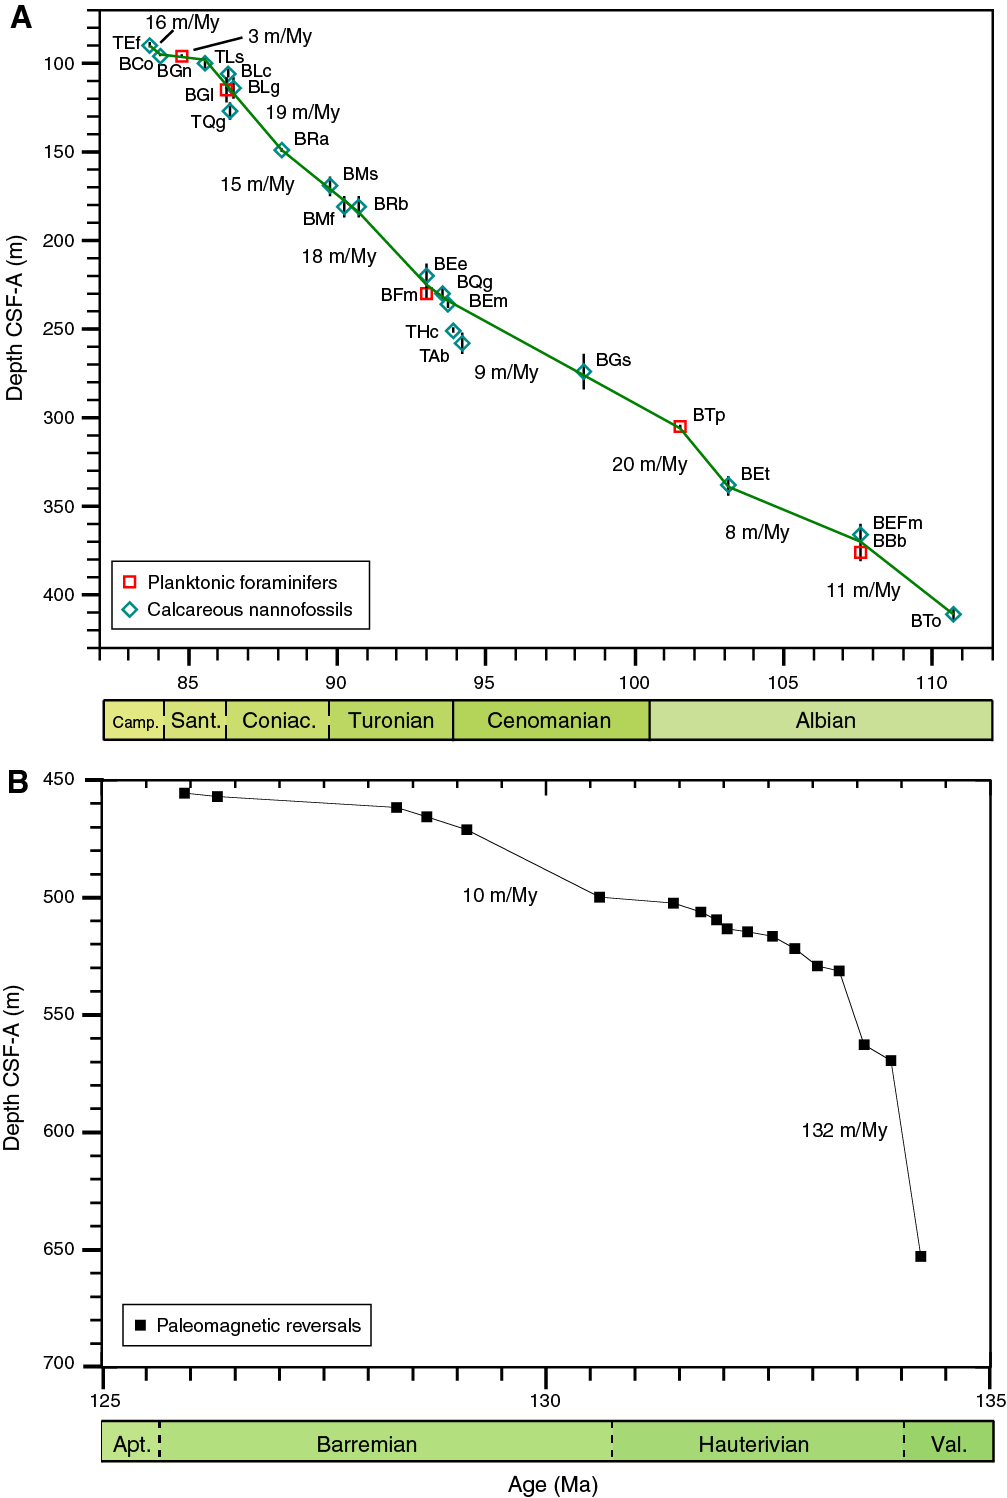
Figure F13. Cretaceous age-depth plots.
Calcareous nannofossils
Calcareous nannofossils were recovered and examined in sediment from Cores 369-U1513A-1H through 50X, 369-U1513B-1H through 14F, and 369-U1513D-4R through 57R. These three holes recovered a composite section from the Pleistocene to the Lower Cretaceous with calcareous nannofossils preserved from the Pleistocene to the lower Albian. Calcareous nannofossils are present throughout the cored interval in Hole U1513A (Pleistocene to lower Cenomanian), in Hole U1513B (Pleistocene to upper Santonian), and in Hole U1513D from Cores 369-U1513D-4R through 40R (Santonian to lower Albian). Unless otherwise noted in the text, the Pleistocene to Coniacian portion of the succession is relative to Hole U1513A, whereas the Turonian to Albian portion is specific to Hole U1513D.
Calcareous nannofossil datums are given in Table T5. The distribution of biostratigraphically important calcareous nannofossil species for Holes U1513A, U1513B, and U1513D is given in Tables T8, T9, and T10, respectively. Selected age-diagnostic calcareous nannofossil taxa are illustrated in Figure F14.

Figure F14. Age-diagnostic calcareous nannofossils.
The Neogene in Hole U1513A is present in Cores 369-U1513A-1H through 8H, although mixed assemblages characterize much of this material. Sample 1H-2, 146–150 cm, contains an abundant, well-preserved assemblage dominated by Gephyrocapsa caribbeanica and, to a lesser extent, Emiliania huxleyi, indicating upper Pleistocene calcareous nannofossil Zone CN15. This material contains reworked species from the Neogene (i.e., Pseudoemiliania lacunosa) and minor amounts of species from the Paleogene (e.g., Reticulofenestra umbilica). Sample 1H-CC contains P. lacunosa but no E. huxleyi, indicative of Subzone CP14b. Cores 2H and 3H are assigned to middle Pleistocene Subzone CN14a based on the presence of P. lacunosa and the absence of E. huxleyi and members of the Discoaster genus. Species abundance is common to abundant, and preservation is moderate within this interval. Numerous reworked Neogene and Paleogene specimens, degraded specimens of ascidian spicules, and broken foraminifers are evident.
The occurrence of Reticulofenestra pseudoumbilica and discoasters including Discoaster tamalis in Sample 369-U1513A-4H-CC, 17–22 cm, suggests upper Pliocene Subzone CN12a. Cores 5H and 6H contain mixed assemblages of Neogene and Paleogene species, predominantly Reticulofenestra producta, including Amaurolithus triconiculatus, Amaurolithus delicatus, and Ceratolithus armatus, suggesting lower Pliocene Zone CN10. Paleogene species (e.g., R. umbilica) are relatively rare in Sample 5H-CC, 13–18 cm, but more frequent in Sample 6H-CC, 20–25 cm. Sample 7F-CC, 9–14 cm, contains a mixed assemblage of nannofossils but is dominated by species that include R. producta, Discoaster neohamatus, and Minylitha convallis. This assemblage suggests the upper Miocene; however, elements of older assemblages are evident, such as the presence of Discoaster hamatus and Catinaster coalitus and Paleogene forms such as Discoaster lodoensis and R. umbilica. In addition, the unusual nature of the “background” assemblage is reinforced by the presence of the Southern Ocean species Reticulofenestra perplexa and the high abundance of M. convallis.
Sample 369-U1513A-8F-CC, 20–25 cm, contains calcareous ooze mixed with fragmented manganese oxide nodules and phosphatized limestone. The ooze contains a mixed assemblage of species derived from the Upper Cretaceous (e.g., Eiffellithus eximius, Cribrosphaerella ehrenbergii, and Micula staurophora), Paleogene (e.g., D. lodoensis, Nannotetrina spp., Isthmolithus recurvus, and Dictyococcites bisectus), and Neogene (e.g., Sphenolithus heteromorphus, C. coalitus, Coccolithus miopelagicus, and Discoaster brouwerii). This mixed assemblage cannot be assigned confidently to a calcareous nannofossil zone given the disturbed nature of the core catcher sample; however, the presence of forms such as D. brouweriii indicates a Neogene age. This age interpretation is in general agreement with the paleomagnetic results (see Paleomagnetism).
The Neogene/Cretaceous stratigraphic boundary was recovered intact in interval 369-U1513B-8H-2, 7–47 cm, where it occurs as a complex hardground sequence with at least two distinct mineralized surfaces. Macroscopic inspection indicates multiple generations of burrowing and boring of the complexly mineralized surfaces, suggesting that a relatively long and complicated history is recorded in this relatively short (~40 cm) stratigraphic interval. Because of the obvious complexity of this series of surfaces, the detailed sampling necessary to derive a coherent and relatively complete history of this boundary is deferred to shore-based studies.
The hardground complex sits stratigraphically above a composite section of Cretaceous sedimentary and igneous rocks. The lower Campanian in Sample 369-U1513A-9H-CC, 13–18 cm, is characterized by diverse and well-preserved calcareous nannofossil assemblages that include Broinsonia furtiva, Lucianorhabdus cayeuxii, and Seribiscutum primitivum. The presence of S. primitivum indicates the high-latitude affinity of these assemblages. Isolated specimens of Calculites obscurus in Sample 15F-CC, 0–10 cm, and the absence of Broinsonia parca parca throughout the upper part of the Cretaceous section indicate lowermost Campanian Zone CC17. The last appearance datum of Eprolithus floralis in Sample 12F-CC, 7–12 cm, ~6.9 m above the isolated C. obscurus occurrence, suggests that this appearance of C. obscurus is near its first appearance datum (FAD) (following Hardenbol et al., 1998) and in close proximity to the Santonian/Campanian boundary.
Sample 369-U1513A-16X-CC, 10–15 cm, contains abundant, well-preserved nannofossils assigned to upper Santonian Subzone CC16b based on the absence of Lithastrinus septenarius and C. obscurus within the interval. The absence of C. obscurus in this sample may be due to paleoecological exclusion because it occurs only in one sample in the overlying Zone CC17. As a result, zonal assignment to Subzone CC16b is tentative. The co-occurrence of L. septenarius, Lithastrinus grillii, and L. cayeuxii in Sample 17X-CC, 37–42 cm, indicates lower Santonian Subzone CC16a.
The absence of L. cayeuxii and the FADs of L. grillii and Prediscosphaera desiderograndis in Sample 369-U1513A-18X-CC, 0–5 cm, indicate placement in the uppermost Coniacian part of Zone CC15 based on correlation with the Western Interior Basin (Blair and Watkins, 2009). Upper Coniacian Zone CC15 continues downhole to Sample 23X-CC, 26–31 cm, based on the consistent occurrence of Reinhardtites anthophorus. From Sample 24X-CC, 27–32 cm, to Sample 28X-1, 18–24 cm, R. anthophorus is absent, but the presence of M. staurophora, E. eximius (s.s.), and Marthasterites furcatus indicates middle to lower Coniacian Zone CC14.
The presence of M. furcatus and E. eximius (sensu Verbeek of Huber et al., 2017) without E. eximius (s.s.) and Micula spp. in Sample 369-U1513D-10R-CC, 24–29 cm, indicates upper Turonian Zone CC13. The interval from Sample 11R-CC, 10–15 cm, to Sample 14R-CC, 13–18 cm, contains E. eximius (sensu Verbeek), Eiffelithus perchnielseniae, Quadrum gartneri, and Quadrum intermedium, which are diagnostic for middle to upper Turonian Zone CC12. Sample 15R-CC, 7–12 cm, contains E. perchnielseniae, Eprolithus moratus, and the FADs of Q. gartneri and Q. intermedium but lacks E. eximius (sensu Verbeek), indicating lower Turonian Zone CC11.
Samples 369-U1513D-16R-CC, 15–20 cm, to 20R-CC, 17–22 cm, contain a succession that spans the Cenomanian/Turonian boundary. Sample 16R-CC, 15–20 cm, lacks Q. gartneri and contains the FAD of the seven-rayed E. moratus, placing it in the upper part of early Turonian Subzone CC10b. The next deepest sample (17R-4, 102-103 cm) lacks E. moratus but contains its evolutionary ancestral form, the eight-rayed Eprolithus octopetalus. This short-ranging form is restricted to the lowermost Turonian, immediately above the Cenomanian/Turonian boundary and Oceanic Anoxic Event (OAE) 2. The sample that underlies the E. octopetalus assemblage, Sample 18R-CC, 10–15 cm, is characterized by a depauperate assemblage dominated by opportunist species, suggesting a substantial collapse of the nannoplankton paleocommunity associated with the boundary. This sample is in the same biostratigraphic interval (Subzone CC10b, which straddles the Cenomanian/Turonian boundary) as the underlying Sample 19R-CC but has only half the species richness.
Samples 369-U1513D-20R-CC, 17–22 cm, to 21R-CC, 9–14 cm, contain a more diverse assemblage, including Helenea chiastia, Corollithion kennedyi, Cylindralithus sculptus, Gartnerago segmentatum, and Discolithus watkinsii, indicating middle to upper Cenomanian Subzones CC9c–CC10a. These subzones cannot be separated given the sample spacing, although it should ultimately be possible because the bioevent differentiating Zone CC10 from CC9 is the FAD of Lithraphidites acutus, a species whose type specimen is from DSDP Site 258. This interval is separated from the underlying succession by a barren interval in Section 22R-CC.
The interval from Sample 369-U1513D-23R-CC to Sample 27R-CC is placed in lower Cenomanian Subzone CC9c based on the presence of Eiffellithus turriseiffelii, Eiffellithus casulus, and Gartnerago theta without Watznaueria britannica. The presence of Eiffellithus equibiramus in the deepest sample (27R-CC, 15–20 cm) indicates that the base of this subzone is close to the Albian/Cenomanian boundary. Samples in Core 28R contain W. britannica, E. turriseiffelii, and E. equibiramus, indicating upper Albian Subzones CC9a–CC9b. The association of these species indicates that this interval corresponds, in part, to OAE 1d (Watkins et al., 2005).
Samples 369-U1513D-29R-CC, 5–10 cm, to 31R-CC, 10–18 cm, contain Eiffellithus monechiae without E. casulus or E. turriseiffelii, indicating upper Albian Subzone CC8d. Samples 32R-CC, 21–26 cm, to 36R-CC, 9-14 cm, are placed in the combined middle Albian Subzone CC8b–CC8c based on the co-occurrence of Prediscosphaera columnata, Tranolithus orionatus, and Seribiscutum primitivum. The criterion for separating these subzones, the FAD of Axopodorhabdus biramiculatus (= Axopodorhabdus albianus of some authors), is not reliable at this site because of its low abundance and sporadic occurrence.
The interval from Sample 369-U1513D-37R-CC, 28–33 cm, through Core 39R contains circular forms of small (>5 μm) P. columnata without T. orionatus, indicating lower Albian Subzone CC8a. The consistent frequent to common abundance of S. primitivum throughout this interval is important for two reasons. First, it indicates the high-latitude affinities of these assemblages, and second, the FAD of S. primitivum is in the lower Albian, which is defined at the Global Boundary Stratotype Section and Point (Kennedy et al., 2017).
Sediment sampled stratigraphically deeper than Core 369-U1513D-39R is barren of calcareous nannofossils.
Planktonic foraminifers
Core catcher samples from Hole U1513A and U1513D and selected samples from Hole U1513B were analyzed for planktonic foraminiferal biostratigraphy. Bioevents for Holes U1513A, U1513B, and U1513D are presented in Table T6, and planktonic foraminiferal occurrences are listed in Tables T11, T12, and T13. SEM micrographs of stratigraphically significant planktonic foraminiferal taxa are in Figure F15.
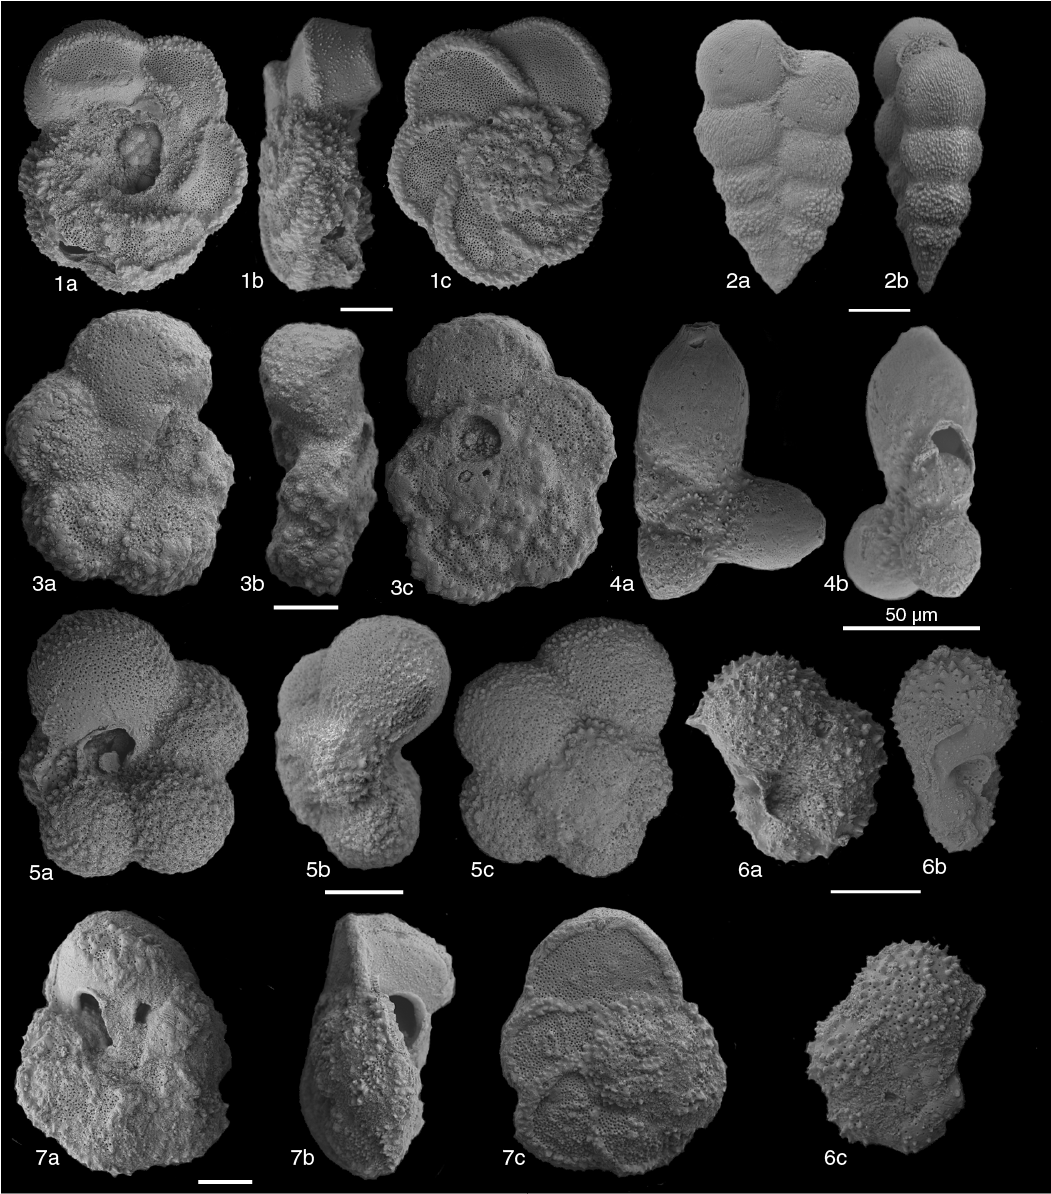
Figure F15. Planktonic foraminifers.
Several thousand particles (multiple picking trays) were routinely scanned for each sample. Planktonic foraminiferal assemblages span the Pleistocene through late Miocene and unconformably overlie a lower Campanian through Albian sequence. Preservation varies throughout the sequence from very poor to excellent, with samples showing minimal or no evidence of recrystallization at several levels in the Cretaceous (e.g., Albian). In the modern ocean, Site U1513 is near the transition between the subtropical and transitional provinces (Kucera, 2007), which explains why highly diverse assemblages of planktonic foraminifers occur in the Pleistocene to Miocene. Evidence of reworking was observed throughout this interval (Samples 369-U1513A-1H-CC to 8F-CC and 369-U1513B-1H-CC to 8H-2, 1–3 cm). Many of the classic low-latitude marker species are present in the Neogene, although often at very low abundances; therefore, the low-latitude biozonation scheme of Wade et al. (2011) can be applied to these sediments. However, Cretaceous assemblages are largely dominated by smaller taxa (<200 µm), and as a result, many low-latitude planktonic foraminifer marker species are absent. Thus, Cretaceous ages are largely determined based on evaluation of whole assemblages and either the transitional zonal scheme (Petrizzo, 2003) or equivalent low-latitude biozones (Robaszynski and Caron, 1995; geomagnetic timescale of Gradstein et al., 2012) are denoted.
Lower Pleistocene planktonic foraminiferal Subzone Pt1a occurs in Samples 369-U1513A-1H-2, 146–150 cm, to 3H-CC and 369-U1513B-1H-CC to 3H-CC and is defined by the overlapping occurrences of Truncorotalia truncatulinoides and Truncorotalia tosaensis. Notably, T. tosaensis is rare in the shallower samples and may be reworked higher in the section. Postexpedition evaluation of secondary datums in this interval may provide further constraints. T. truncatulinoides is used to define the base of Subzone PT1a in the absence of Globigerinoides fistulosus at Site U1513.
Sample 369-U1513A-4H-CC is assigned to Zone PL5 in the upper Pliocene based on the overlapping occurrences of Menardella multicamerata and T. tosaensis and the absence of Dentoglobigerina altispira. The underlying presence of the highly distinctive D. altispira and absence of Sphaeroidinellopsis seminulina in Sample 5H-3, 146–150 cm, indicates Zone PL4. Sample 5H-CC in both Holes U1513A and U1513B is placed in lower Pliocene Zone PL2 based on the overlapping occurrences of Globorotalia margaritae and Globorotalia crassaformis and absence of Globoturborotalita nepenthes. Pliocene Zones PL1 and PL6 were not identified at Site U1513 because they presumably fall between studied samples.
Sample 369-U1513A-6H-5, 146–150 cm, is tentatively assigned to upper Miocene Zone M14 based on the presence of Globorotalia lenguaensis and the absence of Globorotalia tumida (note that G. tumida is rare at this site even well within its range). The presence of G. nepenthes in the sample supports assignment to Zones M14/PL1; the extinction of G. nepenthes defines the base of overlying Zone PL2. The co-occurrence of Globorotalia plesiotumida and G. lenguaensis indicates that Samples 6H-CC and 7H-CC correlate with Subzone M13b. Below this, the presence of Neogloboquadrina acostaenis and absence of G. plesiotumida indicate Subzone M13a in Sample 8F-3, 132–136 cm. The overlapping occurrences of Paragloborotalia mayeri and G. nepenthes and the absence of N. acostaensis indicate Zone M11 in Sample 369-U1513B-7H-CC. Samples 369-U1513B-8H-2, 1–3 cm, and 369-U1513A-8F-CC are also likely Zone M11 and are immediately above a hardground, as evidenced by highly fragmented, often stained and reworked planktonic foraminifers (including the Paleogene taxon Chiloguembelina), abundant manganese and phosphate nodules, and common fish teeth. Although age assignment for these samples is difficult, the dominant component of both sample assemblages suggests a mid- to late Miocene age. Specifically, G. nepenthes is present in Sample 369-U1513A-8F-CC, which indicates Zone M11 immediately above the hardground.
Beneath the hardground in Core 8 in both Holes U1513A and U1513B is a Cretaceous sequence spanning the lowermost Campanian to Albian. Samples 369-U1513A-9H-CC and 10H-CC are unzoned, but the planktonic foraminifer assemblages are characteristic of the uppermost Santonian to lowermost Campanian and contain Schackoina cenomana, Schackoina multispinata, rare marginotruncanids, Globotruncana linnieana, and Globotruncana neotricarinata. Sample 369-U1513A-10H-CC is from a highly disturbed core (see Lithostratigraphy) and contains recognizable downhole contamination from the upper portion of the hole. Samples 369-U1513A-11F-CC to 18X-CC; 369-U1513B-8H-2, 89–91 cm, to the bottom of the hole (14F-CC); and 369-U1513D-5R-CC to 7R-CC are assigned to the Planoheterohelix papula Zone, identified at nearby Exmouth Plateau and Kerguelen Plateau (47°–50°S) (Petrizzo, 2000, 2001). The overlapping occurrences of P. papula and the marginotruncanids is a robust and isochronous event at higher southern latitudes in the absence of the late Coniacian to Santonian Dicarinella asymetrica Total Range Zone (Petrizzo, 2003), which is applicable only at low to middle latitudes (Premoli Silva and Sliter, 1995; Robaszynski and Caron, 1995; Petrizzo, 2000; Gradstein et al., 2012). The lowermost occurrence (LO) of G. linnieana (a secondary marker for the base of the Santonian) (Lamolda et al., 2014; Petrizzo et al., 2017) coincides with the base of P. papula in Holes U1513A (115.48 ± 6.79 m CSF-A) and U1513B (deeper than 98.57 m CSF-A) (Table T6). In Hole U1513D, it G. linnieana occurs within the P. papula Zone (130.13 ± 5.57 m CSF A), permitting the division of the Santonian (Section 369-U1513D-5R-CC) and upper Coniacian sediments (Core 6R and Sample 7R-CC) observed in southern Tanzania (Petrizzo et al., 2017). Division of the P. papula Zone is further supported by the LO of G. neotricarinata, a marker taxon for the upper Santonian (Petrizzo et al., 2011) that falls within the P. papula Zone in Hole U1513A (at 96.29 ± 0.59 m CSF-A) and coincides with the LOs of P. papula and G. linneiana in Hole U1513B (deeper than 98.57 m CSF-A). Globotruncana neotricarinata was not recorded in Hole U1513D.
Samples 369-U1513A-19X-CC to 27X-CC and 369-U1513D-8R-2, 73–75 cm, to 11R-CC are within the stratigraphic interval between the base of the P. papula Zone and the highest occurrence (HO) of the distinctive Falsotruncana maslakovae taxon (Caron, 1981; Wonders, 1992; Petrizzo, 2000, 2001, 2003). This interval is designated as Coniacian and is considered equivalent to the upper portion of the Dicarinella concavata Zone in the tropical zonation scheme (Premoli Silva and Sliter, 1995; Robaszynski and Caron, 1995; Gradstein et al., 2012), to the Marginotruncana marianosi Zone on the Exmouth Plateau (Petrizzo, 2000), and to the Marginotruncana marginata Zone in the transitional realm zonation (Petrizzo, 2003). Planktonic foraminifers are generally common, and the assemblage is mainly composed of Marginotruncana coronata, Marginotruncana pseudolinneiana, Whiteinella baltica, Whiteinella brittonensis, Muricohedbergella holmdelensis, Muricohedbergella flandrini, and Planoheterohelix globulosa.
Below the equivalent of the D. concavata Zone, the F. maslakovae Zone, defined by the total range of the nominate taxon, was identified between Samples 369-U1513A-28X-CC and 32X-CC (Table T11) and between Samples 369-U1513D-12R-CC and 15R-CC (Table T13). The F. maslakovae Zone is equivalent to the lower portion of the D. concavata Zone and to the Marginotruncana schneegansi Zone in tropical biozonation schemes (Premoli Silva and Sliter, 1995; Robaszynski and Caron, 1995; Gradstein et al., 2012) and spans the lower Coniacian through upper Turonian (Petrizzo, 2003; Huber et al., 2017). The HO of F. maslakovae has not yet been calibrated and is therefore not reported in Table T6. In general, planktonic foraminifers are rare to common in Hole U1513A, and preservation ranges from poor to moderate. The assemblage is dominated by whiteinellids (W. baltica, W. brittonensis, and Whiteinella paradubia), muricohedbergellids, and a few keeled species of Marginotruncana. The same stratigraphic interval in Hole U1513D is characterized by rare, poorly preserved planktonic foraminifers and very rare keeled species. To improve the biostratigraphic data, thin sections from Samples 369-U1513D-12R-CC to 14R-CC and 16R-CC were evaluated. Although planktonic foraminifers are sparse, the species observed in thin sections compare well with observations from washed residues.
Between Samples 369-U1513A-33X-CC and 46X-CC and between Samples 369-U1513D-16R-CC and 25R-CC, planktonic foraminifers are typically very rare, relatively small (<200 µm), and moderately to poorly preserved. A number of samples within this interval are barren (Samples 369-U1513A-45X-CC and 369-U1513D-16R-CC to 18R-CC, 23R-CC, and 24R-CC). Therefore, this stratigraphic interval is unzoned in both Holes U1513A and U1513D, although a Cenomanian to late Albian age is inferred based on the presence of rare Globigerinelloides bentonensis. From Sample 369-U1513A-46X-CC to the bottom of the hole (Core 50X), foraminiferal preservation and abundance slightly increase. Although unzoned, the planktonic foraminiferal assemblage is characteristic of the middle Cenomanian to late Albian and includes microhedbergellids, Praeglobotruncana stephani, W. baltica, and W. brittonensis. This age range is confirmed by the identification of a single specimen of Thalmanninella gandolfii in Sample 369-U1513A-47X-2, 130–133 cm; this species is documented as ranging across the Albian/Cenomanian boundary interval at low latitudes (Kennedy et al., 2004; Petrizzo et al., 2015).
Samples 369-U1513D-26R-1, 68–71 cm, to 26R-CC are assigned to the Thalmanninella appenninica and Pseudothalmanninella ticinensis Zones of the upper Albian based on the overlapping ranges of Ticinella primula, small biserials, and Microhedbergella praeplanispira (Petrizzo and Huber, 2006; Gale et al., 2011; Huber and Leckie, 2011; Haynes et al., 2015). The HO of T. primula (Sample 26R-1, 68–71 cm), a datum occurring in the T. appenninica Zone (Petrizzo and Huber, 2006), has been calibrated in the Vocontian Basin (Gale et al., 2011; Gradstein et al., 2012) (Table T6). The LO of Biticinella breggiensis in the mid-Albian indicates the base of the B. breggiensis Zone below Sample 32R-CC; Samples 33R-CC and 34R-CC are barren.
Samples 369-U1513D-33R-CC to 64R-CC are predominantly barren with the exception of isolated occurrences of Microhedbergella spp. in Cores 35R and 40R. The occurrence of Microhedbergella rischi in Sample 40R-CC indicates that the sediment in this sample is no older than the earliest Albian (112.96 Ma). Below this level, toward the bottom of Hole U1513D, core catcher sample lithology becomes increasingly difficult to process. Hence, Cores 54R, 59R, 61R, 62R, and 65R were not analyzed. Cores 66R through 75R are basalt; thus, they were not analyzed.
Benthic foraminifers
All Hole U1513A and U1513D core catcher samples (except for 369-U1513A-4H-CC and 369-U1513D-1R-CC, as well as below Core 64R) were analyzed for benthic foraminifers. In addition, three Hole U1513B core catcher samples were scanned. Benthic foraminifers are present in most samples (Tables T14, T15, T16), and selected benthic foraminiferal taxa are shown in Figure F16. Of the samples examined, benthic foraminifers are present in 27 samples, rare in 21 samples, frequent in 17 samples, and dominant in only 5 samples. Thirty-nine samples are barren of benthic foraminifers.
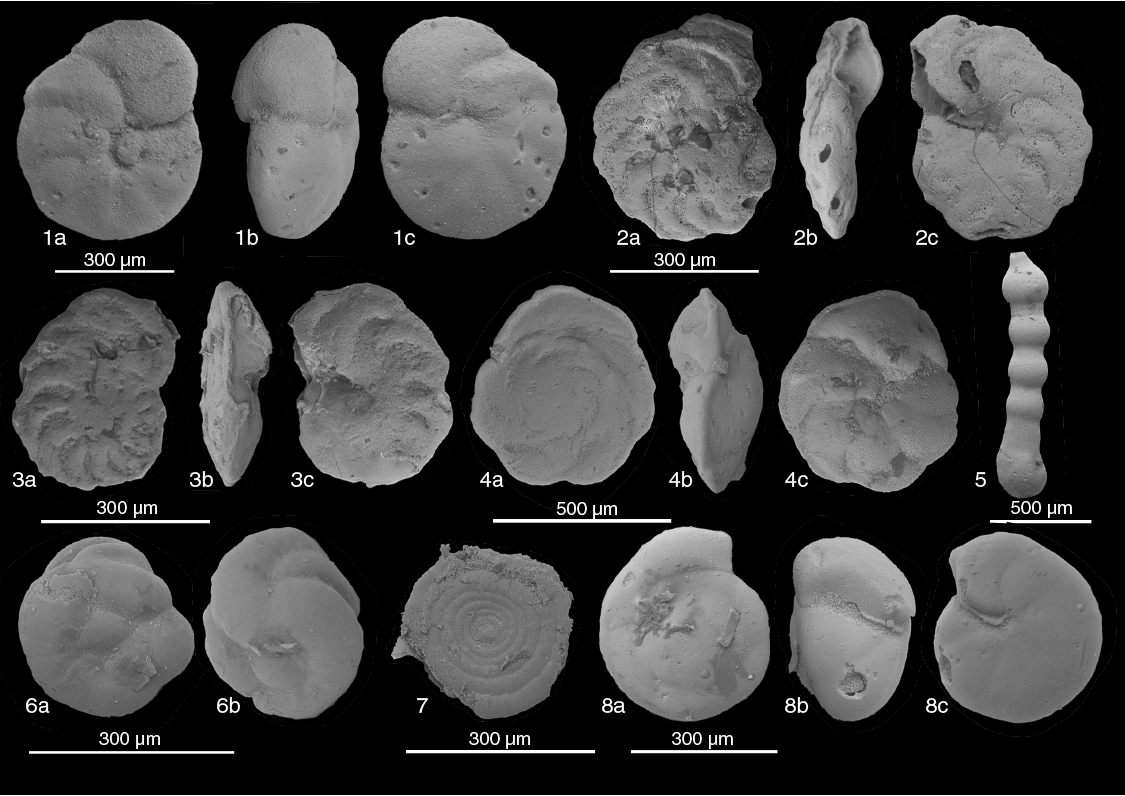
Figure F16. Benthic foraminifers.
Pleistocene to Miocene benthic foraminiferal communities recovered from Hole U1513A (i.e., Samples 369-U1513A-1H-CC to 8F-CC) are characteristic of open-marine, bathyal assemblages. Calcareous-walled taxa dominate the assemblages, and no agglutinated taxa were recorded in this interval. The percentage of planktonic foraminifers relative to benthic forms in this interval is >90%. The assemblages are dominated by infaunal taxa such as Uvigerina sp., Dentalina sp., and Fursenkoina sp.
The Cretaceous sequence in Hole U1513A (Samples 369-U1513A-9H-CC to 50X-CC) spans the lower Campanian/Santonian to Cenomanian/Albian. Two distinct benthic foraminiferal assemblage types are recognized within this interval: calcareous-walled taxa dominate the benthic foraminiferal community in the lower Campanian through mid-Turonian, and agglutinated taxa dominate lower assemblages.
The benthic foraminiferal assemblage in Samples 369-U1513A-9H-CC to 36X-CC is characterized by the frequent occurrence of Notoplanulina sp. aff. N. rakauroana, abundant gavelinellids (including Gavelinella stellula Belford), Eponides concinnus, diverse dentalinids and lenticulinids, and the agglutinated taxon Dorothia oxycona. The percentage of planktonic foraminifers relative to benthic forms fluctuates between 80% and >99% but decreases to 40% in the Turonian (Cores 28X through 42X). The high abundance of planktonic foraminifers during the Coniacian and the paleowater depth ranges of benthic foraminifers farther downhole indicate that Site U1513 was at midbathyal paleodepths throughout the lower Campanian to mid-Turonian.
Benthic foraminifers are sparse or absent between Samples 369-U1513A-34X-CC and 43X-CC. Agglutinated foraminifers dominate the benthic foraminiferal assemblages in Cores 45X through 50X. The most common taxa recorded in this interval are Glomospira sp., Ammodiscus sp., and elongated tubular agglutinated forms such as Psammosiphonella sp. The agglutinated foraminiferal assemblage is frequently accompanied by the occurrence of Lenticulina spp. and Gavelinella spp. The presence of Glomospira in the majority of samples in this interval indicates a bathyal water depth (Kaminski and Gradstein, 2005).
Benthic foraminiferal assemblages recorded in Hole U1513B (Samples 369-U1513B-9F-CC, 12F-CC, and 14F-CC) are consistent with observations from Hole U1513A.
Benthic foraminiferal assemblages in Samples 369-U1513D-5R-CC to 40R-CC span the Santonian through Albian and are similar in composition to those in Hole U1513A from the same time intervals. The early Albian assemblages are similar to those from the Cenomanian. Samples 41R-CC to 47R-CC, 49R-CC, 51R-CC, and 53R, 12–15 cm, to 64R-CC are barren of benthic foraminifers. The remaining foraminifer-bearing samples throughout this interval indicate a midbathyal (or shallower) paleodepth based on the presence of Quinqueloculina sp. and Lenticulinella sp.
Dinocysts
Cretaceous organic-walled dinocyst taxa were found during routine scanning of the >45 µm sieve size fraction of samples at Site U1513. Dinocysts are sporadically present from Core 369-U1513A-47X to Sample 50X-CC and from Core 369-U1513D-20R to Sample 40R-CC (Table T4). A number of different morphotypes are illustrated in Figure F17, including some specimens from the genus Oligosphaeridium. These cores correspond to Albian to Cenomanian sediments based on calcareous plankton age determinations (Tables T5, T6). Younger dinocysts occur in a single sample (369-U1513A-25X-CC) from the upper Turonian. No dinocysts were recorded in Hole U1513B, in which the oldest recorded sediments are Santonian.
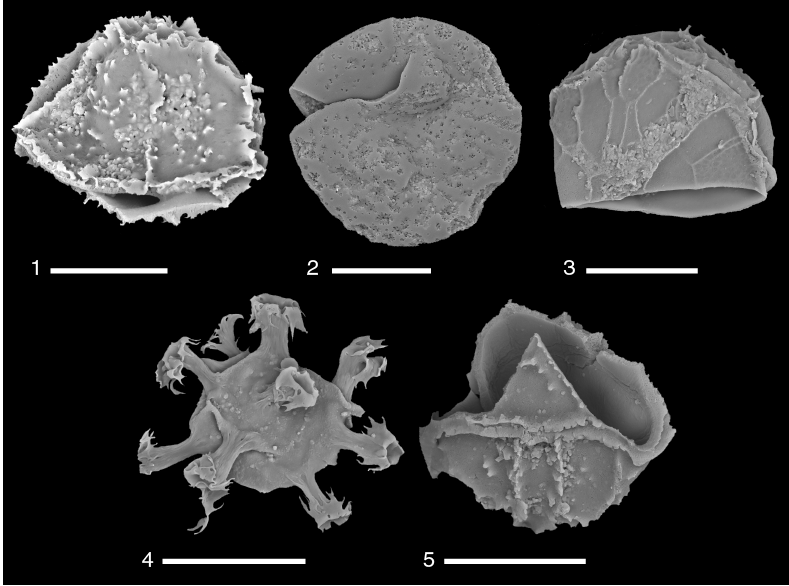
Figure F17. Cretaceous dinocyst.
Paleomagnetism
We measured the natural remanent magnetization (NRM) of all Hole U1513A, U1513B, U1513D, and U1513E archive-half sections (Cores 369-U1513A-1H through 50X, 369-U1513B-1H through 14F, 369-U1513D-1R through 75R, and 369-U1513E-2R through 9R). A total of 98 discrete samples were collected from the working-half sections in Holes U1513A and U1513D. The archive-half sections were subjected to either 10 and 20 mT alternating field (AF) demagnetization (Cores 369-U1513A-1H through 50X); 5, 10, 15, and 20 mT AF demagnetization (Cores 369-U1513B-1H through 14F); or 10, 20, and 30 mT AF demagnetization (Cores 369-U1513D-2R through 75R and 369-U1513E-2R through 9R) and measured with the pass-through superconducting rock magnetometer (SRM) at 5 cm intervals. Discrete samples were subjected to progressive AF demagnetization up to 80 mT using an in-line, automated AF demagnetizer and measured with the SRM to isolate the characteristic remanent magnetization (ChRM). To constrain the mineralogy of magnetic phases, isothermal remanent magnetization (IRM) acquisition experiments were conducted with four discrete samples (369-U1513A-10H-3, 99–101 cm; 12F-3, 75 cm; 14F-3, 75–77 cm; and 24X-1, 23–25 cm).
Natural remanent magnetization of sedimentary cores
Hole U1513A
Downhole variations in the Hole U1513A paleomagnetic results are shown in Figure F18. Hole U1513A cores (1H through 50X) were drilled with a combination of the APC/HLAPC and XCB systems. APC Cores 369-U1513A-1H through 6H were oriented with the Icefield MI-5 core orientation tool, enabling correction of magnetic declination (Table T17). Core orientation with the HLAPC and XCB systems deployed in the deeper part of Hole U1513A was not possible. APC and HLAPC core recovery is generally good, except for Core 10H, which was significantly affected by flow-in and therefore was excluded from the measurement program. Coring-induced disturbance is significant in the XCB cores, and recovery is generally low, except for Cores 46X through 48X.
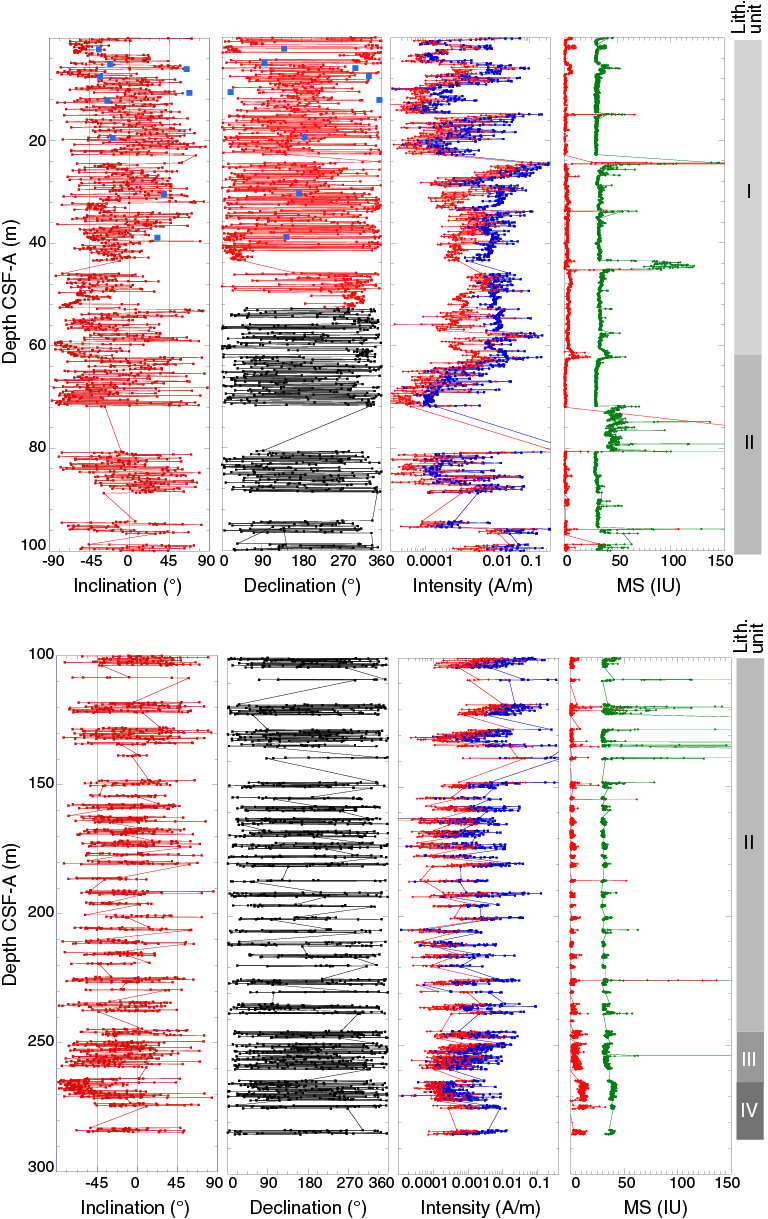
Figure F18. Paleomagnetic data, Hole U1513A.
In APC cores (shallower than ~95 m CSF-A) and XCB Core 369-U1513A-48X (~265–275 m CSF-A), NRM inclinations generally point steeply downward, indicating a drilling-induced viscous overprint (e.g., Richter et al., 2007) that can generally be removed by AF demagnetization (Figure F18). The majority of the XCB cores (~100–250 m CSF-A) exhibit a highly scattered distribution of both NRM inclination and declination values, and AF demagnetization does not appear to have effectively removed the overprint. NRM intensity in Hole U1513A sedimentary cores varies between 7.7 × 10⁻⁶ and 2.45 A/m with a mean of 1.55 × 10⁻² A/m. Overall, NRM intensity is elevated in the uppermost 10 m and between ~35 and 65 m CSF-A.
Whole-round low-field magnetic susceptibility in Hole U1513A sedimentary cores (Figure F18; see Petrophysics) is low, mostly ~5 instrument units (IU). Some intervals are characterized by negative magnetic susceptibility (e.g., most of the uppermost 28 m and 64–74 and 80–85 m CSF-A), indicating the predominance of diamagnetic material. Deeper than 260 m CSF-A, magnetic susceptibility gradual increases (Core 369-U1513A-48X and deeper). Striking magnetic susceptibility spikes >1000 IU occur at ~92, 120, 128, 134, and 225 m CSF-A, corresponding to the tops of Cores 16X, 19X, 21X, and 40X, respectively, and suggest strong magnetic contamination by the XCB system. Indeed, a 1 cm piece of metal from an XCB cutting shoe was recovered from the uppermost 10 cm of Core 40X. In addition, several cores with low and almost constant whole-round magnetic susceptibility show relatively high NRM intensity at section ends (e.g., 246.5 m CSF-A, between Sections 45X-2 and 45X-3), suggesting that core splitting could have induced an overprint to the sedimentary cores (Fuller et al., 2006).
Hole U1513B
Downhole variations in paleomagnetic results obtained from Hole U1513B are shown in Figure F19. Hole U1513B was cored with the APC and HLAPC systems to achieve optimum recovery of the uppermost 95 m of the sedimentary section. Cores 369-U1513B-1H through 8H were oriented with the FlexIT core orientation tool, which allows for the correction of the declination values of these cores (Table T18). Cores 9F through 14F were recovered using the HLAPC system without deploying the FlexIT core orientation tool. Hole U1513B sedimentary core recovery is excellent, except for Core 13F. In the lower half of Section 13F-2 and in Sections 13F-3 and 13F-4, we observed soft-sediment beds with an upward curvature and flow-in structure, suggesting that the sediments were sucked into the liner during core recovery. The physical properties, including the magnetic signature of these sediments, would have been significantly compromised and were therefore omitted from the paleomagnetic measurement program.
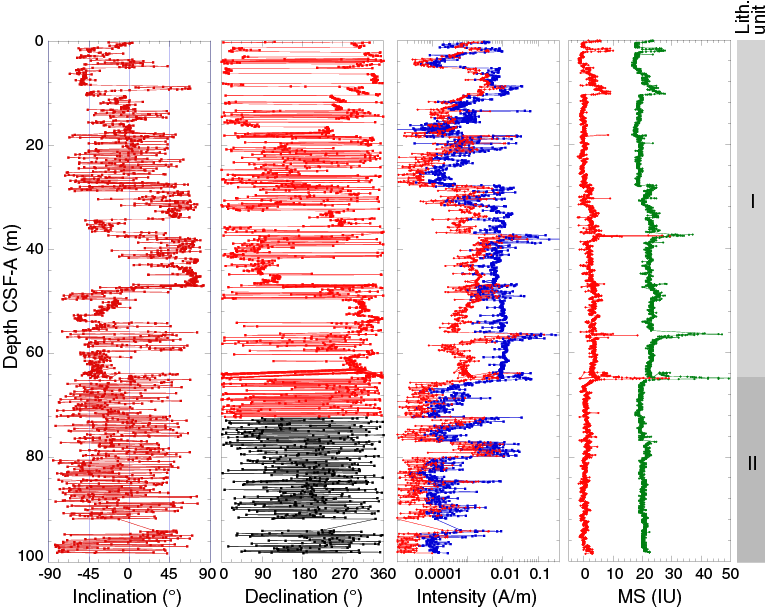
Figure F19. Paleomagnetic data, Hole U1513B.
NRM inclinations generally point moderately to steeply downward, indicating a drilling-induced viscous overprint (e.g., Richter et al., 2007). The overprint was generally removed by AF demagnetization, except for the 15–25 m CSF-A interval, where NRM inclinations and inclinations after the 20 mT demagnetization treatment are indistinguishable. NRM intensity in Hole U1513B varies from 8.06 × 10⁻⁶ to 7.0 × 10⁻¹ A/m with a mean of 6.8 × 10⁻³ A/m. Overall, the 4–12 and ~28–64 m CSF-A intervals exhibit high NRM intensity (~1.0 × 10⁻² A/m) (Figure F19). NRM intensity peaks occur at 13.5, 38, 56, and 65 m CSF-A. Except for the peak at 13.5 m CSF-A, the NRM intensity peaks correspond to the top of Cores 369-U1513B-5H, 7H, and 8H, indicating drilling-induced overprints at the top of these cores. The NRM intensity peak at 13.5 m CSF-A occurs in the upper part of Section 2H-4. Because whole-round magnetic susceptibility does not display an anomaly at this depth, this NRM intensity peak may be related to core splitting (Fuller et al., 2006). It is also possible that a broken wire from the core splitter is present in this part of the core.
The majority of the whole-round low-field magnetic susceptibility values are negative in the uppermost and lowermost third of Hole U1513B (Figure F19; see Petrophysics), indicating the predominance of diamagnetic minerals. The middle part of the hole, between 28 and 66 m CSF-A, exhibits positive magnetic susceptibility mainly between 1 and 5 IU. This interval of high positive magnetic susceptibility also corresponds to relatively high NRM intensity, suggesting an increase in magnetic mineral content in this interval. Magnetic susceptibility peaks at 38, 56, and 66 m CSF-A correspond to the tops of Cores 369-U1513B-5H, 7H, and 8H, indicating drilling-induced magnetic contamination.
Hole U1513D
Downhole paleomagnetic variations in Hole U1513D are displayed in Figure F20. All sedimentary cores in Hole U1513D were drilled with the RCB system. The uppermost 95 m of Hole U1513D, which overlaps the cored interval of Hole U1513B, was not cored. The sedimentary cores consist of five major lithostratigraphic units (see Lithostratigraphy).
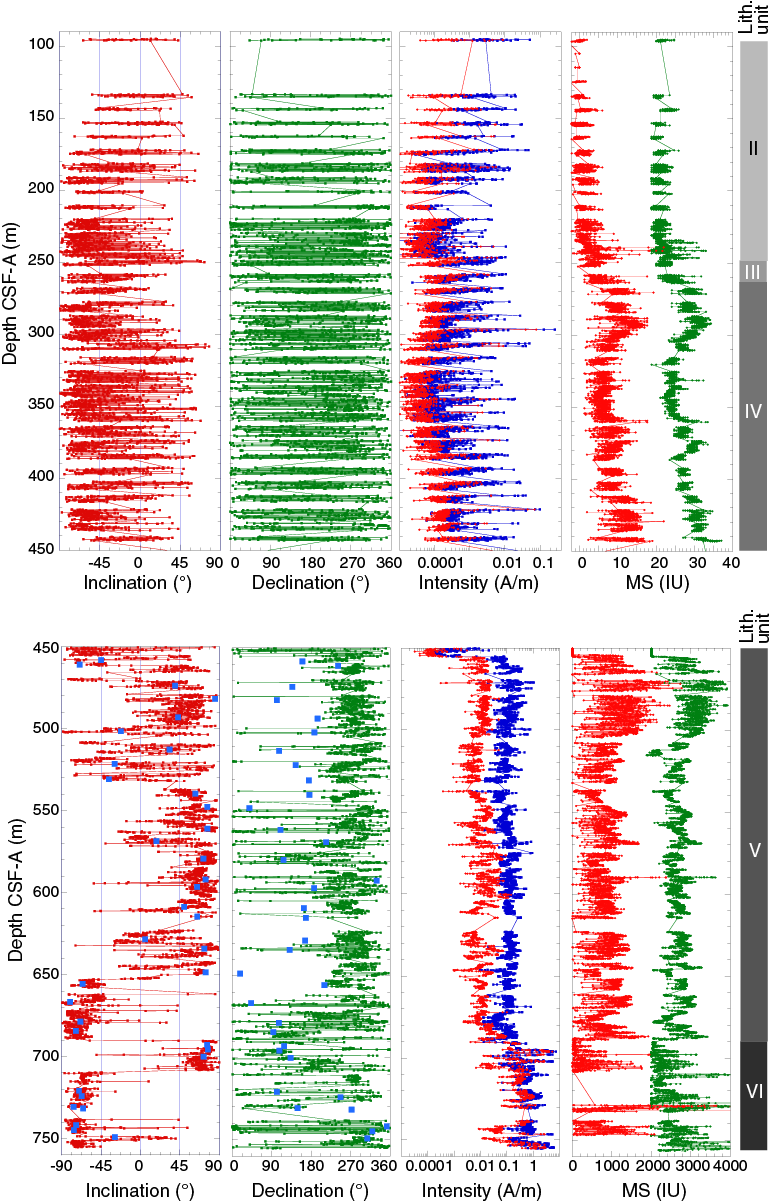
Figure F20. Paleomagnetic data, Hole U1513D.
The low recovery of sediment from the upper part of lithostratigraphic Unit II makes it impossible to discern trends in NRM variation (Figure F20). Unit II NRM inclinations and declinations show highly scattered distributions, whereas NRM in Unit III mostly displays moderate to low upward-pointing inclinations and random declinations. Mean NRM intensity decreases by an order of magnitude after 30 mT AF demagnetization, and the inclination and declination scatter remains after the 30 mT AF demagnetization treatment. NRM intensity in the sedimentary cores from Units II and III varies from 5.64 × 10⁻⁶ to 2.66 × 10⁻¹ A/m with a mean of 2.14 × 10⁻³ A/m. Moderately high NRM intensity peaks occur more frequently at the core tops from Hole U1513D than those from Holes U1513A and U1513B, suggesting stronger contamination by the RCB coring method than the less intrusive APC and XCB coring techniques.
Downhole magnetic susceptibility variations show that the majority of the sedimentary cores from lithostratigraphic Units II and III display positive magnetic susceptibility values ranging from a few instrument units to ~16 IU (Figure F20). Magnetic susceptibility in Unit II is <5 IU and shows subtle variations. Magnetic susceptibility in Unit III gradually increases downhole from ~2 to 12 IU and peaks at ~290 m CSF-A, followed by a broadly stepwise decrease to ~4 IU. Magnetic susceptibility then fluctuates around 4 IU from 320 to 360 m CSF-A, moderately increases to ~12 IU, and subsequently decreases before a gradual increase to ~16 IU at the base of Unit III.
Hole U1513E
Downhole paleomagnetic variations in Hole U1513E are shown in Figure F21. Hole U1513E was drilled for the primary purpose of obtaining downhole logs and to recover additional basalt material from lithostratigraphic Unit VI. Paleomagnetic results are comparable with those from the same depth interval in Hole U1513D. NRM intensity is strong, ranging from 2.6 × 10⁻⁶ to 13 A/m with a mean of 1.4 A/m. Magnetic susceptibility is very high, ranging from 0 to 5000 IU with a mean of 740 IU.
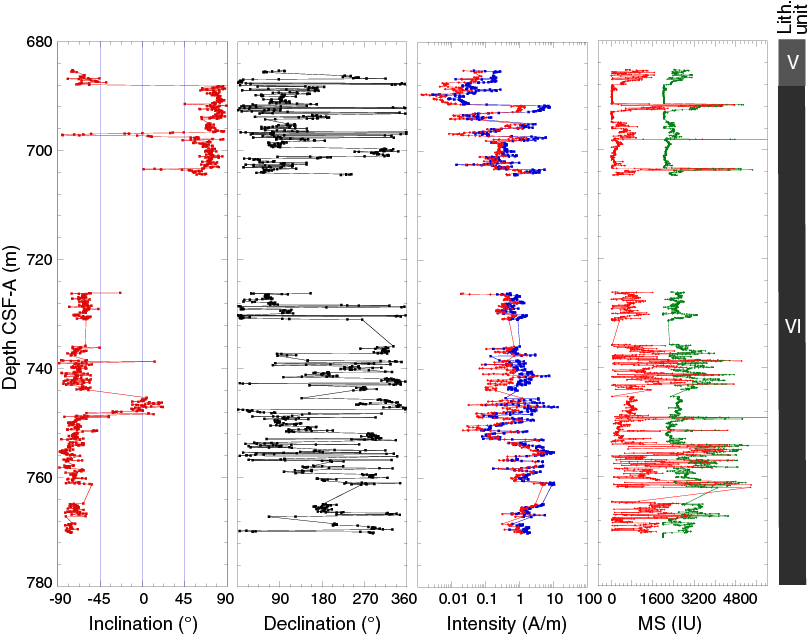
Figure F21. Paleomagnetic data, Hole U1513E.
Paleomagnetic demagnetization results
Archive-half sections of Cores 369-U1513A-1H through 50X and 369-U1513B-1H through 14F were subjected to stepwise AF demagnetization up to 20 mT. Archive-half sections of Cores 369-U1513D-2R through 66R were subjected to stepwise AF demagnetization up to 30 mT. Cores from below 690 m CSF-A consist of basalts and exhibit strong magnetic intensity, two to three orders of magnitude stronger than the sediment cores.
The demagnetization results were visually inspected using the IODP Laboratory Information Management System Information Viewer (LIVE) and the PuffinPlot (Lurcock and Wilson, 2012) and ZPlotit (http://paleomag.ucdavis.edu/software-Zplotit.html) software packages. Principal component analysis (PCA) was performed only for selected intervals using these software packages to aid in defining the ChRMs and assigning polarity. Given the amount of demagnetization data collected, it was not possible to perform a complete PCA on board because of time constraints. Nevertheless, shipboard analysis permits the determination of first-order features in the paleomagnetic demagnetization results.
The demagnetization data show that the drilling-induced magnetic overprint (Richter et al., 2007) can generally be removed by AF demagnetization at 10 mT, as indicated by a large drop in magnetic intensity (e.g., Figures F18, F19, F20, F21) and significant changes in the demagnetization trajectories (Figures F22, F23, F24, F25, F26, F27). AF demagnetization up to 20 or 30 mT typically led to a >50% decrease in magnetic intensity. In many cases, ChRMs can be defined from the paleomagnetic data acquired from pass-through measurements. ChRMs can be determined by PCA using three demagnetization steps that show a trajectory decaying toward the origin. In some cases, samples display either a gradual increase or a rapid decrease in magnetic intensity and/or show erratic directions upon demagnetization. In these cases, the ChRMs cannot be isolated.
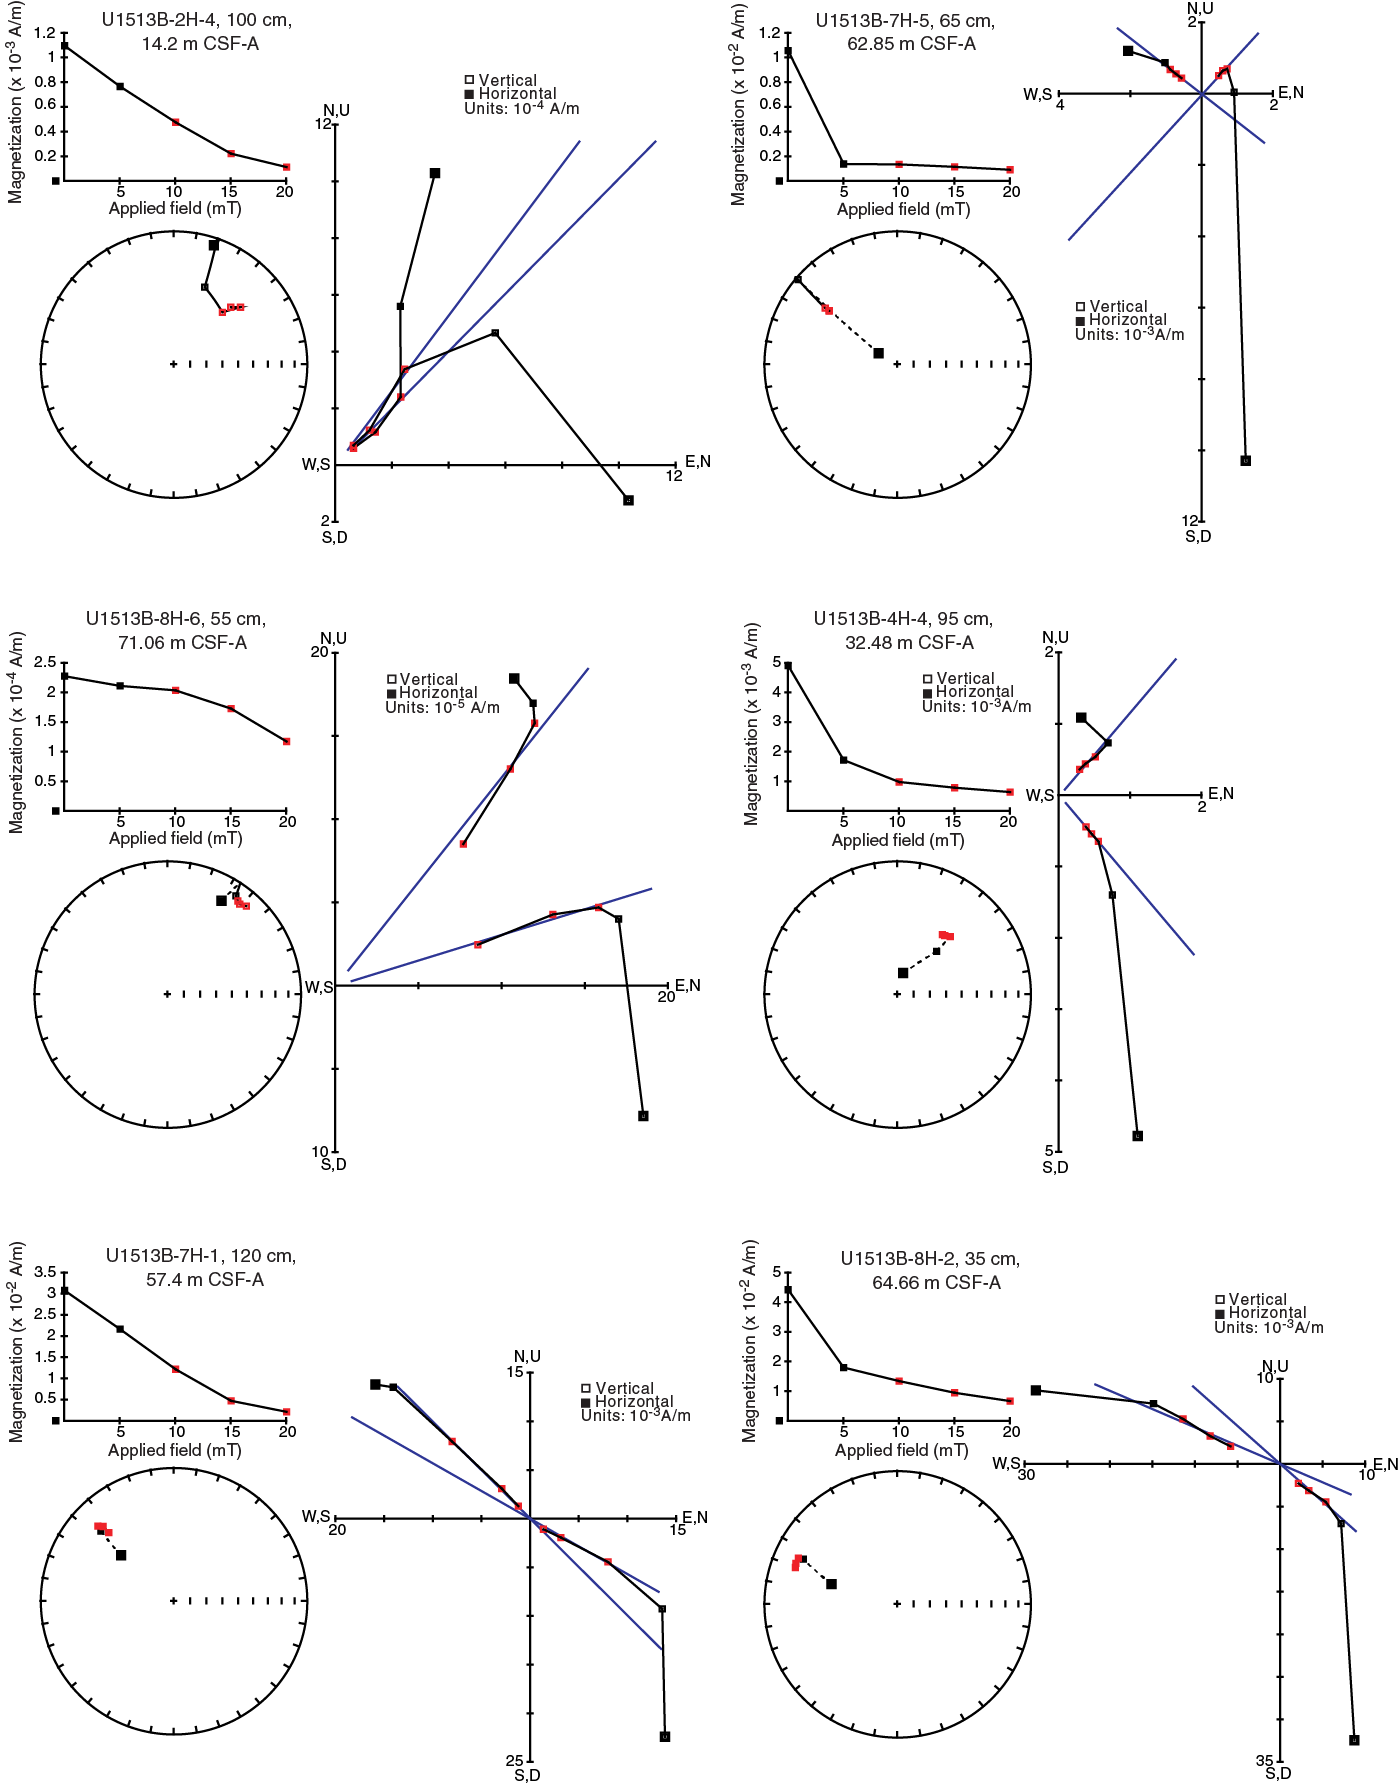
Figure F22. Section-half vector endpoint diagrams, Units I and II.

Figure F23. Section-half vector endpoint diagrams, Units III–V.

Figure F24. Section-half vector endpoint diagrams, Unit VI.
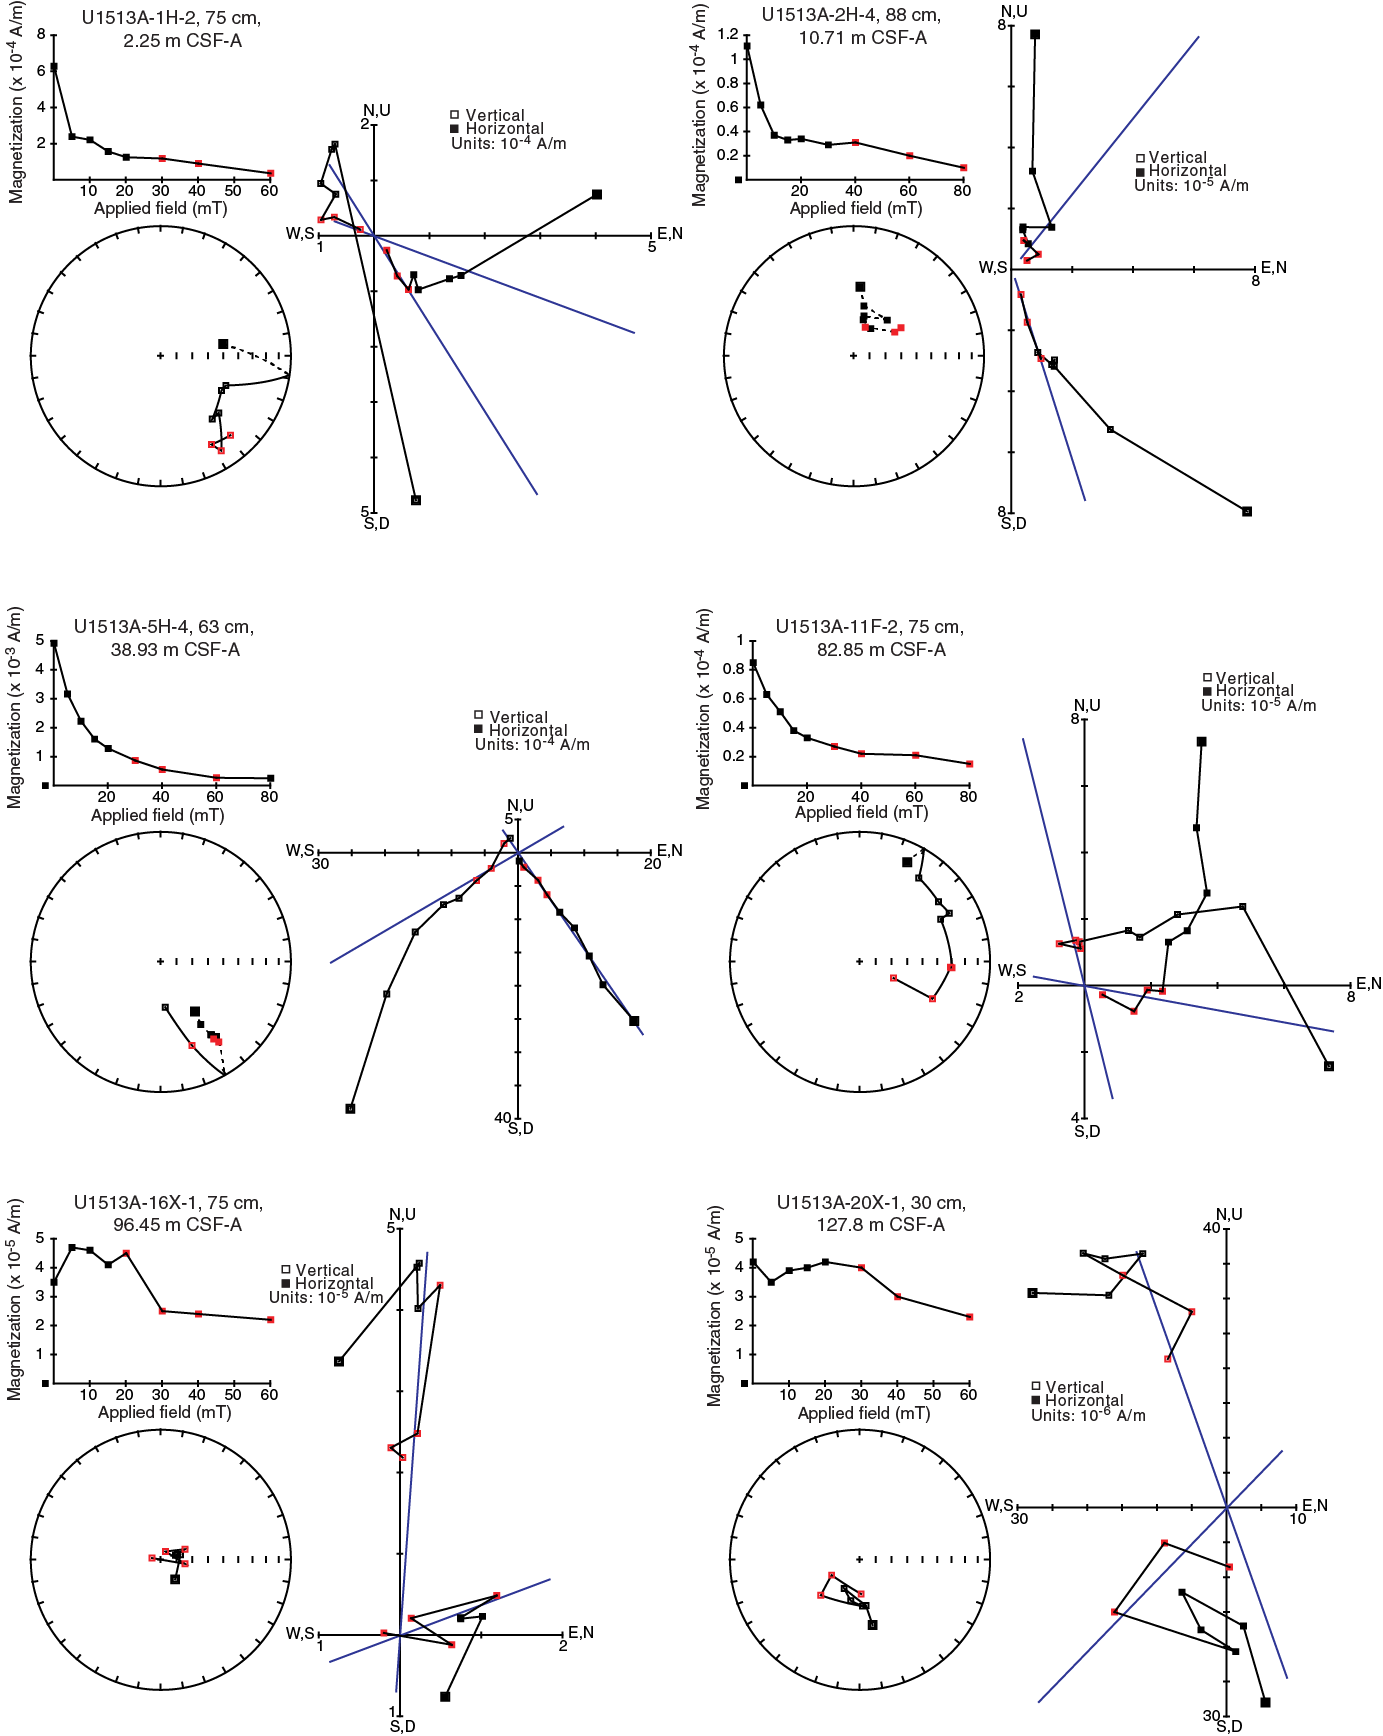
Figure F25. Discrete sample vector endpoint diagrams, Units I and II.
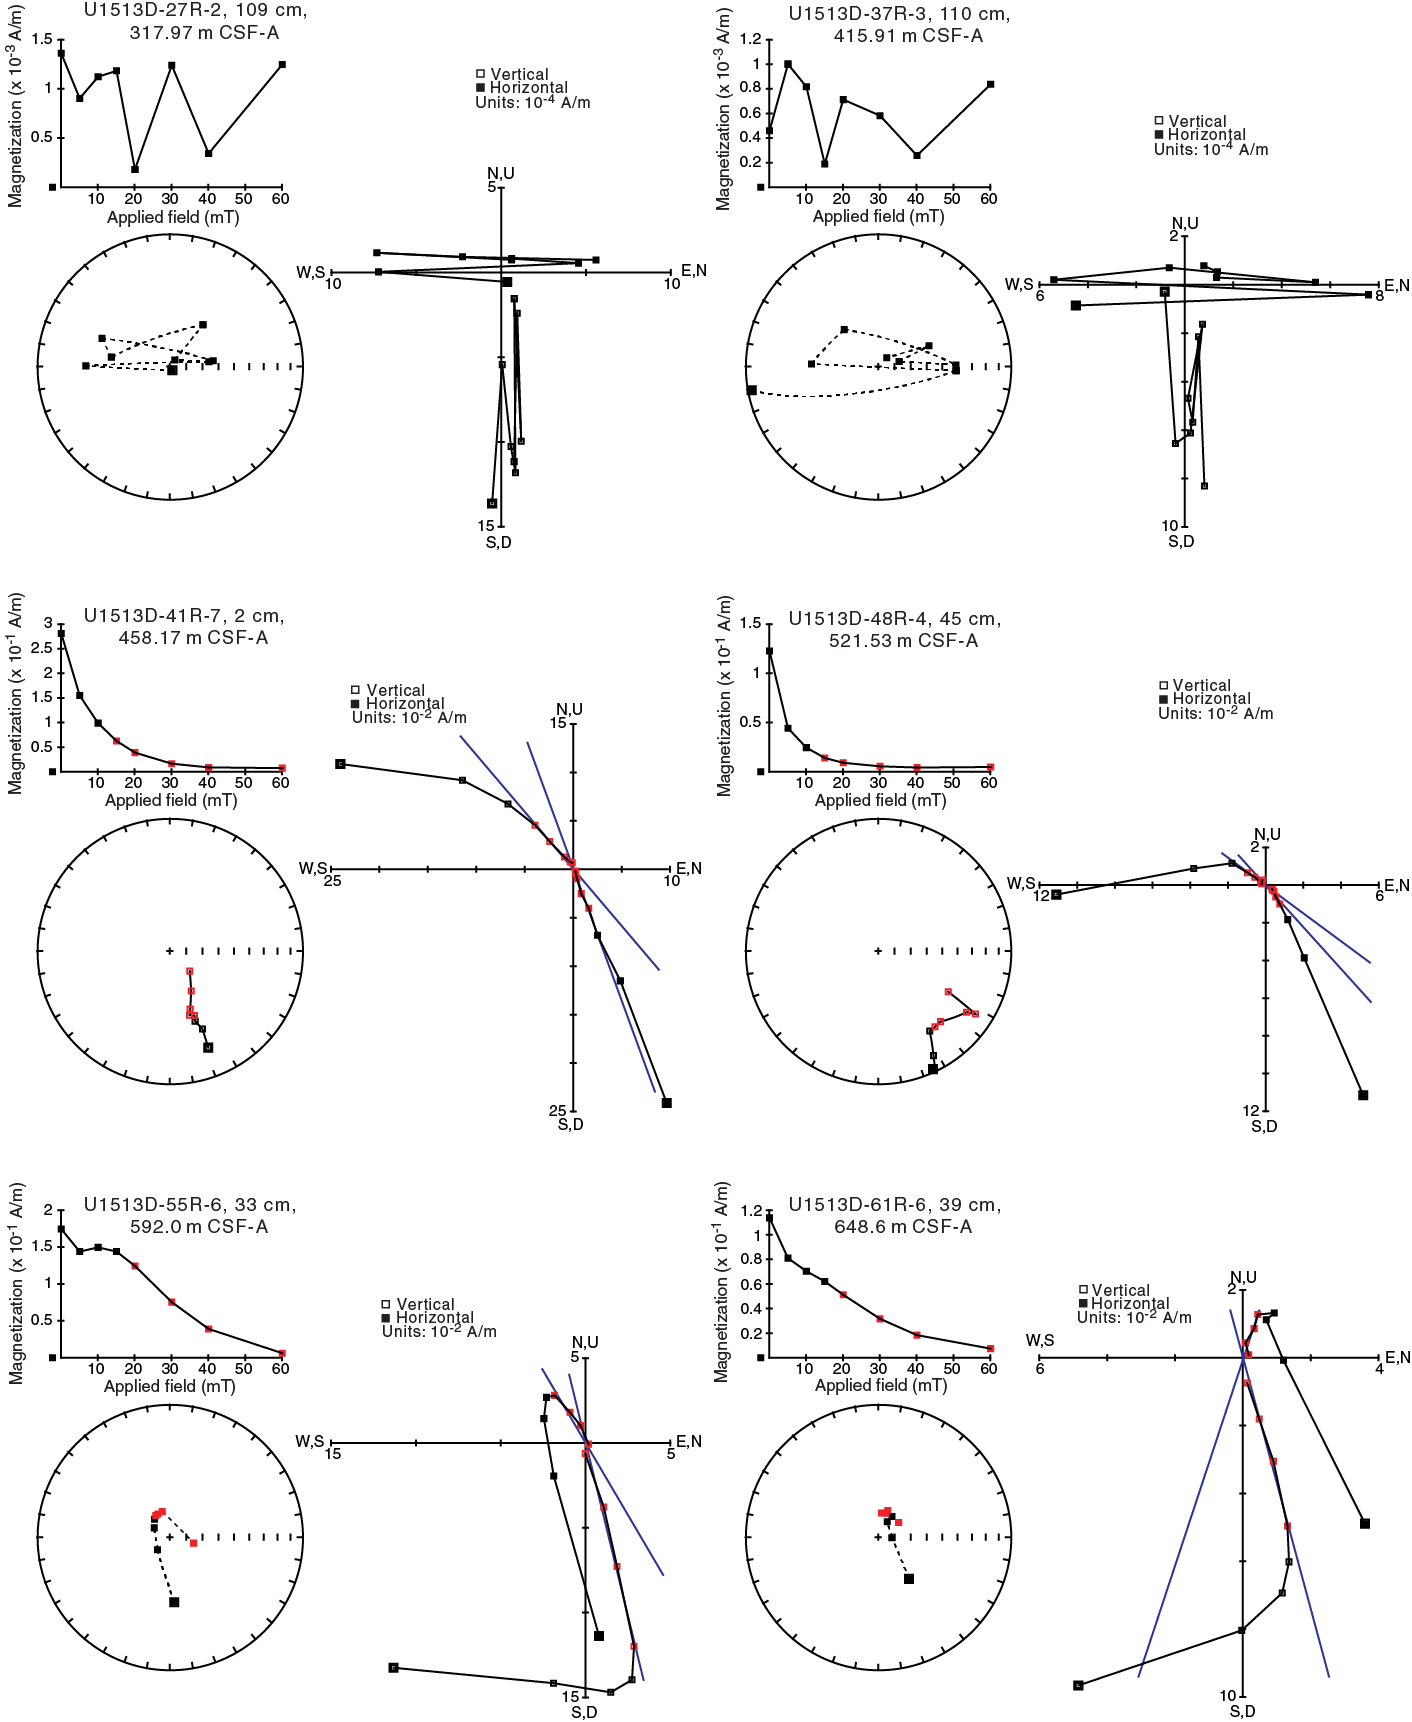
Figure F26. Discrete sample vector endpoint diagrams, Units III–V.
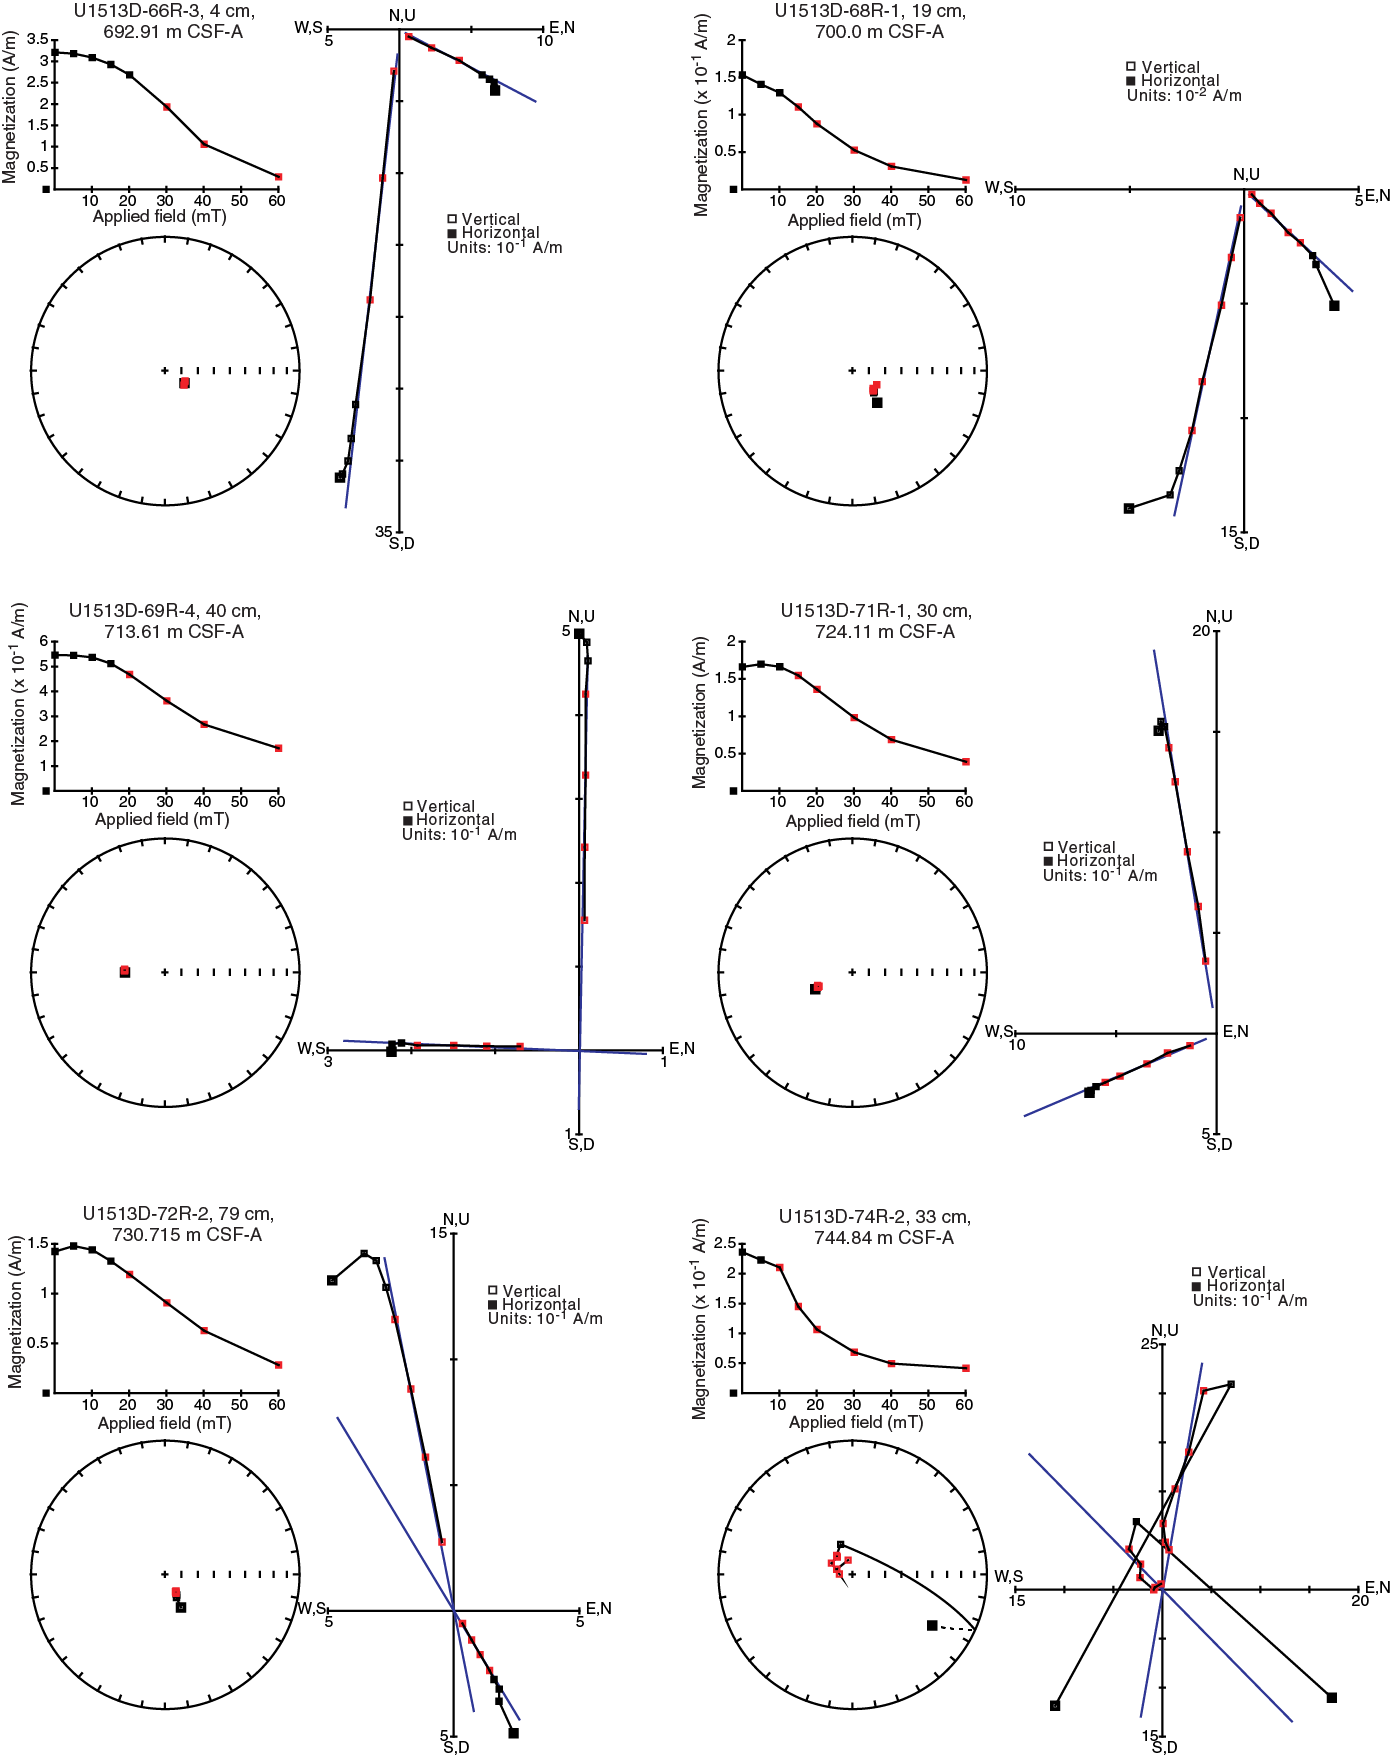
Figure F27. Discrete sample vector endpoint diagrams, Unit VI.
The NRM of 98 discrete samples from Holes U1513A and U1513D was investigated using detailed stepwise AF demagnetization up to 60 or 80 mT. Declination-corrected demagnetization data are presented in Table T19. Although the NRM intensity of calcareous ooze and chalk samples from lithostratigraphic Units I and II is low, mostly 10−4 A/m or less, most discrete samples from these two units measured with the JR-6A spinner magnetometer display a trajectory decaying toward the origin, and ChRMs can be isolated (Figures F25, F26, F27). However, the majority of the discrete samples from the two units measured with the SRM display either erratic directions or an increase in magnetic intensity upon stepwise demagnetization.ChRMs can only be resolved from 2 of the 24 discrete samples measured with the SRM. IRM acquisition data of discrete samples from Units I and II, the calcareous ooze and chalk-dominated interval, show that the samples are generally saturated by 200 mT (Figure F28), indicating that the main magnetic carriers in these samples have low coercivity. PCA results of well-resolved samples are presented in Table T20.
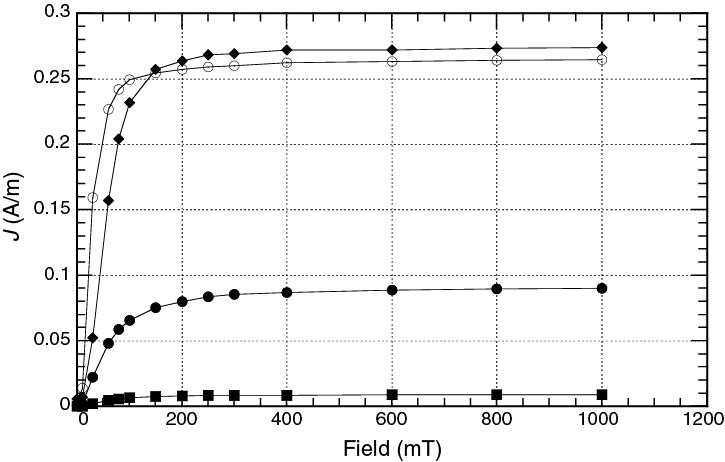
Figure F28. Discrete sample IRM acquisition.
The NRM intensity of discrete samples from Units III and IV, which are dominated by claystones, is typically ~10−3 A/m. These samples exhibit unstable trajectories upon progressive demagnetization, and ChRM cannot be defined from these samples (Figure F26). Discrete samples from Unit V, which consists of mainly black sandstone and silty claystone, generally display a two-component magnetization. The 15 or 20 mT AF demagnetization step generally cleans the lower coercivity component, and the higher coercivity component is readily identified, defining the ChRMs of these samples (Figure F26). The NRM intensity of the discrete samples from lithostratigraphic Unit IV, which is composed of altered basalts, is typically 10−1 to 10−2 A/m. The demagnetization results of all the samples show stable trajectories decaying toward the origin upon stepwise demagnetization, and ChRMs are well defined from these samples (Figure F27).
Magnetostratigraphy
We mainly used inclinations from the section-half measurements after the highest AF demagnetization treatment (20 or 30 mT) to define magnetic polarity. ChRM inclinations of discrete samples and declinations of oriented APC cores from Holes U1513A and U1513B were used as additional constraints to aid in magnetic polarity assignment. Age information from shipboard biostratigraphic analyses (see Biostratigraphy and micropaleontology) were used as the basis for making tentative correlations between the established magnetic polarity zones and the geomagnetic polarity timescale (Ogg et al., 2012). Because of the overall moderate to poor recovery and significant scatter of paleomagnetic directions in Hole U1513A, the magnetostratigraphy of Site U1513 is mainly based on the paleomagnetic results from Holes U1513B and U1513D. Paleomagnetic data from the uppermost 95 m of the APC-cored sediments in Hole U1513A are compared with those from a similar interval in Hole U1513B to refine the magnetostratigraphy of the uppermost 95 m at this site. For clarity of presentation, we divided the magnetostratigraphy of the 760 m composite section at Site U1513 into three subsections: 0–70, 70–450, and 450–760 m CSF-A (Figure F29).

Figure F29. Magnetostratigraphic results.
Intervals of dominantly positive and negative inclinations can be clearly discerned in the uppermost 65 m (Figure F29). Intervals of dominantly negative inclinations indicate normal polarity zones, and intervals of dominantly positive inclinations indicate reversed polarity zones. The first-order patterns of polarity zones recognized in Holes U1513A and U1513B are comparable and consistent, but the pattern in Hole U1513B is better defined. Inclinations between 12 and 25 m CSF-A and between 56 and 60 m CSF-A are scattered and are both positive and negative. Declinations in these intervals show dominantly southward-pointing directions, allowing us to assign a reversed polarity to these intervals. Shipboard micropaleontological studies suggest that the uppermost 65 m spans the Pleistocene to Pliocene (see Biostratigraphy and micropaleontology). Therefore, the magnetic polarity zones of the uppermost 65 m can be correlated with Chrons C1n to C2An.3n (Gradstein et al., 2012). Inclinations from deeper than 65 m CSF-A are scattered, and declinations are not available to aid in discerning the magnetic polarity because sediment from this interval was cored with the HLAPC system, which does not allow the deployment of an orientation tool.
The interval between 70 and 450 m CSF-A is dominated by calcareous ooze/chalk, silicified limestone, and claystone (see Lithostratigraphy and Petrophysics). Both declinations and inclinations show highly scattered distributions (Figure F29). Inclinations are dominantly negative, indicative of normal polarity, from ~175 to 450 m CSF-A. Inclinations overall trend toward positive values from 175 to 110 m CSF-A, which may indicate an interval of reversed polarity. Because discrete samples from this interval do not yield stable demagnetization results, no reliable ChRMs could be obtained to constrain the magnetic polarity in this interval. Shipboard biostratigraphic data demonstrate that the 70–450 m CSF-A interval spans the Campanian to Albian (see Biostratigraphy and micropaleontology). The normal polarity interval between ~175 and 450 m CSF-A is therefore assigned to the Cretaceous Normal Superchron (CNS) C34n (Ogg, 2012).
The interval between 450 and 760 m CSF-A consists mainly of sandstone and basalt (lithostratigraphic Units V and VI). Inclinations after the 30 mT AF demagnetization step exhibit a distinct pattern of dominantly positive and negative intervals. Intervals of dominantly positive (negative) inclination values are defined as reversed (normal) polarity zones (Figure F29).
We tentatively correlated the magnetic polarity zones in the 450–690 m CSF-A interval with Chrons C34n to M10N based on chronological constraints on Unit IV and regional stratigraphic correlations with this site using seismic data (https://archive-petroleumacreage.industry.slicedtech.com.au/sites/archive.petroleumacreage/files/files/2010/geology/mentelle/mentelle.html). Shipboard biostratigraphic studies suggest that the base of Unit IV (454.9 m CSF-A) is Albian and within the CNS. The reversed polarity that occurs in the uppermost part of Unit V should represent Chron M0r. Subsequently, the long interval of reversed polarity between ~470 and 500 m CSF-A is assigned to Chron M3r. Because Chrons M0r and M3r occur at the base of the Aptian and Barremian, respectively, magnetostratigraphy indicates that most of the Aptian strata are missing, and the base of the Barremian can be defined at 500 m CSF-A. Although Chrons M5r, M8r, M9r, and M10r have comparable duration, the reversed polarity zones of Chrons M9r and M10r are significantly thicker than Chrons M5r and M8r, indicating increased sedimentation rates in the Chron M9r and M10r polarity zones (Figure F13). A switch from normal to reversed polarity occurs at the boundary between sandstone-dominated Unit V and basalt Unit VI, suggesting a time gap between Units V and VI. Lithostratigraphic Unit VI contains a reversed polarity interval from 690 to 710 m CSF-A and a normal polarity interval from 710 to 760 m CSF-A. These two polarity zones may be assigned with onshore numerical age determination of the basalts. A summary of magnetostratigraphic data with age and depth information is provided in Table T21.
Petrophysics
Physical properties
Physical property data were collected from Holes U1513A, U1513B, U1513D, and U1513E. Data gaps between 70 and 300 m CSF-A caused by poorly recovered core sections from Hole U1513A were covered by core sections from Hole U1513B, which had better recovery through this interval and serves as a more complete record of this depth range. Measurements obtained from Hole U1513D provide some additional coverage over this interval and also provide data to 757 m CSF-A. No physical property data were collected for Hole U1513C because these cores were taken for postexpedition OSL analyses. The following discussion is based on integrated results from Holes U1513A, U1513B, U1513D, and U1513E.
Natural gamma radiation
NGR data show apparent cyclic behavior from the seafloor to 31 m CSF-A, with an average thickness of 5–6 m and amplitude of ~15 counts/s (Figure F30). NGR in this interval ranges from undetectable to 30 counts/s. The deconvolution of NGR from raw Natural Gamma Radiation Logger (NGRL) data (De Vleeschouwer et al., 2017) indicates that these fluctuations are due to varying K and U concentrations, whereas Th concentrations remain stable and below 2 ppm (Figure F31). These concentrations notably result in cycles in the U/Th ratio.
From 34 to 230 m CSF-A, NGR remains below 10 counts/s, with the exception of two peaks of 15 and 30 counts/s at 49 and 64 m CSF-A, respectively (Figures F30, F31). The deeper peak is related to the presence of a hardground (see Lithostratigraphy). In the uppermost 100 m, K content shows numerous sharp peaks (Figure F31). NGR gradually increases downcore from ~5 counts/s near 230 m CSF-A to a local maximum of 50 counts/s at 290 m CSF-A. Within this trend, a peak in NGR of ~40 counts/s occurs from 244 to 248 m CSF-A in the Cenomanian/Turonian boundary interval (Figure F32) (see Stratigraphic correlation). From 230 to 290 m CSF-A, U, K, and Th contents all increase (Figure F33); Th is the most pronounced, increasing from 2 to 10 ppm. This increase may be caused by increased weathering or higher supply of detrital sediment.
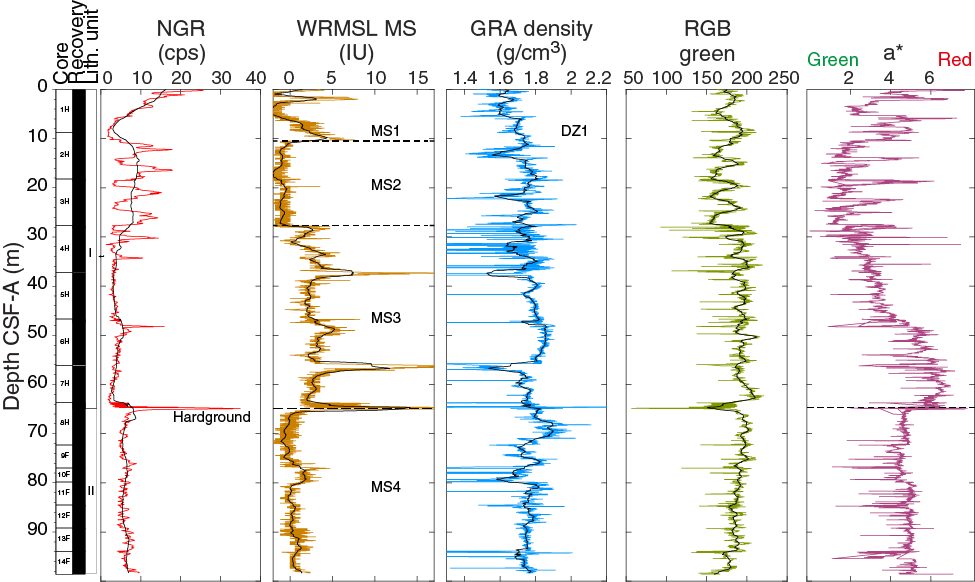
Figure F30. Core physical properties, Hole U1513B.
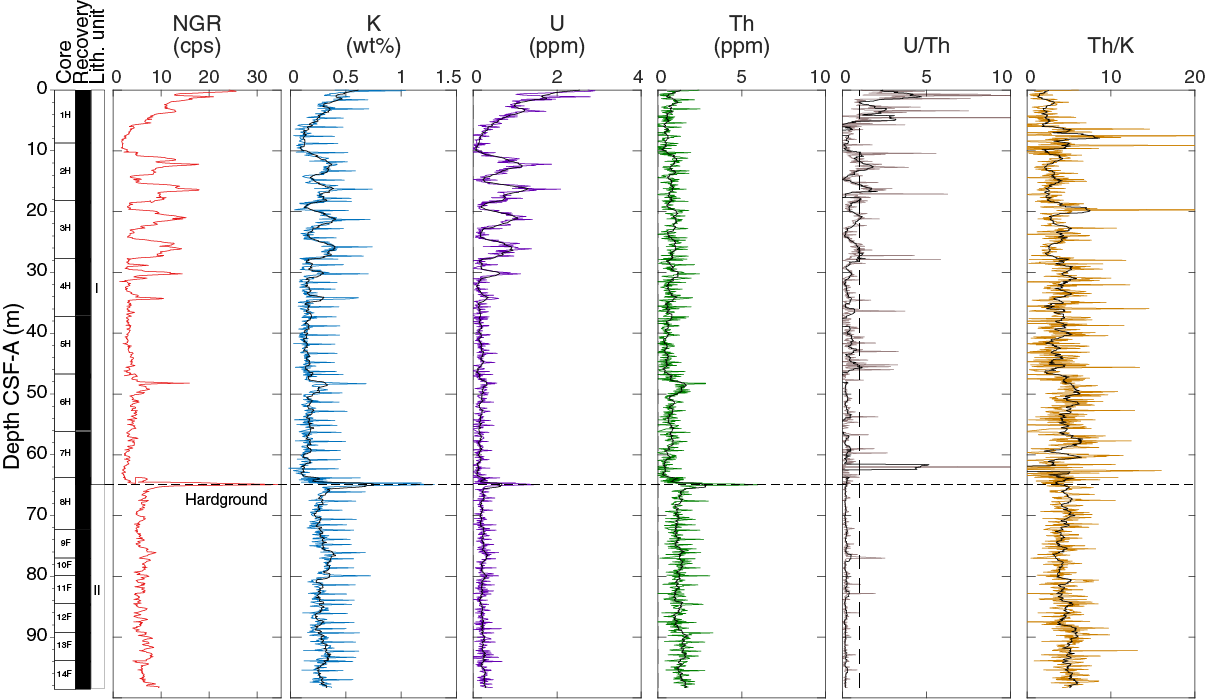
Figure F31. Downhole logging NGR, Hole U1513B.
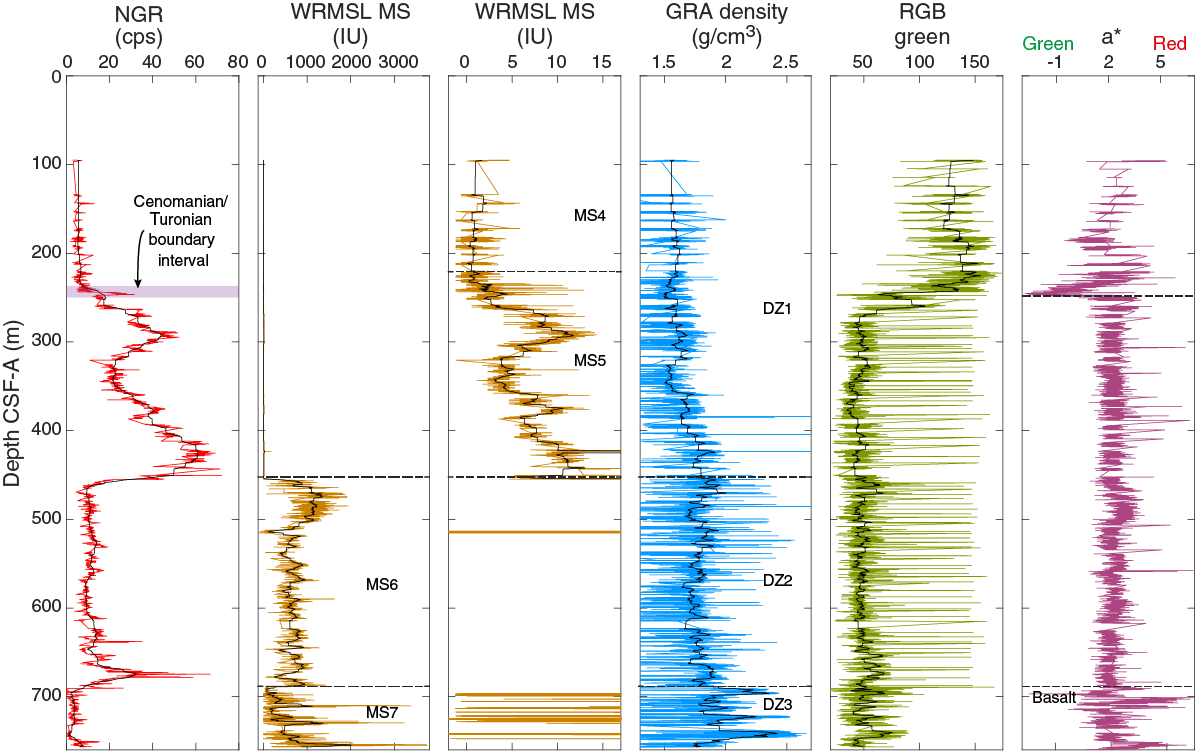
Figure F32. Core physical properties, Hole U1513D.
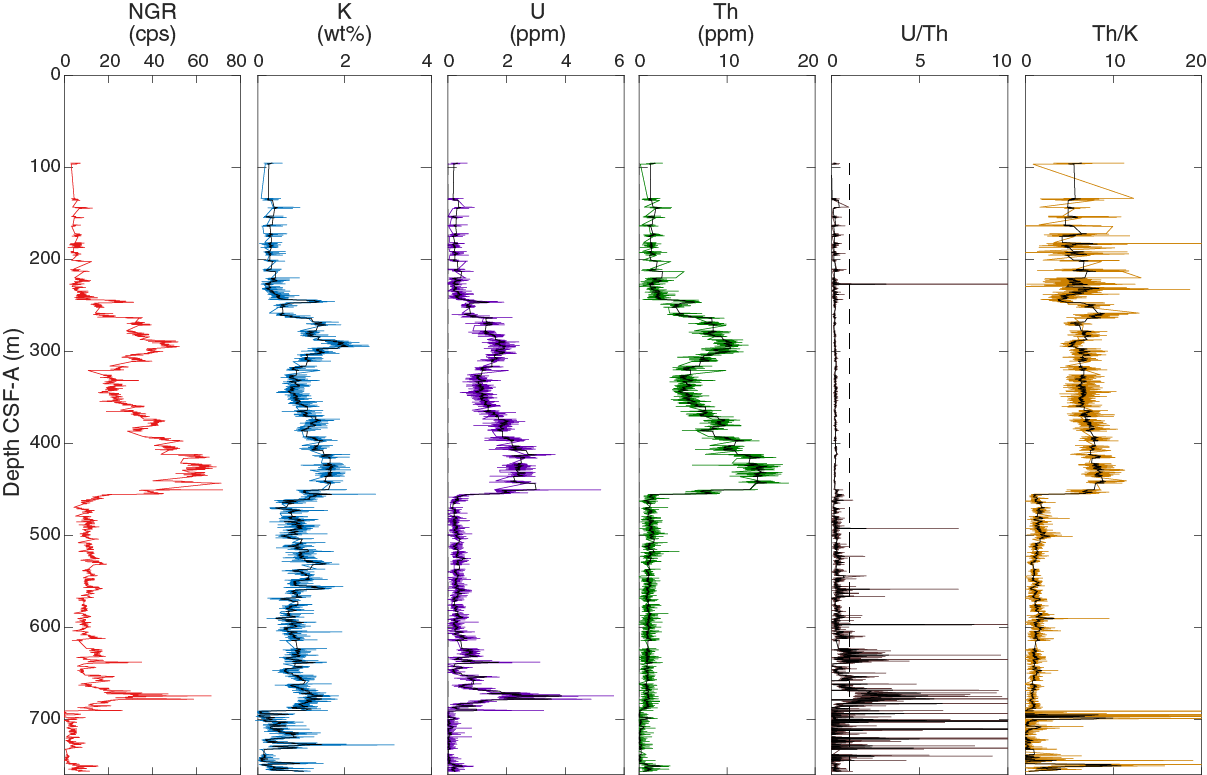
Figure F33. Downhole logging NGR, Hole U1513D.
NGR then decreases downhole to a local minimum of ~20 counts/s near 330 m CSF-A. NGR increases again between ~330 and 450 m CSF-A, where the maximum plateau of NGR (~75 counts/s) for Site U1513 was observed (Figure F32). NGR decreases sharply from 450 to 455 m CSF-A, mainly due to the scarcity of U and Th, whose concentrations decrease to trace levels; K decreases by approximately half (Figure F33). This break in NGR values is associated with the transition from siltstone-claystone to sandstone between lithostratigraphic Units IV and V (see Lithostratigraphy). The fact that K levels remain elevated but at a lower level across this transition is probably due to the presence of clay minerals in the matrix of the sandstone.
NGR remains less than 20 counts/s downhole from 460 to 630 m CSF-A. NGR then increases in several steps from 630 to 690 m CSF-A (Figure F32). K and Th concentrations remain quite stable throughout (Figure F33). However, U concentrations increase to 5.6 ppm at 675 m CSF-A, and this change is accompanied by a corresponding increase in the U/Th ratio (>10). The enrichment in U is likely linked to the presence of disseminated organic debris in the sediment observed throughout this interval (see Lithostratigraphy) because U is an organophile element.
Deeper than 690 m CSF-A, where igneous rocks were recovered (see Lithostratigraphy), the NGR series reaches its lowest mean values of around 3 counts/s (Figures F32, F34). U and Th contents are below the detection limit of the NGRL. K values increase downhole to 3.1 wt% at 730 m CSF-A (Figure F33) and then sharply decreases to below detection limit. Another increase in K content occurs between 749 m CSF-A and the bottom of Hole U1513D and is accompanied by an increase in U and Th content. The top of this layer is marked by a spike in the NGR count, most clearly seen in Hole U1513E, that coincides with a breccia interval (see Lithostratigraphy).
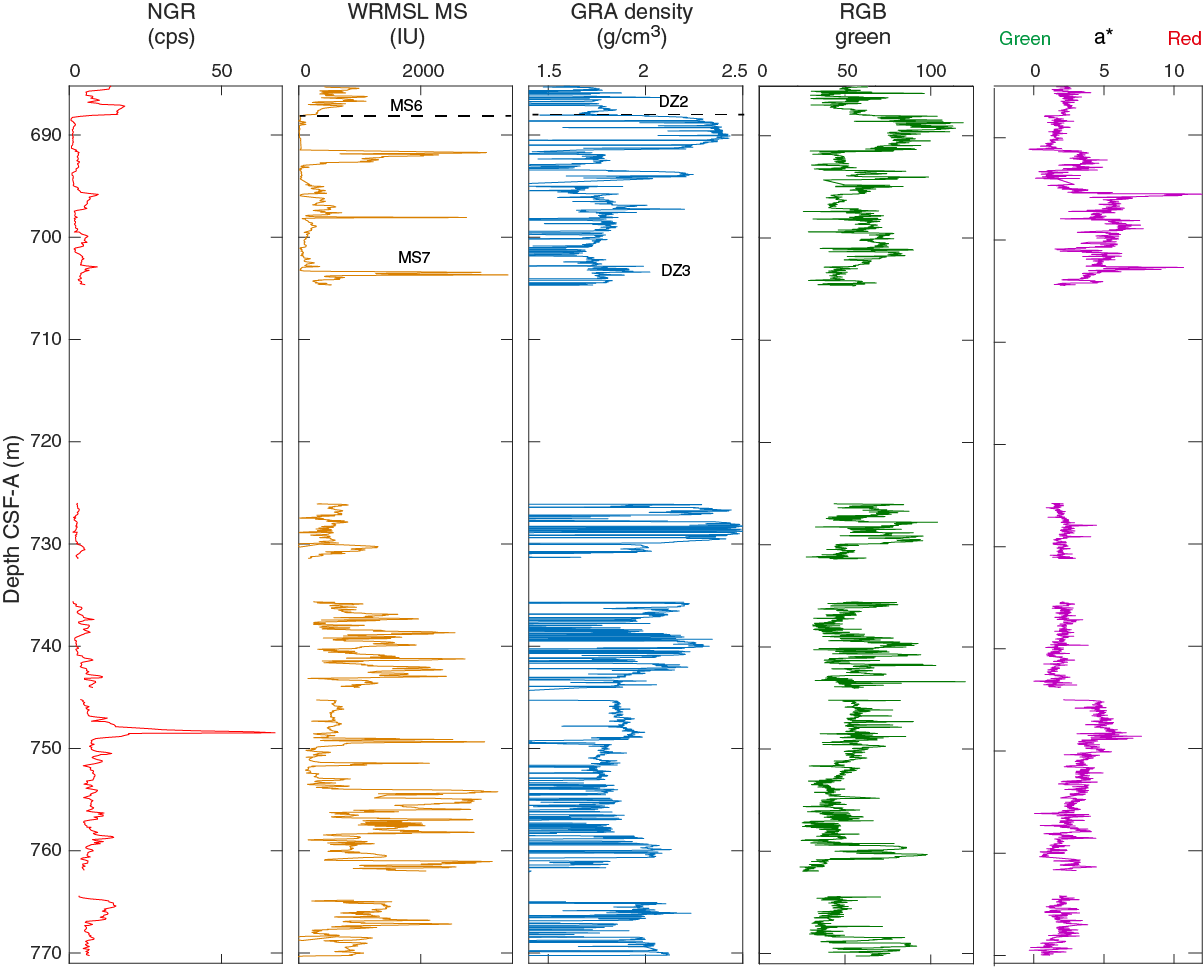
Figure F34. Core physical properties, Hole U1513E.
Magnetic susceptibility
Magnetic susceptibility was measured on all whole-round sections with the Whole-Round Multisensor Logger (WRMSL), and section-half point measurements were made on the Section Half Multisensor Logger (SHMSL). Downhole trends in the data from the two instruments are comparable, although data from the SHMSL are noisier. The following report thus refers to the values measured with the WRMSL (Figures F30, F32, F34). Magnetic susceptibility ranges from −116.23 to 3756.8 IU and can be separated into seven different zones (MS1–MS7) within the borehole on the basis of downhole trends and magnitude (see Paleomagnetism).
Zone MS1 encompasses the uppermost 10 m of the site and corresponds to magnetic susceptibility values that increase downcore and show an opposite trend to the NGR signal (Figure F30). Zone MS2 shows relatively low magnetic susceptibility compared with the intervals above and below (nearly 0 IU). This zone correlates with an interval preserving high-amplitude cycles in the NGR data and the green color reflectance (Figure F30). Zone MS3 shows magnetic susceptibility increasing to 3 IU with occasional spikes occurring at 37, 57, and 65 m CSF-A. The last spike is related to the hardground layer. Zone MS4 (65 to ~230 m CSF-A) corresponds to the predominantly calcareous ooze, nannofossil ooze, nannofossil chalk, and silicified limestone intervals (see Lithostratigraphy). This zone has relatively low magnetic susceptibility compared with that at greater depths and averages 1.6 IU in the calcareous ooze– and nannofossil ooze–dominated lithologies (shallower than 130 m CSF-A) and 0.8 IU in the nannofossil chalk (130–230 m CSF-A) (Figure F32). A change in the downhole gradient of magnetic susceptibility marks the top of Zone MS5 at ~230 m CSF-A, which coincides with a change from nannofossil chalk to a dominantly claystone lithology. Magnetic susceptibility in Zone MS5 (230–450 m CSF-A) has a higher mean value (6.7 IU) and high variance (ranging from −1.17 to 177.9 IU) compared with the shallow ooze and chalk lithologies. Peaks in magnetic susceptibility in this zone separate intervals in which magnetic susceptibility is either nearly constant or increases uniformly downhole. The trends in magnetic susceptibility correlate with similar features in the NGR data (Figure F32).
Zone MS6 is characterized by markedly higher magnetic susceptibility (mean = 716.5 IU) with much higher variance (from −116.2 to 1941.2 IU). This zone begins at the top of the sandstone lithology encountered at 450 m CSF-A and extends through the sandstone, silty claystone, and siltstone lithologies present between 450 and 690 m CSF-A. This interval displays a sawtooth pattern in the downhole magnetic susceptibility trend, with intervals of alternating steep gradient separated by cusps that define magnetic susceptibility maxima and minima. Several of these cusps correspond to lithologic boundaries, but a roughly equal number occur within lithologic intervals.
Zone MS7 extends from 690 m CSF-A to the bottom of Hole U1513D at 755 m CSF-A and from 688 m CSF-A to the bottom of Hole U1513E (Figure F32, F34). Magnetic susceptibility in this zone ranges from −2.9 to 3756.8 IU with a mean of 535.3 IU. Magnetic susceptibility varies downhole in a sawtooth pattern similar to that observed in Zone MS6 but with a variance of approximately twice. This lowermost zone correlated with an interval of low NGR and corresponds to igneous rocks and breccia intervals of lithostratigraphic Unit VI (see Lithostratigraphy).
GRA bulk density
Gamma ray attenuation (GRA) bulk density shows large variance due to differences in core diameter and recovery (Figures F30, F32, F34). Excluding sparse outliers, the highest values within a given core section are deemed to be the most reliable and are generally in agreement with those obtained from moisture and density (MAD) measurements on discrete samples (see Bulk density, grain density, and porosity). In general, trends in GRA bulk density can be separated into three zones (DZ1–DZ3; Figure F32). The upper zone (DZ1), from the seafloor to ~450 m CSF-A, is characterized by increasing density downcore from 1.6 to 2.0 g/cm3 (Figure F30, F32). This increase is locally interrupted by lower density values at 30, 60, 80, 230, 340, 390, and 450 m CSF-A.
The density decrease around 240 m CSF-A corresponds to the lithologic transition from chalk to claystone. Two other decreases at 340 and 390 m CSF-A are associated with decreases in NGR and magnetic susceptibility. The density decrease at 450 m CSF-A marks the top of Zone DZ2 and corresponds to the transition from claystone to sandstone between lithostratigraphic Units IV and V (see Lithostratigraphy). From 450 to 690 m CSF-A, density decreases downhole to about 600 m CSF-A then starts to increase again, but this trend is interrupted by several thinner intervals that show localized minima in bulk density. Zone DZ3 corresponds to the breccia and igneous rocks encountered deeper than 690 m CSF-A in Hole U1513D and 688 m CSF-A in Hole U1513E. The position of this feature correlates with Zone MS7 and a low NGR interval. In this zone, GRA bulk density generally increases with depth from 1.8 to 2.0 g/cm3. Intervals of markedly higher density occur at the top of this zone (e.g., around 690 m CSF-A) and in the lower part of the zone (730–740 m CSF-A). The average density of these two intervals is 2.3 g/cm3 and 2.5 g/cm3, respectively. Density decreases abruptly to 1.9 g/cm3 at 750 m CSF-A, remains approximately at this value to the bottom of Hole U1513D (~757 m CSF-A), and then shows alternating layers with a higher value to the bottom of Hole U1513E (770 m CSF-A).
Color reflectance
High-resolution (2 cm) reflectance spectroscopy colorimetry and RGB data such as reflectance (L*), red versus green (a*), and blue versus yellow (b*) from archive-half sections measured on the SHMSL display significant amounts of instrumental noise; however, some general trends exist. Near 65 m CSF-A, a* sharply decreases by ~1.5 at a horizon corresponding to a hardground and transition in lithologic units (see Lithostratigraphy; Figure F30). Deeper than 100 m CSF-A, a* (Figures F32, F34 is relatively constant, except for a decrease at ~245 m CSF-A. Deeper than 690 m CSF-A, a* variation corresponds to intervals of altered basalt and breccia (see Lithostratigraphy).
Green reflectance band intensity appears to correspond well to changing lithofacies in the core (see Stratigraphic correlation). Green reflectance intensity is highest at this site (>125) in the uppermost 230 m (Figures F30, F32). In this interval, ~5 m thick high-amplitude green reflectance cycles from the seafloor to 30 m CSF-A are negatively correlated to NGR (Figure F30). Green reflectance remains high and stable downhole to 230 m CSF-A. From 230 to 270 m CSF-A, green color reflectance intensity decreases markedly from 150 to <50. This decrease is accompanied by higher NGR and magnetic susceptibility and a transition to more clay rich lithologies (see Lithostratigraphy). The values remain stable with low-amplitude variability downhole to 690 m CSF-A. From this depth to the bottom of the cored depth, green reflectance varies in relation to the quick change in facies observed in the basalt unit (see Lithostratigraphy) (Figures F32, F34).
Bulk density, grain density, and porosity
The bulk density, grain density, and porosity were measured on discrete samples using MAD measurement techniques. These were typically taken from two samples per core that are representative of the overall lithology. In general, MAD measurements indicate that bulk density increases downcore relatively linearly from 1.8 to 2.2 g/cm3. Porosity decreases downcore from ~60% to 45% (Figures F35, F36). In some instances, bulk density spikes to >2.2 g/cm3 deeper than 460 m CSF-A. Also, porosity decreases to <40% in horizons with cemented beds at 465, 560, 610, and 645 m CSF-A (Figure F36). Grain density is relatively constant (~2.7 g/cm3) in the uppermost 170 m of Site U1513. This zone corresponds to an interval of nannofossil ooze, chalk, and silicified limestone (see Lithostratigraphy). From 170 to 455 m CSF-A, average grain density is slightly lower (2.5–2.6 g/cm3) and corresponds to a more clay rich interval. Grain density measurements indicate a plateau of near-maximum values (2.8–2.9 g/cm3) in an interval dominated by volcanic-rich sandstones between 455 and 690 m CSF-A.
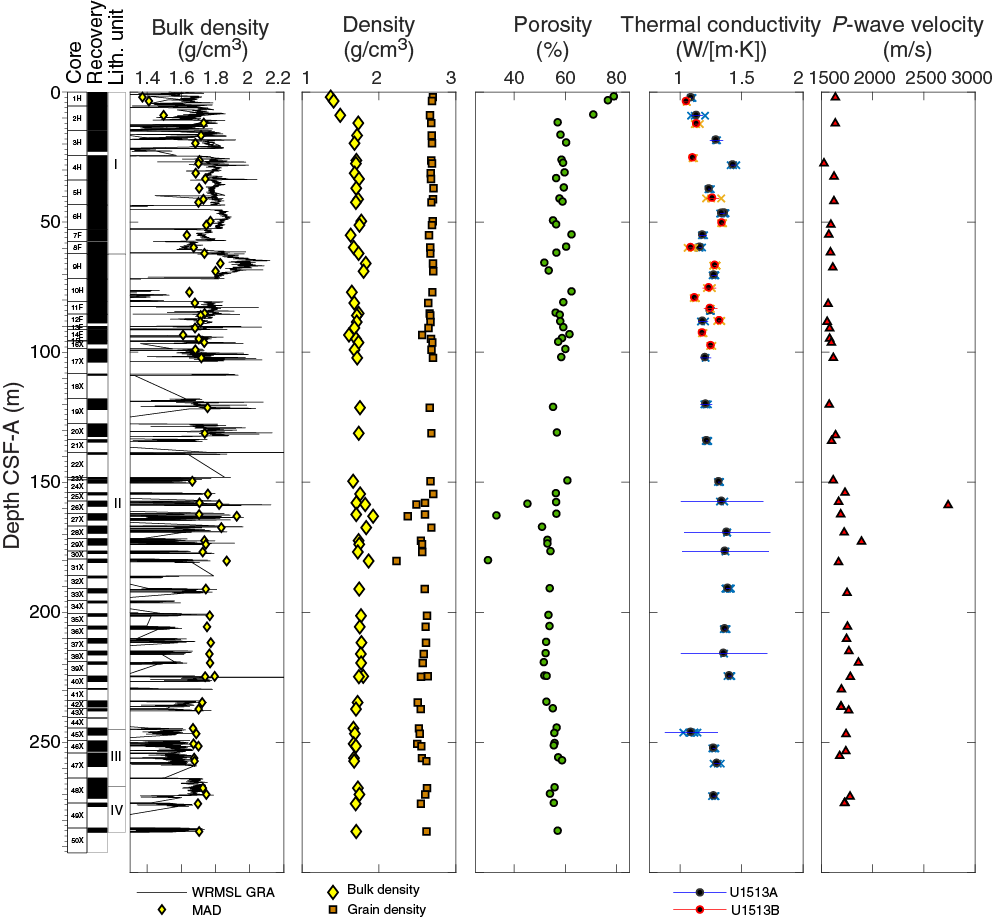
Figure F35. Density, porosity, thermal conductivity, and P-wave velocity, Hole U1513A.
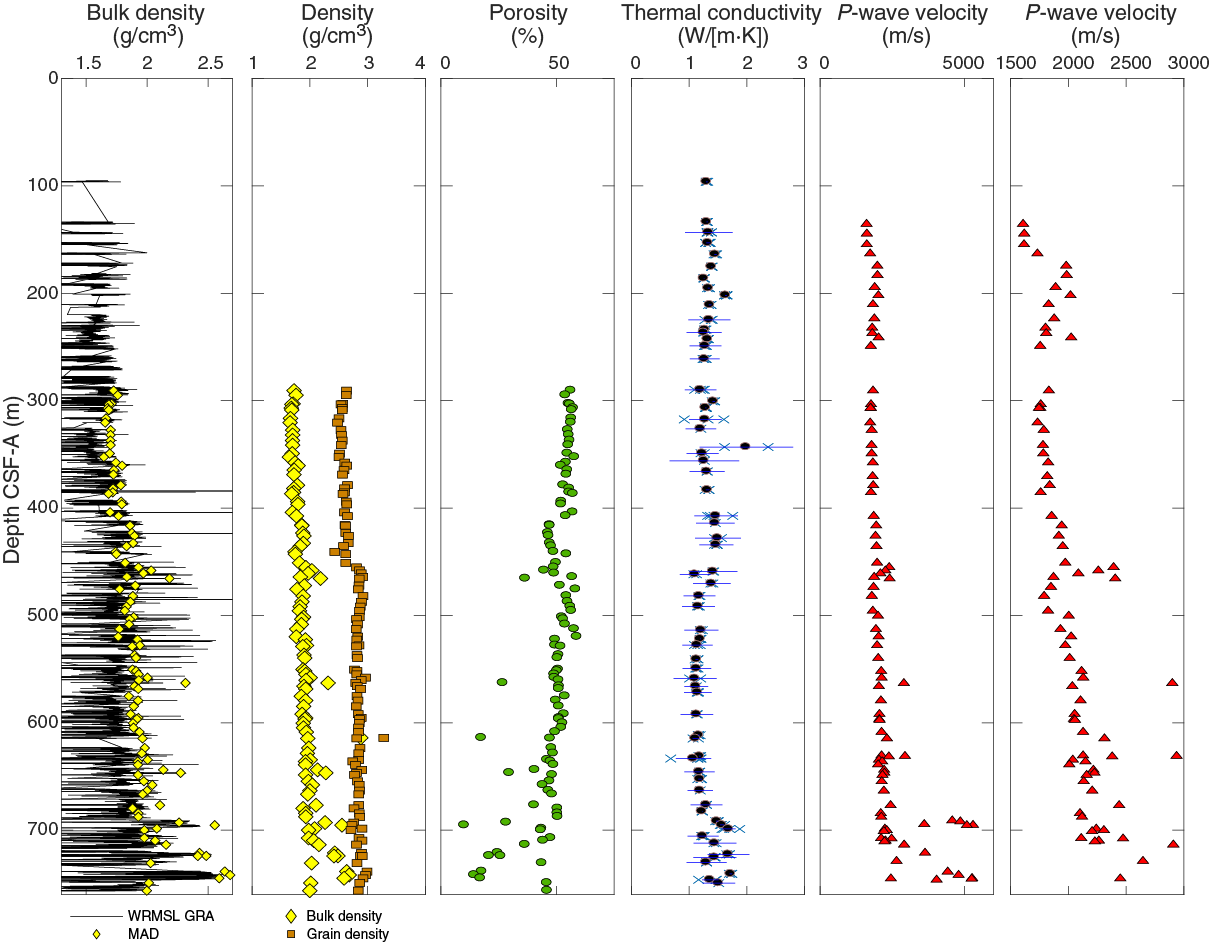
Figure F36. Density, porosity, thermal conductivity, and P-wave velocity, Hole U1513D.
Igneous rocks and breccia were recovered deeper than ~690 m CSF-A in Hole U1513D. MAD measurements are somewhat variable through this interval, with several intervals of high bulk density (~2.5–2.8 g/cm3) and low porosity (~15%–25%) and several intervals of low bulk density (~2 g/cm3) and higher porosity (~45%–50%); however, grain density varies very little (~2.8–3.0 g/cm3) (Figure F36). The intervals with higher porosity and lower bulk density correspond to highly altered porphyritic and/or vesicular basalt intervals and siliciclastic material interbedded with basalt flows (see Lithostratigraphy). No MAD analyses were performed on cores from Hole U1513E.
Thermal conductivity
Thermal conductivity was measured on less-disturbed cores, but null results were obtained from multiple sections. Nonetheless, enough data were obtained to resolve three general trends in the downhole thermal conductivity data at Site U1513 (Figures F35, F36, F37). Thermal conductivity is variable from the seafloor to 460 m CSF-A but averages ~1.2 W/(m·K). It decreases from ~460 to ~690 m CSF-A, ranging between 1.1 and 1.2 W/(m·K) in the volcanic-rich sandstone unit (see Lithostratigraphy). From ~690 m CSF-A to total depth in Holes U1513D and U1513E, thermal conductivity is variable from 1.0 to 2.2 W/(m·K).
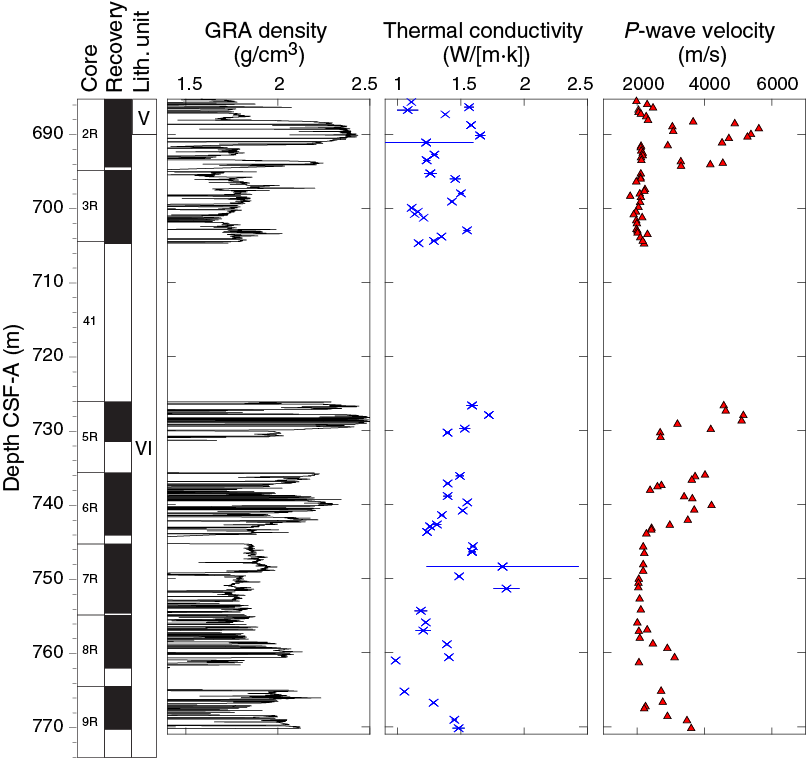
Figure F37. Density, thermal conductivity, and P-wave velocity, Hole U1513E.
P-wave velocity
For Site U1513, the WRMSL P-wave logger (PWL) measured whole-round P-wave velocity and the Section Half Measurement Gantry measured P-wave caliper (PWC) velocity on working-half sections and discrete samples (Figures F35, F36, F37). Whole-round P-wave velocity was not measured in some intervals because of scattered data and poor contact between the core and liner and is therefore not shown. Deeper than ~290 m CSF-A in Hole U1513D, PWC velocity was measured near the MAD samples. Additionally, from 305 to 451 m CSF-A, z-axis PWC velocity was also collected. The P-wave velocity in the z-axis, although similar to the P-wave velocity in the x/y-axis, is on average 4% slower, suggesting a degree of anisotropic behavior in samples measured with the PWC over this interval. The PWC automatically picks P-wave velocity values (see Petrophysics in the Expedition 369 methods chapter [Huber et al., 2019a]); however, this process was supervised, and any samples with nonrepresentative velocity values were not recorded.
Where reliable PWL P-wave velocity values were obtained, they increase with depth from ~1550 m/s near the seafloor to ~2400 m/s at total depth. PWC P-wave velocity values (Figures F35, F36, F37) measured on silicified limestone horizons (e.g., 2737 m/s at 158.85 m CSF-A) are significantly higher than those in the overlying and underlying intervals. The relatively higher velocity interval between 170 and 245 m CSF-A corresponds to a thick silicified limestone and clayey nannofossil chalk lithofacies (see Lithostratigraphy). P-wave velocity increases to ~2340 m/s in an interval of cemented sandstone near 455 m CSF-A. Deeper than 455 m CSF-A, occasional spikes (e.g., 5261 m/s at 744.79 m CSF-A) in PWC P-wave velocity correspond to lithologic changes in volcanic-rich sandstones and basalts with various degrees of alteration (see Lithostratigraphy). In general, a strong correlation exists between PWC P-wave velocity and bulk density measurements.
Downhole logging
Downhole wireline logging operations were undertaken in Holes U1513A, U1513D, and U1513E. For Hole U1513A, downhole logging was completed to 277 m wireline log matched depth below seafloor (WMSF) near the bottom of the hole. In Hole U1513D, logging operations were completed to an obstruction at ~350 m WMSF. These two holes were logged using the Quambo tool string (see Operations; see also Petrophysics in the Expedition 369 methods chapter [Huber et al., 2019a]). The drill string’s BHA was retracted to ~81.8 m WMSF in Hole U1513A and ~157 m WMSF in Hole U1513D; at shallower depths, the BHA interfered with borehole measurements.
Hole U1513E was drilled primarily as a borehole for downhole logging and also to core an additional section of basaltic material (see Operations). The first logging run of Hole U1513E utilized the Quambo tool string (see Figure F24 in the Expedition 369 methods chapter [Huber et al., 2019a]), which measured resistivity, acoustic velocity, density, and NGR. However, initial logging was aborted due to possible equipment malfunction or a blockage in the drill string at 325.5 m WMSF. After pumping seawater downhole to flush out and reduce the risk of deeper obstructions, the VSI tool was deployed for seismic check shots between 251 and 641 m WMSF (3051.1–3440.9 m wireline log depth below rig floor [WRF]). This was followed by FMS and APS logging between 425 and 610 m WMSF. Lastly, a triple combo tool string (without magnetic susceptibility; see Figure F24 in the Expedition 369 methods chapter [Huber et al., 2019a]) was used to log between 117 and 612 m WMSF. The BHA was positioned at 426.5 m WRF to guide the logging tools into Hole U1513E to minimize the risk from the source of the blockage in Hole U1513D and then retracted to ~117 m WRF. After logging, the preprocessed logs were sent to the Borehole Research Group at Lamont-Doherty Earth Observatory, where the logs were processed, and then processed logs were sent back to the ship during the expedition, except for Hole U1513E because of time constraints. One aspect of this processing involved shifting the wireline logs to a depth scale referenced to the seafloor, which was determined by the step in NGR and resistivity observed with the Quambo at 2800.2 m WRF in Hole U1513A, 2800.0 m WRF in Hole U1513D, and 2799.5 m WRF in Hole U1513E. Thus, the offset between the seafloor depth determined by the drillers and the processed wireline logs was 0.8 m in Hole U1513A and 0.5 m in Hole U1513E (see Petrophysics in the Expedition 369 methods chapter [Huber et al., 2019a]); no discernible offset was detected in Hole U1513D.
An inclinometer housed in the EDTC recorded a deviation of <4° from vertical in Holes U1513A, U1513D, and U1513E. Caliper measurements in the holes varied in different intervals from 11 inches, approximately the bit diameter, to 17 inches, the maximum extension of the caliper. The caliper detected competent borehole stability between ~150 and ~250 m WMSF and recorded borehole disturbance and washout between ~125 and ~145 m WMSF in Hole U1513A. This disturbed section corresponds with softer clay-rich material that is over- and underlain by more resistant layers of silicified limestone (see Lithostratigraphy). Additionally, caliper readings deeper than 252 m WMSF in Hole U1513D regularly reach maximum extension (17 inches), suggesting extensive borehole wall washout, a transition to less competent lithologies, and deterioration downhole. Caliper data in Hole U1513E mimic patterns in Holes U1513A and U1513D in overlapping depth intervals. Washout is pronounced between 468 m and 502 m WMSF in the volcanic-rich sandstones of lithostratigraphic Unit V, where caliper readings sporadically reach values of >15 inches. Other depth intervals preserve caliper dimensions closer to the diameter of the drill bit.
Formation temperature
The APCT-3 was deployed in Hole U1513B and measured a formation temperature of 4.55°C with a mean misfit of 0.1°C at 32.7 m CSF-A in Core 369-U1513B-5H. However, subsequent APC advancement damaged the temperature sensor, precluding further formation temperature measurements at Site U1513.
Natural gamma radiation
In Hole U1513A, the HNGS recorded slightly elevated NGR from ~80 to 105 m WMSF compared with that between 105 and 240 m WMSF (Figure F38); in the interval between 105 and 240 m WMSF, NGR is relatively lower, averaging 19.8 gAPI. In Holes U1513A and U1513D, a sharp peak in NGR between ~240 and ~250 m WMSF with a maximum of ~63 gAPI corresponds to the Cenomanian/Turonian boundary interval (see Stratigraphic correlation; Figures F38, F39). In addition to this peak, the HNGS record from Hole U1513E exhibits two intervals of elevated NGR readings between 243 and 315 m WMSF (maximum = 83 gAPI) and between 424 and 461 m WMSF (maximum = 94 gAPI) (Figure F40). The upper interval with elevated NGR values corresponds to Cenomanian green, light gray, and black claystones and the upper interval of the Cenomanian to Albian black claystones of lithostratigraphic Unit III and upper Unit IV, respectively (see Stratigraphic correlation and Lithostratigraphy). The lower interval of elevated NGR corresponds to Albian black claystones in the lower interval of Unit IV and displays a sharp lower contact with the underlying volcanic-rich sandstones of Unit V at 455 m WMSF. Below this in Unit V, NGR values are lower and relatively stable (average = 26 gAPI).
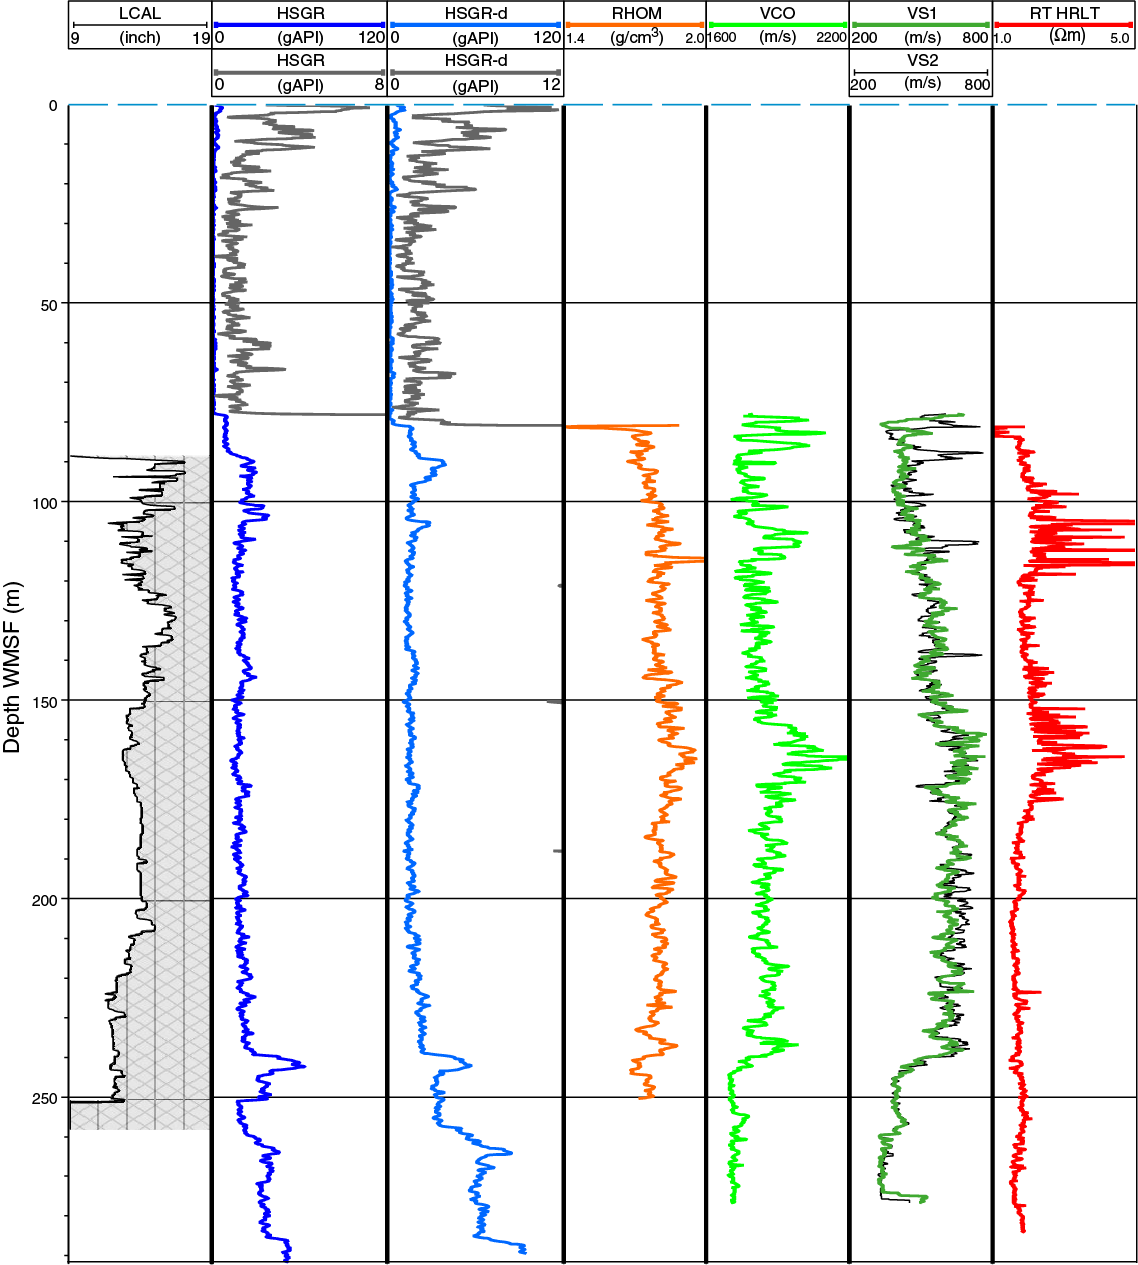
Figure F38. Downhole logging results, Hole U1513A.
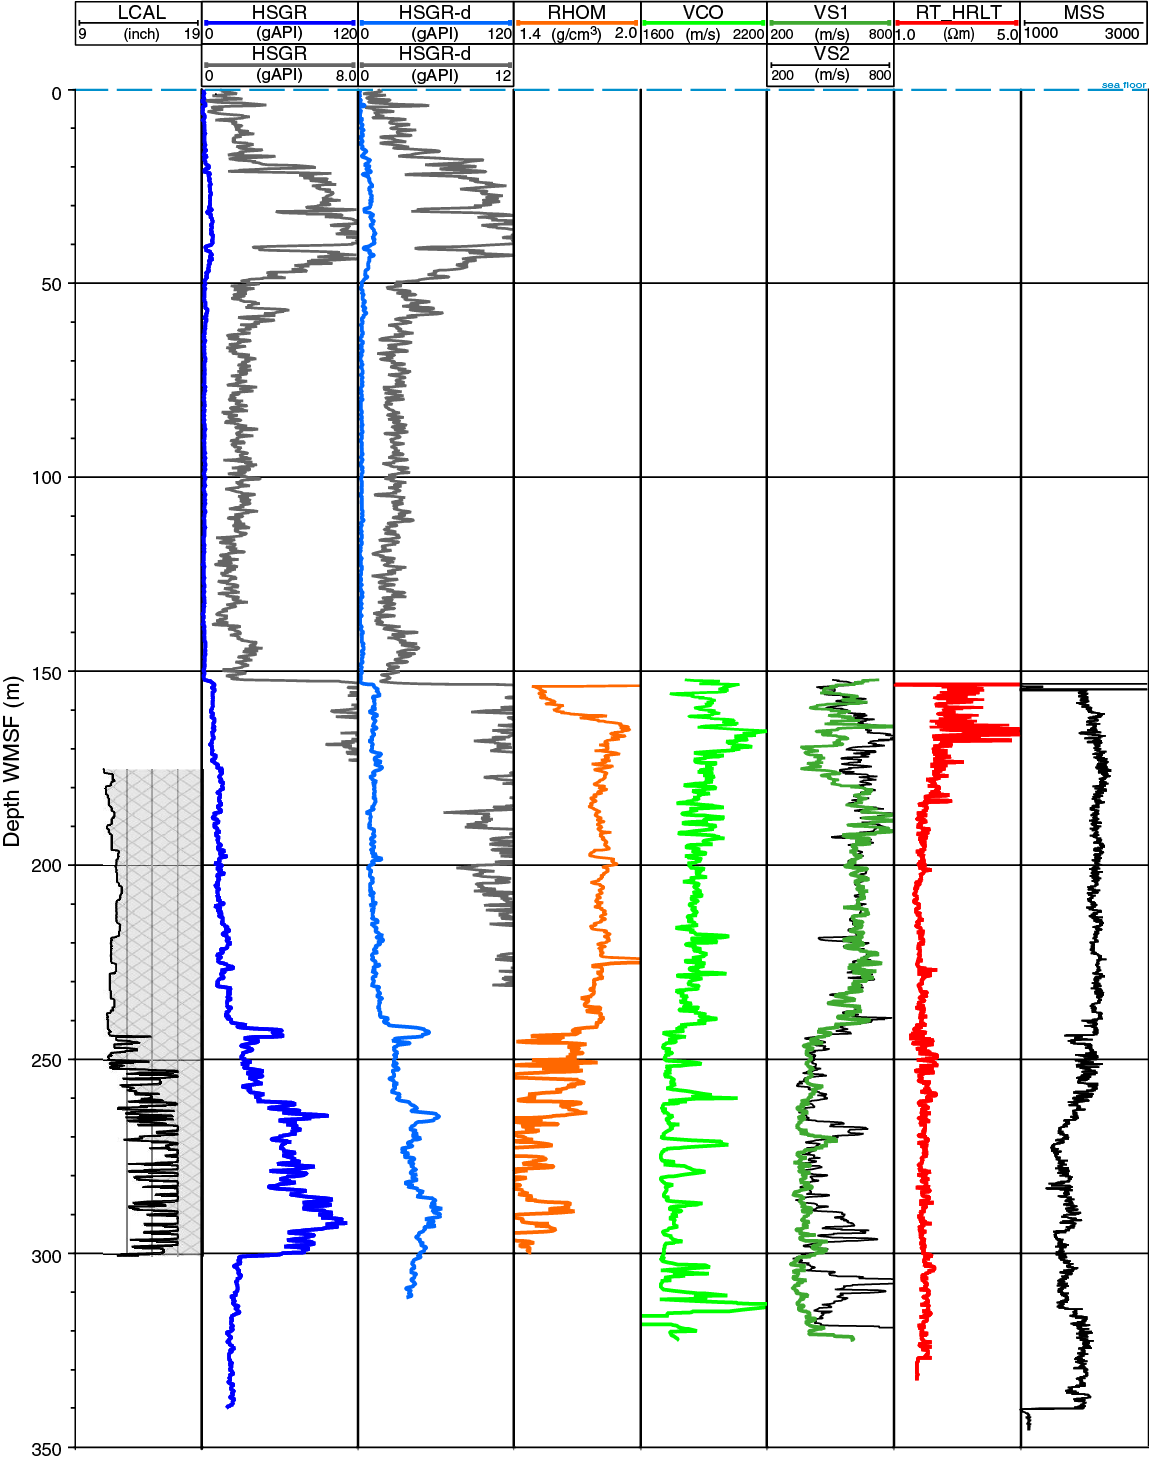
Figure F39. Downhole logging results, Hole U1513D.
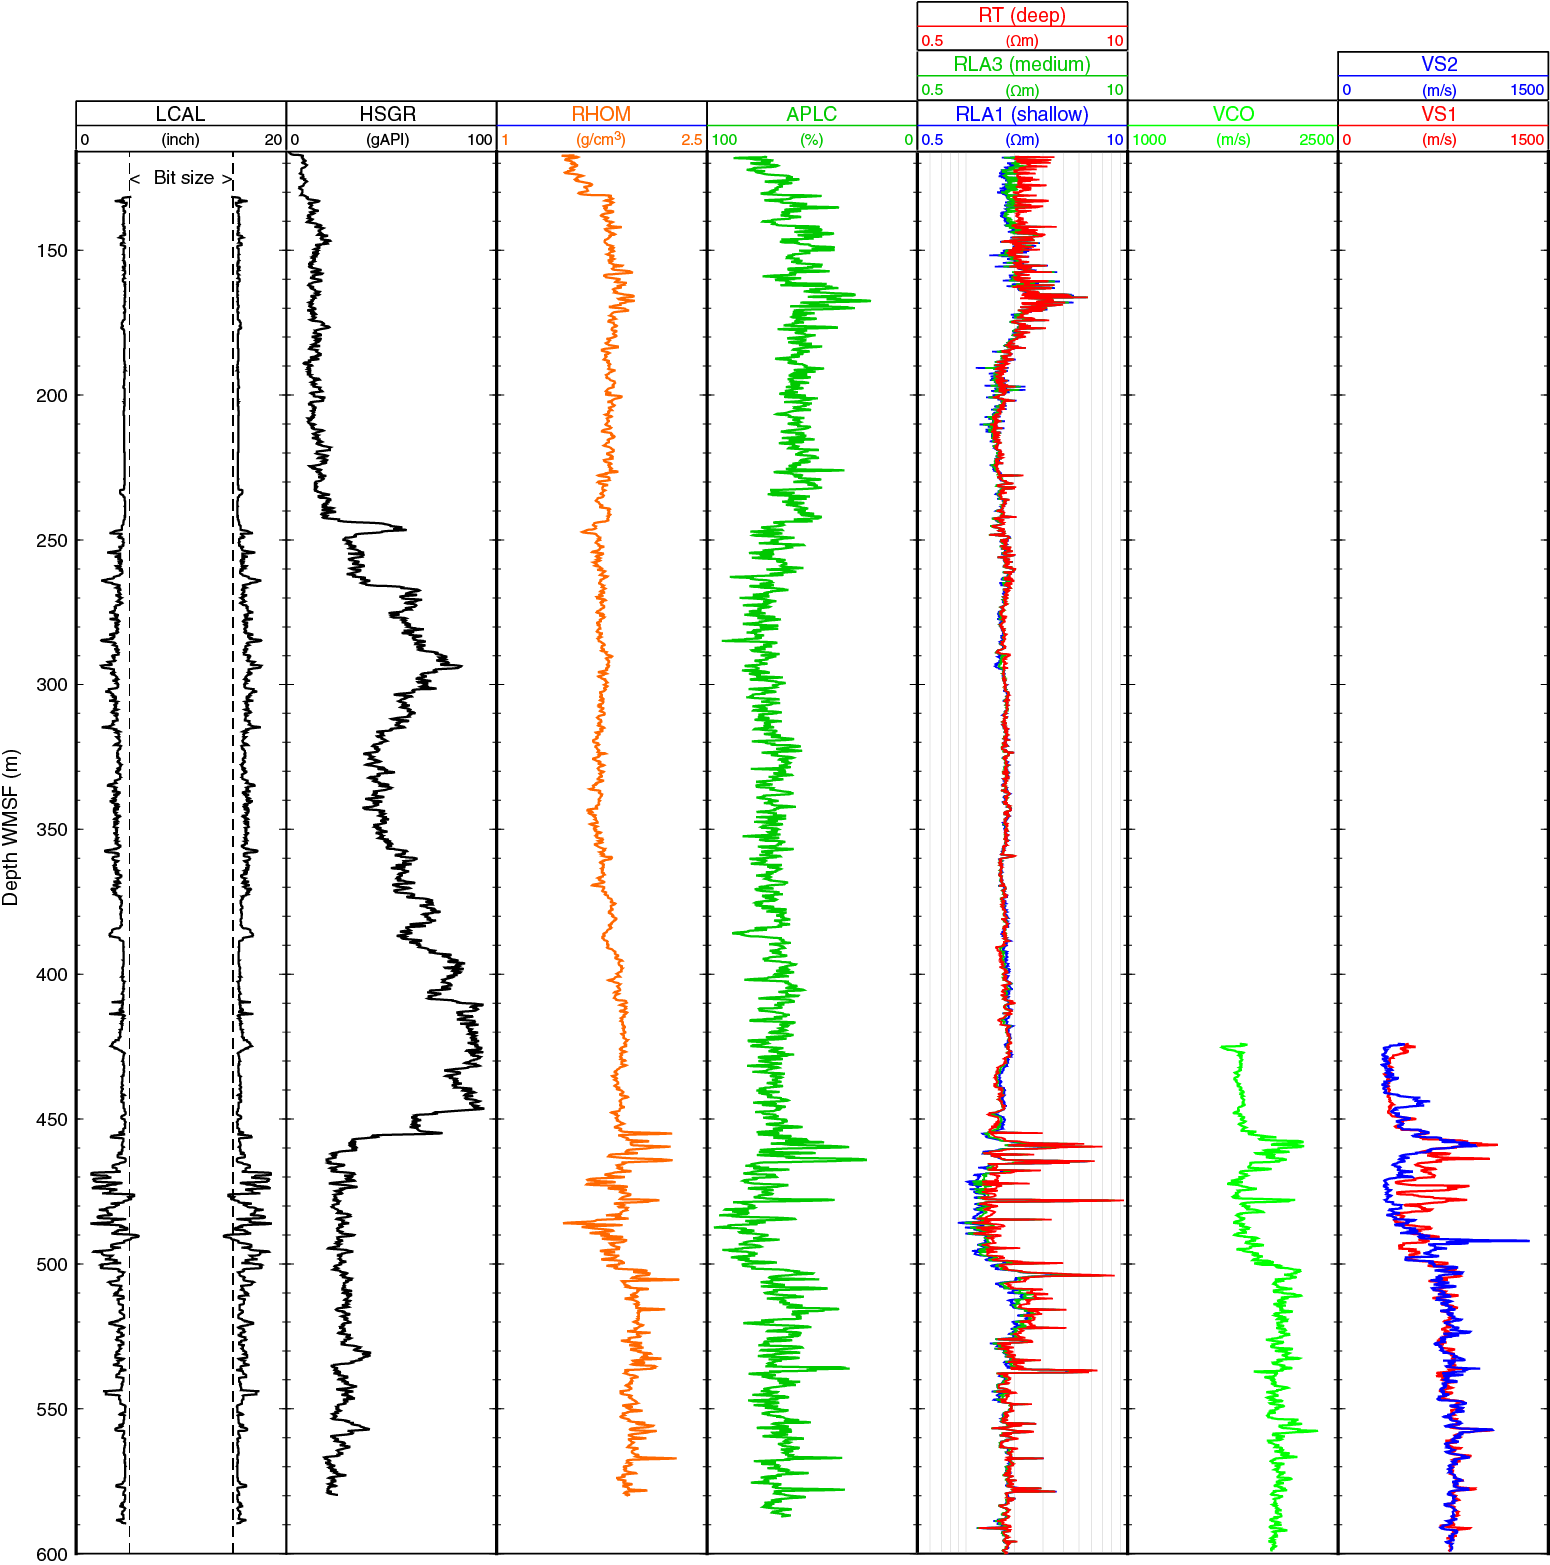
Figure F40. Downhole logging results, Hole U1513E.
The five-window spectroscopy of the HNGS tool also allows determination of approximate U, Th, and K contents. Downhole K and Th contents largely mimic the NGR spectra in Hole U1513A, except for a peak in NGR between 100 and 110 m WMSF caused by an increase in U. Downhole logging U, Th, and K contents in Hole U1513A are similar to those deconvolved from core-based NGR data using the methodology specified in De Vleeschouwer et al. (2017) (Figures F31, F33).
Resistivity
Computed true resistivity (HRLT) is between 1.5 and 4.0 Ωm in most of Hole U1513A and in Hole U1513D (Figures F38, F39). In Hole U1513A, the highest resistivity was recorded in two intervals (90–120 and 150–180 m WMSF) as a series of high-amplitude peaks. These two intervals of increased resistivity correspond to zones of poor core recovery and the presence of siliceous limestone beds (see Lithostratigraphy). Similar resistivity features were observed at 150–180 m WMSF in Hole U1513D. Below these siliceous intervals in Hole U1513E, resistivity values are stable between ~180 and ~455 m WMSF (Figure F40). Layers with higher resistivity values occur between ~455 and 578 m WMSF (maximum = 10 Ωm) and likely correspond to the thin claystone and siltstone interbeds observed in the volcanic-rich sandstone of lithostratigraphic Unit IV (see Lithostratigraphy).
Sonic velocity
Sonic primary wave velocity (P-wave) ranges from ~1650 to 2200 m/s in Holes U1513A and U1513D. Average velocity is broadly similar from ~80 to ~150 m WMSF and notably increases at 165 m WMSF to the fastest velocity in the holes (2200 m/s). A similar broad velocity increase recorded between ~90 and ~120 m WMSF in Hole U1513A was not captured in Hole U1513D because of interference from the BHA. Both of these intervals correspond to zones of increased resistivity (see Resistivity) and broadly correspond to intervals of poor recovery and highly siliceous limestone beds (see Lithostratigraphy).
In Holes U1513A and U1513D, a minor downhole decrease in primary sonic velocity at ~235 m WMSF is followed by an increase at ~240 m WMSF and a sharp decrease at ~245 m WMSF. NGR follows the opposite trend here, and this interval is close to or potentially marks the Cenomanian/Turonian boundary (see Stratigraphic correlation). Sonic velocities below 250 m WMSF in Hole U1531D need to be treated with caution because of washout, as evidenced by the caliper log. The deeper depth interval of Hole U1513E that was logged for sonic velocity records primary velocities of ~1800 m/s from 425 to 455 m WMSF that increase to ~2200 m/s at ~459 m WMSF, decrease to ~1800 m/s from 469 to 499 m WMSF, and then plateau at ~2100 m/s deeper than 502 m WMSF (Figure F40). The increase in sonic velocity deeper than 455 m WMSF corresponds to the upper contact of the volcanic-rich sandstone in lithostratigraphic Unit V. More severe borehole washout between 469 and 499 m WMSF may be responsible for the decreased sonic velocity in that interval of Unit V. However, discrete P-wave measurements record the same trend, suggesting that this velocity trend may be correct and that it also shows a more marked fluctuation of velocity with depth within the volcanic-rich sandstone layer (Figure F36).
Shear wave velocity trends are similar to primary wave velocity and density trends in Holes U1513A and U1513E but not in Hole U1513D. The difference between Holes U1513A and U1513D, the two boreholes with overlapping depth intervals, likely reflects discrepancies in borehole stability; the sonic tool was centralized properly while the caliper arm was open, and the borehole diameter was stable in only a 70 m interval in Hole U1513D. The results from Hole U1513A are therefore considered to be more representative for the upper section of this site.
In Hole U1513A, shear wave velocity progressively increases from ~80 to ~155 m WMSF, followed by a minor overall decrease from ~155 to 235 m WMSF. The apparent difference in primary wave and shear wave velocity potentially reflects the overall shape of the borehole because the two signals become much more uniform as the shape of the borehole becomes more uniform with fewer cave-ins in Hole U1513A. Similar to primary velocity, shear wave velocity decreases sharply deeper than ~235 m WMSF, accompanied by increasing NGR and decreasing density near the position of the Cenomanian/Turonian boundary discussed above (see Stratigraphic correlation).
Because of operational constraints, no sonic log data were acquired in Hole U1513E shallower than 424 m WMSF.
Density
In Hole U1513A, downhole wireline density generally and progressively increases from ~1.7 to ~1.8 g/cm3 between ~80 and 165 m WMSF, followed by a very gradual decrease from ~165 to 250 m WMSF. In addition, several short intervals exhibit increased density (e.g., ~120, ~170, and ~240 m WMSF) that corresponds to the same zones of high velocity and resistivity discussed above.
In Hole U1513D, density measurements are less reliable because of poor contact between the density tool and the borehole wall roughly in intervals shallower than 170 m WMSF and deeper than 240 m WMSF. This poor contact reflects collapse of the borehole shape and portions of the hole where the caliper arm was not opened and the tool string was not properly centered. The best density measurements in Hole U1513D are between 165 and 240 m WMSF and mimic those in Hole U1513A; therefore, density measurements from Hole U1513A are preferred to those from Hole U1513D for the upper interval at Site U1513.
In overlapping intervals in Hole U1513E, density measurements agree with values from Hole U1513A (Figure F40). Additionally, in intervals logged for density and sonic velocity in Hole U1513E (425–600 m WMSF), trends in density generally track trends in sonic velocity, such as a plateau of maximum values in density (~2.0 g/cm3) and sonic velocity deeper than 501 m WMSF. The porosity and density logs are inversely correlated, suggesting that changes in porosity, caused by compaction and/or cementation, likely influence density at this site.
Porosity
The APS measured porosity of the borehole on the final logging run from 117 to 578 m WMSF (Figure F40). Porosity decreases from ~80% at 117 m WMSF to ~55% at ~170 m WMSF in the uppermost logged interval. In the lower portion of the nannofossil chalk and nannofossil claystone of Unit II between ~170 and 240 m WMSF, porosity remains relatively low around 55%. Porosity increases deeper than ~245 m WMSF to 65%–70% in the claystone of lithostratigraphic Units III and IV (see Lithostratigraphy). Porosity increases to >75% between ~460 and 500 m WMSF, which is likely an artifact of borehole washout in the upper portion of Unit V and poor contact of the APS with the borehole wall. Deeper than ~500 m WMSF, the borehole was more stable and porosity values decrease to between 60% and 75% in the volcanic-rich sandstone of Unit V. Occasional spikes to low porosity occur deeper than 455 m WMSF at horizons where density, HRLT resistivity, and FMS resistivity increase as well.
Vertical Seismic Imager
The VSI recorded 33 seismic shots at 11 stations between 424 and 641 m WMSF (3051.1–3440.9 m WRF) (see Petrophysics in the Expedition 369 methods chapter [Huber et al., 2019a]). These measurements were obtained through the Cenomanian to Albian black claystone of lithostratigraphic Unit IV and the Aptian to Valanginian volcanic-rich sandstone of Unit V (see Lithostratigraphy). However, poor contact between the VSI tool and the borehole wall, likely due to the poorly consolidated lithologies and/or washout of the hole, was indicated by caliper data between 468 and 502 m WMSF. This undermined the quality of waveforms recorded at the majority of stations. Three shots at 526.6, 574.6, and 640.7 m WMSF (3326.1, 3374.1, and 3440.2 m WRF) produced good-quality waveforms that documented one-way seismic arrival times between 2.158 and 2.226 s (Figure F41).
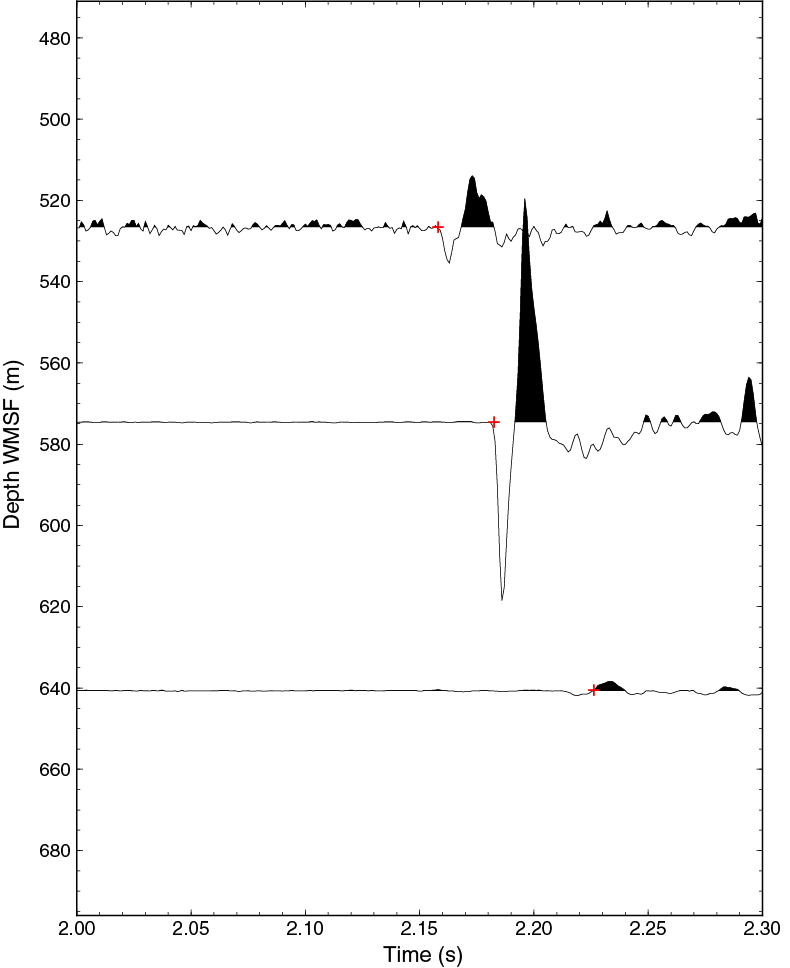
Figure F41. VSI arrival times and waveforms.
Formation MicroScanner
FMS images reveal differences in textures and lithology throughout the logged interval of Hole U1513E from 425 to 610 m WMSF. The FMS images are of generally good quality (Figure F42) because of the high resolution and low logging speed at which the images were acquired. However, washout increased the borehole diameter in certain intervals and may undermine FMS data quality, such as between 465 and 502 m WMSF. Additionally, at least one of the four pads yielded highly conductive results (dark) through some depth intervals, indicating that the pad was not in contact with the borehole wall. Nonetheless, horizontal beds on the scale of tens of centimeters thick appeared on the FMS images as intervals of high resistivity (white) in lithostratigraphic Unit V between 454 and 578 m WMSF. These intervals are accompanied by higher density, lower porosity, and higher resistivity readings in the Quambo logs and decreased caliper diameter. These high-resistivity beds likely correspond to the interbeds of siltstone and claystone observed within the volcanic-rich sandstone unit (see Lithostratigraphy). Faults were commonly noted in cores from Unit V, and FMS images may be able to resolve their orientation in the form of conductive dipping thin beds, such as potentially at ~445 m WMSF. However, preliminary review of the FMS images was inconclusive in confidently locating or characterizing any faults.
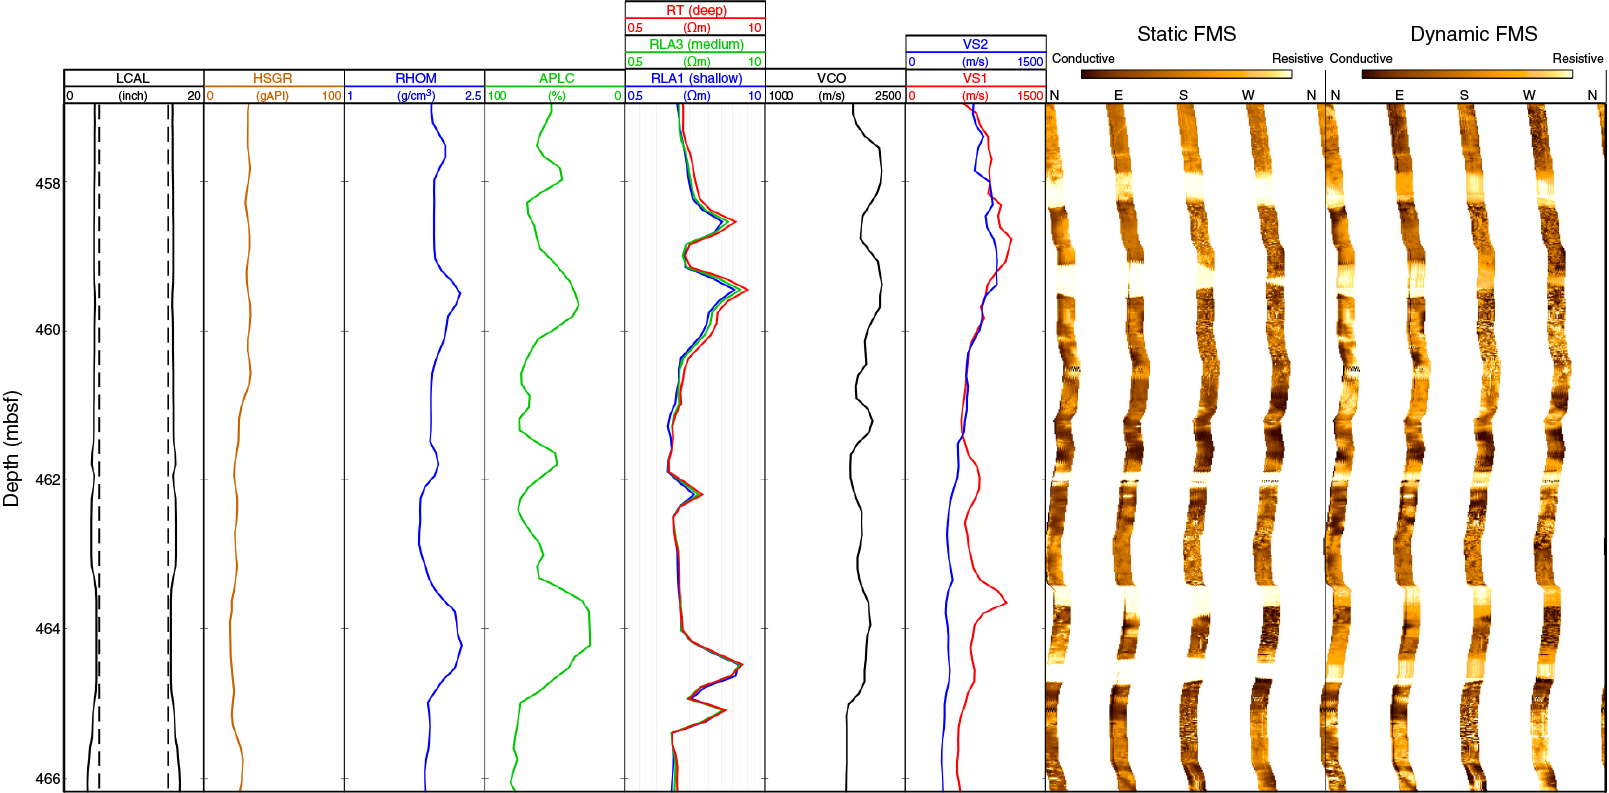
Figure F42. FMS images and downhole logging.
Geochemistry
The geochemistry program at Site U1513 was designed to characterize the composition of interstitial water and solid sediments/rocks and to assess the potential presence of volatile hydrocarbons for routine safety monitoring. Coring at this site recovered Quaternary to Neogene light gray to yellow calcareous ooze (lithostratigraphic Unit I) overlying a Cretaceous sequence (Campanian to Valanginian; Units II–V) of carbonate, silicified limestone, black claystone, and gray to black sandstone. The recovered sequence includes a possibly complete OAE 2 sequence. Samples discussed below come from Holes U1513A (0–282.9 m CSF-A) and U1513D (293.01–757.4 m CSF-A) unless otherwise specified. In addition to routine analyses, the possible OAE 2 sequence at this site (~240–250 m CSF-A) was studied in detail to characterize the bulk sediment and organic matter over this interval. Elemental analysis of the solid igneous material cored deeper than 690 m CSF-A (Unit VI) was also measured to help evaluate the magmatic source and alteration history.
Headspace hydrocarbon gases
A total of 90 headspace gas samples were taken for routine safety monitoring downhole to ~690 m CSF-A, the contact with igneous material. Although only trace amounts of methane were detected (≤60 ppmv), values are highest between ~300 and ~425 m CSF-A (Cores 369-U1513A-26R through 38R), where organic content was correspondingly high (Table T22; Figure F43). Trace amounts of ethane and propane were also detected in this interval. A thermogenic origin is suggested by the relative concentration of methane, ethane, and propane.
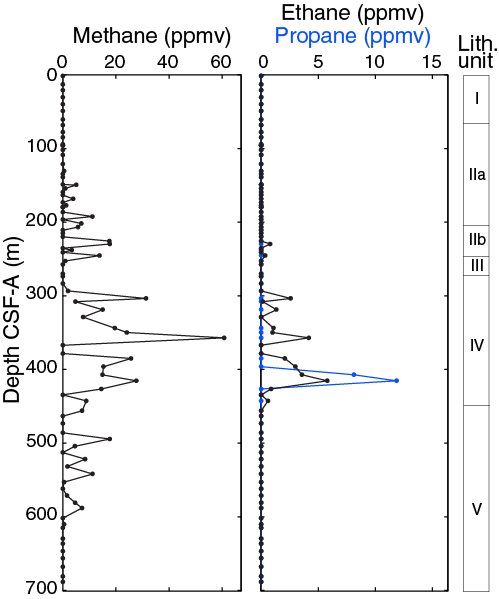
Figure F43. Headspace hydrocarbon gas.
Interstitial water analyses
For analysis of water chemistry, 60 interstitial water samples were taken from whole-round squeezing of sediment intervals in Holes U1513A (black circles and red triangles in Figure F44) and U1513D (green circles and blue triangles in Figure F44), and an additional sample was taken from the mudline. Ion chromatography was used to measure chloride (Cl−) and bromide (Br−), and inductively coupled plasma–atomic emission spectrometry (ICP-AES) was used to analyze barium (Ba), boron (B), lithium (Li), manganese (Mn), silicon (Si), iron (Fe), calcium (Ca), potassium (K), magnesium (Mg), sodium (Na), sulfur (S), and strontium (Sr). All ICP-AES measurements were converted to molar concentrations, and we assumed all sulfur was present as sulfate (SO42−). Sulfate, Na, Ca, Mg, and K were also measured by ion chromatography, but the ICP-AES concentration data were determined to be of higher quality (see Geochemistry in the Expedition 369 methods chapter [Huber et al., 2019a]). Ammonium (NH4+) was measured by spectrophotometry (Gieskes et al., 1991).
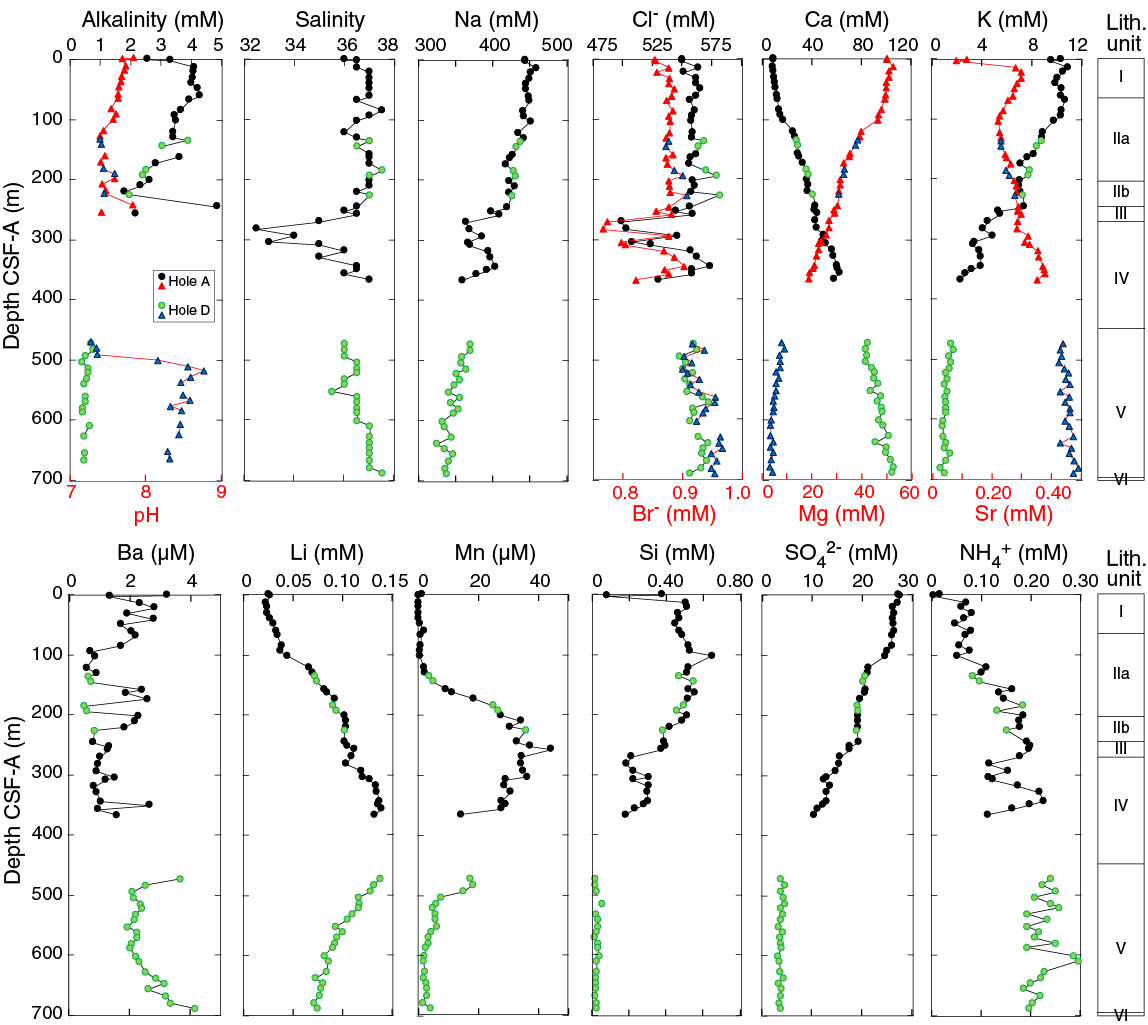
Figure F44. Interstitial water alkalinity, pH, and element and ion concentrations.
The preliminary plan for whole-round sampling was one sample per full-length core or every other half-length core. A mudline water sample was taken from the top of Core 369-U1513A-1H. Sampling intervals varied greatly in Hole U1513A because of recovery. No samples were taken from Cores 369-U1513A-21X through 25X, 30X through 34X, and 40X through 44X; data for these depths were filled in with samples from Cores 369-U1513D-6R, 7R, 11R through 12R, and 15R. The small volumes of interstitial water extracted from some samples meant that some analyses could not be performed for many samples. Preference was given to ICP-AES and ion chromatography analyses due to the quantity of information generated using these techniques. Interstitial water samples were not taken from Cores 369-U1513D-33R through 41R because previous efforts suggested useful amounts water could not be extracted from the lithology (claystone) present in these cores. One sample (42R-2, 138–143 cm) was taken and squeezed, but as expected, no interstitial water was obtained. Sampling for interstitial water resumed with Core 43R, where the lithology changed from claystone to sandstone. Sampling ceased at Core 65R when igneous material was reached.
Salinity, pH, and alkalinity
The salinity of interstitial water samples is generally constant, ranging between 35 and 37.5, except for a short interval between 281.81 and 303.03 m CSF-A where salinity decreases to 32–34 (Table T23; Figure F44). This drawdown in salinity is reflected in an ~10% Na and Cl– depletion. Because the presence of gas hydrate can be excluded, their dissociation could not be the cause of freshening. Thus, we suspect that low-salinity water sourced elsewhere must be present in this interval. The changes in salinity are not seen in the Na/Cl ratio, which decreases downhole.
Alkalinity and pH measurements were limited to depths shallower than ~225.08 m CSF-A and deeper than 471.83 m CSF-A because of the small volumes of interstitial water obtained from samples between those depths. Alkalinity increases slightly from 2.55 mM in the mudline sample to 4.29 mM at 60.39 m CSF-A, followed by a general decrease downhole, except for a single value of 4.85 mM at 244.93 m CSF-A (Table T23; Figure F44). Alkalinity in samples from deeper than 471.83 m CSF-A is particularly low (<1 mM). Shallower than 493.66 m CSF-A, pH values are relatively constant (7.28–7.84), increase abruptly at 503.39 m CSF-A to 8.16, and then remain relatively high through the deepest sample analyzed.
Sulfate and ammonium
SO42− remains relatively constant in lithostratigraphic Unit I, decreases from 25.9 to 10.3 mM throughout Units II–IV (68.1–366.44 m CSF-A), and then remains constant at ~4 mM in Unit V (471.83–687.35 m CSF-A) (Table T23; Figure F44). NH4+ concentration is lowest in the shallowest core samples, increases to ~0.20 mM in Unit III (257.01 m CSF-A; Core 369-U1513D-47X), and then stays relatively constant for the remainder of Unit IV. NH4+ concentrations are highest in Unit V, where they average 0.22 mM.
Magnesium and potassium
Dissolved Mg and K concentrations exhibit steep changes with depth (Table T23; Figure F44). Mg concentration decreases from 52.4 mM in lithostratigraphic Unit I to 3.2 mM at 678.73 m CSF-A. Similarly, K concentration decreases from 10.9 mM in Unit I to 0.7 mM at 678.73 m CSF-A. The coupled changes in K and Mg possibly reflect alteration reactions of volcanic material found throughout Units IV and V and deeper than 690 m CSF-A (Unit VI; altered basalt) (e.g., Gieskes and Lawrence, 1981).
Calcium and strontium
Dissolved Ca concentration steadily increases downhole to a maximum of 106 mM (10 times seawater concentration) in lithostratigraphic Unit V (Table T23; Figure F44). This increase may be explained by the release of Ca during alteration reactions of volcanic material (e.g., Bischoff and Dickson 1975) lower in the section. The dissolved Sr profile is more complex than the Ca profile and seems to document carbonate transformation and associated Sr release in Unit I and, possibly, the upper section of Unit II. From 120.81 m CSF-A downhole, the increases in Sr and Ca parallel each other, suggesting that alteration reactions lead to the synchronous release of Ca and Sr.
Chloride, bromide, sodium, and lithium
Interstitial water concentrations of Cl– and Br– have similar but not parallel profiles. Cl– is relatively constant with minimal variations (548–582 mM), except for a highly variant, negative excursion between 269.55 and 366.44 m CSF-A (Table T23; Figure F44). The Br– profile is similar to that of Cl–, with a constant concentration (0.85–0.90 mM) in the shallowest samples (0–257.01 m CSF-A) followed by a decrease in concentration to ~0.77 mM between 269.55 and 366.44 m CSF-A. Unlike Cl–, however, the deepest samples (513.44–645.74 m CSF-A) have slightly higher Br– concentrations (0.90–0.96 mM) than those in the shallow parts of the section. For both Cl– and Br–, the decrease in concentrations between 269.55 and 366.44 m CSF-A corresponds to the negative excursion in the salinity profile. The Br/Cl ratio steadily increases downhole from seawater-like values of 1.55 × 10⁻³ in Core 369-U1513A-1H to 1.71 × 10⁻³ in Core 369-U1513D-62R. Because Cl− concentration remains essentially constant downhole, the slight increase in Br– must reflect organic matter consumption and associated Br– release (e.g., Calvert and Pedersen, 1993).
Na concentration decreases with depth, as does the Na/Cl ratio (from a seawater-like value of ~0.85 to 0.57 in lithostratigraphic Unit V) (Table T23; Figure F44). This decrease is a strong indication that Na, similar to Mg and K, is involved in alteration processes of volcanic material distributed throughout the lower sedimentary column or igneous rocks in Unit VI and deeper.
Li concentration increases from a seawater-like value (0.03 mM in the mudline sample of Core 369-U1513A-1H) to a maximum of 0.16 mM at 356.55 m CSF-A (lithostratigraphic Unit IV) (Table T23; Figure F44). In Unit V, Li concentration decreases with depth, possibly as a result of incorporation into alteration products of volcanogenic material (i.e., clay minerals). The release of Li likely happens in Unit IV, which is clay-rich but not characterized by high ammonium concentrations and, in this regard, is similar to Unit IV at Site U1512 (see Geochemistry in the Site U1512 chapter [Huber et al., 2019b]). However, Li could also be liberated during silica transformation reactions.
Barium, boron, and silicon
Barium concentration is strongly related to the presence or absence of SO42– in interstitial water (Torres et al., 1996) (Table T23; Figure F44). SO42− is present throughout Site U1513; therefore, Ba concentration is always low (~2 µM), following the solubility product of barite (Church and Wolgemuth, 1972).
Dissolved Si concentration is moderately high throughout lithostratigraphic Units I and II (mean concentration ~0.50 mM), consistent with the presence of biogenic siliceous tests (Table T23; Figure F44). Si concentrations are significantly lower (~0.25 mM) in Unit IV, possibly resulting from the opal-A/CT transformation in Unit III or deeper. Dissolved Si concentration decreases significantly in Unit V, with the change attributed to Si uptake during the transition of opal-CT to quartz (Murray et al., 1992).
Boron concentration is approximately that of seawater (0.42 mM) in the upper 200 m of Site U1513 (Table T23; Figure F44). From 200.92 to 687.35 m CSF-A, B concentration steadily decreases to less than half the seawater concentration. Adsorption/desorption and alteration reactions within the sedimentary column are likely responsible for this decrease (Brumsack and Zuleger, 1992), although squeezing-pressure effects may play a role as well.
Manganese and iron
A maximum Mn concentration of 40 µM is centered around lithostratigraphic Unit III, which is characterized by cycles of dark and green sediments (Table T23; Figure F44). High Mn concentrations reflect the reducing character of the sedimentary column in Units II–IV and the upper section of Unit V. For Fe, only a few reliable data points could be generated because of the rapid oxidation of this element during the squeezing process (Table T23). Noticeable Fe concentrations were mostly detected in Unit II. The reducing character of the sedimentary column and high Mn concentrations in combination with low bacterial SO42− reduction rates suggest that Fe concentrations are likely higher in situ.
Alteration of volcanogenic material and carbonate diagenesis
As mentioned previously, interstitial water geochemistry at Site U1513 reflects intense alteration of volcanogenic material within the sedimentary column or at greater depths (deeper than lithostratigraphic Unit VI). The synchronous depletion of Mg, K, and Na points toward the transformation of volcanic minerals or glass into clay minerals. The concomitant increases in Ca, which attains a concentration 10 times that of seawater, and Sr (deeper than Unit I) may indicate the transformation of Ca-rich feldspars into more Na-rich feldspars. The almost linear trends in the Ca and Na profiles suggest that Ca is released and Na is consumed by alteration reactions still ongoing at greater depths, whereas the slightly concave-downward K profile is indicative of clay mineral transformation and corresponding K uptake throughout Units II, III, and IV.
Carbonate diagenesis mostly occurs in the upper 30 m of lithostratigraphic Unit I, as reflected by the strong increase in Sr concentration. Decreasing concentration downhole to 101.6 m CSF-A reflects the downward-diffusing Sr from carbonate recrystallization, which meets the upward-diffusing Sr from alteration reactions of volcanogenic components.
Bulk-sediment geochemistry
A total of 129 freeze-dried bulk-sediment samples were collected downhole to ~690 m CSF-A (Core 369-U1513D-65R), where igneous material was intersected. For standard low-resolution analyses, these samples were taken from the interstitial water squeeze cake when an interstitial water sample was taken; otherwise, a small sample was taken from the working-half section. Further high-resolution samples were taken across the OAE 2–correlative interval (Cores 369-U1513A-43X through 45X and 369-U1513D-19R). Additional samples were also taken from OAE 1d–correlative sections from Cores 369-U1513D-25R and 26R.
The carbonate content at this site ranges from 0 to ~93 wt%, reflecting the range of claystone and carbonate ooze lithologies in general (Table T24; Figure F45). One sample (369-U1513A-19X, 7–8 cm) taken from a silicified limestone layer has a much lower carbonate content (18.6 wt%) than the adjacent carbonate ooze (82.6 wt%). Carbonate content generally decreases downhole. The black layers of the possible OAE 2 interval (~240–250 m CSF-A) generally contain <0.5 wt% carbonate.
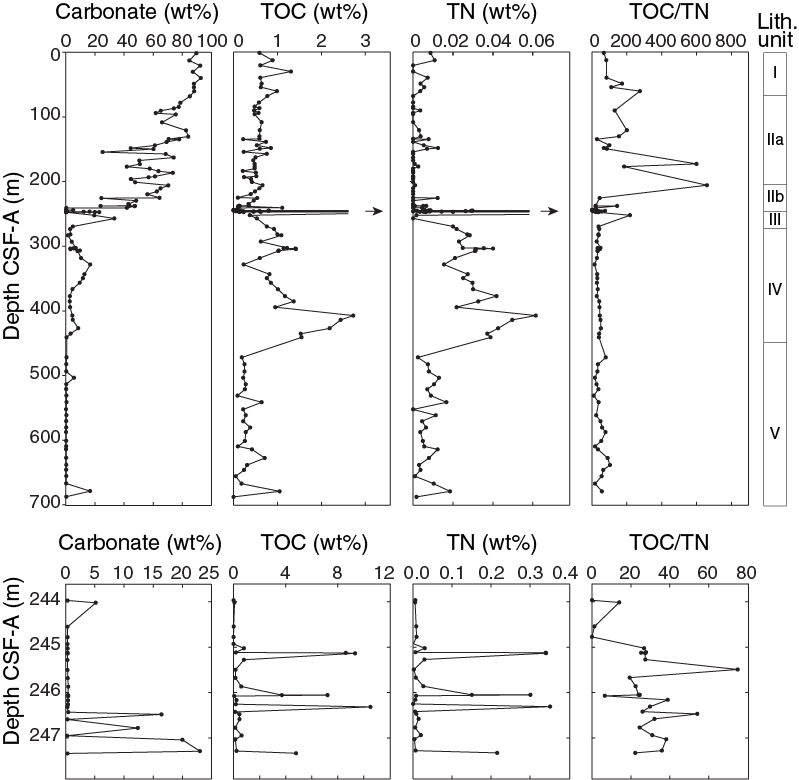
Figure F45. Carbon, TN, and TOC/TN.
Total organic carbon (TOC) content at this site is generally low (≤1 wt%) except for two intervals: one from a sample that may have been deposited during OAE 2 (~245 m CSF-A) and one from ~410 m CSF-A. Within the inferred OAE 2 interval, the black layers contain up to 10.5 wt% TOC (Core 363-U1513D-19R; ~246 m CSF-A). Trends in total nitrogen (TN) content closely follow those of TOC (Figure F45). TN was below detection level for approximately half of the samples; in samples with quantifiable TN content values reached 0.03 wt%, except for the black layer from Core 369-U1513A-45X, which contained 0.34 wt% TN.
Organic matter source analysis
Source rock analysis was performed on 57 samples: those with ≥0.8 wt% TOC based on bulk-rock analyses and additional samples from the possible OAE 2 and 1d horizons. TOC content was independently evaluated during source rock analysis based on detection of pyrolyzed organic matter. Because this calculation of TOC content employs a different analytical method than that used for bulk sediment, these TOC values do not necessarily correspond to TOC values reported from bulk-sediment analysis (see Bulk-sediment geochemistry). To discriminate TOC content derived from regular bulk-sediment analysis, we designate values calculated during source rock analysis as TOCSRA. Measurements with low TOCSRA values (<0.8 wt%) have large uncertainties and potentially overestimate hydrogen index (HI) and oxygen index (OI) values. The nominal temperature of the maximum rate of hydrocarbon yield (Tmax) from these low-TOCSRA samples show significant scatter and are likely not useful for estimating the thermal maturity of organic matter.
Broadly, samples with high TOCSRA (>3 wt%) are composed of Type I or II kerogen, indicating a predominantly algal source (Table T25; Figure F46). Samples with low TOCSRA (<3 wt%), however, are composed primarily of Type IV kerogen (Peters et al., 2005). Samples analyzed to test for the local expression of OAE 1d contain 1.5–2 wt% TOC; the kerogen is likely predominantly from a terrestrial source.
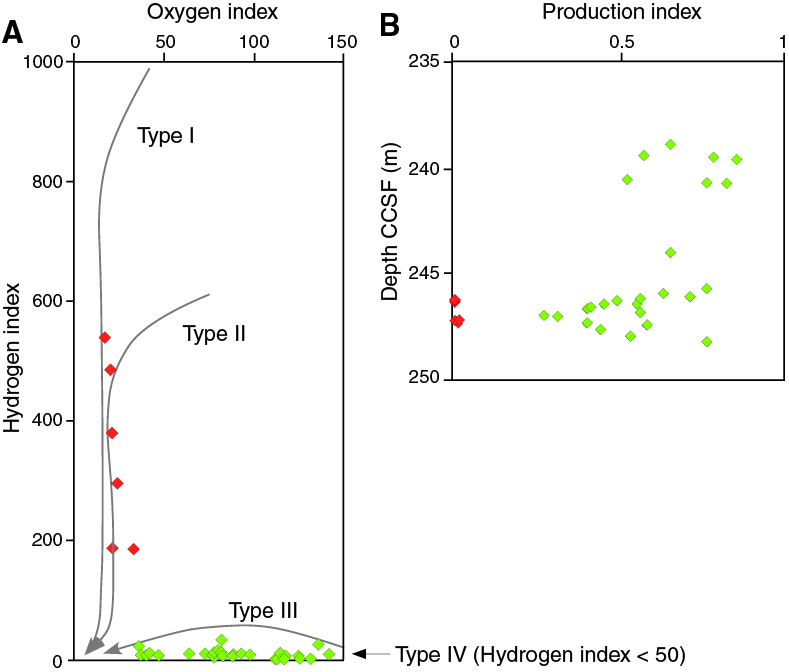
Figure F46. Source rock analysis results.
High TOC content was only found in the black layer of the purported OAE 2 interval (red diamonds in Figure F46A). A sample from the middle of the 5 cm thick black layer (Sample 369-U1513D-19R-2, 102–103 cm) has the highest TOC content (10.5 wt%) and HI (537 mg hydrocarbon [HC]/g TOC), indicating Type I or II kerogen of a probable algal source. Samples from the OAE intervals with low TOCSRA (<1.4 wt%) contain Type IV kerogen, suggesting probable terrestrial source and/or highly degraded marine organic matter. Samples from the purported OAE 2 interval are classified into two groups: material with TOCSRA >3 wt% with high (>180) HI and low (<35) OI values (black layers) and material with TOCSRA <1.4 wt% with low (<70) HI and high (>80) OI values (green claystone). The only exception to this grouping is found in Sample 369-U1513D-19R-3, 15–16 cm (246.95 m CSF-A), which contains dark grayish burrows in greenish host rock. This sample contains 0.89 wt% TOCSRA and has lower HI (23) and OI (36) values.
Tmax values obtained from the samples containing ≥1 wt% TOC through the entire section generally range from 410° to 430°C, suggesting low thermal maturity. Potential bitumen content is suggested from the stratigraphic trend of the production index (PI) calculated from the following equation:
PI indicates the relative abundance of bitumen that already exists in the rock. Bitumen contribution to pyrolyzed hydrocarbons is relatively small in the black layers, whereas bitumen is likely the dominant source of hydrocarbons in the green claystone (Figure F46B). Thus, details of the organic geochemistry seem to be quite different when comparing the green claystone to the black layers. Alternatively, higher values of PI may be ascribed to contamination during drilling processes.
Basalt analysis
The igneous sequence in Cores 369-U1513D-66R through 75R (lithostratigraphic Unit VI) is divided into seven lithologic units consisting of four flow sequences (Units 1, 3, 5, and 7) and three intercalated breccia beds (Units 2, 4, and 6). A dolerite dike intrudes the flow sequences and appears to be the unit least affected by alteration. Based on megascopic and petrographic examination, of the 24 samples analyzed, 2 are from breccia units and 5 are from basalts pervasively altered by hydrothermal activity (Table T26). These seven samples are not described further.
Major element data for all the weakly to moderately altered samples plot in the tholeiitic basalt composition field (SiO2 versus Na2O + K2O panel in Figure F47). SiO2 contents are 43.7–52.5 wt%, and total alkali contents are 2.11–2.38 wt%, values which are typical of tholeiites. Lithologic Unit 1 basalts differ from Unit 3 and 5 tholeiites in that they have higher MgO (8.7–11.8 wt%) and lower TiO2 (0.31–0.60 wt%) and Fe2O3 (6.2–8.0 wt%) contents compared to the Unit 3 and 5 basalt flows, which contain 5.0–10.2 wt% MgO, 1.00–1.67 wt% TiO2, and 9.1–14.1 wt% Fe2O3. The dolerite dike has intermediate TiO2 (1.00–1.40 wt%) and Fe2O3 (10.0–12.7 wt%) contents, but its MgO content is similar to Units 3 and 5. Compatible element Ni and Cr contents are also high in Unit 1 basalts (Ni = 248–330 ppm; Cr = 398–633 ppm), intermediate in Units 3 and 5 (Ni = 27–56 ppm; Cr= 32–262 ppm), and lowest in the dike (Ni = 21–33 ppm; Cr = 27–83 ppm). Both the flows and the dike have similar incompatible element ratios (right panels in Figure F47).
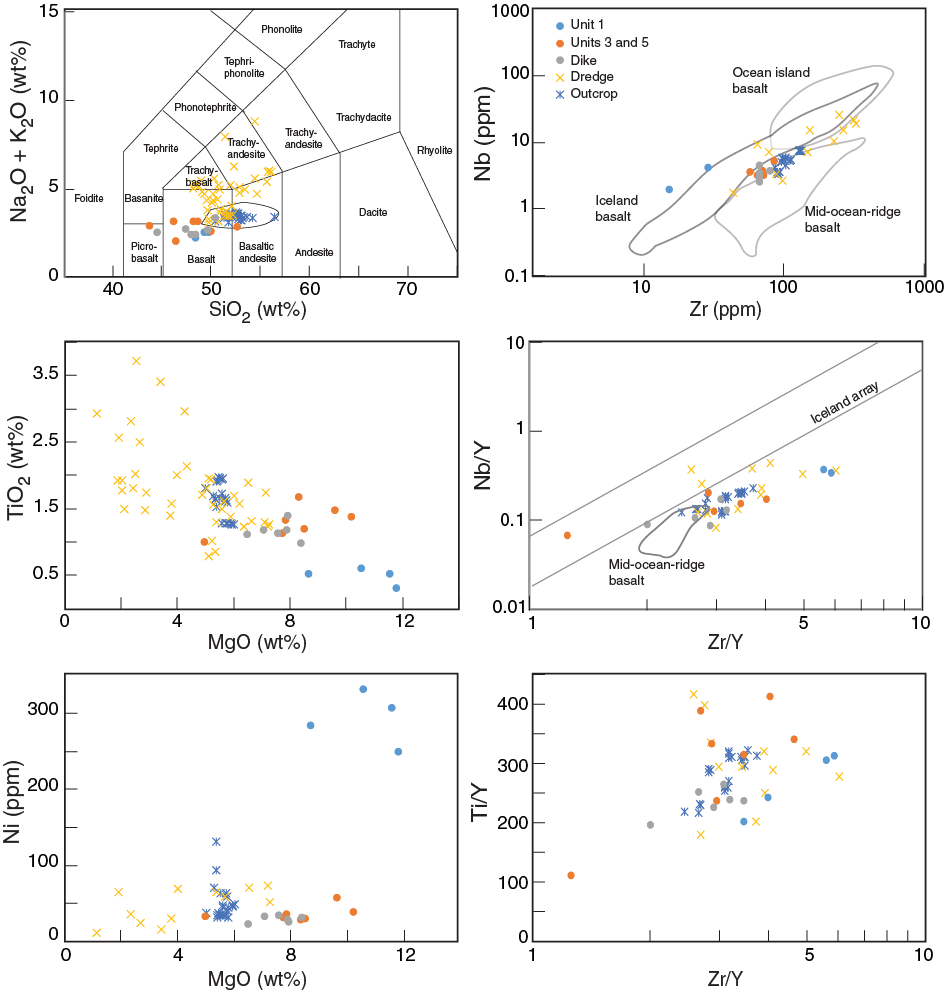
Figure F47. Major and trace element data.
Compared with volcanic rocks recovered by dredging the Naturaliste Plateau (Direen et al., 2017) and Bunbury basalts from outcrops in western Australia (Olierook et al., 2016), the igneous sequence at Site U1513 shows relatively high MgO content and relatively low SiO2 and total alkali contents. Unit 1 basalts appear to be more distinct in their Zr and Nb contents and Zr/Y ratios compared with other drill site tholeiites and are similar to the few dredged basalts from Naturaliste Plateau.
Stratigraphic correlation
At Site U1513, Holes U1513A and U1513B were cored with the APC and HLAPC systems to 95.7 m CSF-A in Hole U1513A and 98.34 m CSF-A in Hole U1513B. A splice was created for this interval. In Hole U1513A, the XCB system was used to continue coring to 292.5 m CSF-A. Hole U1513D was cored with the RCB system from 95 m CSF-A to the bottom of hole at 756.7 m CSF-A. Hole U1513E was cored with the RCB system from 658.2 to 704.73 m CSF-A and from 726.0 to 770.27 m CSF-A. In addition to the Hole U1513A/U1513B splice generated for the upper parts of the recovered section, a second floating splice was generated for the upper Cenomanian to lower Turonian interval from 237.3 to 273.3 m CSF-A in Hole U1413A and from 219.8 to 287.0 m CSF-A in Hole U1513D.
Guidance for coring
Before and during coring in Hole U1513B, target depths were recommended to recover core across recovery gaps or disturbed intervals in Hole U1513A. We compared physical property data and tracked the DSF scale relative to the CSF-A scale in Hole U1513A. To inform decisions regarding coring specifics, magnetic susceptibility, GRA bulk density, and P-wave velocity were measured immediately after recovery on the Special Task Multisensor Logger at 10 cm resolution. Unfortunately, the magnetic susceptibility and GRA density data showed little variation, and the P-wave velocity data, despite showing seemingly coherent patterns within cores, did not seem to capture variation useful for correlation between holes. Thus, depth below seafloor was the primary information used in making decisions.
Fortunately, recovery in Hole U1513B was excellent (103.5%), and coring disturbance was relatively minor, factors which simplified efforts to bridge coring gaps in Hole U1513A. A 3.5 m coring gap was identified between Cores 369-U1513A-1H and 2H based on NGR measurements. NGR data were useful in confirming recovery of a nearly complete sequence and were important for targeting depths of a hardground sequence that was inferred but only partially recovered in Hole U1513A.
The decision to switch from the APC system to the HLAPC system deeper than 72.3 m CSF-A in Hole U1513B was based on drilling disturbance (see Lithostratigraphy and Operations) and the lithology of Hole U1513A cores. The switch resulted in better recovery in Hole U1513B from 72.3 to 98.6 m DSF. In summary, most recovery gaps and disturbances in Hole U1513A cores were adequately covered by undisturbed core in Hole U1513B.
To plan for coring in Hole U1513D, downhole logging and lithologic data for cores in Hole U1513A were used to map intervals with silicified limestone. As expected, recovery was poor in these intervals. However, coring progress through these levels was good, and we cored continuously from 95 m CSF-A to the bottom of the hole. Rates of recovery improved below the regions of silicification. Of note, much of the lower Turonian was recovered well in Hole U1513D, whereas the same interval in Hole U1513A was plagued by large coring gaps.
Correlation of cores
Holes U1513A and U1513B
The physical property records for Holes U1513A and U1513B were compared to establish a splice interval plotted as m core composite depth below sea floor (CCSF). Tie points for Cores 1 through 10 from both holes were identified based mainly on sharp peaks in NGR superimposed on broader NGR trends. The topology of both sharp and broad peaks appear to be similar between holes, increasing confidence in using these features for correlation. Additional tie points were selected between Cores 369-U1513B-8H and 369-U1513A-8F and 9H based on color reflectance. A color change between Cores 369-U1513A-8F and 9H was confirmed to correspond to a single nodular horizon in Core 369-U1513B-8H observed at a lithologic transition and hiatus (see Lithostratigraphy and Biostratigraphy and micropaleontology). The most continuous and representative intervals in both holes were incorporated in the splice. The tie points and splice interval selection for 0–98.54 m CCSF are illustrated in Figure F48.
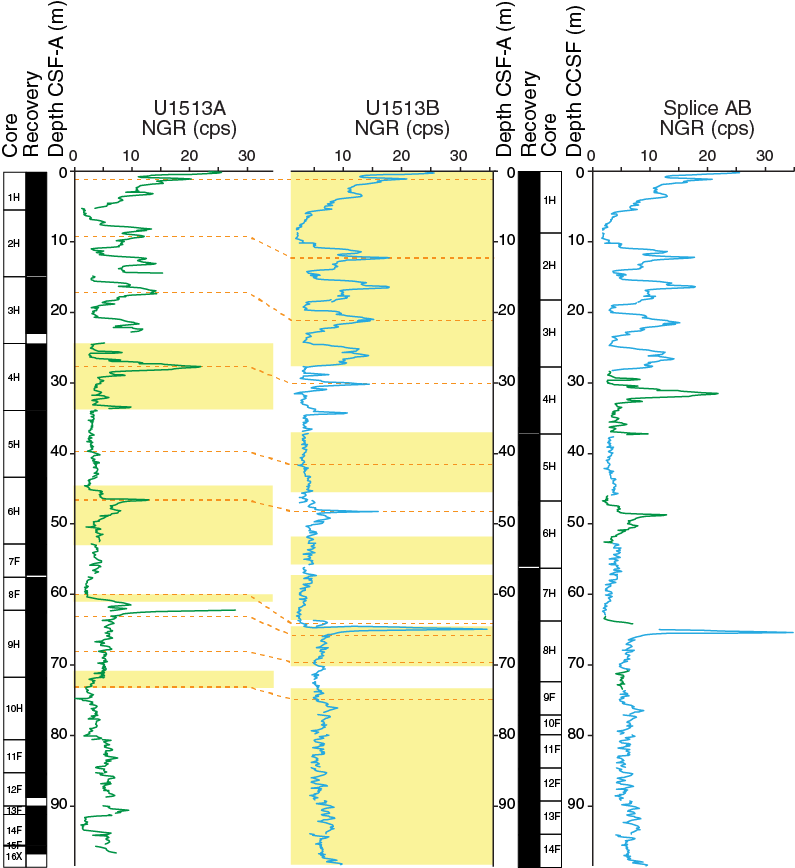
Figure F48. Hole U1513A and U1513B correlation.
Holes U1513A and U1513D
Overlapping portions of Holes U1513A and U1513D between 230 and 270 m CSF-A (Cores 369-U1513A-41X through 48X and 369-U1513D-16R through 22R) contain distinctive variation in physical properties and lithology that allows accurate correlation between holes. For example, a dark horizon in Core 369-U1513A-42X at 235 m CSF-A can be matched to a dark horizon in Core 369-U1513D-17R at 236 m CSF-A (Figure F49). The accuracy of this correlation is supported by the patterns of darker and lighter bands above and below this horizon, although the color bands in Hole U1513A are more closely spaced than those in Hole U1513D. Poor recovery of the lower Turonian in Hole U1513A, coring gaps in the upper Cenomanian cores in both holes, and repetitive sedimentary features made core-to-core correlation uncertain at the decimeter scale. However, correlation to downhole logs using NGR data allowed validation and refinement of correlation (Figure F49). This information was incorporated when constructing a splice for Holes U1513A and U1513D.
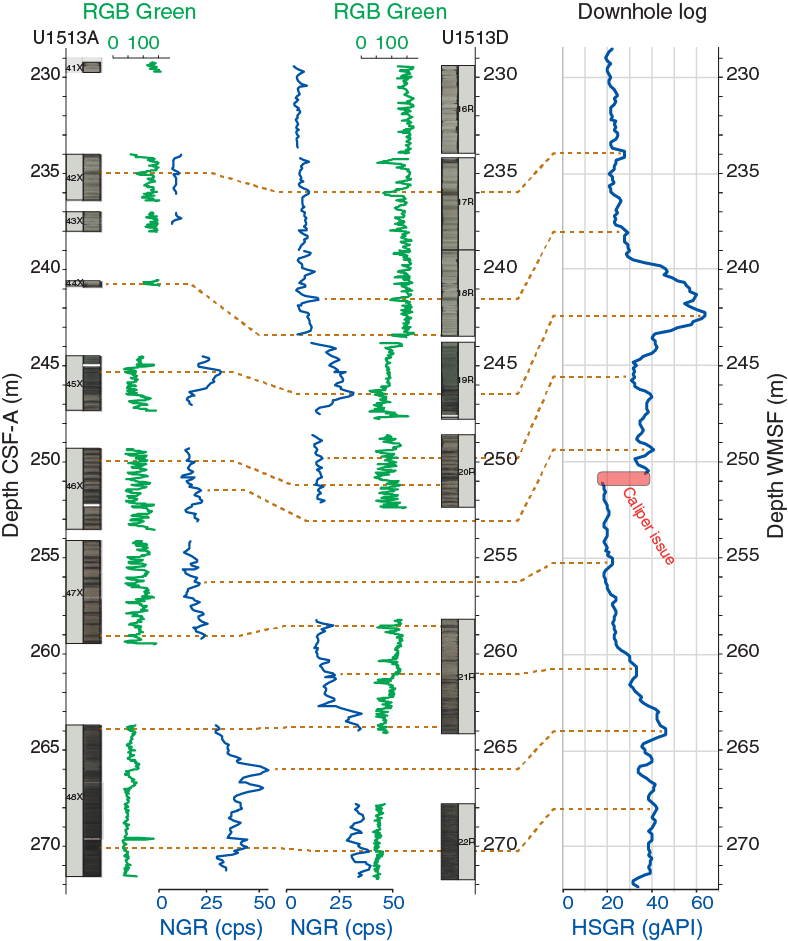
Figure F49. Hole U1513A and U1513D correlation.
The splice predicts 97% coverage of the interval despite 54% overall recovery (44% in Hole U1513A and 66% in Hole U1513D). For the lower Turonian interval, Hole U1513D recovery is excellent. We generally used CSF-A depths to anchor Hole U1513D cores and correlated Hole U1513A cores to that sequence primarily using the data described above (Figure F49). For the upper Cenomanian, determining depth was an iterative process guided by offsets propagated downhole. The most critical issue is the relative depths of and any potential overlaps between Cores 369-U1513D-20R and 369-U1513A-46X. NGR data from cores and downhole logs suggest overlap is minimal, but this conclusion should be considered a working hypothesis so that precision and accuracy can be evaluated based on more refined biostratigraphy and documentation of isotopic trends through sections.
Core-log integration
Recognition of matching, sharp peaks in NGR records from the cores and wireline logging in Hole U1513A permitted translation of the CSF-A scale to the WMSF scale (see Petrophysics) (Figure F50; Table T27). Tie points were chosen at peak NGR values within broad trends in both the core data and wireline logging results. Between 70 and 220 m CSF-A, identification of exact tie points is hampered by the short length of recovered cores, although the overall pattern of NGR variation is consistent between core-based and wireline logging data.
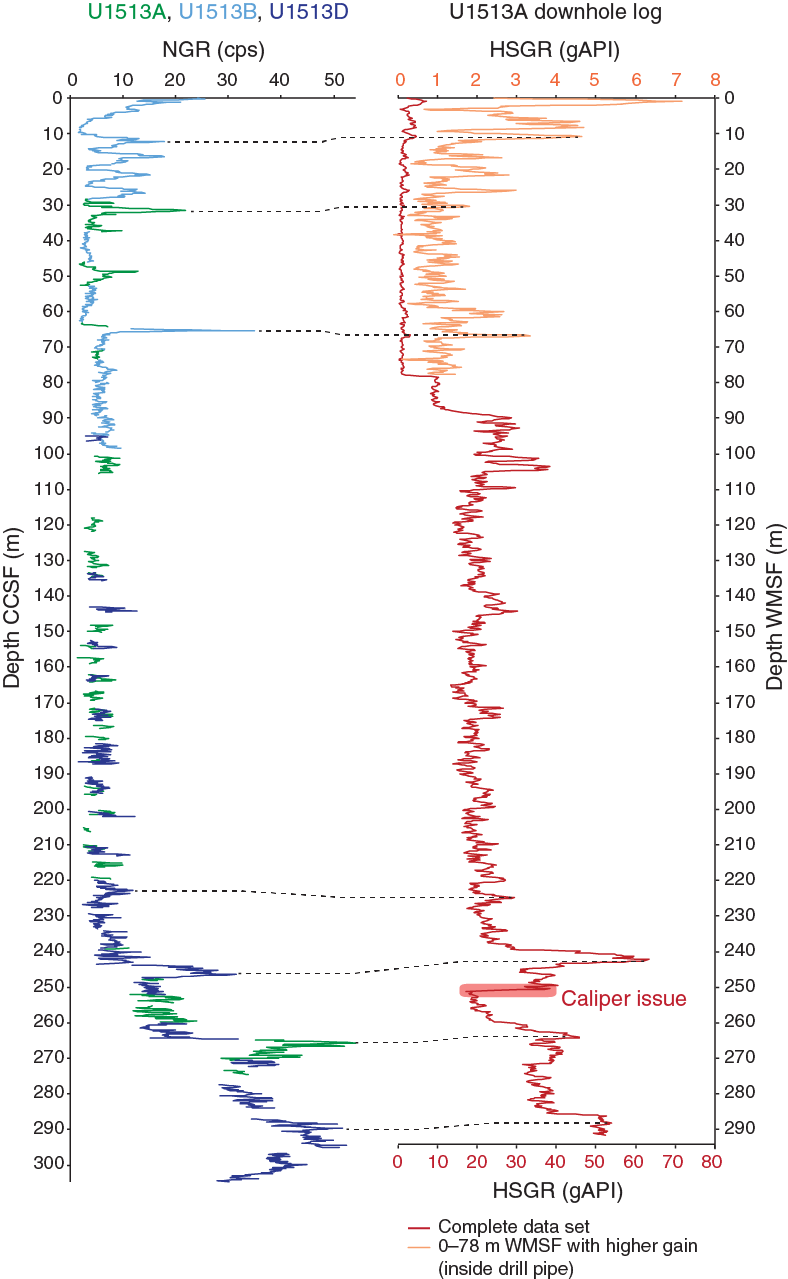
Figure F50. Whole-round and downhole logging NGR.
Summary
Compiled recovery of the cored intervals at Site U1513 demonstrates good to excellent coverage spanning late Neogene, late Early Cretaceous, and Late Cretaceous deposits and 80 m of basalt and basaltic breccia recovered toward the bottom of Holes U1513D and U1513E (Figure F51). The results from interstitial water chemistry reflect the intense downhole alteration of volcanogenic material (see Geochemistry). The sediment accumulation rate for most of the Cretaceous interval (shallower than 530 m CSF-A) varied between 3 and 20 m/My.
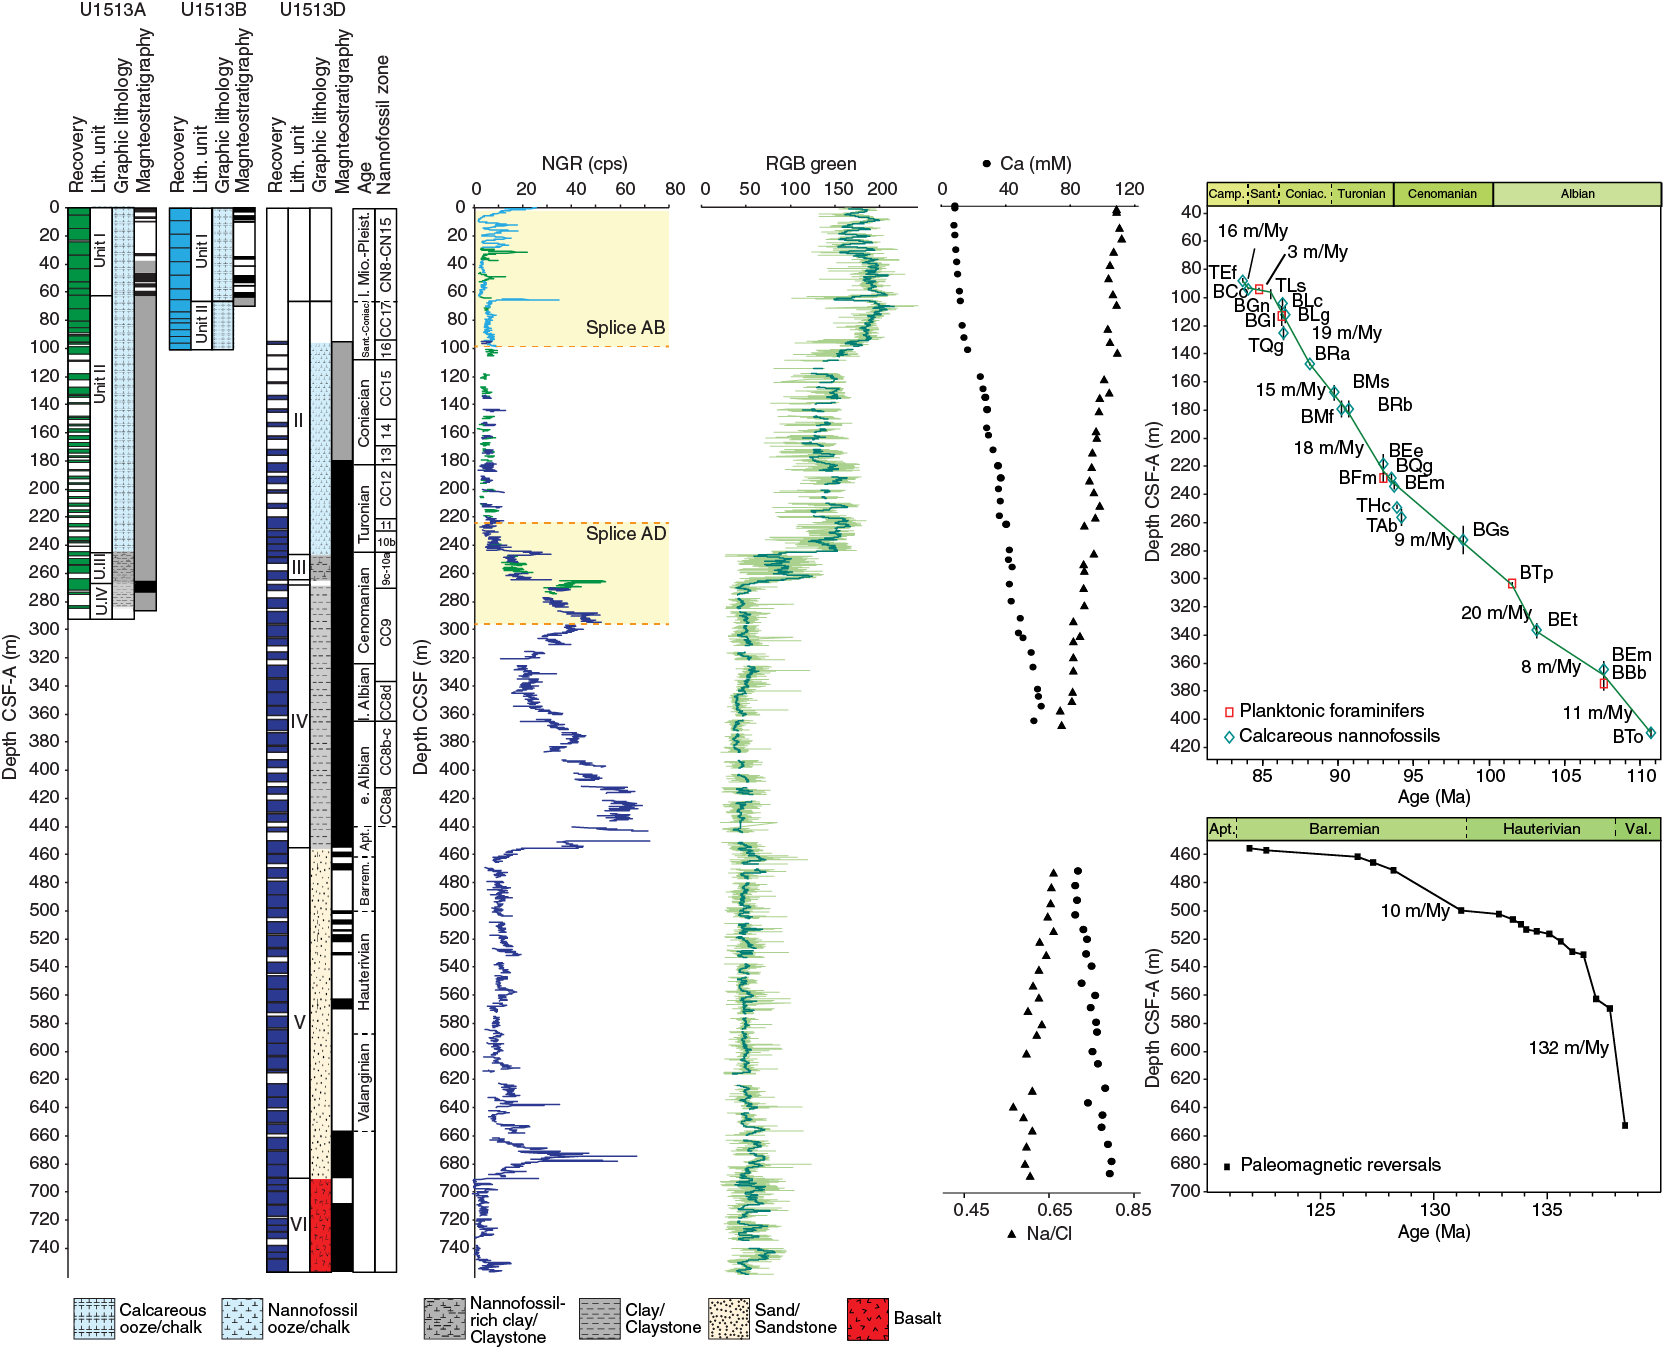
Figure F51. Site U1513 summary.
References
Bischoff, J.L., and Dickson, F.W., 1975. Seawater-basalt interaction at 200°C and 500 bars: implications for origin of sea-floor heavy-metal deposits and regulation of seawater chemistry. Earth and Planetary Science Letters, 25(3):385–397. https://doi.org/10.1016/0012-821X(75)90257-5
Blair, S.A., and Watkins, D.K., 2009. High-resolution calcareous nannofossil biostratigraphy for the Coniacian/Santonian Stage boundary, Western Interior Basin. Cretaceous Research, 30(2):367–384. https://doi.org/10.1016/j.cretres.2008.07.016
Borissova, I., 2002. Geological Framework of the Naturaliste Plateau. Geoscience Australia, 2002/20. http://www.ga.gov.au/metadata-gateway/metadata/record/40535/
Brumsack, H.-J., and Zuleger, E., 1992. Boron and boron isotopes in pore waters from ODP Leg 127, Sea of Japan. Earth and Planetary Science Letters, 113(3):427–433. https://doi.org/10.1016/0012-821X(92)90143-J
Calvert, S.E., and Pedersen, T.F., 1993. Geochemistry of recent oxic and anoxic marine sediments: implications for the geological record. Marine Geology, 113(1–2):67–88. https://doi.org/10.1016/0025-3227(93)90150-T
Caron, M., 1981. Un nouveau genre de foraminifère planctonique du Crétacé: Falsotruncana nov. gen. Eclogae Geologicae Helvetiae, 74:65–73. https://doi.org/10.5169/seals-165091
Church, T.M., and Wolgemuth, K., 1972. Marine barite saturation. Earth and Planetary Science Letters, 15(1):35–44. https://doi.org/10.1016/0012-821X(72)90026-X
De Vleeschouwer, D., Dunlea, A.G., Auer, G., Anderson, C.H., Brumsack, H., de Loach, A., Gurnis, M., et al., 2017. Quantifying K, U, and Th contents of marine sediments using shipboard natural gamma radiation spectra measured on DV JOIDES Resolution. Geochemistry, Geophysics, Geosystems, 18(3):1053–1064. https://doi.org/10.1002/2016GC006715
Direen, N.G., Cohen, B.E., Maas, R., Frey, F.A., Whittaker, J.M., Coffin, M.F., Meffre, S., Halpin, J.A., and Crawford, A.J., 2017. Naturaliste Plateau: constraints on the timing and evolution of the Kerguelen Large Igneous Province and its role in Gondwana breakup. Australian Journal of Earth Sciences, 64(7):851–869. https://doi.org/10.1080/08120099.2017.1367326
Fitton, J.G., and Godard, M., 2004. Origin and evolution of magmas on the Ontong Java Plateau. In Fitton, J.G., Mahoney, J.J., Wallace, P.J., and Saunders, A.D. (Eds.), Origin and Evolution of the Ontong Java Plateau. Geological Society Special Publication, 229(1):151–178. https://doi.org/10.1144/GSL.SP.2004.229.01.10
Fitton, J.G., Saunders, A.D., Norry, M.J., Hardarson, B.S., and Taylor, R.N., 1997. Thermal and chemical structure of the Iceland plume. Earth and Planetary Science Letters, 153(3-4):197–208. https://doi.org/10.1016/S0012-821X(97)00170-2
Fuller, M., Molina-Garza, R., Touchard, Y., and Kidane, T., 2006. Paleomagnetic records from carbonate legs in the Southern Oceans and attendant drilling and coring related effects. In Sager, W.W., Acton, G.D., Clement, B.M., and Fuller, M. (Eds.), ODP Contributions to Paleomagnetism. Physics of the Earth and Planetary Interiors, 156(3–4):242–260. https://doi.org/10.1016/j.pepi.2005.08.007
Gale, A.S., Bown, P., Caron, M., Crampton, J., Crowhurst, S.J., Kennedy, W.J., Petrizzo, M.R., and Wray, D.S., 2011. The uppermost middle and upper Albian succession at the Col de Palluel, Hautes-Alpes, France: an integrated study (ammonites, inoceramid bivalves, planktonic foraminifera, nannofossils, geochemistry, stable oxygen and carbon isotopes, cyclostratigraphy). Cretaceous Research, 32(3):59–130. https://doi.org/10.1016/j.cretres.2010.10.004
Gieskes, J.M., Gamo, T., and Brumsack, H., 1991. Technical Note 15: Chemical Methods for Interstitial Water Analysis aboard JOIDES Resolution. Ocean Drilling Program. https://doi.org/10.2973/odp.tn.15.1991
Gieskes, J.M., and Lawrence, J.R., 1981. Alteration of volcanic matter in deep-sea sediments: evidence from the chemical composition of interstitial waters from deep sea drilling cores. Geochimica Cosmochimica Acta, 45(10):1687–1703. https://doi.org/10.1016/0016-7037(81)90004-1
Gradstein, F.M., Ogg, J.G., Schmitz, M.D., and Ogg, G.M. (Eds.), 2012. The Geological Time Scale 2012: Amsterdam (Elsevier).
Hardenbol, J., Thierry, J., Farley, M.B., Jacquin, T., de Graciansky, P.-C., and Vail, P.R., 1998. Mesozoic and Cenozoic sequence chronostratigraphic framework of European basins. In de Graciansky, P.-C., Hardenbol, J., Jacquin, T., and Vail, P.R. (Eds.), Mesozoic and Cenozoic Sequence Stratigraphy of European Basins. Special Publication - SEPM (Society for Sedimentary Geology), 60:3–13. http://archives.datapages.com/data/sepm_sp/SP60/Mesozoic_and_Cenozoic_Sequence_Chronostratigraphic.pdf
Haynes, S.J., Huber, B.T., and MacLeod, K.G., 2015. Evolution and phylogeny of mid-Cretaceous (Albian–Coniacian) biserial planktic foraminifera. Journal of Foramininiferal Research, 45(1):42–81. https://doi.org/10.2113/gsjfr.45.1.42
Huber, B.T., Hobbs, R.W., Bogus, K.A., Batenburg, S.J., Brumsack, H.-J., do Monte Guerra, R., Edgar, K.M., Edvardsen, T., Garcia Tejada, M.L., Harry, D.L., Hasegawa, T., Haynes, S.J., Jiang, T., Jones, M.M., Kuroda, J., Lee, E.Y., Li, Y.-X., MacLeod, K.G., Maritati, A., Martinez, M., O'Connor, L.K., Petrizzo, M.R., Quan, T.M., Richter, C., Riquier, L., Tagliaro, G.T., Wainman, C.C., Watkins, D.K., White, L.T., Wolfgring, E., and Xu, Z., 2019a. Expedition 369 methods. In Hobbs, R.W., Huber, B.T., Bogus, K.A., and the Expedition 369 Scientists, Australia Cretaceous Climate and Tectonics. Proceedings of the International Ocean Discovery Program, 369: College Station, TX (International Ocean Discovery Program). https://doi.org/10.14379/iodp.proc.369.102.2019
Huber, B.T., Hobbs, R.W., Bogus, K.A., Batenburg, S.J., Brumsack, H.-J., do Monte Guerra, R., Edgar, K.M., Edvardsen, T., Garcia Tejada, M.L., Harry, D.L., Hasegawa, T., Haynes, S.J., Jiang, T., Jones, M.M., Kuroda, J., Lee, E.Y., Li, Y.-X., MacLeod, K.G., Maritati, A., Martinez, M., O’Connor, L.K., Petrizzo, M.R., Quan, T.M., Richter, C., Riquier, L., Tagliaro, G.T., Wainman, C.C., Watkins, D.K., White, L.T., Wolfgring, E., and Xu, Z., 2019b. Site U1512. In Hobbs, R.W., Huber, B.T., Bogus, K.A., and the Expedition 369 Scientists, Australia Cretaceous Climate and Tectonics. Proceedings of the International Ocean Discovery Program, 369: College Station, TX (International Ocean Discovery Program). https://doi.org/10.14379/iodp.proc.369.103.2019
Huber, B.T., and Leckie, R.M., 2011. Planktic foraminiferal species turnover across deep-sea Aptian/Albian boundary sections. Journal of Foraminiferal Research, 41(1):53–95. https://doi.org/10.2113/gsjfr.41.1.53
Huber, B.T., Petrizzo, M.R., Watkins, D.K., Haynes, S.J., and MacLeod, K.G., 2017. Correlation of Turonian continental margin and deep-sea sequences in the subtropical Indian Ocean sediments by integrated planktonic foraminiferal and calcareous nannofossil biostratigraphy. Newsletters on Stratigraphy, 50(2):141–185. https://doi.org/10.1127/nos/2017/0373
Kaminski, M.A., and Gradstein, F.M., 2005. Atlas of Paleogene cosmopolitan deep-water agglutinated foraminifera. Grzybowski Foundation Special Publication, 10. http://www.foraminifera.eu/atlas.html
Kennedy, J.W., Gale, A.S, Huber, B.T., Petrizzo, M.R., Bown, P., and Jenkyns, H.C., 2017. The Global Boundary Stratotype Section and Point (GSSP) for the base of the Albian Stage, of the Cretaceous, the Col de Pré-Guittard section, Arnayon, Drôme, France. Episodes, 40(3)177–188. https://doi.org/10.18814/epiiugs/2017/v40i3/017021
Kennedy, W.J., Gale, A.S., Lees, J.A., and Caron, M., 2004. The Global Boundary Stratotype Section and Point (GSSP) for the base of the Cenomanian Stage, Mont Risou, Hautes-Alpes, France. Episodes, 27(1):21–32. http://www.stratigraphy.org/GSSP/Cenomanian.pdf
Kirschvink, J.L., 1980. The least-squares line and plane and the analysis of palaeomagnetic data. Geophysical Journal of the Royal Astronomical Society, 62(3):699–718. https://doi.org/10.1111/j.1365-246X.1980.tb02601.x
Kucera, M., 2007. Planktonic foraminifera as tracers of past oceanic environments. In Hillaire, M., and de Vernal, A. (Eds.), Developments in Marine Geology (Volume 1): Proxies in Late Cenozoic Paleoceanography: Amsterdam (Elsevier), 213–262. https://doi.org/10.1016/S1572-5480(07)01011-1
Lamolda, M.A., Paul, C.R.C., Peryt, D., and Pons, J.M., 2014. The Global Boundary Stratotype and Section Point (GSSP) for the base of the Santonian Stage, “Cantera de Margas”, Olazagutia, northern Spain. Episodes, 37(1):2–13.
Le Maitre, R.W., Bateman, P., Dudek, A., Keller, J., Lameyre, J., Le Bas, M.J., Sabine, P.A., Schmid, R., Sorensen, H., Streckeisen, A., Woolley, A.R., and Zanettin, B., 1989. A Classification of Igneous Rocks and Glossary of Terms: Oxford, United Kingdom (Blackwell Science Publishing).
Lurcock, P.C., and Wilson, G.S., 2012. PuffinPlot: a versatile, user-friendly program for paleomagnetic analysis. Geochemistry, Geophysics, Geosystems, 13(6):Q06Z45. https://doi.org/10.1029/2012GC004098
Luyendyk, B.P., and Davies, T.A., 1974. Results of DSDP Leg 26 and the geologic history of the Southern Indian Ocean. In Davies, T.A., Luyendyk, B.P., et al., Initial Reports of the Deep Sea Drilling Project, 26: Washington, DC (U.S. Government Printing Office), 909–943. https://doi.org/10.2973/dsdp.proc.26.136.1974
Maloney, D., Sargent, C., Direen, N.G., Hobbs, R.W., and Gröcke, D.R., 2011. Re-evaluation of the Mentelle Basin, a polyphase rifted margin basin, offshore southwest Australia: new insights from integrated regional seismic datasets. Solid Earth, 2(2):107–123. https://doi.org/10.5194/se-2-107-2011
Murray, R.W., Brumsack, H.J., von Breymann, M.T., Sturz, A.A., Dunbar, R.B., and Gieskes, J.M., 1992. Diagenetic reactions in deeply buried sediments of the Japan Sea: a synthesis of interstitial-water chemistry results from Legs 127 and 128. In Tamaki, K., Suyehiro, K., Allan, J., McWilliams, M., et al., Proceedings of the Ocean Drilling Program, Scientific Results, 127/128 (Part 2): College Station, TX (Ocean Drilling Program), 1261–1274. https://doi.org/10.2973/odp.proc.sr.127128-2.177.1992
Ogg, J.G., 2012. Geomagnetic polarity time scale. In Gradstein, F.M., Ogg, J.G., Schmitz, M.D., and Ogg, G.M. (Eds.), The Geologic Time Scale 2012: Amsterdam (Elsevier), 85–113. https://doi.org/10.1016/B978-0-444-59425-9.00005-6
Olierook, H.K.H., Jourdan, F., Merle, R.E., Timms, N.E., Kusznir, N., and Muhling, J.R., 2016. Bunbury basalt: Gondwana breakup products or earliest vestiges of the Kerguelen mantle plume? Earth and Planetary Science Letters, 440:20–32. https://doi.org/10.1016/j.epsl.2016.02.008
Peters, K.E., Walters, C.C., and Moldowan, J.M., 2004. The Biomarker Guide (Volume 2): Biomarkers and Isotopes in Petroleum Systems and Earth History: Cambridge, United Kingdom (Cambridge University Press). https://doi.org/10.1017/CBO9781107326040
Petrizzo, M.R., 2000. Upper Turonian–lower Campanian planktonic foraminifera from southern mid–high latitudes (Exmouth Plateau, NW Australia): biostratigraphy and taxonomic notes. Cretaceous Research, 21(4):479–505. https://doi.org/10.1006/cres.2000.0218
Petrizzo, M.R., 2001. Late Cretaceous planktonic foraminifera from the Kerguelen Plateau (ODP Leg 183): new data to improve the Southern Oceans biozonation. Cretaceous Research, 22(6):829–855. https://doi.org/10.1006/cres.2001.0290
Petrizzo, M.R., 2003. Late Cretaceous planktonic foraminiferal bioevents in the Tethys and in the Southern Ocean record: an overview. Journal of Foraminiferal Research, 33(4):330–337. https://doi.org/10.2113/0330330
Petrizzo, M.R., Caron, M., and Premoli Silva, I., 2015. Remarks on the identification of the Albian/Cenomanian boundary and taxonomic clarification of the planktonic foraminifera index species globotruncanoides, brotzeni and tehamaensis. Geological Magazine, 152(3):521–536. https://doi.org/10.1017/S0016756814000478
Petrizzo, M.R., Falzoni, F., and Premoli Silva, I., 2011. Identification of the base of the lower-to-middle Campanian Globotruncana ventricosa Zone: comments on reliability and global correlations. Cretaceous Research, 32(3):387–405. https://doi.org/10.1016/j.cretres.2011.01.010
Petrizzo, M.R., and Huber, B.T., 2006. On the phylogeny of the late Albian genus Planomalina. Journal of Foraminiferal Research, 36(3):233–240. https://doi.org/10.2113/gsjfr.36.3.233
Petrizzo, M.R., Jiménez Berrocoso, Á., Falzoni, F., Huber, B.T., and Macleod, K.G., 2017. The Coniacian–Santonian sedimentary record in southern Tanzania (Ruvuma Basin, East Africa): planktonic foraminiferal evolutionary, geochemical and paleoceanographic patterns. Sedimentology, 64(1):52–285. https://doi.org/10.1111/sed.12331
Premoli Silva, I., and Sliter, W.V., 1995. Cretaceous planktonic foraminiferal biostratigraphy and evolutionary trends from the Bottaccione section, Gubbio, Italy. Palaeontographia Italica, 82:2–90.
Richter, C., Acton, G., Endris, C., and Radsted, M., 2007. Technical Note 34: Handbook for Shipboard Paleomagnetists. Ocean Drilling Program. https://doi.org/10.2973/odp.tn.34.2007
Robaszynski, F., and Caron, M., 1995. Foraminifères planctoniques du Crétacé: commentaire de la zonation Europe-Méditerranée. Bulletin De La Societe Geologique De France, 166:681–692.
Torres, M.E., Brumsack, H.-J., Bohrmann, G., and Emeis, K.C., 1996. Barite fronts in continental margin sediments: a new look at barium remobilization in the zone of sulfate reduction and formation of heavy barites in diagenetic fronts. Chemical Geology, 127(1–3):125–139. https://doi.org/10.1016/0009-2541(95)00090-9
Wade, B.S., Pearson, P.N., Berggren, W.A., and Pälike, H., 2011. Review and revision of Cenozoic tropical planktonic foraminiferal biostratigraphy and calibration to the geomagnetic polarity and astronomical time scale. Earth-Science Reviews, 104(1–3):111–142. https://doi.org/10.1016/j.earscirev.2010.09.003
Watkins, D.K., Cooper, M.J., and Wilson, P.A., 2005. Calcareous nannoplankton response to late Albian Oceanic Anoxic Event 1d in the western North Atlantic. Paleoceanography, 20(2):PA2010. https://doi.org/10.1029/2004PA001097
Wonders, A.A.H., 1992. Cretaceous planktonic foraminiferal biostratigraphy, Leg 122, Exmouth Plateau, Australia. In von Rad, U., Haq, B.U., et al., Proceedings of the Ocean Drilling Program, Scientific Results, 122: College Station, TX (Ocean Drilling Program), 587–599. https://doi.org/10.2973/odp.proc.sr.122.160.1992
Zijderveld, J.D.A., 1967. AC demagnetization of rocks: analysis of results. In Collinson, D.W., Creer, K.M., and Runcorn, S.K. (Eds.), Developments in Solid Earth Geophysics (Volume 3): Methods in Palaeomagnetism: Amsterdam (Elsevier), 254–286. https://doi.org/10.1016/B978-1-4832-2894-5.50049-5
1 Huber, B.T., Hobbs, R.W., Bogus, K.A., Batenburg, S.J., Brumsack, H.-J., do Monte Guerra, R., Edgar, K.M., Edvardsen, T., Garcia Tejada, M.L., Harry, D.L., Hasegawa, T., Haynes, S.J., Jiang, T., Jones, M.M., Kuroda, J., Lee, E.Y., Li, Y.-X., MacLeod, K.G., Maritati, A., Martinez, M., O’Connor, L.K., Petrizzo, M.R., Quan, T.M., Richter, C., Riquier, L., Tagliaro, G.T., Wainman, C.C., Watkins, D.K., White, L.T., Wolfgring, E., Xu, Z., 2019. Site U1513. In Hobbs, R.W., Huber, B.T., Bogus, K.A., and the Expedition 369 Scientists, Australia Cretaceous Climate and Tectonics. Proceedings of the International Ocean Discovery Program, 369: College Station, TX (International Ocean Discovery Program). https://doi.org/10.14379/iodp.proc.369.104.2019
2 Expedition 369 Scientists’ affiliations.
This work is distributed under the Creative Commons Attribution 4.0 International (CC BY 4.0) license. 
- F1. Site U1513 location.
- F2. Seismic Profile s310_07 with site locations.
- F3. Lithostratigraphic summary.
- F4. Lithologies and unit boundaries.
- F5. Sediment constituents.
- F6. XRD results.
- F7. Rock features.
- F8. SEM images of clinoptilolite.
- F9. Igneous Units 1–7, Hole U1513D.
- F10. Igneous Units 1–7, Hole U1513E.
- F11. Textural features.
- F12. Original igneous textures.
- F13. Cretaceous age-depth plots.
- F14. Age-diagnostic calcareous nannofossils.
- F15. Planktonic foraminifers.
- F16. Benthic foraminifers.
- F17. Cretaceous dinocyst s.
- F18. Paleomagnetic data, Hole U1513A.
- F19. Paleomagnetic data, Hole U1513B.
- F20. Paleomagnetic data, Hole U1513D.
- F21. Paleomagnetic data, Hole U1513E.
- F22. Section-half vector endpoint diagrams, Units I and II.
- F23. Section-half vector endpoint diagrams, Units III–V.
- F24. Section-half vector endpoint diagrams, Unit VI.
- F25. Discrete sample vector endpoint diagrams, Units I and II.
- F26. Discrete sample vector endpoint diagrams, Units III–V.
- F27. Discrete sample vector endpoint diagrams, Unit VI.
- F28. Discrete sample IRM acquisition.
- F29. Magnetostratigraphic results.
- F30. Core physical properties, Hole U1513B.
- F31. Downhole logging NGR, Hole U1513B.
- F32. Core physical properties, Hole U1513D.
- F33. Downhole logging NGR, Hole U1513D.
- F34. Core physical properties, Hole U1513E.
- F35. Density, porosity, thermal conductivity, and P-wave velocity, Hole U1513A.
- F36. Density, porosity, thermal conductivity, and P-wave velocity, Hole U1513D.
- F37. Density, thermal conductivity, and P-wave velocity, Hole U1513E.
- F38. Downhole logging results, Hole U1513A.
- F39. Downhole logging results, Hole U1513D.
- F40. Downhole logging results, Hole U1513E.
- F41. VSI arrival times and waveforms.
- F42. FMS images and downhole logging.
- F43. Headspace hydrocarbon gas.
- F44. Interstitial water alkalinity, pH, and element and ion concentrations.
- F45. Carbon, TN, and TOC/TN.
- F46. Source rock analysis results.
- F47. Major and trace element data.
- F48. Hole U1513A and U1513B correlation.
- F49. Hole U1513A and U1513D correlation.
- F50. Whole-round and downhole logging NGR.
- F51. Site U1513 summary.
- T1. Core summary.
- T2. Lithostratigraphic units.
- T3. Summary of XRF results.
- T4. Microfossils and minerals.
- T5. Calcareous nannofossil events.
- T6. Planktonic foraminiferal events.
- T7. Paleomagnetic events.
- T8. Calcareous nannofossils, Hole U1513A.
- T9. Calcareous nannofossils, Hole U1513B.
- T10. Calcareous nannofossils, Hole U1513D.
- T11. Planktonic foraminifers, Hole U1513A.
- T12. Planktonic foraminifers, Hole U1513B.
- T13. Planktonic foraminifers, Hole U1513D.
- T14. Benthic foraminifers, Hole U1513A.
- T15. Benthic foraminifers, Hole U1513B.
- T16. Benthic foraminifers, Hole U1513D.
- T17. Icefield MI-5 core orientation tool data.
- T18. FlexIT core orientation tool data.
- T19. Paleomagnetic results.
- T20. PCA results.
- T21. Magnetic reversal depths and ages.
- T22. Headspace gas data.
- T23. Interstitial water geochemistry.
- T24. Bulk sediment geochemistry.
- T25. Source rock analysis data.
- T26. ICP-AES major and trace element data.
- T27. Core and wireline data tie points.