Sutherland, R., Dickens, G.R., Blum, P., and the Expedition 371 Scientists
Proceedings of the International Ocean Discovery Program Volume 371
publications.iodp.org
https://doi.org/10.14379/iodp.proc.371.105.2019

Site U15081
R. Sutherland, G.R. Dickens, P. Blum, C. Agnini, L. Alegret, G. Asatryan, J. Bhattacharya, A. Bordenave, L. Chang, J. Collot, M.J. Cramwinckel, E. Dallanave, M.K. Drake, S.J.G. Etienne, M. Giorgioni, M. Gurnis, D.T. Harper, H.-H.M. Huang, A.L. Keller, A.R. Lam, H. Li, H. Matsui, H.E.G. Morgans, C. Newsam, Y.-H. Park, K.M. Pascher, S.F. Pekar, D.E. Penman, S. Saito, W.R. Stratford, T. Westerhold, and X. Zhou2
Keywords: International Ocean Discovery Program, IODP, JOIDES Resolution, Expedition 371, Site U1508, Tasman Frontier, Zealandia, Reinga, Challenger, Eastern Australian Current, Lord Howe, Murihiku, New Caledonia, Norfolk, Northland, Pacific, Ring of Fire, Tasman, Taranaki, Tonga, Kermadec, Waka Nui, Wanganella, subduction, Early Eocene Climatic Optimum, EECO, Middle Eocene Climatic Optimum, MECO, biogenic bloom, stratigraphy, diagenesis, compaction, volcanism
MS 371-105: Published 2 February 2019
Background and objectives
International Ocean Discovery Program (IODP) Site U1508 (34°26.89ʹS, 171°20.59ʹE; 1609 m water depth) is ~130 km west of Cape Reinga, which is the northern tip of the Northland region of New Zealand (Figure F1). This location on the northeast margin of Reinga Basin contains folded Eocene strata and is inferred to be near the southern end of where subduction initiation occurred (Bache et al., 2012a, 2012b; Browne et al., 2016; Sutherland et al., 2017). The site was chosen to sample a proximal record of deformation, uplift, subsidence, and early arc volcanism.
Reinga Basin is a topographic depression with water depths of 1500–2500 m. It is bounded to the southwest by West Norfolk Ridge and Wanganella Ridge and to the northeast by Reinga Ridge and South Maria Ridge (Figure F1). Topographic highs at the edges of the basin are composed of deformed basin sediment and basement rock with typical water depths in the range of 500–1000 m but are locally shallower. Seafloor sediment of the basin is mostly carbonate sand derived from surrounding highs such as South Maria Ridge, where material comprises ~50% bryozoan fragments (Nelson and Hancock, 1984; Nelson et al., 1981). Much of the sediment was probably transported by storms during lowstand sea level conditions. The sediment is also sorted by the Tasman (Eastern Australian) Current, which in places has created megaripples with >100 m wavelength and >5 km axial length that are visible on site survey swath bathymetry data.
The subseafloor of Reinga Basin was first highlighted on reconnaissance seismic reflection surveys (Herzer et al., 1997) but had not been drilled. The geology of onshore Northland has been mapped, and an extensive grid of seismic reflection data exists adjacent to Northland. The Waka Nui-1 offshore petroleum exploration borehole was drilled ~275 km southeast of Site U1508 in Northland Basin (Isaac et al., 1994; Stagpoole, 2011; Figure F1).
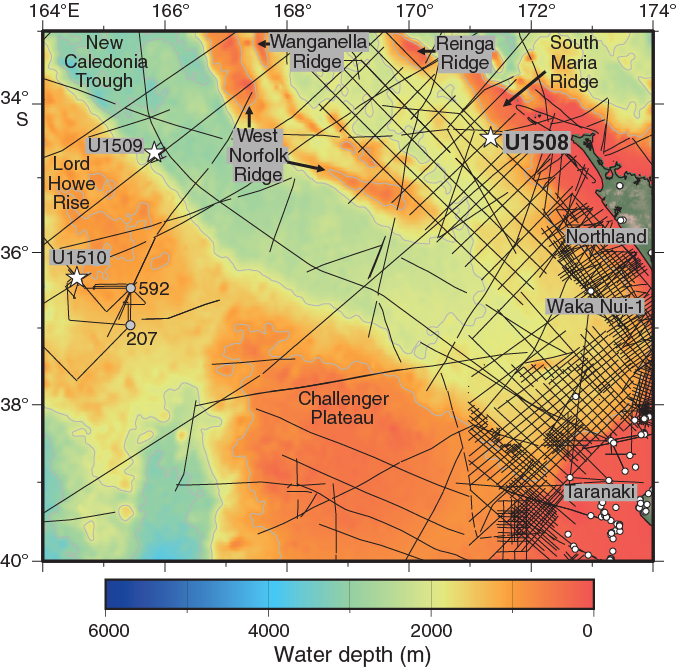
Figure F1. Regional bathymetry, seismic reflection lines, and boreholes.
The geology of Northland and its adjacent basin provides context for interpreting Site U1508 because it is along strike structurally, presumably has a similar tectonic and stratigraphic history, and provides insight into the nature of terrigenous and volcanic sediment sources. Northland autochthonous basement rock is overlain by Eocene coal measures and Oligocene limestone, which is in turn tectonically overlain by deformed marine strata and Northland Allochthon volcanic rocks (Isaac et al., 1994). Basement rock is known from magnetic surveys to have a strong northwest-striking fabric (Sutherland, 1999). The Junction magnetic anomaly is known from exposures farther south to mark the location of the Dun Mountain–Maitai terrane, which is a Permian ophiolite and volcaniclastic sequence (Mortimer, 2004), and its offshore location is close to Site U1508 (Sutherland, 1999). Jurassic volcaniclastic sediments of the Murihiku terrane crop out onshore (Isaac, 1996), were intersected at the base of the Waka Nui-1 borehole (Stagpoole, 2011), and are correlated with the deepest reflectors imaged southwest of Site U1508 (Figure F2). Northeast of the Junction magnetic anomaly, the Bay of Islands terrane basement rock is a deformed sequence of trench and trench-slope sandstone and mudstone of Permian to Jurassic age (Mortimer, 2004; Spörli, 1978) and may have represented a terrigenous sediment source for adjacent sedimentary basins. The Northland Allochthon was emplaced in the late Oligocene to early Miocene based on the minimum age of strata beneath the allochthon and the maximum age of strata above the allochthon; additionally, andesitic volcanism was active in the region during the early Miocene (Isaac et al., 1994; Rait et al., 1991).
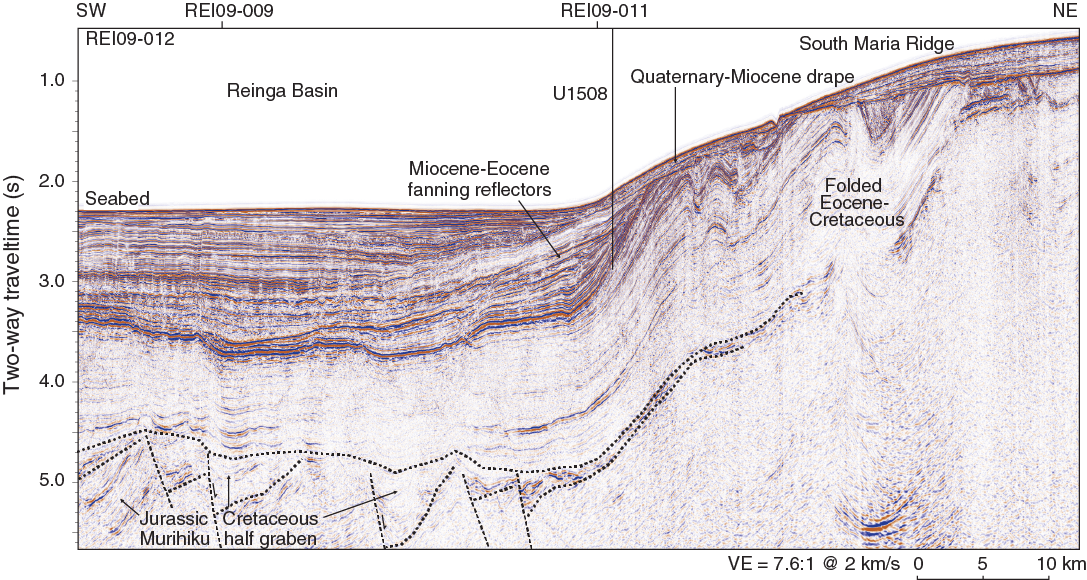
Figure F2. Regional seismic reflection Line REI09-012.
Seismic reflection data near Site U1508 reveal five units (Figure F2). The deepest reflectors are truncated at the base of the basin fill and interpreted to be Jurassic sandstone, mudstone, and coal of the Murihiku terrane based on similarities to seismic reflection data near the Waka Nui-1 borehole. Localized areas of fanning reflectors at the base of the basin fill are interpreted to be Cretaceous extensional half grabens based on regional correlation with Taranaki Basin. The half-graben fill corresponds to seismic Unit U1 of Bache et al. (2012b). A thick (>1 km) sequence of parallel folded reflectors is interpreted on the basis of regional correlations and dredged rock samples to be deformed Cretaceous to Eocene carbonaceous sandstone, mudstone, and bathyal carbonate (Browne et al., 2016; Sutherland et al., 2017) that corresponds to seismic Units U2–U4 of Bache et al. (2012b). Fanning, channeled, and onlapping reflectors at the basin margin record folding, uplift, erosion, and volcanic input during the Eocene–Miocene. A drape sequence overlies folded strata with angular unconformity and records conditions similar to present day, when terrigenous or reworked sediment sources are minimal and the primary source of sediment is biogenic carbonate from adjacent rises (Nelson et al., 1981).
Site U1508 was selected on the basis of seismic reflection data collected in 2009 (Bache et al., 2012a, 2012b) and the Eocene ages obtained from samples of folded sedimentary rock dredged from the seabed elsewhere in the Reinga Basin (Browne et al., 2016). The objective at Site U1508 was to sample the Miocene–Eocene sequence, including the unconformity that marks the onset of deformation (Reflector E; Figure F3). The sequence contains a record of uplift, erosion, and subsidence and can constrain the age and type of nearby volcanic activity. The high-amplitude reflector near the base of the planned borehole (Reflector F) is known to have regional significance for seismic stratigraphic correlation and was hypothesized to represent a major change in sedimentation during the Eocene.
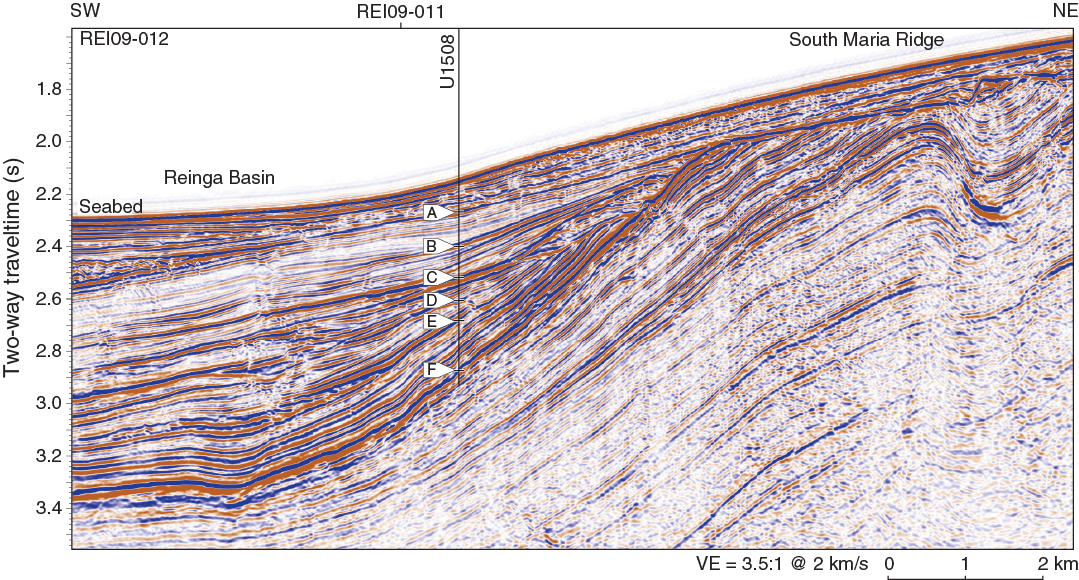
Figure F3. Seismic reflection Line REI09-012 and location of Site U1508.
Operations
Hole locations, water depths, and the number of cores recovered are listed in Table T1. All times are local ship time (UTC + 10 h for Holes U1508A and U1508B and UTC + 11 h for Hole U1508C).
Hole U1508A
We completed the 546 nmi transit from Site U1507 to Site U1508 at an average speed of 9.5 kt and arrived at 2300 h on 20 August 2017. Thrusters and hydrophones were lowered for dynamic positioning, and the rig floor was cleared for operations at 2342 h. At 0130 h on 21 August, we deployed an acoustic beacon for hole positioning. An advanced piston corer (APC)/extended core barrel (XCB) bottom-hole assembly (BHA) was made up, and the drill string was assembled and deployed to just above the seafloor. The top drive was installed, the nonmagnetic core barrels were dressed with core liners, and the orientation tool was deployed. APC coring in Hole U1508A started at 0900 h on 21 August.
After shooting Core 10H at 1520 h, the core line parted just above the sinker bar. The wireline was cut, and a new rope socket was installed. A rotary core barrel (RCB) was dressed with a fishing shoe, and by 1800 h on 21 August the sinker bars and core barrel with Core 10H had been recovered in two wireline trips.
Use of the core orientation tool was postponed until we cut Core 13H because of sandy hole conditions and was discontinued after Core 17H because of unstable hole conditions. Temperature measurements were taken on Cores 7H, 9H, 10H, 12H, 14H, and 17H.
Core 23H had to be drilled for more than 40 min to release it from the formation. At 0600 h on 22 August, we started to retrieve the drill string, and the bit cleared the rig floor at 1140 h, ending Hole U1508A. Total recovery for the 210.3 m cored in Hole U1508A was 201.13 m (96%). The time spent on Hole U1508A was 36.0 h or 1.5 days.
Hole U1508B
The ship was offset ~20 m southwest. An RCB BHA was made up and deployed, and the drill pipe was assembled until the bit was just above the seafloor. The top drive was picked up, and drilling without coring in Hole U1508B started at 1745 h on 22 August 2017 with a center bit installed in the core barrel. At ~75 m drilling depth below seafloor (DSF), the drill string became stuck while making a connection. After pumping a mud sweep, we were able to free the drill string. A total of 85 bbl of mud was pumped for the next ~100 m of drilling. Drilling ahead without coring reached the target (186.6 m DSF) at 2245 h on 22 August. The center bit was retrieved, and a core barrel was dropped to begin coring with Core 2R. After achieving low recovery on Cores 23R through 25R and reaching a zone of particular scientific interest at ~417 m DSF, we decided to cut half cores for Cores 26R through 33R. When recovery began to improve, we switched back to full-length cores with Core 34R.
RCB coring continued through Core 38R (503.4 m DSF), when at 0700 h on 24 August a medical emergency was declared and drill string recovery began. Cores 2R through 38R penetrated from 186.6 to 503.4 m DSF and recovered 133.32 m (42%). Mud sweeps were pumped for hole cleaning on every third core starting with Core 5R. Core recovery varied from 3% to 104% throughout Hole U1508B.
The acoustic beacon was released and recovered, the drill string was retrieved and set back in the derrick, and the rig floor was secured, ending Hole U1508B at 1320 h on 24 August. The time spent on Hole U1508B was 49.5 h or 2.1 days.
Hole U1508C
After securing the rig floor for transit, the hydrophones and thrusters were raised and the 302 nmi transit to Auckland began at 1354 h on 24 August 2017. The clocks were advanced 1 h for the first time at 1400 h and a second time at 0200 h on 25 August. We arrived at the dock in Auckland at 2106 h on 25 August (UTC + 12 h). The medical evacuee, accompanied by two doctors and the port agent, and a crew member disembarked. The ship left Auckland at 0218 h on 26 August to return to Site U1508. The clock was set back 1 h during the transit (UTC + 11 h) and remained that way for subsequent Expedition 371 drilling operations. We completed the 302 nmi transit at an average speed of 10.9 kt and arrived at 0600 h on 27 August. Dynamic positioning was established, and the drill floor was cleared for operations at 0712 h. The RCB BHA was assembled and deployed to the seafloor, and Hole U1508C was initiated ~20 m northwest of Hole U1508B at 1150 h with a center bit installed in the core barrel.
The plan was to drill to ~480 m DSF, ~20 m above the total depth of Hole U1508B, and resume coring. We also decided to spot core two scientifically interesting intervals that had particularly low recovery in Hole U1508B. After drilling without coring to 278 m DSF, we pulled the center bit and collected Cores 2R through 4R from 278 to 292.6 m DSF at half-core intervals. The center bit was deployed again to drill ahead from 292.6 to 316.0 m DSF before cutting a half core and a full core (6R and 7R, respectively) from 316.0 to 330.7 m DSF. The center bit was deployed again, and drilling without coring advanced from 330.7 to 450.0 m DSF. At 0730 h on 28 August, we retrieved the center bit and resumed RCB coring until penetration rates slowed to ~2 m/h. Although short of the desired target depth, at 0300 h on 31 August we decided to stop coring and conduct wireline logging. Collectively, Cores 2R through 38R and the two interspersed drilled intervals penetrated from 278.0 to 704.5 m DSF and recovered 185.04 m of sediment (65% of cored intervals).
At the end of coring, the hole was cleaned with a 30 bbl high-viscosity mud sweep. Next, the rotary shifting tool (RST) was deployed to trigger the mechanical bit release (MBR) and drop the bit at the bottom of the hole (0325 h). The reverse RST was deployed to shift the MBR sleeve back into the circulation position (0430 h). Next, the hole was displaced with 194 bbl of 11.0 lb/gal mud and the end of the drill string was set at 86.7 m DSF. An additional 10 bbl of mud was pumped to ensure the entire hole was displaced with heavy mud.
At 0745 h on 31 August, assembly of the modified triple combo logging tool string began, using the same configuration as was used in Hole U1507B with the exception that no source was installed in the density tool. The logging tools were deployed at 0900 h, and data were collected while lowering the tool string to the bottom of the hole. After logging uphole 128 m for a calibration run, the tools were run back to the bottom of the hole and the main logging pass began. At ~1230 h, the tool string became stuck at ~270 m wireline log depth below seafloor (WSF). The logging line was cut at the rig floor and terminated with connectors that would allow assembly of drill pipe over the logging line to wash down and over the logging tools with the open-ended BHA. The logging tools were free at 2105 h. The tool was pulled to 155 m WSF using the T-bar procedure, at which point sufficient logging line had been retrieved to make a connection with the aft coring line, which was used to pull the logging tools to the surface. The logging tools were recovered and cleaned by 0315 h on 1 September. The drill string was recovered, and the end of pipe cleared the rig floor at 0650 h. The positioning beacon was recovered, the rig floor was secured for transit, the thrusters and hydrophones were raised, and the transit to Site U1509 began at 0730 h on 1 September.
Lithostratigraphy
Site U1508 lies at a moderate water depth (1609 m) along the northeast margin of Reinga Basin (see Background and objectives), ~130 km west of the northern tip of New Zealand, and is the easternmost site drilled during Expedition 371. It was designed to sample a record of flat-lying Neogene sediment overlying folded and fanning Paleogene strata deposited proximal to Eocene subduction initiation. As such, Neogene strata were expected to include sediment sourced from the nearby slope and rises (e.g., Nelson, 1978). Paleogene strata were anticipated to bear some resemblance to age-correlative outcrops of limestone, claystone, and chert on New Zealand (e.g., Campbell et al., 2012; Hollis et al., 2005).
The recovered sedimentary sequence at Site U1508 consists of ~700 m of Pleistocene to lower Eocene heterogeneous sediments divided into three lithostratigraphic units (I–III; Figure F4; Table T2). Lithostratigraphic divisions are based on differences in lithology and sedimentological characteristics, as identified by macroscopic and microscopic (smear slide, thin section, and scanning electron microscope [SEM]) core descriptions (Figure F5) and aided by carbonate content, X-ray fluorescence (XRF), and X-ray diffraction (XRD) analyses.

Figure F4. Lithostratigraphic summary of sedimentary section.
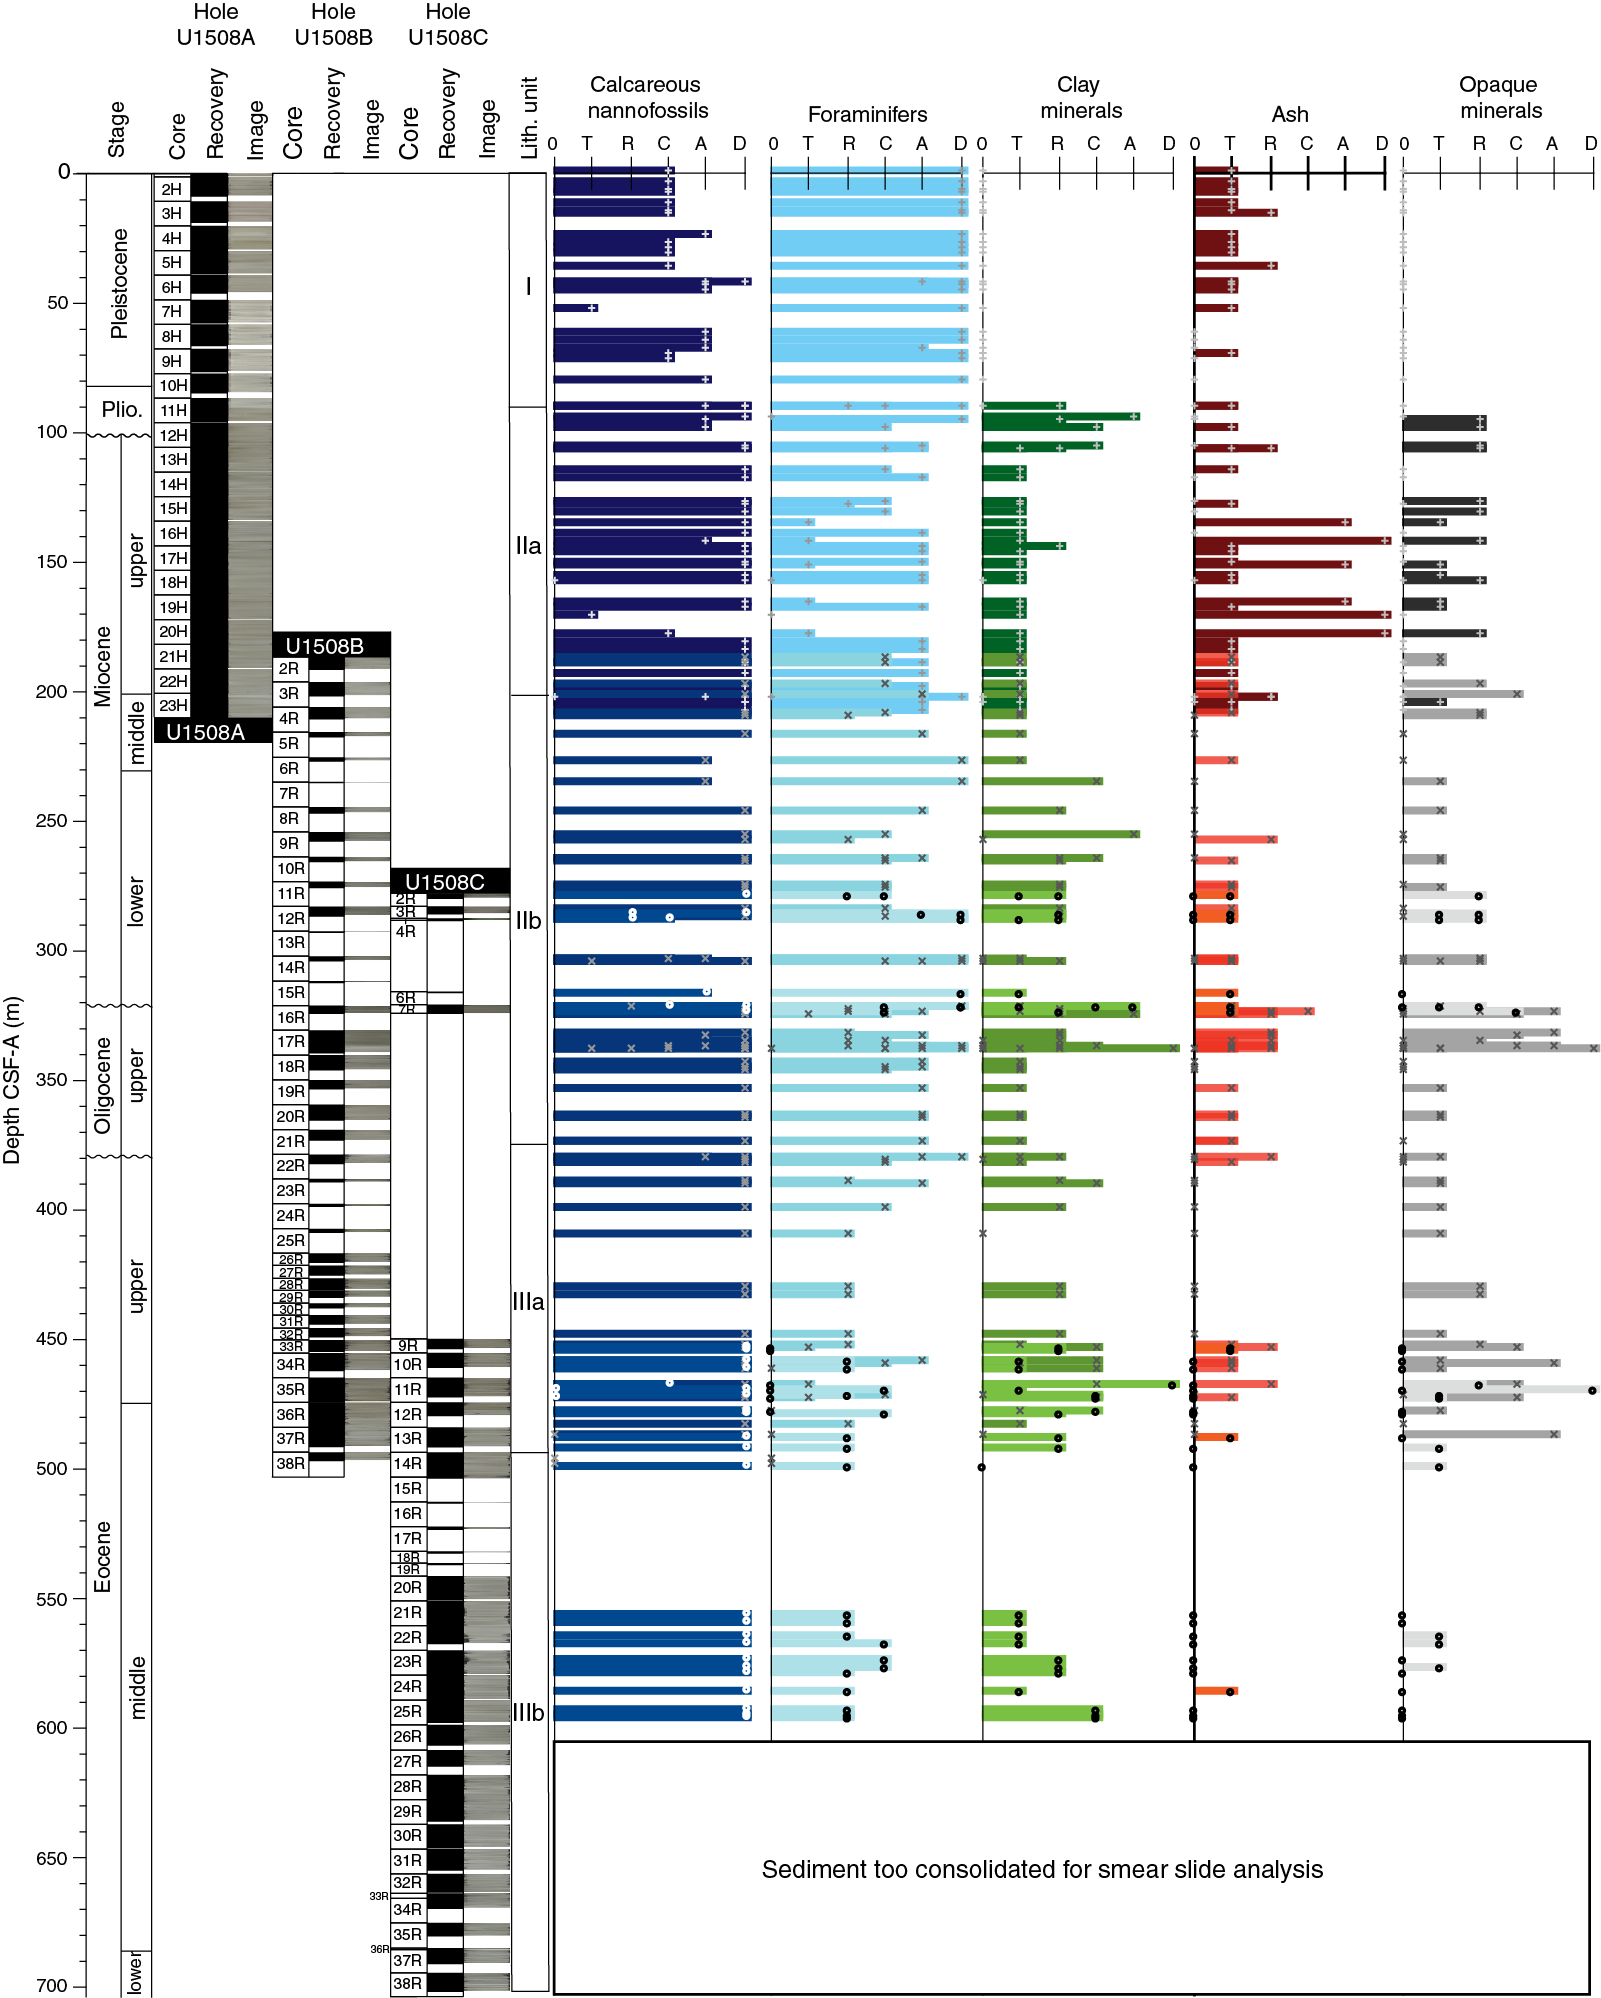
Figure F5. Major biogenic and lithologic constituent abundances.
Unit I consists of ~90 m of Pleistocene to Pliocene foraminiferal ooze with varying amounts of nannofossils and coarse-grained bioclasts, which are composed mainly of bryozoans (Figure F6). The Unit I/II boundary is defined by an abrupt change from foraminiferal ooze with bioclasts to clayey nannofossil ooze with biosilica (Unit II).
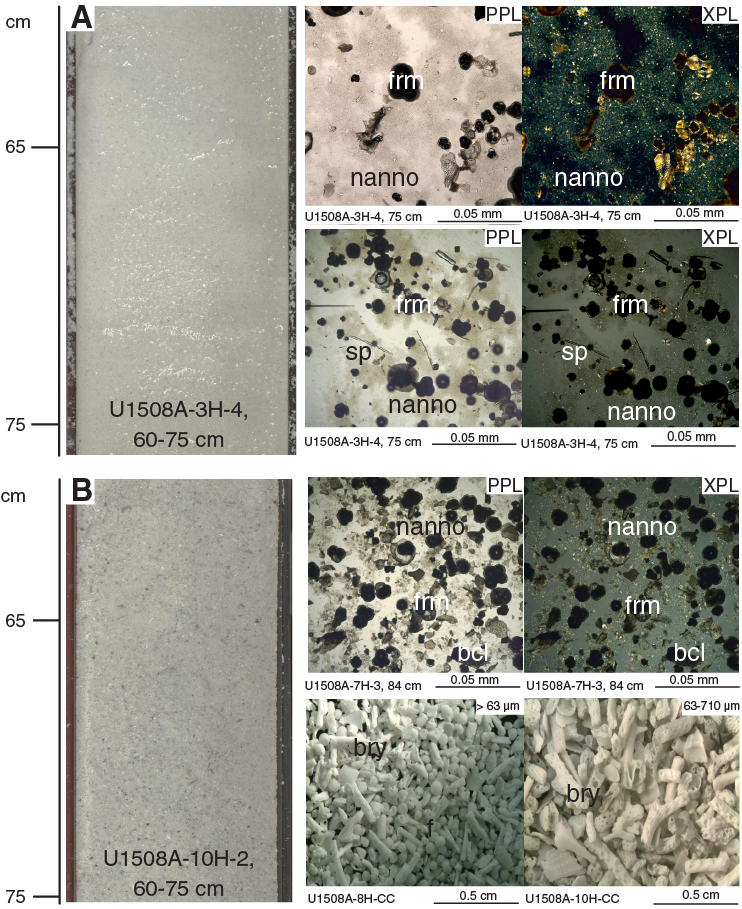
Figure F6. Representative Unit I lithologies.
Unit II consists of ~290 m of upper Miocene to upper Oligocene calcareous ooze and chalk and is divided into two subunits. Subunit IIa consists of clayey nannofossil ooze interbedded with rare ash layers (Figure F7). Subunit IIb consists of beds of coarser grained foraminiferal ooze and chalk with lithic and volcanic grain contents that increase downhole to a peak in Core 371-U1508B-17R (~337 m) (Figures F8, F9) and then subsequently decrease downhole back to biogenic sand-sized grains near the base of the subunit. The Subunit IIa/IIb boundary is defined by the first occurrence of a coarser grained, sharp-based bed of foraminiferal chalk. The Unit II/III boundary is defined by the deepest occurrence of a coarser grained bed (i.e., nannofossil-rich foraminiferal chalk).
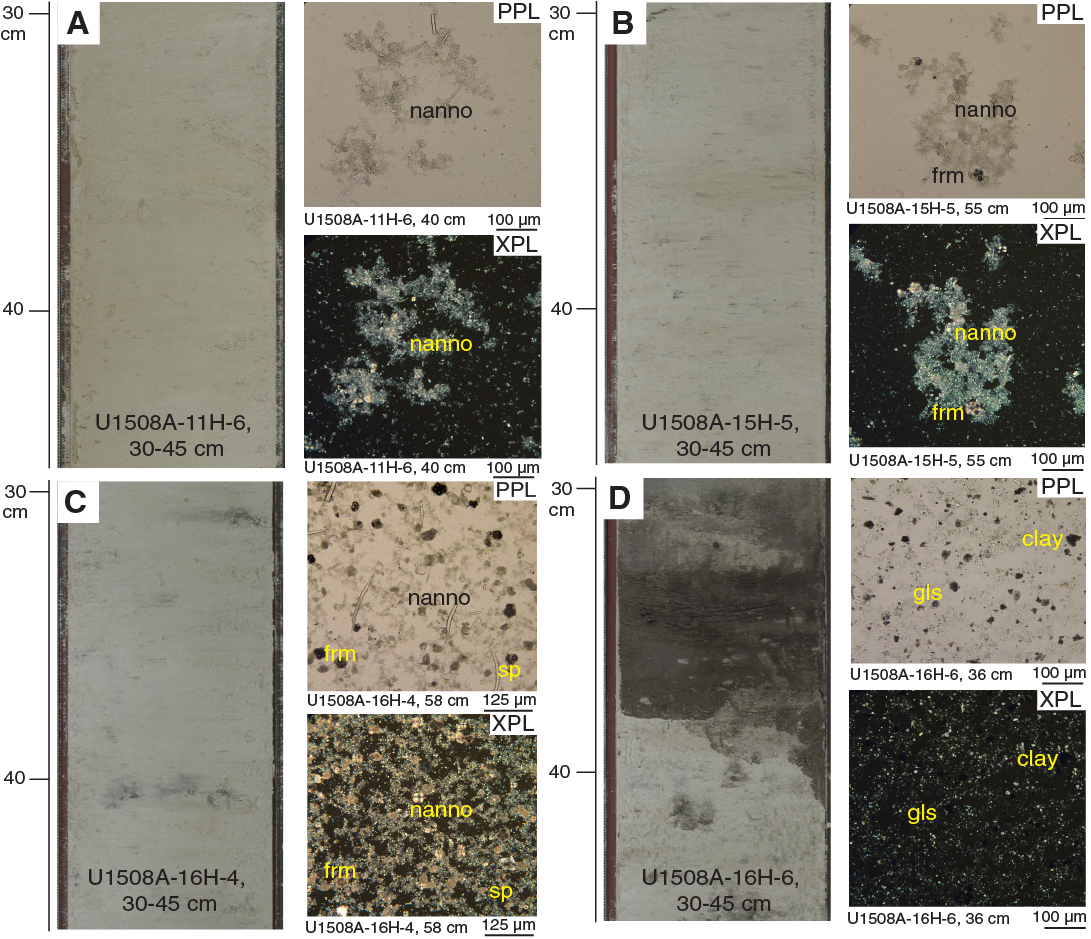
Figure F7. Representative Subunit IIa lithologies.
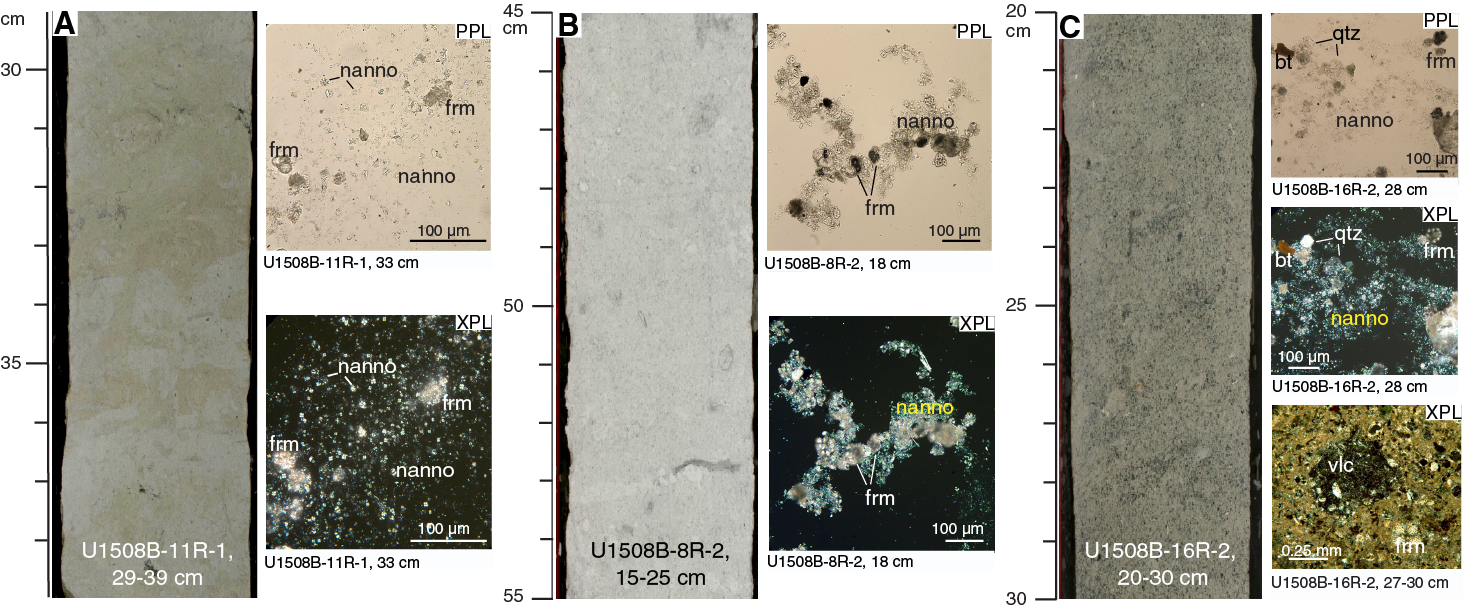
Figure F8. Representative Subunit IIb lithologies.

Figure F9. Erosional bioturbated surfaces.
Unit III is composed of upper to lower Eocene moderately bioturbated nannofossil chalk and is divided into two subunits (Figure F10). Subunit IIIa consists of moderately to heavily bioturbated clayey nannofossil chalk and contains at least 40 centimeter-scale siliceous intervals (cherty limestone; Figure F11). Subunit IIIb is marked by lower clay content, a gradual downhole color lightening, and a progressive loss of cherty limestone nodules. Subunit IIIb is composed of nannofossil chalk and limestone.
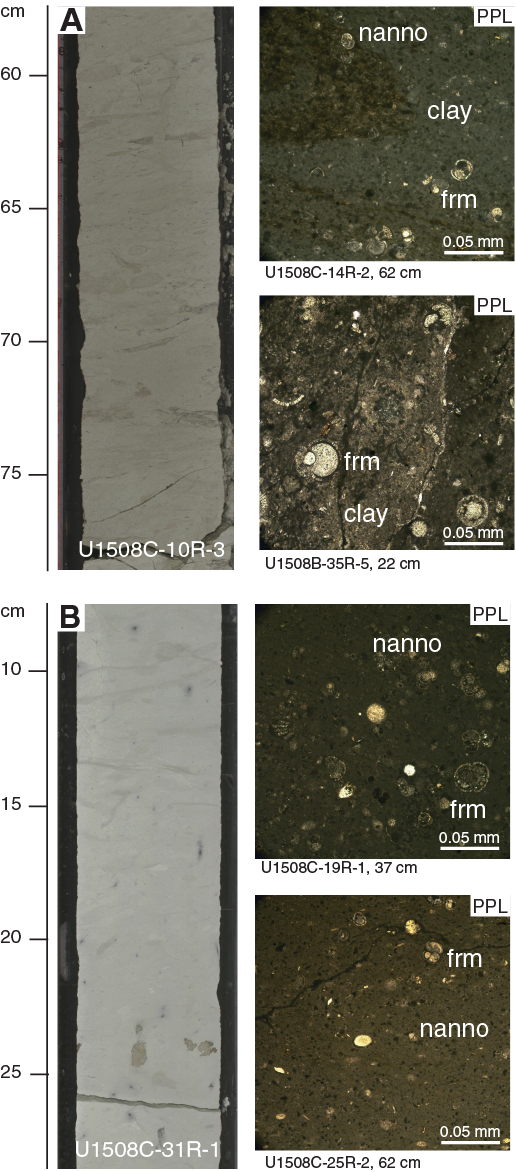
Figure F10. Representative Subunit IIIa and IIIb lithologies.

Figure F11. Depth distribution of cherty limestone horizons.
Unit I
Unit I is ~90 m of Pleistocene to Pliocene white (2.5Y 8/1) to light gray (2.5Y 7/2) foraminiferal ooze with nannofossils and bioclasts in the upper ~46 m and white (2.5Y 9/1) foraminiferal ooze with sand- to granule-sized bioclasts below (Figure F6). The upper eight cores suffered from severe soupy-type drilling disturbance, and discrete intervals of similar drilling disturbance continue to the base of this unit. The unconsolidated and coarse-grained nature of Unit I required some compaction of sediments inside the core liners on the core recovery platform; therefore, some observations may reflect artifacts of core handling. Outside of disturbed intervals, in Cores 371-U1508A-3H and 4H (10.8–29.5 m), sediment color varies subtly at ~1 m scale between white (N/8 and 2.5Y 8/1) and pale olive (5Y 6/3). Rare small grayish blebs that may be sulfide minerals are scattered in a few intervals throughout this unit. Downhole from Core 7H (48.8 m), sediment is white foraminiferal ooze containing common to abundant bioclasts that consist mainly of bryozoans 1–5 mm in size. Bryozoan concentrations appear relatively constant throughout this interval with no apparent trend. The base of Unit I is marked by a sharp transition from foraminiferal ooze to clayey nannofossil ooze with biosilica (Figure F5).
Unit II
Unit II is ~290 m of Pliocene to upper Oligocene calcareous ooze and chalk with changes in the relative proportion of fine-grained (nannofossil-dominated) versus coarse-grained (foraminifer-dominated) facies, resulting in this unit being divided into two subunits (Figure F4). Subunit IIa is light greenish gray (GLEY 1 7/10GY) nannofossil ooze and chalk with varying amounts of foraminifers, clay, or sponge spicules and sporadic volcanic-rich beds (Figure F7). Subunit IIb consists of light greenish gray (GLEY 1 7/10GY) to greenish gray (GLEY 1 6/10Y) nannofossil-rich foraminiferal ooze and chalk with common to abundant clay and clinoptilolite zeolite and rare to common glauconite grains (Figure F8).
Subunit IIa
Subunit IIa is Pliocene to upper Miocene light greenish gray clayey nannofossil ooze and chalk with common to abundant foraminifers (Figure F7), consistent with a bathyal environment (see Biostratigraphy and paleoenvironment). Faint, subtle color banding varying from light greenish gray (GLEY 1 7/10Y and GLEY 1 7/10GY) to greenish gray (GLEY 1 6/10Y) at roughly 1–2 m scale was observed from the top of this subunit (Section 371-U1508A-11H-3, 61 cm; 90.08 m) to the base of Core 16H (144.32 m). Moderate bioturbation was observed throughout this subunit, although it is sparser in the lighter colored sediments than the darker sediments and consists of Planolites and Zoophycos burrows. Pyrite was rarely observed as small dark gray centimeter-sized blebs in Cores 16H through 23H (124.8–200.6 m). Five centimeter-thick beds containing volcanic material occur between 135 and 178 m (Figures F4, F5). Drilling disturbance is generally lower in Unit II than in Unit I. However, moderate, severe to locally destroyed mousse-like drilling disturbance occurs in most Subunit IIa cores. Severe basal flow-in affected the lower three sections of Core 22H. No deformational structures were observed in this subunit. The Subunit IIa/IIb boundary is defined by the highest occurrence of sharp-based foraminiferal chalk beds with lithic grains.
Subunit IIb
Subunit IIb is middle Miocene to upper Oligocene foraminiferal ooze and chalk with variable amounts of clay, nannofossils, sand-sized silicate minerals, lithic grains, and glauconite, indicative of reworking (Figure F8). The upper part of Subunit IIb (Cores 371-U1508B-2R through 17R; 200.6–300.9 m) is characterized by an increasing frequency of sand-sized sediments, starting as thin beds of biogenic foraminiferal ooze and chalk in Core 2R, followed by increasing downhole abundance of silicate minerals, volcanic grains, and glauconite starting in Core 9R, and peaking in Cores 16R and 17R (~321–337 m). Below ~335 m (Section 17R-5), silicate minerals and glauconite decrease, resulting in a clean foraminiferal chalk in the lowest 30 m of the subunit.
In the upper part of Subunit IIb (Cores 371-U1508B-2R through 8R), nannofossil chalk is interbedded with thin beds of light greenish gray (GLEY 1 7/10GY) foraminiferal chalk, often with a sharp basal contact. In Core 9R, sediments darken downhole to greenish gray (GLEY 1 5/10Y and GLEY 1 5/5GY) concomitant with an increase in clay content, suggesting increasing detrital input (Figure F5). This suggestion is supported by a decrease in CaCO3 content of more than 20% and a significant increase in magnetic susceptibility and natural gamma radiation (NGR) values (see Geochemistry and Petrophysics). The interval between 278.0 and 335.82 m (Sections 371-U1508B-11R-1 through 17R-4 and Cores 371-U1508C-2R through 4R) is dominated by interbedding of nannofossil-rich foraminiferal chalk and nannofossil chalk with foraminifers (Figure F8). However, depositional trends are difficult to ascertain because of limited core recovery (25%) for this interval (i.e., Cores 371-U1508B-4R through 16R and 371-U1508C-2R through 4R) despite some of this section being double cored. However, the downhole Natural Gamma Radiation Logger (NGRL) data show high-amplitude variations, with high values presumably representing the coarser grained intervals with silicate minerals and glauconite and lower values representing finer, more biogenic-rich sediments at the multimeter scale (see Petrophysics). Glauconite grains occur in trace amounts throughout Subunit II. Volcanic material, described in the macroscopic sediment description worksheets as silicate minerals and lithic grains, increases in abundance downhole in Cores 371-U1508B-9R through 17R. This volcanic origin is supported by XRD analyses performed on decarbonated samples and smear slide results from this interval that reveal abundant quartz and volcanic material, especially plagioclase and clinoptilolite zeolite (Figure F12).
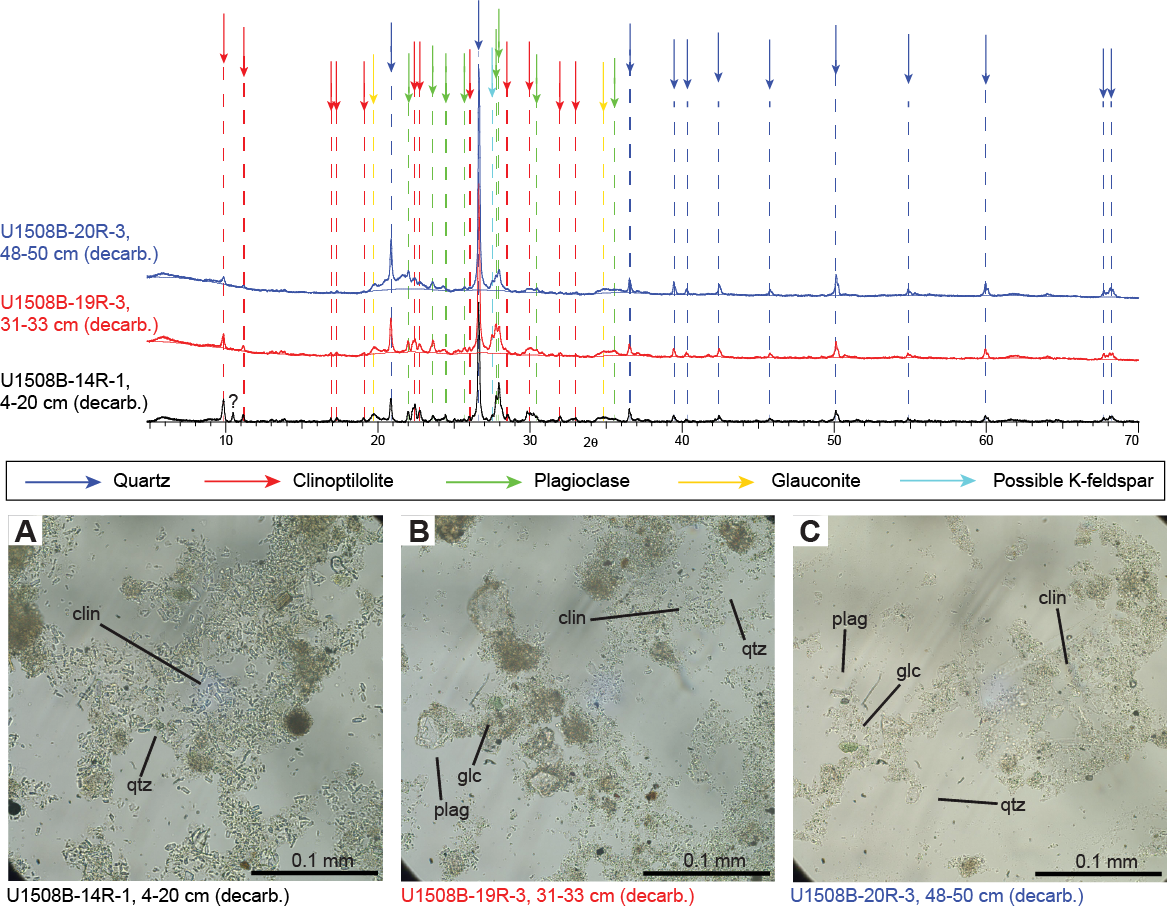
Figure F12. XRD results, Subunit IIb.
Cores 371-U1508B-16R and 17R contain repeated thin, sharp-based, normally graded, moderately bioturbated foraminiferal beds with bioclasts (e.g., ~1 mm size benthic foraminifers, genus Lenticulina spp.; see Biostratigraphy and paleoenvironment) and rare amounts of glauconite and silicate minerals (Figure F9). At 321.48 m, an irregular, bioturbated erosional surface sharply separates medium sand–sized foraminiferal ooze with rare glauconite above from nannofossil chalk with foraminifers below. This surface represents a ~5 My hiatus (see Biostratigraphy and paleoenvironment). Another sharp erosional and bioturbated contact occurs at 336.99 m (Section 17R-5), separating greenish gray (GLEY 1 5/5GY) silicate mineral–rich foraminiferal chalk with bioclasts above and light greenish gray (GLEY 1 8/5GY) foraminiferal ooze with sand-sized glauconite grains below. Pale green laminae occur in this light greenish gray interval between ~336 and 339 m. The nannofossil-rich foraminiferal chalk darkens downhole once again to greenish gray (GLEY 1 6/5GY) and gray (5Y 6/1) where silicate minerals and glauconite grains are rare. Silicate minerals decrease in abundance downhole in the foraminiferal chalk and were rarely observed in the sediments to the base of Core 19R (353.33 m).
Below Core 371-U1508B-19R to the base of Subunit IIb, the sediments are mainly light gray (5Y 7/2) nannofossil-rich foraminiferal chalk. In Core 20R (360–364 m), repeated normally graded (medium sand size fining upward to fine sand size), nannofossil-rich foraminiferal chalk beds occur with sharp basal contacts. In Core 21R (369.3–373.1 m), the nannofossil-rich foraminiferal chalk darkens to gray (5Y 6/1), with faint color banding occurring at the 1.0–1.5 m scale. Bioturbation is moderate to locally heavy in this interval, except for coarser (i.e., medium sand size) foraminiferal chalk, where bioturbation is generally absent.
Deformational structures were not observed in this subunit. Drilling disturbance in the upper part of Subunit IIb (200–300 m) includes slight fracturing, moderate biscuiting, and moderate uparching. The lower 80 m displays slight to moderate fracturing and biscuiting. The Unit II/III boundary is defined at an abrupt contact where foraminiferal chalk overlies nannofossil chalk. This boundary coincides with another hiatus of ~6 My (see Biostratigraphy and paleoenvironment).
Unit III
Unit III is ~320 m of upper to lower Eocene nannofossil chalk that is divided into two subunits. Subunit IIIa consists of moderately to heavily bioturbated clayey nannofossil chalk that contains rare centimeter-scale siliceous intervals (cherty limestone). Subunit IIIb consists of moderately bioturbated nannofossil chalk and nannofossil limestone. It is differentiated from Subunit IIIa by lower clay content and the near absence of siliceous facies.
Subunit IIIa
Subunit IIIa is ~110 m of upper to middle Eocene light greenish gray (GLEY 1 7/10Y to GLEY 1 8/5GY) clayey nannofossil chalk with rare to common foraminifers (Figure F10) with sporadic greenish gray (GLEY 1 6/5GY) cherty limestone nodules and very thin chert beds (Figure F11). The cherty layers are distinguished from the surrounding chalk by their hardness and a dulling of color to gray upon drying.
At least 50 such cherty horizons were observed in Hole U1508B between 380 and 490 m, and at least 15 were observed in partially overlapping equivalent depths in Hole U1508C. Numerous distinct peaks in downhole resistivity logs are interpreted to be cherty horizons (see Petrophysics) on the basis of their occurrence in the depth range where the cherty limestone layers were observed in macroscopic core description (Figure F13). Resistivity peaks in the logging data are most abundant and of highest amplitude in the uppermost 40 m of Subunit IIIa (~380–420 m wireline log matched depth below seafloor [WMSF]), where recovery was poorest (averaging ~15% in Cores 371-U1508B-22R through 25R; see Petrophysics), suggesting the poor recovery of this interval is due to its heavy silicification. Individual cherty layers have between 50 and 75 wt% CaCO3 content (see Geochemistry). SiO2 in the layers occurs as tridymite, cristobalite, and most prominently quartz (Figure F14). Thin section analysis identified recrystallized siliceous microfossils (radiolarians and sponge spicules), as well as quartz occurring in voids, particularly as infills of foraminiferal chambers. The occurrence of siliceous microfossils observed in thin section from cherty horizons contrasts with a general lack of siliceous microfossils in the surrounding chalk. The cherty limestone layers are typically 1–6 cm thick and occur at intervals of tens of centimeters between ~380 and ~490 m. The cherty limestone is also heavily bioturbated, and the contacts with the clayey nannofossil chalk with foraminifers are generally gradual when the core is intact, although often the core is broken and brecciated between the two lithologies.
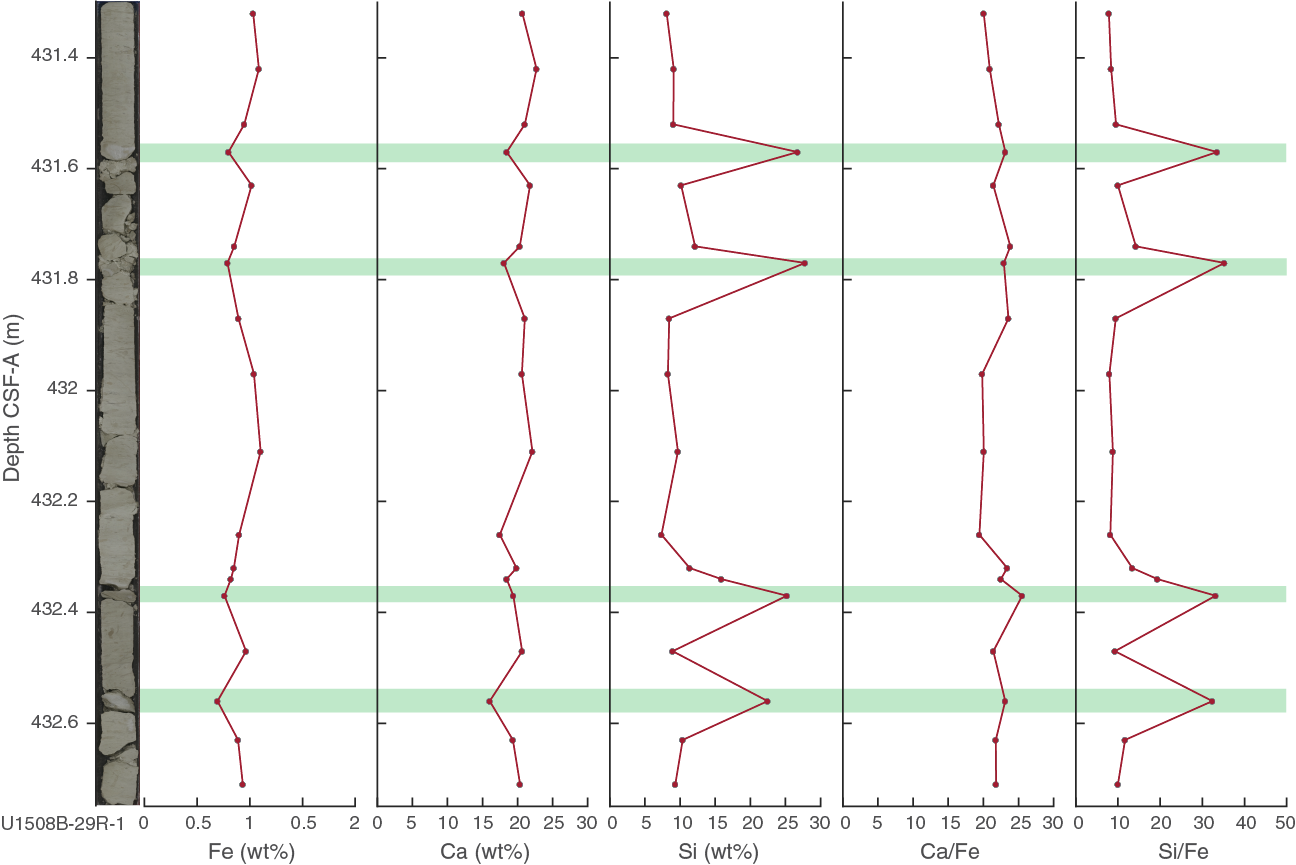
Figure F13. Handheld XRF results from siliceous intervals.
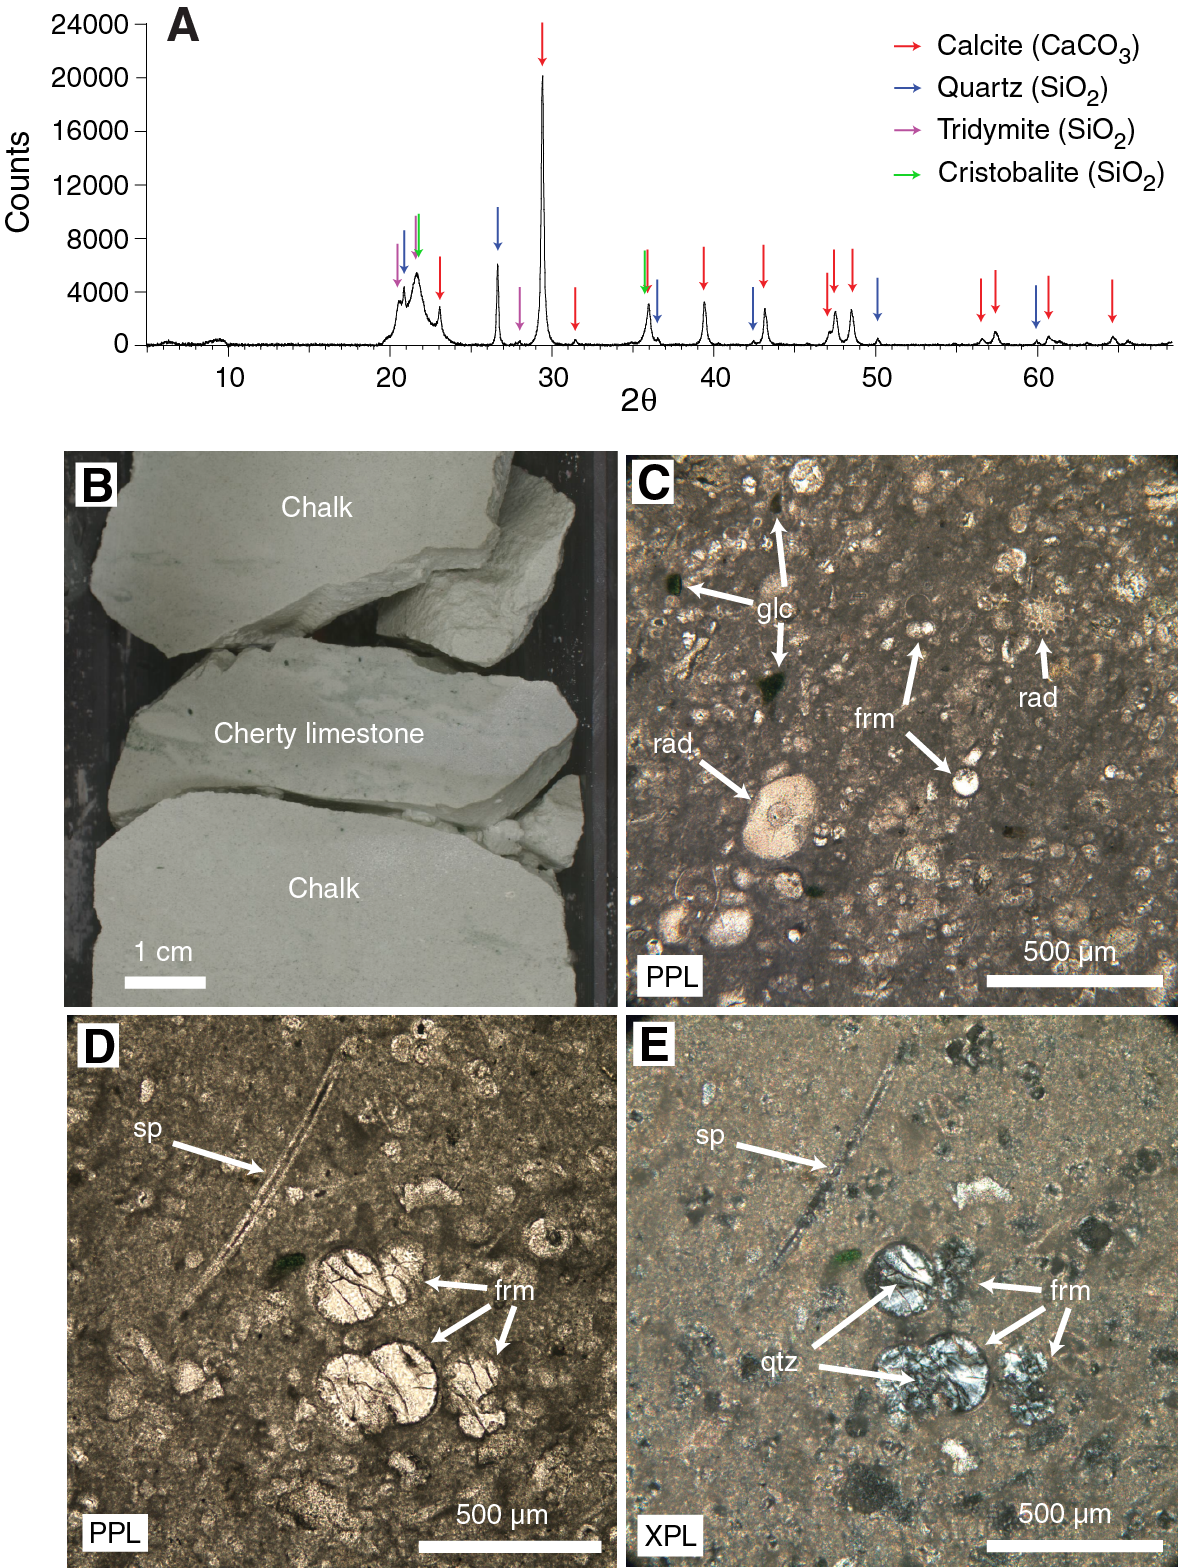
Figure F14. Siliceous interval.
The strata in Subunit IIIa are generally heavily bioturbated and contain Planolites, Nereites, and Zoophycos burrows. Subtle light to dark color variations occur at the 1–2 m scale. Rare alterations, such as pale green laminae and halos, and intermittent pyrite were observed as grayish blebs and small (generally subcentimeter size) nodules throughout this interval. Tilting of the beds was observed below ~475 m, with a maximum tilt of ~10°. Fracturing increases in this subunit, typically occurring at 35° to 45° to the bedding plane.
Subunit IIIb
Subunit IIIb is differentiated from Subunit IIIa by a clay content decrease between Cores 371-U1508C-13R and 14R (491.61–493.80 m), as indicated by a slight color change (GLEY 1 7/5GY to GLEY 1 8/GY) and smear slide data (Figure F5). Carbonate content increases (from 53% to 81%) downhole over an ~36 m interval (495.6–522.7 m; see Geochemistry). Cherty limestone nodules and very thin chert beds become rare downhole and were last observed at ~504 m (Core 15R). Pyrite occurs as large blebs, nodules, and infills of burrows and fractures beginning in Core 371-U1508B-37R (484.20 m) and extending almost to the bottom of the hole (685.92 m). Diagenetic halos and pale green laminae occur in most cores to ~690 m. Black millimeter-scale blebs, rich in pyrite and probably marcasite, occur sporadically, especially in Sample 371-U1508C-11R-3, 83–84 cm. Two medium–thick beds of limestone occur at 532.6 and 536.6 m, and a medium–thick bed of limestone with foraminifers occurs at 547.6 m. Faint color banding was observed with cycle lengths of ~1 m throughout this subunit. Bioturbation intensity is heavy, especially in the darker intervals associated with color banding. Below ~685 m, the nannofossil chalk grades into nannofossil limestone and the intensity of the decimeter-scale color banding increases. Diagenetic features such as pale green laminae, halos, and pyrite are rare in the lowermost two cores. Deformational structures are dominated by tilt of the sediments, ranging from ~12° in the upper half of Subunit IIIb to ~15° in the lower 60 m. Shear veins were observed from ~600 to ~645 m (Core 371-U1508C-26R through Section 30R-7) with incipient shear banding. The apparent dip of the shear bands ranges from 10° to 15°. Low-angle stepped normal microfaults are recorded in Core 27R. Drilling disturbances occur in the majority of Subunit IIIb cores and include slight to occasionally severe fracturing, moderate biscuiting, and rare pulverizing and fall-in.
Ooze–chalk transition
The entire ~210 m of Hole U1508A, including all of Subunit IIa and the uppermost ~9 m of Subunit IIb, is poorly lithified carbonate ooze (with varying contributions of nannofossils, foraminifers, and other bioclasts). However, the overlapping interval in Hole U1508B (186.7–209.92 m) is more lithified nannofossil chalk. Representative sections of this ~30 m overlapping interval from both holes were compared side-by-side to ensure there were no inconsistencies in description, and it was clear that Cores 371-U1508A-21H, 22H, and 23H are nannofossil ooze (easily deformable by a finger), whereas overlapping Cores 371-U1508B-2R, 3R, and 4R are nannofossil chalk (not deformable with a finger but easily deformable with a fingernail). As such, the ooze–chalk transition seemingly occurs below 209.92 m in Hole U1508A and above 186.7 m in Hole U1508B, an apparent discrepancy of more than 30 m. An offset of that magnitude in depth scales between the two holes is extremely unlikely; in fact, a robust stratigraphic tie point between Cores 371-U1508A-23H (ooze) and 371-U1508B-4R (chalk) was identified (see Stratigraphic correlation). Differential drilling disturbance between the two holes (Hole U1508A was APC cored, whereas Hole U1508B was RCB cored) could possibly explain the difference in apparent degree of lithification. However, it is unlikely that RCB coring significantly altered the texture of sediments in the uppermost cores from Hole U1508B because those cores preserve fine structures such as laminations and burrows (Figure F8), and it is difficult to explain an increase in apparent degree of lithification from ooze to chalk by any known type of drilling disturbance. Perhaps APC coring, which is traditionally considered to preserve fine sediment textures more faithfully than rotary coring, may in this case have imparted a destructive disturbance to chalk, rendering it softer and thus described as ooze. Alternatively, the depth of the ooze–chalk transition might be extremely laterally heterogeneous, varying by depths of more than 30 m over only 20 m of lateral offset between Holes U1508A and U1508B.
Biostratigraphy and paleoenvironment
Site U1508 is located in Reinga Basin, relatively proximal to land and where subduction is thought to have initiated. Geophysical data for this location reveal a complex tectonic setting with a presumed shallower depth regime in the past (nearby erosional truncation) followed by subsidence to the present-day water depth of ~1500 m (see Background and objectives).
Micro- and macrofossil assemblages were analyzed to interpret the timing of uplift and folding events by biostratigraphically constraining the age of deposited units in their geophysical context. Moreover, microfossil groups were employed to reconstruct the history of the basin in terms of paleodepth, coastal proximity, and terrestrial linkages. Reworking was assessed to constrain the timing of the main erosional events and the age of the eroded units.
Site U1508 recovered a highly diverse assemblage of macro- and microfossils. Nannofossils and planktic foraminifers range from abundant in most samples to common or frequent and rare, respectively, in a few intervals. Benthic foraminifers are few to rare in most samples. Radiolarians fluctuate from abundant in the upper 300 m to rare to few in the lower part of Hole U1508B and in Hole U1508C. Ostracods are common in the upper half of Hole U1508A but are rare to absent in other samples from this and other holes. Nearly all samples analyzed for palynology yielded rich palynological assemblages. Preservation of microfossil groups at Site U1508 generally decreases with depth, but an apparent inflection in preservation occurs in Hole U1508B across most groups. This inflection corresponds to intervals of lower carbonate content in lithostratigraphic Subunit IIb and pyritization of sponge spicules and foraminifers in Holes U1508B and U1508C. Pyritization corresponds to a zone surrounding the present-day sulfate–methane transition (SMT) (see Geochemistry).
Despite significant reworking and downhole contamination, many stratigraphically important microfossils were found at Site U1508 that allow for the construction of an age-depth model (Figures F15, F43). Microfossil data indicate that sediment recovered at this site ranges in age from the late Pleistocene to early Eocene (Table T3). However, four hiatuses identified on the basis of calcareous nannofossil biostratigraphy punctuate this record. The first hiatus was found between Samples 371-U1508A-12H-4, 75 cm, and 12H-CC (101.55 and 106.02 m) in the early Pliocene–late Miocene with an estimated duration of ~2 My. A ~1 My hiatus occurs during the middle–early Miocene between Samples 371-U1508A-23H-1, 75 cm, and 23H-2, 75 cm (203.05 and 206.05 m), and between Samples 371-U1508B-3R-CC and 4R-1, 75 cm (201.57 and 206.85 m). The third stratigraphic gap, which lasted at least 5 My, separates the lower Miocene and the upper Oligocene sediments between Samples 371-U1508B-16R-1, 6 cm, and 16R-1, 75 cm (321.46 and 322.15 m). The oldest and deepest hiatus is recognized between Samples 21R-CC and 22R-1, 70 cm (373.26 and 379.50 m), and separates the upper Oligocene from the upper Eocene. This oldest hiatus spans at least 6 My.
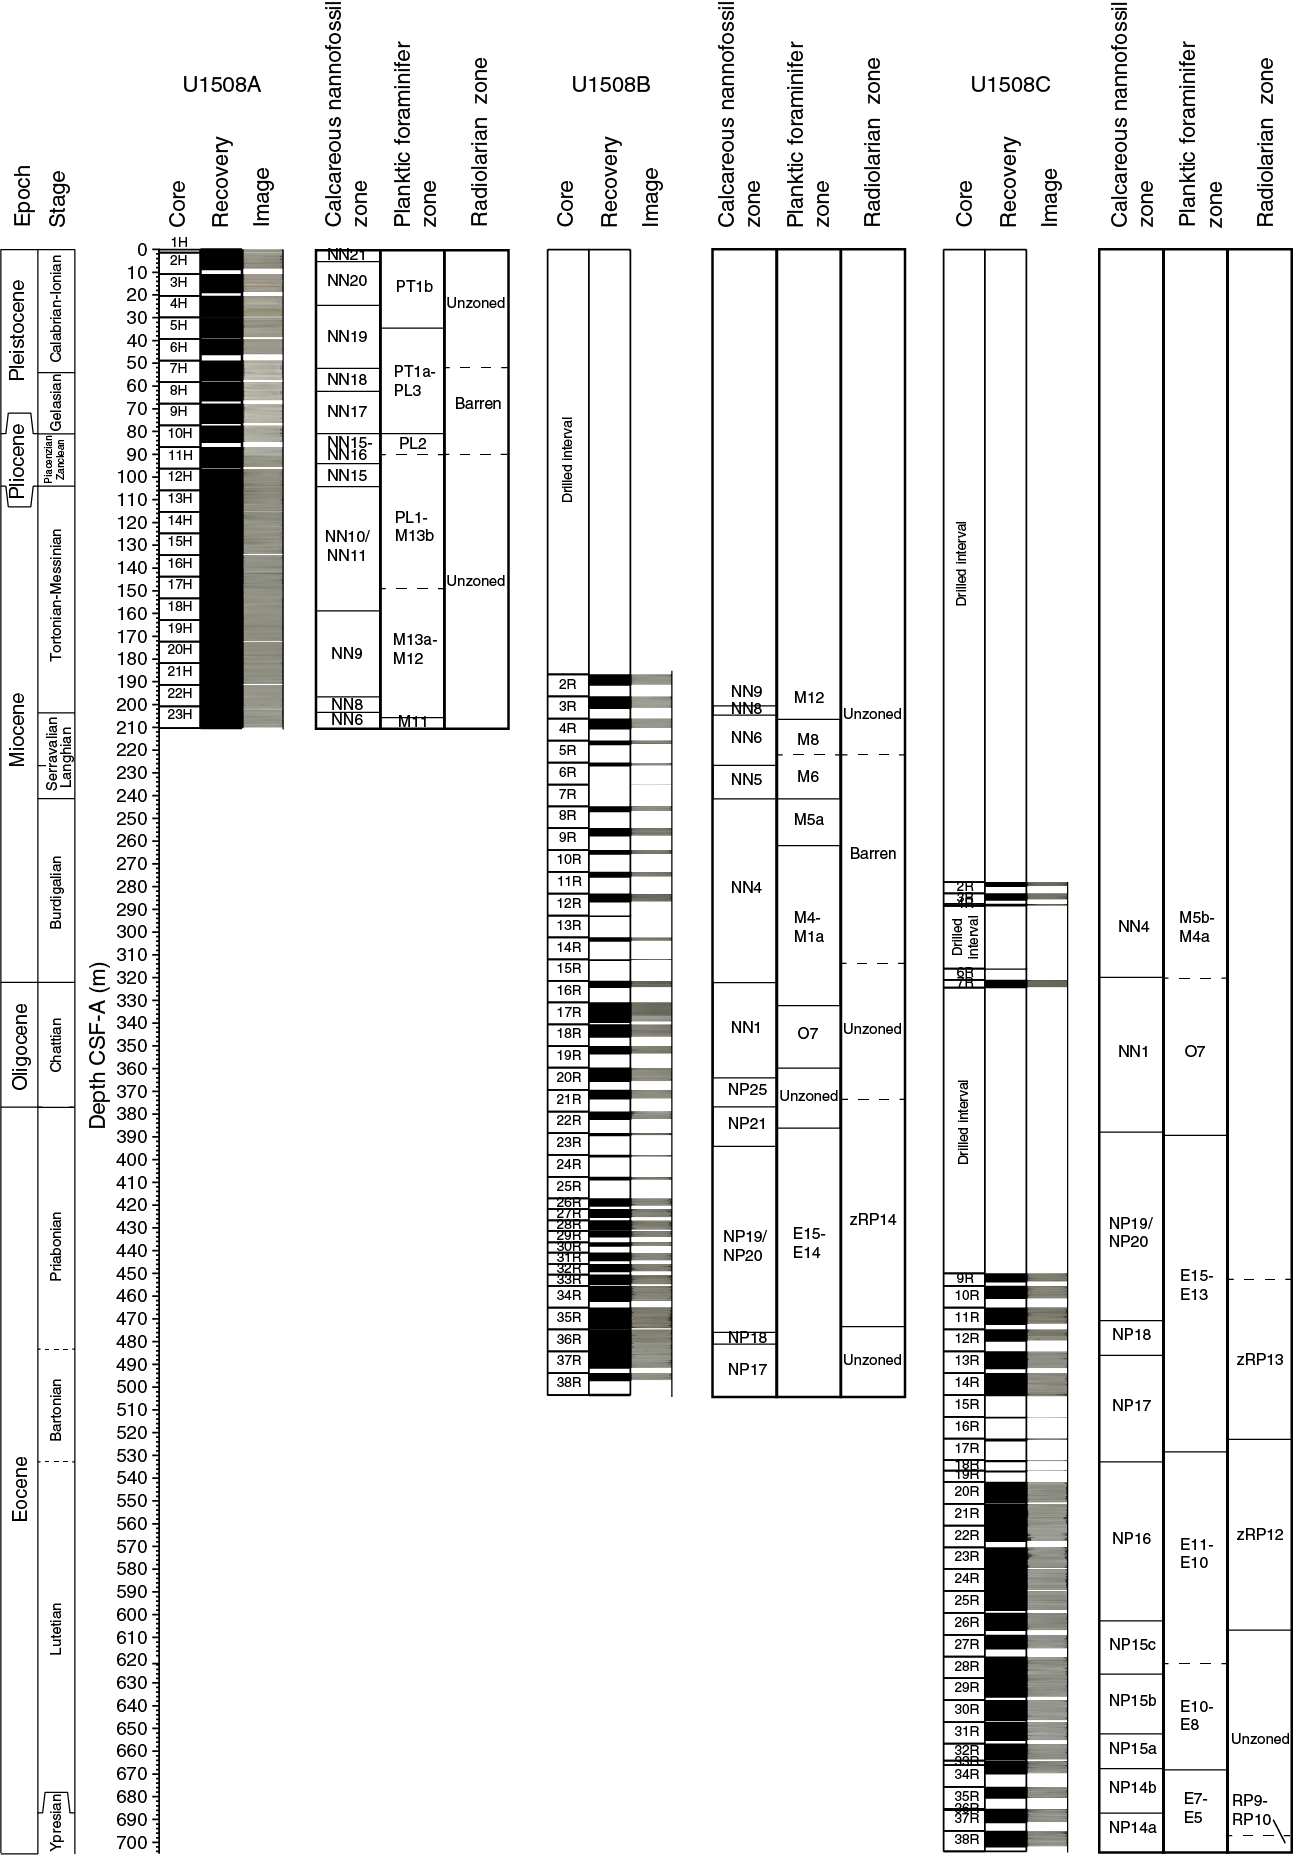
Figure F15. Biozonations.
Reworked sediments were commonly found in all microfossil groups in all holes drilled at Site U1508. The most significant reworking was present from 322.15 to 497.01 m in Hole U1508B, indicating erosion and associated deposition increased during the Oligocene to late Eocene. In this interval, reworked middle Eocene calcareous nannofossils (e.g., chiasmoliths, including Chiasmolithus gigas, Chiasmolithus grandis, and Chiasmolithus solitus, and discoasters, including Discoaster barbadiensis, Discoaster kuepperi, Discoaster lodoensis, Discoaster saipanensis, and Neococcolithes dubius) were often present, and occasional Paleocene specimens were also found (e.g., Prinsius spp., Toweius spp., and Discoaster multiradiatus). In Sample 371-U1508B-20R-CC, contamination is significant, as late Miocene/early Oligocene planktic foraminifers were found in late Eocene strata. Samples 22R-CC to 23R-CC, placed in the late Eocene, contain a well-preserved middle Eocene assemblage.
Mixtures of shallow- and deep-water indicative benthic foraminifers and ostracods and pelagic to inner neritic dinocysts were found in most intervals. Such mixtures typically reflect a deep-water setting characterized by significant distal transport of sediment. Based on benthic foraminifers and ostracods, paleodepth was bathyal throughout most of the sedimentary sequence and increased to lower bathyal to abyssal in the middle Eocene. Additionally, increased reworking in the Oligocene to late Eocene partially coincides with a late Oligocene palynological assemblage lacking pelagic components and a peak in shallow-water ostracods, indicating more proximal conditions. In this interval, large amounts of terrestrial sporomorphs indicate significant amounts of offshore transport from a nearby landmass. Conspicuously, this interval is located right above a 6 My hiatus around the Eocene–Oligocene transition (EOT), which suggests the recorded changes in relative sea level might have been related to EOT-associated global sea level changes and/or reflect a signature of regional uplift in the Eocene–Oligocene (see Background and objectives).
Calcareous nannofossils
Calcareous nannofossil biozones were assigned to sediments from Cores 371-U1508A-1H through 23H, 371-U1508B-2R through 38R, and 371-U1508C-2R through 38R. Analyses are primarily based on core catcher samples (paleontology; PAL), with additional samples from working-half sections used to refine ages for select intervals, particularly those across hiatuses. Calcareous nannofossil distribution data are based on shipboard observations that focus on species that are age diagnostic; therefore, distribution data may not represent the full nannofossil assemblage (Table T4).
Calcareous nannofossils are common to abundant in the upper section of Hole U1508A (Cores 1H through 9H) and abundant through the lower section of Hole U1508A and most of Holes U1508B and U1508C. The exceptions are six samples in Hole U1508B and three samples in Hole U1508C in which calcareous nannofossils range from rare to common. Preservation at Site U1508 varies from good to poor, generally decreasing with depth (Figure F16).

Figure F16. Microfossil preservation and abundance.
The Neogene sections from Holes U1508A–U1508C contain minor Paleogene reworking. The Paleogene sections from Holes U1508B (Core 16R and below) and U1508C (Cores 7R through 13R) contain major early to middle Eocene and rare Paleocene reworking, sometimes inhibiting the correct position of top events.
Hole U1508A drilled Pleistocene (Zones NN21 through NN17), Pliocene (Zones NN16 through NN15), and Miocene (Zones NN11 through NN6) successions. Sequences recovered in Hole U1508B consist of the middle–early Miocene (Zones NN6 through NN1) through the Oligocene (Zones NP25 through NP21) to the late and middle Eocene (Zones NP19/NP20 through NP17). Spot cores drilled in Hole U1508C (Cores 2R through 4R and 6R) recovered sediments of early Miocene age (Zone NN4), and Core 7R recovered sediments of late Oligocene age (Zone NN1). The rest of the succession drilled in Hole U1508C (Cores 9R through 38R) contains a near continuous sequence from the late Eocene to the early Eocene (Zone NP19/NP20 through Subzone NP14a).
The uppermost section of Hole U1508A records Pleistocene, Pliocene, and late to middle Miocene aged sediments. Based on the dominant presence of Emiliania huxleyi in Sample 371-U1508A-1H-CC (1.25 m), this sample has an age younger than 0.3 Ma (Zone NN21). From Samples 2H-CC to 3H-CC (8.60–18.74 m), the recovered section is defined as late Pleistocene based on the rare presence of E. huxleyi and the absence of Pseudoemiliania lacunosa (Zone NN20). Cores 4H through 6H (29.50–46.04 m) are ascribed to the early Pleistocene based on the presence of P. lacunosa and Gephyrocapsa spp. and the absence of Discoaster spp. (Zone NN19). A Pliocene succession (Zones NN18 through NN15) is present from Samples 7H-CC to 12H-4, 75 cm (57.57–101.55 m). A late to middle Miocene section (Zones NN11 through NN6) is bracketed by the absence of Discoaster berggrenii in Sample 12H-CC (106.02 m) and the absence of Sphenolithus heteromorphus in Sample 23H-CC (210.11–210.21 m).
The late middle Miocene (Zones NN9 through NN6) is recorded in both Holes U1508A and U1508B (163.14–210.21 and 191.35–225.88 m, respectively). Only one specimen of Helicosphaera ampliaperta was found (Sample 371-U1508C-3R-CC; 285.79–285.89 m); therefore, it could not be used as the zonal marker for the top of Zone NN4. The top common occurrence of Discoaster deflandrei was thus used as a secondary marker in Hole U1508B to approximate the top of this zone (241.01 m), as suggested by Backman et al. (2012).
The early Miocene is recorded from Sample 371-U1508B-8R-CC to the base of S. heteromorphus in Sample 15R-CC (246.81–312.39 m) and in spot Cores 371-U1508C-2R through 4R and 6R. A 5.4 My hiatus from Zones NN4 to NN1 is recorded between Samples 371-U1508B-16R-1, 6 cm, and 16R-1, 75 cm (321.46 and 322.15 m), and between Samples 371-U1508C-6R-CC and 7R-CC (316.23 and 324.40 m). Zone NN1 can be recognized in Sample 371-U1508B-20R-2, 70 cm (323.61 m), by the presence of Dictyococcites bisectus and in Samples 371-U1508C-7R-2, 57 cm, to 7R-CC. The absence of the Oligocene/Miocene boundary markers (i.e., Sphenolithus capricornutus and Sphenolithus delphix) in either Hole U1508B or U1508C samples means this boundary could not be identified using nannofossil biostratigraphy.
Two samples (371-U1508B-20R-CC and 21R-CC; 365.36–373.26 m) indicate a late Oligocene age due to the presence of Sphenolithus ciperoensis. Moreover, as neither Sphenolithus distentus nor Sphenolithus predistentus were found, these samples are assigned to Zone NP25. Samples 22R-2, 55 cm, to 23R-1, 45 cm (380.71–388.80 m), contain frequently occurring Coccolithus formosus, Isthmolithus recurvus, and Reticulofenestra umbilicus, indicating they are no younger than Zone NP21. The high abundance of reworked forms is particularly challenging when trying to identify the top of the rosette discoasters. This biohorizon and therefore the base of Zone NP21 were tentatively placed in Sample 24R-1, 24 cm (398.14 m), where these taxa start to show a rare and discontinuous abundance. The Eocene/Oligocene boundary also could not be constrained by nannofossil biostratigraphy.
Both Holes U1508B and U1508C contain a late to middle Eocene sequence. The base of I. recurvus recorded between Samples 371-U1508B-35R-CC and 36R-2, 70 cm (475.53 ± 1.28 m), a 76.21 m thick section, coincides with the base of Zone NP19/NP20. The late Eocene (Zone NP19/NP20) interval in Hole U1508C is recorded from Samples 371-U1508C-9R-1, 70 cm, to 11R-3, 70 cm. The base of Chiasmolithus oamaruensis between Samples 371-U1508B-36R-2, 70 cm, and 36R-CC (480.67 ± 3.85 m) and between Samples 371-U1508C-12R-CC and 13R-1, 70 cm (482.26 ± 2.64 m), marks the base of Zone NP18. Samples 371-U1508B-36R-CC to 38R-CC (484.52–497.01 m) are assigned to Zone NP17 due to the top of C. grandis occurring at 480.67 m (±3.85 m) and the presence of D. bisectus, the base of which approximates the base of Zone NP17. Zone NP17 is assigned to Samples 371-U1508C-13R-2, 60 cm, to 18R-1, 20 cm (486.27–532.30 m).
Middle Eocene Zone NP16 extends from Sample 371-U1508C-18R-CC to Sample 25R-CC (532.60–598.06 m). The base of this zone is usually approximated by the base of R. umbilicus because the top of Blackites gladius is an unreliable datum. In Hole U1508C, the base of R. umbilicus is also difficult to apply because rare specimens ascribable to this taxon were recognized below the top of C. gigas (Subzone NP15b marker), hindering the recognition of Subzone NP15c. The top of Nannotetrina spp. is thus used to approximate the base of Zone NP16, which is recognized between Samples 25R-CC and 26R-CC (602.41 ± 4.35 m). The base and top of C. gigas are used to define Subzone NP15b, which spans Samples 28R-CC to 31R-2, 60 cm (628.09–648.93 m). The base of Nannotetrina fulgens defines the base of Subzone NP15a at 667.32 m (±0.7 m). The lower part of the sequence belongs to Zone NP14 and was divided into Subzones NP14b and NP14a using the base of Nannotetrina spp. recorded between Samples 36R-CC and 37R-2, 82 cm (686.88 ± 0.96 m), which also approximates the Ypresian/Lutetian boundary.
Planktic foraminifers
Planktic foraminiferal biozones were assigned to sediments from Cores 371-U1508A-1H through 23H, 371-U1508B-2H through 39R, and 371-U1508C-2R through 33R. All analyses are based on PAL core catcher samples. Planktic foraminifer abundance oscillates between dominant to rare in the majority of samples, with a general decrease in abundance in Hole U1508C.
Planktic foraminifer preservation is excellent to generally good in the uppermost sections of Hole U1508A (Samples 1H-CC to 10H-CC; 1.25–84.72 m) (Figures F16, F17), which largely corresponds to the foraminiferal ooze in lithostratigraphic Unit I. Below this interval, preservation decreases briefly (Samples 11H-CC to 13H-CC; 95.65–115.57 m) but is good to the bottom of the hole (Samples 14H-CC to 23H-CC; 125.21–210.21 m).
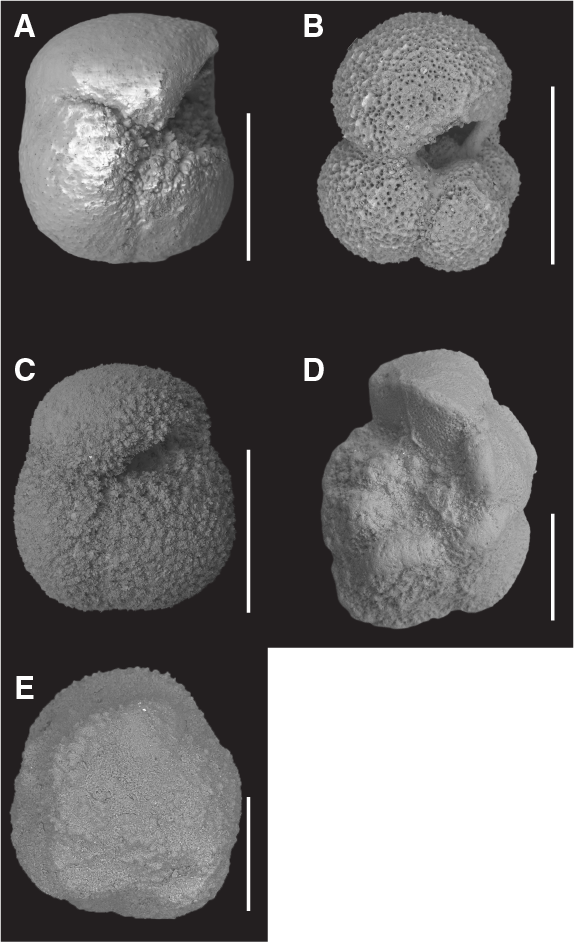
Figure F17. Preservation state of planktic foraminifers.
Preservation in Hole U1508B ranges from very good to poor and decreases with depth (Figure F16). Assemblages are generally dominated by middle- to high-latitude species such as Globigerina bulloides, Globoquadrina dehiscens, and Globigerinatheka index. A number of primary and secondary markers defined in low to middle latitudes (Wade et al., 2011) are absent from this site (Table T5).
For Hole U1508A, top datums were used for planktic foraminiferal biostratigraphy. This method was used in part to reduce error in the preliminary age model (see Age model and sedimentation rates) because of the moderate to severe downhole contamination. For example, Hirsutella hirsuta has a late Pleistocene last recorded occurrence in New Zealand strata but occurs in Sample 371-U1508A-8H-CC, which is dated as early or middle Pliocene. Samples 1H-CC to 6H-CC (1.35–46.04 m) were placed in the Pleistocene by the occurrence of Globorotalia truncatulinoides. The top of Globorotalia tumida between Samples 8H-CC and 9H-CC (71.38 ± 4.93 m) indicates the transition into the Pliocene. Because of the lack of sufficient marker species, the Pleistocene/Pliocene boundary is loosely defined by planktic foraminifer biostratigraphy to lie somewhere between Samples 6H-CC and 9H-CC (46.04–76.4 m). A population of Globoconella miotumida where 10% have more than 4.5 chambers (Crundwell et al., 2016) serves as a proxy for the Pliocene/Miocene boundary and is located between Samples 10H-CC and 11H-CC (100.89 ± 5.14 m). The top of Paragloborotalia mayeri, which defines the Zone M13a/M12 boundary, is located between Samples 22H-CC and 23H-CC (205.75 ± 4.36 m).
The Miocene interval in Hole U1508B has several age-diagnostic taxa. The top of P. mayeri was placed between Samples 371-U1508B-3R-CC and 4R-CC (206.9 ± 4.42 m), which aligns with the same datum in Hole U1508A (see Age model and sedimentation rates). Samples 6R-CC to 10R-CC (226.75–265.7 m) yield a nearly continuous middle Miocene sequence with the Praeorbulina–Orbulina evolutionary lineage. This lineage is rare at Site U1507 to the north (see Biostratigraphy and paleoenvironment in the Site U1507 chapter [Sutherland et al., 2019b]), suggesting less effect of dissolution through the interval at Site U1508. The Miocene/Oligocene boundary was identified between Samples 16R-CC and 17R-CC (331.86 ± 7.60 m) based on the top of Globigerina euapertura, which is used to approximate this epoch boundary in New Zealand (Raine et al., 2015).
The Oligocene/Eocene boundary was tentatively placed between Samples 371-U1508B-22R-CC and 23R-CC (385.77 ± 3.50 m), as indicated by the first occurrence of G. index. These samples exhibit moderate to poor preservation and include large amounts of Oligocene and Eocene taxa with a limited number of species found.
Major redeposition of middle Eocene sediments from the nearby Reinga Ridge likely happened during deposition of Samples 371-U1508B-22R-CC and 23R-CC (382.27–389.27 m) because a robust middle Eocene assemblage of well-preserved planktic foraminifers occurs in Sample 23R-CC. The aforementioned persistence of the nannofossil C. oamaruensis indicates a late Eocene age for this interval, which is consistent with the presence of Hantkenina alabamensis spines in Samples 26R-CC to 31R-CC (420.39–444.17 m). In New Zealand, H. alabamensis ranges in the upper part of the late Eocene Kaiatan Stage (Hornibrook et al., 1989), roughly equivalent to the base of the tropical planktic foraminifer Zone E14 of Wade et al. (2011). Samples 23R-CC to 38R-CC (579.56–701.92 m) are assumed to be in Zones E14–E15 due to the presence of G. index and the absence of Hantkenina australis, a species that appears in the late Kaiatan Stage in New Zealand (Hornibrook et al., 1989).
In Hole U1508C, Samples 2R-CC to 6R-CC are assigned to the early to middle Miocene Subzones M5b–M4a based on the top of Globoconella zealandica and base of Globoconella miozea s.s. between Samples 2R-CC and 3R-CC (282.81 ± 2.98 m). Identification of G. index, located between Samples 7R-CC and 9R-CC (389.00 ± 64.60 m), indicates the downhole transition into the Eocene. The lack of Orbulinoides beckmanni indicates either that the middle Eocene Zone E12 was not recovered or is a very condensed interval or that the site was located in cooler waters outside of the species’ temperature range. The consistent occurrence of Acarinina bullbrooki is recognized between Samples 17R-CC and 18R-CC (528.06 ± 4.54 m) and indicates Zones E11–E10. The top of Morozovella crater is located between Samples 33R-CC and 34R-CC (668.18 ± 1.57 m). This datum marks the base of the Porangan Stage and corresponds to the Zone E8/E7b boundary (Raine et al., 2015). Samples 34R-CC to 38R-CC (669.74–701.92 m) were placed in Zones E7–E5 by the consistent occurrence of M. crater.
Benthic foraminifers
Benthic foraminifers were examined semiquantitatively in core catcher samples from the 23 Hole U1508A cores and qualitatively from 28 Hole U1508B cores and 35 Hole U1508C cores (Table T6). This faunal group is rare relative to total sediment particles in the >63 µm fraction of most studied samples. However, the benthic abundance is few (1%–10%) for the uppermost two samples (371-U1508A-1H-CC and 2H-CC) and for seven samples of Miocene sediment from all three holes. No benthic foraminifers were recovered from Sample 371-U1508B-35R-CC.
Benthic foraminifer preservation in Hole U1508A ranges from mainly excellent in Cores 1H through 4H to very good in Cores 5H through 19H and moderate to poor for the lowermost four cores. Preservation is mainly poor through the Miocene, Oligocene, and Eocene intervals of Holes U1508B and U1508C. A total of 2442 specimens were picked from Hole U1508A sediment, and 131 taxa were identified. For Holes U1508B and U1508C, more than 2000 specimens were picked, representing 135 and 123 taxa, respectively. All samples are strongly dominated by calcareous taxa, and agglutinated taxa generally form a minor component of the assemblages.
The Pleistocene interval is characterized by peaks in relative abundance of Globocassidulina subglobosa, Cassidulina spp., Cassidulina carinata, miliolids, Cibicides spp., Cibicidoides mundulus, lagenids, Planulina spp., and Pleurostomella spp. The assemblages are mainly made up of infaunal morphogroups. Pliocene assemblages are dominated by infaunal taxa, specifically stilostomellids and nodosariids, and the lowermost Pliocene sample (371-U1508A-11H-CC) contains abundant bolivinids (including Bolivina byramensis). These three groups remain common to abundant in the late Miocene, where Cassidulina crassa, C. carinata, G. subglobosa, Melonis barleeanum, Pleurostomella spp., and Trifarina bradyi also become common components of the assemblages. Generally low diversity assemblages of the middle to lower Miocene sediments contain common bolivinids, nodosariids, stilostomellids, and Cibicidoides truncanus.
Cores 371-U1508B-7R through 16R contain abundant reworked benthic foraminifers, as inferred from the mixture of different colors and preservation states of tests (from excellent preservation to very poorly preserved, broken, pyritized, and infilled). Taxa from different ages were identified, including pre-Paleocene/Eocene Thermal Maximum species such as Arenobulimina truncata and pre-Oligocene species such as Nuttallides truempyi. Different paleoenvironments include reworked shelfal taxa such as Planorbulina zelandica, Amphistegina, Ehrenbergina, and large (~1 mm) shallow-water Lenticulina (<100 m depth).
The Oligocene fauna are similar to the Miocene fauna but less diverse. Late Eocene assemblages are also similar but include Cibicides spp., Cibicides collinsi, Cibicidoides spp., T. bradyi, and Uvigerina rippensis as additional common components.
The upper and middle Eocene sequence contains common Anomalinoides spp., Bulimina tuxpamensis, Bulimina spp., Cibicides parki, Cibicidoides eocaenus, Cibicidoides dohmi, G. subglobosa, Gyroidinoides spp., Hanzawaia ammophila, Lenticulina spp., nodosariidae, N. truempyi, Oridorsalis umbonatus, Pullenia bulloides, Spiroplectammina cubensis, U. rippensis, and stilostomellids. A peak in relative abundance of Aragonia aragonensis (to 12% of the assemblages) was observed between 551.5 and 550.5 m (nannofossil Zone NP16; Samples 371-U1508C-20R-CC and 21R-1, 16–18 cm). This likely opportunistic species proliferated in the deep sea during and after Paleogene warming events (Alegret et al., 2016; Arreguín-Rodríguez et al., 2016).
Site U1508 presently lies at ~1600 m water depth, and only a few useful paleobathymetric taxa were recovered from the Pleistocene interval, including a few Cibicidoides bradyi, Cibicides robertsonianus, Nuttallides umbonifera, Planulina wuellerstorfi, stilostomellids, and Pleurostomella spp. Such an assemblage indicates a deep middle bathyal to lower bathyal paleodepth, consistent with modern conditions. However, shelf- or upper bathyal–restricted benthic foraminifers, including Ehrenbergina, Cibicides vortex, Notorotalia spp., and Elphidium spp., are sporadically present, likely indicating some redeposition of material from the nearby shelf.
The Pliocene to Miocene interval contains a variety of predominantly lower bathyal species (Hopkinsina mioindex, Tritaxilina zealandica, and Tritaxia instar) and lower bathyal to abyssal taxa (Eggerella bradyi, P. wuellerstorfi, and C. mundulus) whose upper depth limit is 1000 m or deeper (van Morkhoven et al., 1986). Predominantly abyssal taxa (Epistominella exigua and N. umbonifera) are very scarce. These data indicate a lower bathyal depth of deposition during the Pliocene and Miocene. Traces of reworked shallow-water taxa, including P. zelandica, Ehrenbergina, and Amphistegina, were observed through the Miocene sequence.
Oligocene and upper Eocene samples contain some primarily bathyal taxa such as Anomalina visenda (=Anomalinoides capitatus), Cibicides ihungia, or C. robertsonianus but also taxa that are most common at lower neritic to bathyal (T. bradyi) and upper bathyal (B. tuxpamensis) depths (van Morkhoven et al., 1986; Holbourn et al., 2013). The presence of large costate and spinose uvigerinids, including U. rippensis and the closely related Euuvigerina bortotara, indicates a lower middle bathyal zone (800–1000 m) depth of deposition (Tjalsma and Lohmann, 1983).
The remaining part of the Eocene (Zone NP14) contains more common lower bathyal to abyssal taxa, including Anomalina aotea and C. dohmi, which indicate a slightly deeper, lower bathyal paleodepth. No reworked shallow material was observed.
Ostracods
In total, 894 ostracod specimens were picked and 71 taxa were identified at Site U1508. Ostracods are barren to abundant with preservation ranging from moderate to poor, with mixtures of neritic and bathyal taxa in multiple intervals (Figure F18). A particularly strong shallow-water signal was found below the late Oligocene–early Miocene hiatus (321.48 m). Despite strong reworking, paleodepth estimates based on ostracod assemblages suggest a deep-sea setting (lower to middle bathyal) throughout Holes U1508A–U1508C. Neritic taxa presumably are transported from shallow localities.
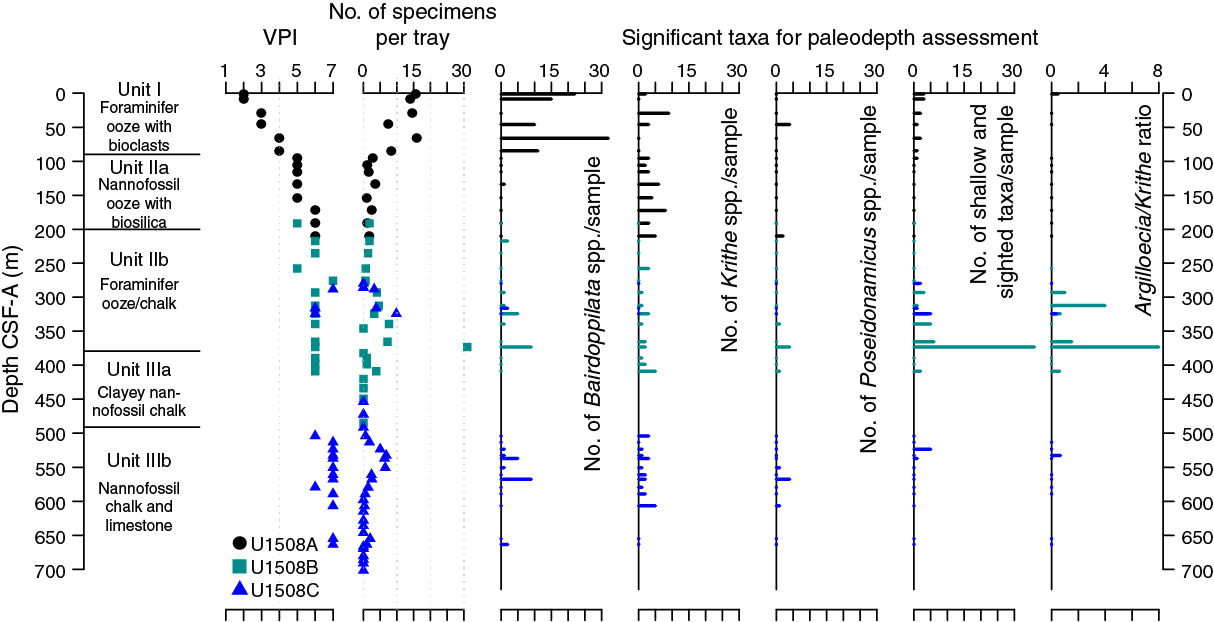
Figure F18. Ostracod preservation, abundance, and assemblage composition.
Abundance data are normalized to the number of specimens per 45 cm2 tray, which ranges from 0 to 31 (Figure F18). Dominant genera are Bairdoppilata spp. and Krithe spp., which mostly inhabit neritic to middle bathyal and middle bathyal to abyssal waters, respectively (Mazzini, 2005; Alvarez Zarikian, 2015). Other abundant taxa include Cytheropteron spp., Bradleya spp., and Debissonia fenestrata. The first two genera have wide paleodepth distribution ranges. D. fenestrata has been recorded in lower bathyal regions, and few have been recorded in abyssal regions in the southern Tasman Sea (Mazzini, 2005). Ostracod fossils are moderately to poorly preserved, with a visual preservation index (VPI) (Dwyer et al., 1995) ranging from 2 to 7.
Synchronous changes occurring in ostracods and lithostratigraphy were found throughout Holes U1508A–U1508C. The lithostratigraphic Unit I/Subunit IIa boundary (90.08 m) corresponds to a minimum in ostracod abundance between Samples 371-U1508A-10H-CC and 11H-CC (84.68–95.75 m) (see Lithostratigraphy; Figure F18). Compared with Unit I, Subunit IIa shows slightly deeper water characteristics: a lower abundance of ostracods, relatively less Bairdoppilata spp., and relatively more Krithe spp. In Subunit IIb, the overall abundance significantly increases with the occurrence of both bathyal and neritic taxa, especially below the hiatus at 321.48 m. The Subunit IIb/Unit III boundary (379.3 m) is marked by an abrupt and temporary decrease in ostracod abundance from 31 specimens/tray in Sample 371-U1508B-21R-CC (373.16 m) to barren in Samples 22R-CC to 38R-CC (382.17–497.01 m). Following the last occurrence of cherty limestone at ~504 m, ostracod abundance slightly increases again with the presence of both bathyal and neritic taxa, which is comparable with CaCO3% behavior in similar intervals. In Subunit IIIb, samples are mostly barren, except for Samples 371-U1508C-31R-CC to 32-CC (655.06–663.56 m), where ostracods are very rare.
Radiolarians
A total of 50 core catcher samples from Site U1508 were examined for radiolarian abundance, preservation, and biostratigraphy (12 from Hole U1508A, 20 from Hole U1508B, and 18 from Hole U1508C; Table T7). In the upper part of Site U1508 from 1.25 to 76.40 m, only small amounts of well-preserved radiolarians are present and some samples are barren (Figure F16). Between 95.65 and 210.61 m, radiolarians are generally well preserved and more frequent, varying between few and abundant. From 217.43 m downhole, radiolarian abundance decreases, with a barren interval between 226.75 and 303.97 m. Radiolarians are only common at the bottom of Hole U1508C (Sample 38R-CC, 701.87 m). Preservation decreases throughout the hole to moderate and poor, possibly due to the deeper burial of the sediments.
Because of only rare radiolarian occurrence in the uppermost part of Site U1508 from 1.25 to 38.75 m (Samples 371-U1508A-1H-CC to 5H-CC; 1.25–38.75 m) and the absence of distinct marker species, this interval remains unzoned (Figure F15).
A very diverse Pliocene–Miocene assemblage was observed from 95.65 to 210.21 m (Samples 371-U1508A-11H-CC to 23H-CC). However, it was not possible to apply the low-latitude radiolarian zonation throughout the Pliocene–late Miocene interval because these datums were not in agreement with nannofossil and planktic foraminifer datums. The Pliocene species Theocorythium vetulum occurs throughout the interval. Additionally, Miocene species such as Stichocorys peregrina (Zones RN9–RN11), Stichocorys delmontensis (Zones RN2–RN8), Didymocyrtis laticonus (Zones RN4–RN6), Didymocyrtis mammifera (Zones RN2–RN5), and Cyrtocapsella tetrapera (Zones RN1–RN6) co-occur and are present in most of the studied intervals between 95.65 and 210.61 m (Samples 371-U1508A-11H-CC to 23H-CC, 371-U1508B-2R-CC, and 4R-CC). S. peregrina, Didymocyrtis spp., and T. vetulum were often observed in the assemblages, a frequency which is almost certainly not an artifact of reworking. Thus, further study is needed to investigate whether some species may have a longer range in the mid-latitudes than in the low latitudes. The interval between 226.75 and 365.46 m remains unzoned due to the absence or only trace occurrence of radiolarians.
A late to middle Eocene radiolarian assemblage was found in the lower part of Site U1508 between 382.17 and 598.06 m (Samples 371-U1508B-22R-CC to 38R-CC and Cores 371-U1508C-9R through 25R). The base of southwest Pacific Zealandia Zone zRP14 were placed between Samples 371-U1508B-34R-CC and 36R-CC (473.34 ± 11.18 m) based on the base of Eucyrtidium spinosum (38.15 Ma). The top of Zone zRP14 cannot be defined because the marker species is absent. The tops of Cryptocarpium ornatum and Lychnocanium amphitrite (33.78 Ma in low latitudes) between Samples 371-U1508B-20R-CC and 22R-CC (373.87 ± 8.36 m) occur close to the Oligocene/Eocene boundary. Three additional events were identified in the late Eocene interval: the top of Eusyringium fistuligerum (35.36 Ma) between Samples 371-U1508B-24R-CC and 26R-CC (409.52 ± 10.78 m), the top of Podocyrtis papalis (35.7 Ma) between Samples 28R-CC and 30R-CC (434.36 ± 3.46 m), and the top of Lychnocanium bellum (35.7 Ma) between Samples 26R-CC and 28R-CC (425.58 ± 5.22 m). The top of Eucyrtidium nishimurae was found between Samples 371-U1508B-36R-CC and 38R-CC (490.77 ± 6.15 m). Reworking of early Eocene to late Paleocene species Buryella tetradica and Lithochytris archaea was observed in several mid- to late Eocene samples (371-U1508B-22R-CC, 30R-CC, 32R-CC, and 36R-CC). This reworking may indicate erosion of older strata in the middle to late Eocene.
The base of Zone zRP13 was placed between Samples 371-U1508C-15R-CC and 17R-CC (513.56 ± 9.86 m) based on the base of Zealithapium mitra. Zone zRP13 was placed in the upper part of Hole U1508C and the lower part of Hole U1508B. The top of the zone cannot be determined in Hole U1508C because E. spinosum is absent in that hole. The base of Zone zRP12 was placed between Samples 371-U1508C-25R-CC and 27R-CC (606.44 ± 8.38 m) based on the base of E. fistuligerum. Two events were identified in Zone zRP12: the top of Artobotrys biaurita (in Zone RP15 in low latitudes) between Samples 371-U1508C-17R-CC and 19R-CC (530.27 ± 6.75 m) and the base of C. ornatum (in low-latitude Zone RP14) between Samples 371-U1508C-23R-CC and 25R-CC (588.81 ± 9.15 m). The low-latitude datum of the top of A. biaurita (40.7 Ma) fits the age-depth plot (constructed using nannofossil and planktic foraminifer datums) better than the southwest Pacific datum (39.3 Ma) (Figure F43). The interval between 614.82 and 691.23 m remains unzoned due to the scarcity of marker species. Sample 371-U1508C-38R-CC (701.82–701.92 m) is assigned to low-latitude Zones RP9–RP10 due to the presence of L. archaea (top in Zone RP10) and Stylatractus pachystylus (base in Zone RP9).
The preliminary results of Site U1508 show the limitations in applying radiolarian biostratigraphy at this site due to the general low abundance throughout the holes, particularly in the Paleogene. In addition, poor preservation of the specimens also hampers correct taxonomic identification. Only a few low-latitude marker species are present at this site, and they occur sporadically throughout the Eocene interval (e.g., Dictyoprora mongolfieri, P. papalis, and Podocyrtis mitra). Likewise, the southwest Pacific zonation has limitations (e.g., sporadic occurrence of marker species) but was used at this site.
Palynology
A total of 19 core catcher samples from Holes U1508A (N = 3), U1508B (N = 8), and U1508C (N = 8) were processed and analyzed for palynological content (Table T8). Nearly all samples from Site U1508 yielded rich palynological associations with both marine (dinocysts, prasinophytes, acritarchs, and organic foraminiferal lining) and terrestrial (sporomorphs and phytoclasts) components (Figures F19, F20, F21, F22). Amorphous organic material and pyritized siliceous microfossils also occur in select intervals. In particular, from ~408 m downhole, pyritized radiolarians become a conspicuous component, which could reflect a diagenetic signal because this interval broadly coincides with the SMT zone (see Lithostratigraphy and Geochemistry). Fungal spores and insect remains were found sporadically. Because of the much lower sample resolution compared with other microfossils groups, shipboard dinocyst biostratigraphy was employed only for supportive age control. Moreover, semiquantitative analysis of the palynological assemblages provides information for paleoenvironmental interpretations.
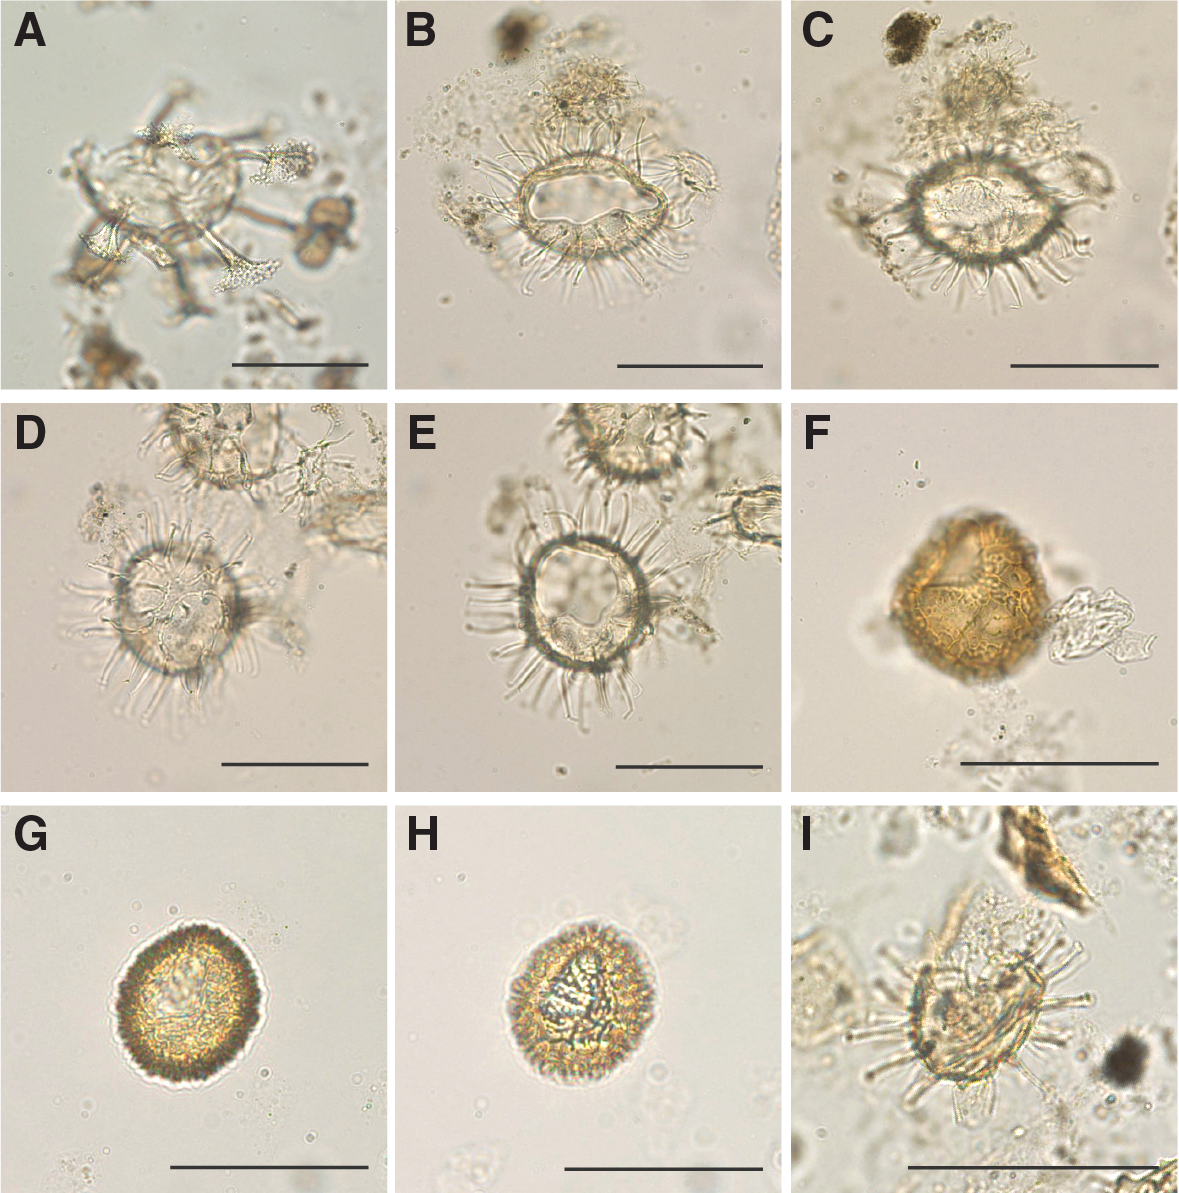
Figure F19. Selected dinocyst taxa.
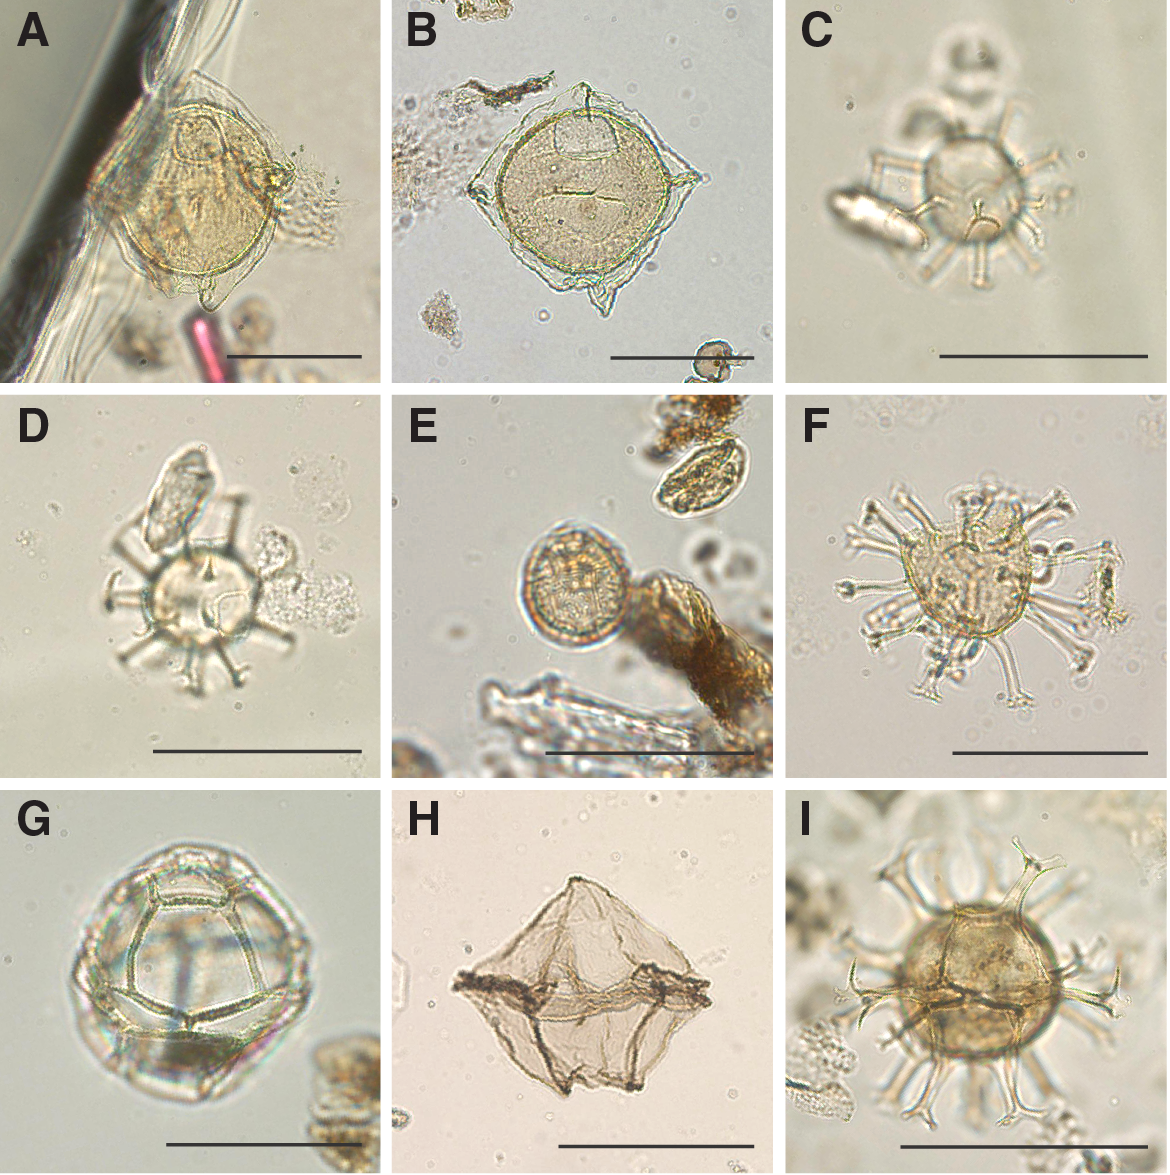
Figure F20. Selected dinocyst taxa.
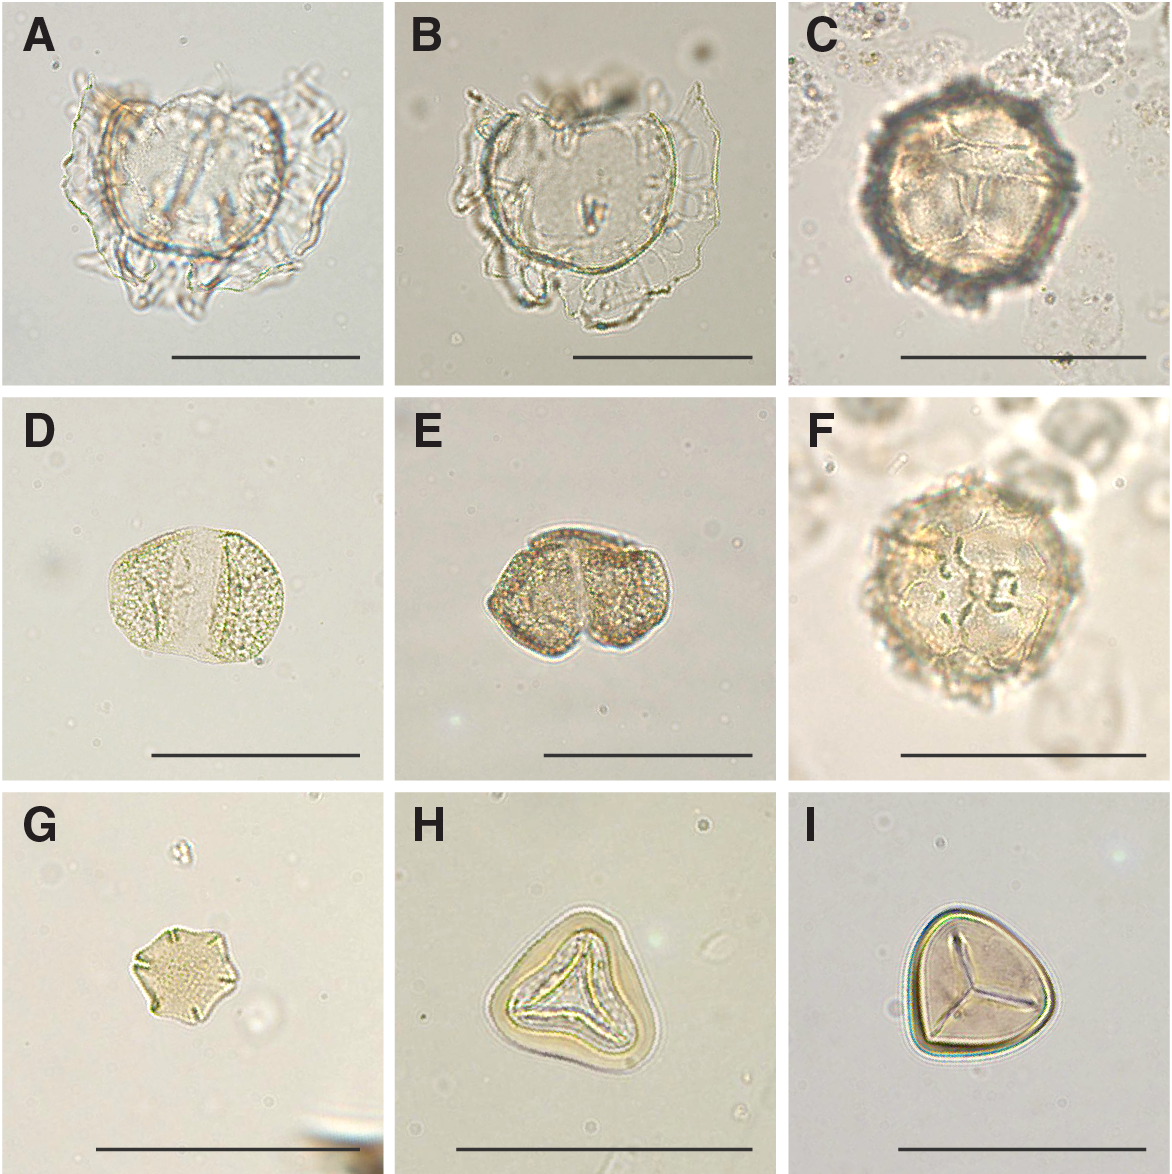
Figure F21. Selected dinocyst and sporomorph taxa.

Figure F22. Selected palynomorphs and palynofacies.
Dinocyst assemblages are generally diverse and well preserved, although preservation distinctly decreases below ~600 m (Table T9). Assemblages include taxa reflective of open-ocean, inner and outer neritic, and lagoonal conditions. The relative proportions of these assemblages change throughout the sedimentary sequence, with most proximal conditions in the late Oligocene. Heterotrophic dinocyst taxa (Lejeunecysta and Selenopemphix) consistently occur at a relative abundance of ~10%, indicating nonoligotrophic conditions.
Stratigraphy
The Miocene and Pliocene samples from lithostratigraphic Units I and II (0–379.30 m) only contain sparse age-diagnostic dinocysts. However, the simultaneous occurrence of Filisphaera filifera, Cerebrocysta poulsenii, and Impagidinium patulum in Sample 371-U1508B-11R-CC (275.63–275.73 m) confirms an early Miocene age.
A relatively large number of biostratigraphically relevant dinocysts were found in samples from lower Subunit IIb and Unit III. The latest Eocene is represented by taxa such as Areosphaeridium diktyoplokum, Hemiplacophora semilunifera, and Stoveracysta ornata. A number of middle to early Eocene biostratigraphic index species were recorded from upper Unit III, including Corrudinium regulare, Dracodinium waipawaense, Dracodinium rhomboideum, Heteraulacacysta porosa, S. ornata, and Wilsonidium echinosuturatum. Furthermore, longer ranging Eocene markers such as Cleistosphaeridium diversispinosum, Diphyes colligerum, Elytrocysta brevis, and Hystrichosphaeridium truswelliae were recorded throughout Unit III. The presence of these age-diagnostic taxa demonstrates the potential for postexpedition refinement of dinocyst biostratigraphy.
Paleoenvironment
Miocene–Pliocene (4 samples; 1–276 m)
In the Miocene–Pliocene interval, a well-preserved palynological assemblage predominantly consists of dinocysts and sporomorphs. Dinocysts consist of mostly outer neritic (Cleistosphaeridium spp. and Spiniferites spp.) and pelagic components. Sporomorphs consist of saccate (windblown) pollen, angiosperm pollen (including Nothofagus spp.), and spores. In the sporomorphs, the dominance shifts from spores in the late Miocene and Pliocene to pollen in the early Miocene. Although high sporomorph abundance indicates a large amount of terrestrial input, the consistent abundance of pelagic taxa such as Impagidinium spp., Nematosphaeropsis labyrinthus, and Batiacasphaera spp. suggests this is an open-ocean setting with high amounts of offshore transport.
Oligocene (2 samples; 340–373 m)
The late Oligocene Sample 371-U1508A-21R-CC (373.16 m) contains a palynomorph assemblage of excellent preservation that records a very proximal location. Sporomorphs are the dominant palynomorph, consisting of dominantly saccate pollen with contributions of angiosperm pollen (including Nothofagus spp.) and spores. Additionally, a diverse and rich dinocyst assemblage was recovered, with large amounts of inner neritic taxa, an absence of oceanic taxa, and some reworking of Eocene forms. This assemblage coincides with a shallow-water signal recorded in depth-indicative ostracod species (see Ostracods above) in the same interval. These combined lines of evidence indicate a possible drop in relative sea level combined with high levels of offshore transport in the late Oligocene. Conspicuously, this interval is located right above a 6 My hiatus around the EOT (see Lithostratigraphy), which suggests the recorded changes in relative sea level might have been related to EOT-associated global sea level changes and/or reflect a signature of regional uplift in the Eocene–Oligocene (see Background and objectives).
Eocene (13 samples; 382–686 m)
Eocene palynological assemblages predominantly consist of dinocysts with only trace amounts of terrestrial material, reflecting much lower offshore transport compared with younger material. Preservation typically decreases downhole. The lowermost analyzed sample is effectively barren of palynomorphs. Spiniferites spp. dominates the dinocyst assemblages and reflects outer neritic conditions. However, in the uppermost Eocene (~500–440 m), an increase of inner shelf species belonging to the Areoligera–Glaphyrocysta complex (cpx) (Sluijs and Brinkhuis, 2009) was found. Notably, this depth interval has a very high abundance of prasinophyte species with affinity to the genus Pterospermella. A high abundance of the prasinophyte algae Tasmanites was observed around 492 m (Figure F22). This record is similar to those from the Tethys Ocean (Brinkhuis and Biffi, 1993), indicating this “bloom” of green algae might have been supraregional to global in scale.
Reworked Cretaceous dinocyst species occur sporadically throughout the Eocene samples and are typically characterized by poor preservation, but higher resolution sampling and more elaborate counts are necessary to further substantiate this observation.
Invertebrate fossils
Site U1508 cores contain varying amounts of invertebrate fossils. Echinoderm spines and siliceous sponge spicules are rare but persistent components throughout all holes. More obviously, the upper Pleistocene and Pliocene Cores 371-U1508A-1H through 10H, which correspond to lithostratigraphic Unit I, contain diverse and well-preserved invertebrate fauna (Figure F23). These fauna include intervals with abundant branching forms of bryozoa and mollusk fragments. Brachiopods, gastropods, and rare otoliths can also be found. Delicate gastropod shells and articulated brachiopods exhibit excellent preservation. Because many of these fauna inhabit a shallow shelf or neritic environment, they indicate a nearby source, possibly the Reinga Ridge to the east of Site U1508. Common bryozoa fragments, found in all holes at Site U1508 with moderate preservation, indicate these bioclasts may have been transported from greater distances, possibly by strong currents. Indeed, temperate skeletal carbonate sediments have been observed on the south Mariana Trench region slightly south of Site U1508. Here, principal carbonate components include abundant bryozoans, bivalves, and foraminifers (Nelson and Hancock, 1984). Previous authors note that the modern counterparts of the skeletal assemblages occur in water depths 100–150 m higher than their living counterparts near Site U1508. This observation supports emplacement of the invertebrate fossils from the South Maria Ridge (Figure F1) during times of sea level lows associated with glacial periods throughout the Pleistocene (Nelson et al., 1981; Nelson and Hancock, 1984). Because water depths at Site U1508 were recorded as middle to lower bathyal throughout the Pleistocene, this interpretation suggests shelfal taxa found at the site were emplaced during sea level lowstand conditions.
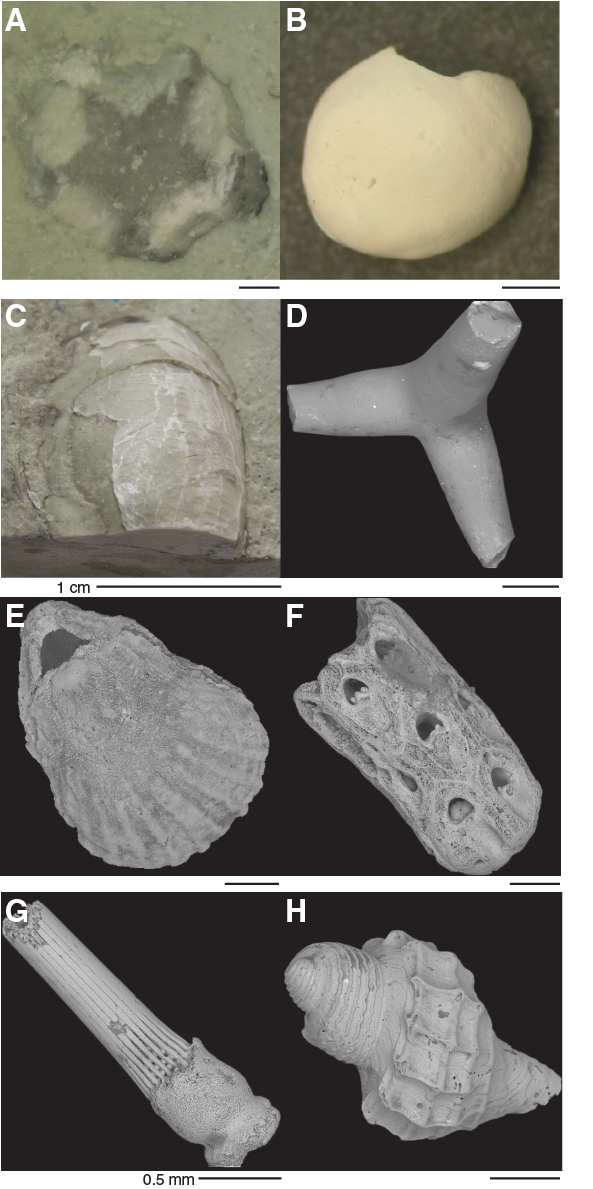
Figure F23. Invertebrate and vertebrate fossils.
Paleomagnetism
Pass-through paleomagnetic measurements were performed on most archive-half sections from Site U1508. However, we excluded a number of sections from lithostratigraphic Unit I in Hole U1508A (0–90.08 m; Figure F24). Cores in this uppermost sediment interval consist of foraminiferal ooze with high sand and water content and were highly disturbed by RCB drilling. This sediment also has very weak natural remanent magnetization (NRM) intensity, mostly in the 10−5 to 10−3 A/m range. Therefore, only a few selected sections from Unit I were subjected to paleomagnetic measurements. A total of 83 discrete samples (15, 39, and 29 samples from Holes U1508A, U1508B, and U1508C, respectively) were taken from intervals in Units II and III. Most discrete samples from above 300 m were taken by pushing 7 cm3 paleomagnetic cubes into sediment. Below this depth, most samples were cut from cores as 2 cm × 2 cm × 2 cm cubes.

Figure F24. Pass-through paleomagnetic data, Hole U1508A.
Paleomagnetic results
Paleomagnetic data show variable quality for different sediment intervals (Figures F24, F25, F26). Hole U1508A sediments are characterized by NRM intensity around 10−3 A/m. NRM inclination in the few sections measured in Unit I appears to be random, most likely because of core disturbance. NRM inclination values in Subunit IIa (~90–210 m) are mostly positive, probably due to a drilling-induced overprint. NRM inclination after alternating field (AF) cleaning at 20 mT and filtering the data using a 10-point moving average shows numerous swings between positive and negative values without any clear polarity pattern. Overall, the quality of paleomagnetic data from Hole U1508A is poor, which can also be seen from the lack of bimodal distribution in the histogram of inclination values (Figure F27A).
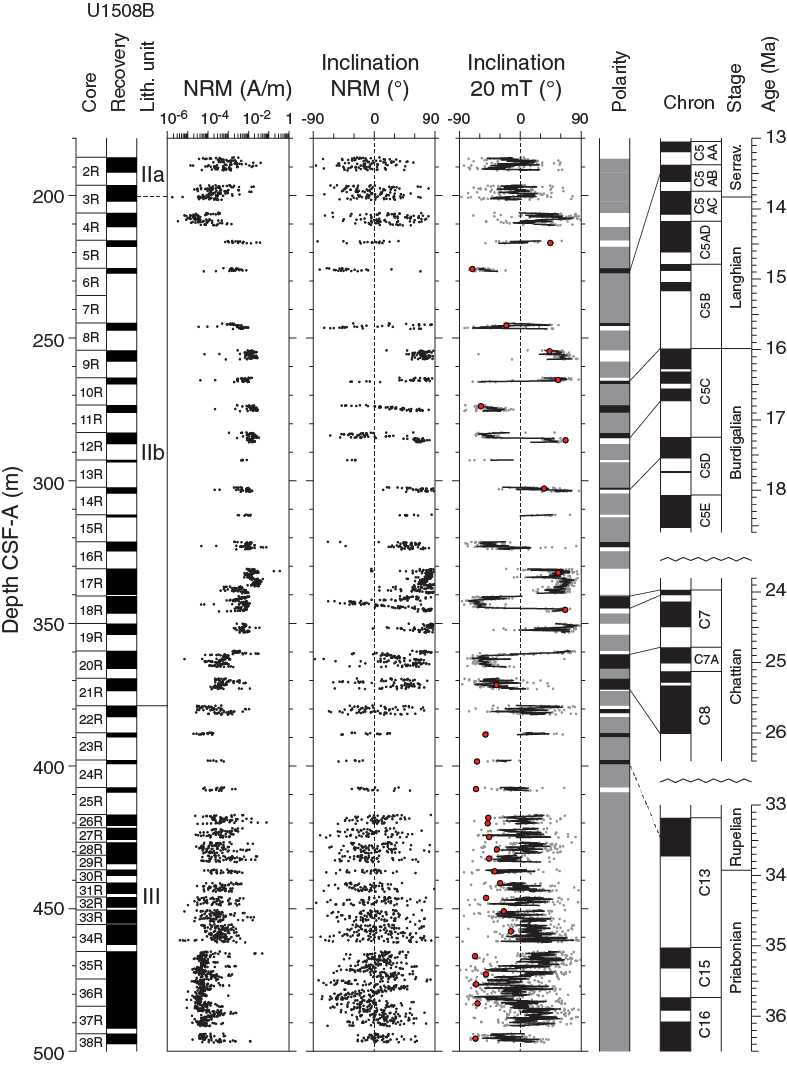
Figure F25. Pass-through paleomagnetic data, Hole U1508B.
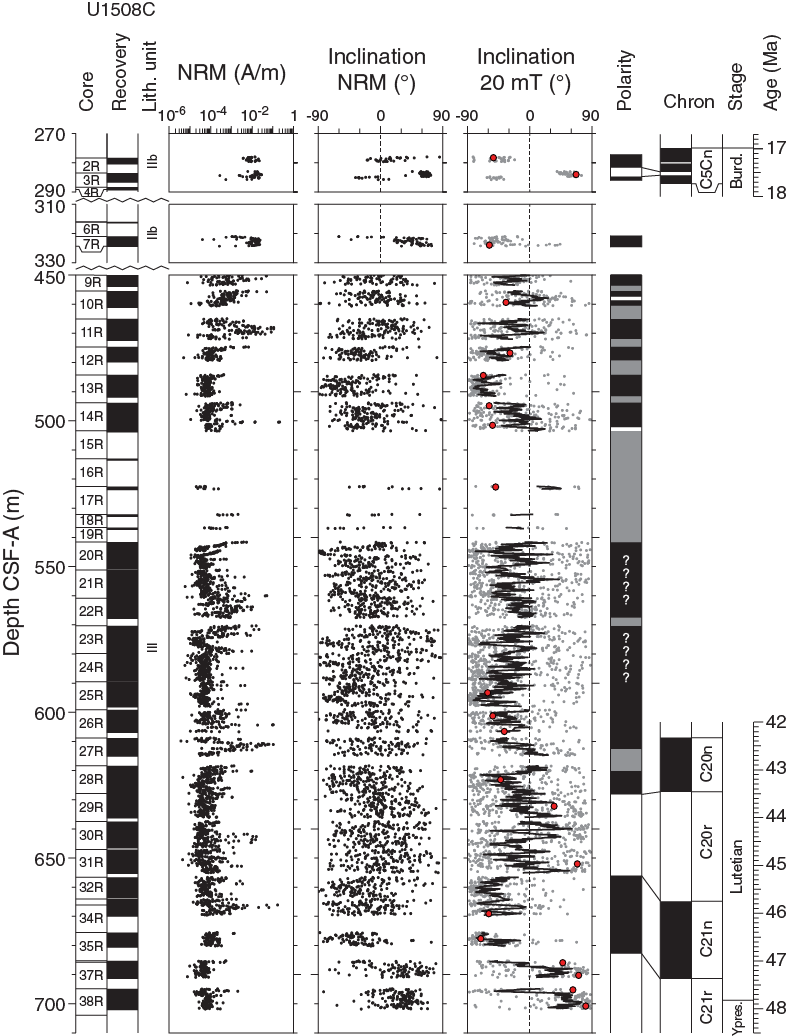
Figure F26. Pass-through paleomagnetic data, Hole U1508C.
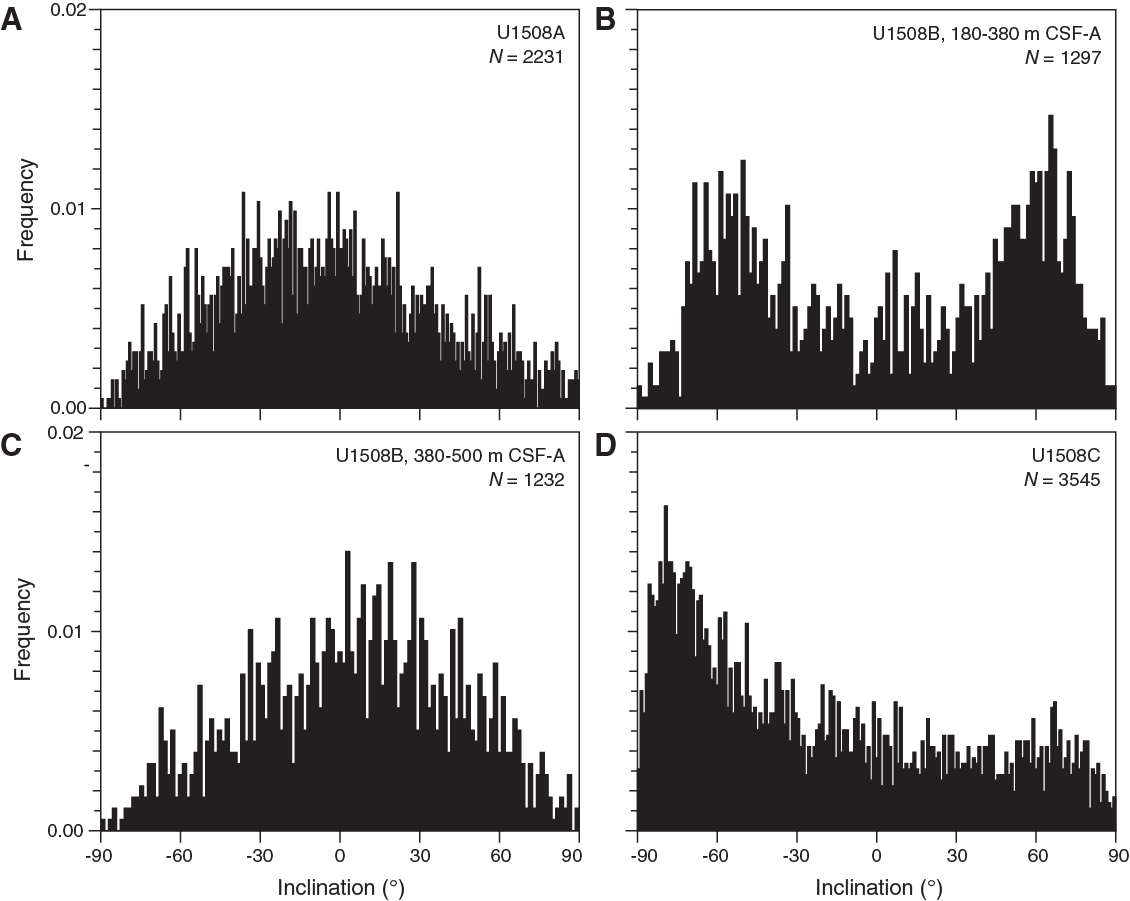
Figure F27. Inclination values.
In contrast, despite the low recovery, high-quality paleomagnetic data were obtained for sediments from Subunit IIb in Hole U1508B. From ~250 to 380 m, NRM inclination after 20 mT AF cleaning reveals a series of geomagnetic reversals (Figure F25) that exhibit a bimodal clustering on a histogram (Figure F27). This interval also has an NRM intensity around 10−2 A/m. From Subunit IIb to Unit III (~380 m), NRM intensity decreases to between 10−4 and 10−3 A/m. Poor paleomagnetic data without a clear bimodal clustering of inclination were obtained from this interval.
Hole U1508C cores generally have weak NRM intensity, mostly about 10−4 A/m, which results in poor paleomagnetic behavior. NRM after 20 mT cleaning in Hole U1508C is dominated by negative inclination (Figure F27D). However, some intervals seem to show reliable paleomagnetic inclination data supported by principal component analysis (PCA) of discrete samples, revealing the presence of different geomagnetic polarity. This polarity can be observed between 278 and 324 m (Cores 371-U1508C-2R and 3R) and between 655 and 700 m (Cores 32R and 38R) (Figure F26).
PCA on discrete samples enables isolation of characteristic remanent magnetization (ChRM) components of the NRM in 12 of 15 discrete samples from Hole U1508A (Figure F28). These data are not sufficient to support a reliable magnetostratigraphic interpretation. In Hole U1508B, 29 of 39 (74%) discrete samples show excellent AF demagnetization behavior; the samples have ChRM directions linearly trending toward the origin of the demagnetization diagrams after AF demagnetization of 10–20 mT. In Hole U1508C, 21 of 29 (72%) discrete samples show similarly good AF demagnetization behavior. The good paleomagnetic behavior of some discrete samples, particularly those from the lower interval in Hole U1508C (~650–700 m), supports the results obtained from pass-through paleomagnetic data from this interval (Figure F26).
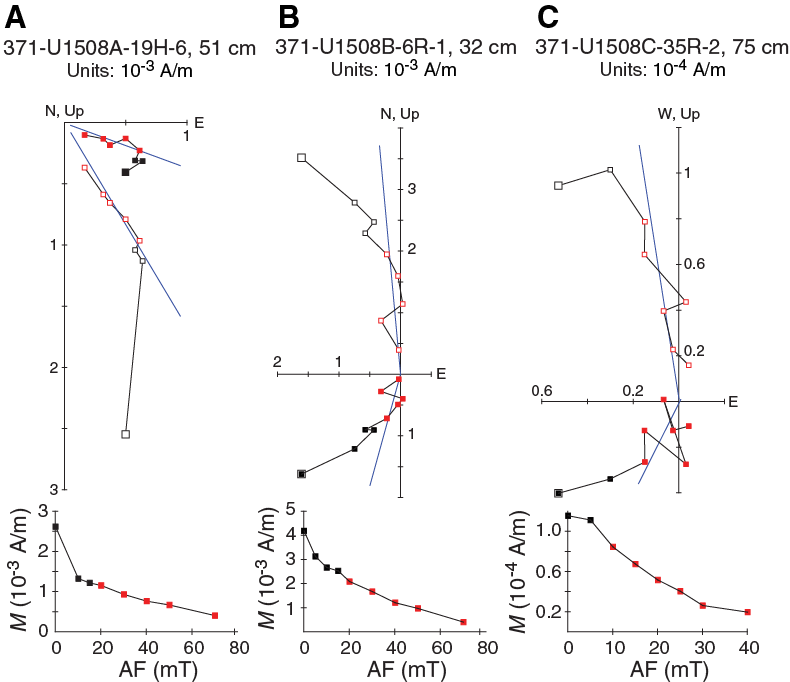
Figure F28. Vector endpoint demagnetization diagrams.
Anisotropy of magnetic susceptibility
Anisotropy of magnetic susceptibility (AMS) was measured on all 83 discrete samples from Site U1508 (Figure F29). Samples from Hole U1508A are magnetically weak and were collected by pushing paleomagnetic cubes, which resulted in a poorly defined orientation of the AMS tensor. Most samples from Holes U1508B and U1508C were trimmed in cubes with a precise orientation control and exhibit a well-defined oblate AMS fabric dominated by foliation, with the minimum axis of the AMS ellipsoids (κmin) statistically oriented perpendicular to the bedding plane. Such an AMS pattern is typical for undeformed sedimentary rocks. This AMS result also indicates that the measured paleomagnetic directions are not affected by synsedimentary deformation.
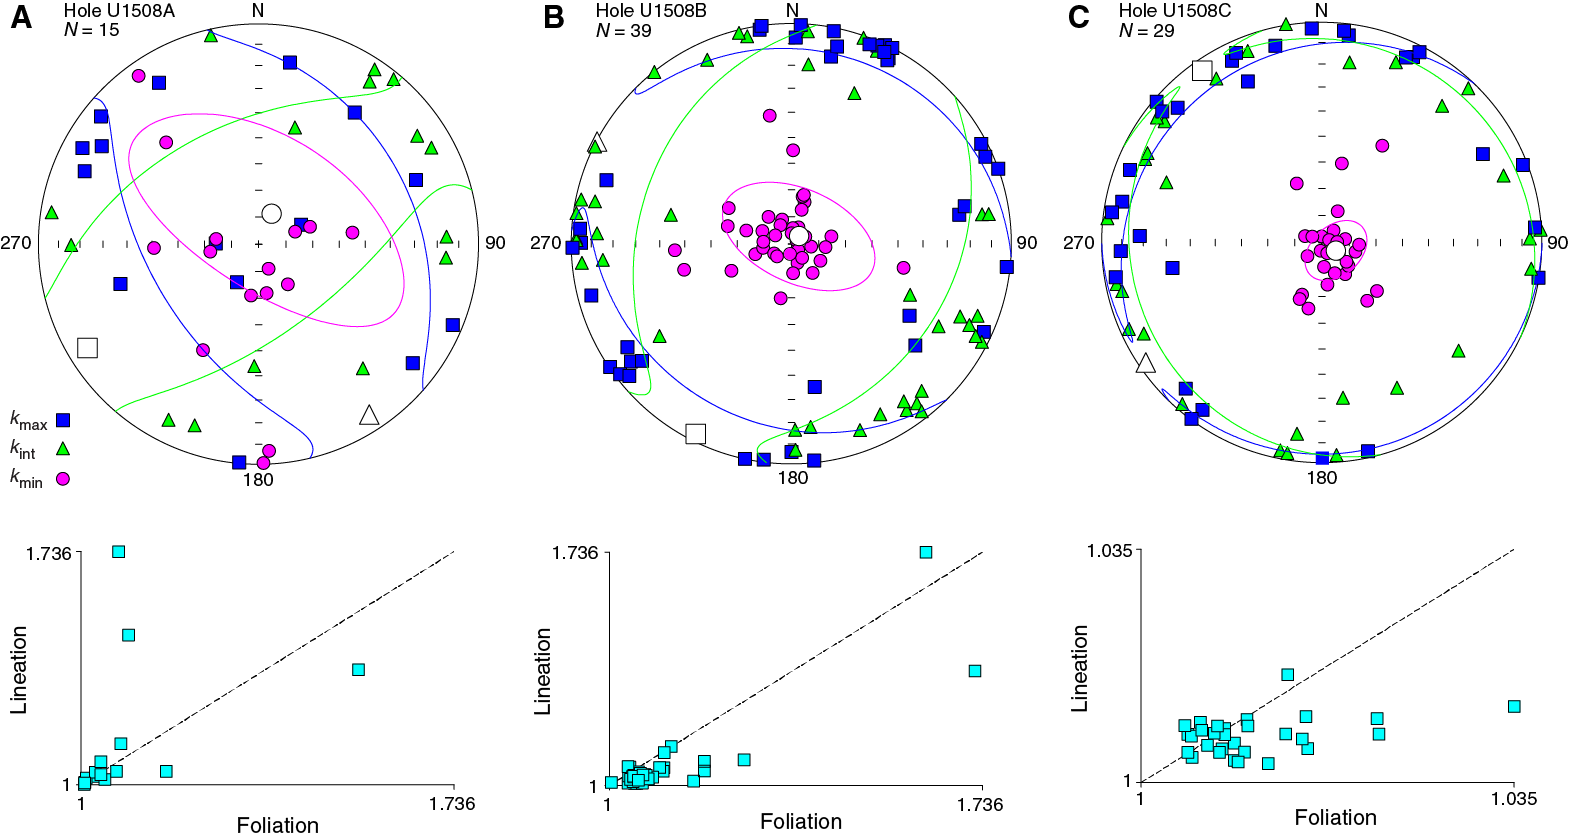
Figure F29. AMS data for discrete samples.
Magnetostratigraphy
Despite low core recovery, paleomagnetic reversals were identified in cores from Hole U1508B. Integration with biostratigraphy (see Biostratigraphy and paleoenvironment) allows correlation of these reversals with the geomagnetic polarity timescale (GPTS) (Figure F25). The short normal polarity interval observed at 226.05 m is tentatively correlated with the midpoint of Chron C5ABn (Table T10). In Hole U1508C, reliable paleomagnetic results from an interval in Unit III allow extending paleomagnetic correlation of Site U1508 with Chron C21r (~48 Ma) (Figure F26; Table T10).
Petrophysics
Whole-Round Multisensor Logger measurements, including gamma ray attenuation (GRA) bulk density, magnetic susceptibility, and NGRL measurements, were performed on all cores from Site U1508. Thermal conductivity, color reflectance, magnetic susceptibility, P-wave velocity, and strength measurements were conducted on section halves, and discrete sample moisture and density (MAD) measurements were also performed on all cores. With deployment in Hole U1508C of a modified triple combo wireline tool, a high-quality data set, including caliper, NGR, resistivity, and P-wave and S-wave velocity, was acquired from 87 to 660 m WSF.
Variations in physical properties define three distinctive boundaries at ~90, ~200, and ~500 m and correlate with reflections on multichannel seismic (MCS) data and with lithostratigraphic boundaries. The upper interval (lithostratigraphic Unit I) has low density, high porosity, and P-wave velocity values of ~1700 m/s. At ~90 m (Unit II), there is a shift to higher bulk density and lower porosity and velocity values. At ~200 m (top of Subunit IIb), ooze transitions to chalk, shear strength decreases from ~100 to ~30 kPa, and the gradient of P-wave velocity (P-wave caliper [PWC]) increases. Velocity values are ~1900 m/s by 380 m. Between 380 and 500 m, variance increases in bulk density, grain density, and porosity in chalk with interbedded layers of cherty limestone. Below 500 m (Subunit IIIb), gradients in bulk density, porosity, and P-wave velocity are higher. At the base of Unit III between 680 and 700 m, a hard limestone layer correlates with P-wave velocity and bulk density increases to ~3600 m/s and 2.45 g/cm3, respectively. Discrepancies between the wireline (Dipole Sonic Imager [DSI-2]) and laboratory-measured P-wave velocity values (PWC) vary between 0 and 300 m/s but do not directly follow the divergent trend with depth associated with porosity rebound, indicating some lithologic dependence.
NGR and color reflectance data also show the three distinctive boundaries at ~90, ~200, and ~500 m and changes associated with lithology, which are predominantly changes in clay content. Magnetic susceptibility is low, except between ~240 and ~380 m in Subunit IIb, where higher concentrations of lithic grains and volcanogenic minerals are inferred (see Lithostratigraphy).
Five in situ temperature measurements were made in Hole U1508A, and together with the thermal conductivity, they were used to calculate the heat flux. Temperature increases below the seafloor with a gradient of 56.1 ± 6.4°C/km, and the heat flux is 62.4 ± 7.0 mW/m2; these values are in line with the tectonics of the region.
Density and porosity
Bulk density was measured on whole-round sections (GRA) and discrete samples (MAD) (Figure F30).
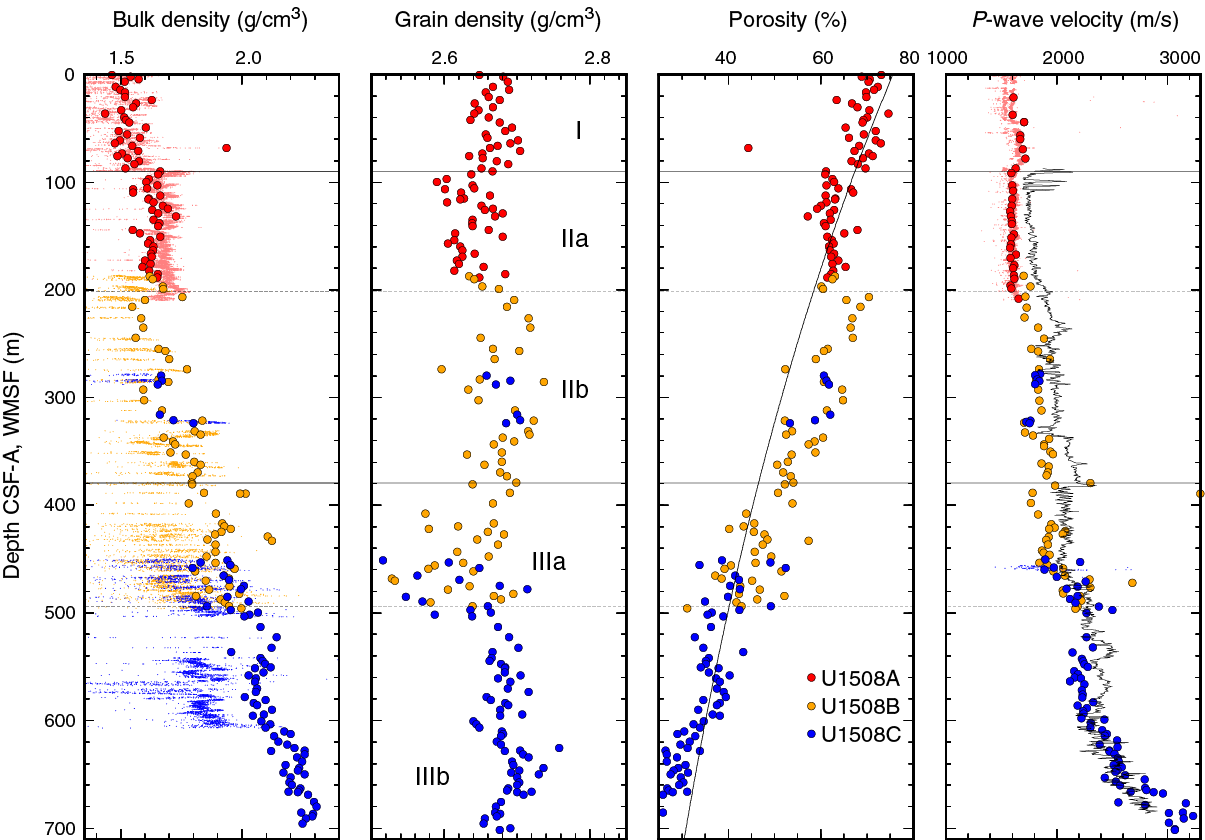
Figure F30. Bulk density, grain density, porosity, and P-wave velocity.
MAD bulk density values increase with depth in Unit I (0–90 m) from 1.50 to 1.60 g/cm3, concurrent with a porosity decrease from 75% to 65%. Grain density ranges from 2.70 to 2.65 g/cm3 in this interval.
MAD bulk density values increase to ~1.65 g/cm3 at the top of Subunit IIa (90 m) and remain constant to the base of the subunit (200 m), which is in accord with the nature of nannofossil-rich ooze in this subunit. MAD bulk density values plot on the low side of the GRA bulk density profile, which is attributed to the bias toward siliciclastic material rather than carbonate in the GRA bulk density calibration method. Grain density is lower (2.65–2.60 g/cm3) in this subunit than in Unit I. Porosity decreases from 65% to 60% in the upper part of the subunit (90–140 m), following the same trend as in Unit I, but remains constant at 60% in the lower part of the subunit (140–200 m).
MAD bulk density values increase to 1.75 g/cm3 at the very top of Subunit IIb (200 m), which corresponds to the first occurrence of nannofossil chalk. This increase is followed by a drop to 1.50 g/cm3 at ~220 m. Throughout the rest of Subunit IIb (240–380 m), MAD bulk density values increase with depth from 1.50 to 1.75 g/cm3 with local variations as high as 0.20 g/cm3 that may relate to density contrasts between nannofossil chalk and interbedded foraminiferal chalk. Grain density ranges from 2.65 to 2.75 g/cm3 in this subunit. Porosity values increase to 70% in foraminiferal chalk at the top of Subunit IIb and gradually decrease to 50% at the base of the subunit (Figure F30).
Bulk density increases at a higher rate with depth in Subunit IIIa (380–493 m), from 1.85 to 2.0 g/cm3. Over this depth range, grain density shows significant variance between 2.50 and 2.70 g/cm3. This scatter may be due to the interbedding of differing lithologies of chalk and cherty limestone (see Lithostratigraphy). In this subunit, porosity values are also scattered but generally decrease with depth from ~50% to ~40%.
Bulk density continues to increase in Subunit IIIb to 1.9 g/cm3 at 493 m and 2.2 g/cm3 at 700 m. Near the base of the hole (700 m), a hard limestone layer has a bulk density of 2.4 g/cm3. Grain density remains constant throughout the subunit, indicating that the bulk density increase is attributable solely to a decrease in porosity, which drops from 40% to 30% over this interval.
A best-fitting curve of porosity (φ) decrease with depth (z) (i.e., φ = φoe−z/c) has φo = 76% ± 1% and c = 783 ± 26 m (Figure F30). In Unit I and Subunit IIa, the curve fits the measurements on average. At the transition from Subunit IIa to Subunit IIb (200 m), a ~10% step increase in porosity is likely due to the diagenetic change from ooze to chalk that occurs at that depth. In Unit III, the curve fits the porosity on average but the decrease with depth is steeper than predicted by the overall best fit. The reason for this steep decrease is unclear, given the change from foraminiferal ooze and chalk in Subunit IIb to the clayey nannofossil chalk in Subunit IIIa.
P-wave velocity
P-wave velocity measurements (PWC) were not possible on Cores 371-U1508A-1H, 2H, and 3H because the material was too soupy for effective coupling between the core material and the caliper and bayonets (PWC and P-wave bayonet). In Cores 4H through 5H (20–40 m), velocity values are ~1600 m/s, and in Cores 6H through 10H (40–85 m) they are ~1700 m/s, indicating two distinct layers in Unit I (Figure F30). At the Unit I/Subunit IIa boundary (90 m), velocity decreases to 1600 m/s and is approximately constant to the base of the subunit at 200 m. This decrease in velocity is associated with a MAD bulk density increase and lower grain density (and porosity). A velocity decrease coupled with a density increase is unusual and occurs in a layer that comprises nannofossil ooze with varying amounts of clay, foraminifers, and sponge spicules. In Subunit IIb in foraminiferal nannofossil chalk (see Lithostratigraphy), velocity increases from ~1600 to ~1800 m/s by 230 m and then ranges between 1700 and 1950 m/s to the base of Subunit IIb.
The wireline logging (DSI-2) P-wave velocity values are ~1700–1800 m/s from 100 to 200 m WMSF (Subunit IIa) and then increase to 2300 m/s by 380 m WMSF (Subunit IIb) (Figures F30, F31). DSI-2 and PWC P-wave velocity profiles are offset in Unit II due to a strong rebound-induced effect. The DSI-2 P-wave velocity values are higher by about 150 m/s (10%) at 100 m WMSF and by as much as 300 m/s (15%) at 380 m WMSF. However, divergence between the velocity values from the two tools does not increase uniformly with depth, and rebound magnitudes are inferred to vary with sediment composition.

Figure F31. Wireline logging data, Hole U1508C.
Laboratory (PWC) and wireline (DSI-2) P-wave velocity values are more consistent deeper than 380 m. P-wave velocity increases downhole from ~1900 to ~2200 m/s in Subunit IIIa, where the lithology is clayey nannofossil chalk interbedded with thin cherty limestone beds. Discrete P-wave velocity on cherty limestone beds (e.g., 389.1 m; Core 371-U1508B-23R) has high values of ~3300 m/s.
P-wave velocity increases downhole from 2200 to 2500 m/s in Subunit IIIb between 493 and 650 m (Figure F30). Below 650 m to the bottom of the hole, P-wave velocity (PWC) gradients are higher and values increase with depth from ~2500 to ~3600 m/s in hard, high-density limestone (Cores 371-U1508C-36R through 38R).
Magnetic susceptibility
Magnetic susceptibility was measured on whole-round sections (loop magnetic susceptibility [MSL]), on section halves (point magnetic susceptibility [MSP]), and in situ with the magnetic susceptibility sonde (MSS) dual-coil sensor (Figure F32). Drilling-induced artifacts occur in the magnetic susceptibility data (MSL and MSP) as spikes in the top section of each core. These spikes are ~150 instrument units (IU) above the background low value of ~5 IU in Unit I and Subunit IIa but decrease in amplitude and disappear below 150 m.
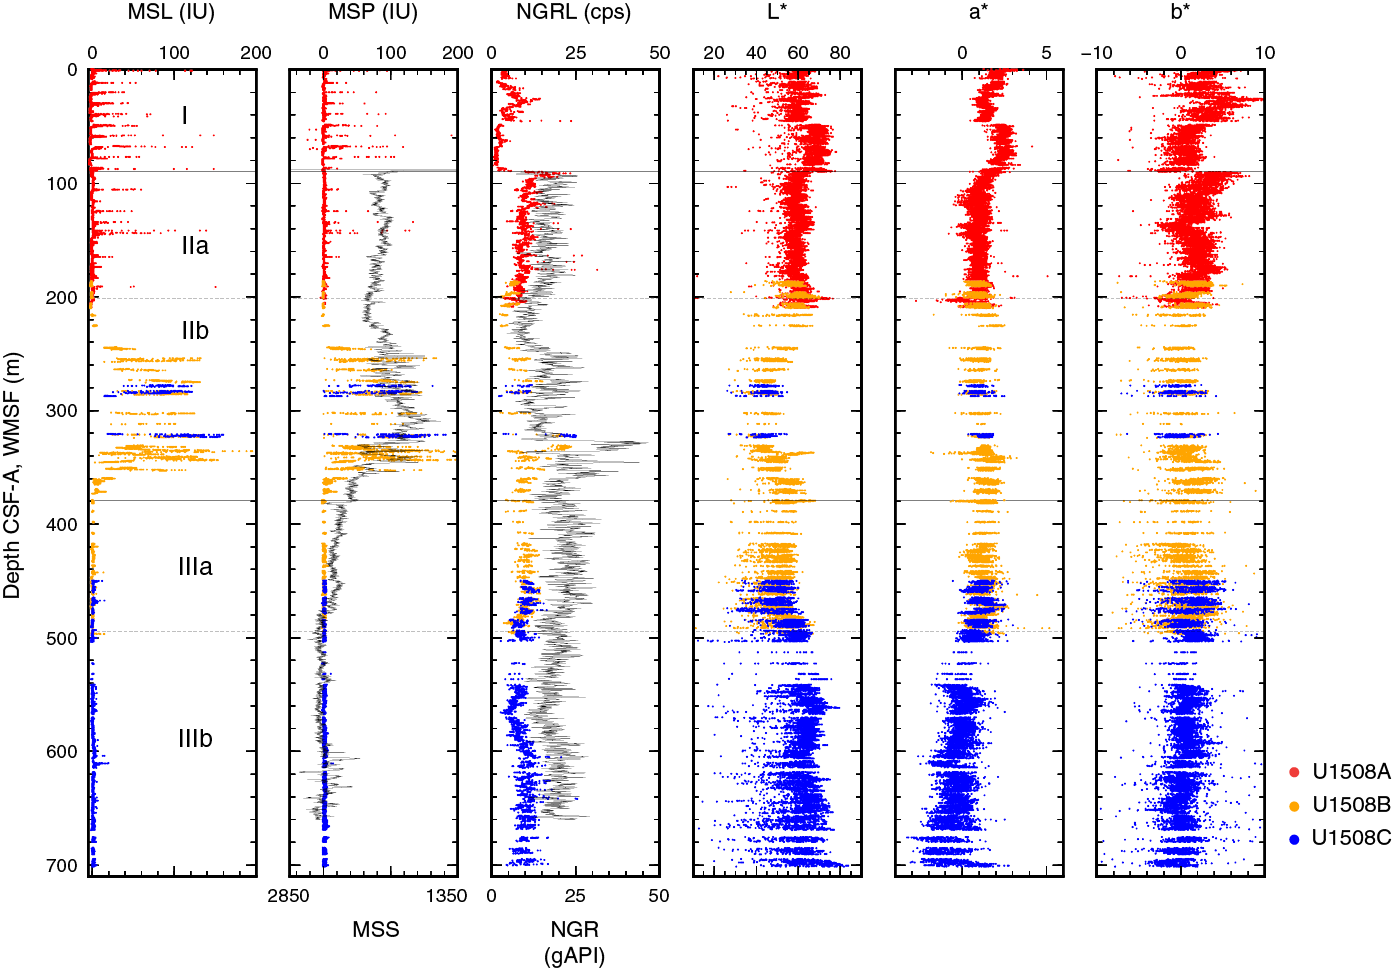
Figure F32. Magnetic susceptibility, NGR, and L*, a*, b*.
Between ~240 and 360 m, magnetic susceptibility increases to ~50–200 IU in Subunit IIb. These higher magnetic susceptibility values are attributed to the higher concentration of lithic grains and volcanogenic minerals in this interval (see Lithostratigraphy). Susceptibility decreases abruptly at the base of Unit II to ~5 IU and remains approximately constant to ~701 m. Magnetic susceptibility measured by the MSS decreases downhole from ~90 to 660 m WMSF, with an interval of higher values between ~240 and 360 m WMSF that correlates with the higher values measured in the cores (MSL and MSP).
Natural gamma radiation
NGR was measured on whole-round sections with the NGRL and in situ with the Hostile Environment Natural Gamma Ray Sonde (HNGS; Figures F31, F32). Variations in NGR are positively correlated with clay content and negatively correlated with carbonate concentration. NGR measured by the NGRL in Unit I increases from 4 to 14 counts/s between 0 and 30 m and then decreases to ~2 counts/s at the bottom of the unit. An abrupt increase from 2 to 22 counts/s occurs at the top of Subunit IIa where clay content increases (see Lithostratigraphy); NGR decreases with depth in the subunit to ~5 counts/s at the base. In Subunit IIb, NGR increases with depth to ~25 counts/s in the middle of the unit and then decreases to ~10 counts/s near the base at 380 m. In Subunit IIIa, NGR is ~10 count/s at 380 m, is constant to ~450 m, and then decreases to ~5 count/s at the base of the subunit at ~500 m. In Subunit IIIb, NGR decreases to ~4 counts/s at 560 m, increases to ~10 counts/s at ~600 m, and remains approximately constant to 700 m.
NGR data acquired by wireline logging show similar trends to core measurements but include complete data across zones of low core recovery (Figures F31, F32). A distinct positive excursion of >45 gAPI occurs at 327–337 m WMSF. This excursion corresponds to the interval of silicate mineral–rich foraminiferal chalk with bioclasts identified in Cores 371-U1508B-16R and 17R (321–337 m) (see Lithostratigraphy). A ~6 My hiatus was identified at the top of this interval by nannofossil and foraminifer biostratigraphy (see Biostratigraphy and paleoenvironment).
Thermal conductivity and in situ temperature
Thermal conductivity measurements were made on the dominant lithology in most cores from Holes U1508A–U1508C (Figure F33A–F33B). Thermal conductivity data show a gradual and increasing trend with depth from 1.0 to 1.4 W/(m·K) over the upper ~400 m (lithostratigraphic Units I and II). Below 400 m to about 600 m, thermal conductivity has substantial variance and increases to about 1.6 W/(m·K). Below about 600 m, conductivity increases from ~1.6 to ~2.1 W/(m·K) in lithostratigraphic Unit III.
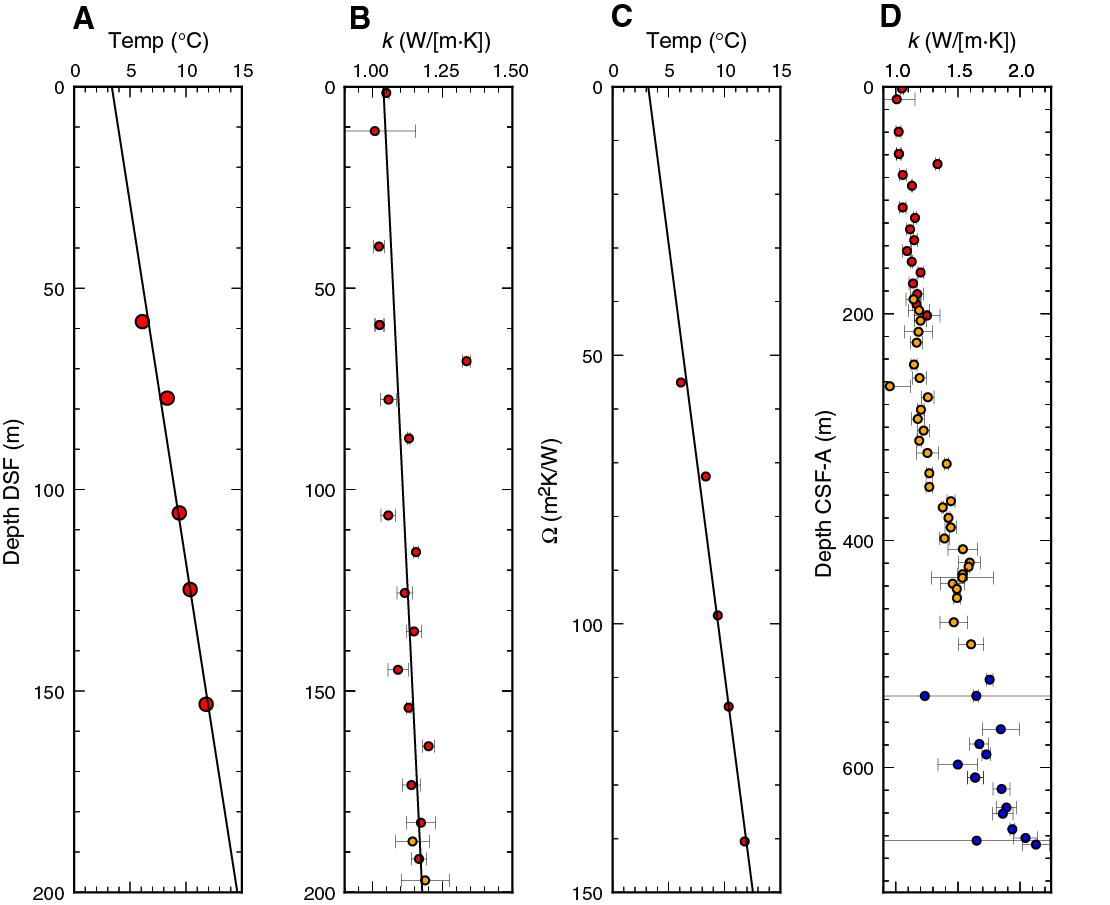
Figure F33. Heat flow.
In Hole U1508A, in situ temperature was successfully measured with the advanced piston corer temperature tool (APCT-3) at five depths just after cutting Cores 7H, 9H, 12H, 14H, and 17H (30–153 m DSF). The APCT-3 measurement at the base of Core 371-U1508A-10H failed when the coring line broke and the sensor package failed. The time-temperature records from coring intervals 9H, 12H, and 14H were good quality, with little deviation during most of the 10 min sensing interval following the initial heat impulse during core penetration. The record from the depth of Core 7H has considerable noise, with an uncertainty on the inferred ambient temperature of >1°C.
Temperature increases below the seafloor with a gradient of 56.1 ± 6.4°C/km (Figure F33). Thermal conductivity was measured on cores from approximately the same depth interval and increases linearly with depth. Because thermal conductivity is not constant with depth, the Bullard method was used to estimate heat flux (see Petrophysics in the Expedition 371 methods chapter [Sutherland et al., 2019a]). The constant slope between thermal resistance (Ω) with temperature is consistent with a thermal regime close to a conductive state. From the plot of temperature with thermal resistance, we estimated the heat flux to be 62.4 ± 7.0 mW/m2 from the slope and the temperature at the seafloor to be 3.2° ± 0.7°C from the intercept. The heat flux is in line with the tectonics of the region (Pollack et al., 1993).
Sediment strength
Sediment strength was measured with both the automated vane shear and penetrometer on all cores from Hole U1508A (Figure F34). Vane shear strength has low values (~25 kPa) from near the seafloor to ~80 m. Values increase to ~100 kPa by 180 m. Strength values then decrease to ~30 kPa around 200 m. Similar depth-strength trends were observed for compressive strength: values are low (~50 kPa) from near the seafloor to ~65 m, increase with high variance to ~450 kPa by ~200 m, and then decrease abruptly to ~100 kPa below ~200 m. This strength weakening occurs in an interval of undercompacted sediments between ~200 and 250 m, where porosity is close to seafloor values of ~70%.
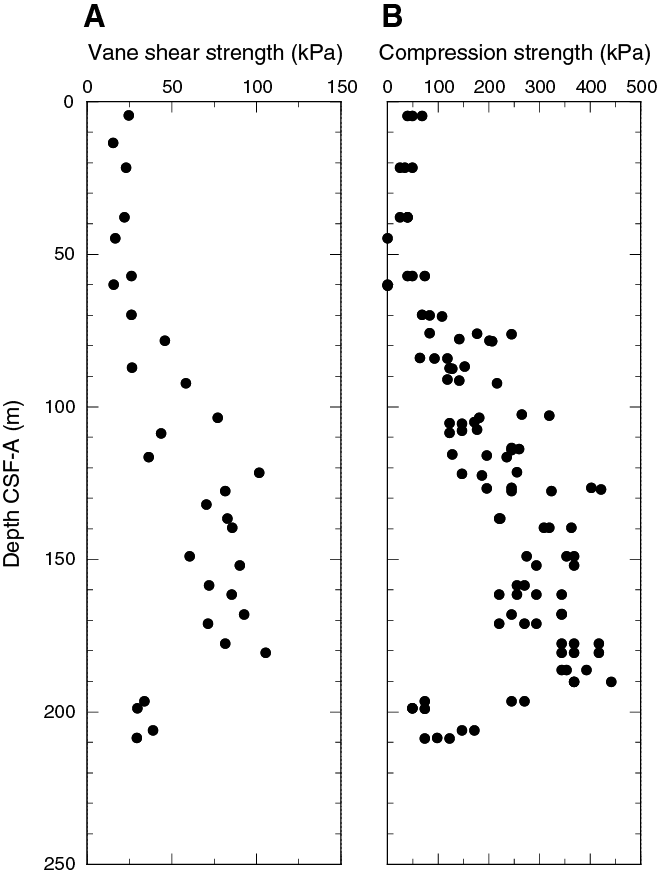
Figure F34. Shear and compressive strength.
Color spectrophotometry
Color reflectance L*, a*, and b* profiles have sharp offsets at ~45 and ~90 m (Figure F32). At ~45 m, where lithology changes from foraminifer ooze with nannofossils (darker) to foraminifer ooze with bioclasts (lighter), L* increases from ~60 to ~70, a* increases from ~1.5 to ~2.5, and b* decreases from ~4 to ~0. At ~90 m (top of lithostratigraphic Subunit IIa), color values are similar to those in the upper ~45 m of the hole. L* and a* color values decrease at the top of Subunit IIa and then remain approximately constant with depth. A positive offset occurs in b* values to ~5 at the top of the subunit, followed by a decrease to ~3 and constant values to the base. In Subunit IIb, L* values are lower (~40–50), indicating darker colors that are attributed to increased clay content (see Lithostratigraphy), whereas a* and b* values are largely unchanged from Subunit IIa. In Unit III, L* values increase with depth from ~50 to ~60, whereas a* and b* values decrease from ~4 to approximately −2 and 2 to −2, respectively. A subtle change in the gradient occurs between Subunits IIIa and IIIb for L* and a* values. This increase in lightness (L*) and greenness (a*) is attributed to the change from clayey nannofossil chalk in Subunit IIIa to nannofossil chalk and limestone in Subunit IIIb.
Two-way traveltime to depth conversion
Acoustic impedance and a synthetic seismic trace were calculated from bulk density and velocity measurements on cores and from downhole wireline velocity (Figure F35A, F35C; see also Petrophysics in the Expedition 371 methods chapter [Sutherland et al., 2019a]). The synthetic trace correlates well with the trace extracted from MCS data (common depth point [CDP] 8470; black line) recorded at Site U1508. The effect of porosity rebound on shallow, core-measured velocity is assumed to be negligible because the traveltime to the first subseafloor reflection (A) on the seismic trace correlates well with the traveltime for Reflector A in the synthetic model. Therefore, no rebound correction was applied to the laboratory data. Where prominent reflections on the synthetic trace correlate well with the MCS trace, two-way traveltime (TWT) depth points were selected (Figure F35C; Table T11).
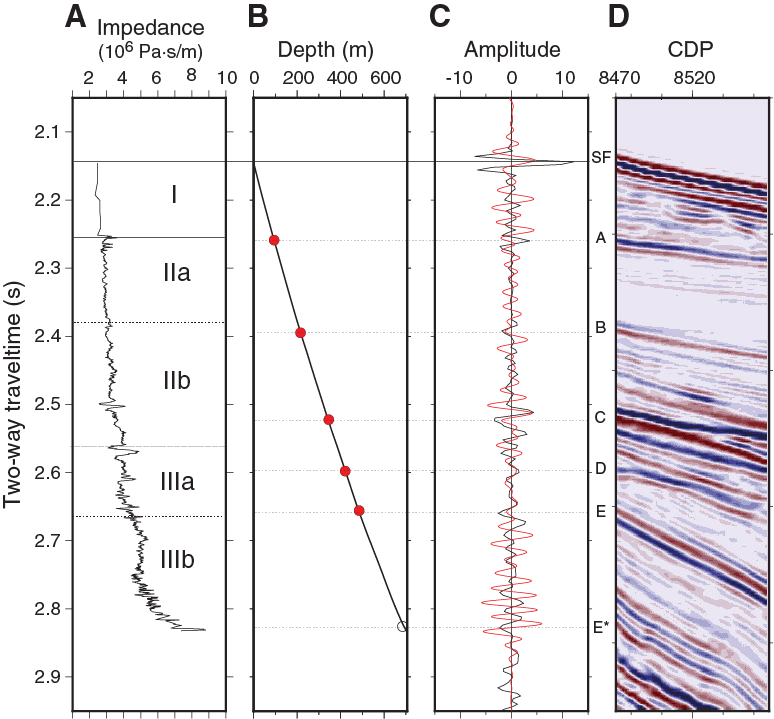
Figure F35. Borehole data tied to MCS data.
Traveltimes for Reflectors A–E in the seismic trace match traveltimes for reflections in the synthetic trace. Both the phase and amplitude of Reflectors B, C, and D are modeled by the synthetic trace. Seismically quiet zones between Reflectors A and B, B and C, and D and E are also reproduced in the synthetic trace. Although Reflector C is the highest amplitude reflection on the seismic trace, the arrival correlates with a wide zone of low impedance rather than a large discrete peak. This correlation may arise from the response of the incident seismic wave to impedance contrasts at depth being frequency dependent.
Geochemistry
The geochemistry program at Site U1508 was designed to characterize the composition of pore water and solid sediment and to assess the potential presence of volatile hydrocarbons. Site U1508 in the Reinga Basin has a thick (>700 m) sediment column. Presently, the basin is starved of terrigenous input, with a large fraction of sediment that is biogenic carbonate derived from surrounding rises (see Background and objectives; Nelson et al., 1981). However, organic-rich rocks may exist at depth and provide a source for thermogenic hydrocarbons (Uruski et al., 2004; Uruski, 2010). Downhole chemical profiles might give indications of deep gas and show influences of diagenesis due to dissolution of primary components and precipitation of secondary authigenic minerals. The latter is especially important for assessing potential modifications to sedimentary components employed for paleoceanographic reconstructions, including biogenic carbonate and magnetic minerals.
Headspace hydrocarbon gases
A total of 89 headspace (HS) gas samples were taken, typically one from every core in the top of the last section or core catcher. Some samples from Hole U1508C were measured multiple times to assess reproducibility.
Hydrocarbon gas concentrations were below the detection limit for the upper 450 m at Site U1508. Below this depth, methane (CH4) concentration generally increases downhole to a high of ~6000 parts per million by volume (ppmv) at 686 m (Table T12; Figure F36). Below 580 m, the increase in CH4 is accompanied by an increase in ethane (C2H6) concentration to a maximum of 36 ppmv at 701 m, the deepest sample examined. Scatter in the gas profiles is attributed to the sampling method (see Geochemistry in the Expedition 371 methods chapter [Sutherland et al., 2019a]), including the loss of gas during core recovery and handling and potentially large differences in the volume of sediment (and pore space) placed into vials for gas analysis.
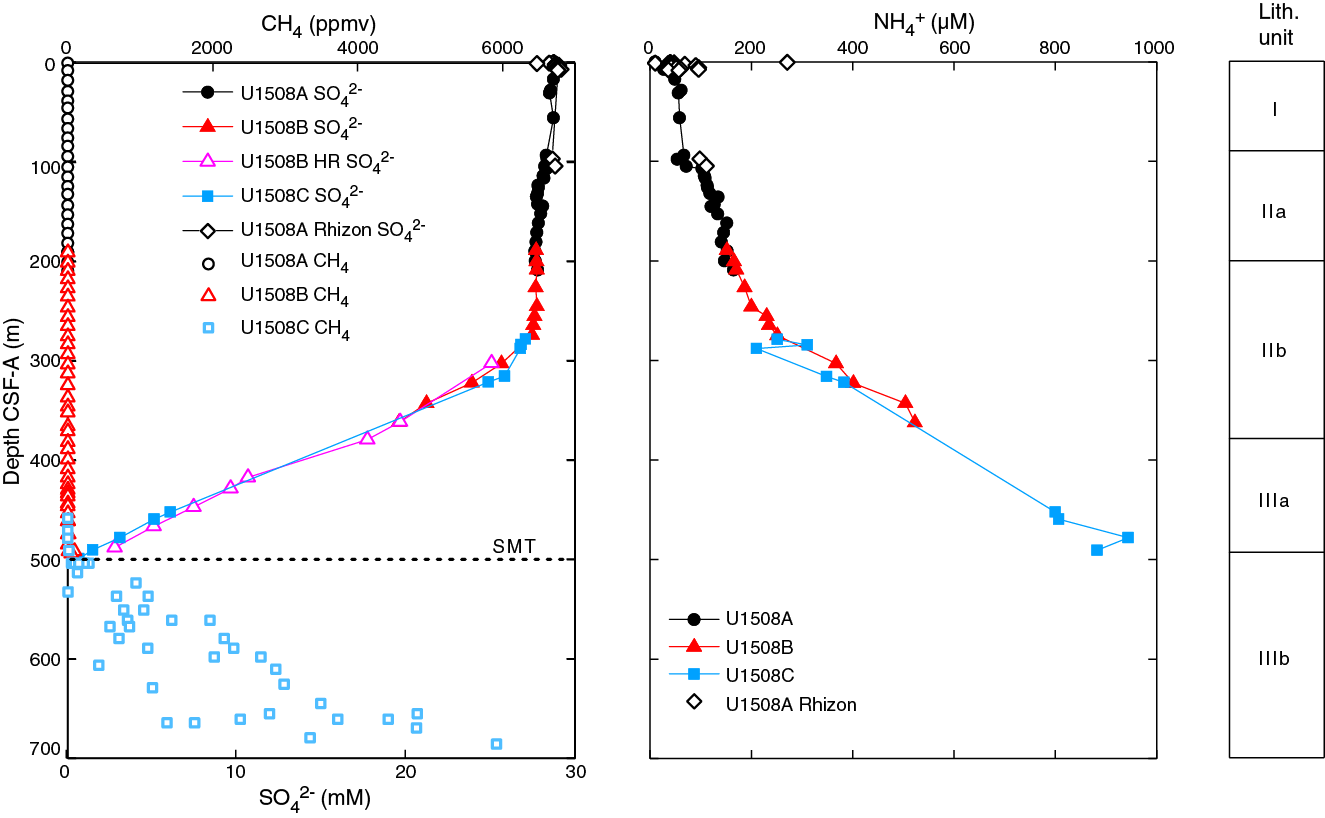
Figure F36. Methane, sulfate, and ammonium.
Interstitial water analyses
A total of 75 interstitial water (IW) samples were collected from Site U1508 by three different methods: whole-round squeezing (46), Rhizon sampling (21), and half-round squeezing (8) (see Geochemistry in the Expedition 371 methods chapter [Sutherland et al., 2019a]) (Table T13). Two adjacent samples from Cores 371-U1508B-14R and 20R were sampled by both whole-round and half-round sample squeezing. Additionally, one mudline sample was taken from the top of Core 371-U1508A-1R.
The deepest IW samples collected came from 209 m in Hole U1508A, 488 m in Hole U1508B, and 499 m in Hole U1508C. The bottom 200 m of the sequence provided no IW samples because the combination of low porosity and sediment induration precluded flow of pore water, even after crushing 20 cm long whole-round samples. Results from all three holes are displayed together but distinguished for discussion. The discussion of results is generally based on squeezed IW samples from whole-round samples (Figure F37), except when specifically mentioning half-round and Rhizon samples.
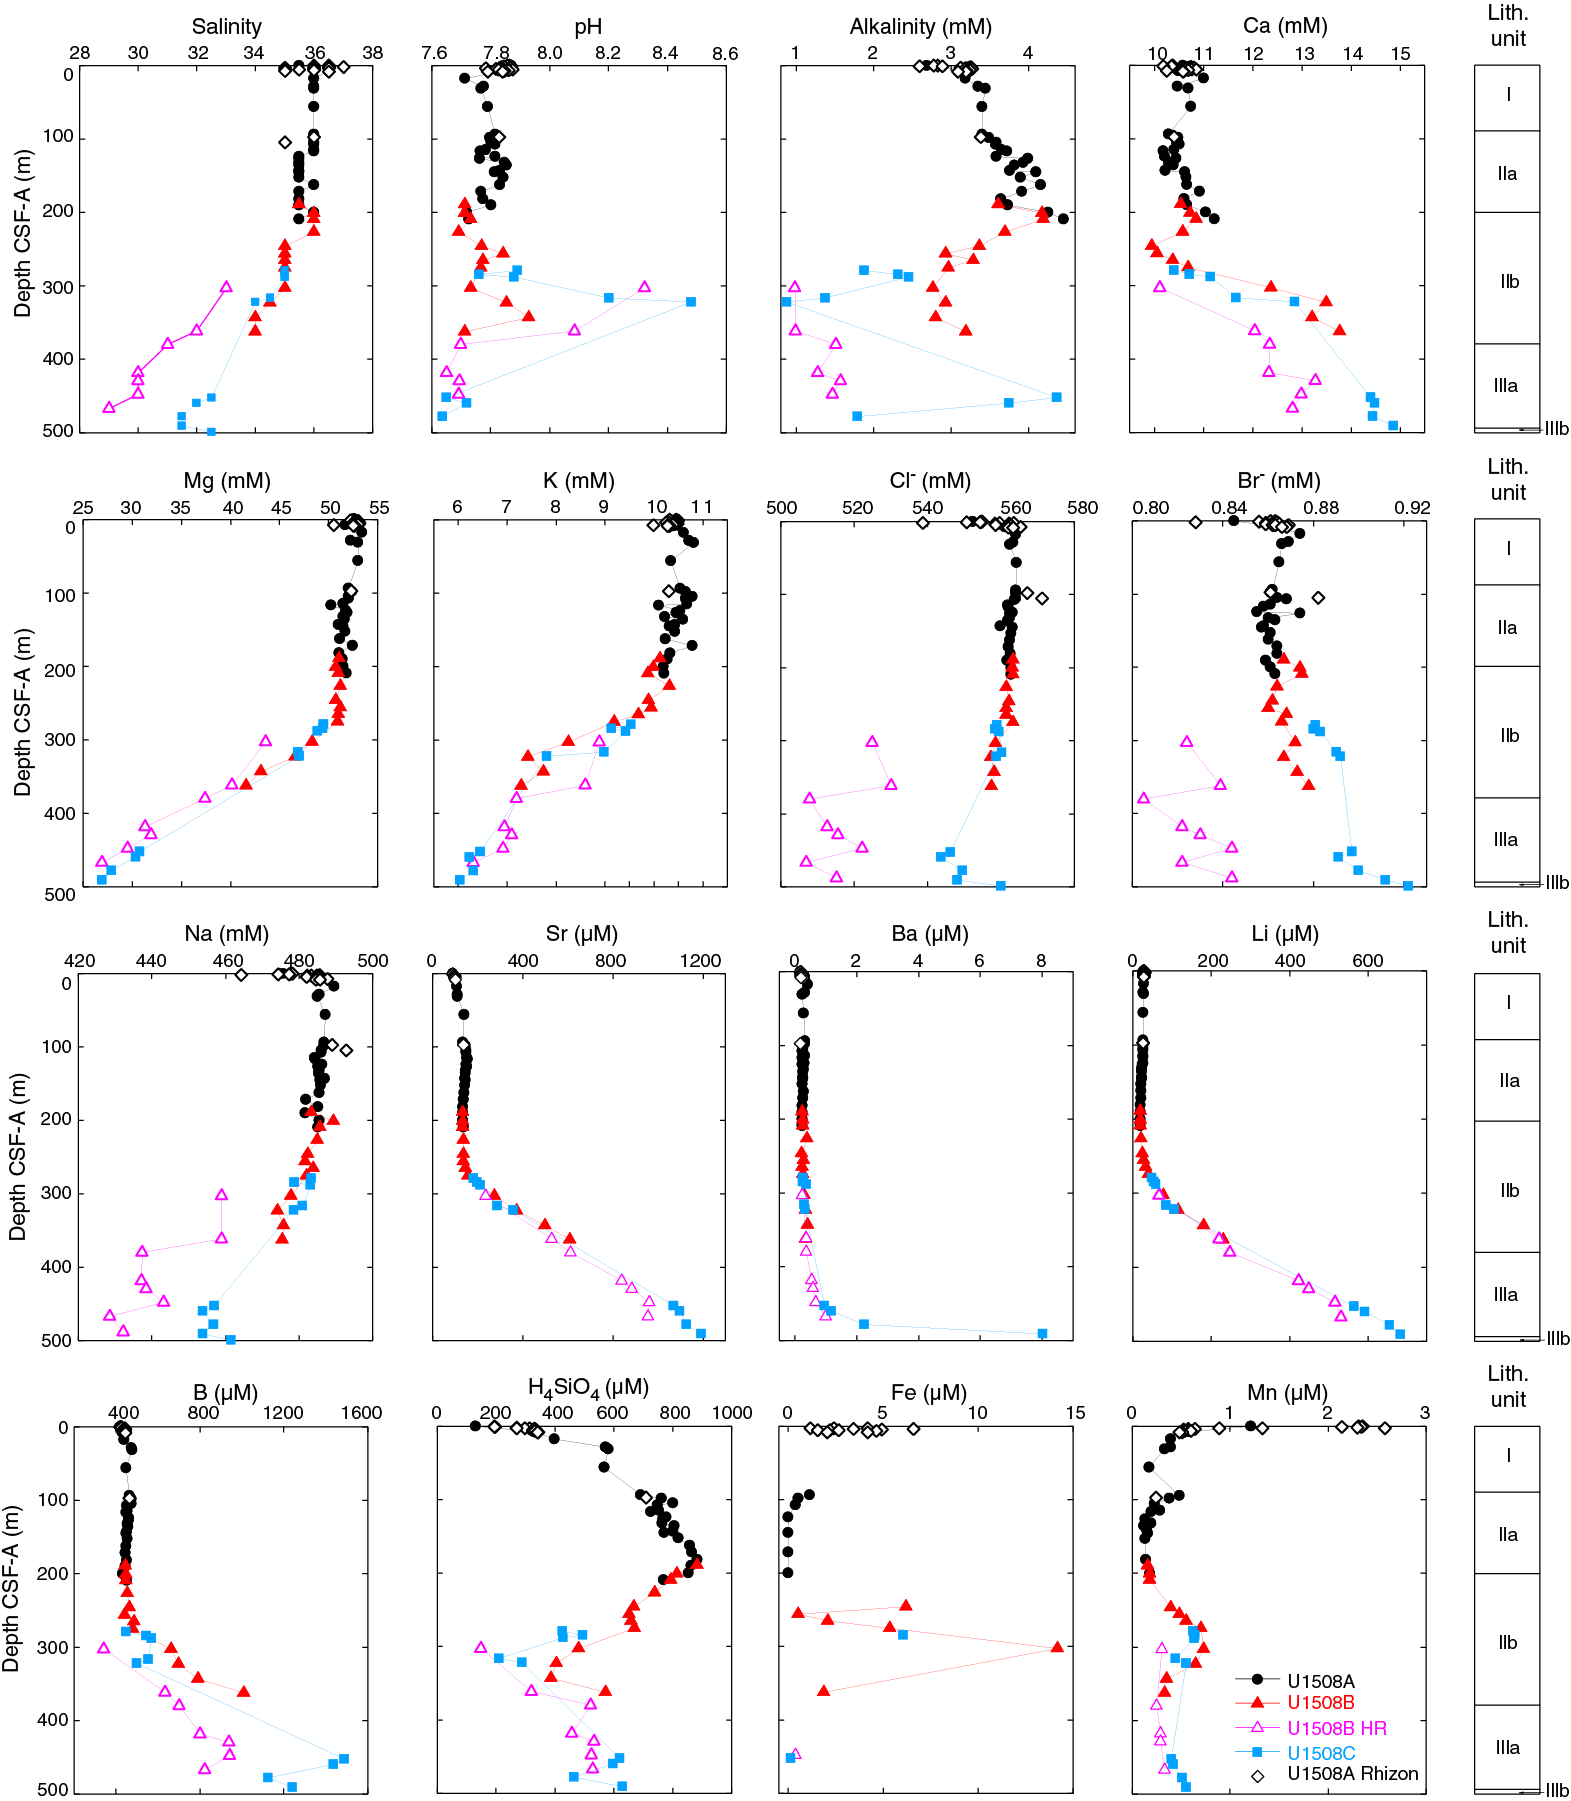
Figure F37. IW chemistry.
Salinity, pH, and alkalinity
The salinity, pH, and alkalinity profiles display different trends above and below ~200 m (Table T13; Figure F37). Salinity varies between 35.5 and 36.5 for the uppermost 227 m and decreases gradually to 32.5 at 500 m, although the lowest value (31.5) occurs at 478 and 491 m. pH varies slightly between 7.69 and 7.87 in the upper 275 m, increases to 8.48 at 322 m, and decreases to 7.64 at 478 m. The pH profile displays higher values in Hole U1508C than in Hole U1508B between 279 and 322 m. Alkalinity increases from 2.69 mM in the mudline sample to 4.45 mM at 209 m and then decreases to 2.96 mM at 275 m. Between 279 and 322 m and like pH, alkalinity differs in Holes U1508B and U1508C, with higher values in Hole U1508B than in Hole U1508C. Below 279 m, alkalinity reaches a minimum value of 0.88 mM at 322 m and a maximum value of 4.36 mM at 453 m.
Sulfate and ammonium
Sulfate concentration decreases slightly from 28.6 mM in the mudline sample to 27.1 mM at 279 m (Table T13; Figure F36). Below 279 m, SO42− decreases almost linearly to 0.7 mM at 499 m with a concentration gradient of 0.12 mM/m. Ammonium concentration increases from 10.2 µM in the mudline sample downhole, reaching a maximum value of 943.7 µM at 478 m. As with SO42−, a significant change in the concentration gradient occurs at 279 m.
Calcium, magnesium, and potassium
Dissolved Ca, Mg, and K concentrations vary slightly in the upper ~250 m and vary considerably below this depth (Table T13; Figure F37). Calcium concentration starts at 10.6 mM in the mudline sample, similar to that of seawater, and varies between 10.0 and 11.2 mM in the uppermost ~288 m. Calcium increases to a maximum value of 14.9 mM at 491 m. Mg and K concentrations vary between 50.3 and 53.4 mM and between 9.7 and 10.8 mM, respectively, in the uppermost 265 m. Again, these concentrations are similar to those of seawater. Below 265 m, however, Mg and K concentrations decrease to 26.9 and 6.0 mM, respectively, at 491 m.
Chloride, bromide, and sodium
The Cl−, Br−, and Na concentration profiles share somewhat similar trends (Table T13; Figure F37). Concentrations of all three increase from the mudline sample to the first IW sample. Below, all three remain constant to ~280 m. Below 280 m, Cl− and Na concentrations decrease by ~20 and ~34 mM, respectively, at ~450 m and increase slightly in the bottom ~50 m of the site. Br− concentrations in both Holes U1508B and U1508C increase downhole, although the values are ~25 mM higher in Hole U1508C than those from similar depths in Hole U1508B. In the whole sediment column, Br− concentration reaches a maximum value of 0.92 mM at 500 m.
Strontium, barium, and lithium
Sr, Ba, and Li concentrations barely change in the upper 275 m but increase sharply below that depth (Table T13; Figure F37). For reference, dissolved concentrations of these elements are 89, 0.77, and 26.2 µM, respectively, in the International Association for the Physical Sciences of the Oceans (IAPSO) standard seawater (see Table T14 in the Expedition 371 methods chapter [Sutherland et al., 2019a]). Sr concentration increases slightly from 89 µM in the mudline sample to 158 µM at 275 m and escalates to 1193 µM at 491 m. Ba concentration generally increases from 0.17 µM in the mudline sample to 0.27 µM at 275 m but increases almost exponentially to 8.01 µM at 491 m. Li concentration decreases slightly from 27.5 µM in the mudline sample to 18.7 µM at 189 m and increases quickly to 683.7 µM at 491 m. Such extreme values are more than 13, 10, and 26 times higher than the Sr, Ba, and Li concentrations, respectively, in standard seawater.
Boron and silica
B concentration increases from 418 µM in the mudline sample to 473 µM at 29 m and barely changes from 29 to 256 m (Table T13; Figure F37). Below 256 m, B concentration increases to a maximum of 1489 µM at 453 m and decreases slightly to 1241 µM at 491 m. Si concentration increases from 130 µM in the mudline sample to 884 µM at 181 m, decreases to a minimum value of 210 µM at 316 m, and increases slightly below to between ~400 and ~600 µM.
Iron and manganese
Dissolved Fe and Mn concentrations are generally <1 µM and do not show much variation, except between ~240 and ~370 m, where both Fe and Mn concentrations increase (Table T13; Figure F37). High Fe concentrations start to appear at 246 m, reaching an acme of 14.2 µM at 303 m. Below that depth, Fe concentration decreases to 0.1 µM at 453 m. Mn concentration decreases from 1.2 µM in the mudline sample to ~0.2 µM in the uppermost ~200 m, reaches a peak of 0.7 µM at ~300 m, and remains around 0.5 µM in most of the samples below 300 m.
Half-round samples
Because the half-round samples were taken 1–2 days after the cores were split, their chemistry likely changed in response to temperature and pressure more than standard sampling. The samples may also have been contaminated by seawater during drilling or by water during core splitting. For many samples, the half-round samples yield lower values than in adjacent whole-round samples (Table T13; Figure F37), in accordance with potential water contamination. Concentrations in the upper three half-round samples generally display larger offsets from expected profiles compared with those from the lower five samples. These offsets may reflect the lack of trimming before squeezing for the upper three samples (see Geochemistry in the Expedition 371 methods chapter [Sutherland et al., 2019a]).
Despite issues with the half-round samples, they generate chemical profiles comparable with whole-round samples for dissolved SO42−, Sr, Ba, and Li. In Hole U1508B, the half-round samples yield consistently lower salinity and alkalinity but higher pH than the whole-round samples. Salinity in the half-round samples is also lower than in the whole-round samples in Hole U1508C. Ca, Mg, Cl−, Br−, Na, and B concentrations are systematically lower in the half-round samples than in the whole-round samples.
Rhizon samples
Rhizon samples at Site U1508 yield reasonable data. For most samples, values are close to those of squeezed samples at nearby depths. Considering the unconsolidated sand layers where Rhizon samples were taken, however, pore water collected by both methods was vulnerable to contamination by infiltrating seawater. As a result, the records from Rhizon samples show wide scatter (Figure F37).
Bulk sediment geochemistry
Downhole carbonate contents display large, 100 m scale fluctuations between highs of ~95 wt% and lows of ~40 wt% (Table T14; Figure F38). These maxima and minima correspond fairly well to measured physical sediment properties, in particular L* and NGR (see Lithostratigraphy and Petrophysics), and to the suggested lithostratigraphic units. High CaCO3 contents >80 wt% characterize Unit I. Subunit IIa has CaCO3 contents generally between 70 and 80 wt%, whereas those of Subunit IIb decrease to ~30 wt%. Unit III has CaCO3 contents of 60–80 wt%.

Figure F38. Bulk sediment profiles.
Total organic carbon (TOC) contents are 0.76 ± 0.36 wt% for the upper 520 m without any consistent downhole trend. Below this depth, TOC measurements were consistently at or below the detection limit (see Geochemistry in the Expedition 371 methods chapter [Sutherland et al., 2019a]). Total nitrogen (TN) is low throughout, averaging 0.014 ± 0.03 wt%.
Discussion
Hydrocarbon gases
Average TOC content at Site U1508 (0.76 wt%) is only slightly higher than that at Sites U1506 (0.35 wt%) and U1507 (0.31 wt%). Therefore, high methane and ethane concentrations probably cannot be explained by in situ microbial gas genesis. Instead, it suggests migration of gases from elsewhere.
Pore water chemistry
Sediment of Unit I is poorly consolidated sand, which makes the collection of sediment and uncontaminated pore water difficult. The dissolved Mn concentration profile does not show a typical peak in the uppermost meter or so, which suggests the true mudline is missing. Adjacent samples from the upper ~100 m of the section show large variance because of sand. Despite this and other issues, prominent features are recorded in IW samples of Unit I and deeper sediment.
Breaks in pore water chemistry profiles
All of the pore water chemistry profiles change at some break point, although at different depths for each element. Dissolved SO42−, Mg, K, Cl−, and Na start to decrease and NH4+, Ca, Br−, Sr, Ba, Li, and B increase from ~280 m downhole. These abrupt changes do not correlate with any lithostratigraphic boundary but occur in the middle of Subunit IIb (see Lithostratigraphy). One possibility is deep penetration of seawater to ~280 m through very permeable sediment. This idea can be ruled out, however, by considering the significant differences between pore water and seawater for some profiles (e.g., alkalinity, Sr, and Li) in the uppermost sediment. No impermeable layer was recovered at ~280 m, but the recovery rates of cores near this depth were low. Therefore, an impermeable layer may not have been recovered by drilling. Wireline logging data reveal that P-wave velocity values change with large amplitudes at ~280 m, suggesting layers with anomalous physical properties.
Sulfate reduction coupled to methane oxidation
The coupled changes in sulfate and ammonium in the upper ~280 m suggest limited sulfate reduction of organic matter. Below this depth, the linear decrease in dissolved SO42− reaches near zero concentrations at about 500 m. This is about the same depth where CH4 concentration initially increases, which suggests a SMT at ~460 m, where anaerobic oxidation of methane presently occurs. This microbially mediated reaction is described as follows (e.g., Jørgensen and Kasten, 2006):
CH4 + SO42− → HCO3− + HS− + H2O.
Importantly, consumption of CH4 and SO42− releases HS− and HCO3−, which can diffuse away from the SMT and facilitate precipitation of authigenic sulfide and carbonate minerals (e.g., Jørgensen and Kasten, 2006). Indeed, nodules and infills of sedimentary pyrite (FeS2) and other iron sulfide minerals, as well as pyritized siliceous microfossils, are recorded at 484–496 m in Hole U1508B and at 321–657 m in Hole U1508C (see Lithostratigraphy and Biostratigraphy and paleoenvironment). It is expected that pyrite formation was associated with dissolution of magnetic minerals under Fe-reducing conditions, which would have contributed to a deteriorated magnetic signal (see Paleomagnetism). It would also explain the interval of high dissolved Fe concentrations between 246 and 303 m and the low Fe values below, where iron sulfide minerals were found.
The downhole decreasing SO42− concentrations between 300 and 500 m are accompanied by increasing Sr, Ba, and Li concentrations. In deep-sea sediment with dissolved SO42−, barite (BaSO4) is a ubiquitous component that exists as small crystals originally formed in association with organic matter (Dehairs et al., 1980). However, when pore water becomes SO42− depleted, barite dissolves and subsequently generates an upward diffusion profile of Ba2+ (von Breymann et al., 1992). The extremely high Sr and Li concentrations may come from the dissolution of biogenic carbonate.
Other elements
At the same depth where SO42− concentration starts to decrease rapidly downhole (~280 m), Ca concentration starts to increase but Mg and K decrease. The changes in Ca, Mg, and K probably involve reactions of the pore water with components of surrounding sediment, particularly dispersed volcanic and terrestrial minerals.
Dissolved H4SiO4 concentration peaks near 200 m, where the Subunit IIa/IIb boundary is located (see Lithostratigraphy). The high H4SiO4 concentrations may result from the dissolution of volcanic minerals, terrestrial silicate minerals, or biogenic silica, the latter of which is abundant in the uppermost 200 m, and the preservation of biogenic silica switches from good to moderate and poor at ~200 m (see Biostratigraphy and paleoenvironment; Figure F16). “Bullseye” diagenetic fronts and diagenetic halos were found in Hole U1508C cores from 487 to 585 m, reflecting dissolution of silicate minerals, which explains the high silica concentrations below 450 m.
Stratigraphic correlation
Magnetic susceptibility and NGR data were loaded into the Correlator software (version 2.1) in an attempt to correlate overlapping intervals between Holes U1508A, U1508B, and U1508C. For the first two holes, a single tie was established based on prominent features in the NGR record between Samples 371-U1508A-23H-6, 80 cm, and 371-U1508B-4R-3, 50 cm (Figure F39). For Holes U1508B and U1508C, three tie points were tentatively established using NGR data: between 371-U1508B-35R-1, 110 cm, and 371-U1508C-11R-4, 90 cm; between 371-U1508B-37R-5, 10 cm, and 371-U1508C-13R-1, 90 cm; and between 371-U1508B-38R-1, 110 cm, and 371-U1508C-13R-4, 120 cm (Figure F40). The tie points are further supported by correlation in light reflectance data (L*, a*, and b*) and core images. Calcareous nannofossil datums also support the correlation with two assumptions: (1) the identified base of I. recurvus in Hole U1508C is actually the base common of I. recurvus (see Agnini et al., 2014), and (2) the top of C. grandis and the base of C. oamaruensis lie in a core gap in Hole U1508C. In any case, because the overlapping interval is relatively short, no core composite depth scale was established.
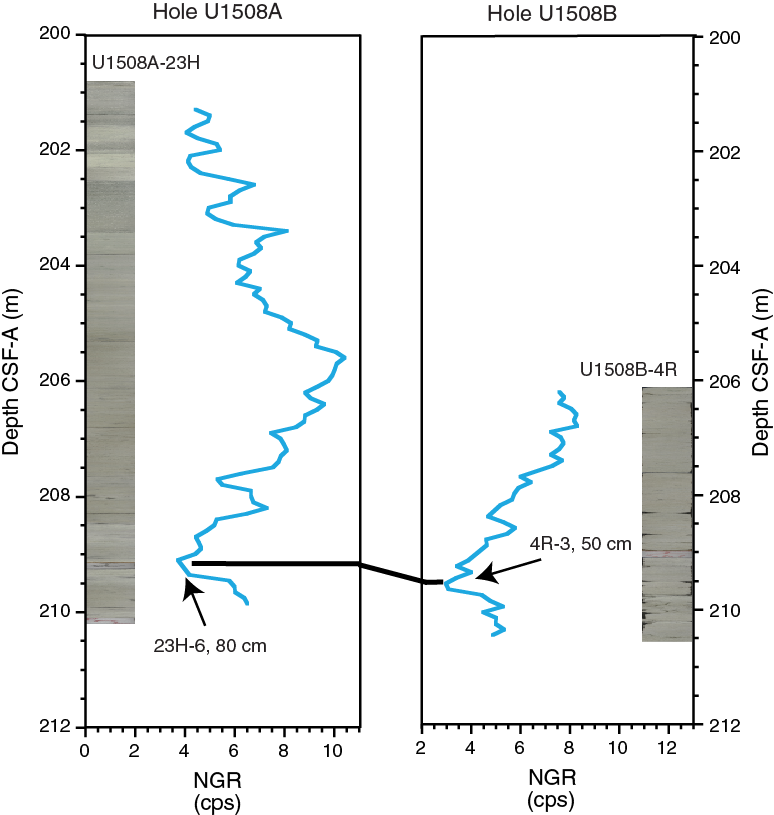
Figure F39. Depth correlation, Holes U1508A and U1508B.
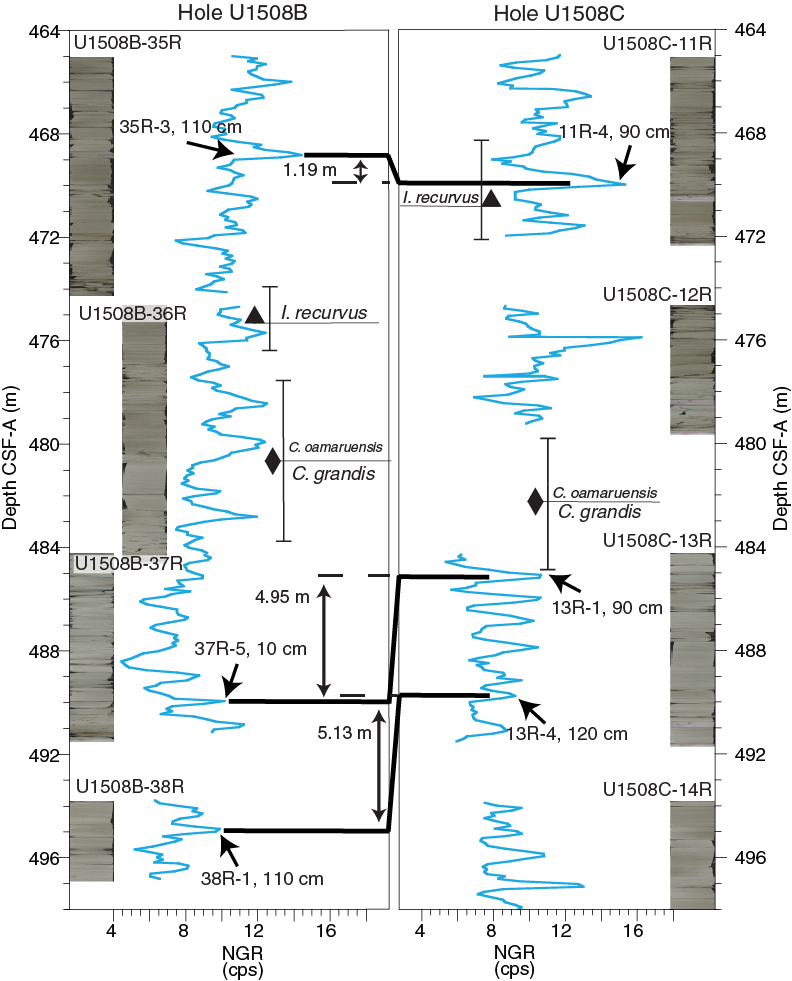
Figure F40. Depth correlation, Holes U1508B and U1508C.
Ties between Holes U1508B and U1508C can be used to generate a short continuous record (~22 m) of the late Eocene spanning the nannofossil Zone NP17/NP18 boundary (base of C. oamaruensis). Correlation between holes is possible due to the high degree of lithification in Unit III, which left the cores largely intact and undisturbed despite rotary coring.
Hole U1508A–U1508C cores were correlated with downhole logging data by matching NGR records. This method permitted the translation of core depth scales from core depth below seafloor (CSF-A) to the Hole U1508C logging depth (WMSF) (Table T15). The Unit II/III boundary was tied to 381.4 m WMSF (Figure F41). The ~22 m continuous interval spans from 471 to 493 m WMSF (Figure F42), but strong coring disturbance prevents reliable correlation of Core 371-U1508C-12R. Other unit boundaries were not mapped because they either fell in a core gap or were in cores where no correlation was possible.
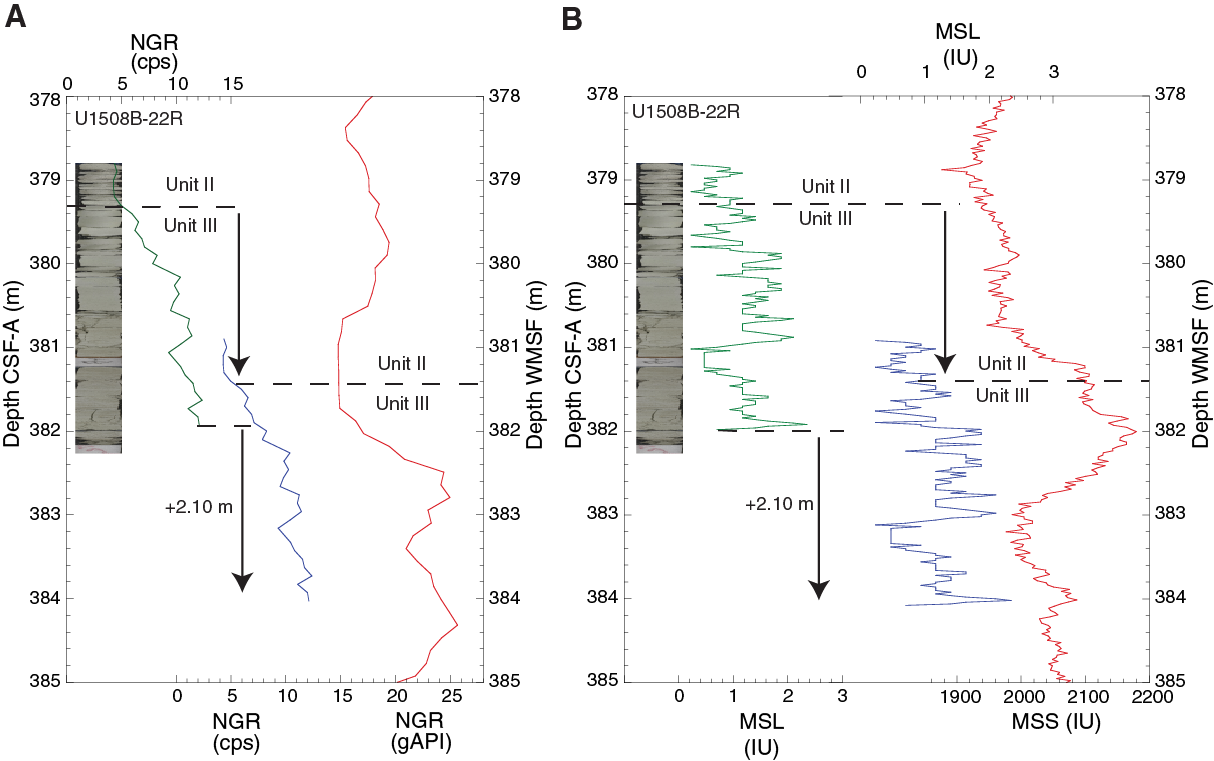
Figure F41. Depth correlation, Hole U1508B core data and wireline data.

Figure F42. Depth correlation across overlapping interval.
Alignment of magnetic susceptibility measured on cores and by logging supports the NGR-based ties made between core depth and logging depth (Figure F41B). Offsets required to map core data to logging data at Site U1508 range between −4.8 and 5.3 m for all cores. Compared with results from Site U1507, these offsets are larger, likely resulting from stronger coring disturbance and lower recovery at Site U1508.
Age model and sedimentation rates
At Site U1508, a 704 m thick sequence of Pleistocene to upper Eocene nannofossil ooze, chalk, and limestone was recovered. Calcareous nannofossils are present throughout lithostratigraphic Units I–III, and only a few polarity chron boundaries were identified. Linear sedimentation rates (LSRs) and mass accumulation rates (MARs) were calculated using a mix of these datums for Site U1508 on the CSF-A depth scale from 0 to 48 Ma (Table T3; Figure F43) (see Biostratigraphy and paleoenvironment and Paleomagnetism).
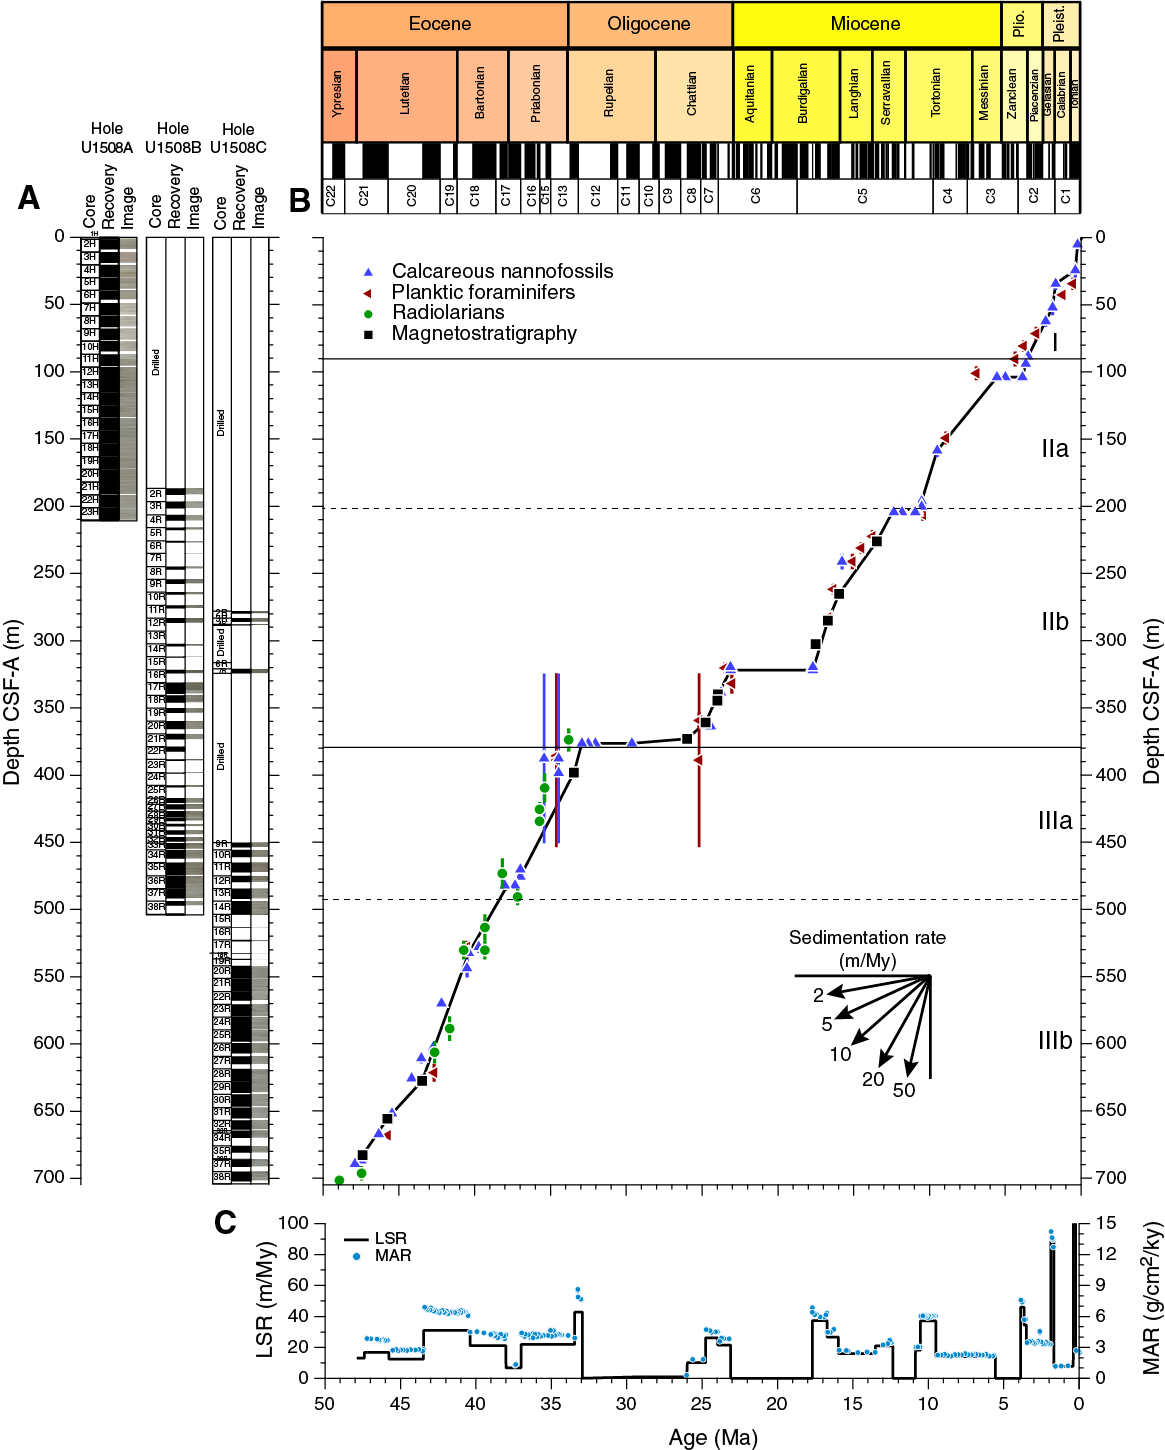
Figure F43. Sedimentation accumulation over time.
Sedimentation rates at Site U1508 are generally uniform despite two minor and two major hiatuses. Late to early Eocene LSRs are relatively steady around 20 m/My. LSRs in the late Oligocene decrease from 20 to 10 m/My. The early Oligocene is highly condensed from 33 to 25 Ma. The condensed interval at around 380 m also marks the lithostratigraphic Unit II/III boundary and is interpreted to be concurrent with seismic Reflector D (see Petrophysics). Another extensive condensed interval spans the early Miocene (23–18 Ma; ~320 m). The middle to late Miocene LSRs are on average ~20 m/My, interrupted by a hiatus from 11 to 12.5 Ma (~200 m). After another 1.5 My condensed section in the latest Miocene to earliest Pliocene, LSRs in the Pliocene–Pleistocene vary between ~10 and 80 m/My.
MARs over time closely mimic observed changes in LSRs and average ~3 g/cm2/ky, with a dominant range of 0–6 g/cm2/ky.
References
Agnini, C., Fornaciari, E., Raffi, I., Catanzariti., R., Pälike, H., Backman, J., and Rio, D., 2014. Biozonation and biochronology of Paleogene calcareous nannofossils from low and middle latitudes. Newsletters on Stratigraphy, 47(2):131–181. https://doi.org/10.1127/0078-0421/2014/0042
Alegret, L., Ortiz, S., Arreguín-Rodríguez, G.J., Monechi, S., Millán, I., and Molina, E., 2016. Microfossil turnover across the uppermost Danian at Caravaca, Spain: paleoenvironmental inferences and identification of the latest Danian event. Palaeogeography, Palaeoclimatology, Palaeoecology, 463:45–49. https://doi.org/10.1016/j.palaeo.2016.09.013
Alvarez Zarikian, C.A., 2015. Cenozoic bathyal and abyssal ostracods beneath the South Pacific Gyre (IODP Expedition 329 Sites U1367, U1368 and U1370). Palaeogeography, Palaeoclimatology, Palaeoecology, 419:115–142. https://doi.org/10.1016/j.palaeo.2014.07.024
Arreguín-Rodríguez, G.J., Alegret, L., and Thomas, E., 2016. Late Paleocene–middle Eocene benthic foraminifera on a Pacific seamount (Allison Guyot, ODP Site 865): greenhouse climate and superimposed hyperthermal events. Paleoceanography and Paleoclimatology, 31:346–364. https://doi.org/10.1002/2015PA002837
Bache, F., Stagpoole, V., and Sutherland, R., 2012a. Seismic stratigraphy of the Reinga Basin, NW New Zealand: tectonic and petroleum implications. In Rosen, N.C., Weimer, P., Coutes dos Anjos, S.M., Henrickson, S., Marques, E., Mayall, M., Fillon, R., et al. (Eds.), New Understanding of the Petroleum Systems of Continental Margins of the World [paper presented at 32nd Annual GCSSEPM Foundation Bob F. Perkins Research Conference, Houston, Texas, 2–5 December 2012], 32:221–252. https://doi.org/10.5724/gcs.12.32.0221
Bache, F., Sutherland, R., Stagpoole, V., Herzer, R., Collot, J., and Rouillard, P., 2012b. Stratigraphy of the southern Norfolk Ridge and the Reinga Basin: a record of initiation of Tonga–Kermadec–Northland subduction in the southwest Pacific. Earth and Planetary Science Letters, 321–322:41–53. https://doi.org/10.1016/j.epsl.2011.12.041
Backman, J., Raffi, I., Rio, D., Fornaciari, E., and Pälike, H., 2012. Biozonation and biochronology of Miocene through Pleistocene calcareous nannofossils from low and middle latitudes. Newsletters on Stratigraphy, 45(3):221–244. https://doi.org/10.1127/0078-0421/2012/0022
Brinkhuis, H., and Biffi, U., 1993. Dinoflagellate cyst stratigraphy of the Eocene/Oligocene transition in central Italy. Marine Micropaleontology, 22(1–2):131–183. https://doi.org/10.1016/0377-8398(93)90007-K
Browne, G.H., Lawrence, M.J.F., Mortimer, N., Clowes, C.D., Morgans, H.E.G., Hollis, C.J., Beu, A.G., Black, J.A., Sutherland, R., and Bache, F., 2016. Stratigraphy of Reinga and Aotea basins, NW New Zealand: constraints from dredge samples on regional correlations and reservoir character. New Zealand Journal of Geology and Geophysics, 59(3):396–415. https://doi.org/10.1080/00288306.2016.1160940
Campbell, H., Malahoff, A., Browne, G., Graham, I., and Sutherland, R., 2012. New Zealand geology. Episodes, 35(1):57–71.
Crundwell, M.P., Morgans, H.E.G., and Hollis, C.J., 2016. Micropaleontological report on dredge samples collected during the 2015 VESPA (Volcanic Evolution of South Pacific Arcs) expedition. GNS Science Internal Report.
Dehairs, F., Chesselet, R., and Jedwab, J., 1980. Discrete suspended particles of barite and the barium cycle in the open ocean. Earth and Planetary Science Letters, 49(2):528–550. https://doi.org/10.1016/0012-821X(80)90094-1
Dwyer, G.S., Cronin, T.M., Baker, P.A., Raymo, M.E., Buzas, J.S., and Corrège, T., 1995. North Atlantic deepwater temperature change during late Pliocene and late Quaternary climatic cycles. Science, 270(5240):1347–1351. https://doi.org/10.1126/science.270.5240.1347
Herzer, R.H., Chaproniere, G.C.H., Edwards, A.R., Hollis, C.J., Pelletier, B., Raine, J.I., Scott, G.H., Stagpoole, V., Strong, C.P., Symonds, P., Wilson, G.J., and Zhu, H., 1997. Seismic stratigraphy and structural history of the Reinga Basin and its margins, southern Norfolk Ridge system. New Zealand Journal of Geology and Geophysics, 40: 425–451. https://doi.org/10.1080/00288306.1997.9514774
Holbourn, A., Henderson, A.S., and MacLeod, N., 2013. Atlas of Benthic Foraminifera: Chichester, United Kingdom (John Wiley & Sons, Ltd.). https://doi.org/10.1002/9781118452493
Hollis, C.J., Dickens, G.R., Field, B.D., Jones, C.M., and Strong, C.P., 2005. The Paleocene–Eocene transition at Mead Stream, New Zealand: a southern Pacific record of early Cenozoic global change. Palaeogeography, Palaeoclimatology, Palaeoecology, 215(3–4):313–343. https://doi.org/10.1016/j.palaeo.2004.09.011
Hornibrook, N.d.B., Brazier, R.C., and Strong, C.P., 1989. Manual of New Zealand Permian to Pleistocene foraminiferal biostratigraphy. New Zealand Geological Survey Paleontological Bulletin, 56.
Isaac, M.J., 1996. Geology of the Kaitaia area 1:250,000 geological map. Institute of Geological & Nuclear Sciences.
Isaac, M.J., Herzer, R.H., Brook, F.J., and Hayward, B.W., 1994. Cretaceous and Cenozoic sedimentary basins of Northland, New Zealand. Institute of Geological & Nuclear Sciences Monograph, 8.
Jørgensen, B.B., and Kasten, S., 2006. Sulfur cycling and methane oxidation. In Schulz, H.D., and Zabel, M. (Eds.), Marine Geochemistry: Berlin (Springer), 271–309. https://doi.org/10.1007/3-540-32144-6_8
Kirschvink, J.L., 1980. The least-squares line and plane and the analysis of palaeomagnetic data. Geophysical Journal of the Royal Astronomical Society, 62(3):699–718. https://doi.org/10.1111/j.1365-246X.1980.tb02601.x
Mazzini, I., 2005. Taxonomy, biogeography and ecology of quaternary benthic Ostracoda (Crustacea) from circumpolar deep water of the Emerald Basin (Southern Ocean) and the S Tasman Rise (Tasman Sea). Senckenbergiana Maritima, 35(1):1–119. https://doi.org/10.1007/BF03043180
Mortimer, N., 2004. New Zealand’s geological foundations. Gondwana Research, 7(1):261–272. https://doi.org/10.1016/S1342-937X(05)70324-5
Nelson, C.S., 1978. Temperate shelf carbonate sediments in the Cenozoic of New Zealand. Sedimentology, 25(6):737–771. https://doi.org/10.1111/j.1365-3091.1978.tb00328.x
Nelson, C.S., and Hancock, G.E., 1984. Composition and origin of temperate skeletal carbonate sediments on South Maria Ridge, northern New Zealand. New Zealand Journal of Marine and Freshwater Research, 18(2):221–239. https://doi.org/10.1080/00288330.1984.9516044
Nelson, C.S., Hancock, G.E., and Kamp, P.J.J., 1981. Shelf to basin, temperate skeletal carbonate sediments, Three Kings Plateau, New Zealand. Journal of Sedimentary Petrology, 52:717–732. https://doi.org/10.1306/v212F803A-2B24-11D7-8648000102C1865D
Pollack, H.N., Hurter, S.J., and Johnson, J.R., 1993. Heat flow from the Earth’s interior: analysis of the global data set. Reviews Of Geophysics, 31(3):267–280. http://dx.doi.org/10.1029/93RG01249
Raine, J.I., Beu, A.G., Boyes, A., Campbell, H.J., Cooper, R.A., Crampton, J.S., Crundwell, M.P., Hollis, C.J., and Morgans, H.E., 2015. A revised calibration of the New Zealand Geological Timescale: NZGT2015 [paper presented at International Conference and Exhibition, Melbourne, Australia, 13–16 September 2015]. https://doi.org/10.1190/ice2015-2211449
Rait, G., Chanier, F., and Waters, D.W., 1991. Landward- and seaward-directed thrusting accompanying the onset of subduction beneath New Zealand. Geology, 19(3):230–233. https://doi.org/10.1130/0091-7613(1991)019<0230:LASDTA>2.3.CO;2
Sluijs, A., and Brinkhuis, H., 2009. A dynamic climate and ecosystem state during the Paleocene–Eocene Thermal Maximum: inferences from dinoflagellate cyst assemblages on the New Jersey shelf. Biogeosciences, 6(8):1755–1781. https://doi.org/10.5194/bg-6-1755-2009
Spörli, K.B., 1978. Mesozoic tectonics, North Island, New Zealand. Geological Society of America Bulletin, 89(3):415–425. https://doi.org/10.1130/0016-7606(1978)89<415:MTNINZ>2.0.CO;2
Stagpoole, V.M., 2011. Two-way time-depth relationship for the Waka Nui-1 well to aid geological interpretations of the offshore northwestern New Zealand. New Zealand Journal of Geology and Geophysics, 54(3)341–346. https://doi.org/10.1080/00288306.2011.567993
Sutherland, R., 1999. Basement geology and tectonic development of the greater New Zealand region: an interpretation from regional magnetic data. Tectonophysics, 308(3):341–362. https://doi.org/10.1016/S0040-1951(99)00108-0
Sutherland, R., Collot, J., Bache, F., Henrys, S., Barker, D., Browne, G., Lawrence, M., Morgans, H., Hollis, C., and Clowes, C., 2017. Widespread compression associated with Eocene Tonga-Kermadec subduction initiation. Geology, 45(4)3255–358. https://doi.org/10.1130/G38617.1
Sutherland, R., Dickens, G.R., Blum, P., Agnini, C., Alegret, L., Asatryan, G., Bhattacharya, J., Bordenave, A., Chang, L., Collot, J., Cramwinckel, M.J., Dallanave, E., Drake, M.K., Etienne, S.J.G., Giorgioni, M., Gurnis, M., Harper, D.T., Huang, H.-H.M., Keller, A.L., Lam, A.R., Li, H., Matsui, H., Morgans, H.E.G., Newsam, C., Park, Y.-H., Pascher, K.M., Pekar, S.F., Penman, D.E., Saito, S., Stratford, W.R., Westerhold, T., and Zhou, X., 2019a. Expedition 371 methods. In Sutherland, R., Dickens, G.R., Blum, P., and the Expedition 371 Scientists, Tasman Frontier Subduction Initiation and Paleogene Climate. Proceedings of the International Ocean Discovery Program, 371: College Station, TX (International Ocean Discovery Program). https://doi.org/10.14379/iodp.proc.371.102.2019
Sutherland, R., Dickens, G.R., Blum, P., Agnini, C., Alegret, L., Asatryan, G., Bhattacharya, J., Bordenave, A., Chang, L., Collot, J., Cramwinckel, M.J., Dallanave, E., Drake, M.K., Etienne, S.J.G., Giorgioni, M., Gurnis, M., Harper, D.T., Huang, H.-H.M., Keller, A.L., Lam, A.R., Li, H., Matsui, H., Morgans, H.E.G., Newsam, C., Park, Y.-H., Pascher, K.M., Pekar, S.F., Penman, D.E., Saito, S., Stratford, W.R., Westerhold, T., and Zhou, X., 2019b. Site U1507. In Sutherland, R., Dickens, G.R., Blum, P., and the Expedition 371 Scientists, Tasman Frontier Subduction Initiation and Paleogene Climate. Proceedings of the International Ocean Discovery Program, 371: College Station, TX (International Ocean Discovery Program). https://doi.org/10.14379/iodp.proc.371.104.2019
Tjalsma, R.C., and Lohmann, G.P., 1983. Paleocene–Eocene bathyal and abyssal benthic foraminifera from the Atlantic Ocean. Micropaleontology, Special Publication, 4.
Uruski, C.I., 2010. New Zealand’s deepwater frontier. Marine and Petroleum Geology, 27(9):2005–2026. https://doi.org/10.1016/j.marpetgeo.2010.05.010
Uruski, C.I., Cook, R.H., Herzer, R.H., and Isaac, M.J., 2004. Petroleum geology of the Northland sector of the Greater Taranaki Basin. PESA News, 69:42–49. http://archives.datapages.com/data/petroleum-exploration-society-of-australia/news/069/069001/pdfs/42.html
van Morkhoven, F.P.C.M., Berggren, W.A., Edwards, A.S., and Oertli, H.J., 1986. Cenozoic cosmopolitan deep-water benthic foraminifera. Bulletin des centres de recherches Exploration-production Elf-Aquitaine: Mémoire, 11.
von Breymann, M.T., Emeis, K.-C., and Suess, E., 1992. Water depth and diagenetic constraints on the use of barium as a palaeoproductivity indicator. In Summerhayes, C.P., Prell, W.L., and Emeis, K.-C. (Eds.), Upwelling Systems: Evolution Since the Early Miocene. Geological Society Special Publication, 64:273–284. https://doi.org/10.1144/GSL.SP.1992.064.01.18
Wade, B.S., Pearson, P.N., Berggren, W.A., and Pälike, H., 2011. Review and revision of Cenozoic tropical planktonic foraminiferal biostratigraphy and calibration to the geomagnetic polarity and astronomical time scale. Earth-Science Reviews, 104(1–3):111–142. https://doi.org/10.1016/j.earscirev.2010.09.003
Zijderveld, J.D.A., 1967. AC demagnetization of rocks: analysis of results. In Collinson, D.W., Creer, K.M., and Runcorn, S.K. (Eds.), Methods in Palaeomagnetism: Amsterdam (Elsevier), 254–286.
1 Sutherland, R., Dickens, G.R., Blum, P., Agnini, C., Alegret, L., Asatryan, G., Bhattacharya, J., Bordenave, A., Chang, L., Collot, J., Cramwinckel, M.J., Dallanave, E., Drake, M.K., Etienne, S.J.G., Giorgioni, M., Gurnis, M., Harper, D.T., Huang, H.-H.M., Keller, A.L., Lam, A.R., Li, H., Matsui, H., Morgans, H.E.G., Newsam, C., Park, Y.-H., Pascher, K.M., Pekar, S.F., Penman, D.E., Saito, S., Stratford, W.R., Westerhold, T., Zhou, X., 2019. Site U1508. In Sutherland, R., Dickens, G.R., Blum, P., and the Expedition 371 Scientists, Tasman Frontier Subduction Initiation and Paleogene Climate. Proceedings of the International Ocean Discovery Program, 371: College Station, TX (International Ocean Discovery Program). https://doi.org/10.14379/iodp.proc.371.105.2019
2 Expedition 371 Scientists’ affiliations.
This work is distributed under the Creative Commons Attribution 4.0 International (CC BY 4.0) license. 
- F1. Regional bathymetry, seismic reflection lines, and boreholes.
- F2. Regional seismic reflection Line REI09-012.
- F3. Seismic reflection Line REI09-012 and location of Site U1508.
- F4. Lithostratigraphic summary of sedimentary section.
- F5. Major biogenic and lithologic constituent abundances.
- F6. Representative Unit I lithologies.
- F7. Representative Subunit IIa lithologies.
- F8. Representative Subunit IIb lithologies.
- F9. Erosional bioturbated surfaces.
- F10. Representative Subunit IIIa and IIIb lithologies.
- F11. Depth distribution of cherty limestone horizons.
- F12. XRD results, Subunit IIb.
- F13. Handheld XRF results from siliceous intervals.
- F14. Siliceous interval.
- F15. Biozonations.
- F16. Microfossil preservation and abundance.
- F17. Preservation state of planktic foraminifers.
- F18. Ostracod preservation, abundance, and assemblage composition.
- F19. Selected dinocyst taxa.
- F20. Selected dinocyst taxa.
- F21. Selected dinocyst and sporomorph taxa.
- F22. Selected palynomorphs and palynofacies.
- F23. Invertebrate and vertebrate fossils.
- F24. Pass-through paleomagnetic data, Hole U1508A.
- F25. Pass-through paleomagnetic data, Hole U1508B.
- F26. Pass-through paleomagnetic data, Hole U1508C.
- F27. Inclination values.
- F28. Vector endpoint demagnetization diagrams.
- F29. AMS data for discrete samples.
- F30. Bulk density, grain density, porosity, and P-wave velocity.
- F31. Wireline logging data, Hole U1508C.
- F32. Magnetic susceptibility, NGR, and L*, a*, b*.
- F33. Heat flow.
- F34. Shear and compressive strength.
- F35. Borehole data tied to MCS data.
- F36. Methane, sulfate, and ammonium.
- F37. IW chemistry.
- F38. Bulk sediment profiles.
- F39. Depth correlation, Holes U1508A and U1508B.
- F40. Depth correlation, Holes U1508B and U1508C.
- F41. Depth correlation, Hole U1508B core data and wireline data.
- F42. Depth correlation across overlapping interval.
- F43. Sedimentation accumulation over time.
- T1. Core summary.
- T2. Lithostratigraphic units.
- T3. Microfossil datums and chrons used to construct age model.
- T4. Nannofossil distribution and occurrence data.
- T5. Planktic foraminifer distribution and abundance data.
- T6. Benthic foraminifer distribution and abundance data.
- T7. Radiolarian distribution data.
- T8. Palynological assemblage data.
- T9. Dinocyst and sporomorph distribution and occurrence data.
- T10. Magnetostratigraphic tie points.
- T11. Seismic reflectors, two-way traveltimes, and depths.
- T12. Gas elements data.
- T13. Interstitial water chemistry.
- T14. Bulk sediment geochemistry.
- T15. Core offsets.