Sutherland, R., Dickens, G.R., Blum, P., and the Expedition 371 Scientists
Proceedings of the International Ocean Discovery Program Volume 371
publications.iodp.org
https://doi.org/10.14379/iodp.proc.371.104.2019

Site U15071
R. Sutherland, G.R. Dickens, P. Blum, C. Agnini, L. Alegret, G. Asatryan, J. Bhattacharya, A. Bordenave, L. Chang, J. Collot, M.J. Cramwinckel, E. Dallanave, M.K. Drake, S.J.G. Etienne, M. Giorgioni, M. Gurnis, D.T. Harper, H.-H.M. Huang, A.L. Keller, A.R. Lam, H. Li, H. Matsui, H.E.G. Morgans, C. Newsam, Y.-H. Park, K.M. Pascher, S.F. Pekar, D.E. Penman, S. Saito, W.R. Stratford, T. Westerhold, and X. Zhou2
Keywords: International Ocean Discovery Program, IODP, JOIDES Resolution, Expedition 371, Site U1507, Tasman Frontier, Zealandia, Reinga, Challenger, Eastern Australian Current, Lord Howe, Murihiku, New Caledonia, Norfolk, Northland, Pacific, Ring of Fire, Tasman, Taranaki, Tonga, Kermadec, Waka Nui, Wanganella, subduction, Early Eocene Climatic Optimum, EECO, Middle Eocene Climatic Optimum, MECO, biogenic bloom, stratigraphy, diagenesis, compaction, volcanism
MS 371-104: Published 2 February 2019
Background and objectives
International Ocean Discovery Program (IODP) Site U1507 (26°29.316ʹS, 166°31.716ʹE; 3568 m water depth) is located on the eastern side of New Caledonia Trough, adjacent to Norfolk Ridge. It is distal from previous scientific drilling sites: ~460 km south of New Caledonia, ~620 km north of Deep Sea Drilling Project (DSDP) Site 206, and ~530 km east of DSDP Sites 208 and 588 (Figure F1). The site was chosen to determine the timing of deformation and uplift of Norfolk Ridge, to constrain the age of trough formation and sediment fill, and to obtain a record of subduction-related volcanism.

Figure F1. Regional bathymetry and seismic reflection lines.
Sediment in New Caledonia Trough was drilled in 1971 at Site 206, where deformed Paleocene and Eocene calcareous ooze and chalk lies beneath middle Oligocene to recent ooze that is clay rich in places (Shipboard Scientific Party, 1973). Basement rock was not sampled at Site 206. In Taranaki Basin, which is at the southern end of New Caledonia Trough and ~1500 km from Site U1507, Cretaceous rifted basin fill is overlain by a transgressive shelf and coastal plain sedimentary sequence that has been imaged by seismic reflection data and drilled by petroleum wells (King and Thrasher, 1996).
The existence of sediments as old as the Cretaceous in the basal strata of southern New Caledonia Trough has led most previous authors to suggest that the trough formed as a Cretaceous rift basin that subsequently underwent postrift subsidence (Burns and Andrews, 1973; Collot et al., 2009; Crook and Belbin, 1978; Eade, 1988; King and Thrasher, 1996; Lafoy et al., 2005; Uruski and Wood, 1991; Uruski et al., 2003; Wood, 1993). However, seismic reflection interpretations of a drowned shelf near Taranaki imply major tectonic subsidence (>2 km) of southern New Caledonia Trough since the Eocene (Baur et al., 2014; Sutherland et al., 2010). This subsidence, combined with structural and stratigraphic observations, has led to an alternate view that Eocene subduction zone initiation may have substantially modified water depth in New Caledonia Trough and been a primary cause of the first-order topography and basin structure observed today (Baur et al., 2014; Collot et al., 2008; Sutherland et al., 2010).
Site U1507 was chosen to fill a knowledge gap in the northern and central New Caledonia Trough. The northern end of the trough is 1700 km from Site 206, and most tectonic models infer that the northern and central segments of New Caledonia Trough (i.e., north of Site 206) were proximal to where Tonga-Kermadec subduction initiated (Herzer et al., 2011; Matthews et al., 2015; Mortimer et al., 2018; Schellart et al., 2006). Seismic reflection profiles reveal the sedimentary sequence to be relatively thin (suitable for drilling) in the central part of the trough and to contain at least three seismic units that can be related to the regional tectonic history.
Site U1507 is located on the basin floor adjacent to Norfolk Ridge (Figure F2). The seabed gently slopes toward the axis of the trough, and swath bathymetry images reveal subtle relief associated with basin floor fans that are derived from incised canyons on the lower part of the Norfolk Ridge slope. Norfolk Ridge has a series of volcanic cones of late Oligocene age lying just west of the ridge crest (Mortimer et al., 2018), and one of them is close to Site U1507.
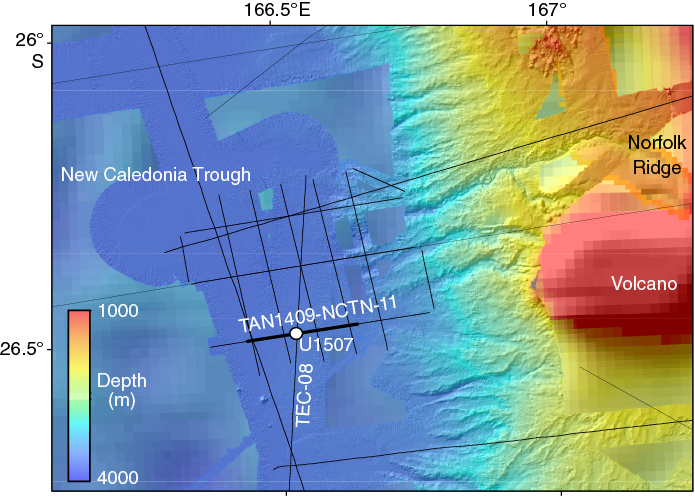
Figure F2. Local site survey data.
A grid of seismic reflection lines was collected to locate the best site for drilling (Figure F2). The upper seismic unit comprises continuous or semicontinuous, moderate-amplitude reflections mixed with chaotic layers several kilometers across that are interpreted as debris flows (Figure F3; Reflectors A–C). The middle seismic unit comprises semicontinuous, high-amplitude reflections in its upper part (Reflectors D and E) and moderate-amplitude, discontinuous reflectors in its lower part that downlap onto the lower unit (Reflector F). The lower unit comprises continuous or semicontinuous, moderate-amplitude reflectors that are locally folded and show fanning relationships. Small faults and apparent volcanic intrusions cut through the lower unit (e.g., bottom left of Figure F3). The technical objective at Site U1507 was to sample all three units to sufficient depth to understand the Paleogene evolution of the New Caledonia Trough.
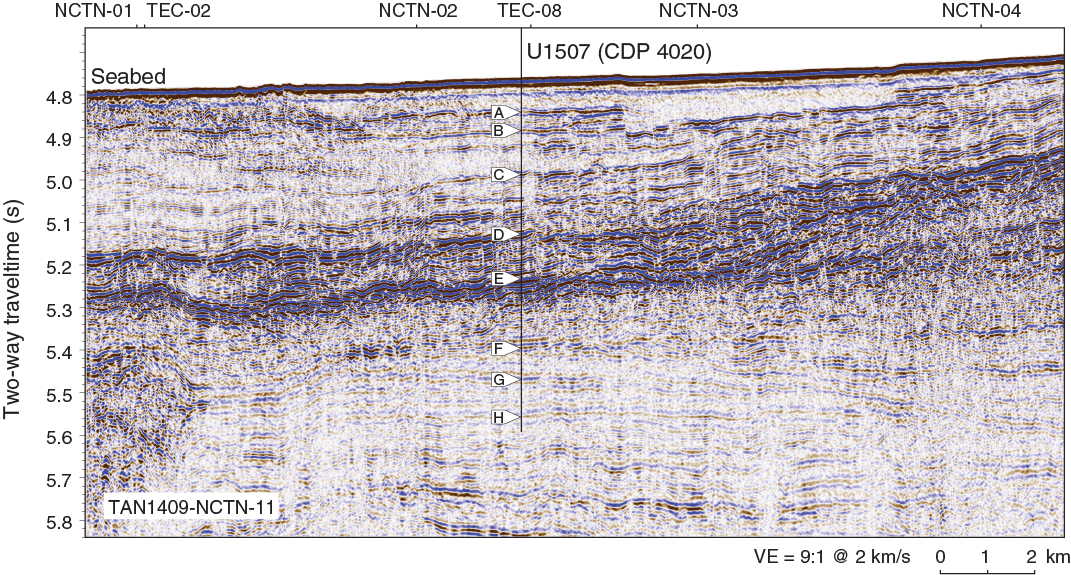
Figure F3. Seismic Section TAN1409-NCTN-11.
Operations
Hole locations, water depths, and the number of cores recovered are listed in Table T1. All times are local ship time (UTC + 10 h).
Hole U1507A
The 286 nmi transit from Site U1506 concluded with the arrival at Site U1507 at 2200 h on 6 August 2017. After lowering the thrusters and switching to dynamic positioning mode, the rig floor was cleared for operations, beginning Hole U1507A at 2225 h. The rig crew assembled an advanced piston corer (APC)/extended core barrel (XCB) bottom-hole assembly (BHA) by 0130 h on 7 August, picked up drill pipe and the top drive, and deployed the bit just above the seafloor. A wiper “pig” was pumped through the drill string to clean out potential debris. The nonmagnetic APC core barrels were dressed with core liners in preparation for spudding Hole U1507A at 1040 h.
The mudline core recovered 6.2 m, establishing a water depth of 3568 m. APC coring continued to Core 26H. Given the increasing force required to retrieve the last few APC cores and the overdrilling required on Core 26H, we switched to XCB coring at 1815 h on 8 August. Given the depth objectives for Site U1507 (>700 m drilling depth below seafloor [DSF]), we decided against using the more time consuming half-length APC coring system. Recovery of Cores 1H through 26H ranged from 99% to 106% and averaged 104% (total of 243.7 m DSF cored and 252.7 m recovered). Temperature measurements were taken with Cores 4H, 7H, 10H, 13H, 16H, and 19H. The deployment of orientation and temperature tools was discontinued after Core 20H.
Coring continued in Hole U1507A with the XCB system. Toward the end of 9 August (at ~425 m DSF), it took ~100–150 min to cut a core. Moreover, the quality of the cores was poor, with prominent biscuiting, slurry, and abundant fracturing. At 0000 h, we decided to terminate Hole U1507A, pull the drill string, and start a rotary core barrel (RCB) hole at the depth where XCB coring became particularly difficult (~375 m DSF). Recovery for the XCB cores varied from 6% to 97% and averaged 55% (total of 181.7 m DSF cored and 100.1 m recovered). The drill string was retrieved from Hole U1507A and cleared the rig floor at 0940 h on 10 August, ending Hole U1507A. The time spent on Hole U1507A was 83.25 h or 3.5 days.
Hole U1507B
The ship was offset 20 m east of Hole U1507A. An RCB BHA was made up with a center bit installed in the core barrel that would allow us to drill without coring for the first 375 m DSF. We included a mechanical bit release (MBR) that would allow us to drop the bit at the bottom of the hole and then wireline log without retrieving the entire drill string. Drill pipe was deployed, and by 1800 h on 10 August 2017 the bit was just above the seafloor. After picking up the top drive, we pulled the core barrel with center bit and pumped a wiper pig through the drill string to clean out debris observed during drill string assembly. The core barrel with center bit was then dropped back in place, and drilling in Hole U1507B commenced at 2045 h on 10 August. Drilling without coring in Hole U1507B reached 376 m DSF by 0630 h on 11 August. The center bit was removed from the core barrel, and coring began at 0730 h and concluded at 1000 h on 17 August. Cores 2R through 53R penetrated from 376.0 to 864.4 m DSF with a total recovery of 371.5 m (76%). Recovery for RCB cores varied between 1% and 109%. Importantly, the quality of RCB cores was superior to those collected by XCB drilling over the 50 m DSF overlap interval. Mud sweeps were pumped for hole cleaning on every third core starting with Core 8R. At the end of coring, Hole U1507B was cleaned with a 25 bbl high-viscosity mud sweep in preparation for logging.
Wireline logging began with a wireline trip for the rotary shifting tool (RST) to activate the MBR and drop the coring bit at the bottom of the hole. The bit was released at 1130 h on 17 August. The RST was recovered, and a second wireline trip was conducted with the reverse RST to reposition the MBR sleeve into the circulating position. The tool was recovered and the sinker bars removed. From 1230 to 1315 h, the hole was displaced with 245 bbl of 11.0 lb/gal mud. The top drive was set back, the end of drill pipe was raised to 75.2 m wireline log depth below seafloor (WSF), and the rig floor was prepared for logging.
Assembly of the modified triple combo logging tool string began at 1700 h. The tool string included magnetic susceptibility, electrical resistivity, sonic, bulk density, and natural gamma radiation (NGR) tools. The neutron porosity tool, often run in the triple combo, and the microresistivity imaging (Formation MicroScanner) tool, often run in a separate string with the sonic tool, were omitted from the logging plan for this hole. The tools were assembled and tested at 1815 h, and the tool string was lowered into Hole U1507B.
The wireline active heave compensator was switched on once the tools reached open hole. A downhole log was performed from just above the seafloor to the bottom of the hole at ~864 m WSF. The hole was then logged uphole for a 124 m calibration pass, run back to the bottom, and logged uphole to just below the end of the pipe where the caliper was closed prior to entering the BHA. The tools were pulled from the hole and were back at the surface at 0200 h on 18 August. By 0345 h, all logging equipment was rigged down, and the rig crew began retrieving the drill string.
Hole conditions were excellent for logging, with a hole diameter close to the bit diameter (~10 inches) all the way from the bottom of the hole (846.4 m WSF) to ~490 m WSF. Hole conditions were still good up to 234 m WSF, where a bridge with a hole diameter of only ~6 inches was encountered. Additional bridges were indicated in the caliper log farther uphole and just below the base of the drill string. The tool string passed these obstructions successfully and acquired high-quality measurements throughout the open hole. However, several hours of remediation work (washing) would have been required before the Versatile Seismic Imager (VSI) tool could have been run as planned, with limited chance of success, significant daylight time restrictions, and a poor weather forecast. Given the quality of the standard logs, particularly the sonic log, the primary logging scientific objective of tying cores to seismic reflection images had been substantially achieved, so we canceled the VSI run.
While the drill string was recovered, the seafloor positioning beacon was released and recovered. With bad weather expected during the transit to the next site, the drill collars were disassembled and secured in the drill collar rack. At 1130 h on 18 August, the end of the drill string cleared the rig floor. The rig floor was secured for transit at 1150 h, ending Hole U1507B and Site U1507. A total of 194 h or 8.1 days were spent on Hole U1507B.
While raising the thrusters, a hydraulic malfunction occurred and was repaired, and the transit to Site U1508 began at 1330 h on 18 August.
Lithostratigraphy
The sedimentary sequence at Site U1507 consists of ~686 m of Pleistocene to upper Eocene biogenic ooze and chalk with variable clay interbedded with ash layers and volcaniclastic turbidites (lithostratigraphic Unit I) overlying ~170 m of upper to middle Eocene homogeneous clayey nannofossil chalk (lithostratigraphic Unit II; Figure F4).

Figure F4. Lithostratigraphic summary.
Unit I sediments are divided into three subunits based on differences in lithology and sedimentological features, as identified by macroscopic and microscopic (smear slide, thin section, and scanning electron microscope [SEM]) core description (Table T2). Subunit Ia consists predominately of Pleistocene to lower Miocene nannofossil ooze and chalk in places interbedded with discrete foraminiferal ooze and limestone graded beds. Soft-sediment deformation (i.e., slumps) is widespread and most common in the lowermost part of the subunit. Subunit Ib is primarily composed of lower Miocene to upper Oligocene clayey nannofossil chalk with ash. Some intervals are interbedded with clayey tuffaceous sandstone or disrupted clayey foraminiferal chalk and limestone with volcanic clasts. In general, Subunit Ib differs from Subunit Ia by an overall increase in clay and volcanic content (Figure F5). Subunit Ic consists of lower Oligocene to upper Eocene coarse-grained tuffaceous conglomerate and sandstone alternating with clayey nannofossil chalk with ash. Volcaniclastic deposits display a range of sedimentary facies that point to deposition by various gravity flow processes, from debris flows to turbidity currents. It is noteworthy that a wide range of silica saturation in volcanic grains and clasts was observed, suggesting multiple source and complex petrogenesis.
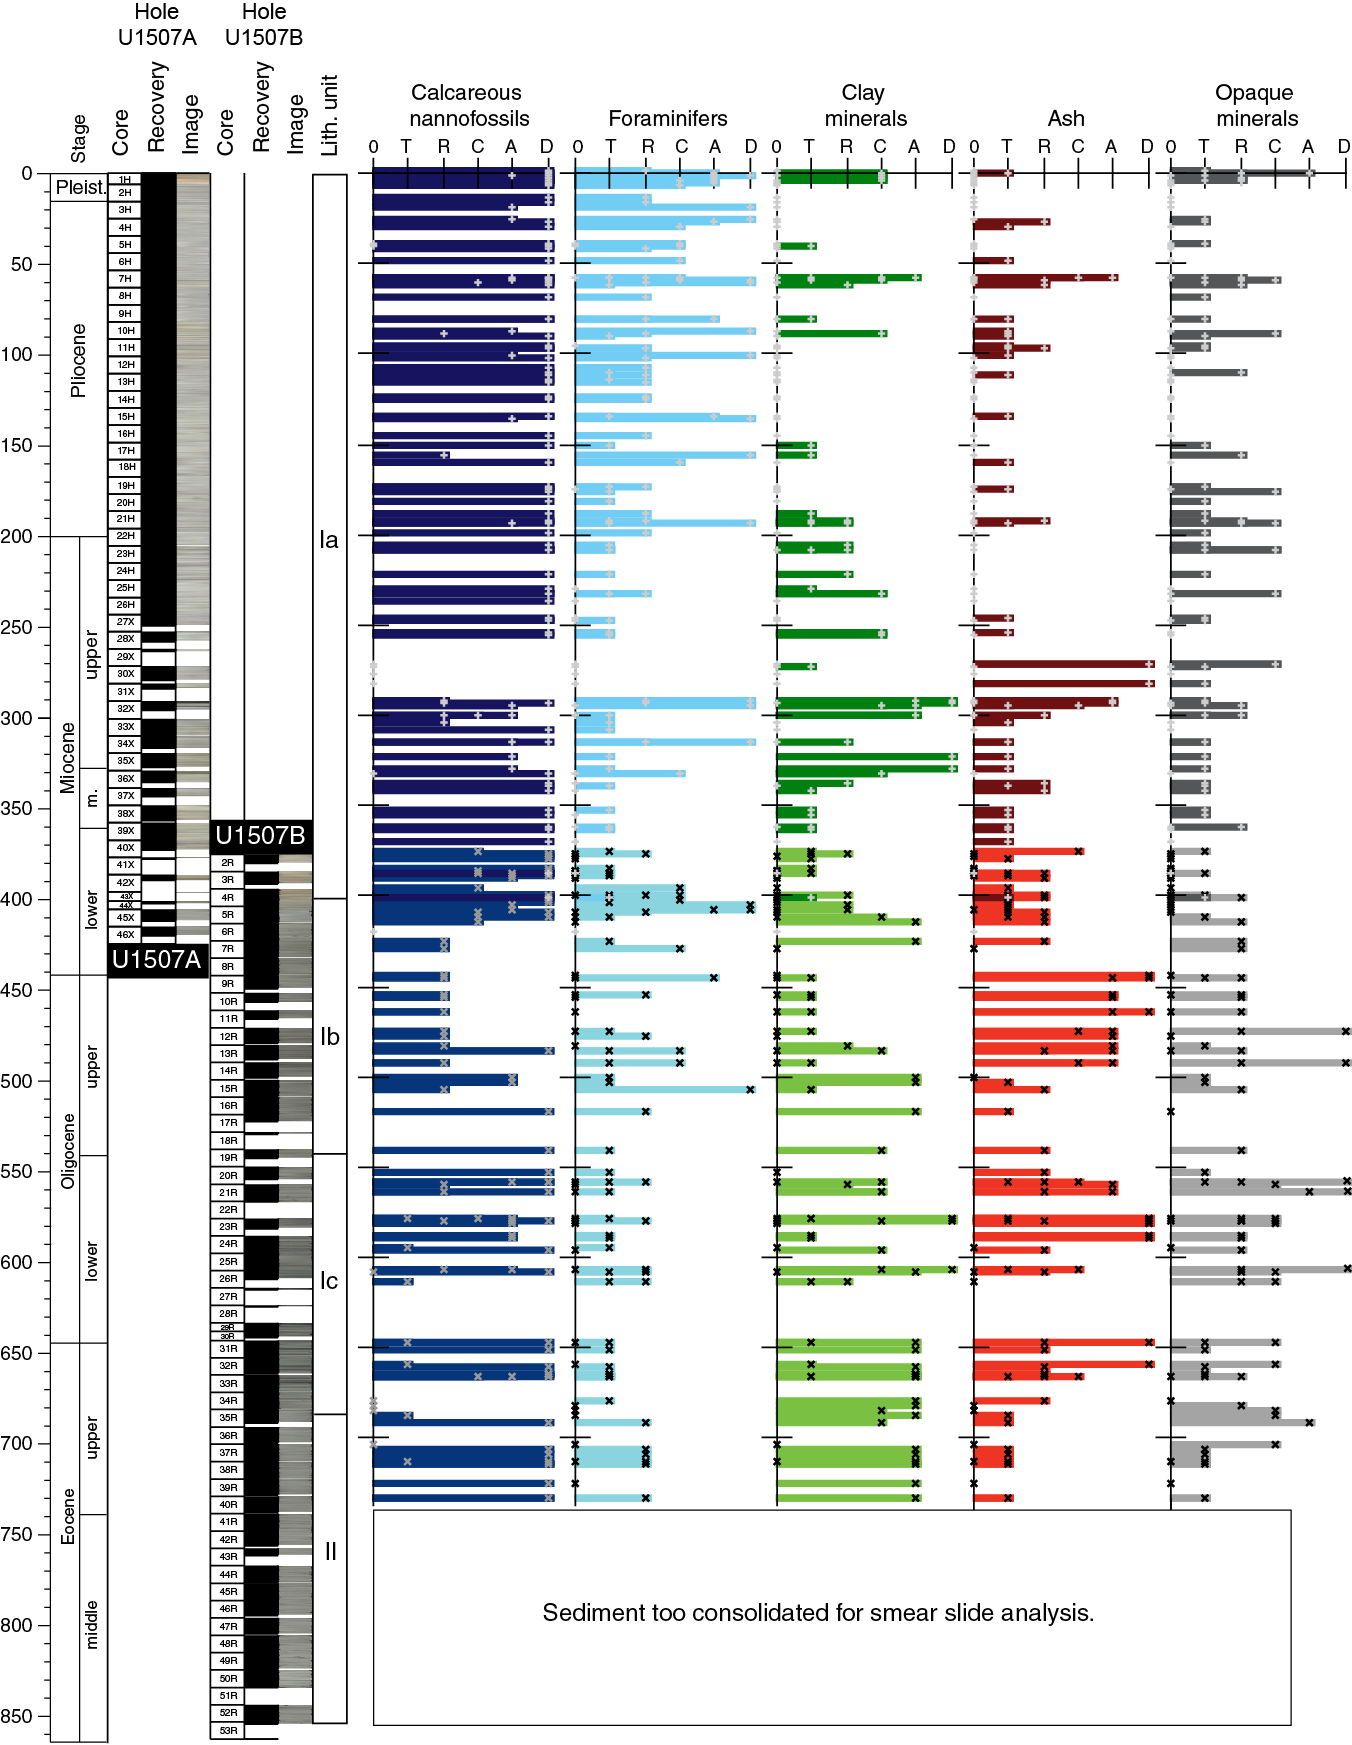
Figure F5. Major biogenic and lithologic constituent abundances.
Lithostratigraphic Unit II comprises upper to middle Eocene clayey nannofossil chalk and clayey limestone. Between 835 and 845 m, the lithology changes to a greenish gray nannofossil claystone, probably reflecting decreased carbonate content across the Middle Eocene Climatic Optimum (MECO).
In Hole U1507A, the shift from APC to XCB coring resulted in significant core disturbance, typically substantial fracturing and biscuiting of the sediments. In Hole U1507B, rotary drilling led to common fracturing of sediments and poorer recovery, notably in intervals containing coarse-grained volcaniclastic lithologies.
Unit I
Unit I is a lithologically heterogeneous and sedimentologically complex Pleistocene–upper Eocene succession of biogenic ooze and chalk interbedded with nannofossil-rich clay with ash, foraminiferal ooze/chalk/limestone beds, and coarse-grained volcaniclastic deposits. The relative proportion, vertical distribution, and facies variability of these main lithologies are captured by three subunits, presented below (Subunits Ia–Ic; Figure F4). Despite the variable lithology and evidence for synsedimentary deformation, no significant hiatuses were documented in the succession (see Biostratigraphy and paleoenvironment).
Subunit Ia
Subunit Ia is ~401 m of Pleistocene to upper Miocene white to light gray (N8 to GLEY 1 8/10Y) bioturbated nannofossil ooze or chalk interbedded with common white gray (predominantly GLEY 1 8/N) foraminiferal ooze, chalk, or limestone (Figures F5, F6). The latter are typically very thin to medium-bedded, normally graded, sharp-based, planar- to ripple-laminated beds dominated by sand-sized planktic foraminifers. Microscopic examination from smear slides, thin sections, and SEM samples revealed common pyritization of individual foraminifers (Figure F7).
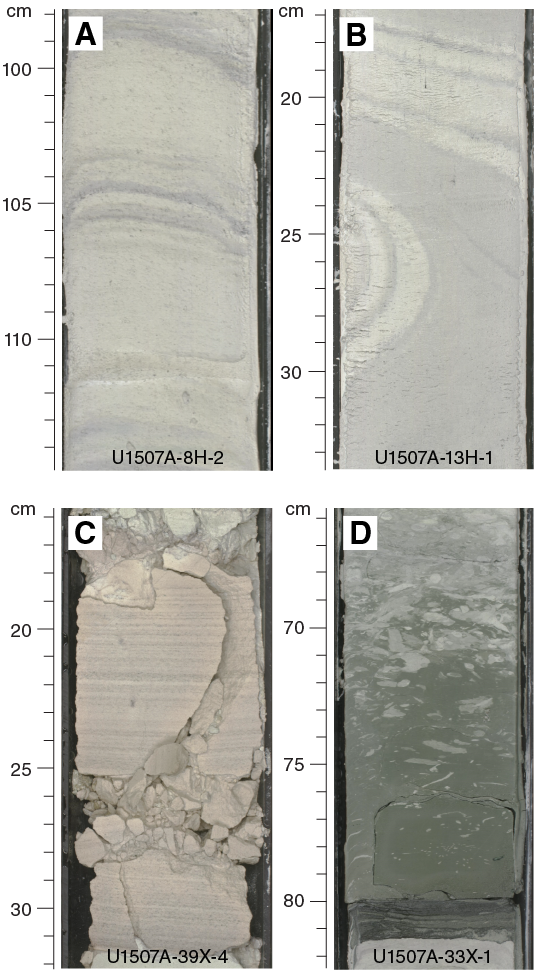
Figure F6. Common Subunit Ia sedimentary lithologies, section half images.
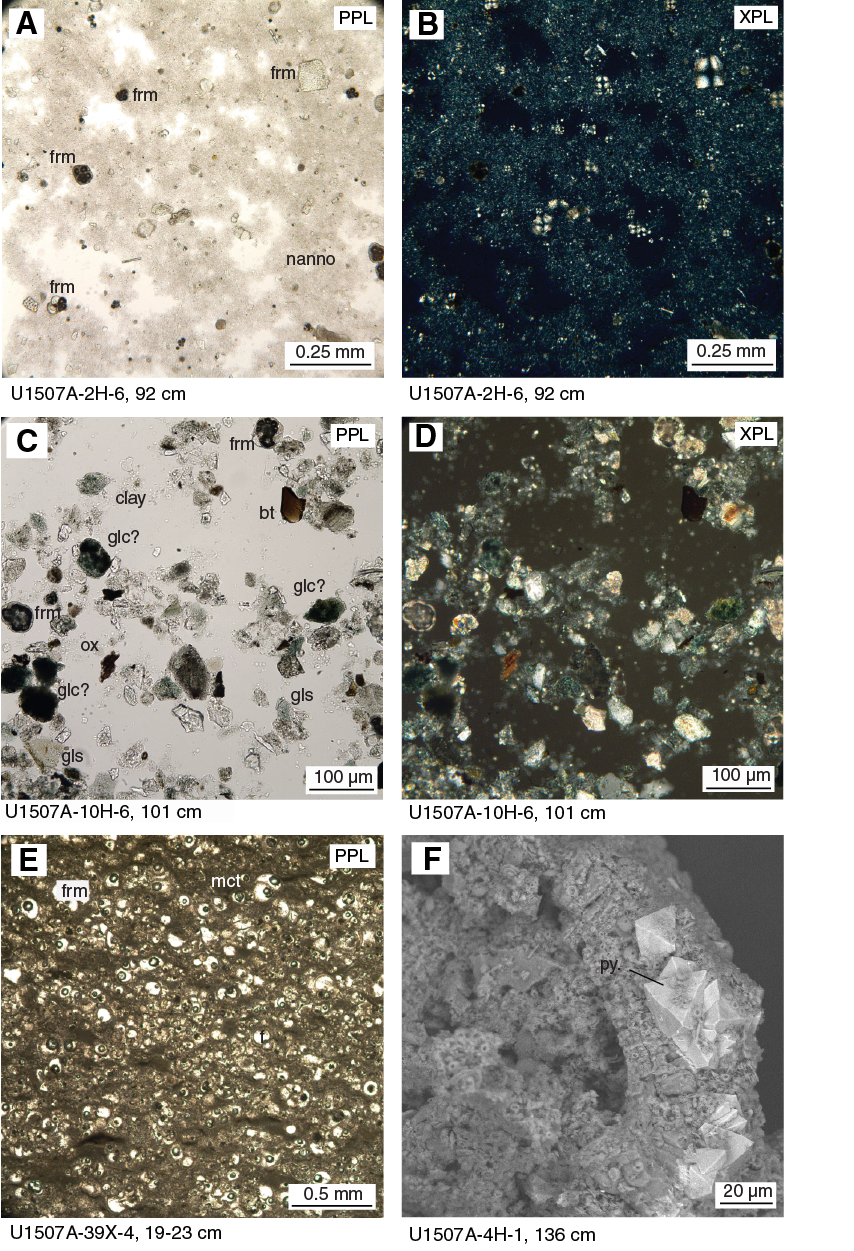
Figure F7. Common Subunit Ia sedimentary lithologies, photomicrographs.
Soft-sediment deformation, expressed as overturned folds and tilted bedding, is widespread throughout the subunit. It typically affects biogenic ooze and chalk (Figure F6) and is common in the lowermost section of the subunit, between Cores 371-U1507A-36X and 371-U1507B-4R (~330–405 m).
Starting downhole from Core 371-U1507A-7H (~54 m), intervals of greenish gray (predominantly 10GY 6/1) clayey nannofossil ooze to nannofossil-rich clay with ash were encountered (Figure F6). Such intervals are usually sharp based and faintly laminated to massive, and they progressively grade into nannofossil ooze or chalk through a heavily bioturbated interval with Chondrites, Planolites, Nereites, or Zoophycos burrows. Microscopic examination from smear slides and thin sections identified silt-sized altered glass together with clay-sized green minerals (Figure F7). X-ray diffraction (XRD) examination of a thin green clay-rich layer in Core 10H (90.7 m) revealed a significant amount of serpentine, which was not observed in samples from Subunits Ib and Ic and Unit II (Figure F8).
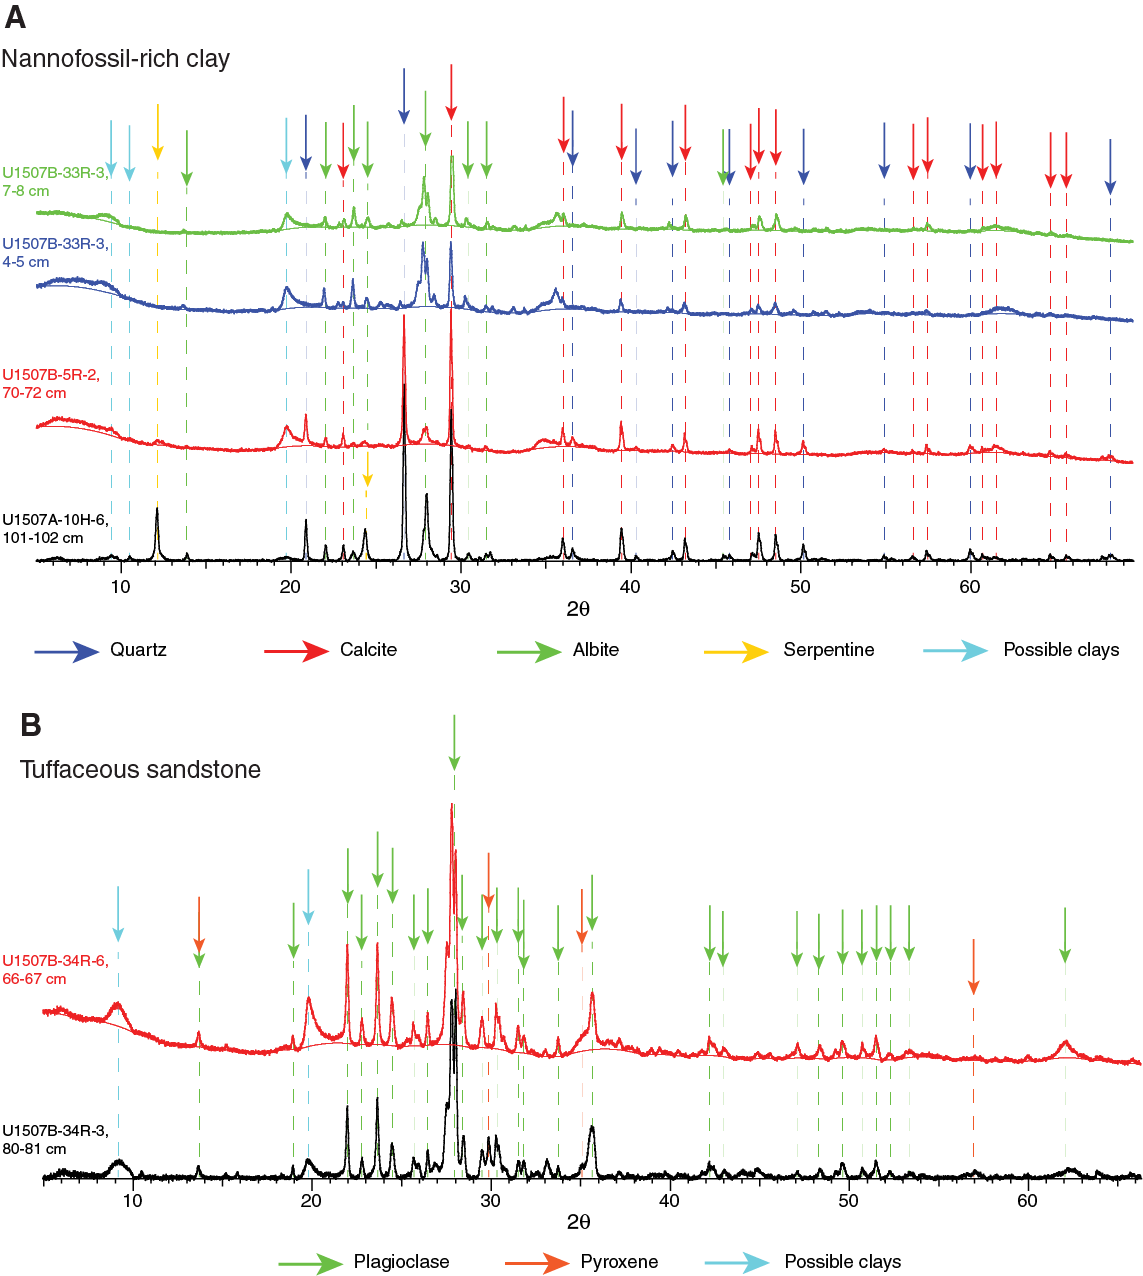
Figure F8. XRD diffractograms of selected powdered sediment samples.
A ~2 m thick interval with very dark greenish gray (GLEY 1 3/10Y) volcaniclastic deposits occurs in Core 371-U1507A-32X. Individual deposits consist of volcanic breccia and tuffaceous sandstone dominated by clasts of variably altered volcanic glass. The matrix is micritic and contains common planktic foraminifers. Subrounded to subangular nannofossil chalk rip-up clasts are also common.
The ooze–chalk transition is gradual and occurs across Cores 371-U1507A-30X through 32X (~272–296 m). The change from APC to XCB coring between Cores 26H and 27X resulted in poorer recovery and significant disturbance of sediment at the lower depths in Hole U1507A.
Subunit Ib
Subunit Ib is ~142 m of lower Miocene to upper Oligocene greenish gray (predominantly GLEY 1 7/5GY) clayey nannofossil chalk with ash interbedded with dark greenish gray (GLEY 1 4/10Y) clayey tuffaceous sandstone and greenish gray (GLEY 1 6/10GY) clayey foraminiferal chalk and limestone with volcanic clasts (Figure F9). The boundary with overlying Subunit Ia is marked by an overall increase in clayey and volcaniclastic lithologies (Figures F5, F10) with a clear color change from pale yellow to greenish gray in Cores 371-U1507B-2R through 4R. Clayey tuffaceous sandstone occurs as sharp-based, normally graded, thin to medium-bedded intervals with common planar to ripple laminations. The clayey foraminiferal chalk and limestone was typically encountered as thick- to very thick bedded, convoluted, internally disrupted beds with scattered volcanic clasts (e.g., Sections 16R-1 through 16R-3).
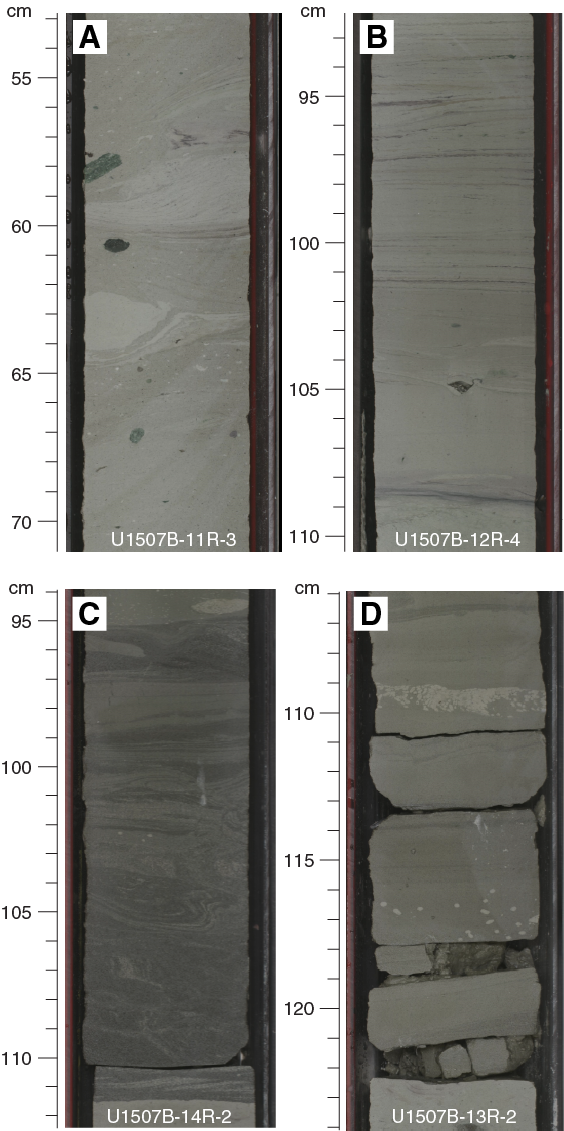
Figure F9. Common Subunit Ib sedimentary lithologies, section half images.
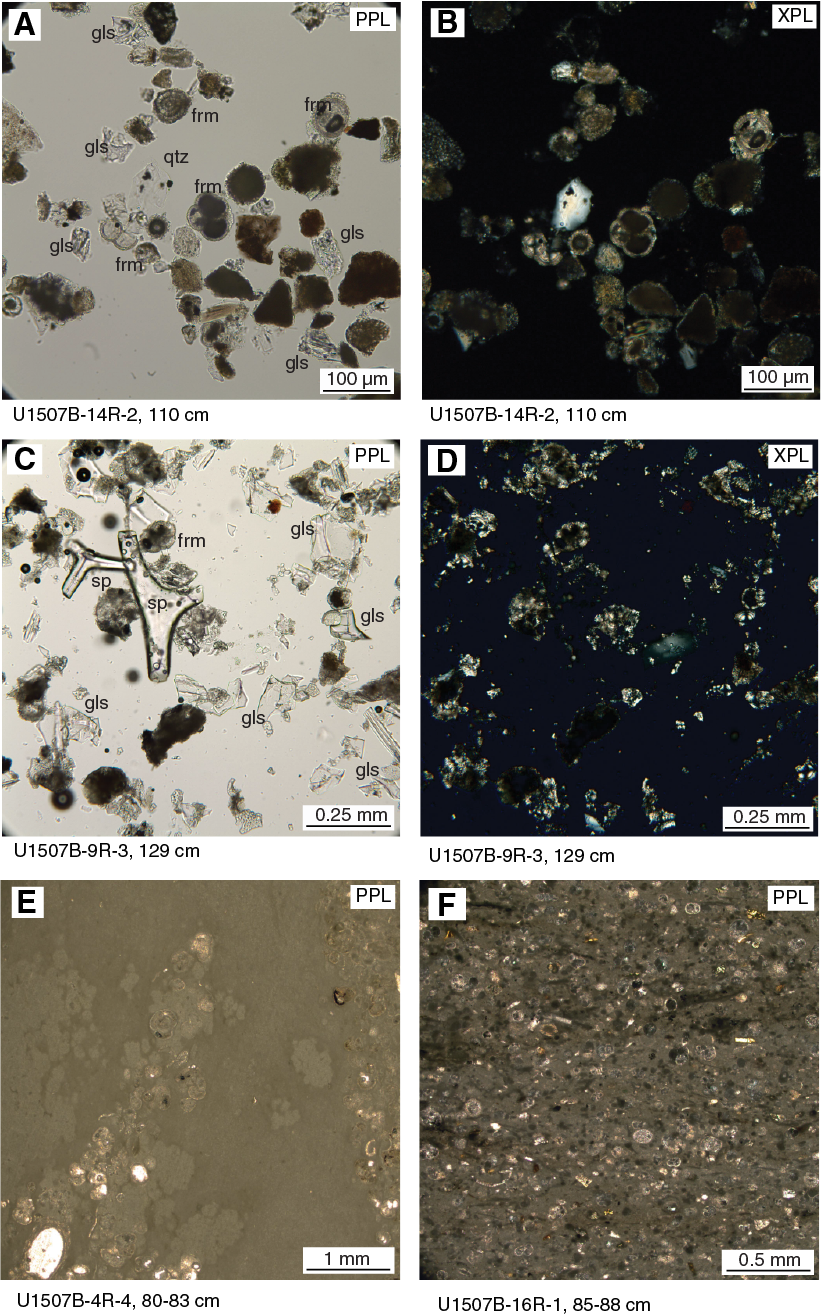
Figure F10. Common Subunit Ib sedimentary lithologies, photomicrographs.
Subunit Ic
Subunit Ic is ~143 m of lower Oligocene to upper Eocene dark greenish gray (dominantly GLEY 1 4/10GY) tuffaceous conglomerate and sandstone along with very dark greenish gray (GLEY 1 3/N) tuff interbedded with light greenish gray (GLEY 1 7/10GY) clayey nannofossil chalk with ash (Figure F11). Lithologies are significantly coarser than those in the rest of lithostratigraphic Unit I and have higher magnetic susceptibility and NGR values (Figure F4). The boundary with Subunit Ib is defined by the first occurrence of a thick-bedded tuffaceous conglomerate in Core 371-U1507B-19R.
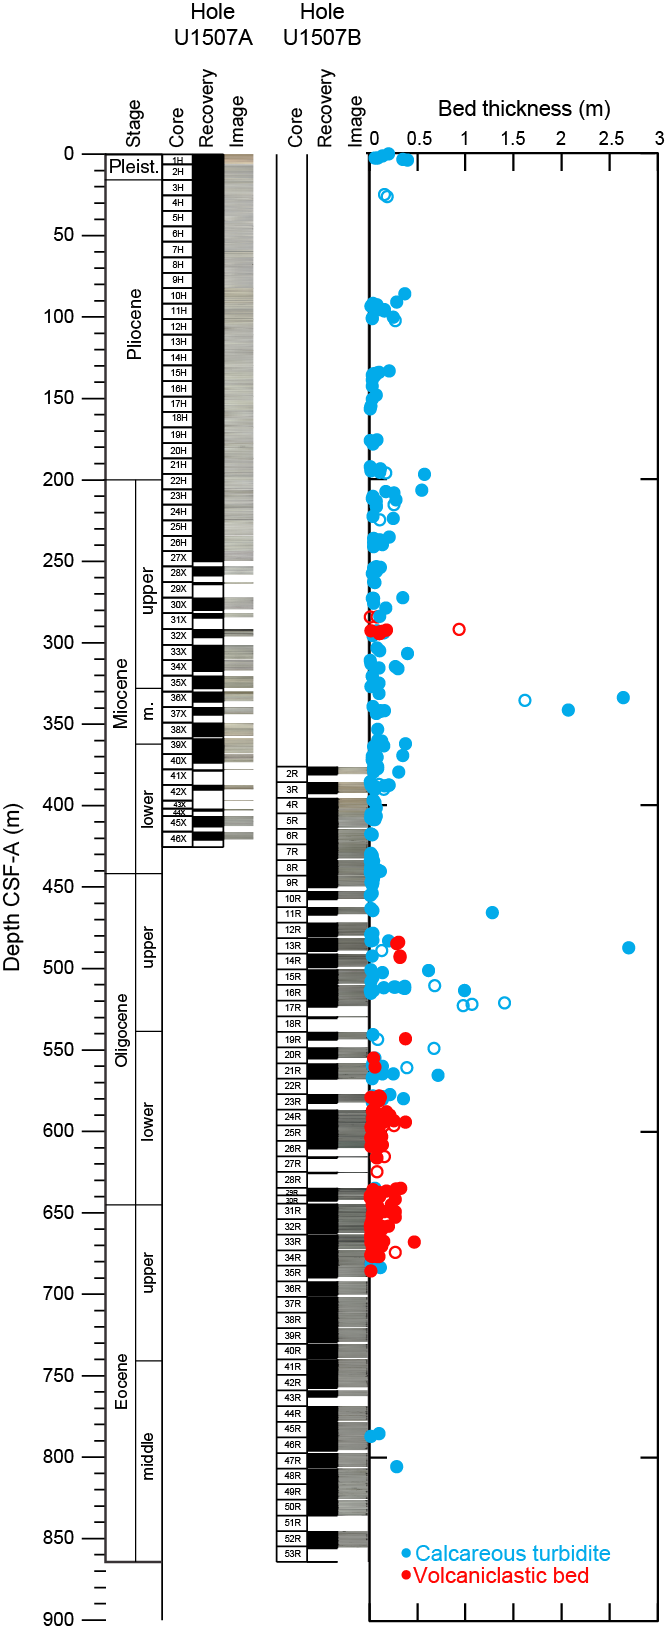
Figure F11. Distribution and thickness of calcareous turbidites and volcaniclastic turbidites.
Bed thickness and grain size increase gradually upward in the lower part of the subunit and then decrease in the upper part, displaying an overall symmetrical trend (Figure F11). Volcaniclastic facies vary from very thick bedded, poorly sorted tuffaceous conglomerate to thinly bedded, typically planar- to ripple-laminated, medium- to fine-grained tuffaceous sandstone (Figure F12). Typically, beds are sharp based and normally graded but are abruptly overlain by bioturbated nannofossil clay with a clear grain size break. Thin sections and XRD measurements on tuffaceous intervals (Figures F13, F8) reveal isolated pyroxene, plagioclase, and possible amphibole alongside microcrystalline volcanic clasts with common plagioclase and pyroxene phenocrysts. Large benthic foraminifers and recrystallized bioclasts are also found in tuffaceous sandstone, typically floating in a fine-grained micritic matrix. Notably, quartz is absent from both the green clay and tuffaceous sandstone layers of Subunit Ic.
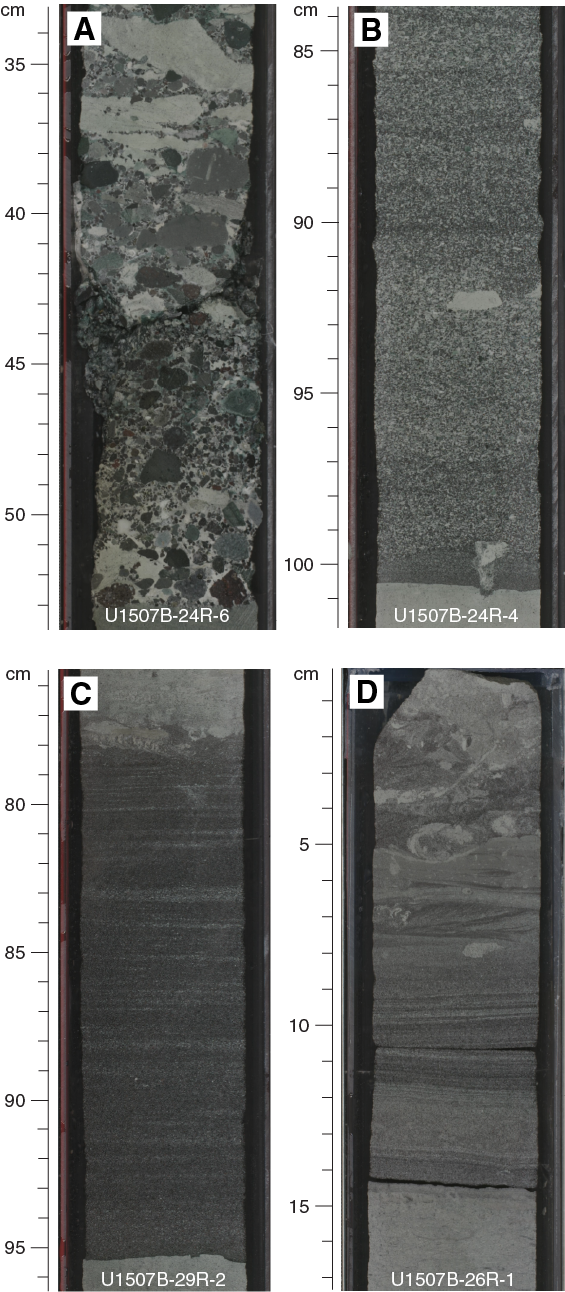
Figure F12. Common Subunit Ic sedimentary lithologies, section half images.
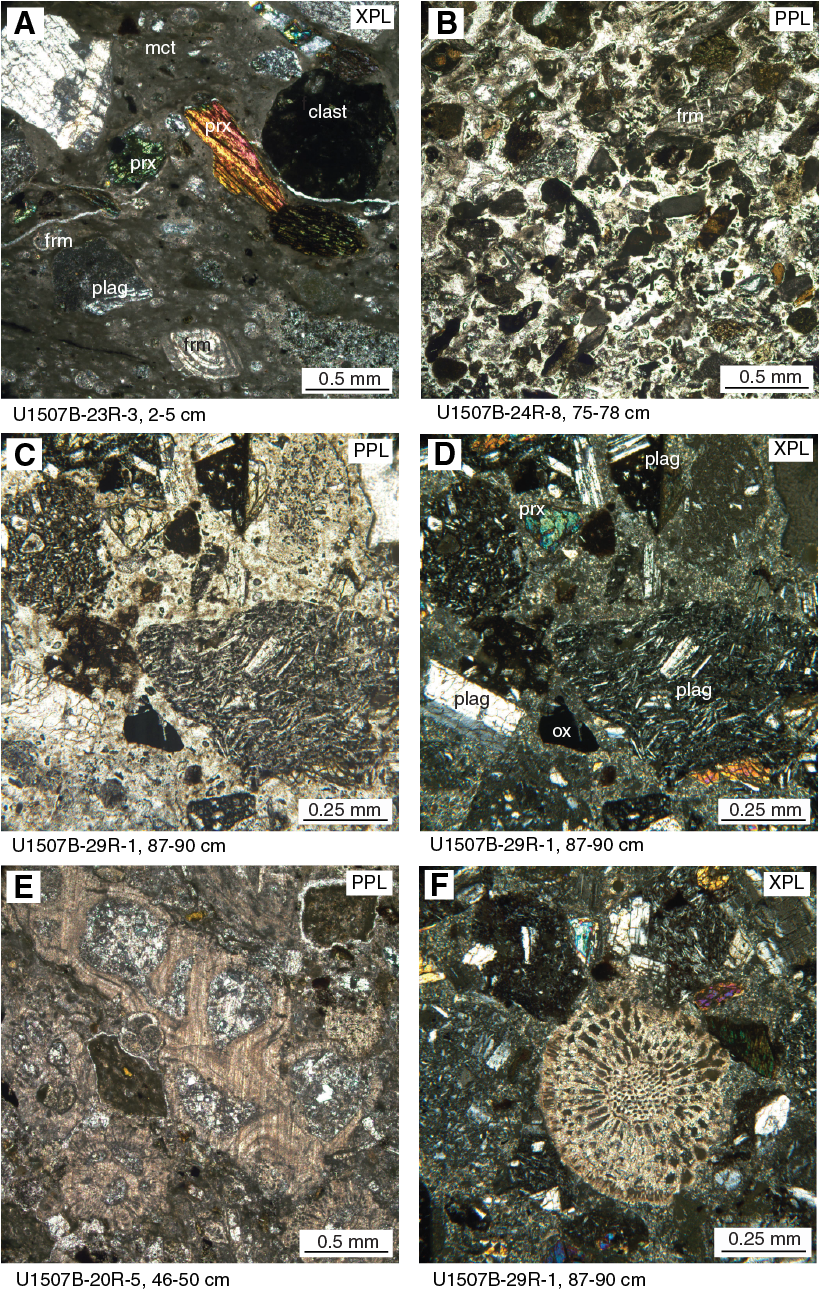
Figure F13. Common Subunit Ic sedimentary lithologies, photomicrographs.
Unit II
Unit II is ~170 m of upper to middle Eocene homogeneous light greenish gray (dominantly GLEY 1 7/10GY) clayey nannofossil chalk with rare thin beds of planar-laminated, normally graded foraminiferal limestone (Figure F14). Thin section examination of the latter revealed recrystallized bioclasts and extraclasts and possibly volcanic plagioclase (Figure F15). Bioturbation is moderate throughout the unit, with prominent Zoophycos, Nereites, Asterosoma, and Spirophyton burrows. In detail, the clayey nannofossil chalk displays subtle color banding on both the centimeter and multidecimeter scales, from light greenish gray to greenish gray (Figure F16), defining apparent cycles with a period of approximately 2 m. The boundary with Unit I is defined by the lowest occurrence of tuffaceous sandstone.
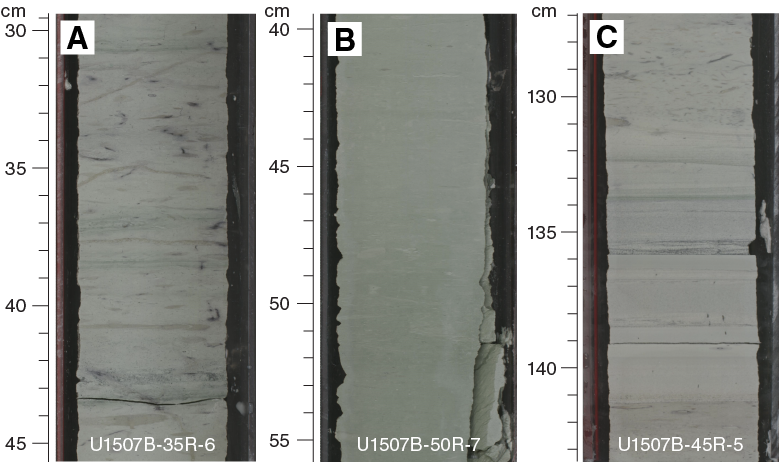
Figure F14. Common Unit II sedimentary lithologies, section half images.
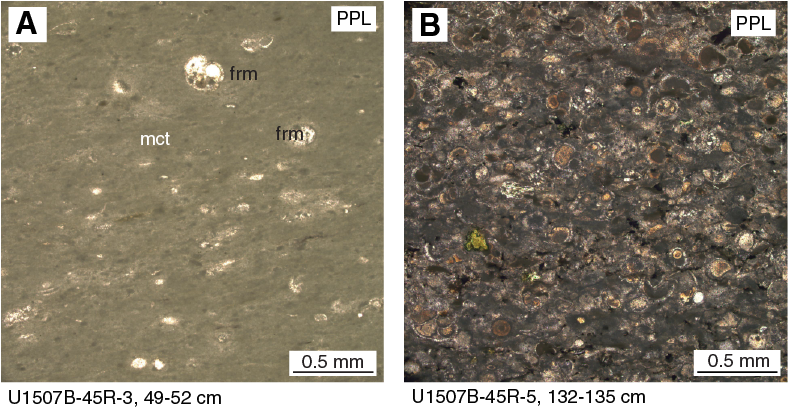
Figure F15. Common Unit II sedimentary lithologies, photomicrographs.

Figure F16. Decimeter-scale cyclicity in middle Eocene clayey nannofossil chalk, Unit II.
A change in color and lithology was observed in the lower sections of Core 371-U1507B-50R and in Core 51R, where a greenish gray (GLEY 1 5/5G) nannofossil claystone was encountered. This change in lithology potentially reflects increased carbonate dissolution related to the MECO (see Biostratigraphy and paleoenvironment). Carbonate content is high across this interval (60%–80%; see Geochemistry), although wireline logging data are consistent with higher clay content in the sediment that we were not able to collect (see Petrophysics). Below this interval, the lithology is pervasively more lithified and classified as clayey limestone.
Biostratigraphy and paleoenvironment
Calcareous nannofossil, planktic foraminifer, and radiolarian biostratigraphic data at Site U1507 (Table T3) indicate a mostly continuous Pleistocene to early Miocene age for Hole U1507A and an expanded continuous early Miocene to middle Eocene age for Hole U1507B (Figures F17, F18).
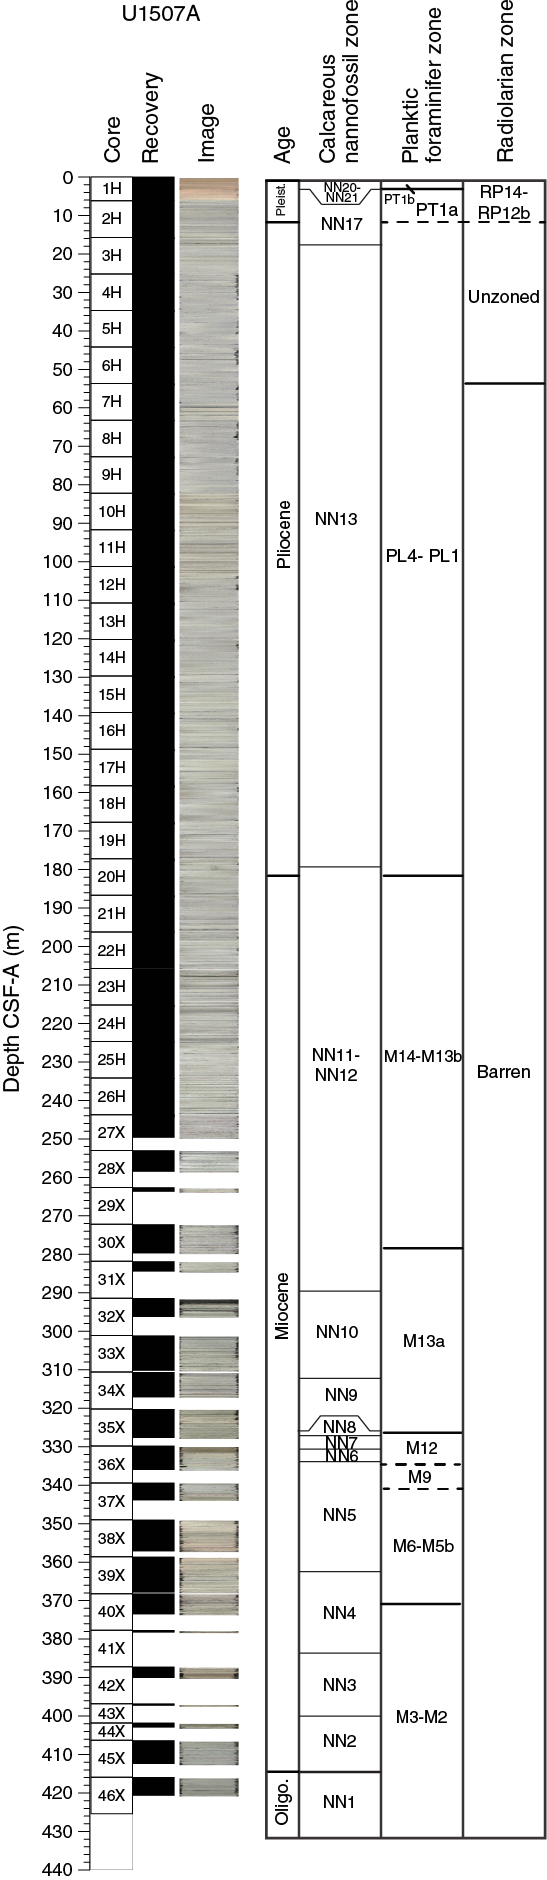
Figure F17. Biozonations, Hole U1507A.

Figure F18. Biozonations, Hole U1507B.
Paleodepth estimates based on benthic foraminifers are abyssal from the Pleistocene to the uppermost Oligocene and lower bathyal to possibly middle bathyal from the Oligocene to the Eocene. Microfossil assemblages recovered at this site generally show preservation ranging from very good to moderate in Hole U1507A but moderate to poor in Hole U1507B. Microfossil abundance largely varies among all groups. Calcareous microfossils are almost always present, whereas radiolarians are only recorded in the upper part of Hole U1507A and in the upper and lower parts of Hole U1507B (Figure F19).
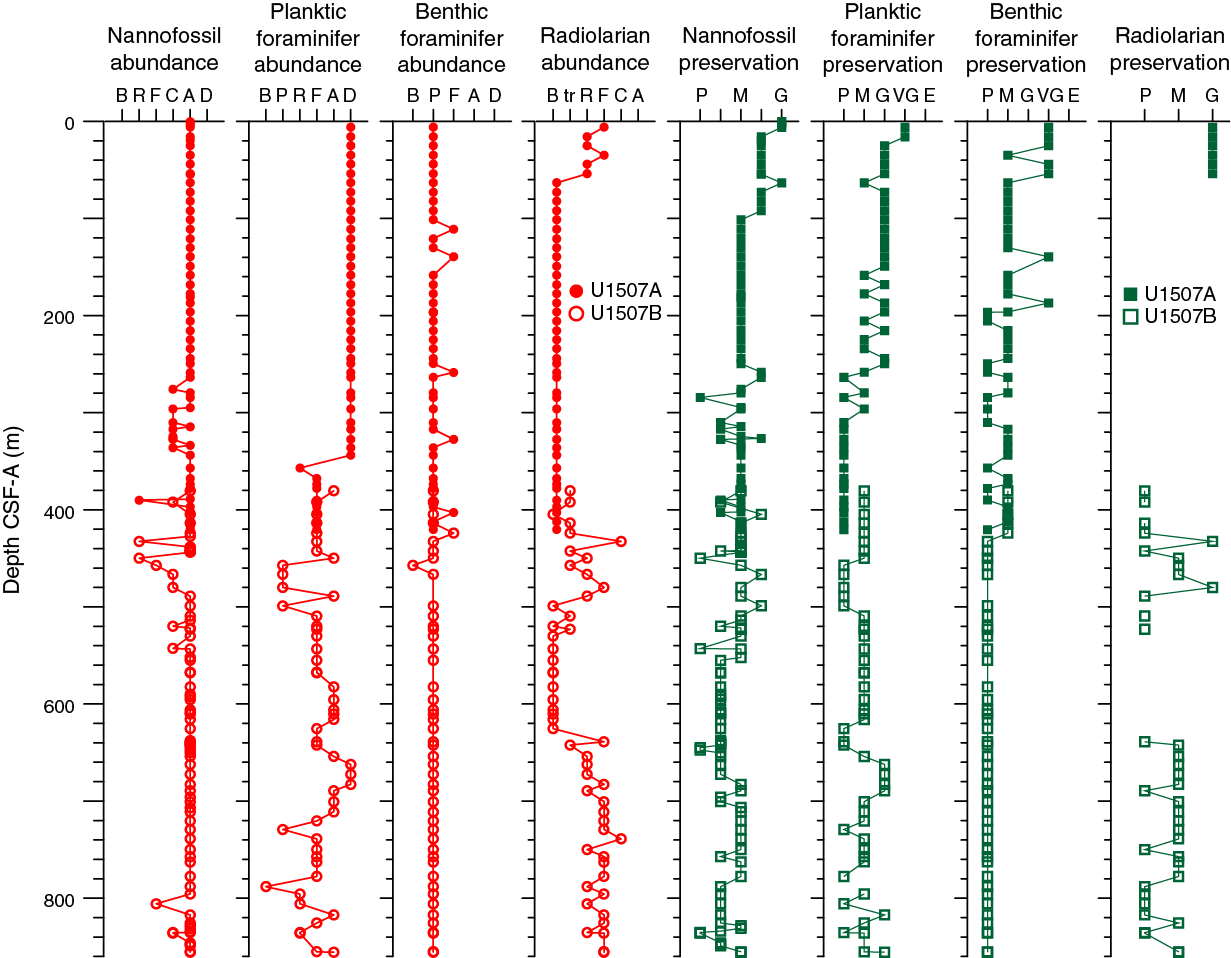
Figure F19. Microfossil abundance and preservation.
Calcareous nannofossils
Calcareous nannofossil biozones were assigned to sediments from Holes U1507A (Cores 1H through 46X) and U1507B (Cores 2R through 53R). Analyses are based primarily on core catcher samples (paleontology; PAL), with additional samples from working-half sections to refine ages of selected intervals, particularly key boundaries or hiatuses. Calcareous nannofossil distribution data (Table T4) are based on shipboard observations that focus on species that are age diagnostic. The distribution data may not represent the full nannofossil assemblage.
In both Holes U1507A and U1507B, calcareous nannofossils are generally common to abundant except in Samples 371-U1507A-42X-CC, 371-U1507B-9R-CC, and 10R-CC, where they are rare to few. Preservation varies from good to moderately good in the upper sections at the site to moderate and eventually poor in the lower part of the sequence (Figure F19). Hole U1507A drilled Pleistocene (nannofossil Zones NN20/NN21 through NN17), Pliocene (nannofossil Zone NN13), and Miocene (nannofossil Zones NN11 through NN4) sections. The sequence recovered in Hole U1507B is early Miocene (Zones NN4 through NN1), Oligocene (Zones NP25 through NP21), and late to middle Eocene (nannofossil Zones NP19/NP20 through NP16).
The uppermost section of Hole U1507A (Samples 1H-1, 25 cm, to 1H-1, 75 cm; 0.25–0.75 m) can be identified as Pleistocene age, with assemblages containing Gephyrocapsa spp., Calcidiscus leptoporus, Helicosphaera carteri, and ceratoliths. The following late Pleistocene interval (Samples 1H-3, 75 cm, to 2H-CC; 3.75–15.98 m) is identified by the presence of Gephyrocapsa spp. (>4 µm) and Helicosphaera sellii. (Zone NN19). Cores 3H through 31X (19.45–284.37 m) represent an expanded early Pliocene to late Miocene interval. Samples 3H-3, 75 cm, to 19H-CC (19.45–177.75 m) represent Zone NN13, with the top of this interval approximated by the top of Amaurolithus primus and the base defined by the base of Ceratolithus rugosus. Samples 11H-CC to 19H-CC (101.48–177.75 m) in Zone NN13 record a high number of reworked Eocene and Paleocene nannofossils (e.g., Chiasmolithus spp., Dictyococcites bisectus, and Toweius spp.). Samples 20H-3, 75 cm, to 31X-CC (180.83–284.34 m) are ascribed to Zone NN11 due to the presence of A. primus in Sample 29X-CC (263.61 m) and the presence of Discoaster berggrenii in Sample 31X-CC (284.34 m). A continuous late to middle Miocene interval from Zones NN10 to NN5 is recorded in Hole U1507A (310.21–335.93 m). The top of Discoaster hamatus, recognized between Samples 33X-CC and 34X-3, 74 cm (312.28 ± 2.07 m), is used to define the base of Zone NN10. The base of Zone NN9 correlates with the base of D. hamatus (325.58 ± 1.00 m). Between Samples 35X-5, 38 cm, and 35X-CC (327.08 ± 0.50 m), the base of Catinaster coalitus marks the base of Zone NN8, whereas the top of Cyclicargolithus floridanus, used to approximate the base of Zone NN7, is between Samples 35X-CC and 36X-3, 75 cm (330.61 ± 2.94 m). The base of Zone NN6 is identified by the top of Sphenolithus heteromorphus, which is between Samples 36X-3, 75 cm, and 36X-CC (334.74 ± 1.19 m).
The early Miocene is recorded in Holes U1507A and U1507B at 362.40–420.66 and 380.55–442.24 m, respectively. Helicosphaera ampliaperta was not found in the assemblages, so the top common occurrence of Discoaster deflandrei is used as a secondary marker to approximate the base of Zone NN5 (Backman et al., 2012) at 362.45 m (±5.33 m) in Hole U1507A. Standard biohorizons based on sphenolith markers are used to define Zones NN3 through NN1 in both holes. The top of Sphenolithus belemnos, which marks the base of Zone NN4, is found in Samples 371-U1507A-43X-CC and 371-U1507B-6R-CC. The base of Sphenolithus disbelemnos, which approximates the base of Zone NN2, is recognized between Samples 371-U1507A-45X-CC and 46X-1, 77 cm (414.57 ± 2.11 m), and between Samples 371-U1507B-8R-4, 106 cm, and 8R-5, 34 cm (438.70 ± 0.39 m).
The Oligocene is recorded in Hole U1507B in Samples 8R-7, 50 cm, to 30R-3, 45 cm (442.00–641.96 m). The Oligocene/Miocene boundary occurs just above the top of Sphenolithus delphix at 442.24 m (±0.24 m) between Samples 8R-7, 50 cm, and 8R-CC (Figure F20). This location agrees with the paleomagnetic data, which indicates the base of Chron C6Cn.2n is at 441.73 m (±0.025 m). The top and base of Sphenolithus ciperoensis are used to constrain the base of Zone NN1 (461.97 ± 4.69 m) and the base of Zone NP24 (553.58 ± 1.45 m), respectively. The tops of Sphenolithus distentus and Sphenolithus predistentus, observed between Samples 16R-CC and 17R-2, 73 cm (520.89 ± 0.85 m), indicate the top of Zone NP24. The top of Reticulofenestra umbilicus is recognized between Samples 25R-CC and 26R-3, 59 cm (607.47 ± 1.31 m), and marks the top of Zone NP22. The top of Coccolithus formosus, observed between Samples 28R-CC and 29R-3, 73 cm (631.59 ± 6.05 m), marks the top of Zone NP21.
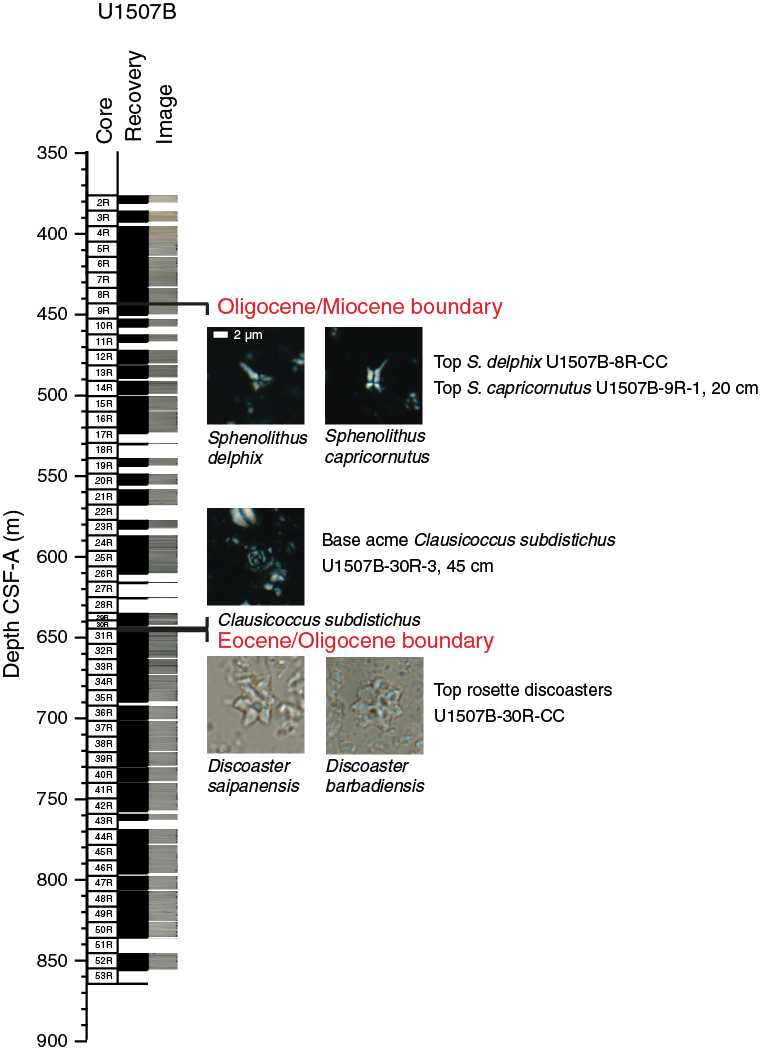
Figure F20. Nannofossil datums, Hole U1507B.
The late to middle Eocene, recorded through an expanded 213.59 m thick section, represents Zones NP19/NP20 through NP16. The Eocene/Oligocene boundary occurs close to the base acme of Clausicoccus subdistichus, recorded between Samples 30R-CC and 30R-3, 45 cm (642.15 ± 0.19 m), and the top of the rosette discoasters (i.e., Discoaster barbadiensis and Discoaster saipanensis), which marks the base of Zone NP21 (648.95 ± 1.41 m; Figure F20). This location agrees with the paleomagnetic data, which indicate the base of Chron C13n occurs at 640.76 m (±0.025 m). The base of Isthmolithus recurvus defines the base of Zone NP19/NP20 and is recorded between Samples 37R-CC and 38R-CC (715.77 ± 4.68 m). The base of Reticulofenestra isabellae at 36.49 Ma (Agnini et al., 2014) is used to further refine the biostratigraphic resolution in Zone NP19/NP20 and is found between Samples 33R-CC and 34R-CC (741.78 ± 2.69 m). The top of Chiasmolithus grandis, which marks the base of Subzone CP15b (Okada and Bukry, 1980), is used to approximate the base of Zone NP18. However, the short-lived (37.70–38.07 Ma; Agnini et al., 2014) acme of Reticulofenestra erbae, which occurs in interval 40R-CC, 13–23 cm (738.98–739.08 m), provides further age constraint and is used to approximate the base of the late Eocene (Priabonian). The top of Chiasmolithus solitus is not used to mark the base of Zone NP17 because of the high number of reworked specimens found throughout the section. Instead, the base of D. bisectus (>10 µm), found between Samples 51R-CC and 52R-1, 75 cm (841.07 ± 4.98 m), is used to recognize the base of Zone NP17 and to mark the initiation of the MECO; however, in Hole U1507B, this event cannot be accurately constrained due to poor recovery of Core 51R. The top of Sphenolithus furcatolithoides, recorded between Samples 52R-2, 75 cm, and 52R-3, 80 cm (848.25 ± 0.75 m), occurs just below the MECO. An incomplete record of S. predistentus and Sphenolithus spiniger means that the top of the MECO interval cannot be approximated, but the base of Sphenolithus obtusus is used to define the end of the post-MECO interval and occurs between Samples 49R-CC and 50R-2, 81 cm (826.94 ± 1.295 m; Figure F21).

Figure F21. Nannofossil and planktic and benthic foraminiferal datums, Hole U1507B.
Planktic foraminifers
Core catcher samples were examined for their planktic foraminifer assemblages in Holes U1507A and U1507B. Planktic foraminifer preservation is generally moderate to good but is poor in Cores 371-U1507A-29X through 45X and 371-U1507B-10R through 14R (Table T5; Figures F19, F22). Depth positions and age estimates of biostratigraphic events can be derived from the presence of marker species and the stratigraphic distribution of planktic foraminifers (Tables T3, T5).
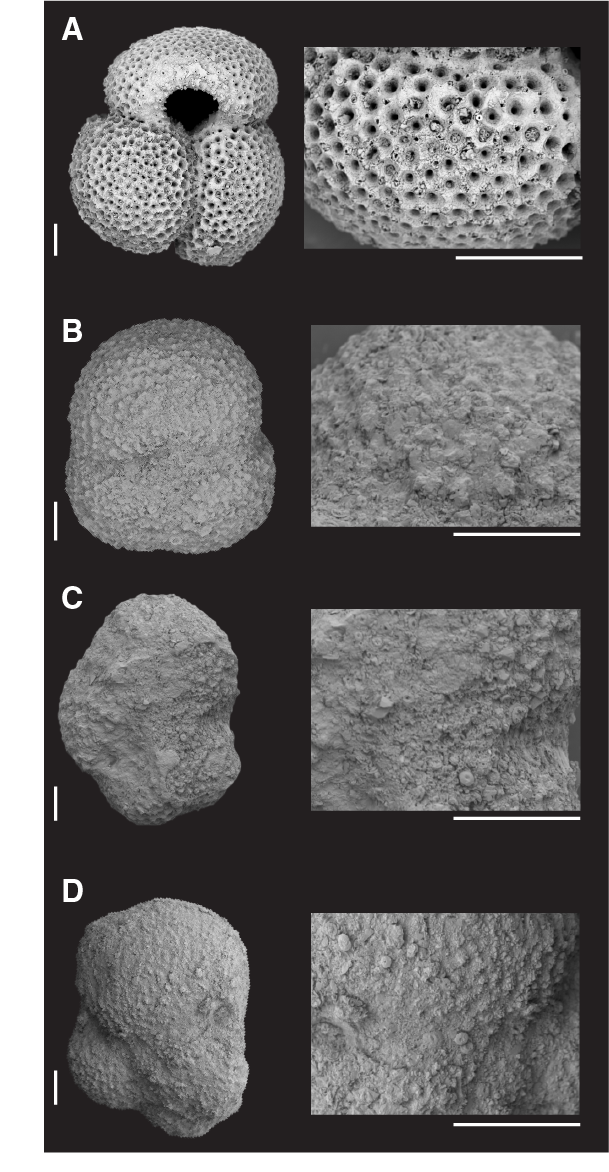
Figure F22. Preservation state of planktic foraminifers.
The upper 187.03 m of core from Hole U1507A contains a diverse assemblage of planktic foraminifers from the Pleistocene and Pliocene. Samples 371-U1507A-1H-CC to 2H-CC (6.27–15.98 m) contain Globorotalia truncatulinoides and Globorotalia tosaensis, indicative of a Pleistocene age. Samples 3H-CC to 20H-CC (25.10–187.13 m) consistently contain assemblages of Pliocene marker species such as Globoquadrina altispira, Globorotalia tumida, Sphaeroidinellopsis seminulina, Sphaeroidinellopsis kochi, and Hirsutella margaritae. Occasional specimens of Globigerinatheka index and Catapsydrax unicavus throughout this interval indicate reworking of older sediments, perhaps from outcrops at shallower water depths. Occurrences of G. truncatulinoides and G. tosaensis within this interval indicate downhole contamination. The base of G. tumida in Samples 20H-CC to 21H-CC (191.71 ± 4.58 m) tentatively suggests that Samples 3H-CC to 20H-CC (25.20–187.03 m) are within Zones PL4 through PL1.
The interval spanning Samples 21H-CC to 30X-CC (196.28–279.69 m) contains late Miocene planktic foraminifers from Zone M14 to Subzone M13b. The base of Globorotalia plesiotumida marks the Subzone M13b/M13a boundary between Samples 30X-CC and 31X-CC (282.02 ± 2.32 m). Below Sample 30X-CC, dissolution-resistant species such as S. seminulina and Dentoglobigerina venezuelana are commonly found. Samples 36X-CC to 37X-CC (336.03–343.81 m) yield the middle Miocene Fohsella lineage (Fohsella fohsi fohsi, Fohsella peripheroacuta, and Fohsella robusta), indicating this interval is in Zone M9. The coiling direction of Paragloborotalia spp. changes from dominantly sinistral to random between Samples 40X-CC and 41X-CC (375.82 ± 2.32 m). The coiling change in this group has been reported around the Subzone M5b/M5a boundary (Abdul Aziz et al., 2008), indicating the subzone boundary may be located between these samples. The interval between Samples 38X-CC and 40X-CC (357.11–373.40 m) is assigned to Zone M6 through Subzone M5b based on the absence of F. peripheroacuta.
Foraminifer assemblages recovered from Hole U1507B are indicative of an early Miocene to Eocene age. The occurrence of Catapsydrax dissimilis and absence of Paragloborotalia kugleri and Paragloborotalia pseudokugleri in Samples 371-U1507B-41X-CC to 46X-CC (378.23–420.56 m) indicate this interval is early Miocene in age (Zones M3 through M2). The uppermost interval, including Samples 2R-CC to 6R-CC (380.55–424.22 m), contains C. dissimilis in absence of P. kugleri and P. pseudokugleri, an assemblage that indicates an early Miocene age.
The top of Globigerina euapertura, whose first occurrence is slightly below the Miocene/Oligocene boundary in New Zealand, is used to approximate the transition into the Oligocene between Samples 371-U1507B-7R-CC and 8R-CC (437.55 ± 4.93 m). The top and base of P. pseudokugleri, identified between Samples 6R-CC and 7R-CC (428.37 ± 4.15 m) and between Samples 8R-CC and 9R-CC (446.22 ± 3.65 m), respectively, are additional evidence that the Miocene/Oligocene boundary lies within this interval.
Although the absence of Hantkenina spp. prevents determination of the Eocene/Oligocene boundary, the late Eocene Zone E16/E15 boundary is well defined by the top of G. index between Samples 371-U1507B-30R-CC and 31R-CC (648.23 ± 5.89 m). This species dominates the assemblages to the base of Hole U1507B (Table T5). Samples 50R-CC and 51R-CC contain Orbulinoides beckmanni, whose range defines Zone E12 and coincides with the MECO (Figure F21; Edgar et al., 2013).
Benthic foraminifers
Benthic foraminifers were examined semiquantitatively in core catcher samples from Holes U1507A and U1507B and in additional working-half sections (intervals 371-U1507A-22H-1, 51–53 cm, and 22H-1, 95–97 cm; Section 371-U1507B-24R-7; Table T6). Because benthic foraminifers are rare relative to total particles in the >63 µm fraction in most of the examined samples, they are generally classified as present. However, in five samples from Hole U1507A, benthic foraminifers can be described as few, with one sample from Hole U1507B (Sample 10R-CC) completely barren. In Hole U1507A, benthic foraminifer preservation is very good through Pleistocene and Pliocene Cores 1H through 6H but is recorded as generally moderate to poor through most of the remaining Miocene and uppermost Oligocene (Figure F19). Preservation in Hole U1507B is moderate through the top five early Miocene samples and poor through the rest of the hole. In Hole U1507A, 3075 specimens were picked from 47 samples and 141 taxa were identified; in Hole U1507B, 1664 specimens were picked from 48 samples and 108 were taxa identified. Most samples are strongly dominated by calcareous taxa.
Assemblages in the Pleistocene and in the top four cores (Samples 371-U1507A-3H-CC to 6H-CC; 25.10–54.09 m) of the Pliocene in Hole U1507A are dominated by mixed infaunal and epifaunal morphogroups. These indicate meso-eutrophic conditions at the seafloor (Jorissen et al., 2007). Stilostomellids, nodosariids, miliolids, pleurostomellids, Bolivina spp., Fissurina spp., Fursenkoina spp., Anomalinoides globosus, Globocassidulina subglobosa, and Oridorsalis umbonatus are the most representative taxa.
Miocene and Oligocene assemblages are dominated by epifaunal morphogroups and in some samples by mixed infaunal–epifaunal morphogroups. Nodosariids, stilostomellids, O. umbonatus, G. subglobosa, Buliminella grata, Vulvulina spinosa, Pullenia bulloides, Bolivina spp., Pleurostomella spp., and Uvigerina spp. are the most common taxa among infaunal morphogroups. Cibicides spp., Cibicidoides spp. (including Cibicidoides mundulus and Cibicidoides dohmi), Gyroidinoides spp., Anomalinoides spp. (including Anomalinoides semicribratus), Planulina wuellerstorfi, and Nuttallides umbonifera are the most common among epifaunal taxa. This assemblage suggests oligotrophic to mesotrophic conditions at the seafloor (Jorissen et al., 2007).
Most Oligocene samples are characterized by small-sized specimens (Samples 371-U1507B-10R-CC to 30R-CC; 457.18–642.43 m), with trochamminids making up half of the assemblages in Sample 11R-CC where abundant siliceous (diatoms and radiolarians) and calcareous microfossils (calcareous dinoflagellates) occur. Trochamminids behave as opportunistic taxa, and they may proliferate at the seafloor under changing trophic conditions and varying oxygenation of bottom waters (Kaminski and Gradstein, 2005). Their high abundance indicates environmental stress. A small number of shelfal warm-water taxa, including Asterigerina spp., Amphistegina spp., and Cibicides vortex, probably deposited by turbidites, were recovered from Samples 25R-CC, 26R-CC, and 28R-CC.
Eocene benthic foraminifers are poorly preserved throughout the lower part of Hole U1507B, including Samples 31R-CC to 53R-CC (654.12–855.74 m). Assemblages are much less diverse and abundant compared with the Oligocene and Miocene sequences and are mostly dominated by epifaunal taxa such as C. mundulus, C. dohmi, Nuttallides truempyi, and Anomalinoides spp. Nodosariids, stilostomellids, Spiroplectammina cubensis, O. umbonatus, and pleurostomellids were identified among the infaunal taxa.
The assemblages of the Pleistocene to uppermost Oligocene indicate deposition at abyssal depths. This deposition is inferred from the occurrence of typically abyssal (e.g., Favocassidulina favus, N. umbonifera, and Cibicidoides havanensis; van Morkhoven et al., 1986) and lower bathyal to abyssal taxa (e.g., Anomalinoides globulosus, Bolivina spp., B. grata, C. mundulus, Laticarinina pauperata, P. wuellerstorfi, G. subglobosa, and V. spinosa; Tjalsma and Lohmann, 1983; van Morkhoven et al., 1986; Hayward et al., 2010). Reworked shallower taxa were also identified in intervals 371-U1507A-22H-1, 51–53 cm, and 22H-1, 95–97 cm. These intervals contain a mixture of benthic foraminifer preservation states (from moderate to very poor and some completely pyritized tests). In addition to typically deep-water taxa, other species that resemble recent shallow-water taxa living on the shelves in New Caledonia (e.g., Discorbinella, Planulina, Laticarinina, and Planularia; Debenay, 2012) were observed.
The assemblages of the rest of the Oligocene and the Eocene, including Samples 371-U1507B-12R-CC to 49R-CC (80.13–825.64 m), indicate deposition in the lower bathyal zone. This deposition is inferred from the common occurrence of lower bathyal species (e.g., A. semicribratus, Cibicidoides bradyi, G. subglobosa, Gyroidinoides neosoldanii, Eggerella bradyi, O. umbonatus, and P. bulloides) and from the occurrence of taxa with an upper depth limit at 1000 m (C. mundulus; van Morkhoven et al., 1986). The Eocene sequence has a similar assemblage that includes C. mundulus, O. umbonatus, Pleurostomella spp., stilostomellids, S. cubensis, and N. truempyi. C. dohmi is occasionally common to abundant in the Eocene samples and, together with the lower bathyal–abyssal species V. spinosa, indicates a paleodepth in the lower part of the bathyal zone.
The presence of N. truempyi, O. umbonatus, Karreriella chilostoma, and Vulvulina bortonica in the lowermost samples from Hole U1507B (Samples 50R-CC to 53R-CC) may indicate shallower, deep middle bathyal paleodepth.
The top occurrence of N. truempyi in Sample 371-U1507B-30R-CC (642.33–642.43 m) allowed identification of the Eocene/Oligocene boundary between this sample and Sample 29R-CC (638.95–639.05 m).
Assemblages overlying the MECO are very poor, and a population of small specimens of trochamminids strongly dominates the benthic fauna through the MECO and pre-MECO intervals (Samples 371-U1507B-50R-CC to 52R-CC; 835.51–855.33 m; Figure F21). The agglutinated tests of trochamminid specimens are heavily recrystallized, and their strong dominance indicates a stressed environment during this time, possibly combined with CaCO3 dissolution in bottom waters.
Ostracods
Ostracod preservation, abundance, assemblage composition, and paleodepth estimates were investigated using core catcher samples and additional samples from working-half sections (Figure F23). Ostracods are rare to common in intervals 371-U1507A-1H-CC, 11–16 cm, through 30X-CC, 11–21 cm (6.17–279.69 m). Barren intervals are found in intervals 31X-CC, 24–27 cm, through 46X-CC, 26–36 cm (284.34–420.66 m). In addition, the entirety of Hole U1507B is also barren of ostracods (Figure F19).
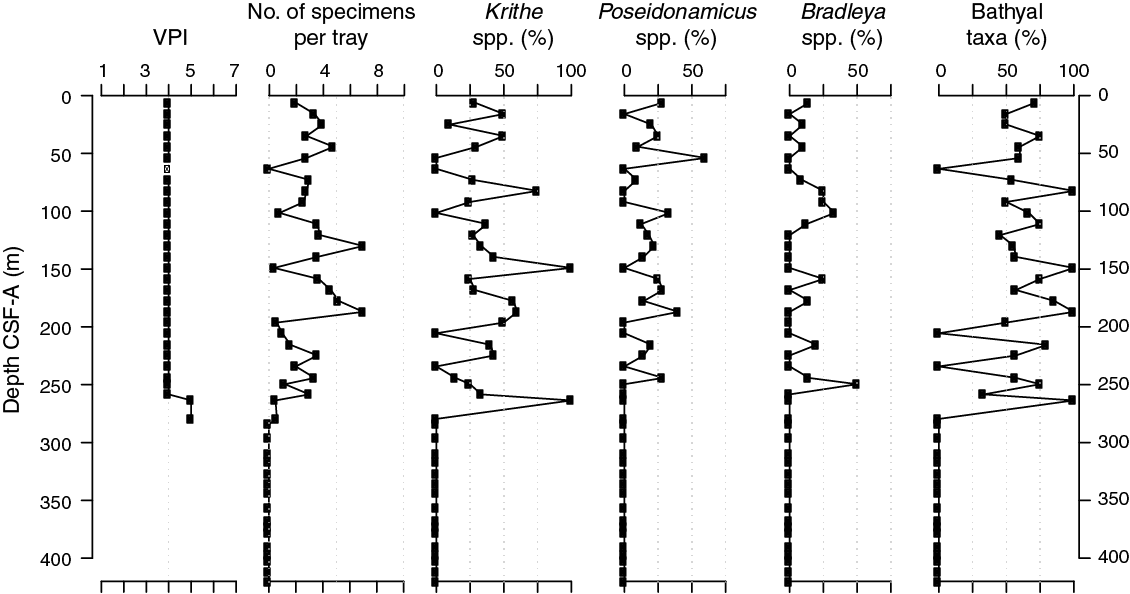
Figure F23. Ostracod preservation, abundance, and assemblage composition, Hole U1507A.
In Hole U1507A, 152 specimens were picked and 46 taxa were identified. The fossils are relatively well preserved for most nonbarren samples, and the visual preservation index (VPI) (Dwyer et al., 1995) ranges from 4 to 5 (Figure F23). The abundance data are standardized by presenting the number of specimens per size tray, which ranges from 1 to 7. The dominant genera are Krithe spp. and Poseidonamicus spp. Other abundant genera include Bradleya, Cytheropteron, and Henryhowella. In Hole U1507B, only one carapace specimen (Philoneptunus sp.) is found in interval 31R-4, 23–25 cm (648.440 m).
Paleoenvironmental interpretations based on ostracod assemblages are possibly biased due to numerous barren samples and repeated intervals with reworking. Nevertheless, paleodepth estimates based on ostracods suggest a continuous deep-sea setting (lower bathyal) of sediments in intervals 371-U1507A-1H-CC, 11–16 cm, through 30X-CC, 11–21 cm (6.17–279.69 m).
The disappearance of ostracods corresponds to the ooze–chalk transition in Cores 371-U1507A-30X through 32X (Figure F23). The barren intervals probably result from poor preservation, which is also inferred for the nannofossil and planktic and benthic foraminifer assemblages in similar samples (Figure F19).
Radiolarians
Core catcher samples from Holes U1507A and U1507B were analyzed for the occurrence of radiolarians (Samples 371-U1507A-1H-CC to 46X-CC [6.17–420.66 m] and 371-U1507B-2R-CC to 53R-CC [380.55–855.74 m]). Due to time constraints, shipboard observations focused on the presence of age diagnostic species. Distribution data do not fully represent the full radiolarian assemblage (Table T7). When observed, other siliceous microfossils were noted.
In Hole U1507A, radiolarians are rare to few in Cores 1H through 6H but with overall good preservation (Figure F19). Sponge spicules occur in great abundance in all six samples. The uppermost sample (371-U1507A-1H-CC) is tentatively assigned to Subzone RN12b–Zone RN14 due to the absence of Collosphaera tuberosa (base of Zone RN15) and the presence of Cycladophora davisiana, the base of which occurs in the lower part of Subzone RN12b. Samples 2H-CC to 6H-CC (15.98–54.09 m) are dominated by Spumellaria and Collosphaeridae but are not assigned to any radiolarian zone because marker species were absent. Reworked Miocene Cyrtocapsella spp. was observed in Samples 3H-CC and 4H-CC. The remaining cores are barren of radiolarians.
In Hole U1507B, radiolarians are present in varying abundance in Samples 2R-CC to 13R-CC (380.55–489.04 m), although with moderate to poor preservation (Figure F19). The interval between Cores 14R and 28R (498.90 and 625.54 m) is basically barren of radiolarians, except for trace amounts in two samples. Radiolarians are rare to common in abundance in Samples 29R-CC to 53R-CC (638.95–855.74 m) but are poorly to moderately preserved and often infilled with clay.
The base of early Miocene Zone RN02 is at 437.55 m (±4.93 m) based on the top of Theocyrtis annosa (21.3 Ma) and the base of Calocycletta serrata in Sample 371-U1507B-7R-CC (Figure F18; Table T3). The top of the zone cannot be recognized. Samples 8R-CC to 12R-CC (442.57–480.03 m) are tentatively assigned to late Oligocene Subzone RP21b through early Miocene Zone RN01 based on the presence of Calocycletta robusta (Subzone RP21b through Zone RN01) and the absence of C. serrata. The base of Cyrtocapsella tetrapera, which defines the base of Zone RN01, was observed in the same sample as the base of C. serrata (Zone RN02).
Based on nannofossil and planktic foraminifer biostratigraphy, Cores 371-U1507B-29R through 53R are late to middle Eocene in age (Figure F18). This interval can be correlated with low-latitude radiolarian Zones RP19 through RP14. However, many low-latitude index species are absent or rare and sporadic in occurrence. The top of Zone RP19 is determined by the top of Dictyoprora mongolfieri (33.9 Ma) between Samples 30R-CC and 31R-CC (648.28 ± 5.85 m). The Zone RP18/RP19 boundary is recognized between Samples 33R-CC and 34R-CC (677.69 ± 5.11 m) by the top of Thyrsocyrtis tetracantha (35.4 Ma). The base of Zone RP17–RP18 is determined by the base of Cryptocarpium azyx (38.26 Ma) between Samples 43R-CC and 44R-CC (770.15 ± 7.46 m). C. azyx is only found in Sample 43R-CC. The base of Calocyclas turris is found between Samples 42R-CC and 43R-CC (759.93 ± 2.66 m) and occurs in the lower part of Zone RP17 (37.96 Ma). The Zone RP16/RP17 boundary is recognized between Samples 43R-CC and 44R-CC (770.15 ± 7.46 m) based on the tops of Calocycloma ampulla (38.36 Ma) and Anthocyrtoma sp. (38.47 Ma). The top of Zone RP14–RP15 is recognized between Samples 51R-CC and 52R-CC (845.66 ± 9.58 m) based on the tops of Sethochytris triconiscus (40.18 Ma) and Artobotrys biaurita (40.5 Ma). The top of Podocyrtis mitra (41.22 Ma), which defines the base of Zone RP15, is found between Samples 50R-CC and 51R-CC (835.8 ± 0.18 m). The southwest Pacific Zealandia radiolarian zonation (zRP zones) was not applied at this site due to the absence or sporadic occurrence of marker species. Only the base of Zealithapium mitra (base of Zone zRP13) was observed between Samples 49R-CC and 50R-CC (830.58 ± 4.93 m).
Palynology
A low-resolution palynological study was carried out on 10 core catcher samples from Site U1507 (4 from Hole U1507A and 6 from Hole U1507B) at an average sampling resolution of 1 sample per 10 cores. Samples were effectively barren of palynomorphs, which is not unexpected in pelagic carbonate deposits that contain little organic carbon (see Lithostratigraphy and Geochemistry). Trace amounts of dinocysts were found in Sample 371-U1507A-7H-CC (63.47 m) from the upper part of Subunit Ia and in Sample 371-U1507B-52R-CC (855.33 m) from the bottom of Unit II. These are consistent with Pliocene and middle Eocene ages, respectively, as inferred from nannofossil and planktic foraminifer biostratigraphy.
Paleomagnetism
Pass-through paleomagnetic measurements were performed on all archive-half sections from Holes U1507A and U1507B. Inclination data were used to determine magnetic polarity stratigraphy. To supplement and verify pass-through paleomagnetic data, 123 discrete samples were taken from intervals with minimal coring disturbance. For Unit I in Hole U1507B, samples were often collected on top of apparent turbidite layers. All discrete samples were subjected to stepwise alternating field (AF) demagnetization, as described in Paleomagnetism in the Expedition 371 methods chapter (Sutherland et al., 2019a). To investigate the magnetic fabric, all discrete samples were measured for anisotropy of magnetic susceptibility (AMS).
Paleomagnetic results
Paleomagnetic data of archive halves, including natural remanent magnetization (NRM) intensity and inclination of remanence, show variable quality for different lithostratigraphic units (Figures F24, F25). In Hole U1507A, the NRM intensity is on the order of 10−2 A/m, with slightly higher average values below ~237 m (Core 371-U1507A-26H). The NRM inclination before demagnetization is mostly positive, likely reflecting a drilling-induced overprint. Inclination values after 20 mT AF cleaning were filtered using a 10-point moving average. Cores 1H through 6H (0–53.8 m) are characterized by negative remanence inclinations (i.e., normal polarity), although some swings toward positive inclination (reversed polarity) were observed. Down to Core 23H at 215 m, inclination data show a series of reversals, although without a defined bimodal clustering (Figure F26A). In Cores 23H through 46X (215–420.3 m), inclinations oscillate randomly around zero with no clear polarity pattern. The average inclination for Hole U1507A is about −20°. The scattered paleomagnetic inclinations likely derive from drilling-induced overprint and coring-related sediment deformation.
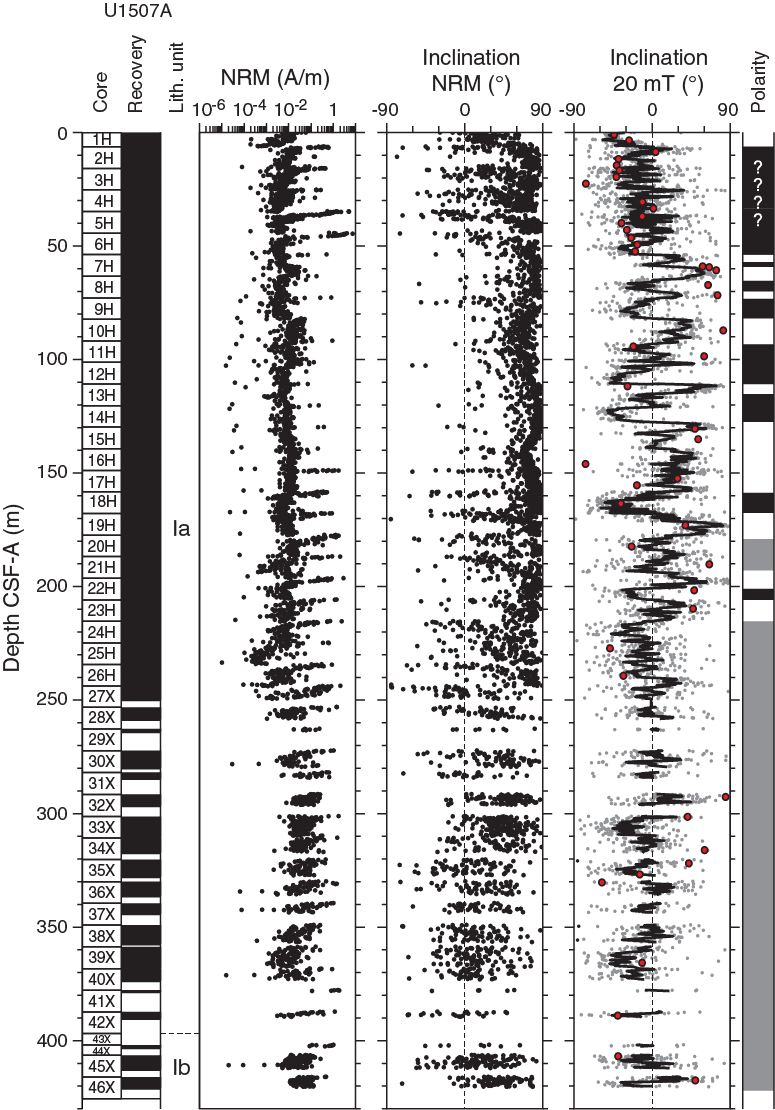
Figure F24. Pass-through paleomagnetic data, Hole U1507A.
Figure F25. Pass-through paleomagnetic data, Hole U1507B.

Figure F26. Inclination values.
Reliable paleomagnetic results were obtained for most intervals in Hole U1507B. The NRM intensity of lithostratigraphic Subunits Ib and Ic ranges between 10−2 and 1 A/m with a gentle increasing trend downcore (Figure F25). A particularly well defined series of positive and negative inclination shifts was observed after 20 mT AF cleaning in this part of Unit I (Cores 2R through 34R; 376–682 m). The histogram of inclination values indicates two clear peaks clustered around ±45° (Figure F26B). Sediments in lithostratigraphic Unit II, from Cores 35R through 53R (682–856 m), are characterized by a marked decrease of NRM intensity to ~10−4 A/m (i.e., about two orders of magnitude lower than Subunits Ib and Ic). This decrease results in generally scattered inclination values with no clear bimodal clustering. However, two switches from negative to positive inclination in Cores 43R (759.3 m) and 50R (834.0 m) are tentatively used for magnetostratigraphic correlation (see below). The higher NRM intensity in Subunits Ib and Ic presumably comes from the greater abundance of ferromagnetic (sensu lato) minerals associated with ash layers and volcaniclastic turbidites (see Lithostratigraphy).
After principal component analysis (PCA) of the demagnetization diagrams, linear characteristic remanent magnetization (ChRM) components of the NRM were isolated from 21 out of 57 (37%) discrete samples from Hole U1507A (Figure F27), which is not sufficient to support a reliable magnetostratigraphic interpretation. In Hole U1507B, 59 of 72 (82%) discrete samples show excellent AF demagnetization behavior with linear ChRM directions pointing toward the origin of the demagnetization diagrams after AF demagnetization at 10–20 mT. The good paleomagnetic behavior of discrete samples confirms the reliability of pass-through paleomagnetic results from Unit I in Hole U1507B.
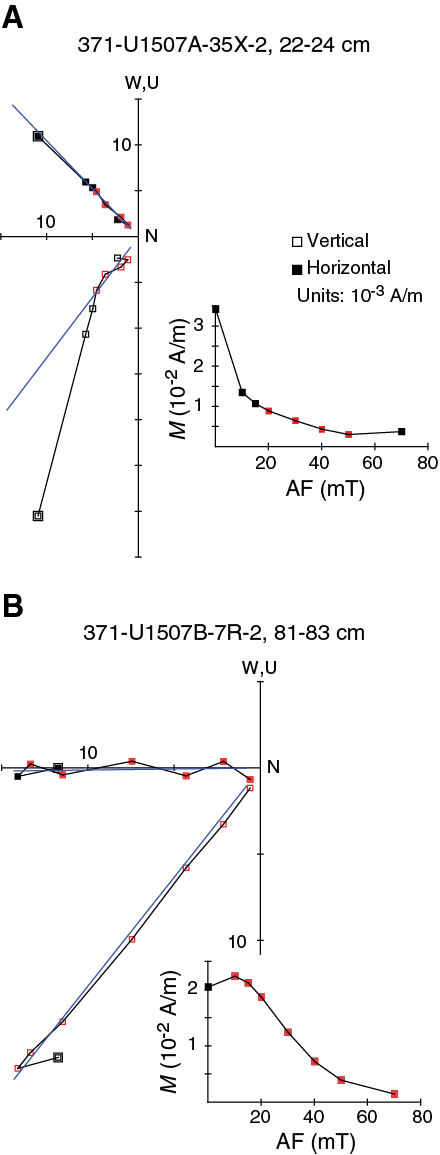
Figure F27. Vector endpoint demagnetization diagrams.
Anisotropy of magnetic susceptibility
AMS was measured on all 123 discrete samples from Site U1507 (Figure F28). Samples from Hole U1507A were mostly collected with 7 cm3 plastic cubes pushed into soft-sediment cores, which resulted in a generally poorly defined orientation of the AMS tensor. However, the κmin axis of the AMS ellipsoid is statistically oriented roughly perpendicular to the horizontal plane. Samples from Hole U1507B were trimmed into cubes directly from the hard sediment, allowing precise orientation. AMS results for samples from Hole U1507B show a clear oblate magnetic fabric, with the minimum axis of the AMS ellipsoids well clustered and perpendicular to the bedding, typical of undeformed sedimentary rocks.
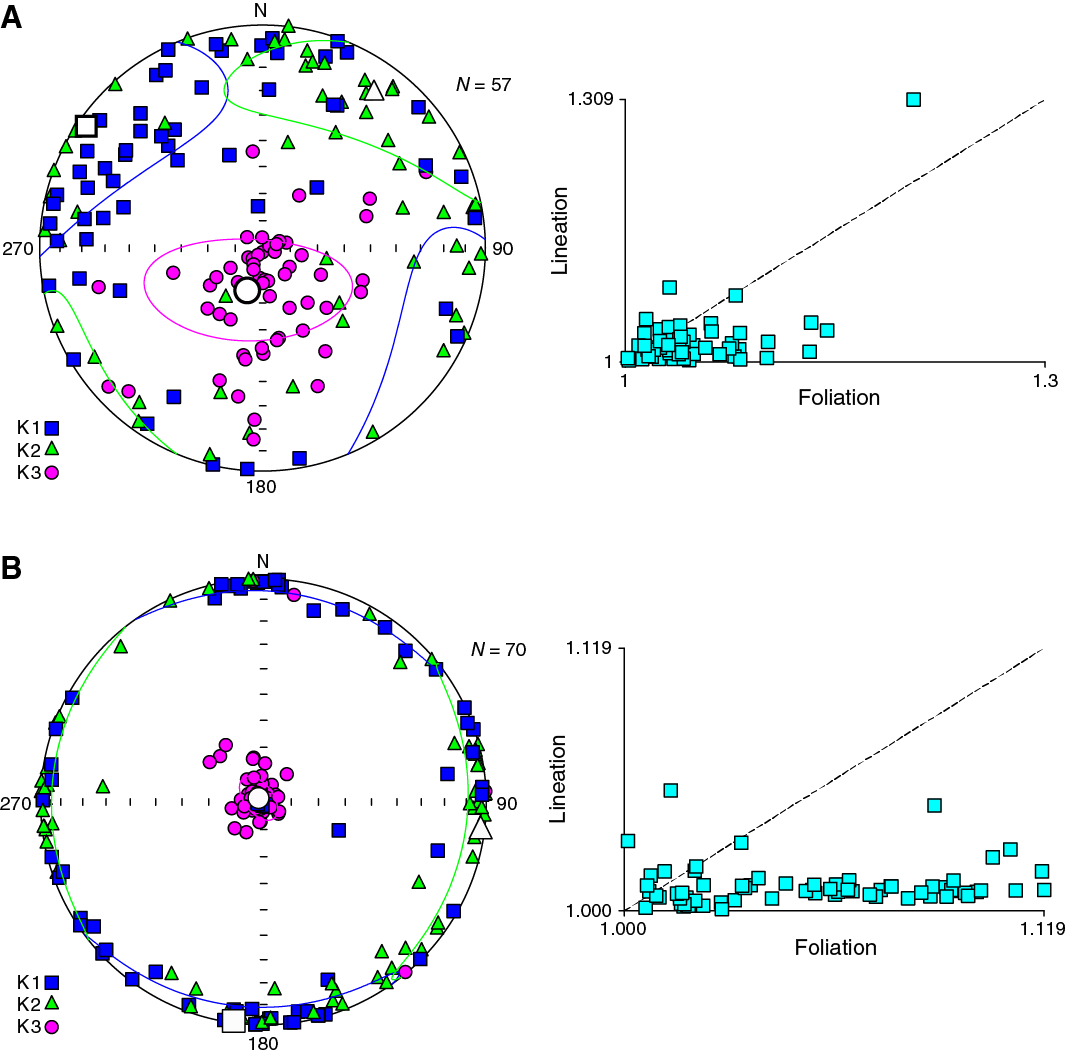
Figure F28. AMS data.
Magnetostratigraphy
No reliable shipboard magnetostratigraphy was obtained for Hole U1507A, but for Cores 371-U1507B-8R through 34R (433–683 m), integration with biostratigraphic results (see Biostratigraphy and paleoenvironment) allows a reliable correlation of measured polarity with known polarity chrons of the geomagnetic polarity timescale (GPTS). All chrons from Chron C6Br in the early Miocene to Chron C16n in the late Eocene were detected (Figure F25). Despite the high noise level in the remanence data, integration with biostratigraphy also allows interpretation of the two switches from normal to reversed polarity observed in Cores 43R (759.3 m) and 50R (834.0 m). These reversals correlate with the bases of Chrons 17n and C18n, respectively, and reinforce the age model for the lowermost depths at Site U1507 (Table T8).
Petrophysics
The full suite of physical properties measurements were made on cores recovered from Holes U1507A and U1507B (see Petrophysics in the Expedition 371 methods chapter [Sutherland et al., 2019a]). Downhole temperature measurements were made in Hole U1507A during drilling, and wireline logging was completed using a modified triple combo tool in Hole U1507B (see Operations). Measurable variations in physical properties arise from increasing lithification and from variations in sediment composition, including clay, volcaniclastics, foraminiferal ooze, and limestone.
Although rather uniform in their properties, data from lithostratigraphic Subunit Ia show small variations in magnetic susceptibility, NGR, P-wave velocity, and density (Figures F29, F30, F31). High magnetic susceptibility and NGR values correlate with tuffaceous and volcaniclastic layers. The overall higher P-wave velocity, greater density, and color change in the lower part of the subunit (300–400 m) are attributed to the diagenetic change of ooze to chalk and to an increase in clay content. Significant variations in physical properties were also observed in Subunits Ib and Ic, except in color, which remains approximately constant. High magnetic susceptibility and NGR values correlate with increased volcaniclastic content, and NGR peaks also occur where higher clay content is identified. In these subunits, P-wave velocity and bulk density correlate, reflecting changes in clay, chalk, and volcaniclastic content. Physical properties change little with depth in the homogeneous chalk and limestone of Unit II.
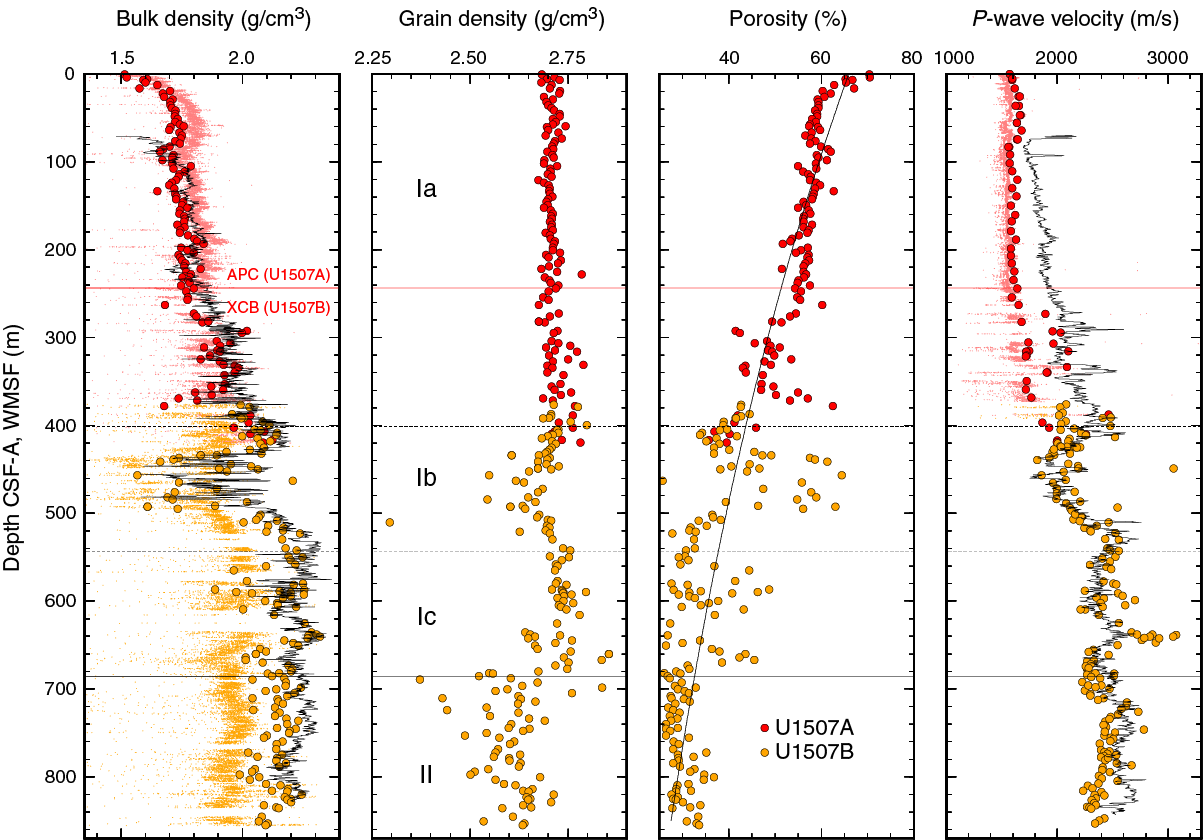
Figure F29. Bulk density, grain density, porosity, and P-wave velocity.
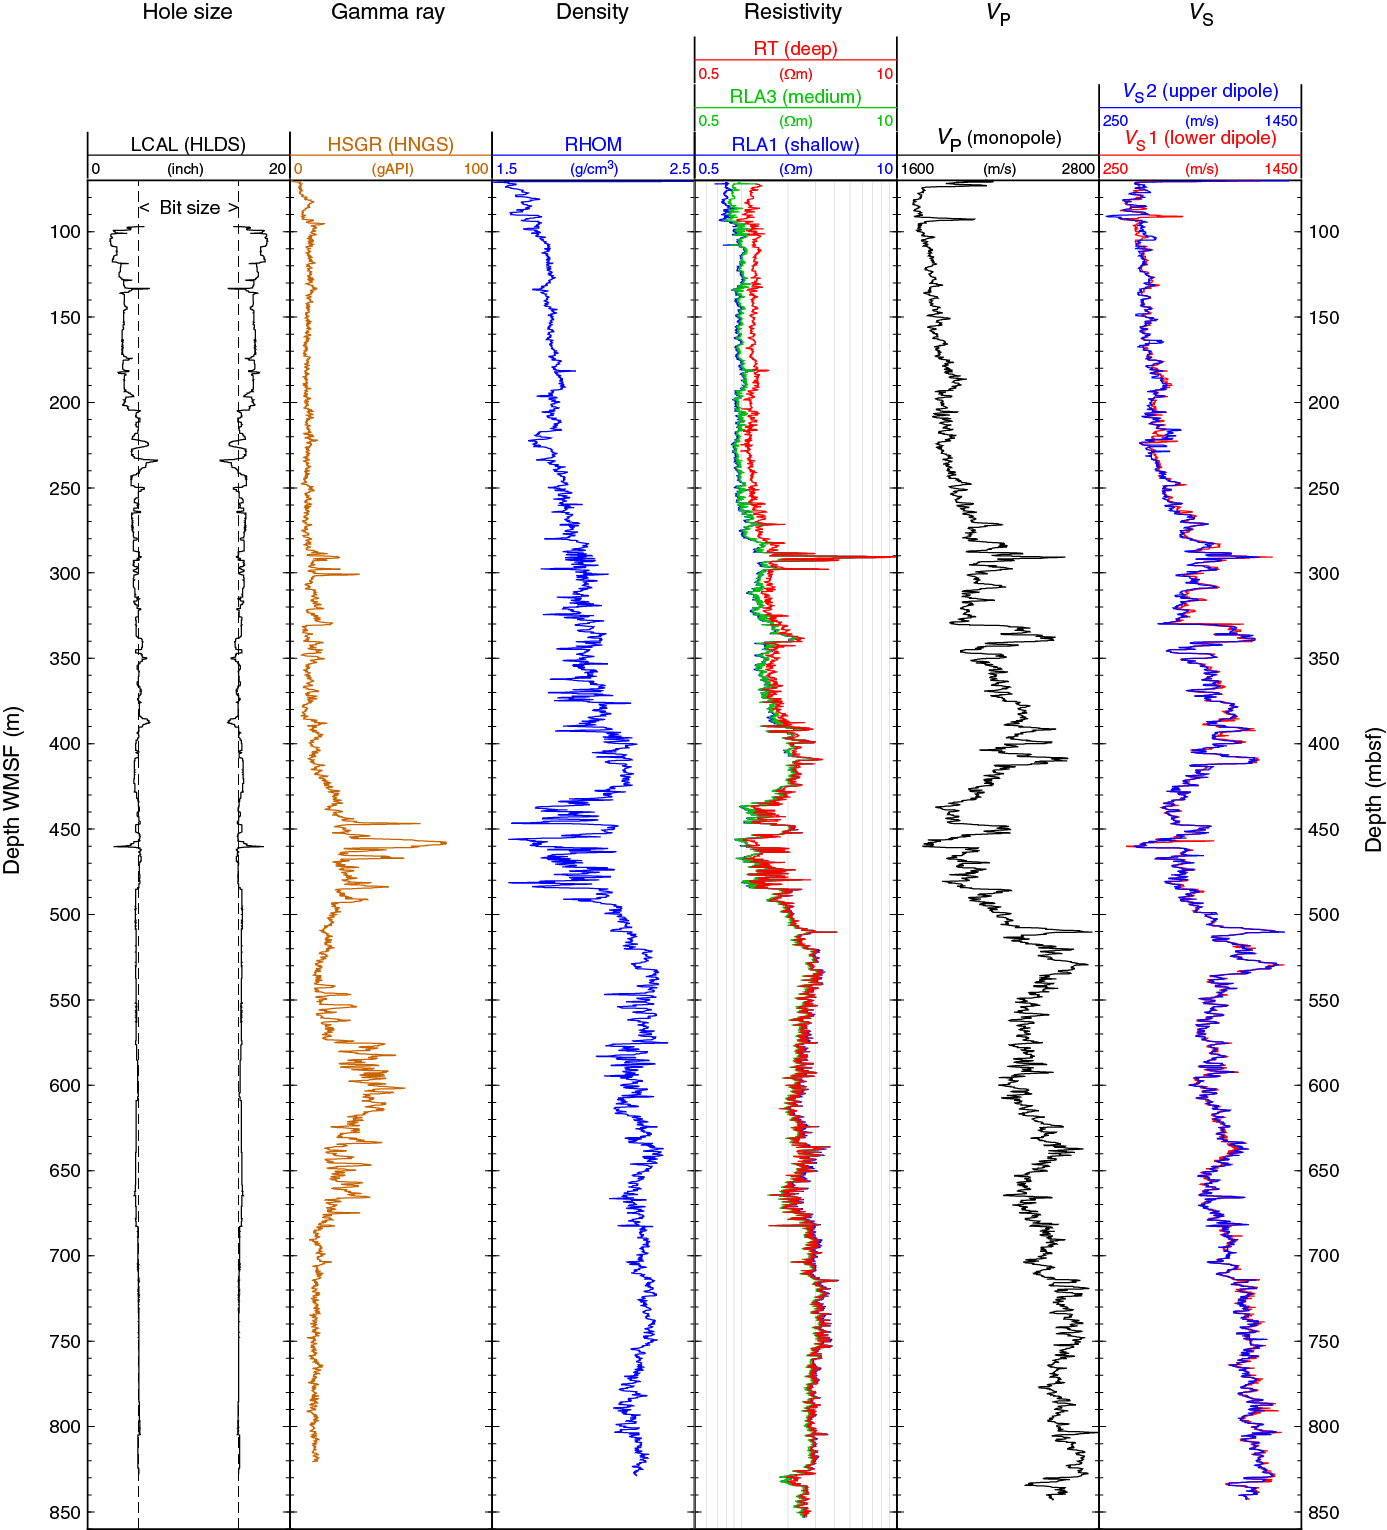
Figure F30. Wireline logging data, Hole U1507B.
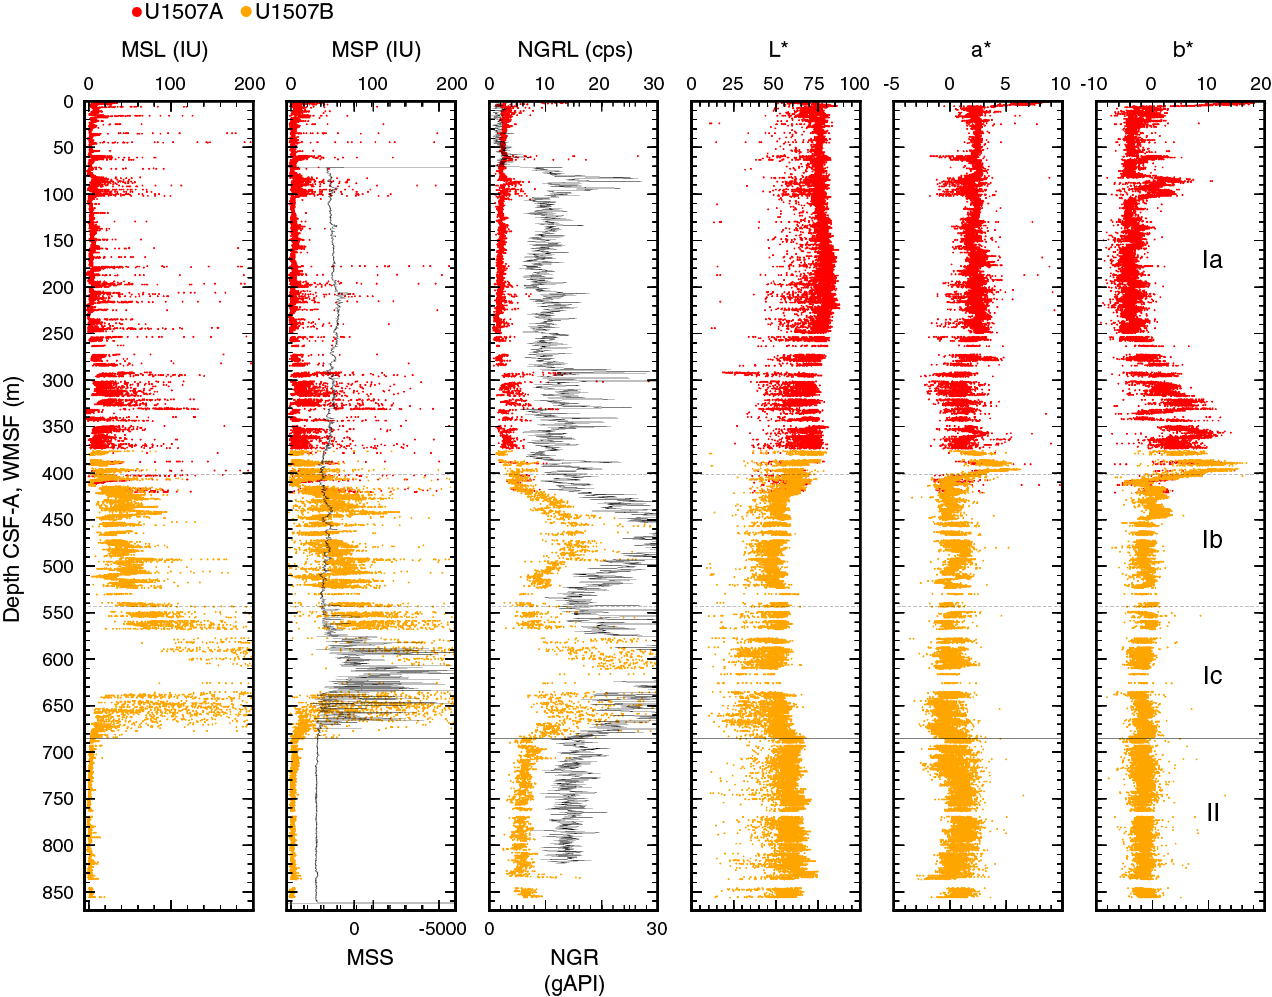
Figure F31. Magnetic susceptibility, NGR, and L*, a*, b*.
Density and porosity
Bulk density was estimated using the gamma ray attenuation (GRA) method on whole-round sections, the moisture and density (MAD) method on discrete samples from section halves, and the Hostile Environment Litho-Density Sonde (HLDS) wireline logging tool, which also uses the GRA method and is referred to as RHOM (Figures F29, F30).
Bulk density values show significant variations throughout the sedimentary column that correlate with porosity and grain density variations (Figure F29). Bulk density increases with depth in Subunit Ia (0–401 m; Cores 371-U1507A-1H through 46X and 371-U1507B-2R through 4R) from 1.5 to 2.1 g/cm3, presumably in response to a decrease in porosity, given that the material has similar grain density. GRA bulk density values are ~6% higher in the upper half of Subunit Ia (to about 250 m) than MAD and RHOM values, a difference attributed to the GRA calibration method that is biased toward siliciclastic material. In the upper part of Subunit Ib (~401–490 m), bulk density decreases from ~2.1 to ~1.7 g/cm3 and porosity values show a significant increase to 70%. This pronounced change measured on cores is also clearly evident in the in situ RHOM bulk density and resistivity (a proxy for porosity). Bulk density increases from ~1.7 to 2.2 g/cm3 and porosity decreases from 70% to 30% in the lower part of Subunit lb between 490 and 543 m. In Subunit Ic (~543–685 m) and Unit II (685–856 m), the bulk density downhole trend is approximately constant with local variations between ~2.0 and 2.3 g/cm3. Throughout Unit I, bulk density values decrease by ~0.1 g/cm3 in layers of foraminiferal ooze (e.g., Section 371-U1507A-16H-3).
In Unit II below 685 m, bulk density is approximately constant at ~2.2–2.3 g/cm3 (RHOM) and ~2.0–2.2 g/cm3 (MAD).
Grain density values (Figure F29) are approximately constant in Subunit Ia, with an average value of 2.71 ± 0.03 g/cm3 typical of carbonates. Higher variance in grain density values was observed between 300 and 400 m. In Subunit Ib, grain density decreases from ~2.7 to ~2.6 g/cm3 in clayey nannofossil chalk with ash. In Subunit Ic, which has abundant volcaniclastic deposits, grain density averages ~2.75 g/cm3. Grain density in Unit II (clayey nannofossil chalk) varies between ~2.5 and 2.7 g/cm3.
MAD-derived porosity values decrease with depth from about 70% in nannofossil ooze at the top of Hole U1507A to about 25% at the base of Hole U1507B in Eocene nannofossil chalk (Figure F29). Porosity decreases by 10% in the top 30 m of pelagic ooze and then another 10% by 280 m in Hole U1507A through the gravity flows (see Lithostratigraphy). The rate of porosity decrease with depth is higher below 280 m than it is above, a change associated with lithification of the calcareous sediments to chalk. In Subunits Ib and Ic, porosity spikes of ~50%–70% and ~40%–50%, respectively, are well above the baselines of ~40% and 35%, respectively. Porosity remains approximately constant with depth at ~35% in Unit II (686–856 m).
A best-fitting curve of porosity (φ) decrease with depth (z) (i.e., φ = φoe−z/c) has φo = 66% ± 1% and c = 975 ± 32 m (Figure F29). In the upper portion of Subunit Ia, from the seafloor to about 30 m, the decrease is much faster than predicted by the best fit. A more important deviation between the single model and the data is evident near the Unit I/II boundary: both the downhole trend and the variance in porosity differs significantly in the two units, and applying separate model coefficients may be appropriate.
P-wave velocity
P-wave velocity was measured on whole-round sections (P-wave logger [PWL]), on working-half sections (P-wave caliper [PWC] and P-wave bayonet [PWB]), and with the Dipole Sonic Imager (DSI-2) wireline logging tool (Figures F29, F30). In Hole U1507B, PWL measurements were made on Cores 371-U1507B-2R and 3R (376–392 m) only because gaps between RCB cores and core liner made results unreliable elsewhere. From ~390 m downhole, the frequency of discrete PWC measurements was increased to a minimum of three per core because this method provided good results.
P-wave velocity in Subunit Ia of Hole U1507A gradually increases with depth from ~1600 m/s at the seafloor to 1670 m/s at 280 m, an interval where sediments are predominantly nannofossil ooze. PWC velocity values over this depth range lie on the maximum of the PWL values. DSI-2 in situ velocity values are consistently higher than PWC and PWL values obtained from the cores, with the discrepancy increasing with depth from ~200 m/s at 80 m to ~400 m/s at 280 m. The laboratory-measured values are lower than the downhole values, which is attributed to porosity rebound (see Petrophysics in the Expedition 371 methods chapter [Sutherland et al., 2019a]) that affects the largely unconsolidated ooze after recovery (Figure F29).
A gradual change in the physical properties is associated with the diagenetic change from ooze to chalk between 284 and 293 m (see Lithostratigraphy). P-wave velocity (PWC and PWL) in the chalk of Core 371-U1507A-32X ranges between 1720 and 2100 m/s, an increase of ~100–400 m/s compared with the ooze in overlying Core 31X. DSI-2 velocity values are also higher in this depth range. From this ooze–chalk transition to ~400 m (base of Subunit Ia), P-wave velocity values are ~2000 m/s. The misfit between DSI-2 and PWL/PWC correlates with a reduction in porosity at the base of the subunit, indicating diminishing porosity rebound in the lower, more lithified sediments (Figure F29).
From the top of Subunit Ib (401 m) to ~800 m, PWC and DSI-2 velocity values agree well and are high and show gradients. A velocity increase from 2000 to 2500 m/s between 440 and 530 m occurs in the clayey nannofossil chalk (see Lithostratigraphy). In Subunit Ic and Unit II (543–856 m), the velocity trend and local variations mimic those of bulk density. Velocity averages ~2400 m/s throughout the interval, with local variations from 2200 to 3000 m/s. The highest values of ~3000 m/s are measured in Cores 371-U1507B-29R through 31R (639–649 m) in layers of clayey nannofossil chalk with volcanic ash that are interbedded with tuffaceous conglomerate up to 50 cm thick (e.g., Sample 29R-1, 15 cm; 634.9–635.4 m). A smaller increase to 2600 m/s is indicated by the DSI-2 velocity values at this depth.
DSI-2 P-wave velocity values are ~100–300 m/s higher than PWC values in the lowermost ~120 m of the hole. A negative excursion to ~2400 m/s at ~835 m wireline log matched depth below seafloor (WMSF) is associated with the MECO (see Biostratigraphy and paleoenvironment).
Magnetic susceptibility
Magnetic susceptibility was measured with the pass-through system (loop magnetic susceptibility [MSL]) on all whole-round sections, the point measurement system (point magnetic susceptibility [MSP]) on all section halves, and the magnetic susceptibility sonde (MSS) wireline logging tool (dual-coil sensor) (Figure F31). MSL and MSP values generally agree and are in accord with MSS variations. Magnetic susceptibility is low (~0–5 instrument units [IU]) in Subunit Ia, with many local spikes (up to 100 IU) correlated with volcanic ash layers (e.g., Section 371-U1507A-23H-3). Values in Subunit Ib range between ~5 and ~80 IU. Magnetic susceptibility values are higher (~100 to ~2000 IU) in Subunit Ic, where abundant volcaniclastic layers occur in clayey nannofossil chalk (see Lithostratigraphy). Values are consistently very low (~0–5 IU) throughout the clayey nannofossil chalk in Unit II.
Natural gamma radiation
NGR was measured on all whole-round sections using the Natural Gamma Radiation Logger (NGRL) and in situ through most of Hole U1507B using the wireline logging Hostile Environment Natural Gamma Ray Sonde (HNGS) (Figures F31, F32). Variations observed in core measurements closely match those in the wireline log (see Stratigraphic correlation). NGRL values are between ~2 and ~5 counts/s (10–15 gAPI in the hole) throughout Subunit Ia, except in four thin zones (10–30 cm thick) that have values of 10–20 counts/s (60, 100, 300, and 340 m). These zones correspond to nannofossil-rich clay layers (see Lithostratigraphy). NGRL values increase with depth from ~2 to ~20 counts/s in the upper 50 m of Subunit Ib (Cores 371-U1507B-4R through 16R; 400–550 m). Values decrease again to ~8 counts/s at the base of Subunit Ib (~550 m). In Subunit Ic, values increase to ~40 counts/s at ~600 m and then decrease again to ~8 counts/s at the base of Unit I. The source of the hundreds of NGR peaks, which make up two conspicuous rises in NGR in Subunits Ib and Ic over intervals of ~100 m, are the many volcaniclastic layers interbedded in clayey nannofossil chalk in these units (see Lithostratigraphy). In Unit II, composed mostly of homogeneous clayey nannofossil chalk and limestone, NGR values remain low (~7 counts/s) and approximately constant with depth.

Figure F32. K, Th, and U contents and Th to K ratio, Hole U1507B.
Potassium, thorium, and uranium contents were computed from the wireline logging data (HNGS; Figure F32). In Subunit Ia and Unit II, potassium, thorium, and uranium are at the detection limit. In Subunit Ib, potassium contents are higher (0.6 wt%), with spikes of 1.85 wt%. Thorium and uranium contents increase to 3 and 1 ppm, respectively, in Subunit Ib, with spikes of 9 and 3 ppm, respectively. Potassium and thorium contents are higher in Subunit Ic, up to 1.5 wt% and 6 ppm, respectively. The thorium to potassium ratio shows a higher baseline in the lower half of Subunit Ic and in Unit II because the abundance of potassium decreases.
Thermal conductivity and temperature
Conductivity measurements were made in each core on the dominant lithology. Thermal conductivity increases with depth from 1.1 to 1.8 W/(m·K) over the upper ~420 m. In Subunit lb and at the top of Subunit Ic, conductivity is variable. Values decrease to ~1.4 W/(m·K) at 460 m, increase to ~2.0 W/(m·K) at 550 m, and decrease to 1.3 W/(m·K) at 620 m. Below 620 m, thermal conductivity is approximately constant or decreases slightly in the lower part of Subunit Ic and in Unit II. The general trends in the conductivity data bear a close resemblance to the porosity profile (Figure F29), indicating that porosity is likely the main control on thermal conductivity variations.
In Hole U1507A, in situ temperature was measured with the advanced piston corer temperature tool (APCT-3) at six depths just after cutting Cores 4H, 7H, 10H, 13H, 16H, and 19H (30–190 m). The time-temperature records from Cores 4H, 16H, and 19H are good quality with little deviation from a single heat impulse. All other values are fair quality and yield ambient temperatures with errors <1°C. Temperature increases below the seafloor with a gradient of 49.2 ± 2.0°C/km (Figure F33A). Thermal conductivity was measured on cores from the same depth interval and increases linearly with depth (Figure F33B). Because thermal conductivity is not constant with depth, the Bullard method was used to estimate heat flux (see Petrophysics in the Expedition 371 methods chapter [Sutherland et al., 2019a]; Figure F33C). The constant slope between thermal resistance with temperature is consistent with a thermal regime that is close to a conductive state. From the plot of temperature with thermal resistance, we estimate the heat flux to be 66.6 ± 2.7 mW/m2 from the slope and the temperature at the seafloor to be 2.5 ± 0.3°C from the intercept. The heat flux is in line with the tectonics of the region (Pollack et al., 1993).
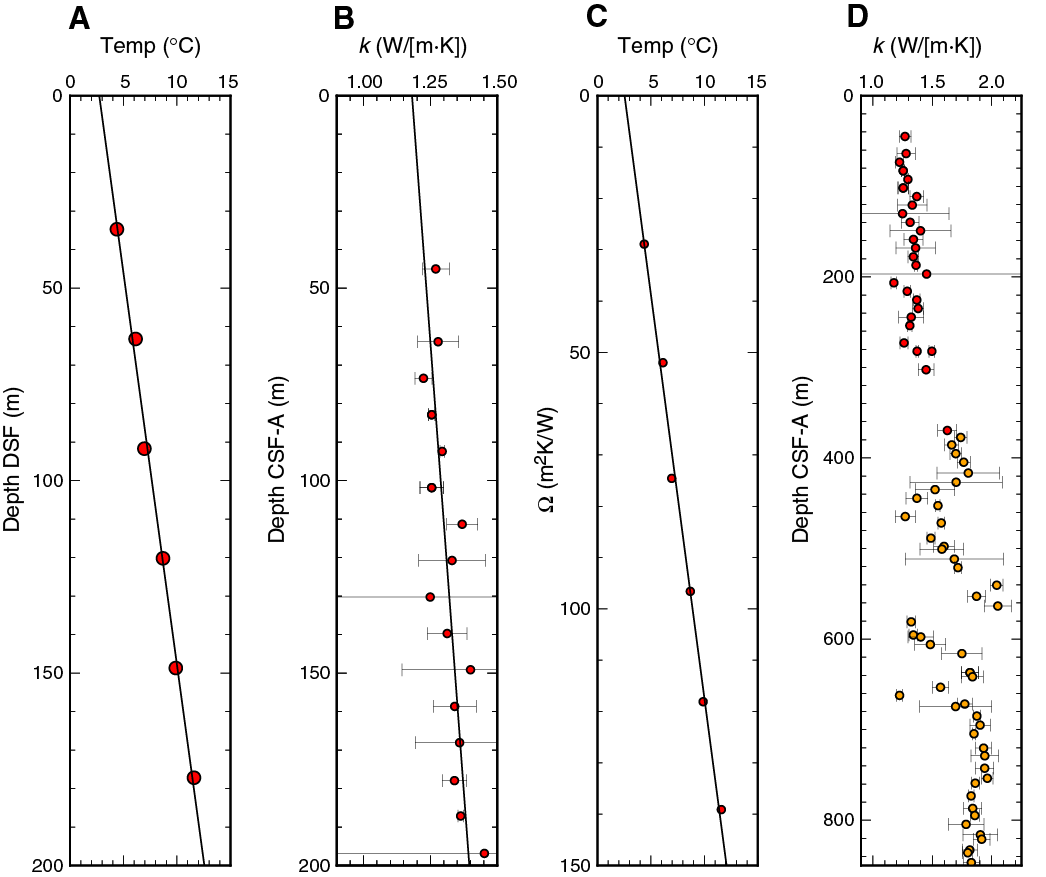
Figure F33. Heat flow.
Sediment strength
Sediment strength was measured with both the automated vane shear and penetrometer and generally increases with depth (Figure F34). Vane shear strength linearly increases from ~18 kPa near the seafloor to ~50 kPa at ~250 m. Compressive strength increases from 0 kPa near the seafloor to ~80 kPa at ~75 m. Strength increases but becomes more variable, ranging between ~50 and ~300 kPa, to ~250 m, where sediments are too hard to penetrate with the tool.

Figure F34. Shear and compressive strength.
Color spectrophotometry
In the upper part of Subunit Ia (0–280 m), reflectance L*, a*, and b* values are constant around ~75, ~2, and approximately −2, respectively (Figure F31), except for some peaks and troughs at ~60 and 80–100 m. The lithology in this depth range is gray/white nannofossil ooze. At ~280–400 m, the dominant lithology changes to nannofossil chalk and L* (~55) and a* (~1) values are lower, whereas b* values increase with depth in this interval to ~10. These changes indicate an increase in green (vs. red) and yellow (vs. blue). In Subunits Ib and Ic and Unit II, a* and b* values are constant at ~1 and approximately −1, respectively. L* values are constant at ~40 in Subunits Ib and Ic and increase to 60 in Unit II. The increase in L* is attributed to the downhole disappearance of ash in clayey nannofossil chalk in Unit II.
Two-way traveltime to depth conversion
Using a combination of P-wave velocity and bulk density data obtained from core and in situ measurements, acoustic impedance and a synthetic trace were computed. Corrections for the change in velocity and density arising from porosity rebound (Urmos and Wilkens, 1993) under atmospheric conditions are applied to core data values (Figure F35A, F35C; also see Petrophysics in the Expedition 371 methods chapter [Sutherland et al., 2019a]). The synthetic trace was compared with a trace extracted from multichannel seismic (MCS) data (Line TAN1409-NCTN-11, common depth point [CDP] 4020, black line) recorded at Site U1507. Where prominent reflections on the seismic trace and the synthetic trace are well correlated, two-way traveltime (TWT) depth points were selected (Figure F35B; Table T9). Reflectors A–F are well fit by the synthetic seismogram, with some variability in the fit to the amplitude of these reflections. The fit is poorer for the two deepest reflectors (G and H); the synthetic solution is of higher frequency than the seismic data, and the synthetic arrival times are ~0.005 s early, or ~1/4 wavelength ahead. Higher attenuation of the MCS data, compared with the synthetic model, or an overestimation of velocity values may account for the discrepancy below 700 m WMSF.

Figure F35. Borehole data to MCS data tie.
Geochemistry
The geochemistry program at Site U1507 was designed to characterize the composition of pore water and solid sediment and to assess the potential presence of volatile hydrocarbons. Site U1507 was expected to have a relatively thick sediment column adjacent to the submerged Norfolk Ridge in relatively deep water. Low primary productivity in overlying surface water and limited terrigenous input might lead to a carbonate-rich lithology lean in organic components (see Background and objectives). Furthermore, reactions with the volcanic sedimentary components might influence pore water chemistry.
Headspace hydrocarbon gases
A total of 97 headspace gas samples were taken for routine safety monitoring, typically one from the top of the last section of every core. Hydrocarbon gases were consistently below the detection limit.
Interstitial water analyses
A total of 56 interstitial water (IW) samples were collected and analyzed, 51 from Hole U1507A and 5 from Hole U1507B. One mudline sample was taken from the top of Core 371-U1507A-1R. The deepest IW samples were at 411 m in Hole U1507A and 497 m in Hole U1507B. The bottom ~370 m of the sequence was not sampled because the sediment was too hard to squeeze. Below 243 m, XCB cores were retrieved instead of APC cores, which may explain some of the chemistry results at depth, in particular significantly different concentrations for dissolved species in adjacent samples. Results from both holes are displayed together but distinguished for discussion. The general elemental and ion concentration profiles show some similarity to those of Site U1506.
Salinity, pH, and alkalinity
Salinity is 35.5 in the mudline sample and increases to 37.0 at 15 m (Table T10; Figure F36). Below this depth, salinity decreases to 34.5 at 167 m and then increases downhole to as high as 36.0 with fluctuations. Salinity at this site displays more variation than at Site U1506, where it is constant at 35.5. Alkalinity at Site U1507 increases from 2.6 mM in the mudline sample to 3.5 mM at 36 m and then decreases gradually to 0.4 mM at 411 m. Alkalinity at this site has a wider concentration range than at Site U1506. The upper part of the pH profile at this site is similar to that at Site U1506, decreasing from 7.74 in the mudline sample to 7.47 at 233 m. Unlike Site U1506, pH increases below 233 m to as high as 8.14 at 295 m. The high pH value at this depth signals a change in lithology from nannofossil ooze to chalk with volcanic ash (see Figure F4).

Figure F36. Salinity, alkalinity, pH, and major, minor, and trace elements.
Sulfate and ammonium
Sulfate (SO42−) and ammonium (NH4+) profiles generally change in the opposite direction of each other (Table T10; Figure F36). Sulfate decreases from 28.4 mM in the mudline sample to 17.3 mM at 233 m and then decreases downhole gradually with fluctuations to a minimum value of 15.3 mM at 342 m. The concave-down SO42− profile mimics that at Site U1506 but has a lower minimum value.
The dissolved NH4+ profile shows more detail and a broader range than at Site U1506 (Table T10; Figure F36). NH4+ concentration is 32.4 µM in the mudline sample but is otherwise below the detection limit in the uppermost 5 m. Below this depth, it increases slightly to values <50 µM from 5 to 24 m. Such low values of NH4+ in the uppermost sediment suggest consumption below the seafloor by microbial oxidation (e.g., Bolliger et al., 1991). NH4+ concentration increases downhole to a maximum value of 385.9 µM at 224 m, more than twice as high as at Site U1506. This maximum value supports the interpretation of greater organic matter oxidation at Site U1507.
Calcium, magnesium, and potassium
The dissolved calcium (Ca) and magnesium (Mg) concentration profiles generally mirror each other downhole with smooth trends in the upper 243 m (Table T10; Figure F36). Ca concentration increases from 10.4 mM at 3 m to 34.9 mM at 497 m, whereas Mg concentration decreases from 51.1 to 15.7 mM in the same interval. The coupled change in Ca and Mg may reflect reactions of the pore water with volcanic ash dispersed in the sediment column, which is abundant in Subunits Ib and Ic (see Lithostratigraphy). Potassium (K) concentration shows a decreasing trend from 10.5 mM at 3 m to 4.6 mM at 497 m with small fluctuations below 243 m (Table T10; Figure F36). The continuous decrease in K with depth may result from ion exchange with clay minerals in the sediment, which are abundant below 295 m (see Lithostratigraphy).
Chloride, bromide, and sodium
The Cl−, Br−, and Na concentration profiles are similar downhole. All three show slight fluctuations in the uppermost 8 m, a sharp increase at 15 m, and a gradual increase from 15 m to the bottom of the sediment column (Table T10; Figure F36). This pattern is similar to the profiles at Site U1506 but has small variations that could be possibly revealed by higher resolution sampling.
Strontium, boron, silica, and lithium
Dissolved Sr, B, and Si change with depth differently at Site U1507 than at Site U1506 (Table T10; Figure F36). Sr concentration increases smoothly from 124 µM at 3 m to 1106 µM at 177 m but remains almost constant between 177 and 248 m. Below that depth, Sr concentration generally increases downhole with fluctuations to a maximum value of 1287 µM, ~15 times as high as the concentration in seawater.
The B concentration profile displays a gradual decrease with depth with fluctuations (Table T10; Figure F36). Fluctuations in B concentration become larger in amplitude with depth, which also happens in the pH profile.
Silica concentration exhibits an unusual profile. H4SiO4 concentration in most samples is between 150 and 180 µM. However, in two intervals, one in the upper 100 m and the other one between 400 and 500 m, H4SiO4 concentration reaches as high as 787 µM.
The Li concentration profile at Site U1507 fluctuates smoothly downhole at the 100 m scale, ranging between 4.4 and 32.4 µM. Li decreases from 22.6 µM in the mudline sample to a minimum of 4.4 µM at 167 m, then increases to 7.1 µM at 177 m, and remains almost the same to 233 m. Below, Li concentration decreases to 4.5 µM at 243 m and increases almost linearly to 32.1 µM at 356 m. Li remains at a similar value for the next 50 m and decreases to a low of 14.5 µM between 400 and 500 m. The high Li concentrations at about 400 m may relate to clay-rich sediment, compared with carbonate ooze above.
Bulk sediment geochemistry
A total of 118 freeze-dried bulk sediment samples with a maximum volume of 5 cm3 were collected from Holes U1507A (48 samples) and U1507B (70 samples) at a sampling resolution of at least one sample per core. Typically, samples were taken adjacent to MAD samples to facilitate comparison with physical properties.
In general, changes in total carbon (TC) and total inorganic carbon (TIC) contents correspond well to the defined lithostratigraphic units (see Lithostratigraphy). Throughout the sediment column, TC and TIC contents range between 1.8 and 11.8 wt% and between 1.6 and 11.4 wt%, respectively (Table T11; Figure F37). Such values reflect carbonate (CaCO3) contents between 14 and 95 wt%, assuming that calcium carbonate hosts all inorganic carbon. Because most carbon exists as CaCO3, downhole profiles of TC and CaCO3 closely mimic each other.
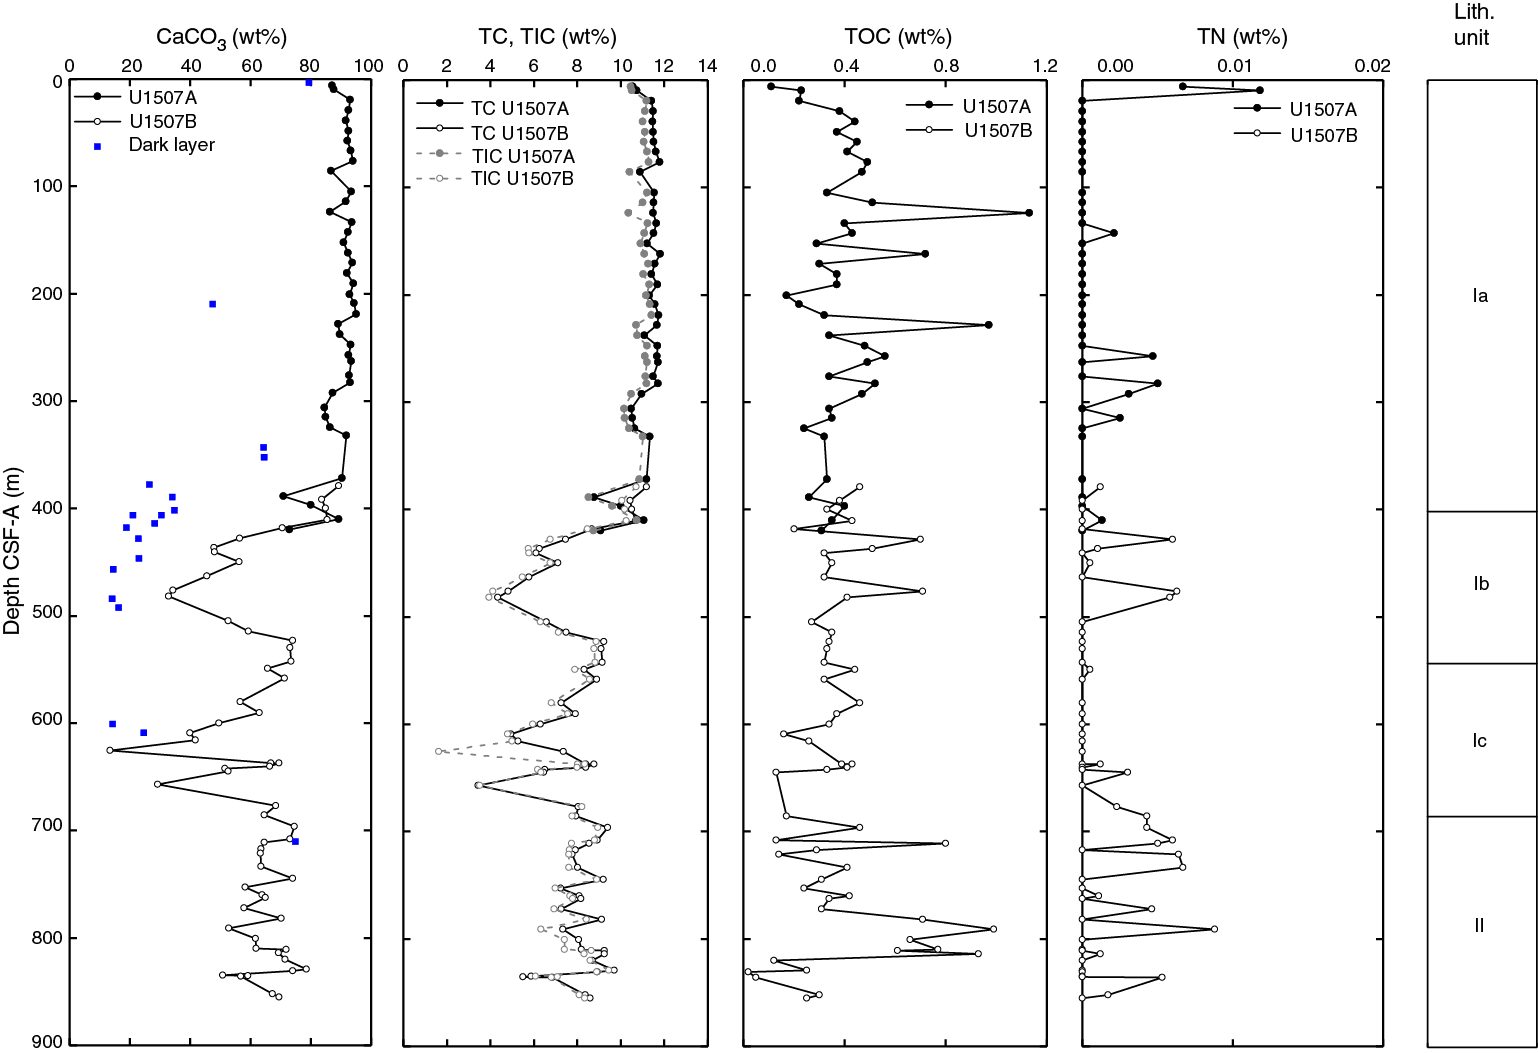
Figure F37. CaCO3, TC, TIC, TOC, and TN.
The highest CaCO3 contents are recorded in Subunit Ia (86 ± 13 wt%). In this subunit, relative lows were observed around 100, 230, 300, and 390 m. Subunits Ib and Ic are represented by relatively large fluctuations in carbonate contents (14–85 wt%), with the lowest values attained in the middle part of both subunits. These trends in carbonate content correlate well with changes in other measured properties such as reflectance L*, magnetic susceptibility, and NGR (see Petrophysics). In these units, some (typically darker) layers with subdominant lithologies were measured and are represented by lower TC (3.4 ± 2.1 wt%) and carbonate (27 ± 17 wt%) contents. Carbonate contents in Unit II are high, varying between 50 and 80 wt%. Total organic carbon (TOC) contents are low (averaging 0.4 wt%) throughout the sediment column and do not differ significantly between units.
Nitrogen contents throughout the sediment column are consistently low, mostly <0.01 wt% (Table T11; Figure F37).
Discussion
The downhole profiles of SO42−, NH4+, and pH likely relate to modest organoclastic sulfate reduction (OSR) in the upper ~250 m of sediment. This process is mentioned in Geochemistry in the Site U1506 chapter (Sutherland et al., 2019b).
The dissolved Ca, Mg, and K concentration profiles at Site U1507 share similarities with those at Site U1506 (see Geochemistry in the Site U1506 chapter [Sutherland et al., 2019b]) and with carbonate-rich sediment sequences from many open-ocean settings (e.g., Gieskes and Lawrence, 1976; Baker, 1986; Delaney et al., 1991; Sun et al., 2016). The coupled change in Ca and Mg has been documented since early DSDP legs and has been explained by reactions of the pore water with volcanic materials in the sediment, dissolution of carbonate, formation of clay minerals such as smectite, or ion exchange (e.g., above references and Gieskes, 1981; Kastner and Gieskes, 1976). Formation of clay minerals may also consume K (e.g., Gieskes and Lawrence, 1981; Sun et al., 2016). The abundant clay in Subunit Ib and volcanic ash in Subunit Ic may be a sink of K, in accordance with the two peaks in the K profile from wireline logging data (Figure F32).
Starting at 243 m, several profiles of dissolved species show differences compared with the overlying sequence. Although the switch from APC to XCB coring can explain the less smooth trends of major elements below this depth, the change in coring operations cannot explain the reversal in trends for pH, NH4+, and especially Li. Volcanic ash is found at 243 m, but no major change in lithology occurs at this depth.
At DSDP and Ocean Drilling Program sites where data are available, it is commonly reported that pore water Sr concentration increases to a plateau at depth and silica becomes enriched across specific horizons (e.g., Gieskes and Lawrence, 1976; Baker, 1986; Delaney et al., 1991). Carbonate dissolution and recrystallization definitely occur at Site U1507 because the lithology changes from nannofossil ooze to chalk at approximately 295 m (see Lithostratigraphy). Because biogenic carbonate typically contains Sr and recrystallized calcite excludes Sr, the downhole increase in dissolved Sr may come from the dissolution of biogenic calcite (e.g., Gieskes, 1981; Baker et al., 1982). Dissolved silica could result from the dissolution of biogenic silica (opal-A) or volcanic ash (e.g., Gieskes, 1981). Radiolarians are found in the upper 50 m and between 420 and 500 m at this site (see Biostratigraphy and paleoenvironment). Volcanic ash is also abundant in Subunits Ib and Ic. Therefore, biogenic silica and/or volcanic ash could be sources of dissolved silica at this site. Lower silica concentrations in the middle part of the sequence may reflect uptake by clay minerals (e.g., Gieskes, 1981).
Similar to Site U1506, high carbonate percentages in the major lithologies reflect a large contribution of calcareous nannofossil and, secondarily, foraminiferal components to the sediment. This situation is similar to that of the present day, in which New Caledonia Trough surface sediment is dominantly nannofossil ooze (see Background and objectives). Low organic carbon contents of <1 wt% (and absence of nitrogen) conform to an oligotrophic open-ocean setting (Hedges and Keil, 1995). The slightly higher TOC% at Site U1507 (0.4% for the upper 240 m) compared with that at Site U1506 (0.3% for the upper 210 m) may drive stronger OSR at Site U1507 and explain the lower dissolved SO42− and higher dissolved NH4+ concentrations.
Changes in carbonate content correspond to lithostratigraphic units. Decreasing carbonate contents and reflectance L* toward the middle of Subunits Ib and Ic, together with increasing NGR, likely indicate increased amounts of terrigenous or volcanic aluminosilicate. The varying carbonate contents in Unit II could reflect cyclical processes. For example, the MECO interval (three samples) may have low-range carbonate contents of 50–59 wt% (centered at ~835 m), corresponding to an increase in NGR. Deep-sea carbonate dissolution during the MECO is well recorded at a global suite of sites (Bohaty et al., 2009) and could be assessed at Site U1507 through a higher resolution study, although recovery of the MECO interval is not optimal.
Stratigraphic correlation
Paleomagnetic inclination, magnetic susceptibility, NGR, and GRA data were loaded into the Correlator software (version 2.1) to establish a depth correlation between the overlapping depths in Holes U1507A and U1507B. A single tie was established based on a prominent feature in the NGR records that occurs in the interval between Samples 371-U1507A-46X-2, 100 cm, and 371-U1507B-6R-2, 140 cm (Figure F38). This tie is further supported by robust correlation of variations in paleomagnetic inclination, light reflectance data (L*, a*, and b*), and core images. Given the limited overlap of cores between the holes, no core composite depth scale was established. It should be noted that according to core descriptions, this interval is affected by slumping, which may explain the observed discrepancies in calcareous nannofossil datums between Holes U1507A and U1507B. Interestingly, the overlapping interval cored with the XCB system (Hole U1507A) is significantly less complete than the one cored with the RCB system (Hole U1507B).
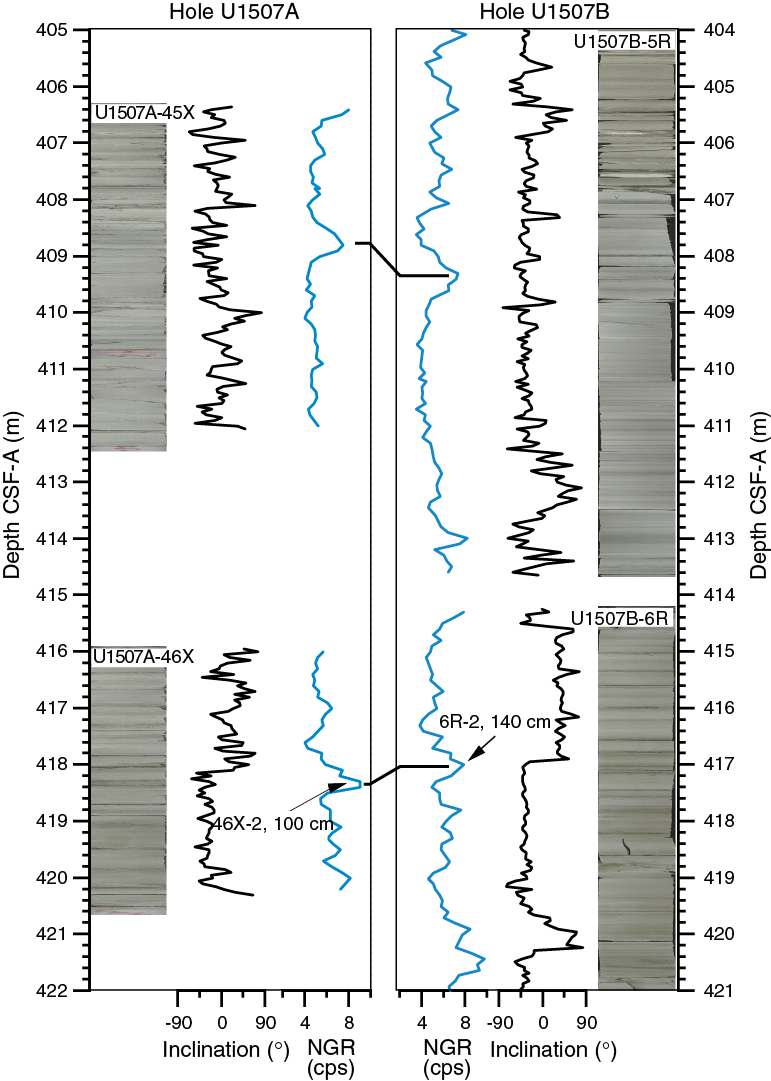
Figure F38. Depth correlation between overlapping intervals.
All cores from Holes U1507A and U1507B were tied to downhole logging data by matching NGR measured on cores and in the borehole. This permitted the translation of core depth scales from core depth below seafloor (CSF-A) to WMSF (Table T12) so that lithologic boundaries could be mapped to logging data (Figure F39). Alignment of magnetic susceptibility measured on cores and determined by logging (Figure F40) supports the established correlation between core depth and logging depth. The amount of offset required to map core data to logging data was minimal (0.0 to −2.7 m for all cores), which indicates a close match between the CSF-A and WMSF depth scales.
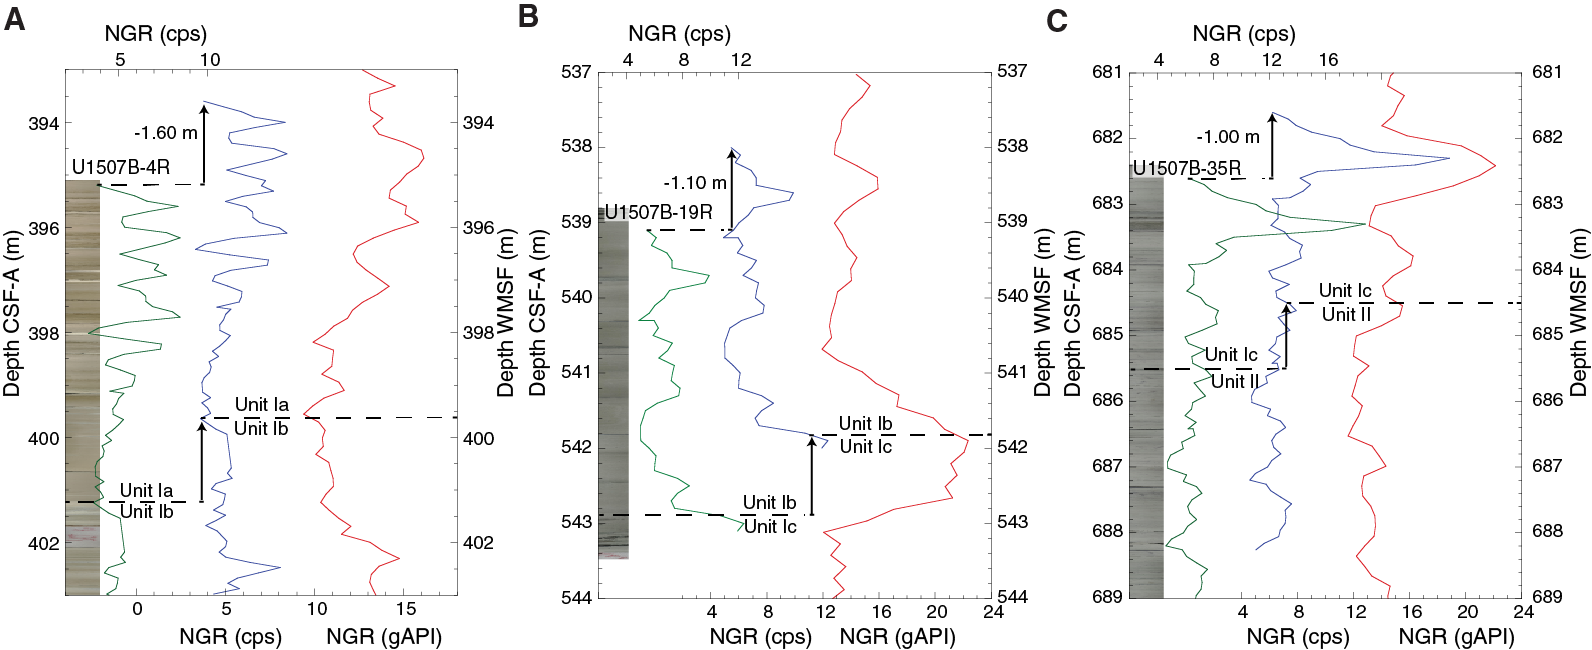
Figure F39. Depth correlation based on NGR, Hole U1507B.
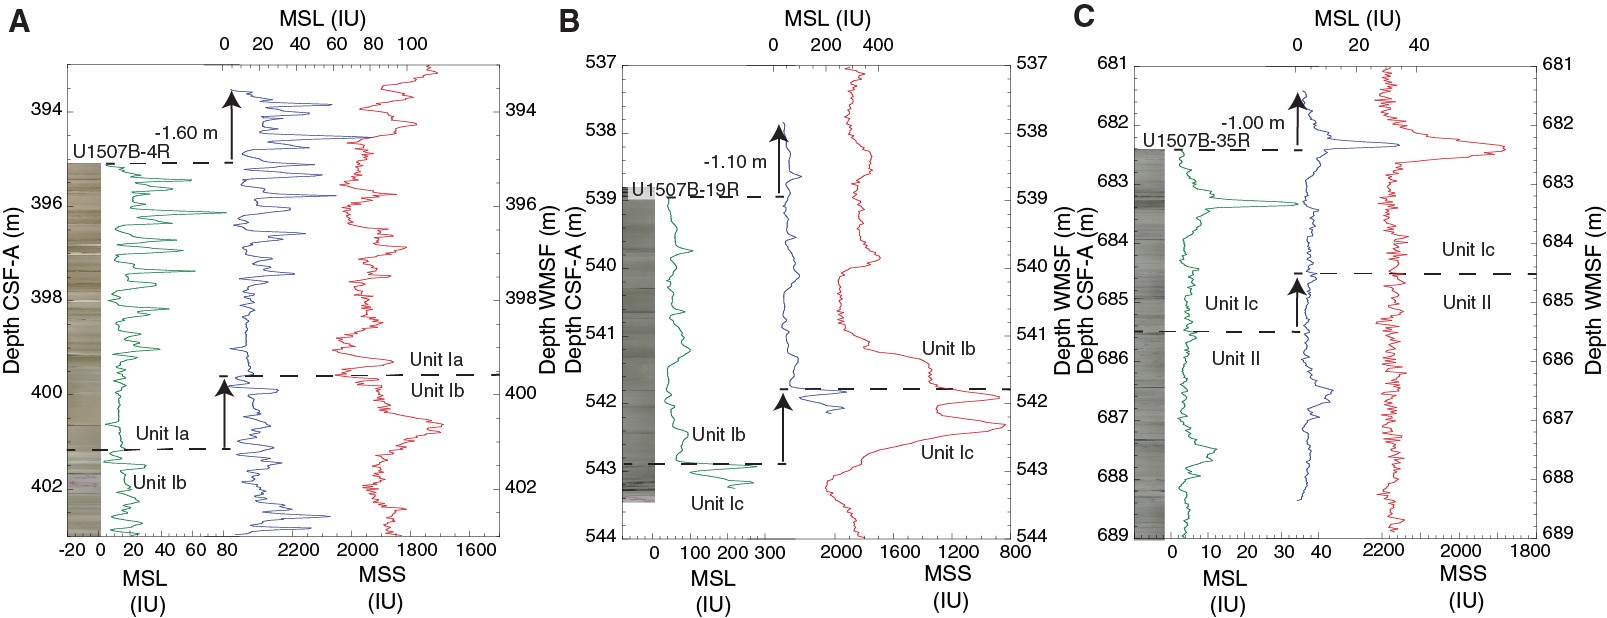
Figure F40. Depth correlation based on MS, Hole U1507B.
Age model and sedimentation rates
At Site U1507, a 855 m thick sequence of Pleistocene to middle Eocene biogenic ooze and chalk interbedded with calcareous and volcaniclastic turbidites and clayey nannofossil chalk was recovered. Calcareous nannofossils are present throughout lithostratigraphic Units I and II, and polarity chron boundaries were identified for intervals of Subunits Ib and Ic and Unit II. Using paleomagnetic and biostratigraphic datums, linear sedimentation rates (LSRs) and mass accumulation rates (MARs) were calculated for Site U1507 on the CSF-A depth scale (Table T3; Figure F41; see Biostratigraphy and paleoenvironment and Paleomagnetism). LSRs have not been corrected for increasing compaction of sediment with depth, elastic rebound at atmospheric pressure levels, or coring disturbance. Sedimentation rates for the 0–41 Ma interval were calculated preferentially using magnetostratigraphic datums, when present; otherwise, calcareous nannofossil events were utilized.
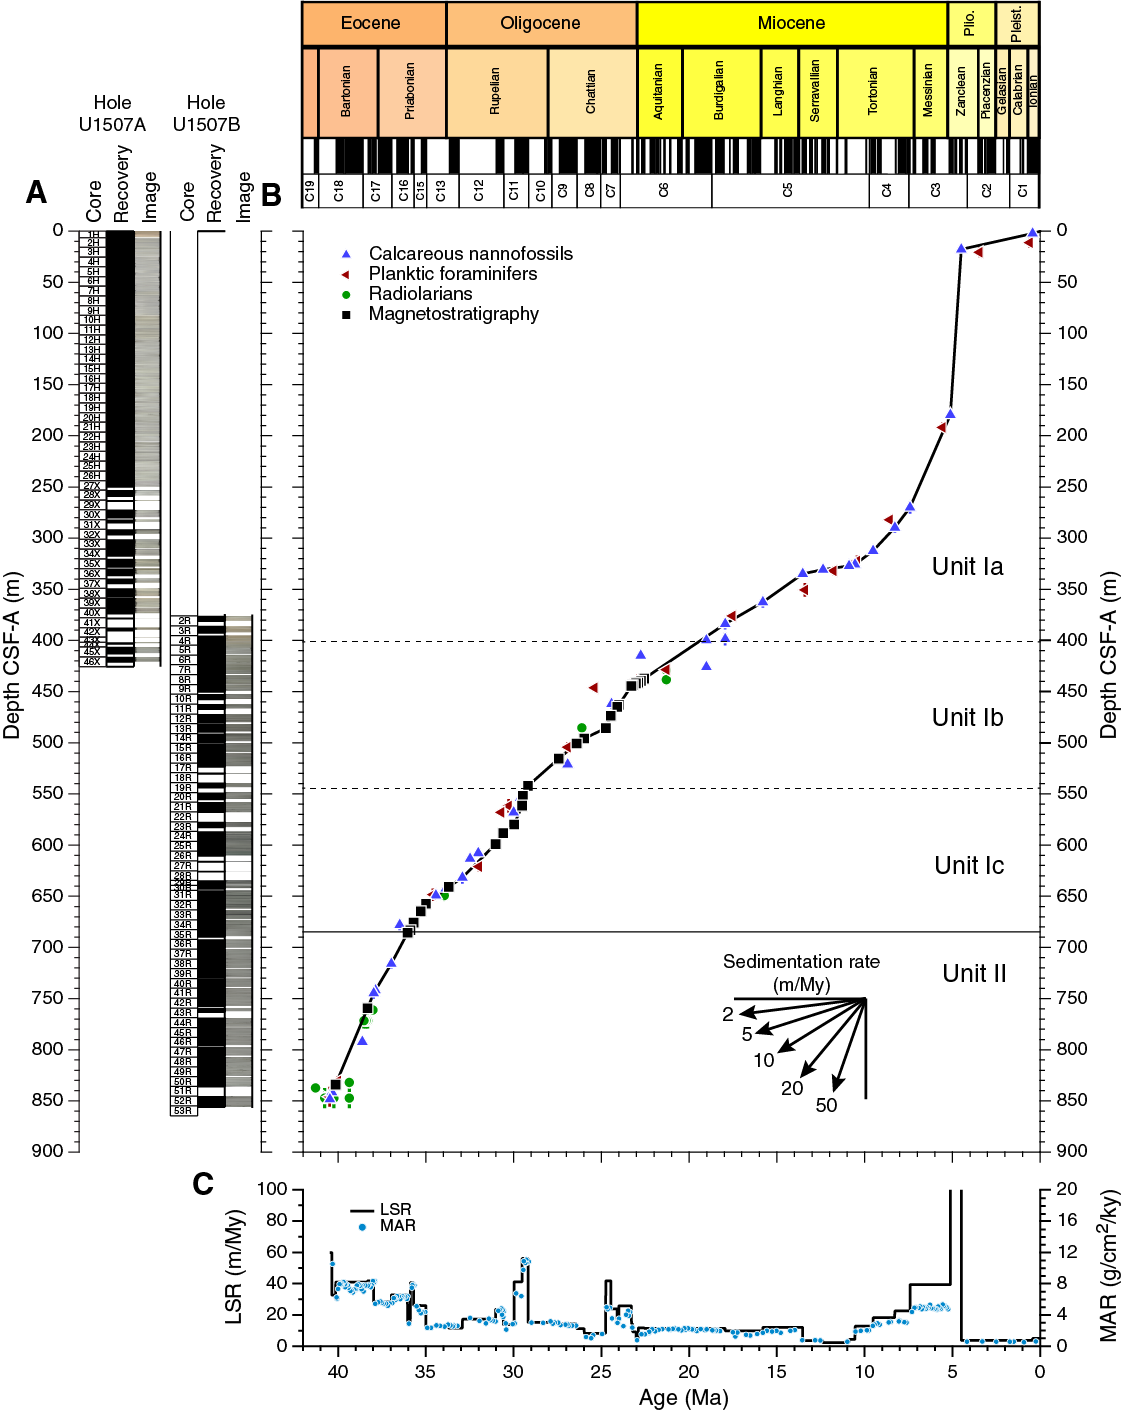
Figure F41. Sedimentation accumulation over time.
The sedimentary record recovered at Site U1507 is remarkably continuous despite the numerous turbidite deposits and seismic observations showing prominent reflectors. The entirety of the Oligocene is present, albeit with low-recovery intervals, which is surprising given previous work in the area. LSRs from the mid- to late Eocene to the latest Eocene vary between ~30 and 60 m/My and decrease at the Eocene–Oligocene transition to ~15–20 m/My. Through the entire Oligocene, LSRs average 15 m/My, interrupted by two intervals with more enhanced LSR. These intervals span from 30 to 29 Ma with LSRs between 40 and 60 m/My and from 25 to 23 Ma with LSRs between 20 and 40 m/My. At the Oligocene/Miocene boundary, LSR drops from 26 to 12 m/My, and it stays relatively constant until 13.8 Ma. At 13.8 Ma, LSR drops to 4 m/My, remaining at lower values until 10.6 Ma, when LSR increases to 13 m/My. During the late Miocene, LSR increases stepwise to 18 m/My at 9.5 Ma, to 23 m/My at 8.3 Ma, and to almost 40 m/My at 7.4 Ma. MARs closely mimic those observed for LSRs.
Interestingly, LSR appears to be lowest across intervals in which numerous turbidite deposits were observed, implying that the turbidites removed significant amounts of sediment originally deposited. Elevated LSRs for the latest Miocene to early Pliocene interval were also observed at Site U1506 and at DSDP Leg 90 sites (Kennett and von der Borch, 1986), and they correspond to the “biogenic bloom” event (Dickens and Owen, 1999). Exceptionally high LSRs (>120 m/My) from 5.1 to 4.5 Ma in the early Pliocene correspond to thick debris flows, a prominent feature observed in seismic data. The uppermost interval of Site U1507 is condensed (LSR < 4 m/My).
References
Abdul Aziz, H., Di Stefano, A., Foresi, L.M., Hilgen, F.J., Iaccarino, S.M., Kuiper, K.F., Lirer, F., Salvatorini, G., and Turco, E., 2008. Integrated stratigraphy and 40Ar/39Ar chronology of early Middle Miocene sediments from DSDP Leg 42A, Site 372 (Western Mediterranean). Palaeogeography, Palaeoclimatology, Palaeoecology, 257(1–2):123–138. https://doi.org/10.1016/j.palaeo.2007.09.013
Agnini, C., Fornaciari, E., Raffi, I., Catanzariti., R., Pälike, H., Backman, J., and Rio, D., 2014. Biozonation and biochronology of Paleogene calcareous nannofossils from low and middle latitudes. Newsletters on Stratigraphy, 47(2):131–181. https://doi.org/10.1127/0078-0421/2014/0042
Backman, J., Raffi, I., Rio, D., Fornaciari, E., and Pälike, H., 2012. Biozonation and biochronology of Miocene through Pleistocene calcareous nannofossils from low and middle latitudes. Newsletters on Stratigraphy, 45(3):221–244. https://doi.org/10.1127/0078-0421/2012/0022
Baker, P.A., 1986. Pore-water chemistry of carbonate-rich sediments, Lord Howe Rise, Southwest Pacific Ocean. In Kennett, J.P., von der Borch, C.C., et al., Initial Reports of the Deep Sea Drilling Project, 90: Washington, DC (U.S. Government Printing Office), 1249–1256. https://doi.org/10.2973/dsdp.proc.90.132.1986
Baker, P.A., Gieskes, J.M., and Elderfield, H., 1982. Diagenesis of carbonates in deep-sea sediments: evidence from Sr/Ca ratios and interstitial dissolved Sr2+ data. Journal of Sedimentary Research, 52(1):71–82. https://doi.org/10.1306/212F7EE1-2B24-11D7-8648000102C1865D
Baur, J., Sutherland, R., and Stern, T., 2014. Anomalous passive subsidence of deep-water sedimentary basins: a prearc basin example, southern New Caledonia Trough and Taranaki Basin, New Zealand. Basin Research, 26(2):242–268. https://doi.org/10.1111/bre.12030
Bohaty, S.M., Zachos, J.C., Florindo, F., and Delaney, M.L., 2009. Coupled greenhouse warming and deep-sea acidification in the middle Eocene. Paleoceanography, 24(2):PA2207. https://doi.org/10.1029/2008PA001676
Bolliger, R., Hanselmann, K.W., and Bachofen, R., 1991. Microbial potential in deep-sea sediments. Experientia, 47(6):517–523. https://doi.org/10.1007/BF01949870
Burns, R.E., and Andrews, J.E., 1973. Regional aspects of deep sea drilling in the southwest Pacific. In Burns, R.E., Andrews, J.E., et al., Initial Reports of the Deep Sea Drilling Project, 21: Washington, DC (U.S. Govt. Printing Office), 897–906. https://doi.org/10.2973/dsdp.proc.21.128.1973
Collot, J., Geli, L., Lafoy, Y., Vially, R., Cluzel, D., Klingelhoefer, F., and Nouzé, H., 2008. Tectonic history of northern New Caledonia Basin from deep offshore seismic reflection: relation to late Eocene obduction in New Caledonia, southwest Pacific. Tectonics, 27(6):TC6006. https://doi.org/10.1029/2008TC002263
Collot, J., Herzer, R., Lafoy, Y., and Géli, L., 2009. Mesozoic history of the Fairway-Aotea Basin: implications for the early stages of Gondwana fragmentation. Geochemistry, Geophysics, Geosystems, 10(12):Q12019. https://doi.org/10.1029/2009GC002612
Crook, K.A.W., and Belbin, L., 1978. The southwest Pacific area during the last 90 million years. Journal of the Geological Society of Australia, 25(1–2)23–40. https://doi.org/10.1080/00167617808729012
Debenay, J.-P., 2012. A Guide to 1,000 Foraminifera from Southwestern Pacific, New Caledonia: Paris (Publications Scientifiques du Muséum national d’Histoire naturelle). http://horizon.documentation.ird.fr/exl-doc/pleins_textes/divers14-01/010058351.pdf
Delaney, M.L., and Shipboard Scientific Party, 1991. Inorganic geochemistry summary. In Kroenke, L.W., Berger, W.H., Janecek, T.R., et al., Proceedings of the Ocean Drilling Program, Initial Reports, 130: College Station, TX (Ocean Drilling Program), 549–551. https://doi.org/10.2973/odp.proc.ir.130.112.1991
Dickens, G.R., and Owen, R.M., 1999. The latest Miocene–early Pliocene biogenic bloom: a revised Indian Ocean perspective. Marine Geology, 161(1):75–91. https://doi.org/10.1016/S0025-3227(99)00057-2
Dwyer, G.S., Cronin, T.M., Baker, P.A., Raymo, M.E., Buzas, J.S., and Corrège, T., 1995. North Atlantic deepwater temperature change during late Pliocene and late Quaternary climatic cycles. Science, 270(5240):1347–1351. https://doi.org/10.1126/science.270.5240.1347
Eade, J.V., 1988. The Norfolk Ridge system and its margins. In Nairn, A.E.M., Stehli, F.G., and Uyeda, S. (Eds.), The Ocean Basins and Margins (Volume 7B): The Pacific Ocean: New York (Plenum Press), 803–824. https://doi.org/10.1007/978-1-4615-8041-6_7
Edgar, K.M., Bohaty, S.M., Gibbs, S.J., Sexton, P.F., Norris, R.D., and Wilson, P.A., 2013. Symbiont “bleaching” in planktic foraminifera during the Middle Eocene Climatic Optimum. Geology, 41(1):15–18. http://dx.doi.org/10.1130/G33388.1
Gieskes, J.M., 1981. Deep-sea drilling interstitial water studies: implications for chemical alteration of the oceanic crust, Layers I and II. In Warme, J.E., Douglas, R.G., and Winterer, E.L. (Eds.), The Deep Sea Drilling Project: A Decade of Progress. Special Publication - Society of Economic Paleontologists and Mineralogists, 32:149–167. http://archives.datapages.com/data/sepm_sp/SP32/Deep_Sea_Drilling_Interstitial_Water_Studies.html
Gieskes, J.M., and Lawrence, J.R., 1976. Interstitial water studies, Leg 35. In Hollister, C.D., Craddock, C., et al., Initial Reports of the Deep Sea Drilling Project, 35, Washington, DC (U.S. Government Printing Office), 407–423. https://doi.org/10.2973/dsdp.proc.35.121.1976
Gieskes, J.M., and Lawrence, J.R., 1981. Alteration of volcanic matter in deep-sea sediments: evidence from the chemical composition of interstitial waters from deep sea drilling cores. Geochimica Cosmochimica Acta, 45(10):1687–1703. https://doi.org/10.1016/0016-7037(81)90004-1
Hayward, B.W., Grenfell, H.R., Sabaa, A.T., Neil, H.L., and Buzas, M.A., 2010. Recent New Zealand deep-water benthic foraminifera: taxonomy, ecologic distribution, biogeography, and use in paleoenvironmental assessment. GNS Sciences Monograph, 26:1–363.
Hedges, J.I., and Keil, R.G., 1995. Sedimentary organic matter preservation: an assessment and speculative synthesis. Marine Chemistry, 49(2–3):81–115. https://doi.org/10.1016/0304-4203(95)00008-F
Herzer, R.H., Barker, D.H.N., Roest, W.R., and Mortimer, N., 2011. Oligocene–Miocene spreading history of the northern South Fiji Basin and implications for the evolution of the New Zealand plate boundary. Geochemistry, Geophysics, Geosystems, 12(2):Q02004. https://doi.org/10.1029/2010GC003291
Jorissen, F.J., Fontanier, C., and Thomas, E., 2007. Paleoceanographical proxies based on deep-sea benthic foraminiferal assemblage characteristics. In Hillaire-Marcel, C., and De Vernal, A. (Eds.), Developments in Marine Geology (Volume 1): Proxies in Late Cenozoic Paleoceanography: Amsterdam (Elsevier), 263–325. http://dx.doi.org/10.1016/S1572-5480(07)01012-3
Kaminski, M.A., and Gradstein, F.M., 2005. Atlas of Paleogene cosmopolitan deep-water agglutinated foraminifera. Grzybowski Foundation Special Publication, 10. http://www.foraminifera.eu/atlas.html
Kastner, M., and Gieskes, J.M., 1976. Interstitial water profiles and sites of diagenetic reactions, Leg 35, DSDP, Bellingshausen Abyssal Plain. Earth and Planetary Science Letters, 33(1):11–20. https://doi.org/10.1016/0012-821X(76)90152-7
Kennett, J.P., and von der Borch, C.C., 1986. Southwest Pacific Cenozoic paleoceanography. In Kennett, J.P., von der Borch, C.C., et al., Initial Reports of the Deep Sea Drilling Project, 90: Washington, DC (U.S. Government Printing Office), 1493–1517. https://doi.org/10.2973/dsdp.proc.90.148.1986
King, P.R., and Thrasher, G.P., 1996. Cretaceous–Cenozoic geology and petroleum systems of the Taranaki Basin, New Zealand. Institute of Geological & Nuclear Sciences Monograph, 2.
Kirschvink, J.L., 1980. The least-squares line and plane and the analysis of palaeomagnetic data. Geophysical Journal of the Royal Astronomical Society, 62(3):699–718. https://doi.org/10.1111/j.1365-246X.1980.tb02601.x
Lafoy, Y., Brodien, I., Vially, R., and Exon, N.F., 2005. Structure of the basin and ridge system west of New Caledonia (southwest Pacific): a synthesis. Marine Geophysical Research, 26(1):37–50. https://doi.org/10.1007/s11001-005-5184-5
Matthews, K.J., Williams, S.E., Whittaker, J.M., Müller, R.D., Seton, M., and Clarke, G.L., 2015. Geologic and kinematic constraints on Late Cretaceous to mid Eocene plate boundaries in the southwest Pacific. Earth-Science Reviews, 140:72–107. https://doi.org/10.1016/j.earscirev.2014.10.008
Mortimer, N., Gans, P.B., Meffre, S., Martin, C.E., Seton, M., Williams, S., Turnbull, R.E., et al., 2018. Regional volcanism of northern Zealandia: post-Gondwana break-up magmatism on an extended, submerged continent. In Sensarma, S., and Storey, B.C. (Eds.), Large Igneous Provinces from Gondwana and Adjacent Regions. Geological Society Special Publication, 463(1):199–226. https://doi.org/10.1144/SP463.9
Okada, H., and Bukry, D., 1980. Supplementary modification and introduction of code numbers to the low-latitude coccolith biostratigraphic zonation (Bukry, 1973; 1975). Marine Micropaleontology, 5:321–325. https://doi.org/10.1016/0377-8398(80)90016-X
Pollack, H.N., Hurter, S.J., and Johnson, J.R., 1993. Heat flow from the Earth’s interior: analysis of the global data set. Reviews of Geophysics, 31(3):267–280. http://dx.doi.org/10.1029/93RG01249
Schellart, W.P., Lister, G.S., and Toy, V.G., 2006. A Late Cretaceous and Cenozoic reconstruction of the Southwest Pacific region: tectonics controlled by subduction and slab rollback processes. Earth-Science Reviews, 76(3–4):191–233. https://doi.org/10.1016/j.earscirev.2006.01.002
Shipboard Scientific Party, 1973. Site 206. With contributions by D. Burns and P.N. Webb. In Burns, R.E., Andrews, J.E., et al., Initial Reports of the Deep Sea Drilling Project, 21: Washington, DC (U.S. Government Printing Office), 103–195. https://doi.org/10.2973/dsdp.proc.21.106.1973
Sun, X., Higgins, J., and Turchyn, A.V., 2016. Diffusive cation fluxes in deep-sea sediments and insight into the global geochemical cycles of calcium, magnesium, sodium and potassium. Marine Geology, 373:64–77. https://doi.org/10.1016/j.margeo.2015.12.011
Sutherland, R., Collot, J., Lafoy, Y., Logan, G.A., Hackney, R., Stagpoole, V., Uruski, C., et al., 2010. Lithosphere delamination with foundering of lower crust and mantle caused permanent subsidence of New Caledonia Trough and transient uplift of Lord Howe Rise during Eocene and Oligocene initiation of Tonga-Kermadec subduction, western Pacific. Tectonics, 29(2). https://doi.org/10.1029/2009TC002476
Sutherland, R., Dickens, G.R., Blum, P., Agnini, C., Alegret, L., Asatryan, G., Bhattacharya, J., Bordenave, A., Chang, L., Collot, J., Cramwinckel, M.J., Dallanave, E., Drake, M.K., Etienne, S.J.G., Giorgioni, M., Gurnis, M., Harper, D.T., Huang, H.-H.M., Keller, A.L., Lam, A.R., Li, H., Matsui, H., Morgans, H.E.G., Newsam, C., Park, Y.-H., Pascher, K.M., Pekar, S.F., Penman, D.E., Saito, S., Stratford, W.R., Westerhold, T., and Zhou, X., 2019a. Expedition 371 methods. In Sutherland, R., Dickens, G.R., Blum, P., and the Expedition 371 Scientists, Tasman Frontier Subduction Initiation and Paleogene Climate. Proceedings of the International Ocean Discovery Program, 371: College Station, TX (International Ocean Discovery Program). https://doi.org/10.14379/iodp.proc.371.102.2019
Sutherland, R., Dickens, G.R., Blum, P., Agnini, C., Alegret, L., Asatryan, G., Bhattacharya, J., Bordenave, A., Chang, L., Collot, J., Cramwinckel, M.J., Dallanave, E., Drake, M.K., Etienne, S.J.G., Giorgioni, M., Gurnis, M., Harper, D.T., Huang, H.-H.M., Keller, A.L., Lam, A.R., Li, H., Matsui, H., Morgans, H.E.G., Newsam, C., Park, Y.-H., Pascher, K.M., Pekar, S.F., Penman, D.E., Saito, S., Stratford, W.R., Westerhold, T., and Zhou, X., 2019b. Site U1506. In Sutherland, R., Dickens, G.R., Blum, P., and the Expedition 371 Scientists, Tasman Frontier Subduction Initiation and Paleogene Climate. Proceedings of the International Ocean Discovery Program, 371: College Station, TX (International Ocean Discovery Program). https://doi.org/10.14379/iodp.proc.371.103.2019
Tjalsma, R.C., and Lohmann, G.P., 1983. Paleocene–Eocene bathyal and abyssal benthic foraminifera from the Atlantic Ocean. Micropaleontology, Special Publication, 4.
Urmos, J., and Wilkens, R.H., 1993. In situ velocities for pelagic carbonates: new insights from Ocean Drilling Program Leg 130, Ontong Java Plateau. Journal of Geophysical Research: Solid Earth, 98(B5):7903–7920. https://doi.org/10.1029/93JB00013
Uruski, C., Baillie, P., and Stagpoole, V., 2003. Development of the Taranaki Basin and comparisons with the Gippsland Basin: implications for deepwater exploration. APPEA Journal, 43(1):185–196. https://doi.org/10.1071/AJ02009
Uruski, C., and Wood, R., 1991. A new look at the New Caledonia Basin, an extension of the Taranaki Basin, offshore North Island, New Zealand. Marine and Petroleum Geology, 8(4):379–391. https://doi.org/10.1016/0264-8172(91)90061-5
van Morkhoven, F.P.C.M., Berggren, W.A., Edwards, A.S., and Oertli, H.J., 1986. Cenozoic cosmopolitan deep-water benthic foraminifera. Bulletin des centres de recherches Exploration-production Elf-Aquitaine: Mémoire, 11.
Wood, R.A., 1993. The Challenger Plateau. In Ballance, P.F. (Ed.), Sedimentary Basins of the World (Volume 2): South Pacific Sedimentary Basins: Amsterdam, (Elsevier), 351–364.
Zijderveld, J.D.A., 1967. AC demagnetization of rocks: analysis of results. In Collinson, D.W., Creer, K.M., and Runcorn, S.K. (Eds.), Developments in Solid Earth Geophysics (Volume 3): Methods in Palaeomagnetism: Amsterdam (Elsevier), 254–286. https://doi.org/10.1016/B978-1-4832-2894-5.50049-5
1 Sutherland, R., Dickens, G.R., Blum, P., Agnini, C., Alegret, L., Asatryan, G., Bhattacharya, J., Bordenave, A., Chang, L., Collot, J., Cramwinckel, M.J., Dallanave, E., Drake, M.K., Etienne, S.J.G., Giorgioni, M., Gurnis, M., Harper, D.T., Huang, H.-H.M., Keller, A.L., Lam, A.R., Li, H., Matsui, H., Morgans, H.E.G., Newsam, C., Park, Y.-H., Pascher, K.M., Pekar, S.F., Penman, D.E., Saito, S., Stratford, W.R., Westerhold, T., Zhou, X., 2019. Site U1507. In Sutherland, R., Dickens, G.R., Blum, P., and the Expedition 371 Scientists, Tasman Frontier Subduction Initiation and Paleogene Climate. Proceedings of the International Ocean Discovery Program, 371: College Station, TX (International Ocean Discovery Program). https://doi.org/10.14379/iodp.proc.371.104.2019
2 Expedition 371 Scientists’ affiliations.
This work is distributed under the Creative Commons Attribution 4.0 International (CC BY 4.0) license. 
- F1. Regional bathymetry and seismic reflection lines.
- F2. Local site survey data.
- F3. Seismic Section TAN1409-NCTN-11.
- F4. Lithostratigraphic summary.
- F5. Major biogenic and lithologic constituent abundances.
- F6. Common Subunit Ia sedimentary lithologies, section half images.
- F7. Common Subunit Ia sedimentary lithologies, photomicrographs.
- F8. XRD diffractograms of selected powdered sediment samples.
- F9. Common Subunit Ib sedimentary lithologies, section half images.
- F10. Common Subunit Ib sedimentary lithologies, photomicrographs.
- F11. Distribution and thickness of calcareous turbidites and volcaniclastic turbidites.
- F12. Common Subunit Ic sedimentary lithologies, section half images.
- F13. Common Subunit Ic sedimentary lithologies, photomicrographs.
- F14. Common Unit II sedimentary lithologies, section half images.
- F15. Common Unit II sedimentary lithologies, photomicrographs.
- F16. Decimeter-scale cyclicity in middle Eocene clayey nannofossil chalk, Unit II.
- F17. Biozonations, Hole U1507A.
- F18. Biozonations, Hole U1507B.
- F19. Microfossil abundance and preservation.
- F20. Nannofossil datums, Hole U1507B.
- F21. Nannofossil and planktic and benthic foraminiferal datums, Hole U1507B.
- F22. Preservation state of planktic foraminifers.
- F23. Ostracod preservation, abundance, and assemblage composition, Hole U1507A.
- F24. Pass-through paleomagnetic data, Hole U1507A.
- F25. Pass-through paleomagnetic data, Hole U1507B.
- F26. Inclination values.
- F27. Vector endpoint demagnetization diagrams.
- F28. AMS data.
- F29. Bulk density, grain density, porosity, and P-wave velocity.
- F30. Wireline logging data, Hole U1507B.
- F31. Magnetic susceptibility, NGR, and L*, a*, b*.
- F32. K, Th, and U contents and Th to K ratio, Hole U1507B.
- F33. Heat flow.
- F34. Shear and compressive strength.
- F35. Borehole data to MCS data tie.
- F36. Salinity, alkalinity, pH, and major, minor, and trace elements.
- F37. CaCO3, TC, TIC, TOC, and TN.
- F38. Depth correlation between overlapping intervals.
- F39. Depth correlation based on NGR, Hole U1507B.
- F40. Depth correlation based on MS, Hole U1507B.
- F41. Sedimentation accumulation over time.
- T1. Core summary.
- T2. Lithostratigraphic units.
- T3. Microfossil datums and chrons used to construct age model.
- T4. Nannofossil distribution and occurrence data.
- T5. Planktic foraminifer distribution and abundance data.
- T6. Benthic foraminifer distribution and abundance data.
- T7. Radiolarian distribution data.
- T8. Magnetostratigraphic tie points.
- T9. Seismic reflectors, two-way traveltimes, and depths.
- T10. Interstitial water chemistry.
- T11. Bulk sediment geochemistry.
- T12. Offsets applied to cores based on correlation to wireline logs.