Pecher, I.A., Barnes, P.M., LeVay, L.J., and the Expedition 372A Scientists
Proceedings of the International Ocean Discovery Program Volume 372A
publications.iodp.org

https://doi.org/10.14379/iodp.proc.372A.201.2021
Data report: clay mineral assemblages within and beneath the Tuaheni Landslide Complex, IODP Expedition 372A Site U1517, offshore New Zealand1
Michael B. Underwood2 and Brandon Dugan3
Keywords: International Ocean Discovery Program, IODP, JOIDES Resolution, Expedition 372, Creeping Gas Hydrate Slides, Site U1517, clay mineral assemblages, Hikurangi margin, X-ray diffraction, Tuaheni landslide, hemipelagic mud
MS 372A-201: Received 7 August 2020 · Accepted 2 April 2021 · Published 25 August 2021
Abstract
The Tuaheni Landslide Complex is thought to have originated through multiple slip events offshore the Hawke’s Bay region, North Island (New Zealand). Cores were obtained from within and beneath the interpreted landslide complex to a maximum depth of ~188 meters below seafloor (mbsf) in Hole U1517C during International Ocean Discovery Program Expedition 372. This data report provides the results of 99 X-ray diffraction analyses of the clay-sized fraction (<2 µm spherical equivalent); sampling focused on the background lithology of hemipelagic mud. Normalized weight percent values for common clay-sized minerals (where smectite + illite + undifferentiated [chlorite + kaolinite] + quartz = 100%) do not vary markedly among the five lithostratigraphic units. Overall, the mean and standard deviation (σ) values are smectite = 47.1 wt% (σ = 5.2), illite = 34.0 wt% (σ = 3.4), chlorite + kaolinite = 8.8 wt% (σ = 1.9), and quartz = 10.2 wt% (σ = 4.0). Mineral proportions within the clay-sized fraction do change somewhat across the boundaries between units and near inferred slip surfaces (e.g., at ~31 mbsf), but those excursions are within the normal range of statistical scatter for the site. Likewise, indicators of clay diagenesis are relatively monotonous throughout the cored interval. The average value of illite crystallinity index is 0.53Δ°2θ (σ = 0.027). Smectite expandability averages 77.4% (σ = 4.9), and the average proportion of illite in illite/smectite mixed-layer clay is 8.7% (σ = 5.6).
Introduction
International Ocean Discovery Program (IODP) Expedition 372 was implemented along the Hikurangi subduction margin, offshore the Hawke’s Bay region, North Island (New Zealand) (Figure F1A). The coring program at Site U1517 (Figure F1B) was designed to groundtruth seismic reflection interpretations of an actively deforming landslide known as the Tuaheni Landslide Complex (TLC) (Barnes et al., 2017). The apparent submarine slide is thought to have initiated as a sudden failure, followed by slow, ongoing creep (Mountjoy et al., 2014; Barnes et al., 2017). Creep seems to occur where the base of gas hydrate stability pinches out at the seafloor (Mountjoy et al., 2014), so one inference has been that gas hydrate contributes to slope instability by reducing permeability in the host sediment, which in turn might lead to buildup of overpressure and hydrofracturing (Crutchley et al., 2010; Ellis et al., 2010). Another possibility is that hydrate-bearing sediments are subjected to time-dependent plastic deformation similar to the behavior of glaciers (Mountjoy et al., 2014). These and other hypotheses were tested during Expedition 372.

Figure F1. New Zealand and vicinity.
The cores recovered from Hole U1517C (Figure F1C) extend from the seafloor to 188.5 meters below seafloor (mbsf). The cores pass across what had been interpreted on seismic profiles to be the landslide’s décollement at ~37 mbsf, the base of landslide debris at ~59 mbsf, and the base of gas hydrate stability at ~162 mbsf (Barnes et al., 2019; Screaton et al., 2019). Shipboard sedimentologists defined five lithostratigraphic units (Figure F2) using information from visual description of the split cores, smear slide analysis, digital color, and magnetic susceptibility logs (Barnes et al., 2019). Overall, the common lithologies include discrete layers of fine sand, silt, and volcanic ash in a background of hemipelagic mud (silty clay to clayey silt). The depositional ages, based on calcareous nannofossils and planktonic foraminifers, range from Holocene to Middle Pleistocene (Barnes et al., 2019).

Figure F2. Stratigraphic column and lithologic units.
The bathymetric position of Site U1517, at a water depth of ~732 meters below sea level, is within a domain that is profoundly affected by a strong southwest-directed current known as the East Cape Current (Carter and Wilkin, 1999; Carter et al., 2002, 2004; Chiswell et al., 2015). Sediments agitated by such currents are typically remobilized into contourite drifts (e.g., Stow et al., 2002; Rebesco et al., 2014). Recent interpretations of high-resolution seismic reflection data from the Hikurangi margin classify the acoustic character of the upper slope domain (i.e., in the vicinity of Site U1517) as the “giant elongated mounded” type of contourite drift (Bailey et al., 2021a, 2021b).
According to the shipboard designations of Barnes et al. (2019), Lithologic Unit I (0–3.0 mbsf) is a thin Holocene mud blanket consisting of structureless silty clay. Unit II (3.0–40.74 mbsf) contains alternating layers of mud and very fine sand, with sand bed thicknesses up to 29 cm. In Unit III (40.74–66.38 mbsf), hemipelagic mud alternates with laminated stacked couplets of silt and clay. Unit IV (66.38–103.16 mbsf) consists mostly of structureless hemipelagic mud, whereas Unit V (103.16–187.53 mbsf) is more variable and has numerous interbeds of normally graded sand and hemipelagic mud (Figure F2).
In addition to their division of lithologic units, Barnes et al. (2019) provisionally assigned the upper ~67 m of strata (Units I–III) to the TLC (Figure F2). That collective interval of cores is somewhat perplexing, however, because it displays minimal internal deformation and no mesoscopic indicators of concentrated slip at the base (Barnes et al., 2019). The only mesoscopic indicators of gravity-driven soft-sediment deformation are scattered patches in Unit III that display convolute bedding and/or intraformational mud clasts. On the other hand, post-expedition research has reinforced the idea that the TLC is made up of at least two discrete deposits. In one such study, numerical modeling of pore water chemistry data (Luo et al., 2020) supports the contention of two separate slip events, the more recent of which occurred as a coherent block that measures roughly 40 m in thickness and retains its initial pore water signature. If true, the décollement to the upper slide block coincides with the base of Lithologic Unit II (Figure F2). Adding to the complexity, however, is the identification of a weak layer at ~31 mbsf based on a pronounced drop in shear strength (Barnes et al., 2019); ongoing research is investigating microfabric associated with this weak layer and the mechanisms that may control its anomalously low strength. Thus, uncertainties persist with regard to the number of discrete slip events, their dimensions, whether or not the slip events were “catastrophic,” and the influence of lithology and mineralogy in modulating slip. Moreover, shipboard data documented the occurrence of gas hydrate only at depths below 100 mbsf (Barnes et al., 2019), so the role gas hydrates might play in controlling deformation in the TLC remains questionable. Those discoveries from drilling necessitate a more holistic analysis of how lithology and mineralogy might contribute to slope instability.
This data report summarizes the results of X-ray diffraction (XRD) analyses of the clay mineral assemblages at Site U1517. The primary objective of our study is to test whether or not stratigraphic variations in sediment composition might have contributed to the dynamics and spatial extent of mass wasting. Of particular interest are the magnitudes of potential contrasts or excursions in clay composition across the unit boundaries and/or the inferred slip surfaces (Figure F2). A secondary objective is to provide constraints on interpretations of detrital provenance and sediment dispersal on the upper slope, with potential implications for regional-scale reconstructions of paleoclimate and paleoceanography (e.g., Petschick et al., 1996; Thiry, 2000; Gingele et al., 2001; Phillips et al., 2014). Such information will expand on provisional documentation of clay composition across the broader Hikurangi margin (Underwood, 2020, 2021).
Methods
Samples
A total of 99 specimens for XRD analyses were obtained from the working halves of split cores, covering all five lithologic units. Although the intent was to focus on the background lithology of silty clay to clayey silt (hemipelagic mud), some of the sampling may have inadvertently captured the muddy tops of turbidites and/or contourites. Most samples were colocated in “clusters” immediately adjacent to whole-round specimens. Some of those specimens were analyzed shipboard for interstitial water geochemistry (Barnes et al., 2019), whereas others were collected for shore-based tests of hydrogeological, frictional, and geotechnical properties (e.g., Dugan et al., 2018; Nole et al., 2018). The clusters also included specimens for shipboard measurements of moisture and density, carbon/carbonate, and bulk powder XRD (see Wallace et al., 2019, for XRD methods).
Sample preparation
Several steps are required to isolate the clay-sized fraction (<2 µm) for XRD analyses. First, a split of air-dried sediment is placed in a 600 mL beaker with 2% hydrogen peroxide to initiate disaggregation and remove organic matter. Next, the disaggregated sediment is suspended in ~250 mL of Na hexametaphosphate solution (4 g/1000 mL distilled H2O). Beakers with suspended sediment are inserted into an ultrasonic bath for several minutes to promote dispersion and retard flocculation of the clays. Suspensions are washed of solutes by two passes through a centrifuge (8000 rpm for 20 min; ~6000× g) with resuspension in distilled deionized water after each pass. Next, the suspensions are transferred to 125 mL plastic bottles and dispersed by vigorous shaking plus insertion of an ultrasonic cell probe for ~2.5 min. Clay-sized splits (<2 µm equivalent spherical diameter) are separated from the silt and sand by centrifugation (1000 rpm for 3.6 min; ~320× g). We prepared oriented clay aggregates following the filter-peel method (Moore and Reynolds, 1989b) using 0.45 µm filter membranes and glass discs. Good preferred orientation is beneficial because it enhances the intensity of basal reflections. To saturate the clay aggregates with ethylene glycol, clay-covered discs are placed in a closed vapor chamber at room temperature for ~48 h. This last step expands the interlayer of smectite to ~17Å, which minimizes overlap between the smectite (001) and chlorite (001) reflections (Figure F3).
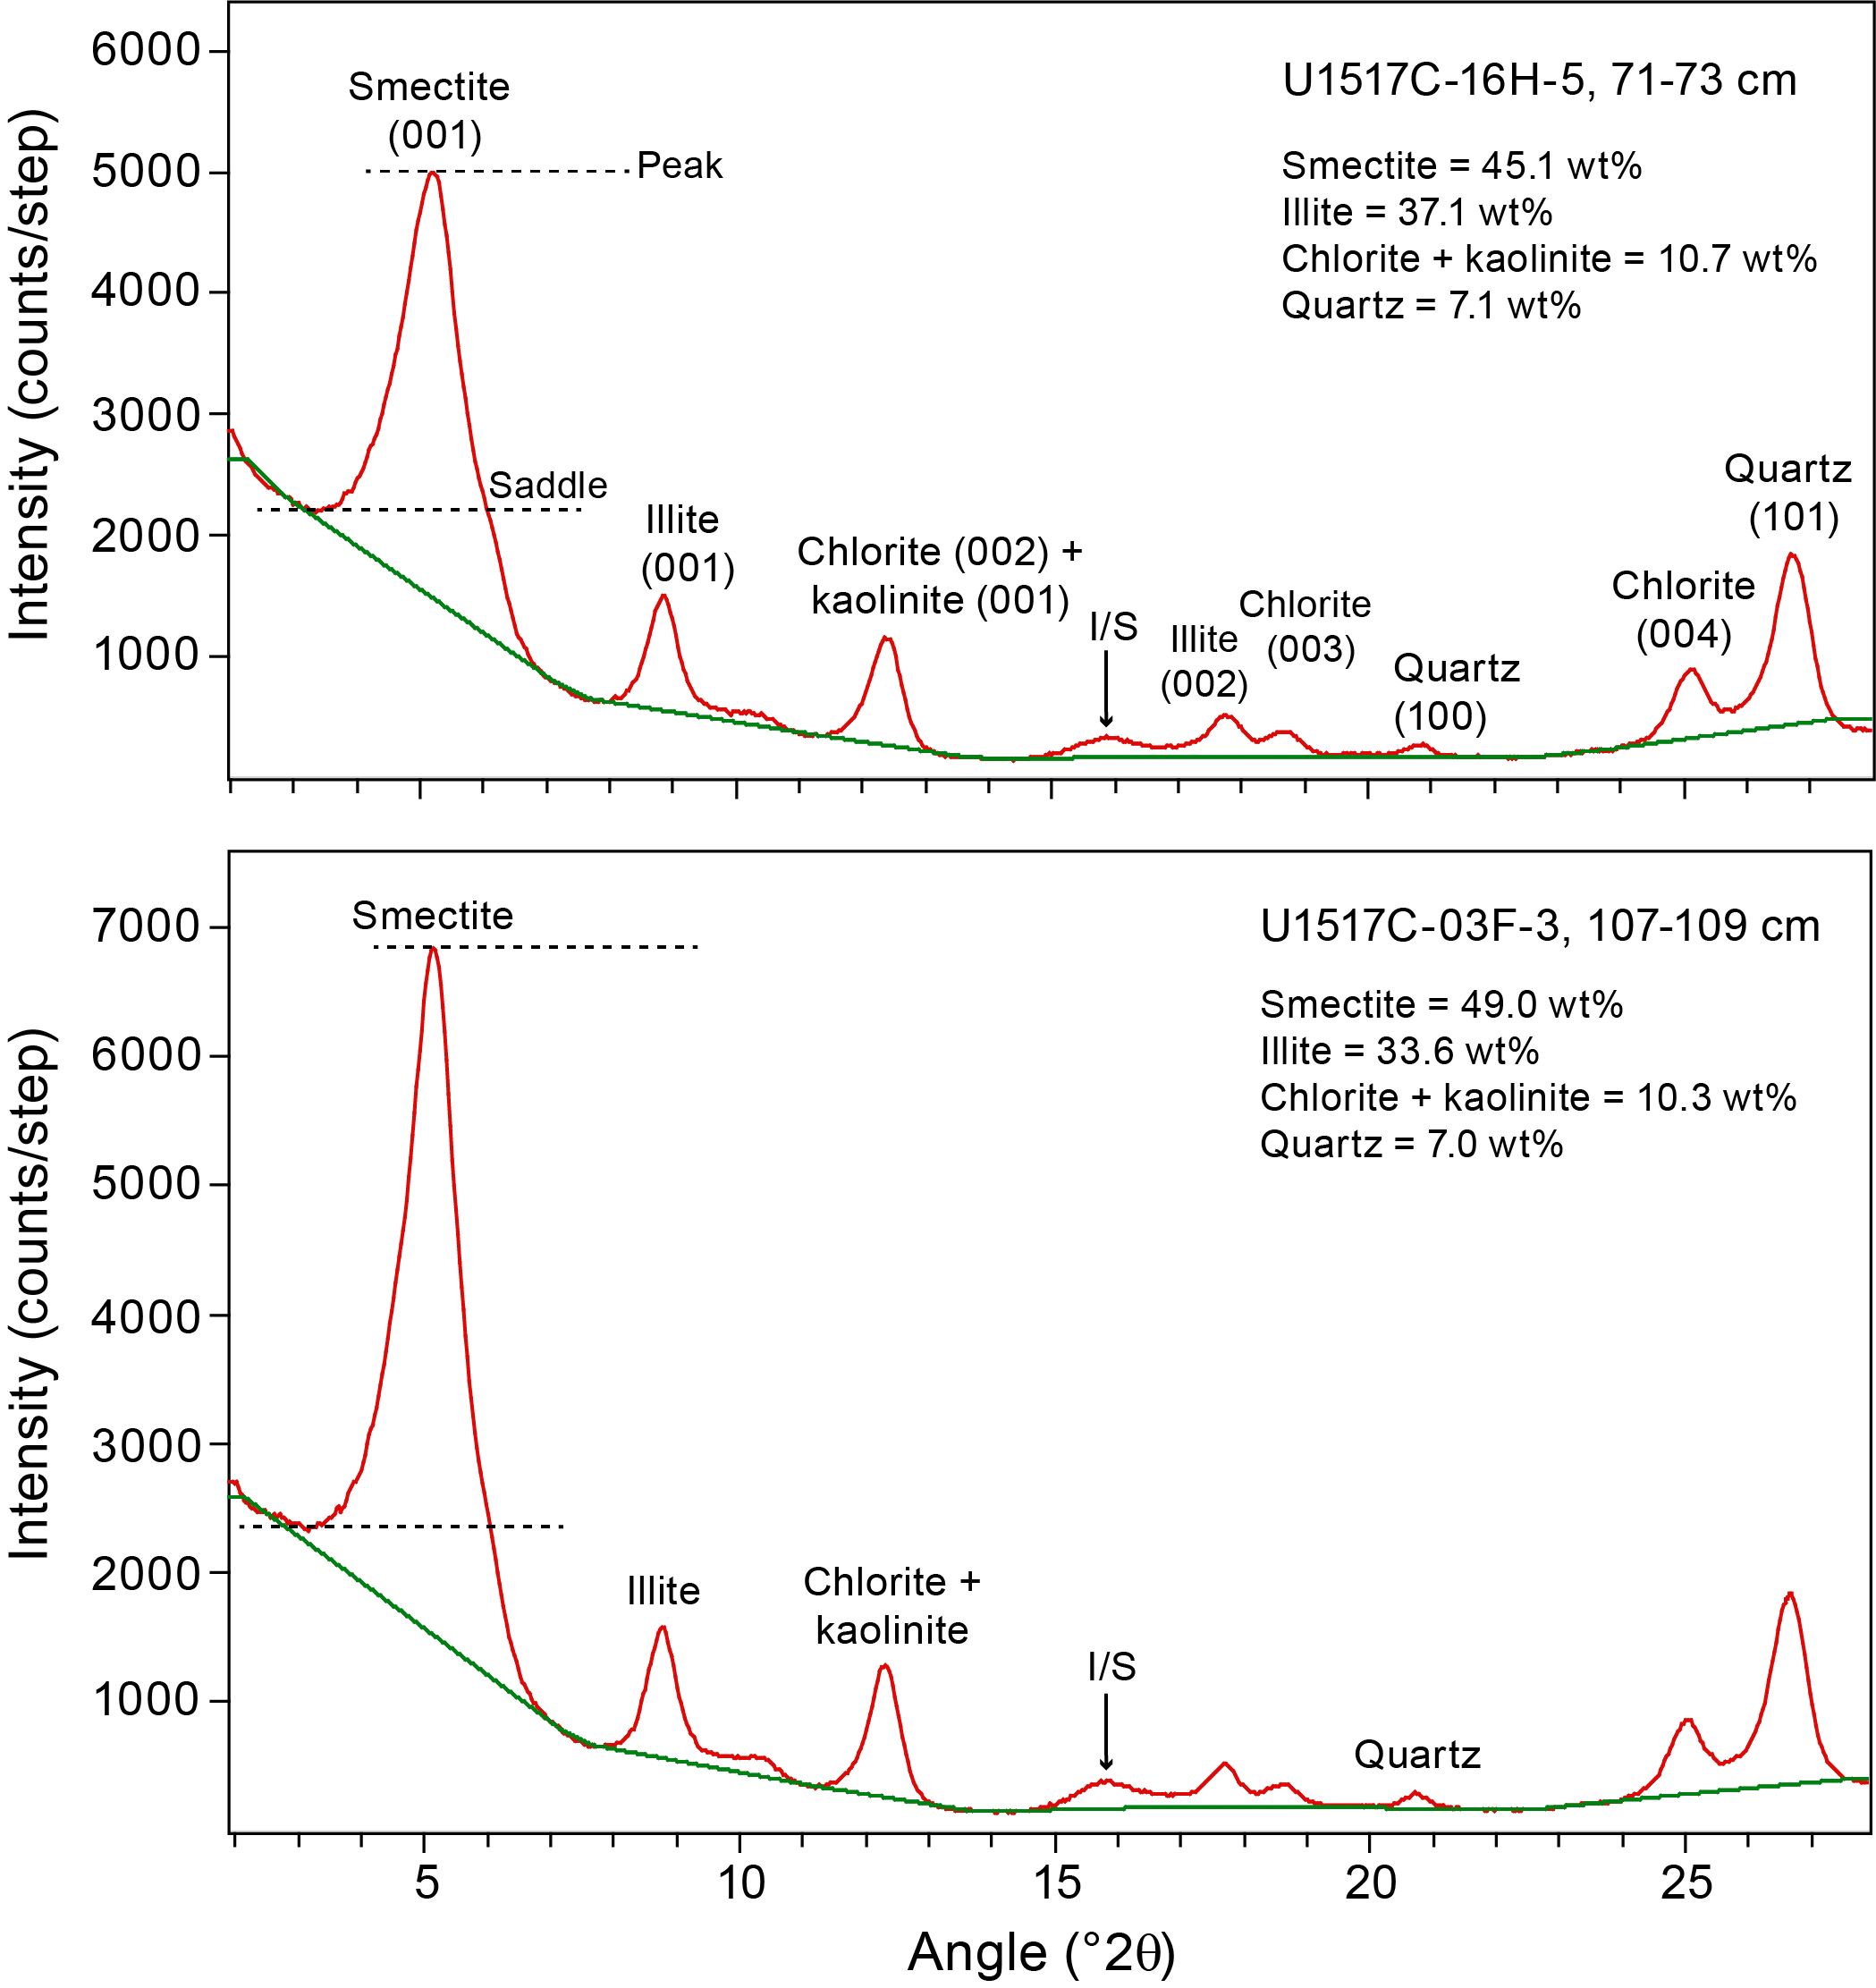
Figure F3. X-ray diffractograms for oriented clay-sized specimens.
X-ray diffractometer settings
The oriented aggregates were analyzed at the New Mexico Bureau of Geology and Mineral Resources using a Panalytical X’Pert Pro diffractometer under the following parameters:
- Generator settings = 45 kV and 40 mA.
- Angular range = 2°–28.0°2θ.
- Scan step time = 1.6 s.
- Step size = 0.01°2θ.
- Sample holder = stationary.
- Slits = fixed at 0.5 mm (divergence) and 0.1 mm (receiving).
- Specimen length = 10 mm.
Raw data files were processed using MacDiff software (version 4.2.5) to establish a baseline of intensity, smooth counts, correct peak positions offset by slight misalignments of the detector and sample holder (using the quartz 100 peak at 20.95°2θ), record peak intensities (counts/step), and compute integrated peak areas (total counts). Two representative diffractograms are shown in Figure F3, and diagnostic peaks for smectite, illite, undifferentiated (chlorite + kaolinite), and quartz are identified.
Computations of mineral abundance
Computations of relative abundance for each of the common clay-sized minerals are based on values of integrated peak area, using the smectite (001), illite (001), chlorite (002) + kaolinite (001), and quartz (100) reflections (Figure F3). As scrutinized in more detail by Underwood et al. (2020), we employed three computational approaches: (1) Biscaye (1965) peak-area weighting factors, which are equal to 1× smectite, 4× illite, and 2× undifferentiated (chlorite + kaolinite); (2) a set of regression equations that relate peak area to weight percent, where smectite + illite + undifferentiated (chlorite + kaolinite) + quartz = 100%; and (3) a matrix of singular value decomposition (SVD) normalization factors (see Fisher and Underwood [1995] and Underwood et al. [2003] for a full description of the SVD approach), where smectite + illite + undifferentiated (chlorite + kaolinite) + quartz = 100% (Table T1). When using SVD factors or regression equations, the sum of the four relative-abundance values is sometimes less than 100%, and that dampening of peak intensities is usually caused by filter-peel transfers that are too thin (i.e., less than “infinite” thickness). Another contributing factor might be inclusion of additional minerals or amorphous solids within the clay-size fraction (e.g., feldspar, volcanic glass shards, or biogenic carbonate). To negate those artifacts of methodology, the four relative-abundance values were normalized to 100%.
XRD data from standard mineral mixtures were used to determine errors of accuracy (Underwood et al., 2020). The Biscaye (1965) weighting factors result in systematic overestimates of the proportion of chlorite + kaolinite and underestimates of the proportion of illite (Underwood et al., 2020). In addition, the Biscaye (1965) approach does not account for clay-sized quartz; those values might be more important for assessments of frictional properties, but perhaps less so for studies of detrital provenance. To permit comparisons among all three sets of computational results, the weight percent values were recalculated to a three-component, clay-only assemblage, where smectite + illite + undifferentiated (chlorite + kaolinite) = 100%. Underwood et al. (2020) found that the average absolute errors of accuracy are smallest when regression equations are used for computations: illite = 3.0 wt%, undifferentiated (chlorite + kaolinite) = 5.1 wt%, and smectite = 3.9 wt%. Errors using SVD factors are slightly larger. Errors are largest when the Biscaye (1965) weighting factors are used in computations (as high as 18.6%). In spite of those shortcomings, we have tabulated the Biscaye-computed values in this report to permit direct comparisons with legacy data from previous studies in the Hikurangi region (e.g., Winkler and Dullo, 2002). All of the graphical plots in this report (e.g., Figure F4) use data computed from the regression equations. We consider compositional differences among individual specimens and lithologic units to be geologically significant only if those differences are greater than the errors of accuracy shown above (i.e., >5 wt%).
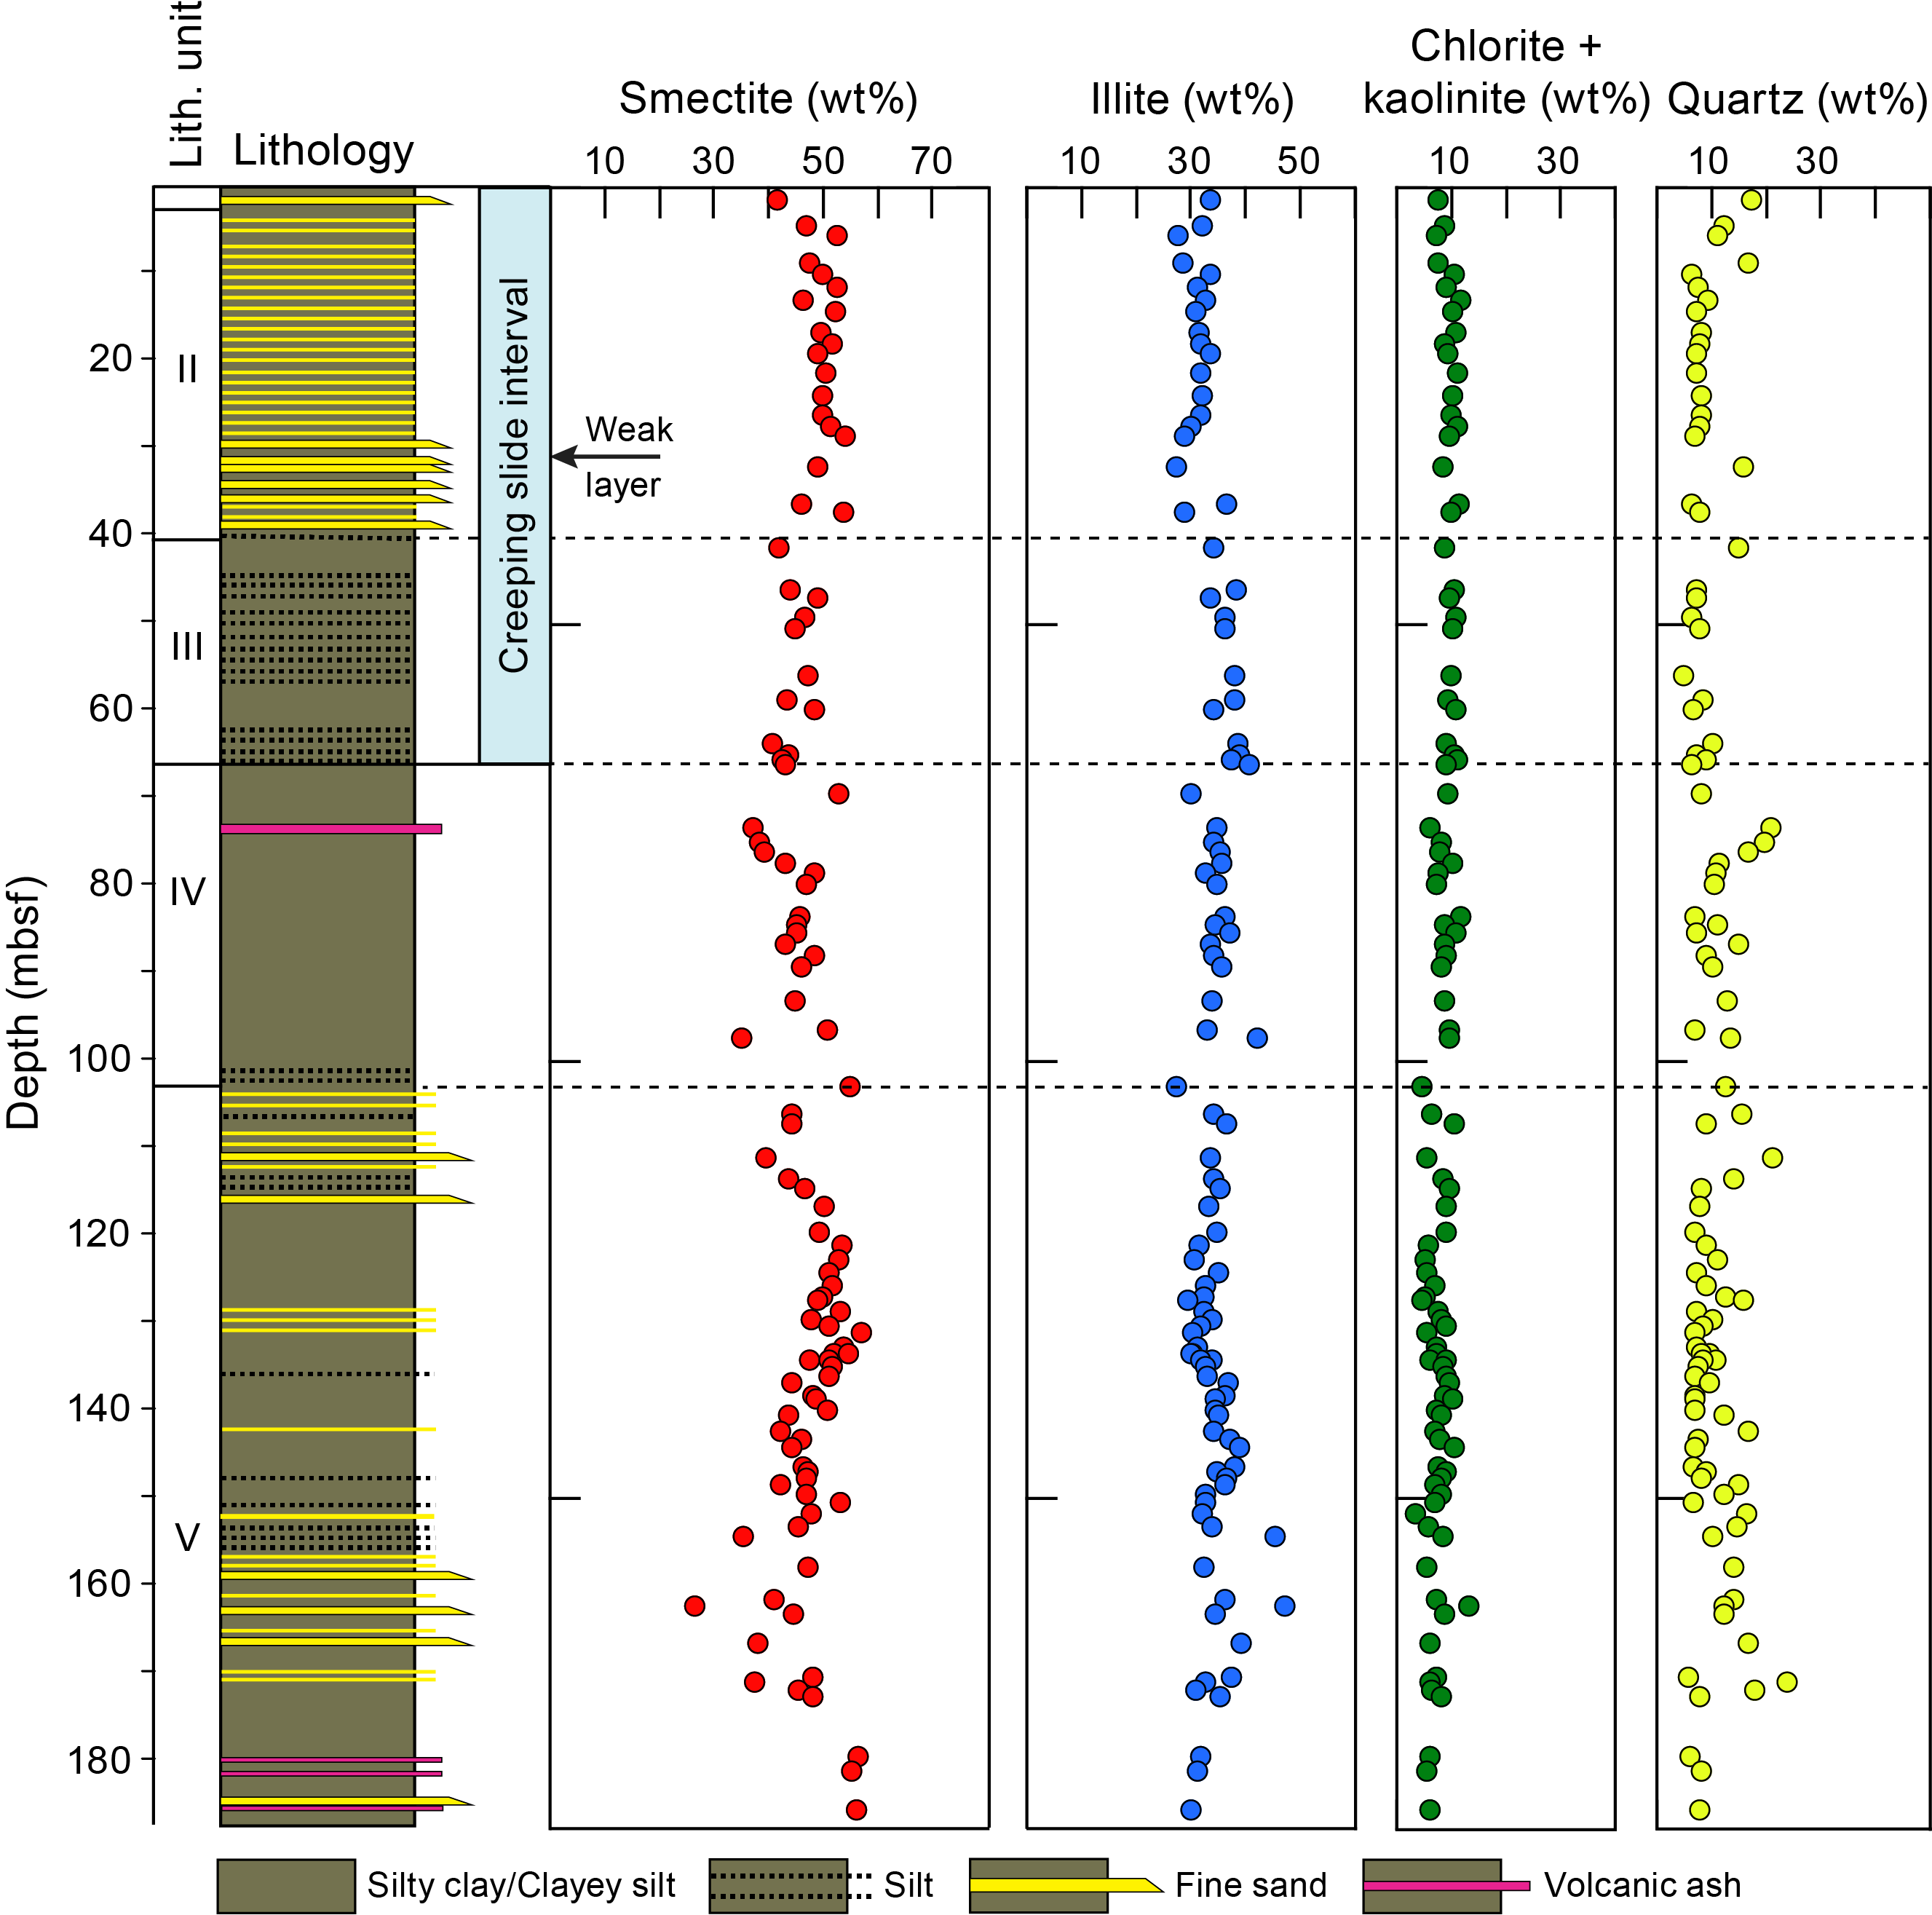
Figure F4. Stratigraphic column with minerals in the clay-sized fraction.
To compute the normalized percentage of each individual clay mineral (e.g., smectite) in the bulk sediment, we multiplied the normalized relative abundance of total clay minerals, as obtained from shipboard bulk-powder XRD (Barnes et al., 2019), by the computed weight percent value for that specific clay mineral (e.g., smectite) in the clay-only assemblage. A key assumption here is that most of the clay minerals reside in the clay-sized fraction. The bulk-sediment weight percent values for the clays are included in this report to help with assessments of potential compositional controls on frictional and geotechnical properties (e.g., Brown et al., 2003; Kopf and Brown, 2003; Ikari et al., 2018), especially as they apply to the whole-round specimens used in post-expedition laboratory experiments.
Indicators of clay diagenesis
Given the relatively shallow burial depths of all samples analyzed (<186 mbsf) and the projected in situ temperature of ~12°C at the bottom of Hole U1517C (Barnes et al., 2019; Screaton et al., 2019), the common ways to assess clay diagenesis using XRD should be viewed as indicators of geologic conditions in detrital source areas. For example, the peak width at half maximum for the illite (001) peak is a common measure of illite crystallinity (units = Δ°2θ), otherwise known as the Kübler Index (e.g., Kisch, 1991; Ferreiro Mählmann and Frey, 2012; Warr and Ferreiro Mählmann, 2015). Those peaks narrow as the assemblage of illite plus white mica becomes more crystalline. The saddle:peak intensity ratio (Figure F3) can be used to compute the “expandability” of smectite plus illite/smectite (I/S) mixed-layer clay in the assemblage (Rettke, 1981). This method is sensitive to the proportions of discrete illite versus I/S mixed-layer clay; we picked the curve for a 1:1 mixture of I and S + I/S. To compute the percentage of illite layers in the I/S mixed-layer clay, we made a visual pick of the angular position (°2θ) of the composite I(002)/S(003) peak (Figure F3). With progressive illitization, that peak shifts systematically to higher angles (Moore and Reynolds, 1989a). A reliable determination of %illite is possible only when the intensity of the I/S peak is high enough to resolve a clear apex.
Results
Clay mineral assemblages
The results of 99 XRD measurements are tabulated in Table T2, and the computed values of relative and normalized weight percent, using the three computational approaches, are listed in Table T3. Overall, the stratigraphic section at Site U1517 displays considerable uniformity in clay mineral assemblages. Figure F4 shows the results plotted as normalized proportions in the clay-sized fraction (computed using regression equations). Proportions of smectite range from 26.5 to 57.0 wt% with a mean value (µ) of 47.1 wt% and a standard deviation (σ) of 5.2 wt%. Weight percent values for illite range from 27.2 to 47.1 wt% (µ = 34.0; σ = 3.4), and the proportion of undifferentiated (chlorite + kaolinite) ranges from 3.9 to 14.2 wt% (µ = 8.8; σ = 1.8). Careful examination of the overlapping chlorite (004) and kaolinite (002) peaks indicates that kaolinite occurs in trace amounts. The content of clay-sized quartz ranges from 4.8 to 23.7 wt% (µ = 10.2; σ = 4.0). Variable quartz content in the clay-sized fraction is most likely an effect of grain size, with higher concentrations in the muddy tops of turbidites and/or contourites.
Weight percent values among the clay minerals (i.e., where smectite + illite + undifferentiated [chlorite + kaolinite] = 100%) are tabulated in Table T3. Smectite is the most abundant clay mineral in all five lithologic units. Only one sample from Unit I was analyzed; its composition is smectite = 50.1 wt%, illite = 40.6 wt%, and chlorite + kaolinite = 9.3 wt%. Statistics for Unit II are
- Smectite: µ = 55.0 wt%; σ = 2.6.
- Illite: µ = 34.1 wt%; σ = 2.1.
- Chlorite + kaolinite: µ = 10.9 wt%; σ = 1.0.
- Smectite: µ = 48.3 wt%; σ = 2.3.
- Illite: µ = 40.2 wt%; σ = 2.3.
- Chlorite + kaolinite: µ = 11.5 wt%; σ = 0.5.
Thus, relative to overlying strata, the results from Unit III reveal small but consistent decreases in the abundance of smectite that are balanced by small increases in the proportion of illite. Values for Unit IV are
- Smectite: µ = 50.9 wt%; σ = 4.8.
- Illite: µ = 39.0 wt%; σ = 4.1.
- Chlorite + kaolinite: µ = 10.1 wt%; σ = 1.3.
- Smectite: µ = 52.9 wt%; σ = 5.3.
- Illite: µ = 38.2 wt%; σ = 4.1.
- Chlorite + kaolinite: µ = 8.9 wt%; σ = 1.8.
On average, Unit II contains the most smectite and Unit III contains the least, but the magnitude of compositional differences across unit boundaries falls within the normal range of scatter for the site. We regard the relatively small shifts at key horizons of interest (e.g., ~31 and ~41 mbsf) as geologically insignificant.
Bulk sediment composition
Figure F5 shows normalized concentrations of smectite, illite, and undifferentiated (chlorite + kaolinite) in the bulk sediment. These values are probably the most relevant for assessing how hydrogeological, frictional, and geotechnical properties might change as a function of sediment composition. The average content of total clay minerals at Site U1517 is 39.7 wt% (from shipboard XRD analyses of bulk powders) but those values range considerably from 10.1 to 49.0 wt% (Barnes et al., 2019). Typically, such variations in bulk XRD results are caused by changes in biogenic calcium carbonate and/or grain size distribution (i.e., less total clay in specimens with higher proportions of silt). Contents of total clay minerals are slightly lower than average in Unit II (µ = 36.2 wt%; σ = 3.6). Shifts among individual clay minerals across the unit boundaries fall within the range of scatter for the site as a whole (Table T3). The values of mean and standard deviation for the entire site are smectite = 20.8 wt% (σ = 4.4), illite = 15.0 wt% (σ = 2.6), and chlorite + kaolinite = 3.9 wt% (σ = 0.9). Statistical scatter clearly increases in Unit V (Figure F5), mirroring that unit’s more erratic variability in total clay minerals (σ = 7.5). We do not recognize systematic depth-dependent trends in bulk mineralogy, nor do the data reveal marked compositional excursions at the slip surfaces inferred at ~31 and ~41 mbsf (Figure F5).
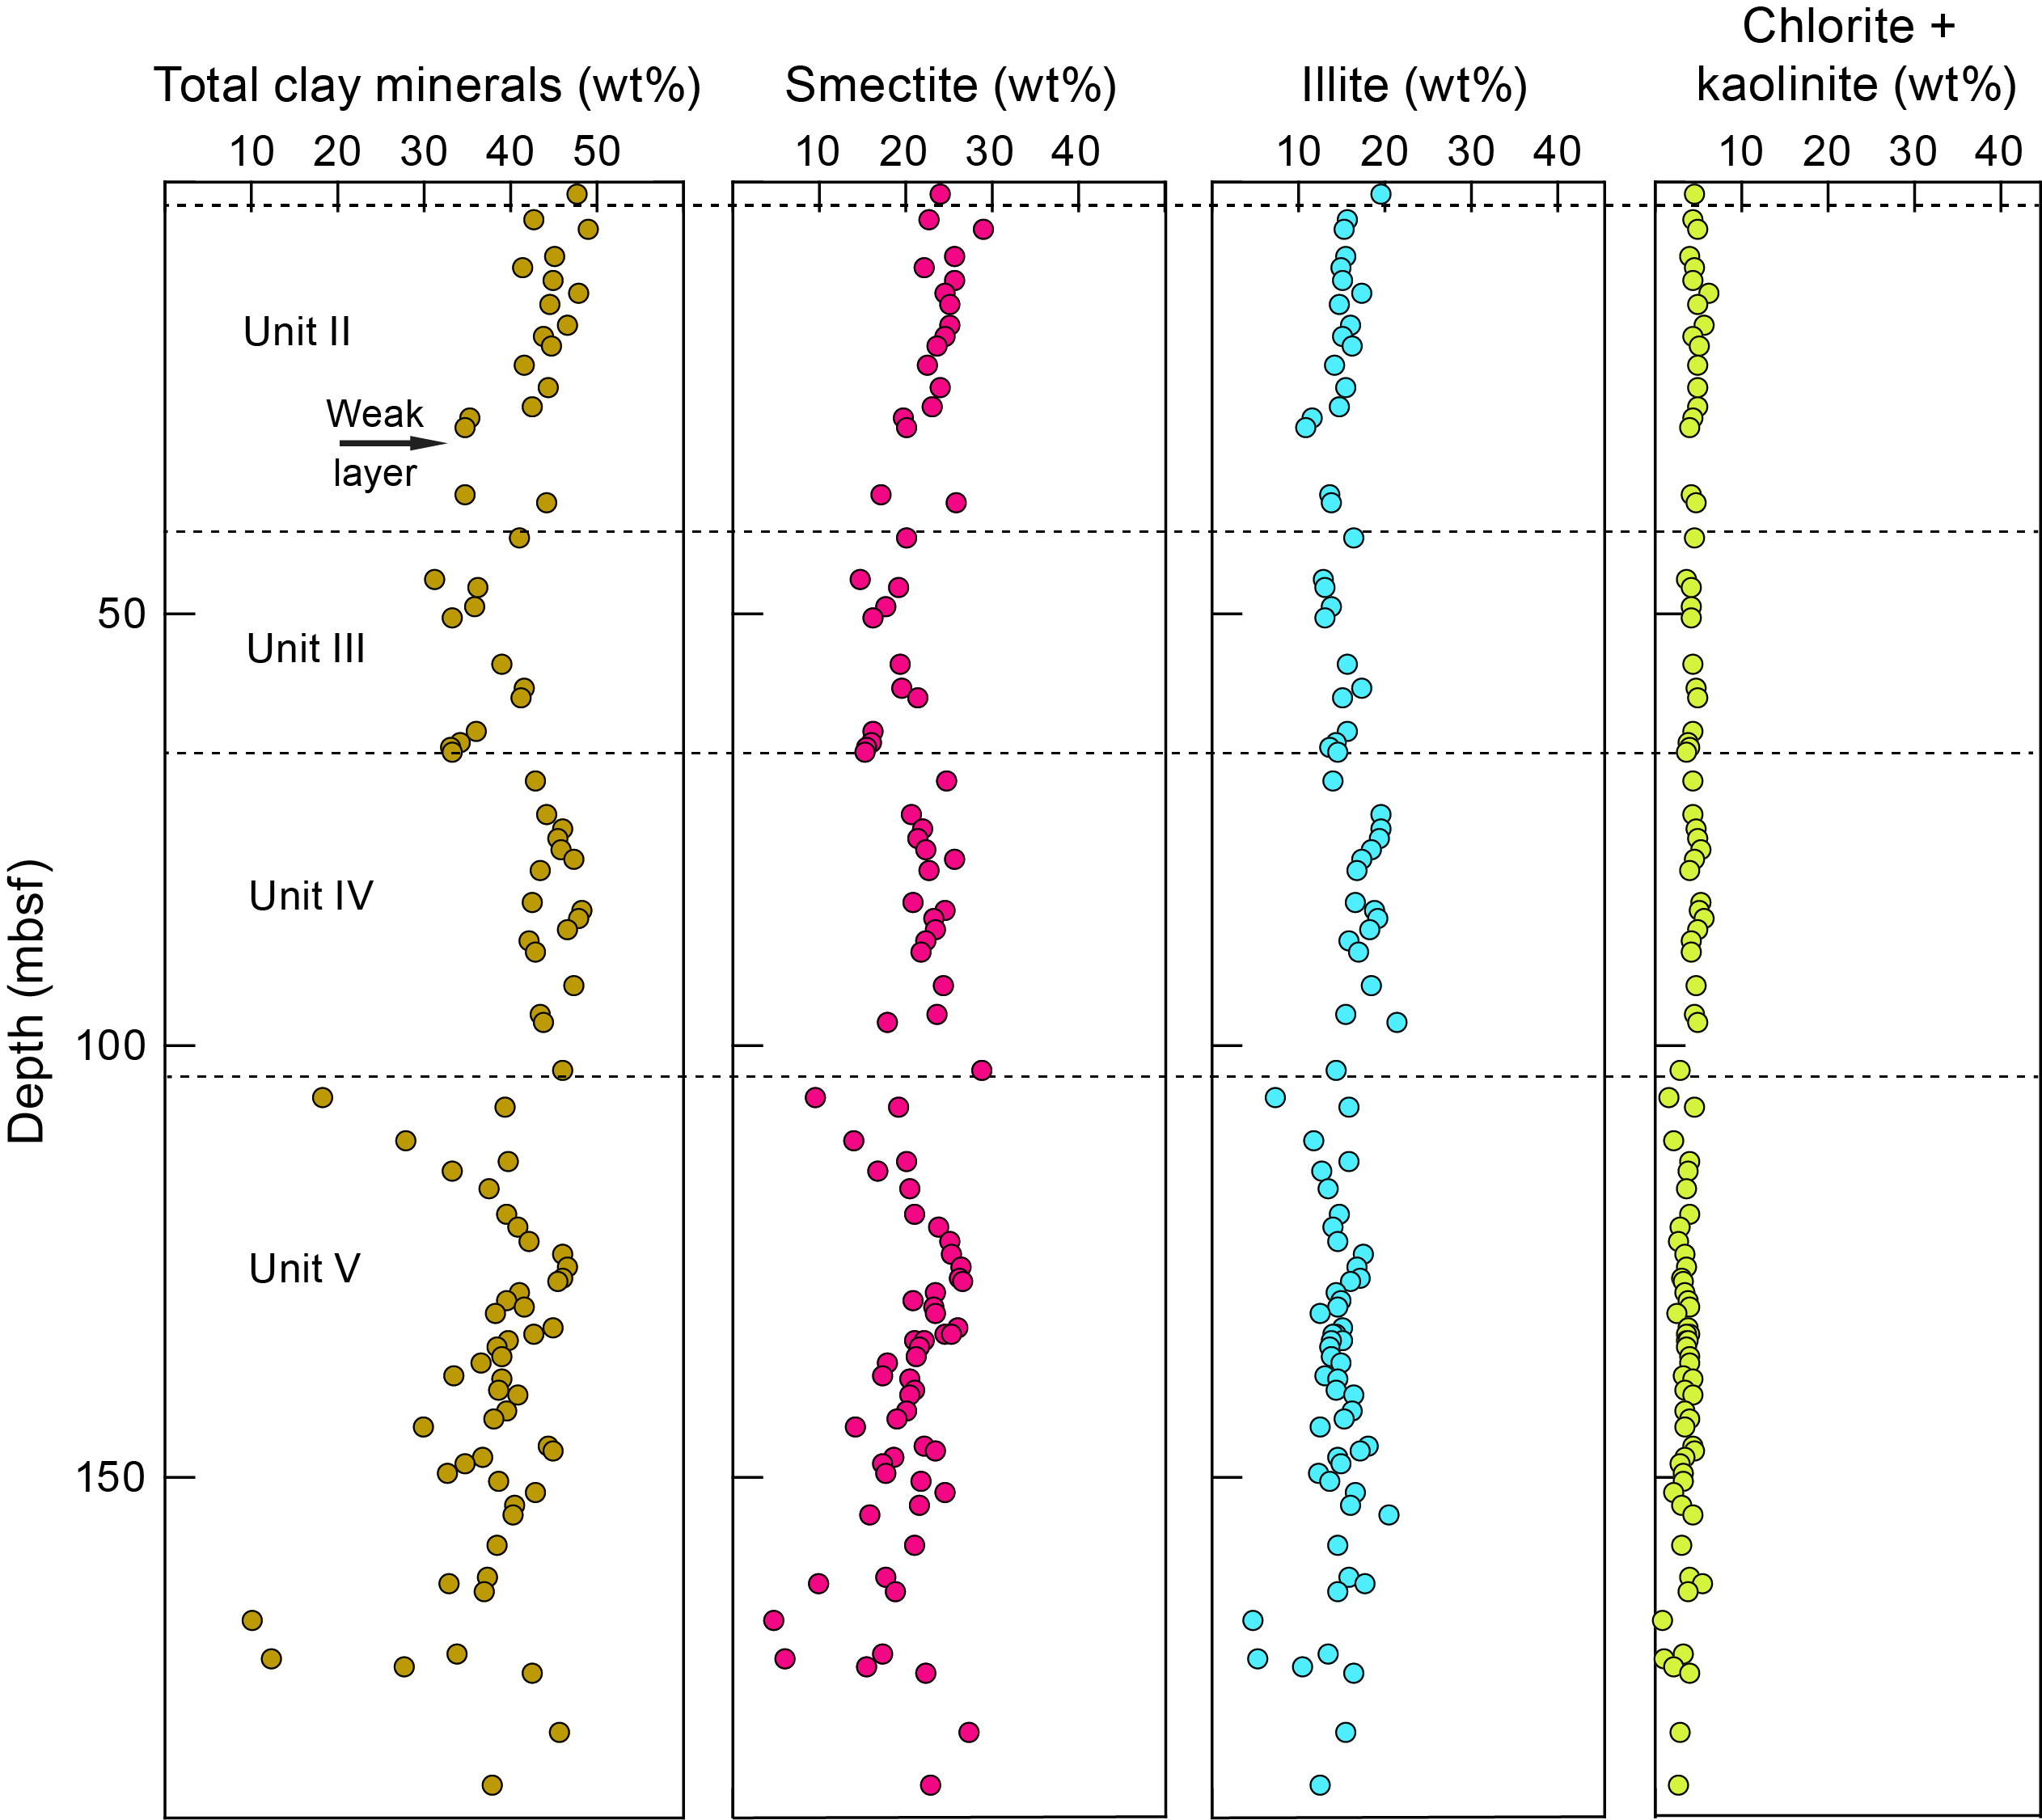
Figure F5. Relative-abundance values of total clay minerals.
Indicators of clay diagenesis
Values of crystallinity index for the detrital illite assemblage fall between 0.44Δ°2θ and 0.62Δ°2θ with a mean of 0.53Δ°2θ and a standard deviation of 0.027 (Table T2; Figure F6). According to the criteria of Warr and Ferreiro Mählmann (2015), that range of crystallinity values straddles the domains of advanced diagenesis and anchimetamorphism (i.e., incipient greenschist facies). Given the cool in situ burial temperatures in Hole U1517C (Barnes et al., 2019; Screaton et al., 2019), these results should be viewed as indicators of geologic conditions in detrital source terranes (e.g., Warr and Cox, 2016). Viewed similarly, the expandability of smectite and smectite-rich I/S mixed layer clay ranges from 67% to 90% with a mean value of 77.4% and a standard deviation of 4.9 (Table T2; Figure F6). For generic reference, lower values (less expandability) are consistent with higher proportions of detrital I/S mixed-layer clay in the assemblage, whereas higher values are indicative of more discrete smectite from altered volcanic sources. Percentages of illite within the I/S mixed-layer phase range from 1% to 24% with a mean of 8.7% and a standard deviation of 5.6 (Table T2; Figure F6). We see no systematic variations in any of these diagenetic indicators as a function of burial depth or lithostratigraphic unit.
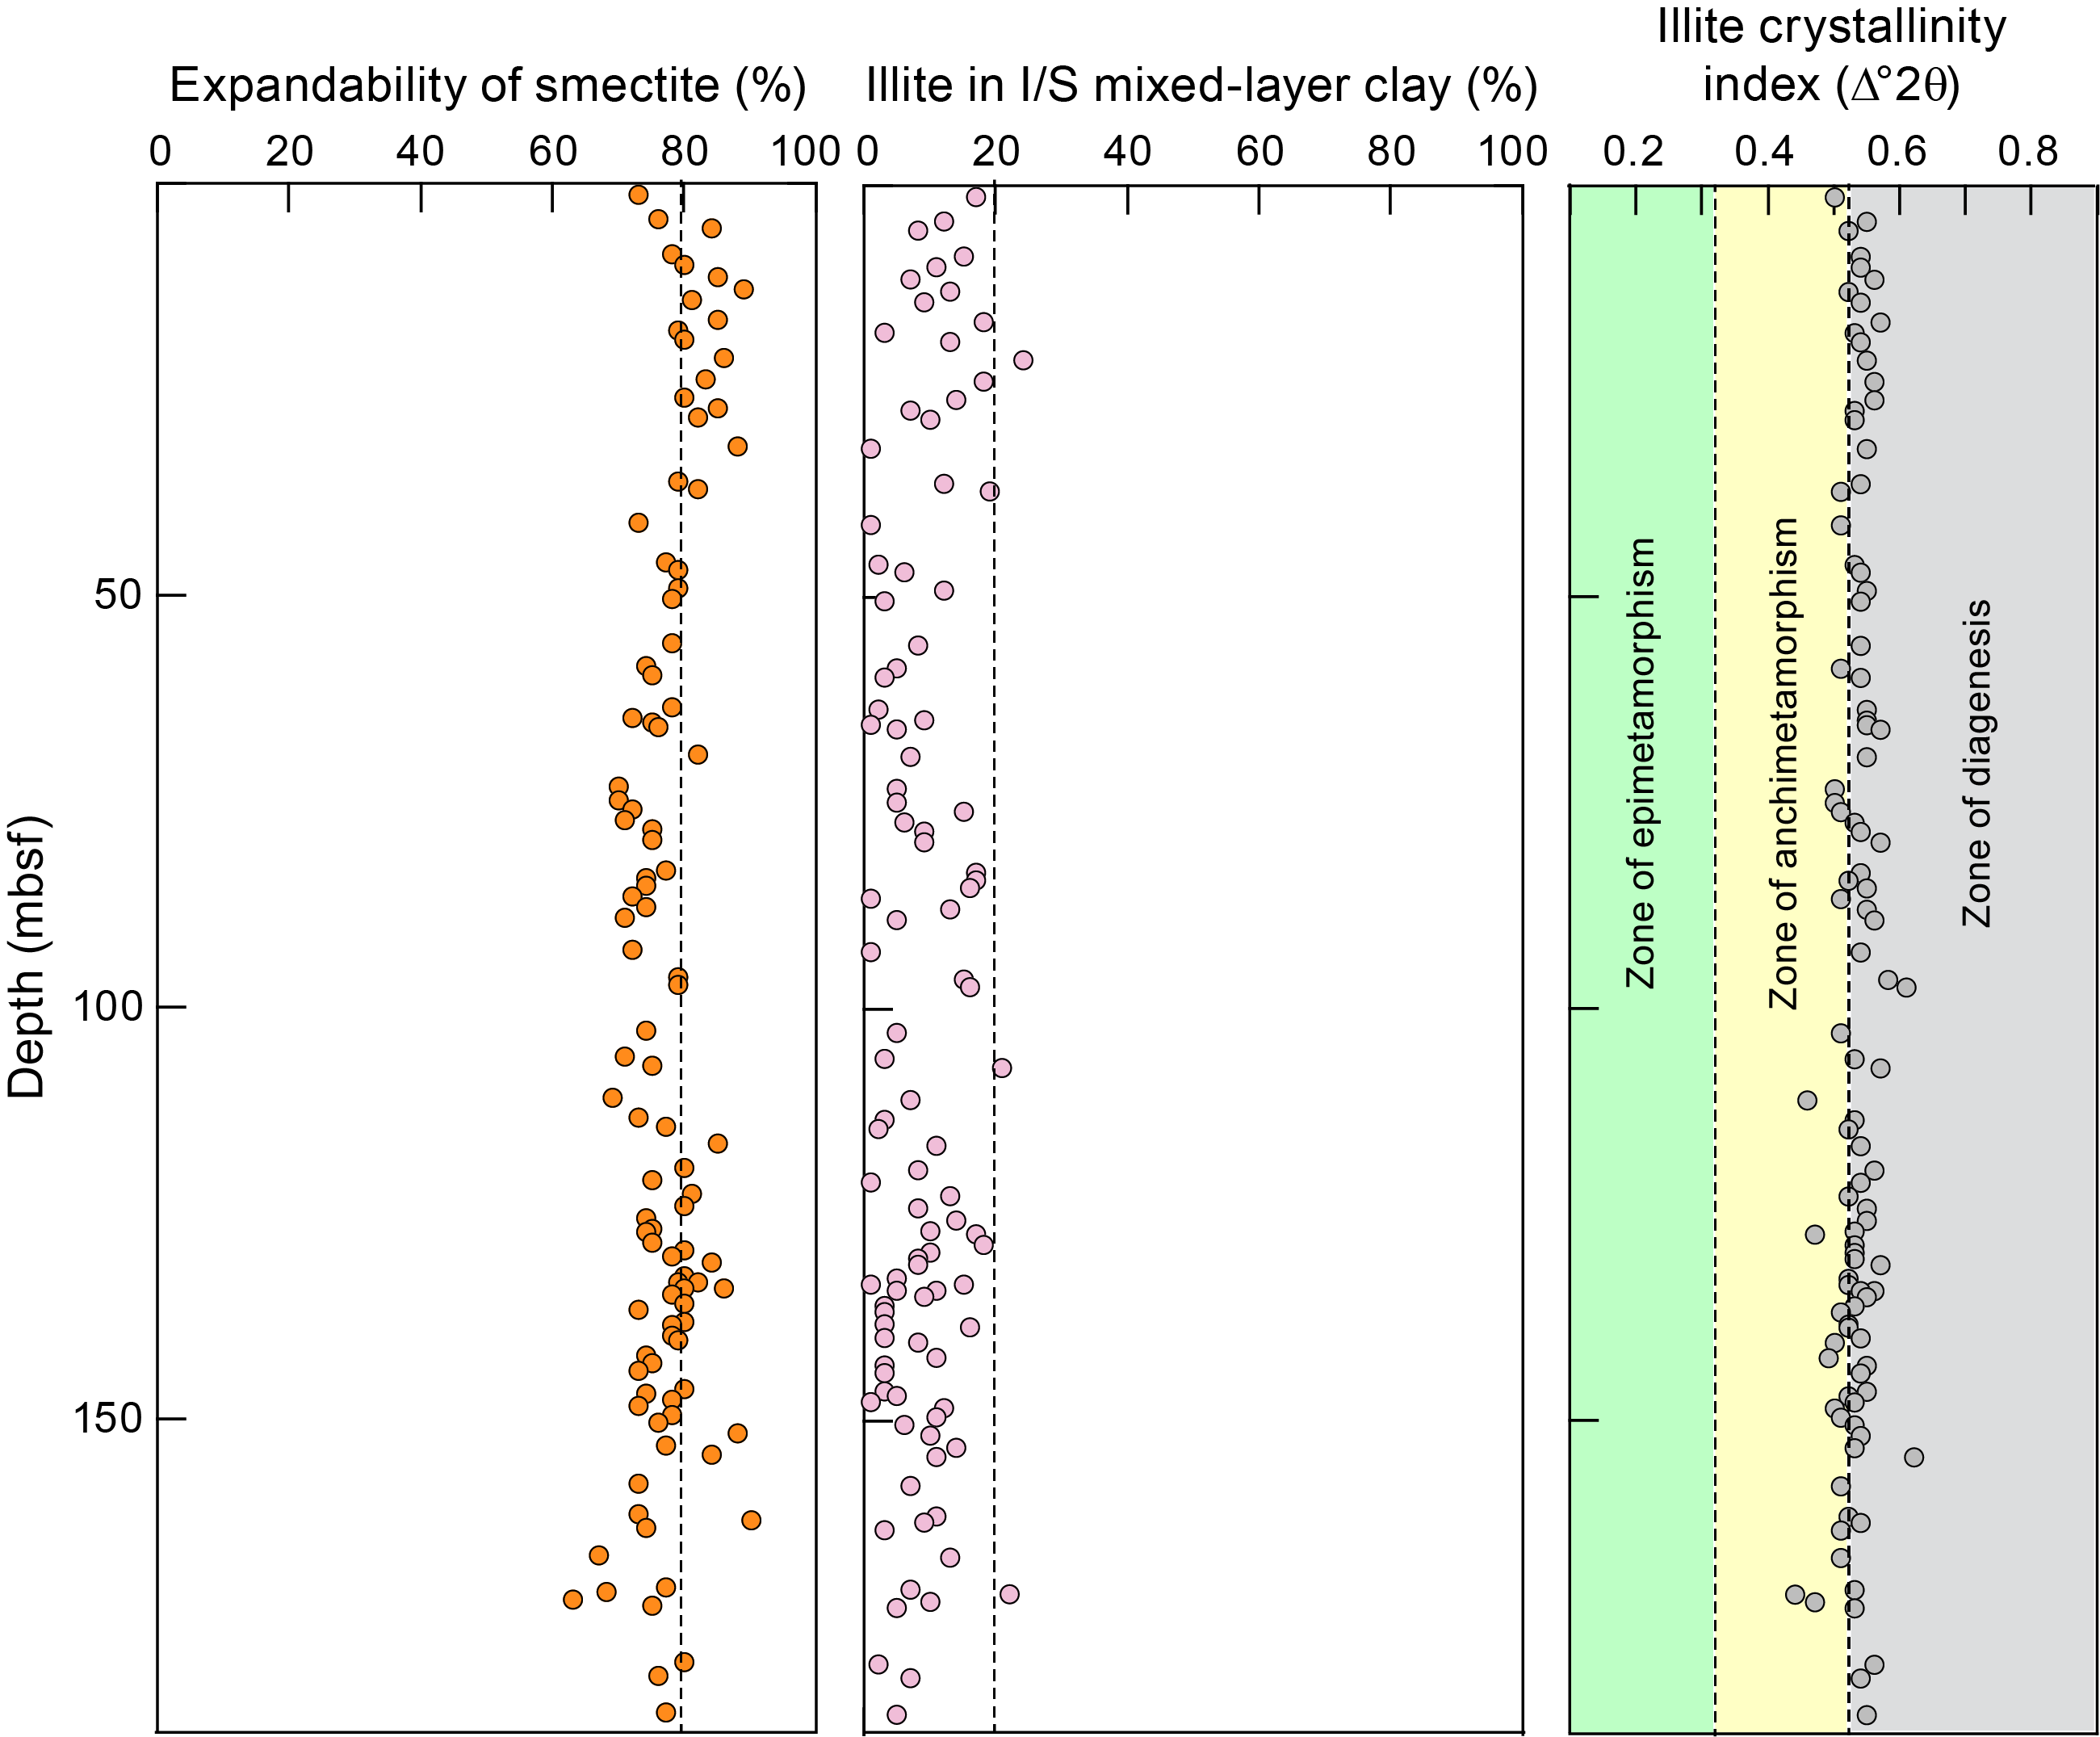
Figure F6. Expandability for clay minerals.
Conclusions
XRD analyses of the clay-sized fraction of hemipelagic mud specimens from Site U1517 reveal considerable monotony in clay mineral assemblages throughout the cored interval (0–188.5 mbsf). Proportions of clay-sized smectite show the most variability, ranging from 26.5 to 57.0 wt% with a mean value (µ) of 47.1 wt% and a standard deviation (σ) of 5.2 wt%. Weight percent values for illite range from 27.2 to 47.1 wt% (µ = 34.0; σ = 3.4), and the proportion of undifferentiated (chlorite + kaolinite) ranges from 3.9 to 14.2 wt% (µ = 8.8; σ = 1.8). The content of clay-sized quartz ranges from 4.8 to 23.7 wt% (µ = 10.2; σ = 4.0). Spatially, the XRD results reveal small excursions in mineralogy at one inferred slip surface (~41 mbsf) and near a weak layer (~31 mbsf) as well as across the boundaries between lithologic units. The magnitude of those differences, however, falls within the normal range of scatter for the site as a whole. XRD indicators of clay diagenesis (illite crystallinity index, smectite expandability, and %illite in I/S mixed layer clay) display uniformity versus depth. Their values should be viewed as diagnostic of geologic conditions in potential detrital source regions rather than in situ burial conditions.
Acknowledgments
This study used samples and/or data provided by the International Ocean Discovery Program (IODP). Funding to the coauthors was provided by the U.S. Science Support Program. We thank the crew members, IODP technicians, and shipboard scientists for their assistance with sample acquisition during Expedition 372. Karissa Rosenberger assisted with sample preparation at the New Mexico Institute of Mining and Technology, and Kelsey McNamara completed XRD scans at the New Mexico Bureau of Geology and Mineral Resources. An anonymous reviewer provided useful comments regarding the statistical descriptions of compositional variability.
References
Bailey, W., McArthur, A., and McCaffrey, W., 2021a. Sealing potential of contourite drifts in deep-water fold and thrust belts: examples from the Hikurangi margin, New Zealand. Marine and Petroleum Geology, 123:104776. https://doi.org/
Bailey, W.S., McArthur, A.D., and McCaffrey, W.D., 2021b. Distribution of contourite drifts on convergent margins: examples from the Hikurangi subduction margin of New Zealand. Sedimentology, 68(1):294–323. https://doi.org/
Barnes, P.M., Pecher, I., and LeVay, L.J., 2017. Expedition 372 Scientific Prospectus: Creeping Gas Hydrate Slides and LWD for Hikurangi Subduction Margin. International Ocean Discovery Program. https://doi.org/
Barnes, P.M., Pecher, I.A., LeVay, L.J., Bourlange, S.M., Brunet, M.M.Y., Cardona, S., Clennell, M.B., Cook, A.E., Crundwell, M.P., Dugan, B., Elger, J., Gamboa, D., Georgiopoulou, A., Greve, A., Han, S., Heeschen, K.U., Gaowei, H., Kim, G.Y., Kitajima, H., Koge, H., Xuesen, L., Machado, K.S., McNamara, D.D., Moore, G.F., Mountjoy, J.J., Nole, M.A., Owari, S., Paganoni, M., Petronotis, K.E., Rose, P.S., Screaton, E.J., Shankar, U., Shepherd, C.L., Torres, M.E., Underwood, M.B., Xiujuan, W., Woodhouse, A.D., and Wu, H.-Y., 2019. Site U1517. In Pecher, I.A., Barnes, P.M., LeVay, L.J., and the Expedition 372A Scientists (Ed.), Creeping Gas Hydrate Slides. Proceedings of the International Ocean Discovery Program, 372A: College Station, TX (International Ocean Discovery Program). https://doi.org/
Biscaye, P.E., 1965. Mineralogy and sedimentation of recent deep-sea clay in the Atlantic Ocean and adjacent seas and oceans. Geological Society of America Bulletin, 76(7):803–832. https://doi.org/
Brown, K.M., Kopf, A., Underwood, M.B., and Weinberger, J.L., 2003. Compositional and fluid pressure controls on the state of stress on the Nankai subduction thrust: a weak plate boundary. Earth and Planetary Science Letters, 214(3):589–603. https://doi.org/
Carter, L., Carter, R.M., and McCave, I., 2004. Evolution of the sedimentary system beneath the deep Pacific inflow off eastern New Zealand. Marine Geology, 205(1–4):9–27. https://doi.org/
Carter, L., Manighetti, B., Elliot, M., Trustrum, N., and Gomez, B., 2002. Source, sea level and circulation effects on the sediment flux to the deep ocean over the past 15 ka off eastern New Zealand. Global and Planetary Change, 33(3):339–355. https://doi.org/
Carter, L., and Wilkin, J., 1999. Abyssal circulation around New Zealand—a comparison between observations and a global circulation model. Marine Geology, 159(1–4):221–239. https://doi.org/
Chiswell, S.M., Bostock, H.C., Sutton, P.J.H., and Williams, M.J.M., 2015. Physical oceanography of the deep seas around New Zealand: a review. New Zealand Journal of Marine and Freshwater Research, 49(2):286–317. https://doi.org/
Crutchley, G.J., Geiger, S., Pecher, I.A., Gorman, A.R., Zhu, H., and Henrys, S.A., 2010. The potential influence of shallow gas and gas hydrates on sea floor erosion of Rock Garden, an uplifted ridge offshore of New Zealand. Geo-Marine Letters, 30(3):283–303. https://doi.org/
Dugan, B., Pecher, I.A., Nole, M., Mountjoy, J.J., Barnes, P.M., and LeVay, L., 2018. Formation pore pressure through the Tuaheni landslide complex and the gas hydrate stability zone at IODP Expedition 372 Site U1517, Hikurangi margin, New Zealand [presented at the American Geophysical Union Fall Meeting 2018, Washington, DC, 10–14 December 2018]. (Abstract T51I-0313) https://agu.confex.com/
Ellis, S., Pecher, I., Kukowski, N., Xu, W., Henrys, S., and Greinert, J., 2010. Testing proposed mechanisms for seafloor weakening at the top of gas hydrate stability on an uplifted submarine ridge (Rock Garden), New Zealand. Marine Geology, 272(1–4):127–140. https://doi.org/
Ferreiro Mählmann, R., and Frey, M., 2012. Standardisation, calibration and correlation of the Kübler-index and the vitrinite/bituminite reflectance: an inter-laboratory and field related study. Swiss Journal of Geosciences, 105(2):153–170. https://doi.org/
Fisher, A.T., and Underwood, M.B., 1995. Calibration of an X-ray diffraction method to determine relative mineral abundances in bulk powders using matrix singular value decomposition: a test from the Barbados accretionary complex. In Shipley, T.H., Ogawa, Y., Blum, P., et al., Proceedings of the Ocean Drilling Program, Initial Reports, 156: College Station, TX (Ocean Drilling Program), 29–37. https://doi.org/
Gingele, F.X., De Deckker, P., and Hillenbrand, C.-D., 2001. Clay mineral distribution in surface sediments between Indonesia and NW Australia—source and transport by ocean currents. Marine Geology, 179(3–4):135–146. https://doi.org/
Ikari, M.J., Kopf, A.J., Hüpers, A., and Vogt, C., 2018. Lithologic control of frictional strength variations in subduction zone sediment inputs. Geosphere, 14(2):604–625. https://doi.org/
Kisch, H.J., 1991. Illite crystallinity: recommendations on sample preparation, X-ray diffraction settings, and interlaboratory samples. Journal of Metamorphic Geology, 9(6):665–670. https://doi.org/
Kopf, A., and Brown, K.M., 2003. Friction experiments on saturated sediments and their implications for the stress state of the Nankai and Barbados subduction thrusts. Marine Geology, 202(3–4):193–210. https://doi.org/
Luo, M., Torres, M.E., Kasten, S., and Mountjoy, J.J., 2020. Constraining the age and evolution of the Tuaheni landslide complex, Hikurangi margin, New Zealand, using pore-water geochemistry and numerical modeling. Geophysical Research Letters, 47(11):e2020GL087243. https://doi.org/
Moore, D.M., and Reynolds, R.C., Jr., 1989a. Identification of mixed-layered clay minerals. In Moore, D.M., and Reynolds, R.C., Jr. (Eds.), X-ray Diffraction and the Identification and Analysis of Clay Minerals: New York (Oxford University Press), 241–271.
Moore, D.M., and Reynolds, R.C., Jr., 1989b. Sample preparation techniques for clay minerals. In Moore, D.M., and Reynolds, R.C., Jr. (Eds.), X-ray Diffraction and the Identification and Analysis of Clay Minerals: New York (Oxford University Press), 179–201.
Mountjoy, J.J., Pecher, I., Henrys, S., Crutchley, G., Barnes, P.M., and Plaza-Faverola, A., 2014. Shallow methane hydrate system controls ongoing, downslope sediment transport in a low-velocity active submarine landslide complex, Hikurangi margin, New Zealand. Geochemistry, Geophysics, Geosystems, 15(11):4137–4156. https://doi.org/
Nole, M., Daigle, H., Dugan, B., Clennell, M.B., Paganoni, M., Barnes, P., Pecher, I.A., and LeVay, L., 2018. Pore morphology, permeability, and constraints on gas hydrate accumulation in sediments from the Tuaheni landslide complex, NZ [presented at the American Geophysical Union Fall Meeting 2018, Washington, DC, 10–14 December 2018]. (Abstract OS51F-1331) https://agu.confex.com/
Petschick, R., Kuhn, G., and Gingele, F., 1996. Clay mineral distribution in surface sediments of the South Atlantic: sources, transport, and relation to oceanography. Marine Geology, 130(3–4):203–229. https://doi.org/
Phillips, S.C., Johnson, J.E., Underwood, M.B., Guo, J., Giosan, L., and Rose, K., 2014. Long-timescale variation in bulk and clay mineral composition of Indian continental margin sediments in the Bay of Bengal, Arabian Sea, and Andaman Sea. Marine and Petroleum Geology, 58(A):117–138. https://doi.org/
Rebesco, M., Hernández-Molina, F.J., Van Rooij, D., and Wåhlin, A., 2014. Contourites and associated sediments controlled by deep-water circulation processes: state-of-the-art and future considerations. Marine Geology, 352:111–154. https://doi.org/
Rettke, R.C., 1981. Probable burial diagenetic and provenance effects on Dakota Group clay mineralogy, Denver Basin. Journal of Sedimentary Research, 51(2):541–551. https://doi.org/
Screaton, E.J., Torres, M.E., Dugan, B., Heeschen, K.U., Mountjoy, J.J., Ayres, C., Rose, P.S., Pecher, I.A., Barnes, P.M., and LeVay, L.J., 2019. Sedimentation controls on methane-hydrate dynamics across glacial/interglacial stages: an example from International Ocean Discovery Program Site U1517, Hikurangi margin. Geochemistry, Geophysics, Geosystems, 20(11):4906–4921. https://doi.org/
Stow, D.A.V., Faugères, J.-C., Howe, J.A., Pudsey, C.J., and Viana, A.R., 2002. Bottom currents, contourites and deep-sea sediment drifts: current state-of-the-art. Memoir - Geological Society of London, 22(1):7–20. https://doi.org/
Thiry, M., 2000. Palaeoclimatic interpretation of clay minerals in marine deposits: an outlook from the continental origin. Earth-Science Reviews, 49(1–4):201–221. https://doi.org/
Underwood, M.B., 2020. Data report: reconnaissance of bulk sediment composition and clay mineral assemblages: inputs to the Hikurangi subduction system. In Wallace, L.M., Saffer, D.M., Barnes, P.M., Pecher, I.A., Petronotis, K.E., LeVay, L.J., and the Expedition 372/375 Scientists, Hikurangi Subduction Margin Coring, Logging, and Observatories. Proceedings of the International Ocean Discovery Program, 372B/375: College Station, TX (International Ocean Discovery Program). https://doi.org/
Underwood, M.B., 2021. Data report: clay mineral assemblages within trench-floor and accreted trench-floor deposits, IODP Sites U1518 and U1520, offshore New Zealand. In Wallace, L.M., Saffer, D.M., Barnes, P.M., Pecher, I.A., Petronotis, K.E., LeVay, L.J., and the Expedition 372/375 Scientists, Hikurangi Subduction Margin Coring, Logging, and Observatories. Proceedings of the International Ocean Discovery Program, 372B/375: College Station, TX (International Ocean Discovery Program). https://doi.org/
Underwood, M.B., Basu, N., Steurer, J., and Udas, S., 2003. Data report: normalization factors for semiquantitative X-ray diffraction analysis, with application to DSDP Site 297, Shikoku Basin. In Mikada, H., Moore, G.F., Taira, A., Becker, K., Moore, J.C., and Klaus, A. (Eds.), Proceedings of the Ocean Drilling Program, Scientific Results. 190/196: College Station, TX (Ocean Drilling Program), 1–28. https://doi.org/
Underwood, M.B., Lawler, N., and McNamara, K., 2020. Data report: standard mineral mixtures, normalization factors, and determination of error for quantitative X-ray diffraction analyses of bulk powders and clay-sized mineral assemblages. In Wallace, L.M., Saffer, D.M., Barnes, P.M., Pecher, I.A., Petronotis, K.E., LeVay, L.J., and the Expedition 372/375 Scientists, Hikurangi Subduction Margin Coring, Logging, and Observatories. Proceedings of the International Ocean Discovery Program, 372B/375: College Station, TX (International Ocean Discovery Program). https://doi.org/
Wallace, L.M., Saffer, D.M., Barnes, P.M., Pecher, I.A., Petronotis, K.E., LeVay, L.J., Bell, R.E., Crundwell, M.P., Engelmann de Oliveira, C.H., Fagereng, A., Fulton, P.M., Greve, A., Harris, R.N., Hashimoto, Y., Hüpers, A., Ikari, M.J., Ito, Y., Kitajima, H., Kutterolf, S., Lee, H., Xuesen, L., Min, L., Malie, P.R., Meneghini, F., Morgan, J.K., Noda, A., Rabinowitz, H.S., Savage, H.M., Shepherd, C.L., Shreedharan, S., Solomon, E.A., Underwood, M.B., Maomao, W., Woodhouse, A.D., Bourlange, S.M., Brunet, M.M.Y., Cardona, S., Clennell, M.B., Cook, A.E., Dugan, B., Elger, J., Gamboa, D., Georgiopoulou, A., Han, S., Heeschen, K.U., Gaowei, H., Kim, G.Y., Koge, H., Machado, K.S., McNamara, D.D., Moore, G.F., Mountjoy, J.J., Nole, M.A., Owari, S., Paganoni, M., Rose, P.S., Screaton, E.J., Shankar, U., Torres, M.E., Xiujuan, W., and Wu, H.-Y., 2019. Expedition 372B/375 methods. In Wallace, L.M., Saffer, D.M., Barnes, P.M., Pecher, I.A., Petronotis, K.E., LeVay, L.J., and the Expedition 372/375 Scientists, Hikurangi Subduction Margin Coring, Logging, and Observatories. Proceedings of the International Ocean Discovery Program, 372B/375: College Station, TX (International Ocean Discovery Program). https://doi.org/
Warr, L.N., and Cox, S.C., 2016. Correlating illite (Kübler) and chlorite (Árkai) “crystallinity” indices with metamorphic mineral zones of the South Island, New Zealand. Applied Clay Science, 134(3):164–174. https://doi.org/
Warr, L.N., and Ferreiro Mählmann, R., 2015. Recommendations for Kübler Index standardization. Clay Minerals, 50(3):283–286. https://doi.org/
Winkler, A., and Dullo, W.-C., 2002. Data report: Miocene to Pleistocene sedimentation pattern on the Chatham Rise, New Zealand. In Richter, C. (Ed.), Proceedings of the Ocean Drilling Program, Scientific Results. 181: College Station, TX (Ocean Drilling Program), 1–21. https://doi.org/
1 Underwood, M.B., and Dugan, B., 2021. Data report: clay mineral assemblages within and beneath the Tuaheni Landslide Complex, IODP Expedition 372A Site U1517, offshore New Zealand. In Pecher, I.A., Barnes, P.M., LeVay, L.J., and the Expedition 372A Scientists, Creeping Gas Hydrate Slides. Proceedings of the International Ocean Discovery Program, 372A: College Station, TX (International Ocean Discovery Program). https://doi.org/10.14379/iodp.proc.372A.201.2021
2 Department of Earth & Environmental Science, New Mexico Institute of Mining & Technology, USA. UnderwoodM@missouri.edu
3 Department of Geophysics, Colorado School of Mines, USA.
This work is distributed under the Creative Commons Attribution 4.0 International (CC BY 4.0) license. 