Wallace, L.M., Saffer, D.M., Barnes, P.M., Pecher, I.A., Petronotis, K.E., LeVay, L.J.,
and the Expedition 372/375 Scientists
Proceedings of the International Ocean Discovery Program Volume 372B/375
publications.iodp.org

https://doi.org/10.14379/iodp.proc.372B375.104.2019
Site U15191
P.M. Barnes, L.M. Wallace, D.M. Saffer, I.A. Pecher, K.E. Petronotis, L.J. LeVay, R.E. Bell, M.P. Crundwell, C.H. Engelmann de Oliveira, A. Fagereng, P.M. Fulton, A. Greve, R.N. Harris, Y. Hashimoto, A. Hüpers, M.J. Ikari, Y. Ito, H. Kitajima, S. Kutterolf, H. Lee, X. Li, M. Luo, P.R. Malie, F. Meneghini, J.K. Morgan, A. Noda, H.S. Rabinowitz, H.M. Savage, C.L. Shepherd, S. Shreedharan, E.A. Solomon, M.B. Underwood, M. Wang, A.D. Woodhouse, S.M. Bourlange, M.M.Y. Brunet, S. Cardona, M.B. Clennell, A.E. Cook, B. Dugan, J. Elger, D. Gamboa, A. Georgiopoulou, S. Han, K.U. Heeschen, G. Hu, G.Y. Kim, H. Koge, K.S. Machado, D.D. McNamara, G.F. Moore, J.J. Mountjoy, M.A. Nole, S. Owari, M. Paganoni, P.S. Rose, E.J. Screaton, U. Shankar, M.E. Torres, X. Wang, and H.-Y. Wu2
Keywords: International Ocean Discovery Program, IODP, JOIDES Resolution, Expedition 372, Expedition 375, Site U1519, Hikurangi margin, slow slip events, observatory, subduction
MS 372B375-104: Published 5 May 2019
Background and objectives
Site U1519 (proposed Site HSM-01A) is located on the upper continental slope of the Hikurangi margin ~38 km from shore in 1000 m water depth at the landward edge of a 12 km wide midslope sedimentary basin (Figure F1; see Figure F3 in the Expedition 372B/375 summary chapter [Saffer et al., 2019a]). The basin is officially unnamed but is referred to as the Tuaheni Basin. The slope west of the Tuaheni Basin rises to the edge of the continental shelf and hosts the North Tuaheni Landslide. This landslide and other landslides have delivered late Quaternary mass transport deposits (MTDs) and associated sediments directly into the basin (Mountjoy et al., 2014). The seafloor in the basin is underlain by these deposits and is approximately horizontal with localized relief of <20 m in the area of Site U1519 (Figures F1, F2).
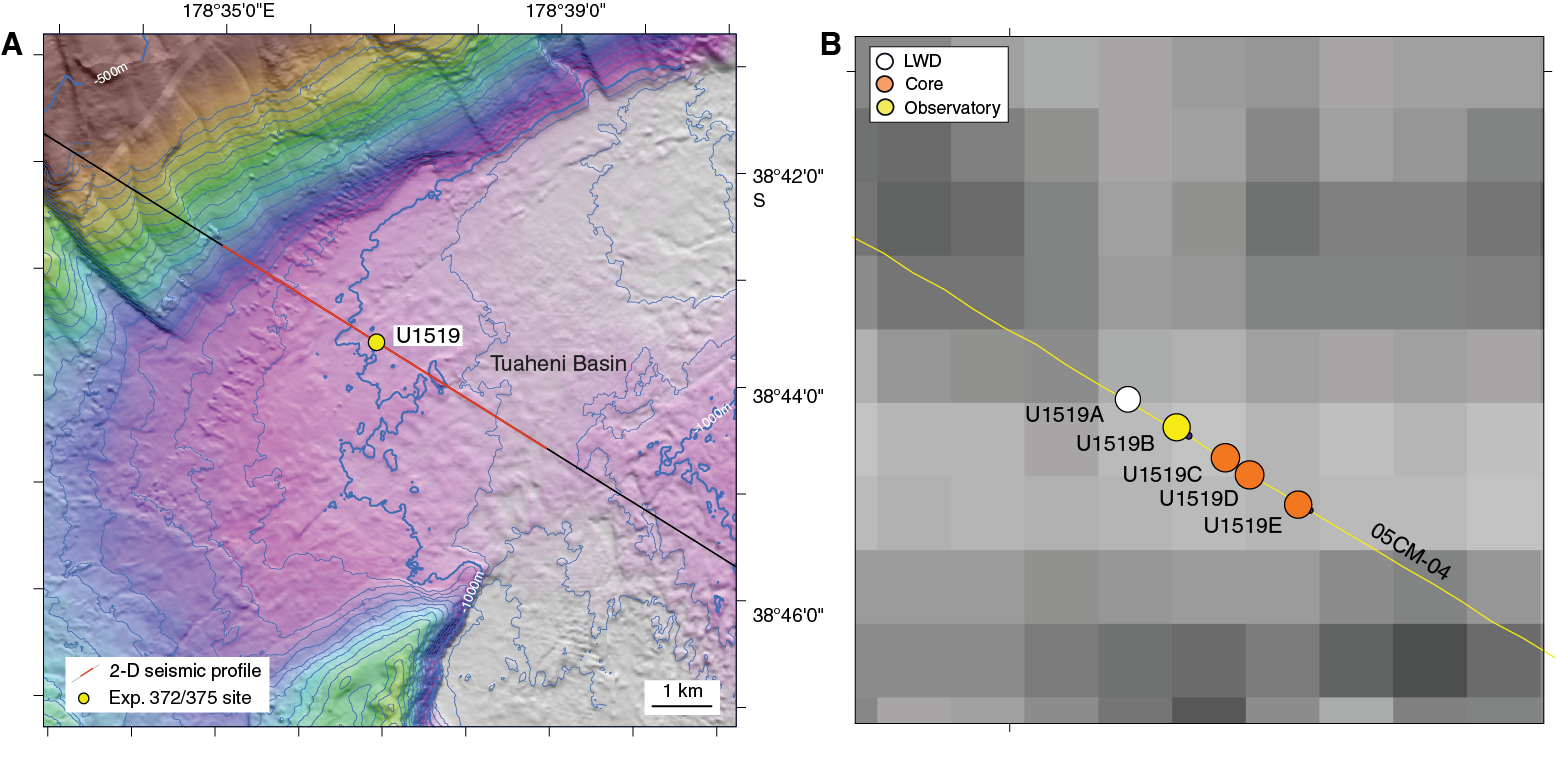
Figure F1. Bathymetry and location, Site U1519.
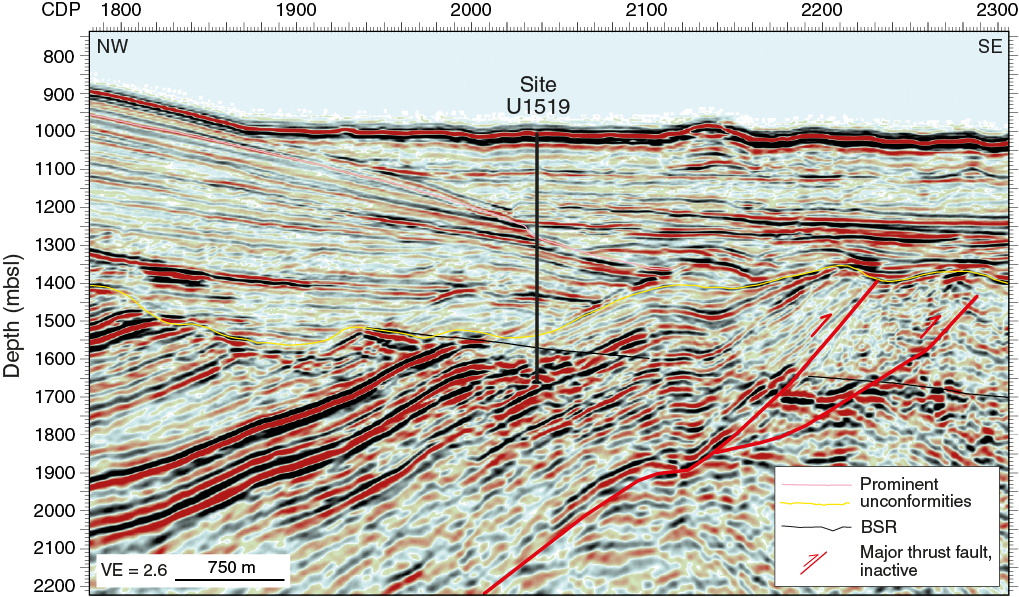
Figure F2. Seismic reflection image, Profile 05CM-04.
Active thrust faults reach the seafloor on the continental shelf west (landward) of Site U1519 (Mountjoy and Barnes, 2011) and on the mid–lower slope trenchward of the site (Barker et al., 2009, 2018; Bell et al., 2010; Pedley et al., 2010). No active thrust faults are recognized directly beneath the basin; however, an apparently inactive and buried northwest-dipping thrust fault lies ~1.1 km below Site U1519. This fault is associated with an eroded hanging wall sequence that dips northwest (Figure F2). The plate interface that hosts large (>10 cm) slip during slow slip events (SSEs) lies ~5 km below the seafloor at Site U1519 (Wallace et al., 2016) (see Figure F2 in the Expedition 372B/375 summary chapter [Saffer et al., 2019a]).
Based on predrilling interpretation of the seismic data (Figure F2), three main unconformity-bounded lithostratigraphic units were identified at Site U1519 to the drilling target depth at 650 meters below seafloor (mbsf). These units include ~260–270 m of horizontally layered basin fill comprising MTDs and sequences of turbidites, a southeast-dipping slope sequence of MTDs and layered strata about 260–270 m thick (to 530 mbsf), and a basal 120 m thick unit of northwest-dipping strata on the back limb of the inactive thrust fault. Although no age control was available prior to drilling, the upper unit was interpreted to be late Quaternary in age and the middle unit was thought to be Plio–Pleistocene. Prior to drilling, the basal unit was interpreted to be Miocene–Pliocene, possibly correlating with the Tolaga Group onshore (e.g., Field et al., 1997). A possible weak bottom-simulating reflector (BSR) projects through Site U1519 at or below 560 mbsf.
The primary objectives at Site U1519 were to install an observatory to monitor deformation, temperature, and hydrological changes throughout the slow slip cycle and to use coring and logging-while-drilling (LWD) data to better understand the composition, physical properties, thermal state, and in situ stress state in the hanging wall above the SSE source region. The objective of the borehole observatory is to record pressure and temperature over multiple SSE cycles at a site on the inner margin above portions of the plate interface that host large SSE displacements modeled from geodetic data (e.g., Wallace and Beavan, 2010; Wallace et al., 2016).
The main objective of logging and coring at Site U1519 was to provide information about rock physical properties, composition, thermal state, and structural geology and deformation in the upper plate overlying the SSE source region. LWD logs and core from Site U1519 will also provide constraints on the evolution of the upper slope and basin environment and the timing of apparent thrust cessation across this section of the inner continental slope. Pore fluid geochemistry data will provide insights into diagenetic processes and potential sources and flow pathways of fluid sampled in the upper plate.
One key focus for post-expedition studies on core samples will be geomechanical measurements to define poroelastic and strength properties. These data will be essential for interpretation of observatory data, such as calibrating the use of pore pressure as a proxy for volumetric strain (e.g., Wang, 2004; Davis et al., 2009). Similarly, strength, permeability, and elastic moduli measurements will provide the necessary data to estimate in situ stress magnitude from any observed wellbore breakouts (e.g., Zoback, 2007; Chang et al., 2010; Huffman and Saffer, 2016) and to parameterize hydrological and geomechanical models. Core-log-seismic integration will allow extrapolation of seismic attributes and in situ conditions (stress, fault zone properties, and pore pressure) away from the borehole over a broad region of existing 2-D and newly acquired 3-D seismic data.
Drilling during International Ocean Discovery Program (IODP) Expedition 372 included LWD to 650 mbsf in Hole U1519A. Drilling during IODP Expedition 375 included coring with the rotary core barrel (RCB) system in Hole U1519C in three discrete intervals (108–163.6, 250–288.4, and 520–640 mbsf) and the advanced piston corer (APC) system from 0 to 23.3 mbsf in Hole U1519D and from 0 to 85.8 mbsf in Hole U1519E. The observatory installed in Hole U1519B includes two formation pore pressure monitoring intervals at 125 and 263.6 mbsf and a string of 15 temperature sensors spanning from 47.8 to 262 mbsf.
Operations
Expedition 372
The R/V JOIDES Resolution arrived at Site U1519 at 0530 h (UTC + 13 h) on 24 December 2017 after a 15.4 nmi transit from Site U1518. Site U1519 consisted of one LWD hole during Expedition 372 (Table T1).
Hole U1519A
The LWD bottom-hole assembly (BHA) was assembled and included the geoVISION, NeoScope, StethoScope, TeleScope, SonicScope, and proVISION tools behind an 8½ inch drill bit. The LWD BHA and drill string were deployed to 952 meters below sea level (mbsl), and the tools were pump tested before spudding the hole; all turbine-dependent tools were activated during the pump test. Hole U1519A (38°43.6372ʹS, 178°36.8537ʹE; 1000.7 mbsl; Table T1) was spudded at 1200 h on 24 December 2017 and continued to 26 December. The seafloor depth for Hole U1519A was set at 1000.7 mbsl based on the LWD logs. After logging to 650 mbsf, a 30 bbl mud sweep was used to clean the hole, and the LWD tools and drill string were pulled out of the hole. The bit cleared the seafloor at 0425 h and the rig floor at 0855 h. The vessel began the transit to Site U1520 at 0910 h on 26 December. The time spent at Site U1519 during Expedition 372 was 2.17 days.
Safety monitoring
Continuous safety monitoring (see Logging while drilling in the Expedition 372B/375 methods chapter [Wallace et al., 2019]) was completed during LWD operations at Site U1519 to monitor for the presence of abnormal pressure or free gas and to ensure safe drilling conditions. Real-time monitoring in Hole U1519A started at 37 mbsf and continued to 650 mbsf. Overpressures generally increased downhole, reaching approximately 0.689 MPa (100 psi) at the bottom of the borehole. Eight pressure kicks were observed in the borehole and required special monitoring. Each of these pressure kicks was an isolated point and likely the result of circulation or annular pressure while drilling (APWD) sensor issues. Additionally, these kicks were manageable with 10.5 lb/gal mud. Mud circulation was not required, however, because of the short duration of these events.
Expedition 375
After waiting on weather in the Bay of Plenty for 36.75 h, we arrived at Site U1519 at 1810 h (UTC + 12 h) on 13 April 2018. Upon arriving on location, the thrusters were lowered, the dynamic positioning system was engaged, and an acoustic positioning beacon was deployed. During Expedition 375, Site U1519 consisted of an observatory hole and three coring holes (Table T1). The time spent at Site U1519 during Expedition 375 was 8.79 days. The total time spent at Site U1519 during both expeditions was 10.96 days.
Hole U1519B observatory
First, we moved the base of the reentry cone needed for the observatory installation to the moonpool. Next, we assembled a BHA with a 14¾ inch drill bit. Hole U1519B (38°43.6426ʹS, 178°36.8655ʹE; 1000.4 mbsl; Table T1) was spudded at 0105 h on 14 April 2018 and reached a total depth of 283.2 mbsf at 1630 h. A 30 bbl mud sweep was circulated to clean the hole of cuttings, and the bit was raised to 71 mbsf. At 1845 h, the reentry cone and its base were released from the moonpool and allowed to fall to the seafloor. The subsea camera was deployed to check that the reentry cone had landed properly and to observe the reentry cone while pulling the BHA out of the hole. The subsea camera was recovered at 2015 h on 14 April, and the drill string was recovered at 2225 h. Next, the hydraulic release tool (HRT) needed to deploy the first stage of the observatory was assembled and stored in the derrick.
The next step in the observatory installation was to assemble the 279 m long ACORK casing string consisting of 22 joints of 10¾ inch casing, two casing joints with 2 m long screens for pressure monitoring, and an umbilical secured on the outside of the casing to connect the two casing screens to pressure loggers on the wellhead (Figure F3A). As the casing string was assembled from the bottom up, the umbilical was connected to the bottom and top screens, which were intended to be deployed at 264 and 124 mbsf, respectively. The casing string was completed at 1245 h on 15 April and landed in the moonpool.
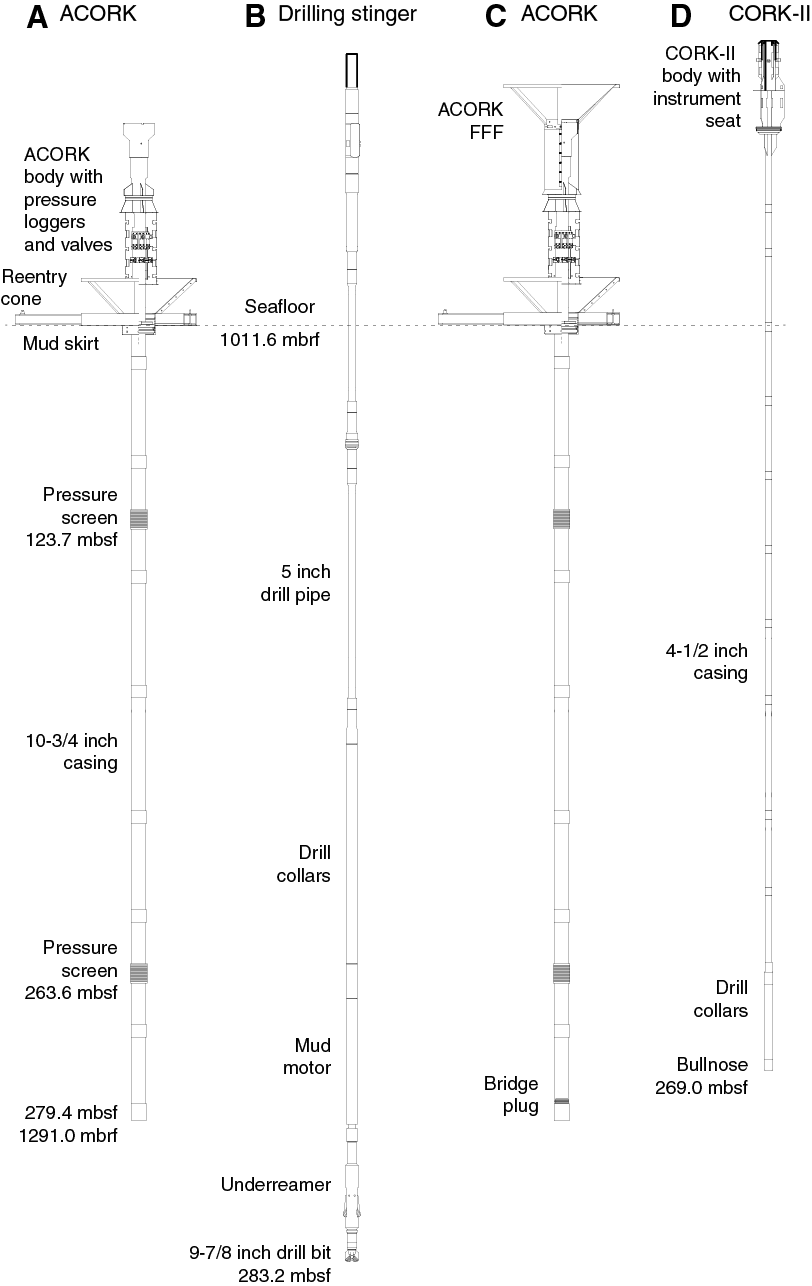
Figure F3. Site U1519 observatory installation.
Next, we assembled the drilling stinger needed to guide the casing into the predrilled hole. The drilling assembly was composed of a 9⅞ inch drill bit, an underreamer with its arms set to 14¾ inches to clear any obstacles in the hole, and a mud motor to rotate the bit and underreamer in isolation from the ACORK casing (Figure F3B). The underreamer arms were tested, and the drilling assembly was completed and landed inside the casing by 1645 h on 15 April.
The pressure umbilical terminations were made on the ACORK wellhead at 1930 h, and the wellhead was submerged for 10 min with the valves in the open position to purge the lines of air. The wellhead was then brought back to the surface to set the valves to their deployment (closed) position, and the wellhead was submerged for the last time. The entire assembly with the HRT running tool; the ACORK wellhead, casing, and umbilical; and the drilling assembly was lowered to the seafloor between 2000 and 2130 h on 15 April.
The subsea camera was then deployed to assist with reentry. Hole U1519B was reentered at 2310 h, and the ACORK wellhead landed in the reentry cone on the seafloor at 0635 h on 16 April. Once the ACORK was released (0715 h), we recovered the subsea camera and deployed an ACORK free-fall funnel (FFF) at 0845 h (Figure F3C). To save time and avoid the complications encountered at Site U1518, we decided to not deploy a remotely operated vehicle (ROV) platform. The subsea camera was redeployed to verify that the FFF had landed correctly on top of the ACORK wellhead. The drill string with the mud motor, underreamer, and drill bit was recovered at 1605 h, and the BHA was cleaned with water.
In preparation for deploying a bridge plug at the bottom of the ACORK casing, the drill string was deployed with a 9⅞ inch drill bit BHA. Hole U1519B was reentered at 2100 h on 16 April with the aid of the subsea camera, the hole was cleared of cuttings, and the drill string was recovered at 0315 h. Next, we assembled a BHA with a bridge plug to seal the bottom of the ACORK casing. The drill string was lowered to the seafloor, and the subsea camera was deployed to aid with the reentry. Hole U1519B was reentered at 0755 h on 17 April. The end of the drill string was positioned at 277 mbsf inside the ACORK casing, the bridge plug was activated until the packer was set at 1135 h (Figure F3C), and the bridge plug BHA was recovered at 1455 h.
Next, we started assembling the 269 m long CORK-II casing string consisting of 20 full joints and four pup joints of 4½ inch casing (~234 m), four 6¾ inch drill collars (~36 m), and a bullnose (Figure F3D). The CORK-II body and casing string were deployed with a J running tool, and the entire assembly was lowered to the seafloor. The subsea camera was deployed, and the CORK-II entered the ACORK funnel at 0120 h on 18 April. The CORK-II wellhead was lowered to ~20 m above the ACORK and kept there while we deployed the instrument string.
At 0230 h on 18 April, we started assembling the 268 m long instrument string consisting of a single segment of Spectra rope with 15 temperature sensors, one weak link, a sinker bar at the bottom, and a top plug. The top plug was connected to the Schlumberger wireline with the Electronic Release System (ERS), and the instrument string was lowered to the seafloor inside the drill pipe connected to the running tool. Once the top plug latched inside the CORK-II wellhead at 0530 h, the ERS mechanism was activated, releasing the instrument string. The CORK-II then landed inside the ACORK funnel at 0700 h and was released from the running tool at 0735 h on 18 April, completing the observatory installation. Following a brief visual survey of the wellhead, the camera and running tool BHA were recovered at 1100 h. In the inspection video, we noted minor damage on the CORK-II wellhead caused during the running tool release and a thick cover of cuttings over the hydraulic connections in the ACORK funnel, which should not pose a problem for future data recovery.
Hole U1519C
The primary coring objective at Site U1519 was to sample sediment in the intervals surrounding the ACORK pressure screens (around 124 and 264 mbsf) and in the lowermost sedimentary section logged in Hole U1519A (~520–640 mbsf). In preparation for coring, we assembled an RCB BHA. The drill string was lowered to the seafloor, and the vessel was offset 20 m from Hole U1519B at a heading of 122°. Hole U1519C (38°43.6483ʹS, 178°36.8773ʹE; 1000.3 mbsl; Table T1) was spudded at 1640 h on 18 April 2018, and drilling without core recovery continued to 108 mbsf until 0600 h on 19 April (drilled interval 375-U1519C-11). Cores 2R–26R advanced from 108.0 to 640.0 mbsf and recovered 119.17 m (55% recovery). This cored interval included two drilled intervals (375-U1519C-81 and 131) without coring at 163.6–250.0 and 288.4–518.4 mbsf, respectively. The drill string was recovered at 0815 h on 21 April, and the BHA was put away.
Hole U1519D
The final objective at Site U1519 was to core the shallow sedimentary section to sample interstitial water chemistry and collect in situ temperature measurements with the advanced piston corer temperature tool (APCT-3). An APC/extended core barrel (XCB) BHA was assembled, and the drill string was lowered to the seafloor. The vessel was offset 10 m at a heading of 122°, and Hole U1519D (38°43.6516ʹS, 178°36.8831ʹE; 1000.4 mbsl; Table T1) was spudded at 1505 h on 21 April 2018. Cores 375-U1519D-1H through 3H advanced from 0 to 23.3 mbsf and recovered 23.64 m (101% recovery). Nonmagnetic core barrels were used for all APC cores. Because coarse, unconsolidated material made it difficult to collect in situ temperature measurements and resulted in a partial stroke with Core 3H, we decided to start a new hole.
Hole U1519E
The vessel was offset 20 m at a heading of 122°, and Hole U1519E (38°43.6572ʹS, 178°36.8949ʹE; 1000.3 mbsl; Table T1) was spudded at 1845 h on 21 April 2018. Cores 375-U1519E-1H through 13F advanced from 0 to 85.8 mbsf and recovered 88.75 m (103% recovery). Nonmagnetic core barrels were used for all APC/half-length APC (HLAPC) cores. Formation temperature measurements were taken with the APCT-3 for Cores 4H–8H, 9F, 11F, and 13F.
Lithostratigraphy
We identified two lithostratigraphic units at Site U1519 (Table T2), which were informed to some extent by the petrophysical attributes of depth-correlative logging units in Hole U1519A drilled during Expedition 372 (Figure F4). Detailed characterization of lithofacies was hampered by large coring gaps, poor recovery, and pervasive coring disturbance. We used descriptive visual criteria to compare facies, and we did not define any subunits. The sedimentary strata at Site U1519 range in age from Holocene to early Pleistocene (see Biostratigraphy). Common lithologies include mud(stone), silt(stone), and sand(stone). Zones of soft-sediment deformation are also present.
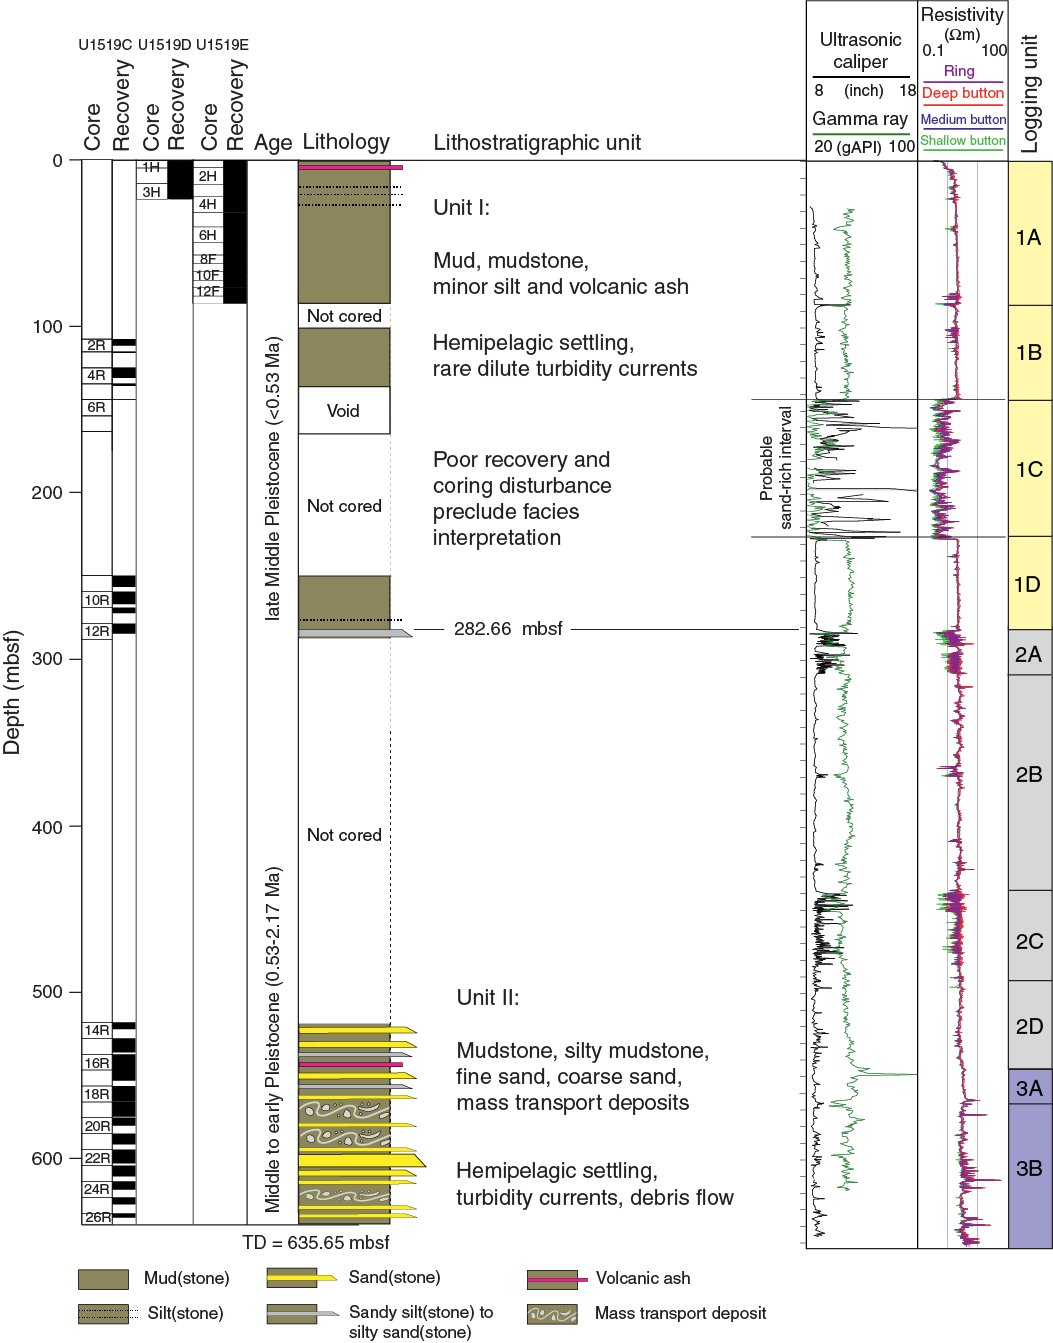
Figure F4. Lithostratigraphic summary.
Unit I
- Interval: 375-U1519D-1H-1, 0 cm, and 375-U1519E-1H-1, 0 cm, to 375-U1519C-12R-3, 99 cm
- Thickness: Holes U1519C–U1519E = 282.66 m
- Depth: Holes U1519C–U1519E = 0–282.66 mbsf
- Age: Holocene to late Middle Pleistocene
- Lithology: mud(stone) and sparse silt(stone)
Coring of Lithostratigraphic Unit I started in Hole U1519C at 108 mbsf (Section 2R-1, 0 cm) and at the seafloor in Holes U1519D (Section 1H-1, 0 cm) and U1519E (Section 1H-1, 0 cm). The unit extends to 282.66 mbsf (Section 375-U1519C-12R-3, 99 cm). Cores from this depth range contain a background of dark greenish gray mud (silty clay to clayey silt) and mudstone with variable levels of consolidation. As explained in Lithostratigraphy in the Expedition 372B/375 methods chapter (Wallace et al., 2019), sediments in RCB cores are, by convention, called mudstone (Hole U1519C), whereas identical lithologies in APC cores (Hole U1519D) are called mud. We interpret these sediments to be typical hemipelagic suspension-fallout deposits alternating with very thin beds and laminae of silt. The uppermost part of Unit I (Cores 375-U1519D-1H and 375-U1519E-1H) contains a 1 m thick deposit of light gray, unconsolidated, silicic volcanic ash (Figure F5).
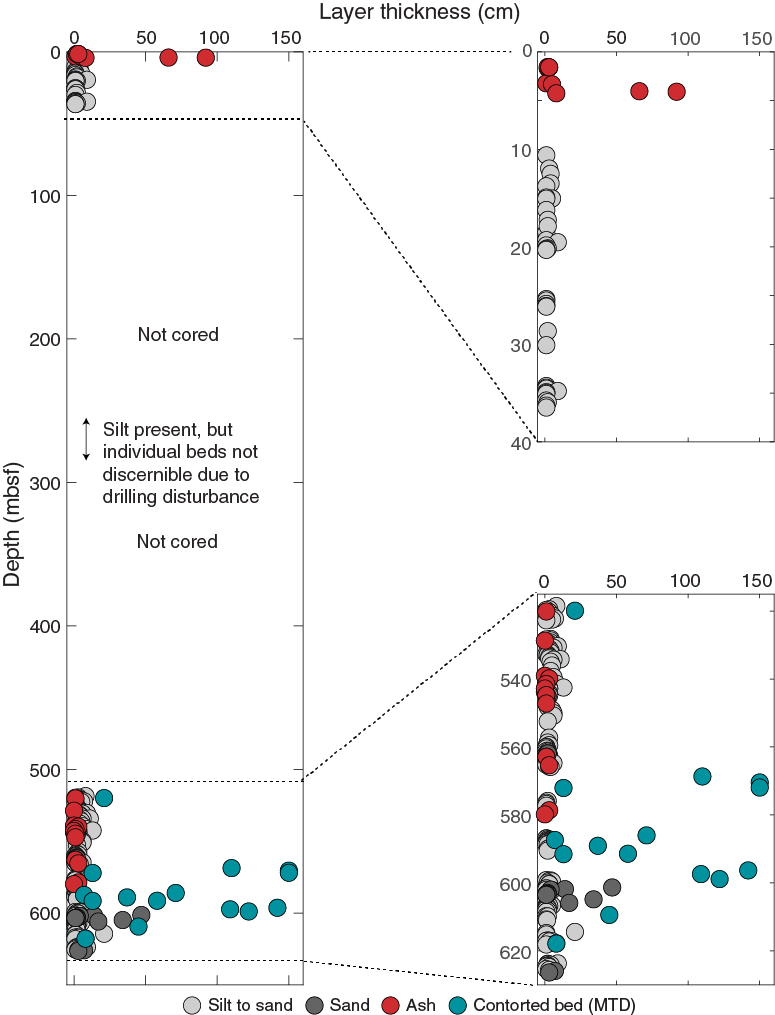
Figure F5. Event bed thickness.
Seismic reflection records and high-resolution bathymetry are indicative of shallow mass transport remobilization at Site U1519 (see Core-log-seismic integration), similar to the Tuaheni Landslide Complex that was cored at IODP Site U1517. The APC cores from Holes U1519D and U1519E, however, reveal no definitive diagnostic indicators of gravity-driven soft-sediment deformation in the hemipelagic mud. Recognition of such features might have been compromised by coring disturbance that consists mostly of upward arching of the sedimentary layers and vertical streaking from flow-in.
The shallow RCB cores from Hole U1519C are also overprinted by severe drilling artifacts. Internal sedimentary structures include dark silty laminae, but ubiquitous coring disruption broke most of the material into thin biscuits with truncated and rotated laminae. Normal size grading is preserved only locally, manifested as subtle changes in color. Irregular pods and distorted lenses of fine sand occur in one core (interval 375-U1519C-10R-1, 51–72 cm) (Figure F6).

Figure F6. Representative Unit I and II lithologies.
Smear slides reveal that the detrital grain assemblage in the background mud(stone) lithology is dominated by clay minerals, with significant amounts of calcareous nannofossils, quartz, feldspar, and sedimentary lithic and volcaniclastic grains (Figure F7). Carbonate contents in mud(stone) specimens range from 0.4 to 12.1 wt% with an average value of 7.9 wt% (see Geochemistry). Normalized mineral abundances from bulk powder X-ray diffraction (XRD) analyses are shown in Figure F8 and Table T3. Proportions of total clay minerals (smectite + illite + chlorite + kaolinite) range from 36.0 to 53.3 wt% (mean = 45.3 wt%). Quartz ranges from 23.7 to 37.5 wt% (mean = 29.5 wt%). Feldspar (plagioclase + K-feldspar) abundance ranges from 12.5 to 21.8 wt% (mean = 16.7 wt%), and calcite abundance ranges from 6.9 to 9.9 wt% (mean = 8.4 wt%). We recognize no significant trends in composition with depth.

Figure F7. Silt layers, Unit I.

Figure F8. Lithostratigraphic summary and XRD abundance.
Unit II
- Interval: 375-U1519C-12R-3, 99 cm, through 26R-CC
- Thickness: 352.99 m
- Depth: 282.66–635.65 mbsf
- Age: Middle to early Pleistocene
- Lithology: mudstone with scattered interbeds of silt(stone) and very fine sand(stone), medium to coarse sand(stone), contorted mudstone, and matrix-supported MTDs
We placed the upper boundary of Unit II in Section 375-U1519C-12R-3, 99 cm (282.66 mbsf), which is close to the top of Logging Unit 2 (281.5 mbsf). This unit boundary coincides with a noticeable change in color from dark greenish gray above to light greenish gray below, and the grain size coarsens somewhat to silt-rich mudstone. Plane-parallel laminae are more common and better preserved below the boundary. The upper part of Unit II also generates a positive excursion in magnetic susceptibility, and drilling disturbance is less severe. Below a 230 m gap in coring, Core 14R (518.4 mbsf) contains similar mudstone with scattered thin interbeds of dark gray sandy siltstone to very fine sandstone. Some of the coarser interbeds reach thicknesses of 5–10 cm (Figure F5) and include shell fragments and terrigenous organic matter. Most of the coarser interbeds display sharp bases and subtle normal grading.
Seismic reflection data exhibit geometry indicative of an unconformity at approximately 547 mbsf (see Core-log-seismic integration). However, no consequential changes in lithology or in the inferred processes of sedimentation occur over this depth range. Furthermore, the ages do not change across the seismically interpreted unconformity (see Biostratigraphy). At the top of Section 375-U1519C-19R-2, the mudstone displays clear evidence of soft-sediment deformation, including convolute laminae, mesoscale folds, dismembered bedding, and clasts of mudstone supported by a mudstone matrix. Zones of soft-sediment deformation also occur in Cores 21R and 22R (Figure F9). We interpret the deformed zones to be intraformational MTDs. The lithologies recovered from the remainder of Unit II consist of consolidated greenish gray mudstone interbedded with poorly indurated, uncemented sandy silt and sand. Some of the sandy sediment is medium to coarse grained and poorly sorted, with abundant shell fragments and sedimentary lithic grains. The most noteworthy examples are in Core 22R. Sandy beds in Core 23R are not as coarse; they display well-preserved bases and normal size grading. Core 23R also contains a distinctive matrix-supported conglomerate with widely dispersed clasts of mudstone (granule to pebble size and rounded to subrounded shapes) and small, intact shells of what appear to be shallow-water fauna.
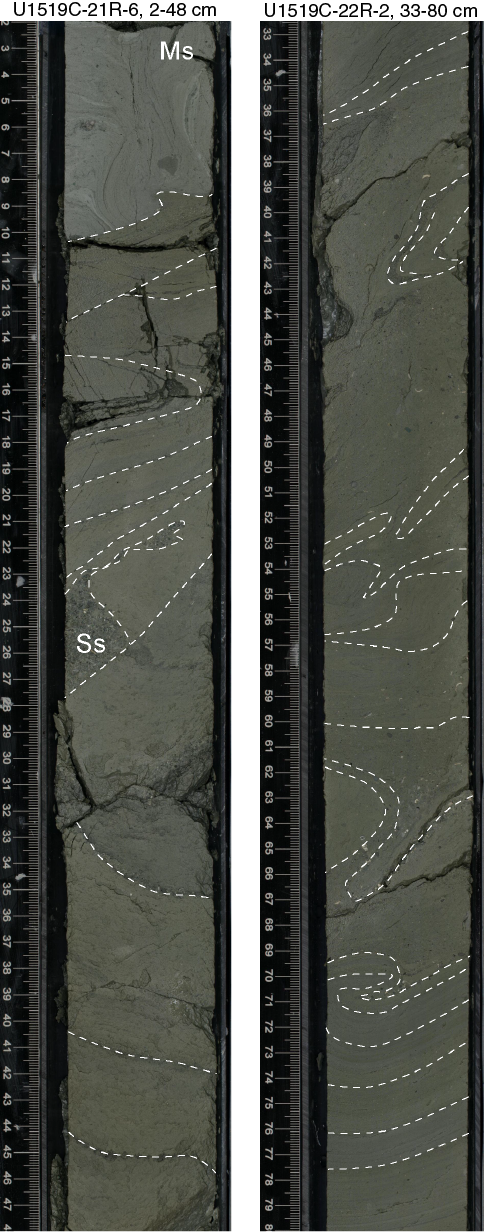
Figure F9. Soft-sediment deformation, Unit II.
Smear slide observations demonstrate that the detrital grain assemblage in the mudstones of Unit II is dominated by clay minerals, with significant amounts of silt- and sand-sized quartz, feldspar, sedimentary lithic and volcaniclastic grains, and calcareous nannofossils. Terrestrial organic matter is slightly more abundant than in Unit I. The sand deposits are composed largely of quartz and sedimentary rock fragments, although some are mixed with considerable amounts of volcanic glass shards and pumice. Carbonate contents in mudstone specimens range from 7.0 to 21.9 wt% with an average value of 11.2 wt% (see Geochemistry). Normalized mineral abundances from bulk powder XRD are shown in Figure F8 and Table T3. Proportions of total clay minerals (smectite + illite + chlorite + kaolinite) range from 33.1 to 52.3 wt% (mean = 44.6 wt%). Quartz ranges from 21.7 to 36.6 wt% (mean = 25.9 wt%). Feldspar (plagioclase + K-feldspar) abundance ranges from 12.9 to 22.2 wt% (mean = 15.7 wt%), and calcite abundance ranges from 6.5 to 17.9 wt% (mean = 13.8 wt%).
Comparison of Holes U1519C–U1519E core data and Hole U1519A log data
In general, logging data provide an uninterrupted record of stratigraphic variability at Site U1519 (see Logging while drilling). Correlation between lithostratigraphic units and logging units, however, was compromised by spot coring, poor recovery, and coring disturbance (Figure F4). Logging Unit 1 in Hole U1519A (0–281.5 mbsf) shows petrophysical characteristics typical of fine- and coarse-grained lithologies. It is divided into four subunits based on changes in logging response. Subunit 1A (0–86 mbsf) consists of uniformly fine grained sediment. APC cores from Lithostratigraphic Unit I confirm this interpretation. Subunit 1B (86–143 mbsf) is defined based on a change to slightly lower resistivity, thin beds, and small washouts in the coarse-grained thin beds. Coring disturbance in Hole U1519C is too extensive to corroborate the occurrences of thin interbeds (probable turbidites). Subunit 1C (143–227.5 mbsf) is interpreted to comprise coarse-grained sediment with extensive washouts. We failed to recover sediment from this interval (Cores 375-U1519C-6R and 7R). Subunit 1D (227.5–281.5 mbsf) marks a return to the lithologic character of Subunit 1B. Cores from the upper part of Lithostratigraphic Unit II, although highly disturbed, are consistent with this interpretation; we find remnants of fine sand layers scattered as pods in the mudstone.
Logging Unit 2 (281.5–546 mbsf) is thought to comprise a sequence of mostly fine grained sediments punctuated by coarser interbeds. Four subunits were defined over this depth interval (Figure F4). Subunit 2A (281.5–308.5 mbsf) is interpreted to consist of coarser sediment content and larger pore sizes separated by a thin interval of uniform fine sediment. Bed thickness and contrasts among interbeds are variable. These deposits are interpreted to be thin-bedded turbidites. One bed of silty sand to sandy silt was recovered just below the top of Unit II. Subunit 2B (308.5–438.5 mbsf) is interpreted to consist of uniformly fine grained sediment. No coring was attempted in that interval. Subunit 2C (438.5–483.0 mbsf) marks another interval of inferred thin-bedded turbidites with layers as thick as 10 cm. That interval was not cored. LWD results from Subunit 2D (483.0–546 mbsf) are indicative of more uniformly fine grained sediment with sparse thin layers of coarser sediment. The lithologies in Cores 375-U1519C-14R through 17R are consistent with that interpretation, but they are not fundamentally different than the lithologies in Core 19R and below.
Lithologic interpretation of Logging Unit 3 (546–650 mbsf) is dubious. Unit 3 is interpreted to consist of uniformly fine grained sediment. Distinctions between two logging subunits (3A and 3B) are based on small differences in compressional wave velocity, density, and resistivity values. Subunit 3A (546–567 mbsf) is characterized by higher resistivity, lower porosity, and higher density. Subunit 3B (567–650 mbsf) yields evidence for a gradational change to slightly higher porosity values and slower velocity values. These subtle differences in petrophysical attributes are not detectable at either the mesoscale or microscale in the cored lithologies. Cores confirm that mudstone is the most common lithology from many meters above the top of Logging Unit 3 through Section 375-U1519C-26R-CC, but we also recovered a substantial number of coarser interbeds throughout the depth range of Unit 3. Some of these layers are similar in texture, thickness, and composition to those in the overlying depth range of Unit 2, but the more distinctive sand beds are considerably thicker and include medium and very coarse grain sizes. The recovery of thicker and coarser sand beds, particularly in Core 22R, coincides with a broader zone of increased resistivity and positive resistivity spikes in the LWD logs. The occurrences of MTDs and pebbly mudstone are not detected in any of the log attributes, even as anomalous zones of bedding dips.
Biostratigraphy
Planktonic foraminifers and calcareous nannofossils from core catcher samples and additional split-core samples from Holes U1519C–U1519E were examined to develop a shipboard biostratigraphic framework for Site U1519. Additionally, benthic foraminifers provided data on paleowater depths and downslope reworking.
A Holocene to Pleistocene sedimentary sequence was recovered at Site U1519. The base of the Holocene was identified between Samples 375-U1519E-1H-CC, 8–18 cm (4.40 mbsf), and 2H-CC, 14–24 cm (14.00 mbsf). The underlying section (to Sample 375-U1519C-15R-CC, 10–19 cm [536.32 mbsf]) is dated Late to Middle Pleistocene (Haweran to Castlecliffian; 0.011–0.62 Ma), indicating a sedimentation rate of 0.84 m/ky. The age through the lower part of the section to the base of Hole U1519C is poorly constrained but is shown by calcareous nannofossils and planktonic foraminifers to be early Pleistocene or younger (younger than 1.73 Ma and younger than 2.17 Ma, respectively).
Highly variable planktonic foraminifer abundances in the upper part of the cored section (Samples 375-U1519E-1H-1, 0 cm, through 15R-CC, 10–19 cm [0–536.32 mbsf]) fluctuate between outer neritic and oceanic values. This variability is attributed to downslope reworking that is evident from the occurrence of common inner shelf benthic taxa and shell fragments with bathyal benthic taxa in the same sample (e.g., 375-U1519C-15R-CC, 10–19 cm [536.32 mbsf]). In the lower part of the cored sequence (Samples 16R-CC, 0–11 cm, through 26R-CC, 0–5 cm [546.86–635.6 mbsf]), benthic markers indicate deposition in mid- to lower bathyal or deeper water depths.
Calcareous nannofossils
Calcareous nannofossil biostratigraphy at Site U1519 was established through the analysis of core catcher samples from Holes U1519C and U1519E. Nannofossils are common throughout the cored sequence, with poor to moderate preservation. Reworking of older, poorly preserved material is common in most samples. Biostratigraphic datums are given in Table T4, and the distribution of calcareous nannofossil taxa is shown in Table T5.
Split-core samples from Hole U1519E were analyzed under a scanning electron microscope to determine the presence/absence of Emiliania huxleyi. The presence of E. huxleyi in Samples 375-U1519E-1H-1, 4 cm, through 2H-1, 52 cm (0.04–5.12 mbsf), indicates a Late Pleistocene to Holocene age (0.29 Ma or younger) in Zone NN21 of Martini (1971). Below 5.12 mbsf, the recognition of key datums is problematic because of substantial reworking of Pliocene–Eocene taxa throughout the sequence.
Medium Gephyrocapsa spp. (4–5.55 µm) are recorded sporadically throughout Holes U1519C and U1519E. Based on the first appearance datum of medium Gephyrocapsa spp. (1.73 Ma or younger; in Zone NN19), the base of Hole U1519C (Sample 375-U1519C-26R-CC, 0–5 cm [635.60 mbsf]) is assigned an early Pleistocene or younger age.
Other taxa in the Pleistocene sequence include rare to common specimens of Coccolithus pelagicus, Gephyrocapsa spp. (<3.5 µm), Helicosphaera carteri, Pseudoemiliania lacunosa, Pseudoemiliania ovata, Reticulofenestra haqii, Reticulofenestra minuta, Reticulofenestra minutula, Reticulofenestra producta, and Syracosphaera pulchra and rare to few specimens of Braarudosphaera bigelowii, Calcidiscus leptoporus, Calcidiscus tropicus, Calciosolenia brasiliensis, Ceratolithus cristatus, Gephyrocapsa spp. (>5.5 µm), Helicosphaera hyalina, Helicosphaera sellii, Pontosphaera discopora, Pontosphaera japonica, Pontosphaera multipora, Reticulofenestra perplexa, Rhabdosphaera clavigera, Umbilicosphaera rotula, and Umbilicosphaera sibogae.
Planktonic foraminifers
Planktonic foraminifer biostratigraphy at Site U1519 was based on the examination of core catcher samples from Holes U1519C–U1519E. Absolute ages assigned to biostratigraphic datums follow those listed in Table T4 in the Expedition 372B/375 methods chapter (Wallace et al., 2019). Biostratigraphic datums are given in Table T4, and the distribution of planktonic foraminifer taxa is given in Table T6. Planktonic foraminifer abundances, indications of oceanicity (qualitative measure of the extent to which the paleoenvironment recorded by the faunal assemblage represents open ocean conditions relative to a nearshore-influenced environment), paleowater depths, and downslope reworking are given in Table T7 and Figure F10.
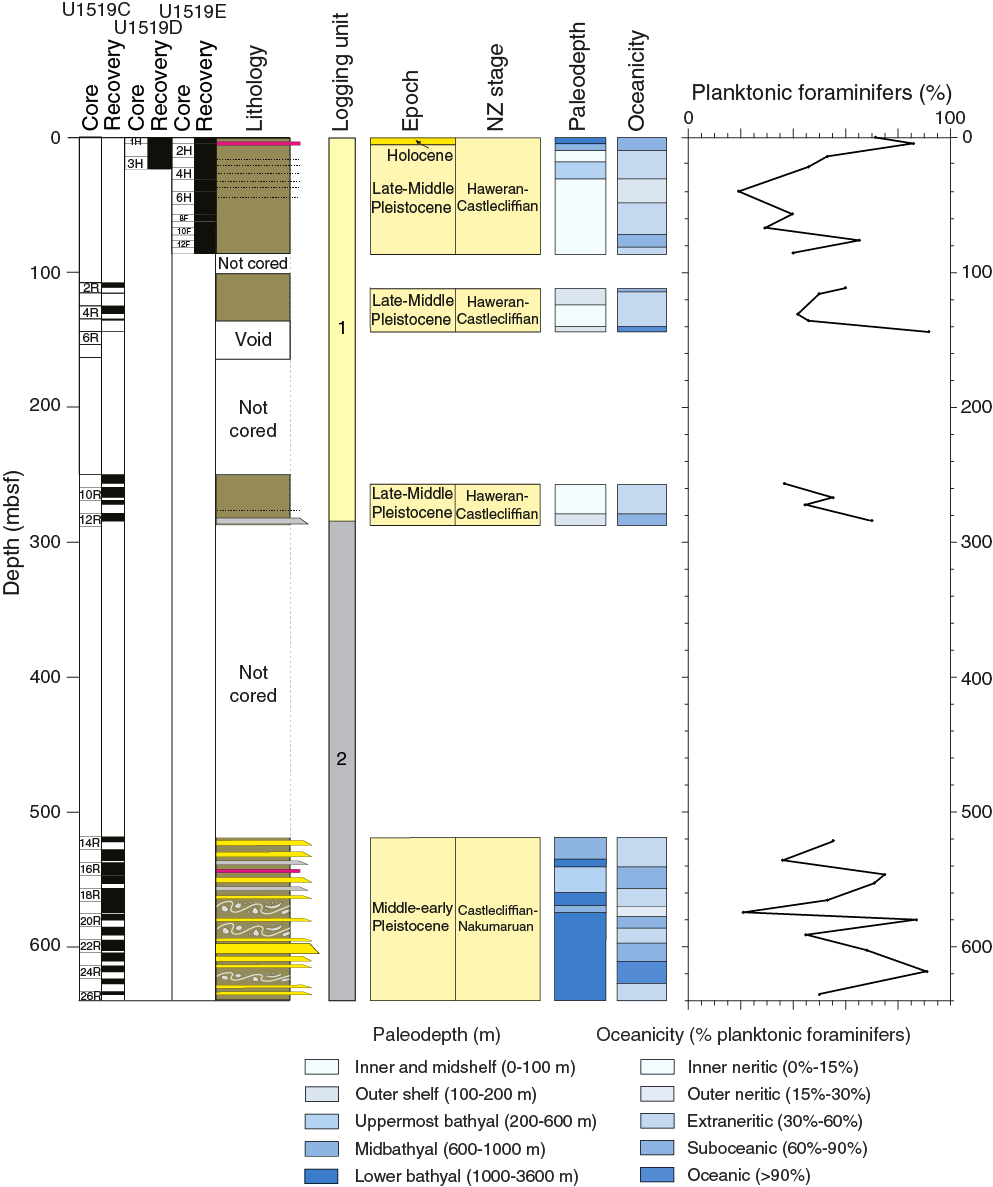
Figure F10. Lithostratigraphy, foraminifer abundance, and oceanicity.
Because of the high sedimentation rate and the relatively fine grained nature of the cored sedimentary sequence, microfossil residues (>125 µm) from washed samples are often small, even from 10 cm whole-round (352 cm3) samples. Foraminifers (mostly planktonic) dominate the small residues, however, and age markers are present in sufficient numbers to date most samples reliably. Plant-derived matter and other fossil material including shell (bivalve, gastropod, scaphopod, and barnacle) fragments, echinoid spines and plate fragments, radiolarians, ostracods, and otoliths are also present in variable amounts in most samples. In addition, rare fish teeth, sponge spicules, charophytes, and reworked Pliocene–Miocene taxa are present in some samples.
Holocene
Assemblages from the Holocene section in Hole U1519E are generally well preserved and include rare reworked Pliocene taxa that are moderately to poorly preserved. The presence of Hirsutella hirsuta in mudline Sample 375-U1519E-1H-1, 0 cm (0.0 mbsf), and Sample 1H-CC, 8–18 cm (4.40 mbsf), indicates that the uppermost part of the cored succession is Holocene (younger than 0.011 Ma). The absence of Hr. hirsuta in underlying samples indicates the base of the Holocene lies between Samples 1H-CC, 8–18 cm, and 2H-CC, 14–24 cm (4.40–14.00 mbsf).
Pleistocene
Pleistocene planktonic foraminifer abundances in Hole U1519E and the upper two cored sections of Hole U1519C (Samples 375-U1519E-2H-CC, 14–24 cm, through 375-U1519C-12R-CC, 6–16 cm [14.00–284.70 mbsf]) are highly variable and fluctuate between outer neritic and oceanic values (Figure F10). Assemblages are generally well preserved, but rare reworking in the form of moderately to poorly preserved Pliocene and Miocene taxa occurs in some samples. Truncorotalia truncatulinoides is common throughout this interval, and populations are predominantly sinistral coiled, indicating a Late to Middle Pleistocene age (Haweran to Castlecliffian; 0.011–0.53 Ma). Cores were not taken from the drilled interval (375-U1519C-131 [288.4–518.4 mbsf]).
The lower part of the cored Pleistocene section (Samples 375-U1519C-14R-CC, 0–15 cm, through 26R-CC, 0–5 cm [522.39–635.60 mbsf]) includes planktonic foraminifer assemblages with dextrally coiled populations of Tr. truncatulinoides, indicating a Middle to early Pleistocene (Castlecliffian to Nukumaruan) age of 0.53–2.17 Ma. The first common occurrence of Tr. truncatulinoides (0.62 Ma) occurs in Sample 15R-CC, 10–19 cm (536.32 mbsf), and indicates that the uppermost part of the lower cored section is Middle Pleistocene (Castlecliffian; 0.53–0.62 Ma). The age to the bottom of Hole U1519C where Tr. truncatulinoides is much less common is Middle to early Pleistocene (Castlecliffian to Nukumaruan; 0.62–2.17 Ma).
Benthic foraminifers
Benthic foraminifer abundances in Holes U1519C and U1519E are generally much lower than planktonic abundances and range from 8% to 79%. Midbathyal markers, including Eggerella bradyi and Sigmoilopsis schlumbergeri, occur sporadically through the cored sedimentary sequence, indicating paleowater depths of at least 600 m. Lower bathyal markers including Planulina wuellerstorfi and Cibicides robertsonianus are also present in the mudline sample and in the lower part of the cored section (Samples 375-U1519C-16R-CC, 0–11 cm, through 26R-CC, 0–5 cm [546.86–635.60 mbsf]), indicating paleowater depths of 1000 m or deeper. Inner shelf taxa including Zeaflorilus parri, Nonionella flemingi, Elphidium charlottensis, Haynesina depressula, Notorotalia spp., and miliolids are relatively common, especially in samples with higher benthic abundances. The presence of these taxa in association with bathyal and midbathyal benthic markers suggests they have been transported downslope.
Paleomagnetism
Paleomagnetic analyses at Site U1519 included natural remanent magnetization (NRM) measurement of archive-half core sections prior to and following stepwise alternating field (AF) demagnetization. Five discrete samples from Hole U1519C and eleven samples from Holes U1519D and U1519E were subjected to exploratory anisotropy of magnetic susceptibility measurements, more detailed AF demagnetization, and isothermal remanent magnetization acquisition experiments.
Drilling disturbance, including ductile deformation, mixing, severe biscuiting, and bed drag along the core liners, often resulted in depositional remanence destruction that compromised the paleomagnetic analyses and limited the reliability of the data sets. As a result, we did not conduct any paleomagnetic analyses on spot cores recovered from 108 to 136 mbsf (Cores 375-U1519C-2R through 5R) and from 250 to 285 mbsf (Cores 9R–12R). We analyzed the largely intact core material recovered from the more consolidated interval from 525 to 635 mbsf (Cores 14R–26R). As usual for RCB cores, sections in this interval were often dissected into numerous 5–50 cm long subhorizontal biscuits (see Lithostratigraphy and Structural geology).
The material recovered from Holes U1519D and U1519E was also affected by drilling disturbance, and most sections have vertical flow-in features and/or bed drag along the rims of the core liners. We avoided the measurement of section halves in which any sedimentary features were severely damaged or absent, but for rock magnetic purposes we measured sections that were affected by bed drag and small-scale flow-in.
Hole U1519C
Archive halves from Cores 375-U1519C-14R through 26R were subjected to AF demagnetization in 5 or 10 mT increments up to 40 mT and measured following each treatment step. NRM intensity values prior to demagnetization range from ~5 × 10⁻³ to 0.01 A/m (Figure F11) with little variation downhole, which is consistent with the magnetic susceptibility records. Visual inspection of individual measurements in vector component diagrams shows that magnetic remanences are usually pervasively overprinted, with measurements on only a few sections showing straight-line decay to the origin at demagnetization levels ≥20 mT (Figure F12). Many measurements yield a minor component with a characteristic remanent magnetization direction that extends through the origin in the coercivity range of 20–30 mT. Upon demagnetization to higher levels, however, the demagnetization trajectory often trends away from the origin. Declination records from differing cores or across biscuit boundaries are usually offset with respect to each other, indicating that drilling-induced overprints do not have a major effect on the data set. From 528.0 to 590.8 mbsf (Core 15R through Section 21R-5), NRM inclinations measured following demagnetization to 30 mT are mostly negative. In contrast, from 590.8 to 635.65 mbsf (Section 21R-6 through Core 26R) we primarily measured shallow downward dipping (positive inclination) remanence directions. The sedimentary package in this interval was likely affected by significant tectonic deformation and bedding tilt. It comprises sequences of MTDs interbedded with coarse sand and silt layers (see Lithostratigraphy), and detrital remanences may have been further overprinted or damaged during the diagenetic alteration of the magnetic remanence carriers following deposition and burial, which makes the data set unsuitable for a shipboard magnetostratigraphic interpretation.
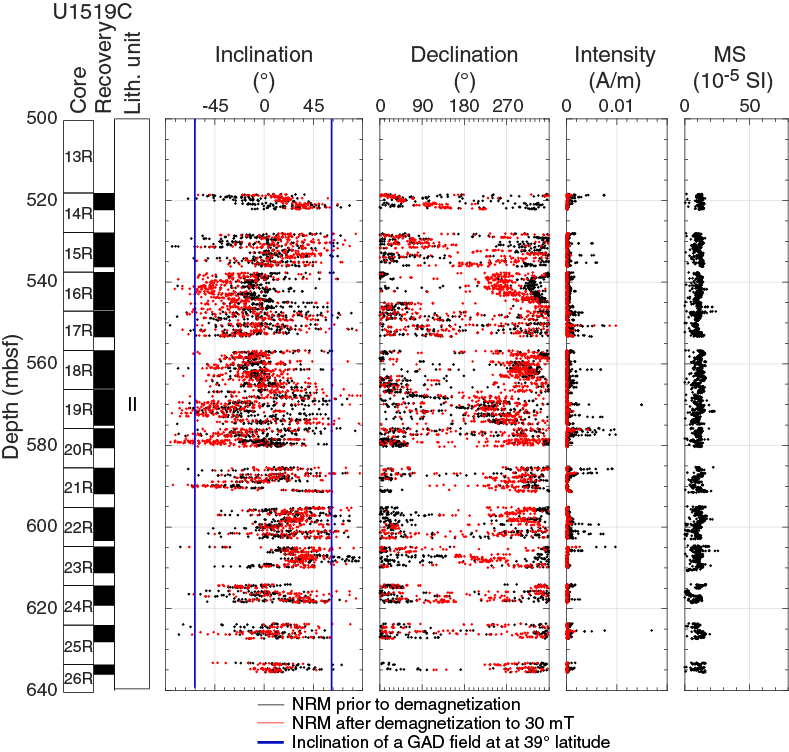
Figure F11. Magnetic inclination, declination, and intensity and MS, Hole U1519C.
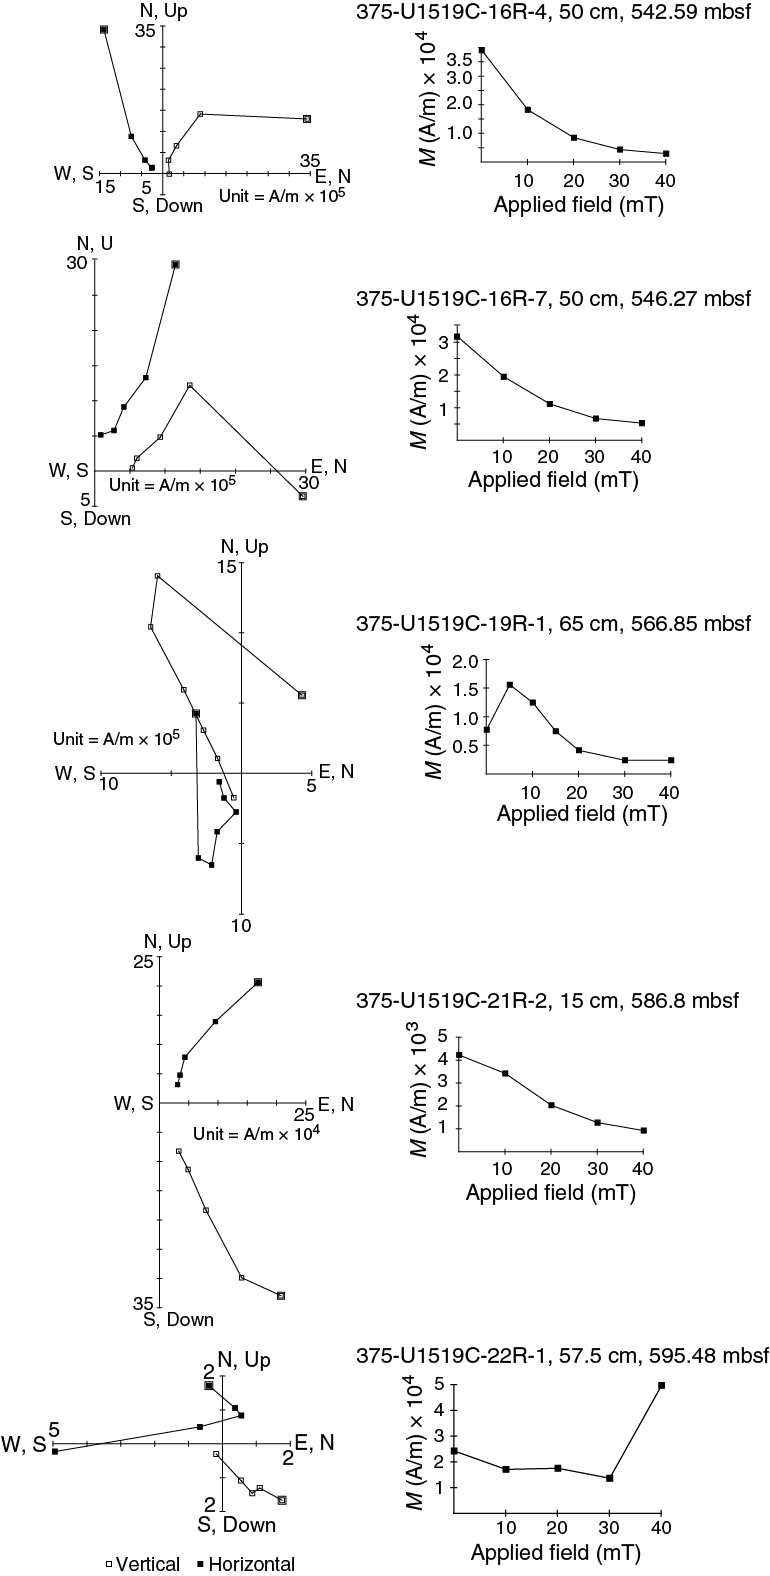
Figure F12. Vector components and NRM intensity.
Holes U1519D and U1519E
Figure F13 displays the paleomagnetic inclination, declination, and intensity records of the NRM measured on Hole U1519E archive halves prior to and following AF demagnetization to a peak field of 20 mT, as well as the section-half magnetic susceptibility measured using the Section Half Multisensor Logger (SHMSL) (see Physical properties). Figure F14 compares the paleomagnetic records following partial demagnetization and susceptibility values recorded on sediments from Hole U1519D and the upper 22.5 m of Hole U1519E. NRM remanence intensity values range from ~4 × 10⁻⁴ to 0.02 A/m, whereas peak values coincide with tephra bearing units. Visual inspection of measurements in vector component diagrams shows that viscous overprints are largely removed at the 15 or 20 mT demagnetization step, where remanences decay univectorially toward the origin. The majority of cores were therefore demagnetized to a peak field of 20 mT only, whereas a smaller subset of archive halves were further demagnetized up to 30 or 40 mT to validate these results. Measurement sequences extended to the 40 mT demagnetization level showed that the material recovered throughout Holes U1519D and U1519E yields median destructive fields of 30 mT or more, and in many cases sediments in the archive halves retained as much as 70% of their initial remanence upon demagnetization to 40 mT. The NRM directions prior to and following partial demagnetization yield declinations that are offset from core to core, which suggests that drilling-induced overprints are absent. The NRM directions usually have negative inclinations, and many sections carry remanences that fall well into the directions expected in a normal polarity field. Swings in inclination observed downhole, however, may be a feature of core disturbance and do not necessarily reflect variations in the inclination of the ambient field at the time of deposition.
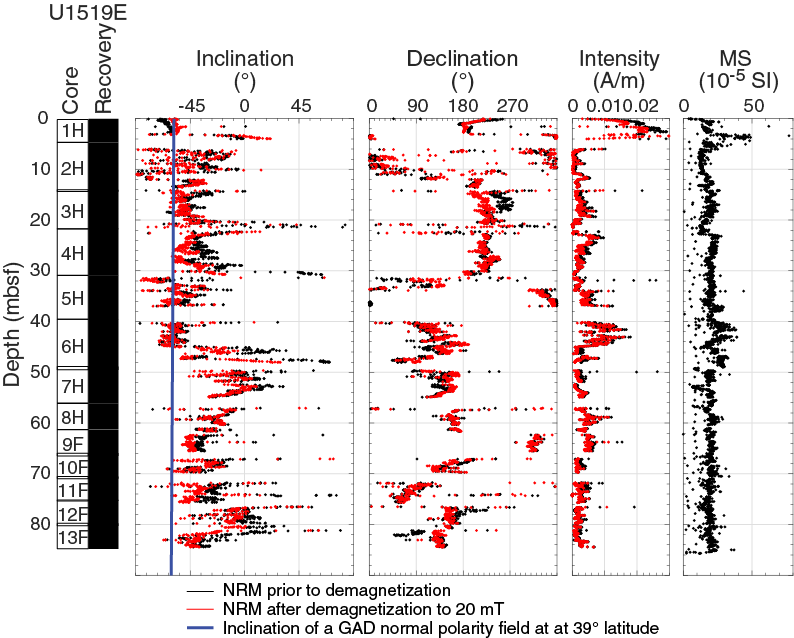
Figure F13. Magnetic inclination, declination, and intensity and MS, Hole U1519E.
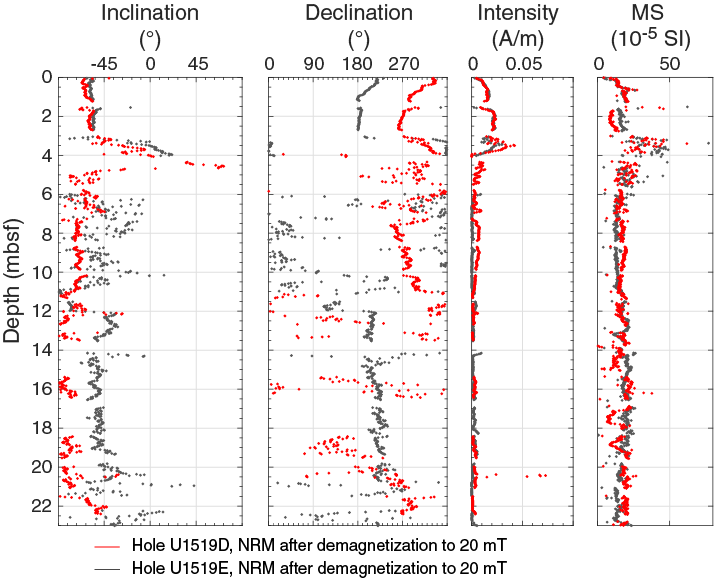
Figure F14. Magnetic inclination, declination, and intensity and MS, Holes U1519D and U1519E.
Structural geology
At Site U1519, cores were recovered from four zones separated by depth intervals that were drilled without coring. The top zone (Cores 375-U1519D-1H through 3H and 375-U1519E-1H through 13F) was cored with the APC system, whereas the three lower intervals (Hole U1519C) were cored with the RCB system. Because of partial core recovery, we rely on dip data from geoVISION (GVR) resistivity image logs obtained from LWD during Expedition 372 for the intervals with no core recovery or extensive drilling disturbance.
The strata at Site U1519 are inclined and have bed dips that rarely exceed 60° (Figure F15). Exceptions where steeper bedding dips are recorded are in folded strata interpreted to be MTDs. Small displacement fractures and minor faults are present locally. The dip and depth distributions of structures recorded in the core and GVR image logs are plotted in Figures F15 and F16. Many of the structures and dipping beds observed in the core were oriented to a geographical reference frame using paleomagnetic data (see Paleomagnetism), and these preliminary orientations are plotted in Figures F15 and F17. Typical uncertainty for the reoriented azimuths is ~030° (see Structural geology in the Expedition 372B/375 methods chapter [Wallace et al., 2019]).
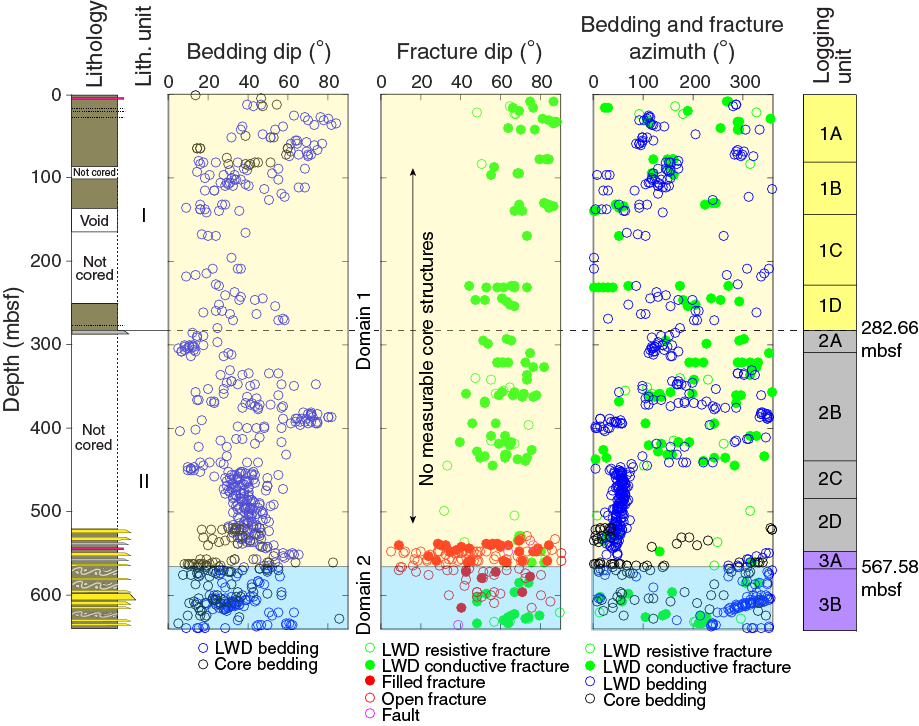
Figure F15. Structure dips and azimuths.
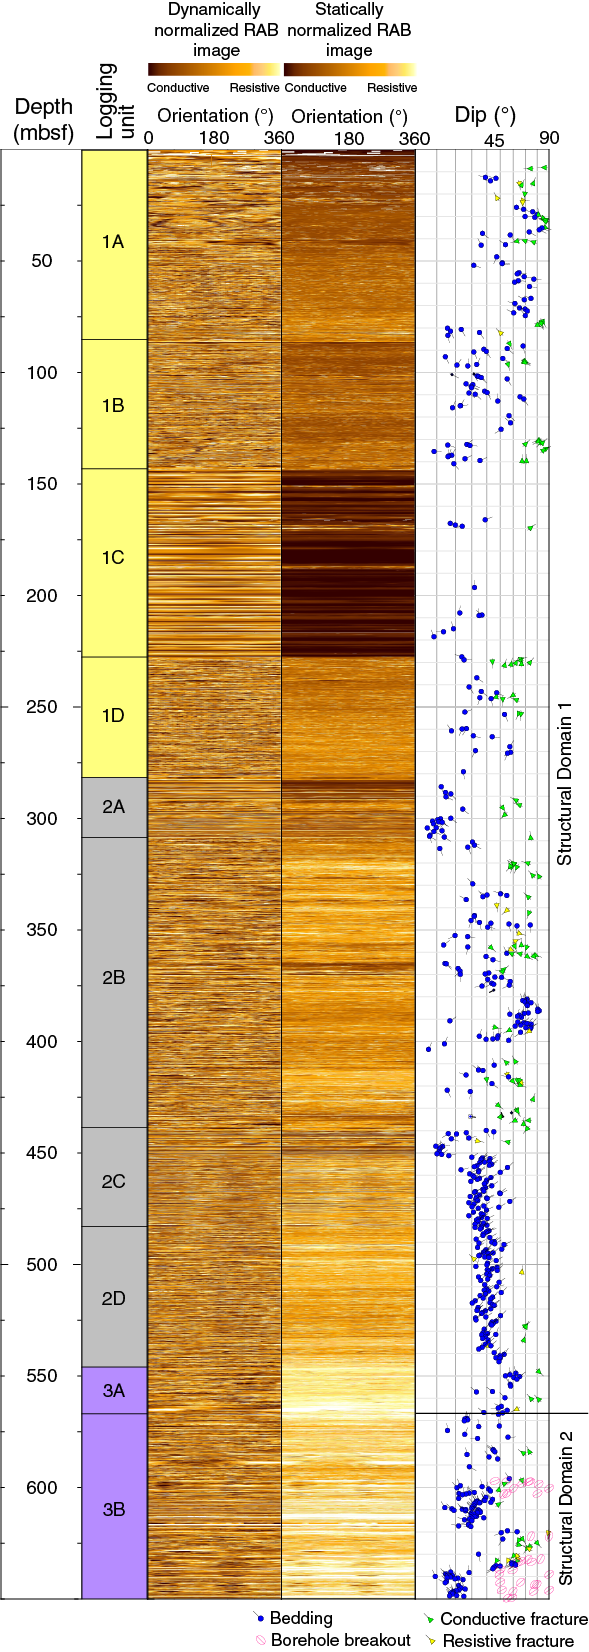
Figure F16. GVR image log and orientation data.
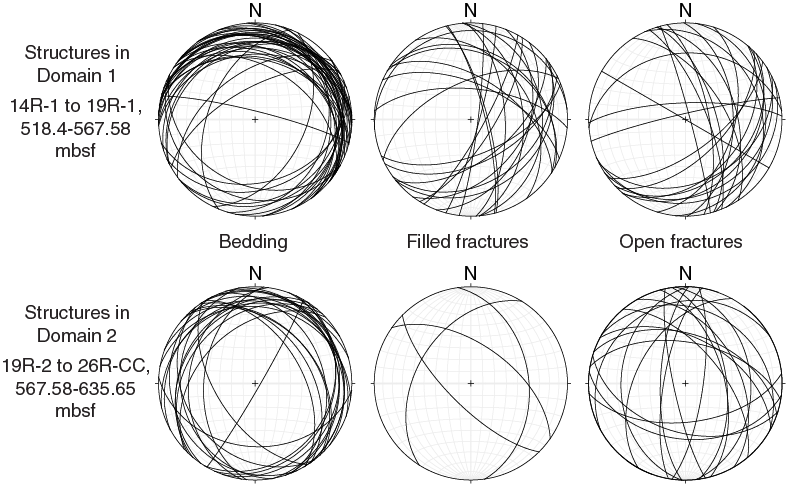
Figure F17. Bedding and fracture orientation data.
We define two structural domains based on changes in structures observed in the core and GVR image logs. Domain 1 is characterized by intervals of moderate bedding dips alternating with intervals where dips are steeper and more variable (Figures F15, F16). Domain 2 is defined by a marked decrease in the number of filled fractures and gentle to moderate bedding dips to the northwest. Scattered, steeply dipping, dominantly conductive fractures are identified in GVR image logs throughout both domains (Figure F16).
Types of structures observed in the core
The main structure types observed at Site U1519 are fractures and rare small faults. Features designated as “fractures” include all opening-mode discontinuities that show little to no evidence of apparent shear displacement. At this site, these fractures are predominantly open fractures, although sets of variably oriented, filled fractures are present below 534.5 mbsf (Section 375-U1519C-15R-6) (Figure F15). Soft-sediment deformation is evident in MTDs in some intervals (see Lithostratigraphy), including folded and locally overturned beds and some zones of sheared sediments (Figure F18).
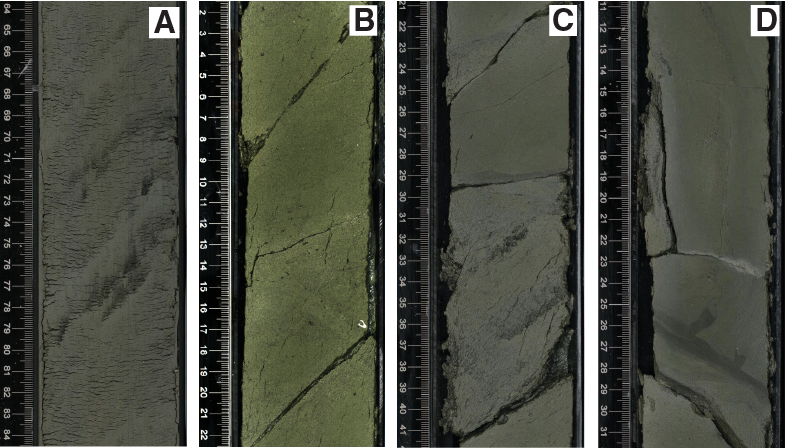
Figure F18. Bedding and related structures, Domain 1.
Domain 1
Domain 1 is defined from the tops of Cores 375-U1519D-1H and 375-U1519E-1H through Section 375-U1519C-19R-1 (0–567.58 mbsf) and is characterized by scattered steep fractures and dominantly, moderately northeast-dipping beds interrupted by intervals of variable but markedly steeper dipping beds with a range of dip azimuths. Four separate intervals were cored in this domain: the uppermost interval used the APC system, and the three lower intervals used the RCB system. Severe drilling disturbance occurred in the shallower three intervals, making structural observations difficult. Structural Domain 1 spans Lithostratigraphic Units I and II and Logging Units 1 and 2 (Figures F15, F16) (see Lithostratigraphy and Logging while drilling). Below, we describe observations from the cored intervals in the context of the structural features revealed by the GVR image logs (Figure F16).
APC and HLAPC cores from the top of Domain 1 (Cores 375-U1519D-1H through 3H [0.0–23.13 mbsf] and 375-U1519E-1H through 13F [0.0–86.21 mbsf]) were disturbed by upward-warping of beds to variable degrees, but some geological features were preserved (Figure F15). Bedding in the core is gently to moderately dipping (15°–60°) (Figure F18A). Bedding dips from the GVR image log range from 10° to vertical, which is slightly steeper than bedding dips measured in the core (Figure F15). The steeper beds in the GVR data are common to 80 mbsf, and dips as steep as 60° persist to 143 mbsf at the base of Logging Subunit 1B (Figure F16). These steep dips likely result from MTDs dominating this interval, which are also visible in seismic reflection data (see Core-log-seismic integration). The Logging Subunit 1B/1C boundary lies in Domain 1 and is marked by a transition to more gently dipping beds (<50°). Although this transition was sampled in the first RCB cored interval (Cores 375-U1519C-2R through 7R [108.0–163.6 mbsf]), cores were severely biscuited (<5 cm thick biscuits), and we were unable to resolve bedding or other structures. Furthermore, Core 7R, which would have sampled the top of Logging Subunit 1C, had no recovery.
Core 375-U1519C-6R through drilled interval 131 (144.3–518.4 mbsf) represent intervals with no recovery (including two intervals drilled without coring [375-U1519C-81 and 131]) or severe drilling disturbance, including the second RCB cored interval (Cores 9R–12R [250.0–288.4 mbsf]), where no structures were identified. The GVR image log in this depth interval provides information about structural trends. Bedding dips range from <10° to nearly 80°, although steep dips (>60°) are rare (Figures F15, F16). From 450 to 550 mbsf, bedding dips lie in a consistent range from 30° to 50° and dips are to the northeast (Figure F15). A lithostratigraphic boundary is defined at 282.66 mbsf in these cores (see Lithostratigraphy), but no distinct change in structural style occurs at this boundary in either the core or GVR image data (Figures F15, F16).
The third RCB interval (Cores 375-U1519C-14R through 26R [518.4–635.6 mbsf]) yielded good quality cores. From 518.4 to 567.6 mbsf (base of Section 19R-1), beds generally dip <50° to the north-northeast (Figures F15, F17, F18B) and localized intervals of abundant filled fractures occur. Bedding dips from GVR data over much of this interval range from 40° to 60° to the east-northeast, which is a smaller range of dips than measured in the core (Figure F15). However, steep beds in the core are commonly associated with soft-sediment deformation features (Figure F18C, F18D). Below 550 mbsf, the dominant dip direction in GVR data shifts to the west-northwest and dip angles are more variable (10°–60°). The change in dip direction at ~550 mbsf corresponds to the Logging Unit 2/3 boundary (Figure F16; also see Core-log-seismic integration).
Scattered open and filled fractures are present throughout Cores 375-U1519C-14R through 26R (518.4–635.65 mbsf), but their abundance decreases markedly below Section 19R-1 (from 567.58 mbsf) (Figure F15). Filled fractures are more abundant in some sections (e.g., 16R-2 and 18R-2) and are present at a range of dip angles from subhorizontal to near vertical (Figures F15, F19A, F19B). A few steep, filled fractures form the edge of fracture meshes that comprise intersecting smaller fractures (Figure F19B). A few steep (>60°), indeterminate faults are present in the lower section of Domain 1. These faults truncate beds that cannot be traced across the fault (e.g., interval 16R-6, 95–108 cm; Figure F19C).
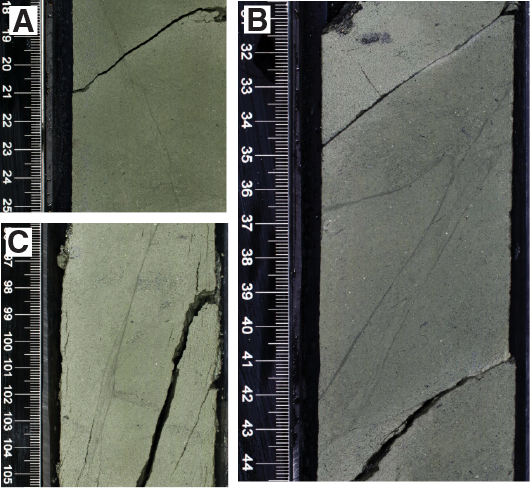
Figure F19. Representative fractures and faults, Domain 1.
Open fractures range from subhorizontal to vertical with a large variation of dip directions (Figures F15, F17, F19). The open fractures commonly appear in spaced sets (e.g., Figure F19B) and are locally en echelon. It is difficult to determine whether these fractures were present prior to drilling. In some places they occur along filled fractures, in other places they are parallel to bedding or filled fractures, and in some they crosscut all other planar structures. It is possible that many of these fractures were original structures or interfaces, such as bedding, that were activated during drilling.
Domain 2
Domain 2 is defined from 567.58 mbsf to the base of the hole at 635.6 mbsf (Section 375-U1519C-19R-2 through Core 26R) and is characterized by gentle to moderate bedding dips toward the northwest, soft-sediment deformation, and scattered fractures. The Domain 1/2 boundary is defined by a decrease in the abundance of filled fractures in the core and also marked by the top of an obvious zone of MTDs and a gradual change in bedding azimuth (Figure F15). In the GVR image log, bedding dip direction changes gradually between Logging Units 2 and 3, the boundary of which is located slightly shallower than the Domain 1/2 boundary. In the core, bedding dips become generally gentler than 30° from the top of Domain 2 downhole (Figure F15). Oriented bedding dip azimuths in Domain 2 are variable but dominantly northwest and southeast with fewer to the northeast (Figure F17). In the GVR image log, most identified beds dip to the northwest (Figure F15). Open fractures in this zone are sparser and generally steeper than in Domain 1 but remain common in some intervals.
Borehole breakouts are observed in Domain 2 in a cluster around ~600 mbsf and from 620 to 650 mbsf (Figure F16). Borehole breakout orientations are approximately 054°/234°, implying a minimum horizontal stress (Shmin) orientation of northeast–southwest, from which a maximum horizontal stress (SHmax) orientation of northwest–southeast can be inferred. Borehole breakout widths range from 33.9° to 83.6°.
Drilling disturbance
Drilling disturbance in the cores was extensive throughout most of Holes U1519C–U1519E and included biscuiting (RCB cores) and sediment flow (both APC and RCB cores). In Hole U1519D, cores typically have upward-arching beds, and in some cores this upward arching was severe enough that original bedding was subparallel to the core axis. The shallow RCB cores (375-U1519C-2R through 7R and 9R–12R) were severely biscuited, and sediments in the biscuits showed intense ductile flow (e.g., tight folds with variable orientations). No structures could be recognized in these cores. The deeper RCB cores (14R–26R) have mild to moderate biscuiting and were also disturbed by fractures that may be caused or enhanced by drilling. Rare sandy intervals were generally affected by mingling, appeared soupy, and did not preserve any internal structure. However, except for these scattered coarse intervals, structures were generally recognizable and measurable in cores recovered from below 518.4 mbsf.
Summary
Deformation features at Site U1519 include small-scale localized fractures and variably inclined bedding. The description of Domain 1 is based on core description, GVR image log data, and seismic reflection images that indicate a large range of bedding dips attributed to stacked MTDs at the top of Expedition 372 Hole U1519A, transitioning downward to moderately dipping beds (Figures F15, F16) (see Core-log-seismic integration). Filled fractures are common in some cored intervals near the base of Domain 1. Domain 2 is defined by a reduced frequency of filled fractures, a change in bedding dip azimuth from northeast to northwest, and generally gentle bedding dips, except where steep and locally overturned beds are present in MTDs inferred from both core observation and LWD data. Borehole breakouts observed between 600 and 650 mbsf have an approximate northeast–southwest (054°/234°) Shmin orientation.
Geochemistry
Inorganic geochemistry
The main objective of the inorganic geochemistry program at Site U1519 was to identify potential fluid flow and fluid–rock interactions that may affect the physical, hydrological, and mechanical properties of the sediment hosting the borehole observatory installed in Hole U1519B. A total of 75 routine pore water whole-round (WR) samples (10–30 cm long) were collected and squeezed for shipboard and shore-based pore water chemical analyses. We collected 30 samples from RCB cores in Hole U1519C, 15 samples from APC cores in Hole U1519D, and 30 samples from APC cores in Hole U1519E. WR samples were collected on the catwalk at a frequency of six samples per core in the upper ~20 m and ~1–4 samples per core deeper than 20 mbsf. Each core in Hole U1519C deeper than 250 mbsf was scanned with an IR camera to identify the occurrence of methane hydrate, indicated by cold temperature anomalies resulting from methane hydrate dissociation during core recovery.
All WR samples were thoroughly cleaned in an effort to remove drilling fluid contamination, placed in titanium squeezers, and squeezed at gauge forces to a maximum of 30,000 lb. The volume of recovered pore water varied with lithology, depth, and coring technique and ranged between 11 and 56 mL in APC cores, 34 and 45 mL in HLAPC cores, and 12 and 42 mL in RCB cores. The pore water data were not corrected for drilling water contamination at this site because sulfate concentrations below the sulfate–methane transition zone (SMTZ) were uniformly low (mostly below 0.4 mM), indicating less than 2% drilling fluid contamination, with the exception of one WR from a silty interval (Sample 375-U1519C-25R-4, 67–95 cm) collected to assess gas hydrate concentration. An additional 43 WR samples were collected adjacent to the routine pore water WRs in APC Holes U1519D and U1519E. These WRs were immediately processed in a glove bag flushed with ultrahigh-purity nitrogen for shipboard and shore-based analyses of redox-sensitive elements.
Major and minor element concentrations are listed in Tables T8 and T9. Major element concentrations analyzed via ion chromatography (IC) of samples that were processed in the nitrogen glove bag are listed in Table T10. Only the samples processed under atmospheric conditions are shown in Figures F20, F21, F22, and F23.
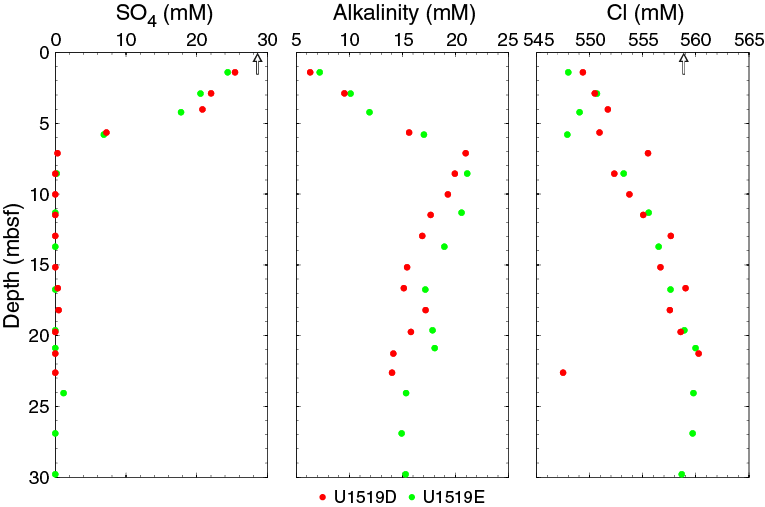
Figure F20. Sulfate, alkalinity, and chloride.
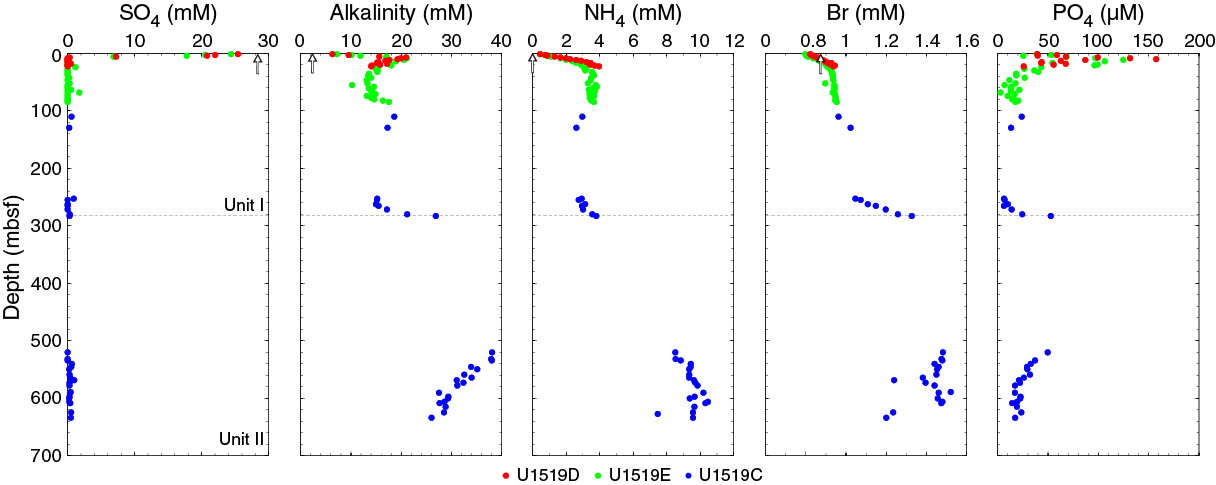
Figure F21. Sulfate, alkalinity, ammonium, bromide, and phosphate.
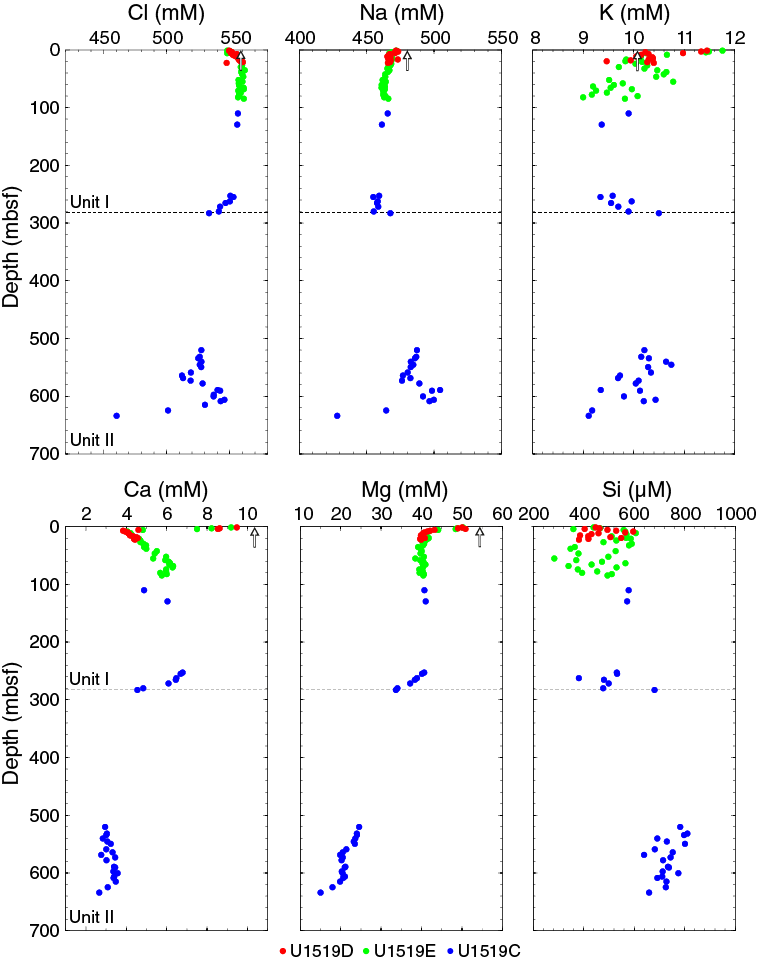
Figure F22. Chloride, sodium, potassium, calcium, magnesium, and silica.
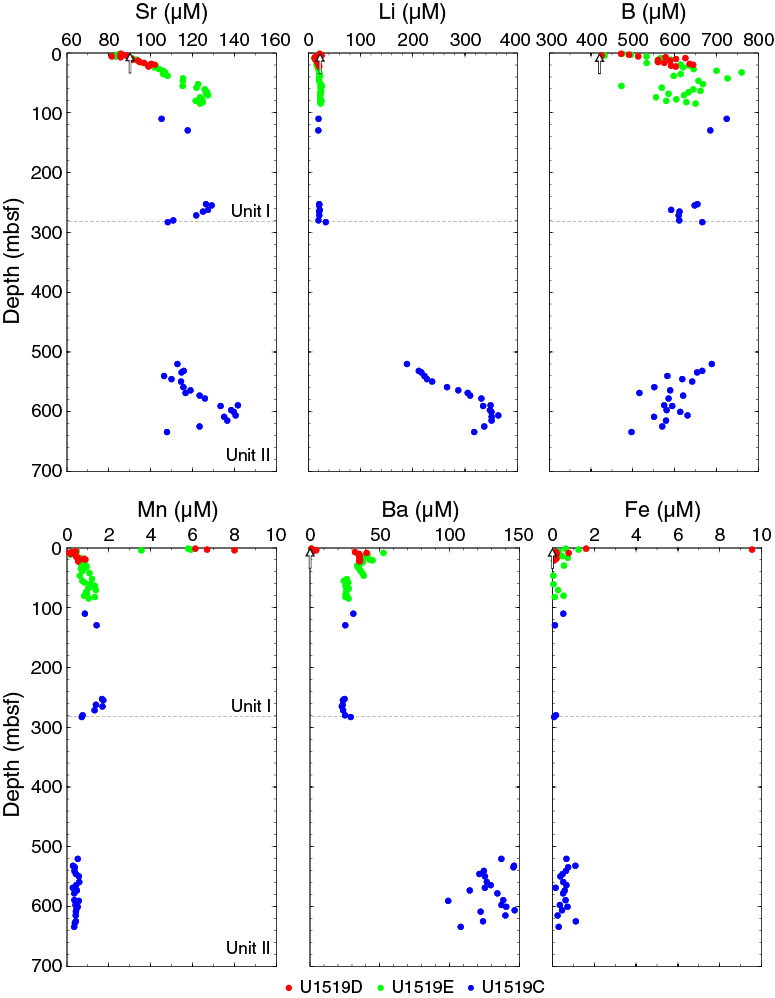
Figure F23. Strontium, lithium, boron, manganese, barium, and iron.
The geochemical profiles at Site U1519 reflect the combined effects of organic matter diagenesis, authigenic carbonate precipitation, and silicate mineral/volcanic ash alteration under high sedimentation rates. Below, we provide a general description of the pore water chemical profiles and the evidence for diagenetic reactions.
Organic matter diagenesis
The pore water profiles of sulfate, alkalinity, ammonium, bromide, and phosphate in Lithostratigraphic Unit I show characteristic changes with depth related to organic matter degradation. The profiles in the upper ~8 m, however, do not reflect steady-state sedimentation. Under steady-state conditions, sulfate concentrations typically decrease linearly from seawater value at the seafloor to depletion at the SMTZ. The pore water sulfate profiles in Holes U1519D and U1519E are kinked, with an abrupt change in depth trend at ~4 mbsf indicating a recent period of rapid sedimentation in the upper few meters (Figure F20) that produces a deeper SMTZ than would be observed under steady-state sedimentation, which is also indicated by the kinked alkalinity profile between the seafloor and the SMTZ. As a result, the SMTZ at Site U1519 is at ~7–8 mbsf, similar to that observed at the frontal accretionary wedge Site U1518 but shallower than nearby Site U1517 (Barnes et al., 2019).
Below the SMTZ in Unit I, alkalinity concentrations decrease to ~14 mM at 90 mbsf. Phosphate concentrations mimic the alkalinity profile, with a peak of 157 µM at 10 mbsf (Figure F21). Ammonium concentrations also increase with depth to a maximum of ~3.8 mM at 15 mbsf and then decrease slightly in samples from Sections 375-U1519C-2R-2 through 2R-4. The trend of the bromide concentration profile mimics that of ammonium (Figure F21).
Typically, an increase in ammonium and alkalinity concentrations occurs down to the SMTZ and a decrease in alkalinity and phosphate concentrations occurs below the SMTZ, reflecting the competition between metabolite production through ongoing microbial methanogenesis and consumption in authigenic minerals. Deeper in the sediment column (typically >50 mbsf), alkalinity and ammonium concentrations reach asymptotic values and phosphate concentrations remain below detection. At Site U1519, however, a sharp increase in ammonium, alkalinity, phosphate, and bromide concentrations occurs across the Unit I/II boundary, with a second concentration maxima in Unit II. The depth of the second concentration maxima is unknown because of the coring gap between 285 and 520 mbsf. The concentrations of species related to organic matter diagenesis remain elevated in the cored interval from 520 to 635 mbsf, but their concentrations decrease with depth. We relate these second alkalinity, ammonium, phosphate, and bromide concentration maxima to rapid burial that preserves an older diagenetic sequence characterized by enhanced organic matter degradation and continued microbial methanogenesis, which is consistent with an average estimated sedimentation rate of 0.8 m/ky in Unit I (see Biostratigraphy).
Volcanic ash alteration and silicate mineral diagenesis
Dissolved calcium concentrations decrease sharply from 9.5 mM at 1.4 mbsf to 3.8 mM at the SMTZ, reflecting consumption in authigenic carbonate minerals driven by the alkalinity produced by sulfate reduction through both particulate organic carbon oxidation and anaerobic oxidation of methane (Figure F22). Below the SMTZ, calcium concentrations increase to 6.3 mM at 70 mbsf. The reversal in the Ca profile below the SMTZ suggests enhanced silicate mineral/volcanic ash alteration in the zone of microbial methanogenesis leading to a net addition of Ca to the pore water despite concurrent removal in authigenic carbonates (e.g., Solomon et al., 2014). Likewise, below the SMTZ, strontium concentrations increase to 130 µM (50% greater than seawater value), boron concentrations increase to ~750 µM (79% greater than seawater value), and potassium concentrations steadily decrease, consistent with silicate mineral/volcanic ash weathering in the upper 100 m of Unit I (Figures F22, F23). A second interval of enhanced silicate mineral/volcanic ash diagenesis occurs between 520 and 630 mbsf in Unit II. As observed in Unit I, strontium concentrations increase markedly to ~600 mbsf and potassium concentrations decrease; however, unlike the zone in Unit I, lithium concentrations increase sharply to values as high as 380 µM (~15× seawater value) at this depth, dissolved silica values are consistently elevated and range between 700 and 800 µM (silica in Unit I is between 400 and 600 µM), and boron concentrations have a decreasing trend. The different fluid compositions in the two zones of enhanced weathering likely reflect a difference in the composition of the reactive silicate phases and the secondary minerals produced through the weathering reactions.
Dissolved Ba concentrations increase abruptly below the SMTZ, likely in response to barite dissolution in response to sulfate depletion (Figure F23) (e.g., Torres et al., 1996; Dickens, 2001). Ba concentrations are also high between 520 and 630 mbsf in Unit II and range from 100 to 150 µM. The high Ba concentrations in this interval may simply reflect relict Ba addition from barite dissolution in the older diagenetic sequence buried in Unit II, but ongoing volcanic ash alteration and silicate mineral diagenesis may also be contributing additional Ba to the pore water.
Chloride and sodium concentration profiles
Chloride concentrations are lower than average modern seawater value (559 mM) in the upper portion of Unit I, increasing from 549 mM at 1.4 mbsf (2% lower than average seawater value) to 559 mM at 17 mbsf (Figure F20). Between 17 and 120 mbsf, Cl concentrations remain relatively constant at or near seawater value. Sodium concentrations are also 2% lower than average seawater value between the seafloor and 17 mbsf but remain low throughout Unit I (Figure F22). The cause of the lower Cl concentrations in the upper sediment section will be a focus of post-expedition research but could reflect (1) a recent change to a lower salinity water mass at this upper slope site or (2) constant low-salinity bottom water along the upper slope, in which case the increase in Cl concentrations in the upper 17 m is likely related to alteration and hydration of volcanic ash and silicate weathering reactions.
Chloride concentrations decrease from 550 to 534 mM across the Unit I/II boundary and are low, ranging from 440 to 546 mM, between 520 and 630 mbsf. Discrete anomalies in the Cl profile between 520 and 630 mbsf are the result of methane hydrate dissociation during core recovery, marking zones of elevated methane hydrate concentrations. However, Cl concentrations remain low throughout the 520–630 mbsf cored interval, and this low background chlorinity may reflect (1) disseminated methane hydrate throughout the section or (2) the presence of freshened fluids advected from a region where temperatures are high enough to support mineral dehydration reactions. Unfortunately, because of the coring gap above this cored interval, the background Cl profile is unconstrained, and determining the source of freshening at the base of Site U1519 (disseminated methane hydrate or advection) will require post-expedition isotopic studies.
IR scans on the catwalk were used to detect the occurrence of methane hydrate in each Hole U1519C core from deeper than 250 mbsf. Cold temperature anomalies were not frequently observed, partially because of poor core recovery in Cores 375-U1519C-2R through 7R. One methane hydrate–bearing WR was identified by IR scanning and collected to quantify methane hydrate saturation (Sample 25R-4, 67–95 cm) in the region of low chlorinity values in Unit II. This WR sample consisted of a gas hydrate–bearing silt layer. Because of the relatively high permeability of this silt, a considerable amount of drilling water contamination occurs, manifested by a sulfate concentration of 12.73 mM (~45% drilling fluid contamination). The measured chloride concentration for this sample is 440 mM. Considering the drilling fluid sulfate and chloride concentrations are 29 mM and 561 mM, respectively, the drilling water contamination–corrected Cl concentration for this sample is 333 mM. We do not provide an estimate of the methane hydrate saturation for this sample because it was collected below the coring gap; thus, a background Cl concentration profile is not clearly defined from which to estimate methane hydrate saturation.
Organic geochemistry
Gas analyses
Headspace samples were taken from each sediment core to monitor for the presence and abundance of C1–C3 hydrocarbons as part of the standard safety protocol (Pimmel and Claypool, 2001). Where possible, these samples were taken immediately adjacent to WR samples collected for pore water geochemistry. A total of 63 headspace and 2 void gas samples were analyzed by gas chromatography (see Geochemistry in the Expedition 372B/375 methods chapter [Wallace et al., 2019]). The results from Site U1519 are listed in Table T11 and shown in Figure F24.
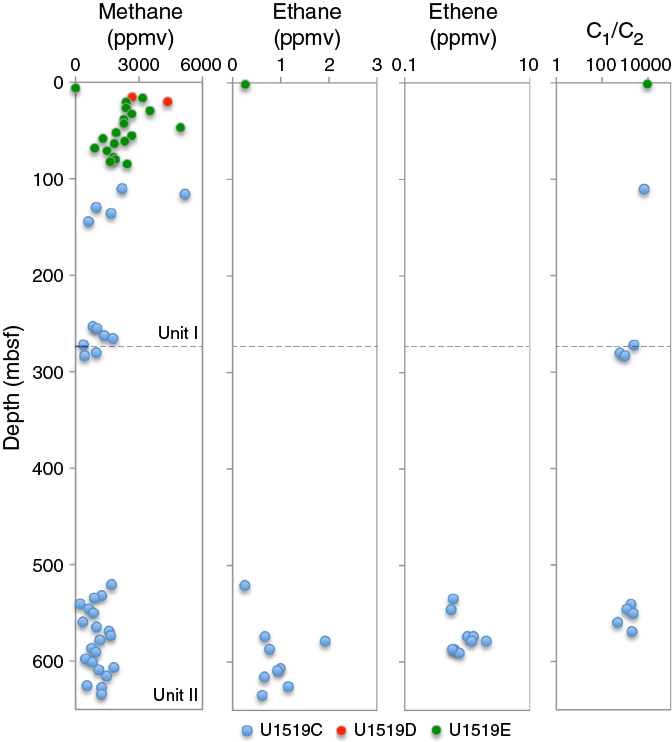
Figure F24. Methane, ethane, and propane.
Between the seafloor and 144.3 mbsf, methane concentrations range from 0.55 to 5172 parts per million by volume (ppmv). Deeper than 144.3 mbsf, methane concentrations in the headspace samples are lower and remain between 212 and 1802 ppmv with an average concentration of 1011 ppmv. Ethane was detected in headspace samples deeper than 520.5 mbsf (ranging from 0.25 to 1.92 ppmv) but was not detected at shallower depths. The methane/ethane (C1/C2) ratios are consistently >500, suggesting a dominantly microbial source for the methane (Claypool and Kvenvolden 1983).
Bulk sediment analysis
A total of 101 samples were taken at Site U1519 (54 in Hole U1519C, 15 in Hole U1519D, and 32 in Hole U1519E) for elemental analysis by coulometric and carbon-hydrogen-nitrogen-sulfur (CHNS) measurements to determine inorganic carbon, calcium carbonate, total carbon (TC), total nitrogen (TN), and organic carbon concentrations (Table T12).
TC in Lithostratigraphic Units I and II increases slightly with depth and ranges from 1.05 to 3.27 wt% with an average of 1.48 wt% (Figure F25). Calcium carbonate concentrations range from 0.4 to 12.1 wt% in Unit I and from 6.1 to 21.9 wt% in Unit II (Figure F25). Organic C values in Units I and II range from 0 to 1.2 wt% with an average of 0.39 wt%. Inorganic C and TN concentrations increase slightly with depth in all lithostratigraphic units and range from 0.05 to 1.95 wt% (average = 1.1 wt%) and from 0.00 to 0.09 wt% (average = 0.05 wt%), respectively. Total organic carbon (TOC)/TN (C/N) ratios range from 0.85 to 14.9.
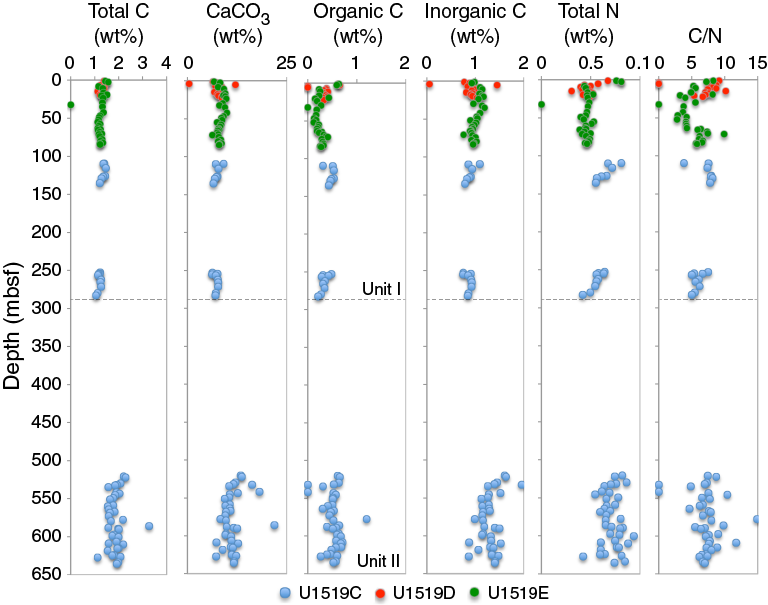
Figure F25. TC, CaCO3, TOC, inorganic carbon, TN, and C/N.
Physical properties
Density and porosity
Gamma ray attenuation (GRA) bulk density was determined on WR cores with the Whole-Round Multisensor Logger (WRMSL), and moisture and density (MAD) bulk density, grain density, and porosity were determined on discrete samples from Hole U1519C–U1519E working halves (see Physical properties in the Expedition 372B/375 methods chapter [Wallace et al., 2019]). Within 1 m of the seafloor, the GRA bulk density measured on cores from Holes U1519D and U1519E is ~1.5 g/cm3. It increases rapidly to ~1.9 g/cm3 at 7 mbsf and then gradually increases to ~2.0 g/cm3 at 85 mbsf (Figure F26). GRA bulk density decreases slightly from the bottom of Hole U1519E to the first cored interval in Hole U1519C at 108–136 mbsf to values that generally range from 1.9 to 2.0 g/cm3. From 250 to 284 mbsf, GRA bulk density is approximately 2.0–2.1 g/cm3. Lower values, mostly between 1.8 and 2.0 g/cm3, are observed in the lowermost cored interval in Hole U1519C (520–635 mbsf).
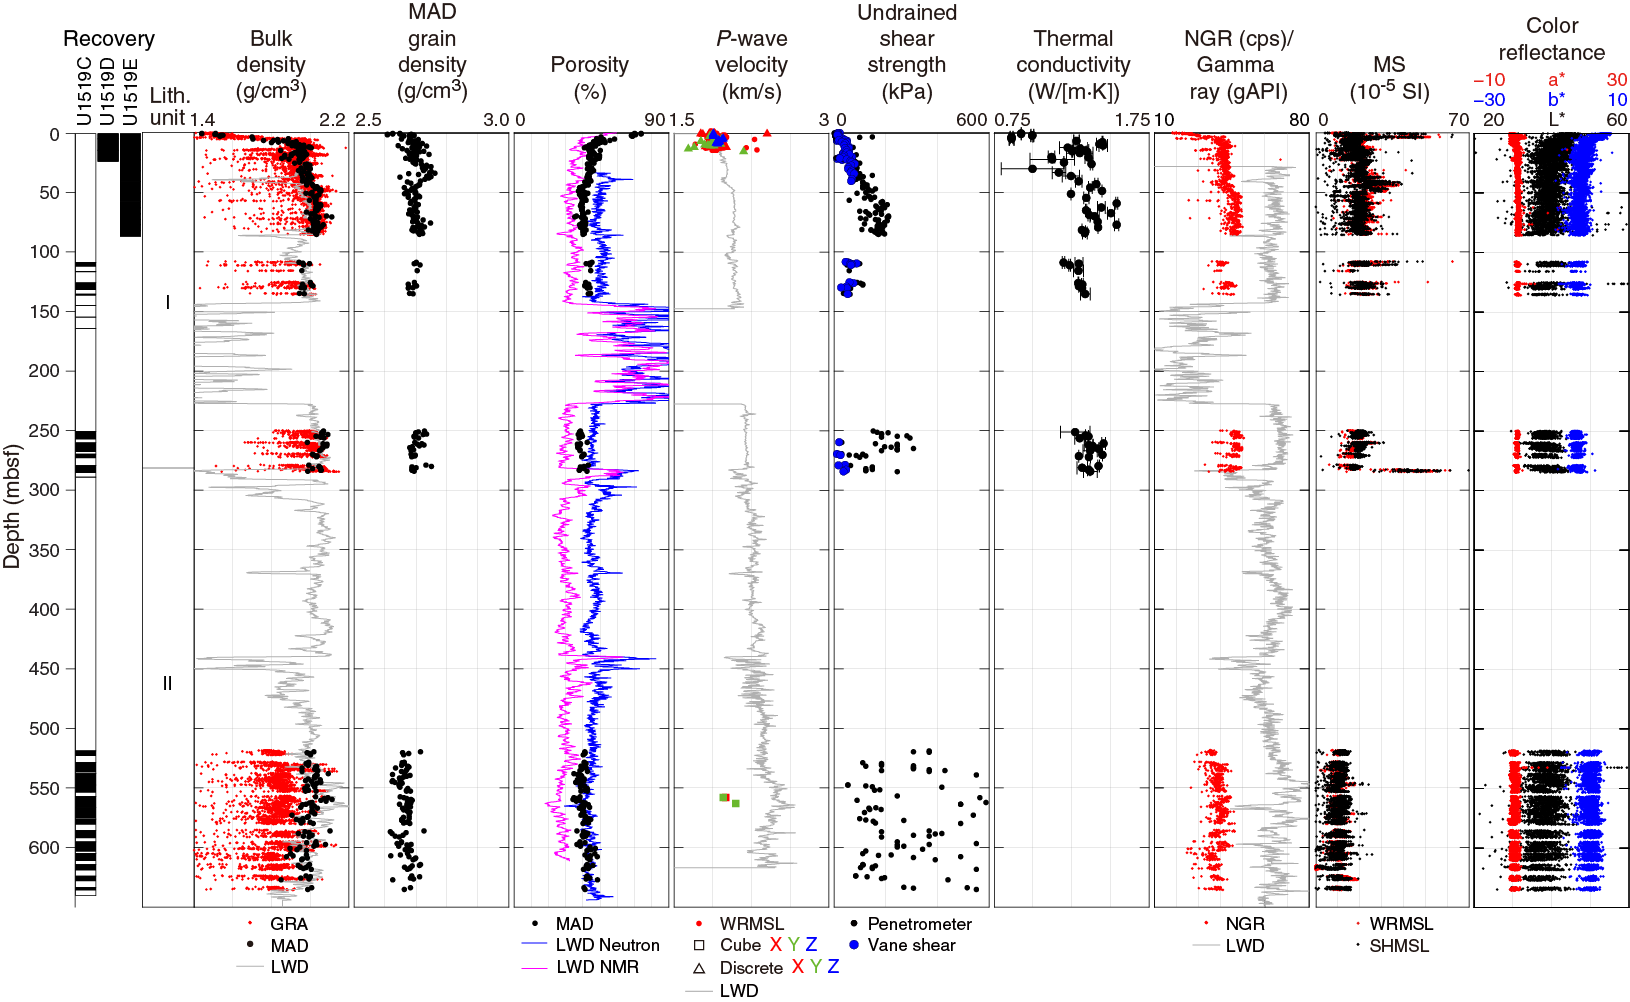
Figure F26. Physical properties.
MAD bulk density values from Hole U1519D consistently overlap with data from Hole U1519E and are characterized by a large increase in MAD bulk density from 1.4 to 1.9–2.0 g/cm3 in the uppermost 15 m. Between 15 mbsf and the bottom of Hole U1519E at 85 mbsf, bulk density increases gradually to 2.0–2.1 g/cm3. MAD bulk density shifts to slightly lower values between the bottom of Hole U1519E at 85 mbsf and the first cored interval in Hole U1519C (109–135 mbsf), followed by an increase to values above 2.0 g/cm3 from 250 to 284 mbsf. In the deepest cored interval in Hole U1519C (520–635 mbsf), MAD bulk density averages 2.0 g/cm3 and exhibits a slight decreasing trend with depth.
MAD bulk density values provide an excellent match to both LWD density measurements and GRA density measurements from the WRMSL throughout the borehole, with the exception of the deepest cored interval in Hole U1519C, where the GRA bulk density values are lower than those from the MAD and LWD measurements, likely due to the small diameter of RCB cores at greater depths where sediments are more lithified. GRA bulk density corrected for the diameter of RCB cores based on image analysis (see Physical properties in the Expedition 372B/375 methods chapter [Wallace et al., 2019]) is consistent with MAD values for the entire depth (Figure F27).
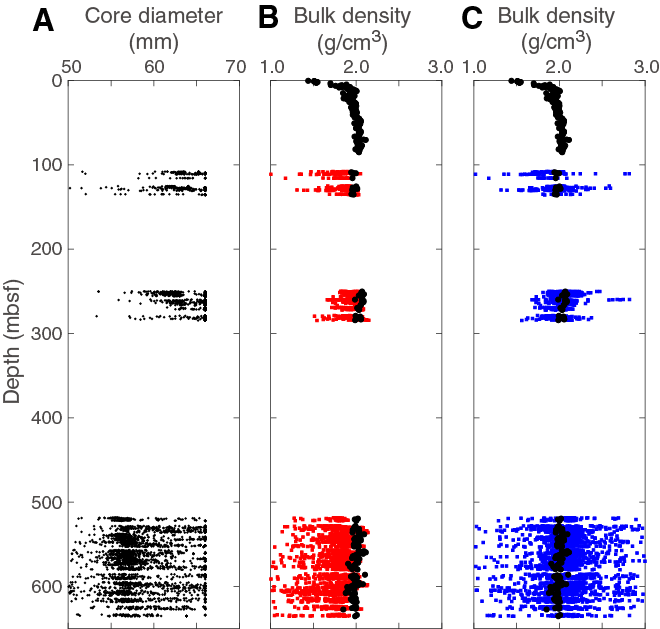
Figure F27. Core diameter and GRA and MAD bulk density.
MAD grain density values are nearly constant, ranging between 2.6 and 2.8 g/cm3 (Figure F26). The lowest values are observed near the seafloor and increase slightly in the uppermost 10 m. An excursion to slightly higher MAD grain density values occurs at 30–40 mbsf, and another excursion to slightly lower values occurs deeper than 520 mbsf. The average grain density for the site is 2.7 g/cm3.
Porosity values decrease rapidly from 74% at <1 mbsf to 41% at 12 mbsf in both Holes U1519D and U1519E. An excursion to slightly higher values (as high as 50%) occurs at ~20 mbsf, and then porosity decreases gradually to <40% at 50 mbsf and remains approximately constant (average = 40%) from 50 to 85 mbsf. Porosity shifts from 40% at the bottom of Hole U1519E to slightly higher values ranging from 41% to 45% from 109 to 135 mbsf in Hole U1519C. Porosity then decreases to an average value of 39% from 250 to 284 mbsf. In the deepest cored interval from 520 to 635 mbsf, porosity averages 41% but exhibits a slight overall trend of increasing porosity with depth, likely related to a large proportion of coarser grained material in this interval. In general, porosity values and trends are consistent with values obtained by LWD nuclear magnetic resonance (NMR) and neutron porosity measurements (Figure F26).
P-wave velocity
P-wave velocity was measured on working halves and a limited number of discrete cubes (2 cm × 2 cm × 2 cm) at Site U1519. After careful investigation of the waveform data, it was discovered that most of the measurements on working halves were not real signals but system noise and that the only reliable data are from the upper 10 m of Holes U1519D and U1519E. Between 0 and 10 mbsf, P-wave velocity ranges from 1500 to 1600 m/s, consistent with LWD data in Hole U1519A (Figure F26) (see Logging while drilling). P-wave velocity on a limited number of discrete samples at ~560 mbsf (from Core 375-U1519C-18R) ranges from 1400 to 1700 m/s, which is much lower than LWD data in this depth interval (2300–2500 m/s).
Shear strength
Undrained shear strength increases from 0 to ~180 kPa with an average gradient of ~2.4 kPa/m between 0 and 85 mbsf in Holes U1519D and U1519E (Figure F26). The sediments were too indurated to measure strength using the automated vane shear (AVS) between 55 and 85 mbsf. Between 105 and 140 mbsf in Hole U1519C, shear strength remains mostly constant with an average value of ~62 kPa. Between 250 and 290 mbsf, shear strength estimated using the AVS is relatively constant with an average value of 30 kPa, whereas shear strength estimated using the penetrometer exhibits significant scatter and ranges between 29 and 307 kPa. In the cored interval of Hole U1519C deeper than 518 mbsf, the indurated sediments were measured only using the penetrometer. Between 518 and 635 mbsf, shear strength ranges 54–1104 kPa and averages ~319 kPa.
Thermal conductivity
Thermal conductivity measurements were conducted on sediment WR cores using the needle probe method on all samples shallower than 285 mbsf from Site U1519 (see Physical properties in the Expedition 372B/375 methods chapter [Wallace et al., 2019]). No measurements were conducted in the cored interval of Hole U1519C deeper than 518 mbsf, where the sediments were too stiff for a needle probe and too fragile for a half space probe. In most cases, three measurements were made with the needle probe at each measurement position. The plotted value in Figure F26 represents the mean of the three measurements, and the horizontal bar shows the standard deviation of the three measurements. Although a sample of three does not represent an accurate measure of the standard deviation, this value can be used to assess the relative scatter in the measurements.
From the seafloor to about 80 mbsf in Hole U1519E, thermal conductivity values range 0.8–1.6 W/(m·K). From 109 to 135 mbsf, thermal conductivity is relatively uniform at 1.3 W/(m·K), and deeper than 250 mbsf, thermal conductivity is about 1.4 W/(m·K).
Natural gamma radiation
Natural gamma radiation (NGR) values range from 18 to 67 counts/s at Site U1519 and are relatively uniform through the cored intervals, with an average of 40 counts/s (Figure F26). The NGR spectra were used to estimate 40K, 232Th, and 238U concentrations using the algorithm presented by De Vleeschouwer et al. (2017) (Figure F28). K, Th, and U concentrations are relatively uniform through the cored intervals. Mean values of 40K, 232Th, and 238U are 2.0 wt%, 5.1 ppm, and 1.4 ppm, respectively. These values likely reflect the low concentration of clay throughout the cored intervals.
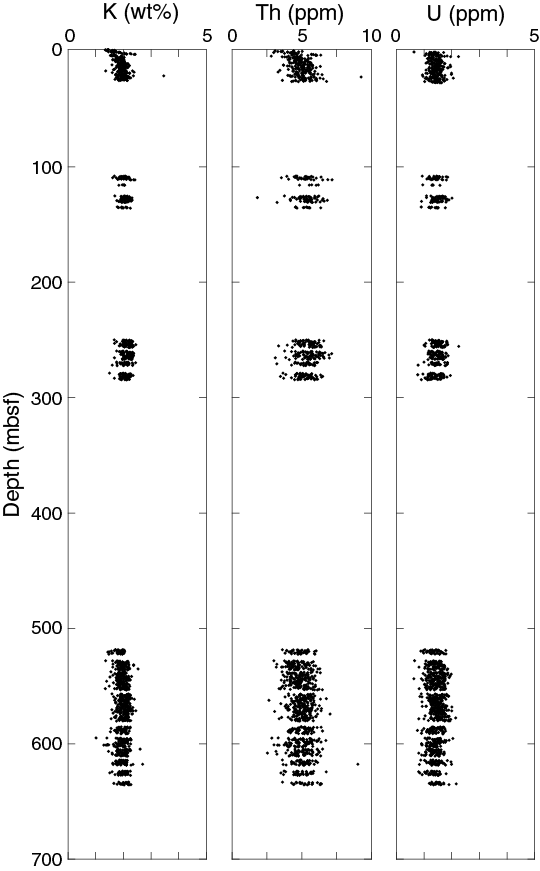
Figure F28. K, Th, and U.
Magnetic susceptibility
Magnetic susceptibility is mostly constant from 0 to 150 mbsf, ranging between 10 × 10−5 and 30 × 10−5 SI (Figure F26). At ~1.5 and 3–4 mbsf, magnetic susceptibility is as high as 300 × 10−5 SI, corresponding to ash layers. Between 250 and 283 mbsf, magnetic susceptibility ranges from 15 × 10−5 to 20 × 10−5 SI. At 283 mbsf, it shifts to higher values of 40 × 10−5 to 50 × 10−5 SI, corresponding to the Lithostratigraphic Unit I/II boundary. Deeper than 518 mbsf, magnetic susceptibility is nearly constant at 10 × 10−5 SI.
Reflectance spectroscopy and colorimetry
Color reflectance data collected from archive halves are presented in the L*a*b* color space (Figure F26). L*, a*, and b* are nearly constant for the cored depth interval, with average values of 39, 1, and −1.4, respectively. From 0 to ~30 mbsf, L* and b* decrease gradually with depth from 50 to 40 and from 4 to −5, respectively, and a* increases from 0 to 1. From 30 to 285 mbsf, L*, a*, and b* are nearly constant at 35–42, 2, and −3, respectively. Deeper than 518 mbsf, a* and b* are both nearly constant at ~1 and L* decreases gradually with depth from 40 to 37 at 636 mbsf.
Downhole measurements
Formation temperature and heat flow
The APCT-3 was deployed eight times in Hole U1519E (Table T13). Two APCT-3s (1858002C and 1858005C) were each used for four measurements. All temperature measurements show a clear frictional heating spike upon insertion indicating that the tool penetrated the sediment (Figures F29, F30). Equilibrium temperatures are determined based on the cooling trend between the APCT-3 insertion time and the pull-out time. At this site, the majority of the temperature decay curves show deviations from a smooth cooling trend indicating that the APCT-3 was likely disturbed, degrading the quality of temperature determinations. The one exception is the measurement associated with Core 375-U1519E-8H. Because of the disturbances, the decay curves were fit over the longest period of time containing a smooth record. Despite these problems, the APCT-3 measurements provide reliable estimates of the formation temperature.
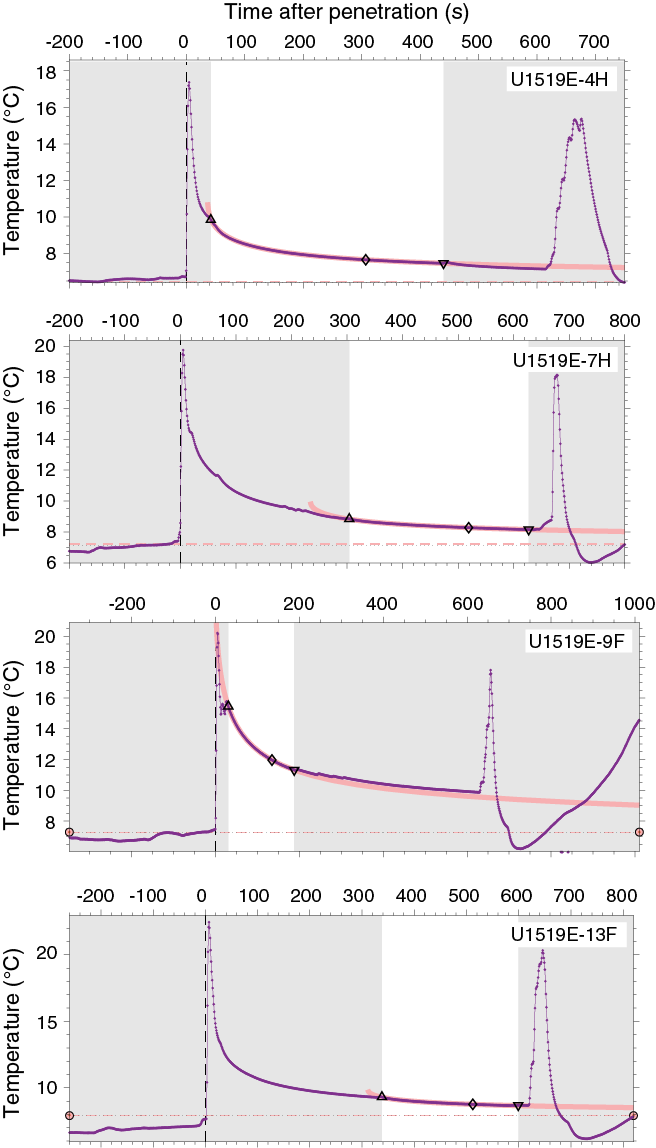
Figure F29. APCT-3 1858002C temperature-time series.
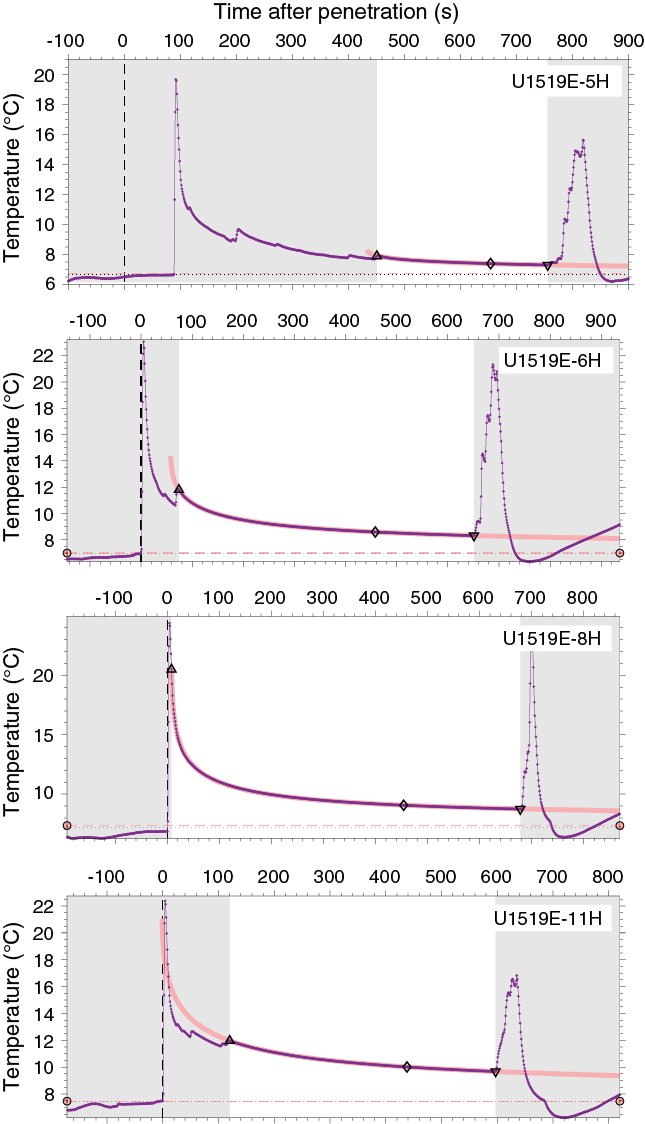
Figure F30. APCT-3 1858005C temperature-time series.
Estimated equilibrium temperatures are plotted as a function of measurement depth (Figure F31A). The best-fitting thermal gradient to these data is 24.3°C/km. This fit yields an intercept corresponding to a bottom water temperature of 5.7°C, which is in good agreement with nearby bottom water temperature measurements made during the year-long Hikurangi Ocean Bottom Investigation of Tremor and Slow Slip (HOBITSS) deployment (Wallace et al., 2016) and expendable bathythermograph (XBT) casts made during R/V Roger Revelle Cruise RR1508 between 16 May and 18 June 2005. These water column temperature measurements show temperatures from 5.6° to 5.8°C at water depths between 990 and 1000 m. The consistency of the bottom water temperature measurements with the estimate of bottom water temperature based on the fit to the equilibrium temperatures adds confidence to the APCT-3 results. To estimate the vertical conductive heat flow (q), we use Fourier’s law:
where k is the thermal conductivity and Γ is the thermal gradient. The mean thermal conductivity is 1.31 W/(m·K) (see Physical properties) and is combined with the best-fitting thermal gradient to yield a heat flow value of 32 mW/m2.
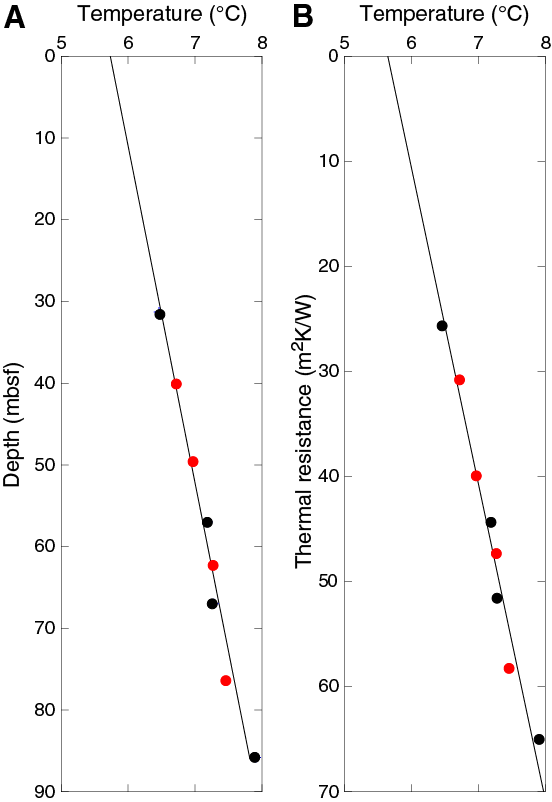
Figure F31. Estimated equilibrium temperatures.
A second method for estimating the conductive heat flow takes into account variations in thermal conductivity measured separately on core samples using the relationship (Bullard, 1939)
where k(z)i is the individual thermal conductivity value and Δzi is the distance between adjoining thermal conductivity measurements.
In practice, q and T0 can be estimated by plotting T(z) against thermal resistance between the seafloor and the depth of the temperature measurement (Figure F31B). The thermal resistance of the sediment overlying each APCT-3 measurement is given in Table T13. The heat flow estimate defined by the slope of the least-squares linear fit is 33 mW/m2 (Figure F31B), which is close to the estimate using Fourier’s law. The estimated bottom water temperature using this technique is 5.6°C.
The heat flow value at Site U1519 is lower than regional heat flow values of ~50 mW/m2 near the trench decreasing landward to 35 mW/m2 estimated based on BSRs (Henrys et al., 2003; Townend, 1997). This heat flow is also lower than the 49 mW/m2 estimated at Site U1517 (16 km to the southwest) (Barnes et al., 2019) but higher than shallow probe values (~27 mW/m2) obtained in the same location (Antriasian et al., 2018).
Logging while drilling
The LWD data for Hole U1519A were collected with a BHA composed of six LWD tools attached behind the bit (from bottom to top): geoVISION, NeoScope, StethoScope, TeleScope, SonicScope, and proVISION. These tools provide a wide array of measurements including gamma ray (geoVISION and NeoScope), resistivity (geoVISION and NeoScope), porosity (NeoScope and proVISION), and compressional (P-wave) and shear (S-wave) wave velocity (SonicScope) as described in Logging while drilling in the Expedition 372B/375 methods chapter (Wallace et al., 2019). The StethoScope probe was not deployed at this site; therefore, the tool only collected APWD measurements.
Drilling parameters
In the composite plot of drilling parameters (Figure F32), the data are displayed according to the LWD operations period starting on 23 December 2017 at 2258 h (UTC + 13 h) and terminating on 25 December at 1246 h. The average rate of penetration (ROP) was ~40 m/h at ~40 mbsf and was gradually slowed over the depth of the hole to ~20 m/h at ~560 mbsf. Below ~560 mbsf, the ROP was increased to ~40 m/h. The drilling pipe rotation rate was ~20 rpm as the borehole was spudded, increased to ~50 rpm at ~80 mbsf, and then stayed close to this value for the remainder of the borehole. Weight on bit (WOB) ranged between −10 and 10 klb. From ~16 to 398 mbsf, WOB was ~4 klb. Below ~398 mbsf, WOB fluctuated between about −1 and 18 klb. Annular pressure increased progressively with depth. At the seafloor, the measured annular temperature was ~6°C; it increased to ~12°C at the bottom of the borehole.

Figure F32. Drilling parameters.
Data quality
In general, the highest quality logging measurements are collected when the borehole is close to bit size. Thus, borehole conditions were assessed by the ultrasonic caliper measurement of borehole diameter to define zones of borehole enlargement, or washouts (Figures F32, F33). The ultrasonic caliper, however, can incorrectly identify intervals with extreme borehole enlargement (>5 cm) and instead report values close to the bit size (8.5 inch); therefore, porosity and resistivity measurements were also used to identify enlarged or washout intervals. These zones are characterized by anomalously low resistivity (~0.3–0.9 Ωm) and unrealistically high porosity (~0.7–1.0), both of which imply that measurements are affected by a large volume of seawater between the tool and borehole wall. Degraded borehole conditions are more likely in intervals with less cohesive sediment such as sand and silt with little clay. In finer grained (typically clay-rich) intervals, the borehole is likely to be closer to bit size.
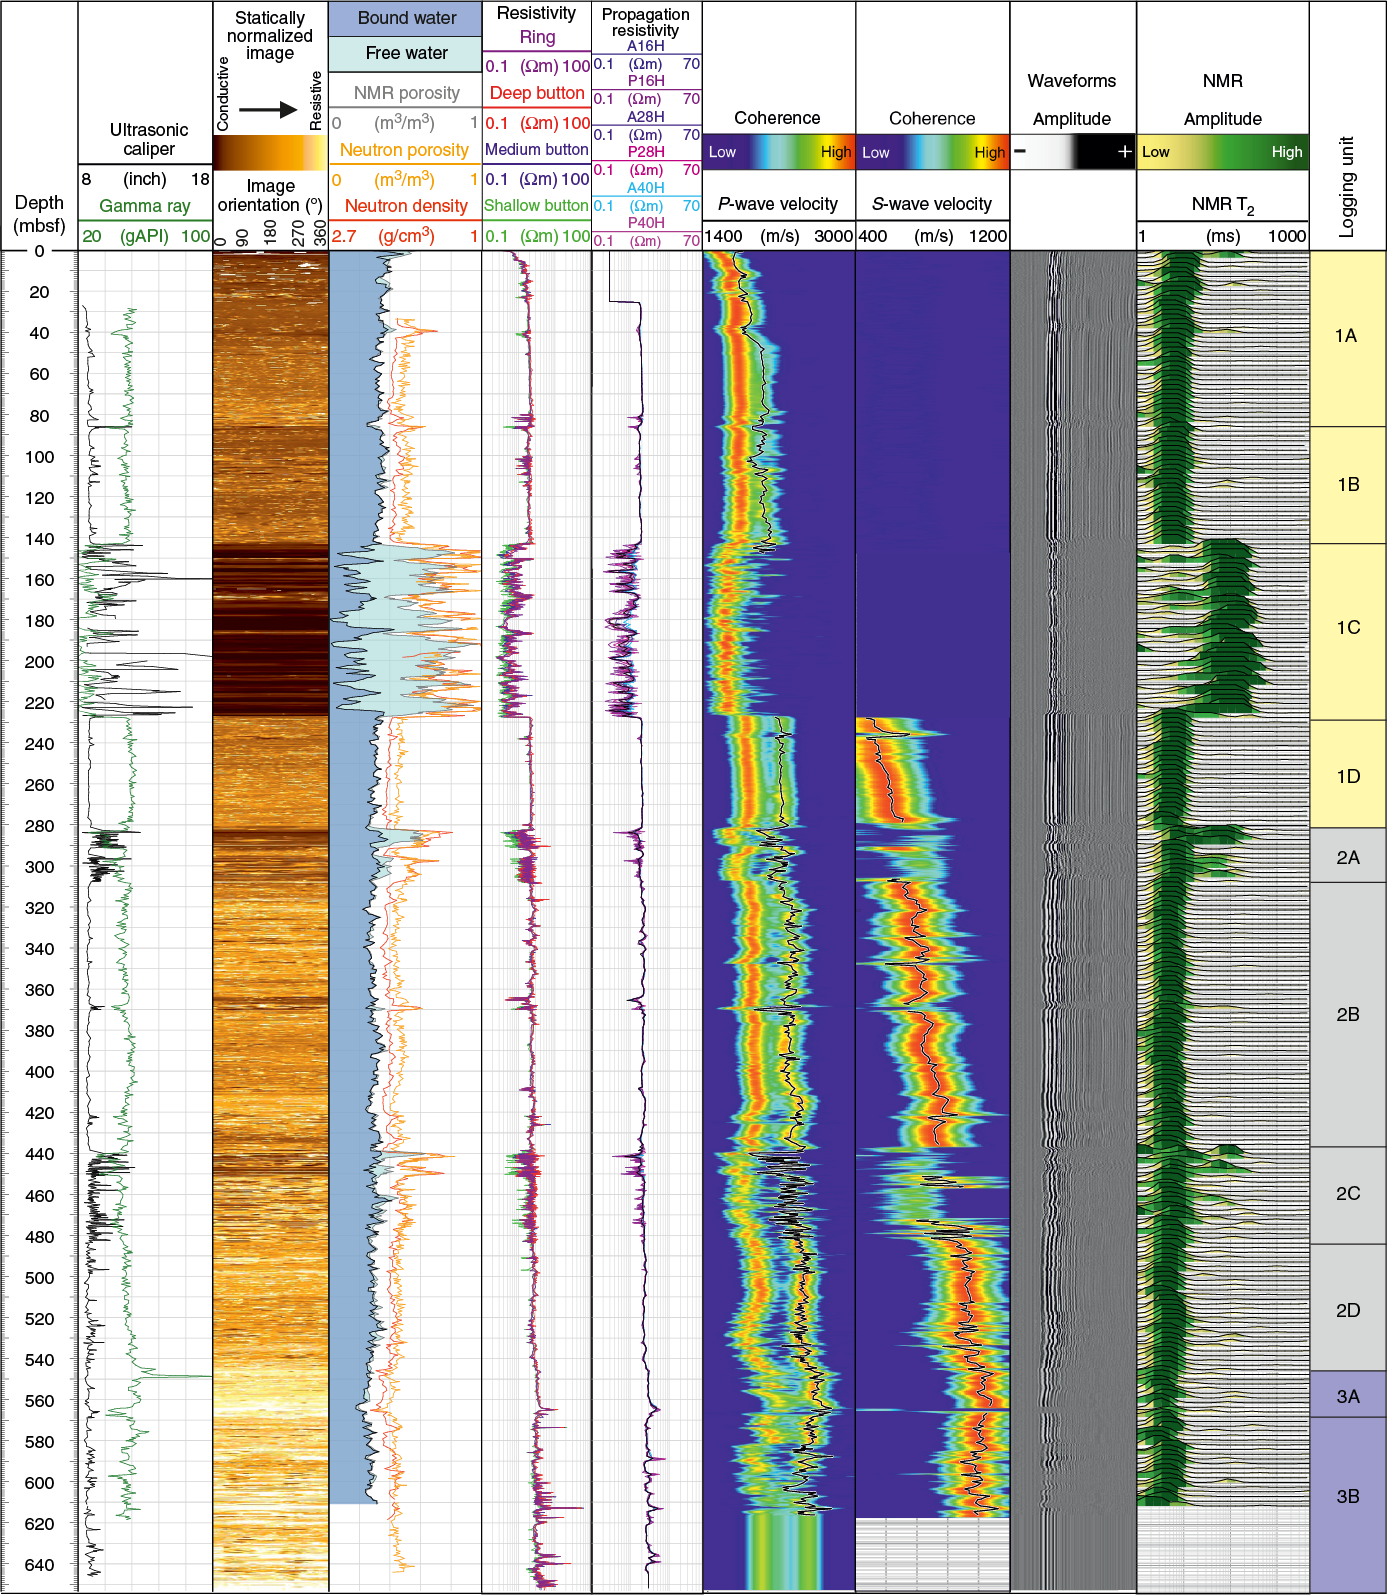
Figure F33. LWD measurements.
The NMR data are generally of good quality, but the transverse relaxation time (T2) distribution is truncated to values between 1 and 1000 ms (Figure F33). Therefore, not all of the clay-bound water (which typically ranges from 0.3 to 3 ms) is recorded. Additionally, the largest pores in coarse sediments and any open pore space or washouts are recorded as a long NMR T2 peak between 50 and 500 ms rather than an expected peak position at 1000 ms.
A GVR resistivity image log was acquired from 0 to 650 mbsf in Hole U1519A (Figure F34). The image log is of variable quality. Poor image log quality is due to a combination of missing data, image log stretching effects, horizontal image log artifacts, and spiral-hole image log artifacts. Missing data and image stretch reduce image quality significantly from 0 to 5 mbsf. At 120–130, 228–281, 370–439, and 483–591 mbsf, spiral-hole image artifacts are evident and reduce image quality, but geological features can still be observed. Image stretching is significant at 241, 281–291, 296, 305, 438–450, 535, and 558 mbsf. From 142 to 228 mbsf, image quality is very poor because of washout of the borehole over a sandy unit (Logging Subunit 1C). Horizontal image artifacts are common throughout the imaged interval and are thought to be related to stick and slide as the resistivity buttons rotate around the borehole, possibly smearing the sediments being drilled through.
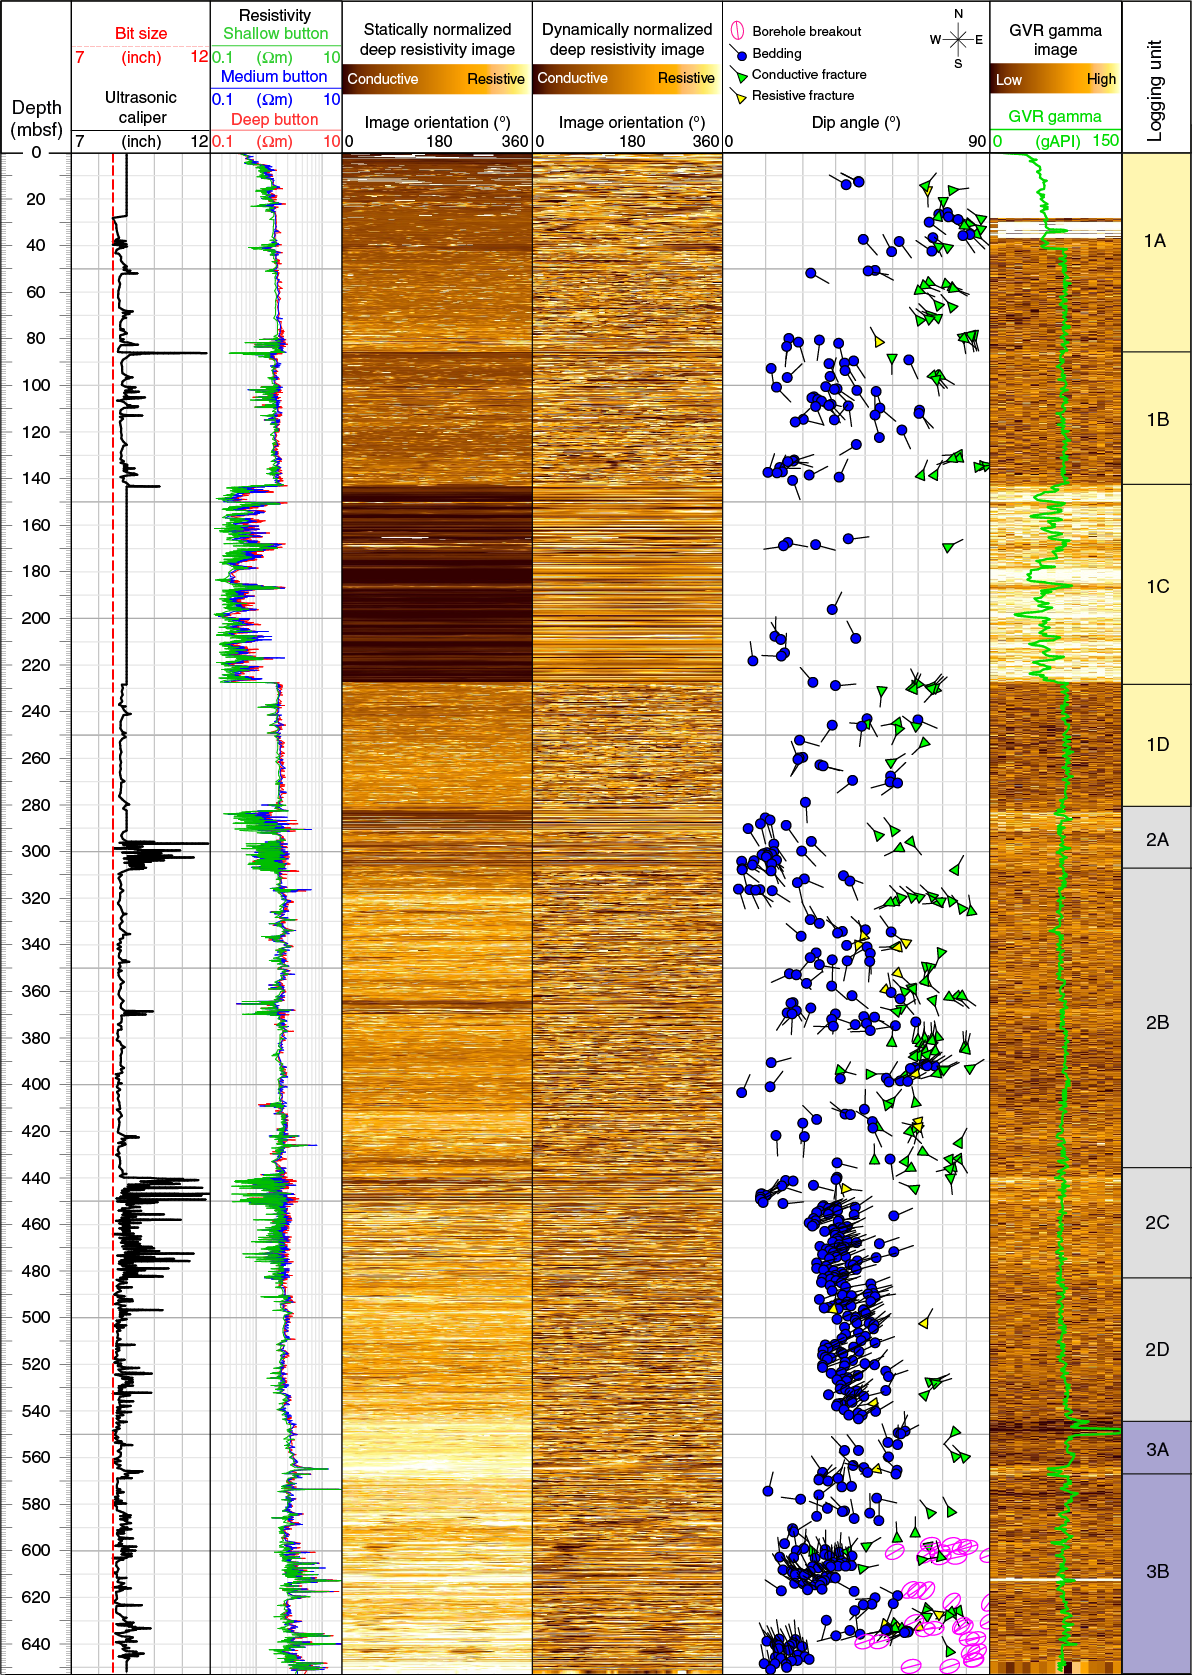
Figure F34. Resistivity image log data.
Logging units
The combination of different LWD measurements allowed us to define three logging units (Figures F33, F34) that correspond approximately to major seismic units defined in this area of the Tuaheni Basin (Seismic Units 1–3; see Core-log-seismic integration).
Logging Unit 1 (0–281.5 mbsf)
Logging Unit 1 is divided into four subunits based on significant changes in logging responses.
Logging Subunit 1A (0–86 mbsf) shows a short, unimodal NMR T2 response that indicates a dominance of bound water in small pores and very little free water, implying the sediment is uniformly fine grained sediment. The gamma ray response is uniform with an average value of 50 gAPI. Aside from the near-seafloor sediments (0–5 mbsf), resistivity in this logging subunit is also generally uniform with a value of 2.0 Ωm, except for small decreases adjacent to very thin intervals that likely represent the presence of washed out, coarse-grained sediments (e.g., ~41 mbsf). Neutron porosity decreases from ~0.55 to ~0.45 through this logging subunit. Compressional wave velocity increases from 1550 to 1725 m/s, although measurements between 0 and 50 mbsf are likely inaccurate because of borehole enlargement. Bedding is difficult to resolve from the resistivity image logs, but identified beds have moderate to high dip angles (~15°–80°) to the southeast or northwest (Figure F34). Steeply dipping image log features identified as bedding require further investigation to confirm their classification and interpret the steep dip angles. A number of conductive fractures and one resistive fracture, dipping 60°–90° to the southeast or northwest, are observed in this logging subunit.
Logging Subunit 1B (86–143 mbsf) is defined based on a small decrease in resistivity that can be seen in the statically normalized resistivity image log as a change to a darker color. Resistivity averages 1.9 Ωm. Neutron porosity is close to 0.50 throughout this logging subunit, and gamma ray is uniform at around 50 gAPI. The NMR T2 distribution remains unimodal and similar to Subunit 1A. Bedding is easily identified from the resistivity image logs, with a range of dip angles (10°–60°) dipping dominantly to the southeast from 86 to 130 mbsf and to the east from 130 to 143 mbsf. Some thin conductive intervals are observed throughout this logging subunit and may be washed out, coarse-grained sediment beds. P-wave velocity increases from 1700 to 1875 m/s through the subunit with local decreases in thin bedded intervals between 101 and 110 mbsf. High-angle conductive fractures are observed dipping (65°–70°) to the southeast at ~97 mbsf and between 70° and 90° to the east and west from 130 to 140 mbsf.
Logging Subunit 1C (143–227.5 mbsf) shows a long NMR T2 peak and low gamma ray (~20 gAPI) indicating an interval of relatively uniformly coarse grained sediment. Resistivity and velocity are low and porosity is high; these measurements are most likely affected by washout in this logging subunit. The attenuation resistivity measured at low frequency (A40L), which is the least affected of all the curves, reads 1–1.6 Ωm. Only occasional narrow depth intervals capture any usable image log data, and few geological features are observed.
Logging Subunit 1D (227.5–281.5 mbsf) shows signatures similar to those in Logging Subunit 1B, with gamma ray of ~50 gAPI and low T2 distributions inferred to represent uniform fine-grained sediments. Resistivity is uniform (~2 Ωm), punctuated very occasionally by thin, more conductive beds. S-wave velocity is first resolved in this logging subunit starting at ~450 m/s near the top and increases to ~700 m/s at the base. Bedding identified from the resistivity image logs is sparse with no consistent orientation. At the top of this logging subunit, a cluster of conductive fractures are observed dipping 55°–70° to the northeast.
Logging Unit 2 (281.5–546.0 mbsf)
Logging Unit 2 corresponds to Seismic Unit 2 and lies beneath an onlapping and locally unconformable horizon below Logging Unit 1 (Seismic Unit 1), the present basin depocenter (see Core-log-seismic integration). Four subunits are identified from the LWD data.
Logging Subunit 2A (281.5–308.5 mbsf) is characterized by a bimodal NMR T2 distribution that indicates a coarse sediment package with large pore sizes interrupted by a small interval of uniform fine sediments at 291–293.5 mbsf. The upper coarse sediment interval exhibits large resistivity oscillations, and bedding dips from 5° to 15° to the southeast. The lower coarse sediment interval shows distinct thin bedding with dips from ~5° to ~20° to the southeast, and bedding thickness increases with depth. Compressional wave velocity in this logging subunit is variable between 1800 and 2000 m/s and is affected by borehole quality; no shear wave velocity is recorded in this logging subunit.
Logging Subunit 2B (308.5–438.5 mbsf) consists of uniformly fine grained sediments interpreted from the unimodal, short NMR T2 distribution and uniform gamma ray around 50 gAPI. Neutron porosity varies in a narrow range from 0.42 to 0.45. P-wave and S-wave velocities increase steadily with depth from 2200 to 2400 m/s and from ~510 to 620 m/s, respectively. Bedding observed from the resistivity image logs in this logging subunit is nonuniform in both dip angle and azimuth. Numerous fractures, both conductive and resistive, are present throughout this logging subunit, with dip angles 30°–90° and variable dip azimuths (Figure F34).
The pattern of NMR T2 distribution in Logging Subunit 2C (438.5–483 mbsf) is distinct with the proportion of the longer T2 peak increasing where more conductive beds occur. Bed dips are clearly defined and consistent throughout the subunit, dipping dominantly 20°–40° to the northeast. Neutron porosity is uniform at ~0.45, although large increases occur over specific thin beds suggesting the presence of coarse-grained sediments and/or borehole washouts. Gamma ray ranges from 20 to 50 gAPI, and the lowest values are most likely influenced by the borehole washout. This logging subunit is interpreted to be a stack of turbidite sequences with coarse-grained layers as thick as 10 cm. The Logging Subunit 2C/2D boundary is gradational.
Logging Subunit 2D (483.0–546.0 mbsf) consists of uniform fine sediments with occasional thin layers of coarser sediments, as indicated by a dominantly unimodal, small NMR T2 distribution. Neutron porosity decreases from around 0.5 at the top to 0.46 at the base. The resistivity response is relatively constant at ~2.3 Ωm. P-wave and S-wave velocities both increase through the logging subunit, reaching 2300 and 1000 m/s at the base, respectively. Bedding dips are consistently 20°–45° to the northeast.
Logging Unit 3 (546–650 mbsf)
The Logging Unit 2/3 boundary is placed above a notable spike in gamma ray at 549 mbsf where density and resistivity show an inflection toward higher values and bedding orientations change from the consistent measurements in Logging Subunit 2D to variable orientations in the upper interval of Logging Unit 3 (546–600 mbsf). Logging Unit 3 contains two logging subunits defined on the basis of different velocity, density, and resistivity characteristics.
Logging Subunit 3A (546–567 mbsf) is characterized by higher resistivity, lower porosity, and higher density than overlying Logging Unit 2. Gamma ray is highly variable in contrast to other logging units. For example, the presence of a very high gamma ray spike (>100 gAPI) at ~550 mbsf likely marks the presence of volcanic ash (see Lithostratigraphy). P-wave velocity increases to 2500 m/s, the highest value in Hole U1519A, at the base of the subunit, and S-wave velocity reaches 1020 m/s. The resistivity image log in Logging Subunit 3A is more resistive (brighter) than in overlying logging units and contains thin (centimeter to ~1 m scale), highly resistive beds interpreted to be gas hydrate–filled, coarse-grained sediment layers. Bedding orientations are inconsistent, and three conductive fractures are noted in this logging subunit.
Logging Subunit 3B (567–650 mbsf) marks a gradational change from Logging Subunit 3A to slightly higher porosity, slower P-wave and S-wave velocities, and the occurrence of spikes of high resistivity (>10 Ωm on button resistivity measurements) and high P-wave velocity. From 620 to 640 mbsf, a mix of conductive and resistive fractures dip 45°–80° dominantly to the southwest. The P-wave velocity spikes coincide with centimeter to ~1 m scale, resistive (bright) layers and with intervals on the resistivity image logs interpreted to be gas hydrate–filled, coarse-grained sediment layers. These coarse-grained layers likely map to turbidite sequences noted in the core (see Lithostratigraphy). Bedding orientations vary with depth: bedding is inconsistent from 567 to 595 mbsf, dips 15°–35° to the north-northwest between 595 and 620 mbsf, is again inconsistent from 620 to ~635 mbsf, and dips ~10°–20° to the north-northwest from 635 mbsf to the bottom of the borehole.
Borehole breakouts are observed in the resistivity image logs in Logging Subunit 3B between 595 and 650 mbsf (Figure F34). Borehole breakout azimuths are dominantly aligned ~054°/234° (northeast–southwest) from which we infer a northeast–southwest Shmin orientation and a northwest–southeast SHmax orientation in this interval. Preliminary measurements of borehole breakout widths range from 33.9° to 83.6°.
Core-log-seismic integration
Depth scale
During Expedition 372, LWD data were acquired in Hole U1519A. The seafloor was penetrated at 1000.7 mbsl, and data were collected to a total depth of 650 mbsf (see Logging while drilling). During Expedition 375, Hole U1519B was drilled for the emplacement of an observatory, and the seafloor was tagged at 1000.4 mbsl (see Operations). Coring took place in Holes U1519C, U1519D, and U1519E, and the seafloor was measured at 1000.3, 1000.4, and 1000.3 mbsl, respectively. Spot-coring with the RCB system took place in Hole U1519C at 108.0–163.6, 250.0–288.4, and 518.4–640 mbsf. APC coring was done in Hole U1519D from 0 to 23.64 mbsf and in Hole U1519E from 0 to 85.8 mbsf.
Holes U1519A and U1519C are located 40 m apart, and all holes at Site U1519 lie on Seismic Line 05CM-04 (Figure F1) (see Background and objectives). Because of minor differences in seafloor depth, close proximity of the LWD and coring sites, and relatively simple geological structure, it is possible to conduct a correlation of the core, log, and seismic data with no depth shifting required.
Seismic-well ties
A seismic-well tie is needed to correlate physical properties changes in the logging data, lithostratigraphic units and structural domains in cores, and seismic reflections and seismic facies units to extrapolate results from drilling at Site U1519 over the Tuaheni Basin and surrounding slopes. Holes U1519A and U1519C intersect Seismic Line 05CM-04 at common depth points (CDPs) 2038 and 2041, respectively. To correlate seismic data (recorded in time) and log/core data (recorded in depth), it is necessary to develop an accurate time-depth relationship. P-wave velocity data were acquired by the SonicScope LWD tool in Hole U1519A, providing velocity information from 0 to 617 mbsf (see Logging while drilling).
The LWD P-wave velocity logs were compared with seismic velocity estimates produced for the depth migration of Seismic Line 05CM-04 (Barker et al., 2018) and a full waveform inversion (FWI) (see Core-log-seismic integration in the Expedition 372B/375 methods chapter [Wallace et al., 2019]) (Figure F35). LWD P-wave velocity is generally higher than the prestack depth migration (PSDM) model (Barker et al., 2018) from 150 to 400 mbsf. The FWI velocity model matches the average LWD velocity from the seabed to 617 mbsf and also detects a velocity inversion at 580 mbsf, which is close to a significant velocity inversion observed in the LWD data at 564 mbsf. The PSDM and FWI velocity models predict a very similar time-depth relationship, and both models slightly underestimate depth from 200 to 650 mbsf.
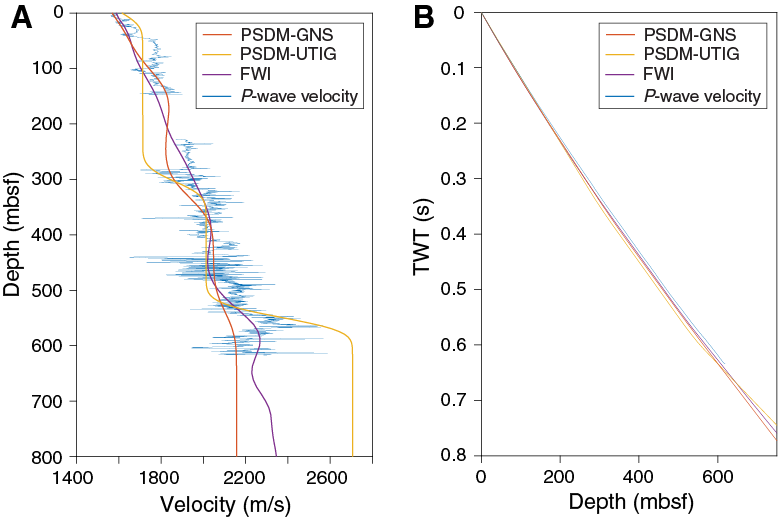
Figure F35. Hole U1519A, PSDM, and FWI VP profiles.
The LWD logs provided a more direct measurement of P-wave velocity at Site U1519 than the pre-expedition seismic velocity models. Therefore, the LWD P-wave velocity log was used to perform the depth-time conversion in the production of a synthetic seismic trace (Figure F36A). No P-wave velocity data were collected between 148 and 227 mbsf because of a significant borehole washout, so velocity values were linearly interpolated across this interval. The P-wave velocity log was then smoothed over 20 samples (sampling interval of 15 cm) to produce a profile relevant to the vertical resolution of the seismic data. The LWD sourceless neutron-gamma density log from Hole U1519A was used in the construction of the synthetic seismic-well tie from 0 to 611 mbsf. The density log was smoothed over 20 samples (sampling interval of 15 cm).
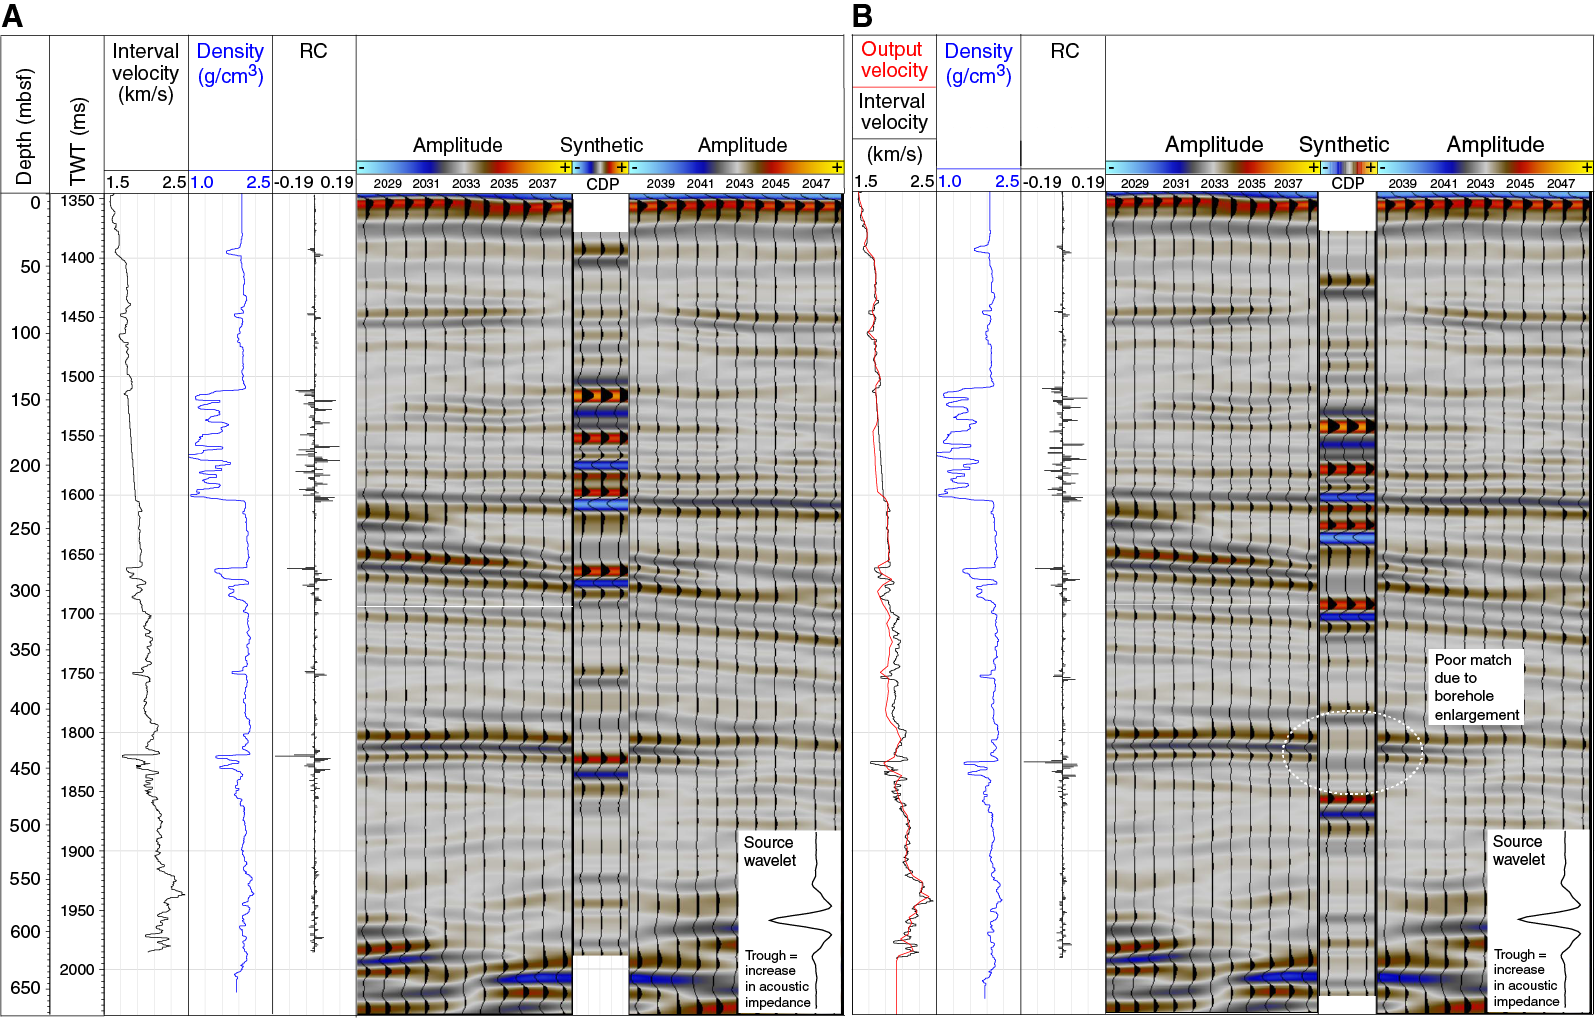
Figure F36. Synthetic seismic-well tie.
Following testing using analytical, statistical, and deterministic wavelet extractions, a preferred wavelet was selected from Profile 05CM-04 by stacking 10 adjacent seismic traces from a flat region of the seafloor close to but not intersecting Site U1519 (between CDPs 2090 and 2100) to yield a high signal-to-noise ratio (Figure F36). This wavelet was convolved with the reflection coefficient log measured in two-way traveltime (TWT) to produce a synthetic seismic trace that can be compared with Seismic Line 05CM-04 in the vicinity of CDP 2038 near Site U1519.
The resulting synthetic seismic trace in the time domain is shown in Figure F36A, together with the real seismic data (Line 05CM-04, CDPs 2028–2048), with no depth shifts applied. Some significant high-amplitude reflections predicted by the synthetic, such as around 200–300 mbsf, match the seismic data. Very high amplitude reflections predicted around 130–200 mbsf may be exaggerated by reduced velocity and density values caused by borehole collapse in this area (see Logging while drilling). The synthetic also reproduces a zone of low-amplitude reflectivity from 475 to 550 mbsf (Figure F36A).
At 425–450 mbsf, it appears that a mismatch occurs between a high-amplitude, reversed polarity reflection in the data and synthetic. We note that this high-amplitude reflection is caused by a large decrease in density and velocity in an area where the caliper increases at 440 mbsf (see Logging while drilling). A reversed polarity reflection occurs in the data at 442 mbsf; however, there appears to be an even higher amplitude, reversed polarity reflection at a shallower depth of 425 mbsf (Figure F36A). We do not think that the reflection predicted in our synthetics at 440 mbsf represents the reflection at 425 mbsf because it would require the sediment velocity from 300 to 400 mbsf to be ~200 m/s faster than that measured by LWD. Instead, we suggest that the smaller amplitude, reversed polarity reflection in our synthetics at 420 mbsf represents the observed reflection at 425 mbsf. Subsequently, the very high amplitude reflection in our synthetics at 440 mbsf is in fact the observed reflection at 442 mbsf, but the amplitude of the latter is artificially enhanced because of borehole washout.
Minor changes to the velocity log (red line, Figure F36B) allow the synthetic trace and real seismic reflections to be brought into slightly closer alignment. The discrepancies between the velocity required by the seismic-well tie and the real velocity logs could be the result of reduced quality P-wave velocity measurement because of washouts. The close match between the synthetic trace and Line 05CM-04 provides a high-confidence correlation between the LWD, core, and seismic reflection data.
Seismic stratigraphy, seismic units, and comparison with log and core data
Three major seismic reflection units are defined at Site U1519. In Figures F37 and F38, the broader seismic stratigraphic architecture of the units is highlighted and compared with unpublished pre-expedition seismic stratigraphy (P. Barnes, unpubl. data). In Figure F39, the units are shown in meters below seafloor converted from time using the seismic-well tie (Figure F36; Table T14) and are compared with the logging units defined by LWD (see Logging while drilling).
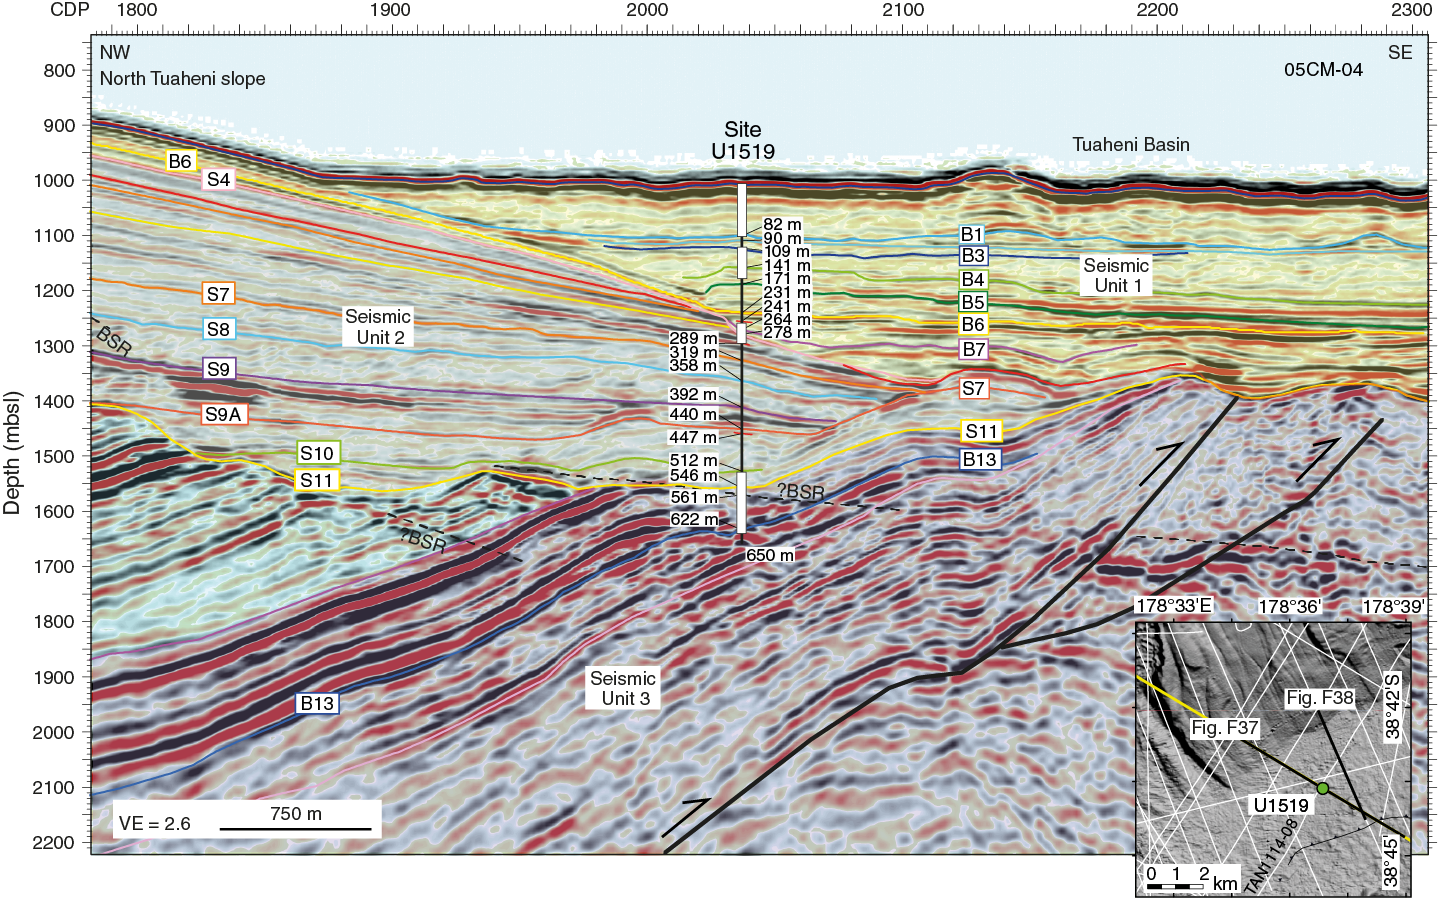
Figure F37. Seismic units, Line 05CM-04.
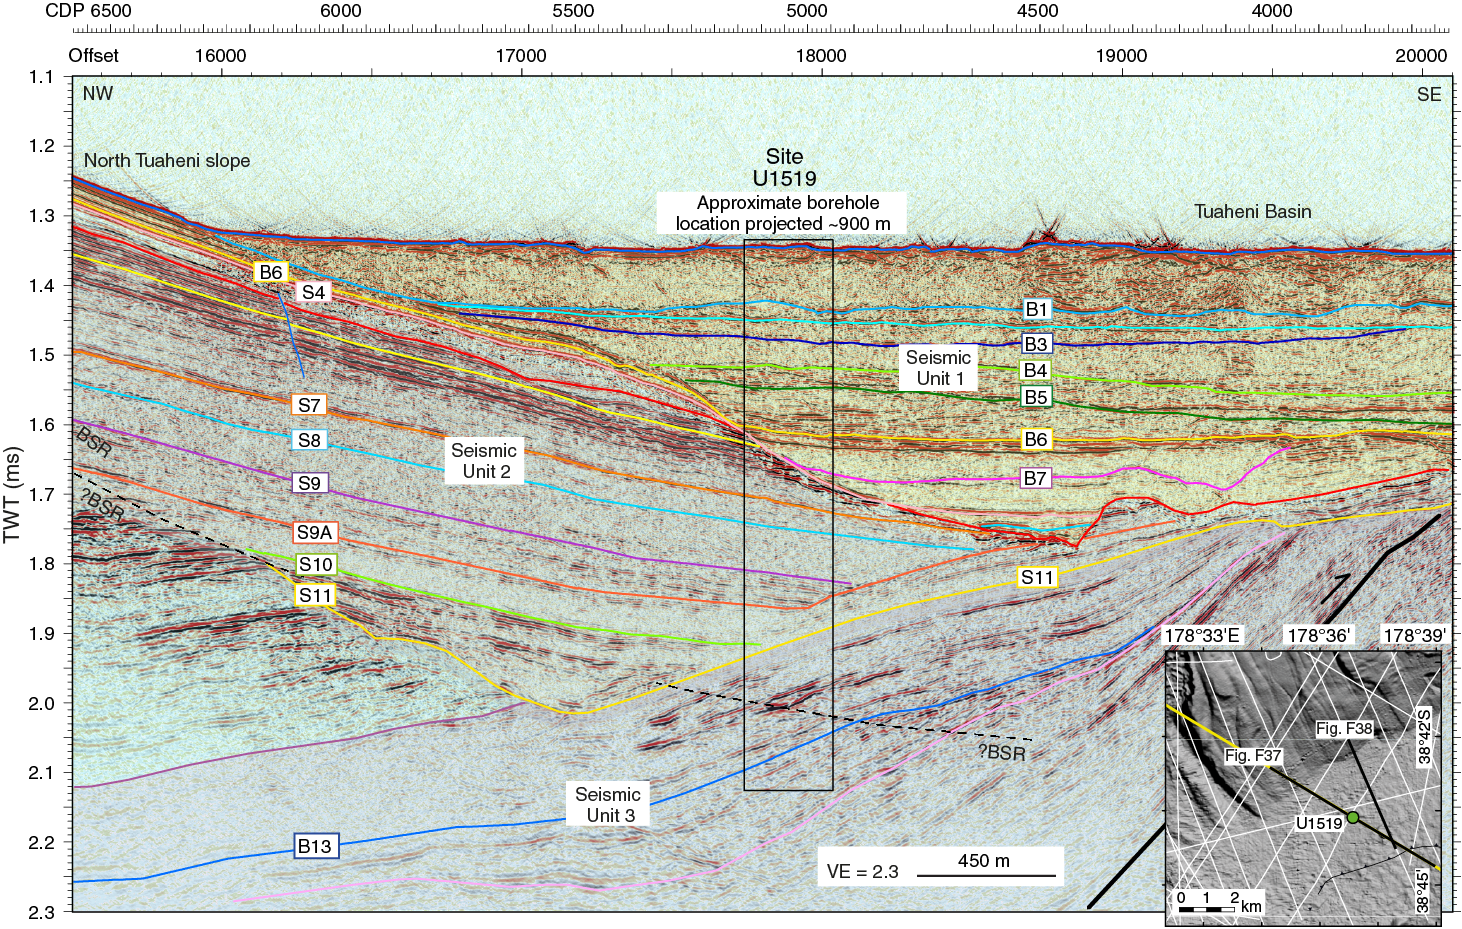
Figure F38. Seismic units, Line TAN1404-P3106.

Figure F39. Units, synthetic-well tie, and seismic data.
Below, we describe the reflection and logging characteristics of each seismic unit and discuss the in situ physical properties that lead to the observed reflection characteristics. At 0–85.8, 108.0–163.6, 250.0–288.4, and 518.4–640 mbsf, we also tie lithologic, biostratigraphic, and core-based physical properties to the seismic data to enable interpretation of the depositional environment and history in the vicinity of Site U1519. Using a combination of correlation panels, crossplots, and the seismic-well tie, we discuss the character of each seismic unit, including lithologic and biostratigraphic information from the cored intervals (Figures F40, F41, F42) (see Lithostratigraphy and Biostratigraphy).
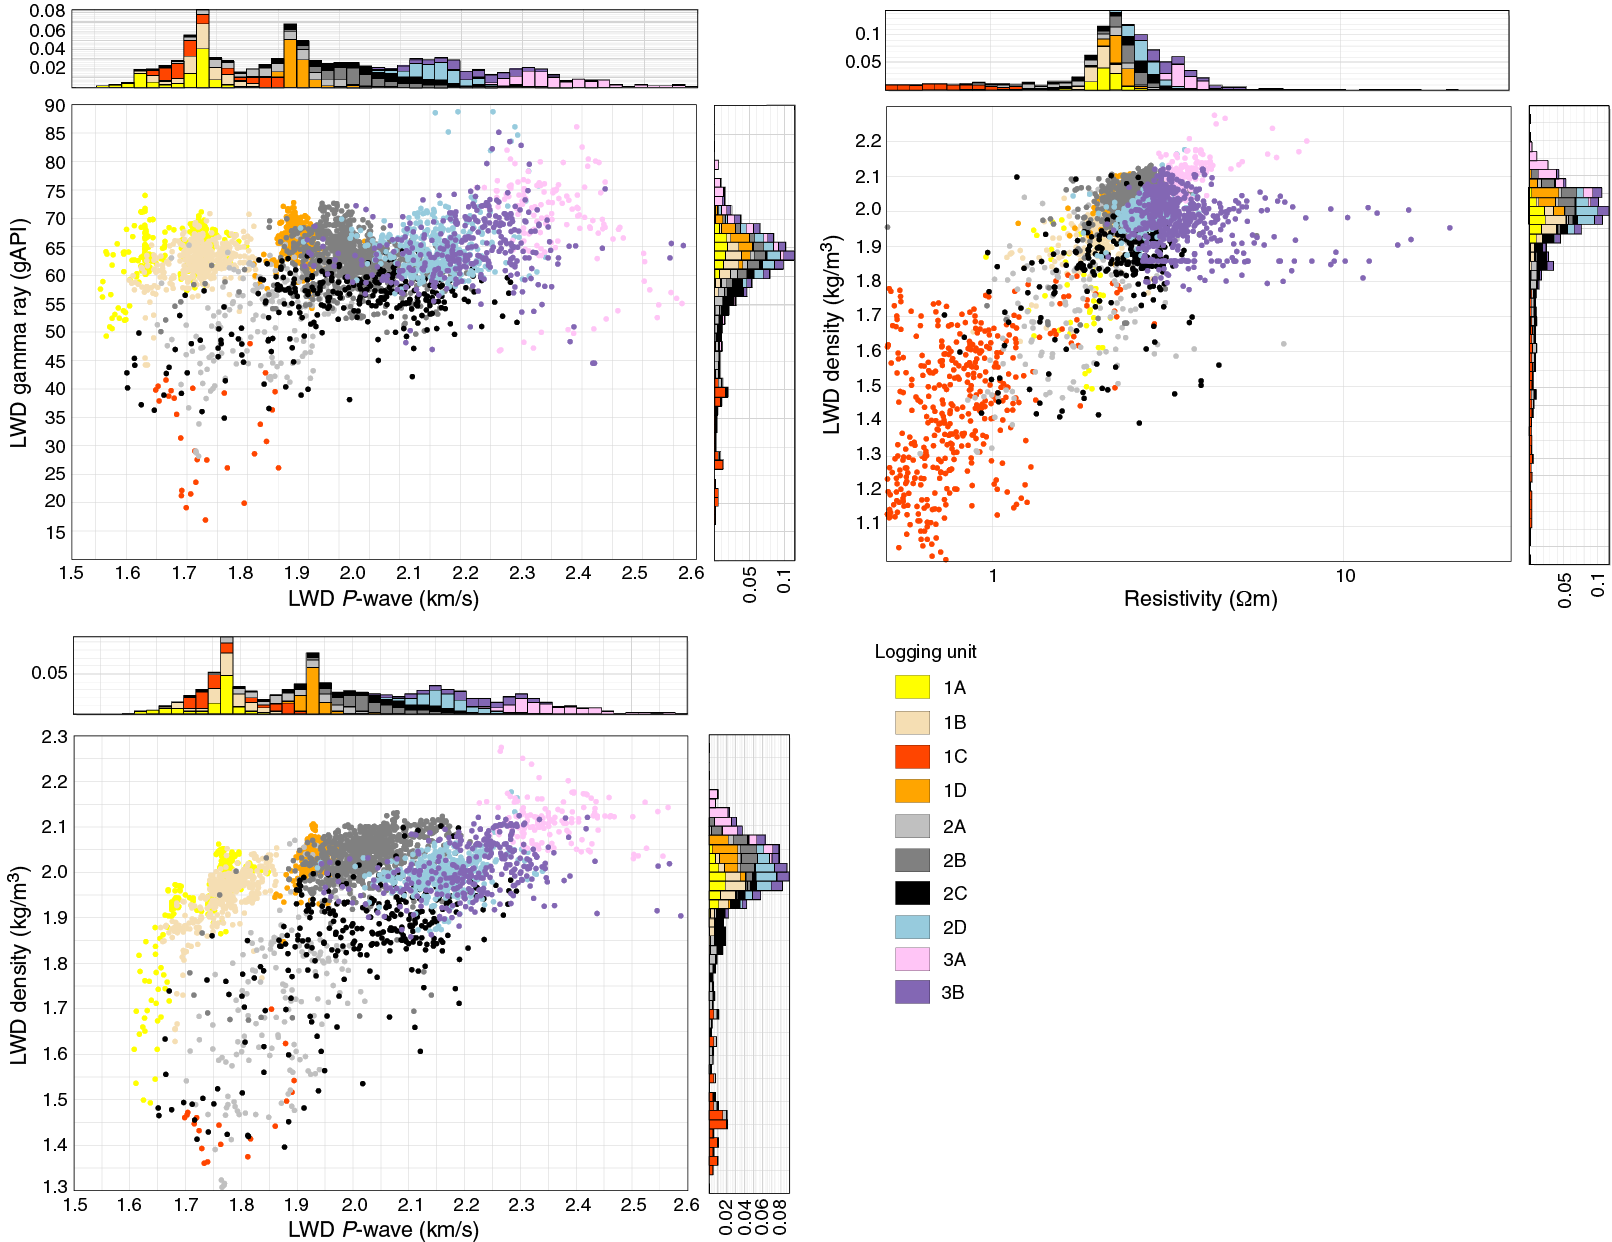
Figure F40. Gamma ray, P-wave velocity, density, and resistivity.
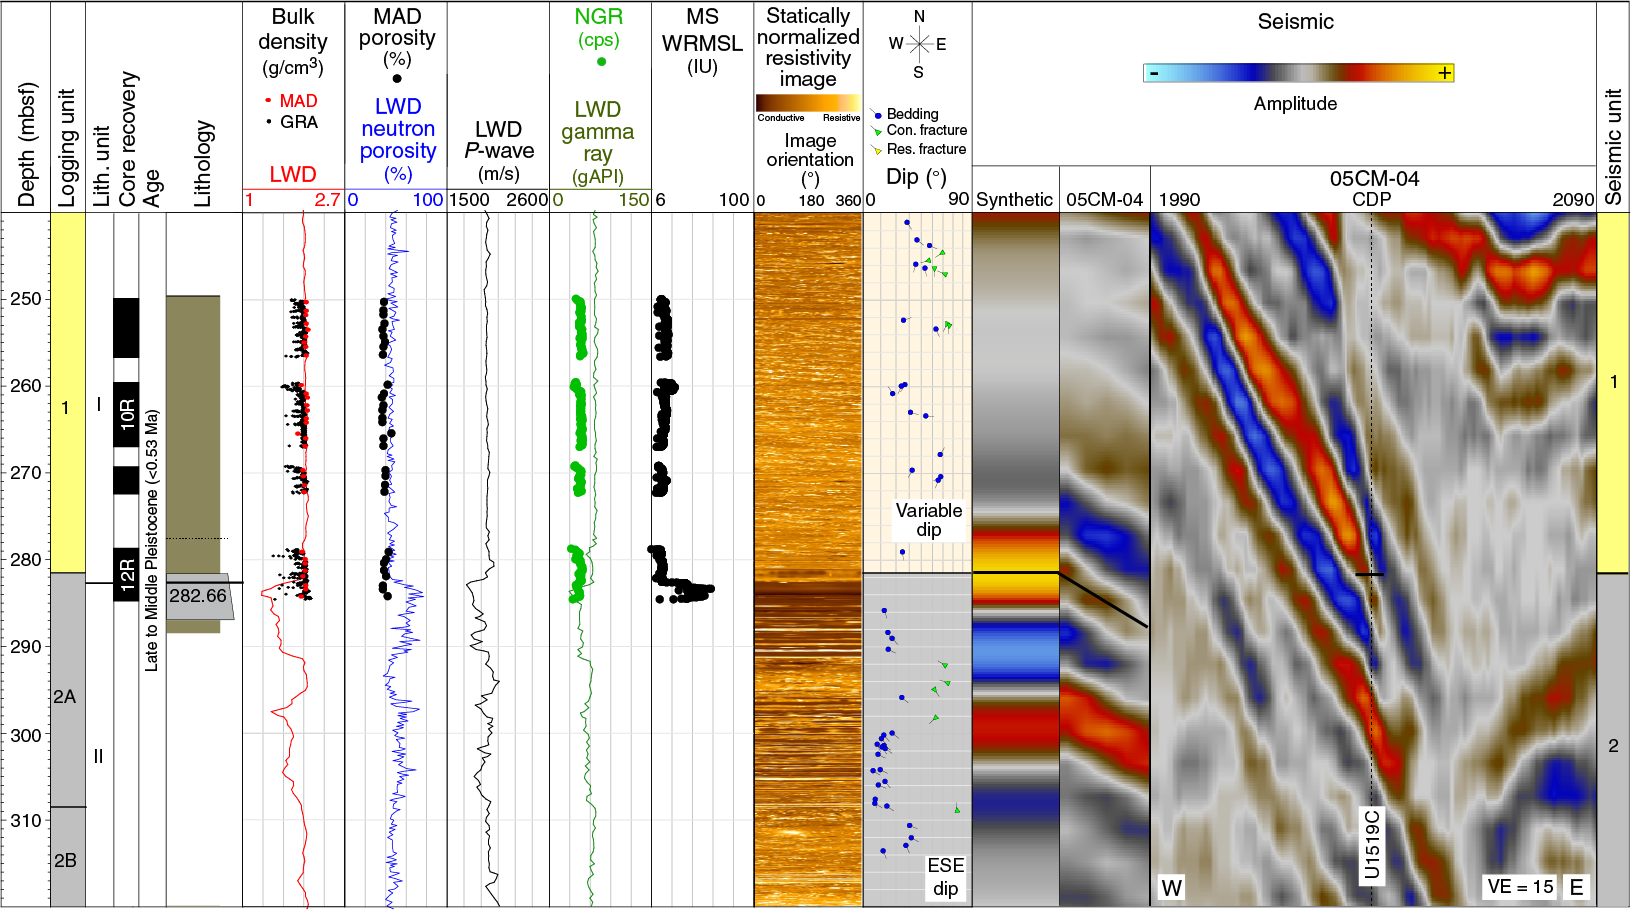
Figure F41. LWD, physical properties, and seismic data, 240–320 mbsf.
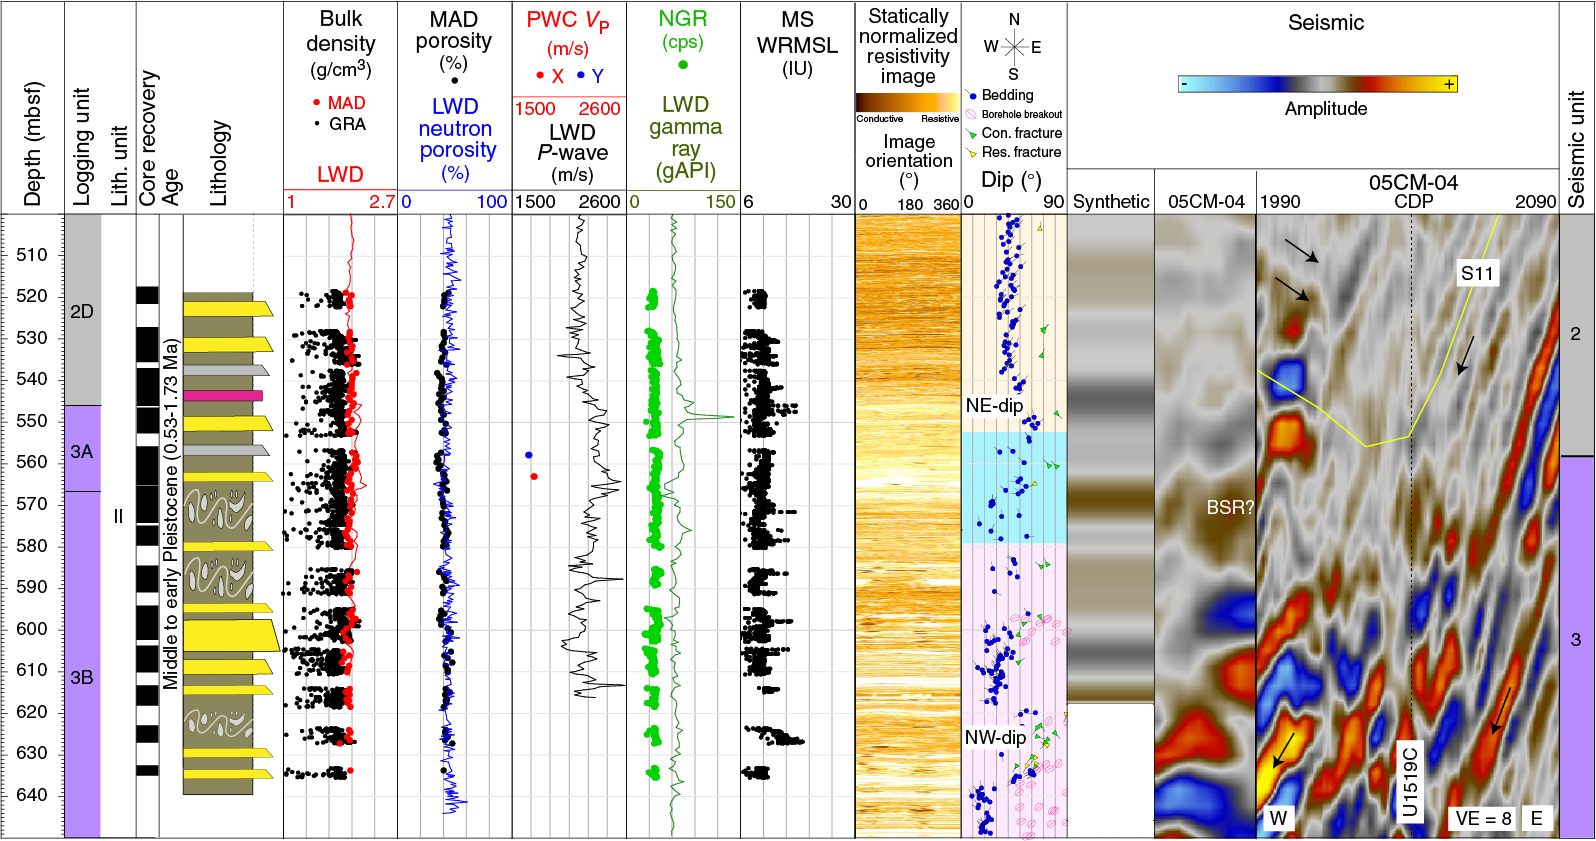
Figure F42. LWD, physical properties, and seismic data, 500–650 mbsf.
Seismic Unit 1 (0–281.5 mbsf)
Seismic Unit 1 (0–281.5 mbsf) is a near-horizontal basin fill sequence that onlaps Seismic Unit 2 in a landward direction and partly buries a thrust-faulted sequence beneath the eastern side of the Tuaheni Basin. Seismic Unit 1 correlates with Logging Unit 1 and Lithostratigraphic Unit I (Figure F39) (see Logging while drilling and Lithostratigraphy).
The upper part of Seismic Unit 1 above Reflection B4 (141 mbsf) (Figures F37, F38) is characterized by generally weakly reflective intervals with low-amplitude and chaotic discontinuous reflections and interspersed more continuous high-amplitude reflections. This sequence is interpreted to comprise at least two stacked MTDs separated by relatively thin intervals of layered sediments. Multibeam bathymetry (30 kHz) and seismic reflection data show that the upper MTD is the debris field associated with the North Tuaheni Landslide (Mountjoy et al., 2009, 2014). High-resolution seismic data show that this deposit is covered regionally by a veneer of more reflective sediment that ranges from ~0 to 25 m thick (e.g., Figure F38).
The upper part of Seismic Unit 1 above Reflection B4 (141 mbsf) coincides with Logging Subunits 1A and 1B (Figures F39, F40). These subunits are characterized predominantly by uniform gamma ray values of ~65–70 gAPI, in-gauge borehole conditions, and fairly uniform resistivity of about 2 Ωm that increases slightly with depth (see Logging while drilling). APC cores from Holes U1519D (0–23 mbsf) and U1519E (0–85 mbsf) indicate that the upper 137 m of Seismic Unit 1 comprises hemipelagic mudstone with silty turbidites. The inferred sediment veneer in the upper 10 m interval is characterized by very low resistivity of <2 Ωm and a 1 m thick volcanic ash. Biostratigraphy indicates that the upper 5 m is Holocene age and the underlying sequence to 141 mbsf is younger than 0.53 Ma (see Biostratigraphy).
The lower part of Seismic Unit 1 comprises two intervals. The interval between Reflections B4 and B6 (~141–231 mbsf) is characterized by strong, discontinuous reflections with locally channelized geometry and unconformable relationships. This interval coincides with Logging Subunit 1C, which is characterized by an abrupt decrease in resistivity, density, and gamma ray associated with borehole washout and loss of sonic data. No core was recovered from this interval that is inferred to be noncohesive and coarse grained. The underlying interval between Reflections B6 and S4 (~231–281 mbsf) comprises a generally weakly reflective sequence containing at least one seismic unconformity marked by Reflection B7 (Figure F38). This interval coincides with Logging Subunit 1D, which has uniform density, gamma, and resistivity and in-gauge borehole conditions. RCB cores from Hole U1519C (108–281 mbsf) indicate this interval comprises mudstone (Figure F41). The lower part of Seismic Unit 1 is dated as younger than 0.53 Ma (see Biostratigraphy).
The base of Seismic Unit 1 is a clear angular unconformity marked locally by Seismic Reflection S4 (Figures F37, F38). Modeling of the synthetic seismic trace (Figure F36) indicates that the contact is a reversed polarity reflection resulting from an abrupt decrease in density and velocity. This feature coincides with the negative-amplitude phase immediately beneath Reflection S4 (Figures F39, F41). The unconformable nature of the contact is not developed regionally but is localized in the vicinity of Site U1519. Away from the site, the phase of the reflection marking the base of Seismic Unit 1 differs depending on the physical properties and lithologies above and below the contact (Figures F37, F38).
The LWD data indicate that the base of Seismic Unit 1 is marked by an increase in gamma ray, density, resistivity, and P-wave velocity and a decrease in porosity (see Logging while drilling). Resistivity images reveal changes in bedding orientations across the Seismic Unit 1/2 boundary (Figure F41). RCB Section 375-U1519C-12R-3 indicates the contact occurs across mudstones that have a marked change in color and a slight change in grain size that coincides with an abrupt increase in magnetic susceptibility (Figure F41) (see Lithostratigraphy). The biostratigraphic data do not resolve a detectable change in age across the boundary (see Biostratigraphy).
Seismic Unit 2 (281.5–546 mbsf)
Seismic Unit 2 (281.5–546 mbsf) is characterized by a layered slope sequence of easterly dipping low- to high-amplitude reflection intervals that are locally truncated at the unconformity between Seismic Units 1 and 2 (Figures F37, F38). This unit directly underlies the seafloor beneath the North Tuaheni slope and the western part of Seismic Unit 1. At Site U1519, the unit correlates directly with Logging Unit 2 (see Logging while drilling) (Figure F39) and most of Lithostratigraphic Unit I (see Lithostratigraphy) (Figures F41, F42).
The upper part of Seismic Unit 2 immediately below the unconformity and between Seismic Reflections S4 and S7 (281–319 mbsf) is strongly reflective. The seismic reflection intervals below are generally low amplitude and continuous between Reflections S7 and S8 (319–358 mbsf), chaotic and discontinuous between Reflections S8 and S9 (358–392 mbsf), high amplitude and continuous between Reflections S9 and S9A (392–440 mbsf), and weak and discontinuous between Reflections S9A and S11 (440–546 mbsf) (Figures F37, F38). The unit between Reflections S8 and S9 is interpreted to be an MTD. Bedding orientations in the lower portion of Seismic Unit 2 (440–546 mbsf) dip 20°–40° to the northeast as observed from resistivity image logs (see Logging while drilling).
The interval corresponding to Seismic Unit 2 includes Logging Subunits 2A–2D (Figure F39), which have physical properties that separate into distinct groups on crossplots involving gamma ray, P-wave velocity, density, and resistivity (Figure F40) (see Logging while drilling). The entire seismic unit is characterized by irregular but overall increasing P-wave velocity. The resistivity, density, gamma, and porosity logs show fairly uniform values throughout Seismic Unit 2, with notable excursions generally associated with higher amplitude seismic reflections, including Reflections S7, S8, and S9A (Figure F36).
The base of Seismic Unit 2 is defined by a regional erosional unconformity marked by Reflection S11 (Figures F37, F38). At Site U1519, however, the precise location of the unconformity is not clear, partly because of high-amplitude irregular reflections complicated by the presence of a BSR near the top of Seismic Unit 3. The base of Seismic Unit 2 coincides with the base of Logging Unit 2 at 546 mbsf. This boundary is defined by an increase in gamma ray, density, resistivity, and P-wave velocity (Figures F39, F40) together with a significant change in bedding dip and strike (Figure F42) (see Logging while drilling). The increase in density and P-wave velocity across the base of Seismic Unit 2 results in a normal polarity reflection at Horizon S11.
Although most of Seismic Unit 2 was not targeted for coring during Expedition 375, RCB cores were recovered in the lower 29 m of the unit below 517 mbsf (Figure F42) (see Lithostratigraphy). These cores indicate that the lower part of the unit comprises mudstones with interbeds of sandy siltstone and very fine sandstone and rare volcanic ash. No obvious change in lithology or processes of sedimentation are recognized across Horizon S11. Biostratigraphy indicates that Seismic Unit 2 is Middle to early Pleistocene (see Biostratigraphy).
Seismic Unit 3 (546–650 mbsf)
Seismic Unit 3 is characterized by high-amplitude northwest-dipping reflections that lie in the hanging wall of a thrust fault located 500 m beneath the base of Site U1519 (Figure F37). This seismic unit coincides with Logging Unit 3, which is characterized overall by slightly elevated gamma ray and high density, resistivity, and P-wave velocity (Figures F39, F40). Moreover, predominantly northwest-dipping bedding orientations identified from resistivity image logging are consistent with the apparent dips in seismic data (Figure F42) (see Logging while drilling). RCB cores from the upper part of Seismic Unit 3 and coinciding with Logging Subunit 3A consist of mudstones with interbeds of sandy siltstone and very fine sandstone, similar to the lower part of Seismic Unit 2, as well as relatively thicker beds of medium- to very coarse grained sandstone (Figure F39) (see Lithostratigraphy).
A reversed polarity reflection at about 567 mbsf appears to coincide with the Logging Subunit 3A–3B transition, defined by a significant reduction in gamma ray, density, resistivity, and P-wave velocity and an increase in porosity (Figures F39, F40). Similar physical properties changes are apparent across this depth in laboratory measurements from cores (Figure F42) (see Physical properties). These changes coincide approximately with a change in lithology from bedded mudstone and sandstone to MTDs that include beds of shelly coarse-grained sand (see Lithostratigraphy). Structural observations from both core and resistivity image logs suggest that the lower part of Seismic Unit 3 exhibits fractures and faults with a wide range of dips and strikes (see Structural geology and Logging while drilling).
Prior to the expedition, Seismic Unit 3 was inferred to possibly be of late Miocene–Pliocene age, potentially equivalent to the Tolaga Group immediately onshore (Field et al., 1997). The biostratigraphic data from Hole U1519C, however, indicate that Seismic Unit 3 above 645 mbsf is Pleistocene age (younger than 1.7 Ma) (see Biostratigraphy), somewhat younger than anticipated.
Hole U1519B observatory screened intervals
The observatory installed in Hole U1519B comprises two screened intervals, each 2 m long, in which pressure sensors were deployed (see Observatory). The pressure screens are centered at approximately 124 and 264 mbsf (Figure F39), and both are in Seismic Unit 1. The upper screen at 124 mbsf is located between Seismic Reflections B3 and B4, corresponding to Logging Subunit 1B and Lithostratigraphic Unit I. The lower observatory screen at 264 mbsf is located between Seismic Reflections B6 and S4, coinciding with Logging Subunit 1D and Lithostratigraphic Unit I. These intervals are both weakly reflective, and at least the upper interval is likely an MTD. On LWD logs, these intervals are characterized by gamma ray of about 61 and 66 gAPI, density of 2.0 and 2.1 g/cm3, neutron density porosity of about 0.49 and 0.44, ring resistivity of 1.9 and 2.3 Ωm, and P-wave velocity values of 1795 and 1945 m/s, respectively. Both depths were associated with in-gauge borehole conditions (see Logging while drilling). RCB cores from both intervals were severely disturbed by drilling but are indicative of predominantly laminated silty mud of late Quaternary age (see Lithostratigraphy and Biostratigraphy).
Observatory
The borehole observatory installed in Hole U1519B is designed to provide a time series of formation pressures and temperatures in the hanging wall directly above the source area of recurring SSEs on the plate interface. The data will be retrieved at a later date using a submersible ROV. The objectives of the observatory are to characterize hydrologic and thermal conditions in the upper plate and to document deformation and hydrological processes acting over a range of timescales, including short-lived transients associated with slow slip.
General design
Similar to the observatory installed at Site U1518 (see Observatory in the Site U1518 chapter [Saffer et al., 2019b]), the observatory at Site U1519 includes nested ACORK and CORK-II elements (Figure F43) (Becker and Davis, 2005). The ACORK consists of 10¾ inch steel casing with two 2 m long casing screens and an umbilical on its exterior. The umbilical contains hydraulic lines that terminate in the casing screens at depth and are connected to pressure gauges and a data logger at the wellhead. The CORK-II is installed inside the ACORK casing and consists of 4½ inch steel casing and an additional wellhead that is seated on top of the ACORK. An instrument string containing temperature sensors is hung in the CORK-II casing. In contrast to the observatory installed in Hole U1518H, the observatory in Hole U1519B does not contain an OsmoSampler package and the ACORK casing has no perforated sections. Installation operations are described in Operations.
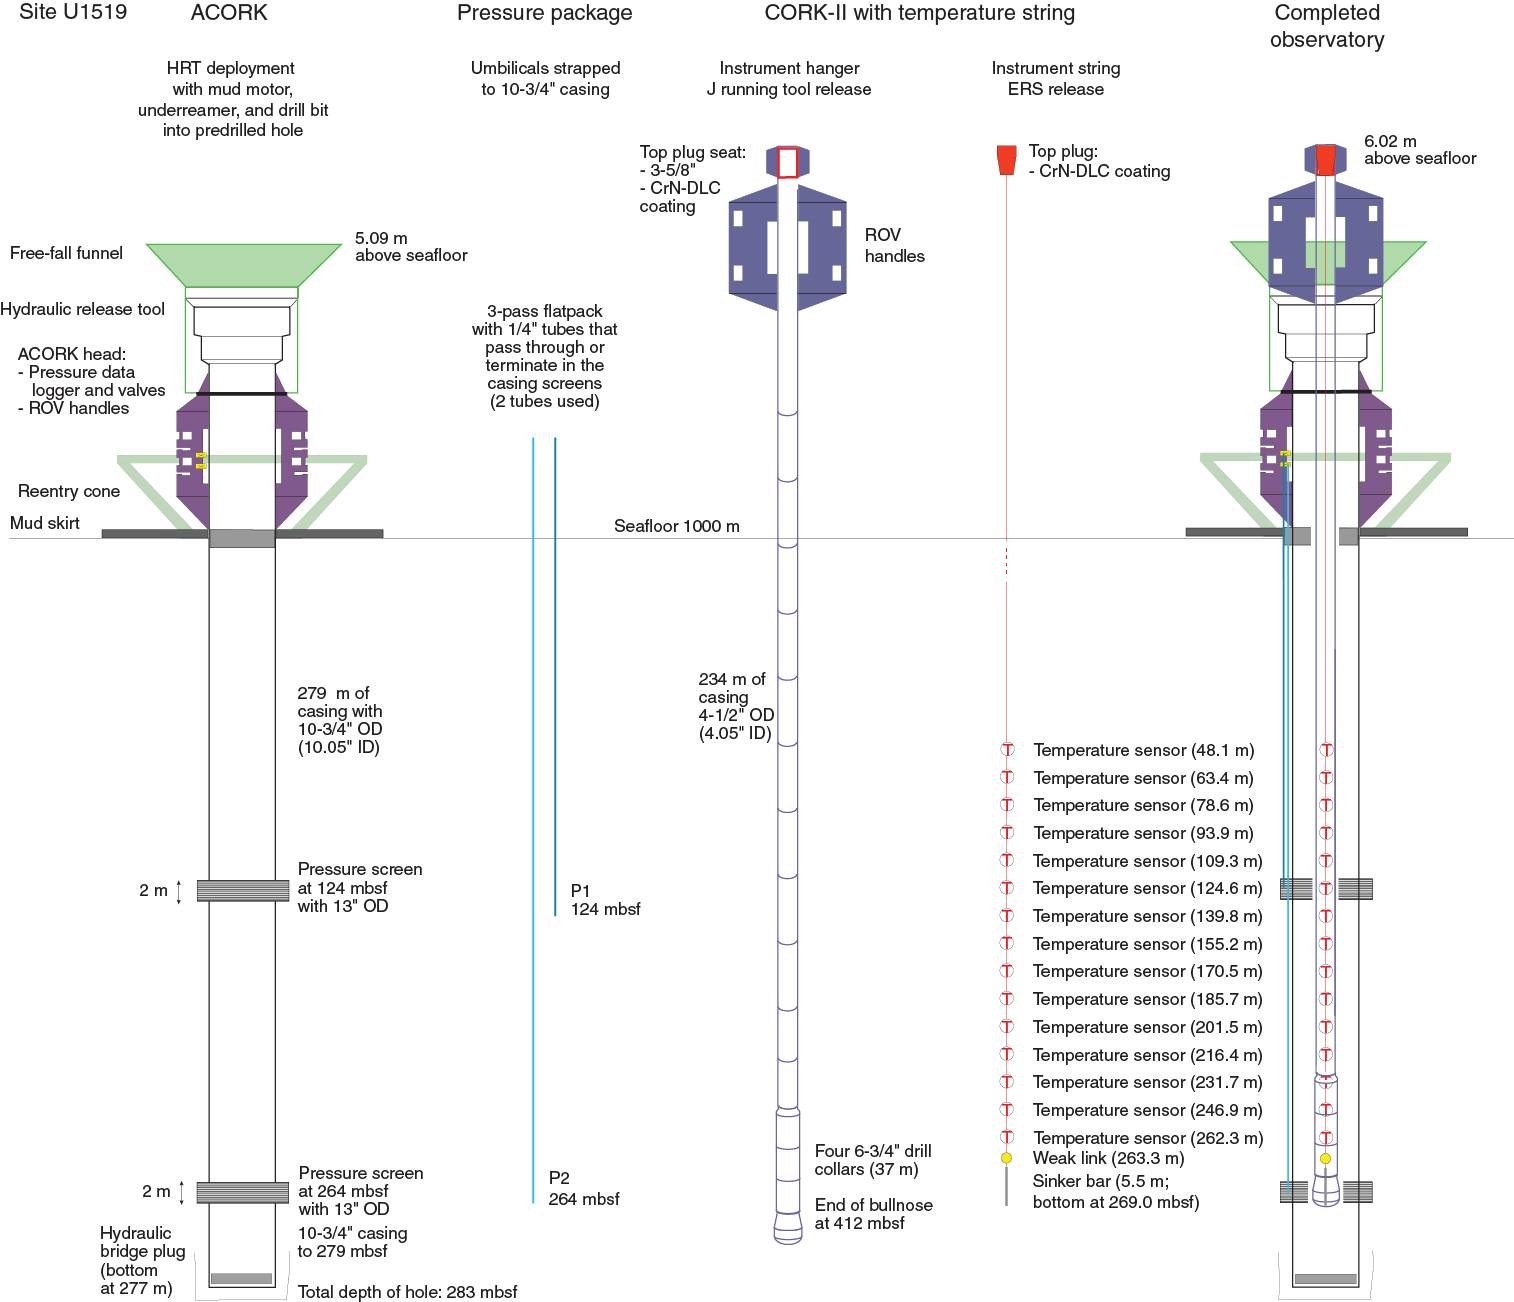
Figure F43. Completed observatory.
The two screened intervals where hydraulic lines terminate (for pressure sensing) are centered at 123.74 and 263.60 mbsf (Table T15). Both screens are placed in lithologies interpreted to be homogeneous mudstone or siltstone in Logging Subunits 1B and 1D (see Logging while drilling and Core-log-seismic integration). The position and serial number of each of the 15 temperature sensors in the observatory are listed in Table T16. Temperature sensor positions are reported relative to the seafloor and to the weak link at the bottom of the sensor string (Figure F43; see Operations).
Pressure sensing and ACORK
Seafloor and formation fluid pressures are measured with absolute pressure gauges (APGs) connected to a data logger on the ACORK wellhead. Three APGs are mounted on the wellhead: two APGs measure formation pressure (Figure F44B), and the third senses pressure at the wellhead (seafloor pressure). The pressure sensing package is equipped with Paroscientific Digiquartz pressure transducers (two Model 8B2000-2 for formation pressure sensing and one Model 8B1400-2 for seafloor pressure), a high-precision pressure period counter with a 12.8 MHz real-time clock (RTC-PPC system resolving ~10 ppb of full-scale pressure or ~0.7 Pa), and a 24-bit/channel analog-to-digital converter and data logger (Bennest Enterprises, Ltd.; Minerva Technologies, Ltd.; and the Pacific Geoscience Centre, Geological Survey of Canada). The data logger in the pressure sensing unit at the wellhead can be accessed via an ODI Teledyne underwater mateable connector mounted on the unit. The data logger is programmed to record pressures once every 60 s from each of the APGs.
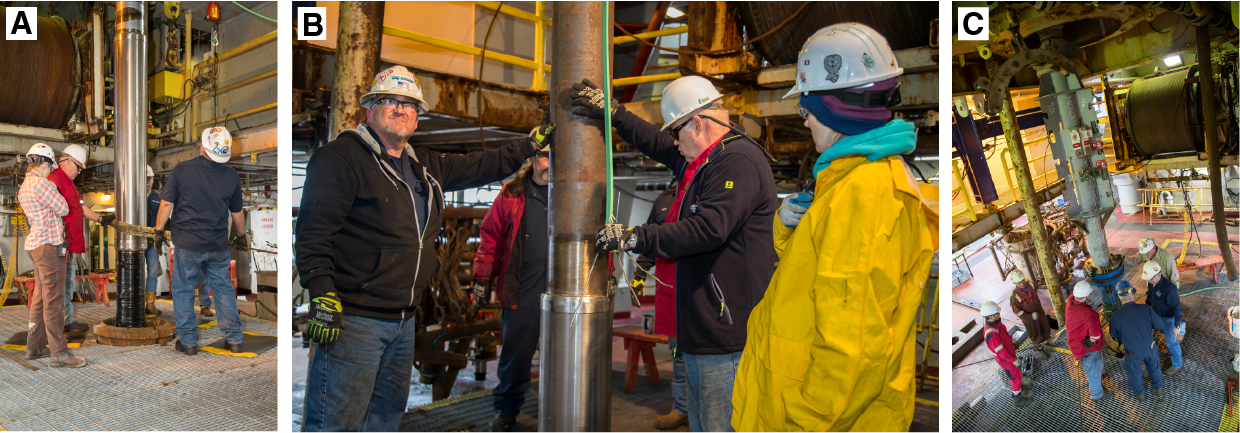
Figure F44. Pressure sensing components.
The APGs for the formation pressure measurements are connected to an umbilical along the exterior of the ACORK casing that terminates in carbolite-filled screens external to the casing. The screens are made out of 316SS stainless steel and wrapped with 0.085 inch wire with a 0.01 inch wire-to-wire spacing that results in an open cross section of 15%. The carbolite beads have a diameter of 600 µm. Figure F44A shows the uppermost screen and some of the umbilical tubing. The umbilical tubes (Figure F44B) act as pressure conduits that relay pressures from the screens in communication with the formation to the gauges at the wellhead. The bottom of the ACORK is sealed with a bridge plug so that the interior of the borehole is fully isolated from formation fluids. Valves at the wellhead allow individual pressure lines to be closed to the ocean so that the gauges directly record the pressure in the formation at depth or open to the ocean for periodic hydrostatic checks or to allow fluid sampling (Figure F44C).
Instrument string and temperature sensing
Fifteen temperature sensors are suspended on ⅜ inch Spectra rope as part of the instrument string. Table T16 lists the position of the temperature sensors relative to seafloor and relative to the weak link above the sinker bar at the bottom of the sensor string. We use RBRsolo T 10K abyssal temperature recorders manufactured by RBR. The instruments have a temperature accuracy of ±0.002°C and titanium enclosures that are pressure rated for ocean depths as deep as 10,000 m. Each unit is autonomous, with its own sensor and data logger. The units are programmed to measure once every 10 s. The measurement duration is limited by their battery life; for 10 s sampling intervals, measurements are expected to continue for >7 y (until April 2025).
The temperature sensors are connected to the Spectra rope with utility cord tied to attachment eyelets spliced into the line (see Observatory in the Site U1518 chapter [Saffer et al., 2019b]). Each instrument is then wrapped in a protective covering of ¼ inch (or thinner) rubber sheeting and wrapped in tape. The covering protects the instrument from impacts and creates a smooth profile to prevent the instrument string from snagging during deployment or recovery.
Additional instrument string components
From the bottom up, the instrument string consists of one sinker bar, one weak link, a single 269.28 m long rope section with 15 temperature sensors, and a top plug. The sinker bar at the bottom of the instrument string is a single ~6 m long, ~7.5 cm diameter steel bar weighing ~500 lb in water (Figure F45). The purpose of the sinker bar is to keep the rope taut during deployment, maintain the position of the temperature sensors at their correct depths, and help pull the instrument string into the CORK-II wellhead and seat the top plug.
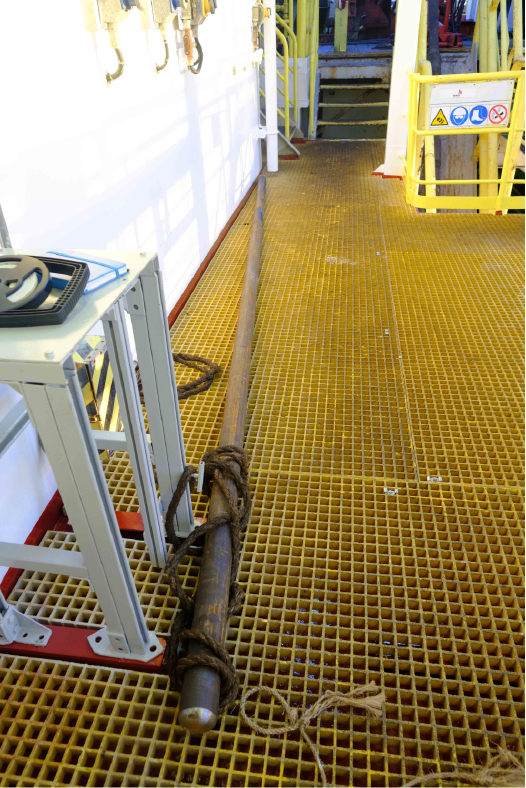
Figure F45. Sinker bar.
The weak link is placed between the instrument string and the sinker bar to address the possibility of the sinker bar hanging up during retrieval (Figure F46). The weak link consists of two metal end pieces and two connection plates (see Figure F70 in the Site U1518 chapter [Saffer et al., 2019b] for a different view of similar weak links). The pieces are sewn together with ⅛ inch polypropylene cord through as many as 150 pass-through holes. The number of holes that are threaded controls the strength because the end pieces can only separate by shearing the polypropylene cords. For Hole U1519B, the weak link is programmed for 4400 lb tensile strength, with 39 of the 75 threads sewn on each end.
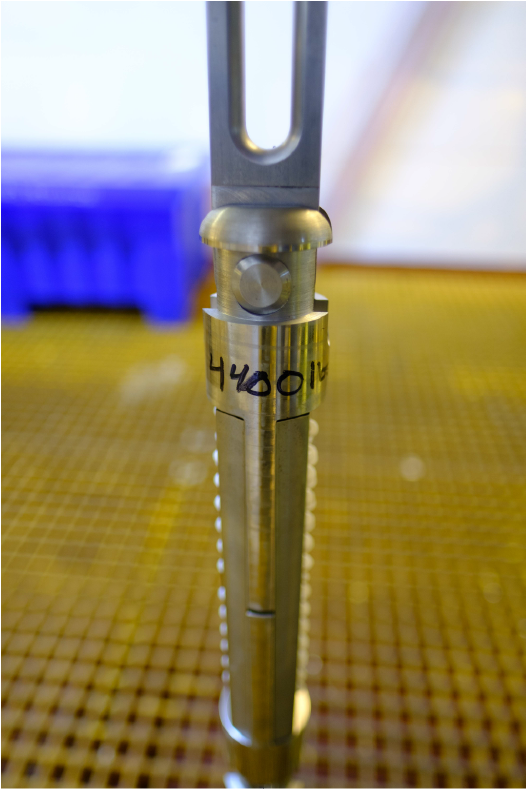
Figure F46. Weak link.
The rope section above the weak link is composed of ⅜ inch 12-strand Spectra rope (manufactured by Cortland, Ltd.). Spectra is a Class II rope material that is ideal for the purposes of the observatory because it has high strength and low stretch, is easy to splice, and is slightly positively buoyant (Fisher et al., 2005, 2011; Edwards et al., 2012). For the ⅜ inch rope, the mean tensile strength is 15,400 lb and 13,900 lb when spliced. Rope splices are used to connect rope sections to other parts, attach sensors, and provide handling eyes to ease deployment and recovery (see Figure F68 in the Site U1518 chapter [Saffer et al., 2019b] for examples).
A top plug forms the upper end of the instrument string and includes an O-ring and a 3⅝ inch seat that seals the interior of the CORK-II casing (Figure F47). In contrast to the Hole U1518H observatory, this top plug does not latch because the interior of the ACORK casing is isolated from formation pressures via the bridge plug (and unlike the observatory at Site U1518, the ACORK casing does not have any perforated sections). The top plug also serves as the instrument hanger, with a 1½ inch diameter ring through which the rope is spliced. The top of the top plug is designed to permit recovery with the ERS.
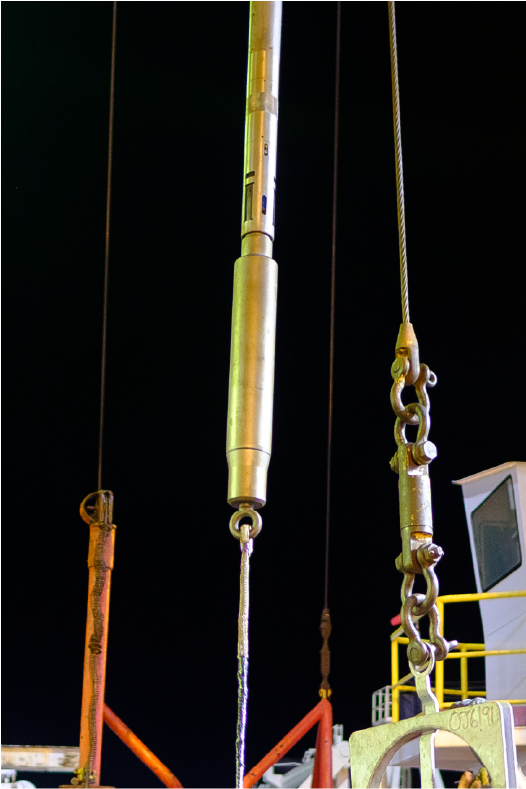
Figure F47. Instrument string top plug.
Deployment and completion
The weight of the instrument string was monitored with the Schlumberger wireline system during deployment. Wireline tension monitoring did not show any sign of a hang up and recorded a drop in tension when the top plug was seated.
As described in Operations, the CORK-II was then lowered the remaining 11 m to its seat in the ACORK. The CORK-II was then released from the drill pipe using a J running tool. There are two issues to note regarding the release and subsequent inspection of the wellhead. First, the CORK-II wellhead appears to have sustained minor damage during release, and one of the fins on the wellhead is slightly bent. We do not anticipate that this will pose a problem for temperature sensor recovery; however, if the inner bore of the casing at the wellhead is warped or obstructed, then the sinker bar may be difficult to recover and the weak link may need to be broken. In addition, cuttings have accumulated in the reentry cone beneath the ACORK wellhead such that the hydraulic connections to the pressure instrument package are covered. This should not impact the ability to download data or manipulate valves but may complicate future exchange of the pressure data logger and batteries (Figure F48). Tentative plans are to use an ROV to download initial pressure data in 2019 and to collect the instrument string with temperature sensors and conduct an additional pressure data download by 2023.
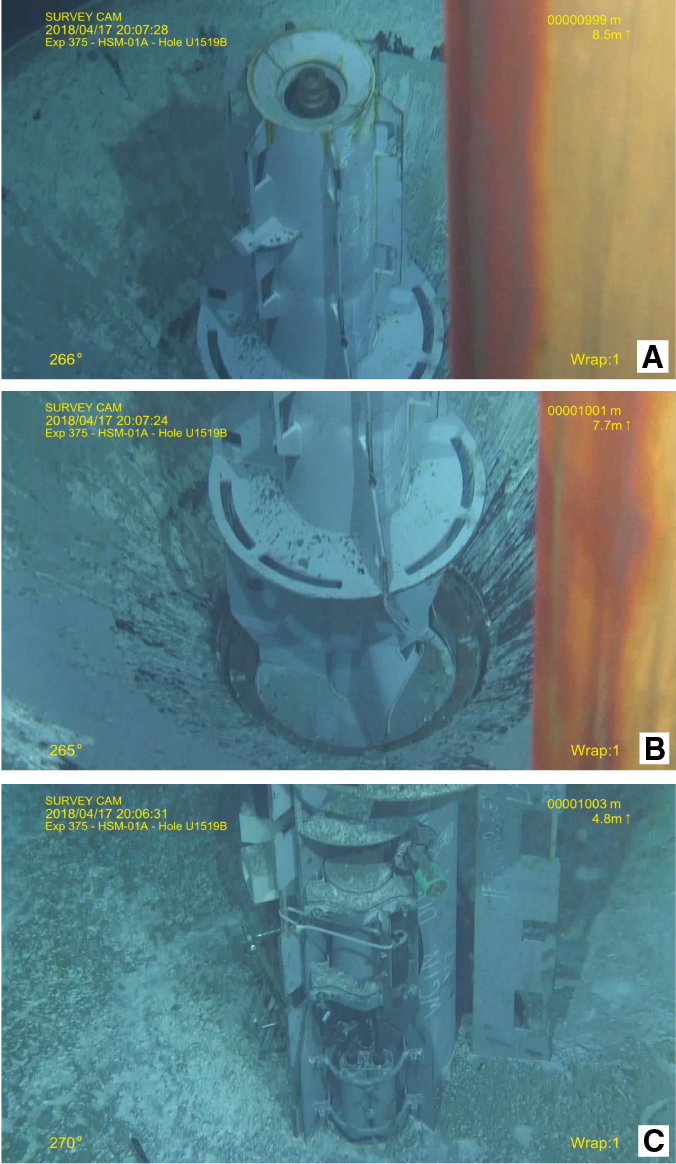
Figure F48. Wellhead immediately after installation.
References
Antriasian, A., Harris, R.N., Tréhu, A.M., Henrys, S.A., Phrampus, B.J., Lauer, R., Gorman, A.R., Pecher, I.A., and Barker, D., 2018. Thermal regime of the northern Hikurangi margin, New Zealand. Geophysical Journal International, 216(2):1177–1190. https://doi.org/10.1093/gji/ggy450
Barker, D.H.N., Henrys, S., Caratori Tontini, F., Barnes, P. M., Bassett, D., Todd, E., and Wallace, L., 2018. Geophysical constraints on the relationship between seamount subduction, slow slip and tremor at the north Hikurangi subduction zone, New Zealand. Geophysical Research Letters, 45(23):12804–12813. https://doi.org/10.1029/2018GL080259
Barker, D.H.N., Sutherland, R., Henrys, S., and Bannister, S., 2009. Geometry of the Hikurangi subduction thrust and upper plate, North Island, New Zealand. Geochemistry, Geophysics, Geosystems, 10(2):Q02007. https://doi.org/10.1029/2008GC002153
Barnes, P.M., Pecher, I.A., LeVay, L.J., Bourlange, S.M., Brunet, M.M.Y., Cardona, S., Clennell, M.B., Cook, A.E., Crundwell, M.P., Dugan, B., Elger, J., Gamboa, D., Georgiopoulou, A., Greve, A., Han, S., Heeschen, K.U., Hu, G., Kim, G.Y., Kitajima, H., Koge, H., Li, X., Machado, K.S., McNamara, D.D., Moore, G.F., Mountjoy, J.J., Nole, M.A., Owari, S., Paganoni, M., Petronotis, K.E., Rose, P.S., Screaton, E.J., Shankar, U., Shepherd, C.L., Torres, M.E., Underwood, M.B., Wang, X., Woodhouse, A.D., and Wu, H.-Y., 2019. Site U1517. In Pecher, I.A., Barnes, P.M., LeVay, L.J., and the Expedition 372A Scientists, Creeping Gas Hydrate Slides. Proceedings of the International Ocean Discovery Program, 372A: College Station, TX (International Ocean Discovery Program). https://doi.org/10.14379/iodp.proc.372A.103.2019
Becker, K., and Davis, E.E., 2005. A review of CORK designs and operations during the Ocean Drilling Program. In Fisher, A.T., Urabe, T., Klaus, A., and the Expedition 301 Scientists, Proceedings of the Integrated Ocean Drilling Program, 301: College Station, TX (Integrated Ocean Drilling Program Management International, Inc.). https://doi.org/10.2204/iodp.proc.301.104.2005
Bell, R., Sutherland, R., Barker, D.H.N., Henrys, S., Bannister, S., Wallace, L., and Beavan, J., 2010. Seismic reflection character of the Hikurangi subduction interface, New Zealand, in the region of repeated Gisborne slow slip events. Geophysical Journal International, 180(1):34–48. https://doi.org/10.1111/j.1365-246X.2009.04401.x
Bullard, E.C., 1939. Heat flow in South Africa. Proceedings of the Royal Society of London, Series A: Mathematical, Physical and Engineering Sciences, 173(955):474–502. https://doi.org/10.1098/rspa.1939.0159
Chang, C., McNeill, L.C., Moore, J.C., Lin, W., Conin, M., and Yamada, Y., 2010. In situ stress state in the Nankai accretionary wedge estimated from borehole wall failures. Geochemistry, Geophysics, Geosystems, 11:Q0AD04. https://doi.org/10.1029/2010GC003261
Claypool, G.E., and Kvenvolden, K.A., 1983. Methane and other hydrocarbon gases in marine sediment. Annual Review of Earth and Planetary Sciences, 11(1):299–327. https://doi.org/10.1146/annurev.ea.11.050183.001503
Davis, E., Becker, K., Wang, K., and Kinoshita, M., 2009. Co-seismic and post-seismic pore-fluid pressure changes in the Philippine Sea plate and Nankai decollement in response to a seismogenic strain event off Kii Peninsula, Japan. Earth, Planets Space, 61(6):649–657. http://www.terrapub.co.jp/journals/EPS/abstract/6106/61060649.html
De Vleeschouwer, D., Dunlea, A.G., Auer, G., Anderson, C.H., Brumsack, H., de Loach, A., Gurnis, M., et al., 2017. Quantifying K, U, and Th contents of marine sediments using shipboard natural gamma radiation spectra measured on DV JOIDES Resolution. Geochemistry, Geophysics, Geosystems, 18(3):1053–1064. https://doi.org/10.1002/2016GC006715
Dickens, G.R., 2001. Sulfate profiles and barium fronts in sediment on the Blake Ridge: present and past methane fluxes through a large gas hydrate reservoir. Geochimica et Cosmochimica Acta, 65(4):529–543. https://doi.org/10.1016/S0016-7037(00)00556-1
Edwards, K.J., Wheat, C.G., Orcutt, B.N., Hulme, S., Becker, K., Jannasch, H., Haddad, A., Pettigrew, T., Rhinehart, W., Grigar, K., Bach, W., Kirkwood, W., and Klaus, A., 2012. Design and deployment of borehole observatories and experiments during IODP Expedition 336, Mid-Atlantic Ridge flank at North Pond. In Edwards, K.J., Bach, W., Klaus, A., and the Expedition 336 Scientists, Proceedings of the Integrated Ocean Drilling Program, 336: Tokyo (Integrated Ocean Drilling Program Management International, Inc.). https://doi.org/10.2204/iodp.proc.336.109.2012
Field, B.D., Uruski, C.I., Bey, A., Browne, G., Crampton, J., Funnell, R., Killops, S., Laird, M., Mazengarb, C., Morgans, H., Rait, G., Smale, D., and Strong, P., 1997. Cretaceous–Cenozoic Geology and Petroleum Systems of the East Coast Region, New Zealand. GNS Monograph, 19.
Fisher, A.T., Wheat, C.G., Becker, K., Cowen, J., Orcutt, B., Hulme, S., Inderbitzen, K., Turner, A., Pettigrew, T.L., Davis, E.E., Jannasch, H., Grigar, K., Adudell, R., Meldrum, R., Macdonald, R., and Edwards, K., 2011. Design, deployment, and status of borehole observatory systems used for single-hole and cross-hole experiments, IODP Expedition 327, eastern flank of Juan de Fuca Ridge. In Fisher, A.T., Tsuji, T., Petronotis, K., and the Expedition 327 Scientists, Proceedings of the Integrated Ocean Drilling Program, 327: College Station, TX (Integrated Ocean Drilling Program Management International, Inc.). https://doi.org/10.2204/iodp.proc.327.107.2011
Fisher, A.T., Wheat, C.G., Becker, K., Davis, E.E., Jannasch, H., Schroeder, D., Dixon, R., Pettigrew, T.L., Meldrum, R., McDonald, R., Nielsen, M., Fisk, M., Cowen, J., Bach, W., and Edwards, K., 2005. Scientific and technical design and deployment of long-term subseafloor observatories for hydrogeologic and related experiments, IODP Expedition 301, eastern flank of Juan de Fuca Ridge. In Fisher, A.T., Urabe, T., Klaus, A., and the Expedition 301 Scientists, Proceedings of the Integrated Ocean Drilling Program, 301: College Station, TX (Integrated Ocean Drilling Program Management International, Inc.). https://doi.org/10.2204/iodp.proc.301.103.2005
Henrys, S.A., Ellis, S., and Uruski, C., 2003. Conductive heat flow variations from bottom-simulating reflectors on the Hikurangi margin, New Zealand. Geophysical Research Letters, 30(2):1065. https://doi.org/10.1029/2002GL015772
Huffman, K.A., and Saffer, D.M., 2016. In situ stress magnitudes at the toe of the Nankai Trough Accretionary Prism, offshore Shikoku Island, Japan. Journal of Geophysical Research: Solid Earth, 121(2):1202–1217. https://doi.org/10.1002/2015JB012415
Martini, E., 1971. Standard Tertiary and Quaternary calcareous nannoplankton zonation. In Farinacci, A. (Ed.), Proceedings of the Second Planktonic Conference, Roma 1970: Rome (Edizioni Tecnoscienza), 739–785.
Mountjoy, J.J., and Barnes, P., 2011. Active upper plate thrust faulting in regions of low plate interface coupling, repeated slow slip events, and coastal uplift: example from the Hikurangi margin, New Zealand. Geochemistry, Geophysics, Geosystems, 12(1):Q01005. https://doi.org/10.1029/2010GC003326
Mountjoy, J.J., McKean, J., Barnes, P.M., and Pettinga, J.R., 2009. Terrestrial-style slow-moving earthflow kinematics in a submarine landslide complex. Marine Geology, 267(3–4):114–127. https://doi.org/10.1016/j.margeo.2009.09.007
Mountjoy, J.J., Pecher, I., Henrys, S., Crutchley, G., Barnes, P.M., and Plaza-Faverola, A., 2014. Shallow methane hydrate system controls ongoing, downslope sediment transport in a low-velocity active submarine landslide complex, Hikurangi Margin, New Zealand. Geochemistry, Geophysics, Geosystems, 15(11):4137–4156. https://doi.org/10.1002/2014GC005379
Pedley, K.L., Barnes, P.M., Pettinga, J.R., and Lewis, K.B., 2010. Seafloor structural geomorphic evolution of the accretionary frontal wedge in response to seamount subduction, Poverty Indentation, New Zealand. Marine Geology, 270(1–4):119–138. https://doi.org/10.1016/j.margeo.2009.11.006
Pimmel, A., and Claypool, G., 2001. Technical Note 30: Introduction to Shipboard Organic Geochemistry on the JOIDES Resolution. Ocean Drilling Program. https://doi.org/10.2973/odp.tn.30.2001
Saffer, D.M., Wallace, L.M., Barnes, P.M., Pecher, I.A., Petronotis, K.E., LeVay, L.J., Bell, R.E., Crundwell, M.P., Engelmann de Oliveira, C.H., Fagereng, A., Fulton, P.M., Greve, A., Harris, R.N., Hashimoto, Y., Hüpers, A., Ikari, M.J., Ito, Y., Kitajima, H., Kutterolf, S., Lee, H., Li, X., Luo, M., Malie, P.R., Meneghini, F., Morgan, J.K., Noda, A., Rabinowitz, H.S., Savage, H.M., Shepherd, C.L., Shreedharan, S., Solomon, E.A., Underwood, M.B., Wang, M., Woodhouse, A.D., Bourlange, S.M., Brunet, M.M.Y., Cardona, S., Clennell, M.B., Cook, A.E., Dugan, B., Elger, J., Gamboa, D., Georgiopoulou, A., Han, S., Heeschen, K.U., Hu, G., Kim, G.Y., Koge, H., Machado, K.S., McNamara, D.D., Moore, G.F., Mountjoy, J.J., Nole, M.A., Owari, S., Paganoni, M., Rose, P.S., Screaton, E.J., Shankar, U., Torres, M.E., Wang, X., and Wu, H.-Y., 2019a. Expedition 372B/375 summary. In Wallace, L.M., Saffer, D.M., Barnes, P.M., Pecher, I.A., Petronotis, K.E., LeVay, L.J., and the Expedition 372/375 Scientists, Hikurangi Subduction Margin Coring, Logging, and Observatories. Proceedings of the International Ocean Discovery Program, 372B/375: College Station, TX (International Ocean Discovery Program). https://doi.org/10.14379/iodp.proc.372B375.101.2019
Saffer, D.M., Wallace, L.M., Barnes, P.M., Pecher, I.A., Petronotis, K.E., LeVay, L.J., Bell, R.E., Crundwell, M.P., Engelmann de Oliveira, C.H., Fagereng, A., Fulton, P.M., Greve, A., Harris, R.N., Hashimoto, Y., Hüpers, A., Ikari, M.J., Ito, Y., Kitajima, H., Kutterolf, S., Lee, H., Li, X., Luo, M., Malie, P.R., Meneghini, F., Morgan, J.K., Noda, A., Rabinowitz, H.S., Savage, H.M., Shepherd, C.L., Shreedharan, S., Solomon, E.A., Underwood, M.B., Wang, M., Woodhouse, A.D., Bourlange, S.M., Brunet, M.M.Y., Cardona, S., Clennell, M.B., Cook, A.E., Dugan, B., Elger, J., Gamboa, D., Georgiopoulou, A., Han, S., Heeschen, K.U., Hu, G., Kim, G.Y., Koge, H., Machado, K.S., McNamara, D.D., Moore, G.F., Mountjoy, J.J., Nole, M.A., Owari, S., Paganoni, M., Rose, P.S., Screaton, E.J., Shankar, U., Torres, M.E., Wang, X., and Wu, H.-Y., 2019b. Site U1518. In Wallace, L.M., Saffer, D.M., Barnes, P.M., Pecher, I.A., Petronotis, K.E., LeVay, L.J., and the Expedition 372/375 Scientists, Hikurangi Subduction Margin Coring, Logging, and Observatories. Proceedings of the International Ocean Discovery Program, 372B/375: College Station, TX (International Ocean Discovery Program). https://doi.org/10.14379/iodp.proc.372B375.103.2019
Solomon, E.A., Spivack, A.J., Kastner, M., Torres, M.E., and Robertson, G., 2014. Gas hydrate distribution and carbon sequestration through coupled microbial methanogenesis and silicate weathering in the Krishna–Godavari Basin, offshore India. Marine and Petroleum Geology, 58(A):233–253. https://doi.org/10.1016/j.marpetgeo.2014.08.020
Torres, M.E., Brumsack, H.-J., Bohrmann, G., and Emeis, K.C., 1996. Barite fronts in continental margin sediments: a new look at barium remobilization in the zone of sulfate reduction and formation of heavy barites in diagenetic fronts. Chemical Geology, 127(1–3):125–139. https://doi.org/10.1016/0009-2541(95)00090-9
Townend, J., 1997. Estimates of conductive heat flow through bottom-simulating reflectors on the Hikurangi and southwest Fiordland continental margins, New Zealand. Marine Geology, 141(1–4):209–220. https://doi.org/10.1016/S0025-3227(97)00073-X
Wallace, L.M., and Beavan, J., 2010. Diverse slow slip behavior at the Hikurangi subduction margin, New Zealand. Journal of Geophysical Research: Solid Earth, 115(B12):B12402. https://doi.org/10.1029/2010JB007717
Wallace, L.M., Saffer, D.M., Barnes, P.M., Pecher, I.A., Petronotis, K.E., LeVay, L.J., Bell, R.E., Crundwell, M.P., Engelmann de Oliveira, C.H., Fagereng, A., Fulton, P.M., Greve, A., Harris, R.N., Hashimoto, Y., Hüpers, A., Ikari, M.J., Ito, Y., Kitajima, H., Kutterolf, S., Lee, H., Li, X., Luo, M., Malie, P.R., Meneghini, F., Morgan, J.K., Noda, A., Rabinowitz, H.S., Savage, H.M., Shepherd, C.L., Shreedharan, S., Solomon, E.A., Underwood, M.B., Wang, M., Woodhouse, A.D., Bourlange, S.M., Brunet, M.M.Y., Cardona, S., Clennell, M.B., Cook, A.E., Dugan, B., Elger, J., Gamboa, D., Georgiopoulou, A., Han, S., Heeschen, K.U., Hu, G., Kim, G.Y., Koge, H., Machado, K.S., McNamara, D.D., Moore, G.F., Mountjoy, J.J., Nole, M.A., Owari, S., Paganoni, M., Rose, P.S., Screaton, E.J., Shankar, U., Torres, M.E., Wang, X., and Wu, H.-Y., 2019. Expedition 372B/375 methods. In Wallace, L.M., Saffer, D.M., Barnes, P.M., Pecher, I.A., Petronotis, K.E., LeVay, L.J., and the Expedition 372/375 Scientists, Hikurangi Subduction Margin Coring, Logging, and Observatories. Proceedings of the International Ocean Discovery Program, 372B/375: College Station, TX (International Ocean Discovery Program). https://doi.org/10.14379/iodp.proc.372B375.102.2019
Wallace, L.M., Webb, S.C., Ito, Y., Mochizuki, K., Hino, R., Henrys, S., Schwartz, S.Y., and Sheehan, A.F., 2016. Slow slip near the trench at the Hikurangi subduction zone, New Zealand. Science, 352(6286):701–704. https://doi.org/10.1126/science.aaf2349
Wang, K., 2004. Applying fundamental principles and mathematical models to understand processes and estimate parameters. In Davis, E.E., and Elderfield, H. (Eds.), Hydrogeology of the Oceanic Lithosphere: Cambridge, United Kingdom (Cambridge University Press), 376–413.
Zoback, M.D., 2007. Reservoir Geomechanics: Cambridge, United Kingdom (Cambridge University Press). https://doi.org/10.1017/CBO9780511586477
1 Barnes, P.M., Wallace, L.M., Saffer, D.M., Pecher, I.A., Petronotis, K.E., LeVay, L.J., Bell, R.E., Crundwell, M.P., Engelmann de Oliveira, C.H., Fagereng, A., Fulton, P.M., Greve, A., Harris, R.N., Hashimoto, Y., Hüpers, A., Ikari, M.J., Ito, Y., Kitajima, H., Kutterolf, S., Lee, H., Li, X., Luo, M., Malie, P.R., Meneghini, F., Morgan, J.K., Noda, A., Rabinowitz, H.S., Savage, H.M., Shepherd, C.L., Shreedharan, S., Solomon, E.A., Underwood, M.B., Wang, M., Woodhouse, A.D., Bourlange, S.M., Brunet, M.M.Y., Cardona, S., Clennell, M.B., Cook, A.E., Dugan, B., Elger, J., Gamboa, D., Georgiopoulou, A., Han, S., Heeschen, K.U., Hu, G., Kim, G.Y., Koge, H., Machado, K.S., McNamara, D.D., Moore, G.F., Mountjoy, J.J., Nole, M.A., Owari, S., Paganoni, M., Rose, P.S., Screaton, E.J., Shankar, U., Torres, M.E., Wang, X., and Wu, H.-Y., 2019. Site U1519. In Wallace, L.M., Saffer, D.M., Barnes, P.M., Pecher, I.A., Petronotis, K.E., LeVay, L.J., and the Expedition 372/375 Scientists, Hikurangi Subduction Margin Coring, Logging, and Observatories. Proceedings of the International Ocean Discovery Program, 372B/375: College Station, TX (International Ocean Discovery Program). https://doi.org/10.14379/iodp.proc.372B375.104.2019
2 Expedition 372B/375 Scientists’ affiliations.
This work is distributed under the Creative Commons Attribution 4.0 International (CC BY 4.0) license. 