Wallace, L.M., Saffer, D.M., Barnes, P.M., Pecher, I.A., Petronotis, K.E., LeVay, L.J., and the Expedition 372/375 Scientists
Proceedings of the International Ocean Discovery Program Volume 372B/375
publications.iodp.org

https://doi.org/10.14379/iodp.proc.372B375.203.2020
Data report: reconnaissance of bulk sediment composition and clay mineral assemblages: inputs to the Hikurangi subduction system1
Michael B. Underwood2
Keywords: International Ocean Discovery Program, IODP, JOIDES Resolution, Expedition 372, Expedition 375, Hikurangi Subduction Margin Coring, Logging, and Observatories, Hikurangi margin, clay mineral assemblage, bulk sediment
MS 372B375-203: Received 26 August 2019 · Accepted 26 November 2019 · Published 3 March 2020
Abstract
This report provides a reconnaissance-scale assessment of bulk mineralogy and clay mineral assemblages in sediments and sedimentary rocks that are entering the Hikurangi subduction zone, offshore North Island, New Zealand. Samples were obtained from three sites drilled during Leg 181 of the Ocean Drilling Program (Sites 1123, 1124, and 1125) and 38 piston/gravity cores that are distributed across the strike-length of the margin. Results from bulk-powder X-ray diffraction show large variations in normalized abundances of total clay minerals and calcite. The typical lithologies range from clay-rich hemipelagic mud (i.e., mixtures of terrigenous silt and clay with lesser amounts of biogenic carbonate) to calcareous mud, muddy calcareous ooze, and nearly pure nannofossil ooze. Basement highs (Chatham Rise and Hikurangi Plateau) are dominated by biocalcareous sediment, whereas most deposits in the trench (Hikurangi Trough and Hikurangi Channel) and on the insular trench slope are hemipelagic. Clay mineral assemblages (<2 µm) change markedly as a function of geographic position. Sediment entering the southwest side of the Hikurangi subduction system is enriched in detrital illite (>60 wt%) relative to chlorite, kaolinite, and smectite. Normalized proportions of detrital smectite increase significantly toward the northeast to reach values of 40–55 wt% offshore Hawkes Bay and across the transect area for Expeditions 372 and 375 of the International Ocean Discovery Program.
Introduction
Expeditions 372 and 375 of the International Ocean Discovery Program (IODP) drilled five sites on the overriding and subducting plates of the Hikurangi convergent margin, offshore North Island, New Zealand (Figure F1). The project’s overarching goal is to understand the behavior and spatial distribution of slow slip events (SSE) along the plate interface (Saffer et al., 2017). Drilling focused on recovery of sediments, rocks, and pore fluids, acquisition of logging-while-drilling data, and installation of long-term borehole observatories. Interpretations of new compositional results from the transect area are challenging, however, because comparable information is almost nonexistent from other sectors along the strike-length of the margin. The closest Ocean Drilling Program (ODP) sites (1123, 1124, and 1125) are located far seaward of the Hikurangi Trough (Figure F1). Shipboard X-ray diffraction (XRD) measurements were not completed during that expedition, and only one published report contains postcruise compositional data (Winkler and Dullo, 2002). Far to the southwest, XRD data from the Canterbury Basin and Canterbury slope (Land et al., 2010; Villaseñor et al., 2015) are of limited value to Hikurangi studies because those sites capture a different system of detrital sources and dispersal routes off the South Island of New Zealand (Figure F1).
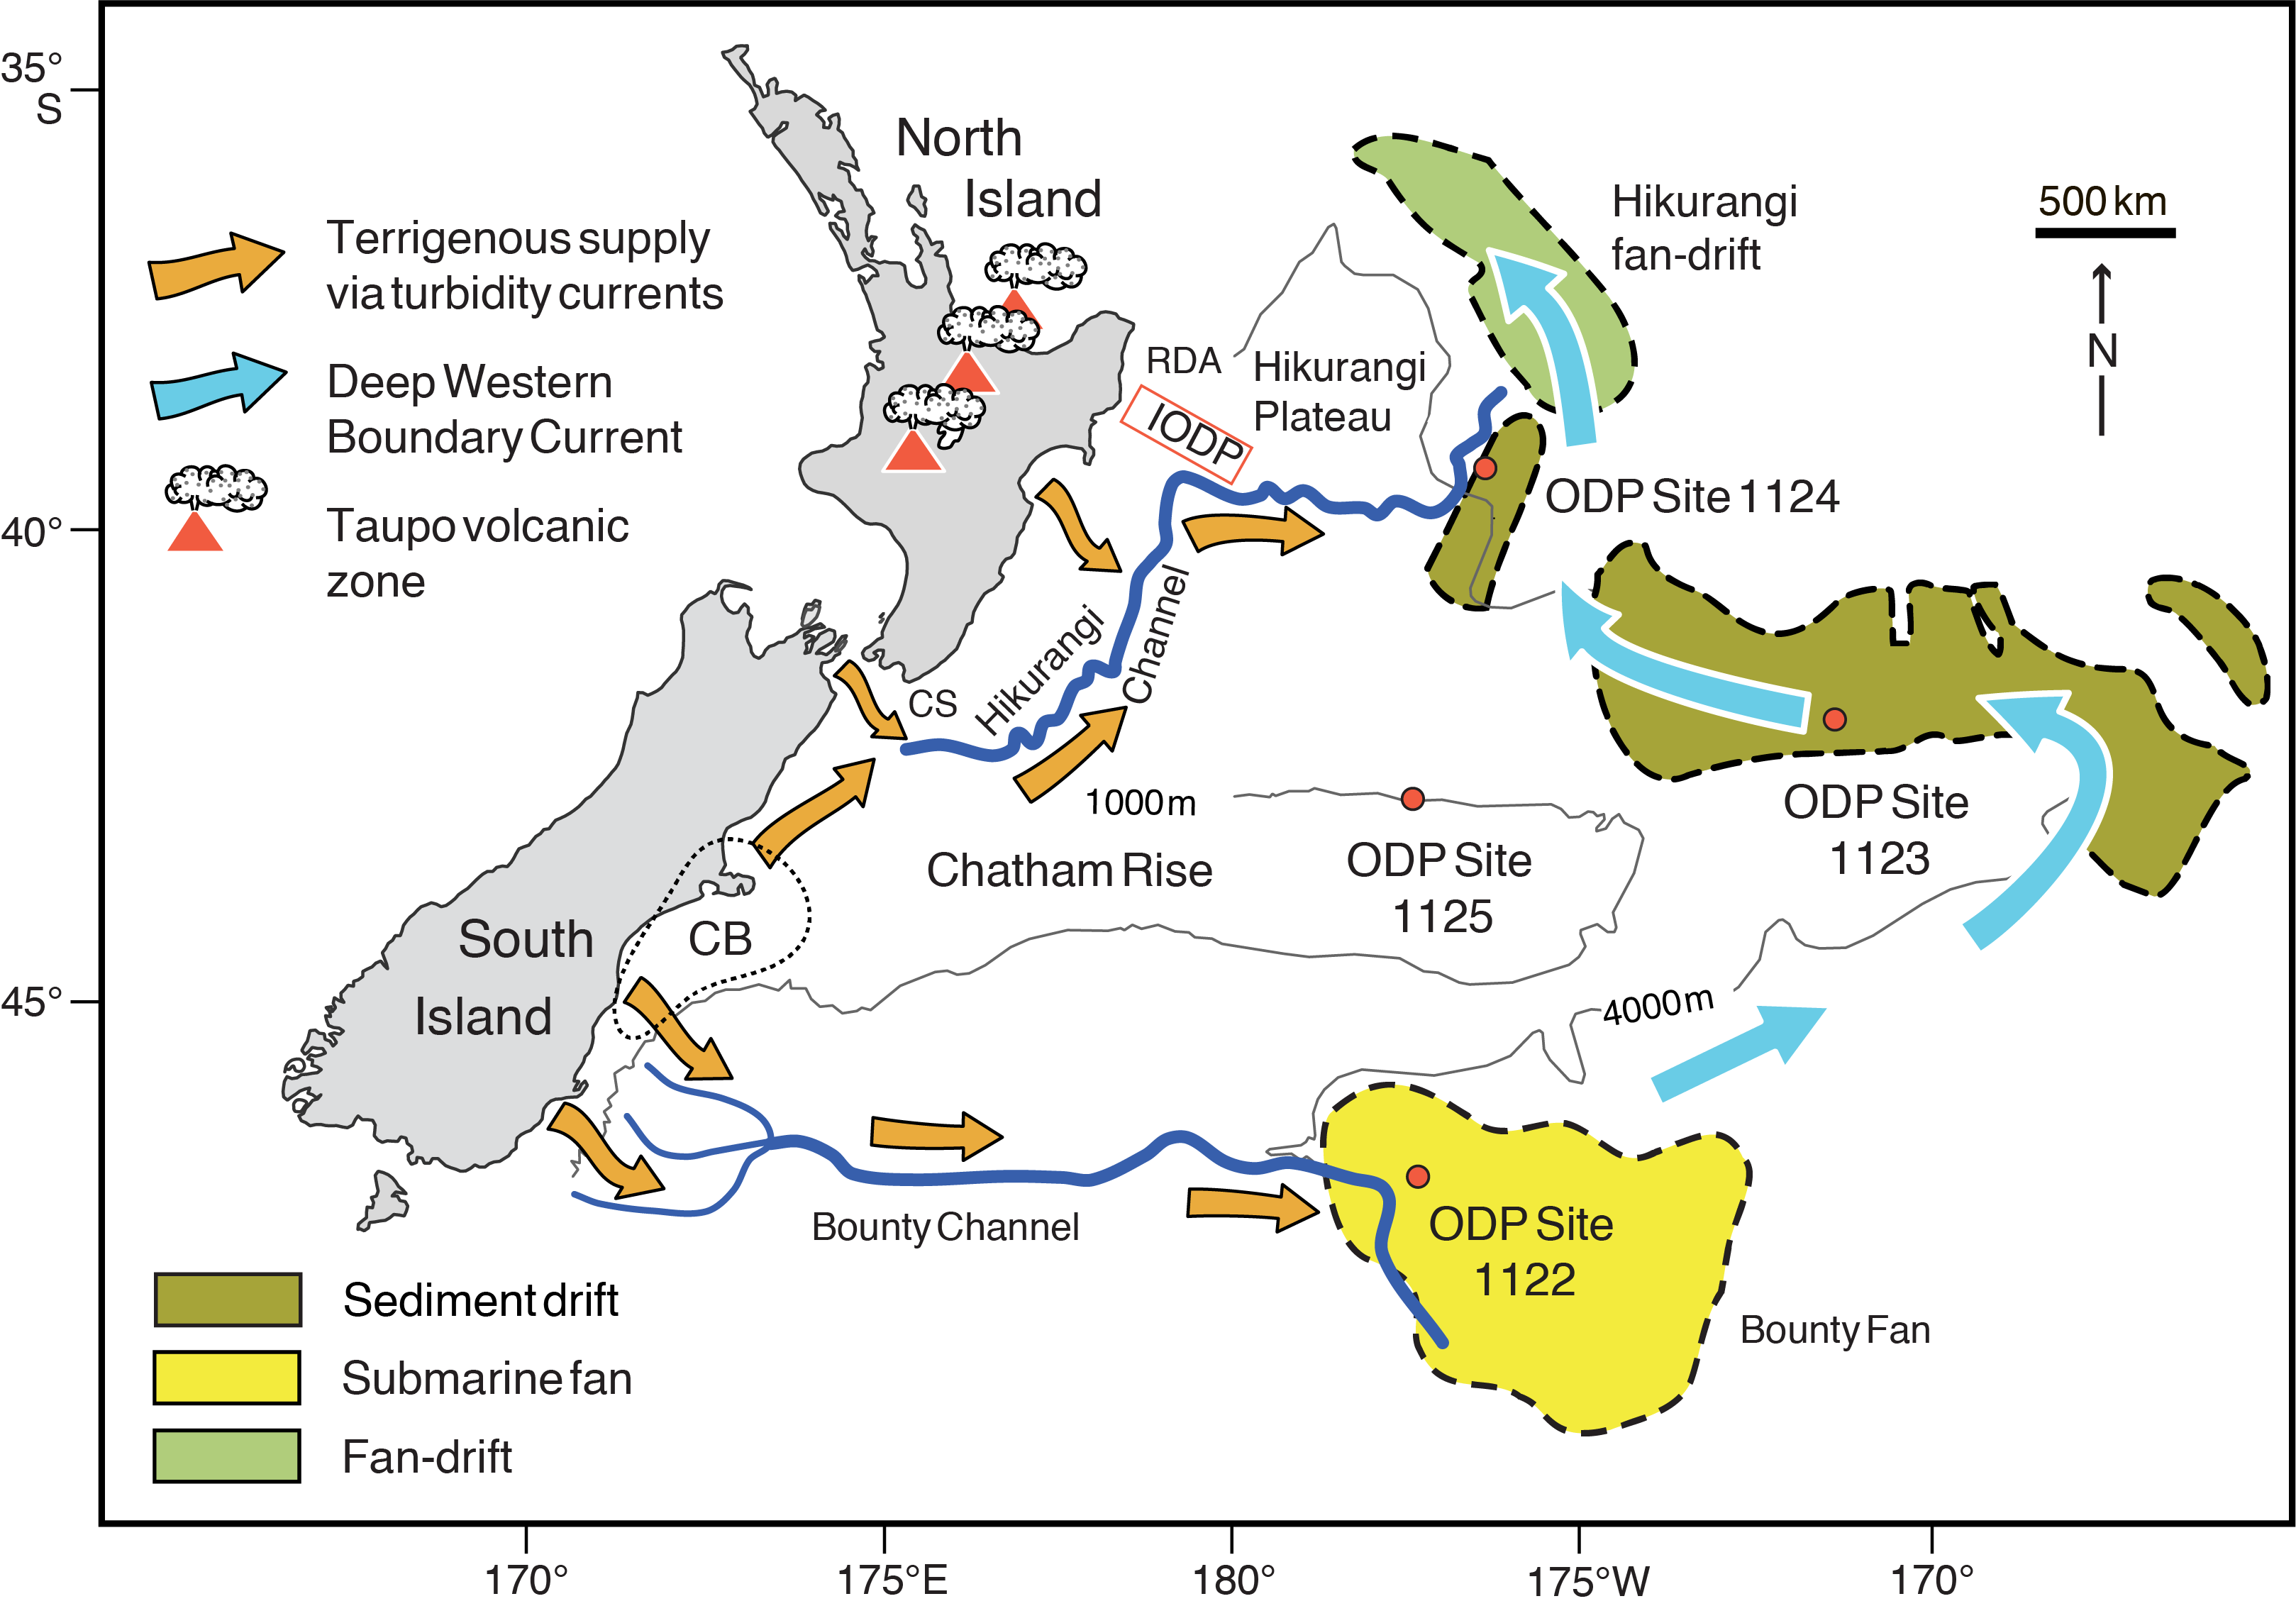
Figure F1. Offshore eastern New Zealand region.
The motivation for regional-scale reconnaissance of sediment composition is to provide better context for forthcoming interpretations of detrital provenance, sediment dispersal, and temporal evolution of sedimentary systems. Quantitative compositional data are also important for several ancillary reasons. The geologic hosts for slow slip events near the Hikurangi IODP transect likely include lithified and variably altered volcaniclastic sediments of Late Cretaceous age, but incorporation of other rock types in the fault zone (e.g., siliciclastic mudstone, altered basalt, marl, and nannofossil chalk) is also possible (Davy et al., 2008; Barnes et al., 2010; see the Expedition 372B/375 summary chapter [Saffer et al., 2019]). If chalk and marl are volumetrically significant at the depths where slow slip occurs, then the subducting carbonates might modulate fault-slip behavior by crystal plasticity (Kennedy and White, 2001) or diffusive mass transfer (Rutter, 1976). The purity of the marl/chalk is a critical variable, however, as is the extent of replacement of primary volcaniclastic constituents by expandable clay minerals (smectite group). How much clay is present in these lithologies, and which clay minerals are dominant? How variable are the lithologies along the strike-length of the margin? This report provides some preliminary compositional information to help answer those important questions.
To build an archive of relevant compositional data, samples were acquired for XRD analyses from ODP Sites 1123, 1124, and 1125 (Figure F1) plus a representative distribution of piston/gravity cores along the strike-length of the Hikurangi margin. Prominent bathymetric features targeted by the sampling include (1) the Bounty Channel, which heads off the southeast coast of South Island and directs gravity flows toward the southeast (Lawver and Davey, 2005); (2) submarine canyons emanating from the Cook Strait sector between South Island and North Island (Mountjoy et al., 2009); (3) the Hikurangi Channel, which funnels gravity flows down the axis of Hikurangi Trough (toward the north-northeast) before bending sharply to the east (Lewis and Pantin, 2002); (4) the Ruatoria debris avalanche, which remobilized accreted trench sediments and slope deposits along the northernmost Hikurangi margin (Collot et al., 2001); and (5) two prominent basement highs on the subducting plate, Chatham Rise and the Hikurangi Plateau (Wood and Davy, 1994; Davy et al., 2008). In addition, the array of sampling sites encompasses the region’s most influential ocean current, the Pacific Deep Western Boundary Current (DWBC) (Shipboard Scientific Party, 1999a; McCave et al., 2004).
Another reason for reconnaissance-scale sampling was to calibrate shipboard and shore-based XRD computations. The method used during IODP Expeditions 372 and 375 (see the Expedition 372B/375 methods chapter [Wallace et al., 2019]) depends on analyses of standard mineral mixtures (Fisher and Underwood, 1995; Underwood et al., 2003). Data from the standards were used to calculate a matrix of normalization factors with singular value decomposition (SVD), as well as a suite of regression equations that relate values of integrated peak area to mineral abundance (weight percent). Because of differences in XRD hardware, tube fatigue, and software, each individual instrument requires calibration and computation of its own set of normalization factors and/or regression equations. It is also important to blend the “correct” mineral mixtures using individual standards that match as close as possible to the natural mineral assemblages of a particular study area. The “wrong” blend of clay minerals, for example, or the “wrong” crystallinity of calcite will exacerbate errors in their calculated values of weight percent. Underwood et al. (in press) provided details regarding the standard mineral mixtures (both bulk powder and clay size), along with intralaboratory and interlaboratory tests of precision and comparisons of accuracy. The results reported herein were used to inform choices for the Hikurangi-specific standards.
Methods
Samples
A total of 61 specimens from Sites 1123, 1124, and 1125 were acquired from the Gulf Coast Repository in College Station, TX (USA). The lithologies range from hemipelagic mud (defined here as silty clay to clayey silt, or lithified equivalent, with subordinate biogenic carbonate) to marl (defined here as muddy calcareous ooze to calcareous mud or lithified equivalents) and chalk (>75% carbonate). Sample spacing for those specimens was designed to cover a representative spread of burial depths and ages for each site. A total of 91 specimens from 38 piston and gravity cores were acquired from repositories at Lamont-Doherty Earth Observatory (multiple cruises on the R/V Vema and the R/V Conrad), Oregon State University (Cruise RR0503 on the R/V Roger Revelle), and the New Zealand National Institute of Water and Atmospheric Research (NIWA). The NIWA collection comprises material from multiple research vessels and cruises, including giant piston cores collected by the R/V Marion Dufresne. Table T1 provides the geographic information for each coring station. The lithologic name assigned to each sample (e.g., lutite, clay-bearing nannofossil ooze, and silty clay) was taken from the original shipboard core descriptions (e.g., Shipboard Scientific Party, 1999c) without regard to potential inconsistencies in terminology or classification scheme. Shipboard descriptions of the piston/gravity cores were downloaded from the National Oceanic and Atmospheric Administration (NOAA) Index to Marine and Lacustrine Geological Samples (https://www.ngdc.noaa.gov/geosamples). Specific sample intervals in those cores cover a representative spread of lithologies, which is indicated by the shipboard descriptions of color, carbonate content, texture, and clay content. The NIWA cores and specific sample intervals in those cores were chosen by NIWA personnel (Lisa Northcote and Philip Barnes).
Bulk-powder XRD
The specimens of bulk sediment were freeze-dried, and splits were crushed to a fine powder using a mechanical mortar and pestle for 2.5–3.0 min. Those specimens were analyzed at the New Mexico Bureau of Geology and Mineral Resources as back-loaded random powders using a Panalytical X’Pert Pro diffractometer with Cu anode. Continuous scans were run at generator settings of 45 kV and 40 mA over an angular range of 5°–70°2θ. The scan step time was 5.08 s, the step size was 0.008°2θ, and the sample holder was spinning. Slits were fixed at 0.25 mm (divergence) and 0.1 mm (receiving), and the specimen length was 10 mm. Raw data files were processed using MacDiff software (version 4.2.5) to establish a baseline of intensity, smooth counts, and correct peak positions (relative to quartz) and to calculate peak intensities and peak areas. Figure F2 shows representative diffractograms with identification of the diagnostic peaks for total clay minerals, quartz, feldspar, and calcite.
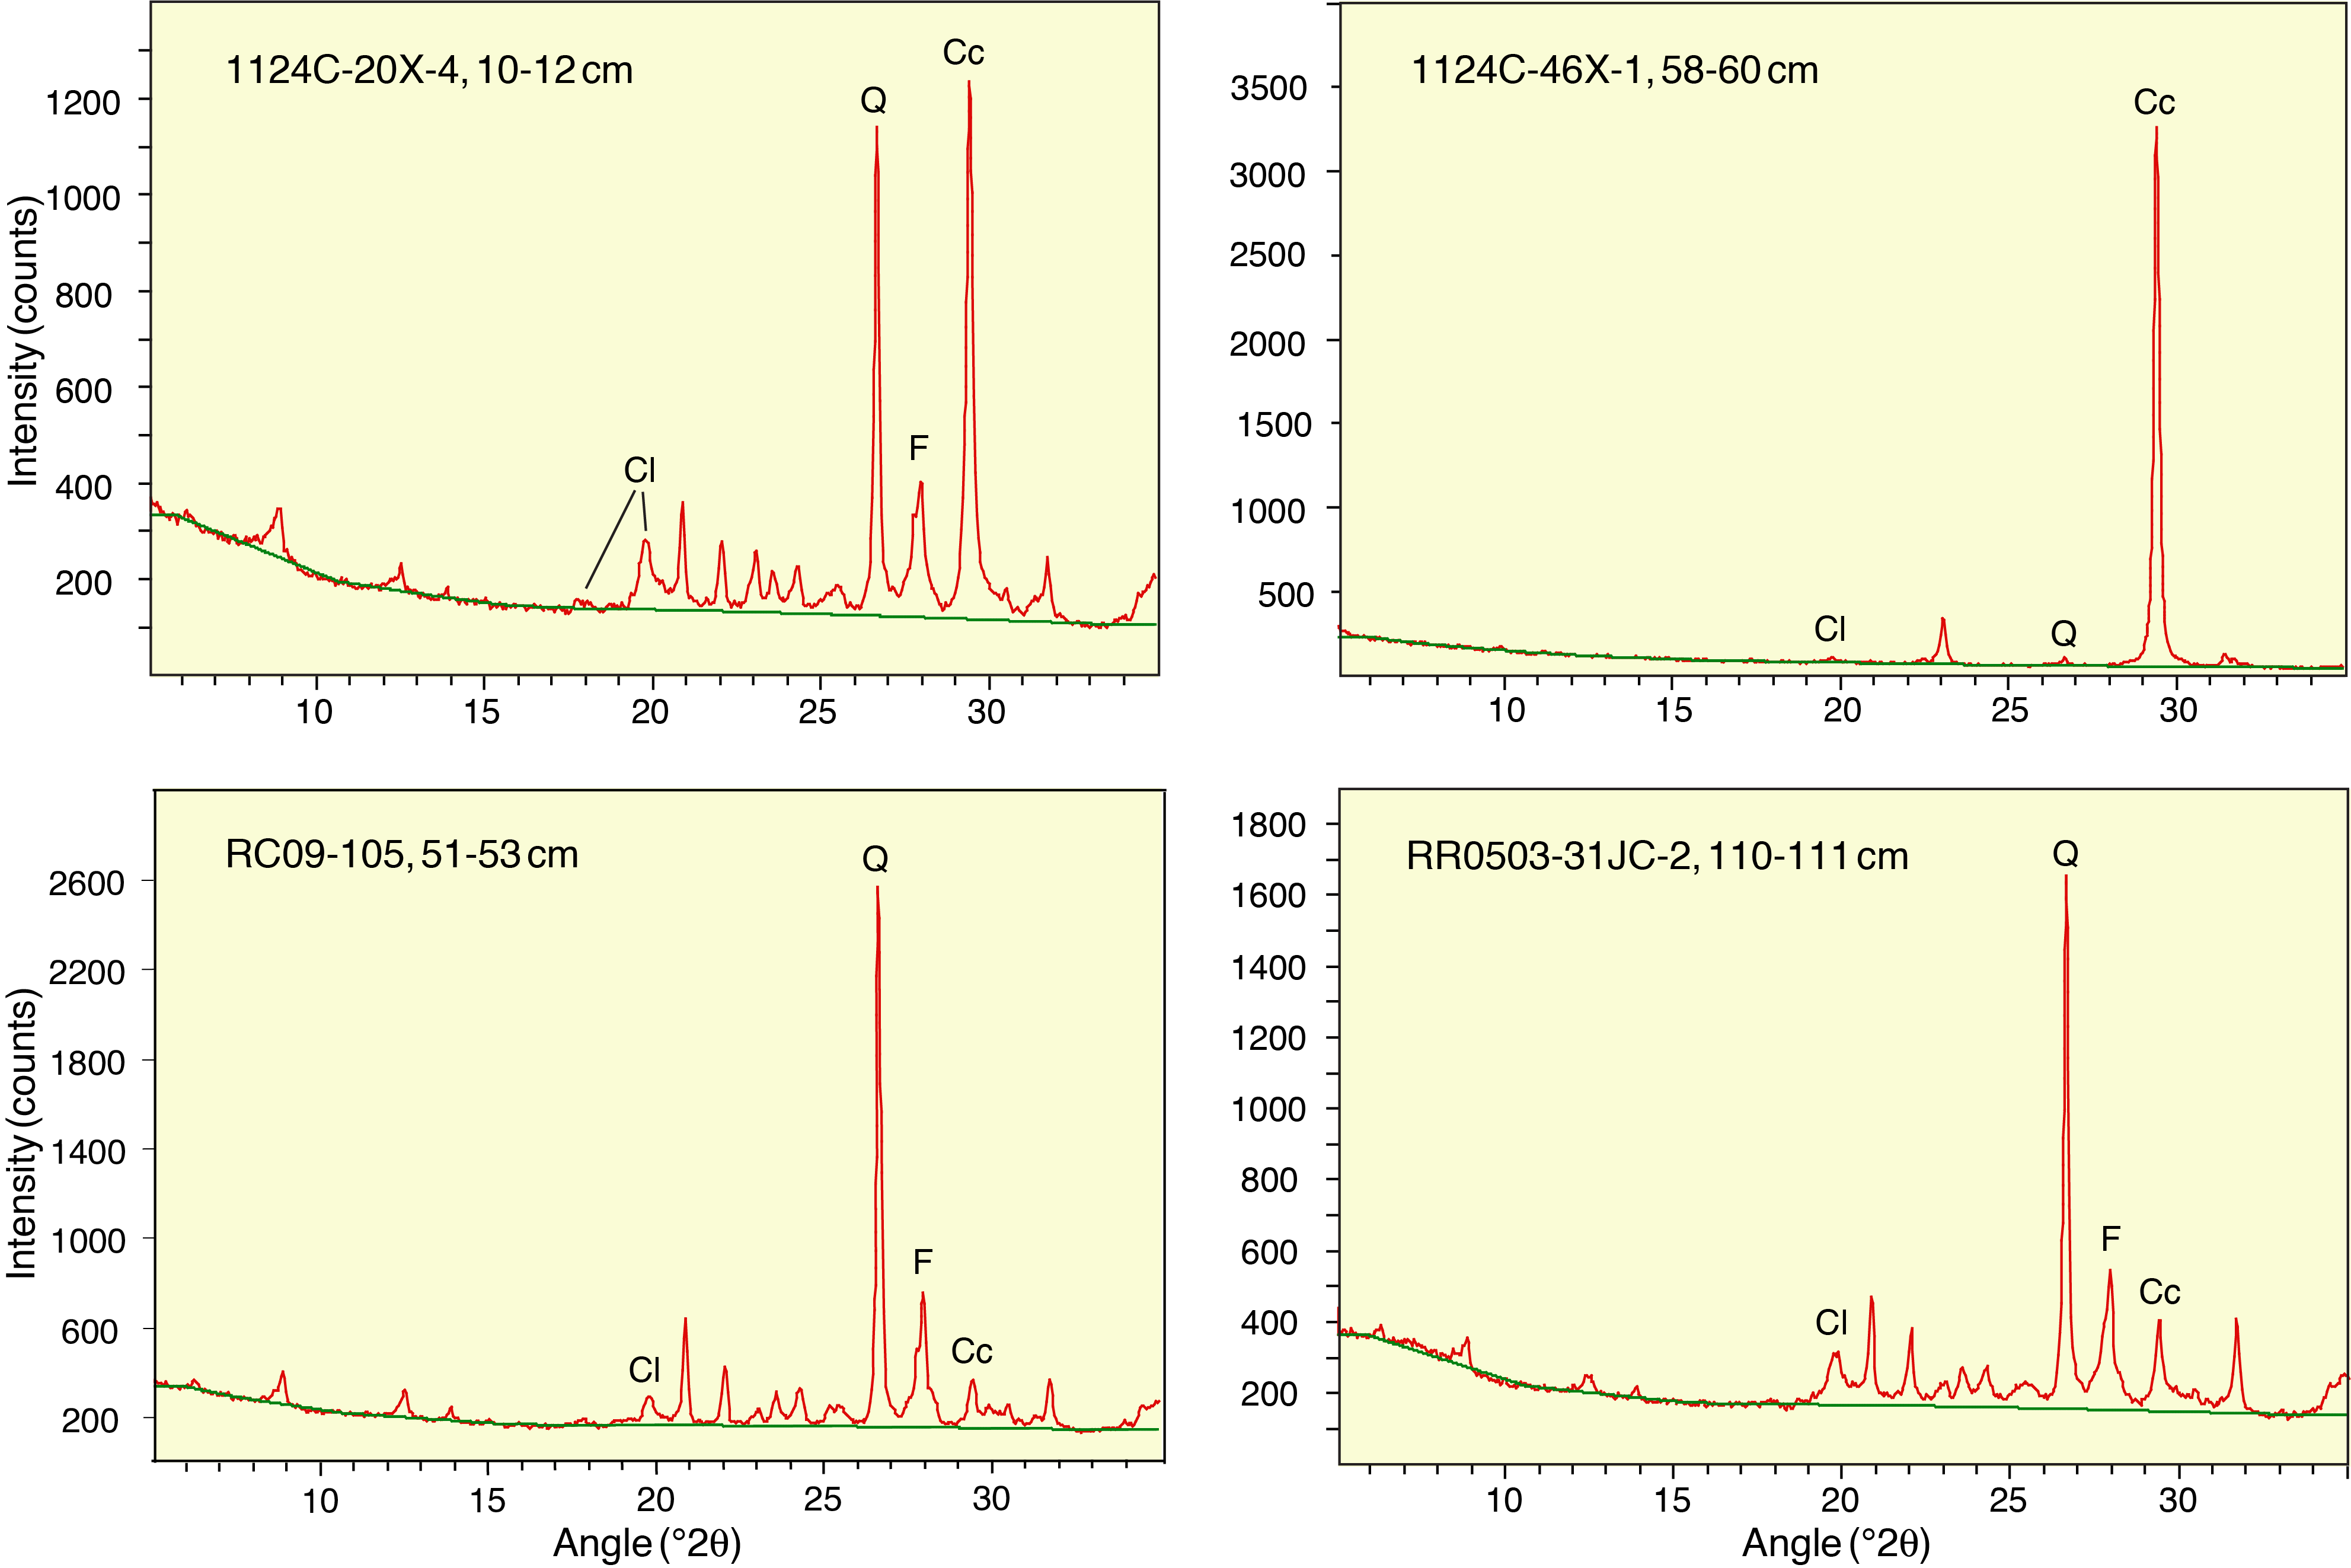
Figure F2. Representative bulk-powder XRD.
Values of integrated peak area were used to compute relative weight percent for total clay minerals, quartz, feldspar, and calcite following two approaches: (1) a set of polynomial regression equations that relate weight percent to peak area in standard mineral mixtures and (2) a matrix of SVD normalization factors also calibrated from analyses of standard mineral mixtures (Table T2). If a natural sample comes close to matching the compositional character of the standards, then the sum of the values of relative weight percent will be close to 100%. Sums greater than 100% usually mean mismatches of mineral crystallinity. Sums significantly less than 100% are usually caused by an abundance of solids (amorphous and/or crystalline) not included in the standard mix (e.g., volcanic glass, zeolites). All of the relative abundance values were normalized to total clay minerals + quartz + feldspar + calcite = 100%. The same analytical and computational approach was used for shipboard data acquisition during Expeditions 372 and 375 (see the Expedition 372B/375 methods chapter [Wallace et al., 2019]). Underwood et al. (in press) provide a thorough assessment of interlaboratory precision between the R/V JOIDES Resolution and New Mexico Tech. Errors of accuracy for the standard mineral mixtures are smaller using the regression equations, as opposed to SVD normalization factors. The average errors (computed weight percent − true weight percent) are total clay minerals = 1.7%, quartz = 1.2%, feldspar = 1.6%, and calcite = 1.2% (Underwood et al., in press).
Clay-size XRD
The clay-sized fraction (<2 µm) was isolated from representative bulk samples of hemipelagic mud and mudstone. Carbonate-rich specimens (chalk, marl, etc.) were excluded from the clay-mineral reconnaissance because they would have required time-consuming acid digestion steps. Splits of the freeze-dried bulk sediment were transferred to 600 mL beakers, treated with 2% hydrogen peroxide to remove organic matter, and suspended in ~250 mL of sodium hexametaphosphate solution (4 g/1000 mL of distilled H2O). Beakers with suspended clay were inserted into an ultrasonic bath for several minutes to promote dispersion and retard flocculation. Suspensions were washed of solutes by two passes through a centrifuge (8200 rpm for 25 min; ~6000× g) with resuspension in distilled-deionized water after each pass. The suspended particles were then transferred to 125 mL plastic bottles and resuspended by vigorous shaking plus insertion of an ultrasonic cell probe for ~2 min. Clay-size splits of each suspension (<2 µm equivalent spherical diameter) were separated by centrifugation (1000 rpm for 2.4 min; ~320× g). Preparation of oriented clay aggregates for the XRD scans followed the filter-peel method (Moore and Reynolds, 1989b) using 0.45 μm filter membranes and glass discs. Discs were placed in a closed vapor chamber at room temperature for at least 24 h to saturate the clay aggregates with ethylene glycol. This last step expands the interlayer of smectite to minimize overlap between the smectite (001) and chlorite (001) reflections (Figure F3).
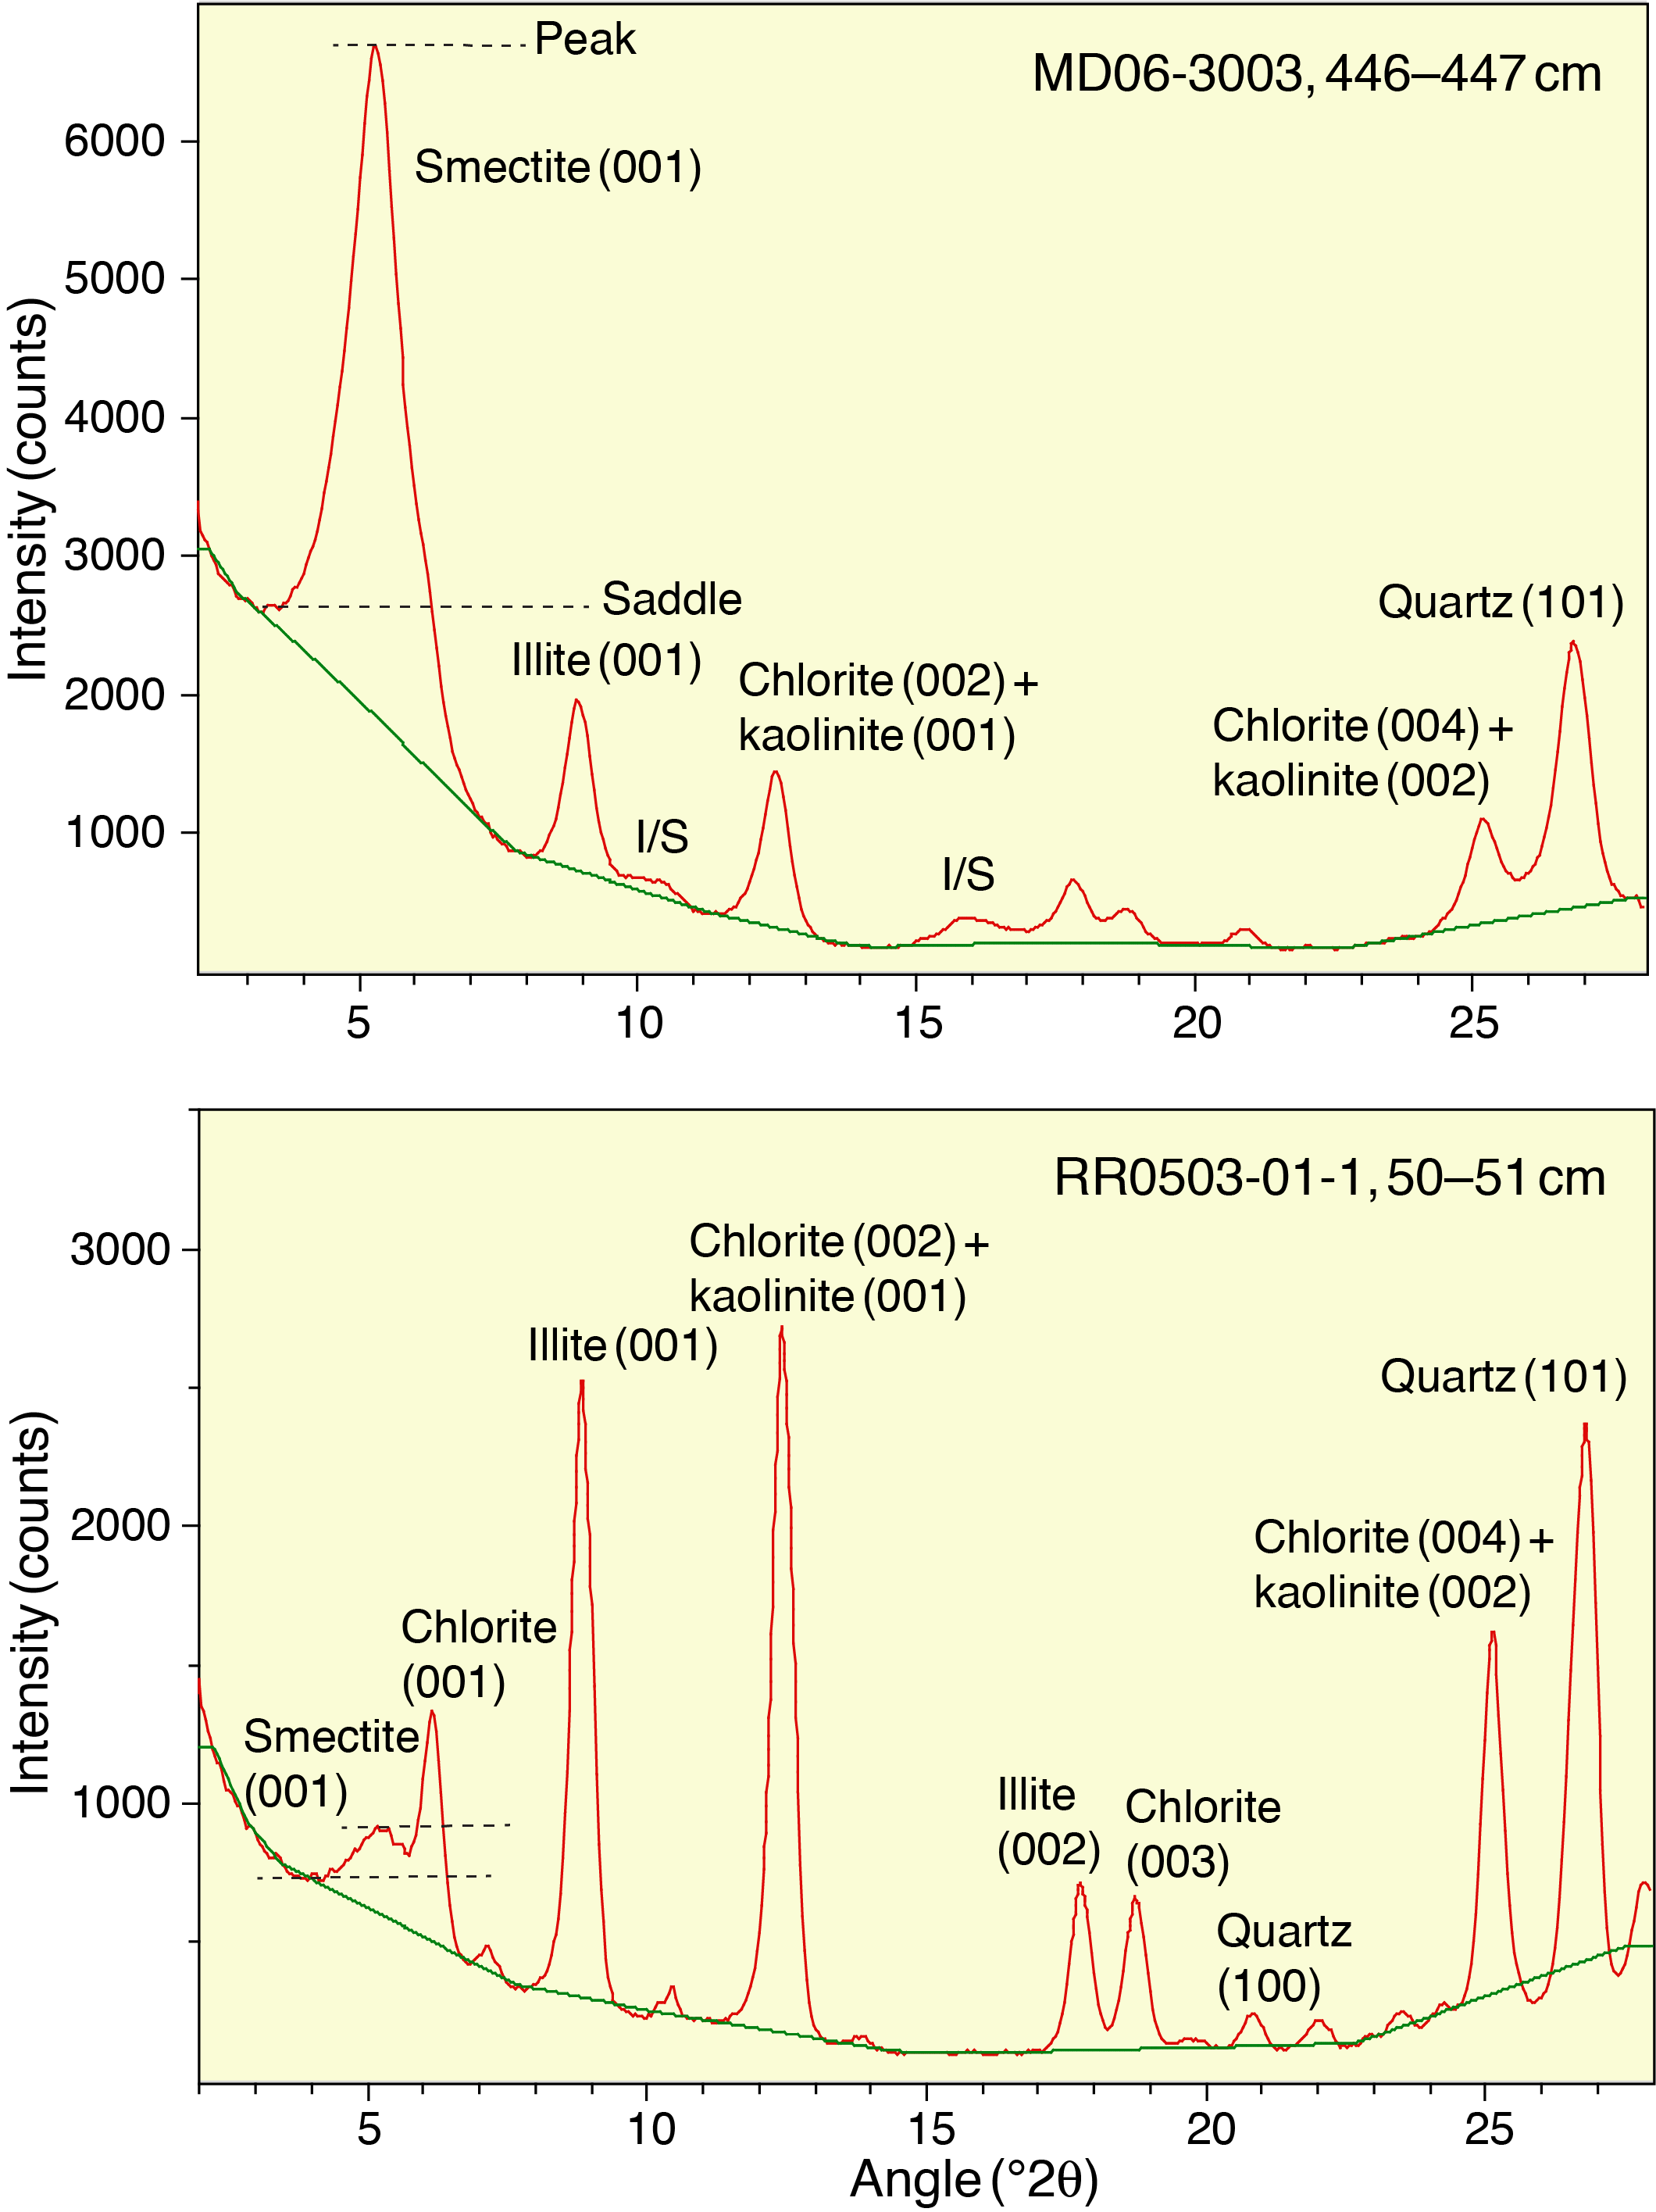
Figure F3. Representative clay-size XRD.
The oriented glycol-saturated clay-size specimens were analyzed at the New Mexico Bureau of Geology and Mineral Resources using the same Panalytical X’Pert Pro diffractometer. Those scans were run at generator settings of 45 kV and 40 mA over an angular range of 2°–28.0°2θ and using a scan step time of 1.6 s, a step size of 0.01°2θ, and a stationary sample holder. Slits were fixed at 0.5 mm (divergence) and 0.1 mm (receiving), and the specimen length was 10 mm. Raw data files were processed using MacDiff software (version 4.2.5) to establish a baseline of intensity, smooth counts, correct peak positions (relative to quartz), and calculate peak intensities and peak areas. Representative diffractograms are shown in Figure F3 with identification of the diagnostic peaks for smectite, illite, undifferentiated chlorite + kaolinite, and quartz.
Values of integrated peak area were used to compute relative and normalized abundance values for each of the common clay-sized minerals following three approaches: (1) Biscaye (1965) peak-area weighting factors, which are equal to 1× smectite, 4× illite, and 2× undifferentiated chlorite + kaolinite; (2) a set of regression equations where smectite + illite + undifferentiated (chlorite + kaolinite) + quartz = 100%; and (3) a matrix of SVD normalization factors, where smectite + illite + undifferentiated (chlorite + kaolinite) + quartz = 100% (Table T2). To permit comparisons among the three computational approaches, the weight percent values were also normalized to a clay-only assemblage of smectite + illite + undifferentiated (chlorite + kaolinite) = 100%. As described more fully by Underwood et al. (in press), errors of accuracy for the standard mineral mixtures are largest using the Biscaye (1965) weighting factors (as high as 18.6%), but those values are tabulated here to permit direct comparisons with data from previous studies (e.g., Winkler and Dullo, 2002). The average errors using the regression equations are illite = 3.0%, undifferentiated (chlorite + kaolinite) = 5.1%, and smectite = 3.9% (Underwood et al., in press).
Methods for routine assessment of clay diagenesis include the saddle:peak method to compute “expandability” of smectite and/or illite/smectite (I/S) mixed-layer clay (Rettke, 1981). The angular position of the composite I/S 002/003 peak (°2θ) was used to compute the percentage of illite layers in the mixed-layer clay (Moore and Reynolds, 1989a). This computation is possible only when the I/S peak intensity is high enough to resolve a clear apex. The peak width at half maximum for the illite 001 peak (Δ°2θ) is used as a measure of illite crystallinity (Warr and Mählmann, 2015).
Results
Bulk-powder XRD
To illustrate spatial changes in the bulk-powder XRD results (Table T3), the data are grouped by geographic sector; all of the values on such plots are normalized abundances computed using the regression equations (Table T2). Figure F4 shows the sector offshore South Island, New Zealand. This sector includes the transect area for IODP Expedition 317 (Canterbury Basin), ODP Site 1119, Deep Sea Drilling Project (DSDP) Site 594, and distal reaches of the Bounty Channel. Samples from Cores VM16-122 and RR0503-06 display the greatest amount of compositional variability with calcite contents of 0.9 to 86.7 wt% and total clay contents of 2.2–38.8 wt%. Judging from those compositional ranges, the cores appear to contain both biocalcareous ooze and hemipelagic mud from Bounty Channel spillover. The remaining samples are typical hemipelagic muds (i.e., mixtures of terrigenous silt and clay plus subordinate biogenic carbonate). Their values of total clay content are 28.0–39.1 wt%; quartz content is 17.0–38.1 wt%, feldspar content is 20.6–36.3 wt%, and calcite content is 0.8–32.1 wt%. Those compositions are in general agreement with bulk-powder XRD data from the Canterbury Basin (Villaseñor et al., 2015), although quantitative comparisons should be made with caution because of differences in methodology.
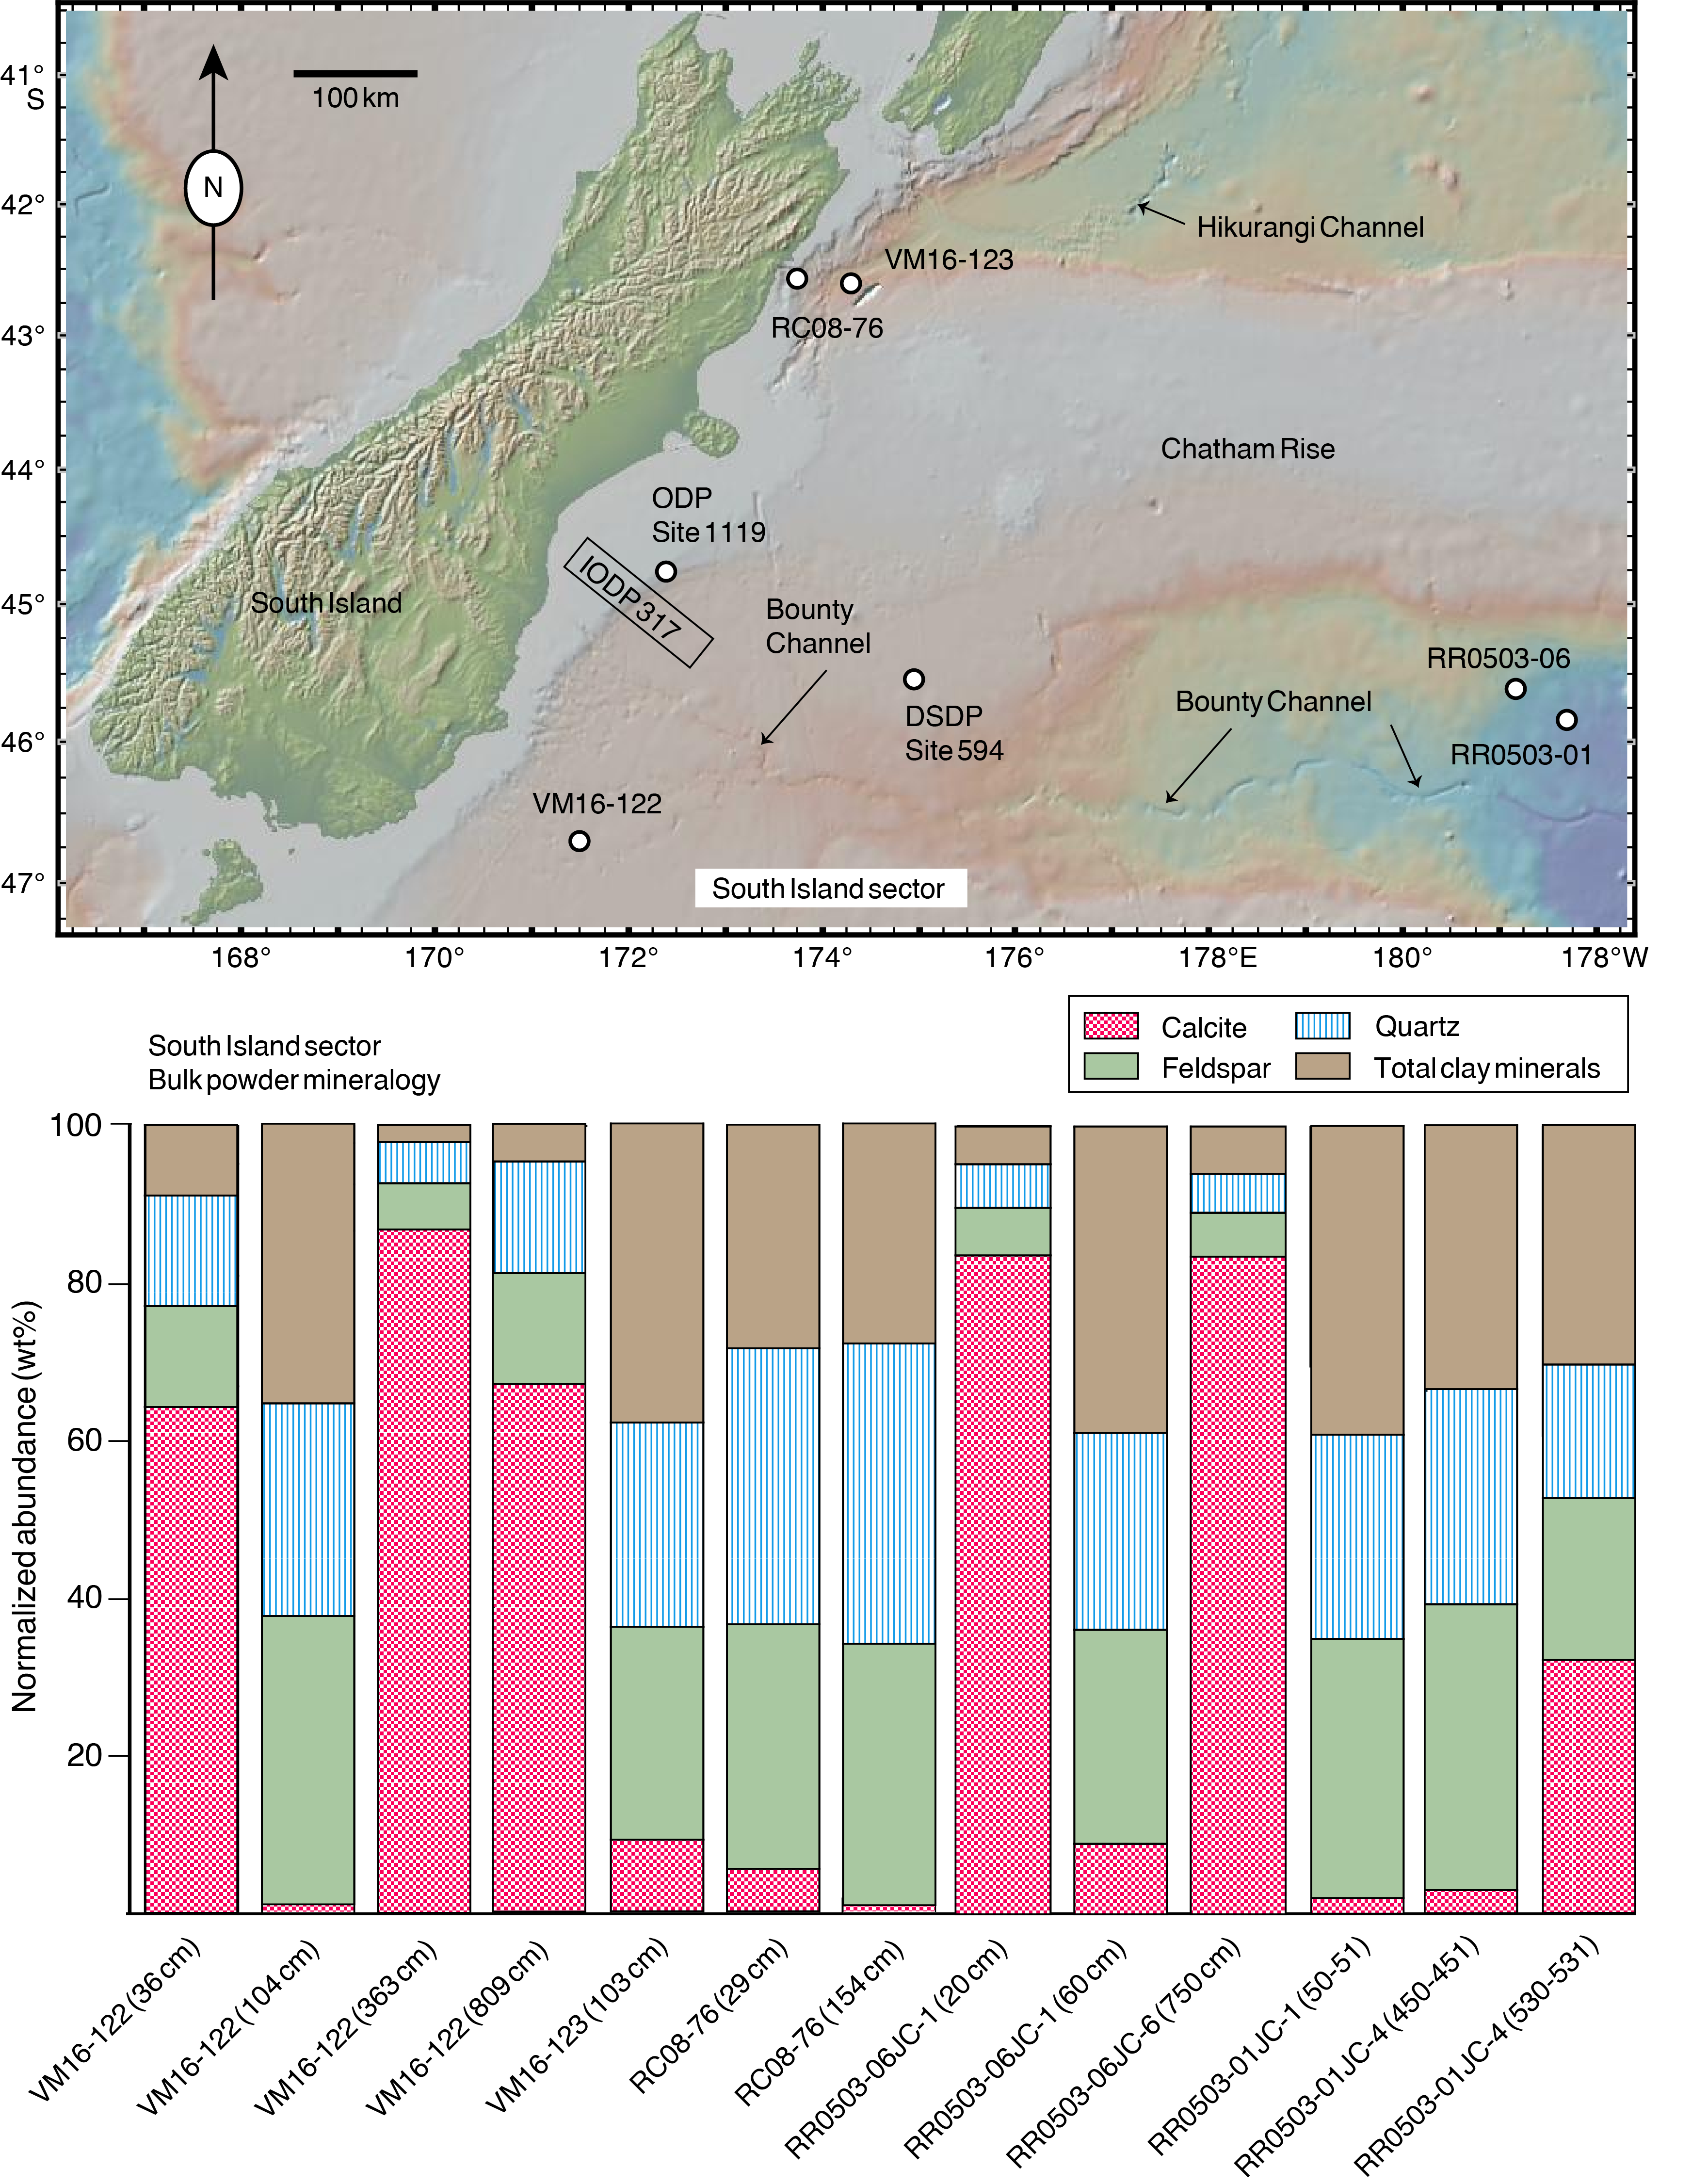
Figure F4. South Island sites and normalized bulk-powder values.
Samples analyzed from the Chatham Rise sector (Figure F5) include those from nine piston/gravity cores and two ODP sites. The one specimen from Core RC09-111, located in the distal northeast corner of the sector, is nearly devoid of calcite and contains 58.1 wt% total clay. Water depth at that coring station is 4777 m below sea level, so the provisional interpretation is depletion of carbonate due to deposition (and dissolution) below the calcite compensation depth (CCD). Core samples from shallower water depths along the crest and northern flank of Chatham Rise are consistently enriched in calcite, with normalized percentages of 34.3–88.7 wt%. The total clay content is 5.5–34.7 wt%. Normalized percentages of quartz range 3.1–16.5 wt%, and values for feldspar are 2.6–14.5 wt%. These compositions are consistent with a continuum of mixing between biogenic carbonate ooze and subordinate siliciclastic silt + clay (i.e., calcareous mud to nearly pure nannofossil ooze). Cores from the southern flank of Chatham Rise (RR0503-10, RR0503-11, and RC09-108) are more variable in composition, with calcite contents of 4.1–83.7 wt% and total clay contents of 4.8–39.9 wt%. The occurrences of mud with low percent calcite values are consistent with spillover from the distal reaches of Bounty Channel, which meanders across the southern edge of the sector (Figure F5).
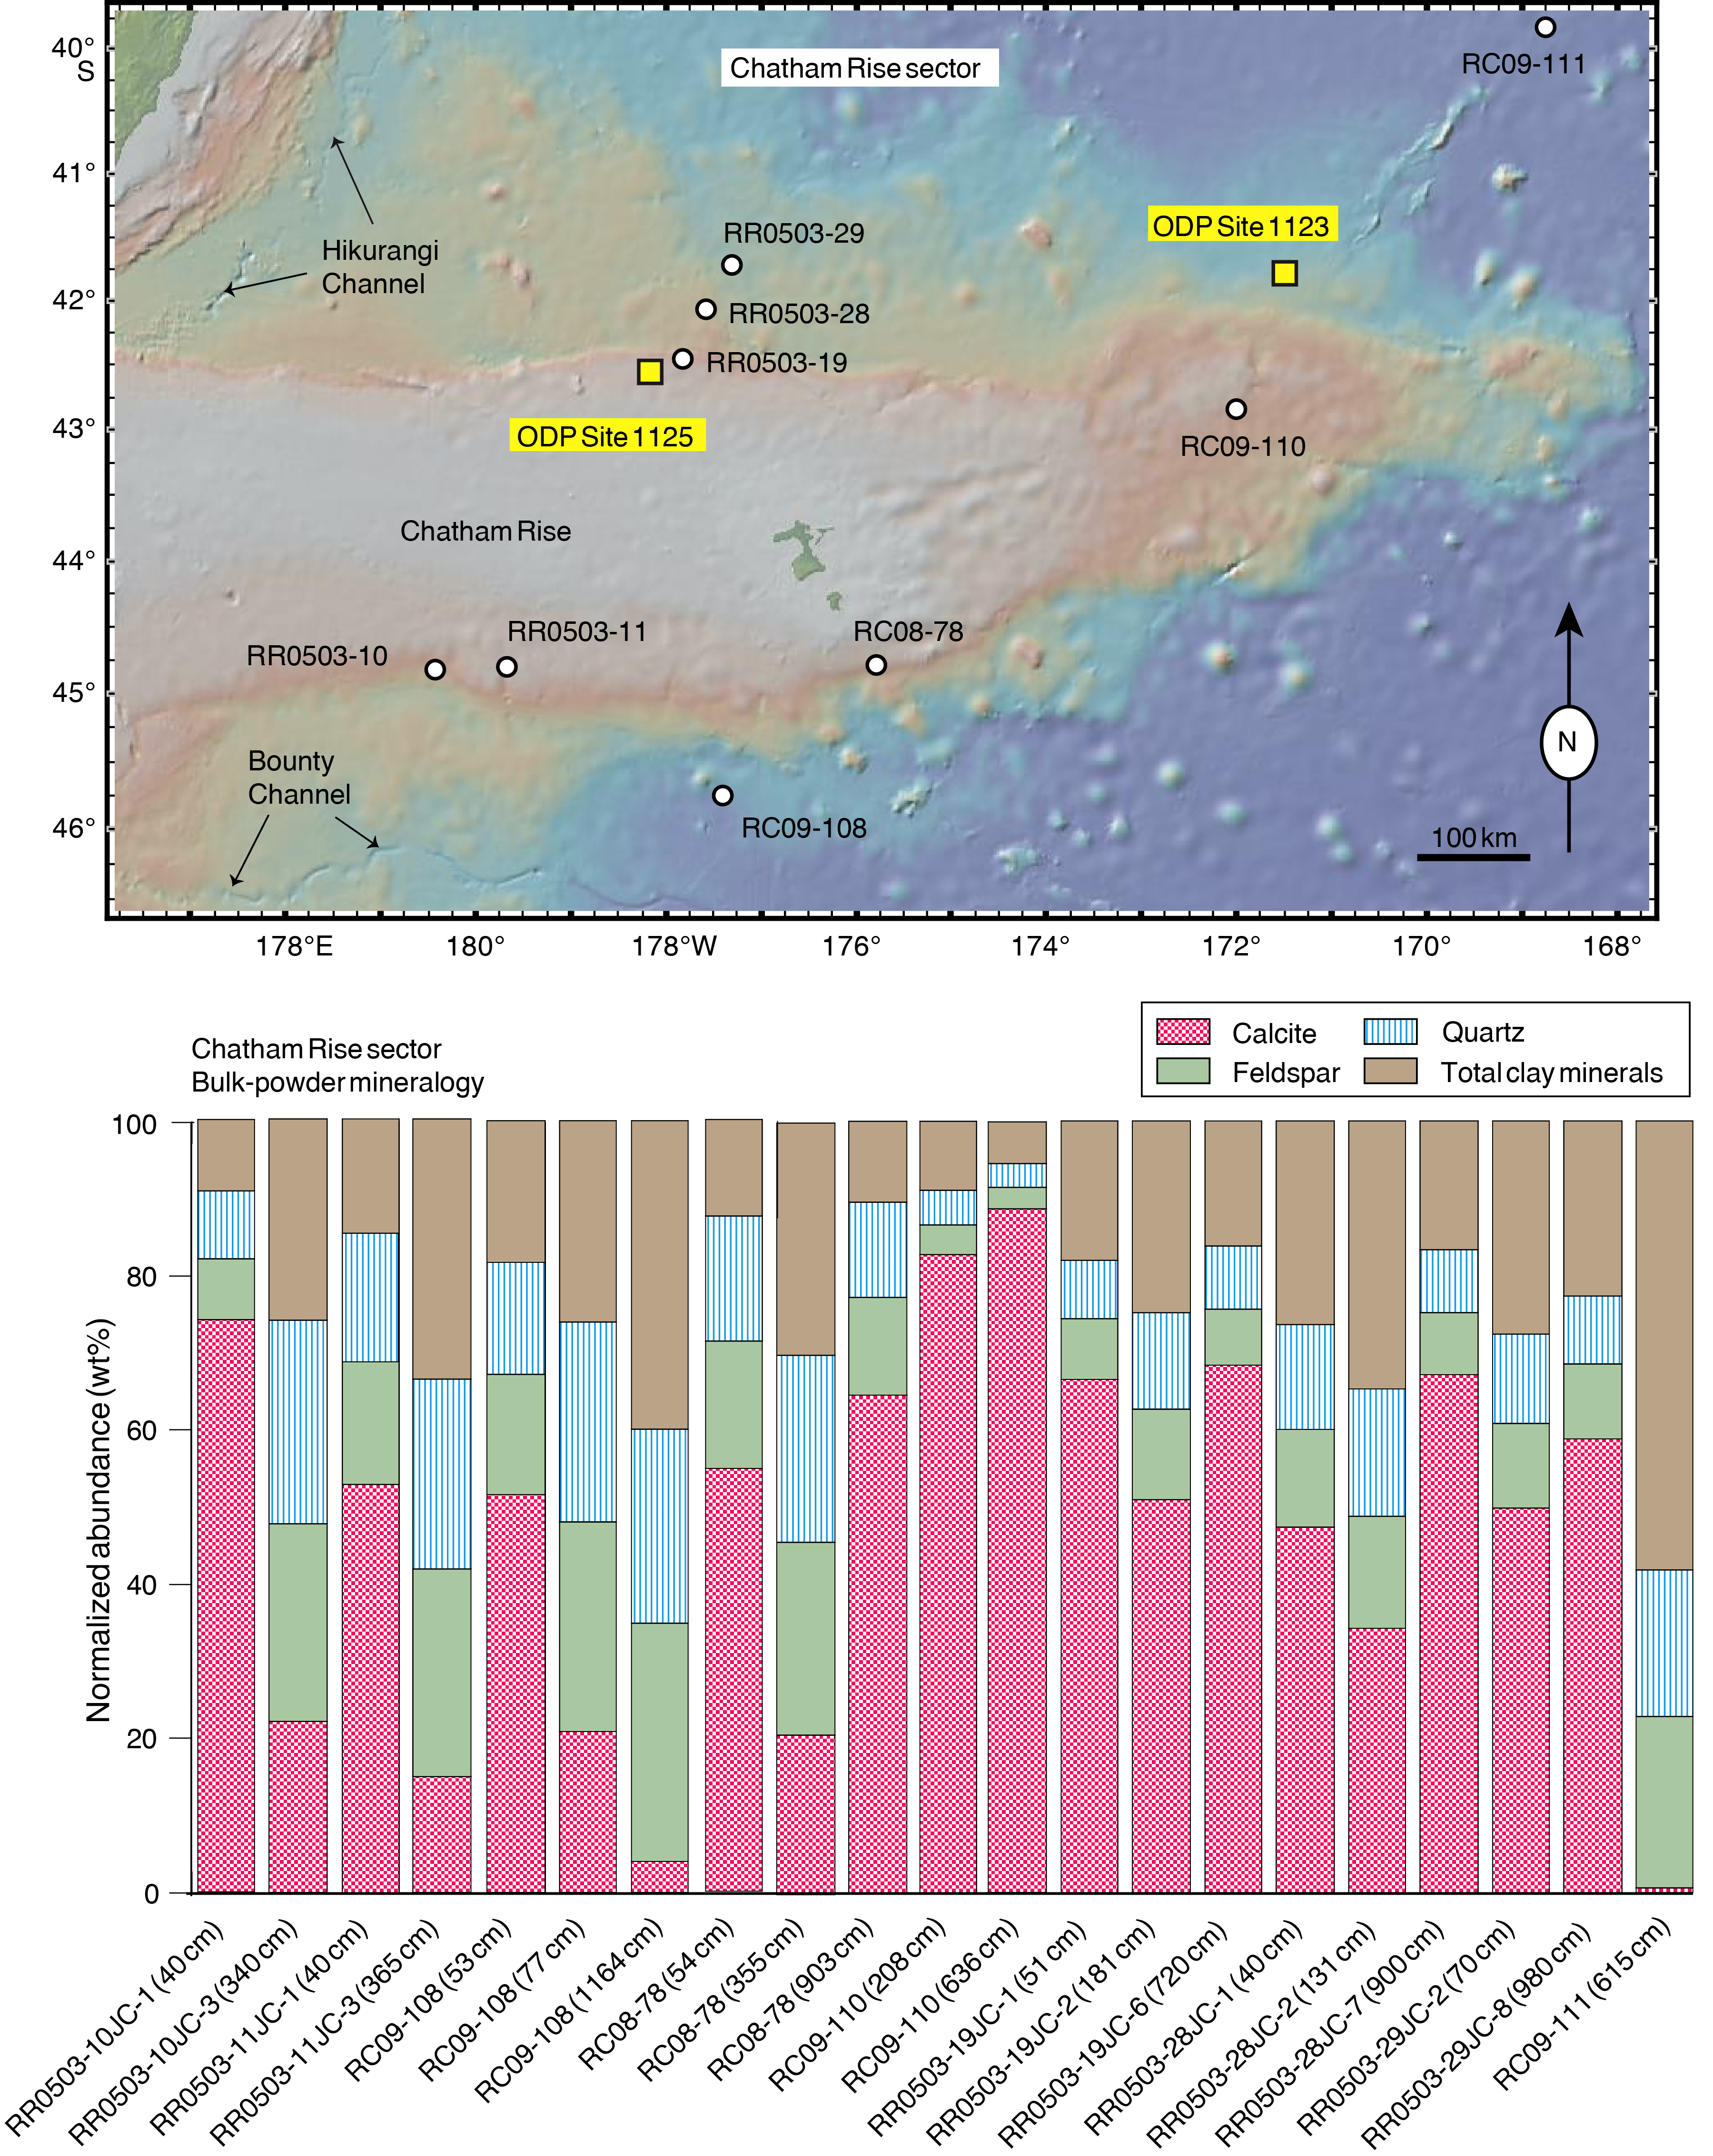
Figure F5. Chatham Rise sites and normalized bulk-powder values.
Site 1123 was drilled on the northeastern flank of Chatham Rise at a water depth of 3290 m (Figure F5). The main purpose for drilling there was to document the long-term effects of the DWBC on sedimentation (Shipboard Scientific Party, 1999b). Coring extended to a total depth of 632.8 meters below seafloor (mbsf), and the strata range in age from late Eocene to Quaternary (Shipboard Scientific Party, 1999b). The lithologies include clay-rich nannofossil ooze, nannofossil chalk, nannofossil-rich mudstone, and micrite (Figure F6). Beds are typically 1–1.5 m thick and distinguished by color variations (greenish gray to white) caused by differing proportions of biogenic carbonate and terrigenous clay. Values of CaCO3 (from shipboard coulometric measurements) are highly scattered throughout the section and range 10%–84% (Shipboard Scientific Party, 1999b). XRD analyses of 20 samples (Table T3) confirm the compositional variability (Figure F6); normalized calcite abundances are 34.8–85.5 wt% (average = 69.3 wt%). Contents of total clay minerals range 6.5–42.0 wt% (average = 17.5 wt%), and the proportions of both quartz and feldspar remain consistently <12 wt%.
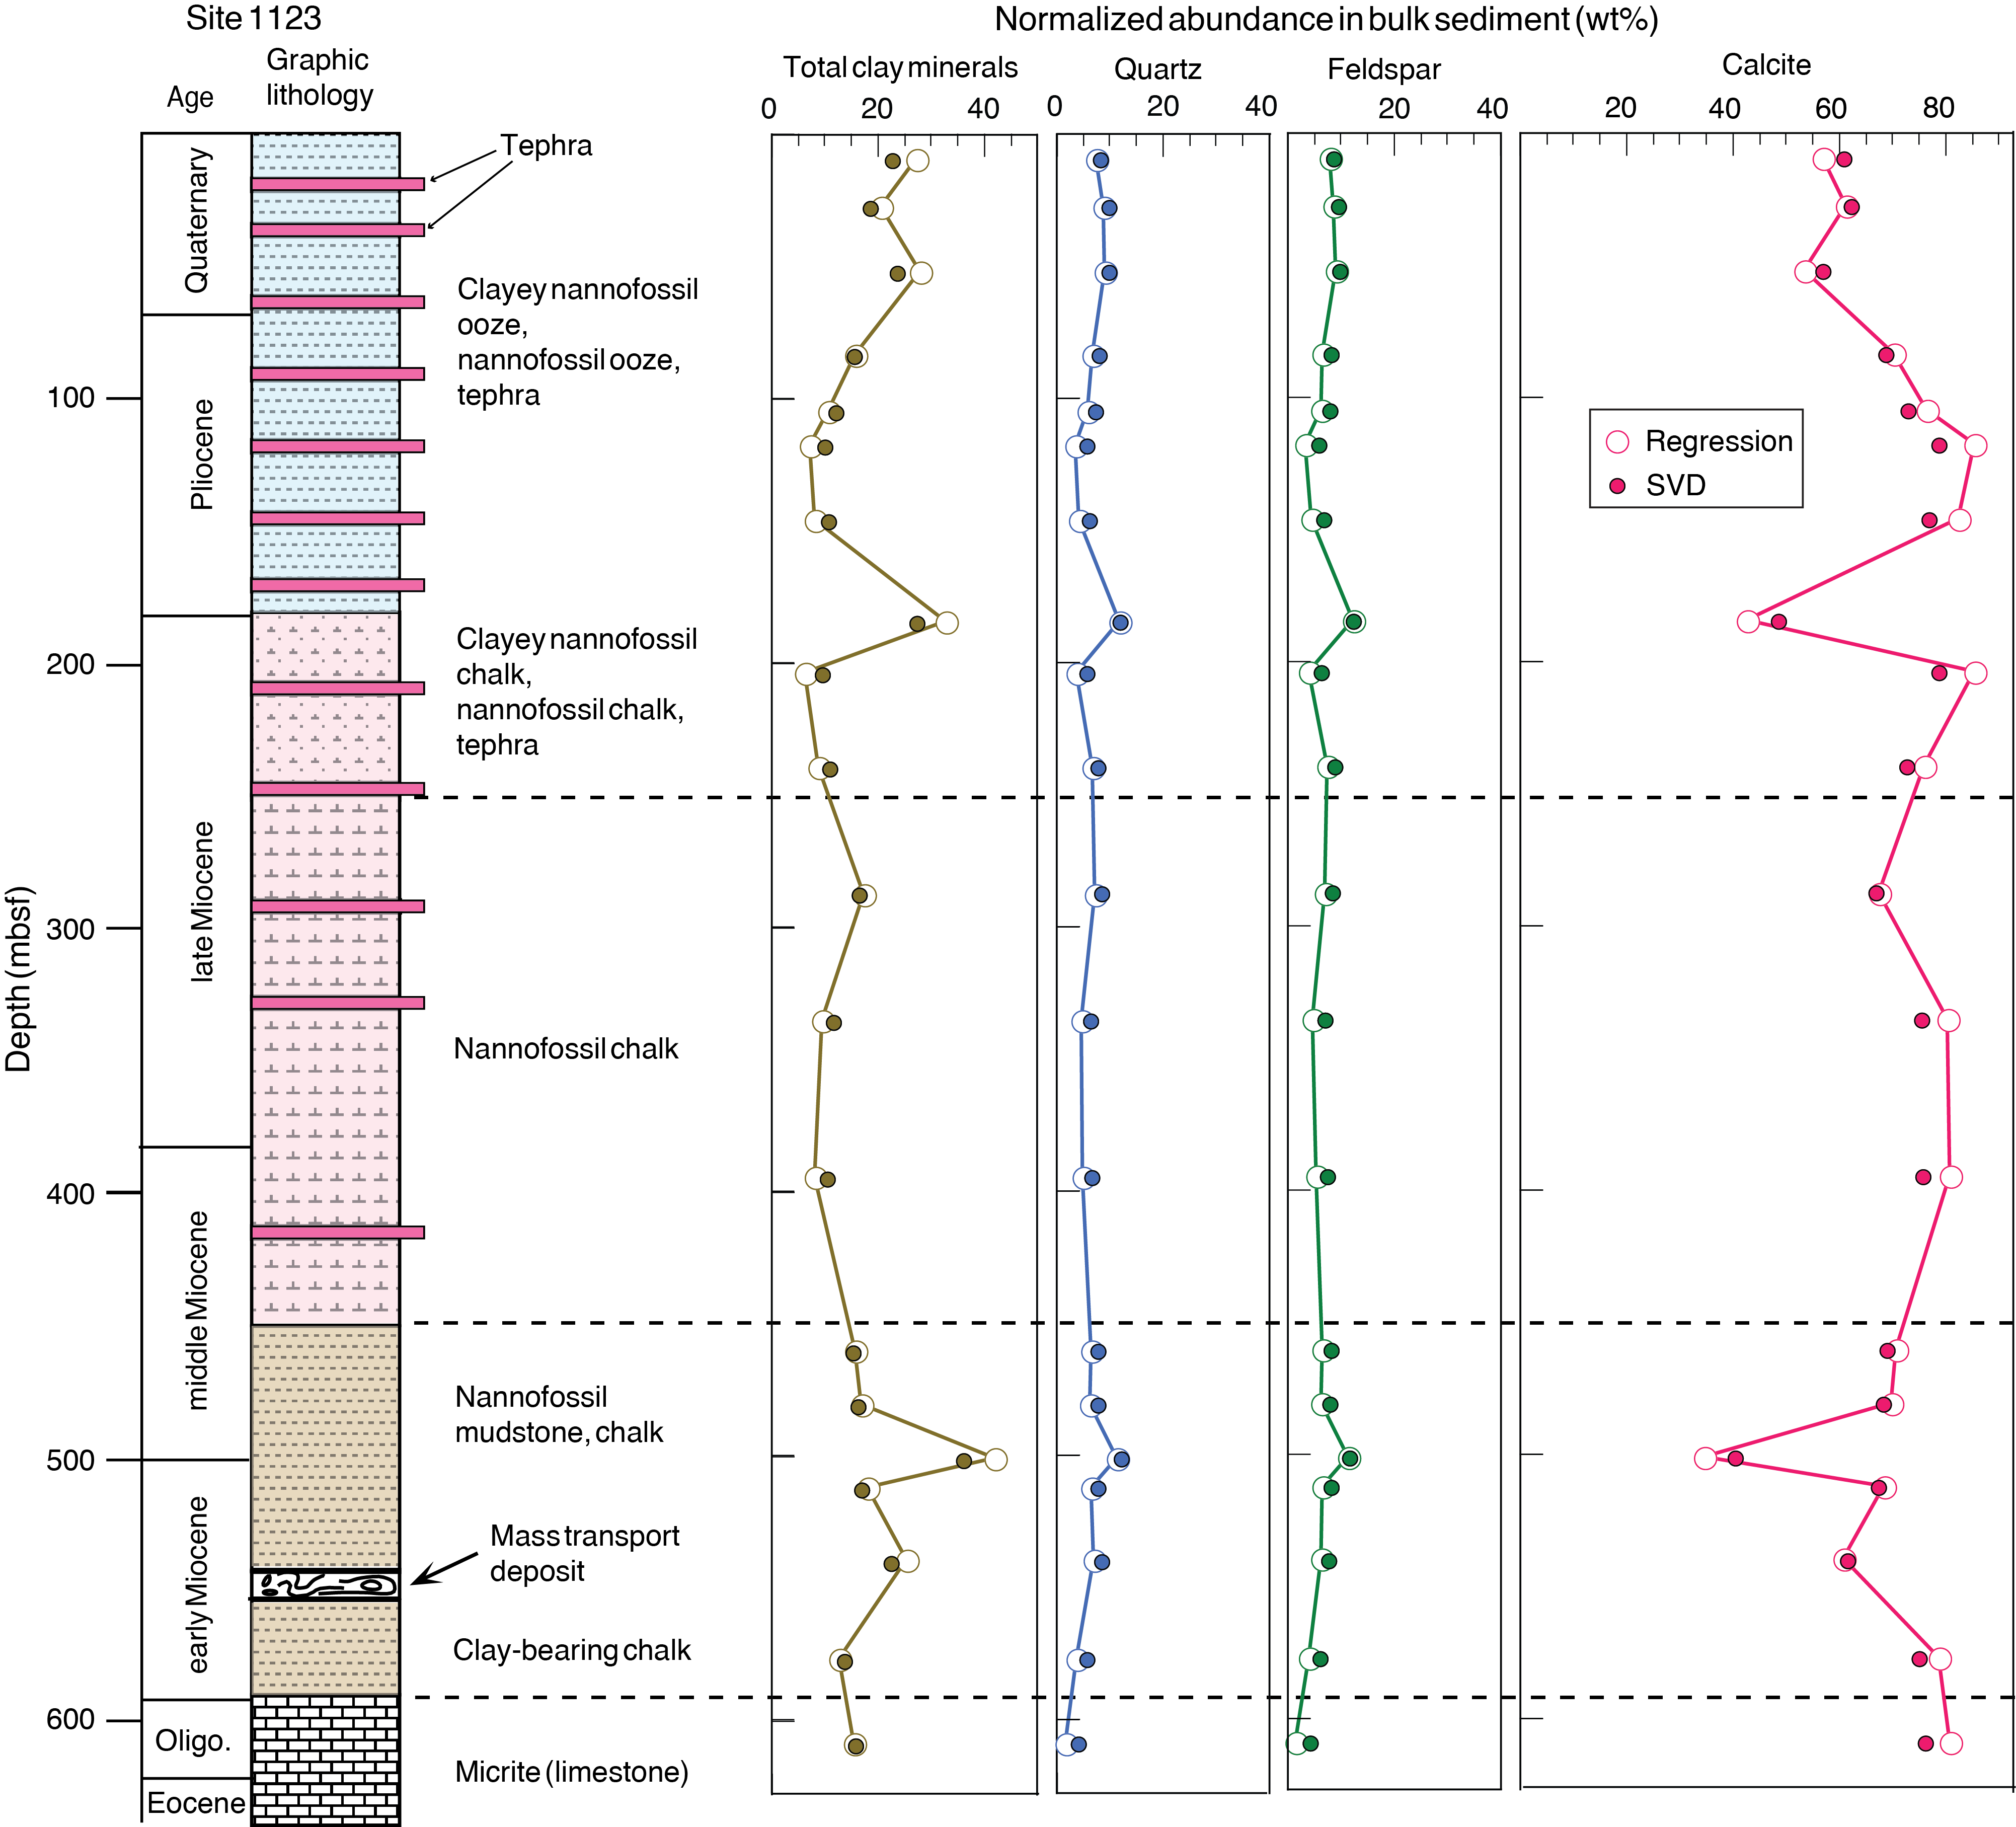
Figure F6. Site 1123 stratigraphic column and normalized bulk-powder values.
Site 1125 is located on the north flank of Chatham Rise at a water depth of 1360 m (Figure F5). This site lies beneath a zone of high primary productivity (the Subtropical Convergence), but sedimentation is also modulated by two surface currents, the East Cape Current, which carries suspended terrigenous sediment from eastern North Island, and the Southland Current, which flows up the east coast of South Island before turning east to parallel the crest of Chatham Rise (Shipboard Scientific Party, 1999d). The cores recovered from Site 1125 comprise a Miocene to Quaternary succession of clay-rich nannofossil ooze and chalk alternating with layers more enriched in terrigenous silt and clay (Shipboard Scientific Party, 1999d). Coulometric measurements of CaCO3 were not completed at this site, but XRD analyses of 18 samples (Table T3) show consistently high concentrations of calcite (58.0–86.6 wt%; average = 73.9 wt%). Normalized proportions of total clay minerals range 4.6–19.9 wt% (average = 11.0 wt%), whereas the contents of both quartz and feldspar are consistently <11 wt%. The contributions of terrigenous silt and clay are slightly higher in the lower 170 m of the section (Figure F7).

Figure F7. Site 1125 stratigraphic column and normalized bulk-powder values.
The Hikurangi Channel (Figure F8) is the primary conduit for turbidity currents and related gravity flows entering Hikurangi Trough from the southwest (Lewis et al., 1998; Lewis and Pantin, 2002). The channel extends >2000 km from feeder canyons that head in the Cook Strait and along the southeast coast of South Island (Lewis, 1994; Mountjoy et al., 2009). Six hemipelagic mud samples were analyzed from four cores in the channel-levee complex (Figure F8). The mud specimens contain 33.4–43.7 wt% total clay minerals, 20.4–31.0 wt% quartz, 20.6–28.7 wt% feldspar, and 6.6–14.8 wt% calcite (Table T3). These bulk compositions are similar to the values documented in Cores VM16-123 and RC08-76 offshore southeast South Island (Figure F4).
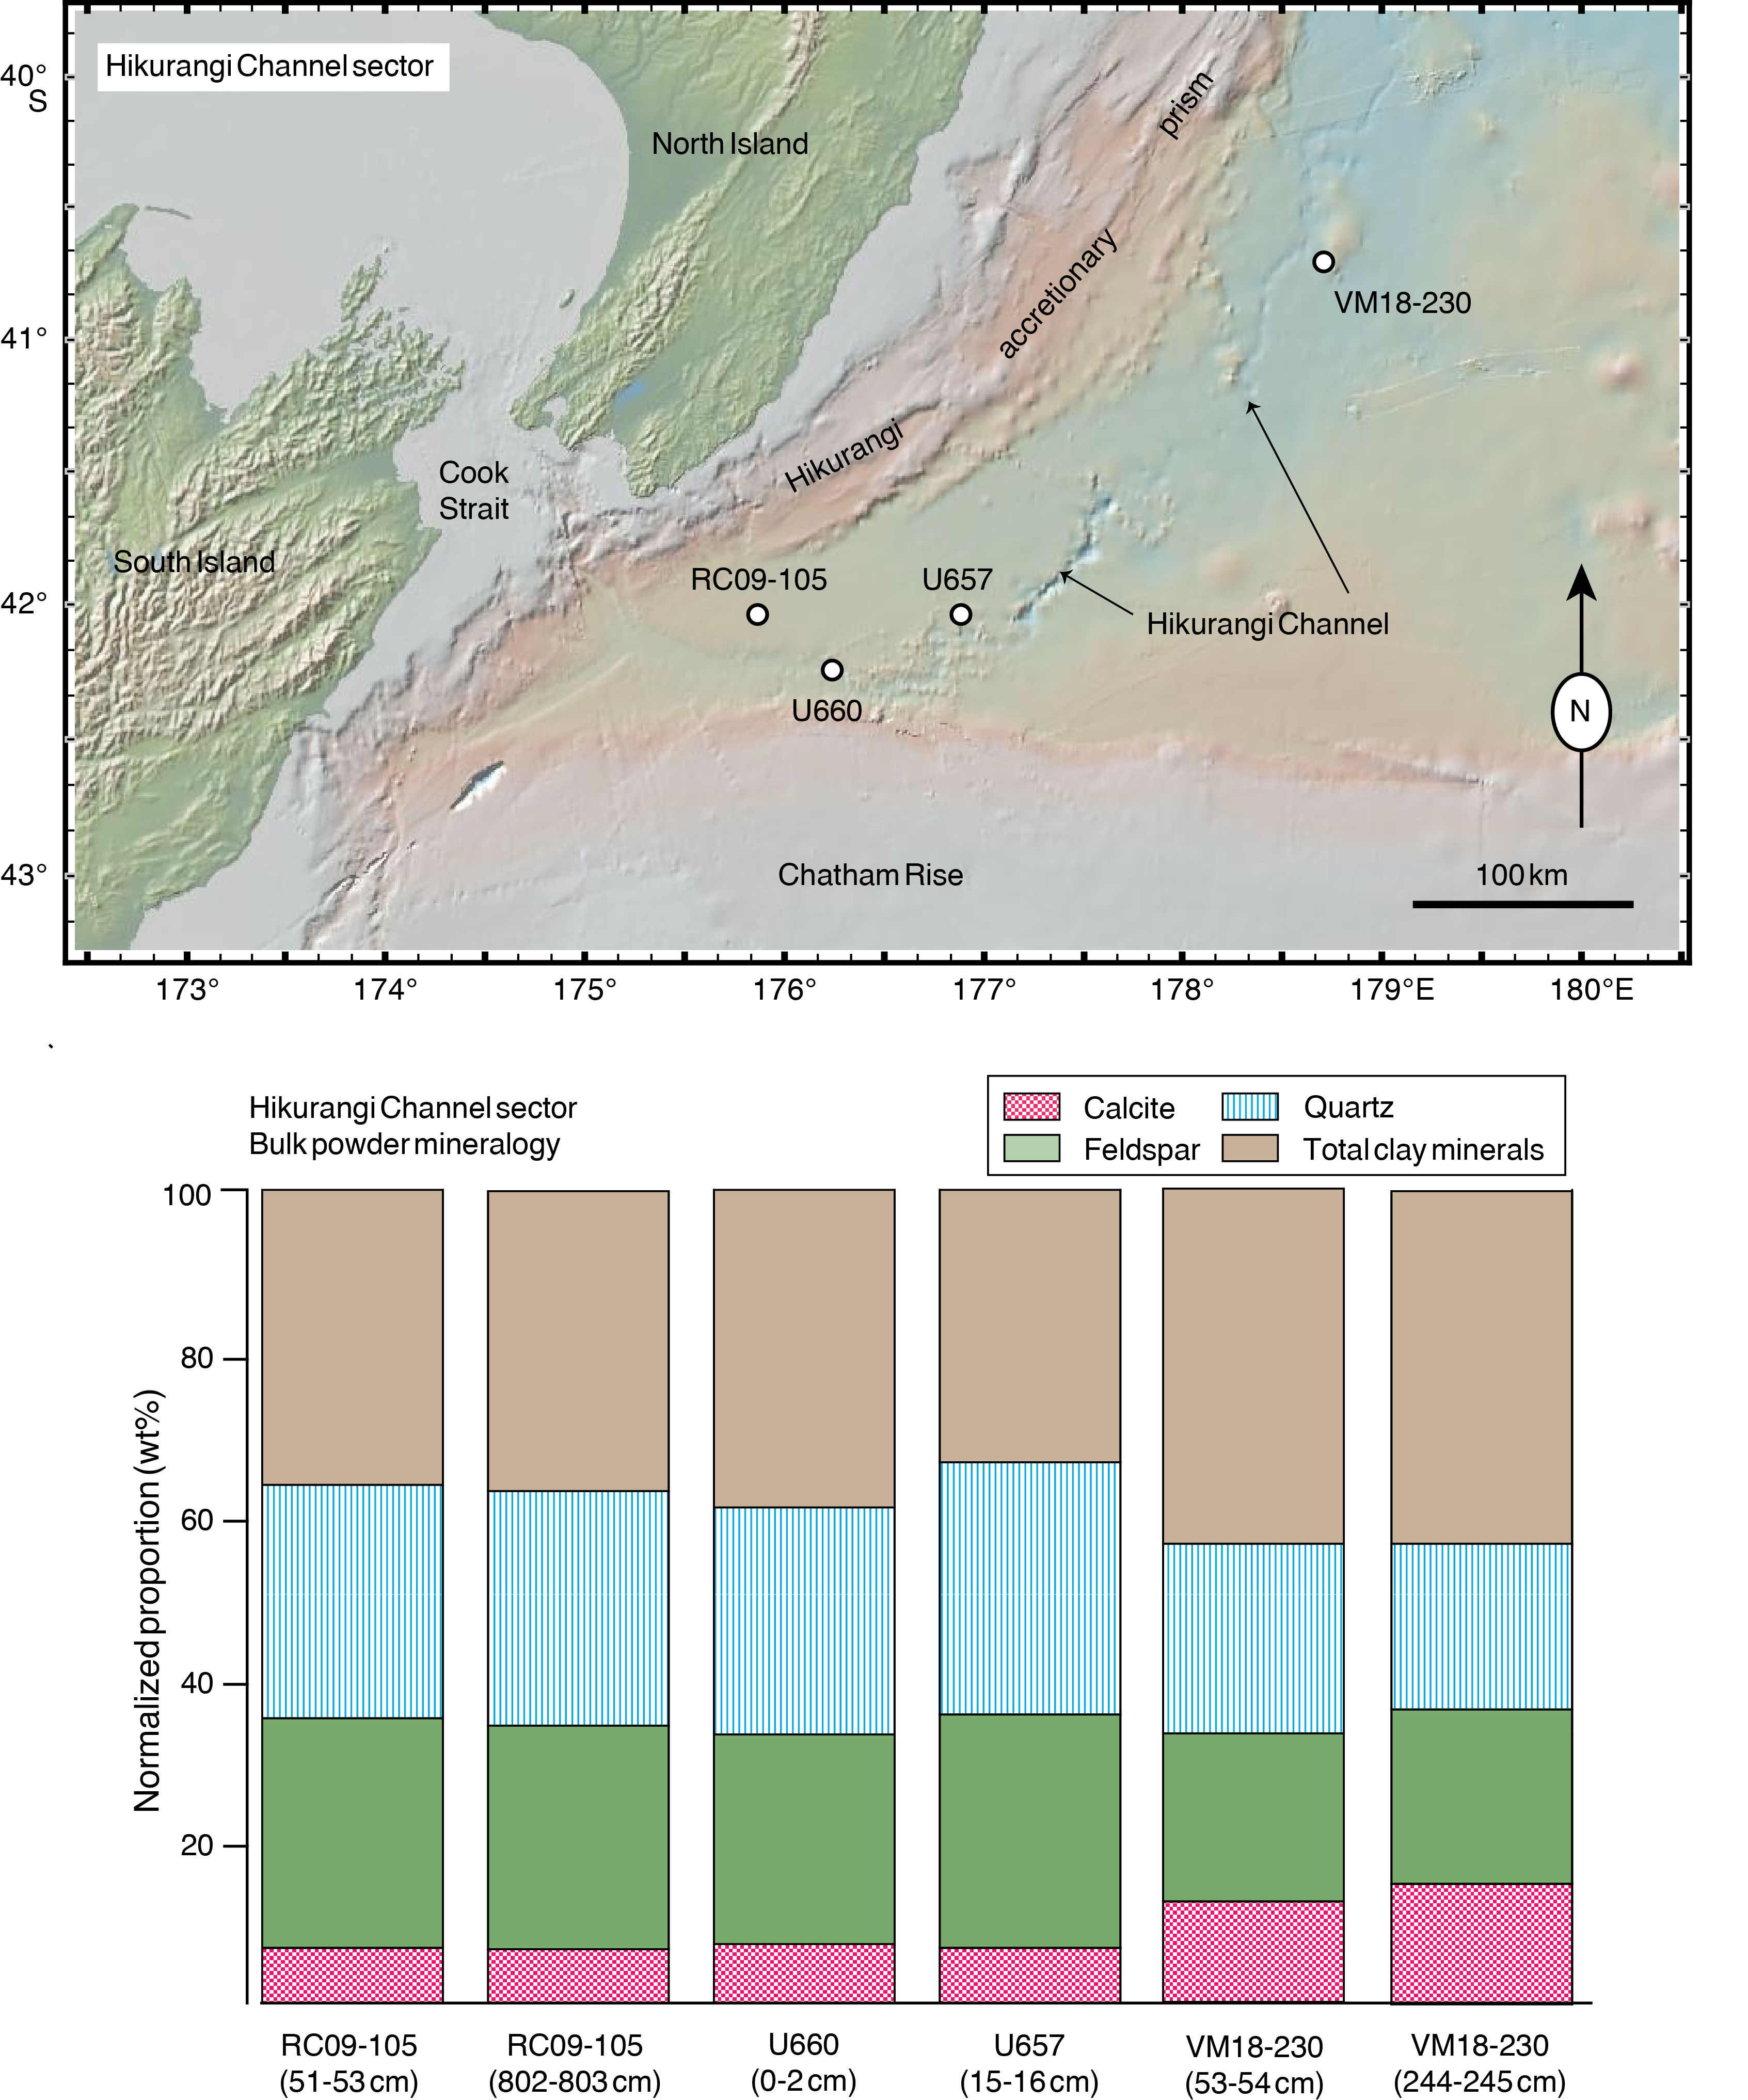
Figure F8. Proximal Hikurangi Channel sites and normalized bulk-powder values.
The Hawkes Bay sector offshore North Island lies farther to the northeast along the subduction margin (Figure F9). A total of 10 samples were analyzed from giant piston Core MD2121, on the landward trench slope, to test for compositional variability within the Holocene and latest Pleistocene. Normalized concentrations of total clay minerals in that core range from 35.2 to 41.1 wt%. The content of quartz is 23.6–28.2 wt%, and feldspar varies between 20.1 and 23.3 wt%. Values for calcite range from 12.3 to 19.1 wt%. Nearby Cores RR0503-52 and RR0503-56 yielded similar bulk compositions (Table T3). One sample from Core MD06-2997, on the outer continental shelf, contains slightly more quartz (30.1 wt%) balanced by a reduction of calcite (8.0 wt%). Two samples from Core VM18-231, recovered from the seaward levee of Hikurangi Channel, contain 42.1–42.4 wt% total clay, 23.5–27.5 wt% quartz, 19.5–23.7 wt% feldspar, and 6.7–14.6 wt% calcite (Figure F9), which is similar to samples from the upstream reaches of the Hikurangi Trough (Figure F8).
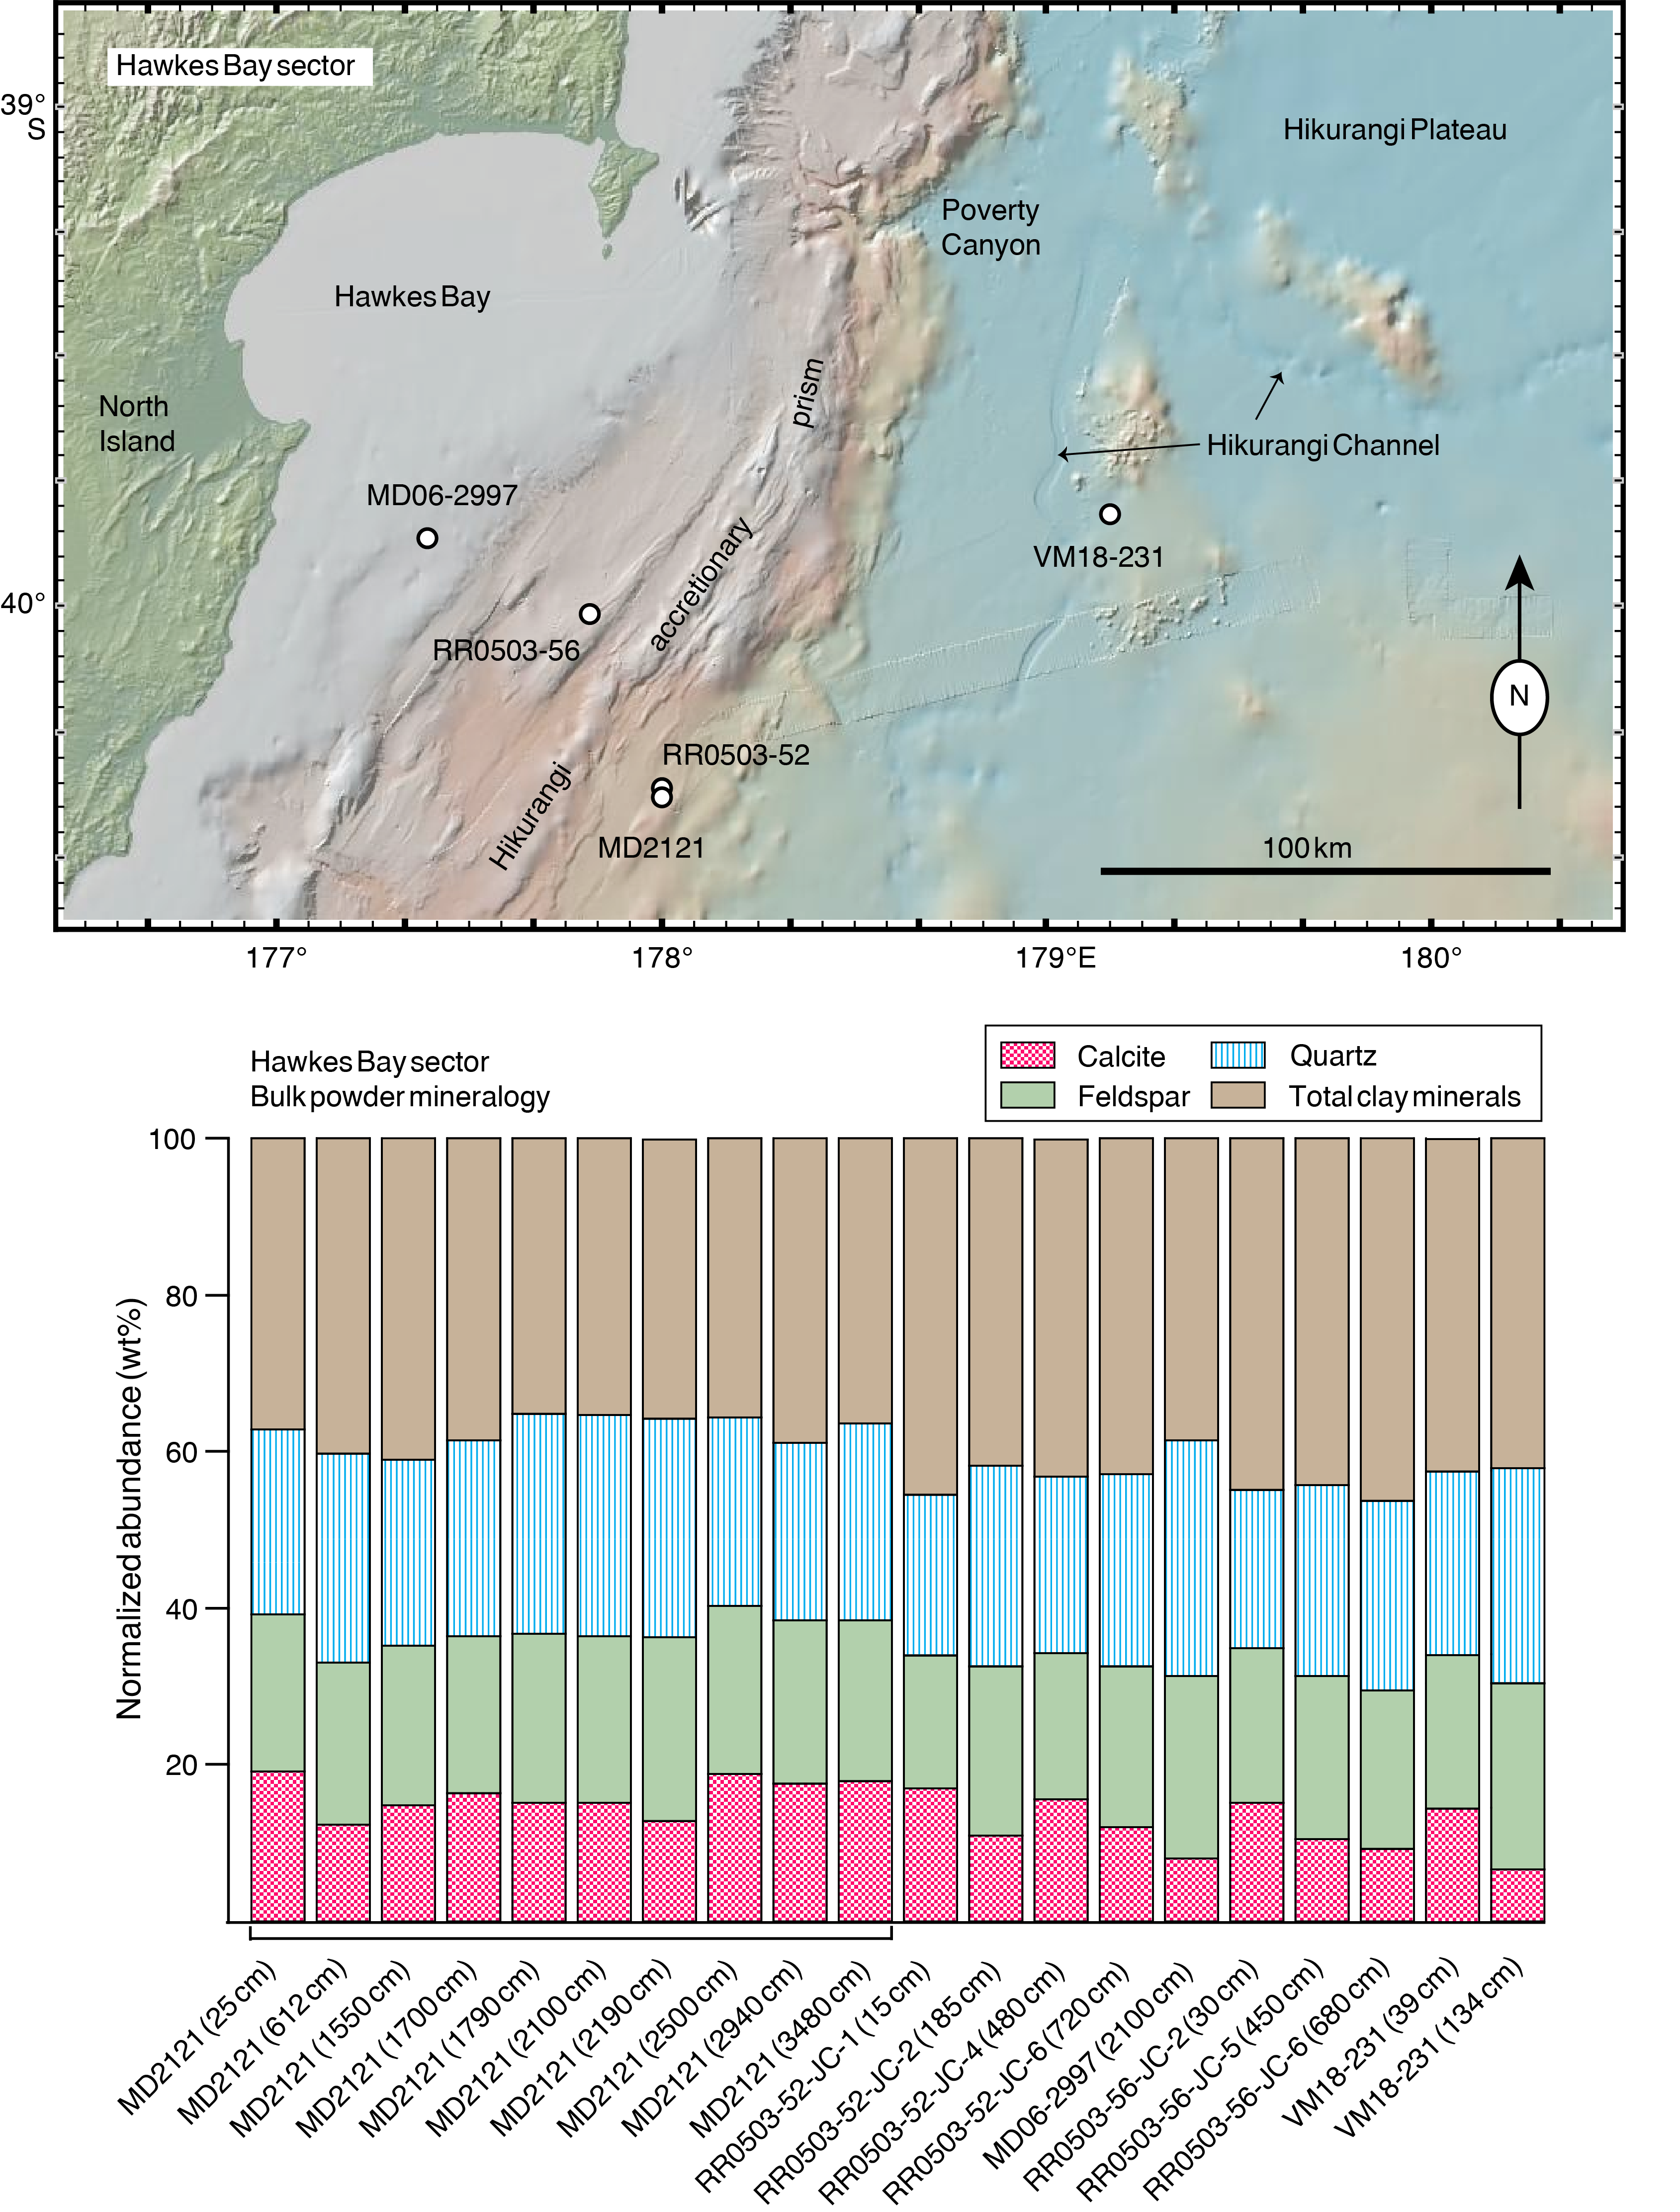
Figure F9. Hawkes Bay sites and normalized bulk-powder values.
The IODP transect region (Figure F10) includes the five sites drilled during Expeditions 372 and 375 (see the Expedition 372B/375 summary chapter [Saffer et al., 2019]), the Ruatoria debris avalanche, and a transverse submarine canyon in the Poverty reentrant. Three giant piston cores from this sector (MD06-3003, MD06-3008, and MD06-3009) were described and interpreted in detail by Pouderoux et al. (2012). With one exception (Site U1751; 52.3 wt% calcite), the bulk compositions from these cores mirror those of sediments in the Hawkes Bay sector to the southwest (Figure F9). Normalized abundance is 20.6–43.1 wt% total clay, 23.1–39.1 wt% quartz, 19.1–33.9 wt% feldspar, and 4.1–14.7 wt% calcite (Table T3). Samples from the Ruatoria debris avalanche and vicinity reveal no significant differences in bulk composition compared to undeformed slope sediments to the southwest (Figure F10). Core MD06-3004, on the continental shelf, contains less total clay (20.6–24.2 wt%) and higher proportions of quartz (37.8–39.1 wt%) and feldspar (31.9–33.9 wt%) (Table T3). It’s reasonable to surmise that relatively small contrasts in composition compared to nearby slope and trench-floor deposits are probably related to the grain size distribution because quartz and feldspar are expected to increase in the silt and fine sand fractions.
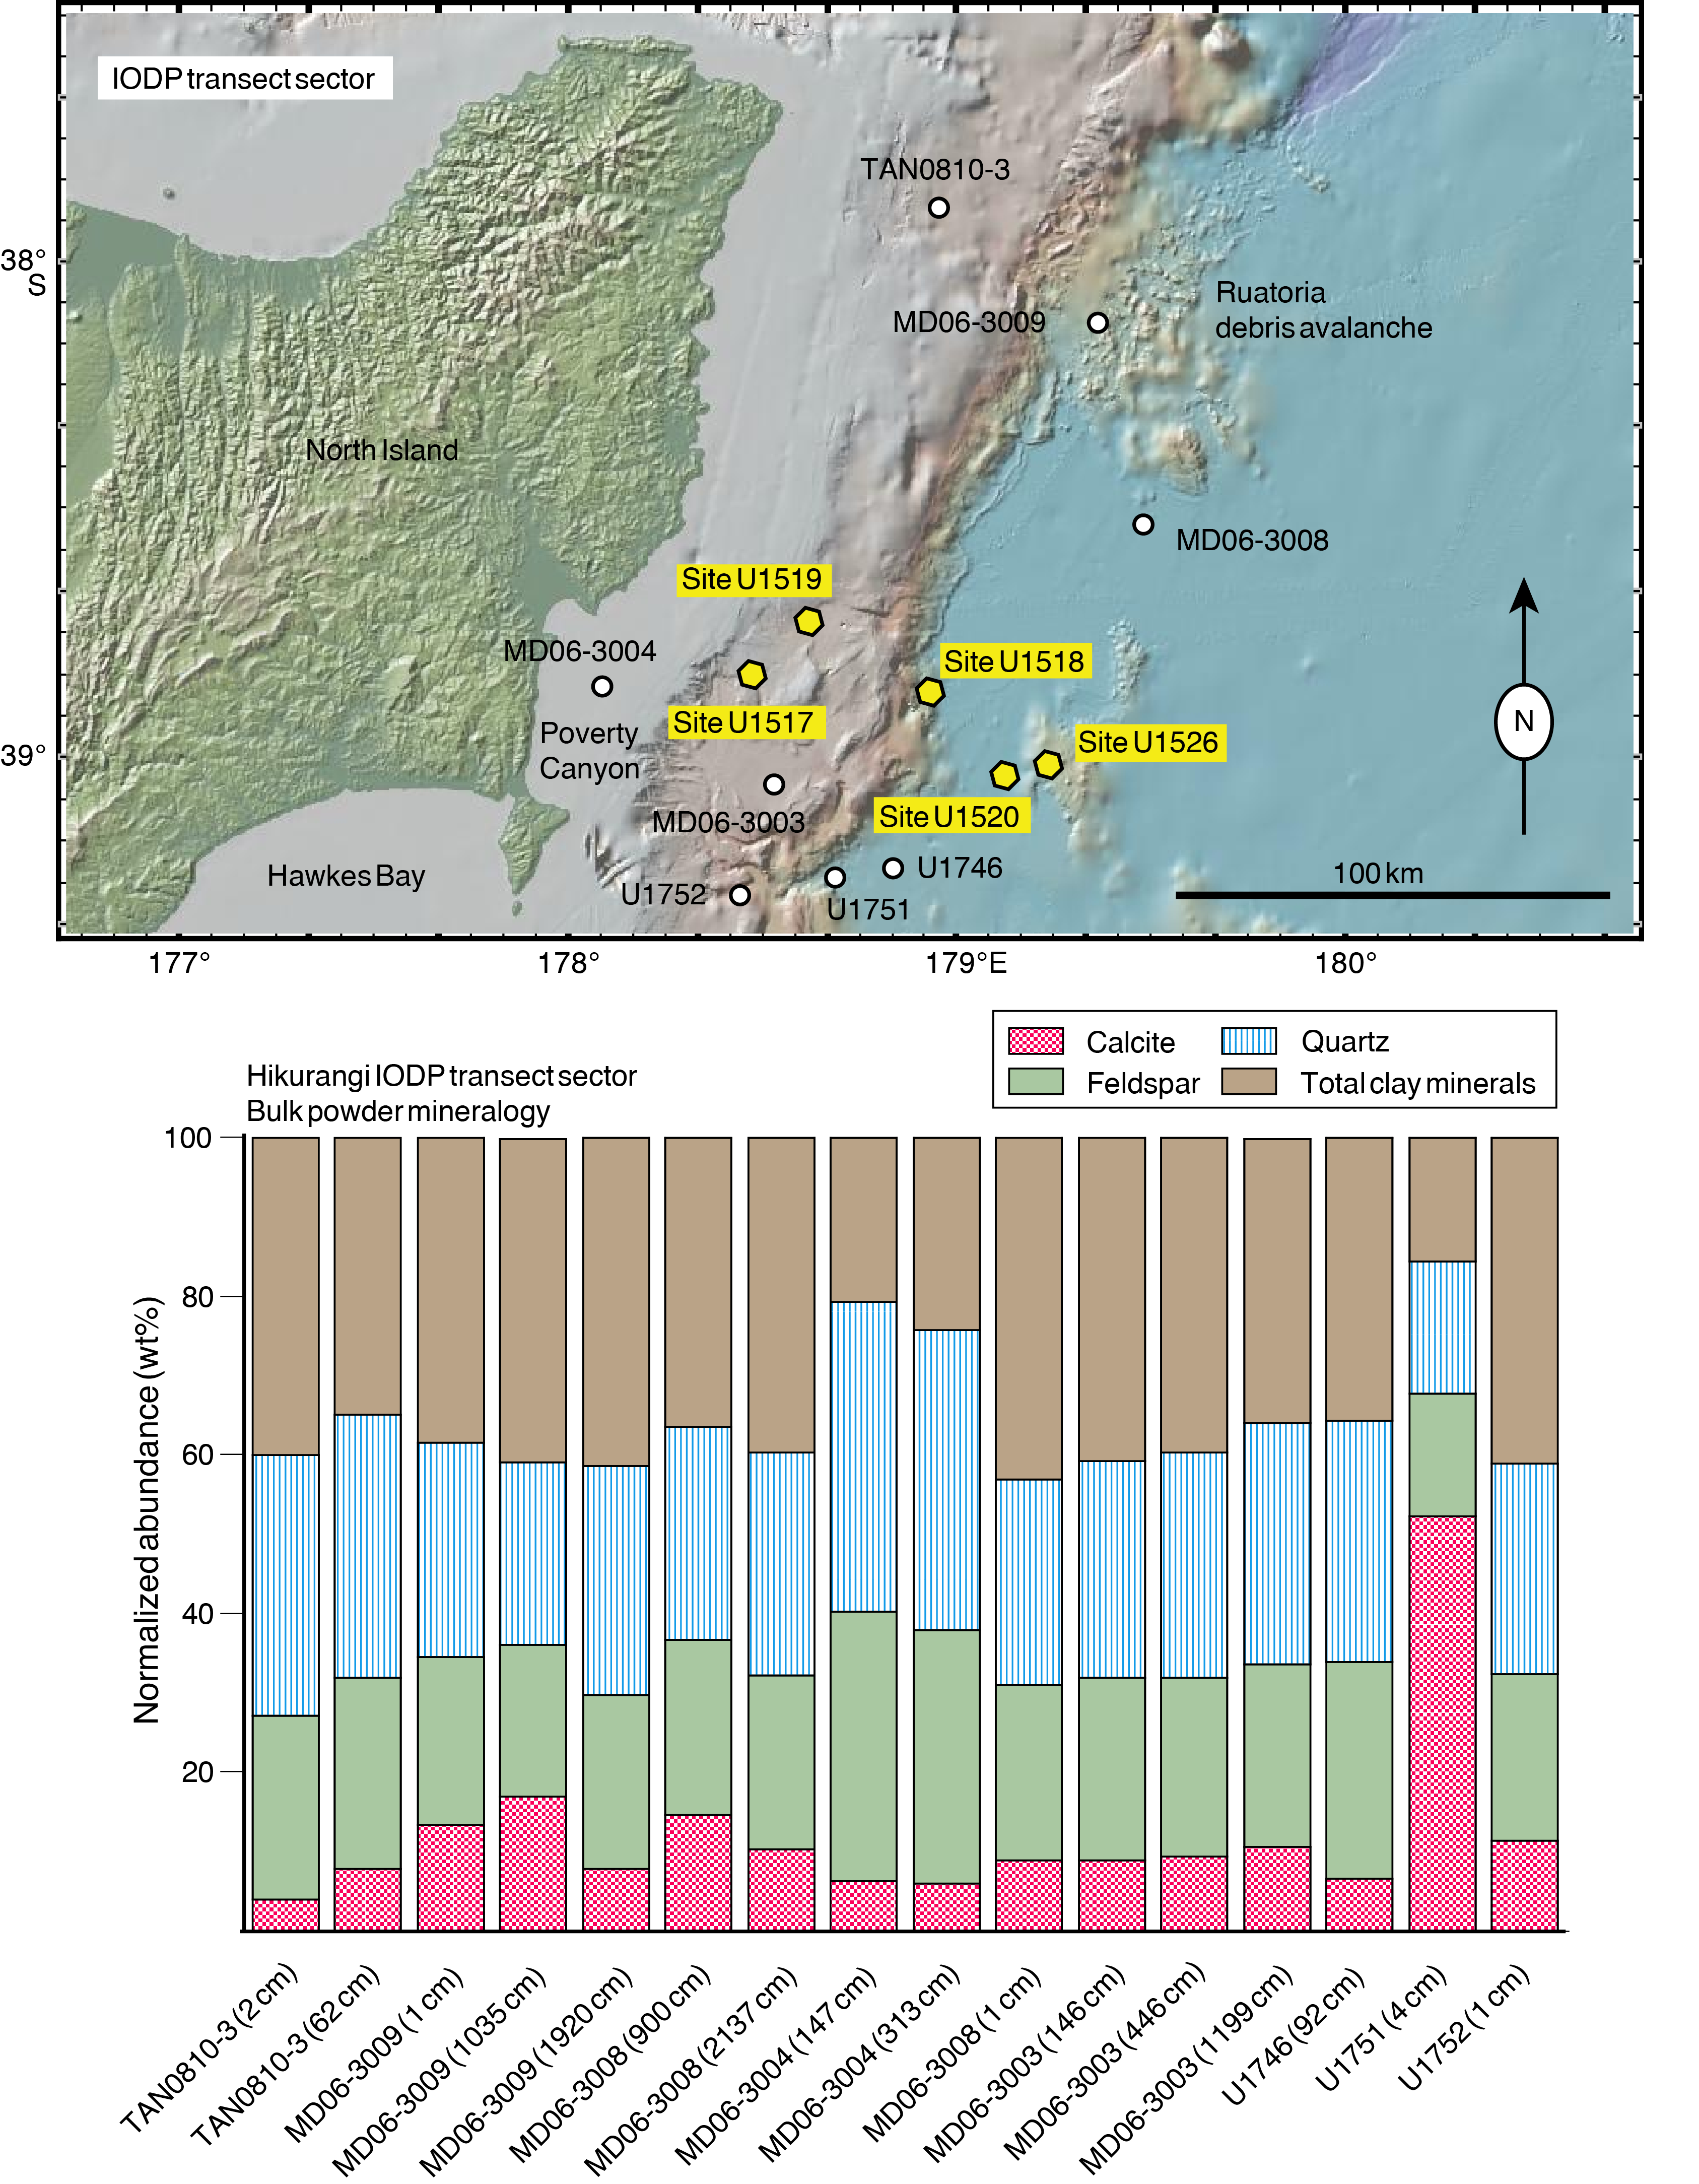
Figure F10. IODP transect sites and normalized bulk-powder values.
Hikurangi Plateau is the dominant bathymetric feature seaward of the IODP transect sector (Figure F11). The Hikurangi Channel meanders toward the east across the plateau before bending north in the vicinity of Site 1124 (Lewis, 1994; Davy et al., 2008). Six cores were sampled from along the southern flank of the plateau. With two clay-rich exceptions (Cores RR0503-31 and RR0503-48), these sediments cover the spectrum from calcareous mud to muddy calcareous ooze. Contents of total clay minerals range from 15.0 to 40.2 wt%, and the proportion of calcite ranges from 25.4 to 67.1 wt%. Contents of quartz and feldspar are <20 wt%. One core from the southernmost Kermadec Trench was also sampled (Figure F11). Mud from that core contains 37.9–40.8 wt% clay minerals, 24.4–29.4 wt% quartz, 21.7–26.1 wt% feldspar, and 6.7–13.0 wt% calcite.
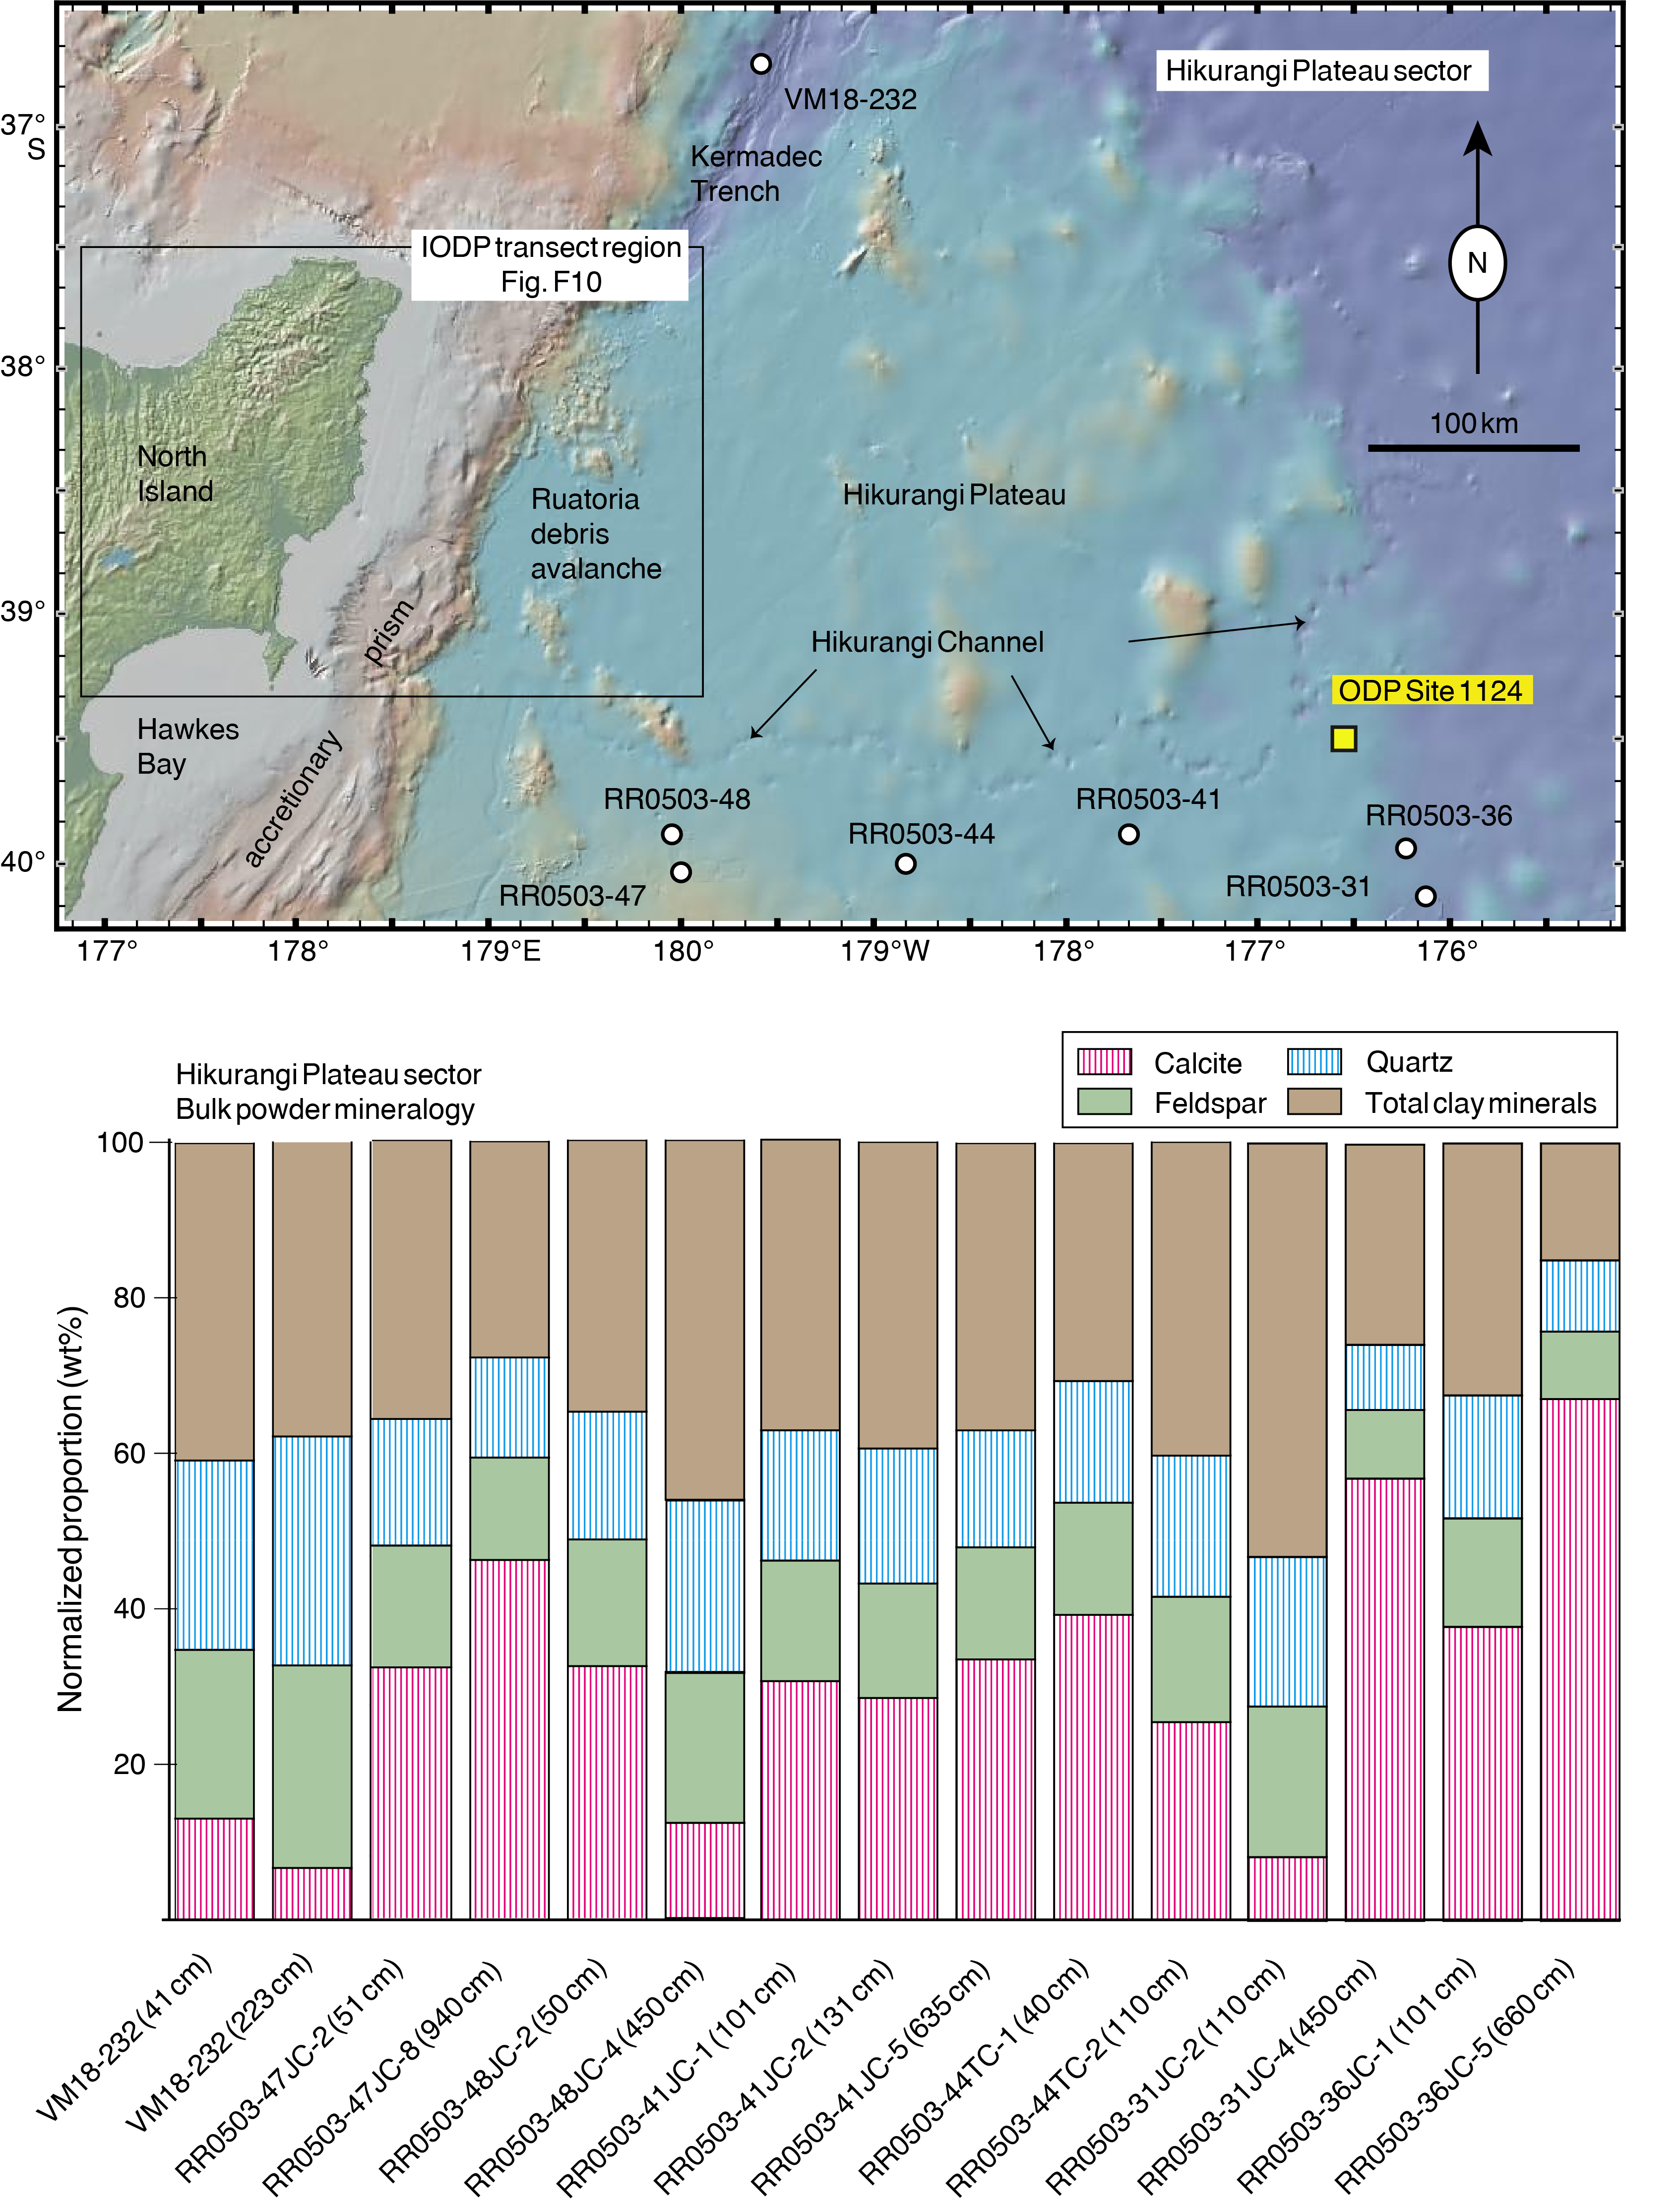
Figure F11. Hikurangi Plateau sites and normalized bulk-powder values.
Site 1124 is located on a north-south–trending ridge of drift sediment at a water depth of 3978 m (Shipboard Scientific Party, 1999c). The main goal of drilling at Site 1124 was to obtain a record of Miocene sedimentation under the influence of the DWBC. In addition, a sequence of Pleistocene turbidites laps onto the drift sediments from the west, having spilled over the right bank of Hikurangi Channel (Shipboard Scientific Party, 1999c). Coring reached a total depth of 473 mbsf with recovery of sedimentary rocks as old as Late Cretaceous (Figure F12). The common lithologies include clay-bearing nannofossil ooze, nannofossil-bearing mud, chalk, mudstone, zeolitic mudstone, and chert. Coulometric measurements revealed large variations in the abundance of CaCO3; values range 1.5–88.3 wt% with considerable scatter throughout the section (Shipboard Scientific Party, 1999c). Bulk XRD data from 23 samples are generally consistent with the heterogeneous nature of core descriptions (Figure F12). The normalized abundance of total clay minerals ranges 5.8–60.7 wt%, and the abundance of calcite varies between 3.0 and 91.3 wt% (Table T3). Quartz values range 1.5–17.9 wt%, and feldspar content ranges 1.4–19.6 wt%. In general, the content of total clay increases downsection from the seafloor to ~300 mbsf, with a corresponding decrease in calcite (Figure F12). Conversely, the lower 125 m of the section is generally more enriched in calcite.
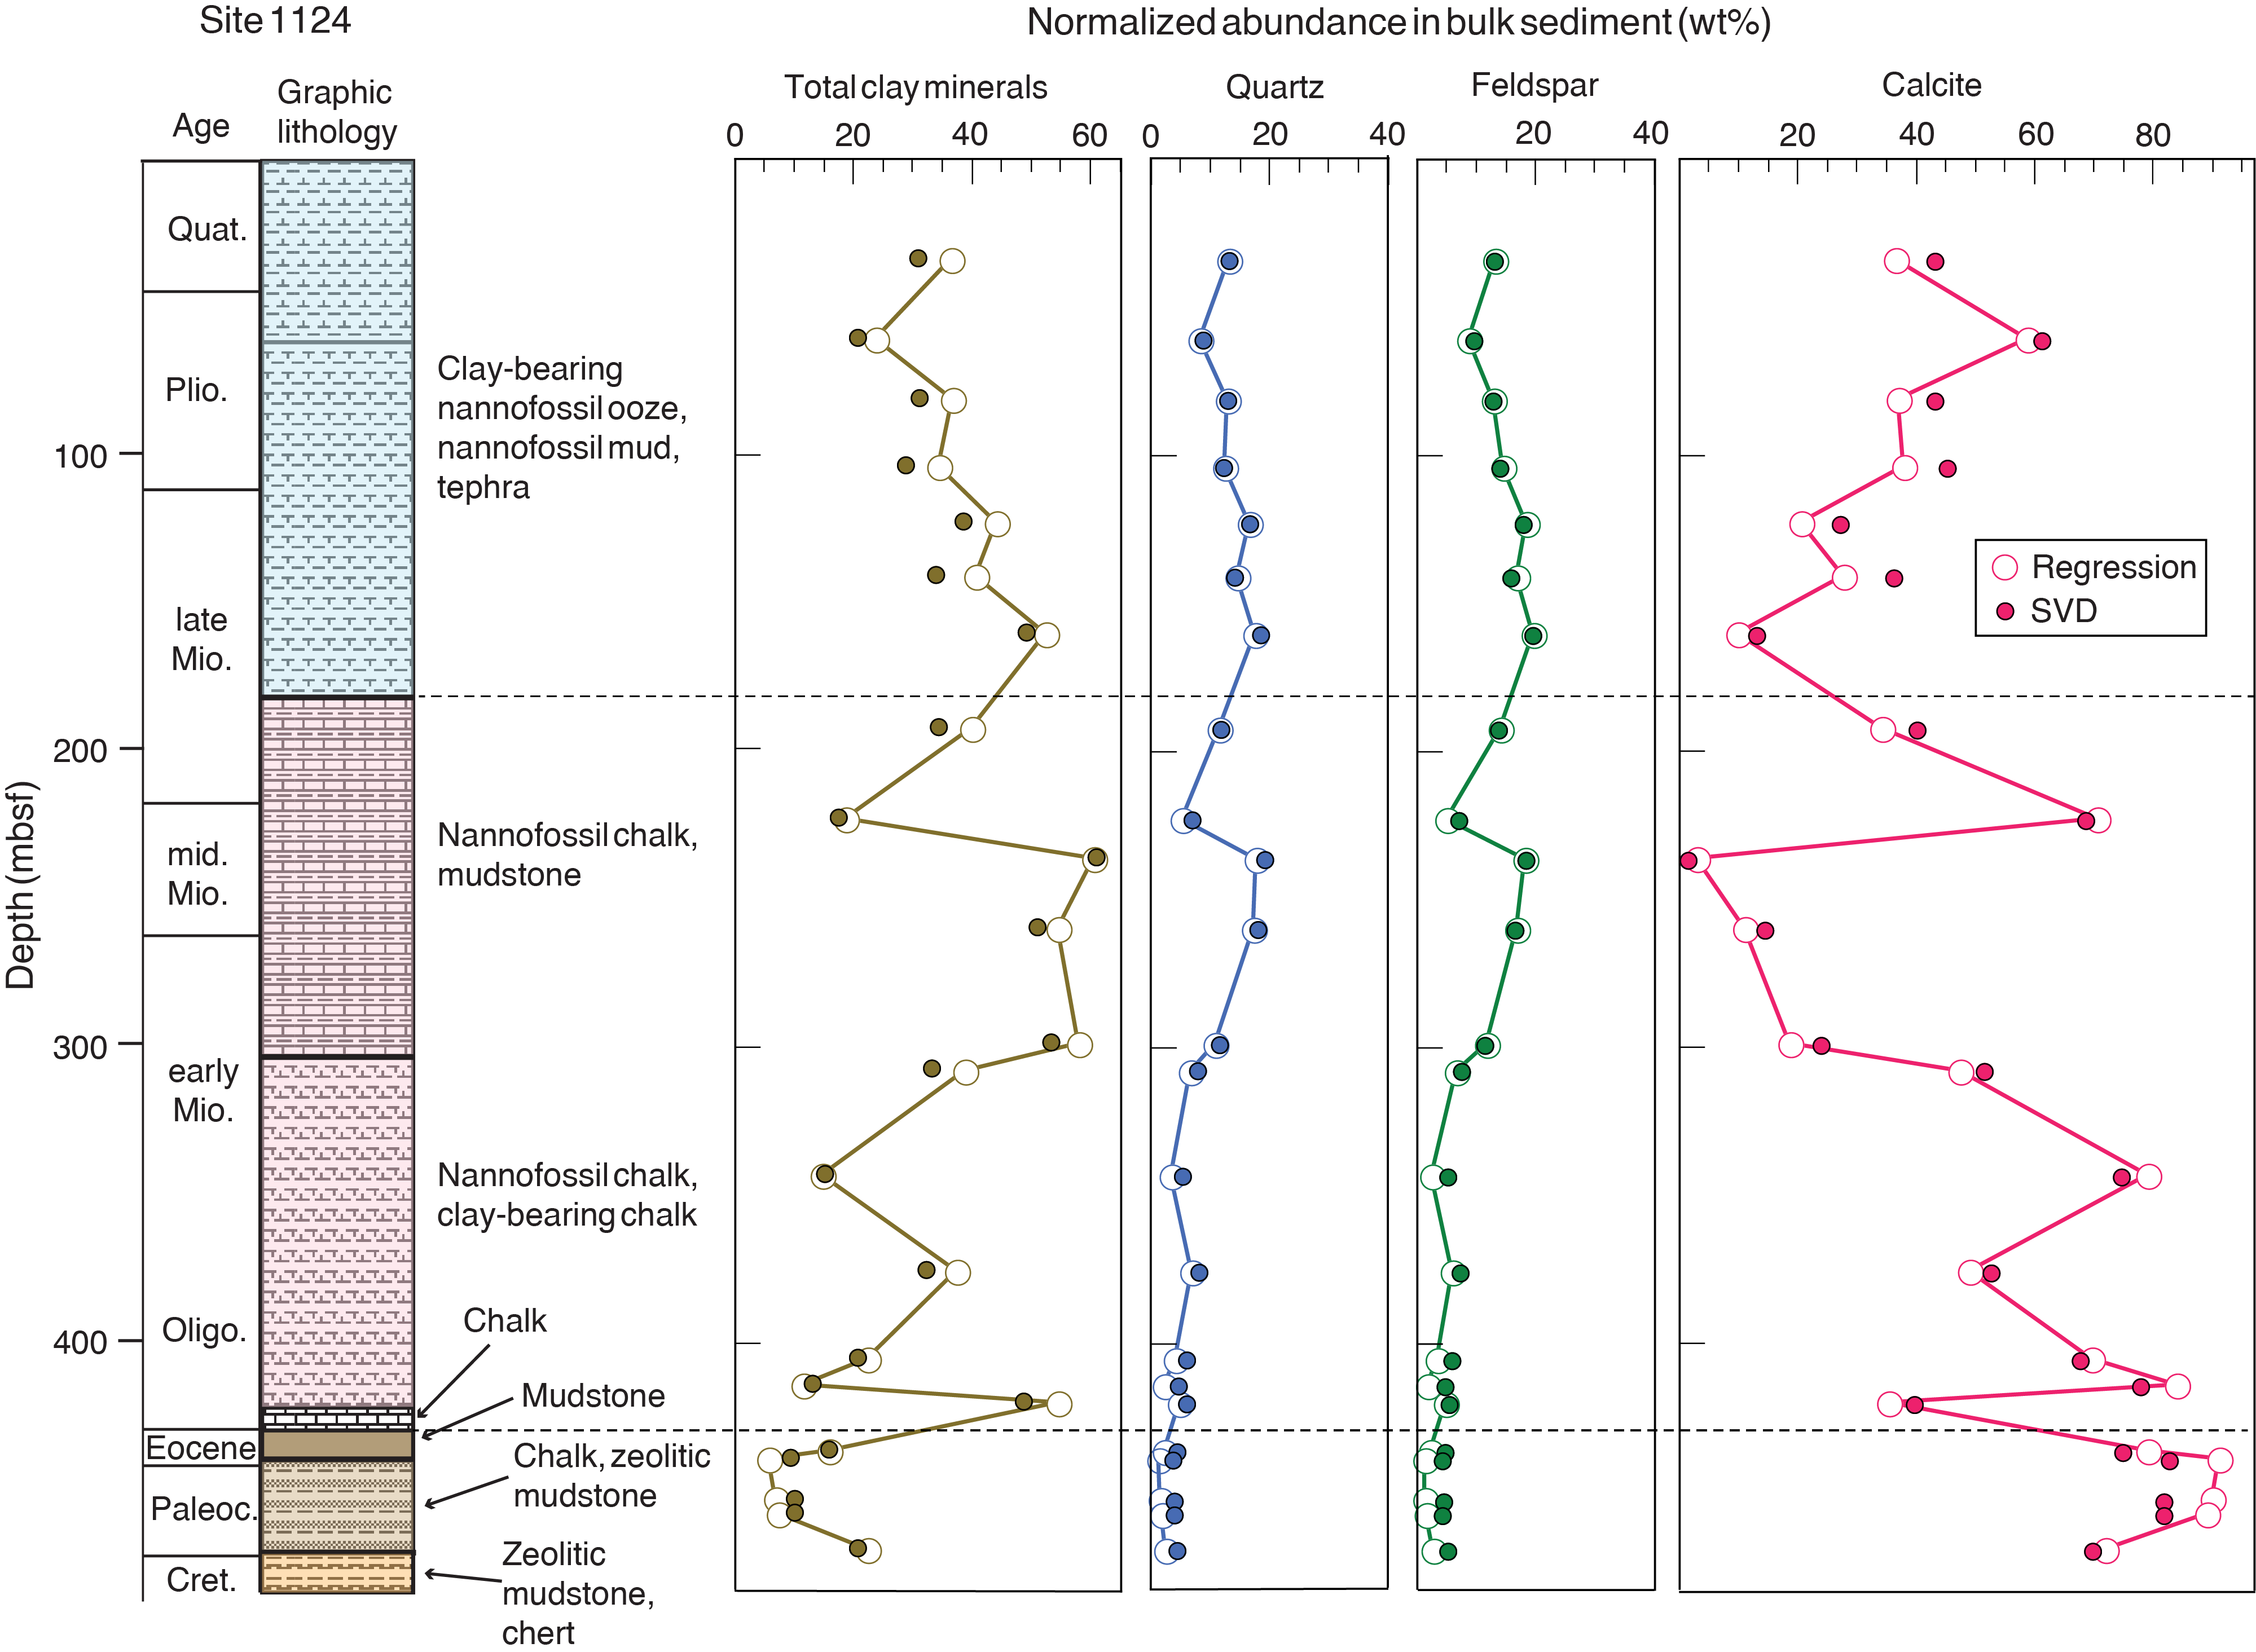
Figure F12. Site 1124 stratigraphic column and normalized bulk-powder values.
Clay mineral assemblages
A smaller subset of the total suite of bulk sediment specimens was used to generate initial results for the clay-sized fraction. This effort concentrated on lithologies with relatively high proportions of total clay minerals (Table T4) to reveal possible first-order changes in clay along the strike length of the Hikurangi margin. Figure F13 shows the geographic distribution of clay-size results plotted as normalized proportions of clay minerals (i.e., where smectite + illite + undifferentiated [chlorite + kaolinite] = 100%). Proportions of smectite overall range 5.0–54.2 wt%. Weight percent values for illite range 35.7–67.4 wt%, and the proportion of undifferentiated chlorite + kaolinite ranges 9.4–27.8 wt%. The spatial changes, however, are noteworthy. The region offshore South Island and continuing into the proximal reaches of Hikurangi Channel is dominated by detrital illite, with normalized proportions of 61–71 wt% (or 53%–64% using Biscaye weighting factors; Table T4). Proportions of smectite begin to increase significantly near 41°S (Core VM18-230), and smectite remains the dominant clay throughout the Hawkes Bay sector and the IODP transect area (Figure F13), with most values >40 wt%.
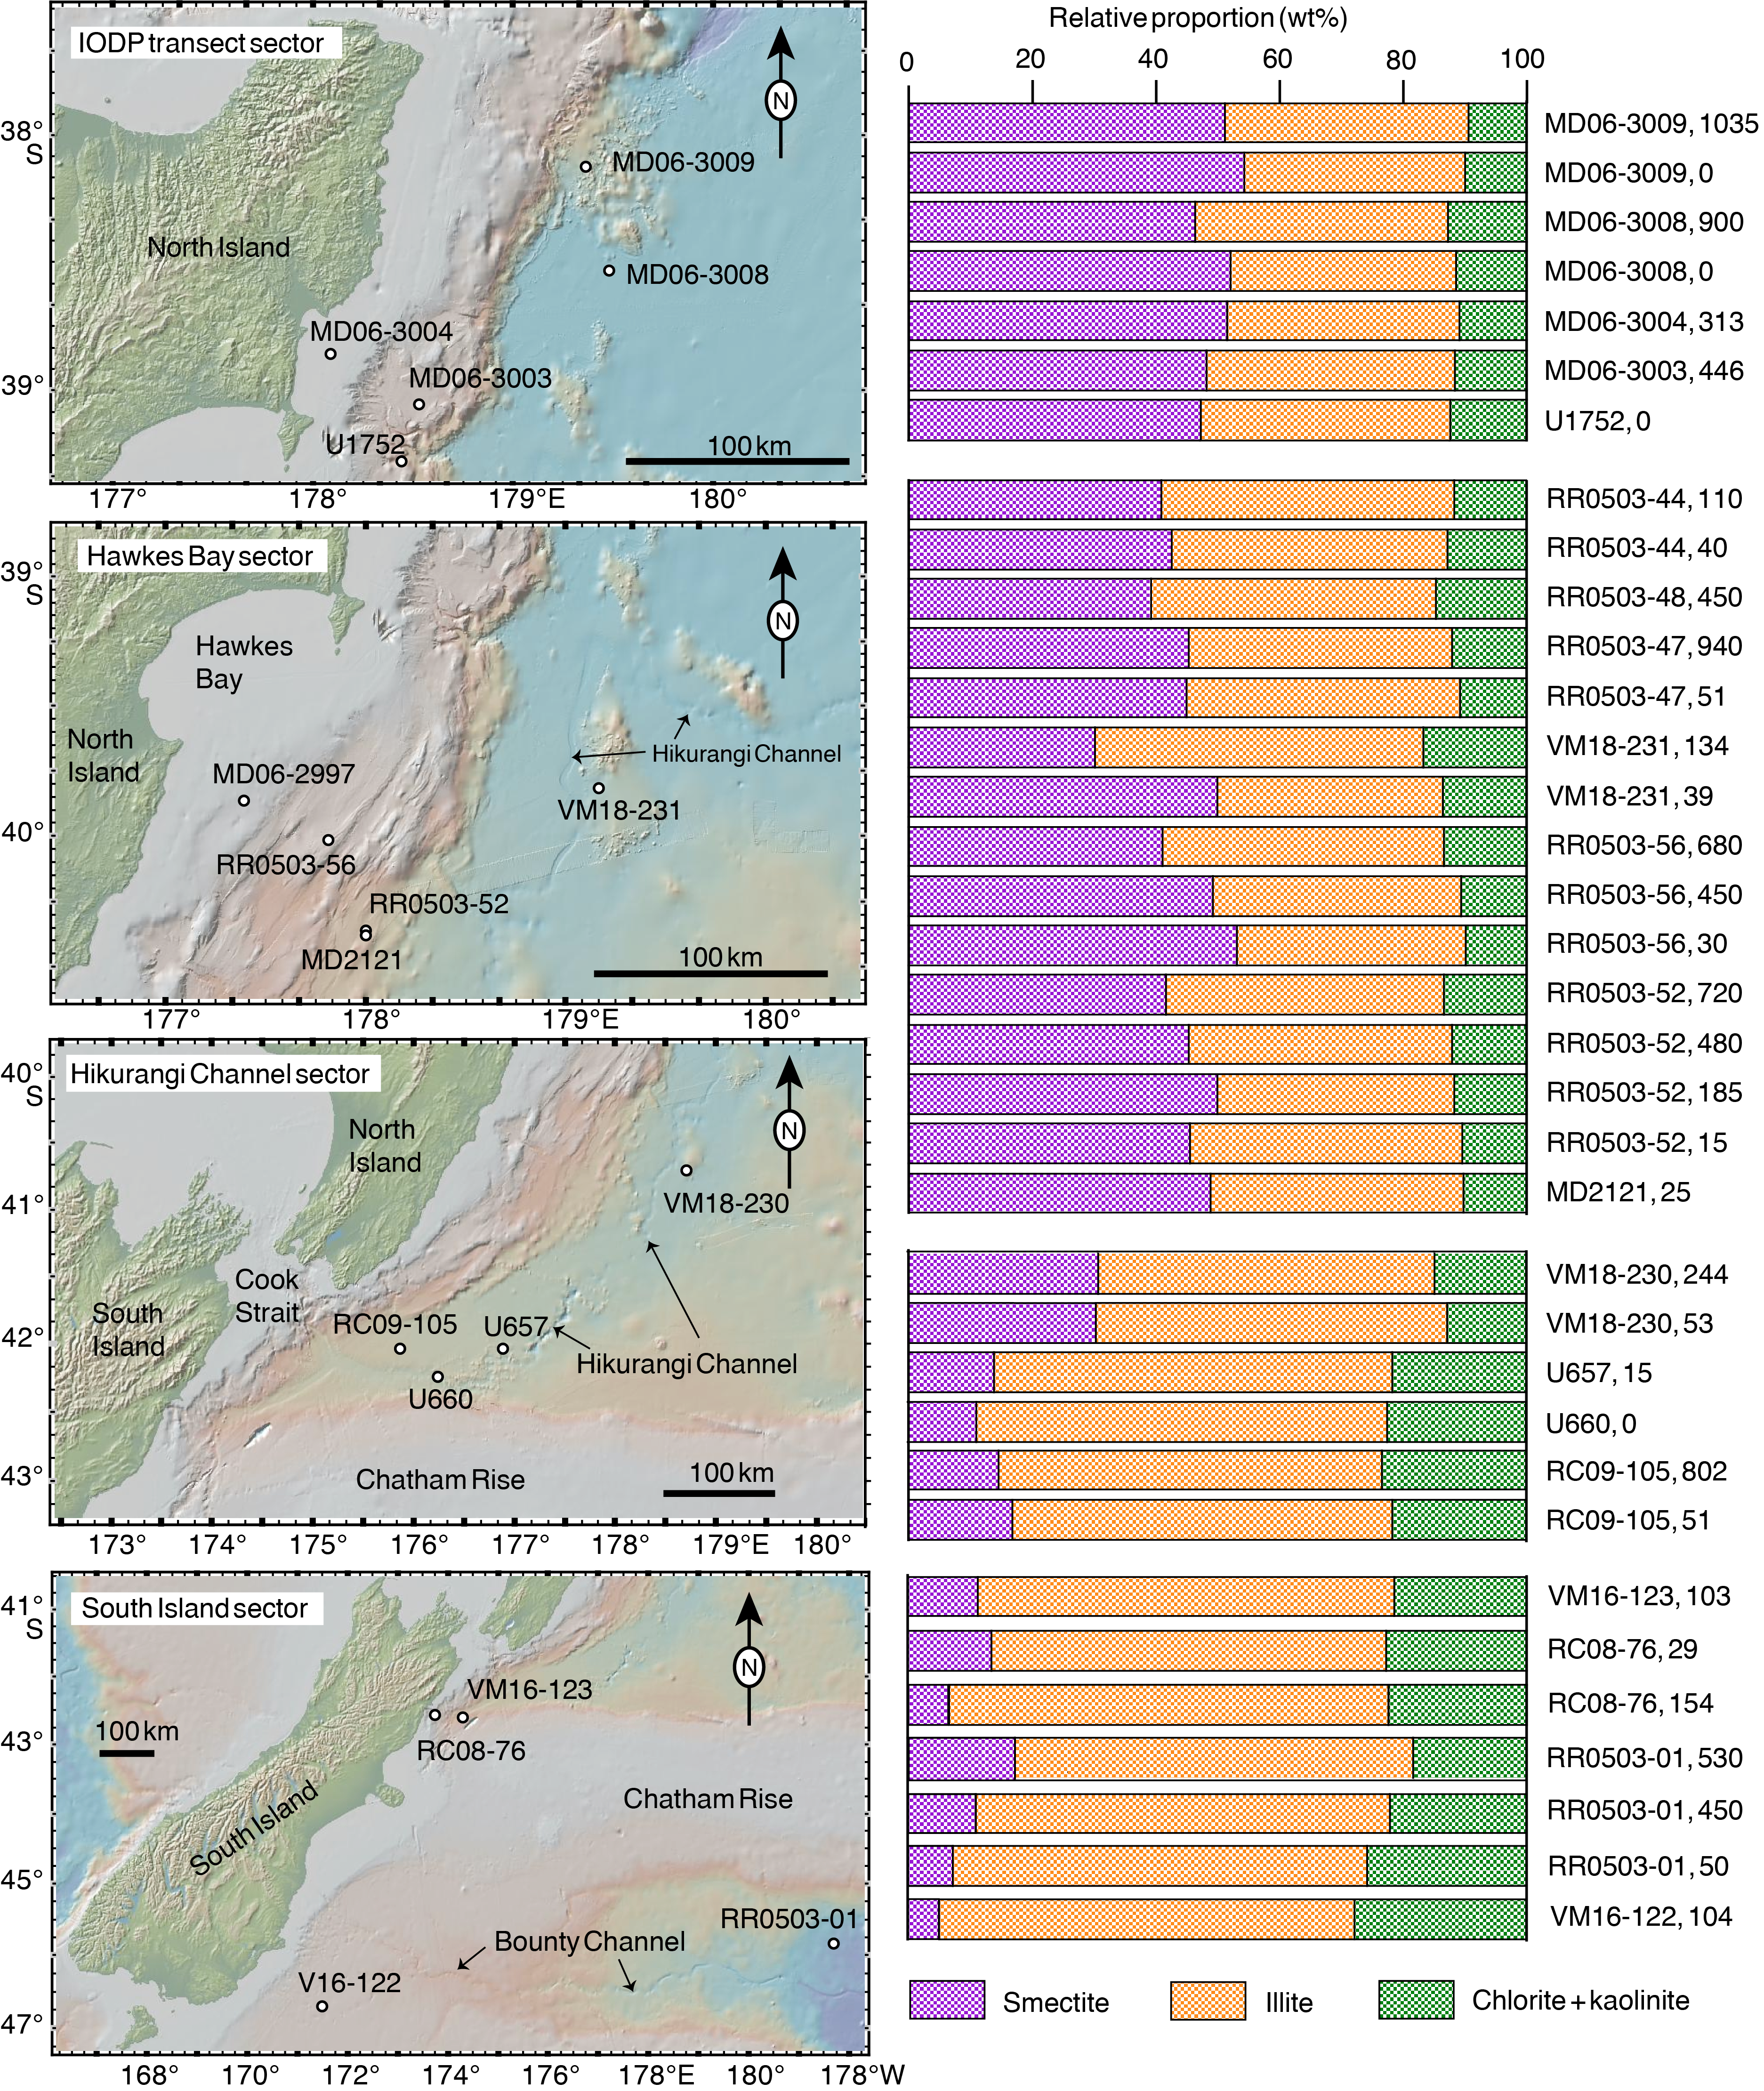
Figure F13. Core locations and normalized clay mineral proportions.
The crystallinity index for illite is consistently between 0.42Δ°2θ and 0.59Δ°2θ (Table T4). The illite-rich clay assemblage (e.g., South Island sector) tends to contain more crystalline illite (i.e., narrower peak) as compared to smectite-rich specimens (broader peak). The range of crystallinity values spans the domain from advanced diagenesis to anchimetamorphism (i.e., incipient greenschist facies). Given the near-seafloor position of the cored intervals, these results should be regarded as indicators of geologic conditions in the detrital source areas rather than in situ burial diagenesis.
Smectite expandability ranges 46%–86% (Table T4). In a generic sense, the lower values (less expandability) are consistent with higher proportions of detrital I/S mixed-layer clay in the assemblage, whereas higher values are indicative of more discrete smectite in the assemblage from altered volcanic sources. Percentages of illite within the I/S mixed-layer phase range 1.1%–21.8% (Table T4). Those measurements were possible only for smectite-rich specimens with intensities high enough to resolve the I/S 002/003 peak. Again, these results should be regarded as indicators of geologic conditions in the detrital source areas rather than in situ burial diagenesis.
Comparisons between these reconnaissance results for clay minerals and data from published XRD studies in the region are unreliable because of differences in methodology. For example, Land et al. (2010) analyzed the clay mineral assemblages from ODP Site 1119 in the Canterbury Basin (Figure F4), but their computations of relative abundance were based on proportions of raw peak-area values without application of weighting factors. Qualitatively, those results show that the mineral assemblage in Canterbury Basin is dominated by illite and chlorite with minor to trace amounts of smectite. In terms of qualitative temporal trends, the data from Site 1119 reveal higher smectite values in the lower Pliocene with consistent decreases upsection into the upper Pliocene and Pleistocene (Land et al., 2010). Accuracy errors in the reported percentages, however, are probably >25%. Computations without weighting factors result in underestimated values for illite, and the values for chlorite are overestimated. Bulk-powder data from Villaseñor et al. (2014) also reveal low concentrations of detrital smectite in the Canterbury Basin sediments relative to illite, muscovite, and chlorite.
Carbonate-rich samples from ODP Site 1123 (Figure F5) were analyzed by Winkler and Dullo (2002) after treating the specimens with acetic acid to remove CaCO3. Their computations of relative abundance utilized Biscaye (1965) weighting factors (Table T2), so semiquantitative comparisons are possible with the results reported here (Table T4). The data from Site 1123, when plotted versus depositional age, show clear trends over time (Winkler and Dullo, 2002). Smectite content decreases from maximum values of ~80% at 33 Ma to ~20%–30% by 1–2 Ma. Conversely, proportions of illite and chlorite both increase over the same timespan. Robert et al. (1986) documented a similar temporal trend at DSDP Site 594 (Figure F5; Shipboard Scientific Party, 1986). In sediments younger than 6 Ma, the content of illite ranges 41%–57% (Winkler and Dullo, 2002), overlapping the range of values reported here for offshore South Island and proximal Hikurangi Channel (Table T4).
Conclusions
Reconnaissance-scale XRD analysis of bulk sediment reveals large variations in proportions of biogenic calcite and terrigenous clay minerals across the Hikurangi subduction system. Most specimens from subducting bathymetric highs (Chatham Rise, Hikurangi Plateau) are composed of fine-grained biocalcareous sediment (calcareous mud, muddy calcareous ooze, and nannofossil ooze), whereas clay-rich hemipelagic mud typifies the Hikurangi Trough and landward trench slope. Locally, the carbonate-rich and clay-rich sediments are interbedded. The clay mineral assemblage changes significantly along the strike length of the margin. Detrital illite is the dominant clay mineral from offshore South Island into the southwest portion of the Hikurangi Trough. Smectite becomes the dominant clay mineral in the trench–forearc domain between 41°S latitude and the Kermadec Trench.
Acknowledgments
This study used samples provided by core repositories at the International Ocean Discovery Program (Ocean Drilling Program Leg 181), Lamont-Doherty Earth Observatory, Oregon State University (supported by NSF grant Number OCE-1558679), and the New Zealand National Institute of Water and Atmospheric Research. Funding for XRD analyses was obtained through a grant to Laura Wallace at GNS Science from the New Zealand Ministry for Business, Innovation, and Employment’s Endeavour Research (Contract C05X1605). Karissa Rosenberger assisted with sample preparation at New Mexico Tech, and Kelsey McNamara assisted with XRD at the New Mexico Bureau of Geology and Mineral Resources. Katherine Maier provided a helpful review of the manuscript.
References
Barnes, P.M., Lamarche, G., Bialas, J., Henrys, S., Pecher, I., Netzeband, G.L., Greinert, J., Mountjoy, J.J., Pedley, K., and Crutchley, G., 2010. Tectonic and geological framework for gas hydrates and cold seeps on the Hikurangi subduction margin, New Zealand. Marine Geology, 272(1–4):26–48. https://doi.org/10.1016/j.margeo.2009.03.012
Biscaye, P.E., 1965. Mineralogy and sedimentation of recent deep-sea clay in the Atlantic Ocean and adjacent seas and oceans. Geological Society of America Bulletin, 76(7):803–831. https://doi.org/10.1130/0016-7606(1965)76[803:MASORD]2.0.CO;2
Collot, J.-Y., Lewis, K., Lamarache, G., and Lallemand, S., 2001. The giant Ruatoria debris avalanche on the northern Hikurangi margin, New Zealand; result of oblique seamount subduction. Journal of Geophysical Research: Solid Earth, 106(B9):19271–19297. https://doi.org/10.1029/2001JB900004
Davy, B., Hoernle, K., and Werner, R., 2008. Hikurangi Plateau: crustal structure, rifted formation, and Gondwana subduction history. Geochemistry, Geophysics, Geosystems, 9(7):Q07004. https://doi.org/10.1029/2007GC001855
Fisher, A.T., and Underwood, M.B., 1995. Calibration of an X-ray diffraction method to determine relative mineral abundances in bulk powders using matrix singular value decomposition: a test from the Barbados accretionary complex. In Shipley, T.H., Ogawa, Y., Blum, P., et al., Proceedings of the Ocean Drilling Program, Initial Reports, 156: College Station, TX (Ocean Drilling Program), 29–37. https://doi.org/10.2973/odp.proc.ir.156.103.1995
Kennedy, L.A., and White, J.C., 2001. Low-temperature recrystallization in calcite: mechanisms and consequences. Geology, 29(11):1027–1030. https://doi.org/10.1130/0091-7613(2001)029%3C1027:LTRICM%3E2.0.CO;2
Land, M., Wust, R.A.J., Robert, C., and Carter, R.M., 2010. Plio-Pleistocene paleoclimate in the Southwest Pacific as reflected in clay mineralogy and particle size at ODP Site 1119, SE New Zealand. Marine Geology, 274(1–4):165–176. https://doi.org/10.1016/j.margeo.2010.04.001
Lawver, L.A., and Davey, F.J., 2005. River-like erosion within the Bounty submarine channel, southwest Pacific Ocean. Marine Geology, 216(3):101–106. https://doi.org/10.1016/j.margeo.2005.02.005
Lewis, K.B., 1994. The 1500-km-long Hikurangi Channel: trench-axis channel that escapes its trench, crosses a plateau, and feeds a fan drift. Geo-Marine Letters, 14(1):19–28. https://doi.org/10.1007/BF01204467
Lewis, K.B., Collot, J.-Y., and Lallemand, S.E., 1998. The dammed Hikurangi Trough: a channel-fed trench blocked by subducting seamounts and their wake avalanches (New Zealand–France GeodyNZ Project). Basin Research, 10(4):441–468. https://doi.org/10.1046/j.1365-2117.1998.00080.x
Lewis, K.B., and Pantin, H.M., 2001. Channel-axis, overbank and drift sediment waves in the southern Hikurangi Trough, New Zealand. Marine Geology, 192(1–3):123–151.
https://doi.org/10.1016/S0025-3227(02)00552-2
McCave, I.N., Carter, L., Carter, R.M., and Hayward, B.W., 2004. Cenozoic oceanographic evolution of the SW Pacific gateway: introduction. In McCave, I.N., Carter, L., Carter, R.M., and Hayward, B.W. (Eds.), Cenozoic Oceanographic Evolution of the Southwest Pacific Gateway, ODP Leg 181. Marine Geology, 205(1–4):1–7.
https://doi.org/10.1016/S0025-3227(04)00015-5
Moore, D.M., and Reynolds, R.C., Jr., 1989a. Identification of mixed-layered clay minerals. In Moore, D.M., and Reynolds, R.C., Jr. (Eds.), X-Ray Diffraction and the Identification and Analysis of Clay Minerals: New York (Oxford University. Press USA), 241–271.
Moore, D.M., and Reynolds, R.C., Jr., 1989b. Sample preparation techniques for clay minerals. In Moore, D.M., and Reynolds, R.C., Jr. (Eds.), X-Ray Diffraction and the Identification and Analysis of Clay Minerals: New York (Oxford University Press USA), 179–201.
Mountjoy, J.J., Barnes, P.M., and Pettinga, J.R., 2009. Morphostructure and evolution of submarine canyons across an active margin: Cook Strait sector of the Hikurangi margin, New Zealand. Marine Geology, 260:45–68. https://doi.org/10.1016/j.margeo.2009.01.006
Pouderoux, H., Proust, J.-N., Lamarche, G., Orpin, A., and Neil, H., 2012. Postglacial (after 18 ka) deep-sea sedimentation along the Hikurangi subduction margin (New Zealand): characterisation, timing and origin of turbidites. Marine Geology, 295–298:51–76. https://doi.org/10.1016/j.margeo.2011.11.002
Rettke, R.C., 1981. Probable burial diagenetic and provenance effects on Dakota Group clay mineralogy, Denver Basin. Journal of Sedimentary Petrology, 51(2):541–551. https://doi.org/10.1306/212F7CCF-2B24-11D7-8648000102C1865D
Robert, C., Stein, R., and Acquaviva, M., 1986. Cenozoic evolution and significance of clay associations in the New Zealand region of the South Pacific, Deep Sea Drilling Project, Leg 90. In Kennett, J.P., von der Borch, C.C., et al., Initial Reports of the Deep Sea Drilling Project, 90: Washington, DC (U.S. Govt. Printing Office), 1225–1238. https://doi.org/10.2973/dsdp.proc.90.130.1986
Rutter, E.H., 1976. The kinetics of rock deformation by pressure solution. Philosophical Transactions of the Royal Society, A: Mathematical, Physical & Engineering Sciences, 283:203–219. https://www.jstor.org/stable/74639
Saffer, D.M., Wallace, L.M., and Petronotis, K., 2017. Expedition 375 Scientific Prospectus: Hikurangi Subduction Margin Coring and Observatories. International Ocean Discovery Program. https://doi.org/10.14379/iodp.sp.375.2017
Saffer, D.M., Wallace, L.M., Barnes, P.M., Pecher, I.A., Petronotis, K.E., LeVay, L.J., Bell, R.E., Crundwell, M.P., Engelmann de Oliveira, C.H., Fagereng, A., Fulton, P.M., Greve, A., Harris, R.N., Hashimoto, Y., Hüpers, A., Ikari, M.J., Ito, Y., Kitajima, H., Kutterolf, S., Lee, H., Li, X., Luo, M., Malie, P.R., Meneghini, F., Morgan, J.K., Noda, A., Rabinowitz, H.S., Savage, H.M., Shepherd, C.L., Shreedharan, S., Solomon, E.A., Underwood, M.B., Wang, M., Woodhouse, A.D., Bourlange, S.M., Brunet, M.M.Y., Cardona, S., Clennell, M.B., Cook, A.E., Dugan, B., Elger, J., Gamboa, D., Georgiopoulou, A., Han, S., Heeschen, K.U., Hu, G., Kim, G.Y., Koge, H., Machado, K.S., McNamara, D.D., Moore, G.F., Mountjoy, J.J., Nole, M.A., Owari, S., Paganoni, M., Rose, P.S., Screaton, E.J., Shankar, U., Torres, M.E., Wang, X., and Wu, H.-Y., 2019. Expedition 372B/375 summary. In Wallace, L.M., Saffer, D.M., Barnes, P.M., Pecher, I.A., Petronotis, K.E., LeVay, L.J., and the Expedition 372/375 Scientists, Hikurangi Subduction Margin Coring, Logging, and Observatories. Proceedings of the International Ocean Discovery Program, 372B/375: College Station, TX (International Ocean Discovery Program). https://doi.org/10.14379/iodp.proc.372B375.101.2019
Shipboard Scientific Party, 1986. Site 594: Chatham Rise. In Kennett, J.P., von der Borch, C.C., et al., Initial Reports of the Deep Sea Drilling Project, 90: Washington, DC (U.S. Government Printing Office), 653–744. https://doi.org/10.2973/dsdp.proc.90.110.1986
Shipboard Scientific Party, 1999a. Leg 181 summary: southwest Pacific paleoceanography. In Carter, R.M., McCave, I.N., Richter, C., Carter, L., et al., Proceedings of the Ocean Drilling Program, Initial Reports, 181: College Station, TX (Ocean Drilling Program), 1–80. https://doi.org/10.2973/odp.proc.ir.181.101.2000
Shipboard Scientific Party, 1999b. Site 1119: drift accretion on Canterbury Slope. In Carter, R.M., McCave, I.N., Richter, C., Carter, L., et al., Proceedings of the Ocean Drilling Program, Initial Reports, 181: College Station, TX (Ocean Drilling Program), 1–112. https://doi.org/10.2973/odp.proc.ir.181.103.2000
Shipboard Scientific Party, 1999c. Site 1123: north Chatham Drift—a 20-Ma record of the Pacific Deep Western Boundary Current. In Carter, R.M., McCave, I.N., Richter, C., Carter, L., et al., Proceedings of the Ocean Drilling Program, Initial Reports, 181: College Station, TX (Ocean Drilling Program), 1–184. https://doi.org/10.2973/odp.proc.ir.181.107.2000
Shipboard Scientific Party, 1999d. Site 1124: Rekohu Drift—from the K/T boundary to the Deep Western Boundary Current. In Carter, R.M., McCave, I.N., Richter, C., Carter, L., et al., Proceedings of the Ocean Drilling Program, Initial Reports, 181: College Station, TX (Ocean Drilling Program), 1–137. https://doi.org/10.2973/odp.proc.ir.181.108.2000
Shipboard Scientific Party, 1999e. Site 1125: productivity under the subtropical convergence on north Chatham Slope. In Carter, R.M., McCave, I.N., Richter, C., Carter, L., et al., Proceedings of the Ocean Drilling Program, Initial Reports, 181: College Station, TX (Ocean Drilling Program), 1–92. https://doi.org/10.2973/odp.proc.ir.181.109.2000
Underwood, M.B., Basu, N., Steurer, J., and Udas, S., 2003. Data report: normalization factors for semiquantitative X-ray diffraction analysis, with application to DSDP Site 297, Shikoku Basin. In Mikada, H., Moore, G.F., Taira, A., Becker, K., Moore, J.C., and Klaus, A. (Eds.), Proceedings of the Ocean Drilling Program, Scientific Results, 190/196: College Station, TX (Ocean Drilling Program), 1–28. https://doi.org/10.2973/odp.proc.sr.190196.203.2003
Underwood, M.B., Lawler, N., and McNamara, K., in press. Data report: standard mineral mixtures, normalization factors, and determination of error for quantitative X-ray diffraction analyses of bulk powders and clay-sized mineral assemblages. In Wallace, L.M., Saffer, D.M., Barnes, P.M., Pecher, I.A., Petronotis, K.E., LeVay, L.J., and the Expedition 372/375 Scientists, Hikurangi Subduction Margin Coring, Logging, and Observatories. Proceedings of the International Ocean Discovery Program, 372B/375: College Station, TX (International Ocean Discovery Program). https://doi.org/10.14379/iodp.proc.372B375.201.2020
Villaseñor, T., Jaeger, J.M., Marsaglia, K.M., and Browne, G.H., 2015. Evaluation of the relative roles of global versus local sedimentary controls on middle to late Pleistocene formation of continental margin strata, Canterbury Basin, New Zealand. Sedimentology, 62(4):1118–1148. https://doi.org/10.1111/sed.12181
Wallace, L.M., Saffer, D.M., Barnes, P.M., Pecher, I.A., Petronotis, K.E., LeVay, L.J., Bell, R.E., Crundwell, M.P., Engelmann de Oliveira, C.H., Fagereng, A., Fulton, P.M., Greve, A., Harris, R.N., Hashimoto, Y., Hüpers, A., Ikari, M.J., Ito, Y., Kitajima, H., Kutterolf, S., Lee, H., Li, X., Luo, M., Malie, P.R., Meneghini, F., Morgan, J.K., Noda, A., Rabinowitz, H.S., Savage, H.M., Shepherd, C.L., Shreedharan, S., Solomon, E.A., Underwood, M.B., Wang, M., Woodhouse, A.D., Bourlange, S.M., Brunet, M.M.Y., Cardona, S., Clennell, M.B., Cook, A.E., Dugan, B., Elger, J., Gamboa, D., Georgiopoulou, A., Han, S., Heeschen, K.U., Hu, G., Kim, G.Y., Koge, H., Machado, K.S., McNamara, D.D., Moore, G.F., Mountjoy, J.J., Nole, M.A., Owari, S., Paganoni, M., Rose, P.S., Screaton, E.J., Shankar, U., Torres, M.E., Wang, X., and Wu, H.-Y., 2019. Expedition 372B/375 methods. In Wallace, L.M., Saffer, D.M., Barnes, P.M., Pecher, I.A., Petronotis, K.E., LeVay, L.J., and the Expedition 372/375 Scientists, Hikurangi Subduction Margin Coring, Logging, and Observatories. Proceedings of the International Ocean Discovery Program, 372B/375: College Station, TX (International Ocean Discovery Program). https://doi.org/10.14379/iodp.proc.372B375.102.2019
Warr, L.N., and Mählmann, R.F., 2015. Recommendations for Kubler Index standardization. Clay Minerals, 50(3):283–286. https://doi.org/10.1180/claymin.2015.050.3.02
Winkler, A., and Dullo, W.-C., 2002. Data report: Miocene to Pleistocene sedimentation pattern on the Chatham Rise, New Zealand. In Richter, C. (Ed.), Proceedings of the Ocean Drilling Program, Scientific Results, 181: College Station, TX (Ocean Drilling Program), 1–21. https://doi.org/10.2973/odp.proc.sr.181.206.2002
Wood, R., and Davy, B., 1994. The Hikurangi Plateau. Marine Geology, 118(1–2):153–173. https://doi.org/10.1016/0025-3227(94)90118-X
1 Underwood, M.B., 2020. Data report: reconnaissance of bulk sediment composition and clay mineral assemblages: inputs to the Hikurangi subduction system. In Wallace, L.M., Saffer, D.M., Barnes, P.M., Pecher, I.A., Petronotis, K.E., LeVay, L.J., and the Expedition 372/375 Scientists, Hikurangi Subduction Margin Coring, Logging, and Observatories. Proceedings of the International Ocean Discovery Program, 372B/375: College Station, TX (International Ocean Discovery Program). https://doi.org/10.14379/iodp.proc.372B375.203.2020
2 Department of Earth & Environmental Science, New Mexico Institute of Mining & Technology, Socorro NM 87801, USA. UnderwoodM@missouri.edu
This work is distributed under the Creative Commons Attribution 4.0 International (CC BY 4.0) license. 