Wallace, L.M., Saffer, D.M., Barnes, P.M., Pecher, I.A., Petronotis, K.E., LeVay, L.J.,
and the Expedition 372/375 Scientists
Proceedings of the International Ocean Discovery Program Volume 372B/375
publications.iodp.org

https://doi.org/10.14379/iodp.proc.372B375.201.2020
Data report: standard mineral mixtures, normalization factors, and determination of error for quantitative X-ray diffraction analyses of bulk powders and clay-sized mineral assemblages1
Michael B. Underwood,2 Nicolette Lawler,3 and Kelsey McNamara4
Keywords: International Ocean Discovery Program, JOIDES Resolution, Expedition 372, Expedition 375, Hikurangi Subduction Margin Coring, Logging, and Observatories, Site U1517, Site U1520, Hikurangi subduction zone, bulk powder X-ray diffraction, clay-sized X-ray diffraction
MS 372B375-201: Received 9 July 2019 · Accepted 16 December 2019 · Published 1 April 2020
Abstract
X-ray diffraction (XRD) was an important analytical component of International Ocean Discovery Program (IODP) Expeditions 372 and 375 in the Hikurangi subduction zone. This report documents the composition of standard mineral mixtures that we used to calibrate computations of mineral abundance in bulk powder and clay-sized fractions of the sediment. Shipboard analyses of the bulk powders were completed on the R/V JOIDES Resolution using a Bruker D4 Endeavor diffractometer, and reduction of those data utilized two types of software (MacDiff and Bruker DIFFRAC.EVA). To evaluate precision more rigorously, we replicated the bulk powder analyses at the New Mexico Bureau of Geology and Mineral Resources (New Mexico Tech; United States) using a Panalytical X'Pert Pro diffractometer, and MacDiff software was used for data reduction. The relation between peak area (integrated intensity) and weight percent in the bulk powder mixtures is constrained in two ways: a matrix of normalization factors, derived by singular value decomposition (SVD), and polynomial regression equations. Differences in results between the two computational methods are trivial. Absolute errors (known weight percent − computed weight percent) average less than 3 wt%, which is a level of accuracy more than sufficient to satisfy the scientific goals of shipboard XRD. The clay-sized standards were analyzed only at New Mexico Tech, and MacDiff software was used for data reduction. For computations of weight percent using those raw data, we tested three computations: Biscaye weighting factors, SVD normalization factors, and regression equations. Results using the SVD normalization factors and regression equations are significantly more accurate than those using Biscaye weighting factors.
Introduction
X-ray diffraction (XRD) has been included as a routine part of shipboard and shore-based measurements throughout the history of scientific ocean drilling. In one category of coring objectives, the primary goal of shipboard XRD is simple: to verify occurrences of specific detrital and/or authigenic minerals through recognition of characteristic peak positions on diffractograms. In other cases, however, the goal of XRD is to make initial estimates of absolute mineral abundance. Quantitative XRD becomes more important when an expedition's science plan includes extensive whole-round sampling of cores for shore-based measurements of frictional, geotechnical, and hydrogeological properties; this emphasis is added because many such properties are modulated by bulk sediment composition. The science plans for International Ocean Discovery Program (IODP) Expeditions 372 and 375, which drilled in the Hikurangi subduction zone offshore New Zealand, fell into the second category (Barnes et al., 2017; Saffer et al., 2017). Accordingly, considerable effort was invested to generate reasonably accurate mineral abundance values using XRD data. Practitioners of quantitative XRD consider results to be "good" if errors amount to ±10% of the amounts present for major constituents (e.g., Moore and Reynolds, 1989a). Other workers have contended that an error of 3 wt% absolute "is about the best that can be done for typical natural rock samples containing many phases" (e.g., Calvert et al., 1989). We regard those bounds as reasonable targets for IODP shipboard analyses.
The purpose of this data report is to describe the procedures for computing values of mineral weight percent from bulk powder and clay-sized XRD data during Expeditions 372 and 375. This report provides documentation of the standard mineral mixtures used for bulk powder calibration, together with a thorough analysis of the errors in accuracy for shipboard XRD measurements using two computational approaches: singular value decomposition (SVD) and polynomial regression equations. We also assess how precision was affected by the use of two X-ray diffractometers (Bruker and Panalytical) and two types of data reduction software (DIFFRAC.EVA and MacDiff). For the clay-sized XRD data, this report documents the standards, mineral mixtures, and errors in weight percent values using three computational approaches: Biscaye (1965) weighting factors, SVD normalization factors, and regression equations.
Lessons from previous studies
Several strategies have been tested and refined over five decades of scientific ocean drilling to compute relative and absolute abundances of common minerals in marine sediments (e.g., Moore, 1968; Cook et al., 1975; Heath and Pisias, 1979; Johnson et al., 1985; Mascle et al., 1988; Fisher and Underwood, 1995; Underwood et al., 2001). The basic schemes multiply values of peak intensity or peak area by empirical weighting factors to account for differences in diffracting power among common minerals (e.g., Biscaye, 1965; Cook et al., 1975). Fisher and Underwood (1995) analyzed mixtures of standard minerals to derive a matrix of normalization factors via SVD.
As stated above, quantitative results that fall within 3 wt% of known mineral proportions are generally considered to be "highly accurate" (e.g., Calvert et al., 1989), but the challenges in achieving that level of accuracy are multifaceted (Moore and Reynolds, 1989a). To begin with, intra- and interlaboratory errors can be exacerbated by differences in design among diffractometers, generator settings, slit dimensions, scanning rates, choices of fixed-step versus continuous-scan mode, use of automatic versus fixed slits, and inconsistent tuning of detectors. Furthermore, the performance of any individual instrument can change over the course of a project (e.g., fatigue of the X-ray tube or detector or upgrades of electronics). If peak intensities decrease significantly after prolonged use of an X-ray tube, then recalibration of regression equations and weighting factors might be warranted; the same is true if a tube or detector must be replaced. Different brands of software for data reduction and peak fitting, moreover, will yield results that are almost impossible to reproduce using other software; those errors can be attributed to differences among the algorithms used for setting the baseline, smoothing counts, matching peaks to ideal geometries, and computing area under a peak. All of this means that each calibration is instrument specific and tuned to an invariable set of scanning parameters and software.
Tests by other practitioners of quantitative XRD have stressed the importance of sample preparation (including the disaggregation or powdering techniques), chemical pretreatments, uniformity in particle size separation, and random orientation (e.g., Raven and Self, 2017). Accuracy sometimes improves if internal standards are added (e.g., spiking specimens with known weights of such nonnative minerals as corundum). The reference intensity ratio (RIR) method is constrained by results from mixtures with a common mineral (e.g., quartz) or an internal standard (e.g., Hillier, 2000; Zhou et al., 2018). Some workers integrate the results of bulk chemical analyses or various types of spectroscopy in the calibrations (Knudsen, 1981; Środoń, 2002; Craddock et al., 2017). Another common approach is to use computer simulation programs (e.g., NEWMOD or RockJock; Yuan and Bish, 2010) and Rietveld least-squares refinement to make iterative peak-fitting matches between natural XRD responses and either synthetic traces or diffractograms from standards. Workers can match either single-line RIRs or full patterns (Chipera and Bish, 2013; Zhou et al., 2018). In all cases, however, accuracy is reduced by the deleterious effects of preferred crystallite orientation (e.g., Ottner et al., 2000). To enhance the randomness of grain orientations, some workers have resorted to fairly elaborate and time-consuming steps in sample preparation, such as spray drying ethanol-based slurries to produce spherical aggregates of powder (e.g., Środoń et al., 2001; Hillier, 2000; Omotoso et al., 2006).
Another potential pitfall with quantitative XRD calibration is the failure to match the indigenous mineral mixtures for a particular study area with standards that have similar XRD properties. As stated by Moore and Reynolds (1989a), "A most important problem, over which little control can be exercised, is choosing a standard mineral whose diffraction characteristics are identical to those of the same mineral in the unknowns. For example, all specimens of illite are not identical." To compound that problem, many of the readily available clay standards are far from pure (e.g., illite contaminated by quartz), so it is also important to test for impurities and solve for the amounts of those impurities. Furthermore, absolute accuracy deteriorates if a natural sediment contains high concentrations of amorphous solids (e.g., biogenic silica or volcanic glass). Such assemblages can be calibrated by spiking felsic sediment samples with known weights of tephra or biogenic silica (Andrews et al., 2006, 2013). Otherwise, high contents of diatoms or volcanic glass will elevate errors in absolute weight percent for the crystalline phases. Similarly, because of differences in diffracting power, calibration factors computed for a kaolinite-rich mineral suite will generate larger errors if applied to an illite-chlorite assemblage. As another example, mixtures of crystalline illite and clay-sized white mica eroded from a greenschist-facies metamorphic source terrane will not match the more subdued XRD response of poorly crystalline detrital illite eroded from sedimentary rock sources exposed to modest levels of diagenesis. Accordingly, advanced knowledge of the natural sediment's typical composition is a critical prerequisite to choosing and mixing site-appropriate mineral standards for XRD calibration.
All of the issues summarized above need to be considered during the planning stages of any IODP expedition, but it is also important to mull over the practicality of associated workloads for shipboard scientists and laboratory technicians during those expeditions. Shipboard sample preparation must keep pace with core flow through the laboratory; if the demand for shipboard XRD data is high, then that pace might require running 25–30 specimens per day for seven or eight consecutive weeks. Under such circumstances, sample preparation needs to be uncomplicated and efficient (i.e., freeze-drying and powdering), with judicious milling times. We acknowledge, for example, that grinding each specimen for 12 min or more in a McCrone mill (e.g., Hillier, 2000) ensures optimal reduction of particle size, but such preparation times become prohibitively long in the shipboard setting. Introduction of such compounds as polyvinyl alcohol, ethanol, and 1-octanol needs to be avoided during milling because splits of the same powders are often used for coulometric carbon-carbonate and bulk X-ray fluorescence analyses. The shipboard protocols for data reduction and interpretation, moreover, need to be straightforward enough to allow multiple operators (who often join the science party with much different levels of XRD experience) to replicate one another's results both quickly and precisely. With those considerations in mind, we adopted a strategy for bulk powder XRD during Expeditions 372 and 375 that built on experiences gained during previous Ocean Drilling Program legs and IODP expeditions (e.g., Fisher and Underwood, 1995; Shipboard Scientific Party, 1997, 2001; Expedition 315 Scientists, 2009; McNeill et al., 2017). The scientific goal of shipboard XRD was clear cut: to generate the first iteration of compositional information for a diverse array of lithologies.
Unique challenges posed by Expeditions 372 and 375
The bulk mineral assemblage for generic Hikurangi-type sediment and sedimentary rock is relatively simple, with compositions dominated by total clay minerals + quartz + feldspar + calcite. A representative X-ray diffractogram for a typical hemipelagic mud specimen (bulk powder) is shown in Figure F1. We stress here that calibration for quantitative XRD using this suite of standard minerals will not work as intended for distinctly different lithologies, such as basalt and mildly altered volcaniclastic breccia, or for sediments containing significant concentrations of other minerals (e.g., zeolite or opal-CT). Thus, a reconnaissance-scale investigation of sediment from the Hikurangi region was completed (Underwood, 2017a; Underwood, 2020) to better anticipate the recoveries expected during Expeditions 372 and 375, and the standard mineral mixtures were blended accordingly.

Figure F1. Bulk powder hemipelagic mud specimen, Site U1517.
The first step in the reduction of raw XRD data generated from either standard mixtures or natural specimens is to determine the areas (integrated intensity values) for the following diagnostic XRD peaks (Figure F1): composite clay minerals centered at ~19.8°2θ (d-value = 4.49 Å), quartz (101) at 26.65°2θ (d-value = 3.34 Å), a characteristic double peak for plagioclase at 27.77°–28.02°2θ (d-value = 3.21–3.18 Å), and calcite (104) at 29.42°2θ (d-value = 3.04 Å). Recording the dimensions of individual clay mineral peaks at lower diffraction angles is not as effective on scans of air-dried random powders for three reasons: their intensities are usually too low (often unresolved relative to background noise), overlap is irresolvable between counts from the smectite (001) and chlorite (001) reflections, and error propagates with four individual peak measurements rather than one composite.
Once the peak areas are recorded, the second step is to compute weight percent values using equations calibrated from XRD analyses of the standards. The approach of Fisher and Underwood (1995) utilizes a matrix of SVD normalization factors. That method accounts for changes in one mineral's peak dimensions (integrated area) as a function of its own absolute abundance, as well as the abundance of every other mineral in the mixture. Because of complexities described below, we also elected to simplify the statistics by using polynomial regression curves to quantify the relation between weight percent and peak area. The closeness of fit between computed weight percent values and "true" percentages in the total solids of a natural sample depends largely on how close the standard mixtures come to matching natural compositions. Mismatches increase if unaccounted-for constituents are more abundant; typical offenders in marine sediment include dispersed amorphous solids (e.g., biogenic opal and volcanic glass) and the sum total of minerals that might occur in minor or trace quantities (e.g., pyroxene, pyrite, cristobalite, zeolites, and halite precipitated from interstitial water). With those caveats in mind, we report computed weight percent values for both standards and natural specimens normalized to a system of total clay minerals + quartz + feldspar + calcite = 100%.
For shore-based studies of the clay-sized mineral assemblages (<2 µm), we applied the same strategy of calibration with standard mineral mixtures, where the components are smectite + illite + undifferentiated (chlorite + kaolinite) + quartz = 100%. Integrated intensity (peak area) values were used to test three computational approaches: Biscaye (1965) weighting factors, SVD normalization factors, and regression equations. It should be noted that sample preparation for clay-sized XRD is too time consuming to be practical as a routine shipboard measurement, so the clays were analyzed only at the New Mexico Bureau of Geology and Mineral Resources (New Mexico Tech; United States). To allow for confident comparisons with clay-sized XRD data from published studies of interest, especially those from comparable subduction systems, we also replicated procedures that were used over the course of the Nankai Trough Seismogenic Zone Experiment (NanTroSEIZE) project (e.g., Guo and Underwood, 2012; Underwood and Guo, 2013; Underwood, 2017b).
The shipboard bulk powder XRD program during Expeditions 372 and 375 was challenged by several unanticipated circumstances that required more than the usual rigor in quality assurance/quality control. First, the science party during Expedition 372 lacked sufficient expertise in XRD interpretation, so the decision was made preexpedition to complete all of the data reduction and computation, including scans of standard mineral mixtures, in a shore-based setting. That option triggered another problem, however, because the license held by IODP for shipboard software (Bruker DIFFRAC.EVA) is restricted; to process the raw data on shore, an open-access software package (MacDiff) was used instead. Mismatches between the software functions (with different algorithms to draw baseline, smooth counts, and compute peak area) necessitated statistical comparison between two sets of processed results for the one set of raw data (i.e., software-dependent precision). Second, a circuit board on the Bruker diffractometer failed at the beginning of Expedition 375. Its replacement, together with the installation of a new X-ray detector, did not occur until after Expedition 375 ended. The standard mineral mixtures were rerun shipboard, but those data also had to be processed in a shore-based setting using MacDiff software. Third, analyses of the many backlogged XRD specimens from Expedition 375 could not be completed until the R/V JOIDES Resolution transited to the Philippines after Expedition 376 ended. All of those raw data files were also transmitted to shore, where MacDiff software was used for data reduction. Finally, to establish interlaboratory precision, we opted to compare the results from JOIDES Resolution (using the Bruker diffractometer, MacDiff, and DIFFRAC.EVA) with results from analyses of the identical standards at New Mexico Tech (using a Panalytical diffractometer and MacDiff software). That test was necessary to accommodate postexpedition analyses of sample intervals associated with shore-based experiments by fellow scientists (e.g., trimmings from tests of frictional properties).
Methods and materials
Composition and preparation of bulk powder standards
To solve for the relation between net peak area and known mineral abundance, we mixed and analyzed 20 combinations of standard minerals with measured weight percentages (Table T1). The individual mineral standards are quartz (St. Peter sandstone, nearly pure), feldspar (plagioclase mix), calcite (Cyprus chalk), illite (mixture of Clay Mineral Society IWi-1 and IMt-2), chlorite (mixture of Clay Mineral Society CCa-1 and CCa-2), kaolinite (Clay Mineral Society KGa-1), and smectite group clay (mixture of SAz-1 Ca-montmorillonite and SWy-1 Na-montmorillonite). For more information regarding these and other source clays in the Clay Mineral Society repository, see Chipera et al. (2001) and Vogt et al. (2002).
Each individual mineral standard was freeze-dried and milled to a fine powder for 5 min using a SPEX CertiPrep 5100 ball mill with tungsten carbide balls and end plates. Mineral proportions in the powder mixtures were measured as dry weights using an analytical balance at room temperature. The dry weights for smectite powder at room temperature probably reflect a hydration state with two layers of interlayer water. After hand blending the contributions with a spatula, each powder mixture was milled, stirred, and milled again to enhance its homogenization. For that phase of milling, we used a mechanical mortar and pestle at New Mexico Tech with tungsten carbide components, with milling times of 2–3 min. Splits of the powder mixtures were hand carried to JOIDES Resolution prior to Expedition 372. To guard against the possibility of differential segregation by particle size and/or mineral type during transport, the mixtures were powdered again on the ship using a tungsten carbide puck mill for 5 min.
XRD scans of "pure" calcite (Cyprus chalk), quartz (St. Peter sandstone), feldspar (plagioclase mix), and smectite (Ca-montmorillonite + Na-montmorillonite) powder standards were included in the calibrations to anchor the regression curves of peak area versus weight percent at high concentrations. We also computed the amounts of contamination of the "pure" illite, smectite, and calcite standards using the first-iteration polynomial regression equations, and known weight percentages in the total mixtures were recalculated. The second-iteration regression equations, as well as the SVD normalization factors, utilize the weight percent values corrected for those impurities (Table T1).
Composition and preparation of clay-sized standards
The individual standards used for clay-sized mixtures are the same as those described above, with one exception. Sericite (clay-sized white mica) was added to the illite mix to enhance its crystallinity and improve its match of diffracting power with natural specimens. Table T2 shows the corresponding blends for 23 mixtures (one mix was omitted from the statistics because of faulty slide preparation). All of the standard mixtures were blended to match the compositional range of natural Hikurangi clay mineral assemblages as closely as possible (e.g., Underwood, 2017a; Underwood, 2020).
Before mixing the clays, the individual clay standards were dried and milled for 2–3 min using the mechanical mortar and pestle at New Mexico Tech. To isolate the clay-sized fraction (<2 µm) for each mineral, milled powders were transferred to 600 mL beakers and suspended in ~250 mL of Na-hexametaphosphate solution (concentration of 4 g/1000 mL distilled H2O). Beakers were inserted into an ultrasonic bath for several minutes to promote dispersion and retard flocculation. Suspensions were washed of solutes by two passes through a centrifuge (8200 rpm for 25 min; ~6000 × g) with resuspension in distilled deionized water after each pass. The suspended particles were then transferred to a 125 mL plastic bottle and resuspended by vigorous shaking plus a 2 min insertion of an ultrasonic cell probe. Clay-sized splits of each suspension (<2 µm equivalent settling diameter) were separated by centrifugation (1000 rpm for 2.4 min; ~320 × g).
To ensure optimal homogenization in the clay mixtures, the clay-sized components were blended as suspensions rather than dry powders. The concentration of each mineral in suspension (grams of clay per milliliter H2O) was determined by extracting a known volume by pipette, transferring the aliquot to a small beaker of predetermined weight, drying in an oven at 80°C, and reweighing the beaker. We used the average concentration from two aliquots and assumed that the hydration state of smectite in the oven-dried clay was one layer of interlayer water. XRD scans of the individual standards show good purity, except for illite. The amount of contamination of the illite standard by clay-sized quartz was determined by iteration using a linear regression of peak area versus weight percent. Once those corrected concentrations were computed, the standards were blended by pipette aliquot. After that step, preparation of oriented clay aggregates for XRD scans followed the filter-peel method (Moore and Reynolds, 1989b) using 0.45 µm filter membranes and glass discs. A closed vapor chamber at room temperature for at least 24 h was used to saturate the clay aggregates with ethylene glycol. This last routine was necessary to expand the interlayer of smectite and minimize overlap between the smectite (001) and chlorite (001) reflections.
Analytical procedures
For scans on JOIDES Resolution, the randomly oriented bulk powders were top mounted onto sample holders and scanned using a Bruker D4 Endeavor diffractometer mounted with a VANTEC-1 detector and nickel-filtered CuKα radiation. The routine locked-coupled scanning parameters were set as follows:
- Voltage = 40 kV.
- Current = 40 mA.
- Goniometer angle = 4°–40°2θ.
- Step size = 0.0166°2θ.
- Scan speed = 0.5 s/step.
- Divergence slit = 0.6 mm.
Each bulk powder mixture of standard minerals was analyzed twice following identical protocols; the powders were remixed and top mounted again between the two runs.
We processed raw digital data on JOIDES Resolution using the DIFFRAC.EVA software package, which allows for baseline definition (set at enhanced, 1.000 curvature, and 1.000 threshold) and smoothing (set at smooth default factor = 0.124). Diagnostic net peak areas (recorded in units of counts/s × angle [in 2θ], measured above the baseline) for each mineral (or mineral group) were determined using the "create area" function in DIFFRAC.EVA; that function accommodates manual adjustment of the upper and lower limits of the peaks. A representative diffractogram with identification of the diagnostic peaks for a natural specimen of mud is shown in Figure F1. For shore-based data reduction, we processed the identical raw data files using MacDiff software (version 4.2.5) to establish a baseline of intensity, smooth counts, correct peak positions (relative to quartz), and calculate peak intensity values and peak areas. Representative MacDiff diffractograms for hemipelagic mud are shown in Figure F2, with identification of the diagnostic peaks. With both types of software, we refined the determination of the composite peak area for total clay minerals by expanding the lower angular limit to include the chlorite (003) reflection (Figure F1).
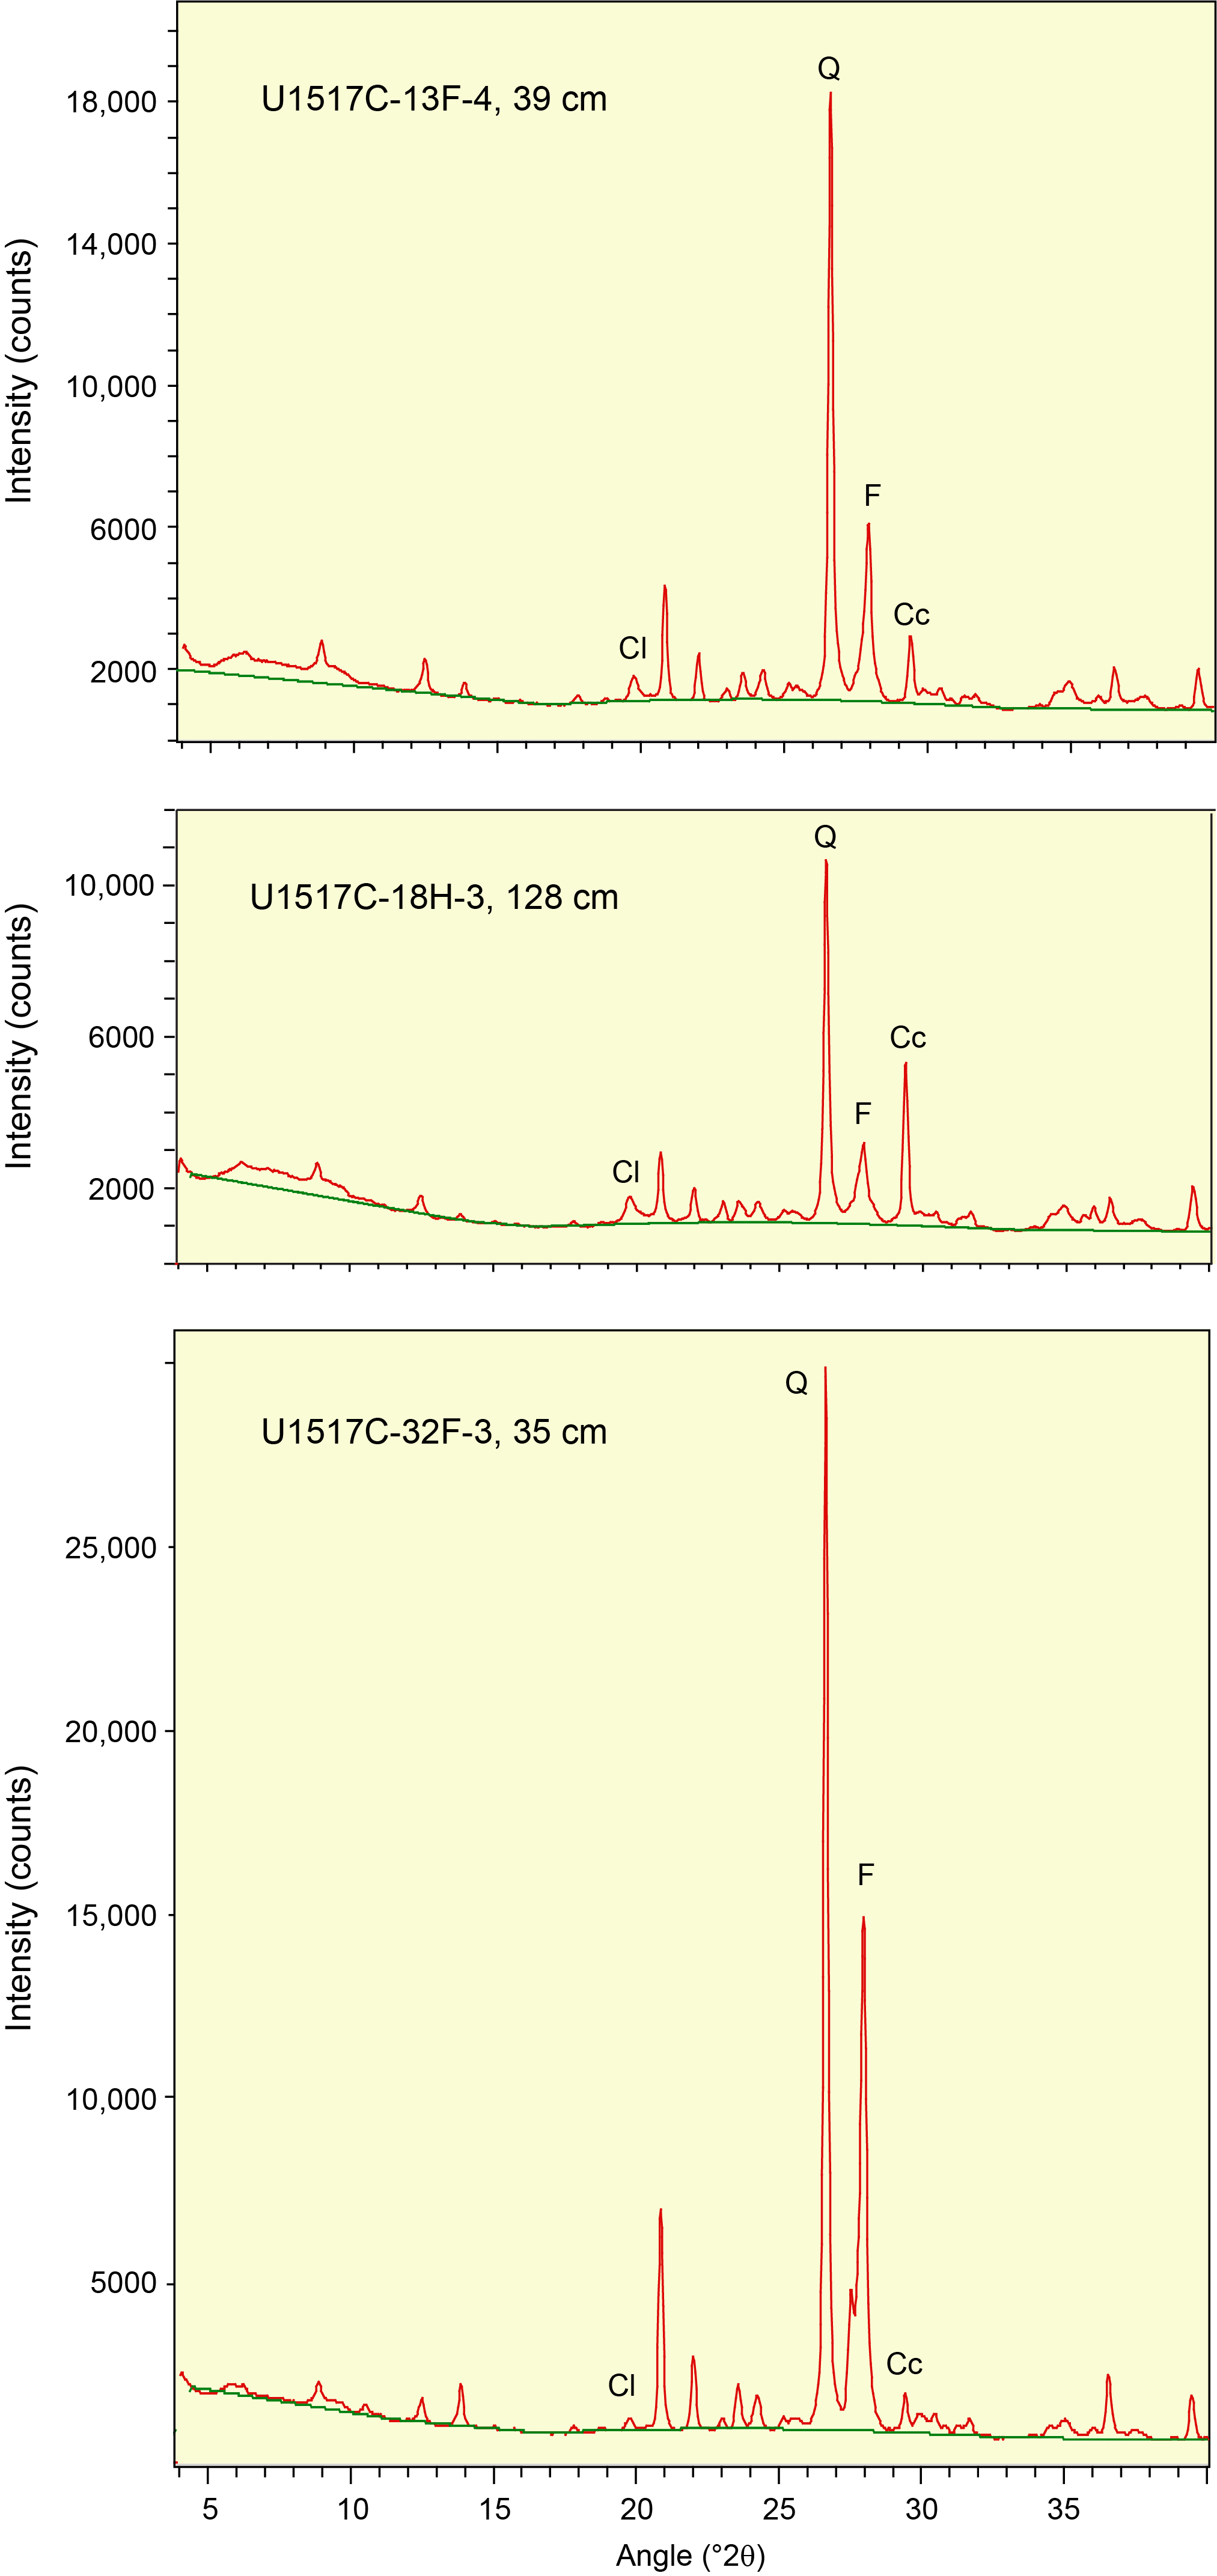
Figure F2. Bulk powder hemipelagic mud specimens, Site U1517.
To quantify interlaboratory precision, splits of the same bulk powder mixtures were analyzed at the New Mexico Bureau of Geology and Mineral Resources (New Mexico Tech). Those splits were scanned twice each, as back-loaded random powders, using a Panalytical X'Pert Pro diffractometer with Cu anode at generator settings of 45 kV and 40 mA. The continuous scans cover an angular range of 5°–70°2θ using a scan step time of 5.08 s, a step size of 0.008°2θ, and the sample holder spinning. Slits were fixed at 0.25 mm (divergence) and 0.1 mm (receiving), and the specimen length was 10 mm.
The oriented, glycol-saturated, clay-sized aggregates were analyzed only at the New Mexico Bureau of Geology and Mineral Resources, using the same Panalytical X'Pert Pro diffractometer at generator settings of 45 kV and 40 mA. The continuous scans cover an angular range of 2°–28.0°2θ using a scan step time of 1.6 s, a step size of 0.01°2θ, and the sample holder stationary. Slits were fixed at 0.5 mm (divergence) and 0.1 mm (receiving), and the specimen length was 10 mm. Each oriented, clay-sized aggregate was analyzed twice following identical protocols. A representative diffractogram for the clay-sized fraction of a naturally occurring hemipelagic mud is shown in Figure F3, with identification of the diagnostic peaks used in weight percent computations.

Figure F3. Clay-sized aggregates in hemipelagic mud specimens, Site U1517.
Results
Table T3 provides the of peak intensity and net peak area values for the 20 bulk powder mixtures (see Table T1 for mineral proportions) plus the individual minerals as analyzed on JOIDES Resolution using DIFFRAC.EVA software. Comparable peak intensity and integrated peak area values for the same raw data using MacDiff software are in Table T4. Table T5 summarizes the results generated by the Panalytical diffractometer and MacDiff software. Figure F4 catalogs the diffractograms for each bulk powder mixture, along with the measured weight percent of each constituent. Figure F5 catalogs the diffractograms for each clay-sized mixture, along with the measured weight percent of each constituent. All of the corresponding peak area values for clay-sized mixtures are in Table T6.
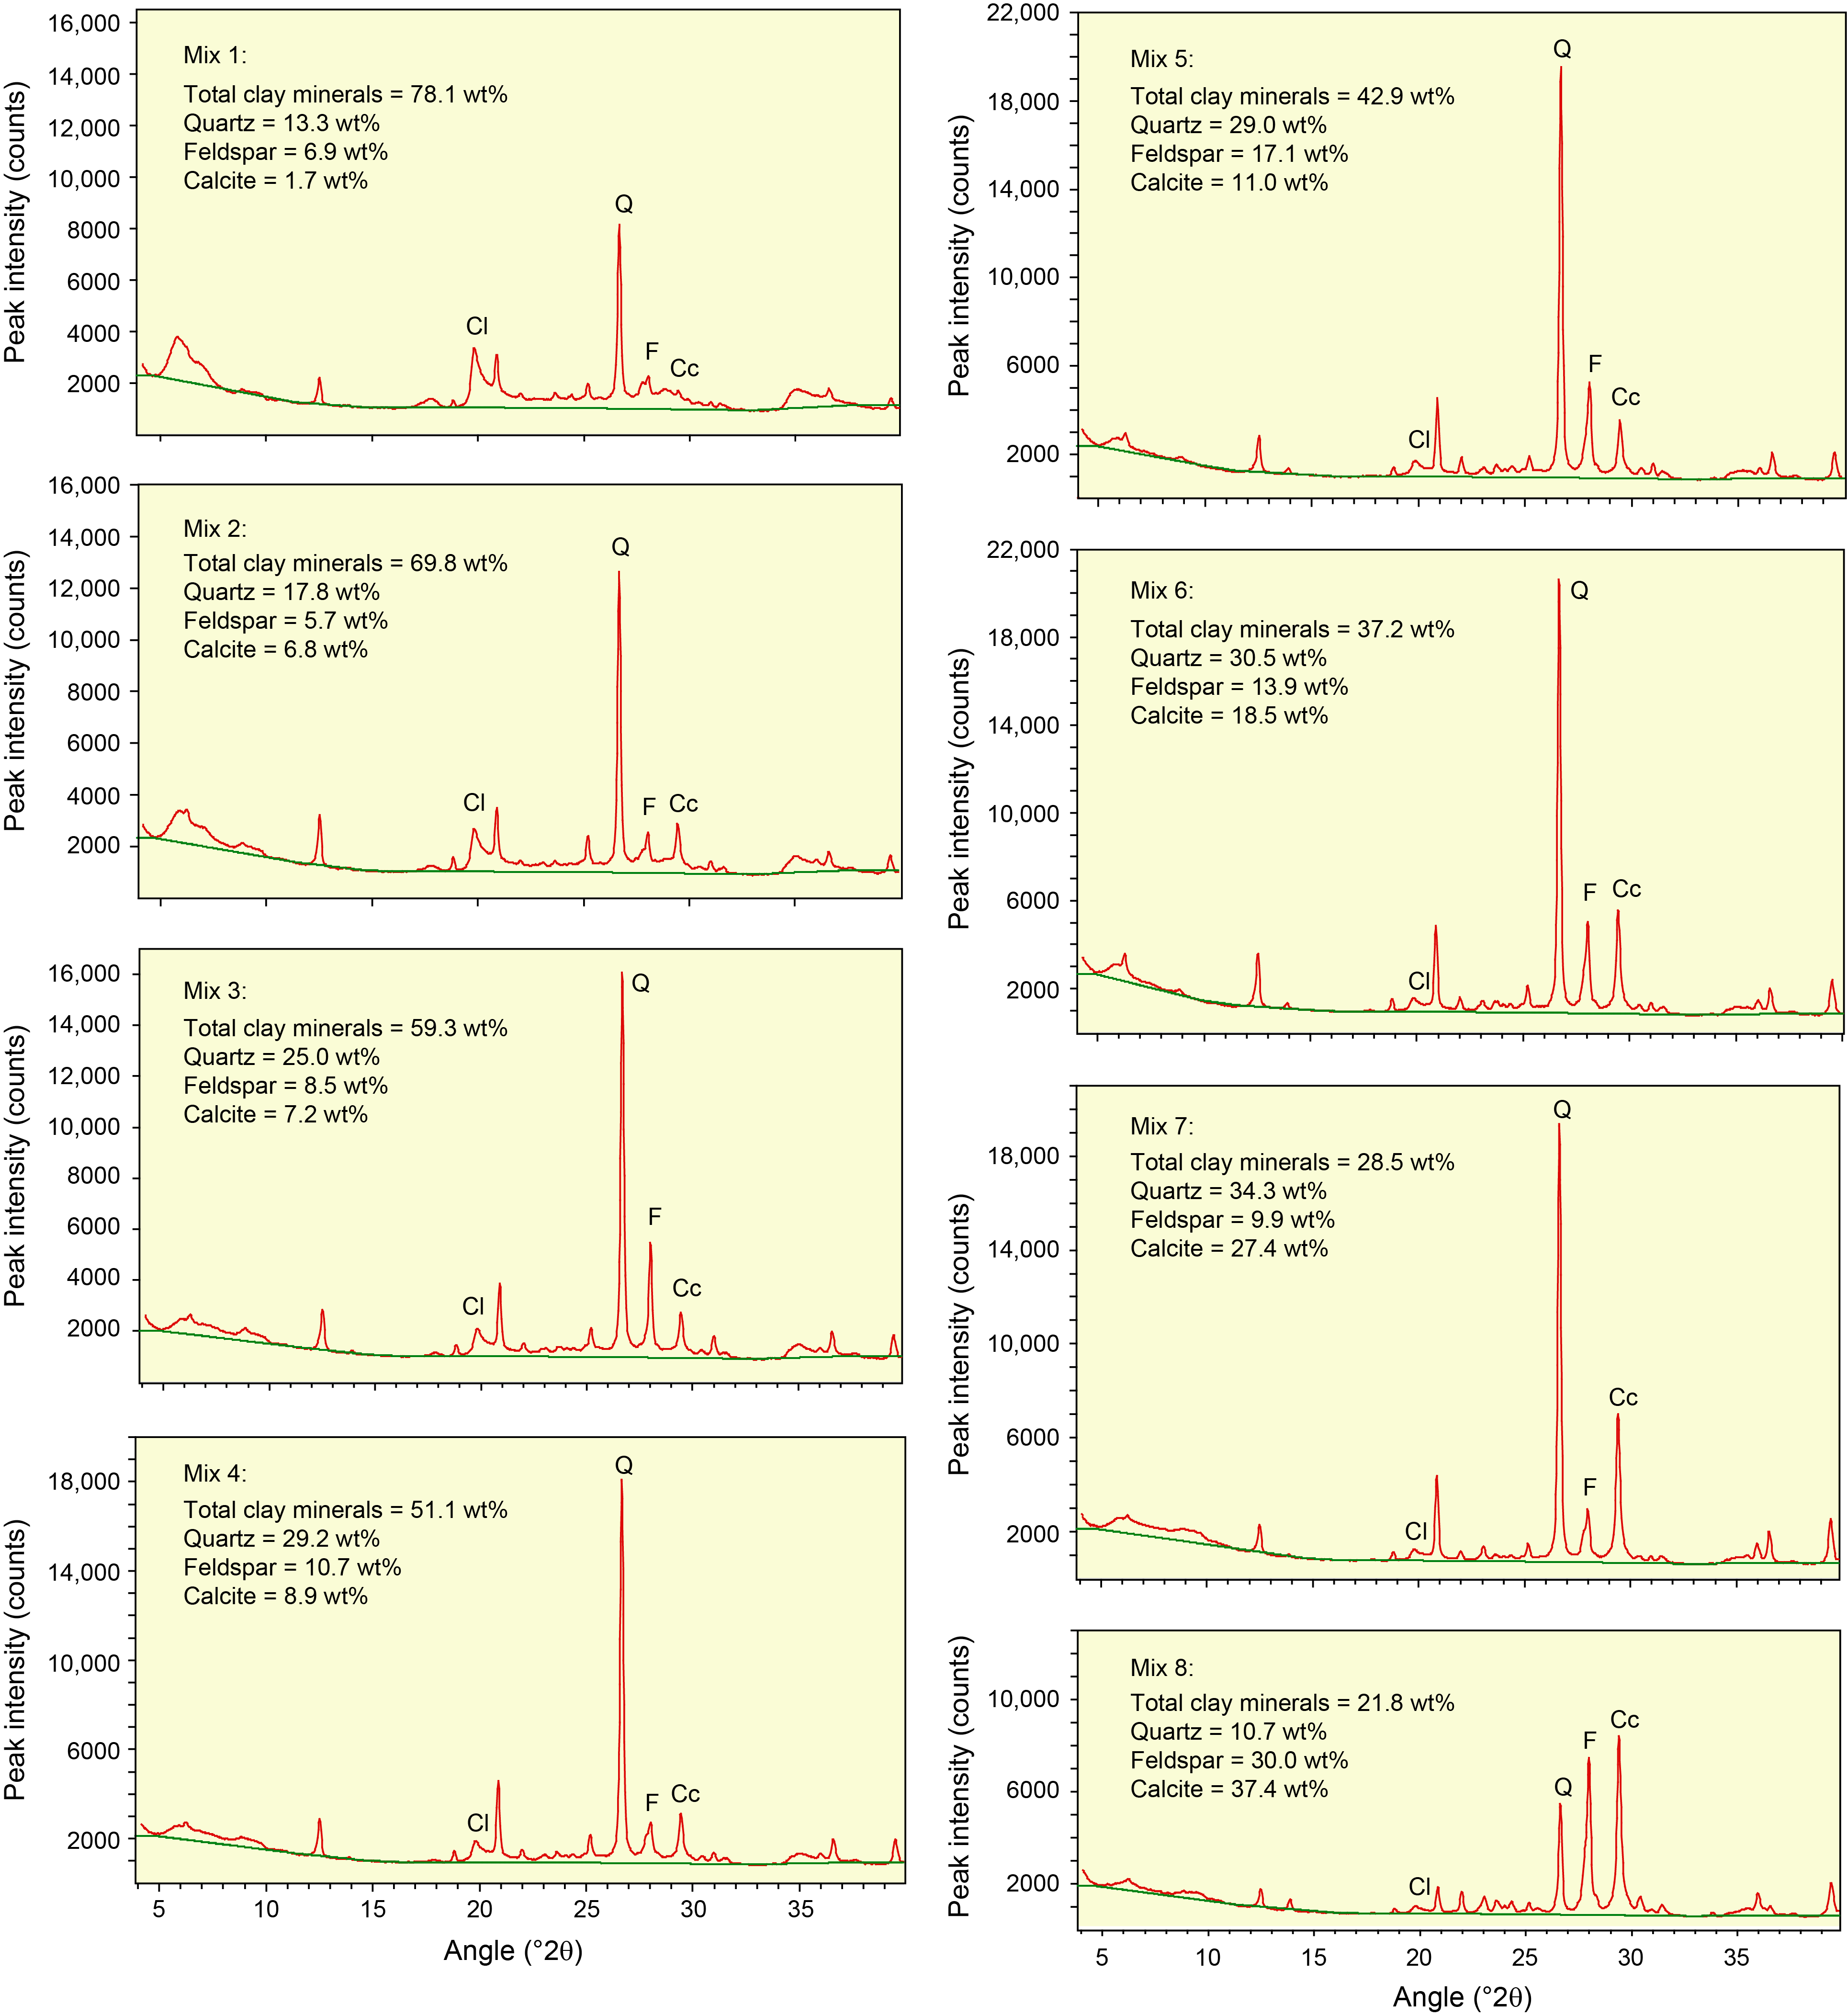
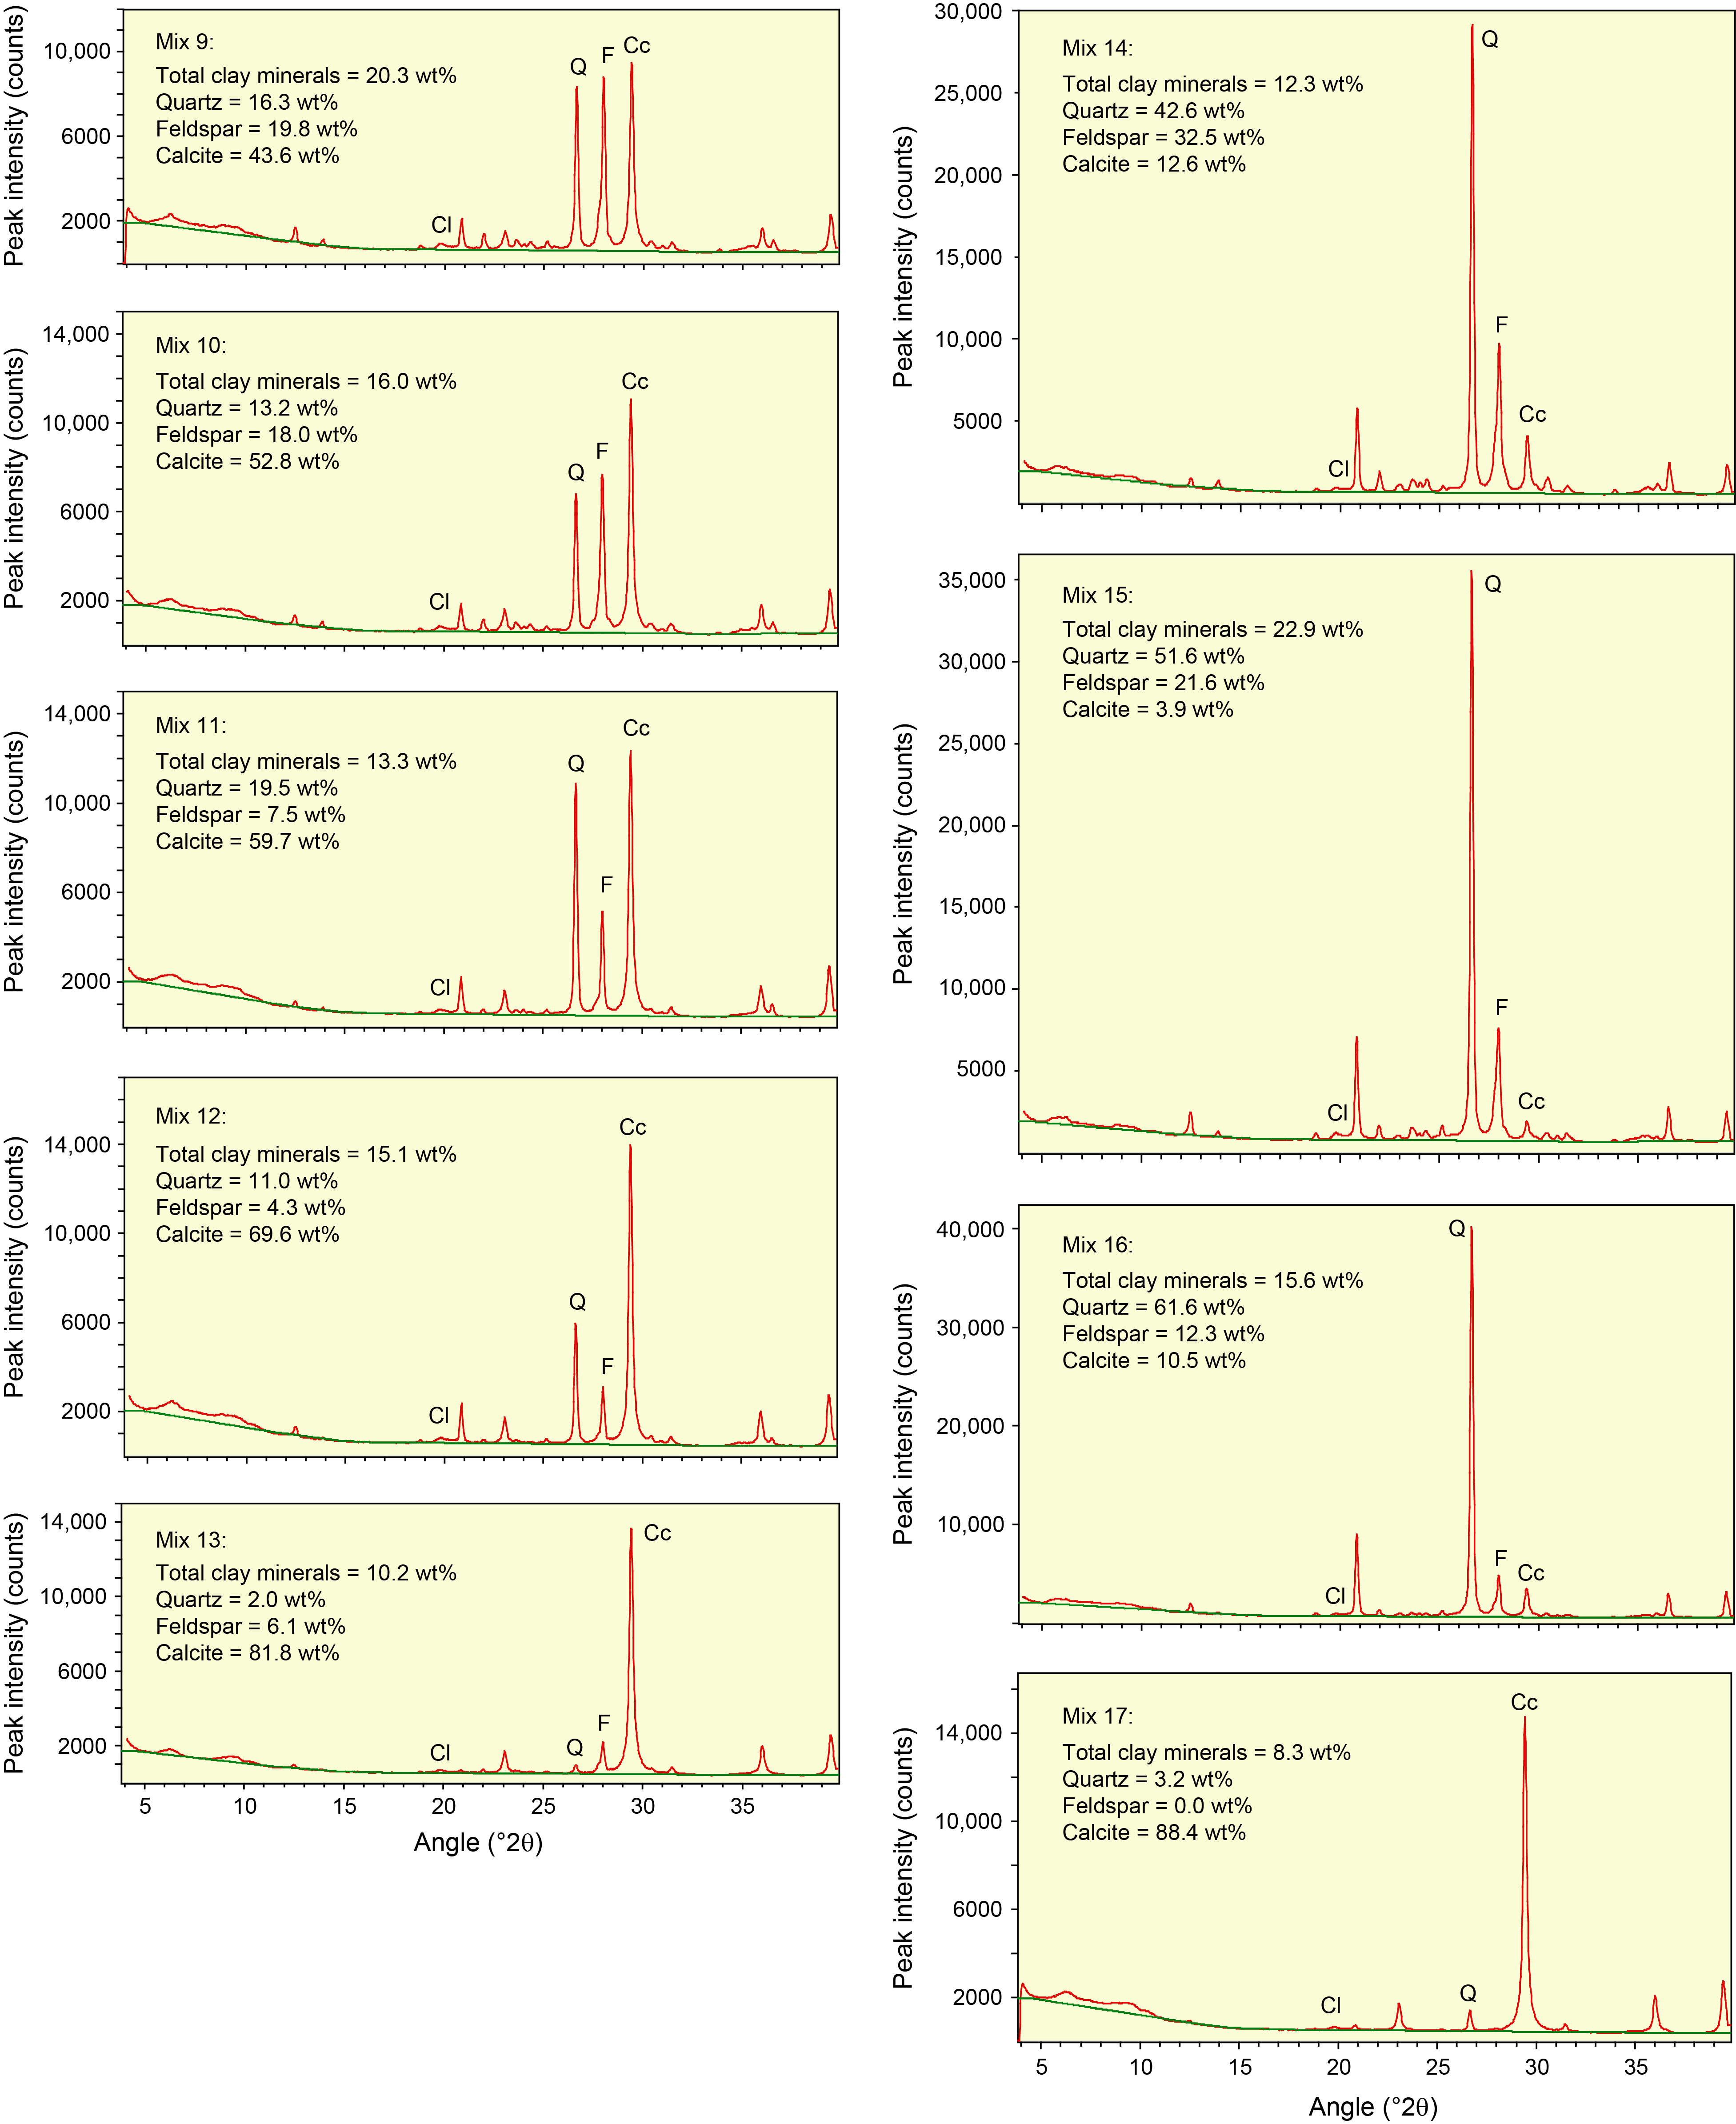
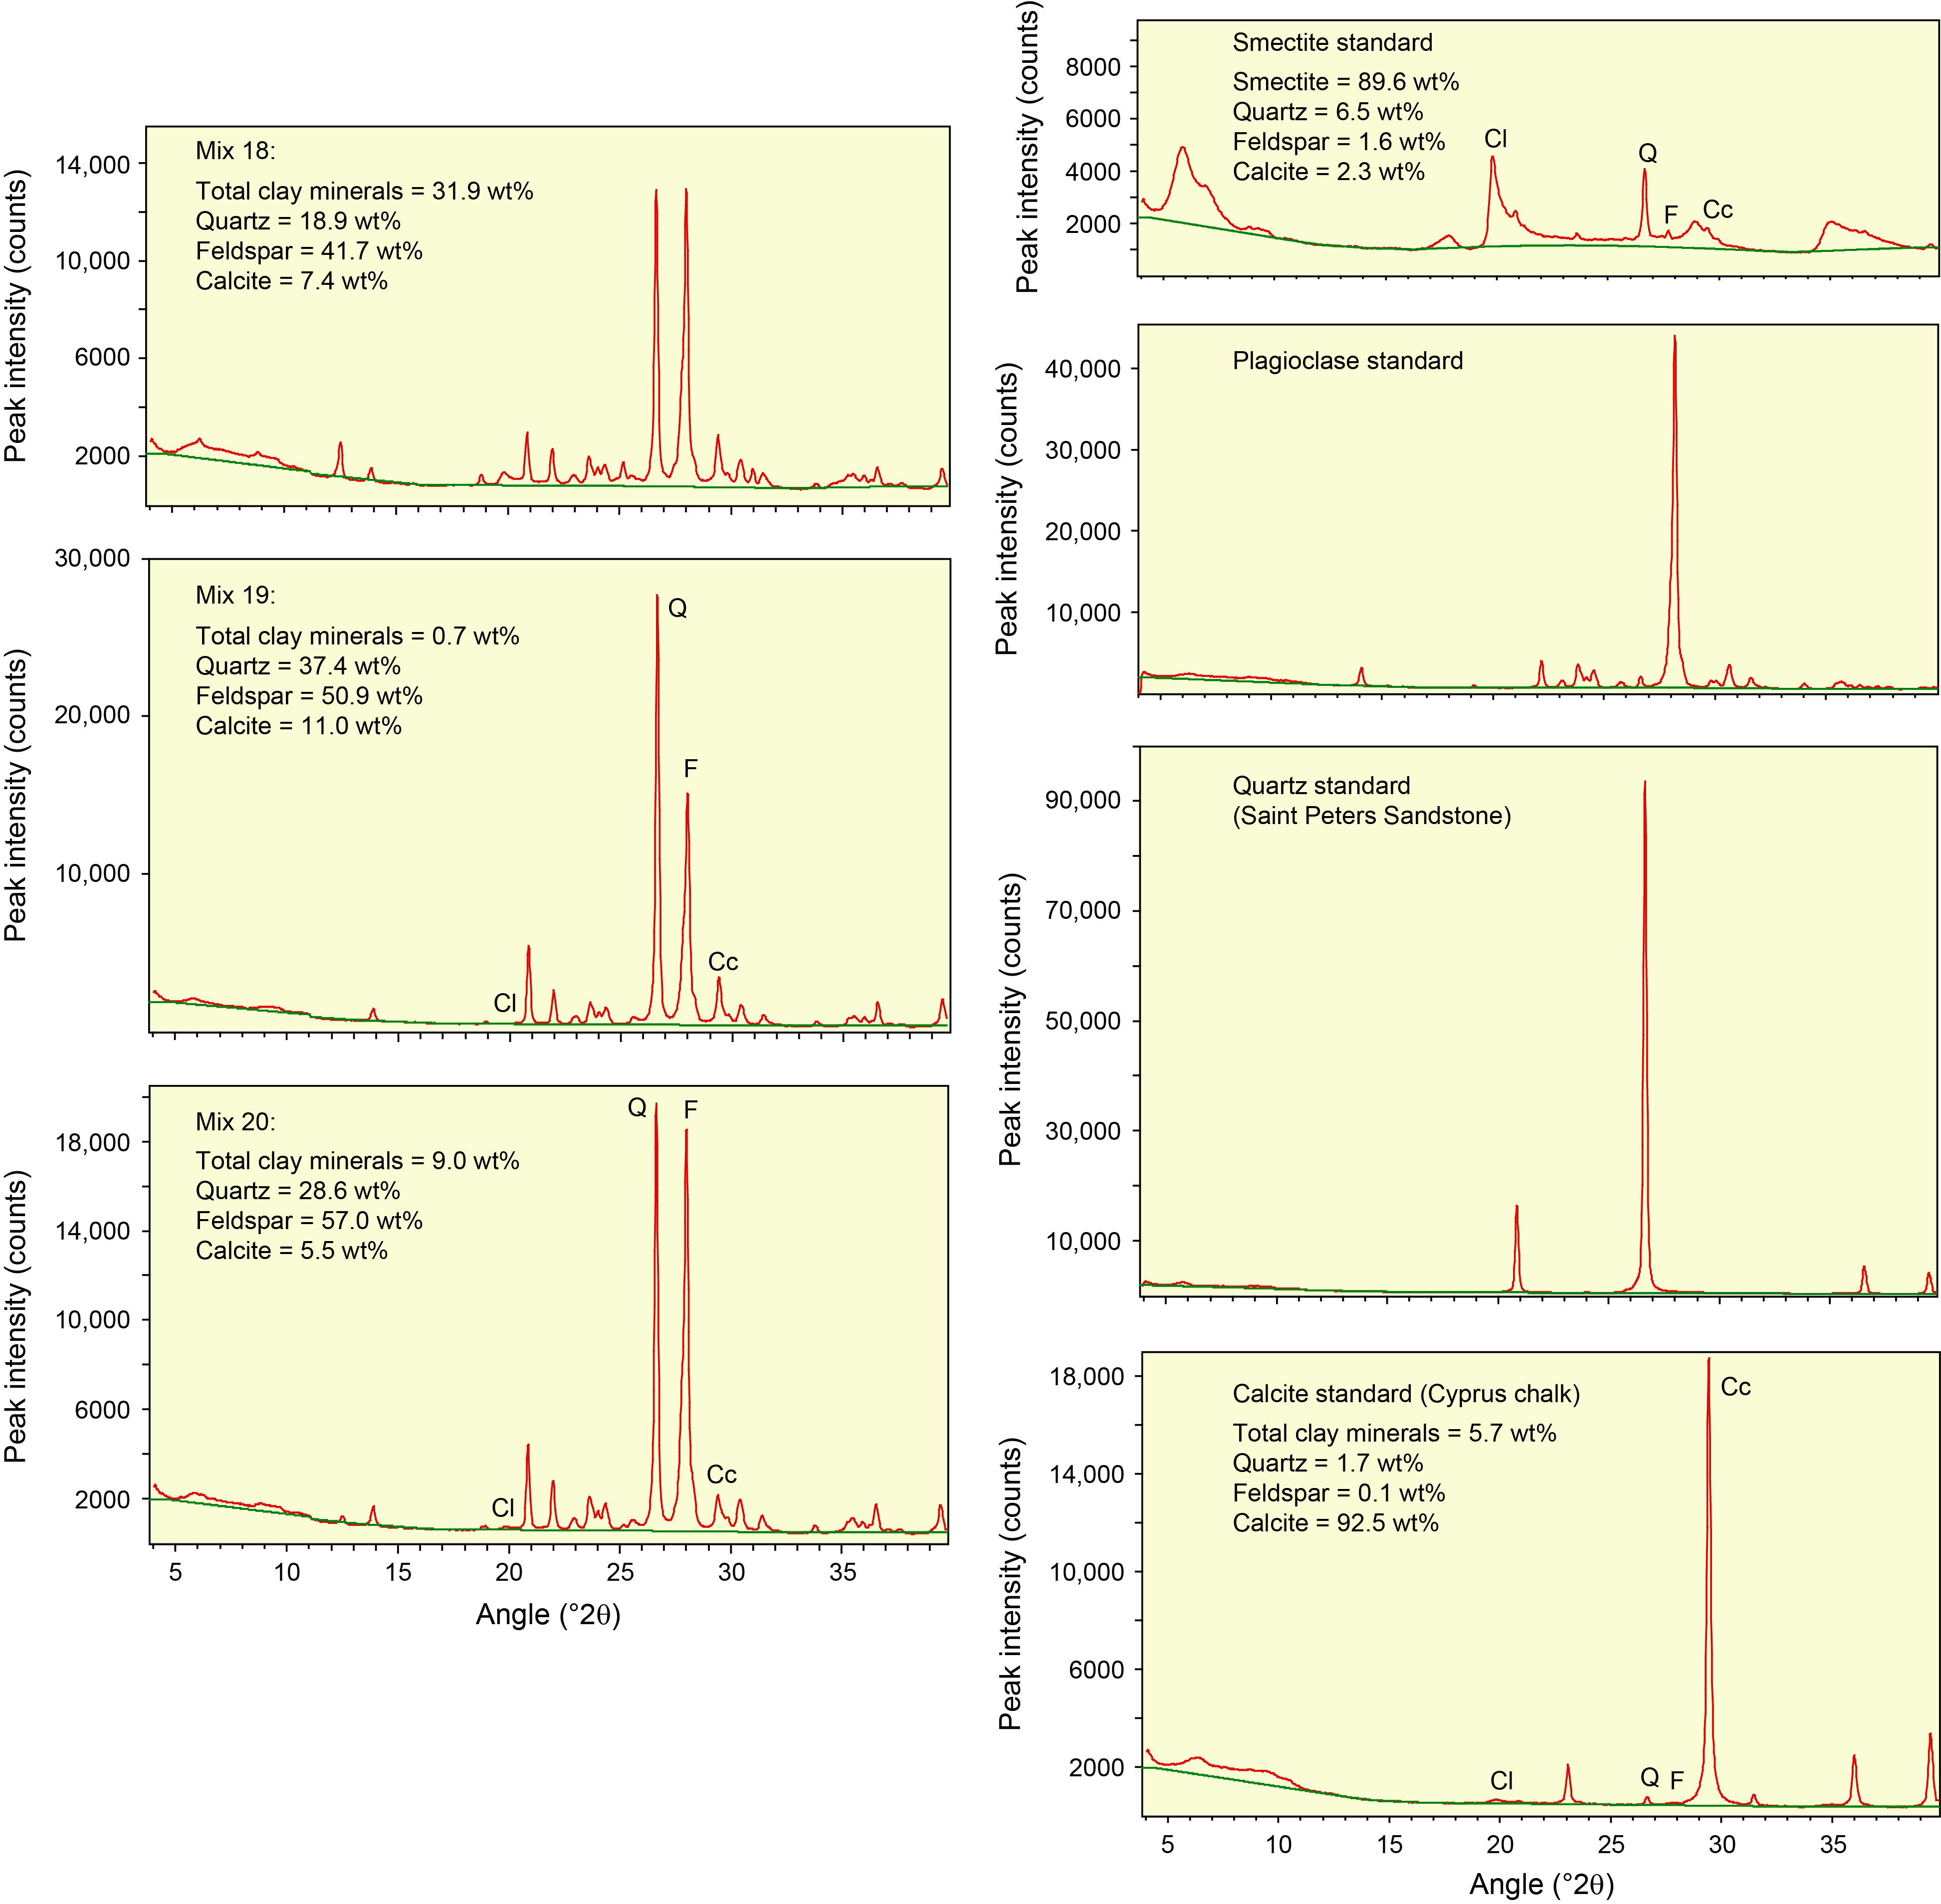
Figure F4. Bulk powder standard mineral mixtures.
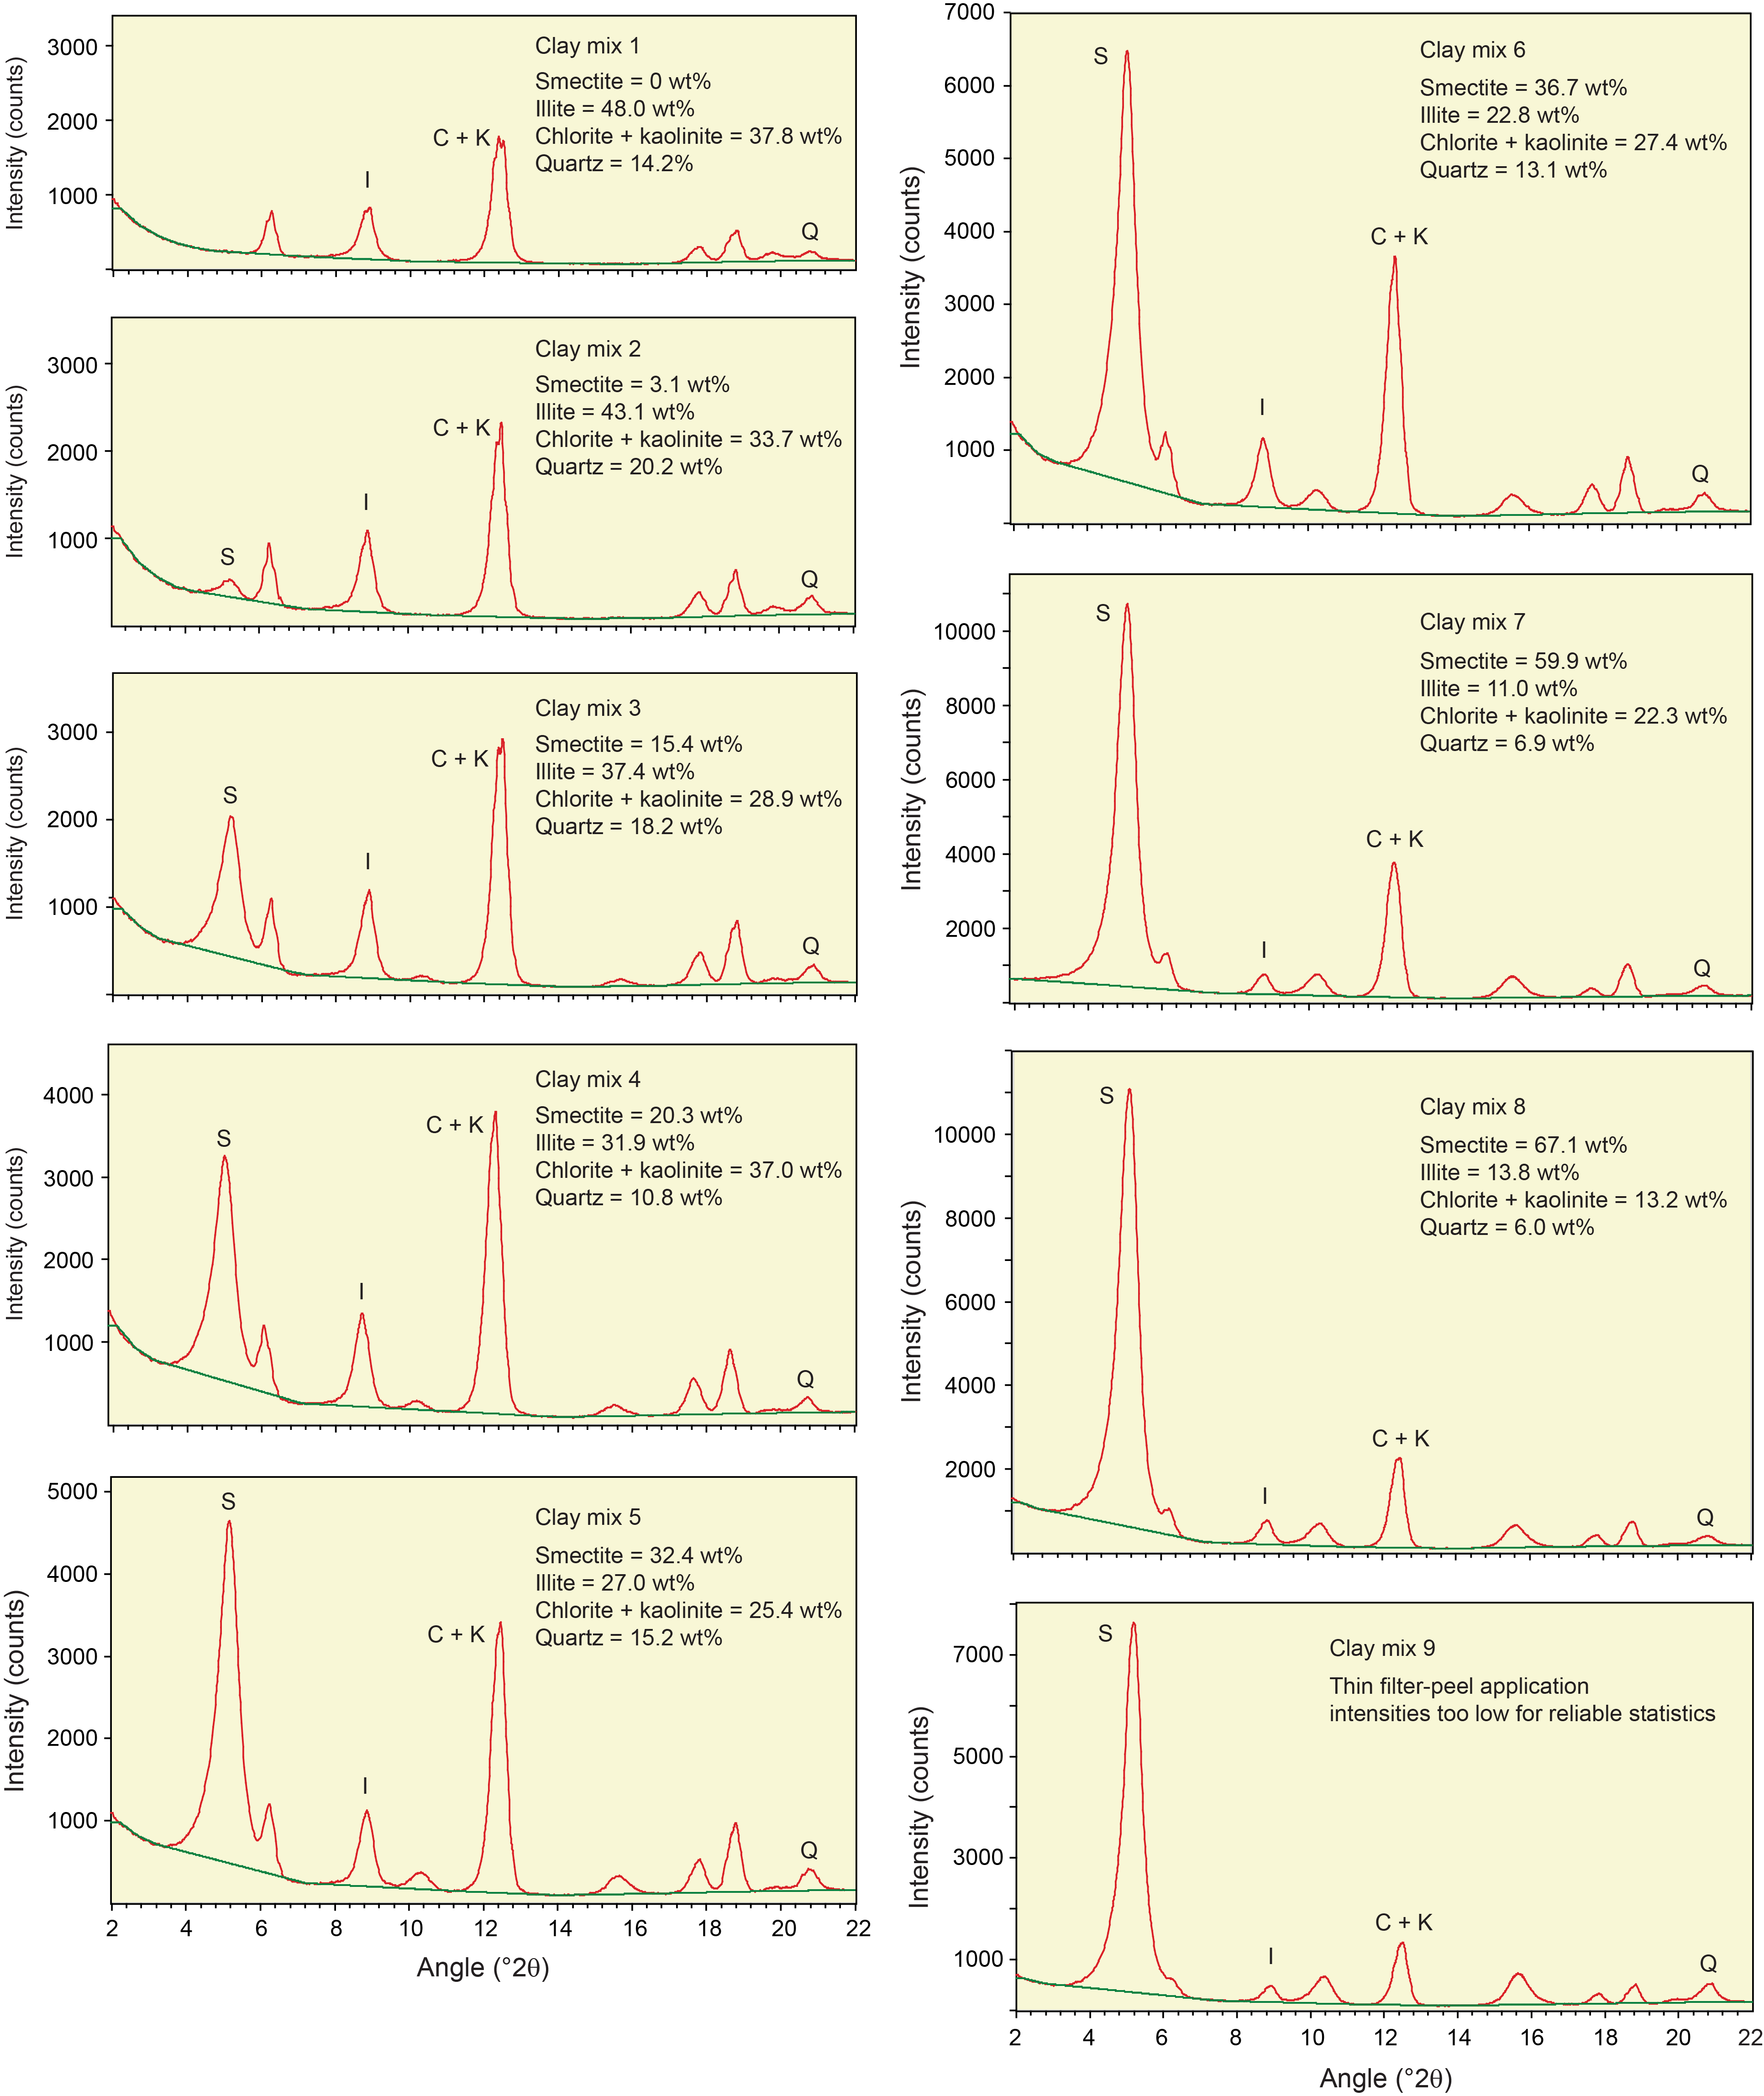
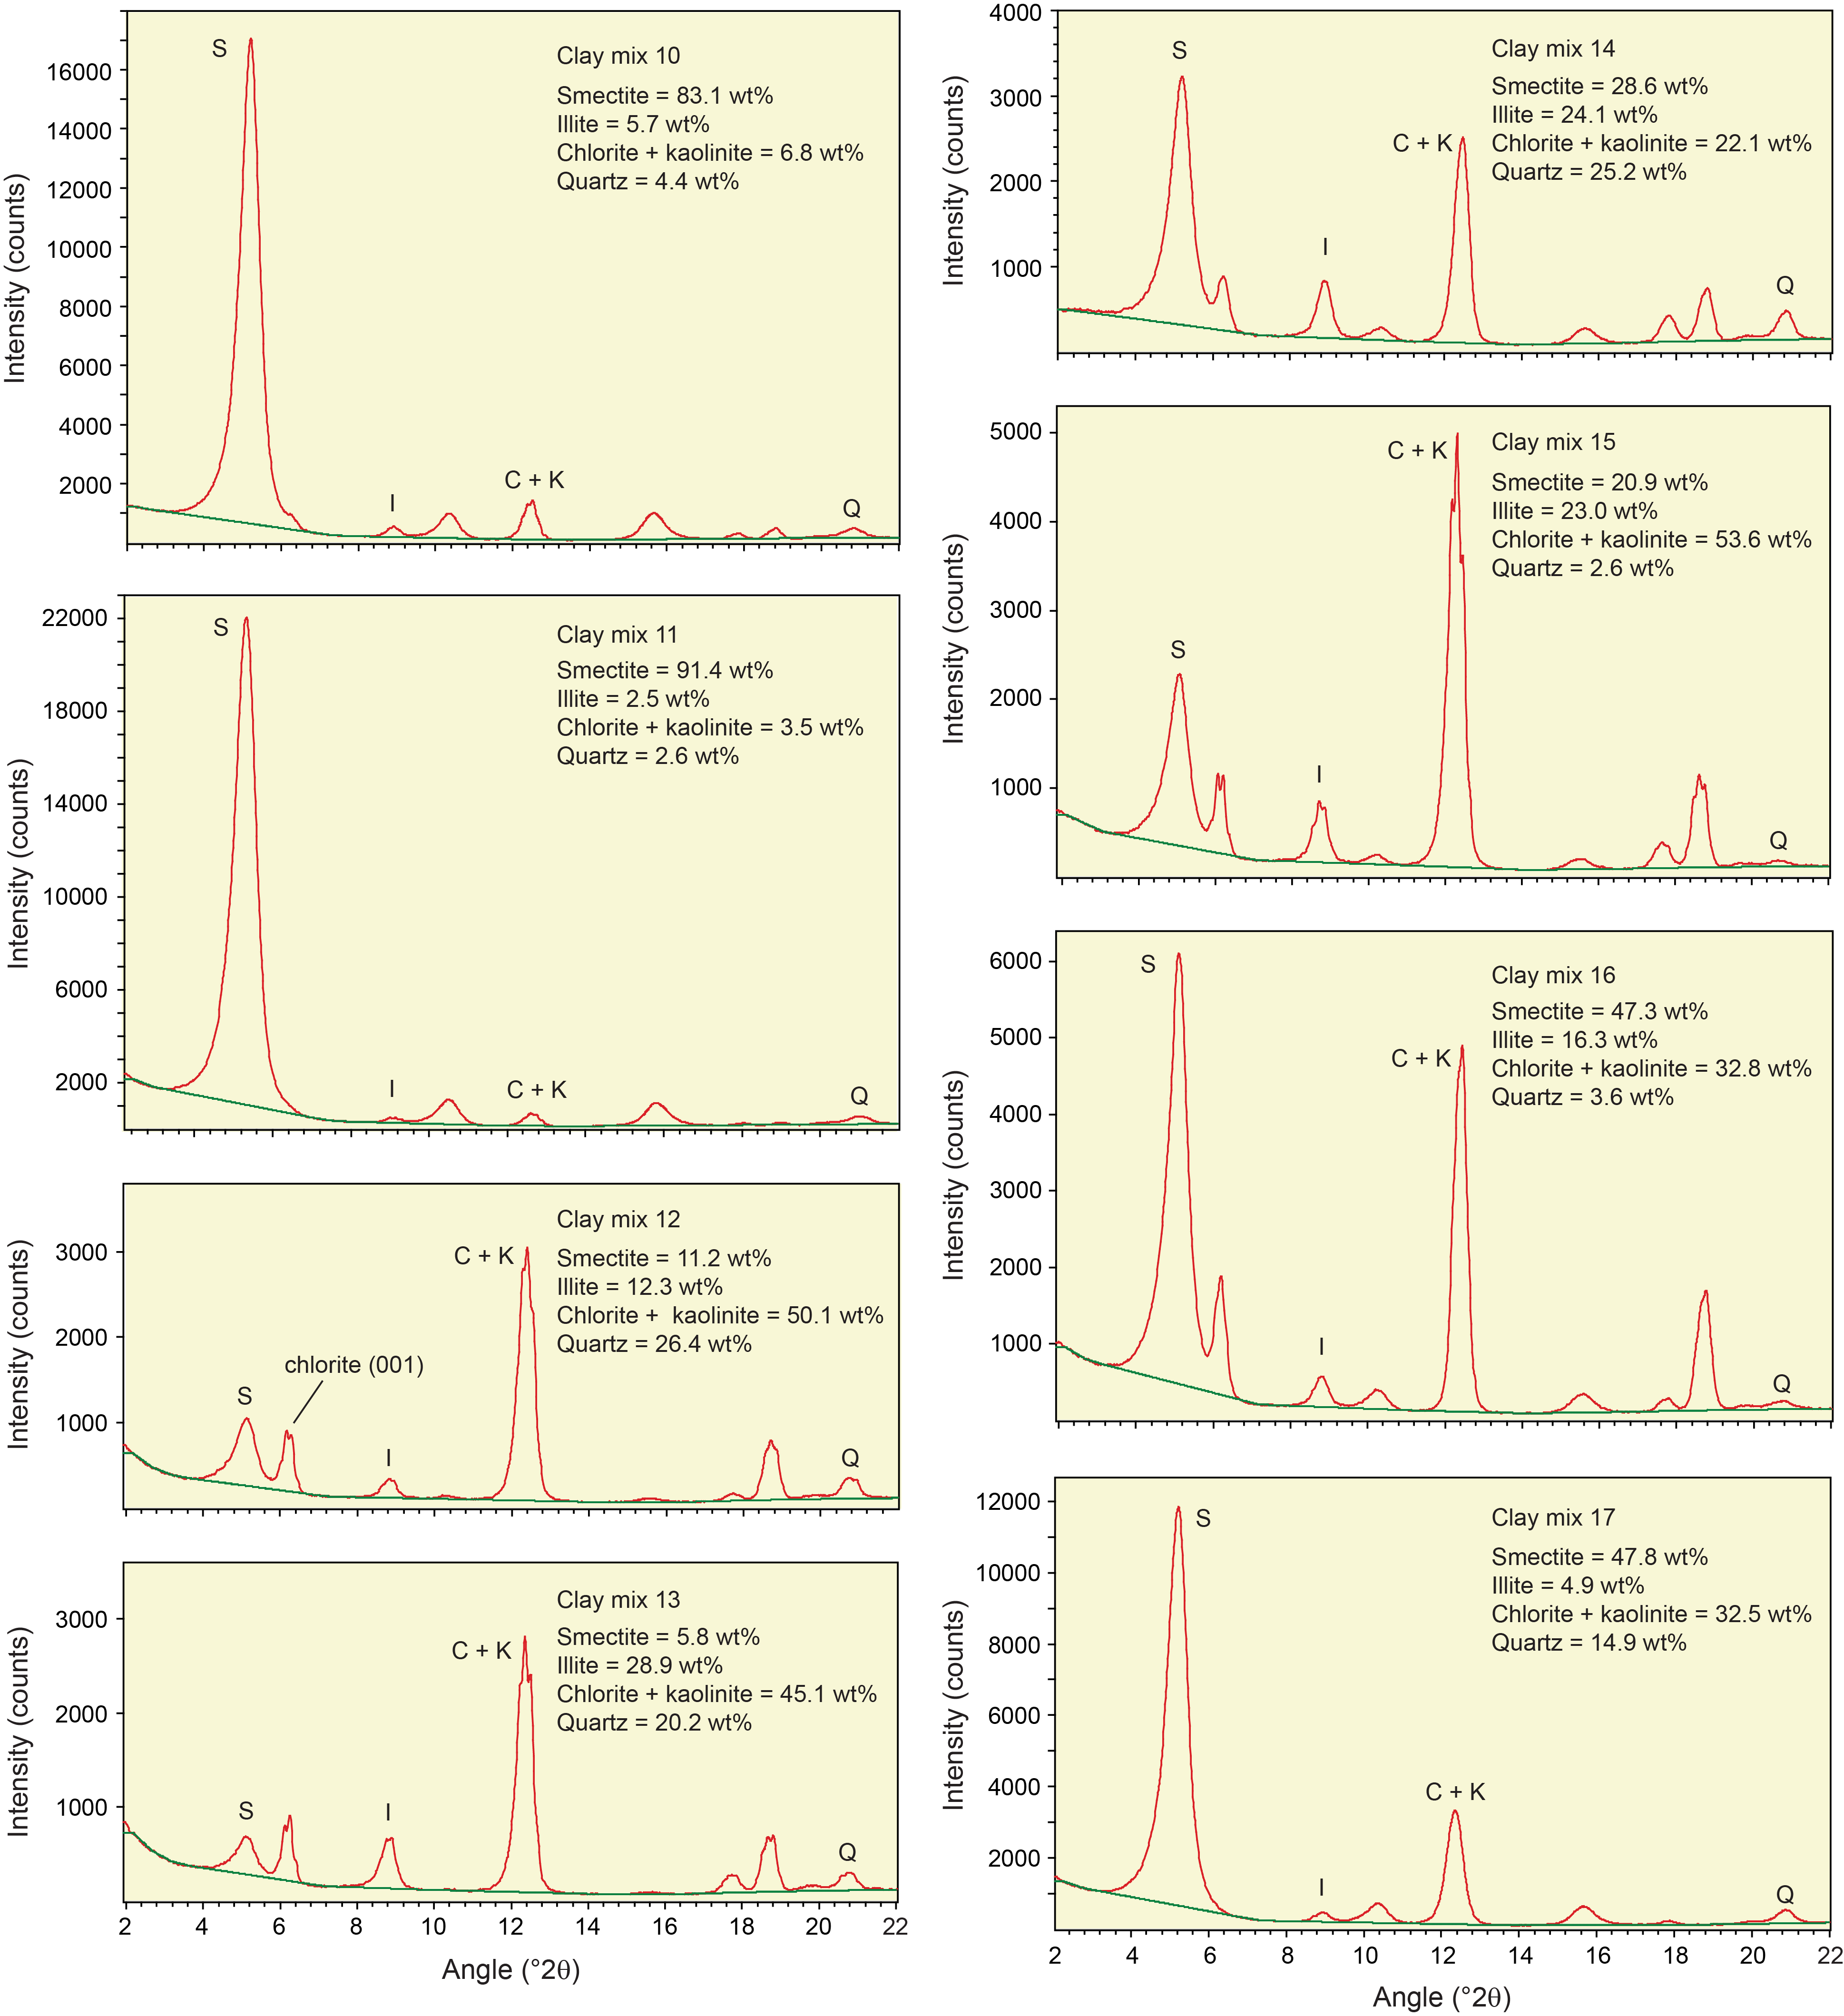
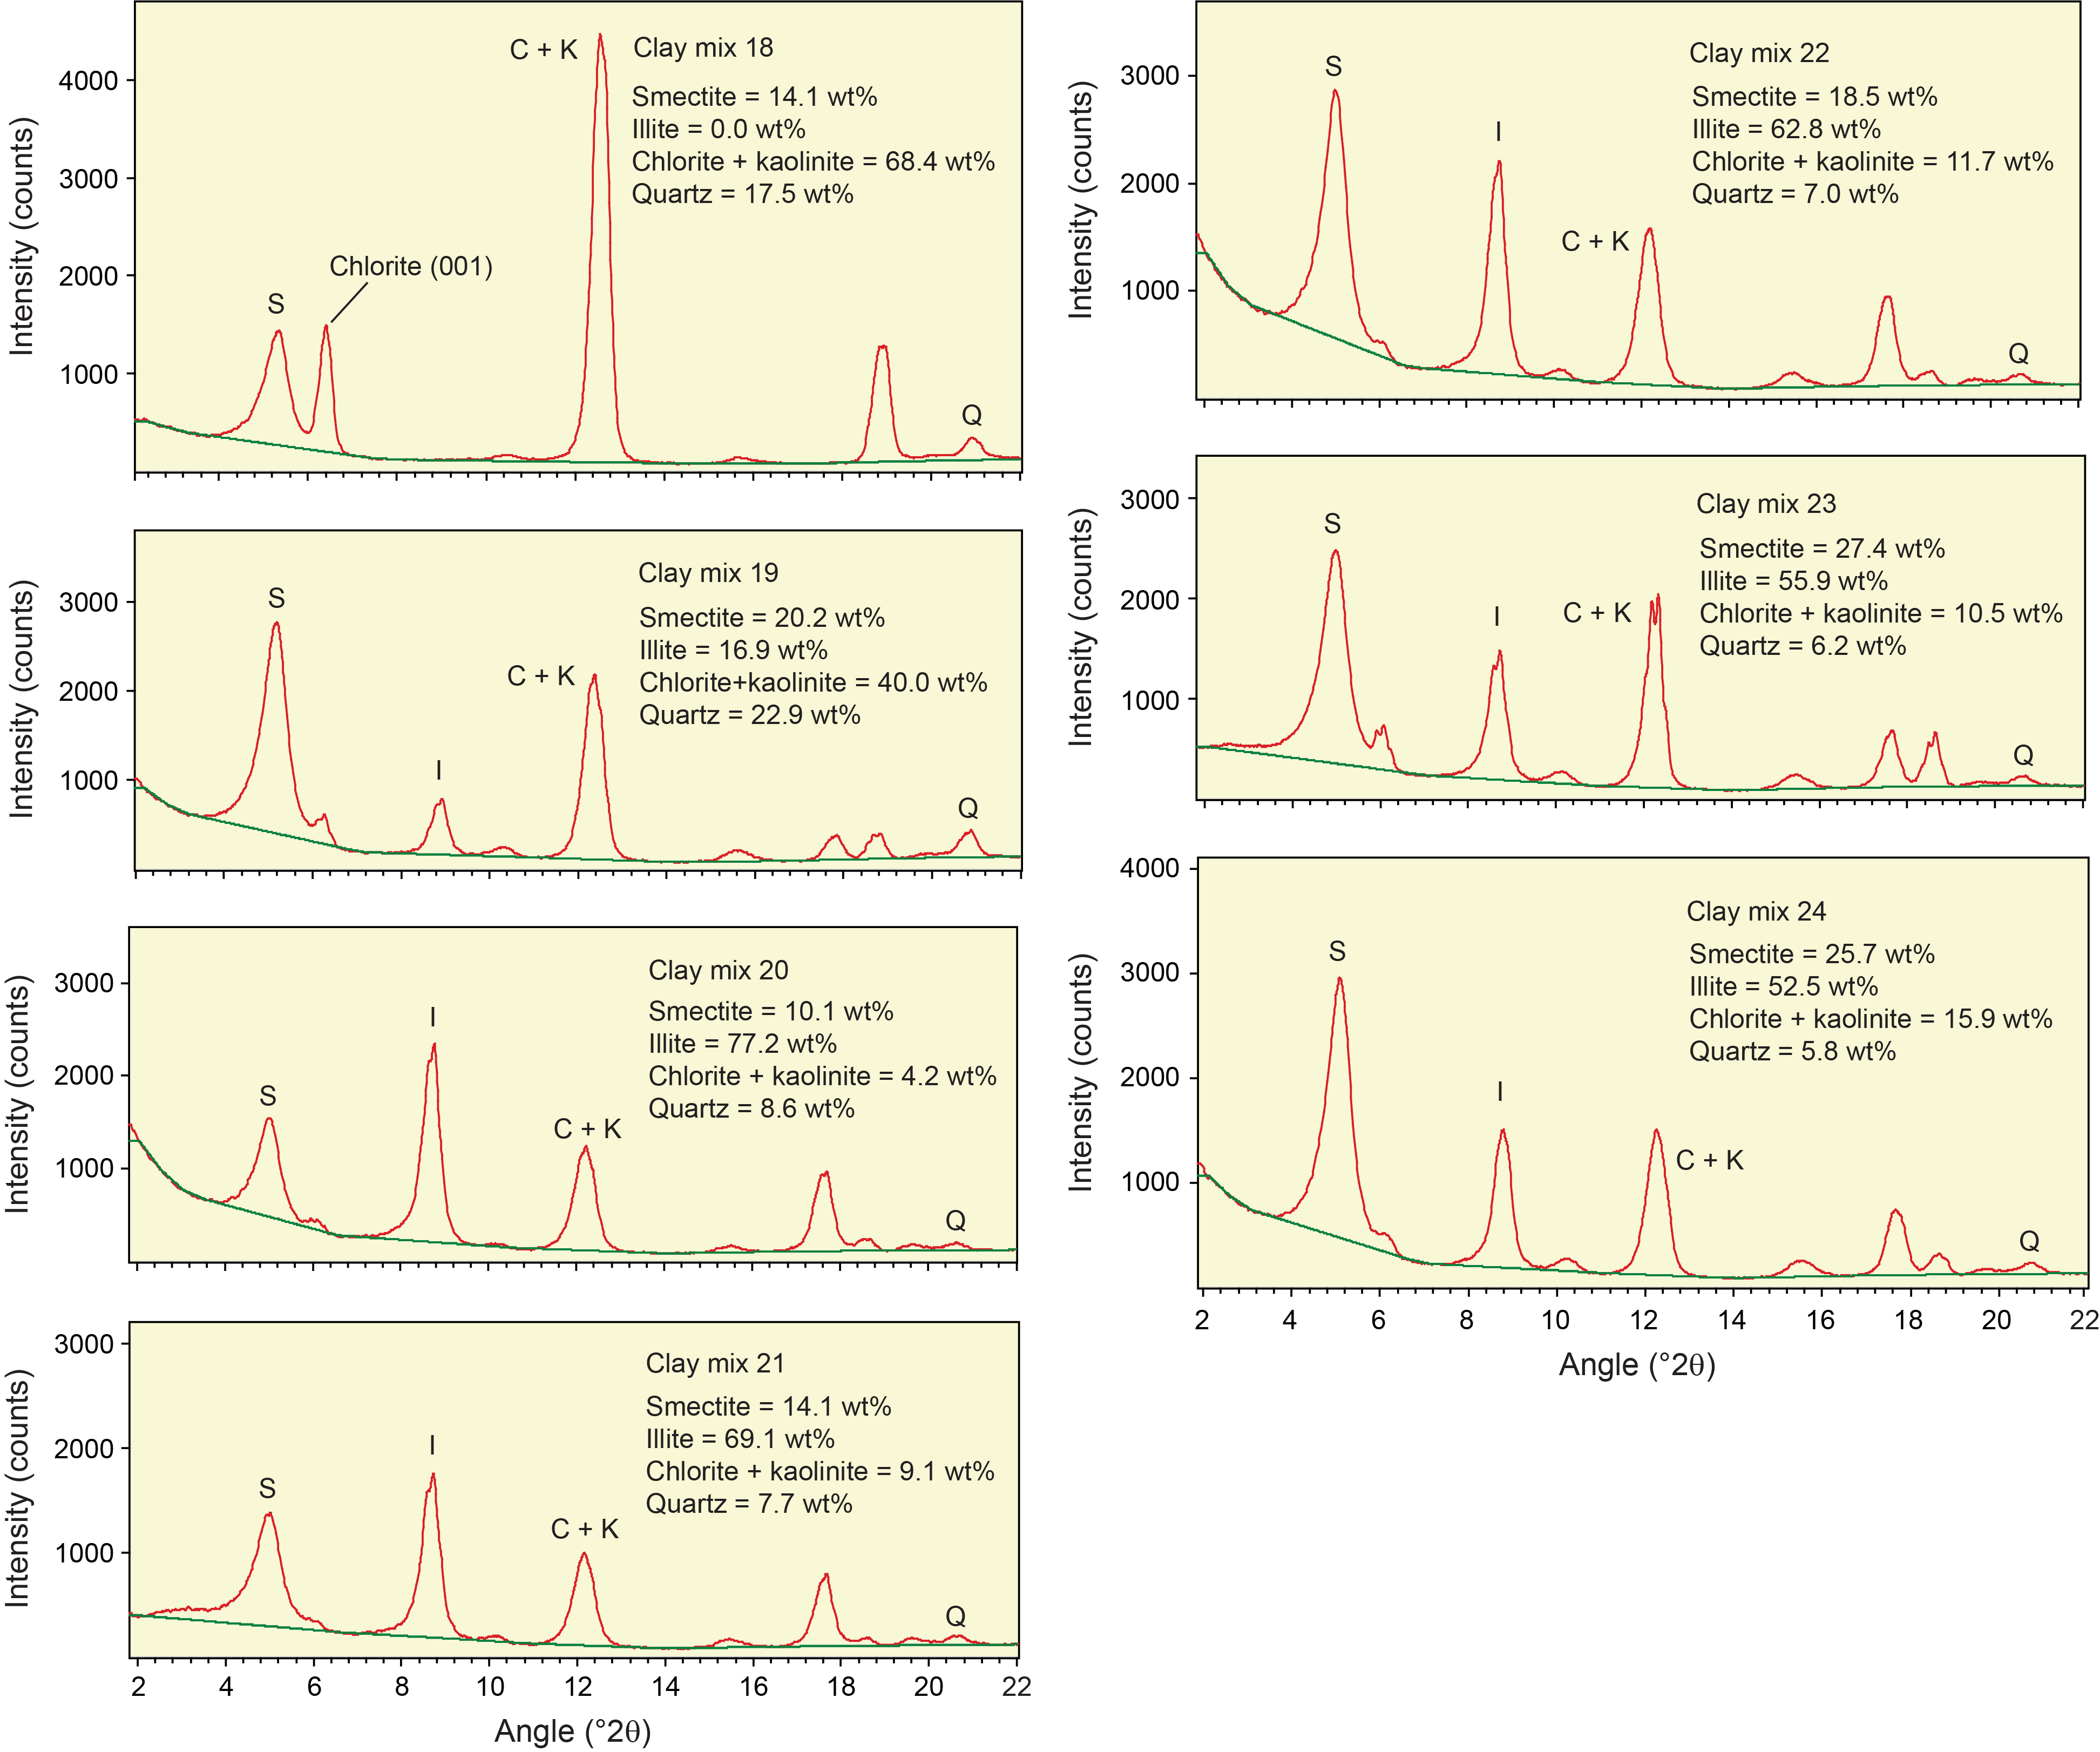
Figure F5. Clay-sized standard mineral mixtures.
Statistical analysis of bulk powder XRD results
Some practitioners of quantitative XRD prefer to use peak intensity values or an RIR for weight percent computations (e.g., Hillier, 2000). In theory, one RIR value should work for all proportions of a given mineral relative to the reference mineral (e.g., quartz). In consideration of those concepts, Figure F6 provides linear regression plots for the peak intensity data we generated using all the diffractometer (Bruker and Panalytical) and software (DIFFRAC.EVA and MacDiff) combinations. The trends of weight percent (plotted as the independent variable) versus peak intensity (plotted as the dependent variable) are distinctly nonlinear for total clay minerals, and those correlation coefficients are 0.93 or less. Linear regression yields better fits for the nonplaty minerals, and those correlation coefficients are 0.96 or greater. Calcite yields the best fit among linear regressions, with correlation coefficients of 0.99 (Figure F6). As described below, we achieved consistently better results using peak area values.
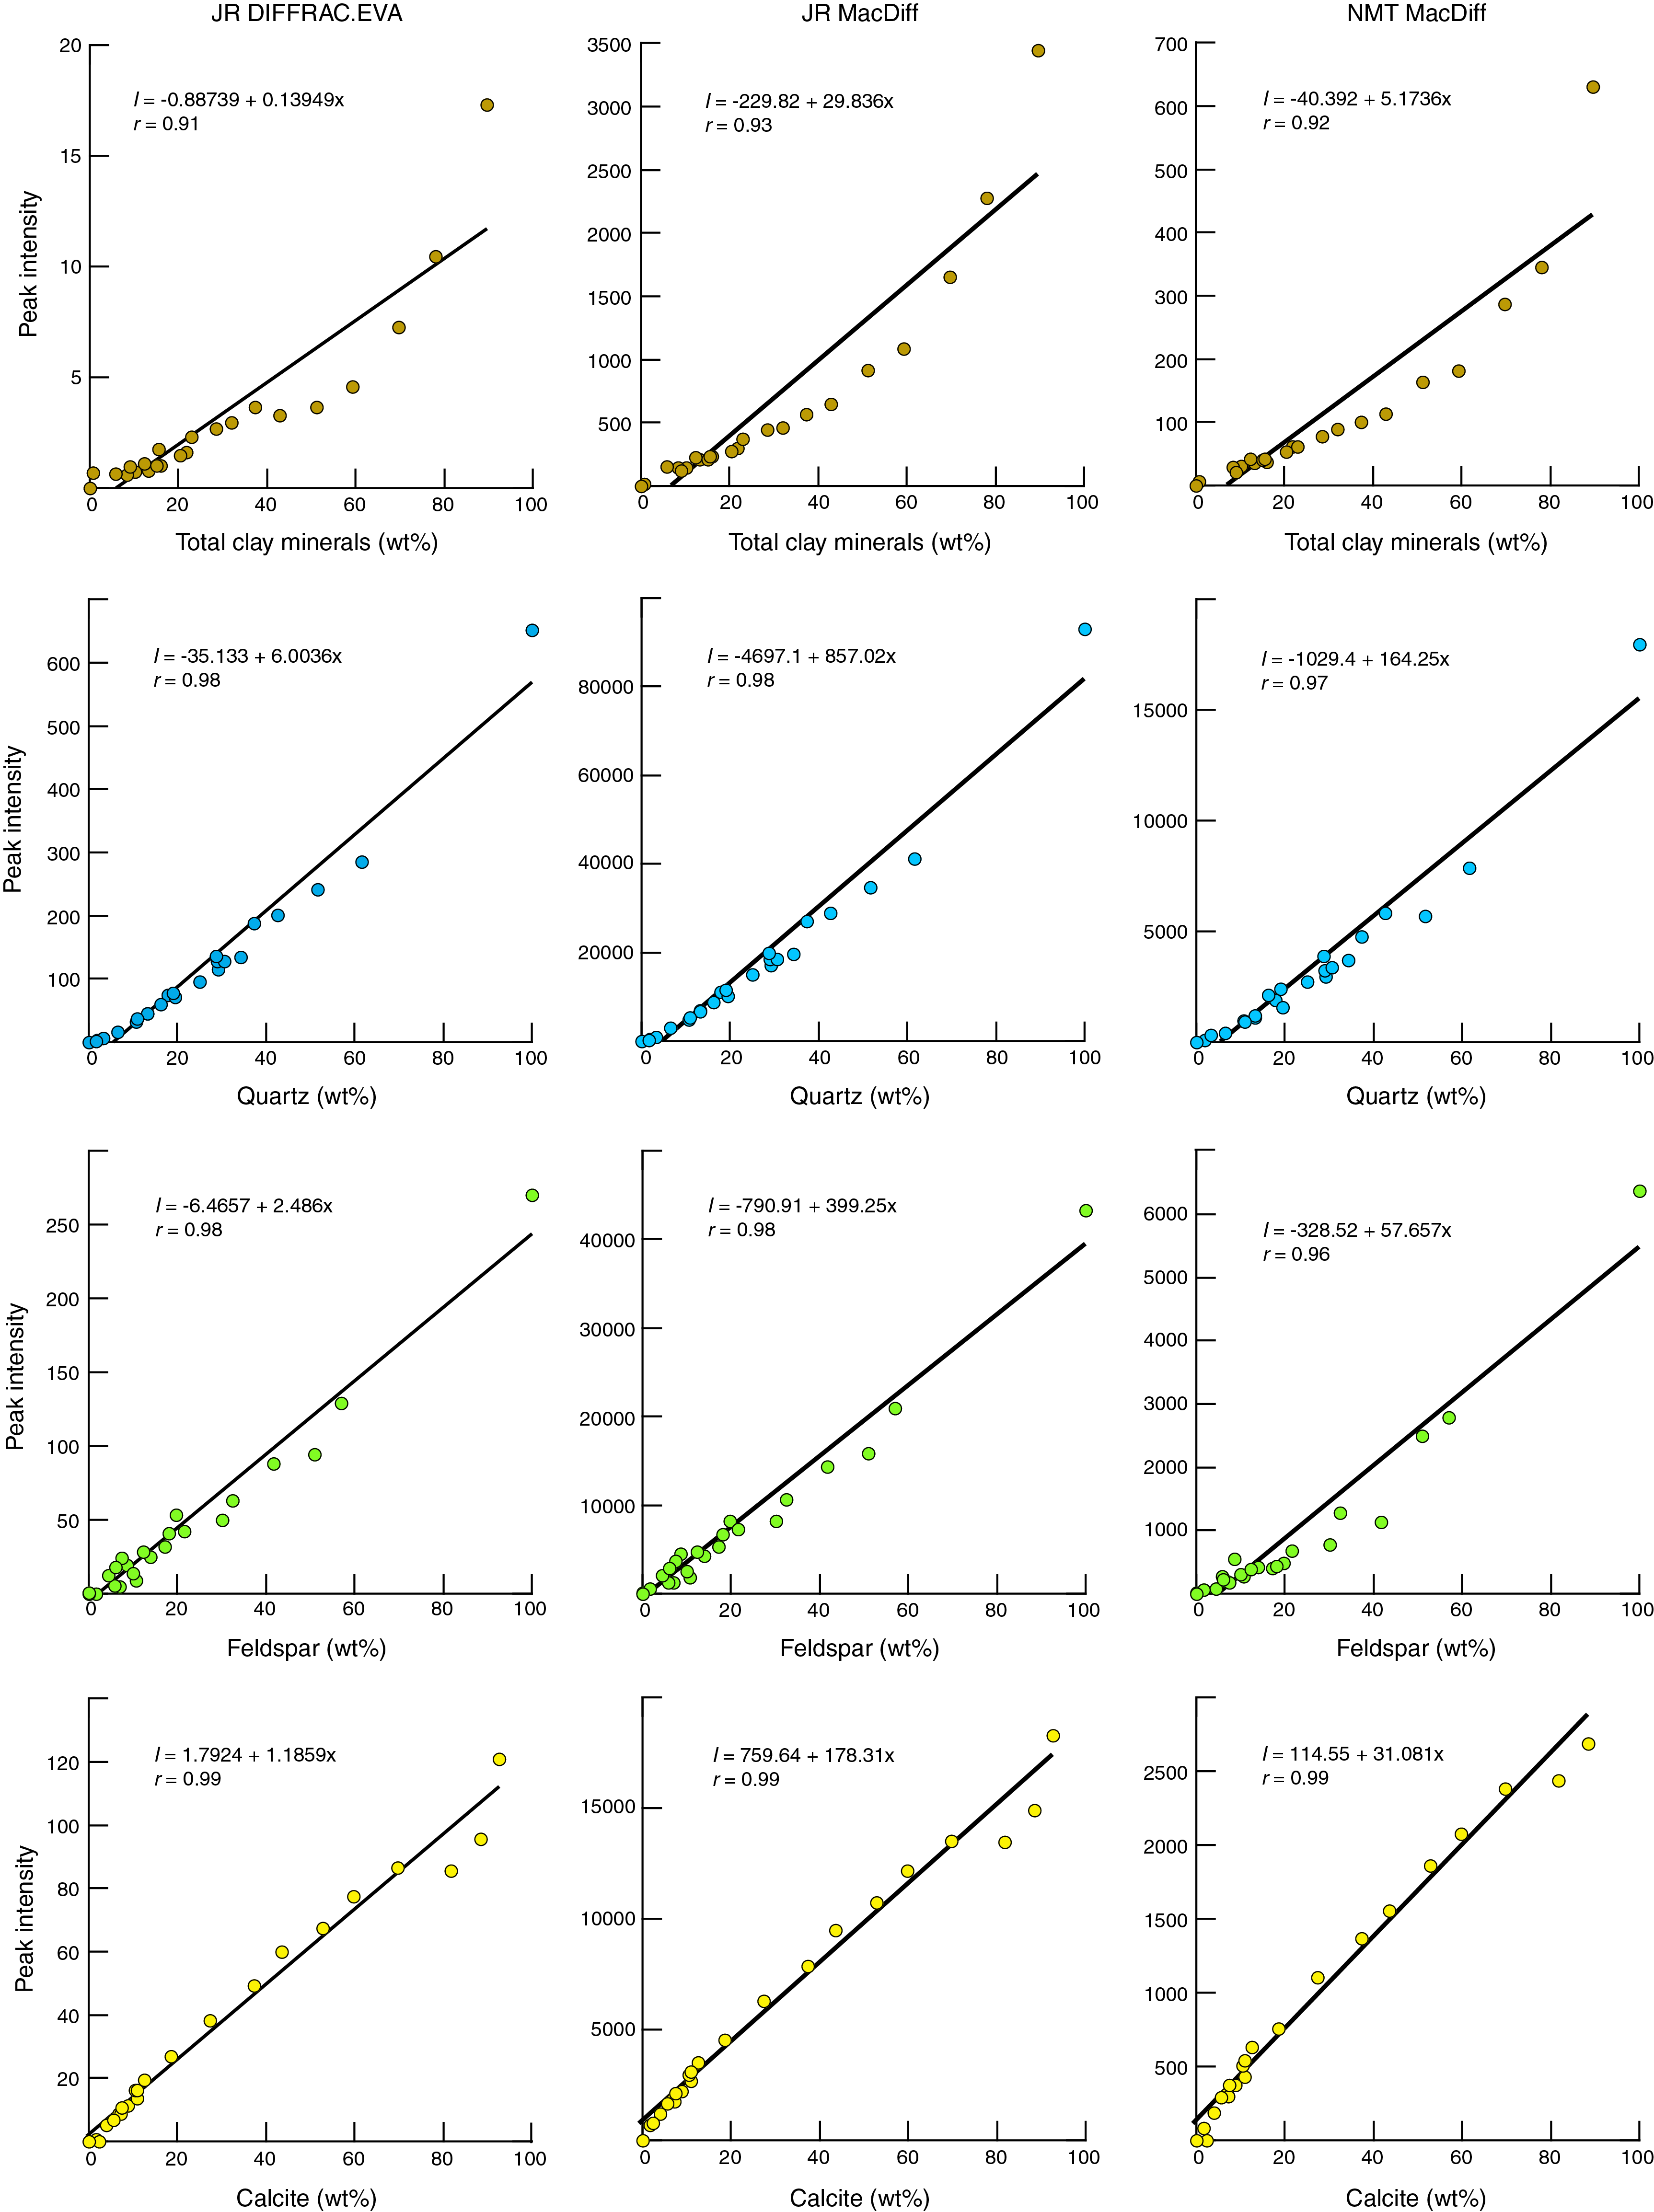
Figure F6. Peak intensity vs. measured weight percent.
Figure F7 shows polynomial regression plots (together with corresponding equations) for the weight percent and net peak area values generated by the Bruker diffractometer on JOIDES Resolution and DIFFRAC.EVA software (JR-EVA). Figure F8 shows comparable plots and equations for peak area data generated by the Bruker diffractometer on JOIDES Resolution and MacDiff software (JR-MD). Figure F9 displays the results for the Panalytical diffractometer at New Mexico Tech and MacDiff software (NMT-MD). The best-fit curves for MacDiff results are nonlinear (second- and third-order polynomials), and all reveal almost perfect closeness of fit, with correlation coefficients >0.99.
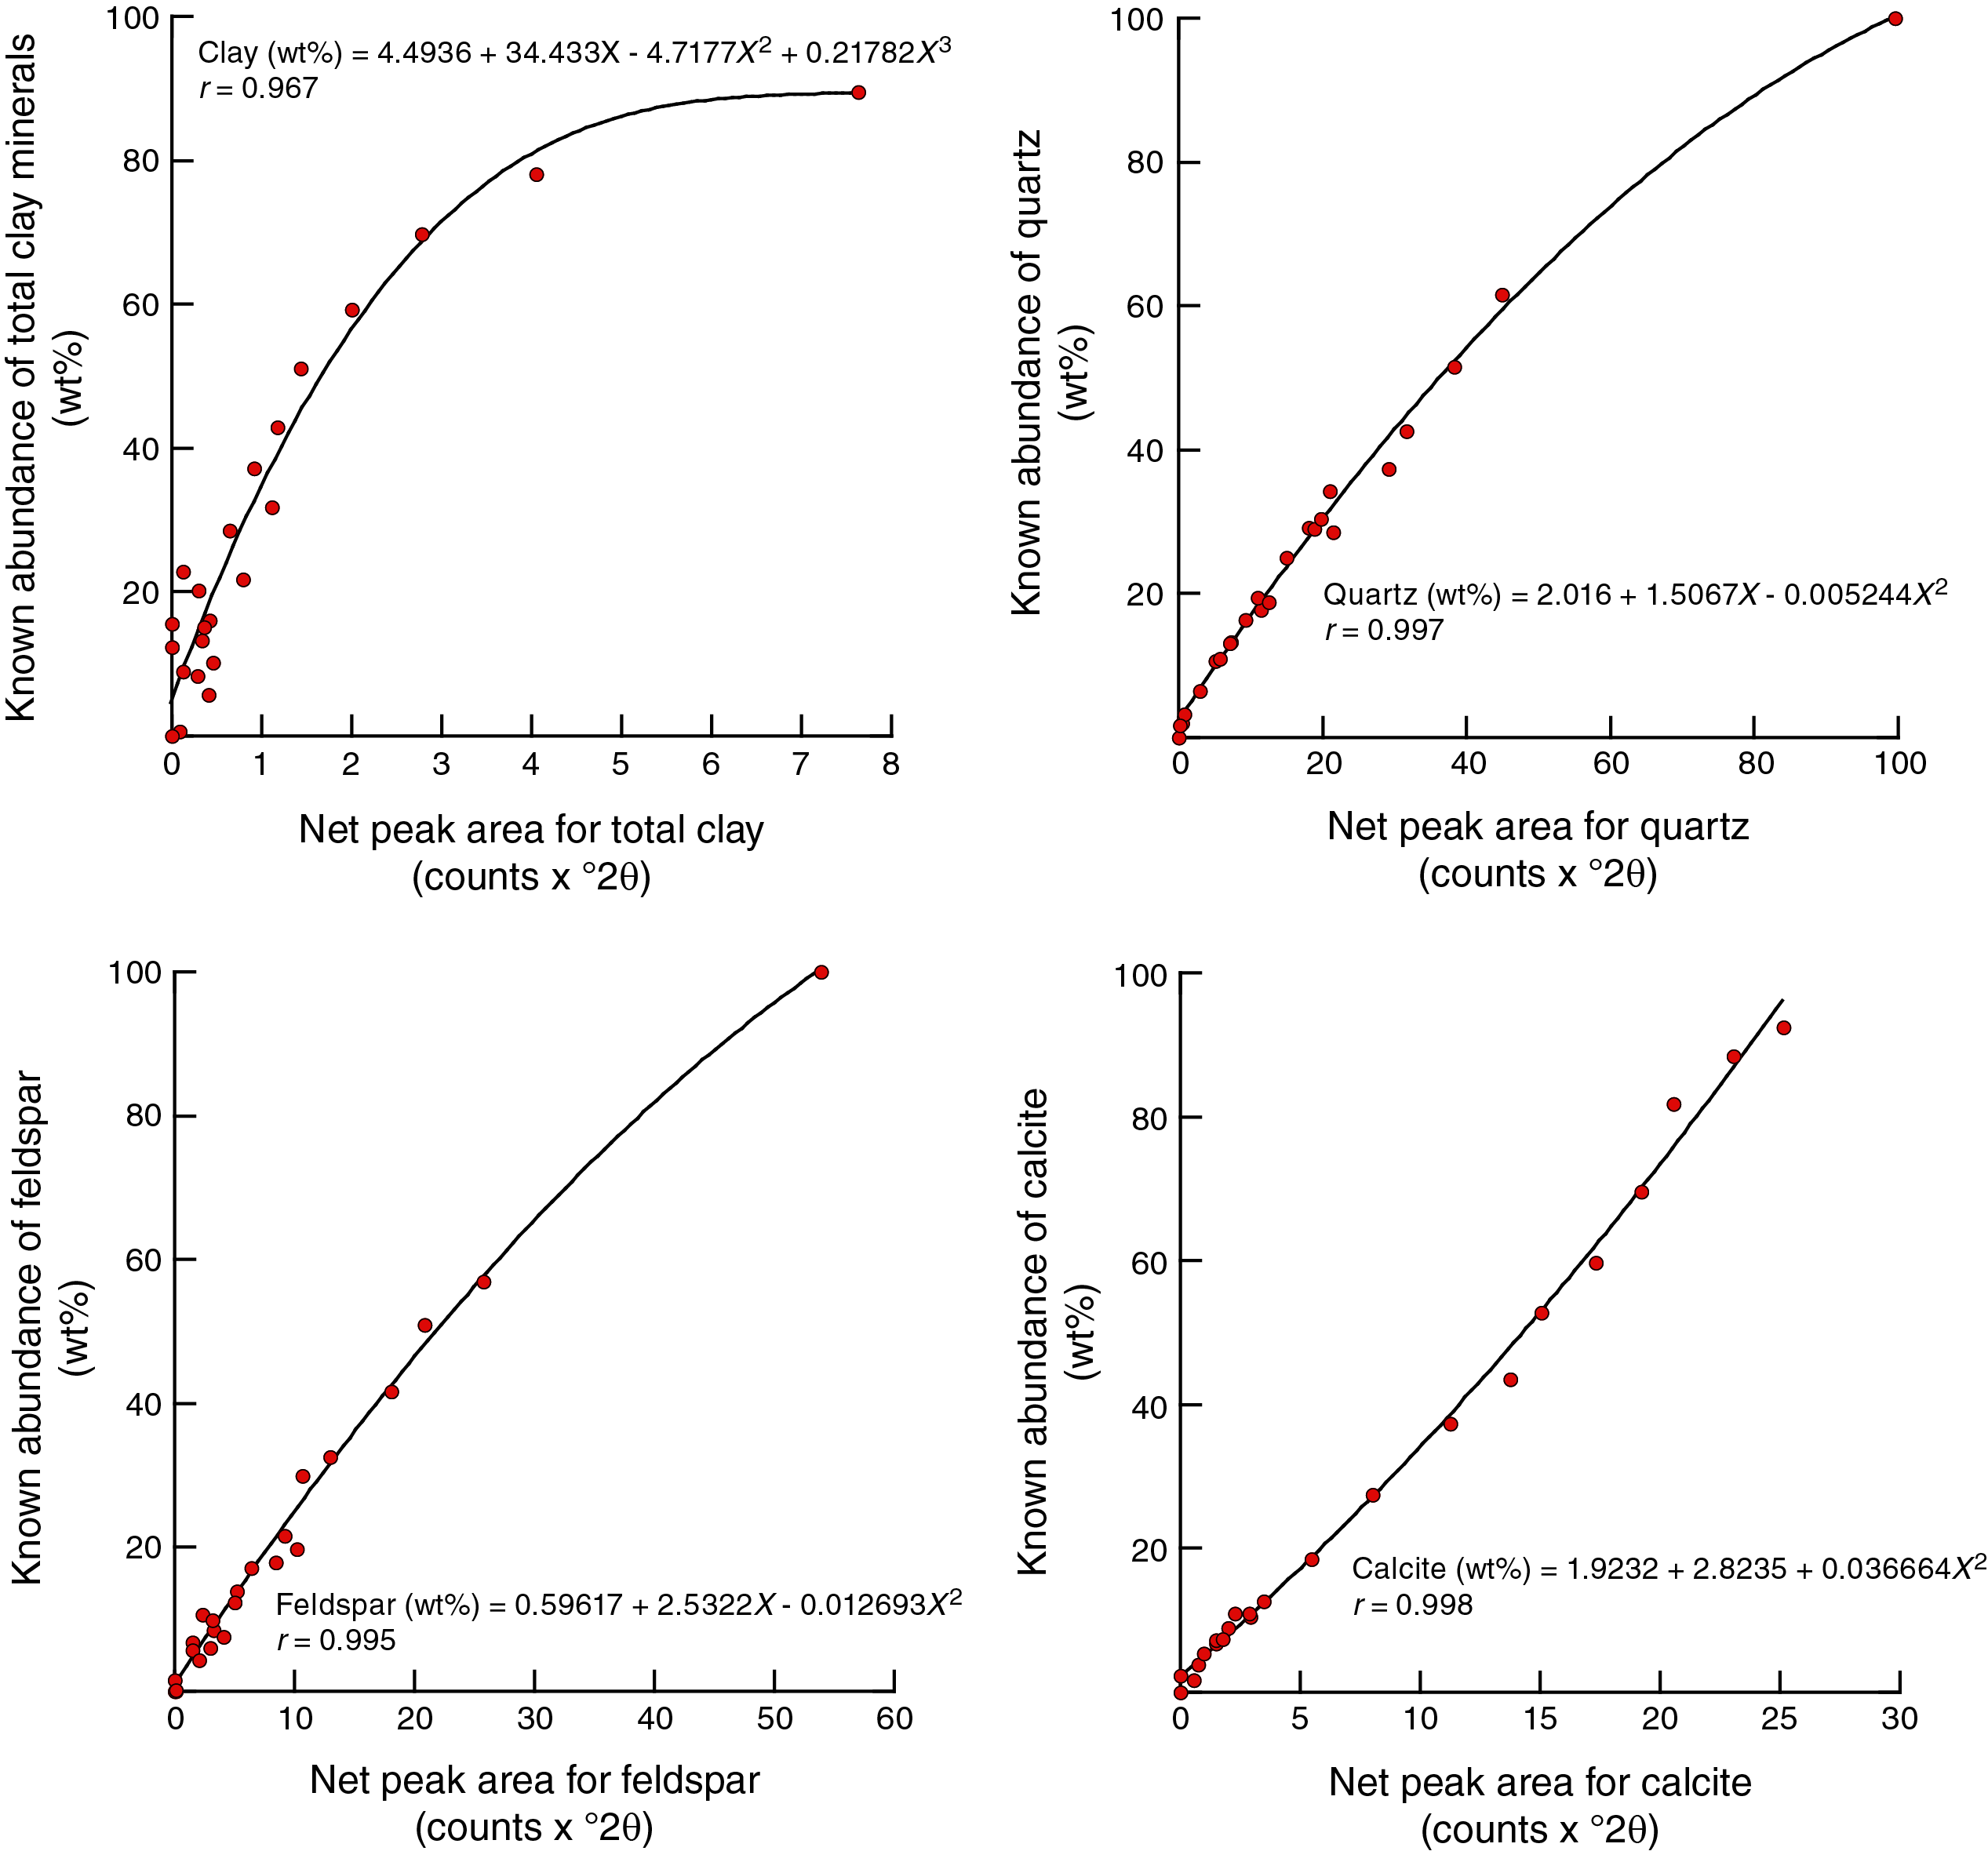
Figure F7. Net peak area vs. measured weight percent.
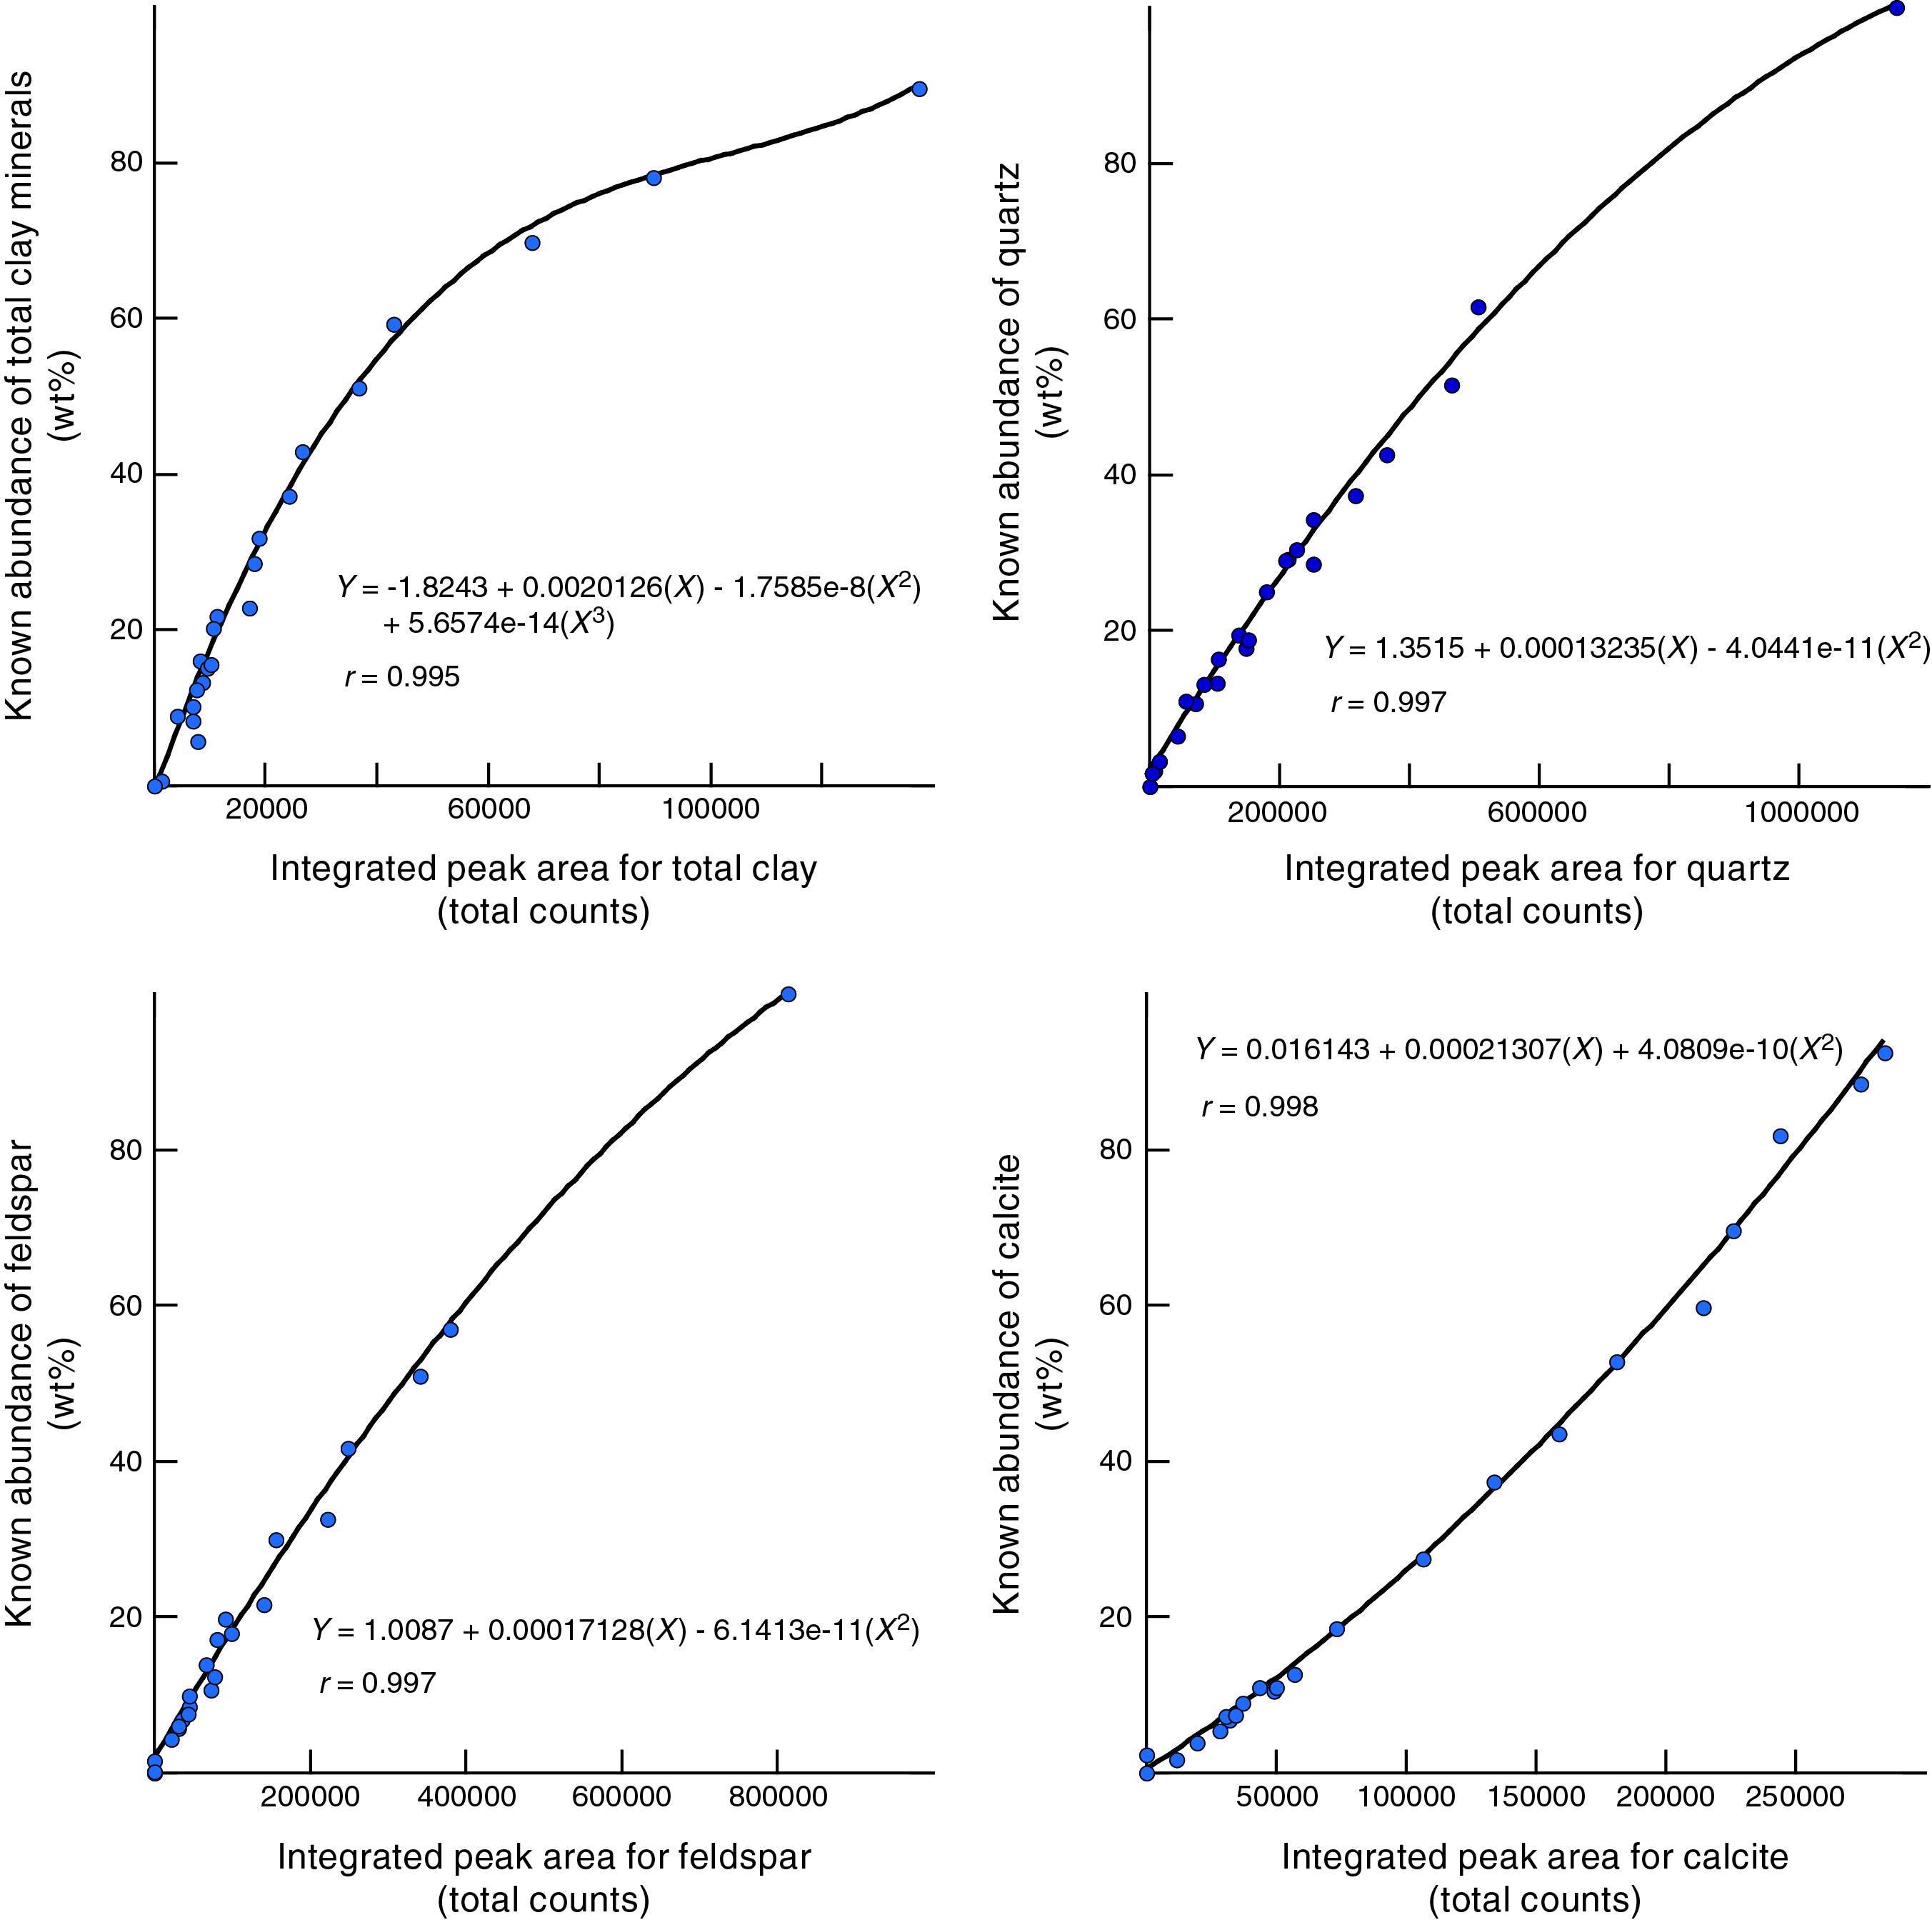
Figure F8. Integrated peak area vs. measured weight percent for bulk powder standards, Bruker diffractometer using MacDiff.
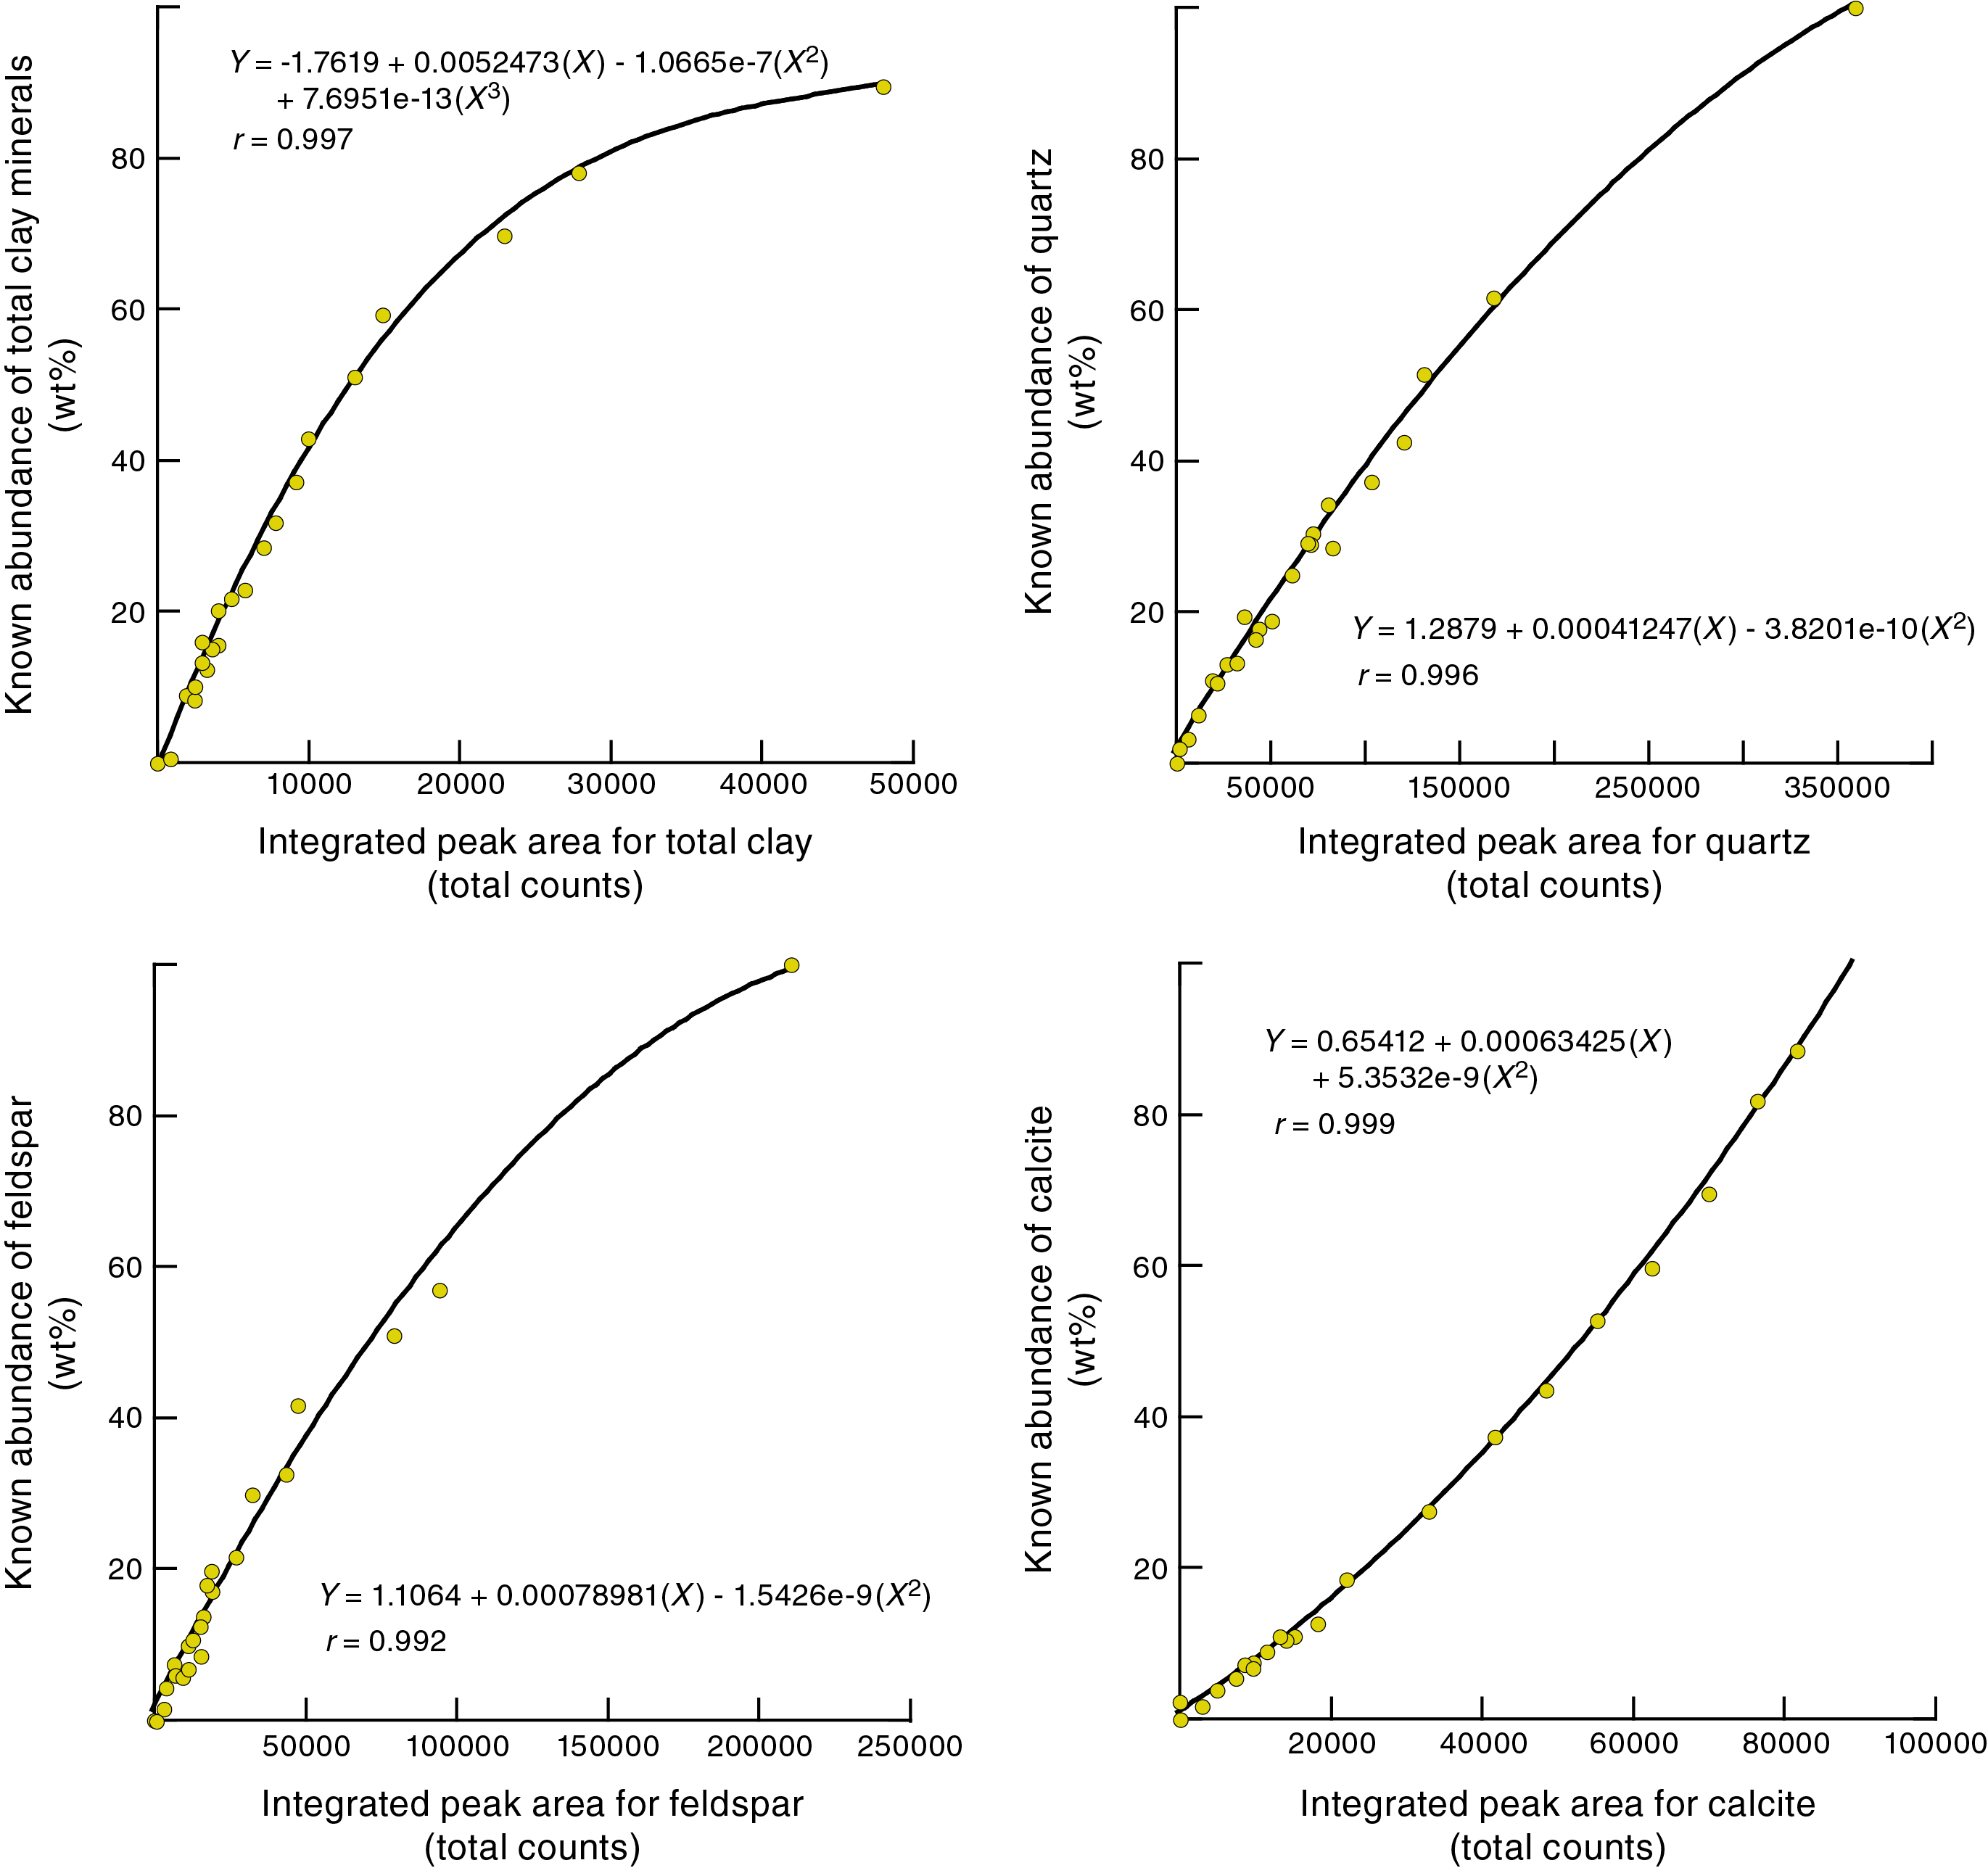
Figure F9. Integrated peak area vs. measured weight percent for bulk powder standards, Panalytical diffractometer using MacDiff.
We also used the two sets of MacDiff data (JR-MD and NMT-MD) to compute matrixes of SVD normalization factors (Table T7). One way to assess the accuracy of these XRD computations is to compare the weight percent values computed using the polynomial equations (normalized to 100%) to the true weight percentages (known abundance) of each mineral in the standard mixtures (Table T8). All of the absolute errors are less than 6 wt%, and most are less than 3 wt%. The average error for each mineral computed from absolute values of the polynomial regression error are as follows:
- JR-EVA: total clay minerals = 4.1 wt%, quartz = 2.3 wt%, feldspar = 1.3 wt%, and calcite = 2.0 wt%.
- JR-MD: total clay minerals = 1.2 wt%, quartz = 1.2 wt%, feldspar = 1.3 wt%, and calcite = 0.6 wt%.
- NMT-MD: total clay minerals = 1.7 wt%, quartz = 1.2 wt%, feldspar = 1.6 wt%, and calcite = 1.2 wt%.
Overall, these statistical outcomes are highly accurate for quantitative XRD. The JR-MD combination slightly outperforms NMT-MD, although the opposite is true for SVD normalization factors (see below). The effects of changing software on precision are relatively small. We suggest that the larger errors in JR-EVA results are related to improper baseline fitting through the middle of background noise; that software quirk resulted in some negative net peak area values for clay-poor mixtures (Table T3). Those negative numbers were set to zero in the statistical regressions (Figure F7). The effects of changing diffractometers are less problematic than software effects. Given the restricted access to the Bruker diffractometer postexpedition, these assessments of precision raise confidence in the validity of merging shipboard and shore-based data sets.
Table T9 displays the errors derived from computations using SVD normalization factors. In all cases, these errors are less than 10 wt%. The average error for each component computed from absolute values of the SVD error are as follows:
- NMT-MD: total clay minerals = 2.3 wt%, quartz = 1.5 wt%, feldspar = 2.0 wt%, and calcite = 2.8 wt%
- JR-MD: total clay minerals = 3.2 wt%, quartz = 1.5 wt%, feldspar = 1.4 wt%, and calcite = 2.6 wt%.
These statistics demonstrate that computations using SVD normalization factors are also highly accurate but less so than the computations using polynomial regression equations (see above).
The results outlined above are more accurate than earlier SVD calibrations with standard mineral mixtures (e.g., Fisher and Underwood, 1995; Shipboard Scientific Party, 1990; Expedition 315 Scientists, 2009). We attribute that upgrade to four decisions: (1) using a larger number (20) of standard mineral mixtures, (2) anchoring the regression curves at the high end of weight percent values using peak area data for "pure" (or nearly pure) individual components, (3) solving for impurities in the standards and recalculating true weight percent values, and (4) expanding the peak area range for total clay minerals to include counts from the chlorite (003) reflection.
To test for systematic shifts in inaccuracy as a function of each mineral's known abundance in the mixtures, we plotted data from the three combinations of hardware and software (JR-EVA, JR-MD, and NMT-MD) as crossplots of computed weight percent (normalized to 100%) versus known weight percent (Figure F10). JR-EVA results show larger perturbations at the low end of concentration for total clay minerals and at the high end of concentration for quartz. The values computed using MacDiff and polynomial regression equations do not show any systematic shifts relative to a reference line of 1:1 (Figure F10). Using the SVD normalization factors (Figure F11), the computed values of total clay minerals reveal small but systematic underestimates over the midrange of absolute abundances. Conversely, calcite is systematically overestimated over the midrange of absolute abundances and consistently underestimated at the high end (Figure F11). In our judgment, these statistical comparisons reinforce the slight superiority of polynomial regression equations over SVD normalization factors.
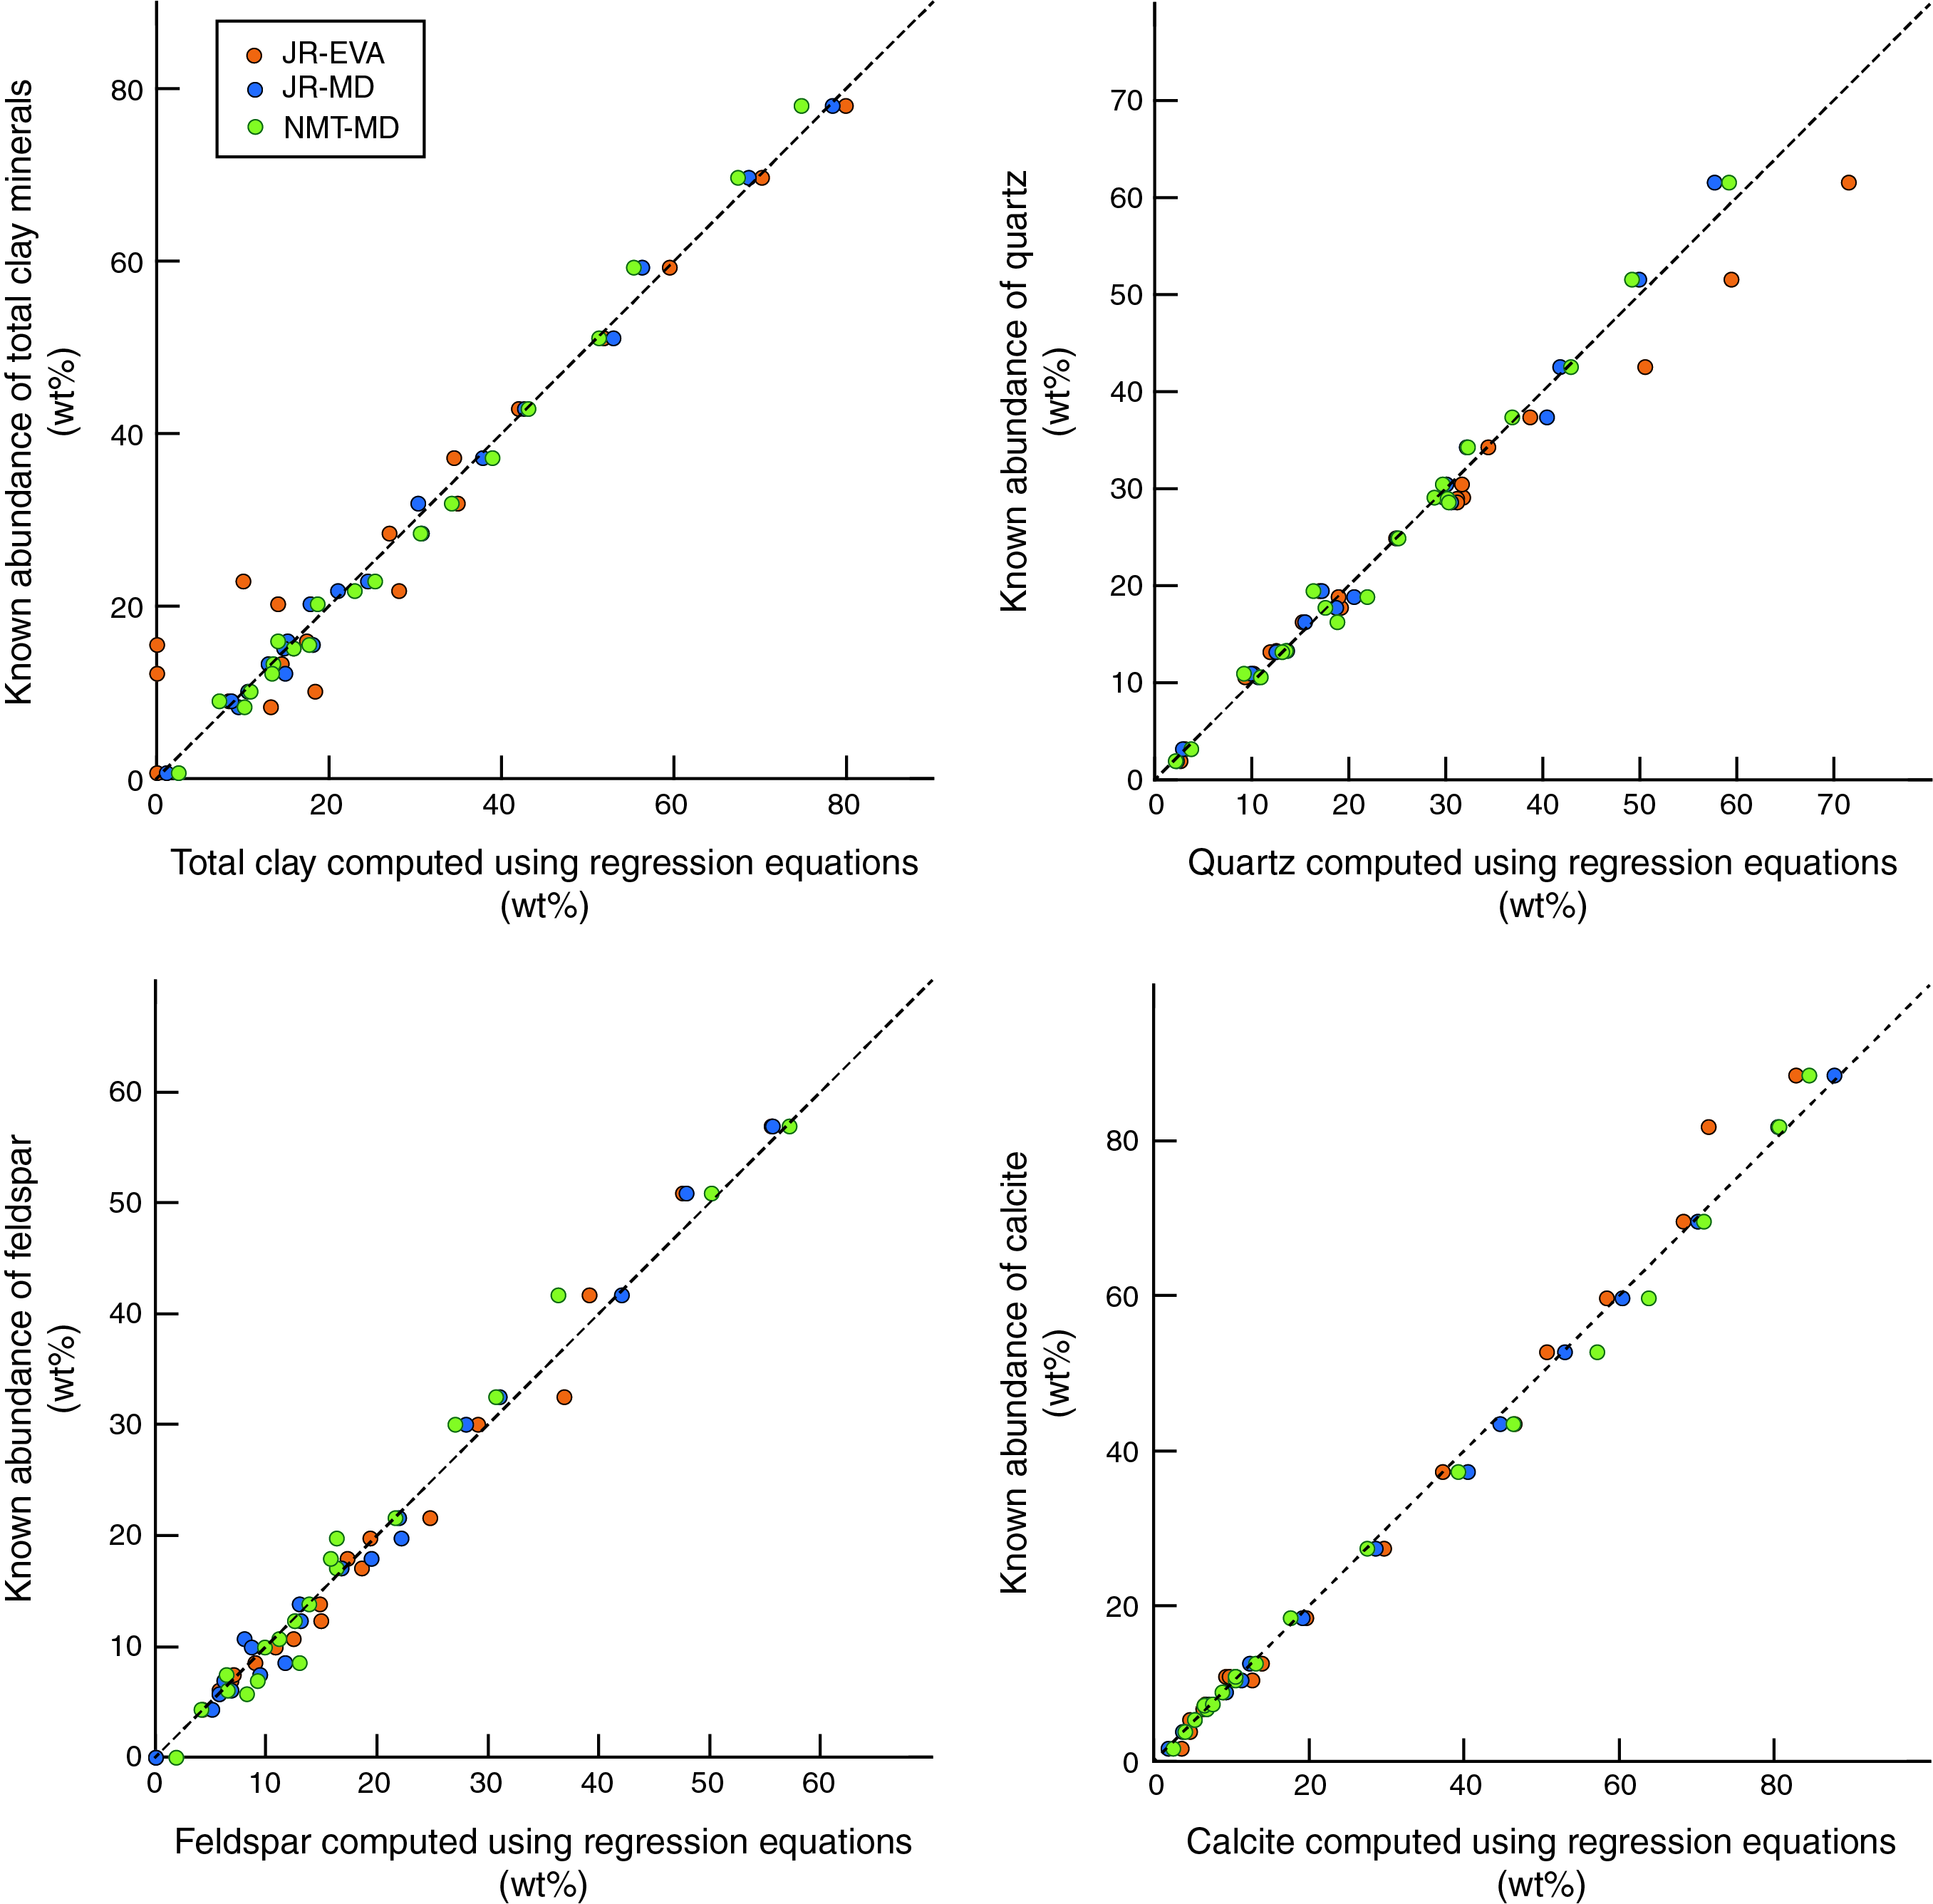
Figure F10. Errors associated with polynomial regression equations.
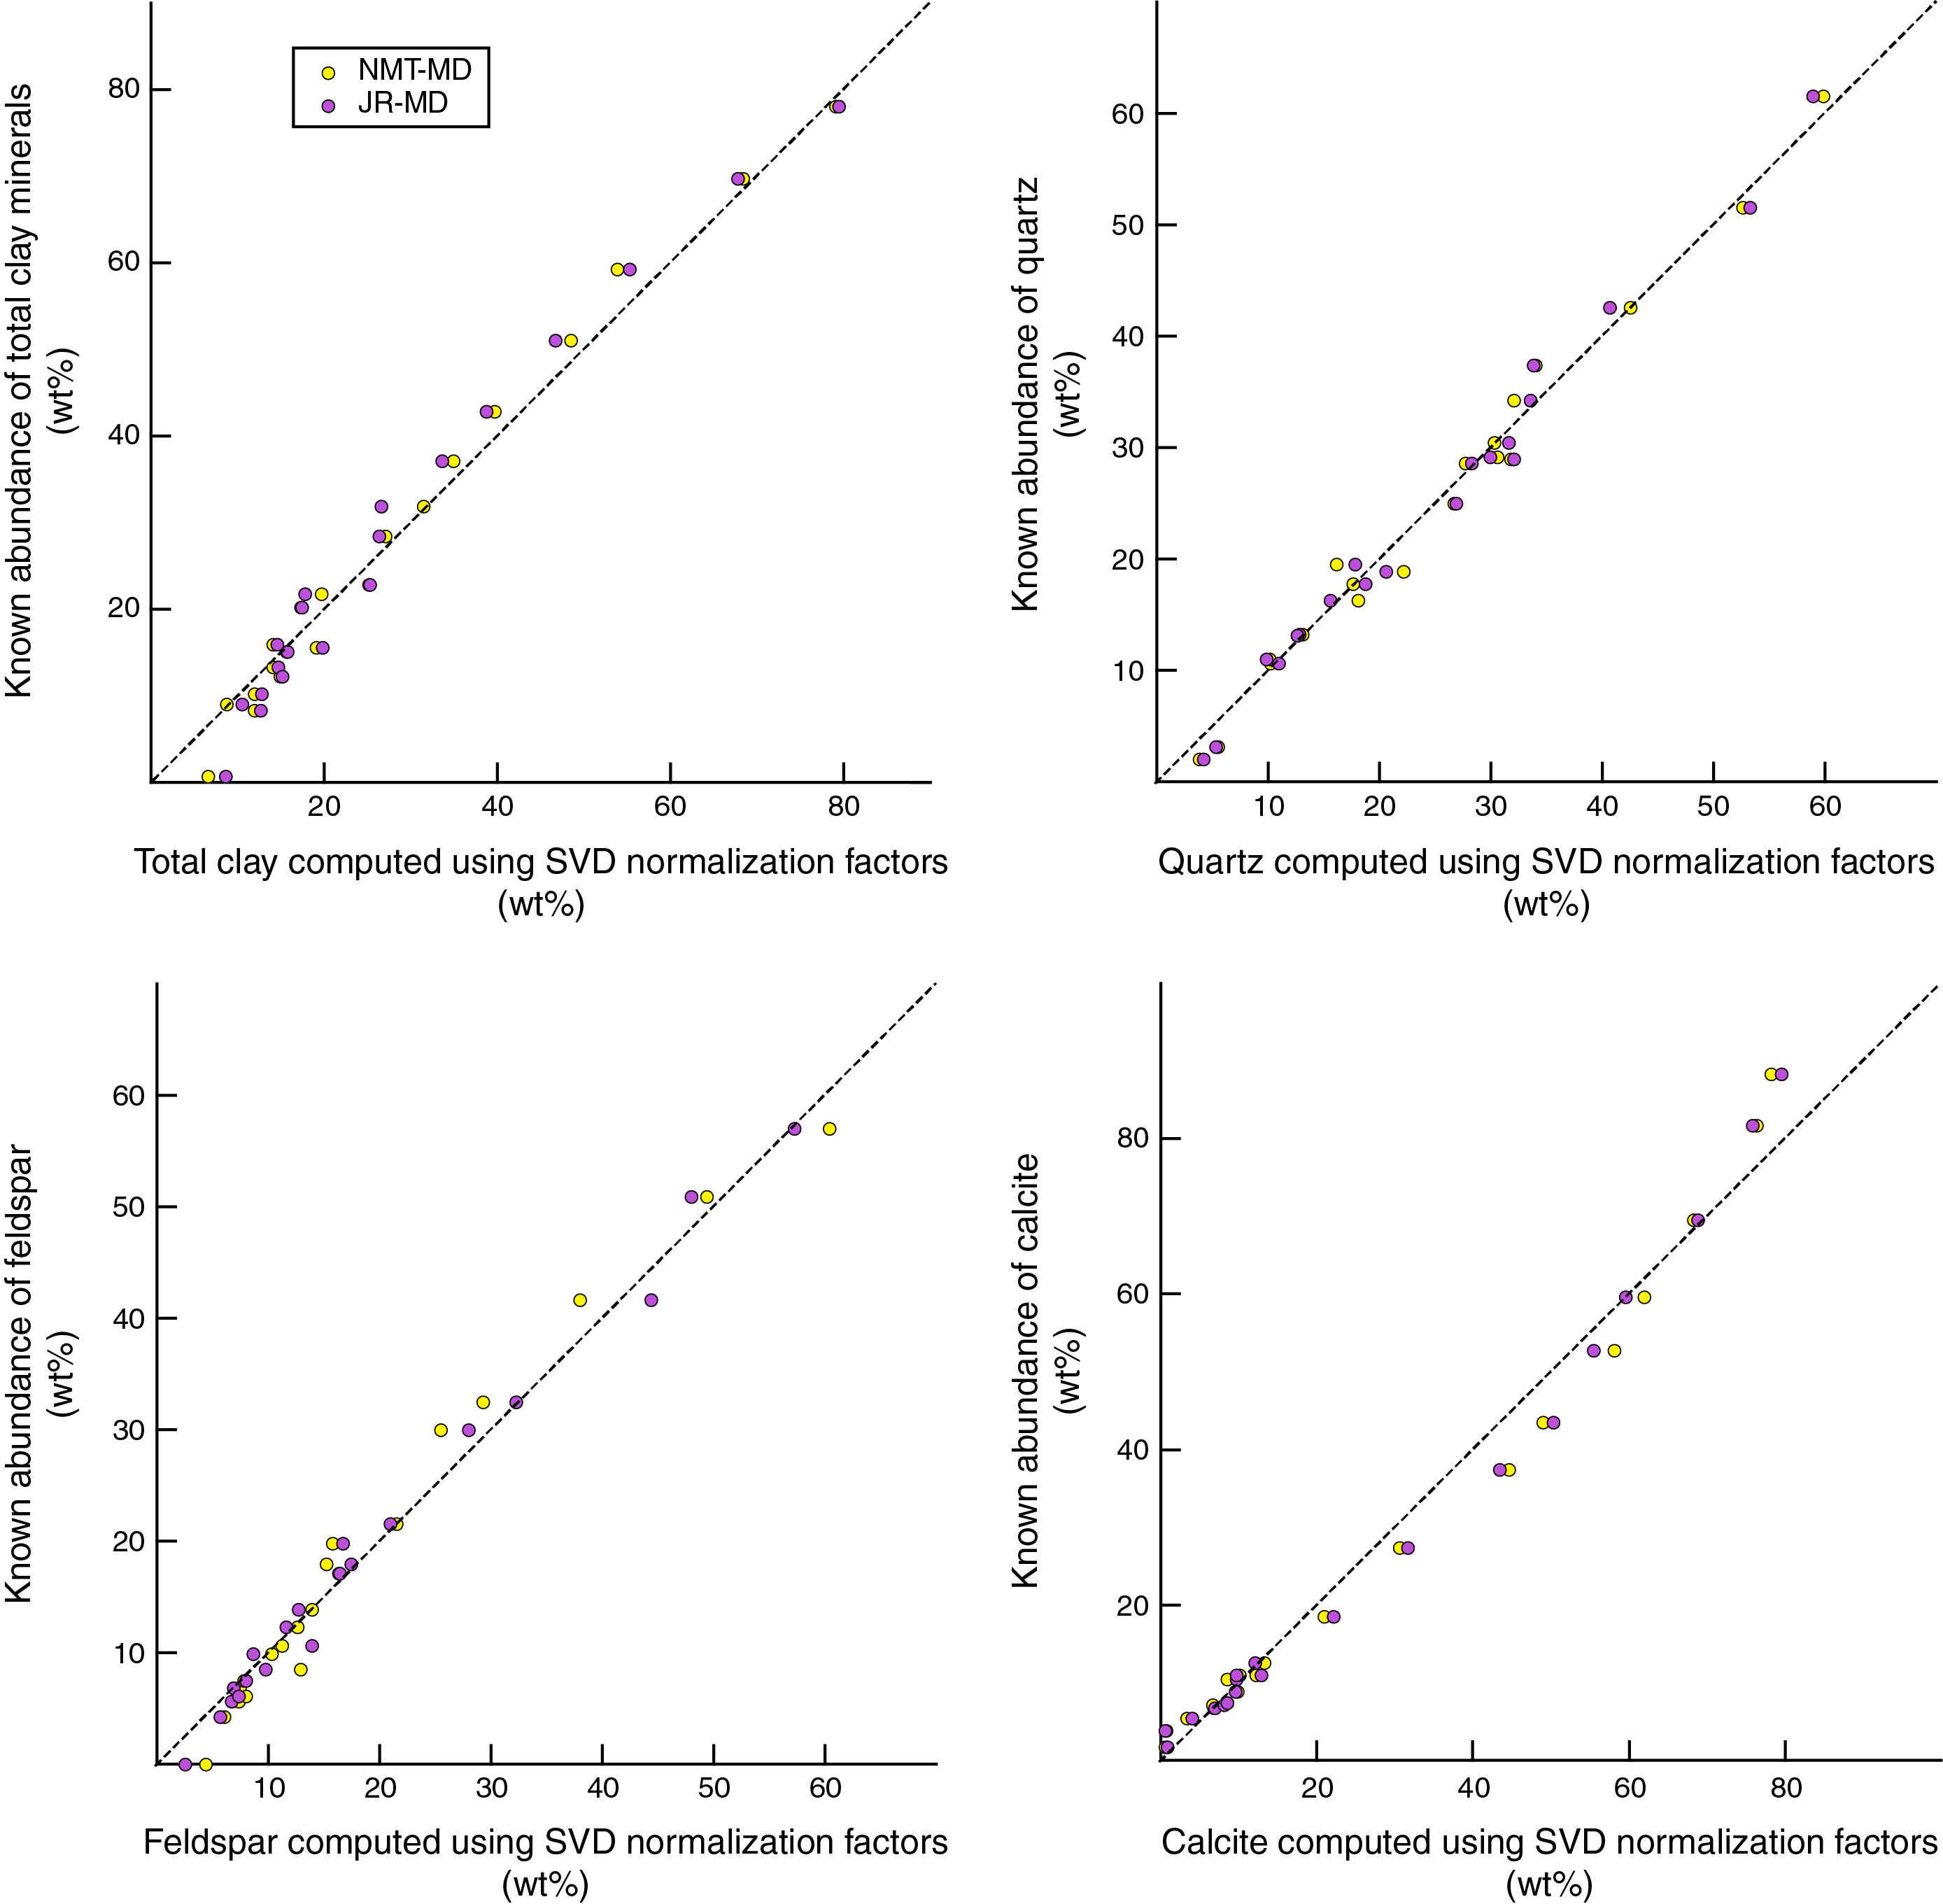
Figure F11. Errors associated with SVD normalization factors.
As a final test of accuracy, we have the benefit of comparing the computed XRD weight percent calcite values versus percent carbonate values, as determined independently by shipboard coulometric analysis (for methods, see Wallace et al., 2019). The comparisons for Sites U1517 and U1520 (for tabulated data, see Barnes et al., 2019a) are shown in Figure F12, based on JR-MD results and the corresponding polynomial regressions. The full range of compositional possibility is relatively small at Site U1517, with most of the hemipelagic mud specimens clustering between 5% and 15% calcite. As expected, the computed abundance of calcite (normalized to 100%) is consistently greater than the percent carbonate value for the same sediment sample. This mismatch stands to reason because XRD values (normalized to 100%) exclude all solid constituents other than clay minerals, quartz, feldspar, and calcite, whereas coulometric carbonate is a measure of the total solids.
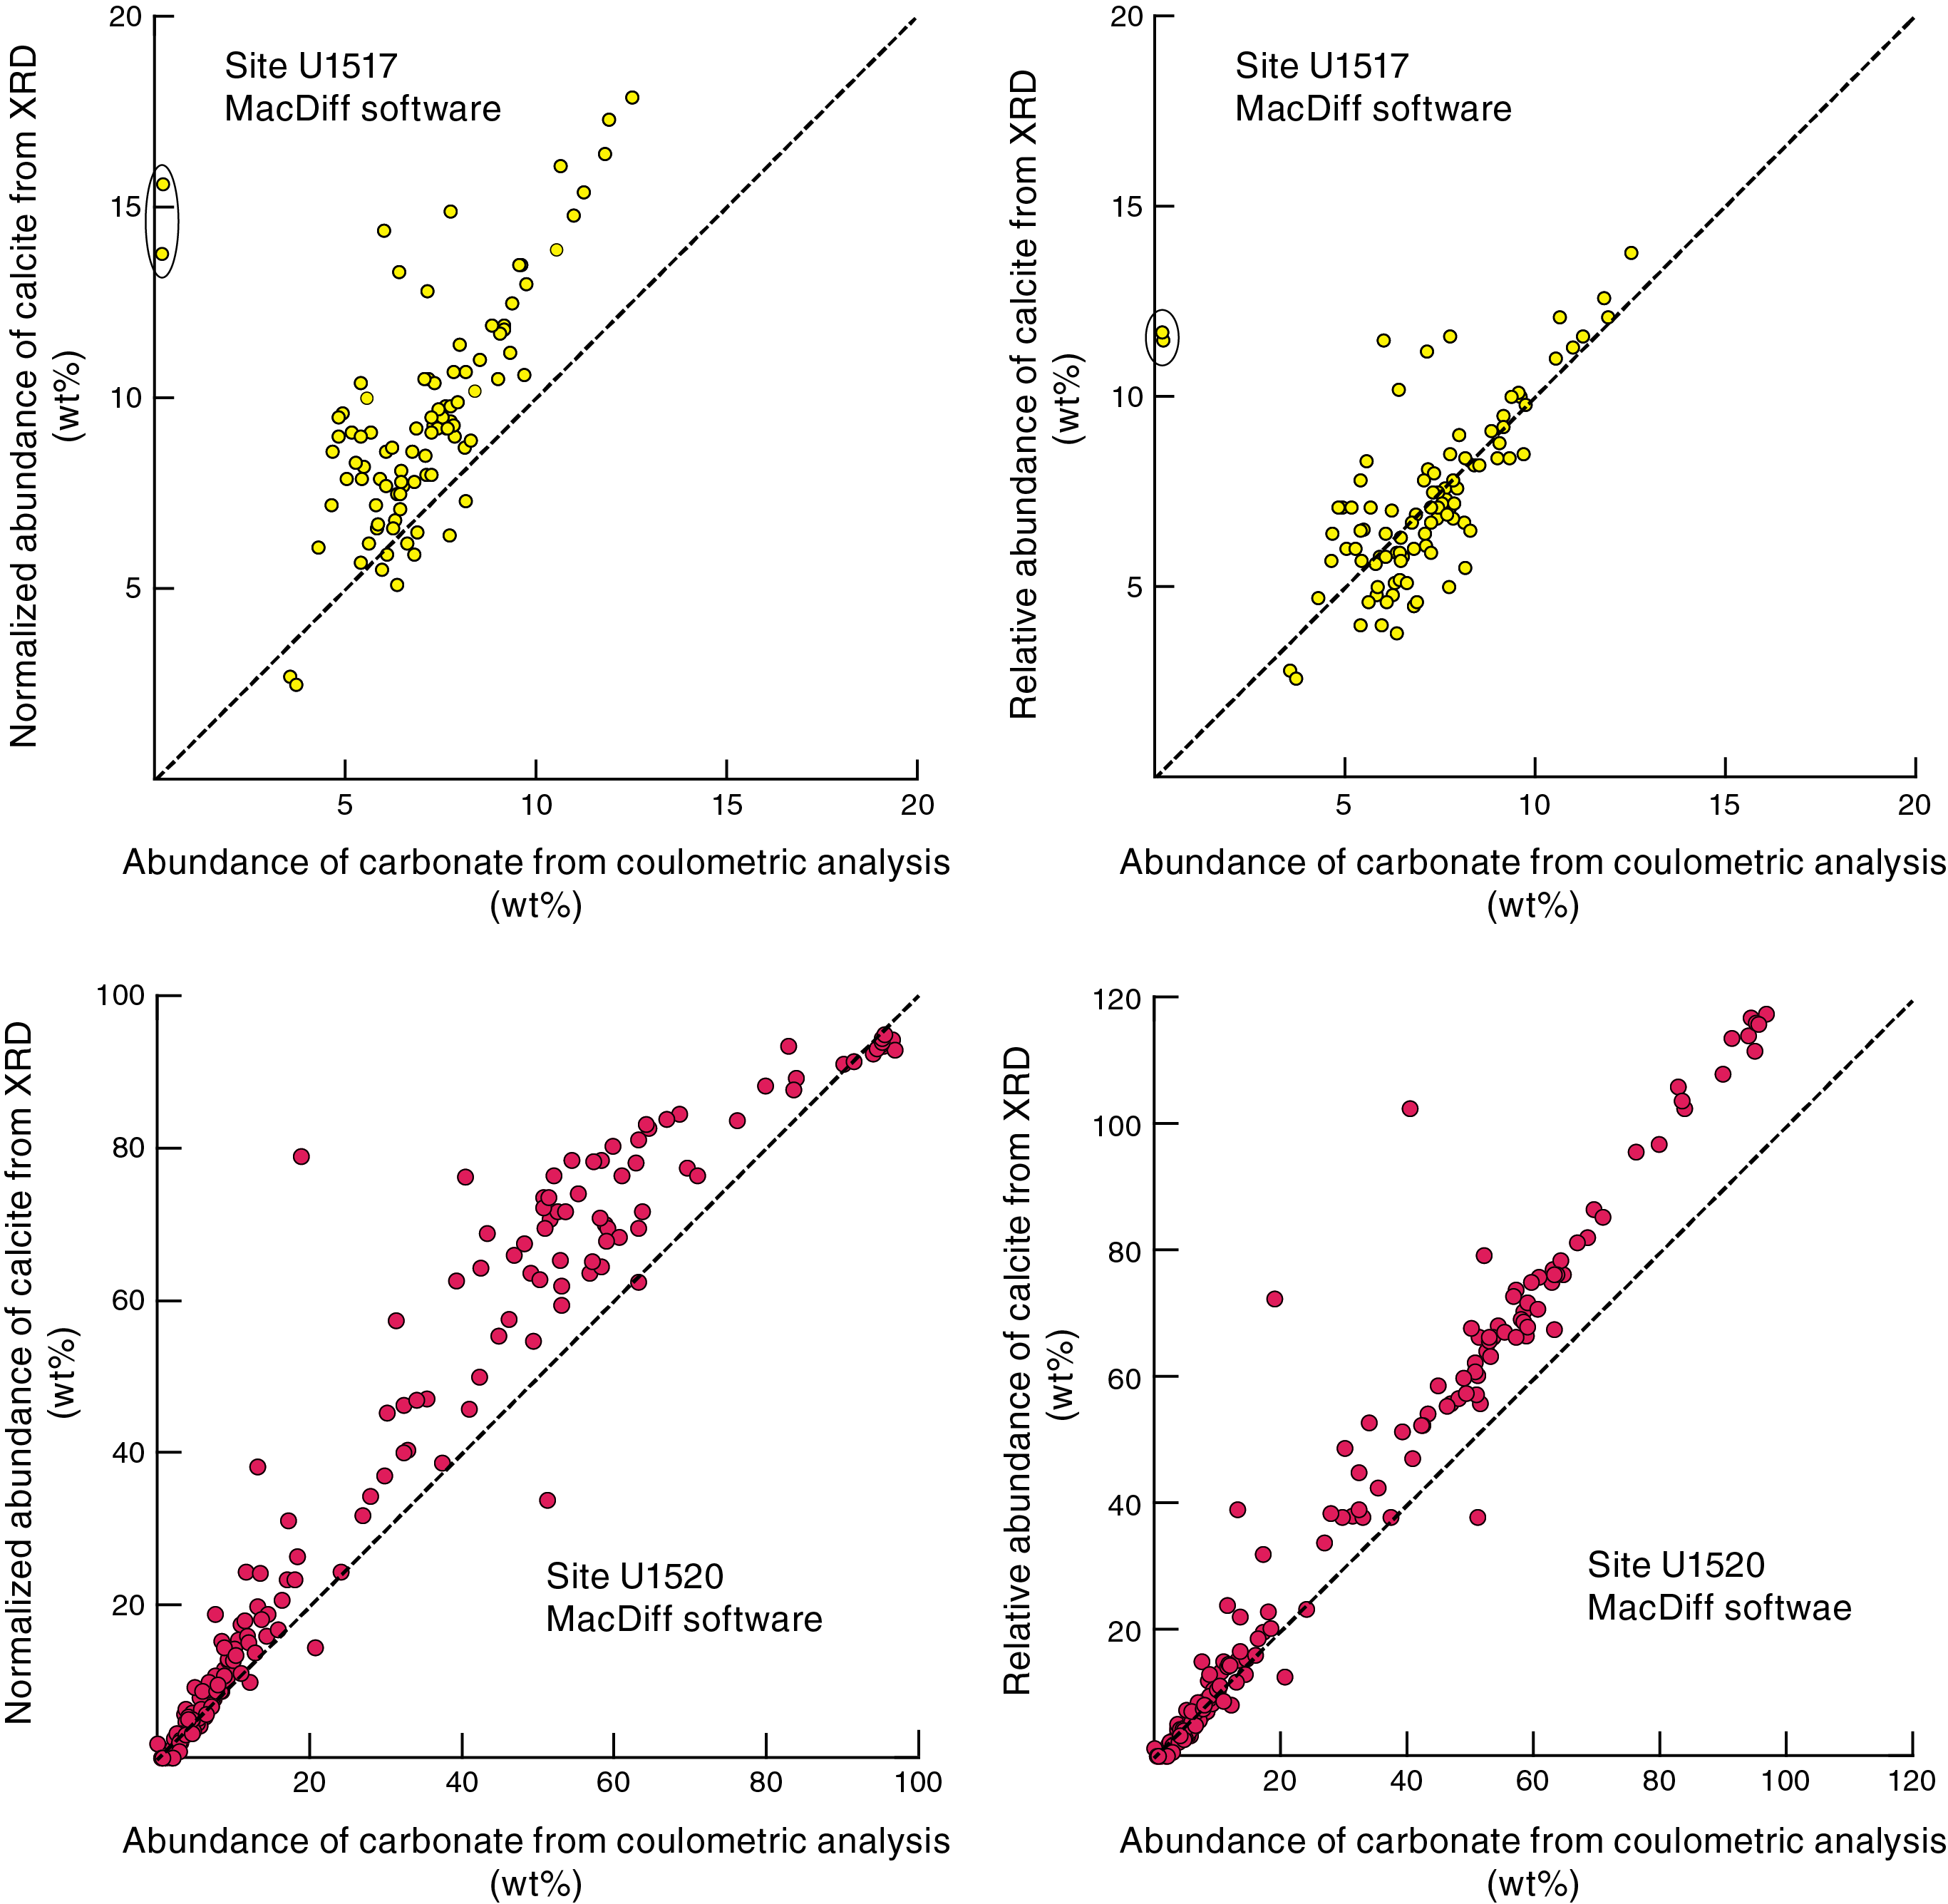
Figure F12. Independent tests of absolute accuracy, Sites U1517 and U1520.
The spectrum of possibility for carbonate content is considerably greater at Site U1520 (for tabulated data, see Barnes et al., 2019b), with a wide range of lithologies that includes silty clay to clayey silt, calcareous mudstone, muddy nannofossil chalk, and nearly pure nannofossil chalk. For carbonate concentrations <15 wt%, we see good agreement between XRD and coulometric results but not at higher concentrations (Figure F12). The pelagic carbonates show multiple signs of advanced diagenesis with extensive recrystallization of calcareous nannofossils and high degrees of induration. Consequently, the weaker diffracting power of calcite in the XRD standards (unaltered nannofossil chalk from Cyprus) provides a mediocre counterpart to the more crystalline calcite (microspar) in the Hikurangi carbonates. As a result, the calcite XRD peaks "spiked" to unusually high intensity values, and computations yield significant overestimates of weight percent calcite (Figure F12). In extreme cases (nearly pure chalk), the computed values of relative abundance for calcite exceed 100 wt%. This mismatch confirms one of the guiding principles for effective calibration of XRD results using standards. Diligence in the selection of optimal standards depends on preexpedition reconnaissance of the anticipated mineral assemblage, with considerations that include such nuances as mineral crystallinity.
The absolute errors (computed weight percent − known weight percent) using polynomial regression equations (Table T8) and SVD normalization factors (Table T9) both compare favorably with results based on more highly touted RIR values and Rietveld peak fitting. Fundamentally, the accuracy we achieved is more than sufficient to satisfy the scientific goals of shipboard XRD. Table T10 provides a comparison between our results, those of Hillier (2000), and those of the first, second, and third place finishers in the third Reynolds Cup (RC) competition (Omotoso et al., 2006). As a caveat, the averages for Hillier (2000) are based on only five synthetic "sandstone" mixtures with a more restricted compositional range, and the averages for RC competitors are based on only two artificial mixtures. Note also that all of the statistics were normalized to a single common suite where total clay minerals + quartz + feldspar + calcite = 100%. In all cases, the average errors fall within the window for highly accurate results (Calvert et al., 1989). Given that outcome, we see no justification for adopting more time-consuming steps in shipboard sample preparation and/or calibration when potential improvements in accuracy would be trivial.
Statistical analysis of clay-sized XRD results
Figure F13 shows plots of integrated peak area versus known weight percent for the clay-sized standard mixtures, using the NMT-MD. In addition to the four regression equations, we computed matrixes of SVD normalization factors, as listed in Table T11. The best-fit curve for weight percent smectite versus peak area is a third-order polynomial, but we chose simple linear regressions for the other clay-sized constituents (Figure F13). The correlation coefficients for smectite and illite are respectable (r = 0.986 and 0.968, respectively). The closeness of fit deteriorates, however, for the composite peak area generated by the chlorite (002) + kaolinite (001) reflections (r = 0.794). The statistical fit between peak area for chlorite + kaolinite and measured weight percent was affected by contrasts in crystallinity or diffracting power between the two standards, with chlorite generating higher intensity peaks and larger integrated areas than kaolinite. That blend created scatter in the composite response, depending on which of the two minerals is dominant in a particular mix (larger peak area for chlorite-rich mixes; smaller peak area for kaolinite-rich mixes). Using the relatively weak (100) peak for clay-sized quartz is also problematic (r = 0.754). Measurements of the quartz (100) peak area suffer from interference by counts from smectite, especially in mixtures with higher proportions of smectite, rendering that computation less reliable. In addition, the range of known weight percent values for quartz is relatively small, so the statistical scatter is exacerbated. This problem with inaccuracy for quartz reinforces the wisdom of Moore and Reynolds (1989a) who warned about quantitative analyses of platy (clay) and nonplaty (nonclay) minerals in the same sample because of their very different preferred orientations. We favor using the quartz (100) reflection to correct peak positions, but estimates of quartz abundance in the clay-sized fraction should be viewed as semiquantitative.
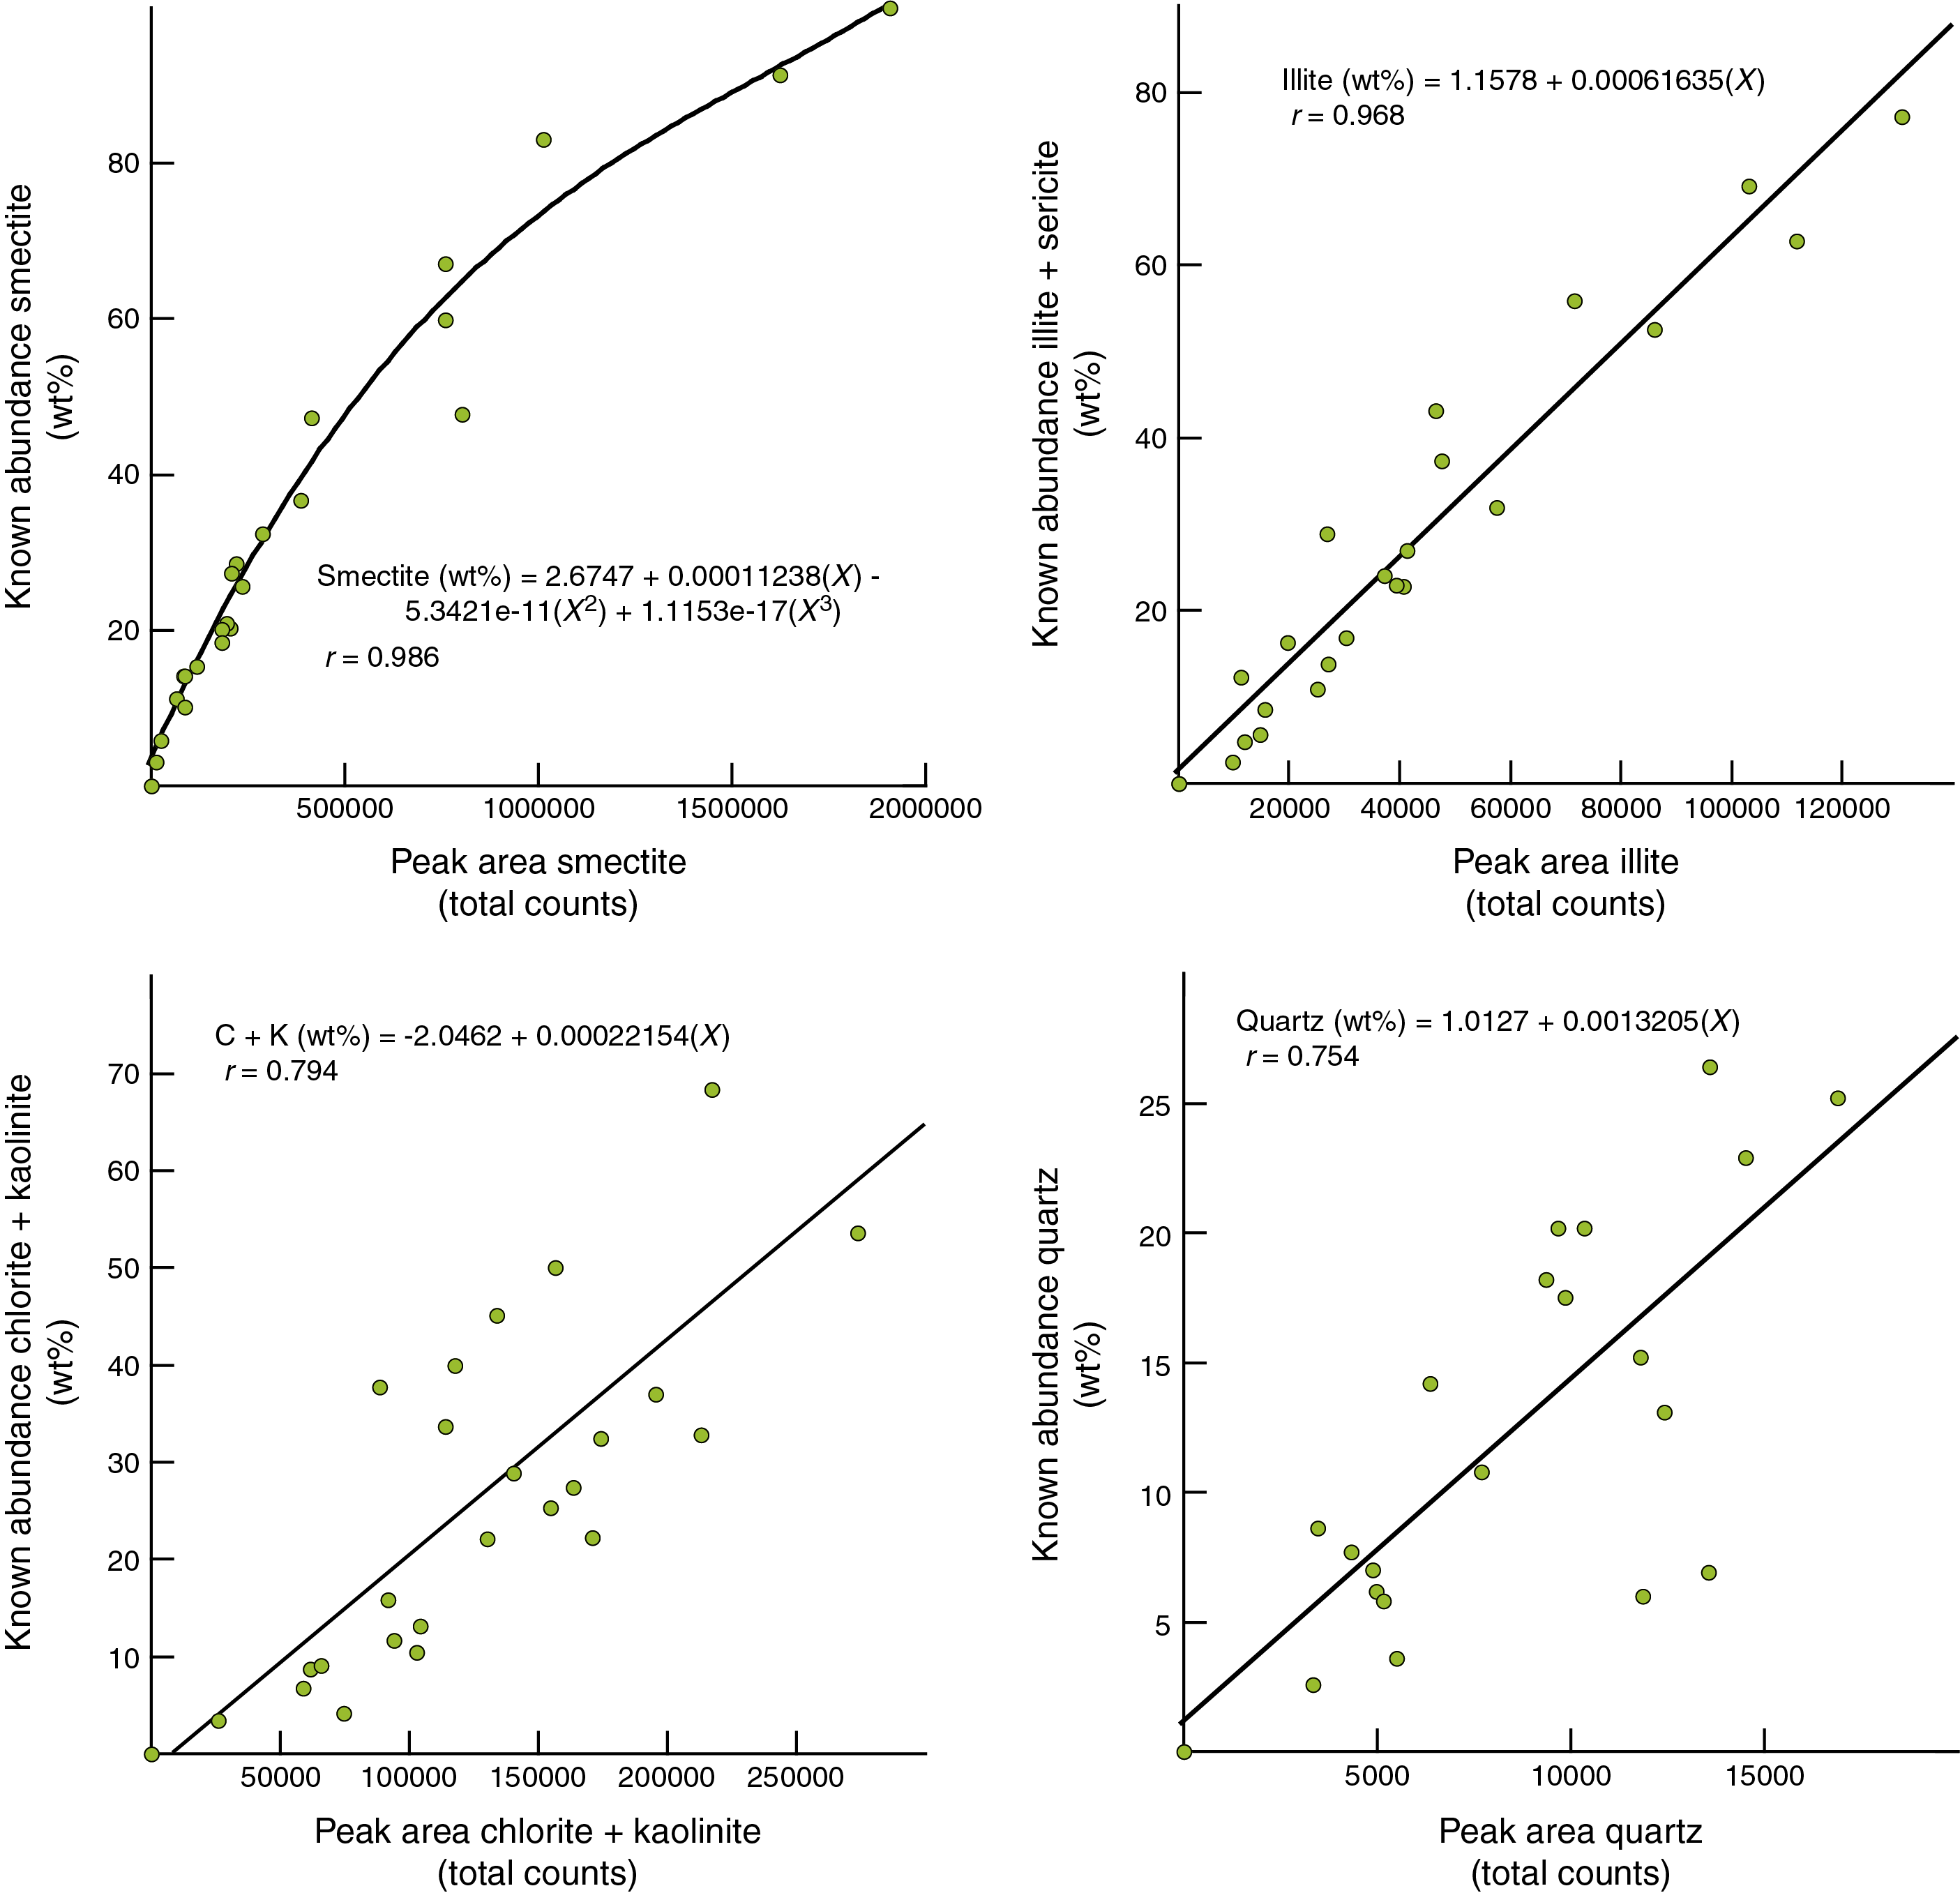
Figure F13. Integrated peak area vs. known weight percent in clay-sized standards.
The results in Table T6 were used to determine the accuracy of weight percent values for the clays, following three computational approaches: the Biscaye (1965) weighting factors for peak area (1× smectite, 4× illite, and 2× chlorite + kaolinite), the SVD normalization factors (Table T11), and the regression equations (Figure F13). Because computations using the Biscaye factors do not include quartz, the following comparison of error only pertains to the clay minerals (normalized to 100%). Note also that one clay mix was omitted from the assessment because the filter-peel applications were too thin to produce reliable results.
The absolute errors of accuracy (computed weight percent − known weight percent) using Biscaye (1965) weighting factors are acceptable for smectite, averaging only 2.1 wt%. For illite and undifferentiated chlorite + kaolinite, however, the errors are as high as 18.6 wt% and average 7.7 and 8.5 wt%, respectively. These larger inaccuracies are similar to those reported by Underwood et al. (2003). Using the regression equations, accuracy improves considerably for illite (average = 3.0 wt%) and undifferentiated chlorite + kaolinite (average = 5.1 wt%) but deteriorates a little bit for smectite (average = 3.9 wt%). The average errors using SVD normalization factors are 6.2 wt% for smectite, 3.3 wt% for illite, and 5.9 wt% for undifferentiated chlorite + kaolinite. Thus, we contend that the best results are obtained using the regression equations shown in Figure F13.
Figure F14 displays plots of known abundance versus computed abundance using the three computation varieties. From this illustration, one can see that computations using Biscaye (1965) weighting factors consistently underestimate the abundance of illite and overestimate the abundance of chlorite + kaolinite. Up-to-date, instrument-specific empirical adjustments to those weighting factors (e.g., changing from 4× illite and 2× chlorite to 4.2× and 1.8×, respectively) might help reduce that problem, but the factors themselves are firmly entrenched in the literature (e.g., McManus, 1991). In other words, if scientists wish to compare older data sets from the literature, it is impossible to avoid the limitations of Biscaye (1965). Conversely, the errors from SVD and regression equations distribute more or less evenly on both sides of the 1:1 reference line (Figure F14). We attribute those errors to four factors: (1) difficulties in finding optimal clay-sized standards to match natural assemblages, (2) problems inherent in quantitative analyses of platy (clay) and nonplaty (quartz) minerals in the same sample, (3) peak interference between chlorite–kaolinite and smectite–quartz, and (4) contrasts in crystallinity or diffracting power between pure kaolinite and pure chlorite in the undifferentiated summation.
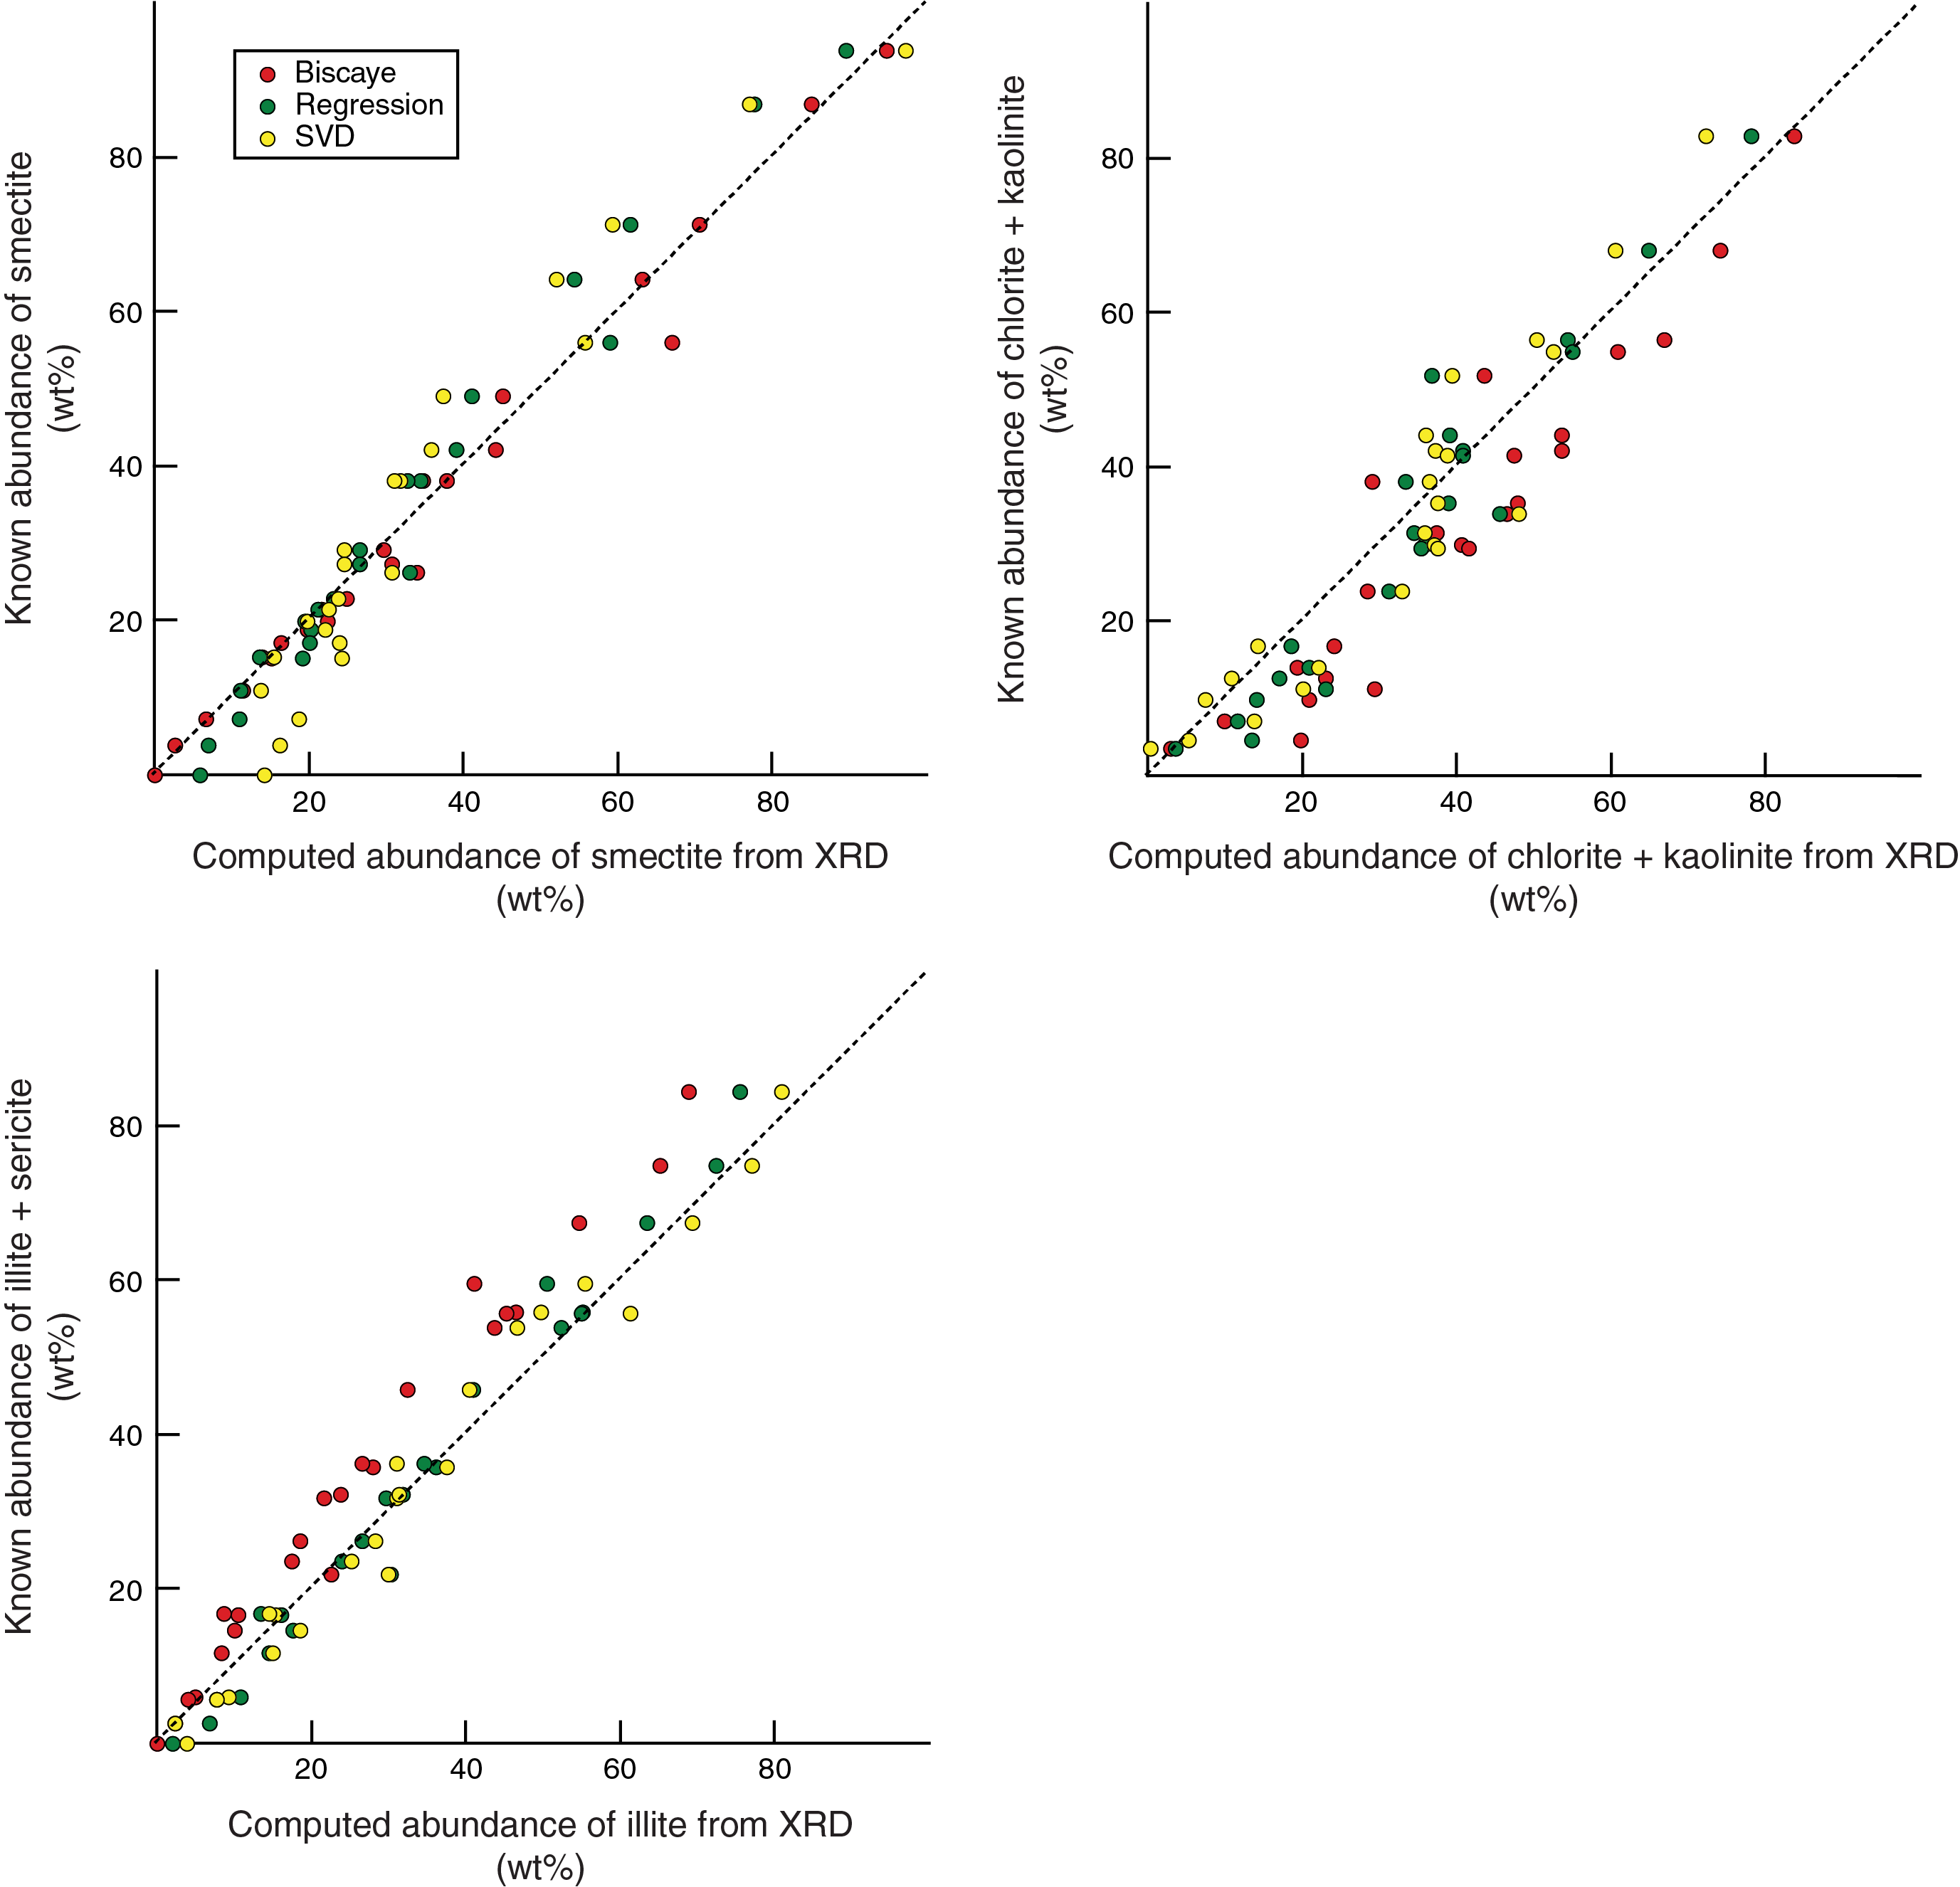
Figure F14. Errors associated with different computations.
Figure F15 shows nine crossplots using the three sets of results for clay-sized standards. The comparison between values computed using SVD normalization factors versus regression equations reveals nothing in the way of systematic or consistent shifts. The mismatch between Biscaye (1965) and SVD factors is exacerbated at lower concentrations of smectite. The consistent underestimates of percent illite and overestimates of percent chlorite + kaolinite using Biscaye weighting factors are also obvious from these plots. All things considered, the differences between values computed using SVD versus regression equations are relatively small. The justification for tilting our preference toward the regression equations lies in the smaller average differences between computed weight percent and measured weight percent (Table T12) and the better linearity of error over the full range of compositions (Figure F15).
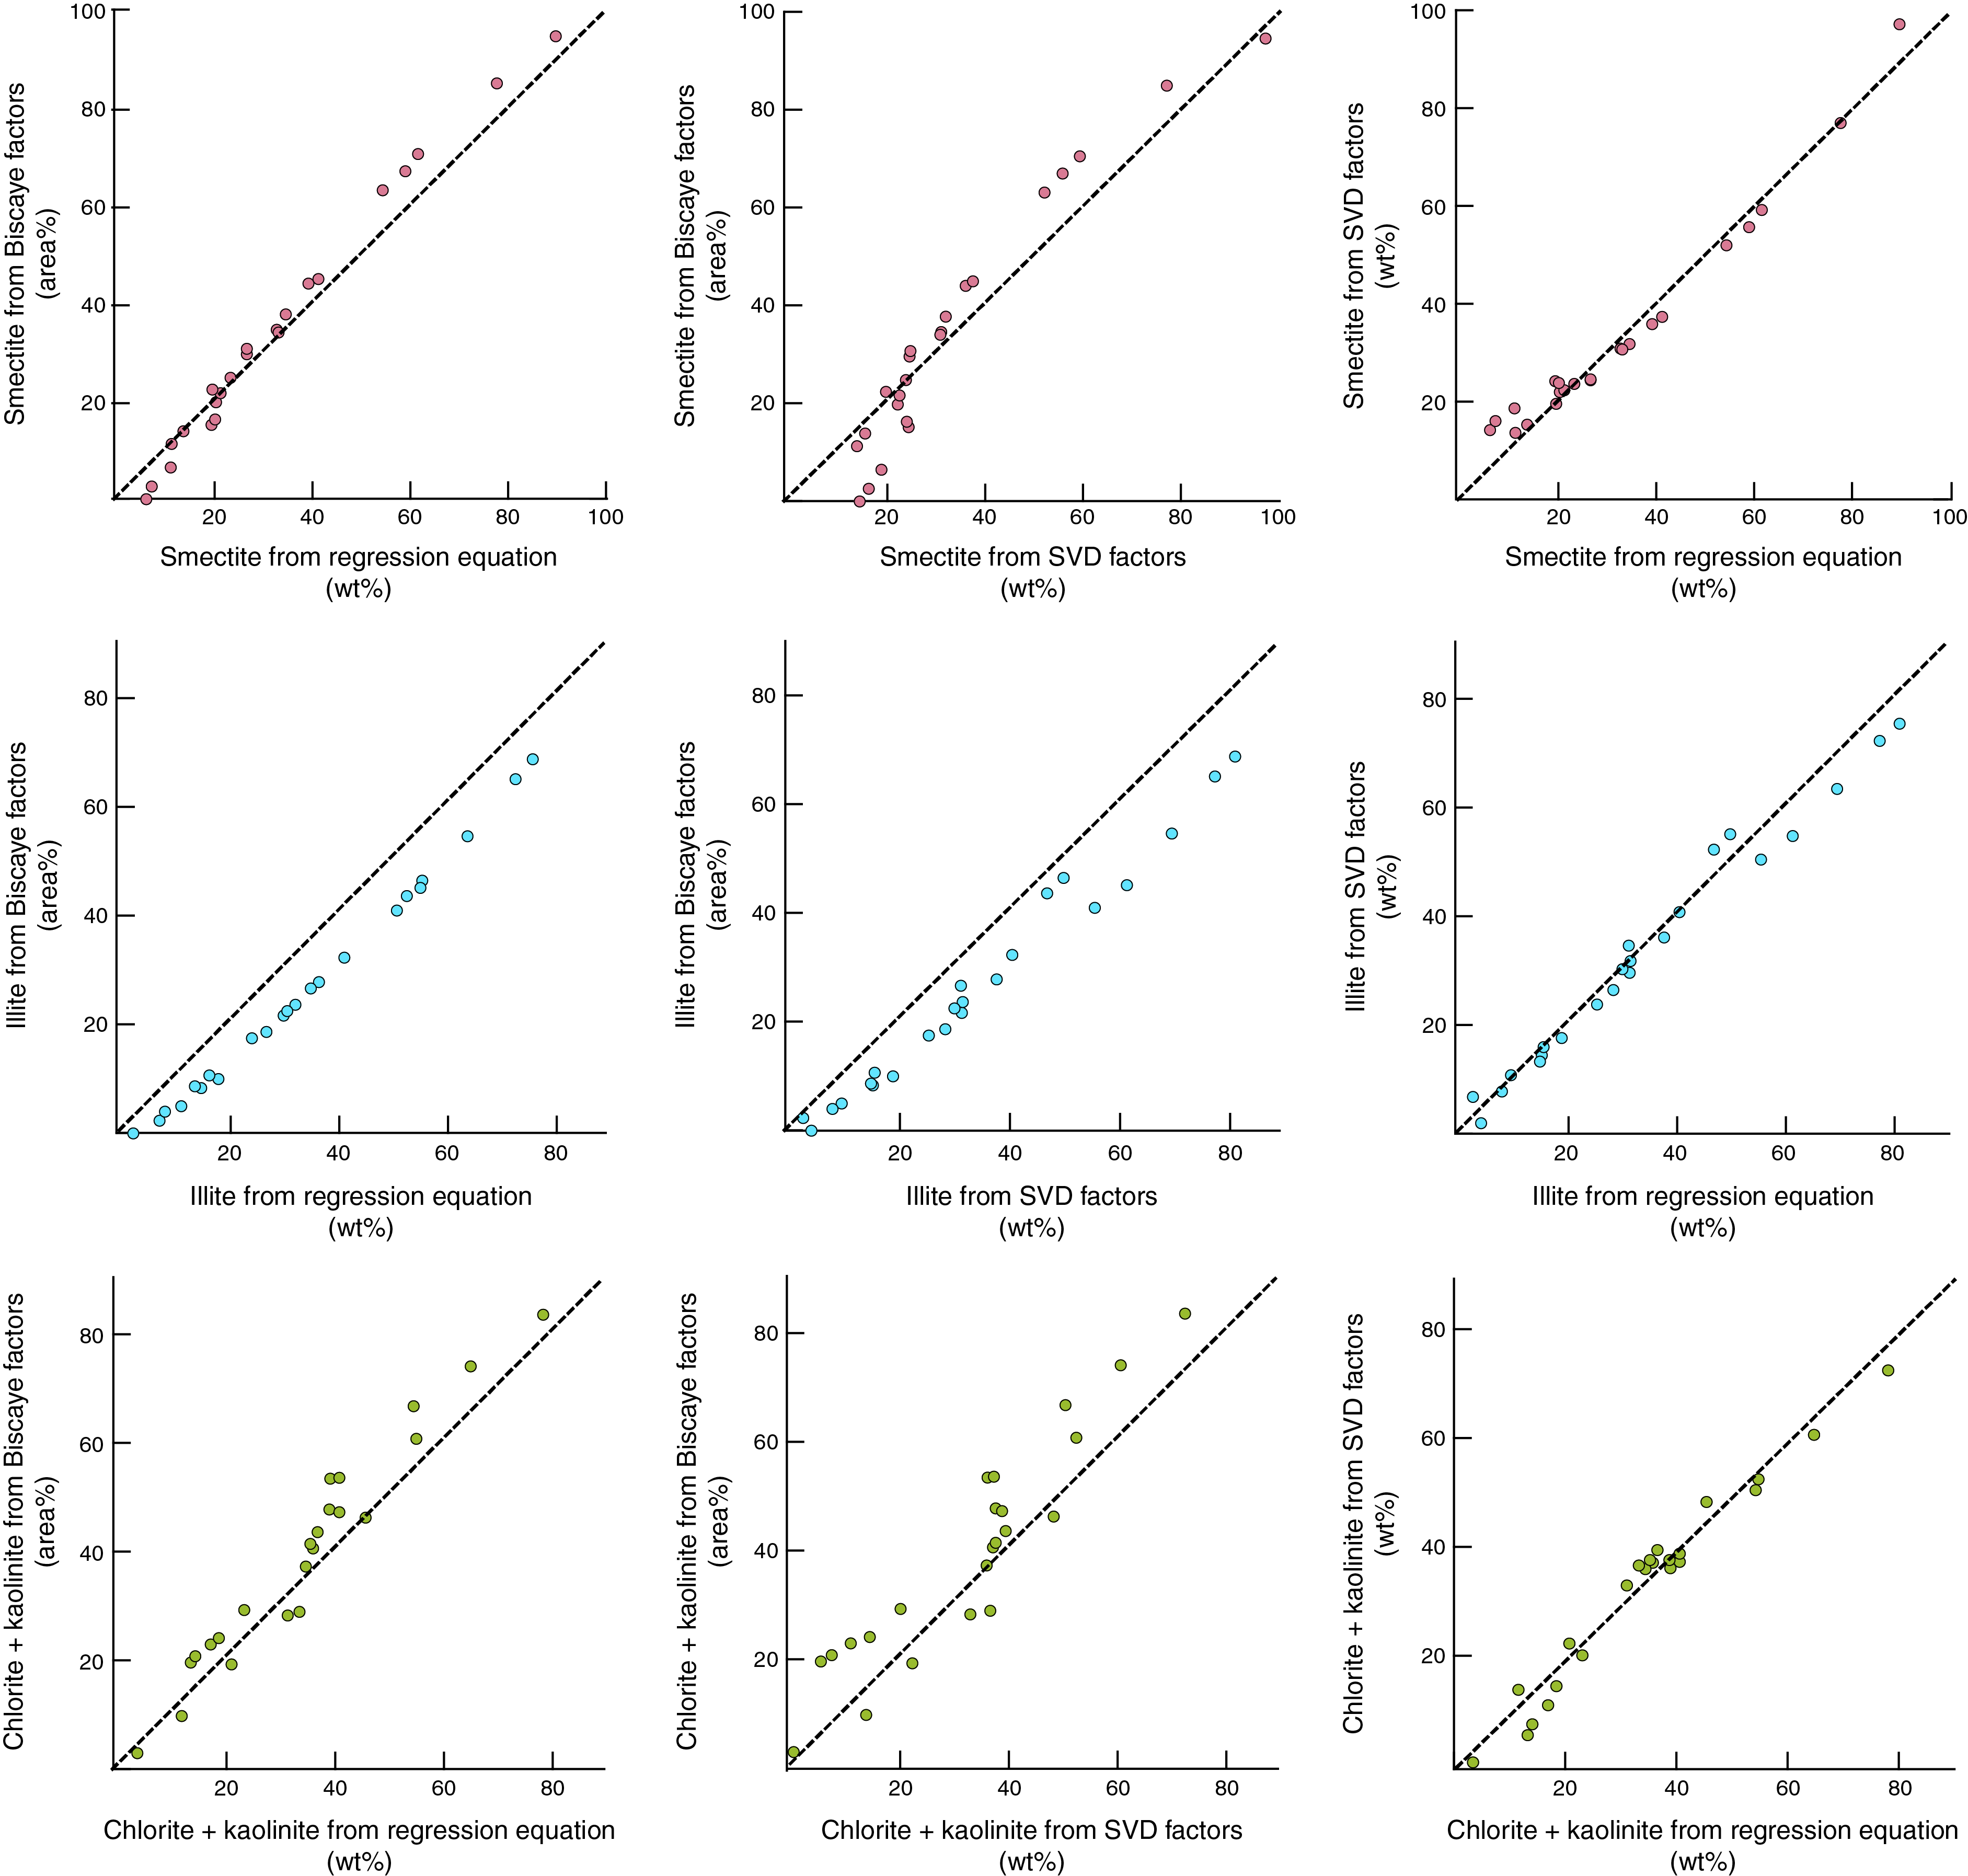
Figure F15. Weight percent values for minerals in standard mixtures.
Conclusions
This assessment of precision for bulk powder XRD analyses includes comparisons between two X-ray diffractometers (Bruker and Panalytical) and two types of data reduction software (MacDiff and DIFFRAC.EVA). The computed weight percent values from scans of standard mineral mixtures (where total clay minerals + quartz + feldspar + calcite = 100%) show excellent levels of reproducibility, with trivial differences between the two instruments. Differences attributed to software are also relatively small.
Our preference for bulk powder XRD is to use MacDiff software for peak area measurements and polynomial regression equations to compute weight percent values. Accuracy exceeded expectations for the scientific goals of shipboard XRD data, and we attribute the improvements (relative to previous IODP studies of this type) to four refinements: (1) using a larger number (20) of the standard mineral mixtures, (2) including data from "pure" standards to anchor the regression curves at the high end of weight percent values, (3) solving for the weight percent of impurities in the standards, and (4) expanding the angular limits of the composite clay mineral peak to include counts from the chlorite (003) reflection. The absolute errors (computed weight percent − known weight percent) average less than 3 wt% and compare favorably with results from more highly touted quantitative methods, such as the application of RIRs and Rietveld peak fitting (e.g., Hillier, 2000; Omotoso et al., 2006). Any additional improvements in the accuracy would be trivial and would require more elaborate and time-consuming steps in sample preparation (e.g., spray-dried ethanol-based slurries) and/or diffractometer settings (e.g., smaller steps and longer count times per step); we contend that such protocols are too inefficient to be practical under shipboard working conditions.
When compared to bulk powder results, errors of accuracy are generally larger for the clay-sized fraction (<2 µm), where smectite + illite + undifferentiated (chlorite + kaolinite) + quartz = 100%. We attribute the inaccuracies to four circumstances: (1) challenges in finding optimal clay mineral standards, (2) problems inherent in quantitative analyses of platy (clay) and nonplaty (quartz) minerals in the same sample, (3) peak interference between chlorite–kaolinite and smectite–quartz, and (4) contrasts in diffracting power between pure kaolinite and pure chlorite in the undifferentiated response. Computations of relative abundance using Biscaye (1965) weighting factors result in the largest errors, with systematic underestimates of percent illite and overestimates of percent chlorite–kaolinite. Our preference for clay-sized XRD is to use MacDiff software for data reduction and regression equations to compute weight percent values. The average errors using that combination are smectite = 3.9 wt%, illite = 3.0 wt%, and undifferentiated chlorite + kaolinite = 5.1 wt%.
Acknowledgments
This study used shipboard data generated during International Ocean Discovery Program (IODP) Expeditions 372 and 375. Karissa Rosenberger assisted with sample preparation at New Mexico Tech. Funding for XRD analyses at New Mexico Tech was obtained through a grant to Laura Wallace at GNS Science from the New Zealand Ministry for Business, Innovation, and Employment's Endeavour Research (contract C05X1605). S. Hillier provided a thorough review of the manuscript.
References
Andrews, J.T., Eberl, D.D., and Kristjansdottir, G.B., 2006. An exploratory method to detect tephras from quantitative XRD scans: examples from Iceland and east Greenland marine sediments. The Holocene, 16(8):1035–1042. https://doi.org/10.1177/0959683606069384
Andrews, J.T., Kristjansdottir, G.B., Eberl, D.D., and Jennings, A.E., 2013. A quantitative X-ray diffraction inventory of volcaniclastic inputs into the Holocene marine sediment archives off Iceland: a contribution to V.A.S.T. Polar Research, 32(1):11130. https://doi.org/10.3402/polar.v32i0.11130
Barnes, P.M., Pecher, I., and LeVay, L., 2017. Expedition 372 Scientific Prospectus: Creeping Gas Hydrate Slides and LWD for Hikurangi Subduction Margin. International Ocean Discovery Program. https://doi.org/10.14379/iodp.sp.372.2017
Barnes, P.M., Pecher, I.A., LeVay, L.J., Bourlange, S.M., Brunet, M.M.Y., Cardona, S., Clennell, M.B., Cook, A.E., Crundwell, M.P., Dugan, B., Elger, J., Gamboa, D., Georgiopoulou, A., Greve, A., Han, S., Heeschen, K.U., Hu, G., Kim, G.Y., Kitajima, H., Koge, H., Li, X., Machado, K.S., McNamara, D.D., Moore, G.F., Mountjoy, J.J., Nole, M.A., Owari, S., Paganoni, M., Petronotis, K.E., Rose, P.S., Screaton, E.J., Shankar, U., Shepherd, C.L., Torres, M.E., Underwood, M.B., Wang, X., Woodhouse, A.D., and Wu, H.-Y., 2019a. Site U1517. In Pecher, I.A., Barnes, P.M., LeVay, L.J., and the Expedition 372A Scientists, Creeping Gas Hydrate Slides. Proceedings of the International Ocean Discovery Program, 372A: College Station, TX (International Ocean Discovery Program). https://doi.org/10.14379/iodp.proc.372A.103.2019
Barnes, P.M., Wallace, L.M., Saffer, D.M., Pecher, I.A., Petronotis, K.E., LeVay, L.J., Bell, R.E., Crundwell, M.P., Engelmann de Oliveira, C.H., Fagereng, A., Fulton, P.M., Greve, A., Harris, R.N., Hashimoto, Y., Hüpers, A., Ikari, M.J., Ito, Y., Kitajima, H., Kutterolf, S., Lee, H., Li, X., Luo, M., Malie, P.R., Meneghini, F., Morgan, J.K., Noda, A., Rabinowitz, H.S., Savage, H.M., Shepherd, C.L., Shreedharan, S., Solomon, E.A., Underwood, M.B., Wang, M., Woodhouse, A.D., Bourlange, S.M., Brunet, M.M.Y., Cardona, S., Clennell, M.B., Cook, A.E., Dugan, B., Elger, J., Gamboa, D., Georgiopoulou, A., Han, S., Heeschen, K.U., Hu, G., Kim, G.Y., Koge, H., Machado, K.S., McNamara, D.D., Moore, G.F., Mountjoy, J.J., Nole, M.A., Owari, S., Paganoni, M., Rose, P.S., Screaton, E.J., Shankar, U., Torres, M.E., Wang, X., and Wu, H.-Y., 2019b. Site U1520. In Wallace, L.M., Saffer, D.M., Barnes, P.M., Pecher, I.A., Petronotis, K.E., LeVay, L.J., and the Expedition 372/375 Scientists, Hikurangi Subduction Margin Coring, Logging, and Observatories. Proceedings of the International Ocean Discovery Program, 372B/375: College Station, TX (International Ocean Discovery Program). https://doi.org/10.14379/iodp.proc.372B375.105.2019
Biscaye, P.E., 1965. Mineralogy and sedimentation of recent deep-sea clay in the Atlantic Ocean and adjacent seas and oceans. Geological Society of America Bulletin, 76(7):803–831. https://doi.org/10.1130/0016-7606(1965)76[803:MASORD]2.0.CO;2
Calvert, C.S., Palkowsky, D.A., and Pevear, D.R., 1989. A combined X-ray powder diffraction and chemical method for quantitative mineral analysis of geological samples. In Pevear, D.R., and Mumpton, F.A. (Eds.), Quantitative Mineral Analysis of Clays. CMS Workshop Lectures, 1. https://doi.org/10.1346/CMS-WLS-1.6
Chipera, S.J., and Bish, D.L., 2001. Baseline studies of the Clay Minerals Society source clays: powder X-ray diffraction analyses. Clays and Clay Minerals, 49(5):398–409.
Chipera, S.J., and Bish, D.L., 2013. Fitting full X-ray diffraction patterns for quantitative analysis: a method for readily quantifying crystalline and disordered phases. Advances in Minerals Physics and Chemistry, 3:47–53. https://doi.org/10.4236/ampc.2013.31A007
Cook, H.E., Zemmels, I., and Matti, J.C., 1975. X-ray mineralogy data, far western Pacific, Leg 31 Deep Sea Drilling Project. In Karig, D.E., Ingle, J.C., Jr., et al., Initial Reports of the Deep Sea Drilling Project, 31: Washington (U.S. Government Printing Office), 883–895. https://doi.org/10.2973/dsdp.proc.31.app.1975
Craddock, P.R., Herron, M.M., and Herron, S.L., 2017. Comparison of quantitative mineral analysis by X-ray diffraction and Fourier transform infrared spectroscopy. Journal of Sedimentary Research, 87(6):630–652. https://doi.org/10.2110/jsr.2017.34
Expedition 315 Scientists, 2009. Expedition 315 methods. In Kinoshita, M., Tobin, H., Ashi, J., Kimura, G., Lallemant, S., Screaton, E.J., Curewitz, D., Masago, H., Moe, K.T., and the Expedition 314/315/316 Scientists, Proceedings of the Integrated Ocean Drilling Program, 314/315/316: Washington, DC (Integrated Ocean Drilling Program Management International, Inc.). https://doi.org/10.2204/iodp.proc.314315316.122.2009
Fisher, A.T., and Underwood, M.B., 1995. Calibration of an X-ray diffraction method to determine relative mineral abundances in bulk powders using matrix singular value decomposition: a test from the Barbados accretionary complex. In Shipley, T.H., Ogawa, Y., Blum, P., et al., Proceedings of the Ocean Drilling Program, Initial Reports, 156: College Station, TX (Ocean Drilling Program), 29–37. https://doi.org/10.2973/odp.proc.ir.156.103.1995
Guo, J., and Underwood, M.B., 2012. Data report: clay mineral assemblages from the Nankai Trough accretionary prism and the Kumano Basin, IODP Expeditions 315 and 316, NanTroSEIZE Stage 1. In Kinoshita, M., Tobin, H., Ashi, J., Kimura, G., Lallemant, S., Screaton, E.J., Curewitz, D., Masago, H., Moe, K.T., and the Expedition 314/315/316 Scientists, Proceedings of the Integrated Ocean Drilling Program, 314/315/316: Washington, DC (Integrated Ocean Drilling Program Management International, Inc.). https://doi.org/10.2204/iodp.proc.314315316.202.2012
Heath, G.R., and Pisias, N.G., 1979. A method for the quantitative estimation of clay minerals in North Pacific deep-sea sediments. Clays and Clay Minerals, 27(3):175–184. https://doi.org/10.1346/CCMN.1979.0270302
Hillier, S., 2000. Accurate quantitative analysis of clay and other minerals in sandstones by XRD: comparison of a Rietveld and a reference intensity ratio (RIR) method and the importance of sample preparation. Clay Minerals, 35(1):291. https://doi.org/10.1180/000985500546666
Johnson, L.J., Chu, C.H., and Hussey, G.A., 1985. Quantitative clay mineral analysis using simultaneous linear equations. Clays and Clay Minerals, 33(2):107–117. https://doi.org/10.1346/CCMN.1985.0330204
Knudsen, T., 1981. Quantitative X-ray diffraction analysis with quantitative control of calibration samples. X-ray Spectrometry, 10(2):54–56.
Mascle, A., Moore, J.C., Taylor, E., and Shipboard Scientific Party, 1988. ODP Leg 110 at the northern Barbados Ridge: introduction and explanatory notes. In Mascle, A., Moore, J.C., et al., Proceedings of the Ocean Drilling Program, Initial Reports, 110: College Station, TX (Ocean Drilling Program), 5–25. https://doi.org/10.2973/odp.proc.ir.110.102.1988
McManus, D.A., 1991. Suggestions for authors whose manuscripts include quantitative clay mineral analysis by X-ray diffraction. Marine Geology, 98(1):1–5. https://doi.org/10.1016/0025-3227(91)90030-8
McNeill, L.C., Dugan, B., Petronotis, K.E., Backman, J., Bourlange, S., Chemale, F., Chen, W., Colson, T.A., Frederik, M.C.G., Guerin, G., Hamahashi, M., Henstock, T., House, B.M., Hüpers, A., Jeppson, T.N., Kachovich, S., Kenigsberg, A.R., Kuranaga, M., Kutterolf, S., Milliken, K.L., Mitchison, F.L., Mukoyoshi, H., Nair, N., Owari, S., Pickering, K.T., Pouderoux, H.F.A., Yehua, S., Song, I., Torres, M.E., Vannucchi, P., Vrolijk, P.J., Yang, T., and Zhao, X., 2017. Expedition 362 methods. In McNeill, L.C., Dugan, B., Petronotis, K.E., and the Expedition 362 Scientists, Sumatra Subduction Zone. Proceedings of the International Ocean Discovery Program, 362: College Station, TX (International Ocean Discovery Program). https://doi.org/10.14379/iodp.proc.362.102.2017
Moore, C.A., 1968. Quantitative analysis of naturally occurring multicomponent mineral systems by X-ray diffraction. Clays and Clay Minerals, 16:325–336. https://doi.org/10.1346/CCMN.1968.0160502
Moore, D.M., and Reynolds, R.C., Jr., 1989a. Quantitative analysis. In Moore, D.M., and Reynolds, R.C., Jr. (Eds.), X-Ray Diffraction and the Identification and Analysis of Clay Minerals: New York (Oxford University Press USA), 272–309.
Moore, D.M., and Reynolds, R.C., Jr., 1989b. Sample preparation techniques for clay minerals. In Moore, D.M., and Reynolds, R.C., Jr. (Eds.), X-Ray Diffraction and the Identification and Analysis of Clay Minerals: New York (Oxford University Press), 179–201.
Omotoso, O., McCarty, D.K., Hillier, S., and Kleeberg, R., 2006. Some successful approaches to quantitative mineral analysis as revealed by the 3rd Reynolds Cup contest. Clays and Clay Minerals, 54(6):748–760. https://doi.org/10.1346/CCMN.2006.0540609
Ottner, F., Gier, S., Kuderna, M., and Schwaighofer, B., 2000. Results of an inter-laboratory comparison of methods for quantitative clay analysis. Applied Clay Science, 17(5–6): 223–243. https://doi.org/10.1016/S0169-1317(00)00015-6
Raven, M.D., and Self, P.G., 2017. Outcomes of 12 years of the Reynolds Cup quantitative mineral analysis round robin. Clays and Clay Minerals, 65(2):122–134. https://doi.org/10.1346/CCMN.2017.064054
Saffer, D., Wallace, L., and Petronotis, K., 2017. Expedition 375 Scientific Prospectus: Hikurangi Subduction Margin Coring and Observatories. International Ocean Discovery Program. https://doi.org/10.14379/iodp.sp.375.2017
Shipboard Scientific Party, 1997. Methods. In Davis, E.E., Fisher, A.T., Firth, J.V., et al., Proceedings of the Ocean Drilling Program, Initial Reports, 168: College Station, TX (Ocean Drilling Program), 35–45. https://doi.org/10.2973/odp.proc.ir.168.103.1997
Shipboard Scientific Party, 2001. Explanatory notes. In Moore, G.F., Taira, A., Klaus, A., et al., Proceedings of the Ocean Drilling Program, Initial Reports, 190: College Station, TX (Ocean Drilling Program), 1–51. https://doi.org/10.2973/odp.proc.ir.190.103.2001
Środoń, J., 2002. Quantitative mineralogy of sedimentary rocks with emphasis on clays and with applications to K-Ar dating. Mineralogical Magazine, 66(5):677–687. https://doi.org/10.1180/0026461026650055
Środoń, J., Drits, V.A., McCarty, D.K., Hsieh, J.C.C., and Eberl, D.D., 2001. Quantitative X-ray diffraction analysis of clay-bearing rocks from random preparations. Clays and Clay Minerals, 49(6):514–528. https://doi.org/10.1346/CCMN.2001.0490604
Underwood, M.B., 2017a. Composition of sediment inputs to the Hikurangi subduction margin: a prelude to IODP Expedition 375 [presented at the 2017 American Geophysical Union Fall Meeting, New Orleans, LA, 11–15 December 2017]. (Abstract T21E-01) https://abstractsearch.agu.org/meetings/2017/FM/T21E-06.html
Underwood, M.B., 2017b. Data report: clay mineral assemblages and illite/smectite diagenesis in cuttings from Hole C0002P, IODP Expedition 348, Nankai Trough accretionary prism. In Tobin, H., Hirose, T., Saffer, D., Toczko, S., Maeda, L., Kubo, Y., and the Expedition 348 Scientists, Proceedings of the Integrated Ocean Drilling Program, 348: College Station, TX (Integrated Ocean Drilling Program). https://doi.org/10.2204/iodp.proc.348.204.2017
Underwood, M.B., 2020. Data report: reconnaissance of bulk sediment composition and clay mineral assemblages: inputs to the Hikurangi subduction system. In Wallace, L.M., Saffer, D.M., Barnes, P.M., Pecher, I.A., Petronotis, K.E., LeVay, L.J., and the Expedition 372/375 Scientists, Hikurangi Subduction Margin Coring, Logging, and Observatories. Proceedings of the International Ocean Discovery Program, 372B/375: College Station, TX (International Ocean Discovery Program). https://doi.org/10.14379/iodp.proc.372B375.203.2020
Underwood, M.B., and Guo, J., 2013. Data report: clay mineral assemblages in the Shikoku Basin, NanTroSEIZE subduction inputs, IODP Sites C0011 and C0012. In Saito, S., Underwood, M.B., Kubo, Y., and the Expedition 322 Scientists, Proceedings of the Integrated Ocean Drilling Program, 322: Tokyo (Integrated Ocean Drilling Program Management International, Inc.). https://doi.org/10.2204/iodp.proc.322.202.2013
Underwood, M.B., Basu, N., Steurer, J., and Udas, S., 2003. Data report: normalization factors for semiquantitative X-ray diffraction analysis, with application to DSDP Site 297, Shikoku Basin. In Mikada, H., Moore, G.F., Taira, A., Becker, K., Moore, J.C., and Klaus, A. (Eds.), Proceedings of the Ocean Drilling Program, Scientific Results, 190/196: College Station, TX (Ocean Drilling Program), 1–28. https://doi.org/10.2973/odp.proc.sr.190196.203.2003
Vogt, C., Lauterjung, J., and Fischer, R.X., 2002. Investigation of the clay fraction (<2 µm) of the Clay Mineral Society reference clays. Clays and Clay Minerals, 50(3):388–400. https://doi.org/10.1346/000986002760833765
Wallace, L.M., Saffer, D.M., Barnes, P.M., Pecher, I.A., Petronotis, K.E., LeVay, L.J., Bell, R.E., Crundwell, M.P., Engelmann de Oliveira, C.H., Fagereng, A., Fulton, P.M., Greve, A., Harris, R.N., Hashimoto, Y., Hüpers, A., Ikari, M.J., Ito, Y., Kitajima, H., Kutterolf, S., Lee, H., Li, X., Luo, M., Malie, P.R., Meneghini, F., Morgan, J.K., Noda, A., Rabinowitz, H.S., Savage, H.M., Shepherd, C.L., Shreedharan, S., Solomon, E.A., Underwood, M.B., Wang, M., Woodhouse, A.D., Bourlange, S.M., Brunet, M.M.Y., Cardona, S., Clennell, M.B., Cook, A.E., Dugan, B., Elger, J., Gamboa, D., Georgiopoulou, A., Han, S., Heeschen, K.U., Hu, G., Kim, G.Y., Koge, H., Machado, K.S., McNamara, D.D., Moore, G.F., Mountjoy, J.J., Nole, M.A., Owari, S., Paganoni, M., Rose, P.S., Screaton, E.J., Shankar, U., Torres, M.E., Wang, X., and Wu, H.-Y., 2019. Expedition 372B/375 methods. In Wallace, L.M., Saffer, D.M., Barnes, P.M., Pecher, I.A., Petronotis, K.E., LeVay, L.J., and the Expedition 372/375 Scientists, Hikurangi Subduction Margin Coring, Logging, and Observatories. Proceedings of the International Ocean Discovery Program, 372B/375: College Station, TX (International Ocean Discovery Program). https://doi.org/10.14379/iodp.proc.372B375.102.2019
Yuan, H., and Bish, D.L., 2010. NEWMOD+, a new version of the NEWMOD program for interpreting X-ray powder diffraction patterns from interstratified clay minerals. Clays and Clay Minerals, 58(3): 318–326. https://doi.org/10.1346/CCMN.2010.0580303
Zhou, X., Liu, D., Bu, H., Deng, L., Liu, H., Yuan, P., Du, P., and Song, H., 2018. XRD-based quantitative analysis of clay minerals using reference intensity ratios, mineral intensity factors, Rietveld, and full pattern summation methods: a critical review. Solid Earth Sciences, 3(1):16–29. https://doi.org/10.1016/j.sesci.2017.12.002
1 Underwood, M.B., Lawler, N., and McNamara, K., 2020. Data report: standard mineral mixtures, normalization factors, and determination of error for quantitative X-ray diffraction analyses of bulk powders and clay-sized mineral assemblages. In Wallace, L.M., Saffer, D.M., Barnes, P.M., Pecher, I.A., Petronotis, K.E., LeVay, L.J., and the Expedition 372/375 Scientists, Hikurangi Subduction Margin Coring, Logging, and Observatories. Proceedings of the International Ocean Discovery Program, 372B/375: College Station, TX (International Ocean Discovery Program). https://doi.org/10.14379/iodp.proc.372B375.201.2020
2 Department of Earth and Environmental Science, New Mexico Institute of Mining and Technology, USA. UnderwoodM@missouri.edu
3 International Ocean Discovery Program, Texas A&M University, USA.
4 New Mexico Bureau of Geology and Mineral Resources, New Mexico Institute of Mining and Technology, USA.
This work is distributed under the Creative Commons Attribution 4.0 International (CC BY 4.0) license. 