McKay, R.M., De Santis, L., Kulhanek, D.K., and the Expedition 374 Scientists
Proceedings of the International Ocean Discovery Program Volume 374
publications.iodp.org
Data report: Site U1523 composite section and stratigraphic splice based on X-ray fluorescence data, IODP Expedition 3741
D.K. Kulhanek,2 C. Prunella,3 J.R. McLaughlin,4 B. Griffin,5 R.M. McKay,5 M.O. Patterson,6 J. Gales,7 A.E. Shevenell,3 T.E. van Peer,8 and the Expedition 374 Scientists9
1 Kulhanek, D.K., Prunella, C., McLaughlin, J.R., Griffin, B., McKay, R.M., Patterson, M.O., Gales, J., Shevenell, A.E., van Peer, T.E., and the Expedition 374 Scientists, 2022. Data report: Site U1523 composite section and stratigraphic splice based on X-ray fluorescence data, IODP Expedition 374. In McKay, R.M., De Santis, L., Kulhanek, D.K., and the Expedition 374 Scientists, Ross Sea West Antarctic Ice Sheet History. Proceedings of the International Ocean Discovery Program, 374: College Station, TX (International Ocean Discovery Program). https://doi.org/
2 International Ocean Discovery Program, Texas A&M University, USA. Present affiliation: Institute of Geosciences, Christian-Albrechts-University of Kiel, Germany. Correspondence author: denise.kulhanek@ifg.uni-kiel.de.
3 College of Marine Science, University of South Florida, USA.
4 College of Geosciences, Texas A&M University, USA. Present affiliation: Jackson School of Geosciences, University of Texas, USA.
5 Antarctic Research Centre, Victoria University of Wellington, New Zealand.
6 Department of Geological and Environmental Studies, Binghamton University, USA.
7 School of Biological & Marine Sciences, University of Plymouth, United Kingdom.
8 National Oceanography Centre Southampton, University of Southampton, United Kingdom. Present affiliation: Department of Earth Sciences, University College London, United Kingdom.
9 Expedition_374_Participants@iodp.tamu.edu.
Abstract
Contribution of melting Antarctic Ice Sheets (AIS) to rising sea level remains one of the least quantified inputs to predictive models for the future. To improve these estimates, International Ocean Discovery Program Expedition 374 cored five sites in the Ross Sea, Antarctica, to examine the stability of the AIS to past intervals of global warmth. Site U1523 proved difficult to core because of the presence of gravel lags and indurated intervals; thus, we cored three holes with overlapping stratigraphy at that site to recover a more complete stratigraphic section. Given these challenges, no attempt was made to create a composite depth scale or stratigraphic splice during the expedition. Here we use a combination of physical property data (primarily magnetic susceptibility and natural gamma radiation), X-ray fluorescence core scanning, and visual core description to construct a core composite depth below seafloor (CCSF) depth scale to the base of Hole U1523B. This composite depth scale is discontinuous because of challenging coring conditions and variable core recovery, although there are several intervals of reasonably good stratigraphic continuity between 0 and 26 m CCSF and 82 and 96 m CCSF. We also created a stratigraphic splice from 0 to 93.95 m CCSF, although the splice is only continuous to 15.82 m CCSF. Additionally, we mapped the off-splice interval of Core 374-U1523E-1H to the composite depth scale over several intervals with significant core disturbance by stretching and squeezing to obtain a best fit. Development of the composite depth scale and stratigraphic splice will improve postcruise research results by allowing scientists to compare samples from different holes on the same depth scale.
1. Introduction
Five sites were cored during International Ocean Discovery Program (IODP) Expedition 374 in the Ross Sea sector of Antarctica to examine the stability of the Antarctic ice sheets during past intervals of warmer-than-present conditions (McKay et al., 2019b). Site U1523 is located on the outer continental shelf (Figure F1) in the pathway of both the alongslope current and downslope flow of Ross Sea Bottom Water, which flows into the deep ocean to become Antarctic Bottom Water. This site was cored to examine the interplay between these currents through time in a location never covered by grounded ice (McKay et al., 2019c).
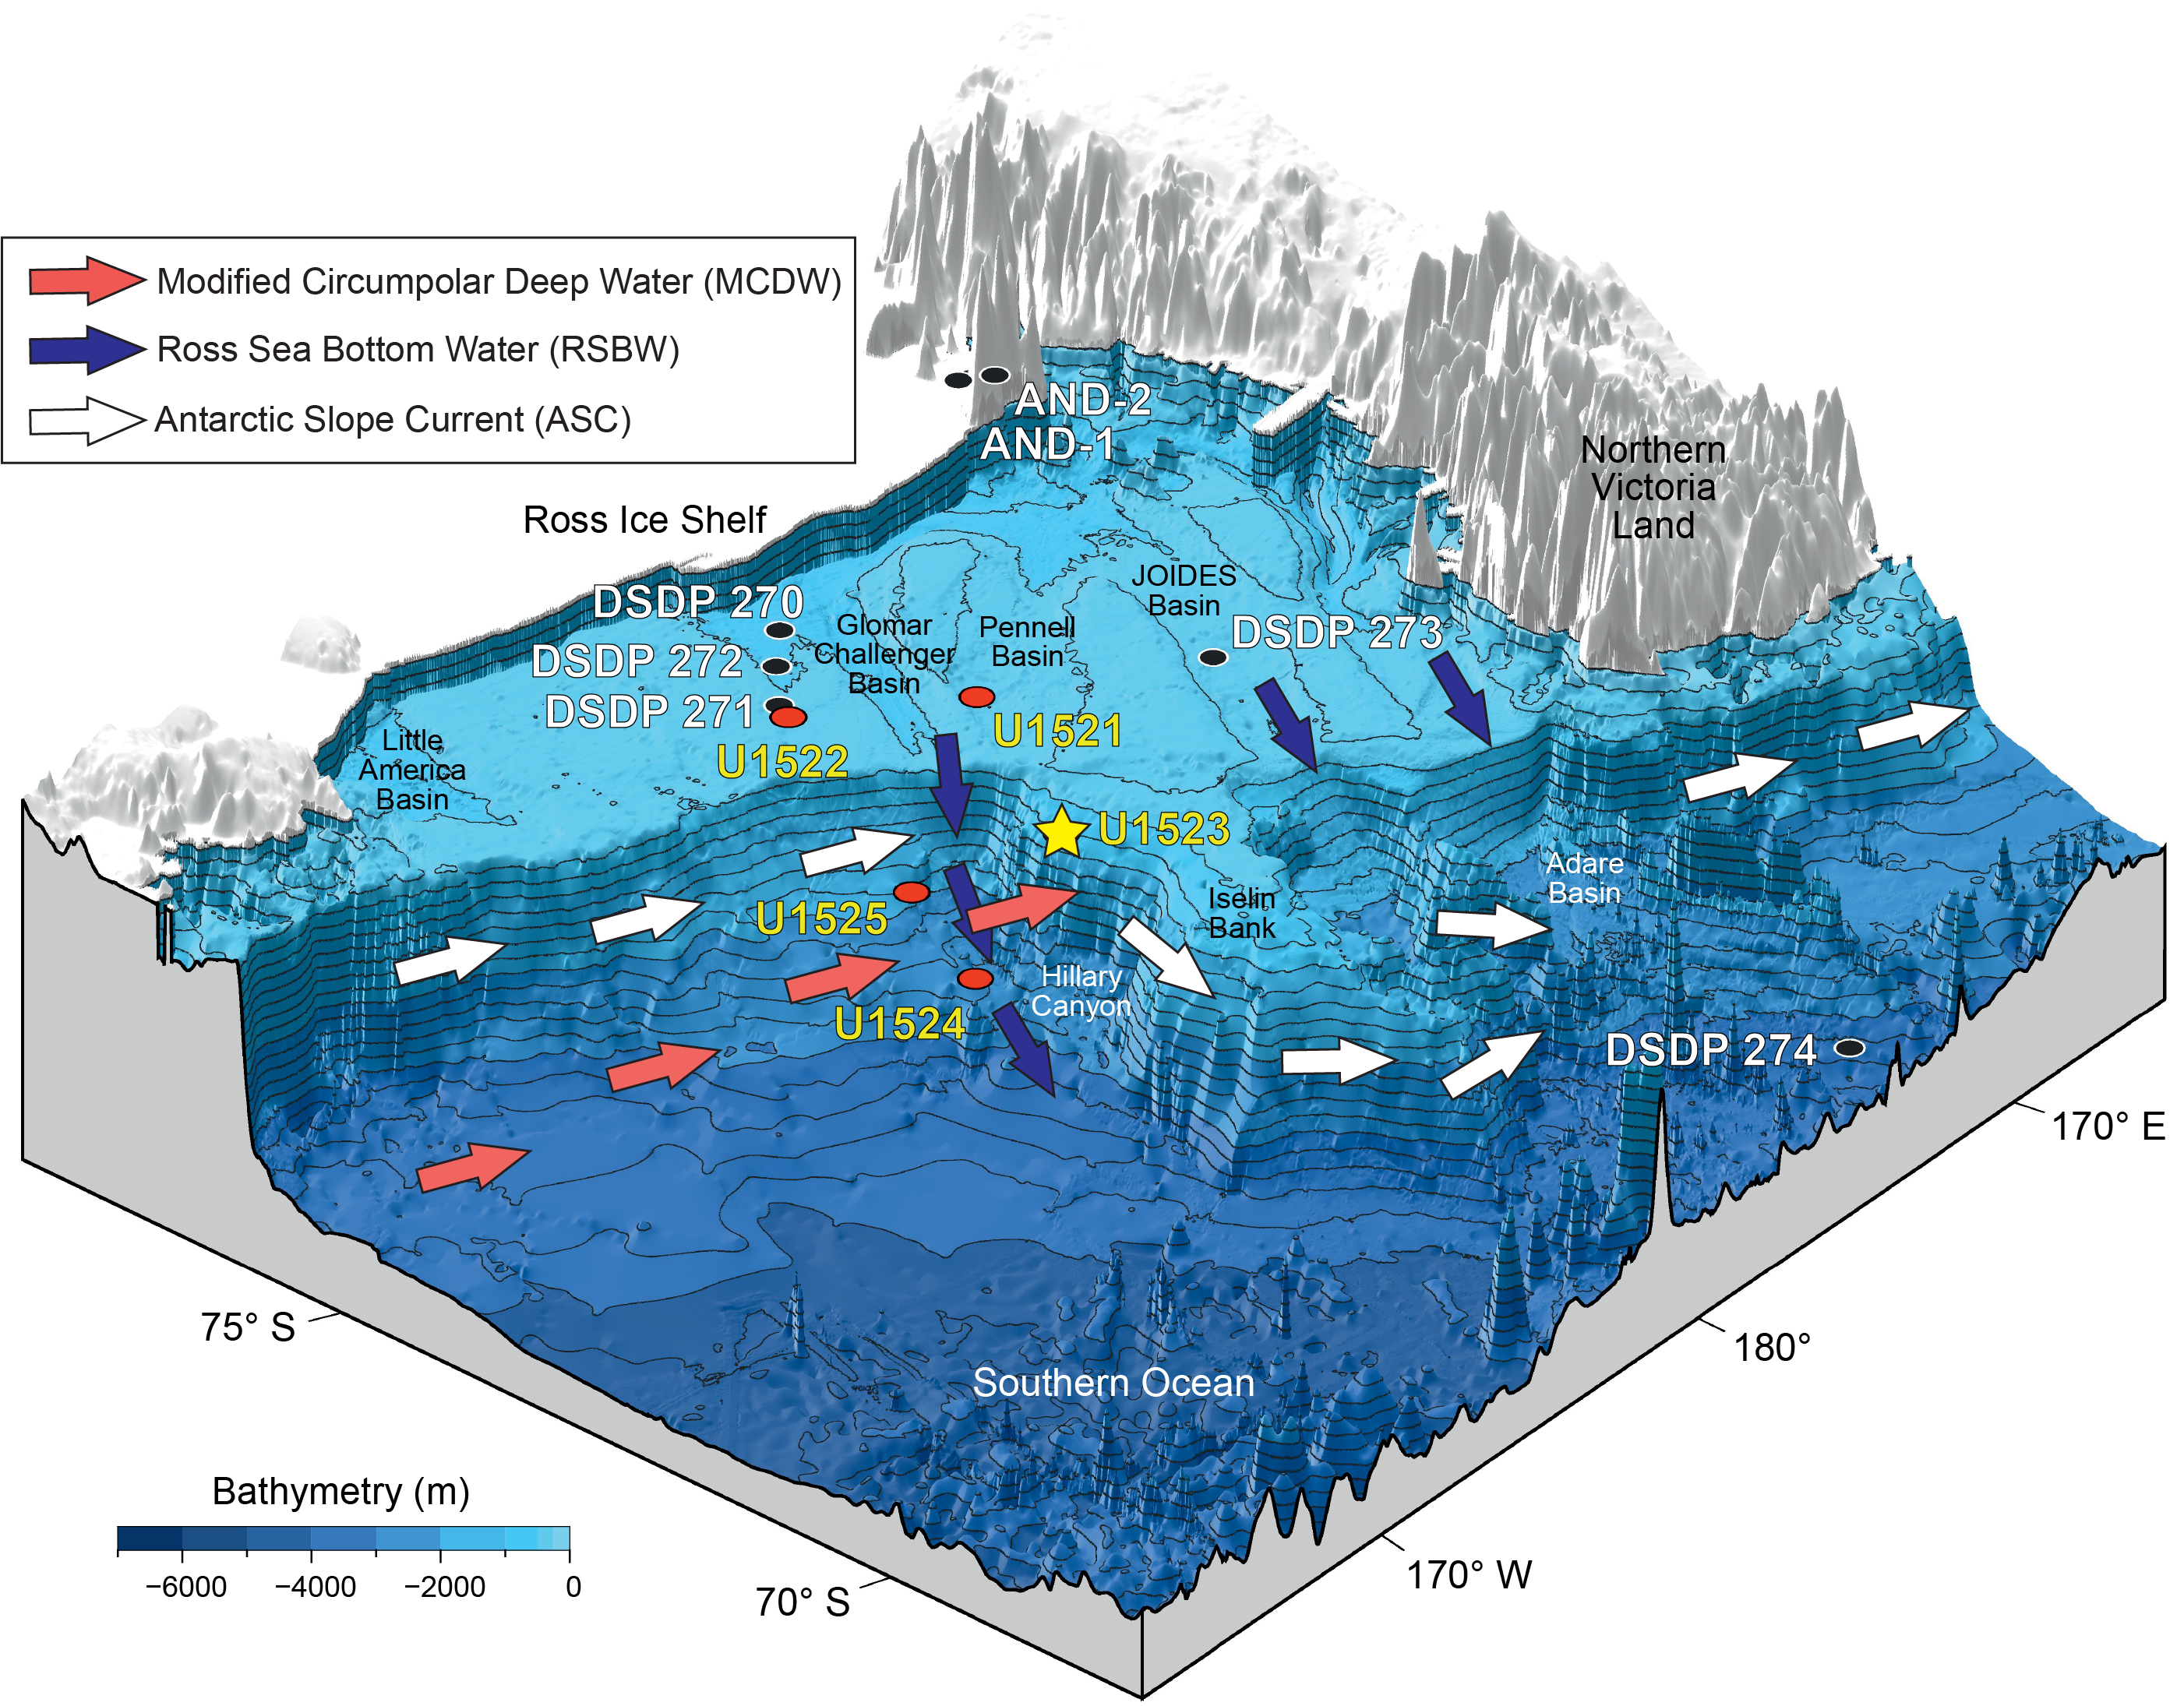
Figure F1. Bathymetric map showing Site U1523.
High current speeds at this site often winnowed fine-grained material, creating challenging coring conditions, and the advanced piston corer (APC) and half-length APC (HLAPC) were unable to penetrate gravel lags and indurated intervals. We employed a drilling strategy using drilling parameters from Holes U1523A and U1523B to attempt to HLAPC core between lags and indurated intervals in Hole U1523E to recover a more complete stratigraphic section (McKay et al., 2019c). This method was somewhat successful in recovering gaps in the stratigraphy (Figure F2), but recovery was not continuous enough to warrant development of a composite section during the expedition. Here we use a combination of physical property data collected shipboard, together with postcruise X-ray fluorescence (XRF) core scanning data and lithostratigraphy, to establish tie points between the three holes, creating a composite depth scale (core composite depth below seafloor [CCSF]), as well as an incomplete stratigraphic splice to ~90 m CCSF.
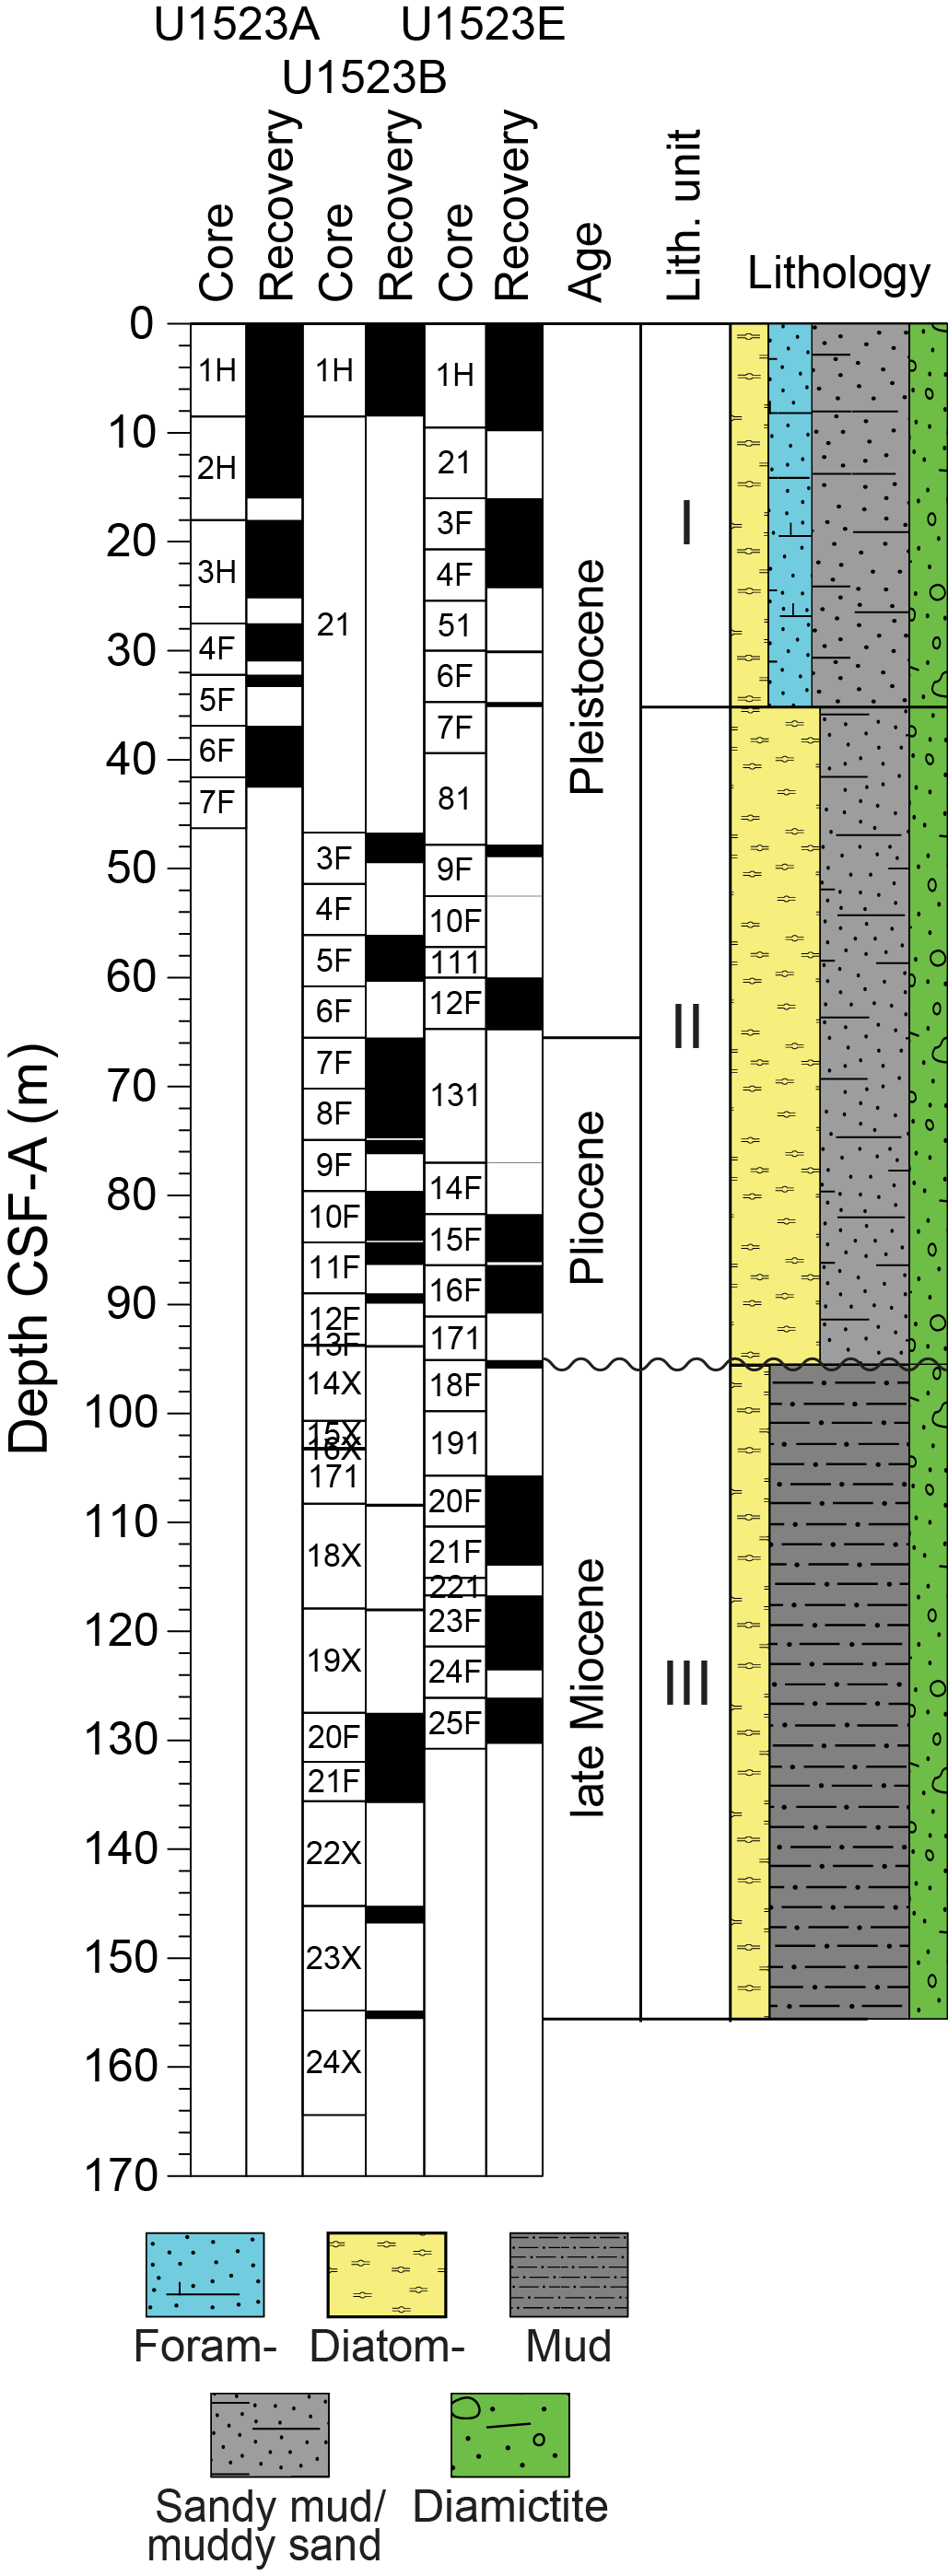
Figure F2. Coring summary.
2. Methods and materials
2.1. X-ray fluorescence core scanning
XRF core scanning was conducted on Site U1523 cores using a third-generation Avaatech core scanner (XRF2) at the IODP Gulf Coast Repository at Texas A&M University equipped with a 100 W rhodium side-window X-ray tube. Prior to scanning, cores were moved from cold storage to the laboratory to warm to room temperature for at least 3 h to avoid condensation. Each section was prepared by scraping the core surface using either a glass microscope slide or a stainless steel spatula to remove the upper ~2 mm of sediment. The stainless steel spatula was used to avoid chipping glass onto the core surface when clasts were present. After scraping, the core surface was covered with 4 µm thick Ultralene film (SPEX Centriprep, Inc.) to protect the detector.
Each section was scanned at 1 cm (Hole U1523E) or 2 cm (Holes U1523A and U1523B) resolution along the center of the core section using a 1.2 cm2 illumination window set to 1 cm downcore and 1.2 cm crosscore. Three successive scans were performed on each core section using different excitation settings. The first scan was performed at 10 kV, 0.16 mA, and no filter with 6 s of live time to analyze for Al, Si, K, Ca, Ti, and Fe. The second scan used 30 kV, 1.25 mA, and a Pd thick filter with 6 s of live time to analyze for Ni, Br, Rb, Sr, Zr, and Mo. The last scan was at 50 kV, 0.75 mA, and a Cu filter with 10 s of live time to analyze for Ba. Raw X-ray spectra were processed using bAxil software (Brightspec), which uses a nonlinear least squares method.
XRF data are archived in the Laboratory Information Management System (LIMS) database (http://web.iodp.tamu.edu/LORE).
2.2. Core images
Digital linescan images of the archive-half sections were collected during the expedition using a JAI linescan camera and LED lights to illuminate the core surface (McKay et al., 2019a). These section images were loaded into Igor Pro (Wavemetrics) using the Code for Ocean Drilling Data (CODD) of Wilkens et al. (2017) and concatenated into composite core images used to verify tie points when constructing the CCSF depth scale. Core images were then reprocessed to the CCSF depth scale, and a spliced image was created along the stratigraphic splice. Core images are archived in the LIMS database (http://web.iodp.tamu.edu/LORE).
2.3. Lithostratigraphy
Site U1523 cores were redescribed at the IODP Gulf Coast Repository in August 2018 to verify and improve on shipboard core description, which is limited in resolution because of time limitations during coring operations. Lithologic description followed the methods outlined in McKay et al. (2019a) and focused on providing higher resolution description detail and correlations between the three holes. Descriptions were recorded manually on core description sheets, which were then scanned into PDF format for archiving. These descriptions were used to confirm correlations between the holes during development of the composite stratigraphic section.
2.4. Creation of CCSF depth scale and stratigraphic splice
Shipboard data, including core images and physical properties (gamma ray attenuation bulk density, magnetic susceptibility, natural gamma radiation, and color spectrophotometry), as well as the XRF data, were loaded into Igor Pro using CODD (Wilkens et al., 2017). Because no composite section was created during the expedition, 0 m offsets for cores were loaded to define a CCSF depth scale equal to the core depth below seafloor, Method A (CSF-A) depth scale.
Ties between cores in adjacent holes were made using several XRF data ratios: Rb/Sr, Ca/Ti, Br/Ti, and Zr/Rb. After a tie was made, other data sets were examined to ensure the best possible tie based on multiple data types. Because there was minimal overlap of cores below ~20 m CCSF, the offset for many cores was set equal to the offset of the core above. In rare cases, the offset was increased by a small amount to avoid overlap with the core above when recovery was >100%.
After creation of the CCSF depth scale, we defined a stratigraphic splice for the upper 94 m CCSF. Intervals included in the splice were selected by examining the core descriptions and core photos to avoid disturbed sections when possible. Tie points were defined using either XRF Zr/Rb data or magnetic susceptibility.
3. Results
3.1. Composite depth scale
We developed a composite depth scale using a variety of physical property, XRF, and visual core description data. Offsets for the CCSF depth scale are given in Table T1 (affine table), and select XRF ratios and magnetic susceptibility are presented on the original CSF-A and new CCSF depth scale in Figures F3 (Zr/Rb), F4 (Rb/Sr), F5 (Ca/Ti), F6 (Br/Ti), and F7 (magnetic susceptibility). We selected Core U1523A-1H as the anchor core because Core U1523E-1H contains disturbed intervals in the upper two sections. We tied interval U1523E-1H-5, 9 cm, to interval U1523A-1H-5, 14 cm, using Zr/Rb (Figure F3A). The mudline core from Hole U1523B was used for interstitial water and microbiology whole-round sampling, so no material remains to tie that cored interval into the composite depth scale, and its offset was artificially set to 0 m. Interval U1523A-2H-1, 103 cm, is tied to interval U1523E-1H-7, 27 cm, using Rb/Sr data (Figure F4A).
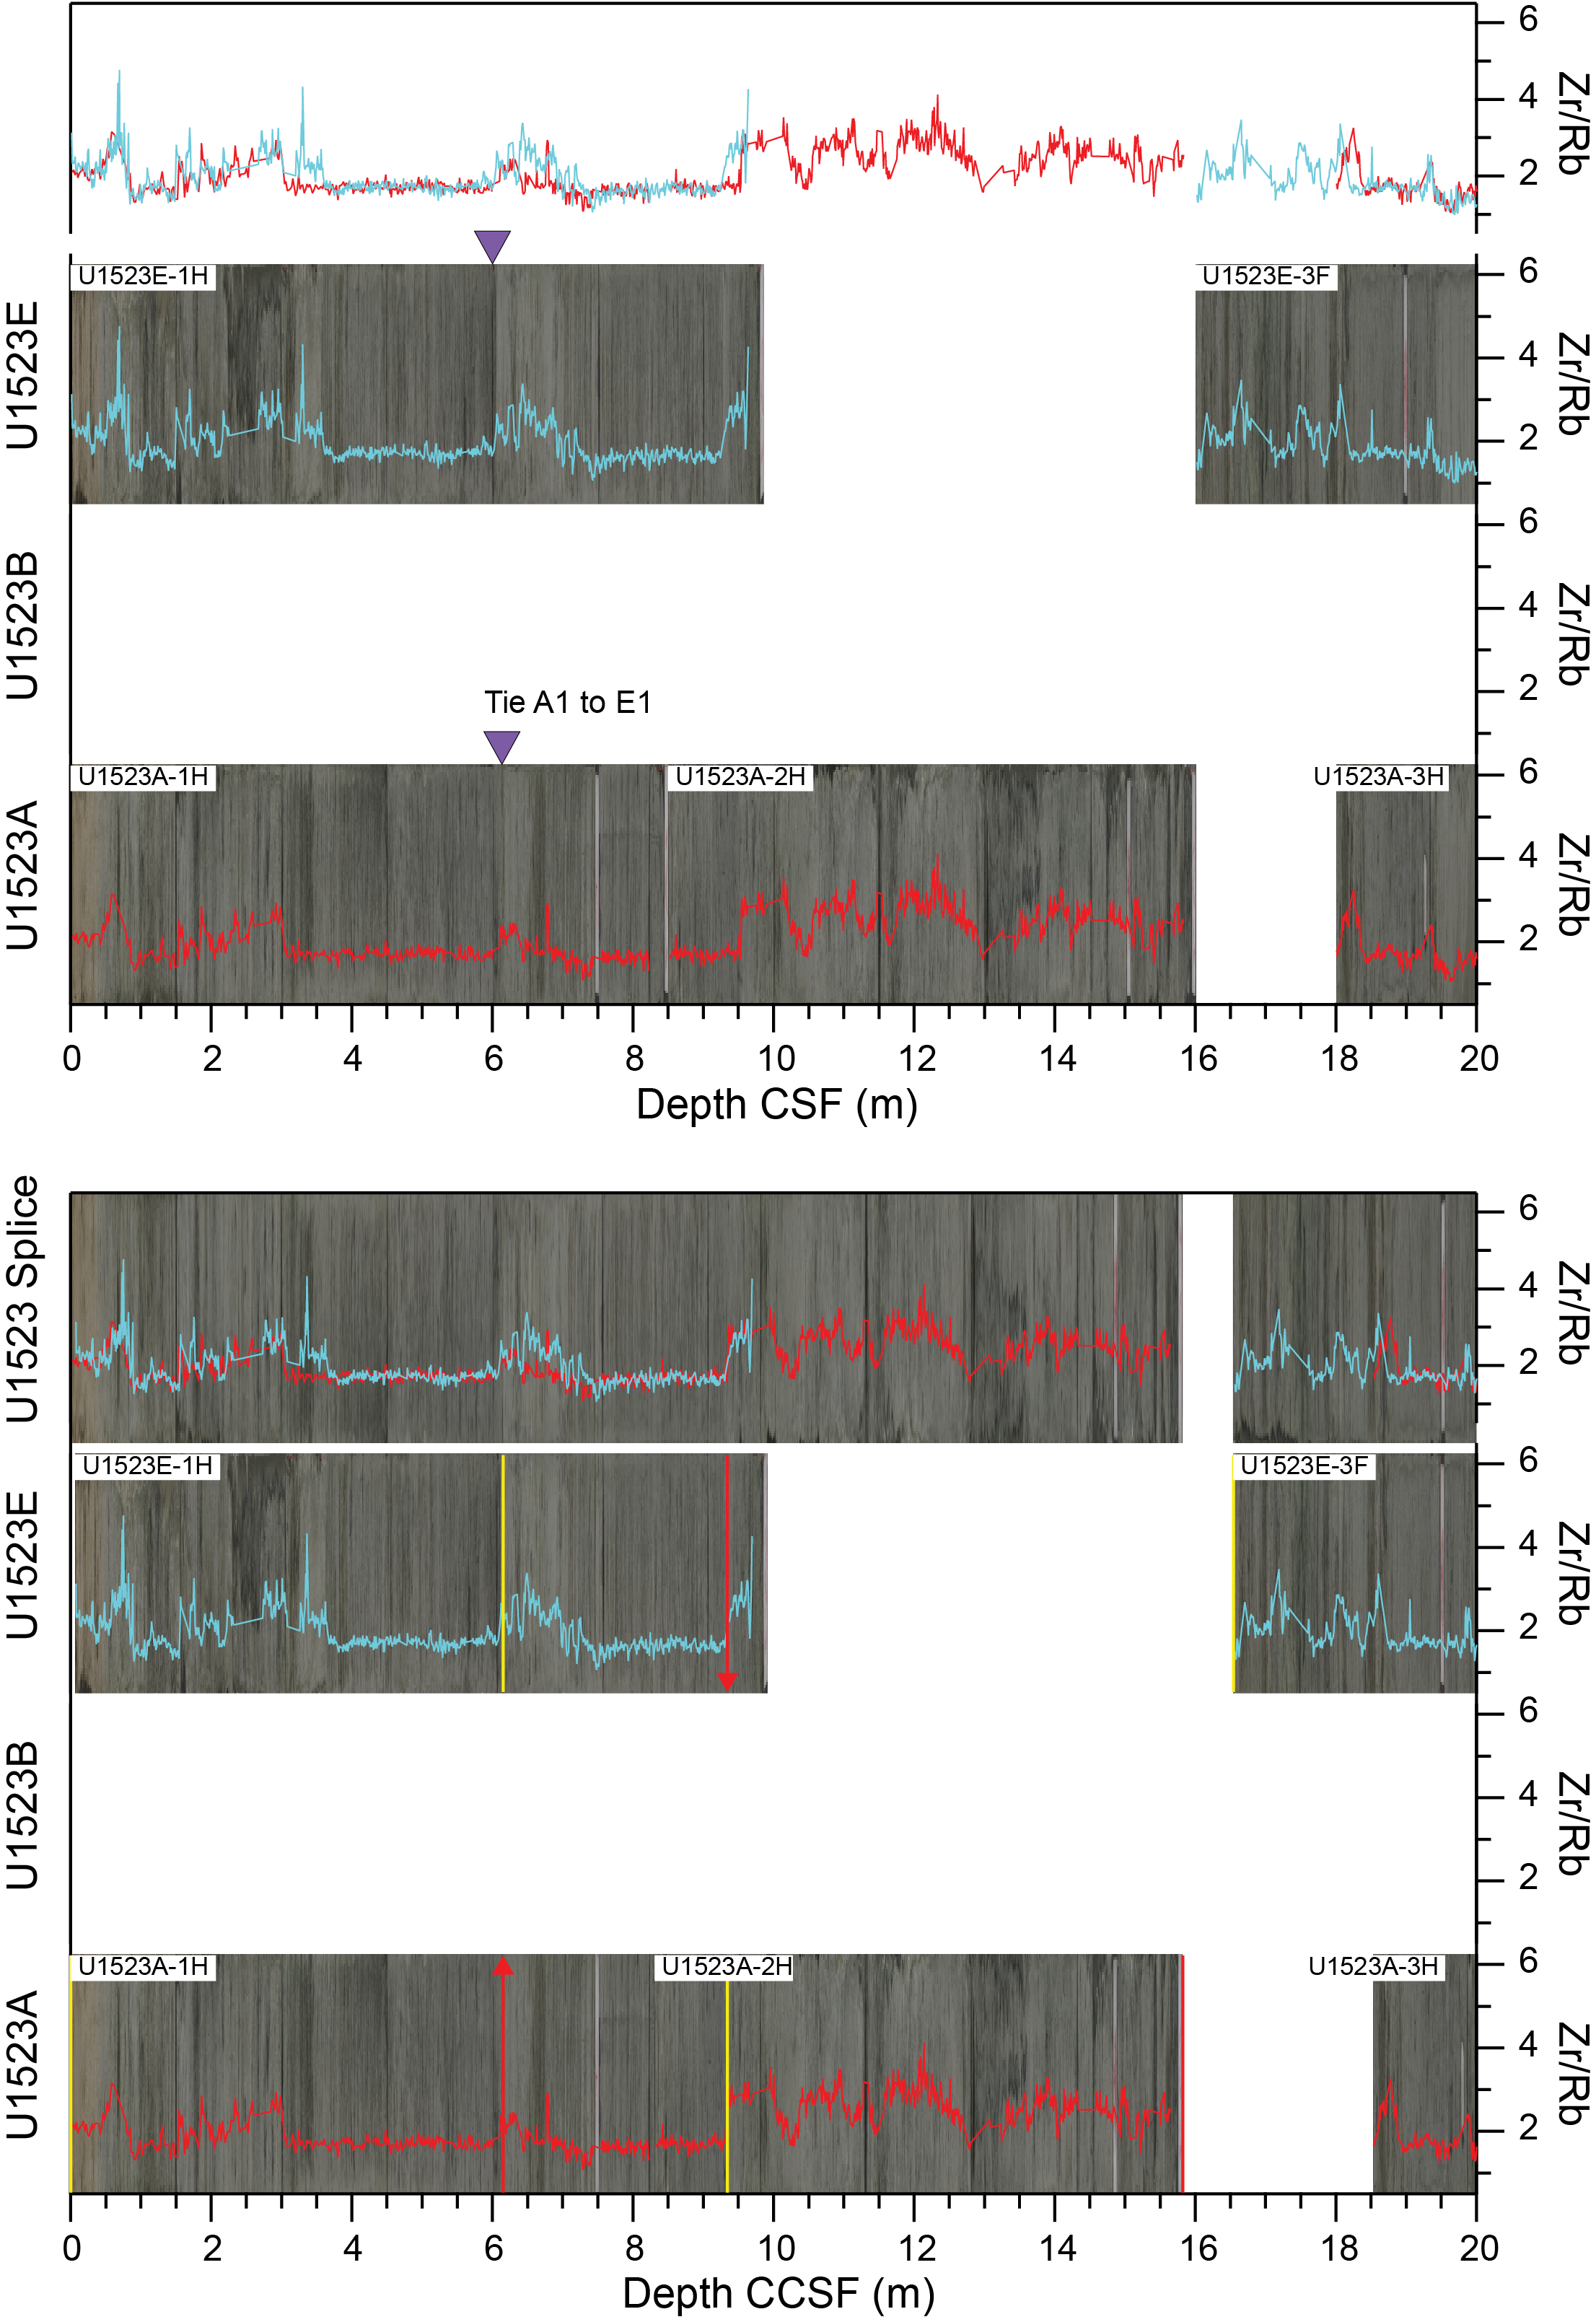
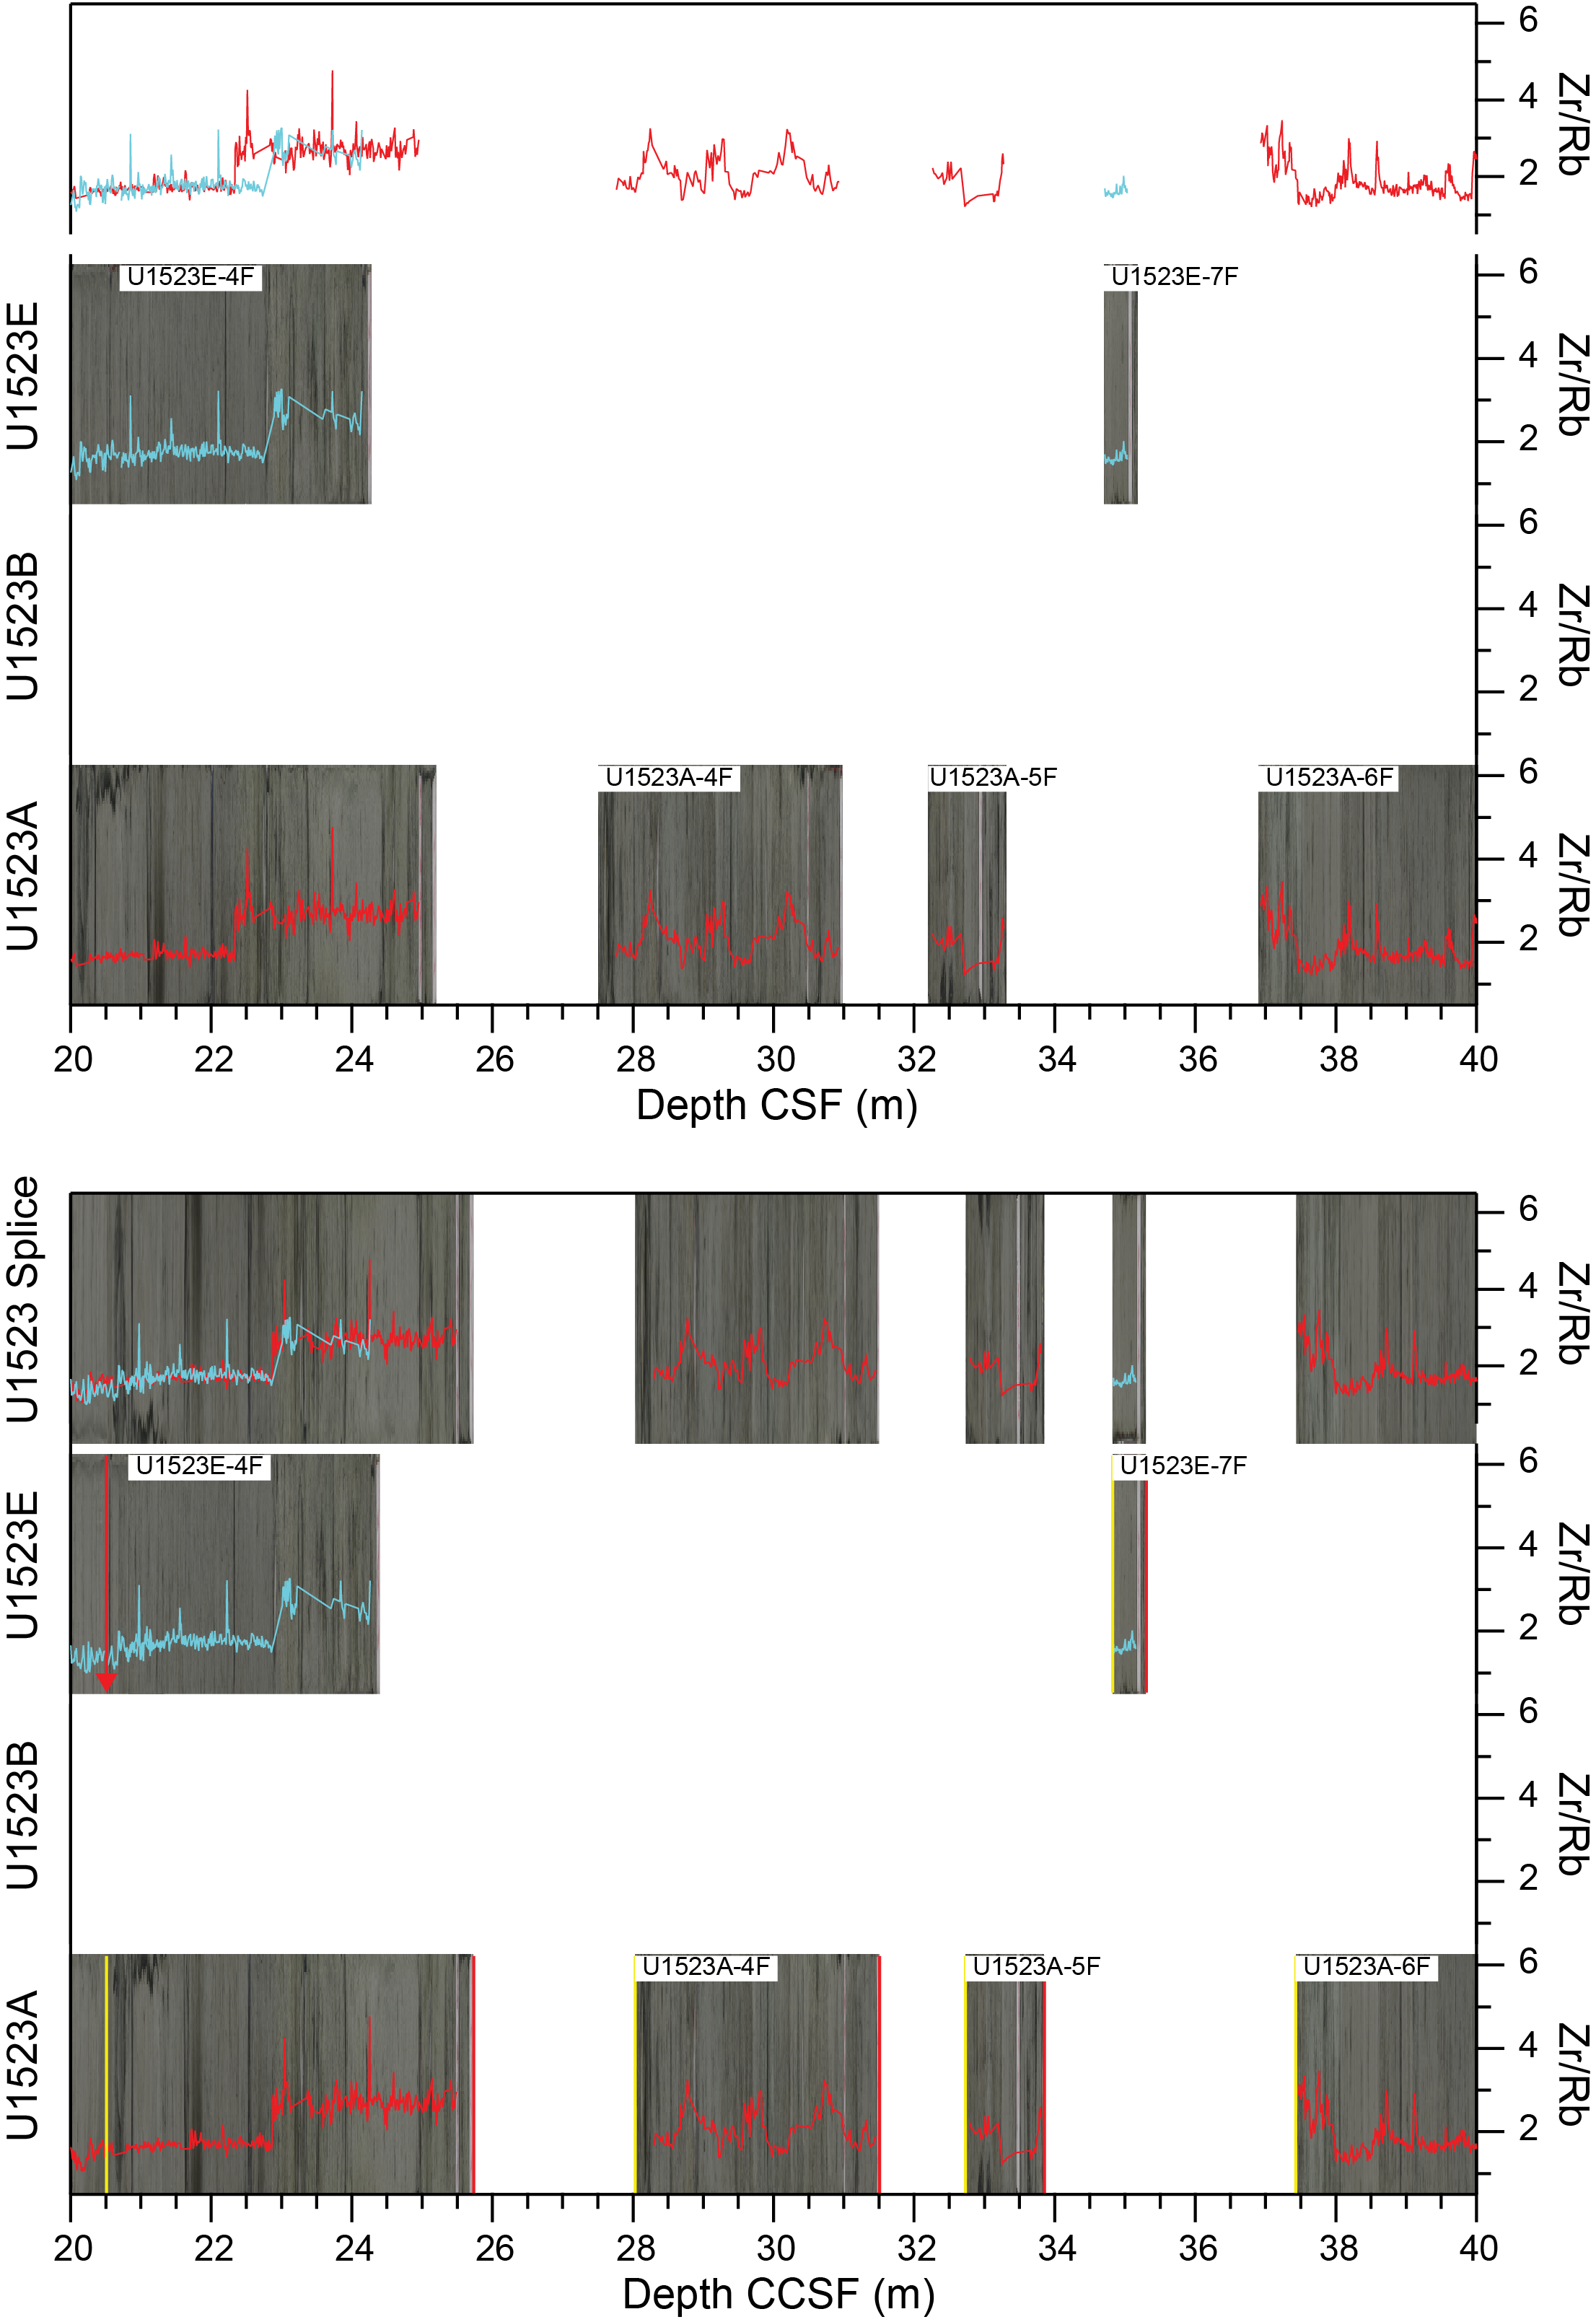
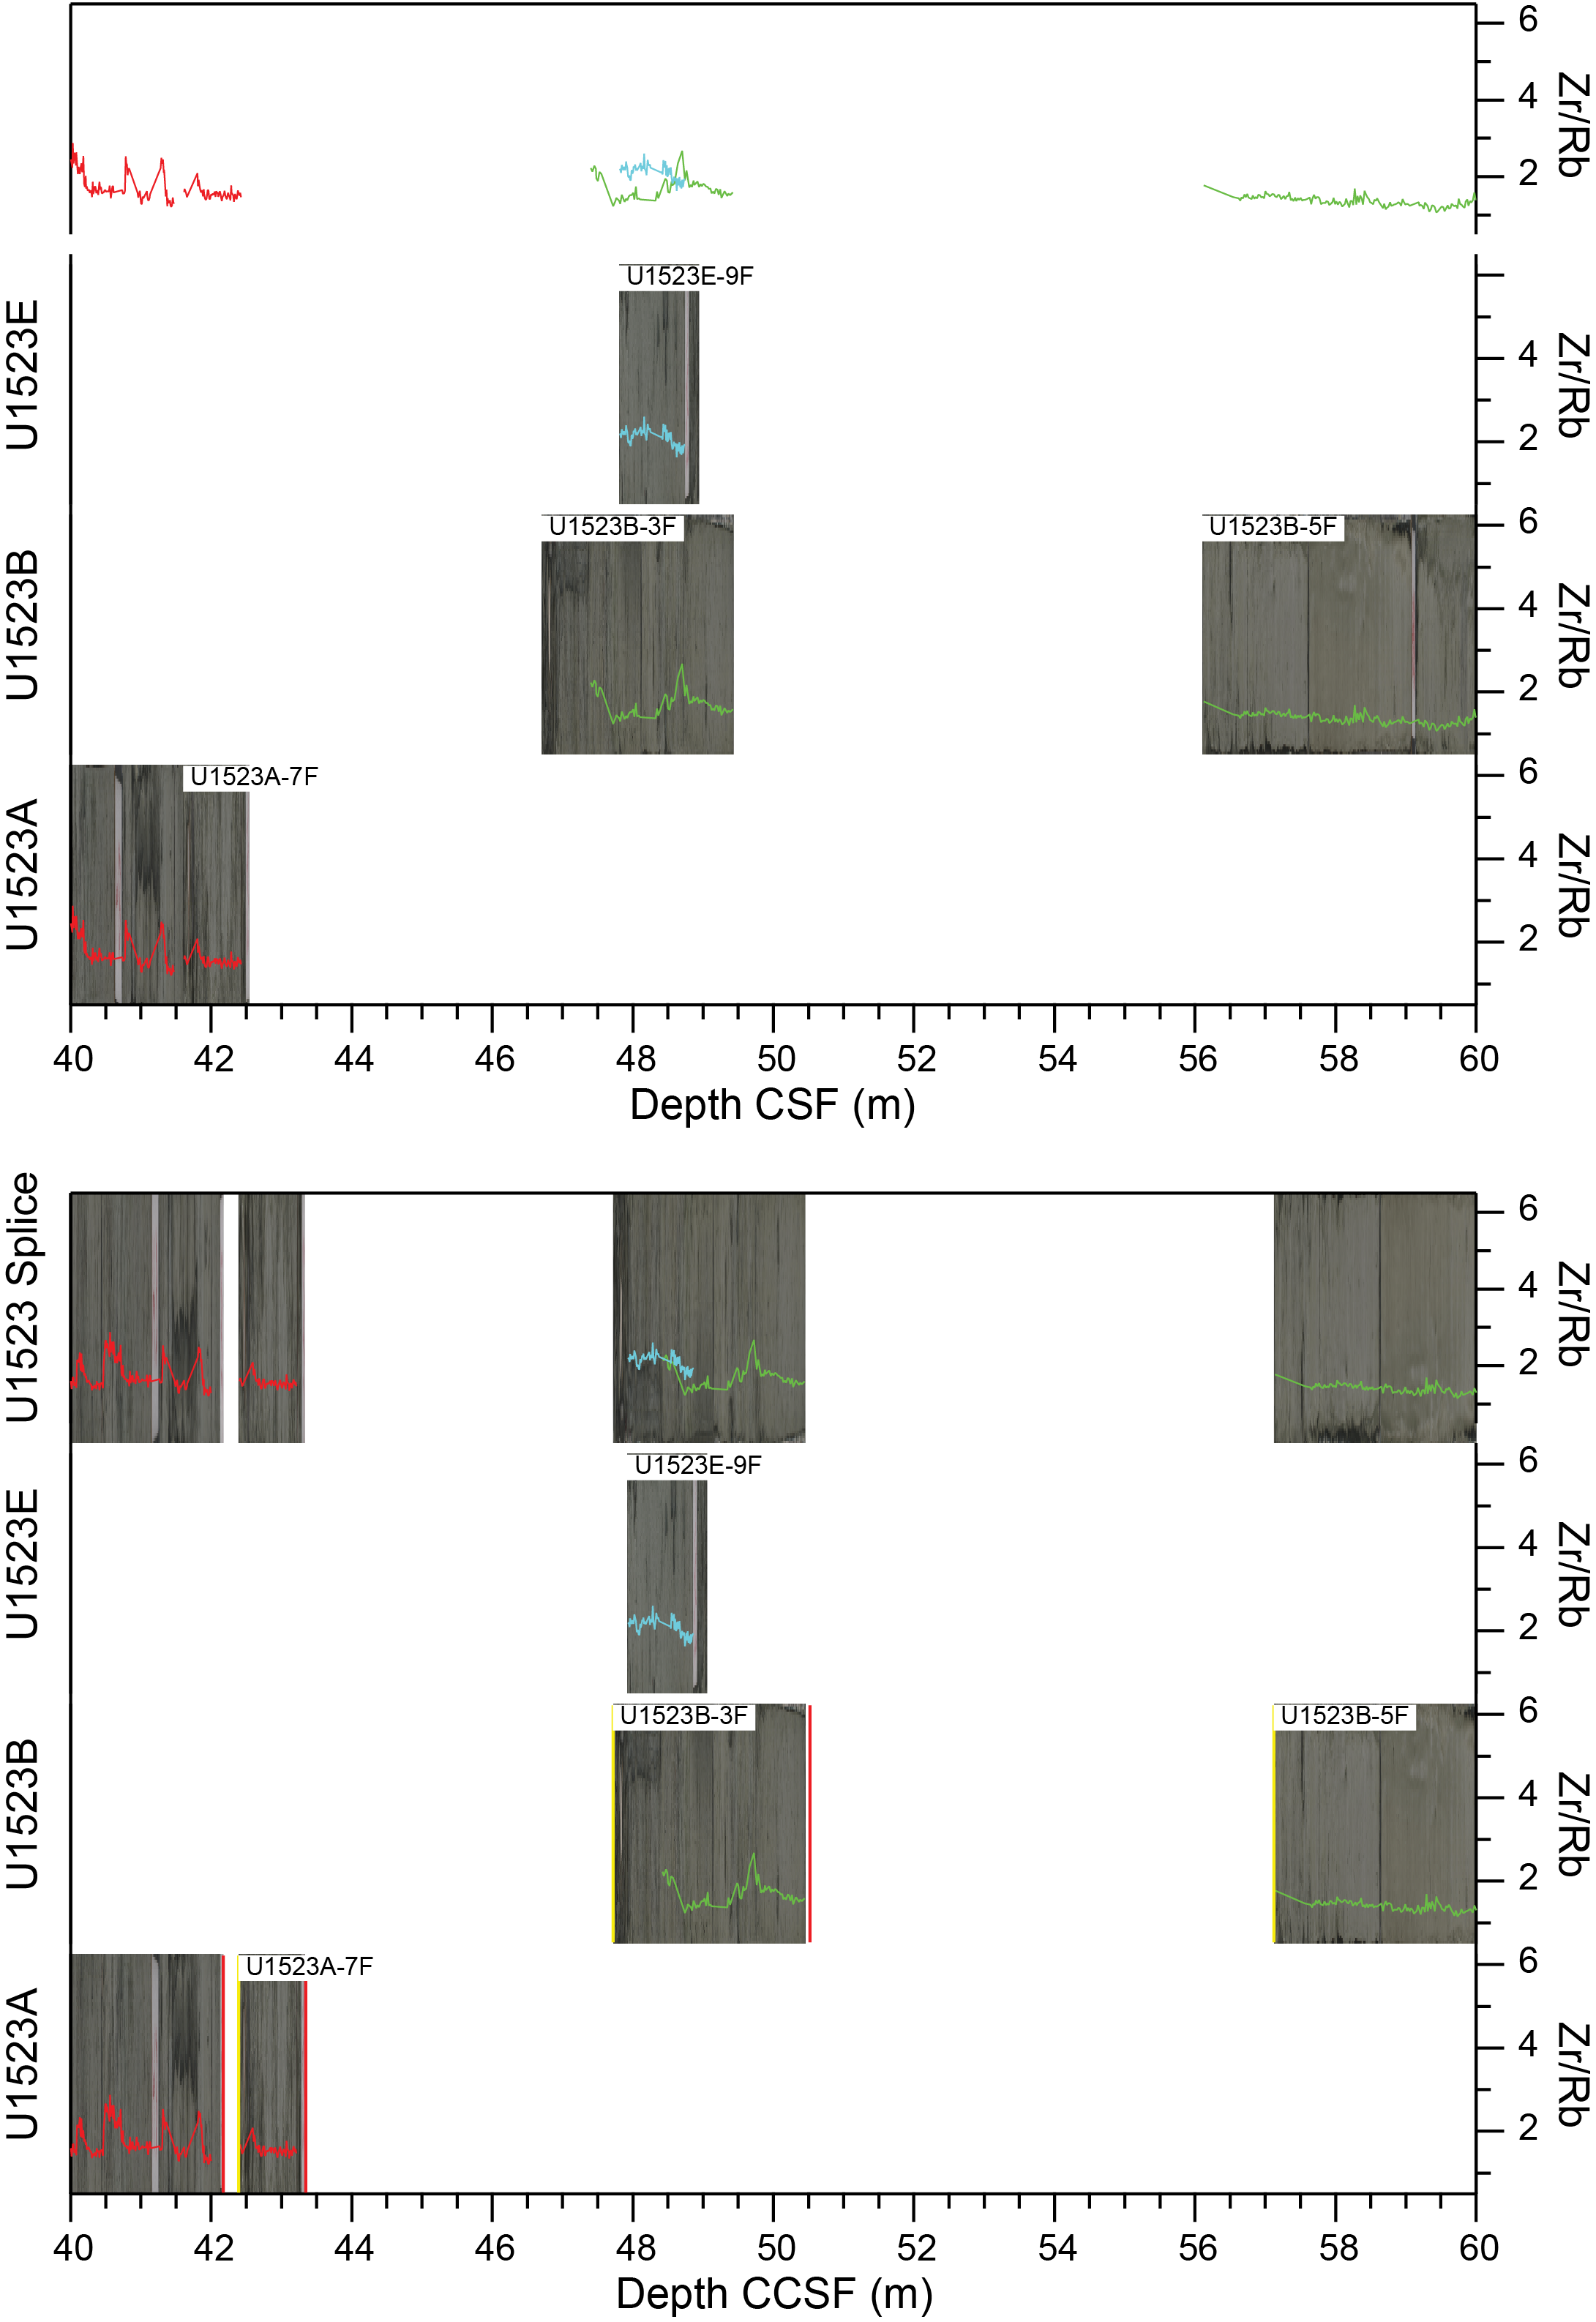

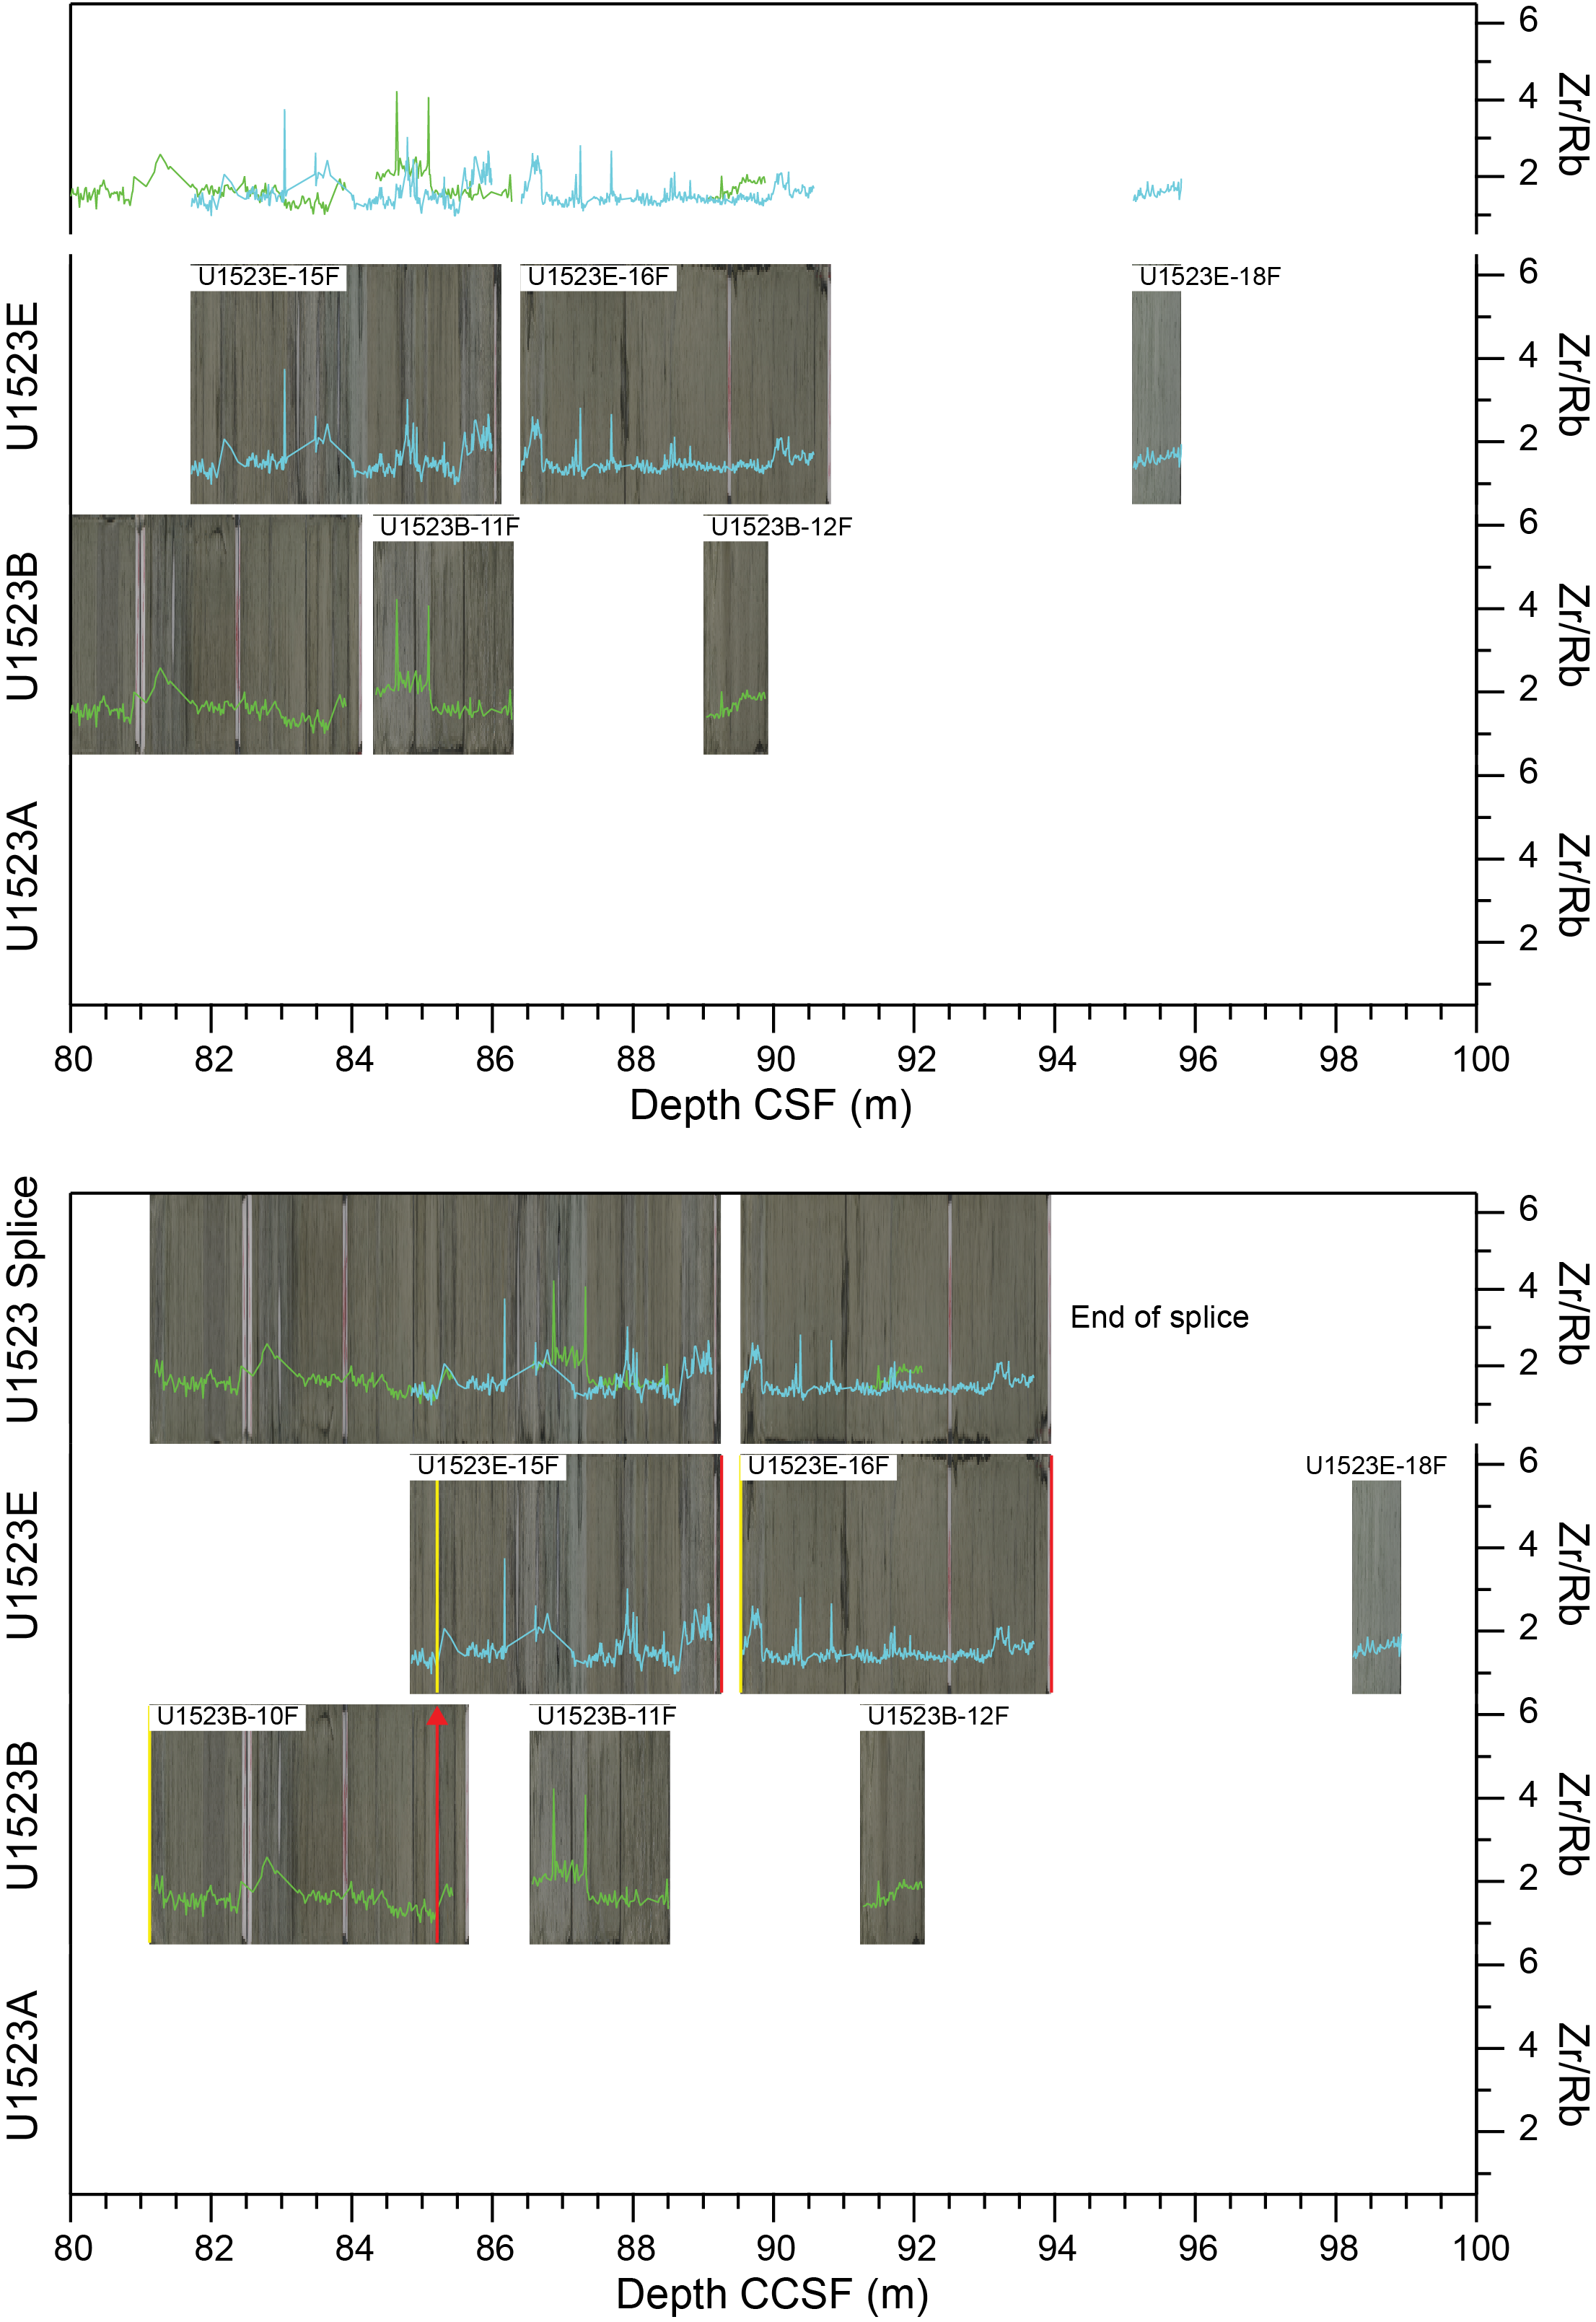
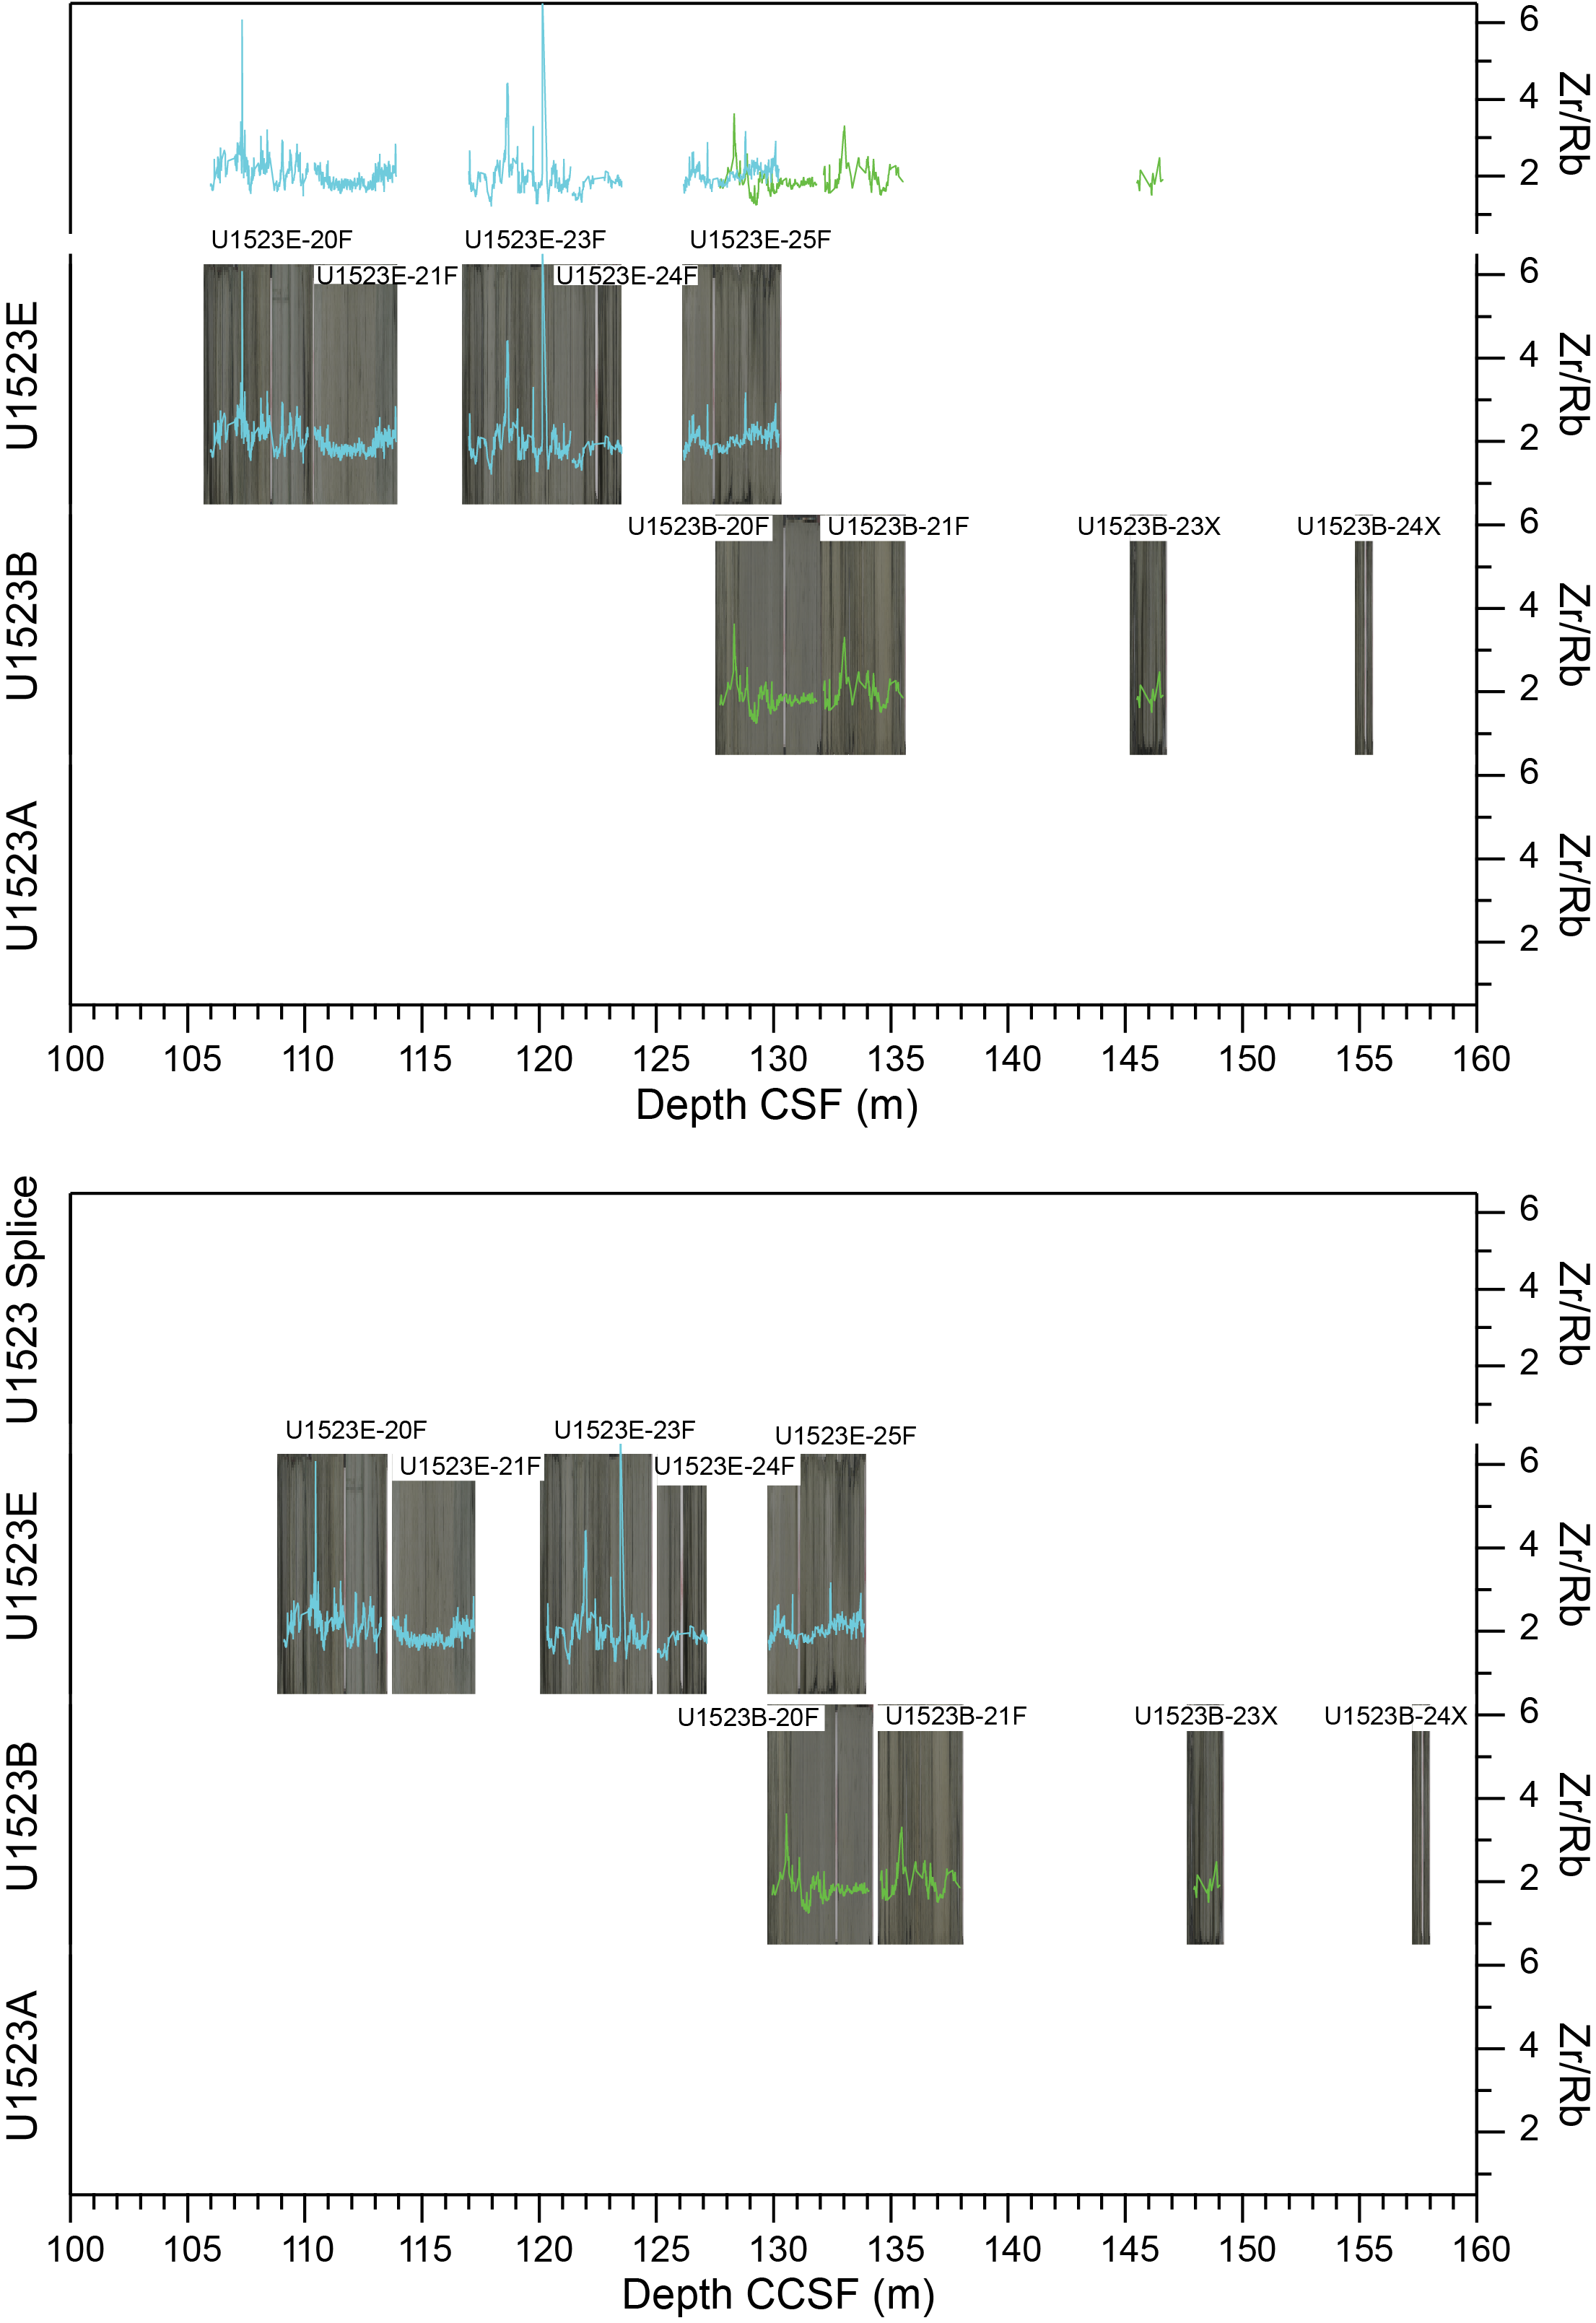
Figure F3. Linescan core images and Zr/Rb XRF.
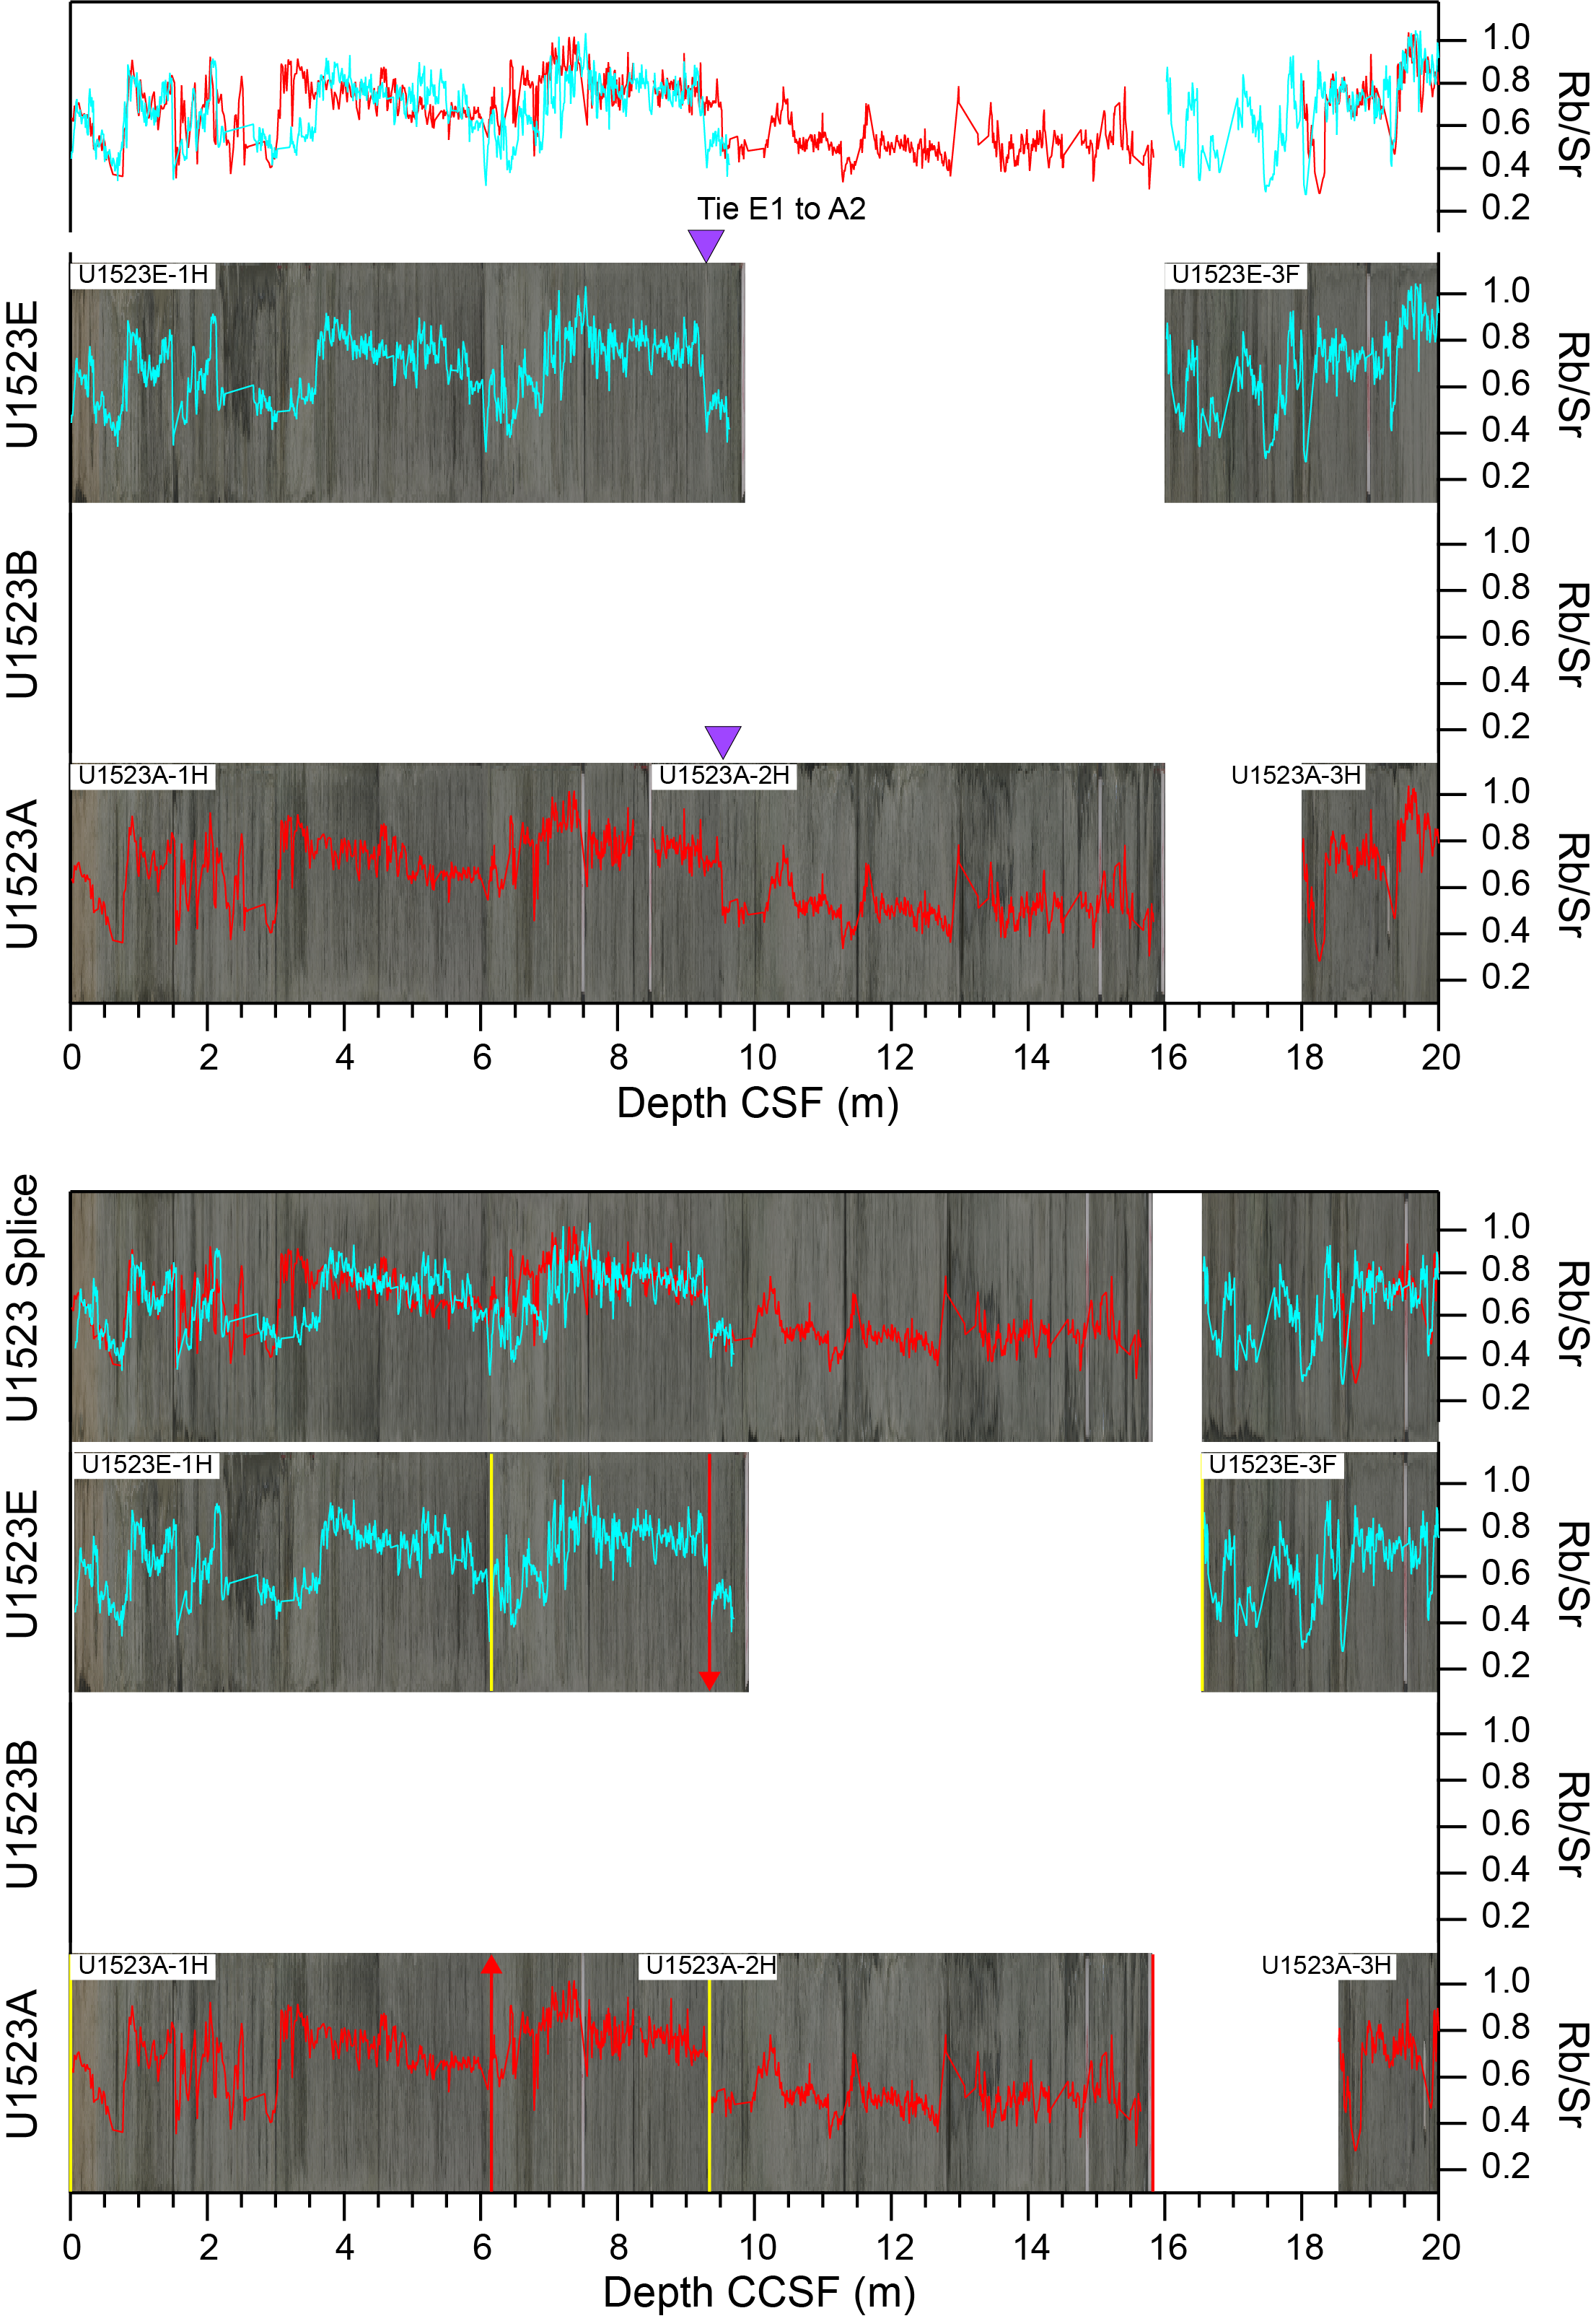
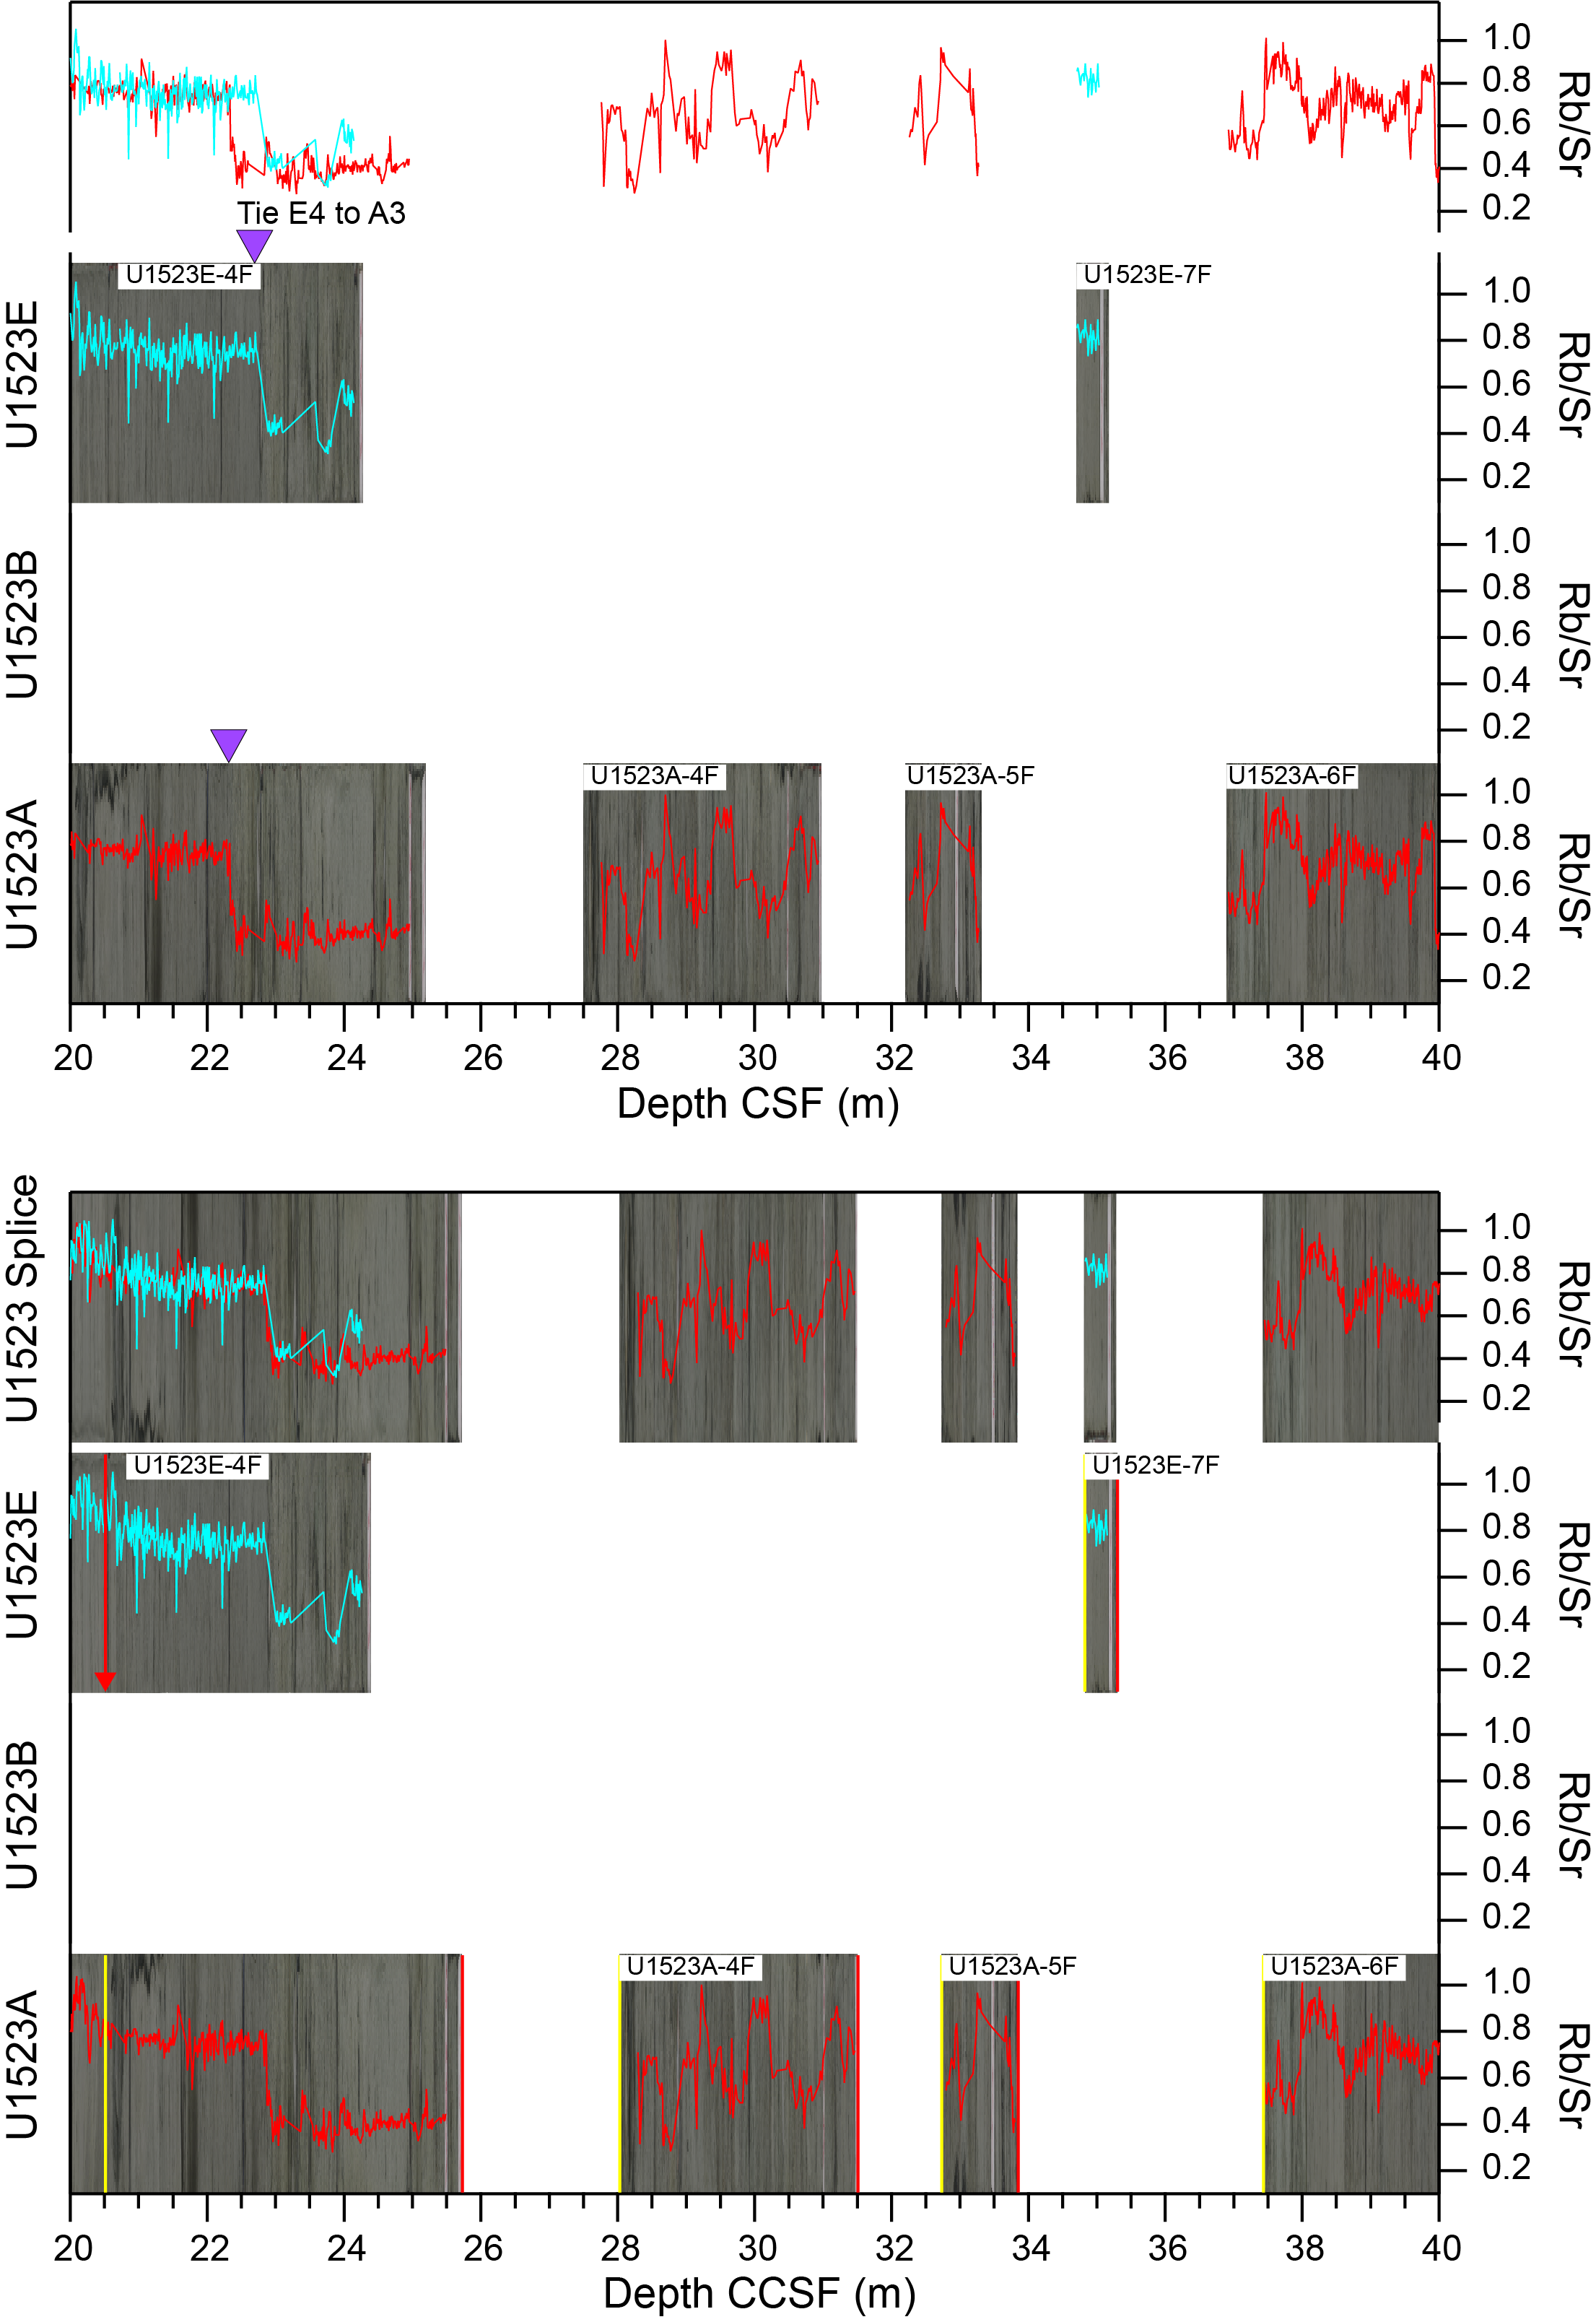
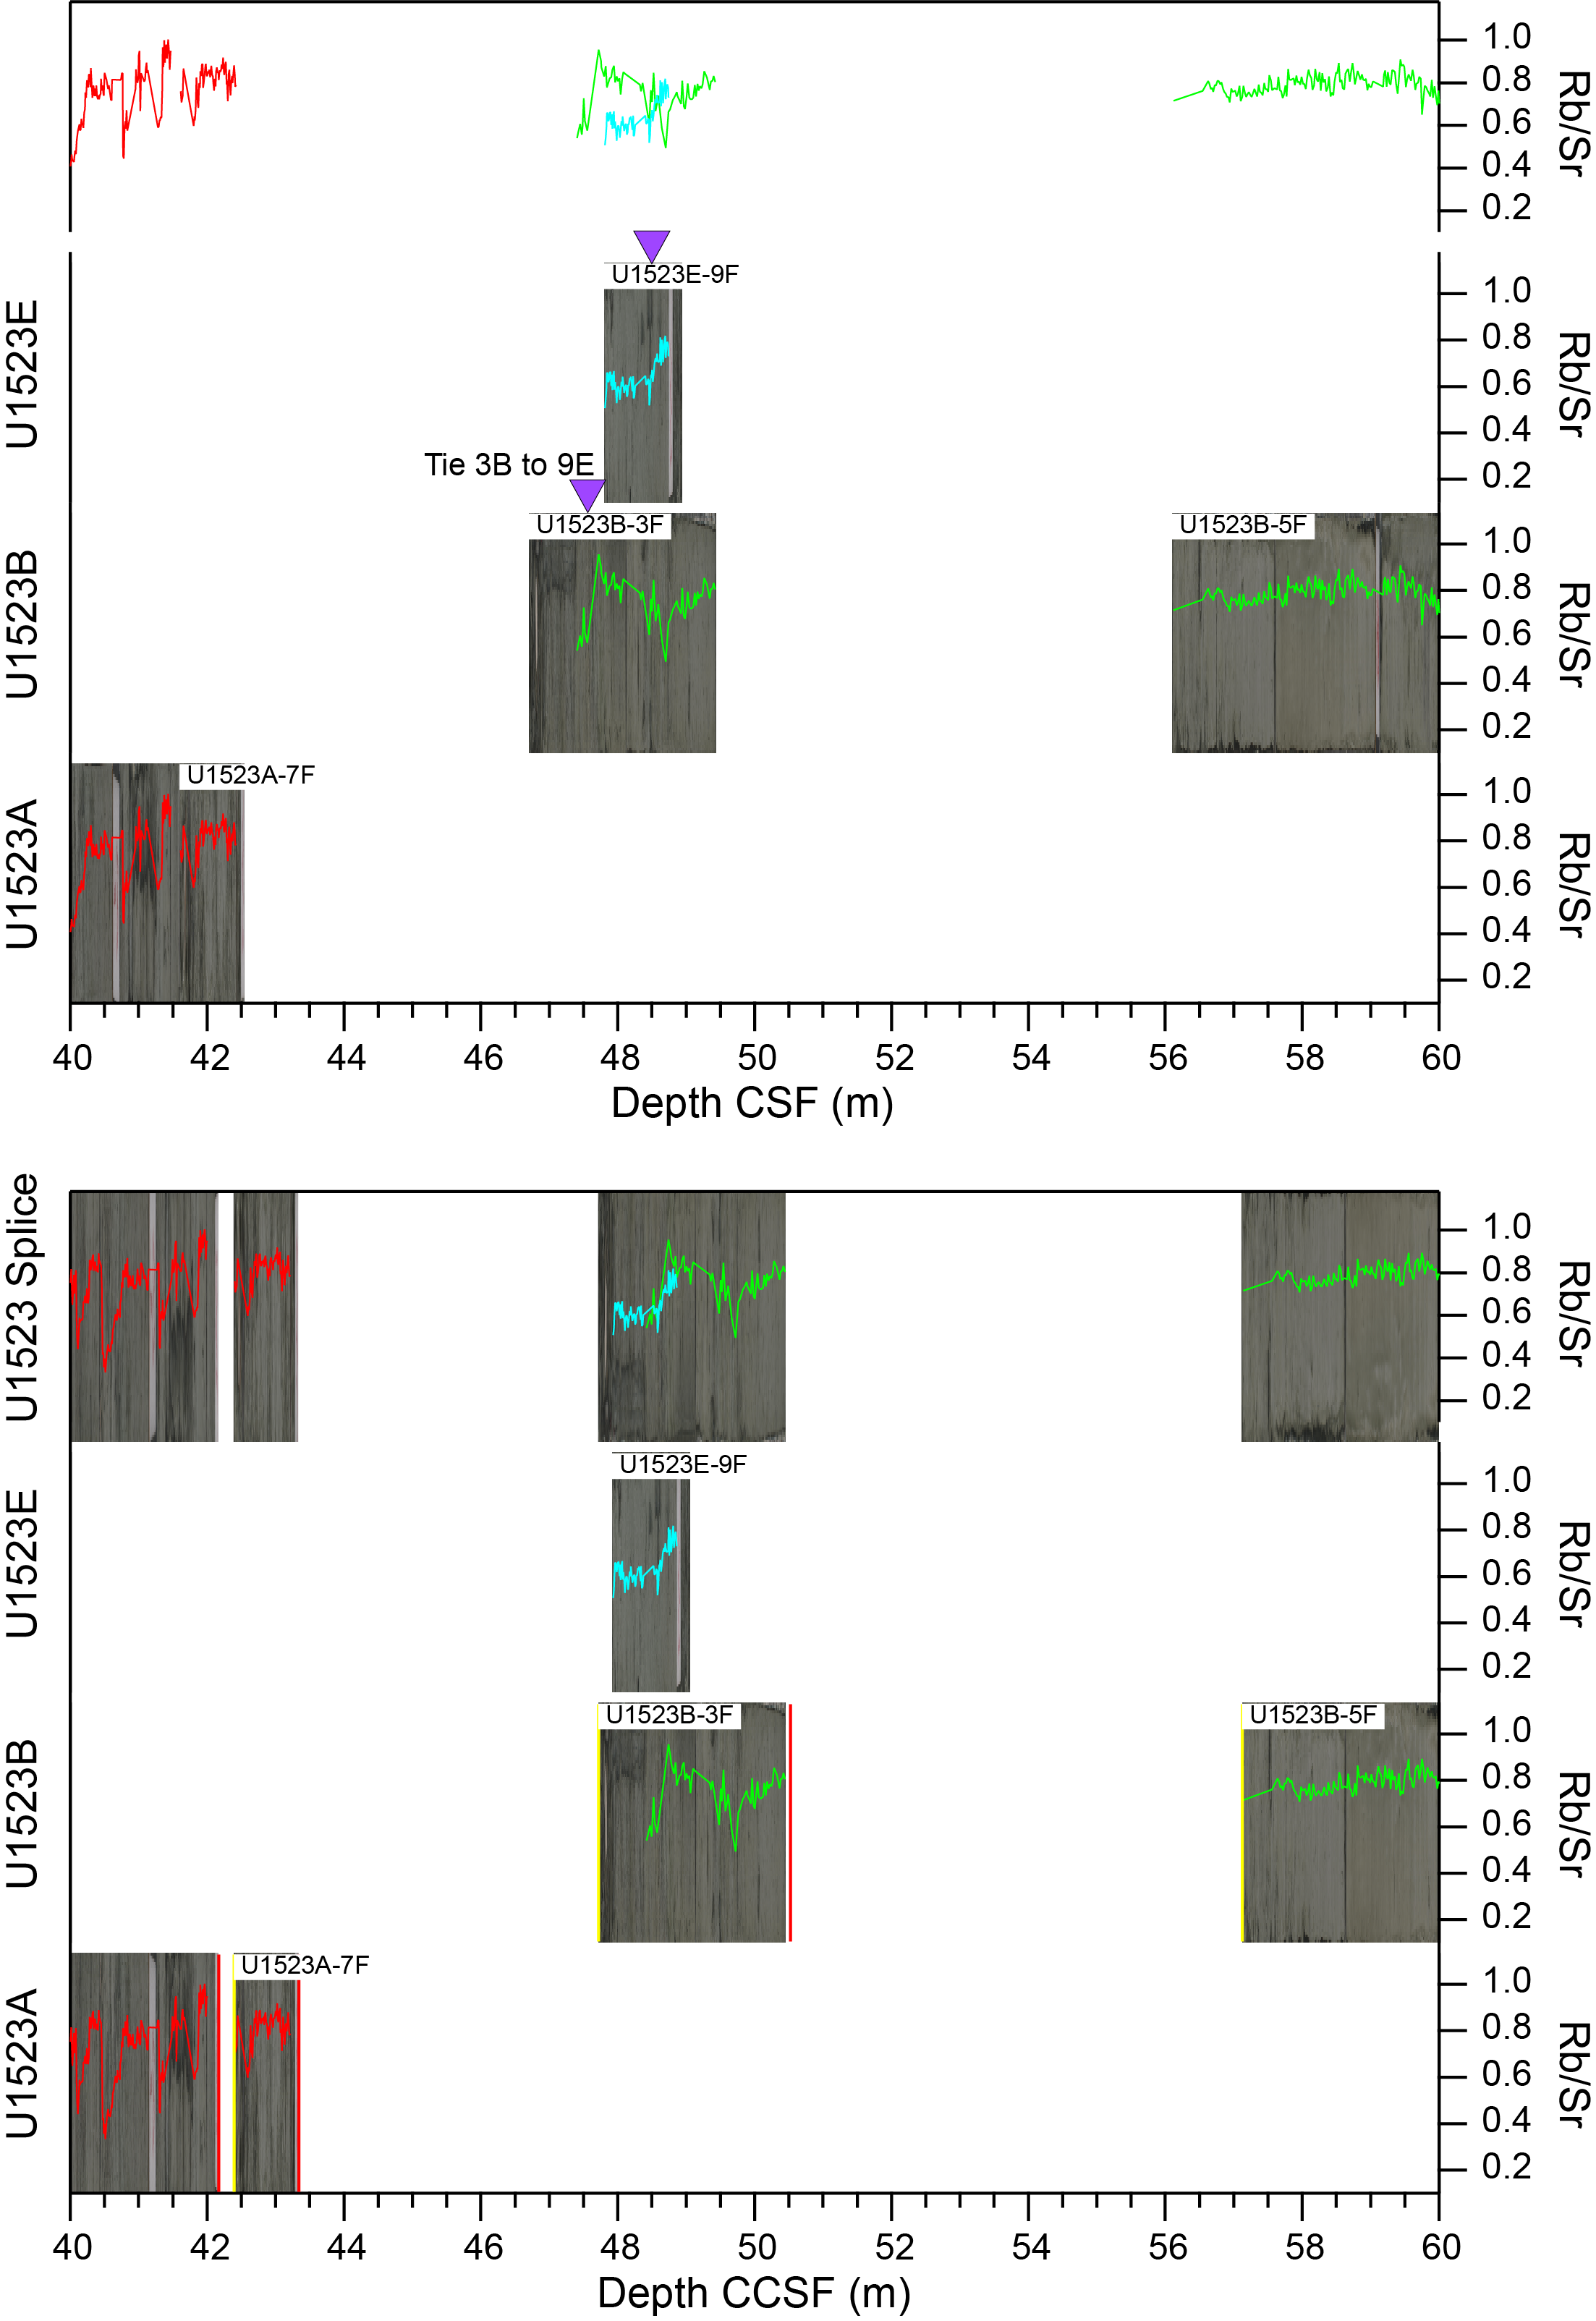
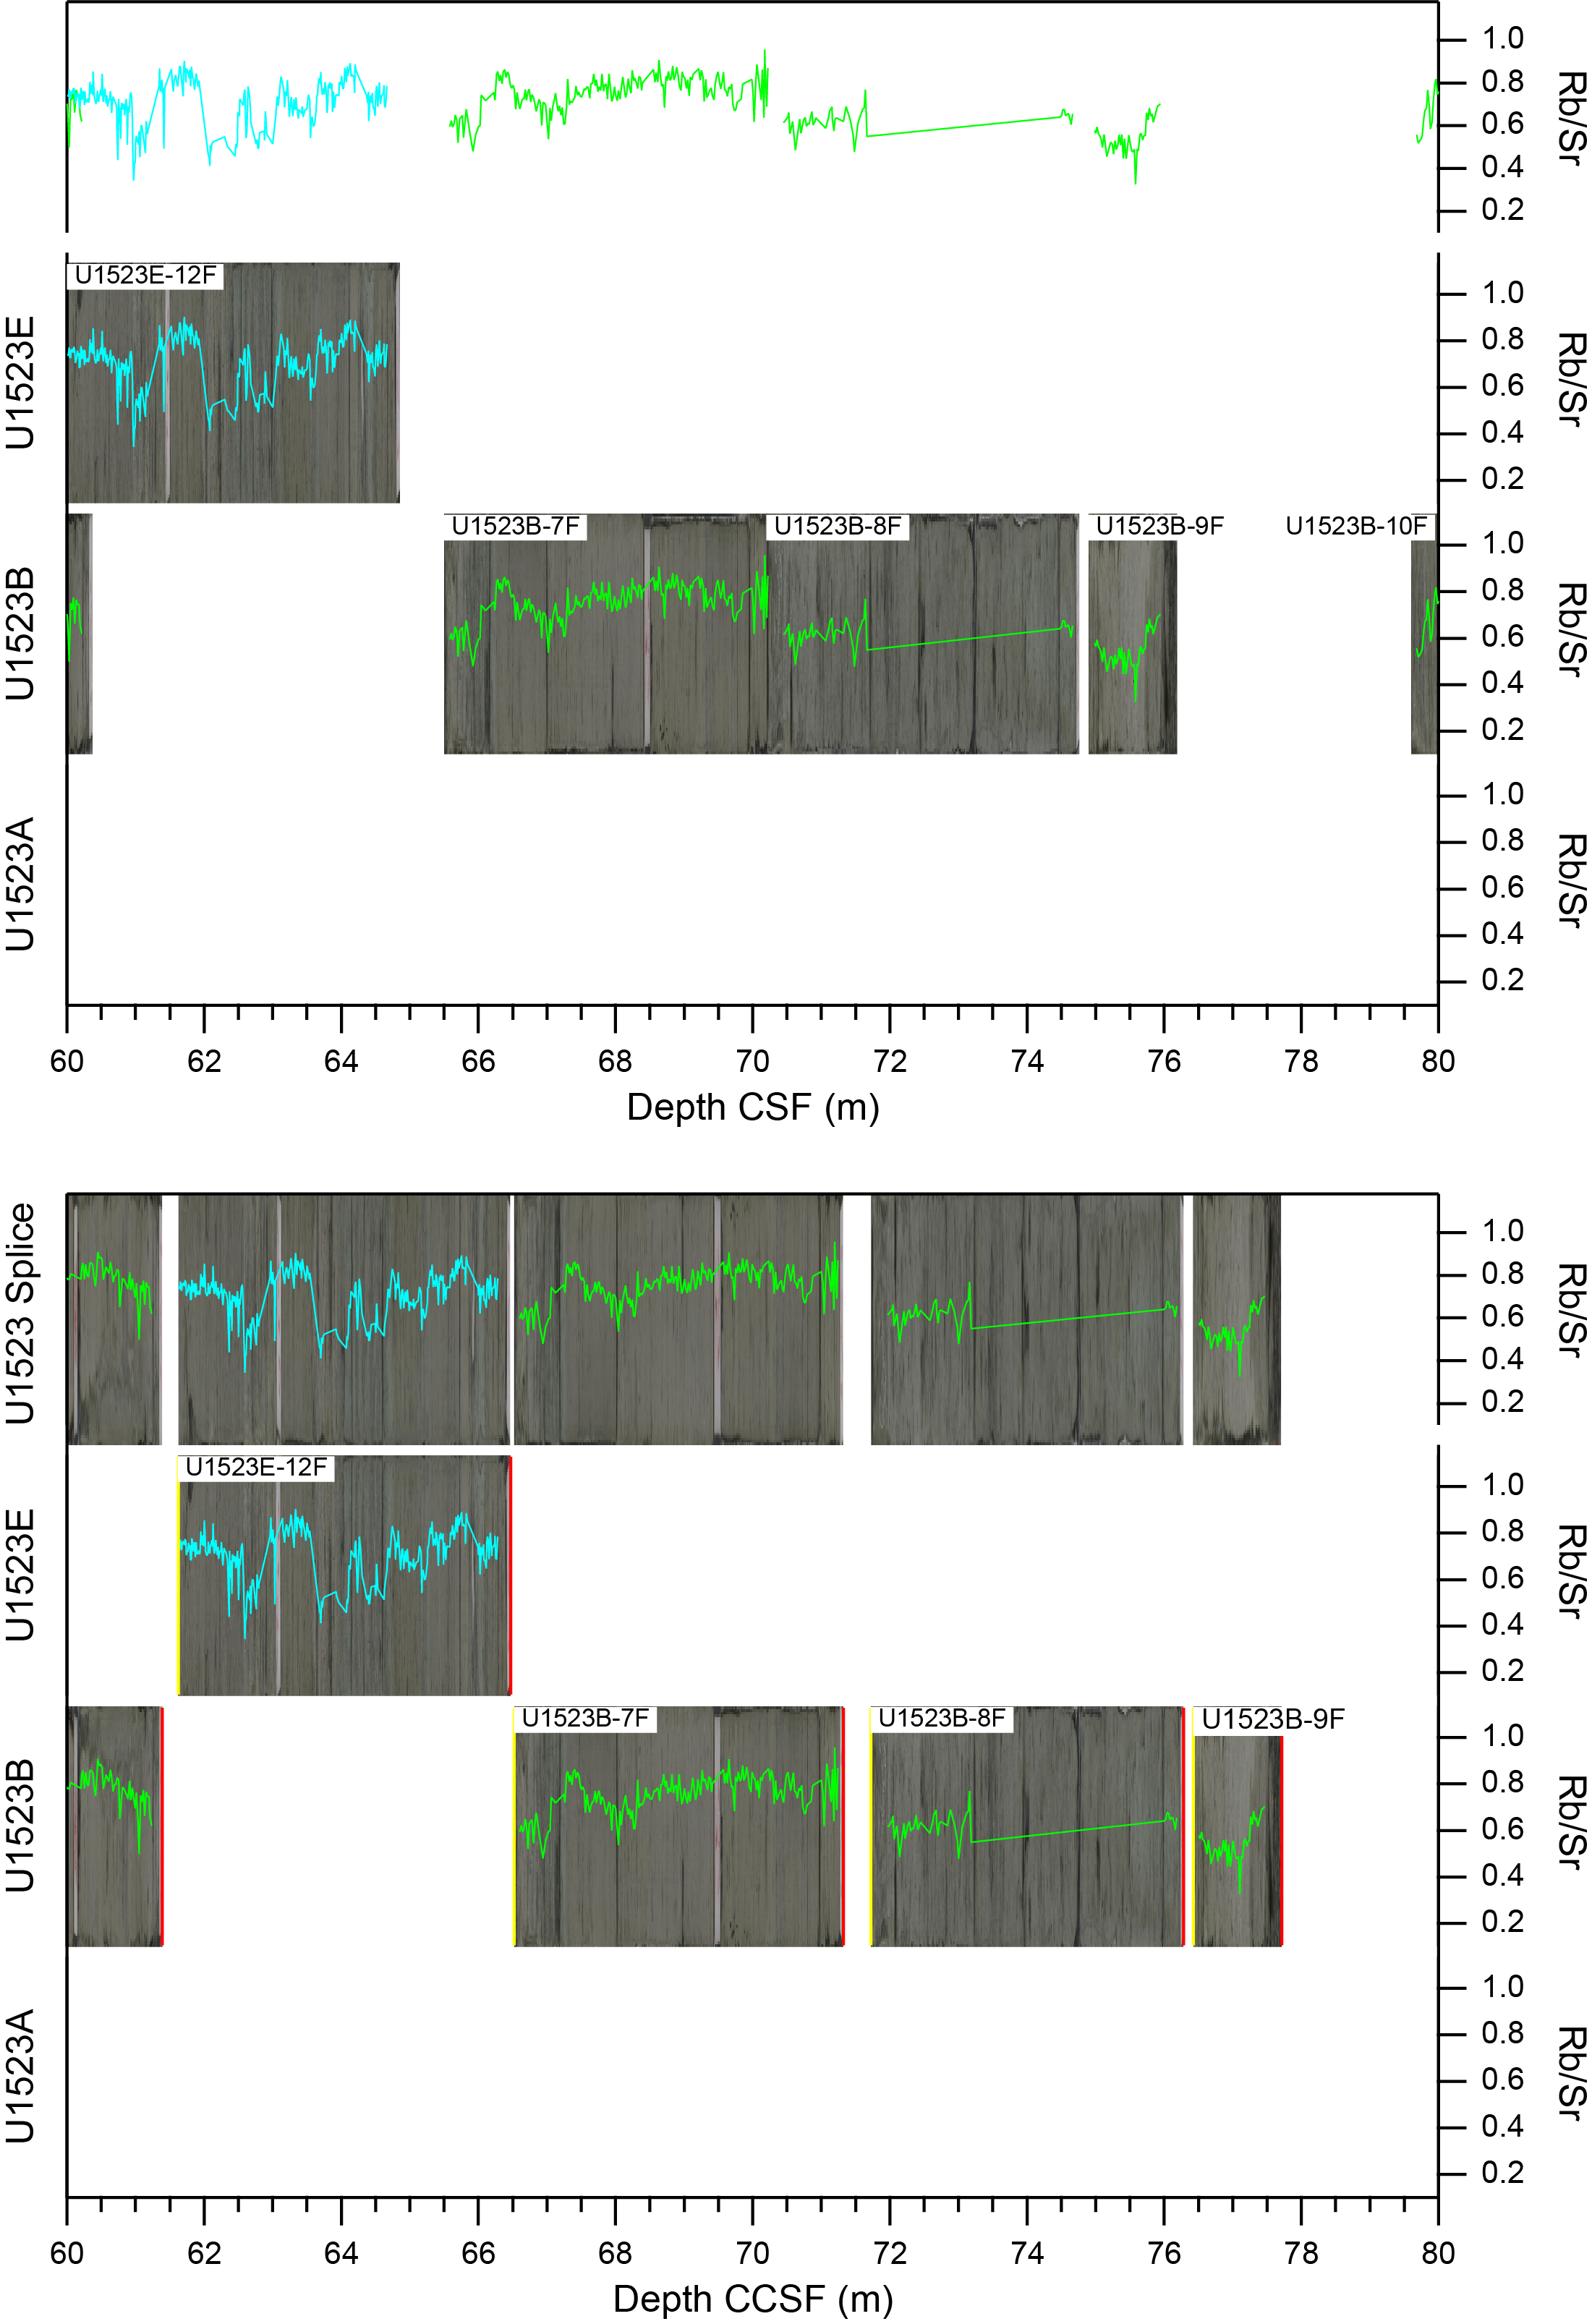

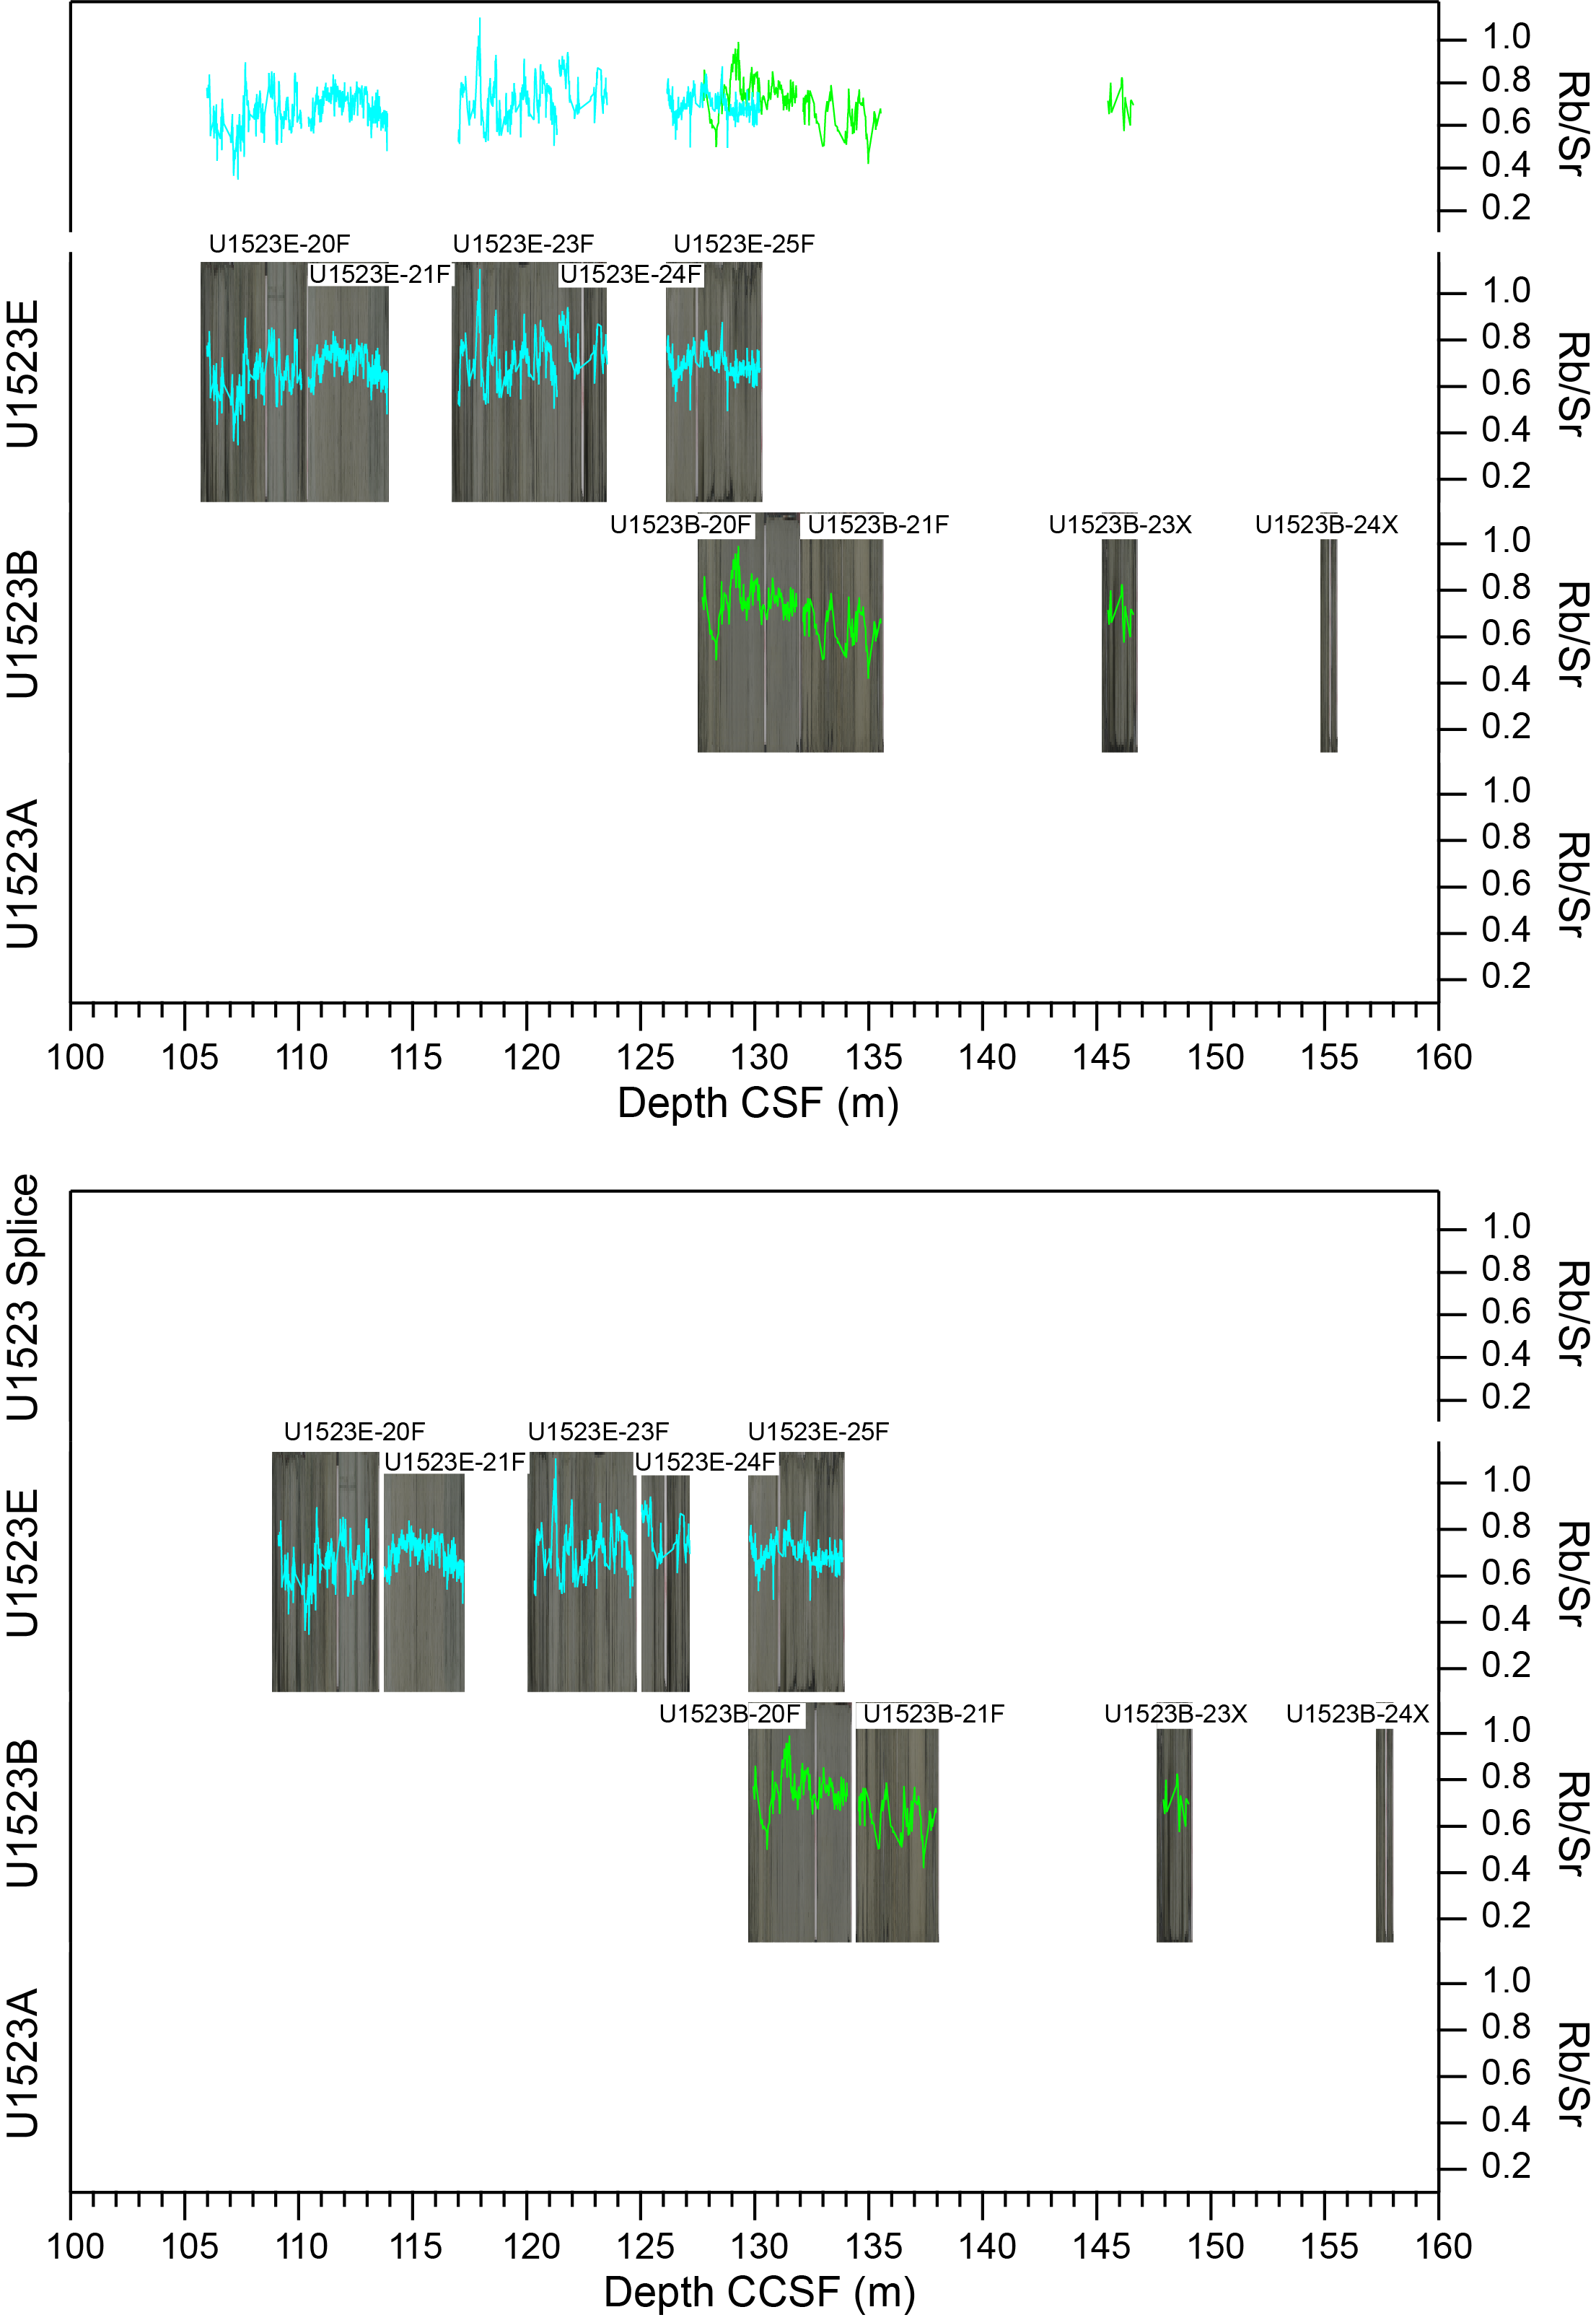
Figure F4. Linescan core images and Rb/Sr XRF.

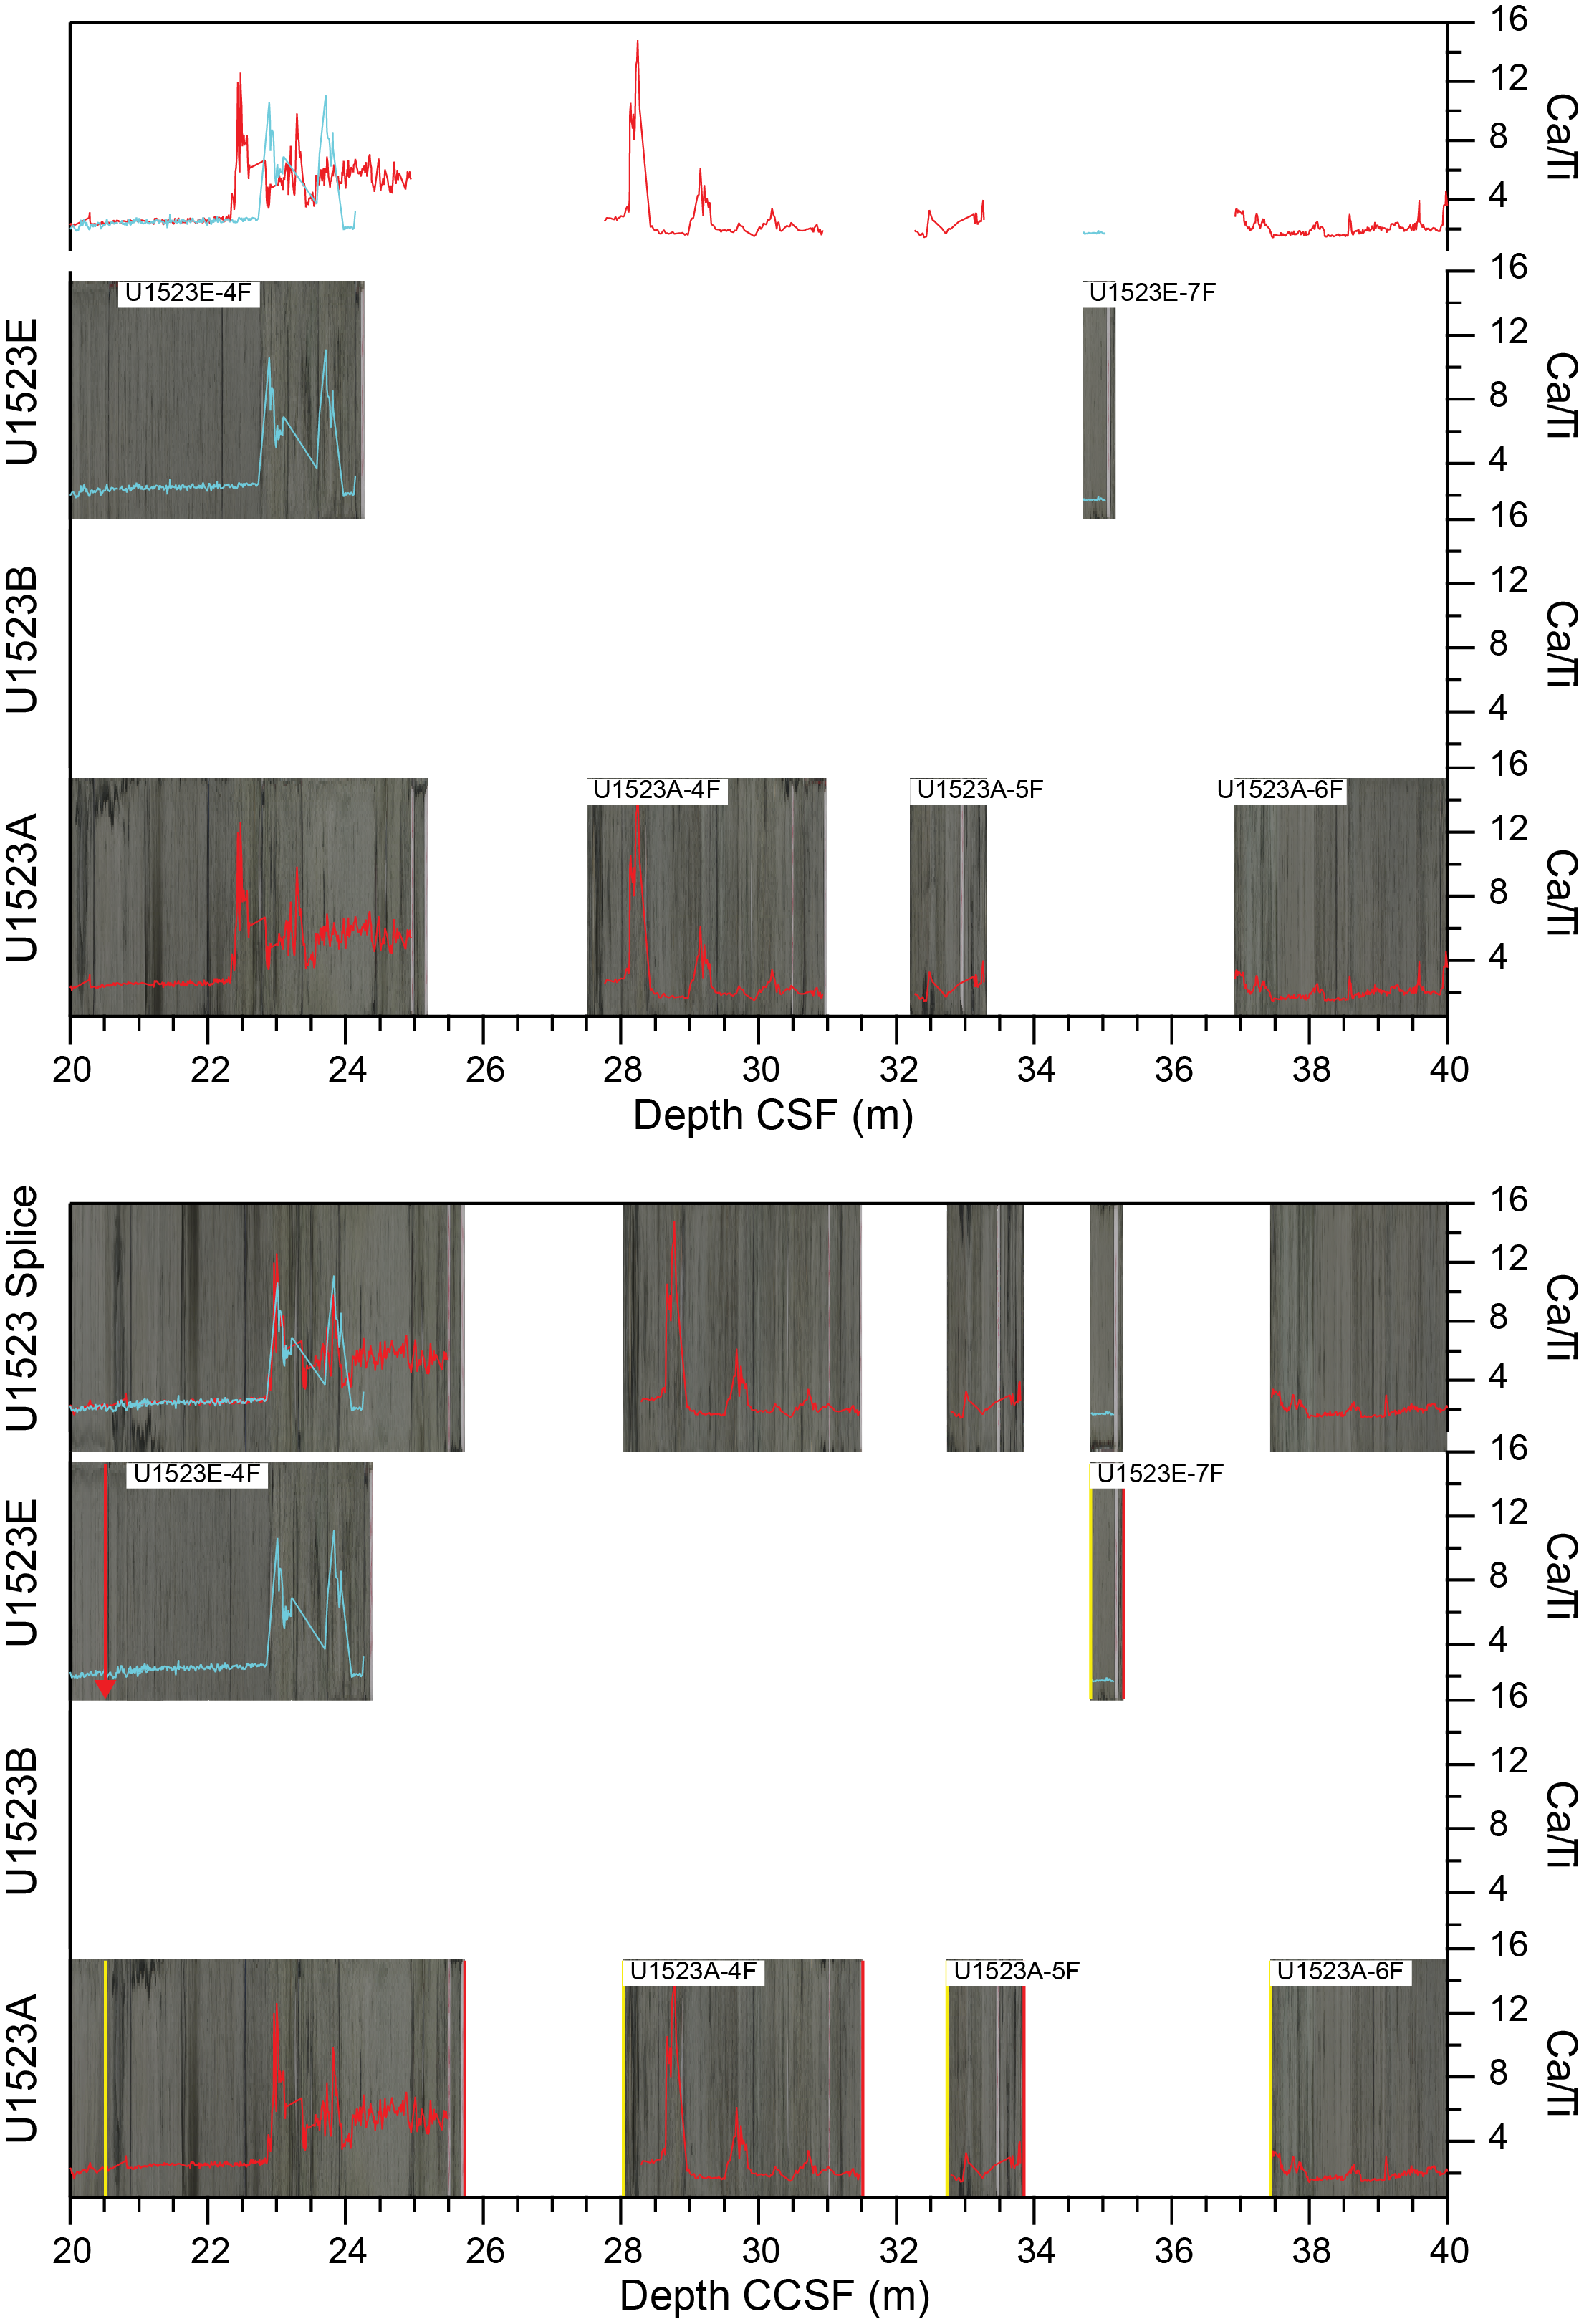
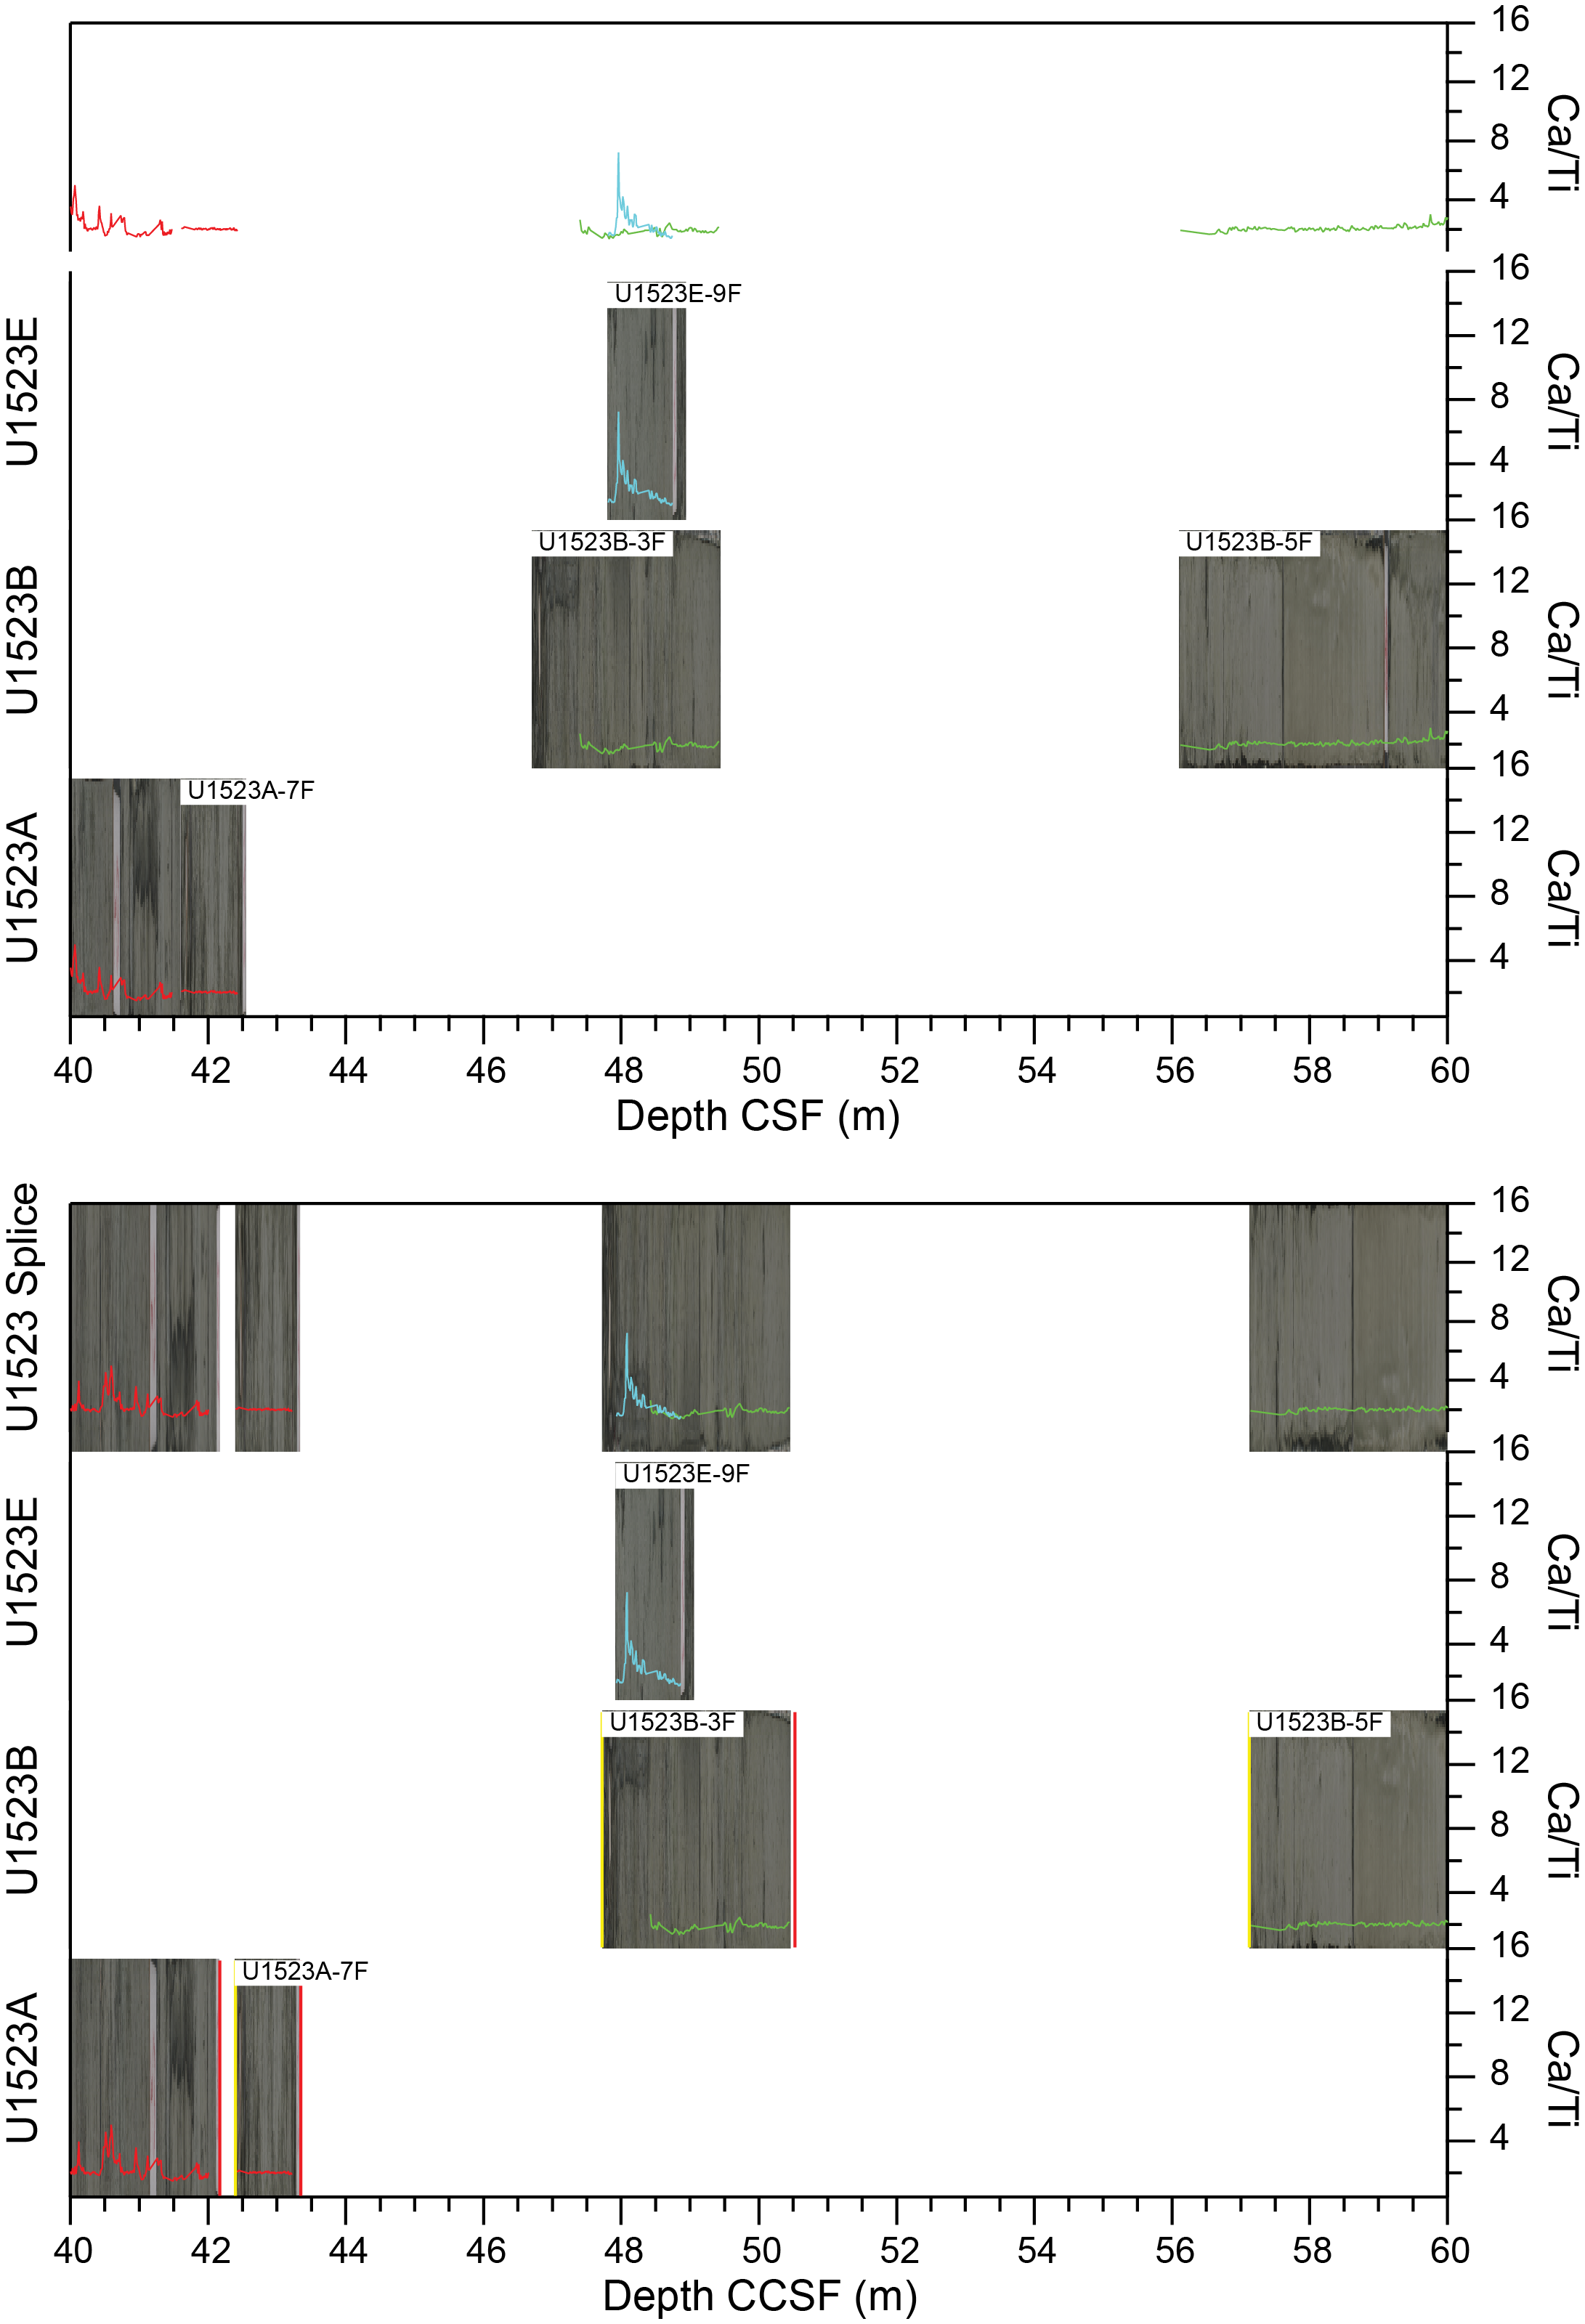
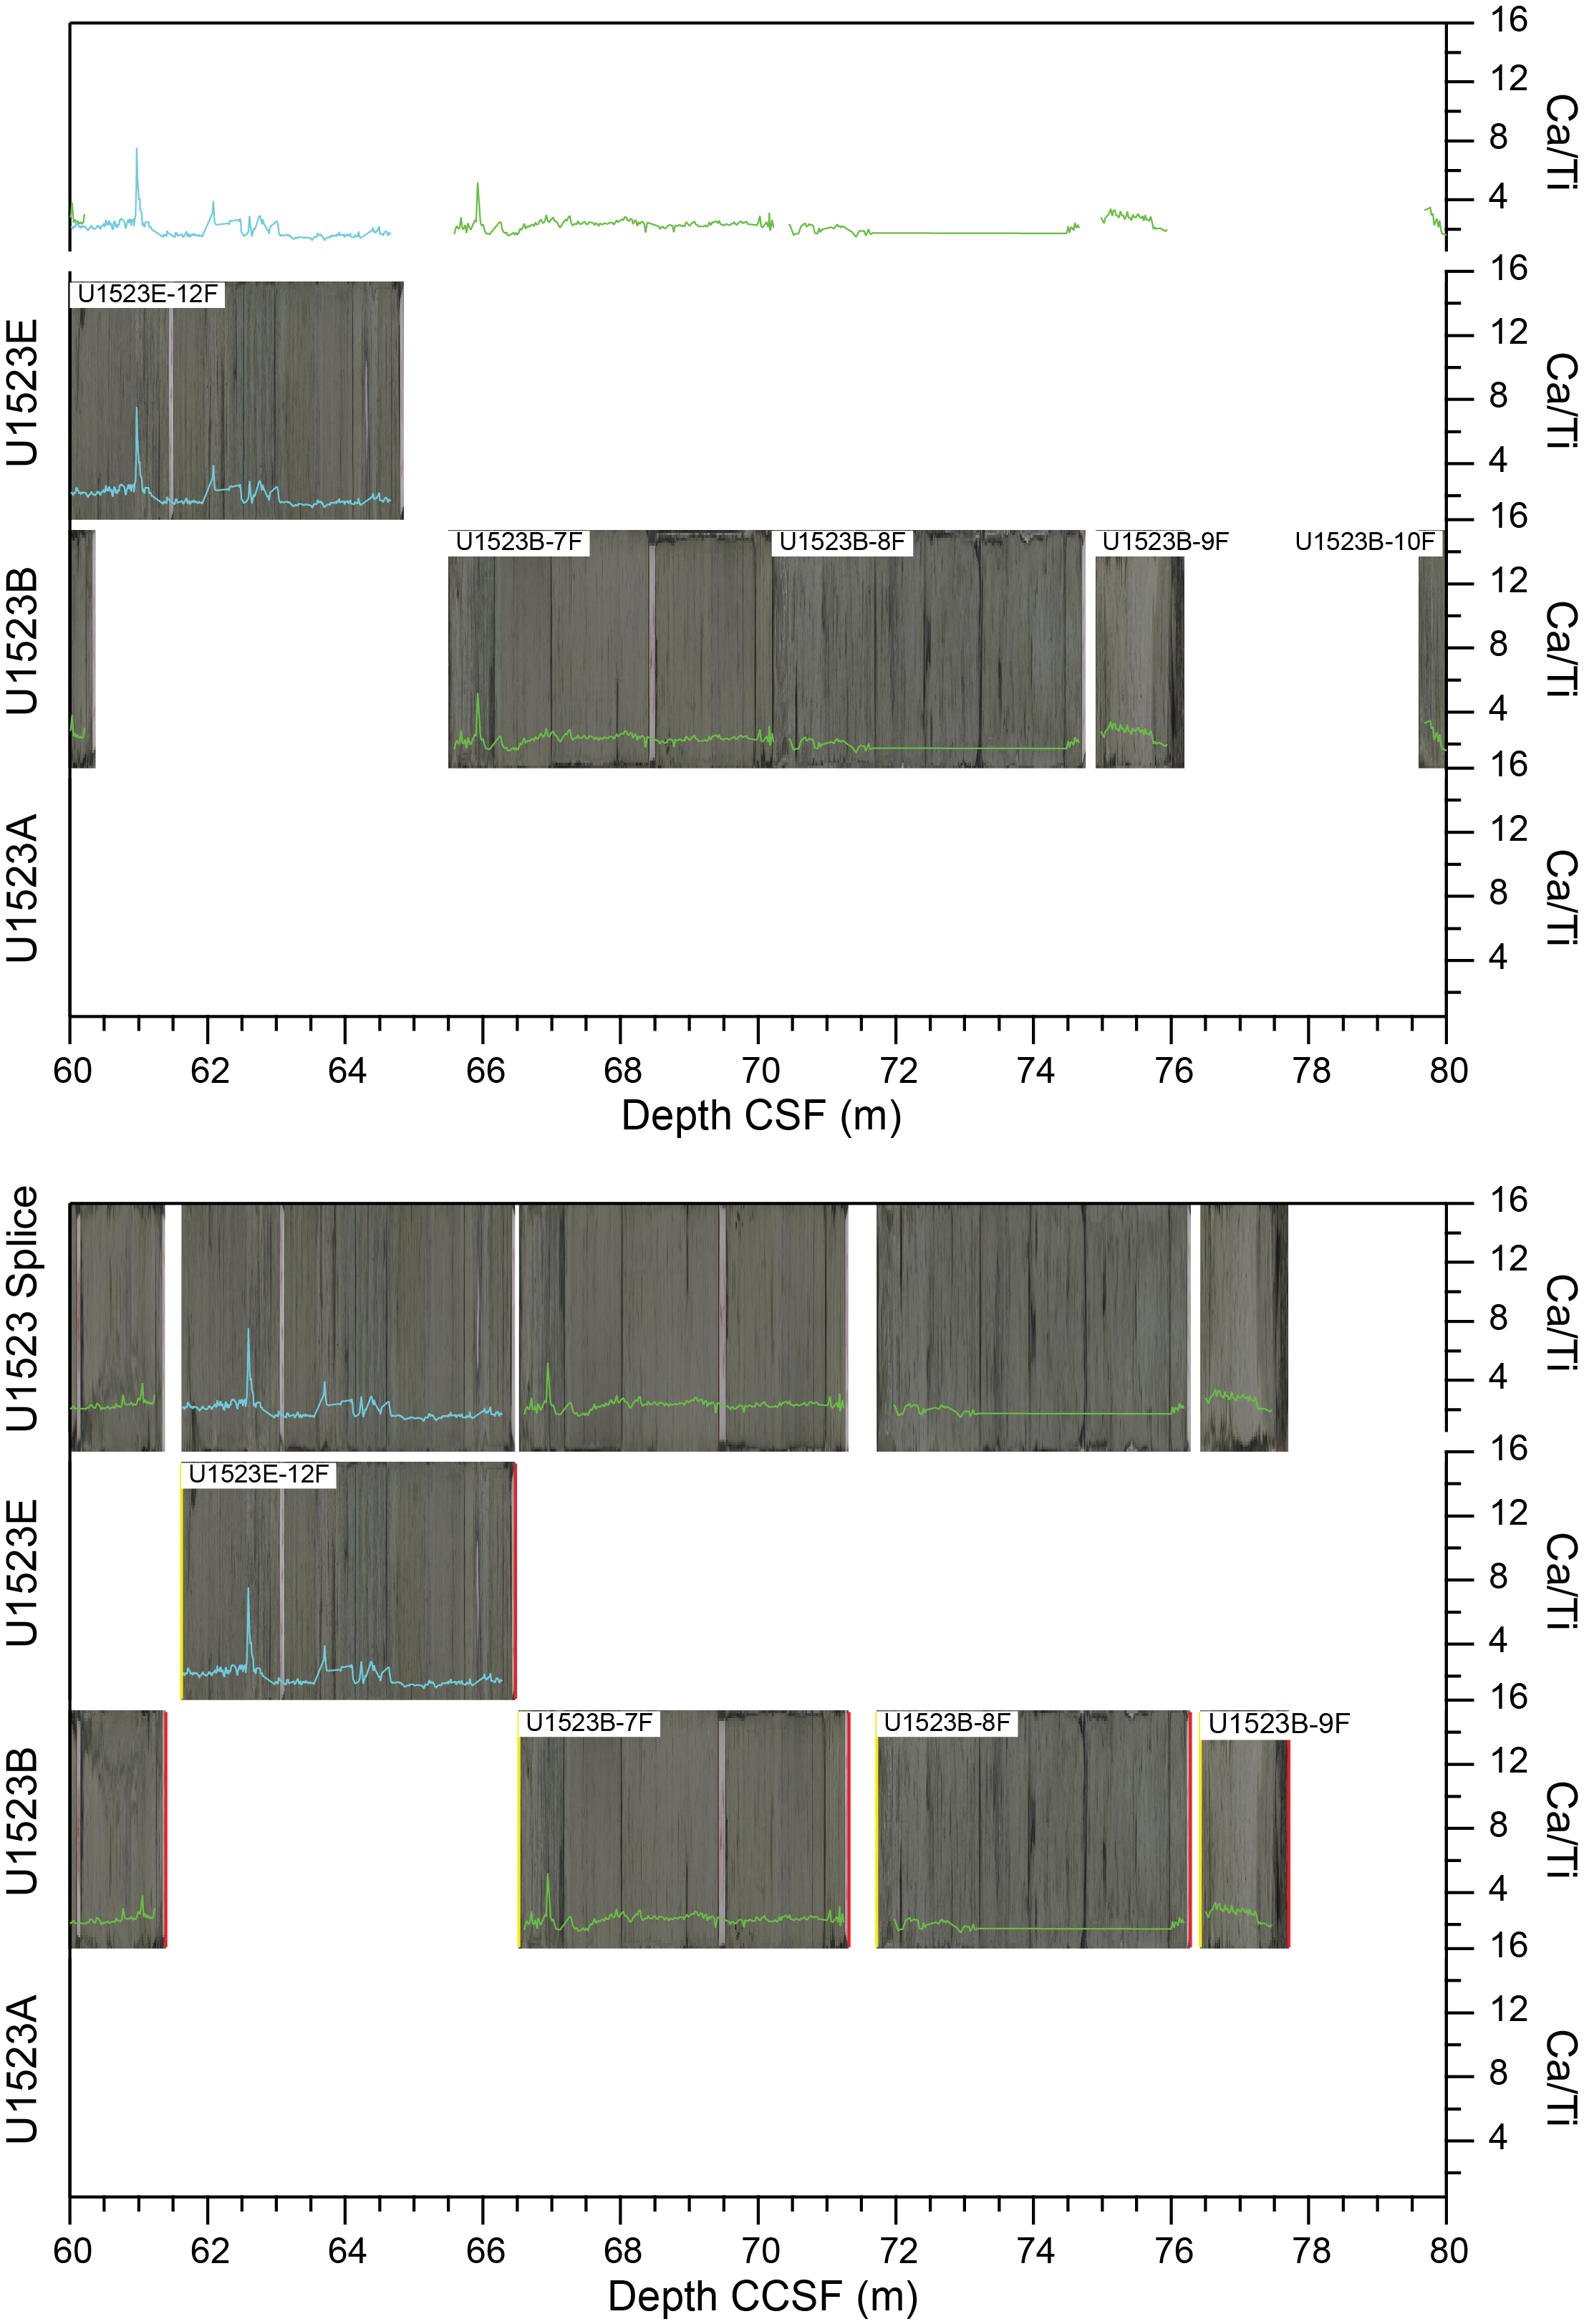
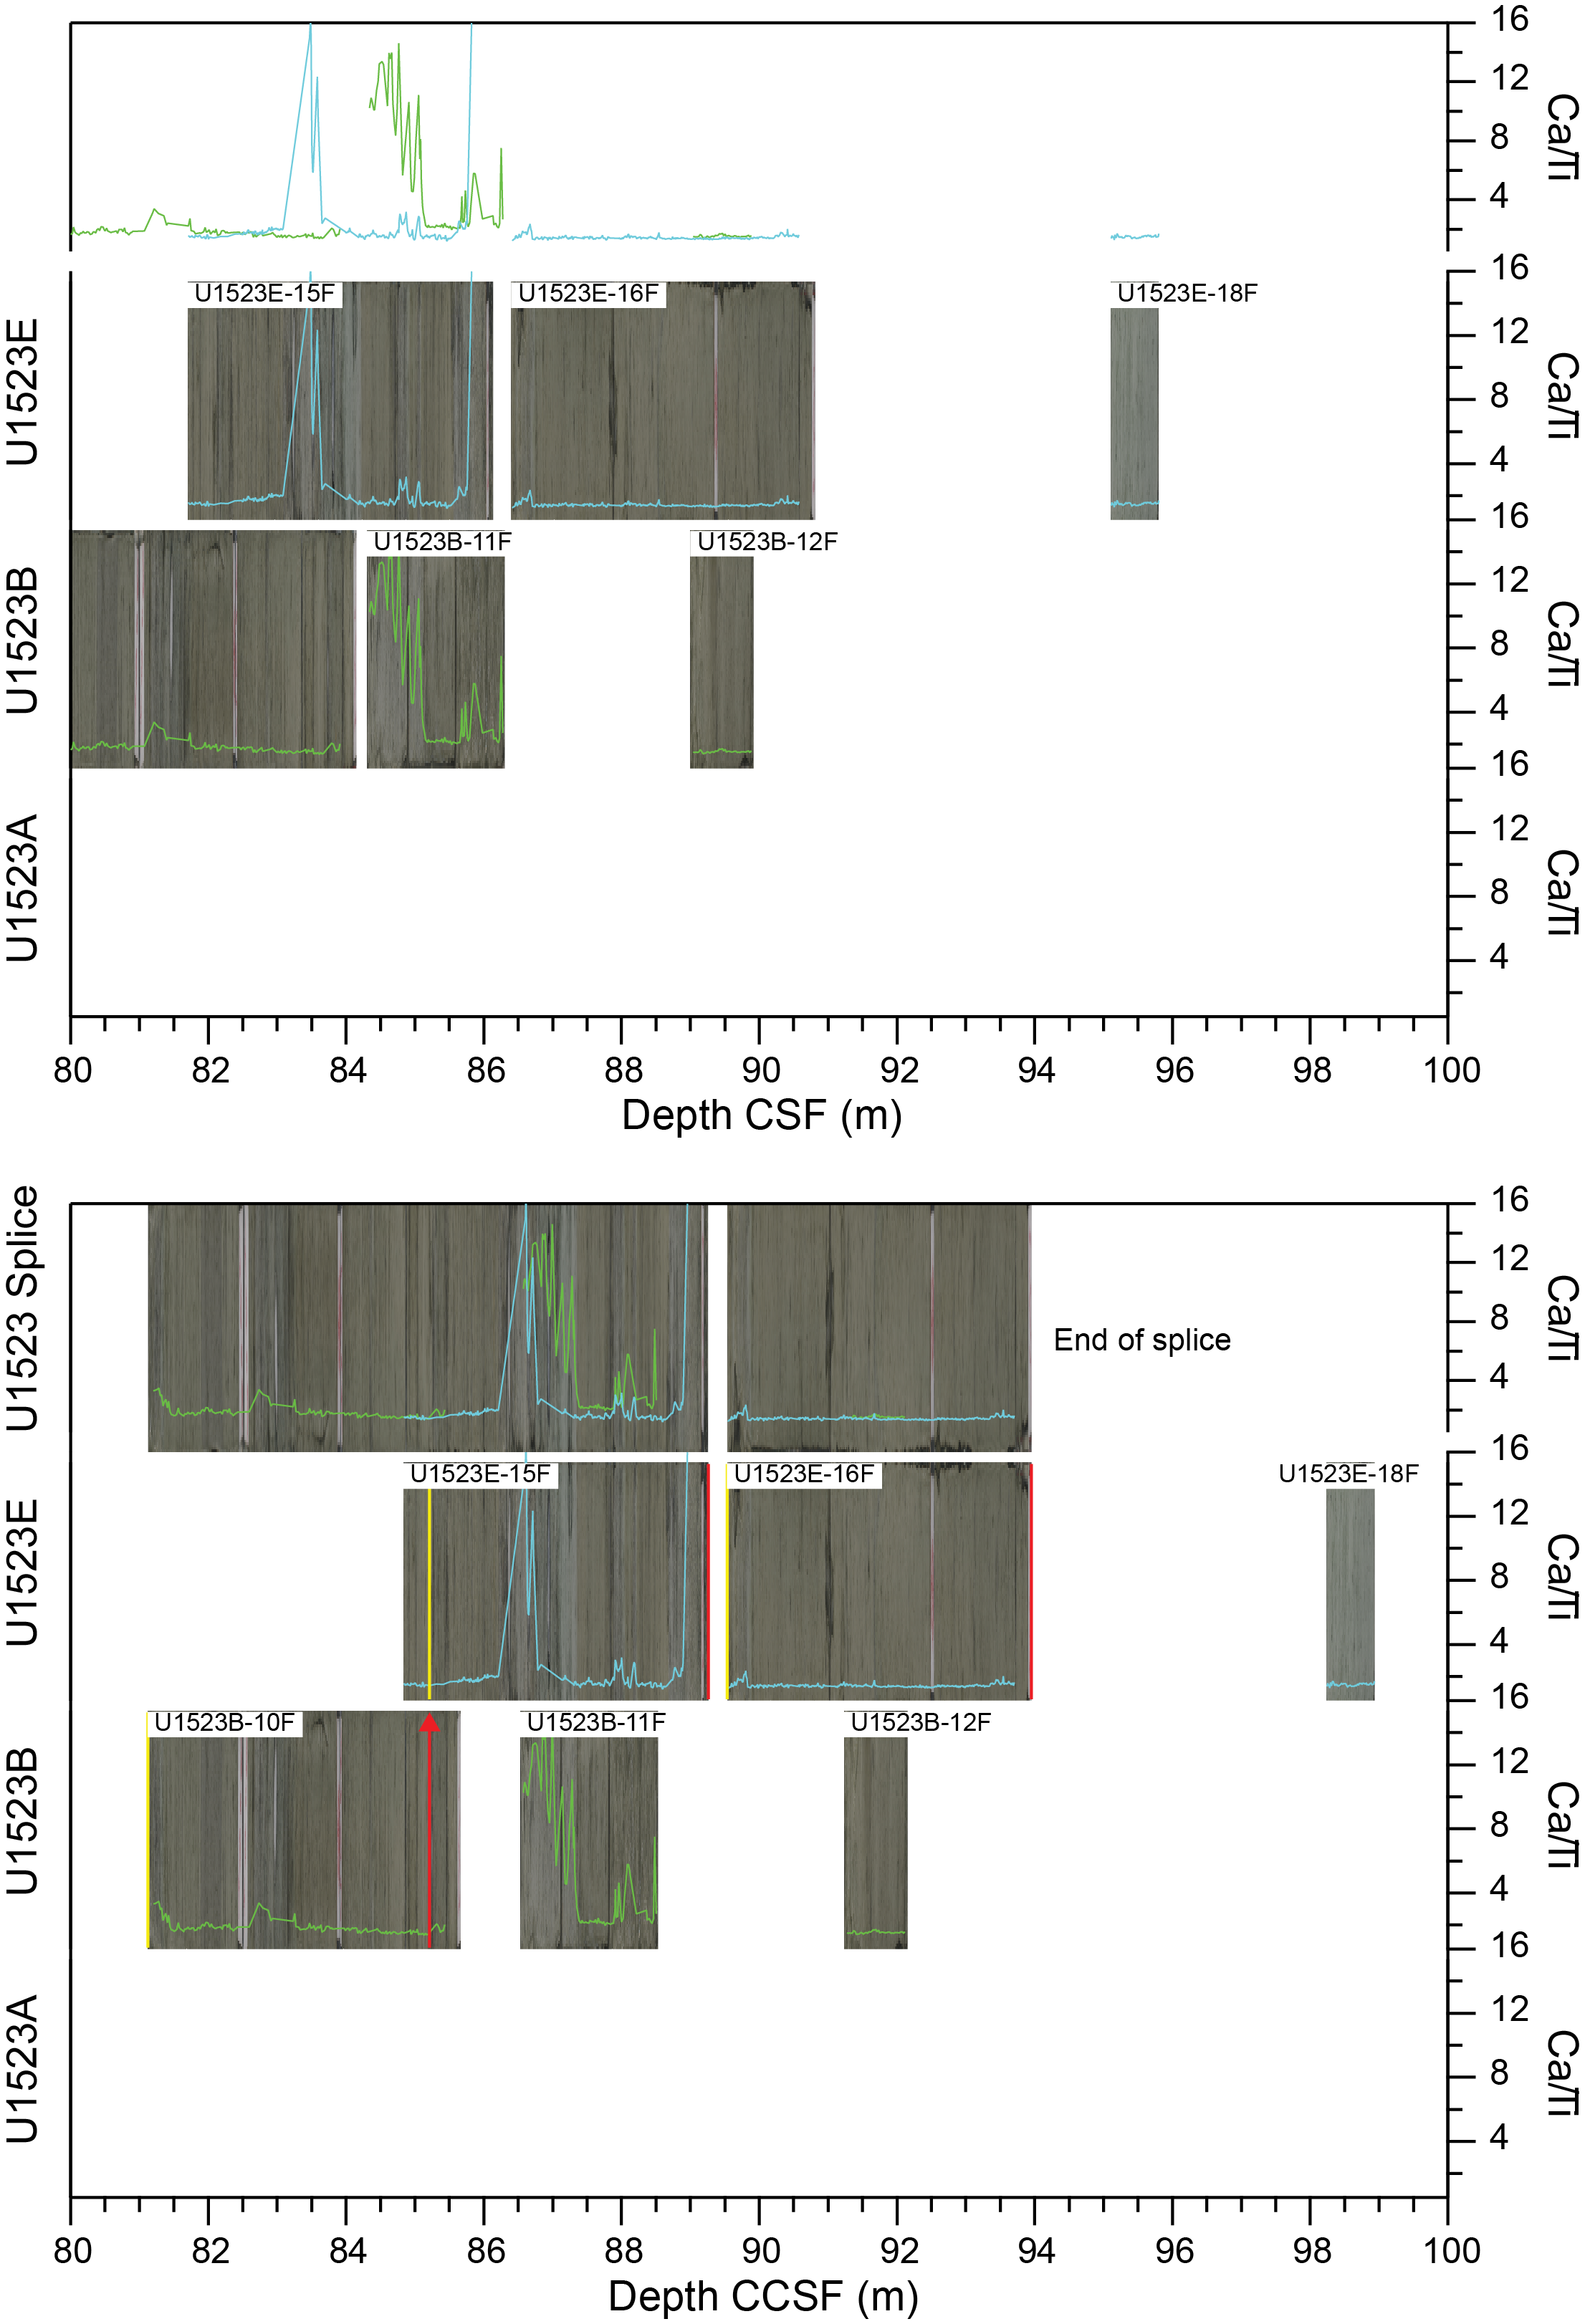
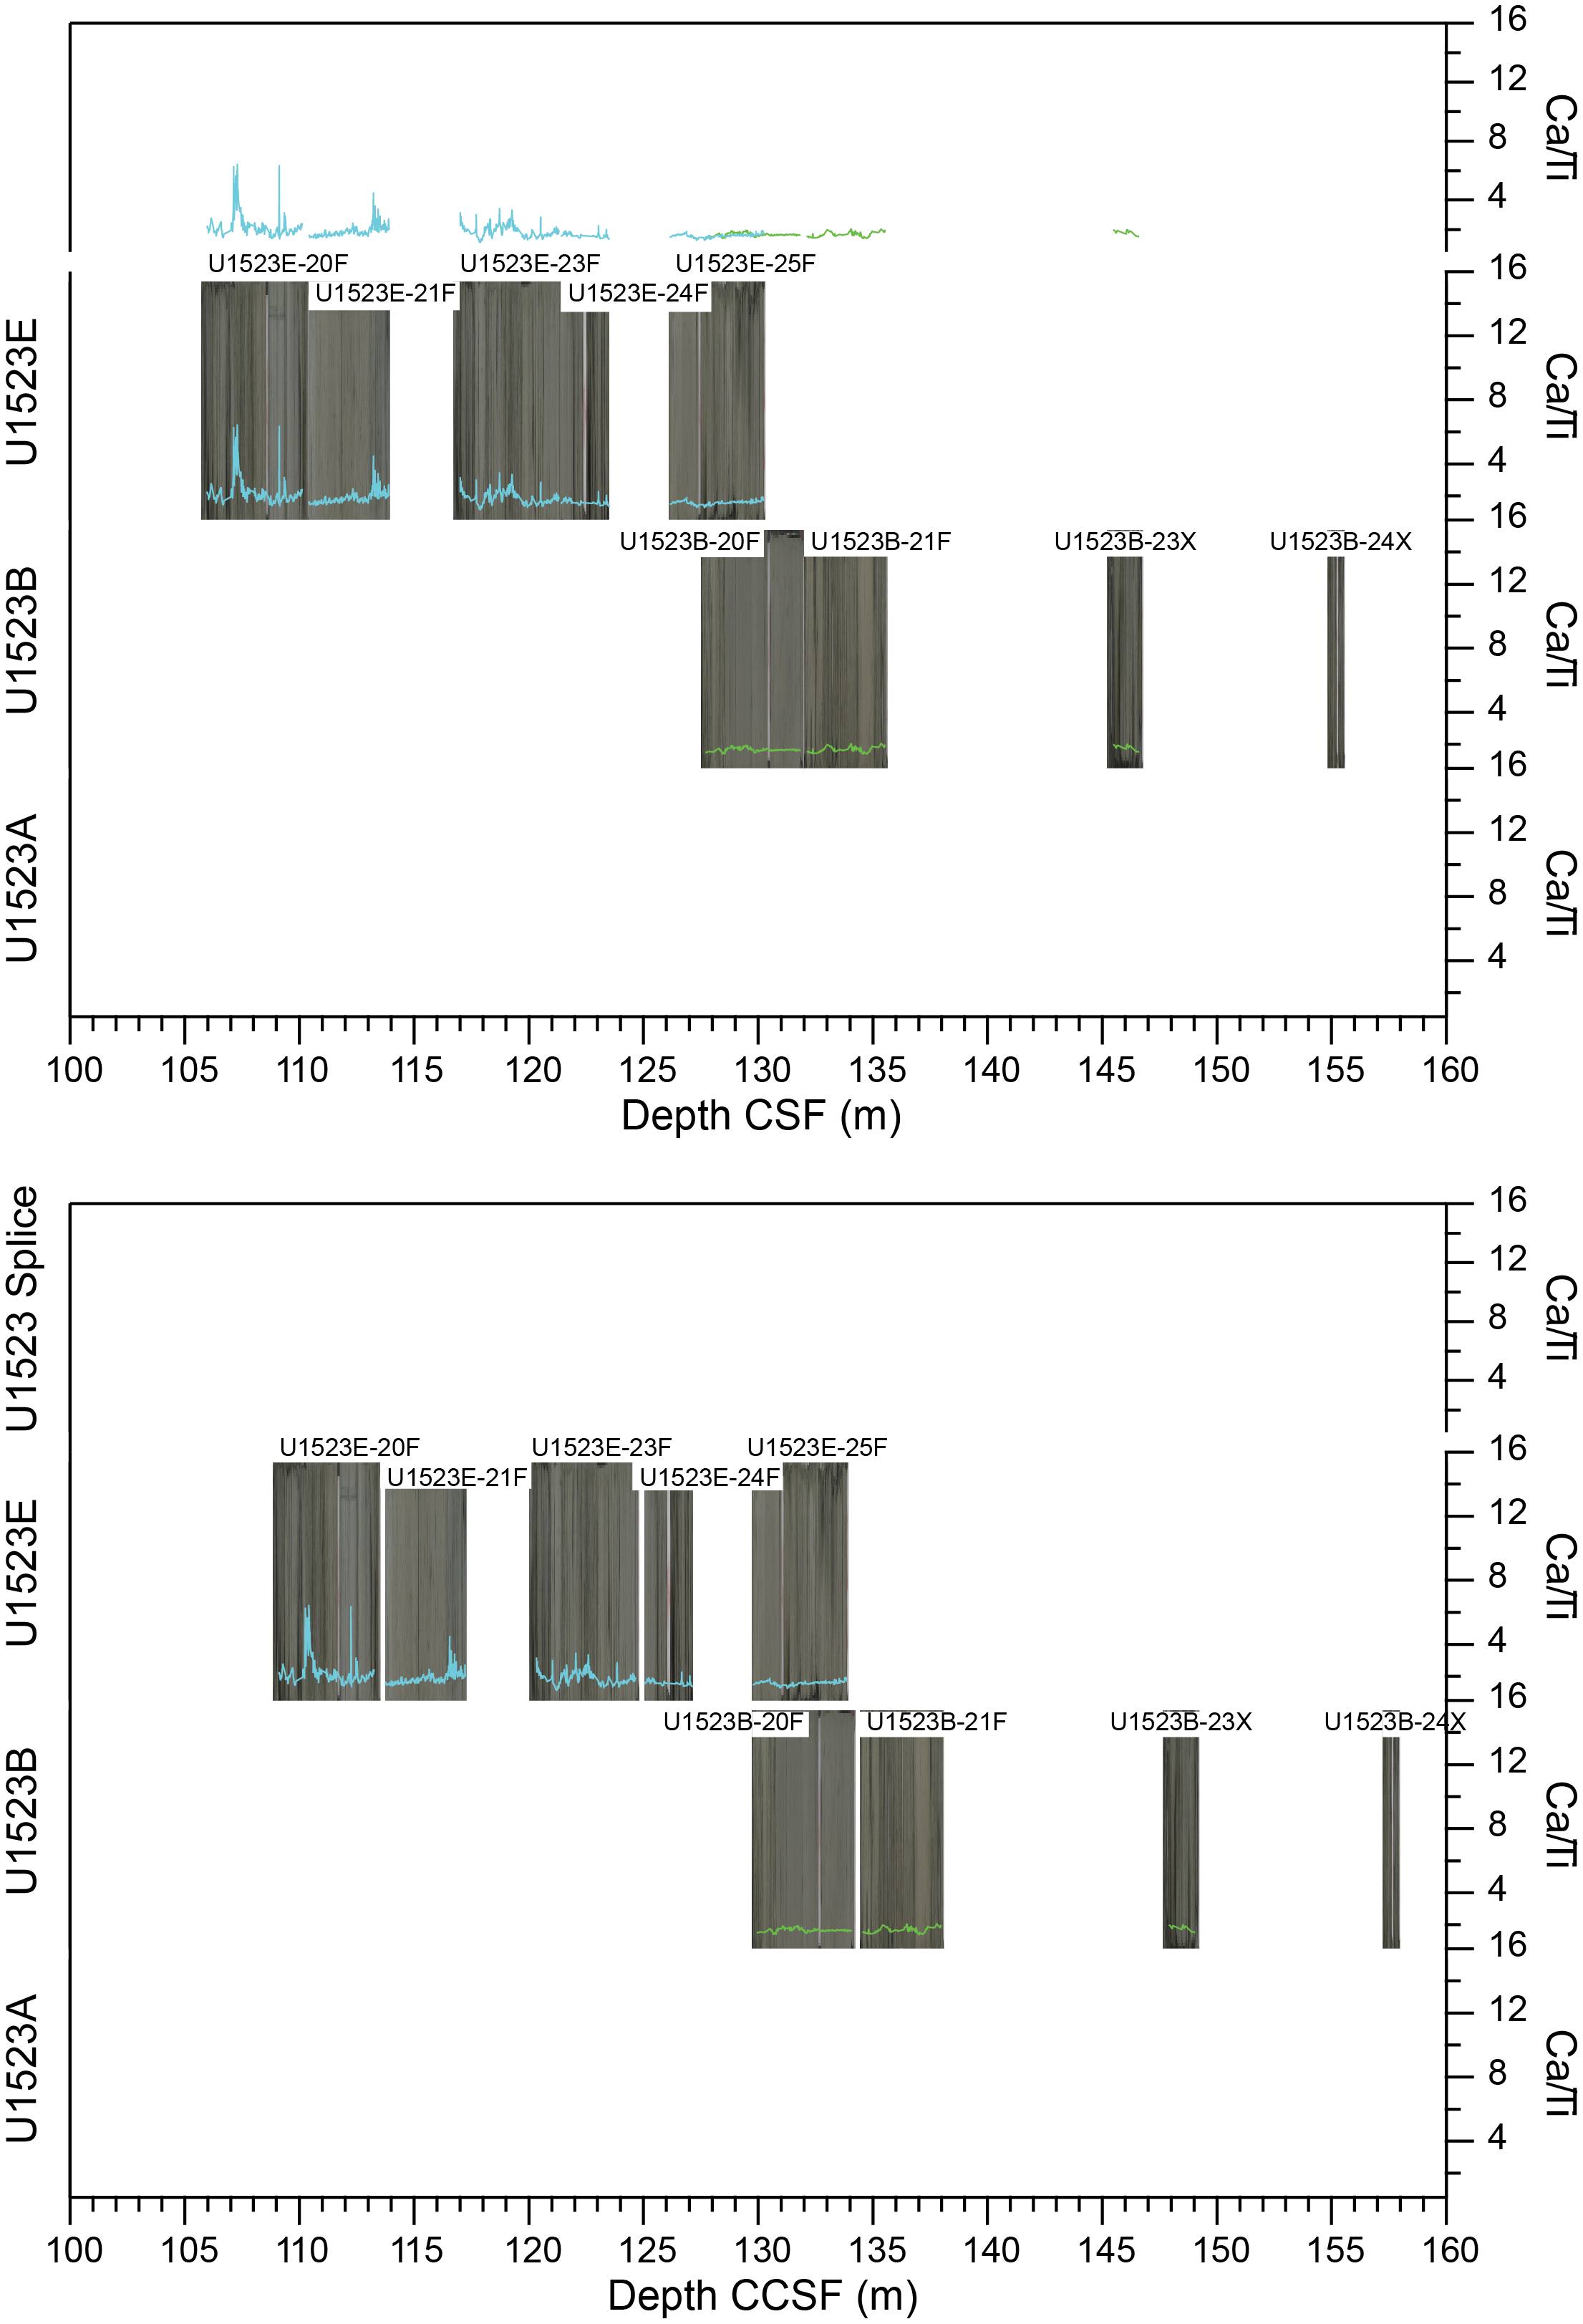
Figure F5. Linescan core images and Ca/Ti XRF.

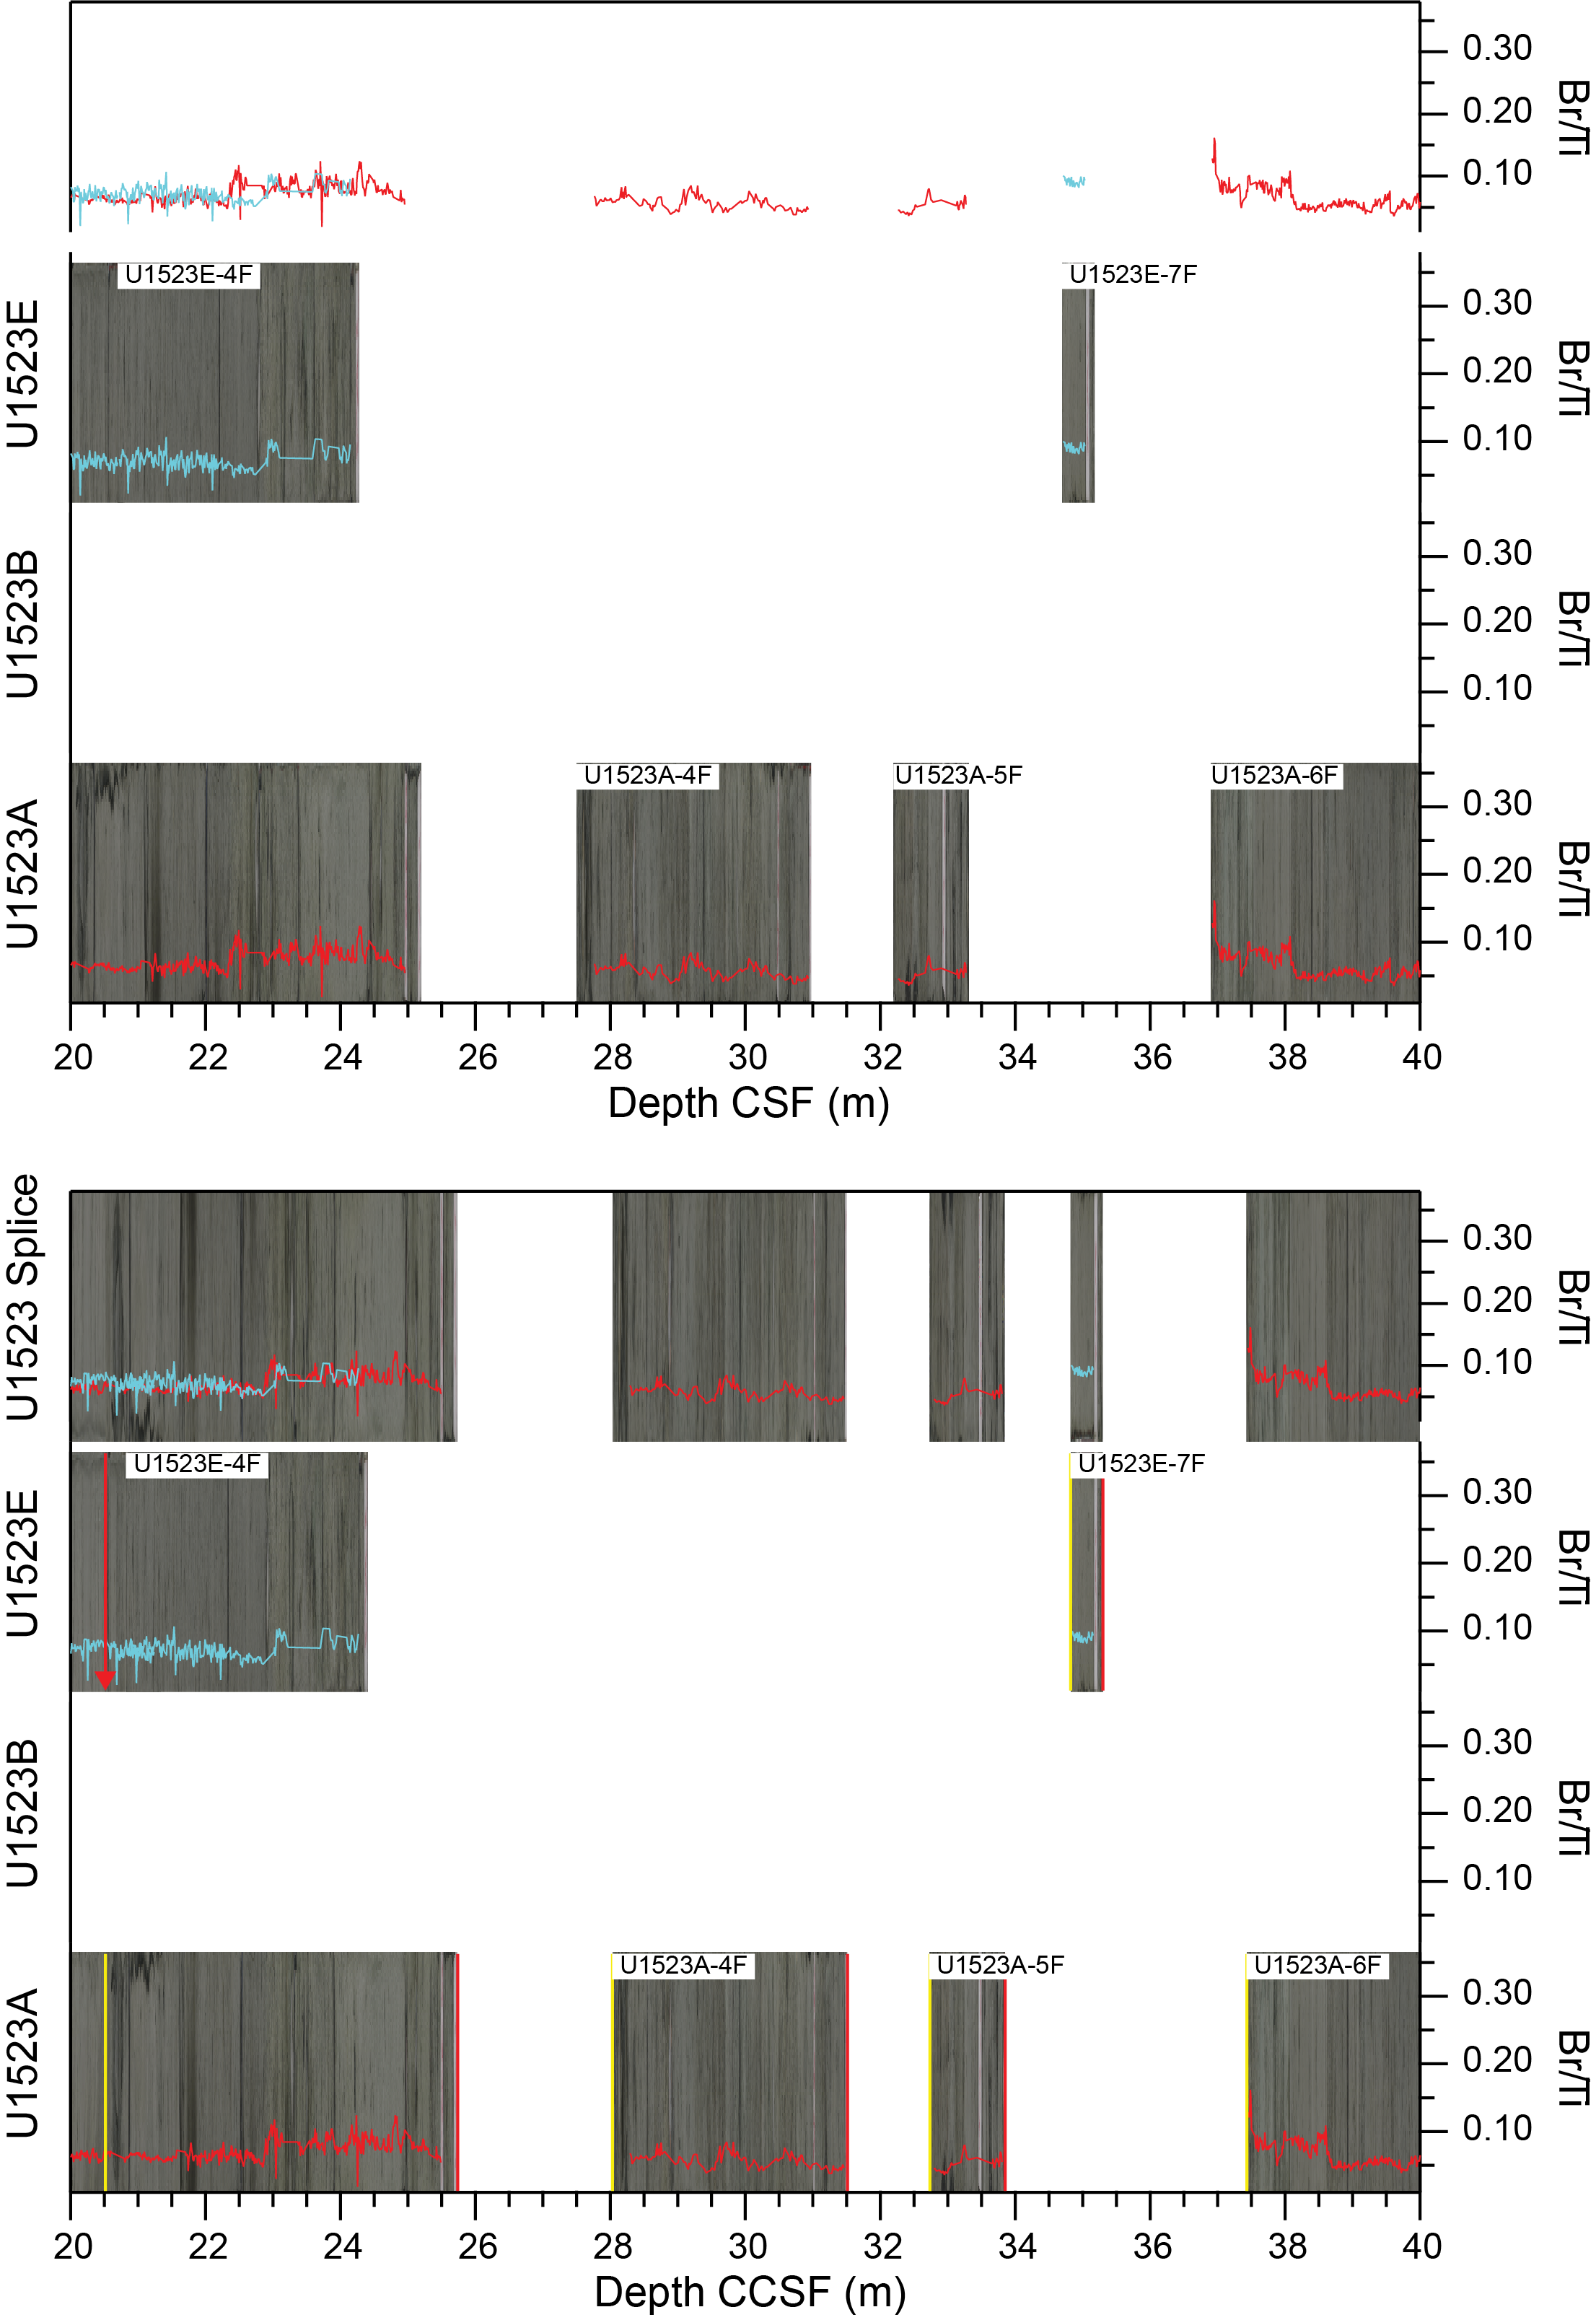
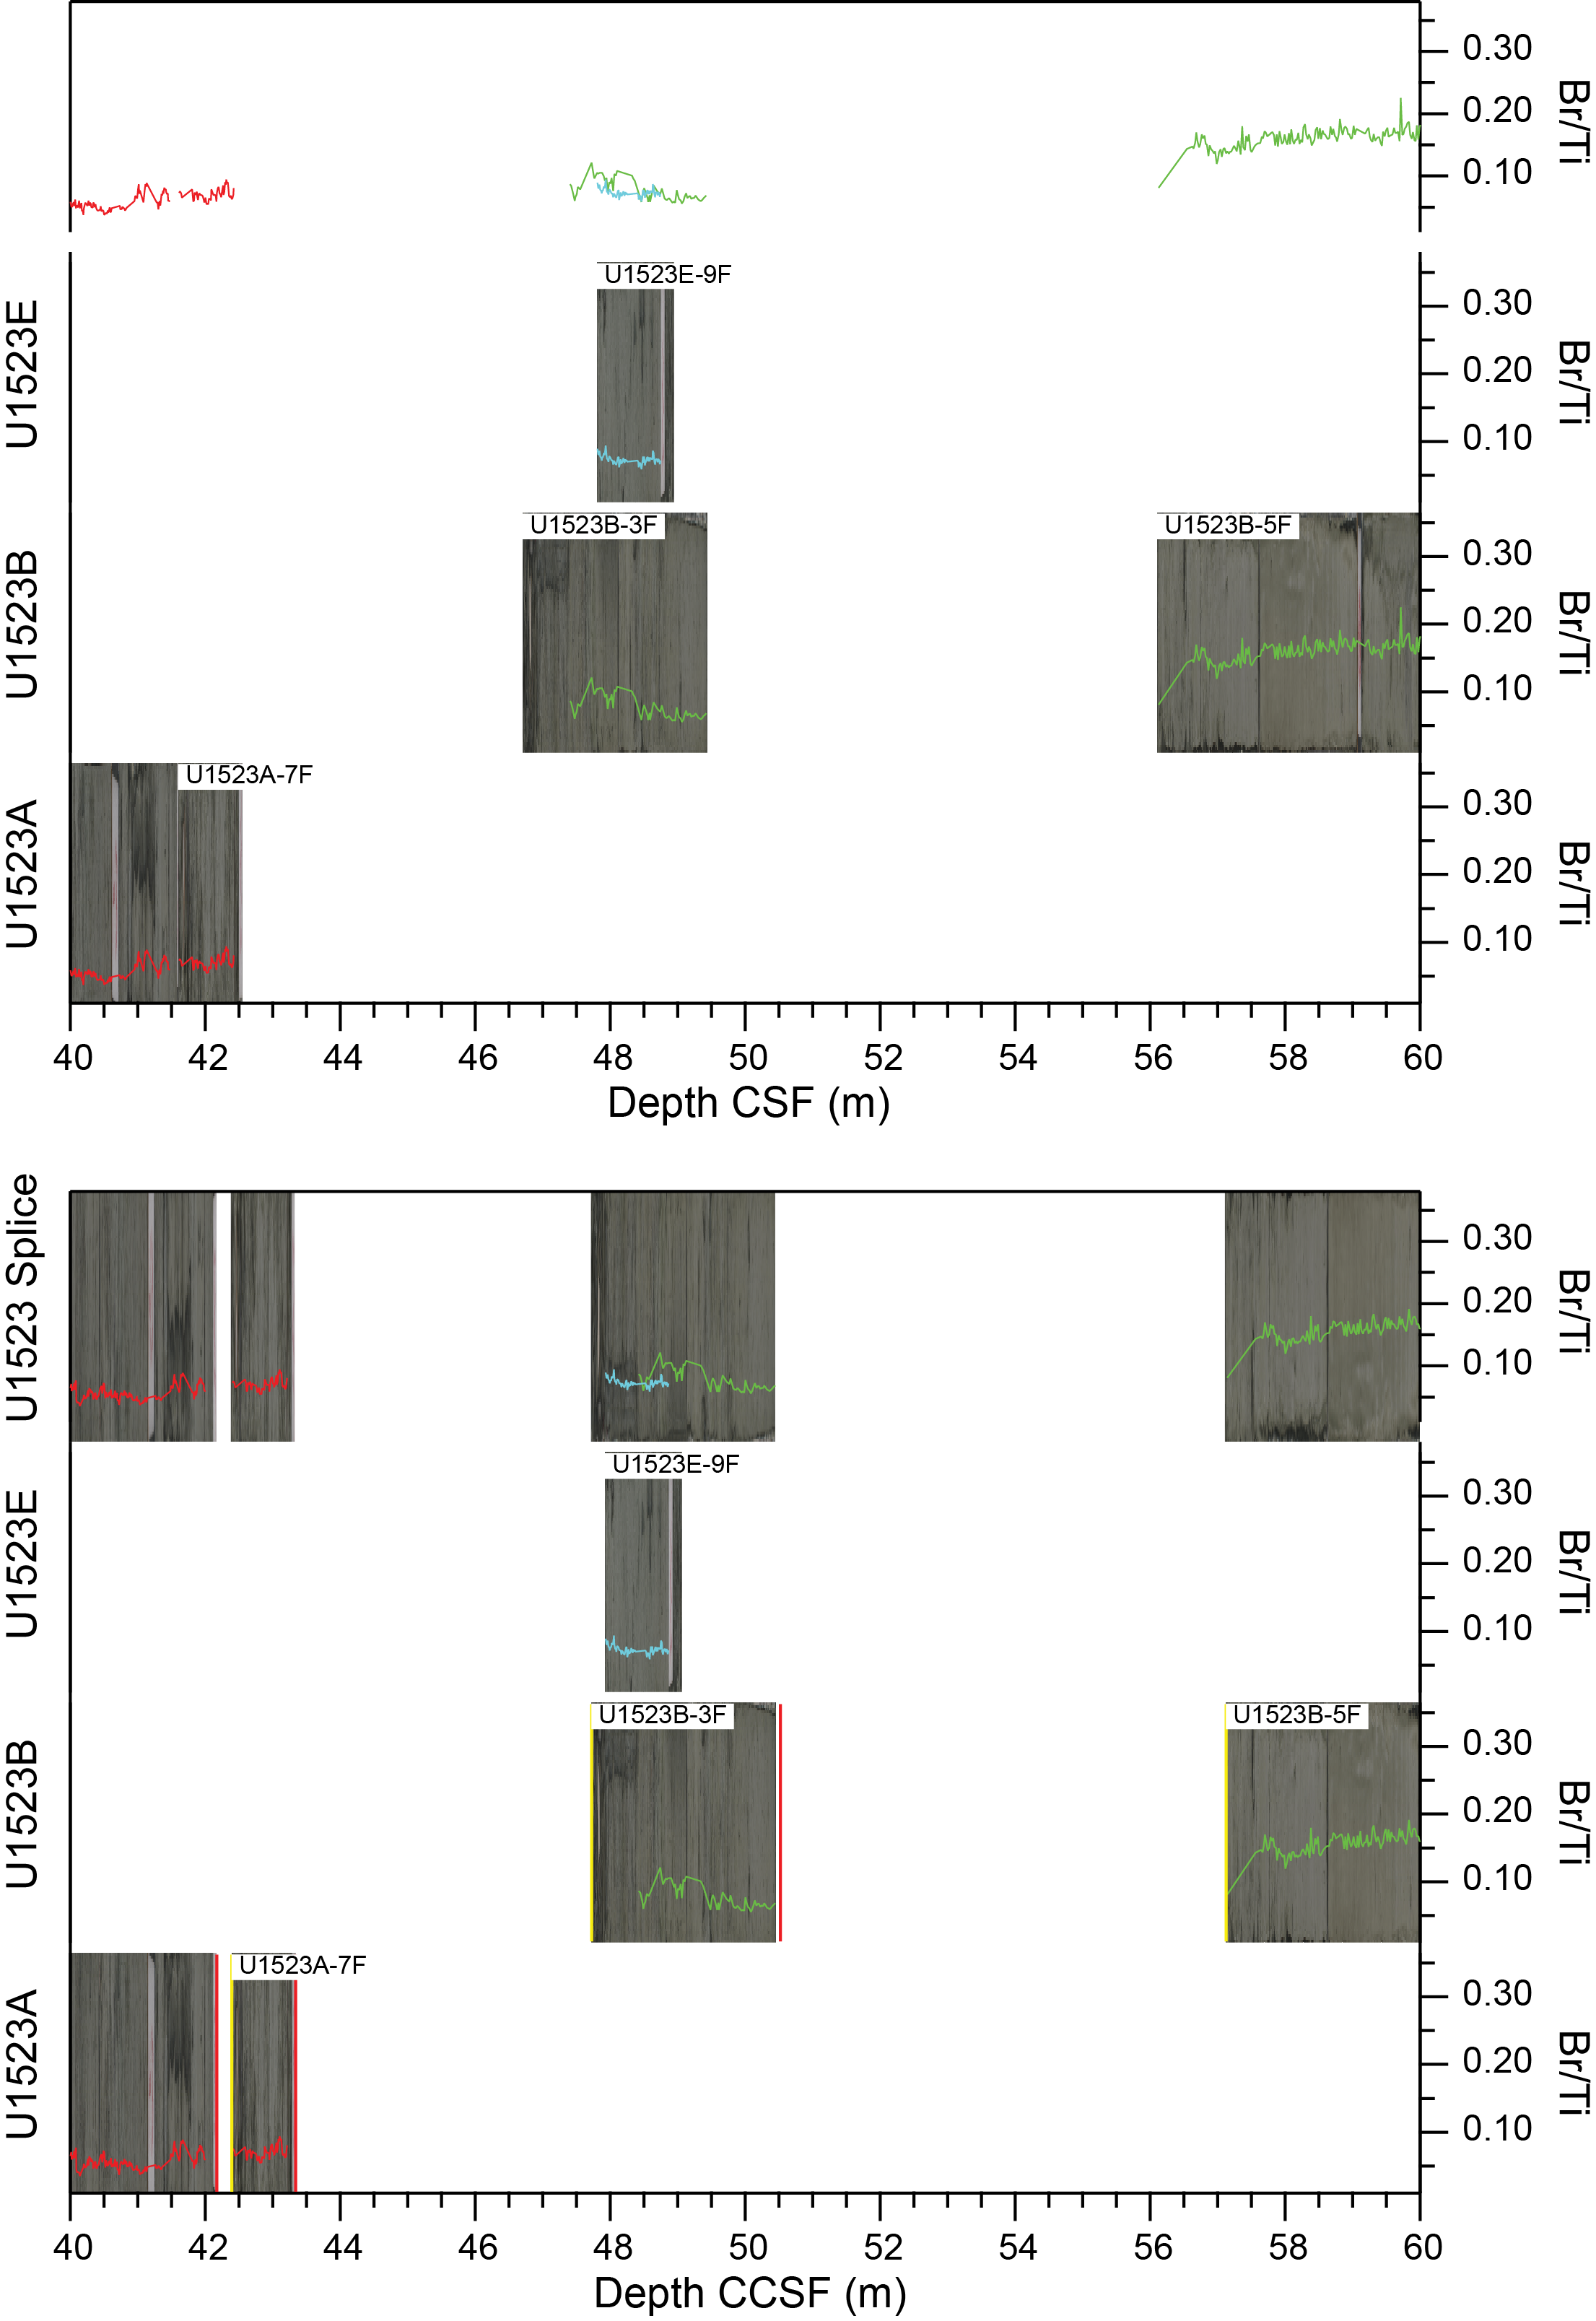

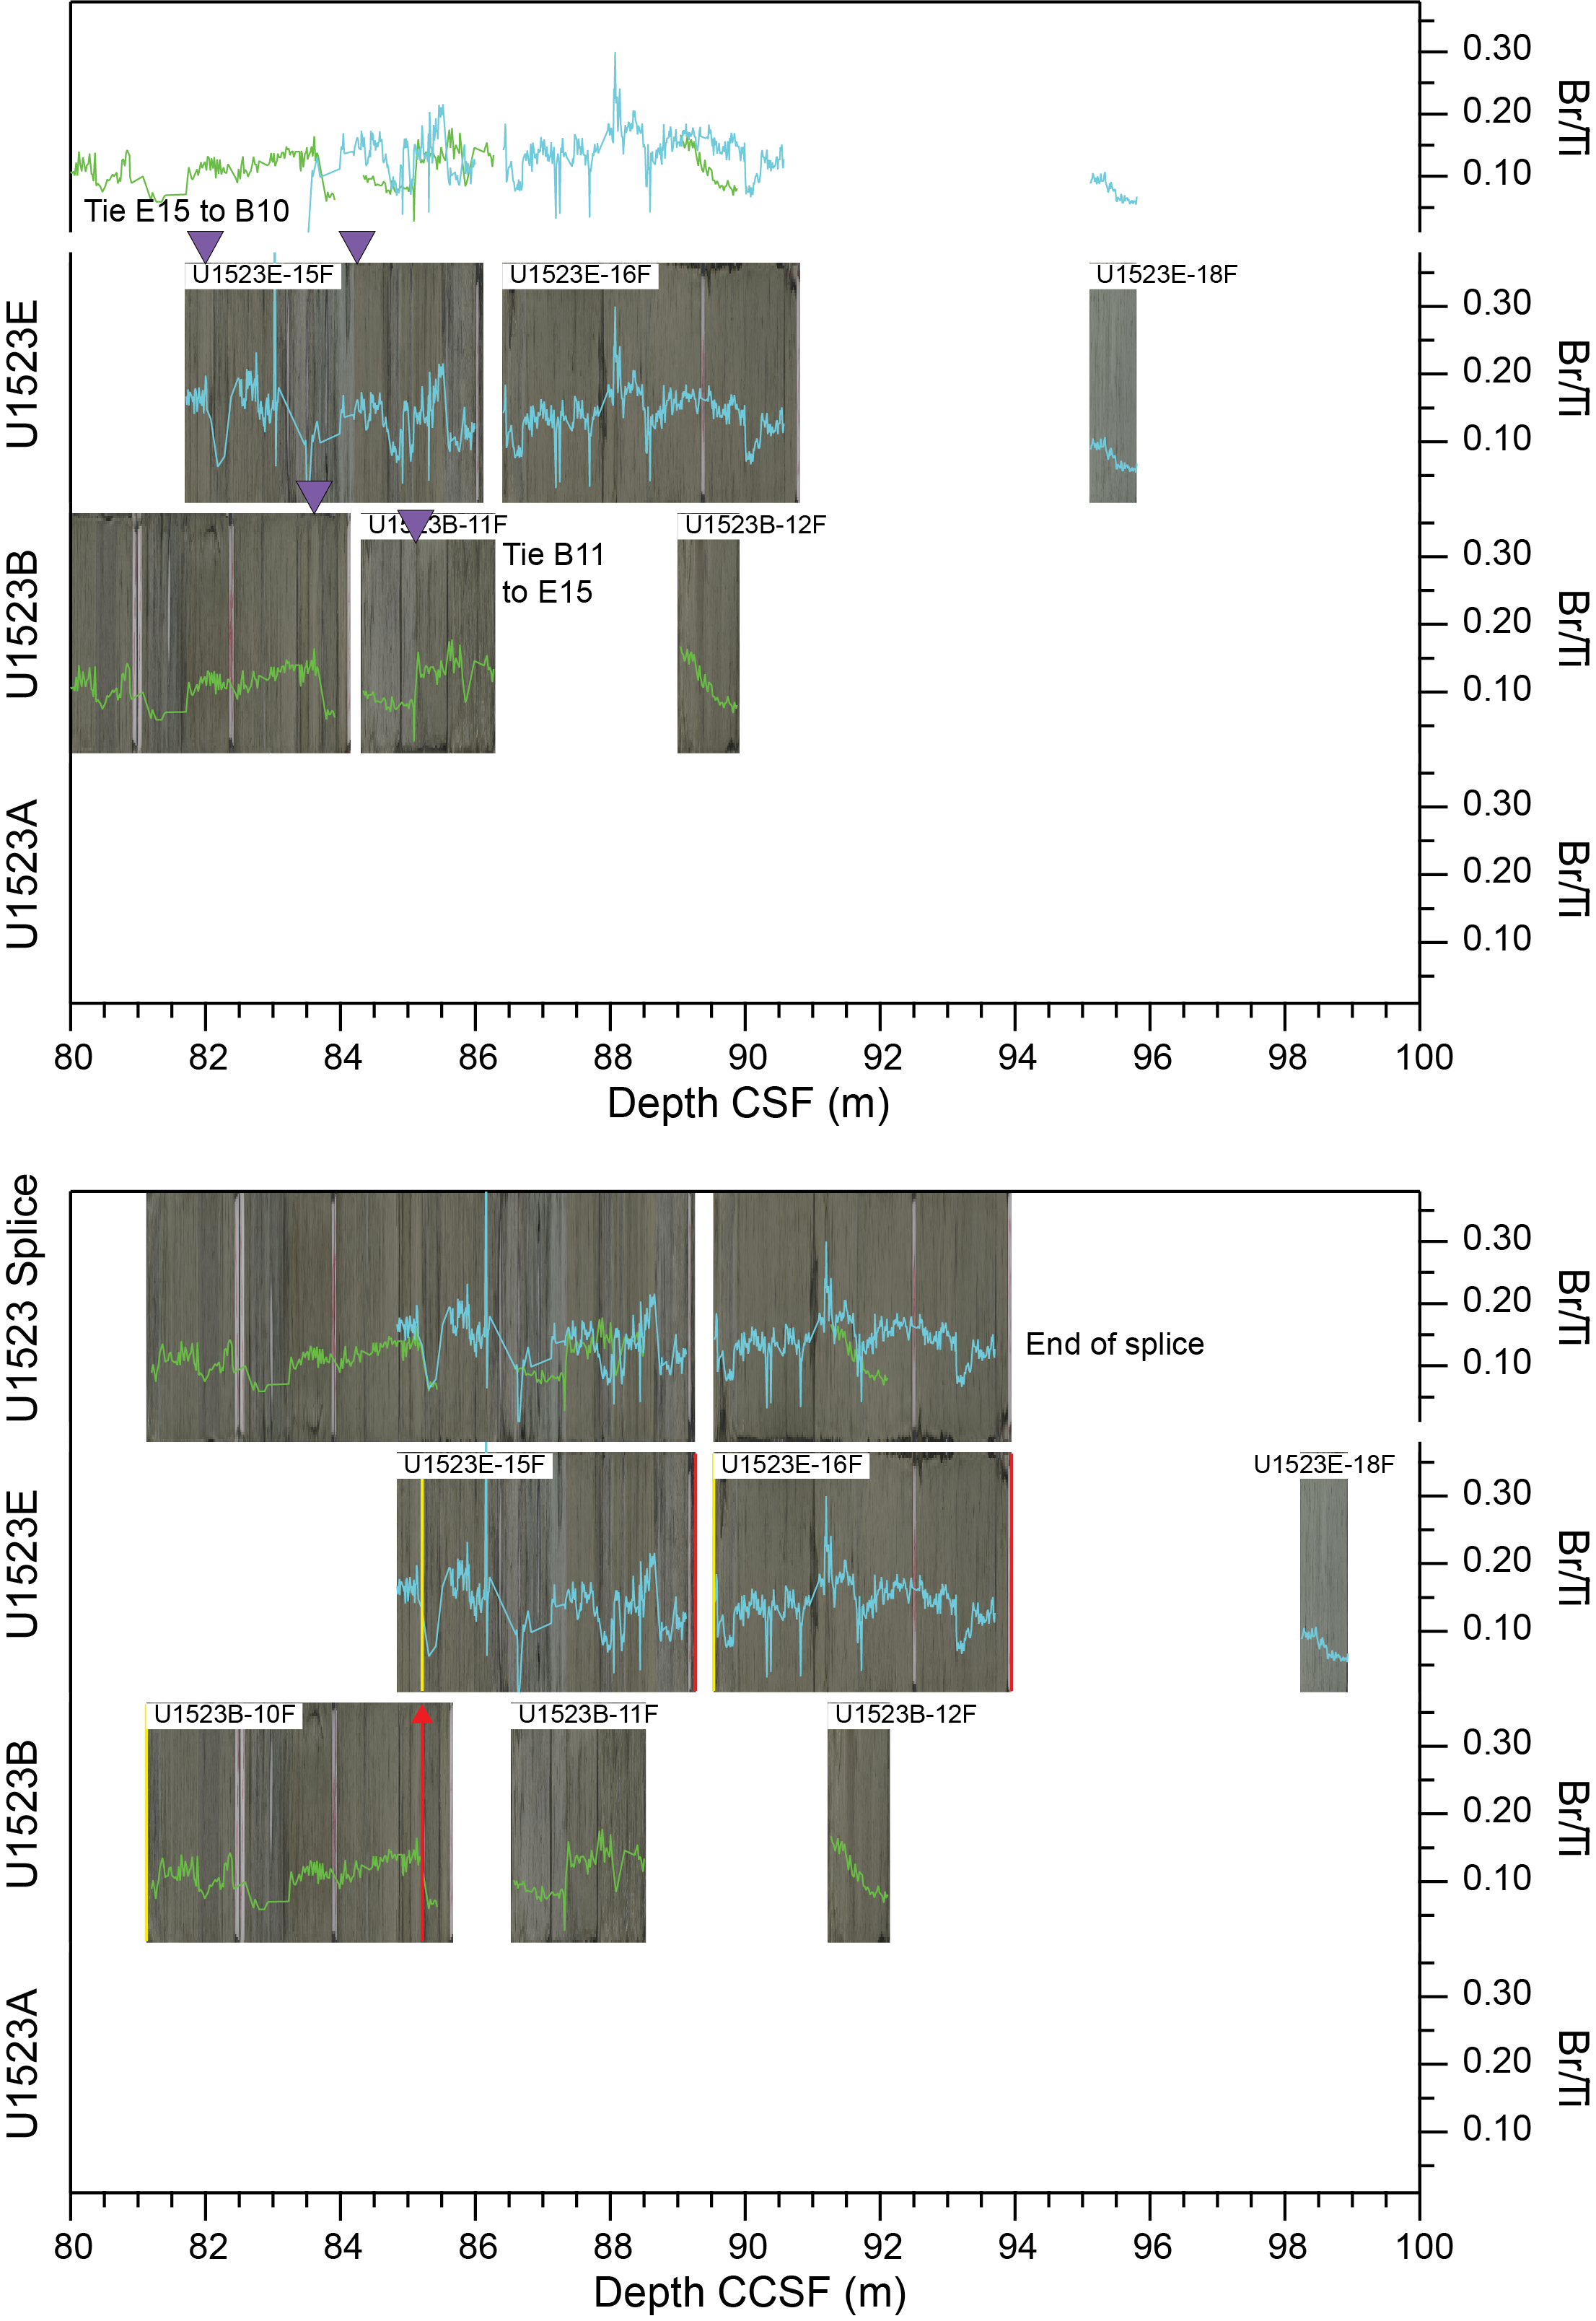
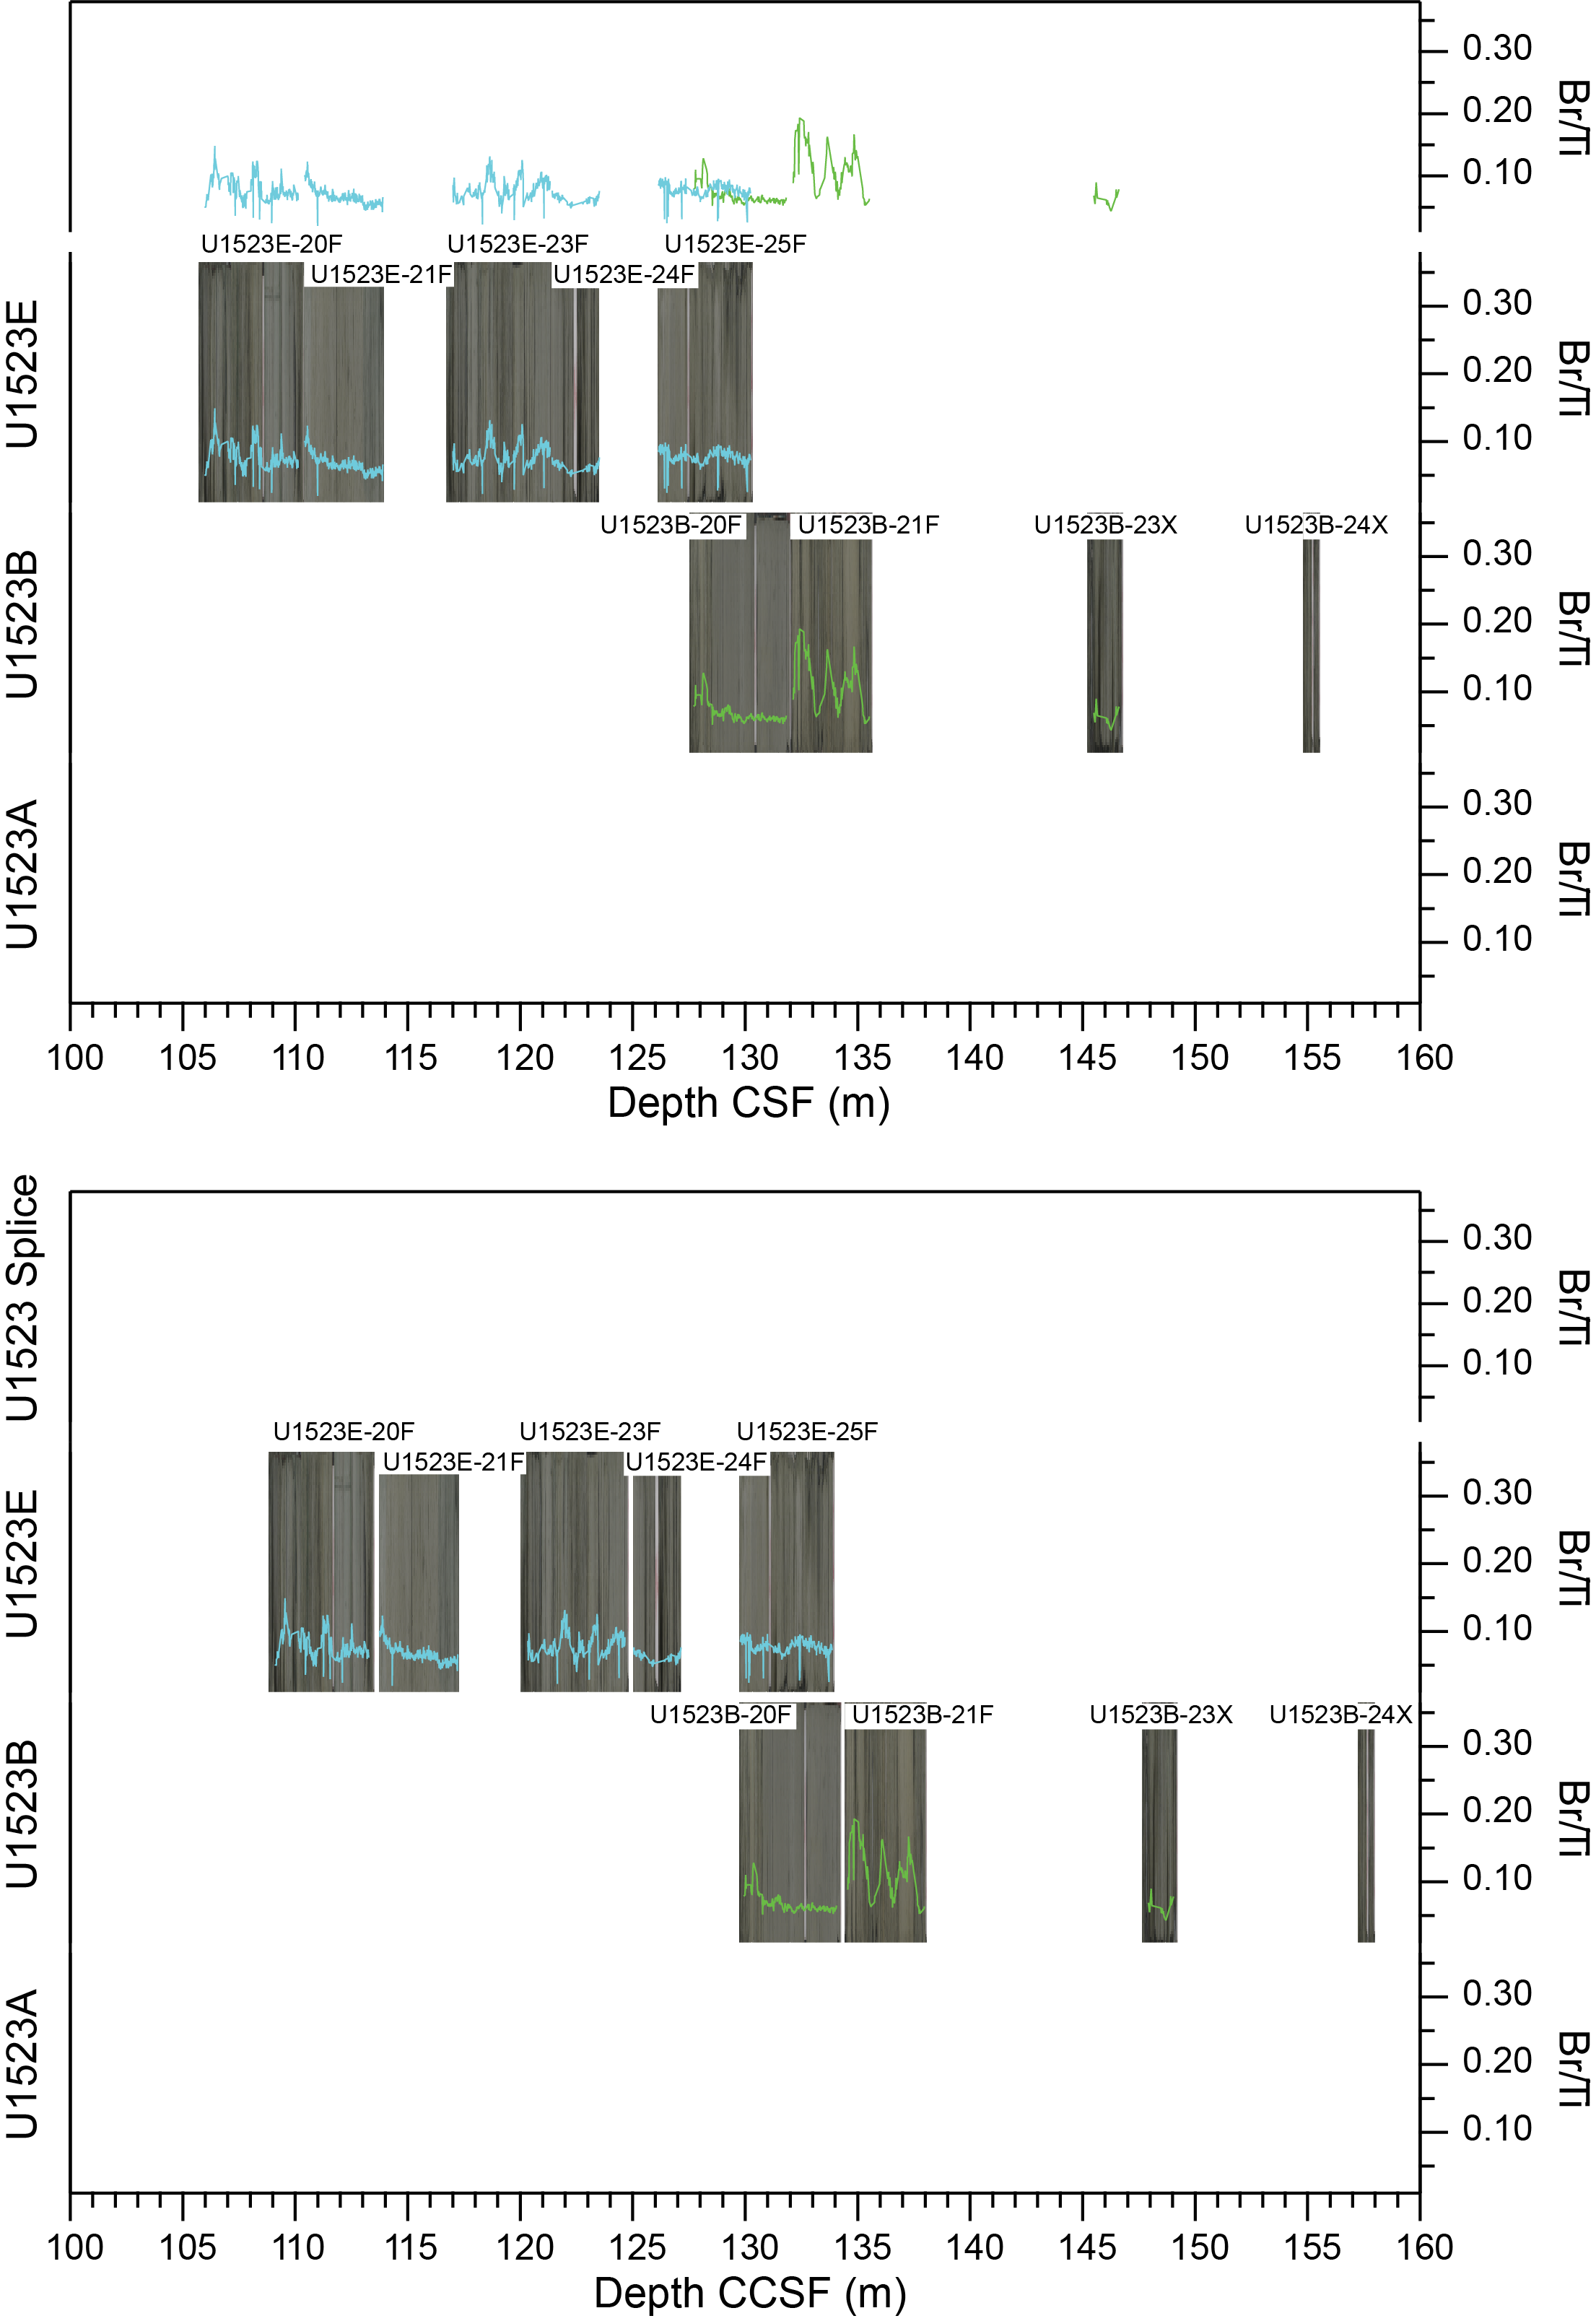
Figure F6. Linescan core images and Br/Ti XRF.
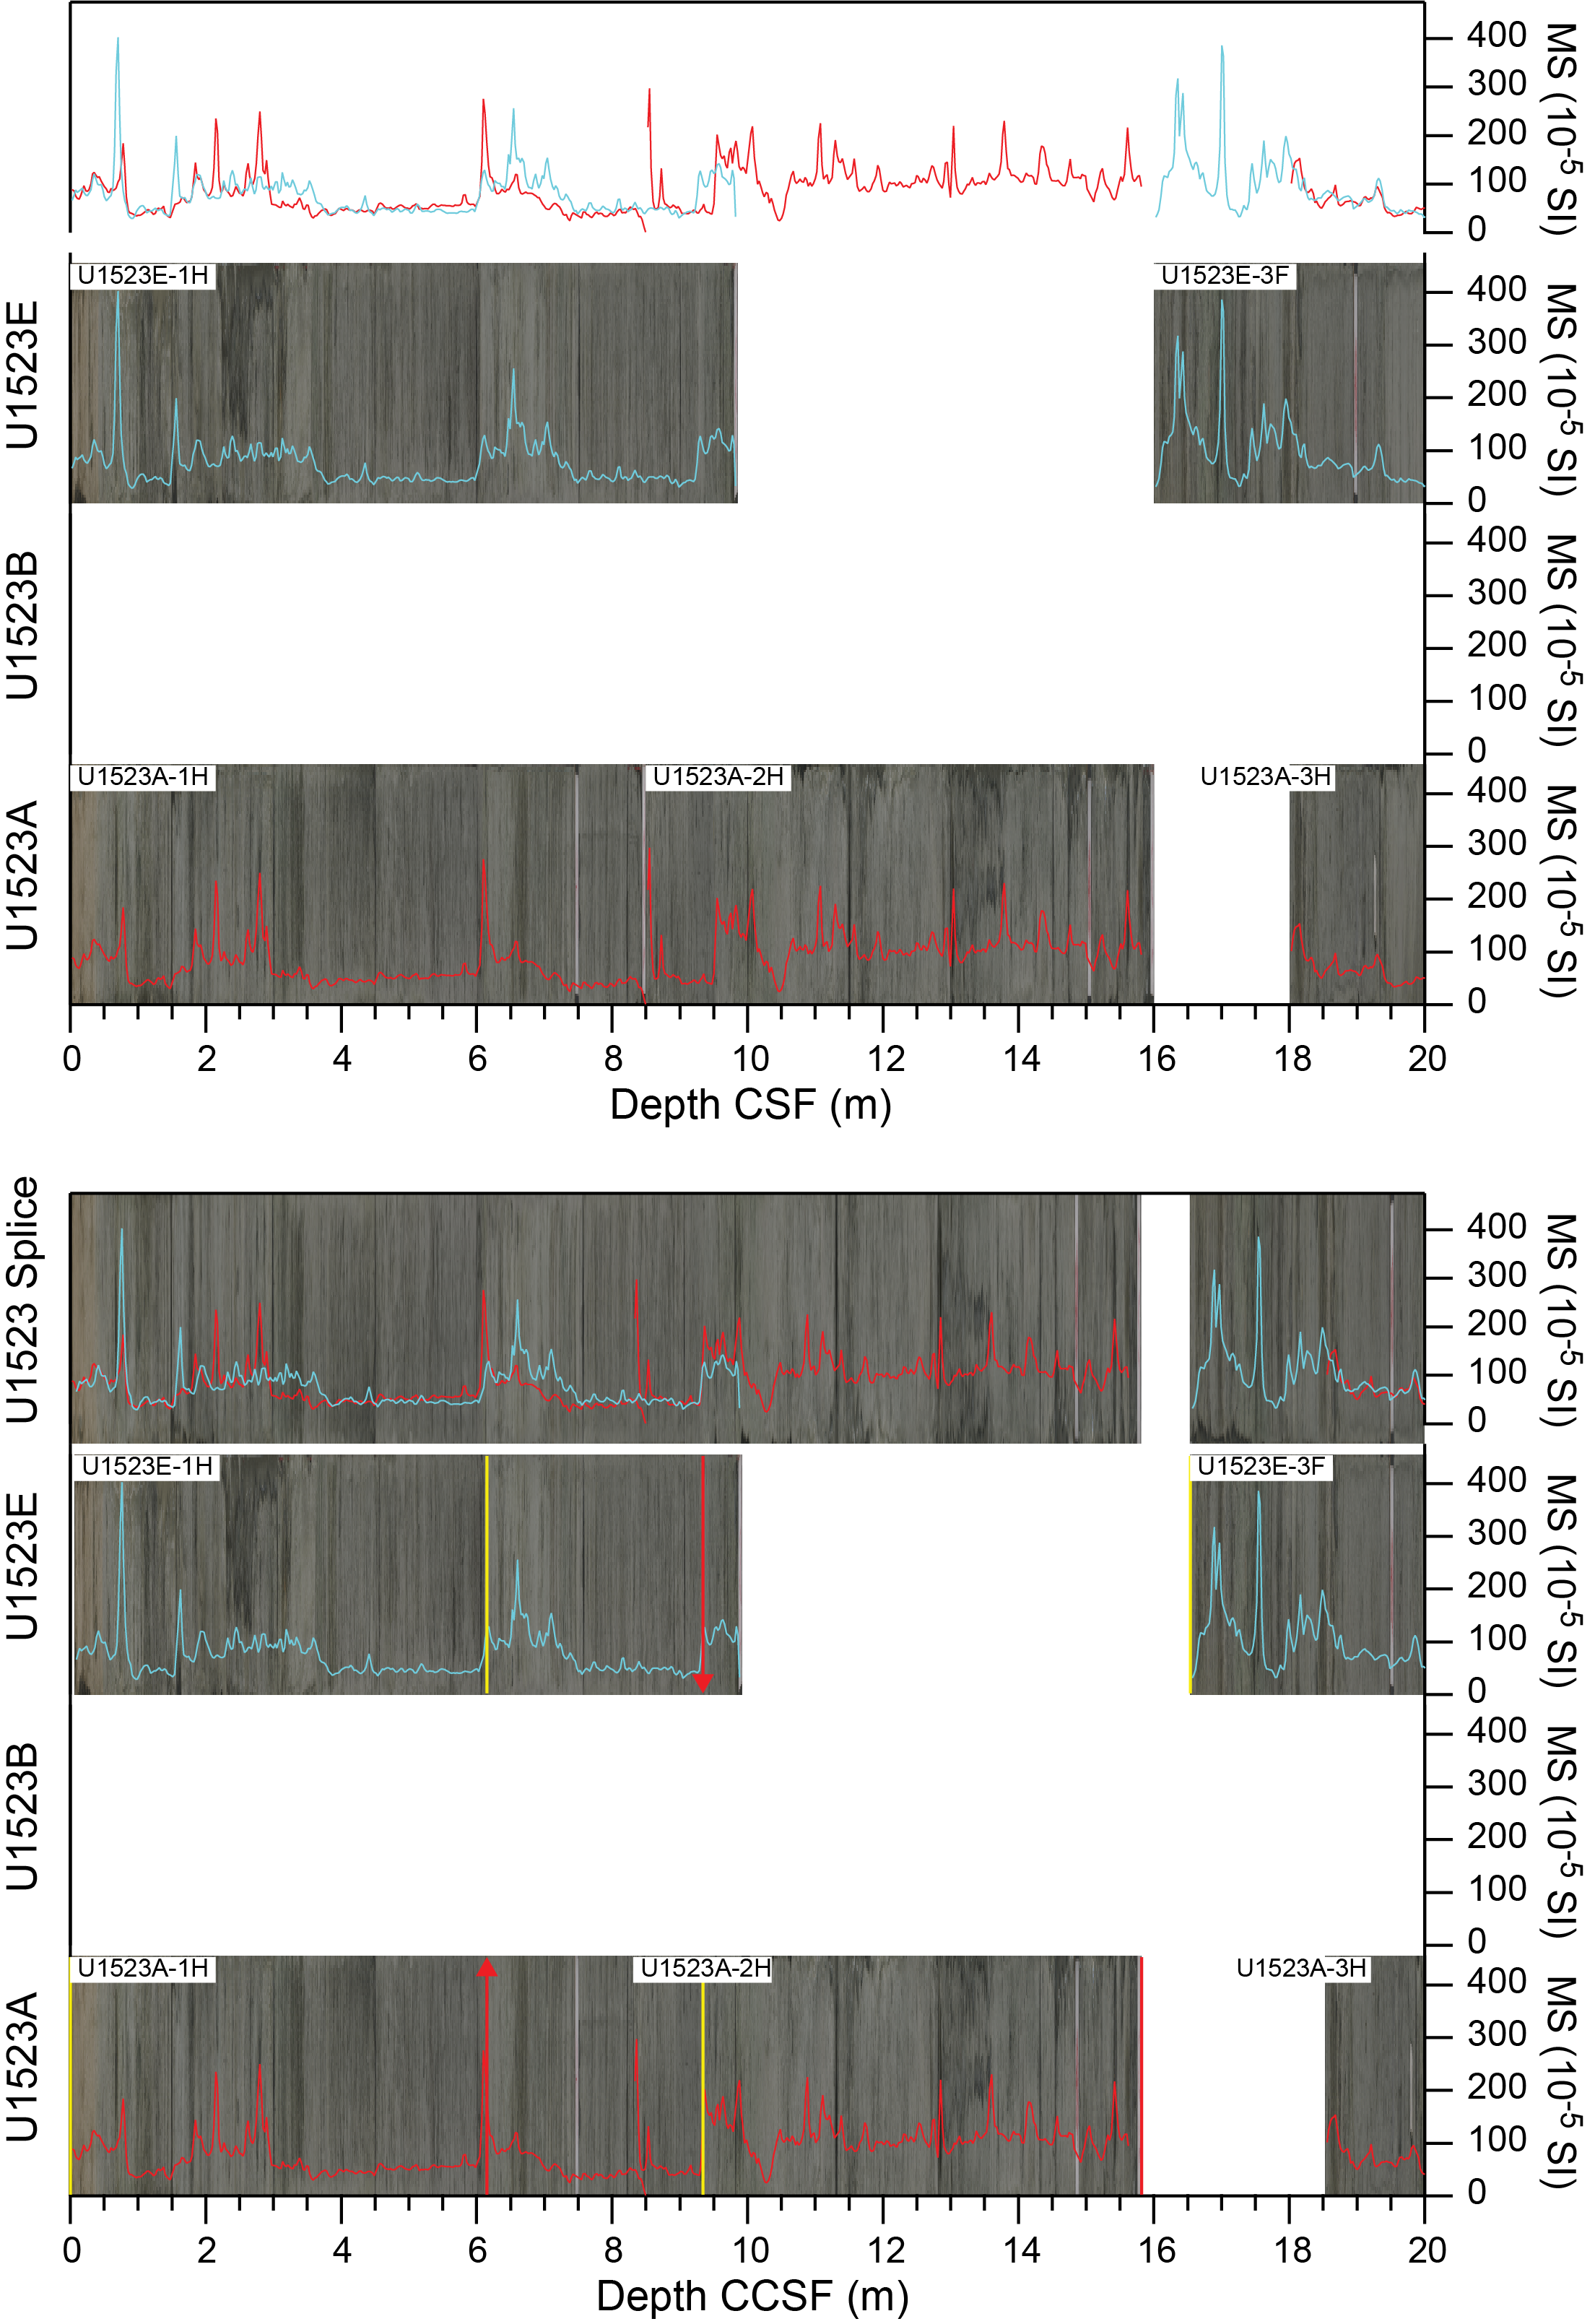
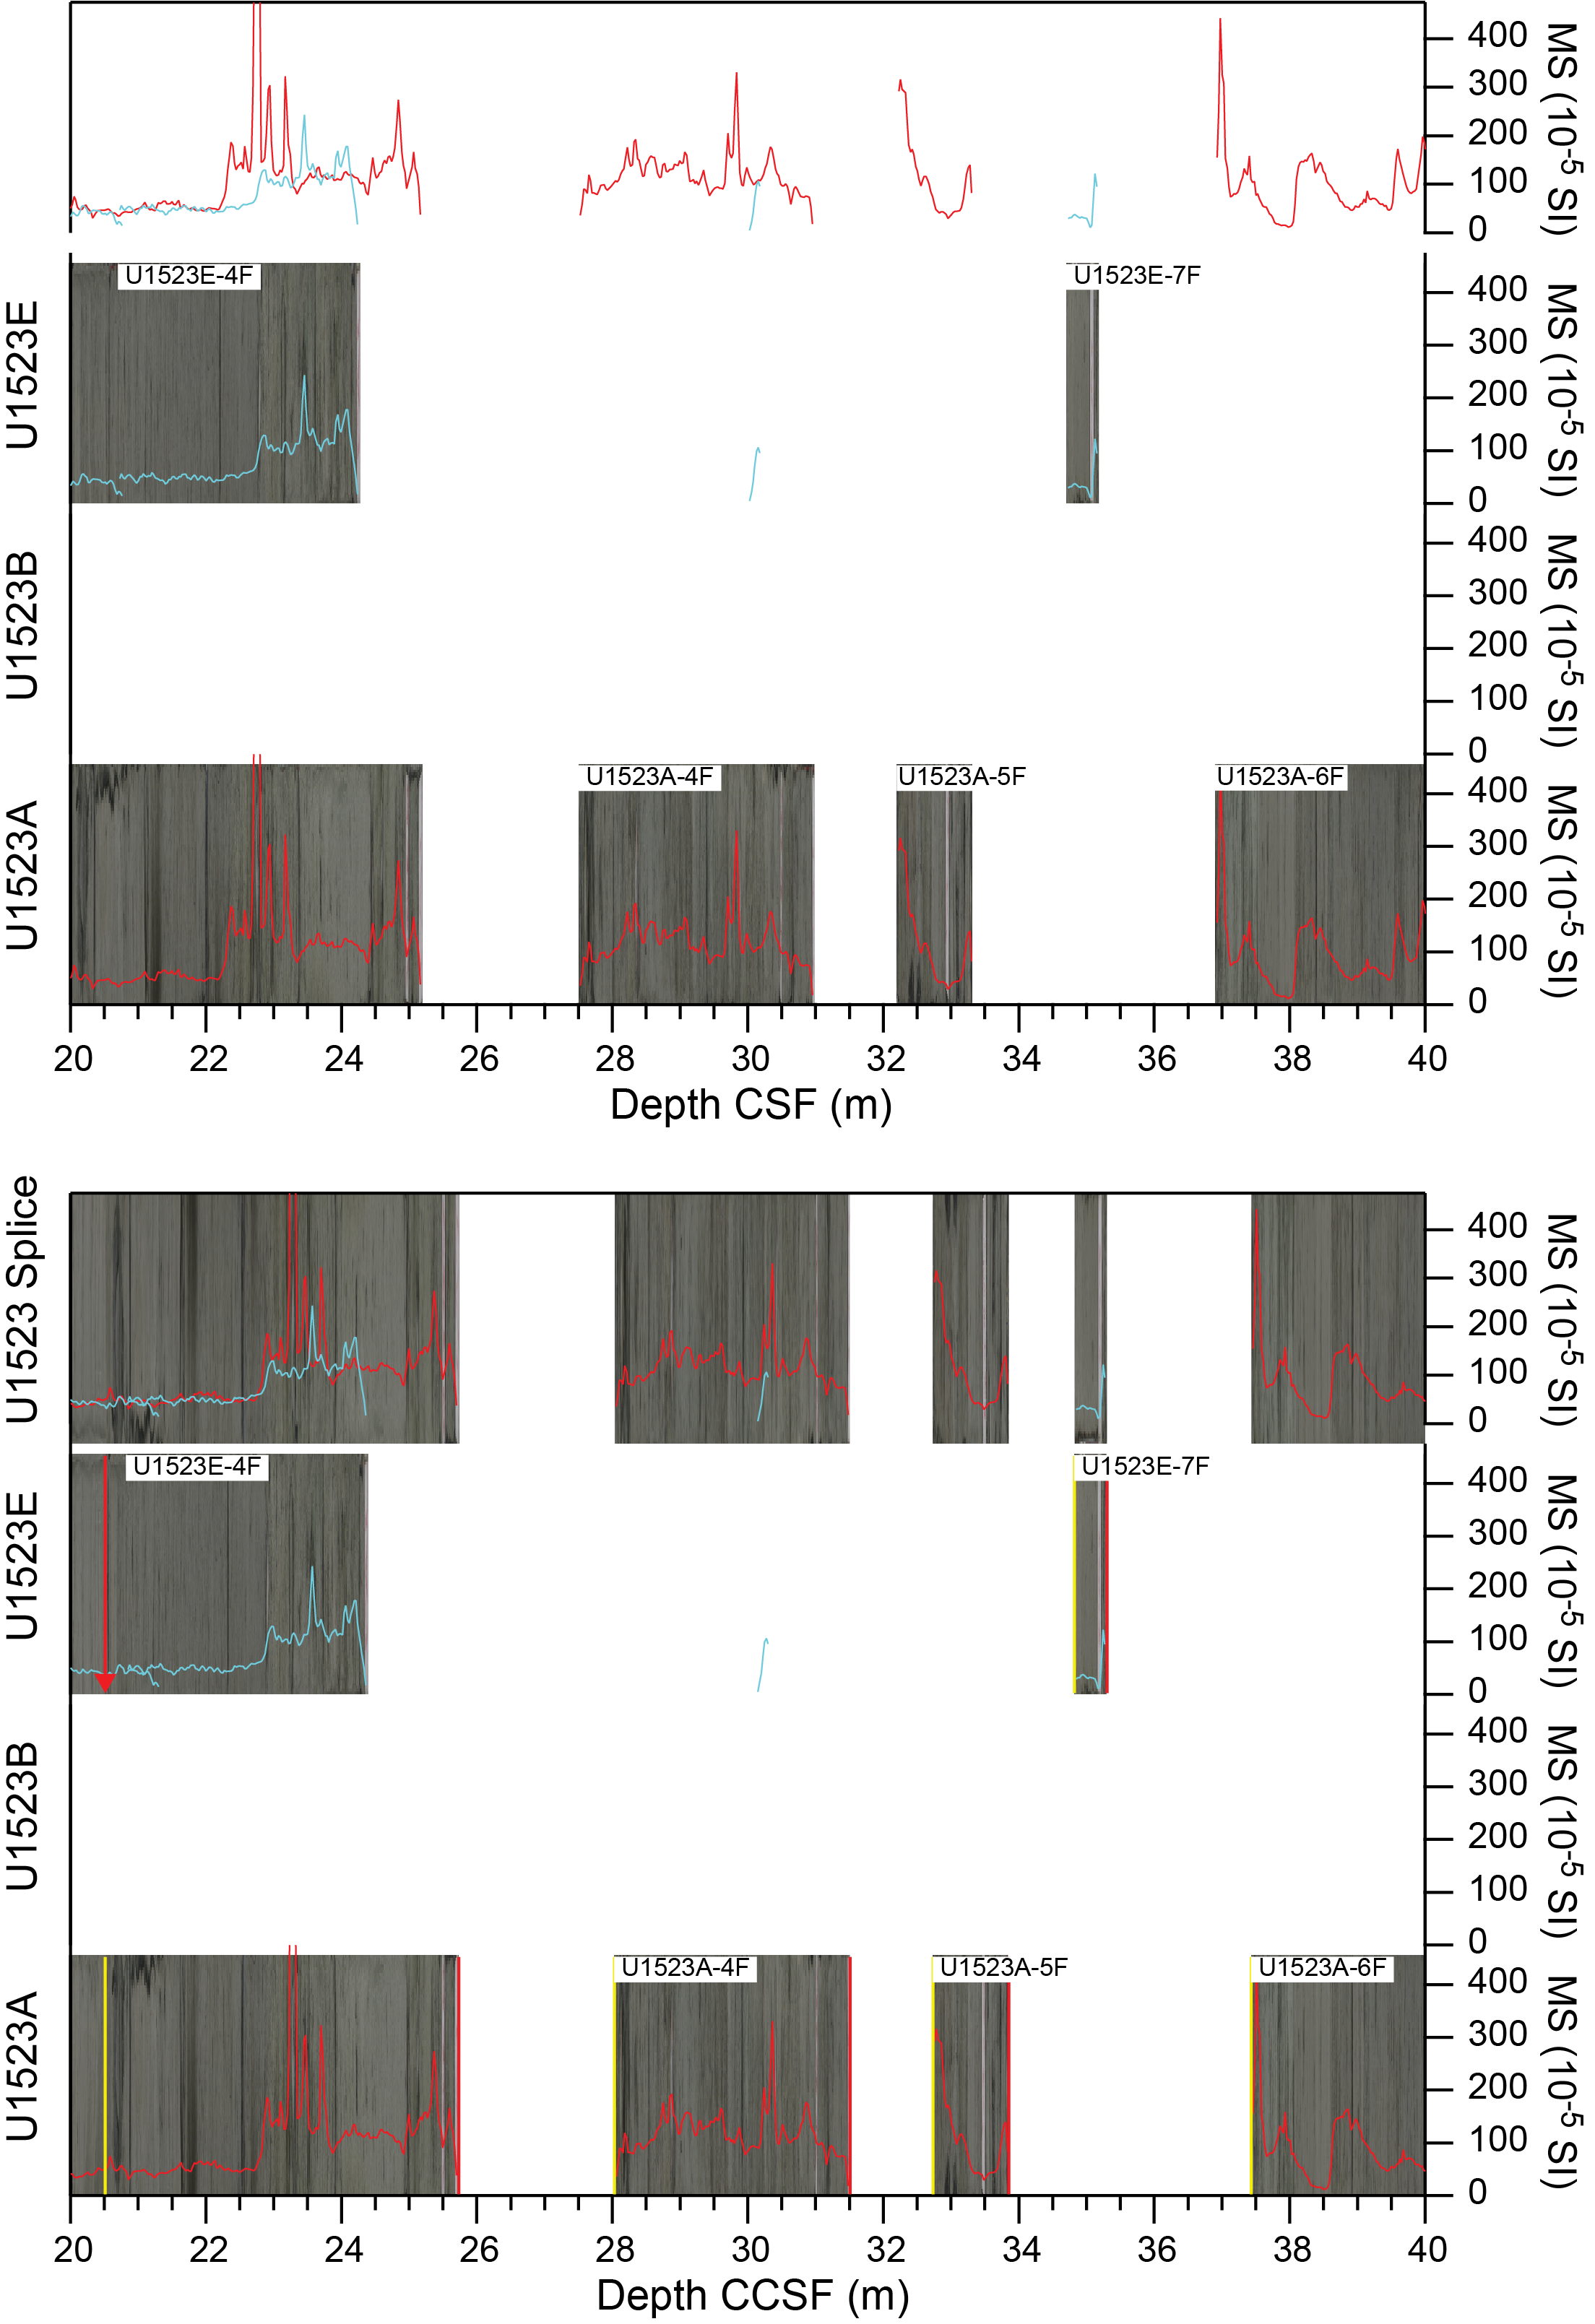
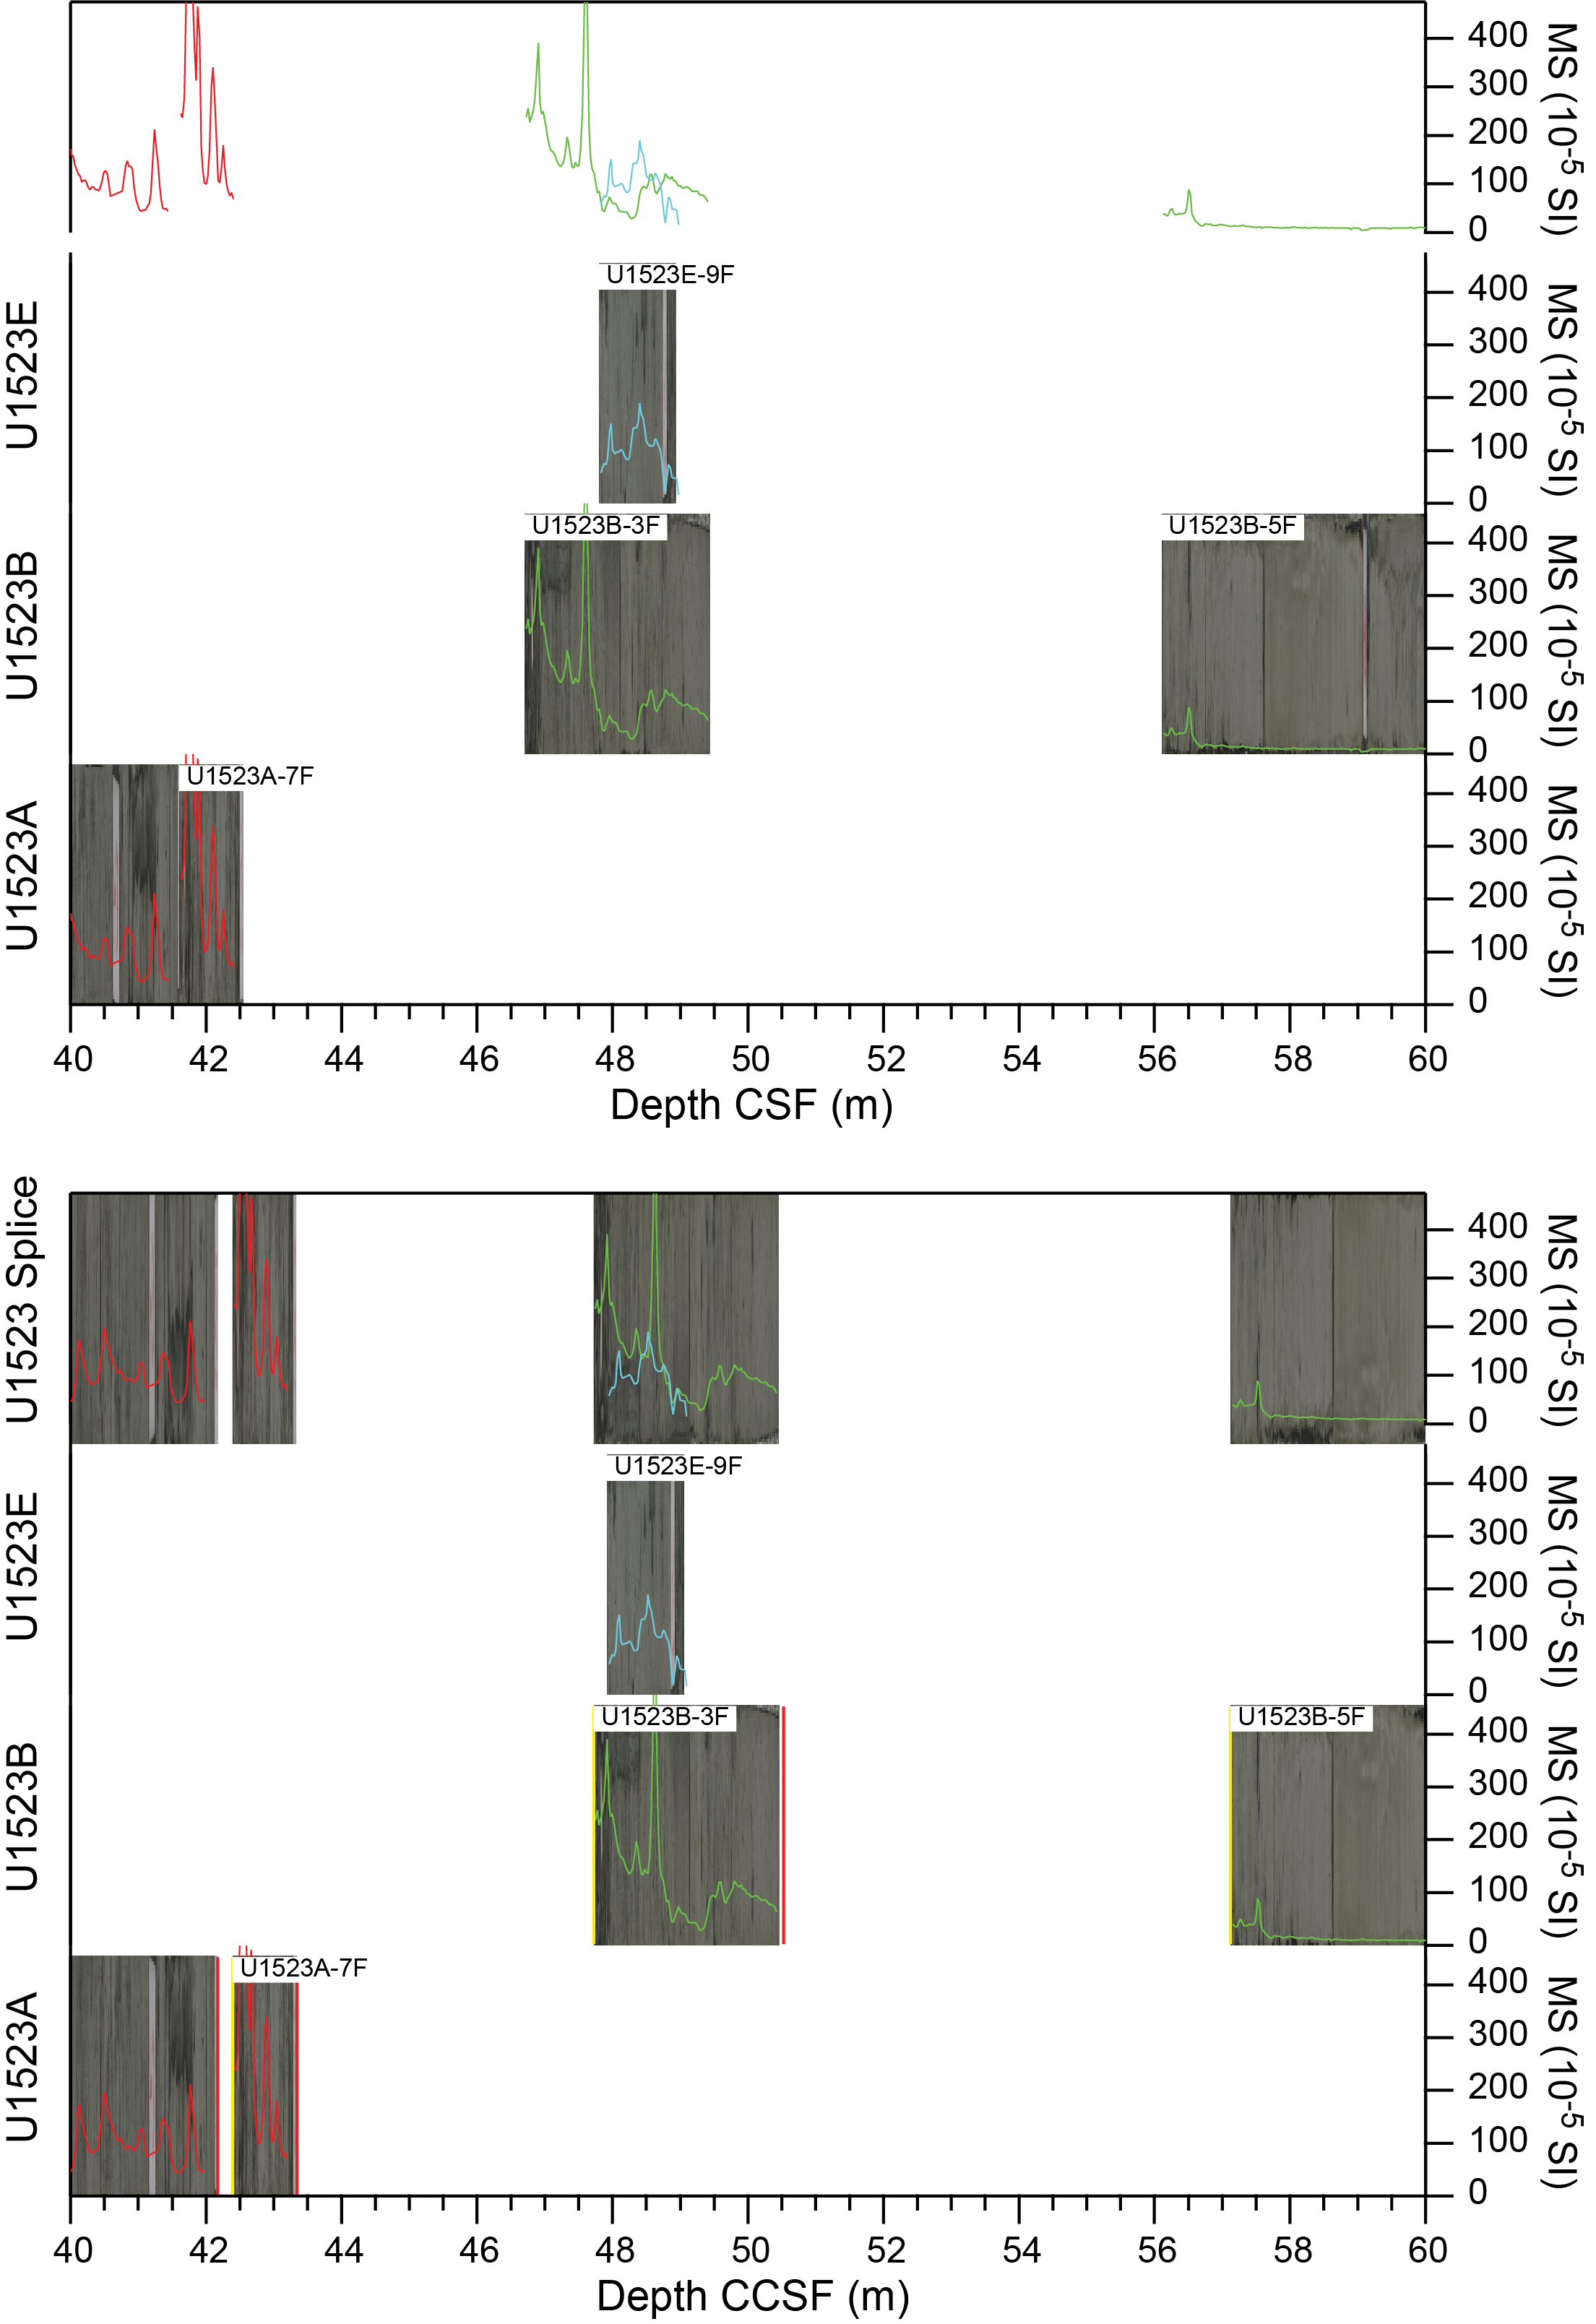
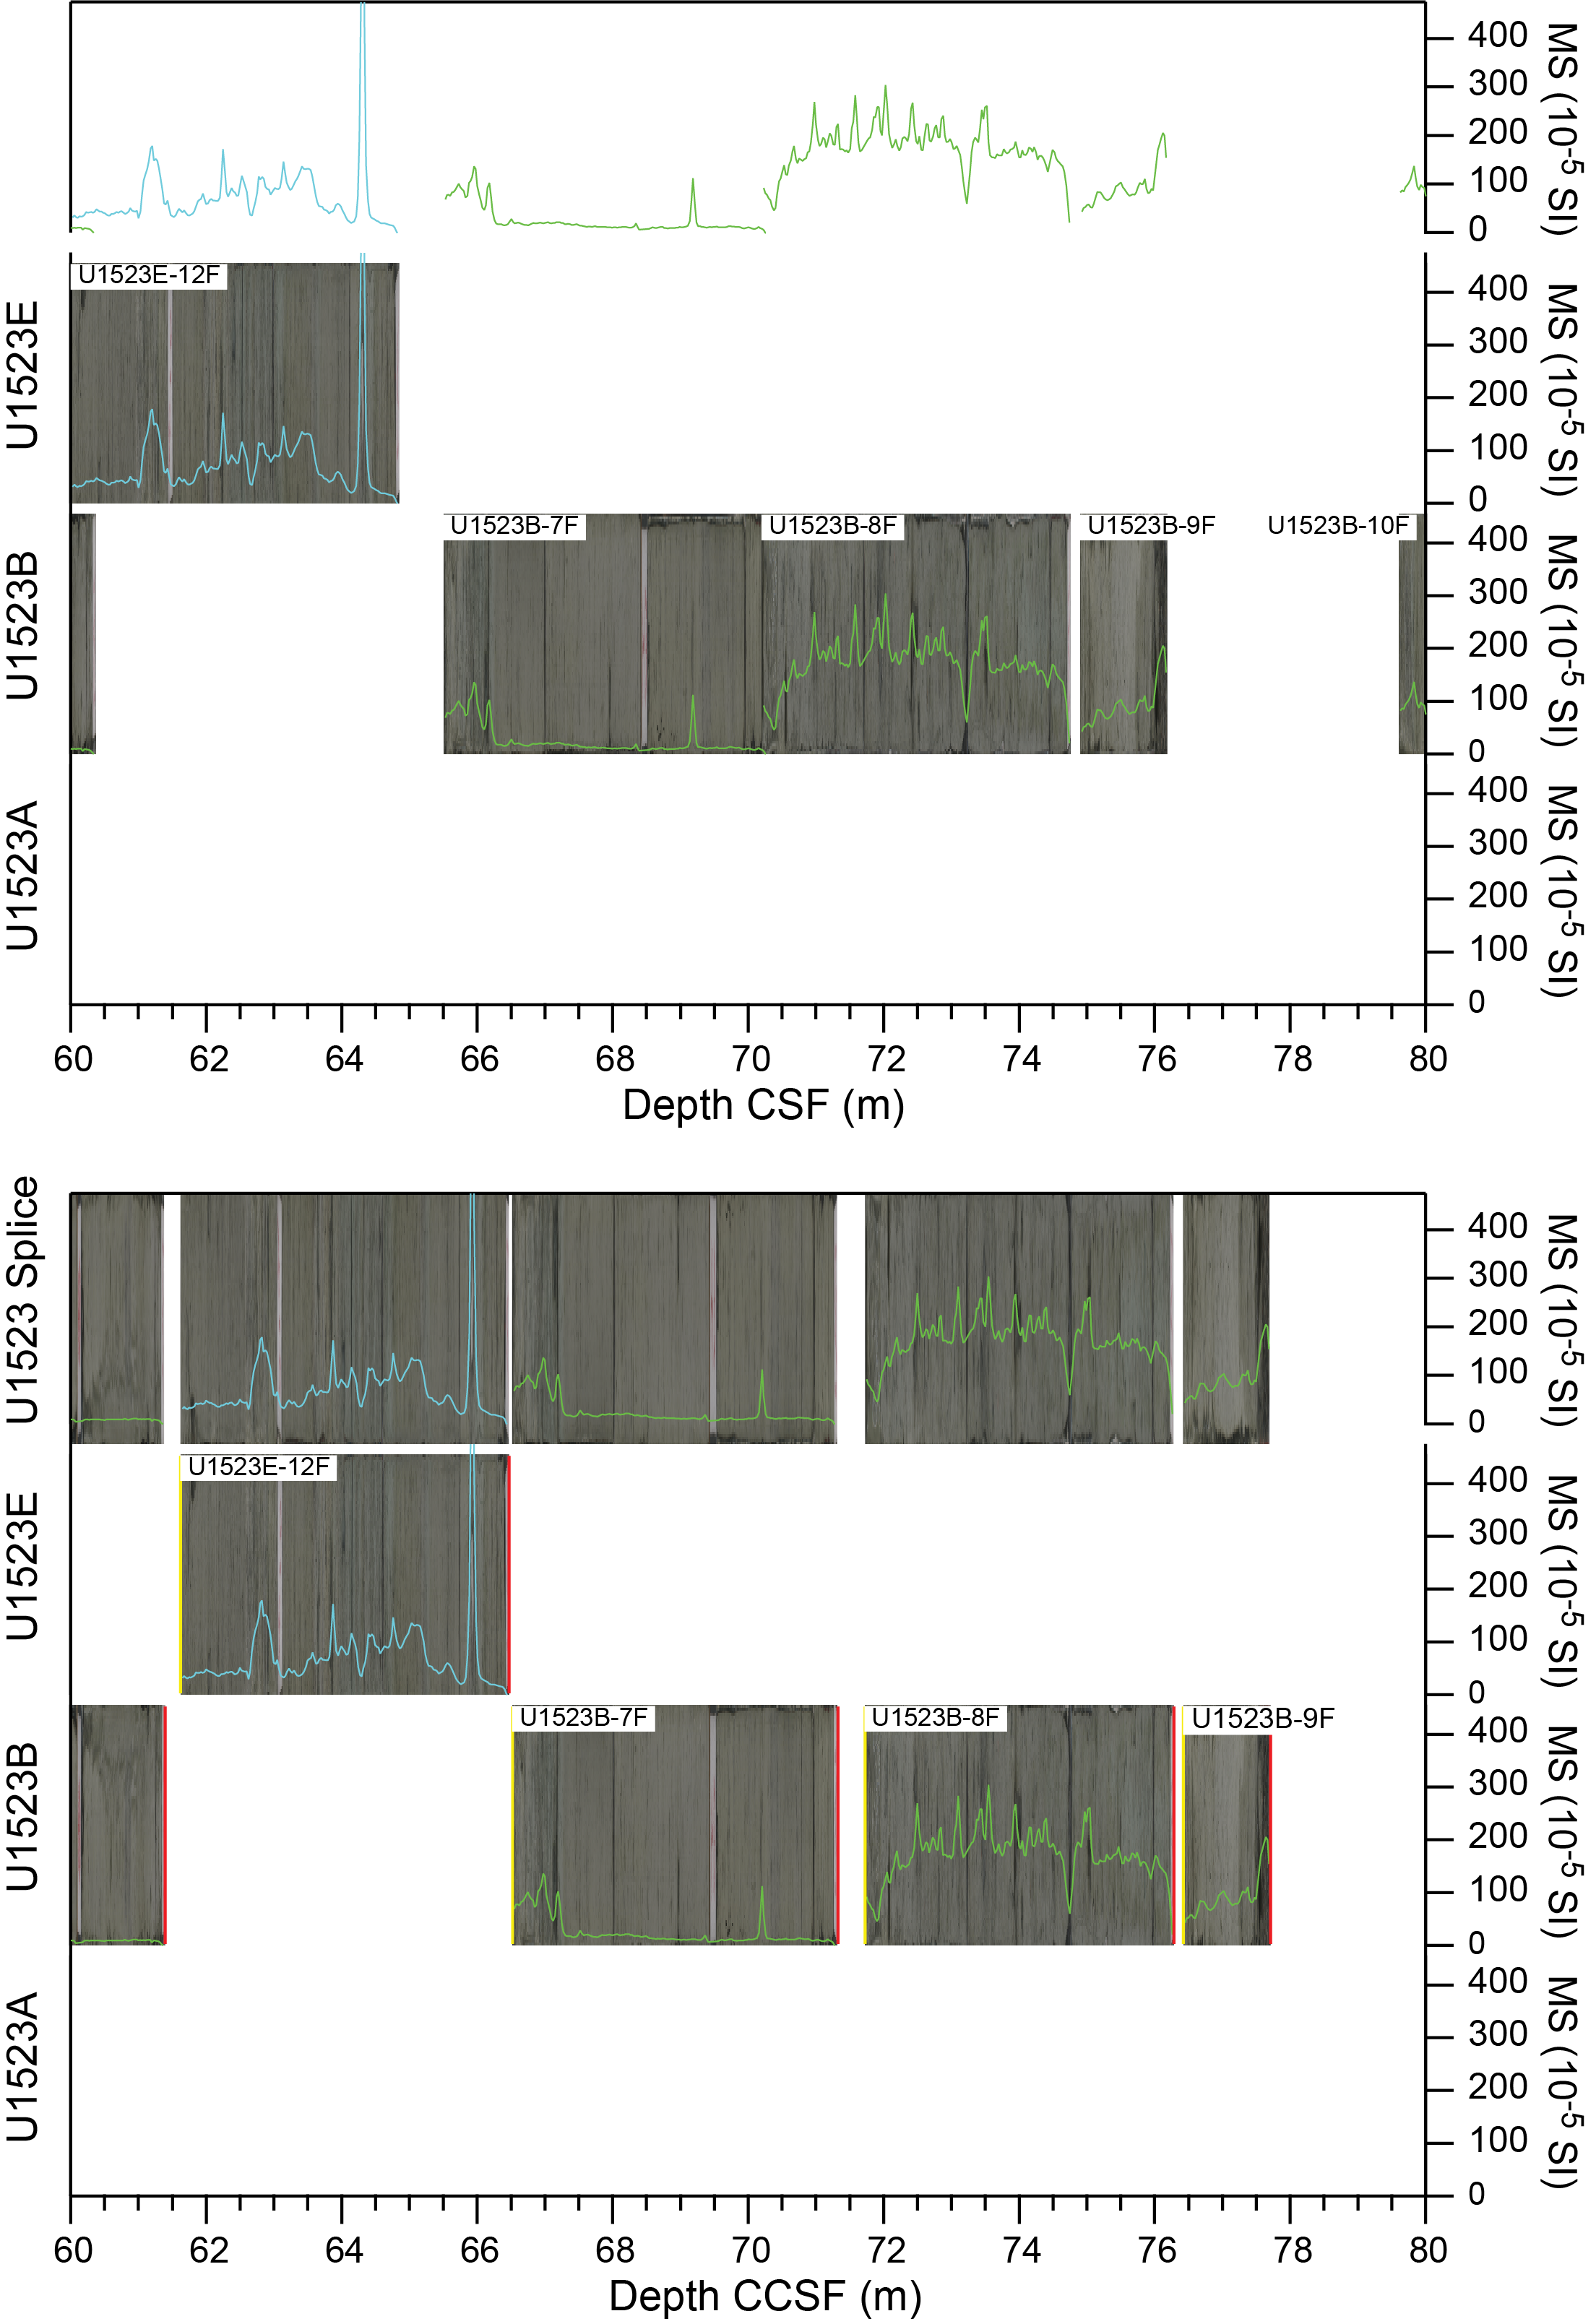
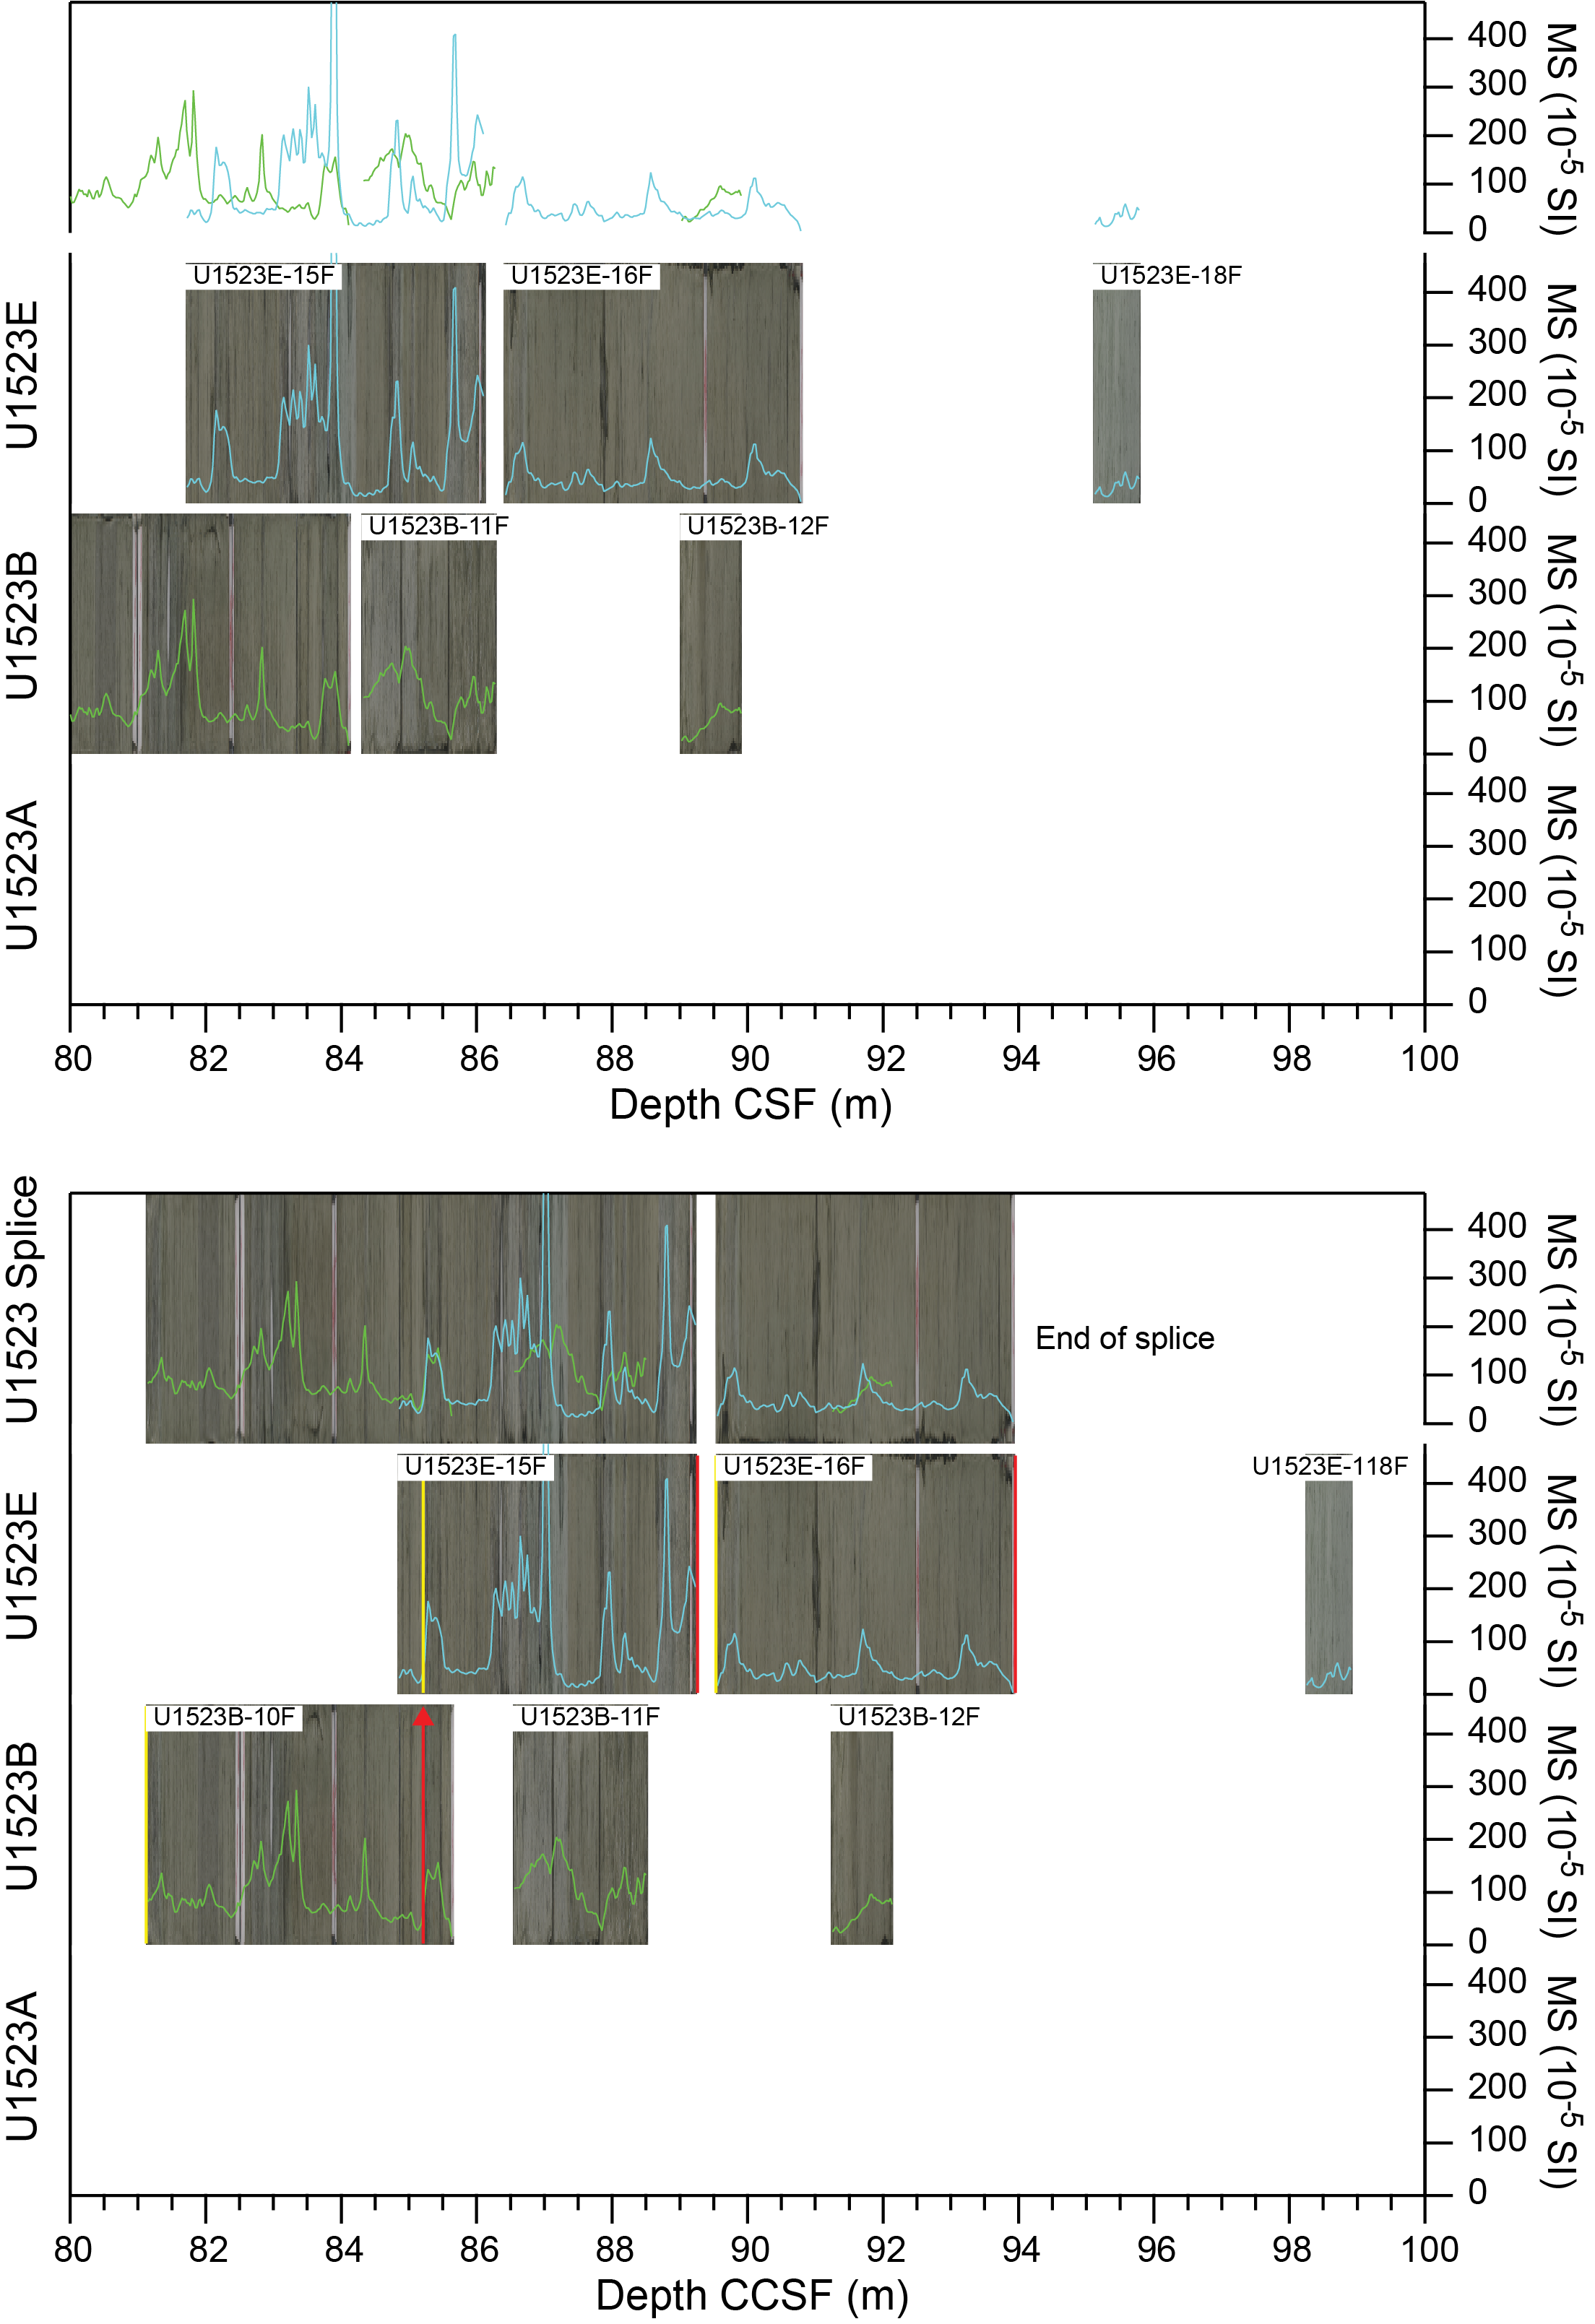
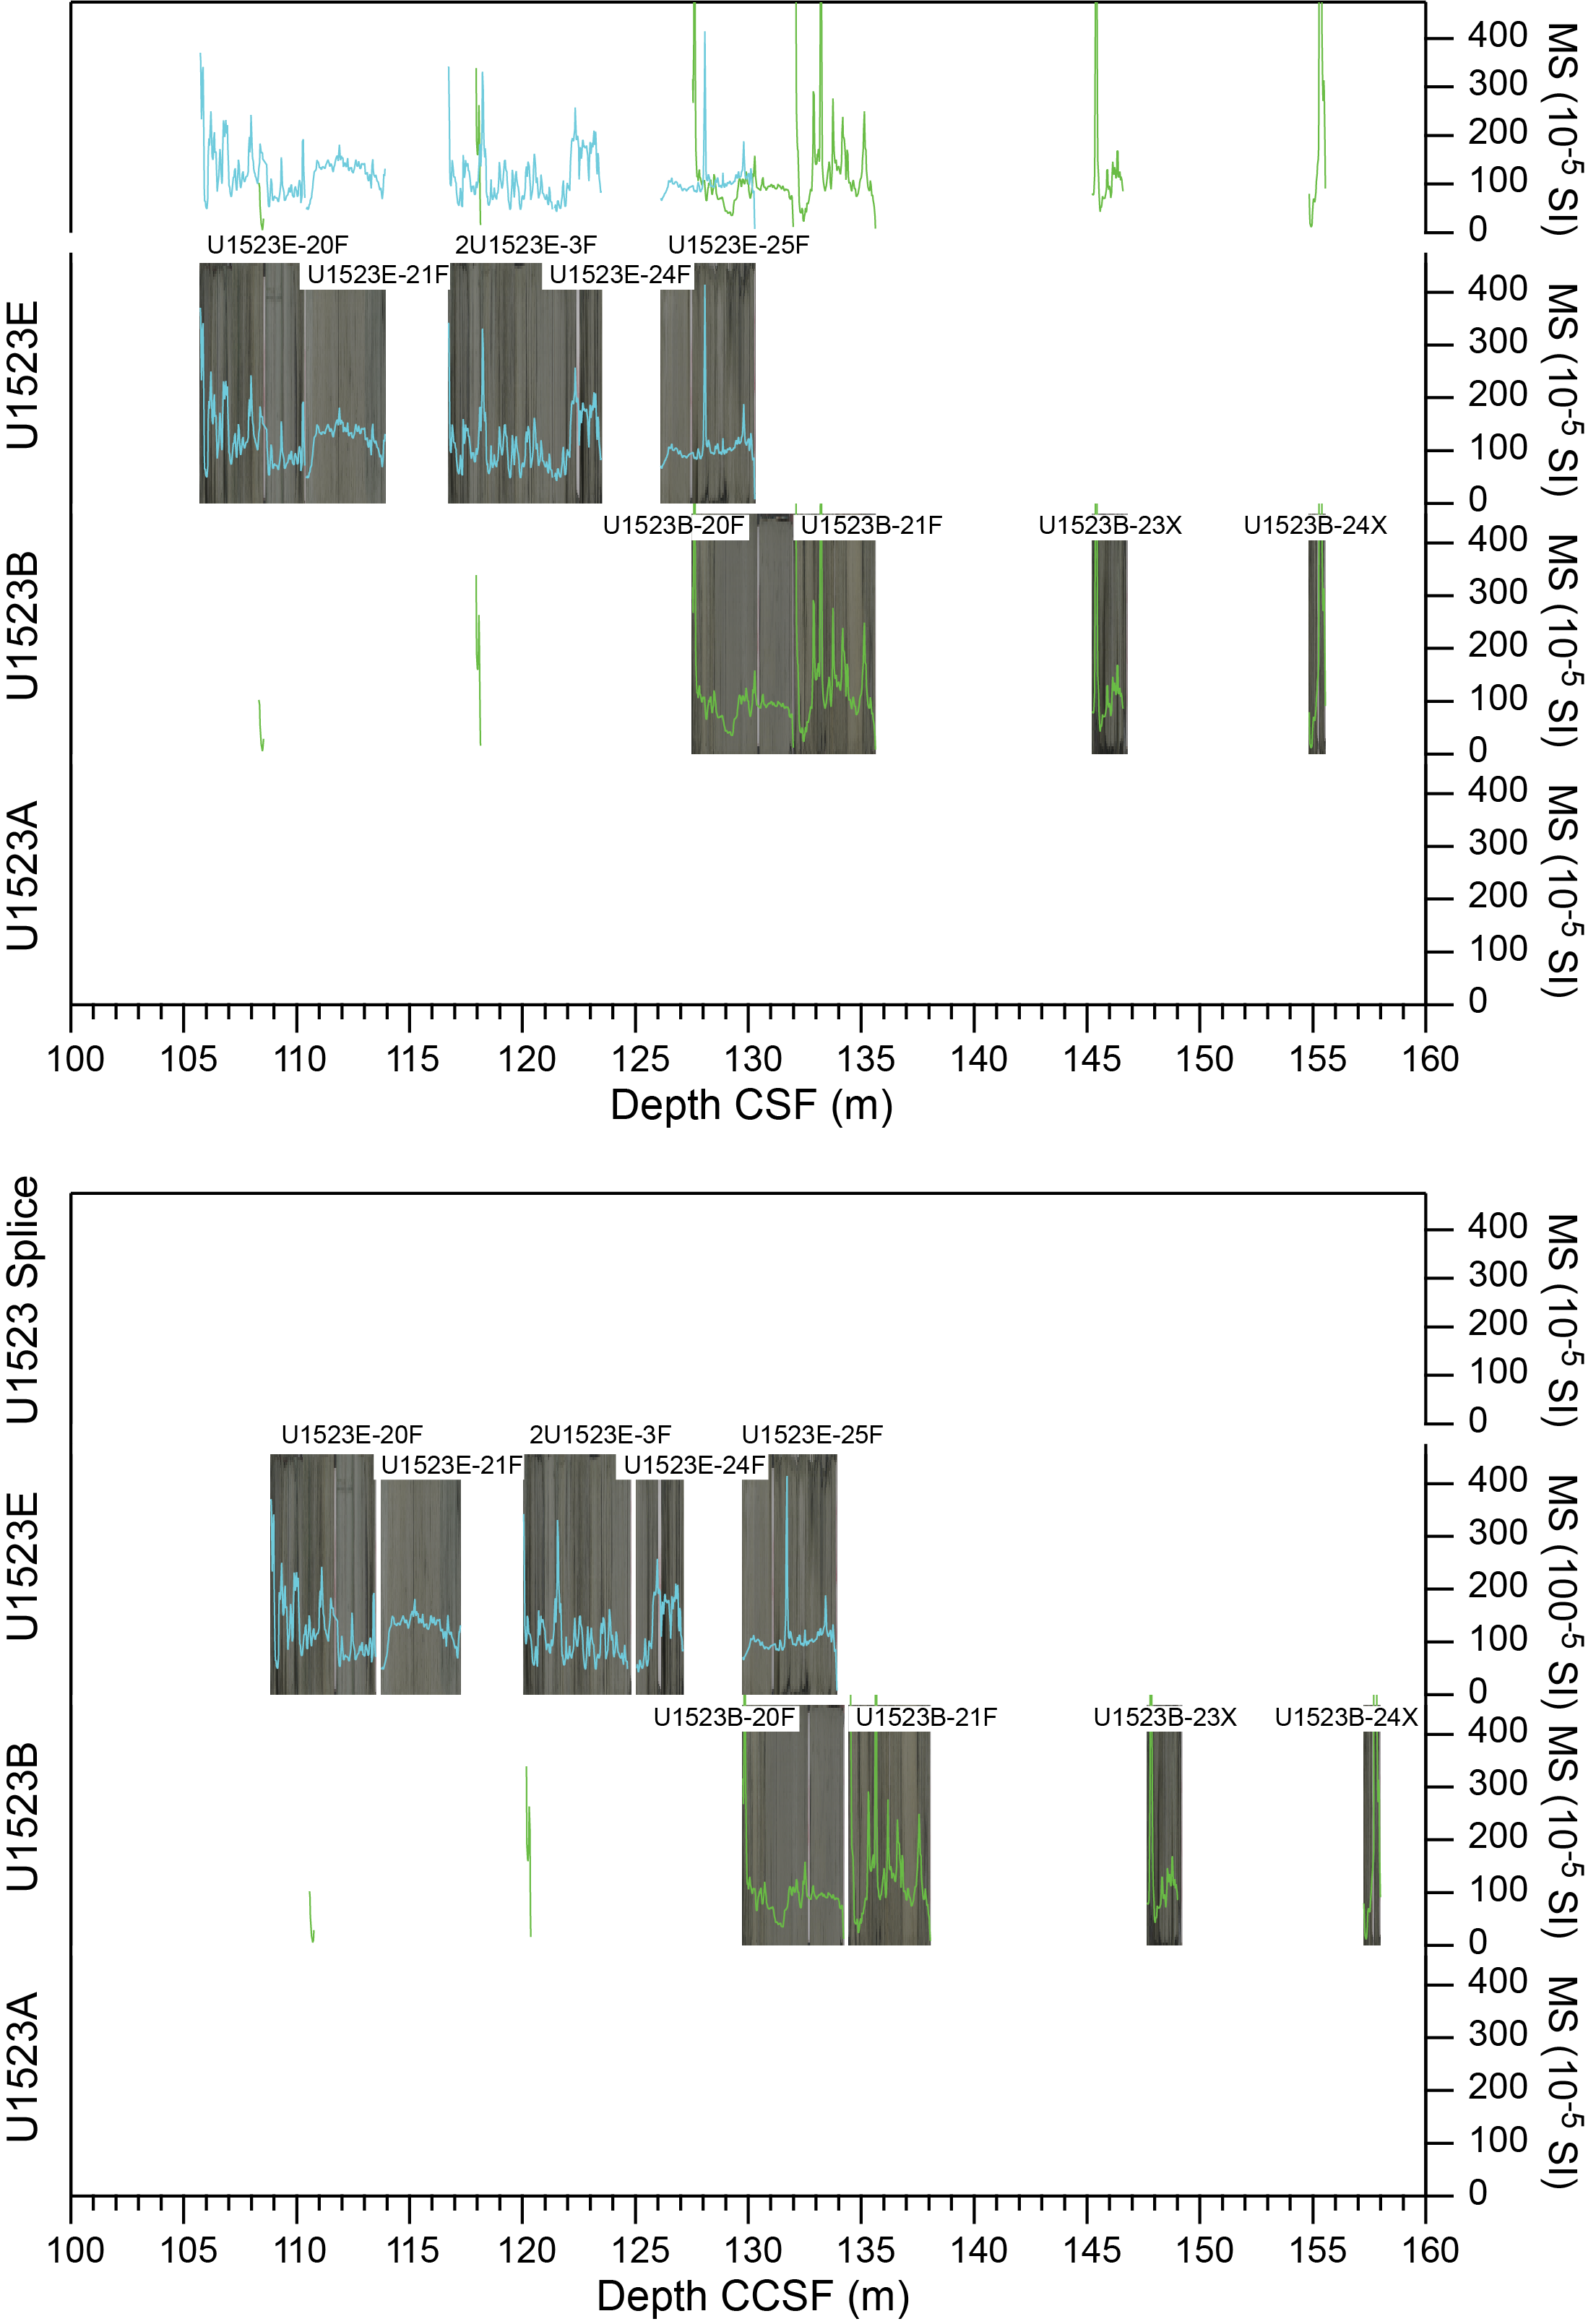
Figure F7. Linescan core images and magnetic susceptibility.
There is no apparent overlap between the base of Core U1523A-2H and the top of Core U1523E-3F based on physical properties and XRF data. Therefore, the offset for Core U1523E-3F is set to 0.54 m so as to not overlap the base of Core U1523A-2H. Interval U1523A-3H-2, 6 cm, is tied to U1523E-3F-3, 38 cm, using Ca/Ti. Interval U1523E-4F-2, 52 cm, is tied to interval U1523A-3H-5, 31 cm, using Rb/Sr.
Below the bases of Cores U1523A-4H and U1523E-4F, there is very little overlap among the holes. The offsets for Cores U1523A-4F through 6F are set equivalent to that of Core 3H (0.53 m), and Core 7F is set to 0.79 m to avoid overlap of the CCSF depth scale with the base of Core 6F, which has 101% recovery.
In Hole U1523E, Core 6F had only 4% recovery and no XRF data were collected, so its offset was set equal to the offset of Core 4F (0.12 m). Core 7F also had minimal recovery (10%) and no apparent overlap to cores from Hole U1523A, so its offset was also set to 0.12 m. The offsets for Cores 9F (24% recovery) and 10F (1% recovery) were also set to 0.12 m.
Below the mudline core in Hole U1523B, coring resumed at 46.7 m CSF-A with Core U1523B-3F after drilling without coring through the overlying sediment, at a depth just below the termination depth of Hole U1523A. XRF Rb/Sr and magnetic susceptibility data show a possible match between Cores U1523B-3F and U1523E-9F, so interval U1523B-3F-1, 85 cm, is tied to interval U1523E-9F-1, 65 cm, using Rb/Sr. Although this tie is tentative, it provides the best possible option to tie cores from Hole U1523B into the composite stratigraphy below the drilled interval.
Core U1523B-4F had no recovery, so its offset is set equal to that of Core 3F (1.02 m). Below this, core recovery improved (with the exception of Core 6F, which also had no recovery). However, with little or no overlap between Holes U1523B and U1523E, the offsets for Cores U1523B-5F through 7F are also set equal to that of Core 3F (1.02 m). Because core recovery for Core 7F was 102%, the offset for Core 8F is set at 1.52 m to avoid overlap with the base of Core 7F. The offset of 1.52 m is also applied to Cores 9F and 10F. Only Core U1523E-12F overlaps with this interval in Hole 1523B, but no definitive ties could be found between Core U1523E-12F and either Core U1523B-5F or 7F. Therefore, the offset for Core U1523E-12F is set at 1.62 m to avoid overlap with the base of Core U1523B-5F, with which no tie could be found. This position corresponds to the unrecovered interval of Core U1523B-6F and also does not overlap with the top of Core U1523B-7F.
Improved recovery in Cores U1523E-15F and 16F allow for ties between Holes U1523B and U1523E. A shell hash sandy layer in Section U1523B-11F-1 correlates to a similar layer in Section U1523E-15F-2 based on visual core description. Using this as a reference, we can tie interval U1523E-15F-1, 30 cm, to interval U1523B-10F-4, 26 cm, using Br/Ti, despite relatively little overlap between the base of Core U1523B-10F and the top of Core U1523E-15F. Interval U1523B-11F-2, 26 cm, is tied to interval U1523E-15F-2, 105 cm, using a peak in Br/Ti just below the base of the shell hash sandy layer in each hole. Because there is no overlap with Hole U1523B, the offset for Core U1523E-16F is set equal to the offset of Core 15F (3.03 m). About 1 m of material was recovered in Core U1523B-12F; however, a good correlation to Hole U1523E could not be found. Therefore, the offset for Core U1523B-12F was set equal to that of Core 11F (2.23 m).
Below Core U1523E-16F (~95 m CCSF) there is very little overlap in recovery between Holes U1523B and U1523E. The offsets for Cores U1523E-18F, 20F, 21F, and 23F are set equal to the offset for 16F (3.13 m). Because Core 23F had 102% recovery, the offset for Core 24F is set at 3.63 m to avoid overlap with the base of Core 23F and this offset is also applied to Core 25F. In Hole U1523B, there is almost no recovery from Cores U1523B-13F through 19X, so the offsets for those cores are set equal to the offset for Core 12F (2.23 m). Core U1523B-20F had excellent recovery (101%); however, there is no clear tie between it and cores from Hole U1523E, so its offset is set equal to Core 12F as well (2.23 m). The remainder of the cores from Hole U1523B are taken from deeper in the sequence than Hole U1523E, so no additional ties are possible and the remainder of the offsets are set to allow for a composite depth scale to the base of Hole U1523B. Because Core 20F had greater than 100% recovery, the offset for Core 21F was set to avoid overlap between it and the base of Core 20F (2.43 m), and this offset was applied to the remaining cores from Hole U1523B (22X–24X).
3.2. Stratigraphic splice
We created a stratigraphic splice from 0 to 93.95 m CCSF (Table T2), although the splice is only continuous to 15.82 m CCSF. Below this depth, most cores are appended, although there is a short interval of continuous section between 81 and 89 m CCSF. The splice is constructed to include as much recovered material as possible while also avoiding disturbed sections when feasible.
The top of the stratigraphic splice is defined in Core U1523A-1H from 0 to 6.15 m CCSF. The tie point to Core U1523E-1H at 6.15 m CCSF is defined using Zr/Rb. The tie point from Core U1523E-1H to Core U1523A-2H is defined at 9.34 m CCSF using an increase in magnetic susceptibility. Because there is no obvious overlap between the top of Core U1523E-3F and the base of Core U1523A-2H, Core U1523E-3F is appended to the splice. The tie point from Core U1523E-3F to U1523A-3H is defined at 20.51 m CCSF using Zr/Rb.
Below 20.51 m CCSF, cores are appended to include as much material as possible: Cores U1523A-4F and 5F, U1523E-7F, U1523A-6F and 7F, U1523B-3F and 5F, U1523E-12F, and U1523B-7F through 10F. A tie point from Core U1523B-10F to Core U1523E-15F is established at 85.21 m CCSF using Zr/Rb. Core U1523E-16F is appended below that, and its base at 93.95 m CCSF marks the end of the stratigraphic splice for Site U1523.
3.3. Off-splice mapping
Creation of a composite depth scale by aligning features in cores from different holes results in a good match at the tie point; however, features away from the tie point may not align well because a single offset from the CSF-A depth scale is applied to the entire core (e.g., Hagelberg et al., 1992; Westerhold et al., 2012; van Peer et al., 2017). This is particularly an issue for Core U1523E-1H, which contains several disturbed intervals that do not correlate well on the CCSF scale to Core U1523A-1H. To address this, we mapped the off-splice interval of Core U1523E-1H between 0 and 6.15 m CCSF to the splice interval in Core U1523A-1H using CODD (Wilkens et al., 2017). This process allowed creation of multiple tie points within the core, and then the data and images were stretched or squeezed between the tie points to better align features from the off-splice core to those in the splice and to produce an adjusted CCSF (aCCSF) depth scale. We established 13 tie points between 0 and 3.70 m CCSF using Zr/Rb data, and an additional 15 tie points between 3.70 and 6.15 m CCSF using Rb/Sr data to better correlate the off-splice interval of Core U1523E-1H to the splice in Core U1523A-1H (Figure F8; Table T3).
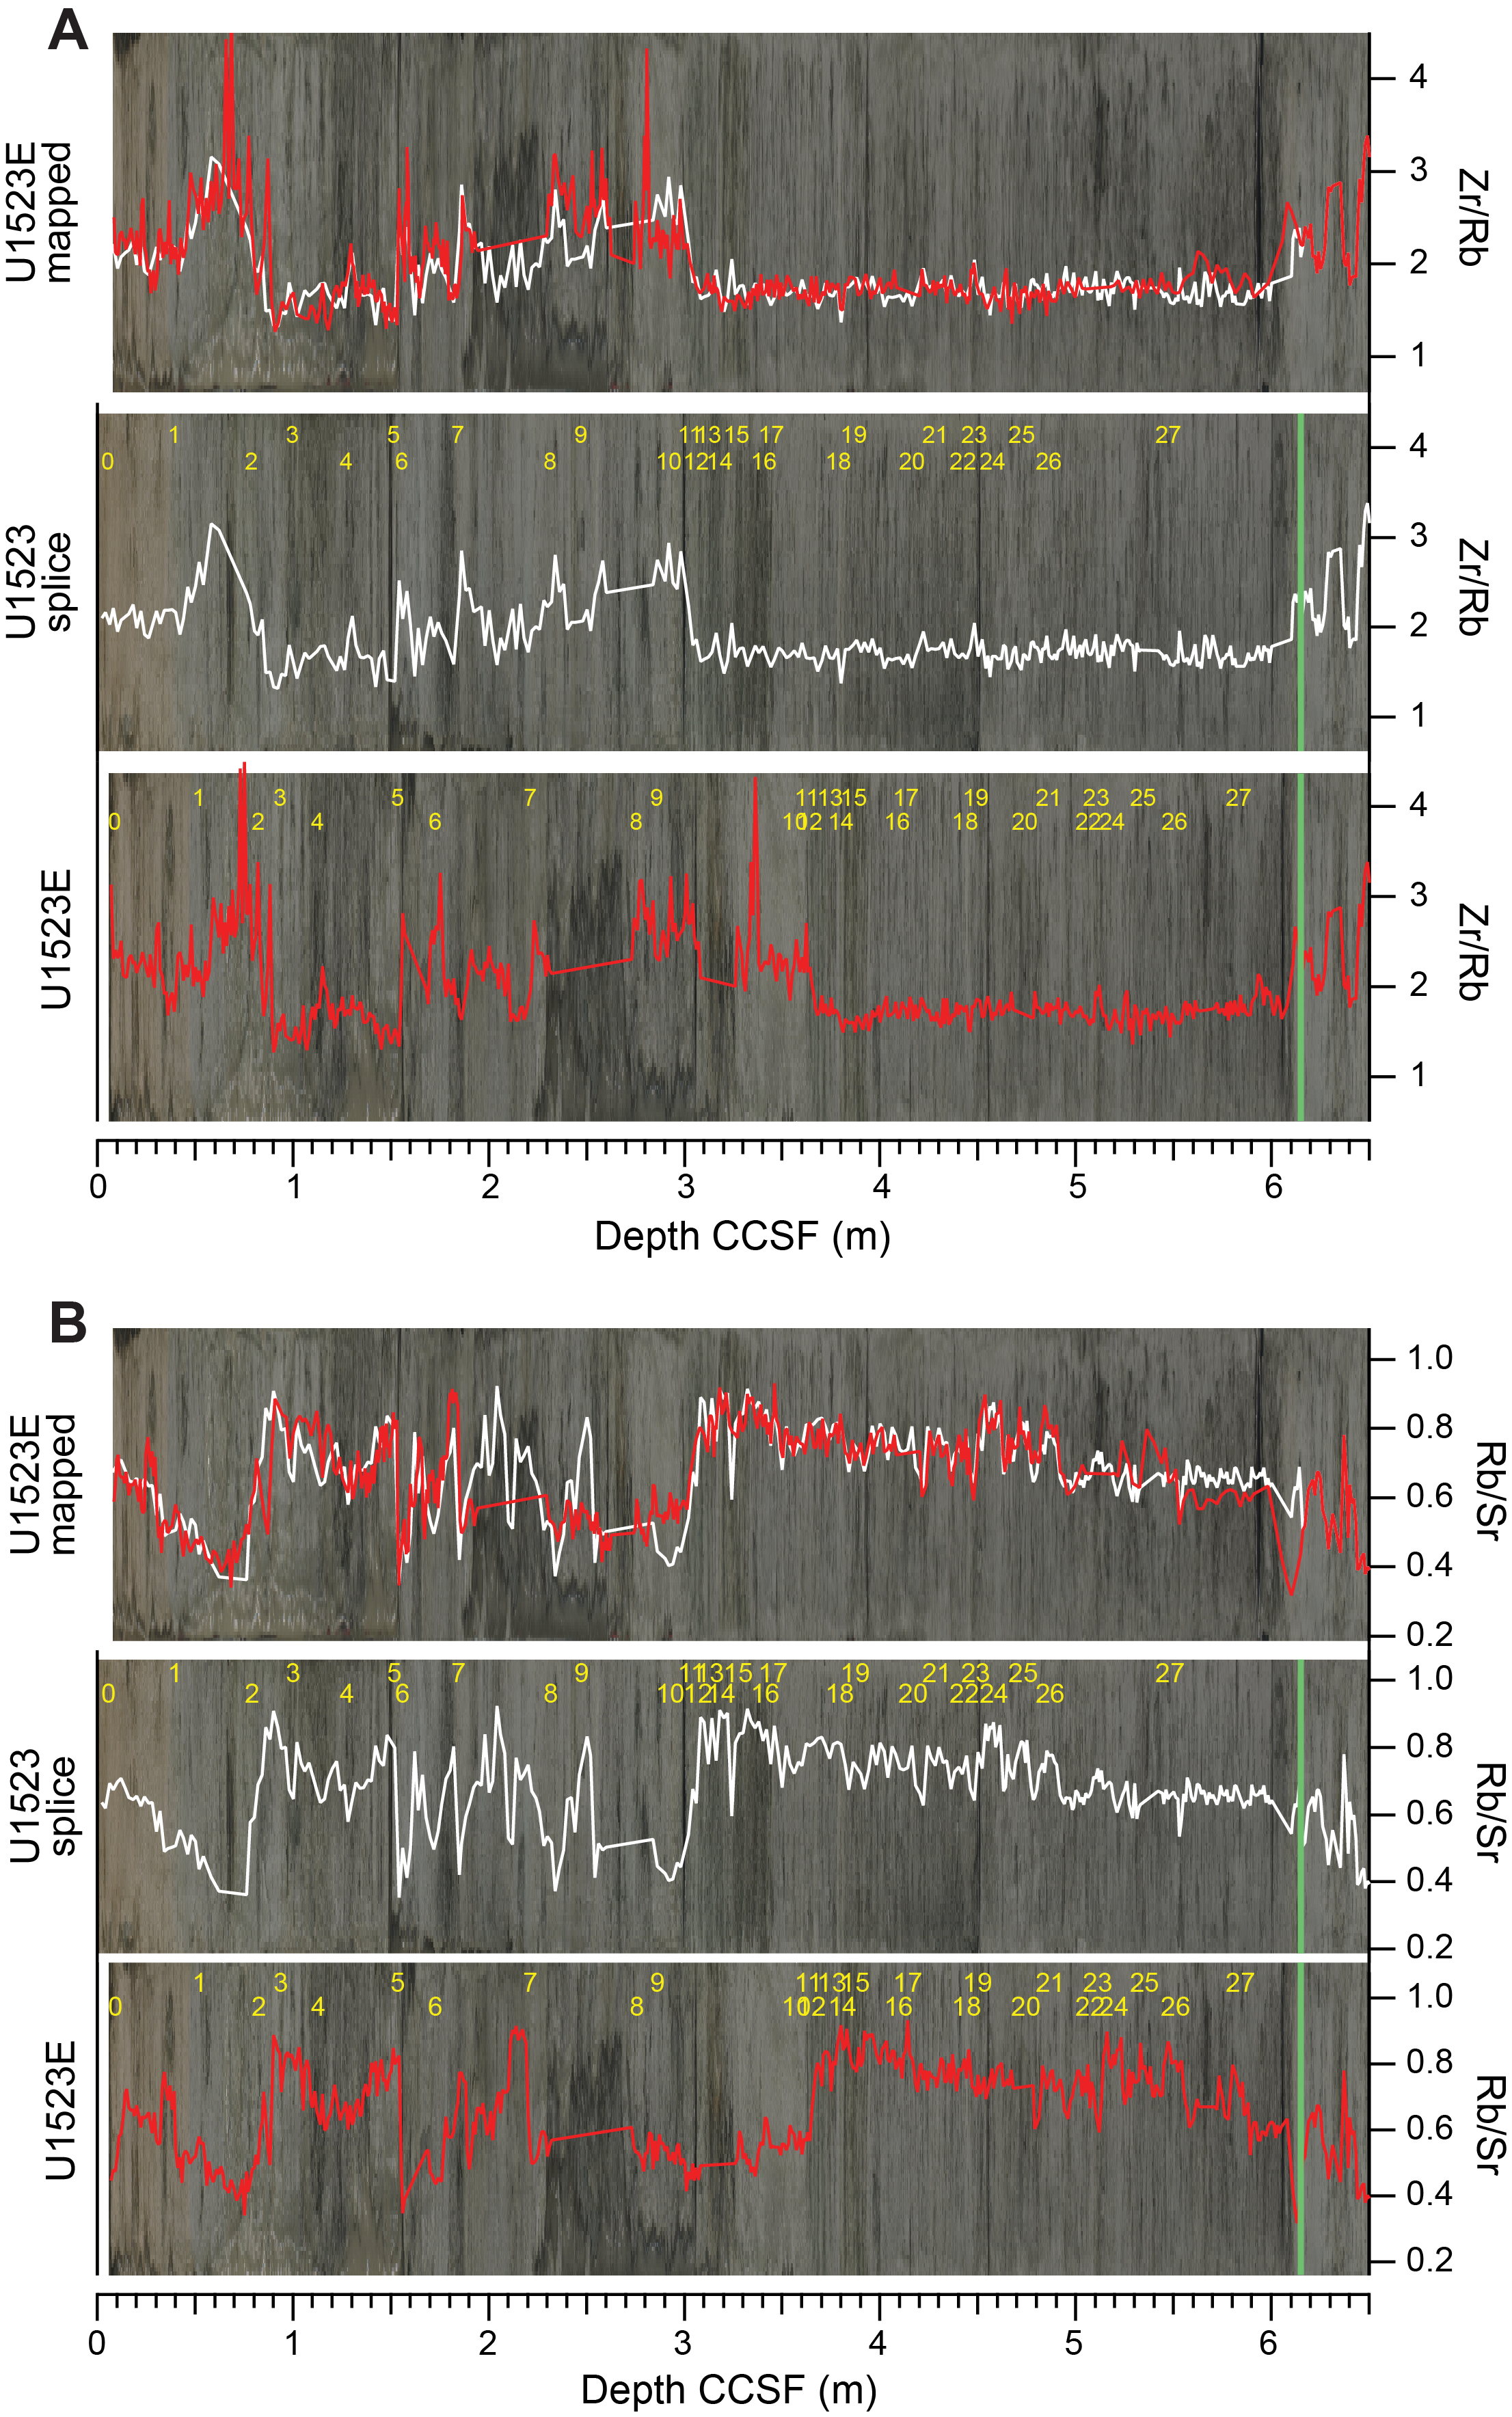
Figure F8. Off-splice mapping.
4. Acknowledgments
This study used samples and data provided by IODP. D.K. Kulhanek was funded by the IODP JOIDES Resolution Science Operator and US National Science Foundation (grant numbers OCE-1326927 and OPP-2000995). C. Prunella and A.E. Shevenell were supported by funding from the US Science Support Program. T.E. van Peer was funded by Natural Environment Research Council (NERC) grants NE/R018235/1 and NE/T012285/1. We thank the captain and crew aboard JOIDES Resolution for a successful expedition to retrieve these cores. We also thank reviewer Jennifer Middleton and editor Leah LeVay for their comments and corrections to the manuscript. Brian LeVay (XRF laboratory manager) and MacKenzie Schoemann (XRF laboratory assistant) provided invaluable assistance while collecting and analyzing the XRF data. We also thank Jenna Chapman and David Valerio for assistance with XRF core scanning. Anna Joy Drury, Thomas Westerhold, and Roy Wilkens provided valuable guidance with the CODD functions.
References
Arndt, J.E., Schenke, H.W., Jakobsson, M., Nitsche, F.O., Buys, G., Goleby, B., Rebesco, M., et al., 2013. The International Bathymetric Chart of the Southern Ocean (IBCSO) Version 1.0—a new bathymetric compilation covering circum-Antarctic waters. Geophysical Research Letters, 40(12):3111–3117. https://doi.org/
Hagelberg, T., Shackleton, N., Pisias, N., and the Shipboard Scientific Party, 1992. Development of composite depth sections for Sites 844 through 854. In Mayer, L., Pisias, N., Janecek, T., et al., Proceedings of the Ocean Drilling Program, Initial Reports, 138: College Station, TX (Ocean Drilling Program), 79–85. https://doi.org/
McKay, R.M., De Santis, L., Kulhanek, D.K., Ash, J.L., Beny, F., Browne, I.M., Cortese, G., Cordeiro de Sousa, I.M., Dodd, J.P., Esper, O.M., Gales, J.A., Harwood, D.M., Ishino, S., Keisling, B.A., Kim, S., Kim, S., Laberg, J.S., Leckie, R.M., Müller, J., Patterson, M.O., Romans, B.W., Romero, O.E., Sangiorgi, F., Seki, O., Shevenell, A.E., Singh, S.M., Sugisaki, S.T., van de Flierdt, T., van Peer, T.E., Xiao, W., and Xiong, Z., 2019a. Expedition 374 methods. In McKay, R.M., De Santis, L., Kulhanek, D.K., and the Expedition 374 Scientists, Ross Sea West Antarctic Ice Sheet History. Proceedings of the International Ocean Discovery Program, 374: College Station, TX (International Ocean Discovery Program). https://doi.org/
McKay, R.M., De Santis, L., Kulhanek, D.K., Ash, J.L., Beny, F., Browne, I.M., Cortese, G., Cordeiro de Sousa, I.M., Dodd, J.P., Esper, O.M., Gales, J.A., Harwood, D.M., Ishino, S., Keisling, B.A., Kim, S., Kim, S., Laberg, J.S., Leckie, R.M., Müller, J., Patterson, M.O., Romans, B.W., Romero, O.E., Sangiorgi, F., Seki, O., Shevenell, A.E., Singh, S.M., Sugisaki, S.T., van de Flierdt, T., van Peer, T.E., Xiao, W., and Xiong, Z., 2019b. Expedition 374 summary. In McKay, R.M., De Santis, L., Kulhanek, D.K., and the Expedition 374 Scientists, Ross Sea West Antarctic Ice Sheet History. Proceedings of the International Ocean Discovery Program, 374: College Station, TX (International Ocean Discovery Program). https://doi.org/
McKay, R.M., De Santis, L., Kulhanek, D.K., Ash, J.L., Beny, F., Browne, I.M., Cortese, G., Cordeiro de Sousa, I.M., Dodd, J.P., Esper, O.M., Gales, J.A., Harwood, D.M., Ishino, S., Keisling, B.A., Kim, S., Kim, S., Laberg, J.S., Leckie, R.M., Müller, J., Patterson, M.O., Romans, B.W., Romero, O.E., Sangiorgi, F., Seki, O., Shevenell, A.E., Singh, S.M., Sugisaki, S.T., van de Flierdt, T., van Peer, T.E., Xiao, W., and Xiong, Z., 2019c. Site U1523. In McKay, R.M., De Santis, L., Kulhanek, D.K., and the Expedition 374 Scientists, Ross Sea West Antarctic Ice Sheet History. Proceedings of the International Ocean Discovery Program, 374: College Station, TX (International Ocean Discovery Program). https://doi.org/
van Peer, T.E., Liebrand, D., Xuan, C., Lippert, P.C., Agnini, C., Blum, N., Blum, P., Bohaty, S.M., Bown, P.R., Greenop, R., Kordesch, W.E.C., Leonhardt, D., Friedrich, O., and Wilson, P.A., 2017. Data report: revised composite depth scale and splice for IODP Site U1406. In Norris, R.D., Wilson, P.A., Blum, P., and the Expedition 342 Scientists, Proceedings of the Integrated Ocean Drilling Program, 342: College Station, TX (Integrated Ocean Drilling Program). https://doi.org/
Westerhold, T., Röhl, U., Wilkens, R., Pälike, H., Lyle, M., Jones, T.D., Bown, P., Moore, T., Kamikuri, S., Acton, G., Ohneiser, C., Yamamoto, Y., Richter, C., Fitch, P., Scher, H., Liebrand, D., and the Expedition 320/321 Scientists, 2012. Revised composite depth scales and integration of IODP Sites U1331–U1334 and ODP Sites 1218–1220. In Pälike, H., Lyle, M., Nishi, H., Raffi, I., Gamage, K., Klaus, A., and the Expedition 320/321 Scientists, Proceedings of the Integrated Ocean Drilling Program, 320/321: Tokyo (Integrated Ocean Drilling Program Management International, Inc.). https://doi.org/
Wilkens, R.H., Westerhold, T., Drury, A.J., Lyle, M., Gorgas, T., and Tian, J., 2017. Revisiting the Ceara Rise, equatorial Atlantic Ocean: isotope stratigraphy of ODP Leg 154 from 0 to 5 Ma. Climate of the Past, 13(7):779–793. https://doi.org/