Weber, M.E., Raymo, M.E., Peck, V.L., Williams, T., and the Expedition 382 Scientists
Proceedings of the International Ocean Discovery Program Volume 382
publications.iodp.org

https://doi.org/10.14379/iodp.proc.382.104.2021
Site U15351
V.L. Peck, M.E. Weber, M.E. Raymo, T. Williams, L.H. Armbrecht, I. Bailey, S.A. Brachfeld, F.G. Cardillo, Z. Du, G. Fauth, M. García, A. Glüder, M.E. Guitard, M. Gutjahr, S.R. Hemming, I. Hernández-Almeida, F.S. Hoem, J.-H. Hwang, M. Iizuka, Y. Kato, B. Kenlee, Y.M. Martos, S. O'Connell, L.F. Pérez, B.T. Reilly, T.A. Ronge, O. Seki, L. Tauxe, S. Tripathi, J.P. Warnock, and X. Zheng2
Keywords: International Ocean Discovery Program, IODP, JOIDES Resolution, Expedition 382, Iceberg Alley and Subantarctic Ice and Ocean Dynamics, Site U1535, Subantarctic Front, Scotia Sea, Weddell Sea, contourites, Weddell Sea Deep Water, Antarctic Circumpolar Current, Southern Hemisphere westerly winds, paleoceanography, paleoclimatology, mid-Pleistocene transition, Pliocene, interglacial climate, marine isotope stage, MIS 5, MIS 11
MS 382-104: Published 20 May 2021
Background and objectives
International Ocean Discovery Program (IODP) Site U1535 (proposed Site SFSD-02A) is located on the northern flank of a large trough ~668 km east of the Strait of Magellan at 53°11.49′S, 58°38.60′W in 647 m of water. The site is situated at Common Depth Point 9220 on Seismic Reflection Profile SGFI93-107. Site U1535 is the second of a pair of sites. The first site (U1534; proposed Site SFSD-03A), which is 8 km west of Site U1535, had a more extensive coring program targeting the deeper part of the common stratigraphy at the two sites.
The primary objective at Site U1535 was to recover a continuous 120 m sedimentary section from the upper sequences of a contourite drift deposited on the northern flank of the east–west trending trough. The crest of the contourite drift is currently being deposited beneath the Subantarctic Front in 600 m of water. The drift is bathed by Antarctic Intermediate Water as it begins its northward penetration into the Atlantic Ocean. The principal scientific motivation to core this drift is to better understand the role of Antarctic Intermediate Water in climate change on millennial, glacial–interglacial, and longer term timescales. See Background and objectives in the Site U1534 chapter (Peck et al., 2021) for more detailed information about the objectives at this pair of sites.
Coring at Site U1535 aimed to recover the sedimentary unit between Reflectors A and B, an interval that is thicker here than in the laterally correlative unit at Site U1534. Site U1534, conversely, targeted the most continuous and expanded sediments above Reflector A and below Reflector B.
Operations
For Hole U1535A, the seafloor was determined by the Core 382-U1535A-1H mudline to be at 646.9 meters below sea level (mbsl). Hole U1535A was started at 0930 h on 2 April 2019. Advanced piston corer (APC) coring proceeded without difficulty to Cores 9H–11H, which were difficult to remove from the core barrel. At that point, we switched to half-length APC (HLAPC) coring for Core 12F at 88.5 meters below seafloor (mbsf). Cores 1H–17F penetrated from the seafloor to 117.3 mbsf and recovered 112.4 m (96%) (Table T1). Having achieved sufficient stratigraphic coverage and considering the overall time constraints for the expedition, we concluded operations at Subantarctic Front Sites U1534 and U1535 and started pulling up the drill string at 0330 h on 3 April. The bottom-hole assembly was stowed, and the rig floor was secured for transit. We started the voyage across the Southern Ocean to Scotia Sea Site U1536 at 0848 h on 3 April.
Lithostratigraphy
One hole (U1535A) was drilled at Site U1535 to a total depth of 117.3 mbsf. At this site, two of the lithostratigraphic units (Figure F1) described for Site U1534 were identified based on sediment composition in smear slides and visual core description. Bioturbation is present throughout, but no distinct trace fossils were identified.
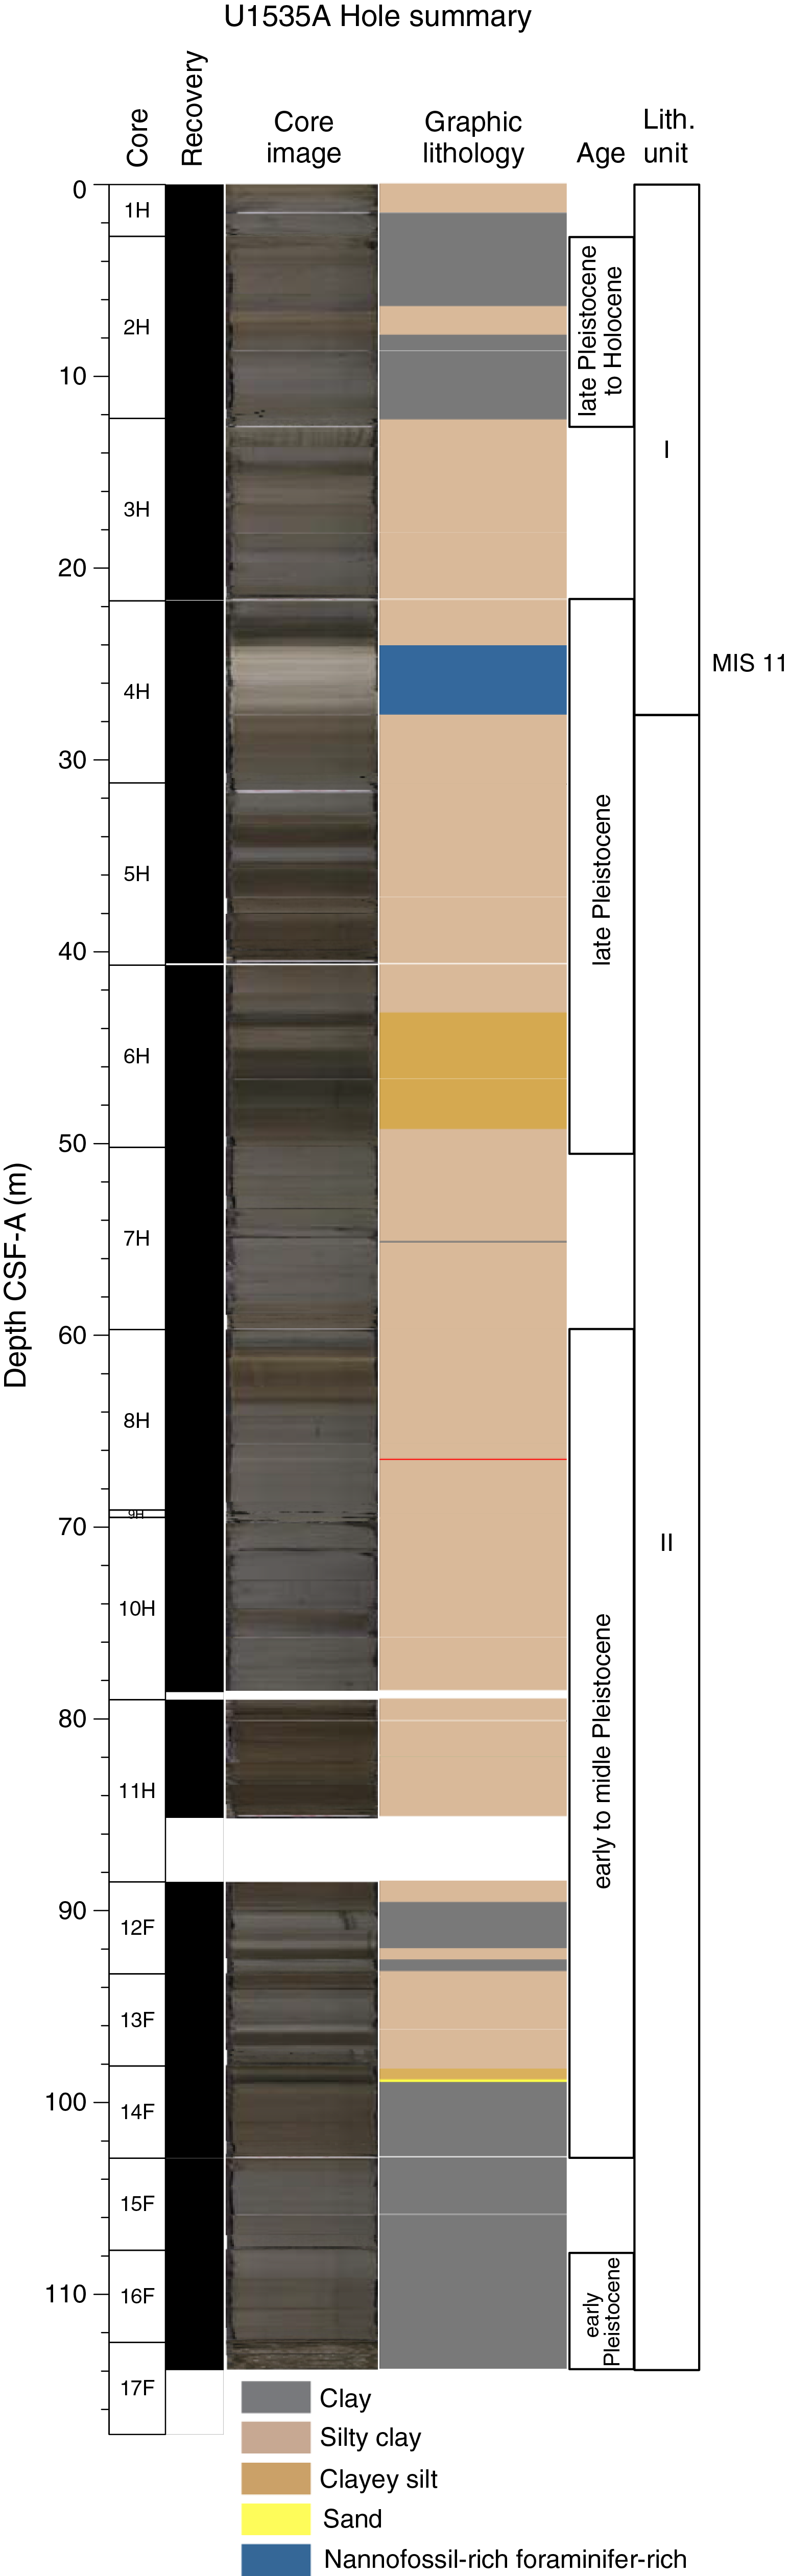
Figure F1. Visual core description.
Most cores are relatively undisturbed. The most common drilling disturbances, however, are mushy to soupy upper intervals at the top of several cores. Hole U1535A contains several sequences of silty clays interbedded with clayey silts and clay layers. The most common biogenic components (sponge spicules and diatoms) are generally between 10% and 25% of the sediment.
Unit descriptions
Unit I
Lithostratigraphic Unit I comprises interbedded foraminifer-bearing sediment with dark and very dark greenish gray (10Y 4/1 and 10Y 3/1) biosilica-rich silty clays. As estimated from smear slides, the terrigenous fraction is composed of >50% quartz with <25% feldspar and accessory opaque minerals and glauconite. The biogenic fraction consists of >50% biosilica (diatoms and spicules).
Three carbonate-rich intervals were identified. The first interval (Section 382-U1535A-2H-3 to the top of Section 2H-4) is a dark greenish gray (10Y 4/1) biosiliceous silty clay that contains 25% foraminifers and nannofossils and likely corresponds the interval assigned to Marine Isotope Stage (MIS) 5e at Site U1534. The second foraminifer-bearing unit is greenish gray (10Y 6/1), was recovered in Section 3H-1, and may correspond to MIS 9. The third carbonate-rich interval was recovered in Sections 4H-2 through 4H-4 and corresponds to the light gray (10Y 7/1) layer at Site U1534 that was identified as MIS 11 (Figure F1). The upper boundary of this carbonate-rich MIS 11 interval to the overlying spicule-rich silty clay is very sharp and probably erosional. The lower boundary of the MIS 11 layer displays a gradual transition from the silty clay unit below. Smear slide analyses of the center of the MIS 11 layer show a ratio of about 40% terrigenous and 60% biogenic material, hence the ooze classification. Quartz, glauconite, and opaque minerals are the main component of the terrigenous fraction, as identified from smear slide analyses. Foraminifers and nannofossils are the dominant biogenic components, yet diatoms and spicules are also common (Figure F1). The base of this interval defines the base of Lithostratigraphic Unit I.
Although present, dropstones are rare in Hole U1535A and could only be visually identified when on the split surface of the archive or working half (i.e., Sections 382-U1535A-1H-2, 2H-3, 3H-2, 8H-1, 10H-6, and 14F-1). A few additional dropstones were observed in the X-radiographs.
Unit II
Lithostratigraphic Unit II is dominated by biosilica-bearing to biosilica-rich silty clay that is dominantly dark greenish gray and very dark greenish gray (10Y 4/1 and 10Y 3/1). At more than 50%, quartz is the dominant mineral of the terrigenous fraction. Smear slide analyses also show rare to common feldspar minerals in most core samples, as well as accessory minerals of mica, glauconite, and opaques (probably pyrite). Several sharp boundaries between clay-rich and siltier layers are present, but graded bedding was not observed. Section 382-U1535A-14F-1 is marked by pronounced greenish black glauconite sand that is part of a normal-graded turbiditic interval (Figure F2).
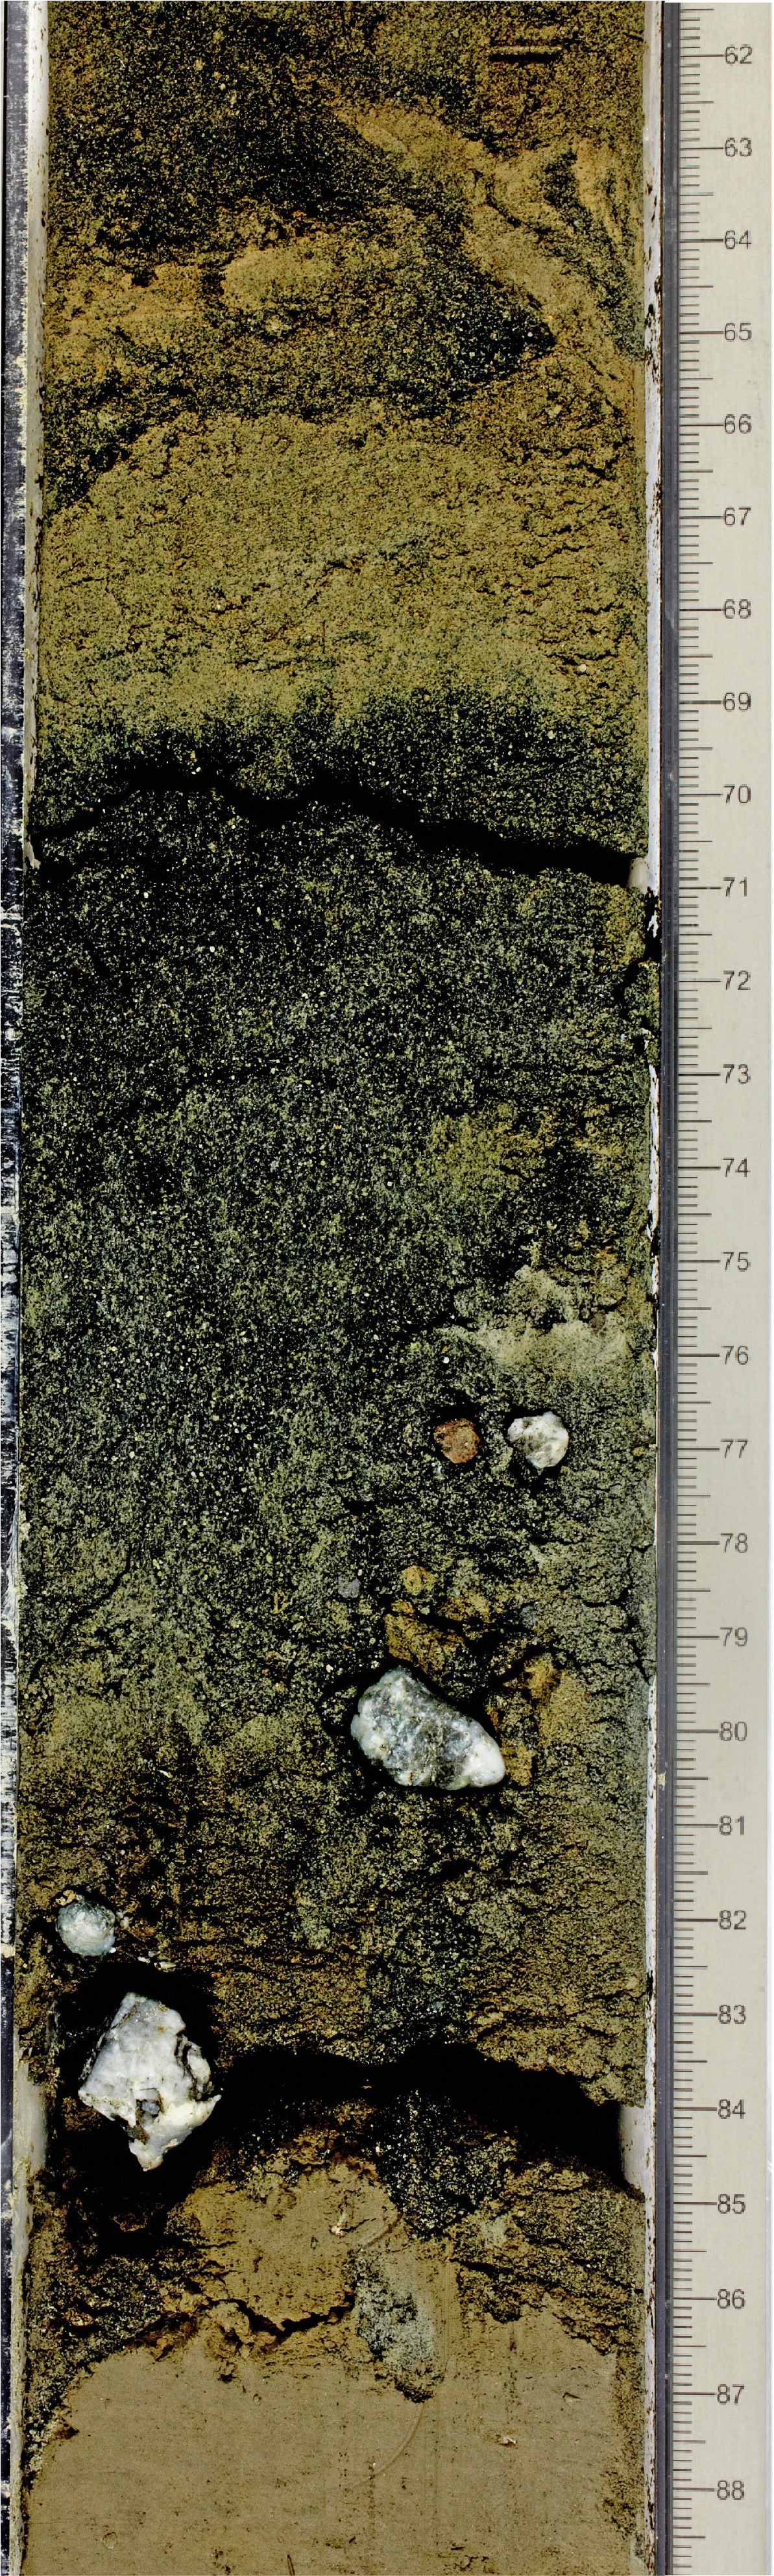
Figure F2. Graded glauconite sand.
X-radiographs
Radiographs from Site U1535 show some distinct textures (Figure F3), including millimeter-scale laminations (mostly parallel but also cross-laminations in some cases), faint centimeter-scale bands of alternating higher and lower density values, millimeter- to centimeter-scale dropstones, fossil traces, and a variety of macrofossils (shells and corals). X-ray images were used to identify fossils to sample for dating.
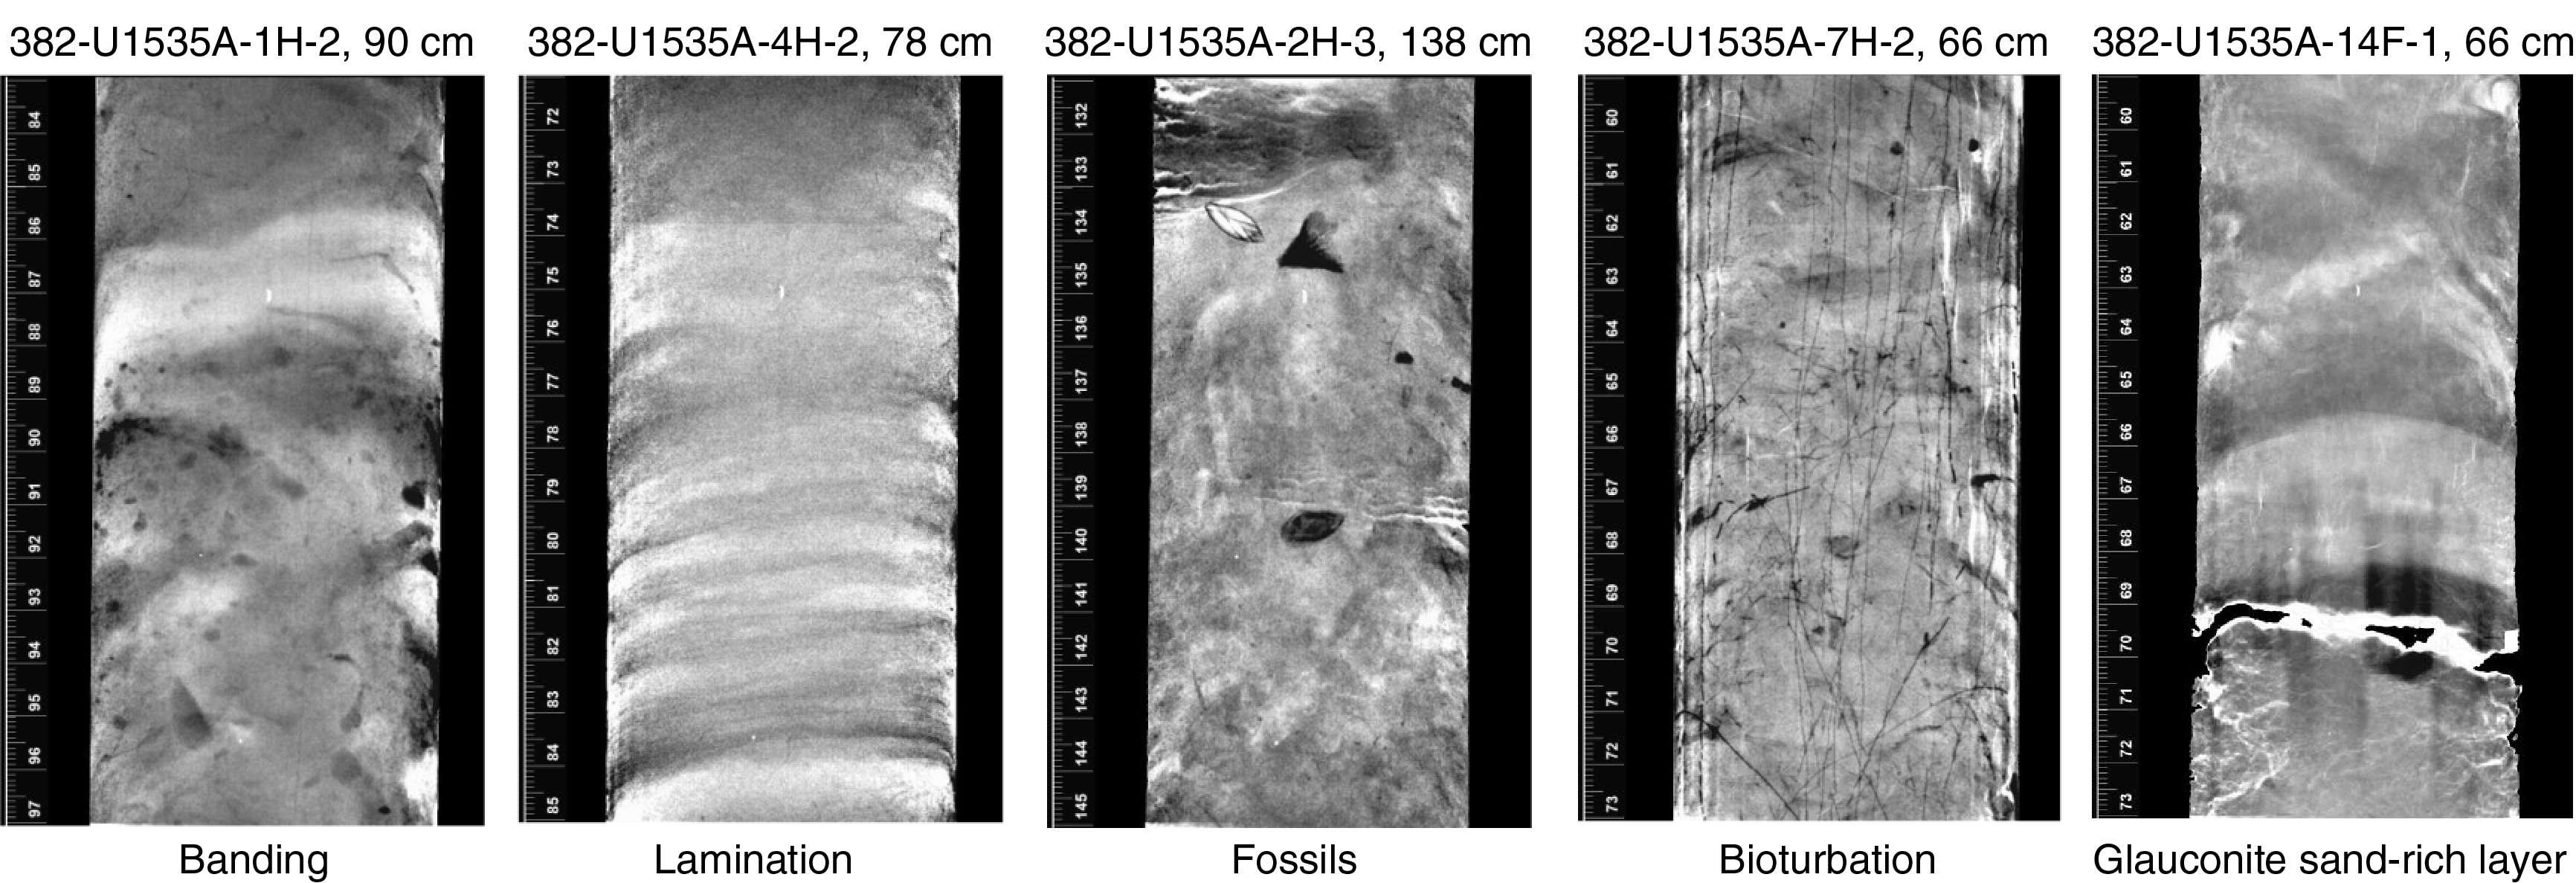
Figure F3. X-radiographs.
Biostratigraphy
Silty clays and clayey silts containing siliceous and organic-walled microfossils were recovered from Hole U1535A. Core catcher samples from Cores 382-U1535A-1H through 17F were analyzed for diatoms, radiolarians, and palynomorphs. This site description is focused primarily on biostratigraphically relevant taxa (i.e., presence/absence and first occurrence [FO]/last occurrence [LO] events). Results from shipboard analyses are presented in Figure F4 and Tables T2 and T3.
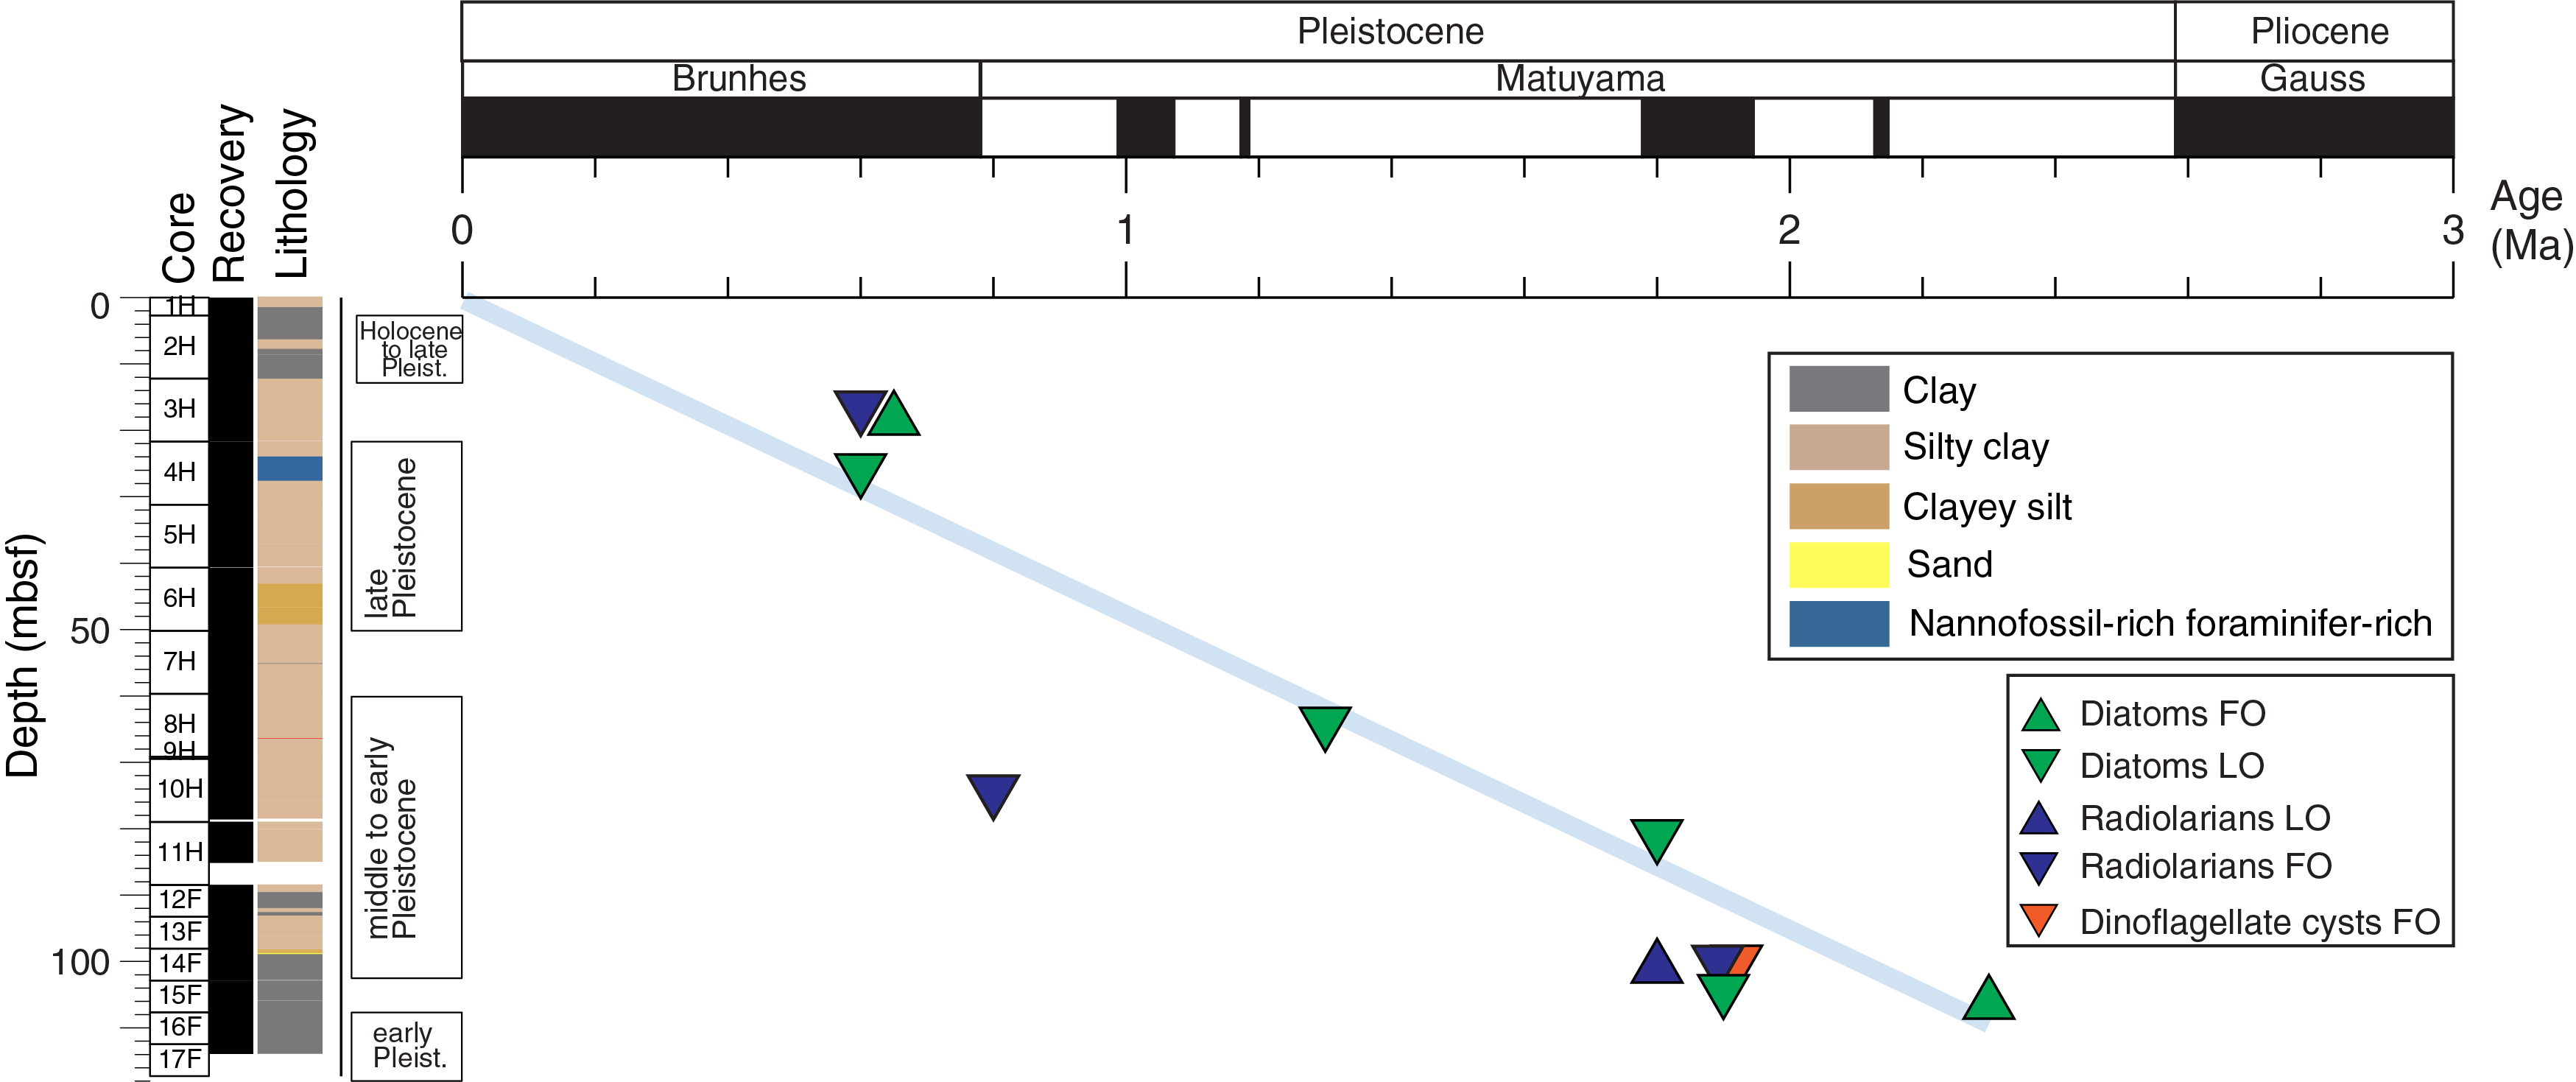
Figure F4. Biostratigraphic age-depth plot.
Siliceous microfossils
Diatoms
Abundance and preservation (fragmentation and dissolution) are variable throughout the analyzed sections; however, diatoms were identified in nearly all samples. Silicoflagellates, ebridians, and sponge spicules are present but not considered in this analysis. Diatoms are generally present at trace levels in all samples. Diatom dissolution and fragmentation varies from medium to high, but both are generally high throughout.
Sample 382-U1535A-1H-CC contains very few diatoms and is barren of biostratigraphically relevant taxa. Sample 2H-CC contains the biostratigraphic markers Fragilariopsis kerguelensis (FO = 2.3 Ma), Fragilariopsis rhombica (FO = 1.4 Ma), Fragilariopsis ritscheri (FO = 2.8–3.6 Ma), and Thalassiosira antarctica (FO = 0.65 Ma). These species represent a Holocene to late Pleistocene assemblage. The only biostratigraphic marker diatom species in Sample 3H-CC is F. kerguelensis, which represents a late Pleistocene assemblage. Samples 4H-CC to 6H-CC all contain F. kerguelensis and Sample 4H-CC contains Actinocyclus ingens (LO = 0.6 Ma), making this interval representative of the late Pleistocene. In Samples 2H-CC to 6H-CC, the diatom species Paralia sulcata and Thalassionema nitzschioides were found. Chaetoceros resting spores were also typically encountered. Other diatoms were found infrequently (Table T4).
Samples 382-U1535A-7H-CC to 14F-CC contain a middle Pleistocene assemblage typified by Fragilariopsis barronii (FO = 4.4 Ma; LO = 1.3 Ma) and F. kerguelensis. One specimen of Thalassiosira inura (FO = 5.6 Ma; LO = 1.8–2.0 Ma) was found in Sample 7H-CC but may have been reworked, considering its sporadic occurrence and the lack of consistency with radiolarian-based ages. Chaetoceros resting spores and the common species P. sulcata and T. nitzschioides were also found in this interval. Other diatom species were found in individual samples (Table T4).
Sample 382-U1535A-15F-CC contains a similar assemblage to that of Samples 7H-CC to 14F-CC; however, it also includes Thalassiosira kolbei (FO = 4.1 Ma; LO = 1.9 Ma). Subsequently, Samples 16F-CC and 17F-CC contain an assemblage similar to that of Samples 7H-CC to 14F-CC (i.e., T. kolbei was not identified in these two samples). All three of these samples represent the early Pleistocene. All species data are documented in Table T4.
Radiolarians
We analyzed radiolarians in every second core catcher sample between Samples 382-U1535A-1H-CC and 6H-CC. Below that, core catcher samples were analyzed continuously, along with additional samples from several sections in Core 10H. Radiolarian abundance varies from rare to abundant with moderate to good preservation. Four bioevents were identified (Table T3). The LO of Antarctissa cylindrica (0.64 Ma) in Sample 2H-CC was used to mark the Pleistocene Omega/Phi Zone boundary. Although we are confident that this species was correctly identified based on its external morphology, we lack a good specimen in which the internal structure can be observed, which would be a better diagnostic for its identification. Moreover, we cannot exclude the possibility that the individuals of A. cylindrica observed in Samples 2H-CC and 4H-CC are reworked. The occurrence of Pterocanium trilobum (LO = 0.86 Ma) in Sample 10H-6, 74 cm, defines the Psi/Chi Zone boundary. The first appearance datum of Phormospyris antarctica (FO = 1.88 Ma) and last appearance datum of Eucyrtidium calvertense (LO = 1.92 Ma) in Samples 13F-CC and 14F-CC, respectively, indicate the transition between the Chi and Phi Zones. Together with these two events, the occurrence of Cycladophora pliocenica in Sample 14F-CC and below indicates early Pleistocene ages. The occurrence of Desmospyris spongiosa in Samples 15F-CC and 17F-CC gives a maximum age for the bottom of Hole U1535A of 2.47 Ma, which is the lower limit of the Phi Zone. All radiolarian data are documented in Table T5.
Palynology
Five core catcher samples from Hole U1535A were processed with hydrofluoric acid and analyzed for palynological content (dinoflagellate cysts [dinocysts], pollen, and spores). All samples analyzed have well-preserved marine and terrestrial palynomorph assemblages. Generally, the dominant palynomorph association is composed of the heterotrophic dinocyst genera Brigantedinium spp., Selenopemphix spp., and Protoperidinium spp., whereas various trilete spores are the most abundant sporomorphs. All cores analyzed contain some reworked specimens. Sample 382-U1535A-13F-CC in particular has an abundance of reworked dinocysts of Eocene age.
Because of the sparse age-diagnostic dinocysts and much lower sample resolution compared with the other microfossil groups, shipboard dinocyst biostratigraphy was employed only for supportive age control. In the samples studied, only one biostratigraphically significant species was found, Selenopemphix dionaeacysta in Sample 382-U1535A-13F-CC, and it last occurred in the early Pleistocene (LO = 1.92 Ma) (Table T3).
All samples analyzed contain palynofacies other than dinocysts and sporomorphs. Acritarchs, foraminifer test linings, copepod remains, fungal spores, black and brown phytoclasts, and amorphous organic matter are commonly recorded throughout. Detailed assemblage data from Hole U1535A with semiquantitative estimates of palynofacies and dinocyst species are accessible in Table T6.
Marine sedimentary ancient DNA
No samples were collected for marine sedimentary ancient DNA or contamination control (perfluorocarbon tracers).
Summary
Diatom, radiolarian, and palynomorph age estimates are consistent for the majority of samples from Hole U1535A. These analyses showed 12 biostratigraphic events (Table T3). Generally, species assemblages and biostratigraphic age estimates reflect those in Hole U1534A. However, the maximum age above the hiatus associated with Reflector B in Hole U1534A (Sample 382-U1534A-10H-3, 75 cm) was mid-Pleistocene (~0.9 Ma), whereas mid- to early Pleistocene sediments were recovered above this reflector in Hole U1535A (Sample 382-U1535A-17F-CC). A biostratigraphic age-depth plot showing microfossil datums in relation to sediment core depth is provided in Figure F4. Assuming continuous accumulation, a sedimentation rate of 49 m/My is estimated in Hole U1535A.
Paleomagnetism
Paleomagnetic measurements were made on 79 APC and HLAPC core sections from Site U1535 to investigate the natural remanent magnetization (NRM). No cores were oriented. No archive-half measurements were made on Section 382-U1535A-1H-1, Core 17F, or any core catchers because visual coring deformation indicated highly disturbed sedimentary fabric. Cores 10H and 11H were measured despite being from cores with significant coring deformation in the hopes that some of the less deformed intervals preserved the primary inclination. These data are presented in this report but should be interpreted with caution. On all archive halves (see the exceptions listed above), we measured the initial magnetization and the magnetization following peak alternating field (AF) demagnetization at 10 and 15 mT. Because of an error in the superconducting rock magnetometer (SRM) software where the Y calibration constant had the opposite sign, declinations had to be corrected by subtracting the declination from 360° (see discussion in Paleomagnetism in the Site U1534 chapter [Peck et al., 2021]).
A total of 68 discrete cube samples were taken from the working halves, with roughly one sample taken per section from APC and HLAPC cores. Cores 382-U1535A-10H and 11H were not sampled because of the visually disturbed sedimentary fabric. The NRM of the discrete samples was measured on the SRM using a series of at least three measurements per AF level for the initial magnetization and the magnetization after 5, 10, 15, and 20 mT peak AFs. Although no discrete samples were subject to an AF >20 mT, we note that observations from nearby Site U1534 indicate a complex magnetic mineralogy, including the likely presence of authigenic ferrimagnetic iron sulfides, which have an unknown time of remanence acquisition and can complicate investigation of the NRM through the acquisition of a gyroremanent magnetization in an AF (see Paleomagnetism in the Site U1534 chapter [Peck et al., 2021]).
Natural remanent magnetization
Stratigraphic archive-half results
Like observations from nearby Site U1534, a positive downward drilling overprint was typically removed by the 10 mT AF demagnetization step. The preliminary magnetostratigraphy is based on the inclination and declination from the 15 mT AF demagnetization step. Archive-half data were filtered as follows:
- We deleted all measurements within 5 cm of the section ends to remove the edge effect inherent in all pass-through measurement systems such as the SRM.
- We deleted all measurements in the upper 50 cm of Section 1 of all cores because they are the most susceptible to the accumulation of fall-in material during coring and often appeared to be more resistant to the removal of the drill string overprint.
- We deleted all data from all intervals containing the "high" drilling disturbance intensity code entered during core description (see Lithostratigraphy) to remove data in intervals affected by coring-induced disturbance such as fall-in and flow-in.
- We inspected core photographs and X-radiographs in intervals with suspect directions to assess whether the directions coincided with dropstones or large shells beneath the core surface, turbidites, tephra layers, or other lithologic features.
After removing the drilling overprint, inclination values are predominantly negative (Figure F5) with an interval containing scattered but steep positive inclinations from about 68.3 to 97.81 mbsf. This interval spans Cores 382-U1535A-10H and 11H, which were heavily disturbed during coring; thus, the intervals recovered by these cores should be interpreted only with extreme caution. Small regions of reversed intervals were also found in Core 8H, which has transitions between steep positive and steep negative inclinations with associated changes in declination that likely reflect polarity transitions.
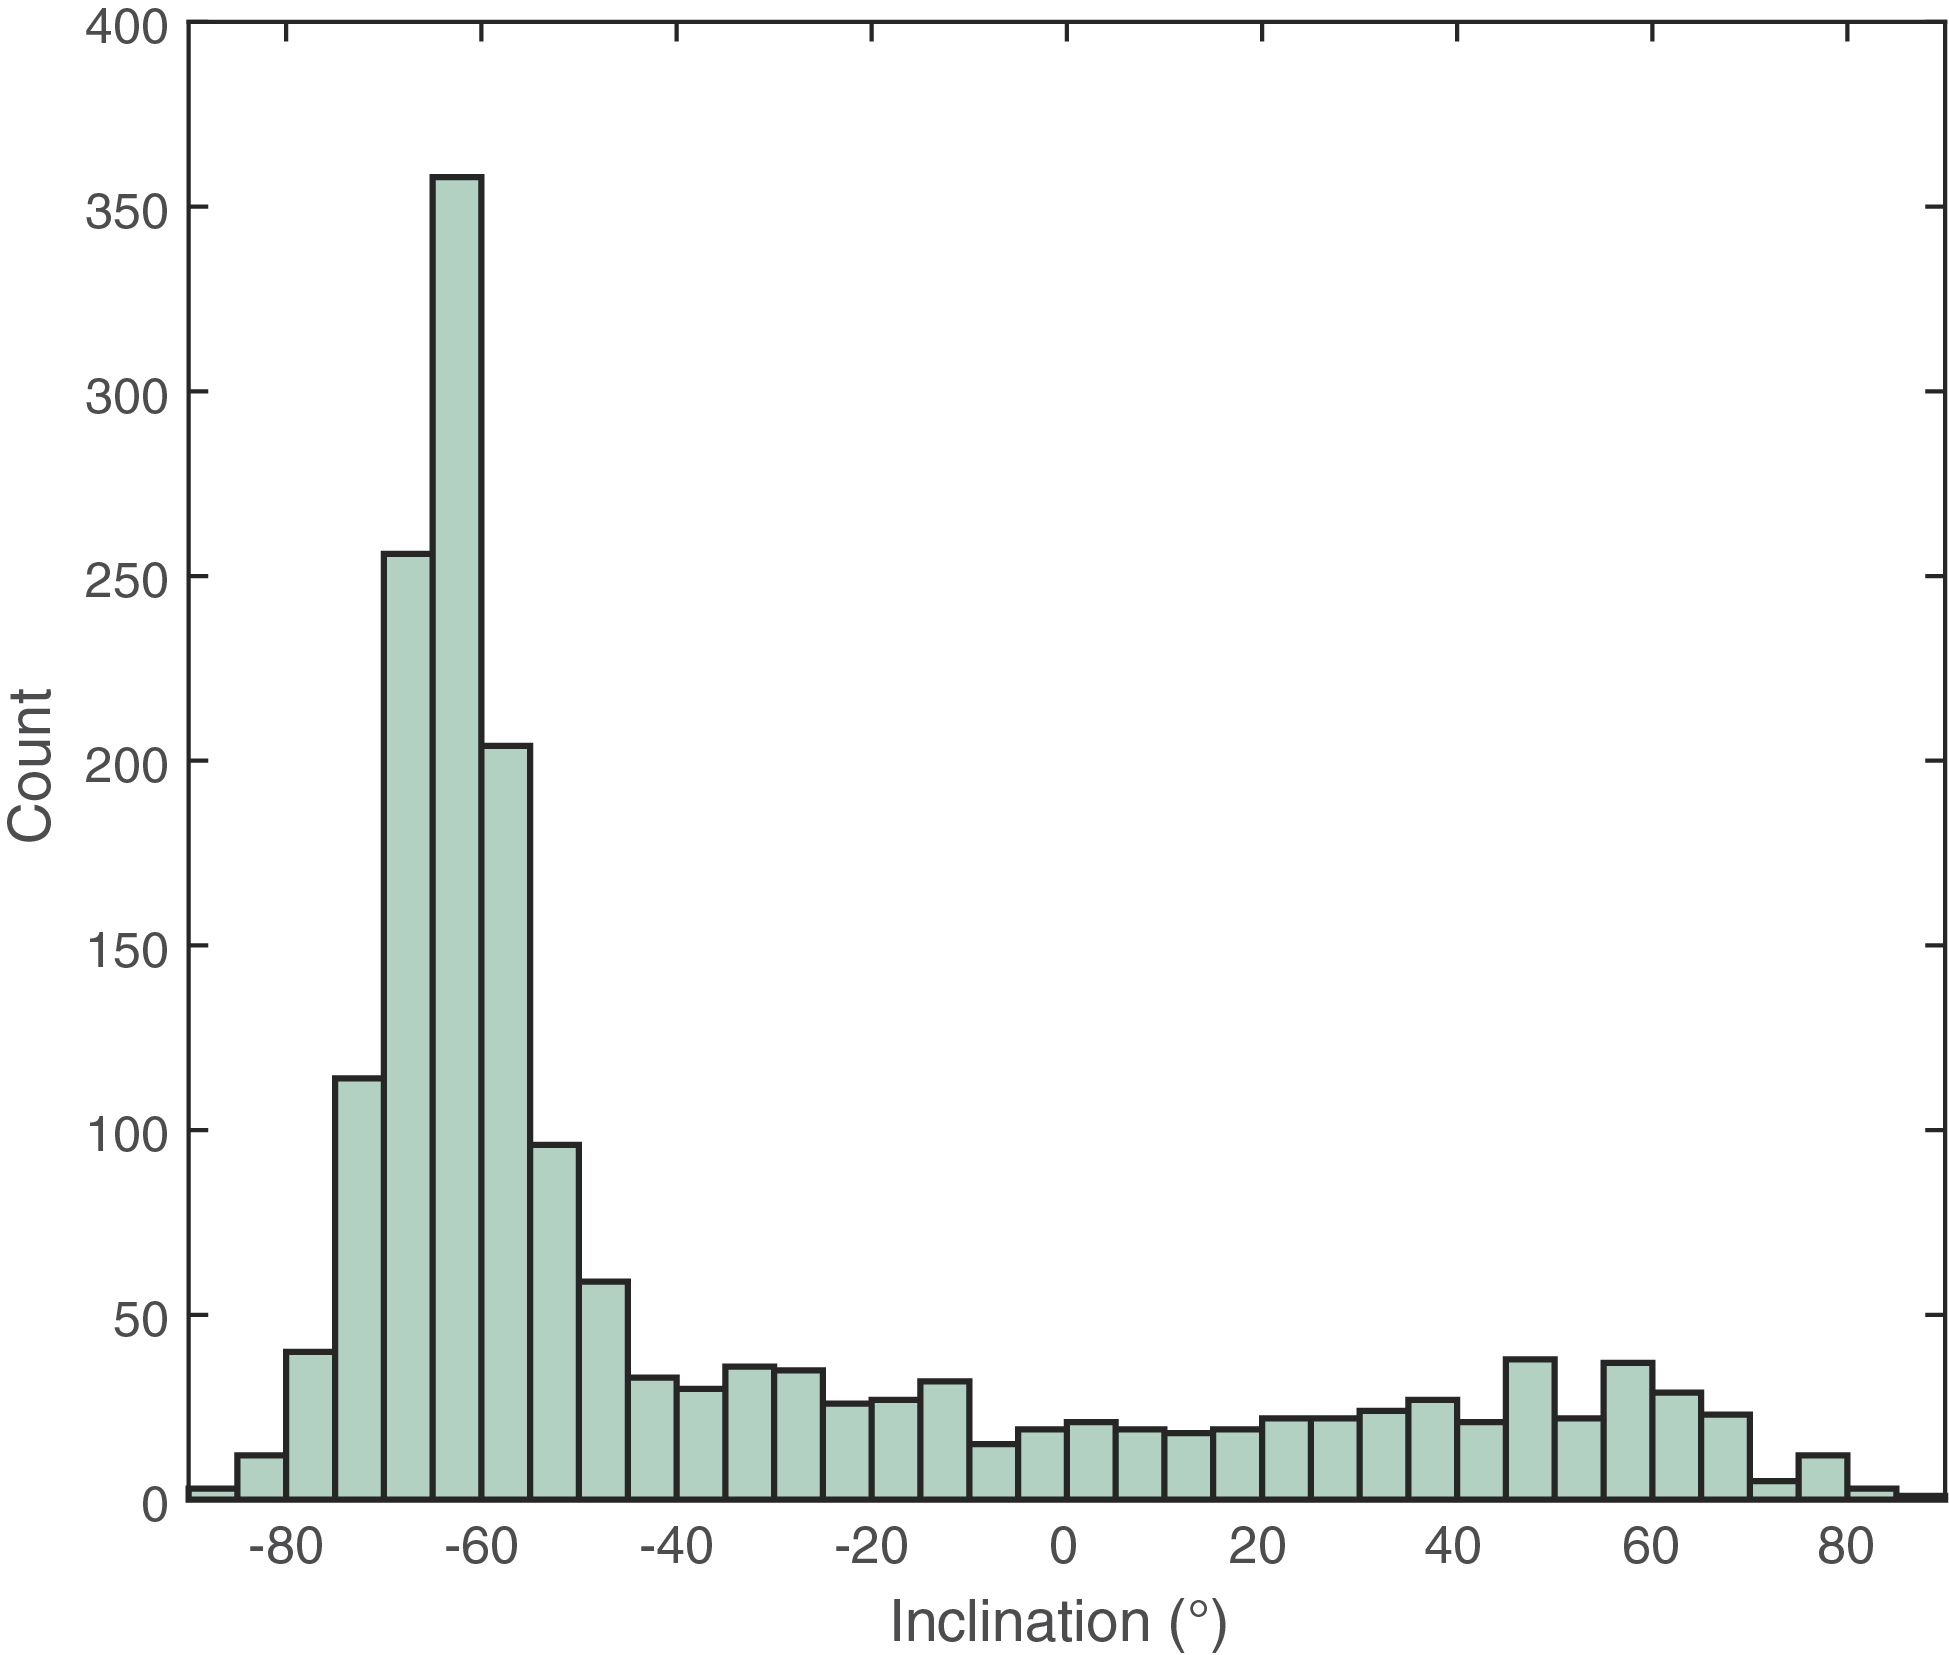
Figure F5. Inclination measurements.
Intervals of shallow inclinations and positive inclinations were observed elsewhere. In some cases, these intervals correspond to lithologic features such as silt layers that may define the base of a turbidite, dropstones or shells within the sediment, or possibly core flow-in. X-radiographs indicate that sediment deformation likely occurs during core expansion and the release of built-up gas pressure, which occurs when a handheld drill is used to puncture the core liner to keep the core section end caps from breaking loose. An example of this is Section 382-U1535A-10H-6, where shallow inclinations are associated with sediment deformation related to the buildup and release of gas pressure versus steep positive inclinations that are associated with the less deformed sediments (Figure F6). In this example, comparison with the X-radiograph suggests the less deformed intervals show reversed polarity; however, it is difficult to assign polarity to the entire core or even core section with confidence.
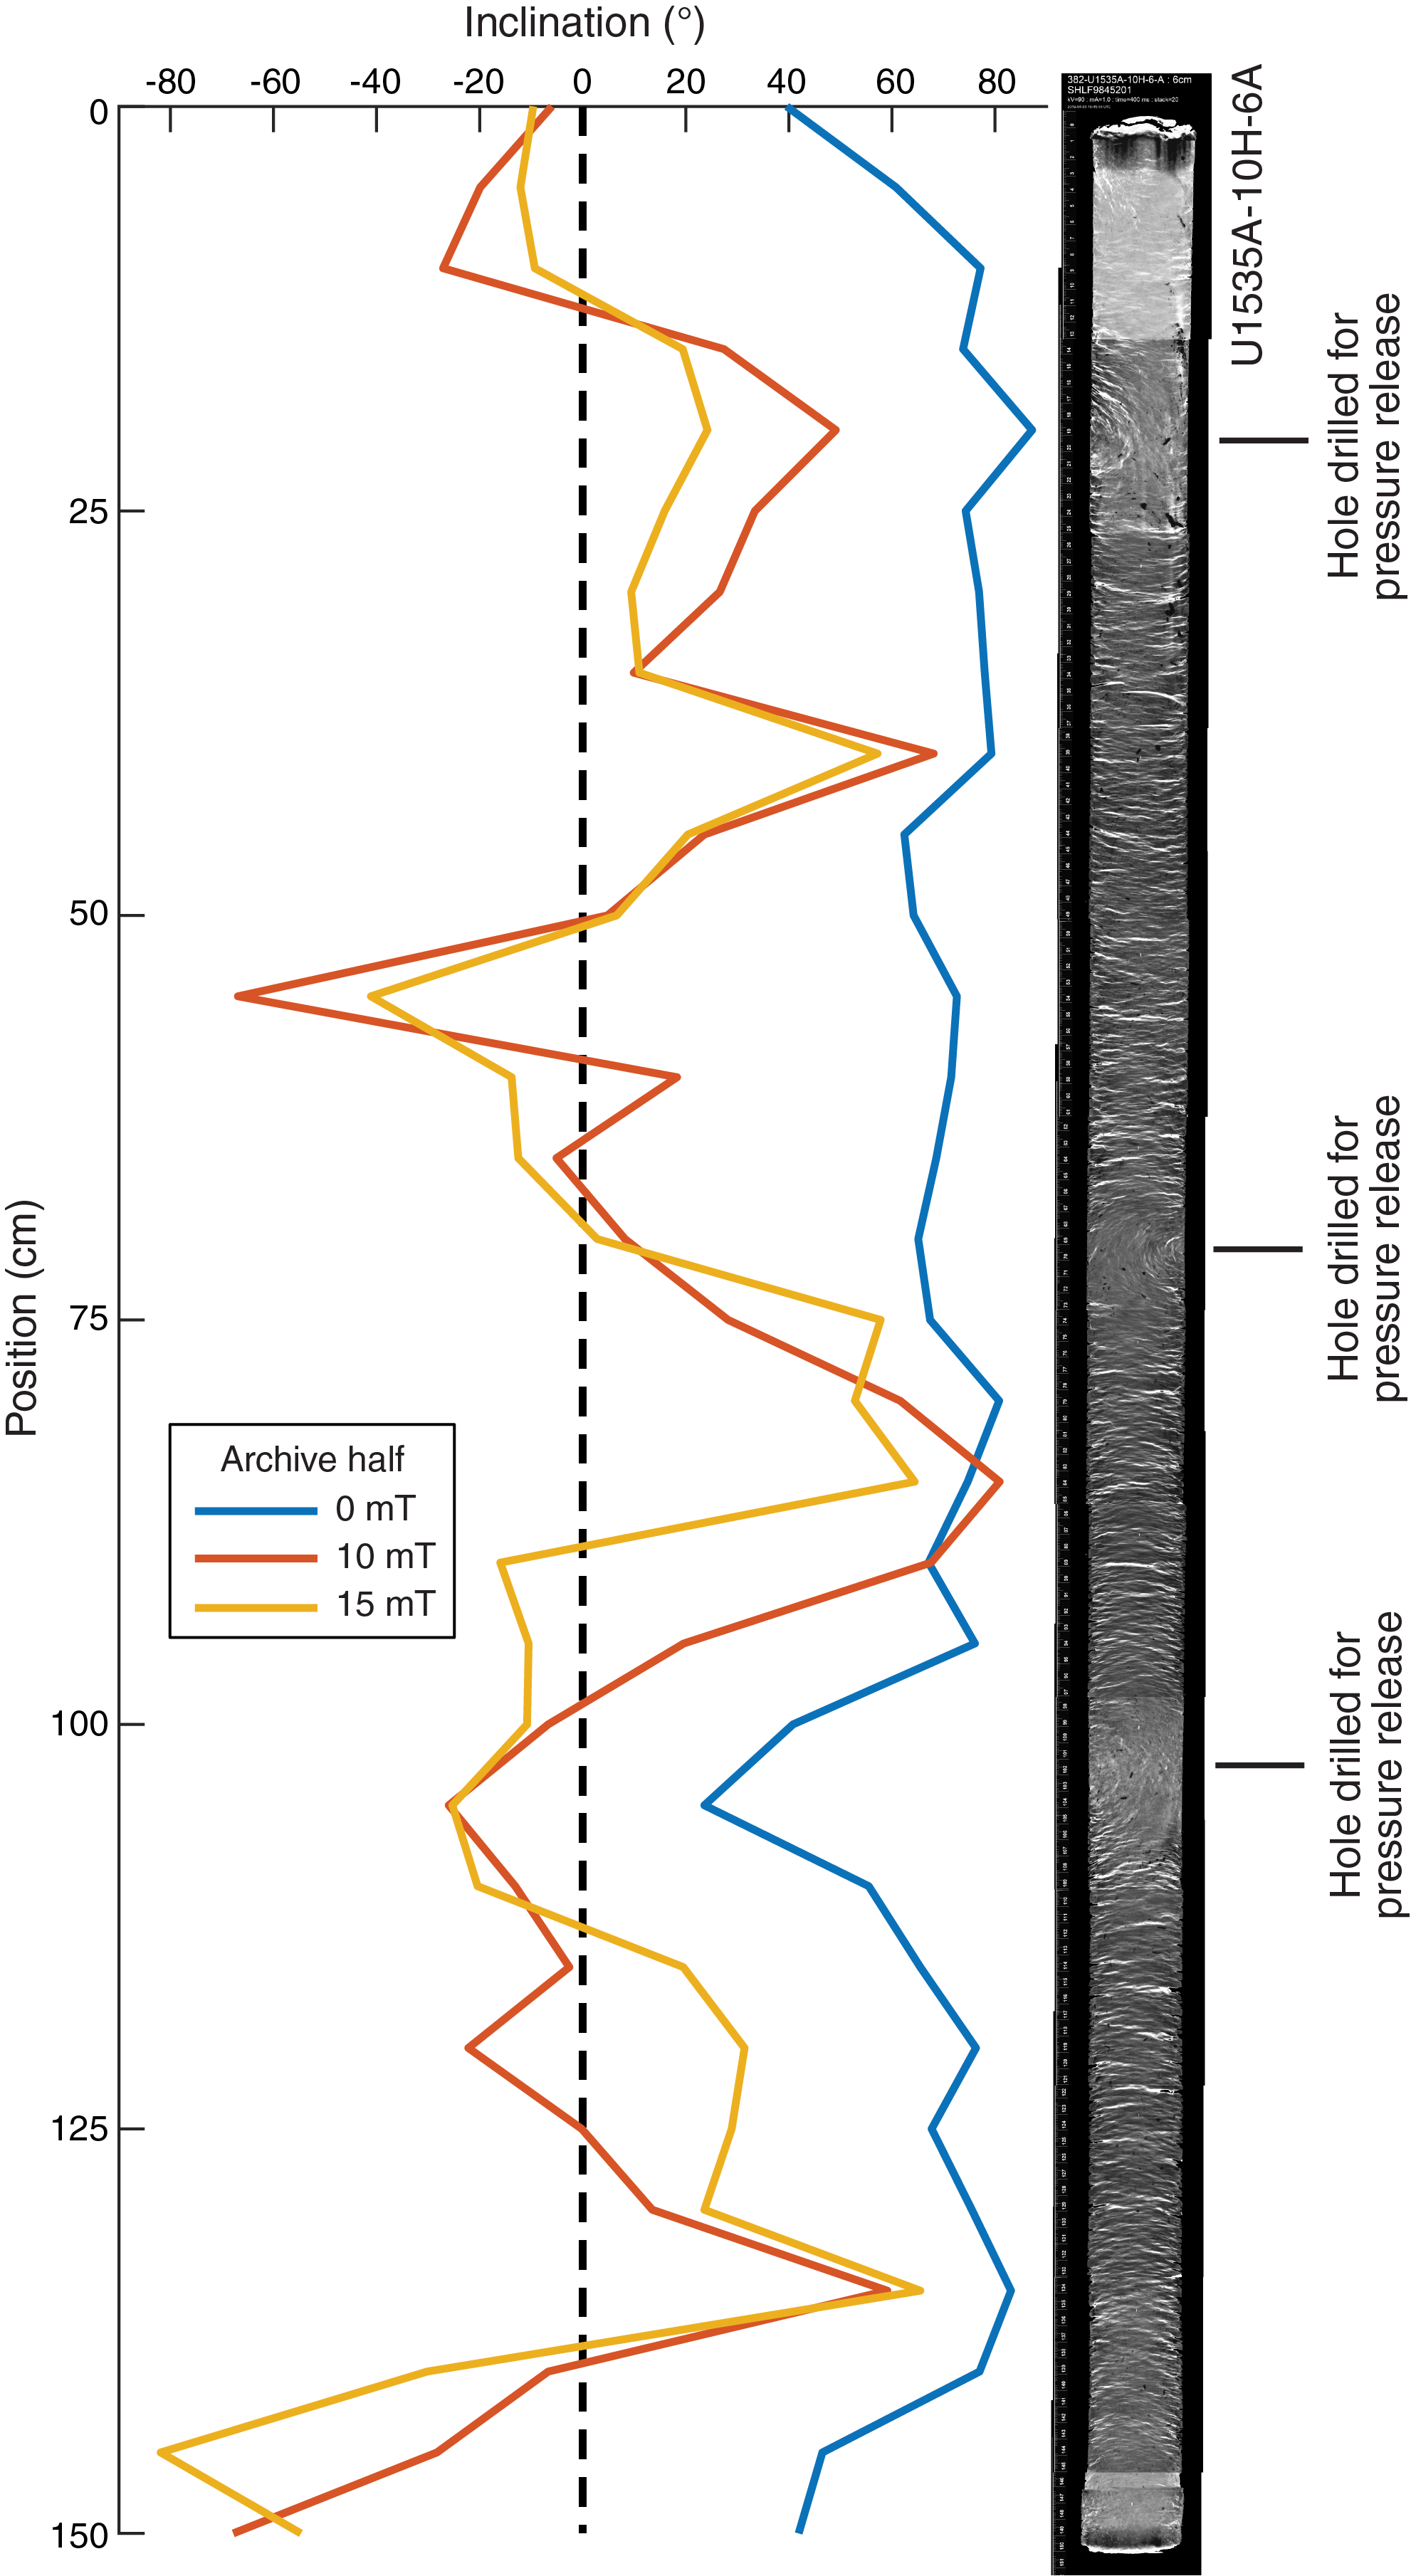
Figure F6. X-radiograph compared to inclination.
Magnetic polarity stratigraphy
Steep negative inclinations at the latitude of Site U1535 indicate normal polarity. We observed normal polarity extending from Core 382-U1535A-1H through Core 7H (Zone N1) (Figure F7; Table T7). Core 8H has dominantly steep negative inclinations but also contains steep positive inclinations that change along with declination consistent with brief intervals of reversed polarity (Zones N1, R1, N2, and R2), particularly from 62.8 to 63.2 mbsf and at the base of the core from 68.23 to 69.2 mbsf (Figure F8). The base of the stratigraphically younger of these intervals occurs at a sharp lithologic transition, suggesting that it may not necessarily represent a reversal but could potentially be a hiatus for which the underlying sediments are normal and the overlying sediments are reversed. Based on constraints from biostratigraphic datums, we interpret Zone N1 to have been deposited during the Brunhes Chron (C1n), whereas the transitions defining Zones R1, N2, and R2 could represent subchrons in the Matuyama Chron (C1r–C2r) with hiatuses obscuring their boundaries.
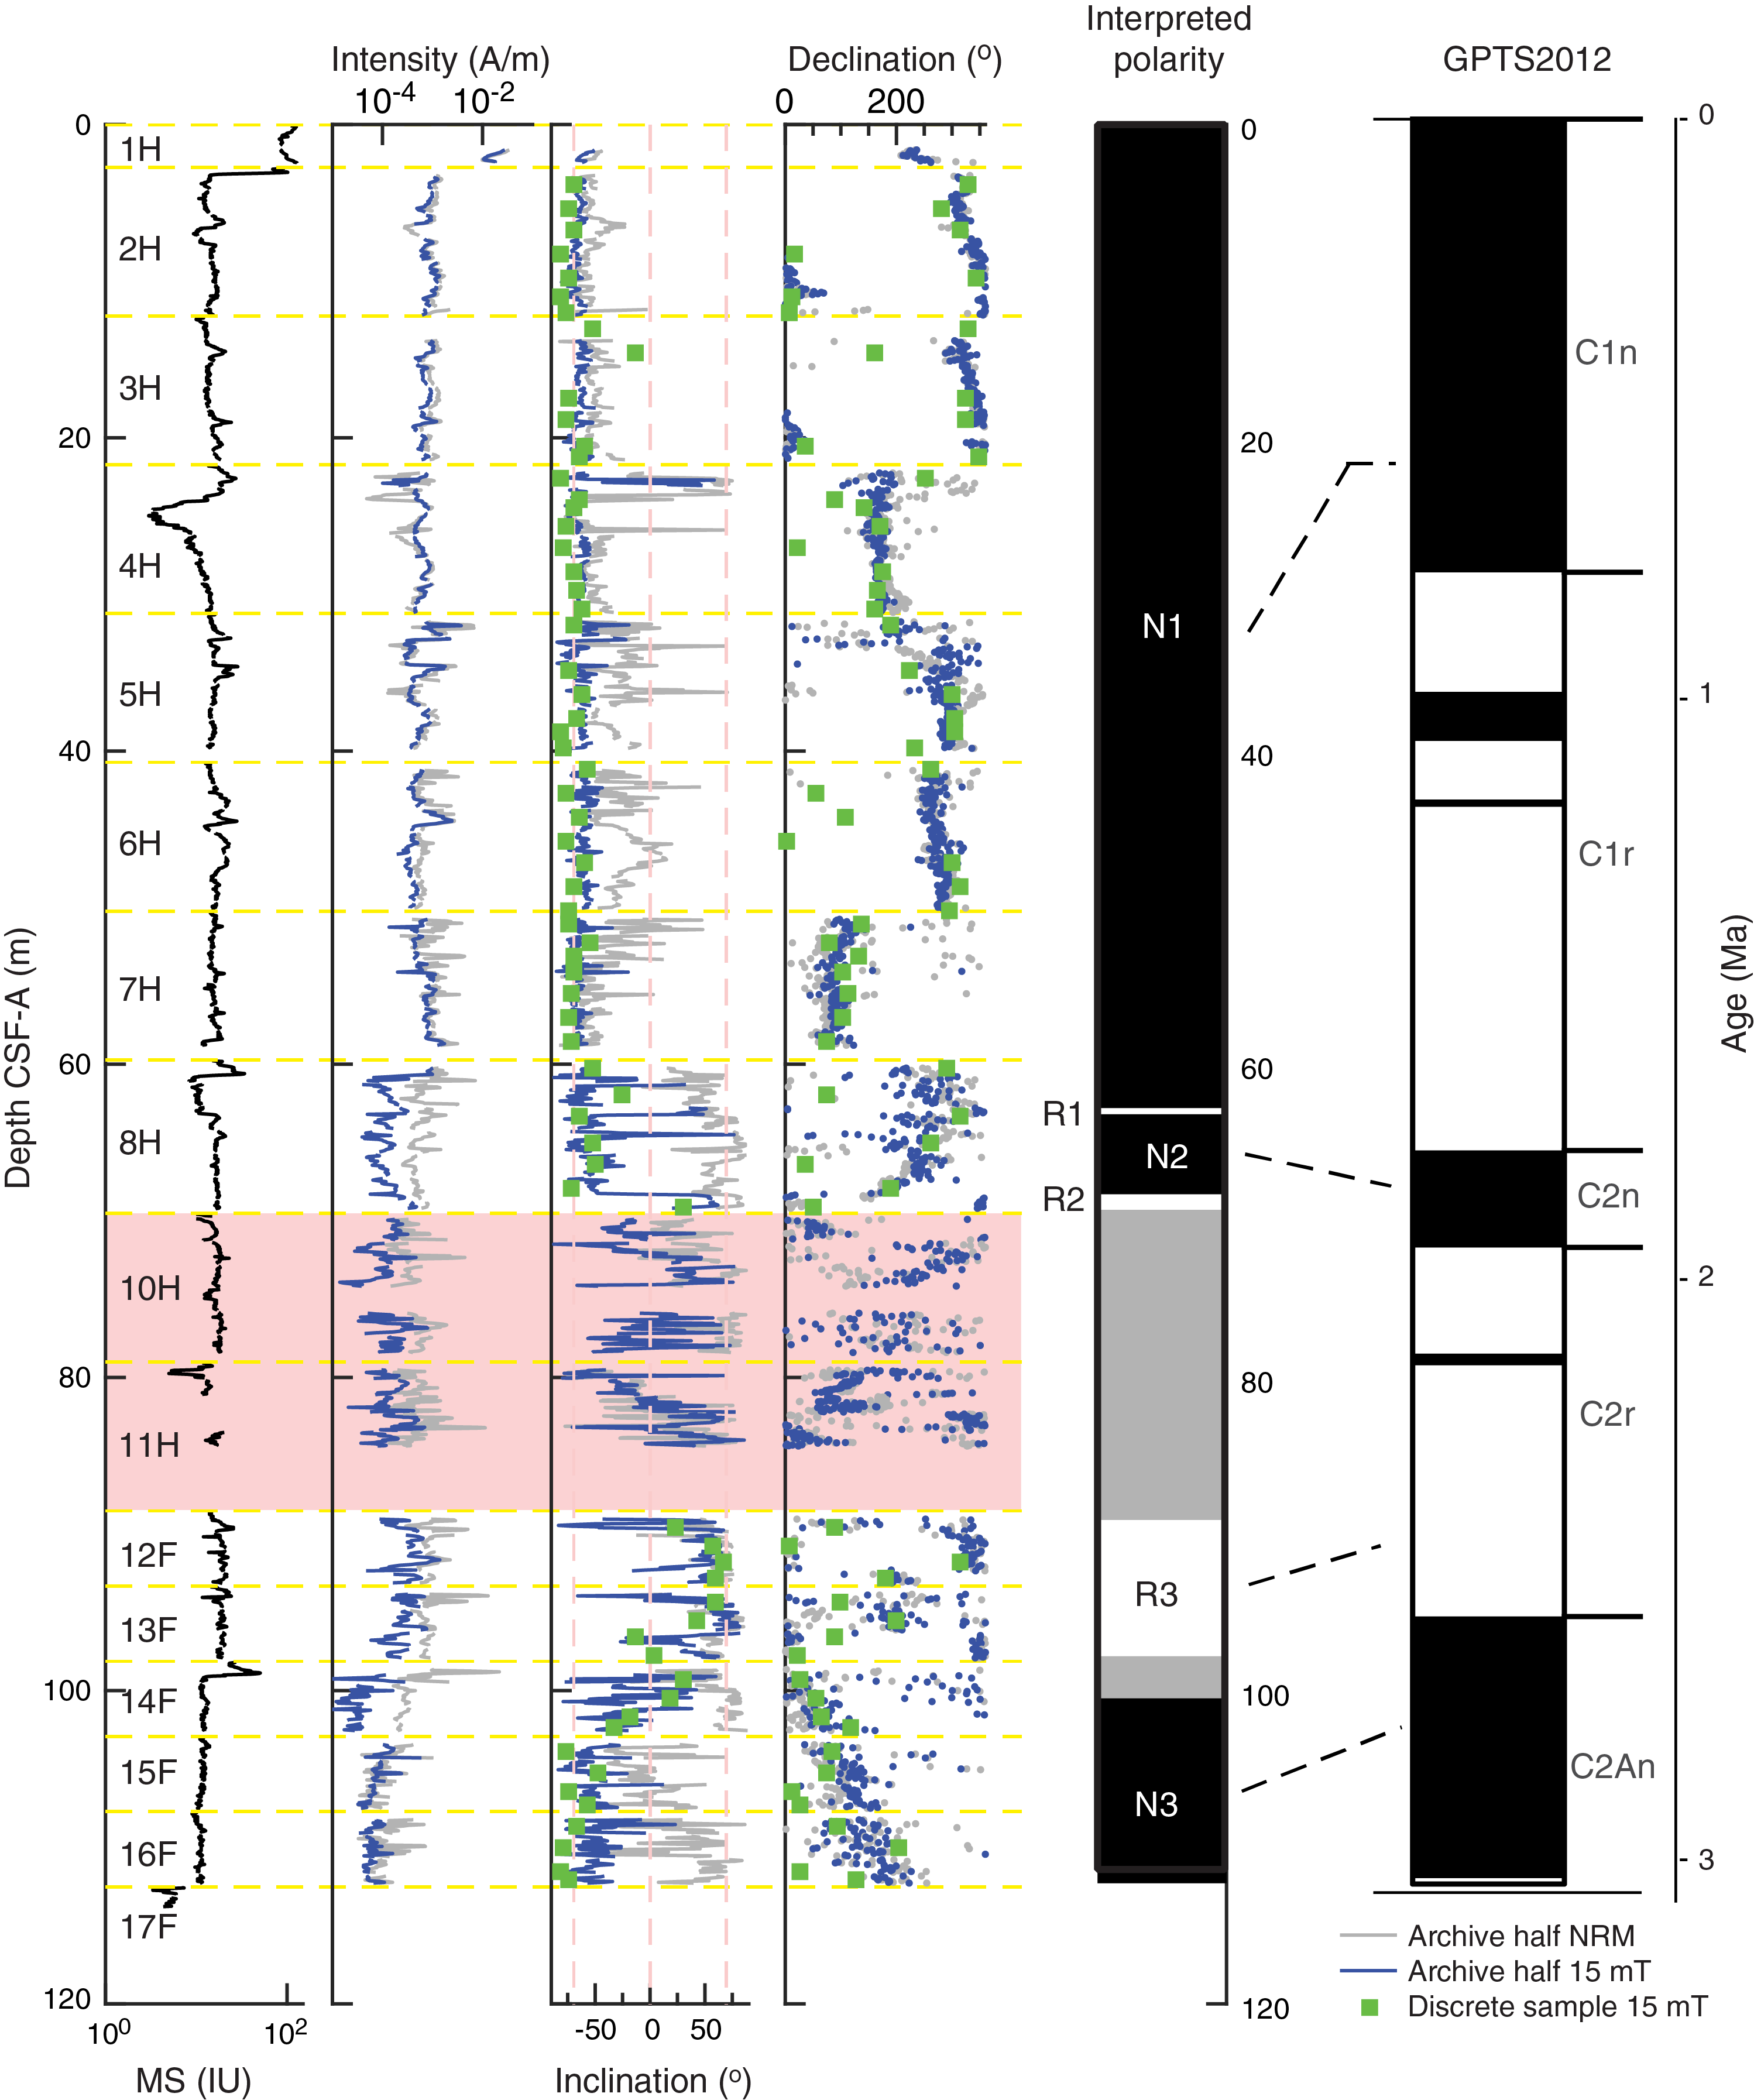
Figure F7. MS, remanence intensity, inclination, declination, interpreted polarity, and GPTS2012.
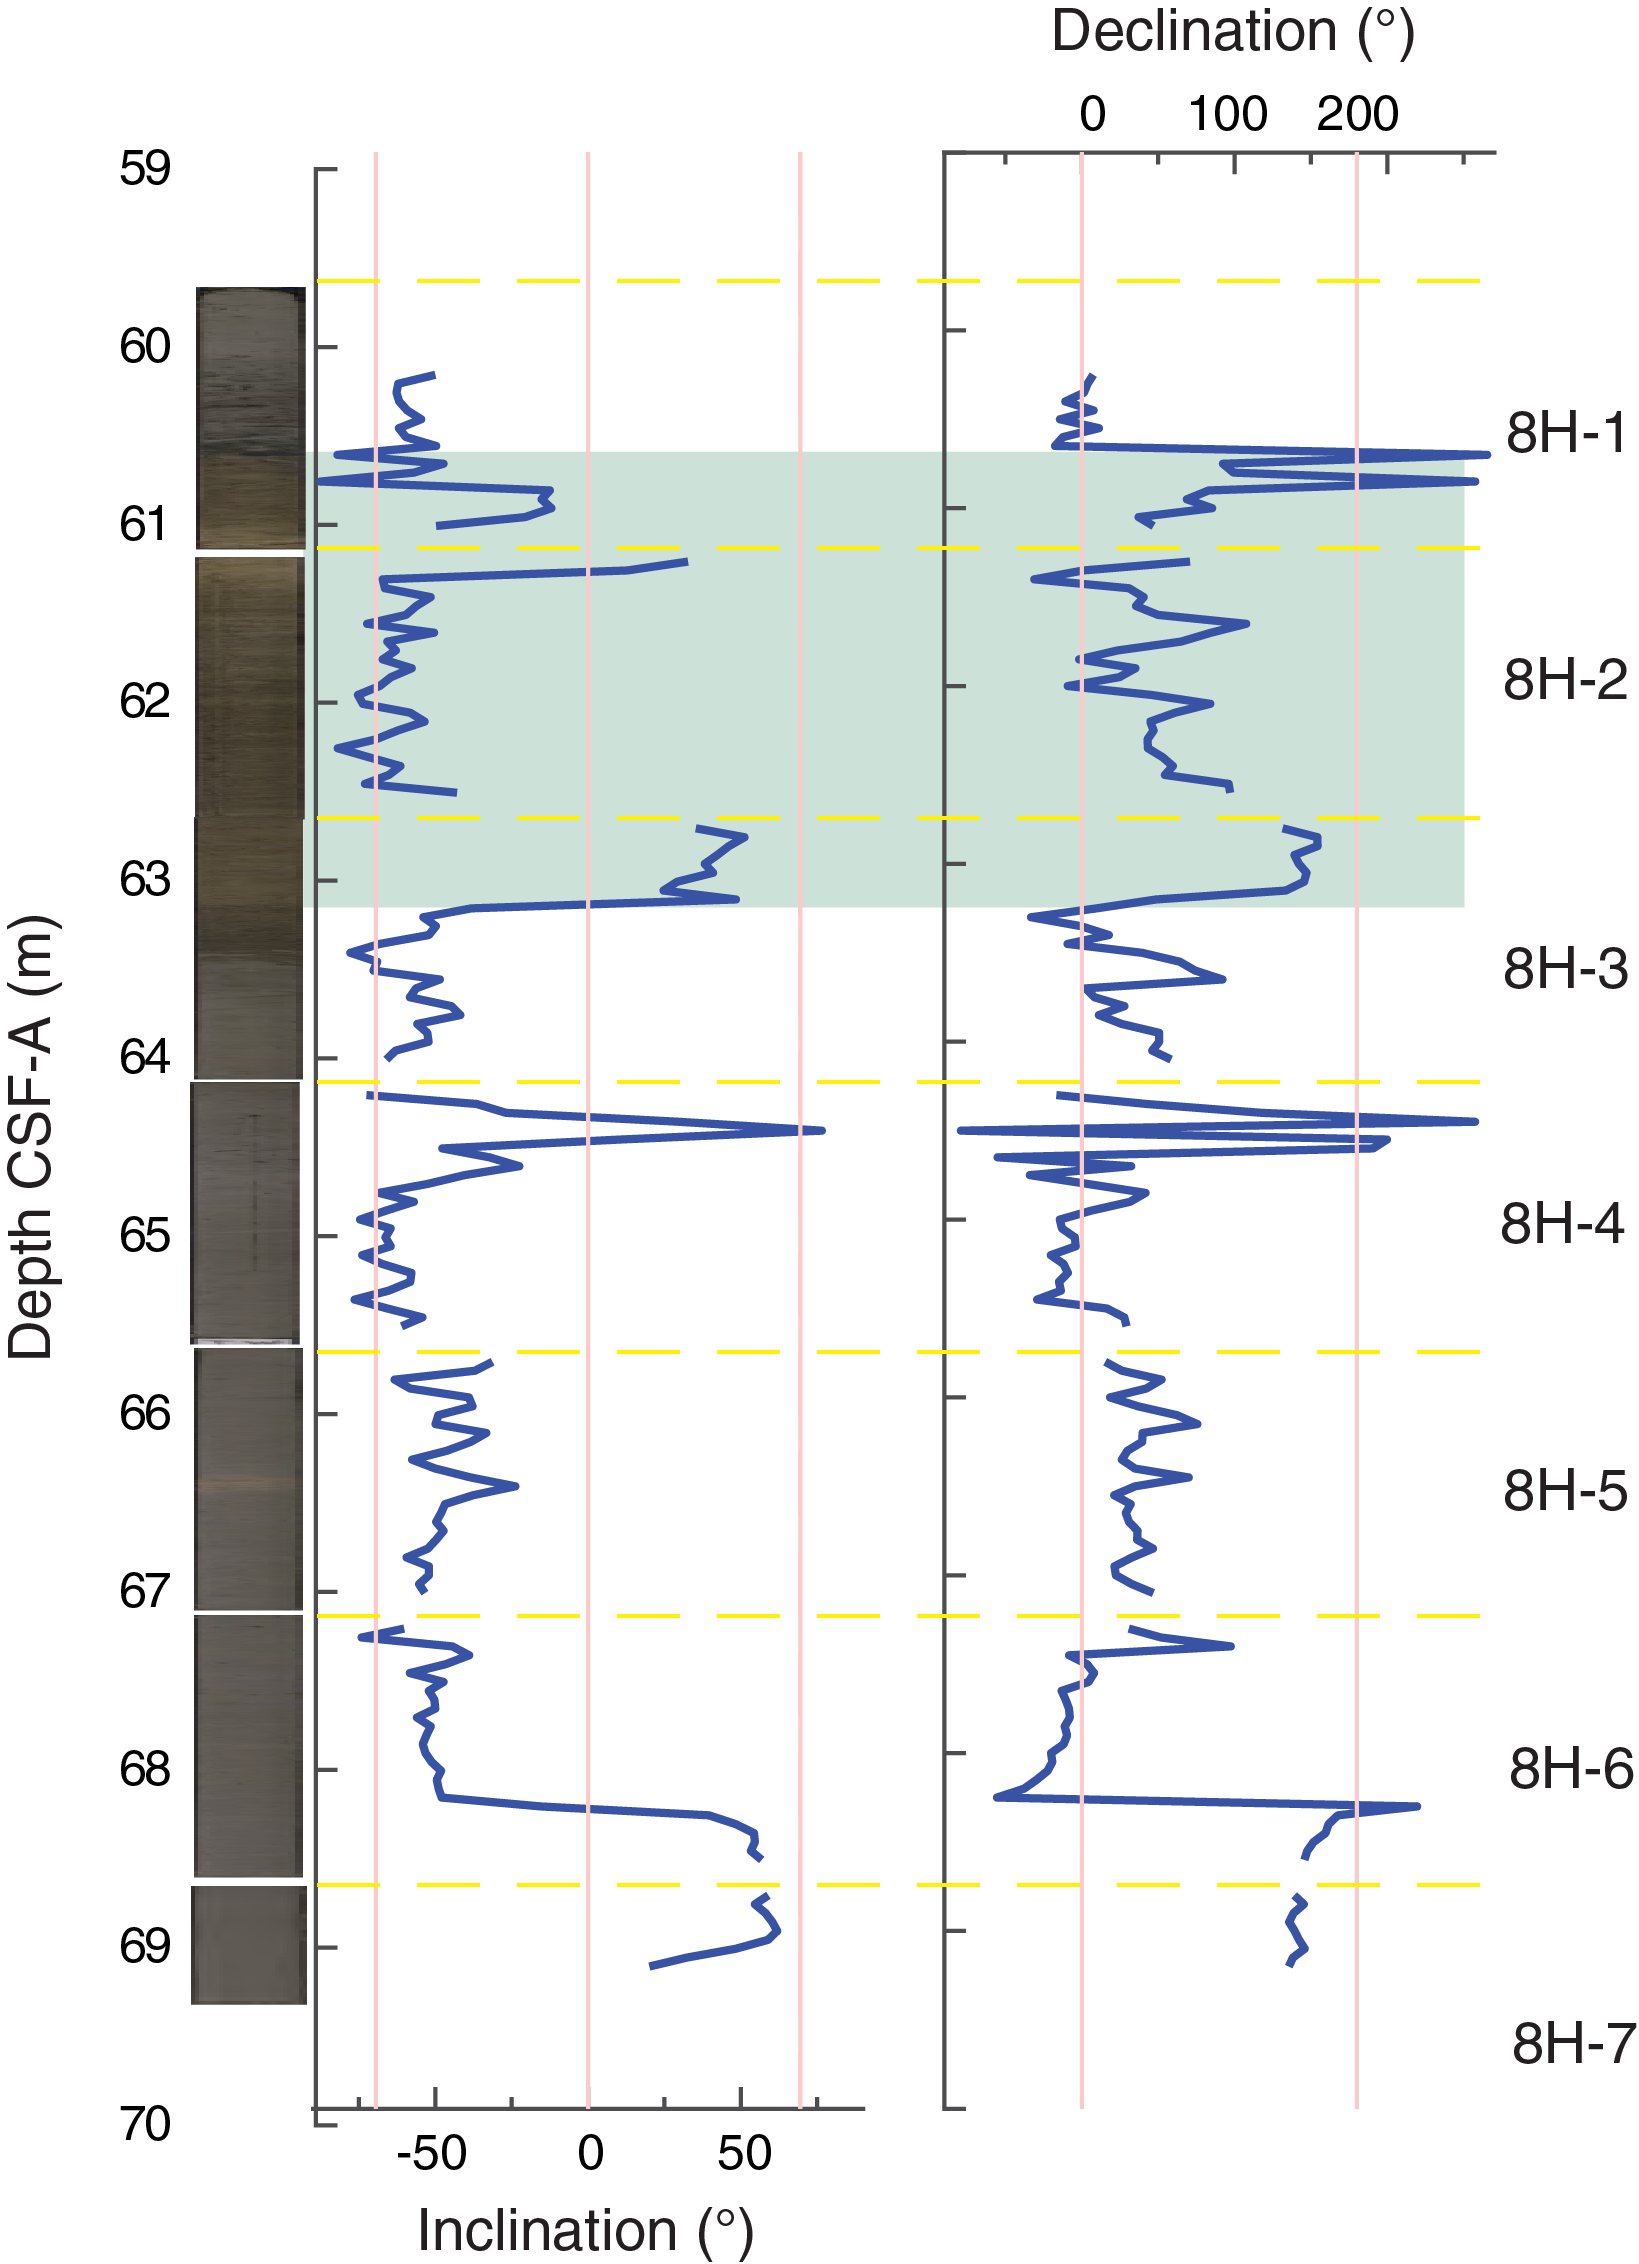
Figure F8. Inclination and declination.
Cores 382-U1535A-10H and 11H are heavily disturbed, and we cannot make a confident polarity interpretation. However, comparison of the magnetic data to X-radiographs of Core 10H suggests the less deformed sediments have steep positive inclinations and could be reversed or contain reversed intervals (e.g., Figure F6). Cores 12F and 13F have dominantly steep positive inclinations that indicate deposition during reversed polarity (Zone R3), whereas Cores 15F and 16F have dominantly steep negative inclinations that indicate deposition during normal polarity (Zone N3). Core 14F is more difficult to interpret; it contains steep positive inclinations overlying steep negative inclinations, which could be a polarity transition or could reflect the difficulties of interpreting polarity in the deeper sediments recovered from this site and Site U1534 (see Paleomagnetism in the Site U1534 chapter [Peck et al., 2021]). Based on biostratigraphic constraints and the seismic stratigraphic relationship to Site U1534, polarity Zones R3 and N3 likely represent the transition from the Gauss Chron (C2An.1n) to the Matuyama Chron (C2r).
Geochemistry
Volatile hydrocarbons
As part of the routine environmental protection and safety monitoring program, headspace gas analyses were performed at a resolution of one sample per full-length core (9.6 m advance) or one sample every other core for half-length cores (4.8 m advance) throughout Hole U1535A (Cores 382-U1535A-2H through 17F). Methane (CH4) is the dominant hydrocarbon present in low concentrations (8–28 parts per million by volume [ppmv]) in the upper 20 m, and it increases downhole with variable concentrations ranging from 2,600 to 33,000 ppmv from 30 to 110 mbsf (Figure F9; Table T8). Ethane (C2H6) is also present in low concentrations (<6 ppmv) throughout the hole with one exception at 100 mbsf where it increases to 11 ppmv (Figure F9). The methane/ethane ratio is variable, ranging from 3,500 to 11,000 (Figure F9). Data are reported in Table T8.
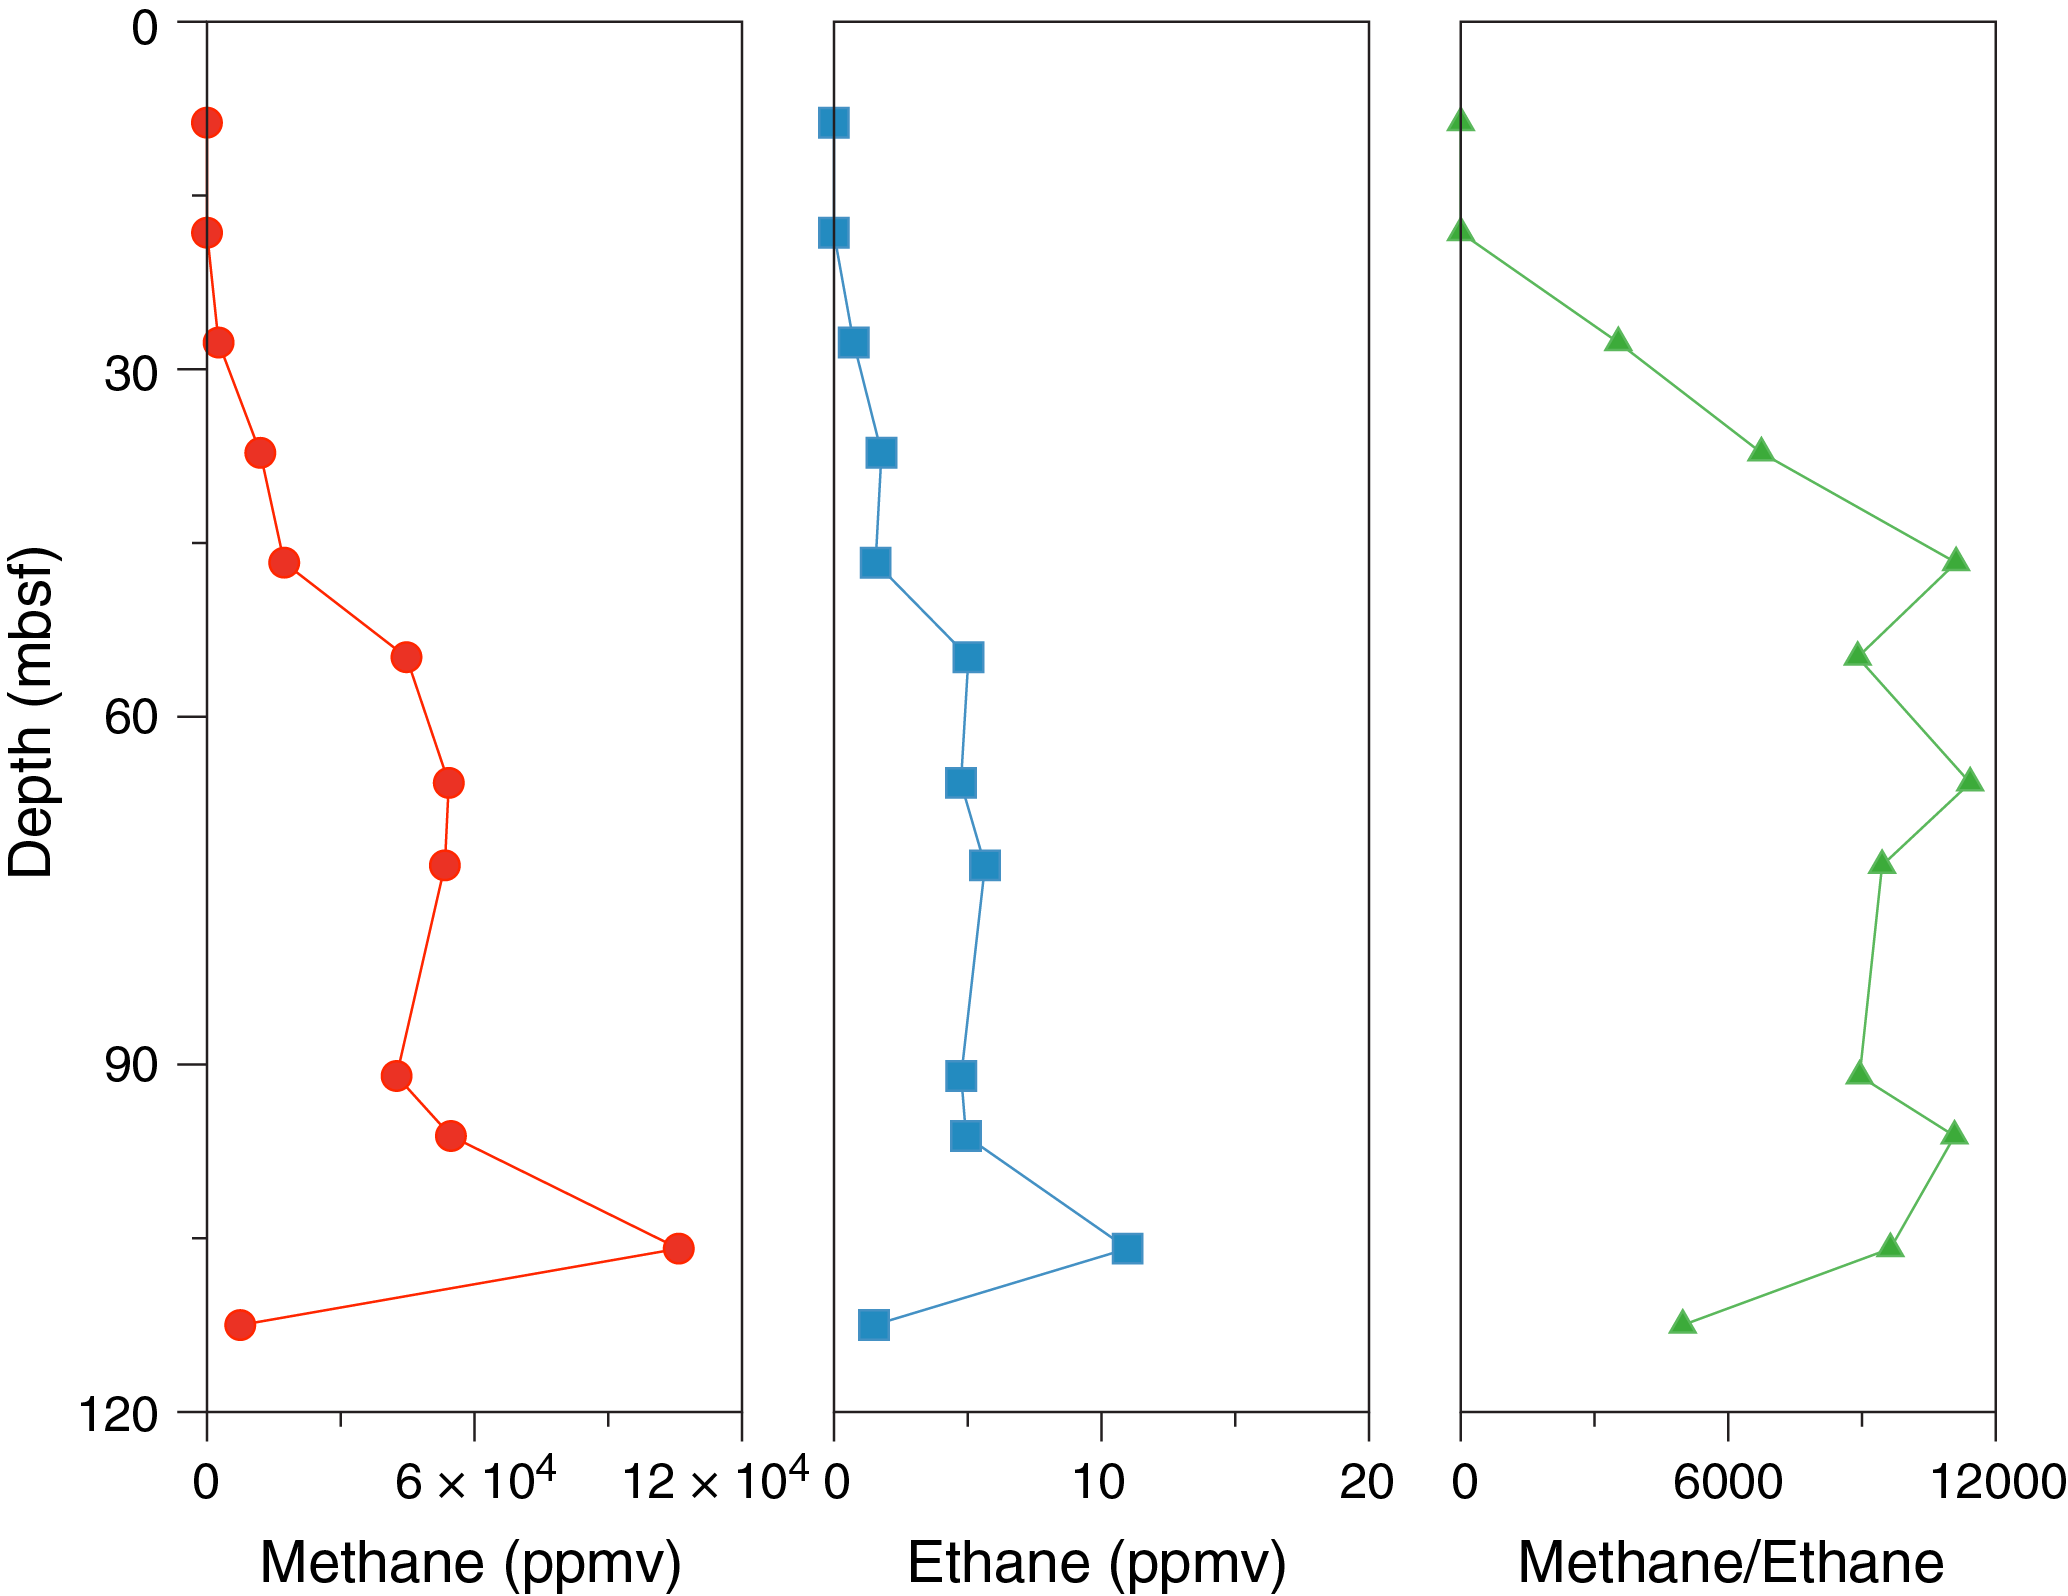
Figure F9. Methane, ethane, and methane/ethane ratio.
Interstitial water chemistry
Ten interstitial water (IW) samples were squeezed from 5 cm whole-round samples from 1.40 to 105.85 mbsf (Cores 382-U1535A-1H through 15F). IW was recovered in sufficient quantities (>30 mL) throughout. Filtered samples were analyzed for all envisioned shipboard analyses, and additional aliquots were set aside for further trace metal analyses at the Helmholtz Centre for Ocean Research Kiel (Germany). IW properties are presented in Figures F10 and F11 and Table T9.
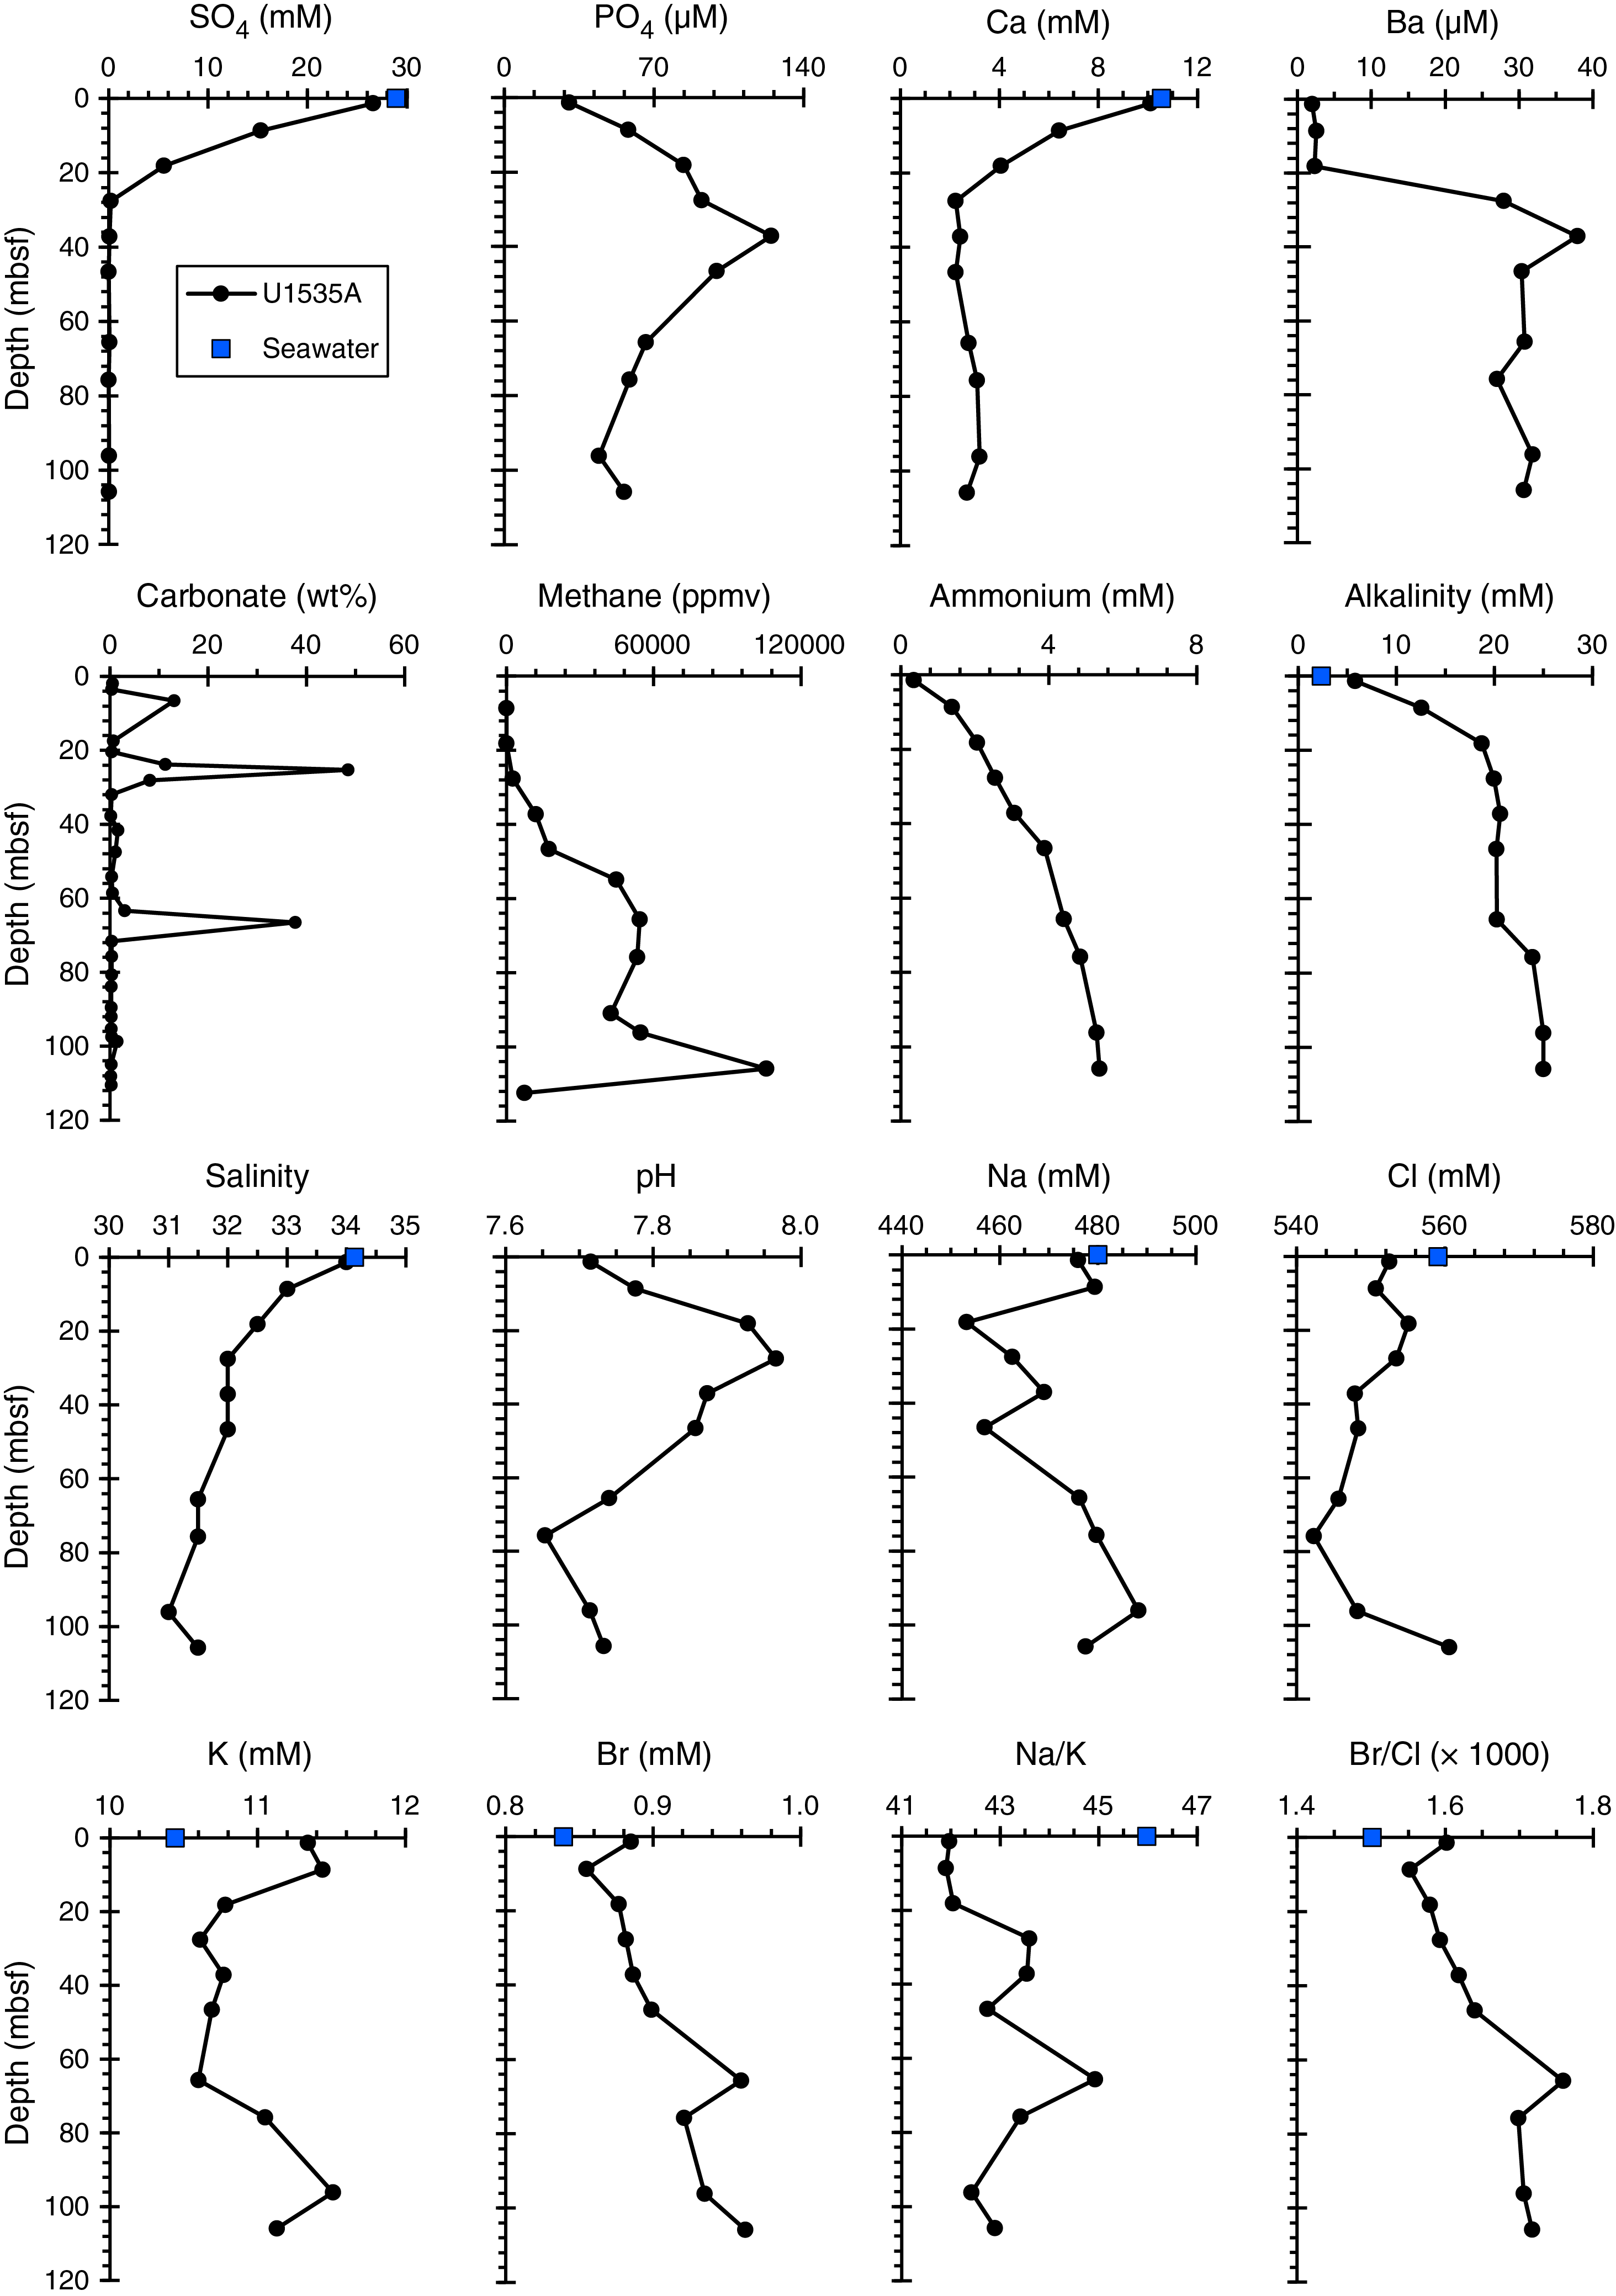
Figure F10. IW properties.
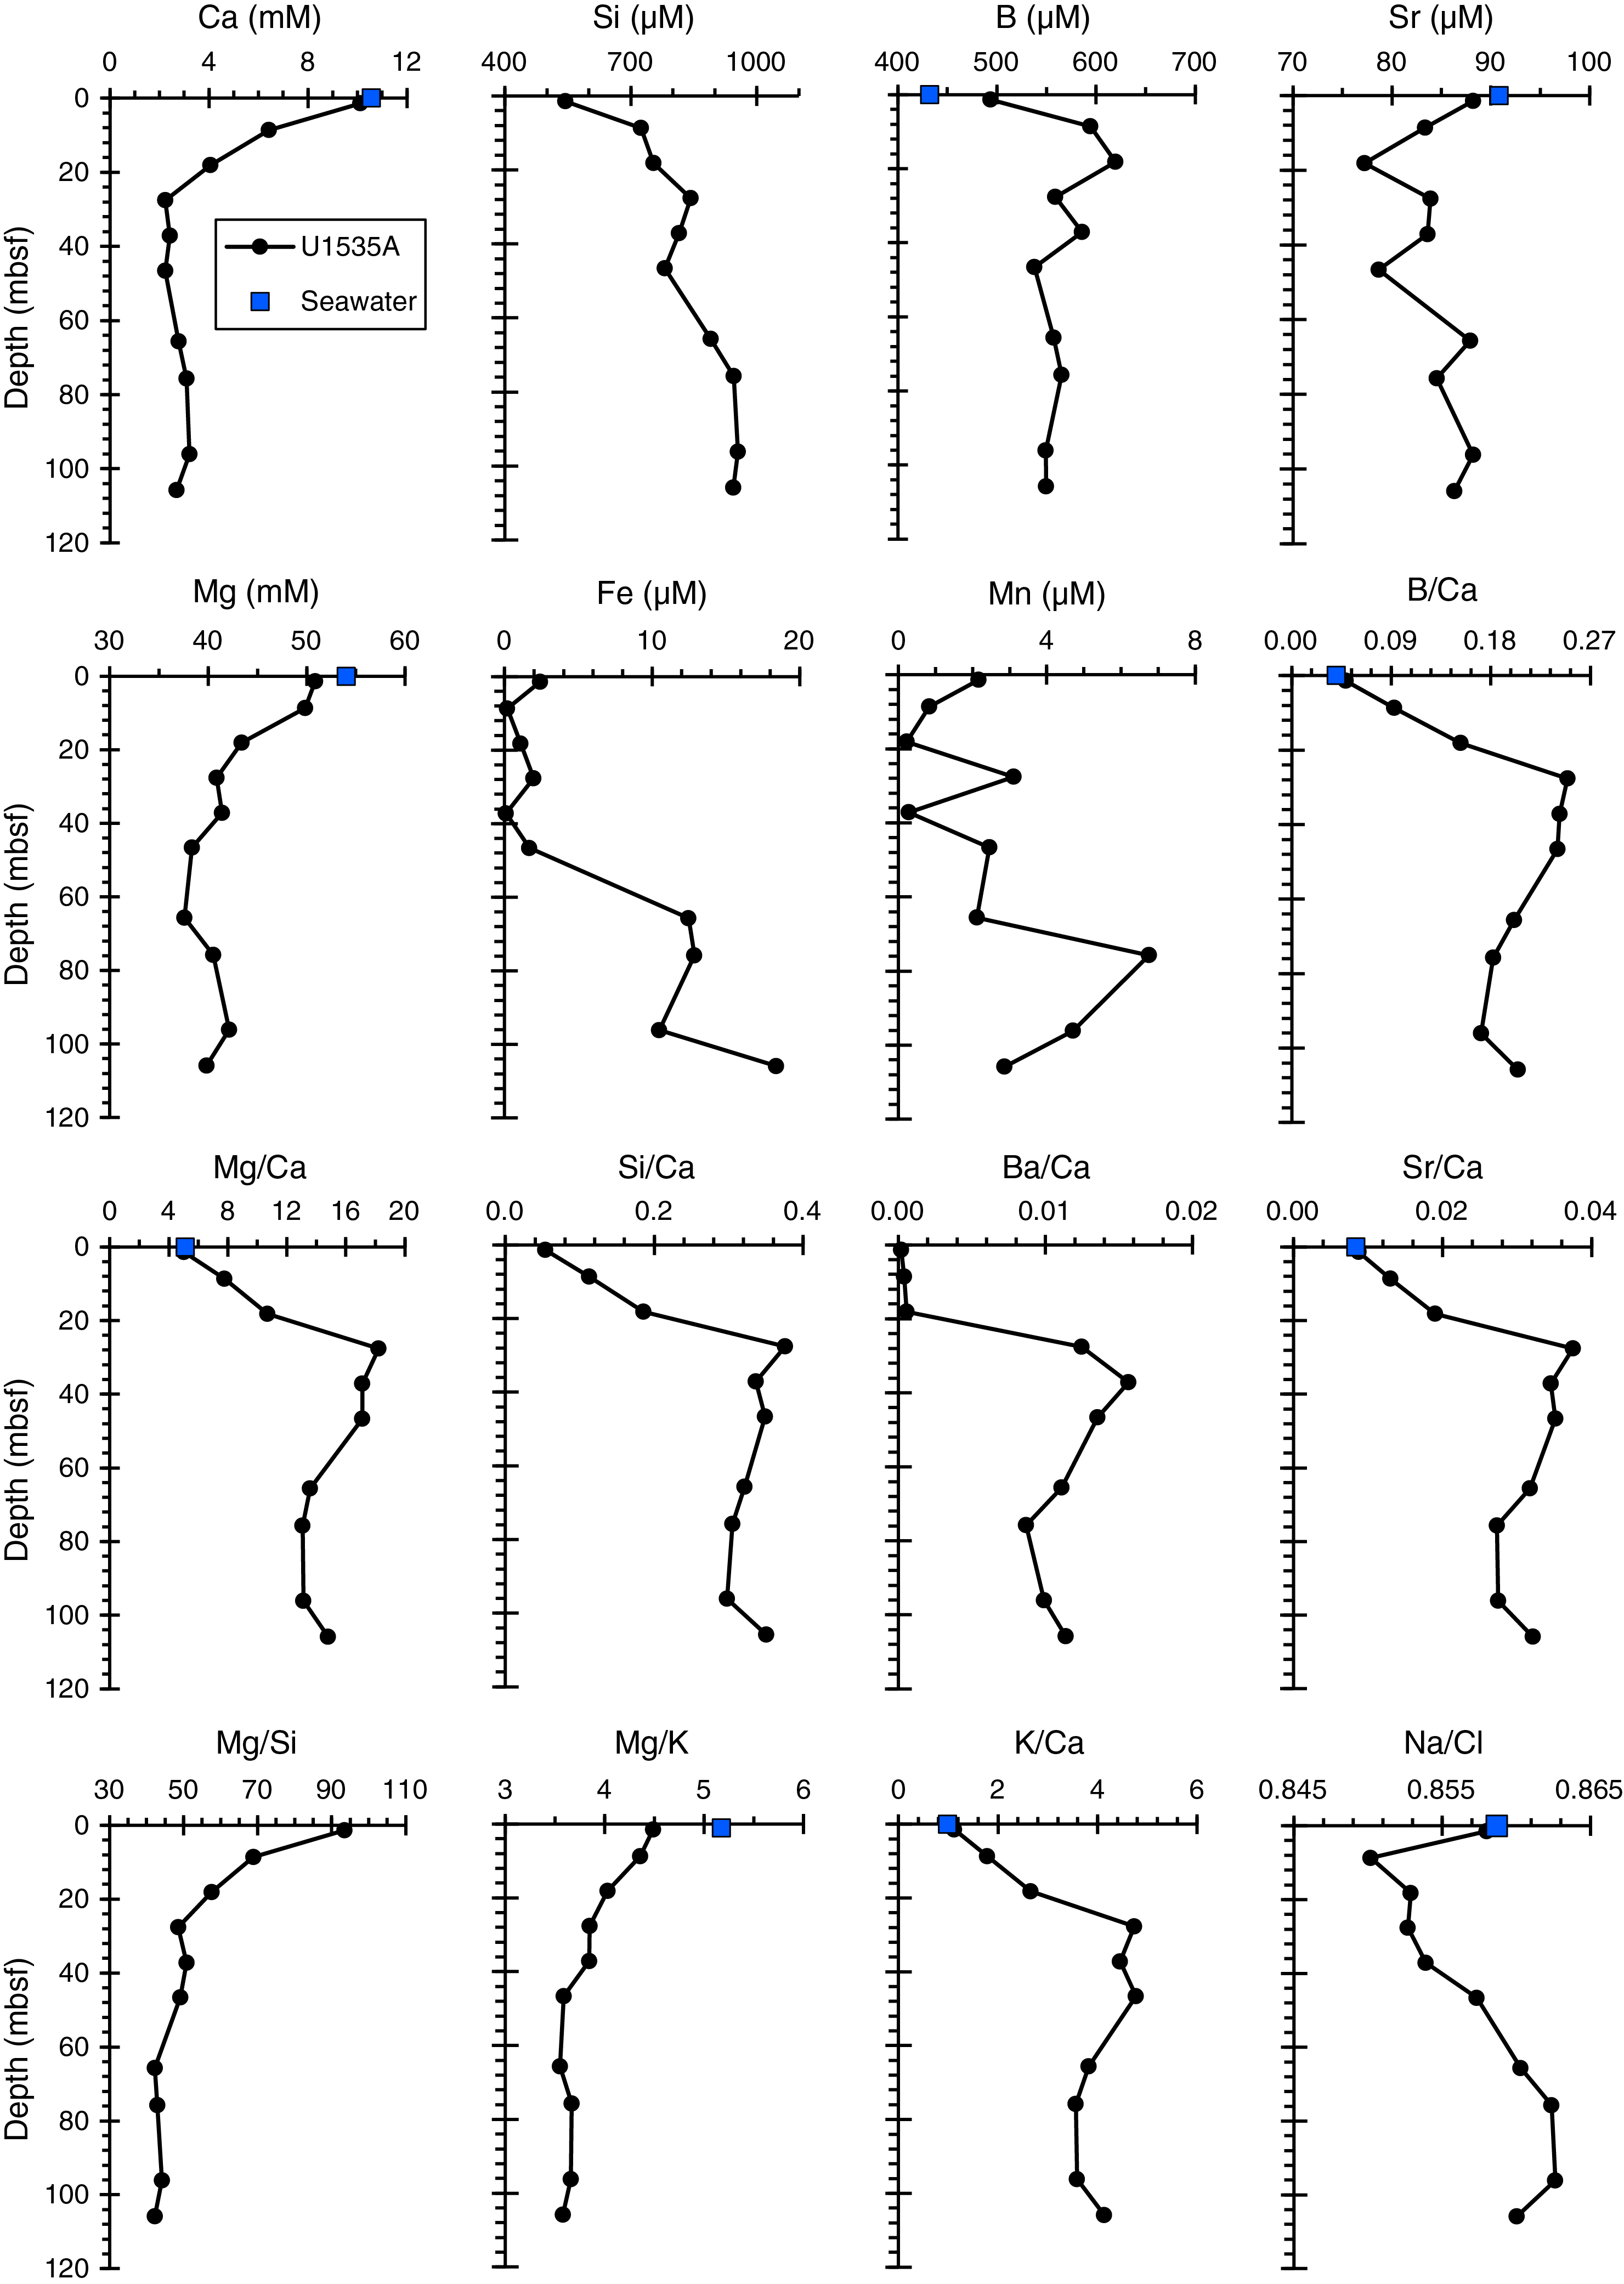
Figure F11. IW properties.
Salinity, sulfate, alkalinity, manganese, iron, and ammonium
IW salinity decreases from values matching ambient seawater (i.e., 34.13 at the nearest conductivity-temperature-depth [CTD] seawater sampling station according to the Global Ocean Data Analysis Project Version 2 [GLODAPv2] database [61.7°W, 53.3°S; 508 m water depth] [Olsen et al., 2016; Key et al., 2015]) to an IW salinity minimum (31.0) at 96 mbsf. Salinity increases slightly below this horizon. Sulfate concentrations in the uppermost IW sample almost match ambient bottom water levels (26.6 mM compared to ~28 mM) and are slightly higher than those seen at Site U1534. Sulfate concentrations rapidly drop to levels close to the detection limit at 27 mbsf and remain depleted throughout the lower part of the core (SO4 = 0.088 ± 0.141 mM; n = 7).
The sulfate–methane transition zone (SMTZ) is positioned about 8 m deeper than the SMTZ at Site U1534 (see Geochemistry in the Site U1534 chapter [Peck et al., 2021]). Alkalinity in this interval reaches ~20 mM. Alkalinity is remarkably constant between 20 and 65 mbsf and then increases again to a maximum of 25 mM at 105.85 mbsf (Figure F10).
Manganese concentrations throughout core are depleted (<5 µM) but become slightly higher around ~75 mbsf (approaching 7 µM). IW Fe concentrations are depleted in the upper 46 m (<7 µM) and are slightly higher deeper in the hole (<19 µM). Ammonium levels increase steadily with depth from 350 µM at 1.42 mbsf to 105,850 µM at 105.85 mbsf. Although ammonium concentrations in the upper 40 m do not increase as much as those observed at similar depths at Site U1534, ammonium levels are higher at respective depths at Site U1535 below 40 mbsf compared with ammonium concentrations at respective depths at Site U1534 (see Figure F18 in the Site U1534 chapter [Peck et al., 2021]; Figure F10). Methane concentrations at Site U1535 resemble the trends seen at Site U1534 with increasing concentrations below the SMTZ, whereas methane concentrations peak at 105.9 mbsf with almost twice as much methane as seen at any depth at Site U1534 (105,830 ppmv). The observation of differentially increasing ammonium and methane concentrations downcore may be a reflection of temporally variable sedimentation rates and resulting IW diagenetic environments at the two sites. The lowest sampled interval at Site U1535 in turn contained much reduced methane concentrations (7,480 ppmv) at the lowermost depth (112 mbsf) (Figure F10). Ammonium and sulfate profiles are consistent and show pronounced reducing conditions deeper than ~27 mbsf.
Chloride, bromide, sodium, potassium, pH, boron, and phosphate
Chloride, potassium, and sodium concentrations display conservative behavior in Site U1535 sediment IW and have concentrations close to seawater (Figure F10) that show barely resolvable downhole variations. Bromide concentrations in turn increase with depth, similar to concentrations seen at Site U1534; this increase is particularly evident in the IW Br/Cl trends that increase with depth (Figure F10). This increase in Br/Cl suggests microbially mediated organic matter degradation in the sediment during which organically bound Br is released to IW (Berg and Solomon, 2016). None of the observed (dominantly) diagenetic trends in IW chemical properties vary with carbonate concentrations (Figure F10). Boron contents increase toward peak concentrations (790 µM) at the SMTZ and remain roughly constant at slightly lower concentrations (564 ± 46 µM; 2 standard deviation [SD]) between 37 and 106 mbsf (Figure F11). pH in most parts of the sediment column is lower than average seawater (pH = 7.96). It increases from 7.71 at the uppermost depth to 7.97 toward the SMTZ, steadily decreases to 7.65 at ~76 mbsf, and then increases again deeper in the hole. Phosphate steadily increases from the top of the core to 37 mbsf and decreases deeper in the hole (Figure F10).
Calcium, magnesium, silicon, barium, and other major and trace elements
Site U1535 calcium concentration trends in IW are remarkably similar to those seen at Site U1534 (Figure F10; see Figure F18 in the Site U1534 chapter [Peck et al., 2021]) and decrease from typical seawater concentrations with increasing sedimentary depth. Dissolved magnesium is more variable but also decreases downcore. The uppermost sample shows concentrations close to seawater (Figure F11). Silicon and barium show increasing IW concentrations downcore, whereas strontium concentrations scatter around a mean concentration of 85 ± 8.7 µM (2 SD).
Below the SMTZ, calcium is most depleted, leading to pronounced positive excursions of Mg/Ca, Si/Ca, B/Ca, Ba/Ca, Sr/Ca, and K/Ca (Figure F11). The likely occurrence of authigenic carbonate formation below the SMTZ (e.g., Nöthen and Kasten, 2011) does not seem to be reflected in the measured sedimentary carbonate contents, which are very low in most parts of the sampled section at Site U1535 (Figure F10).
Lithium concentrations are below the detection limit of inductively coupled plasma–atomic emission spectroscopy (ICP-AES) in the uppermost 75 m (Table T9). Dissolved silicon levels are variable, reaching a first concentration peak (987 µM) below the SMTZ and a second similar enrichment deeper than 65 mbsf. In contrast to Site U1534, barium at Site U1535 (Figure F10) is low in the upper 18 m, shows the strongest enrichments over the SMTZ, and then remains constant at 29.9 ± 3.9 µM (2 SD) below 32 mbsf. Barium enrichment due to barite dissolution below the sedimentary SMTZ is hence also apparent here (Torres et al., 1996; Dickens, 2001; Riedinger et al., 2006). The level with the most pronounced authigenic carbonate formation seems to be located at 27 mbsf, as indicated by the lowest IW Ca and highest Mg/Ca (Figure F11).
Bulk sediment geochemistry
Carbon, nitrogen, and carbonate
Discrete sediment samples (N = 28) from all major lithostratigraphic units identified in Hole U1535A were analyzed for total carbon (TC), total nitrogen (TN), and total inorganic carbon. Total organic carbon (TOC) and calcium carbonate (CaCO3) contents were subsequently calculated (Table T10). TOC contents range from 0.4 to 1.4 wt% (Figure F12). TOC/TN ratios vary from 7.8 to 25, but most values stay around 10, suggesting a mixed (i.e., marine and terrigenous) source of the organic matter deposited in Hole U1535A. CaCO3 contents range between 0.1 and 49 wt% in Hole U1535A (Figure F12). The higher values (~49 wt%) were found in the upper section of the sequences (6–26 mbsf) and at one level in the middle part of the sequence (66–67 mbsf). Both horizons may correspond to interglacial sections (Figure F12).
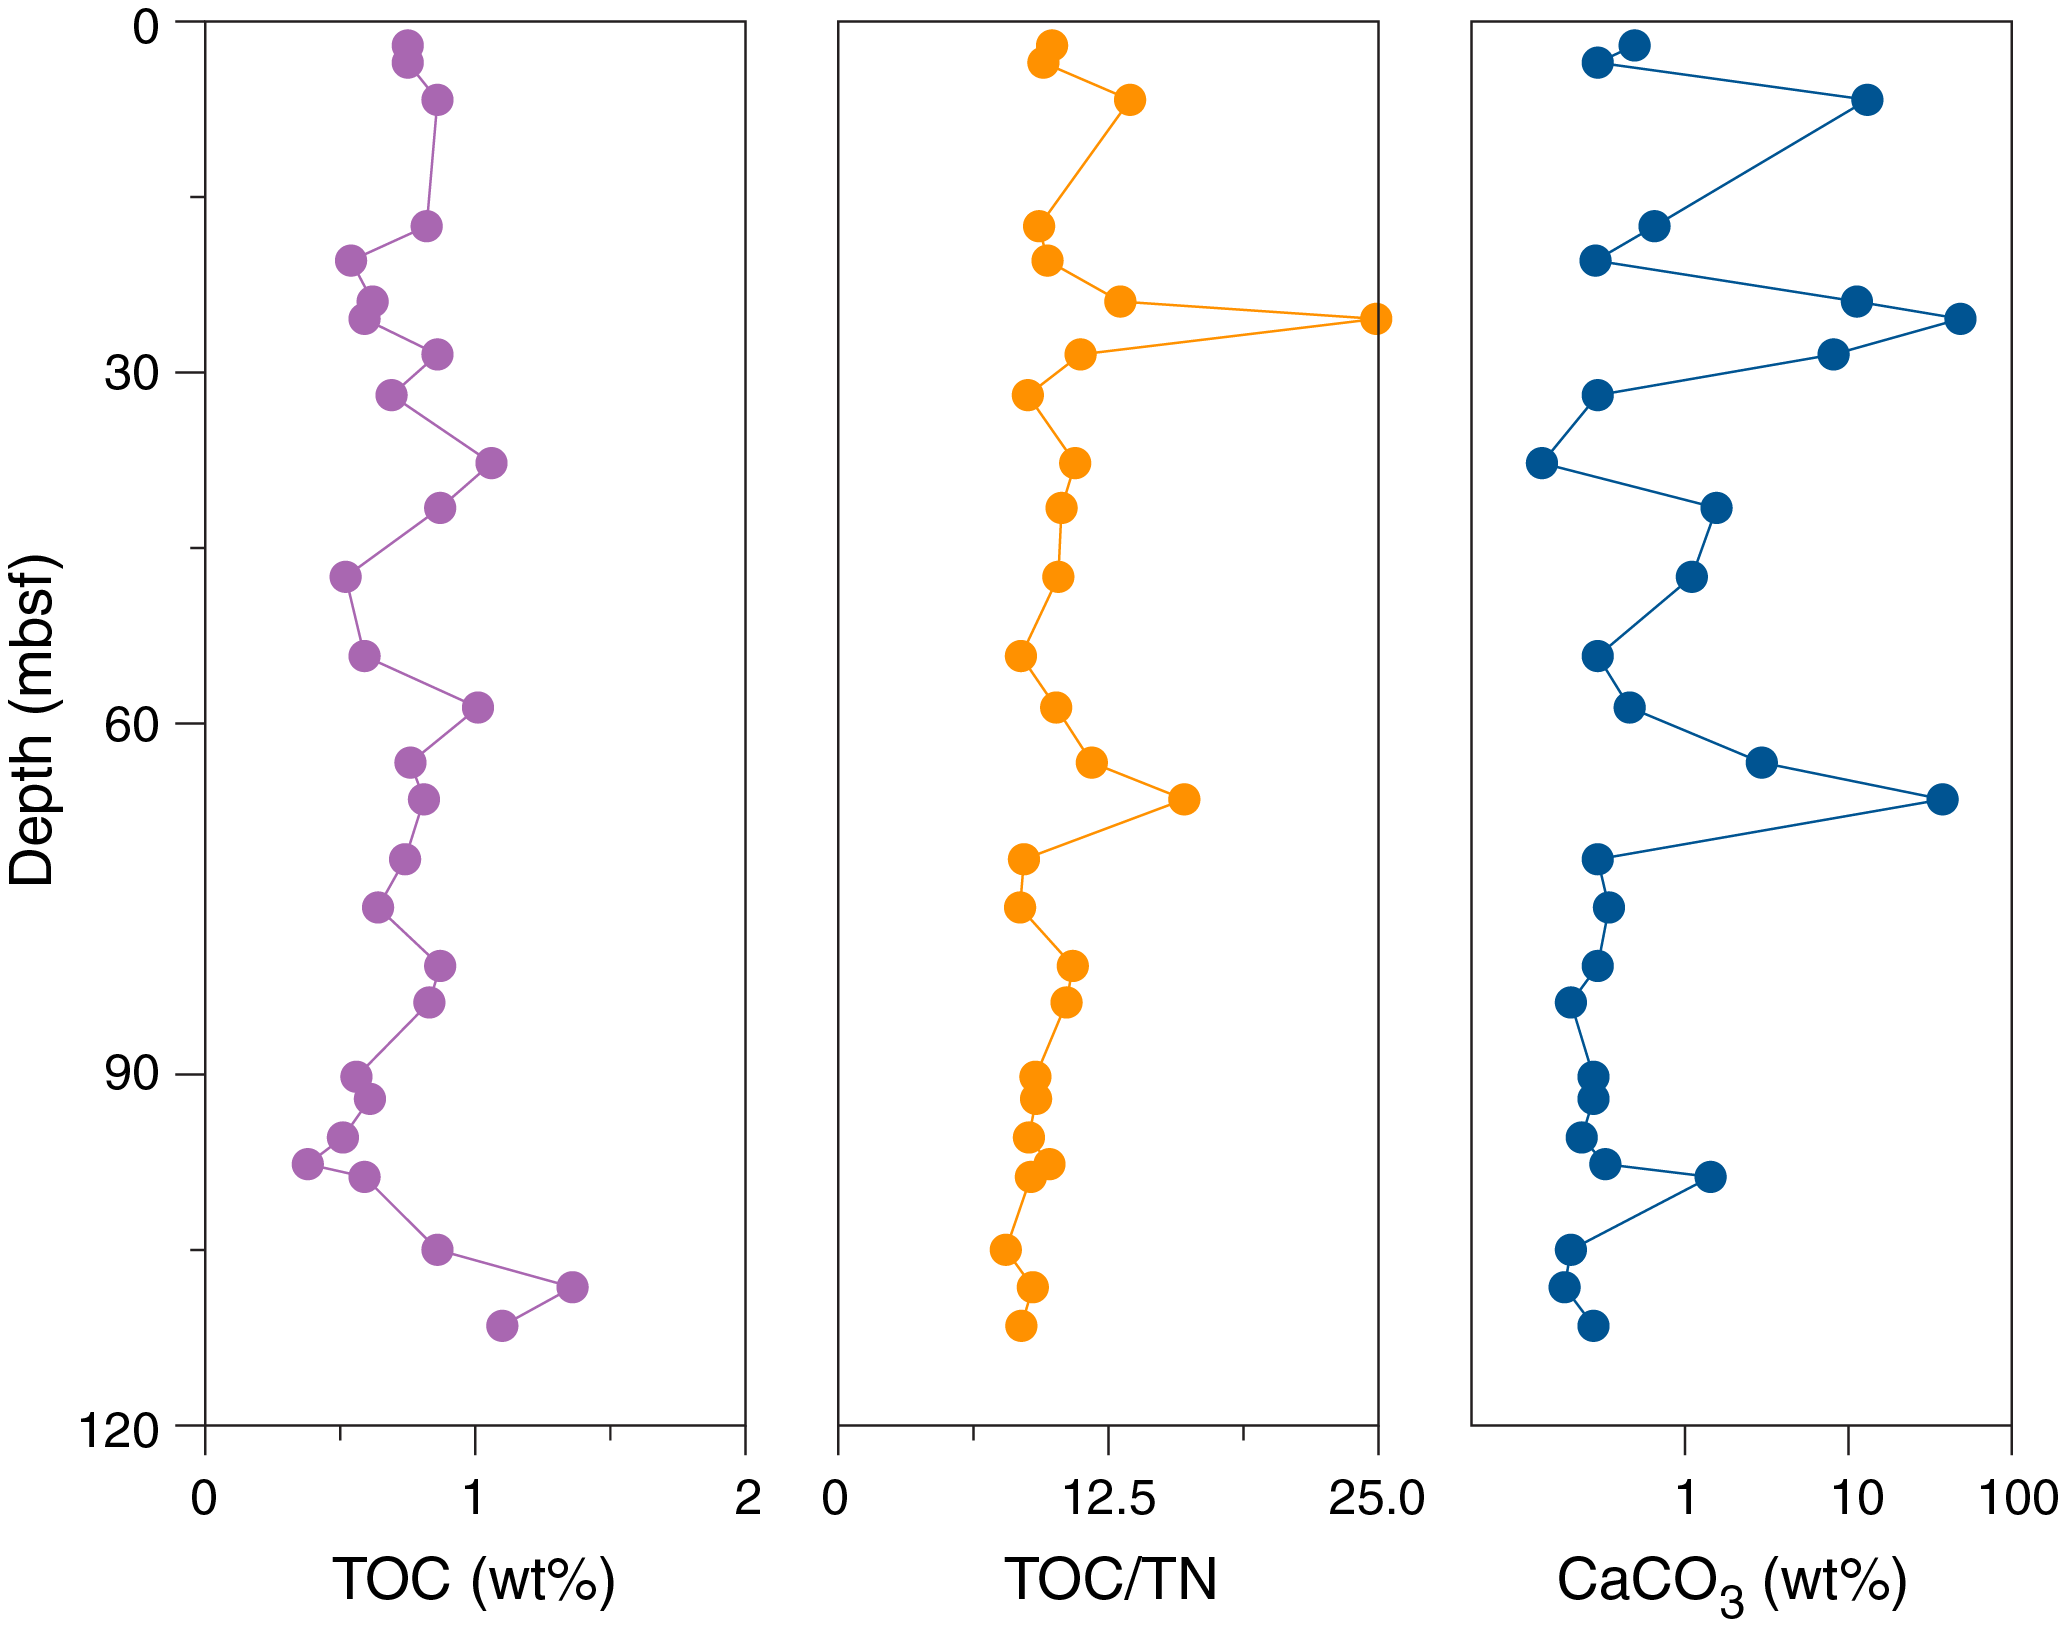
Figure F12. Bulk sediment TOC, TOC/TN ratio, and CaCO3.
Inorganic bulk sediment geochemistry
A total of 12 sediment samples were analyzed over 106 m of core, and results display very consistent geochemical trends. A selection of key elements and ratios are displayed in Figures F13 and F14. The full suite of results is presented in Table T11. The majority of samples are dominated by a terrigenous matrix, as indicated by low CaO concentrations (<3 wt%) and high SiO2 (>50 wt%) and Al2O3 (>15 wt%) concentrations. Between ~20 and 75 mbsf, a slight deviation from these compositions was recorded that has lower Al, Ti, K, Fe, and Cr concentrations bracketed by carbonate layers. The upper carbonate-rich layer coincides with the SMTZ, which may be coincidence but could also point toward an authigenic origin of some of the carbonates present at that depth. Moreover, the deeper carbonate layer at ~66 mbsf is associated with a positive Mg concentration spike, which may indicate the presence of authigenic high-Mg calcite or dolomite (Meister et al., 2007). Although seen at slightly shallower depths than at Site U1534, the carbonate-rich layers can be identified at both Sites U1535 and U1534. At both sites, the deeper carbonate-rich layer also displays elevated Mg and P concentrations that are not seen in the upper carbonate layer.
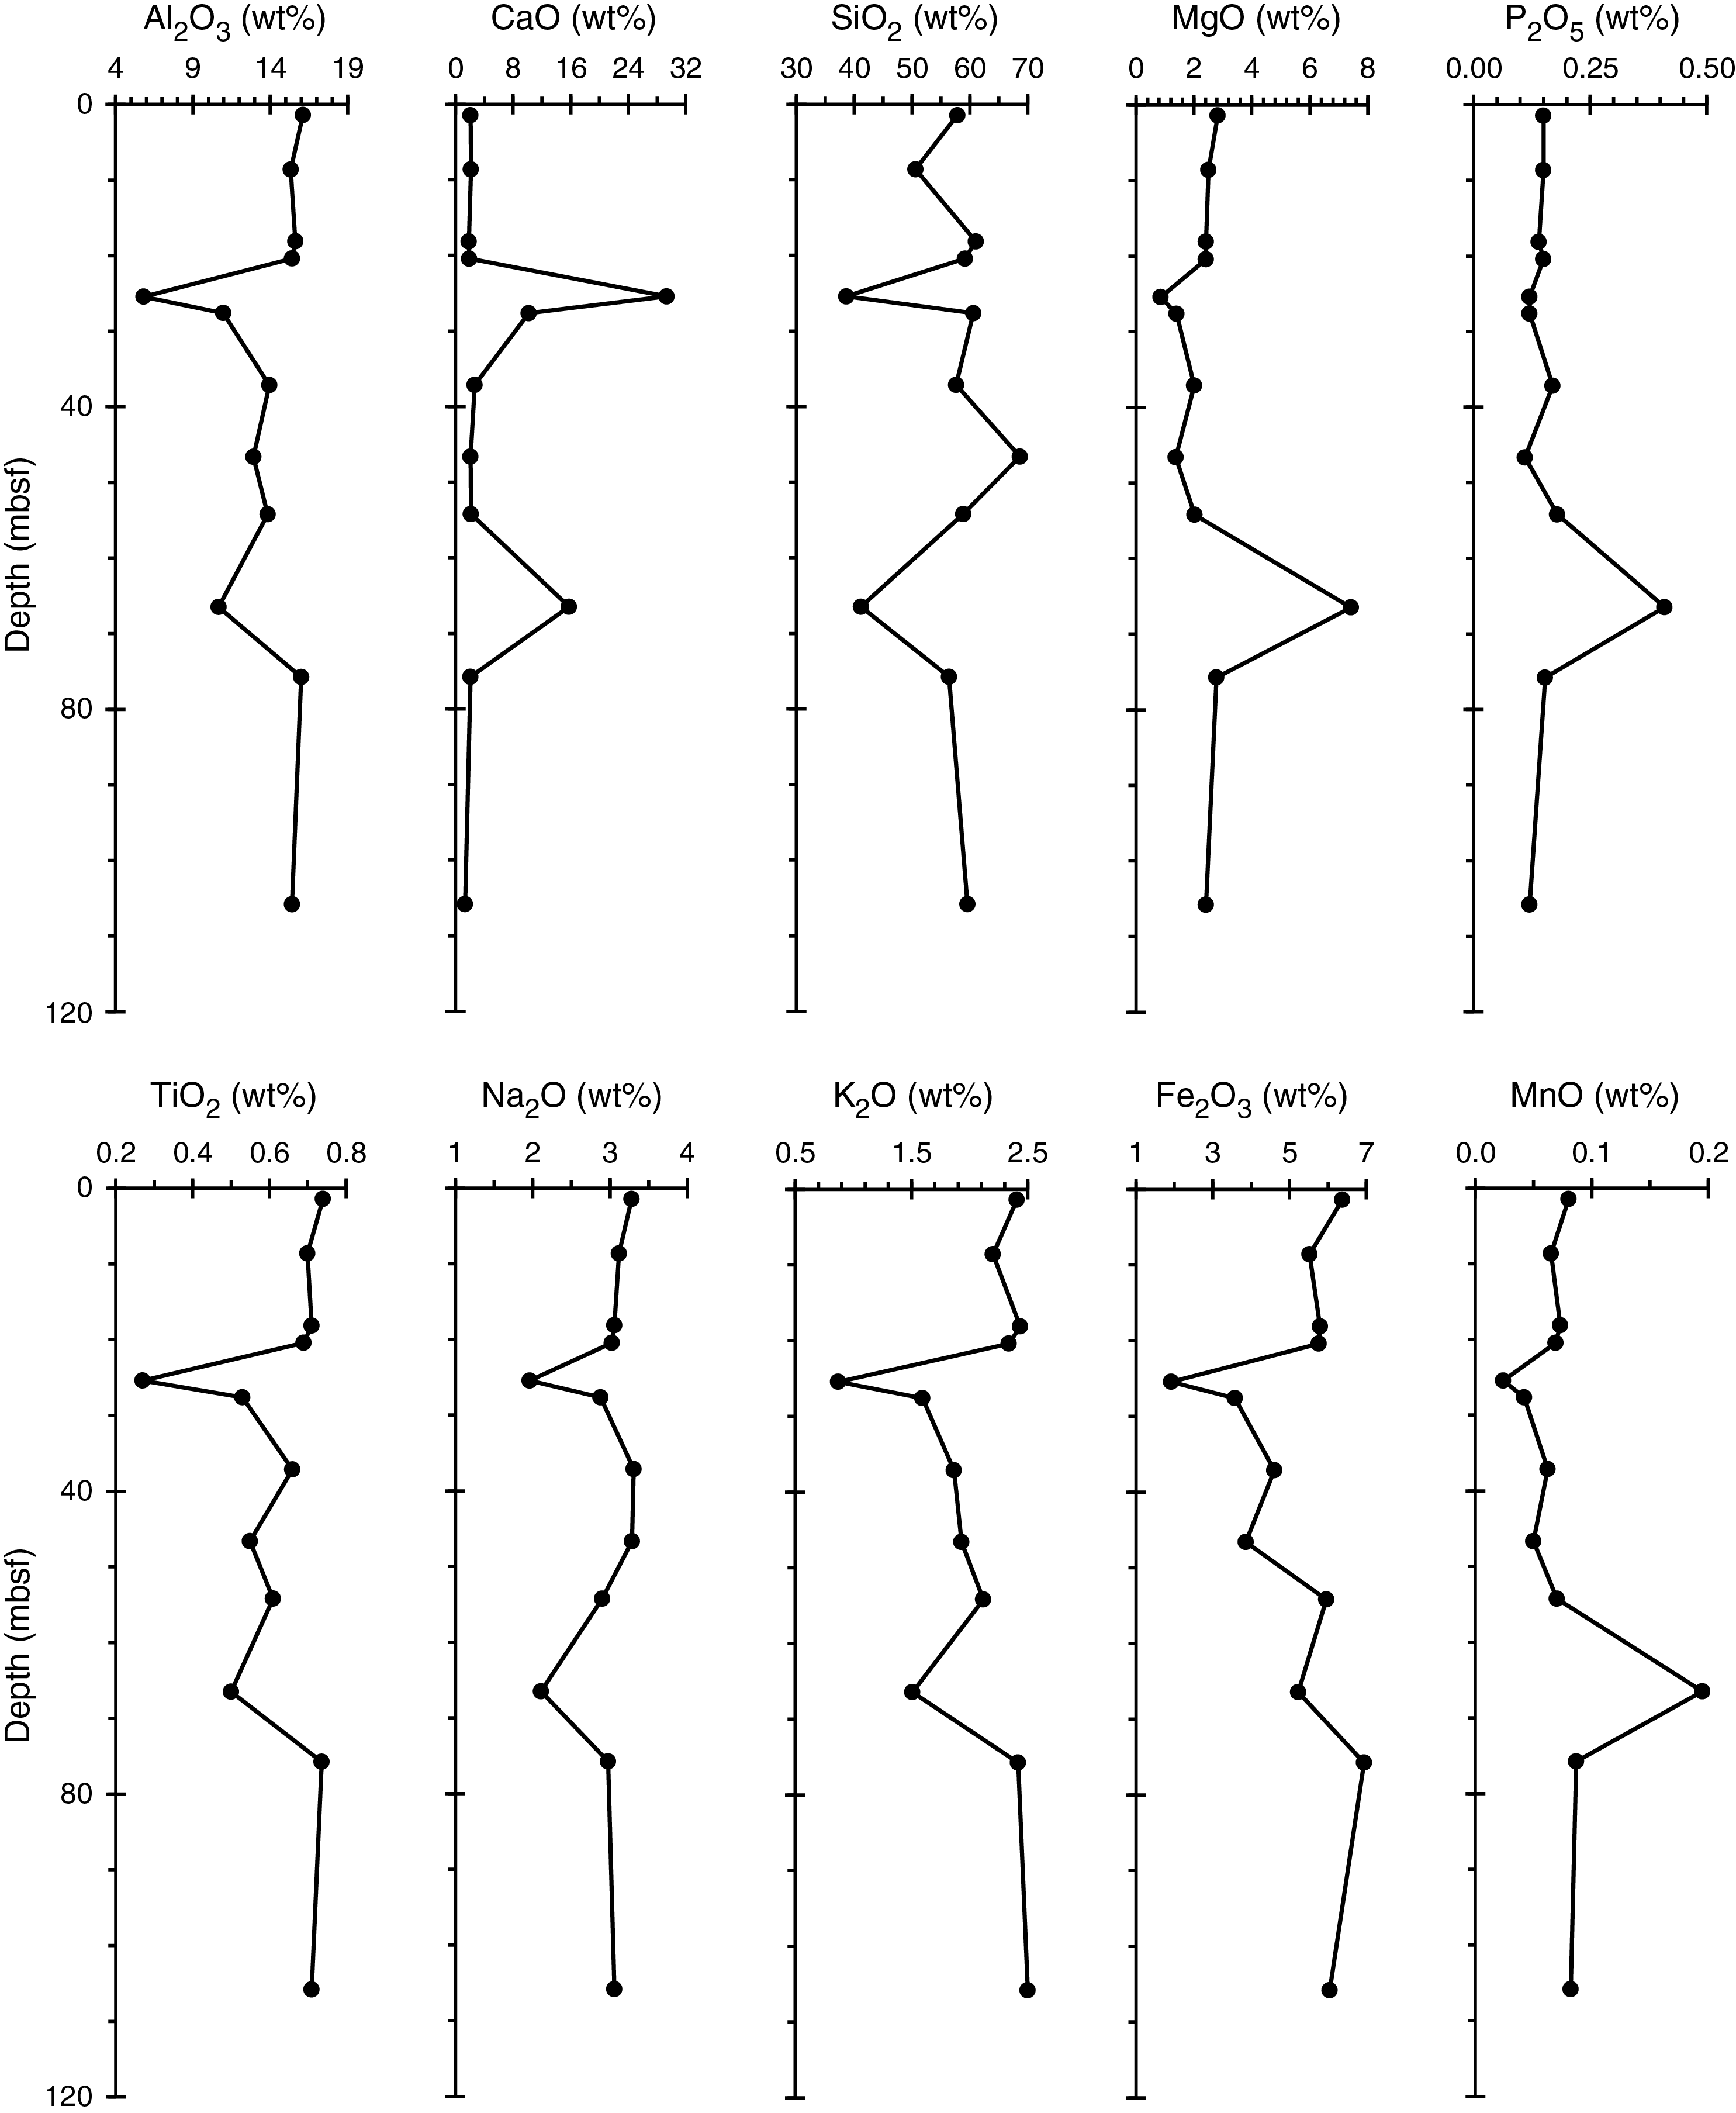
Figure F13. Bulk sediment major element compositions.
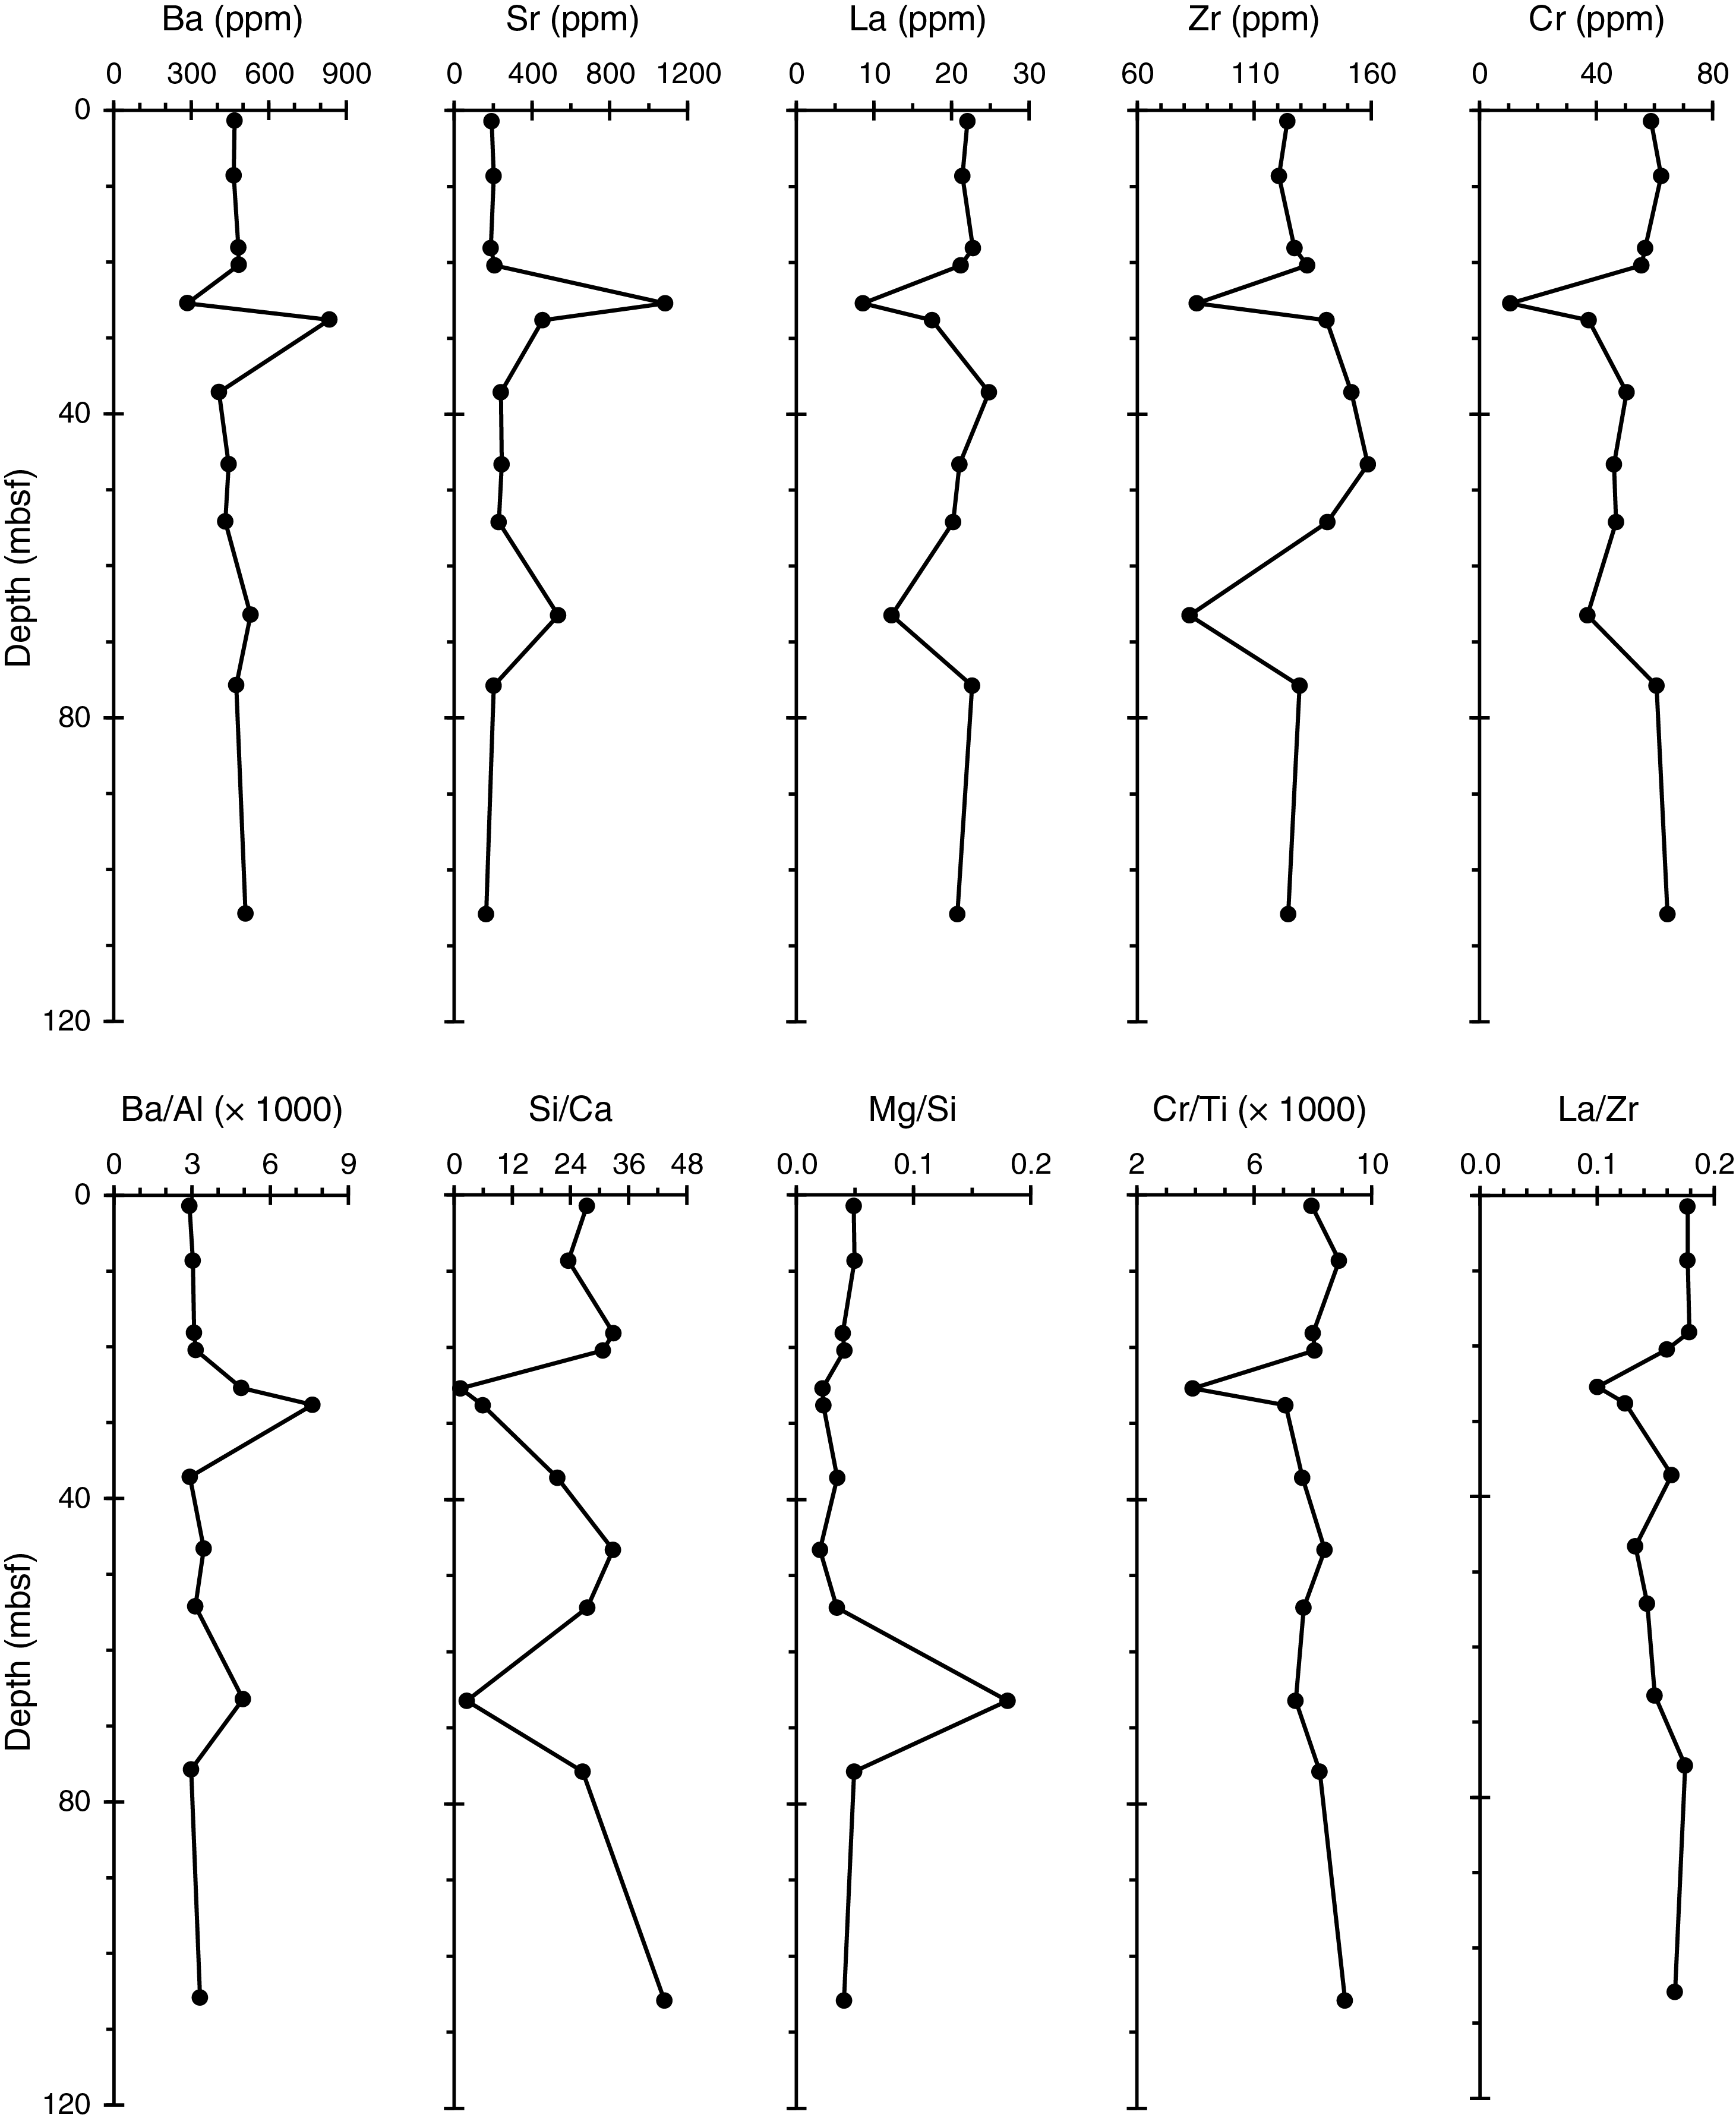
Figure F14. Sediment trace element compositions.
Summary
Headspace gas analyses, IW chemistry, and bulk sediment geochemistry measurements were performed in Hole U1535A. Headspace gas concentrations are low in the upper 30 m of the hole and increase to 10,000 ppmv for methane and 11 ppmv for ethane. IW analyses show a typical diagenetic profile that is relatively similar to observations made at neighboring Site U1534, with sulfate reduction in the uppermost 20 m and increasing ammonium, alkalinity, and barium concentrations below 20 mbsf. TOC, TN, and CaCO3 contents range from 0.4 to 1.4 wt%, from 0.02 to 0.15 wt%, and from 0.1 to 49 wt%, respectively, throughout the hole. The TOC/TN ratio ranges between 7.8 and 24.9, suggesting a mixed (i.e., marine and terrigenous) source of the organic matter deposited at Site U1535. Inorganic bulk sediment analyses were carried out on 12 samples for an assessment of the sedimentary geochemical properties over this relatively short core. In most of the sampled interval, compositions are remarkably constant and dominated by terrigenous sediments. Two carbonate-rich intervals were identified at 26 and 66 mbsf. The upper carbonate-rich layer coincides with the SMTZ, and the lower layer was found in the interval with the lowest IW pH. Although the carbonates are primary deposits based on the presence of fossils (see Lithostratigraphy), a partial diagenetic control on these carbonate layers cannot be excluded at this stage. Among the various displayed elemental ratios, La/Zr may indicate minor sediment provenance and/or grain size sorting effects, with the interval between 20 and 70 mbsf characterized by slightly lower La/Zr ratios than the shallower and deeper sediments.
Physical properties
High-resolution physical property measurements were made on all cores and most core catchers from Hole U1535A (the only hole at this site) to provide basic information on sediment composition and variability. The Whole-Round Multisensor Logger (WRMSL) measured gamma ray attenuation (GRA) bulk density, magnetic susceptibility (MS), and compressional wave velocity (on the P-wave logger [PWL]) at 2.5 cm intervals. On whole-round cores, we also measured natural gamma radiation (NGR) at 10 cm intervals and thermal conductivity at one measurement per core. P-wave caliper (PWC) velocity was acquired in at least three sections per core, and more where possible, for Hole U1535A. On archive halves, point magnetic susceptibility (MSP) and color reflectance were measured mostly at 2.5 cm increments using the Section Half Multisensor Logger (SHMSL) and digital color imaging was completed with the Section Half Imaging Logger (SHIL). Additionally, we took discrete samples from Hole U1535A for moisture and density (MAD) measurements (1–3 samples per core; ideally samples that represent the sections and different sediment nature) to determine water content, wet bulk density, dry bulk density, porosity, and grain density.
Whole-Round Multisensor Logger measurements
Results from WRMSL measurements for Hole U1535A are compiled in Figure F15. We measured physical properties at 2.5 cm for all cores and the majority of the core catchers. For Hole U1535A, cores were run on the WRMSL and the X-Ray Imager as soon as they entered the laboratory. Data presented in Figure F15 include outliers, such as unrealistic density and velocity measurements (e.g., density < 1.05 g/cm3 and velocity < 1800 m/s), caused by artifacts including internal cracks in the core (created by expansion in the laboratory).
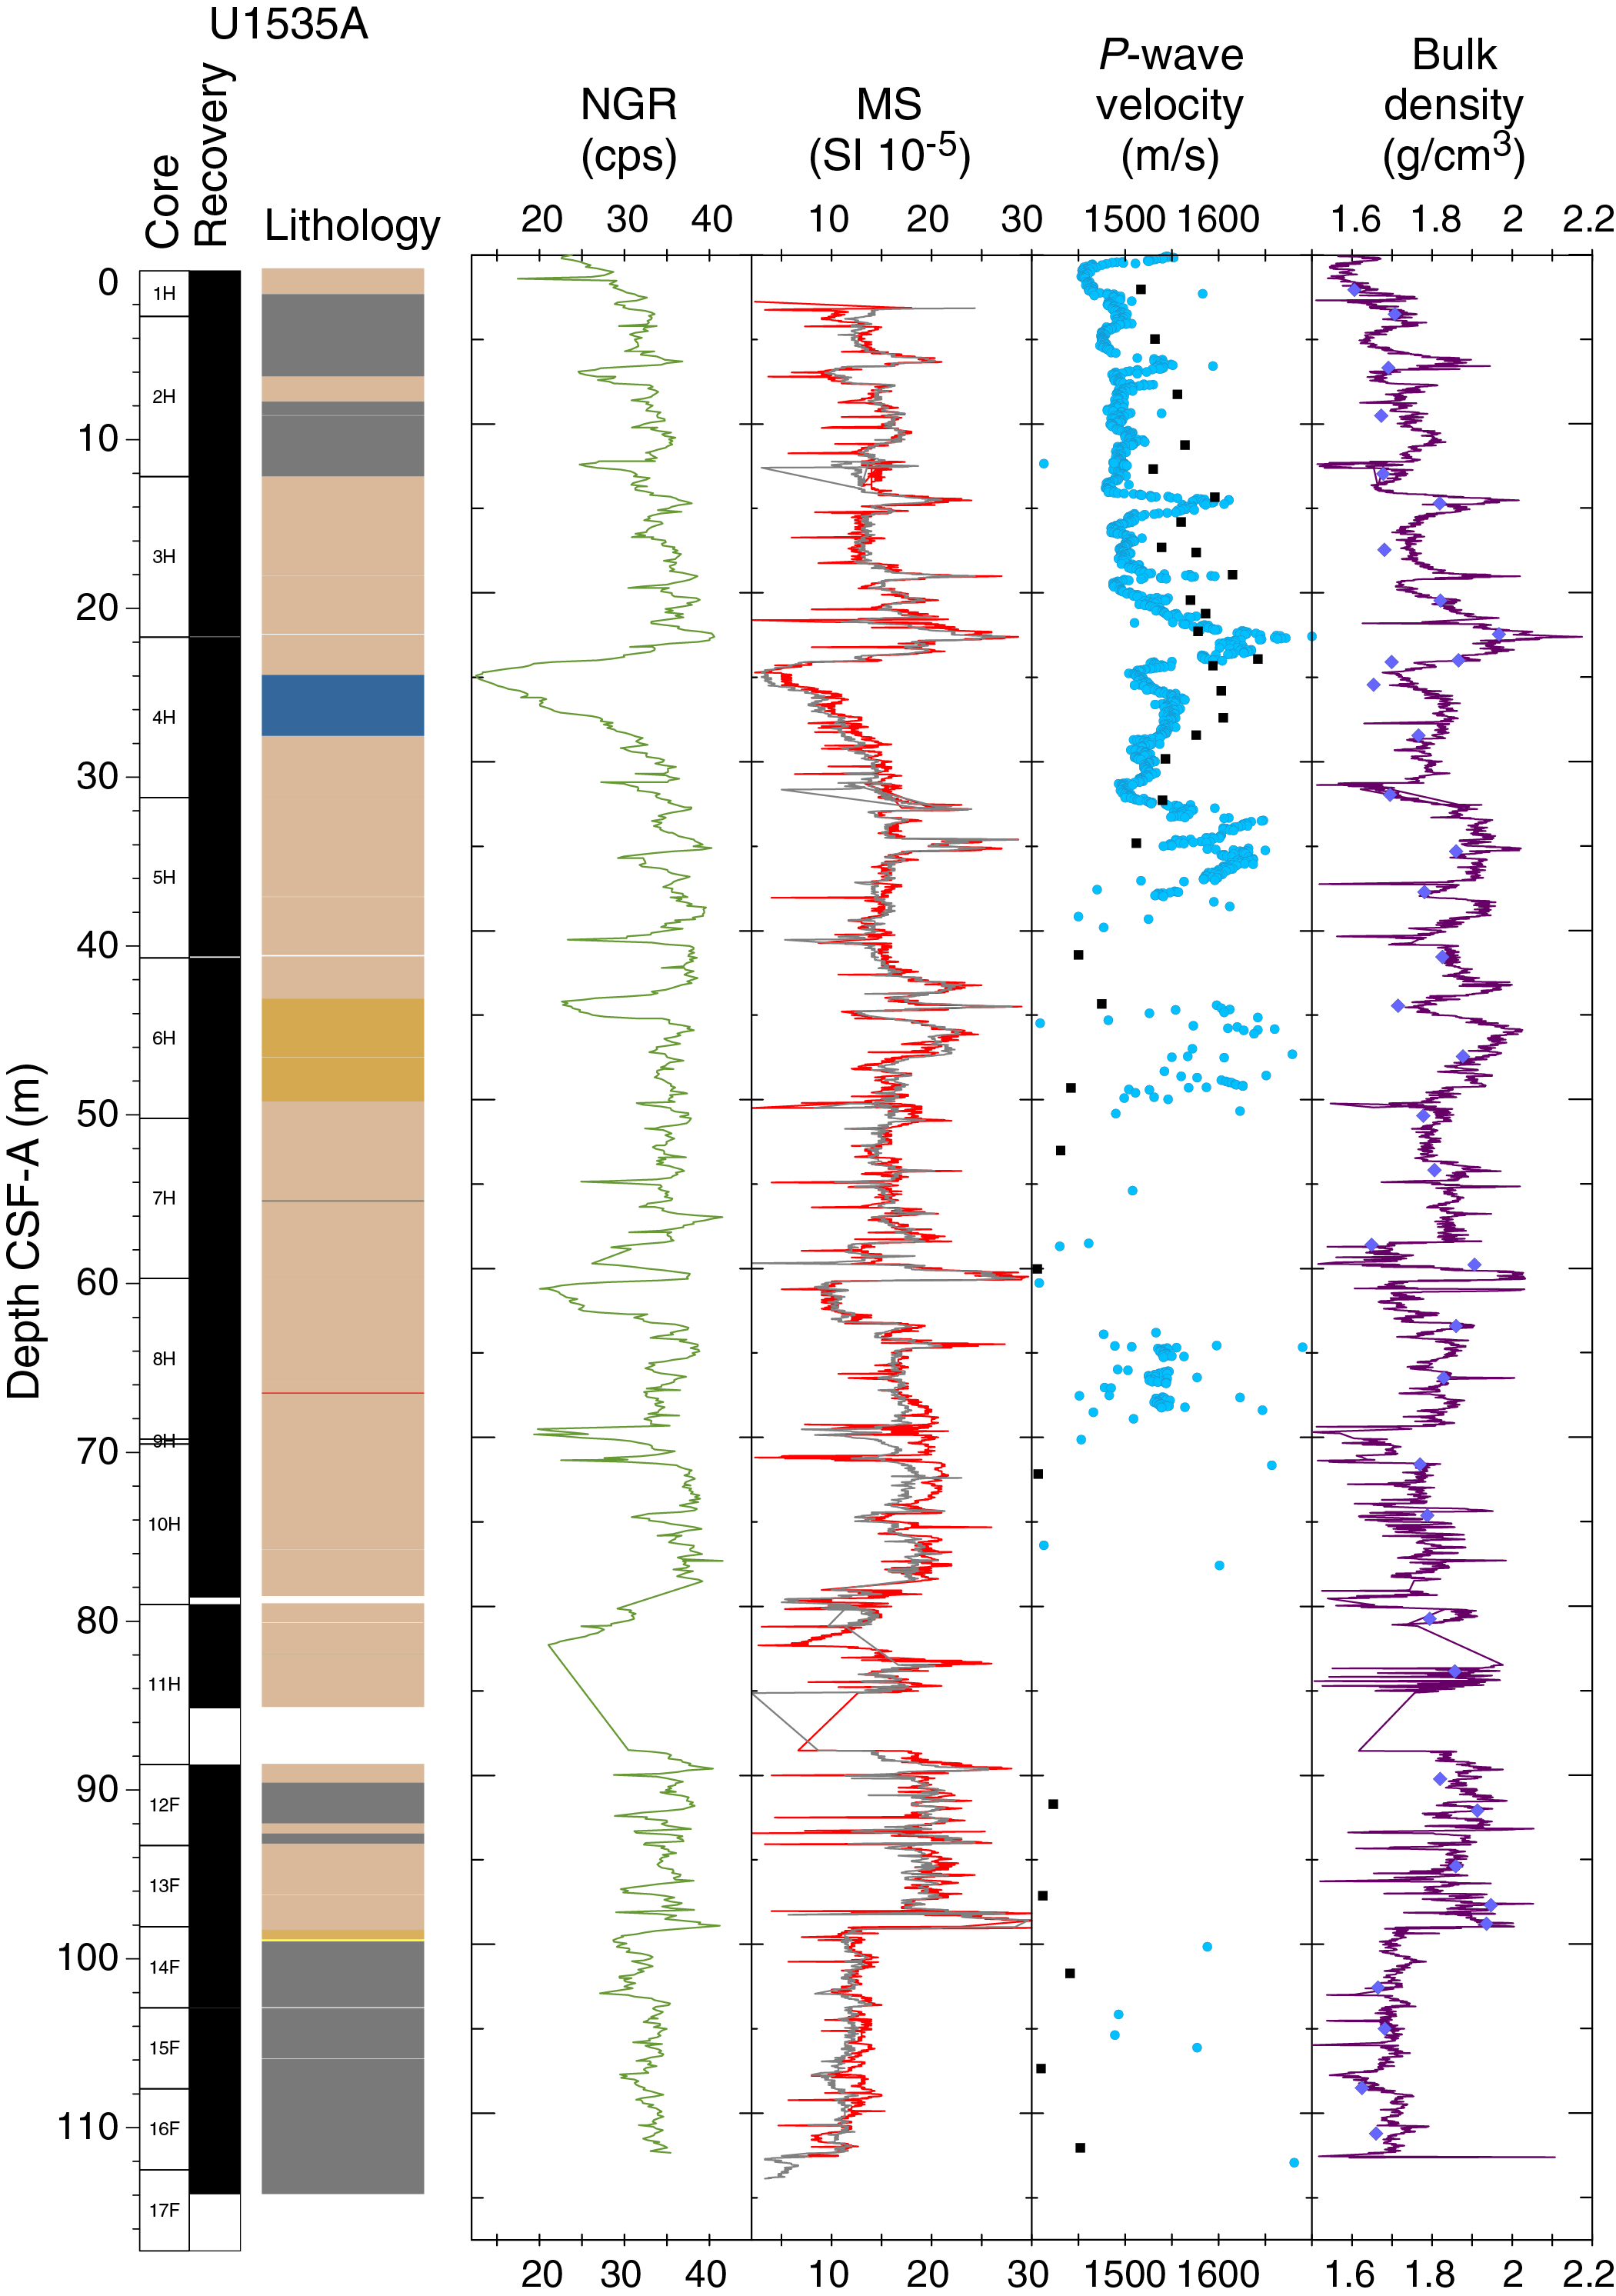
Figure F15. Physical properties.
Gamma ray attenuation bulk density
Bulk density values range from 1.5 to 2.2 g/cm3. Cyclic amplitude variability is most pronounced in the upper seven cores, consistent with mid- to late Pleistocene glacial–interglacial variability. A stepwise decrease in absolute values and the amplitude of variability is observed from Core 382-U1535A-14F to the base of the hole.
Magnetic susceptibility
As observed at Site U1534, anomalously high MS values as high as 130 × 10−5 SI are recorded in the upper 3 m of the hole. Through the remainder of the hole, MS values range from 3 × 10⁻⁵ to 30 × 10−5 SI. A pronounced low in MS is observed in Core 382-U1535A-4H where we identified the biogenic-rich sediments associated with MIS 11 (see Chronostratigraphy). A positive anomaly in MS observed in Section 14F-1 is associated with a greenish black glauconite sand (see Lithostratigraphy). Below this sand layer and for the remainder of the role, MS drops to relatively low values of 10 × 10−5 to 15 × 10−5 SI and exhibits little variability. Generally, we observe a positive correlation between NGR and the different physical properties determined with the WRMSL (Figure F16).
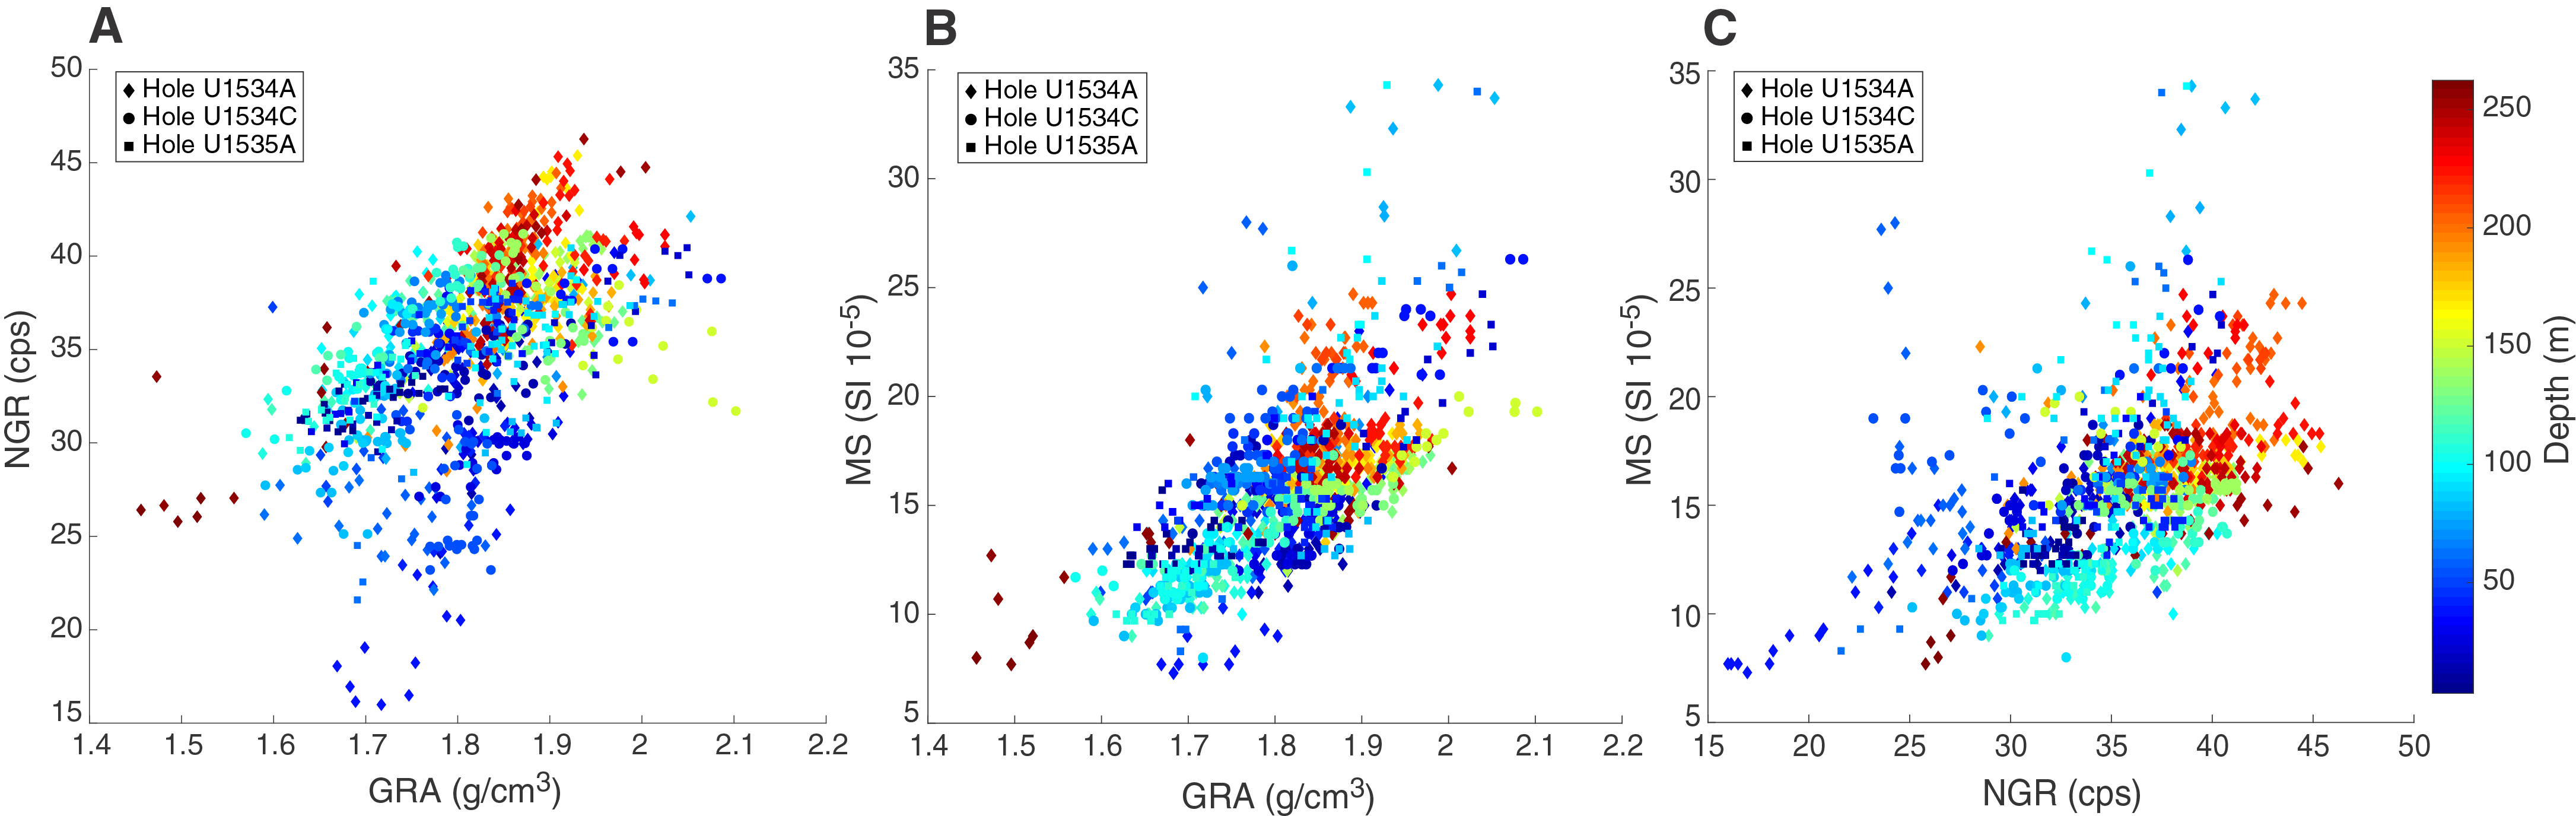
Figure F16. NGR, GRA, and MS, Sites U1534 and U1535.
P-wave velocity
P-wave velocity values measured on the PWL range from 1400 to 1700 m/s. Velocity measurements are generally meaningful for the uppermost cores (through Core 382-U1535A-4H), but the data for deeper cores often do not yield valid velocity values because of expansion of the sediments after they were taken out of in situ conditions. Expansion can be seen as cracks in the X-ray images.
Natural gamma radiation
NGR values display significant amplitude variations downcore. Values generally are between 30 and 40 counts/s except during periodic excursions to lower values observed throughout the core. The strongest amplitude variability (~30 counts/s) is again observed in Core 4H (likely MIS 11) in agreement with data from the other sensors (Figure F15).
Thermal conductivity
Thermal conductivity varies between 0.89 and 1.5 W/(m·K) in Hole U1535A (Figure F17). A clear positive trend with depth occurs through Core 382-U1535A-6H (50 mbsf), and a decrease occurs below it, followed by a modest increase in Cores 7H–13F. The lowest thermal conductivity was measured in the deepest three cores, the same interval where MS and bulk density were lowest. No clear dependence on sediment facies is observed. Thermal conductivity measurements were combined with borehole temperatures for heat flow estimates in Hole U1535A (see Downhole measurements).
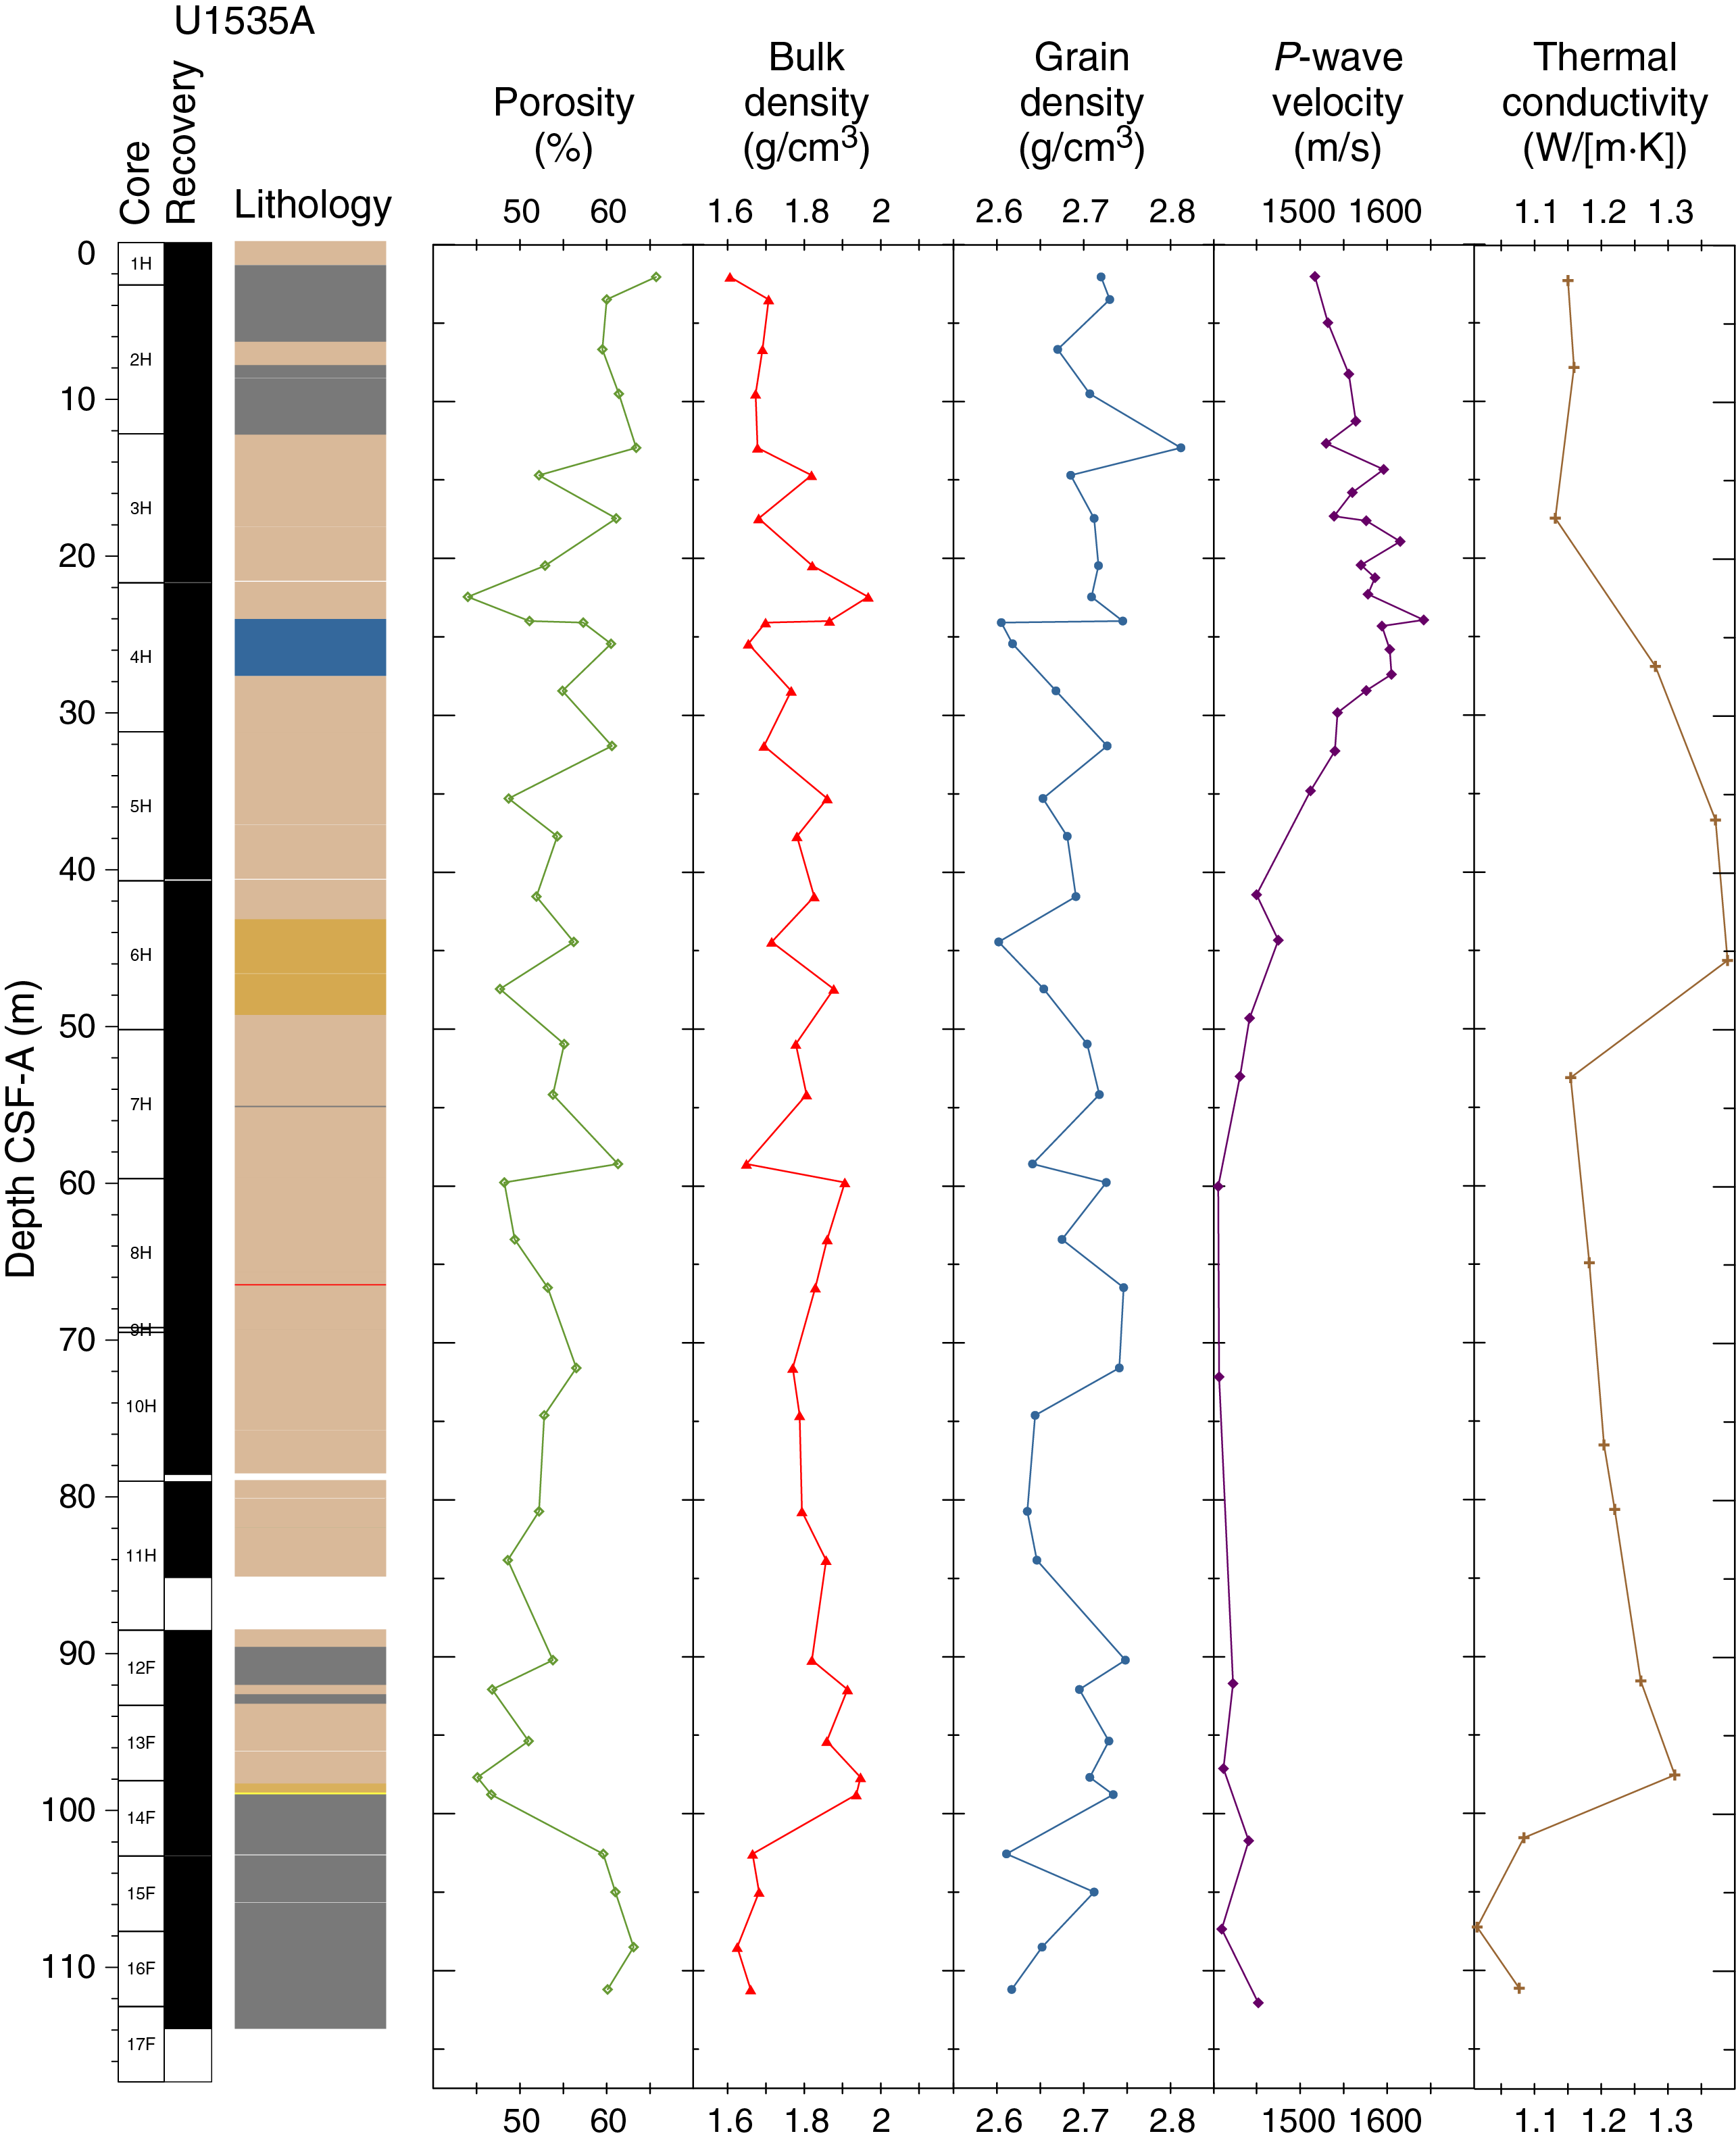
Figure F17. MAD results.
Point magnetic susceptibility
MSP measurements were performed on archive halves. The absolute values and downhole patterns are very similar to the equivalent WRMSL MS data (Figure F15). MSP measurements were acquired at 2.5 cm spacing, the same resolution as the WRMSL. In some cases, higher variability in MS signature is observed with this instrument because of the smaller integration volume of the sensor (~1 cm depth interval; 1σ) compared to the loop sensor (~18 cm depth interval; 1σ) used on the WRMSL (Weber et al., 1997).
Discrete compressional wave velocity
We relied on the P-wave velocities measured on the working halves with the caliper (PWC) because the P-wave data yielded by the WRMSL were scattered below Core 382-U1535A-4H (Figure F15). We measured at least three sections per core where possible. Measurements were extremely difficult to obtain in some cores because of poor contact between the sensors, the liner, and the sediments. We used acid-buffered distilled water on some occasions to achieve a better coupling of the sensors to the sediment. P-wave velocity values peak at ~1650 m/s in the biosiliceous ooze in Core 4H, decrease to lower values over the next 20 m of sediment, and then remain low and relatively constant through the bottom of the hole (Figure F17).
Moisture and density
Bulk density values were calculated from moisture and volume measurements made on discrete samples taken from the working halves (see Physical properties in the Expedition 382 methods chapter [Weber et al., 2021]). The sample resolution in each core varied depending on lithology, recovery, and quality, and 2–5 samples were taken per core. A total of 38 samples were taken for MAD measurements from Hole U1535A.
MAD density values correspond well to GRA bulk density values measured on the WRMSL for Hole U1535A (Figures F15, F17). Bulk density values range from ~1.6 g/cm3 at the top of the hole to ~2.0 g/cm3 at 22 mbsf. Between 24 and 60 mbsf, bulk density values fluctuate regularly between ~1.6 and ~1.9 g/cm3. Below 72 mbsf, bulk density values increase slightly to ~1.9 g/cm3 before decreasing suddenly to ~1.7 g/cm3 below 99 mbsf. Density values remain at ~1.7 g/cm3 through the remainder of the hole.
Grain density is fairly uniform through Hole U1535A with no overall change in the downcore trend. Values range between ~2.6 and 2.8 g/cm3. Porosity (percent of pore space of the wet sediment volume) is included in the suite of MAD measurements. Discrete porosity values range from ~66% near the top of Hole U1535A to generally lower values toward the bottom of the hole. Between ~97 and ~110 mbsf (Cores 382-U1535A-14F through 16F), porosity increases to ~60% (Figure F17).
Color reflectance
L*a*b* color reflectance measurements describe coordinates in a spherical system with 16.8 million possible variations (Weber, 1998; Blum, 1997). All color components show distinct cyclic variability of amplitude and rather noisy signals. The L* axis measures the black–white color component and is known as the lightness or gray value. It can be a reliable tracer for the content of biogenic carbonate in marine sediment (Weber, 1998). Core 382-U1535A-4H (22–31 mbsf; inferred to be MIS 11 deposits) has the highest L* values (Figure F18), consistent with the high biogenic content associated with MIS 11.
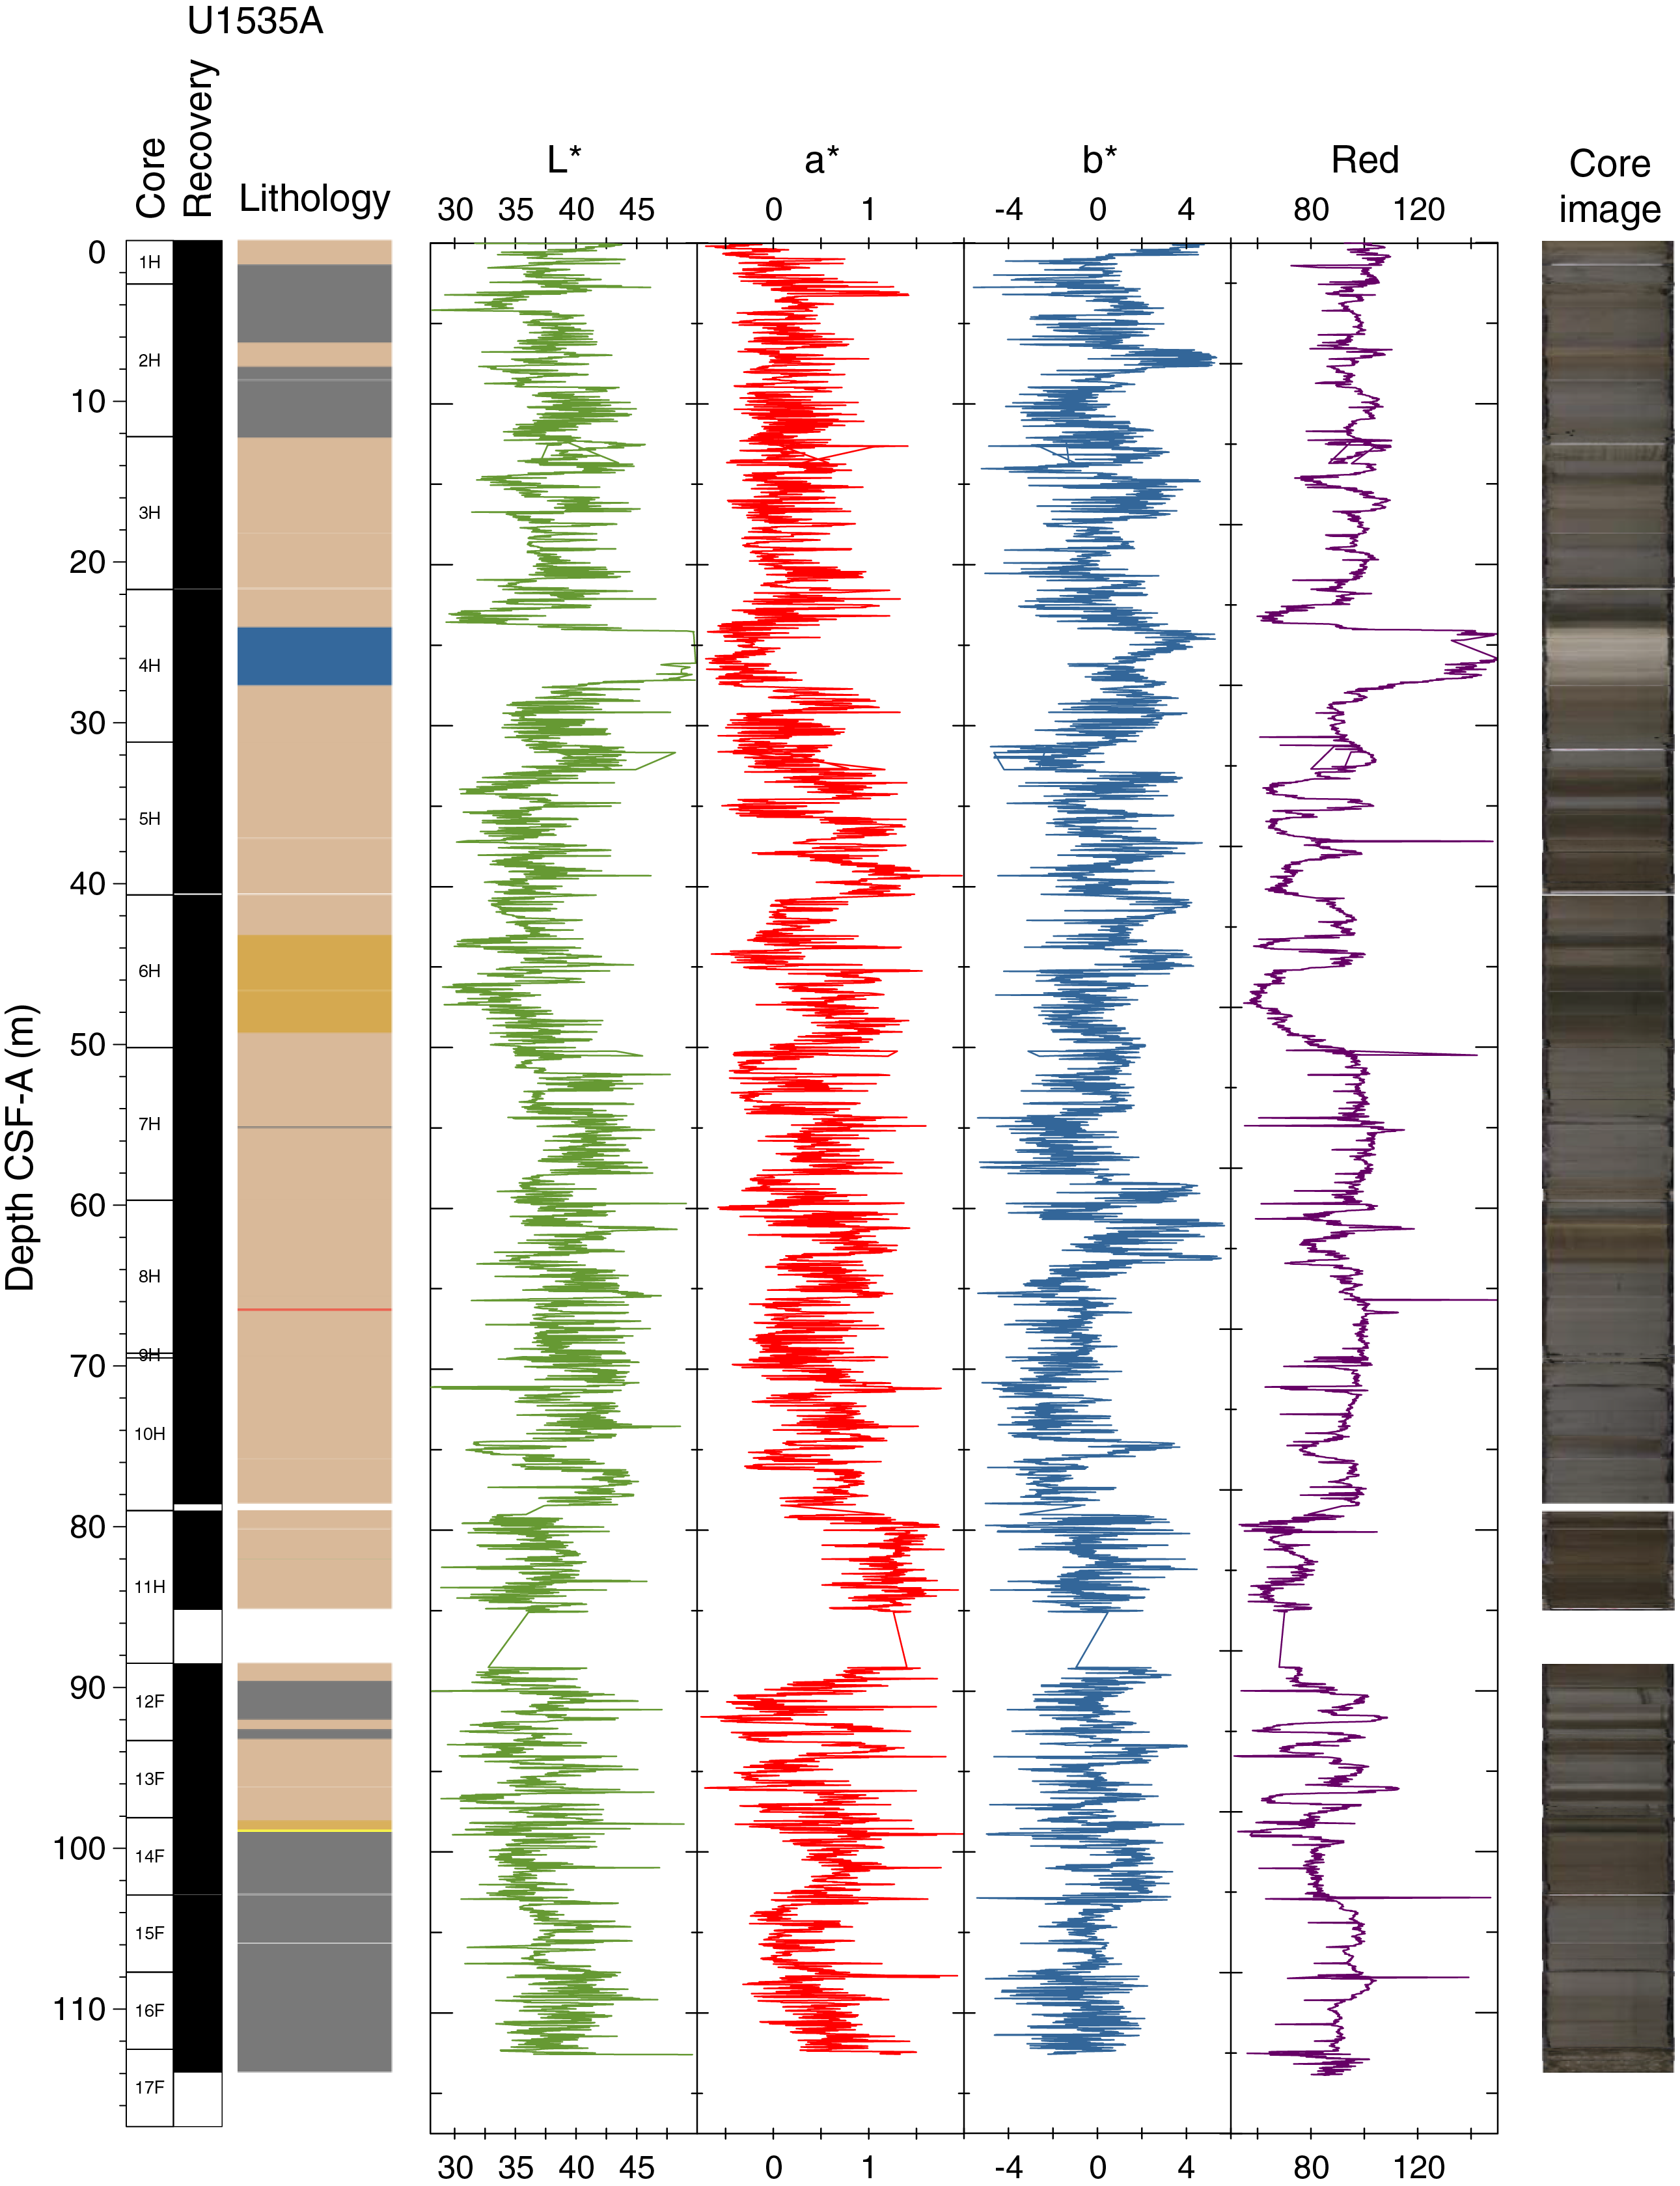
Figure F18. Color reflectance.
The a* axis is the green–red component and is usually a tracer of changing redox conditions in the sediments. In Hole U1535A, a* values show low-amplitude cycles that generally correlate with the other color records.
The b* axis is the yellow–blue component with yellower (more positive) b* commonly corresponding to increased biogenic opal content of sediments (Sprenk et al., 2013). At Site U1535, b* values exhibit low-amplitude cycles consistent with the other color records.
Physical properties and relationship with facies
In general, as at Site U1534, the sediments at Site U1535 are composed of silty clay and clayey silt with some intervals rich in foraminifers and nannofossils. Variability in the biogenic proportion relative to terrigenous clastic content is likely largely responsible for variations in physical properties. As at Site U1534, much of the lithologic sequence is described as biosilica-bearing silty clay. Glauconite is also abundant in the terrigenous fraction and may influence the color/light measurements.
Core disturbances and data quality
Core recovery was typically 100%, except when we encountered hard layers in Cores 382-U1535A-11H and 17F. The HLAPC system was used after Core 11H. Overall, data quality and recovery were good at this site except for the PWL measurements, which were affected by cracks that originated because of thermal expansion in cores recovered below 30 mbsf (Core 4H). In addition, because of the use of double liners to fix imperfections or cracks in many of the recovered cores, we were not able to X-ray image all cores. Similarly, WRMSL measurements were not possible in a few of the cores.
Summary
Physical property data were acquired on all cores from Site U1535 using the WRMSL for GRA wet bulk density, MS, and P-wave velocity (PWL). We also measured NGR in all sections longer than 50 cm and acquired X-ray imaging. Thermal conductivity was acquired in one section per core. The SHMSL was used to measure MSP and color reflectance using the L*a*b* color system, and the red-green-blue (RGB) color of the sediments was measured with digital color imaging (SHIL). In addition, we determined P-wave velocity values at discrete points on the working halves and measured discrete samples for MAD of wet bulk density, dry bulk density, and grain density on Hole U1535A cores. The sensors worked correctly, and the data are of good quality except for those from the PWL, which recorded a great number of spikes due to the gaps created in the core during thermal expansion as the core equilibrated with laboratory temperature.
Silty clay, clay, and silt dominate the lithology of most recovered cores. The most prominent variations in physical property signals are observed in Core 382-U1535A-4H where MIS 11–aged sediments with high biogenic content were recovered.
Stratigraphic correlation
One hole was drilled at Site U1535 using the APC and HLAPC coring systems. The goal for this site was to recover the more expanded sedimentary sequence above Reflector B relative to Site U1534.
Whole-round cores from Hole U1535A were analyzed for their physical properties using the WRMSL (for MS, GRA density, and P-wave velocity) and gamma ray track (for NGR intensity) and subsequently the SHMSL (for MS and color reflectance) once they were split into working and archive halves (see Physical properties; also see Physical properties in the Expedition 382 methods chapter [Weber et al., 2021] for details).
Correlation to Site U1534
Time constraints did not permit occupying more than one hole at Site U1535. The liners of the last three full-length APC cores shattered and were difficult to remove from the core barrel, so the final six cores were recovered using the HLAPC system. Owing to the lack of a second hole at Site U1535, it was also not possible to construct composite depths for this site. However, the proximity of Site U1534 (~8 km due west) meant that it was possible to recognize common features (sedimentologically and by comparison of their physical properties) between the two sites (Figure F19).
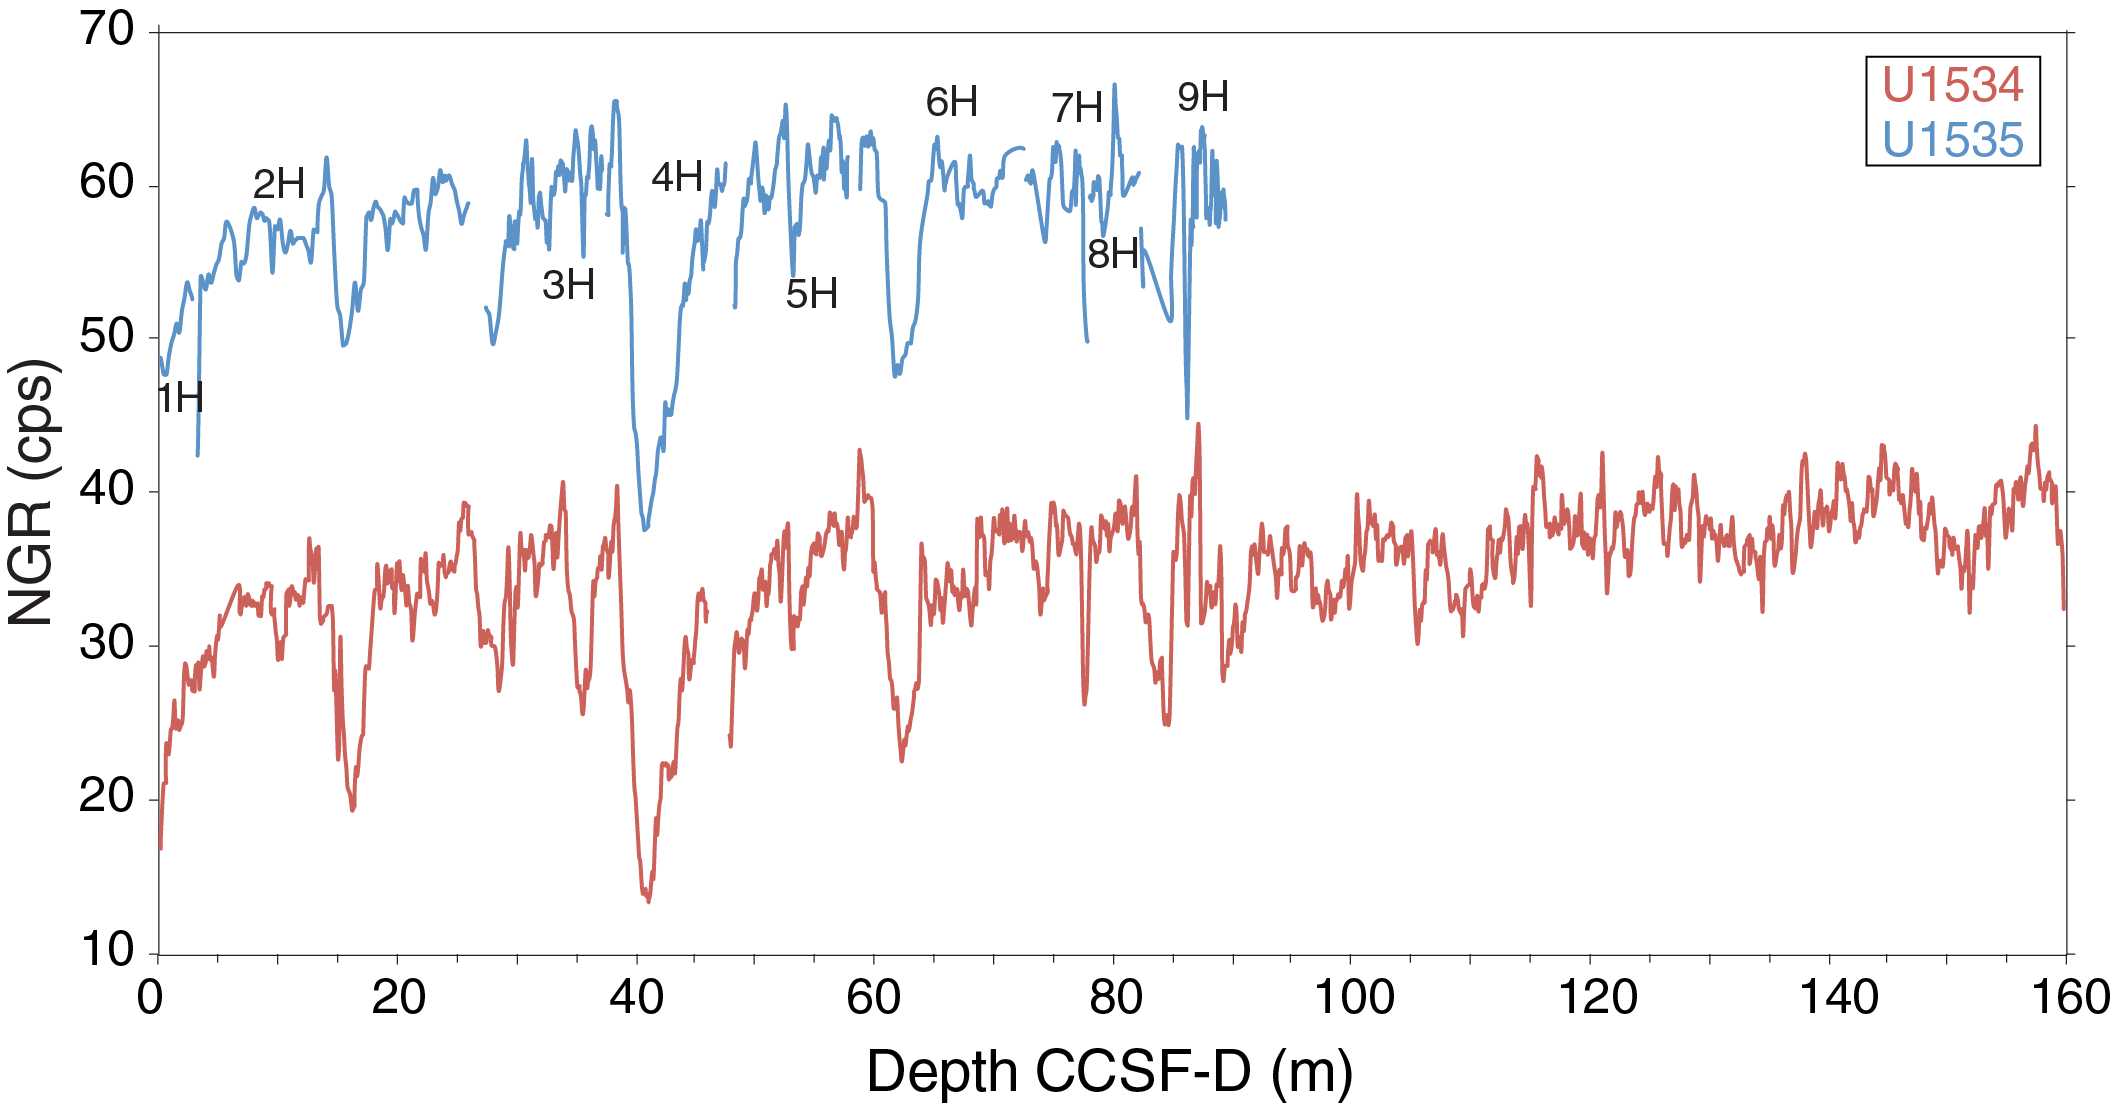
Figure F19. NGR intensity data, Sites U1534 and U1535.
Chronostratigraphy
See Chronostratigraphy in the Site U1534 chapter (Peck et al., 2021).
Downhole measurements
Downhole temperature and heat flow
Advanced piston corer temperature tool (APCT-3) downhole temperature measurements were made on Cores 382-U1535A-4H and 7H. The seafloor temperature was determined to be 4.5°C based on APCT-3 data taken while the tool was held at the mudline for 5 min during each run (Figure F20). The obtained temperatures are 5.7°C at 31.2 m drilling depth below seafloor (DSF) and 6.6°C at 59.7 m DSF (Table T12; Figures F20, F21), giving an approximately linear temperature increase with depth and a geothermal gradient of 35°C/km.
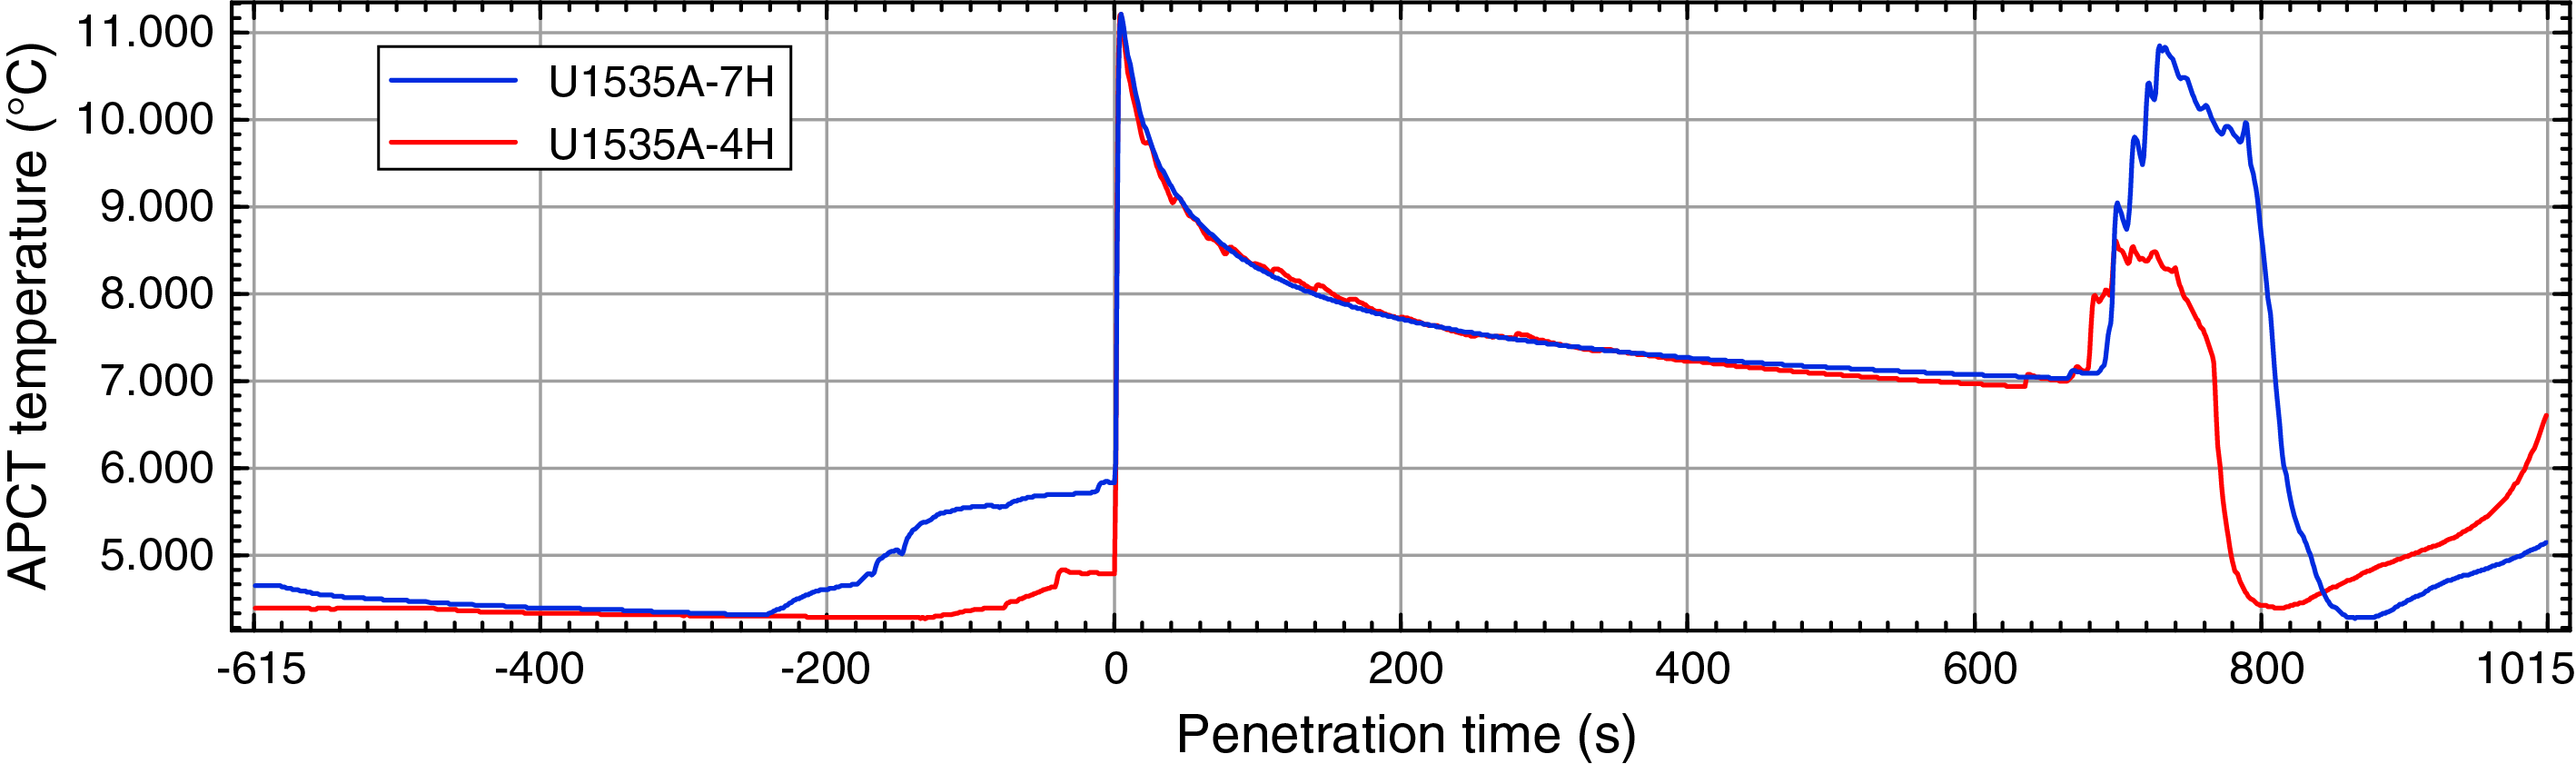
Figure F20. APCT-3 temperature-time series.
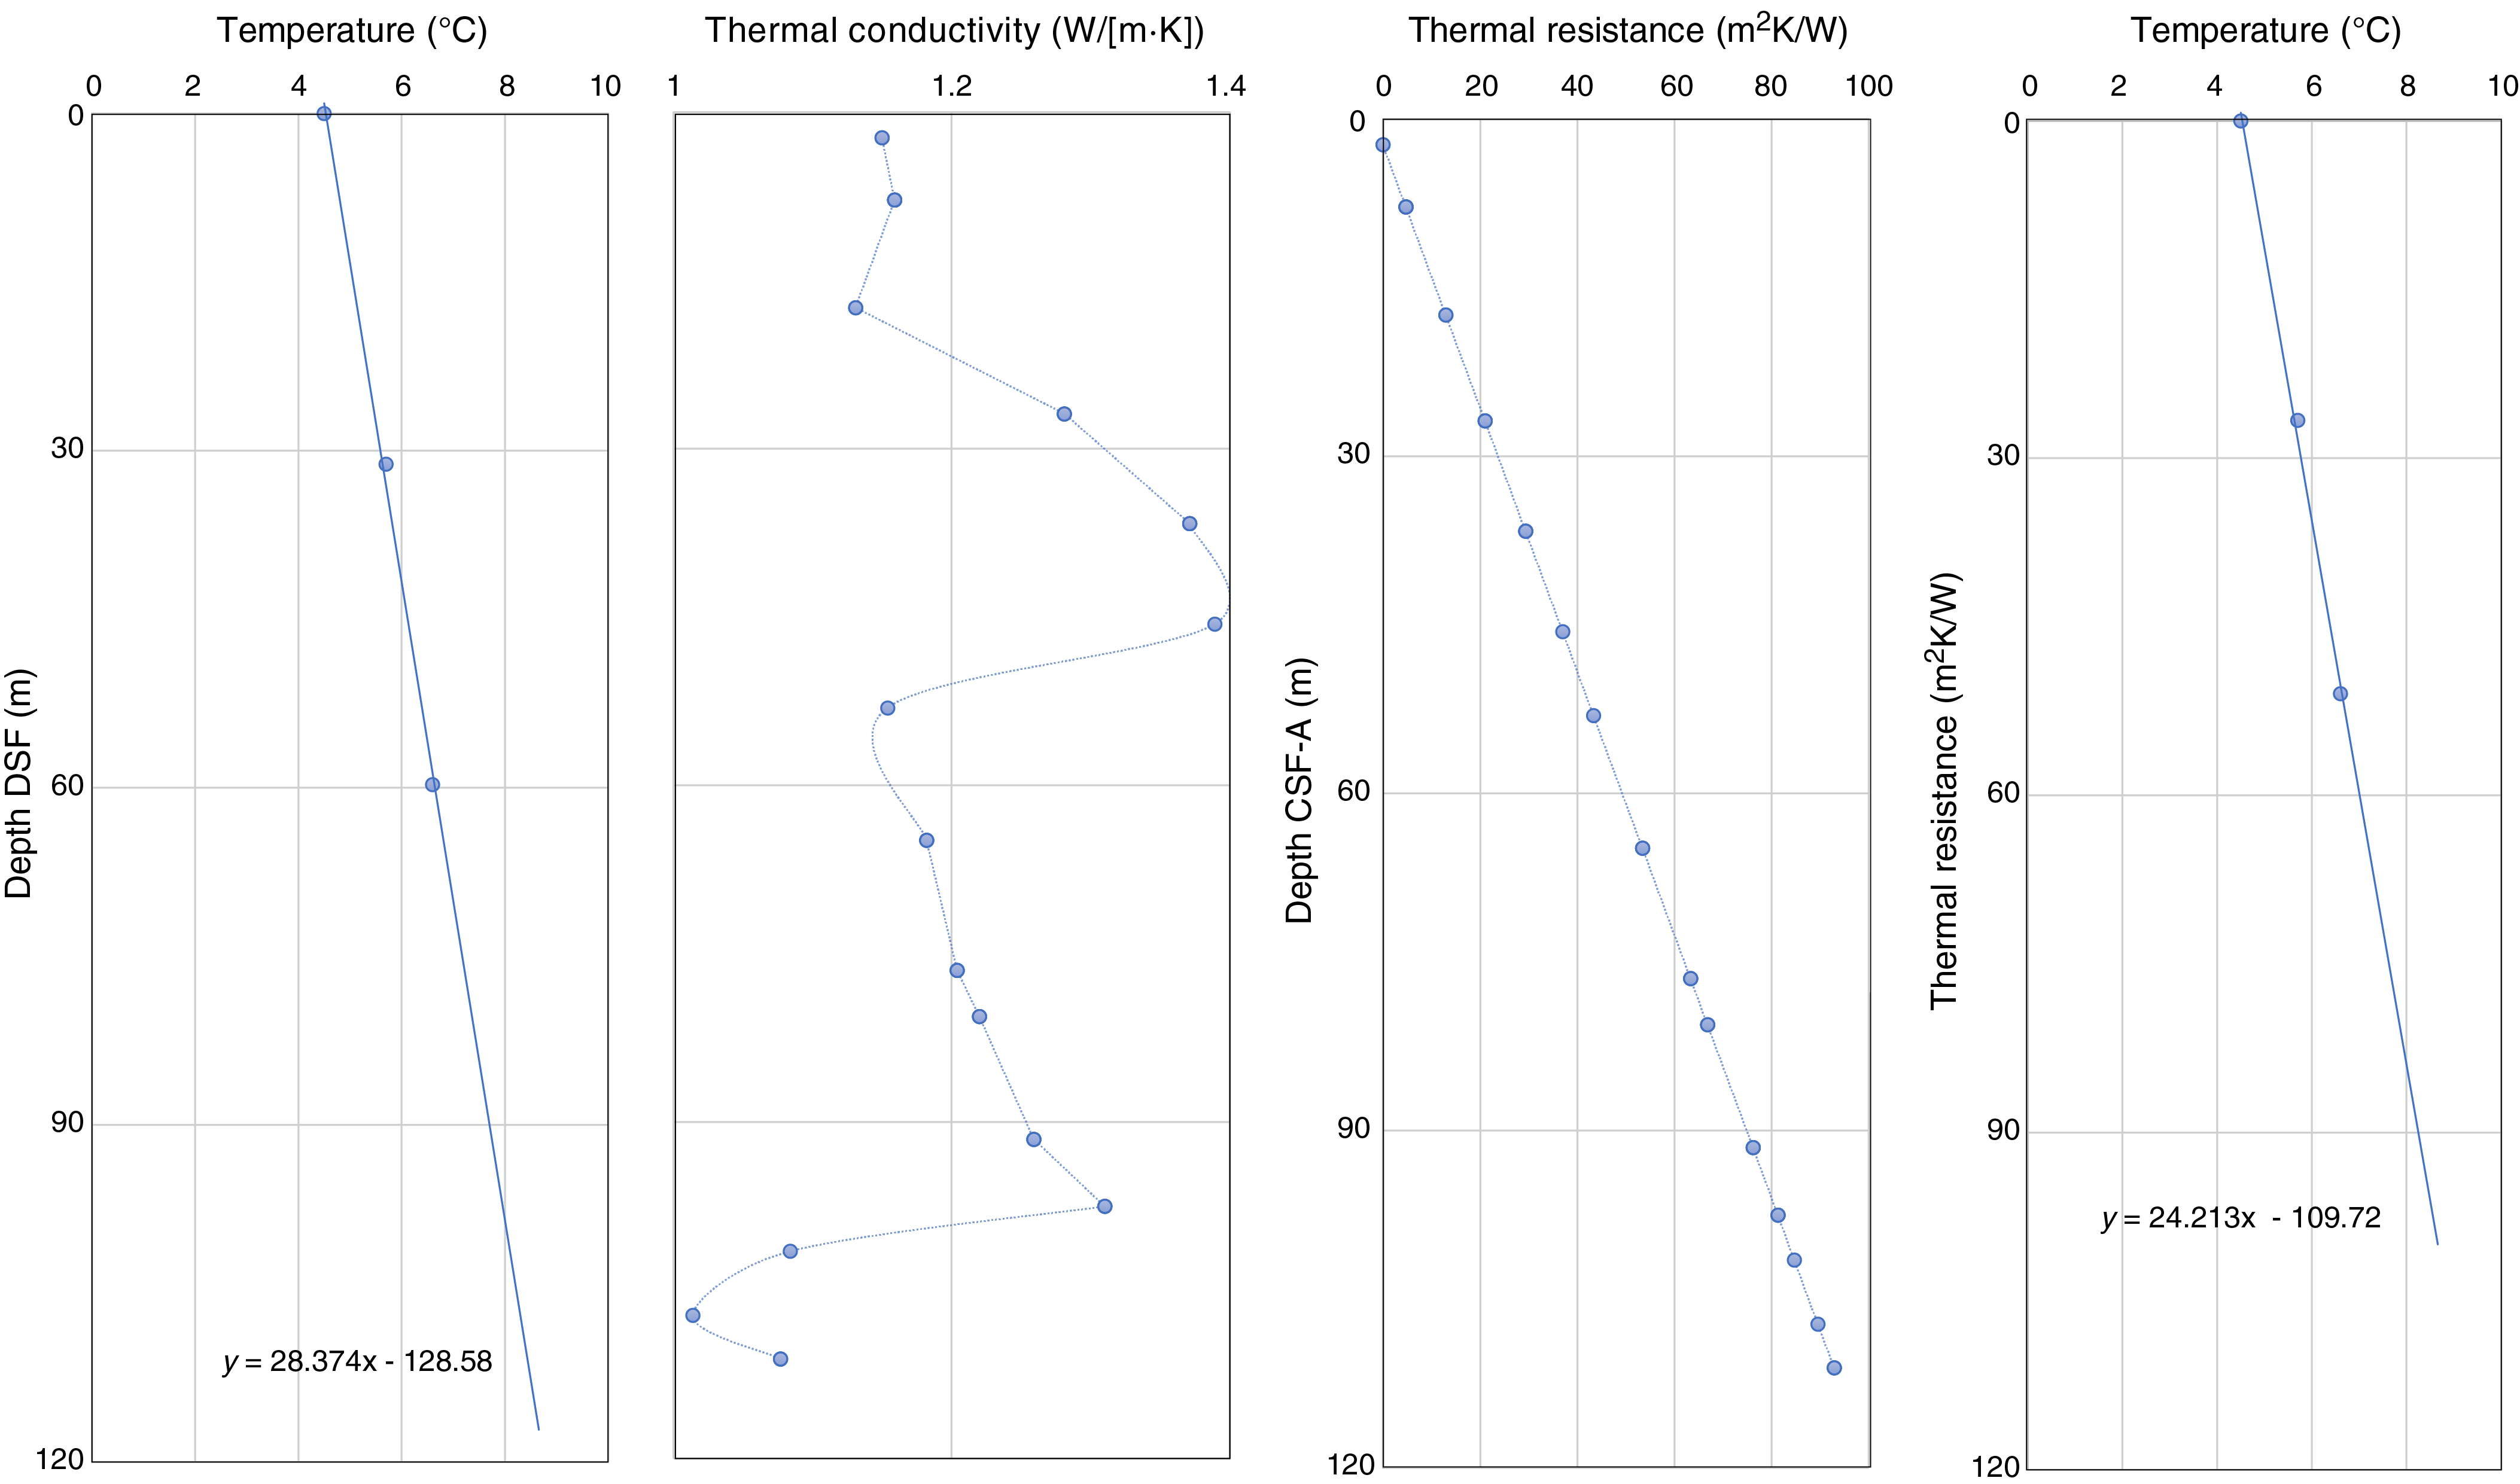
Figure F21. Heat flow calculation.
Thermal conductivity under in situ conditions was estimated from laboratory-determined thermal conductivity from Hole U1535A using the method of Hyndman et al. (1974) (see Physical properties in the Expedition 382 methods chapter [Weber et al., 2021]). The calculated in situ values are within 2% of the measured laboratory values. Thermal resistance was calculated by integrating the inverse of the in situ thermal conductivity over depth. A heat flow of 41 mW/m2 was determined from the linear fit between temperature and thermal resistance using the approach of Pribnow et al. (2000). A difference of 8 mW/m2 is found with respect to Site U1534, which is large for such nearby locations and indicates the level of uncertainty in the estimate. Additionally, the geothermal gradient at Site U1535 is estimated based on only two shallow temperature profile measurements. Another complicating factor is that fluid in the formation can play an important role in the thermal structure of the sediments, and such complexity cannot be identified with a small number of measurements.
Core-log-seismic integration
Physical properties measured on cores from Site U1535 and multichannel seismic data from the region were integrated.
Physical properties and relationship with seismic interpretation
Coring at Site U1535 was limited to one hole (U1535A) with a maximum depth of 117 mbsf. Hole U1535A recovered the upper two seismic units recovered at Site U1534 (Units 2A and 2B from bottom to top, following Koenitz et al. [2008]) and appears to have reached Reflector B, which marks the top of Unit 1B (Figures F22, F23). The seismic signal was correlated with depth using discrete P-wave velocity (PWC) measurements as the velocity model. Details of core-log physical property variability at Site U1535 are described in detail in Physical properties. Here, we focus on the comparison to seismic data and show overview figures only. Sediments in Unit 1B have lower and less variable loop magnetic susceptibility (MSL), MSP, and GRA density than overlying sediments (Figure F15). The top of Unit 1B, which corresponds to Reflector B, is characterized by a relative maximum in MSL, MSP, NGR, and GRA density (Figure F22). The top of Unit 2A, which corresponds to Reflector A, is identified by a minimum in MSL, MSP, and NGR. PWC, NGR, MSL, and MSP values oscillate in overlying Unit 2B and show a general upward decrease.
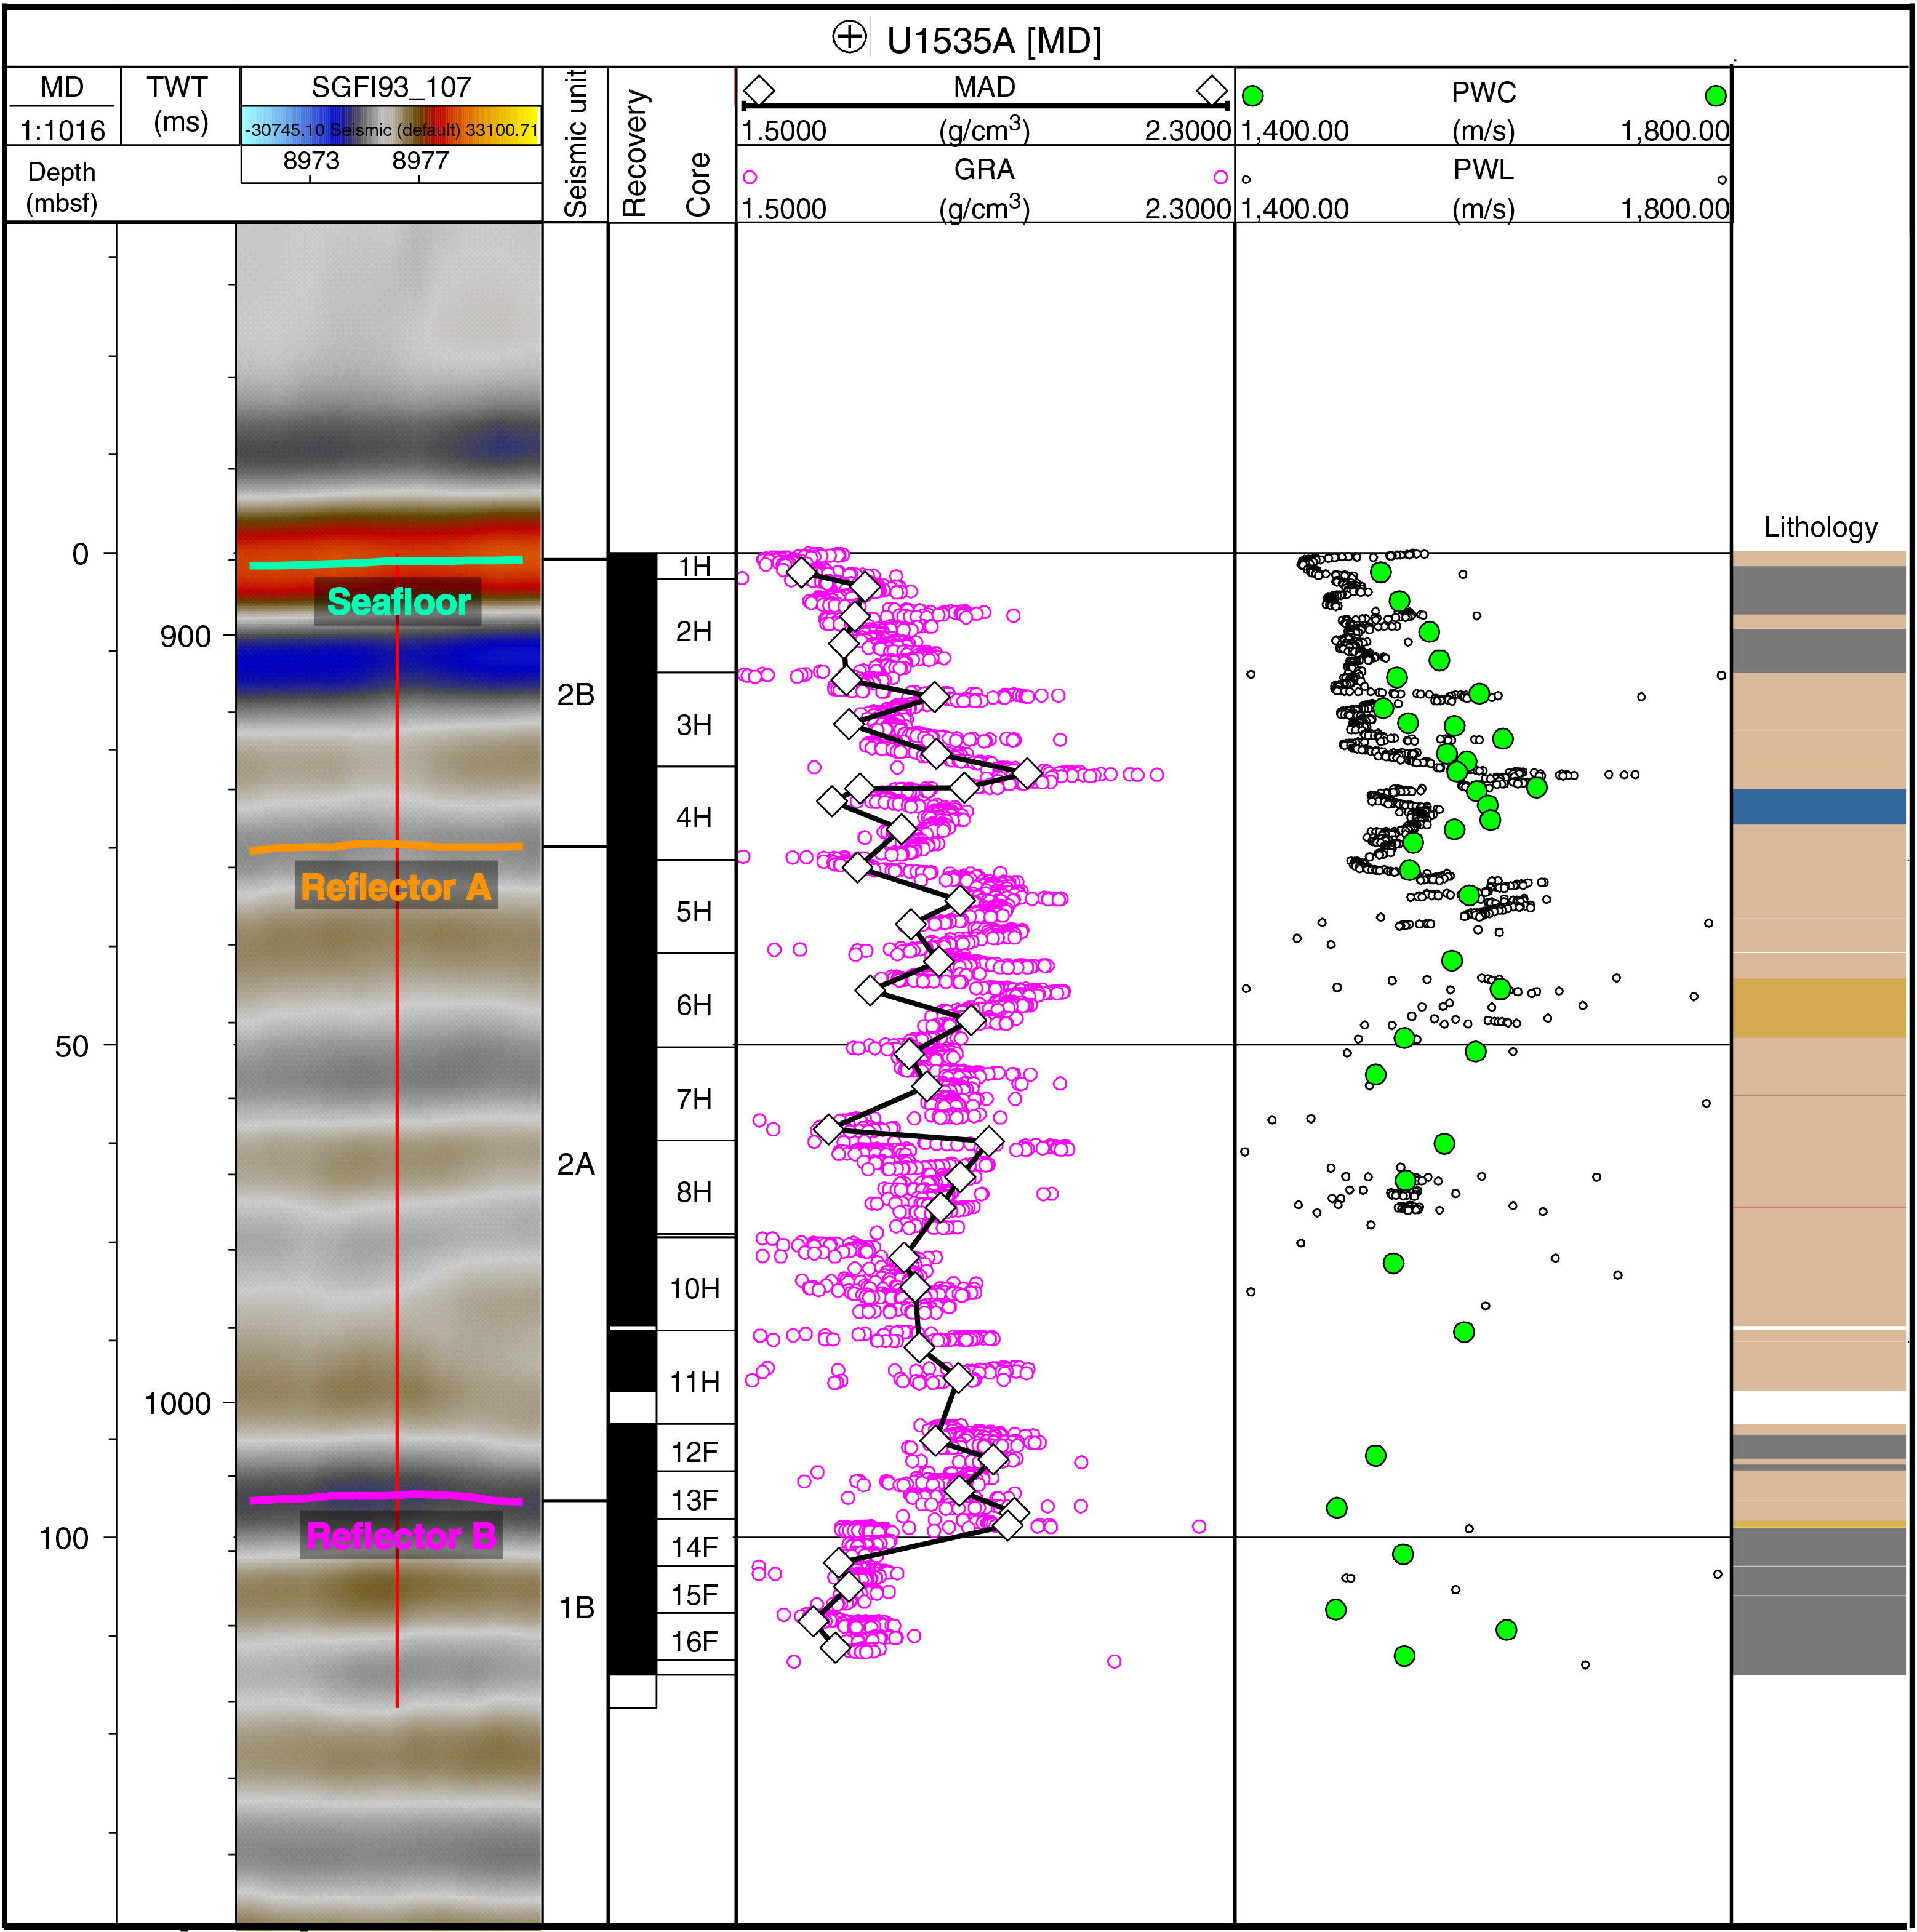
Figure F22. Physical property with seismic reflectors.
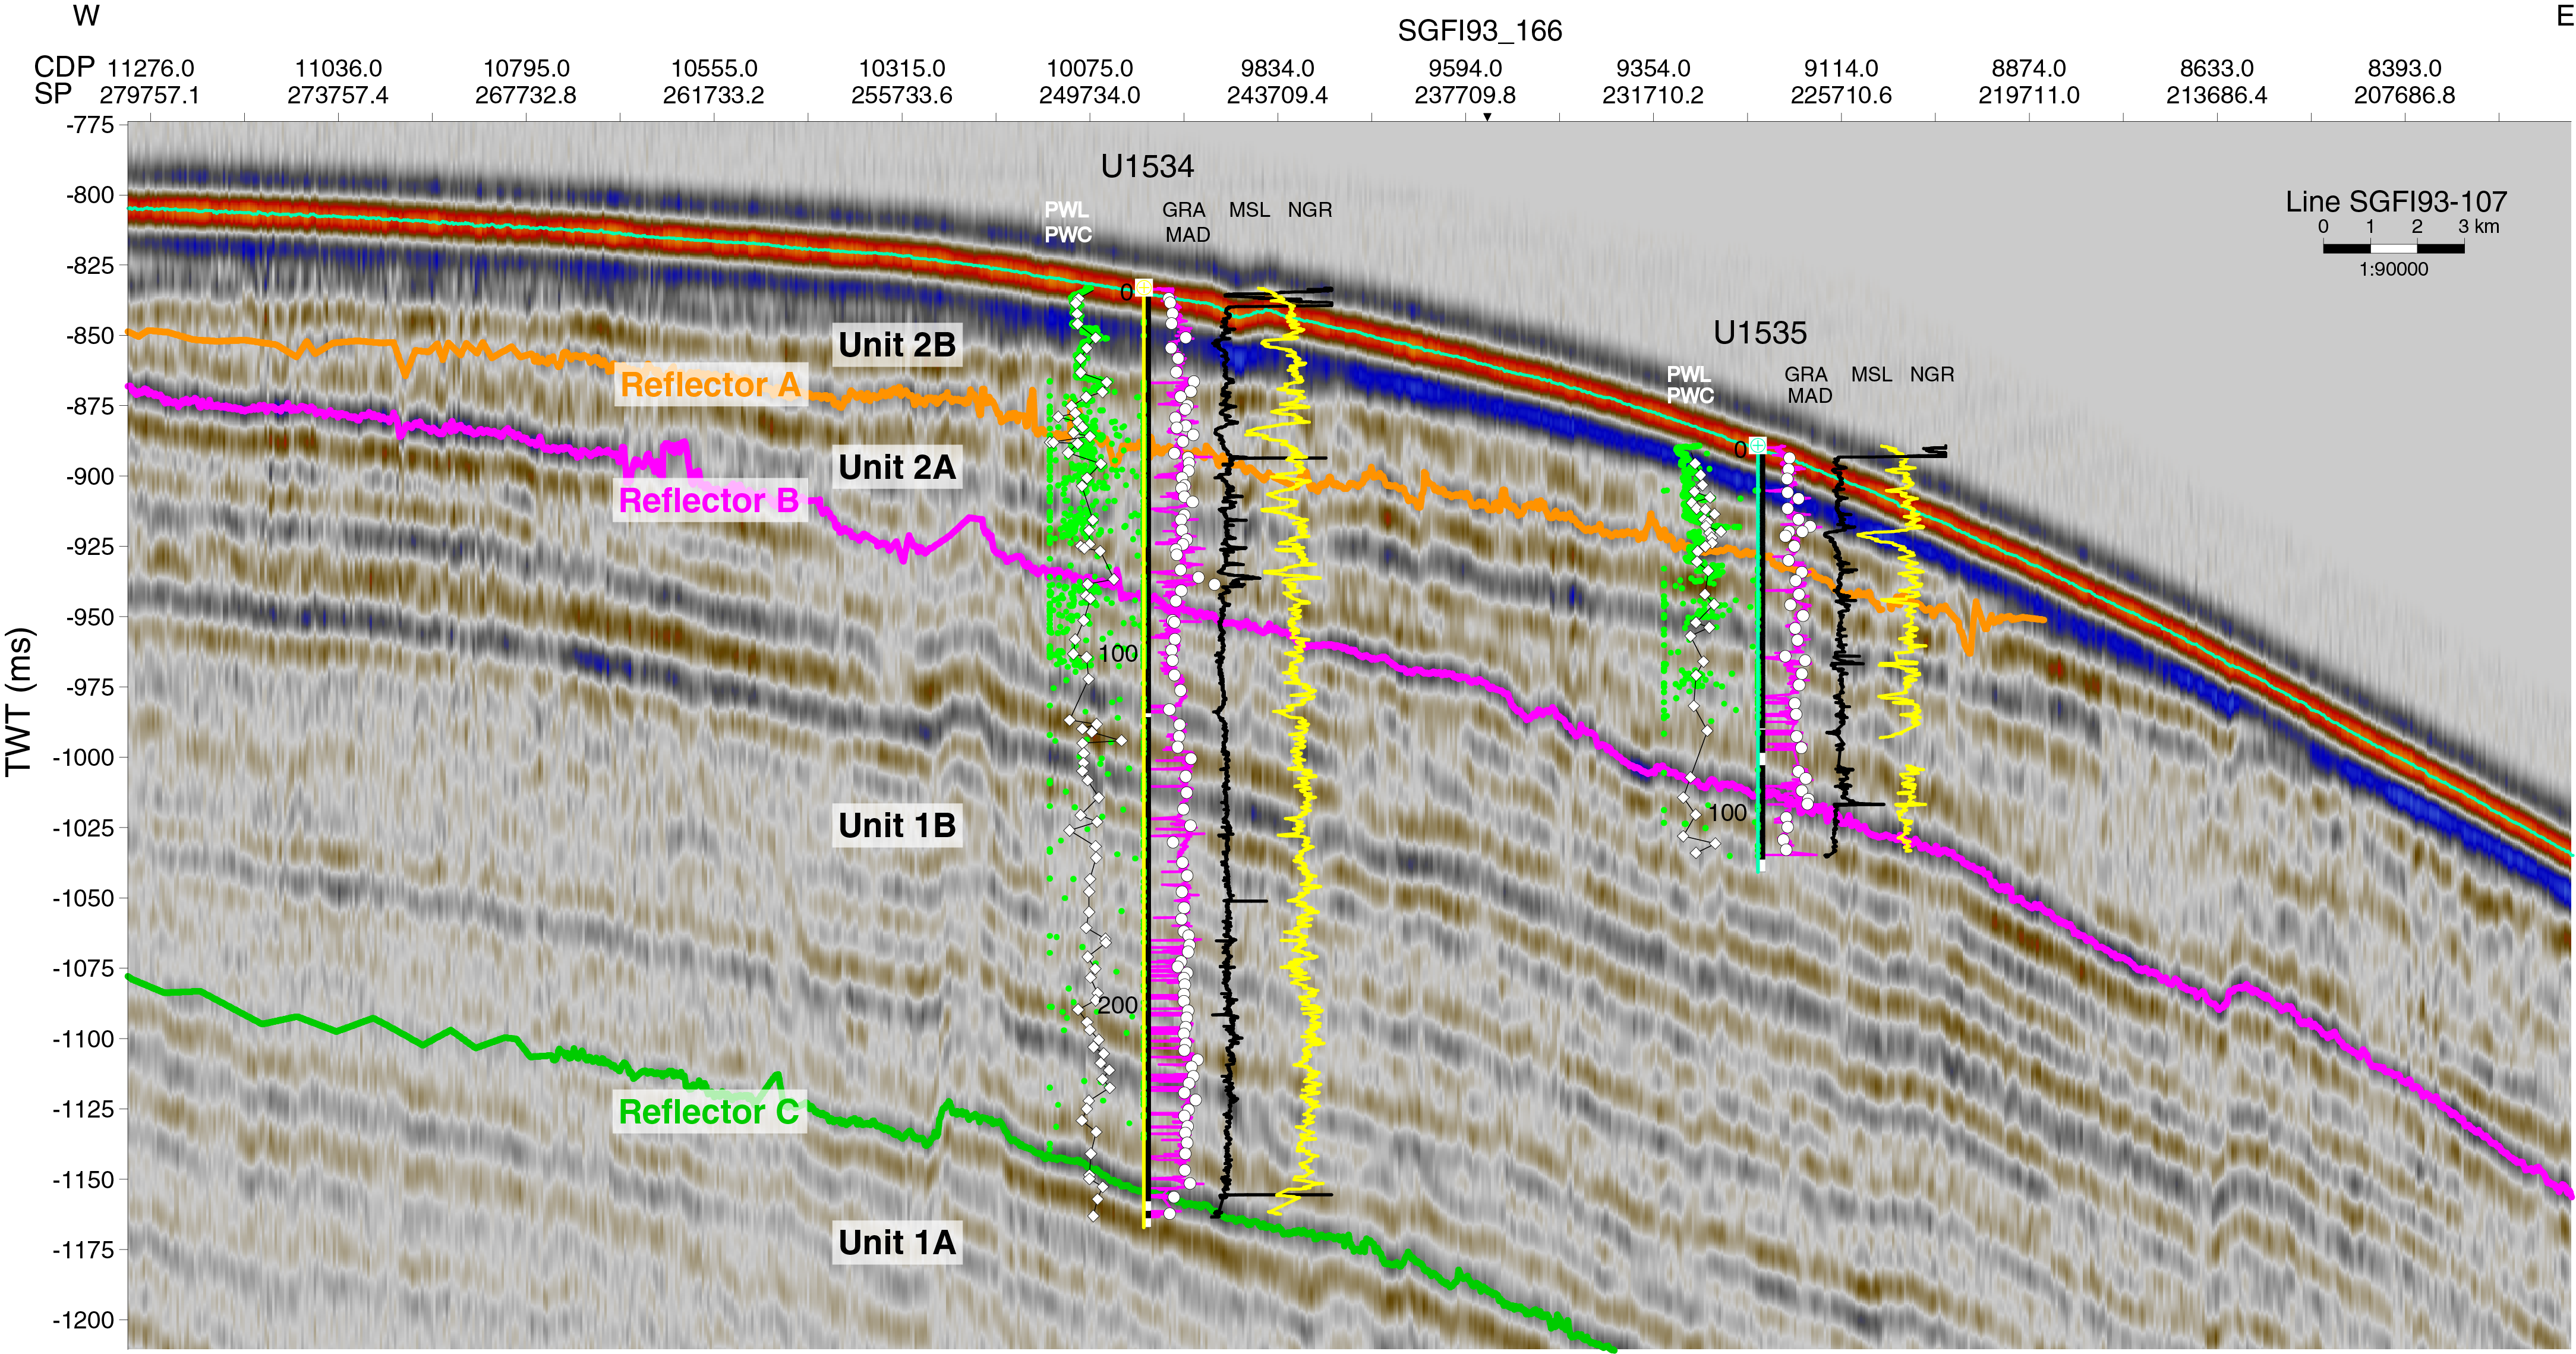
Figure F23. Seismic profile and physical properties.
References
Berg, R.D., and Solomon, E.A., 2016. Geochemical constraints on the distribution and rates of debromination in the deep subseafloor biosphere. Geochimica et Cosmochimica Acta, 174:30–41. https://doi.org/10.1016/j.gca.2015.11.003
Blum, P., 1997. Technical Note 26: Physical Properties Handbook—A Guide to the Shipboard Measurement of Physical Properties of Deep-Sea Cores. Ocean Drilling Program. https://doi.org/10.2973/odp.tn.26.1997
Dickens, G.R., 2001. Sulfate profiles and barium fronts in sediment on the Blake Ridge: present and past methane fluxes through a large gas hydrate reservoir. Geochimica et Cosmochimica Acta, 65(4):529–543. https://doi.org/10.1016/S0016-7037(00)00556-1
Gradstein, F.M., Ogg, J.G., Schmitz, M.D., and Ogg, G.M. (Eds.), 2012. The Geological Time Scale 2012: Amsterdam (Elsevier). https://doi.org/10.1016/C2011-1-08249-8
Hyndman, R.D., Erickson, A.J., and Von Herzen, R.P., 1974. Geothermal measurements on DSDP Leg 26. In Davies, T.A., Luyendyk, B.P., et al., Initial Reports of the Deep Sea Drilling Project, 26: Washington, DC (U.S. Govt. Printing Office), 451–463. https://doi.org/10.2973/dsdp.proc.26.113.1974
Key, R.M., Olsen, A., van Heuven, S., Lauvset, S.K., Velo, A., Lin, X., Schirnick, C., et al., 2015. Global Ocean Data Analysis Project, Version 2 (GLODAPv2), ORNL/CDIAC-162, ND-P093. Oak Ridge, Tennessee (US Department of Energy). https://doi.org/10.3334/CDIAC/OTG.NDP093_GLODAPv2
Koenitz, D., White, N., McCave, I.N., and Hobbs, R., 2008. Internal structure of a contourite drift generated by the Antarctic Circumpolar Current. Geochemistry, Geophysics, Geosystems, 9(6):Q06012. https://doi.org/10.1029/2007GC001799
Meister, P., McKenzie, J.A., Vasconcelos, C., Bernasconi, S., Frank, M., Gutjahr, M., and Schrag, D.P., 2007. Dolomite formation in the dynamic deep biosphere: results from the Peru Margin. Sedimentology, 54(5):1007–1032. https://doi.org/10.1111/j.1365-3091.2007.00870.x
Nöthen, K., and Kasten, S., 2011. Reconstructing changes in seep activity by means of pore water and solid phase Sr/Ca and Mg/Ca ratios in pockmark sediments of the Northern Congo Fan. Marine Geology, 287(1–4):1–13. https://doi.org/10.1016/j.margeo.2011.06.008
Olsen, A., Key, R.M., van Heuven, S., Lauvset, S.K., Velo, A., Lin, X., Schirnick, C., et al., 2016. The Global Ocean Data Analysis Project version 2 (GLODAPv2) – an internally consistent data product for the world ocean. Earth System Science Data, 8:2907–323. https://doi.org/10.5194/essd-8-297-2016
Peck, V.L., Weber, M.E., Raymo, M.E., Williams, T., Armbrecht, L.H., Bailey, I., Brachfeld, S.A., Cardillo, F.G., Du, Z., Fauth, G., García, M., Glüder, A., Guitard, M.E., Gutjahr, M., Hemming, S.R., Hernández-Almeida, I., Hoem, F.S., Hwang, J.-H., Iizuka, M., Kato, Y., Kenlee, B., Martos, Y.M., O'Connell, S., Pérez, L.F., Reilly, B.T., Ronge, T.A., Seki, O., Tauxe, L., Tripathi, S., Warnock, J.P., and Zheng, X., 2021. Site U1534. In Weber, M.E., Raymo, M.E., Peck, V.L., Williams, T., and the Expedition 382 Scientists, Iceberg Alley and Subantarctic Ice and Ocean Dynamics. Proceedings of the International Ocean Discovery Program, 382: College Station, TX (International Ocean Discovery Program). https://doi.org/10.14379/iodp.proc.382.103.2021
Pribnow, D., Kinoshita, M., and Stein, C., 2000. Thermal Data Collection and Heat Flow Recalculations for Ocean Drilling Program Legs 101–180: Hanover, Germany (Institute for Joint Geoscientific Research, Institut für Geowissenschaftliche Gemeinschaftsaufgaben [GGA]). http://www-odp.tamu.edu/publications/heatflow/ODPReprt.pdf
Riedinger, N., Kasten, S., Gröger, J., Franke, C., and Pfeifer, K., 2006. Active and buried authigenic barite fronts in sediments from the Eastern Cape Basin. Earth and Planetary Science Letters, 241(3–4):876–887. https://doi.org/10.1016/j.epsl.2005.10.032
Sprenk, D., Weber, M.E., Kuhn, G., Rosén, P., Frank, M., Molina-Kescher, M., Liebetrau, V., and Röhling, H.-G., 2013. Southern Ocean bioproductivity during the last glacial cycle—new decadal-scale insight from the Scotia Sea. Geological Society Special Publication, 381(1):245–261. https://doi.org/10.1144/SP381.17
Torres, M.E., Brumsack, H.-J., Bohrmann, G., and Emeis, K.C., 1996. Barite fronts in continental margin sediments: a new look at barium remobilization in the zone of sulfate reduction and formation of heavy barites in diagenetic fronts. Chemical Geology, 127(1–3):125–139. https://doi.org/10.1016/0009-2541(95)00090-9
Weber, M.E., 1998. Estimation of biogenic carbonate and opal by continuous non-destructive measurements in deep-sea sediments: application to the eastern equatorial Pacific. Deep-Sea Research, Part I: Oceanographic Research Papers, 45(11):1955–1975. https://doi.org/10.1016/S0967-0637(98)00028-4
Weber, M.E., Niessen, F., Kuhn, G., and Wiedicke, M., 1997. Calibration and application of marine sedimentary physical properties using a multi-sensor core logger. Marine Geology, 136(3–4):151–172. http://dx.doi.org/10.1016/S0025-3227(96)00071-0
Weber, M.E., Raymo, M.E., Peck, V.L., Williams, T., Armbrecht, L.H., Bailey, I., Brachfeld, S.A., Cardillo, F.G., Du, Z., Fauth, G., García, M., Glüder, A., Guitard, M.E., Gutjahr, M., Hemming, S.R., Hernández-Almeida, I., Hoem, F.S., Hwang, J.-H., Iizuka, M., Kato, Y., Kenlee, B., Martos, Y.M., O'Connell, S., Pérez, L.F., Reilly, B.T., Ronge, T.A., Seki, O., Tauxe, L., Tripathi, S., Warnock, J.P., and Zheng, X., 2021. Expedition 382 methods. In Weber, M.E., Raymo, M.E., Peck, V.L., Williams, T., and the Expedition 382 Scientists, Iceberg Alley and Subantarctic Ice and Ocean Dynamics. Proceedings of the International Ocean Discovery Program, 382: College Station, TX (International Ocean Discovery Program). https://doi.org/10.14379/iodp.proc.382.102.2021
1 Peck, V.L., Weber, M.E., Raymo, M.E., Williams, T., Armbrecht, L.H., Bailey, I., Brachfeld, S.A., Cardillo, F.G., Du, Z., Fauth, G., García, M., Glüder, A., Guitard, M.E., Gutjahr, M., Hemming, S.R., Hernández-Almeida, I., Hoem, F.S., Hwang, J.-H., Iizuka, M., Kato, Y., Kenlee, B., Martos, Y.M., O'Connell, S., Pérez, L.F., Reilly, B.T., Ronge, T.A., Seki, O., Tauxe, L., Tripathi, S., Warnock, J.P., and Zheng, X., 2021. Site U1535. In Weber, M.E., Raymo, M.E., Peck, V.L., Williams, T., and the Expedition 382 Scientists, Iceberg Alley and Subantarctic Ice and Ocean Dynamics. Proceedings of the International Ocean Discovery Program, 382: College Station, TX (International Ocean Discovery Program). https://doi.org/10.14379/iodp.proc.382.104.2021
2 Expedition 382 Scientists' affiliations.
This work is distributed under the Creative Commons Attribution 4.0 International (CC BY 4.0) license. 