Lamy, F., Winckler, G., Alvarez Zarikian, C.A., and the Expedition 383 Scientists
Proceedings of the International Ocean Discovery Program Volume 383
publications.iodp.org
Data report: calibration of XRF scanning CaCO3 estimates for the upper 30 m along the Site U1543 splice, International Ocean Discovery Program Expedition 3831
Takuto Kasuya,2 Shinya Iwasaki,3, 4 and Yusuke Okazaki2
1 Kasuya, T., Iwasaki, S., and Okazaki, Y., 2023. Data report: calibration of XRF scanning CaCO3 estimates for the upper 30 m along the Site U1543 splice, International Ocean Discovery Program Expedition 383. In Lamy, F., Winckler, G., Alvarez Zarikian, C.A., and the Expedition 383 Scientists, Dynamics of the Pacific Antarctic Circumpolar Current. Proceedings of the International Ocean Discovery Program, 383: College Station, TX (International Ocean Discovery Program). https://doi.org/10.14379/iodp.proc.383.201.2023
2 Kyushu University, Japan. Correspondence author: [email protected]
Abstract
To estimate the calcium carbonate (CaCO3) content in the Site U1543 sediment core samples retrieved during International Ocean Discovery Program (IODP) Expedition 383 at high downcore resolution, the X-ray fluorescence (XRF) scanning Ca data, at a spacing of every 10 mm downcore, were calibrated using a total of 118 coulometry-based discrete CaCO3 analyses from the upper 30 meters composite depth (mcd) along the splice. To remove the volume measurement problems of XRF and estimating CaCO3 contents quantitatively, first, raw XRF peak areas were scaled to reduce the effect resulting from the differences in efficiency at absorbing X-rays. Then, the scaled XRF scanning data were normalized to adjust the variability of the amount of XRF peak areas due to porosity and calibrated to properly estimate CaCO3 content. Based on the quality assessment, the calibrated XRF CaCO3 estimates are within ±4.50 wt% of the discrete measurements (1 standard deviation). This data report presents a discrete CaCO3 measurement data set, a normalized median-scaled XRF data set, and XRF CaCO3 estimates on the core depth below seafloor, Method A (CSF-A), and core composite depth below seafloor, Method A (CCSF-A), depth scales.
1. Introduction
The calcium carbonate (CaCO3) content (in weight percent), often converted to the mass accumulation rate (MAR; in g/cm2/ky) or flux, provides essential information for discussing the carbon cycle and biological production in the ocean. However, the conventional CaCO3 measurements using a coulometer require a long time to measure the samples from long cores retrieved by the International Ocean Discovery Program (IODP) (Lyle and Backman, 2013). Alternatively, X-ray fluorescence (XRF) scanning has been routinely performed during recent IODP expeditions because it is a fast, high-resolution, low-cost, and nondestructive measurement to acquire wide-range elemental composition (e.g., Penkrot et al., 2017). Among the element data obtained from XRF scanning, the height or area of the Ca peak was used for calibration to CaCO3 content (Lyle and Backman, 2013; Gottschalk et al., 2018; Lübbers et al., 2019; Toyos et al., 2020).
Although XRF scanning determines the chemical composition from the sediment core faster and easier by a nondestructive method, the peak area of each element is affected by the volume measurement problems identified in Lyle et al. (2012). In XRF analysis, the amount of an element is acquired as the peak area (or height) of the characteristic X-ray returned from an element in response to an illuminated source X-ray, which partly depends on the mass of the sediment in a certain volume that the X-ray illuminates. Thus, the pore space occupying parts of the illuminated volume in unconsolidated sediment with high porosity decreases the amount of returned XRF (Lyle et al., 2012). Furthermore, low atomic weight elements emit lower X-ray energy than high atomic weight elements, and those low-energy X-rays tend to be absorbed by other elements as they pass out of the sample. This effect (i.e., the matrix effect) causes the emissions of characteristic X-rays from lighter elements to be smaller than those of heavier elements (Tjallingii et al., 2007; Lyle et al., 2012; Katsuta et al., 2019). Therefore, the raw elemental peak areas should not be directly used for the calibration to estimate the sedimentary elemental concentration without any corrections because they are affected by these problems related to volume measurement (Lyle et al., 2012).
Here, to estimate the CaCO3 content from the XRF core scanning data on the sediment core samples obtained during Expedition 383 in the eastern South Pacific, we adopted the three-step method established by Lyle et al. (2012) and Lyle and Backman (2013). Their method consists of scaling, normalization, and calibration. Scaling and normalization, respectively, reduce the effect resulting from the differences in efficiency at absorbing X-rays and adjust the variability of the amount of XRF peak areas due to porosity. First, the range of elemental raw peak area is scaled to the range of the sedimentary elemental concentration by using the median of the measured bulk sediment composition. Then, the scaled sediment composition is normalized to 100%. After those processes, XRF data are calibrated using a data set of discrete chemical analyses to properly estimate the chemical composition. Based on this protocol, we present a CaCO3 data set measured in 118 discrete samples from the upper 30 meters composite depth (mcd) along the Site U1543 splice. From this data set, we calibrated the XRF measurement of Ca peak area to the discrete CaCO3 and show the XRF-estimated CaCO3 with the estimated error.
2. Materials and methods
2.1. Sediment core samples
Site U1543 is located in the eastern South Pacific at 54°35.06ʹS, 76°40.59ʹW, off the Chilean margin at ~3860 m water depth (Lamy et al., 2021) (Figure F1). The site is west of the Chile Trench on a topographically elevated ridge ~300 m above the trench axis (~4200 m water depth). The sediment splice of Site U1543 was constructed using Holes U1543A and U1543B based on Whole-Round Multisensor Logger (WRMSL) magnetic susceptibility data (Lamy et al., 2021). Here, all our CaCO3 analyses and XRF scan data used for calibration were performed on the splice, and Tables T1, T2, and T3 show the data at two depth scales, core depth below seafloor, Method A (CSF-A), and core composite depth below seafloor, Method A (CCSF-A) (Winckler et al., 2021).
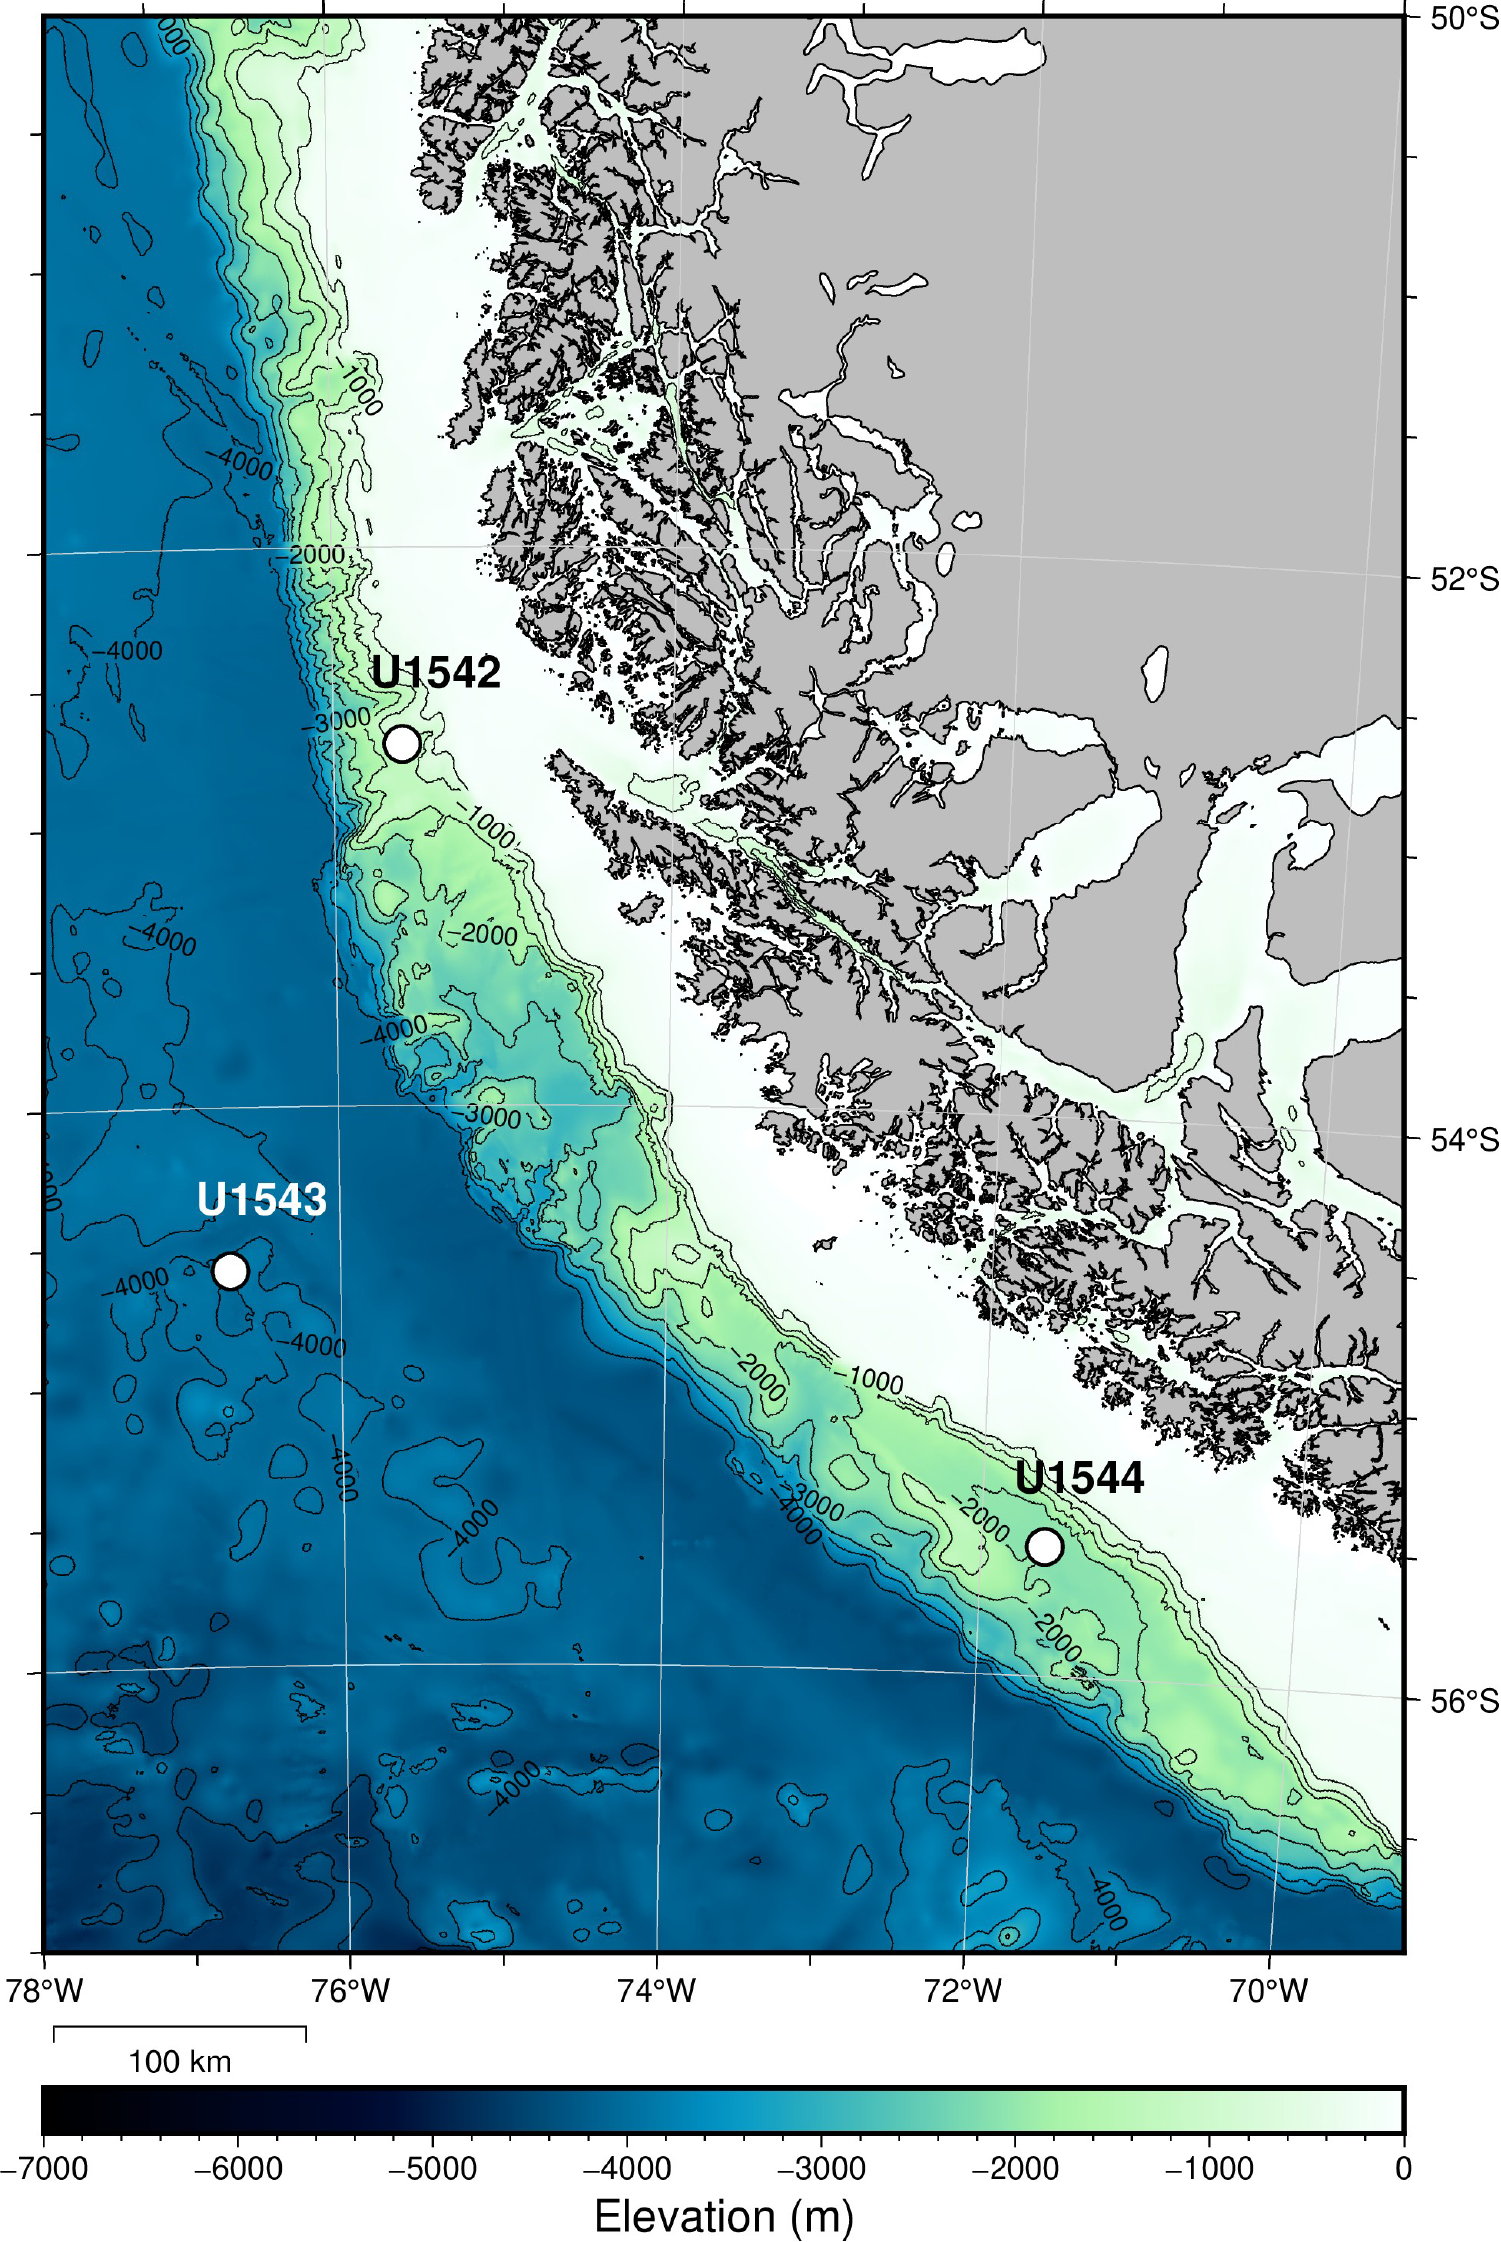
Figure F1. Site U1543.
From the sediment core samples at Site U1543, 118 discrete CaCO3 analyses from the upper 30 mcd along the splice sections were conducted at Kyushu University. XRF core scans of splice sections were performed at Texas A&M University.
2.1.1. CaCO3 analyses
The weight percentages of CaCO3 were determined from discrete samples using a Model 3000A coulometer (Nihon Ans Co., Ltd.). A total of 118 samples were freeze-dried, ground to dry powder, and stored in a desiccator with silica gel before analysis. After removing electricity using a KD-110 static eliminator (Kasuga Denki, Inc.), ~2–3 mg of sediment powder was weighed using a Sartorius MSE6.6S microbalance with a standard deviation of ≤ ±1 μg and a linearity ≤ ±4 μg. The weighed sediment powder was placed on the bottom of a glass vial and set into a coulometer. After 5 min of purging the glass vial and lines with pure N2 gas (purity ≥ 99.99995%), 2 mL of 10% phosphoric acid were added, drenching all of the sediment powder. The coulometer operation followed the basic procedures by the instrument manufacturer, and total inorganic carbon (TIC; in μgC) was measured for 12 min. The contents of TIC (%TIC; in weight percent) and calcium carbonate (%CaCO3; in weight percent) were calculated by Equations 1 and 2, respectively:
(1)
(2)
where ICp (μgC) is the blank value with the amount of inorganic carbon included in N2 gas and phosphoric acid, which were measured for every 6–10 measurements, and M (μg) is the weighed mass of sediment powder. About three-fourths of the samples were measured twice to estimate measurement reproducibility, and a few standards of pure CaCO3 (Wako 033-14682, 99.99% CaCO3) were analyzed before the daily runs of sediment samples.
2.1.2. XRF core scanning
The archive half core sections of the splice at Site U1543 were scanned as a postexpedition program by the Expedition 383 scientists using the third generation Avaatech XRF core scanner at the IODP Gulf Coast Repository in College Station, Texas. The XRF scanning data were downloaded from the IODP Laboratory Information Management System (LIMS) database (https://web.iodp.tamu.edu/LORE). Sample spacing along each core section was set at 10 mm, and separate scans at different voltages were conducted to cover a wide range of elements. The first scans were performed at 10 kV with no filter for the major elements Al, Si, K, Ca, Ti, Mn, and Fe. The measurements’ live time was set at 6 s, and the X-ray tube current was set to 0.16 mA. The separate scans for Ba were performed at 50 kV with a copper (Cu) filter; the live time was set at 10 s, and the X-ray tube current was set to 0.75 mA. The spot area X-ray illumination was set at 10 mm in the downcore direction and 12 mm in the cross-core direction.
2.2. Calibration of XRF scanning Ca peak area to CaCO3 contents
The areas of Ca peaks measured by XRF scanning were calibrated to the CaCO3 contents to estimate high downcore resolution CaCO3 for the upper 30 mcd along the Site U1543 splice. The calibration was conducted with a three-step method following Lyle et al. (2012) and Lyle and Backman (2013). First, the peak areas of elements were scaled by the median shipboard-measured bulk elemental composition to scale elemental peak areas into typical ranges of sedimentary elemental concentrations. Second, the scaled components were summed and normalized to 100% to reduce the effects caused by differences in porosity and composition. Finally, the scaled and normalized data were calibrated with discrete bulk CaCO3 analyses. In addition, the obtained regression equation was tested using discrete measurements.
Equation 3 from Lyle et al. (2012), with minor modifications, was used to scale the XRF data:
(3)
where Se is an elemental scaling. Med%e is the median weight percent of a converted most probable sedimentary component, such as the oxide, carbonate, or sulfate for each element (e.g., for Fe, we assumed Fe2O3; for Ca, CaCO3; and for Ba, BaSO4) from shipboard inductively coupled plasma–atomic emission spectroscopy (ICP-AES) analyses (Lamy et al., 2021). There were, however, only three measurements along the splice of the upper 30 mcd. The median values were from Samples 383-U1543A-1H-1, 9–10 cm (Al, Si, K, Ca, Ti, and Fe), and 2H-3W, 90–91 cm (Mn and Ba), respectively. PeakAreae is the measured elemental area in a sample, and PeakAreae, med is the peak area to form counterparts of median elemental compositions. Although Lyle et al. (2012) originally described PeakAreae, med as the median peak area over the data set, these median peak areas showed large differences from Med%e at Site U1543 because shipboard ICP-AES analyses were preferentially performed on samples with higher carbonate contents rather than random samples. Therefore, we used the peak areas from the same intervals with Med%e as PeakAreae, med instead of the original one in Lyle et al. (2012).
Each scaled component (Se) was then multiplied by 100/(raw sum) to bring the total sum of components to 100% to normalize the XRF data, thereby eliminating the volume effect:
(4)
- NMSC = normalized median-scaled (NMS) value for the component,
- Se = median-scaled (MS) values of the corresponding elements (i.e., if the component is CaCO3, use Se of Ca), and
- raw sum = the sum of all MS components.
The sedimentary components in this data set assumed Al2O3, SiO2, K2O, CaCO3, TiO2, MnO, Fe2O3, and BaSO4 following Lyle et al. (2012). Normalization can adjust the lowering of the raw sum values in the shallower sections with high porosity and the overestimating Ca in the intervals with high CaCO3 contents.
As the final step, we conducted the calibration and error estimation established by Lyle and Backman (2013). A total of 118 discrete CaCO3 measurements were used to calibrate CaCO3 NMS data for the upper 30 mcd of the Site U1543 splice. The calibration is from the linear regression using the least squares method. The same data set used for calibration with four shipboard CaCO3 analyses along the splice (Lamy et al., 2021) was used to check the quality of the XRF CaCO3 estimates.
3. Results
3.1. CaCO3 measurements
A total of 118 discrete samples were analyzed for CaCO3 by coulometer, and 86 samples were reanalyzed to assess the reproducibility. Both the mean values and the standard deviation are shown in Table T1. The standard deviations of the two measurements were less than 0.10 in 58 samples (equivalent to 67% of samples), less than 0.75 in 82 samples (95%), and less than 2.84 for all samples (three samples between 1.3 and 2.84). One sample in which the standard deviation was 13.72 was excluded. This sample showing high standard deviation was subsampled from the interval where the CaCO3 contents rapidly changed more than 20 wt% in short depth intervals, such as only 4 cm. Thus, this large error was caused by the high rate of change in actual CaCO3 content and the insufficient homogenization of the sediment sample.
The changes in the mean of discrete CaCO3 measurements are shown with the XRF scanned Ca peak area (Figure F2A), and the XRF NMS CaCO3 (Figure F2B) in the upper 30 mcd along the Site U1543 splice. The downcore relative variations in discrete measurements clearly show better relationship with the changes in NMS CaCO3 than that in raw Ca peak area, indicating the scaling and normalization steps effectively removed the influences resulting from volume measurement of XRF. Moreover, Figure F2B shows that the CaCO3 sedimentation was limited to five specific intervals in the upper 30 mcd. The discrete CaCO3 analyses revealed that CaCO3 contents vary from 0 to ~90 wt%, whereas NMS CaCO3 contents are at least ~4%. These offsets were caused by the assumption during the scaling process that all Ca exists as CaCO3, even small amounts of Ca constituting detrital minerals like feldspar. The shipboard bulk major elements analyses using ICP-AES show ~3.7 wt% of CaO in the sediment, whereas shipboard CaCO3 analyses revealed no CaCO3 contents (Lamy et al., 2021). However, because these offsets were sufficiently small and systematically constant in whole ranges of CaCO3 contents in the Site U1543 splice shown in Figure F3, these would not affect the calibration.
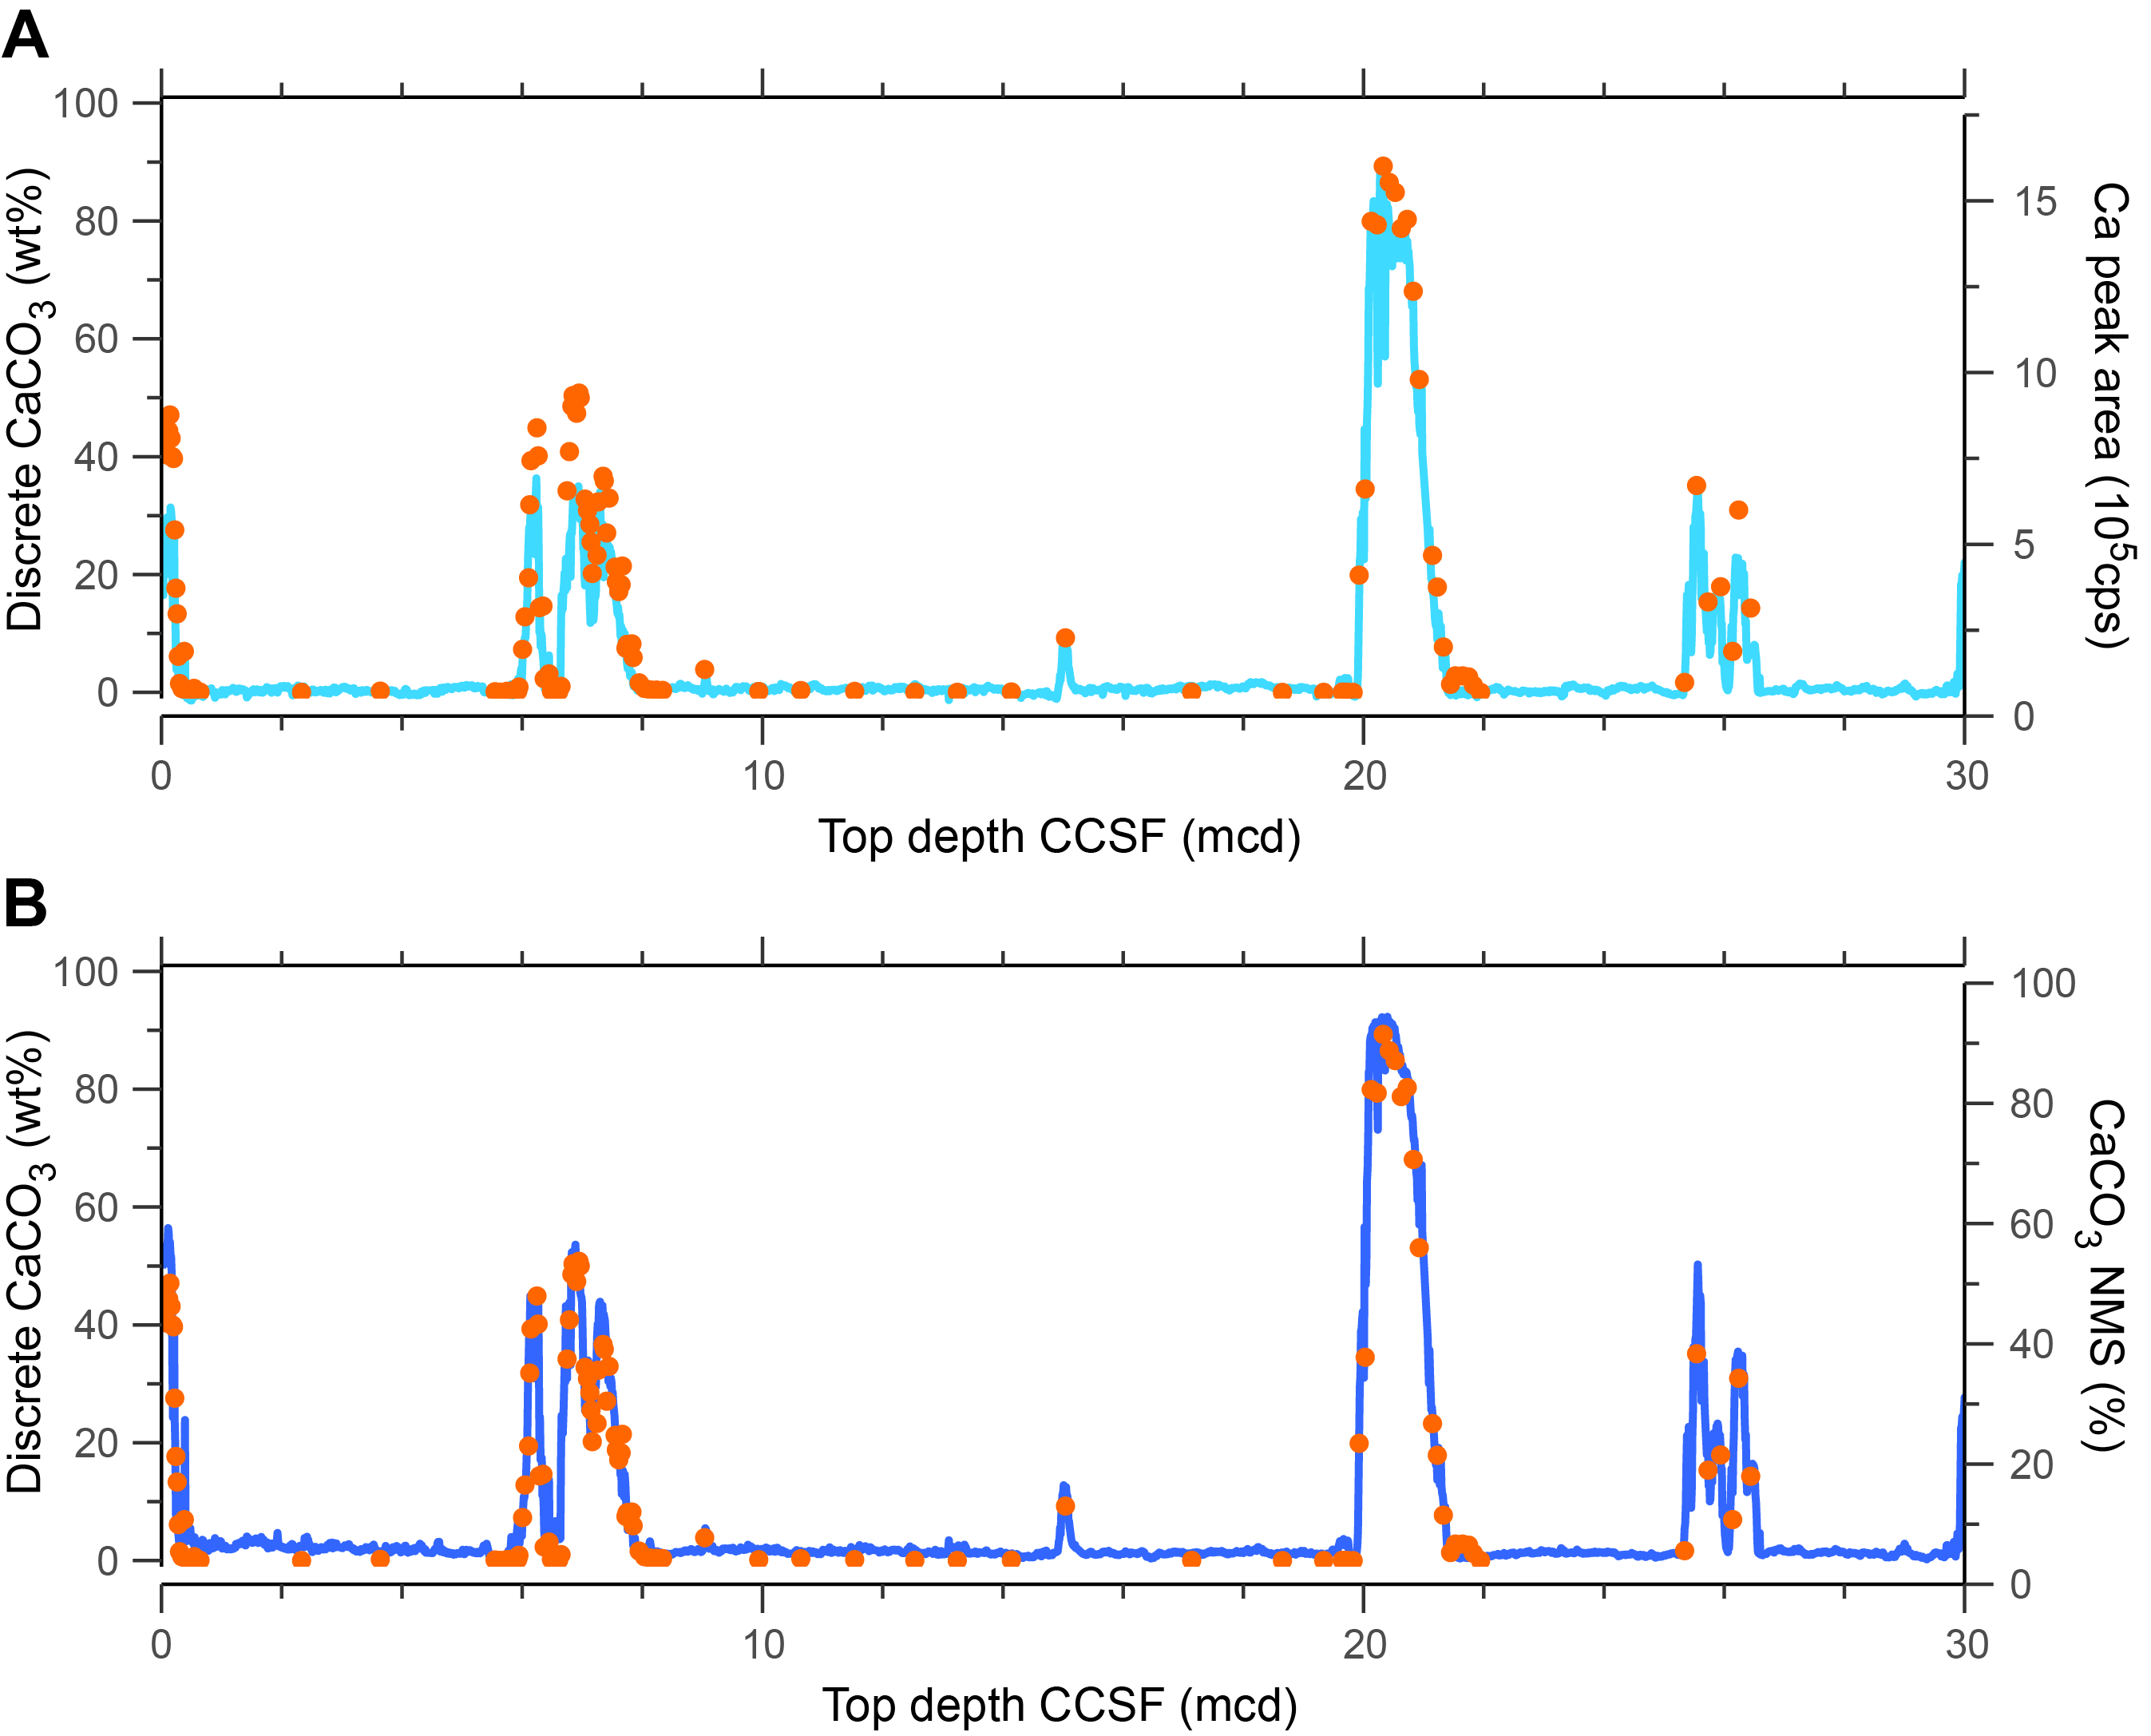
Figure F2. CaCO3.
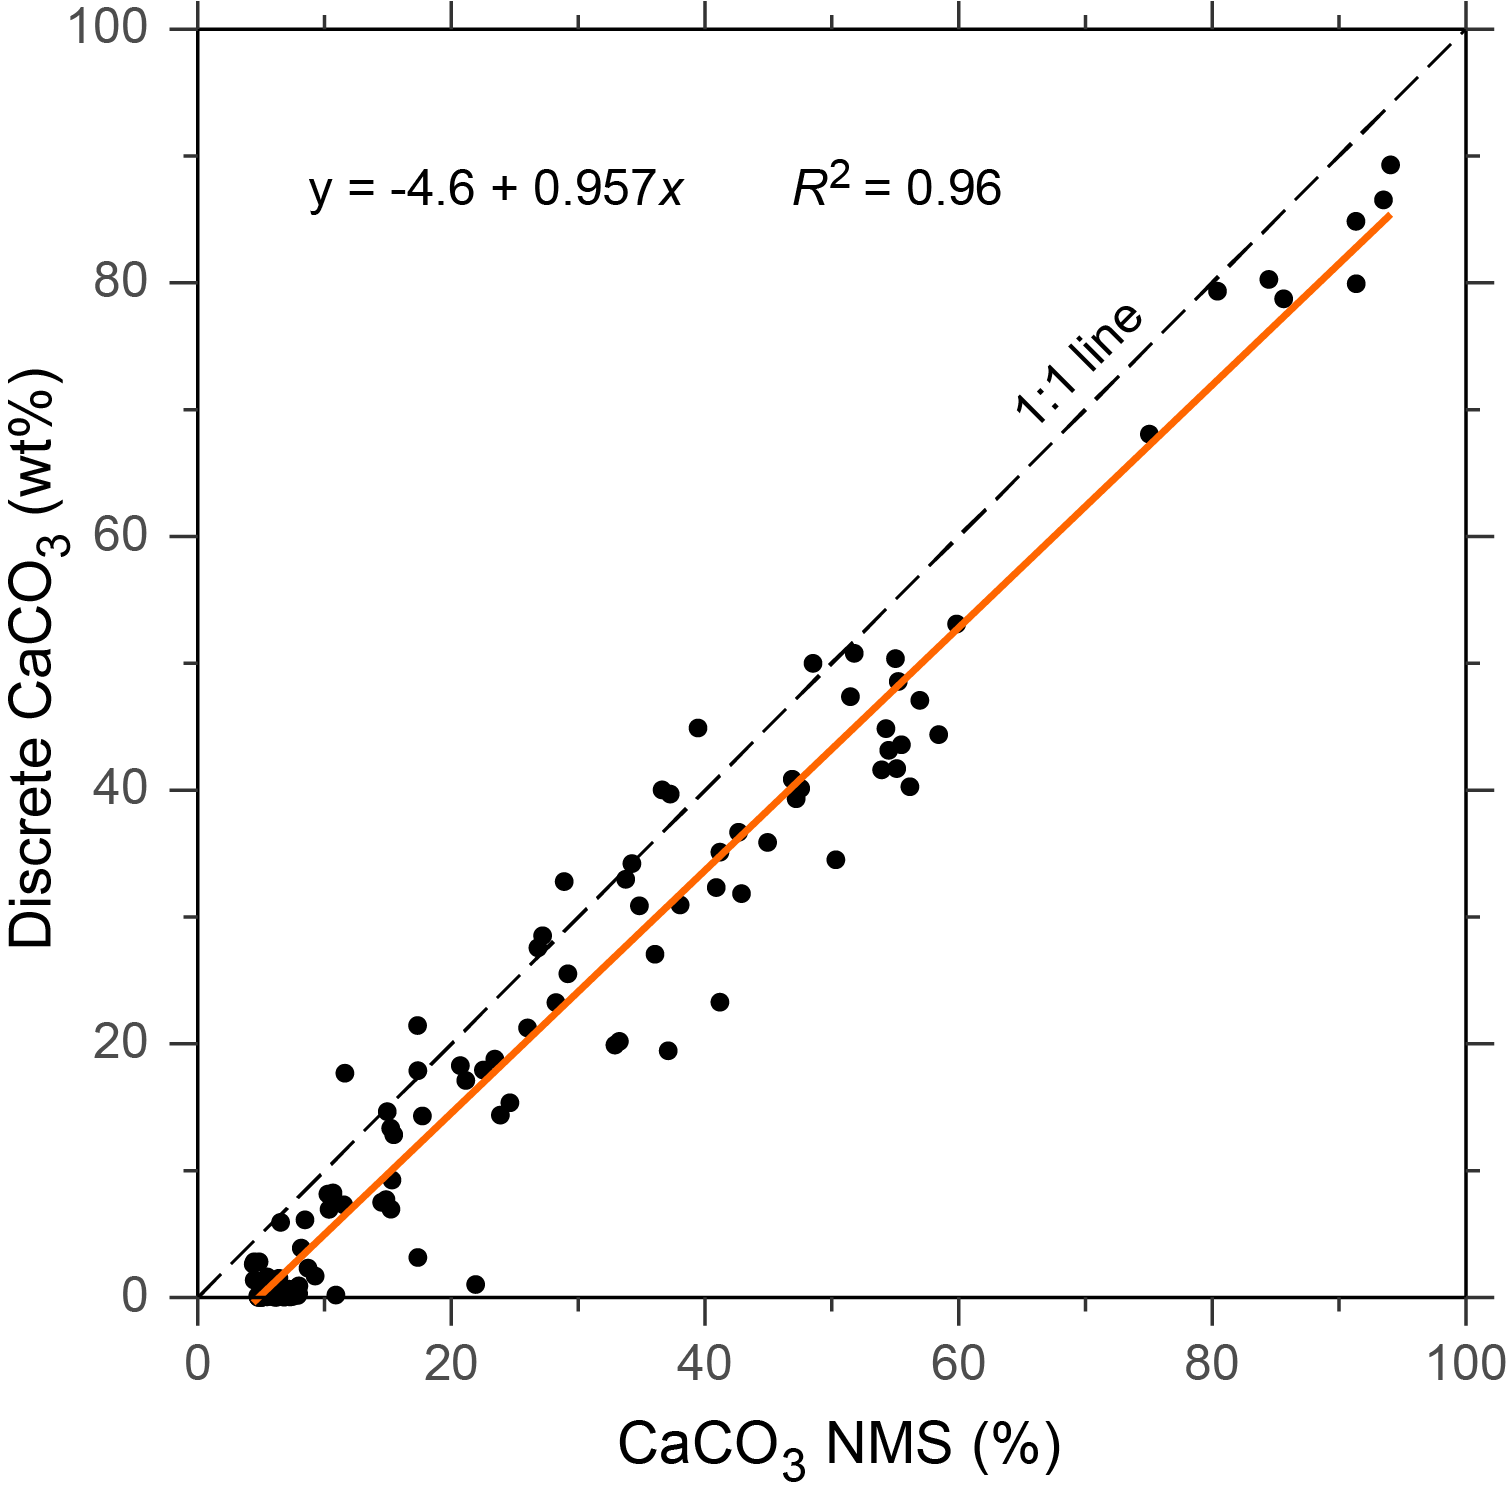
Figure F3. NMS XRF CaCO3.
3.2. Calibration of XRF scanning data to CaCO3 contents
The calibration is from the linear regression shown in Figure F3 with an R2 of 0.96. CaCO3 values can be estimated from the XRF NMS CaCO3 components using Equation 5, resulting from regression:
(5)
where NMSCaCO3 is reported in Table T2 and XRF CaCO3 is the XRF scanning estimate of CaCO3 content presented in Table T3. In the table, negative values of estimations were set to zero because these values are otherwise unrealistic.
The calibration line has a small offset from the 1:1 line in Figure F3 because, as described above, we assume all Ca constitutes carbonate even though a small portion of Ca exists as an oxide in the detrital minerals. Nevertheless, the slope of calibration is close to 1, so the offset between discrete measurements and the NMS CaCO3 is reasonably constant. Therefore, uncalibrated NMS CaCO3 can be available if only to reveal the downcore variations, and the NMS CaCO3 only requires subtracting the systematic offset corresponding to the intercept when the quantitative discussions.
The changes in XRF scanning CaCO3 estimates reproduce the changes in discrete CaCO3 measurements with some errors (Figure F4). To quantify the extent of these errors, the differences between the data set for checking, which include the same discrete measurements used for calibration and four shipboard analyses, and the paired XRF scanning estimates were investigated and presented as a histogram (Figure F5). The mean and median of the differences are −0.01 wt% and −0.09 wt%, respectively. The standard deviation is ±4.50 wt%. Although 68.2% of the data are expected to exist within ±1σ in the normal distribution, more than 75% of the data are within ±4.50 wt%. Thus, the distribution is more concentrated near the mean than a Gaussian distribution, and the actual precision is better than the standard deviation. In addition, though not shown, these differences did not change significantly when calibration was conducted independently using the data set of discrete measurements randomly separated into one-fourth for calibration and three-fourths for assessment of the quality of calibration (Lyle and Backman, 2013). Therefore, despite the number of samples in our data set being much fewer than in Lyle and Backman (2013), the common relationship was observed, so it clearly shows that the three-step calibration procedures are effective.

Figure F4. XRF scanning CaCO3 estimates.
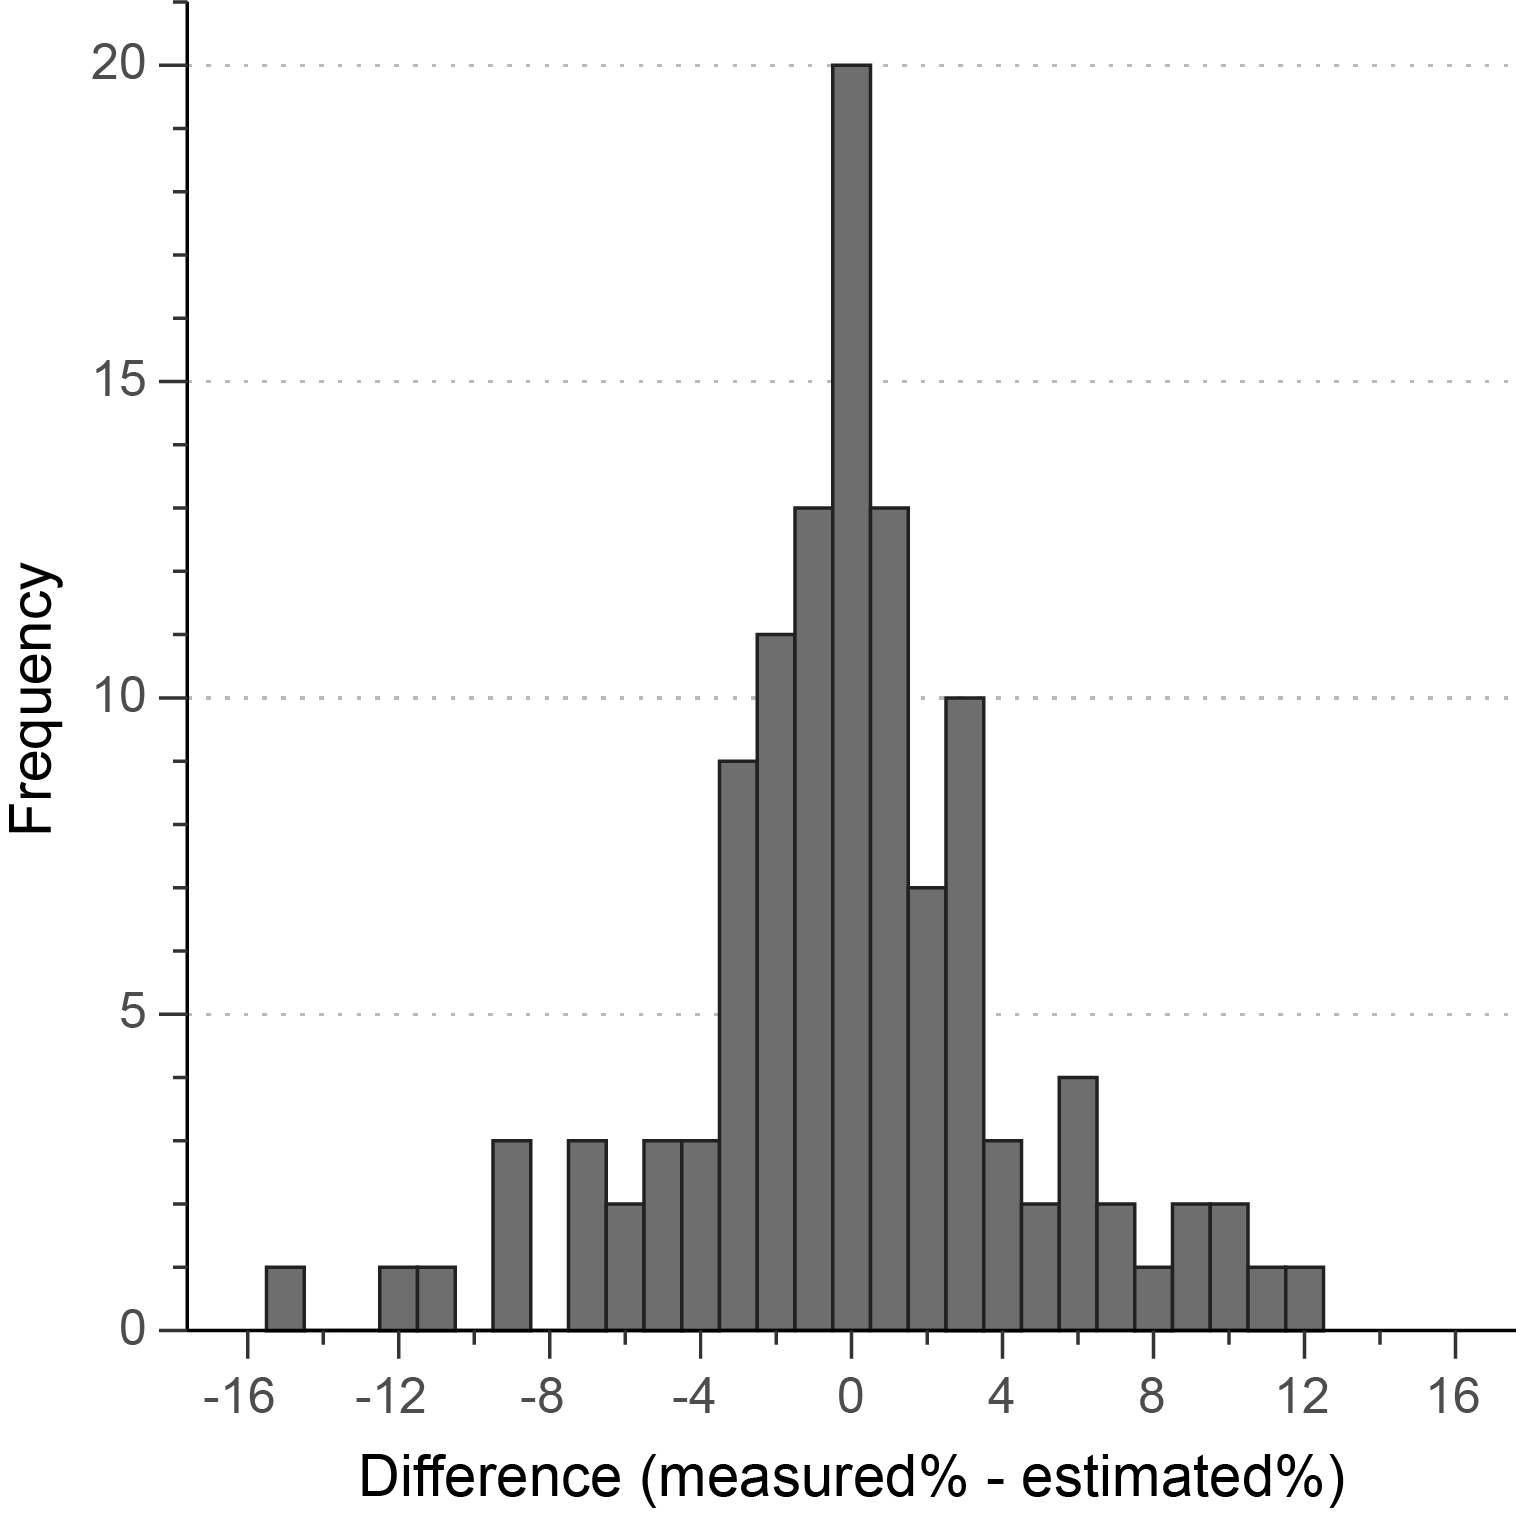
Figure F5. Measured and XRF-estimated CaCO3.
Figure F5 also reveals several estimates with large differences from measured CaCO3. The samples showing, particularly, over ±10 wt% residues were taken from 0.240, 6.107, 6.247, 6.647, and 7.247 mcd along the splice, where carbonate contents rapidly and largely changed in a few centimeter depth intervals. Lyle and Backman (2013) reported similar significant differences in the intervals where the rates of changes in CaCO3 contents were high. They suggested that such differences occur either where there are slight mismatches in depth or where there are significant differences in the sample compositions between near the center surfaces of core halves where the XRF scanned and near the edge below surfaces where the discrete samples were taken. In our results, such mismatches or differences in composition would result in large differences, so we should be careful, though they are unusual.
In the top 0.2 mcd, XRF scanning CaCO3 estimates are systematically higher by 2.5–8.9 wt% compared to the measurements (Figure F4B), whereas no systematic differences were found in other intervals (Figure F4C–F4E). This suggests that the effect from a large amount of pore water contained in the top interval remains uncorrected. Figure F6 shows the profile of bulk water content and XRF scanning CaCO3 estimates in the top 0.5 mcd from Site U1543. Bulk water contents (ω; in weight percent) were estimated from wet bulk density (WBD; in grams per cubic centimeter) based on shipboard gamma ray attenuation (GRA) density (Lamy et al., 2021), assuming constant grain density (GD; in grams per cubic centimeter) and pore water density by Equation 6. Before calculating the water content, GRA-based WBD (WBD_GRA) were calibrated using wet bulk density directly determined by shipboard moisture and density (WBD_MAD) measurements (Lamy et al., 2021), such as WBD_MAD = 0.178 + 0.86 × WBD_GRA. A GD of 2.68 ± 0.08 g/cm3 averaged for all MAD measurements for the Site U1543 samples was assumed for all samples, and the pore water density was assumed to be 1.024 g/cm3 (Lamy et al., 2021; Winckler et al., 2021):
(6)

Figure F6. Bulk water content and XRF scanning CaCO3 estimates.
Figure F6 indicates that the water content in the top 0.2 mcd was significantly higher than the mean ±1σ of water content distribution throughout the upper 30 mcd. The water film on the surface of the sediment core samples and the interstitial water tend to absorb the X-rays returned from lighter elements such as Al and Si more than those returned from the heavier elements (Kido et al., 2006; Hennekam and de Lange, 2012; Katsuta et al., 2019). Thus, as the moisture increases toward the core top, the XRF of Si decreases more than that of Ca, which together comprise the large part of the sediment, and the elemental composition estimated from XRF is biased toward less Si and more Ca than actual. Therefore, although XRF scanning CaCO3 estimates presented here are ensured sufficient quality (Figure F5) comparable to the original protocol by Lyle and Backman (2013), this bias must be kept in mind and should be corrected by the procedures such as Kido et al. (2006) and Hennekam and de Lange (2012), including further XRF analyses in the future.
4. Acknowledgments
This research used samples and data provided by the International Ocean Discovery Program (IODP). The authors are grateful to the scientists, technicians, and crew of the R/V JOIDES Resolution during IODP Expedition 383. We thank Dr. Thomas Ronge for the comments to improve our manuscript and the English editing.
References
GEBCO Bathymetric Compilation Group, 2021. The GEBCO_2021 Grid—a Continuous Terrain Model of the Global Oceans and Land: Southampton, UK (British Oceanographic Data Centre).
https://doi.org/
Gottschalk, J., Hodell, D.A., Skinner, L.C., Crowhurst, S.J., Jaccard, S.L., and Charles, C., 2018. Past carbonate preservation events in the deep Southeast Atlantic Ocean (Cape Basin) and their implications for Atlantic overturning dynamics and marine carbon cycling. Paleoceanography and Paleoclimatology, 33(6):643–663. https://doi.org/
Hennekam, R., and de Lange, G., 2012. X-ray fluorescence core scanning of wet marine sediments: methods to improve quality and reproducibility of high-resolution paleoenvironmental records. Limnology and Oceanography: Methods, 10(12):991–1003. https://doi.org/
Katsuta, N., Takano, M., Sano, N., Tani, Y., Ochiai, S., Naito, S., Murakami, T., Niwa, M., and Kawakami, S.-i., 2019. Quantitative micro-X-ray fluorescence scanning spectroscopy of wet sediment based on the X-ray absorption and emission theories: its application to freshwater lake sedimentary sequences. Sedimentology, 66(6):2490–2510. https://doi.org/
Kido, Y., Koshikawa, T., and Tada, R., 2006. Rapid and quantitative major element analysis method for wet fine-grained sediments using an XRF microscanner. Marine Geology, 229(3–4):209–225.
https://doi.org/
Lamy, F., Winckler, G., Alvarez Zarikian, C.A., Arz, H.W., Basak, C., Brombacher, A., Esper, O.M., Farmer, J.R., Gottschalk, J., Herbert, L.C., Iwasaki, S., Lawson, V.J., Lembke-Jene, L., Lo, L., Malinverno, E., Michel, E., Middleton, J.L., Moretti, S., Moy, C.M., Ravelo, A.C., Riesselman, C.R., Saavedra-Pellitero, M., Seo, I., Singh, R.K., Smith, R.A., Souza, A.L., Stoner, J.S., Venancio, I.M., Wan, S., Zhao, X., and Foucher McColl, N., 2021. Site U1543. In Lamy, F., Winckler, G., Alvarez Zarikian, C.A., and the Expedition 383 Scientists, Dynamics of the Pacific Antarctic Circumpolar Current. Proceedings of the International Ocean Discovery Program, 383: College Station, TX (International Ocean Discovery Program). https://doi.org/
Lübbers, J., Kuhnt, W., Holbourn, A.E., Bolton, C.T., Gray, E., Usui, Y., Kochhann, K.G.D., Beil, S., and Andersen, N., 2019. The middle to late Miocene “carbonate crash” in the equatorial Indian Ocean. Paleoceanography and Paleoclimatology, 34(5):813–832. https://doi.org/
Lyle, M.W., and Backman, J., 2013. Data report: calibration of XRF-estimated CaCO3 along the Site U1338 splice. In Pälike, H., Lyle, M., Nishi, H., Raffi, I., Gamage, K., Klaus, A., and the Expedition 320/321 Scientists, Proceedings of the Integrated Ocean Drilling Program. 320/321: Tokyo (Integrated Ocean Drilling Program Management International, Inc.). https://doi.org/
Lyle, M.W., Olivarez Lyle, A., Gorgas, T., Holbourn, A., Westerhold, T., Hathorne, E., Kimoto, K., and Yamamoto, S., 2012. Data report: raw and normalized elemental data along the Site U1338 splice from X-ray fluorescence scanning. In Pälike, H., Lyle, M., Nishi, H., Raffi, I., Gamage, K., Klaus, A., and the Expedition 320/321 Scientists, Proceeding of the Integrated Ocean Drilling Program, 320/321: Tokyo (Integrated Ocean Drilling Program Management International, Inc.). https://doi.org/
Penkrot, M., Levay, L.J., and Jaeger, J.M., Gulick, S.P.S., LeVay, L.J., and the Expedition 341 Scientists, 2017. Data report: X-ray florescence scanning of sediment cores, Site U1419, Gulf of Alaska. In Jaeger, J.M., Gulick, S.P.S., LeVay, L.J., and the Expedition 341 Scientists, Proceedings of the Integrated Ocean Drilling Program, 341: College Station, TX (Integrated Ocean Drilling Program). https://doi.org/
Tjallingii, R., Röhl, U., Kölling, M., and Bickert, T., 2007. Influence of the water content on X-ray fluorescence core-scanning measurements in soft marine sediments. Geochemistry, Geophysics, Geosystems, 8(2):Q02004. https://doi.org/
Toyos, M.H., Lamy, F., Lange, C.B., Lembke-Jene, L., Saavedra-Pellitero, M., Esper, O., and Arz, H.W., 2020. Antarctic Circumpolar Current dynamics at the Pacific entrance to the Drake Passage over the past 1.3 million years. Paleoceanography and Paleoclimatology, 35(7):e2019PA003773. https://doi.org/
Winckler, G., Lamy, F., Alvarez Zarikian, C.A., Arz, H.W., Basak, C., Brombacher, A., Esper, O.M., Farmer, J.R., Gottschalk, J., Herbert, L.C., Iwasaki, S., Lawson, V.J., Lembke-Jene, L., Lo, L., Malinverno, E., Michel, E., Middleton, J.L., Moretti, S., Moy, C.M., Ravelo, A.C., Riesselman, C.R., Saavedra-Pellitero, M., Seo, I., Singh, R.K., Smith, R.A., Souza, A.L., Stoner, J.S., Venancio, I.M., Wan, S., Zhao, X., and Foucher McColl, N., 2021. Expedition 383 methods. In Lamy, F., Winckler, G., Alvarez Zarikian, C.A., and the Expedition 383 Scientists, Dynamics of the Pacific Antarctic Circumpolar Current. Proceedings of the International Ocean Discovery Program, 383: College Station, TX (International Ocean Discovery Program). https://doi.org/