Strasser, M., Ikehara, K., Everest, J., and the Expedition 386 Scientists
Proceedings of the International Ocean Discovery Program Volume 386
publications.iodp.org
https://doi.org/10.14379/iodp.proc.386.101.2023
Expedition 386 summary1
![]() M. Strasser,
M. Strasser,
![]() K. Ikehara,
K. Ikehara,
![]() J. Everest,
J. Everest,
![]() L. Maeda,
L. Maeda,
![]() K. Hochmuth,
K. Hochmuth,
![]() H. Grant,
H. Grant,
![]() M. Stewart,
M. Stewart,
![]() N. Okutsu,
N. Okutsu,
![]() N. Sakurai,
N. Sakurai,
![]() T. Yokoyama,
T. Yokoyama,
![]() R. Bao,
R. Bao,
![]() P. Bellanova,
P. Bellanova,
![]() M. Brunet,
M. Brunet,
![]() Z. Cai,
Z. Cai,
![]() A. Cattaneo,
A. Cattaneo,
![]() K.-H. Hsiung,
K.-H. Hsiung,
![]() J.-J. Huang,
J.-J. Huang,
![]() T. Ishizawa,
T. Ishizawa,
![]() T. Itaki,
T. Itaki,
![]() K. Jitsuno,
K. Jitsuno,
![]() J.E. Johnson,
J.E. Johnson,
![]() T. Kanamatsu,
T. Kanamatsu,
![]() M. Keep,
M. Keep,
![]() A. Kioka,
M. Kölling,
A. Kioka,
M. Kölling,
![]() M. Luo,
M. Luo,
![]() C. März,
C. März,
![]() C. McHugh,
C. McHugh,
![]() A. Micallef,
A. Micallef,
![]() Y. Nagahashi,
Y. Nagahashi,
![]() D.K. Pandey,
D.K. Pandey,
![]() J.-N. Proust,
J.-N. Proust,
![]() E.T. Rasbury,
E.T. Rasbury,
![]() N. Riedinger,
N. Riedinger,
![]() Y. Satoguchi,
Y. Satoguchi,
![]() D.E. Sawyer,
D.E. Sawyer,
![]() C. Seibert,
C. Seibert,
![]() M. Silver,
M. Silver,
![]() S.M. Straub,
S.M. Straub,
![]() J. Virtasolo,
J. Virtasolo,
![]() Y. Wang,
Y. Wang,
![]() T.-W. Wu, and
T.-W. Wu, and
![]() S.D. Zellers2
S.D. Zellers2
1 Strasser, M., Ikehara, K., Everest, J., Maeda, L., Hochmuth, K., Grant, H., Stewart, M., Okutsu, N., Sakurai, N., Yokoyama, T., Bao, R., Bellanova, P., Brunet, M., Cai, Z., Cattaneo, A., Hsiung, K.-H., Huang, J.-J., Ishizawa, T., Itaki, T., Jitsuno, K., Johnson, J.E., Kanamatsu, T., Keep, M., Kioka, A., Kölling, M., Luo, M., März, C., McHugh, C., Micallef, A., Nagahashi, Y., Pandey, D.K., Proust, J.-N., Rasbury, E.T., Riedinger, N., Satoguchi, Y., Sawyer, D.E., Seibert, C., Silver, M., Straub, S.M., Virtasalo, J., Wang, Y., Wu, T.-W., and Zellers, S.D., 2023. Expedition 386 summary. In Strasser, M., Ikehara, K., Everest, J., and the Expedition 386 Scientists, Japan Trench Paleoseismology. Proceedings of the International Ocean Discovery Program, 386: College Station, TX (International Ocean Discovery Program). https://doi.org/10.14379/iodp.proc.386.101.2023
2 Expedition 386 Scientists’ affiliations.
Abstract
Short historical and even shorter instrumental records limit our perspective of earthquake maximum magnitude and recurrence and thus are inadequate to fully characterize Earth’s complex and multiscale seismic behavior and its consequences. Motivated by the mission to fill the gap in long-term paleoseismic records of giant (Mw 9 class) subduction zone earthquakes, such as the Tohoku-Oki earthquake in 2011, International Ocean Discovery Program Expedition 386 successfully collected 29 giant piston cores at 15 sites (total core recovery = 831.19 m), recovering up to 37.82 m long, continuous upper Pleistocene to Holocene stratigraphic successions of 11 individual trench-fill basins that are expected to have recorded past earthquakes. Preliminary expedition results document event-stratigraphic successions comprising numerous event deposits and initially characterize their different types, facies, properties, composition, and frequency of occurrence, which show spatial variations across the entire Japan Trench.
The occurrence of several tephra beds, radiolarian biostratigraphic events, and characteristic variations of paleomagnetic declination and inclination that probably represent paleomagnetic secular variation reveal high potential for establishing robust age models in all parts of the Japan Trench. The central Japan Trench models are most likely to cover the longest timescales, with expected age ranges reaching back to ~24 ka. Together, these preliminary initial results indicate that the applied concept and strategy of multisite coring will likely be successful to test and further develop sub-marine paleoseismology to extract megathrust earthquake signals from event-stratigraphic sequences preserved in the sedimentary record. Obtained data and samples will now be examined using postexpedition multimethod applications to comprehensively characterize and date event deposits. Detailed work will include detailed characterization of the sedimentologic, physical, and (bio-)geochemical features; stratigraphic expressions of relationships; and spatiotemporal distribution of event beds. These will be analyzed as foundational proxy evidence for distinguishing giant earthquakes from smaller earthquakes and aseismic processes driving mechanisms to ultimately develop a long-term record of giant earthquakes. Furthermore, Expedition 386 achievements comprise the first ever high temporal and high spatial resolution subsurface investigation and sampling in a hadal oceanic trench, which are the deepest and least explored environments on our planet. Preliminary initial results show high total organic carbon content and downcore pore water and headspace gas profiles with characteristic changes related to organic matter degradation. In combination, these are suggestive of the occurrence of intensive remineralization and reveal evidence of nonsteady-state behavior. Together with the successful offshore sampling for microbiology postexpedition analyses and research, this provides exciting new perspectives to advance our understanding of deep-sea elemental cycles and their influence on hadal environments.
1. Introduction
The 2004 magnitude (M) 9.2 Sumatra and 2011 M 9.0 Tohoku-Oki earthquakes and tsunamis were catastrophic geologic events with major societal consequences. Both ruptured portions of subduction plate boundaries, which had been deemed incapable of these giant earthquakes and had unexpectedly shallow and large coseismic slip, contributed to large tsunamis (Fujii and Satake, 2007; Ide et al., 2011; Bilek and Lay, 2018). More than 90% of the stress accumulated by global plate tectonics is released along active margins by subduction earthquakes. On a global average, one M 8 class earthquake occurs per year, and most subduction boundaries have produced such great earthquakes. In contrast, since instrumental recording of earthquakes began, only five giant earthquakes (M > 9) have occurred globally (Bilek and Lay, 2018), posing scientific challenges in relating their occurrence and rupture characteristics to long-term evolving subduction zone parameters. Despite these observational limitations, there have been substantial advances in understanding megathrust earthquakes since the early twenty-first century owing to increases in data density and quality from various sources, including historical seismology, seismic and geodetic instrumentation, offshore fault zone drilling, and advanced physics-based numerical modeling (e.g., Nakamura et al., 2015; Bilek and Lay, 2018; Kioka et al., 2019b; Brodsky et al., 2020; Kodaira et al., 2020, 2021; Uchida and Bürgmann, 2021; Wirth et al., 2022).
From this recent research, we can generalize the following about giant earthquakes:
- They are multisegment ruptures of strongly coupled patches of the megathrust for which limited short-term records may not contain evidence of their being previously ruptured together.
- They rupture over large distances and may have the potential to break boundaries that are deemed rupture barriers.
- They can propagate into the shallow megathrust part by extreme coseismic weakening of the fault with rupture reaching the seafloor in the trench and generating large tsunamis that propagate into the far field.
- They produce long-period, high-amplitude, long-duration seismic waves that can lead to resonance with offshore sediment layers initiating large-scale surficial sediment remobilization, sediment mass, and carbon transfer to deep-sea trenches.
- They are accompanied by widespread triggered earthquakes away from the coseismic slip zone, aftershock sequences, aseismic afterslip, and viscoelastic relaxation in the mantle.
Knowledge of megathrust earthquake processes is currently observation-limited because the long recurrence time means that these catastrophic geologic events are poorly represented in the instrumental and historic records. The full range of possible hazards they pose, therefore, is poorly understood due to the paucity of high-resolution earthquake records that span long enough to capture the full spectrum of spatiotemporal rupture variability (Wirth et al., 2022). Answers to critical questions such as “What are the effects of giant earthquakes?” and “How often are we to expect them?” rely on limited examples so far. Examining prehistoric events preserved in the geological record is essential to reconstruct the history of giant earthquakes on timescales long enough to study relevant subduction zone processes. Furthermore, such paleoseismic data interpretation remains the only path to deliver observational data that help reduce epistemic uncertainties in seismic hazard assessment for long return periods.
Expedition 386, Japan Trench Paleoseismology, was motivated by the mission to fill the gap in long-term records of giant earthquakes and aimed to test and develop submarine paleoseismology in the deep-sea environment of the Japan Trench.
Subduction earthquakes affect offshore environments, including deep-sea trenches formed by the downward bending of the oceanic lithosphere along convergent plate boundary systems. Most trenches are deeper than 6000 m and are located in the hadal zone, one of the least explored aquatic environments on Earth (Jamieson et al., 2010; Kioka and Strasser, 2022). Sediment supply to terminal trench basins has been linked to large-scale sediment remobilization and translocation processes initiated by earthquake shaking (Oguri et al., 2013; Ikehara et al., 2016; Migeon et al., 2017; Kioka et al., 2019b). Shaking of the seafloor can trigger landslides or surficial sediment resuspension that evolve downslope into turbidity currents or mud density flows, respectively (Talling, 2014; Goldfinger et al., 2017; Molenaar et al., 2019; Ikehara et al., 2020). Widespread shaking causes nearly synchronous sediment instability over hundreds of kilometers, producing widely distributed event deposits (Goldfinger et al., 2012; Cattaneo et al., 2012; McHugh et al., 2016; Kioka et al., 2019b; Howarth et al., 2021). Such widespread remobilizations over large distances are not expected with other triggers, such as floods and storms. Exceptional supertyphoons might have comparable spatial footprints, but initiation of sediment remobilization would be limited to relatively shallow waters.
Submarine paleoseismology relies on the premise that the marine environment preserves long and continuous records that allow for identification of earthquake-triggered deposits (and allows for their distinction from nonseismically triggered deposits). In subaquatic environments, the sedimentary archive provides high sensitivity and continuity, so event deposits are better preserved and dateable than their terrestrial counterparts. For example, coastal records (e.g., tsunami deposits) only cover the last 8 ky of the Holocene highstand because of eustatic sea level.
Several submarine paleoseismic studies along subduction zones (Cascadia, Calabria, Chile, Sumatra, Hikurangi, and the Japan Trench) (see compilations by Strasser et al. [2015], De Batist et al. [2017], Howarth et al. [2021], and references therein) have been successful in obtaining sedimentary event records that can be positively correlated to instrumentally recorded and historical earthquakes and/or reveal evidence for prehistoric events. These studies, which are mostly based on conventional 10 m long cores, demonstrate the potential to advance our understanding of earthquake recurrence beyond timescales of the last few thousand years.
The International Ocean Discovery Program (IODP) is uniquely positioned to provide such paleoseismologic data by coring sedimentary sequences comprising continuous depositional conditions and records of earthquake occurrence over longer time periods. The 2015 IODP workshop in Zürich discussed and identified strategies on how and where best use could be made of giant piston coring efforts to make some major advancements in submarine paleoseismology (Strasser et al., 2015; McHugh et al., 2015). Workshop discussion revealed the endorsement of the Japan Trench as a primary target for understanding the causes, consequence, and recurrence of giant earthquakes. Thus, the central theme of Expedition 386 was set to test and develop submarine paleoseismology en route to understanding earthquakes and tsunamis in the Japan Trench and eventually other margins with similar settings.
2. Background
2.1. Submarine paleoseismology
At subduction margins, earthquake sources include faults in the upper and lower plates and the interplate megathrust that can rupture over a wide range of depths that may reach the trench. Differences in seafloor motion from these distinct sources result in distinct driving forces for sediment remobilization (Ye et al., 2013; Nakamura et al., 2015). Accordingly, recent observations have demonstrated a wide range of earthquake-related sedimentary signatures linked to exceptionally large subduction earthquakes and their aftershock sequences:
- Slumps in the trench linked to the 2011 Tohoku-Oki earthquake (Fujiwara et al., 2011; Strasser et al., 2013);
- Turbidity currents released simultaneously in different canyon heads traveling downcanyon to merge below confluences during the 1700 Common Era (CE) Mw 9.0 Cascadia earthquake (Goldfinger et al., 2012, 2017) and the M 7.8 2016 Kaikōura earthquake in New Zealand (Howarth et al., 2021);
- Homogeneous sediment extending for large distances across the abyssal plain of the Mediterranean linked to the 365 CE Crete earthquake (Polonia et al., 2013, 2016);
- Dense plumes of sediment remaining in suspension above the seafloor for months after the 2004 Mw 9.2 Sumatra and 2011 Mw 9.0 Tohoku-Oki earthquakes (Seeber et al., 2007; Oguri et al., 2013); and
- Significant sediment volume and carbon transport to the deep sea by canyon flushing and remobilization of young organic carbon–rich surficial sediments over wide areas, triggered by the 2016 Mw 7.8 Kaikōura (New Zealand; Mountjoy et al., 2018) and 2011 Mw 9.0 Tohoku-Oki (Bao et al., 2018; Kioka et al., 2019b) earthquakes, respectively.
For a given margin where physiography, sediment properties, sediment routing systems, and downslope transport can be reliably assessed, this complexity in both structure and sedimentary deposition provides opportunities for study and suggests that distinct classes of earthquakes may leave characteristic sedimentary signatures.
Multimethod characterization for detailed structural, physical, chemical, and microbiological characterization has revealed distinct signatures and patterns for event deposit sedimentary sequences that result from (1) the remobilized material and its original provenance (as a proxy for sediment source and/or routing processes), (2) grain size distribution and structural orientation reflecting transport and depositional dynamics, and (3) consolidation and microbial organic matter degradation reflecting postdepositional processes (McHugh et al., 2011; Polonia, et al., 2016; Goldfinger et al., 2017). Positive stratigraphic correlation of such multiproxy signatures between widely separated sites favors a common causative mechanism, especially if the respective sites are isolated from each other (Goldfinger et al., 2012; Talling, 2014; Ikehara et al., 2018; Schwestermann et al., 2020). These studies and more, many of which investigated event deposits positively correlated to historic earthquakes, proposed characteristic patterns or signals to be potentially distinctive for earthquake origin, subsequent tsunamis, and their aftershock series (Goldfinger et al., 2012; Oguri et al., 2013; Ikehara et al., 2016, 2018; Polonia et al., 2016, 2017; Kioka et al., 2019b; Howarth et al., 2021; Schwestermann et al., 2020, 2021). The currently available data sets are mostly limited by conventional 10 m long coring. They often comprise few event deposits that can be linked to earthquakes for a given margin.
Therefore, conceptual depositional models are not validated against a longer temporal record. Furthermore, deposition and preservation of event layers and their stratigraphic signal vary by location and may change through time (Sumner et al., 2013; Bernhardt, et al., 2015; Ikehara et al., 2018). Long temporal (i.e., reaching back in time to sample several low-recurrence events) and spatially extensive records that sample different types of events over long distances at locations with different preservation potential are needed to test the robustness of the proposed models and relations. Grácia et al. (2010), Pouderoux et al. (2012, 2014), and St-Onge et al. (2012) tracked inferred earthquake-related event deposits recovered by the CALYPSO coring system further back in time. These few pioneer studies demonstrated the potential for paleoseismologic application. However, they were performed on a limited number of cores taken where paleoceanography was one of the primary objectives, and site location may not have been optimal for paleoseismology. Site location and assessment of site variability are key issues in subaquatic paleoseismology (Goldfinger et al., 2017; Ikehara et al., 2018; Kioka et al., 2019a). Detailed characterization of the depositional history of a site can reveal the causes of apparent gaps in the paleoseismic record and identify sites ideal for preserving earthquake-related deposits. Because likely no single technique can provide the full paleoseismic history at an individual site and because feedback between earthquake type, seafloor motion, and its eventual manifestation in the stratigraphic record are complicated, our strategy includes (1) a multicoring approach to sample, characterize, and date a wide range of event deposits over a wide area along the entire Japan Trench (see Operational strategy) and (2) accompanying studies that will combine field observation with physical experiments and numerical models. The latter will explore mechanisms that link coseismic seafloor motions, shaking and deformation, sediment remobilization, and transport dynamics with their signatures in the sedimentary record and provide the knowledge base to translate sedimentary observations into constraints on prehistoric seismicity. This multidisciplinary approach is expected to deliver answers to various research questions, including the following:
- Can we distinguish different earthquake events and types from the sedimentary records?
- Is there an earthquake magnitude threshold for a given signal/pattern in the sedimentary record?
- Does record sensitivity change along strike and/or through time?
- Can we link the sedimentary signal to the earthquake rupture characteristics?
- Can we assess seismic activity of different along-strike segments?
Building on what we have learned from the 2011 Mw 9.0 Tohoku-Oki earthquake, an established correlation of event deposits to historical earthquakes, and the Japan Trench characteristics that are suitable for submarine paleoseismology (see Japan Trench paleoseismology), there is a high potential that our objectives can be achieved. At a minimum, we will identify the giant Mw 9 class tsunamigenic earthquakes that stand in contrast to the frequently occurring Mw 7.5–8 earthquakes that have relatively modest consequences. This is expected to provide a long-term record of Mw 9 class earthquakes, significantly expanding currently available paleoseismic records of such upper end-member events at other subduction margins (e.g., Chile at 5.5 ka [Kempf et al., 2017; Moernaut et al., 2018], Cascadia at 7.6 ka [Goldfinger et al., 2017], Sumatra at 6.5 ka [Patton et al., 2015], and Hikurangi at 16 ka [Pouderoux et al., 2014]). Based on these so far available records, the occurrence of different types of earthquake supercycles has been hypothesized (Sieh et al., 2008; Goldfinger et al., 2013; Ratzov et al., 2015; Usami et al., 2018; Moernaut, 2020; Philibosian and Meltzner, 2020; Griffin et al., 2020; Salditch et al., 2020). Earthquake supercycles have also been proposed based on seismomechanical models (Herrendörfer et al., 2015; Shibazaki et al., 2011; Barbot et al., 2020; Nie and Barbot, 2022). Some seismologists (e.g., Geller, 2011; Mulargia et al., 2017) question the seismic cycle hypothesis. Instead, they propose Poissonian behavior for earthquake recurrence (i.e., large earthquakes can occur any time with a low but on average constant probability). Studying prehistoric events preserved in the geological record is the best way to reconstruct the history of megathrust earthquakes on timescales long enough to provide statistically rigorous tests to answer the research question: “Do giant earthquakes recur quasiperiodically, clustered, or randomly through time?”
2.2. Japan Trench paleoseismology
Recent literature and community input during the IODP Paleoseismology workshop in 2015 described characteristics that predispose margins to being suitable for submarine paleoseismology and formulated guidelines to be considered for designing scientific experiments (Sumner et al., 2013; Goldfinger et al., 2014; Strasser et al., 2015; McHugh et al., 2015). The Japan Trench (Figure F1) is a well suited area according to these criteria. The 2011 Tohoku-Oki earthquake is the first event of its kind worldwide for which the entire activity was recorded by offshore geophysical, seismological, and geodetic instruments. Additionally, direct observation for sediment resuspension and redeposition was documented across the entire margin by seafloor monitoring systems and/or rapid response research missions. Shirasaki et al. (2012) and Pope et al. (2017) reported submarine cable breaks along the southern and central Japan Trench due to turbidity currents generated by the 2011 Tohoku-Oki earthquake. Sediment remobilization related to the earthquake and tsunami is also attested by measured turbidity in the bottom waters (Noguchi et al., 2012; Oguri et al., 2013) and ocean-bottom instrument data (Arai et al., 2013). Submarine landslides were documented by differential bathymetry (Fujiwara et al., 2011; Strasser et al., 2013). However, the most significant volumetric contribution of earthquake-triggered sediment remobilization occurs through surficial sediment remobilization of just the uppermost few centimeters of young, unconsolidated, and organic carbon–rich seafloor sediments over a very wide area (McHugh et al., 2016; Kioka et al., 2019b), as documented by the occurrence of centimeter-thick gaps in the slope stratigraphic succession correlating to large earthquakes (Molenaar et al., 2019).

Figure F1. Japan Trench subduction margin physiography.
Overall, cores document various distinct earthquake-related event deposits throughout an extensive region from the coastal sea to the Japan Trench floor (Figure F1; see references in caption). Correlation of the event deposit to the 2011 earthquake has been proved positive by short-lived radionuclide (Oguri et al., 2013; McHugh et al., 2016, 2020; Ikehara et al., 2016, 2021; Kioka et al., 2019b) and transient disequilibrium pore water profiles (Strasser et al., 2013). Although there is local variability in deposition and preservation of the event layers (Yoshikawa et al., 2016; Ikehara et al., 2018, 2021), the general pattern obtained from >70 cores revealed a good along-strike correlation of documented event deposit occurrence within the reconstructed rupture area (McHugh et al., 2016; Ikehara et al., 2018; Kioka et al., 2019b). Extensive research is still ongoing to further calibrate the sedimentary record of the 2011 Tohoku-Oki earthquake and assess what earthquake parameters can reliably be deduced from the geological record, making the Japan Trench among the best study areas for calibration of submarine paleoseismology.
High sedimentation rates of diatomaceous hemipelagic mud reflect the influence of high oceanic productivity as a consequence of the interplay between the cold Oyashio Current and warm Tsugaru and Kuroshio Currents (Saino et al., 1998). Bioturbation of 2011 event deposits documented from surface cores is strong to moderate on the upper and lower slopes, respectively (Ikehara et al., 2018, 2021). There, comparably low sedimentation rates (6–50 cm/ky on the upper slope [von Huene et al., 1980] and ~23 cm/ky on the midslope terrace [Shipboard Scientific Party, 1980]) and thinner deposition observed for the 2011 event layer suggest a lower preservation potential of the earthquake-related bed in the stratigraphic record but also provide evidence of past earthquake-related event deposits (Usami et al., 2018; Ikehara et al., 2020). In contrast, very high sedimentation rates occur in the Japan Trench (1–3 m/ky; Ikehara et al., 2018; Schwestermann et al., 2021; Kanamatsu et al., 2022), which prevents the destruction of thick, fine-grained event deposits by currents and benthos activity, resulting in a high preservation potential of the earthquake-related bed.
Indeed, cores obtained during the last 8 y from trench-fill basins preserve evidence for at least two older major sediment remobilization events. These deposits comprise thick, multipulse, fine-grained turbidite sequences that correlate throughout cores taken from separated trench-fill basins and extend along strike for ~120 km (Ikehara et al., 2016, 2018; Kioka et al., 2019a; McHugh et al., 2020; Schwestermann et al., 2020, 2021; Kanamatsu et al., 2022) (Figures F1, F2). Interbedded volcanic ash provides a well-constrained tephra chronological age control (Ikehara et al., 2017), suggesting that the prominent event deposits correlate to the 869 CE Jogan and 1454 CE Kyotoku earthquakes (Ikehara et al., 2016). Sawai et al. (2015) and Namegaya and Satake (2014) also suggested major megathrust earthquakes as the source of the 1454 CE and 869 CE tsunamis based on onshore tsunami records and historical documents. Chronology of Japan Trench event deposits and their correlation to historical earthquakes is corroborated by pioneer studies applying innovative dating methods for deep-sea sediments (i.e., below the carbonate compensation depth, where traditional 14C dating and stable isotope stratigraphy on carbonate biominerals are confounded). Bao et al. (2018) and Schwestermann et al. (2021) showed a successful application of organic matter radiocarbon analyses for constraining the chronology of event deposits related to historic earthquakes (Figure F3); Kanamatsu et al. (2017, 2022, 2023) found that the sediment recovered in the Japan Trench contains excellent paleomagnetic secular variation and that high-resolution paleomagnetic secular variation stratigraphy can successfully be used to confirm synchronicity of earthquake induced turbidites in hadal trench-fill sequences (Kanamatsu et al., 2022, 2023)

Figure F2. Stratigraphic correlation.
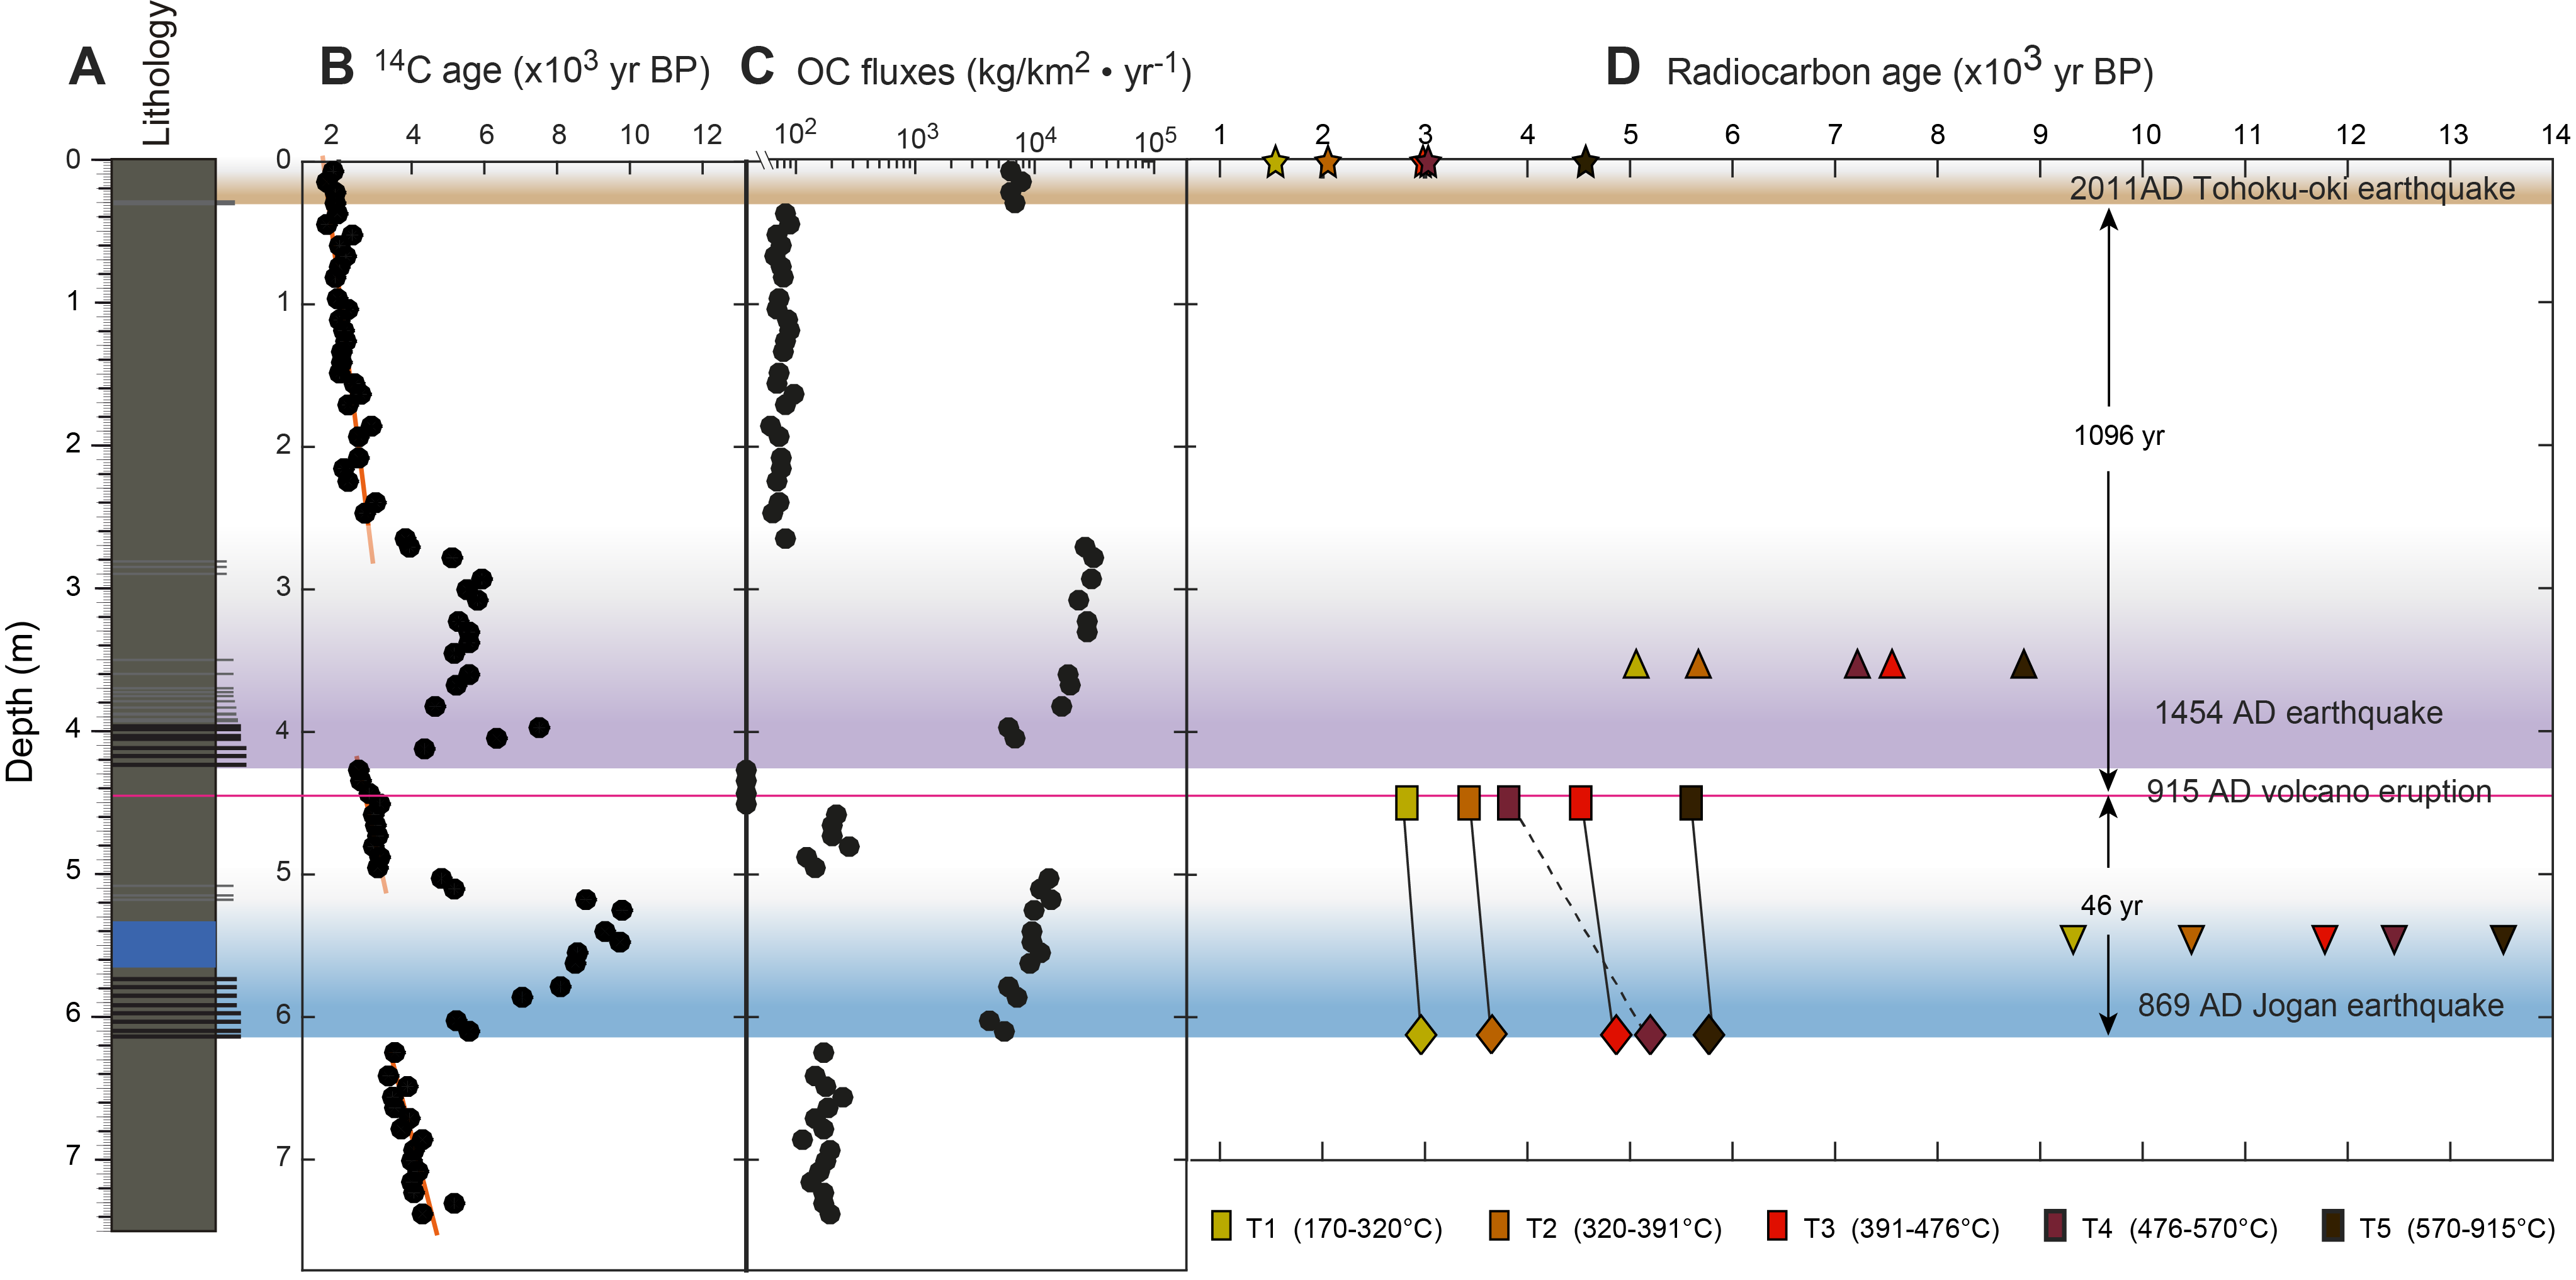
Figure F3. Organic matter radiocarbon analyses.
These studies show that large-scale resedimentation events recorded as widespread fine-grained turbidite sequences occur less frequently despite the generally high seismicity with Mw 7–8 earthquakes occurring regularly every few tens to hundreds of years. This finding supports the hypothesis that the Japan Trench event deposit record is representative for exceptionally large events with low recurrence. The occurrence of three giant earthquakes in the last 1500 y is consistent with return times of 260–880 y for Mw 9 earthquakes off Tohoku as calculated from seismic moment frequency relation (Uchida and Matsuzawa, 2011) and other recurrence estimates based on slip deficit accumulation over time assuming full interplate coupling (590–730 y; Uchida and Bürgmann, 2021) and seismomechanical modeling (520–800 y [Barbot, 2020]; ~600 y [Nakata et al., 2021]). Smaller earthquakes may have the potential to locally resuspend unconsolidated seafloor sediments, as reported by Oguri et al. (2016) for an Mw 7.3 aftershock of the 2011 Tohoku-Oki earthquake. The global cable break database by Pope et al. (2017) revealed that for the time period covered by cable monitoring in the Japan Trench, no earthquakes below Mw 7.0 and only 5 of 25 earthquakes Mw 7 or above actually triggered cable breaking sediment flows. These data support the concept that slope stability is greater in areas with high seismic activity where sediments are consolidated and strengthened during low-magnitude events (Sawyer and DeVore, 2015; ten Brink et al., 2016; Molenaar et al., 2019). During regional moderate-sized earthquakes (Mw 7–8) and potentially even triggered by remotely generated earthquake waves (Johnson et al., 2017), sediment resuspension and remobilization in regions with high sedimentation rates may redistribute sediment to the trench floor. These processes do not form distinct thick and regionally extensive event deposits but may instead contribute to and maintain the high background sedimentation rate (with respect to the great events) in the trench (Ikehara et al., 2016, 2018).
Examination of the acoustic facies from high-resolution subbottom (HRS) profiles of the trench fill reveals variably thick, acoustically transparent bodies interbedded in the otherwise parallel reflection pattern of the trench-fill basins (Ikehara et al., 2018; Kioka et al., 2019a; McHugh et al., 2020). Seismic-core correlation reveals groundtruthing of the uppermost acoustically transparent bodies to reflect thick, massive, fine-grained event deposits linked to historic earthquakes (Kioka et al., 2019a) (Figure F4). HRS profiles from the small isolated trench basins along the entire Japan Trench axis image acoustic reflection patterns consistent with basin-fill successions interbedded by episodic deposition of fine-grained turbidites (Kioka et al., 2019a), thus defining clear target successions for deeper coring to sample older events not reached by conventional coring.
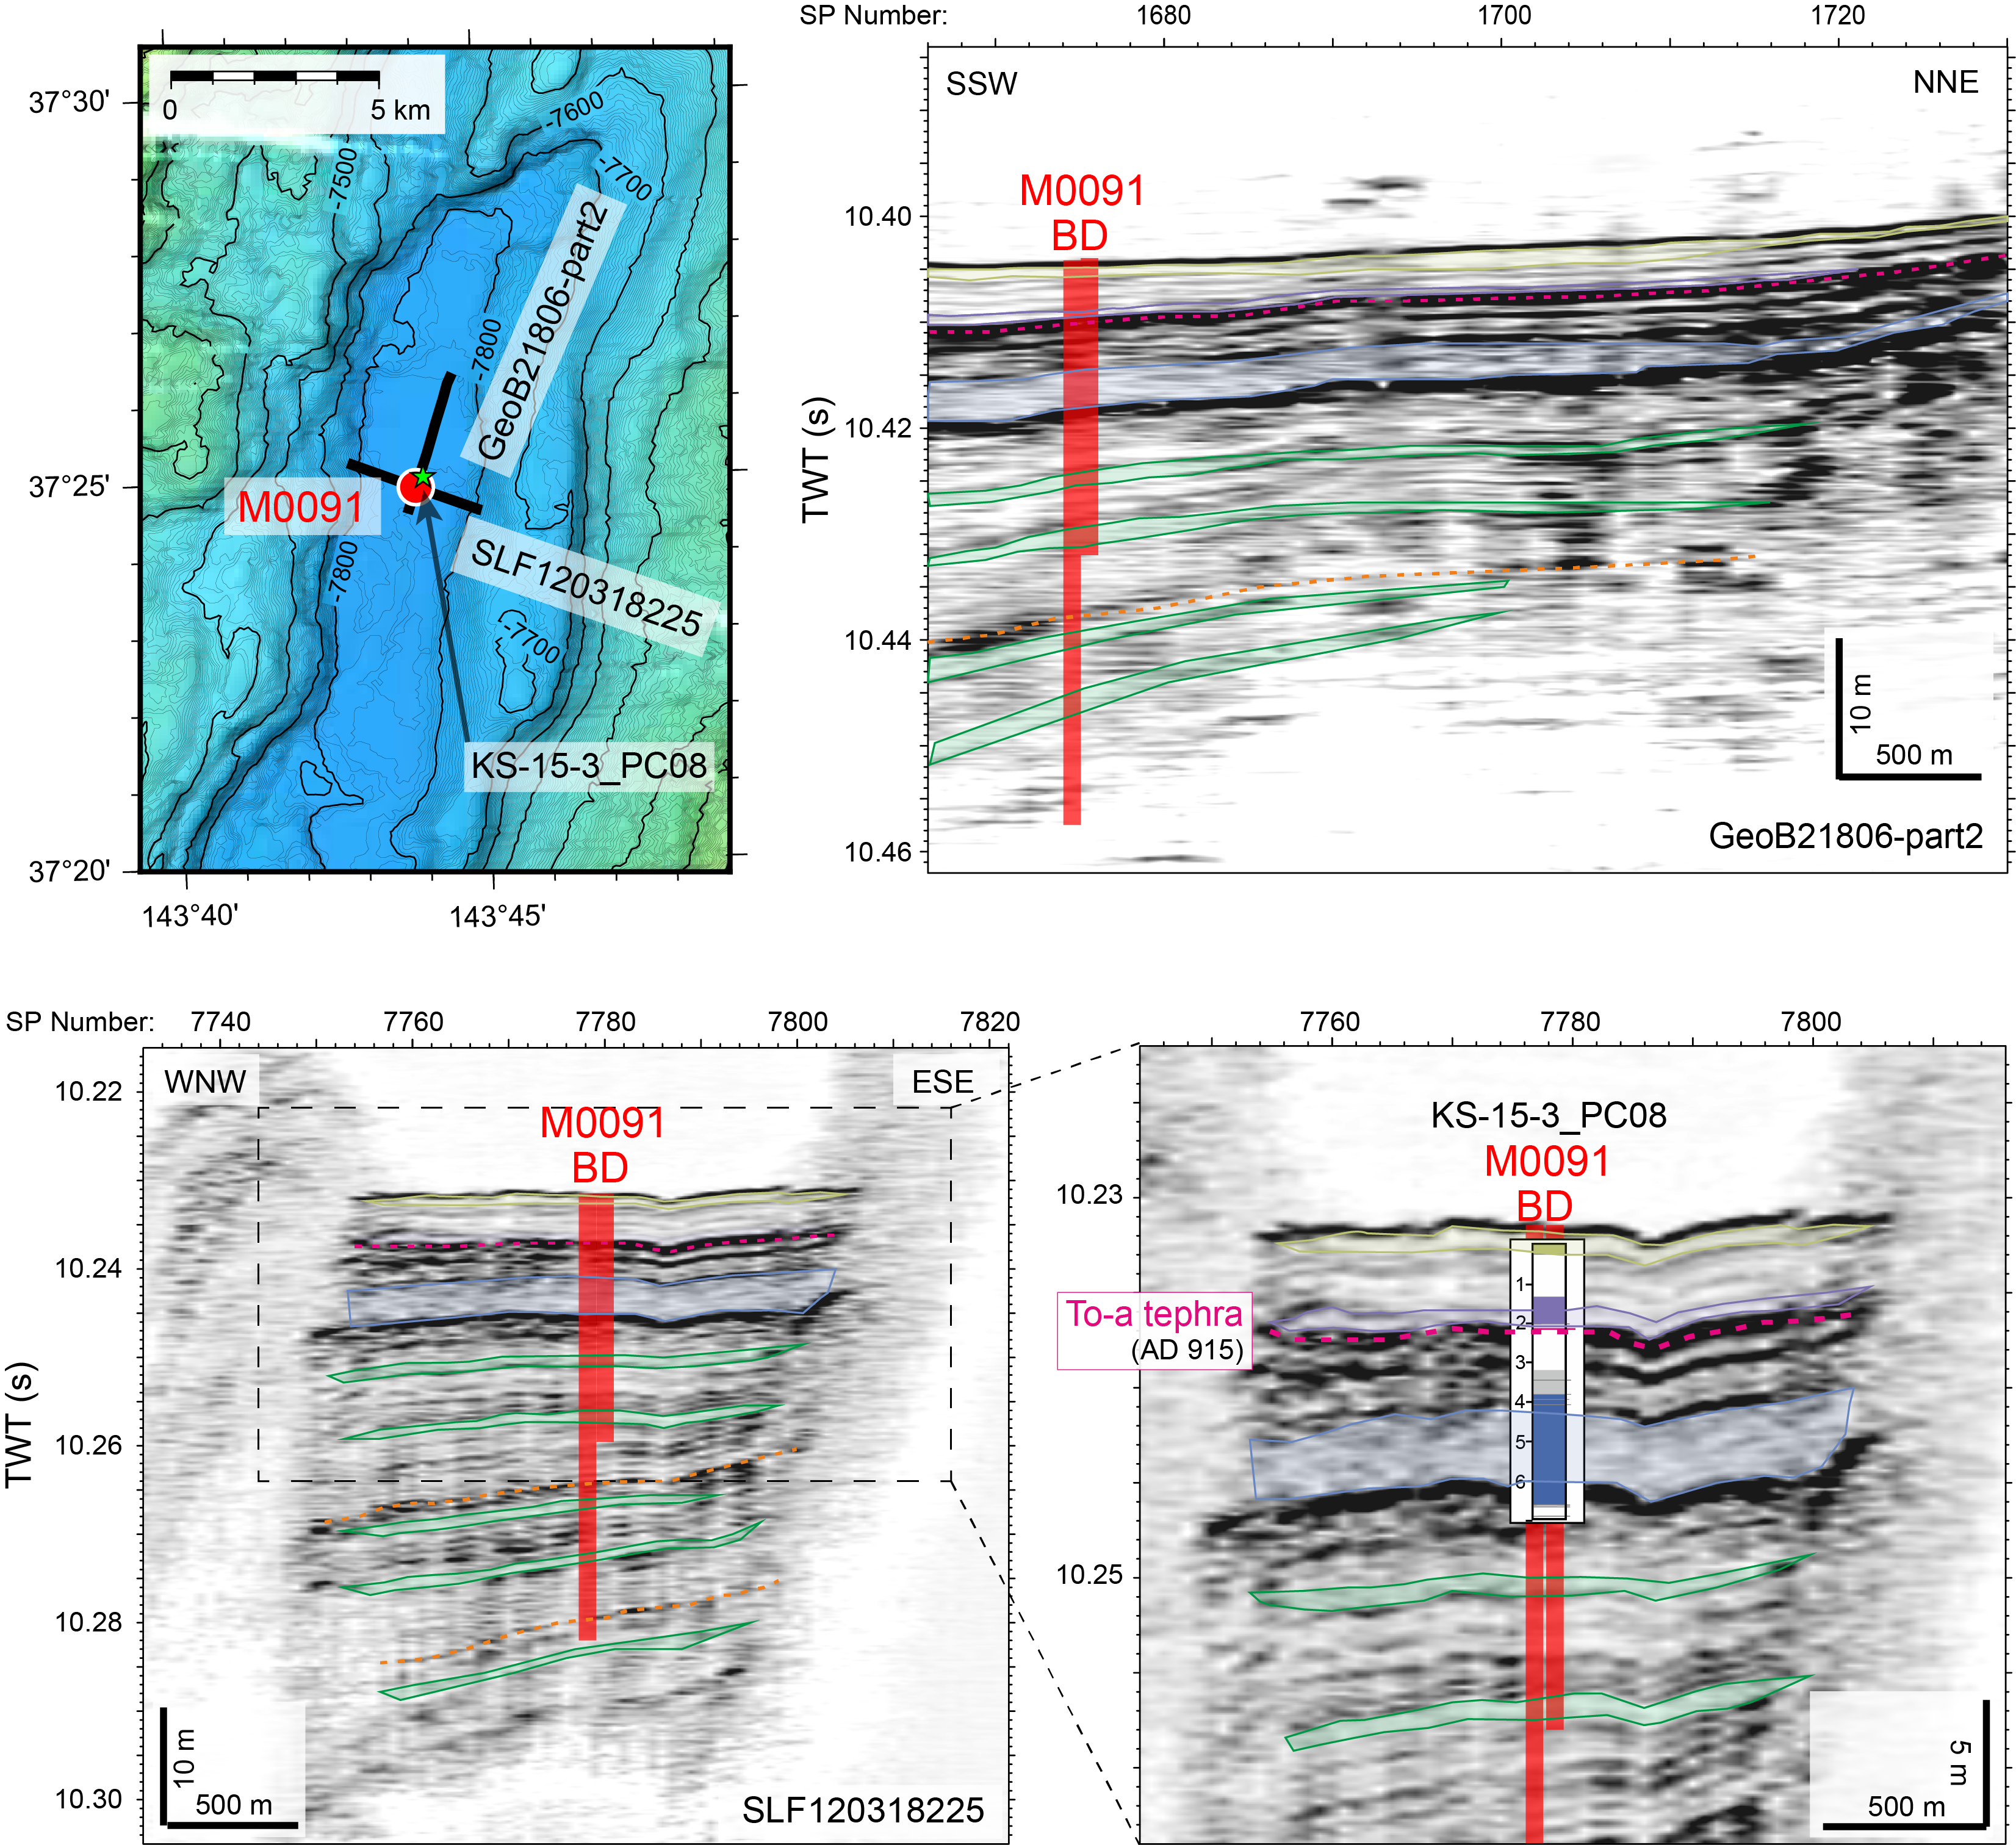
Figure F4. High-resolution bathymetric map, Line GeoB21806-part2, and Line SLF120318225.
According to the available data and research results, large earthquakes and related tsunamis are the most probable origin of major sediment remobilization events recorded in Japan Trench stratigraphic sequences. However, alternative mechanisms have to be considered and will be a primary objective for this expedition (see Scientific objectives). With the exception of the Ogawara and Nakaminato Submarine Canyons in the north and south, respectively (Figure F1), the Japan Trench margin contains no major submarine canyon systems directly connecting the shore or shelf to the deepwater trench floor. Instead, several isolated basins that form in concert with tectonic subsidence on the upper slope (Arai et al., 2014) serve as natural sediment traps receiving sediment from the shelf. The Ogawara and Nakaminato Submarine Canyons have not been reported as significant sediment routing systems. Thus, the physiographic setting of the entire Japan Trench convergent margin limits the formation and mobility of meteorologically induced turbidity currents such as by storm surges, hyperpycnal flows from rivers (floods), and large storm waves to reach the central part of the deep-sea trench (Ikehara et al., 2018; Kioka et al., 2019a; Schwestermann et al., 2021).
At this stage, we cannot exclude the possibility that sediment delivery mobilized in shallow waters and routed through the Ogawara and Nakaminato Submarine Canyons, potentially enhanced during upper Pleistocene sea level lowstands, may have reached the trench. This possibility is suggested by results from sediment routing systems analysis by Kioka et al. (2019a). The influence of sediment remobilization of these two submarine canyons on the event stratigraphic record were investigated during Expedition 386.
2.3. Japan Trench structural characteristics
The Pacific plate is subducting beneath the Okhotsk plate along the Japan Trench at a rate of 8.0–8.6 cm/y (DeMets et al., 2010). The trench strikes north–south to NNE–SSW, originating at the triple junction of the Pacific, Philippine Sea, and Okhotsk plates at the south and intersecting the Kuril Trench to the north. The plate interface is erosional, and subduction erosion produces tectonic subsidence (von Huene and Lallemand, 1990) that forms a low-gradient (1°–2°) upper slope terrace. Although there is no clear fore-arc basin, isolated basins occur on the upper slope terrace (Arai et al., 2014). The lower slope is steeper with an average gradient of ~5°. Active faulting along the subduction margin (Tsuru et al., 2002; Kodaira et al., 2017) forms a narrow midslope terrace at water depths of 4000–6000 meters below sea level (mbsl). North–south to NNW–SSE trending horst and graben structures formed by flexural bending of the subducting Pacific plate result in a relatively rough trench floor morphology with small elongated, physically separated trench- and graben-fill basins. Vertical relief within the basins is typically on the order of a few hundreds of meters (Kioka and Strasser, 2022).
The study area of the deep Japan Trench (7600, 7500, and 8000 meters below sea level [mbsl] in the northern, central, and southernmost parts, respectively) is bounded to the north and south by subducting seamounts (Erimo and Daiichi-Kashima Seamounts, respectively), where the trench floor is elevated to 6000 and 5500 meters below seafloor (mbsf), respectively. The trench floor is also relatively shallower (~7400 m) in the boundary area between the central and northern Japan Trench, around 39.4°N, where a petit-spot volcano field (Hirano et al., 2006) enters the subduction system (Fujie et al., 2020). There, a large >1 km high escarpment suggests large-scale gravitational collapse and megalandslides on the lowermost landward slope (Nakamura et al., 2020). HRS profiles, however, do not show young large-scale landslide deposits, suggesting that the collapse structure is significantly older (Kioka et al., 2019a).
3. Scientific objectives
Motivated by the mission to fill the gap in long-term records of giant (Mw 9 class) earthquakes, Expedition 386 aims to test and develop submarine paleoseismology in the Japan Trench.
Primary scientific objectives are as follows:
- Identify the sedimentologic, physical, chemical, and biogeochemical proxies of event deposits in the sedimentary archive that allow confident recognition and dating of past Mw 9 class earthquakes versus smaller earthquakes versus other driving mechanisms.
- Explore the spatial and temporal distribution of such event deposits to investigate along-strike and time-dependent variability of sediment sources, transport and deposition processes, and stratigraphic preservation.
- Develop a long-term earthquake record for giant earthquakes.
Objectives 1 and 2 are related to the mission of testing and developing submarine paleoseismology to produce robust long-term records as input for addressing Objective 3 in the Japan Trench, as compared with global examples. To address these objectives, Expedition 386 implemented a multicoring approach by mission-specific platform (MSP) shallow subsurface (40 m) giant piston coring to recover the continuous upper Pleistocene–Holocene stratigraphic successions of isolated trench-fill basins along an axis-parallel transect of the 7–8 km deep Japan Trench. Cores from 29 Giant Piston Corer (GPC) deployments at 15 sites located in 11 individual trench-fill basins will be used for multimethod applications to characterize event deposits for which the detailed stratigraphic expressions and spatiotemporal distribution will be analyzed for proxy evidence of extreme events.
The Expedition 386 multicoring approach at 7445–8023 mbsl also comprised the first ever high-resolution investigation and sampling of the >10 m deep subsurface in a hadal oceanic trench. Such hadal environments are the deepest places on our planet and arguably one of Earth’s most challenging environments for earth science research. They act as terminal sinks for sedimentary mass and carbon and form high-resolution archives, presenting the possibility of unraveling the history of deep-ocean elemental cycles. Hence, a secondary objective of Expedition 386 is to systematically describe the Japan Trench hadal environment in unparalleled high temporal and spatial resolution, quantify sedimentary and dissolved geochemical concentrations, and characterize hadal microbiological communities. This aims at investigating the deep-ocean elemental cycle and is expected to shed new light on sediment and carbon fluxes of event-triggered sediment mobilization to a deep-sea trench and its influence on hadal environments.
4. Site selection and coring strategy
Site selection for the multicoring approach was based on high-resolution multichannel seismic (HRMCS) data (Kodaira et al., 2017; Nakamura et al., 2013, 2020, submitted) and HRS data (Kioka et al., 2019a). HRMCS data revealed variable thickness of trench-fill basins ranging from practically 0 to >300 m, reflecting along-strike variation in the structural style of horst-graben basins bending along faults in the downgoing slab and Mesozoic–Cenozoic sediment cover of the Pacific plate (Nakamura et al., 2013; Boston et al., 2014). Sites were located in basins where trench-fill sediment thickness is >50 m, even where the lower part of the trench fill is not well imaged in the HRS data. There, the acoustic basement in HRS data is interpreted as linked to local landslides or deformation of trench-fill sediments by coseismic slip propagation to the trench (Kodaira et al., 2012; Strasser et al., 2013; Kioka et al., 2019a; Nakamura et al., 2020, submitted). Sites were selected that allowed sampling of event deposits that are well characterized by homogeneous acoustic facies intercalated within acoustically stratified sediments imaged by HRS data (Figure F4). In most cases, two sites are located <2–5 km apart in an individual trench-fill basin for which site-to-site correlation is well constrained by good reflector continuity (Kioka et al., 2019a). The two sites form a couple that allows for coring both an expanded and a condensed stratigraphic section, applying the composite-stratigraphy concept to address Objective 1 and reaching further back in time (Objective 3). Correlation between sites across different basins is possible in many cases in the northern and southern Japan Trench (Kioka et al., 2019b). However, these correlations are partly obscured by steep morphologies across subducting horst or landslides structures. To study along-strike variability (Objective 2), we located fewer coring sites in basins with better along-strike continuity, whereas high site location density is chosen where basins are smaller and continuity is restricted.
5. Operational strategy
5.1. Offshore operations
The MSP coring platform used for Expedition 386 was the R/V Kaimei (100.5 m long; 5747 tonnes) operated by the Japan Agency for Marine-Earth Science and Technology (JAMSTEC). This dynamically positioned vessel has onboard laboratory facilities adaptable to a wide range of scientific applications. For Expedition 386, the usual suite of European Consortium for Ocean Research Drilling (ECORD) containerized laboratories were not required, and the laboratories aboard were adapted to accommodate all analytical equipment required to carry out IODP shipboard and time-critical Science Party sampling and analysis.
The expedition used a GPC system, enabling deployment of either a 20, 30, or 40 m GPC and its 12,000 m cable (Figure F5). At all Expedition 386 sites, the proposed site locations (Strasser et al., 2019) were first surveyed by acquiring at least one site-crossing multibeam swath bathymetry and HRS to confirm that the seafloor and subseafloor sediment targets were free of large solid obstructions that can bend the piston corer barrel on impact. Upon confirmation of a suitable site location, Kaimei was dynamically positioned at the proposed sites approved by the IODP Environmental Protection and Safety Panel. The coordinates for the position of the GPC system deployments at the seabed were calculated from a combination of the corrected ship’s position and the position of a transponder mounted on the cable 50 m above the GPC (Figure F5), with all holes at Sites M0081–M0095 situated within 300 m of the specified coordinates (Figure F6; Table T1).

Figure F5. GPC deployment sequence.

Figure F6. Site map.
Mobilization of the vessel took place in Yokusuka, Japan, with Japan-based scientists and the full complement of Marine Works Japan (MWJ) and The Institute for Marine-Earth Exploration and Engineering (MarE3) staff joining on 13 April 2021. Kaimei set sail from Yokusuka on 13 April, and the offshore phase of the expedition continued until 1 June 2021, when Kaimei returned to Yokusuka. Following completion of operations at Site M0088, a ~30 h port call was made in Hachinohe on 7 and 8 May for crew and technician change and to load supplies. Demobilization also took place at Yokusuka, where the refrigerated (reefer) containers were offloaded from the vessel in preparation for transfer to the D/V Chikyu.
Scientists departed the vessel on 1 June, and MarE3 and MWJ staff disembarked following completion of demobilization. The cores, core catcher samples, headspace gas samples, and interstitial water (IW) splits collected offshore were transported under refrigeration to Chikyu.
In total, 25 days of Expedition 386 were spent operational on station, 8.5 days were spent in transit between sites, 2 days were spent in port, 13 days were spent on standby at station because of weather, 0.2 days were spent on equipment-related downtime, and 1.4 days were spent carrying out a medical evacuation from the vessel. See Table T1 for a summary of offshore operations and core recovery. Shipboard-generated core recovery plots are available in the weekly ship reports on the ECORD Expedition 386 website (https://www.ecord.org/expedition386/expedition-386-reports).
As with all MSP expeditions, no cores were split during the offshore phase; therefore, a comprehensive onshore phase complemented the offshore phase, unfortunately prolonged due to the continuation of the COVID-19 pandemic. Table T2 summarizes the descriptions and measurements made during Expedition 386 and indicates whether they were conducted offshore or onshore.
5.2. Onshore Science Party
A number of analyses were completed in the period between the offshore and onshore phases of the expedition. X-ray computed tomography (CT) scans were carried out on all sections, including trigger cores, using the X-ray CT scanner on Chikyu. Headspace samples taken offshore were analyzed aboard Chikyu for gas chromatography with flame-ionization detection (GC-FID). Smear slides taken offshore were described and entered into the drilling information system (DIS) Spreadsheet template.
The global situation resulting from the COVID-19 pandemic necessitated changes in the structure and operation of the Onshore Science Party (OSP). The OSP was held aboard Chikyu on 14 February–15 March 2022; however, due to travel and entry restrictions to Japan, only Japanese-resident Science Party members and operator staff were able to attend. This forced a number of significant changes to be made to the core flow prior to, during, and after the OSP. The most significant of these was the decision to conduct only IODP shipboard sampling and analysis during the OSP. A further restriction forced upon the operators was the limitations on staff numbers to attend the OSP in person. As a result, a complicated core flow was designed (Figure F7), ensuring that analyses that could not be completed aboard Chikyu were carried out at ECORD Science Operator (ESO) laboratories at the Marum Bremen Core Repository and the European Petrophysics Consortium at the University of Leicester. Data derived from analyses conducted in Japan and Europe were shared with the full Science Party as they were produced, including the Japanese participants aboard Chikyu, and with the remaining 26 scientists around the world after a full QA/QC process conducted by ESO and MarE3 operator staff.

Figure F7. Core processing and measurement flow.
5.3. Personal Sampling Party
The relaxation of travel restrictions and the opening of Japan’s borders to overseas visitors in September 2022 enabled the final phase of the onshore portion of the expedition to take place. The Personal Sampling Party (PSP) took place aboard Chikyu on 15–30 November 2022. All Science Party members were invited to attend, and MarE3 and ESO operators finalized planning for the sampling of the expedition cores to satisfy individual research proposals and to complete IODP standard physical properties measurements. ESO operator staff traveled to Japan to help coordinate and assist MarE3 staff in Science Party logistics and PSP workflow. Over the course of 2 weeks, all samples and measurements were completed, fulfilling the sample requirements for 44 Science Party sample requests and completing IODP penetrometer and automated vane shear (AVS) measurements for those core sections not already measured during the OSP.
Sampling planning was coordinated by ESO over several months in close communication with scientists. All samples, once taken, were packed, labeled, and stored according to agreed protocols and then shipped to scientists’ home institutions after the conclusion of the PSP. Sample information held in the Harumon system underwent full QA/QC and was then integrated into the ExpeditionDIS database by the ESO Database Managers.
6. Principal results
6.1. Southern Japan Trench
6.1.1. Sites M0081 and M0082
Sites M0081 and M0082 are in the southernmost trench-fill basin (Basin S1) of the Japan Trench (Figure F6). The basin has an elongated shape with a northeast–southwest trend extending ~18 km in a trench-parallel direction with its rather flat basin floor at around 8025 mbsl. The width of the asymmetric basin, with its steeper (up to 50% slope gradient) northwestern and more gentle (~20% slope gradient) southeastern margins, ranges 3800–5200 m. Site M0081 was selected to core the basin floor, where the greatest sediment recovery was anticipated based on the subbottom profiles. Acoustic images are characterized by closely, regularly spaced acoustic laminations down to >50 m in the subsurface with intercalated, approximately 2–3 m thick acoustically transparent intervals separated by high-amplitude reflections (Figure F8). The acoustically transparent intervals thin with the general reflection pattern, becoming slightly less coherent toward a bathymetric high. Site M0082 was located here to sample a condensed section overlying a basal high in ~40 m subsurface depth.

Figure F8. Line 386_Underway_010.
Visual core description–derived lithologies based on texture are dominated at both sites by clayey silt, silty clay, and clay with minor components of medium sand, fine sand, very fine sand, and silt (Figures F9, F10). Detailed smear slide observations indicate that there is a large siliceous biogenic component that can dominate the lithology (lithogenic-rich siliceous ooze versus siliceous-rich, lithogenic silty clay). The most common sedimentary structures at both sites are thin beds (1–3 cm thick) and laminae, sometimes forming parallel laminated intervals that contain fine sand, very fine sand, silt, and clayey silt with rare but occasionally present foraminifera and calcareous nannoplankton, as revealed by microscopic observation. These structures occur within interpreted event beds that are characterized by a coarse-grained basal layer ranging from medium sand to silty clay. A sharp or bioturbated contact is found at the base of the coarse-grained layer. The coarser grained basal deposits contain laminae and beds (1–5 cm thick) and are often capped by clays. This clay deposit can be a few centimeters to meters thick, mostly lacking bioturbation, for example, in a notable ~5 m thick clay bed at ~10–15 mbsf (Interval 2). The sediments have undergone extensive organoclastic sulfate reduction and/or anaerobic oxidation of methane that is manifested as iron monosulfides. These postdepositional processes (bioturbation and formation of iron monosulfides) overprint the primary depositional bedding features and are seen filling burrows as mottling and filling porosity in laminae as color bands. The lithostratigraphic succession at Site M0081 comprises the following three intervals in a downcore direction (as summarized for Hole M0081F, shown in Figure F9):
- Interval 1 is a 9.8 m thick silty clay interbedded with thin beds and laminae.
- Interval 2 is a 5 m thick interval of clay with sparse iron monosulfides and bioturbation.
- Interval 3 is 22.5 m thick composed of silty clay interbedded with thin beds (1–3 cm), laminae, and parallel laminae.
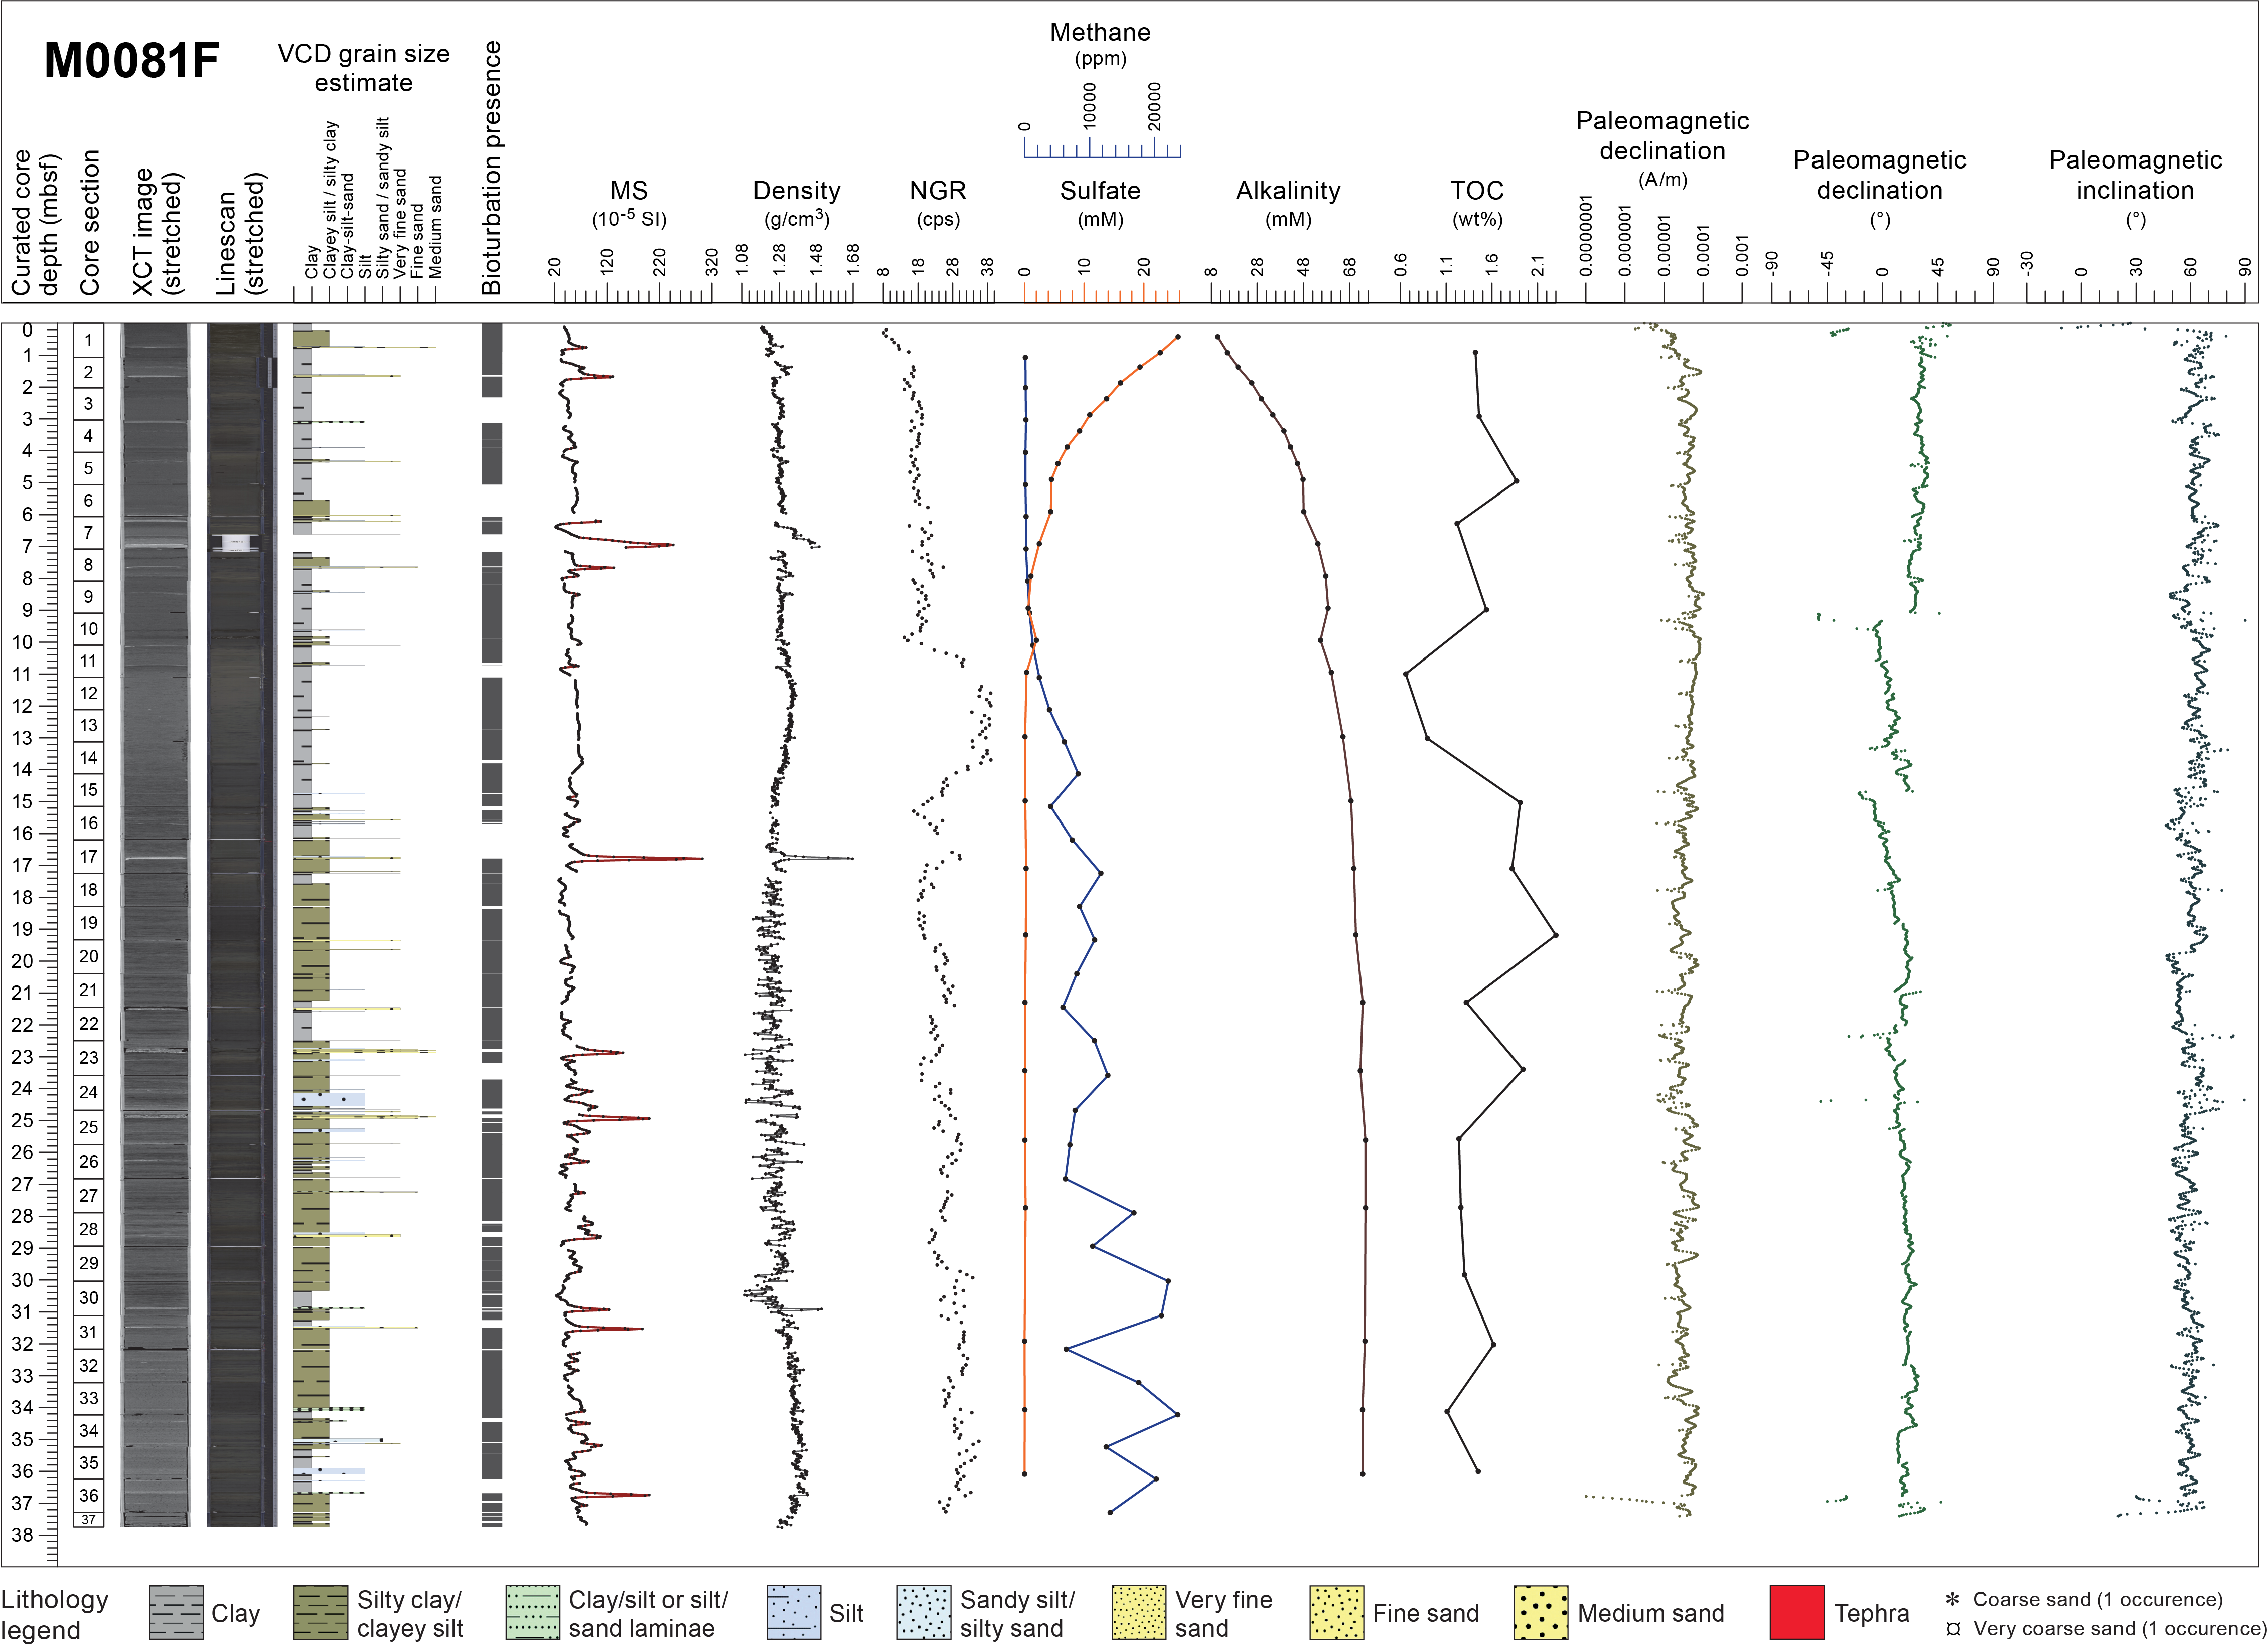
Figure F9. Composite Strater plot, Hole M0081F.
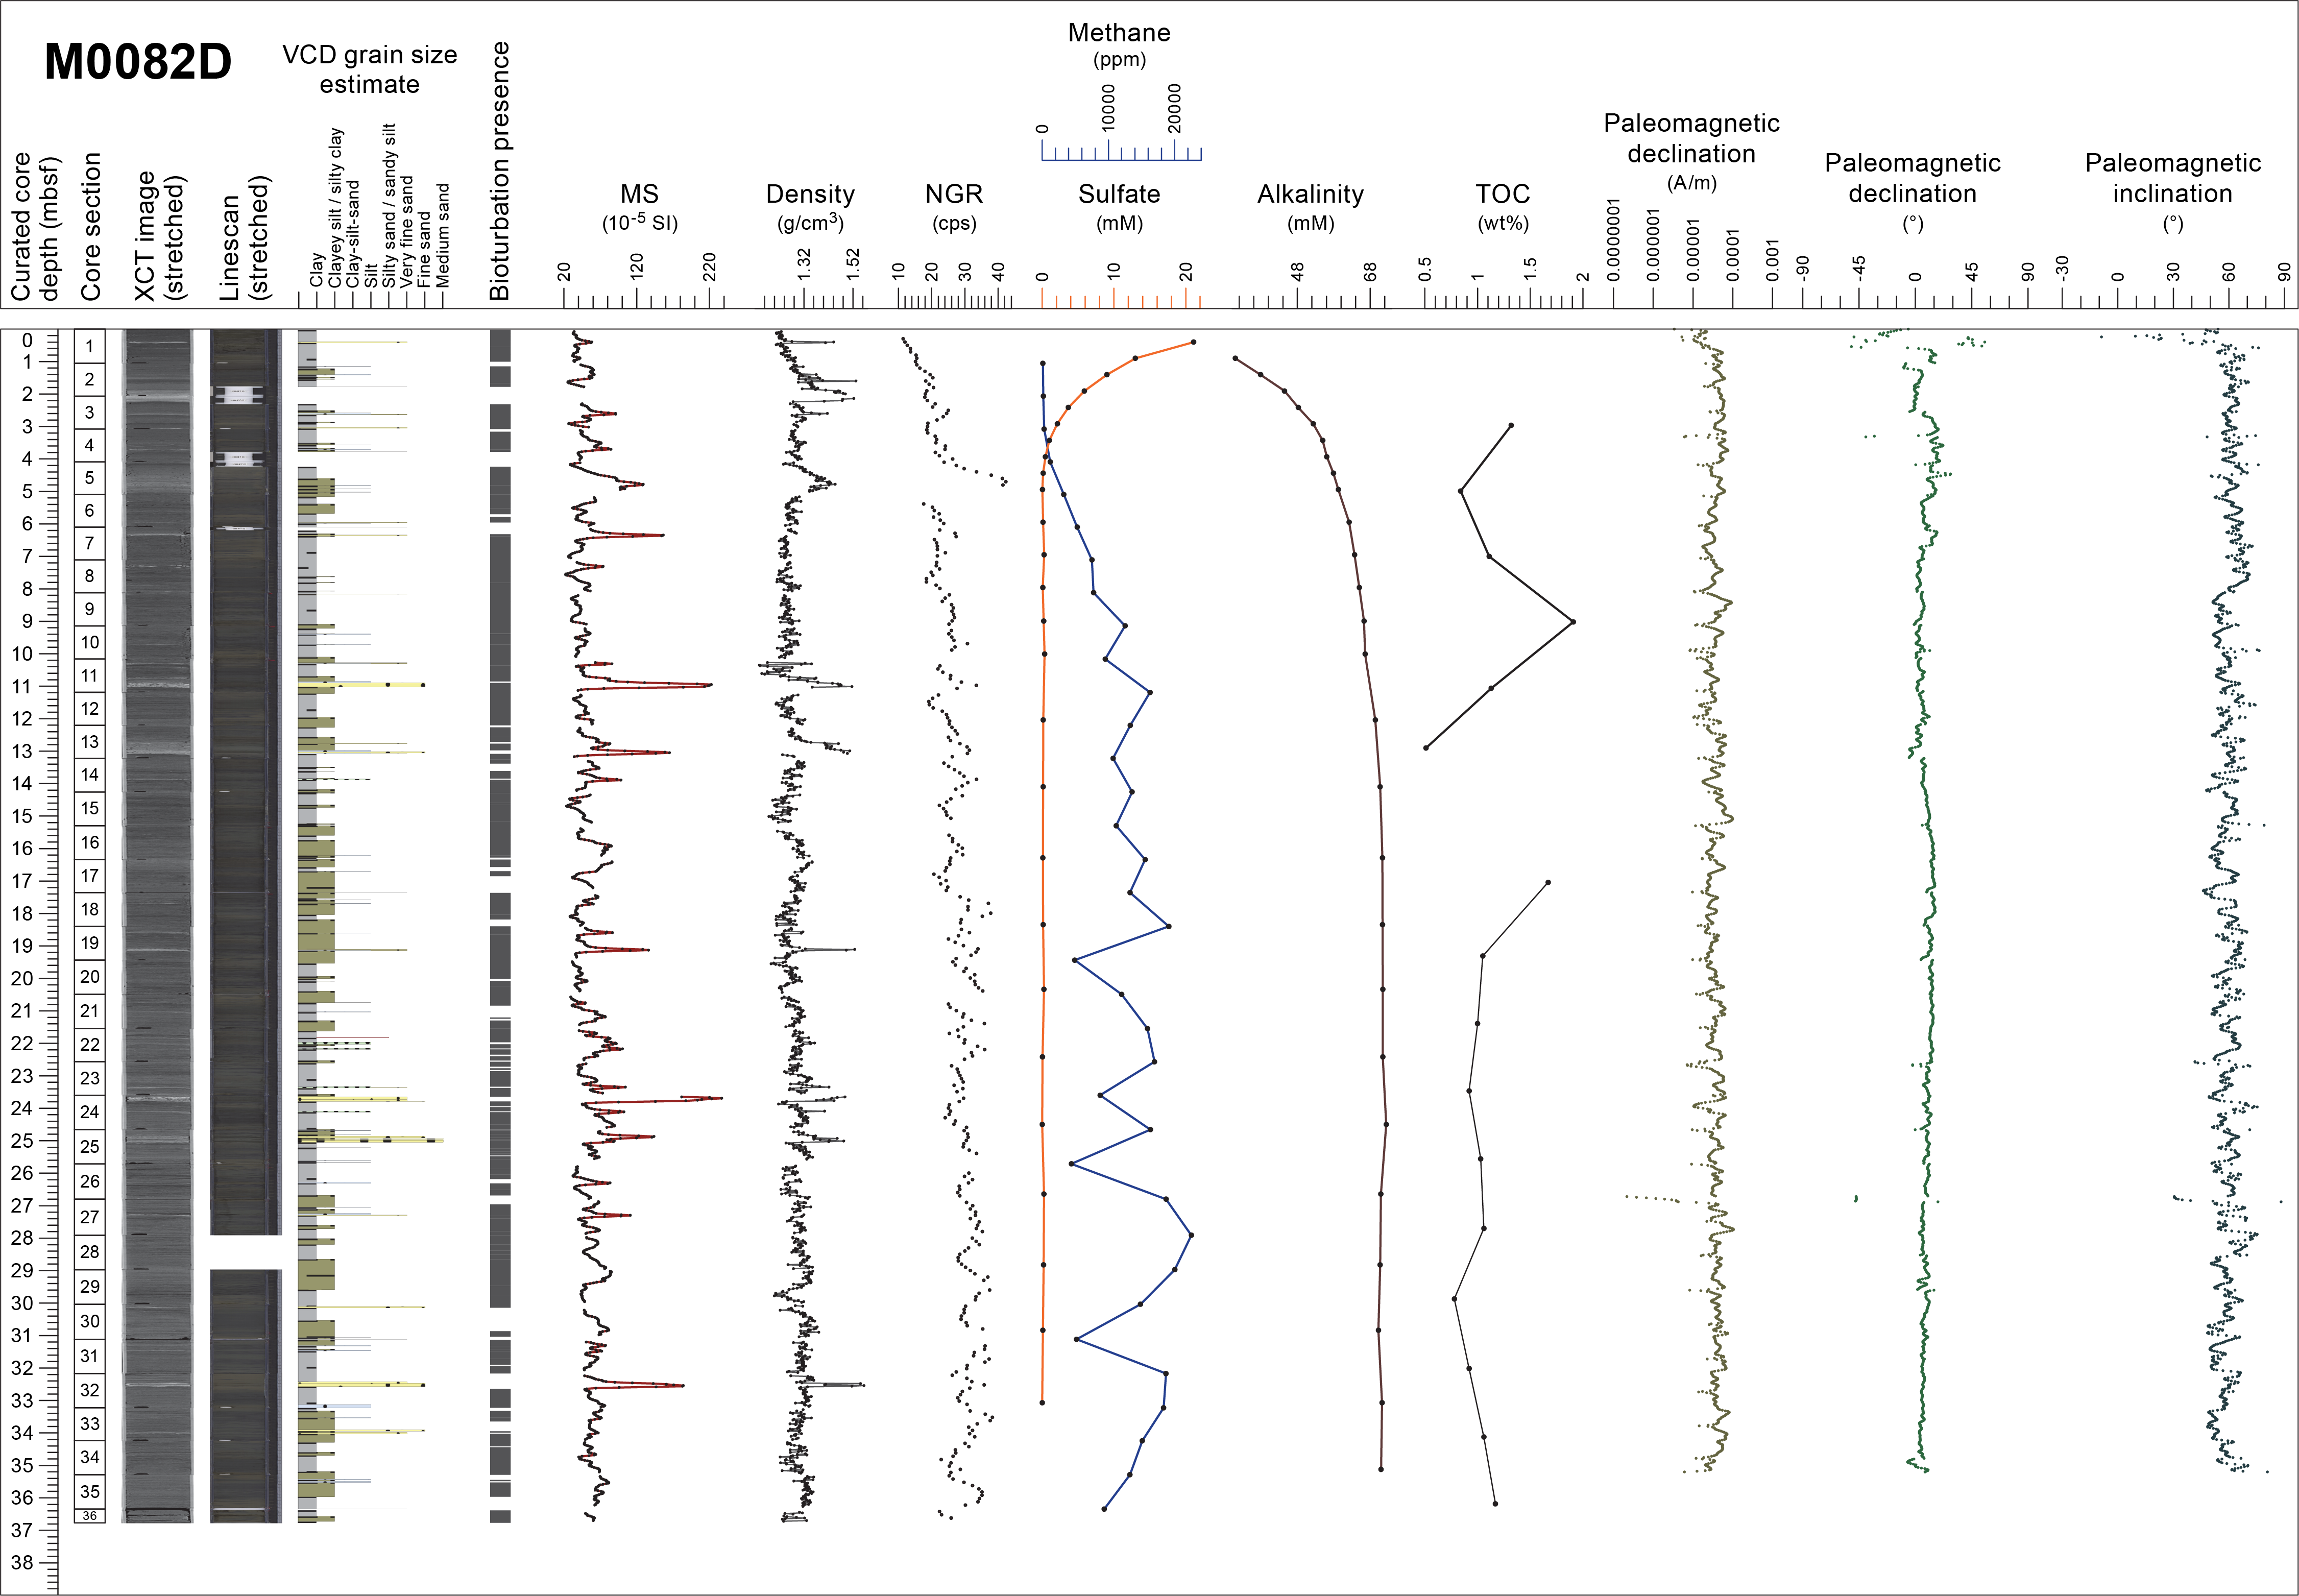
Figure F10. Composite Strater plot, Hole M0082D.
The identification of intervals is not as clear for Site M0082 because the clay and silty clay intervals are thinner than at Site M0081, ranging in thickness from centimeters to 1.5 m. There are notable tephra layers in the upper part of the succession, and their characteristic facies are found at both Sites M0081 and M0082 at ~7 and 2.5 mbsf, respectively, as key beds, allowing correlation between holes and sites, with a superposition of the two tephra layers occupying similar stratigraphic positions in both cores. Another tephra layer was only observed at Site M0082 at 22 mbsf. The difference in the subsurface depth of the correlative tephra layers suggests lower sedimentation rates at Site M0082. Even within the ultra-deepwater hadal environment, benthic and planktonic foraminifera occur with varying moderate to good preservation in sediment. Except for the agglutinated foraminifera, which may be either in situ or reworked, all foraminifera are considered to be allochthonous. Because of low foraminiferal abundance, no provenance interpretation of benthic foraminifera can be made, but for one sample in the lower part of Site M0082 (386-M0082D-1H-25, 102.5–105.5 cm; 25.68 mbsf), the common assemblage of brownish orange stained benthic and planktonic foraminifera suggests a source no shallower than an outer neritic environment.
Physical property logs of Sites M0081 and M0082 show mostly parallel variations. Bulk density increases downcore from ~1.20 g/cm3 at the top of the core to ~1.40 g/cm3 at the bottom at both sites (Figures F9, F10). At both sites, several peaks in bulk density exceeding 1.5 g/cm3 occur (e.g., at 3, 7, 8, 12, and 14 mbsf) and correspond to peaks in magnetic susceptibility (exceeding 100 × 10−5 SI, well above a baseline of roughly 50 × 10−5 SI) and natural gamma radiation (NGR). At Site M0081, the zone between ~20 and 30 mbsf is characterized by rapid fluctuations of high- and low-density values and corresponds to similar fluctuations in magnetic susceptibility, resistivity, and NGR. Although magnetic susceptibility generally tends to vary over short, centimeter-scale depths, a ~3 m thick zone of nearly continuous readings of 65 × 10−5 SI occurs at ~11–14 mbsf (Interval 2, above). This interval is also a high-NGR zone with readings up to 40 counts/s. A comparable high-gamma interval occurs at Site M0082 at 4.5–5.5 mbsf, also with corresponding high magnetic susceptibility and high bulk density values. Undrained shear strength increases with depth at both sites, but maximum values at the base of the deepest hole at Site M0081 are approximately three times higher than at the base of the deepest hole at Site M0082.
The downcore IW and headspace gas profiles of sulfate, alkalinity, ammonium, bromide, and methane concentrations show characteristic changes related to organic matter degradation at both Sites M0081 (Figure F9) and M0082 (Figure F10). This suggests that intensive remineralization is occurring, which is also supported by the observed high total organic carbon (TOC) content. This process is most active in the uppermost ~3–5 m and gradually diminishes downcore at comparable rates at both sites. Dissolved Fe and Mn are very high in the uppermost meter of the sediment column at both sites, indicating organic matter remineralization by intensive dissimilatory Mn and Fe reduction. The nonlinear, wavy decrease in Mn concentrations below the uppermost meter may indicate repeated periods of nonsteady-state diagenesis preserved in the IW record. Below the uppermost sediment interval, organoclastic sulfate reduction becomes the dominant electron acceptor for organic matter remineralization, followed by methanogenesis at greater depths. Dissolved Si concentrations (>800–1000 μM) are very high immediately below the sediment surface (~0.2–0.3 mbsf) and remain high throughout the recovered intervals at both sites. Amorphous silica appears to dissolve throughout the core, causing some of the highest dissolved Si concentrations reported in marine sediments (e.g., Frings, 2017). In general, patterns and concentrations of IW and dissolved gas parameters are similar at Sites M0081 and M0082, indicating that similar overall depositional and diagenetic processes affected both sites. One significant difference between Sites M0081 and M0082 is the depth of the sulfate–methane transition (SMT), which is located at ~9–10 mbsf at Site M0081 and at ~5 mbsf at Site M0082. This could be explained by different depositional histories, including different sedimentation rates, organic matter reactivities, organic matter delivery rates, and/or variable methane fluxes from depth. The solid phase at Sites M0081 and M0082 is dominated by siliceous material, indicated by high Si contents and corroborated by smear slide descriptions. Fine-grained siliciclastic material, as approximated by Al contents, is quantitatively the second-most important sediment component. Carbonate material, as shown by the inorganic carbon (IC) and partly the Ca contents, is very low but not absent. The Fe contents broadly parallel the Al records and, at first pass, do not indicate significant vertical redistribution by diagenetic dissolution-precipitation processes. This is different for Mn, which exhibits several dramatic peaks reaching up to 0.36 wt% throughout the sites, indicating diagenetic migration of Mn.
The paleomagnetic intensity profiles of Site M0081 are characterized by a wide range in intensity, ranging from 10−5 to 10−4 A/m orders (Figure F9). They are generally scattered, but at Site M0081 their background intensity generally increases downward from the top to around 1.5 mbsf and decreases to more constant lower background values below around 20 mbsf. A similar trend in background intensity can be observed at Site M0082 (Figure F10), but at a shallower subsurface level. Preliminary paleomagnetic data of Sites M0081 and M0082 display various trends in declination profiles, but their trends at Site M0081 are different among the profiles from different holes. This observation suggests that the preliminary reconstruction applied to correct for the relative rotation of the core sample along the vertical axis during penetration of the GPC system into the subbottom sediments is not fully adequate and needs to be improved for correlating the paleomagnetic secular variations. The preliminary correction applied to declination profiles at Site M0082 reveals more consistent declination profiles characterized by short cyclic oscillation in the upper intervals and a longer arch shape trend in the lower part. On the other hand, the inclination does not relate to the horizontal rotation like the declination. In inclination profiles, some sudden drops are observed at Site M0081 (e.g., around 20 mbsf) and at Site M0082 (~8–9 mbsf). These features may be correlatable between holes and enable chronological tie points using inclination data.
Radiolarian fossils are abundant throughout the samples analyzed from Holes M0081D and M0082D, and their preservation is good. Stratigraphic changes of relative abundance for three radiolarian species or species group—Cycladophora davisiana Ehrenberg, Tetrapyle circularis/fruticosa group sensu Matsuzaki et al. (2020), and Lithomelissa setosa Jørgensen—are used as the main radiolarian events (Events 1–7) for Expedition 386 (see Micropaleontology in the Expedition 386 methods chapter [Strasser et al., 2023]). At Site M0081, the relative abundance of Cycladophora davisiana is less than 6% throughout. Therefore, the entire section recovered from Hole M0081D is included in C. davisiana Zone ‘a, corresponding to the Holocene (Morley et al., 1982). Although the relative abundance of the Tetrapyle group is generally low, ranging 2%–8%, it is relatively high (>5%) below 27.9 mbsf, likely correlated with the mid-Holocene warm period (Matsuzaki et al., 2020; Chinzei et al., 1987). Relatively high values (>3%) of L. setosa are observed at the bottom of the core (34.1 mbsf), which could correlate to the upper of two small peaks in the abundance patterns of L. setosa, which could be correlated among most of the sites and is regarded as a potential key marker (Events 2 [upper peak] at ~7 ka and 4 [lower peak] at ~11 ka). At Site M0082, the relative abundance of C. davisiana is less than 15% throughout the core and tends to be somewhat higher (>10%) below 27 mbsf. Therefore, it is likely that the entire section recovered from Site M0082 is included in C. davisiana Zone ‘a, corresponding to the Holocene. The lower part of the core could possibly correspond to the earliest Holocene, near the boundary of C. davisiana Zones ‘a and ‘b (Morley et al., 1982). The relative abundance of the Tetrapyle group varies between 2% and 10%; however, it is difficult to recognize an interval with relatively high abundances (>5%). The relative abundance of L. setosa reaches a maximum (>3%) at 23.2 mbsf that could be correlated to Event 2 (~7 ka).
6.1.2. Sites M0092 and M0095
Sites M0092 and M0095 are in a trench-fill basin located in the central part of the southern Japan Trench (Basin S2; Figure F6). The basin has an elongated shape with a northeast–southwest trend extending ~6 km in a trench-parallel direction and a rather flat basin floor at around 7700 mbsl. The width of the asymmetric basin, with its steeper northwestern and gentler southeastern margins, ranges 1500–2500 m. Subbottom data image the basin infill in the main depocenter around Site M0092 as a package of acoustically laminated basin infill, in places more than 50 m thick (Figure F11). The lower part shows slightly higher amplitudes imaging a very gently folded older basin-fill succession. The overlying horizontally stratified package, which also includes approximately 1–2 m thick, intercalated acoustically transparent intervals in the shallow subsurface, onlaps on the upper surface of the gently deformed older basin infill. Site M0095 was selected to core where the younger and older basin-fill packages are relatively condensed and expanded, respectively, compared to the main depocenter of the basin around Site M0092.
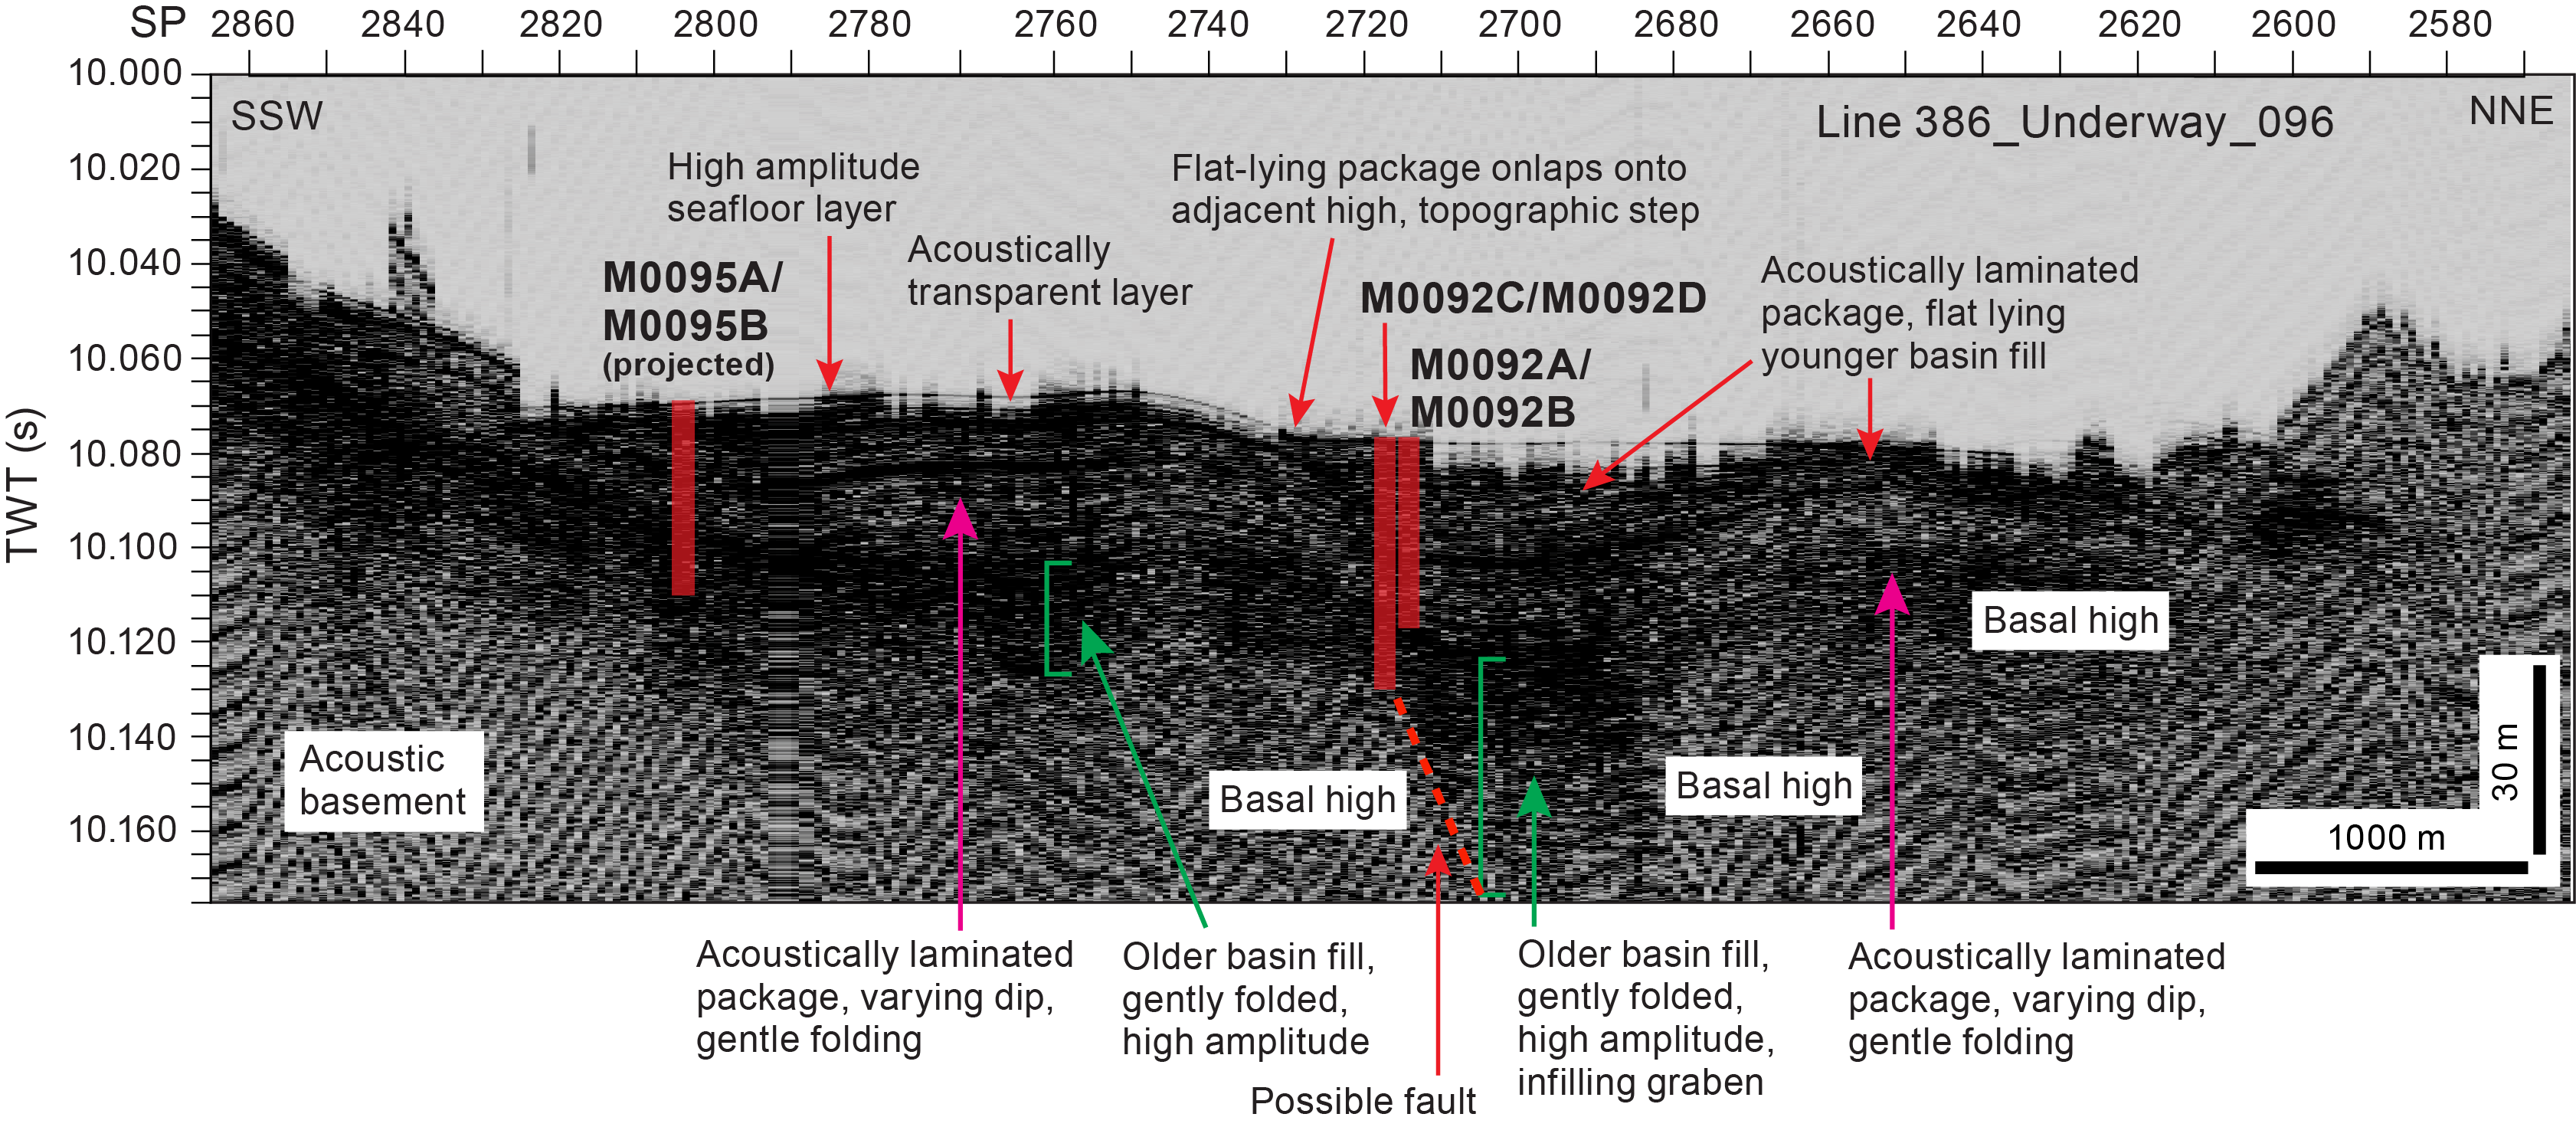
Figure F11. Line 386_Underway_096.
Visual core description–derived lithologies based on texture are dominated at both sites by clayey silt, silty clay, and clay with minor components of medium sand, fine sand, very fine sand, and silt (Figures F12, F13). Detailed smear slide observations indicate that there is a large siliceous biogenic component that in places can dominate the lithology (e.g., lithogenic-rich siliceous ooze versus siliceous-rich, lithogenic silty clay). Bioturbation, except for three fining-upward sequences in the upper 9 (Hole M0092) and 6.5 m (Hole M0095), is common and varies between slight and abundant. The sediments have undergone extensive organoclastic sulfate reduction and/or anaerobic oxidation of methane that is manifested as iron monosulfides. These postdepositional processes (bioturbation and formation of iron monosulfides) overprint the primary depositional bedding features and are seen filling burrows, as mottling, and filling porosity in laminae as color bands. The lithostratigraphic succession at Site M0092 comprises the following three intervals in a downcore direction:
- Interval 1 is a ~9 m thick, medium- to thick-bedded interval comprising three major fining-upward sequences characterized by a sharp contact over a heavily bioturbated and iron mono-sulfide-rich clay.
- Interval 2 is a ~10 m thick bioturbated clay with scattered silty clay horizons and silt laminae.
- Interval 3 is a ~1 (Hole M0092B) to 3 m thick (Hole M0092D) sharp-base, fining-upward succession from very fine sand to silt and bioturbated silty clay with scattered silt and sand laminae.
- Interval 4 is a ~10 (Hole M0092B) to ~15 m thick (Hole M0092D) medium- to thick-bedded silty clay and clay that contains dispersed millimeter-scale pumiceous silt and sand patches and some silt and sand laminae.

Figure F12. Composite Strater plot, Hole M0092D.

Figure F13. Composite Strater plot, Hole M0095B.
Brownish white silt-sized tephra occurs in this interval (Section 386-M0092D-1H-28, 63.5 cm) as patches in the silty sediment.
Similarly, the lithostratigraphic succession at Site M0095 comprises four intervals in a downcore direction:
- Interval 1 is ~2.2 m thick homogeneous clayey silt and silty clay. The base of this interval is marked by a 5 cm thick fining-upward interbedded silt and very fine sand bed underlined by a sharp base sand laminae.
- Interval 2 is a ~4.25 m thick very fine sand bed that fines upward into silt and clayey silt with several very fine sand and silt laminae that lacks bioturbation. It is capped by two clayey silt beds interbedded with heavily to moderately bioturbated clay.
- Interval 3 is 9.75 m thick clay interbedded with two clayey silt beds 4–6 cm thick and sparse silt laminae.
- Interval 4 is a 13.13 m thick (15.2 mbsf to the base of Hole M0095B) interbedded clay with silt beds, silty clay beds, and silt laminae. Three silt beds 10–20 cm thick are present in the upper part of this interval.
No tephra layers were observed at Site M0095. Even within the ultra-deepwater hadal environment, benthic and planktonic foraminifera were observed at Sites M0092 and M0095 with varying moderate to good preservation in the sediment. Except for the agglutinated foraminifera, which may be either in situ or reworked, all foraminifera are considered to be allochthonous. Because of low foraminiferal abundance, no provenance interpretation of benthic foraminifera can be made.
Physical property logs show mostly parallel trends and variations. Bulk density increases downcore from ~1.20 g/cm3 at the top to ~1.35 g/cm3 at the bottom of the deepest hole at both sites, and magnetic susceptibility mostly shows high-frequency variations typically with values of ~30 × 10−5 to 80 × 10−5 SI. NGR fluctuates between 9 and 45 counts/s with the baseline generally increasing with depth in the uppermost ~9 and ~7 m at Sites M0092 and M0095, respectively (Figures F12, F13). At both sites, several peaks in bulk density exceeding 1.4 g/cm3 occur and mostly correspond to peaks in magnetic susceptibility (exceeding 100 × 10−5 SI). The peaks generally have asymmetric shapes with a sharp and abrupt base and upward-decreasing trends above, corresponding to depositional sediment packages with a coarse base and fining-upward trend at respective depths. Well-pronounced peaks occur at ~8.4; between 18.7 and 20; and at 25.7, 31.4, and 33.3 mbsf in Hole M0092D and at ~6.1, between 15.5 and 17, and at 24.3 mbsf in Hole M0095B. The peaks at 8.4 (Hole M0092D) and 6.1 mbsf (Hole M0095B) are unusual in that they cover a broader depth range compared to the other peaks and are characterized by a decreasing trend that is sharper than the increasing trend. The same broader depth ranges also show elevated NGR values. Reliable P-wave velocity measurements are available for the uppermost ~14 m at both sites and fluctuate around a value of ~1500 m/s in the uppermost 4 and 3 m, decrease to ~1484 m/s at 8 and 6 mbsf at Sites M0092 and M0095, respectively, and increase with depth to reach maximum values of ~1550 m/s. Undrained shear strength measurements generally increase with depth at both sites with similar trends. Below ~10 and 6 mbsf at Sites M0092 and M0095, respectively, variability increases, with few meter-thick intervals characterized by elevated undrained shear strength values.
The geochemical pore water profile in the top part of the cores at both sites show elevations in redox sensitive elements (V, Mo, U, Fe, and Mn) and abrupt decreases in sulfate and barium. Methane is low in the shallow parts of the cores and becomes important at a depth where sulfate is below detection, which defines the SMT at ~8 mbsf at Site M0092 and at ~6 mbsf at Site M0095 (Figures F12, F13). Combined, these observations are consistent with organic matter remineralization, likely by intensive dissimilatory Fe reduction. Below the uppermost sediment interval, organoclastic sulfate reduction becomes the dominant electron acceptor for organic matter remineralization as evidenced by the loss of sulfate and dramatic increase in Ba. Sulfate reduction and subsequent formation of diagenetic sulfide minerals is also evident from the abundance of most likely iron sulfides in the visual core descriptions (VCDs). The abundance of amorphous silica (biogenic opal in diatom frustules and sponge spicules as well as volcanic ash) in the smear slide descriptions can account for the very high dissolved Si concentrations immediately below the sediment surface. Amorphous silica appears to reach an equilibrium value around 800–900 µM, which is some of the highest dissolved Si concentrations reported in marine sediments (e.g., Frings, 2017). The solid phase at Sites M0092 and M0095 is dominated by siliceous material, which is indicated by high Si contents and corroborated by smear slide descriptions. Fine-grained siliciclastic material, as approximated by Al contents, is quantitatively the second-most important sediment component. Carbonate material, as shown by the IC and partly by the Ca contents, is very low but not absent. The Fe contents broadly parallel the Al records and, at first pass, do not indicate significant vertical redistribution by diagenetic dissolution-precipitation processes. The coupled but marked variation of total carbon (TC), TOC, and IC may imply transport of material into the Japan Trench. Although intensive remineralization may occur at the top part of sediments at Sites M0092 and M0095, relatively higher TOC and TC contents (almost >1 wt%) were observed in the deeper sediments, suggesting that significant amounts of organic matter may persist in the trench sediments. The high methane concentrations and elevated C1/C2 values in the deeper sediments of the two sites show that remineralization by microbes is important in these hadal sediments.
Preliminary paleomagnetic data from Sites M0092 and M0095 display similar trends in their intensity, declination, and inclination profiles (Figures F12, F13). The paleomagnetic intensity profiles of Site M0092 are characterized by large fluctuations. A low of intense variability and lower values in the 10−5 A/m order is recognized in all profiles at around 19 mbsf in Hole M0092B, 18 mbsf in Hole M0092D, and 15 mbsf in Hole M0095B. A longer low-intensity interval recognized below 30 mbsf at Site M0092 could correlate to the intensity low at the bottom of Hole M0095B. Declination profiles in the upper ~9 and 6.5 m show higher frequency fluctuations, which are punctuated by a scattered declination interval around 7.5–9 and 5–6.5 mbsf in Holes M0092D and M0095B, respectively. A positive declination excursion occurs at ~13–15, 11.5–12.5, and 8–9 mbsf in Holes M0092B, M0092D, and M0095B, respectively. Below these depths, lower values are consistently observed around 16, 14, and 10 mbsf, respectively, followed by a general downward increase documented in all holes and a more gentle decrease with depth toward the bottom of Hole M0092D. The inclination profiles fluctuate between 30° and 60°. Inclination drops are identified at 6–6.5, 14, and 30 mbsf in Hole M0092D and 6 and 12 mbsf in Hole M0095B. An inclination high is recognized at around 8.5 mbsf in Hole M0092D and 7.0 mbsf in Hole M0095B. Similar trends in declination and inclination variation suggest that the data reflect the paleomagnetic secular variation. The scattered declination intervals in the upper portion indicate an unstable sediment magnetization record. The magnetization process of these intervals is interpreted as different from other intervals.
Radiolarian fossils are abundant in all examined samples from Holes M0092D and M0095B, and their preservation is good. At Site M0092, the relative abundance of C. davisiana varies between 0% and 22% and tends to be high (>5%) below 27.4 mbsf. The sharp increase in the relative abundance of C. davisiana from <5% to >10% at this depth could be correlated to the boundary horizon of C. davisiana Zones ‘a and ‘b (Event 5), corresponding to the Holocene/Pleistocene boundary (Morley et al., 1982). A primary peak in the abundance of C. davisiana at 29.5 mbsf is likely correlated to Event 6, and probably the high value at the bottom might be correlated to Event 7, corresponding to Davisiana Event (DAE)-2 (~12 ka) and DAE-3 (~17 ka) of Matsuzaki et al. (2014). The relative abundance of the Tetrapyle group ranges 0%–7%, and higher values (>5%) between 12.9 and 25.3 mbsf are likely correlated with the mid-Holocene warm period (Matsuzaki et al., 2020; Chinzei et al., 1987). Two peaks in the abundance of L. setosa at 14.9 and 27.4 mbsf are likely correlated to Events 2 (~7 ka) and 4 (~11 ka), respectively. At Site M0095, the relative abundance of C. davisiana fluctuates between 1% and 14% and tends to be high (>10%) below 19.6 mbsf. The sharp increase in the relative abundance of C. davisiana from <5% to >10% at this depth could be correlated to the boundary horizon of C. davisiana Zones ‘a and ‘b (Event 5), corresponding to the Holocene/Pleistocene boundary (Morley et al., 1982). Two peaks in the abundance of C. davisiana at 19.6 and 25.9 mbsf are likely correlated to Events 6 and 7, which in turn correspond to DAE-2 (~12 ka) and DAE-3 (~17 ka) of Matsuzaki et al. (2014).
6.1.3. Site M0091
Site M0091 is in a trench-fill basin located in the northern part of the southern Japan Trench (Basin S3; Figure F6). The basin has an elongated shape with a NNE–SSW trend extending ~16 km in a trench-parallel direction and rather flat basin floor at around 7805 mbsl. The width of the asymmetric basin, with its steeper western (~20% slope gradient) and gentler (~3% slope gradient) eastern margins, ranges 5500–6200 m. Trench-parallel subbottom profiles show along-strike changes in acoustic character (Figures F4, F14): Some areas show acoustically laminated basin infill sequences, in places more than 50 m thick (around Site M0091), with intercalated 1–4 m thick acoustically chaotic-to-transparent packages separated by high-amplitude reflections. Juxtaposed against such undisturbed trench-fill are several kilometer-wide areas with a slightly elevated seafloor and disrupted seafloor morphologies with chaotic acoustic facies and limited signal penetration. Therefore, the acoustic basement is defined at a very shallow subsurface depth less than 5–10 mbsf. Around Site M0091, an acoustically transparent layer beneath the seabed reflector is up to ~4 m thick but thins to approximately 2 m on a basal high in the north. Another even thicker acoustically chaotic-to-transparent package with similar ponding geometries and a prominent high-amplitude basal reflection is imaged between ~8 and 13 mbsf near Site M0091. Below the prominent basal high-amplitude horizon, the deeper, mostly subparallel horizons defining the lower part of the acoustically laminated basin fill appear to be very slightly, progressively inclined toward the south. A sharp steeply inclined boundary resembling a fault abruptly terminates the laminated package against the acoustic basement about 500 m south of Site M0091.
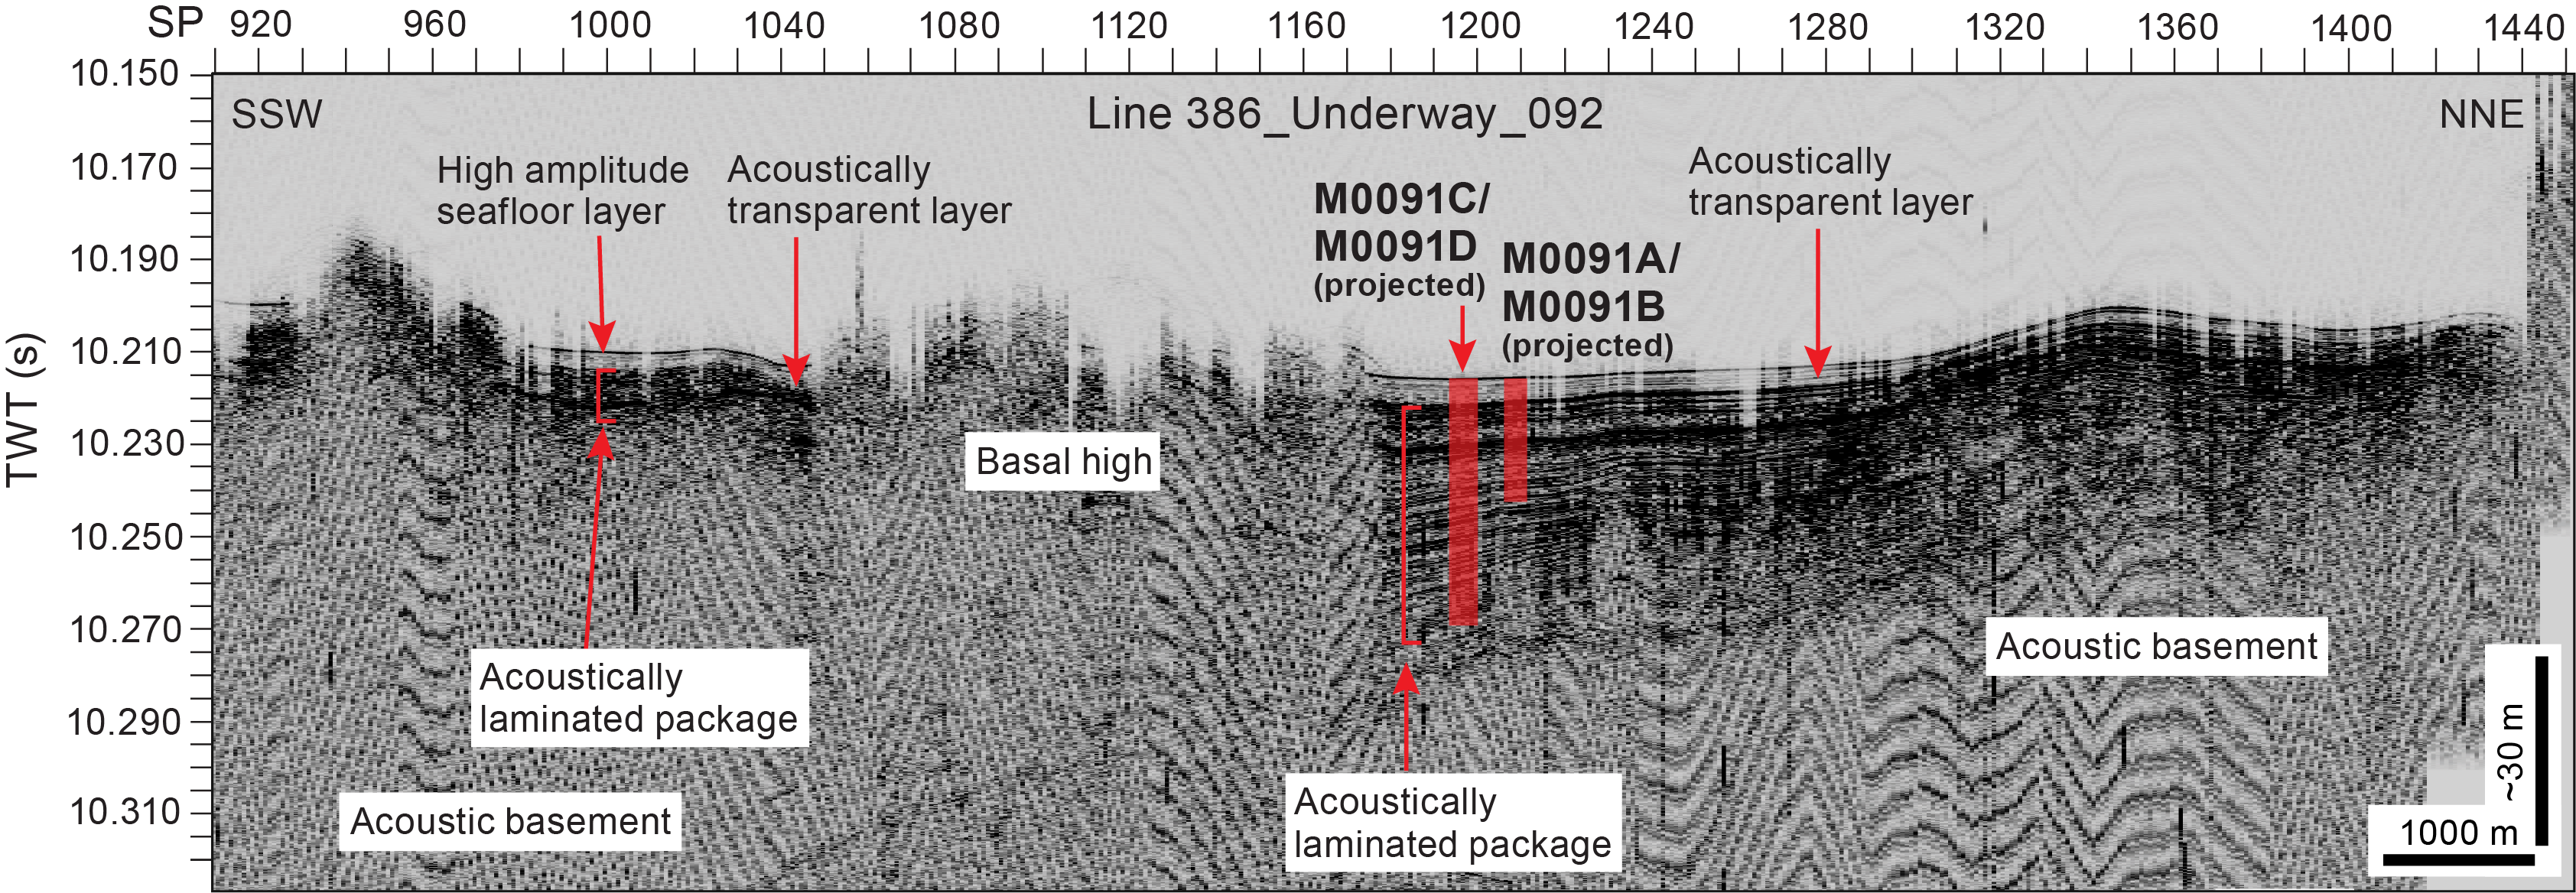
Figure F14. Line 386_Underway_092.
The VCDs reveal that the lithology at Site M0091 is dominated by clay and silty clay with discrete laminae to beds of clayey silt, silt, and very fine sand (Figure F15). Sand, silt, and clay percentage estimates from smear slides in the dominant lithologies confirm these grain size–based lithologies. Total lithogenic, vitric, and biogenic components in smear slides document a bulk composition dominated by variable mixtures of lithogenic and biogenic grains (80%–100%) with some vitric components (0%–20%). The main lithology names derived from the smear slide observations thus far suggest a dominance of silty siliceous ooze. In general, coarser grained sediment beds contain more lithogenic components (clay minerals, quartz, feldspar, and vitrics) than biogenic grains (diatoms, sponge, spicules, radiolaria, and calcareous microfossils). The most common sedimentary structures observed are laminae, sometimes with parallel laminated intervals that contain fine sand, very fine sand, silt, and clay. Intervals that lack any sedimentary structures are also observed. These deposits tend to have sharp, gradational, or bioturbated contacts and fine upward. The sediments have undergone extensive organoclastic sulfate reduction and/or anaerobic oxidation of methane, which manifests as iron monosulfides of variable intensity downcore. Bioturbation is common, ranges from slight to heavy, and is absent from some intervals. The lithostratigraphic succession at Site M0091 comprises the following three intervals in a downcore direction:
- Interval 1 is a ~8 m thick medium- to thick-bedded interval dominated by clay to silty clay with coarser grained laminae and beds of variable thickness (centimeter to meter scale) ranging from silty clay to fine sand. A reddish brown silt-sized bioturbated tephra is distributed in patches in this upper interval in Section 386-M0091D-1H-7, 82–87.6 cm (6.12–6.17 mbsf).
- Interval 2 is a ~5 m thick single large event deposit with a basal 27 cm thick very fine to fine sand, laminated, fining-upward bed that grades into a thick clay above. Some few coarse-grained laminae and beds occur within the upper part of the thick clay bed. Bioturbation and iron monosulfides are absent throughout the interval.
- Interval 3, from 13.14 mbsf to the base of Hole M0091D, is composed of clay with minor silty clay occurrences. Occurrences of laminae and other coarse-grained thin beds are sparse throughout this interval.

Figure F15. Composite Strater plot, Hole M0091D.
Even within the ultra-deepwater hadal environment, benthic and planktonic foraminifera were observed at Site M0091 with varying moderate to good preservation in sediment. Except for the agglutinated foraminifera, which may be either in situ or reworked, all foraminifera are considered to be allochthonous. Because of low foraminiferal abundance, no provenance interpretation of benthic foraminifera can be made.
Physical properties logs of Site M0091 show mostly parallel trends and variations (Figure F15). Bulk density increases from ~1.20 g/cm3 at the top to ~1.70 g/cm3 at a prominent peak at ~13 mbsf. Outstanding peaks in magnetic susceptibility (up to 600 × 10−5 SI) and P-wave velocity (~1600 m/s) are also observed at this depth; they correspond to the base of the thick event bed of Interval 2 and likely define the high-amplitude reflector at comparable depth in the hydroacoustic subbottom profiles. Below this depth, bulk density remains nearly constant at ~1.3 g/cm3. NGR shows a similar downward increasing trend from 10 to 40 counts/s to the peak at 13 mbsf, where values sharply decrease to ~20 counts/s. In Interval 3, NGR fluctuates between 20 and 48 counts/s, showing larger variations than observed in the intervals above. Although magnetic susceptibility mostly shows high-frequency variations, typically with values trended around 50 × 10−5 SI, the 5 m thick event bed between 8 and 13 mbsf shows very smooth upward decreasing values from 100 × 10−5 to 40 × 10−5 SI, in concert with the fining-upward trend shown in the VCDs. Reliable P-wave velocity measurements are available for the uppermost ~15 m and fluctuate around ~1500 and 1510 m/s in Intervals 1 and 3, respectively but show values as low as ~1475 m/s within the thick event bed of Interval 2 with the outstanding peak at its base. Undrained shear strength generally increases with depth, with the gradient of increasing strength with depth roughly doubling below 13 mbsf.
The downcore pore water and headspace gas profiles of sulfate, alkalinity, ammonium, bromide, and methane concentrations show characteristic changes related to organic matter degradation (Figure F15). The slow increase of salinity in the IW with depth points to downcore addition of ions that are metabolic products of organic matter degradation. Additionally, dissolved Fe and Mn concentrations are very high in the uppermost meter of the sediment column, indicating organic matter remineralization by intensive dissimilatory Mn and Fe reduction. Below this uppermost sediment interval, organoclastic sulfate reduction becomes the dominant electron acceptor for organic matter remineralization, followed by methanogenesis onset at about 12 mbsf, and marks the SMT. Around about 9 mbsf, the alkalinity and ammonium profiles show an inflection in their generally increasing concentration trend. This suggests nonsteady-state processes. The observation is supported by the sulfate profile, which shows a slight elevation at the same depth (around 9 mbsf) in the otherwise linear decrease with depth. Sulfate is depleted at around 13 mbsf, marking the SMT. Similarly, a strong increase of U concentrations between 8 and 12 mbsf, corresponding with an increase in Fe, indicates sources of reactive iron that are subject to reductive processes. All these signals are strong indicators of nonsteady-state conditions and are related to the thick event bed observed in the lithology. The very high dissolved Si concentrations are related to the dissolution of amorphous silica throughout the core, which can be explained by the abundance of biogenic opal in diatom frustules, sponge spicules, and vitric volcanic components. Additionally, the solid-phase geochemical data show that the overall sediment composition is dominated by siliceous material. Carbonate phases are very low in concentration, as indicated by the overall low amounts of IC. Ca, Mn, and Fe mainly follow the Al trend, suggesting no significant enrichment from authigenic mineral formation. Similar to the IW profiles, all solid-phase profiles analyzed using X-ray fluorescence (XRF) show a strong change around 9 mbsf in their overall concentration trends. The organic carbon content in the sediments at Site M0091 is relatively high, reaching 1.82 wt% and leading to the high mineralization rates observed in the IW profiles (Glud et al., 2013). The coupled but marked variations of TC, TOC, and IC may imply allochthonous material input into the Japan Trench. In addition, although intensive remineralization occurs at the top part of the sediments, high TOC and TC contents were found in the deeper sediments, suggesting that amounts of organic matter may be buried in the trench sediments. Because the high methane concentrations and C1/C2 values were observed in the deeper sediments, the roles of microbes in the fate of sedimentary organic carbon in the hadal sediments are also of significance.
The paleomagnetic intensity profiles of Site M0091 show large fluctuations, ranging ~2 × 10⁻⁵ to 10 × 10−5 A/m (Figure F15). They are characterized by a linear downward increase to a pronounced peak of ~6 × 10⁻⁵ A/m at ~3 mbsf, a relative intensity low between ~4 and 5 mbsf, and another roughly linear downward increase to reach higher intensity values between ~6 and 8 mbsf. Between 9 and 16 mbsf are lower values, followed by 4–5 high intensity peaks between 16 and 24 mbsf, decreasing values between 24 and 29 mbsf, and one peak of 6 × 10⁻⁵ A/m at 31 mbsf. Preliminary paleomagnetic data display various trends in declination profiles, but their trends between 0 and 12 mbsf are different compared to the profiles from different holes at this site. This observation suggests that the preliminary reconstruction applied to correct for the relative rotation of the core sample along the vertical axis during penetration of the GPC system into the subbottom sediments is not fully adequate and needs to be improved for correlating the paleomagnetic secular variations. Also, the scattered declination intervals between 8 and 14 mbsf are interpreted as indicating that the magnetization process of this interval corresponding to the thick event bed is different from other intervals. The declination trends in between 14 and 19 mbsf, characterized by a positive declination excursion at ~15–16 mbsf in both holes, are interpreted as paleomagnetic secular variation. The inclination profiles generally fluctuate between 30° and 60° and show similar trends in both holes. At around 16 mbsf, an inclination low is identified in both profiles, which is likely to correspond with similar signatures observed at other sites such as M0083 and M0085. The similar trends in declination and inclination variation below 14 mbsf at Site M0091 suggest that the data reflect paleomagnetic secular variation.
Radiolarian fossils are abundant throughout the samples analyzed from Hole M0091D, and their preservation is good. The relative abundance of C. davisiana ranges 1%–9% and tends to be high (>5%) below 26.6 mbsf. Therefore, it is likely that the entire section of this core is included in C. davisiana Zone ‘a, corresponding to the Holocene (Morley et al., 1982), and it is possible that the lower part of the core correlates with the earliest Holocene, near the boundary of C. davisiana Zones ‘a and ‘b. The relative abundance of the Tetrapyle group ranges 3%–12%; however, it is difficult to define the interval with relatively high abundances (>5%) that could be indicative for the mid-Holocene warm period (Matsuzaki et al., 2020; Chinzei et al.,1987). It may be possible to correlate the two peaks in the relative abundance of L. setosa at 2.3 and 26.6 mbsf with Events 2 (~7 ka) and 4 (~11 ka), respectively.
6.2. Central Japan Trench
6.2.1. Site M0090
Site M0090 is in a small trench-fill basin located within the relatively elevated trench-floor segment in the central Japan Trench (Basin C1; Figure F6). The basin has a nearly flat basin floor at around 7445 mbsl and an elongated shape with a north–south trend extending ~3.5 km in a trench-parallel direction. To the north, the basin floor deepens and the strike of the trench axis changes to trend northeast–southwest. The width of the asymmetric basin, with its steeper western (~20% slope gradient) and gentler eastern (~6%–10% slope gradient) margins, is approximately 1 km. Hydroacoustic subbottom profiles show the basin-fill is characterized by closely regularly spaced acoustic laminations down to the acoustic basement at around 9.82 s two-way traveltime (TWT) (~45 mbsf) (Figure F16).
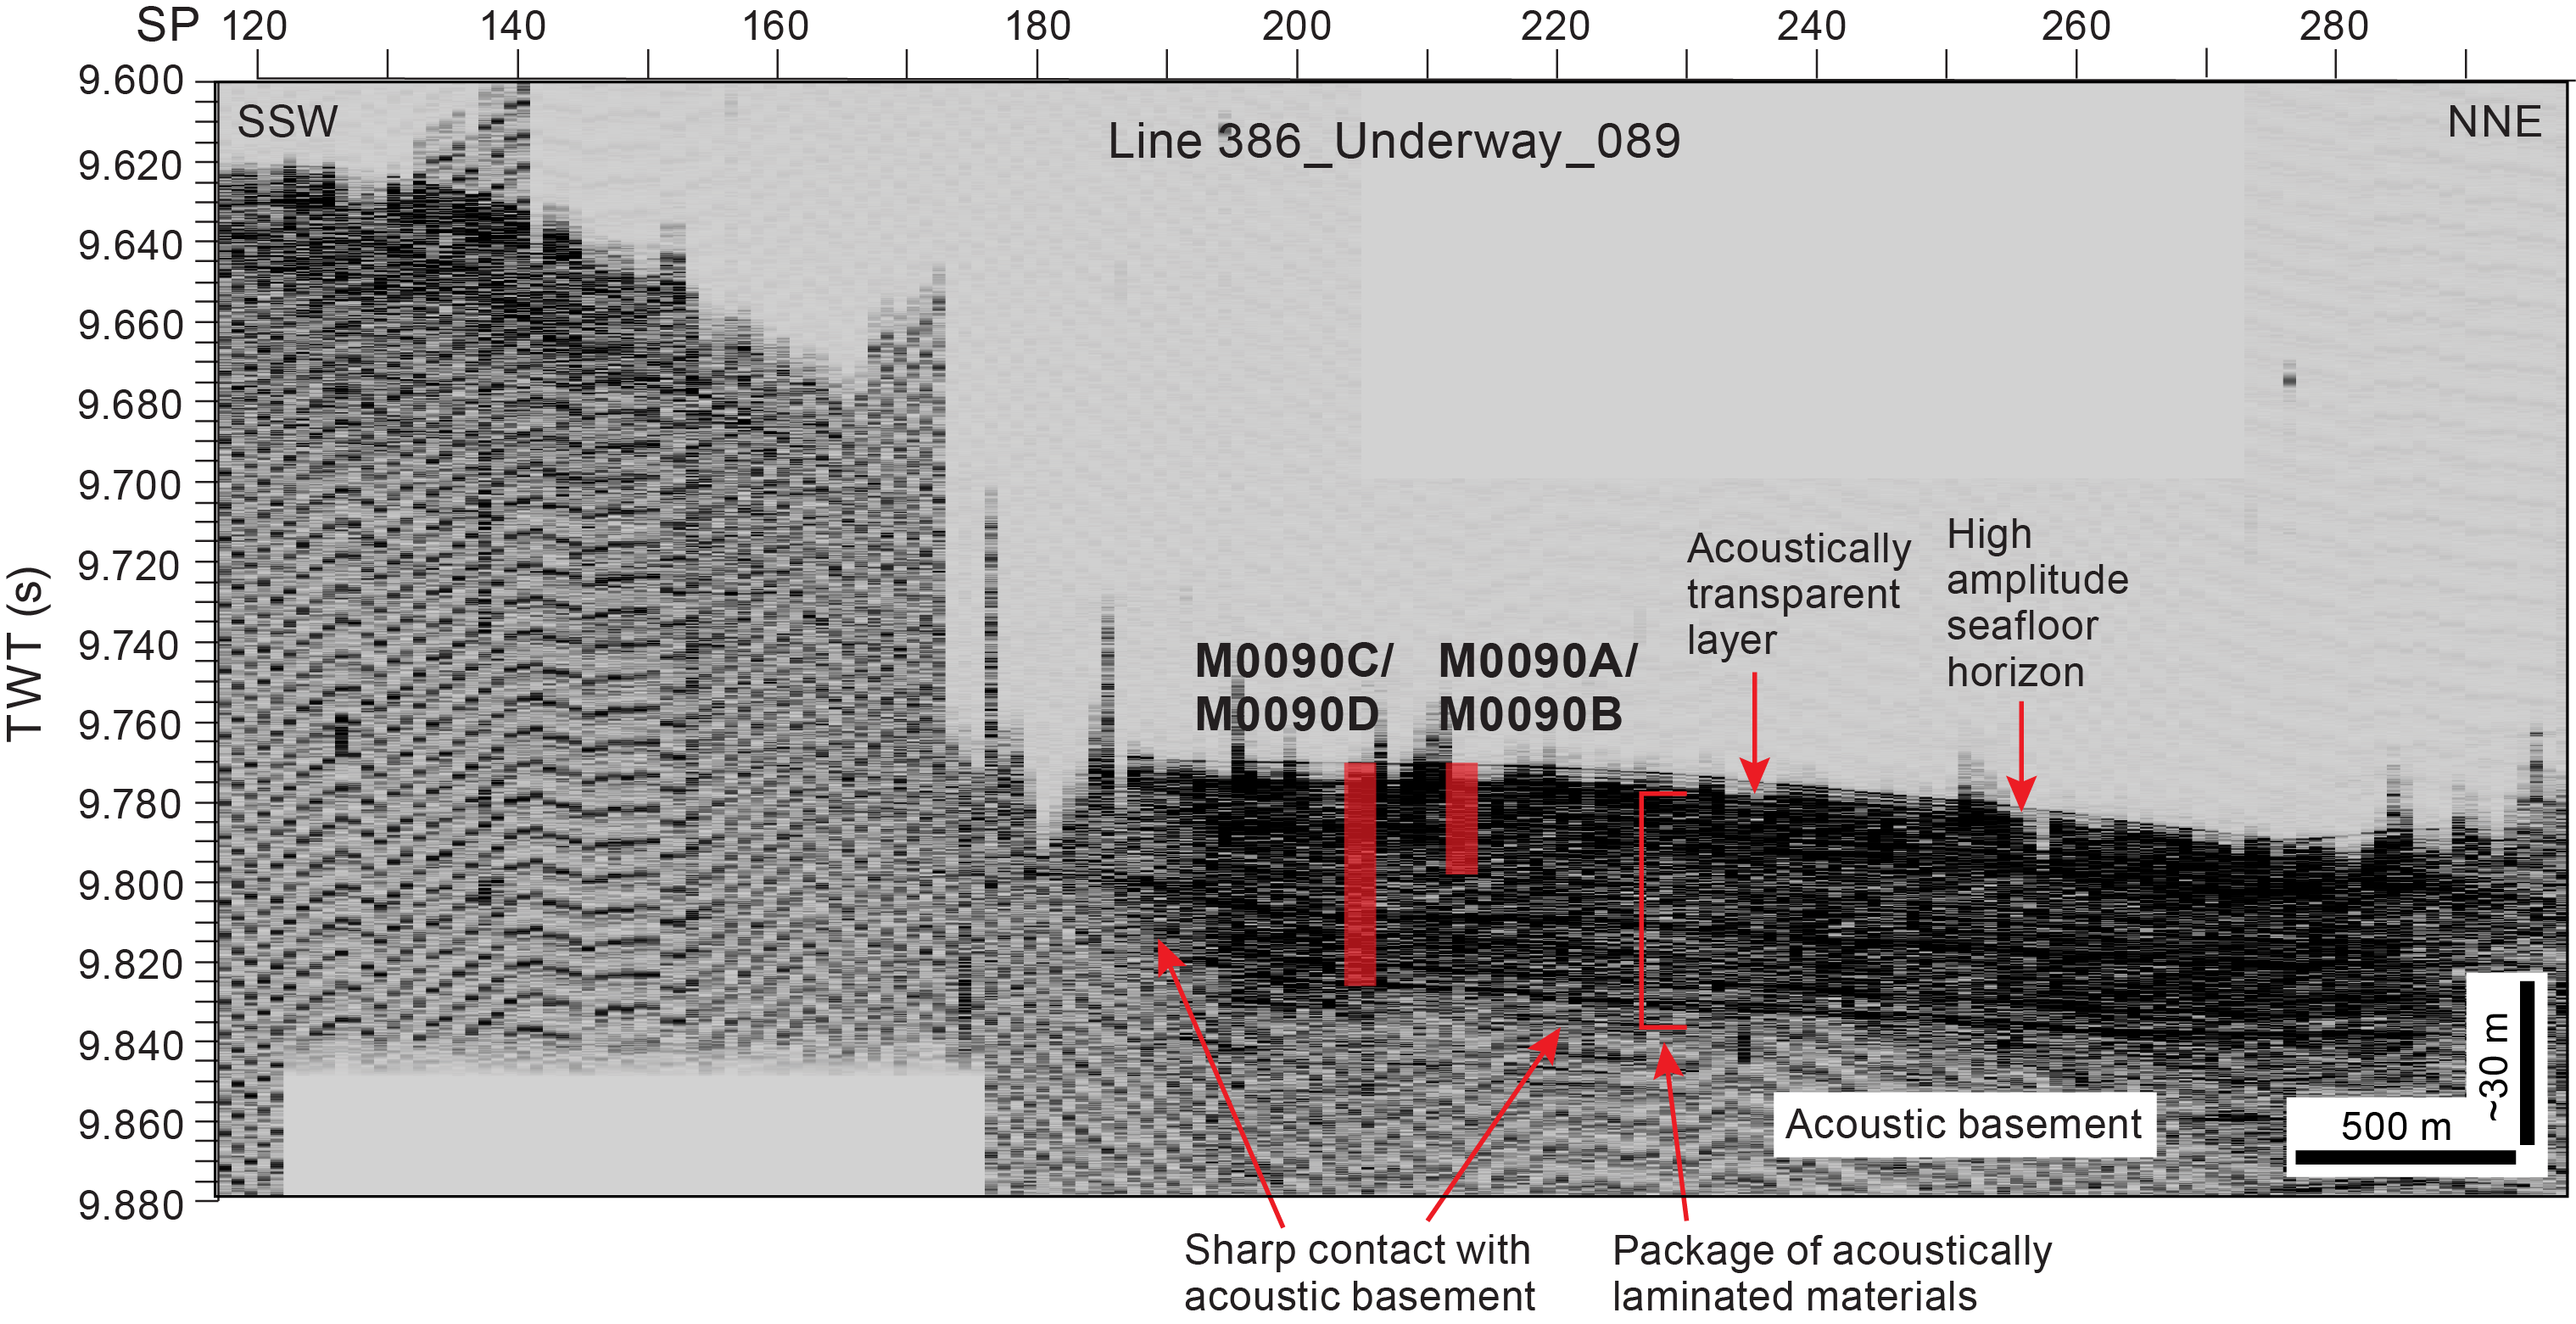
Figure F16. Line 386_Underway_089.
The VCDs reveal that the lithology at Site M0090 is dominated by silty clay/clayey silt, and alternating very fine sand to silt and silty clay layers with clayey silt are also present (Figure F17). Furthermore, six tephra layers were observed deeper in Hole M0090D. The available smear slides show that the biogenic component is almost as abundant as the lithogenic component and contains in decreasing abundance diatoms, sponge spicules, and radiolaria. The main lithology is biosiliceous-rich silty clay with additional lithogenic components such as quartz, feldspar, pyrite, and vitric grains. XRD analyses show that the most abundant minerals are quartz, feldspars, and clays followed by micas with hints of palygorskite, pyrite, pyroxene, and heavy minerals but no carbonates or amphibole group minerals. The most common structures are laminae, sometimes forming parallel laminated intervals that contain fine sand, very fine sand, and silt interbedded with clay. These deposits have sharp, gradational, or bioturbated contacts and sometimes display a fining-upward trend. Iron monosulfides are present at variable intensities, indicative of sulfate reduction and/or anaerobic methane oxidation during early diagenesis. Bioturbation is common and ranges from slight to heavy. The lithostratigraphic succession at Site M0090 comprises the following six intervals in a downcore direction:
- Interval 1 (0–3.195 mbsf) is characterized by alternating millimeter- to centimeter-thick, sharp-based silt layers with bioturbated clay intervals of 10–30 cm. Two bedsets are dominated by silt and/or very fine sand with parallel/wavy laminations, at times with sediment deformation, and lacking bioturbation. A reddish brown silt-sized tephra is intercalated as patches in the bioturbated silty sediments between these two bedsets.
- Interval 2 (3.195–11.80 mbsf) is dominated by bioturbated lithogenic, siliceous-rich silty clay alternating with very thin silt laminae or thin sand beds with sharp contacts, repeated roughly every 10 cm but more frequently every 30 cm or more.
- Interval 3 (11.80–16.00 mbsf) comprises dominant clayey to sandy silt with alternating silt or very fine sand laminae with irregular spacing ranging from a few centimeters to 30 cm. The nature of the contacts are sharp, irregular, or gradational and bioturbation overall is slight to absent. Two light reddish brown silt-sized tephras are intercalated as lenticular beds at ~15 and 15.3 mbsf.
- Interval 4 (16.00–30.20 mbsf) is a succession dominated by bioturbated clayey silt/silty clay/clay with irregularly spaced thin (millimeter thick) silt or very fine sand laminae, mostly with a sharp base. A characteristic dark reddish brown to white silt to fine sand–sized tephra occurs at ~25.7 mbsf and is predominantly composed of pumiceous type volcanic glass shape, abundant hornblende, and a lesser amount of orthopyroxene and opaque minerals. It also contains hornblende similar to cummingtonite and characteristic ß-quartz. With this characteristic composition it can be used as an intersite correlation tie point for stratigraphic correlation across basins in the central Japan Trench (see Sites M0083 and M0089). Another tephra layer occurs as a light brown graded bed composed of dominant pumiceous-type volcanic glass shape with fibrous and bubble-wall types and rare heavy minerals (pyroxene, apatite, and opaque minerals) overlain by pink reworked tephra at the base of this interval.
- Interval 5 (30.20 mbsf to the bottom of Hole M009D) is dominated by the presence of bioturbated clayey silt/silty clay with alternating silt laminae occurring roughly every 10 cm. This interval contains a brownish white silt-sized tephra at ~31.65 mbsf.
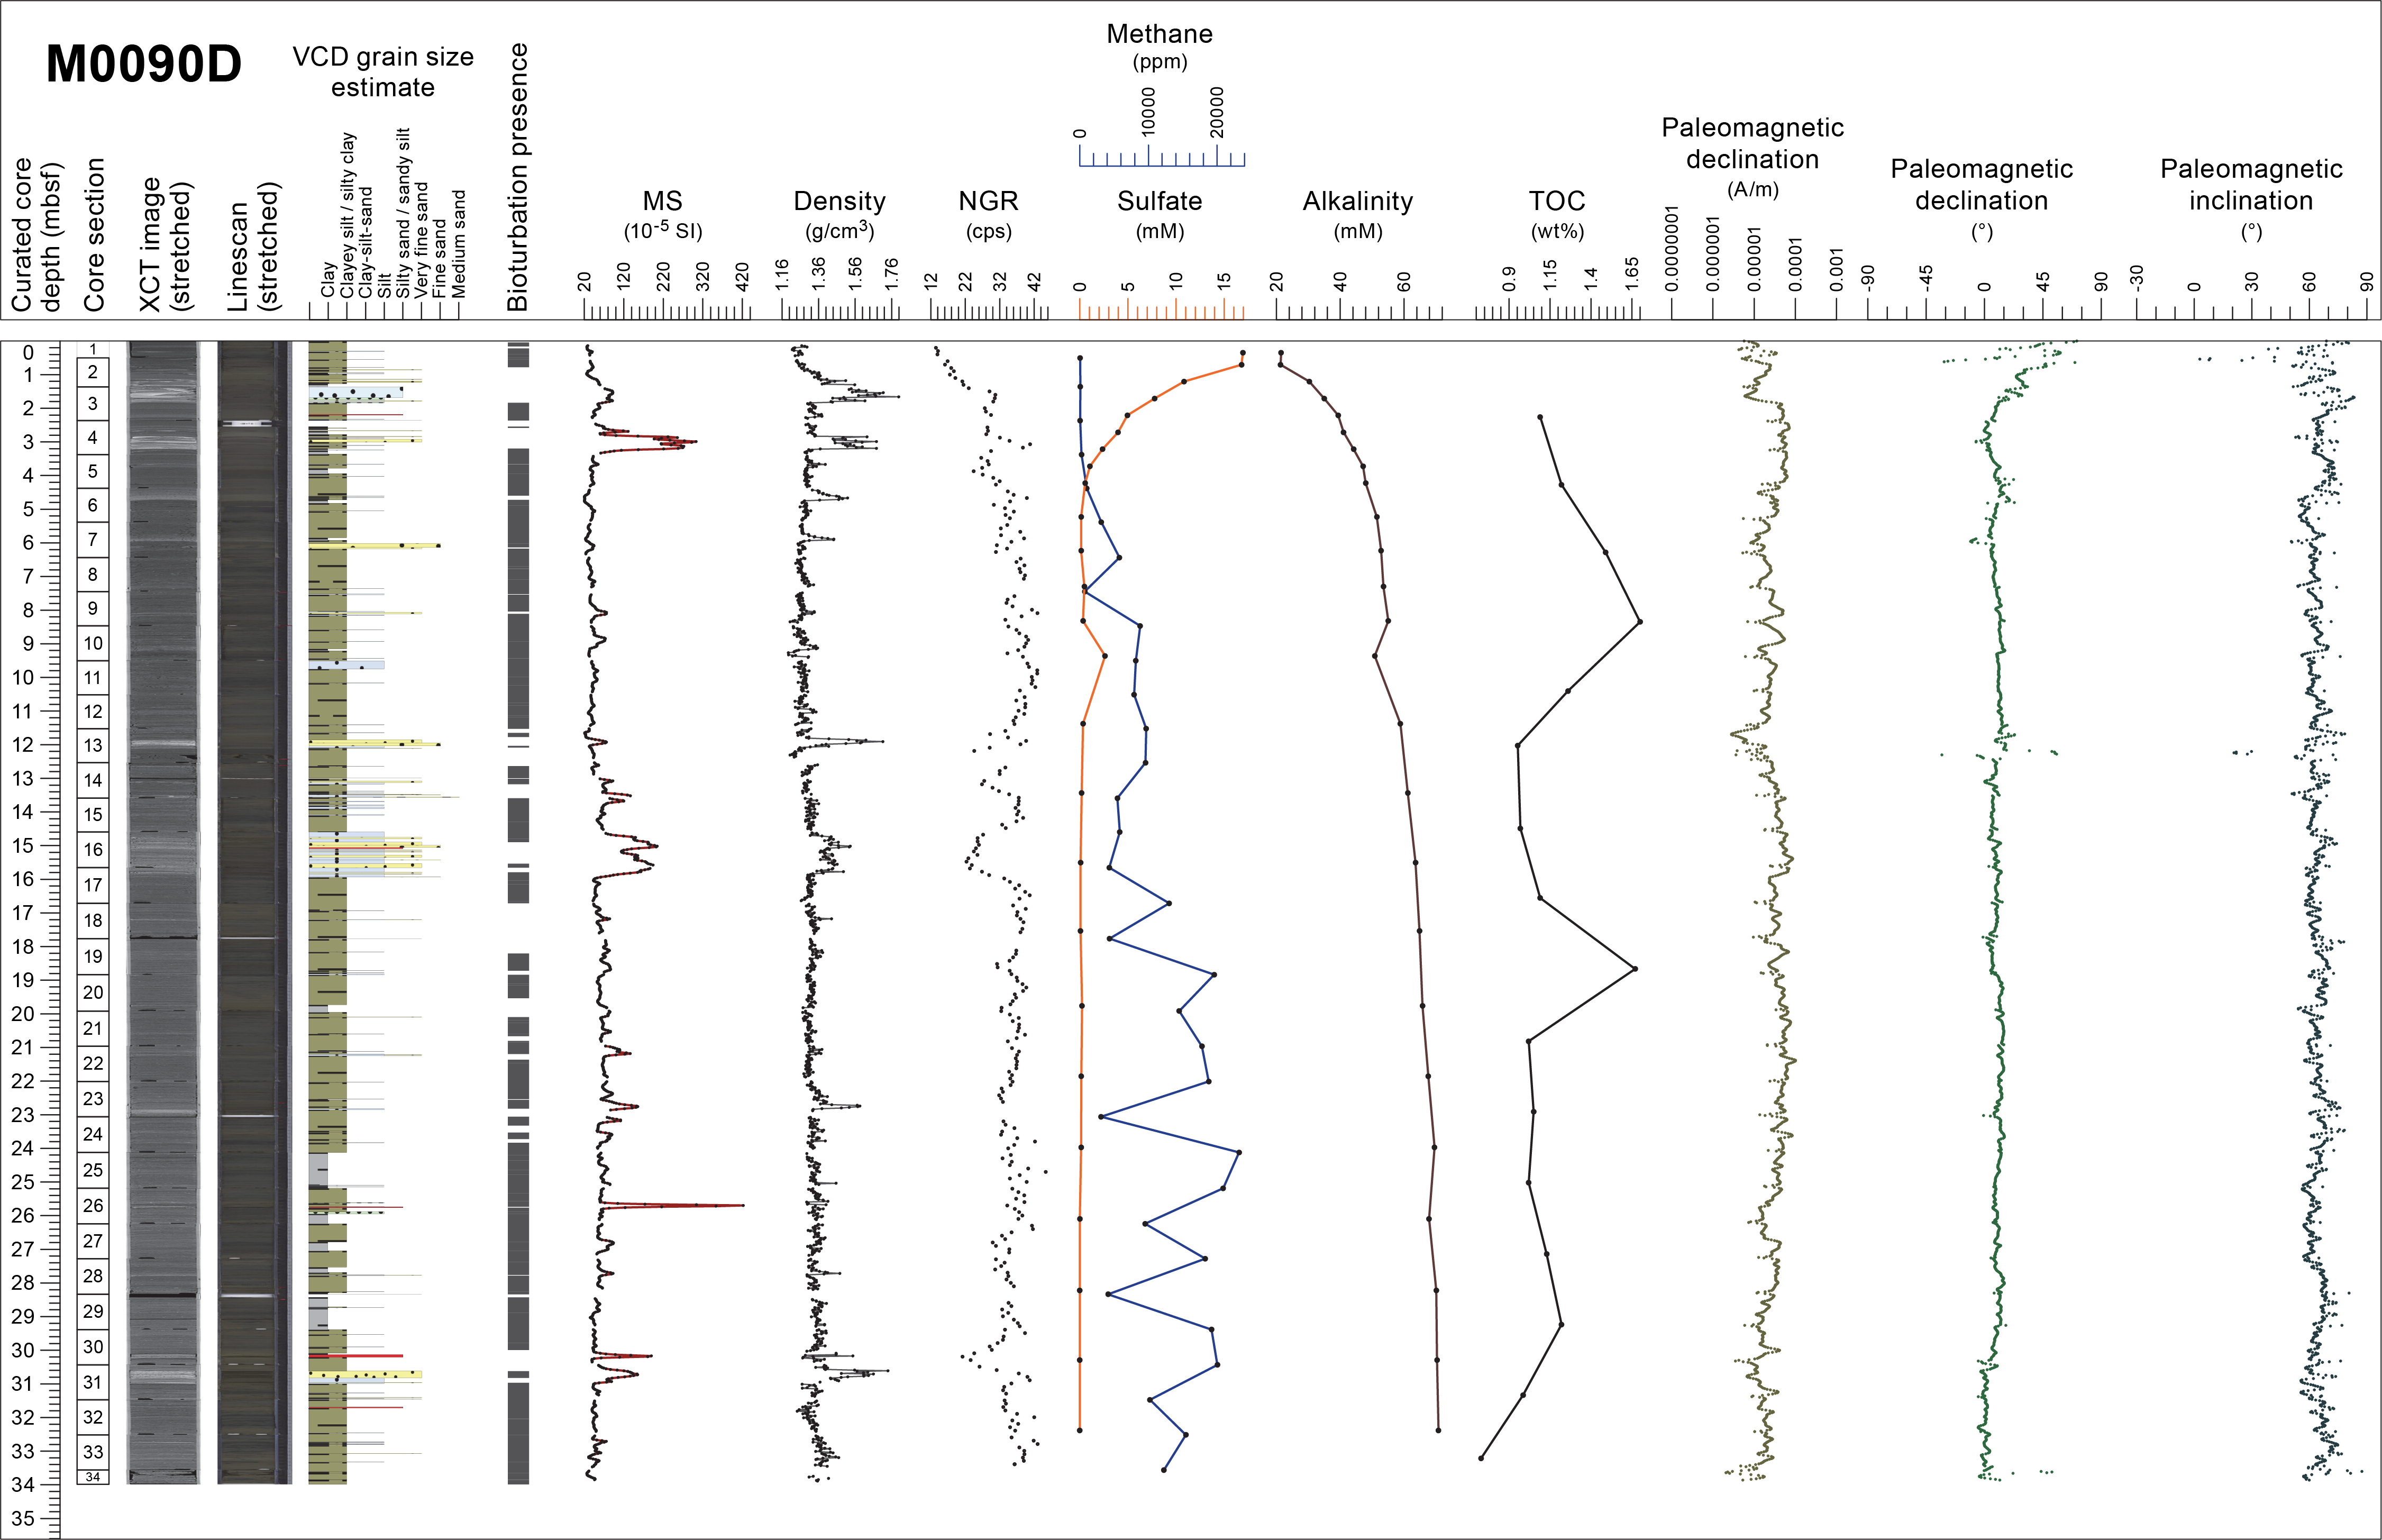
Figure F17. Composite Strater plot, Hole M0090D.
Even within the ultra-deepwater hadal environment, benthic and planktonic foraminifera can occur with varying moderate to good preservation in sediment. Except for the agglutinated foraminifera, which may be either in situ or reworked, all foraminifera are considered to be allochthonous. Because of low foraminiferal abundance, no provenance interpretation of benthic foraminifera can be made, with the exception of samples from 14.34 mbsf in Hole M0090B and 12.51 in Hole M0090D, which contain displaced fauna from an outer neritic environment, and from 33.53 mbsf in Hole M0090D, which contains displaced faunas possibly from outer neritic to middle bathyal environments.
Physical properties logs of Site M0090 show mostly parallel trends and variations (Figure F17). Bulk density shows an overall slightly increasing trend with depth from 1.27 g/cm3 near the seafloor to 1.35 g/cm3 at the bottom of Hole M0090D. The shallowest 3 m shows the highest bulk density fluctuations, including pronounced peaks reaching >1.6 g/cm3 at 1.7 and 3.1 mbsf. Marked higher values with a sharp base and a decreasing upward trend also occur in magnetic susceptibility data (>100 × 10−5 to 300 × 10−5 SI) and P-wave velocities (up to 1655 m/s) at these same depths, which corresponds to the two sand/silt-dominated bedsets of Interval 2. NGR shows a downward increasing trend from 0 near the seafloor to 40 counts/s at the peak at 3.1 mbsf, where values sharply decrease to ~25 counts/s. Below this depth, bulk density and magnetic susceptibility vary over short, centimeter-scale depths around average values of approximately 1.3 g/cm3 and 60 × 10−5 SI, respectively, with isolated spikes at the location of silt/sand beds and a local high zone between ~12 and 16 mbsf corresponding to Interval 3 (with a sharp peak at ~12 mbsf corresponding to the coarsest beds and an overall trend decreasing from the base of Interval 3 toward its top). NGR fluctuates around 35 counts/s, and a comparable low-count zone shows opposite trends to the magnetic susceptibility and density profiles in the zone between ~12 and 16 mbsf (Interval 3). Reliable P-wave velocity measurements are only available to ~6 mbsf and are 1512 m/s on average. Undrained shear strength generally increases with depth.
The IW concentration profiles of ammonium and alkalinity at Site M0090 indicate high rates of organic matter remineralization (Figure F17). Additionally, the methane concentration profiles, with the highest methanogenesis rates in the uppermost 3–5 m, point to a shallow SMT at about 4.5 mbsf. The slow increase of salinity in the IW with depth points to the downcore addition of ions that are likely metabolic products of organic matter degradation or other authigenic alteration processes. Dissolved Fe and Mn concentrations are very high in the uppermost meter of the sediment column, indicating organic matter remineralization by intensive dissimilatory Mn and Fe reduction followed by the process of organoclastic sulfate reduction in the deeper sediments. Dissolved Ba increases below the SMT, reaching high (compared to the other sites) values. This suggests potential input of marine barite at this site that is dissolved below the SMT with the consequential release of Ba to the IW (e.g., Torres et al., 1996). Furthermore, the release of dissolved Fe around 22.5 mbsf could potentially point to a likely impact on the geochemical signatures at Site M0090 by postdepositional alteration of volcanic glass shards. The high contents (>1.0%) of TC and TOC in the upper part of Site M0090 suggests large amounts of carbon burial in the central Japan Trench. Because the high methane concentrations and C1/C2 values and low concentrations of SO42− were observed in the deeper sediments, the roles of microbes in the fate of sedimentary organic carbon in the hadal sediments are of significance. The solid-phase data show that the sediments at Site M0090 are dominated by siliceous material. Iron and Mn mainly mirror the content profile of Al, suggesting detrital sources. One exception is a strong increase in Mn at around 23 mbsf that is likely related to Mn-enriched volcanic deposits.
The paleomagnetic intensities measured at Site M0090 are characterized by large fluctuations (Figure F17). Intensities increase from near the seafloor to 3 mbsf. They then decrease to 6 mbsf in both holes. Short intervals around 1 m in length with low intensities are observed at 6–7 mbsf. High peaks of about 5.0 × 10⁻⁵ A/m are observed at around 8 mbsf. Intensities then decrease from 8 to 12 mbsf. Again, a short interval with low intensities is observed at ~12 mbsf. Intensities gradually increase downward, reaching peaks (13 × 10−5 and 8 × 10⁻⁵ A/m) at 15 mbsf and dropping at 16 mbsf. Below this depth, intensity gradually increases to 22 mbsf and then decreases to the bottom of Hole M0090D. The declination variations of Hole M0090B and the corrected declination in Hole M0090D are similar and characterized by a negative peak at 3 mbsf, a positive peak at 4.5 mbsf, a positive small peak at 11 mbsf in Hole M0090D, a negative peak at 18 mbsf, and a sudden offset at 30 mbsf with some scattered distribution in declination. The inclination profiles generally fluctuate between 30° and 60°. An inclination drop from 70° to 90° is observed at 5 mbsf. Another noteworthy interval of inclination, rising from ~30° to around 60° is observed between 27 and 30 mbsf. Preliminary paleomagnetic data from Holes M0090B and M0090D display similar trends in intensity and declination. Declination variation may be recording paleomagnetic secular variation because several unique peaks are observed here that could be potential tie points.
Radiolarian fossils are abundant throughout the samples analyzed from Hole M0090D, and their preservation is good. C. davisiana ranges between 1% and 14% and tends to be high (9%–14%) below 29.3 mbsf. The increase of C. davisiana from 27.2 to 29.3 mbsf could be correlated with the boundary horizon between C. davisiana Zones ‘a and ‘b (Event 5), corresponding to the Holocene/Pleistocene boundary (Morley et al., 1982). A primary peak of the relative abundance of C. davisiana at 29.3 mbsf is likely correlated with Event 6, corresponding to DAE-2 (~12 ka) of Matsuzaki et al. (2014). The relative abundance of the Tetrapyle group ranges 2%–6%; however, it is difficult to define the interval with relatively high abundances (>5%) that could be indicative of the mid-Holocene warm period (Matsuzaki et al., 2020; Chinzei et al.,1987). A peak in the relative abundance of L. setosa at 14.5 mbsf may correlate with Event 2 (~7 ka).
6.2.2. Sites M0083 and M0089
Sites M0083 and M0089 are in a trench-fill basin located in the central Japan Trench (Basin C2; Figure F6). The basin has an elongated shape with a NNE–SSW trend extending ~14 km in a trench-parallel direction. The basin floor at around 7635 mbsl is flat in the central part (extending ~6 km) and slightly shallows toward the north-northeast and south-southwest to 7605 and 7595 mbsl, respectively. The width of the asymmetric basin, with its steeper (25%–30% slope gradient) northwestern and gentler (~15%–20% slope gradient) southeastern margins, ranges between ~2460 and 3060 m near Sites M0083 and M0089, respectively. Site M0083 was selected to core in the main depocenter of the basin where an expanded basin-fill succession was anticipated based on the subbottom profiles (Figure F18). The subsurface is characterized from top to bottom by (1) a sharp, high-amplitude seafloor reflector; (2) a series of three acoustically transparent or semitransparent packages with strong basal reflections, varying in thickness from approximately 1–2 m (shallowest) to 5–7 m (lower and middle); (3) flat-lying, closely spaced, acoustically laminated high-amplitude reflections; and (4) a basal basin-fill sequence of regularly spaced acoustic laminations down to >0.1 s TWT (~75 mbsf) with intercalated, approximately 1–3 m thick acoustically semitransparent intervals separated by high-amplitude reflections. This older package, although flat lying, is laterally not continuous, with diffuse basal highs separating apparent compartments of deposition. The acoustically (semi-)transparent intervals thin significantly and form (pseudo-)onlaps onto the acoustically laminated sequence draping the elevated acoustic basement in the south. There, Site M0089 was located to sample a condensed section overlying a basal high at ~10.025 s TWT (~45 m below seafloor reflector).
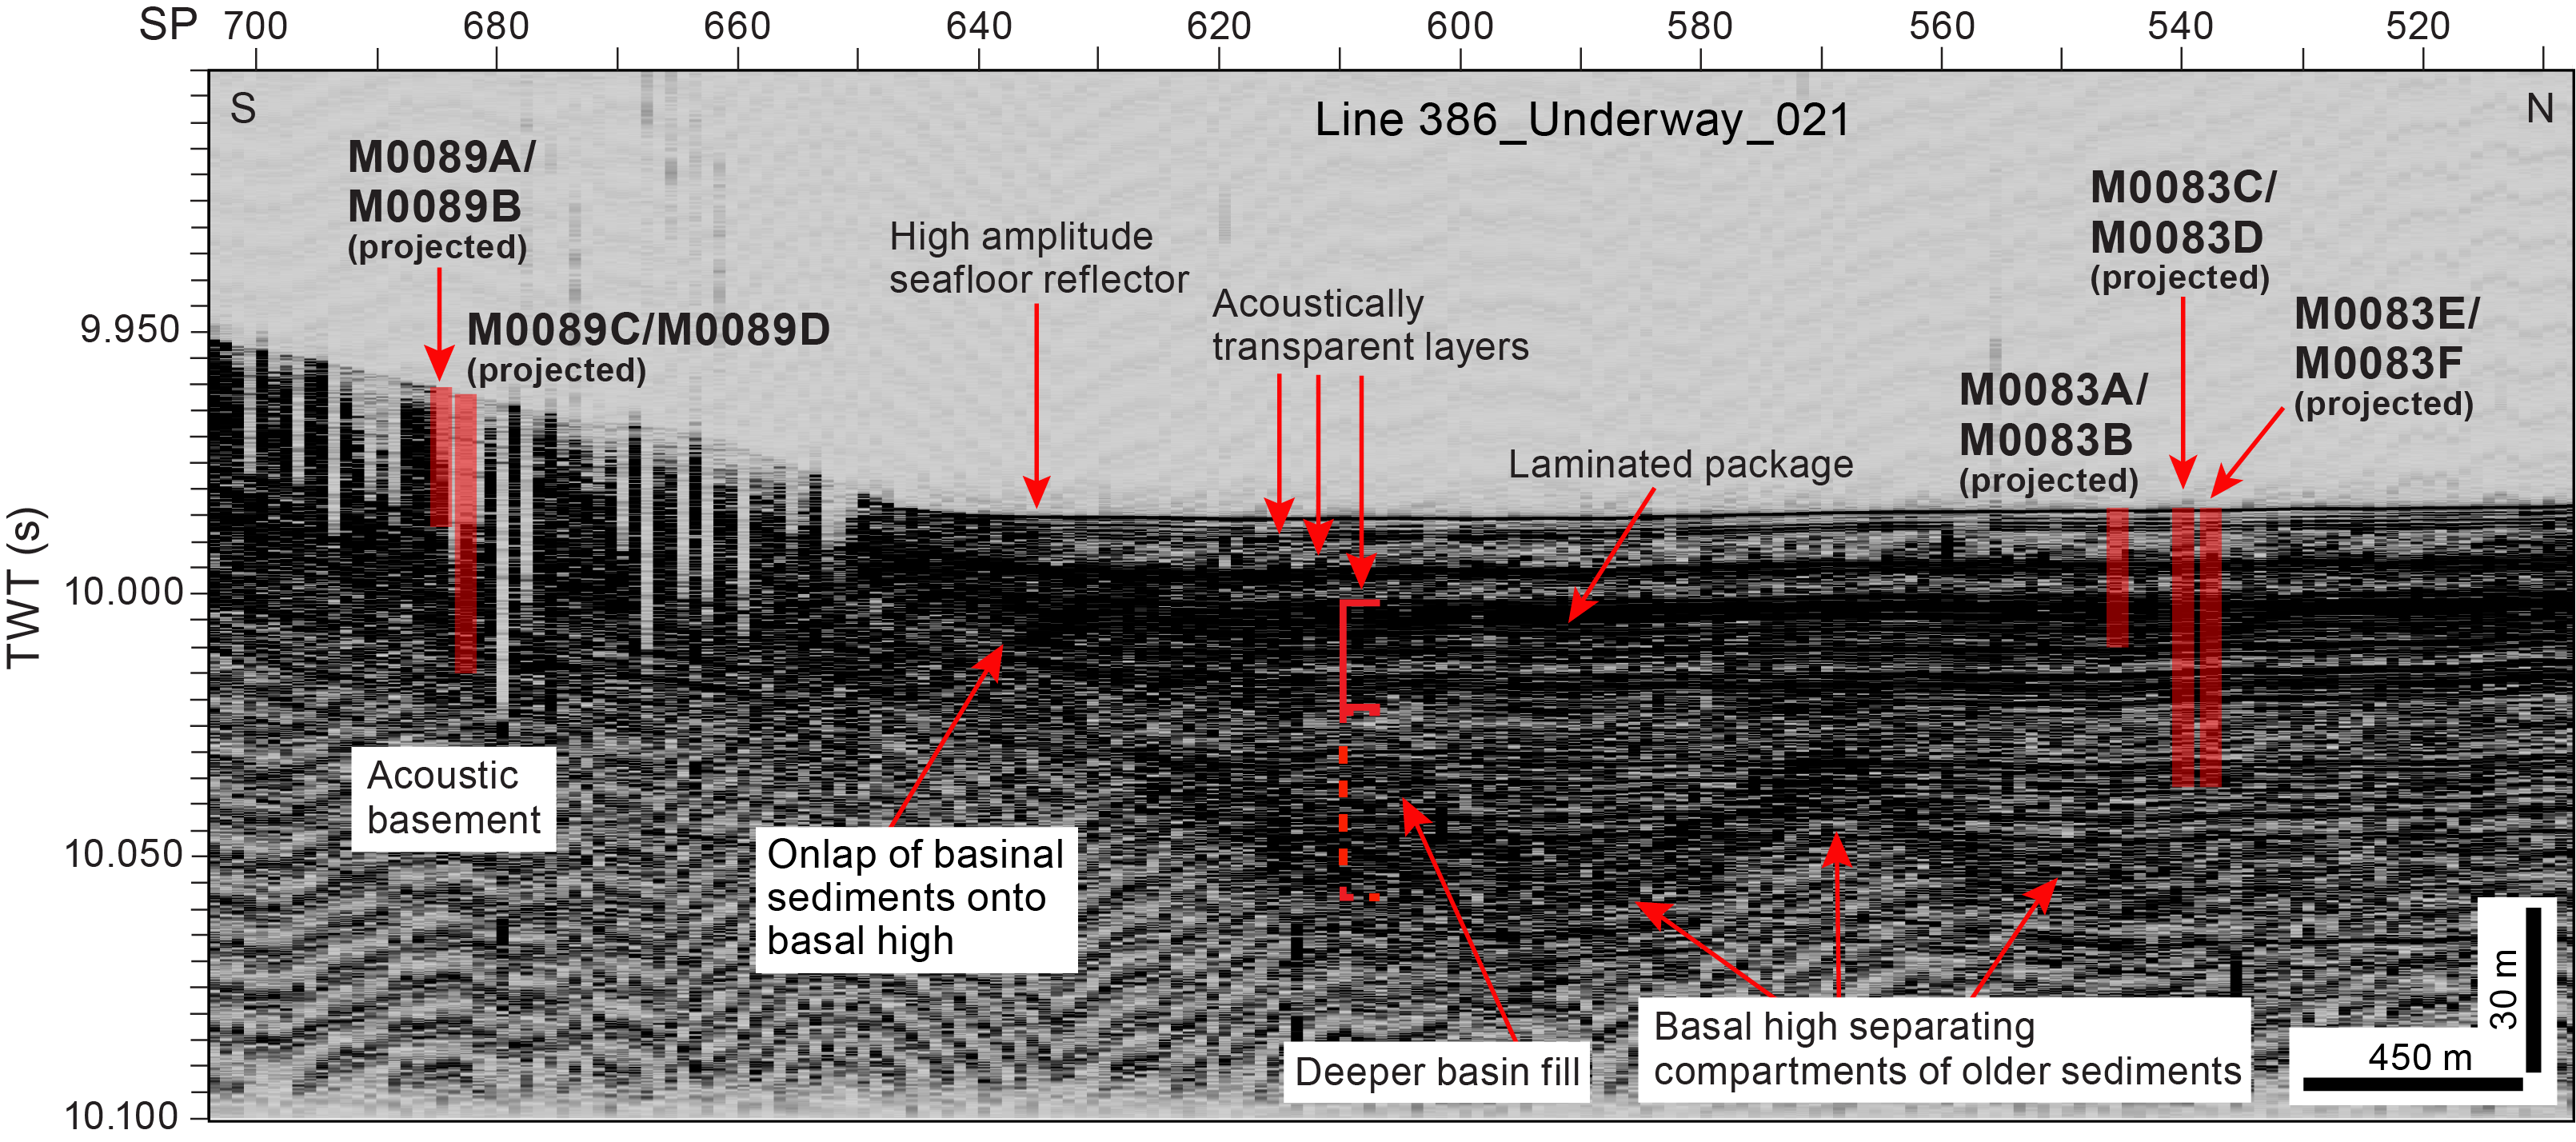
Figure F18. Line 386-Underway_021.
VCD-derived lithologies based on texture are dominated at both sites by clayey silt, silty clay, and clay with minor components of medium sand, fine sand, very fine sand, and silt (Figures F19, F20). Detailed smear slide observations indicate that there is a large siliceous biogenic component that can dominate the lithology (lithogenic-rich siliceous ooze versus siliceous-rich, lithogenic silty clay). The most common sedimentary structures at both sites are thin beds (1–3 cm thick) and laminae sometimes forming parallel laminated intervals that contain fine sand, very fine sand, silt, and clayey silt. These deposits can have sharp, erosional, wavy, gradational, and bioturbated lower and upper contacts. The sediment above the basal contacts can fine or coarsen upward and partially comprise convolute and chaotic bedding structures with folded and dipping beds, drag folds, and floating silt and very fine sand clasts. Additionally, intervals of homogenous sediment are present at Sites M0083 and M0089. These intervals range in thickness from 1 cm to 4 m. Their lithology is generally clay dominated, but silty clay and clayey silt are also present and can rarely contain calcareous nannofossils (as observed in smear slides from the thick clay bed between ~9 and 12 mbsf (Interval 4) at Site M0083 and thinner (10 cm thick) bed at ~2 mbsf at Site M0089. The sediments have undergone secondary depositional processes: bioturbation and the formation of iron monosulfides. These postdepositional processes overprint the primary depositional bedding features. The lithostratigraphic succession at Site M0083 comprises the following eight intervals downcore, as defined in Hole M0083D (Figure F19):
- Interval 1 (0–1.2 mbsf) is composed of bioturbated interbedded clay and clayey silt–silty clay.
- Interval 2 (1.2–7.2 mbsf) is a ~6 m thick single event bed with a sharp basal contact and coarse base grading upward into 4 m thick chaotic clay with dipping layers and floating silt clasts and patches.
- Interval 3 (7.2–8.9 mbsf) is composed of bioturbated interbedded silty clay or clayey silt and clay.
- Interval 4 (8.9–13.9 mbsf) is a 5 m thick single event bed with a sharp basal contact with fining-upward sandy laminae that grade upward into a 3.5 m thick clay bed that lacks bioturbation.
- Interval 5 (13.9–19.8 mbsf) is composed of silty clay and clayey silt thickly interbedded with clay, both containing laminae and parallel laminated intervals of very fine sand, sandy silt, and silt.
- Interval 6 (19.8–26.8 mbsf) is bioturbated clayey silt–silty clay interbedded with clay.
- Interval 7 (26.8–31.6 mbsf) contains a wide range of lithologies and primary structures: clay, silty clay and clayey silt, silt, sandy silt and very fine sand that are interbedded forming laminae, parallel laminae sets and beds <50 cm thick.
- Interval 8 (31.6 mbsf to the bottom of the hole) is sparsely bioturbated clayey silt–silty clay interbedded with rare very fine sand, silt and clayey silt lamina. Three pyroclastic-rich sediments are described in Sections 386-M0083B-1H-21, 1H-23, and 1H-24 and are recognized as reworked tephra layers because of their rounded volcanic glass shards.
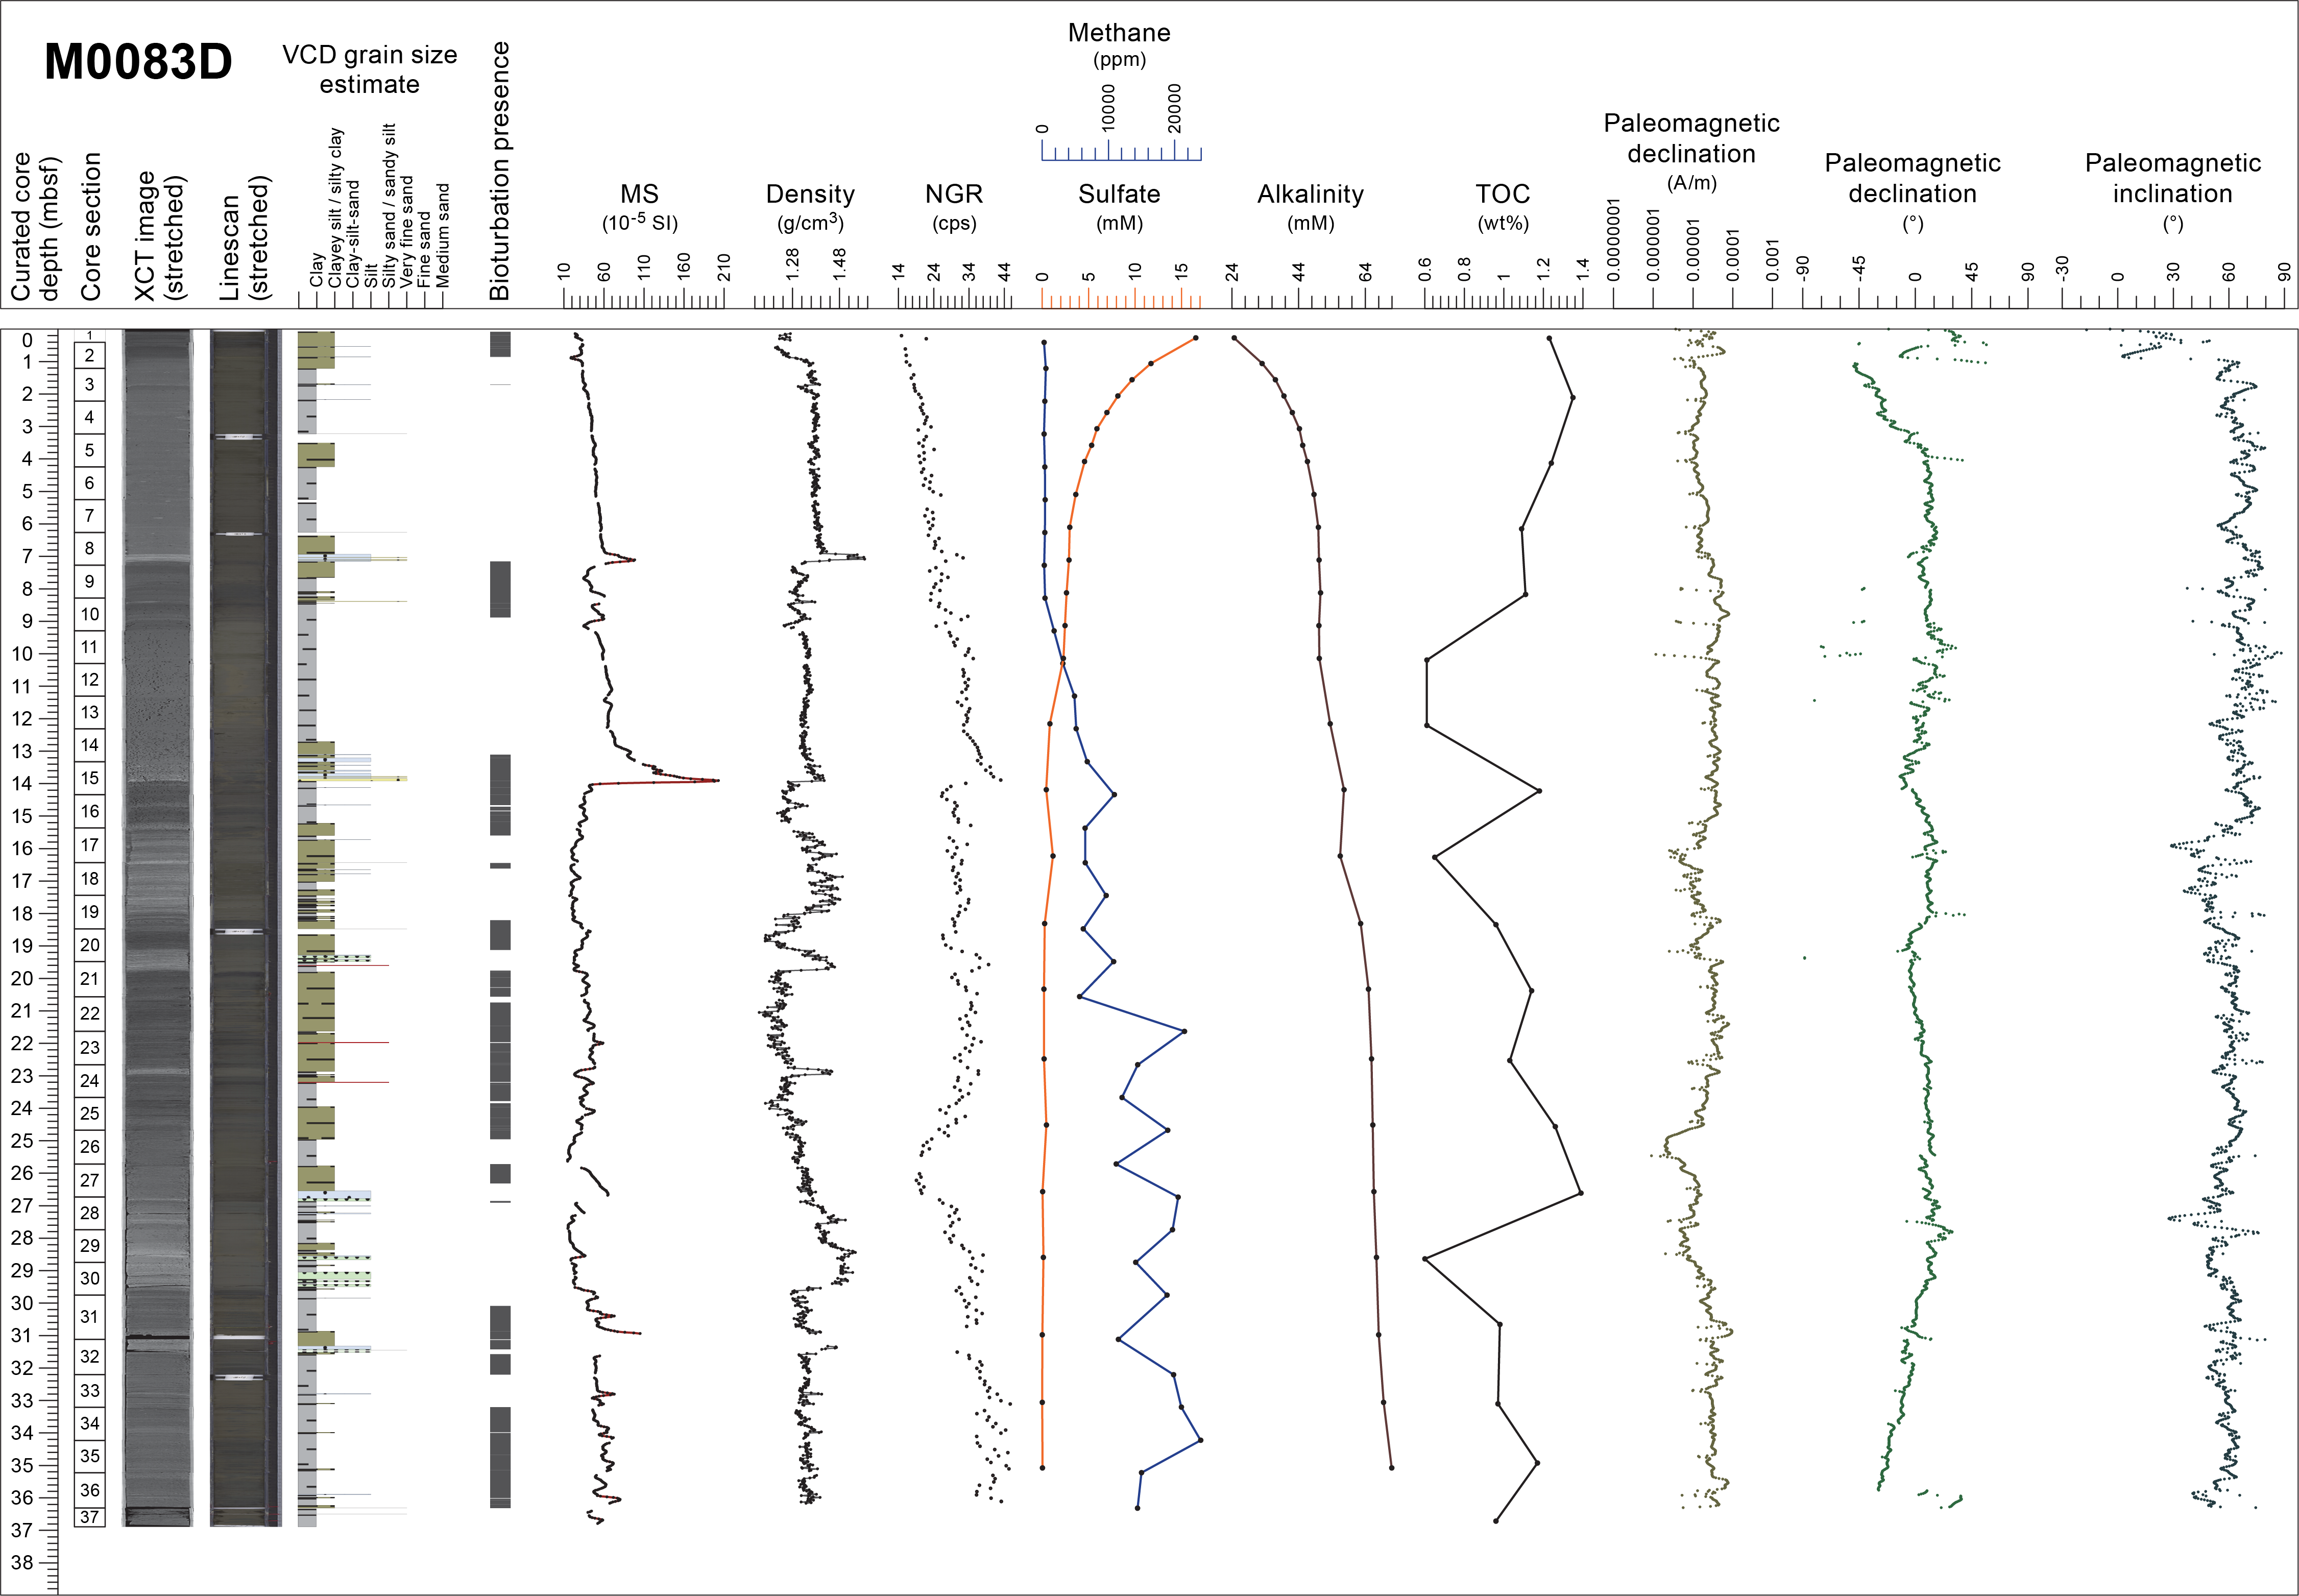
Figure F19. Composite Strater plot, Hole M0083D.
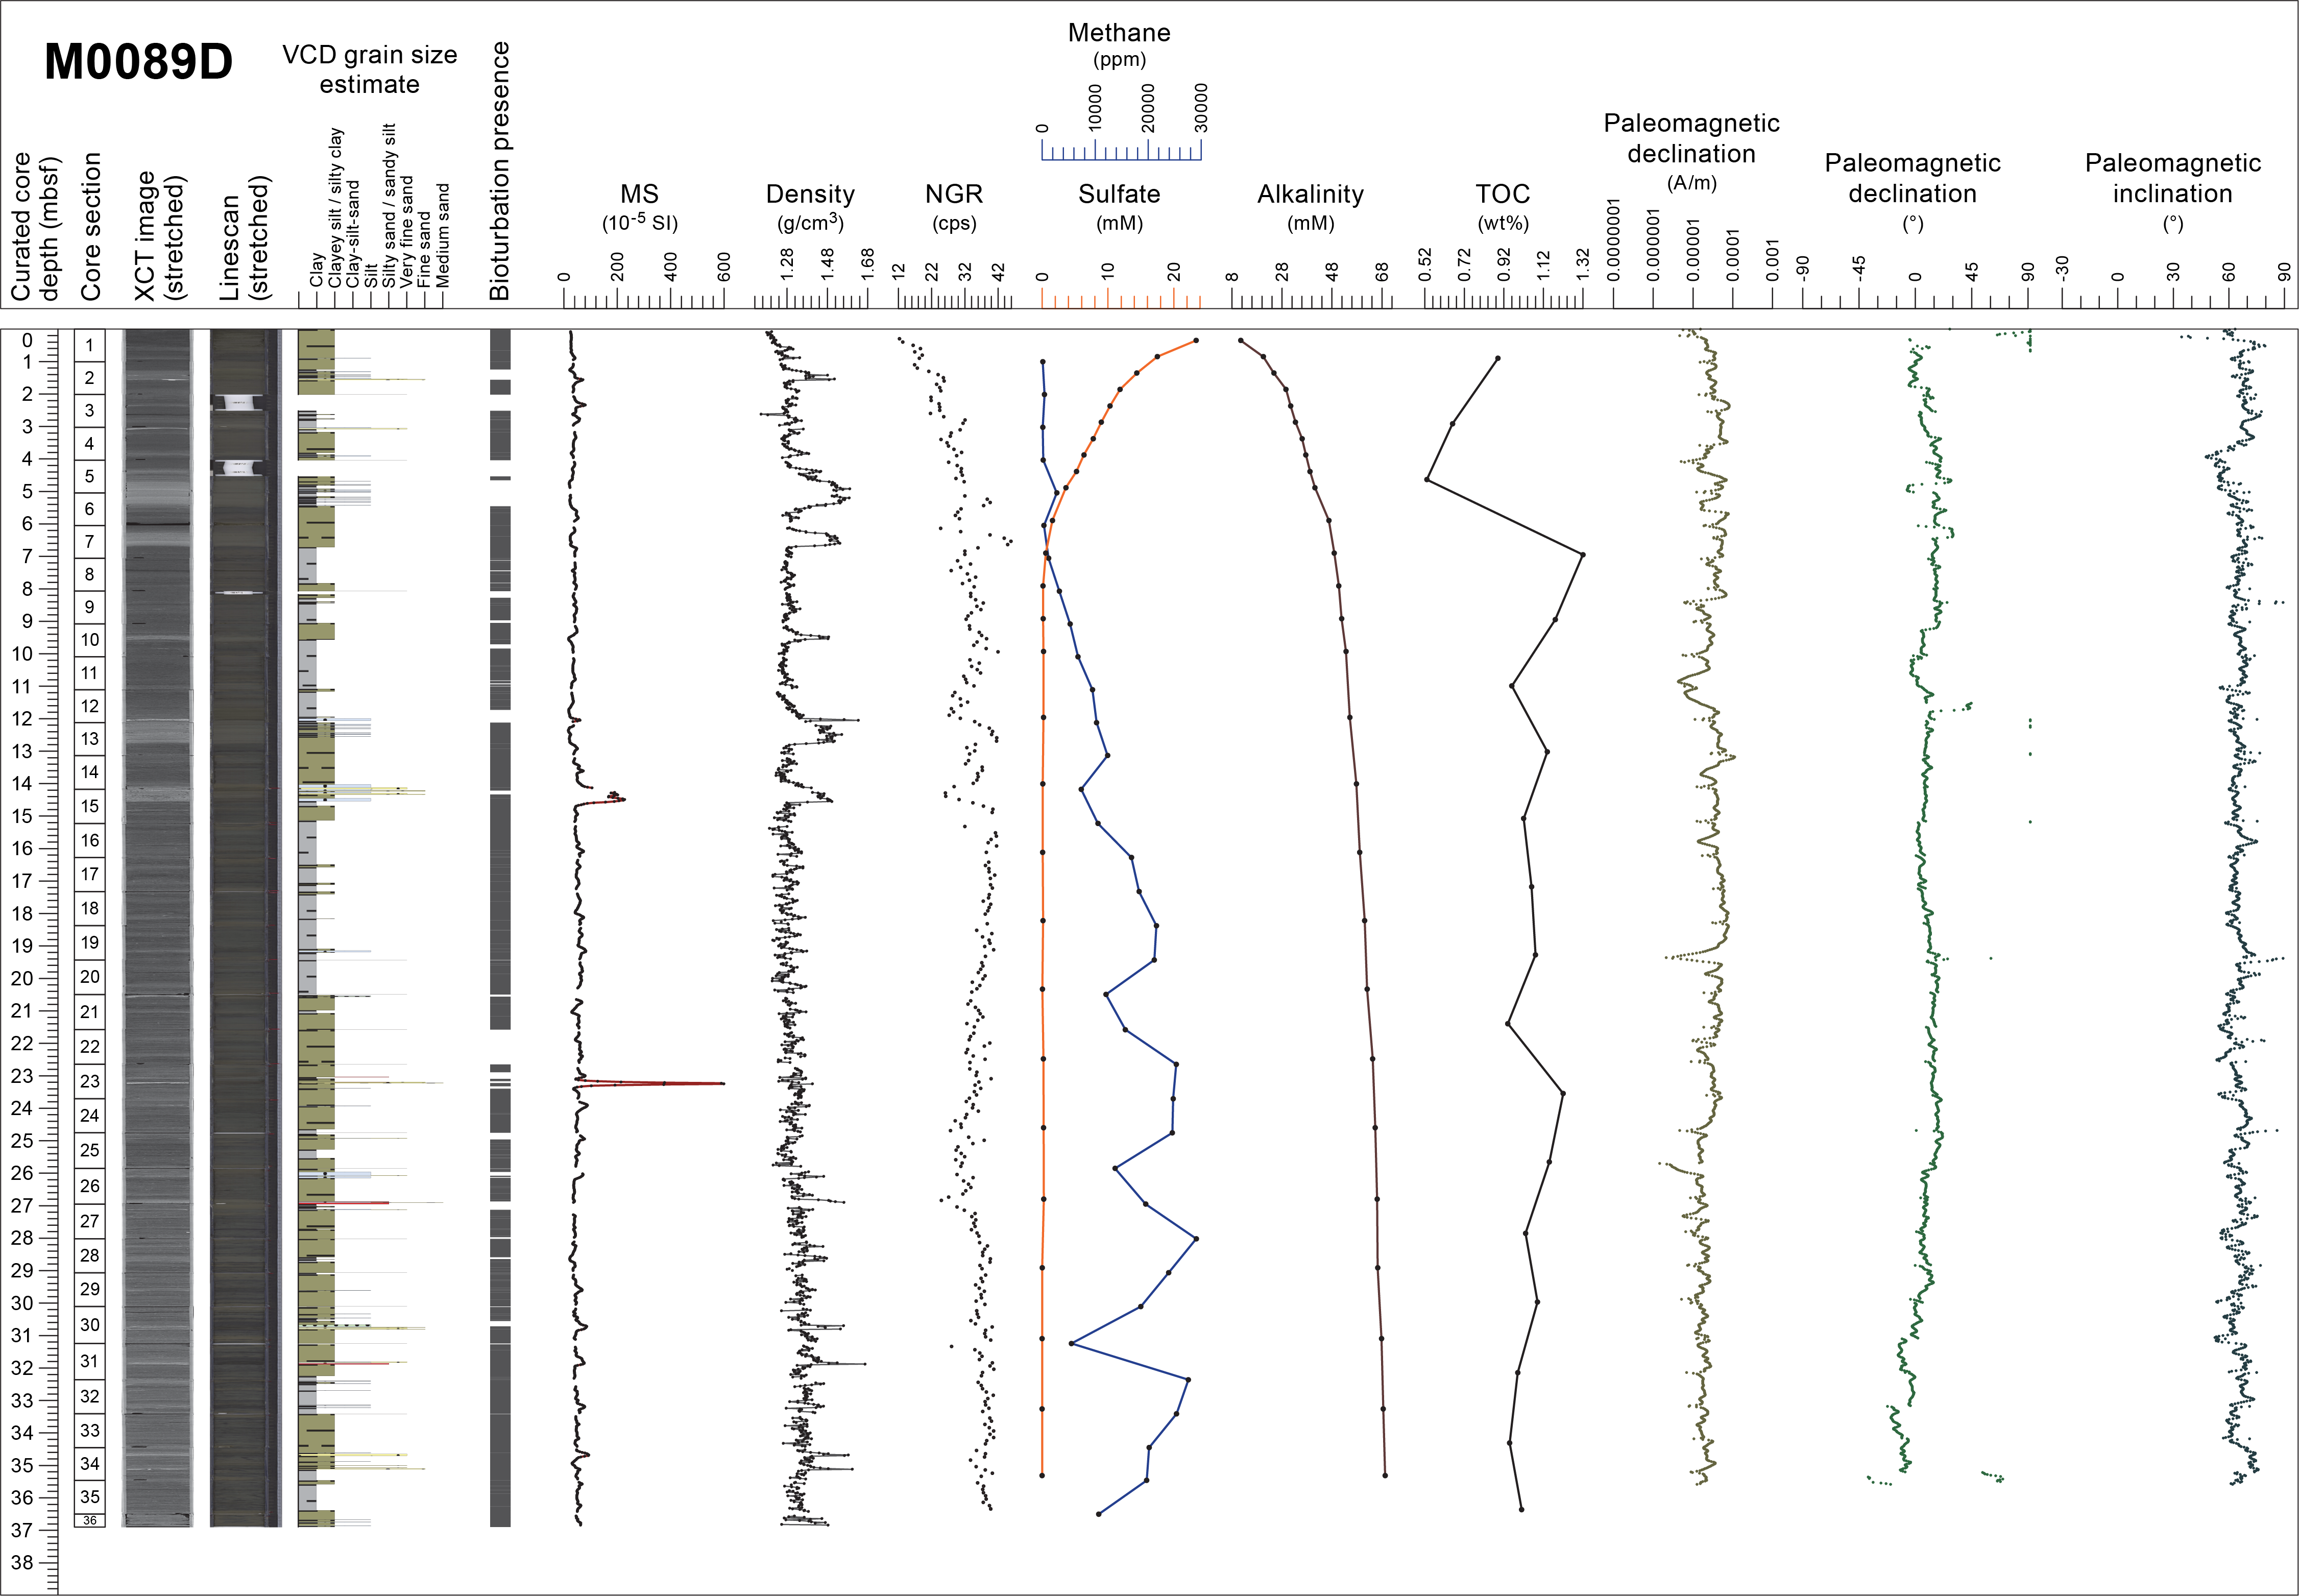
Figure F20. Composite Strater plot, Hole M0089D.
The lithostratigraphic succession at Site M0089 comprises the following five intervals in a downcore direction as defined in Hole M0089D (Figure F20):
- Interval 1 (0–5.40 mbsf) is composed of thickly bedded silty clay–clayey silt, clay, and laminae ranging in grain size from silt to fine sand. The sequence is sparsely to moderately bioturbated with several intervals that lack bioturbation.
- Interval 2 (5.40–11.80 mbsf) comprises interbedded clay and silty clay or clayey silt. The beds range in thickness from ~0.25 to 1 m. Laminae are rare. The lithology in this interval is sparsely to heavily bioturbated.
- Interval 3 (11.80–14.60 mbsf) is composed of clay, silty clay with loosely spaced interbedded laminae of sandy silt and very fine, fine, and medium sand laminae.
- Interval 4 (14.60–20 mbsf) comprises clay with a few thin beds of clayey silt and silty clay (<50 cm thick) and rare laminae toward the base. The section is sparsely to moderately bioturbated throughout.
- Interval 5 (20 mbsf to the bottom of the hole) is composed of silty clay with a few beds of clay. Laminae of silt to medium sand occur throughout and tend to be closely spaced. It is sparsely to heavily bioturbated except for the interval between 21.45 to 22.9 mbsf.
At ~23.2 mbsf (interval 386-M0089D-1H-23, 55–58 cm), a characteristic light gray and white, silt to fine sand–sized tephra layer occurs. It contains equal amounts of volcanic glass shards (the pumiceous volcanic glass shape type is dominant with significantly lower amounts of moderate vesicularity and fibrous types) and minerals, namely quartz (including characteristic ß-quartz), feldspar, and heavy minerals (abundant hornblende including hornblende-similar cummingtonite), smaller amounts of orthopyroxene and opaque minerals, and rare apatite. With this characteristic composition, this tephra can be used as an intersite correlation tie point for stratigraphic correlation across basins in the central Japan Trench (see Site M0090). Additional tephra layers were observed at ~26.9 mbsf as three successive 0.4, 0.5 and 1.5 cm thick black, white, and black silt to fine sand–sized tephra layers (interval 386-M0089D-1H-26, 102.2–105.7 cm), composed of abundant pumiceous (in the basal part) and fibrous types of volcanic glass shards with a lower concentration of bubble-wall types and rare heavy mineral (mostly clinopyroxene). Another pyroclastic-rich 2 cm thick dark gray silt to very fine sand layer occurs at ~31.8 mbsf (Section 386-M0089D-1H-31, 63 cm) and is recognized as reworked tephra because of observed cross-lamination sedimentary structures and rounded volcanic glass shards.
Even within the ultra-deepwater hadal environment, benthic and planktonic foraminifera can occur with varying moderate to good preservation in sediment. Except for the agglutinated foraminifera, which may be either in situ or reworked, all foraminifera are considered to be allochthonous. Because of low foraminiferal abundance, no provenance interpretation of benthic foraminifera can be made, with the exception of three samples from 31.1 mbsf in Hole M0083D and 20.5 and 25.8 mbsf in Hole M0089D with displaced fauna interpreted to be from an outer neritic to upper bathyal environment (200–600 mbsl).
Physical properties logs show distinctly different patterns at the two sites (Figures F19, F20). In Hole M0083D (Figure F19), bulk density rapidly increases to ~1.37 g/cm3 at 1 mbsf, below which depth the values stay at a comparably high level to 6.9 mbsf with a pronounced peak of 1.59 g/cm3 at 7.1 mbsf. Downcore from these peaks, bulk density values range 1.27–1.37 g/cm3 to the next peak of 1.42 g/cm3 at 13.9 mbsf. At the same depth, pronounced asymmetric peaks in magnetic susceptibility of more than 200 × 10−5 SI, NGR reaching >40 counts/s, and P-wave velocity of >1550 m/s are observed. NGR and magnetic susceptibility show a steady increase from ~10 counts/s and ~20 × 10−5 SI, respectively, at the core top. This trend is interrupted by a characteristic triple peak pattern in magnetic susceptibility, with the uppermost peaks at 7.1 mbsf (mimicking a peak in bulk density), the middle peaks at 8.2 mbsf, and the small lowermost peak at 8.9 mbsf, respectively. Downcore from the pronounced peaks at 13.9 mbsf, bulk density drops to values similar to those at the core tops, intercalated with intervals and peaks >1.45 g/cm3 between 16.2 and 17.8 mbsf, between 18.6 and 19.5 mbsf (asymmetric peak), and at 23 mbsf. Throughout this interval and to the base of the hole, magnetic susceptibility shows high-frequency fluctuations, typically with values of approximately 20 × 10−5 to 70 × 10−5 SI. Below 23 mbsf, bulk density increases continuously to the maximum value of 1.53 g/cm3 at 28.6 mbsf. Below this depth, bulk density values range 1.31–1.45 g/cm3 to the bottom of Hole M0083D. Modest to strong asymmetric peaks in magnetic susceptibility and downcore increasing values and sharp drops are observed at 25.8–26.7 and 30.0–30.9 mbsf. Only the lower peak corresponds to a peak in bulk density, whereas both correspond to troughs in NGR, which otherwise shows a general increasing trend from 30 to 40 counts/s from 23 mbsf to the bottom of the hole. The bulk density datasets from Site M0089D (Figure F20) show pronounced, mostly asymmetric peaks characterized by a sharp basal density contrast of ~0.1 g/cm3 to peak values >1.45 g/cm3 with an upward decreasing trend at 1.6, 4.9, 6.6, 9.5, 12.5, and 14.5 mbsf. These peaks correspond to silt and sand beds described in the VCDs. Below this depth, the bulk density profile shows large high-frequency fluctuations between 1.25 and 1.35 g/cm3 intercalated with 11 sharp peaks exceeding >1.45 g/cm3 below 26 mbsf, also corresponding to coarser grained sediment beds described in the VCDs. Magnetic susceptibility fluctuates generally between 20 × 10−5 and 70 × 10−5 SI. The uppermost part shows characteristic modest double peak patterns with the upper and lower peak at 1.6 and 2.4 mbsf, respectively. A more pronounced asymmetric peak of more than 200 × 10−5 SI is observed at 14.5 mbsf, mimicking a density peak and sand bed at the same depth. There is another pronounced peak of 600 × 10−5 SI at ~23.2 mbsf, which does not have a corresponding density peak but links to the tephra layer observed in the VCDs. NGR values generally increase from ~10 counts/s at the core top to more than 30 counts/s at ~4 mbsf. Downcore from these depths, NGR values generally fluctuate between 30 and 40 counts/s to the base of the hole, with maximum values of 45.9 counts/s at 6.5 mbsf corresponding to asymmetric peaks in density but a relative low in magnetic susceptibility at the same depth. Reliable P-wave velocity measurements are available for the upper ~10 and 8 m at Sites M0083 and M0089, respectively. Values at Site M0083 fluctuate around ~1495 m/s in the uppermost 7 m and decrease to ~1484 m/s below the pronounced peaks at 7.1 mbsf. At Site M0089, P-wave velocity fluctuates around ~1495 m/s in the uppermost 4 m and slightly increases with depth to ~1540 m/s at 8.4 mbsf. Undrained shear strength slightly increases with depth at both sites, but maximum values at the base of the deepest hole at Site M0089 are approximately three times higher than at the base of the deepest hole at Site M0083.
The downcore pore water and headspace gas profiles of sulfate, alkalinity, ammonium, bromide, and methane concentrations show characteristic changes related to organic matter degradation and suggest that intensive remineralization occurs at both Sites M0083 and M0089 (Figures F19, F20). It is most active in the uppermost ~3–5 m and gradually diminishes farther downcore, occurring at comparable rates at both sites. Notably, the ammonium and alkalinity profiles at Site M0083 are less linear and more wavy than those at Site M0089, potentially indicating more pronounced and/or more clearly preserved nonsteady-state diagenesis at Site M0083. The salinity changes closely follow ammonium, alkalinity, and bromide, implying seawater salinity in the sediments with the gradual downcore addition of ions that are metabolic products of organic matter degradation. Patterns and concentrations of most other IW parameters are similar at Sites M0083 and M0089, indicating that overall similar depositional and diagenetic processes affected both sites. The coupled but marked variation of TC, TOC, and IC may imply allochthonous material input into the Japan Trench. In addition, although intensive remineralization occurs at the top part of sediments, high TOC and TC contents were found in the deeper sediments, suggesting that significant amounts of organic matter may be buried in the trench sediments. The high methane concentrations and C1/C2 values observed in the deeper sediments highlights the role of microbes in the fate of sedimentary organic carbon in the hadal sediments. At Site M0083, dissolved Fe and Mn are very high in the uppermost meter of the sediment column, indicating organic matter remineralization by intensive dissimilatory Mn and Fe reduction. At Site M0089, Mn and especially Fe concentrations are much lower, and Mn remains elevated down to around 5 mbsf, potentially a sign of less intense and/or deeper dissimilatory Mn and Fe reduction. Below the uppermost sediment interval, organoclastic sulfate reduction becomes the dominant electron acceptor for organic matter remineralization, followed by methanogenesis at greater depth. Sulfate reduction and subsequent formation of diagenetic sulfide minerals is also evident from the abundance of what is most likely iron sulfides, as shown in the VCDs. One significant difference between Sites M0083 and M0089 (based on IW and dissolved gas profiles) is the depth of the SMT, which is located at ~10–12 mbsf at Site M0083 and at ~4–5 mbsf at Site M0089. This could be explained by different depositional histories at these sites, including different sedimentation rates, organic matter reactivities, organic matter delivery rates, and/or variable methane fluxes from depth. Very high dissolved Si concentrations are measured immediately below the sediment surface. Amorphous silica appears to dissolve throughout the core, causing very high dissolved Si concentrations. In contrast, subdued changes in dissolved Sr and Ca suggest very limited dissolution of carbonate material in the sediment. The solid phase at Sites M0083 and M0089 is dominated by siliceous material, indicated by high Si contents and corroborated by smear slide descriptions. Fine-grained siliciclastic material, as approximated by Al contents, is quantitatively the second-most important sediment component. Carbonate material, as shown by the IC and partly by the Ca contents, is very low but absent. The Fe contents broadly parallel the Al records and, at first pass, do not indicate significant vertical redistribution by diagenetic dissolution-precipitation processes. This is different for Mn, which exhibits several dramatic peaks at Site M0083, indicating diagenetic migration of Mn. However, this behavior cannot be observed at Site M0089.
The paleomagnetic intensity profiles of Sites M0083 and M0089 are characterized by two sets of specific signal patterns (Figures F19, F20). One is an interval containing spiky peaks (e.g., 7–15 mbsf in Hole M0083B), and the other is characterized by limited variation with a lower intensity base value (e.g., 2–7 mbsf in Hole M0083B). An additional low-intensity interval is observed below 25 mbsf at Site M0089. Preliminary paleomagnetic data for Sites M0083 and M0089 display declination profiles that are characterized by long periodic changes. More frequent fluctuations of declination in comparison to Site M0083 are recognized in the upper interval of Site M0089 (0–9 mbsf). Scattered declination intervals are common around 12–14 mbsf at Site M0089. The inclination of all the holes from both sites oscillates between 30° and 60° and is characterized by a low around 16 mbsf at Site M0083 and around 4 mbsf at Site M0089. These features may be confirmed as remarkable paleomagnetic signals as robust chronological tie points to be correlated across sites.
Radiolarian fossils are abundant throughout the samples analyzed from Holes M0083D and M0089D, and their preservation is good. At Site M0083, the relative abundance of C. davisiana is less than 6% throughout the core; therefore, it is likely that this entire section of the hole lies within C. davisiana Zone ‘a, corresponding to the Holocene (Morley et al., 1982). In addition, abundances tend to be high (>5%) in the lower part of Hole M0083D (33.2 mbsf). The relative abundance of L. setosa in the same horizon is higher than those of others (>2%), potentially correlating to Events 2 or 4. At Site M0089, the relative abundance of C. davisiana varies between 1% and 23% and tends to be significantly higher (>10%) below 24.6 mbsf. This could correlate with the boundary horizon of C. davisiana Zones ‘a and ‘b (Event 5), corresponding to the Holocene/Pleistocene boundary (Morley et al., 1982). Two significant peaks in the relative abundance of C. davisiana at 24.6–25.8 and 29.6 mbsf are likely to correlate to Events 6 and 7, corresponding to DAE-2 (~12 ka) and DAE-3 (~17 ka) of Matsuzaki et al. (2014), respectively. The low abundance of C. davisiana between 36.0 and 36.5 mbsf below Event 7 possibly corresponds to the minimum C. davisiana abundance between Zones ‘b1 and ‘b2 (approximately 24 ka) of Morley et al. (1982) and Itaki et al. (2009). The relative abundance of the Tetrapyle group ranges 0%–10%, and higher values (>5%) tend to be recognized between 7.9 and 19.4 mbsf, probably corresponding to the mid-Holocene warm period (Matsuzaki et al., 2020; Chinzei et al.,1987). Two minor peaks in the relative abundance of L. setosa in C. davisiana Zone ‘a at 14.6 and 23.7 mbsf are likely correlated to Events 2 and 4, respectively.
6.3. Central/northern Japan Trench
6.3.1. Site M0093
Site M0093 is in a trench-fill basin located at the boundary area between the central and northern Japan Trench (Basin C/N1; Figure F6). The basin has an elongated shape with a north–south trend. At Site M0093, a high-amplitude seafloor layer appears to resolve as a couplet of two parallel reflectors. An acoustically transparent layer ~2–3 m in thickness is present beneath the seafloor layers near Site M0093, where it overlies a 12–15 m thick package of acoustically laminated materials of high amplitude and a lower part of the trench-fill less clearly imaged by the hydroacoustic data down to ~0.040 s TWT (~30 m subsurface depth) (Figure F21).
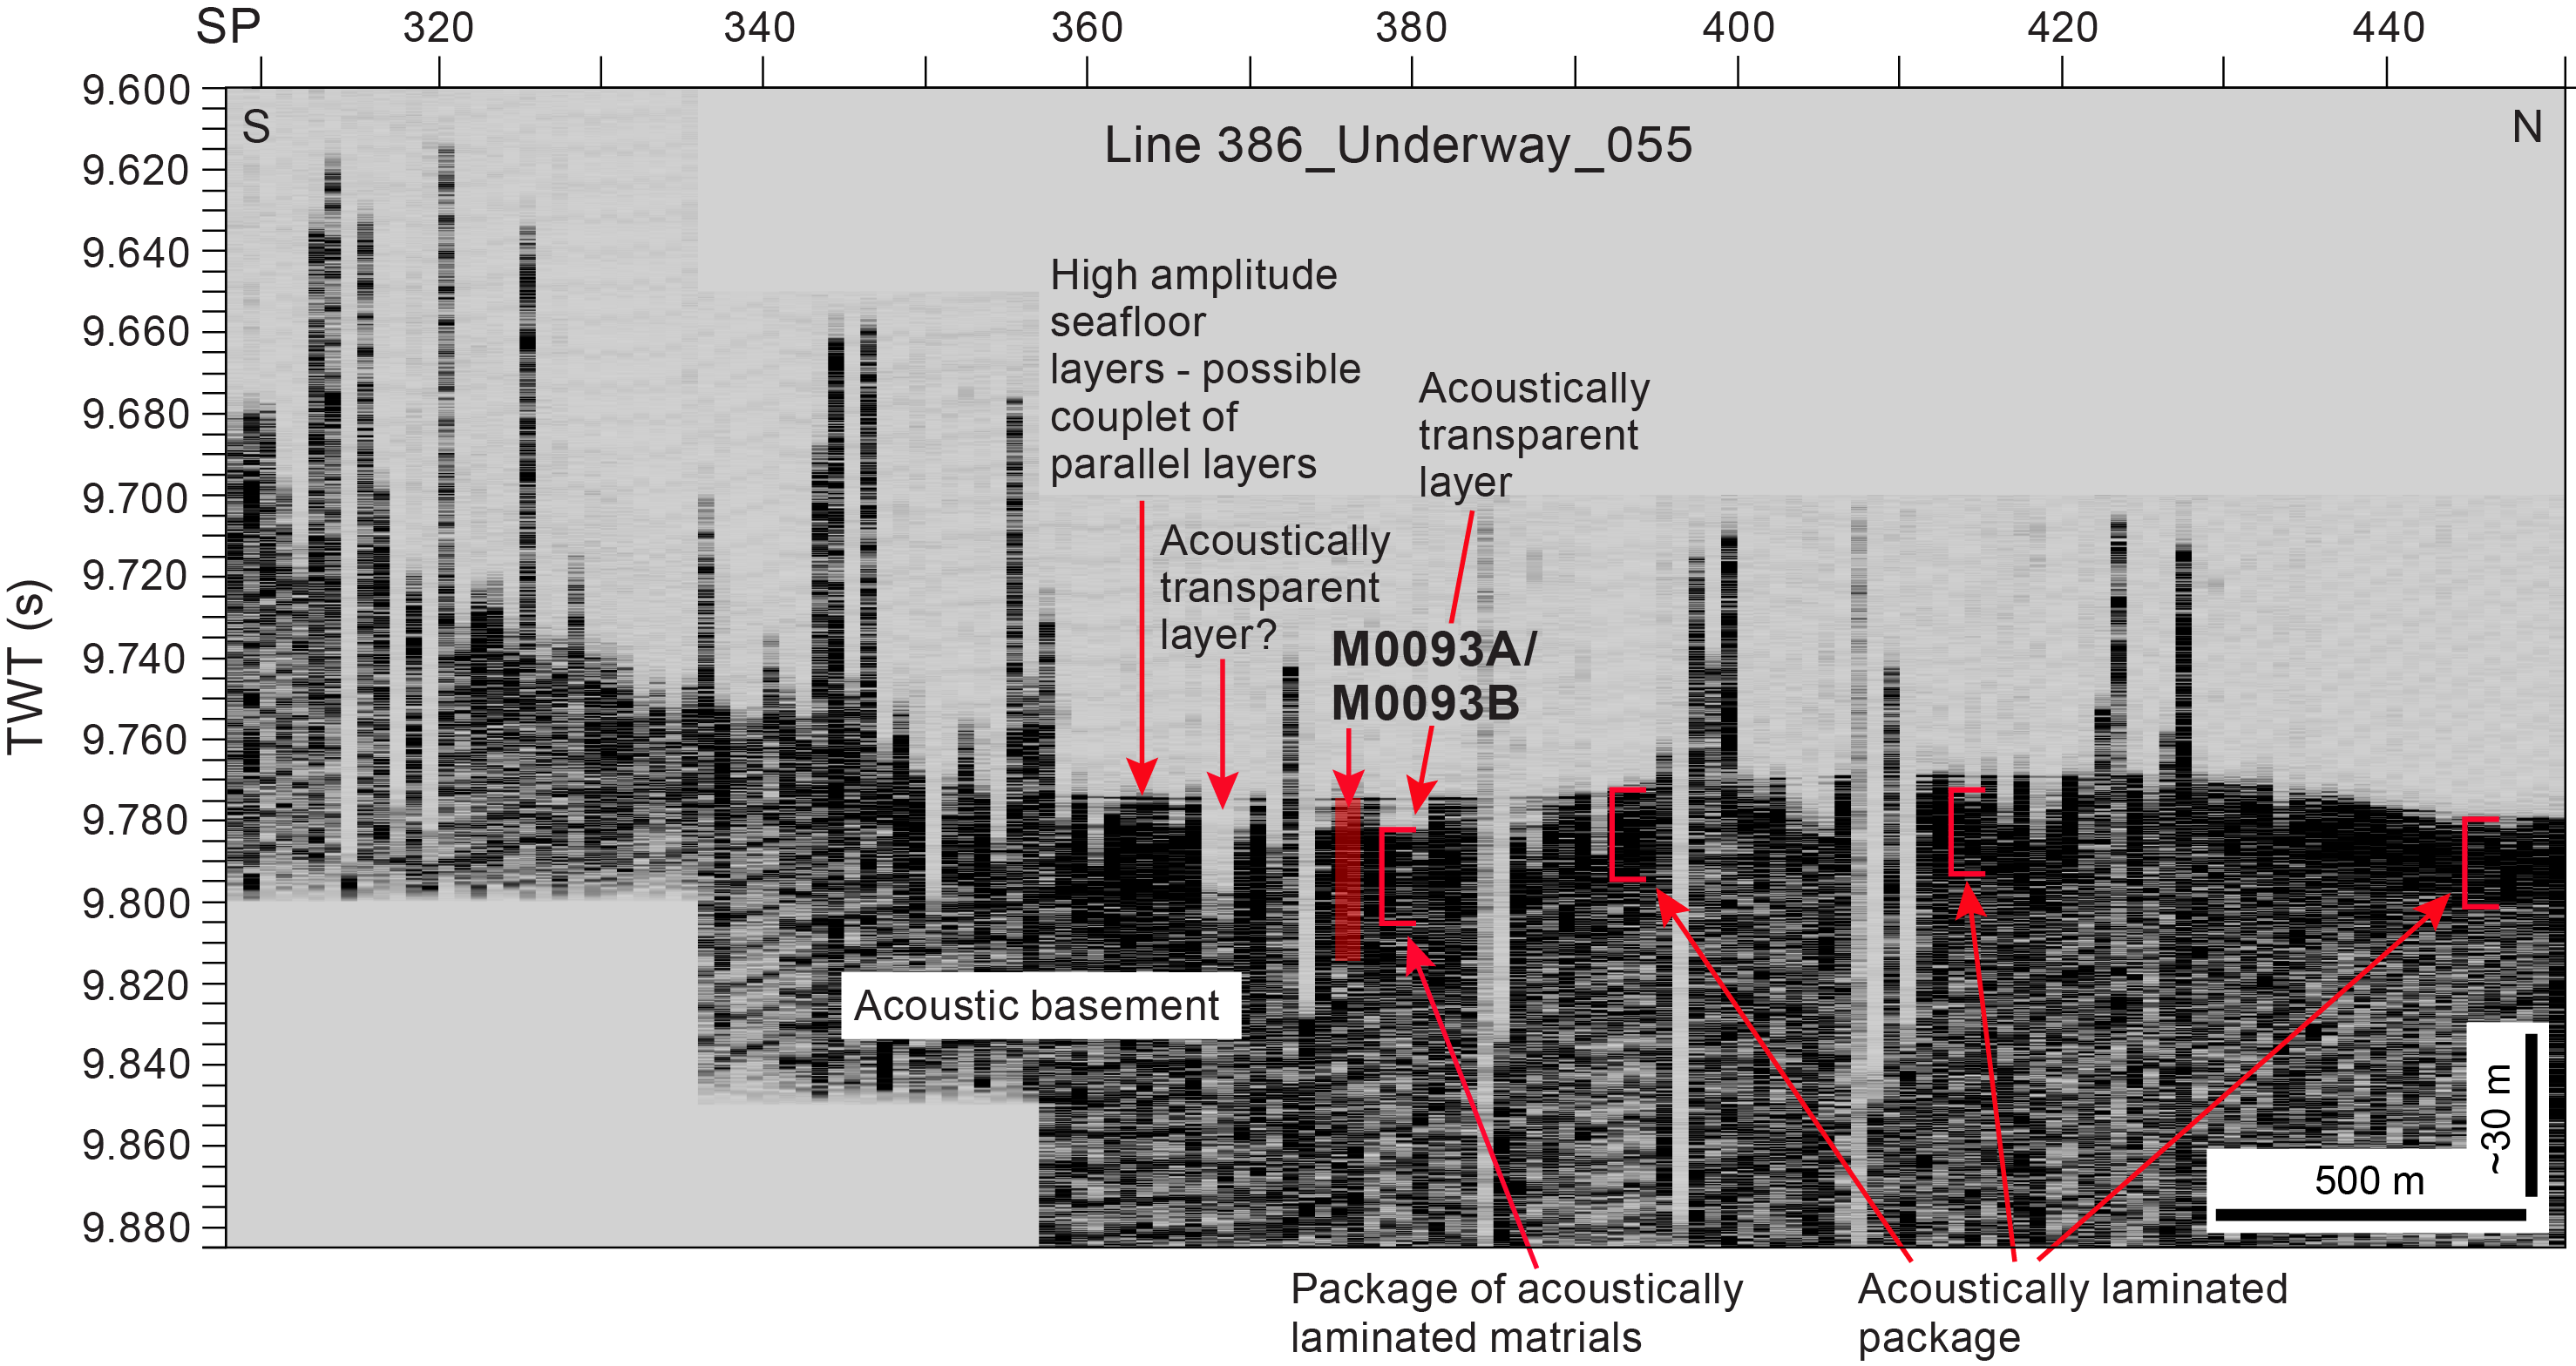
Figure F21. Line 386_Underway_055.
VCDs from Site M0093 show the following five intervals downcore (Figure F22).
- Interval 1 is a ~5.5 m thick-bedded, silty clay interval interbedded with widespread and locally deformed silty beds and laminae and a basal fining-upward sandy layer.
- Interval 2 is a ~8.5 m thick-bedded section composed of several dozen silty to fine sand deposits scattered within clayey background sedimentation.
- Interval 3 is composed of a ~1.2 m thick fining-upward succession from silty clay to clay.
- Interval 4 is recognized as a 0.6 m thick normally graded succession with basal laminae of fine sand to a very fine sand bed and three centimeter-scale silty layers interbedded with silty clay.
- Interval 5 is a ~10.2 m thick section of silty to sandy clay with scattered planar laminae and centimeter-thick beds of silty to very fine sand.
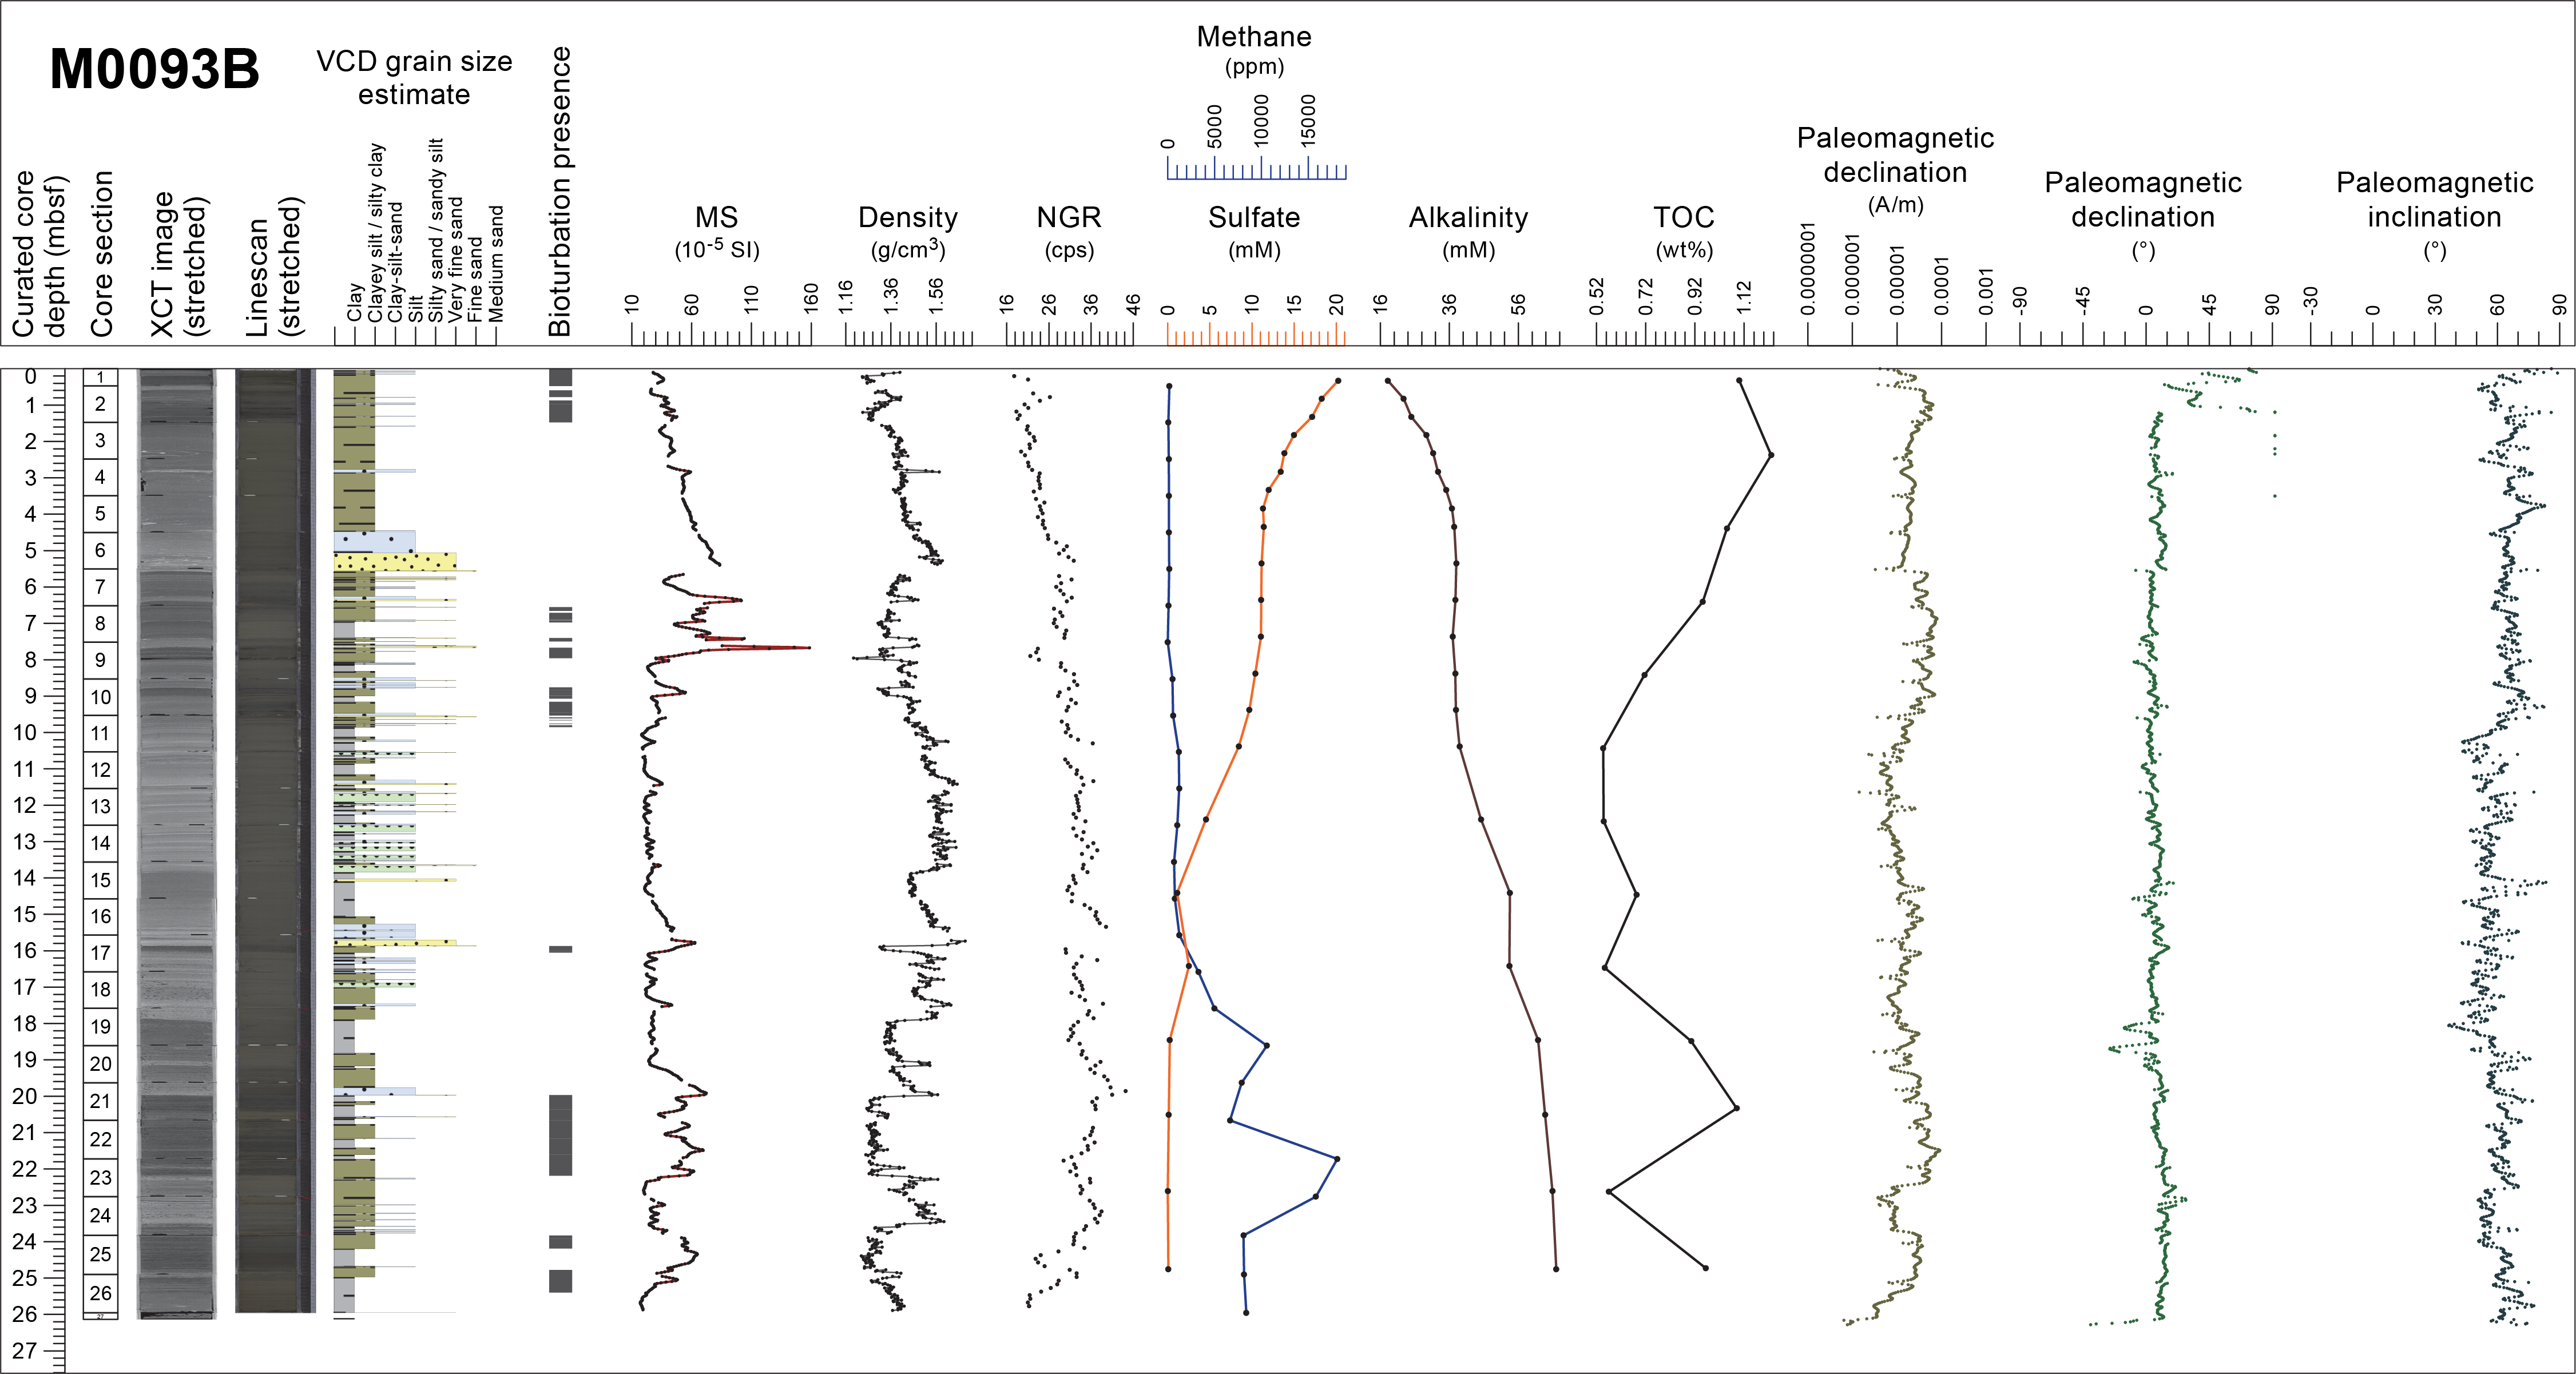
Figure F22. Composite Strater plot, Hole M0093B.
Iron monosulfides are absent in Intervals 3 and 4 but are sparsely present in the upper parts of Intervals 1 and 2 and in Interval 5. Smear slide analyses show that the textures observed at Site M0093 are dominated by clayey silts with minor silts. Sediment composition is mostly lithogenic (30%–70%) with some scattered biogenic components (maximum = 62%). Calcareous nannofossils and radiolaria are observed in one sample (>5%) of Interval 2. Although the abundance of volcanic material varies from 7% to 62.5% and the volcanic glass content is particularly high in Sections 386-M0093B-1H-10 through 1H-24, no visible tephra layer is described at this site. Foraminifera are only observed in Sample 1H-8, 60 cm, with an abundance of 6%. No mica or shell fragments are documented at Site M0093. However, a sample from the lowest part of Interval 1 contains a diverse assemblage of calcareous foraminifera, including well-preserved thin-walled taxa. The provenance of the displaced calcareous assemblage is interpreted to be from an upper bathyal environment within the oxygen minimum zone (200–600 mbsl).
Bulk density values do not increase with depth; instead, they reveal variation between 1.2 and 1.7 g/cm3 (Figure F22). However, two intervals are characterized by a downcore increase in density: (1) between ~1.5 and ~5.5 mbsf, where values increase from 1.3 to 1.6 g/cm3, and (2) between ~8 and ~13.5 mbsf, where values increase from 1.4 to 1.65 g/cm3. At 16, 20, and 23.5 mbsf, three layers (between 1 and 1.5 m thick) are characterized by a sharp density increase at the bottom (to 0.4 g/cm3) and a gradual upcore decreasing trend. Over these trends, several pronounced density peaks are highlighted in Hole M0093B. Magnetic susceptibility measurements show the uppermost 5 m of Hole M0093B are characterized by an increase from 25 × 10−5 to 80 × 10−5 SI. Below this depth, values fluctuate above a baseline value of approximately 25 × 10−5 SI throughout the cored depths. Two pronounced peaks at 6.4 and 7.7 mbsf exceed 100 × 10−5 SI. Magnetic susceptibility values show a gradual downward increase in Interval 1 and high peaks in the upper part of Interval 2. Values are also high in the lower part of Interval 5. Magnetic susceptibility is low whereas density is high in the middle to lower parts of Interval 2 and the upper part of Interval 5. NGR gradually increases downward and shows high values in Intervals 3–5.
Indicators of organic matter degradation in the IW and headspace samples (ammonium, alkalinity, bromide, and methane concentrations) (Figure F22) suggest that intensive remineralization occurs at Site M0093. Remineralization is most active in the uppermost ~3–5 m, gradually diminishes downcore, and occurs at comparable rates at Site M0093. Notably, the ammonium profile is less linear than the other profiles, potentially indicating more pronounced and/or more clearly preserved nonsteady-state diagenesis. Dissolved Fe and Mn levels are very high in the uppermost meter of the sediment column, indicating organic matter remineralization by intensive dissimilatory Mn and Fe reduction. The nonlinear decrease in Mn concentrations below the uppermost meter may indicate repeated periods of nonsteady-state diagenesis preserved in the IW record. Below the uppermost sediment interval, organoclastic sulfate reduction becomes the dominant electron acceptor for organic matter remineralization, followed by methanogenesis at greater depth. Sulfate reduction and subsequent formation of diagenetic sulfide minerals is also evident from the abundance of most likely iron sulfides in the VCDs. Sulfate is depleted below about 14 mbsf, with a small recurring peak and complete depletion at about 18 mbsf marking the SMT. The SMT is also clearly visible in the Ba profile, which shows the highest concentrations below the SMT and a decrease directly above it. The abundance of amorphous silica (biogenic opal in diatom frustules and sponge spicules along with volcanic glass shards) in the smear slide descriptions supports the observation of very high dissolved Si concentrations immediately below the sediment surface. Amorphous silica appears to dissolve throughout the core, causing some of the highest dissolved Si concentrations reported in marine sediments (e.g., Frings, 2017). In contrast, subdued changes in dissolved Sr suggest very limited dissolution of carbonate material in the sediment. The high silicate content in the solid phase, in tandem with low calcium and IC contents, indicates that silicate minerals are dominating the sediment composition, which is in good agreement with smear slide petrologic observations. Solid-phase Fe does not parallel the Al concentration profile, indicating diagenetic dissolution-precipitation processes in the sediment column.
The variation of paleomagnetic intensity in Hole M0093B is characterized by two modes (Figure F22). One is the intervals that show largely fluctuating intensity between around 1.0 × 10⁻⁵ and 8.5 × 10⁻⁵ A/m (0–2, 5.6–9.5, 14.2–22.4, and 23.7–26.3 mbsf), and the other is characterized by smoothed variation with lower values (2–5.6, 9.5–14.2, and 22.4–23.7 mbsf). Declination is relatively constant with spiky fluctuations, although small sudden offsets are identified at 6 and 22 mbsf. The inclination profile of Hole M0093B generally fluctuates between 30° and 60°. At 10 and 18 mbsf, large sudden shifts in inclination can be seen. Inclination between 10 and 18 mbsf tends to shallower angles, but measurements return to fluctuating between 30° and 60° below 18 mbsf. Preliminary paleomagnetic data from Hole M0093B reveal that the intensity profile is characterized by both smoothed low intensity intervals and intervals of high fluctuations. The declination is relatively constant. The interval of shallow inclination in the interval 10–18 mbsf corresponds to the low-intensity interval. This may suggest that this low inclination is not representative of geomagnetic secular variation.
No radiolarian-based age determinations were made at this site.
6.3.2. Site M0094
Site M0094 is in a trench-fill basin (Basin C/N2) at the boundary area between the central and northern Japan Trench (Figure F6). The basin has an elongated shape with a NNW–SSE trend and a ~7470 mbsl. The subbottom profile shows a well-stratified section comprising both acoustically transparent and acoustically laminated packages, which are mostly flat lying (Figure F23). The uppermost 7–8 m is composed of an alternation of high- and low-amplitude reflectors. This interlayered package overlies a distinct acoustically transparent layer that is ~4–6 m thick. Beneath the transparent layer lies another package of high-amplitude reflections overlying the acoustic basement at ~0.035 s TWT (~26 mbsf).
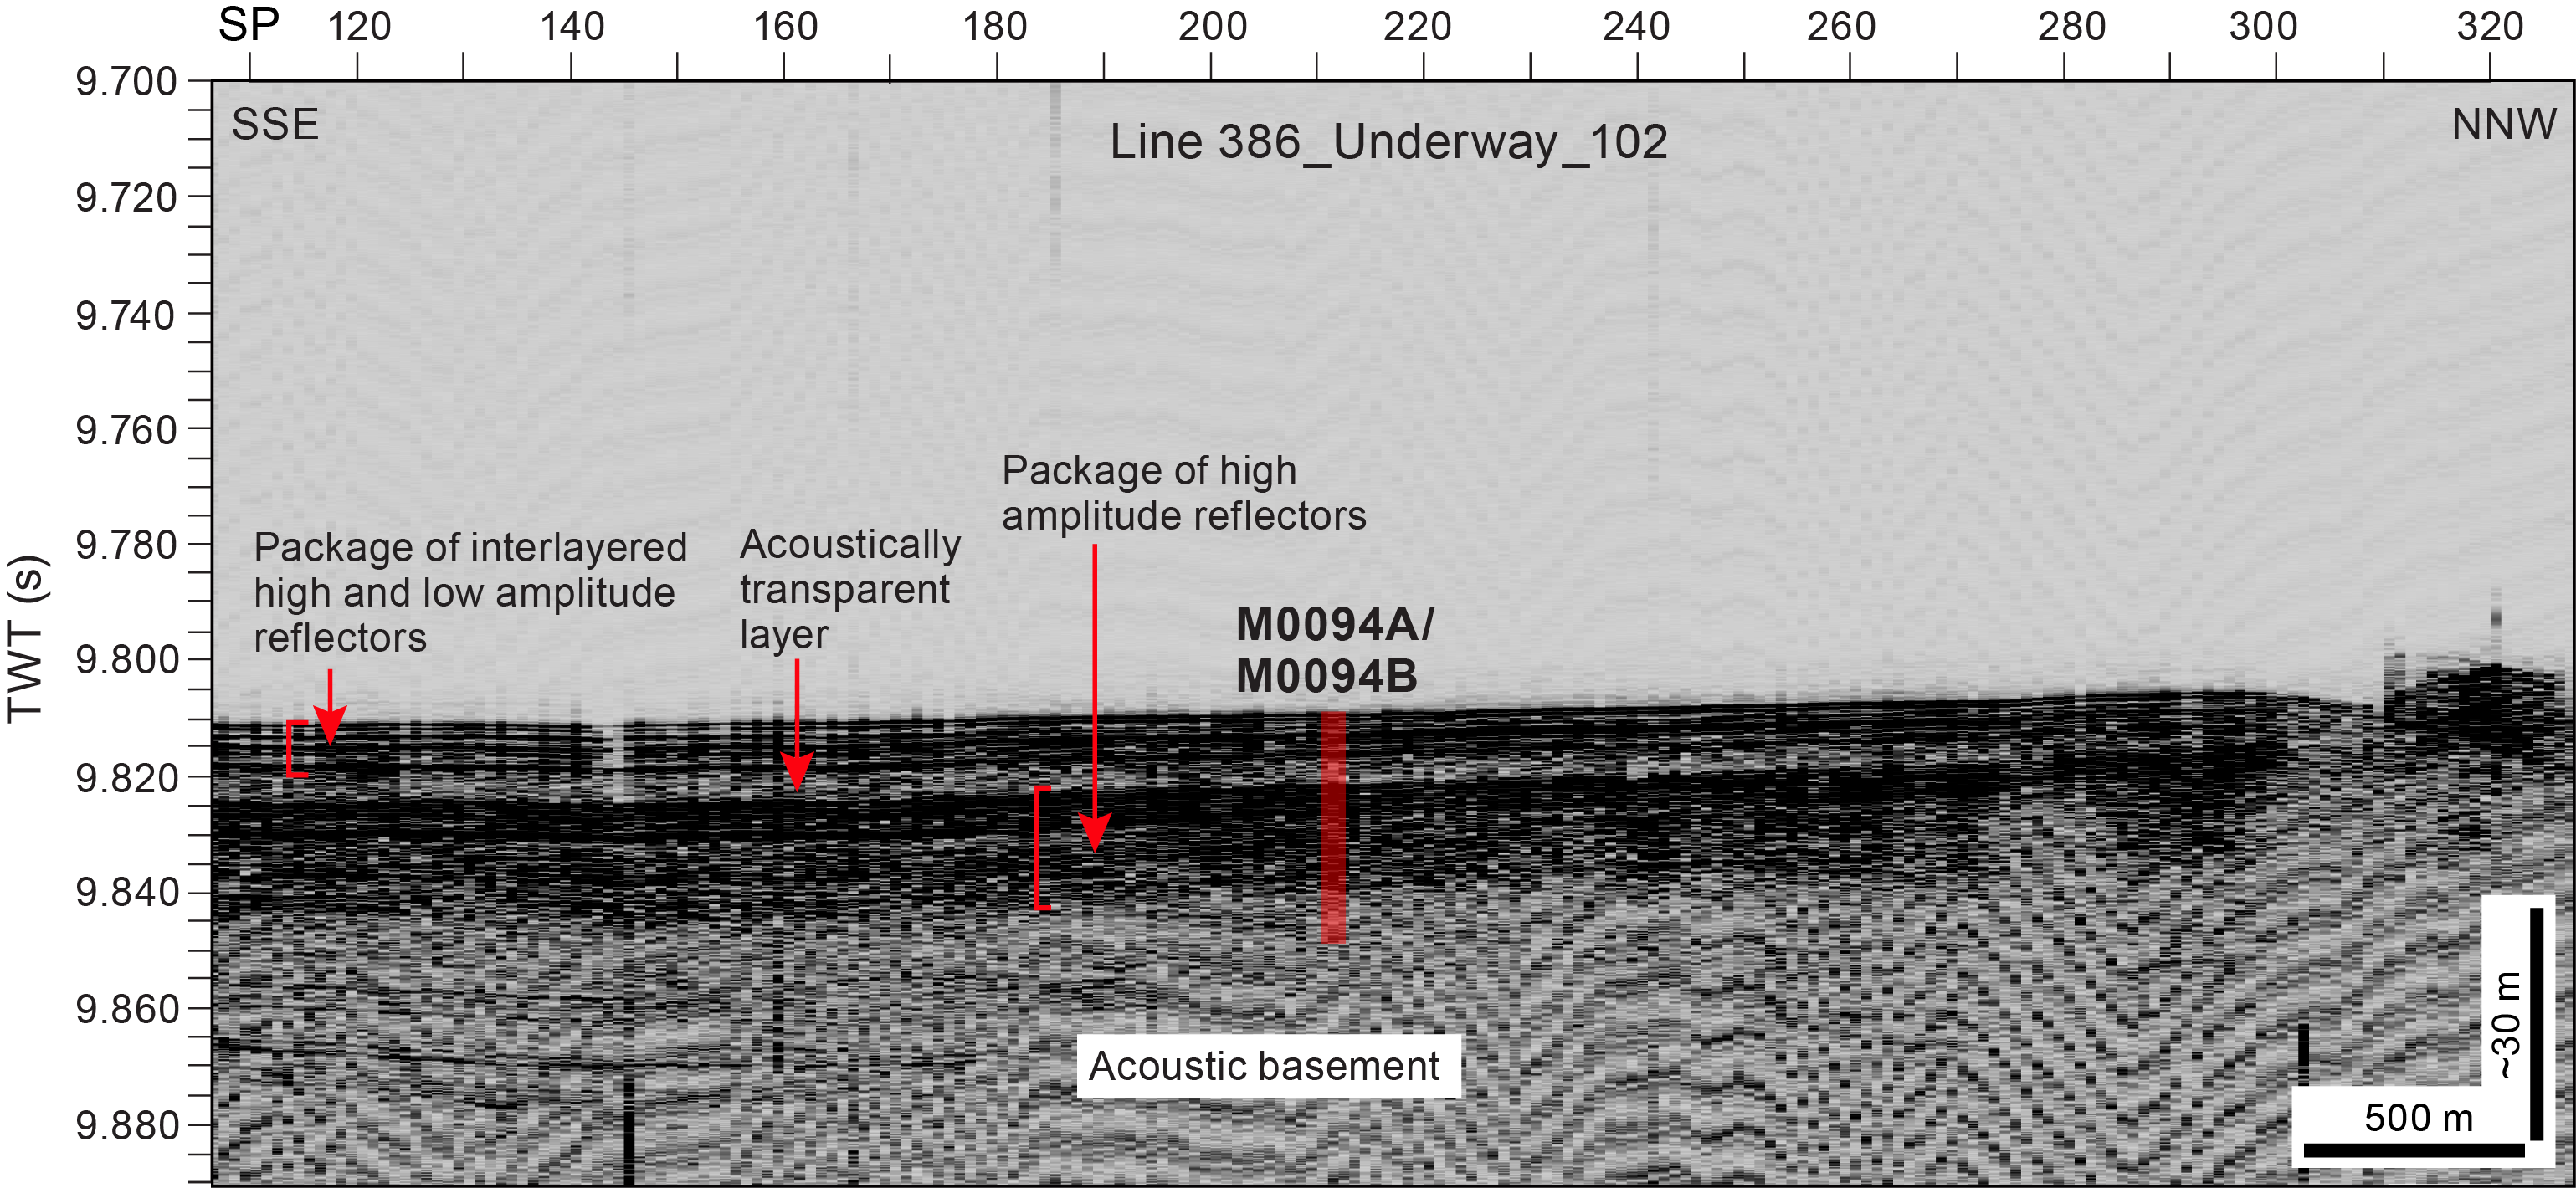
Figure F23. Line 386_Underway_102.
VCDs of core sections from Site M0094 indicate the following four intervals in a downcore direction (Figure F24):
- Interval 1 is a ~4.5 m thick bedded interval composed of several millimeter- to centimeter-scale deposits grading from basal fine sand beds to very fine sand and silty beds interspersed into a silty clay/clayey silt background sedimentation.
- Interval 2 is a 5.9 m thick bedded, highly deformed fining-upward sequence grading from very fine sand to silt and clayey silt/silty clay.
- Interval 3 is a ~5.2 m thick bedded interval composed of several dozen silty to fine sand deposits that range from millimeter- to several centimeter–scale in thickness scattered within clayey background sedimentation.
- Interval 4 is a ~2.6 m thick fining-upward sequence with a basal silty bed fining-upward to a silty clay/clayey silt bed overlying a 1.9 m thick clay bed without any bioturbation.

Figure F24. Composite Strater plot, Hole M0094B.
Bioturbation is rare and so are patches of iron monosulfides. Smear slide analyses show that the textures at Site M0094 are dominated by clayey silt. The sediment composition is mostly lithogenic (2%–65%) with scattered biogenic components (maximum = 60%). Calcareous nannofossils are observed in two samples in Intervals 2 and 3. The abundance of volcanic material varies from 3.7% to 74%. A silt-sized, 0.8 cm thick tephra layer is intercalated in silty sediment in Interval 3. The tephra is composed predominantly of pumiceous type volcanic glass shards. No mica or shell fragments are documented in Hole M0094B.
Downcore bulk density variations in Holes M0094A and M0094B are ~1.25–1.6 and ~1.3–1.67 g/cm3, respectively (Figure F24). From the top of Hole M0094B to ~1 mbsf, bulk density increases steadily with depth and reaches a high of ~1.6 g/cm3 at ~1.1 mbsf. The bulk density profile at Hole M0094B shows a variable pattern between ~1.1 and ~4.2 mbsf with at least three localized highs and lows (densities range ~1.36–1.66 g/cm3). Higher bulk densities could be typically attributed to the dominance of sandy beds, whereas soft, clayey sediments would yield lower bulk density values. Bulk density at intermediate depths (e.g., between ~4.2 and ~11 mbsf) remains fairly uniform with an average value of ~1.4 g/cm3. However, between ~11 and 16 mbsf, the variable density pattern resumes. Density values increase steadily between ~16 mbsf and the bottom of Hole M0094B. A linear increase in bulk density toward the bottom of Hole M0094B is consistent with a steady increase in other physical properties (e.g., magnetic susceptibility, NGR, resistivity, and shear strength). The downcore magnetic susceptibility variations at Site M0094 span 16 × 10−5 to 188 × 10−5 SI. The top sections of the cores from Holes M0094A and M0094B show consistent trends comprising high-frequency undulations. The average magnetic susceptibility at this site appears to be ~40 × 10−5 SI. The central section of Hole M0094B (~4.4–10.75 mbsf) shows a downcore increasing magnetic susceptibility trend. However, it drops abruptly from 80 × 10−5 to 40 × 10−5 SI over a span of ~0.06 m at ~10.77 mbsf. A number of distinct highs and lows at the bottom of Hole M0094B are clearly evident. Broadly, a downcore increasing trend with a few marked fluctuations (e.g., ~4.4, 10.75, and ~15 mbsf) are observed. An anomalous magnetic susceptibility peak (~188 × 10−5 SI) at ~15 mbsf is evident. This peak seems to correspond well with a dark thin tephra layer. A corresponding positive shift in the bulk density values (~1.62 g/cm3) between ~14 and 15.5 mbsf is also observed. Magnetic susceptibility and density profiles show remarkable peaks, which correspond with coarse-grained siltier and sandier layers. Magnetic susceptibility values increase downward in Intervals 2 and 4. The density profile indicates no clear increase in the upper part of Intervals 2 and 4 but a gentle and rapid increase in the lower part of Interval 2 and 4, respectively. Relatively high NGR counts occur in Intervals 1, 3, and 4, and the lowest count occurs in the upper part of Interval 2.
In contrast to other sites, very low ammonium, alkalinity, and methane concentrations indicate that no intensive organic matter remineralization occurs at Site M0094 (Figure F24). This could be explained by the low amount of reactive organic carbon (despite the high TOC values of up to 1.25 wt%) or, more likely, by very high sedimentation rates (or a combination of both). The low mineralization rates are also mirrored in the broad iron reduction zone that stretches to almost 5 mbsf in Hole M0094B and furthermore supported by the overall low changes in salinity with depth. The increases in dissolved Mn and Fe at greater depths (below ~10 mbsf), coinciding with a change in lithology from Interval 2 to Interval 3, indicate a source of ferrous iron likely related to the reduction of deeply buried hydroxides or iron-rich clay minerals (e.g., Köster et al., 2021). The cation concentrations (especially, Na2+, Mg2+, and Ca2+) show very little variation with a small increase at around 5 mbsf. Sulfate occurs throughout the sediment column in Hole M0094B. Sulfate concentrations decrease in the uppermost ~6 m to approximately 13 mM, followed by a constant increase with depth to almost 23 mM, indicating a source of sulfate from below. Thus, no SMT is observed at Site M0094. Dissolved Li shows an increase in concentrations in the lowermost sediments below 15 mbsf. This Li increase exceeds typical seawater values (which could be suggested as a source for the increased sulfate values at depth) and thus likely suggests other Li sources such as deep subseafloor clay mineral diagenesis (e.g., Torres et al., 2015). The high silicate content in the solid phase, in tandem with low calcium and IC contents, indicates that silicate minerals are dominating the sediment composition, which is in good agreement with smear slide petrologic observations. High amounts of solid-phase Fe and low total sulfur (TS) point to an iron-dominated system.
The paleomagnetic intensity data from Hole M0094B (Figure F24) reveal a peak at 3 mbsf and smoothed variation between 4 and 8 mbsf. Scattered but relatively higher intensities are recognized between 12 and 14 mbsf. The declination reveals several short fluctuations, but the general trend is around 20°. The inclination profile shows values predominantly distributed between 30° and 80°. In general, inclination values are shallower below 11 mbsf. Preliminary paleomagnetic data from Hole M0094B reveal unique patterns in the intensity profile with smoothed and highly fluctuating intervals. The signature of paleomagnetic secular variations is not clear in the preliminary results from this site.
No radiolarian-based age determinations were made at this site.
6.3.3. Site M0087
Site M0087 is in a trench-fill basin (Basin C/N3) in the northern part of the boundary area between the central and northern Japan Trench (Figure F6). The basin has an elongated shape with a north–south trend and comprises two (north and south) distinct subbasins (depocenters) separated by an east–west trending topographic ridge (Figure F25). The northern and southern subbasins have water depths of 7480 and 7520 mbsl, respectively. A horseshoe-shaped depression is found at the lowest landward slope of the northern subbasin. Site M0087 is located in the southern subbasin. The basin is filled by alternating acoustically laminated, high-amplitude materials and layers with lower amplitudes, which overlie the acoustic basement at ~0.040 s TWT (~30 mbsf). At Site M0087, an acoustically transparent unit up to 4 m thick lies above a flat-lying package of acoustically laminated materials. There is a series of flat-lying reflections with lower amplitudes, which appear to be additional acoustically transparent layers.

Figure F25. Line 386_Underway_049.
Site M0087 sediment cores are composed of the following five intervals downcore (Figure F26):
- Interval 1 is composed of a 9 m thick series of beds and laminae interbedded with clay and silty clay that lack bioturbation and patches of monosulfides. The underlying coarse-grained (medium sand to silt) layer has a sharp erosional base. Above, there is a clay and/or silty clay interval.
- Interval 2 is characterized by matrix (clay)-supported mud clasts with subrounded and irregular shapes in the upper part and a laminated fine to very fine sand lower layer with an erosional base. The thickness of this interval differs between Hole M0087B (~2.1 m) and Hole M0087D (~0.8 m).
- Interval 3 is a ~5.1 m thick unit composed of thick clay with deformed and irregular-shaped silt and very fine sand patches and a basal fine to very fine sand layer. It lacks bioturbation.
- Interval 4 is 8 m thick and has the same lithologic characteristics as Interval 1.
- Interval 5 is 3 m thick and is also characterized by matrix (clay)-supported mud clasts with subrounded shapes in the upper part and partly laminated very fine and fine sand to clay with a fining-upward grain size trend in the lower part. This interval also lacks bioturbation and patches of iron monosulfides.

Figure F26. Composite Strater plot, Hole M0087D.
Smear slide observations suggest that grain sizes include silt, clayey silt, and silty clay. The major components are lithogenic and biogenic grains.
Four tephra beds are described at this site. Two tephra beds occur in the uppermost part of mass transport deposits (MTDs), one in Interval 3 of Hole M0087B and one in Interval 5 of Hole M0087D. Therefore, these tephras do not represent true tephrostratigraphic horizons. The other two tephra beds (17.981–17.989 mbsf in Hole M0087B and 20.16–20.165 mbsf in Hole M0087D) occur at the same lithostratigraphic level below thick sand beds and have similar petrographic characters: light reddish brown, silt-sized, pumiceous type volcanic glass shards with fewer fibrous type shards, and abundant hornblende with a smaller amount of orthopyroxene and clinopyroxene. Based on the similarity of these petrographic characters, these two beds can be correlated with each other. Of the 11 samples examined, only 2 benthic and 1 planktonic foraminifera from 1 sample from Hole M0087A and 1 broken agglutinated benthic foraminifera from 1 sample from Hole M0087C were found.
In Holes M0087C and M0087D, bulk density increases downcore from ~1.3 g/cm3 at the mudline to ~1.6 g/cm3 at the bottom of Hole M0087D at 26.2 mbsf (Figure F26). Hole M0087D shows three zones with steady increases in bulk density with depth: 0–3, 7–8, and 10–15 mbsf. Other zones show higher fluctuations in density, which are most pronounced between 3 and 7 mbsf. Below 15 mbsf, bulk density increases to the bottom of the hole with some fluctuation. The highest density value of Site M0087 (1.70 g/cm3) is measured at 21.0 mbsf in Hole M0087D. Magnetic susceptibility at Site M0087 fluctuates around a baseline value of approximately 44 × 10−5 SI throughout the cored depth but also shows several pronounced peaks that exceed 100 × 10−5 SI. A 5 m thick zone of continuous readings close to 50 × 10−5 SI (with a slight trend of values increasing downcore) occurs in both holes at similar depths (between 8 and 13 mbsf in Hole M0087B and between 10 and 15 mbsf in Hole M0087D), with a very sharp drop at the base. Below this zone, magnetic susceptibility fluctuates; the highest value in Hole M0087B is 167 × 10−5 SI at 18 mbsf, and the highest value in Hole M0087D is 133 × 10−5 SI at 23.2 mbsf. Peaks in magnetic susceptibility and density profiles are principally correlated with coarse-grained layers at the basal parts of each unit. Gradual upward decreasing trends in both profiles from the peaks indicate fining-upward grain size trends. NGR profiles are similar to those of magnetic susceptibility and density, but the depths of some peaks in NGR occur slightly above the peaks in magnetic susceptibility and density.
The downcore pore water profiles of sulfate, alkalinity, and ammonium in the uppermost ~10 m at Site M0087 show characteristic changes related to organic matter degradation (Figure F26). The downcore decrease in sulfate concentrations is mainly caused by organoclastic sulfate reduction, but sulfate is not depleted within the retrieved cores. The absence of the SMT is due to sulfate supply from below the coring depth. In addition, elevated Fe and Mn concentrations throughout the cores, especially for the uppermost 10 m of sediments, reflect dissimilatory Fe and Mn reduction coupled to organic matter oxidation. High Si concentrations at this site are probably sustained by biogenic opal dissolution, as evidenced by smear slide observation that shows a substantial amount of diatom frustules and sponge spicules in the sediments. The slight downcore increase in B concentrations suggest B desorption from clay minerals and/or biogenic silica dissolution. In contrast, the downcore Li profiles in the uppermost ~10 m could reflect low-temperature silicate diagenesis, which adsorbs and incorporates Li in the secondary minerals. One notable feature of the pore water profiles at Site M0087 is the reversal of most pore water species toward seawater values below ~10 mbsf. The high silicate content in the solid phase, in tandem with low calcium and IC contents, indicates that silicate minerals are dominating the sediment composition, which is in good agreement with smear slide petrologic observations. High amounts of solid-phase Fe, which does not parallel the Al profile, and low TS point to an iron-dominated system, likely with formation of iron sulfide minerals, as suggested from smear slides.
Paleomagnetic intensity profiles are characterized by intervals of high fluctuation, which dominate the profiles for both holes (Figure F26). Smoothed fluctuation with lower values found between 8 and 12 mbsf in Hole M0087B and between 10 and 13 mbsf in Hole M0087D might be correlated. Paleomagnetic declination patterns of the two holes show different trends. The inclination profile of the two holes generally fluctuates between 30° and 60°. The large offset in inclination at 13 mbsf of Hole M0087B and 15 mbsf of Hole M0087D can be regarded as the same event. Preliminary paleomagnetic data of the two holes reveal similar trends in intensity and inclination but not in declination, which makes correlation difficult.
No radiolarian-based age determinations were made at this site.
6.4. Northern Japan Trench
6.4.1. Site M0086
Site M0086 is located at the deepest part of the flat floor of a trench-fill basin (Basin N1) in the southern part of the northern Japan Trench (Figure F6). The basin has a slightly elongated shape with a north–south trend at around 7500 mbsl. The subbottom profile comprises a distinct series of both acoustically transparent and acoustically laminated packages (Figure F27). The youngest basin-fill package comprises a series of ~4 m thick alternating high- and low-amplitude layers. Beneath this youngest package, the upper acoustically transparent layer (~10 m thick) forms a distinct marker horizon. A 10–12 m package of high-amplitude reflections underlies the upper transparent layer. A lower acoustically transparent layer (~3 m thick) occurs between the upper high-amplitude package and a thicker (up to 25 m) lower package of laminated materials.
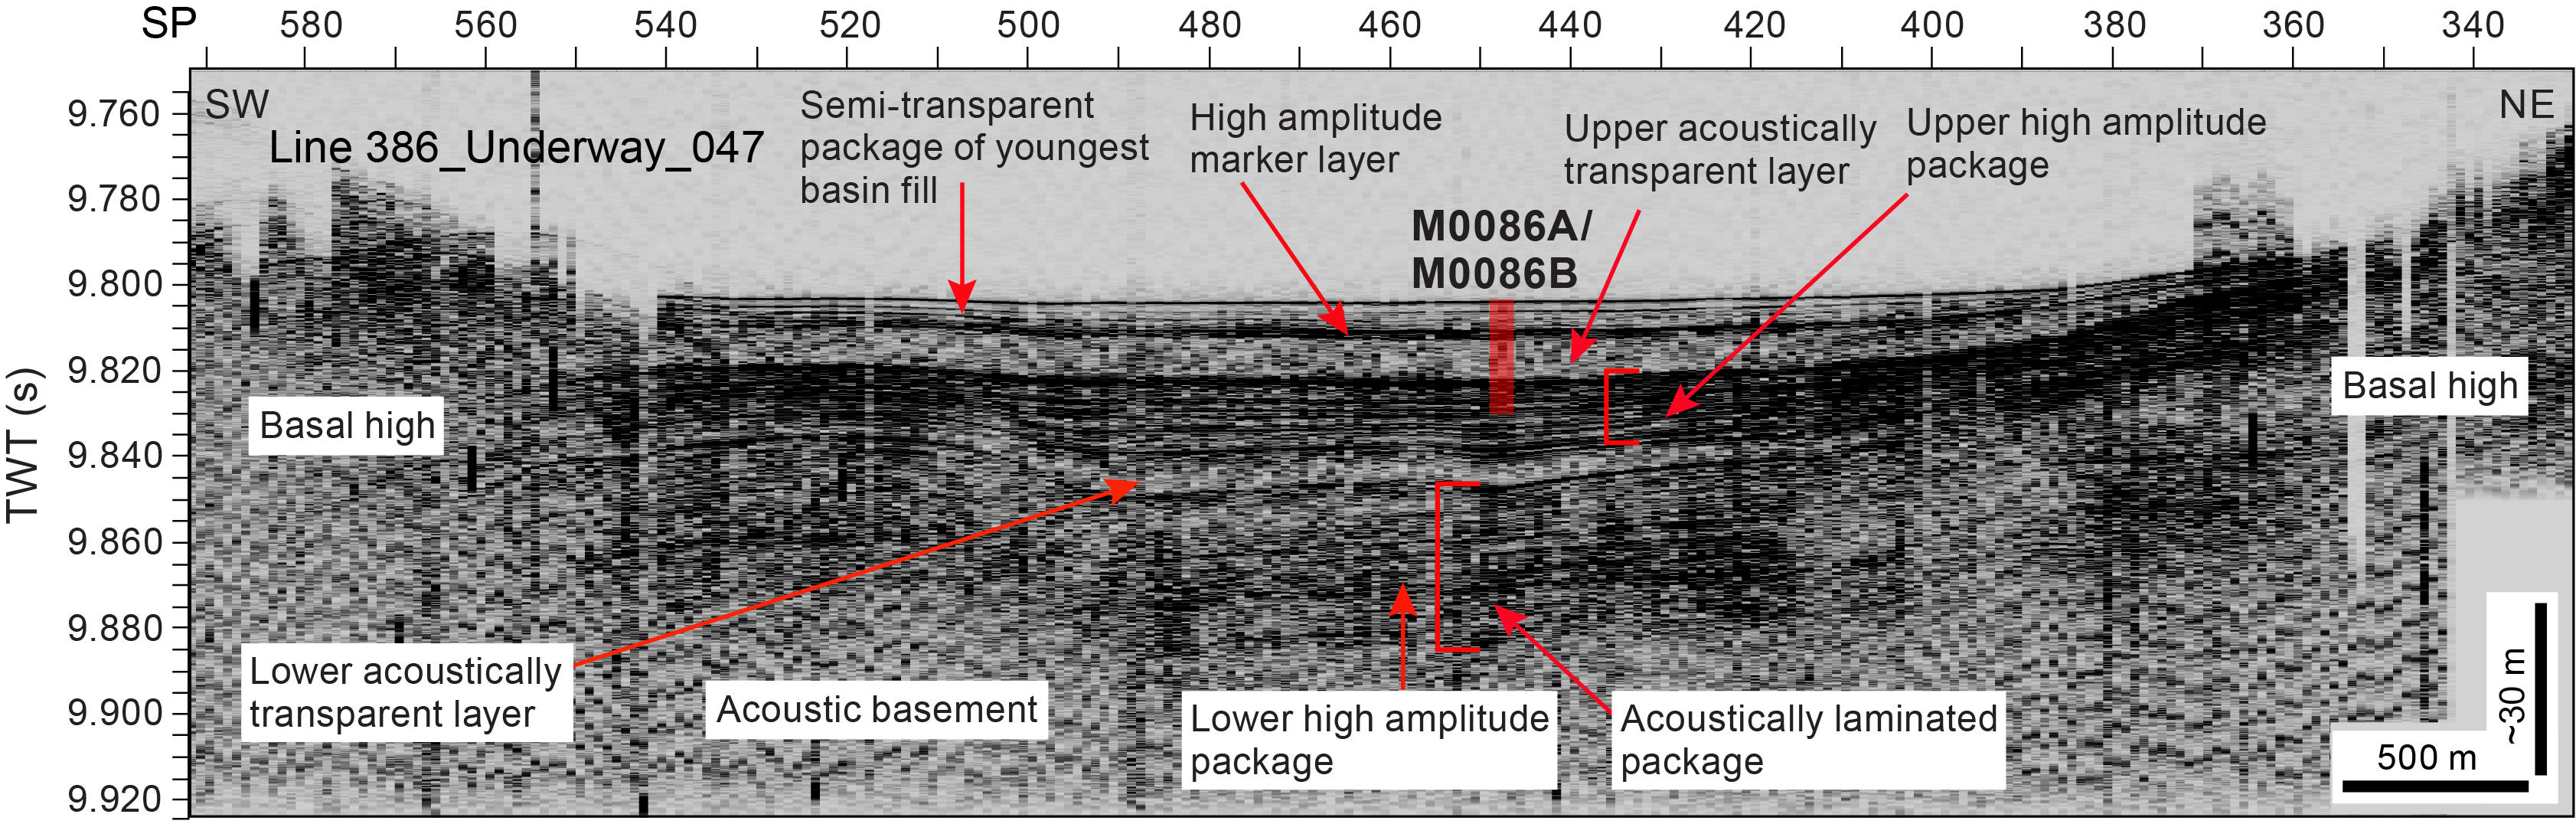
Figure F27. Line 386_Underway_047.
Site M0086 is composed of silty clay/clayey silt with sparse clay, silt, or very fine sand layers and comprises four intervals (Figure F28):
- Interval 1 (0–7.60 mbsf) presents an overall silty clay/clayey silt with scattered (less than one per meter) millimeter- to centimeter-thick silt laminae and three levels of clay.
- Interval 2 (7.60–16.70 mbsf) is characterized by a largely dominant lithology of silty clay with no visible primary sedimentary structure and diffuse very fine sand and silt patches. Soft-sediment deformation occurs as some floating rip-up clasts.
- In Interval 3 (16.70–17.50 mbsf), the lithology changes to silt and very fine sand without bioturbation, with soft-sediment deformation in the upper part and diffuse very fine sand and silt patches.
- Interval 4 (17.50–18.255 mbsf) is composed of bioturbated clay and silty clay under a sharp boundary with Interval 3.
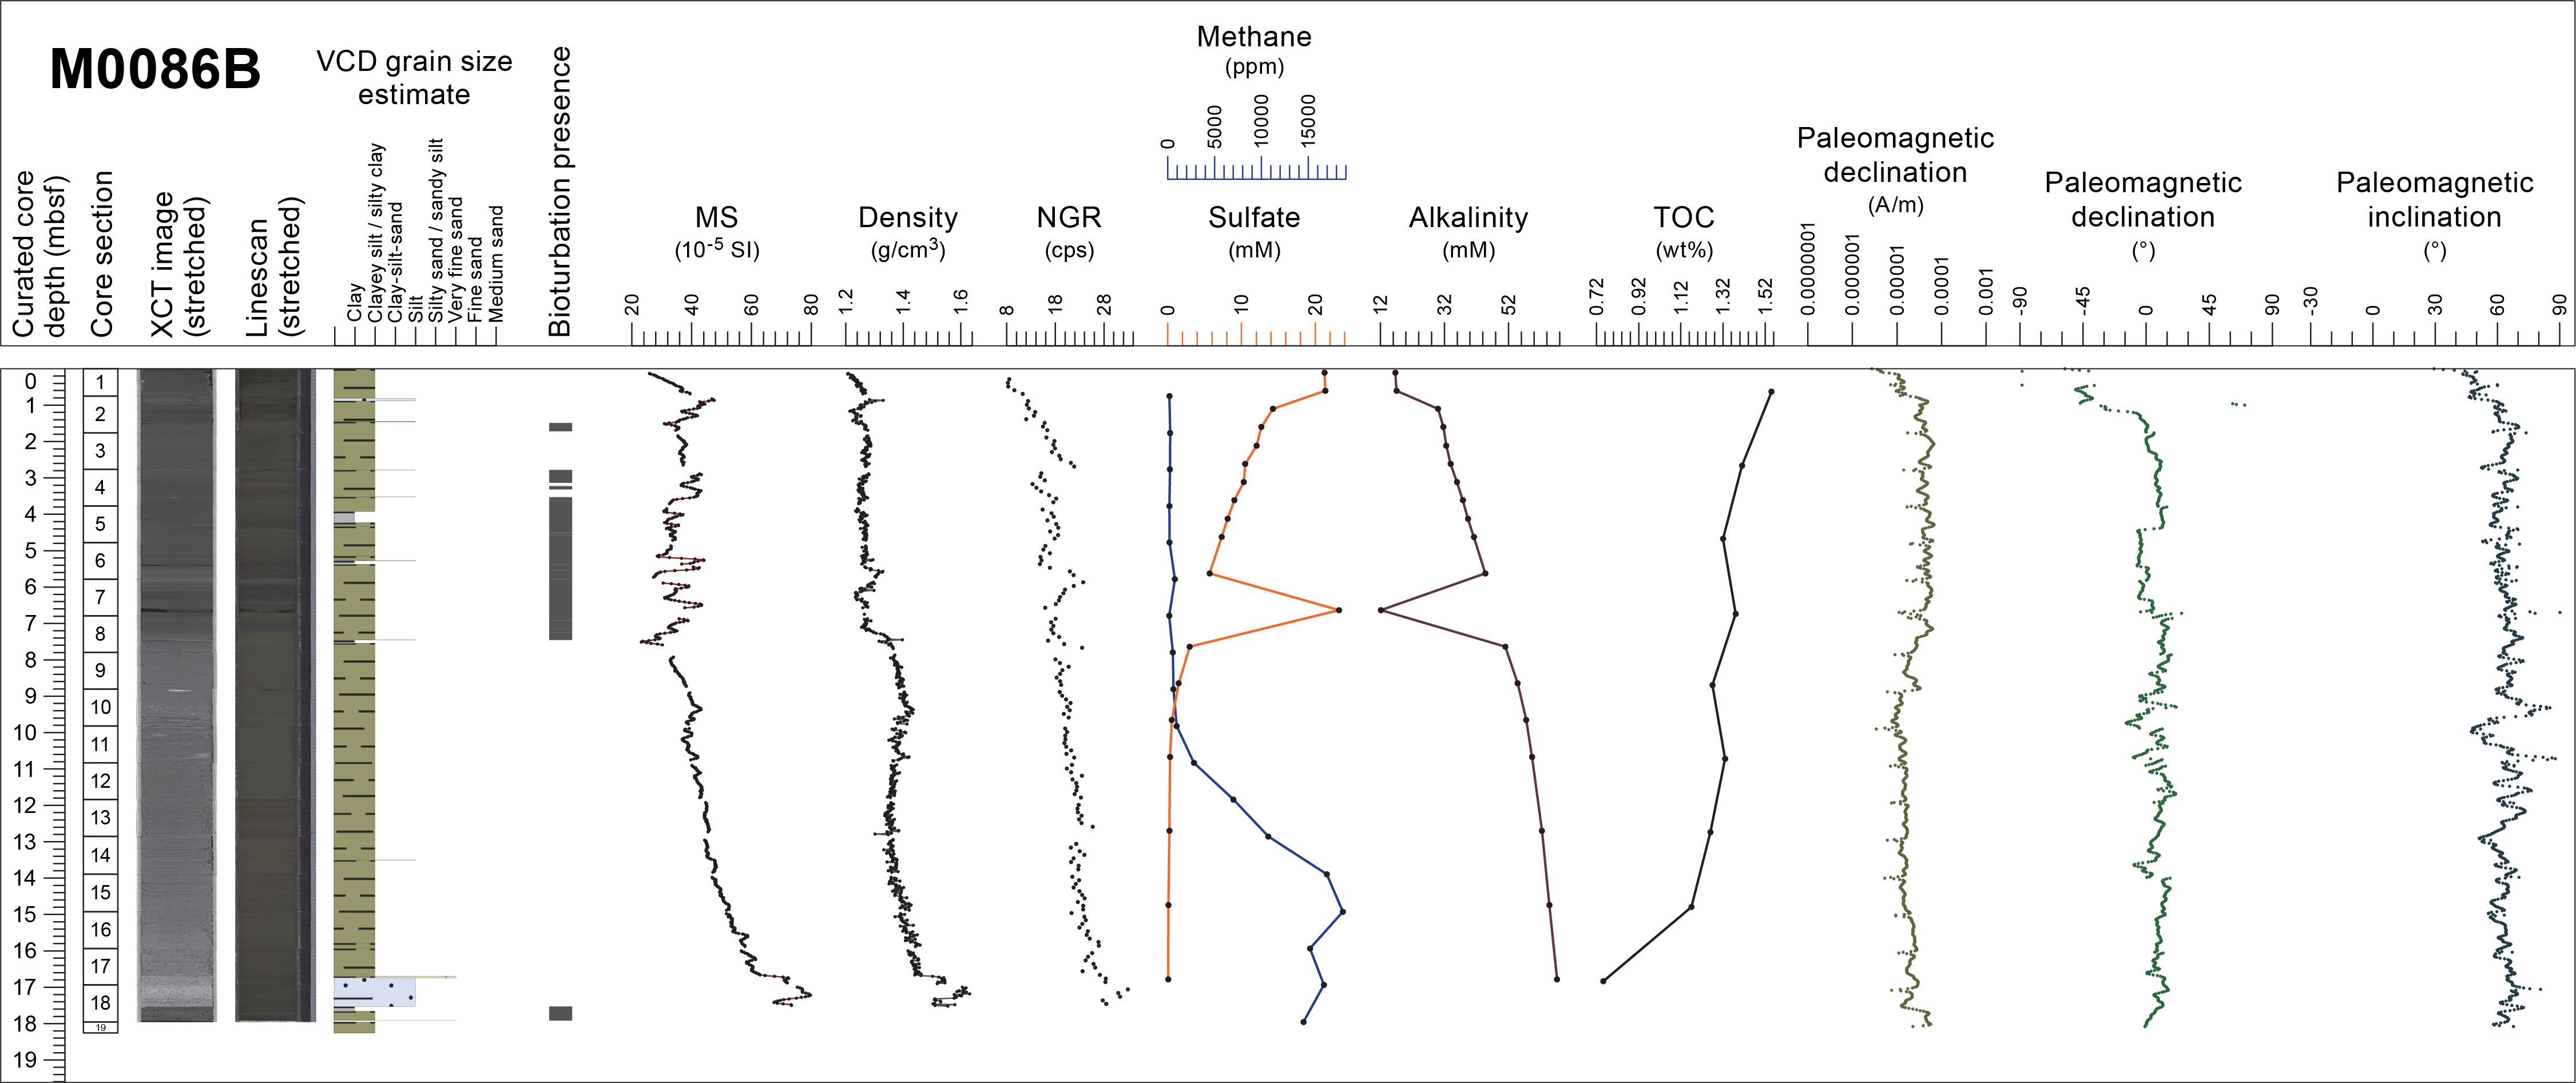
Figure F28. Composite Strater plot, Hole M0086B.
Sediment lithology is described as siliceous ooze, silt, clayey silt, silt and clay, and sandy silt with variable lithogenic, biosiliceous, and vitric components.
No visible tephra bed is described at this site. Even within the ultra-deepwater hadal environment, benthic and planktonic foraminifera occur in sediment. Benthic foraminifera in the upper part of Interval 2 are common and well preserved and indicate the source environment as upper bathyal.
Bulk density values at Site M0086 increase downcore from ~1.2 g/cm3 at the top to ~1.6 g/cm3 at the bottom (~18 mbsf) (Figure F28). Although bulk density generally increases steadily with depth, there is a sudden increase at ~7.5 mbsf where bulk density increases from ~1.25 to ~1.35 g/cm3. At this depth, there are also shifts in several other physical properties datasets (e.g., magnetic susceptibility, resistivity, and NGR). Below this shift, bulk density increases steadily to ~9.5 mbsf before it starts to slowly decrease with depth to ~12 mbsf. From 12 mbsf to the bottom of the core, bulk density steadily increases. There is a 1 m thick interval at the bottom of Hole M0086B where bulk density increases above 1.6 g/cm3, which are the highest values encountered at Site M0086. Magnetic susceptibility values at Site M0086 vary between 20 × 10−5 SI at the top of the hole to a maximum of ~80 × 10−5 SI at the bottom. In the uppermost ~7.5 m, magnetic susceptibility fluctuates around a baseline of ~35 × 10−5 SI. Below ~7.5 mbsf, magnetic susceptibility steadily increases with depth and the fluctuations are much more suppressed. At this transition depth, there are also shifts in several other physical properties datasets. Magnetic susceptibility and density curves show irregular peaks that correspond with laminated silt horizons in Interval 1 and the lowermost siltier horizon in Interval 2 and reach their highest values in the sandier Interval 3. The NGR profile shows peaks coinciding with clayey intervals in Interval 1 and downcore increases in Intervals 2 and 3.
Although salinity is near invariant throughout the cores, the IW concentration profiles of ammonium and alkalinity at Site M0086 (Figure F28) show an increase by 0.75 mbsf that can be explained by moderate rates of organic matter remineralization. The highest concentrations of dissolved Fe and Mn are present in the uppermost 2.5 m of the sediment column, consistent with organic matter remineralization by dissimilatory Mn- and Fe-oxide reduction. Elevated molybdenum in the same interval can result from release of Mo that is adsorbed to these oxide phases. This Mn- and Fe-oxide reduction is followed by organoclastic sulfate reduction below the SMT. At ~10 mbsf, evidence for the SMT is revealed by a transition to low sulfate and elevated methane. The stepped concentration profiles of sulfate, alkalinity, and ammonium with a strong slope change at ~1.1 mbsf clearly indicate nonsteady-state conditions and likely result from a very recent sedimentary event. IW Si concentrations are elevated throughout the cores. This is consistent with the smear slides which show abundant diatoms as well as volcanic glass shards. It is also consistent with elevated Si concentrations in the solid phase. Boron is also very elevated in the IW samples, with every sample being much higher than seawater. Although boron continues to rise while Si is mostly stable throughout the core, diatoms are the most likely source of boron as well. Lithium concentrations drop substantially from seawater values suggesting authigenic phases are forming that have an affinity for Li.
The variation of paleomagnetic intensity is characterized by fluctuations with higher values above 8 mbsf and smoothed variations with lower values below 8 mbsf (Figure F28). The paleomagnetic declination shows high fluctuations throughout the entire core. Inclination fluctuates between 30° and 60°. Large inclination drops are recognized at 10 and 13 mbsf.
No radiolarian-based age determinations were made at this site.
6.4.2. Site M0088
Site M0088 is located on the trench-fill basin floor of Basin N2 in the northern Japan Trench (Figure F6). The basin has an elongated shape with a north–south trend and water depths around 7520–7550 mbsl. A horseshoe-shaped depression occurs at the lowest part of the landward slope. Two thick, acoustically transparent layers are the most characteristic features seen in the subbottom profiles (Figure F29). A thin (~2 m) package of semitransparent materials occurs above the upper acoustically transparent layer (>10 m thick). A ~10 m thick package of high-amplitude reflections separates the upper transparent layer from a lower transparent layer (~7–8 m thick). The lowest layers of basin fill comprise a package of acoustically laminated materials with generally lower amplitude.
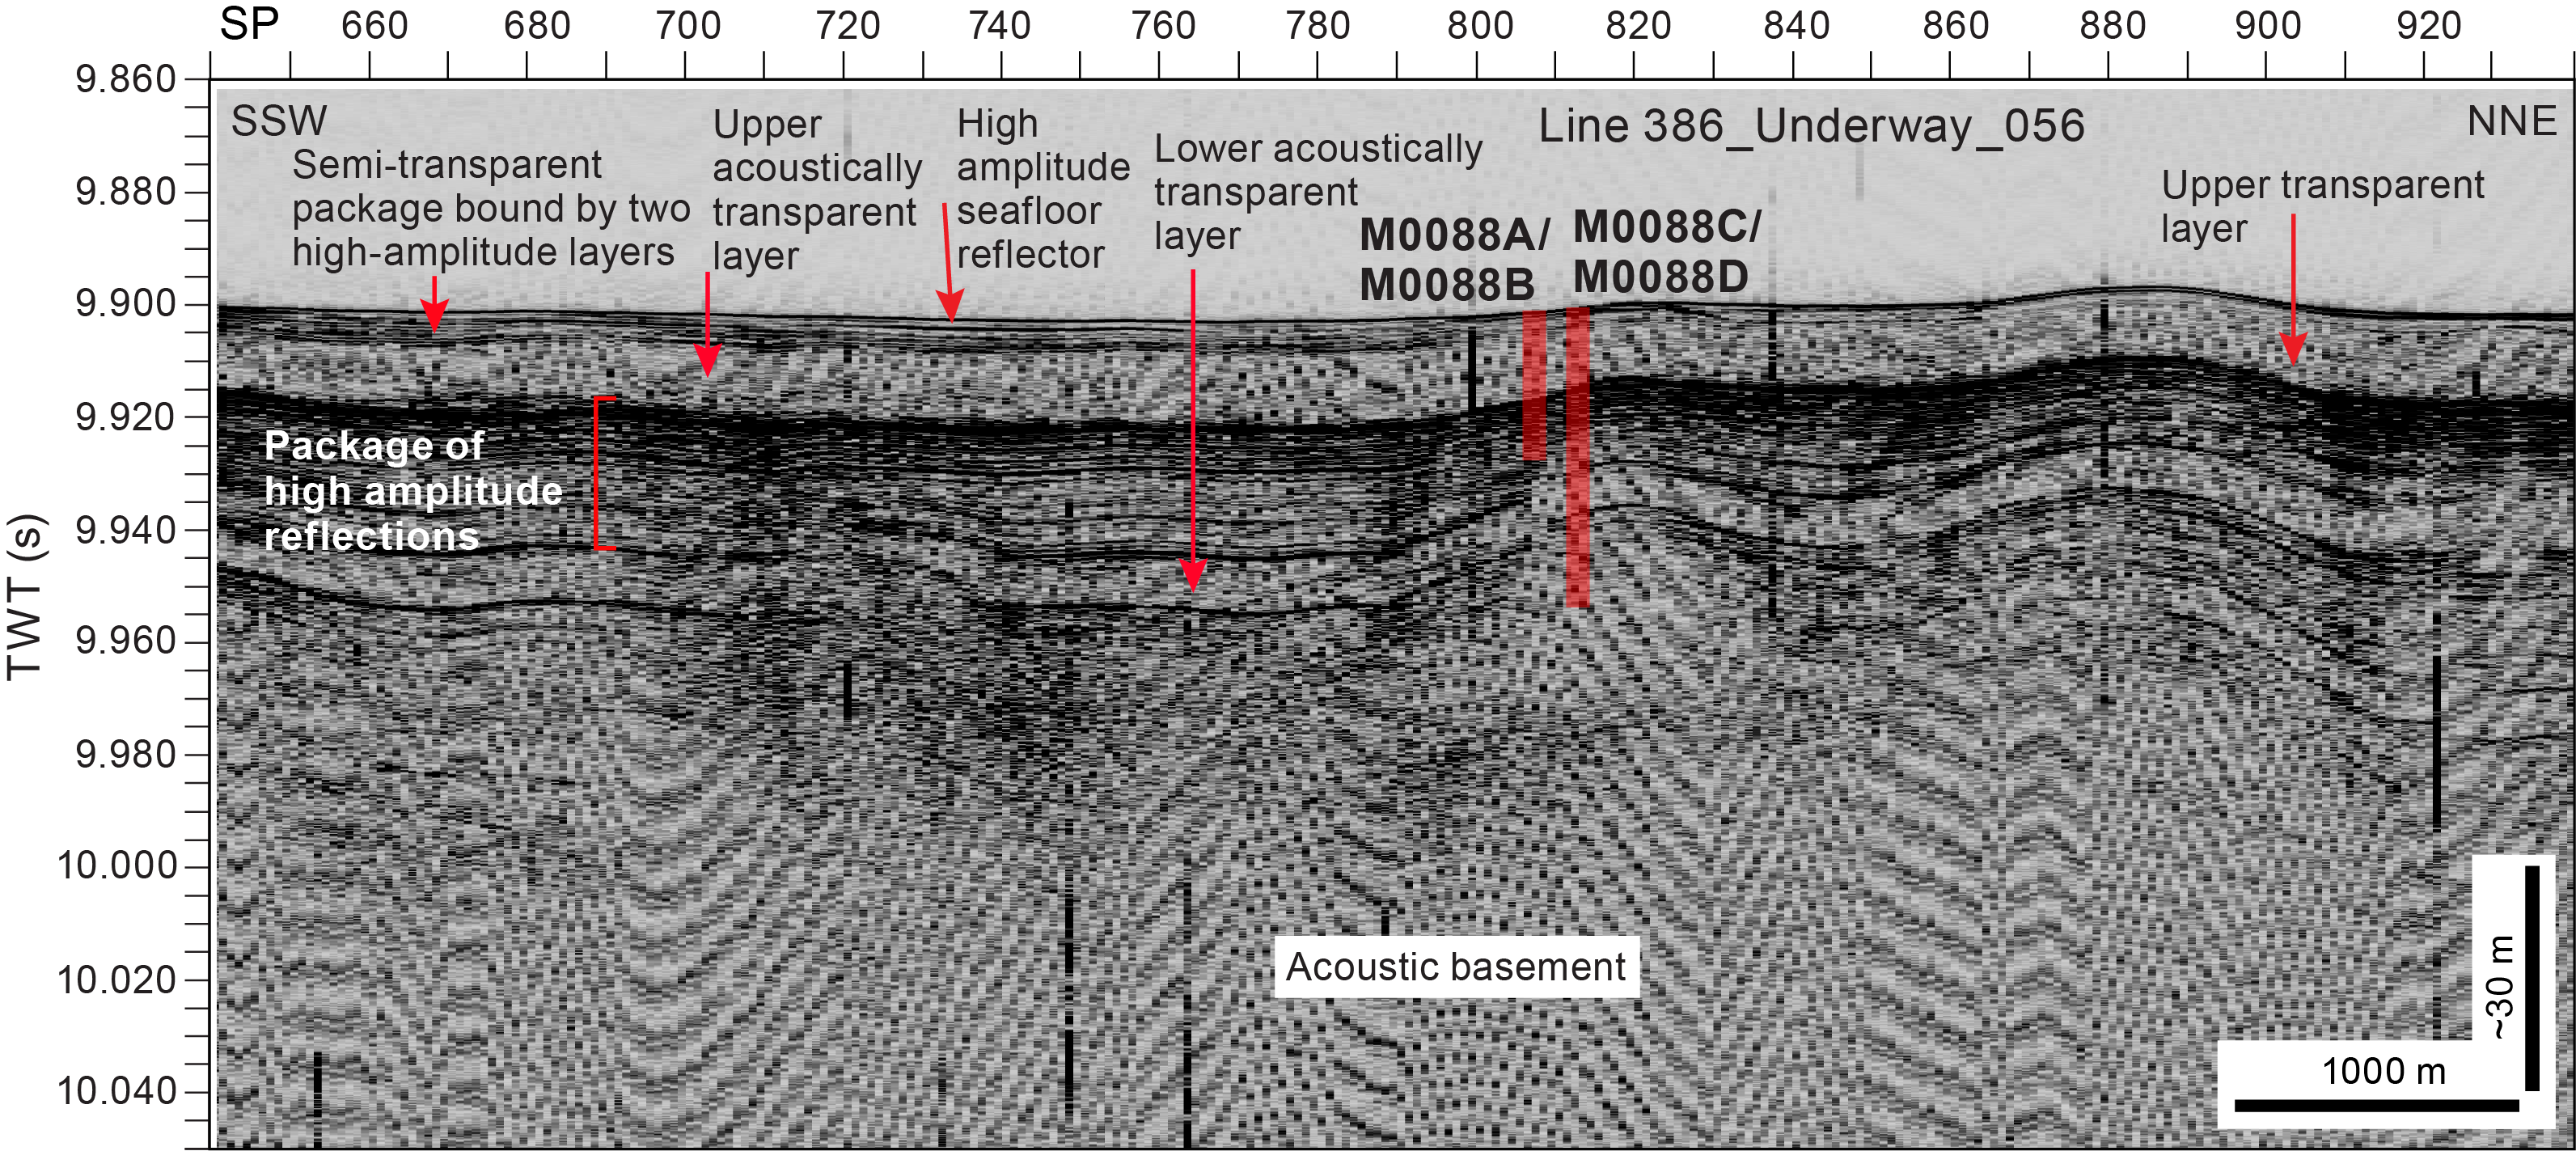
Figure F29. Line 386_Underway_056.
VCDs for Site M0088 indicate the cores are composed of the following five intervals, from the top of the hole to the base, which are defined by their lithostratigraphic character (Figure F30):
- Interval 1 (~0 to 2–2.5 mbsf) consists of slightly to moderately bioturbated silty clay and clay with moderate to heavy iron monosulfide abundance.
- Interval 2 consists of two units. The upper unit (~2–2.5 to 11.5–14.2 mbsf) is a thick silty clay to clay bed that is not bioturbated and contains soft-sediment deformation. The lower unit (~11.5–14.2 to 14.8 mbsf) comprises a fining-upward sand to silt succession with planar and wavy laminations.
- Interval 3 (~14.8 to 17.8–30.1 mbsf) consists of slightly to moderately bioturbated silty clay and clay with iron monosulfide staining and includes silt laminae.
- Interval 4 (~30.1–35.6 mbsf) consists of slightly to nonbioturbated silty clay to clay. Thick fining-upward sand to silt successions are included within the silty clay to clay.
- Interval 5 (~35.6–36.5 mbsf) consists of nonbioturbated silty clay to clay with sparse iron monosulfide.

Figure F30. Composite Strater plot, Hole M0088D.
No visible primary tephra bed is observed at this site. Smear slide observations of major lithologies reveal that the texture is clayey silt with some silty clay and silt. The smear slides show that lithogenic and biogenic components are the major components (80%–100%), with minor volcanic components (0%–20%). Benthic foraminifera with medium to good preservation are present to rare in all samples except for one. Planktonic foraminifera with good preservation are present in only one of the samples. Samples examined for foraminifera contain abundant diatoms, radiolaria, and sponge spicules along with some glass, iron monosulfides, and possible crustacean fragments. Benthic foraminifera in the upper part of Interval 4 with well-preserved thin-shelled taxa suggest that the provenance of the displaced assemblage is from an upper bathyal environment (200–600 mbsl).
Bulk density in the upper part of both holes shows the same trend to ~8.5 and ~5 mbsf in Holes M0088B and M0088D, respectively (Figure F30). These intervals are characterized by a density increase of 0.1 g/cm3 followed by a second increase to 1.4 g/cm3. Bulk density then remains fairly constant downcore over a thickness of 4 m. Below 8.5 and 5 mbsf in Holes M0088B and M0088D, respectively, values show opposite trends, with an increase from 1.3 to 1.4 g/cm3 in Hole M0088B and a decrease from 1.32 to 1.25 g/cm3 in Hole M0088D. Both holes are characterized by a pronounced peak that exceeds 1.6 g/cm3 between 14 and 15 mbsf. In Hole M0088D, this peak has a particular asymmetric shape. It is characterized by a very sharp base, where density values immediately drop by about 0.3 g/cm3 from a maximum value of 1.6 to 1.3 g/cm3. Above this peak, density gradually decreases upward over around 1 m to 1.2 g/cm3. Below 20 mbsf, the bulk density of Hole M0088D increases with depth from 1.1 to 1.35 g/cm3. At the bottom of the hole at 35.55 mbsf, the highest bulk density peak is 1.64 g/cm3. Magnetic susceptibility in Holes M0088B and M0088D shows consistent values that can be divided into four zones:
- The uppermost 2 m show a fluctuation around a baseline value of ~30 × 10−5 SI.
- Throughout the following ~10 m, magnetic susceptibility appears relatively constant at ~30 × 10−5 SI.
- There is then a succession of four peaks at around 15, 16, 17, and 18 mbsf. The first peak is characterized by an asymmetric shape with a very sharp lower base, which reaches 140 × 10−5 SI in Hole M0088B and 100 × 10−5 SI in Hole M0088D before the value immediately drops to 50 × 10−5 SI. The value gradually increases to ~60 × 10−5 SI and then sharply decreases, forming the second peak. The three other peaks have values of around 60 × 10−5 SI in Hole M0088D.
- In Hole M0088D from 20 mbsf downcore, it shows an increasing trend in values from ~10 × 10−5 to 40 × 10−5 SI with four superimposed peaks. The first three peaks around 23, 26, and 28.5 mbsf are about 2.5 m thick. They show a downcore rapid increase followed by a more gentle decrease. In contrast, the last peak at 35.5 mbsf shows a rapid but more gradual increase to over 150 × 10−5 SI followed by a more rapid decrease.
Magnetic susceptibility, density, and NGR show higher values in the fine to medium sand layer in Intervals 3 and 5 at Site M0088. The values show sharp increases at the base of Interval 2 and decrease toward the top of the interval in correlation with a fining-upward trend in grain size. In addition, NGR shows high values and an upward decreasing trend in correlation with the clay lithology of Interval 3. It shows high values in the silty parts of Intervals 2 and 5.
Indicators of organic matter degradation in the IW and headspace samples (ammonium, alkalinity, bromide, and methane concentrations) suggest that intensive remineralization occurs at Site M0088 (Figure F30). This process is most active in the uppermost ~4–5 m and gradually diminishes farther downcore. Notably, the ammonium profile at Site M0088 presents a rather wavy pattern, potentially indicating a pronounced and/or clearly preserved nonsteady-state diagenesis. The salinity changes closely follow ammonium and alkalinity, implying seawater salinity in the sediments with the gradual downcore addition of ions that are metabolic products of organic matter degradation. At Site M0088, dissolved Fe and Mn are highest in the uppermost meter of the sediment column, indicating organic matter remineralization by intensive dissimilatory Mn and Fe reduction. Below the uppermost sediment interval (~0–5 mbsf), organoclastic sulfate reduction becomes the dominant electron acceptor for organic matter degradation, followed by methanogenesis at greater depth. Sulfate reduction and subsequent formation of diagenetic sulfide minerals is also evident from the abundance of most likely iron sulfides in the VCDs. The depth of the SMT at Site M0088 can be located at ~5–7 mbsf. The SMT is clearly visible in the Ba profile, which shows the highest concentrations below the SMT and a decrease directly above it. The high silicate content in the solid phase, in tandem with low calcium and IC contents, indicates that silicate minerals dominate the sediment composition, consistent with smear slide petrology. TOC in the sediments at Site M0088 is relatively high, reaching up to 1.79 wt% and leading to the high mineralization rates observed in the IW profiles. Although intensive remineralization occurs in the top part of the sediments, high TOC and TC contents were found in the deeper sediments, suggesting that high amounts of organic matter may be buried in the trench sediments. High methane concentrations and C1/C2 values were observed in the deeper sediments; therefore, the roles of microbes in the fate of sedimentary organic carbon in the hadal sediments are also of significance.
Variation in paleomagnetic intensity at Site M0088 between 0 and 14 mbsf is characterized by smoothed low intensity, whereas the intervals between 14 and 17 mbsf are characterized by highly fluctuating intensity (Figure F30). The lower part is characterized by smoothed intensity intervals with four high peaks. Paleomagnetic declination of the interval between 0 and 14 mbsf shows fluctuations. Smoothed declination changes below 14 mbsf can be recognized. The lower declination pattern, which shows a large hump, could be interpreted as signatures of paleomagnetic secular variation. The paleomagnetic inclination profile broadly shows variation between 30° and 90°. There is a general shallowing trend downward throughout the profile from ~60° to ~40°. Preliminary paleomagnetic data display a unique pattern in intensity profiles, which are similar to those at Site M0084. They are characterized by smoothed low intensity and highly fluctuating intensity intervals. The declination pattern of the lower interval in Hole M0088D probably represents a signature of paleomagnetic secular variation.
In Hole M0088D, radiolarian fossils are abundant with good preservation. The sharp increase in the relative abundance of C. davisiana from <5% to >10% at 27.5 mbsf could be correlated with the boundary horizon of C. davisiana Zones ‘a and ‘b (Event 5; ~11.5 ka), corresponding to the Holocene/Pleistocene boundary (Morley et al., 1982). Two peaks in the relative abundance of C. davisiana at 27.5 and 33.9 mbsf are likely to correlate with Events 6 and 7, corresponding to DAE-2 (~12 ka) and DAE-3 (~17 ka) of Matsuzaki et al. (2014). Two minor peaks in the relative abundance of L. setosa at 15.3 and 23.4 mbsf are likely correlated to Events 2 (~7 ka) and 4 (~11 ka), respectively.
6.4.3. Sites M0084 and M0085
Sites M0084 and M0085 are located in the northernmost trench-fill basin (N3) in the northern Japan Trench (Figure F6). The basin has an elongated shape with a NNE–SSW trend, and its water depth is around 7600 mbsl. Site M0084 was selected to core at the point in the basin floor where the greatest sediment recovery was anticipated based on the subbottom profiles, which are characterized by several thick acoustically transparent packages and thick packages of acoustically laminated materials with high amplitudes (Figure F31). The uppermost transparent package is the thickest (10–12 m). The transparent packages become thinner toward a bathymetric high, with the acoustic pattern revealing a condensed section where Site M0085 was located. The thickness of the uppermost transparent package at the high is 1–2 m.
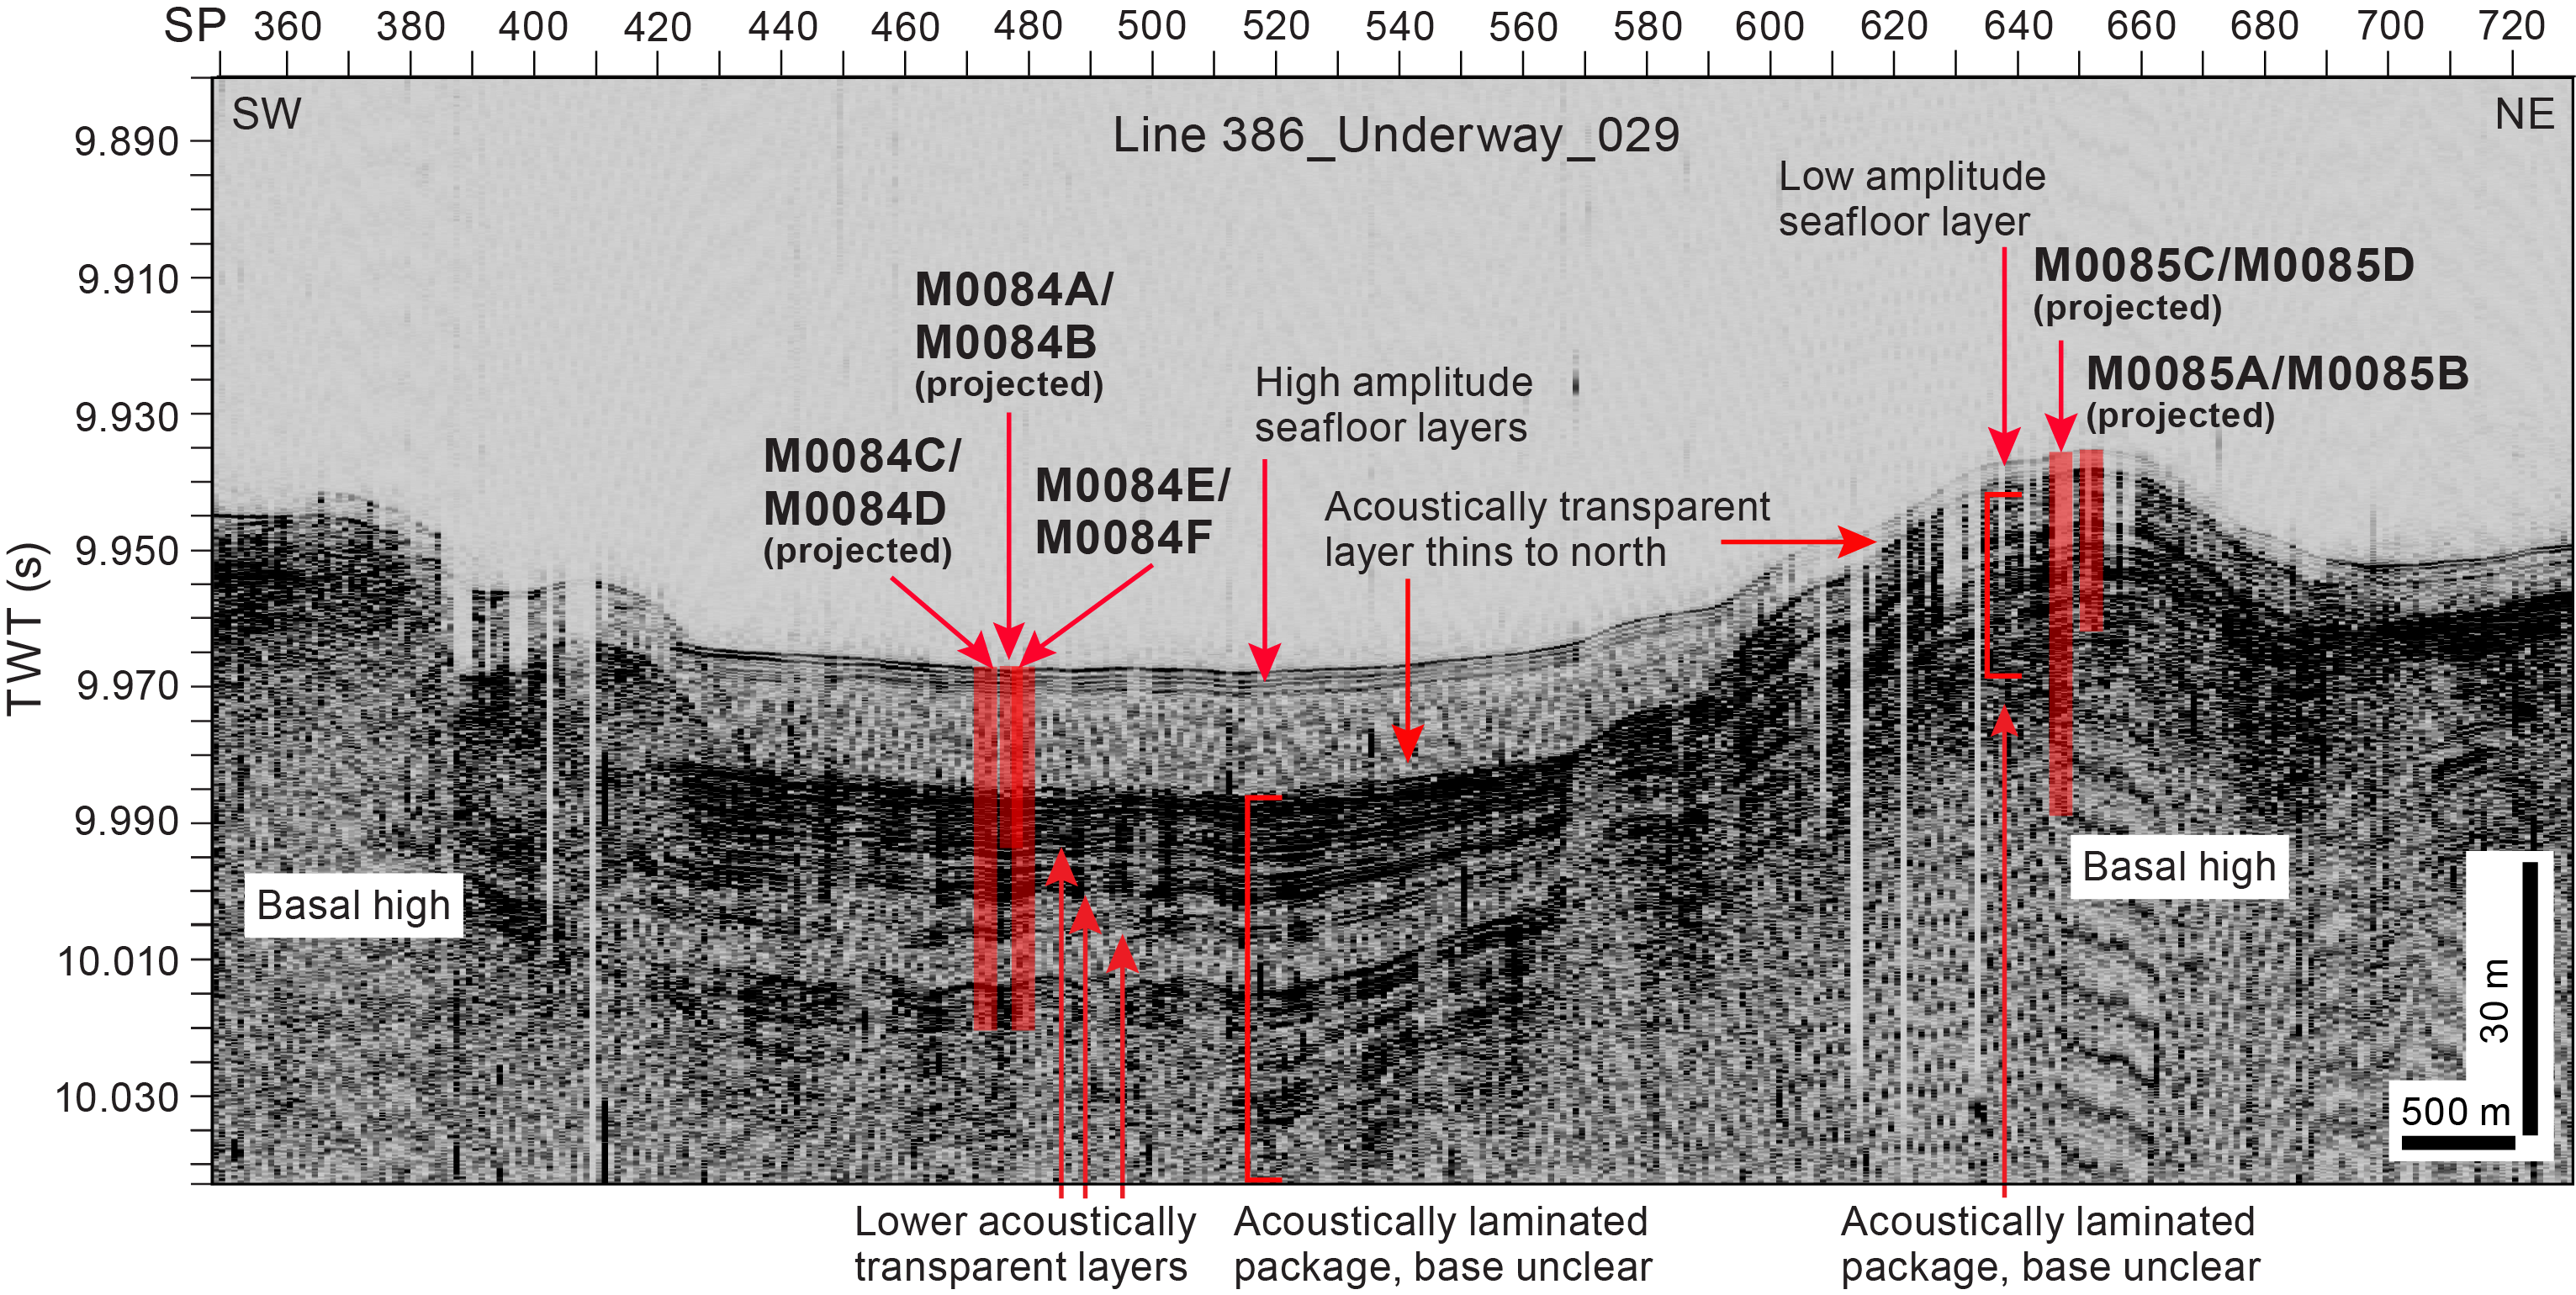
Figure F31. Line 386_Underway_029.
VCDs of core sections from Site M0084 show the following five intervals downcore (Figure F32):
- Interval 1 (above ~2–3 mbsf) is a 1–3 m thick medium- to thick-bedded unit of bioturbated silty clay and clay.
- Interval 2 (~3–15 mbsf) is a 12 m thick, very thick-bedded silty clay with centimeter-scale contorted silt layers and patches.
- Interval 3 (15–17 mbsf) is 1–2 m thick fining-upward sand to silt with well-defined planar and ripple lamination, also with occurrences of foraminifera and micas.
- Interval 4 (15–17 to ~35 mbsf) is a ~20 m thick medium- to thick-bedded, fining-upward succession of very fine sand to bioturbated clay. Soft silt pebble-sized clasts and a 3 cm large yellowish silty carbonate patch (Ikaïte?) are also observed.
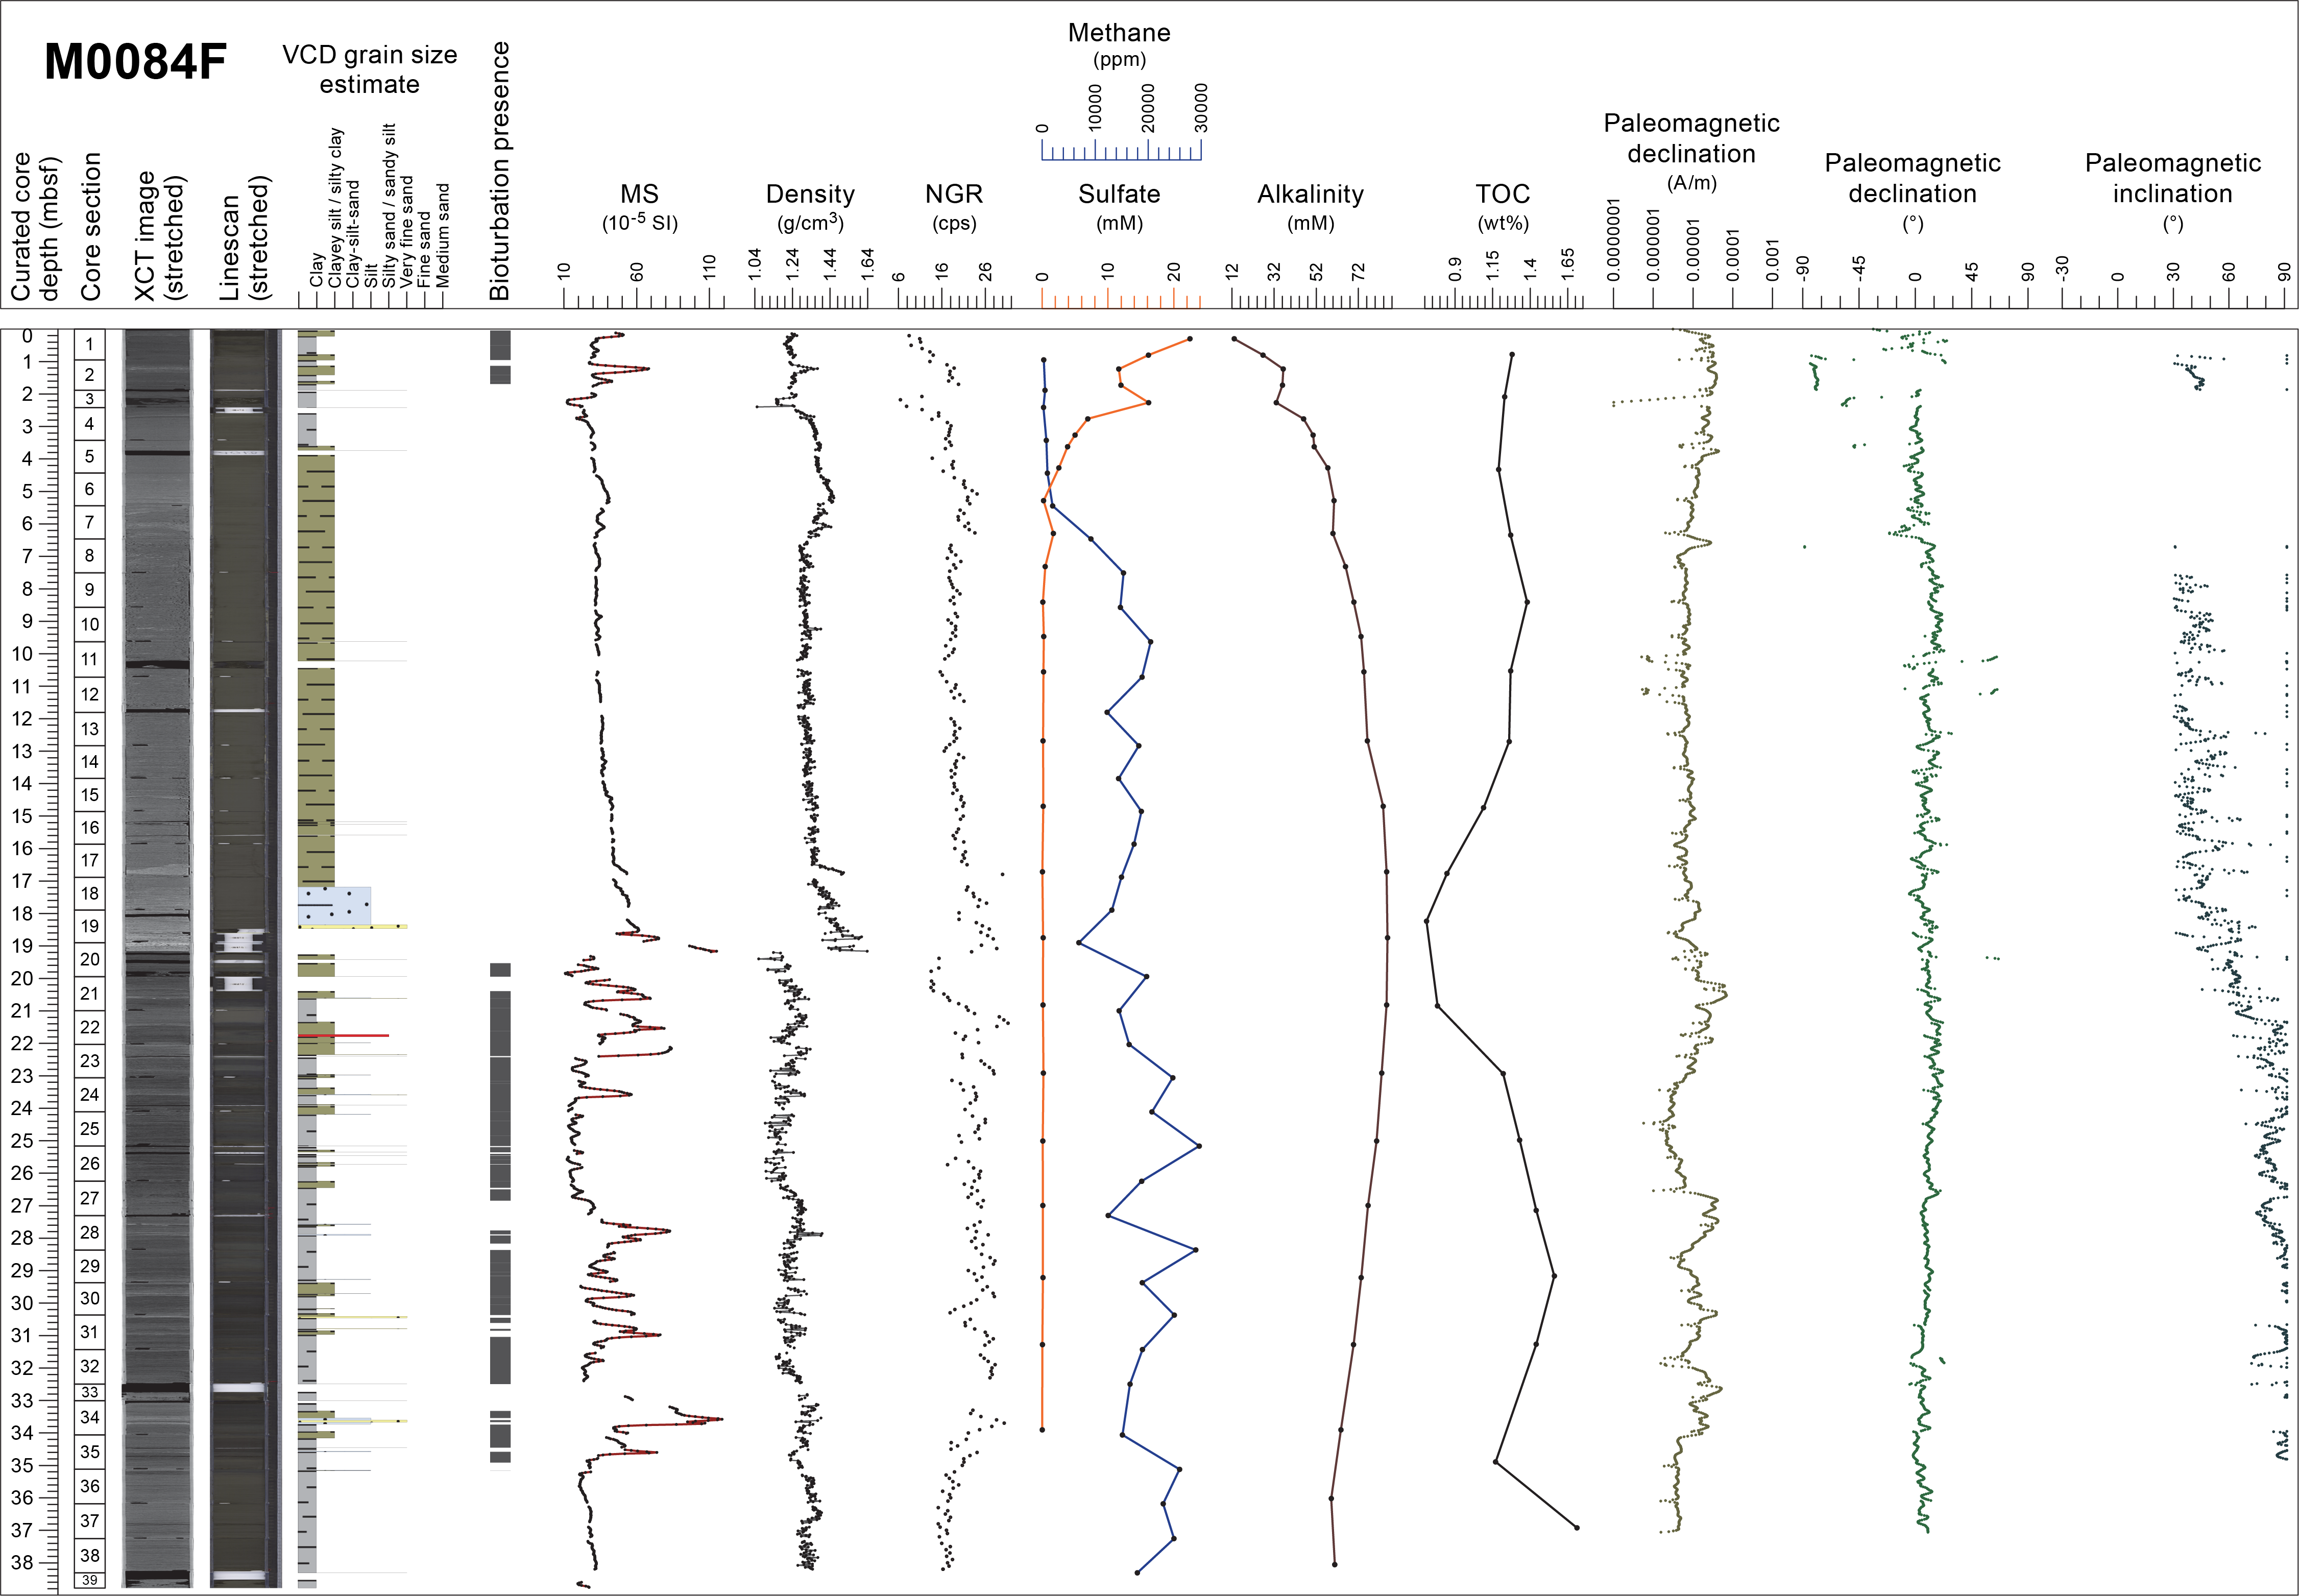
Figure F32. Composite Strater plot, Hole M0084F.
Iron monosulfides are characteristically absent in Intervals 2 and 3 but present in Intervals 1 and 4.
Smear slide observations indicate that the sediment textures of Site M0084 are dominated by clayey silt with silty clay and silt and sediment compositions are lithogenic (50%–80%) and/or siliceous biogenic (20%–70%). The abundance of volcanic material is less than 50%, but a tephra layer occurs at 21.735–21.795 mbsf in Interval 4. Foraminifera, micas, and shell fragments are observed in the sections. Benthic foraminifera with well-preserved thin-shelled taxa in the upper part of Interval 4 suggest that the provenance of the displaced assemblage is from an upper bathyal environment.
VCDs of core sections from Site M0085 show less variability than those from Site M0084 and differ in a number of ways. From the seafloor downhole, a composite section comprises the following intervals (Figure F33):
- Interval 1 is a <5 m thick silty clay with either a fining-upward succession of very fine sand, silt, silty clay, and clay or sand and silt laminae or patches.
- Interval 2 comprises a ~9 m thick clayey segment with minor laminated sand and silt layers, some of which comprise shell fragments.
- Interval 3 is composed of a ~10 m thick bioturbated clay and silty clay with fining-upward very fine sand and silt laminae that rests on a sharp based, decimeter-scale, laminated, fining-upward coarse to very fine sand horizon.
- Interval 4 is a ~10 m thick thick-bedded, fining-upward succession of sand, silt, and bioturbated clay.
- Interval 5 is a ~2 m thick succession of mud (matrix)-supported pebbles and cobble clasts.
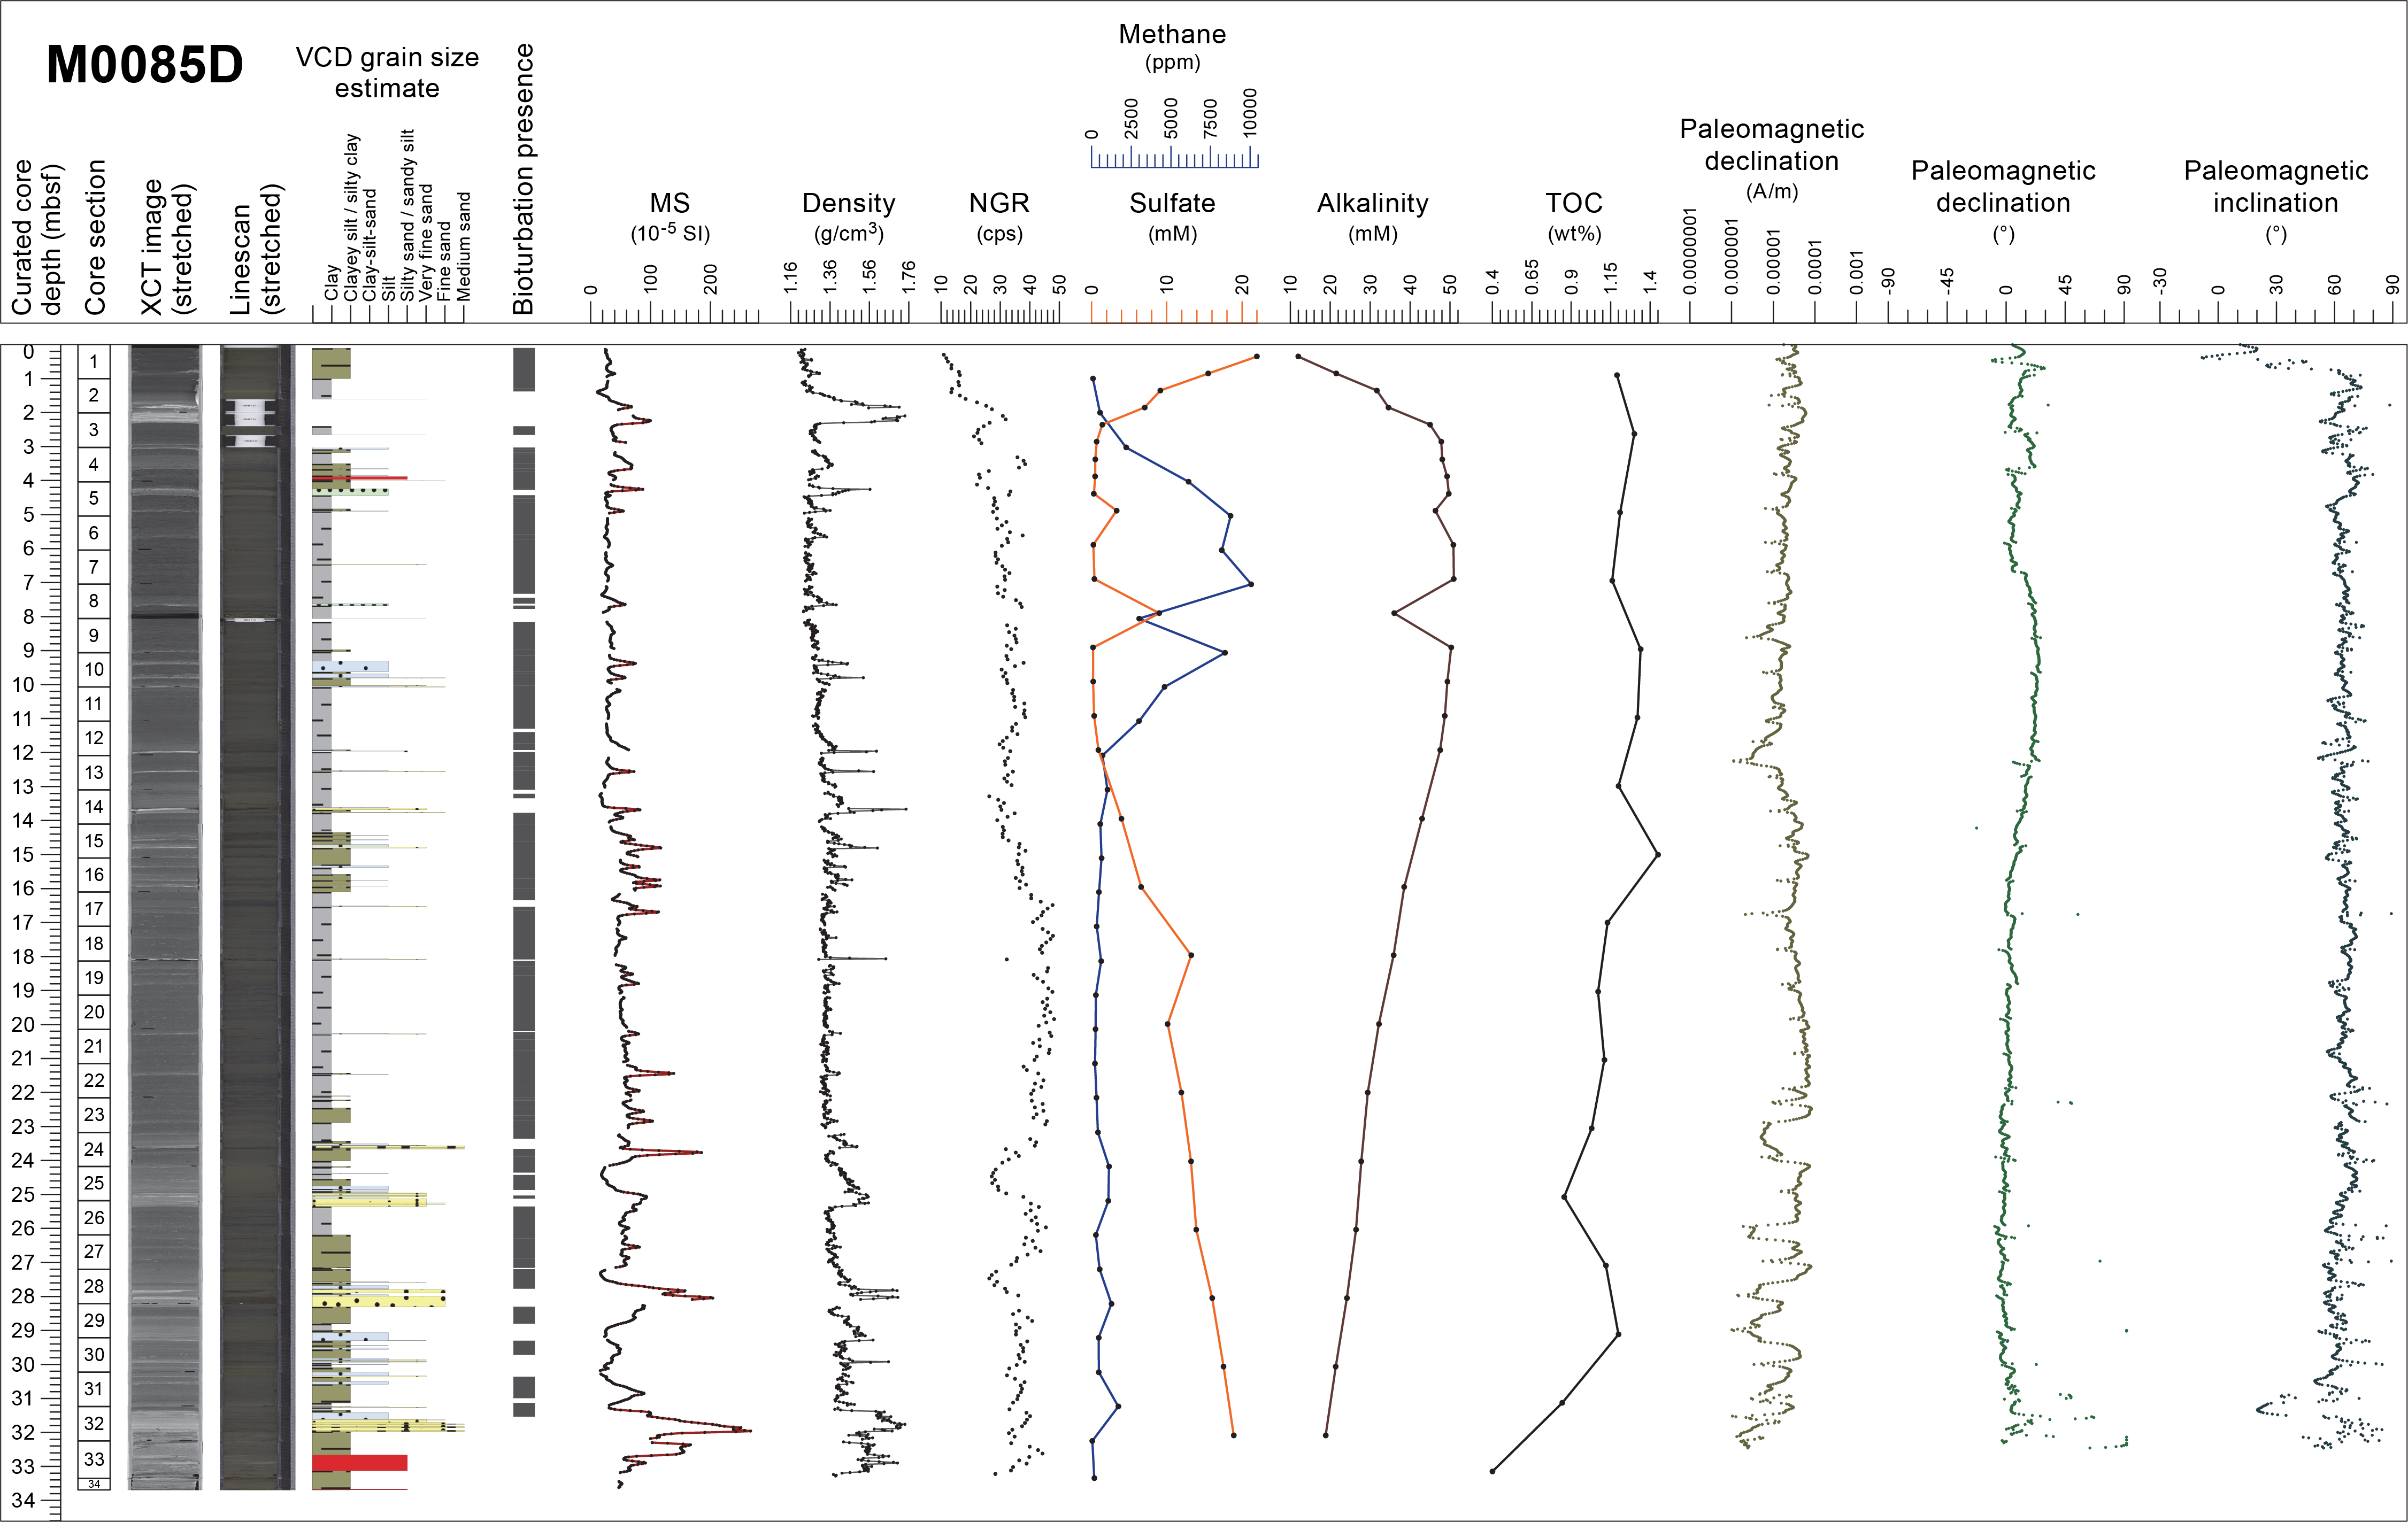
Figure F33. Composite Strater plot, Hole M0085D.
Iron monosulfides are sparse and bioturbation is slight to moderate at Site M0085 except at the top of Intervals 1 and 5 in nonbioturbated sandy and mud-supported clast horizons. Sediment textures at Site M0085 are mostly clayey silts with minor sandy silts, and sediment compositions are lithogenic and/or siliceous biogenic. The abundance of volcanic material is less than 50% except for samples from four tephra layers at 14.995–15.035 mbsf in Hole M0085B and 3.915–3.965, 32.05–33.12, and 33.668–33.688 mbsf in Hole M0085D. The lowermost two tephra layers occur as blocks and patches in a MTD (Interval 5). Foraminifera, micas, and shell fragments are observed in the sections. Two samples from Interval 3 contain few to common benthic and few to abundant planktonic foraminifera. The benthic foraminiferal assemblage from the upper part of Interval 3 shows moderate preservation and suggests that the provenance of the displaced assemblage is interpreted to be from a middle to lower bathyal environment, whereas that from a laminated sand layer in the lower part of Interval 3 has good preservation, indicating the provenance is from an upper bathyal environment.
Magnetic susceptibility values at Sites M0084 and M0085 range 10.90 × 10⁻⁵ to 118.64 × 10⁻⁵ SI and 11.05 × 10⁻⁵ to 267.02 × 10⁻⁵ SI, respectively (Figures F32, F33). Bulk density values measured offshore range 1.05–1.66 g/cm3 at Site M0084 and 1.20–1.74 g/cm3 at Site M0085, whereas those measured using onshore for moisture and density measurements range 1.21–1.61 and 1.22–1.55 g/cm3, respectively. NGR ranges 6.45–31.57 counts/s for Site M0084 and 9.75–48.27 counts/s for Site M0085. Magnetic susceptibility, density, and NGR logs of Site M0084 show parallel variations with a slight wavy shape in Interval 1, a very smooth monotonous trend in Interval 2, a sharp increase at the top of Interval 3 that sharply coincides with the erosion surface at the base of the interval, a saw tooth shape with low values in Interval 4, and a quasilinear smooth trend with very low magnetic susceptibility in the basal clay of Interval 5. In Interval 4, most peaks in magnetic susceptibility values correlate to the very fine sand and silt layers. The very smooth magnetic susceptibility, density, and NGR curves occur in Interval 5. The magnetic susceptibility and density logs of Site M0085 show similar subparallel curves, with most of the peaks correlating with the sandier horizons. The NGR log is smoother and generally anticorrelated with the other two (low NGR values in the sandy parts and high values in the clayey parts). Interval 4 has large variations from high to low magnetic susceptibility and density values that correlate to the 2–5 m thick sand and silty clay to clay alternations. The silty clay and clay in Intervals 1 and 3 show intermediate values of magnetic susceptibility, density, and NGR with some peaks in the sand/silt beds, whereas clay Interval 2 shows very low amplitude variations.
The downcore pore water profiles of sulfate, alkalinity, ammonium, and bromide at Sites M0084 and M0085 show characteristic changes related to organic matter degradation (Figures F32, F33). The rapid linear decrease in sulfate concentrations due to organoclastic sulfate reduction and anaerobic oxidation of methane marks the SMT at ~5–7.5 mbsf at Site M0084 and ~3–4 mbsf at Site M0085. Together with very high alkalinity and ammonium concentrations in the cores, this suggests that intensive organic matter remineralization is taking place, which is also supported by the observed high TOC contents. High Si concentrations at both sites are probably sustained by biogenic opal dissolution, as evidenced by smear slide observations that show a substantial amount of diatom frustules and sponge spicules in the sediments. Tephra alteration could also contribute to the high Si concentrations, as reflected by the downcore increase in Sr concentrations and the occurrence of discrete tephra layers. The general downcore increase in B concentrations is likely caused by desorption from clay minerals. In contrast, the downcore Li profiles could reflect low-temperature silicate diagenesis, which adsorbs and incorporates Li in the secondary minerals, with the exception of the downcore increase in the lowermost 5 m at the bottom of Hole M0085D, which may reflect a supply of Li from below. One notable feature of the pore water profiles at Site M0085 is the reversal of most pore water species toward the seawater values below ~11–12 mbsf. This feature is usually observed in the incoming plates of subduction zones where seawater intrudes into the basement basaltic crust through seamounts or plate bending-related fractures, thereby inducing a diffusional exchange with overlying sediments (Harris et al., 2013; Torres et al., 2015; Zindorf et al., 2019).
Paleomagnetic intensity at Site M0084 is characterized by thick low-intensity intervals of 1 × 10⁻⁵ A/m between ~4 and 18 mbsf in Holes M0084B, M0084D, and M0084F; between 23 and 25 mbsf in Holes M0084D and M0084F; and between 34 and 37 mbsf in Hole M0084F (Figure F32). Conversely, the intensity at Site M0085 decreases downward (from ~6 × 10⁻⁵ A/m to less than 1 × 10⁻⁵ A/m) from 2 to 12 mbsf in Holes M0085B and M0085D and then increases from 12 mbsf to the core bottom in Hole M0085B and up to 22 mbsf in Hole M0085D (reaching intensities of ~6 × 10⁻⁵ A/m) (Figure F33). Noticeable fluctuations in intensity between ~8 × 10⁻⁵ A/m and less than 1 × 10⁻⁵ A/m from 22 mbsf to the core bottom in Hole M0085D are observed. Preliminary paleomagnetic data from Sites M0084 and M0085 display various patterns of declination and inclination. Inconsistent declination and inclination profiles between 4 and 19 mbsf in Holes M0084B, M0084D, and M0084F are recognized. The declination profiles for Holes M0085B and M0085D reveal good agreement with the cyclic pattern between 0 and 6 mbsf. The inclination profiles reveal remarkable inclination lows at 5 mbsf. These signatures suggest Holes M0085B and M0085D possess good paleomagnetic records.
Two and six radiolarian events are recognized in Holes M0084D and M0085D, respectively. In Hole M0084D, the increase in relative abundance of C. davisiana below 28 mbsf can be correlated to the boundary horizon of C. davisiana Zones ‘a and ‘b (Event 5; ~11.5 ka), corresponding to the Holocene/Pleistocene boundary (Morley et al., 1982). A primary peak in the relative abundance of C. davisiana at 28.0 mbsf is likely correlated to Event 6, corresponding to DAE-2 (~12 ka) of Matsuzaki et al. (2014). In Hole M0085D, the increase in relative abundance of C. davisiana below 26.1 mbsf could be correlated with Event 5, and a primary peak in the relative abundance of C. davisiana at 28.3 mbsf is likely correlated to Event 6. The increase in relative abundance of the Tetrapyle group between 14.6 and 20.0 mbsf most likely corresponds with a mid-Holocene warm period (Matsuzaki et al., 2020; Chinzei et al.,1987). A primary peak in the relative abundance of L. setosa at 15.6 mbsf is likely to correlate with Event 2 (~7 ka). Ancient radiolaria were recovered from a MTD near the bottom of the core (32.2 and 33.2 mbsf), such as Lamprocyrtis heteroporos (Hays) and Cycladophora sphaeris (Popova). Significantly, these species disappeared in the early Pleistocene.
7. Preliminary scientific assessment
The overarching goals of Expedition 386 were to sample and analyze the sedimentary sequence in a series of trench-fill basins that record the past great earthquakes along the Japan Trench. This is the first time ~40 m giant piston cores have been taken from multiple sites along this ultra-deep hadal trench environment. Our main objectives were to (1) identify the sedimentologic, physical, chemical, and biogeochemical proxies of event deposits in the sedimentary archive that allow for confident recognition and dating of past Mw 9 class earthquakes versus smaller earthquakes and versus other driving mechanisms; (2) to explore the spatial and temporal distribution of such event deposits to investigate along-strike and time-dependent variability of sediment sources, transport and depositional processes, and stratigraphic preservation; and (3) to develop a long-term earthquake record for giant earthquakes. Our additional objective was to systematically describe the Japan Trench hadal environment in unparalleled high temporal and spatial resolution, quantify sedimentary and dissolved geochemical concentrations, and characterize hadal microbiological communities. For these objectives, the original operational plan was to sample the trench-fill deposits from a total of 18 primary sites along the entire Japan Trench.
Expedition 386 was extremely successful. This is the first time a GPC system has been used in the IODP framework, and the system demonstrated its value, taking up to 40 m cores from multiple sites. The coring objectives were almost completely achieved, and a total of 831.19 m of core was recovered from 15 sites (from ~36°N to 40.4°N and in water depths between 7445 and 8020 mbsl) (Figure F6; Table T1), despite the strong Kuroshio current and rough weather preventing full planned deployments at all primary sites.
The potential range of scientific applications for this unique data set is very large, encompassing paleoseismology, sedimentary processes, tectonics, geochemical cycles, paleoenvironment, and microbiology. Below, we summarize the preliminary highlights of the scientific achievements of Expedition 386.
7.1. Sediment lithology and event deposits in the trench-fill deposits
The lithology in most basins is similar and dominated by clayey silt, silty clay, and clay with minor components of medium sand, fine sand, very fine sand, and silt. The most common primary bedding structures are thin beds (1–3 cm) and laminae sometimes forming parallel laminated or wavy laminated intervals that contain fine sand, very fine sand, silt, and clayey silt. These deposits can have sharp, erosional, wavy, gradational, and bioturbated lower and upper contacts. Notable for the Japan Trench basins are intervals of coarse-grained beds and laminae of medium to very fine sand and silt up to half a meter thick. Above, there can be intervals up to 6 m thick of homogeneous clay and silty clay that lack sedimentary structures and bioturbation. Typical event deposit stratigraphy is demonstrated by a fining-upward sequence from a sharp, erosional basal surface below coarser (sandier) bed grading through laminated and/or graded sand to silt to clay without any sedimentary structures or bioturbation. The thickness of each event deposit is variable, from a few centimeters to >10 m. In some basins, the clay and silty clay intervals can also show soft-sediment deformation structures such as contorted and dipping beds, recumbent and isoclinal folds, and floating silt and sand patches. MTDs with clay clasts, contorted and dipping beds, and other soft-sediment deformation structures were reported at northern Japan Trench Sites M0084–M0088 but were not observed in the southern and central Japan Trench. Coarse-grained (sandier) beds and fining-upward grain size trends of the event deposits are detectable in some physical properties measurements. Rapid increasing and gradual upward decreasing magnetic susceptibility and bulk density values is a typical pattern of thick event deposits from base to top, respectively. Similar patterns are also resolved in X-ray CT data showing clear radiodensity changes at the event deposits. Several event deposits also show characteristic signals but in places with a slightly different pattern (e.g., a peak occurs not at the base of an event deposit, where the grain size is coarsest, but in the middle to upper horizon of a basal coarse bed). As the peak of NGR may occur at the horizon of high concentration of clastic particles that contain high concentration of radioactive elements such as K and Th, this suggests that the concentration of radioactive elements in the event deposits is not solely controlled by grain size.
The sediment shows abundant lithogenic, vitric, and biosiliceous (diatoms and sponges spicules) material, the latter two locally forming vitric ashes and ooze, respectively. Iron monosulfides were observed throughout all records, often visually amplifying the stratigraphic laminations and bioturbation. Authigenic carbonates were restricted to a few occurrences of ikaite at Sites M0084 and M0088, a carbonate nodule at Site M0095, and rare authigenic carbonate microcrystals observed in the smear slides, XRD data, and VCDs. Calcareous fossils such as foraminifera, calcareous nannoplanktons, and shell fragments are occasionally observed. Bulk mineralogy shows an abundance of quartz, feldspar, and clay minerals and minor occurrences of micas, pyroxene, heavy minerals, and amphibole group minerals. Notably, palygorskite is locally present as a weathering product of vitric glass shards and other volcaniclastic materials.
Stratigraphy of the event deposits shows spatial variability. In the northern Japan Trench basins, the occurrence of a thick (>10 m) MTD a few meters below seafloor is the most characteristic feature. Well-preserved benthic foraminifera were observed in the MTD in some holes. These MTDs were described and dated to 1.77 (+0.49/−0.31) bulk OC 14C ky before present (BP) by Usami et al. (2021) and Schwestermann et al. (2021), respectively, although they reported only the upper (muddy) part of the MTD. Similar lithofacies were also found in the lower part of the cores at Sites M0084 and M0088, indicating the repeated occurrence of the MTD in the northern Japan Trench basins. This is supported by the subbottom profiles in the basins as a repeated occurrence of acoustically transparent layers. In the basins at the boundary area between the central and northern Japan Trench, almost all core material was composed of event deposits several tens of centimeters to several meters thick. Only thin intervals below the event deposits had a signature of bioturbation. This suggests frequent deposition of event deposits in these basins. Two MTDs with subrounded or irregular shaped and matrix-supported mud clasts were found at Site M0087. Numerous event deposits a few centimeters to a few meters thick were intercalated in the bioturbated clay and silty clay in the cores from the central and northern part of the southern Japan Trench. Prominent deposits in the uppermost part of the cored stratigraphic succession in these basins likely correlate to deposits related to the 2011 Tohoku-oki, 1454 CE Kyotoku, and 869 CE Jogan earthquakes, as previously described in shallow subsurface cores (Ikehara et al., 2016, 2018; Kioka et al., 2019a, 2019b; Schwestermann et al., 2020). Occurrence of several tephra beds is another characteristic of core lithology in the central Japan Trench. Stratigraphy of event deposits in the southernmost Japan Trench is also characterized by numerous intercalations of event deposits in the bioturbated clay and silty clay. The thickness of each event deposit ranges from a few centimeters to ~5 m. In summary, numerous event deposits and their spatial variations in stratigraphy, facies, and frequency of occurrence provide a solid base for achieving Objectives 1 and 2 in upcoming postexpedition research. Preliminary findings suggest that depositional processes and driving mechanisms of event deposits vary widely along the Japan Trench.
7.2. Chronology of hadal trench-fill sediments
Because of the ultra-deep hadal environment of the Japan Trench, it is difficult to apply the usual methods to establish the core age model using radiocarbon dates or isotope stratigraphy of planktonic foraminifera. However, a combination of tephrochronology and radiolarian biostratigraphy for Expedition 386 cores provided key information on depositional ages of the hadal trench-fill sediments. Correlated tephra beds are the most robust stratigraphic tie points among holes and sites. A few correlative tephra beds were recognized in some holes in the central to northern Japan Trench. In particular, two tephra-based possible intersite correlations between Sites M0089 (Section 386-M0089D-1H-23, 58 cm) and M0090 (Section 386-M0090D-1H-26, 57.8 cm) and between Sites M0087 (Sections 386-M0087B-1H-19, 16.4 cm, and 386-M0087D-1H-20, 87.5 cm) and M0094 (Section 386-M0094B-1H-16, 82.5 cm) are important. Because several more tephra beds are observed in the cores from the central Japan Trench, detailed characterizations and eventual correlations to dated volcanic eruptions using the chemical compositions of each bed are expected to reveal further correlation tie points and robust age constraints, respectively. According to paleoenvironmental changes in this region, the relative abundance pattern of radiolarian species C. davisiana provided some radiolarian bioevent horizons. In particular, a rapid increase in C. davisiana (Event 5) can be correlated with the boundary horizon of C. davisiana Zones ‘a and ‘b, corresponding to the Holocene/Pleistocene boundary at ~11.5 ka (Morley et al., 1982). This important horizon was recognized at Sites M0084, M0085, M0088–M0090, M0092, and M0095. Minor peaks of C. davisiana also provide two radiolarian bioevents (Events 6 and 7), which correspond to DAE-2 at ~12 ka and DAE-3 at ~17 ka (Matsuzaki et al., 2014) in the upper Pleistocene sequences, and the minimum C. davisiana abundance between Zones ‘b1 and ‘b2 (approximately 24 ka) of Morley et al. (1982) and Itaki et al. (2009) may be reached at Site M0089. An increasing trend in relative abundance of the Tetrapyle group, which is a typical Kuroshio fauna (Matsuzaki et al., 2020), suggests that these horizons are likely correlated with a mid-Holocene warm period at ~6–8 ka.
Averaged sedimentation rates of the trench-fill basins are calculated as 1.63–2.55 m/ky based on the radiolarian biostratigraphy. Although no biostratigraphic event horizon is available for the basins at the boundary area between the central and northern Japan Trench (Basins C/N1, C/N2, and C/N3), no SMT zone detected at Site M0087 and M0094 from these basins suggests that the sedimentation rates are likely higher than those in the other basins.
Paleomagnetic secular variation is another important tool to date sediments below the calcite compensation depth (Kanamatsu et al., 2017, 2022, 2023). The characteristic variations of paleomagnetic declination after the correction and inclination recognized in the holes from the southern to the central basins (Sites M0081 and M0082 in Basin S1, Sites M0092 and M0095 in Basin S2, Site M0091 in Basin S3, Site M0090 in Basin C1, and Sites M0083 and M0089 in Basin C2) reveal consistent fluctuations between the sites. These variations probably represent the paleomagnetic secular variation over several thousand years. On the other hand, the paleomagnetic variations at sites from basins at the boundary area between the central and northern Japan Trench (Site M0093 in Basin C/N1, Site M0094 in Basin C/N2, and Site M0087 in Basin C/N3), whose lithology is characterized by a frequent turbidite intercalation, are not as distinct as those observed in the southern and the central basins. In the northern basins (Site M0088 in Basin N1 and Site M0084 in Basin N3), paleomagnetic direction in the significantly thick MTD interval reveals no consistent variation between holes. Variations at the sites in the northern basins prevent interhole correlations, except at Site M0085 (Basin N3). In summary, preliminary Expedition 386 results reveal high potential for establishing robust age models as a solid base for addressing Objective 3 in upcoming postexpedition research.
7.3. Hydroacoustic characteristics of the trench-fill basins
Expedition 386 also conducted hydroacoustic surveys (see Operational strategy) for several basins, producing closely-spaced high-resolution grids of subsurface data to characterize the architecture and depositional pattern of the trench-fill basins. Most of the basins have an elongated shape aligned with the along-strike direction of the trench. Both the landward (western) and seaward (eastern) slopes are steep, but the landward slope is steeper. There are some horseshoe-shaped escarpments in the lowermost part of the landward slope, suggesting the occurrence of submarine landslides. A typical example of a submarine landslide at the lowermost slope occurs in the northern subbasin of Basin C/N3. The basin floor is generally flat, but minor undulations, isolated bathymetric highs, and ridges with trench-normal to trench-oblique direction are recognized. These occurrences might reflect recent tectonic movements, submarine landslides, complicated basement structure, and possibly fluid migration.
Subbottom profiles of the trench-fill basins show the occurrence of relatively thick event layers as acoustically transparent layers in each basin. The occurrence of a few thick acoustically transparent layers sandwiched with acoustically stratified packages with high- or low-amplitude reflections is a characteristic feature of the northern Japan Trench basins (Basins N1, N2, and N3). In the southern and central Japan Trench, acoustically transparent layers are thinner but more frequent, intercalated within acoustically stratified sequences with generally high-amplitude reflection patterns. In the basins at the boundary area between the central and northern Japan Trench, acoustically stratified packages with high-amplitude reflections are the dominant acoustic facies. A few to several thin acoustically transparent layers are intercalated in the stratified package. The spatial difference in acoustic facies at each area is concordant with the difference in core lithology. These preliminary results also reveal that the successful acquisition of high-resolution hydroacoustic survey data, once fully integrated with coring results during postexpedition research, will greatly contribute toward achieving Objectives 1 and 2. Furthermore, observed evidence of recent active tectonic movements that might be related to giant earthquake megathrust rupture reaching the trench as a possible origin of such deformation reveal important perspectives for addressing Objective 3 beyond the development of long-term earthquake records but also linking past earthquake occurrences to type and location of rupture propagation along the shallow megathrust near the trench.
7.4. Geochemistry and fluids of the trench-fill deposits in the hadal environment
Expedition 386 represents the first time >10 m subsurface sediment cores have been sampled from multiple sites in the hadal oceanic trench. These sites act as terminal sinks for sedimentary materials, including carbon. The trench-fill sediments have a potential to form high-resolution archives to unravel the history of deep-ocean elemental cycles. Thus, investigating the deep-ocean elemental cycle and shedding new light on sediment and carbon fluxes of event-triggered sediment mobilization to a deep-sea trench and its influence on the hadal environments were important scientific targets of Expedition 386.
The solid phase of all the sediment samples is characterized by high silicate mineral content (approximately 30% Si and approximately 4% Al, as analyzed by XRF) and relatively high TOC throughout the cores, including both event and hemipelagic deposits. Considering the high sedimentation rates of the trench-fill sediments (~2 m/ky), a large mass accumulation rate of TOC is expected along the entire Japan Trench. High TOC in the event deposits suggests that earthquake-triggered sediment remobilization has contributed to these large mass accumulations of organic carbon in the trench-fill sediments.
The downcore pore water and headspace gas profiles of sulfate, alkalinity, ammonium, bromide, and methane concentrations show characteristic changes related to organic matter degradation. This suggests that intensive remineralization occurs, which is also supported by the observed high TOC contents. Values for salinity, Na+, and Cl– in the pore waters are approximately similar to seawater values and change very little with depth at all of the sites. The sulfate concentration profiles show evidence of nonsteady-state behavior at all sites. In contrast to alkalinity and ammonia, which increase with depth, sulfate concentrations decrease from the sediment surface to below detection within 5–10 m below the seafloor at most sites. Dissolved methane increases below the sulfate containing zone, marking a shallow SMT at all sites (except Sites M0087 and M0094, where no SMT is observed), with the highest values observed in the northern basins. Three sites (Sites M0094 and M0087 at the boundary area between the central and northern Japan Trench [Basins C/N2 and C/N3] and Site M0085 in the northern Japan Trench [Basin N3]) show a return to elevated sulfate concentration with depth (returning toward seawater values) accompanied by elevated Li concentrations. In all other cases, Li decreases with depth in the core. Silicon concentrations are very high and mostly constant (near 900 µM) throughout the sediment column at all sites. These high concentrations are related to the dissolution of amorphous silica throughout the core, which can be explained by the abundance of biogenic opal in diatom frustules, sponge spicules, and vitric volcanic glass shards. Strontium concentrations are mostly near seawater values except for the base of the cores, where concentrations are elevated.
Redox sensitive metals such as Fe, Mn, U, and Mo show extreme variability near and above the SMT, but drop to below detection limit deeper in the core. Boron concentrations mainly increase from slightly above seawater values to near 3 times seawater concentrations, suggesting a diagenetic and/or deep source.
In summary, preliminary results from IW and gas and solid-phase geochemistry, together with the successful offshore sampling for microbiology postexpedition analyses and research, reveal a solid base for addressing the secondary objectives of Expedition 386 and provide exciting new perspectives to advance our understanding of deep-sea elemental cycles and their influence on the hadal environments.
References
Arai, K., Inoue, T., Ikehara, K., and Sasaki, T., 2014. Episodic subsidence and active deformation of the forearc slope along the Japan Trench near the epicenter of the 2011 Tohoku Earthquake. Earth and Planetary Science Letters, 408:9–15. https://doi.org/
Arai, K., Naruse, H., Miura, R., Kawamura, K., Hino, R., Ito, Y., Inazu, D., Yokokawa, M., Izumi, N., Murayama, M., and Kasaya, T., 2013. Tsunami-generated turbidity current of the 2011 Tohoku-Oki earthquake. Geology, 41(11):1195–1198. https://doi.org/
Bao, R., Strasser, M., McNichol, A.P., Haghipour, N., McIntyre, C., Wefer, G., and Eglinton, T.I., 2018. Tectonically-triggered sediment and carbon export to the Hadal zone. Nature Communications, 9(1):121. https://doi.org/
Barbot, S., 2020. Frictional and structural controls of seismic super-cycles at the Japan trench. Earth, Planets and Space, 72(1):63. https://doi.org/
Bernhardt, A., Melnick, D., Hebbeln, D., Lückge, A., and Strecker, M.R., 2015. Turbidite paleoseismology along the active continental margin of Chile — feasible or not? Quaternary Science Reviews, 120:71–92. https://doi.org/
Bilek, S.L., and Lay, T., 2018. Subduction zone megathrust earthquakes. Geosphere, 14(4):1468–1500. https://doi.org/
Boston, B., Moore, G.F., Nakamura, Y., and Kodaira, S., 2014. Outer-rise normal fault development and influence on near-trench décollement propagation along the Japan Trench, off Tohoku. Earth, Planets and Space, 66(1):135. https://doi.org/
Brodsky, E.E., Mori, J.J., Anderson, L., Chester, F.M., Conin, M., Dunham, E.M., Eguchi, N., Fulton, P.M., Hino, R., Hirose, T., Ikari, M.J., Ishikawa, T., Jeppson, T., Kano, Y., Kirkpatrick, J., Kodaira, S., Lin, W., Nakamura, Y., Rabinowitz, H.S., Regalla, C., Remitti, F., Rowe, C., Saffer, D.M., Saito, S., Sample, J., Sanada, Y., Savage, H.M., Sun, T., Toczko, S., Ujiie, K., Wolfson-Schwehr, M., and Yang, T., 2020. The state of stress on the fault before, during, and after a major earthquake. Annual Review of Earth and Planetary Sciences, 48(1):49–74. https://doi.org/
Cattaneo, A., Babonneau, N., Ratzov, G., Dan-Unterseh, G., Yelles, K., Bracène, R., Mercier de Lépinay, B., Boudiaf, A., and Déverchère, J., 2012. Searching for the seafloor signature of the 21 May 2003 Boumerdès earthquake offshore central Algeria. Natural Hazards and Earth System Sciences, 12(7):2159–2172. https://doi.org/
Chester, F.M., Rowe, C., Ujiie, K., Kirkpatrick, J., Regalla, C., Remitti, F., Moore, J.C., Toy, V., Wolfson-Schwehr, M., Bose, S., Kameda, J., Mori, J.J., Brodsky, E.E., Eguchi, N., and Toczko, S., 2013. Structure and composition of the plate-boundary slip zone for the 2011 Tohoku-Oki earthquake. Science, 342(6163):1208–1211. https://doi.org/
Chinzei, K., Fujioka, K., Kitazato, H., Koizumi, I., Oba, T., Oda, M., Okada, H., Sakai, T., and Tanimura, Y., 1987. Postglacial environmental change of the Pacific Ocean off the coasts of central Japan. Marine Micropaleontology, 11(4):273–291. https://doi.org/
De Batist, M., Talling, P., Strasser, M., and Girardclos, S., 2017. Subaquatic paleoseismology: records of large Holocene earthquakes in marine and lacustrine sediments. Marine Geology, 384:1–3. https://doi.org/
DeMets, C., Gordon, R.G., and Argus, D.F., 2010. Geologically current plate motions. Geophysical Journal International, 181(1):1–80. https://doi.org/
Fink, H.G., Strasser, M., Römer, M., Kölling, M., Ikehara, K., Kanamatsu, T., Dinten, D., Kioka, A., Fujiwara, T., Kawamura, K., Kodaira, S., and Wefer, G., 2014. Evidence for mass transport deposits at the IODP JFAST-site in the Japan Trench. In Krastel, S., Behrmann, J.-H., Völker, D., Stipp, M., Berndt, C., Urgeles, R., Chaytor, J., Huhn, K., Strasser, M., and Harbitz, C.B. (Eds.), Advances in Natural and Technological Hazards Research (Volume 37): Submarine Mass Movements and Their Consequences. 33–43. https://doi.org/
Frings, P., 2017. Revisiting the dissolution of biogenic Si in marine sediments: a key term in the ocean Si budget. Acta Geochimica, 36(3):429–432. https://doi.org/
Fujie, G., Kodaira, S., Nakamura, Y., Morgan, J.P., Dannowski, A., Thorwart, M., Grevemeyer, I., and Miura, S., 2020. Spatial variations of incoming sediments at the northeastern Japan arc and their implications for megathrust earthquakes. Geology, 48(6):614–619. https://doi.org/
Fujii, Y., and Satake, K., 2007. Tsunami source of the 2004 Sumatra–Andaman earthquake inferred from tide gauge and satellite data. Bulletin of the Seismological Society of America, 97(1A):S192–S207. https://doi.org/
Fujiwara, T., Kodaira, S., No, T., Kaiho, Y., Takahashi, N., and Kaneda, Y., 2011. The 2011 Tohoku-Oki earthquake: displacement reaching the trench axis. Science, 334(6060):1240. https://doi.org/
Geller, R.J., 2011. Shake-up time for Japanese seismology. Nature, 472(7344):407–409. https://doi.org/10.1038/nature10105
Glud, R.N., Wenzhöfer, F., Middelboe, M., Oguri, K., Turnewitsch, R., Canfield, D.E., and Kitazato, H., 2013. High rates of microbial carbon turnover in sediments in the deepest oceanic trench on Earth. Nature Geoscience, 6(4):284–288. https://doi.org/
Goldfinger, C., Galer, S., Beeson, J., Hamilton, T., Black, B., Romsos, C., Patton, J., Nelson, C.H., Hausmann, R., and Morey, A., 2017. The importance of site selection, sediment supply, and hydrodynamics: a case study of submarine paleoseismology on the northern Cascadia margin, Washington USA. Marine Geology, 384:4–46. https://doi.org/
Goldfinger, C., Morey, A.E., Black, B., Beeson, J., Nelson, C.H., and Patton, J., 2013. Spatially limited mud turbidites on the Cascadia margin: segmented earthquake ruptures? Natural Hazards and Earth System Sciences, 13(8):2109–2146. https://doi.org/
Goldfinger, C., Nelson, C.H., Morey, A.E., Johnson, J.E., Patton, J.R., Karabanov, E.B., Gutierrez-Pastor, J., Eriksson, A.T., Gracia, E., Dunhill, G., Enkin, R.J., Dallimore, A., and Vallier, T., 2012. Turbidite event history—methods and implications for Holocene paleoseismicity of the Cascadia subduction zone. USGS Professional Paper, 1661-F. https://doi.org/
Goldfinger, C., Patton, J.R., Van Daele, M., Moernaut, J., Nelson, C.H., de Batist, M., and Morey, A.E., 2014. Can turbidites be used to reconstruct a paleoearthquake record for the central Sumatran margin?: Comment. Geology, 42(9):e344. https://doi.org/
Grácia, E., Vizcaino, A., Escutia, C., Asioli, A., Rodés, ü., Pallàs, R., Garcia-Orellana, J., Lebreiro, S., and Goldfinger, C., 2010. Holocene earthquake record offshore Portugal (SW Iberia): testing turbidite paleoseismology in a slow-convergence margin. Quaternary Science Reviews, 29(9–10):1156–1172. https://doi.org/
Griffin, J.D., Stirling, M.W., and Wang, T., 2020. Periodicity and clustering in the long-term earthquake record. Geophysical Research Letters, 47(22):e2020GL089272. https://doi.org/
Harris, R.N., Sakaguchi, A., Petronotis, K., Baxter, A.T., Berg, R., Burkett, A., Charpentier, D., Choi, J., Diz Ferreiro, P., Hamahashi, M., Hashimoto, Y., Heydolph, K., Jovane, L., Kastner, M., Kurz, W., Kutterolf, S.O., Li, Y., Malinverno, A., Martin, K.M., Millan, C., Nascimento, D.B., Saito, S., Sandoval Gutierrez, M.I., Screaton, E.J., Smith-Duque, C.E., Solomon, E.A., Straub, S.M., Tanikawa, W., Torres, M.E., Uchimura, H., Vannucchi, P., Yamamoto, Y., Yan, Q., and Zhao, X., 2013. Input Site U1381. In Harris, R.N., Sakaguchi, A., Petronotis, K., and the Expedition 344 Scientists, Proceedings of the Integrated Ocean Drilling Program. 344: College Station, TX (Integrated Ocean Drilling Program). https://doi.org/
Herrendörfer, R., van Dinther, Y., Gerya, T., and Dalguer, L.A., 2015. Earthquake supercycle in subduction zones controlled by the width of the seismogenic zone. Nature Geoscience, 8(6):471–474. https://doi.org/
Hirano, N., Takahashi, E., Yamamoto, J., Abe, N., Ingle, S.P., Kaneoka, I., Hirata, T., Kimura, J.-I., Ishii, T., Ogawa, Y., Machida, S., and Suyehiro, K., 2006. Volcanism in response to plate flexure. Science, 313(5792):1426–1428. https://doi.org/
Howarth, J.D., Orpin, A.R., Kaneko, Y., Strachan, L.J., Nodder, S.D., Mountjoy, J.J., Barnes, P.M., Bostock, H.C., Holden, C., Jones, K., and Cağatay, M.N., 2021. Calibrating the marine turbidite palaeoseismometer using the 2016 Kaikōura earthquake. Nature Geoscience, 14(3):161–167. https://doi.org/
Ide, S., Baltay, A., and Beroza, G.C., 2011. Shallow dynamic overshoot and energetic deep rupture in the 2011 Mw 9.0 Tohoku-Oki earthquake. Science, 332(6036):1426–1429. https://doi.org/
Ikehara, K., Irino, T., Usami, K., Jenkins, R., Omura, A., and Ashi, J., 2014. Possible submarine tsunami deposits on the outer shelf of Sendai Bay, Japan resulting from the 2011 earthquake and tsunami off the Pacific coast of Tohoku. Marine Geology, 349:91. https://doi.org/
Ikehara, K., Kanamatsu, T., Nagahashi, Y., Strasser, M., Fink, H., Usami, K., Irino, T., and Wefer, G., 2016. Documenting large earthquakes similar to the 2011 Tohoku-oki earthquake from sediments deposited in the Japan Trench over the past 1500 years. Earth and Planetary Science Letters, 445:48–56. https://doi.org/
Ikehara, K., Usami, K., Irino, T., Omura, A., Jenkins, R.G., and Ashi, J., 2021. Characteristics and distribution of the event deposits induced by the 2011 Tohoku-oki earthquake and tsunami offshore of Sanriku and Sendai, Japan. Sedimentary Geology, 411:105791. https://doi.org/
Ikehara, K., Usami, K., and Kanamatsu, T., 2020. Repeated occurrence of surface-sediment remobilization along the landward slope of the Japan Trench by great earthquakes. Earth, Planets and Space, 72(1):114. https://doi.org/
Ikehara, K., Usami, K., Kanamatsu, T., Arai, K., Yamaguchi, A., and Fukuchi, R., 2018. Spatial variability in sediment lithology and sedimentary processes along the Japan Trench: use of deep-sea turbidite records to reconstruct past large earthquakes. Geological Society Special Publication, 456(1):75–89. https://doi.org/
Ikehara, K., Usami, K., Kanamatsu, T., Danhara, T., and Yamashita, T., 2017. Three important Holocene tephras off the Pacific coast of the Tohoku region, Northeast Japan: Implications for correlating onshore and offshore event deposits. Quaternary International, 456:138–153. https://doi.org/
Itaki, T., Uchida, M., Kim, S., Shin, H.-S., Tada, R., and Khim, B.-K., 2009. Late Pleistocene stratigraphy and palaeoceanographic implications in northern Bering Sea slope sediments: evidence from the radiolarian species Cycladophora davisiana. Journal of Quaternary Science, 24(8):856–865. https://doi.org/
Jamieson, A.J., Fujii, T., Mayor, D.J., Solan, M., and Priede, I.G., 2010. Hadal trenches: the ecology of the deepest places on Earth. Trends in Ecology & Evolution, 25(3):190-197. https://doi.org/
Johnson, H.P., Gomberg, J.S., Hautala, S.L., and Salmi, M.S., 2017. Sediment gravity flows triggered by remotely generated earthquake waves. Journal of Geophysical Research: Solid Earth, 122(6):4584–4600. https://doi.org/
Kanamatsu, T., Ikehara, K., and Hsiung, K.-H., 2022. Stratigraphy of deep-sea marine sediment using paleomagnetic secular variation: refined dating of turbidite relating to giant earthquake in Japan Trench. Marine Geology, 443:106669. https://doi.org/
Kanamatsu, T., Ikehara, K., and Hsiung, K.-H., 2023. Submarine paleoseismology in the Japan Trench of northeastern Japan: turbidite stratigraphy and sedimentology using paleomagnetic and rock magnetic analyses. Progress in Earth and Planetary Science, 10(1):16. https://doi.org/
Kanamatsu, T., Usami, K., McHugh, C.M.G., and Ikehara, K., 2017. High-resolution chronology of sediment below CCD based on Holocene paleomagnetic secular variations in the Tohoku-oki earthquake rupture zone. Geochemistry, Geophysics, Geosystems, 18(8):2990–3002. https://doi.org/
Kempf, P., Moernaut, J., Van Daele, M., Vandoorne, W., Pino, M., Urrutia, R., and De Batist, M., 2017. Coastal lake sediments reveal 5500 years of tsunami history in south central Chile. Quaternary Science Reviews, 161:99–116. https://doi.org/
Kioka, A., Schwestermann, T., Moernaut, J., Ikehara, K., Kanamatsu, T., Eglinton, T.I., and Strasser, M., 2019a. Event stratigraphy in a hadal oceanic trench: the Japan Trench as sedimentary archive recording recurrent giant subduction zone earthquakes and their role in organic carbon export to the deep sea. Frontiers in Earth Science, 7:319. https://doi.org/
Kioka, A., Schwestermann, T., Moernaut, J., Ikehara, K., Kanamatsu, T., McHugh, C.M., dos Santos Ferreira, C., Wiemer, G., Haghipour, N., Kopf, A.J., Eglinton, T.I., and Strasser, M., 2019b. Megathrust earthquake drives drastic organic carbon supply to the hadal trench. Scientific Reports, 9(1):1553. https://doi.org/
Kioka, A., and Strasser, M., 2022. Oceanic trenches. In Shroder, J.F., Treatise on Geomorphology (Second Edition). 8: 882–900. https://doi.org/
Kodaira, S., Fujiwara, T., Fujie, G., Nakamura, Y., and Kanamatsu, T., 2020. Large coseismic slip to the trench during the 2011 Tohoku-Oki earthquake. Annual Review of Earth and Planetary Sciences, 48(1):321–343. https://doi.org/
Kodaira, S., Iinuma, T., and Imai, K., 2021. Investigating a tsunamigenic megathrust earthquake in the Japan Trench. Science, 371(6534):eabe1169. https://doi.org/
Kodaira, S., Nakamura, Y., Yamamoto, Y., Obana, K., Fujie, G., No, T., Kaiho, Y., Sato, T., and Miura, S., 2017. Depth-varying structural characters in the rupture zone of the 2011 Tohoku-oki earthquake. Geosphere, 13(5):1408–1424. https://doi.org/
Kodaira, S., No, T., Nakamura, Y., Fujiwara, T., Kaiho, Y., Miura, S., Takahashi, N., Kaneda, Y., and Taira, A., 2012. Coseismic fault rupture at the trench axis during the 2011 Tohoku-Oki earthquake. Nature Geoscience, 5(9):646–650. https://doi.org/
Köster, M., Kars, M., Schubotz, F., Tsang, M.-Y., Maisch, M., Kappler, A., Morono, Y., Inagaki, F., Heuer, V.B., Kasten, S., and Henkel, S., 2021. Evolution of (bio-)geochemical processes and diagenetic alteration of sediments along the tectonic migration of ocean floor in the Shikoku Basin off Japan. Geochemistry, Geophysics, Geosystems, 22(8):e2020GC009585. https://doi.org/
Matsuzaki, K.M., Itaki, T., and Sugisaki, S., 2020. Polycystine radiolarians vertical distribution in the subtropical Northwest Pacific during spring 2015 (KS15-4). Paleontological Research, 24(2):113–133. https://doi.org/
Matsuzaki, K.M., Nishi, H., Suzuki, N., Kawate, Y., Takashima, R., and Sakai, T., 2014. Cycladophora davisiana abundances as a paleoceanographic and stratigraphic tool in high latitude siliciceous sediments. Marine Micropaleontology, 106:1–9. https://doi.org/
McHugh, C., Strasser, M., Cattaneo, A., and Ikehara, K., 2015. Submarine paleoseismology: using giant piston coring within IODP to fill the gap in long-term records of great earthquakes. Presented at the [paper presented at U.S. Science Support Program Workshop, Zürich, Switzerland, 16–18 July 2015]. https://usoceandiscovery.org/
McHugh, C.M., Kanamatsu, T., Seeber, L., Bopp, R., Cormier, M.-H., and Usami, K., 2016. Remobilization of surficial slope sediment triggered by the A.D. 2011 Mw 9 Tohoku-Oki earthquake and tsunami along the Japan Trench. Geology, 44(5):391–394. https://doi.org/
McHugh, C.M., Seeber, L., Braudy, N., Cormier, M.-H., Davis, M.B., Diebold, J.B., Dieudonne, N., Douilly, R., Gulick, S.P.S., Hornbach, M.J., Johnson, H.E., III, Mishkin, K.R., Sorlien, C.C., Steckler, M.S., Symithe, S.J., and Templeton, J., 2011. Offshore sedimentary effects of the 12 January 2010 Haiti earthquake. Geology, 39(8):723–726. https://doi.org/
McHugh, C.M., Seeber, L., Rasbury, T., Strasser, M., Kioka, A., Kanamatsu, T., Ikehara, K., and Usami, K., 2020. Isotopic and sedimentary signature of megathrust ruptures along the Japan subduction margin. Marine Geology, 428:106283. https://doi.org/
McIntyre, C.P., Wacker, L., Haghipour, N., Blattmann, T.M., Fahrni, S., Usman, M., Eglinton, T.I., and Synal, H.-A., 2017. Online 13C and 14C Gas Measurements by EA-IRMS–AMS at ETH Zürich. Radiocarbon, 59(3):893–903. https://doi.org/
Migeon, S., Garibaldi, C., Ratzov, G., Schmidt, S., Collot, J.Y., Zaragosi, S., and Texier, L., 2017. Earthquake-triggered deposits in the subduction trench of the north Ecuador/south Colombia margin and their implication for paleoseismology. Marine Geology, 384:47–62. https://doi.org/
Miura, R., Hino, R., Kawamura, K., Kanamatsu, T., and Kaiho, Y., 2014. Accidental sediments trapped in ocean bottom seismometers during the 2011 Tohoku-Oki earthquake. Island Arc, 23(4):365–367. https://doi.org/
Moernaut, J., 2020. Time-dependent recurrence of strong earthquake shaking near plate boundaries: a lake sediment perspective. Earth-Science Reviews, 210:103344. https://doi.org/
Moernaut, J., Van Daele, M., Fontijn, K., Heirman, K., Kempf, P., Pino, M., Valdebenito, G., Urrutia, R., Strasser, M., and De Batist, M., 2018. Larger earthquakes recur more periodically: new insights in the megathrust earthquake cycle from lacustrine turbidite records in south-central Chile. Earth and Planetary Science Letters, 481:9–19. https://doi.org/
Molenaar, A., Moernaut, J., Wiemer, G., Dubois, N., and Strasser, M., 2019. Earthquake impact on active margins: tracing surficial remobilization and seismic strengthening in a slope sedimentary sequence. Geophysical Research Letters, 46(11):6015–6023. https://doi.org/
Morley, J.J., Hays, J.D., and Robertson, J.H., 1982. Stratigraphic framework for the late Pleistocene in the northwest Pacific Ocean. Deep Sea Research, Part A: Oceanographic Research Papers, 29(12):1485–1499. https://doi.org/
Mountjoy, J.J., Howarth, J.D., Orpin, A.R., Barnes, P.M., Bowden, D.A., Rowden, A.A., Schimel, A.C.G., Holden, C., Horgan, H.J., Nodder, S.D., Patton, J.R., Lamarche, G., Gerstenberger, M., Micallef, A., Pallentin, A., and Kane, T., 2018. Earthquakes drive large-scale submarine canyon development and sediment supply to deep-ocean basins. Science Advances, 4(3):eaar3748. https://doi.org/
Mulargia, F., Stark, P.B., and Geller, R.J., 2017. Why is probabilistic seismic hazard analysis (PSHA) still used? Physics of the Earth and Planetary Interiors, 264:63–75. https://doi.org/
Nakamura, T., Takenaka, H., Okamoto, T., Ohori, M., and Tsuboi, S., 2015. Long-period ocean-bottom motions in the source areas of large subduction earthquakes. Scientific Reports, 5(1):16648. https://doi.org/10.1038/srep16648
Nakamura, Y., Fujiwara, T., Kodaira, S., Miura, S., and Obana, K., 2020. Correlation of frontal prism structures and slope failures near the trench axis with shallow megathrust slip at the Japan Trench. Scientific Reports, 10(1):11607. https://doi.org/
Nakamura, Y., Kodaira, S., Fujie, G., Yamashita, M., Obana, K., and Miura, S., submitted. Incoming plate structure at the Japan Trench subduction zone revealed in densely spaced reflection seismic profiles. Progress in Earth and Planetary Science.
Nakamura, Y., Kodaira, S., Miura, S., Regalla, C., and Takahashi, N., 2013. High-resolution seismic imaging in the Japan Trench axis area off Miyagi, northeastern Japan. Geophysical Research Letters, 40(9):1713–1718. https://doi.org/
Nakata, R., Hori, T., Miura, S., and Hino, R., 2021. Presence of interplate channel layer controls of slip during and after the 2011 Tohoku-Oki earthquake through the frictional characteristics. Scientific Reports, 11(1):6480. https://doi.org/
Namegaya, Y., and Satake, K., 2014. Reexamination of the A.D. 869 Jogan earthquake size from tsunami deposit distribution, simulated flow depth, and velocity. Geophysical Research Letters, 41(7):2297–2303. https://doi.org/
Nie, S., and Barbot, S., 2022. Rupture styles linked to recurrence patterns in seismic cycles with a compliant fault zone. Earth and Planetary Science Letters, 591:117593. https://doi.org/
Noguchi, T., Tanikawa, W., Hirose, T., Lin, W., Kawagucci, S., Yoshida-Takashima, Y., Honda, M.C., Takai, K., Kitazato, H., and Okamura, K., 2012. Dynamic process of turbidity generation triggered by the 2011 Tohoku-Oki earthquake. Geochemistry, Geophysics, Geosystems, 13(11):Q11003. https://doi.org/
Nomaki, H., Arai, K., Suga, H., Toyofuku, T., Wakita, M., Nunoura, T., Oguri, K., Kasaya, T., and Watanabe, S., 2016. Sedimentary organic matter contents and porewater chemistry at upper bathyal depths influenced by the 2011 off the Pacific coast of Tohoku Earthquake and tsunami. Journal of Oceanography, 72(1):99–111. https://doi.org/
Oguri, K., Furushima, Y., Toyofuku, T., Kasaya, T., Wakita, M., Watanabe, S., Fujikura, K., and Kitazato, H., 2016. Long-term monitoring of bottom environments of the continental slope off Otsuchi Bay, northeastern Japan. Journal of Oceanography, 72(1):151–166. https://doi.org/
Oguri, K., Kawamura, K., Sakaguchi, A., Toyofuku, T., Kasaya, T., Murayama, M., Fujikura, K., Glud, R.N., and Kitazato, H., 2013. Hadal disturbance in the Japan Trench induced by the 2011 Tohoku–Oki Earthquake. Scientific Reports, 3(1):1915. https://doi.org/
Patton, J.R., Goldfinger, C., Morey, A.E., Ikehara, K., Romsos, C., Stoner, J., Djadjadihardja, Y., Udrekh, Ardhyastuti, S., Gaffar, E.Z., and Vizcaino, A., 2015. A 6600 year earthquake history in the region of the 2004 Sumatra-Andaman subduction zone earthquake. Geosphere, 11(6):2067–2129. https://doi.org/
Philibosian, B., and Meltzner, A.J., 2020. Segmentation and supercycles: a catalog of earthquake rupture patterns from the Sumatran Sunda Megathrust and other well-studied faults worldwide. Quaternary Science Reviews, 241:106390. https://doi.org/
Polonia, A., Bonatti, E., Camerlenghi, A., Lucchi, R.G., Panieri, G., and Gasperini, L., 2013. Mediterranean megaturbidite triggered by the AD 365 Crete earthquake and tsunami. Scientific Reports, 3(1):1285. https://doi.org/
Polonia, A., Nelson, C.H., Romano, S., Vaiani, S.C., Colizza, E., Gasparotto, G., and Gasperini, L., 2017. A depositional model for seismo-turbidites in confined basins based on Ionian Sea deposits. Marine Geology, 384:177–198. https://doi.org/
Polonia, A., Vaiani, S.C., and de Lange, G.J., 2016. Did the A.D. 365 Crete earthquake/tsunami trigger synchronous giant turbidity currents in the Mediterranean Sea? Geology, 44(3):191–194. https://doi.org/
Pope, E.L., Talling, P.J., and Carter, L., 2017. Which earthquakes trigger damaging submarine mass movements: insights from a global record of submarine cable breaks? Marine Geology, 384:131–146. https://doi.org/
Pouderoux, H., Lamarche, G., and Proust, J.N., 2012. Building an 18,000-year-long paleo-earthquake record from detailed deep-sea turbidite characterisation in Poverty Bay, New Zealand. Natural Hazards and Earth System Sciences, 12(6):2077–2101. https://doi.org/
Pouderoux, H., Proust, J.-N., and Lamarche, G., 2014. Submarine paleoseismology of the northern Hikurangi subduction margin of New Zealand as deduced from turbidite record since 16 ka. Quaternary Science Reviews, 84:116–131. https://doi.org/
Ratzov, G., Cattaneo, A., Babonneau, N., Déverchère, J., Yelles, K., Bracene, R., and Courboulex, F., 2015. Holocene turbidites record earthquake supercycles at a slow-rate plate boundary. Geology, 43(4):331–334. https://doi.org/
Rosenheim, B.E., Day, M.B., Domack, E., Schrum, H., Benthien, A., and Hayes, J.M., 2008. Antarctic sediment chronology by programmed-temperature pyrolysis: Methodology and data treatment. Geochemistry, Geophysics, Geosystems, 9(4):Q04005. https://doi.org/
Saino, T., Shang, S., Mino, Y., Suzuki, K., Nomura, H., Saitoh, S.-i., Miyake, H., Masuzawa, T., and Harada, K., 1998. Short term variability of Particle fluxes and its relation to variability in sea surface temperature and chlorophylla field detected by Ocean Color and Temperature Scanner (OCTS) off Sanriku, northwestern North Pacific in the spring of 1997. Journal of Oceanography, 54(5):583–592. https://doi.org/
Salditch, L., Stein, S., Neely, J., Spencer, B.D., Brooks, E.M., Agnon, A., and Liu, M., 2020. Earthquake supercycles and long-term fault memory. Tectonophysics, 774:228289. https://doi.org/
Sawai, Y., Namegaya, Y., Okamura, Y., Satake, K., and Shishikura, M., 2012. Challenges of anticipating the 2011 Tohoku earthquake and tsunami using coastal geology. Geophysical Research Letters, 39(21):L21309. https://doi.org/
Sawai, Y., Namegaya, Y., Tamura, T., Nakashima, R., and Tanigawa, K., 2015. Shorter intervals between great earthquakes near Sendai: scour ponds and a sand layer attributable to A.D. 1454 overwash. Geophysical Research Letters, 42(12):4795–4800. https://doi.org/
Sawyer, D.E., and DeVore, J.R., 2015. Elevated shear strength of sediments on active margins: evidence for seismic strengthening. Geophysical Research Letters, 42(23):10216–10221. https://doi.org/
Schwestermann, T., Eglinton, T.I., Haghipour, N., McNichol, A.P., Ikehara, K., and Strasser, M., 2021. Event-dominated transport, provenance, and burial of organic carbon in the Japan Trench. Earth and Planetary Science Letters, 563:116870. https://doi.org/
Schwestermann, T., Huang, J., Konzett, J., Kioka, A., Wefer, G., Ikehara, K., Moernaut, J., Eglinton, T.I., and Strasser, M., 2020. Multivariate statistical and multiproxy constraints on earthquake-triggered sediment remobilization processes in the central Japan Trench. Geochemistry, Geophysics, Geosystems, 21(6):e2019GC008861. https://doi.org/
Seeber, L., Mueller, C., Fujiwara, T., Arai, K., Soh, W., Djajadihardja, Y.S., and Cormier, M.-H., 2007. Accretion, mass wasting, and partitioned strain over the 26 Dec 2004 Mw9.2 rupture offshore Aceh, northern Sumatra. Earth and Planetary Science Letters, 263(1–2):16–31. https://doi.org/
Shibazaki, B., Matsuzawa, T., Tsutsumi, A., Ujiie, K., Hasegawa, A., and Ito, Y., 2011. 3D modeling of the cycle of a great Tohoku-oki earthquake, considering frictional behavior at low to high slip velocities. Geophysical Research Letters, 38(21):L21305. https://doi.org/
Shipboard Scientific Party, 1980. Site 440: Japan Trench midslope terrace, Leg 57. In Scientific Party, Initial Reports of the Deep Sea Drilling Project, 56/57. Washington, DC (U.S. Government Printing Office), 225–317. https://doi.org/
Shirasaki, Y., Ito, K., Kuwazuru, M., and Shimizu, K., 2012. Submarine landslides as cause of submarine cable fault. Marine Survey & Technology, 24(1):17–20.
Sieh, K., Natawidjaja, D.H., Meltzner, A.J., Shen, C.-C., Cheng, H., Li, K.-S., Suwargadi, B.W., Galetzka, J., Philibosian, B., and Edwards, R.L., 2008. Earthquake supercycles inferred from sea-level changes recorded in the corals of west Sumatra. Science, 322(5908):1674. https://doi.org/
St-Onge, G., Chapron, E., Mulsow, S., Salas, M., Viel, M., Debret, M., Foucher, A., Mulder, T., Winiarski, T., Desmet, M., Costa, P.J.M., Ghaleb, B., Jaouen, A., and Locat, J., 2012. Comparison of earthquake-triggered turbidites from the Saguenay (Eastern Canada) and Reloncavi (Chilean margin) Fjords: implications for paleoseismicity and sedimentology. Sedimentary Geology, 243–244:89–107. https://doi.org/
Strasser, M., et al., 2015. Submarine paleoseismology: using giant-piston coring within IODP to fill the gap in long-term records of great earthquakes – 16-18 July 2015, Zurich (Switzerland). ECORD Newsletter, 25:24.
Strasser, M., Ikehara, K., and Cotterill, C., 2019. Expedition 386 Scientific Prospectus: Japan Trench Paleoseismology. International Ocean Discovery Program. https://doi.org/
Strasser, M., Ikehara, K., Everest, J., Maeda, L., Hochmuth, K., Grant, H., Stewart, M., Okutsu, N., Sakurai, N., Yokoyama, T., Bao, R., Bellanova, P., Brunet, M., Cai, Z., Cattaneo, A., Hsiung, K.-H., Huang, J.-J., Ishizawa, T., Itaki, T., Jitsuno, K., Johnson, J.E., Kanamatsu, T., Keep, M., Kioka, A., Kölling, M., Luo, M., März, C., McHugh, C., Micallef, A., Nagahashi, Y., Pandey, D.K., Proust, J.-N., Rasbury, E.T., Riedinger, N., Satoguchi, Y., Sawyer, D.E., Seibert, C., Silver, M., Straub, S.M., Virtasalo, J., Wang, Y., Wu, T.-W., and Zellers, S.D., 2023. Expedition 386 methods. In Strasser, M., Ikehara, K., Everest, J., and the Expedition 386 Scientists, Japan Trench Paleoseismology. Proceedings of the International Ocean Discovery Program, 386: College Station, TX (International Ocean Discovery Program). https://doi.org/
Strasser, M., Kölling, M., Ferreira, C.d.S., Fink, H.G., Fujiwara, T., Henkel, S., Ikehara, K., Kanamatsu, T., Kawamura, K., Kodaira, S., Römer, M., Wefer, G., SO219A, R.V.S.C., and scientists, J.C.M.-E., 2013. A slump in the trench: tracking the impact of the 2011 Tohoku-Oki earthquake. Geology, 41(8):935–938. https://doi.org/
Strasser, M., Kopf, A.J., Abegg, F., Asada, M., Bachmann, A.K., Cuno, P., Dos Santos Ferreira, C., Fleischmann, T., Fujiware, T., Hatakeyama, E., Heesemann, B.R., Hillman, J.I.T., Hoehne, M., Huusmann, H., Ikari, M.J., Ikehara, K., Jaeger, F.D., Kanamatsu, T., Kang, M.H., Kaul, N.E., Kioka, A., Kölling, M., Lange, K., Luebben, N., Matthiessen, T., Mchugh, C.M., Meier, A., Menapace, W., Mochizuki, K., Moernaut, J., Molenaar, A.W., Moore, G.F., Mu, L.J., Nakano, Y., Pieper, M., Rex, M.L.P.A., Usami, K., Wiemer, G., and Yamaguchi, A., 2017. Report and preliminary results of R/V Sonne Cruise SO251, extreme events archived in the geological record of Japan’s subduction margins (EAGER-Japan). Berichte, MARUM – Zentrum für Marine Umweltwissenschaften, Fachbereich Geowissenschaften, Universität Bremen, 318. http://publications.marum.de/
Sumner, E.J., Siti, M.I., McNeill, L.C., Talling, P.J., Henstock, T.J., Wynn, R.B., Djajadihardja, Y.S., and Permana, H., 2013. Can turbidites be used to reconstruct a paleoearthquake record for the central Sumatran margin? Geology, 41(7):763–766. https://doi.org/
Sun, T., Wang, K., Fujiwara, T., Kodaira, S., and He, J., 2017. Large fault slip peaking at trench in the 2011 Tohoku-oki earthquake. Nature Communications, 8(1):14044. https://doi.org/
Talling, P.J., 2014. On the triggers, resulting flow types and frequencies of subaqueous sediment density flows in different settings. Marine Geology, 352:155–182. https://doi.org/
ten Brink, U.S., Andrews, B.D., and Miller, N.C., 2016. Seismicity and sedimentation rate effects on submarine slope stability. Geology, 44(7):563–566. https://doi.org/
Torres, M.E., Brumsack, H.J., Bohrmann, G., and Emeis, K.C., 1996. Barite fronts in continental margin sediments: a new look at barium remobilization in the zone of sulfate reduction and formation of heavy barites in diagenetic fronts. Chemical Geology, 127(1):125–139. https://doi.org/
Torres, M.E., Cox, T., Hong, W.L., McManus, J., Sample, J.C., Destrigneville, C., Gan, H.M., Gan, H.Y., and Moreau, J.W., 2015. Crustal fluid and ash alteration impacts on the biosphere of Shikoku Basin sediments, Nankai Trough, Japan. Geobiology, 13(6):562–580. https://doi.org/
Tsuru, T., Park, J.-O., Miura, S., Kodaira, S., Kido, Y., and Hayashi, T., 2002. Along-arc structural variation of the plate boundary at the Japan Trench margin: Implication of interplate coupling. Journal of Geophysical Research: Solid Earth, 107(B12):2357. https://doi.org/
Uchida, N., and Bürgmann, R., 2021. A decade of lessons learned from the 2011 Tohoku-Oki earthquake. Reviews of Geophysics, 59(2):e2020RG000713. https://doi.org/
Uchida, N., and Matsuzawa, T., 2011. Coupling coefficient, hierarchical structure, and earthquake cycle for the source area of the 2011 off the Pacific coast of Tohoku earthquake inferred from small repeating earthquake data. Earth, Planets and Space, 63(7):30. https://doi.org/
Usami, K., Ikehara, K., Jenkins, R.G., and Ashi, J., 2017. Benthic foraminiferal evidence of deep-sea sediment transport by the 2011 Tohoku-Oki earthquake and tsunami. Marine Geology, 384:214–224. https://doi.org/
Usami, K., Ikehara, K., Kanamatsu, T., Kioka, A., Schwestermann, T., and Strasser, M., 2021. The link between upper-slope submarine landslides and mass transport deposits in the hadal trenche. In Sassa, K., Mikoš, M., Sassa, S., Bobrowsky, P.T., Takara, K., and Dang, K. (Eds.), Sendai Landslide Partnerships and Kyoto Landslide Commitment. Understanding and Reducing Landslide Disaster Risk, 1. https://doi.org/10.1007/978-3-030-60196-6_26
Usami, K., Ikehara, K., Kanamatsu, T., and McHugh, C.M., 2018. Supercycle in great earthquake recurrence along the Japan Trench over the last 4000 years. Geoscience Letters, 5(1):11. https://doi.org/
Von Huene, R., and Lallemand, S., 1990. Tectonic erosion along the Japan and Peru convergent margins. Geological Society of America Bulletin, 102(6):704–720. https://doi.org/
von Huene, R., Langseth, M., and Nasu, N., 1980. Summary, Japan Trench transect. In Langseth, M., Nasu, N. and Okada, H., Initial Reports of the Deep Sea Drilling Project. 56/57: Washington, DC (US Government Printing Office), 474–488. https://doi.org/
Wirth, E.A., Sahakian, V.J., Wallace, L.M., and Melnick, D., 2022. The occurrence and hazards of great subduction zone earthquakes. Nature Reviews Earth & Environment, 3(2):125–140. https://doi.org/
Ye, L., Lay, T., and Kanamori, H., 2013. Ground shaking and seismic source spectra for large earthquakes around the megathrust fault offshore of northeastern Honshu, Japan. Bulletin of the Seismological Society of America, 103(2B):1221–1241. https://doi.org/
Yoshikawa, S., Kanamatsu, T., and Kasaya, T., 2016. Small-scale spatial variation in near-surface turbidites around the JFAST site near the Japan Trench. Geochemistry, Geophysics, Geosystems, 17(3):1238–1246. https://doi.org/
Zindorf, M., Marz, C., Wagner, T., Gulick, S.P.S., Strauss, H., Benowitz, J., Jaeger, J., Schnetger, B., Childress, L., LeVay, L., van der Land, C., and La Rosa, M., 2019. Deep sulfate-methane-transition and sediment diagenesis in the Gulf of Alaska (IODP Site U1417). Marine Geology, 417:105986. https://doi.org/