Webster, J.M., Ravelo, A.C., Grant, H.L.J., and the Expedition 389 Scientists
Proceedings of the International Ocean Discovery Program Volume 389
publications.iodp.org
https://doi.org/10.14379/iodp.proc.389.104.2025
Site M00971
![]() J.M. Webster,
J.M. Webster,
![]() A.C. Ravelo,
A.C. Ravelo,
![]() H.L.J. Grant,
H.L.J. Grant,
![]() M. Rydzy,
M. Rydzy,
![]() M. Stewart,
M. Stewart,
![]() N. Allison,
N. Allison,
![]() R. Asami,
R. Asami,
![]() B. Boston,
B. Boston,
![]() J.C. Braga,
J.C. Braga,
![]() L. Brenner,
L. Brenner,
![]() X. Chen,
X. Chen,
![]() P. Chutcharavan,
P. Chutcharavan,
![]() A. Dutton,
A. Dutton,
![]() T. Felis,
T. Felis,
![]() N. Fukuyo,
N. Fukuyo,
![]() E. Gischler,
E. Gischler,
![]() S. Greve,
S. Greve,
![]() A. Hagen,
A. Hagen,
![]() Y. Hamon,
Y. Hamon,
![]() E. Hathorne,
E. Hathorne,
![]() M. Humblet,
M. Humblet,
![]() S. Jorry,
S. Jorry,
![]() P. Khanna,
P. Khanna,
![]() E. Le Ber,
E. Le Ber,
![]() H. McGregor,
H. McGregor,
![]() R. Mortlock,
R. Mortlock,
![]() T. Nohl,
T. Nohl,
![]() D. Potts,
D. Potts,
![]() A. Prohaska,
A. Prohaska,
![]() N. Prouty,
W. Renema,
N. Prouty,
W. Renema,
![]() K.H. Rubin,
K.H. Rubin,
![]() H. Westphal, and
H. Westphal, and
![]() Y. Yokoyama2
Y. Yokoyama2
1 Webster, J.M., Ravelo, A.C., Grant, H.L.J., Rydzy, M., Stewart, M., Allison, N., Asami, R., Boston, B., Braga, J.C., Brenner, L., Chen, X., Chutcharavan, P., Dutton, A., Felis, T., Fukuyo, N., Gischler, E., Greve, S., Hagen, A., Hamon, Y., Hathorne, E., Humblet, M., Jorry, S., Khanna, P., Le Ber, E., McGregor, H., Mortlock, R., Nohl, T., Potts, D., Prohaska, A., Prouty, N., Renema, W., Rubin, K.H., Westphal, H., and Yokoyama, Y., 2025. Site M0097. In Webster, J.M., Ravelo, A.C., Grant, H.L.J., and the Expedition 389 Scientists, Hawaiian Drowned Reefs. Proceedings of the International Ocean Discovery Program, 389: College Station, TX (International Ocean Discovery Program). https://doi.org/10.14379/iodp.proc.389.104.2025
2 Expedition 389 Scientists’ affiliations.
1. Operations
The multipurpose vessel MMA Valour was used as the drilling platform throughout Expedition 389. At all sites, dynamic positioning was used to provide accurate positions throughout operations and water depth was established using a Sound Velocity Profiler (SVP) placed on the top of the PROD5 drilling system. For more detail on acquisition methods, see Introduction in the Expedition 389 methods chapter (Webster et al., 2025a).
Summary operational information for Holes M0097A–M0097D is provided in Table T1. All times stated are in Hawaiian Standard Time (HST).
1.1. Hole M0097A
The MMA Valour arrived at Site M0097 at 2030 h on 7 September 2023. Predeployment preparations were carried out until 2205 h, when PROD5 was deployed to a water depth of 414.2 m. Rotary coring and casing at Hole M0097A progressed to 35.05 meters below seafloor (mbsf) until 1710 h on 9 September, when it was decided to end Hole M0097A because hole conditions were making it progressively more difficult to retrieve core barrels from the borehole. Casing was removed, and PROD5 was recovered to deck at 0135 h on 10 September. Core barrels were extracted during deck operations.
A total of 25 cores were recovered from Hole M0097A with a total cored length of 35.05 m and a total recovered length of 26.42 m (75.38% recovery).
1.2. Hole M0097B
PROD5 was launched at 1510 h on 10 September 2023, and coring in Hole M0097B commenced at 1554 h at a water depth of 414.6 m. The hole was wash bored and cased down to 34.36 mbsf, just above the depth reached in Hole M0097A. Rotary coring commenced at 1925 h on 11 September and cored 35.05 to 59.35 mbsf. At 2235 h on 12 September, a water leak into the manifold system was observed, casing was removed, and PROD5 was recovered to deck by 2310 h. Core barrels were extracted during deck operations, and the vessel began a transit to Site M0098, arriving at 0030 h on 13 September.
A total of 12 cores were recovered from Hole M0097B from 24.98 m of rotary coring. A total of 23.17 m of core was recovered (92.75% recovery).
1.3. Hole M0097C
On 15 September 2023, the MMA Valour transited back to an offset location at Site M0097, approximately 93 m and 297° from Hole M0097A. PROD5 was deployed at 2125 h at a water depth of 417.6 m, and rotary coring of Hole M0097C commenced at 2225 h. Coring and casing of Hole M0097C continued until 0130 h on 18 September to 36.16 mbsf, when all core barrels were used. Casing was removed, and PROD5 was recovered to deck at 0215 h. On-deck core barrel extraction commenced, and the vessel began the transit back to Site M0096 at 0345 h.
A total of 32 cores were recovered from Hole M0097C from 35.62 m of rotary coring and 0.54 m of wash boring. A total of 28.04 m of core was recovered (78.72% recovery).
1.4. Hole M0097D
On 30 October 2023, the vessel transited back to Site M0097, arriving at 1110 h. PROD5 was deployed at 1120 h on 30 October at a water depth of 424.0 m, and rotary coring and casing of Hole M0097D progressed to 23.69 mbsf. At 2133 h on 31 October, following removal of casing, PROD5 was recovered to deck following the end of the operational period of Leg 2. On-deck core barrel extraction commenced, equipment was secured, and the return transit to Barbers Point Harbor, Kapolei, began at 2345 h.
A total of 28 cores were recovered from Hole M0097D from 23.66 m of rotary coring and 0.03 m of wash boring. A total of 19.22 m of core was recovered (81.23% recovery).
2. Lithostratigraphy
Site M0097 in the Kawaihae region was drilled at approximately 415.00 meters below sea level (mbsl). For all holes (composite Holes M0097A and M0097B, Hole M0097C, and Hole M0097D) (Figure F1), a mixed carbonate-volcaniclastic coarse-grained deposit up to 1.81 m thick occurs at the top of the succession. Below, coralgal-microbialite boundstone with predominantly branching and columnar Porites extends to about 13.00 mbsf (Holes M0097A and M0097D) and 19.00 mbsf (Hole M0097C), only interrupted in Hole M0097A by short intervals of unconsolidated biodetrital sediments and coralgal boundstone. Farther downhole, intervals of algal and microbialite-algal boundstone comprise thick coralline algal crusts and few corals, mainly branching Porites, to about 20.00 mbsf (Hole M0097A), 24.00 mbsf (Hole M0097D), and 30.00 mbsf (Hole M0097C). Below, coralgal-microbialite boundstone was recovered to 58.42 mbsf (Hole M0097B).
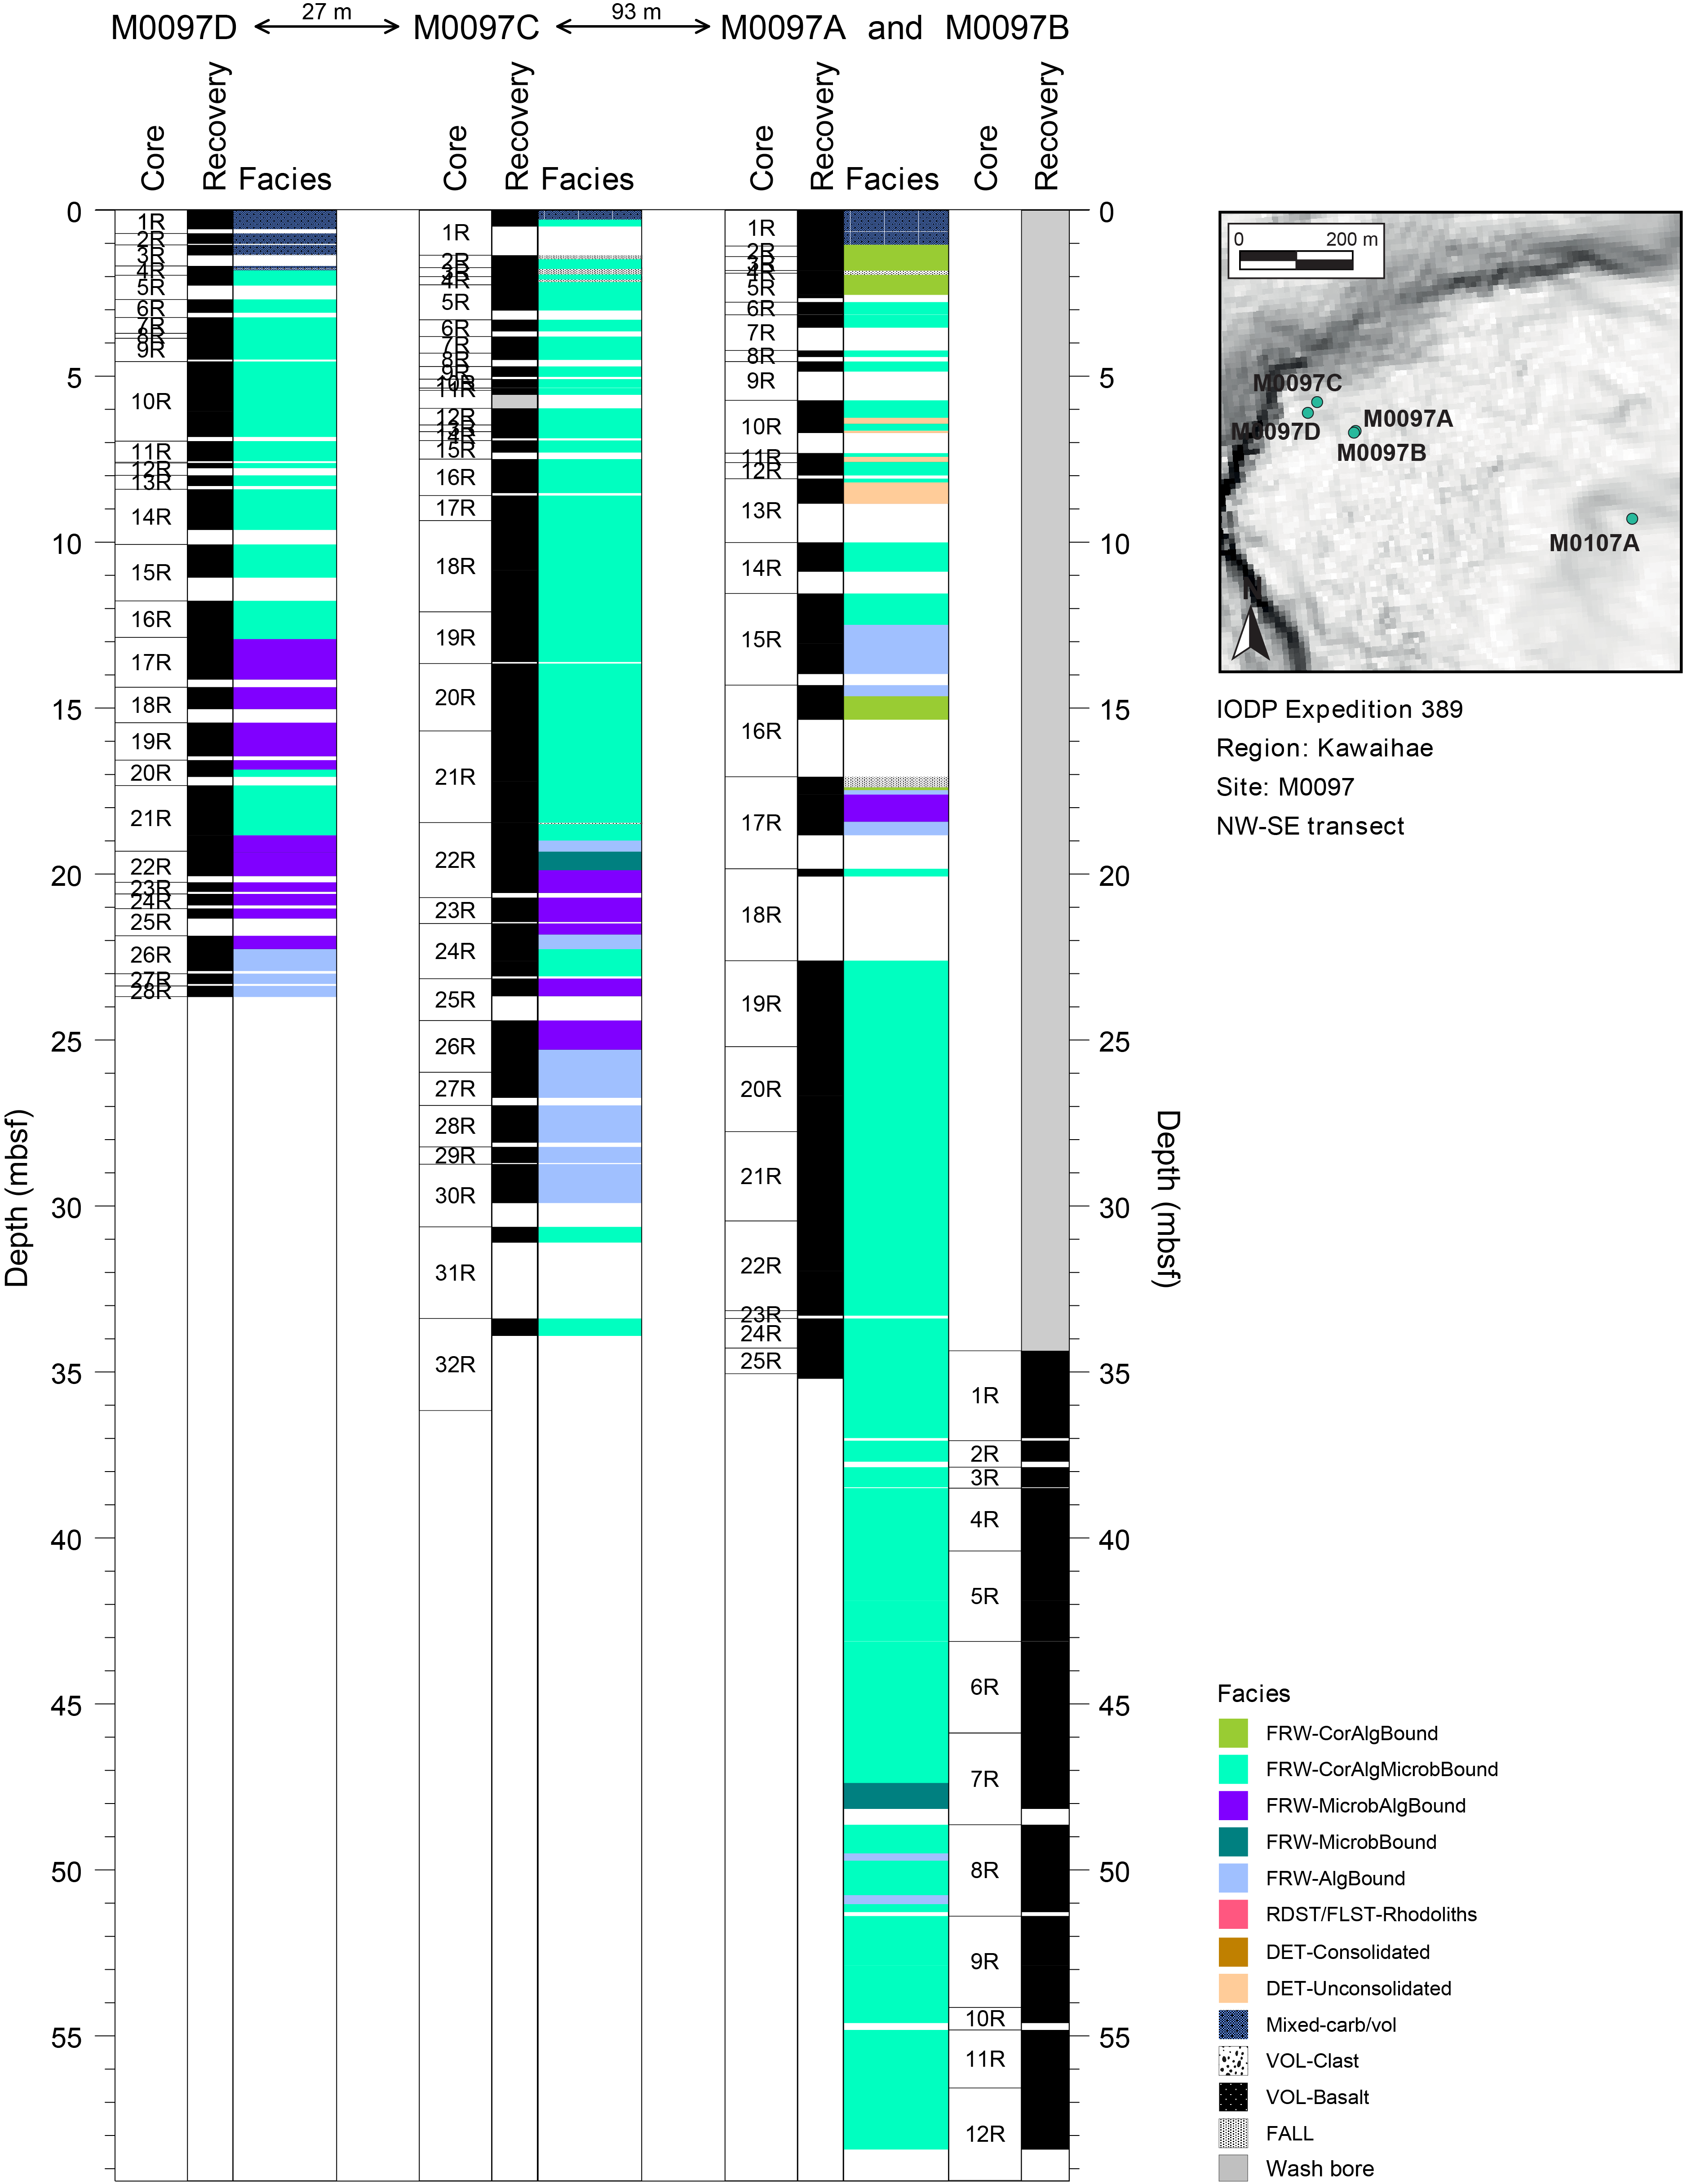
Figure F1. Lithostratigraphy.
2.1. Holes M0097A and M0097B
Holes M0097A and M0097B represent a composite hole and are described together. At this site, core recovery improves significantly below approximately 23.00 mbsf.
In Hole M0097A (Figures F2, F3), mixed carbonate-volcaniclastic sediment (Figure F4A) was recovered from 0.00 to 1.04 mbsf. This sediment is a poorly sorted conglomerate of subangular coral, coralgal, and basaltic pebbles to cobbles in a matrix of fine sand to granules. Bioclasts in the matrix are crustose coralline algae (CCA), bivalve and gastropod shells, bryozoans, pteropods, and echinoid spines. Basaltic clasts are not porphyritic with olivine crystals and rounded vesicles. Most corals are pieces of Porites. Fragmented coralgal boundstone (Figure F4B) extending from 1.04 to 2.25 mbsf consists of broken pieces of Porites encrusted with CCA, with localized vermetids and Homotrema. From 2.25 to 6.25 mbsf, the recovered material is composed of fragments of coralgal-microbialite boundstone. Corals are mainly Porites with a few Pocillopora. CCA crusts include vermetids and Homotrema in some intervals. Microbialite is mostly structureless. From 6.25 to 12.50 mbsf, the boundstone alternates with four intervals (up to several decimeters thick) of unconsolidated detrital sediment (Figure F4C) with a sandy matrix containing echinoid spines, CCA, large benthic foraminifers, and gastropods. From 12.50 to 14.64 mbsf, the deposits consist of algal boundstone made of CCA with abundant vermetids and Homotrema (Figure F4D). Corals, such as Cyphastrea, massive Porites, and Pocillopora, are scarce. Gastropods (including Cypraeidae), bivalves, and small sediment pockets appear in the algal crusts. Coralgal boundstone from 14.64 to 17.47 mbsf consists of Porites and Pocillopora branches encrusted with CCA with vermetids, Homotrema, and sporadic gastropods. Below a short (13 cm) interval of algal boundstone, the facies from 17.60 to 18.42 mbsf is a microbialite-algal boundstone (Figure F4E) with dispersed, heavily bored fragments of branching Pocillopora, bivalves, and gastropods. Homotrema occurs in some CCA crusts. Microbialite is massive to dendritic. A short interval (41 cm) of algal boundstone with Cyphastrea and Porites extends from 18.42 to 18.83 mbsf. CCA crusts include vermetids and Homotrema. The facies from 19.84 mbsf to the base of Hole M0097A at 35.20 mbsf is coralgal-microbialite boundstone. Corals include diverse morphologies of Porites and Pocillopora and rare Montipora and Cyphastrea. CCA are intergrown with Homotrema and vermetids. Microbialite is up to 10 cm thick, massive to dendritic, and generally laminated (Figure F4F). Bivalves, gastropods, echinoid spines, and rare crab carapaces occur in small internal sediment pockets in the microbialite.
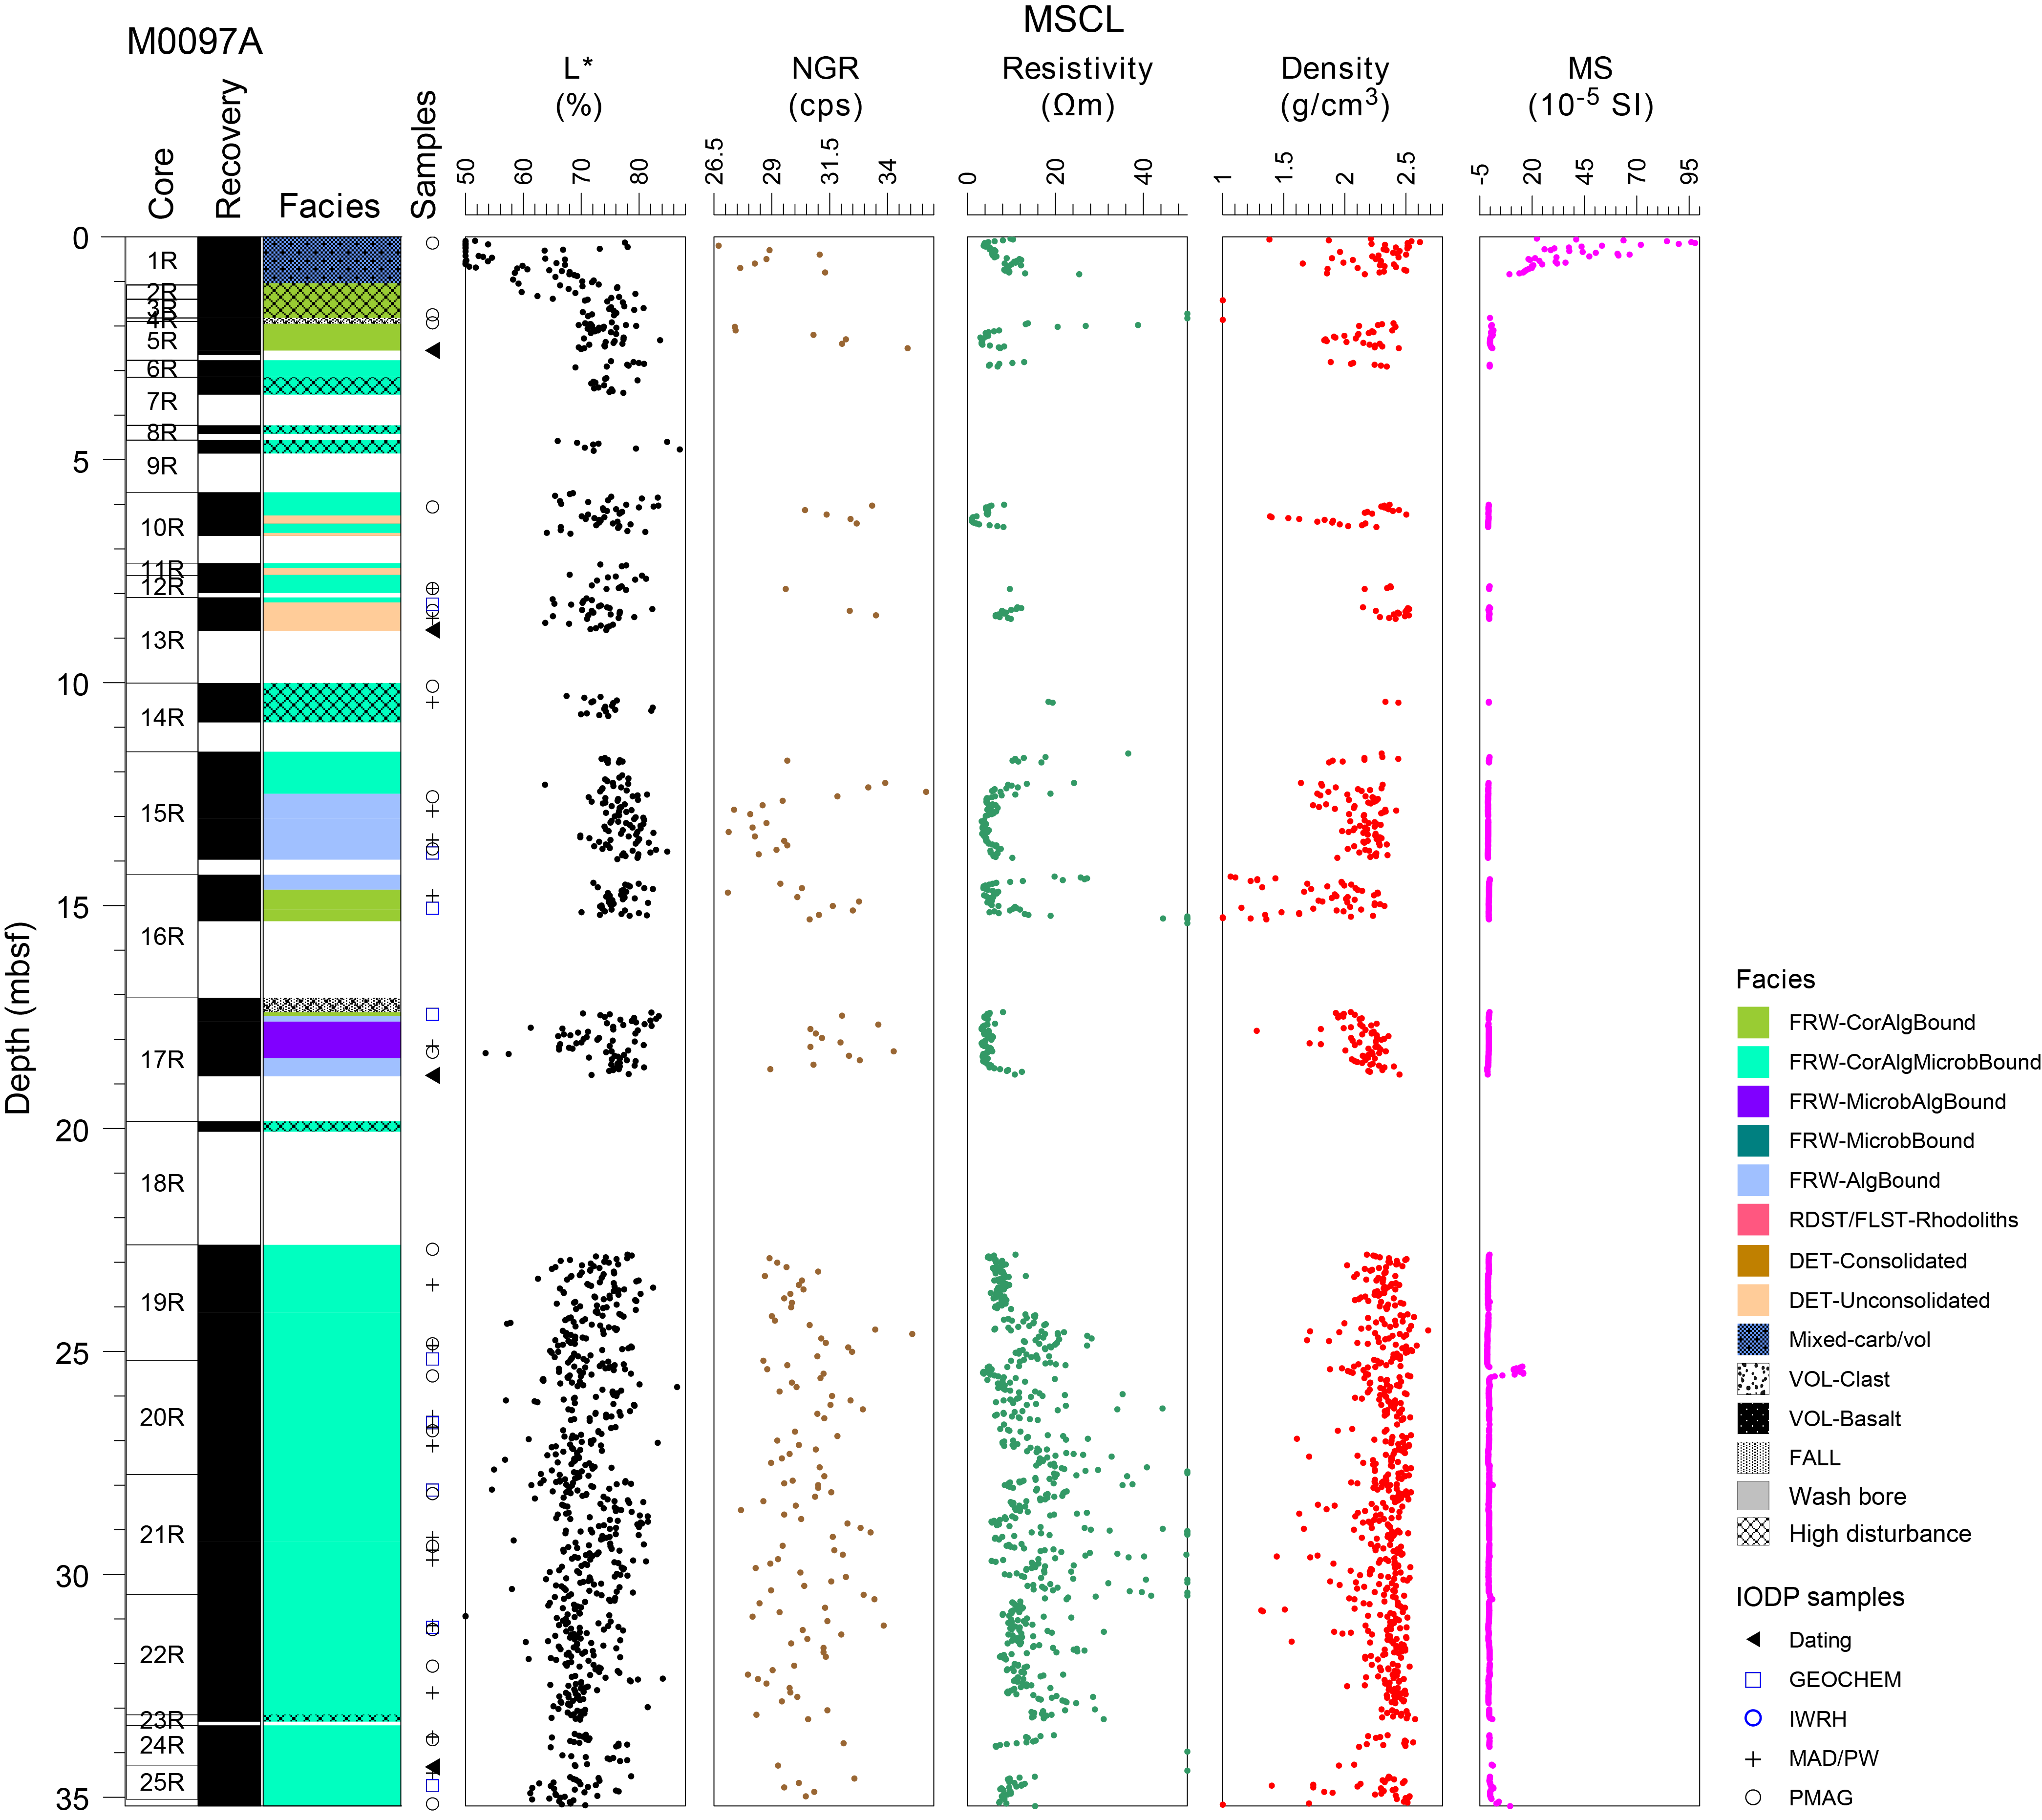
Figure F2. Lithostratigraphy and MSCL data, Hole M0097A.
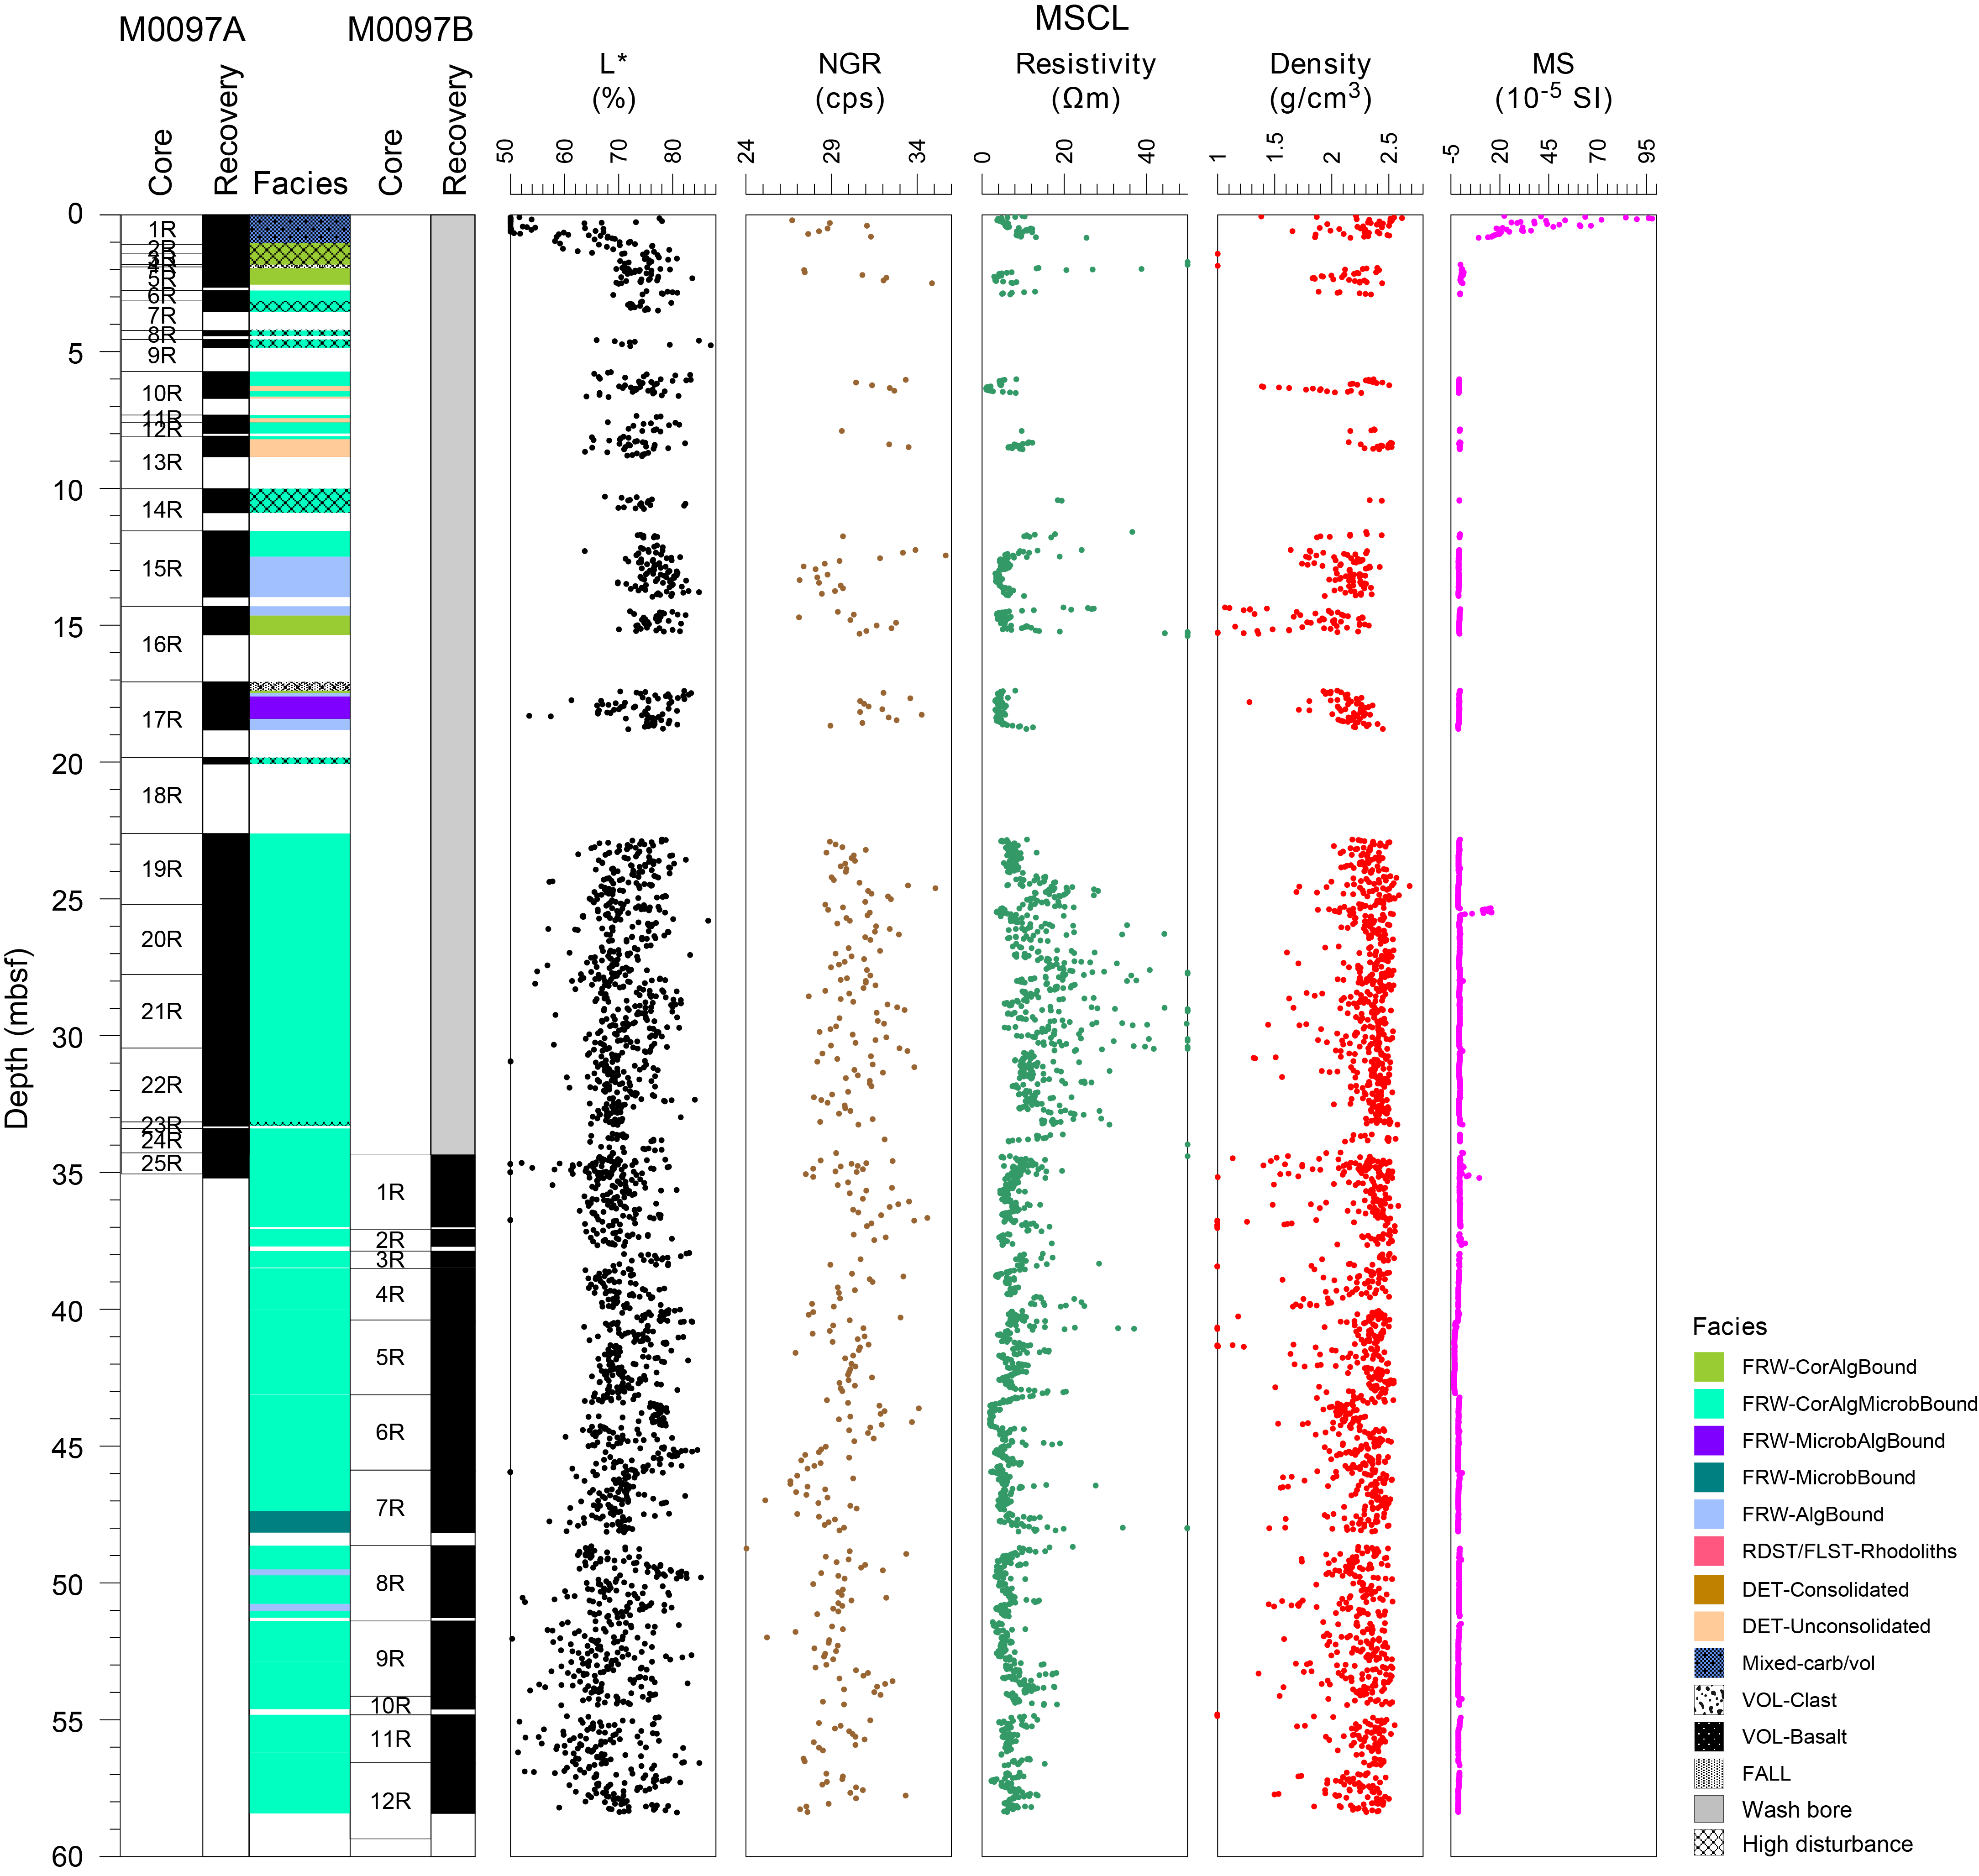
Figure F3. Composite lithostratigraphic log and MSCL data.
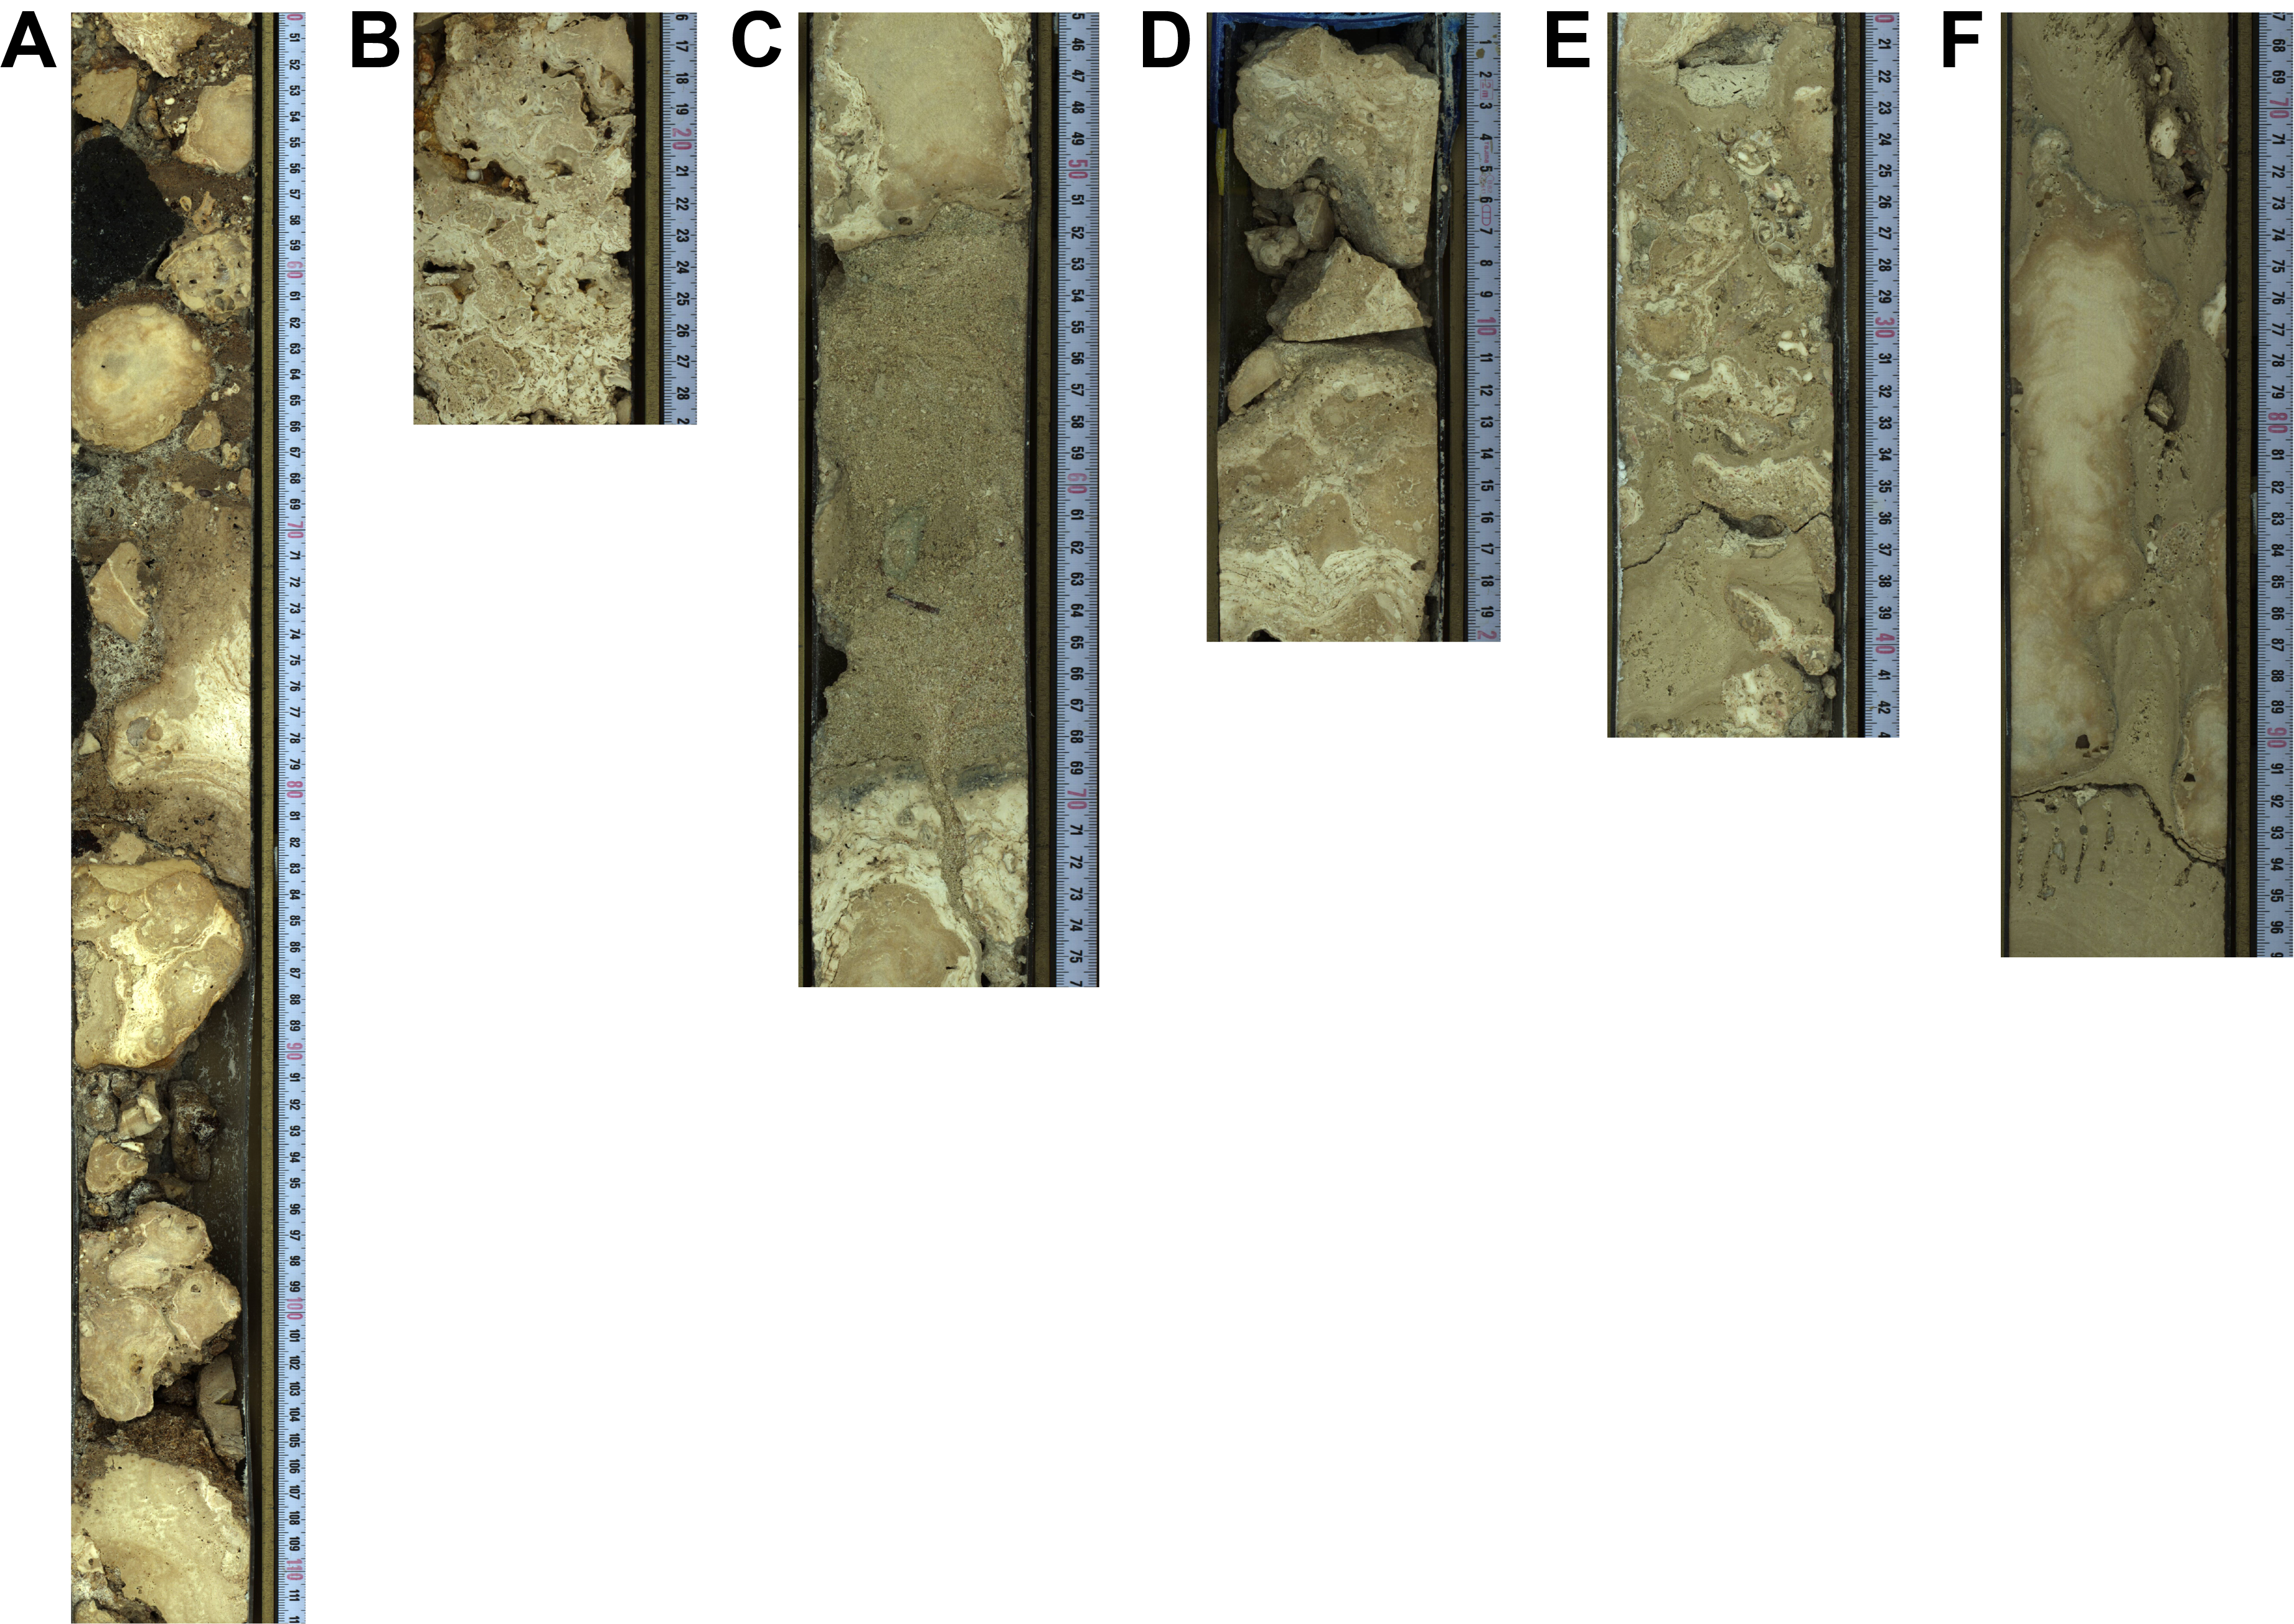
Figure F4. Lithologies, Hole M0097A.
In Hole M0097B (Figure F5), coralgal-microbialite boundstone was recovered from 34.36 to 47.32 mbsf. Porites is the predominant coral in the boundstone, with occurrences of other coral genera. Laminar Porites dominate in the uppermost 1.50 m (Figure F6A), with secondary columnar, branching, and encrusting colonies. Minor branching Pocillopora, Merulinidae, and encrusting Agariciidae also occur. All corals are heavily bored. CCA crusts are relatively thick (several centimeters) and include vermetids and Homotrema. Microbialite crusts are thick, massive to dendritic, and internally laminated. From 35.86 to 44.63 mbsf, the dominant Porites morphology is columnar (Figure F6B, F6C, F6D) and up to 1 m in recovered length, with additional branching colonies. Many colonies are heavily bioeroded. Pocillopora occurs in a few places and is also densely bioeroded. CCA crusts are several centimeters thick and contain vermetids and Homotrema. Microbialites are generally massive or locally dendritic and internally laminated. From 44.63 to 47.39 mbsf, branching Porites dominate the framework, with few columnar and laminar morphologies. CCA crusts, including vermetids and Homotrema, are up to 40 cm thick in the uppermost 1.20 m (Figure F6E) and several centimeters thick in the rest of the interval. Microbialite crusts are thick, massive to columnar and dendritic, and faintly laminated. Microbialite boundstone (Figure F6F), consisting of thick columnar and dendritic, faintly laminated crusts, thin CCA crusts, and few branching corals occurs from 47.38 to 48.16 mbsf. Coralgal-microbialite boundstone with branching Porites, thin CCA and mostly dendritic microbialite is present (48.16–49.51 mbsf). Below a short interval of algal boundstone consisting of CCA with vermetids and Homotrema (49.51–49.71 mbsf), coralgal-microbialite boundstone extends to the base of the hole. Most corals are branching Porites with massive colonies in a few intervals and rare Pocillopora. CCA crusts are up to 20 cm thick in some intervals (Figure F6G) and include vermetids and Homotrema. Microbial crusts are massive, columnar, and dendritic with internal lamination.
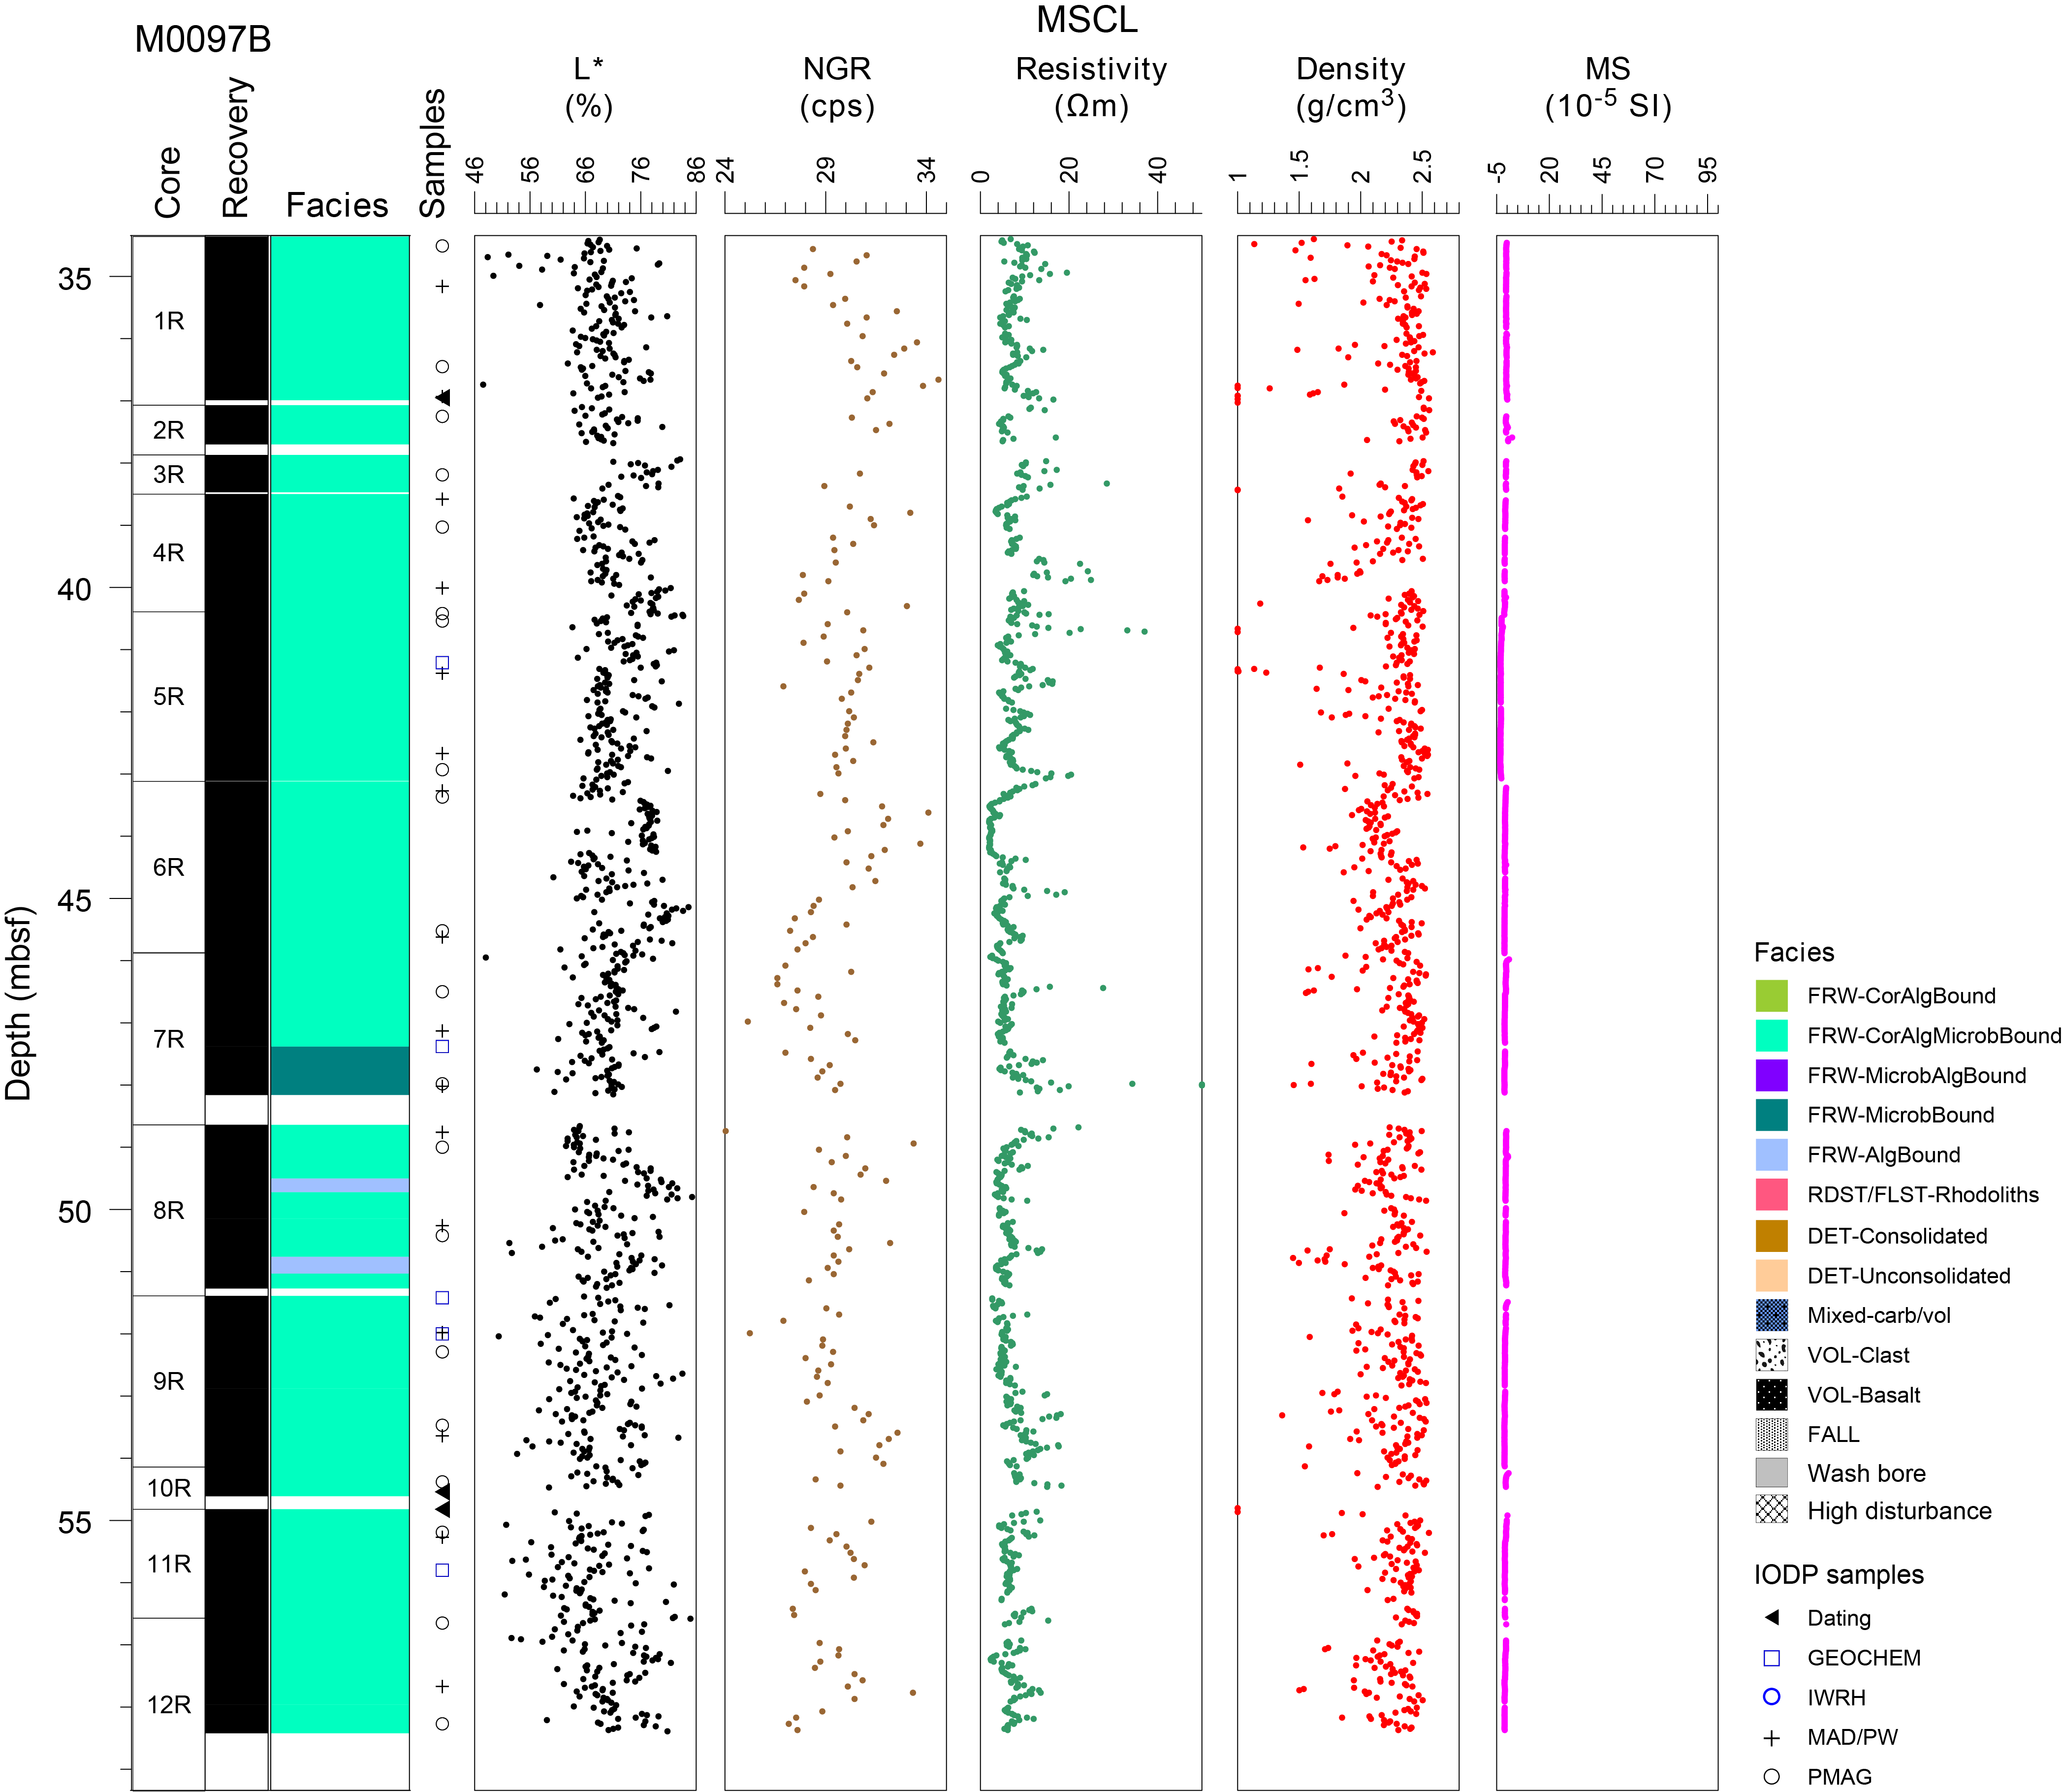
Figure F5. Lithostratigraphy and MSCL data, Hole M0097B.
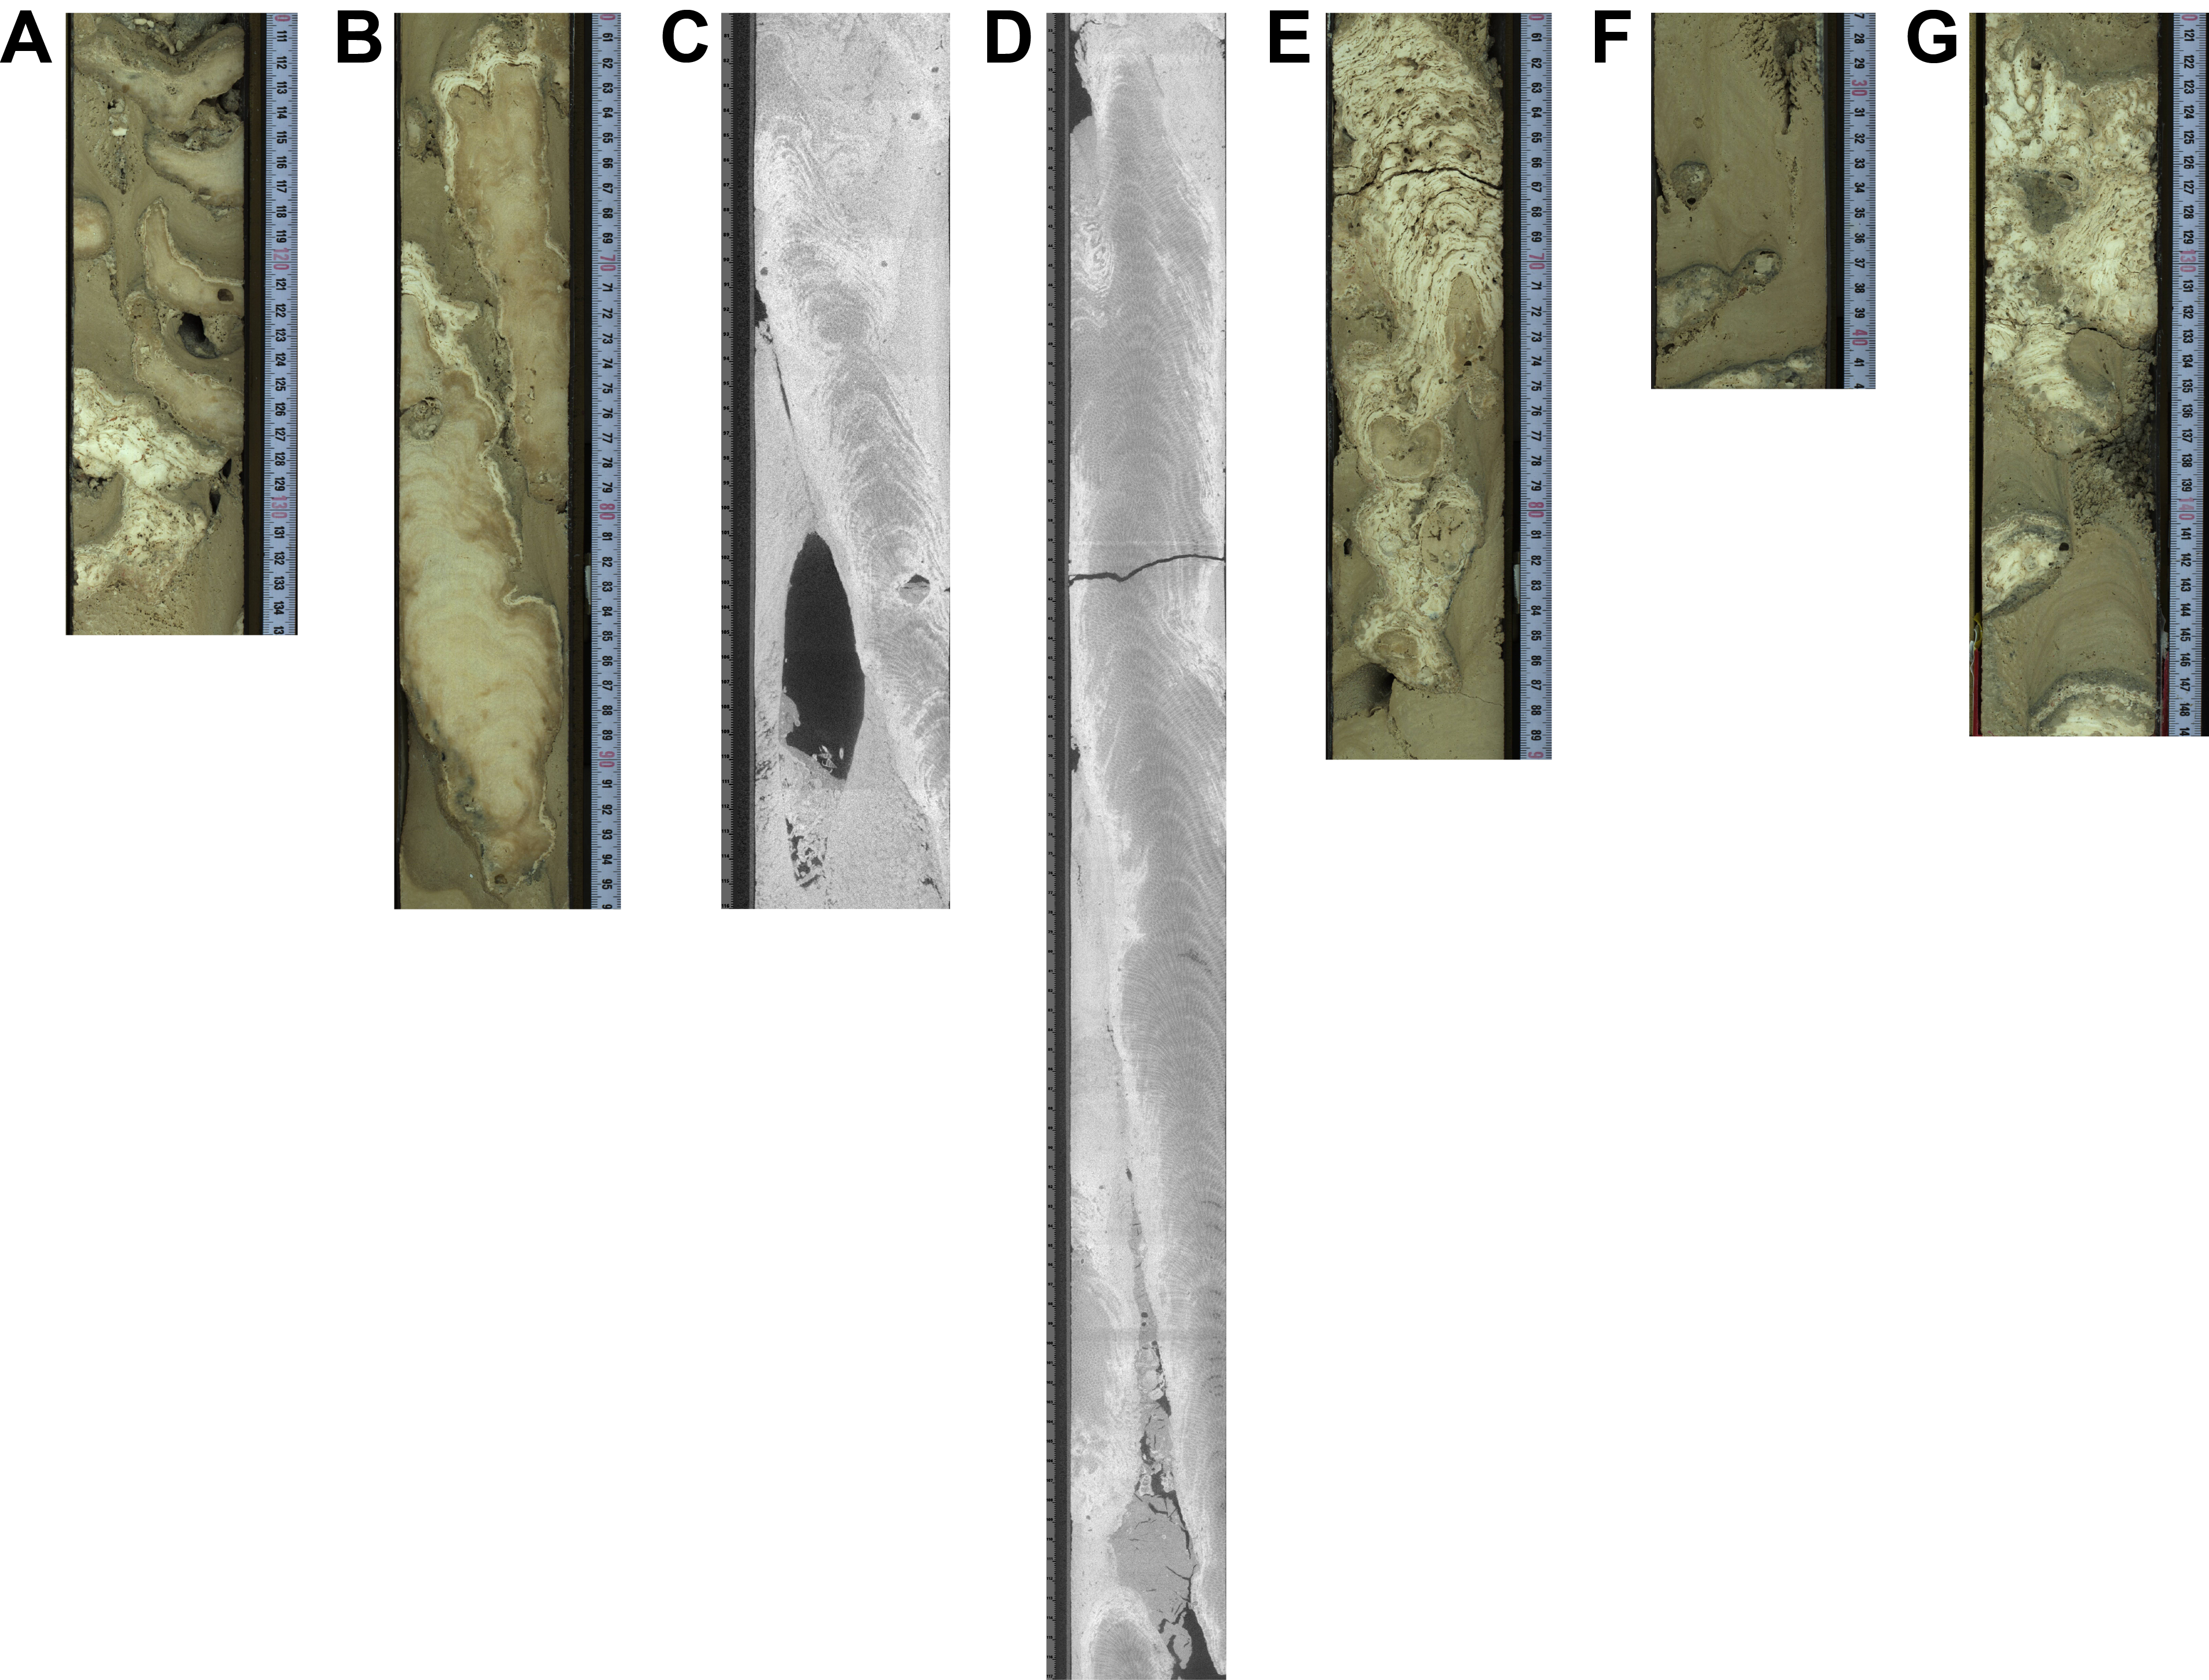
Figure F6. Lithologies, Hole M0097B.
2.2. Hole M0097C
The uppermost 28 cm of Hole M0097C (Figure F7) is a mixed carbonate-volcaniclastic sediment (Figure F8A) composed of poorly sorted, heterometric, granule- to cobble-sized Porites fragments and vesicular basalt clasts in a coarse to very coarse sandy matrix consisting of large benthic foraminifers, gastropods, and corals. From 0.28 to 18.99 mbsf, the dominant facies is coralgal-microbialite boundstone with abundant core disturbance to approximately 7.00 mbsf. This interval is composed of laminar to submassive Porites (Figure F8B) to 2.09 mbsf and branching to columnar Porites below that depth (Figure F8C), with crustose coralline algal crusts and massive to dendritic, laminated or structureless microbialite. Associated coral taxa are Cyphastrea and to a lesser extent Pocillopora. Coralline algal crusts are generally up to a few centimeters thick, except for one 25 cm thick crustose-fruticose algal crust at 16.40 mbsf (Figure F8D). The algal crusts are frequently associated with vermetids and Homotrema. From 18.99 to 25.31 mbsf, the core material is primarily composed of microbialite-algal boundstone (Figure F8E) with two intervals of microbial boundstone and coralgal microbial boundstone. It comprises rare corals (mostly Porites) and thick algal crusts associated with variable proportions of vermetids and Homotrema. Microbialite is columnar, massive, and laminated. The proportion of algal crusts increases downhole, and an algal boundstone is identified between 25.31 and 29.91 mbsf (Figure F8F). In this interval, algal crusts frequently reach 20 cm thick, and the abundance of corals remains low (mainly branching Porites), whereas microbialite generally forms thin crusts. Below 29.91 mbsf to the bottom of the hole at 33.91 mbsf, recovery was very low and the core material consists of coralgal-microbialite boundstone composed of branching to columnar Porites with algal crusts and a low abundance of microbialite showing a dendritic morphology and a structureless texture (Figure F8G).
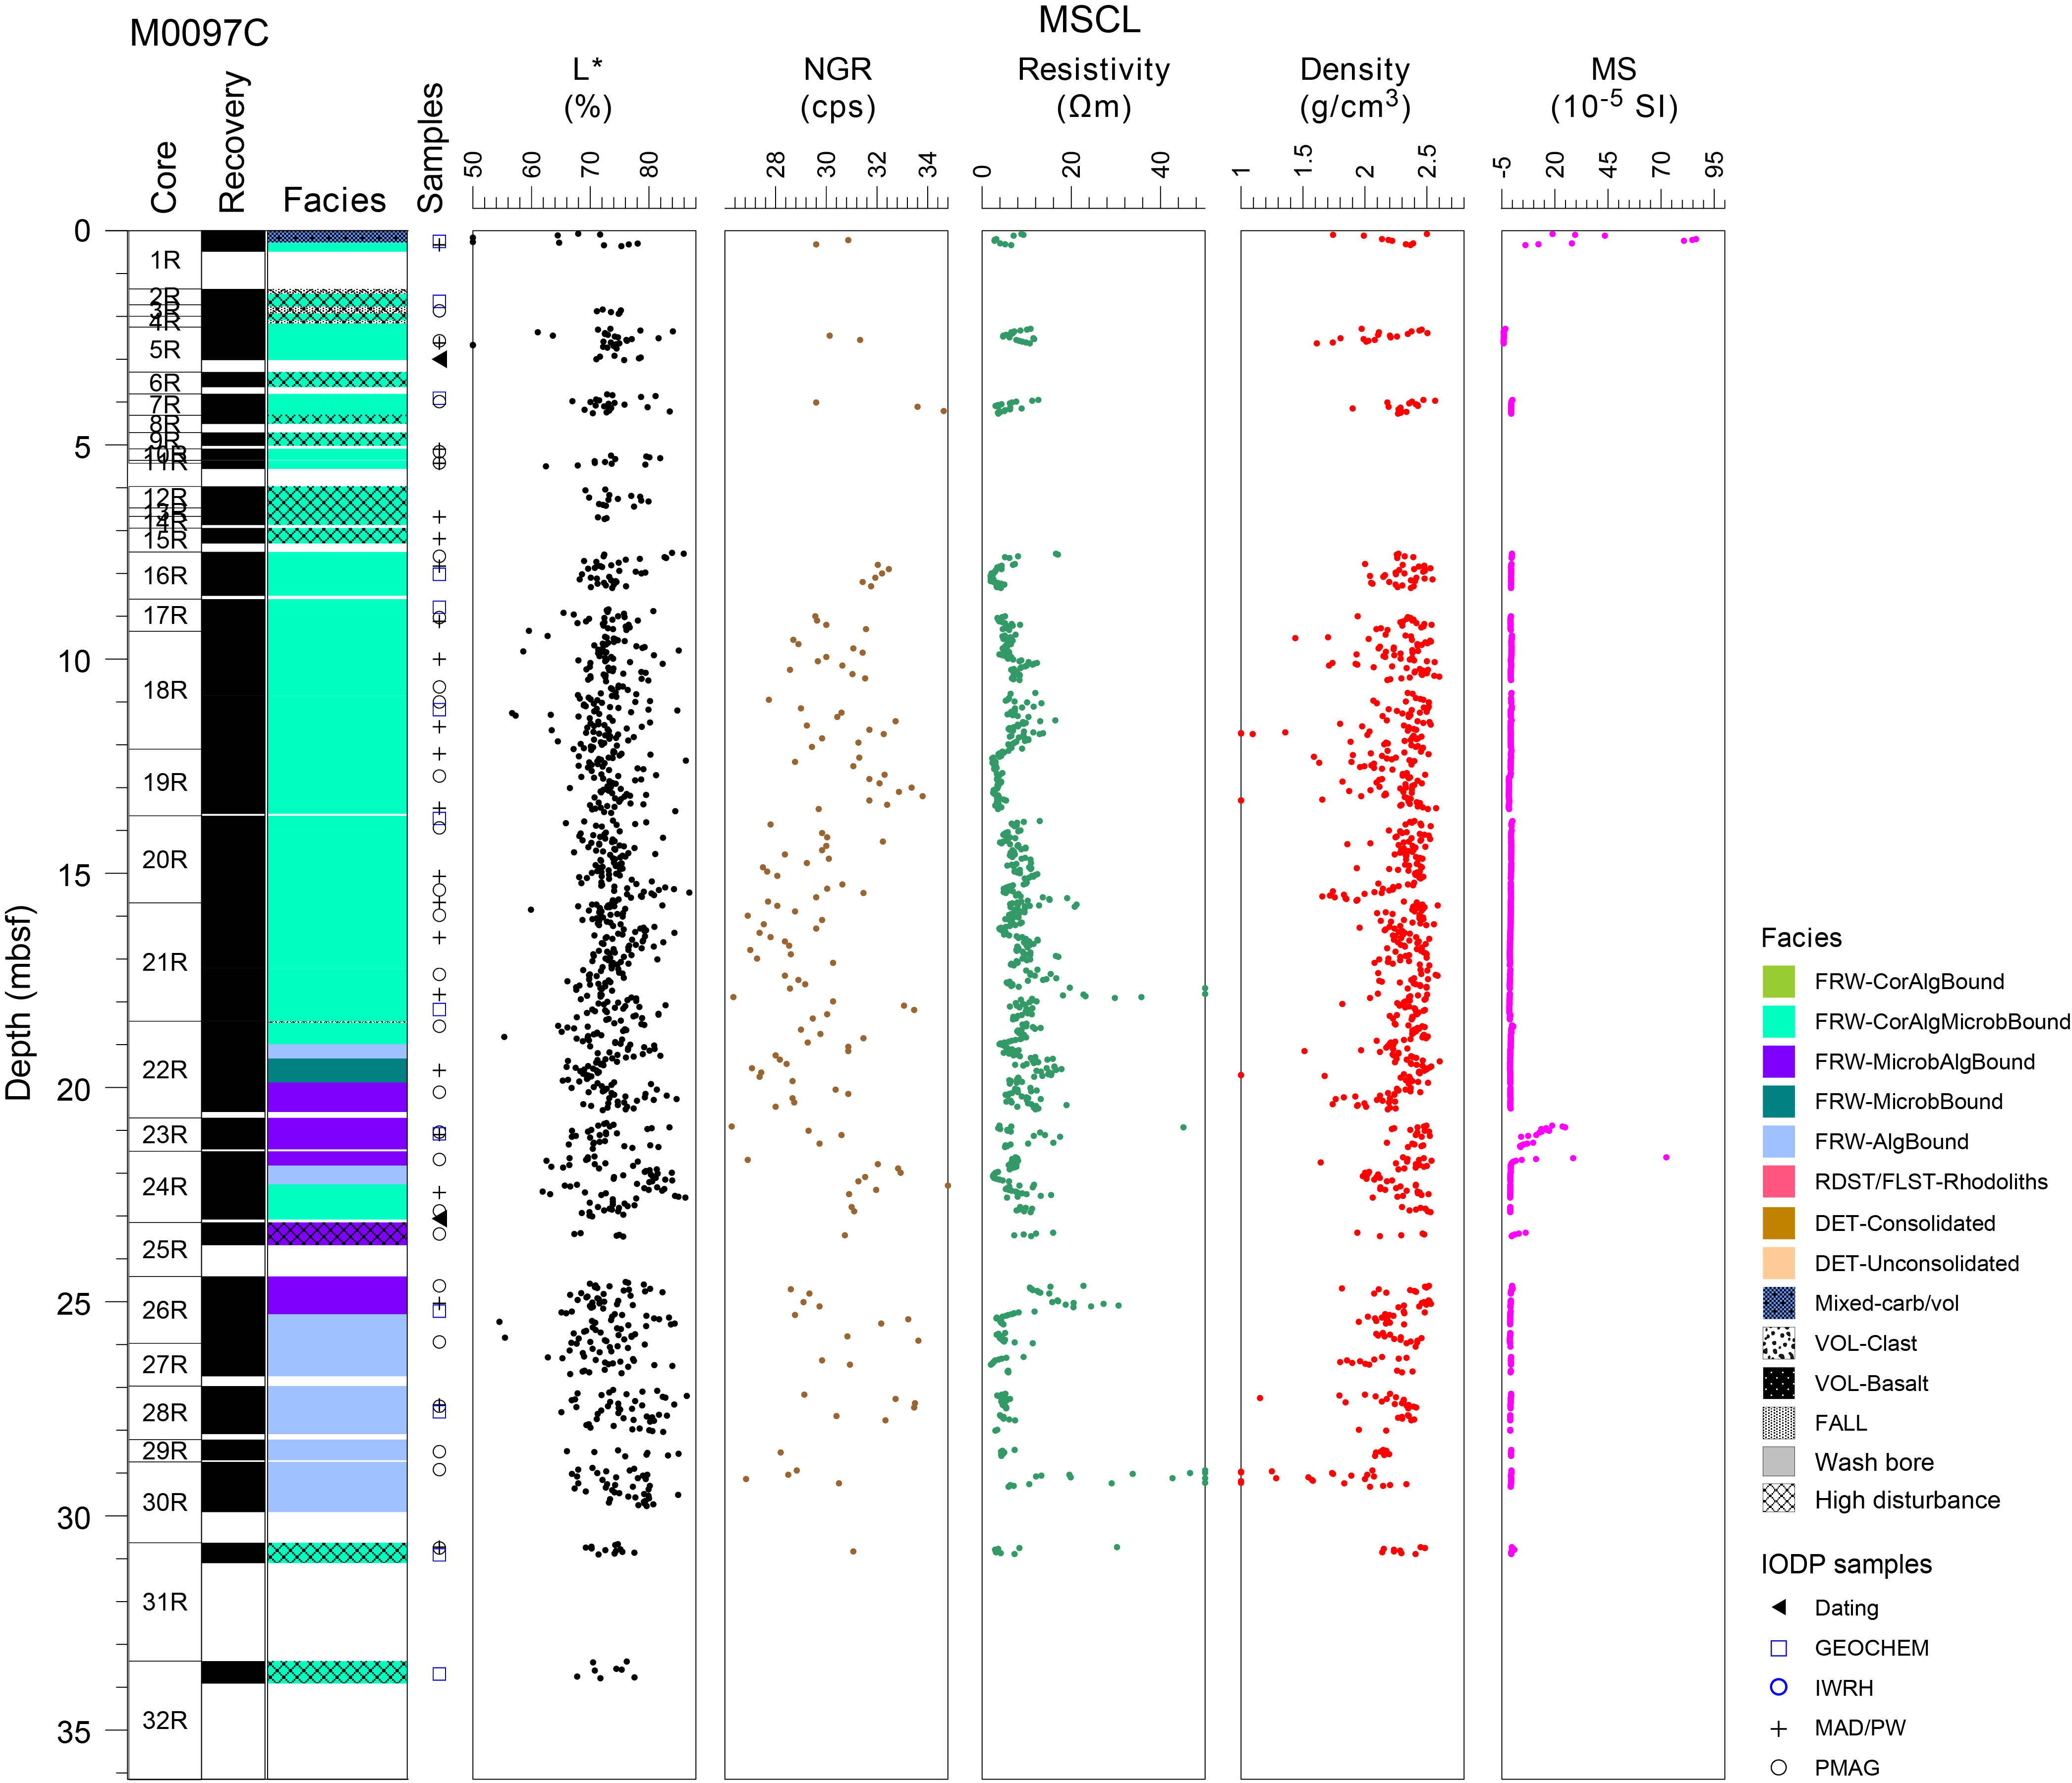
Figure F7. Lithostratigraphy and MSCL data, Hole M0097C.
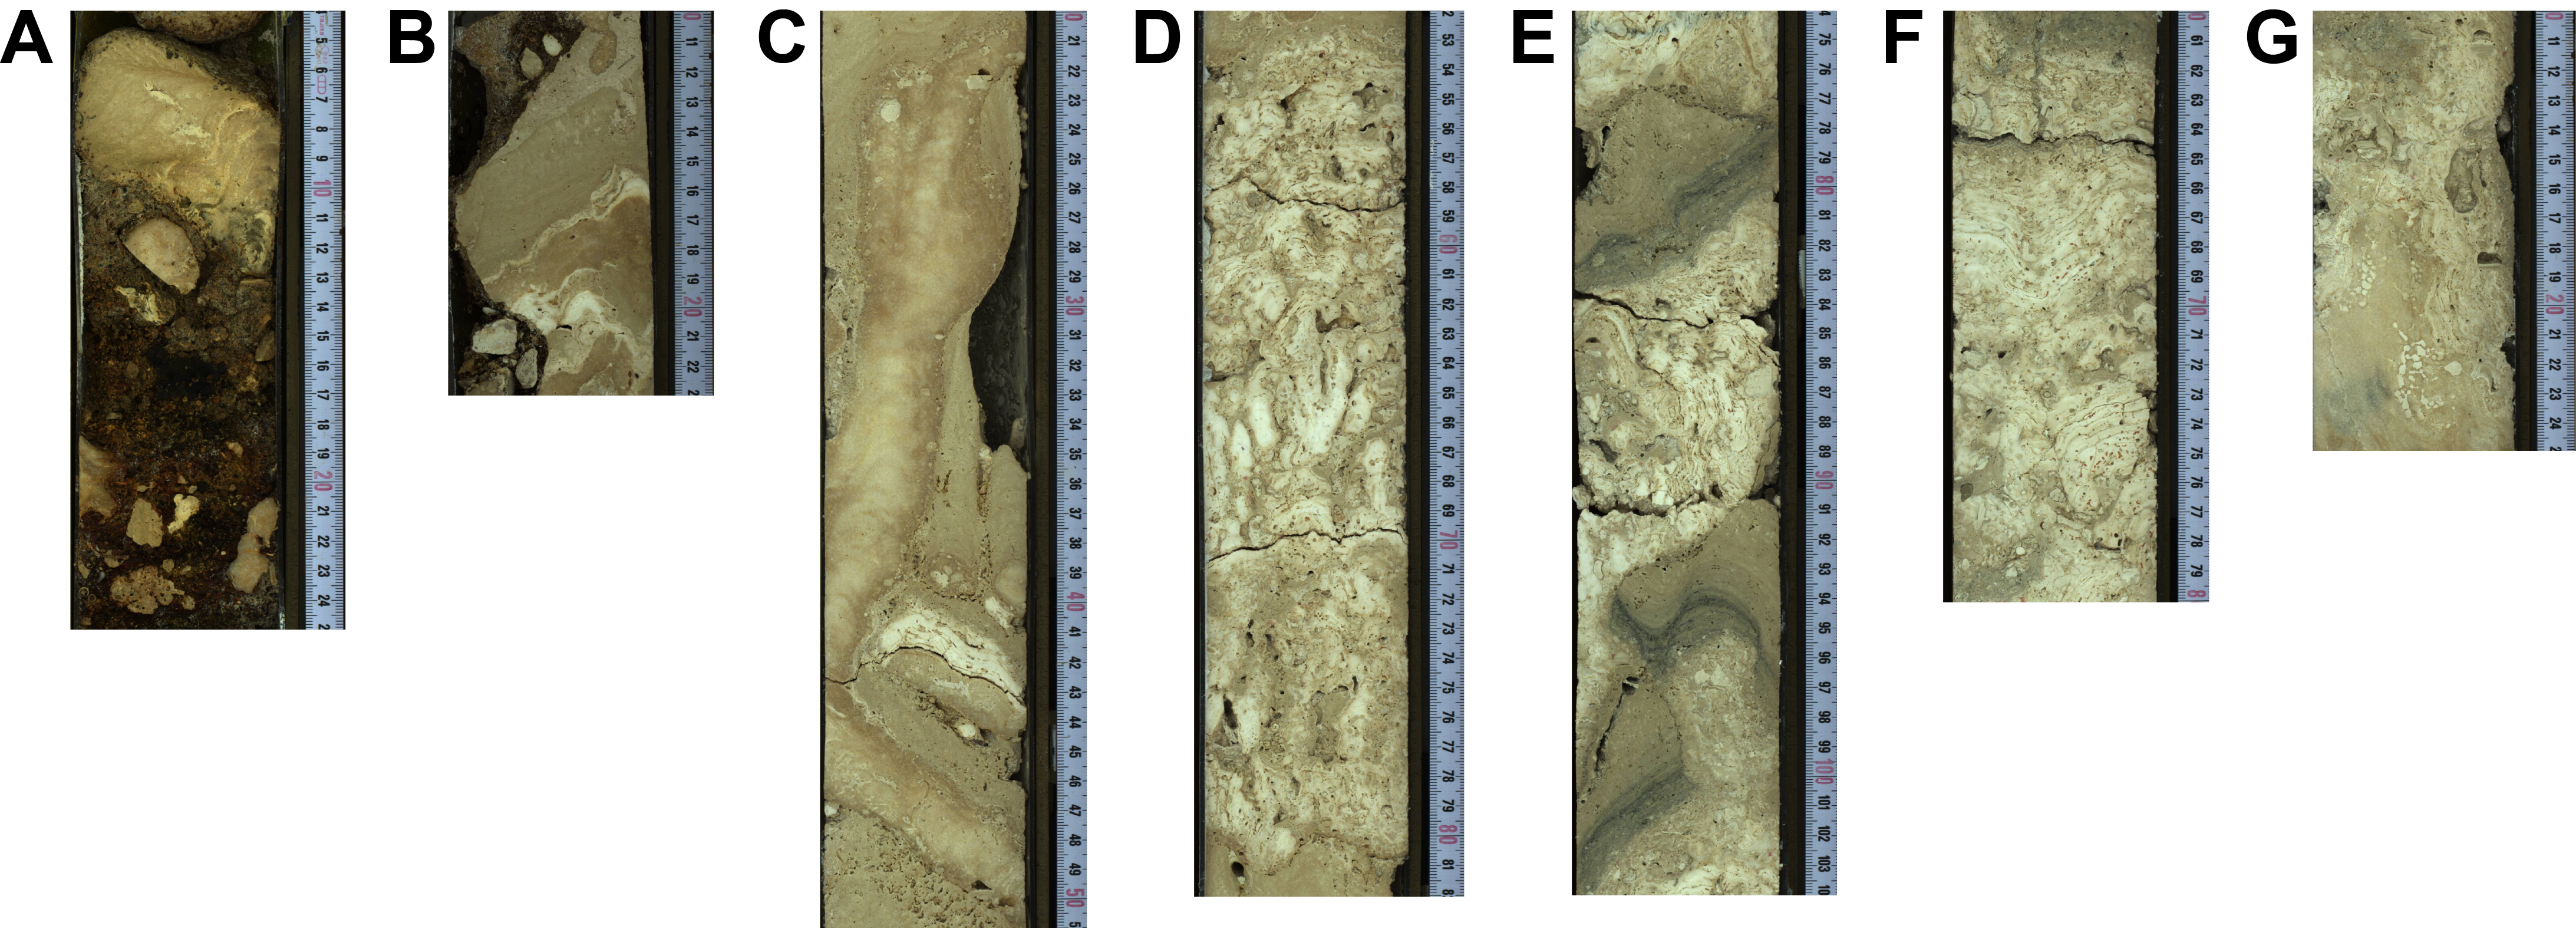
Figure F8. Lithologies, Hole M0097C.
2.3. Hole M0097D
In Hole M0097D (Figure F9), the material recovered from 0.00 to 1.81 mbsf is a mixed carbonate-volcaniclastic sediment composed of clasts of massive laminated microbialite, coralline algal crusts with vermetids, and aphanitic vesicular basalt in a matrix of mixed bioclast-terrigenous coarse-grained sand with layers of fine-grained sand-sized sediment (Figure F10A). A coralgal-microbialite boundstone was recovered from 1.82 to 12.92 mbsf. In this interval, corals mostly comprise branching and columnar Porites, with some encrusting Cyphastrea. Microbialite crusts are primarily structureless and display a variety of morphologies (i.e., massive, columnar, and dendritic). Algal crusts are up to 10 cm thick in several core sections and reach 20 cm in Section 7R-1 (Figure F10B). Core sections recovered from 12.92 to 22.26 mbsf consist of algal-microbialite boundstone, except from 16.85 to 18.83 mbsf, where core material is a coralgal-microbialite boundstone with branching Porites and thick coralline algal crusts (Figure F10C). The algal-microbialite boundstone includes relatively few corals, mostly encrusting Cyphastrea and branching to columnar Porites. The microbialite is structureless or laminated and mostly dendritic. Algal crusts are frequently several centimeters thick but can reach up to 20 cm (Figure F10D). Most are composed of CCA, but some are fruticose. The lowermost part of Hole M0097D (22.26–23.70 mbsf) consists of an algal boundstone with only microbialite crusts up to 2 cm thick and very few corals, including columnar Porites (Figure F10E).
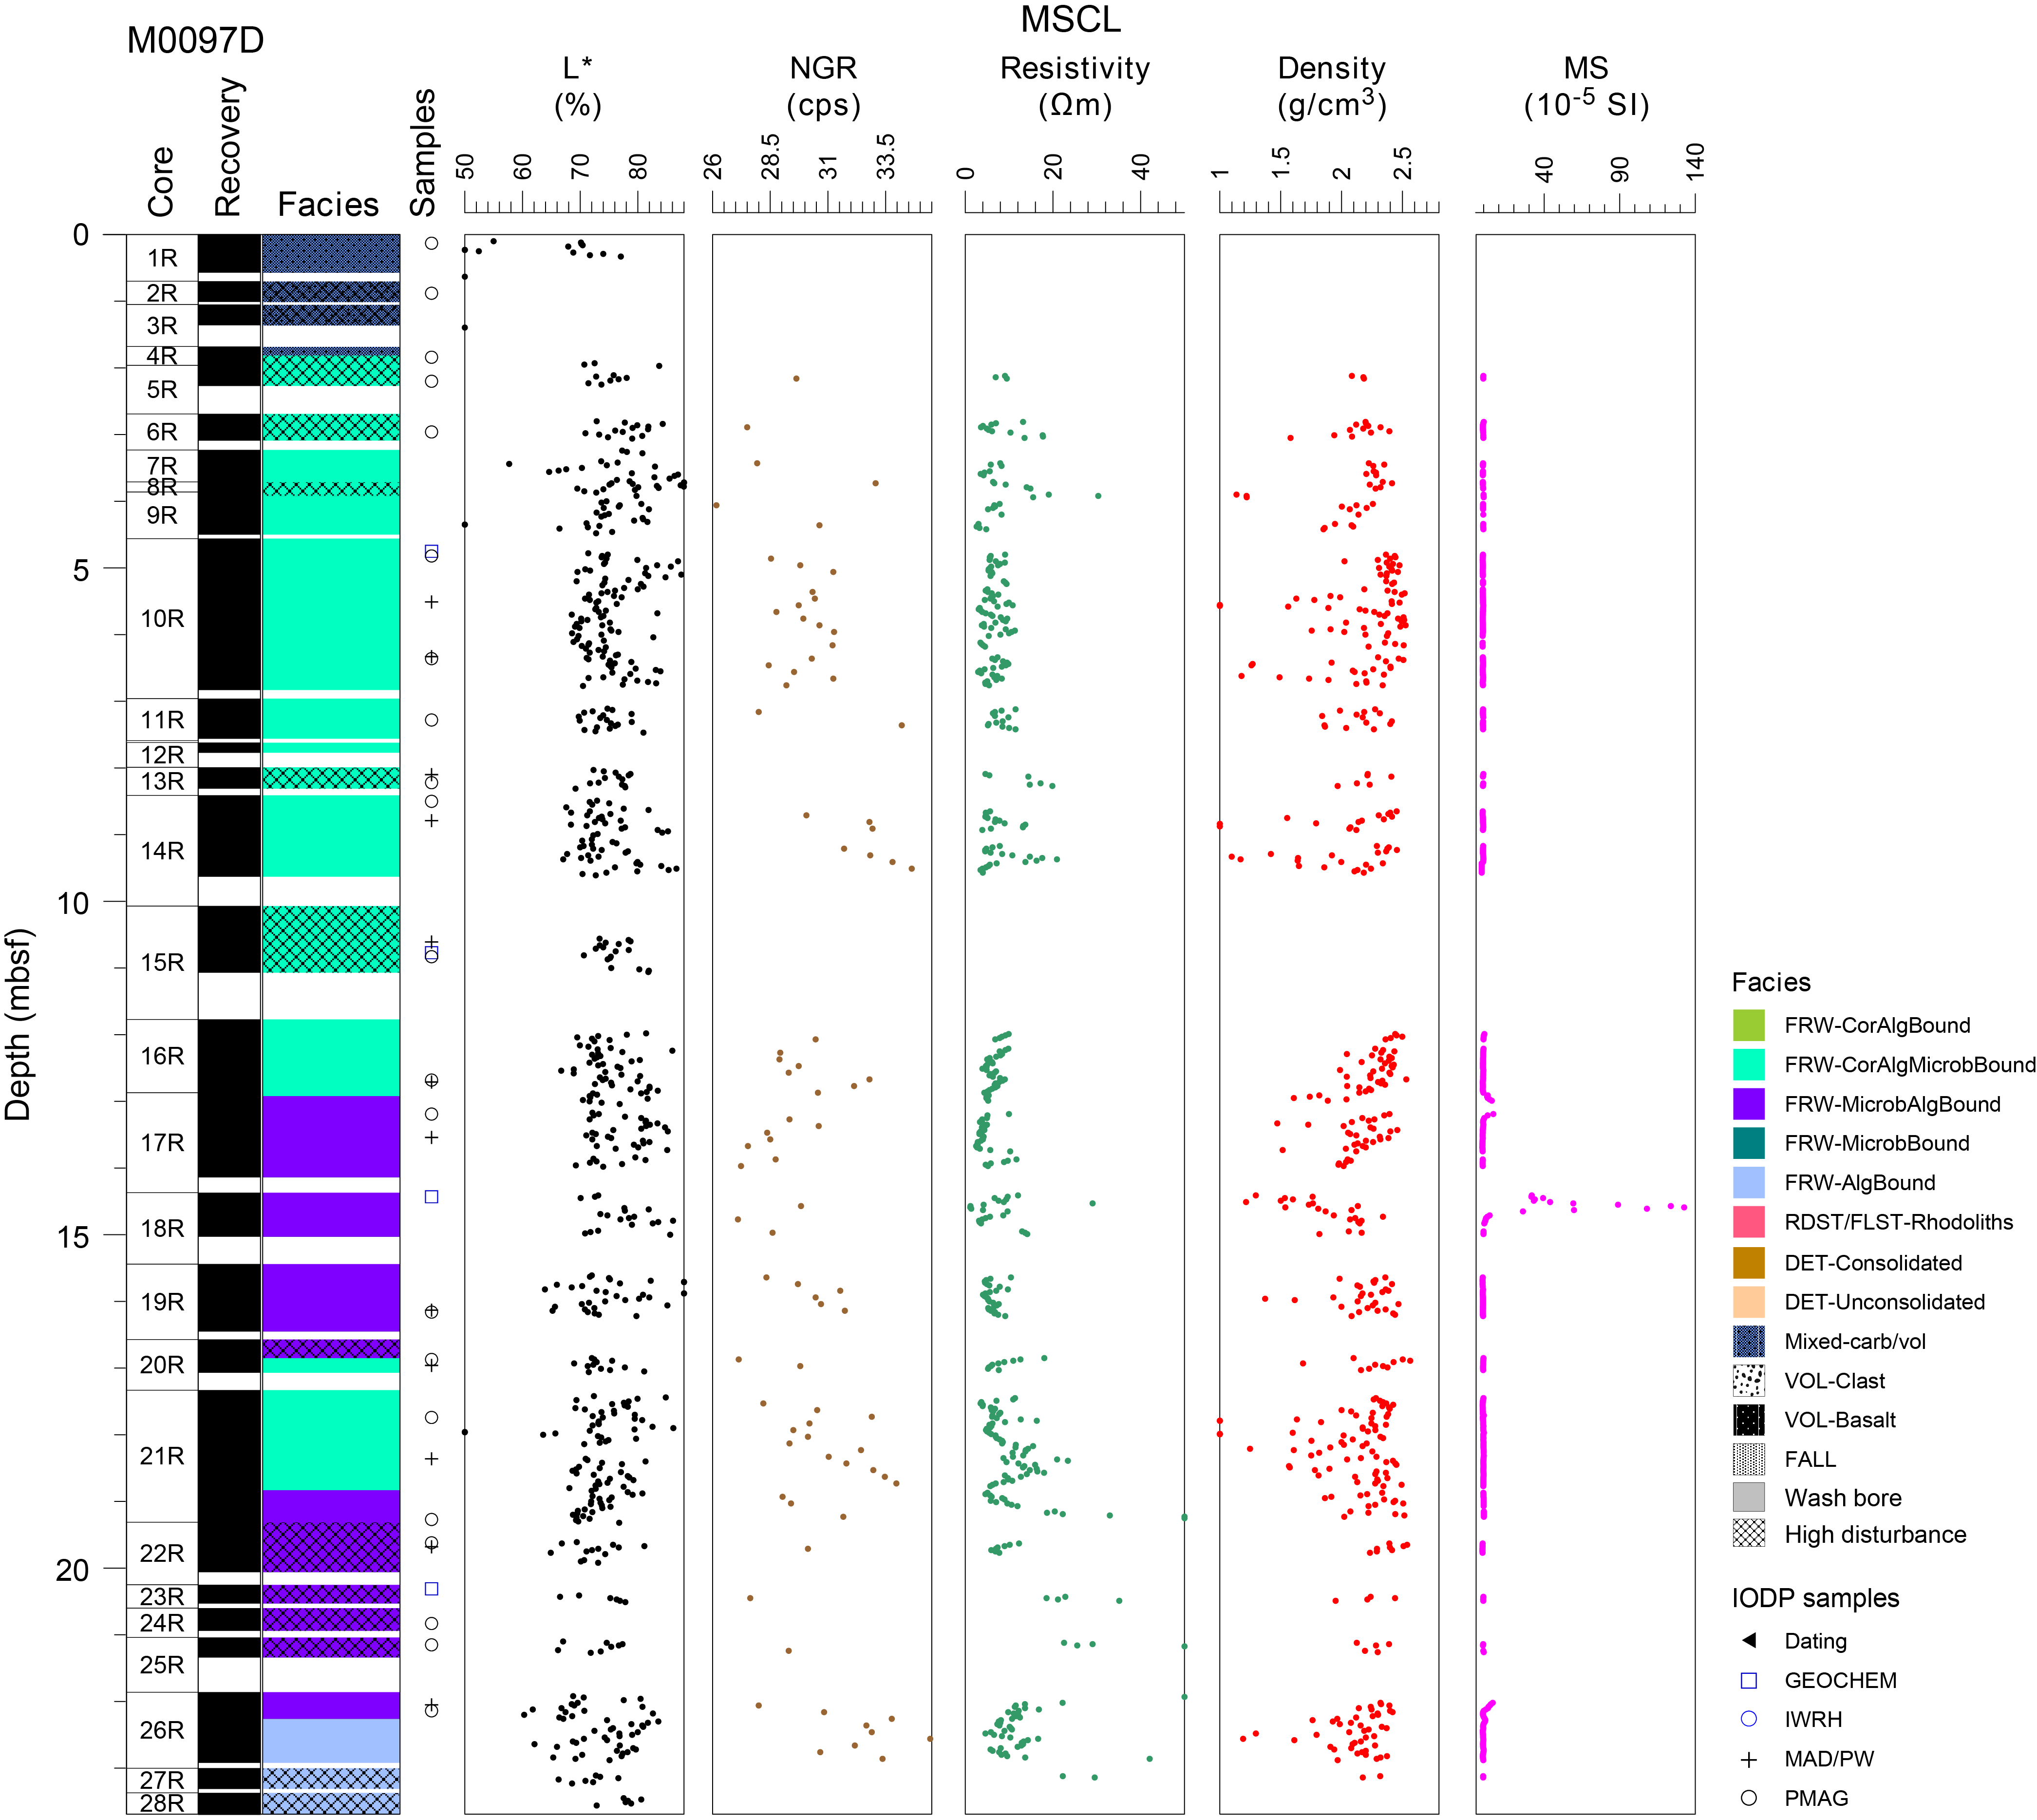
Figure F9. Lithostratigraphy and MSCL data, Hole M0097D.
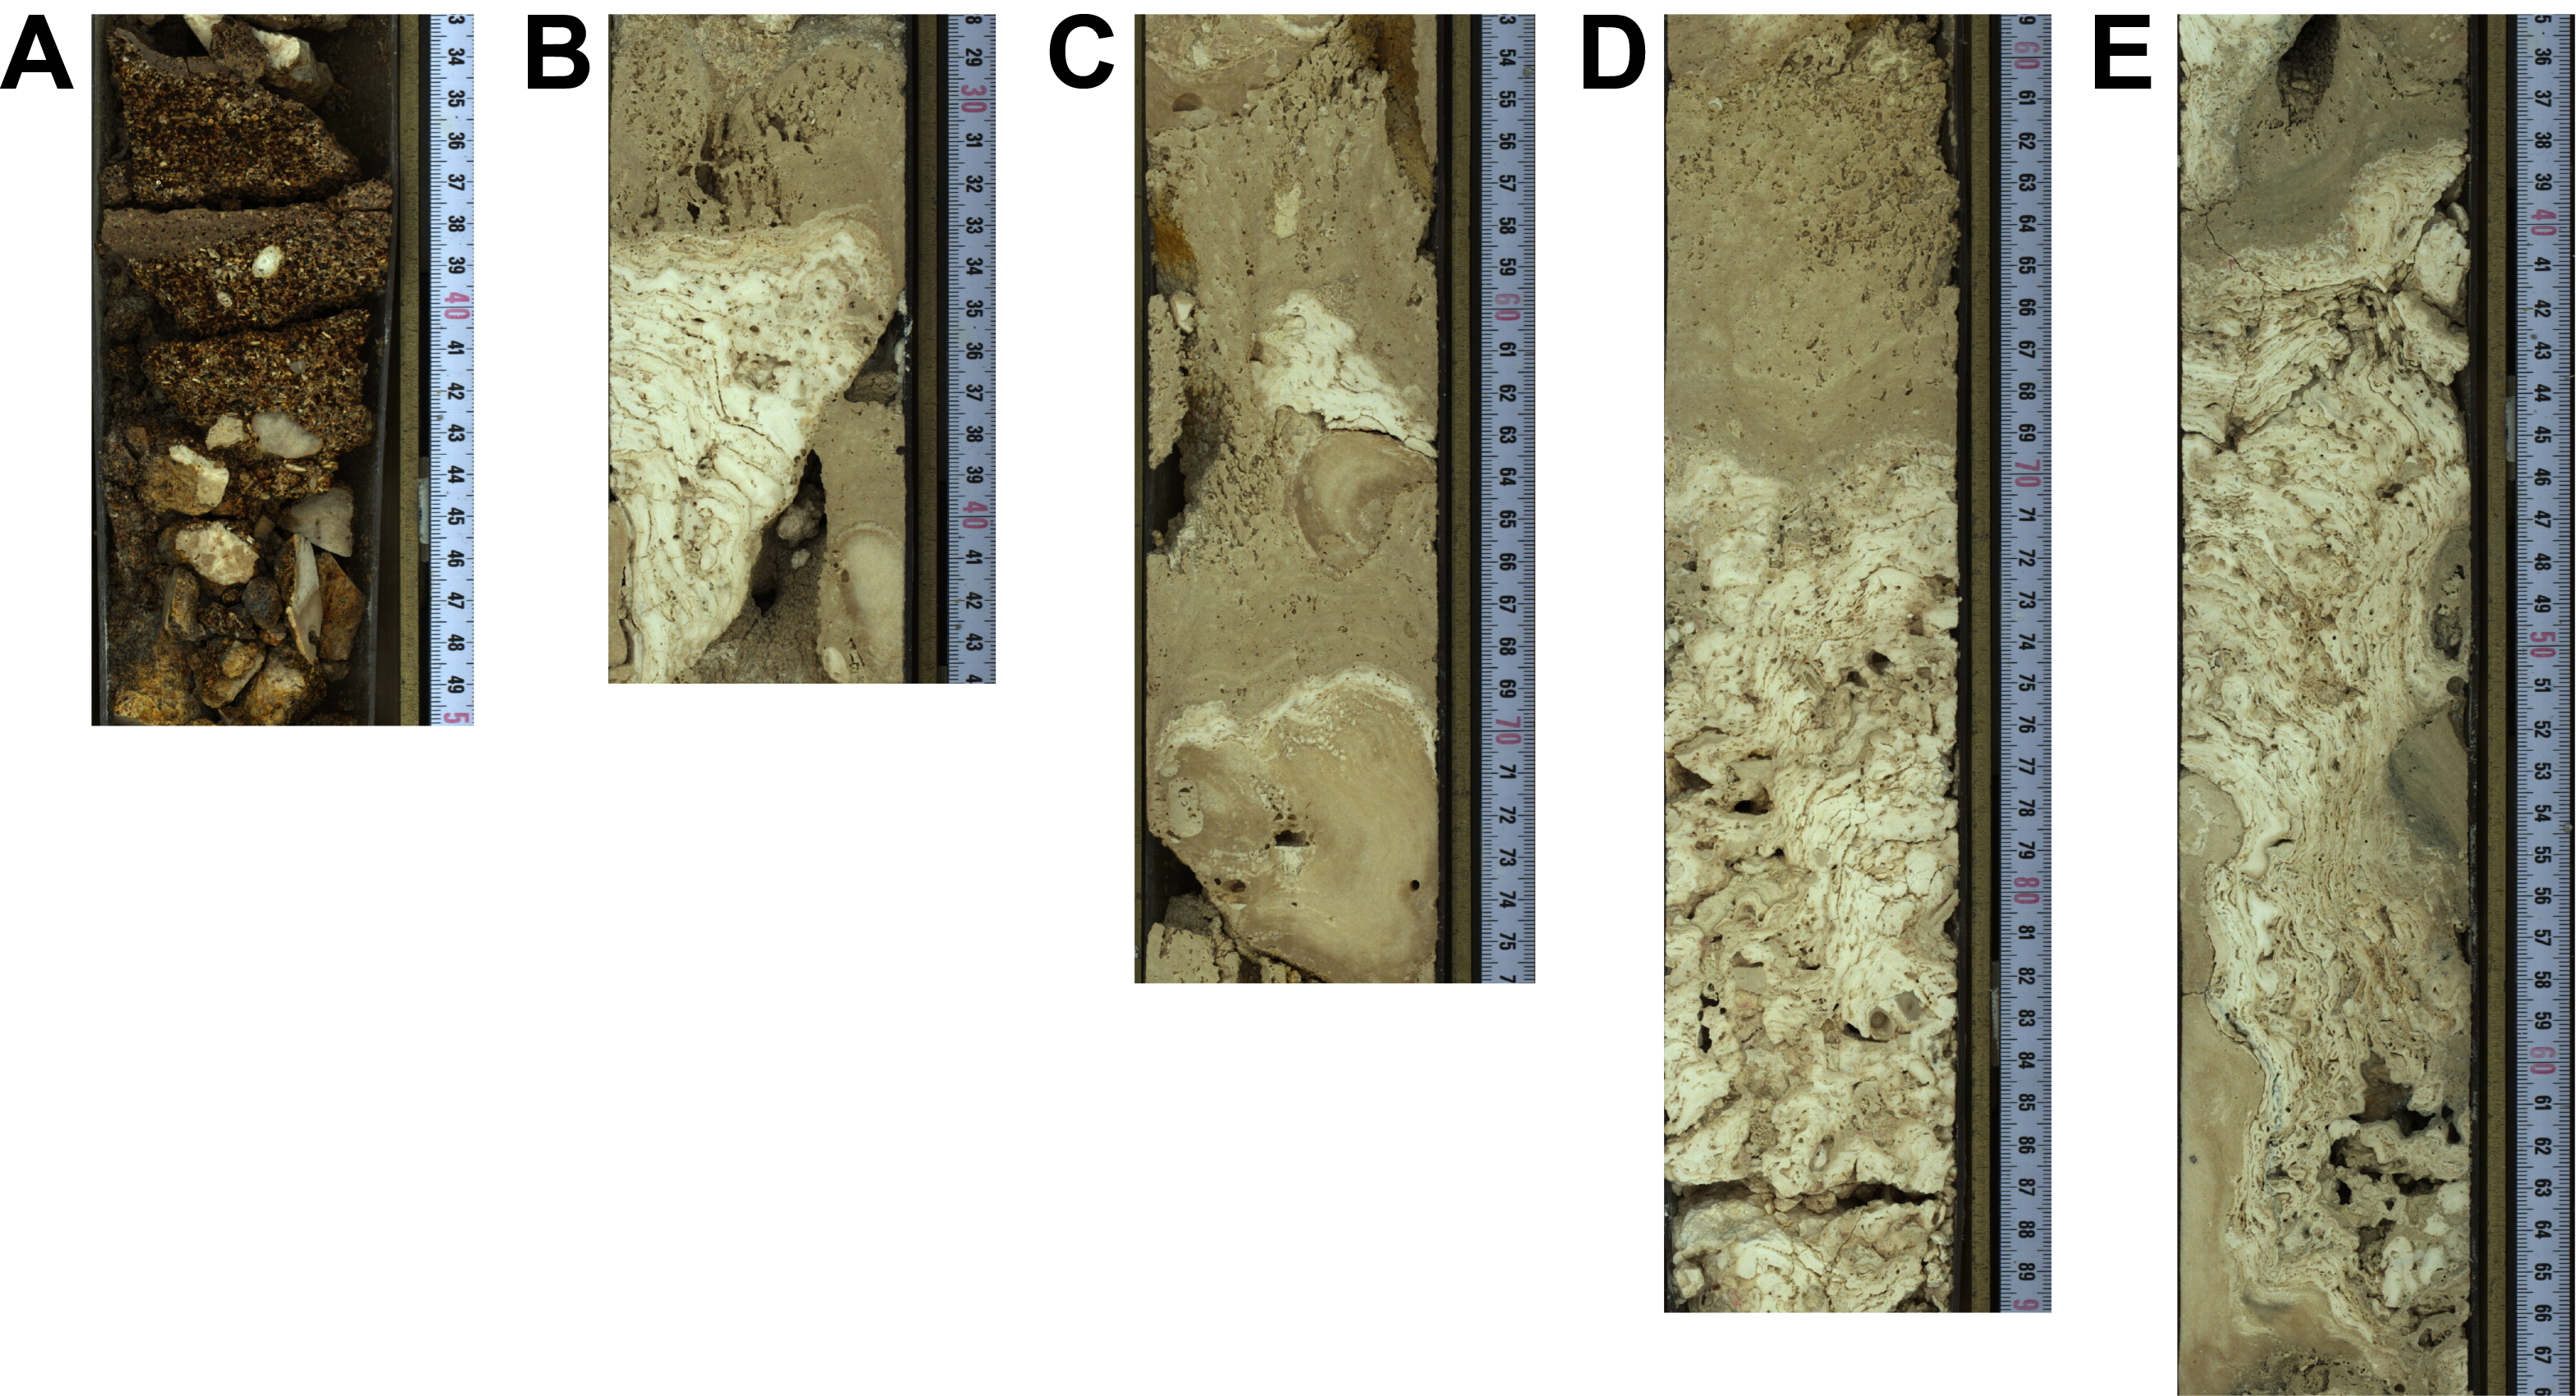
Figure F10. Lithologies, Hole M0097D.
3. Physical properties
Physical properties data for Site M0097 are shown in Table T2 in the Site M0096 chapter (Webster et al., 2025b).
3.1. Hole M0097A
A total of 26.17 m of core from Hole M0097A was scanned with the multisensor core logger (MSCL), and because the core exhibited moderate drilling-induced disturbance, 69% of the acquired data passed QA/QC (see Table T10 in the Expedition 389 methods chapter [Webster et al., 2025a]). A total of 20 discrete samples were taken for P-wave velocity and moisture and density (MAD) measurements. Digital linescans, color reflectance, and hyperspectral imaging were acquired on all cores. Generally, the data show no clear trends, reflecting the fact that the entire hole consists of carbonate facies with no pronounced boundaries.
3.1.1. Density and porosity
Density and porosity data are presented in Figures F2 and F11. MSCL bulk density values range 0.14–2.68 g/cm3. A total of 20 discrete samples were analyzed for MAD, resulting in bulk density values in the range of 1.90 to 2.67 g/cm3. Porosity values for the same samples range 7.7%–35.8%, and grain density values fluctuate between 2.100 and 2.886 g/cm3. There are no clear downhole trends in the density and porosity data sets. Generally, there is good agreement between discrete and MSCL bulk density measurements.
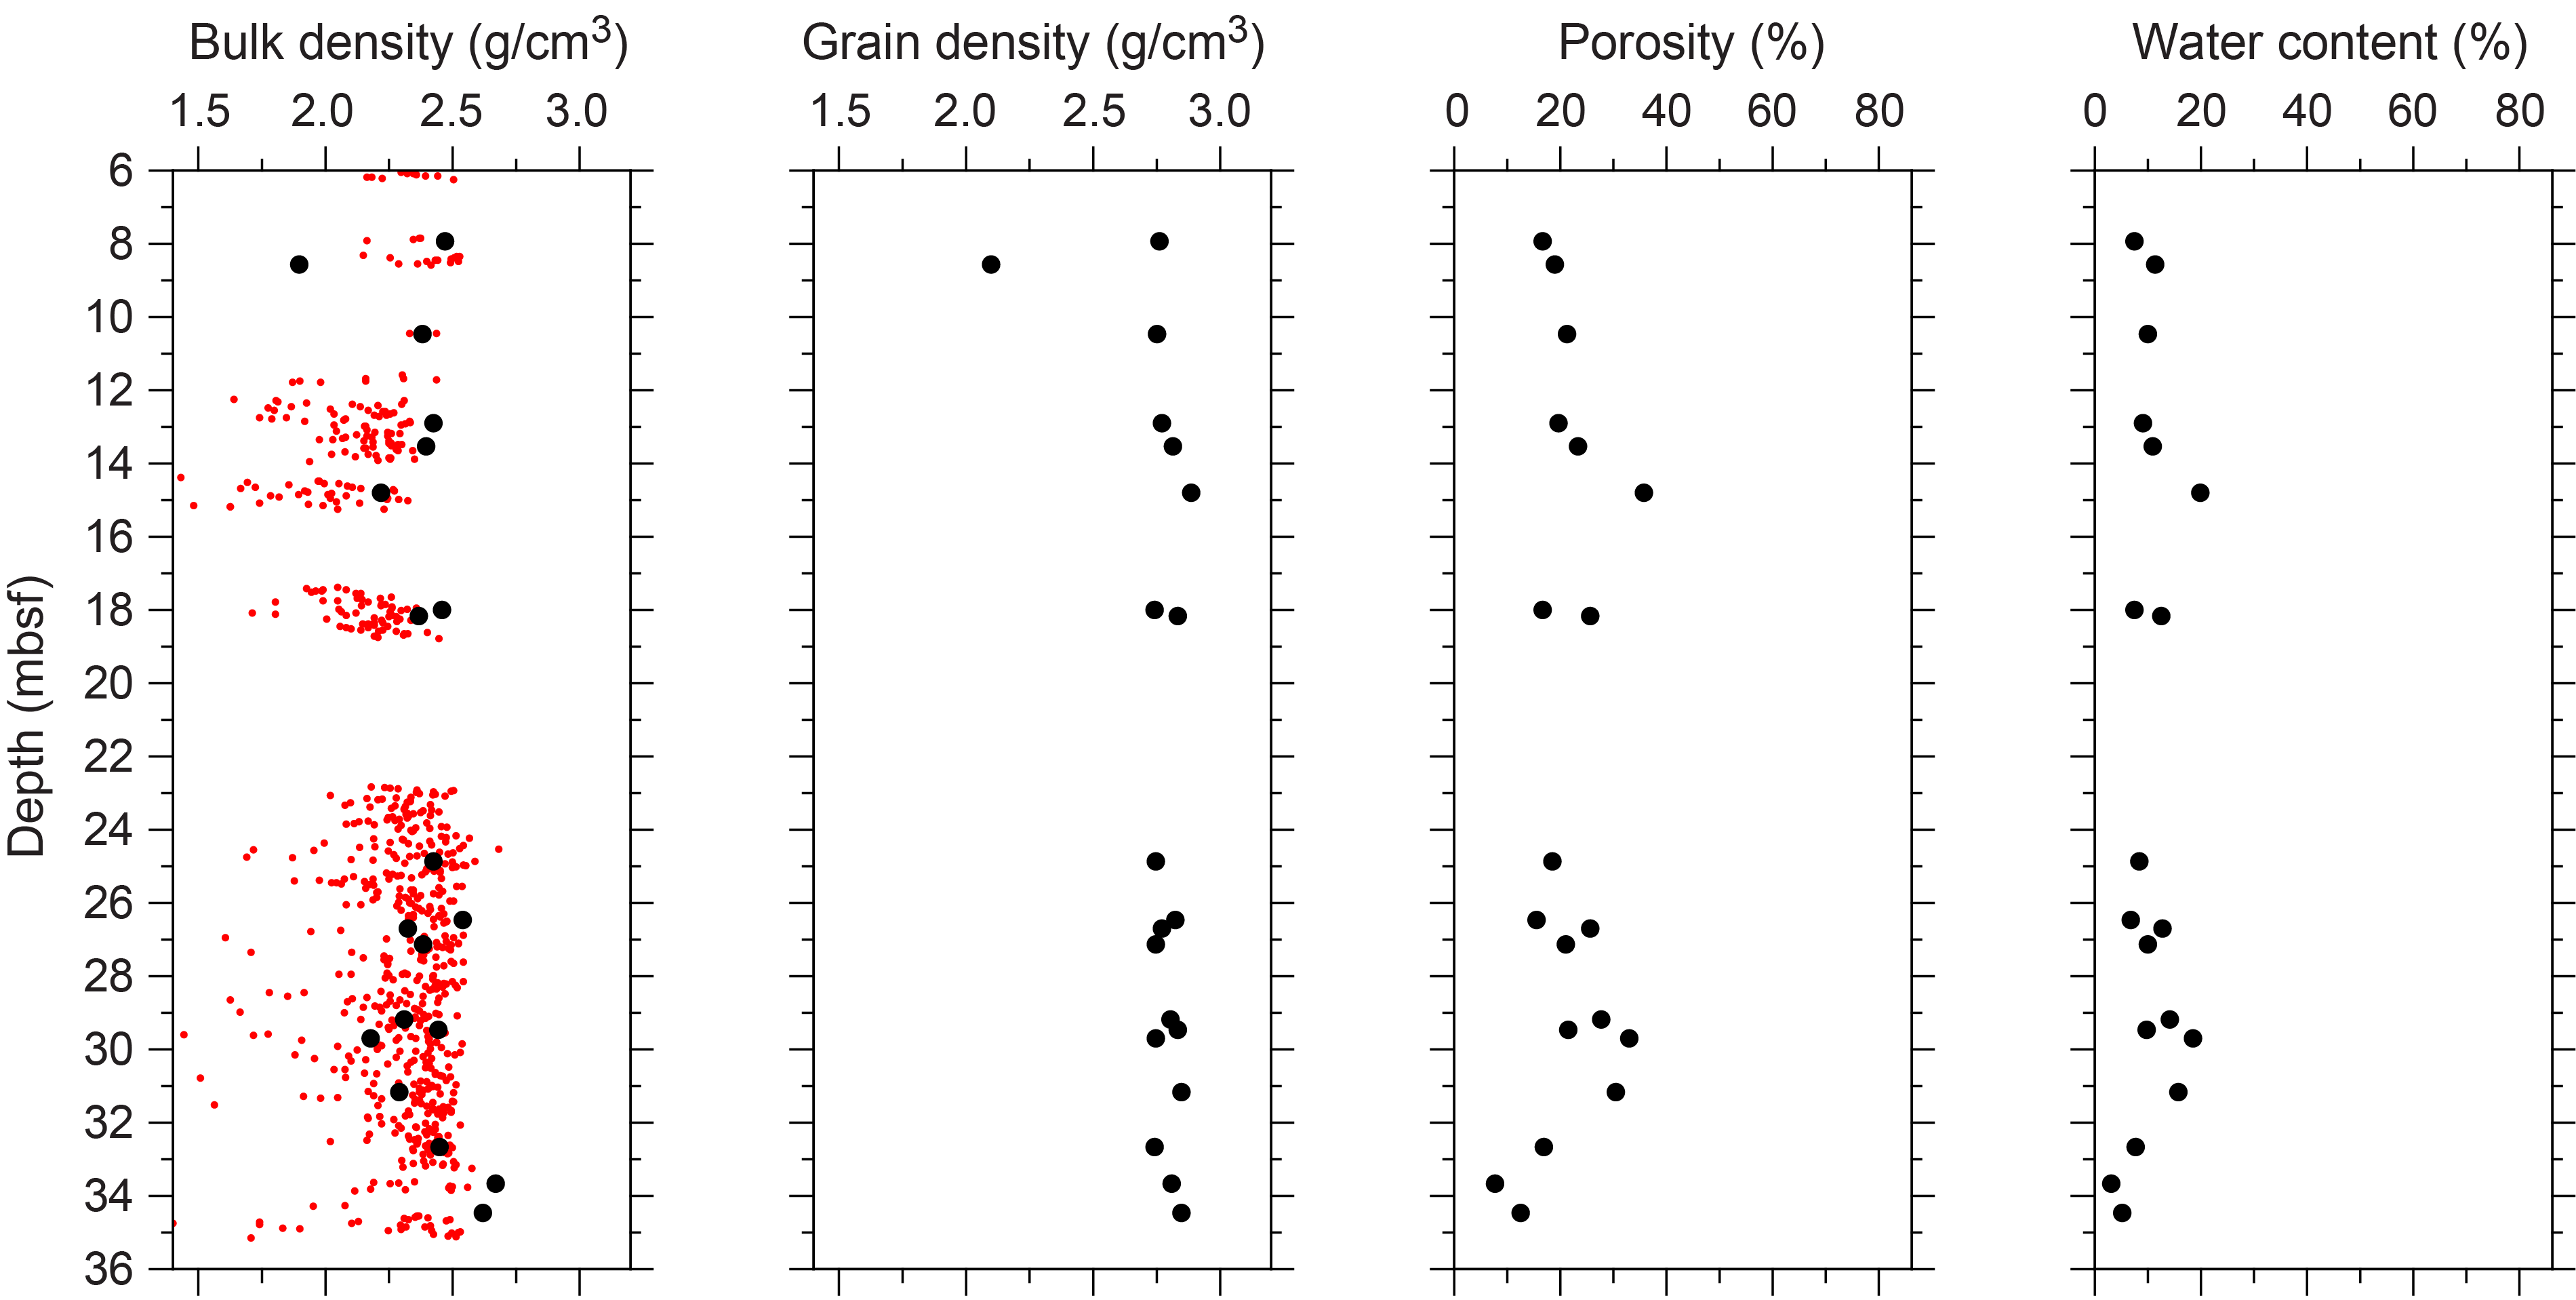
Figure F11. Physical properties, Hole M0097A.
3.1.2. P-wave velocity
MSCL P-wave velocity measurements yielded no data. A total of 19 samples were measured using the discrete P-wave logger. P-wave velocity measured on dry and resaturated samples ranges 1754–5275 and 3122–5804 m/s, respectively (Figure F12). Because of the limited P-wave velocity data points, there are no apparent downhole trends.
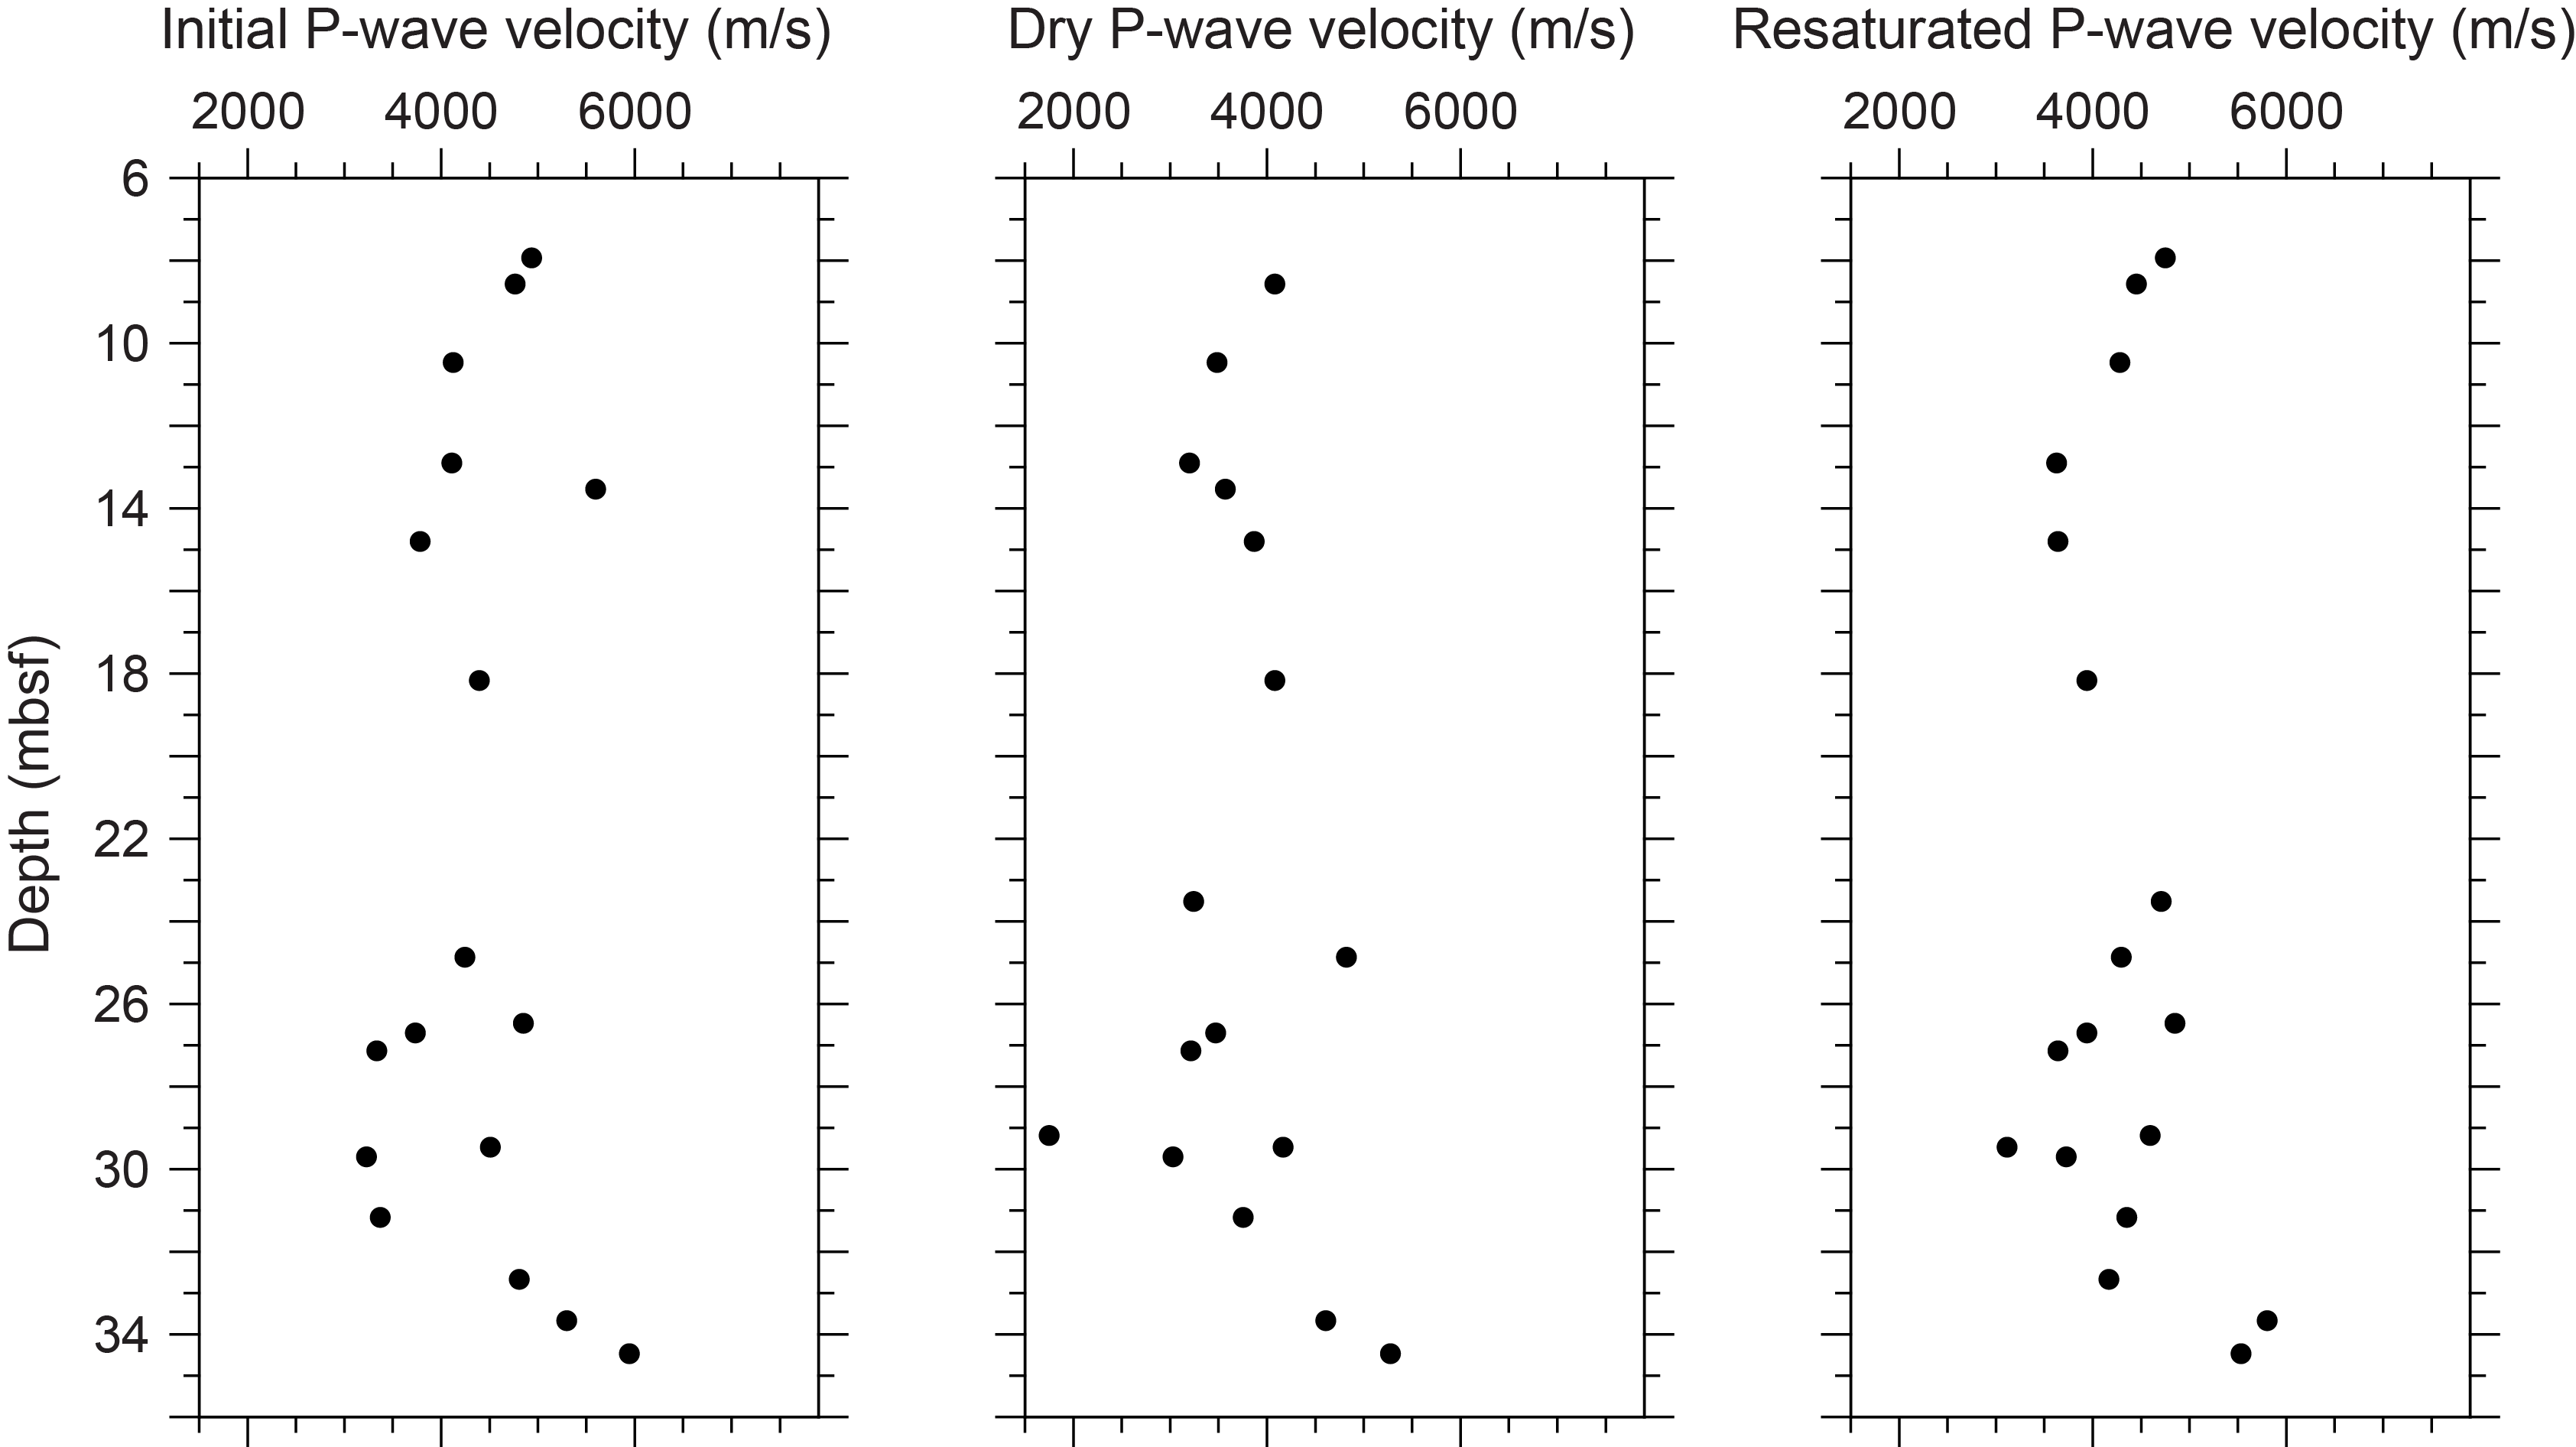
Figure F12. P-wave velocities, Hole M0097A.
3.1.3. Thermal conductivity
Thermal conductivity was measured on three samples (see Table T11 in the Expedition 389 methods chapter [Webster et al., 2025a]) with values ranging 1.142–1.322 W/(m·K).
3.1.4. Magnetic susceptibility
MSCL magnetic susceptibility data range −1.48 × 10⁻⁵ to 97.83 × 10⁻⁵ SI (Figure F2). The majority of magnetic susceptibility values fall around 1.45 × 10⁻⁵ SI. The uppermost 1 m of the hole is marked by an initial excursion of up to ~98 × 10−5 SI. There are also two smaller positive excursions in magnetic susceptibility farther downcore: ~16 × 10−5 SI at 25.5 mbsf and ~9 × 10⁻⁵ SI at 35.2 mbsf.
3.1.5. Electrical resistivity
MSCL noncontact resistivity measurements range 1.01–173.72 Ωm (Figure F2).
3.1.6. Natural gamma radiation
MSCL natural gamma radiation (NGR) measurements range 27–36 counts/s and show no apparent trends (Figure F2).
3.1.7. Digital linescans, color reflectance, and hyperspectral imaging
Cores were digitally scanned, measured for color reflectance (where appropriate), and imaged with the hyperspectral scanner (see HYPERSPECTRAL in Supplementary material). Color reflectance L* values vary between 15.68% and 87.04% (Figure F2), a* varies between −0.48 and 5.78, b* varies between 3.05 and 23.47, and a*/b* varies between −0.12 and 0.36.
3.2. Hole M0097B
A total of 23.16 m of core from Hole M0097B was scanned with the MSCL, and because the core only exhibited minor drilling-induced disturbance, 90% of the acquired data passed QA/QC (see Table T10 in the Expedition 389 methods chapter [Webster et al., 2025a]). A total of 16 discrete samples were taken for P-wave velocity and MAD measurements. Digital linescans, color reflectance, and hyperspectral imaging were acquired on all cores.
3.2.1. Density and porosity
Density and porosity data are presented in Figures F5 and F13. MSCL bulk density values range 0.19–2.59 g/cm3. A total of 16 discrete samples were analyzed for MAD, giving bulk density values in the range of 2.21 to 2.55 g/cm3. Porosity values for the same samples range 12.3%–29.2%, and grain density values range 2.545–2.836 g/cm3. There are no clear downhole trends in the density and porosity data sets. Generally, there is good agreement between the discrete and MSCL bulk density measurements.
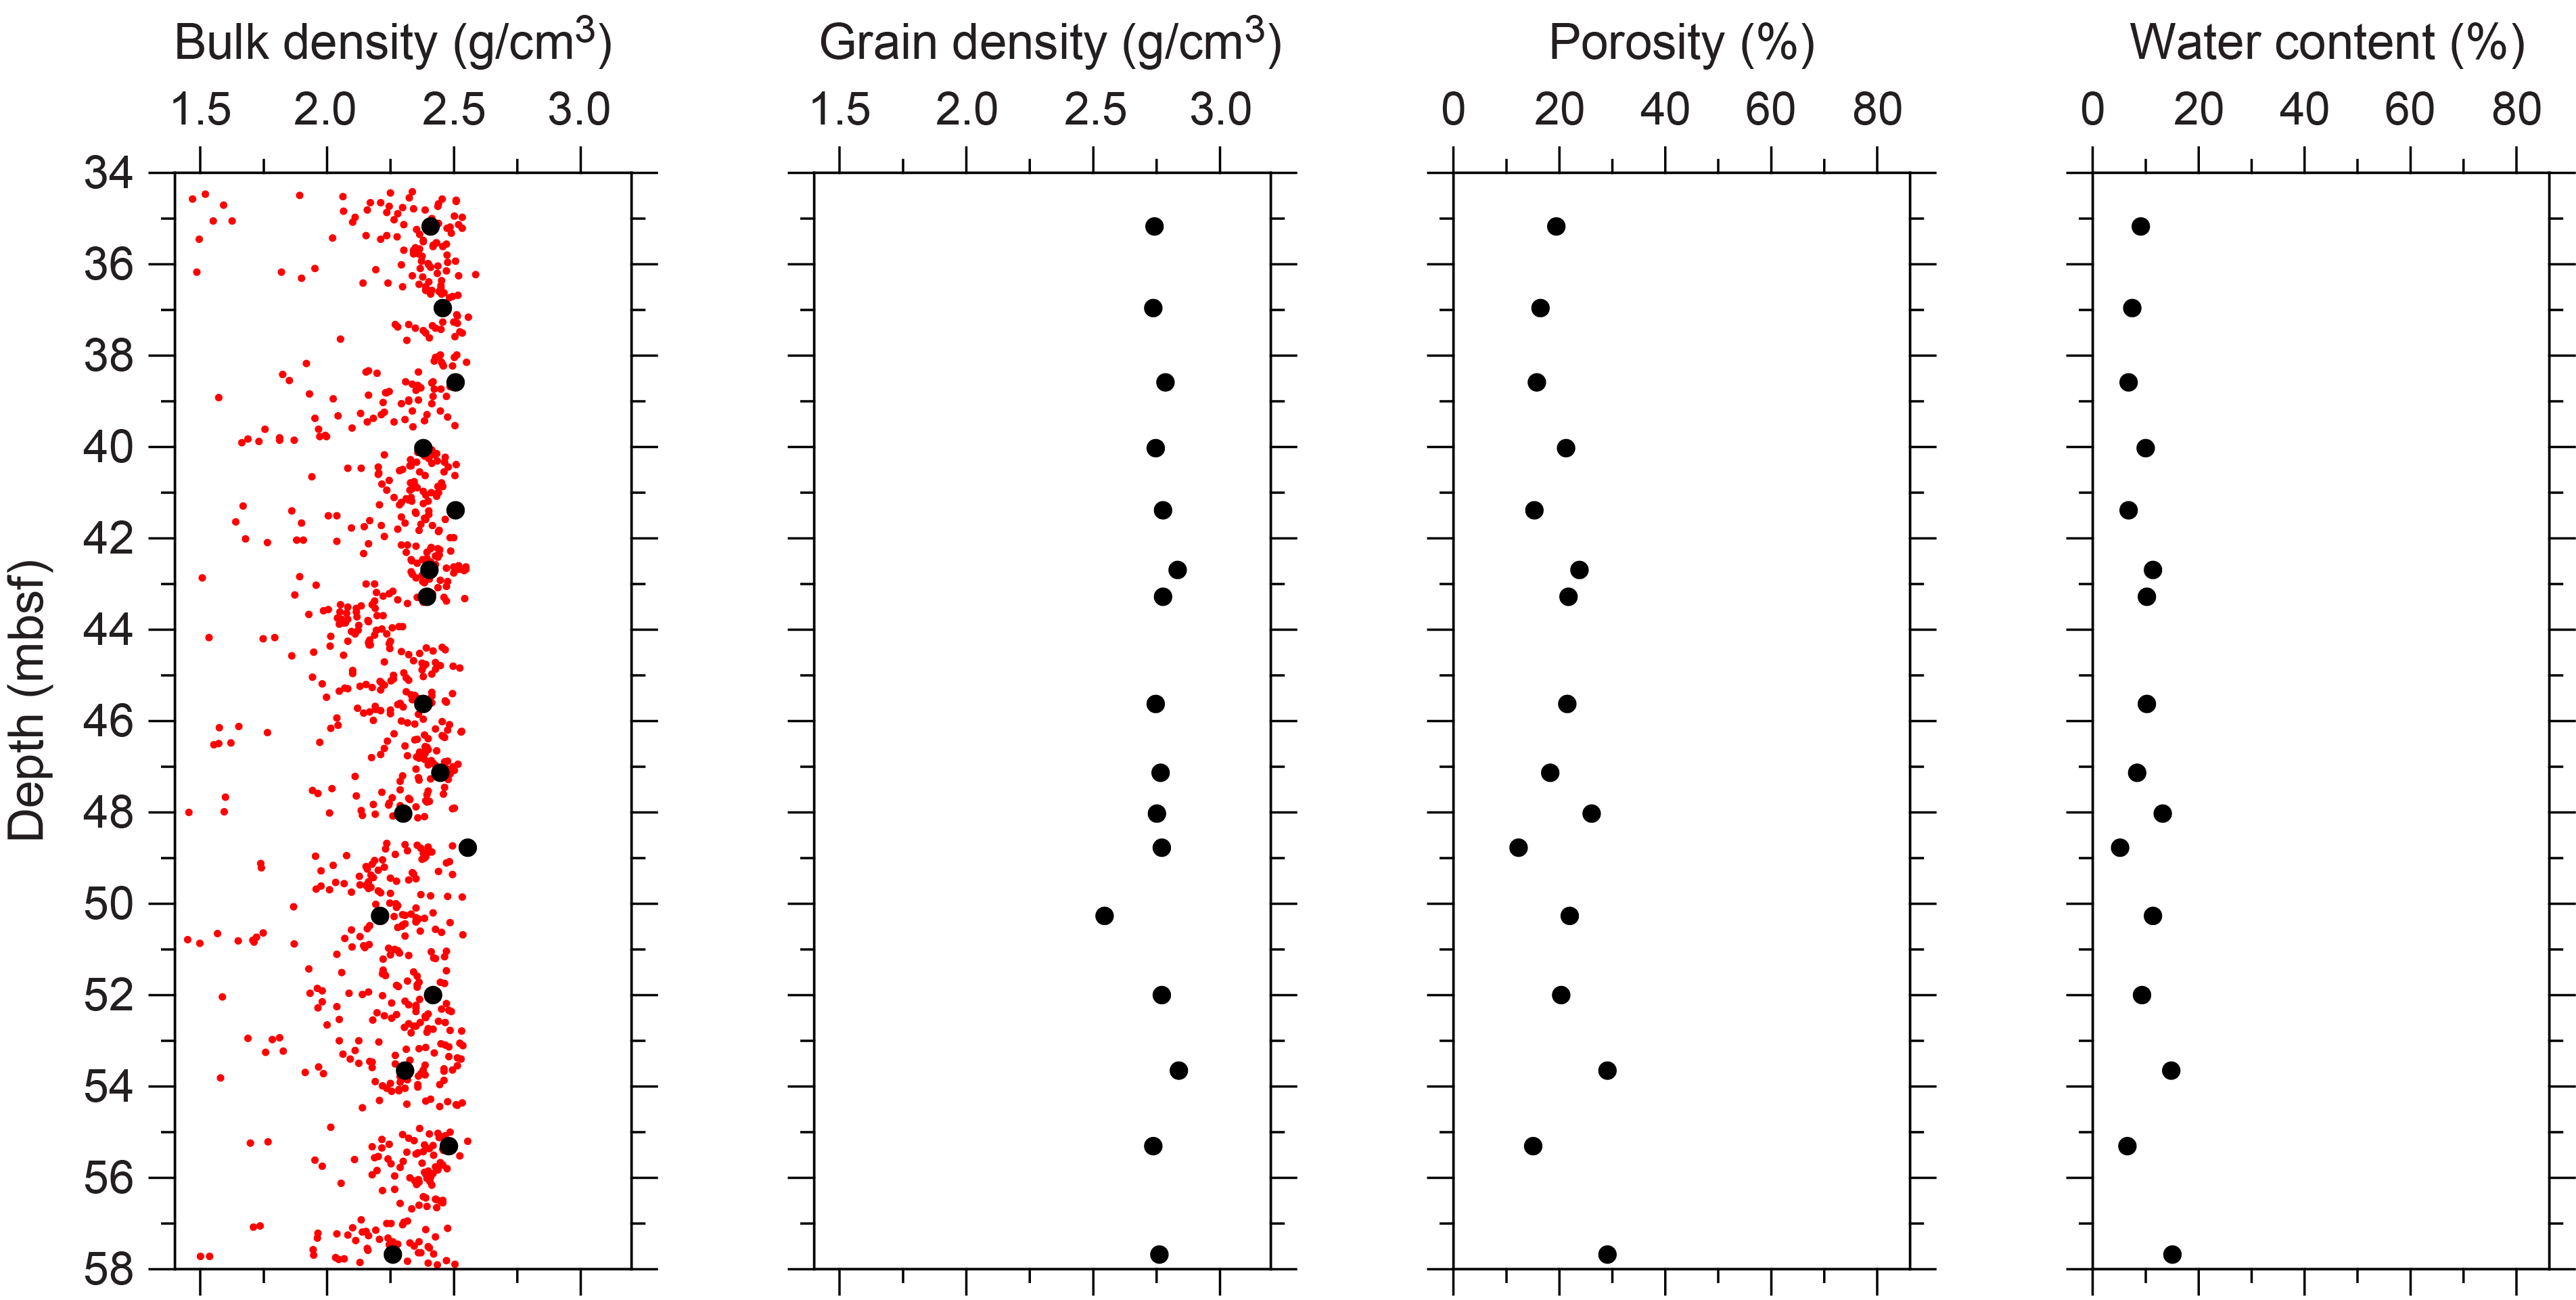
Figure F13. Physical properties, Hole M0097B.
3.2.2. P-wave velocity
MSCL P-wave velocity measurements yielded no data. A total of 12 samples were measured using the discrete P-wave logger. P-wave velocity measured on dry and resaturated samples range 3389–5034 and 3723–5350 m/s, respectively (Figure F14). Because of the limited P-wave velocity data, there are no apparent downhole trends.
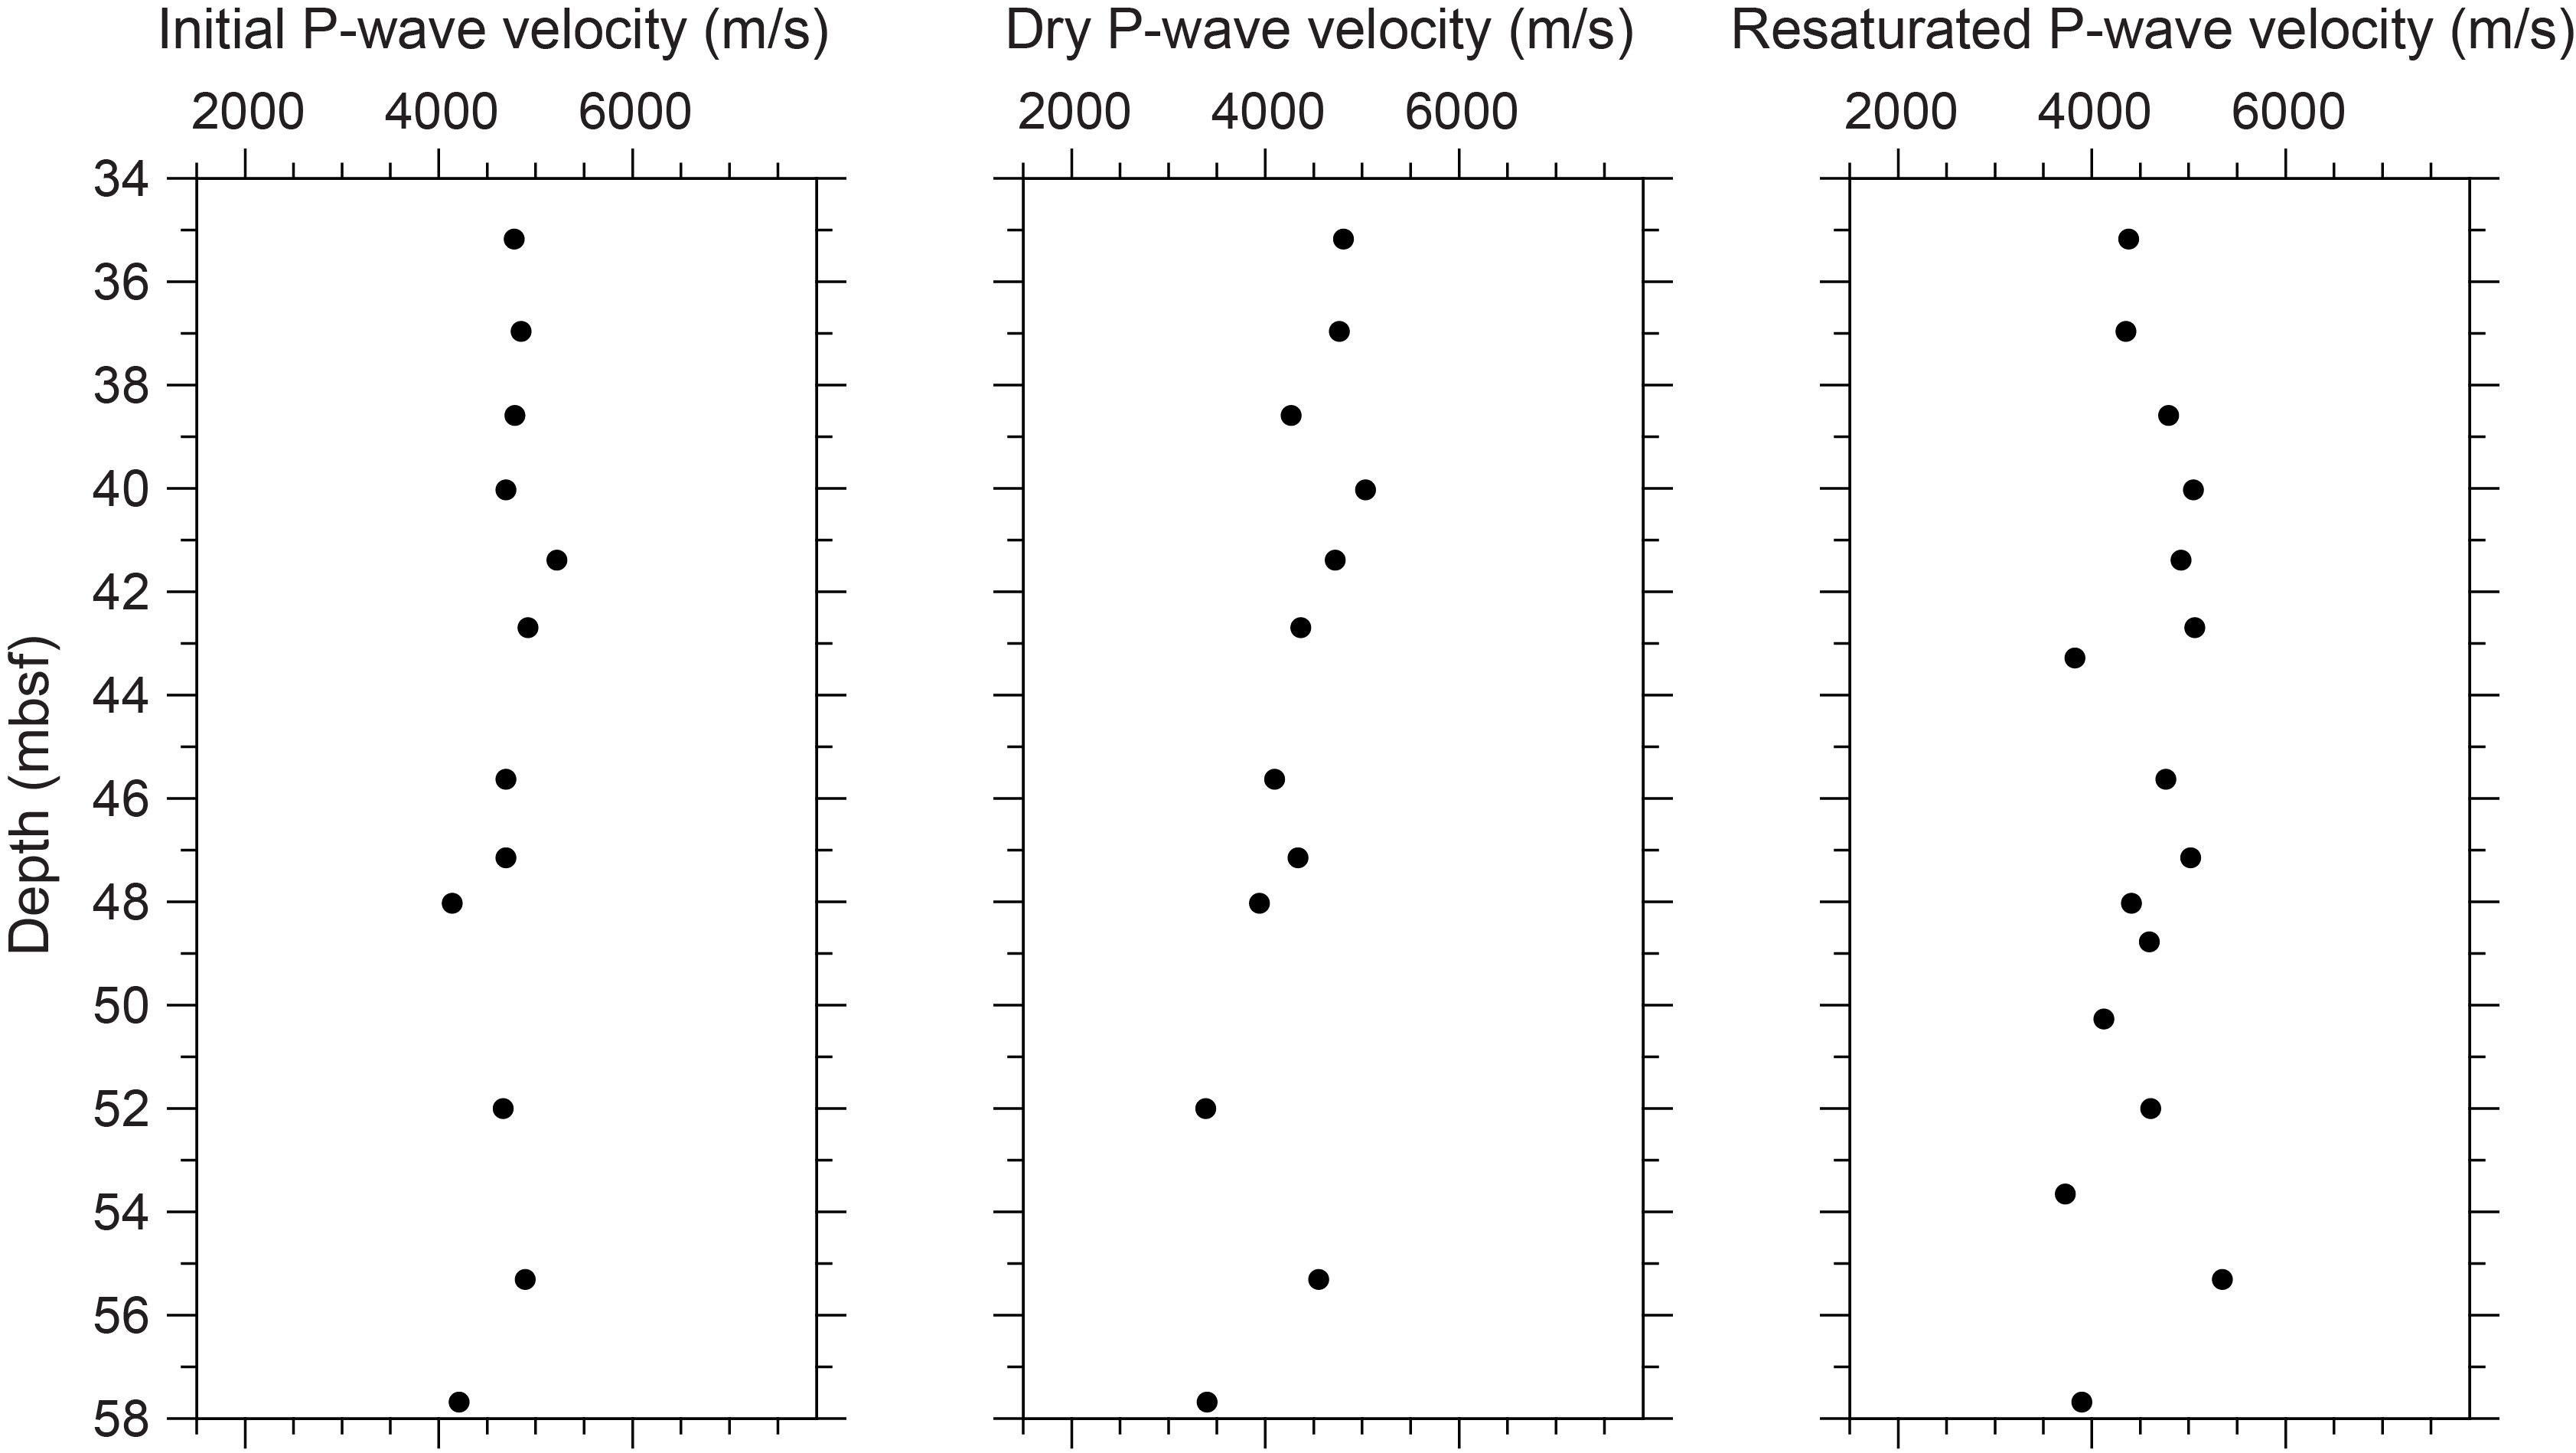
Figure F14. P-wave velocities, Hole M0097B.
3.2.3. Thermal conductivity
Thermal conductivity was measured as 1.286 W/(m·K) at 36.2 mbsf (see Table T11 in the Expedition 389 methods chapter [Webster et al., 2025a]).
3.2.4. Magnetic susceptibility
MSCL magnetic susceptibility data range −3.30 × 10⁻⁵ to 2.36 × 10⁻⁵ SI (Figure F5). The majority of magnetic susceptibility values fall around −1.13 × 10⁻⁵ SI. The top few meters of the hole have magnetic susceptibility values around −0.5 × 10⁻⁵ SI, with the exception of a brief positive excursion to 2.4 × 10⁻⁵ SI at 37.59 mbsf. Between 38 and 43 mbsf, there is a broad negative excursion in magnetic susceptibility that peaks at −3 × 10⁻⁵ SI. Below this excursion, magnetic susceptibility values increase to −0.5 × 10⁻⁵ SI and remain around −1 × 10⁻⁵ SI for the rest of the core record, with the exception of several smaller, positive excursions that do not exceed 1 × 10⁻⁵ SI.
3.2.5. Electrical resistivity
MSCL noncontact resistivity measurements range 1.96–64.48 Ωm (Figure F5). The majority of the resistivity measurements are <20 Ωm, and there are no notable trends within the data.
3.2.6. Natural gamma radiation
MSCL NGR measurements range 24–35 counts/s and show no apparent trends (Figure F5).
3.2.7. Digital linescans and color reflectance
All cores were digitally scanned, and, where appropriate, measured for color reflectance and imaged with the hyperspectral scanner (see HYPERSPECTRAL in Supplementary material). Color reflectance L* values vary between 47.54% and 85.27% (Figure F5), a* varies between −1.33 and 3.14, b* varies between 5.66 and 20.48, and a*/b* varies between −0.21 and 0.16.
3.3. Hole M0097C
A total of 23.76 m of core from Hole M0097C was scanned with the MSCL, and because the core exhibited minor drilling-induced disturbance, 70% of the acquired data passed QA/QC (see Table T10 in the Expedition 389 methods chapter [Webster et al., 2025a]). A total of 22 discrete samples were taken for P-wave velocity and MAD measurements. All cores were digitally scanned, measured for color reflectance (where appropriate), and imaged with the hyperspectral scanner.
3.3.1. Density and porosity
Density and porosity data are presented in Figures F7 and F15. MSCL bulk density values range 0.91–2.60 g/cm3. A total of 33 discrete samples were analyzed for MAD, giving bulk density values in the range of 2.24 to 2.68 g/cm3. Porosity values for the same samples range 9.2%–30.4%, and grain density values fluctuate between 2.748 and 2.849 g/cm3. There are no clear downhole trends in the density and porosity data sets. Generally, there is good agreement between the MSCL and discrete bulk density measurements.
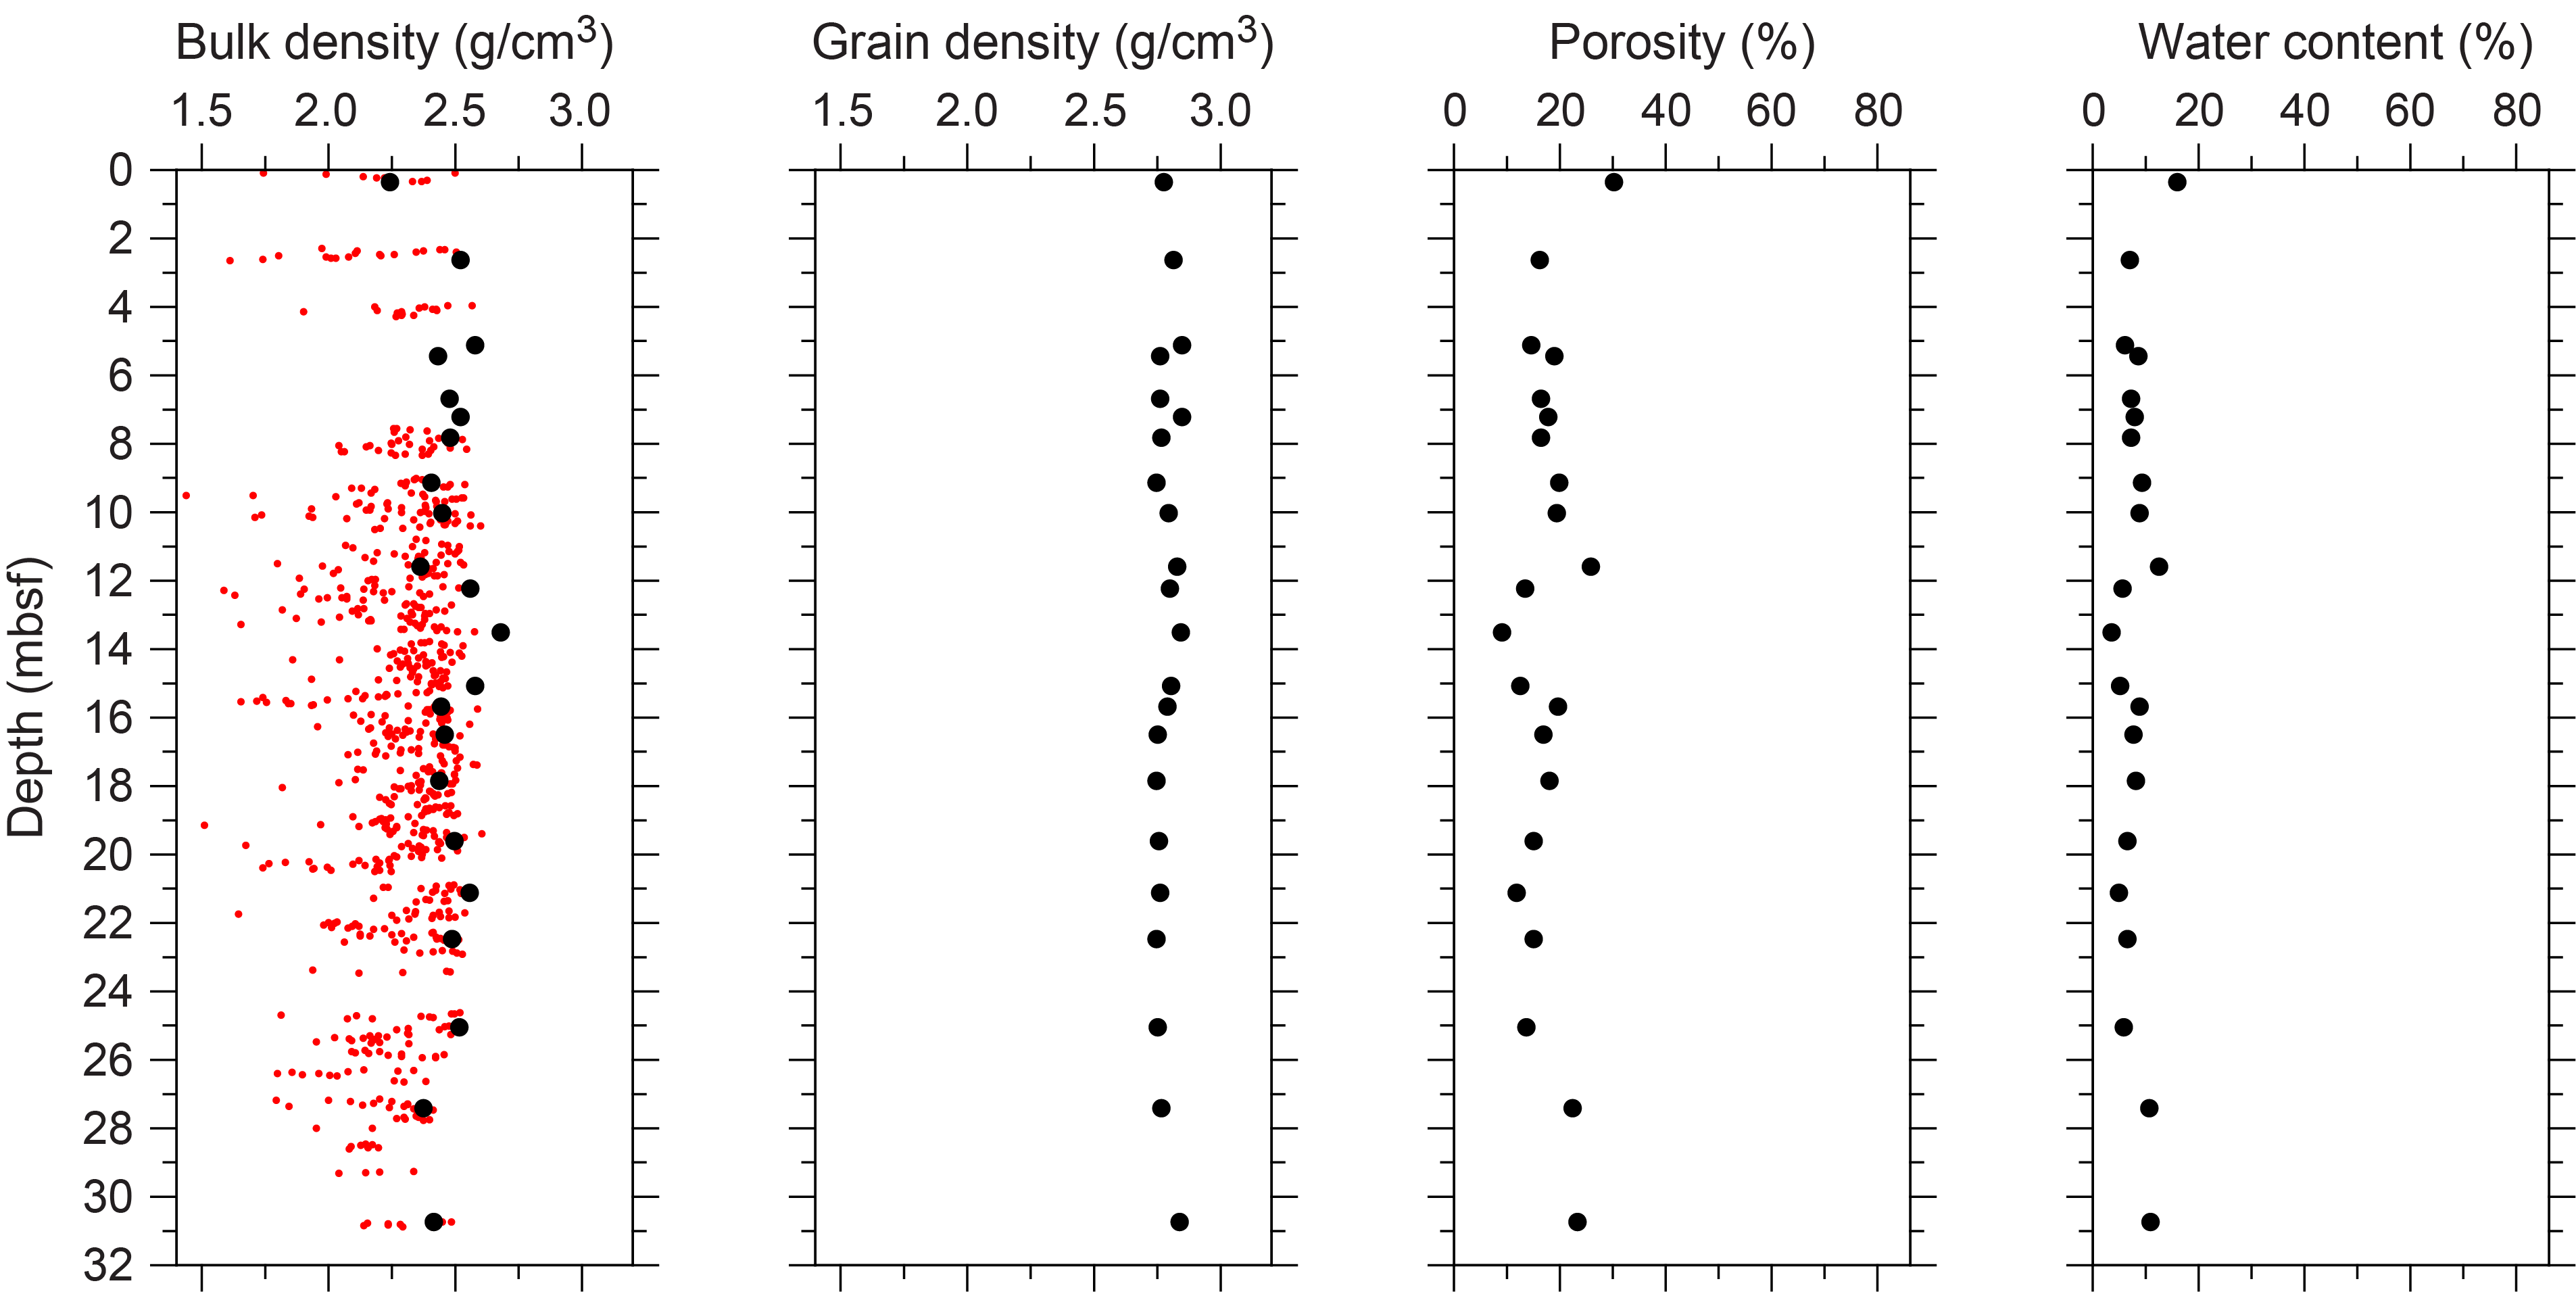
Figure F15. Physical properties, Hole M0097C.
3.3.2. P-wave velocity
MSCL P-wave velocity measurements yielded no data. A total of 19 samples were measured using the discrete P-wave logger. P-wave velocity measured on dry and resaturated samples range 2779–6164 and 2965–6629 m/s, respectively (Figure F16). Because of the limited P-wave velocity data, there are no apparent downhole trends.
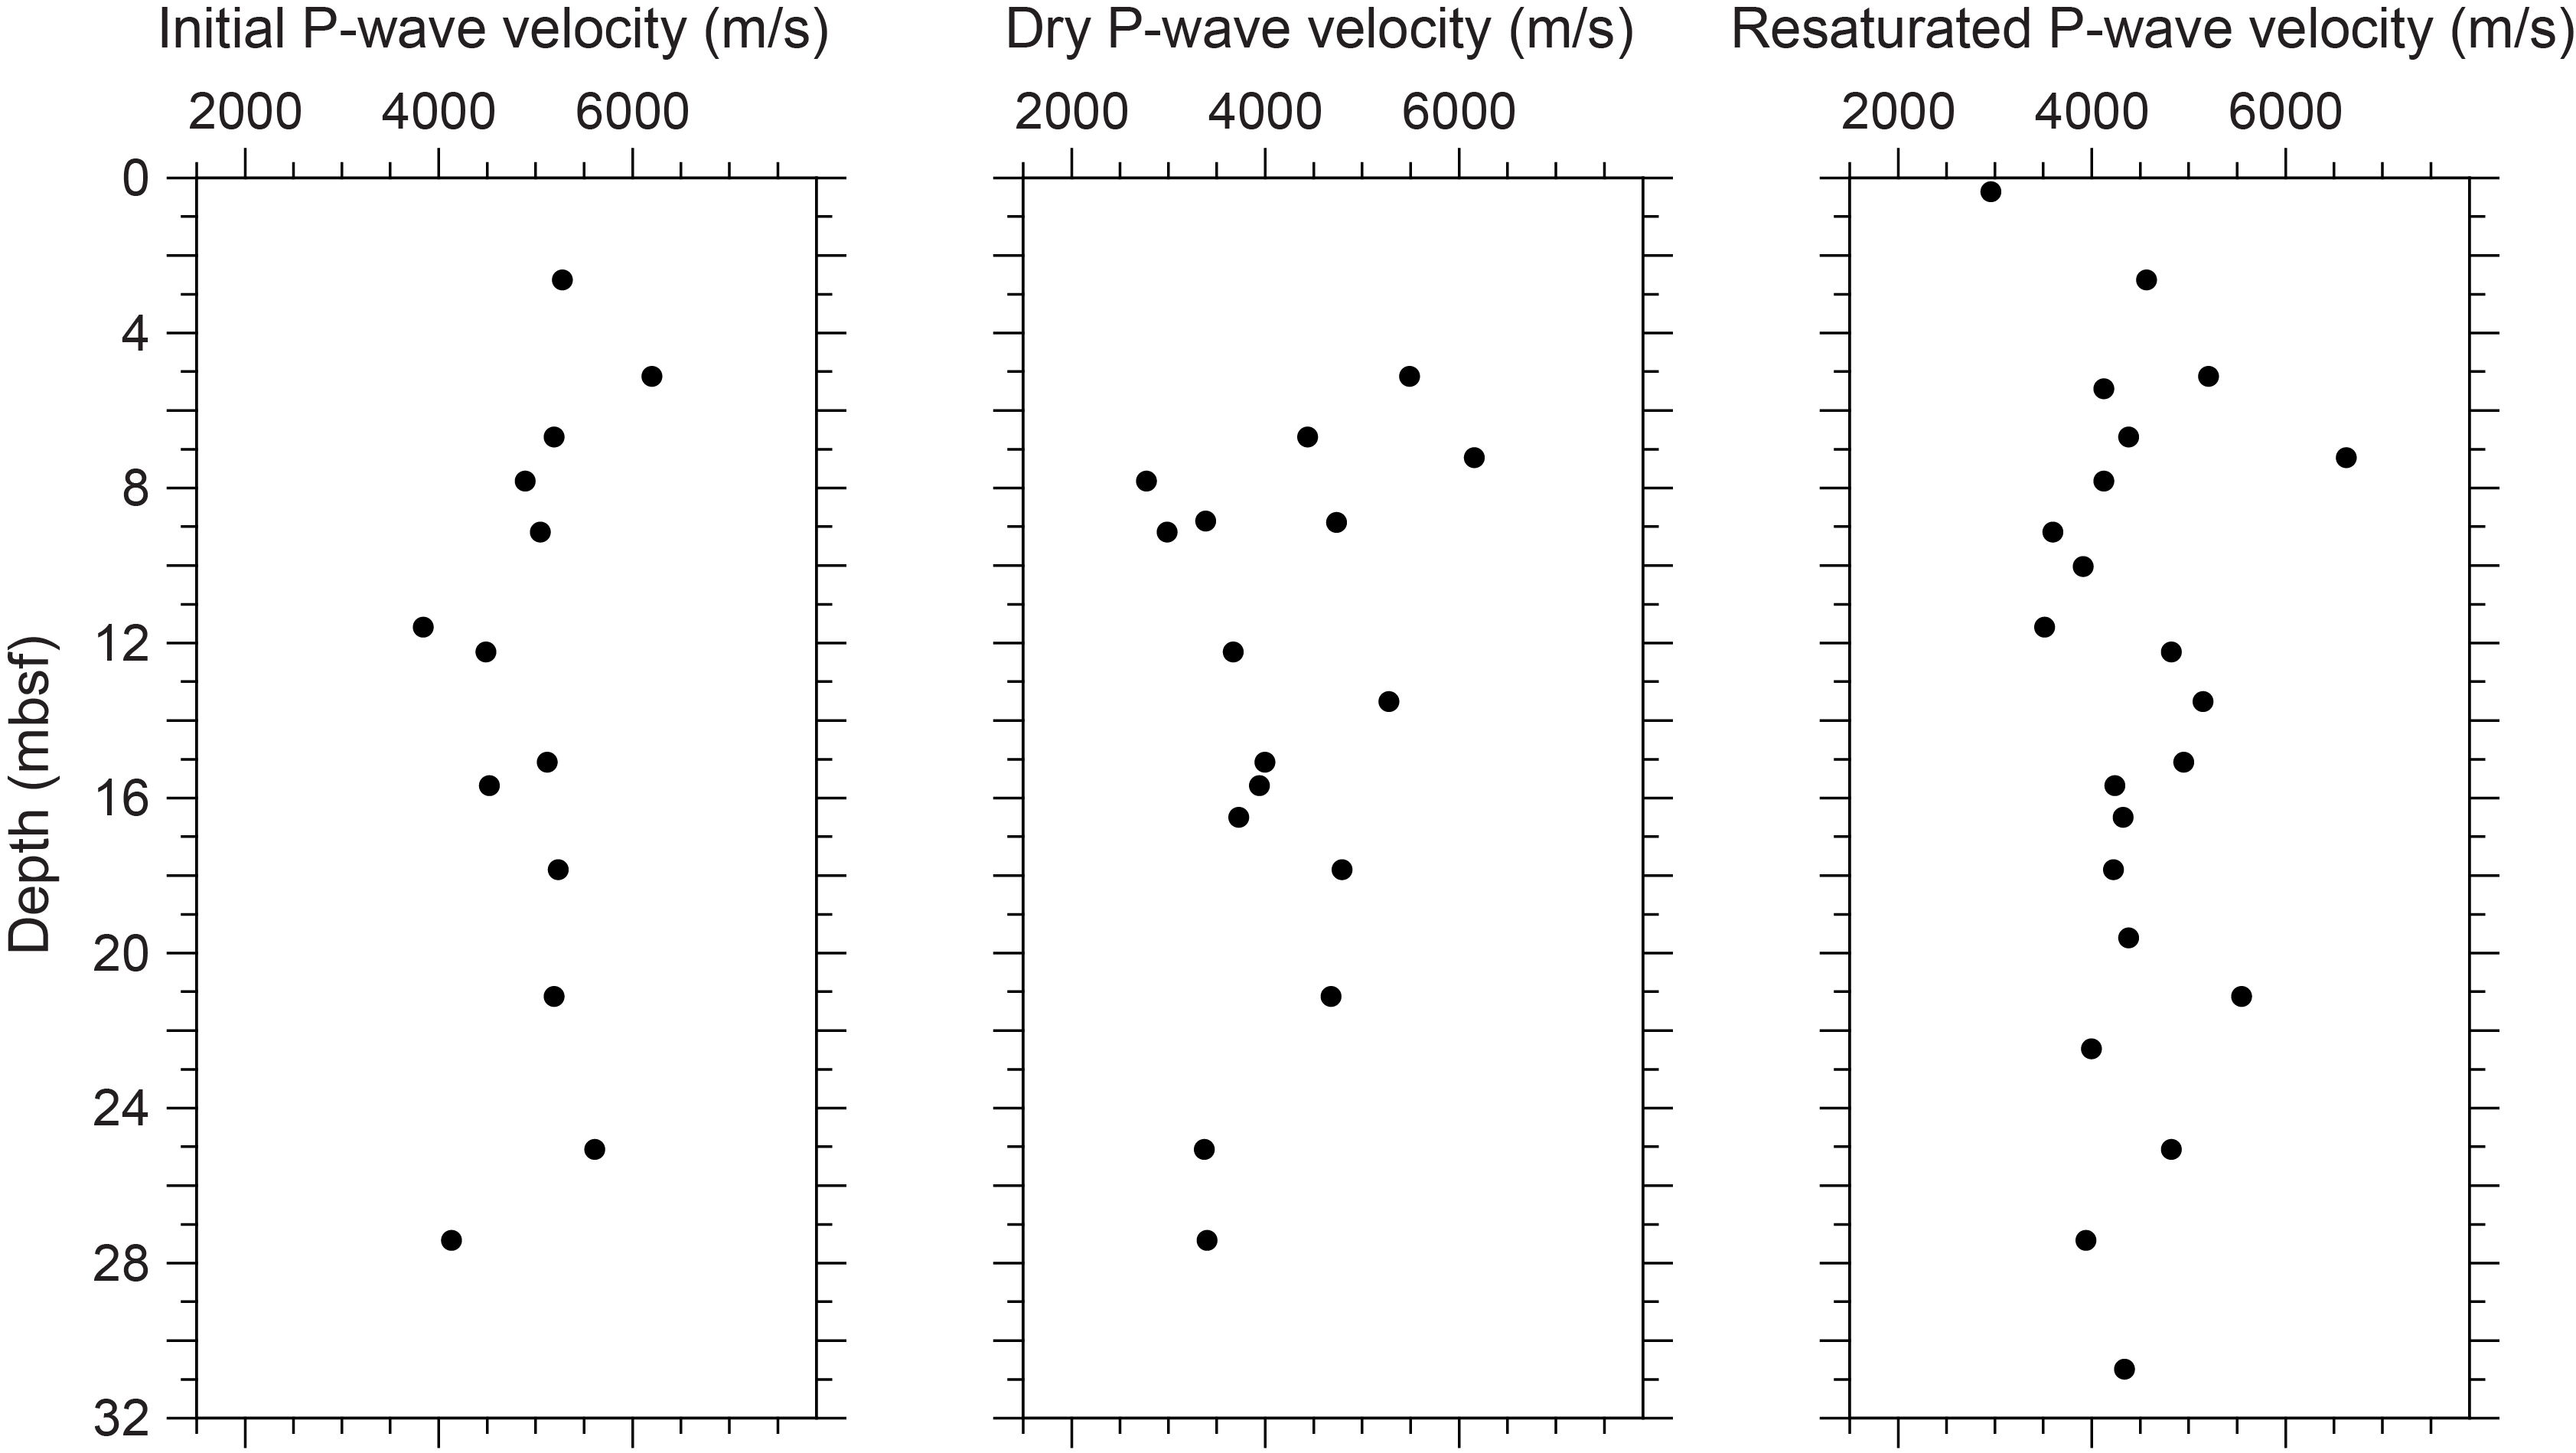
Figure F16. P-wave velocities, Hole M0097C.
3.3.3. Thermal conductivity
Thermal conductivity was measured on three samples (see Table T11 in the Expedition 389 methods chapter [Webster et al., 2025a]) with values ranging 1.234–1.668 W/(m·K).
3.3.4. Magnetic susceptibility
MSCL magnetic susceptibility data range −4.17 × 10⁻⁵ to 86.47 × 10⁻⁵ SI (Figure F7). The majority of magnetic susceptibility values fall around 0.08 × 10⁻⁵ SI. There are three notable excursions in magnetic susceptibility. The first occurs within the uppermost 1 m of core and starts at 86.47 × 10⁻⁵ SI before rapidly decreasing to 0. The second occurs at approximately 2.5 mbsf and consists of a small negative excursion peaking at −4.17 × 10⁻⁵ SI. Finally, a second positive excursion in magnetic susceptibility around 21 mbsf peaks at 72.48 × 10⁻⁵ SI.
3.3.5. Electrical resistivity
MSCL noncontact resistivity measurements range 1.88–247.30 Ωm (Figure F7). The majority of the resistivity measurements are <10 Ωm. There are several positive excursions in resistivity farther downcore, including an excursion of 71.16 Ωm at ~18 mbsf and a large excursion of 247.30 Ωm at approximately 29 mbsf.
3.3.6. Natural gamma radiation
MSCL NGR measurements range 26–35 counts/s and show no apparent trends (Figure F7).
3.3.7. Digital linescans, color reflectance, and hyperspectral imaging
All cores were digitally scanned, measured for color reflectance (where appropriate), and imaged with the hyperspectral scanner (see HYPERSPECTRAL in Supplementary material). Color reflectance L* values vary between 39.36% and 86.88% (Figure F7), a* varies between −0.41 and 7.82, b* varies between 6.69 and 24.80, and a*/b* varies between −0.04 and 0.41.
3.4. Hole M0097D
A total of 18.11 m of core from Hole M0097D was scanned with the MSCL, and because the core exhibited moderate drilling-induced disturbance, 57% of the acquired data passed QA/QC (see Table T10 in the Expedition 389 methods chapter [Webster et al., 2025a]). A total of 12 discrete samples were taken for P-wave velocity and MAD measurements. Digital linescans, color reflectance, and hyperspectral imaging were acquired on all cores.
3.4.1. Density and porosity
Density and porosity data are presented in Figures F9 and F17. MSCL bulk density values range 0.53–2.56 g/cm3. A total of 12 discrete samples were analyzed for MAD, giving bulk density values in the range of 2.35 to 2.51 g/cm3. Porosity values for the same samples range 14.8%–26.4%, and grain density values fluctuate between 2.733 and 2.850 g/cm3. There are no clear downhole trends in density and porosity. Generally, there is good agreement between the MSCL and discrete bulk density measurements.
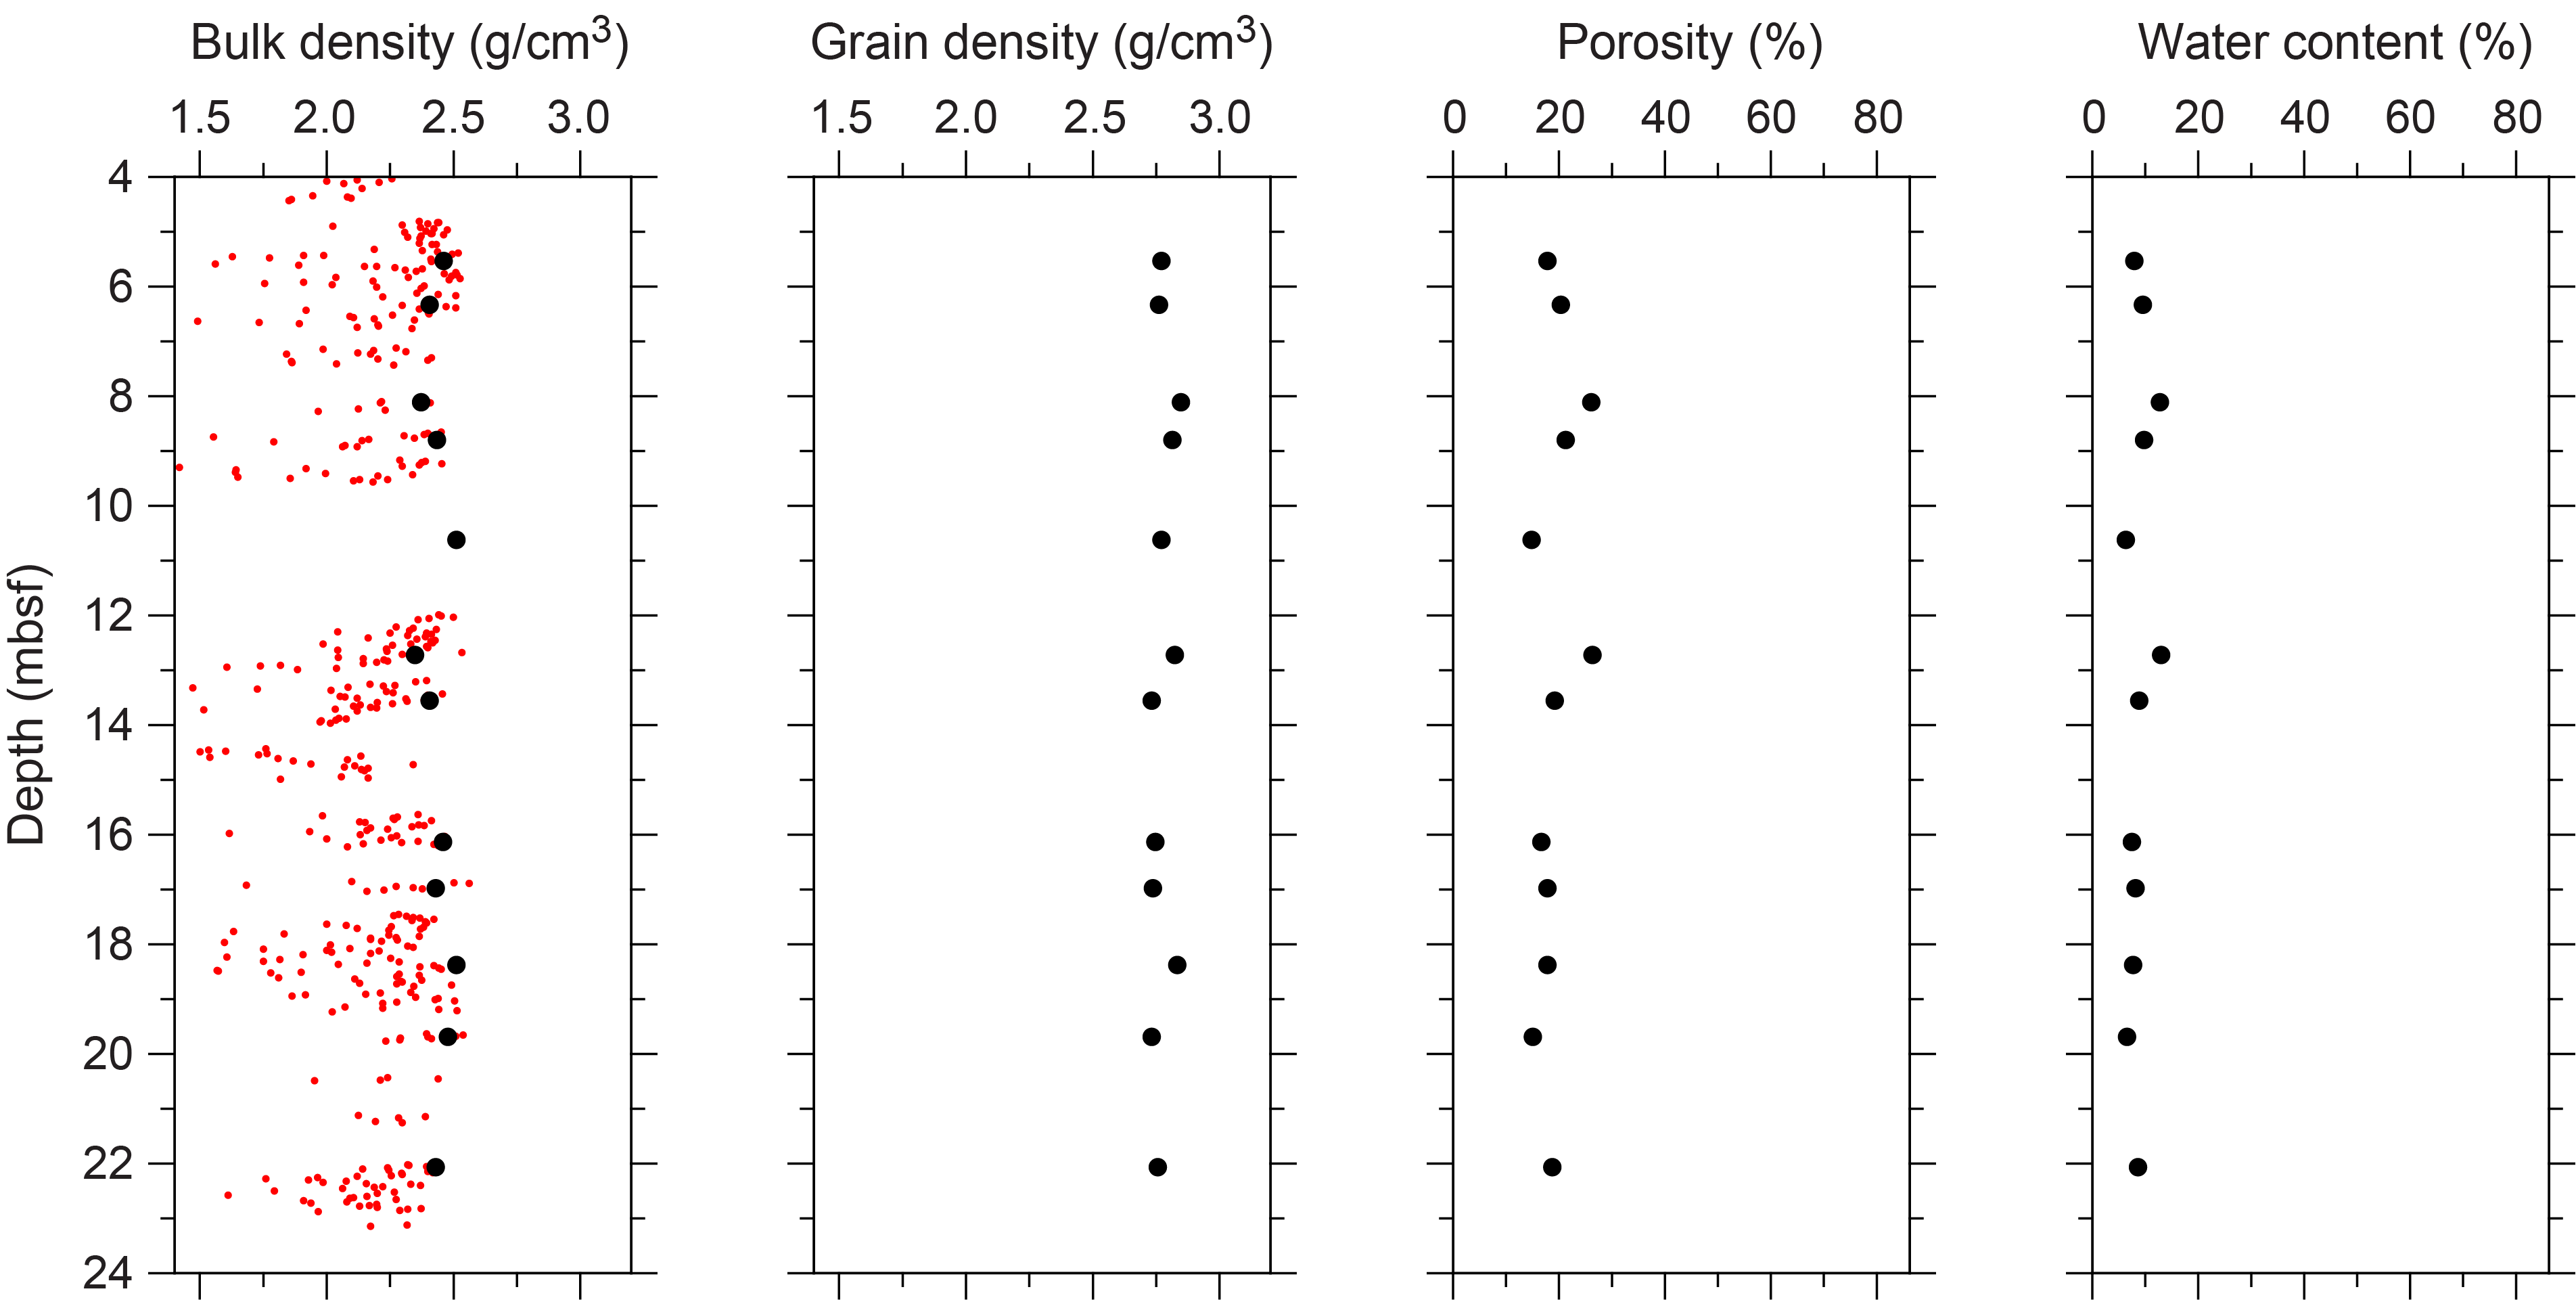
Figure F17. Physical properties, Hole M0097D.
3.4.2. P-wave velocity
MSCL P-wave velocity measurements yielded no data. A total of 12 samples were measured using the discrete P-wave logger. P-wave velocity measured on dry and resaturated samples range 3527–4847 and 3245–5009 m/s, respectively (Figure F18). Because of the limited P-wave velocity data, there are no apparent downhole trends.
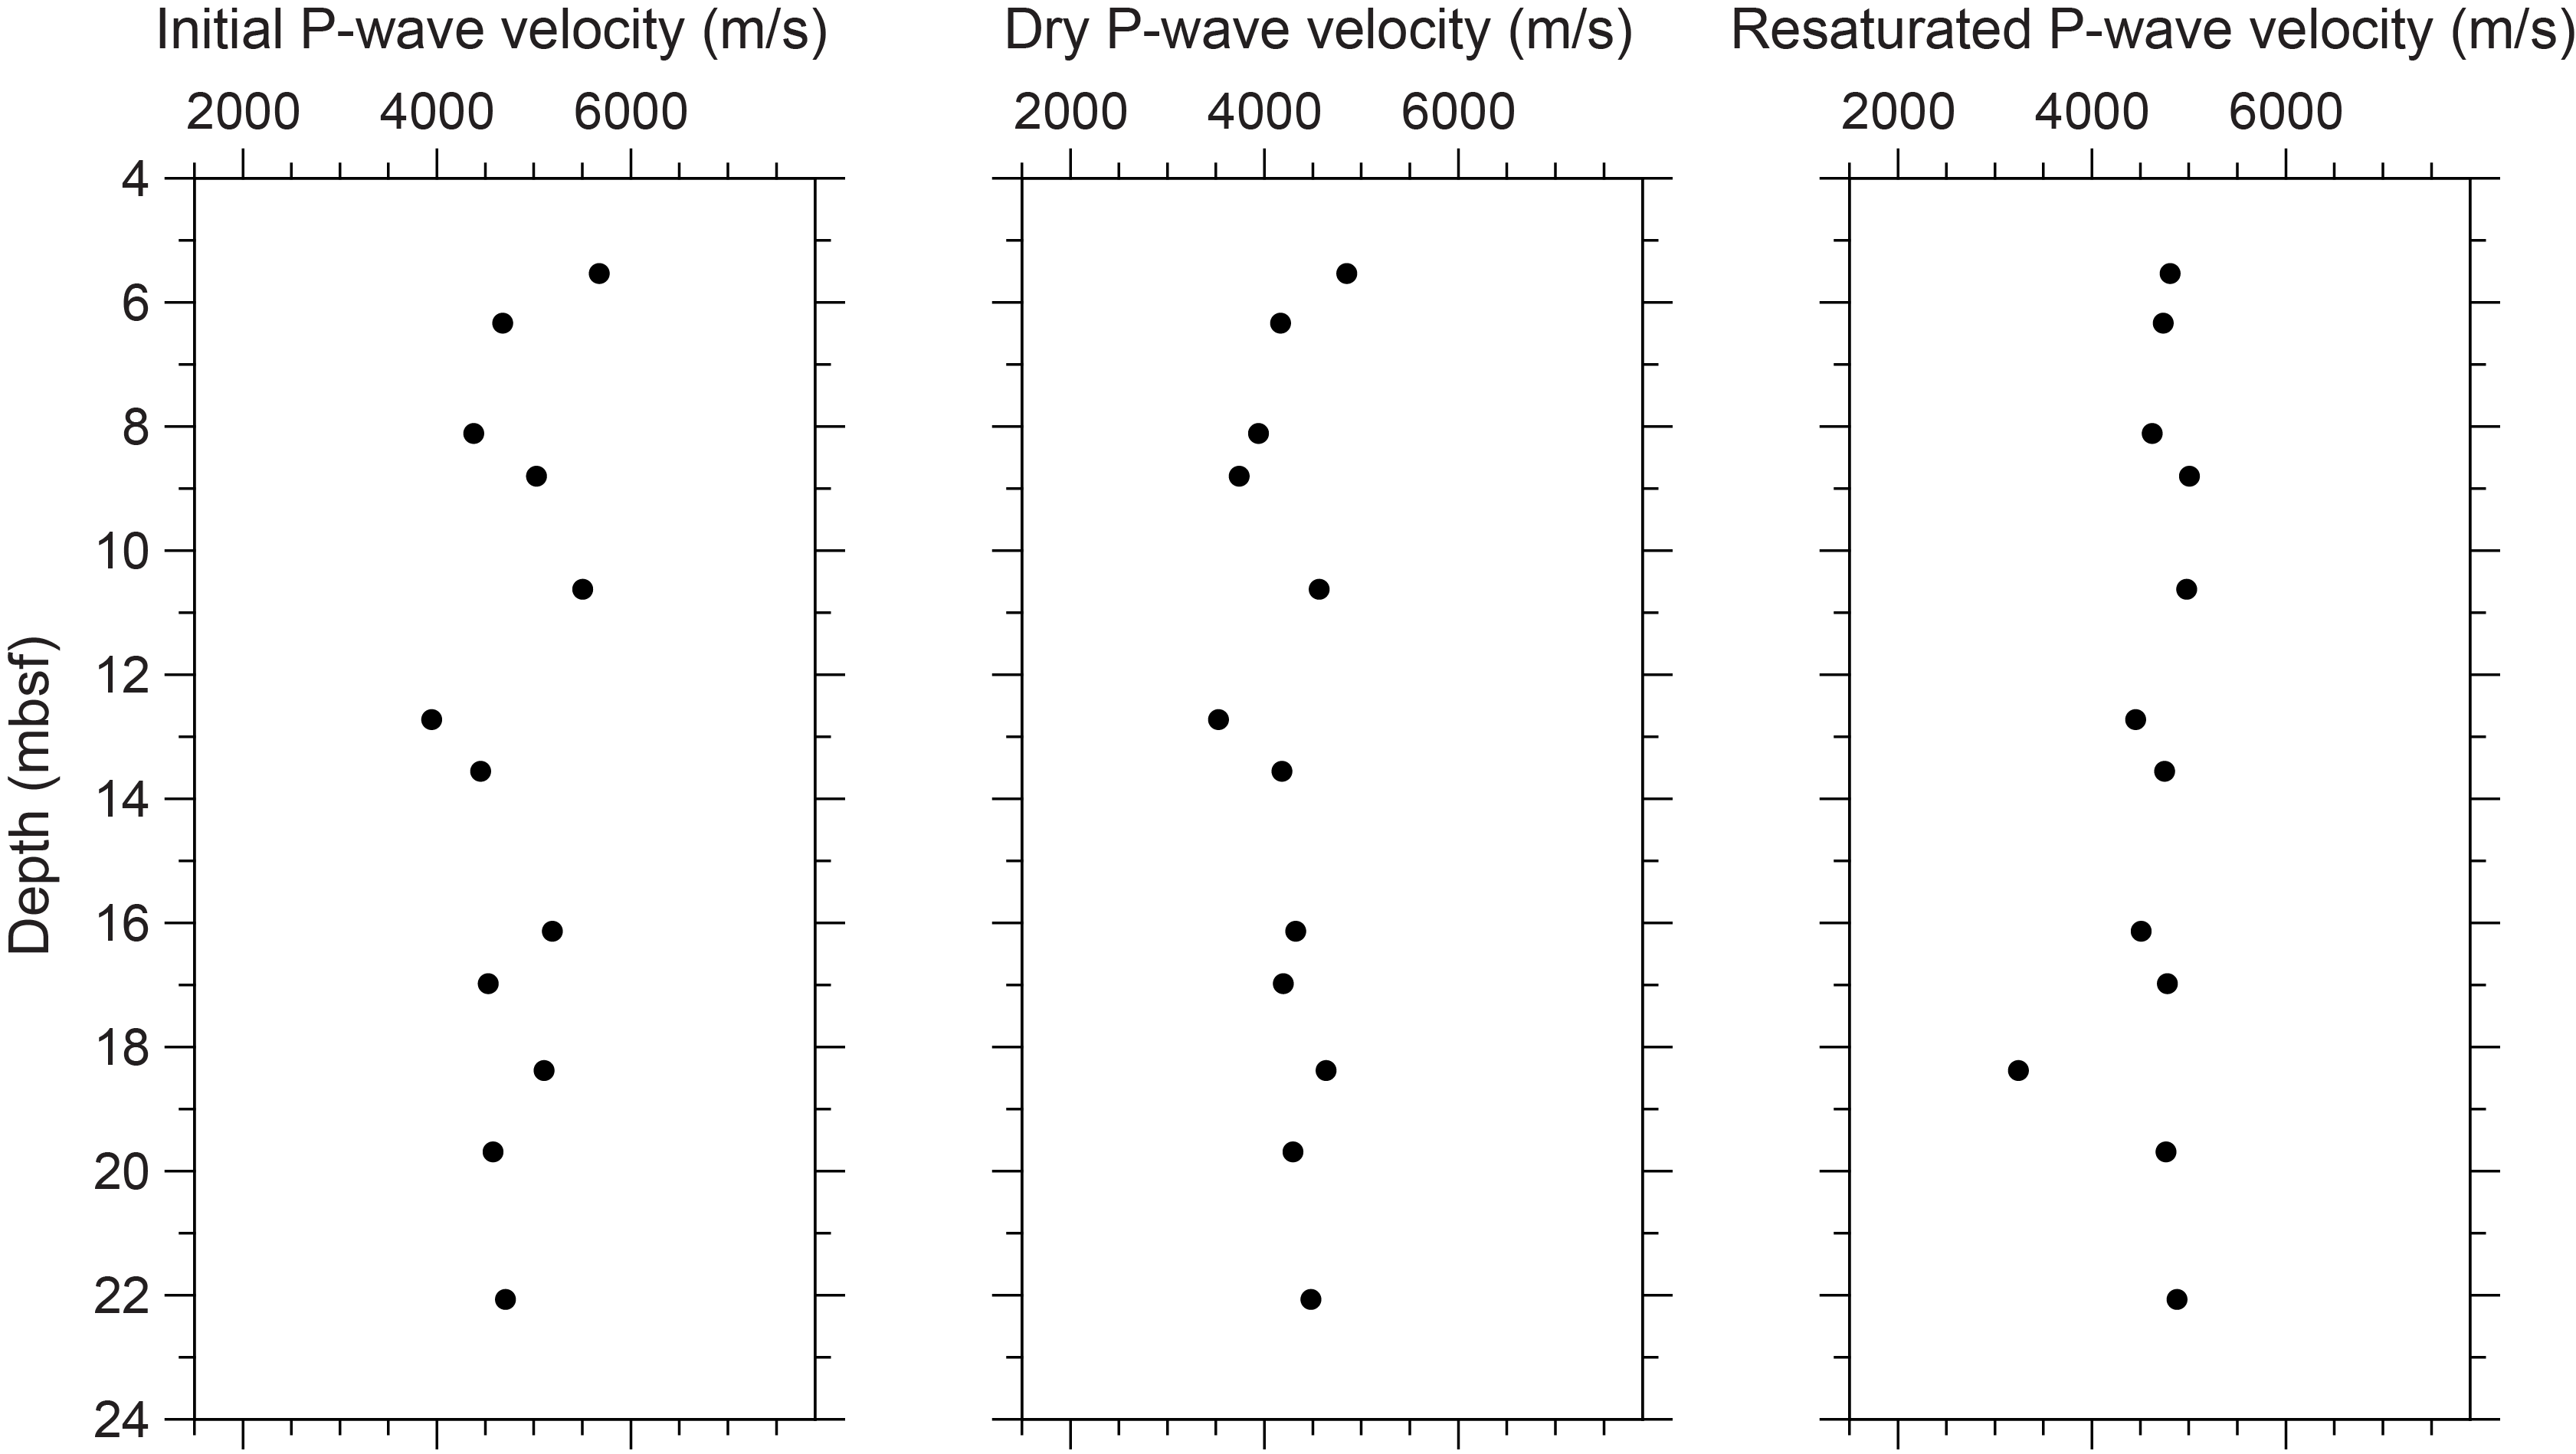
Figure F18. P-wave velocities, Hole M0097D.
3.4.3. Thermal conductivity
No thermal conductivity measurements were conducted for Hole M0097D.
3.4.4. Magnetic susceptibility
MSCL magnetic susceptibility data range −1.28 × 10⁻⁵ to 132.62 × 10⁻⁵ SI (Figure F9). The majority of magnetic susceptibility values fall around 1.51 × 10⁻⁵ SI. There is a large positive excursion in magnetic susceptibility of 132.62 × 10⁻⁵ SI at 14.59 mbsf. Additionally, there are two smaller positive excursions of ~6 × 10⁻⁵ SI at 13.19 and 22.02 mbsf.
3.4.5. Electrical resistivity
MSCL noncontact resistivity measurements range 1.12–260.57 Ωm (Figure F9). The majority of the resistivity measurements are <20 Ωm.
3.4.6. Natural gamma radiation
MSCL NGR measurements range 26–35 counts/s and show no apparent trends (Figure F9).
3.4.7. Digital linescans, color reflectance, and hyperspectral imaging
All cores were digitally scanned, measured for color reflectance (where appropriate), and imaged with the hyperspectral scanner (see HYPERSPECTRAL in Supplementary material). Color reflectance L* values vary between 26.55% and 89.84%, a* varies between −0.62 and 6.14 (Figure F9), b* varies between 1.30 and 21.99, and a*/b* varies between −0.33 and 0.45.
4. Geochemistry
4.1. Interstitial water
No interstitial water samples were collected from Site M0097.
4.2. Surface seawater
One surface seawater sample was collected from Site M0097 using a Niskin bottle from the side of the vessel (see Figure F22 in the Expedition 389 methods chapter [Webster et al., 2025a]). The salinity, pH, alkalinity, and ammonium concentrations were analyzed off shore, and major cations and anions were measured during the Onshore Science Party. The salinity, pH, alkalinity, ammonium, and major element chemistry measured for this sample are consistent with the other surface seawater samples taken during Expedition 389 and align with the expected values for conservative elements in seawater (see Tables T15 and T17 in the Expedition 389 methods chapter [Webster et al., 2025a]).
4.3. Bulk sediment
A total of 32 bulk sediments were taken from Site M0097 (Figure F2). Of those, all 32 samples were analyzed using X-ray diffraction (XRD) for mineralogy, but only 31 samples were analyzed for elemental composition and carbon content. The samples were derived from a variety of facies, including various combinations of coral, algal, and microbial boundstone as well as mixed sediment (see Figure F10 in the Expedition 389 methods chapter [Webster et al., 2025a]).
4.4. Mineralogy
XRD analysis of samples from Site M0097 shows that carbonate minerals dominate (Table T2). Some samples contain minor amounts of other minerals.
Hole M0097A samples are very rich in carbonate minerals, principally aragonite and high-Mg calcite. Some samples have approximately 10% calcite and/or approximately 10% Mn-carbonates. There are trace amounts (<3%) of Fe-carbonates, barite, halite, biotite, and spinel. Samples from Hole M0097B contain abundant aragonite, calcite, and high-Mg calcite and few other minerals. Samples from Hole M0097C are also rich in carbonate minerals, generally consisting of aragonite, calcite, high-Mg calcite, and Mn-carbonates. Two samples composed of mixed sediment (Sample 1R-1, 25–27 cm; 0.25 mbsf) and coral-algal-microbial boundstone (16R-1, 52–55 cm; 8.02 mbsf) contain several other minerals, including plagioclase, barite, chlorite, and pyroxenes. Samples from Hole M0097D are composed exclusively of high-Mg calcite and aragonite.
4.5. Elemental abundances
There are subtle variations in the concentrations of major and minor elements in samples from Site M0097 (Table T3). Calcium concentrations range 242,325–347,306 mg/kg, Mg concentrations range 13,467–41,545 mg/kg, S concentrations range 1,579–2,359 mg/kg, and Sr concentrations range 1,343–5,969 mg/kg (Figure F19). For most samples, the concentrations of Al, Ba, Fe, K, Mn, P, Si, Ti, Zr, Cr, Cu, Ni, Rb, V, and Zn are below the detection limit; Sample 389-M0097-2R-1, 29–31 (1.65 mbsf), is a clear exception to this generalization (Table T3).
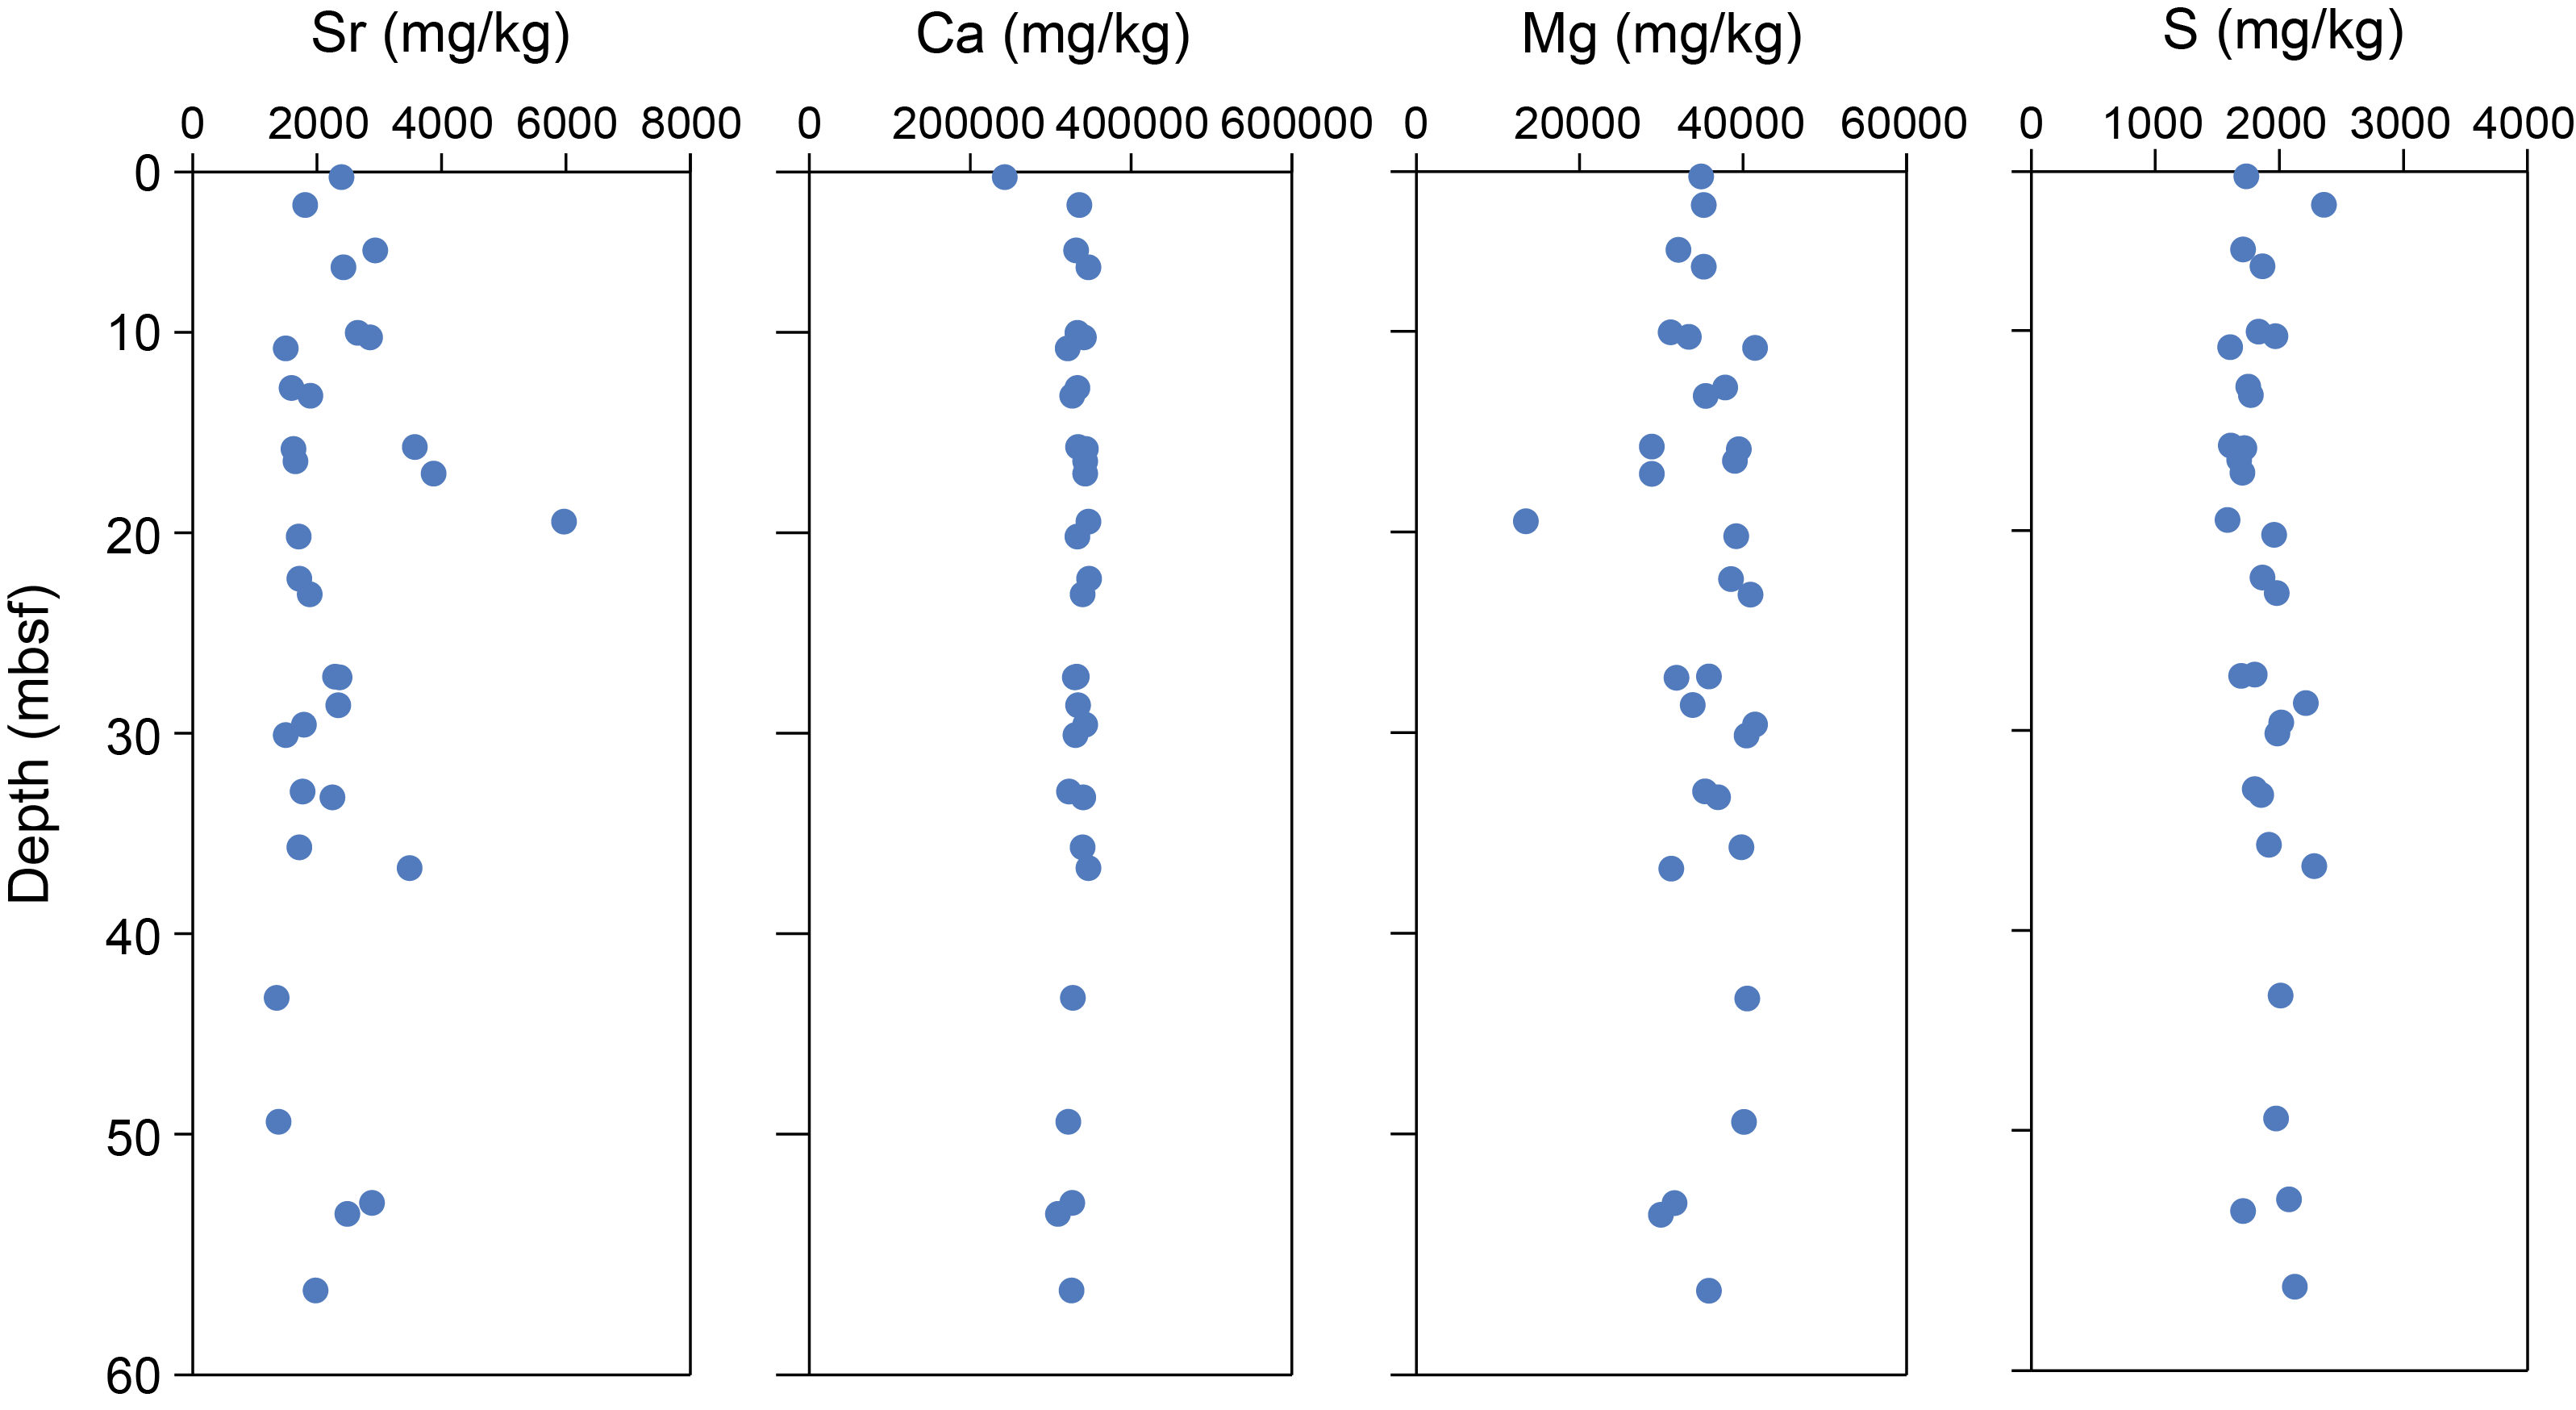
Figure F19. Sr, Ca, Mg, and S.
4.6. Carbon content
The results for total organic carbon (TOC), total carbon (TC), and total inorganic carbon (TIC) at Site M0097 are presented in Tables T3 and T4 and Figure F20. The TC content ranges 8.5%–12.1%, the TOC content ranges 0.15%–0.34%, and the TIC content ranges 8.3%–11.9%. Lower TC and TIC values appear to originate from mixed sediment samples, and higher values tend to be found in coral-algal-boundstone samples.
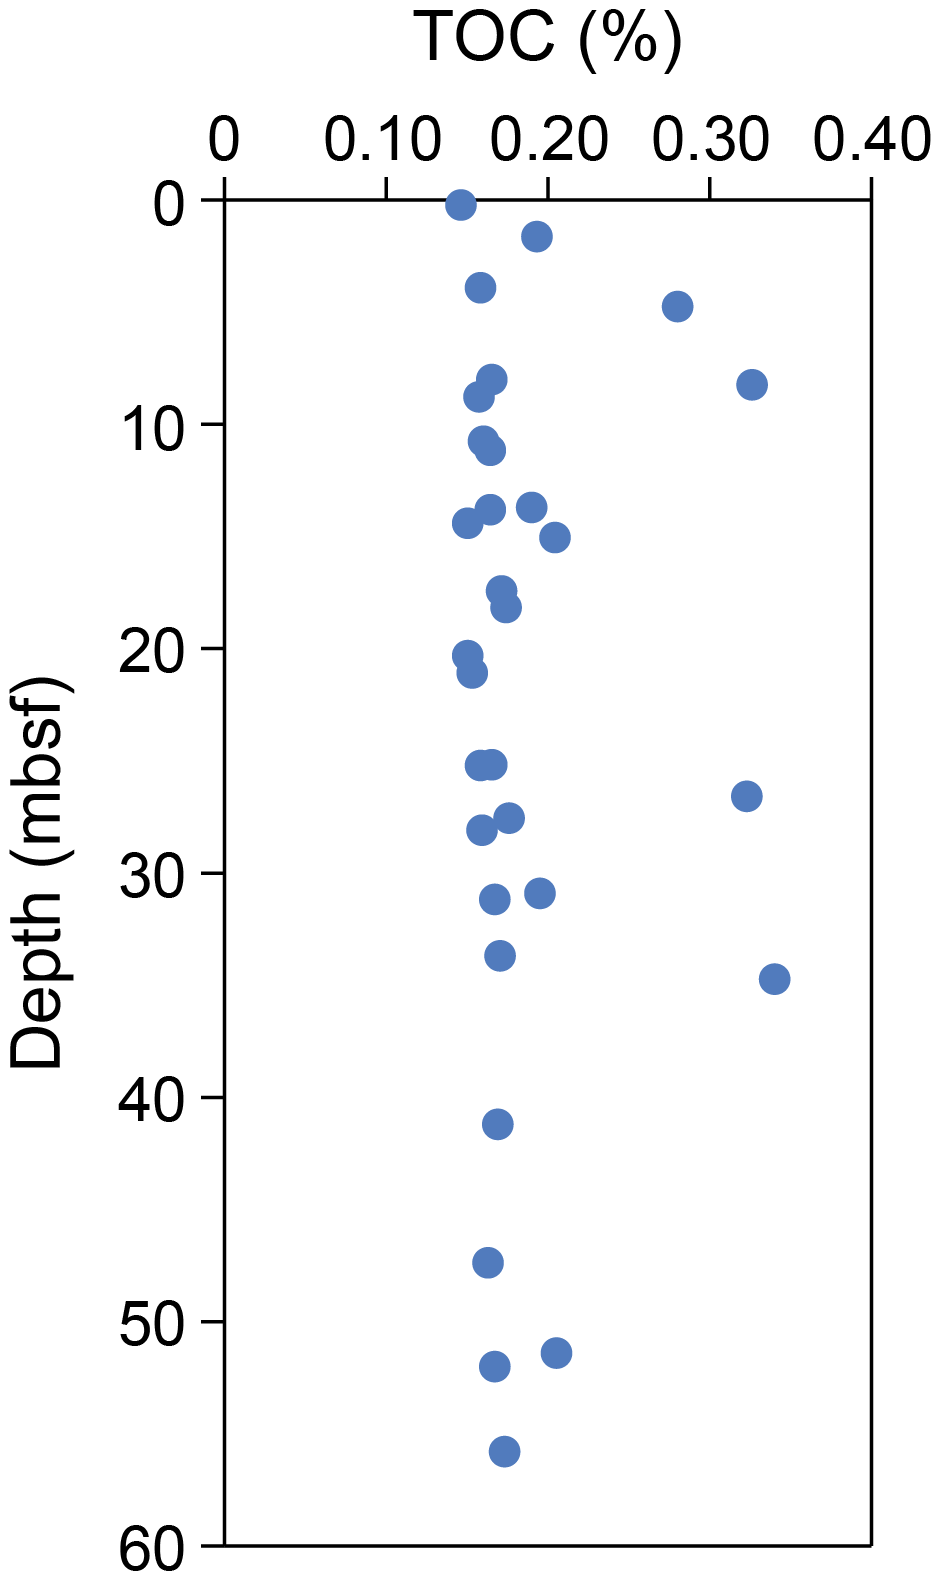
Figure F20. TOC content.
5. Paleomagnetism
A total of 86 plug samples were obtained from Holes M0097A–M0097D. Low-field and mass-specific magnetic susceptibility (χ) measurements were carried out for all samples. The initial natural remanent magnetization (NRM) was determined for all samples, as well as NRM following stepwise alternating field (AF) demagnetization. All basalt samples from all holes and carbonate samples from Hole M0097A were demagnetized up to peak AF fields of 100 mT, whereas the remaining carbonate samples from Holes M0097B–M0097D were only demagnetized up to 20 mT. For further details, see Paleomagnetism in the Expedition 389 methods chapter (Webster et al., 2025a).
5.1. Hole M0097A
A total of 19 carbonate samples were taken from Hole M0097A. Low negative susceptibility values occur throughout the hole, ranging −2.44 × 10⁻⁸ to −0.8.6 × 10−8 m3/kg with an arithmetic mean of −1.70 × 10⁻⁸ m3/kg. From 22.72 mbsf to the base of the hole, repeated fluctuations in χ values are observed. The initial NRM intensity ranges 0.27 × 10⁻⁴ to 4.20 × 10⁻⁴ A/m with an arithmetic mean of 1.18 × 10⁻⁴ A/m. NRM values also fluctuate from 22.72 mbsf to the bottom of the hole (Figure F21) but do not mimic the variations in χ values, so these patterns do not solely reflect variations in mineral concentration.
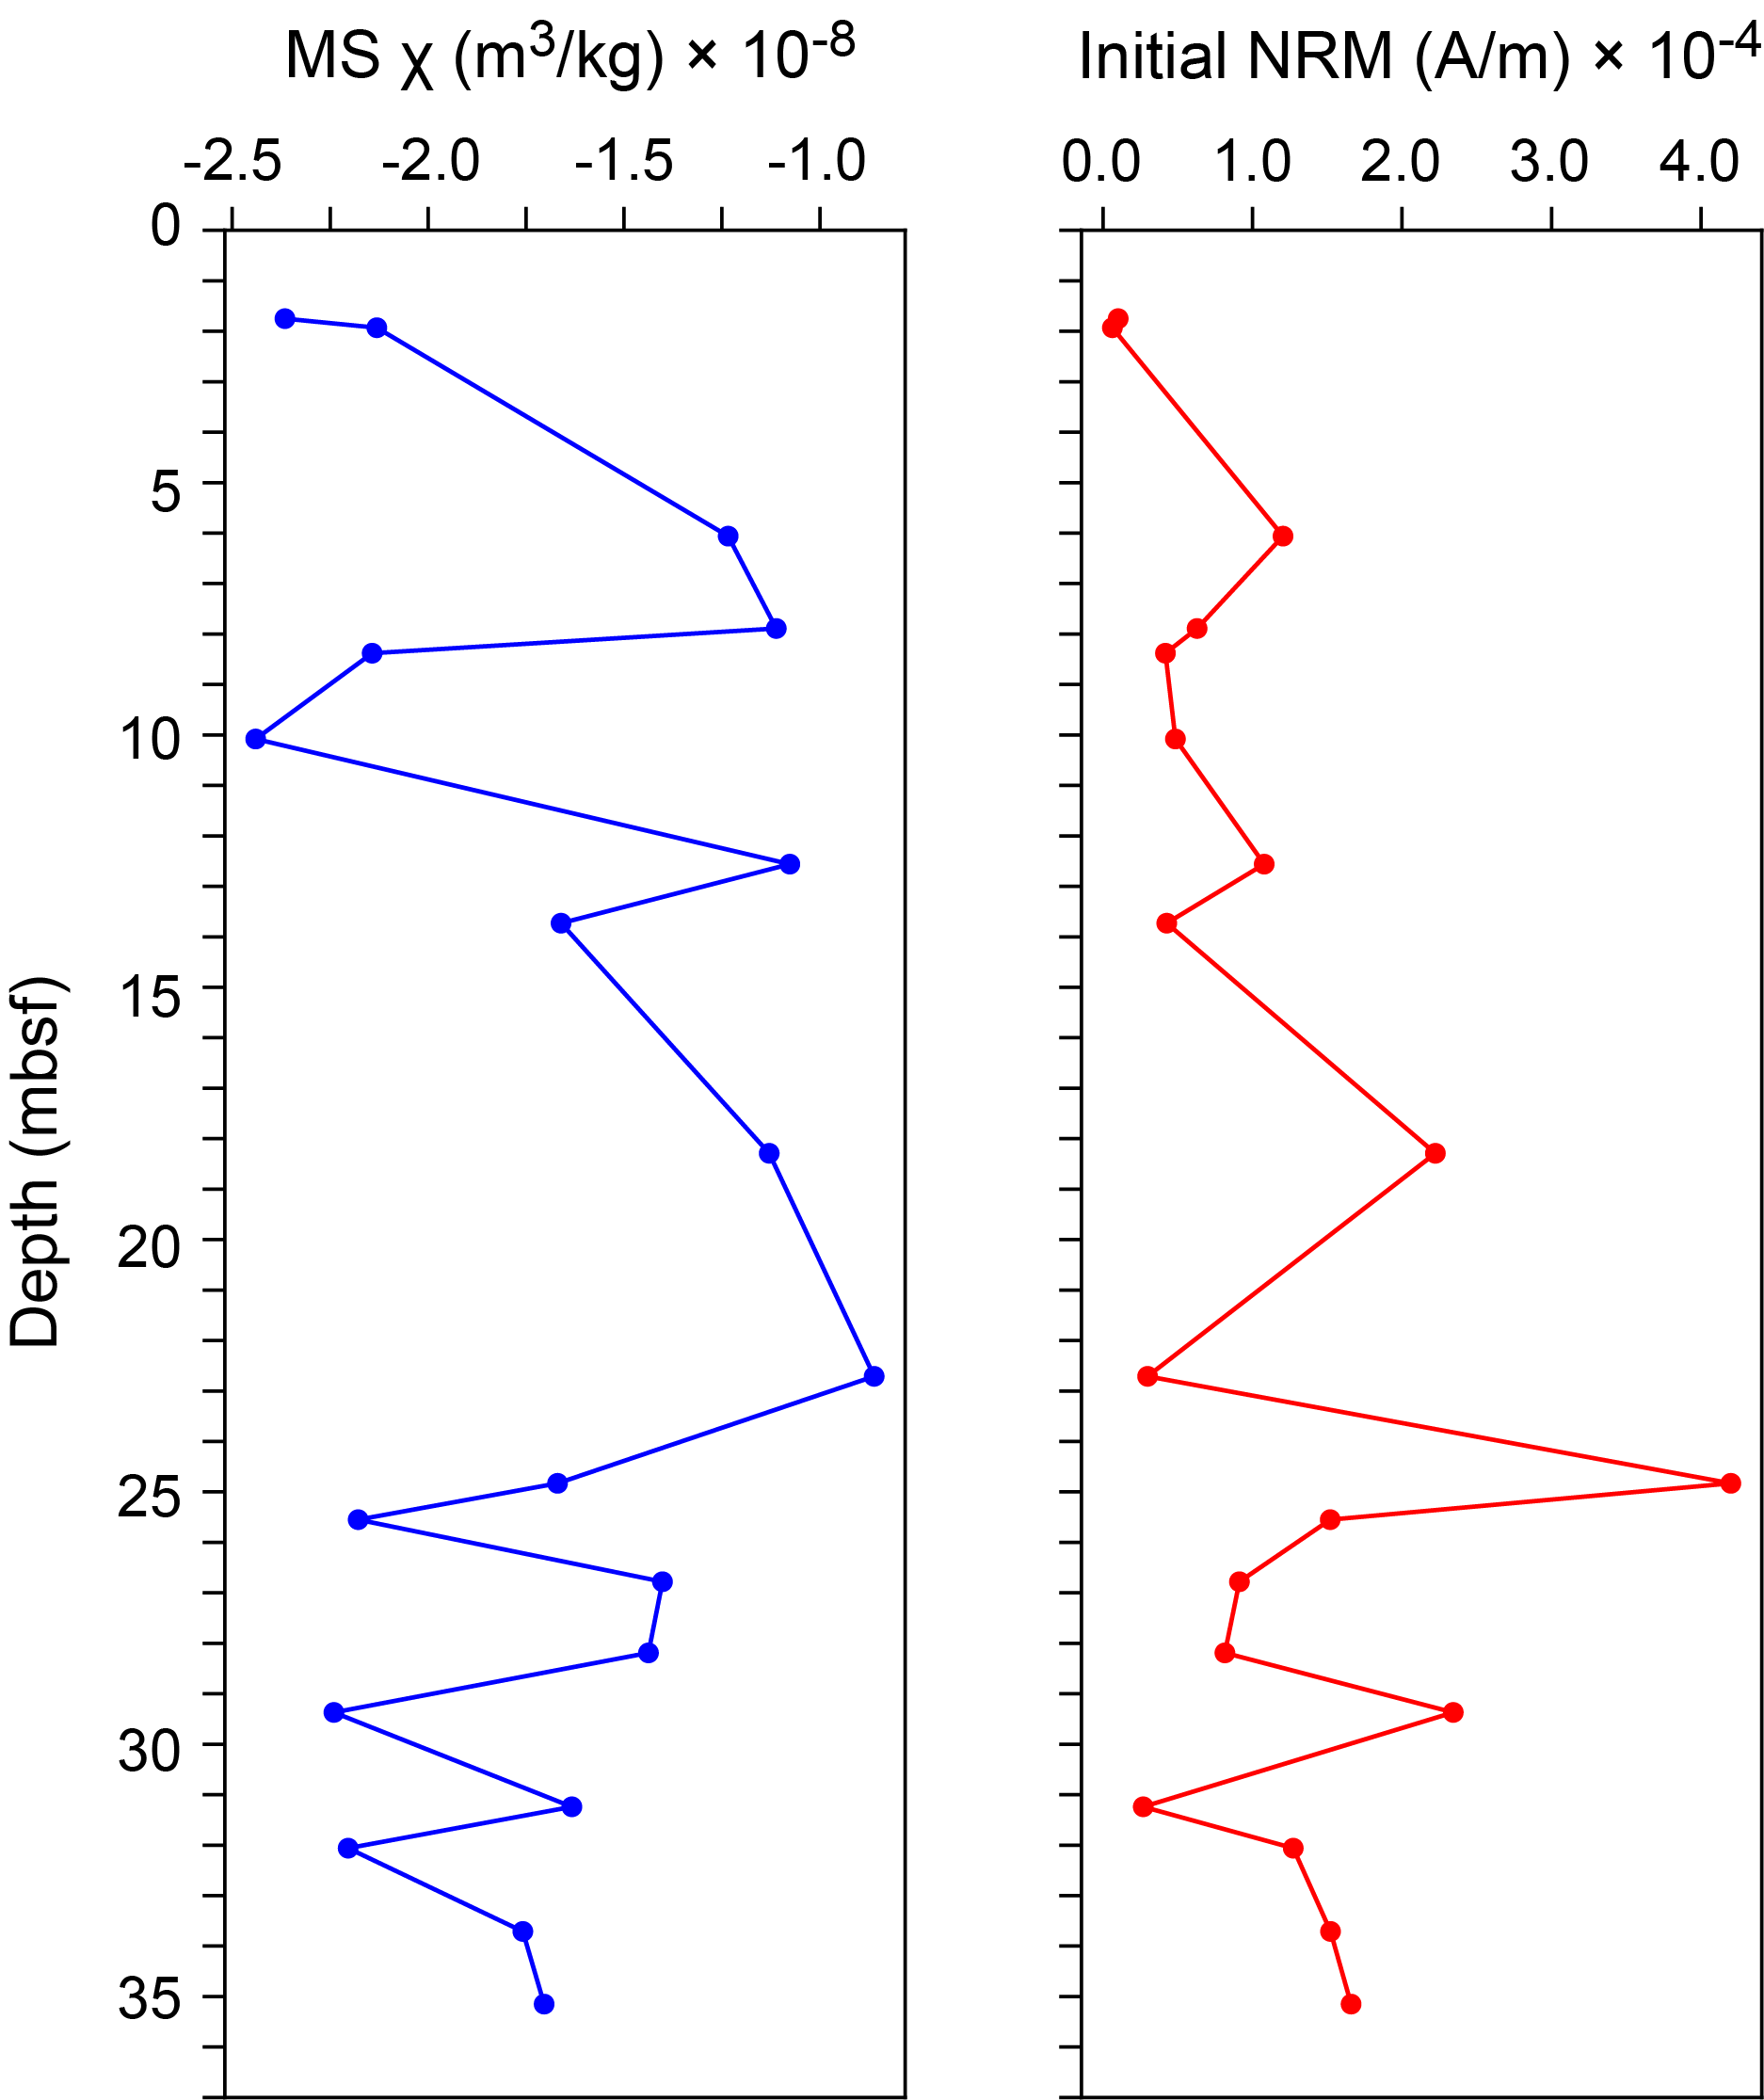
Figure F21. MS and NRM, Hole M0097A.
5.2. Hole M0097B
A total of 20 carbonate samples were obtained from Hole M0097B. Low negative χ values occur throughout the hole, ranging −2.26 × 10⁻⁸ to −1.37 × 10⁻⁸ m3/kg with an arithmetic mean of −1.82 × 10⁻⁸ m3/kg. The initial NRM intensity ranges 0.60 × 10⁻⁴ to 9.64 × 10⁻⁴ A/m with an arithmetic mean of 2.84 × 10⁻⁴ A/m (Figure F22).
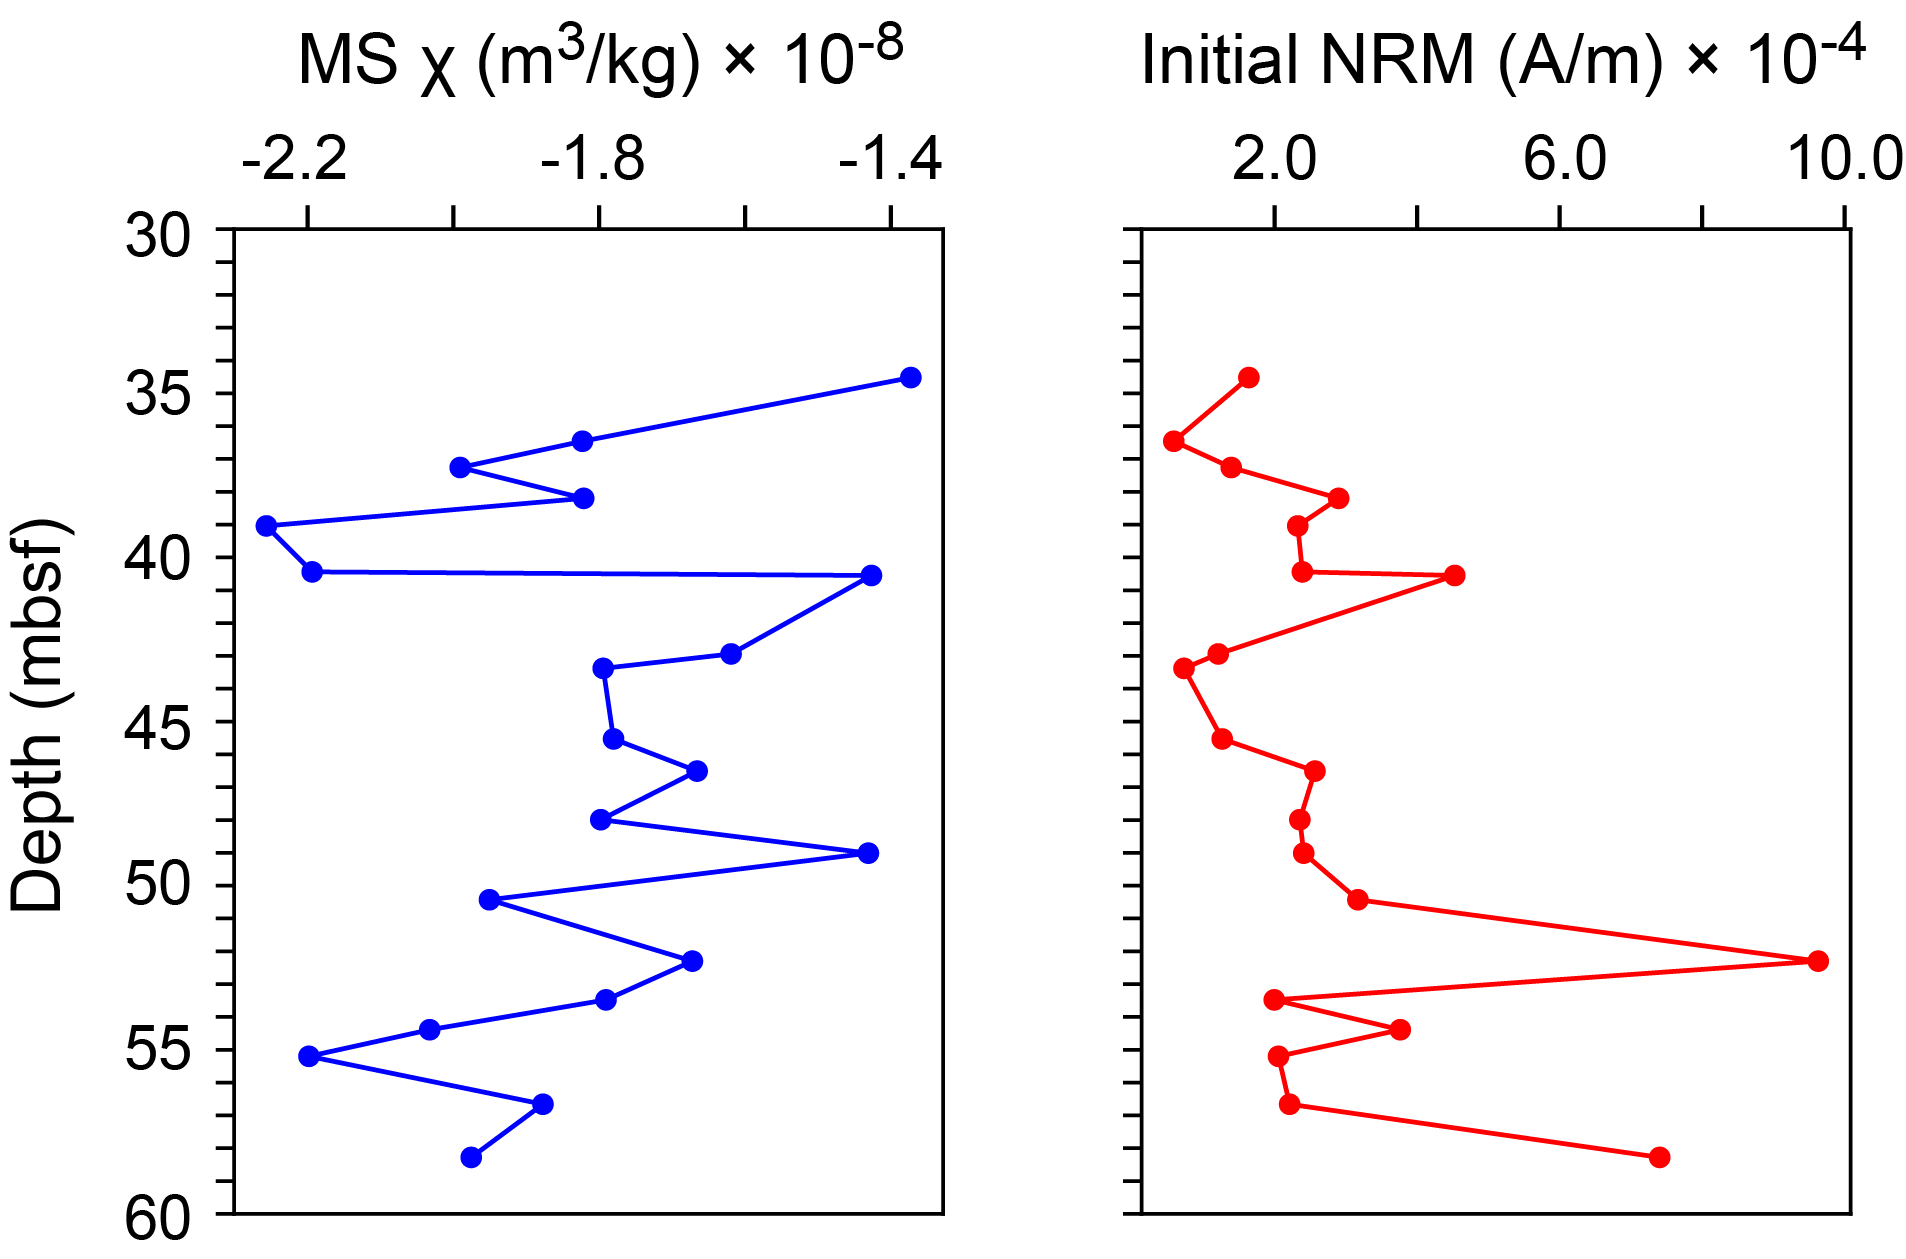
Figure F22. MS and NRM, Hole M0097B.
5.3. Hole M0097C
A total of 26 carbonate samples were collected from Hole M0097C. Low negative χ values occur throughout the core, ranging −2.71 × 10⁻⁸ to −0.49 × 10⁻⁸ m3/kg with an arithmetic mean of −1.86 × 10⁻⁸ m3/kg. From 22.89 to 4.00 mbsf, χ values increase slightly from −2.71 × 10⁻⁸ to −1.73 × 10⁻⁸ m/kg. The initial NRM intensity ranges 0.26 × 10⁻⁴ to 59.0 × 10⁻⁴ A/m with an arithmetic mean of 4.11 × 10⁻⁴ A/m. The initial NRM intensity of Sample 11R-1, 6–8 cm (5.43 mbsf), is a lot higher than all other samples, making it difficult to observe the overall variability. Therefore, the results for the NRM intensity at 10 mT are also presented. The NRM intensity for 10 mT increases from 0.29 × 10⁻⁴ A/m at the base of the hole to 2.32 × 10⁻⁴ A/m at 5.43 mbsf (Figure F23).
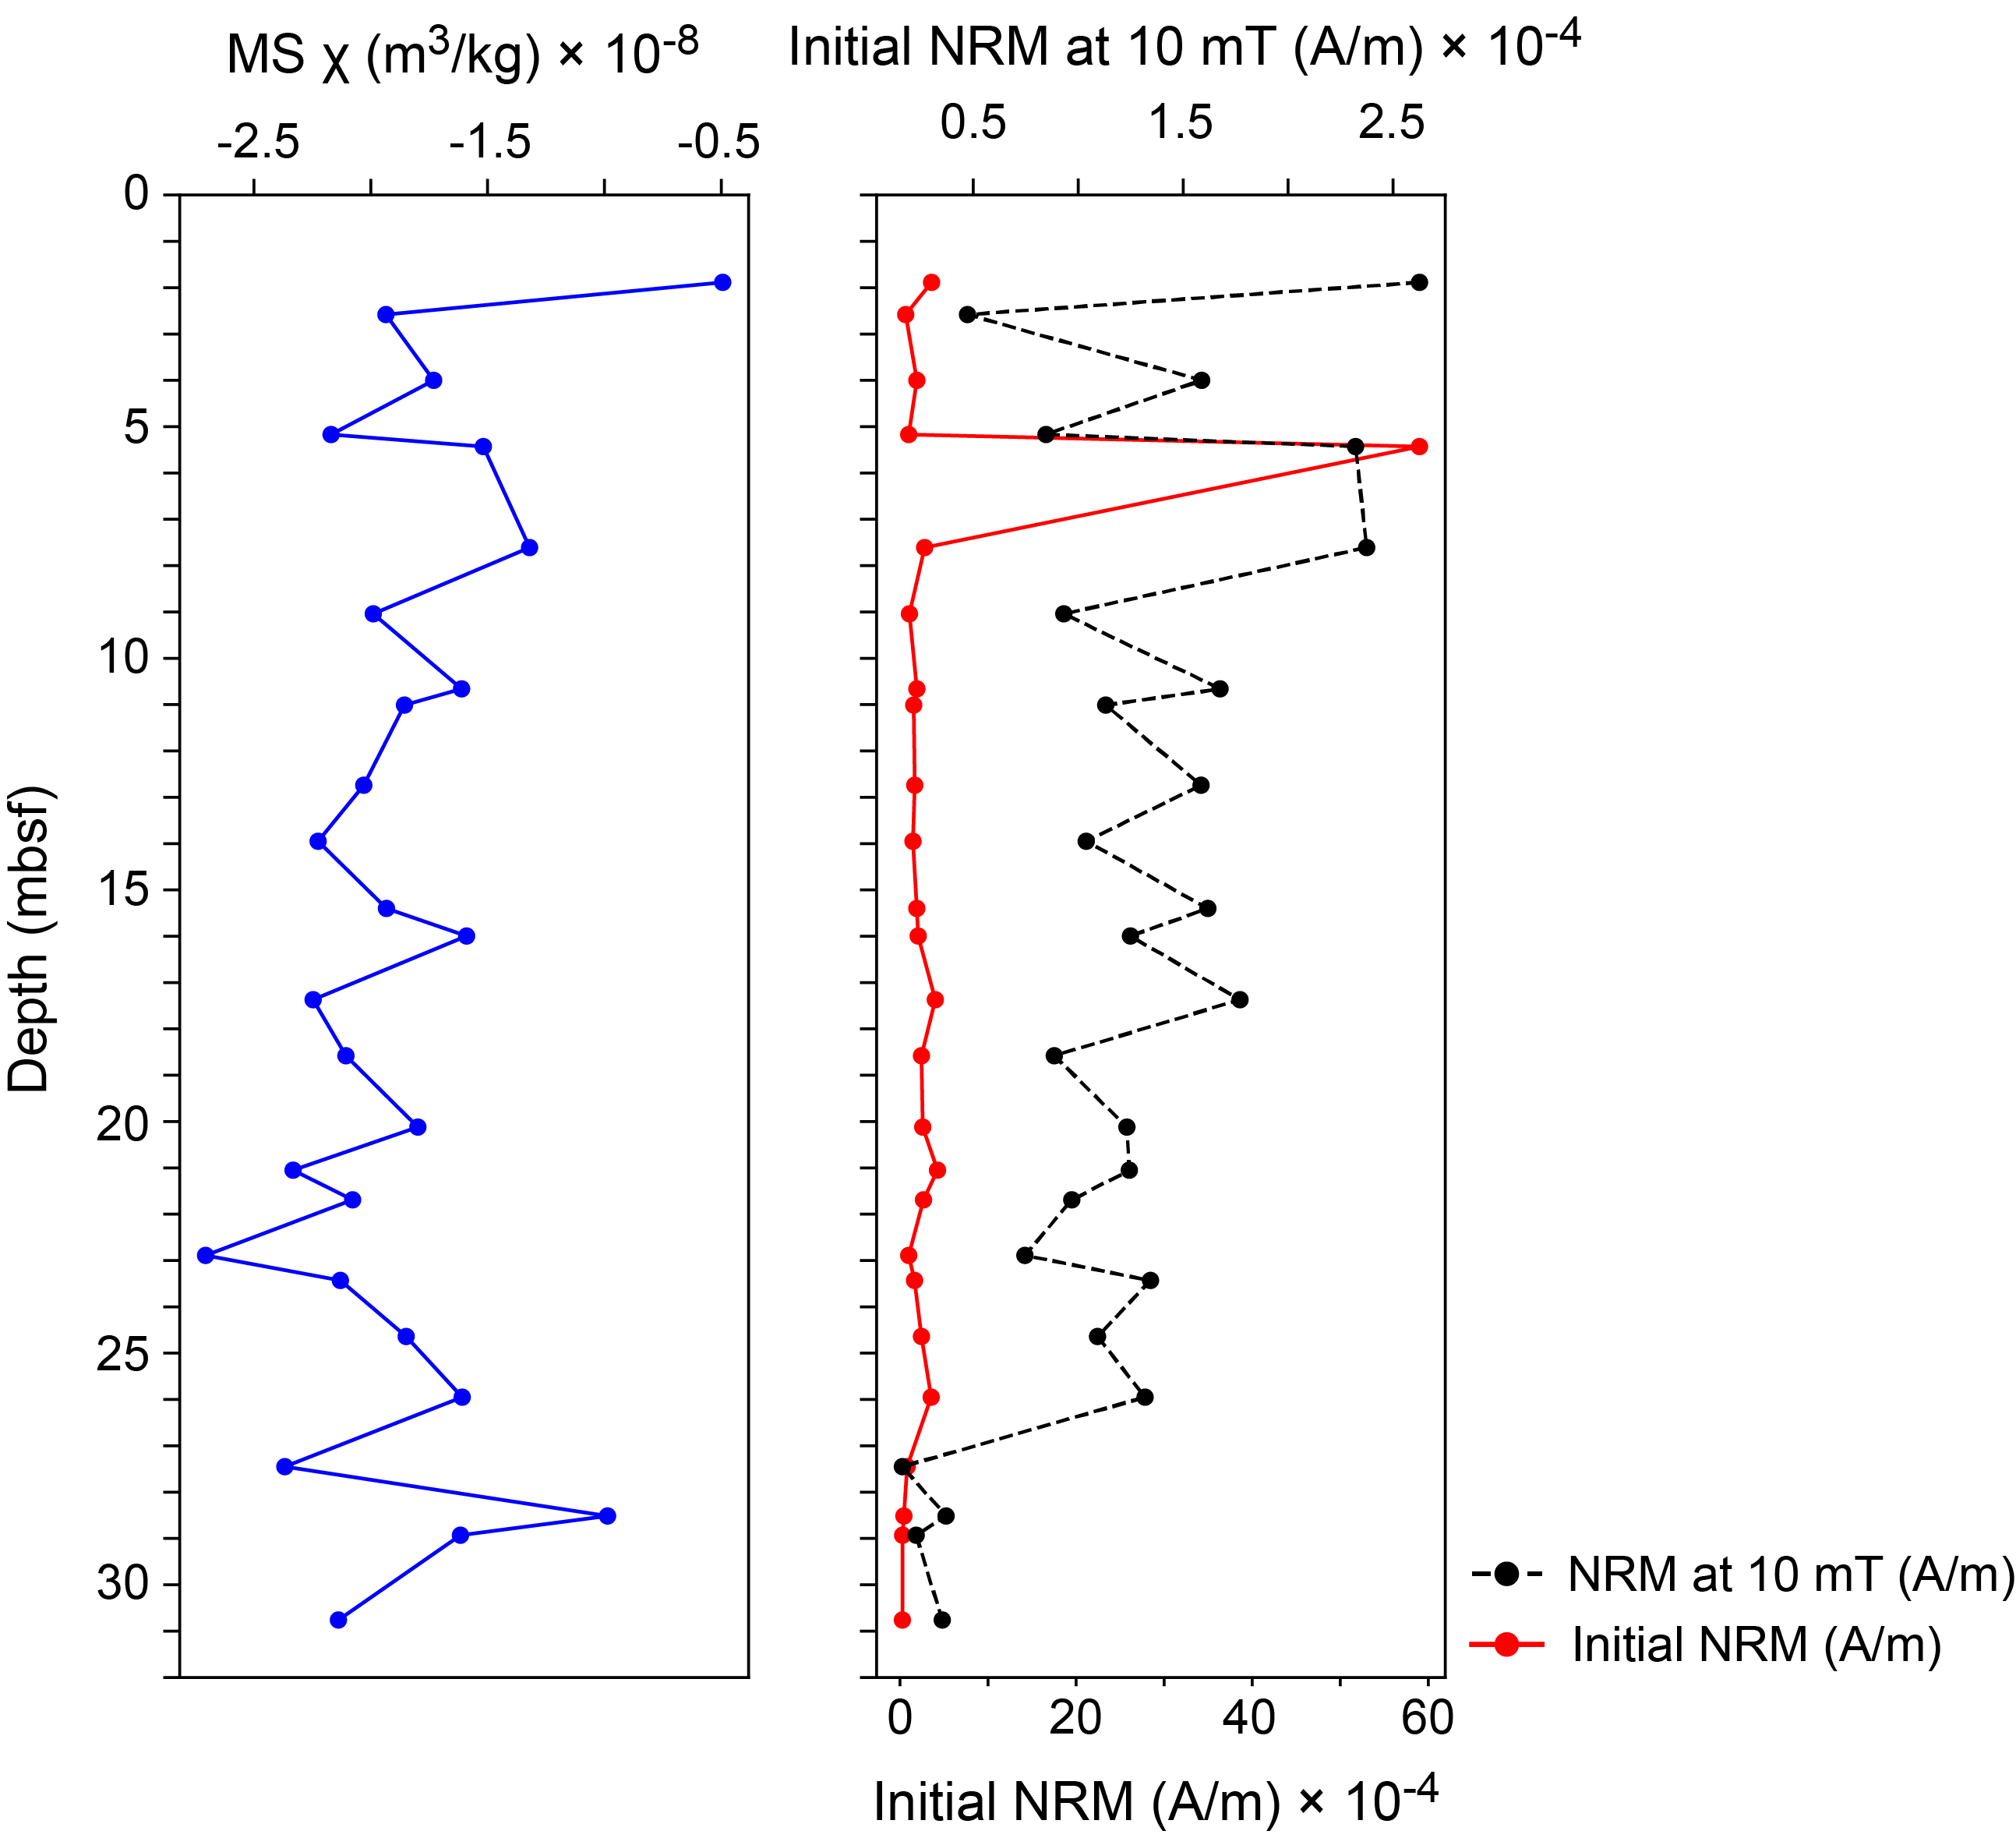
Figure F23. MS and NRM, Hole M0097C.
5.4. Hole M0097D
A total of 20 carbonate samples and one lava sample (389-M0097D-2R-1, 18–20 cm; 0.89 mbsf) were collected from Hole M0097D. The carbonate samples are characterized by low negative χ values throughout the hole, ranging −2.73 × 10⁻⁸ to −0.93 × 10⁻⁸ m3/kg with an arithmetic mean of −1.88 × 10⁻⁸ m3/kg. The initial NRM intensities of the carbonate samples range 0.28 × 10⁻⁴ to 3.84 × 10⁻⁴ A/m with an arithmetic mean of 1.64 × 10⁻⁴ A/m. The lava sample is characterized by a high positive χ value of 8.21 × 10⁻⁶ m3/kg and an initial NRM intensity of 2.00 A/m (Figure F24).
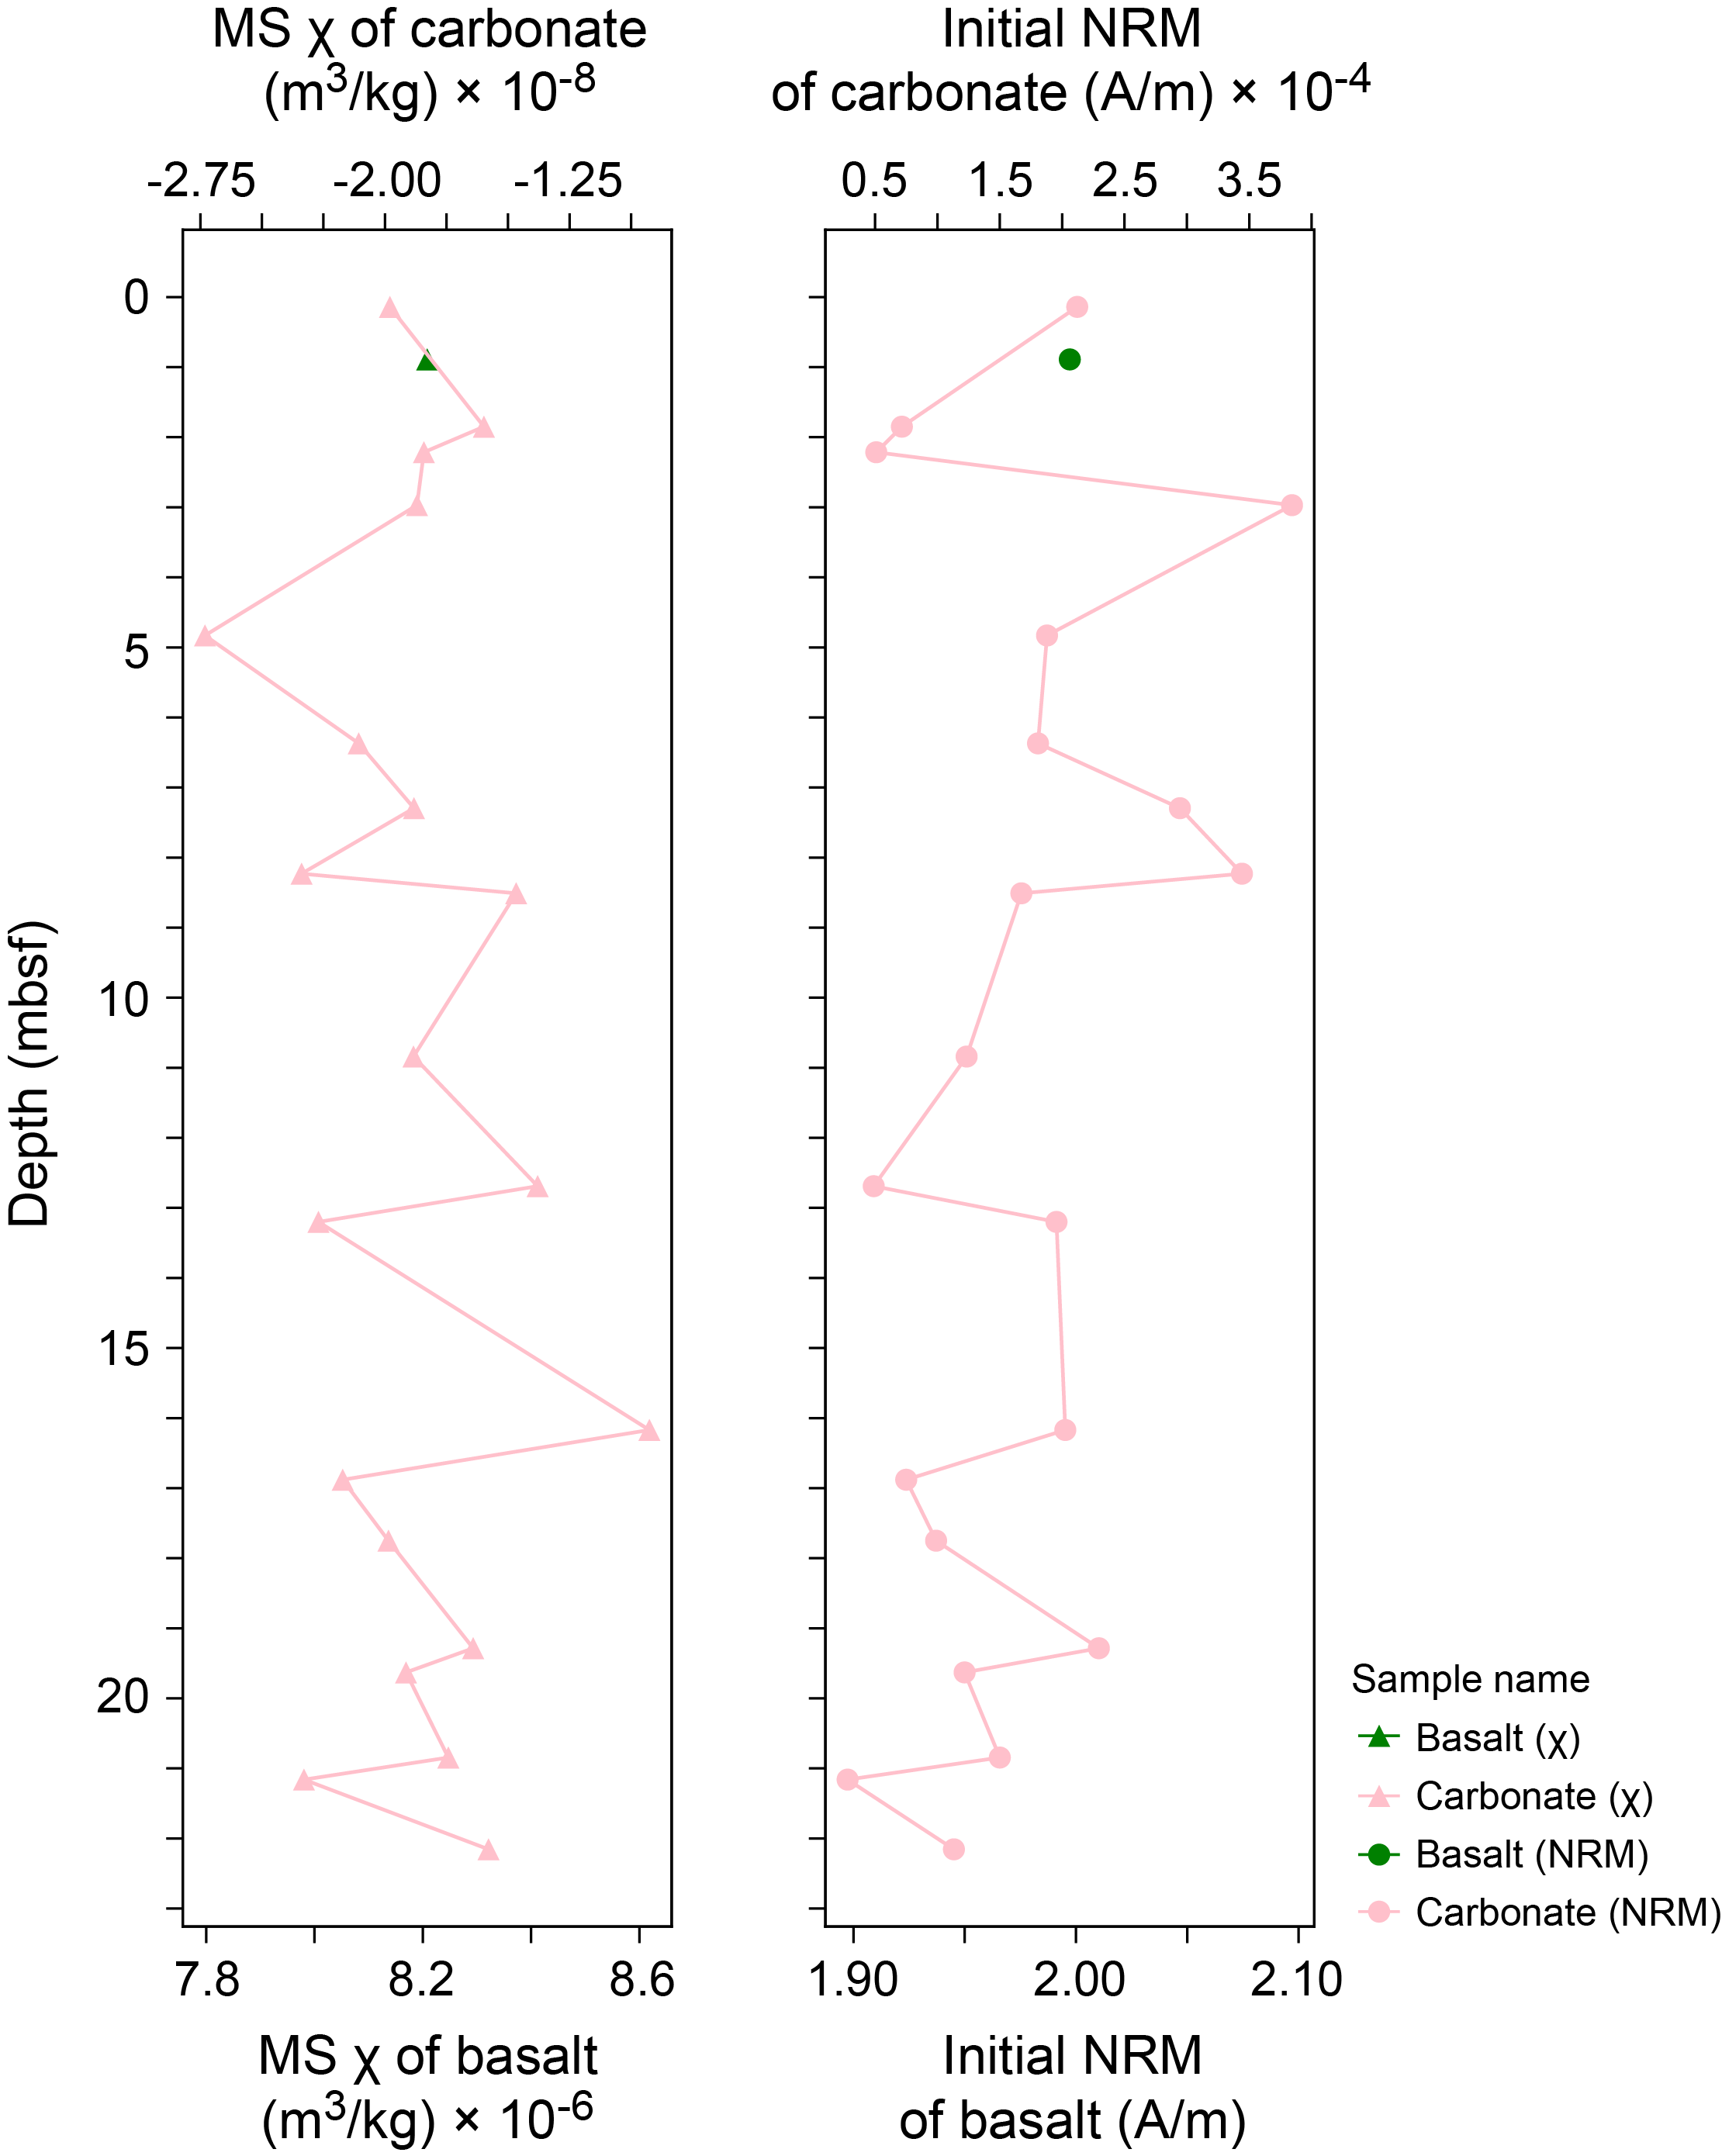
Figure F24. MS and NRM, Hole M0097D.
6. Geochronology
A total of seven U-Th dates were measured on samples from Site M0097, including three from Hole M0097A and two each from Holes M0097B and M0097C (see Tables T21 and T22 in the Expedition 389 methods chapter [Webster et al., 2025a]). Dates from three of these samples (389-M0097A-13R-1, 73–75 cm; 389-M0097C-5R-1, 75–77 cm; and 389-M0097C-24R-2, 44–46 cm) are rejected based on anomalous δ234U initial values (below 130‰ or above 160‰). One of these samples (389-M0097A-13R-1, 73–75 cm) also has an anomalously high 238U concentration (i.e., >4 ppm). Of the remaining four samples, the dates range ~133–150 ky BP with no stratigraphic age inversions. These dates are consistent with the interpretation of the age of this H2 terrace from prior studies (Webster et al., 2009).
References
Webster, J.M., Braga, J.C., Clague, D.A., Gallup, C., Hein, J.R., Potts, D.C., Renema, W., Riding, R., Riker-Coleman, K., Silver, E., and Wallace, L.M., 2009. Coral reef evolution on rapidly subsiding margins. Global and Planetary Change, 66(1–2):129–148. https://doi.org/10.1016/j.gloplacha.2008.07.010
Webster, J.M., Ravelo, A.C., Grant, H.L.J., and the Expedition 389 Scientists, 2025. Supplementary material, https://doi.org/10.14379/iodp.proc.389supp.2025. In Webster, J.M., Ravelo, A.C., Grant, H.L.J., and the Expedition 389 Scientists, Hawaiian Drowned Reefs. Proceedings of the International Ocean Discovery Program, 389: College Station, TX (International Ocean Discovery Program).
Webster, J.M., Ravelo, A.C., Grant, H.L.J., Rydzy, M., Stewart, M., Allison, N., Asami, R., Boston, B., Braga, J.C., Brenner, L., Chen, X., Chutcharavan, P., Dutton, A., Felis, T., Fukuyo, N., Gischler, E., Greve, S., Hagen, A., Hamon, Y., Hathorne, E., Humblet, M., Jorry, S., Khanna, P., Le Ber, E., McGregor, H., Mortlock, R., Nohl, T., Potts, D., Prohaska, A., Prouty, N., Renema, W., Rubin, K.H., Westphal, H., and Yokoyama, Y., 2025a. Expedition 389 methods. In Webster, J.M., Ravelo, A.C., Grant, H.L.J., and the Expedition 389 Scientists, Hawaiian Drowned Reefs. Proceedings of the International Ocean Discovery Program, 389: College Station, TX (International Ocean Discovery Program). https://doi.org/10.14379/iodp.proc.389.102.2025
Webster, J.M., Ravelo, A.C., Grant, H.L.J., Rydzy, M., Stewart, M., Allison, N., Asami, R., Boston, B., Braga, J.C., Brenner, L., Chen, X., Chutcharavan, P., Dutton, A., Felis, T., Fukuyo, N., Gischler, E., Greve, S., Hagen, A., Hamon, Y., Hathorne, E., Humblet, M., Jorry, S., Khanna, P., Le Ber, E., McGregor, H., Mortlock, R., Nohl, T., Potts, D., Prohaska, A., Prouty, N., Renema, W., Rubin, K.H., Westphal, H., and Yokoyama, Y., 2025b. Site M0096. In Webster, J.M., Ravelo, A.C., Grant, H.L.J., and the Expedition 389 Scientists, Hawaiian Drowned Reefs. Proceedings of the International Ocean Discovery Program, 389: College Station, TX (International Ocean Discovery Program). https://doi.org/10.14379/iodp.proc.389.103.2025