Webster, J.M., Ravelo, A.C., Grant, H.L.J., and the Expedition 389 Scientists
Proceedings of the International Ocean Discovery Program Volume 389
publications.iodp.org
https://doi.org/10.14379/iodp.proc.389.106.2025
Site M00991
![]() J.M. Webster,
J.M. Webster,
![]() A.C. Ravelo,
A.C. Ravelo,
![]() H.L.J. Grant,
H.L.J. Grant,
![]() M. Rydzy,
M. Rydzy,
![]() M. Stewart,
M. Stewart,
![]() N. Allison,
N. Allison,
![]() R. Asami,
R. Asami,
![]() B. Boston,
B. Boston,
![]() J.C. Braga,
J.C. Braga,
![]() L. Brenner,
L. Brenner,
![]() X. Chen,
X. Chen,
![]() P. Chutcharavan,
P. Chutcharavan,
![]() A. Dutton,
A. Dutton,
![]() T. Felis,
T. Felis,
![]() N. Fukuyo,
N. Fukuyo,
![]() E. Gischler,
E. Gischler,
![]() S. Greve,
S. Greve,
![]() A. Hagen,
A. Hagen,
![]() Y. Hamon,
Y. Hamon,
![]() E. Hathorne,
E. Hathorne,
![]() M. Humblet,
M. Humblet,
![]() S. Jorry,
S. Jorry,
![]() P. Khanna,
P. Khanna,
![]() E. Le Ber,
E. Le Ber,
![]() H. McGregor,
H. McGregor,
![]() R. Mortlock,
R. Mortlock,
![]() T. Nohl,
T. Nohl,
![]() D. Potts,
D. Potts,
![]() A. Prohaska,
A. Prohaska,
![]() N. Prouty,
W. Renema,
N. Prouty,
W. Renema,
![]() K.H. Rubin,
K.H. Rubin,
![]() H. Westphal, and
H. Westphal, and
![]() Y. Yokoyama2
Y. Yokoyama2
1 Webster, J.M., Ravelo, A.C., Grant, H.L.J., Rydzy, M., Stewart, M., Allison, N., Asami, R., Boston, B., Braga, J.C., Brenner, L., Chen, X., Chutcharavan, P., Dutton, A., Felis, T., Fukuyo, N., Gischler, E., Greve, S., Hagen, A., Hamon, Y., Hathorne, E., Humblet, M., Jorry, S., Khanna, P., Le Ber, E., McGregor, H., Mortlock, R., Nohl, T., Potts, D., Prohaska, A., Prouty, N., Renema, W., Rubin, K.H., Westphal, H., and Yokoyama, Y., 2025. Site M0099. In Webster, J.M., Ravelo, A.C., Grant, H.L.J., and the Expedition 389 Scientists, Hawaiian Drowned Reefs. Proceedings of the International Ocean Discovery Program, 389: College Station, TX (International Ocean Discovery Program). https://doi.org/10.14379/iodp.proc.389.106.2025
2 Expedition 389 Scientists’ affiliations.
1. Operations
The multipurpose vessel MMA Valour was used as the drilling platform throughout Expedition 389. At all Expedition 389 sites, dynamic positioning was used to provide accurate positions throughout operations and water depth was established using a Sound Velocity Profiler (SVP) placed on the top of the PROD5 drilling system. For more detail on acquisition methods, see Introduction in the Expedition 389 methods chapter (Webster et al., 2025a).
Summary operational information for Site M0099 is provided in Table T1. All times stated are in Hawaiian Standard Time (HST).
1.1. Hole M0099A
At 0000 h on 21 September 2023, the MMA Valour arrived at Site M0099. PROD5 was deployed at 0155 h at a water depth of 131.9 m. Coring and casing operations commenced at 0239 h and continued until 1500 h, when a fault with the rotary drill water seal on PROD5 caused the hole to be terminated at 6.44 meters below seafloor (mbsf). Casing was removed, and PROD5 was recovered to deck at 1515 h, when on-deck operations began to extract the core barrels and repairs began.
A total of six cores were recovered from Hole M0099A from 6.44 m of rotary coring, and the total recovered length was 4.29 m (66.61% recovery).
1.2. Hole M0099B
Following repairs, PROD5 was redeployed at 1740 h on 21 September 2023 at a water depth of 131.9 m. At 1758 h, coring and casing operations commenced in Hole M0099B. At 2239 h, an overtorqued tool joint caused the hole to be abandoned at 6.40 mbsf. Casing was removed, and PROD5 was recovered to deck by 0126 h on 22 September. On-deck operations commenced, and core barrels were extracted for curation during repairs to PROD5.
A total of five cores were recovered from Hole M0099B from 6.40 m of rotary coring, with a recovered length of 4.35 m (67.97% recovery).
1.3. Hole M0099C
Following repairs, PROD5 was launched at 0545 h on 22 September 2023 in Hole M0099C at a water depth of 131.9 m. Coring and casing operations commenced at 0620 h and continued until 1725 h on 23 September, when water ingress on a PROD5 manifold caused the hole to be terminated at 38.31 mbsf. Casing was removed, and PROD5 was recovered to deck at 1745 h. On-deck operations commenced, and core barrels were extracted for curation.
A total of 27 cores were recovered from Hole M0099C from 38.31 m of rotary coring, with a total recovered length of 25.50 m (66.56% recovery).
1.4. Hole M0099D
PROD5 was launched at 0315 h on 24 September 2023 at a water depth of 131.7 m. The decision was made to wash bore Hole M0099D to about the final depth of Holes M0099A and M0099C. Wash boring and casing progressed to 27.71 mbsf, where water ingress in the tool arm of PROD5 was detected. The hole was abandoned at 1525 h on 24 September. Casing was removed, PROD5 was recovered to deck by 2000 h, and maintenance was carried out.
No cores were recovered from Hole M0099D.
1.5. Hole M0099E
At 2000 h on 24 September 2023, PROD5 was deployed at a water depth of 144.6 m. Coring and casing operations began in Hole M0099E at 2130 h and continued until 0630 h on 26 September, when the hole was abandoned at 31.62 mbsf because of a manifold fault with PROD5. Casing was removed, and PROD5 was recovered to deck by 0730 h. On-deck operations, maintenance, and extraction of core barrels began.
A total of 25 cores were recovered from Hole M0099E from 31.62 m of rotary coring, with a total length of 18.00 m of core recovered (56.93% recovery).
1.6. Hole M0099F
Following maintenance, PROD5 was launched at 1215 h on 26 September 2023 at a water depth of 145.6 m. Coring and casing operations started in Hole M0099F at 1245 h. At 2353 h, a complete loss of system hydraulic power on PROD5 occurred. Hole M0099F was abandoned at 0245 h on 27 September at 13.45 mbsf. PROD5 was recovered to deck at 0340 h with the casing and core barrel recovered still in the clamps. At 0900 h, on-deck operations began with the extraction of core barrels and securing of equipment for transit to Oahu. At 1000 h on 27 September, the MMA Valour began transit to Barbers Point Harbor, arriving at 0630 h on 28 September for the planned midexpedition port call.
A total of nine cores were recovered from Hole M0099F from 13.45 m of rotary coring, with a total length of 6.75 m of core recovered (50.19% recovery).
1.7. Hole M0099G
The MMA Valour returned to Site M0099 on 19 October 2023, and PROD5 was deployed at 1900 h at a water depth of 146.3 m. Coring and casing of Hole M0099G commenced at 1952 h, and the hole was washed and cased to 30.84 mbsf, a depth just above the final depths of the previous holes at Site M0099. At 1313 h on October 20, rotary and coring commenced, continuing until 0650 h. On 21 October, hole conditions were inhibiting advancement. Between 0650 and 1655 h, the hole was washed and cased to 40.50 mbsf, and rotary coring continued. At 1726 h on October 23, Hole M0099G was terminated by choice at 68.62 mbsf to move to the next site. PROD5 was recovered to deck at 2136 h. On-deck operations commenced, and core barrels were extracted. At 1805 h, the transit to Site M0107 commenced.
A total of 31 cores were recovered from Hole M0099G from 68.62 m of drilling (38.59 m of rotary coring and 30.03 m of wash boring). A total length of 18.93 m was recovered (49.05% recovery).
2. Lithostratigraphy
Holes M0099A–M0099C are located in the Kawaihae region on the same subterrace, at 132 meters below sea level (mbsl), and are directly comparable (Figure F1). Based on the main facies changes, discontinuity surfaces, and/or changes in physical properties, three main lithostratigraphic intervals are identified:
- Interval 1 forms the uppermost 6–7 m of each hole. The basal boundary is a hardened, blackened, and bioeroded surface in Hole M0099A that corresponds to a facies change in the two other holes. This interval is dominated by coralgal-microbialite boundstone in Holes M0099A and M0099C but is composed primarily of microbialite-algal boundstone in Hole M0099B.
- Interval 2 is present only in Hole M0099C (7.05–21.60 mbsf). This interval is dominated by microbialite-algal boundstone and is bounded at its base by a major facies change, as well as a sharp change in physical properties.
- Interval 3, also present only in Hole M0099C (21.60–36.05 mbsf), is bounded at its base by a hardened and bored surface. This interval is divided into two main facies: an upper algal boundstone that overlies a coralgal boundstone with a coarse-grained biodetrital matrix.
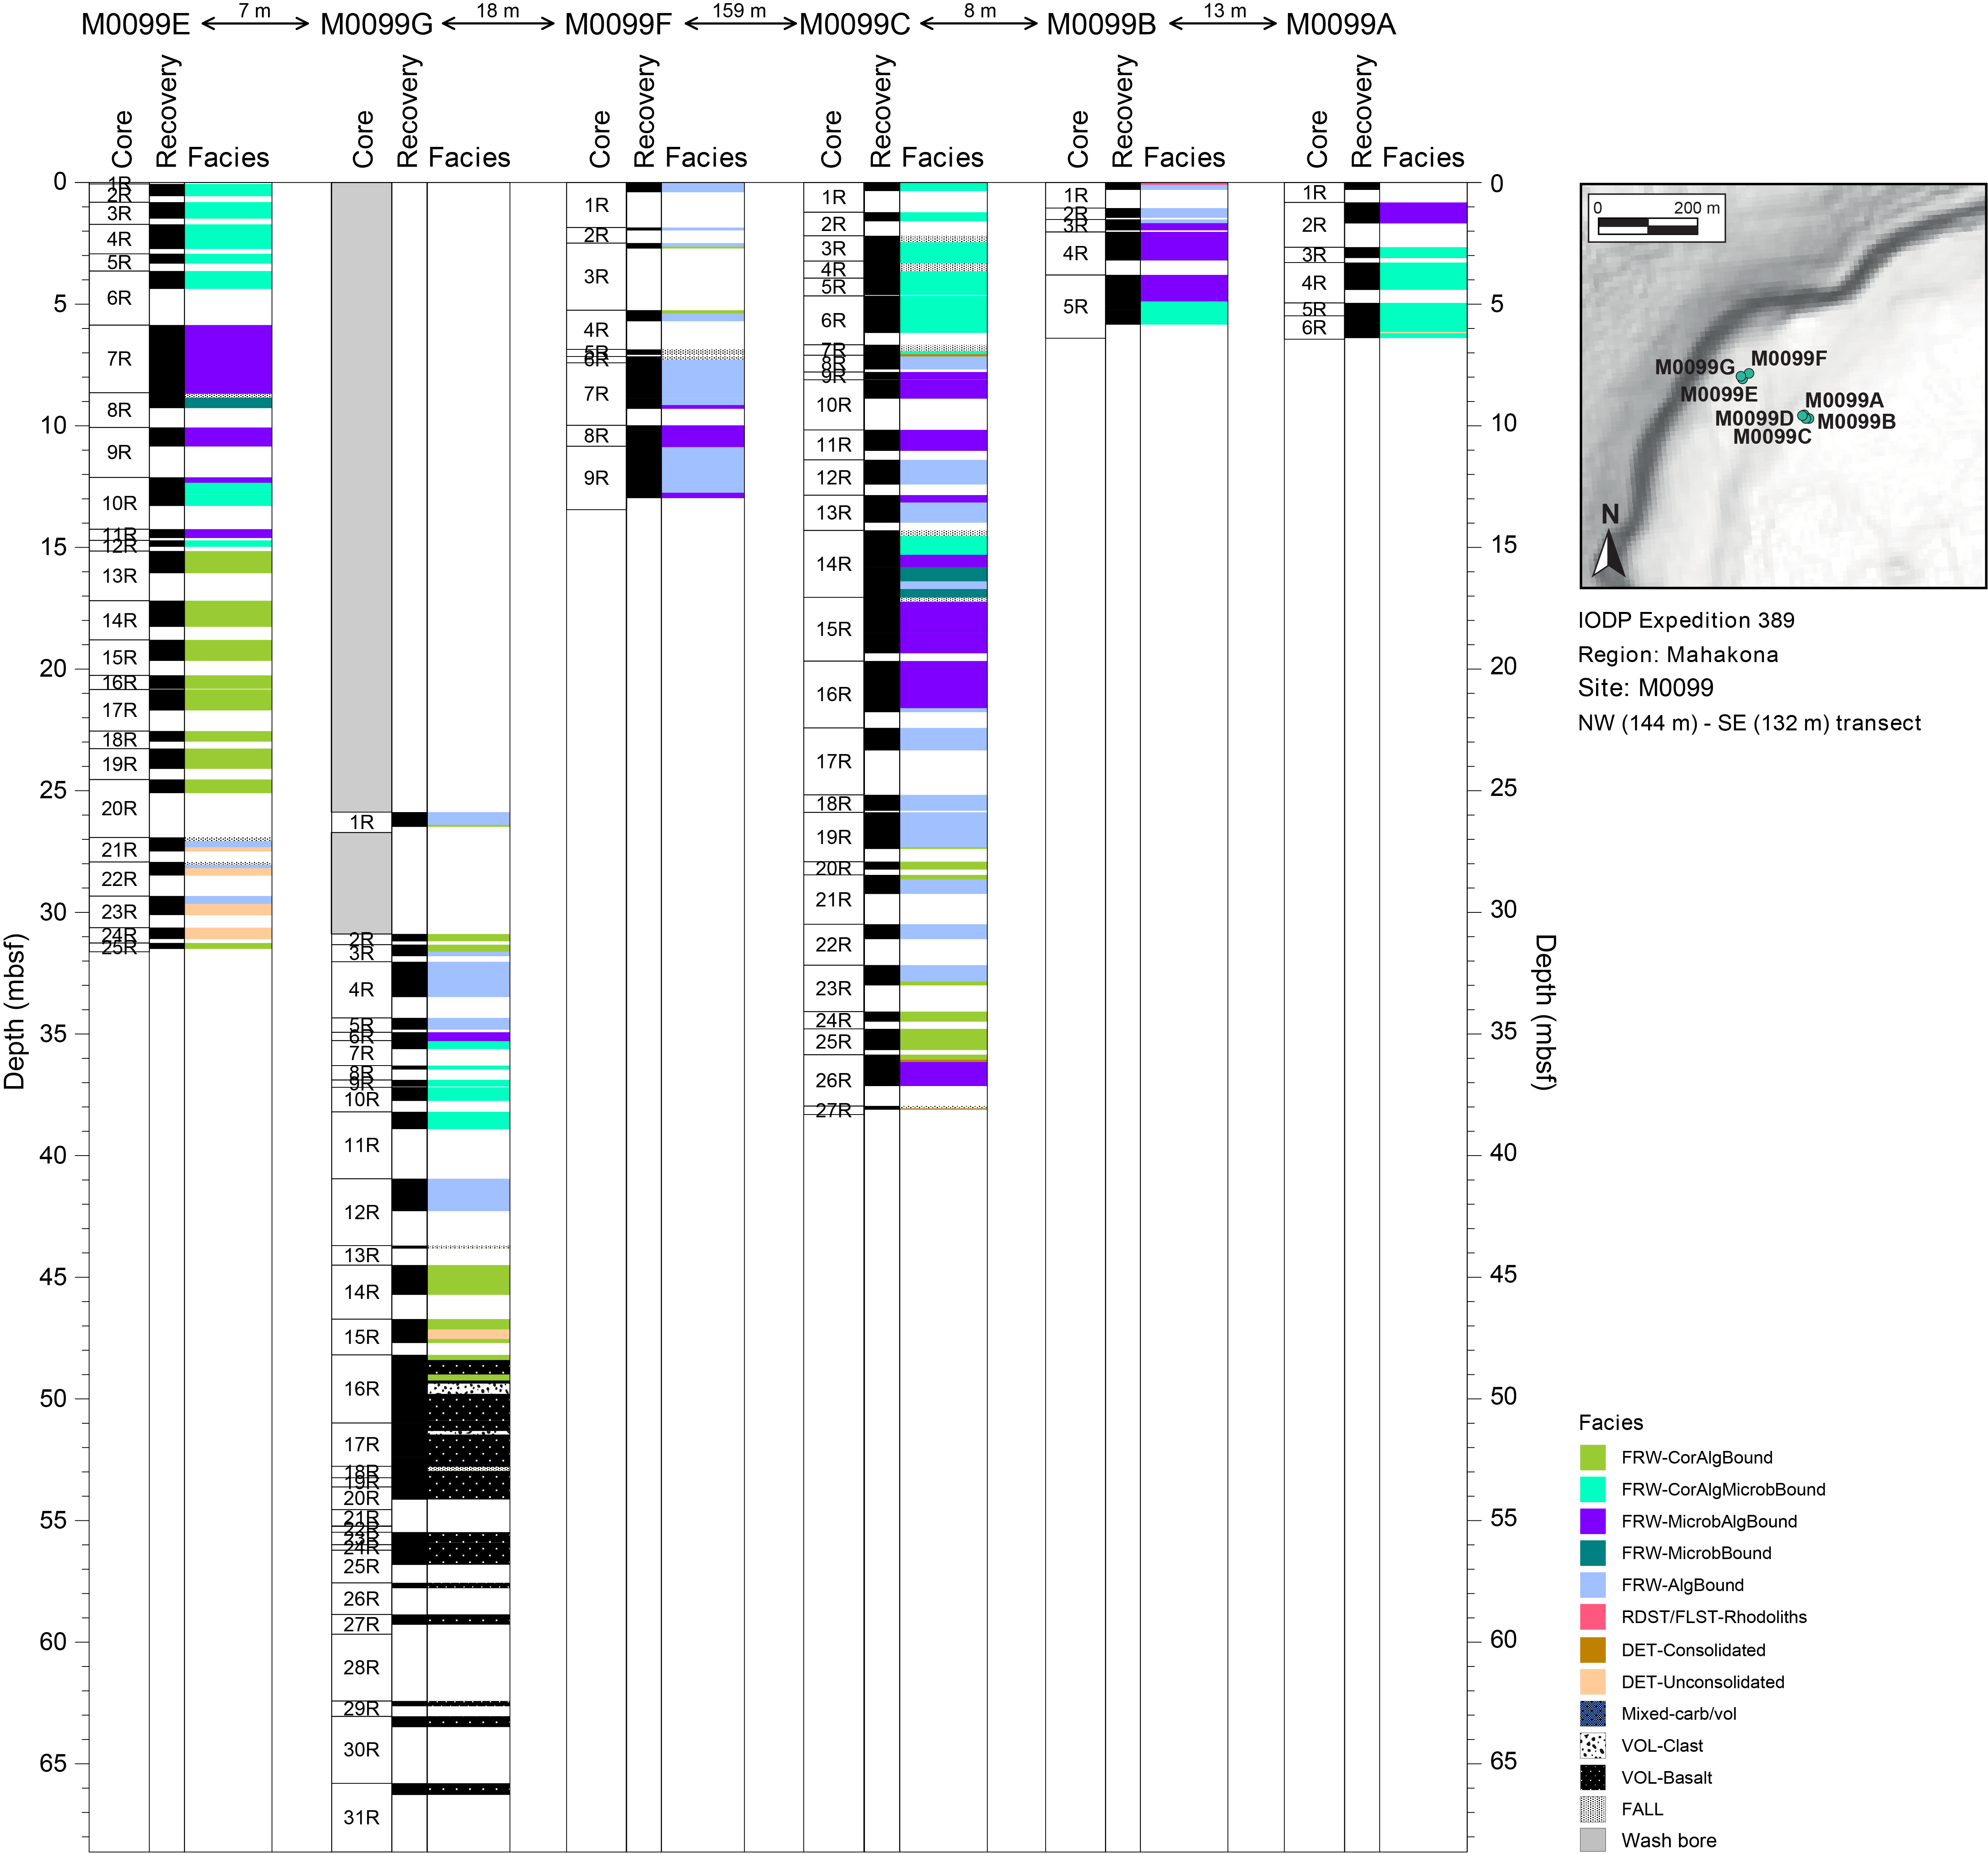
Figure F1. Lithostratigraphy.
Holes M0099E–M0099G are located on a lower subterrace around a 147 m water depth. Four major lithostratigraphic intervals are identified:
- Interval 1 forms the uppermost 6–7 m of Holes M0099E and M0099F. The basal boundary of this interval is not visible, but a facies change occurs below. In Hole M0099E, this interval is composed of coralgal-microbialite boundstone. In Hole M0099F, the recovery is lower and core material consists of an upper algal boundstone that overlies a coralgal boundstone.
- Interval 2, observed in Hole M0099E (5.86–15.15 mbsf) and Hole M0099F (7.08–12.97 mbsf), is dominated by microbialite-algal boundstone and algal boundstone, respectively, and is bounded at its base by a major facies change, as well as a sharp change in physical properties.
- Interval 3 is present only in Hole M0099E (15.15–31.50 mbsf). It is divided into two main lithologies: an upper coralgal boundstone that overlies an alternation of algal boundstone and unconsolidated, coarse-grained biodetrital sediment.
- Interval 4 consists of the recovered material from Hole M0099G (30.89–48.40 mbsf), which is predominantly composed of coralgal boundstone and algal boundstone. The contact with the volcanic substratum defines the basal boundary of this interval.
The lava in the lower parts of Hole M0099G represents coherent lava rock with flow-texture, hyaloclastite-texture, and volcanic rubble, much of which is fresh and unaltered, although zones of substantial alteration occur in both the coherent lava rock and the hyaloclastite-texture rock. A significantly more porphyritic volcanic rock occurs in the lower section of the hole (Figure F1).
2.1. Hole M0099A
In Hole M0099A (Figure F2), there was no recovery from 0.00 to 0.82 mbsf. From 0.82 to 2.66 mbsf, the recovered material consists of microbialite-algal boundstone with thick crustose coralline algae (CCA), locally fruticose coralline algae (FCA), encrusting coral clasts, vermetids, and serpulid tubes (Figure F3A) interlayered with microbialite. The microbialites are massive to dendritic and structureless (Figure F3B). Locally, CCA encrusts fine branches of Porites (possibly not in situ) that show intense Entobia bioerosion. From 2.66 to 6.39 mbsf, the recovered core material is mainly composed of coralgal-microbialite boundstone with thick, decimeter-scale crusts of CCA with vermetids located between corals and microbialites. Corals gradually change downhole from mainly branching Porites near the top of the interval (Figure F3C) to submassive and columnar Porites toward the bottom. There are several generations of microbialite with various morphologies, from massive and structureless to dendritic (Figure F3D). This coralgal-microbialite boundstone succession is interrupted between 6.14 and 6.20 mbsf by a thin layer of unconsolidated bioclastic sediment deposited on a hardened, blackened, and bored surface. Below this layer to the base of the core at 6.39 mbsf, the coralgal-microbialite boundstone includes thin encrusting Cyphastrea (Figure F3E), thin CCA crusts, and thin microbialite with abundant vermetids.
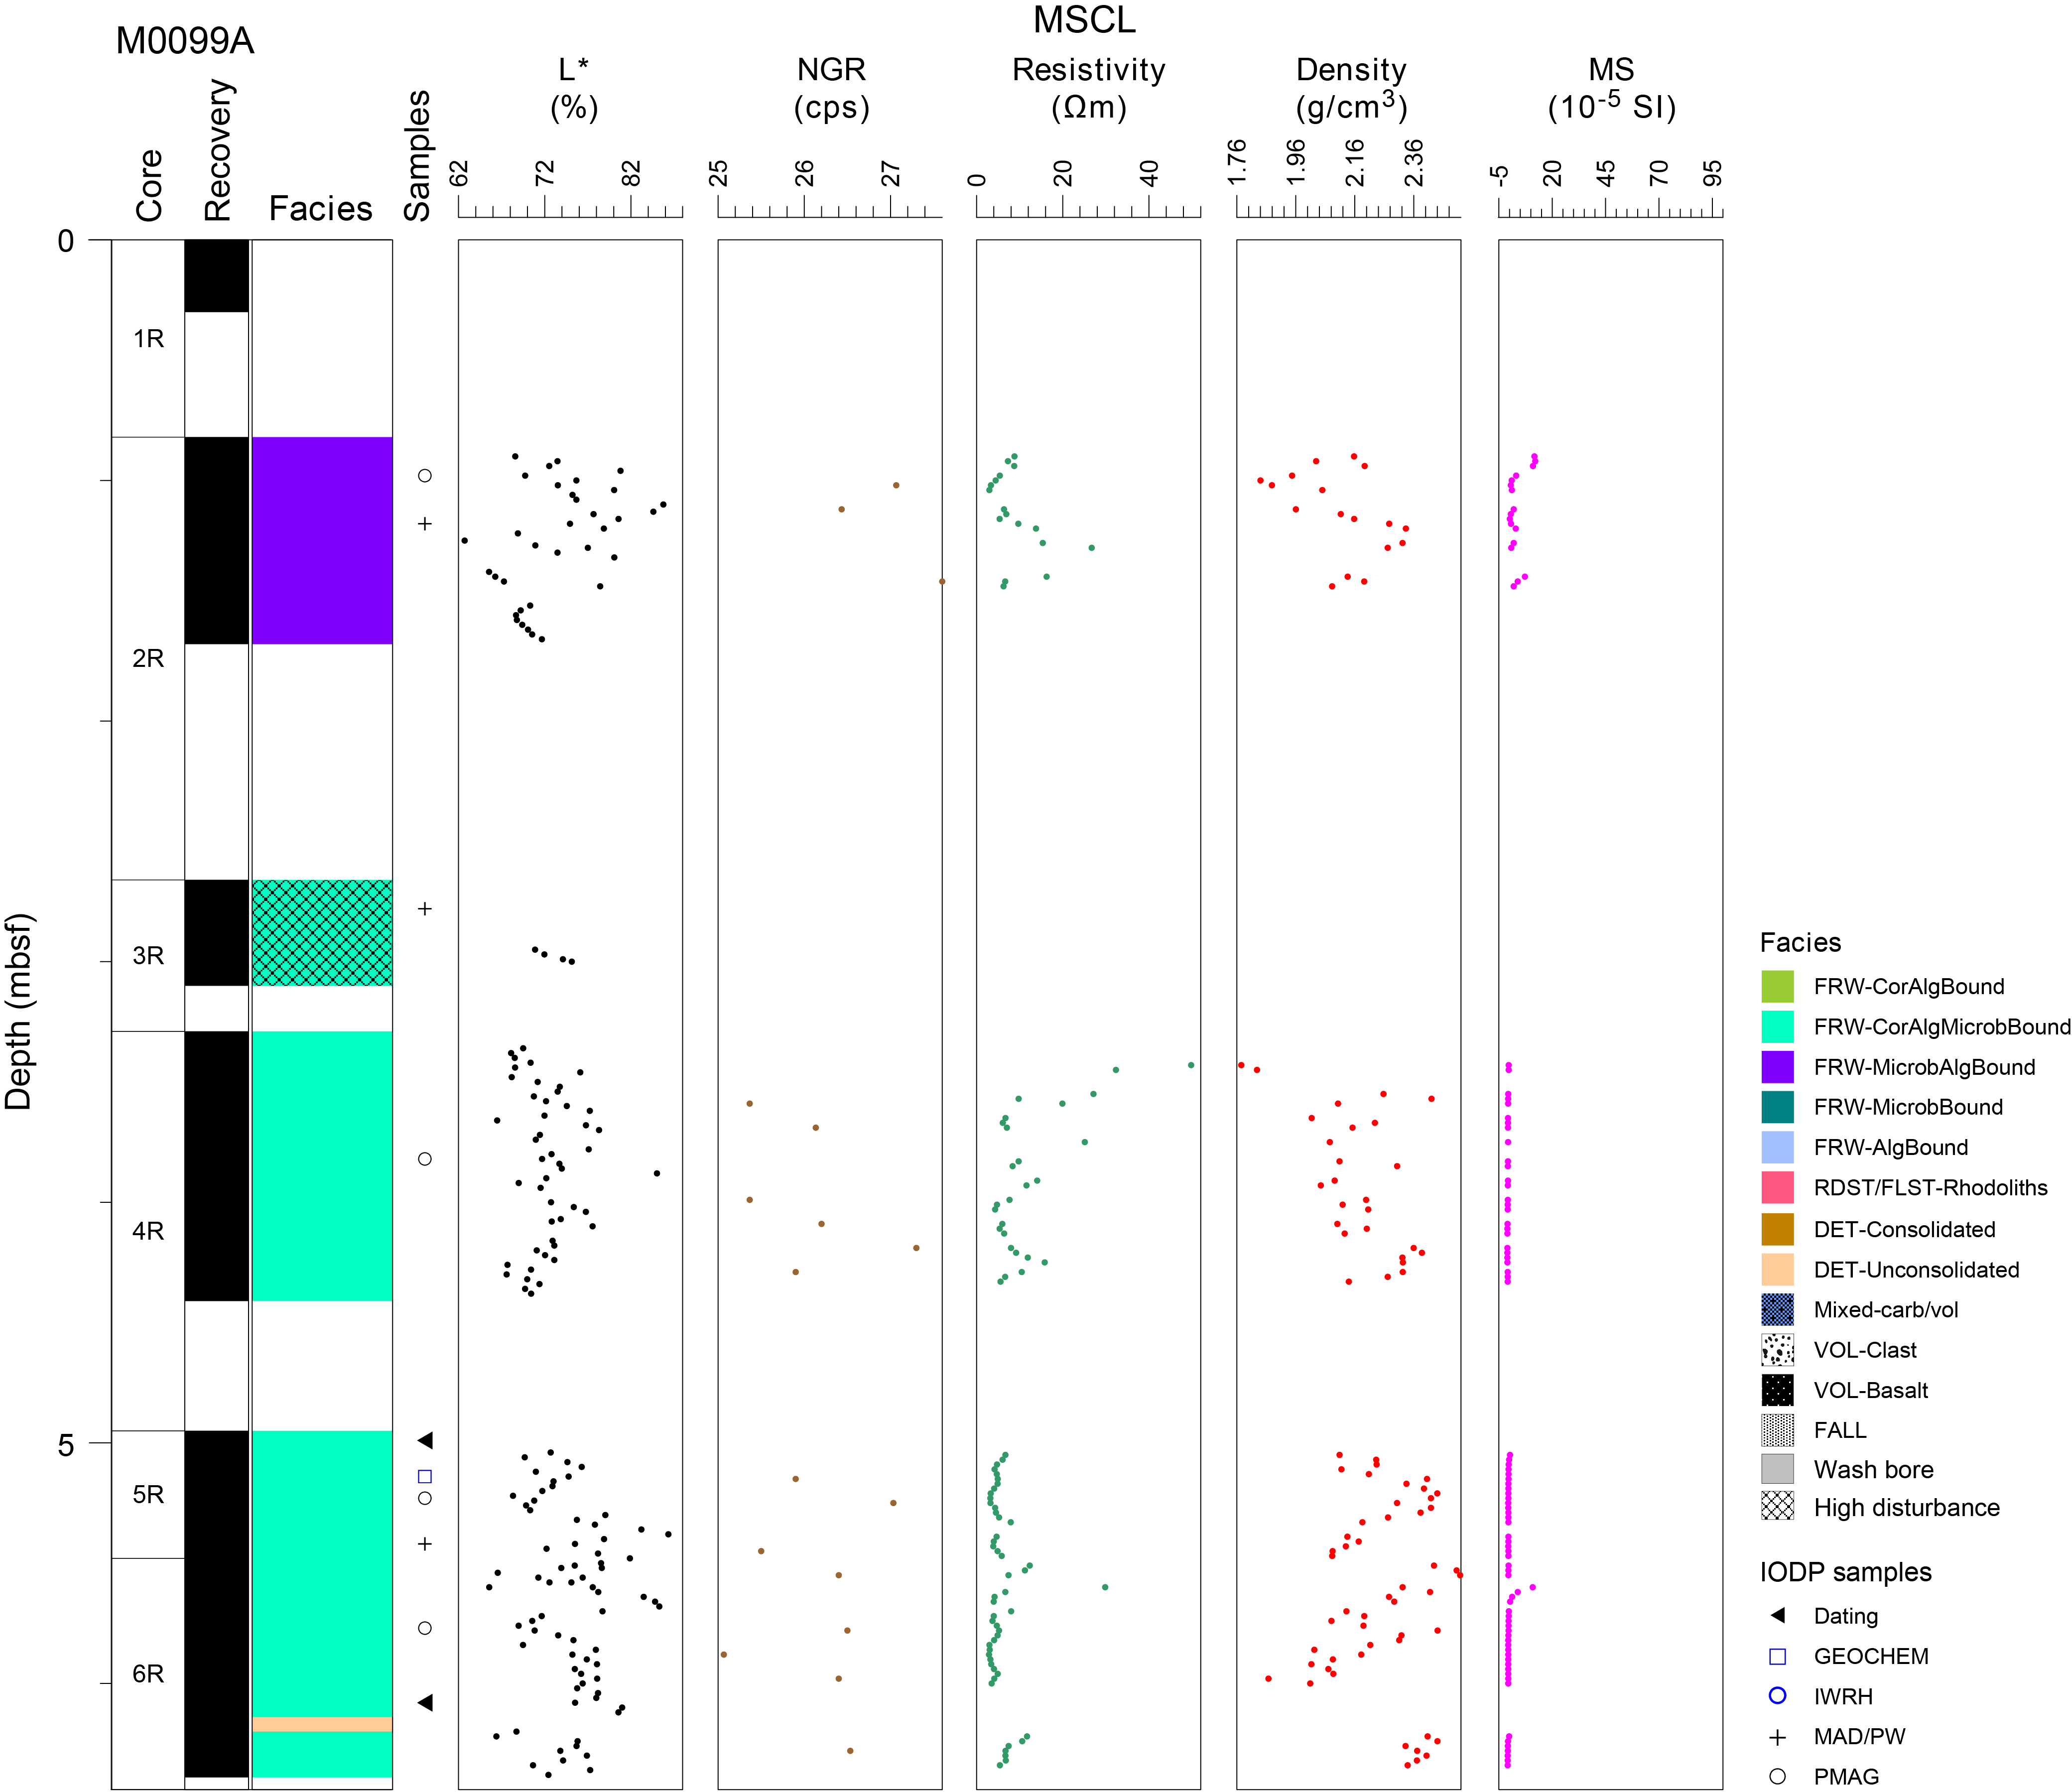
Figure F2. Lithostratigraphy and MSCL data, Hole M0099A.
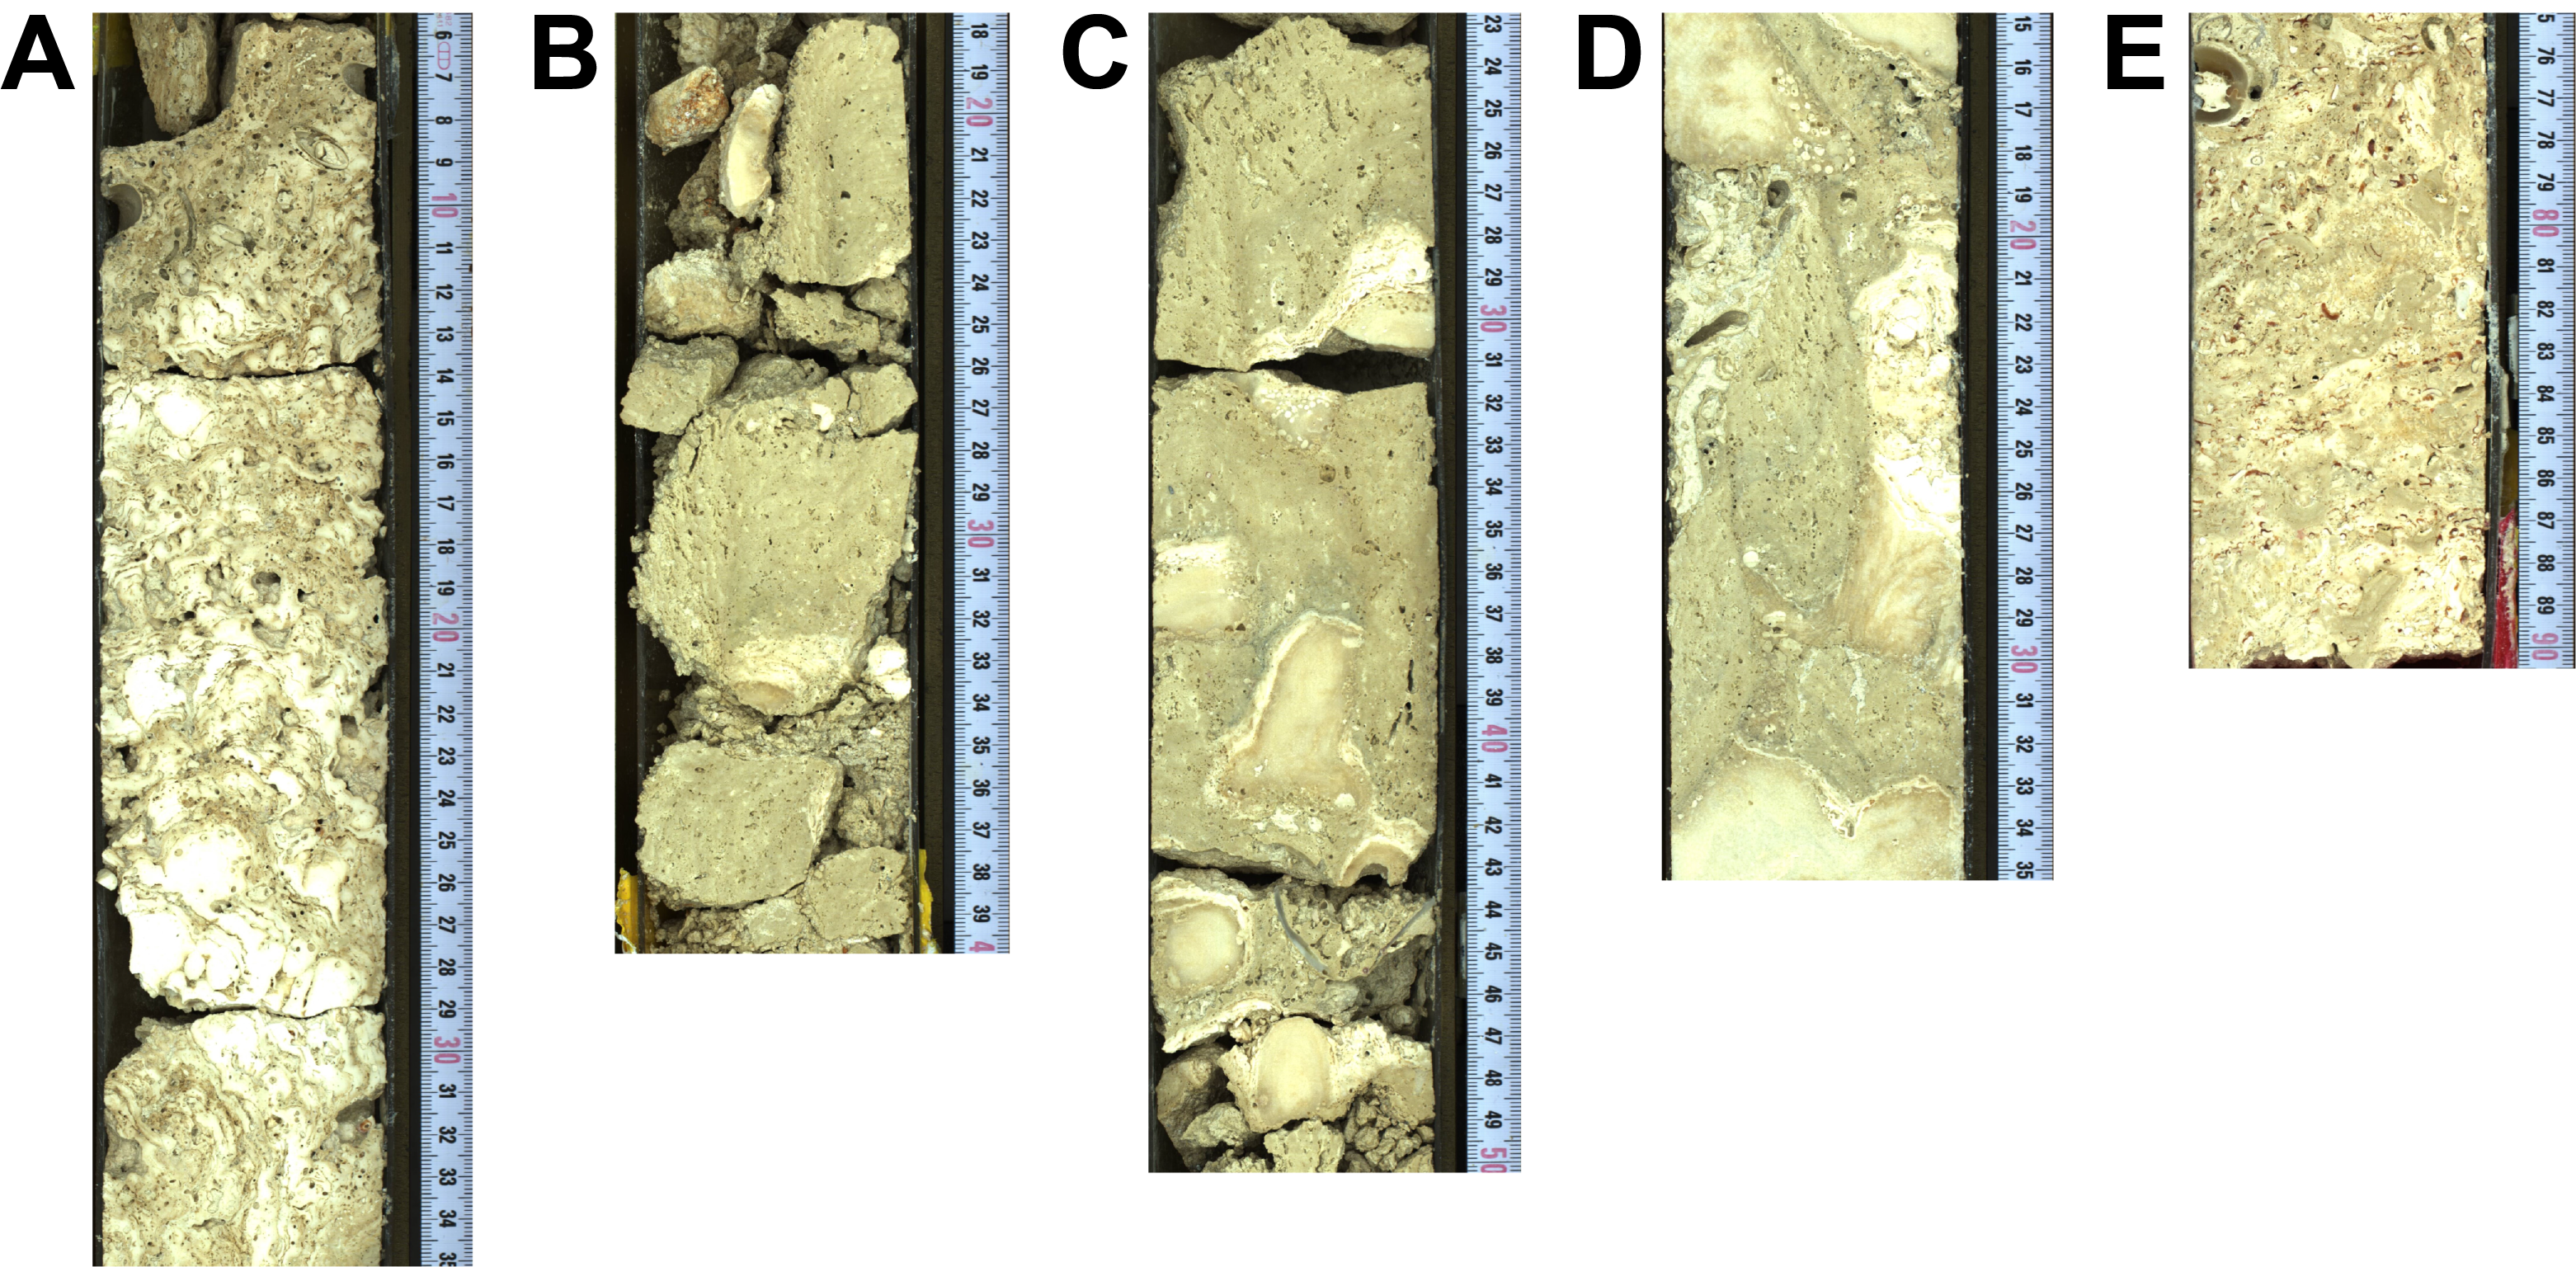
Figure F3. Lithologies, Hole M0099A.
2.2. Hole M0099B
In Hole M0099B (Figure F4), loose, ellipsoidal rhodoliths, which are several centimeters in diameter and heavily bored, were recovered from 0.00 to 0.10 mbsf (Figure F5A). Heavily fragmented (drilling disturbance and core loss) algal boundstone from 0.10 to 1.67 mbsf consists of thick laminar CCA crusts with encrusting foraminifers and rare echinoid spines, mollusk shells, and fragments of undetermined coral. The interval from 1.67 to 4.88 mbsf is composed of microbial-algal boundstone with very thick algal crusts of both laminar CCA and erect FCA (Figure F5B) that locally encrust rare, slightly bioeroded, in situ laminar or branching Porites. This boundstone also contains intervals of thick, massive to dendritic, structureless microbialite as the last stage of encrustation (Figure F5C). Two pockets of loose bioclastic sediment locally interrupt this succession. From 4.88 mbsf to the base of the hole at 5.84 mbsf, the lithology consists of coralgal-microbialite boundstone (Figure F6). The corals comprise diverse morphologies of bioeroded Porites that are mainly massive, locally submassive, and encrusting or branching. The CCA crusts are thin with a few vermetids, whereas the microbialites are up to several tens of centimeters thick and have massive to dendritic and structureless to weakly laminated morphologies.
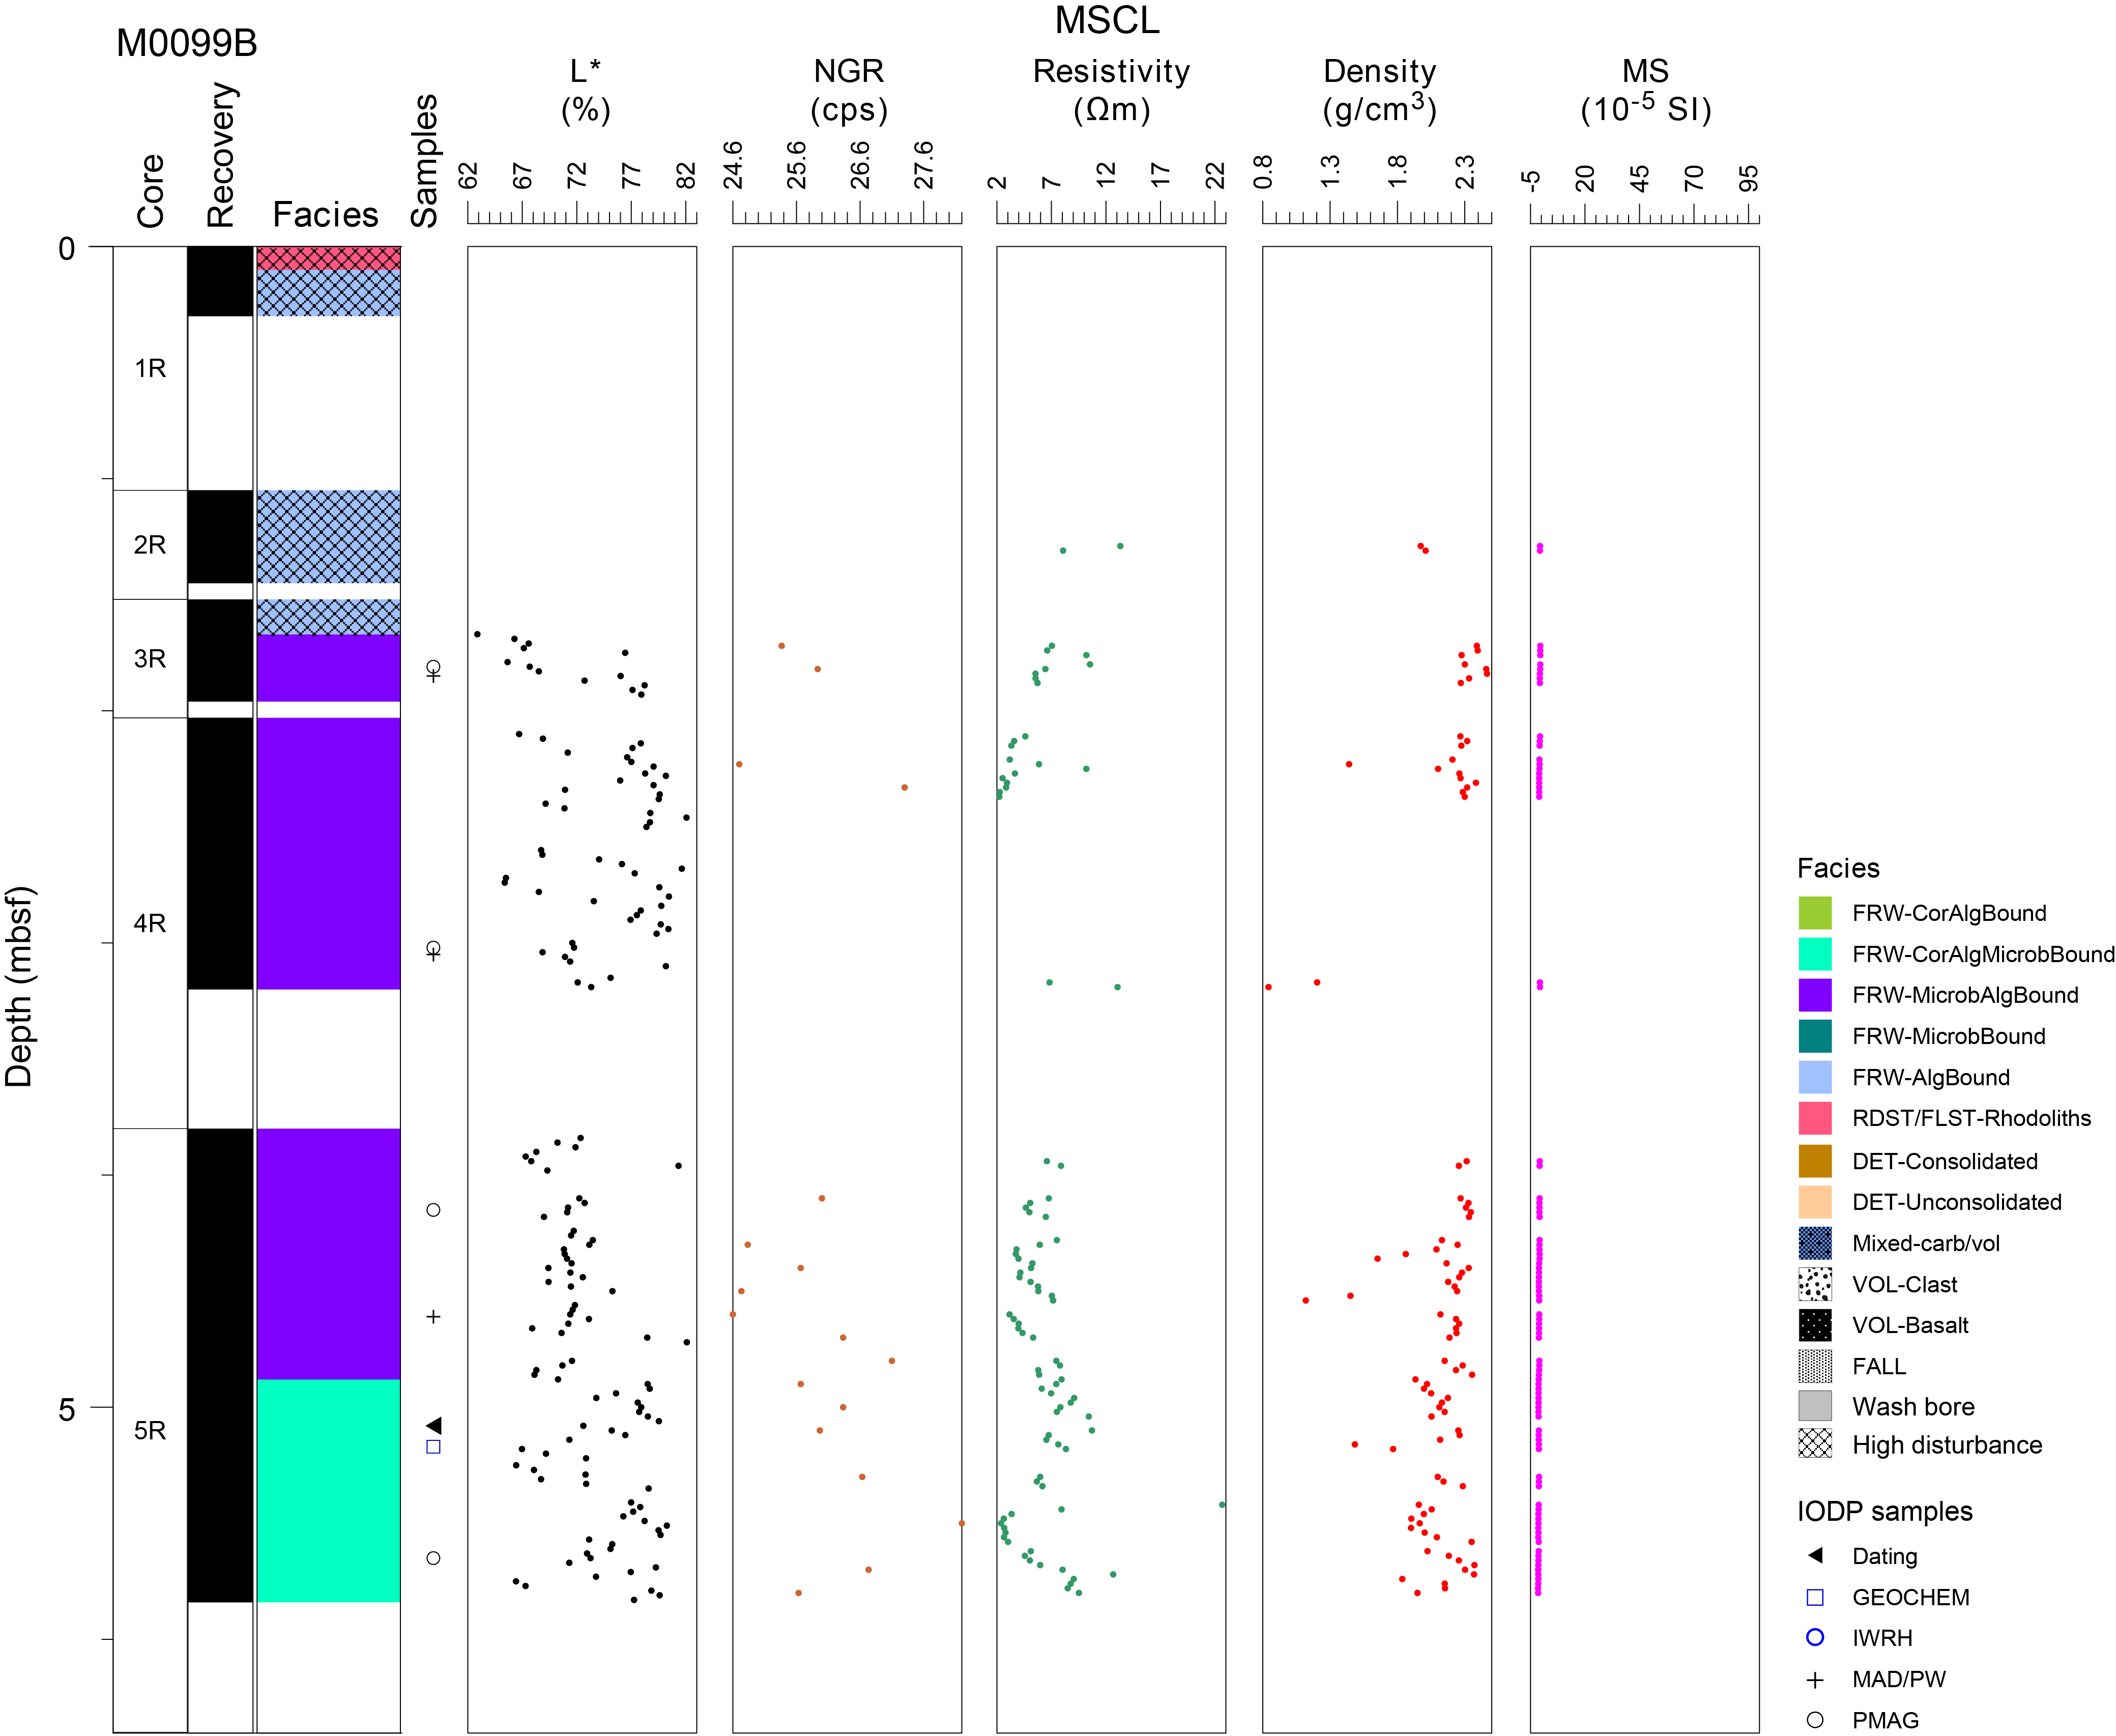
Figure F4. Lithostratigraphy and MSCL data, Hole M0099B.
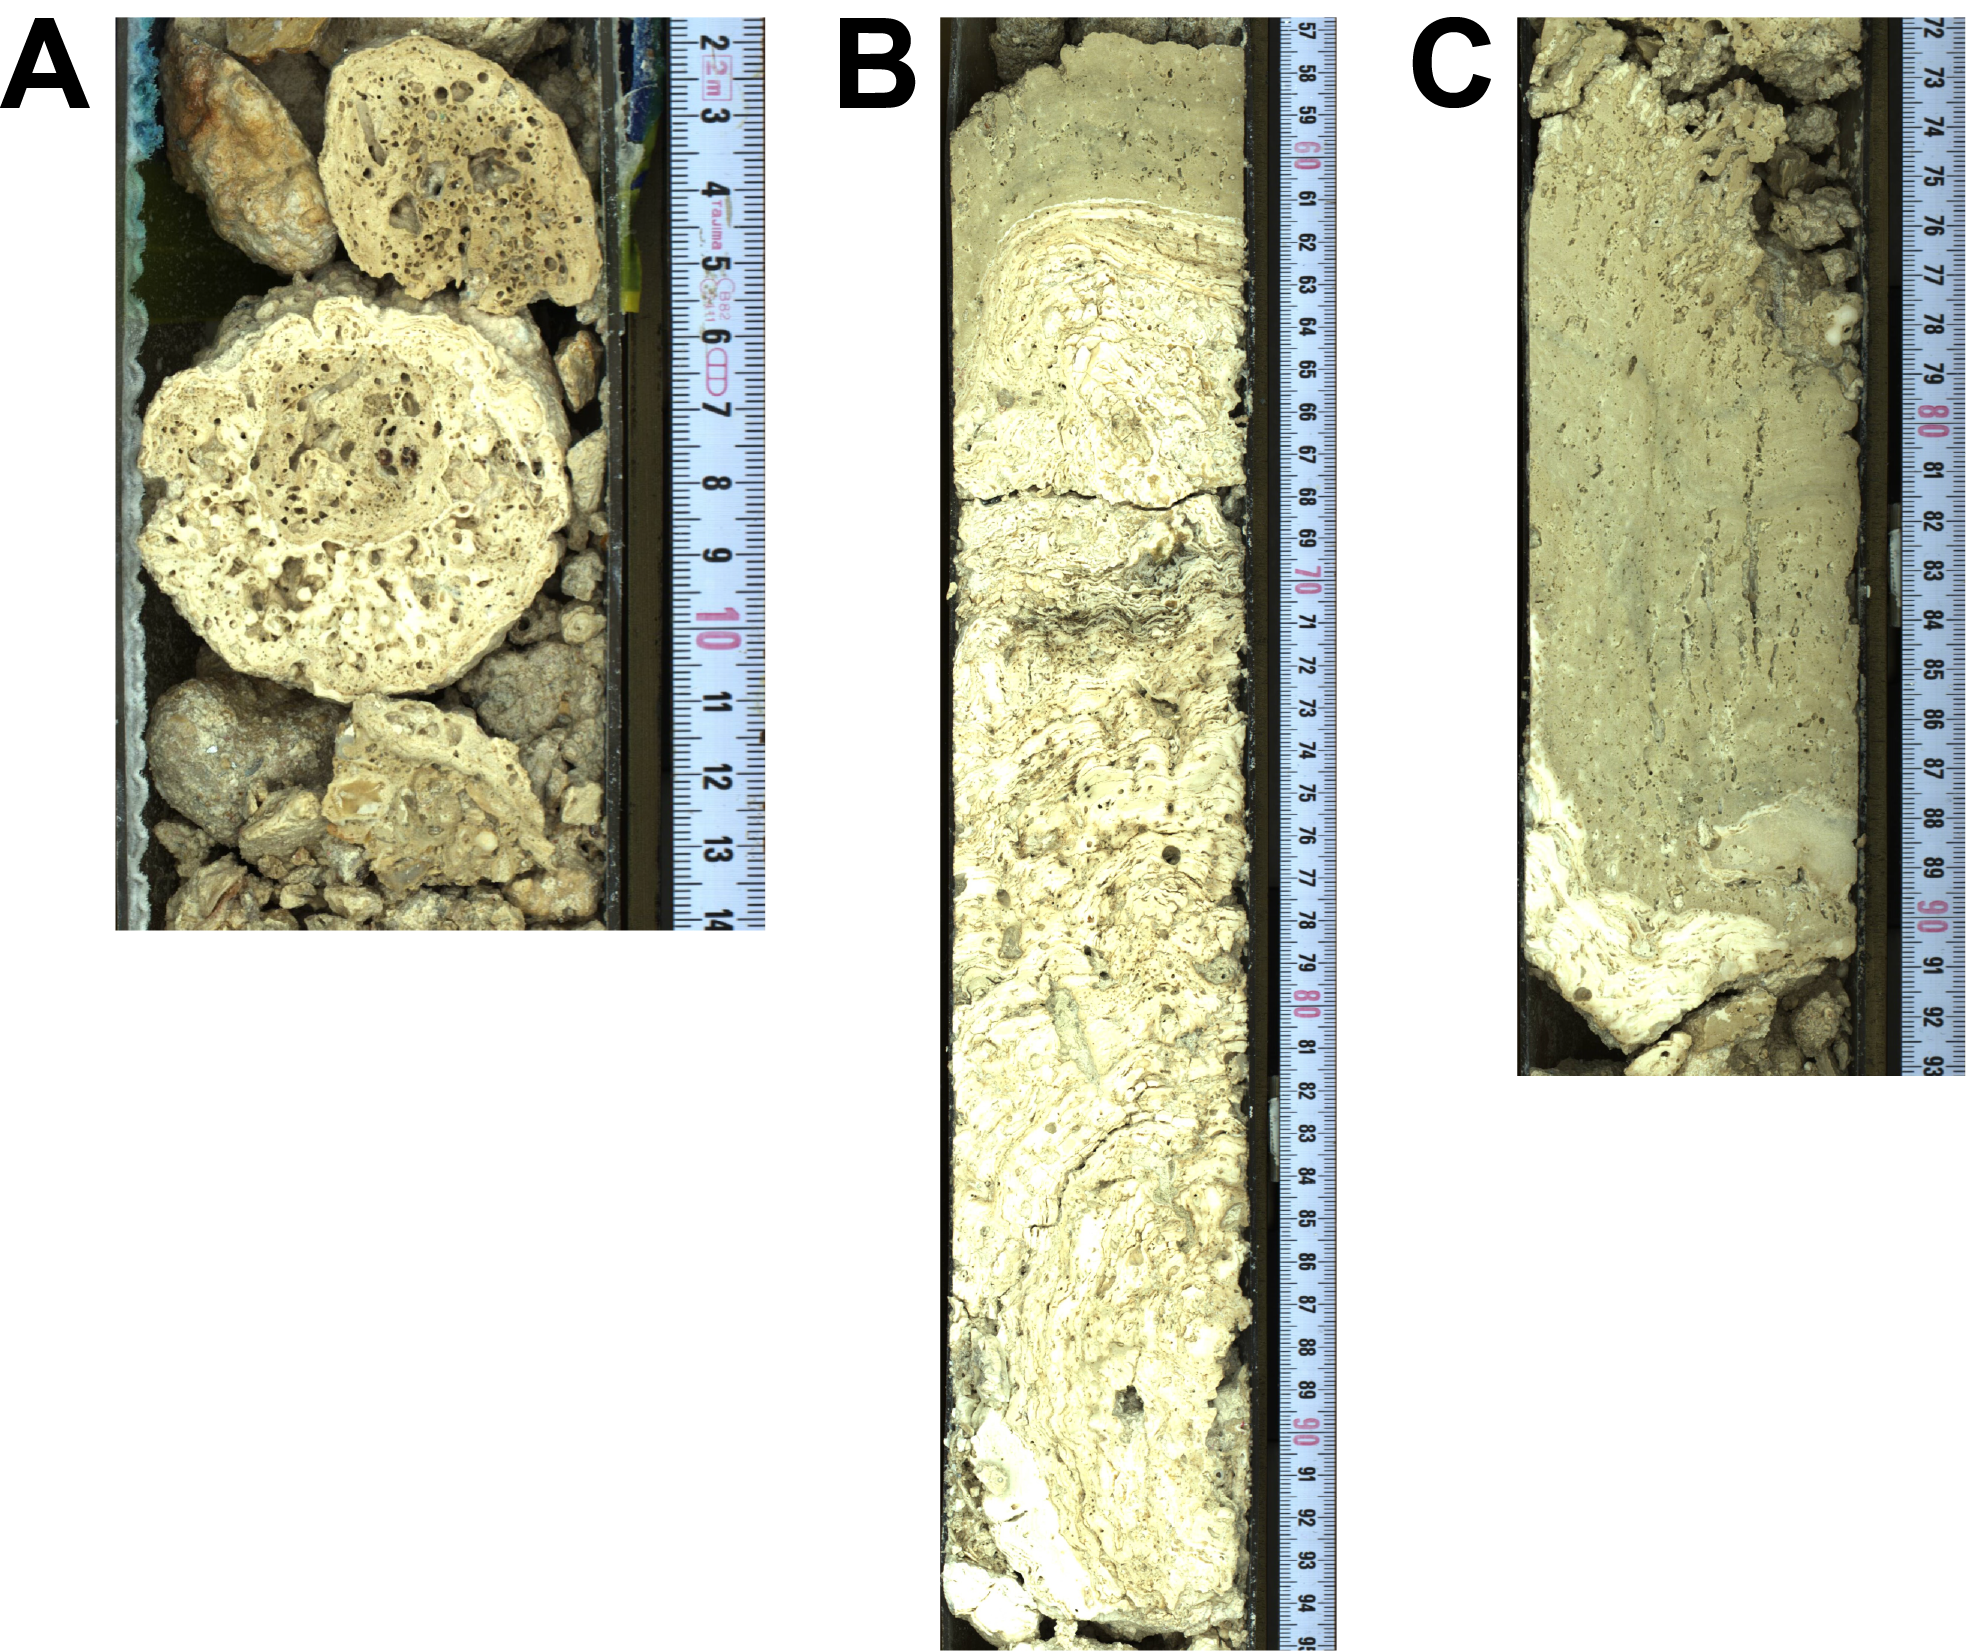
Figure F5. Lithologies, Hole M0099B.
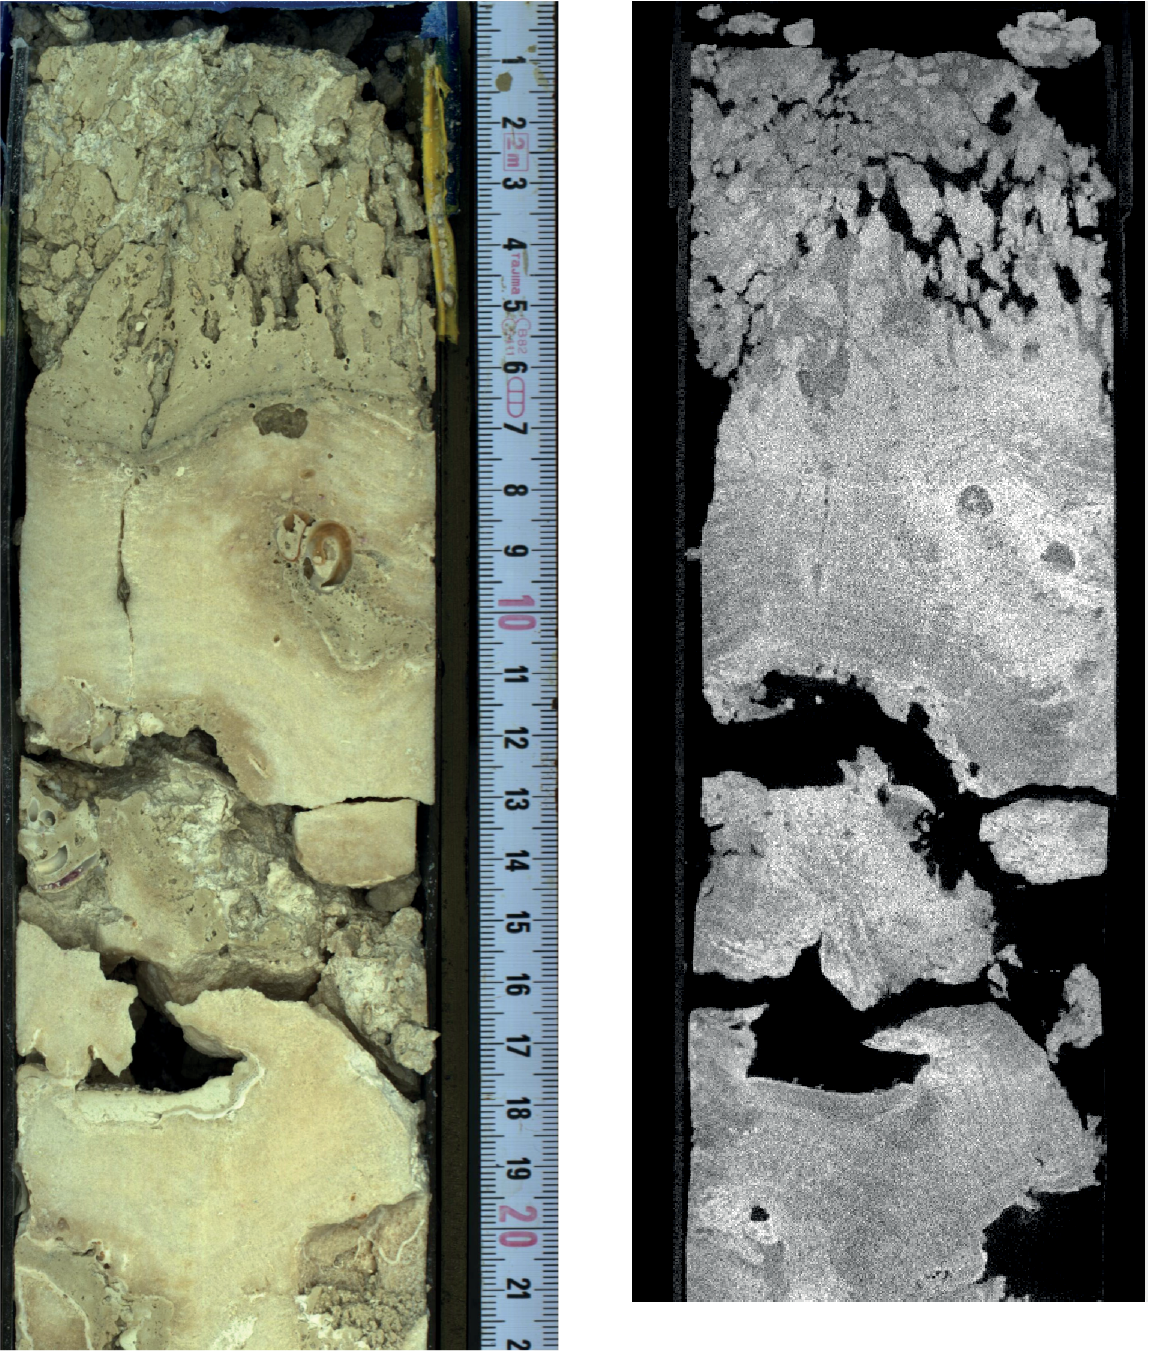
Figure F6. Coralgal-microbialite boundstone.
2.3. Hole M0099C
In Hole M0099C (Figure F7), coralgal-microbialite boundstone from 0.00 to 7.05 mbsf contains centimeter- to decimeter-scale CCA crusts interlayered with Homotrema, vermetids and rare serpulids, and one occurrence of laminar CCA intergrown with Cyphastrea at 3.96 mbsf (Figure F8A). The upper part (to about 2.00 mbsf) has low core recovery and only disturbed cored material. Below, the coralgal-microbialite boundstone is in situ. Corals are bioeroded and gradually change downhole from in situ encrusting Porites (0.00–1.59 mbsf) to predominantly massive to submassive Porites (1.59–4.42 mbsf) and then to branching Porites (4.42–7.05 mbsf) (Figure F8B). Microbialites in this interval are massive to dendritic and structureless. The tops of Sections 3R-1, 4R-1, and 7R-1 contain some unconsolidated biodetrital coarse sand, with gravel-sized clasts of coral and coralline algae that appear to be fall-in material (Figure F8C).
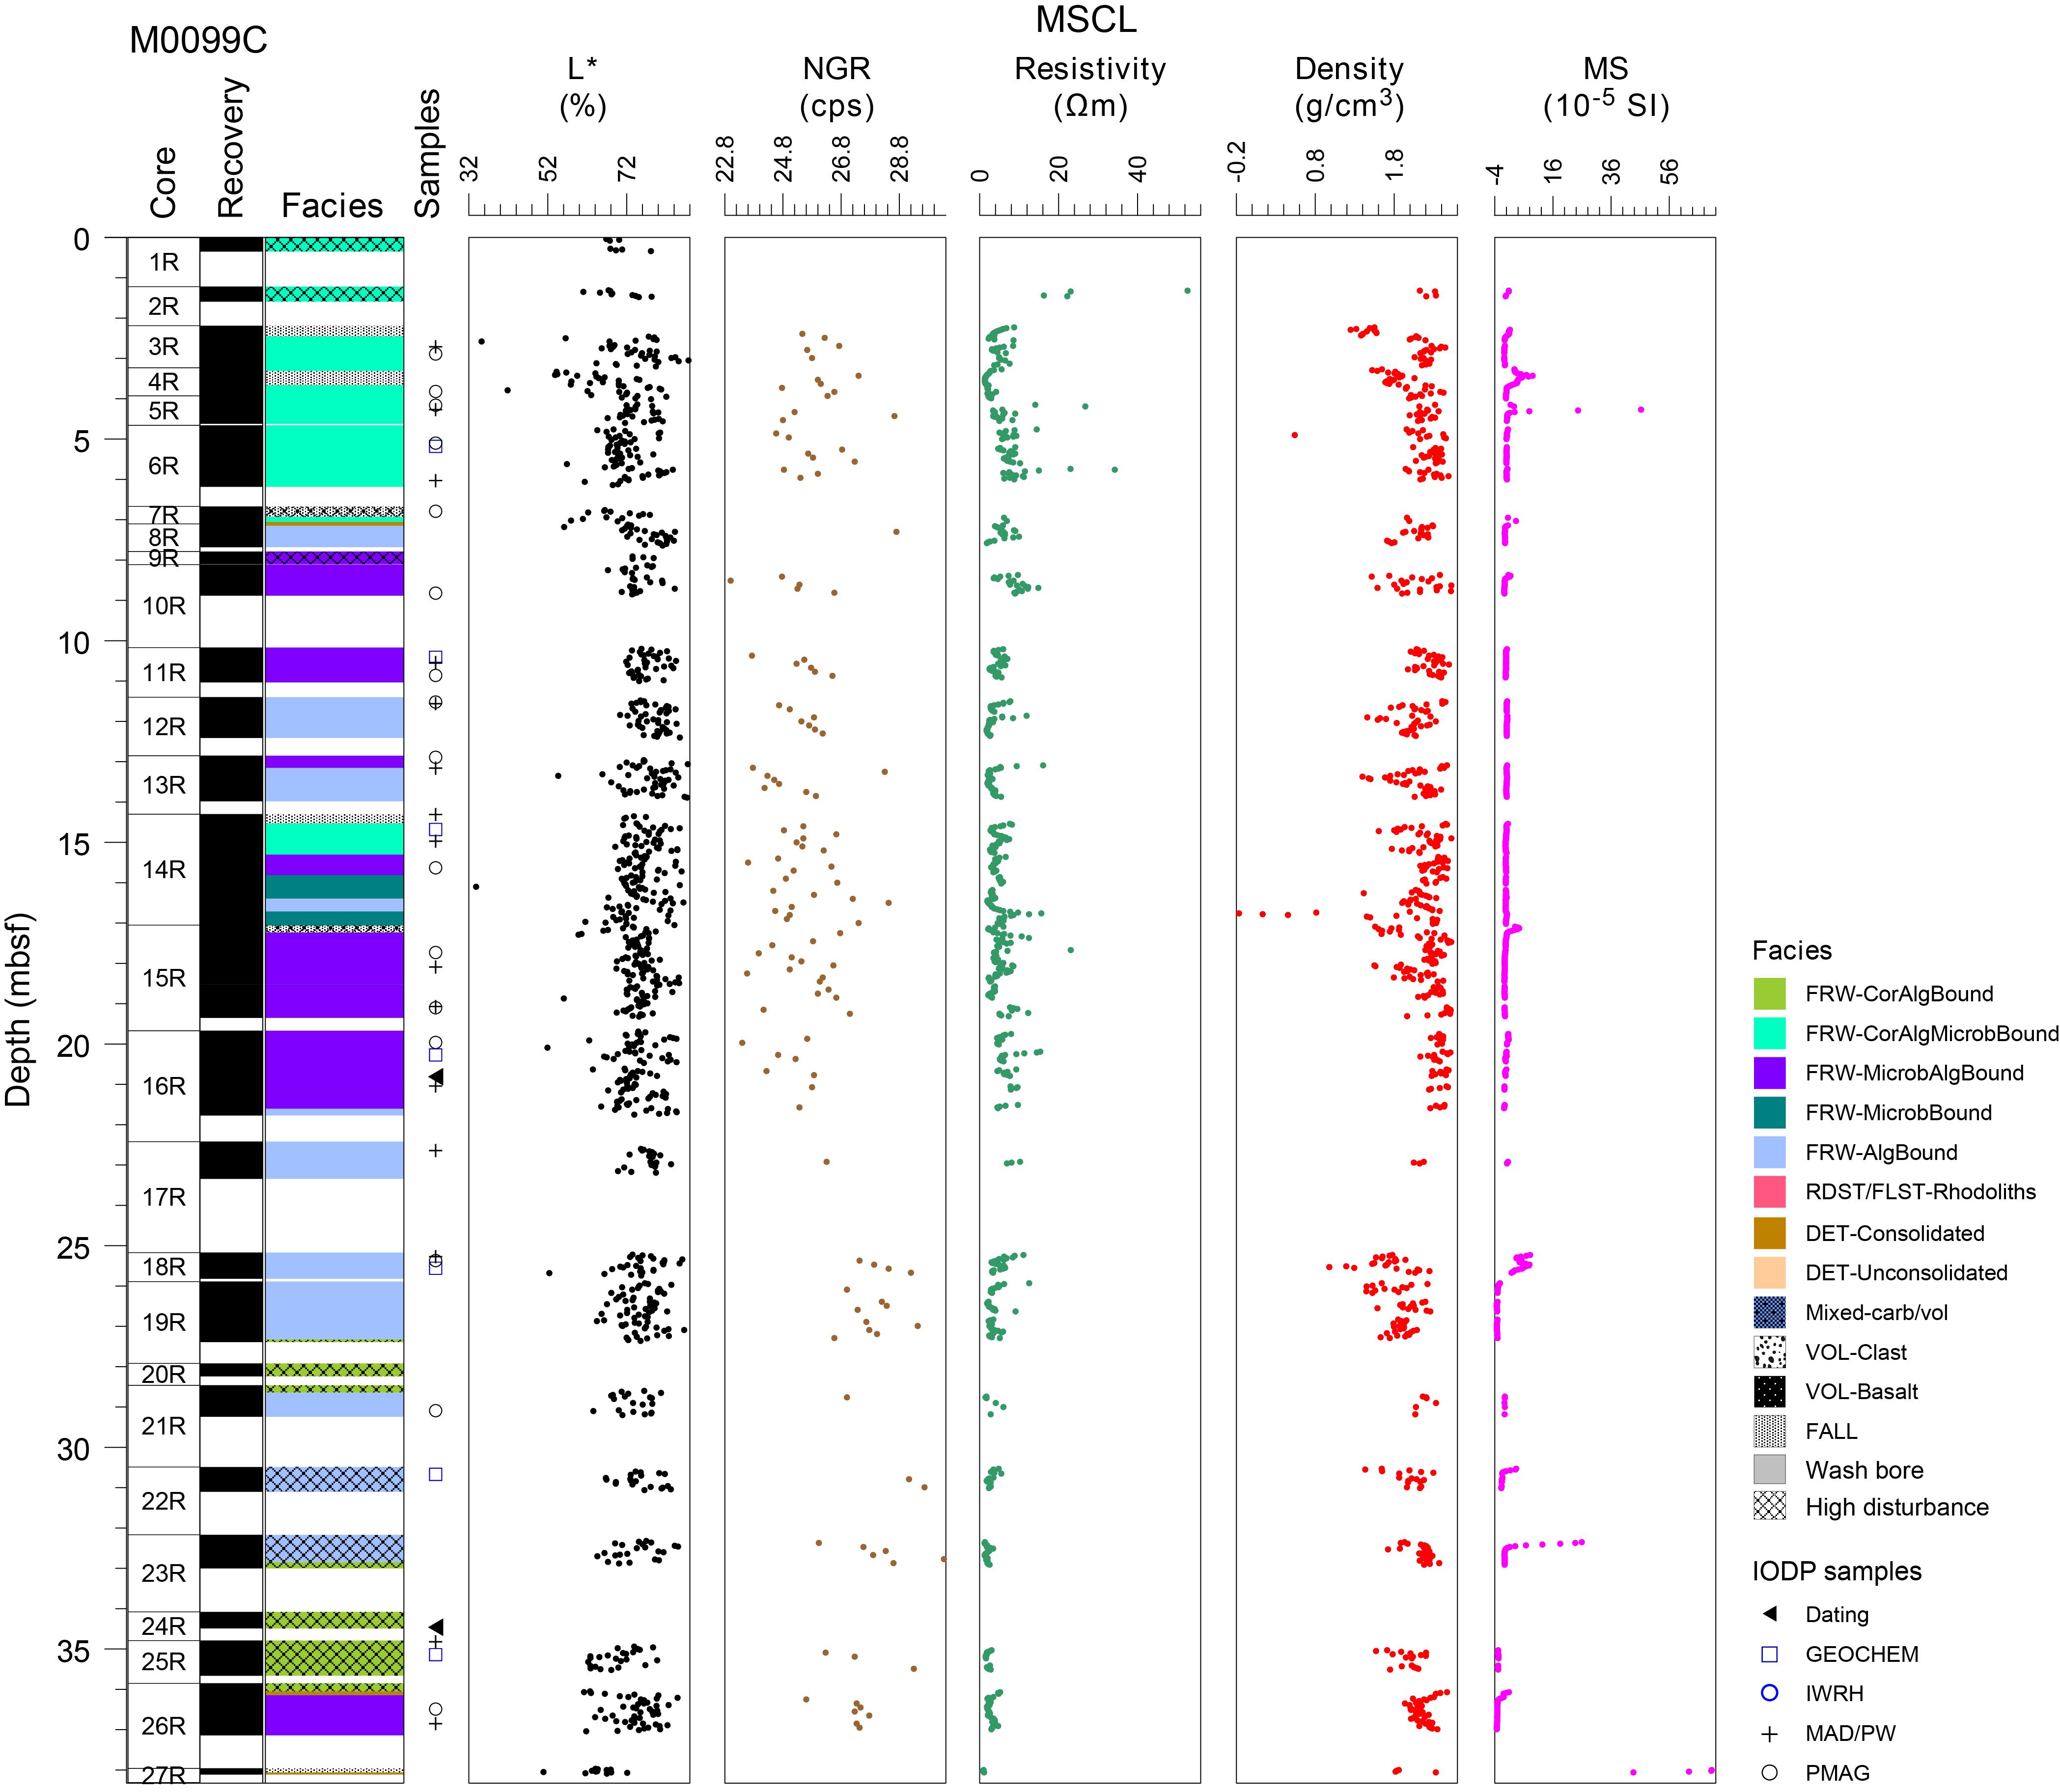
Figure F7. Lithostratigraphy and MSCL data, Hole M0099C.
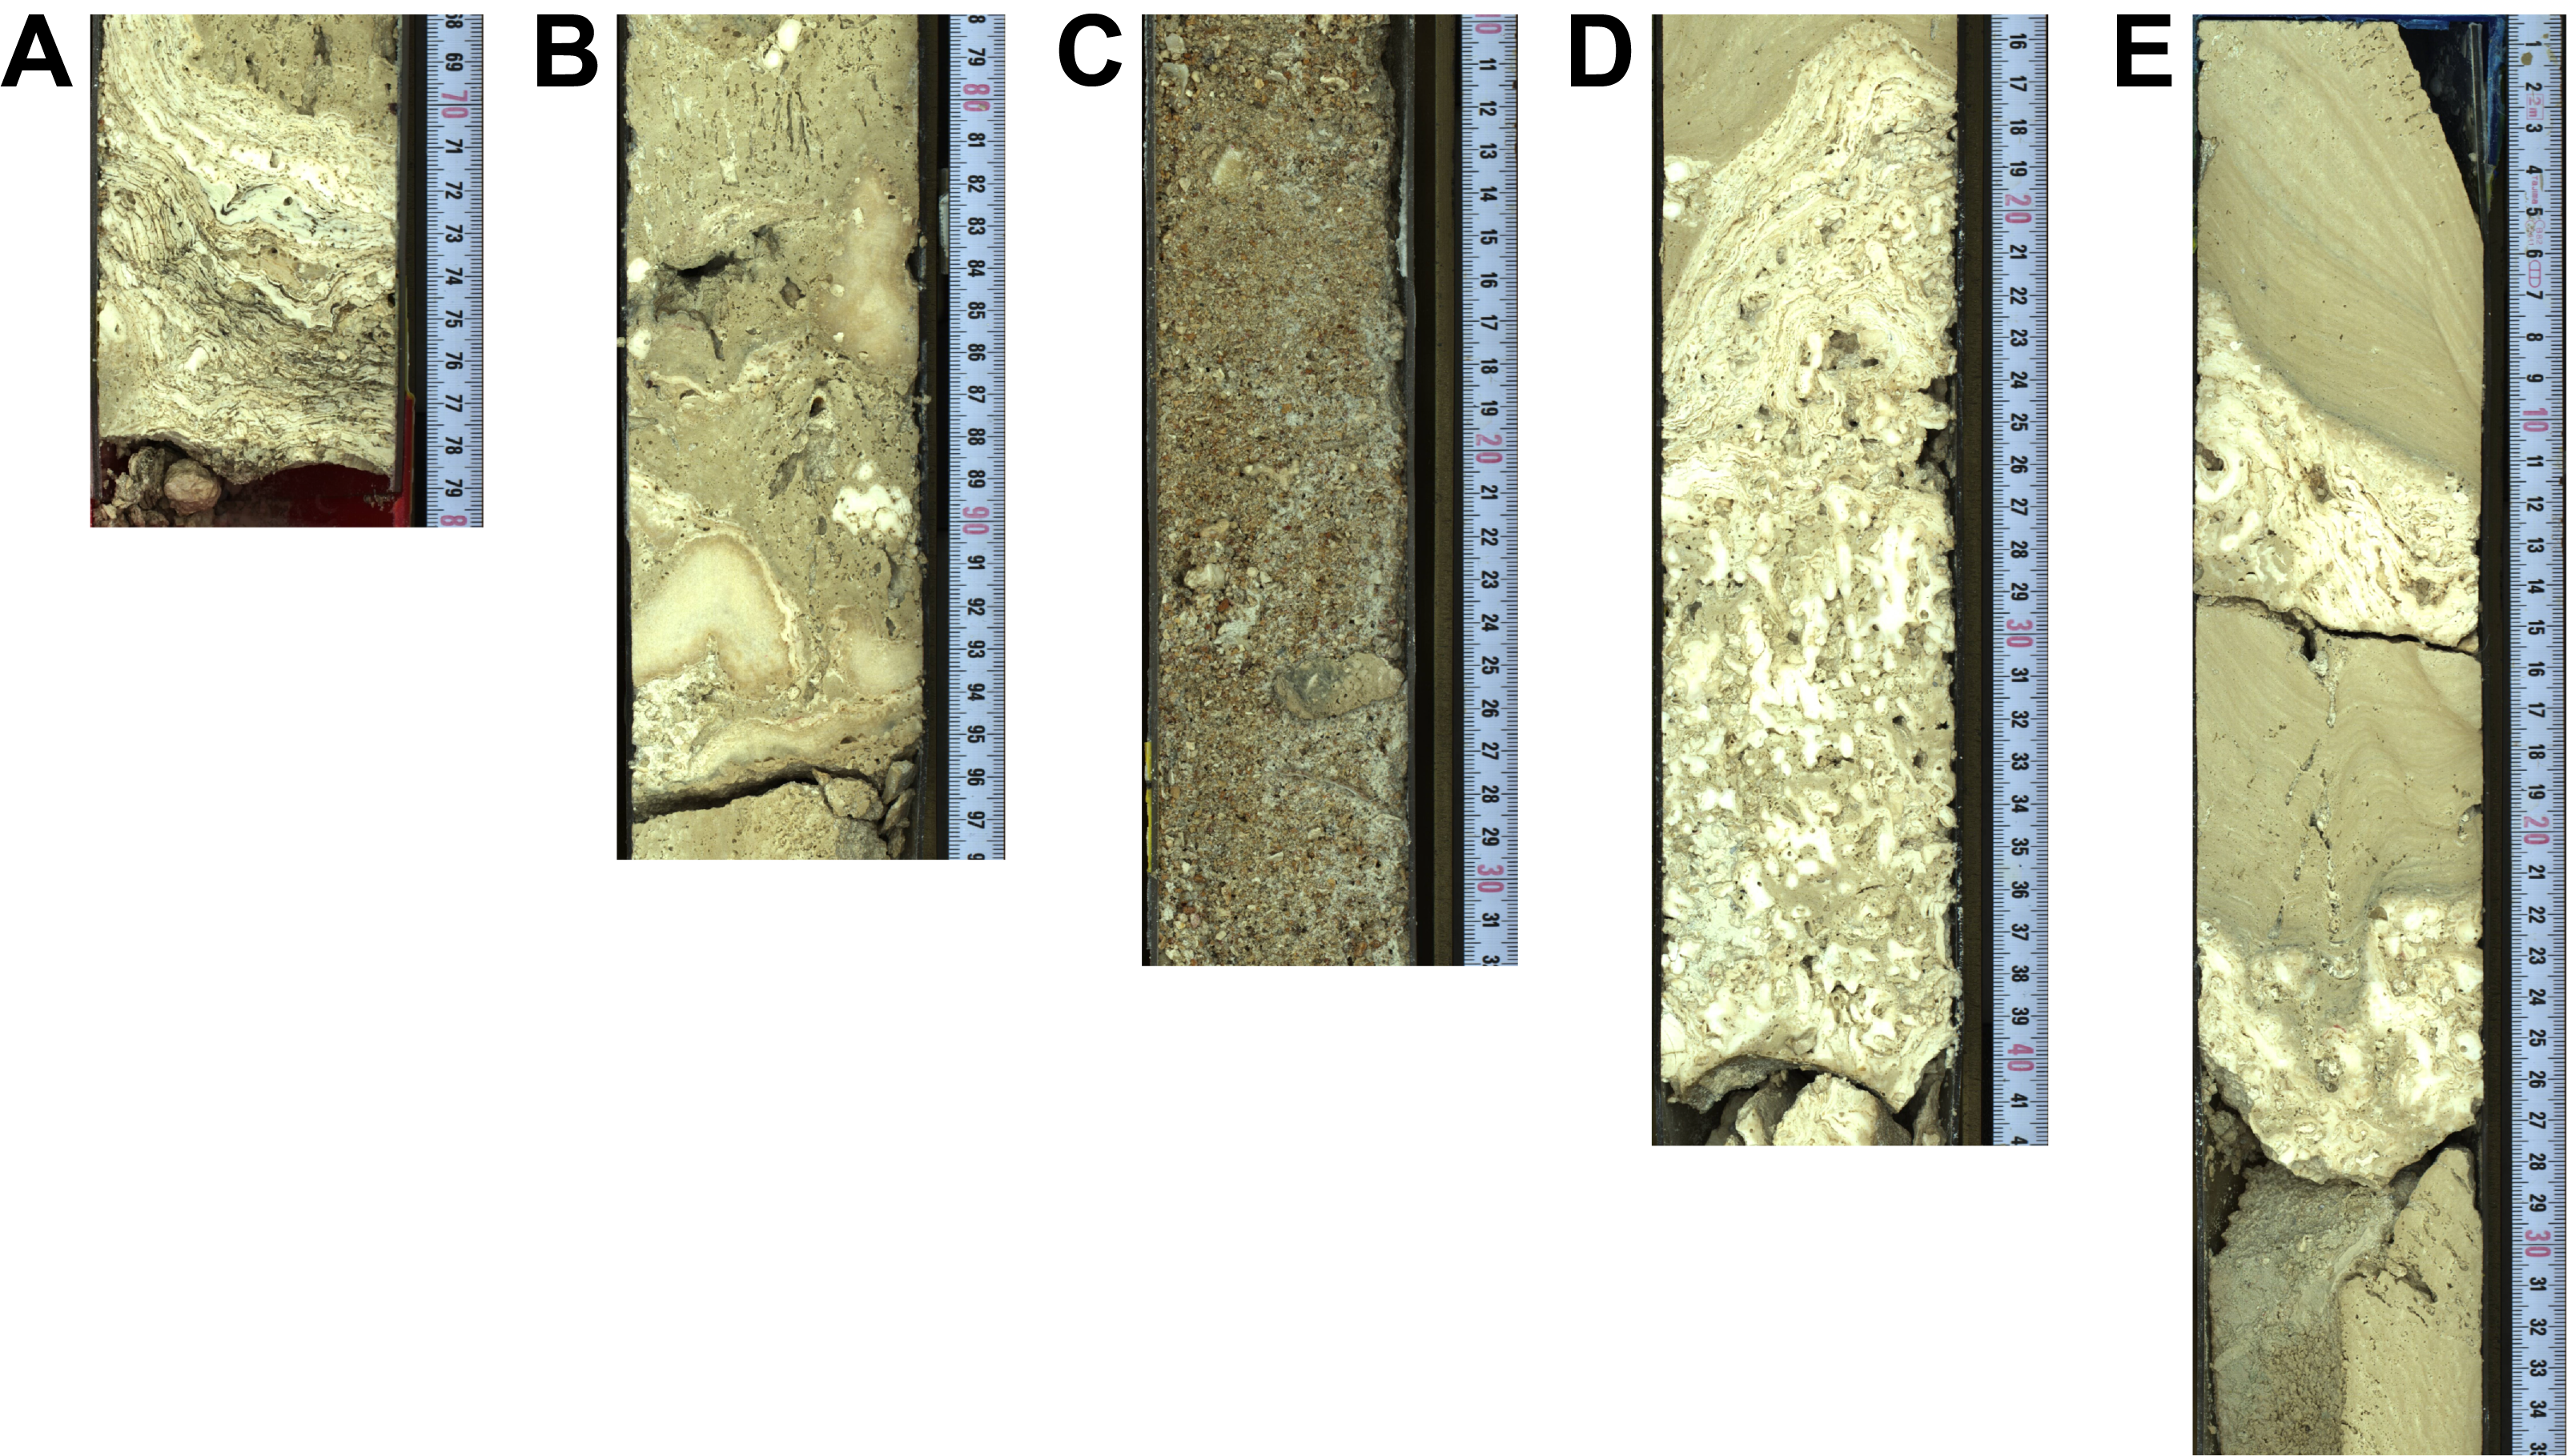
Figure F8. Lithologies, Hole M0099C.
The interval from 7.05 to 7.15 mbsf marks a major lithologic transition. It consists of biodetrital coarse-grained rudstone to grainstone with gastropods, bivalves, coral debris, and coralline algae debris. Below this transition, from 7.15 to 14.70 mbsf, the lithology alternates between (1) intervals of very thick (40–80 cm) composite algal boundstone and (2) microbialite-algal boundstone. The algal boundstone is an assemblage of thick CCA and FCA crusts, Homotrema, encrusting vermetids, serpulids, echinoid spines (Figure F8D), and one occurrence of Pocillopora branches. These crusts are bioeroded with geopetal infills. The microbialite-algal boundstone is composed of decimeter-scale, predominantly CCA crusts and nodules with Homotrema and vermetids, and locally ex situ pieces of encrusting Porites or Cyphastrea, that alternate with columnar-laminar to dendritic microbialites (Figure F8E). The microbialites have borings with geopetal infill. From 14.70 to 17.06 mbsf, there is a steep decrease of coral content from a coralgal-microbialite boundstone on the top, followed by microbialite-algal boundstone, microbialite boundstone, algal boundstone, and again microbialite boundstone.
From 17.25 to 21.60 mbsf, below possibly fall-in material with some reworked branching corals and algal fragments, microbialite-algal boundstone with decimeter-scale alternations of microbialites and algal crusts dominates (Figure F9B). At 21.17 mbsf, solitary cup corals occur in a cavity above a microbialite crust (Figure F9A). In contrast, algal boundstone is the dominant facies between 21.60 and 27.33 mbsf, with thick (up to 80–90 cm) composite CCA and FCA crusts occasionally associated with Pocillopora branches (unknown context) and in situ encrusting Cyphastrea. The transition (21.60 mbsf) from microbialite-algal to algal boundstone corresponds to a sharp increase in natural gamma radiation (NGR) values (see Physical properties).
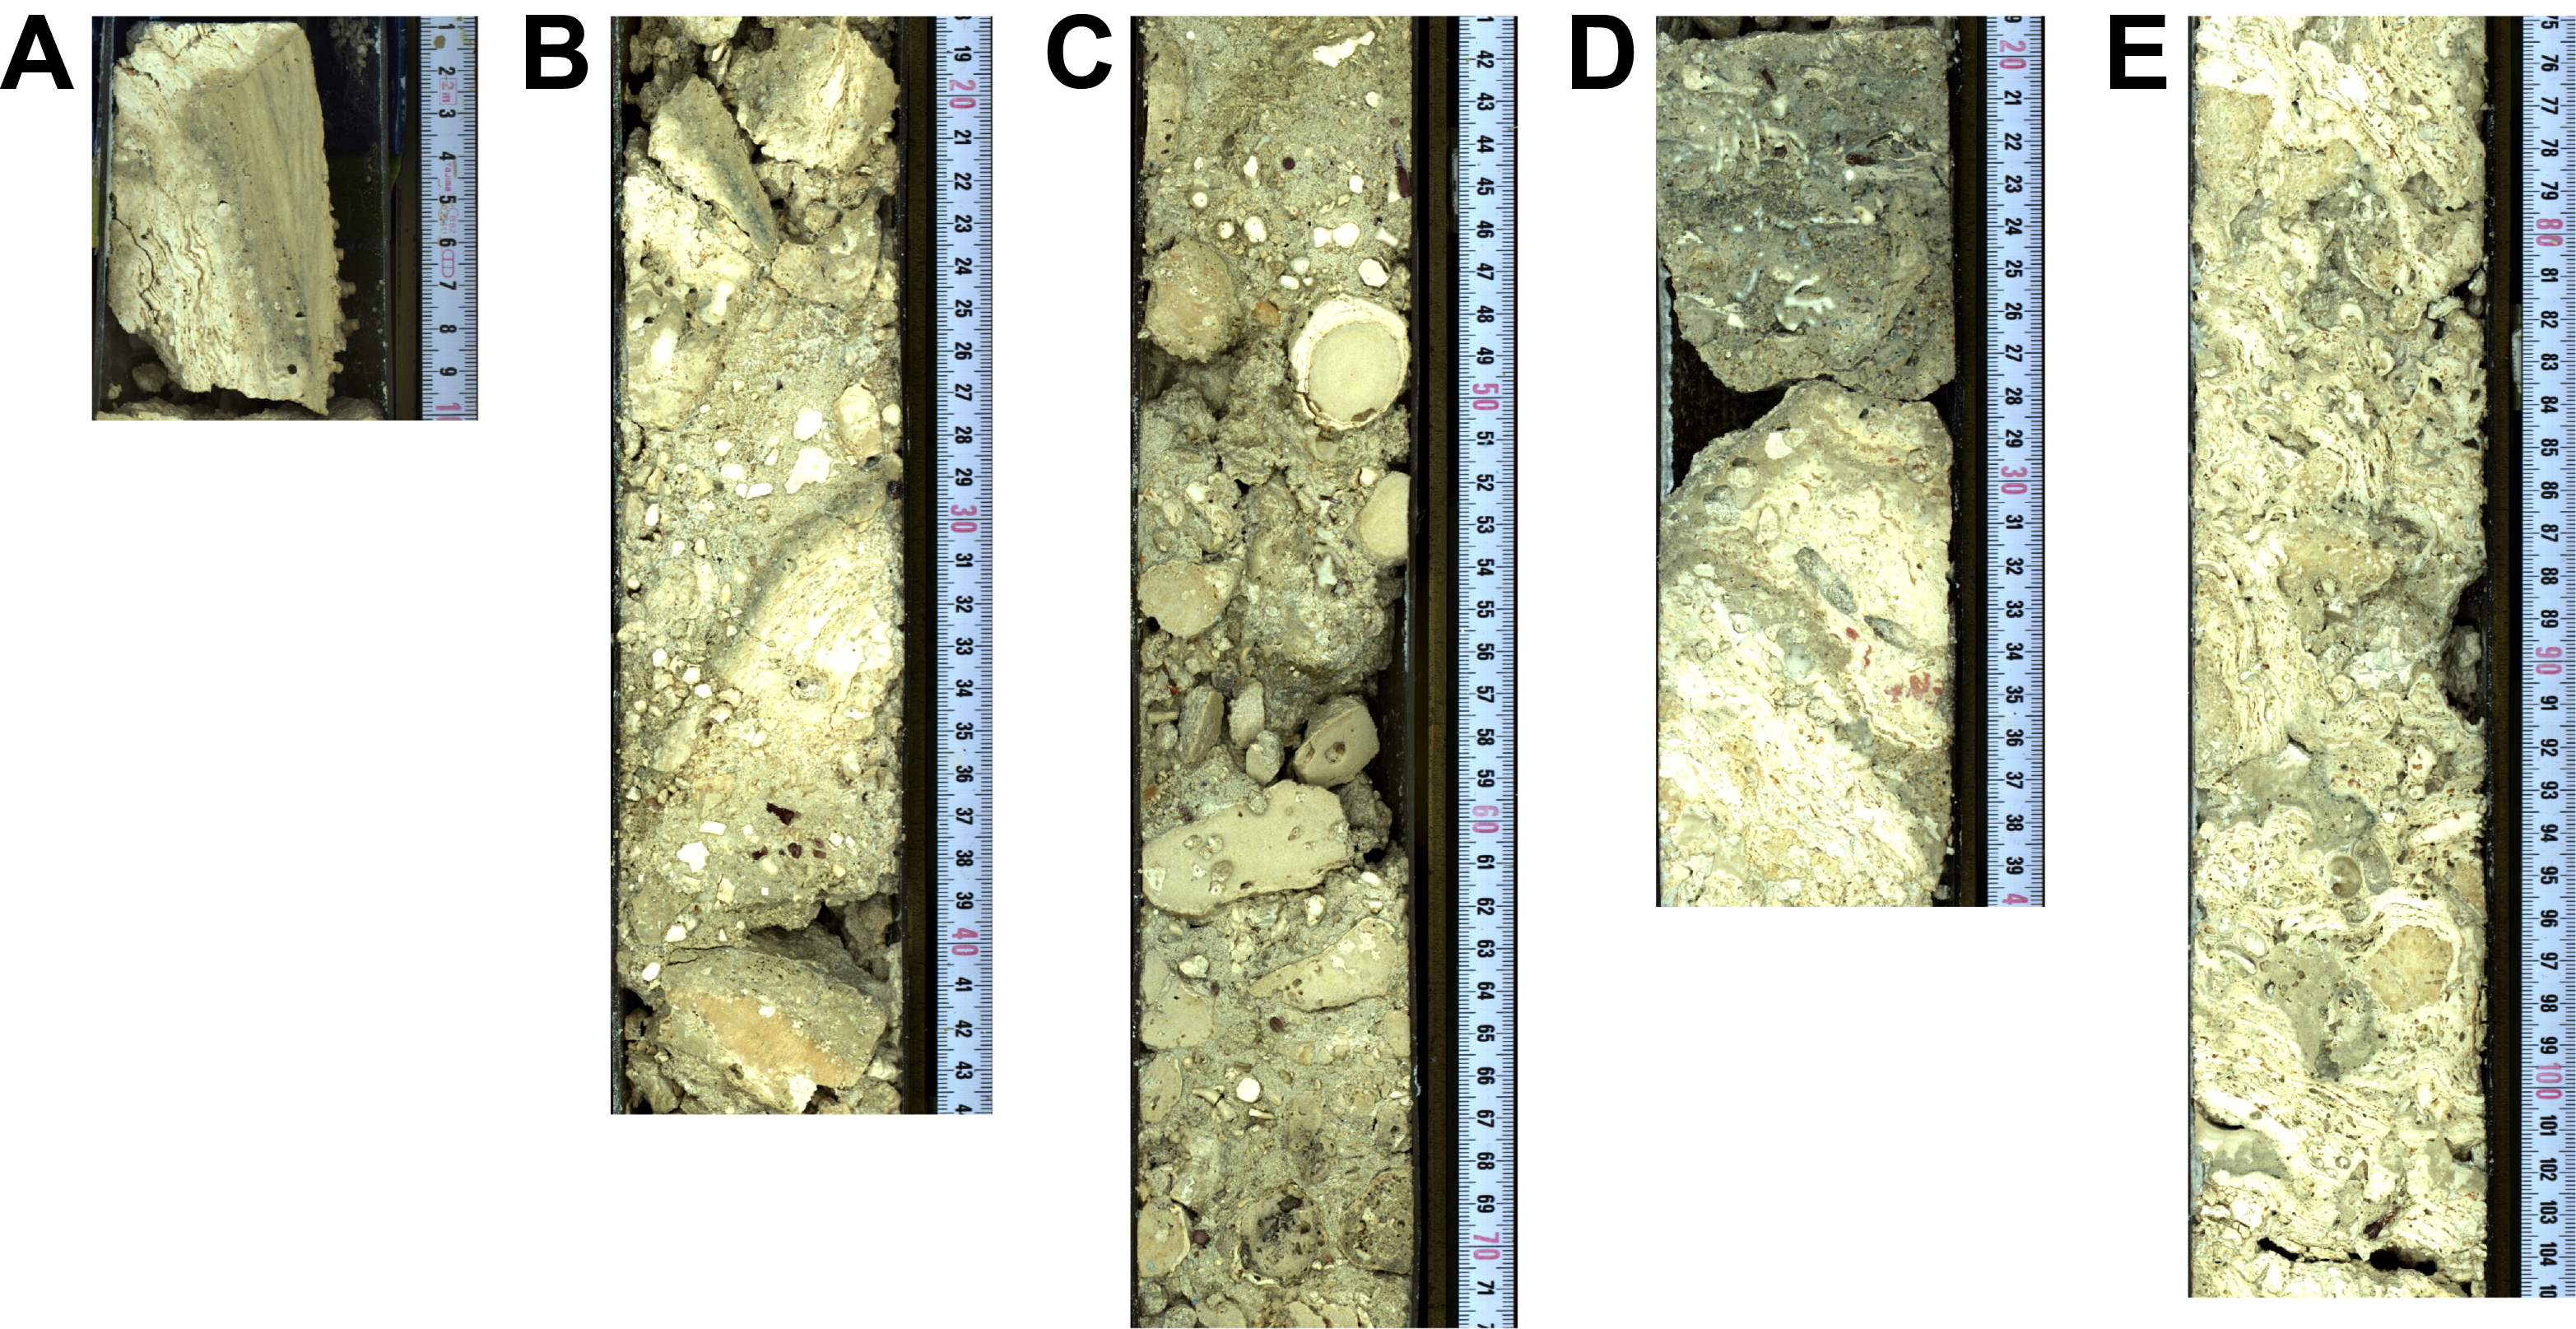
Figure F9. Coral lithologies, Hole M0099C.
Highly disturbed coralgal boundstone from 27.33 to 28.64 mbsf consists of fragments of undetermined Porites and CCA crust within a coarse-grained biodetrital matrix. From 28.64 to 32.84 mbsf, algal boundstone (with heavy drilling disturbance) is characterized by 5–10 cm thick CCA crusts, with a few Homotrema and occasional encrusting vermetids, echinoid spines, and bivalves. The CCA crusts are interlayered with structureless microbialite crusts associated with a coarse-grained biodetrital matrix (Figure F9C).
From 32.84 to 36.05 mbsf, highly disturbed (drilling disturbance) coralgal boundstone consists of numerous coral branches, possibly in situ, that are bioeroded (Entobia, Lithophaga, and Gastrochaenolites) and encrusted with thin CCA crusts and rare thin, massive, structureless microbialite crusts. CCA and microbialite crusts are associated with a coarse-grained biodetrital matrix.
The coralgal boundstone succession is interlayered between 36.05 and 36.15 mbsf by a thin layer of biodetrital packstone composed of coral and algal fragments, echinoid spines, and mollusk shells. The coralgal boundstone is deposited on a hardened, blackened, and bored surface (Figure F9D). Below this layer, from 36.15 to 37.14 mbsf, an algal boundstone consisting of a thick CCA crust with Homotrema, vermetids, and other gastropods is associated with numerous in situ encrusting Cyphastrea (Figure F9E).
From 37.96 to 38.11 mbsf, at the base of the core, the succession consists of packstones to grainstones that contain coral, algal and microbialite fragments, echinoid spines, and mollusk shells.
2.4. Hole M0099D
This hole was cored by wash bore only; no core was recovered (Table T1).
2.5. Holes M0099E and M0099G
Holes M0099E and M0099G represent a composite hole and are described together.
Hole M0099E spans from 0 to 31.50 mbsf (Figure F10), and Hole M0099G was wash bored through this interval and then cored from 25.88 to 66.28 mbsf (Figure F11) (see Introduction in the Expedition 389 Methods chapter [Webster et al., 2025a]). Lithostratigraphic descriptions and multisensor core logger (MSCL) data are presented together in Figure F12.
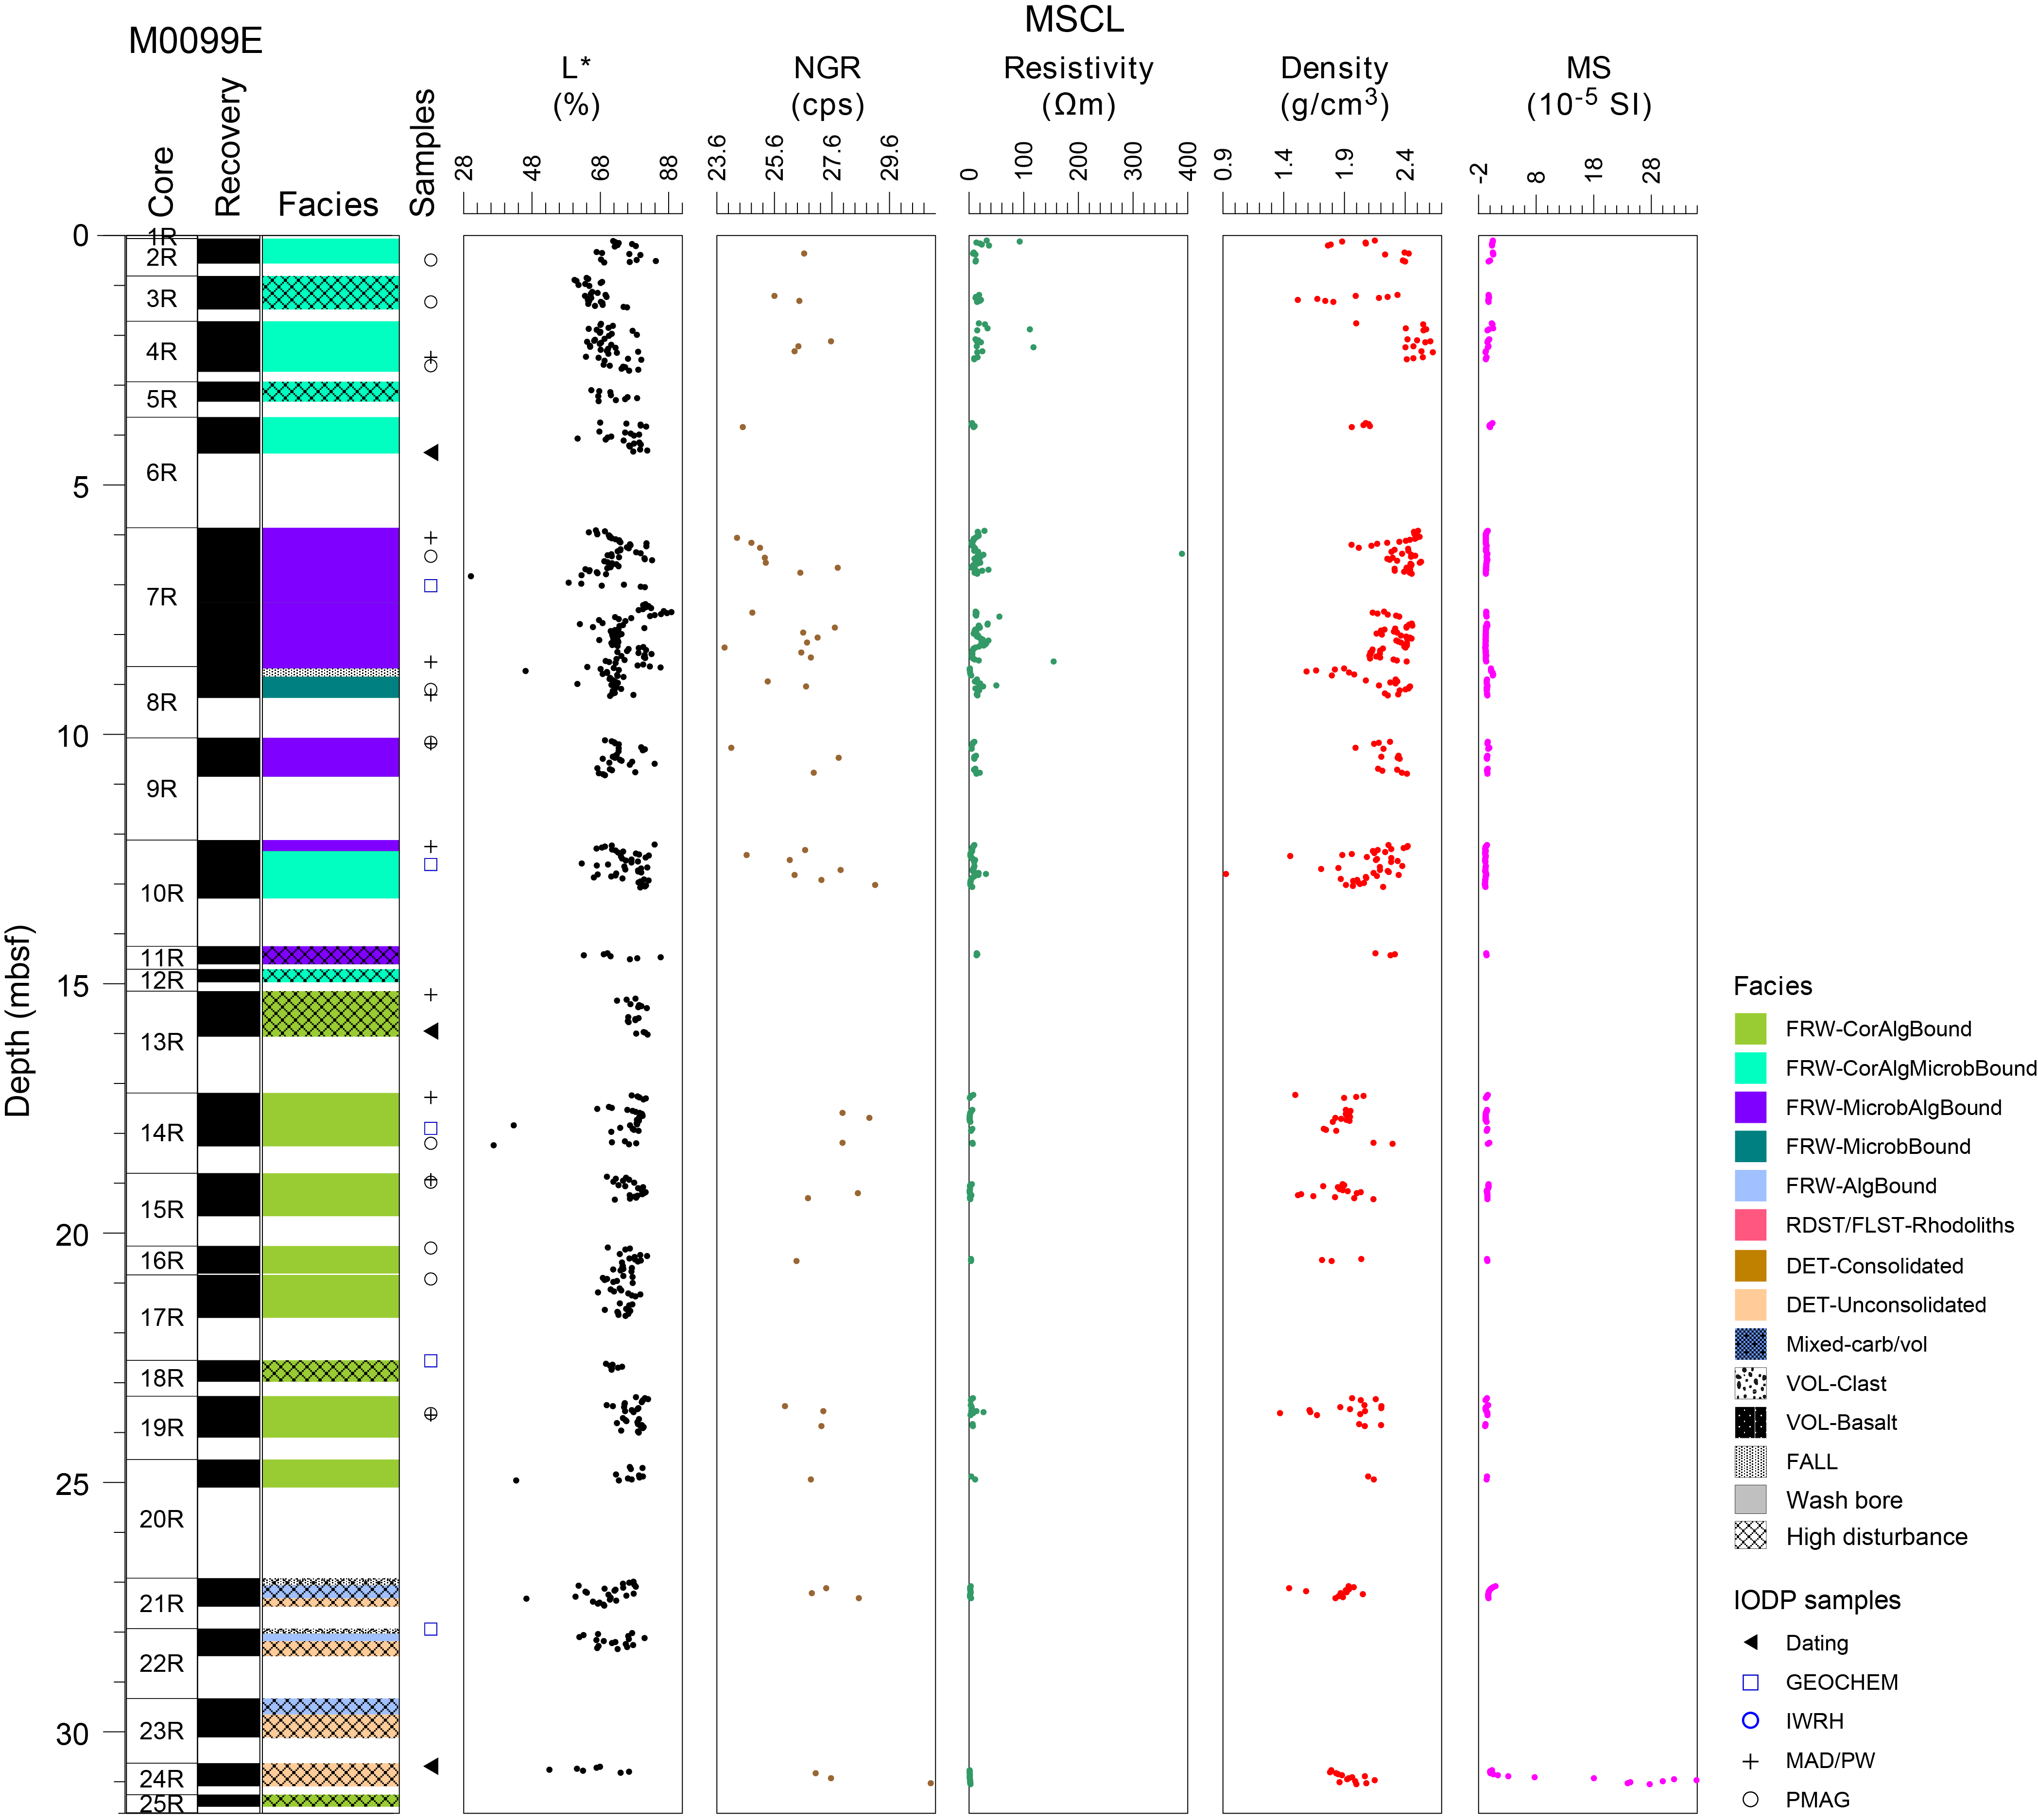
Figure F10. Lithostratigraphy and MSCL data, Hole M0099E.
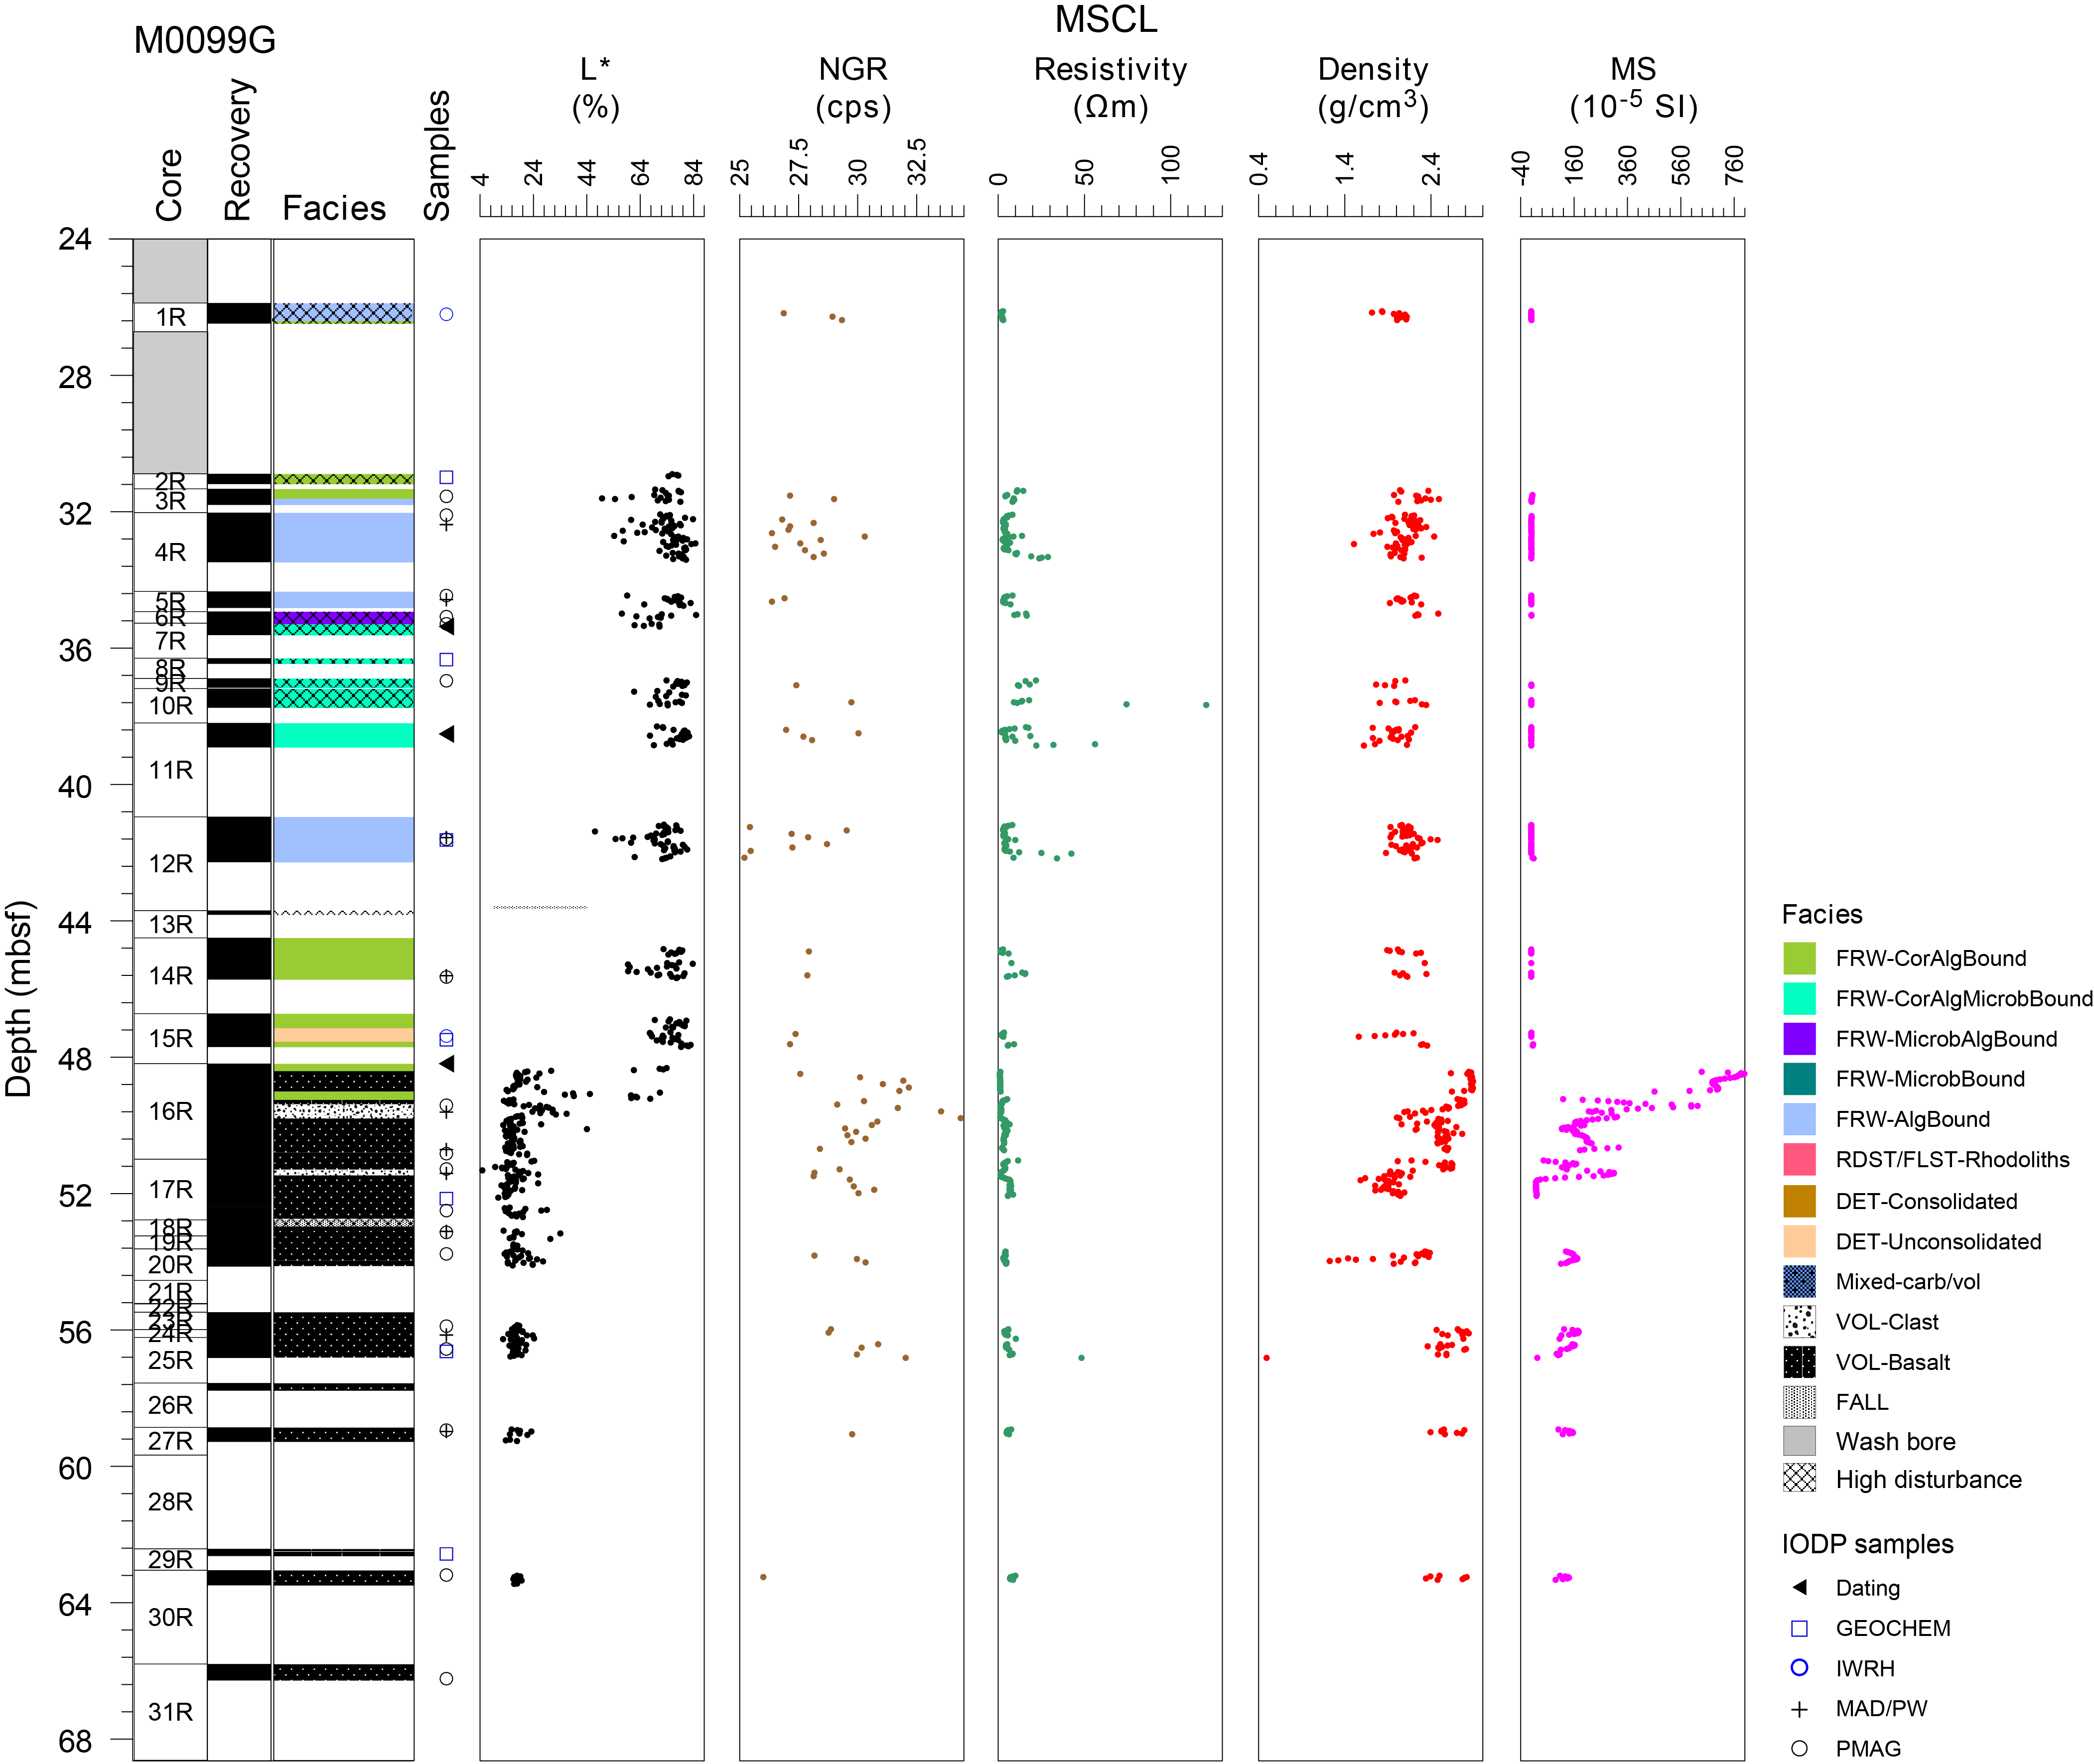
Figure F11. Lithostratigraphy and MSCL data, Hole M0099G.
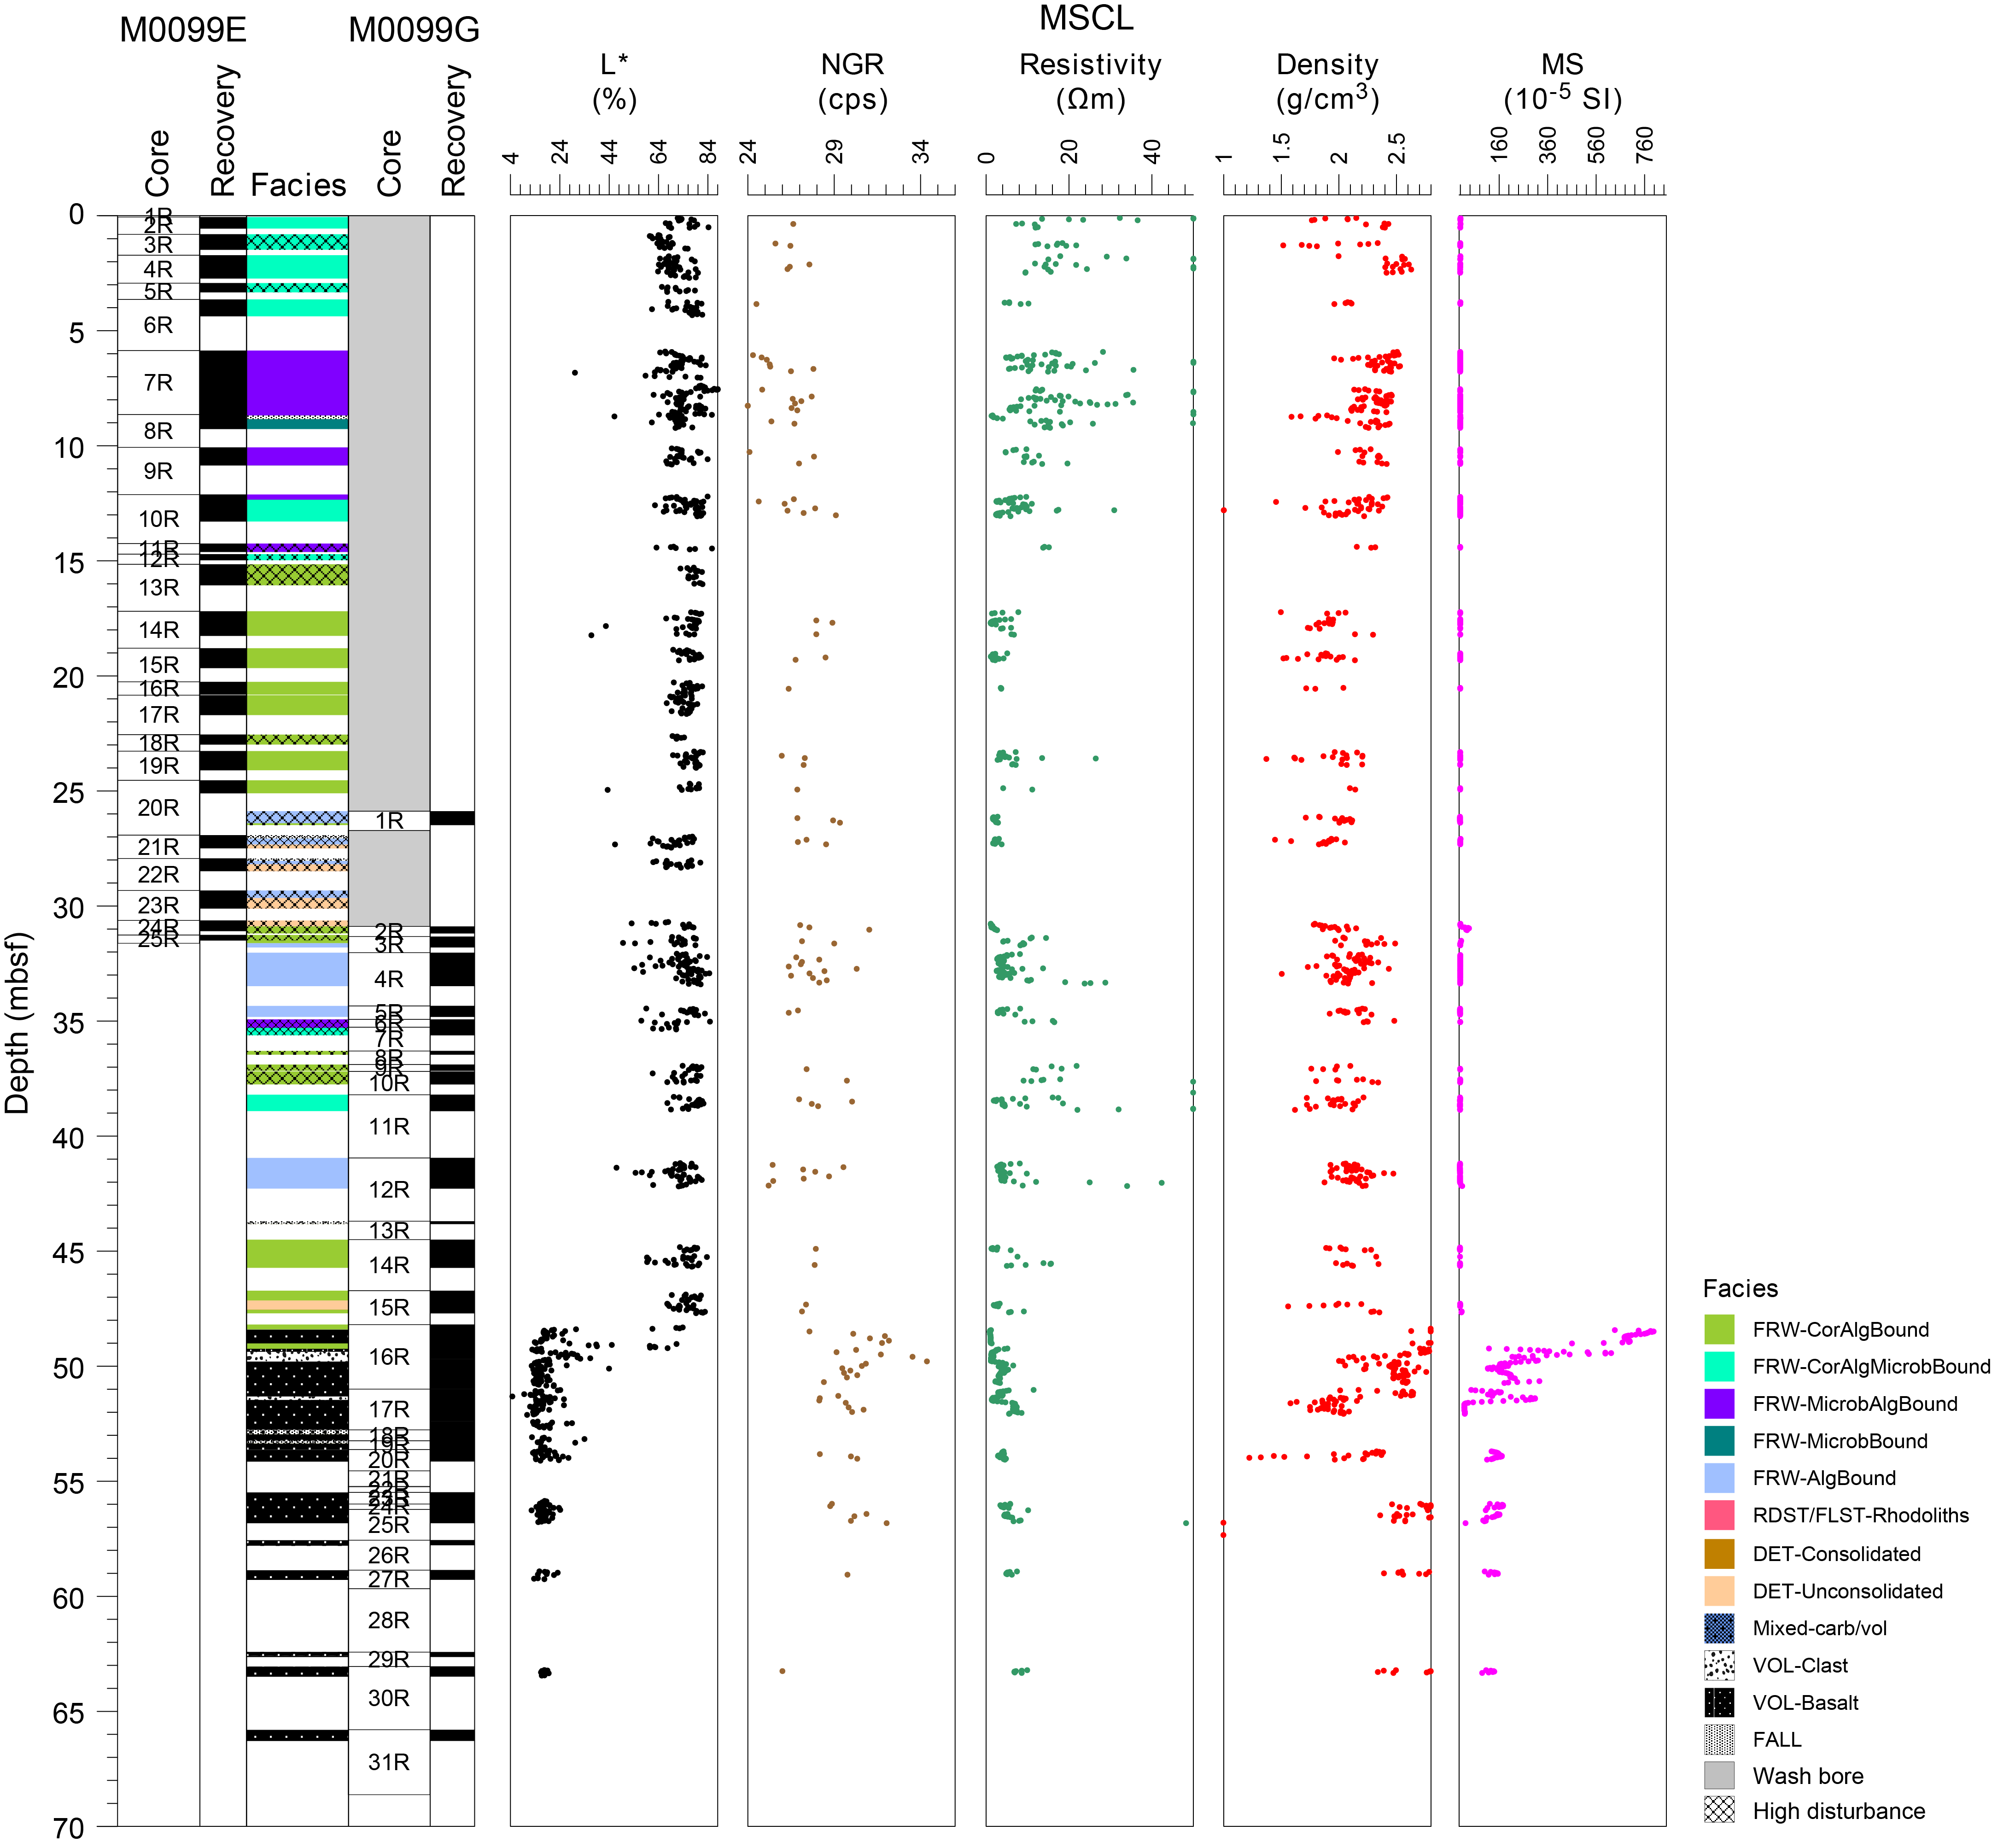
Figure F12. Composite lithostratigraphy and MSCL data.
Coralgal-microbialite boundstone from 0 to 5.86 mbsf consists of highly bioeroded corals with some CCA crusts and microbialite (Figure F13A). Corals are mainly Porites and rare Pocillopora. The Porites have varying morphologies; they are laminar and platy at the top of the interval and gradually change to submassive and massive at the bottom. CCA crusts are rare and relatively thin (centimeter scale), whereas microbialites are thick, massive to thrombolitic, and locally bioeroded. Borings have geopetal sedimentary infilling.
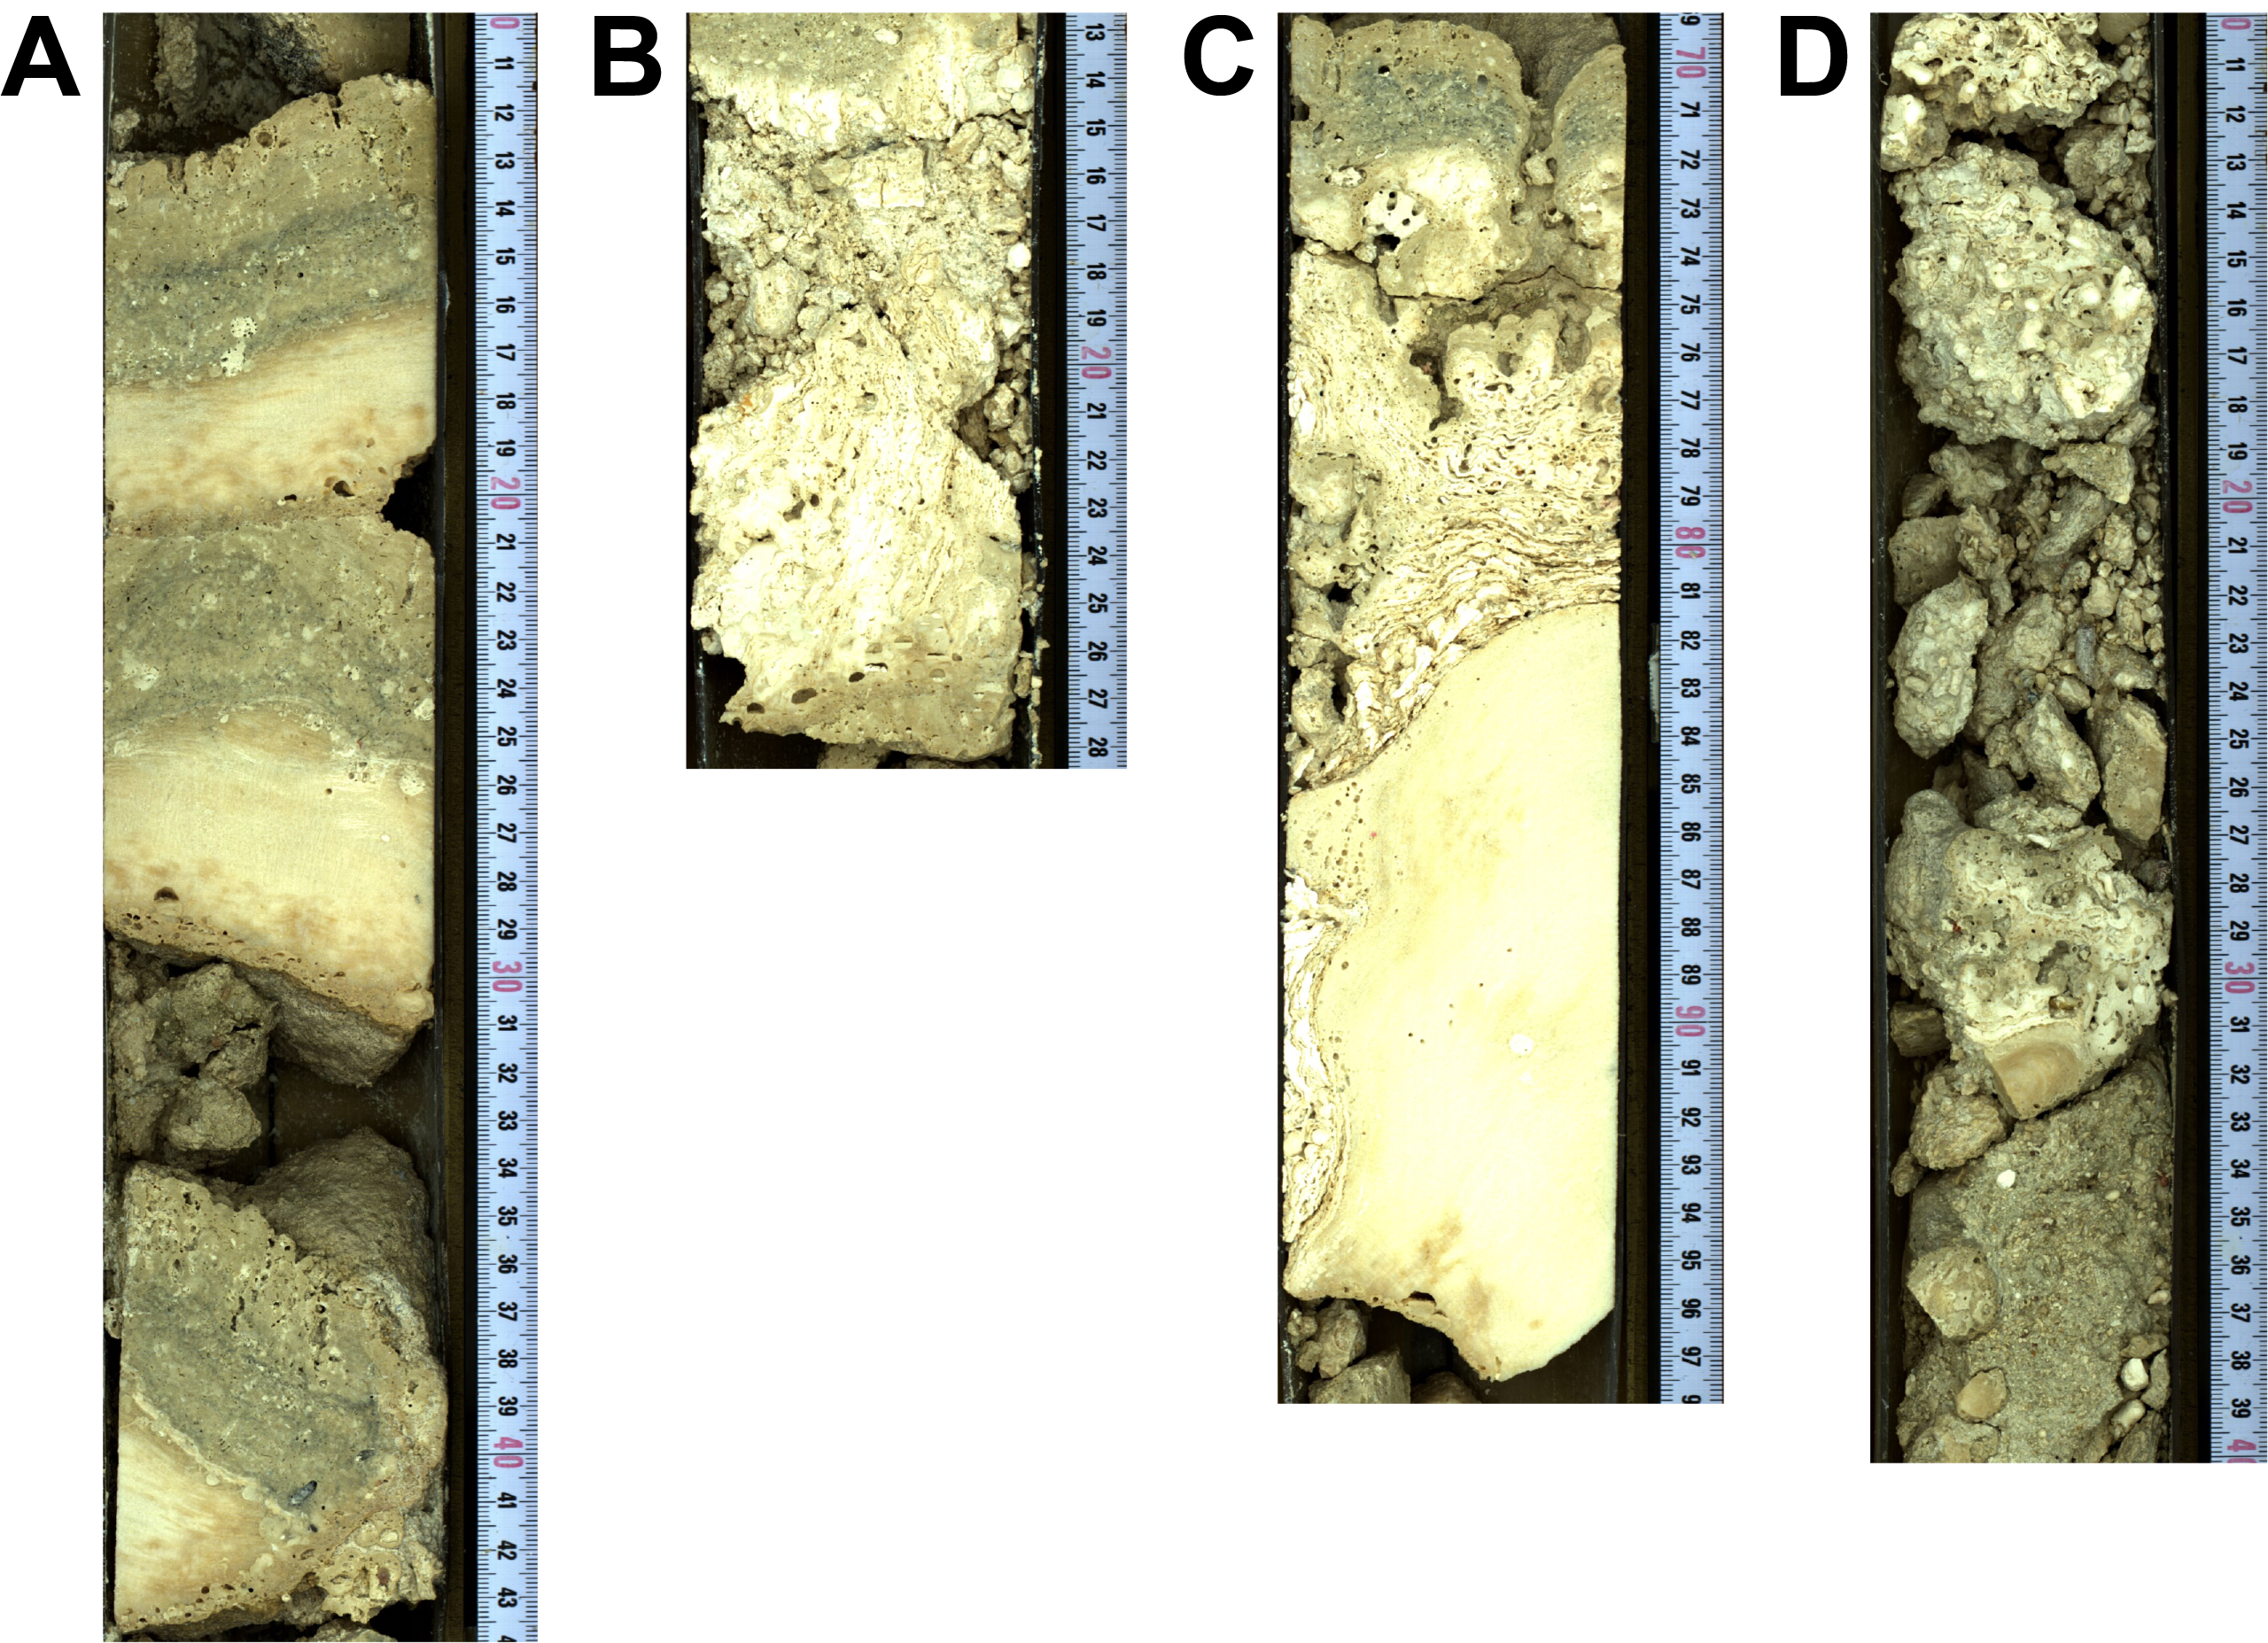
Figure F13. Lithologies, Hole M0099E.
In the microbialite-algal boundstone from 5.86 to 12.35 mbsf, thick (decimeter-scale) CCA crusts with Homotrema and locally vermetids (Figure F13B) alternate with very thick, massive, faintly laminated to dendritic microbialite. CCA also encrusts rare corals (laminar and encrusting Cyphastrea). This interval has repeated interruptions in growth, possibly on erosive surfaces. Abundant borings in both lithologies in this interval are partially to totally filled with a fine-grained whitish sediment. At the top of Section 389-M0099E-8R-1, unconsolidated biodetrital coarse sand with gravel-sized clasts of coral and coralline algae appears to be fall-in material, followed by a short interval of microbialite boundstone.
From 12.35 to 15.15 mbsf, coralgal-microbialite boundstone (Figure F13C), interrupted by a short interval of microbialite-algal boundstone, was in parts highly disturbed by drilling and contains diverse morphologies of Porites (in situ submassive to massive) as well as Pocillopora (fine branching with encrusting base). Coral surfaces are bioeroded and encrusted with CCA. The CCA crusts are decimeter-scale thick and include Homotrema. Microbialites are predominantly massive and structureless.
From 15.15 to 25.10 mbsf is a coralgal boundstone (Figure F14) composed predominantly of submassive to massive Porites, with some sporadic branching Porites and one columnar Pocillopora at 18.90 mbsf. The core is disturbed at the top of the interval. The corals are encrusted with thin, laminar CCA crusts. The facies change at 15.15 mbsf also corresponds to a moderate increase in NGR values and a minor decrease in density values (Figure F10) (see Physical properties).
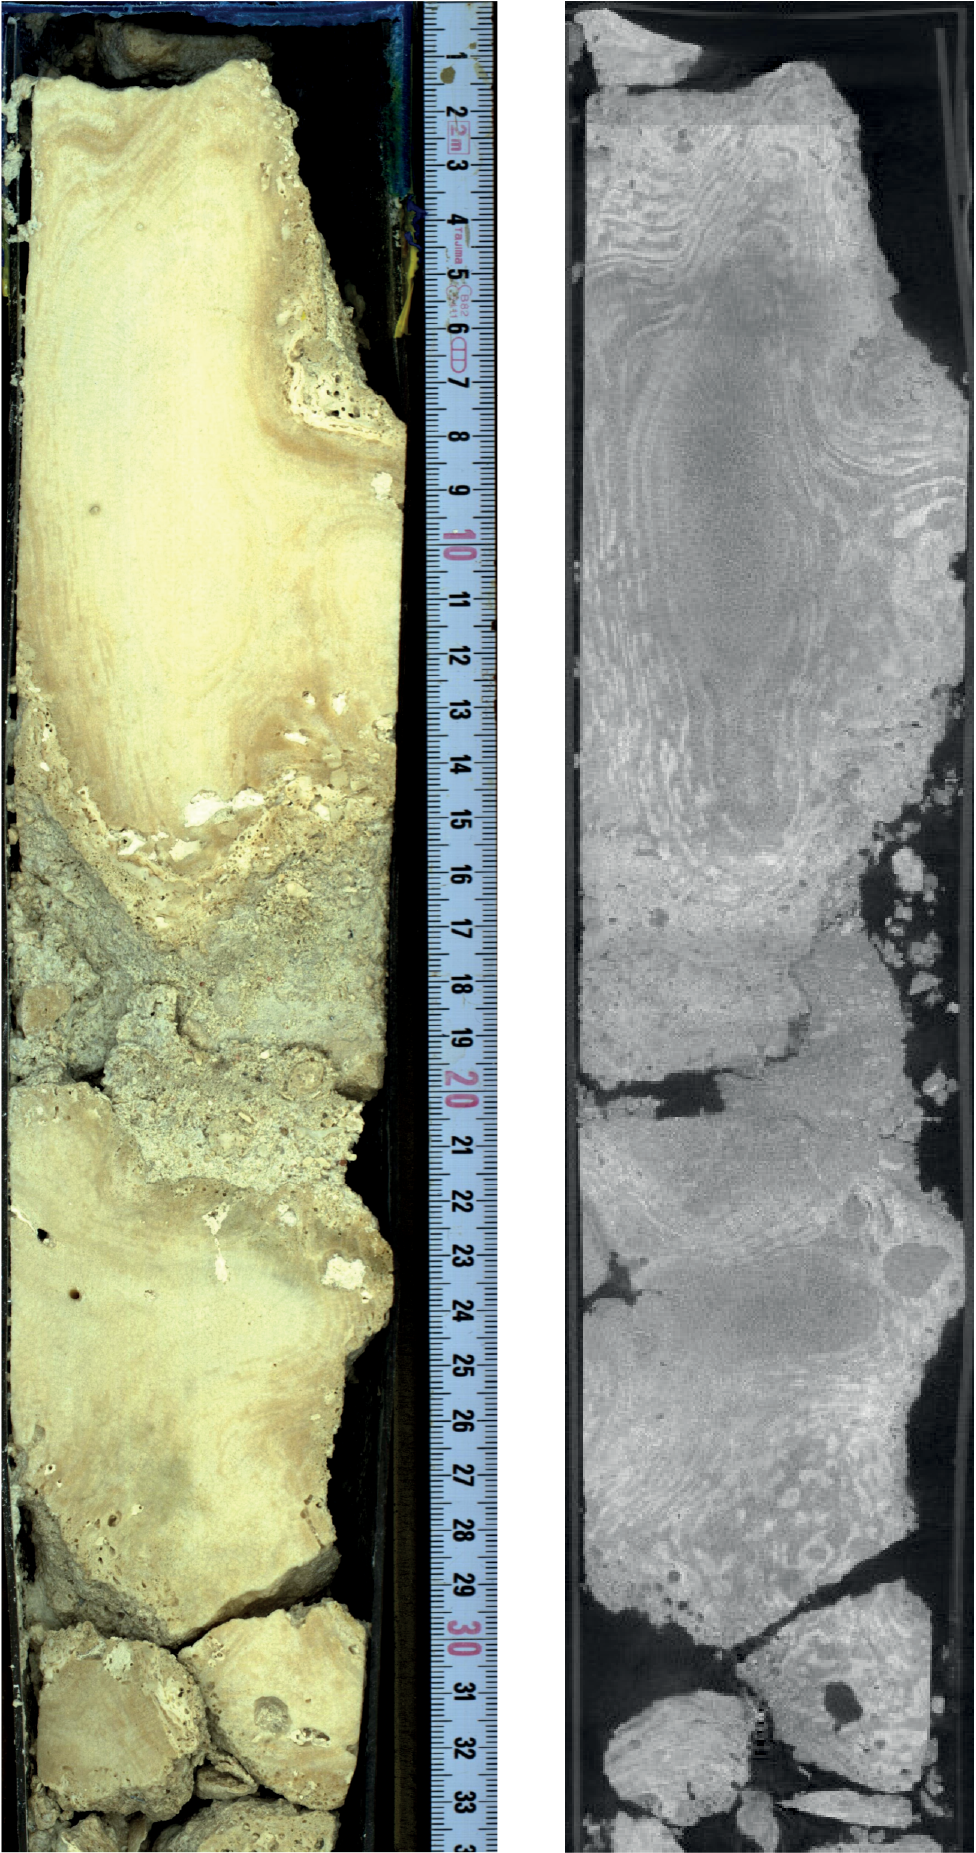
Figure F14. Coralgal boundstone with submassive to massive Porites.
The interval from 25.10 to 31.26 mbsf consists of an alternation of (1) moderately thick (0–20 cm) composite CCA and FCA algal boundstone containing echinoid spines, serpulid tubes, and rare vermetids and (2) unconsolidated, biodetrital sediment with gravelly rubble of FCA and branching Porites that is possibly reworked (Figure F13D).
In the lowermost interval, from 31.26 mbsf to the base of the hole at 31.50 mbsf, coring disturbance is high and the lithology consists of fragments of coralgal boundstone and pieces of branching Porites encrusted with thin CCA crusts. Some corals are bioeroded with partial sediment infill. Rare Halimeda fragments between coral pieces may be fall-in material.
This succession continues in Hole M0099G from 25.88 to 66.28 mbsf, as described below, with an overlap between the holes of approximately 5 m (Figure F12).
A short interval in Hole M0099G, from 25.88 to 26.40 mbsf, is a heavily disturbed algal boundstone with CCA fragments (centimeter-sized) in a coarse, sand-sized biodetrital matrix dominated by fragmented CCA with rare echinoid spines and fragments of gastropod and bivalve shells (Figure F15A). No core was recovered from 26.40 to 30.89 mbsf.
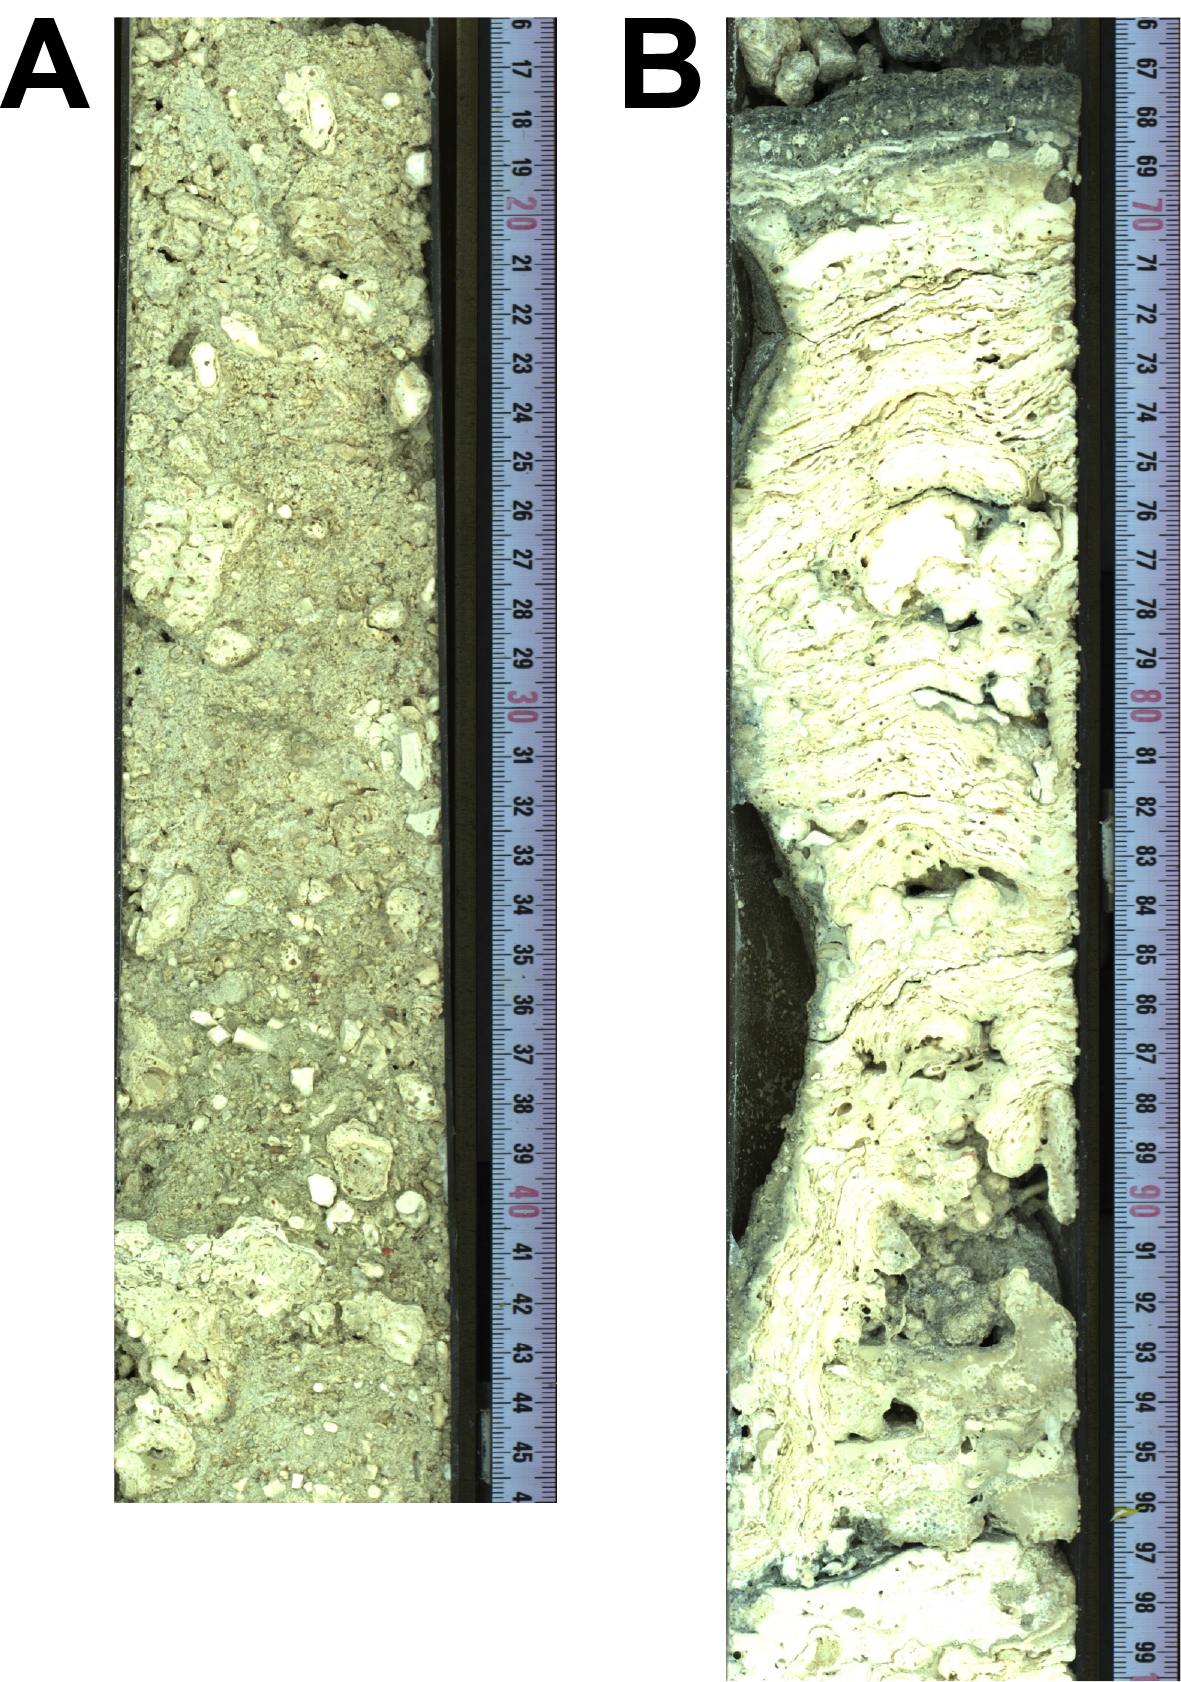
Figure F15. CCA, Hole M0099G.
From 30.89 to 31.61 mbsf is a coralgal boundstone composed predominantly of heavily bioeroded submassive and branching Porites that are encrusted with thin CCA crust. The core is disturbed in the upper part.
From 31.61 to 34.82 mbsf, the core material is described as algal boundstone with thick intervals (up to 60 cm) of composite CCA and FCA crusts, encrusting vermetids, Homotrema, and various centimeter-scale coral branches and fragments (Porites, Cyphastrea, Montipora, and Pocillopora) (Figure F15B). The corals are capped by thin, blackened, and bored microbialite crusts that are also developing in framework cavities. microbialite-algal boundstone was recovered to 35.27 mbsf.
Between 35.27 and 44.50 mbsf, coralgal-microbialite boundstone is dominant, with mainly robust branching, columnar, and massive Porites associated with Cyphastrea (Figure F16). There is medium to high core loss throughout the interval with fall-in material. Corals are bioeroded and encrusted with thin (centimeter-scale) CCA crusts, with rare thin (centimeter-thick) microbialite crusts in framework cavities. This interval is interrupted between 40.95 and 42.28 mbsf by a composite CCA and FCA algal boundstone, several tens of centimeters thick, with vermetids and serpulids, containing branching Porites and encrusting Cyphastrea.
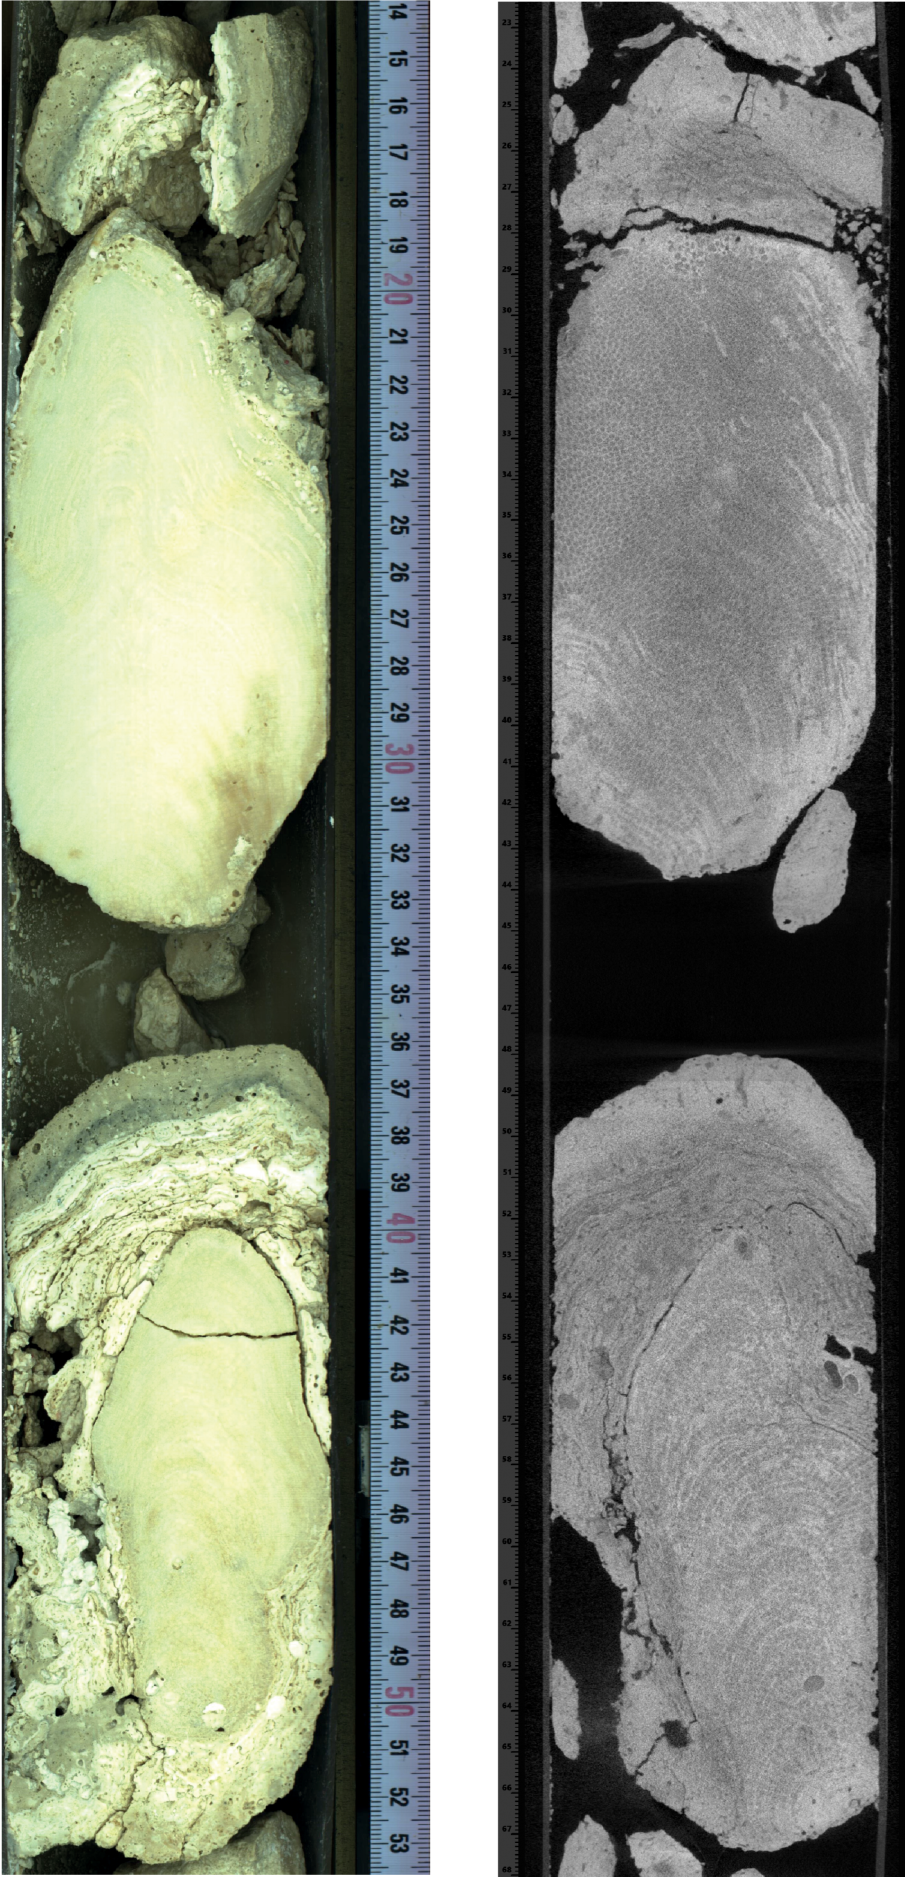
Figure F16. Coralgal boundstone dominated by robust branching to columnar Porites.
From 44.50 to 48.40 mbsf, coralgal boundstone with massive corals that become columnar downcore and are associated with CCA and FCA is recovered. There is a short interval of unconsolidated biodetrital sediment composed of FCA, CCA, corals, bivalves, and echinoids at roughly 47.30 mbsf. Toward the lower contact, the corals become branching to submassive, associated with CCA crusts.
The contact between carbonates and the lava substratum is at 48.40 mbsf (Figure F17A). This lava occurs as a continuous, ~60 cm long, fresh (limited alteration) coherent lava unit, terminated at its base and upper surface in clean contacts with carbonate that lacks volcaniclastic material. Below, to 49.37 mbsf, is a massive aphanitic matrix, mildly porphyritic lava with a population of submillimeter, rounded, noncoalesced vesicles and a second population of larger (up to 1 cm in diameter) irregularly shaped, coalesced vesicles (Figure F17A). It is interrupted between 49.00 and 49.24 mbsf by a thin interval of possibly reworked fragments of submassive and branching Porites, partially encrusted with CCA.
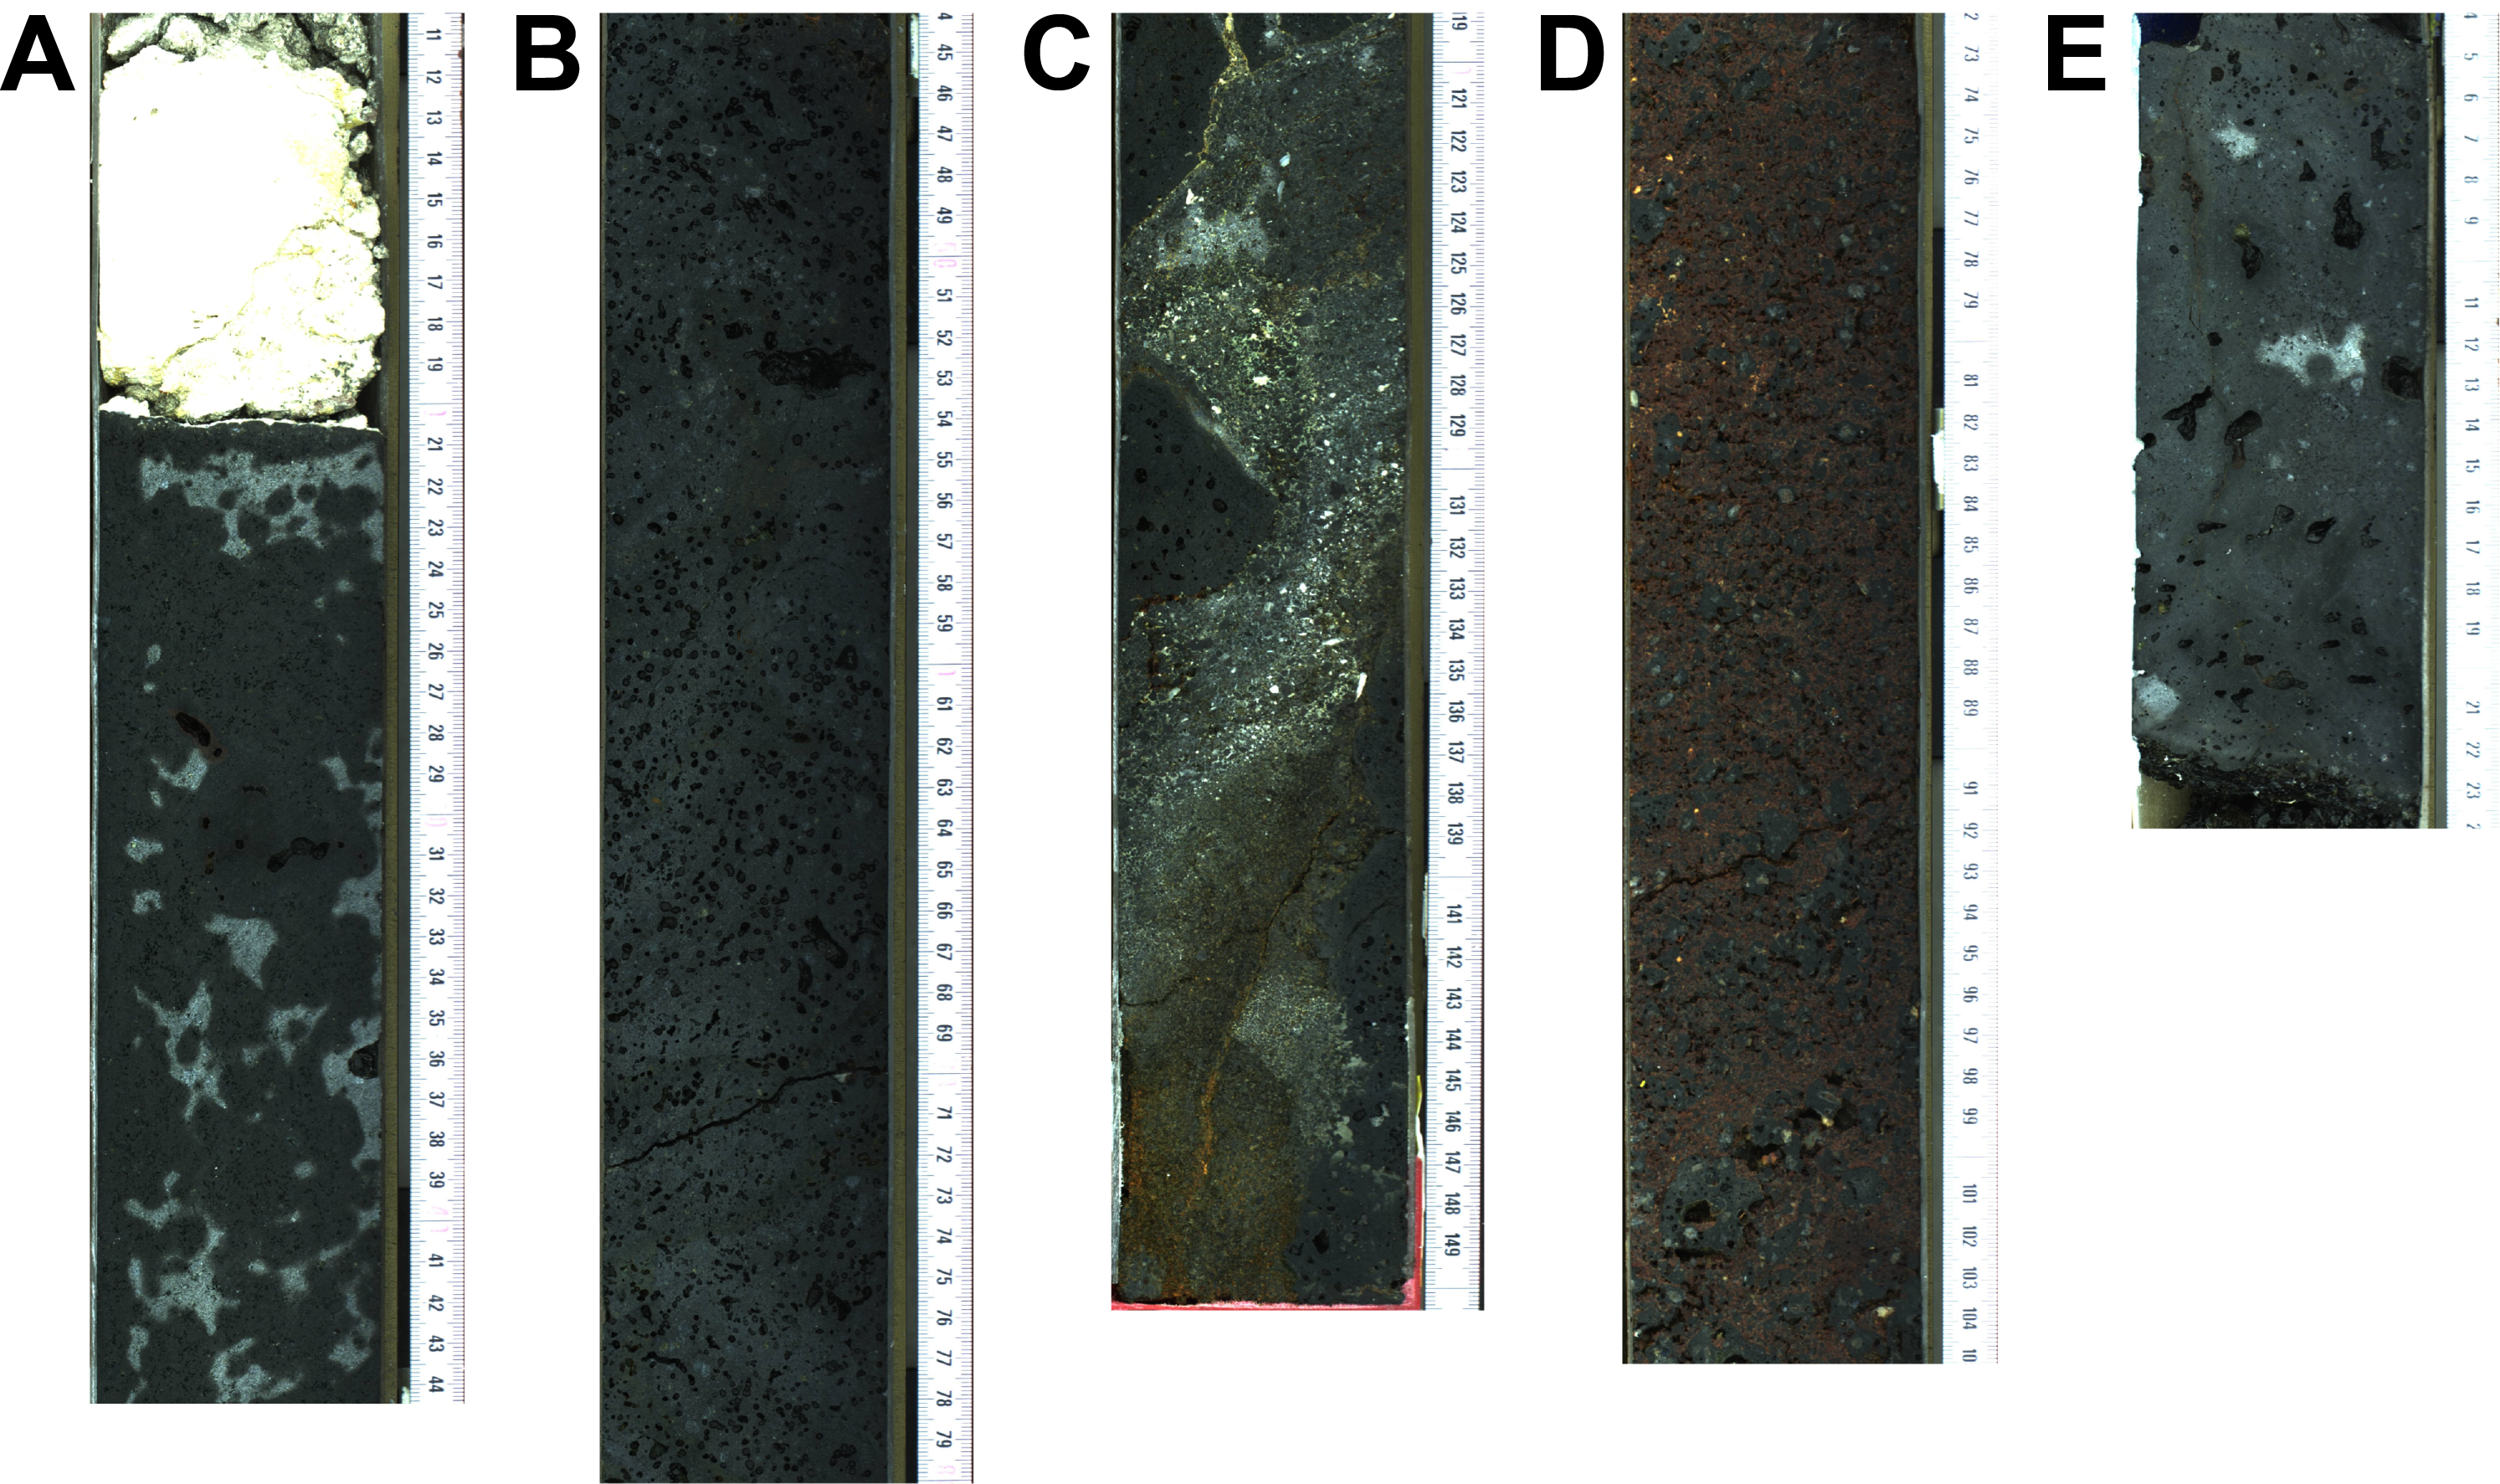
Figure F17. Lithologies, Hole M0099G.
Between 49.37 and 55.63 mbsf, a second lava type consists of black, not porphyritic, vesicular basalt with abundant small (1–3 mm), rounded, noncoalesced vesicles and an aphanitic matrix (Figure F17B). The underlying lava is fresh, with 10% vesicularity and 5%–10% phenocryst vesicularity, and a crack has formed in it, filled with both carbonate cement and angular lava fragments, truncating in a sharp lower contact. This interval is interrupted at several levels: (1) from 49.37 to 49.79 mbsf and from 51.32 to 51.46 mbsf by coarse-grained to very coarse grained volcaniclastic material with a minor bioclastic fraction and some oversized pebbles and cobbles of vesicular basalt lava of the same visual composition as the overlying coherent lava interval (Figure F17C) and (2) from 51.46 to 52.39 mbsf by hyaloclastite corresponding to an altered, reddish, crumbled vesicular lava with various abundant medium-scale vesicles (3–5 mm) (Figure F17D).
Below this complex interface zone between lava and carbonate, the rest of the hole is composed primarily of lava flows, with zones of both fragmental lava and carbonate rubble (possibly as infill) of corals, algal crusts, and microbialites, zones of angular fragment volcaniclastic debris, zones of highly altered but coherent lava flow in Section 389-M0099G-17R-1, zones of disturbed but potentially in place lava fragments, and coherent lava flow (e.g., the majority of the material in Sections 20R-1, 27R-1, and 25R-1).
Finally, from 55.63 mbsf to the base of the hole at 66.28 mbsf, the lithology consists of a mildly porphyritic basalt (5–10 vol% of olivine and pyroxene crystals) with aphanitic matrix (Figure F17E). Round vesicles decline in density downhole, with a few large coalesced ones in the upper part and numerous rounded smaller ones (some large and irregular) in the lower part.
2.6. Hole M0099F
In Hole M0099F (Figure F18), there is high core loss and disturbance. Between 0.00 and 2.65 mbsf, algal boundstone was recovered, consisting of thick composite CCA and FCA crusts with locally encrusting Homotrema, vermetids, bivalves, and rare unidentified coral fragments. These crusts are heavily bioeroded (Figure F19A).
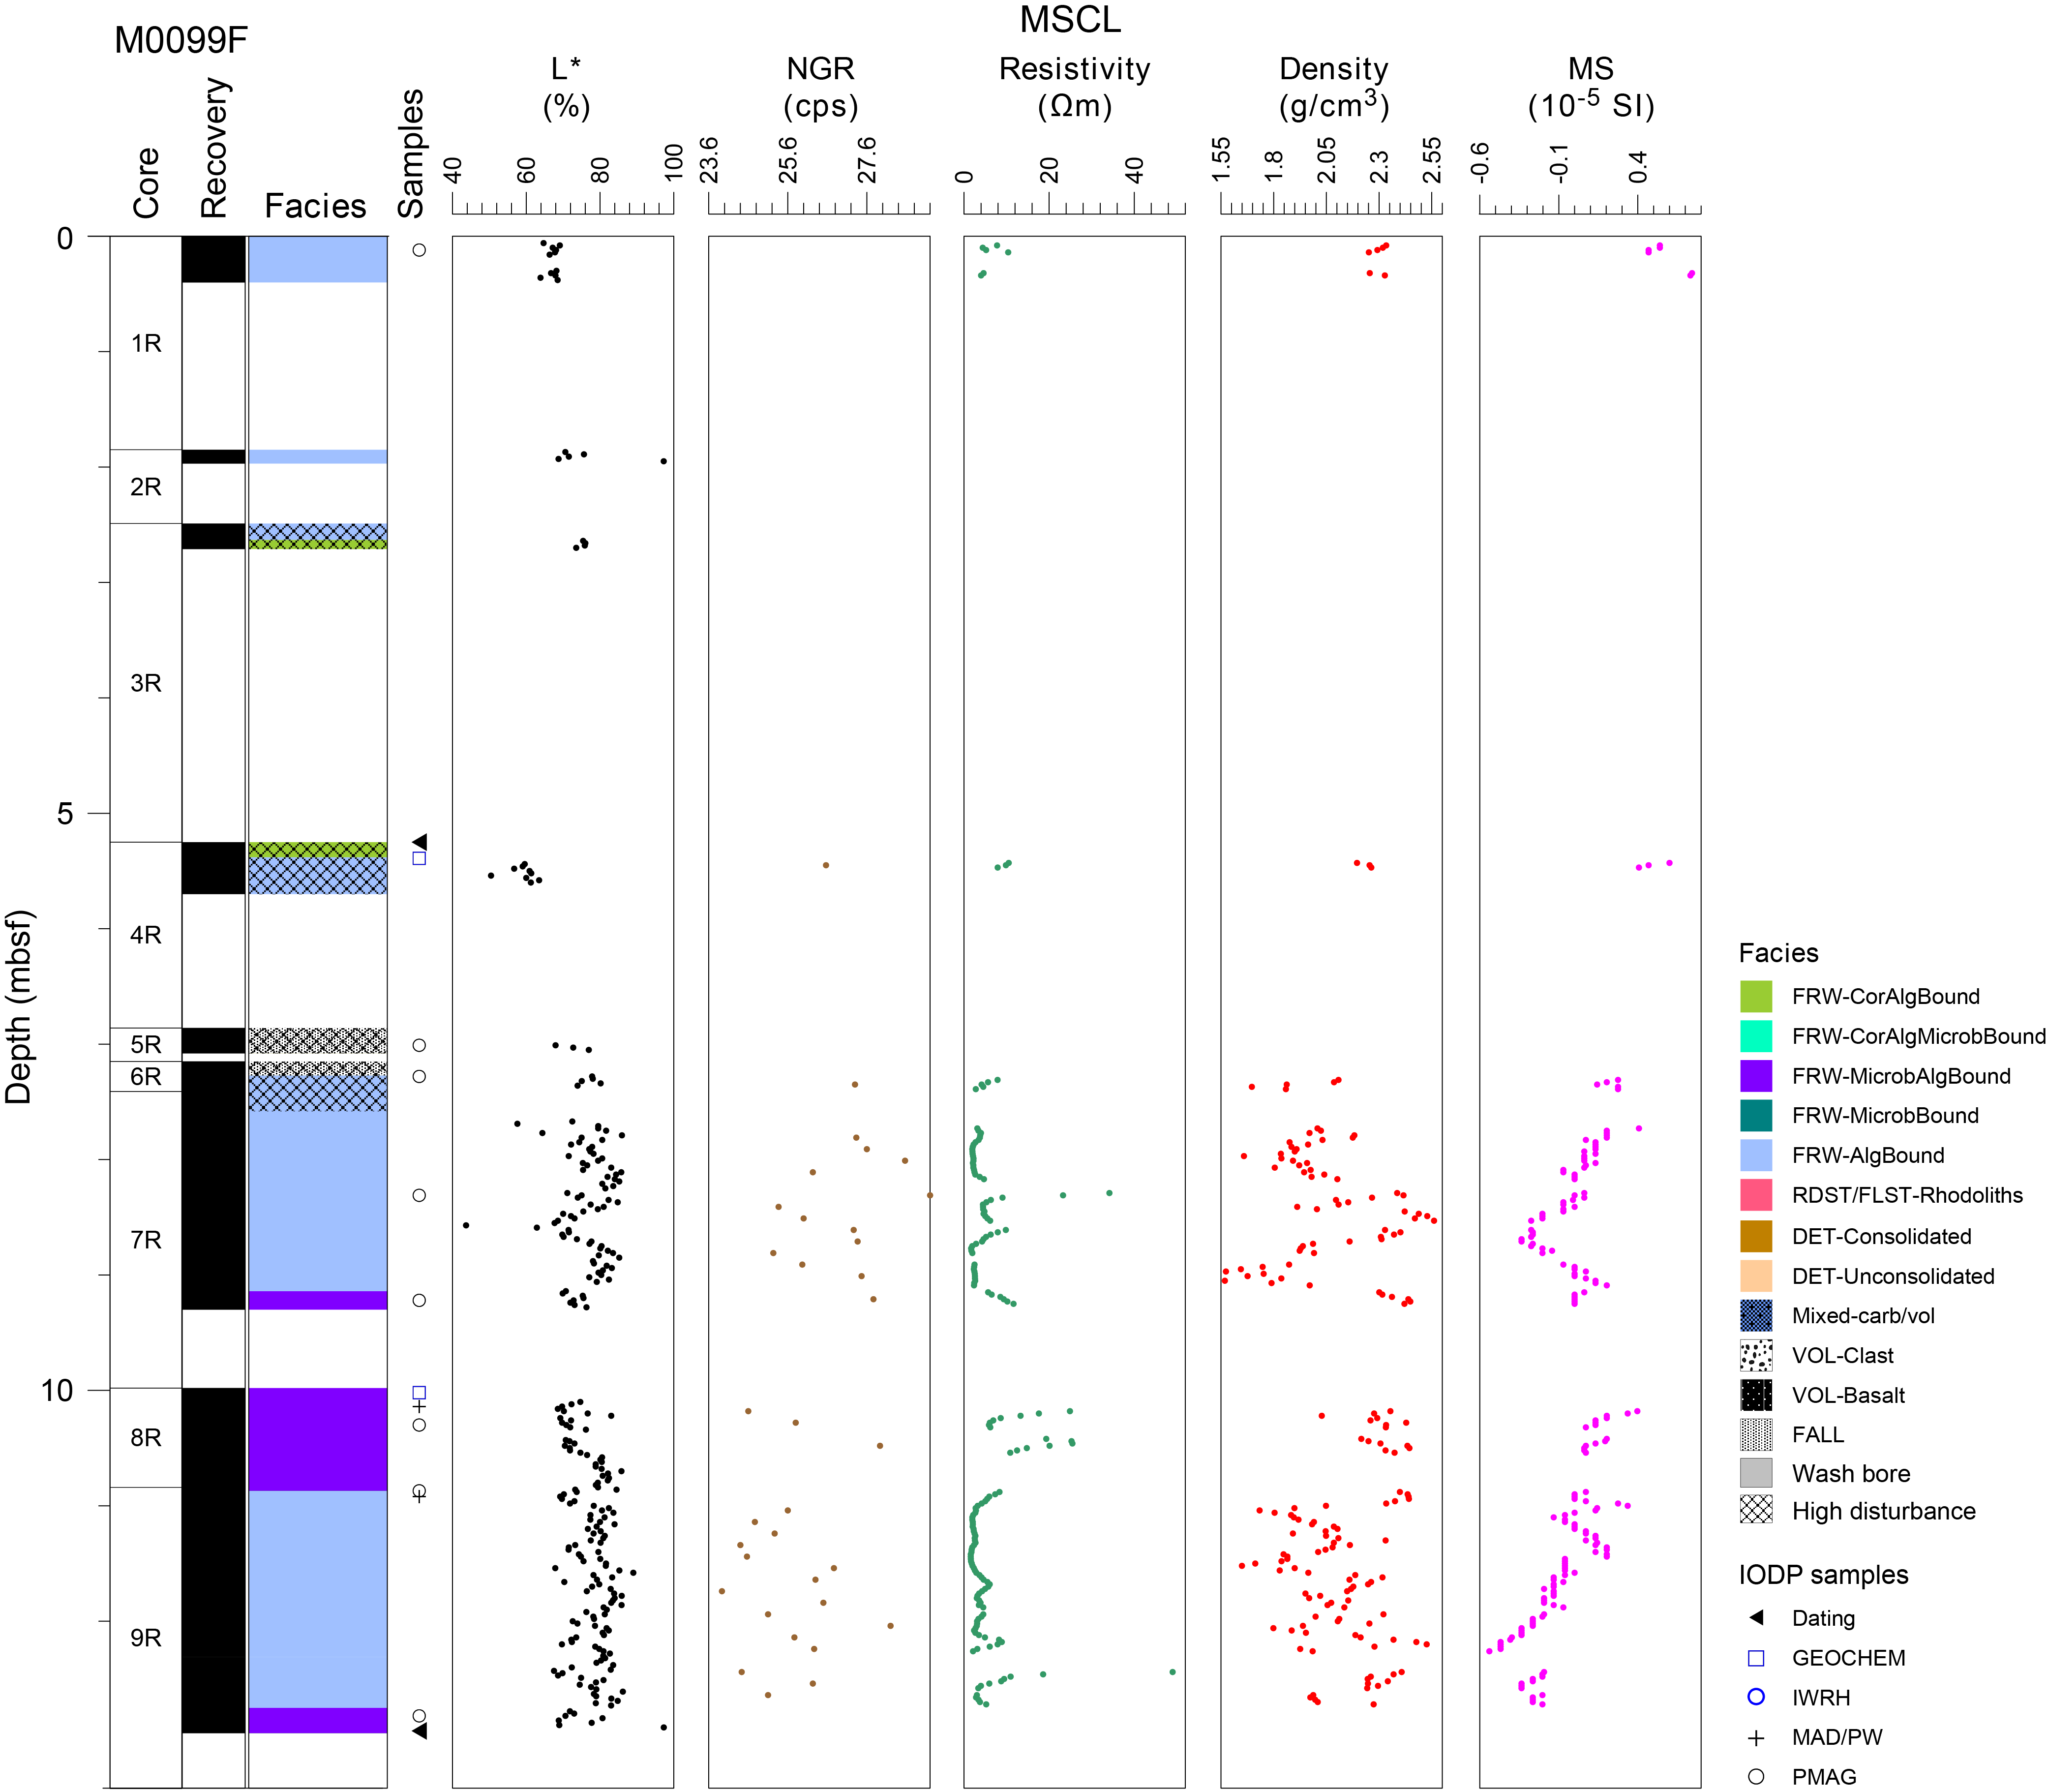
Figure F18. Lithostratigraphy and MSCL data, Hole M0099F.
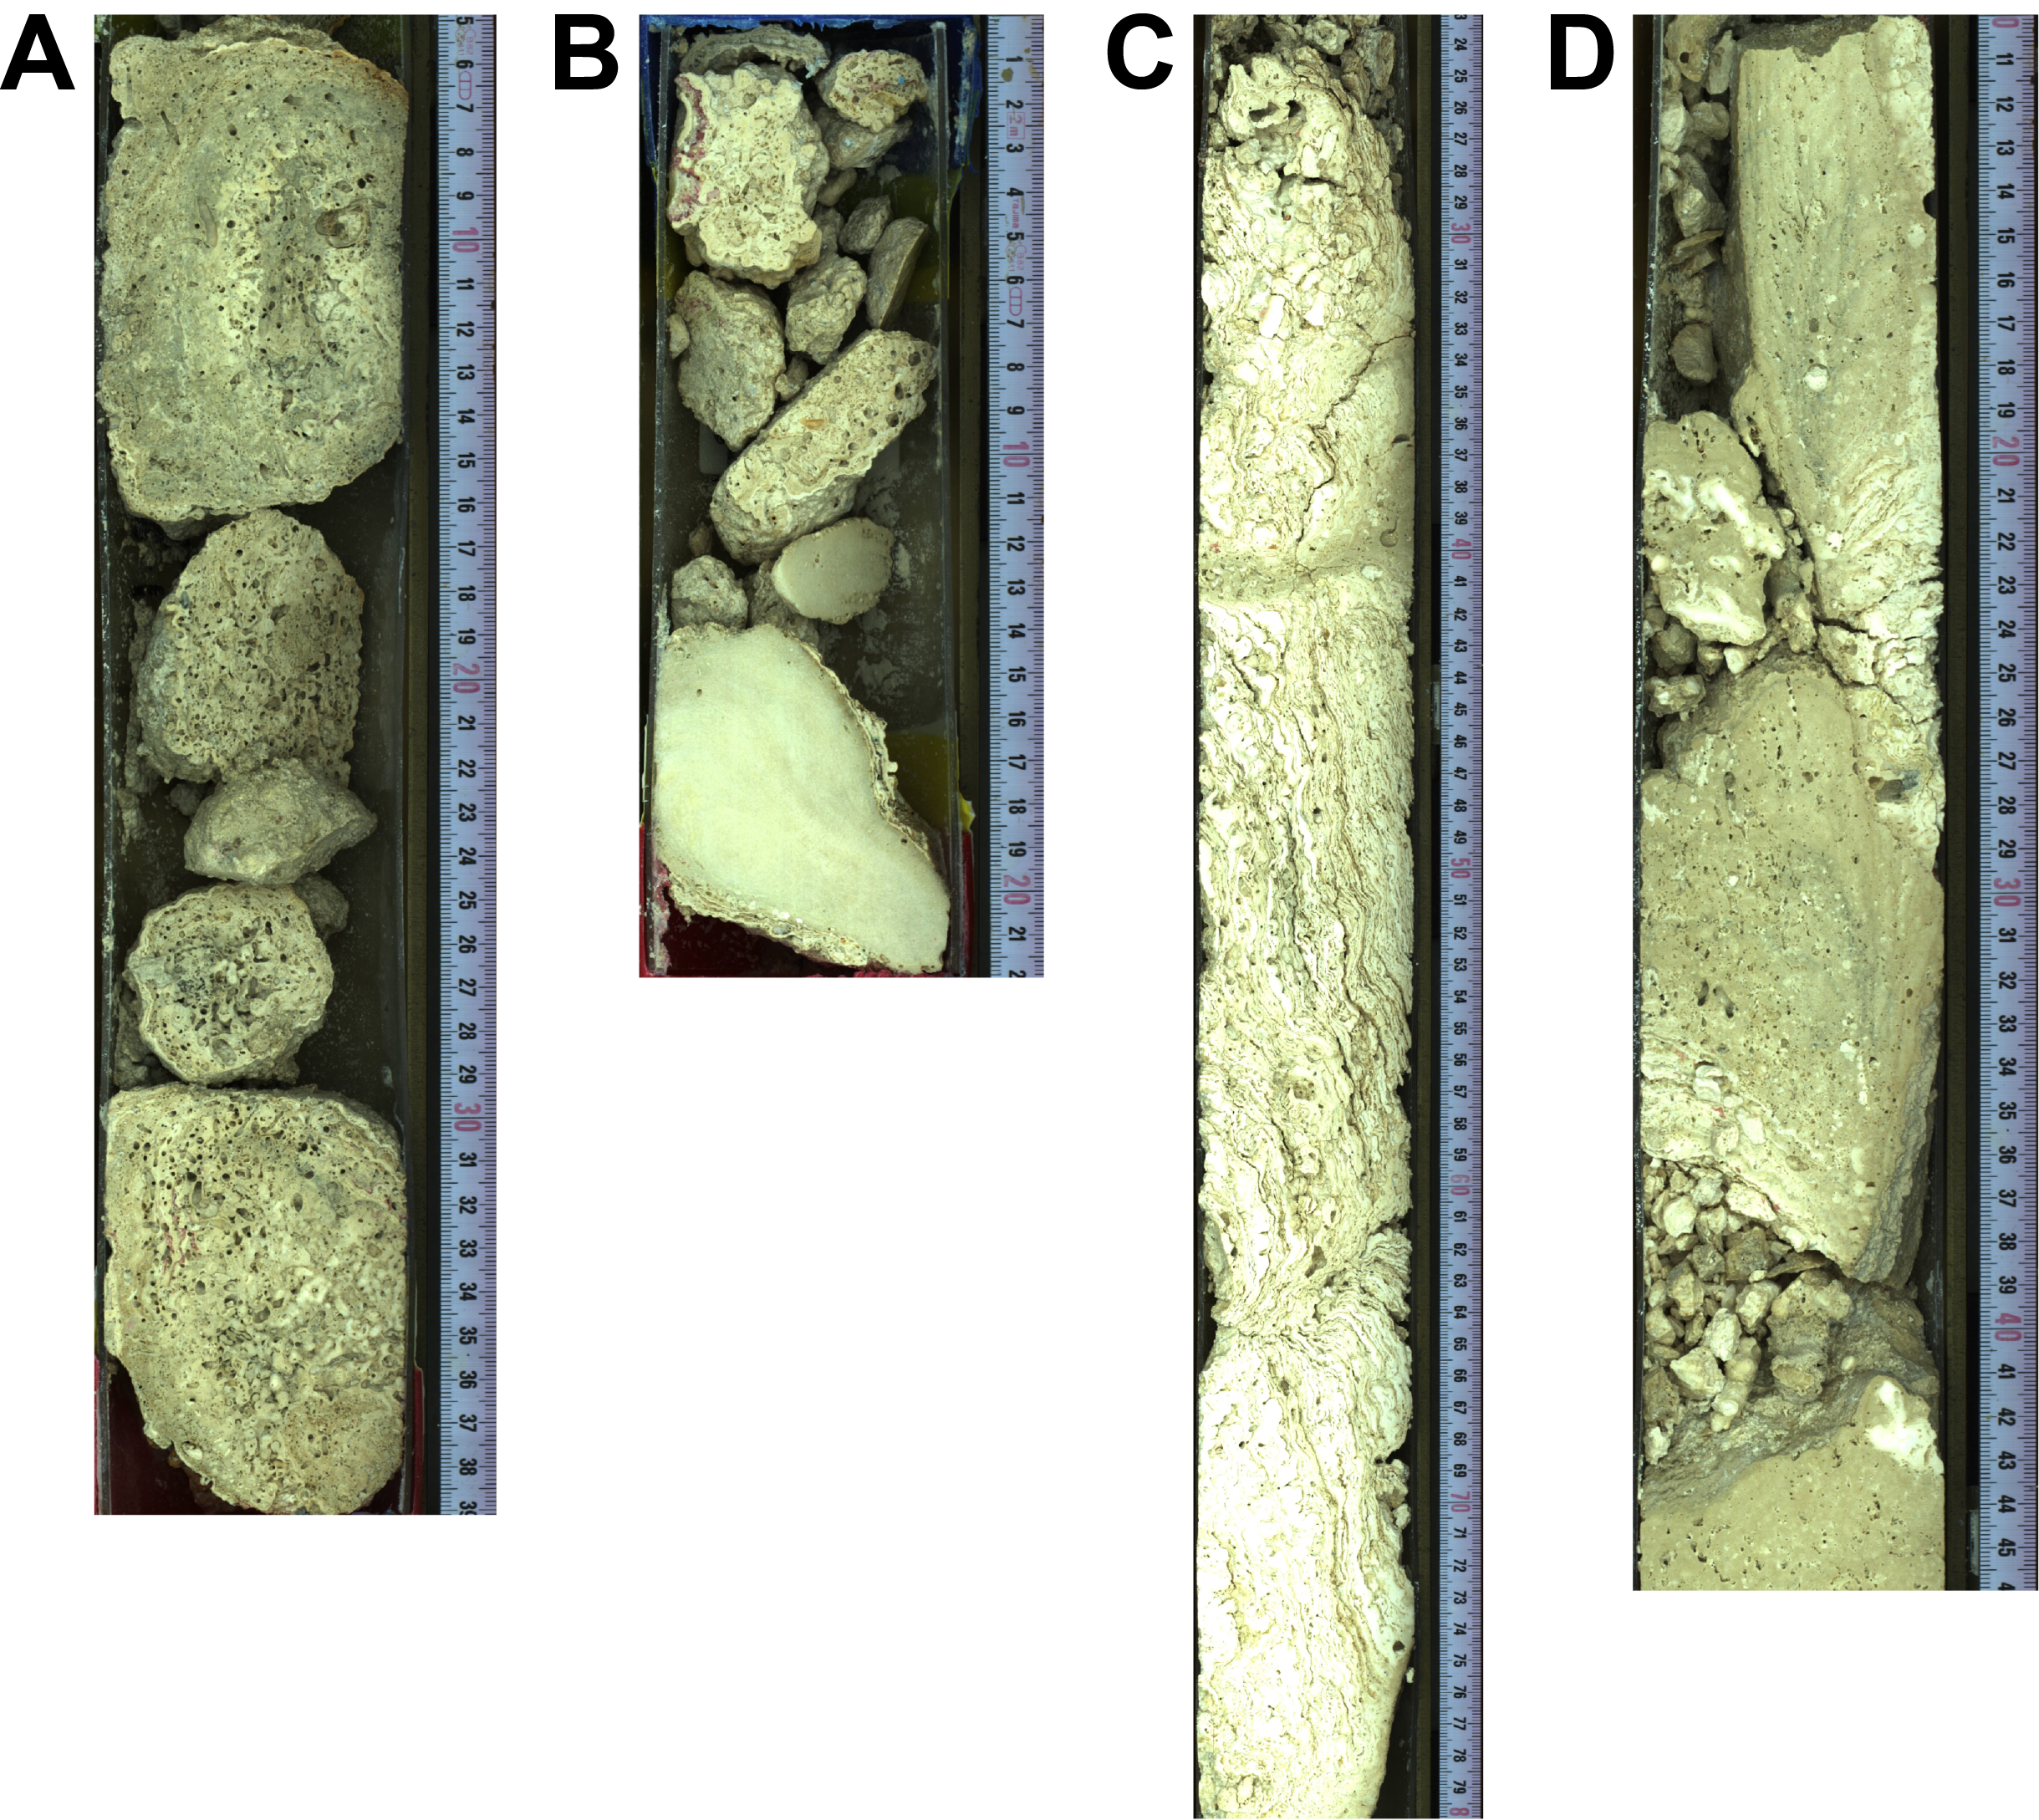
Figure F19. Boundstone.
From 2.65 to 7.15 mbsf, a disturbed coralgal boundstone is composed of branching and submassive to massive Porites, which is bored and has centimeter-scale CCA crusts (Figure F19B). The interval is interrupted from 5.38 to 5.70 mbsf by an algal boundstone with heavily bored and altered CCA and FCA. The bottom 20 cm of this interval also has branches of Pocillopora and pieces of microbialite crust that is possibly fall in material.
From 7.15 to 9.15 mbsf, the dominant facies is algal boundstone with thick (up to 1 m), composite CCA and FCA crusts with Homotrema and vermetids and contains Pocillopora, Cyphastrea, and Porites (Figure F19C). Between these crusts and in framework cavities, centimeter- to decimeter-thick microbialite with varying morphology (laminar and columnar to dendritic) occurs. From 9.15 to 10.84 mbsf, microbialites are thicker, laminar, or columnar to structureless and the facies is a microbialite-algal boundstone (Figure F19D). From 10.84 mbsf to the base of the hole at 12.97 mbsf, an algal boundstone with thick CCA crust, some FCA, microbialites, and fragments of Pocillopora and Cyphastrea was recovered, with a 20 cm interval at the bottom of microbialite-algal boundstone.
3. Physical properties
The MSCL data, particularly the NGR and density data, show a marked change in physical properties at around 25 mbsf in Hole M0099C and 15 mbsf in Hole M0099E, which correlates with changes in lithologies. NGR values are relatively high, and density values are relatively low below these depths compared to the intervals above. Physical properties data for Site M0099 are shown in Table T2 in the Site M0096 chapter (Webster et al., 2025b).
3.1. Hole M0099A
A total of 3.99 m of core from Hole M0099A was scanned with the MSCL, and the core exhibited moderate drilling-induced disturbance, resulting in 52% of the acquired data passing QA/QC (see Table T10 in the Expedition 389 methods chapter [Webster et al., 2025a]). Three discrete samples were taken for P-wave velocity and moisture and density (MAD) measurements. Digital linescans, color reflectance, and hyperspectral imaging were acquired on all cores.
3.1.1. Density and porosity
Data for density and porosity measurements are presented in Figures F2 and F20. MSCL bulk density values range 1.78–2.52 g/cm3. Drilling-induced disturbance and short core lengths compromised data quality (see Physical properties in the Expedition 389 methods chapter [Webster et al., 2025a]) and limited sampling. Three discrete samples were analyzed for MAD, giving bulk density values in the range of 2.28 to 2.47 g/cm3. Porosity values for the same samples range 17.4%–28.3%, and grain density values fall between 2.772 and 2.776 g/cm3. There are no clear downhole trends in the density and porosity data sets and no clear relationship between the two bulk density measurements (MSCL and discrete).
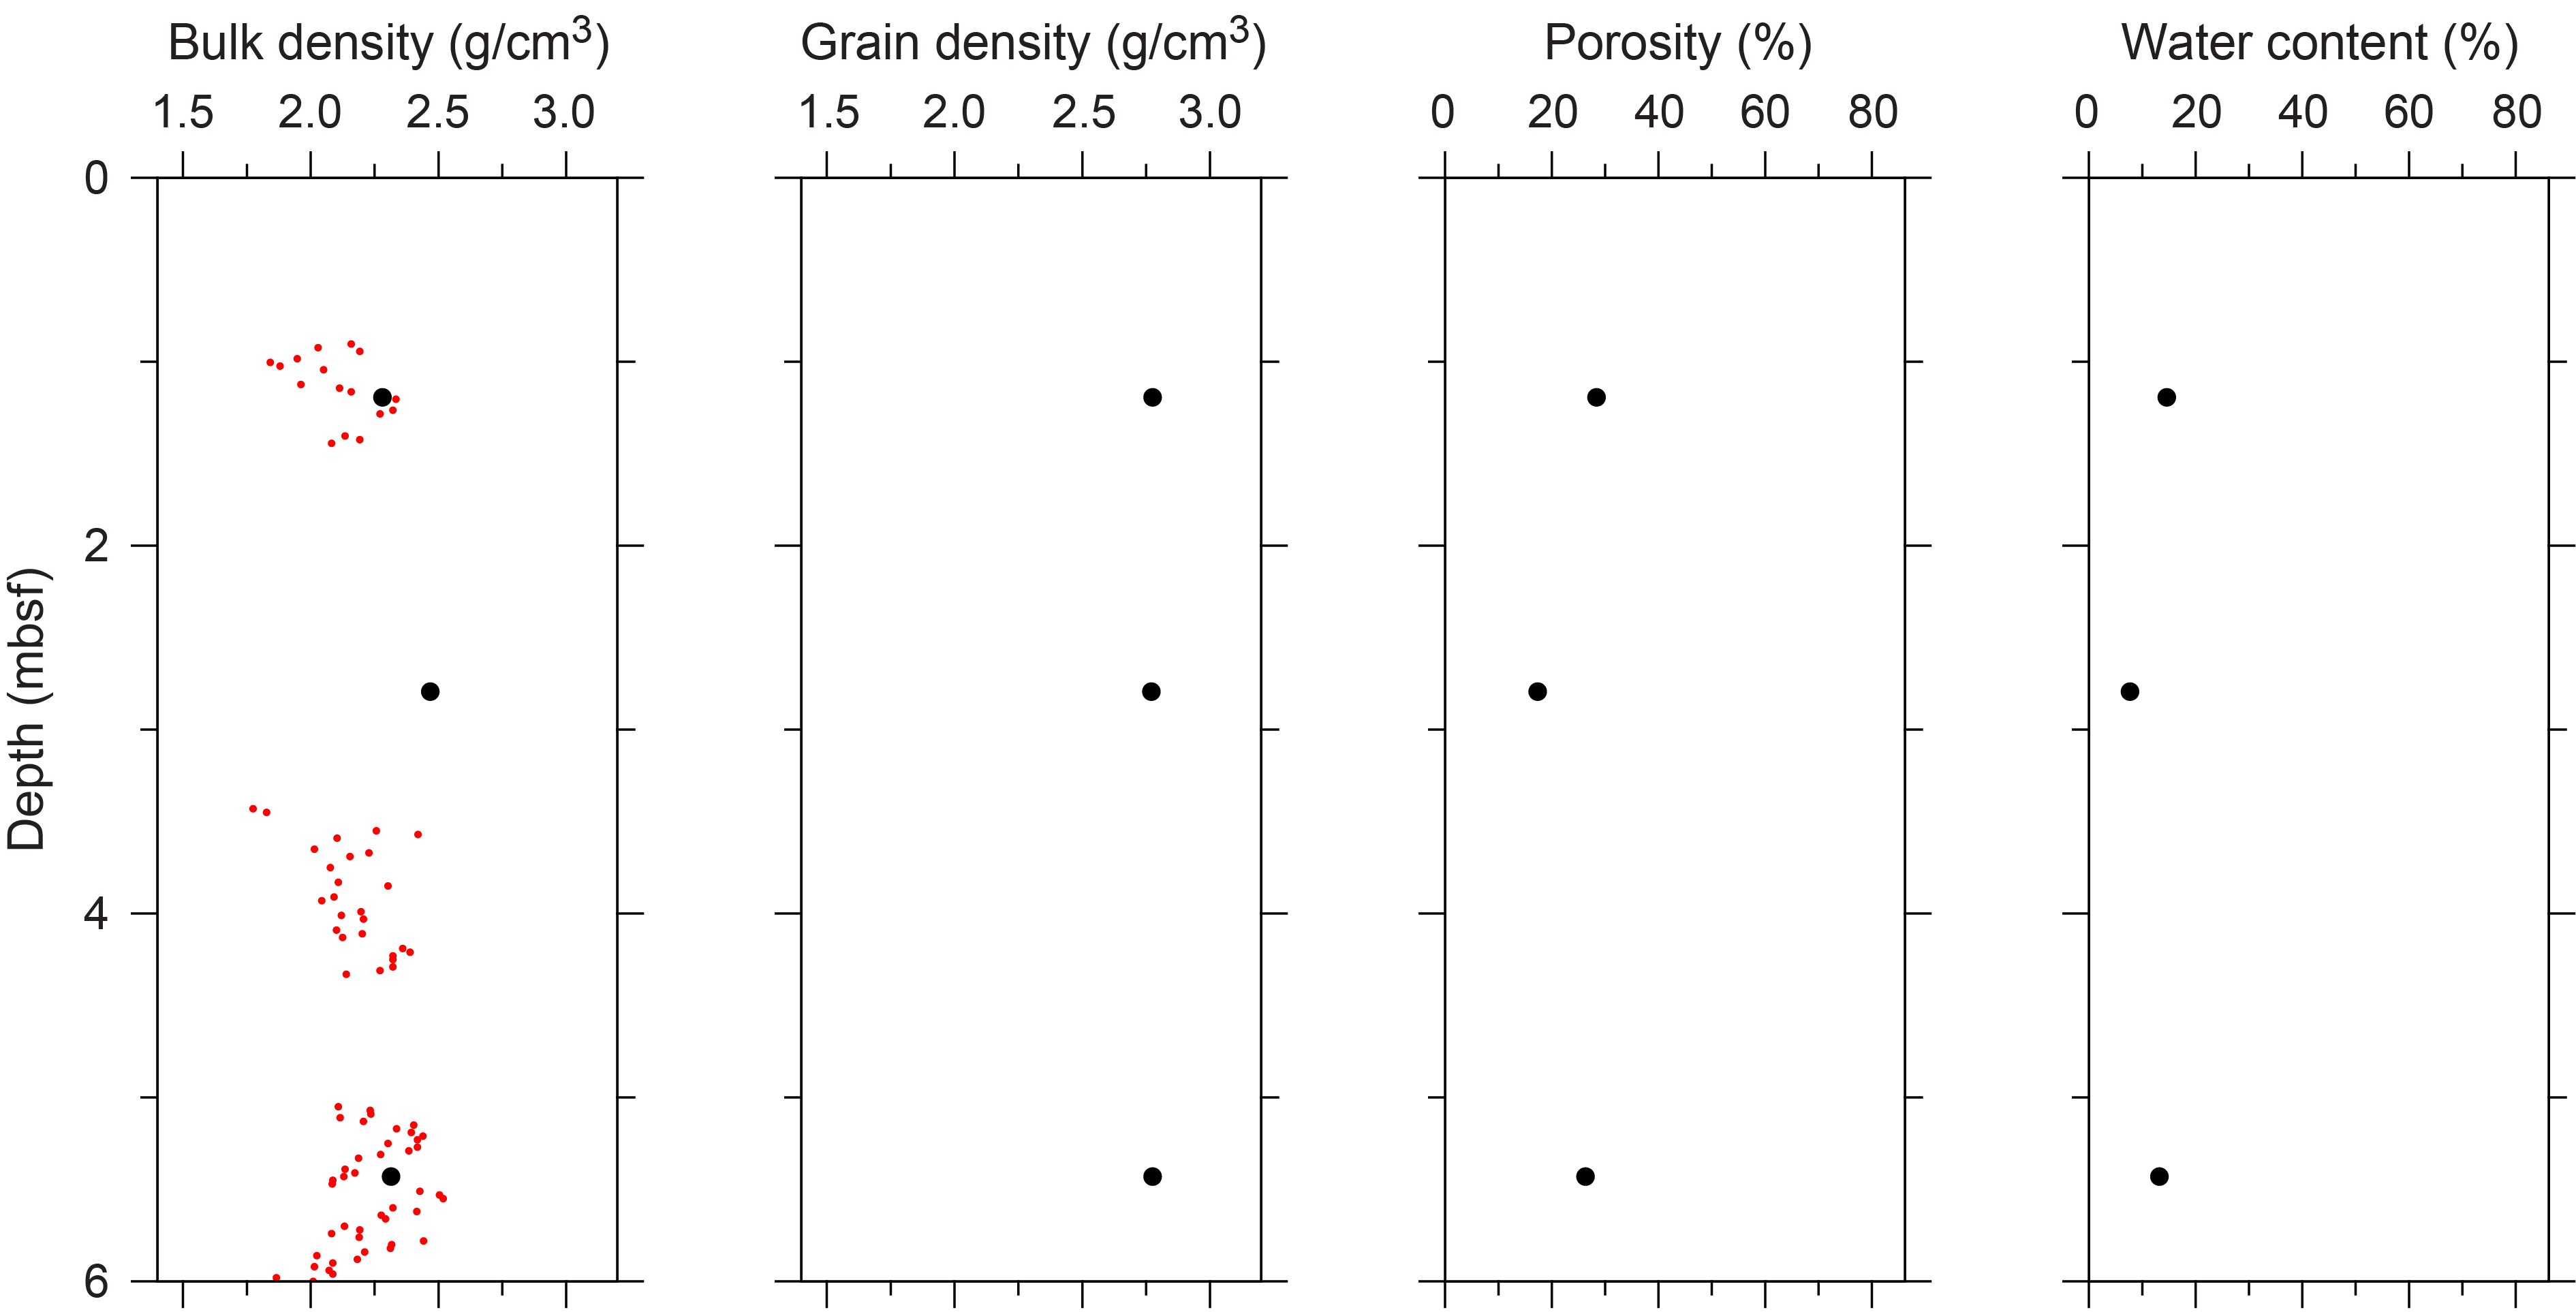
Figure F20. Physical properties, Hole M0099A.
3.1.2. P-wave velocity
MSCL P-wave velocity measurements on Hole M0099A cores yielded no data. One sample was measured using the discrete P-wave logger in the dry state, and a P-wave velocity value of 4606 m/s was obtained (Figure F21). P-wave velocity recorded for the three samples after resaturation ranges 3289–4753 m/s. Because of the limited P-wave data points available, there are no apparent downhole trends.
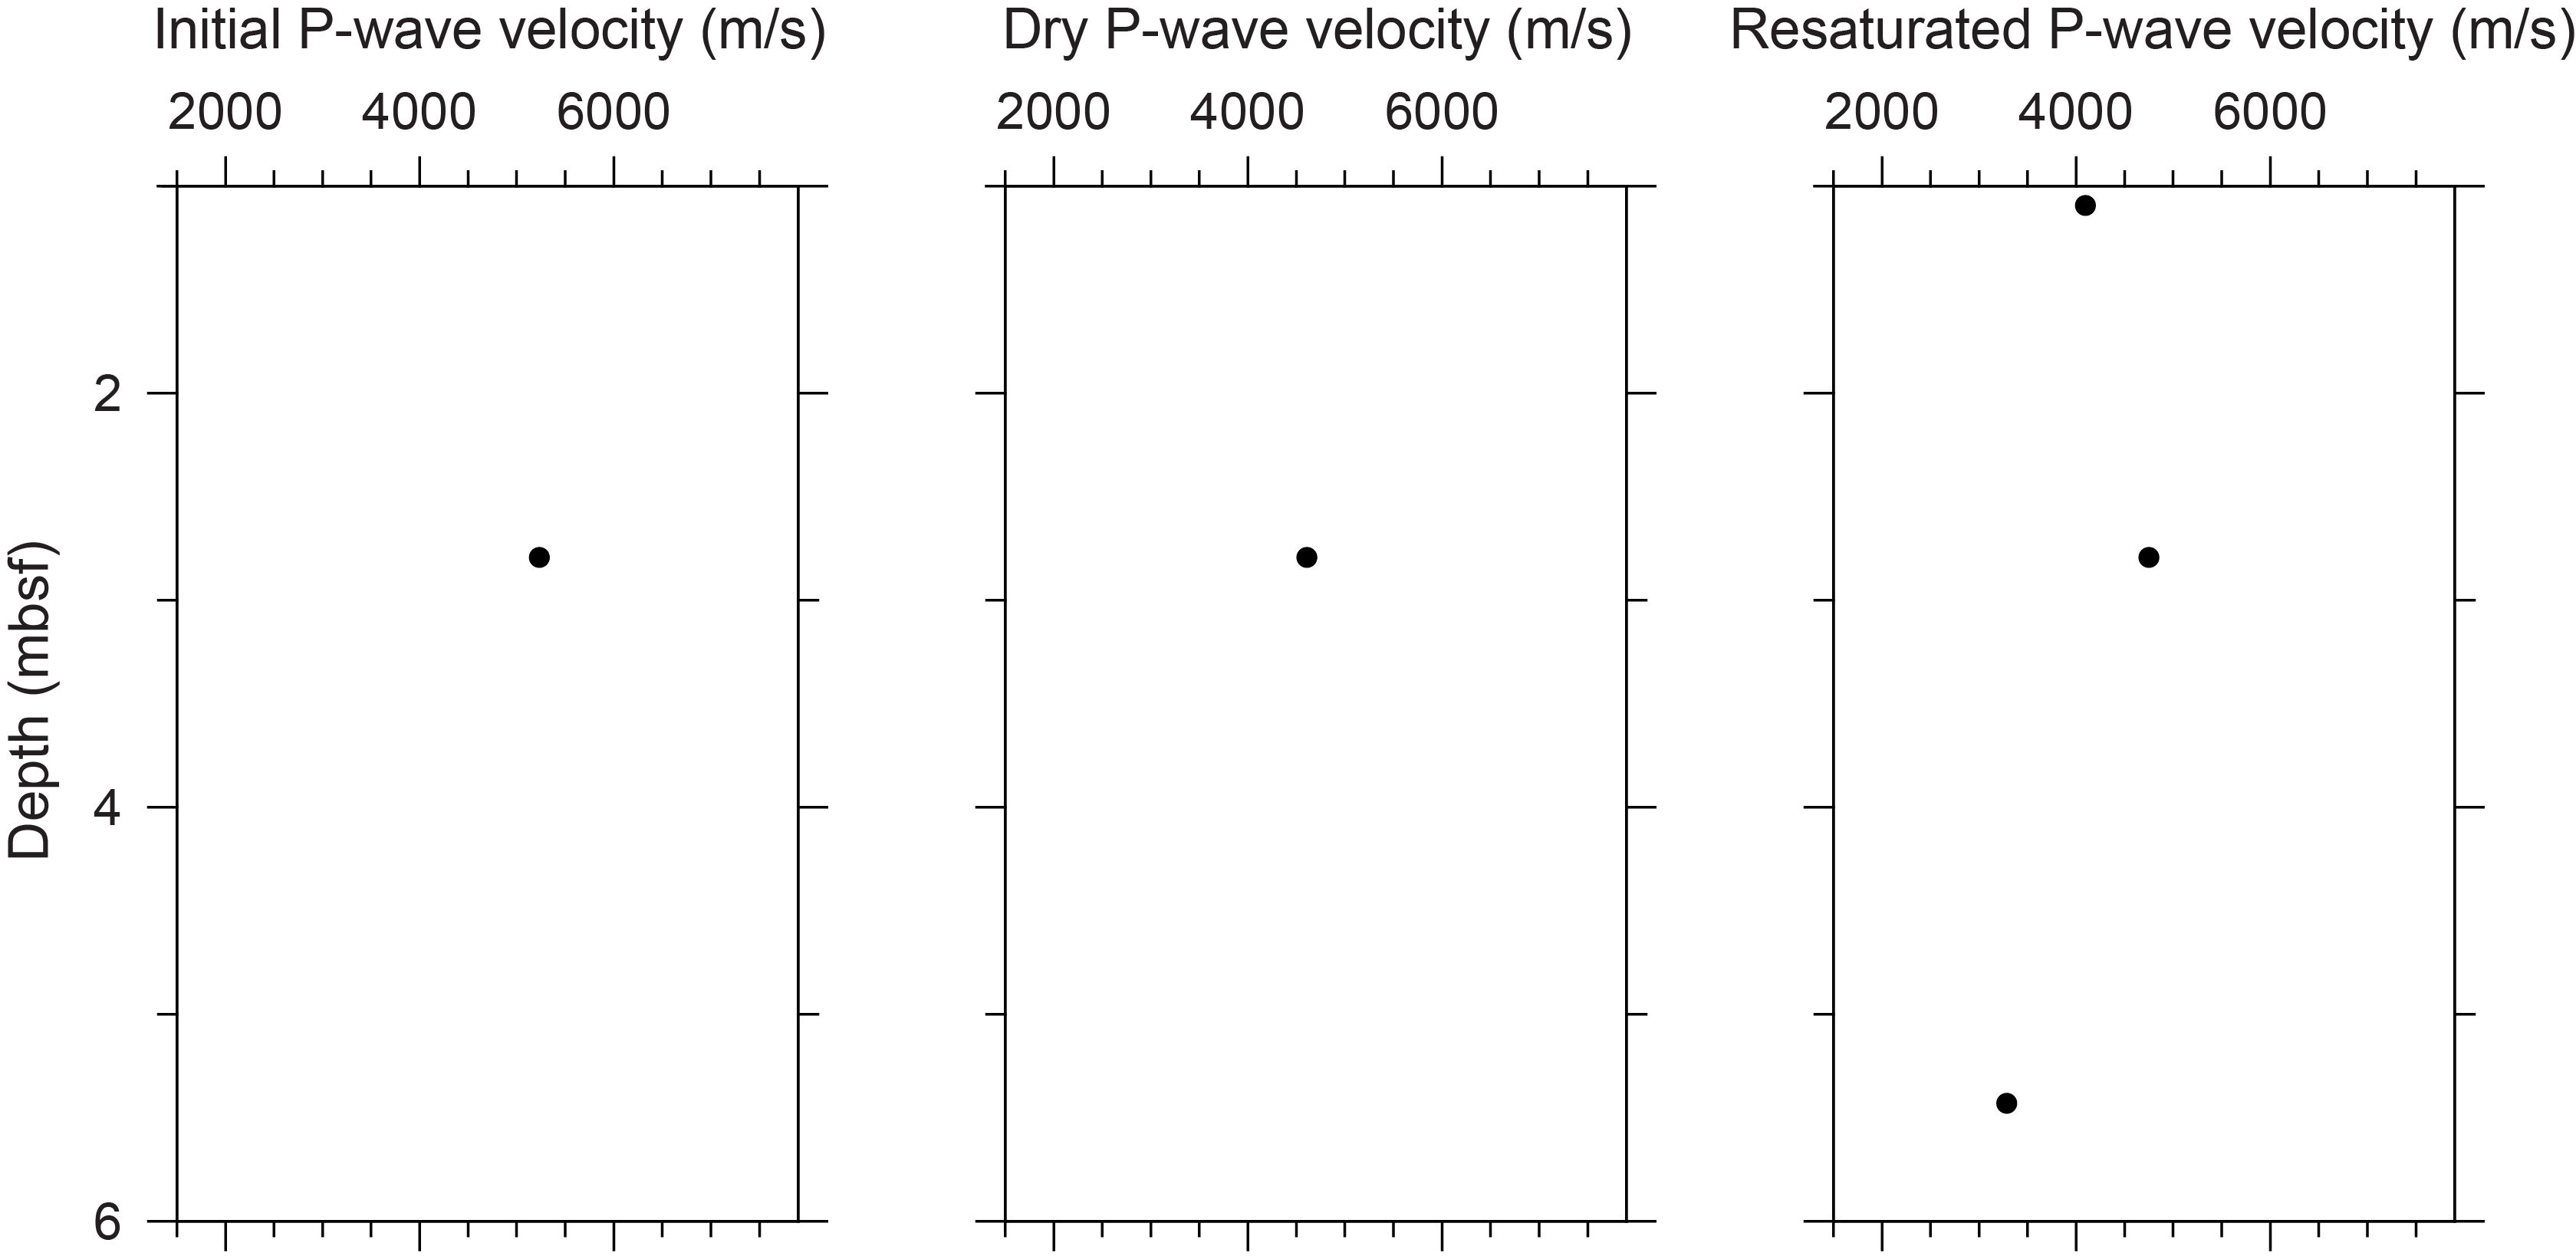
Figure F21. P-wave velocities, Hole M0099A.
3.1.3. Thermal conductivity
Because of the presence of drilling-induced disturbances, large voids, and uneven surfaces, thermal conductivity measurements were not performed for Hole M0099A.
3.1.4. Magnetic susceptibility
MSCL magnetic susceptibility data range −1.02 × 10⁻⁵ to 12.05 × 10⁻⁵ SI (Figure F2). However, the majority of magnetic susceptibility values fall close to 0.35 × 10⁻⁵ SI. There are no apparent downhole trends.
3.1.5. Electrical resistivity
MSCL noncontact resistivity measurements yielded data ranging 2.89–49.79 Ωm (Figure F2). Similar to the other data sets for Hole M0099A, there are no apparent downhole trends or notable features in the resistivity data.
3.1.6. Natural gamma radiation
MSCL NGR measurements display values ranging 25–28 counts/s and show no apparent downhole trends (Figure F2).
3.1.7. Digital linescans, color reflectance, and hyperspectral imaging
All Hole M0099A cores were digitally scanned, and, where appropriate, measured for color reflectance and imaged with the hyperspectral scanner (see HYPERSPECTRAL in Supplementary material). Color reflectance L* values vary between 62.71% and 86.34% (Figure F2), a* varies between −0.50 and 2.82, b* varies between 10.22 and 19.91, and a*/b* varies between −0.03 and 0.15.
3.2. Hole M0099B
A total of 4.05 m of core from Hole M0099B was scanned with the MSCL. The core exhibited moderate drilling-induced disturbance, resulting in 45% of the acquired data passing QA/QC (see Table T10 in the Expedition 389 methods chapter [Webster et al., 2025a]). Three discrete samples were taken for P-wave velocity and MAD measurements. Digital linescans, color reflectance, and hyperspectral imaging were acquired on all cores.
3.2.1. Density and porosity
Data for density and porosity measurements are presented in Figures F4 and F22. MSCL bulk density values range 1.84–2.46 g/cm3. Drilling-induced disturbance and short core lengths compromised data quality (see Physical properties in the Expedition 389 methods chapter [Webster et al., 2025a]) and limited sampling. Three discrete samples were analyzed for MAD, giving bulk density values in the range of 2.34 to 2.37 g/cm3. Porosity values for the same samples range 21.5%–27.1%, and grain density values fall between 2.738 and 2.850 g/cm3.
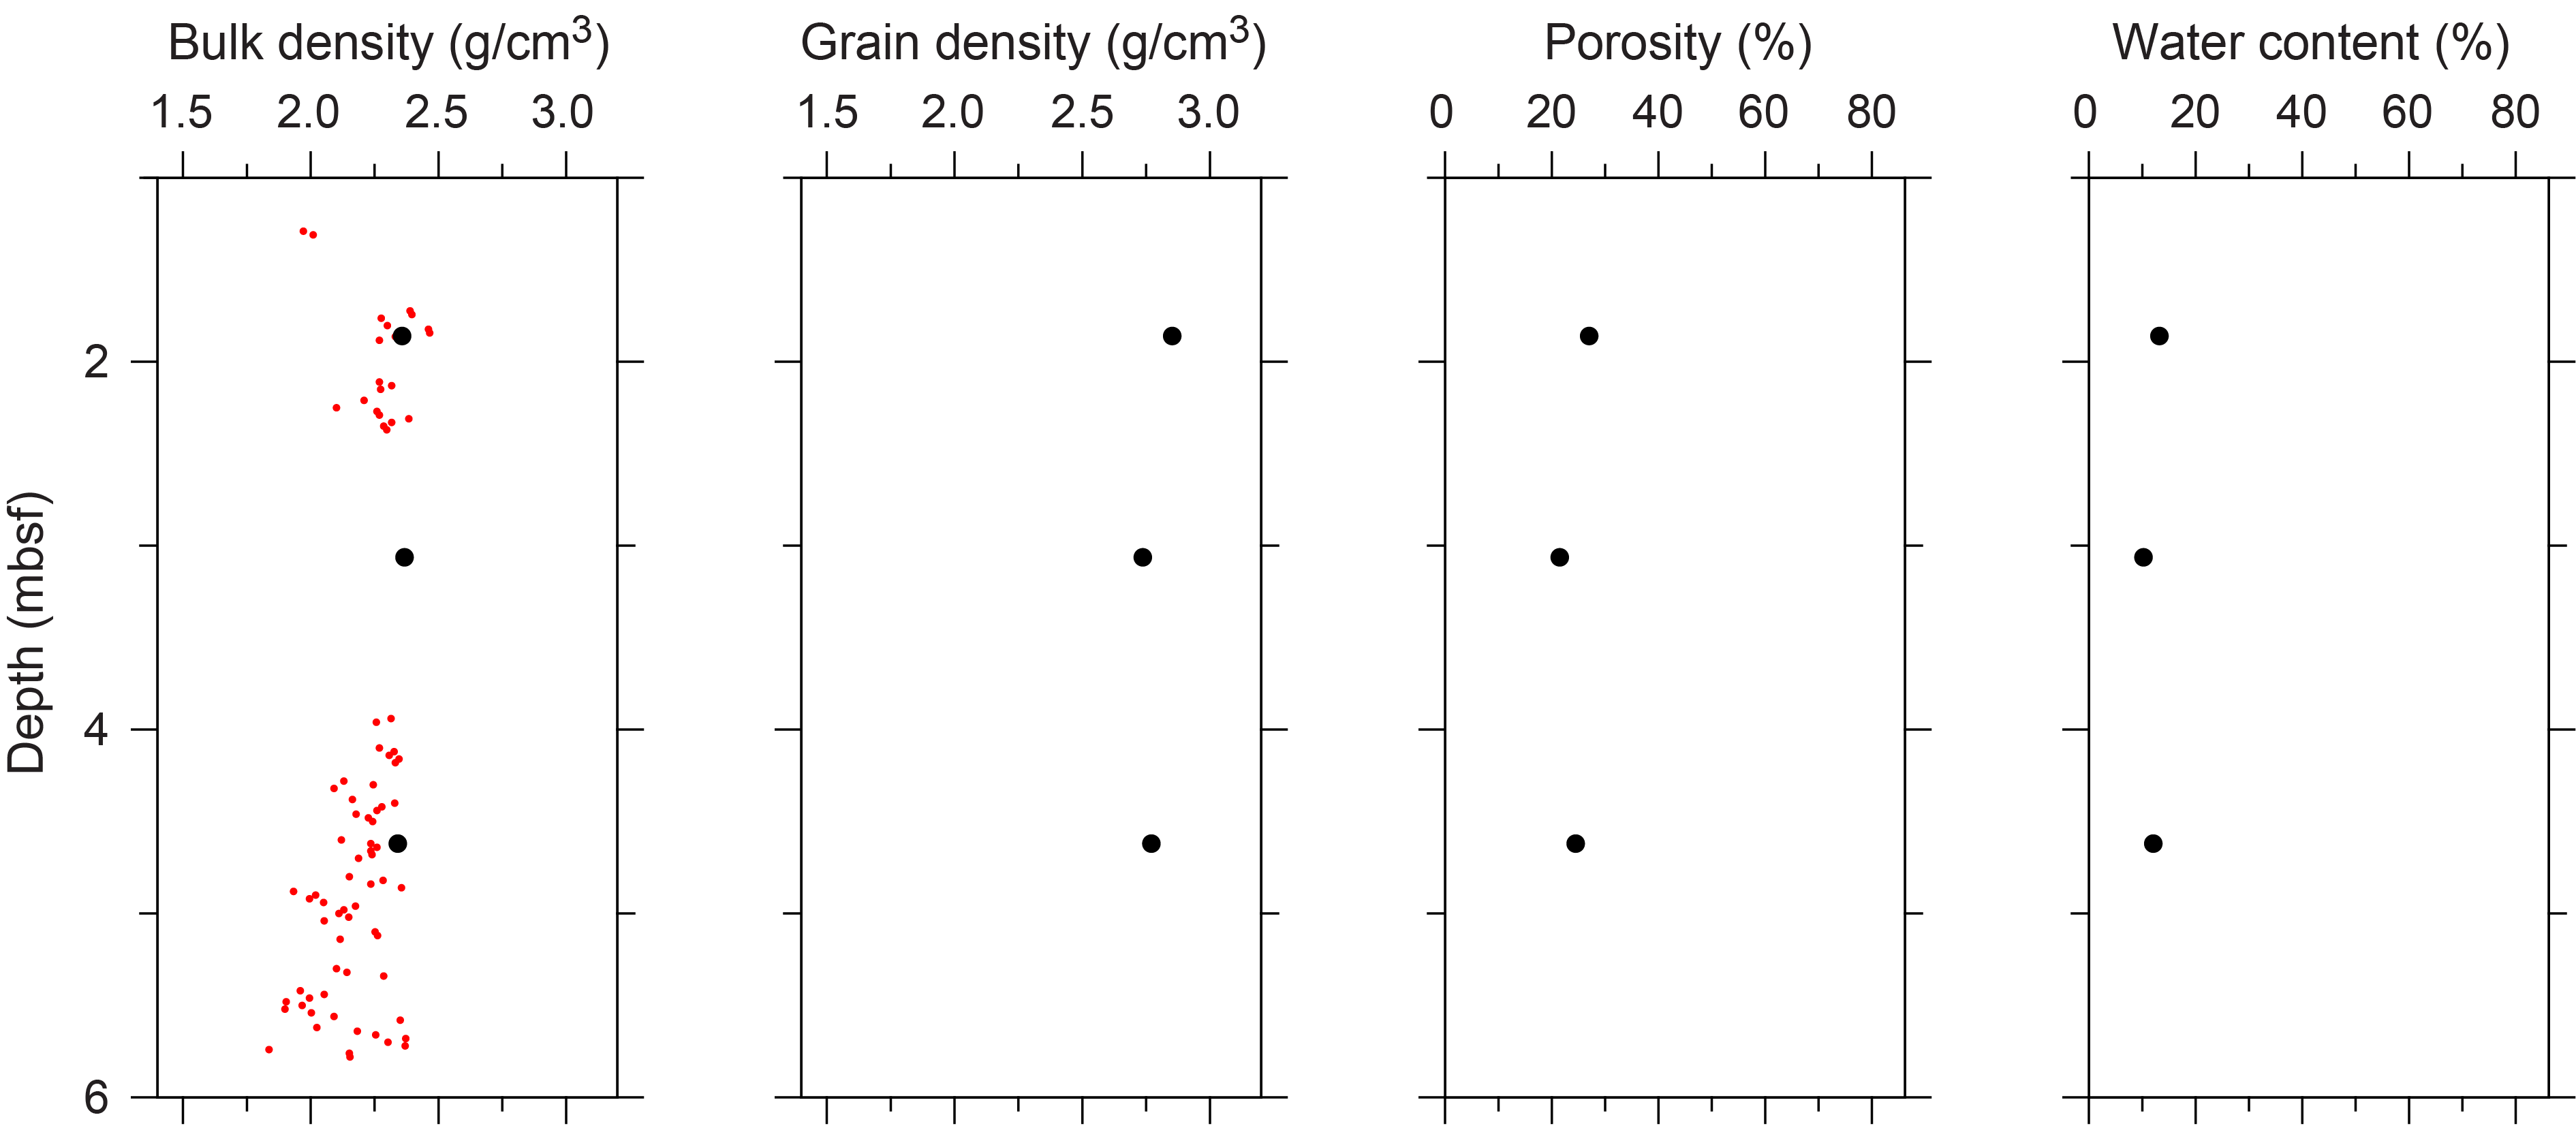
Figure F22. Physical properties, Hole M0099B.
3.2.2. P-wave velocity
MSCL P-wave velocity measurements on Hole M0099B cores yielded no data. Two samples were measured using the discrete P-wave logger. Dry measurement values range 3812–3837 m/s (Figure F23). P-wave velocity recorded for samples after resaturation range 3792–3993 m/s. Because of the limited P-wave data points available, there are no apparent downhole trends.
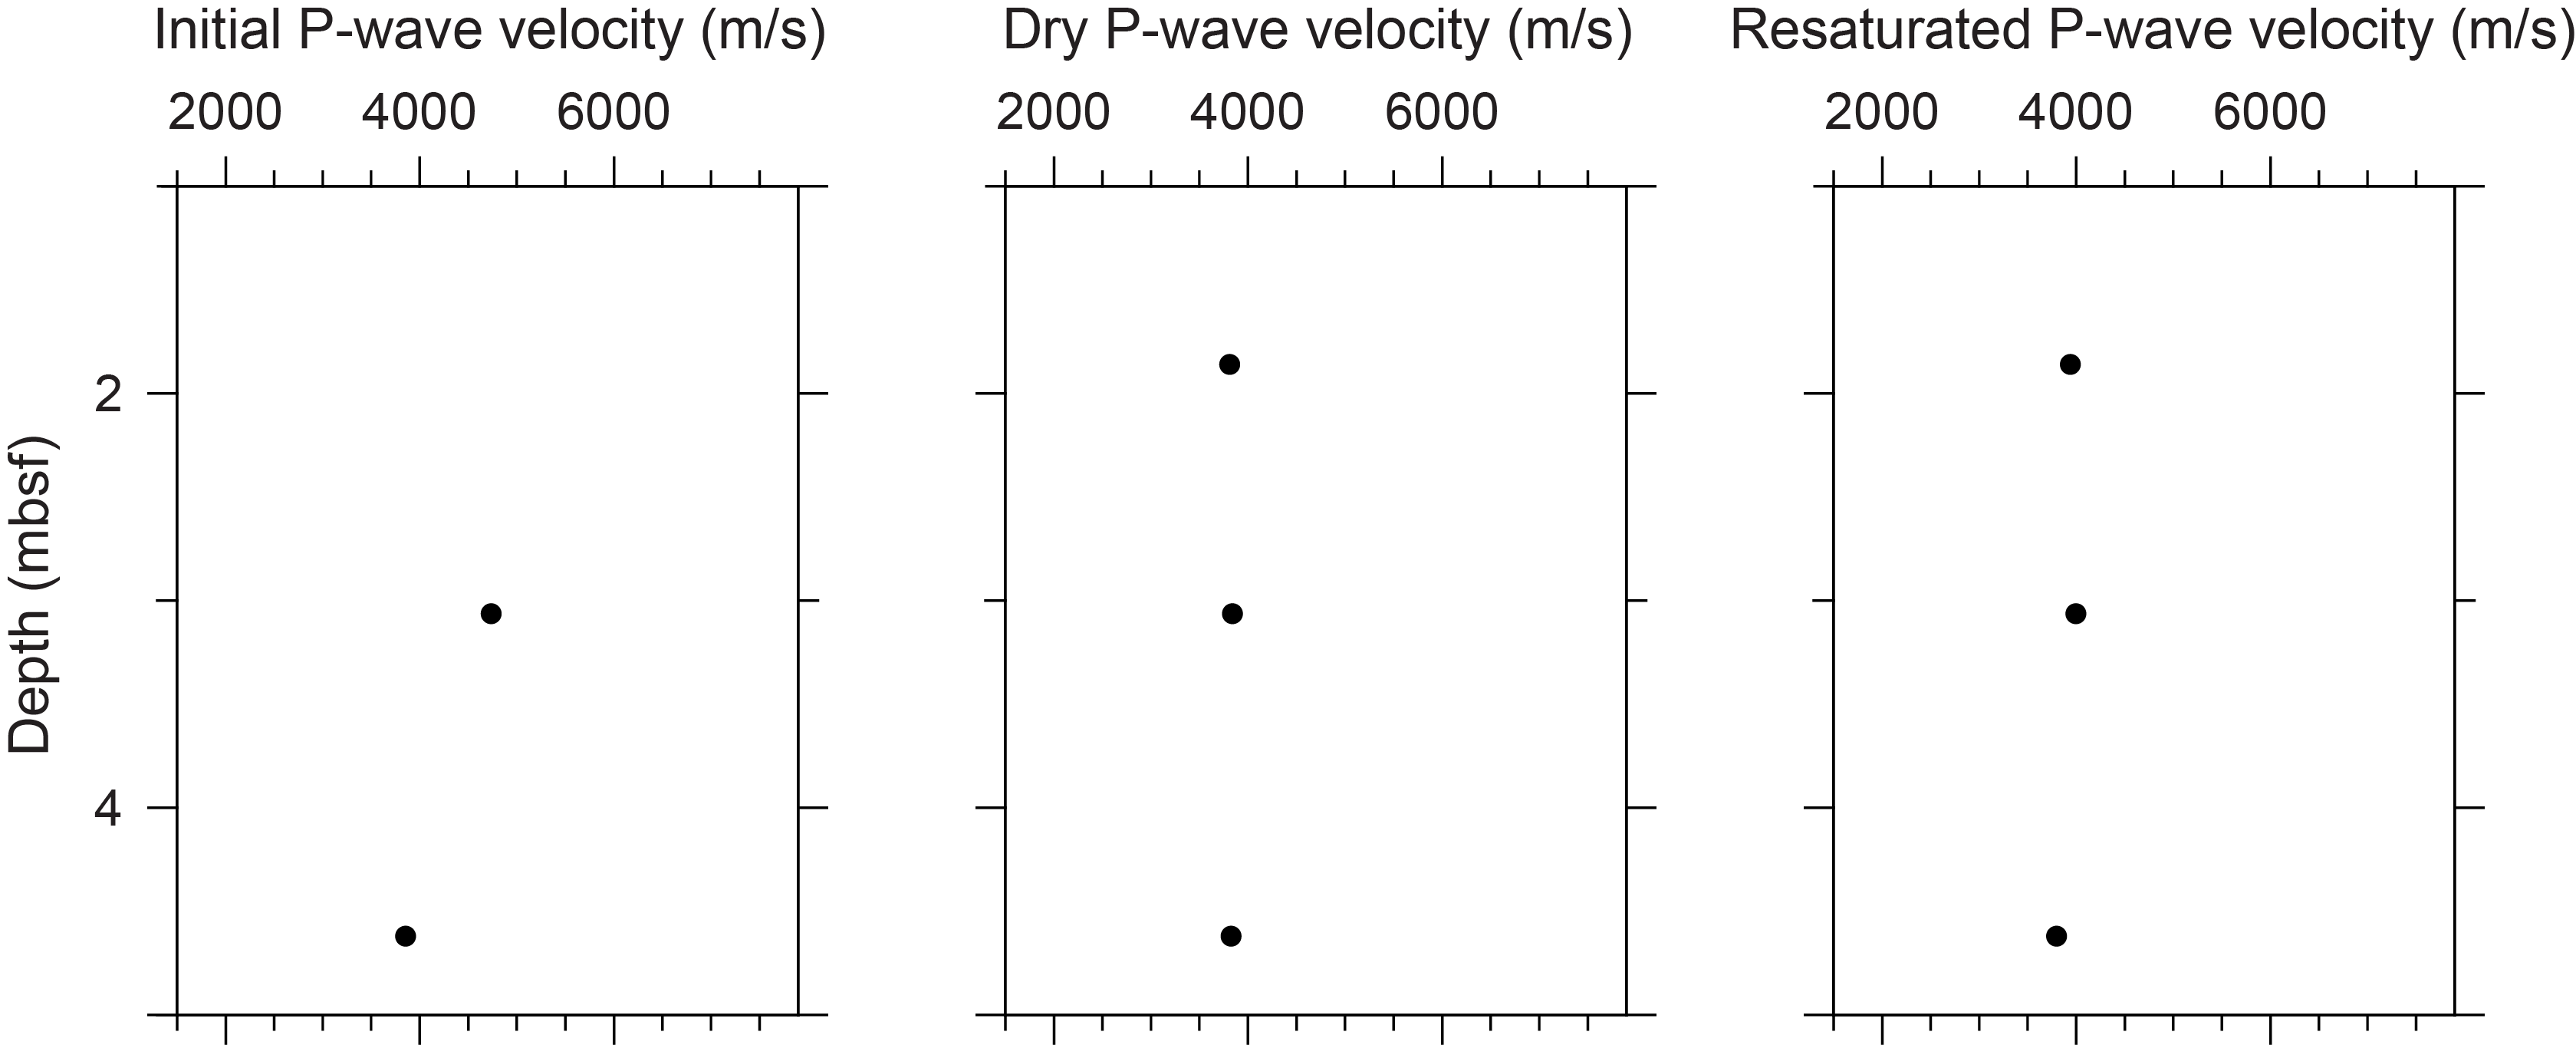
Figure F23. P-wave velocities, Hole M0099B.
3.2.3. Thermal conductivity
Because of the presence of drilling-induced disturbances, large voids, and uneven surfaces, thermal conductivity measurements were not performed for Hole M0099B.
3.2.4. Magnetic susceptibility
MSCL magnetic susceptibility data range −1.55 × 10⁻⁵ to −0.48 × 10⁻⁵ SI (Figure F4). However, the majority of magnetic susceptibility values fall close to −1.04 × 10⁻⁵ SI, and there are no apparent downhole trends.
3.2.5. Electrical resistivity
MSCL noncontact resistivity measurements on Hole M0099B cores yielded data ranging 2.21–22.66 Ωm (Figure F4). Similar to the other data sets for this hole, there are no apparent downhole trends or notable features in the resistivity data.
3.2.6. Natural gamma radiation
MSCL NGR measurements for Hole M0099B display values ranging 25–28 counts/s and show no significant downhole variation, similar to Hole M0099A (Figure F4).
3.2.7. Digital linescans, color reflectance, and hyperspectral imaging
All cores from Hole M0099B were digitally scanned, and, where appropriate, measured for color reflectance and imaged with the hyperspectral scanner (see HYPERSPECTRAL in Supplementary material). Color reflectance L* values vary between 62.88% and 82.09% (Figure F4), a* varies between −1.02 and 2.43, b* varies between 12.20 and 20.06, and a*/b* varies between −0.08 and 0.14.
3.3. Hole M0099C
A total of 24.06 m of core from Hole M0099C was scanned with the MSCL, and the core exhibited moderate drilling-induced disturbance, resulting in 57% of the acquired data passing QA/QC (see Table T10 in the Expedition 389 methods chapter [Webster et al., 2025a]). A total of 15 discrete samples were sampled for P-wave velocity and MAD measurements. Digital linescans, color reflectance, and hyperspectral imaging were acquired on all cores.
3.3.1. Density and porosity
Data for density and porosity measurements are presented in Figures F7 and F24. MSCL bulk density values range 0.54–2.52 g/cm3. Low densities (<1 g/cm3) represent natural vugs and not drilling-induced damages, which have been cleaned up in the MSCL data sets (see Physical properties in the Expedition 389 methods chapter [Webster et al., 2025a]). A total of 15 discrete samples were analyzed for MAD, giving bulk density values in the range of 2.27 to 2.48 g/cm3. Porosity values for the same samples range 14.6%–30.0%, and grain density values fluctuate between 2.726 and 2.804 g/cm3. There is an apparent downhole trend in the density data set, which is characterized by generally lower density values below 25 mbsf compared to those above this horizon.
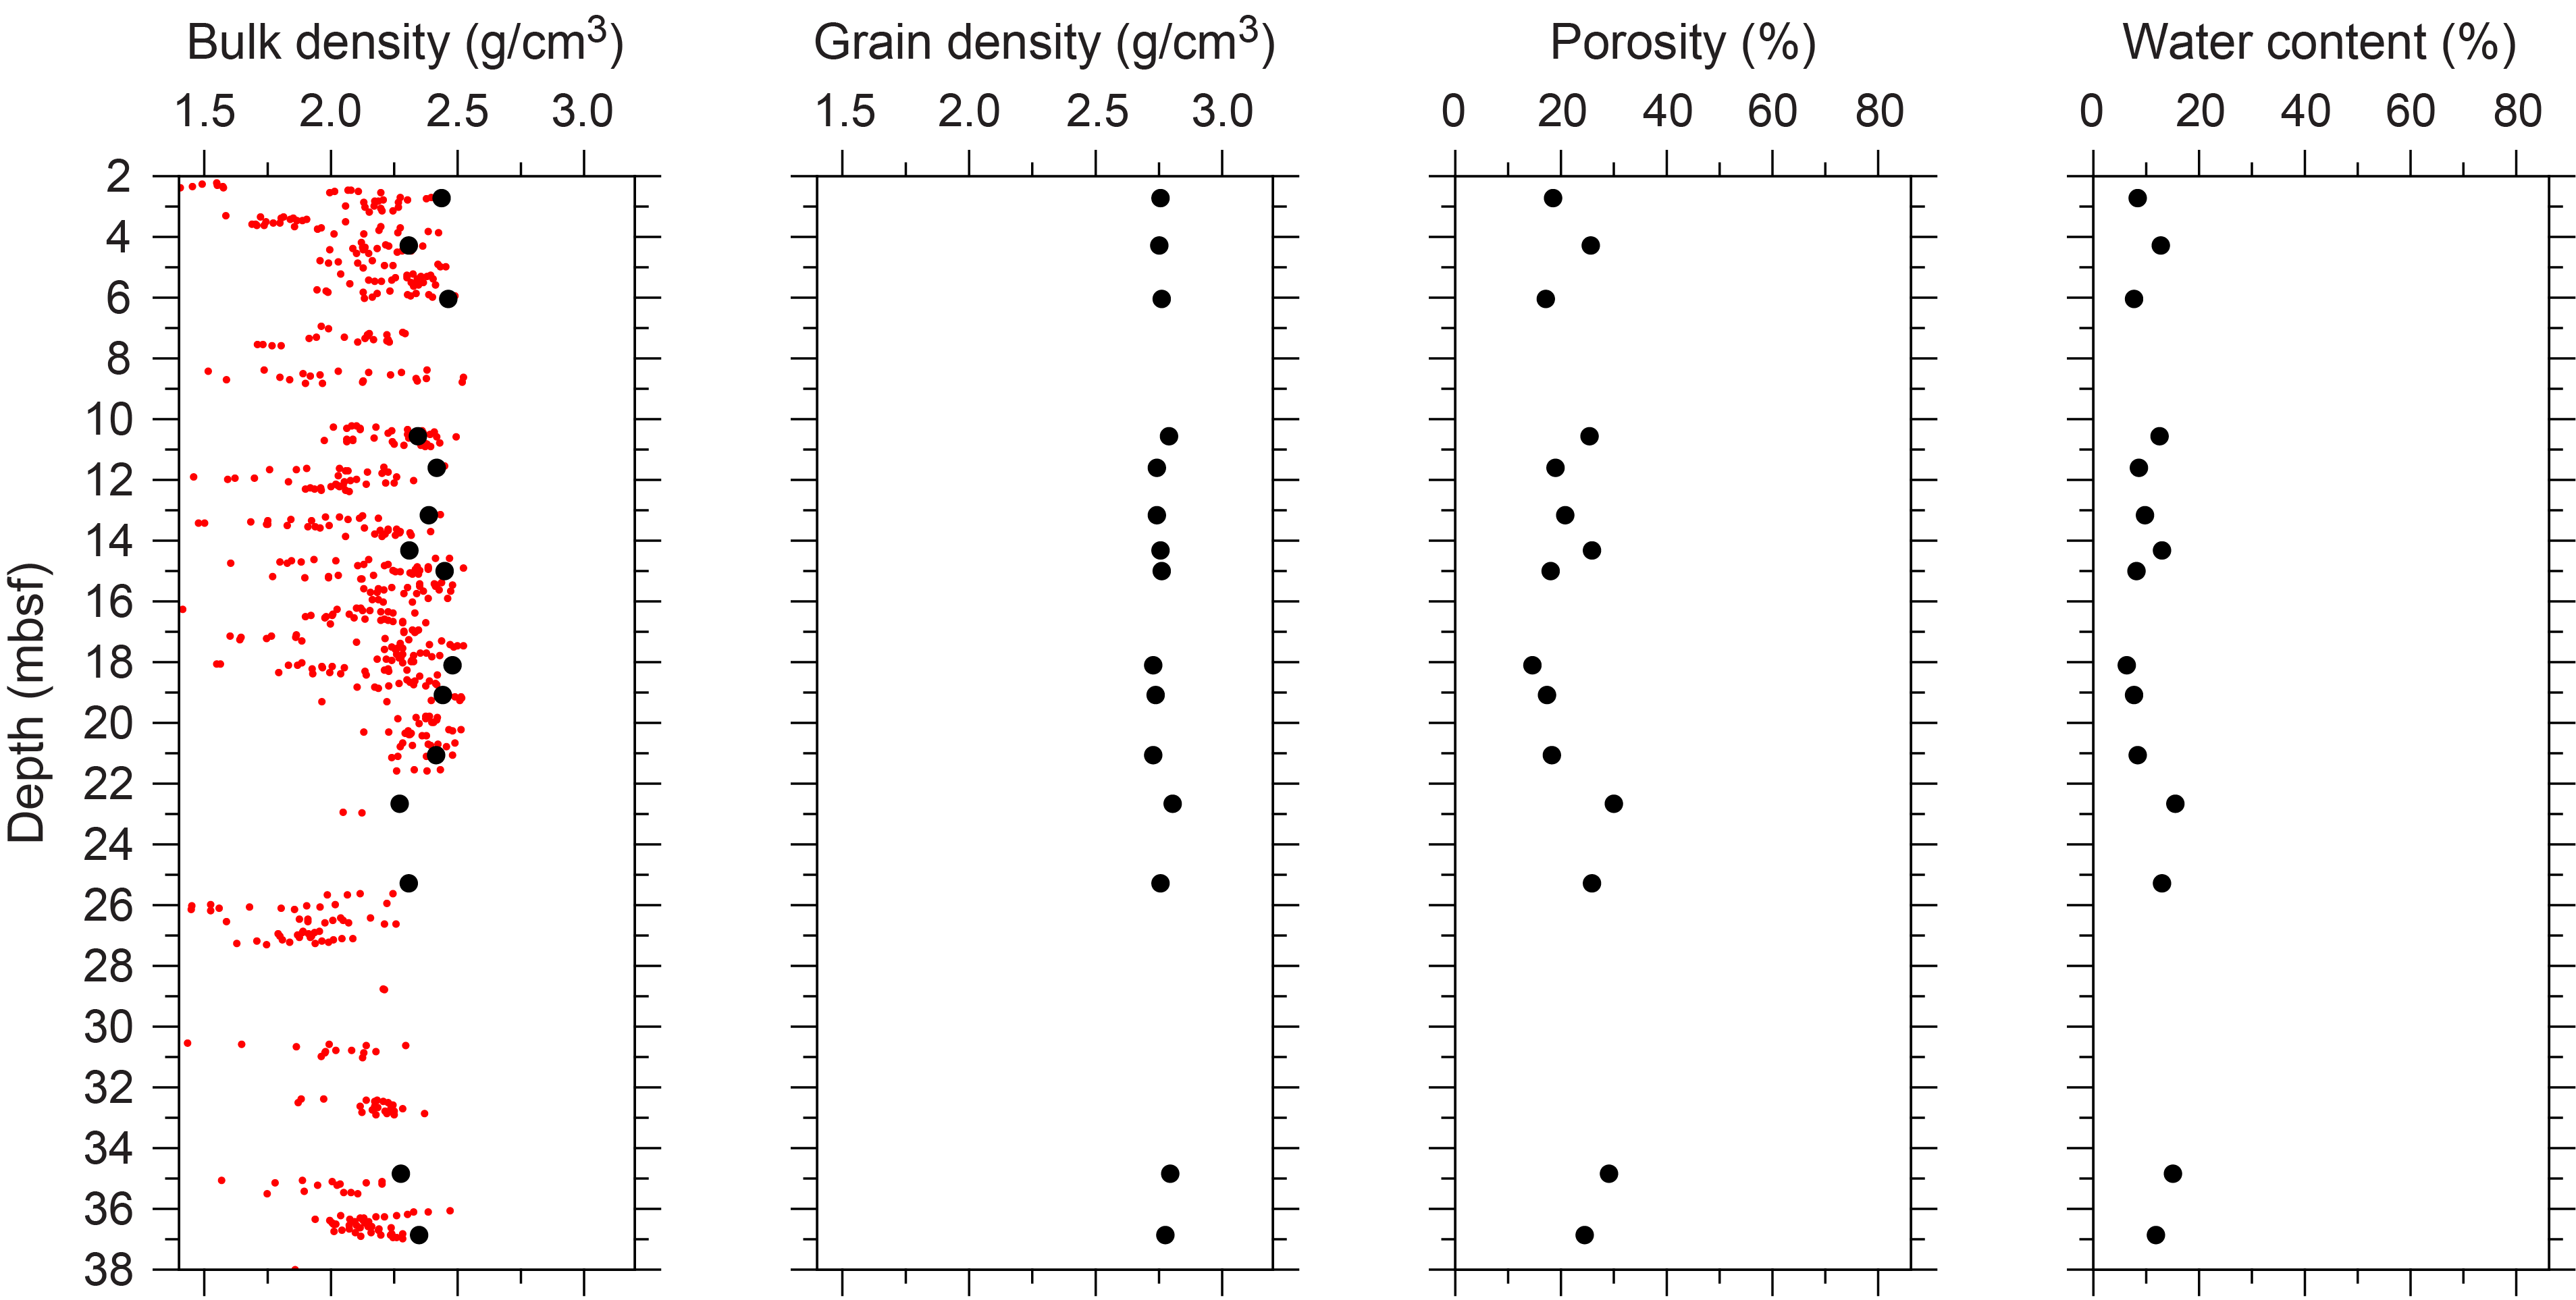
Figure F24. Physical properties, Hole M0099C.
3.3.2. P-wave velocity
MSCL P-wave velocity measurements on Hole M0099C cores yielded no data. A total of 12 samples were measured using the discrete P-wave logger. Dry measurement values range 3078–4864 m/s (Figure F25). P-wave velocity recorded for the samples after resaturation ranges 3343–5258 m/s, and there is no apparent downhole trend.
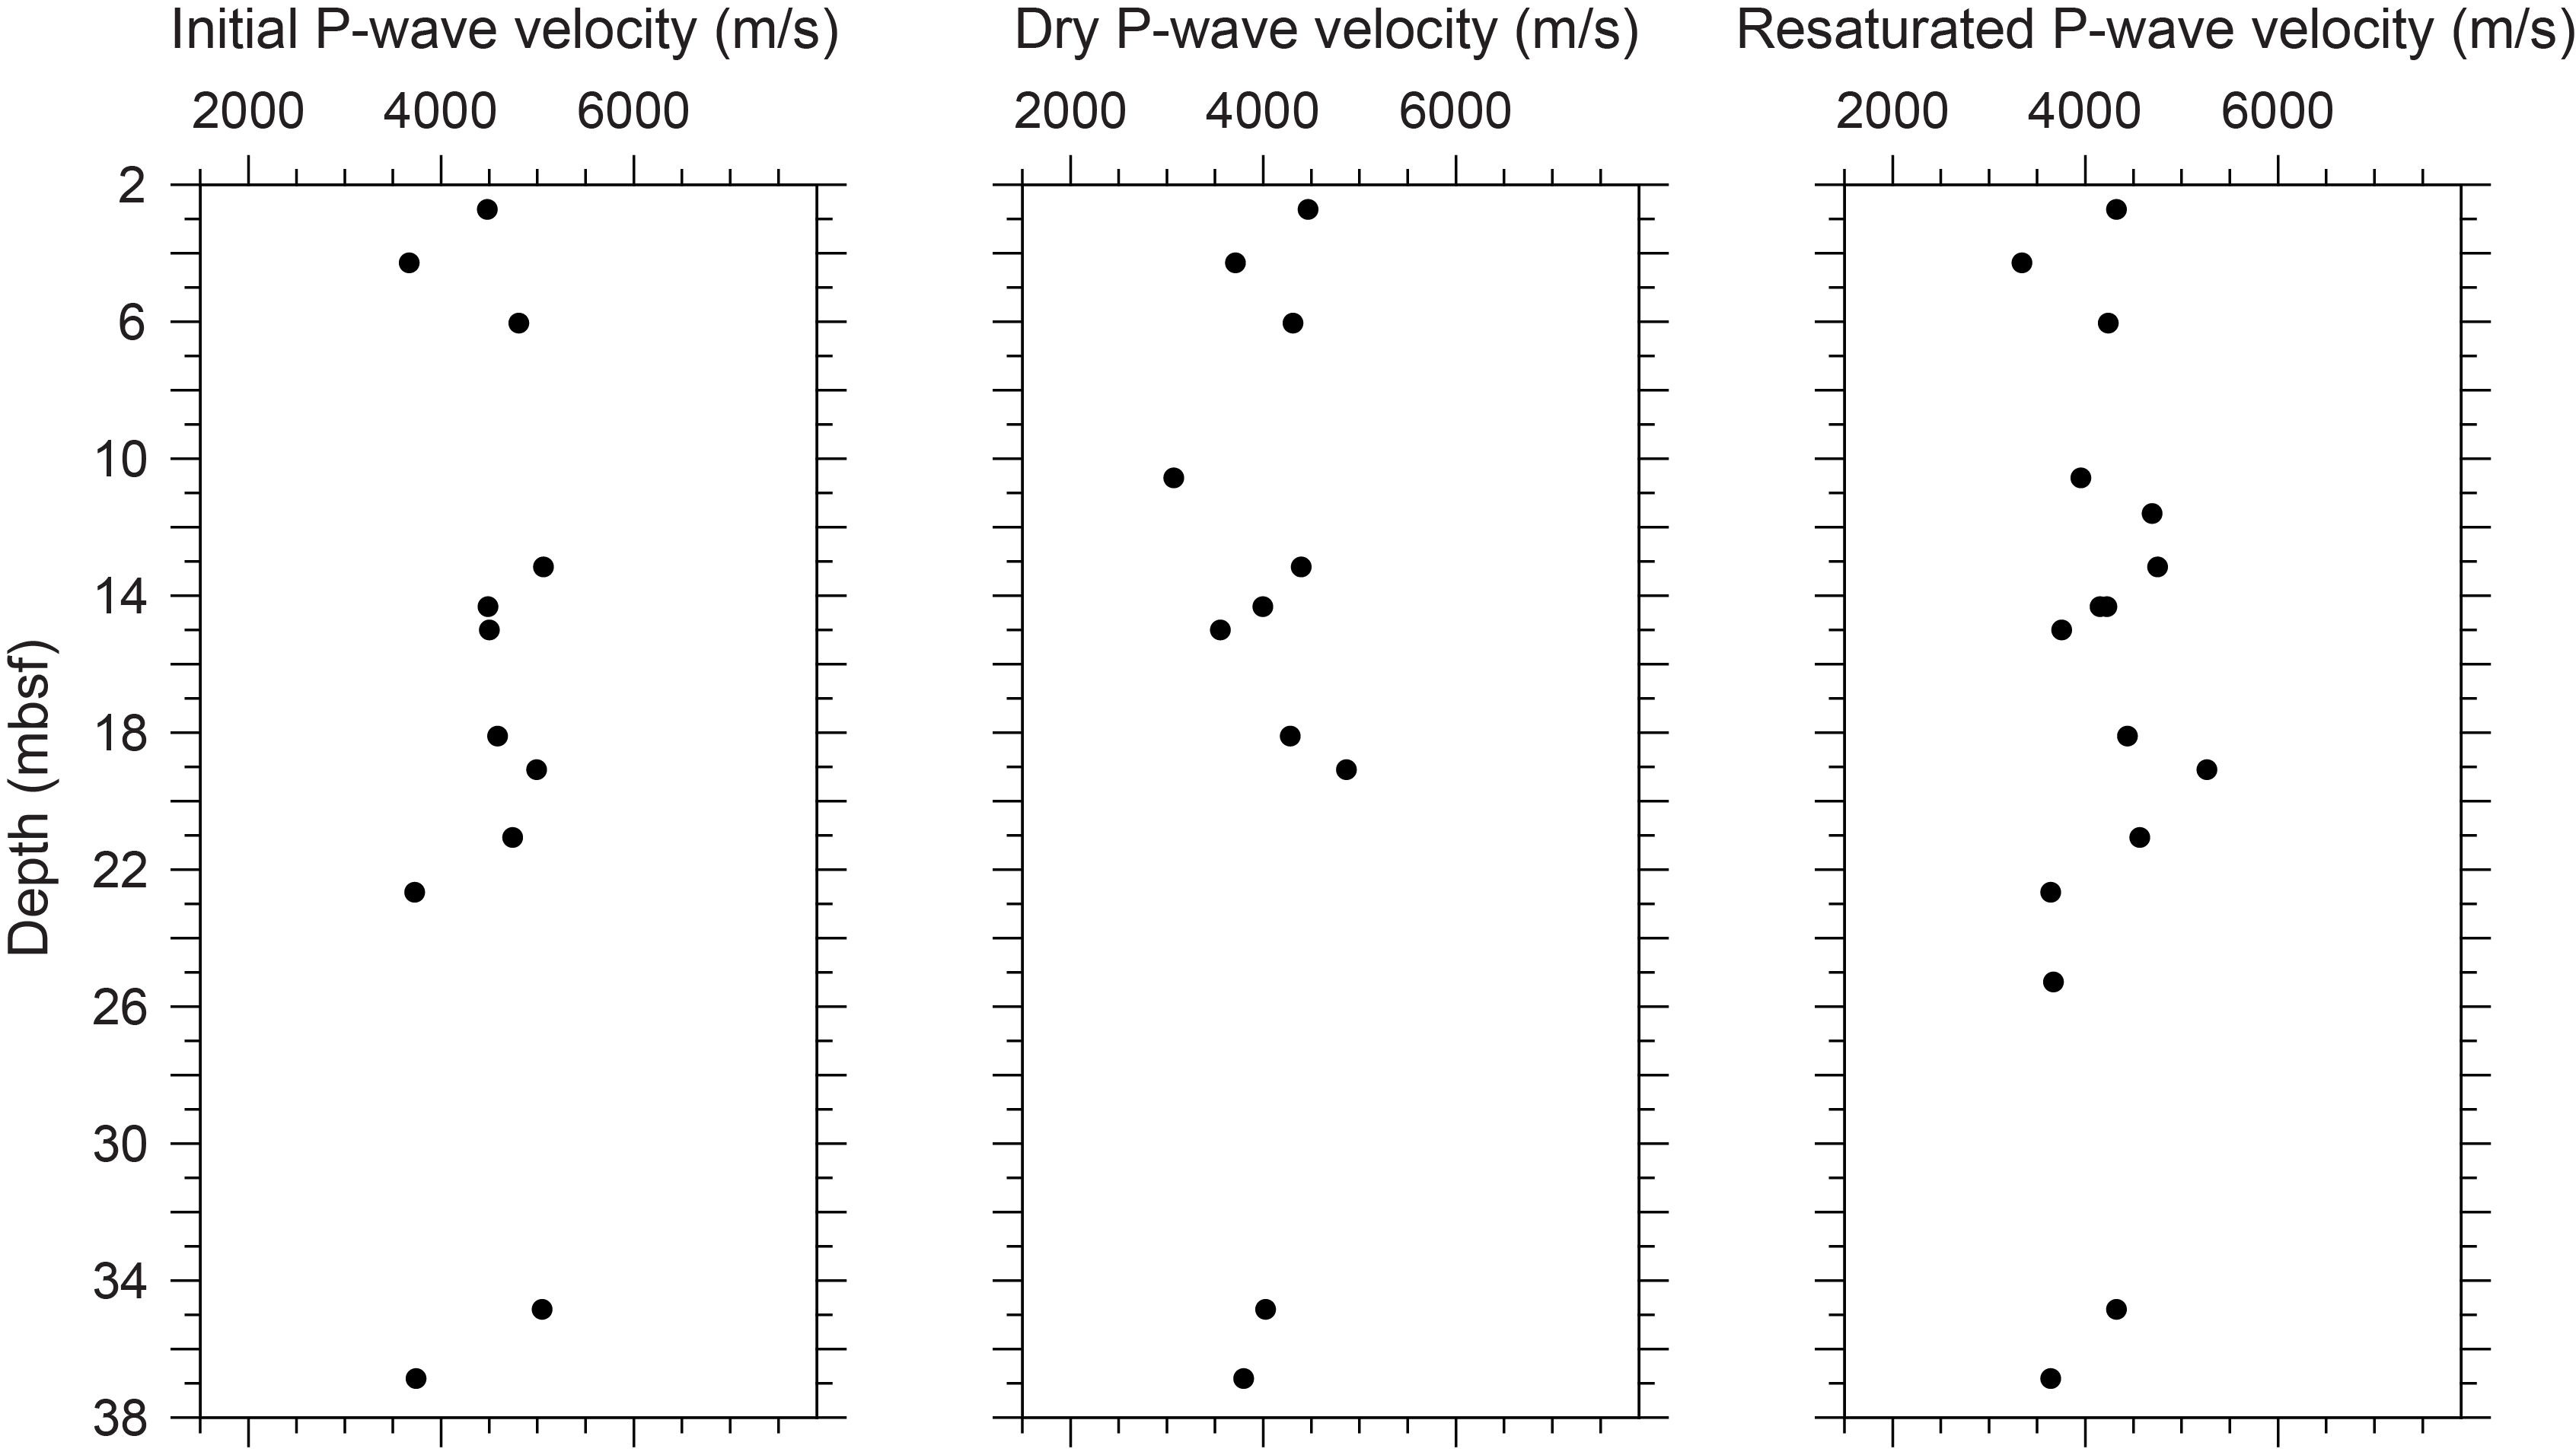
Figure F25. P-wave velocities, Hole M0099C.
3.3.3. Thermal conductivity
Thermal conductivity was collected on three cores (see Table T11 in the Expedition 389 methods chapter [Webster et al., 2025a]) and ranges 1.137–1.657 W/(m·K).
3.3.4. Magnetic susceptibility
MSCL magnetic susceptibility data range −3.36 × 10⁻⁵ to 70.58 × 10⁻⁵ SI (Figure F7). However, the majority of magnetic susceptibility values fall close to 0.32 × 10⁻⁵ SI, displaying a relatively flat signal.
3.3.5. Electrical resistivity
MSCL noncontact resistivity measurements range 0.79–52.66 Ωm (Figure F7). Similar to the other data sets for Hole M0099C, there are no apparent downhole trends or notable features in the resistivity data.
3.3.6. Natural gamma radiation
MSCL NGR measurements display values ranging 23–30 counts/s (Figure F7). A marked change in NGR values occurs at ~25 mbsf; a change at this depth also occurs in the downhole density data.
3.3.7. Digital linescans, color reflectance, and hyperspectral imaging
All cores from Hole M0099C were digitally scanned, and, where appropriate, measured for color reflectance and imaged with the hyperspectral scanner (see HYPERSPECTRAL in Supplementary material). Color reflectance L* values vary between 33.84% and 87.65% (Figure F7), a* varies between −1.23 and 4.20, b* varies between −1.08 and 22.50, and a*/b* varies between −0.25 and 0.20.
3.4. Hole M0099D
This hole was cored by wash bore only; no core was recovered (Table T1).
3.5. Hole M0099E
A total of 16.5 m of core from Hole M0099E was scanned with the MSCL, and the core exhibited moderate drilling-induced disturbance, resulting in 41% of the acquired data passing QA/QC (see Table T10 in the Expedition 389 methods chapter [Webster et al., 2025a]). A total of 10 discrete samples were taken for P-wave velocity and MAD measurements. Digital linescans, color reflectance, and hyperspectral imaging were acquired on all cores.
3.5.1. Density and porosity
Data for density and porosity measurements are presented in Figures F10 and F26. MSCL bulk density values range 1.37–2.63 g/cm3. A total of 10 discrete samples were analyzed for MAD, giving bulk density values in the range of 1.93 to 2.57 g/cm3. Porosity values for the same samples range 10.3%–53.1%, and grain density values fall between 2.741 and 2.953 g/cm3. There is an apparent downhole trend in the density data set toward lower values, with a change in trend occurring at ~15 mbsf.
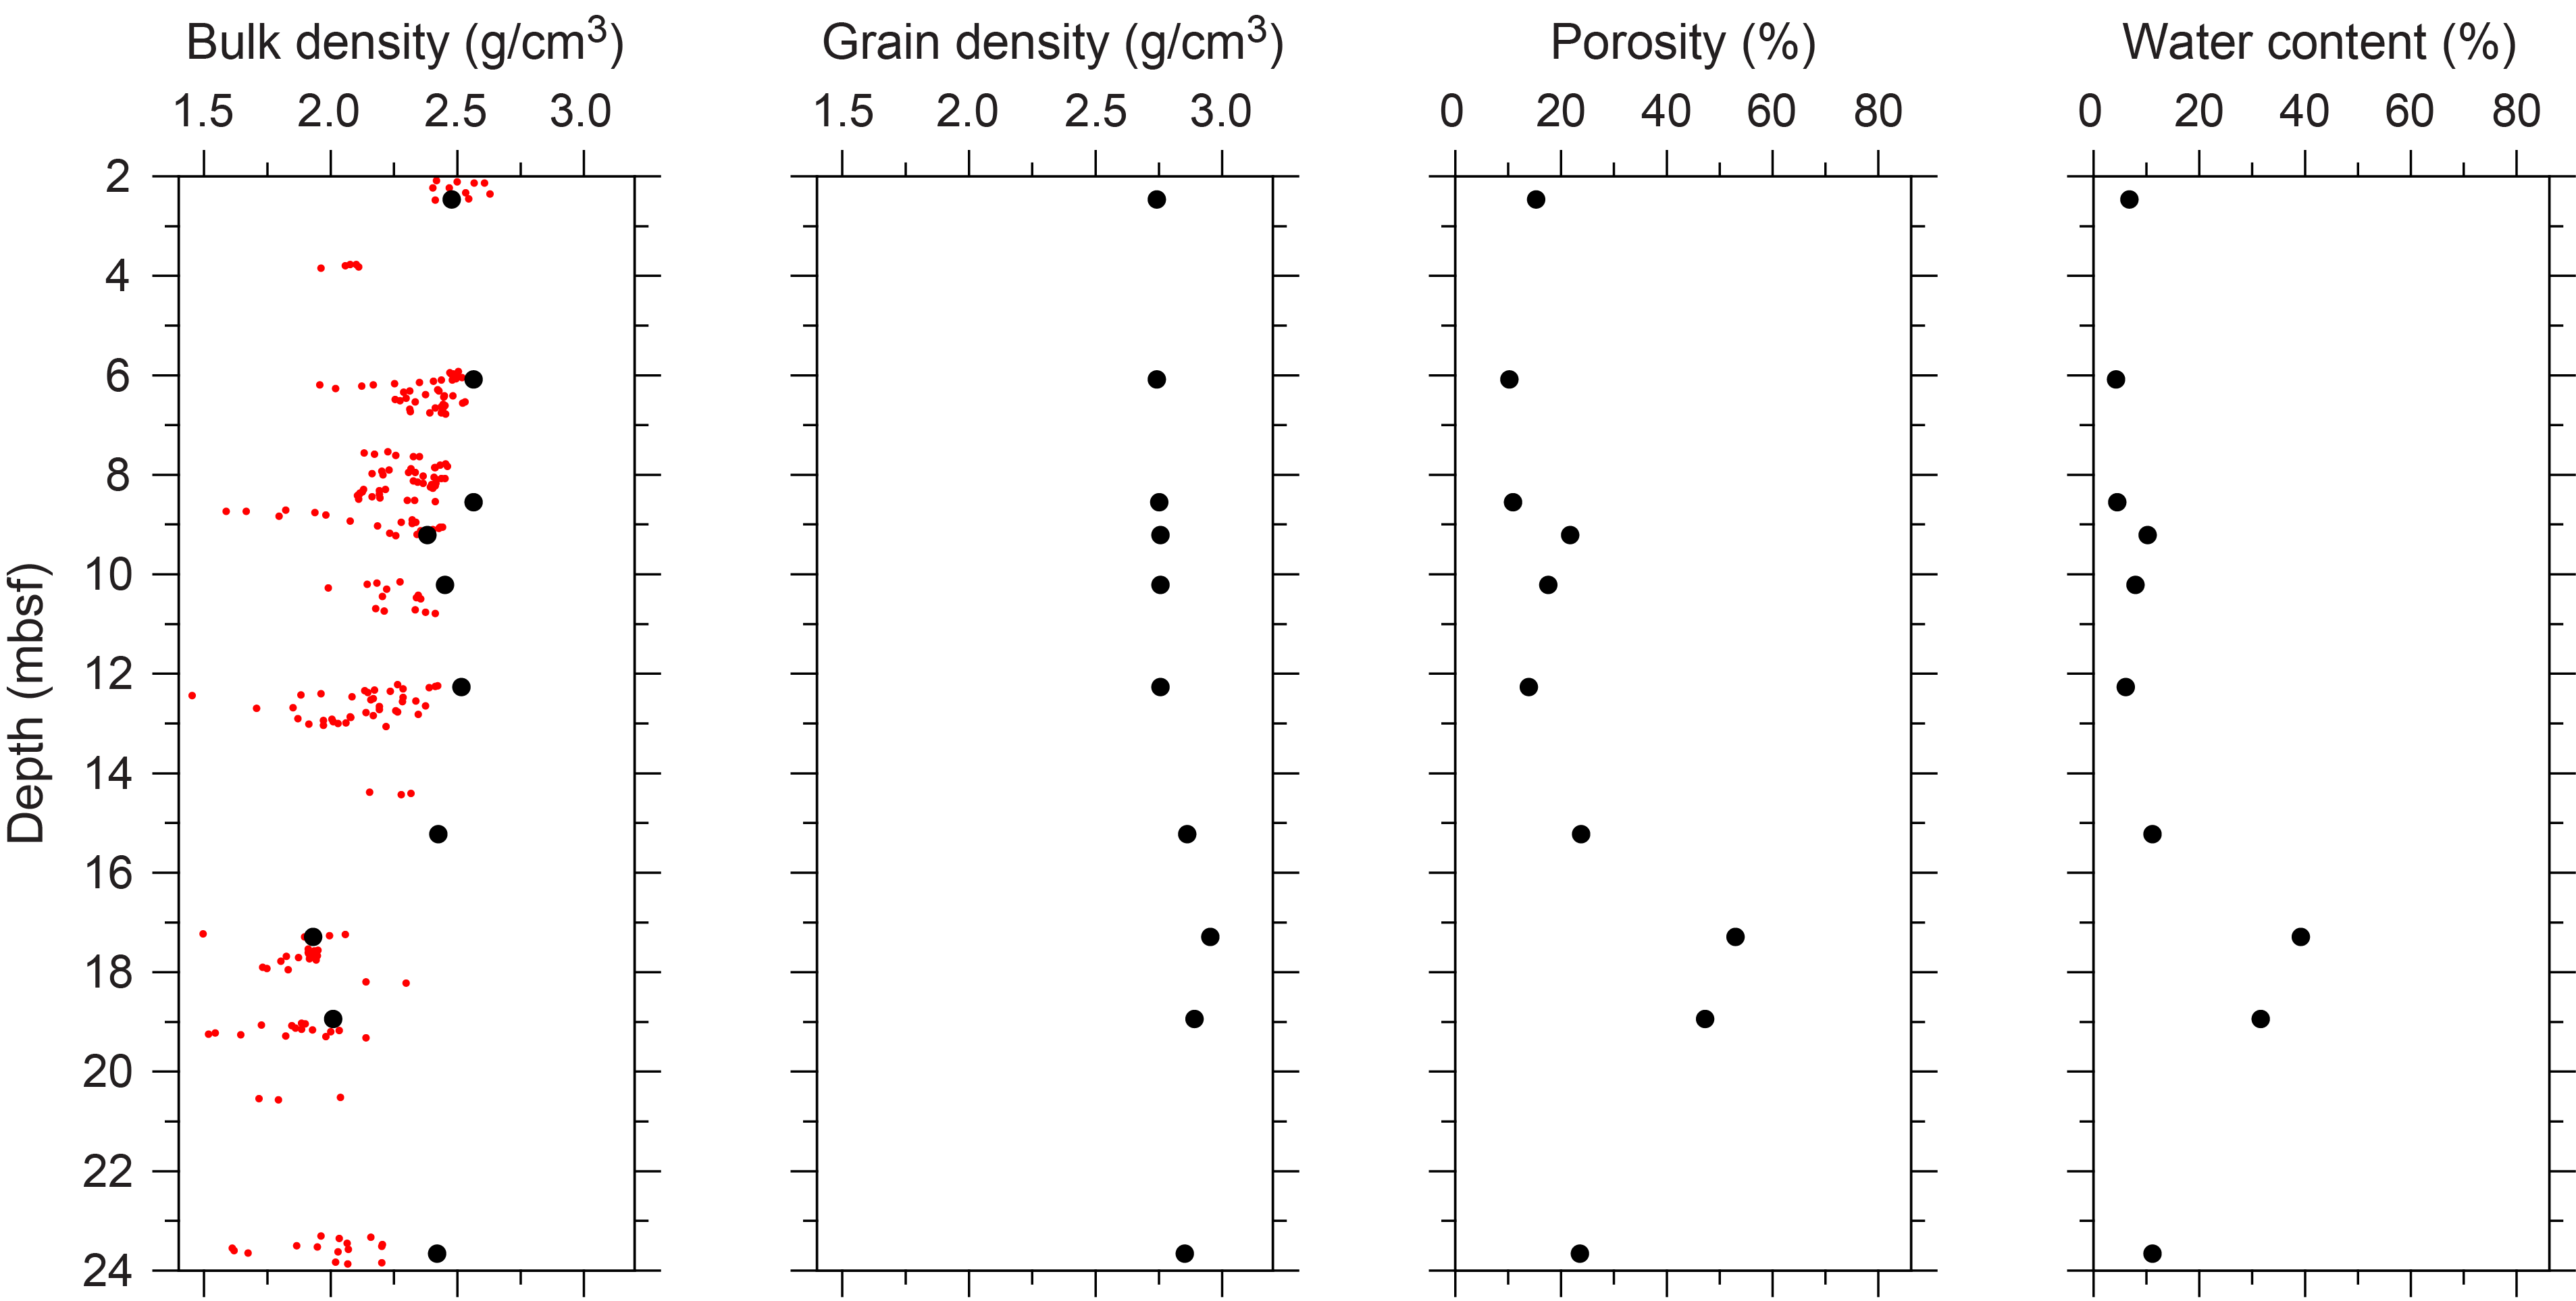
Figure F26. Physical properties, Hole M0099E.
3.5.2. P-wave velocity
MSCL P-wave velocity measurements on Hole M0099E cores yielded no data (see Physical properties in the Expedition 389 methods chapter [Webster et al., 2025a]). A total of nine samples were measured using the discrete P-wave logger. Dry measurement values range 2990–4620 m/s (Figure F27). P-wave velocity recorded for the samples after resaturation range 3500–5425 m/s.
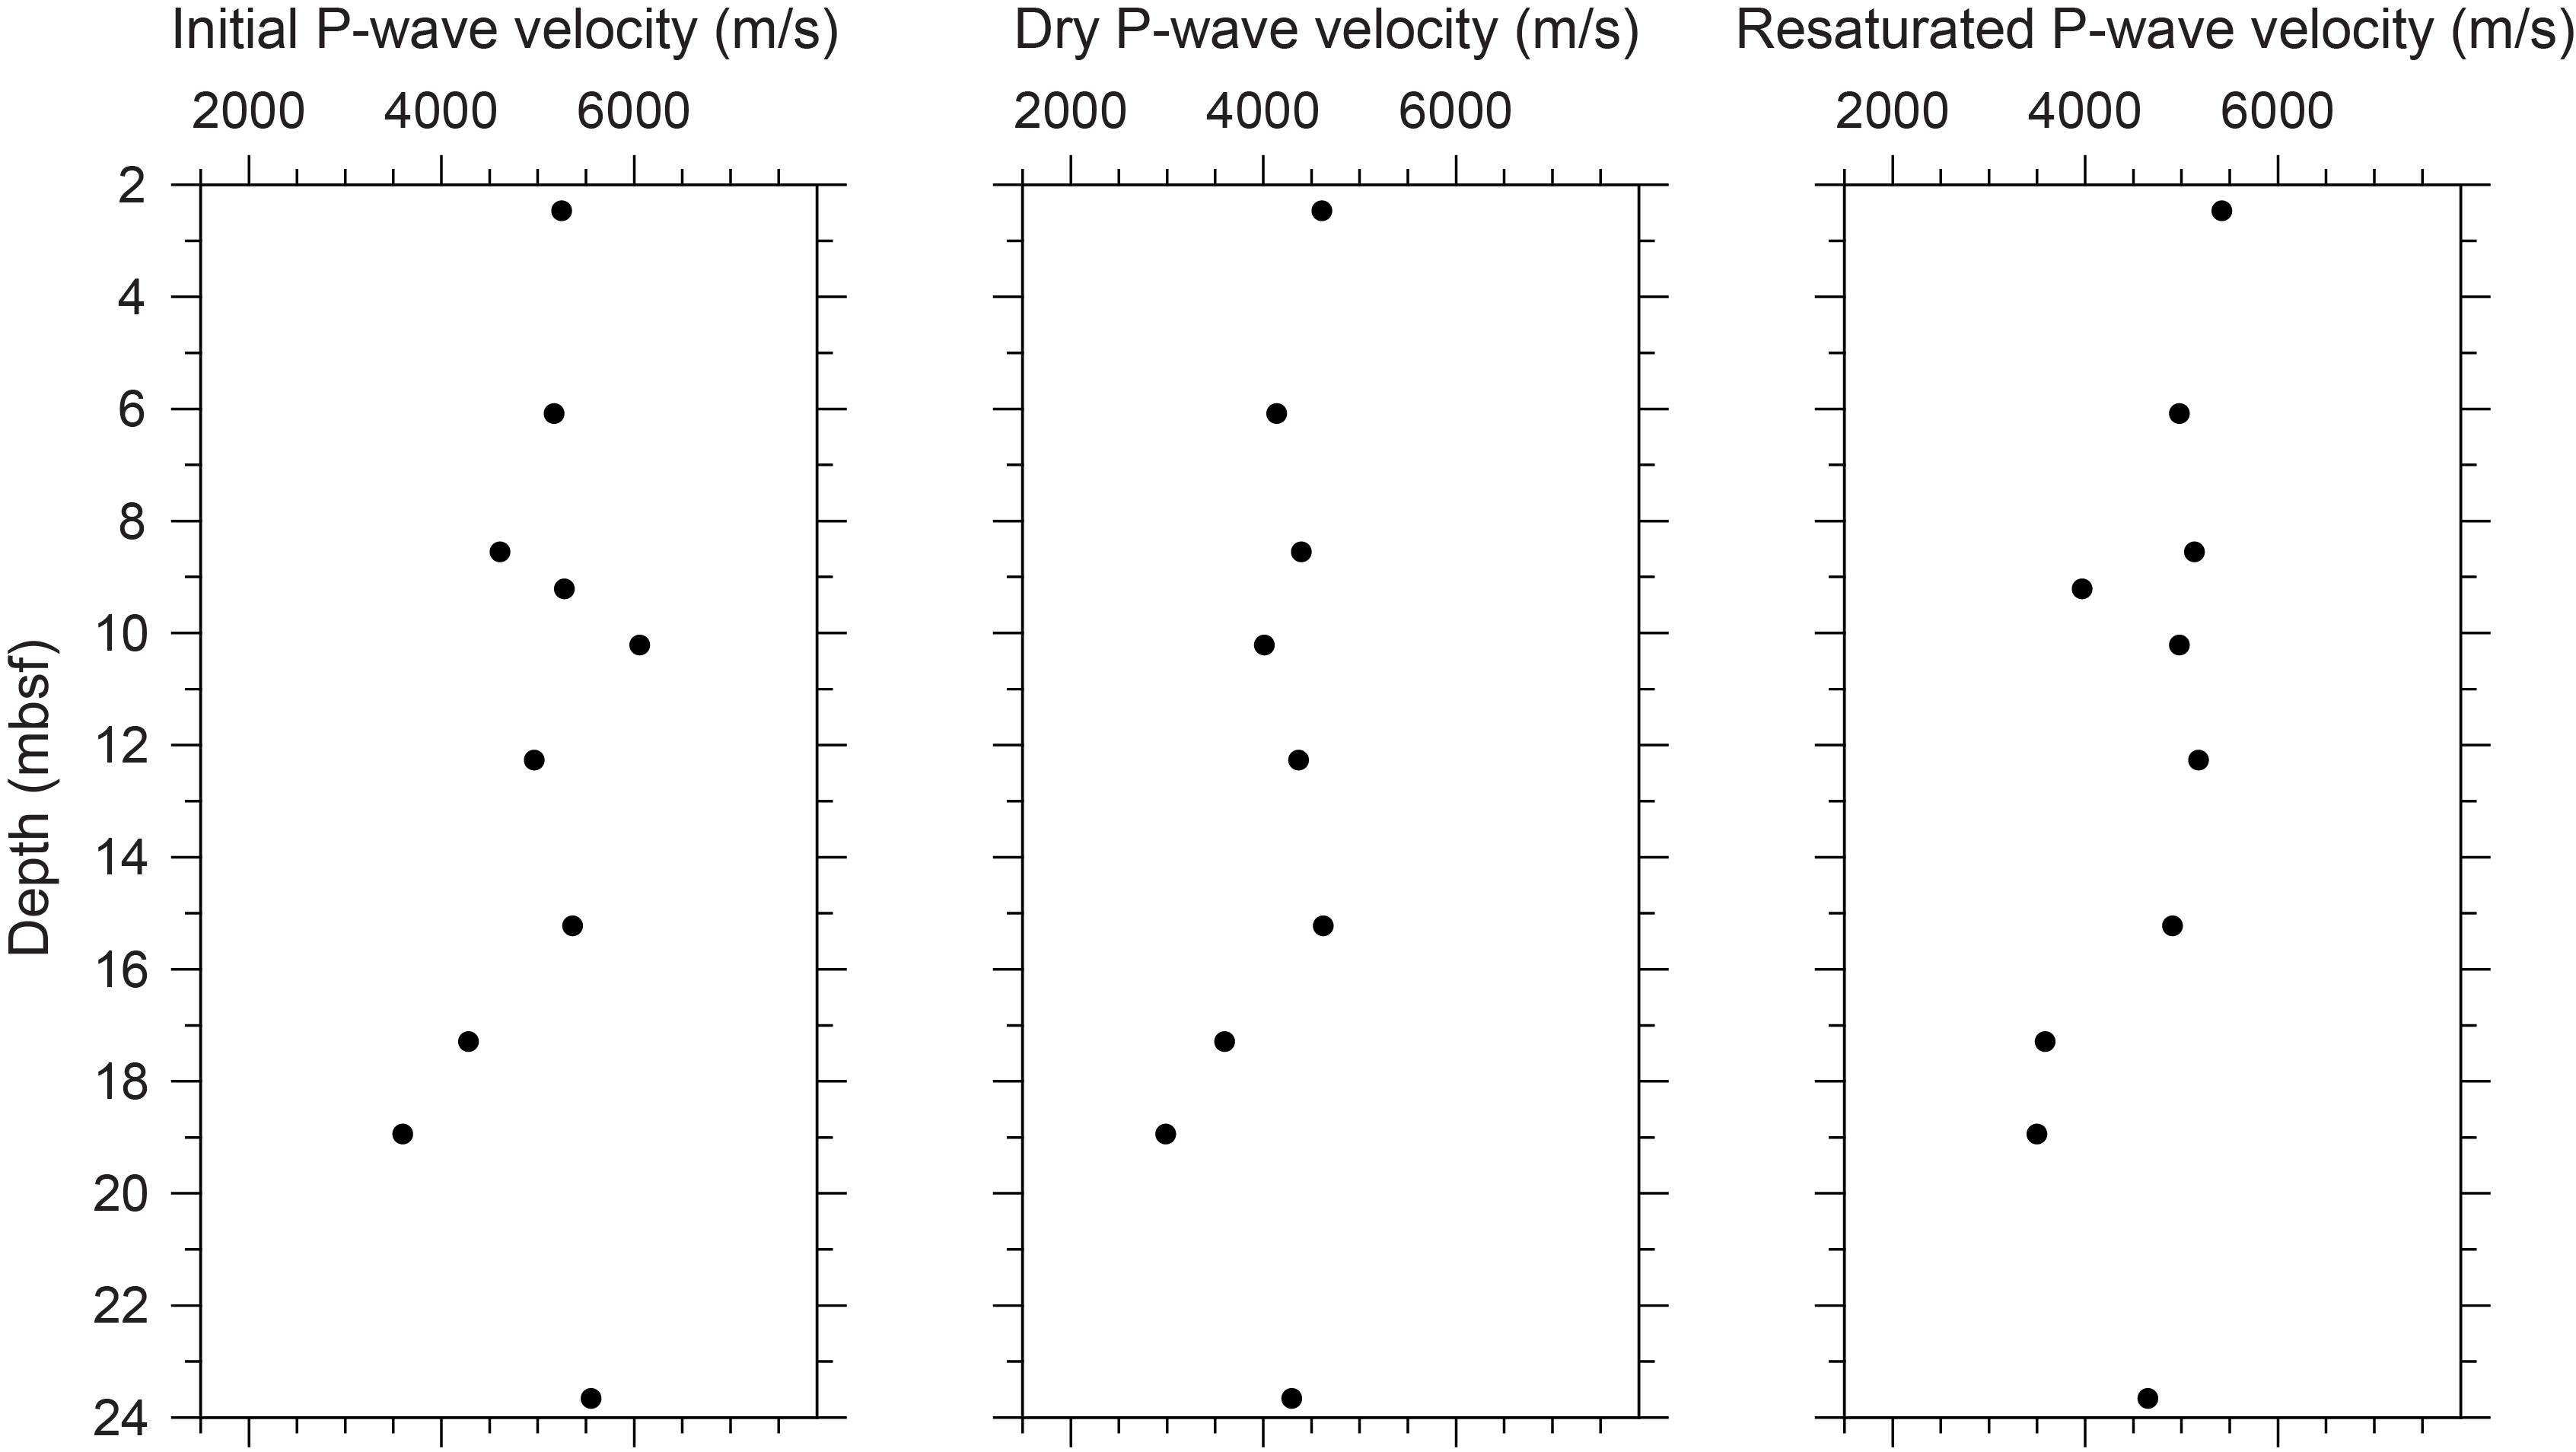
Figure F27. P-wave velocities, Hole M0099E.
3.5.3. Thermal conductivity
Thermal conductivity was measured on one core from 6.40 mbsf (see Table T11 in the Expedition 389 methods chapter [Webster et al., 2025a]) with a value of 1.280 W/(m·K).
3.5.4. Magnetic susceptibility
MSCL magnetic susceptibility data range −0.94 × 10⁻⁵ to 35.87 × 10⁻⁵ SI (Figures F10, F12). However, the majority of magnetic susceptibility values fall close to 0.20 × 10⁻⁵ SI.
3.5.5. Electrical resistivity
MSCL noncontact resistivity measurements range 1.07–389.45 Ωm (Figures F10, F12). Similar to the other data sets for Hole M0099E, no apparent trends or notable features are observed in the resistivity data.
3.5.6. Natural gamma radiation
MSCL NGR measurements for Hole M0099E range 24–31 counts/s (Figures F10, F12), similar to Hole M0099C. A slightly increasing trend in NGR is observed below ~15 mbsf.
3.5.7. Digital linescans, color reflectance, and hyperspectral imaging
All cores from Hole M0099E were digitally scanned, measured for color reflectance (where appropriate), and imaged with the hyperspectral scanner (see HYPERSPECTRAL in Supplementary material). Color reflectance L* values vary between 30.13% and 88.81% (Figures F10, F12), a* varies between −0.72 and 3.34, b* varies between 8.02 and 20.6, and a*/b* varies between −0.06 and 0.18.
3.6. Hole M0099F
A total of 6.31 m of core from Hole M0099F was scanned with the MSCL, and the core exhibited moderate drilling-induced disturbance, resulting in 61% of the acquired data passing QA/QC (see Table T10 in the Expedition 389 methods chapter [Webster et al., 2025a]). A total of two discrete samples were taken for P-wave velocity and MAD measurements. Digital linescans, color reflectance, and hyperspectral imaging were acquired on all cores.
3.6.1. Density and porosity
Data for density and porosity measurements are presented in Figures F18 and F28. MSCL bulk density values range 1.57–2.56 g/cm3. A total of two discrete samples were analyzed for MAD, giving bulk density values in the range of 2.43 to 2.59 g/cm3. Porosity values for the same samples range 9.2%–20.4%, and grain density values fall between 2.747 and 2.789 g/cm3. There is no apparent downhole trend in the density values.
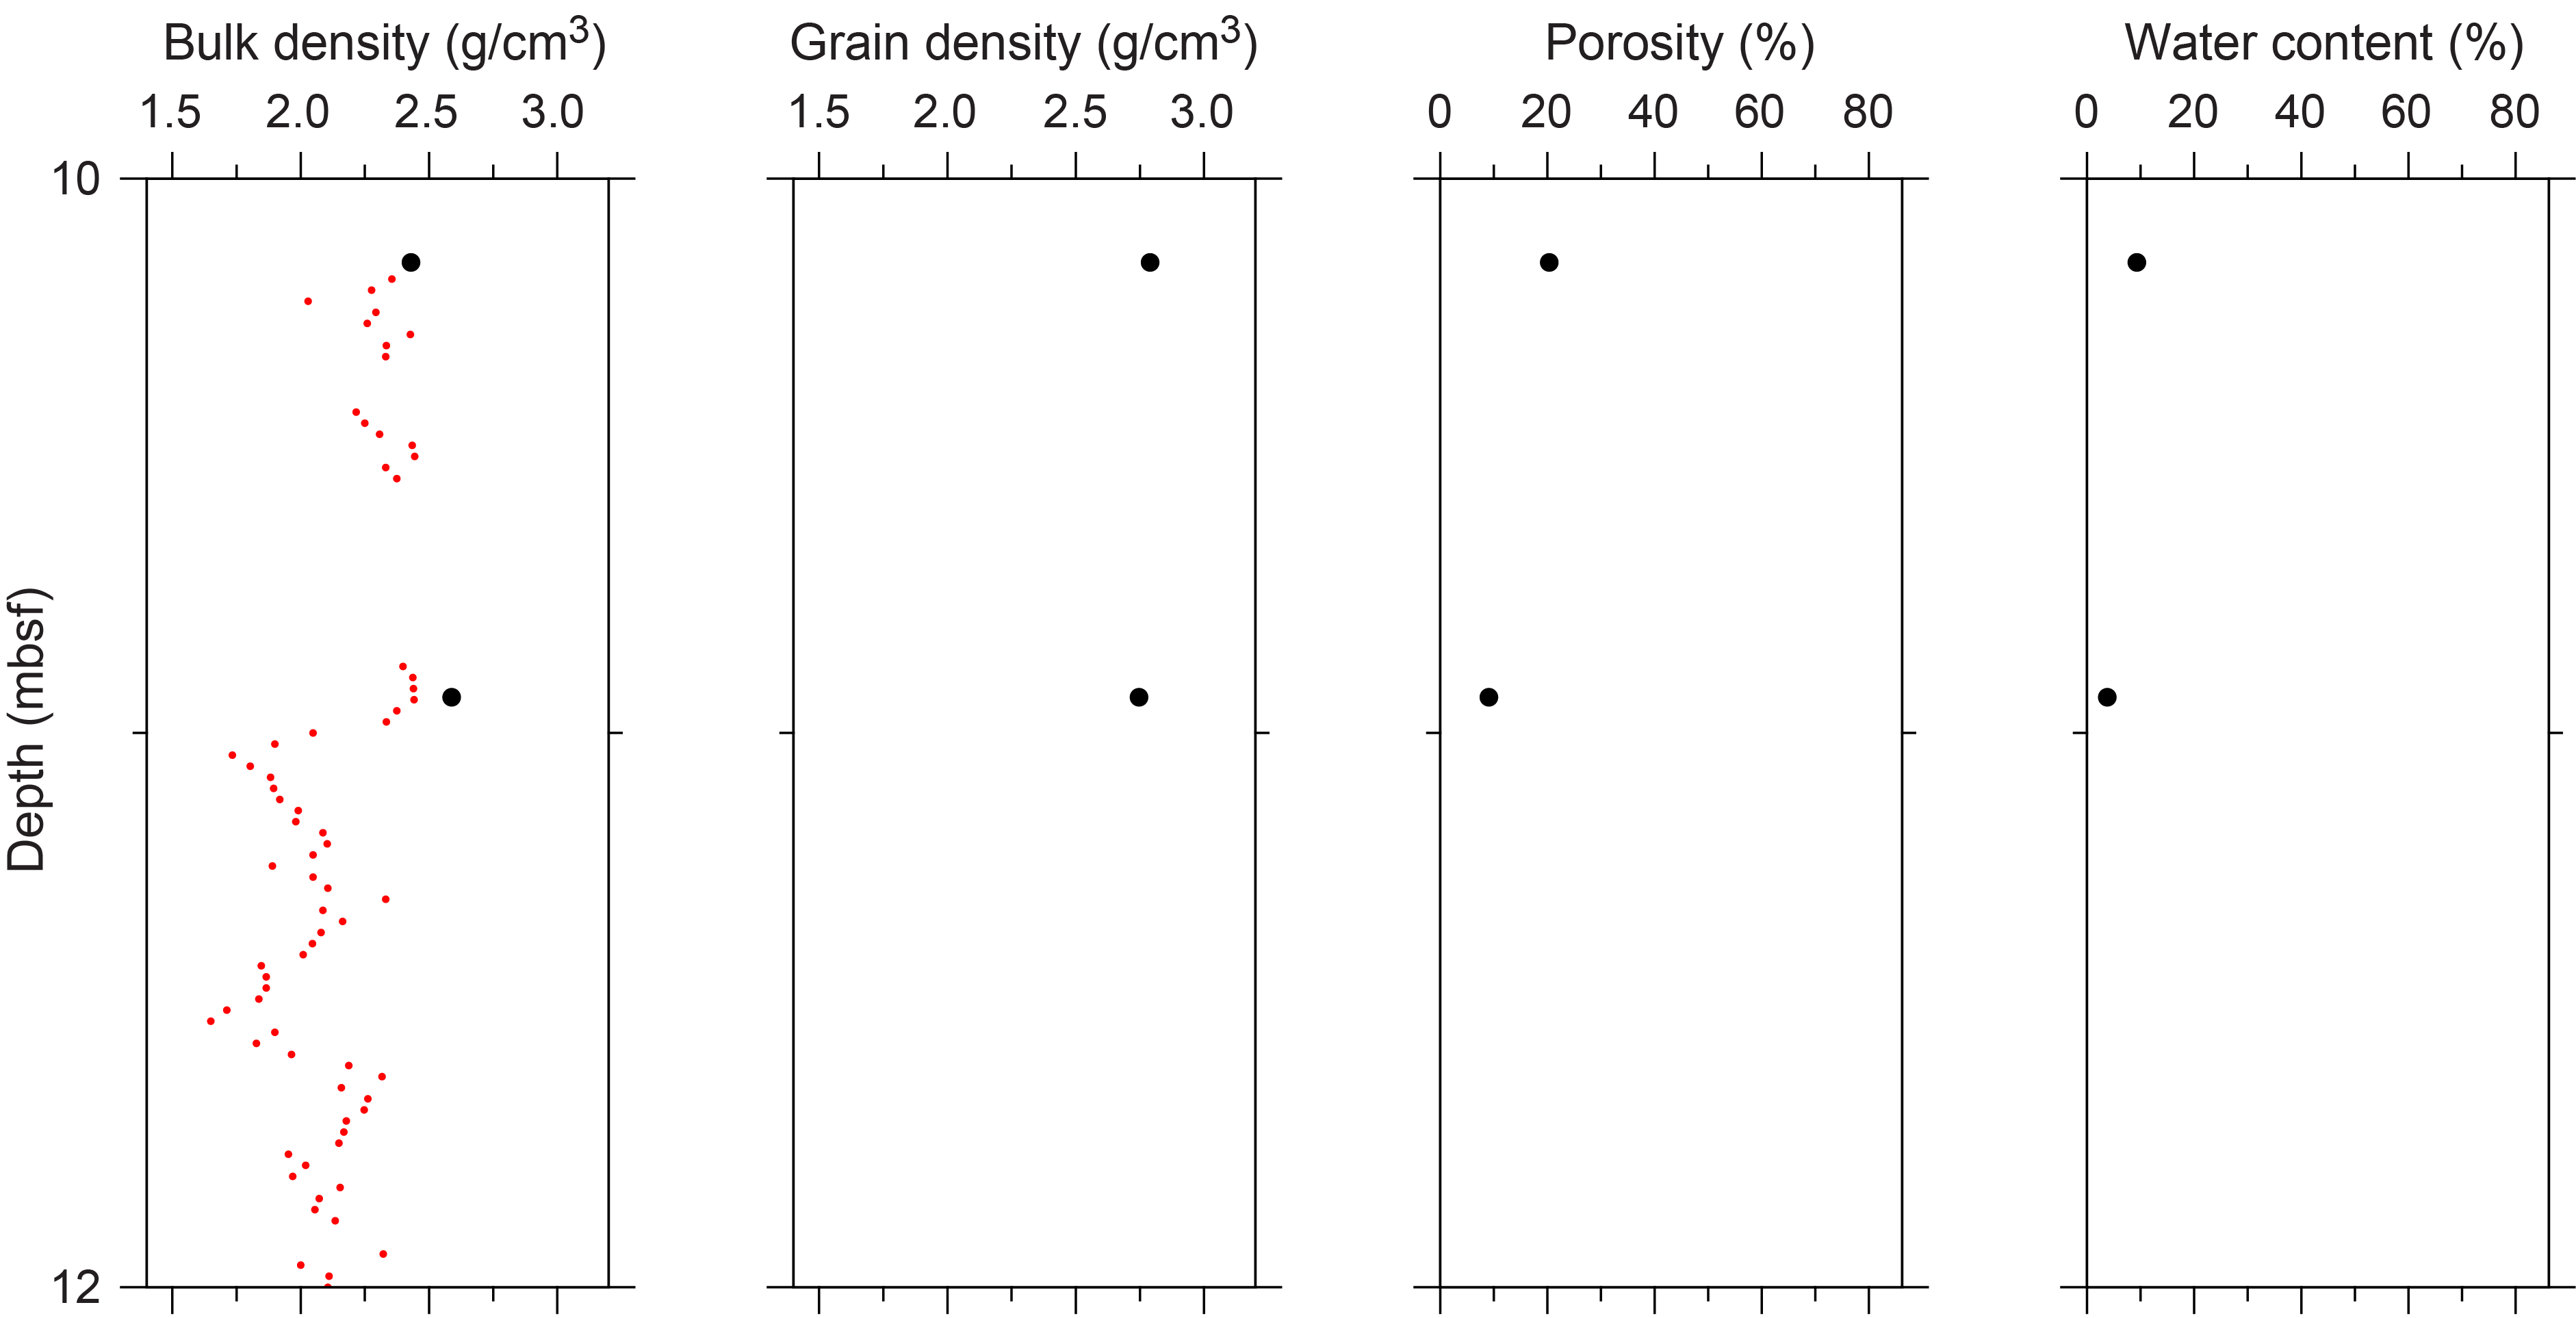
Figure F28. Physical properties, Hole M0099F.
3.6.2. P-wave velocity
MSCL P-wave velocity measurements on Hole M0099F cores yielded no data. A total of two samples were measured using the discrete P-wave logger. Dry measurement values were 4052 and 5108 m/s (Figure F29). P-wave velocity recorded for the same samples after resaturation were 4441 and 5029 m/s. Because of the limited P-wave data points available, no apparent downhole trends are observed.
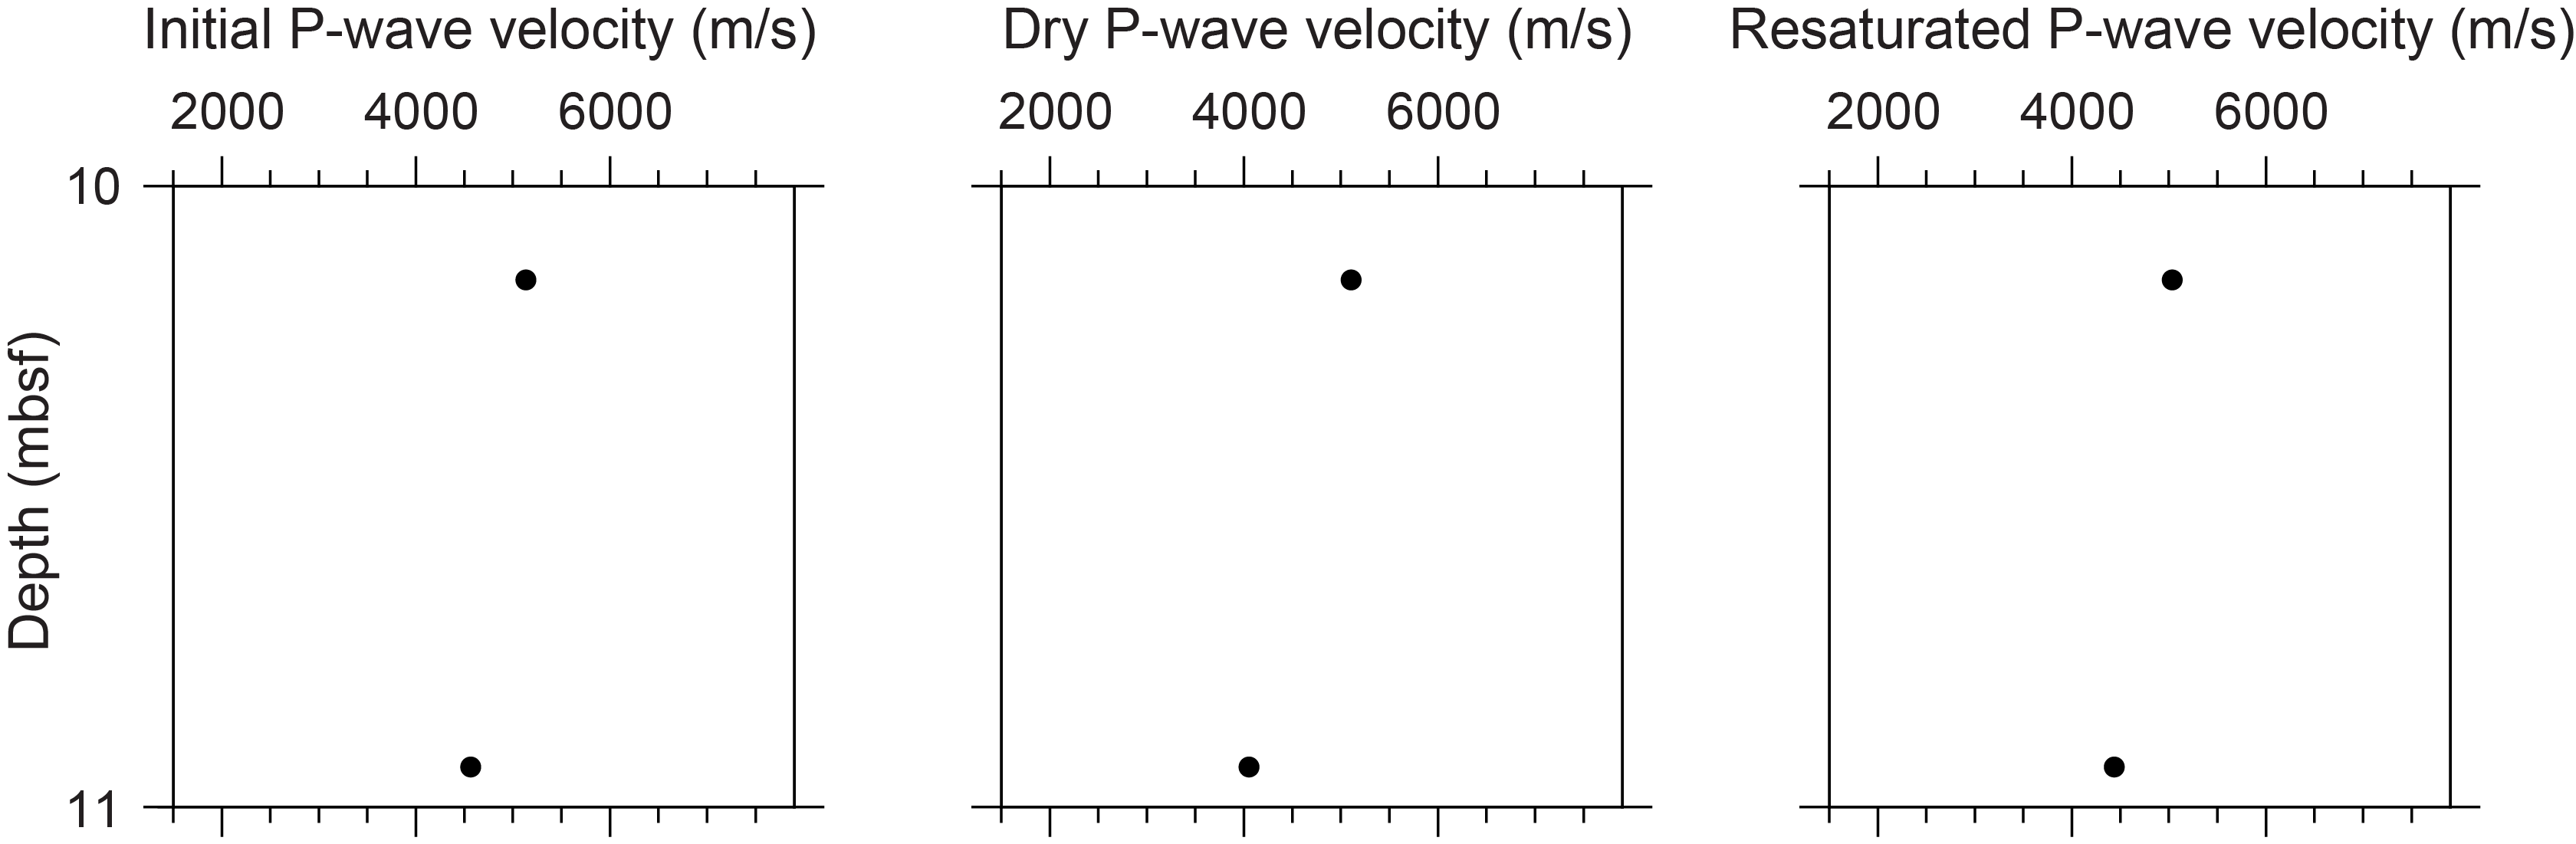
Figure F29. P-wave velocities, Hole M0099F.
3.6.3. Thermal conductivity
Thermal conductivity measurements were made on two cores (see Table T11 in the Expedition 389 methods chapter [Webster et al., 2025a]) with values of 1.012 W/(m·K) at 8.15 mbsf and 1.250 W/(m·K) at 12.15 mbsf.
3.6.4. Magnetic susceptibility
MSCL magnetic susceptibility data range −0.54 × 10⁻⁵ to 0.74 × 10⁻⁵ SI (Figure F18). However, the majority of magnetic susceptibility values fall close to −0.01 × 10⁻⁵ SI.
3.6.5. Electrical resistivity
MSCL noncontact resistivity measurements on Hole M0099F cores range 1.58–49.02 Ωm (Figure F18). Similar to the other data sets for this hole, it is difficult to detect trends or notable features in the resistivity data.
3.6.6. Natural gamma radiation
MSCL NGR measurements for Hole M0099F range 24–29 counts/s (Figure F18), similar to Holes M0099C and M0099E.
3.6.7. Digital linescans, color reflectance, and hyperspectral imaging
All cores from Hole M0099F were digitally scanned, measured for color reflectance (where appropriate), and imaged with the hyperspectral scanner (see HYPERSPECTRAL in Supplementary material). Color reflectance L* values vary between 43.69% and 97.29% (Figure F18), a* varies between −0.32 and 2.95, b* varies between 0.04 and 19.19, and a*/b* varies between −1.50 and 0.18.
3.7. Hole M0099G
A total of 16.27 m of core from Hole M0099G was scanned with the MSCL, and the core exhibited moderate drilling-induced disturbance, resulting in 53% of the acquired data passing QA/QC (see Table T10 in the Expedition 389 methods chapter [Webster et al., 2025a]). A total of 10 discrete samples were collected for P-wave velocity and MAD measurements. Digital linescans, color reflectance, and hyperspectral imaging were acquired on all cores.
3.7.1. Density and porosity
Data for density and porosity measurements are presented in Figures F11 and F30. MSCL bulk density values range 1.23–2.89 g/cm3. A total of ten discrete samples were analyzed for MAD, giving bulk density values in the range of 2.07 to 2.73 g/cm3. A distinct increase in density at 48.39 mbsf correlates with the boundary between the carbonate succession and the underlying volcanic rocks. Porosity values for the same samples range 8.4%–47.8%, and grain density values fall between 2.750 and 3.024 g/cm3. The highest density values are related to the presence of lavas.
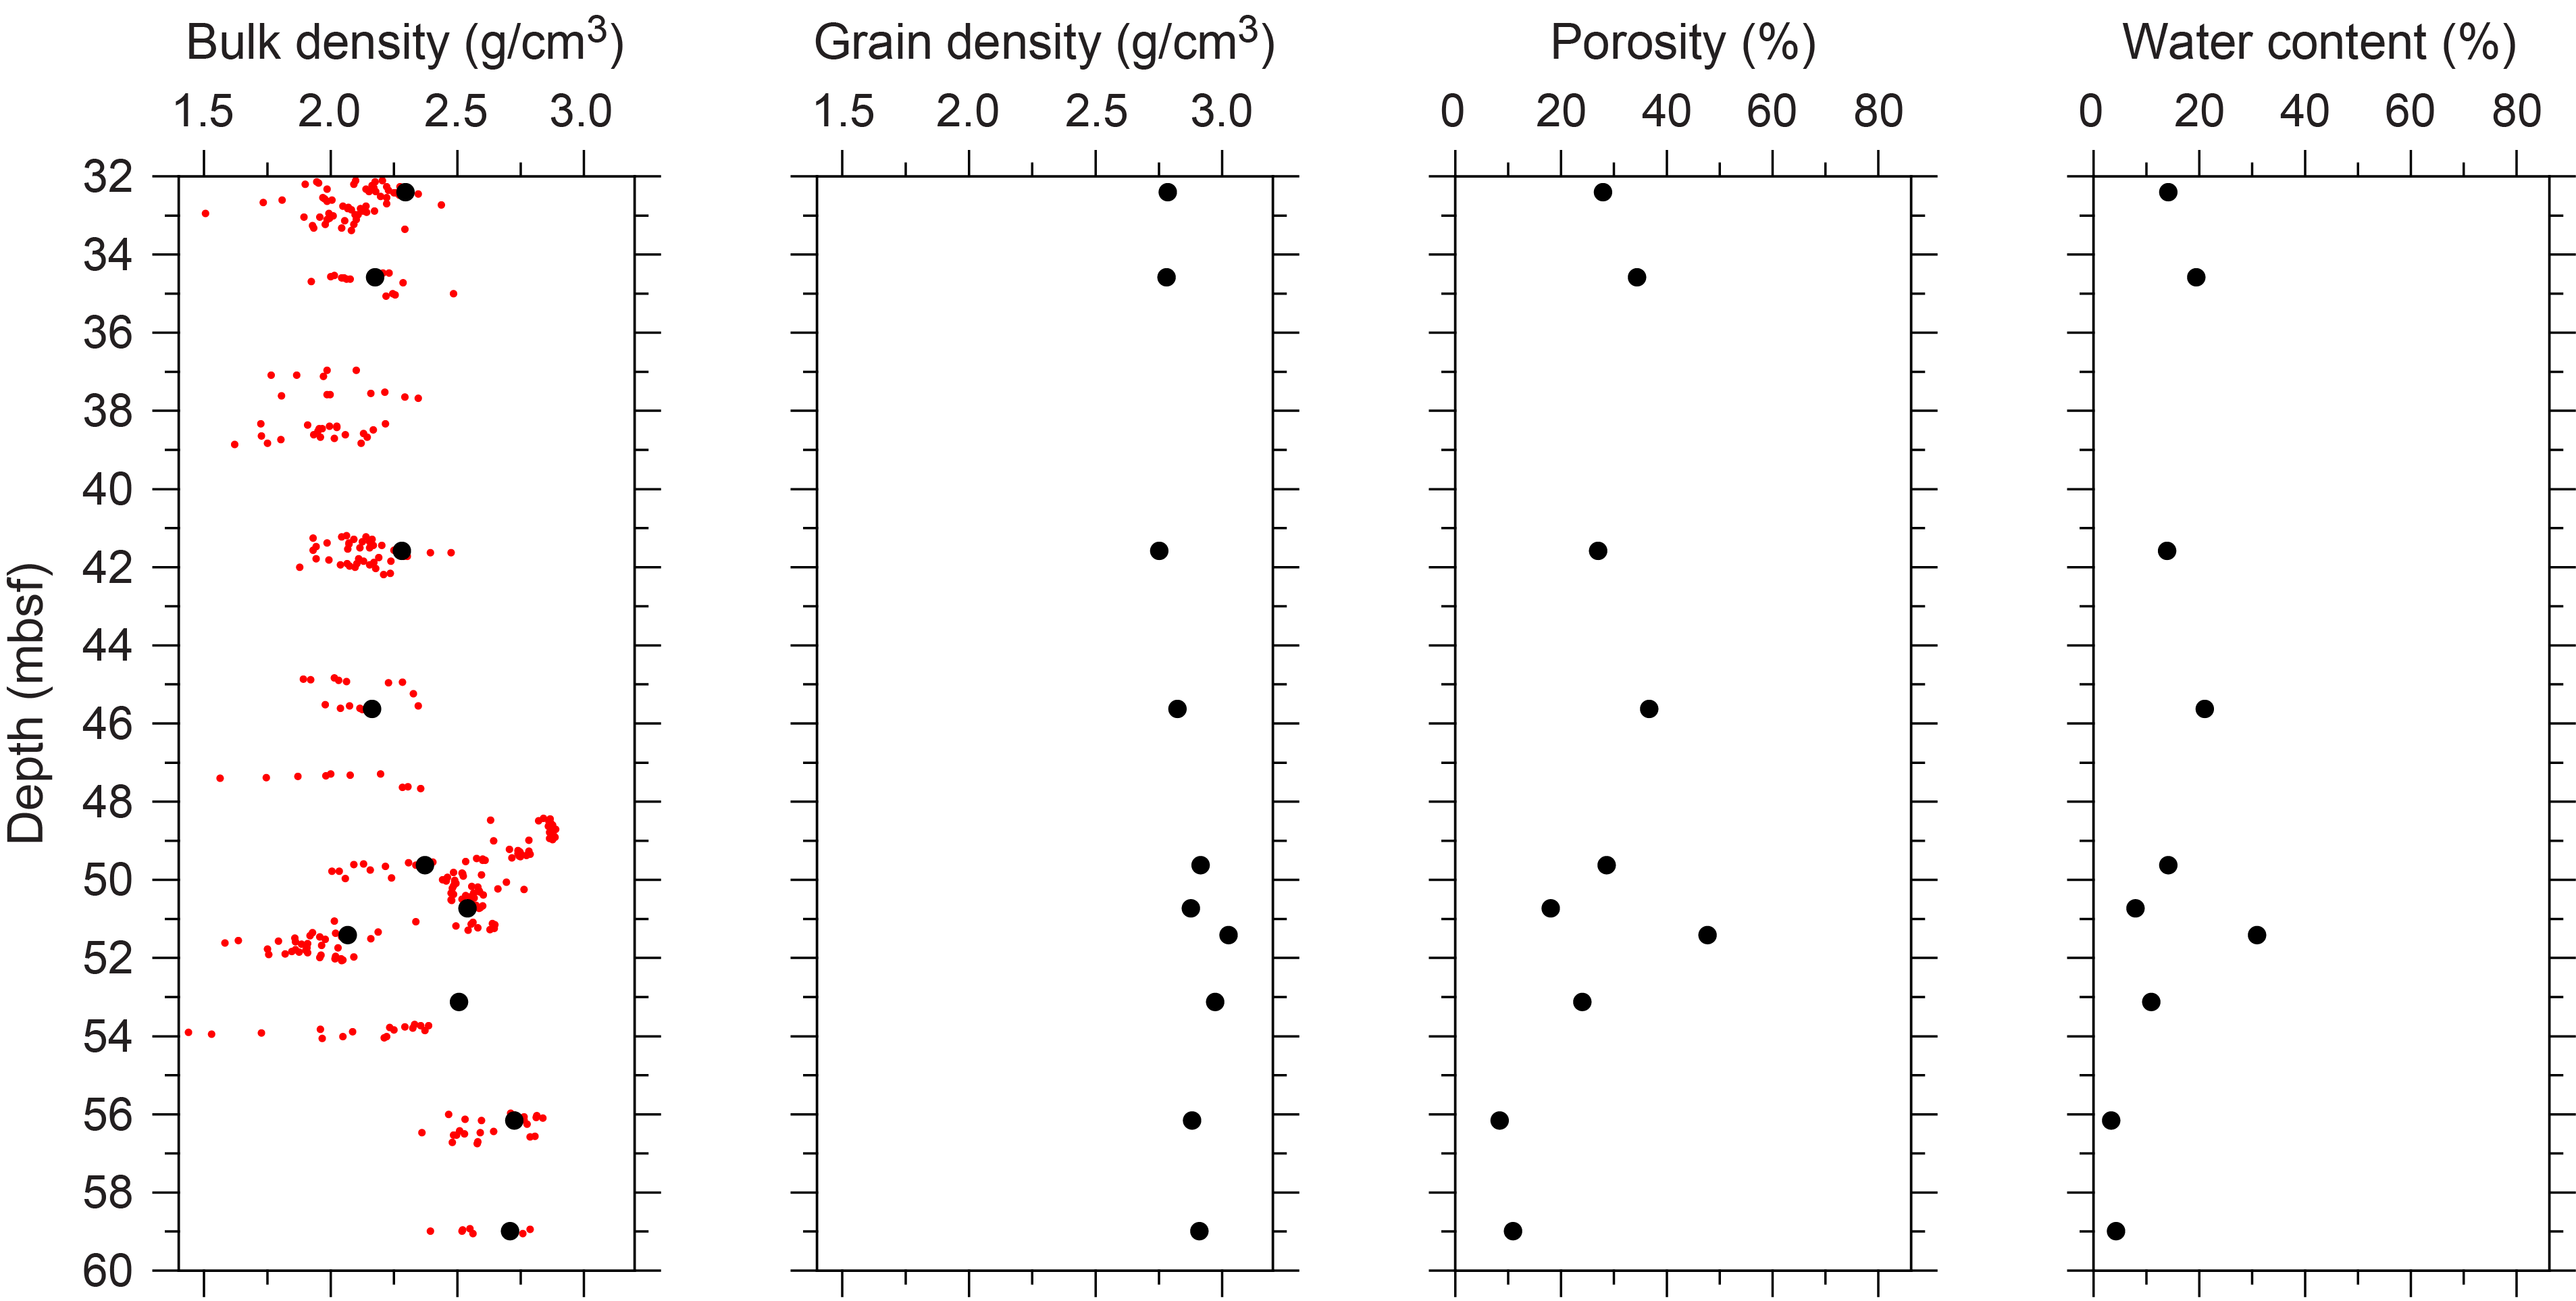
Figure F30. Physical properties, Hole M0099G.
3.7.2. P-wave velocity
P-wave velocity MSCL measurements on Hole M0099G cores yielded no data. A total of 10 samples were measured using the discrete P-wave logger. Dry measurement values range 1715–5039 m/s (Figure F31). P-wave velocity recorded for the samples after resaturation range 3196 to 6040 m/s.
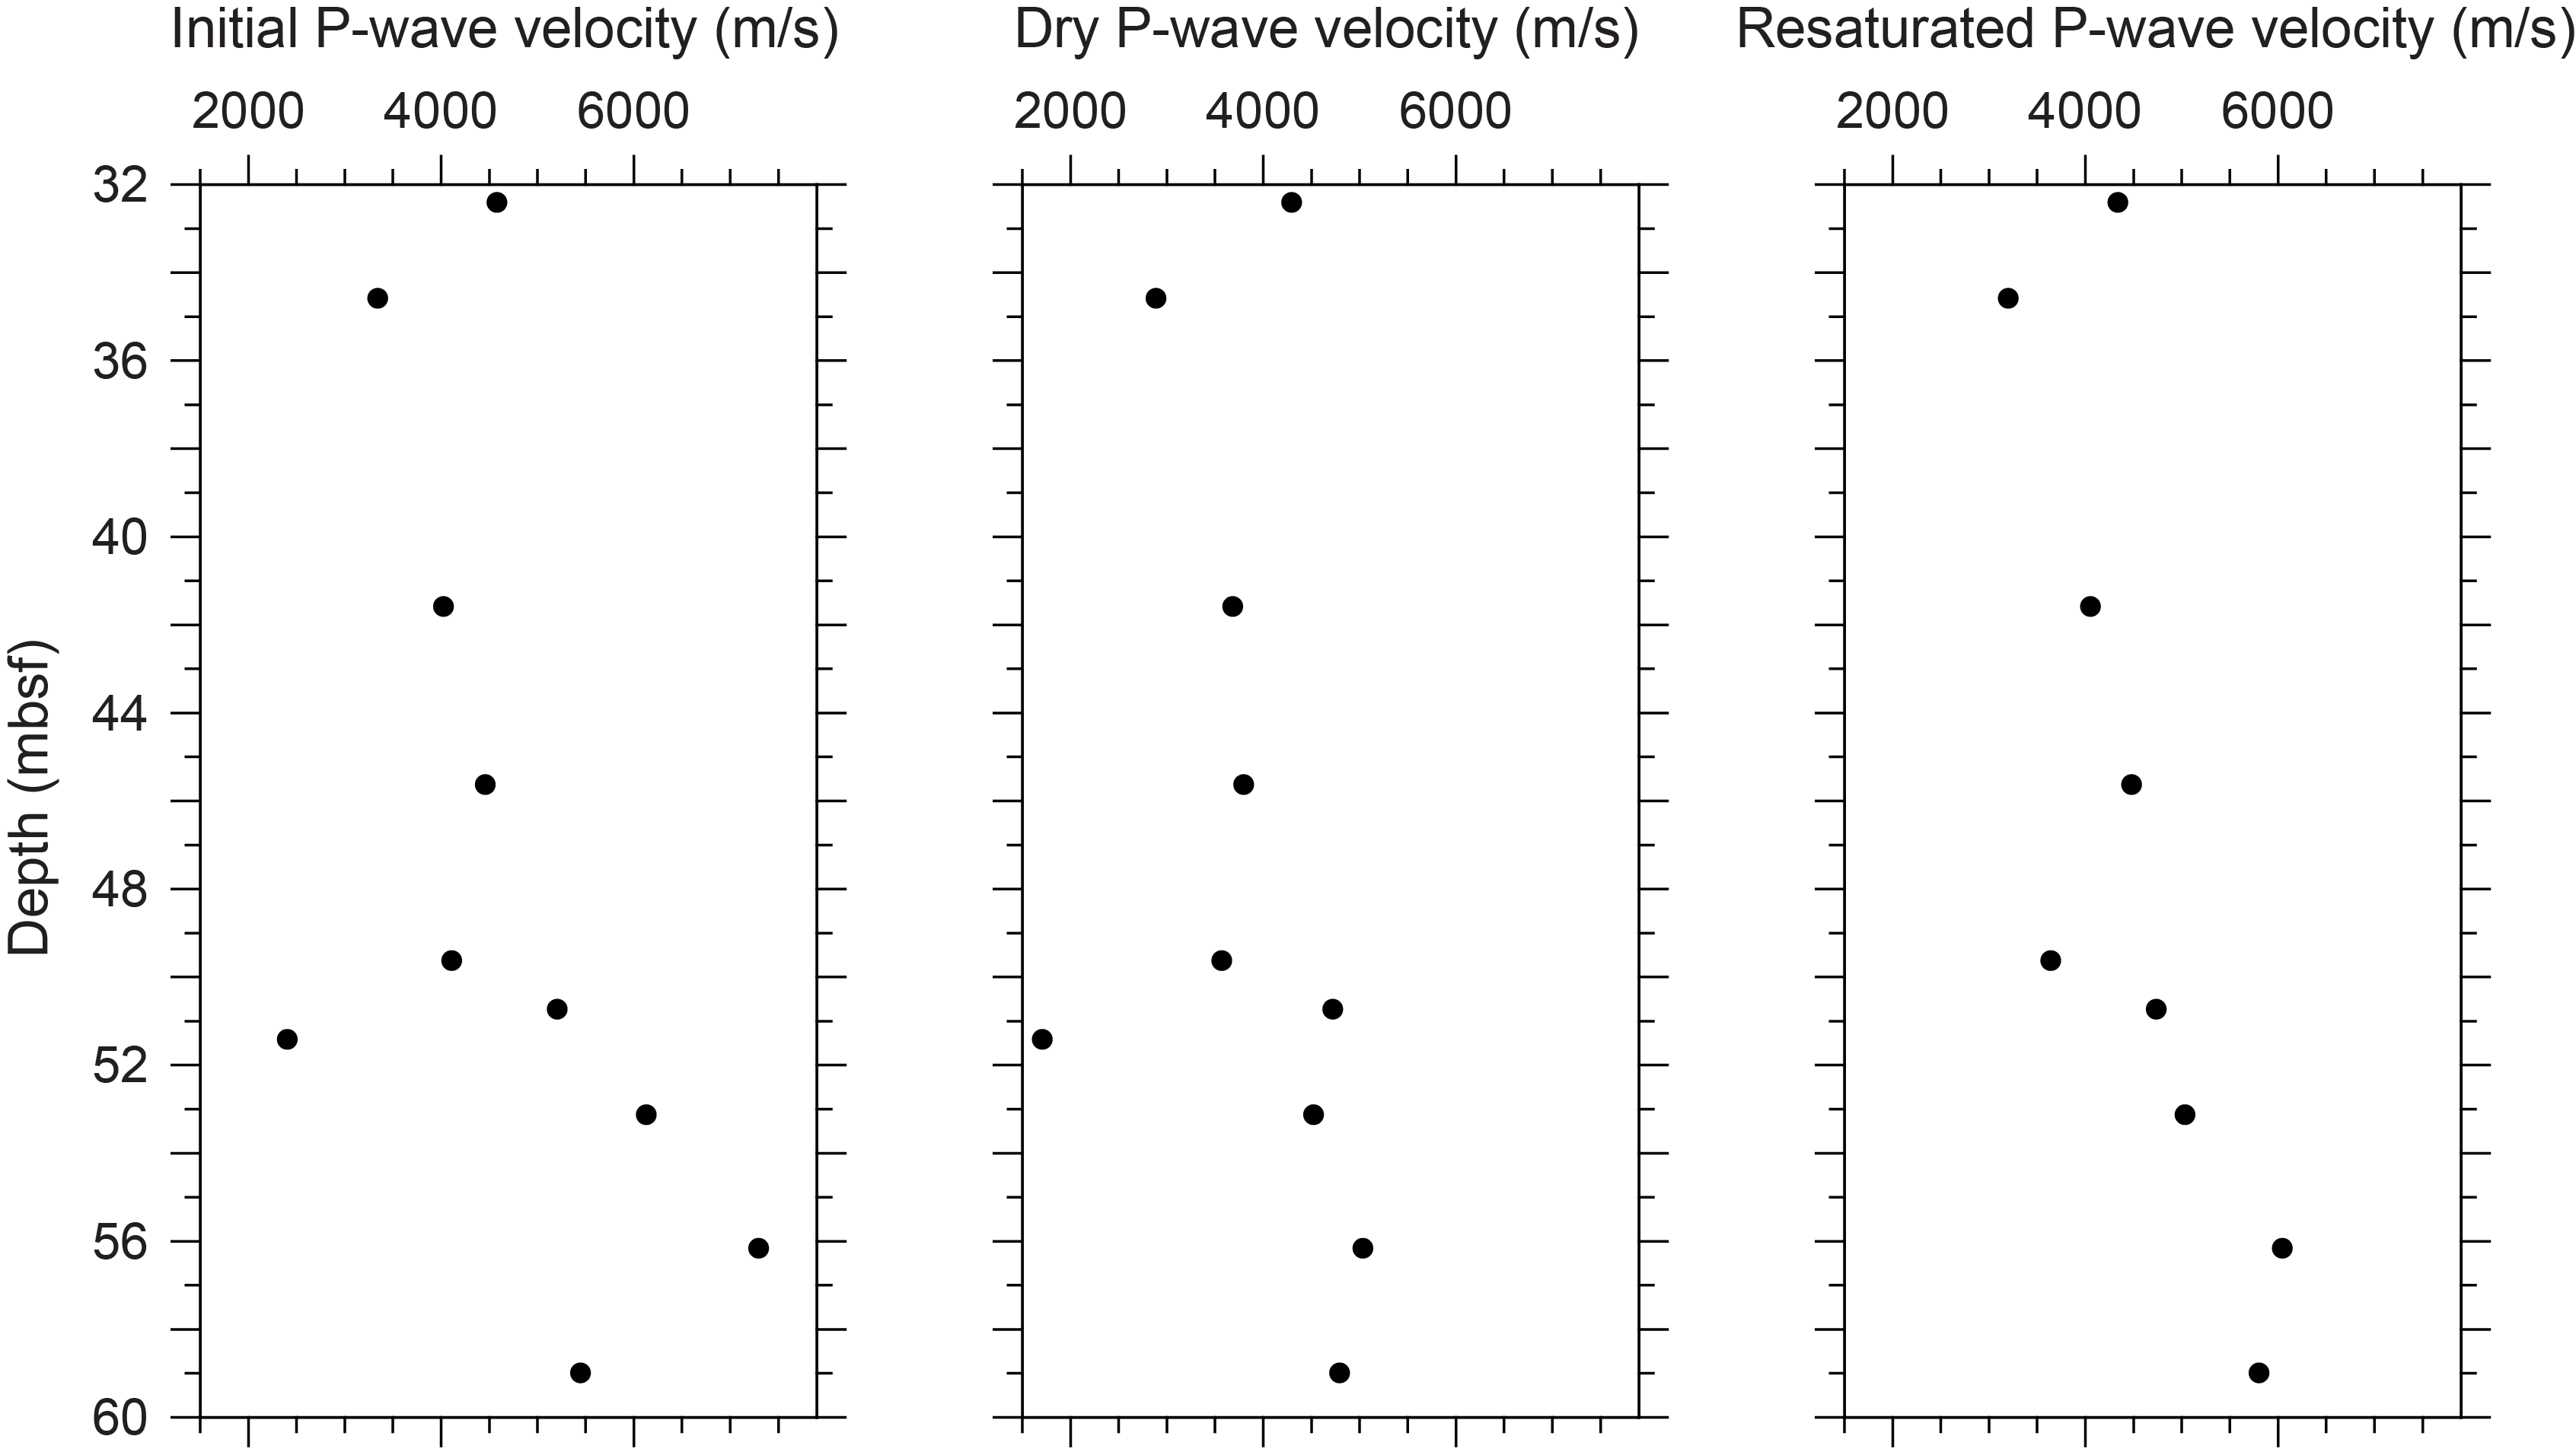
Figure F31. P-wave velocities, Hole M0099G.
3.7.3. Thermal conductivity
Thermal conductivity was collected on three cores (see Table T11 in the Expedition 389 methods chapter [Webster et al., 2025a]), and values range 0.989–1.880 W/(m·K).
3.7.4. Magnetic susceptibility
MSCL magnetic susceptibility data range −0.80 × 10⁻⁵ to 798.19 × 10⁻⁵ SI (Figures F11, F12), with the highest values measured at 48.39 mbsf at the contact between the carbonate deposits and the lava.
3.7.5. Electrical resistivity
MSCL noncontact resistivity measurements range 0.93–120.62 Ωm (Figures F11, F12). A general decreasing trend of the average resistivity from roughly 20 to 5 Ωm was observed.
3.7.6. Natural gamma radiation
MSCL NGR measurements range 25–34 counts/s (Figures F11, F12).
3.7.7. Digital linescans, color reflectance, and hyperspectral imaging
All cores from Hole M0099G were digitally scanned, measured for color reflectance (where appropriate), and imaged with the hyperspectral scanner (see HYPERSPECTRAL in Supplementary material). Color reflectance L* values vary between 4.85% and 84.94% (Figures F11, F12), a* varies between −2.13 and 15.31, b* varies between −0.91 and 19.49, and a*/b* varies between −4.25 and 1.87. The L* values clearly reflect the change from carbonate deposits to lava at 48.39 mbsf.
4. Geochemistry
4.1. Interstitial water
Two interstitial water samples were collected from Site M0099. Concentrations of major ions in these samples are within the normal range for seawater with the exception of slightly lower K concentrations (see Table T16 in the Expedition 389 methods chapter [Webster et al., 2025a]).
4.2. Surface seawater
Two surface seawater samples were collected from Site M0099, one from Hole M0099A using an improvised sampling device and one from Hole M0099G using a Niskin bottle deployed from the side of the vessel (see Figure F22 in the Expedition 389 methods chapter [Webster et al., 2025a]). The salinity, pH, alkalinity, and major element chemistry measured for this sample are consistent with the other surface seawater samples taken during Expedition 389 and align with the expected values for conservative elements in seawater with the exception of elevated alkalinity of 4.08 mmol/L in the sample from Hole M0099G (see Tables T15 and T17 in the Expedition 389 methods chapter [Webster et al., 2025a]).
4.3. Bulk sediment and rocks
A total of 22 bulk sediment and rock samples were taken from Site M0099 (Figure F2) and analyzed for mineralogy, elemental composition, and carbon content. Of these samples, 19 are derived from carbonate facies (see Figure F10 in the Expedition 389 methods chapter [Webster et al., 2025a]), mostly microbialite and some encrusted coral fragments, and three are from the lava unit near the bottom of Hole M0099G.
4.4. Mineralogy
Carbonate samples from Site M0099 tend to be very pure mixtures of high-Mg calcite and aragonite with small amounts of calcite detected in some samples (Table T2). Mixed Mn-Ca carbonates (11%) were detected in only one sample of coral rubble (389-M0099G-2R-1, 10–13 cm; 31 mbsf). There are no discernible downhole trends in carbonate mineralogy in any hole with more than three X-ray diffraction (XRD) analyses.
The basalt samples from Site M0099 contain mixtures of plagioclase (35%−63%) and pyroxenes (12%−63%) with one sample of altered basalt rubble (389-M0099G-17R-1, 116–118 cm; 52.15 mbsf) additionally composed of 25% alteration product clay minerals identified as smectites (15%) and palygorskite (10%). The deepest sample analyzed (389-M0099G-29R-1, 15–18 cm; 62.57 mbsf) contains 2% cristobalite, a high-temperature silica polymorph.
4.5. Elemental abundances
The concentrations of major elements in bulk sediment and rock samples from Site M0099 reflect the lithology (Table T3). The carbonate-rich samples, mostly microbialite with some clasts of mixed coral and algal crust, are so pure that most elements apart from Ca, Mg, S, and Sr were below detection for the majority of samples. There are no discernible downhole trends, but the Sr concentration is strongly correlated with the aragonite content (R2 = 0.90) of the samples and the Mg concentration is correlated to the high-Mg calcite content (R2 = 0.76) (Figure F32). Two of the lava samples have similar concentrations of Al, Fe, Ni, and Zr, probably reflecting a relatively homogeneous basaltic lava. Conversely, in the third lava sample, with a lithology described as altered basalt rubble (389-M0099G-17R-1, 116–118 cm; 52.15 mbsf), concentrations of Fe, K, Mg, and Ti are higher, probably related to the presence of Mg-enriched secondary clays, identified as smectites and palygorskite (Table T2). For Fe and Ti, they could instead be accumulation products from weathering under oxidizing conditions. Further investigations would be required to resolve these possibilities.
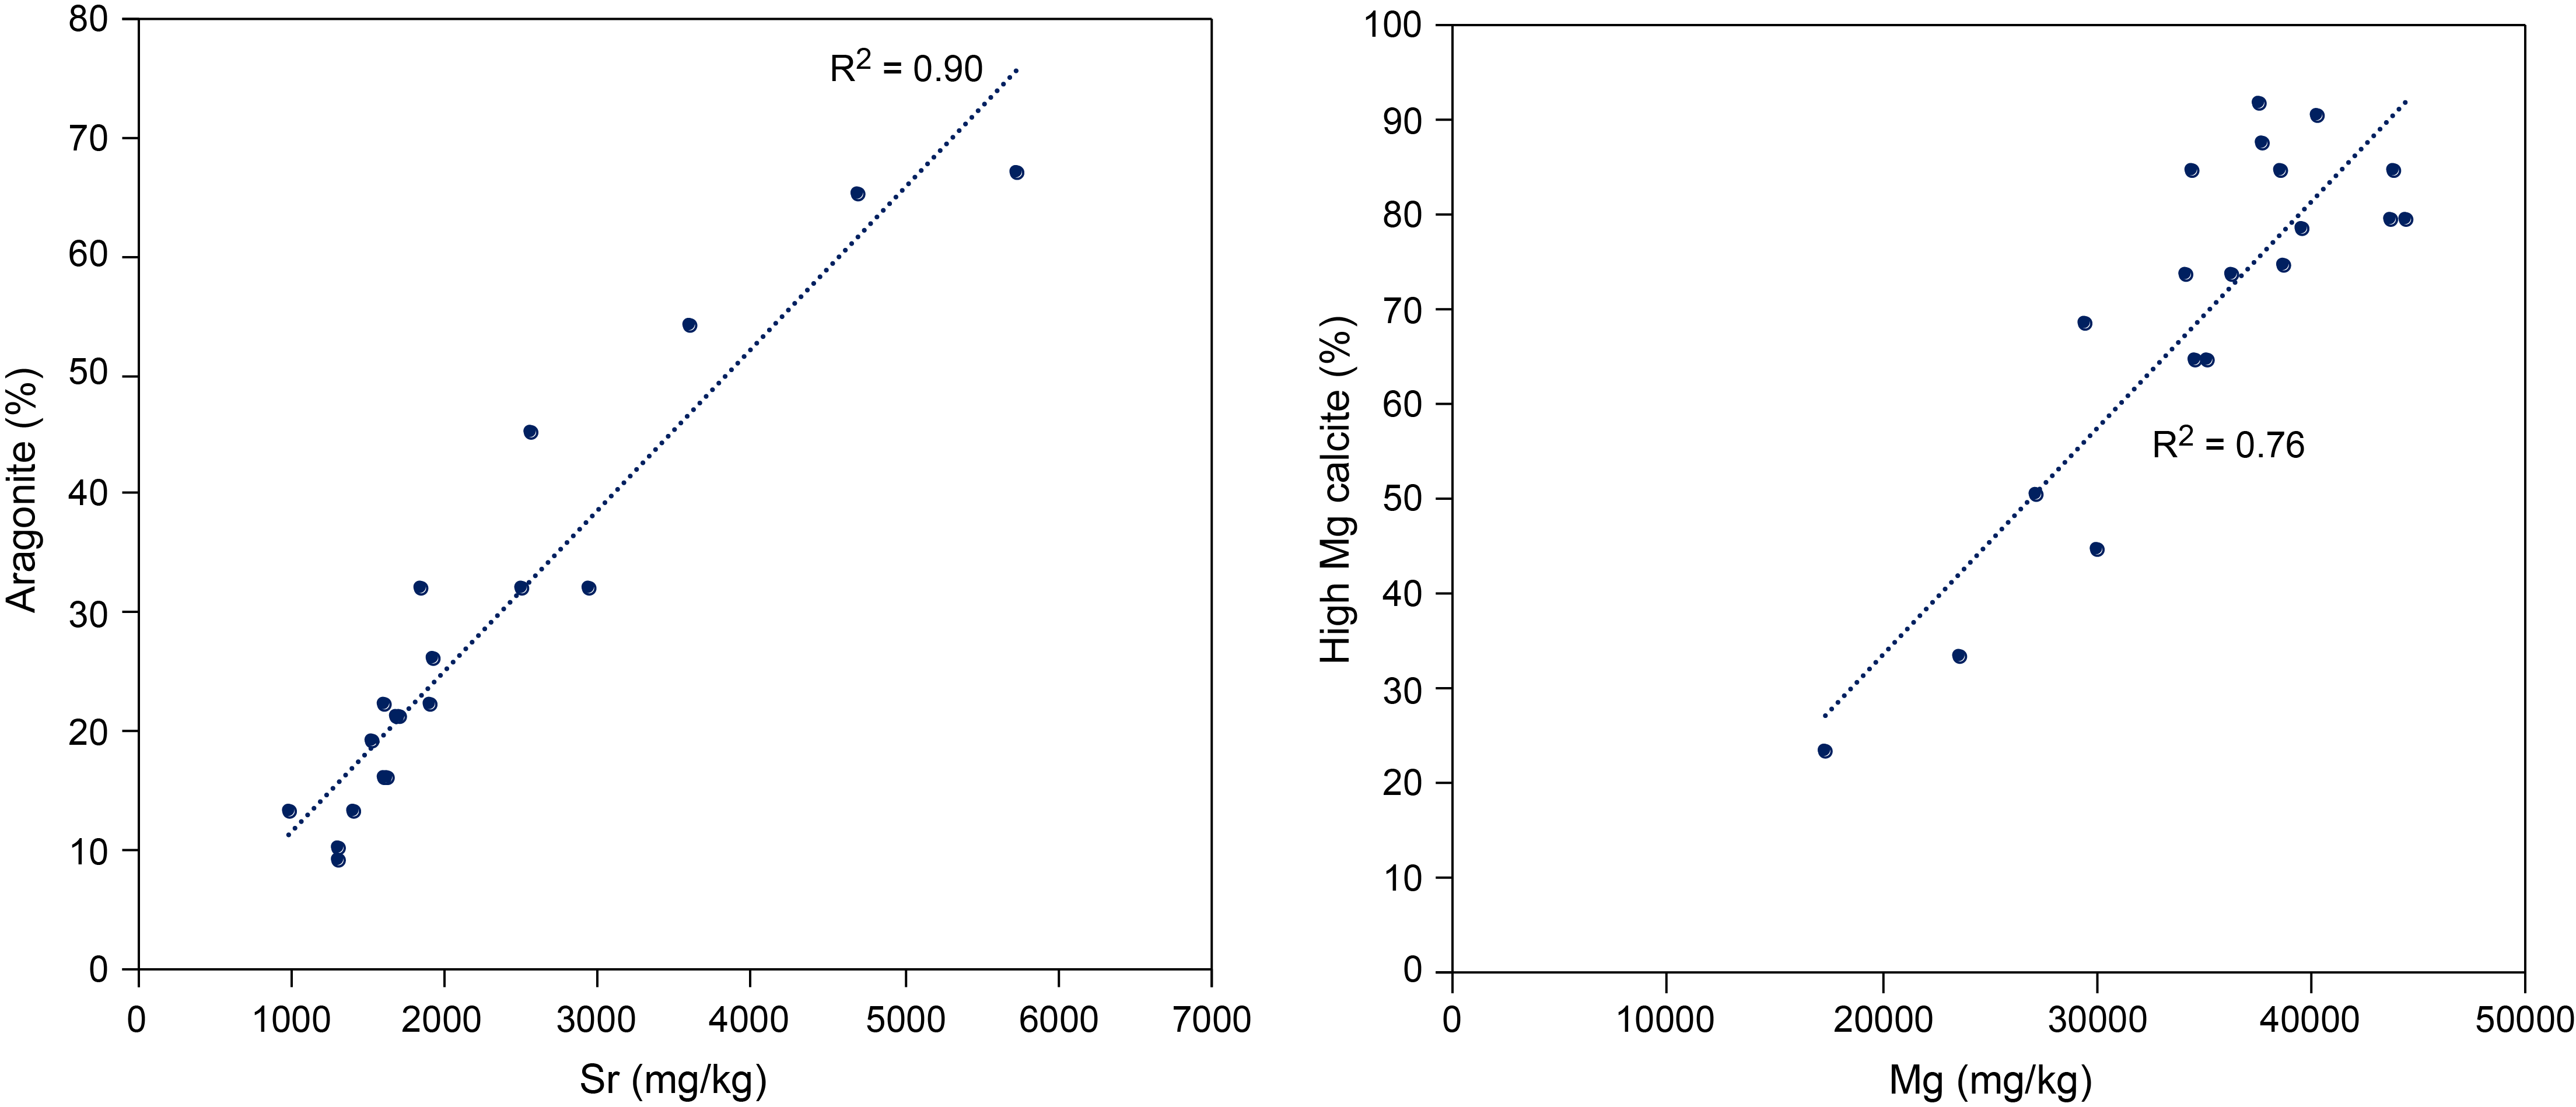
Figure F32. Carbonate mineralogy.
4.6. Carbon content
The results for total organic carbon (TOC), total carbon (TC), and total inorganic carbon (TIC) (also expressed as percent CaCO3) at Site M0099 are presented in Table T4. Total carbon content ranges 11.3%–12.0% in the carbonate samples and is <1% in the basalts. TOC content ranges 0.12%–0.27% for all samples from Site M0099, with the lowest values found in the basalts near the bottom of the recovered section. In the carbonate-rich samples, TIC ranges 11.1%–11.8%, which equates to CaCO3 content of 92%–99%.
5. Paleomagnetism
A total of 62 plug samples were obtained from Holes M0099A–M0099C and M0099E–M0099G. Measurements of low-field and mass-specific magnetic susceptibility (χ) were carried out for all samples. Natural remanent magnetization (NRM) was measured for all plug samples, as well as remanence following stepwise alternating field (AF) demagnetization up to a peak AF of 20 mT and for lava samples up to 100 mT. For further details, see Paleomagnetism in the Expedition 389 methods chapter (Webster et al., 2025a).
5.1. Hole M0099A
A total of four carbonate samples were collected from Hole M0099A. Negative low χ values occur throughout, ranging −1.69 × 10⁻⁸ to −1.08 × 10⁻⁸ m3/kg with an arithmetic mean of −1.48 × 10⁻⁸ m3/kg. The initial NRM intensity values for 0 mT range 1.37 × 10⁻⁴ to 13.4 × 10⁻⁴ A/m with an arithmetic mean of 4.46 × 10⁻⁴ A/m (Figure F33).
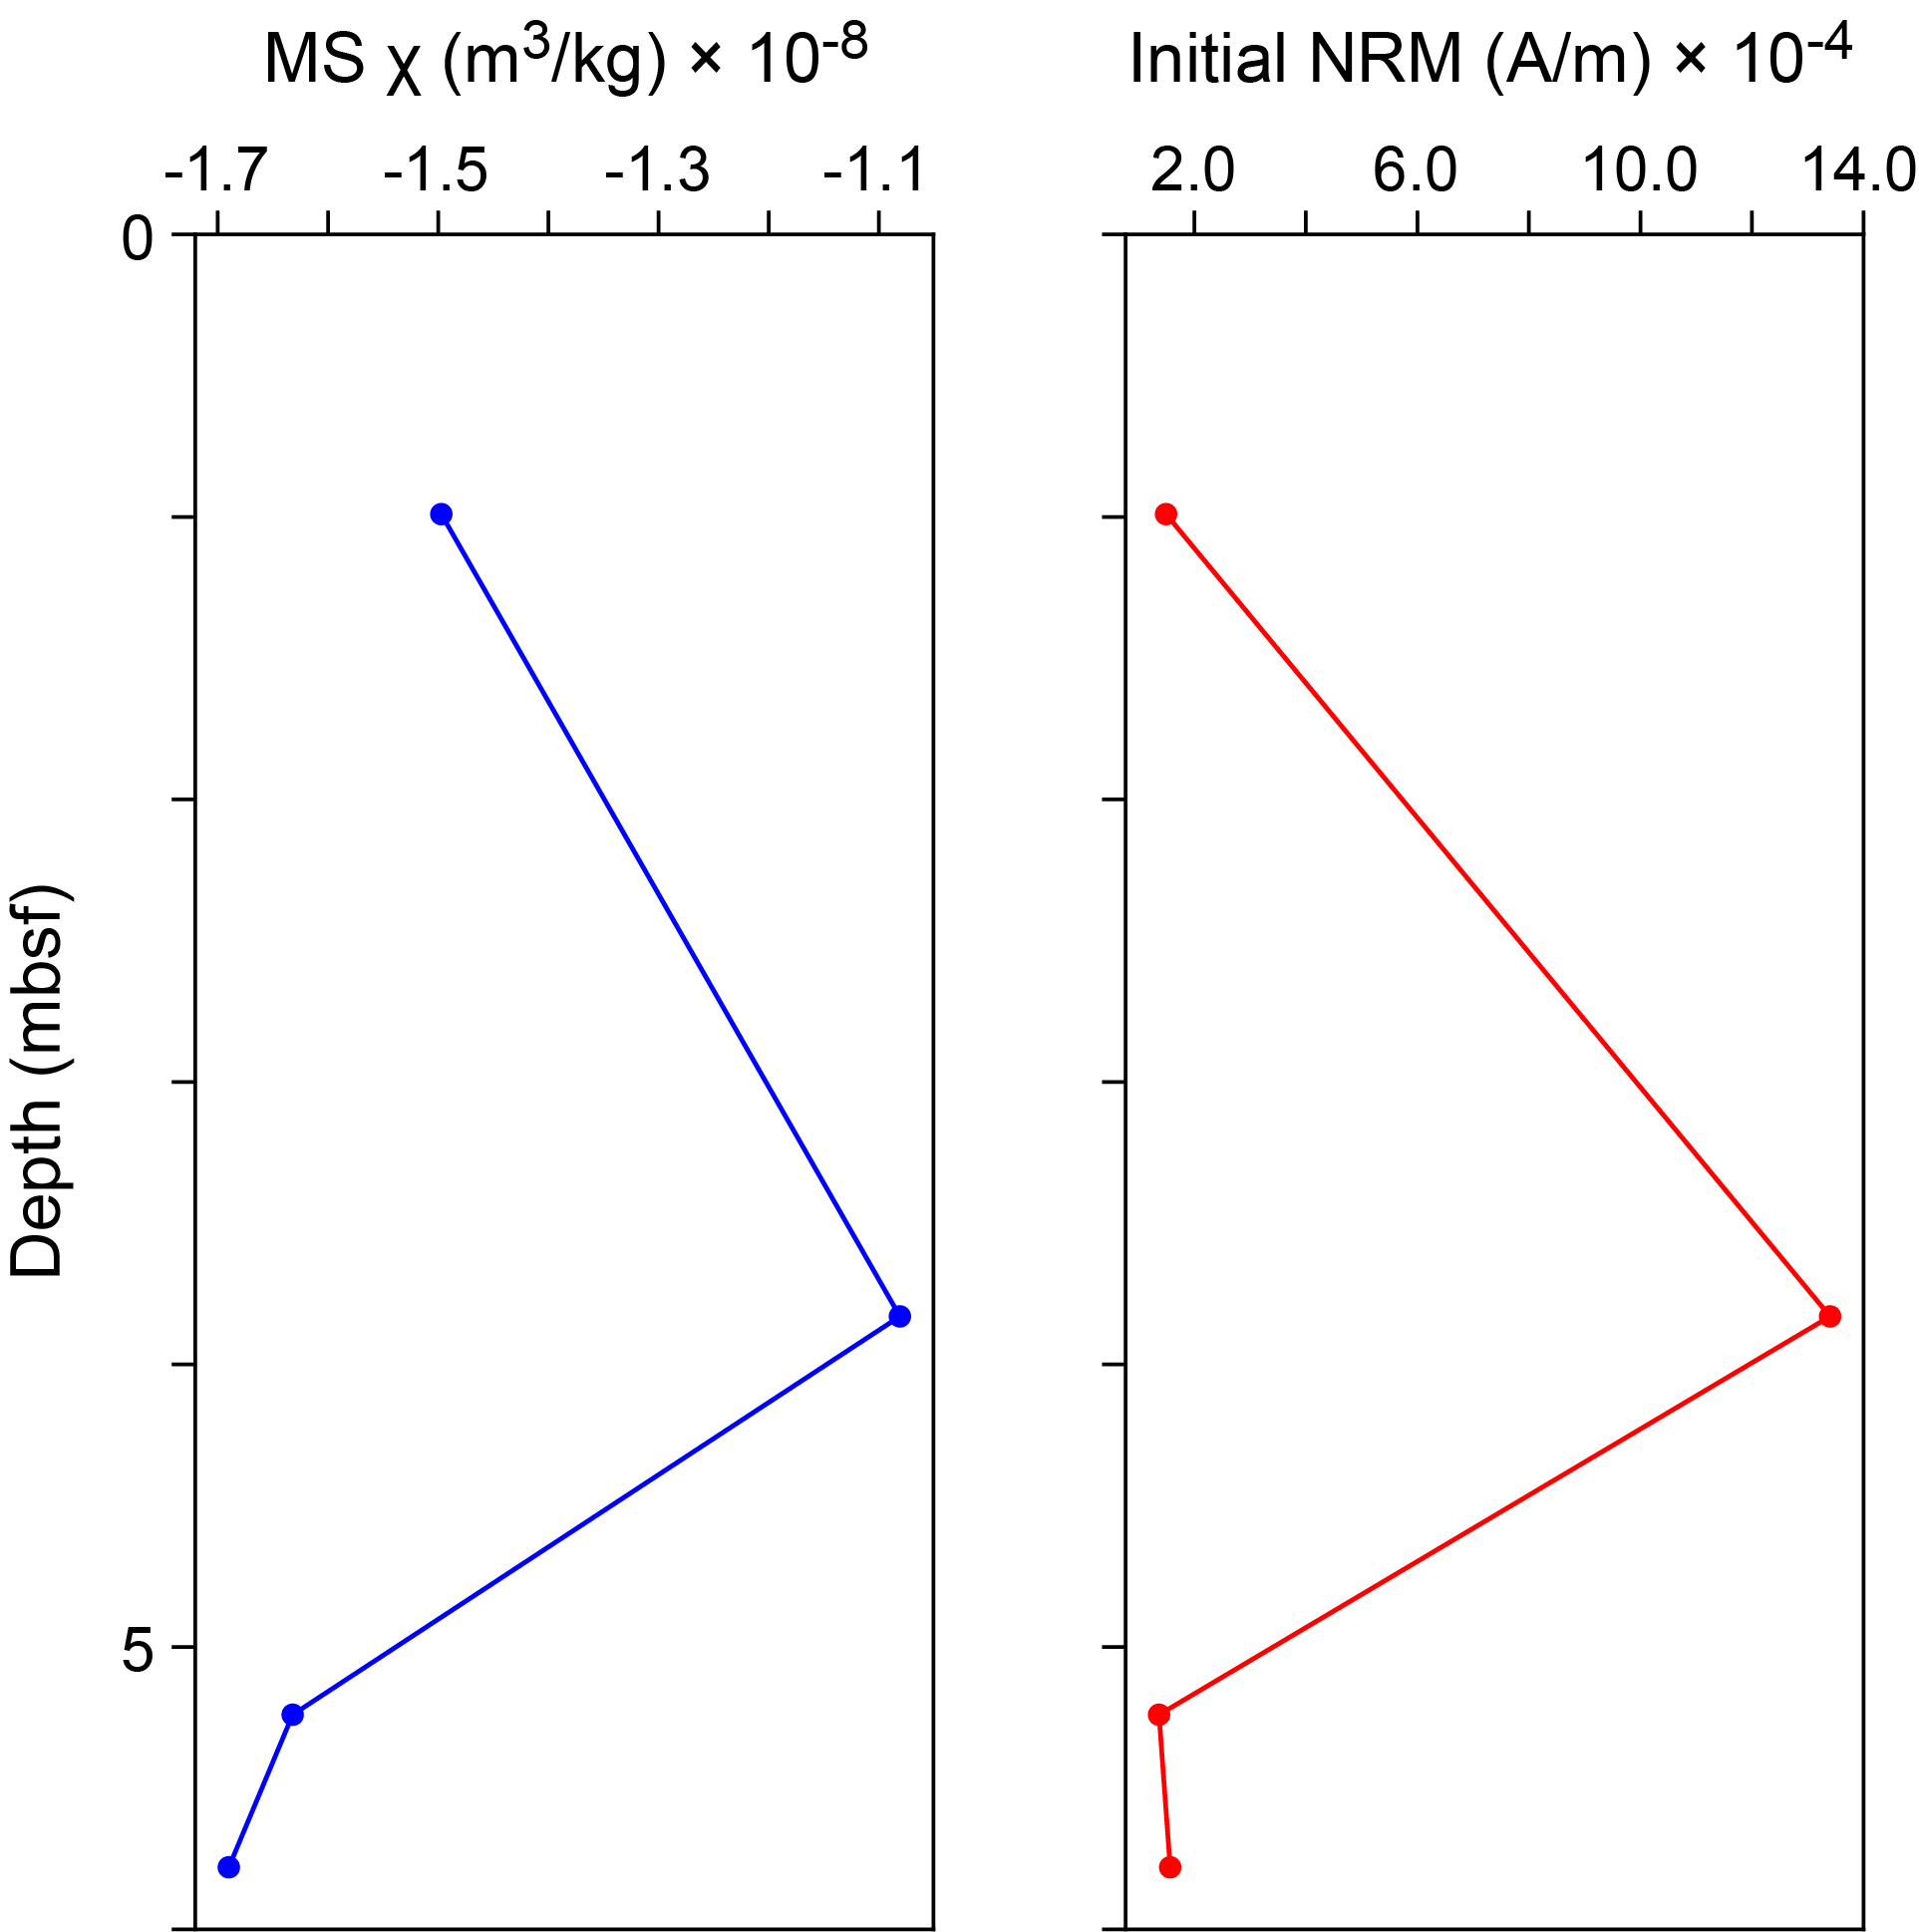
Figure F33. MS and NRM, Hole M0099A.
5.2. Hole M0099B
A total of four carbonate samples were collected from Hole M0099B. Negative low χ values occur throughout, ranging −1.52 × 10⁻⁸ to −1.07 × 10⁻⁸ m3/kg with an arithmetic mean of −1.28 × 10⁻⁸ m3/kg. The initial NRM intensity values for 0 mT range 2.75 × 10⁻⁴ to 14.4 × 10⁻³ A/m with an arithmetic mean of 7.95 × 10⁻⁴ A/m (Figure F34).
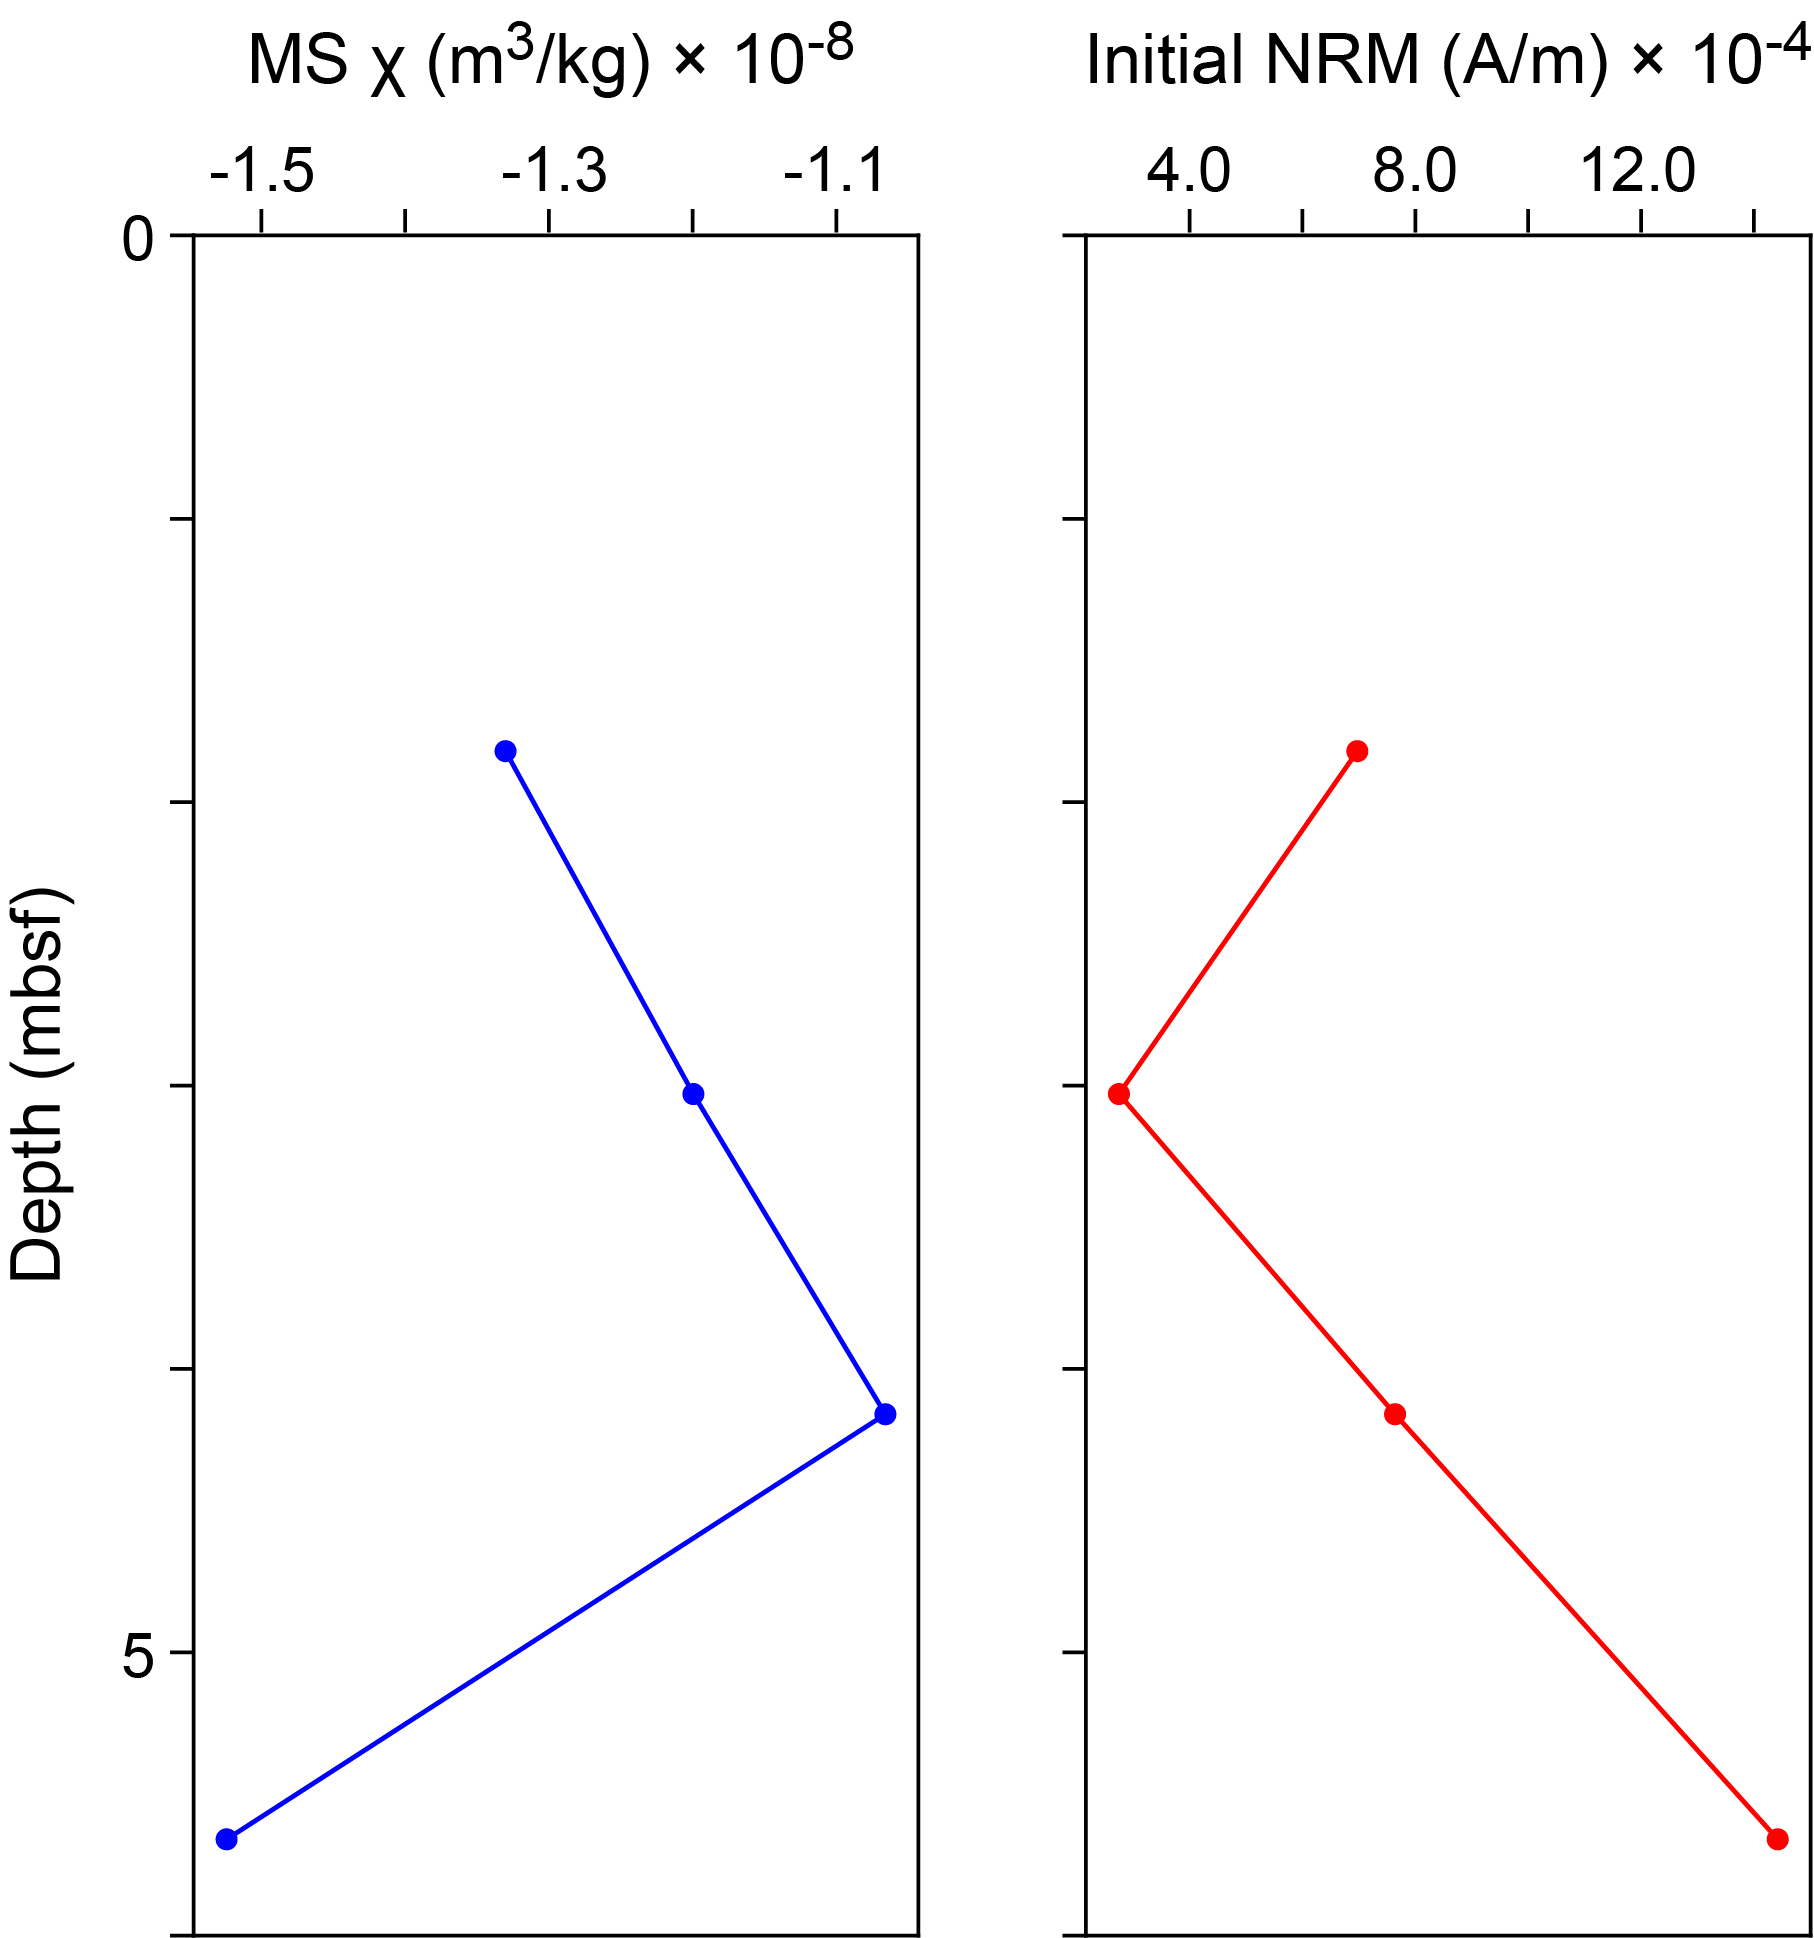
Figure F34. MS and NRM, Hole M0099B.
5.3. Hole M0099C
A total of 16 carbonate samples were collected from Hole M0099C. Negative low χ values occur throughout, ranging −2.36 × 10⁻⁸ to −0.74 × 10⁻⁸ m3/kg with an arithmetic mean of −1.47 × 10⁻⁸ m3/kg. The initial NRM intensity values for 0 mT range 0.74 × 10⁻⁴ to 6.89 × 10⁻⁴ A/m with an arithmetic mean of 2.34 × 10⁻⁴ A/m. χ values and NRM values covary for the top five samples (~3–7 mbsf), suggesting magnetic concentration and properties mainly drive these variations (Figure F35). The lack of correlation between χ and NRM values farther downhole is likely an artifact of the low concentrations of magnetic minerals.
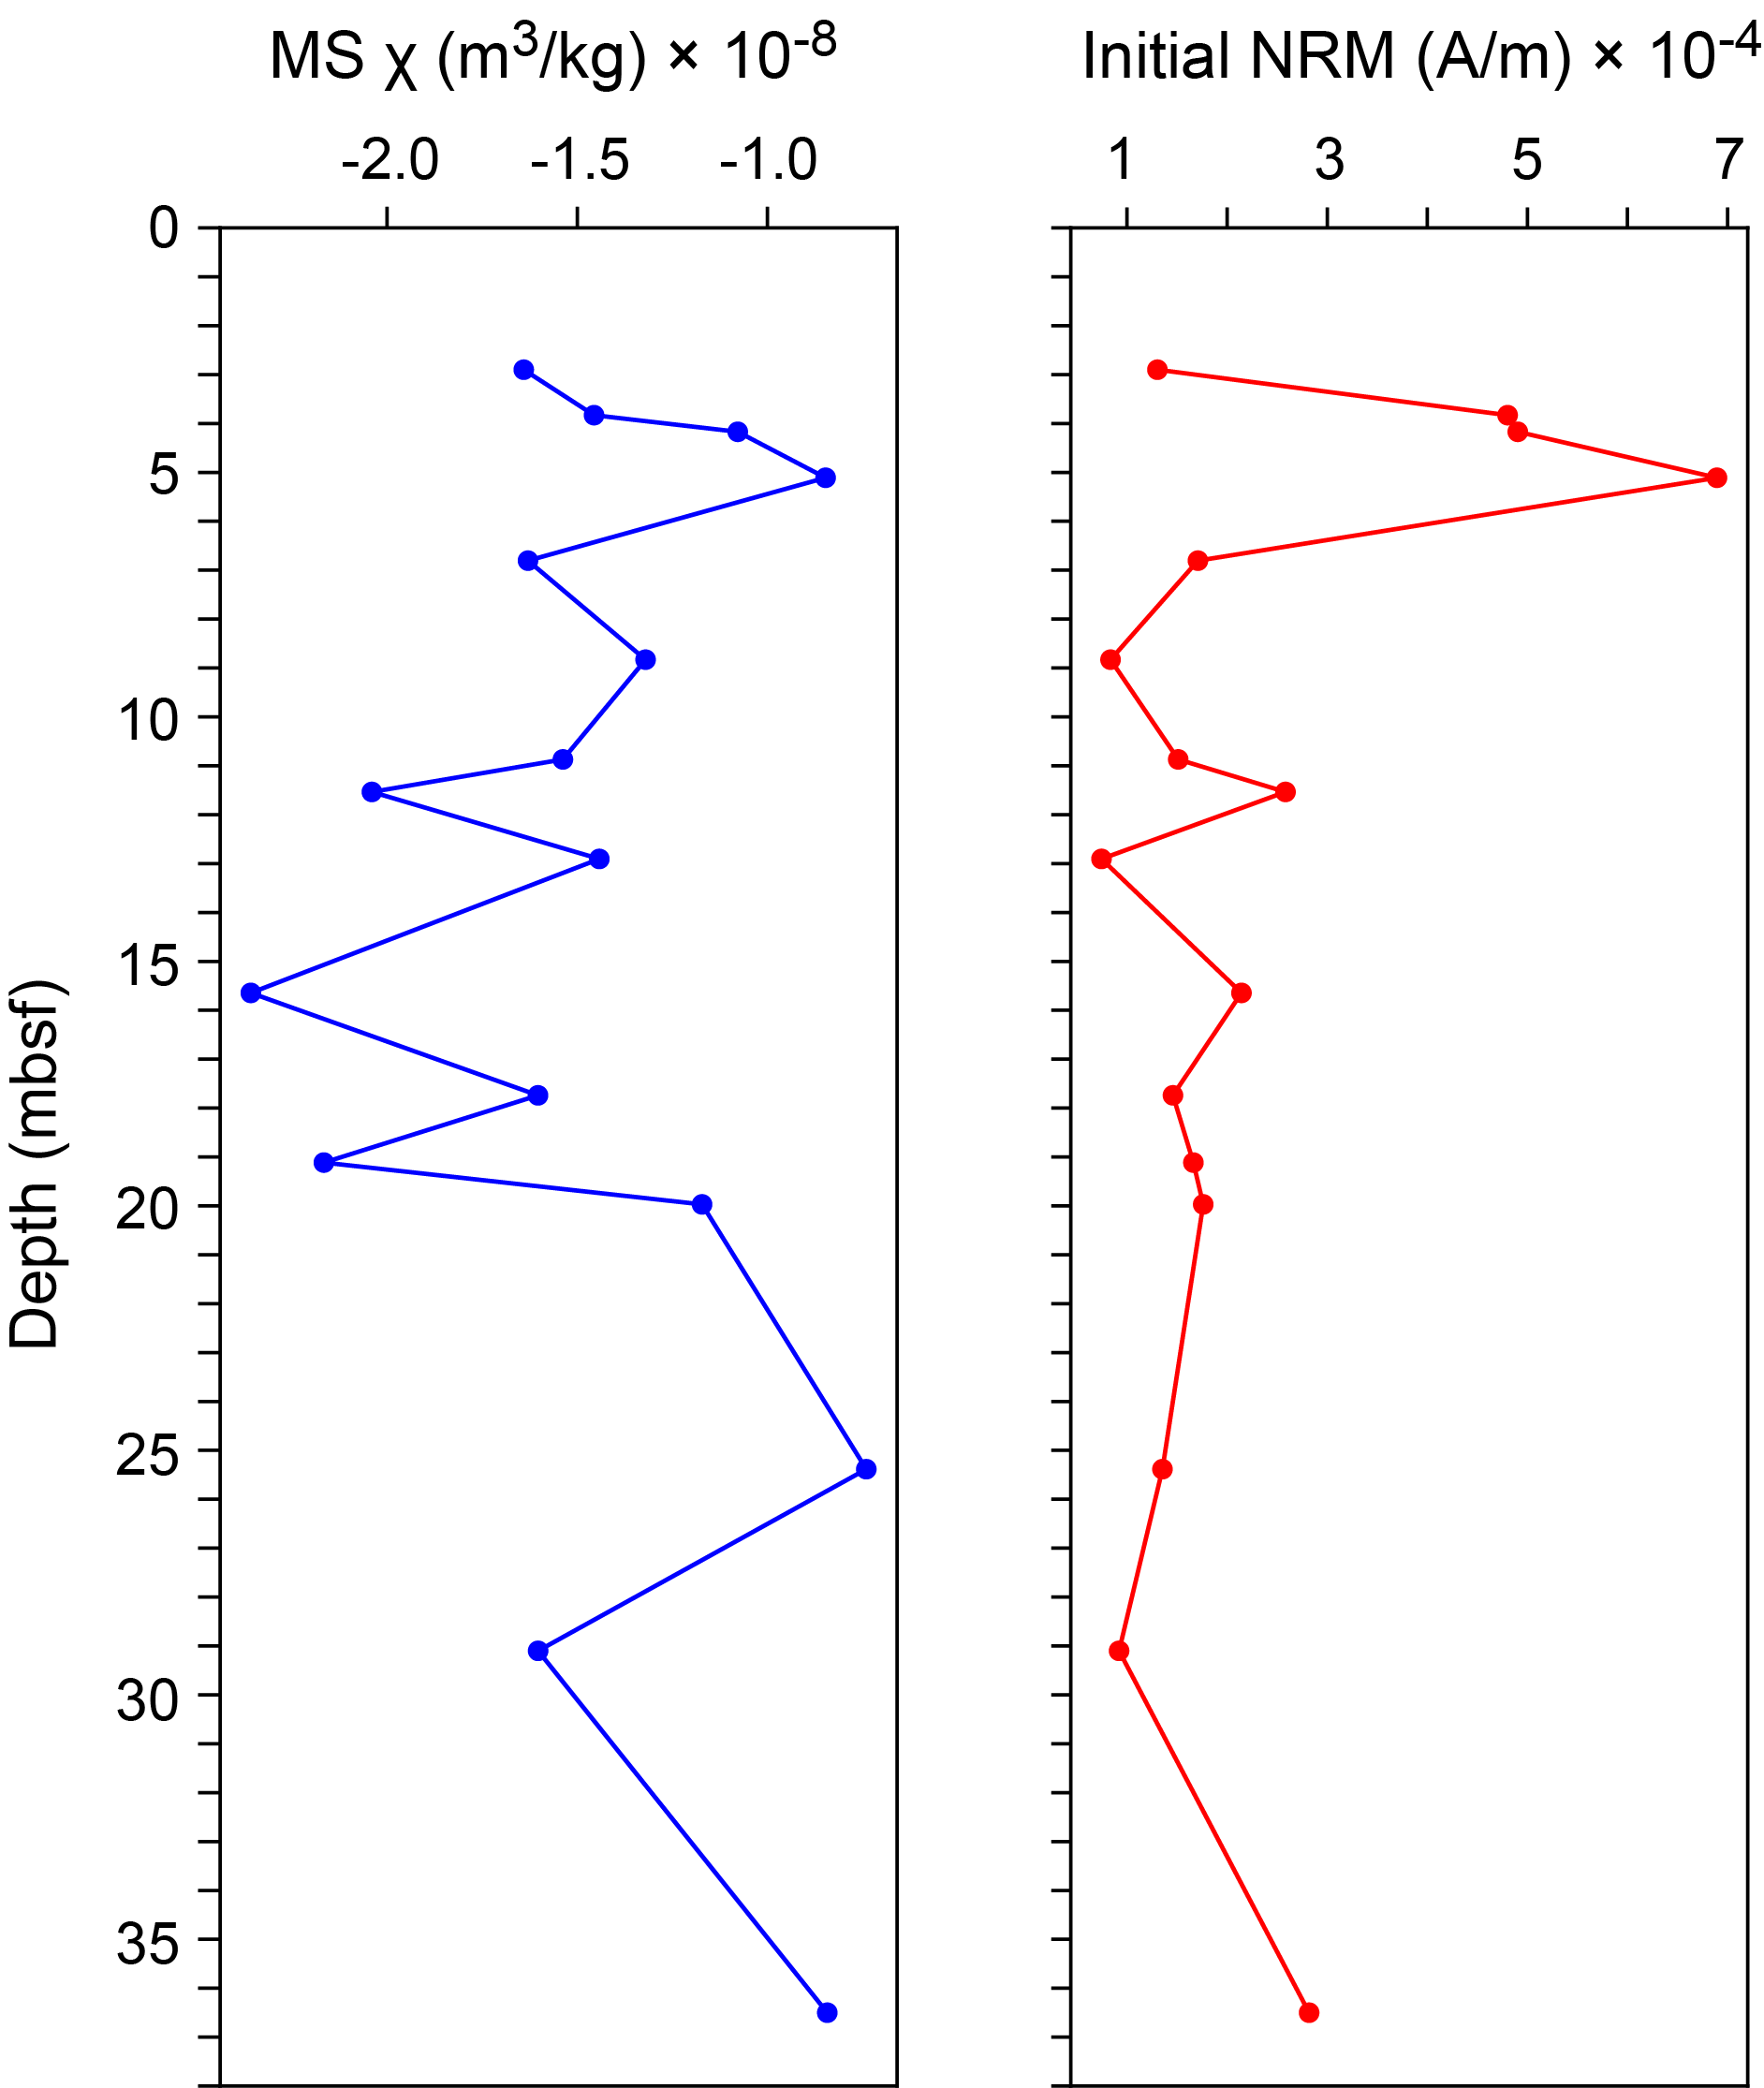
Figure F35. MS and NRM, Hole M0099C.
5.4. Hole M0099D
This hole was cored by wash bore only; no core was recovered (Table T1).
5.5. Hole M0099E
A total of 11 carbonate samples were collected from Hole M0099E. Negative low χ values occur throughout, ranging −1.98 × 10⁻⁸ to −1.27 × 10⁻⁸ m3/kg with an arithmetic mean of −1.62 × 10⁻⁸ m3/kg. The initial NRM intensity values for 0 mT mostly decrease downhole from 0.26 × 10⁻⁴ to 12.1 × 10⁻⁴ A/m with an arithmetic mean of 3.22 × 10⁻⁴ A/m (Figure F36).
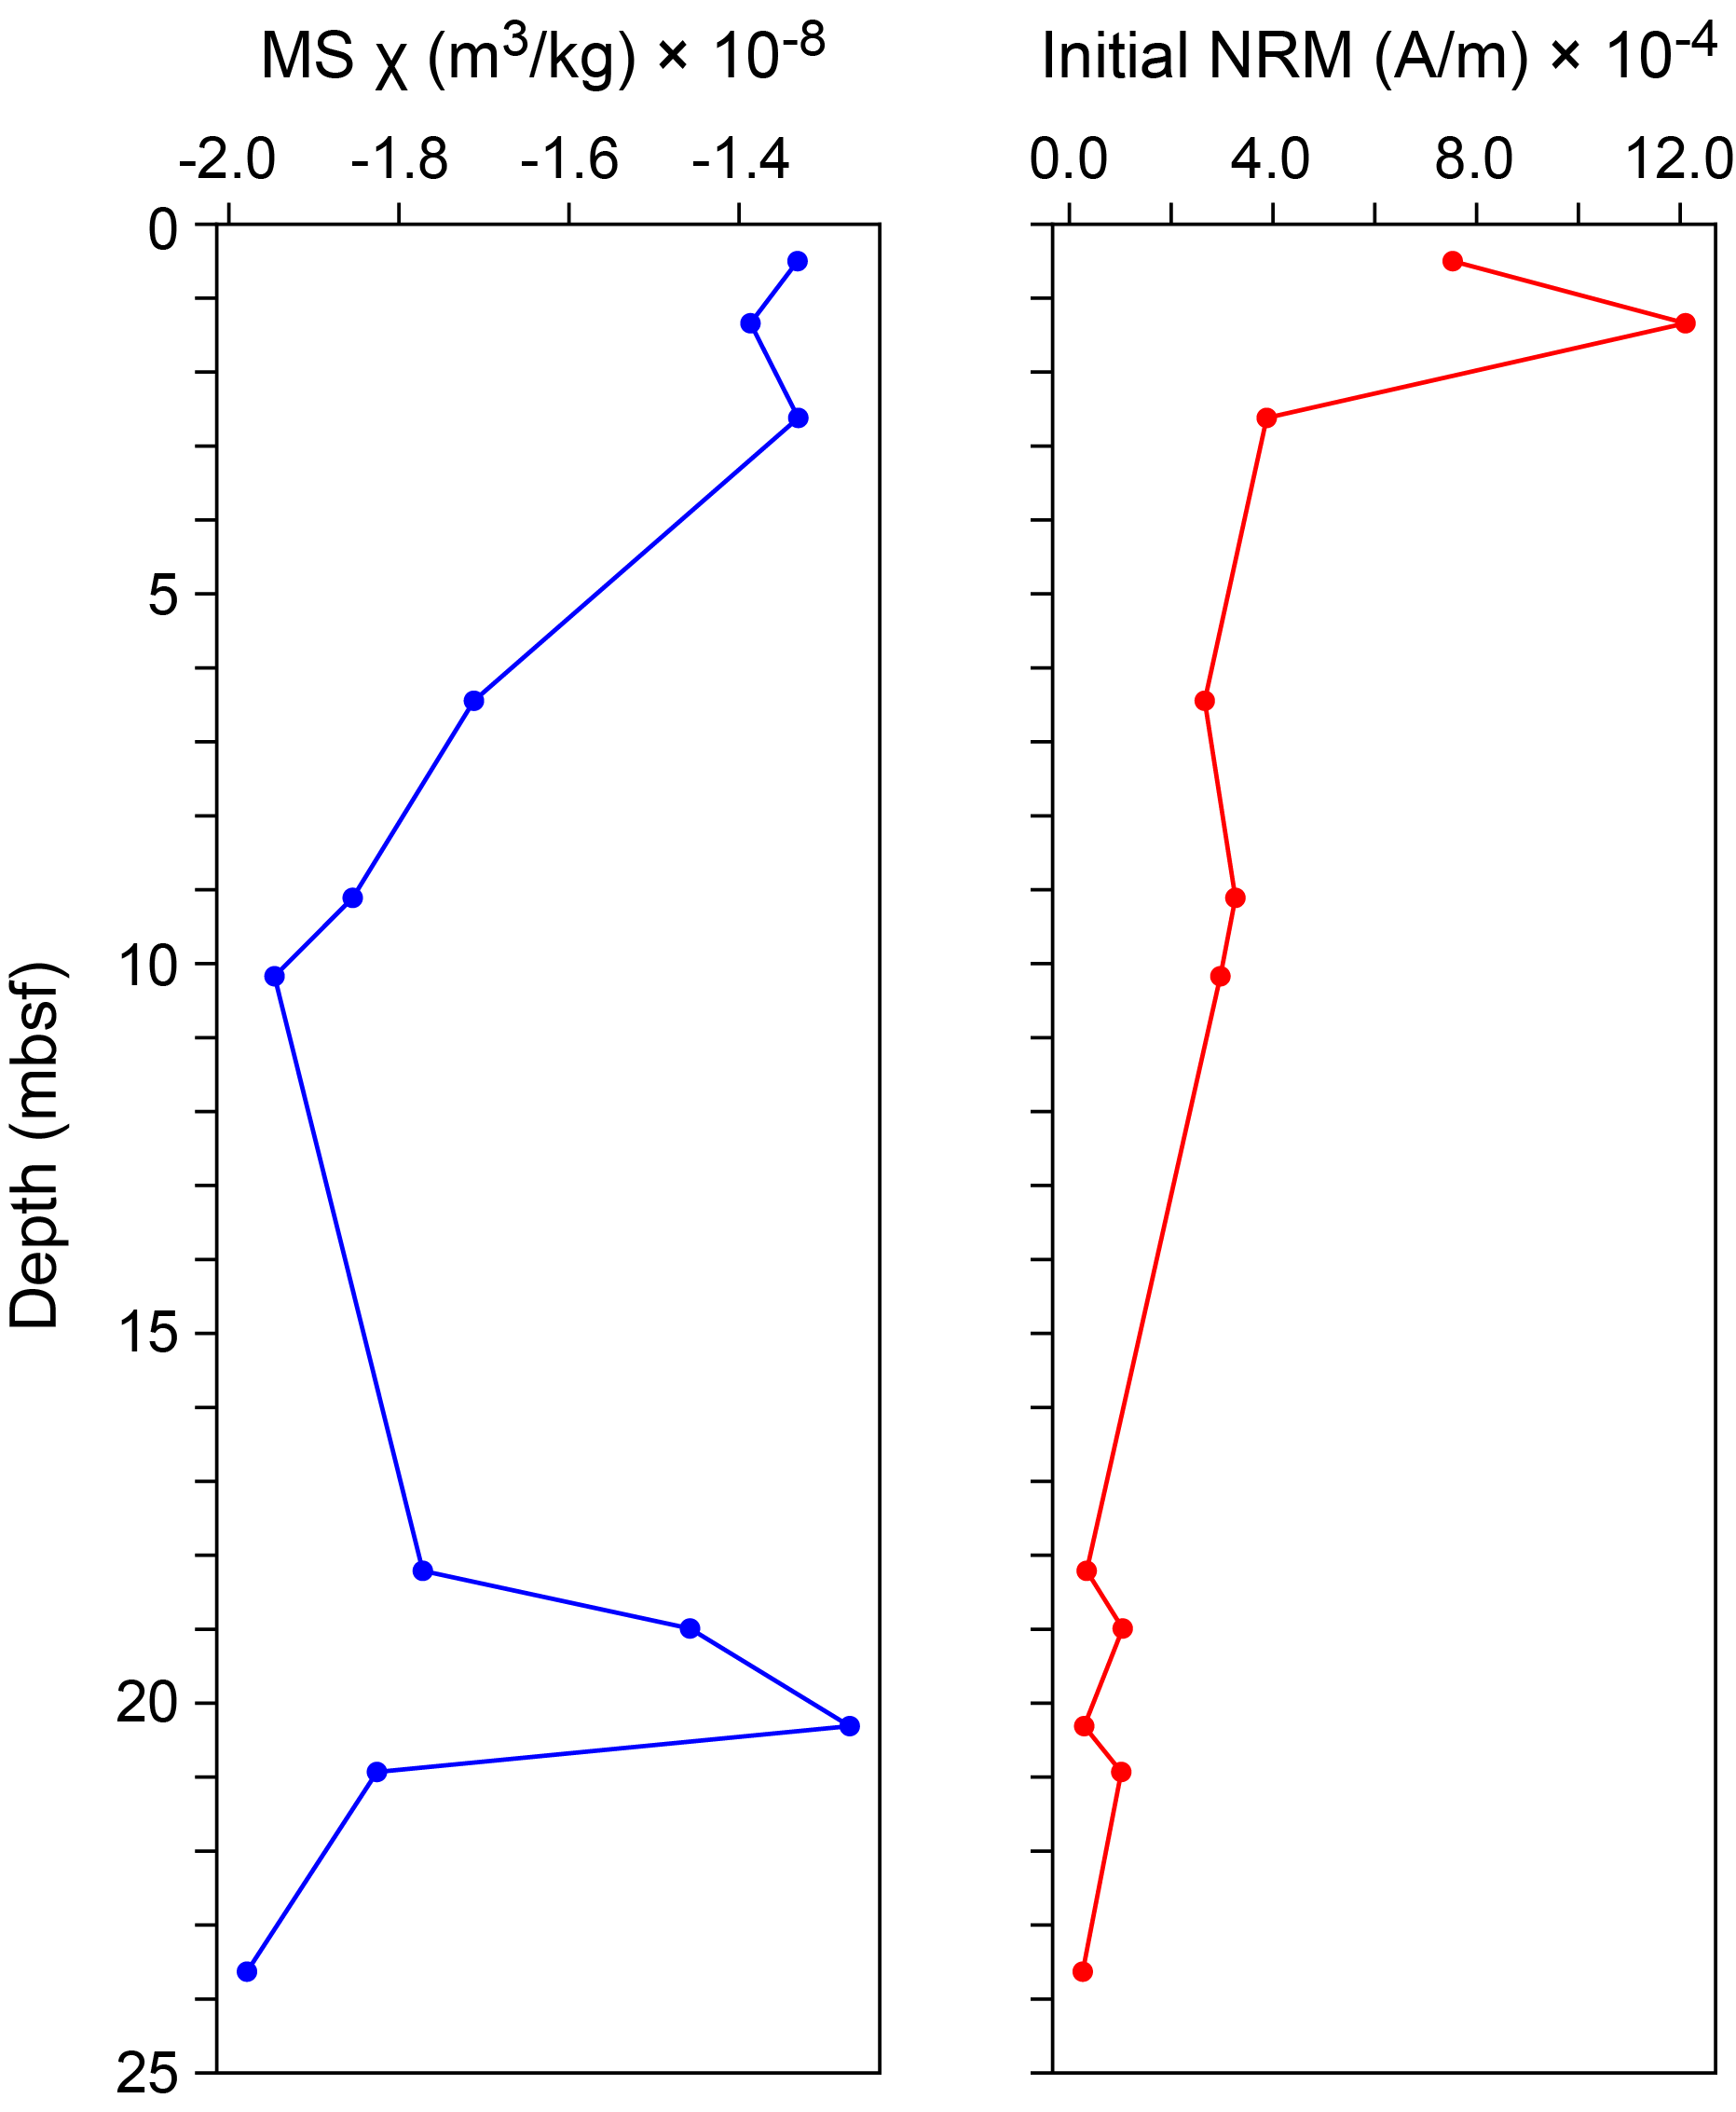
Figure F36. MS and NRM, Hole M0099E.
5.6. Hole M0099F
A total of eight carbonate samples were collected from Hole M0099F. Low χ values occur throughout, ranging −2.19 × 10⁻⁸ to 0.11 × 10⁻⁸ m3/kg with an arithmetic mean of −1.62 × 10⁻⁸ m3/kg. The initial NRM intensity values for 0 mT mostly decrease downcore from 0.83 × 10⁻⁴ to 22.5 × 10⁻⁴ A/m with an arithmetic mean of 3.94 × 10⁻⁴ A/m. The χ value and initial NRM intensity value at 0 mT for Sample 1R-1, 12–14.5 cm (0.14 mbsf), is markedly higher than all other samples, probably reflecting a higher concentration of magnetic particles. The χ values and NRM values synchronously vary farther downhole, suggesting magnetic concentration and properties mainly drive these variations (Figure F37).
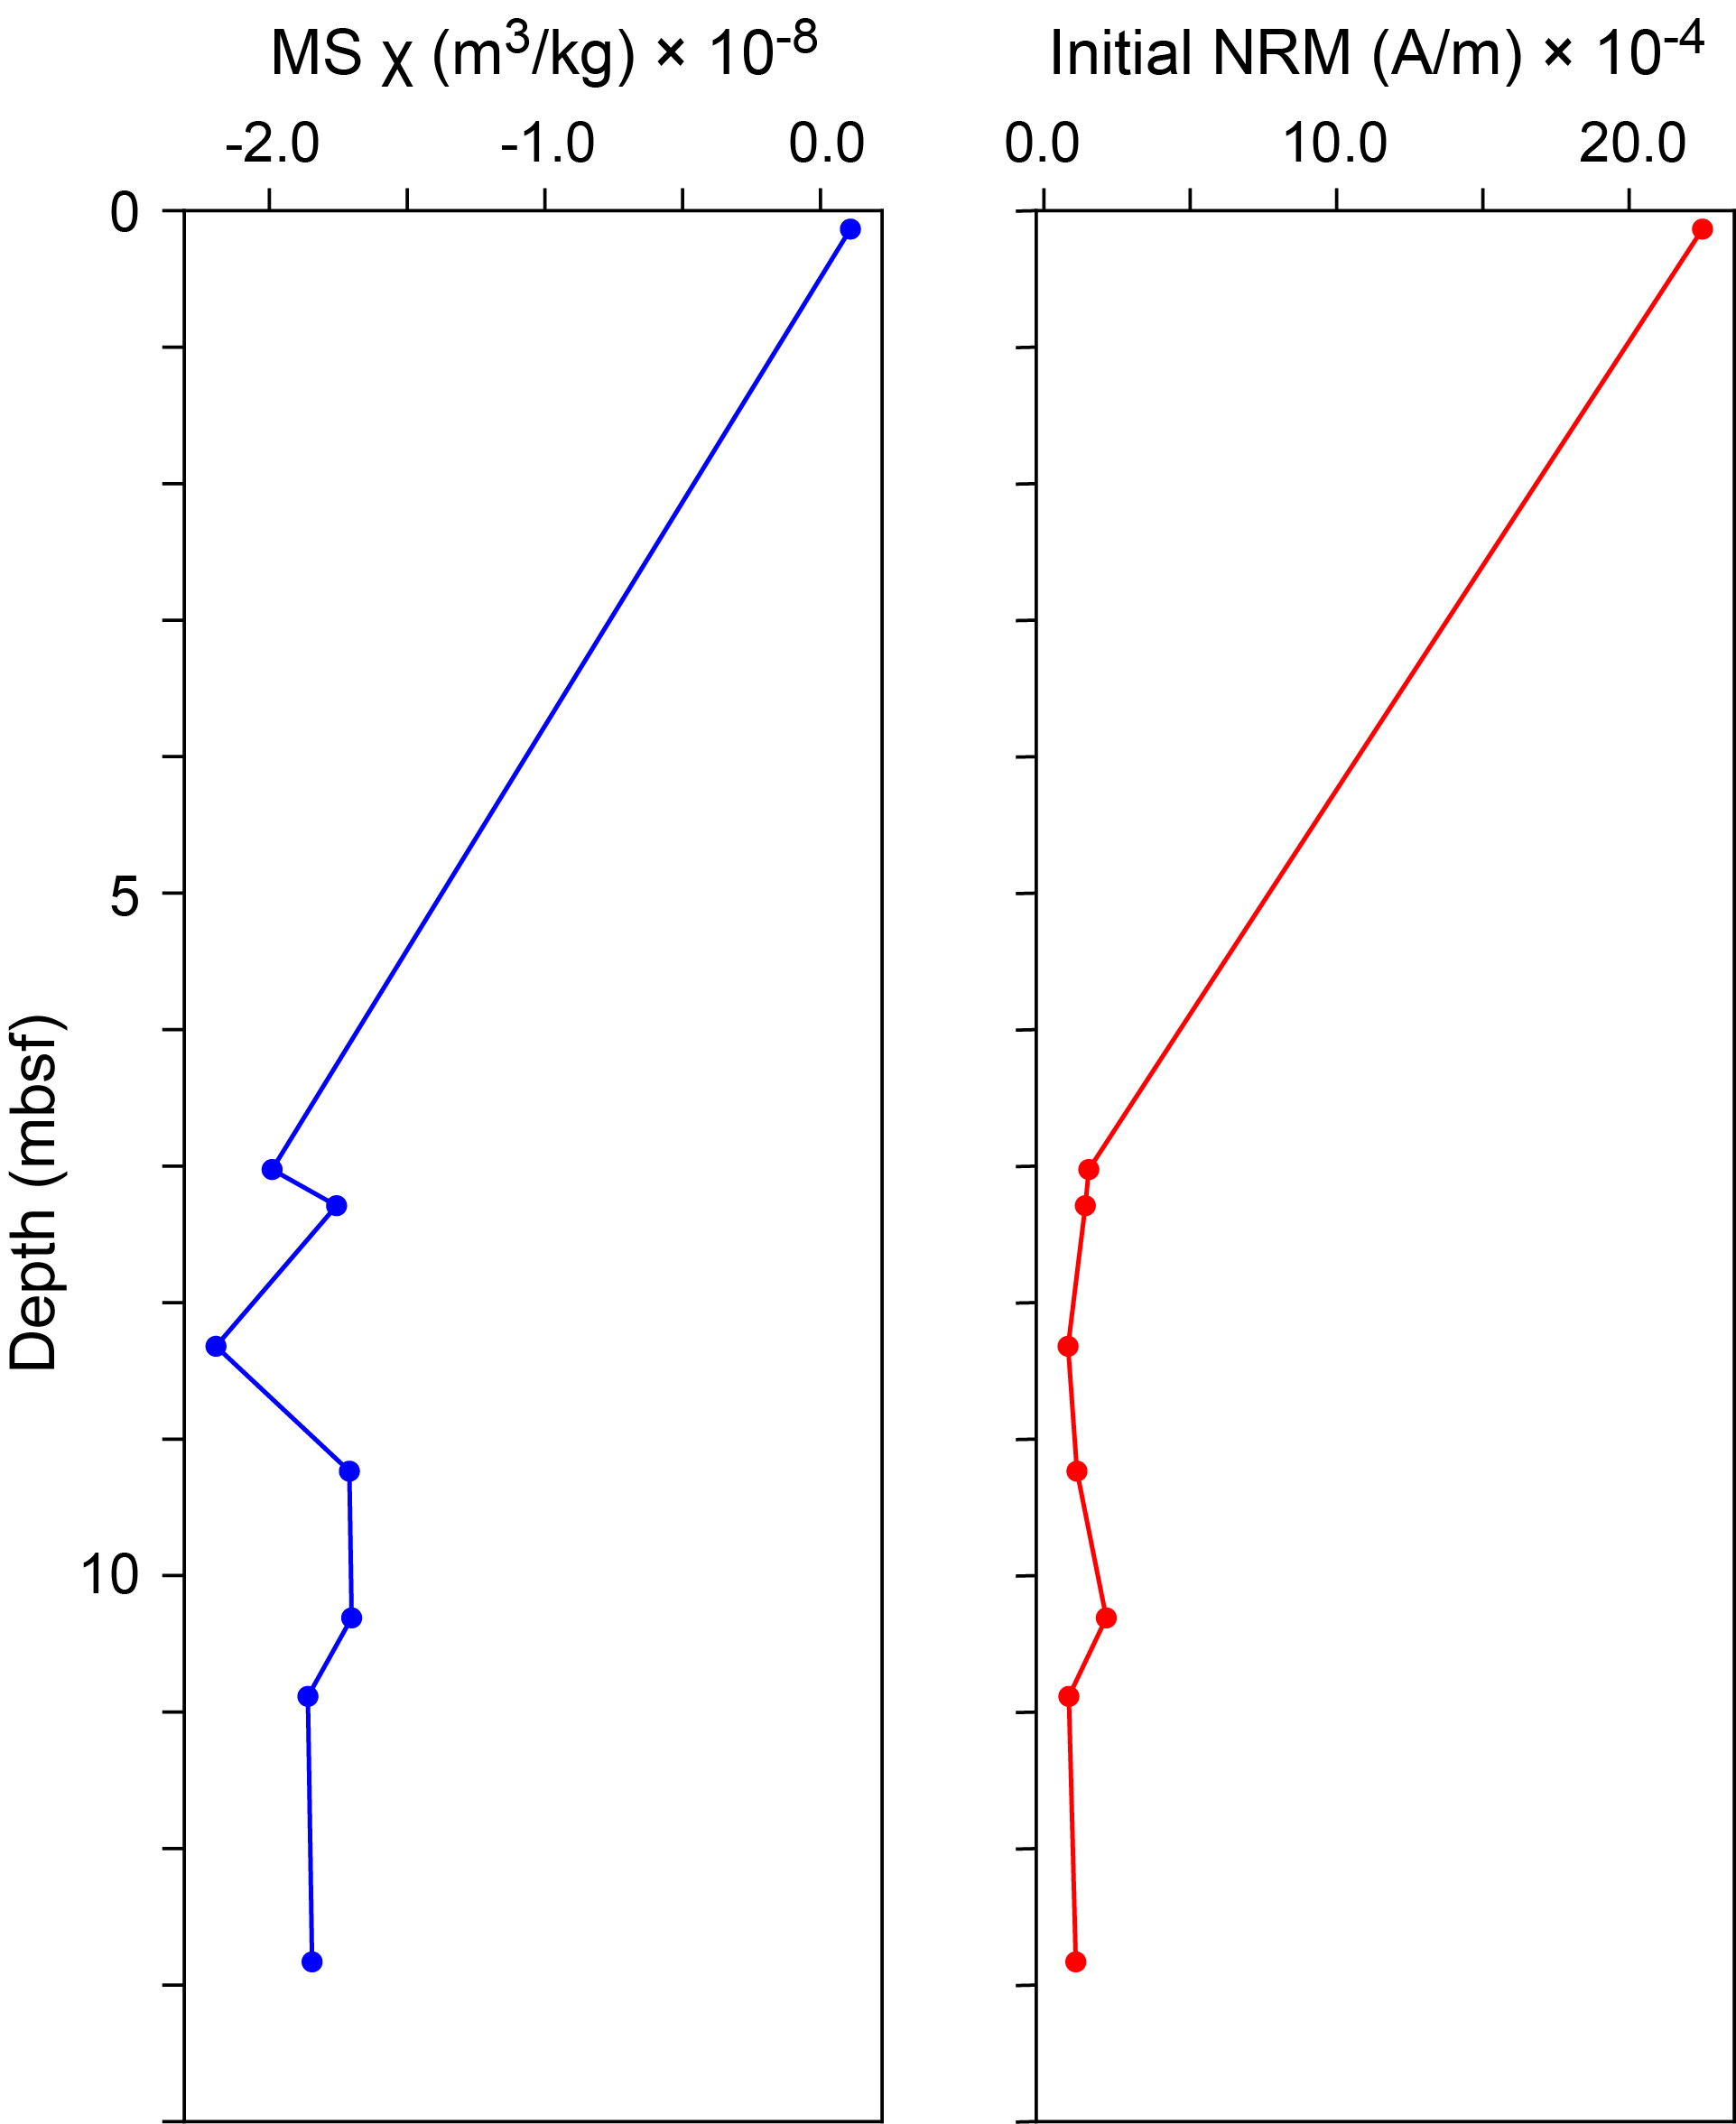
Figure F37. MS and NRM, Hole M0099F.
5.7. Hole M0099G
A total of 8 carbonate and 11 lava samples were collected from Hole M0099G. Low χ values of the carbonate samples occur throughout, ranging −2.01 × 10⁻⁸ to −1.33 × 10⁻⁸ m3/kg with an arithmetic mean of −1.61 × 10⁻⁸ m3/kg. The initial NRM intensity values for 0 mT of the carbonate samples range 0.25 × 10⁻⁴ to 3.57 × 10⁻⁴ A/m with an arithmetic mean of 1.26 × 10⁻⁴ A/m. High χ values of the lava samples occur throughout, ranging 2.00 × 10⁻⁶ to 24.2 × 10⁻⁶ m3/kg with an arithmetic mean of 7.81 × 10⁻⁶ m3/kg. The initial NRM intensity values for 0 mT on the lava samples range 4.14–13.1 A/m with an arithmetic mean of 7.48 A/m. Patterns in χ and initial NRM of both carbonate and lava samples are mostly inversely correlated throughout the hole (Figure F38), potentially reflecting changes in magnetic grain size within the lithologies.
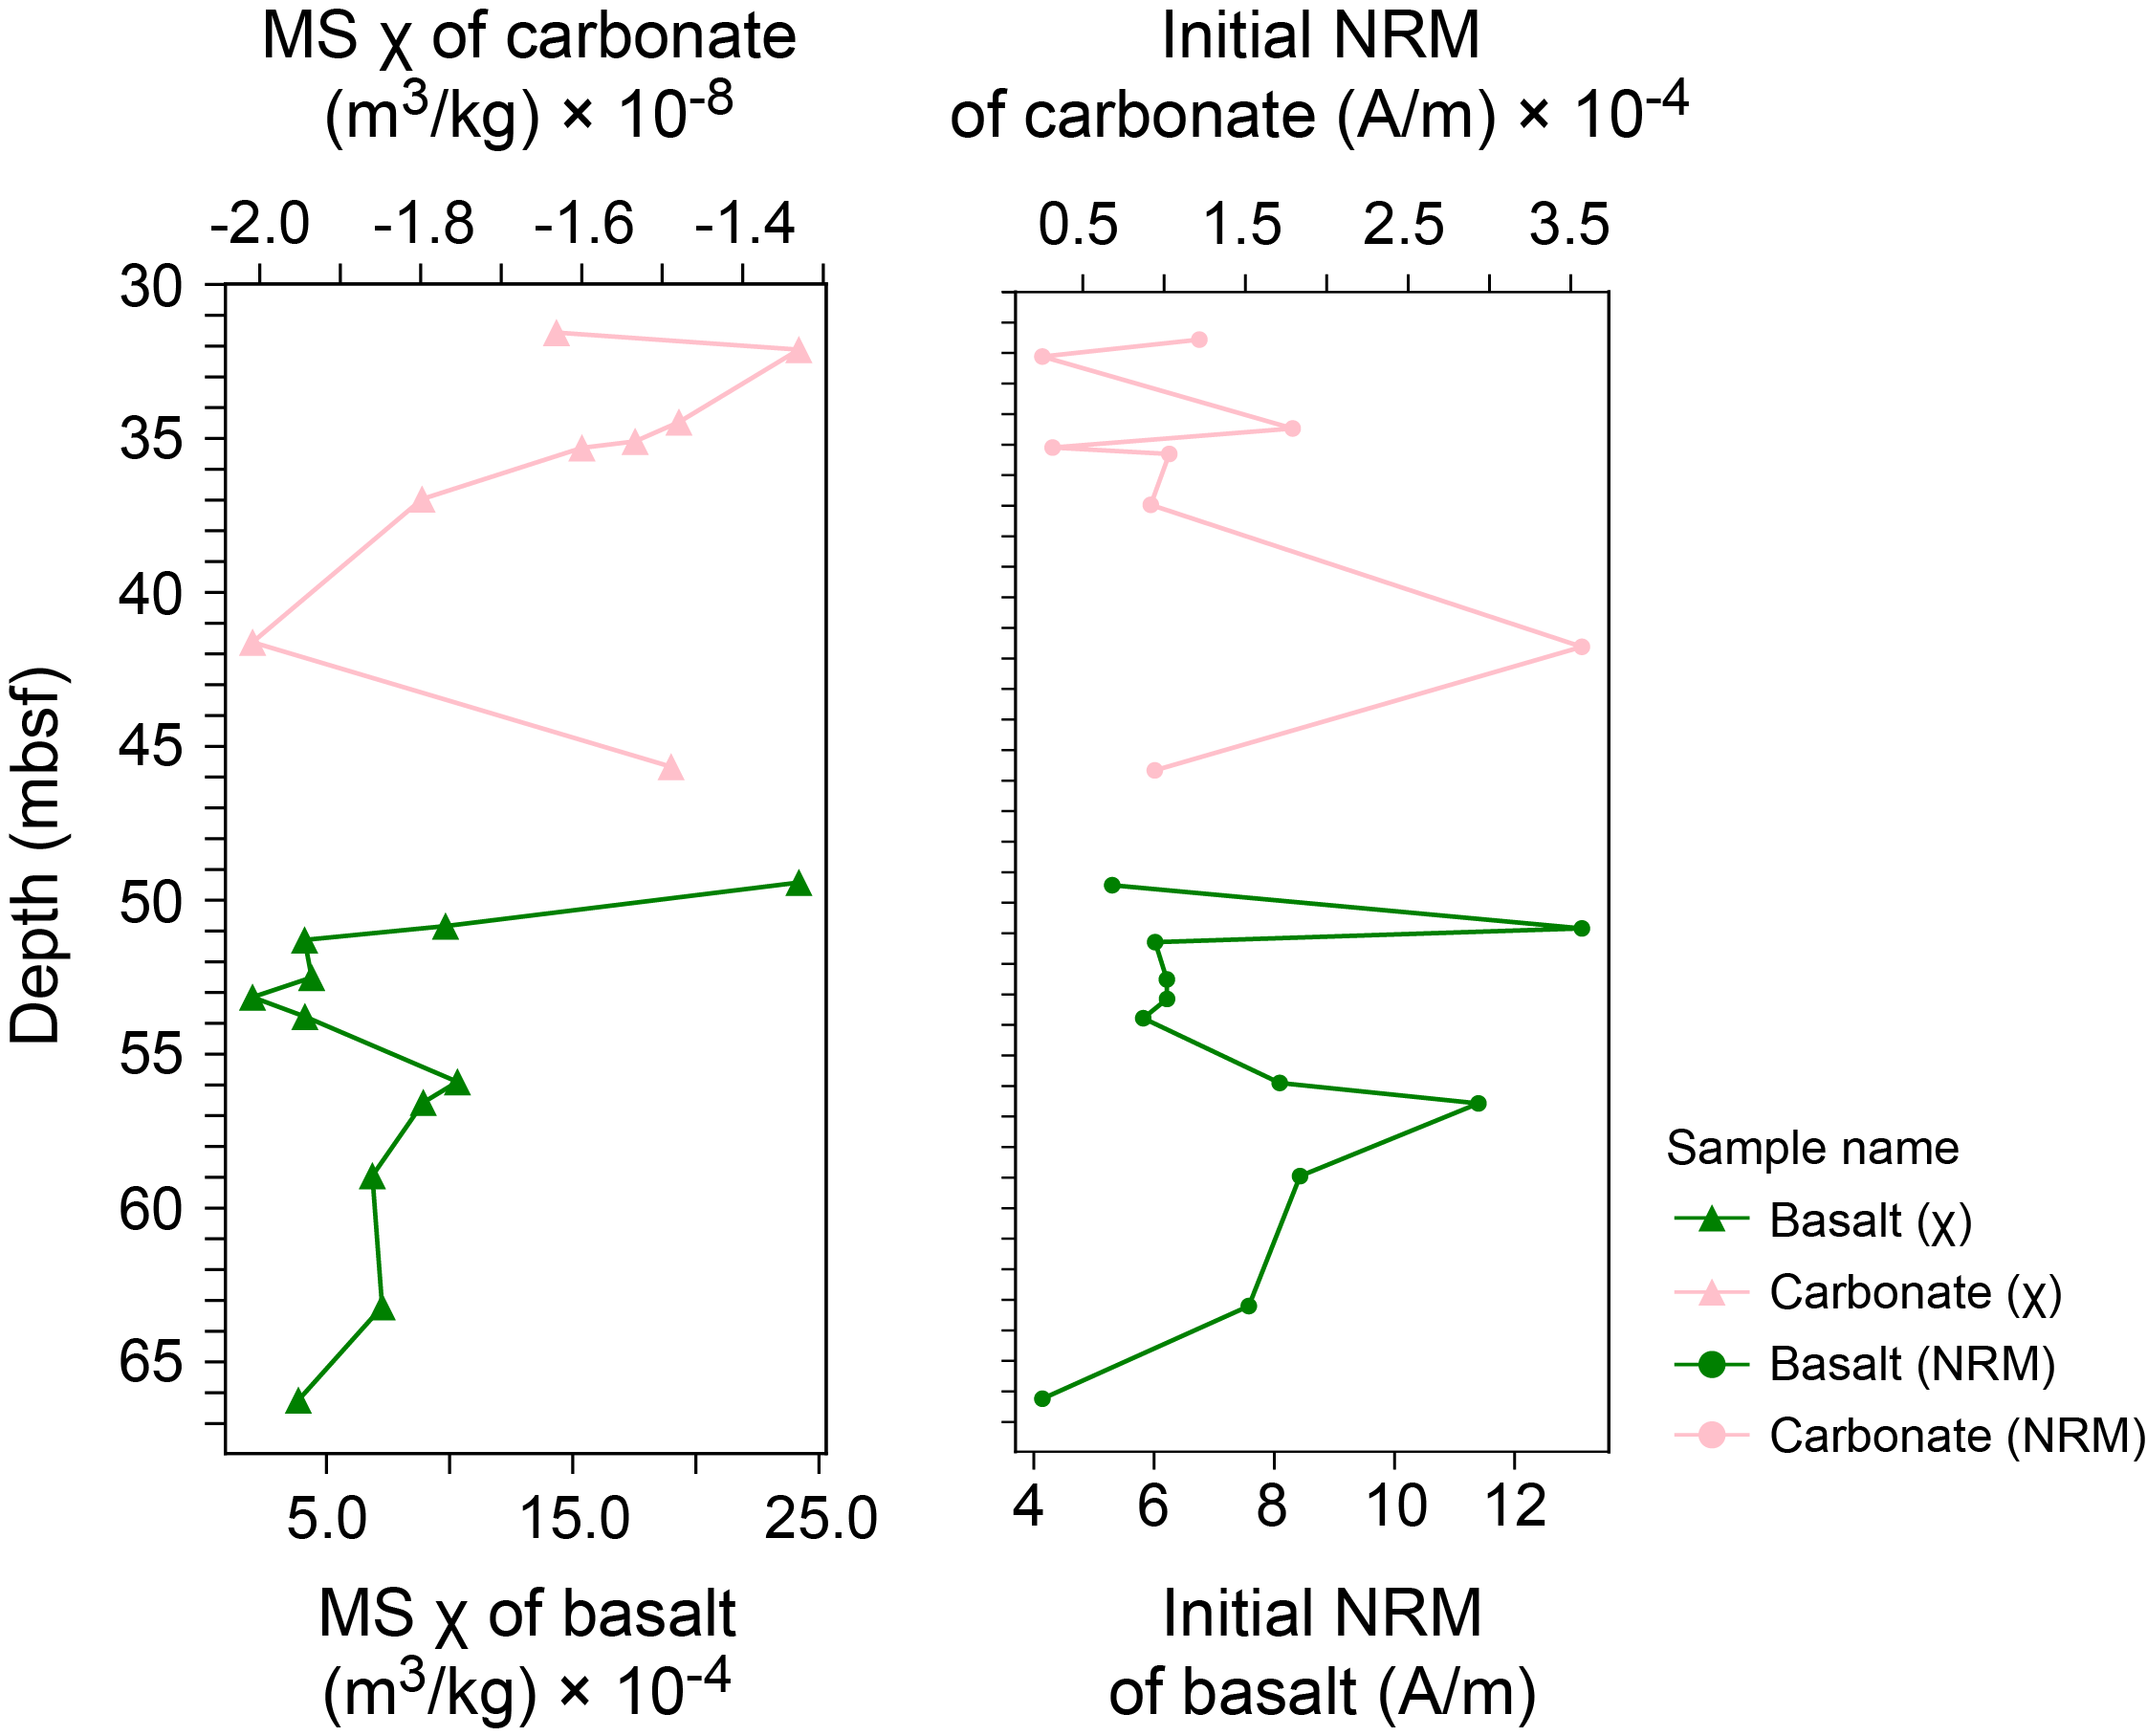
Figure F38. MS and NRM, Hole M0099G.
6. Geochronology
A total of six radiocarbon dates were measured on samples from Site M0099, including one from Hole M0099C, two each from Holes M0099E and M0099F, and one from Hole M0099G (see Table T23 in the Expedition 389 methods chapter [Webster et al., 2025a]). The six radiocarbon dates are in chronological and stratigraphic order. A total of seven samples were also U-Th dated, including two from Hole M0099A, one each from Holes M0099B, M0099C, and M0099E, and two from Hole M0099G (see Table T22 in the Expedition 389 methods chapter [Webster et al., 2025a]). Two dates are rejected based on anomalously high 238U concentrations (i.e., >4 ppm; Samples 389-M0099A-6R-1, 60–61 cm, and 389-M0099E-24R-1, 6–7 cm) (see Table T21 in the Expedition 389 methods chapter [Webster et al., 2025a]).
The radiocarbon dates and remaining five U-Th dates are consistent with the interpretation of the age of the H1 Terrace spanning Marine Isotope Stages 1–5 (Ludwig et al.,1991; Webster et al., 2009; Sanborn et al., 2017).
References
Ludwig, K.R., Szabo, B.J., Moore, J.G., and Simmons, K.R., 1991. Crustal subsidence rate off Hawaii determined from 234U/238U ages of drowned coral reefs. Geology, 19(2):171–174. https://doi.org/10.1130/0091-7613(1991)019<0171:CSROHD>2.3.CO;2
Sanborn, K.L., Webster, J.M., Yokoyama, Y., Dutton, A., Braga, J.C., Clague, D.A., Paduan, J.B., Wagner, D., Rooney, J.J., and Hansen, J.R., 2017. New evidence of Hawaiian coral reef drowning in response to meltwater pulse-1A. Quaternary Science Reviews, 175:60–72. https://doi.org/10.1016/j.quascirev.2017.08.022
Webster, J.M., Braga, J.C., Clague, D.A., Gallup, C., Hein, J.R., Potts, D.C., Renema, W., Riding, R., Riker-Coleman, K., Silver, E., and Wallace, L.M., 2009. Coral reef evolution on rapidly subsiding margins. Global and Planetary Change, 66(1–2):129–148. https://doi.org/10.1016/j.gloplacha.2008.07.010
Webster, J.M., Ravelo, A.C., Grant, H.L.J., and the Expedition 389 Scientists, 2025. Supplementary material, https://doi.org/10.14379/iodp.proc.389supp.2025. In Webster, J.M., Ravelo, A.C., Grant, H.L.J., and the Expedition 389 Scientists, Hawaiian Drowned Reefs. Proceedings of the International Ocean Discovery Program, 389: College Station, TX (International Ocean Discovery Program).
Webster, J.M., Ravelo, A.C., Grant, H.L.J., Rydzy, M., Stewart, M., Allison, N., Asami, R., Boston, B., Braga, J.C., Brenner, L., Chen, X., Chutcharavan, P., Dutton, A., Felis, T., Fukuyo, N., Gischler, E., Greve, S., Hagen, A., Hamon, Y., Hathorne, E., Humblet, M., Jorry, S., Khanna, P., Le Ber, E., McGregor, H., Mortlock, R., Nohl, T., Potts, D., Prohaska, A., Prouty, N., Renema, W., Rubin, K.H., Westphal, H., and Yokoyama, Y., 2025a. Expedition 389 methods. In Webster, J.M., Ravelo, A.C., Grant, H.L.J., and the Expedition 389 Scientists, Hawaiian Drowned Reefs. Proceedings of the International Ocean Discovery Program, 389: College Station, TX (International Ocean Discovery Program). https://doi.org/10.14379/iodp.proc.389.102.2025
Webster, J.M., Ravelo, A.C., Grant, H.L.J., Rydzy, M., Stewart, M., Allison, N., Asami, R., Boston, B., Braga, J.C., Brenner, L., Chen, X., Chutcharavan, P., Dutton, A., Felis, T., Fukuyo, N., Gischler, E., Greve, S., Hagen, A., Hamon, Y., Hathorne, E., Humblet, M., Jorry, S., Khanna, P., Le Ber, E., McGregor, H., Mortlock, R., Nohl, T., Potts, D., Prohaska, A., Prouty, N., Renema, W., Rubin, K.H., Westphal, H., and Yokoyama, Y., 2025b. Site M0096. In Webster, J.M., Ravelo, A.C., Grant, H.L.J., and the Expedition 389 Scientists, Hawaiian Drowned Reefs. Proceedings of the International Ocean Discovery Program, 389: College Station, TX (International Ocean Discovery Program). https://doi.org/10.14379/iodp.proc.389.103.2025