Webster, J.M., Ravelo, A.C., Grant, H.L.J., and the Expedition 389 Scientists
Proceedings of the International Ocean Discovery Program Volume 389
publications.iodp.org
https://doi.org/10.14379/iodp.proc.389.109.2025
Site M01021
![]() J.M. Webster,
J.M. Webster,
![]() A.C. Ravelo,
A.C. Ravelo,
![]() H.L.J. Grant,
H.L.J. Grant,
![]() M. Rydzy,
M. Rydzy,
![]() M. Stewart,
M. Stewart,
![]() N. Allison,
N. Allison,
![]() R. Asami,
R. Asami,
![]() B. Boston,
B. Boston,
![]() J.C. Braga,
J.C. Braga,
![]() L. Brenner,
L. Brenner,
![]() X. Chen,
X. Chen,
![]() P. Chutcharavan,
P. Chutcharavan,
![]() A. Dutton,
A. Dutton,
![]() T. Felis,
T. Felis,
![]() N. Fukuyo,
N. Fukuyo,
![]() E. Gischler,
E. Gischler,
![]() S. Greve,
S. Greve,
![]() A. Hagen,
A. Hagen,
![]() Y. Hamon,
Y. Hamon,
![]() E. Hathorne,
E. Hathorne,
![]() M. Humblet,
M. Humblet,
![]() S. Jorry,
S. Jorry,
![]() P. Khanna,
P. Khanna,
![]() E. Le Ber,
E. Le Ber,
![]() H. McGregor,
H. McGregor,
![]() R. Mortlock,
R. Mortlock,
![]() T. Nohl,
T. Nohl,
![]() D. Potts,
D. Potts,
![]() A. Prohaska,
A. Prohaska,
![]() N. Prouty,
W. Renema,
N. Prouty,
W. Renema,
![]() K.H. Rubin,
K.H. Rubin,
![]() H. Westphal, and
H. Westphal, and
![]() Y. Yokoyama2
Y. Yokoyama2
1 Webster, J.M., Ravelo, A.C., Grant, H.L.J., Rydzy, M., Stewart, M., Allison, N., Asami, R., Boston, B., Braga, J.C., Brenner, L., Chen, X., Chutcharavan, P., Dutton, A., Felis, T., Fukuyo, N., Gischler, E., Greve, S., Hagen, A., Hamon, Y., Hathorne, E., Humblet, M., Jorry, S., Khanna, P., Le Ber, E., McGregor, H., Mortlock, R., Nohl, T., Potts, D., Prohaska, A., Prouty, N., Renema, W., Rubin, K.H., Westphal, H., and Yokoyama, Y., 2025. Site M0102. In Webster, J.M., Ravelo, A.C., Grant, H.L.J., and the Expedition 389 Scientists, Hawaiian Drowned Reefs. Proceedings of the International Ocean Discovery Program, 389: College Station, TX (International Ocean Discovery Program). https://doi.org/10.14379/iodp.proc.389.109.2025
2 Expedition 389 Scientists’ affiliations.
1. Operations
The multipurpose vessel MMA Valour was used as the drilling platform throughout Expedition 389. At all Expedition 389 sites, dynamic positioning was used to provide accurate positions throughout operations and water depth was established using a Sound Velocity Profiler (SVP) placed on the top of the PROD5 drilling system. For more detail on acquisition methods, see Introduction in the Expedition 389 methods chapter (Webster et al., 2025a).
Summary operational information for Site M0102 is provided in Table T1. All times stated are in Hawaiian Standard Time (HST).
1.1. Hole M0102A
The MMA Valour arrived on location at 2100 h on 3 October 2023. PROD5 was deployed at 2308 h, and rotary coring and casing began in Hole M0102A at 0039 h on 4 October at a water depth of 412.8 m. Coring continued until a total hydraulic failure at 26.07 meters below seafloor (mbsf) meant Hole M0102A was abandoned at 1733 h, leaving 23 m of drill string and 8 m of casing in the seabed. PROD5 was recovered to deck at 1952 h on 4 October. On-deck operations commenced, and core barrels were extracted for curation. The transit back to Site M0101 was initiated at 0031 h on 5 October.
A total of 14 cores were recovered from Hole M0102A from 25.14 m of rotary coring. A total recovered core length of 11.08 m was achieved (44.07% recovery).
1.2. Hole M0102B
The MMA Valour returned to Site M0102 at 1700 h on 7 October 2023. PROD5 was launched at 2256 h, and wash boring and casing commenced in Hole M0102B at 0018 h on 8 October at a water depth of 415.4 m. A crack in the manifold and subsequent sensor fault meant the hole was abandoned at 0149 h at 4.70 mbsf. PROD 5 was recovered to deck at 0249 h, and repairs commenced.
No core was recovered for Hole M0102B.
1.3. Hole M0102C
Following repairs, PROD5 was redeployed at 0744 h on 8 October 2023 at a water depth of 415.9 m. Coring in Hole M0102C commenced by wash boring and casing to 19.90 mbsf by 1747 h, just above the final depth of coring in Hole M0102A. Rotary coring commenced, and coring continued throughout 9 and 10 October to a final depth of 73.44 mbsf at 1159 h on 11 October after utilizing all drill barrels. PROD5 was recovered to deck by 1256 h, and on-deck operations commenced with core barrel extraction and on-deck curation. The transit to Site M0103 was underway at 1300 h on 11 October.
A total of 33 cores were recovered from Hole M0102C from 53.55 m of rotary coring and 19.89 m of wash boring. The total length of core recovered was 42.32 m (79.03% recovery).
2. Lithostratigraphy
Holes M0102A and M0102C are located in the Kohala region at 412.8 and 415.9 meters below sea level (mbsl), respectively. Based on the main facies changes and discontinuity surfaces, four main intervals are identified (Figure F1):
- Interval 1 (0.00–22.25 mbsf) forms the major part of the core from Hole M0102A and consists of rhodoliths embedded in unconsolidated biodetrital-volcaniclastic sediment. The basal boundary corresponds to a major facies change in both holes (M0102A and M0102C).
- Interval 2 (22.25–24.61 mbsf in Hole M0102A; 21.58–28.85 mbsf in Hole M0102C) is dominated by coralgal boundstone with submassive to massive Porites. It is bounded at its base by a thin layer of biodetrital, coarse-grained grainstone to rudstone.
- Interval 3 (29.25–70.69 mbsf in Hole M0102C; not recovered in Hole M0102A) is a succession of in situ coralgal-microbialite boundstone with the genus changing downhole from branching and platy Porites and columnar Pavona to predominantly very large massive Porites with rare laminar Pavona.
- Interval 4 (70.69–72.71 mbsf in Hole M0102C; not recovered in Hole M0102A) consists of a coralgal boundstone with abundant branching and platy Porites.
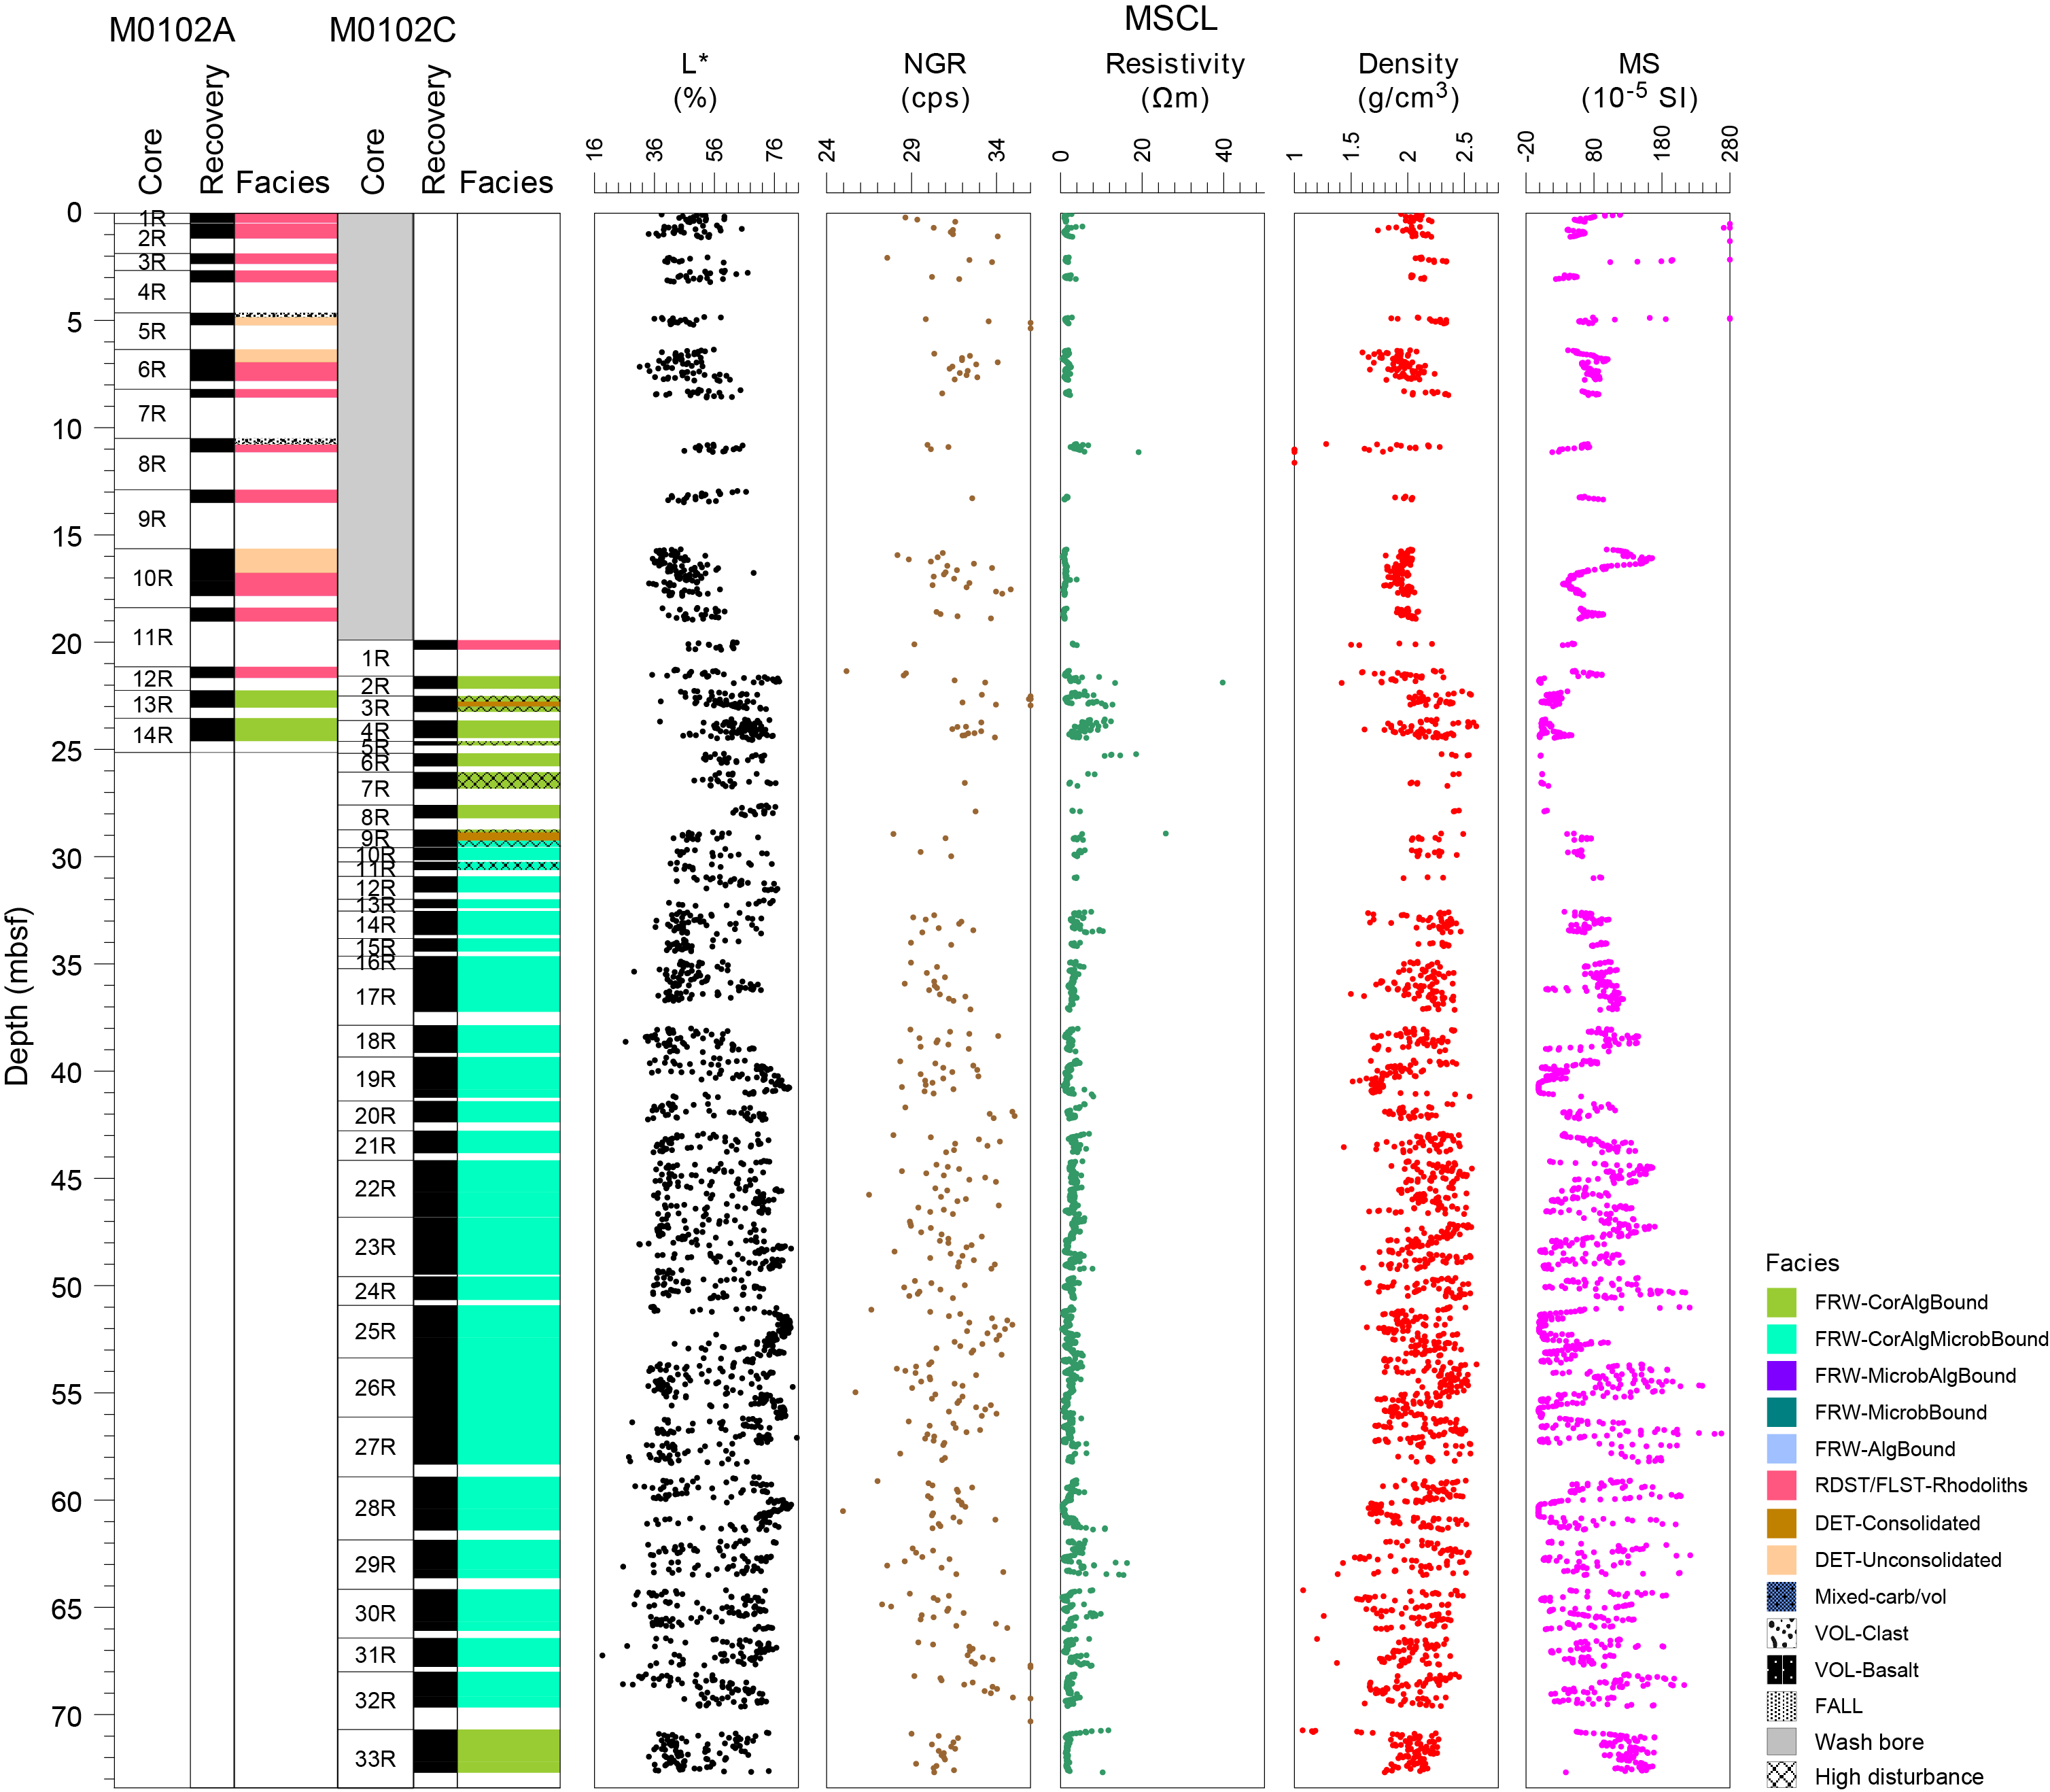
Figure F1. Composite lithostratigraphy.
2.1. Holes M0102A and M0102C
Holes M0102A and M0102C represent a composite hole and are described together (Figure F1). Cores from Hole M0102A span 0.00 to 24.61 mbsf (Figure F2). Hole M0102C was wash bored through most of the Hole M0102A interval and then rotary cored from 19.90 to 72.71 mbsf (Figure F3).
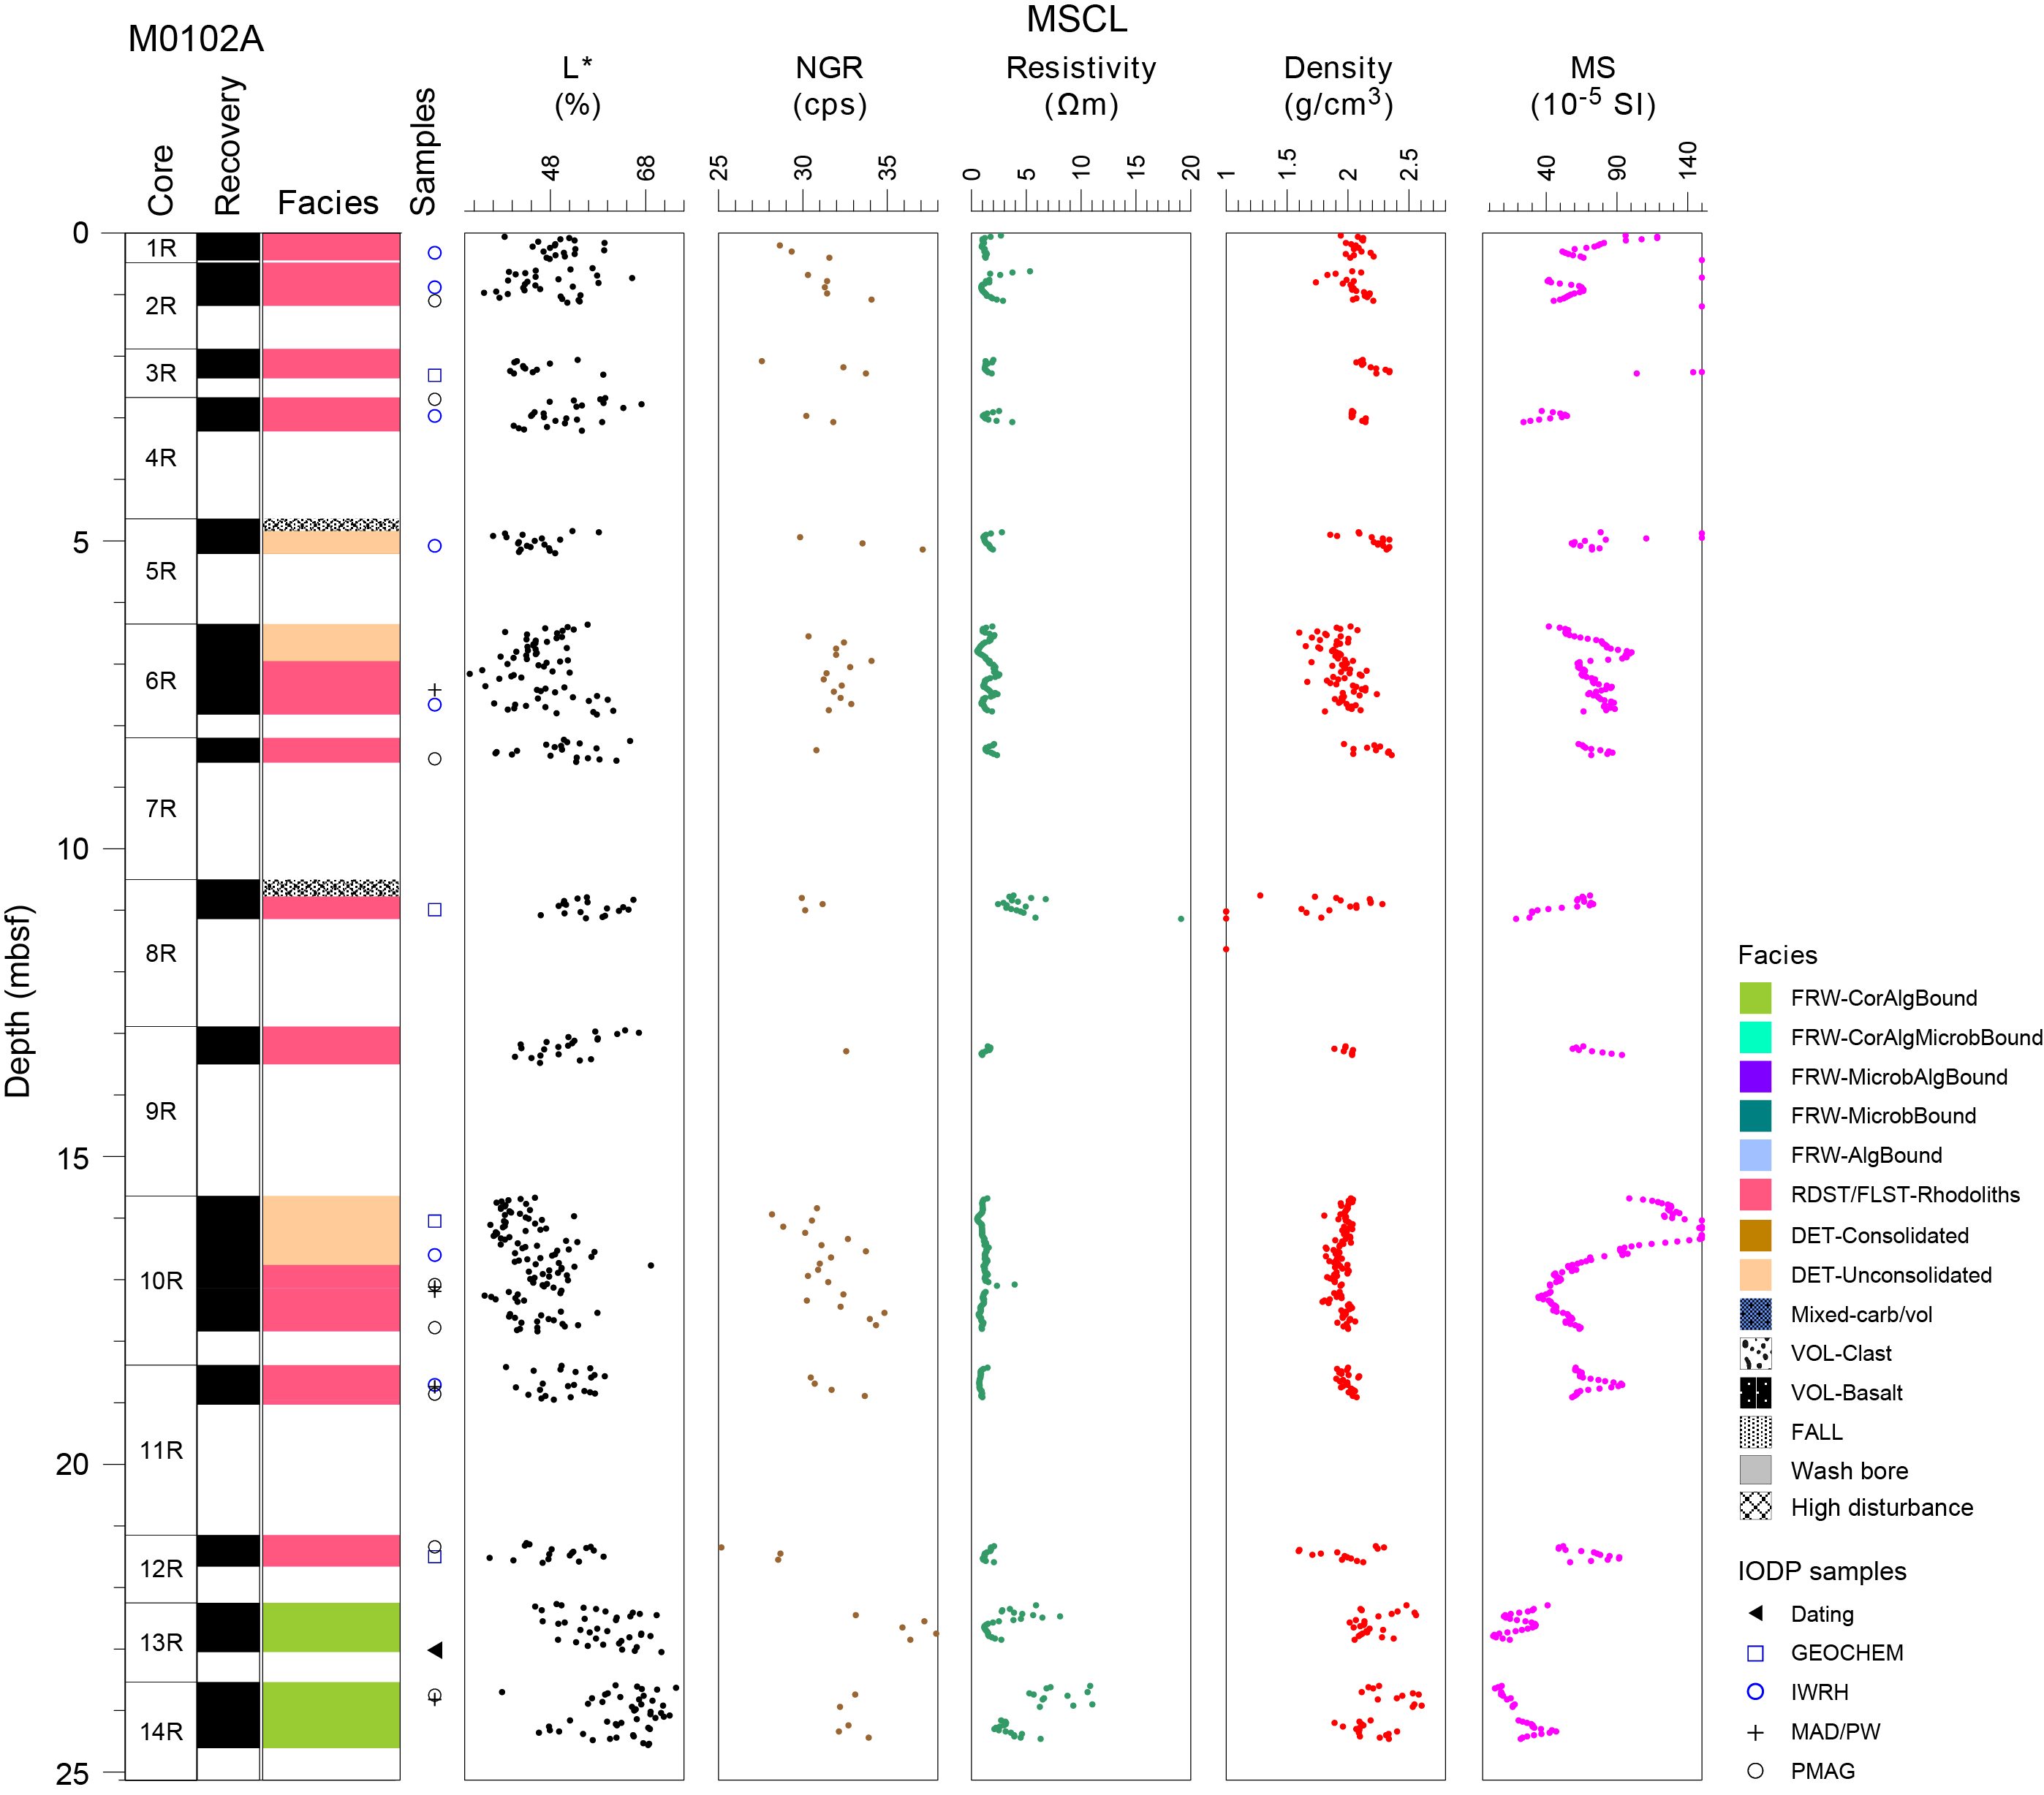
Figure F2. Lithostratigraphy and MSCL data, Hole M0102A.
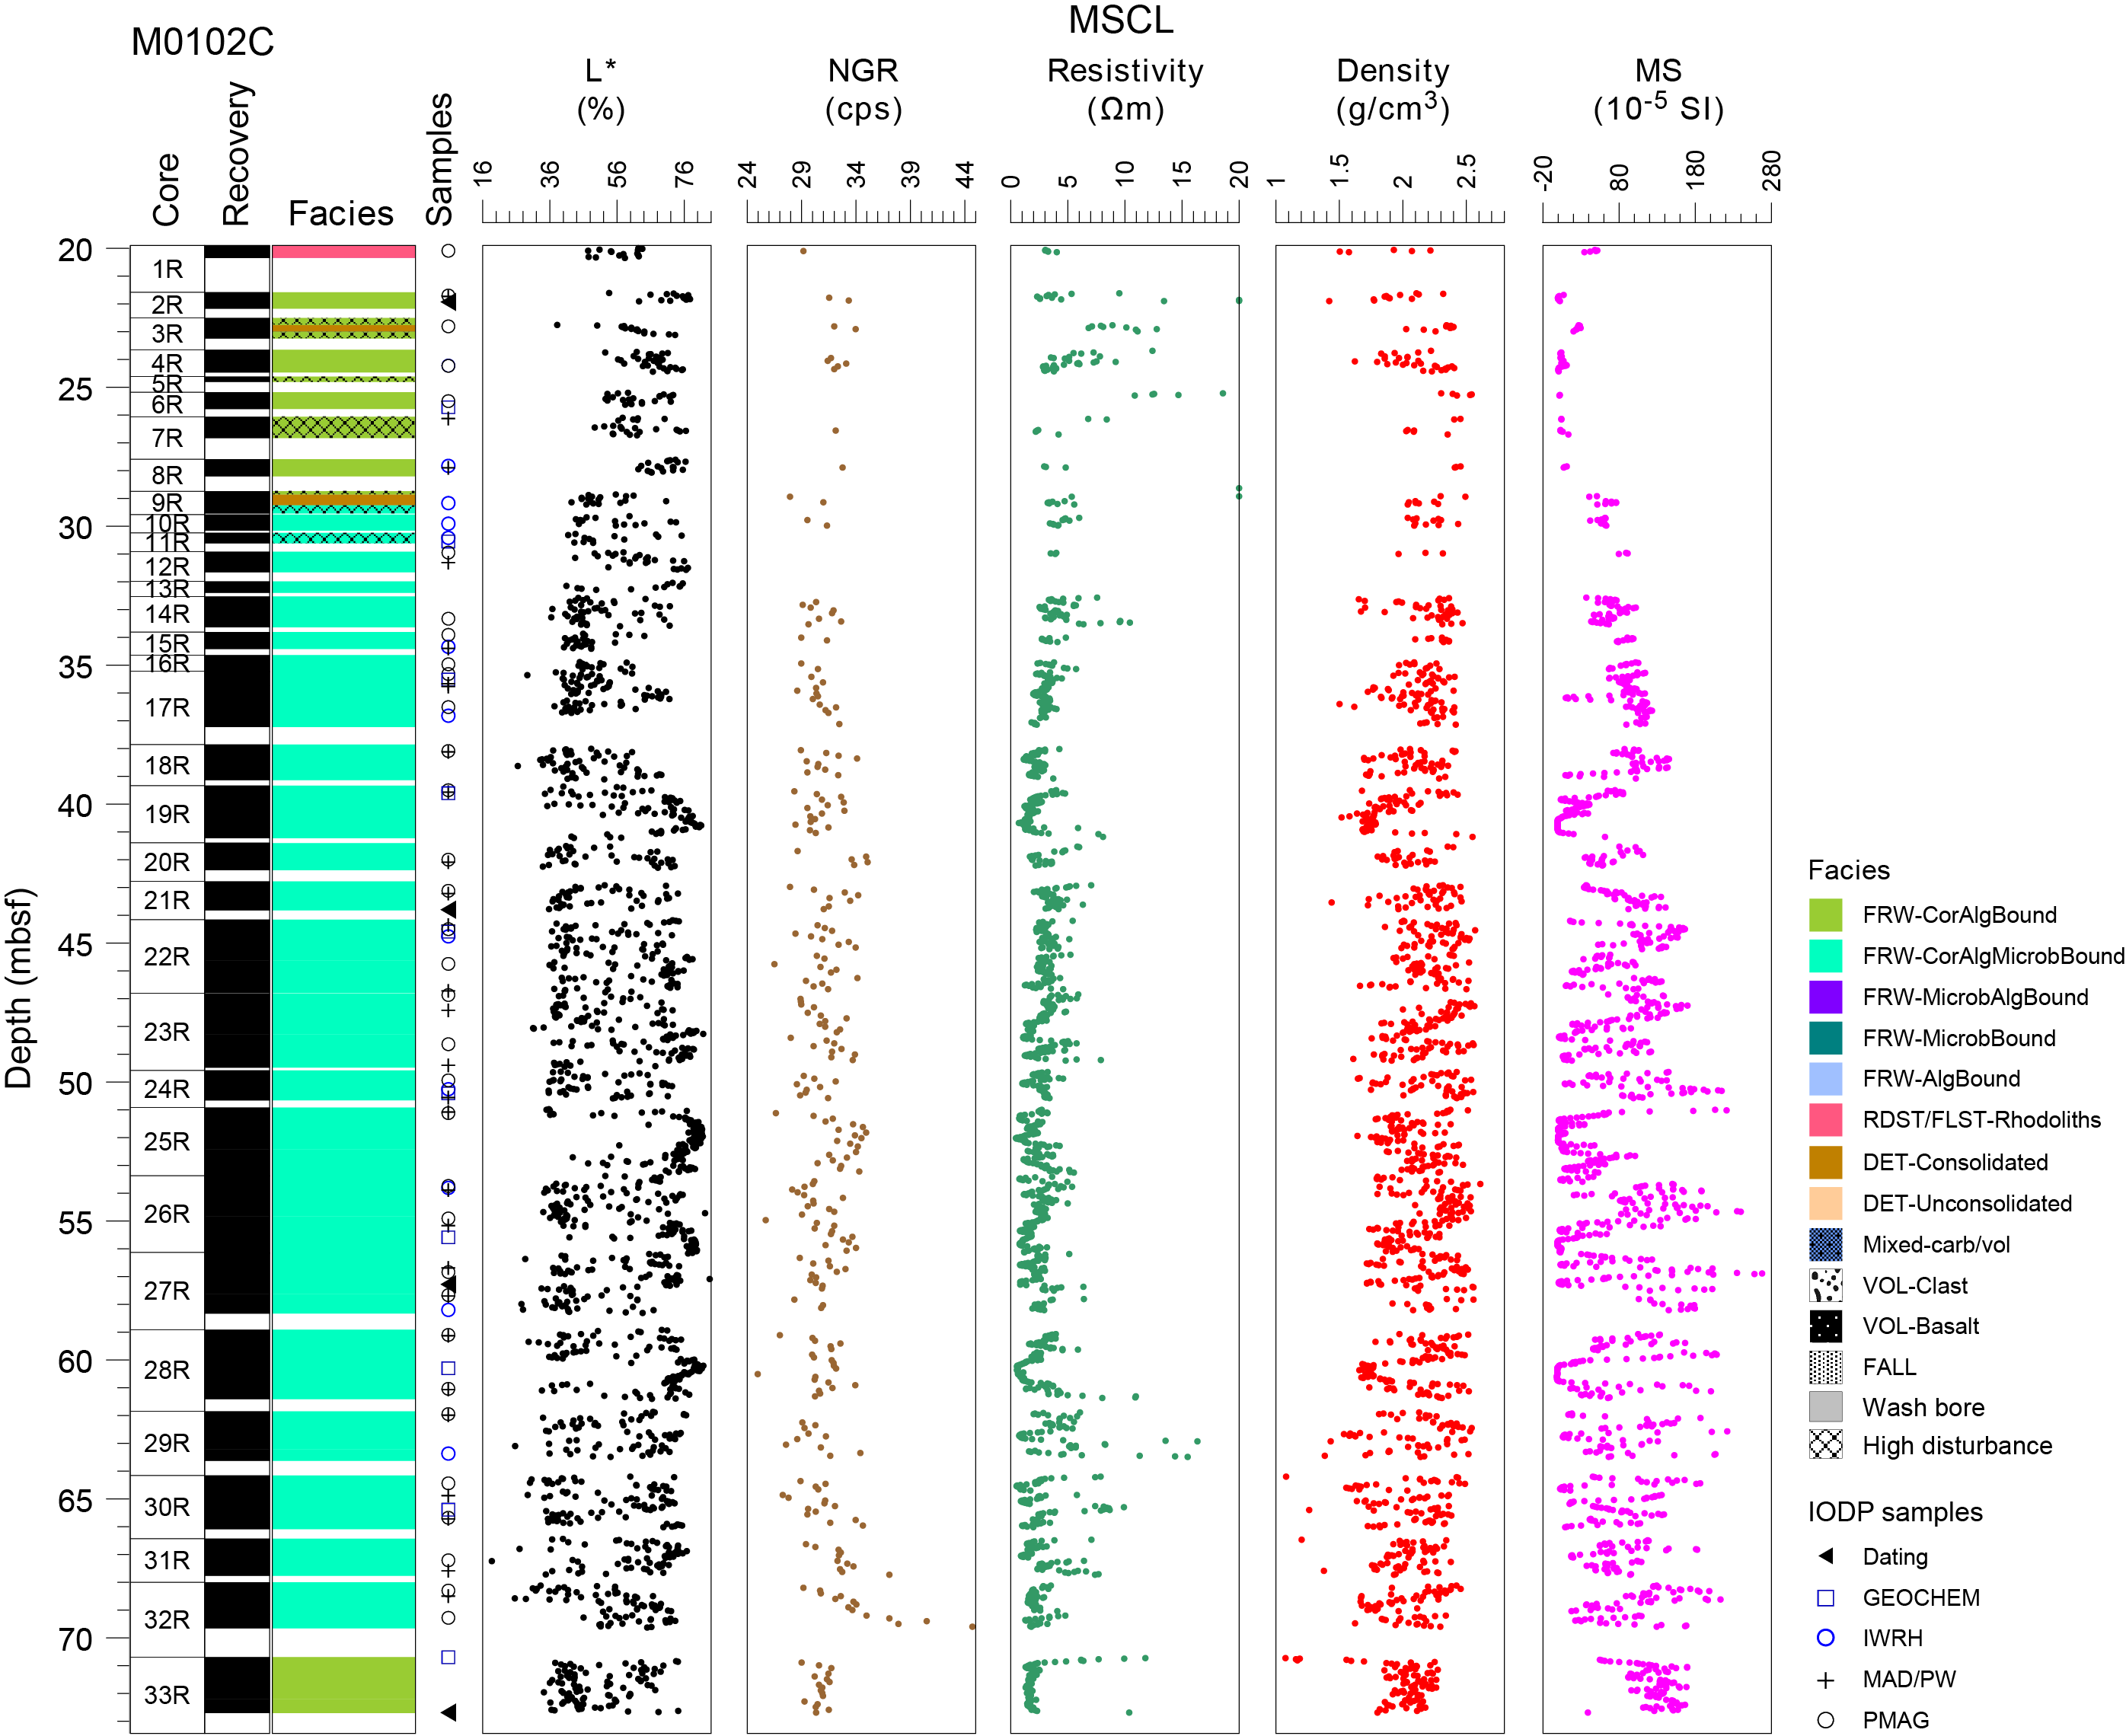
Figure F3. Lithostratigraphy and MSCL data, Hole M0102C.
The lithology of Hole M0102A from 0.00 to 22.25 mbsf is composed of a relatively homogeneous facies comprising centimeter-sized rhodoliths embedded in unconsolidated biodetrital sediment (Figure F4A). Bioclasts include bivalves, gastropods (Polinices), fragments of branching corals (rare Agariciidae), and crustose coralline algae (CCA) crusts, bryozoan branches, and large benthic foraminifers (LBFs). In the lower part of this interval, from 16.75 to 22.25 mbsf, coral fragments are more diverse and include pieces of Cyphastrea and Leptoseris (Figure F4B) and one occurrence of Diaseris (free-living coral). The sand fraction contains bioclasts and fine- to medium-grained volcaniclastic sediments with rare black volcanic granules. Rhodoliths are predominantly composed of CCA encrustations with vermetids, encrusting foraminifers (Homotrema), and bryozoans, with some bryozoan and coral fragments acting as rhodolith nuclei.
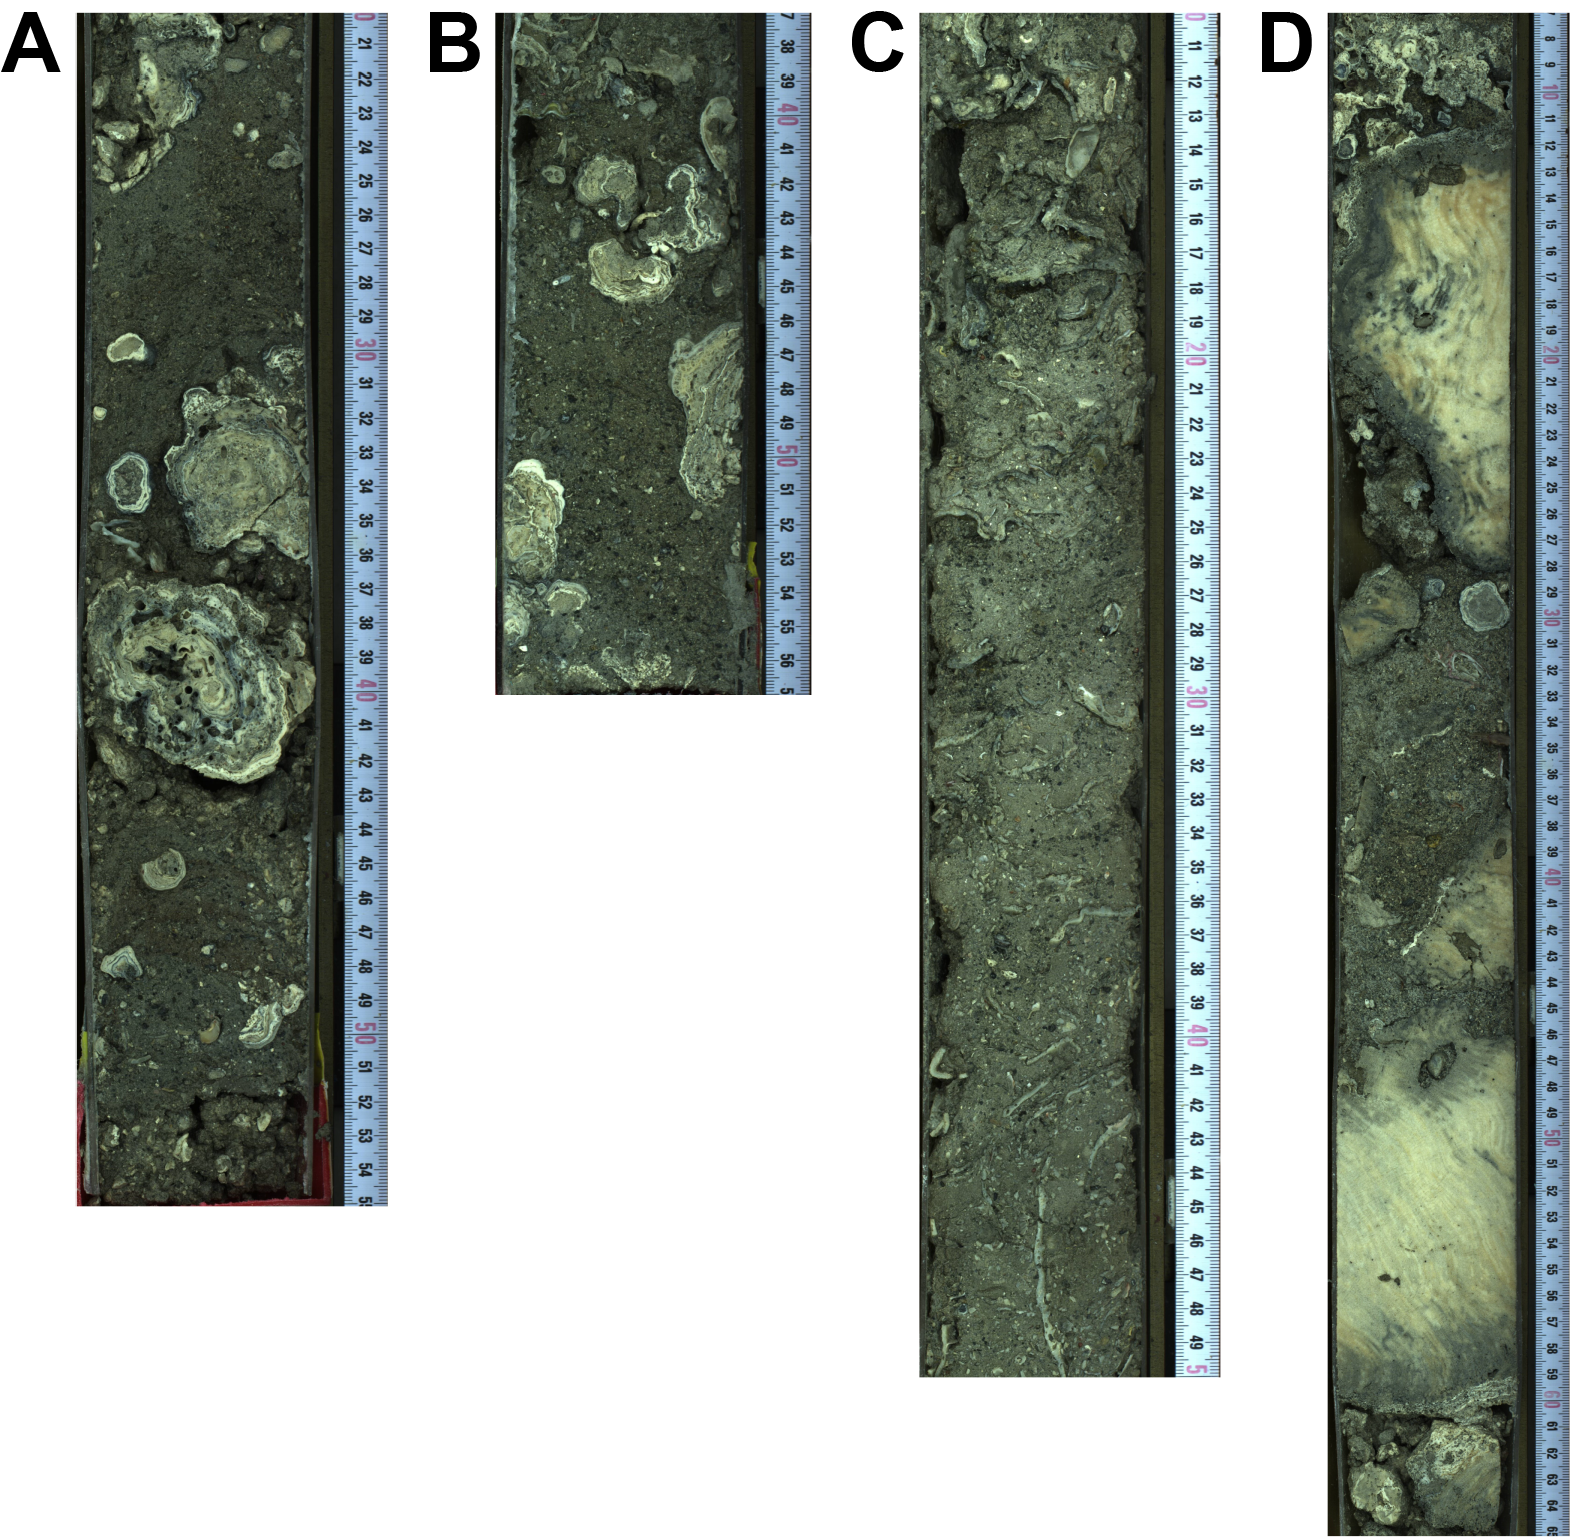
Figure F4. Facies, Hole M0102A.
The rhodolith-rich facies is interrupted by two intervals of unconsolidated biodetrital sediment, from 4.64 to 6.95 mbsf and from 15.64 to 16.75 mbsf, that are devoid of rhodoliths (Figure F4C). These sediments are composed of LBFs, gastropod shells (Cypraea), coral fragments (Leptoseris, Cyphastrea, and branching Montipora), CCA fragments, and fine- to medium-grained volcaniclastic sand with rare black volcanic granules.
From 22.25 to 24.61 mbsf, a fragmented (due to core disturbance) coralgal boundstone consists of large pieces of strongly bioeroded massive Porites with surface staining that are encrusted with CCA with bryozoans and vermetids (Figure F4D). Rare centimeter-sized rhodoliths are observed. The coarse components are embedded in an unconsolidated biodetrital and volcaniclastic matrix similar to that observed above.
The sedimentary succession continues downward in Hole M0102C from 19.90 to 72.71 mbsf, with approximately 5 m overlap with Hole M0102A (Figure F3).
From 19.90 to 21.58 mbsf, the core consists of centimeter-sized rhodoliths composed of laminar and fruticose coralline algae (FCA), bryozoans, and encrusting foraminifers; some rhodoliths reveal coral nuclei (Figure F5A). These rhodoliths are associated with fragments of Cyphastrea.
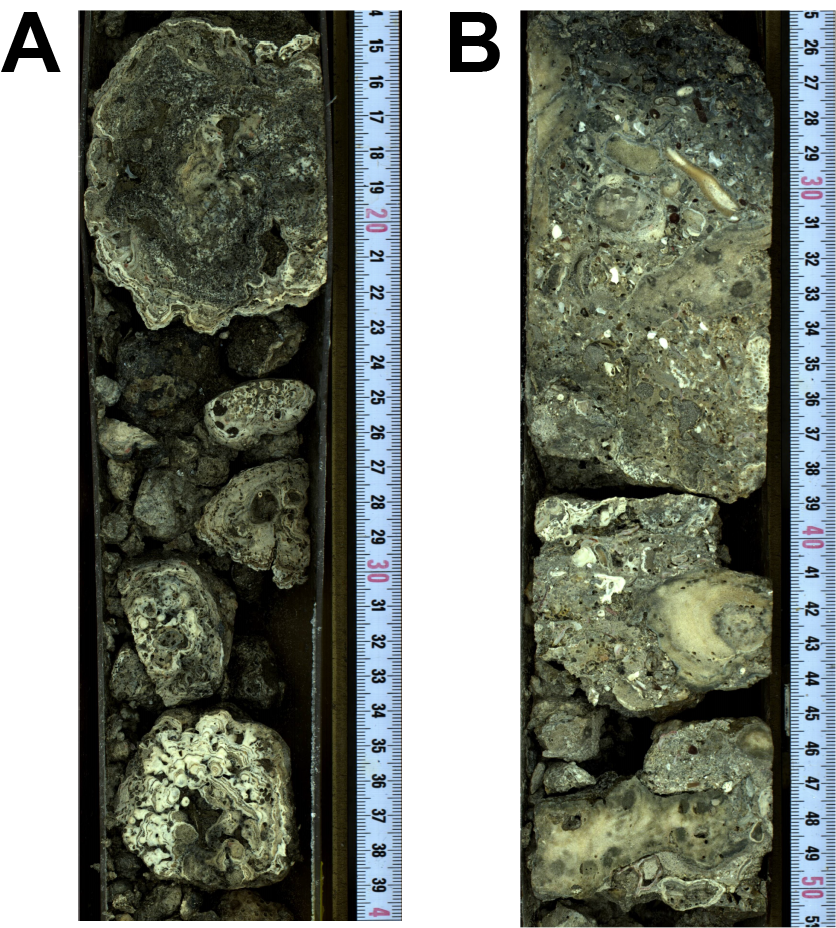
Figure F5. Facies, Hole M0102C.
The interval from 21.58 to 28.85 mbsf consists of coralgal boundstone that is interlayered locally, between 22.77 and 23.01 mbsf, with biodetrital, coarse-grained rudstone with coral fragments (Porites, Millepora, and Pocillopora), bivalves, gastropods, and echinoid spines (Figure F5B). Most corals in the coralgal boundstone are submassive to massive Porites that show some dark growth bands, are in many cases bored (Trypanites), and are rarely encrusted with thin CCA crusts (Figure F6). Below 24.62 mbsf, the coral assemblage is more diverse and includes a few encrusting Cyphastrea and Leptastrea, foliaceous Leptoseris, and encrusting Montipora in order of declining abundance (Figure F7A).
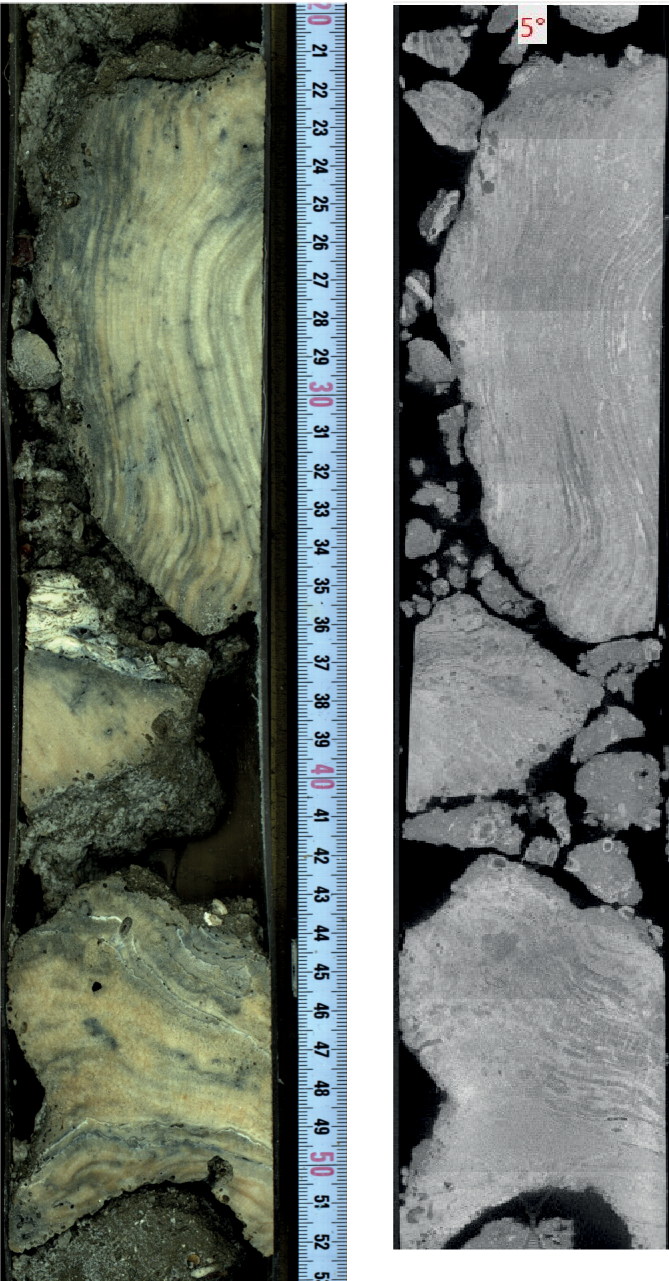
Figure F6. Coralgal boundstone of submassive to massive Porites.
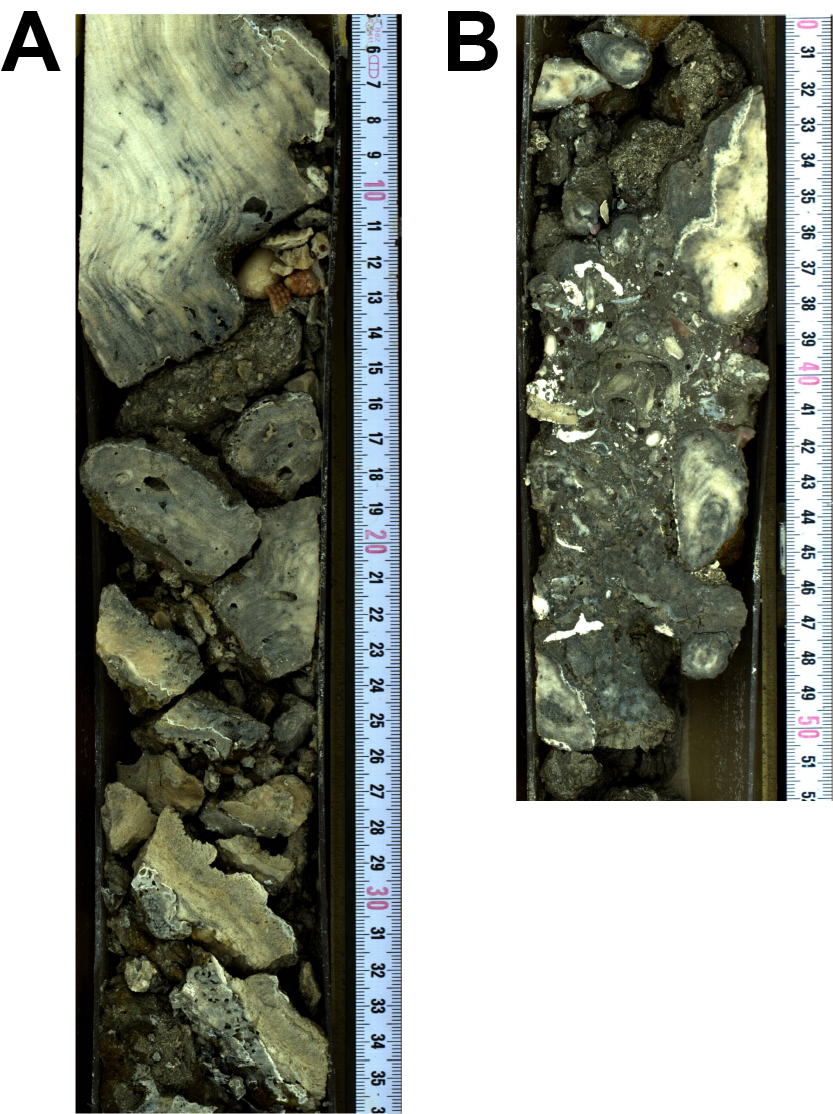
Figure F7. Coral, Hole M0102C.
The interval from 28.85 to 29.25 mbsf represents a transition between the facies above and below and is composed of biodetrital, coarse-grained rudstone to grainstone with coral fragments (Porites, Leptoseris, Millepora, and Cyphastrea) in a bioclastic matrix (algal debris, gastropods, and bivalves) (Figure F7B).
Below this transitional interval, the lithology from 29.25 to 70.69 mbsf consists of in situ coralgal-microbialite boundstone composed of corals with thin CCA crusts with vermetids and Homotrema as well as thick massive to dendritic microbialite crusts with structureless to thrombolitic internal fabric (Figure F8). Echinoid spines (Heterocentrotus) are embedded in the microbialite. Framework cavities are filled with unconsolidated, fine-grained, dark sediment of mixed biodetrital and volcaniclastic material. From 29.25 to 37.86 mbsf, branching and platy Porites and columnar Pavona occur (Figure F9A) along with a few encrusting Cyphastrea and platy Leptoseris. From 37.86 to 70.69 mbsf, corals are predominantly very large massive Porites (up to 1.5 m thick) (Figure F9B) with rare laminar Pavona (only between 44.16 and 46.79 mbsf), encrusted with thick, heavily bored CCA crusts with vermetid tubes (Figure F9C) and locally associated with encrusting Cyphastrea.
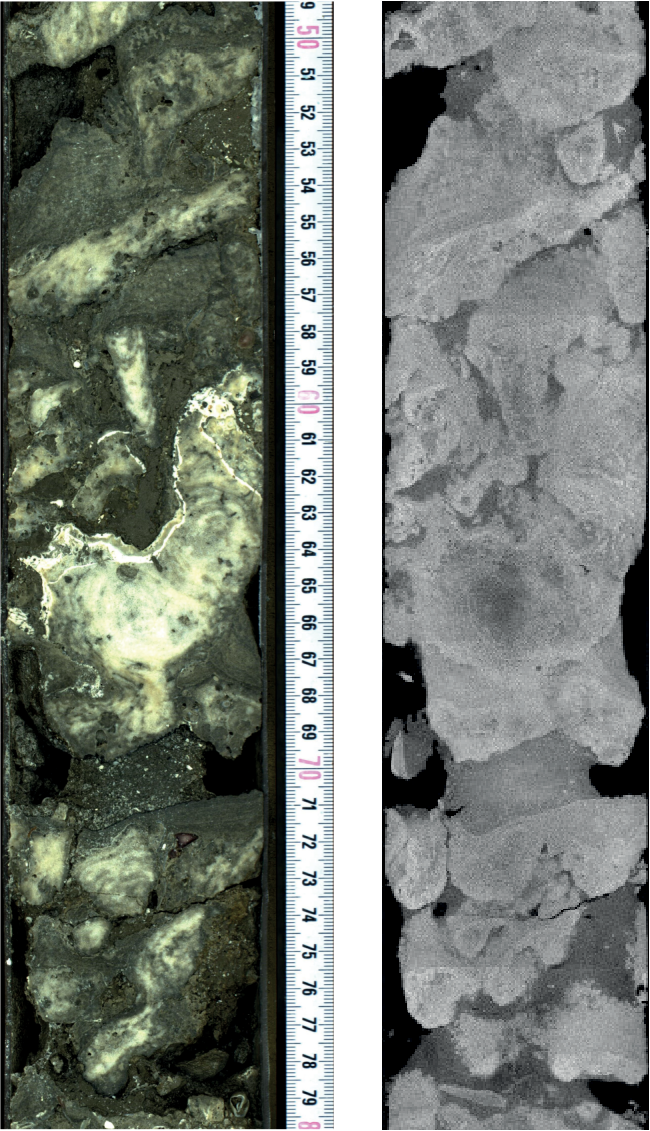
Figure F8. Coralgal-microbialite boundstone.
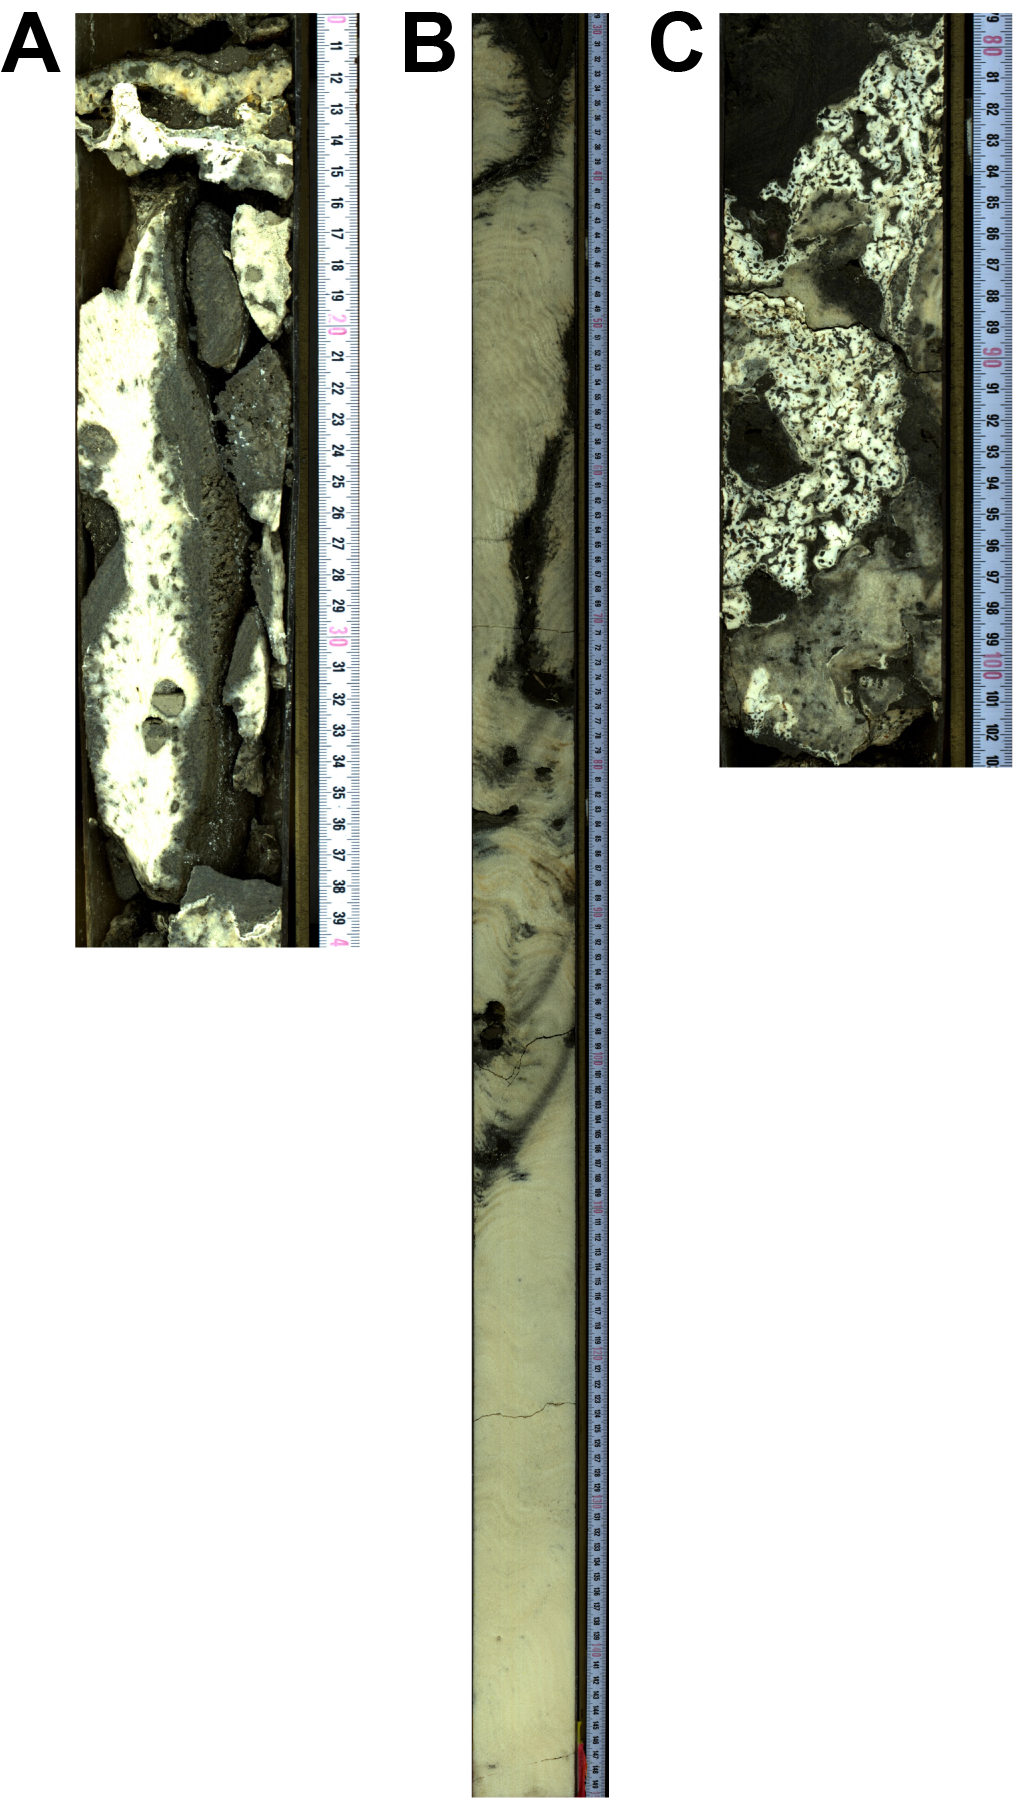
Figure F9. Porites and vermetids, Hole M0102C.
At the base of Hole M0102C, a coralgal boundstone from 70.69 to 72.71 mbsf consists of numerous branching and platy Porites covered with thin CCA crusts (encrusting some vermetids) and locally by very thin microbialite crusts embedded in a matrix of abundant, patchily consolidated, medium- to coarse-grained volcaniclastic and biodetrital clasts (Figure F10A). Both corals and CCA crusts are diagenetically altered. Two oxidized (millimeter-thick) crusts at 71.39 and 72.38 mbsf are observed on top of consolidated sediments (Figure F10B).
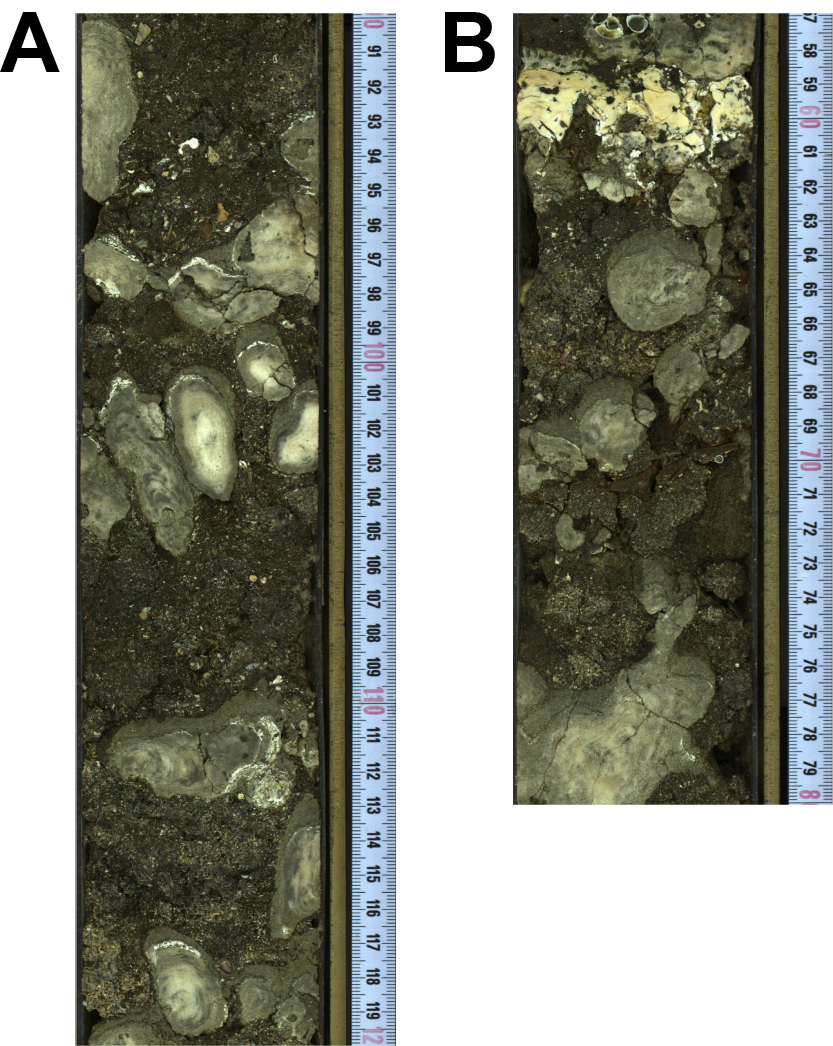
Figure F10. Crusts, Hole M0102C.
2.2. Hole M0102B
This hole was cored by wash bore only; no core was recovered (Table T1).
3. Physical properties
Physical properties data for Site M0102 are shown in Table T2 in the Site M0096 chapter (Webster et al., 2025b).
3.1. Hole M0102A
A total of 11.01 m of core from Hole M0102A was scanned with the multisensor core logger (MSCL), and because the core exhibited only minor drilling-induced disturbance, 75% of the acquired data passed QA/QC (see Table T10 in the Expedition 389 methods chapter [Webster et al., 2025a]). A total of five discrete samples were used for P-wave and moisture and density (MAD) measurements. Digital linescans, color reflectance, and hyperspectral imaging were acquired on all cores.
3.1.1. Density and porosity
Data for density and porosity measurements are presented in Figures F2 and F11. MSCL bulk density measurements range 0.69–2.60 g/cm3. A total of five discrete samples, including four sediment plugs, were analyzed for MAD, giving bulk density values in the range of 1.82–2.35 g/cm3. Porosity values for the same samples range 27.4%–53.7%, and grain density values fluctuate between 2.669 and 2.864 g/cm3. An increase in bulk density occurs at the base of the core in both the MSCL and discrete sample data and corresponds to a change in lithology from rudstone/floatstones (rhodoliths) to coralgal-microbialite boundstone (see Lithostratigraphy).
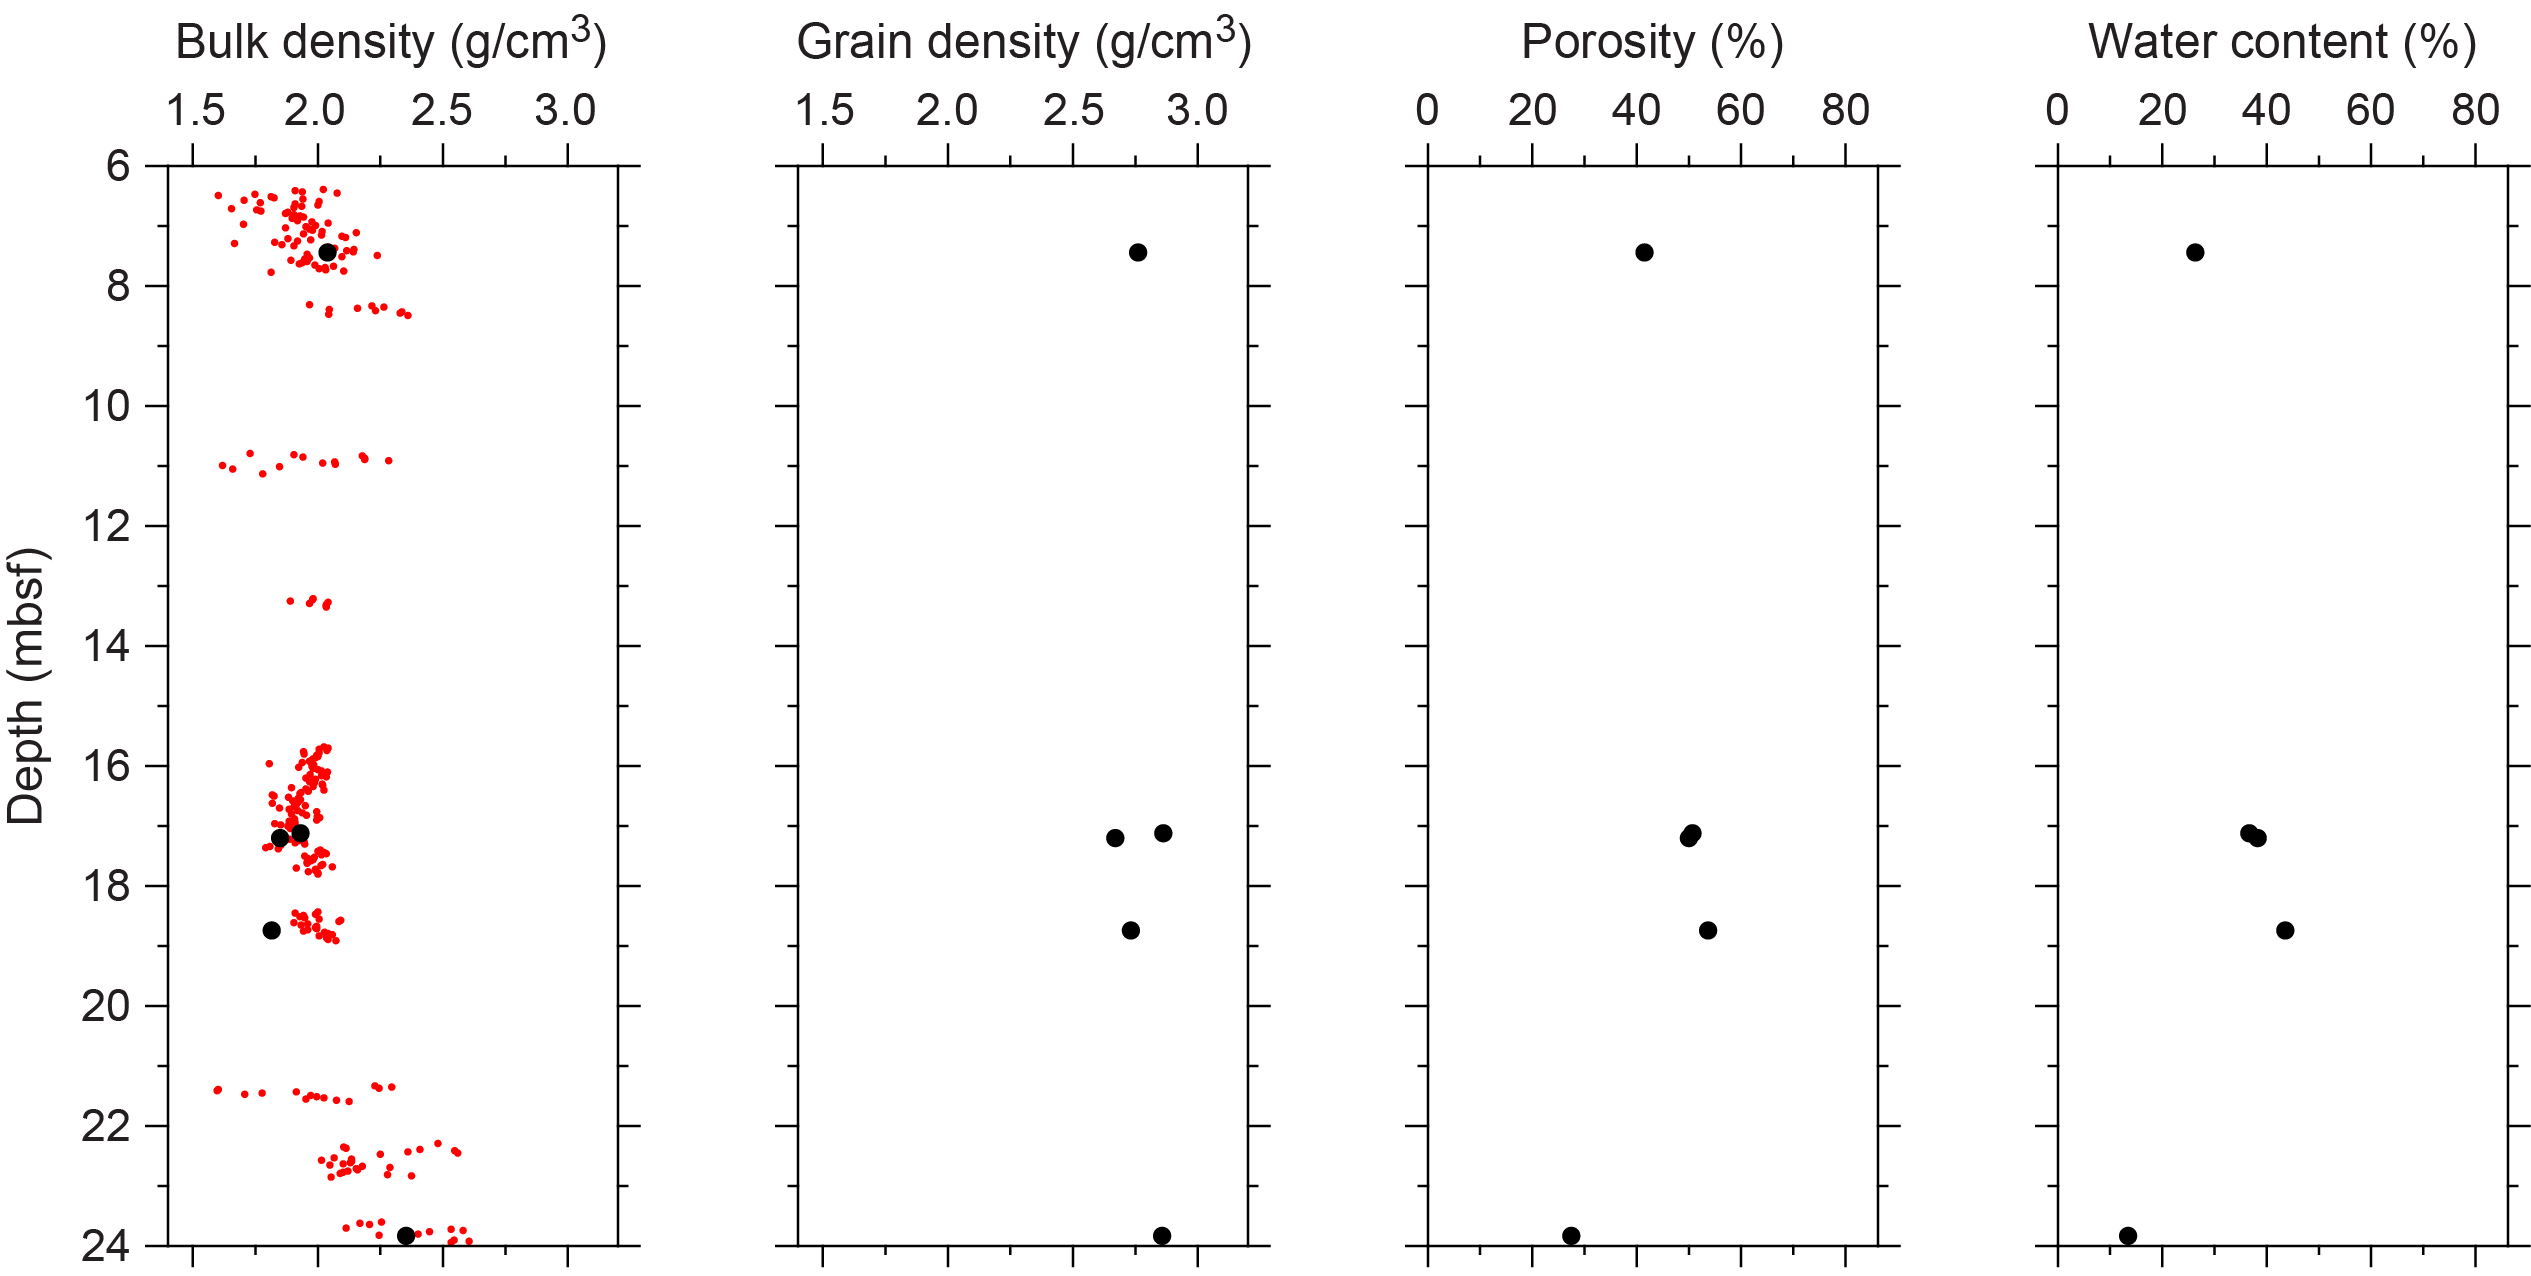
Figure F11. Physical properties, Hole M0102A.
3.1.2. P-wave velocity
MSCL P-wave velocity measurements yielded no data. One sample was measured using the discrete P-wave logger. This sample has a dry velocity of 4078 m/s and a resaturated velocity of 4149 m/s (Figure F12).
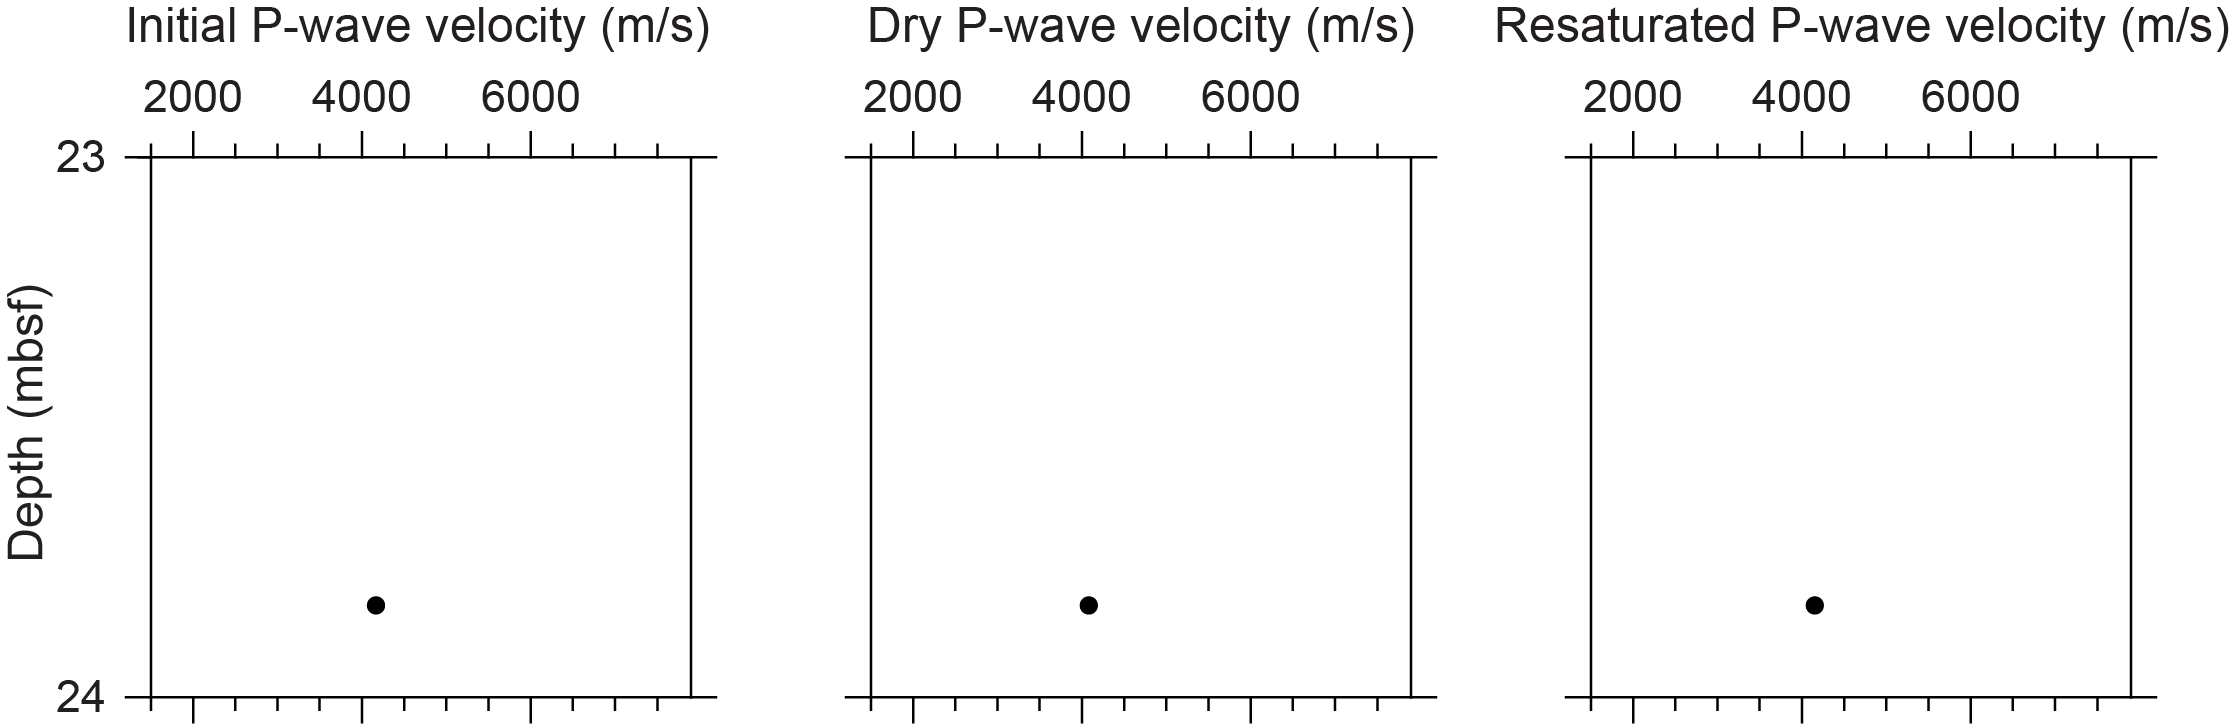
Figure F12. P-wave velocities, Hole M0102A.
3.1.3. Thermal conductivity
Because of the presence of drilling-induced disturbance damage, large voids, and uneven surfaces, thermal conductivity measurements were not performed on Hole M0102A cores.
3.1.4. Magnetic susceptibility
MSCL magnetic susceptibility data range 2.55 × 10⁻⁵ to 1290.01 × 10−5 SI (Figures F1, F2). The majority of magnetic susceptibility values fall close to 86.62 × 10⁻⁵ SI. High variations are found throughout the hole, with the largest variability near the top of Core 389-M0102A-10R relative to the base of the hole.
3.1.5. Electrical resistivity
MSCL noncontact resistivity measurements yielded data ranging 0.52–19.12 Ωm (Figures F1, F2). Little variation is generally found except at the base of the hole, where values are relatively high.
3.1.6. Natural gamma radiation
MSCL natural gamma radiation (NGR) measurements range 25–38 counts/s (Figures F1, F2), showing no apparent downhole change.
3.1.7. Digital linescans, color reflectance, and hyperspectral imaging
All cores were digitally scanned, measured for color reflectance (where appropriate), and imaged with the hyperspectral scanner (see HYPERSPECTRAL in Supplementary material). Color reflectance L* values vary between 31.08% and 74.35%, a* varies between −1.31 and 5.33, b* varies between 2.17 and 20.07, and a*/b* varies between −0.43 and 0.31 (Figures F1, F2).
3.2. Hole M0102B
This hole was cored by wash bore only; no core was recovered (Table T1).
3.3. Hole M0102C
A total of 42.13 m of core from Hole M0102C was scanned with the MSCL, and because the core exhibited only minor drilling-induced disturbance, 75% of the acquired data passed QA/QC (see Table T10 in the Expedition 389 methods chapter [Webster et al., 2025a]). A total of 27 discrete samples for P-wave and MAD measurements, as well as digital linescans, color reflectance, and hyperspectral imaging, were acquired on all core sections.
3.3.1. Density and porosity
Data for density and porosity measurements are presented in Figures F2 and F13. MSCL bulk density measurements range 1.08–2.61 g/cm3 (Figures F1, F3). A total of 27 discrete samples were analyzed for MAD, and bulk density values range 1.75–2.64 g/cm3, in contrast to MSCL density values. Porosity values for the same samples range 10.6%–60.7%, and grain density values range 2.294–2.907 g/cm3. There are no clear downhole trends in the density and porosity data sets and no clear relationship between the two bulk density measurements (MSCL and discrete).
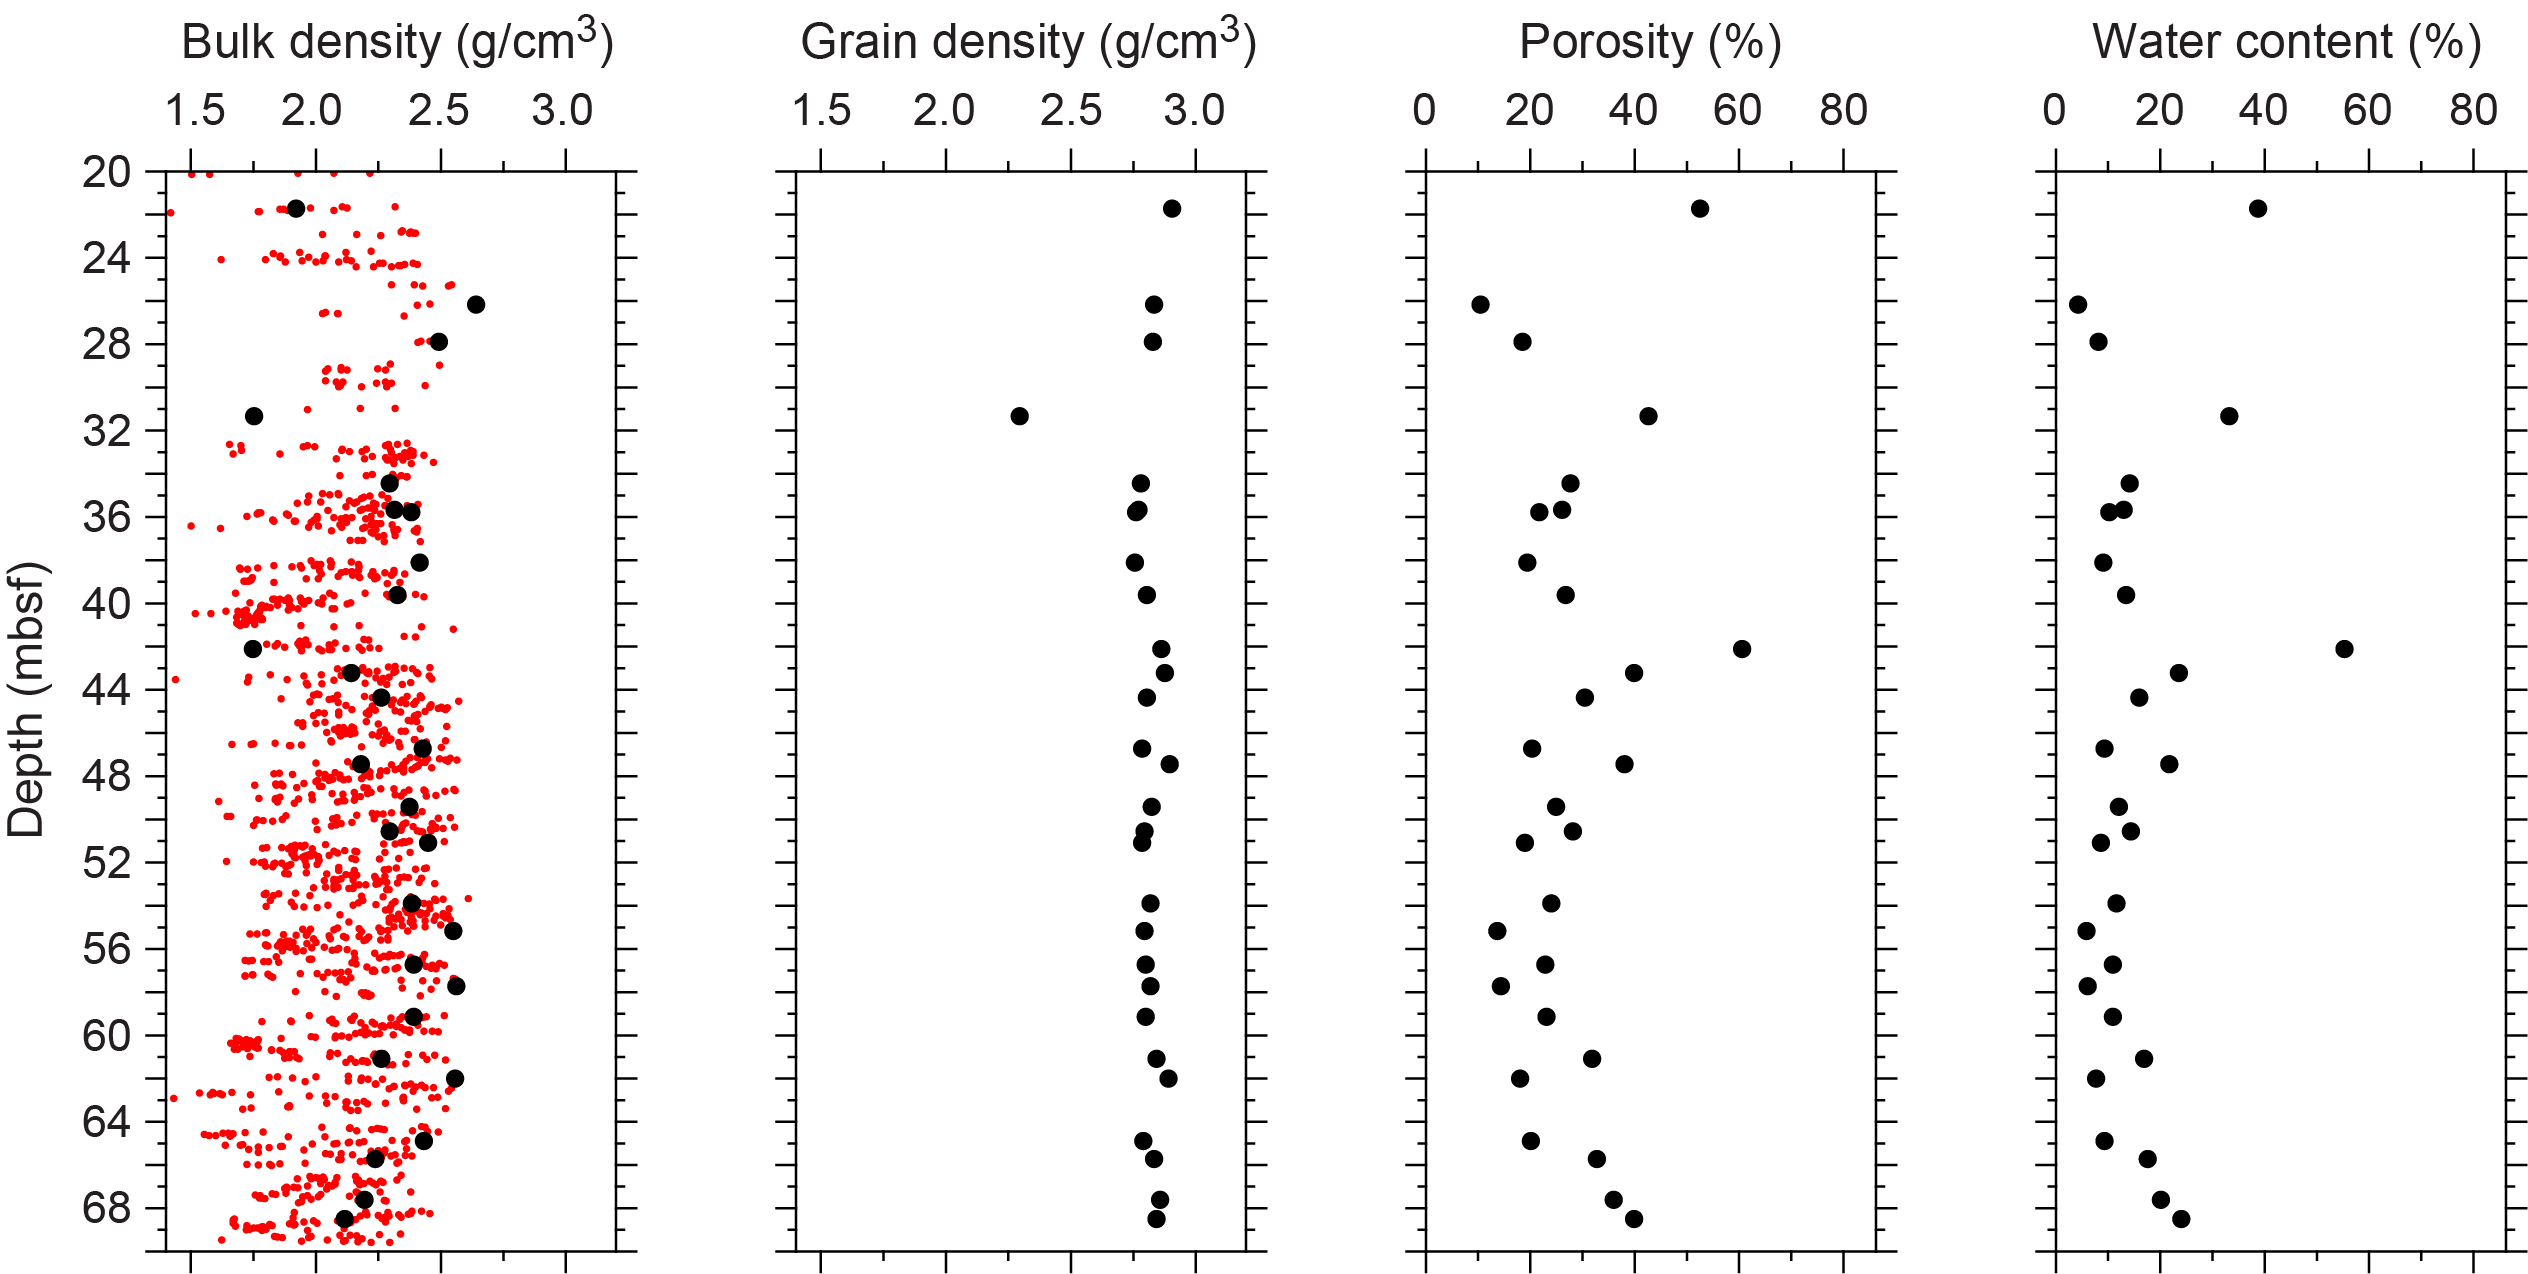
Figure F13. Physical properties, Hole M0102C.
3.3.2. P-wave velocity
MSCL P-wave velocity measurements yielded no data. A total of 27 samples were measured using the discrete P-wave logger. Dry measurement values are between 3183 and 5229 m/s (Figure F14). P-wave velocity recorded for the samples after resaturation range 3066–5253 m/s. There are no apparent downhole trends.
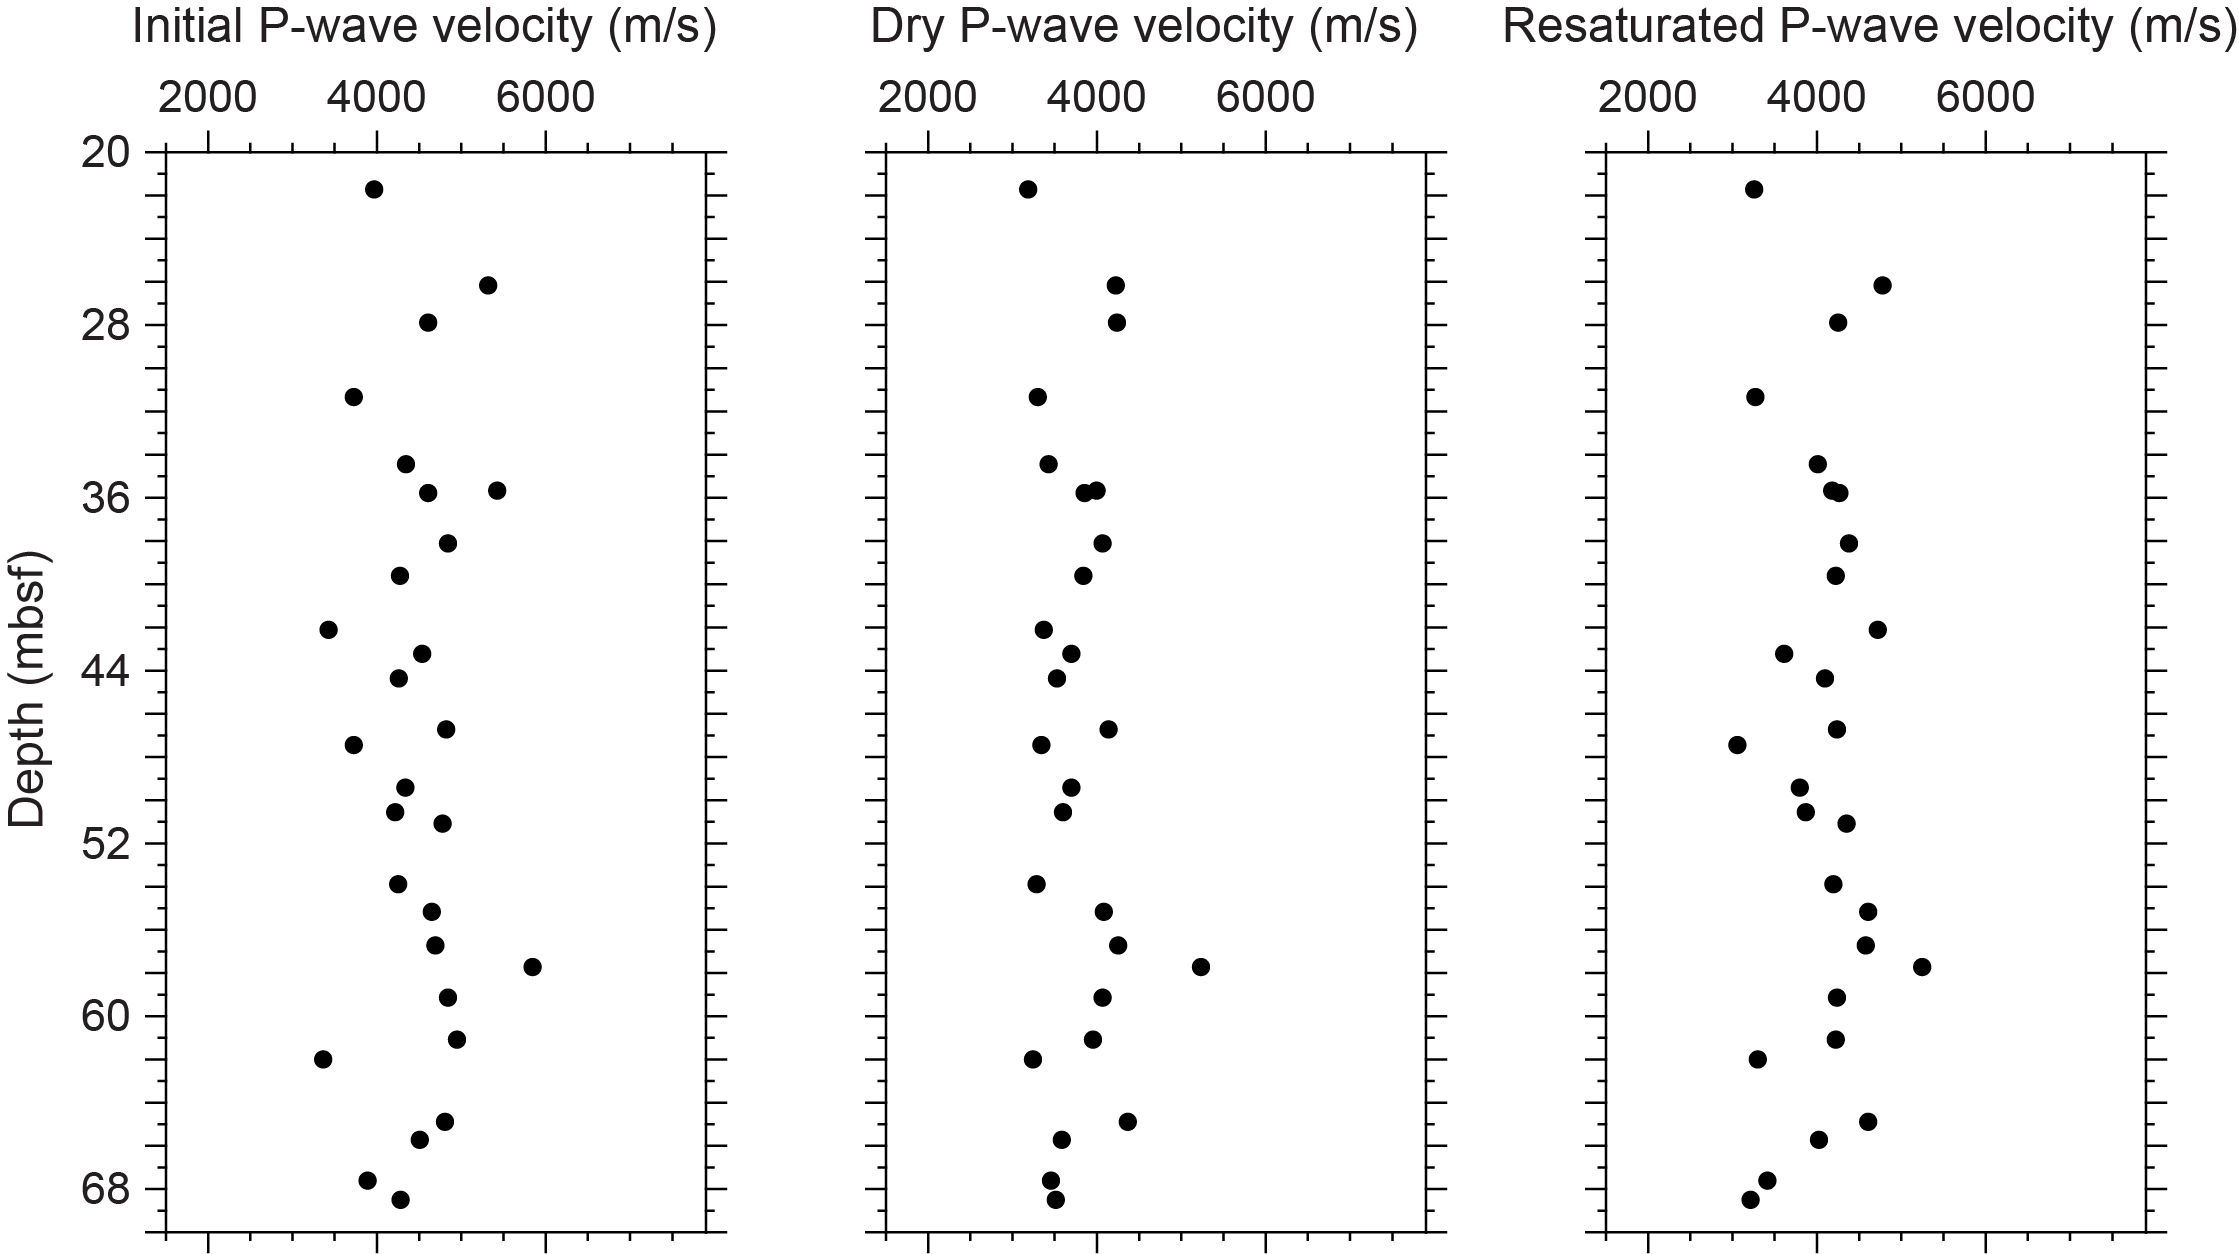
Figure F14. P-wave velocities, Hole M0102C.
3.3.3. Thermal conductivity
Thermal conductivity was collected on two cores. A value of 1.450 W/(m·K) was recorded at 48.39 mbsf, and 1.388 W/(m·K) was recorded at 51.06 mbsf (see Table T11 in the Expedition 389 methods chapter [Webster et al., 2025a]).
3.3.4. Magnetic susceptibility
MSCL magnetic susceptibility data range −1.68 × 10⁻⁵ to 267.75 × 10⁻⁵ SI (Figures F1, F3) with mean values close to 74.75 × 10⁻⁵ SI. The top of Core 389-M0102C-10R (~15.5 mbsf) shows higher than mean values with a change to lower than mean values occurring at ~16.5 mbsf and may reflect the lithology change from unconsolidated biodetrital sediment to a rhodolith floatstone. The lowest values are found below 22 mbsf. The high variability in Interval 3 (see Lithostratigraphy) below 40 mbsf occurs where abundant microbialites incorporate significant volumes of pyroxene (see Geochemistry).
3.3.5. Electrical resistivity
MSCL noncontact resistivity measurements range 0.46–39.82 Ωm (Figures F1, F3).
3.3.6. Natural gamma radiation
MSCL NGR measurements range 25–45 counts/s (Figures F1, F3), showing the largest values near the boundary between Interval 3 and Interval 4 (70.69 mbsf) at the base of Core 389-M0102C-32R.
3.3.7. Digital linescans, color reflectance, and hyperspectral imaging
All cores were digitally scanned, and, where appropriate, cores were measured for color reflectance and imaged with the hyperspectral scanner (see HYPERSPECTRAL in Supplementary material). Color reflectance L* values vary between 18.72% and 83.57%, a* varies between −1.57 and 7.17, b* varies between 1.75 and 28.11, and a*/b* varies between −0.30 and 0.87 (Figures F1, F3). High variations in color reflectance parameters are found throughout the core, particularly in Interval 3 (29.25–70.69 mbsf) where abundant dark-colored microbialites are present.
4. Geochemistry
4.1. Interstitial water
A total of 14 interstitial water samples were collected from Site M0102 (7 from Hole M0102A and 7 from Hole M0102C). Of these, 12 samples were analyzed for salinity and ammonium concentration and 10 samples were analyzed for pH and alkalinity while off shore. Major cations and anions of seven samples were measured during the Onshore Science Party (see Table T16 in the Expedition 389 methods chapter [Webster et al., 2025a]). After combining samples from Holes M0102A and M0102C as a composite section, the pH data show a downcore trend to lower values with R2 = 0.69 (p-value < 0.005; Figure F15). High ammonium concentrations were measured in Samples 389-M0102A-2R-1, 40 cm (95.4 μmol/L), and 4R-1, 30 cm (85.9 μmol/L), from 0.88 and 2.97 mbsf, respectively. Sample 1R-1, 32 cm (0.32 mbsf), has a high alkalinity of 17.64 mmol/L; however, the pH and salinity of this sample remain within range of other samples from Expedition 389, indicating a potential analytical error for this alkalinity measurement. Sample 389-M0102C-22R-1, 59.5 cm (44.80 mbsf), has the lowest alkalinity value measured during this expedition: 1.81 mmol/L (Figure F15).
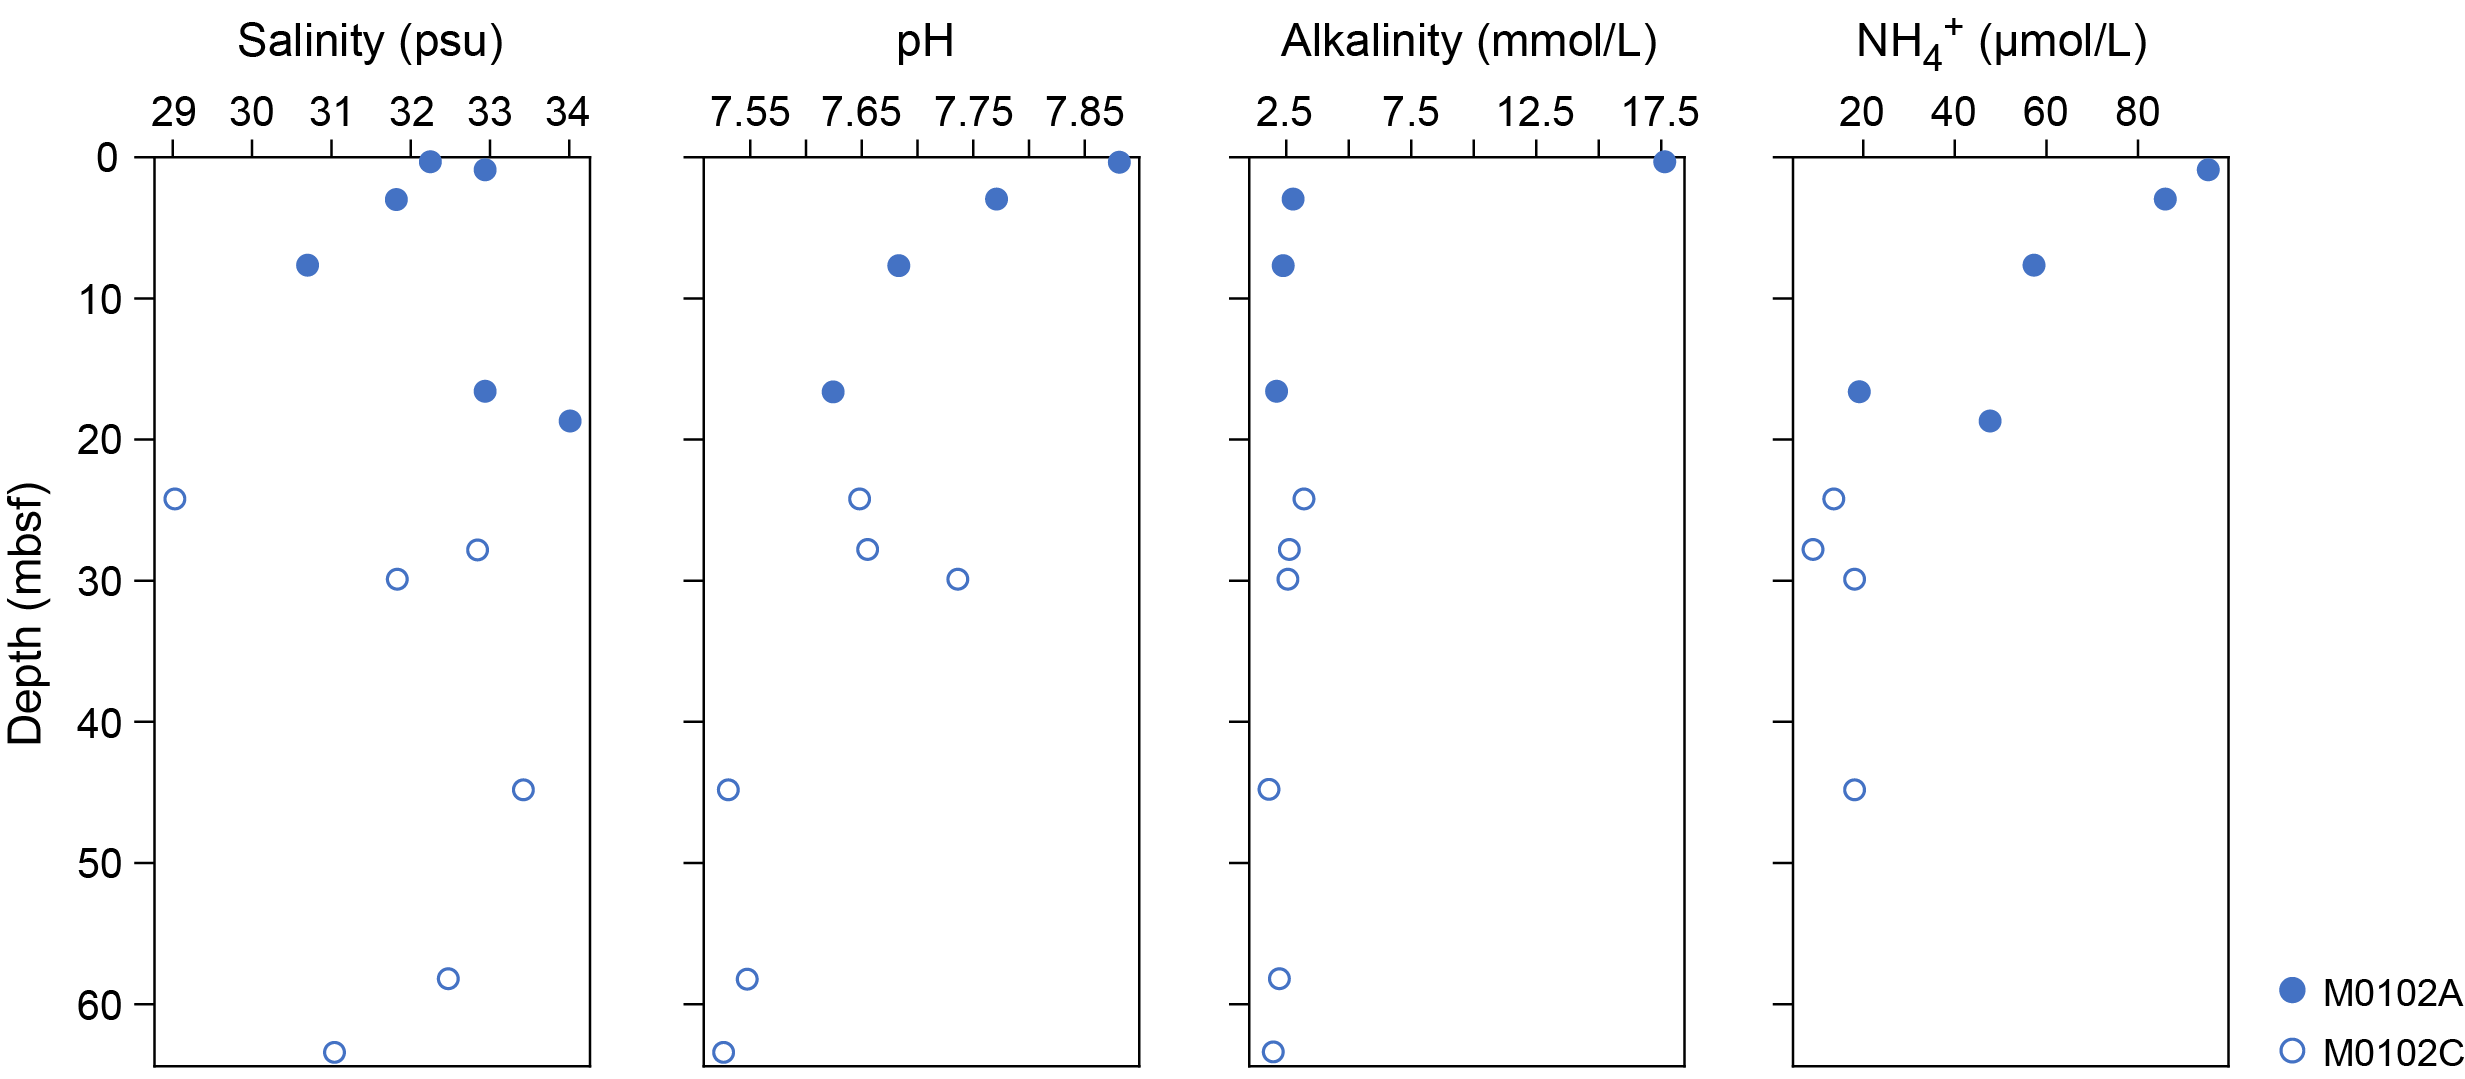
Figure F15. Interstitial water salinity, pH, alkalinity, and ammonium.
Results show that some samples have elevated amounts of B, Ba, Si, and Sr compared to seawater (see Tables T15 and T17 in the Expedition 389 methods chapter [Webster et al., 2025a]). Calcium shows a downhole trend toward higher values, and Sr also increases with depth, peaking at around 45 mbsf, whereas Si shows the opposite trend. Manganese is above detection limit from 28 mbsf downcore (Figure F16).
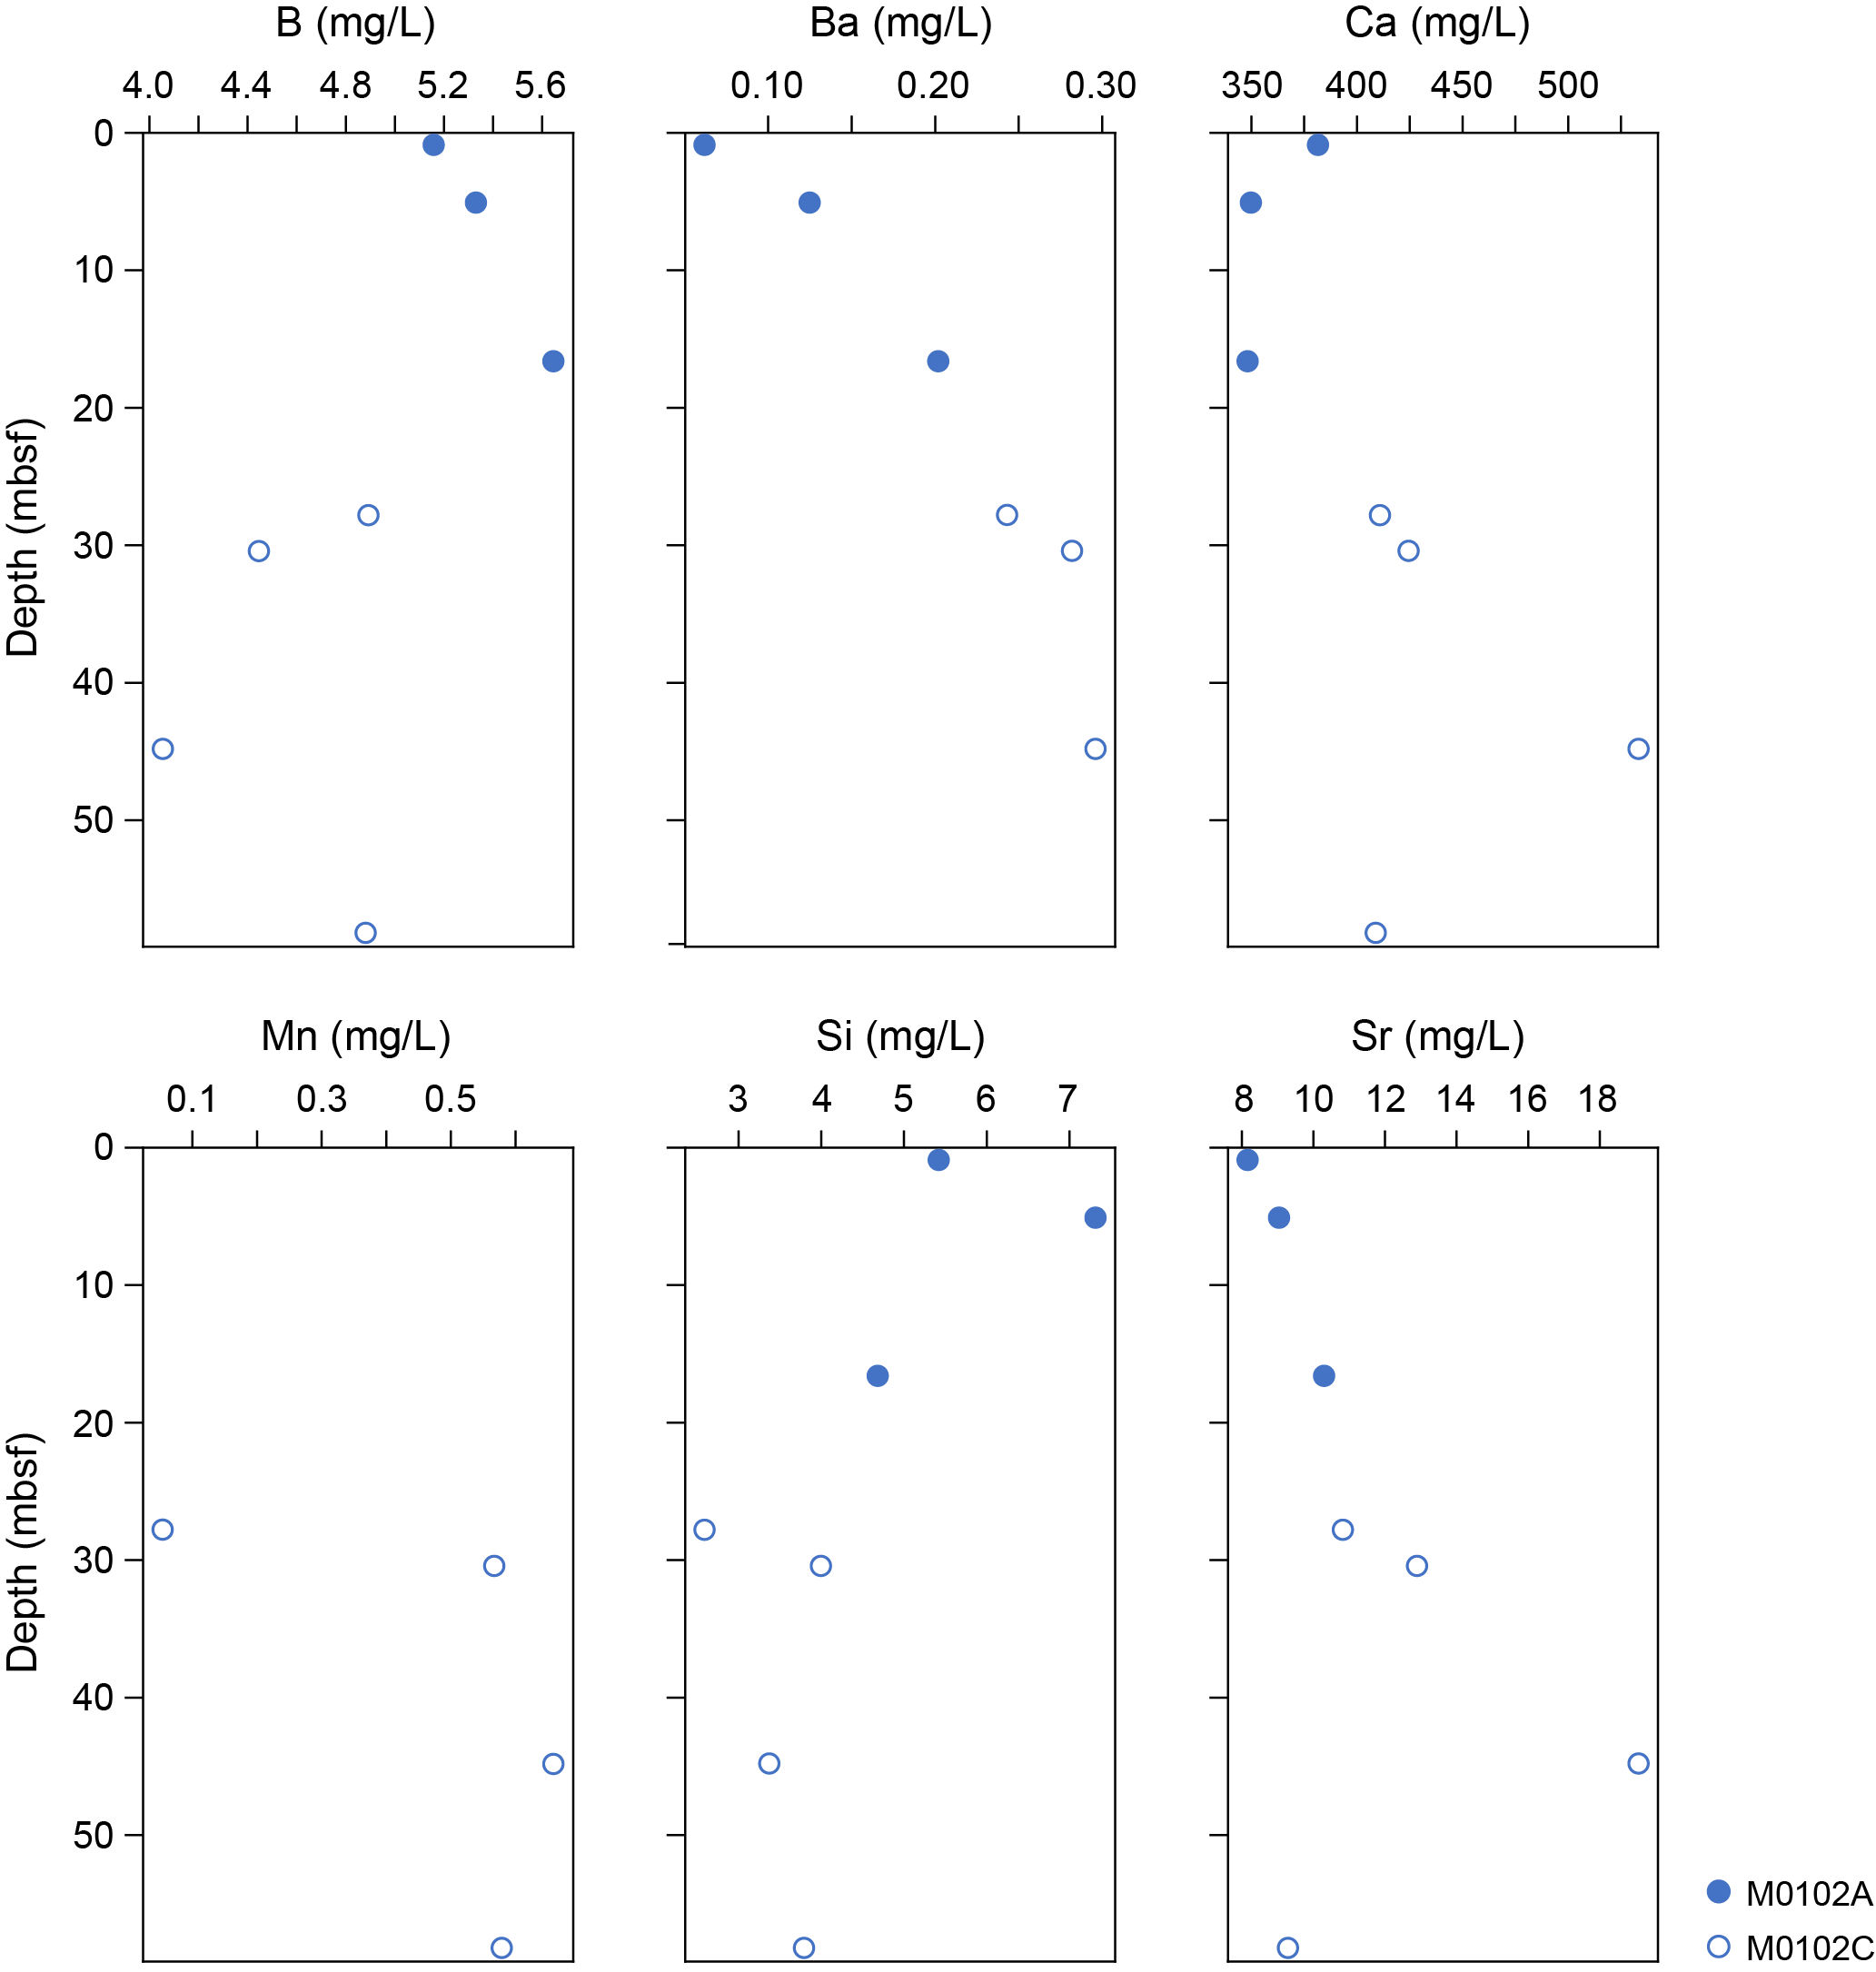
Figure F16. Interstitial water B, Ba, Ca, Si, Sr and Mn.
4.2. Surface seawater
One surface seawater sample was collected from Site M0102 using a Niskin bottle deployed from the side of the vessel (see Figure F22 in the Expedition 389 methods chapter [Webster et al., 2025a]). Parameters including salinity, pH, alkalinity, and concentrations of ammonium were analyzed off shore, and major cations and anions were measured during the Onshore Science Party. The salinity, pH, alkalinity, and ammonium measured for this sample are consistent with the other surface seawater samples taken during Expedition 389 and align with the expected values for conservative elements in seawater. Concentrations of K (412 mg/L), Mg (1306 mg/L), and Sr (7.6 mg/L) are the highest measured during this expedition (see Tables T15 and T16 in the Expedition 389 methods chapter [Webster et al., 2025a]).
4.3. Bulk sediment
A total of 14 bulk sediments were taken from Site M0102 (Figure F2) and analyzed for mineralogy, elemental composition, and carbon content. Samples are derived from a variety of facies (see Figure F10 in the Expedition 389 methods chapter [Webster et al., 2025a]), including rhodoliths, unconsolidated sediment, coralgal boundstone, and coralgal-microbialite boundstone (Figures F2, F7).
4.4. Mineralogy
Samples from Site M0102 are mostly composed of the carbonate minerals aragonite, high-Mg calcite, and ≤10% calcite, except for the sample from the coralgal boundstone at 70.70 mbsf (Sample 389-M0102C-33R-1, 1–3 cm), which contains 56% calcite (Table T2). The X-ray diffraction results suggest Sample 30R-1, 123–125 cm, contains 18% manganocalcite or related manganese-rich carbonates. Other minerals detected in the samples include quartz, cristobalite, plagioclase (up to 12%), gypsum and related minerals, apatite and other phosphate minerals, kaolinite, spinel magnetite, aluminum oxides, and sulfides. Samples from the coralgal-microbialite boundstone at 35.50 and 39.60 mbsf (Samples 17R-1, 30–33 cm, and 19R-1, 27–29 cm) also contain 12% pyroxene.
4.5. Elemental abundances
Although the Ca concentration in the samples is high and stays mostly constant downhole at an average of 318,983 mg/kg, concentrations of the other major elements vary in bulk sediment and rock samples from Site M0102 (Table T3; Figure F17). Compared to the unit above, from 20 to 50 mbsf, where the lithology is dominated by coralgal and coralgal-microbialite boundstone (Figure F2), the chemistry is characterized by slightly higher Al, Fe, Mn, and Ti with lower Br. At 60 mbsf, within the coralgal-microbialite boundstone, concentrations for Al, Br, Fe, Mg, Mn, Si, and Ti are lower than in the unit above. Here, the Sr concentration is the highest at 6,498 mg/kg. Other elements analyzed are minor or below detection limit.
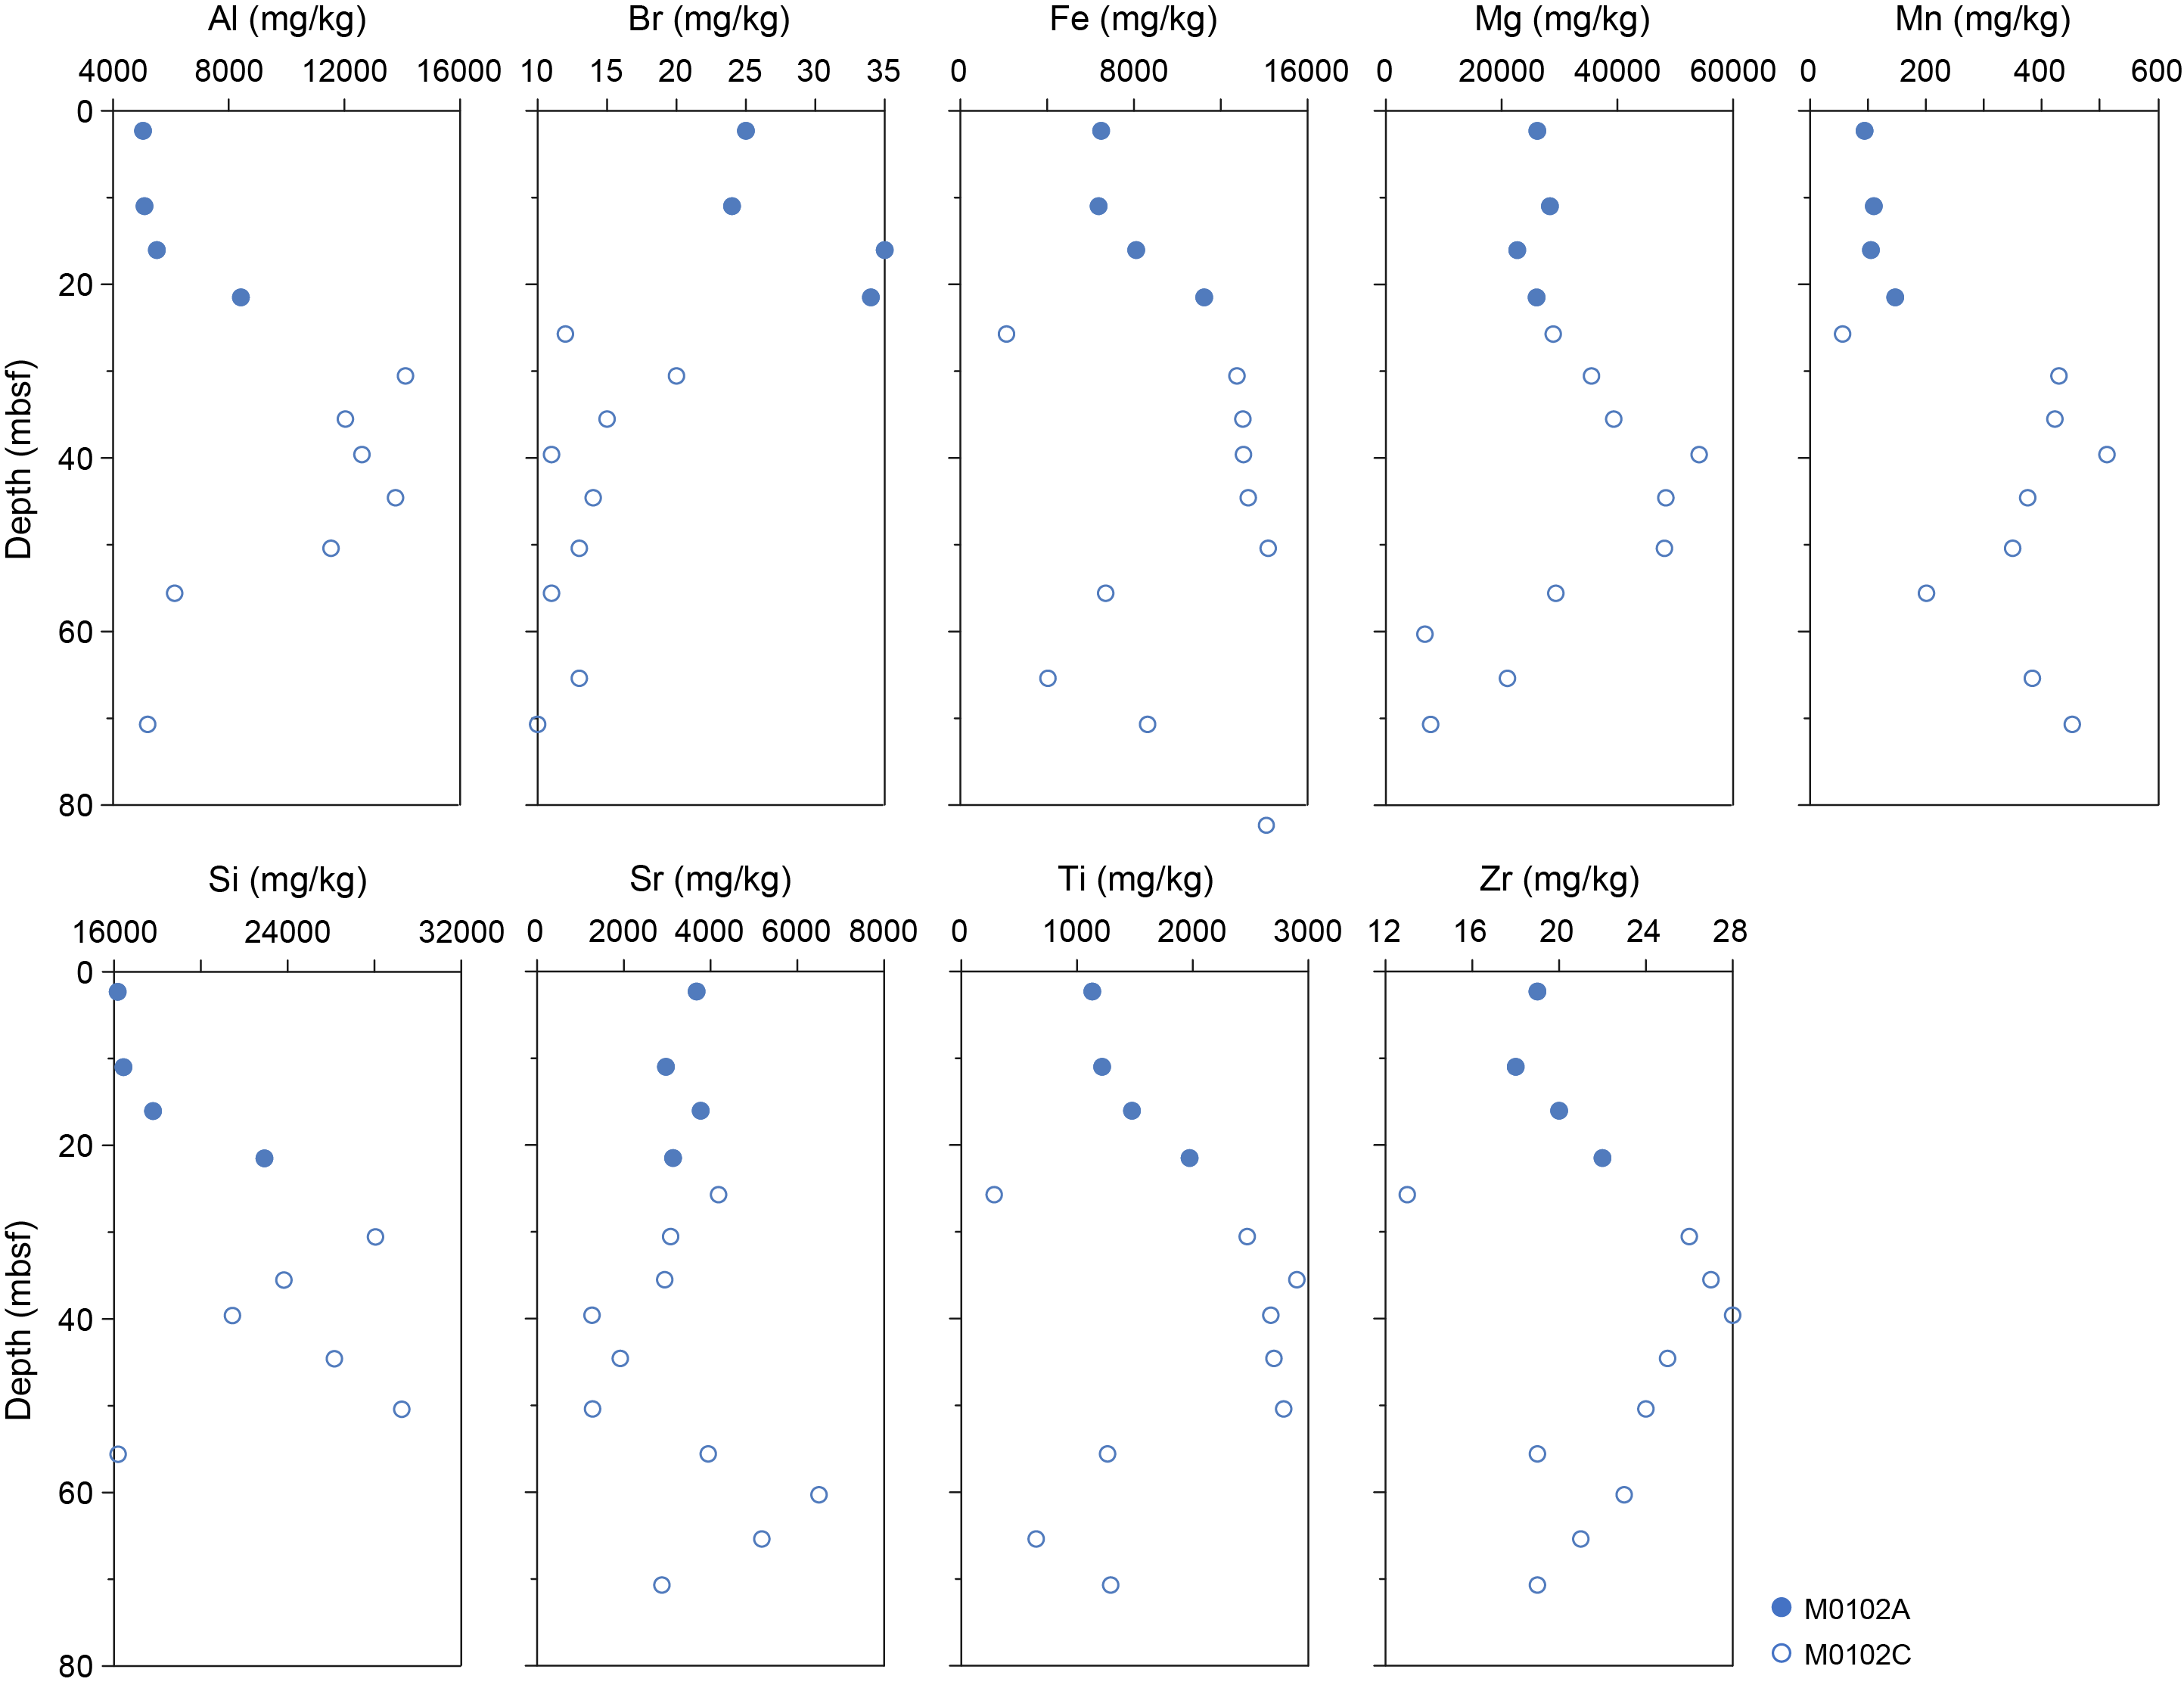
Figure F17. Bulk sediment and rock Al, Br, Fe, Mg, Mn, Si, Sr, Ti, and Zr.
4.6. Carbon content
The results for total organic carbon (TOC), total carbon (TC), and total inorganic carbon (TIC) at Site M0102 are presented in Table T4. TC content ranges 10.0%–11.4%, TOC content ranges 0.13%–0.35%, and TIC content ranges 9.8%–11.3%. TOC is higher in the shallower Hole M0102A, dominated by rhodolith facies by about 0.06% and 0.2% compared to Hole M0102C, except for the deepest sample in Hole M0102C (33R-1, 1–3 cm), where the TOC increases to 0.23%.
5. Paleomagnetism
A total of 38 plug samples and 3 cube samples were obtained from Holes M0102A and M0102C. Measurements of low-field and mass-specific magnetic susceptibility (χ) were carried out for all samples. Natural remanent magnetization (NRM) was measured for all plug samples, as well as remanence following stepwise alternating field (AF) demagnetization up to a peak AF of 20 mT and up to 100 mT for basalt samples. Cube samples were not demagnetized. For further details, see Paleomagnetism in the Expedition 389 methods chapter (Webster et al., 2025a).
5.1. Hole M0102A
Hole M0102A samples include volcaniclastic and bioclastic sediments, as well as other carbonate materials. Three cube samples were taken from 17.09, 17.79, and 18.87 mbsf in Hole M0102A; these samples consist of bioclastic sand, including a clast with volcanic material. The χ values of the cube samples range 4.50 × 10⁻⁷ to 7.24 × 10⁻⁷ m3/kg with an arithmetic mean of 5.97 × 10⁻⁷ m3/kg. Five carbonate samples were also collected from Hole M0102A. Positive χ values occur throughout, except for the sample at 23.76 mbsf (Sample 14R-1, 20.5–22.5 cm). Values range −0.22 × 10⁻⁷ to 16.2 × 10⁻⁷ m3/kg with an arithmetic mean of 9.87 × 10⁻⁷ m3/kg. The initial NRM intensity values for 0 mT range 0.0019 × 10⁻¹ to 3.01 × 10⁻¹ A/m with an arithmetic mean of 1.38 × 10⁻¹ A/m (Figure F18).
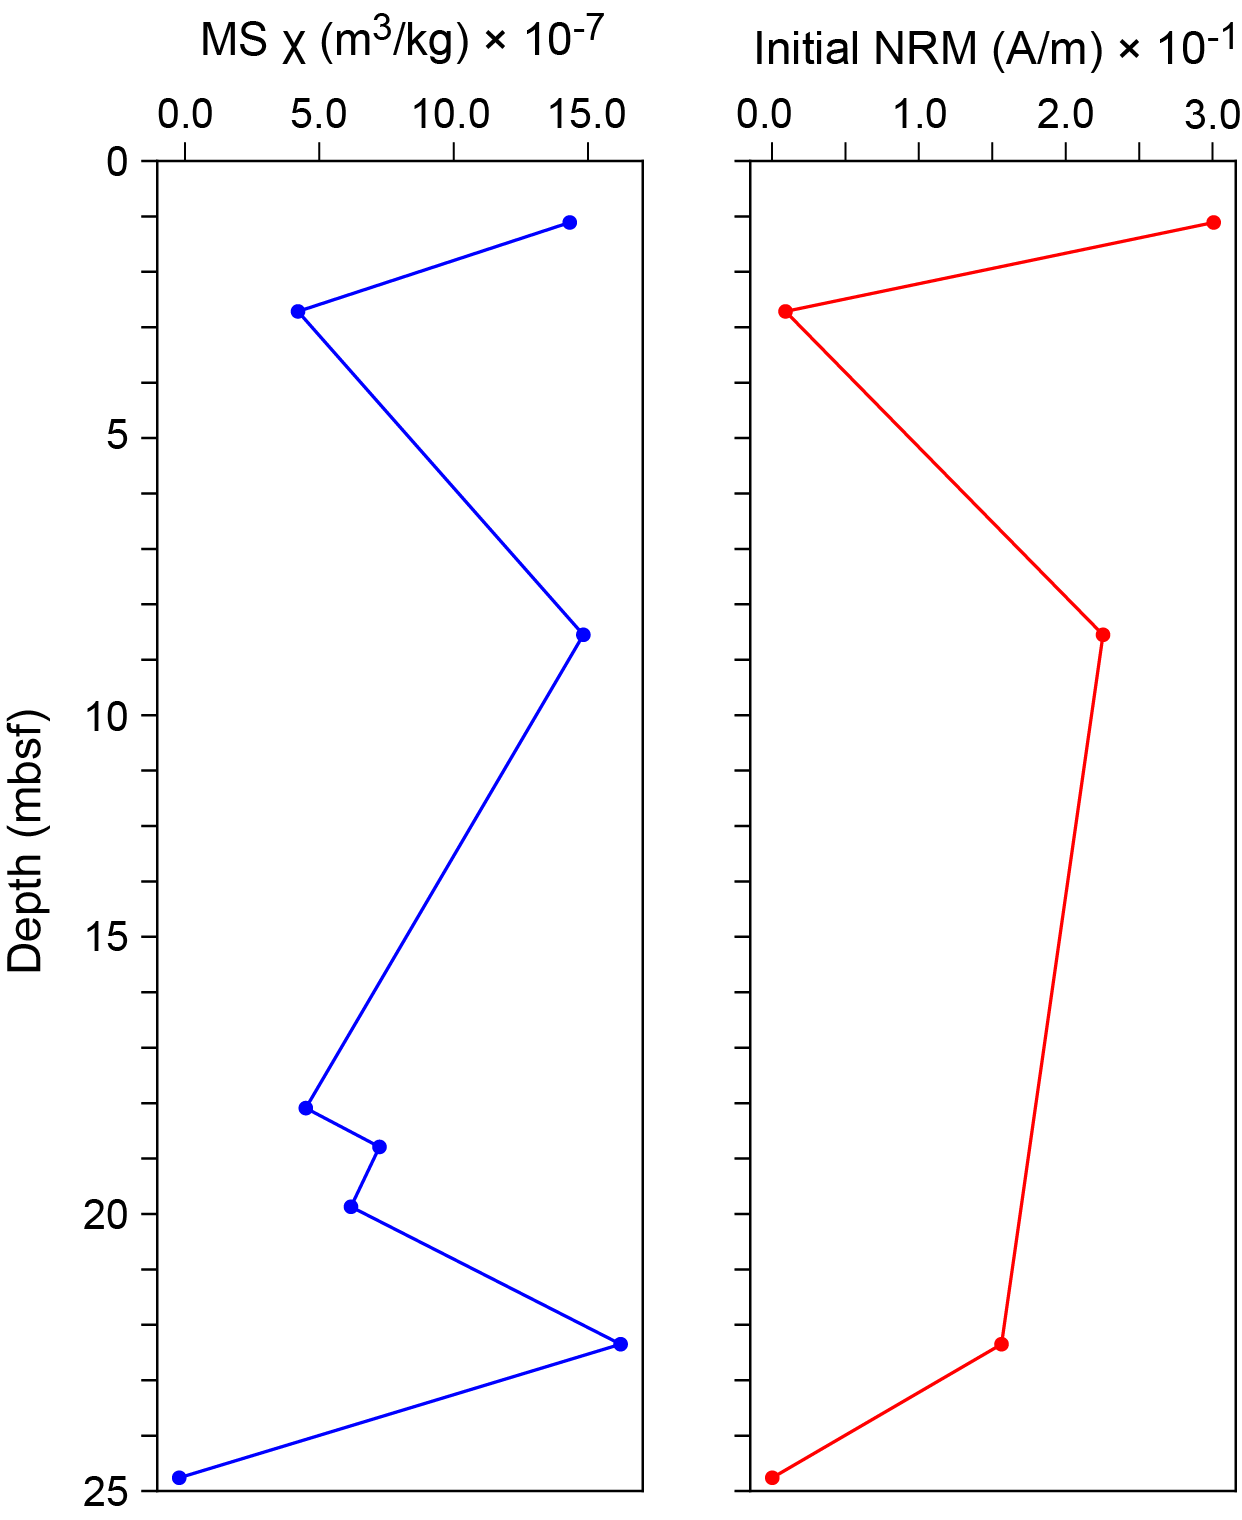
Figure F18. MS and NRM, Hole M0102A.
5.2. Hole M0102D
This hole was cored by wash bore only; no core was recovered (Table T1).
5.3. Hole M0102C
One lava sample (Sample 389-M0102C-30R-1, 27.5–29.5 cm) and 32 carbonate samples were taken from Hole M0102C. The χ value of the lava sample is 1.45 × 10⁻⁵ m3/kg, and the initial NRM intensity is 6.79 × 10⁻¹ A/m. The χ values of carbonate samples range −0.026 × 10⁻⁶ to 9.45 × 10⁻⁶ m3/kg with an arithmetic mean of 2.32 × 10⁻⁶ m3/kg. The initial NRM intensity values for 0 mT on the carbonate samples range 0.0028 × 10⁻¹ to 8.85 × 10⁻¹ A/m with an arithmetic mean of 2.17 × 10⁻¹ A/m. Patterns in χ and initial NRM are synchronous, suggesting that magnetic concentration and properties are the main drivers behind these variations (Figure F19).
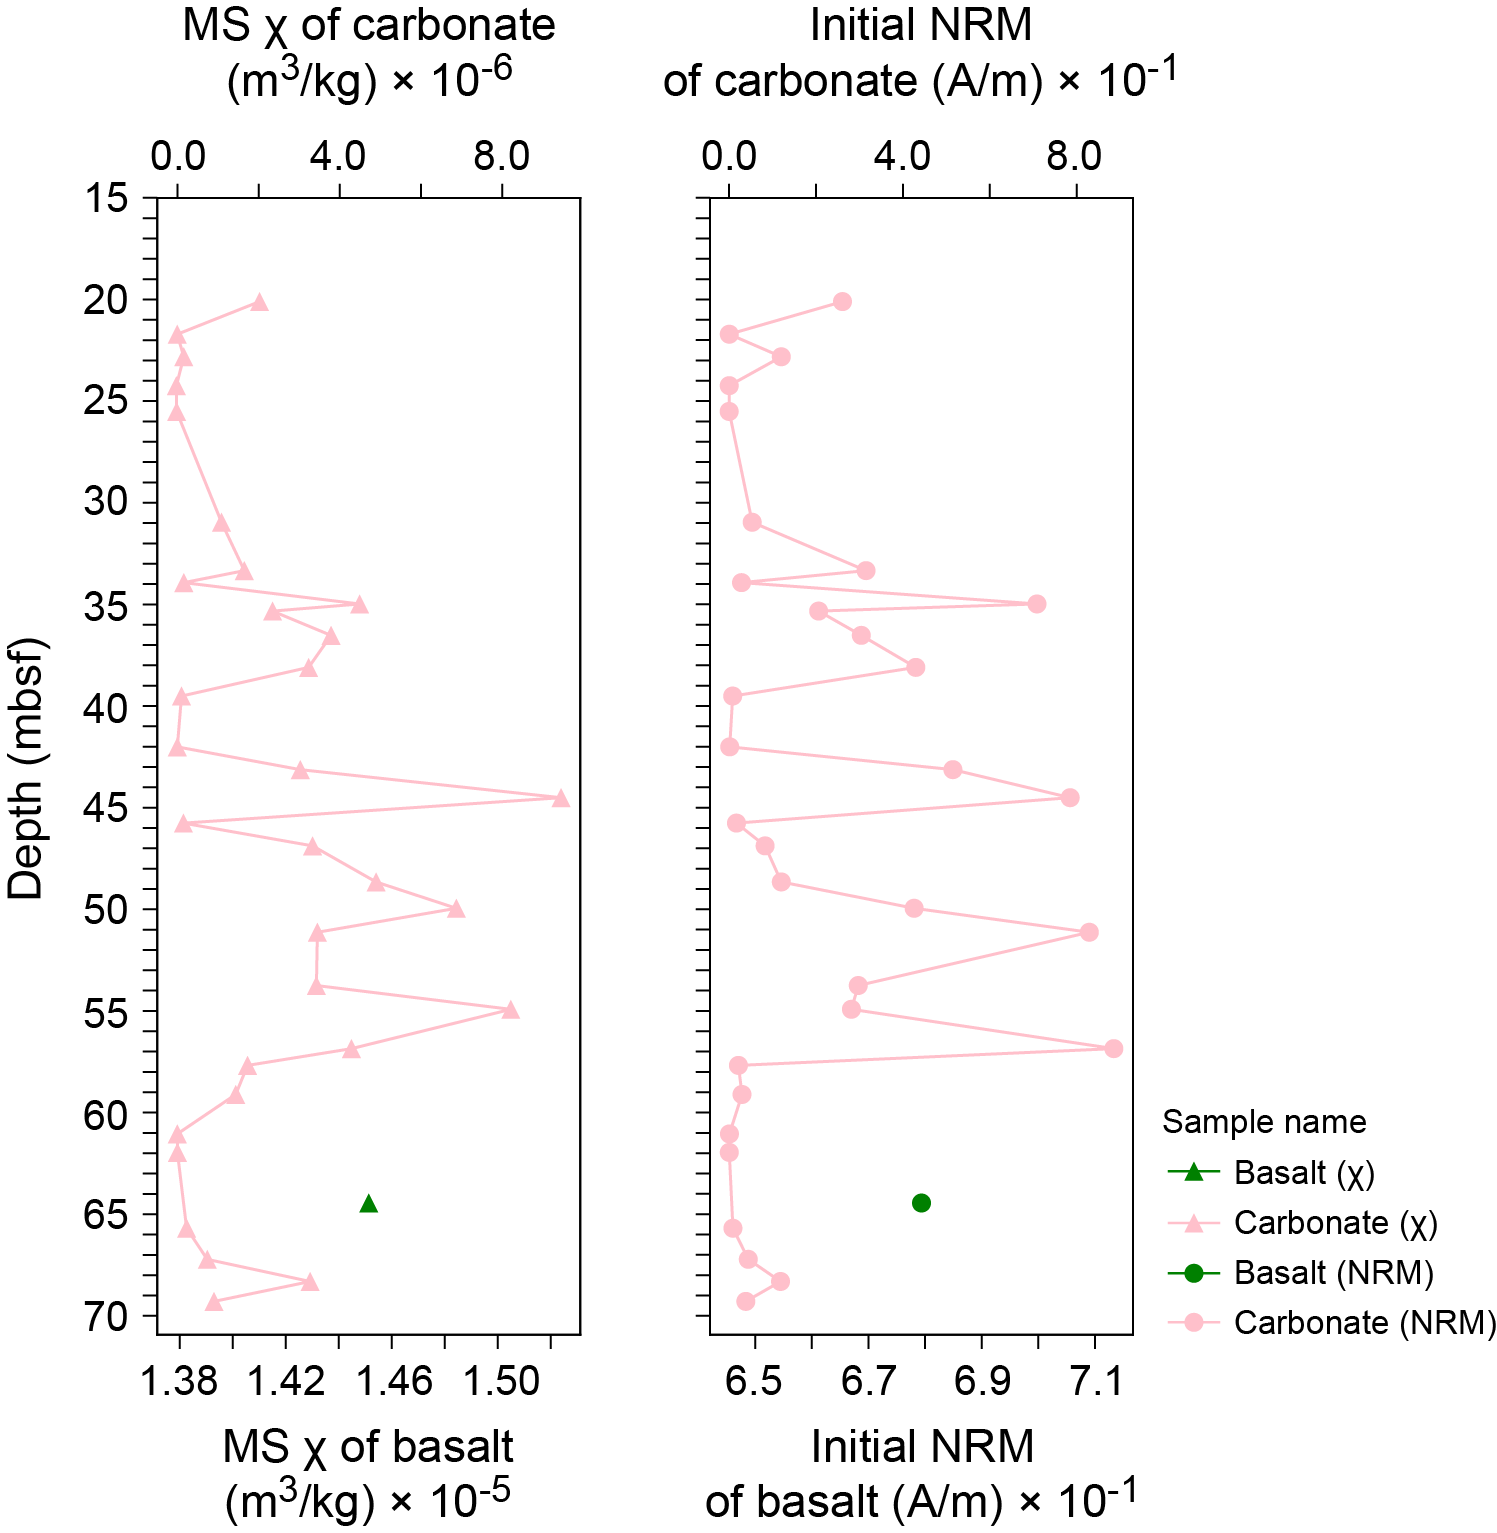
Figure F19. MS and NRM, Hole M0102C.
6. Geochronology
Five U-Th dates were measured on samples from Site M0102, including one from Hole M0102A and four from Hole M0102C, spanning ~171–225 ky BP (see Tables T21 and T22 in the Expedition 389 methods chapter [Webster et al., 2025a]). None of these dates were rejected based on the U-Th geochemistry. However, in Hole M0102C there is one stratigraphic age reversal (Sample 27R-1, 115–117 cm). Overall, the dates from Site M0102 are consistent with the timing of development of the H2 terrace (Webster et al., 2009).
References
Webster, J.M., Braga, J.C., Clague, D.A., Gallup, C., Hein, J.R., Potts, D.C., Renema, W., Riding, R., Riker-Coleman, K., Silver, E., and Wallace, L.M., 2009. Coral reef evolution on rapidly subsiding margins. Global and Planetary Change, 66(1–2):129–148. https://doi.org/10.1016/j.gloplacha.2008.07.010
Webster, J.M., Ravelo, A.C., Grant, H.L.J., and the Expedition 389 Scientists, 2025. Supplementary material, https://doi.org/10.14379/iodp.proc.389supp.2025. In Webster, J.M., Ravelo, A.C., Grant, H.L.J., and the Expedition 389 Scientists, Hawaiian Drowned Reefs. Proceedings of the International Ocean Discovery Program, 389: College Station, TX (International Ocean Discovery Program).
Webster, J.M., Ravelo, A.C., Grant, H.L.J., Rydzy, M., Stewart, M., Allison, N., Asami, R., Boston, B., Braga, J.C., Brenner, L., Chen, X., Chutcharavan, P., Dutton, A., Felis, T., Fukuyo, N., Gischler, E., Greve, S., Hagen, A., Hamon, Y., Hathorne, E., Humblet, M., Jorry, S., Khanna, P., Le Ber, E., McGregor, H., Mortlock, R., Nohl, T., Potts, D., Prohaska, A., Prouty, N., Renema, W., Rubin, K.H., Westphal, H., and Yokoyama, Y., 2025a. Expedition 389 methods. In Webster, J.M., Ravelo, A.C., Grant, H.L.J., and the Expedition 389 Scientists, Hawaiian Drowned Reefs. Proceedings of the International Ocean Discovery Program, 389: College Station, TX (International Ocean Discovery Program). https://doi.org/10.14379/iodp.proc.389.102.2025
Webster, J.M., Ravelo, A.C., Grant, H.L.J., Rydzy, M., Stewart, M., Allison, N., Asami, R., Boston, B., Braga, J.C., Brenner, L., Chen, X., Chutcharavan, P., Dutton, A., Felis, T., Fukuyo, N., Gischler, E., Greve, S., Hagen, A., Hamon, Y., Hathorne, E., Humblet, M., Jorry, S., Khanna, P., Le Ber, E., McGregor, H., Mortlock, R., Nohl, T., Potts, D., Prohaska, A., Prouty, N., Renema, W., Rubin, K.H., Westphal, H., and Yokoyama, Y., 2025b. Site M0096. In Webster, J.M., Ravelo, A.C., Grant, H.L.J., and the Expedition 389 Scientists, Hawaiian Drowned Reefs. Proceedings of the International Ocean Discovery Program, 389: College Station, TX (International Ocean Discovery Program). https://doi.org/10.14379/iodp.proc.389.103.2025