Webster, J.M., Ravelo, A.C., Grant, H.L.J., and the Expedition 389 Scientists
Proceedings of the International Ocean Discovery Program Volume 389
publications.iodp.org
https://doi.org/10.14379/iodp.proc.389.110.2025
Site M01031
![]() J.M. Webster,
J.M. Webster,
![]() A.C. Ravelo,
A.C. Ravelo,
![]() H.L.J. Grant,
H.L.J. Grant,
![]() M. Rydzy,
M. Rydzy,
![]() M. Stewart,
M. Stewart,
![]() N. Allison,
N. Allison,
![]() R. Asami,
R. Asami,
![]() B. Boston,
B. Boston,
![]() J.C. Braga,
J.C. Braga,
![]() L. Brenner,
L. Brenner,
![]() X. Chen,
X. Chen,
![]() P. Chutcharavan,
P. Chutcharavan,
![]() A. Dutton,
A. Dutton,
![]() T. Felis,
T. Felis,
![]() N. Fukuyo,
N. Fukuyo,
![]() E. Gischler,
E. Gischler,
![]() S. Greve,
S. Greve,
![]() A. Hagen,
A. Hagen,
![]() Y. Hamon,
Y. Hamon,
![]() E. Hathorne,
E. Hathorne,
![]() M. Humblet,
M. Humblet,
![]() S. Jorry,
S. Jorry,
![]() P. Khanna,
P. Khanna,
![]() E. Le Ber,
E. Le Ber,
![]() H. McGregor,
H. McGregor,
![]() R. Mortlock,
R. Mortlock,
![]() T. Nohl,
T. Nohl,
![]() D. Potts,
D. Potts,
![]() A. Prohaska,
A. Prohaska,
![]() N. Prouty,
W. Renema,
N. Prouty,
W. Renema,
![]() K.H. Rubin,
K.H. Rubin,
![]() H. Westphal, and
H. Westphal, and
![]() Y. Yokoyama2
Y. Yokoyama2
1 Webster, J.M., Ravelo, A.C., Grant, H.L.J., Rydzy, M., Stewart, M., Allison, N., Asami, R., Boston, B., Braga, J.C., Brenner, L., Chen, X., Chutcharavan, P., Dutton, A., Felis, T., Fukuyo, N., Gischler, E., Greve, S., Hagen, A., Hamon, Y., Hathorne, E., Humblet, M., Jorry, S., Khanna, P., Le Ber, E., McGregor, H., Mortlock, R., Nohl, T., Potts, D., Prohaska, A., Prouty, N., Renema, W., Rubin, K.H., Westphal, H., and Yokoyama, Y., 2025. Site M0103. In Webster, J.M., Ravelo, A.C., Grant, H.L.J., and the Expedition 389 Scientists, Hawaiian Drowned Reefs. Proceedings of the International Ocean Discovery Program, 389: College Station, TX (International Ocean Discovery Program). https://doi.org/10.14379/iodp.proc.389.110.2025
2 Expedition 389 Scientists’ affiliations.
1. Operations
The multipurpose vessel MMA Valour was used as the drilling platform throughout Expedition 389. At all Expedition 389 sites, dynamic positioning was used to provide accurate positions throughout operations and water depth was established using a Sound Velocity Profiler (SVP) placed on the top of the PROD5 drilling system. For more detail on acquisition methods, see Introduction in the Expedition 389 methods chapter (Webster et al., 2025a).
Summary operational information for Hole M0103A is provided in Table T1. All times stated are in Hawaiian Standard Time (HST).
1.1. Hole M0103A
The MMA Valour arrived on location at 2100 h on 11 October 2023. PROD5 was deployed at 2155 h, and rotary coring and casing commenced at 2327 h at a water depth of 404.5 m. Coring and casing continued until 2205 h on 13 October, when all available barrels on the corer had been utilized and casing was removed, at a final depth of 45.61 meters below seafloor (mbsf). PROD5 was recovered to deck by 2203 h, when on-deck operations commenced and core barrels were extracted for curation. The transit to Hole M0104A began at 2242 h on 13 October.
A total of 33 cores were recovered from Hole M0103A from a total rotary cored depth of 45.61 m. The total recovered core length was 14.31 m (31.37% recovery).
2. Lithostratigraphy
Coring at Site M0103 took place at 404.5 meters below sea level (mbsl) in the Hilo region to 44.78 mbsf with generally low core recovery. Core material recovered from Hole M0103A consists predominantly of pebble- to cobble-sized rhodoliths in the uppermost 26.60 m of the hole. The interval below 26.60 mbsf is mostly composed of unconsolidated biodetrital sediment with foliaceous corals, including Leptoseris, to 37.60 mbsf and up to cobble-sized fragments of Porites below that depth. At 42.20 mbsf, a contact with lava breccia was recovered that continues to the bottom of the hole at 44.78 mbsf.
2.1. Hole M0103A
In Hole M0103A (Figure F1), rhodoliths extend from the top of the hole to 26.64 mbsf, intercalated with a short, 25 cm thick interval of unconsolidated detrital gravel with volcanic grains from 18.48 to 18.69 mbsf. The majority of the rhodoliths are affected by drilling disturbance. The rhodoliths reach pebble to cobble size and show a wide range of morphologies. Many are ellipsoidal to spheroidal in shape (Figure F2A). Other large rhodoliths appear to have formed by amalgamation of smaller ones by bridging algal thalli. The resulting nodules have complex, irregular morphologies (Figure F2B). In other cases, the nodule morphology is highly conditioned by the shape of the nucleus (Figure F2C). The rhodoliths are made of varying proportions of crusts formed by coralline algae, encrusting foraminifers, bryozoans (Figure F2D), and corals (encrusting Cyphastrea). Nuclei, when visible, are coral fragments such as branching and encrusting Montipora (Figure F2C) and branching Porites, as well as fragments of other invertebrate skeletons. The inner structure of the rhodoliths is mostly concentric (Figure F2), rarely boxwork, and generally asymmetrical (Figure F2D). Coralline algal growth forms are mainly encrusting and warty (crustose coralline algae; CCA) (Figure F2D). Fruticose morphology (fruticose coralline algae; FCA) is less common, although it can be dominant in a few cases (Figure F2E). Rhodoliths are largely bioeroded, and in some nodules the interior appears structureless because of repeated bioerosion and sediment infilling in borings (Figure F2F). The matrix between the rhodoliths, if recovered, is unconsolidated biodetrital sediment or consolidated grainstone to rudstone with volcanic grains. Fragments of coralline algae, corals, and mollusk shells are the main bioclastic components.
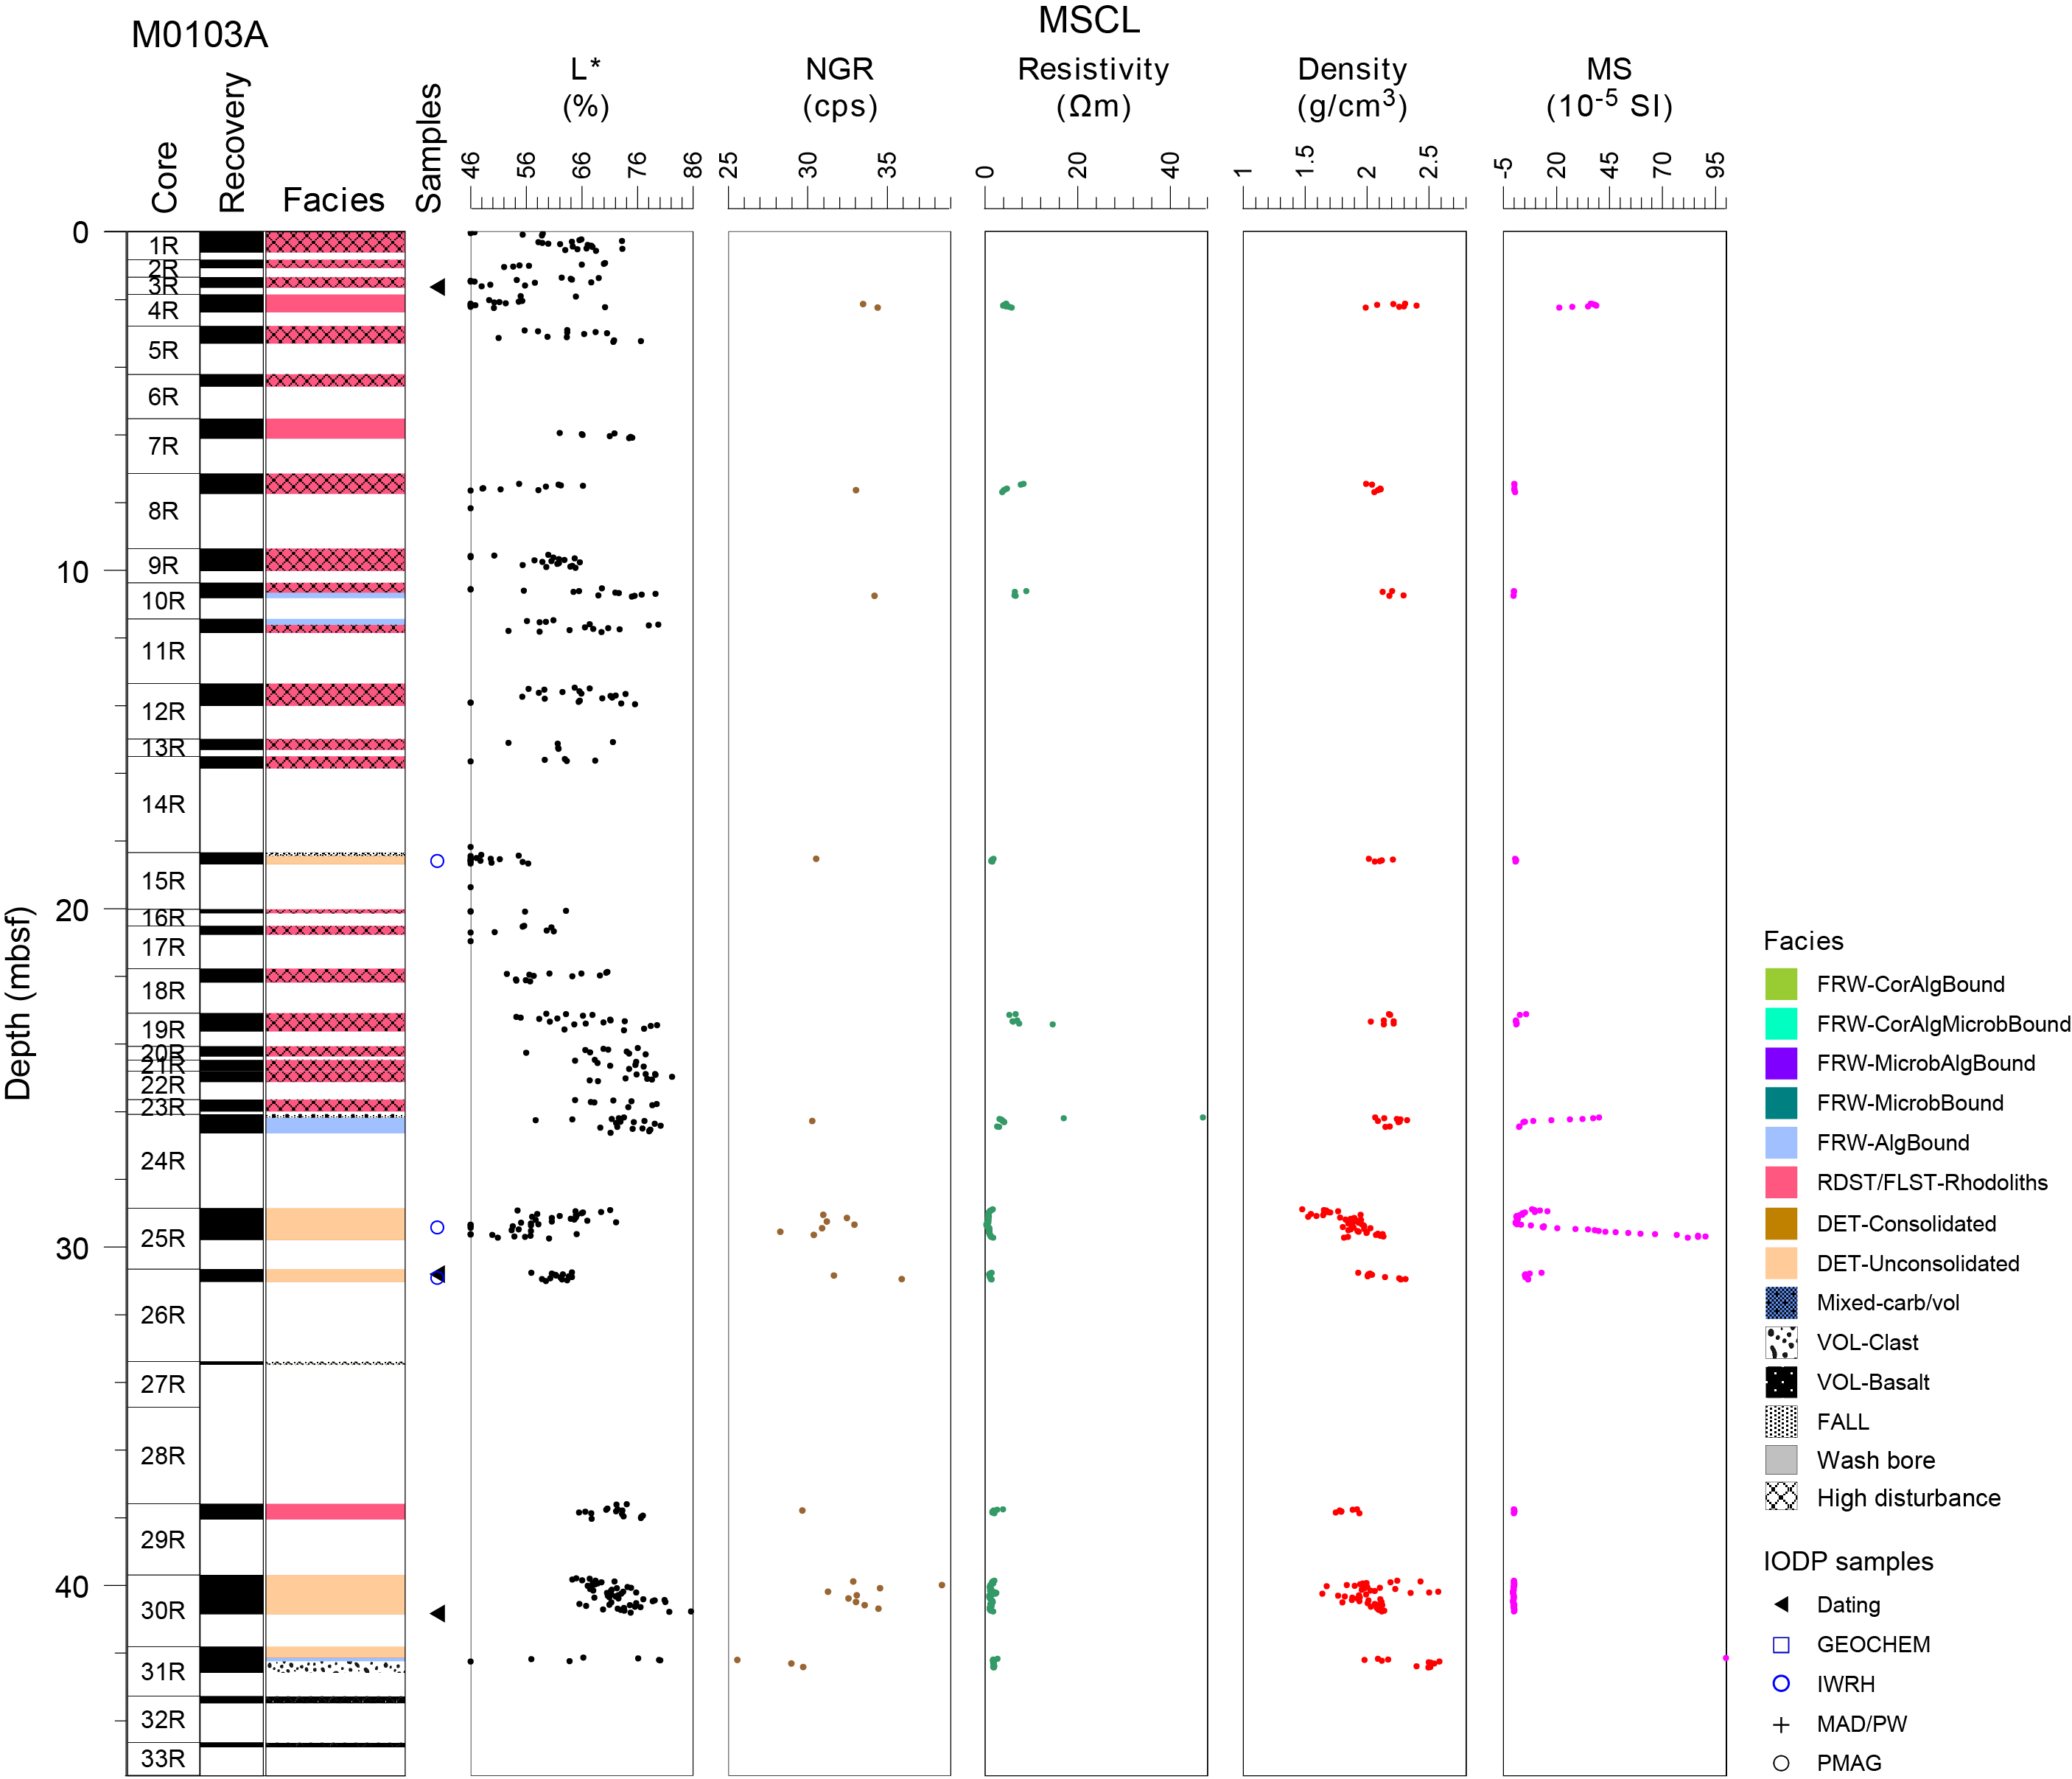
Figure F1. Lithostratigraphy and MSCL data.
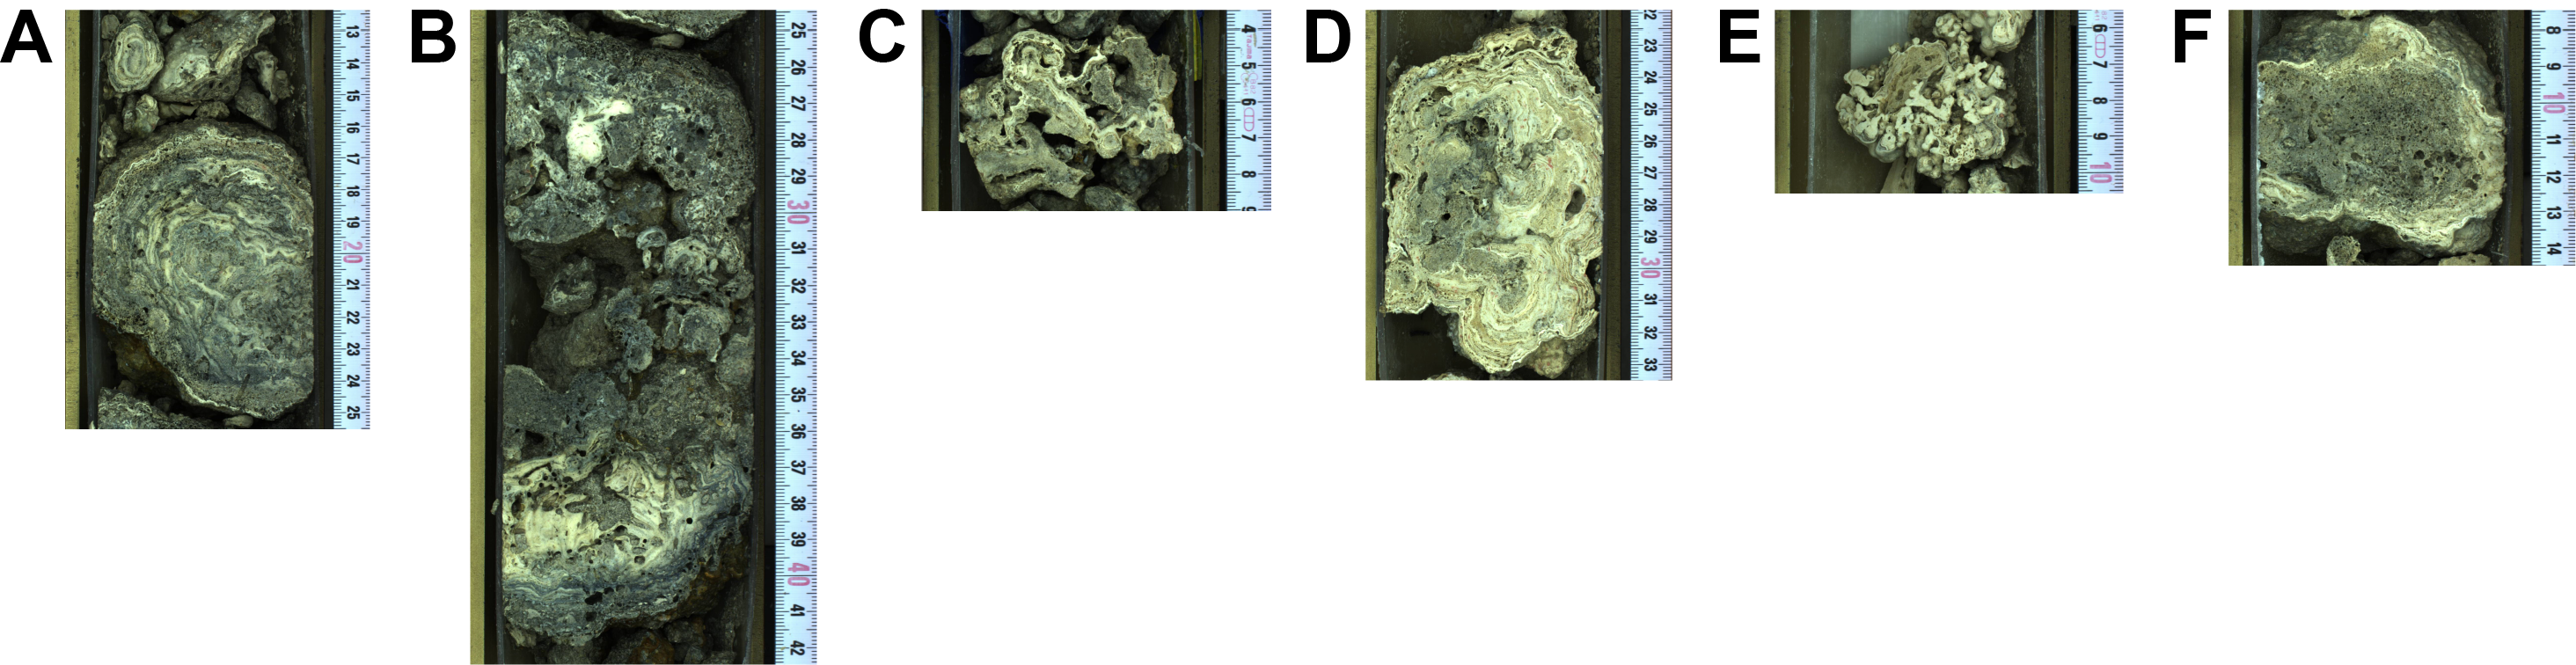
Figure F2. Rhodoliths.
From 28.85 to 31.03 mbsf is an interval of unconsolidated biodetrital sediment with abundant foliaceous Leptoseris (Figure F3A), other undetermined foliaceous corals, a few Diaseris (Figure F3B), common shell fragments, and large benthic foraminifers. Rhodoliths occur from 37.59 to 38.05 mbsf. They overlie an interval of unconsolidated biodetrital sediment recovered from 39.69 to 42.13 mbsf. Up to cobble-sized fragments of Porites, CCA, bivalves, gastropods, and echinoid spines are embedded in a coarse carbonate sand with volcanic grains (Figure F3C). A few foliaceous Leptoseris are also observed. Below, a thin interval (42.13–42.24 mbsf) of algal boundstone with a few coral clasts and biodetrital sediment lies on top of a volcaniclastic interval of lava breccia (42.24–42.58 mbsf) made of angular, pebble-sized fragments of lava (Figure F4A). Fragmented porphyritic basaltic lava with olivine crystals in an aphanitic groundmass was recovered from 43.27 mbsf to the base of the hole at 44.78 mbsf (Figure F4B).
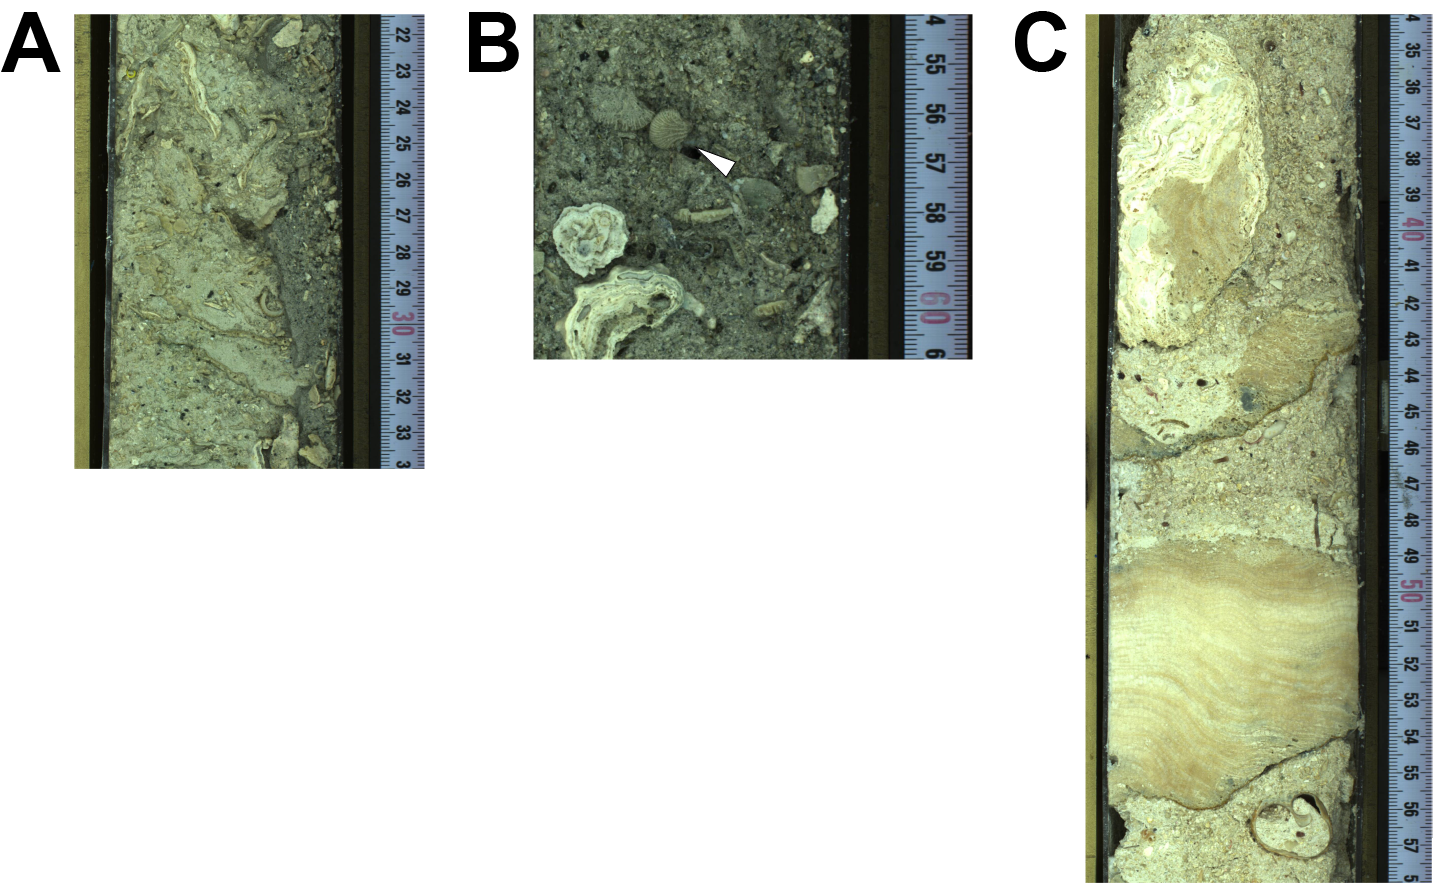
Figure F3. Unconsolidated biodetrital sediment.

Figure F4. Lithologies.
3. Physical properties
Physical properties data for Site M0103 are shown in Table T2 in the Site M0096 chapter (Webster et al., 2025b).
3.1. Hole M0103A
A total of 11.21 m of core from Hole M0103A was scanned with the multisensor core logger (MSCL), and because the core exhibited major drilling-induced disturbance, only 30% of the acquired data passed QA/QC (see Table T10 in the Expedition 389 methods chapter [Webster et al., 2025a]). A total of seven discrete samples were taken for P-wave velocity and moisture and density (MAD) measurements. Digital linescans, color reflectance, and hyperspectral imaging were acquired on all cores. The contact between carbonate/volcaniclastic sediment and the lava at the base of the core (42.20 mbsf) was not covered by measurements.
3.1.1. Density and porosity
Density and porosity data are presented in Figures F1 and F5. MSCL bulk density measurements range 1.48–2.59 g/cm3. The core quality and short core lengths compromised the data quality (see Physical properties in the Expedition 389 methods chapter [Webster et al., 2025a]). A total of seven discrete samples were analyzed for MAD, giving bulk density values in the range of 2.17–2.85 g/cm3. Porosity values for the same samples range 8.1%–34.3%, and grain density values fluctuate between 2.717 and 3.007 g/cm3. There are no apparent downhole trends in the density and porosity data sets nor any apparent relationship between the two bulk density measurements (MSCL and discrete).
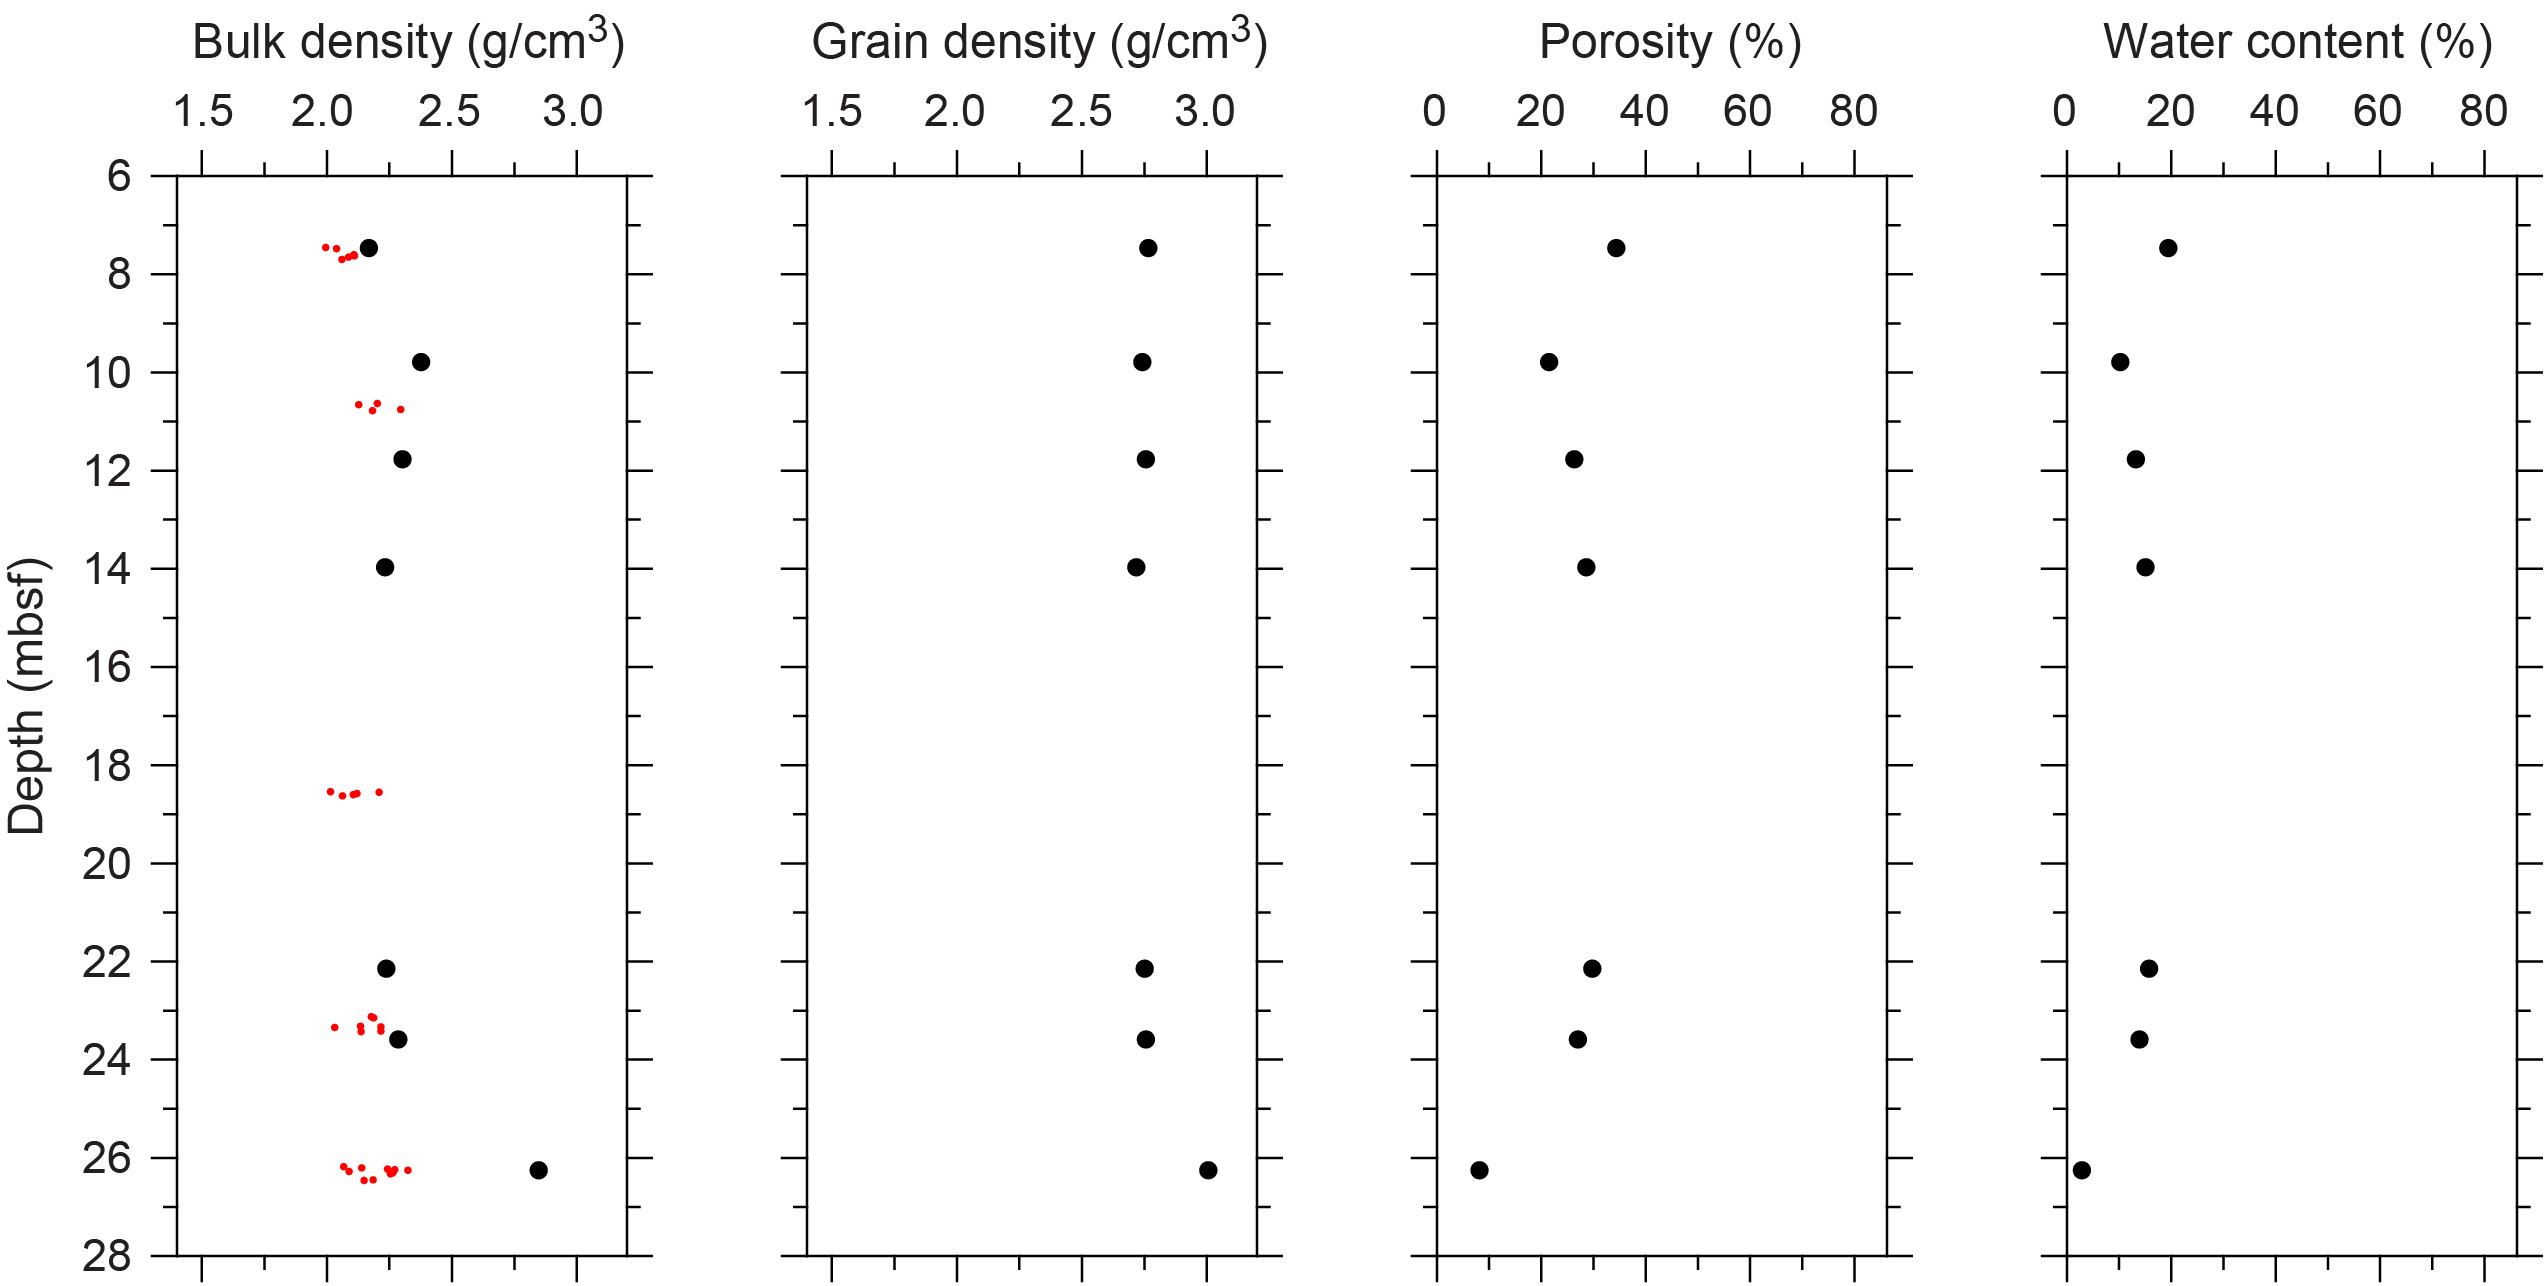
Figure F5. Physical properties.
3.1.2. P-wave velocity
P-wave velocity MSCL measurements yielded no data. A total of seven samples were measured using the discrete P-wave logger. Dry measurement values are between 3203 and 4399 m/s (Figure F6), and P-wave velocities recorded for the same sample after resaturation range 3678–4682 m/s. No downhole trends are apparent.

Figure F6. P-wave velocities.
3.1.3. Thermal conductivity
Because of the presence of drilling-induced disturbances, large voids, and uneven surfaces, thermal conductivity measurements were not performed.
3.1.4. Magnetic susceptibility
MSCL magnetic susceptibility data range −0.67 × 10⁻⁵ to 330.12 × 10⁻⁵ SI (Figure F1). The majority of magnetic susceptibility values fall close to 26.89 × 10⁻⁵ SI. No downhole trends are apparent; however, a peak at 26.60 mbsf marks the boundary between rhodolith-dominated sediments above and coral-bearing biodetrital sediments below. Another, more pronounced, increase in magnetic susceptibility around 29.00 mbsf is located within the biodetrital unit.
3.1.5. Electrical resistivity
MSCL noncontact resistivity measurements range 0.33–47.04 Ωm (Figure F1). No downhole trends are apparent.
3.1.6. Natural gamma radiation
MSCL natural gamma radiation measurements range 26–38 counts/s (Figure F1), showing no apparent downhole change.
3.1.7. Digital linescans, color reflectance, and hyperspectral imaging
All cores were digitally scanned, measured for color reflectance (where appropriate), and imaged with the hyperspectral scanner (see HYPERSPECTRAL in Supplementary material). Color reflectance L* values vary between 16.62% and 85.60%, a* varies between −1.61 and 5.99, b* varies between −0.53 and 28.69, and a*/b* varies between −0.58 and 0.34 (Figure F1).
4. Geochemistry
4.1. Interstitial water
Three interstitial water samples were collected from Site M0103 (Hole M0103A). Two of these were analyzed for salinity, pH, alkalinity, and concentrations of ammonium off shore, and one sample (26R-1, 26.4–26.4 cm) was analyzed on shore for anions and cations. Concentrations of major ions in these samples are within the range of normal seawater (see Table T16 in the Expedition 389 methods chapter [Webster et al., 2025a]). Sample 389-M0103A-23R-1, 26 cm, reveals low concentrations in K (365 mg/L) and Na (9198 mg/L) and high concentrations in Si (7.67 mg/L; highest value measured during this expedition) and Sr (10.5 mg/L).
4.2. Surface seawater
Two surface seawater samples were collected from Site M0103 using a Niskin bottle from the side of the vessel (see Figure F22 in the Expedition 389 methods chapter [Webster et al., 2025a]). For one, only salinity, pH, and alkalinity were determined. For the other one, salinity, pH, alkalinity, and concentrations of ammonium were analyzed off shore, and major cations and anions were measured during the Onshore Science Party. Results for all parameters at Site M0103 are consistent with other Expedition 389 seawater samples and align with Pacific Ocean surface seawater values (see Tables T15 and T17 in the Expedition 389 methods chapter [Webster et al., 2025a]).
4.3. Bulk sediment and rocks
Six bulk sediment and rock samples were taken from Site M0103 (Hole M0103A) (Figure F1) and analyzed for mineralogy and elemental composition. Samples were derived from several coralline algae–dominated intervals, one sediment interval, and two rhodolith intervals (see Figure F10 in the Expedition 389 methods chapter [Webster et al., 2025a]).
4.4. Mineralogy
Samples from Hole M0103A are composed mostly of carbonate minerals (Table T2). Other minerals present include minor amounts of plagioclase (4%) in the stratigraphically highest sample of coralline algae (Sample 7R-1, 11–14 cm; 5.63 mbsf) and barite (4%) and apatite or other phosphates (4%) in the coralline algae sample from 15.83 mbsf (Sample 14R-1, 33–36 cm). Overall, the carbonates consist of 54%–79% Mg-rich calcite, 17%–38% aragonite (and one sample with 70% aragonite), and 0%–26% calcite. Only the sample derived from a sediment interval at 30.77 mbsf (Sample 26R-1, 12–14 cm) has a higher amount of aragonite (70%) compared to Mg-rich calcite (24%).
4.5. Elemental abundances
The concentrations of major elements in bulk sediment and rock samples from Hole M0103A vary very little (Table T3). No clear trends downcore are visible, and samples are dominated by Ca (332,630–356,127 mg/kg), Mg (11,950–34,097 mg/kg), and Sr (1,872–5,042 mg/kg). The sample taken from a coralline algae at 5.63 mbsf (7R-1, 11–14 cm) has the highest Fe amount (3,034 mg/kg) and detectable amounts of Ti and Zr. The coralline algae at 5.63 mbsf is associated with rhodolith facies (Figures F1, F2). The sediment sample from 30.77 mbsf (Sample 26R-1, 12–14 cm) has higher Sr concentrations than the other samples analyzed from this site, consistent with the greater aragonite content, as well as detectable Ti, Zr, Cr, Ni, Rb, and V. Other elements analyzed are minor and/or below detection limit.
4.6. Carbon content
The results for total organic carbon (TOC), total carbon (TC), and total inorganic carbon (TIC) vary very little in Hole M0103A (Table T4). TIC content ranges 10.94%–11.64%, TOC content ranges 0.14%–0.18%, and TC content ranges 11.10%–11.80%.
5. Paleomagnetism
Six plug samples and three cubes were obtained from Hole M0103A. Measurements of low-field and mass-specific magnetic susceptibility (χ) were carried out for all samples. Natural remanent magnetization (NRM) was measured for all plugs, as well as remanence following stepwise alternating field (AF) demagnetization up to a peak AF of 20 mT. NRM measurements for cube samples will be completed at a later stage. For further details, see Paleomagnetism in the Expedition 389 methods chapter (Webster et al., 2025a).
5.1. Hole M0103A
Six carbonate plug samples were taken from Hole M0103A. The three cubes collected between 30.98 and 40.30 mbsf consist of unconsolidated bioclastic sand. Low positive χ values of all samples occur throughout, ranging 0.0035 × 10⁻⁷ to 28.0 × 10⁻⁷ m3/kg with an arithmetic mean of 4.25 × 10⁻⁷ m3/kg. The initial NRM intensity of carbonate samples ranges 0.0097 × 10⁻² to 6.28 × 10⁻² A/m with an arithmetic mean of 1.15 × 10⁻² A/m. There is a peak in χ at 37.62 mbsf (Sample 29R-1, 2–4 cm), suggesting a higher concentration of magnetic particles. A peak in initial NRM intensity at 2.24 mbsf (Sample 4R-1, 38–40 cm) corresponds to a local maximum in χ, suggesting this may also relate to a higher concentration of magnetic particles (Figure F7).
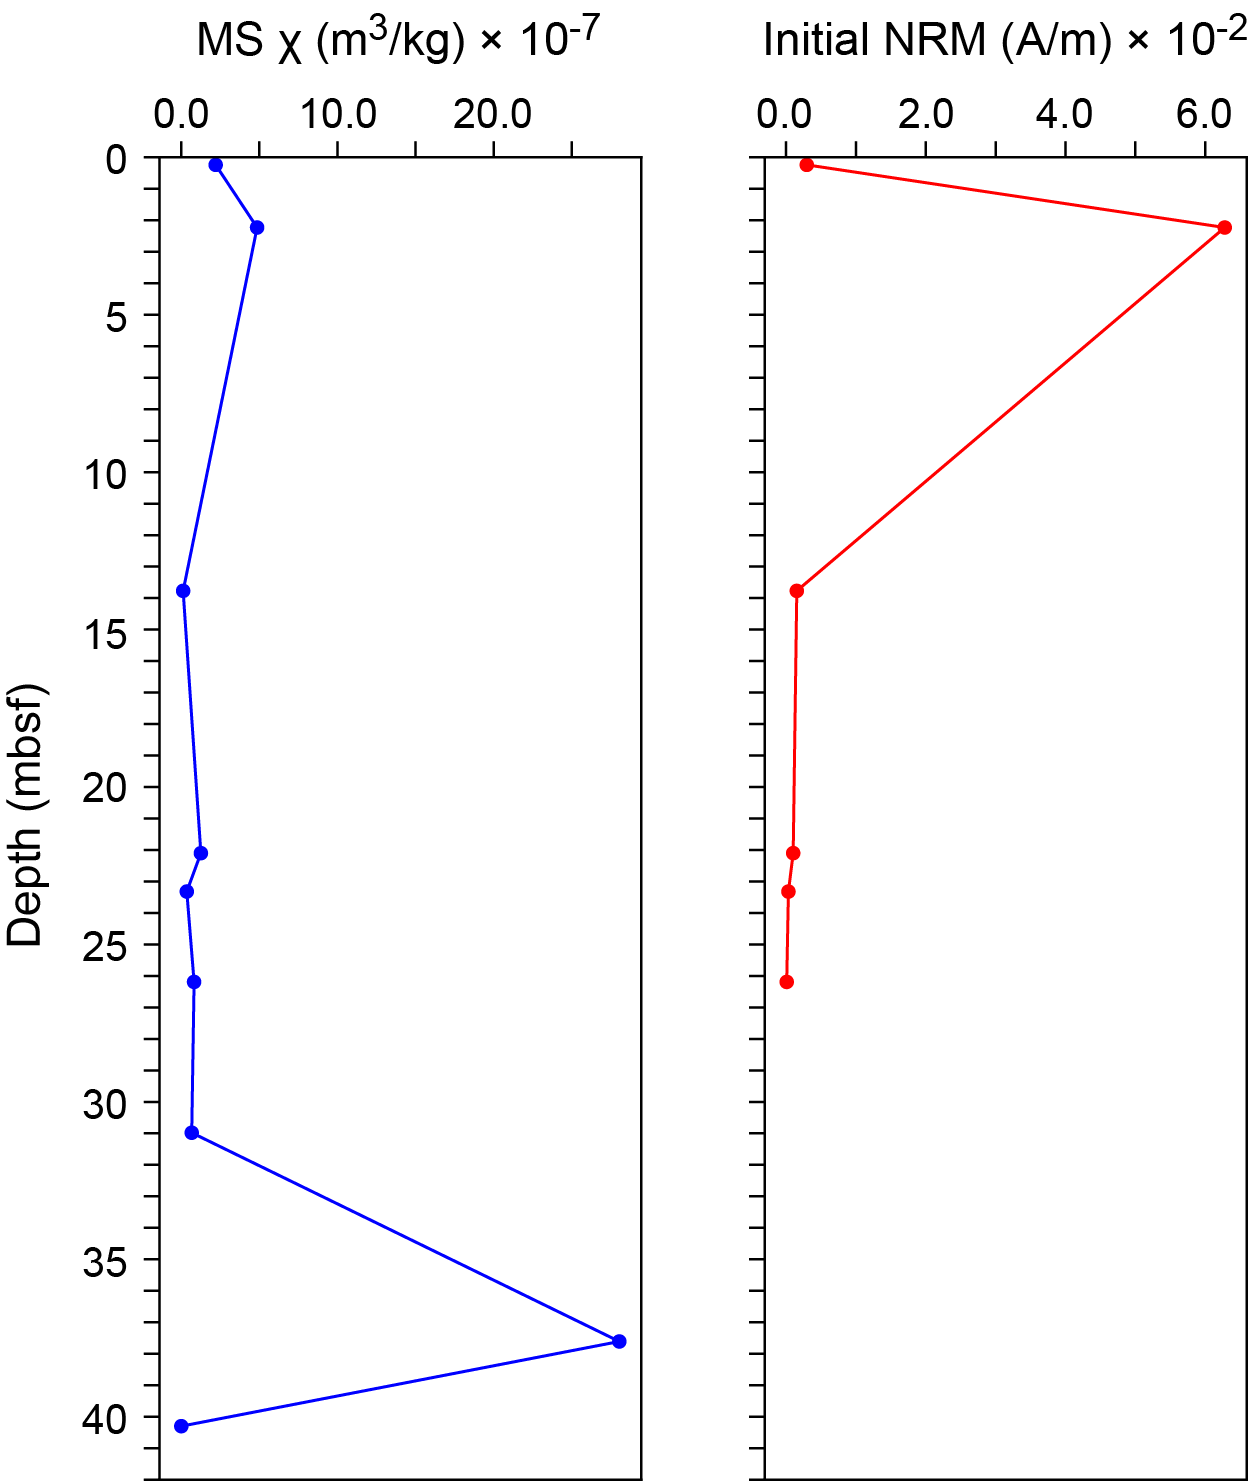
Figure F7. MS and NRM.
6. Geochronology
A total of four U-Th dates were obtained for three coral samples from Hole M0103A. A date from Sample 26R-1, 15–16 cm, is rejected based on anonymously high U content (i.e., >4 ppm; see Table T21 in the Expedition 389 methods chapter [Webster et al., 2025a]). Dates and replicate dates obtained (see Table T22 in the Expedition 389 methods chapter [Webster et al., 2025a]) range ~138–216 ky BP and are consistent with the interpretation of the age of this H2 terrace based on prior studies (Ludwig et al., 1991; Webster et al., 2009).
References
Ludwig, K.R., Szabo, B.J., Moore, J.G., and Simmons, K.R., 1991. Crustal subsidence rate off Hawaii determined from 234U/238U ages of drowned coral reefs. Geology, 19(2):171–174. https://doi.org/10.1130/0091-7613(1991)019<0171:CSROHD>2.3.CO;2
Webster, J.M., Braga, J.C., Clague, D.A., Gallup, C., Hein, J.R., Potts, D.C., Renema, W., Riding, R., Riker-Coleman, K., Silver, E., and Wallace, L.M., 2009. Coral reef evolution on rapidly subsiding margins. Global and Planetary Change, 66(1–2):129–148. https://doi.org/10.1016/j.gloplacha.2008.07.010
Webster, J.M., Ravelo, A.C., Grant, H.L.J., and the Expedition 389 Scientists, 2025. Supplementary material, https://doi.org/10.14379/iodp.proc.389supp.2025. In Webster, J.M., Ravelo, A.C., Grant, H.L.J., and the Expedition 389 Scientists, Hawaiian Drowned Reefs. Proceedings of the International Ocean Discovery Program, 389: College Station, TX (International Ocean Discovery Program).
Webster, J.M., Ravelo, A.C., Grant, H.L.J., Rydzy, M., Stewart, M., Allison, N., Asami, R., Boston, B., Braga, J.C., Brenner, L., Chen, X., Chutcharavan, P., Dutton, A., Felis, T., Fukuyo, N., Gischler, E., Greve, S., Hagen, A., Hamon, Y., Hathorne, E., Humblet, M., Jorry, S., Khanna, P., Le Ber, E., McGregor, H., Mortlock, R., Nohl, T., Potts, D., Prohaska, A., Prouty, N., Renema, W., Rubin, K.H., Westphal, H., and Yokoyama, Y., 2025a. Expedition 389 methods. In Webster, J.M., Ravelo, A.C., Grant, H.L.J., and the Expedition 389 Scientists, Hawaiian Drowned Reefs. Proceedings of the International Ocean Discovery Program, 389: College Station, TX (International Ocean Discovery Program). https://doi.org/10.14379/iodp.proc.389.102.2025
Webster, J.M., Ravelo, A.C., Grant, H.L.J., Rydzy, M., Stewart, M., Allison, N., Asami, R., Boston, B., Braga, J.C., Brenner, L., Chen, X., Chutcharavan, P., Dutton, A., Felis, T., Fukuyo, N., Gischler, E., Greve, S., Hagen, A., Hamon, Y., Hathorne, E., Humblet, M., Jorry, S., Khanna, P., Le Ber, E., McGregor, H., Mortlock, R., Nohl, T., Potts, D., Prohaska, A., Prouty, N., Renema, W., Rubin, K.H., Westphal, H., and Yokoyama, Y., 2025b. Site M0096. In Webster, J.M., Ravelo, A.C., Grant, H.L.J., and the Expedition 389 Scientists, Hawaiian Drowned Reefs. Proceedings of the International Ocean Discovery Program, 389: College Station, TX (International Ocean Discovery Program). https://doi.org/10.14379/iodp.proc.389.103.2025