Webster, J.M., Ravelo, A.C., Grant, H.L.J., and the Expedition 389 Scientists
Proceedings of the International Ocean Discovery Program Volume 389
publications.iodp.org
https://doi.org/10.14379/iodp.proc.389.117.2025
Site M01101
![]() J.M. Webster,
J.M. Webster,
![]() A.C. Ravelo,
A.C. Ravelo,
![]() H.L.J. Grant,
H.L.J. Grant,
![]() M. Rydzy,
M. Rydzy,
![]() M. Stewart,
M. Stewart,
![]() N. Allison,
N. Allison,
![]() R. Asami,
R. Asami,
![]() B. Boston,
B. Boston,
![]() J.C. Braga,
J.C. Braga,
![]() L. Brenner,
L. Brenner,
![]() X. Chen,
X. Chen,
![]() P. Chutcharavan,
P. Chutcharavan,
![]() A. Dutton,
A. Dutton,
![]() T. Felis,
T. Felis,
![]() N. Fukuyo,
N. Fukuyo,
![]() E. Gischler,
E. Gischler,
![]() S. Greve,
S. Greve,
![]() A. Hagen,
A. Hagen,
![]() Y. Hamon,
Y. Hamon,
![]() E. Hathorne,
E. Hathorne,
![]() M. Humblet,
M. Humblet,
![]() S. Jorry,
S. Jorry,
![]() P. Khanna,
P. Khanna,
![]() E. Le Ber,
E. Le Ber,
![]() H. McGregor,
H. McGregor,
![]() R. Mortlock,
R. Mortlock,
![]() T. Nohl,
T. Nohl,
![]() D. Potts,
D. Potts,
![]() A. Prohaska,
A. Prohaska,
![]() N. Prouty,
W. Renema,
N. Prouty,
W. Renema,
![]() K.H. Rubin,
K.H. Rubin,
![]() H. Westphal, and
H. Westphal, and
![]() Y. Yokoyama2
Y. Yokoyama2
1 Webster, J.M., Ravelo, A.C., Grant, H.L.J., Rydzy, M., Stewart, M., Allison, N., Asami, R., Boston, B., Braga, J.C., Brenner, L., Chen, X., Chutcharavan, P., Dutton, A., Felis, T., Fukuyo, N., Gischler, E., Greve, S., Hagen, A., Hamon, Y., Hathorne, E., Humblet, M., Jorry, S., Khanna, P., Le Ber, E., McGregor, H., Mortlock, R., Nohl, T., Potts, D., Prohaska, A., Prouty, N., Renema, W., Rubin, K.H., Westphal, H., and Yokoyama, Y., 2025. Site M0110. In Webster, J.M., Ravelo, A.C., Grant, H.L.J., and the Expedition 389 Scientists, Hawaiian Drowned Reefs. Proceedings of the International Ocean Discovery Program, 389: College Station, TX (International Ocean Discovery Program). https://doi.org/10.14379/iodp.proc.389.117.2025
2 Expedition 389 Scientists’ affiliations.
1. Operations
The multipurpose vessel MMA Valour was used as the drilling platform throughout Expedition 389. At all Expedition 389 sites, dynamic positioning was used to provide accurate positions throughout operations and water depth was established using a Sound Velocity Profiler (SVP) placed on the top of the PROD5 drilling system. For more detail on acquisition methods, see Introduction in the Expedition 389 methods chapter (Webster et al., 2025a).
Summary operational information for Site M0110 is provided in Table T1. All times stated are in Hawaiian Standard Time (HST).
1.1. Hole M0110A
The MMA Valour arrived on location at 0430 h on 28 October 2023. Information was received from the drill contractors at 0447 h, after lifting PROD5 onto the launch and recovery system, that due to a telemetry failure communications with the PROD5 system had been lost and that retermination of the cables might be required. During this investigation, the vessel moved out to sea and away from Site M0110. At 1330 h on 28 October, the vessel transited back to Site M0110, arriving at 1430 h as investigations indicated that only a single fiber required retermination. The retermination was completed by 1650 h, and PROD5 was deployed for wet tests. PROD5 was lowered to the seabed following the tests and landed at a water depth of 156.9 m. Rotary coring and casing in Hole M0110A commenced at 1731 h on 28 October and advanced to 18.70 meters below seafloor (mbsf) before hole termination at 1354 h on 29 October due to the presence of volcanic rocks at a shallower depth than anticipated. PROD5 was recovered to deck by 1558 h, when on-deck operations commenced and core barrels were extracted for curation.
A total of 18 cores were recovered from Hole M0110A from 18.70 m of rotary coring. The total core length recovered was 14.18 m (75.83% recovery).
1.2. Hole M0110B
After encountering volcanic rocks in Hole M0110A, a short transit was made to a higher subterrace of the same H1 reef, arriving on site at 1625 h on 29 October 2023. PROD5 was redeployed at 1757 h. An issue with the beacon signal not being received upon landing meant PROD5 had to be recovered to deck at 1855 h and the beacons replaced and survey systems rebooted. PROD5 was redeployed at 1905 h on 29 October at a water depth of 144.8 m, and rotary coring and casing in Hole M0110B commenced at 1935 h. Coring advanced to 17.22 mbsf, and the borehole was terminated at 0846 h on 30 October due to a long sequence of volcanic rocks and an operational decision to prioritize further operations at other sites before the conclusion of the operational phase of Expedition 389. PROD5 was recovered to deck by 0926 h on 30 October, when on-deck operations commenced and core barrels were extracted for curation. The transit back to Site M0097 was initiated at 1130 h.
A total of 10 cores were recovered from Hole M0110B from 17.22 m of rotary coring. The total core length recovered was 12.90 m (74.91% recovery).
2. Lithostratigraphy
Site M0110 is located in the Kawaihae region and consists of Hole M0110A at 156.9 meters below sea level (mbsl) and Hole M0110B at 144.8 mbsl. The cored succession at Site M0110 is divided into five facies intervals from top to bottom, all of which were recovered in Hole M0110A, whereas Intervals 3 and 4 are absent in Hole M0110B. The intervals include (1) unconsolidated rhodolith accumulation, (2) coralgal-microbialite boundstone, (3) biodetrital rudstone, (4) coralgal-microbialite boundstone, and (5) lava. Intervals 1 and 2 are separated from Intervals 3–5 by a major lithologic boundary recovered at 4.37 mbsf in Hole M0110A (Figure F1).
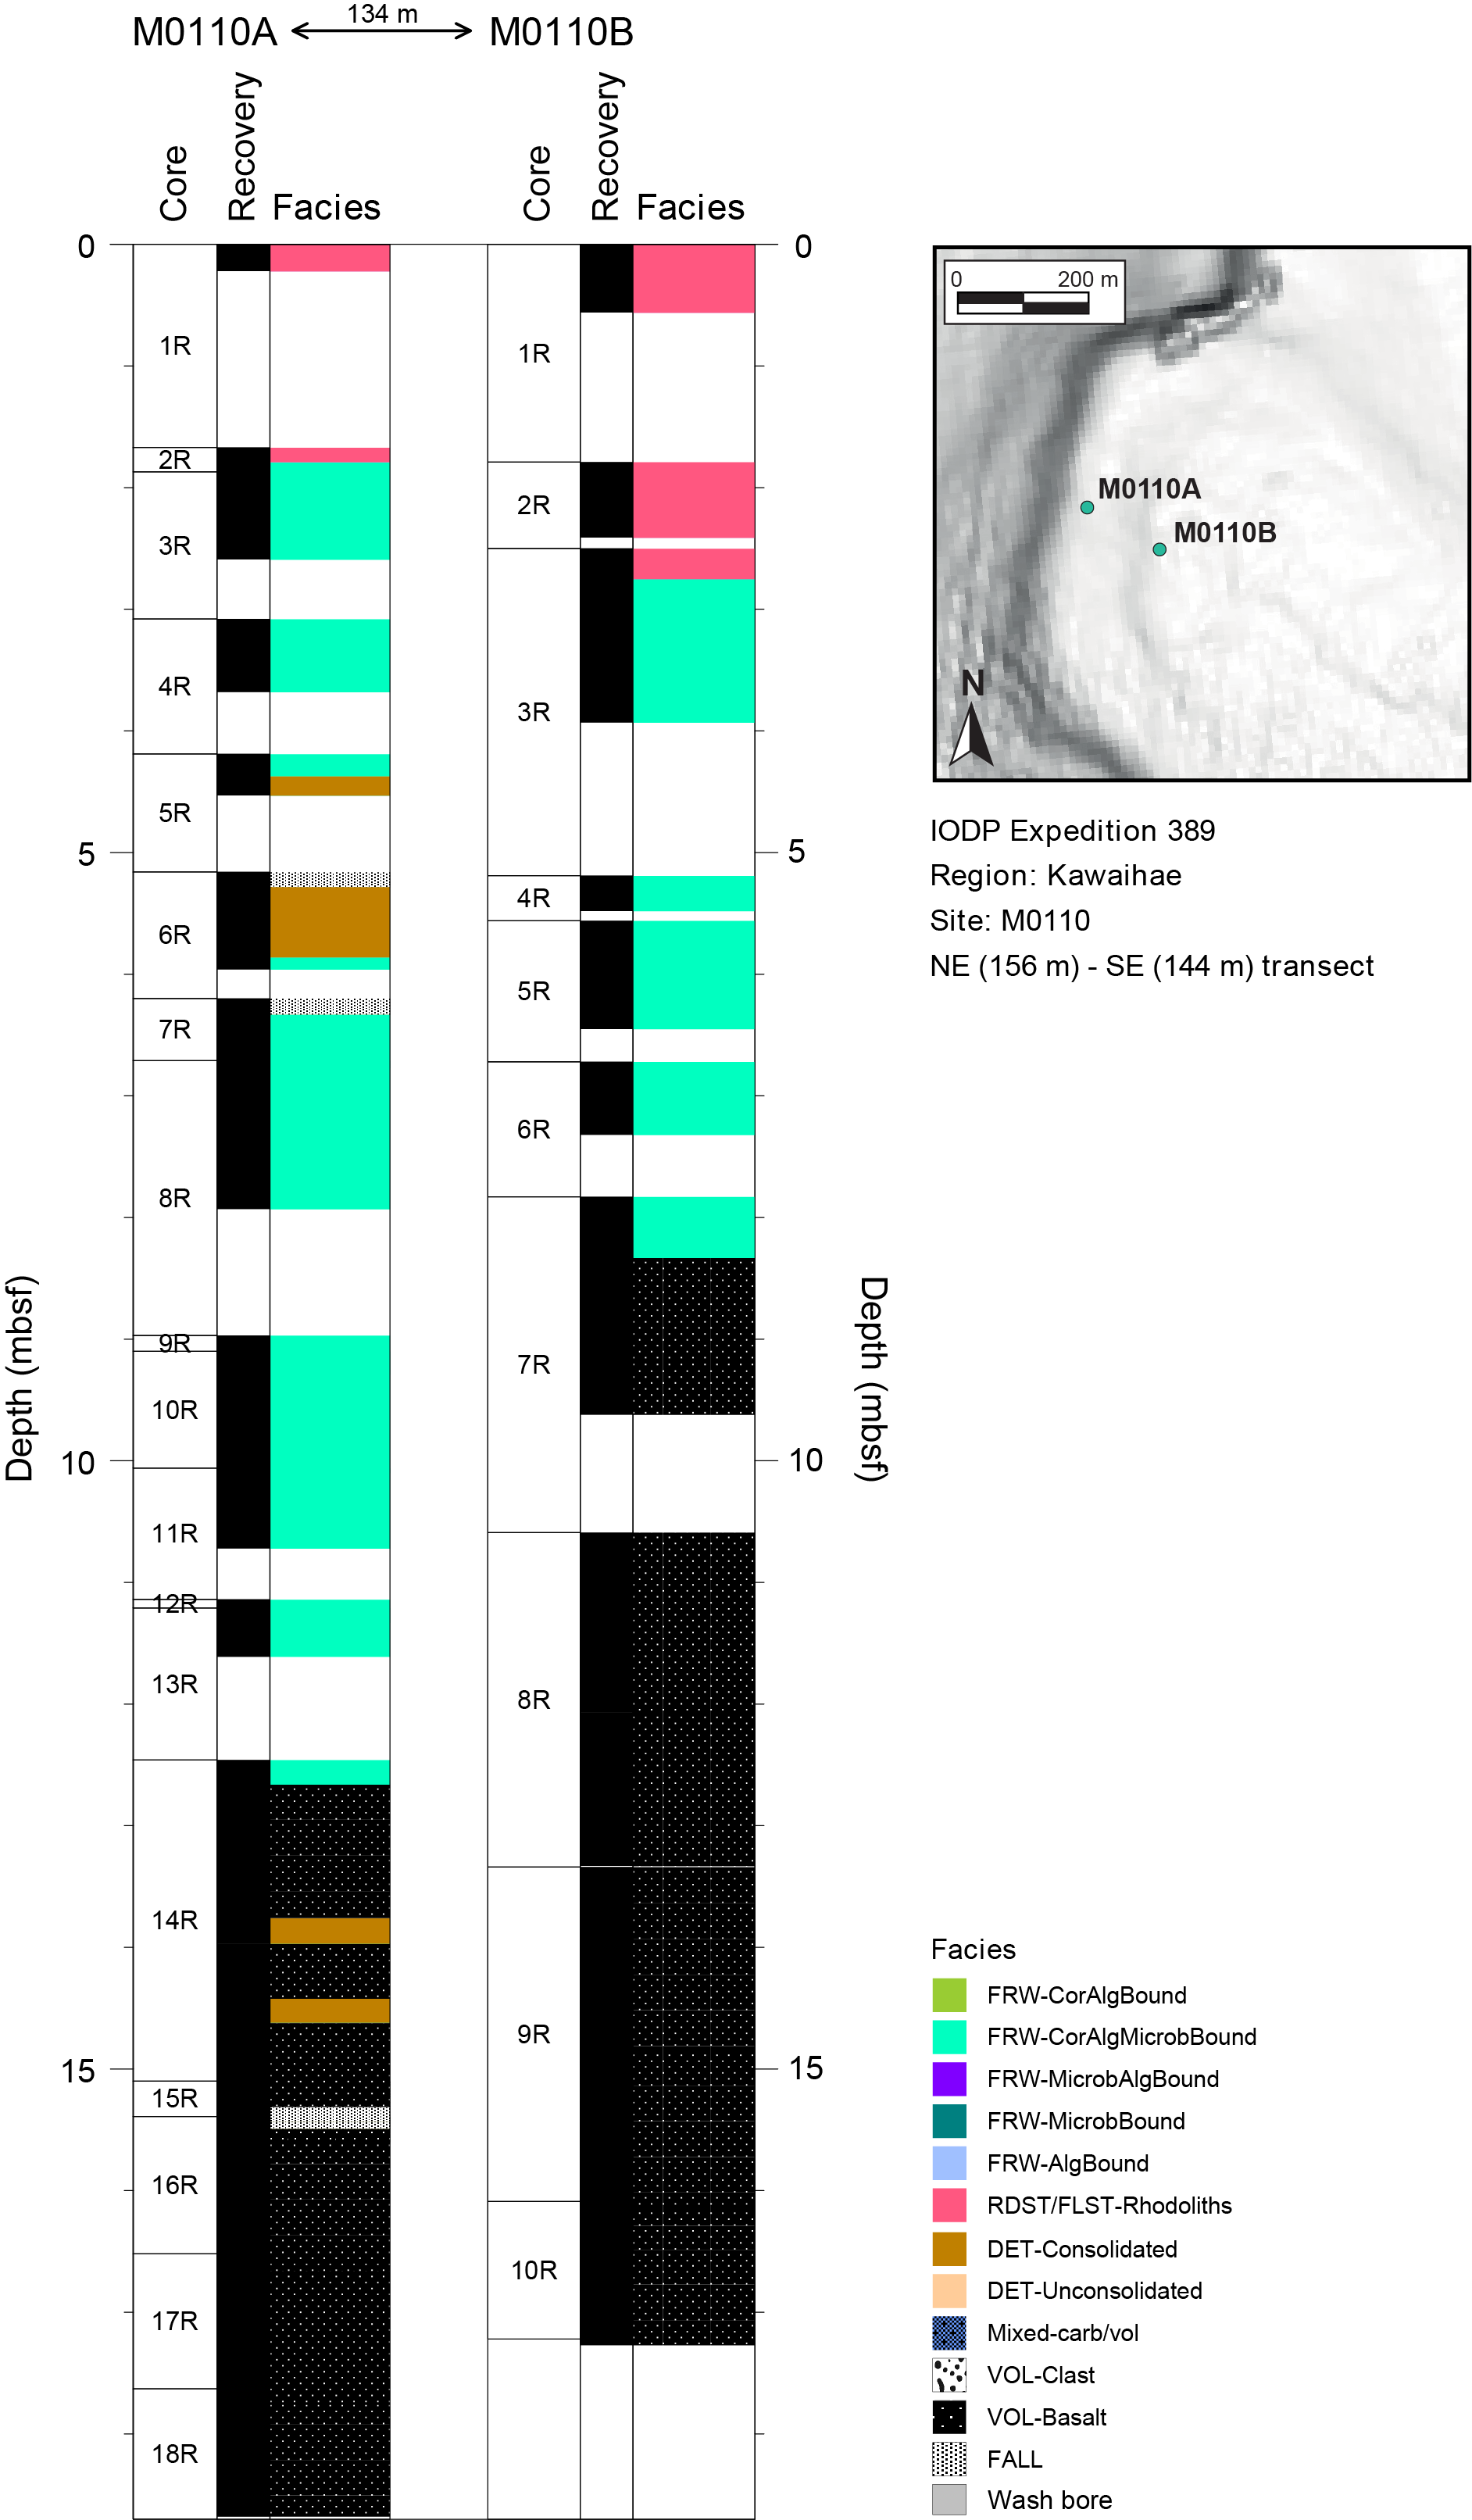
Figure F1. Lithostratigraphy.
2.1. Hole M0110A
Hole M0110A was drilled to 18.70 mbsf (Figure F2) and consists of five distinct facies intervals.
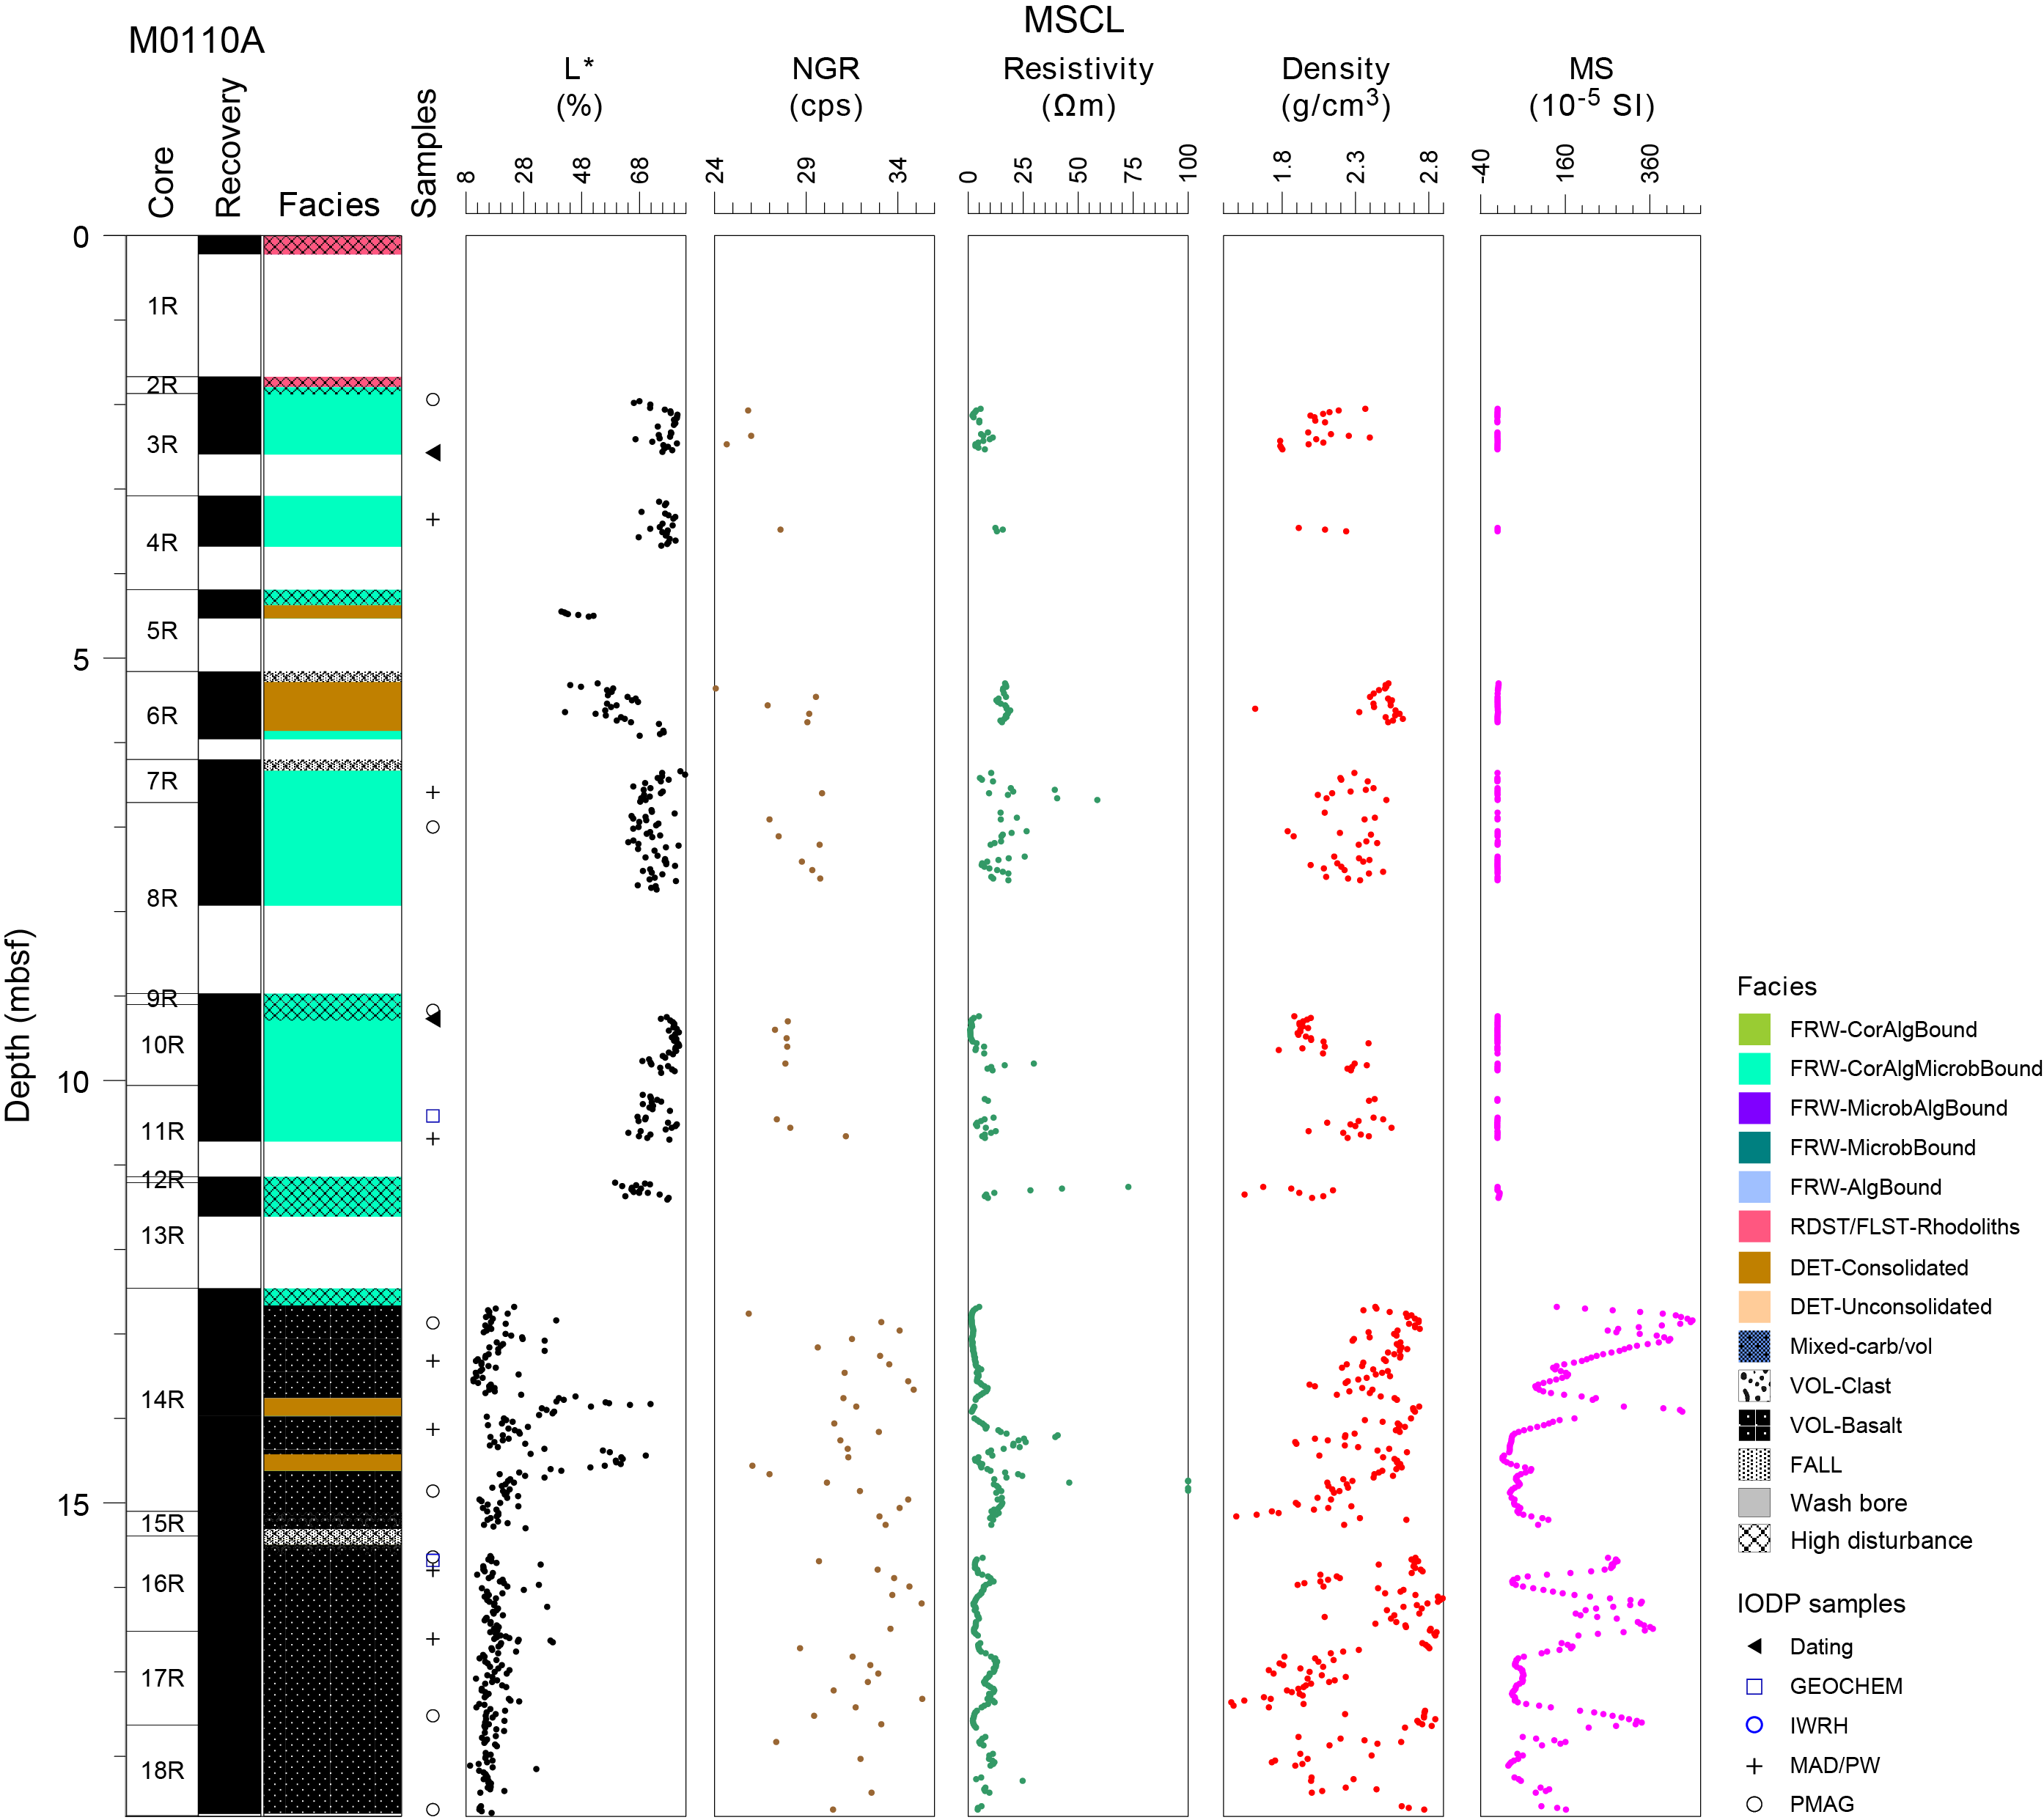
Figure F2. Lithostratigraphy and MSCL data, Hole M0110A.
Interval 1 (0–1.79 mbsf) is composed of poorly recovered gravel- to cobble-sized rhodoliths and smaller fragments of rhodoliths (Figure F3).

Figure F3. Rhodolith.
Interval 2 (1.79–4.37 mbsf) is a coralgal-microbialite boundstone (Figure F4) characterized by massive to submassive Porites corals that are superficially bored or fragmented in places. Some Porites colonies reach several tens of centimeters in thickness. Crustose coralline algal (CCA) crusts are commonly several centimeters thick and locally incorporate vermetid gastropod shells and encrusting foraminifers. Microbialite crusts are structureless, massive, and in places dendritic at the top.
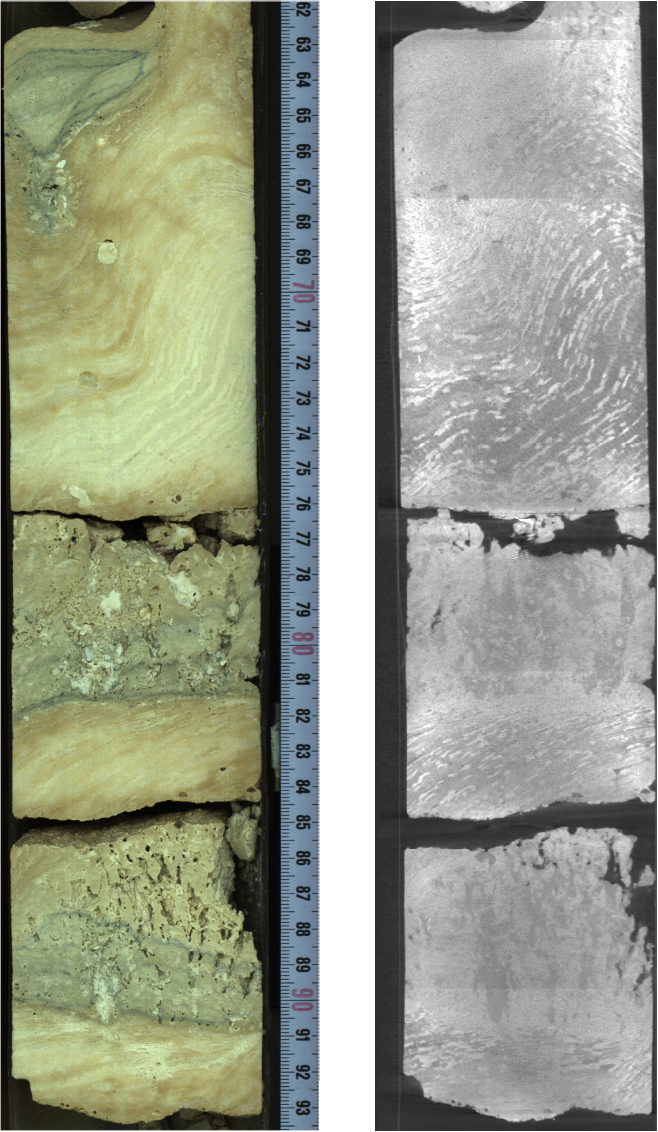
Figure F4. Coralgal-microbialite boundstone.
Interval 3 (4.37–5.86 mbsf) is a biodetrital rudstone containing centimeter-sized corals, calcareous algae, mollusk shells, echinoid spines, and other bioclasts (Figure F5A). Cavities in the rudstone are filled with consolidated, fine-grained biodetrital sediment with a wackestone texture. The upper part of this interval has a dark stain and likely represents a prominent lithologic boundary.
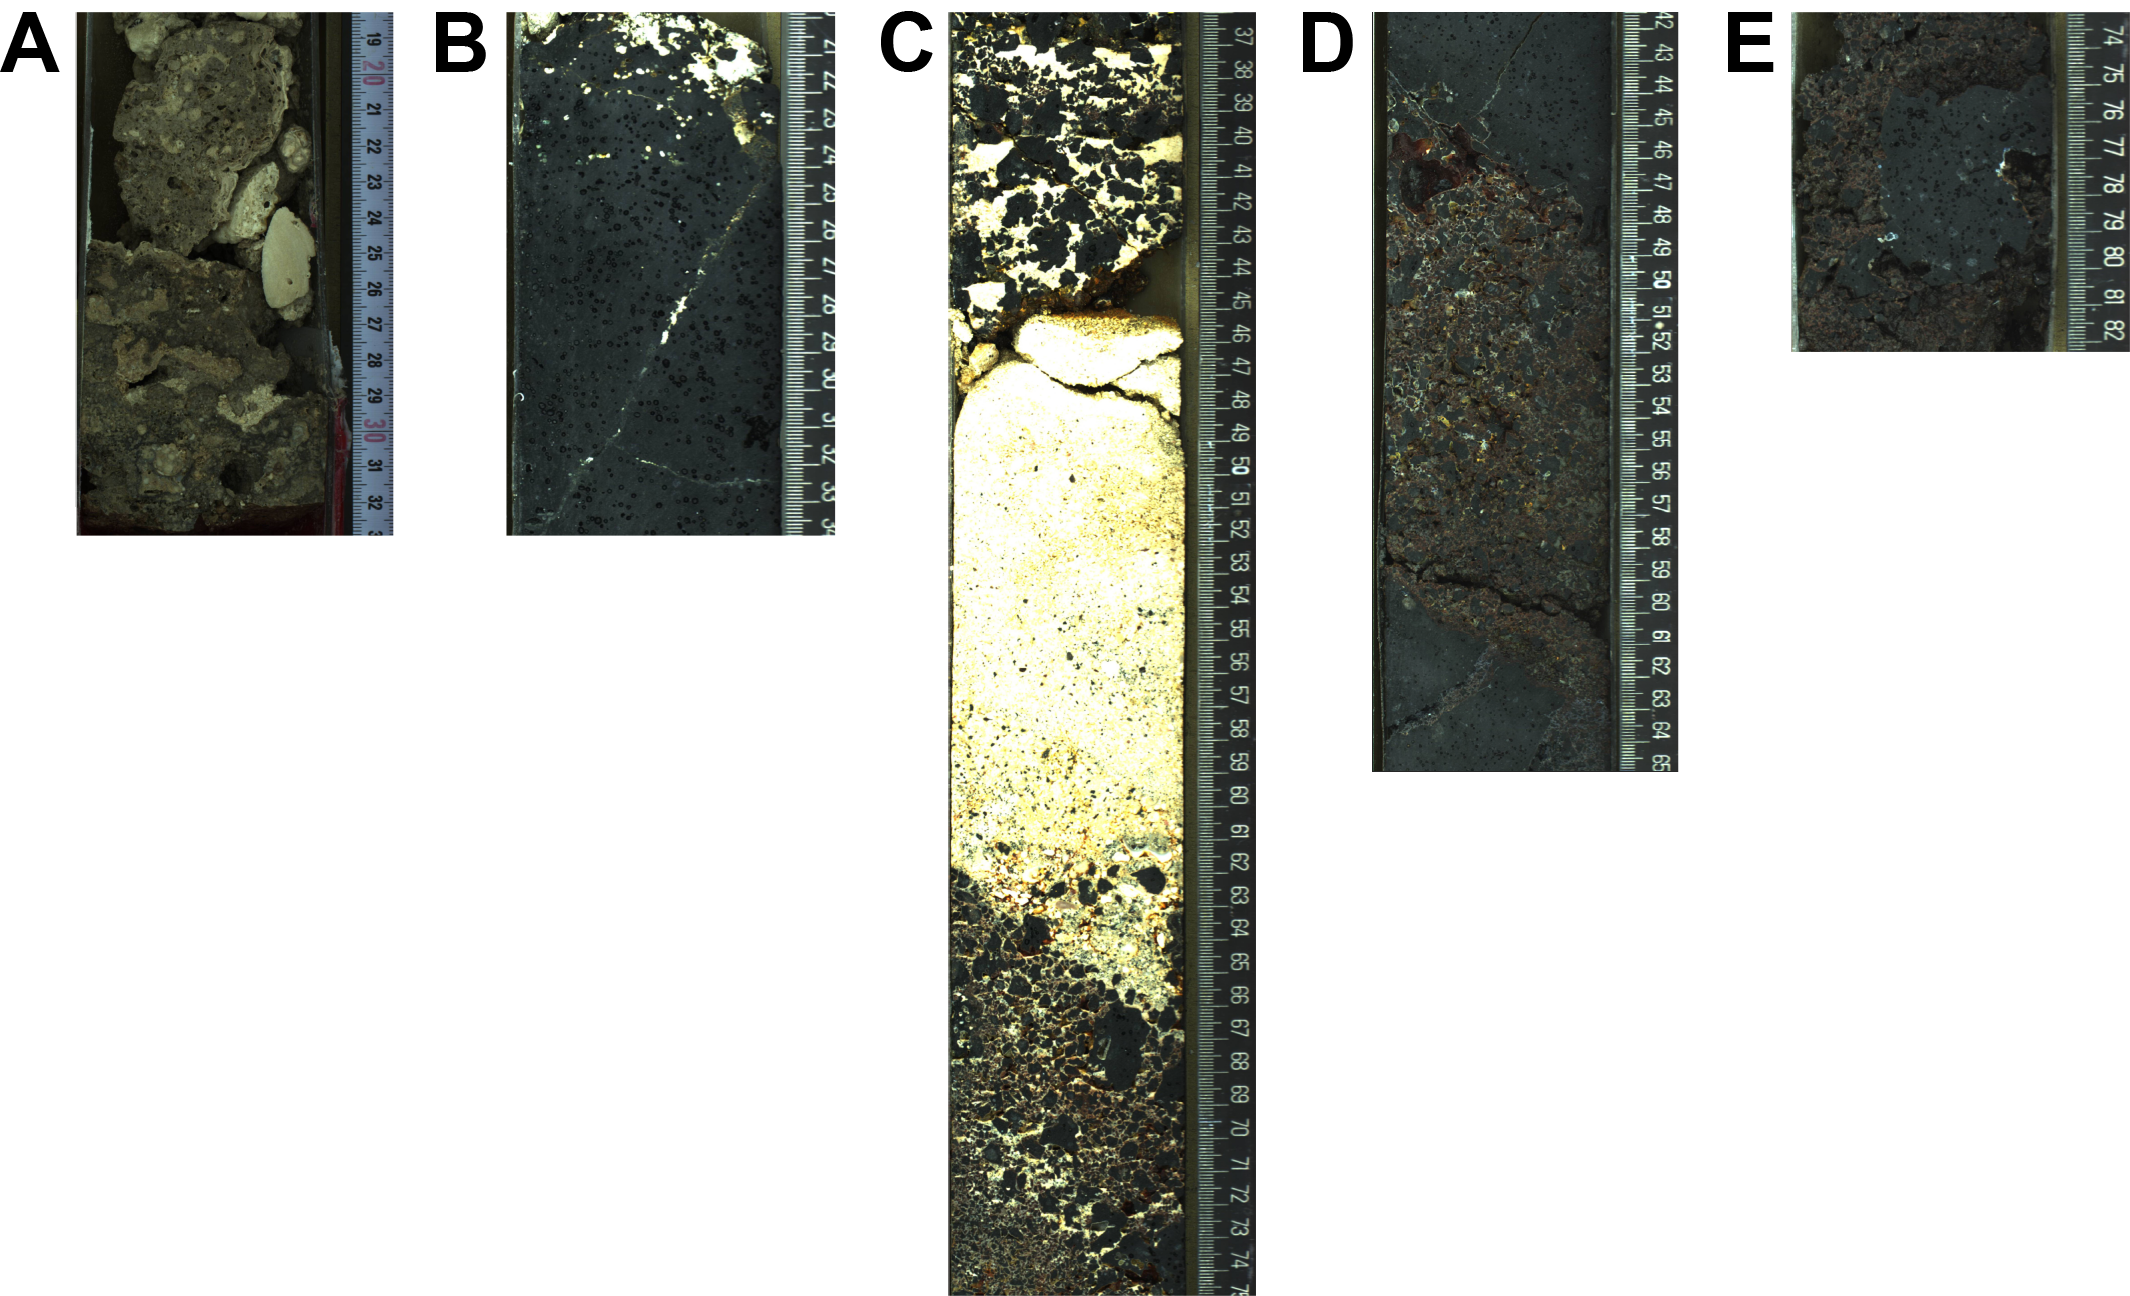
Figure F5. Facies, Hole M0110A.
Interval 4 (5.86–12.66 mbsf) is a succession of coralgal-microbialite boundstone. Massive, submassive, and platy Porites corals show CCA crusts up to several centimeters in thickness. Microbialites form crusts on top of the CCA crusts. They also reach several centimeters in thickness and have a massive and structureless appearance. In places, the microbialites show a dendritic texture at the top. At 9.90 mbsf, a branched, nongeniculate coralline algae is present with microbialite infilling the space between the branches.
Interval 5 (12.66 mbsf to the bottom of the hole at 18.70 mbsf) is largely composed of lava (Figure F5B). The lava groundmass is aphanitic; crystallinity is commonly porphyritic, with olivine and clinopyroxene phenocrysts and locally centimeter-sized euhedral pyroxene megacrysts. Vesicles in the lava range from millimeter-sized and round in shape to several centimeter–sized and irregularly shaped. Interval 5 contains three hyaloclastite accumulations with typical brecciated texture, questionable pillow morphology, and minor carbonate sediment infill. Bioclastic grainstones, tentatively interpreted as beachrock, occur at 13.76–13.97 and 14.42–14.62 mbsf, in association with the hyaloclastite (Figure F5C). A hyaloclastite in Section 389-M0110A-16R-1 (15.85–16.01 mbsf) is characterized by millimeter- to centimeter-sized subangular basaltic grains, some with clay rims, and an Fe oxide–rich matrix separating two lava lobes of similar visual composition, indicating a local water source for syn-eruptive brecciation (Figure F5D). A similar horizon occurs from 16.08 to 17.39 mbsf in Section 17R-1. Section 18R-1 is dominated by hyaloclastic breccia and subrounded lava clasts. These clasts visually resemble fragments of rock formed by pillow lavas but lack glassy rinds, potentially representing air-cooled fragments (Figure F5E).
2.2. Hole M0110B
Hole M0110B was drilled to 17.22 mbsf and contains Intervals 1–3, similar to Hole M0110A (Figure F6).
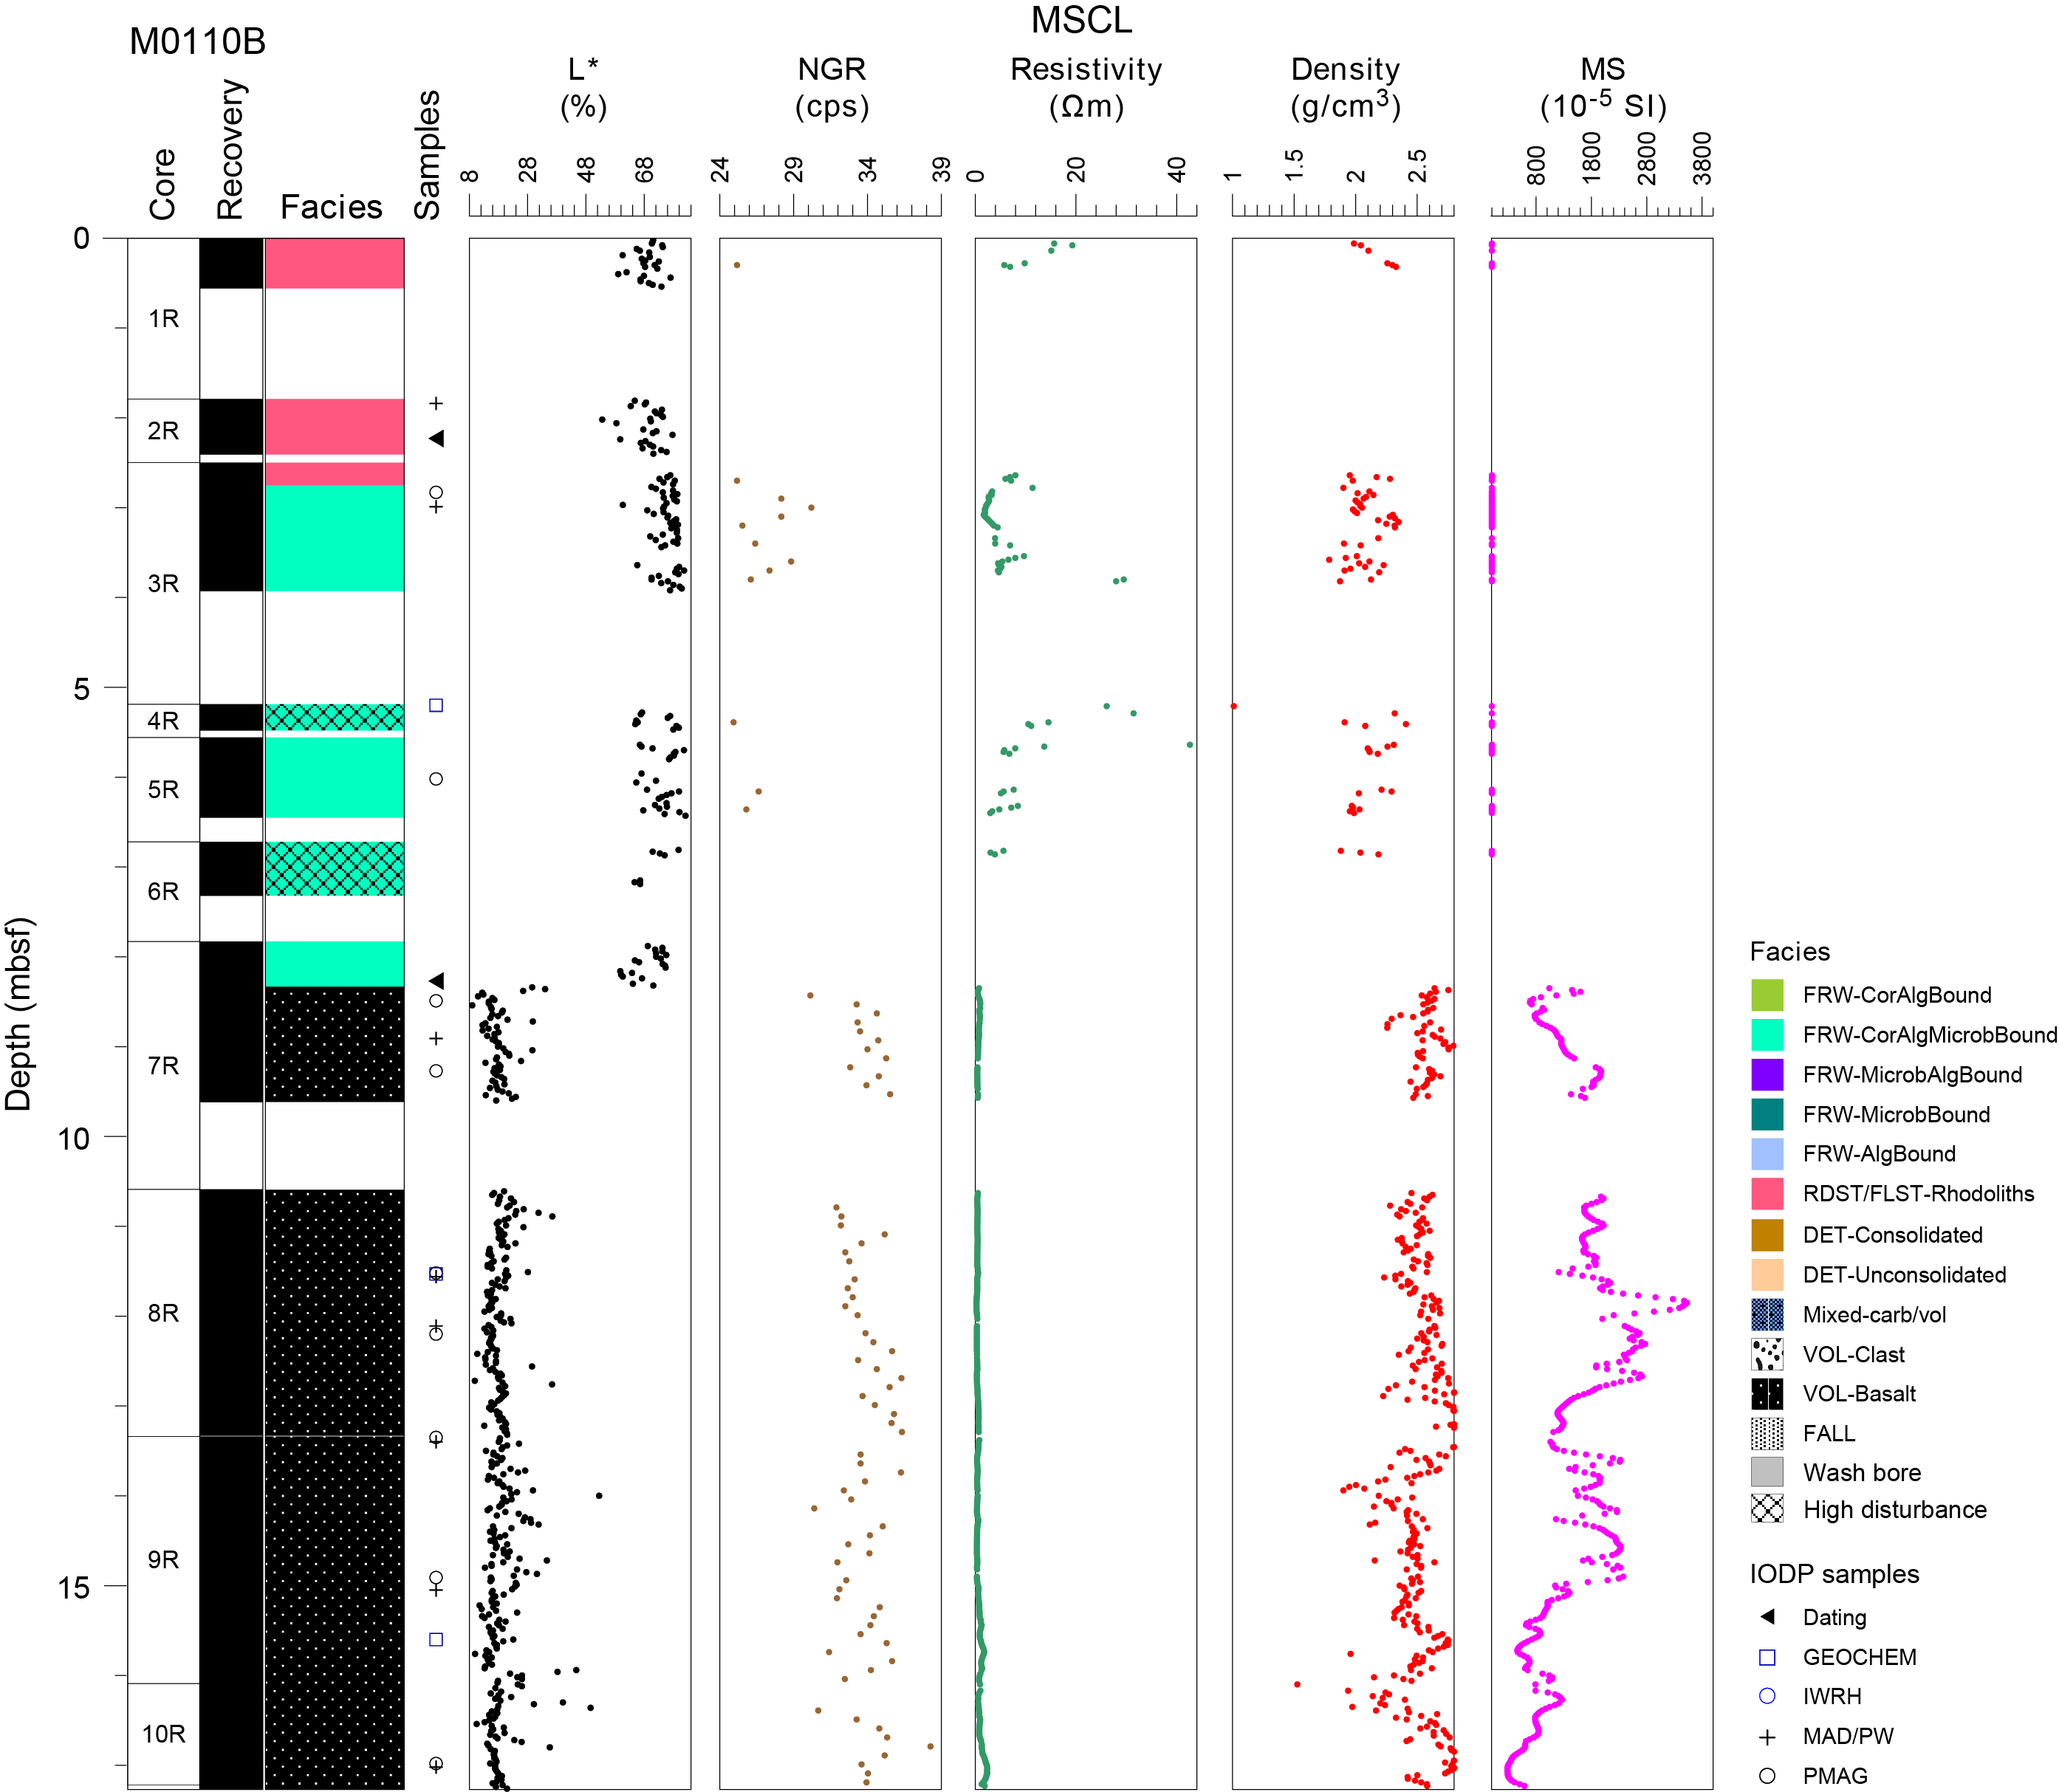
Figure F6. Lithostratigraphy and MSCL data, Hole M0110B.
Interval 1 (0.00–2.73 mbsf) is an unconsolidated rhodolith-rich bed. The rhodoliths reach sizes of >5–10 cm and are composed of thin CCA layers encrusting nuclei of bioeroded corals (Figure F7A), bryozoans, foraminifers, barnacle plates (Figure F7B), or fruticose coralline algae (Figure F7C).
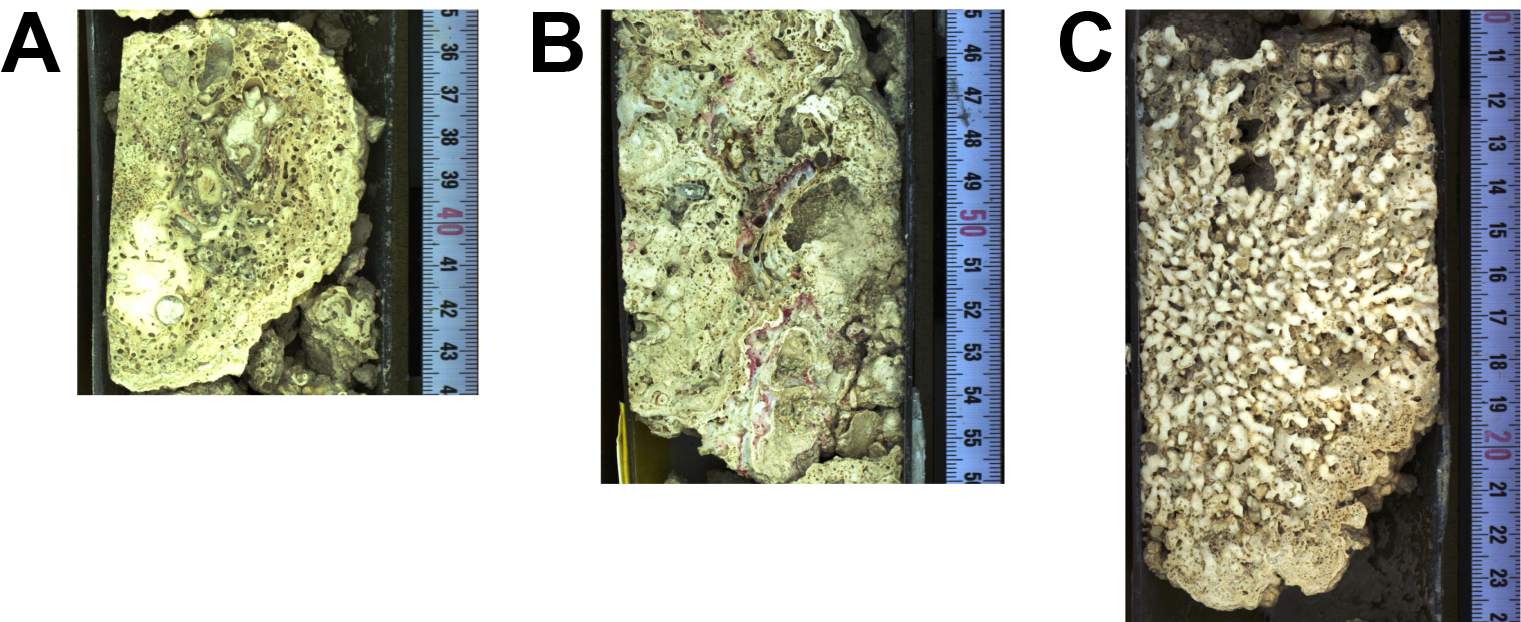
Figure F7. Facies, Hole M0110B.
Interval 2 (2.73–8.33 mbsf) consists of thick coralgal-microbialite boundstone with thick CCA encrusting large pieces of branching or columnar Porites (Figures F8). The CCA crusts are succeeded by massive, structureless microbialite crusts that in many cases show a dendritic morphology at the top (Figure F9A).
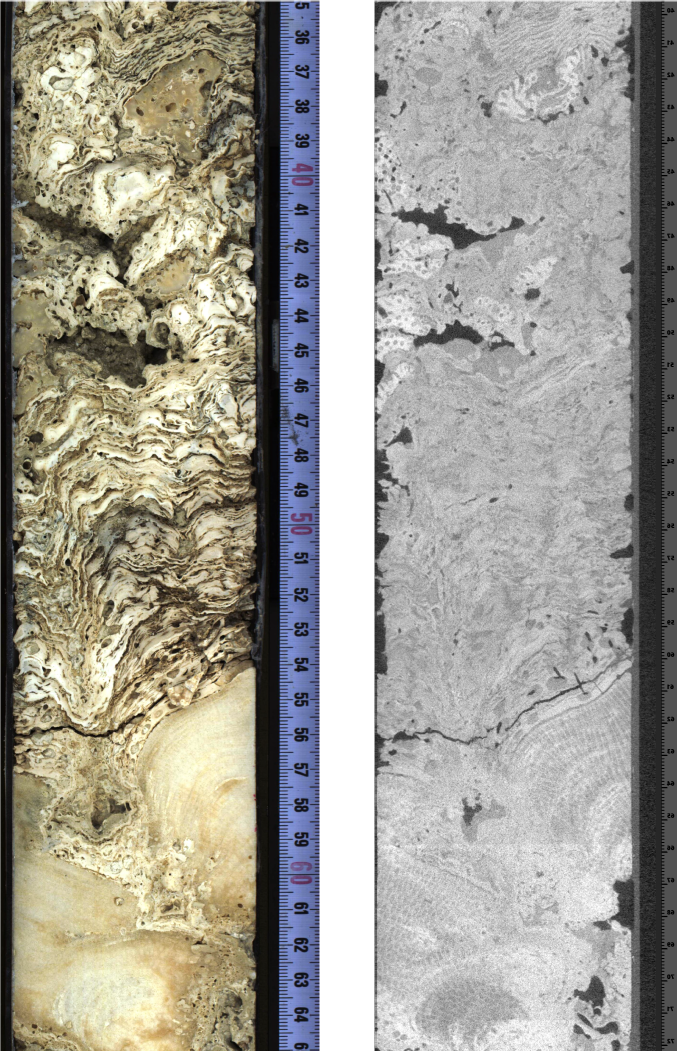
Figure F8. Thick CCA.
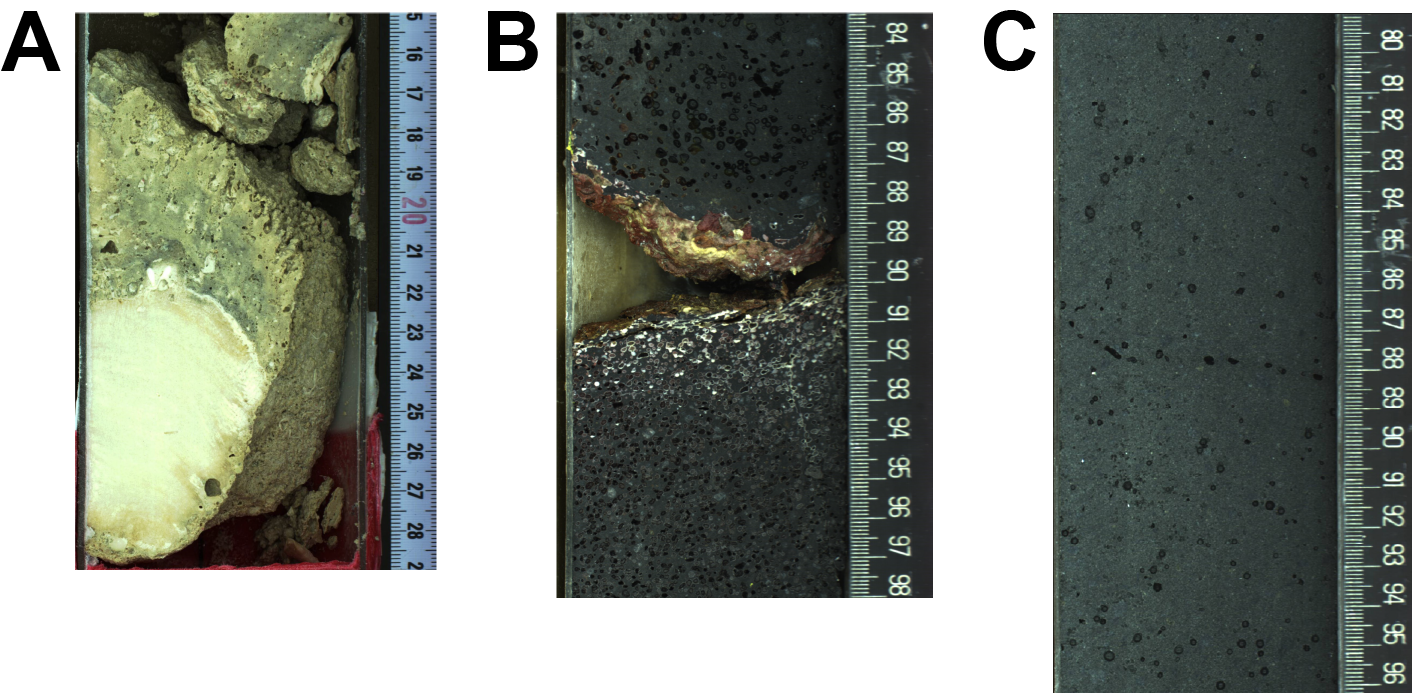
Figure F9. Facies, Hole M0110B.
Interval 3 is a continuous lava sequence from 8.33 mbsf to the bottom of the hole at 17.22 mbsf. The lava varies in vesicularity and crystallinity, which is likely indicative of multiple eruption episodes. Several discrete boundaries within Interval 3 support the notion of distinct phases of the same eruption (pulses and hiatuses) and/or discrete eruptions. One such boundary occurs in Section 389-M0110B-8R-1, 90 cm (11.40 mbsf), where a centimeter-thick altered lava layer with abundant white vesicle linings separates two lava horizons characterized by distinct differences in vesicle size and abundance, as well as differences in phenocrysts (Figure F9B). The bottom of the core (Sections 9R-2 and 10R-1; 14.84–17.27 mbsf) contains lava of substantially lower phenocryst content (5%–10%) and mostly unornamented and larger vesicles (up to 20% of the cut core surface). Several horizons of significantly infilled vesicles in this section may represent flow lobe boundaries. The lava at the base of this hole contains relatively few (2%–3%) sparse phenocrysts of olivine and pyroxene and mostly round, millimeter-sized vesicles (<5%) (Figure F9C). Note that Hole M0110B lacks the hyaloclastite observed in Hole M0110A.
3. Physical properties
Physical properties data for Site M0110 are shown in Table T2 in the Site M0096 chapter (Webster et al., 2025b).
3.1. Hole M0110A
A total of 12.57 m of core from Hole M0110A was scanned with the multisensor core logger (MSCL), and because the core exhibited moderate drilling-induced disturbance, 61% of the acquired data passed QA/QC (see Table T10 in the Expedition 389 methods chapter [Webster et al., 2025a]). A total of seven discrete samples for P-wave velocity and moisture and density (MAD) measurements were taken. Digital linescans, color reflectance, and hyperspectral imaging were acquired on all cores.
3.1.1. Density and porosity
Data for density and porosity measurements are presented in Figures F2 and F10. MSCL bulk density measurements range 1.45–2.90 g/cm3. A total of seven discrete samples were analyzed for MAD, giving bulk density values in the range of 2.10–2.82 g/cm3. Porosity values for the same samples range 4.2%–40.3%, and grain density values fluctuate between 2.660 and 2.901 g/cm3. An increase in bulk density with depth is found at the lava unit contact in both the MSCL and discrete data at 12.66 mbsf.
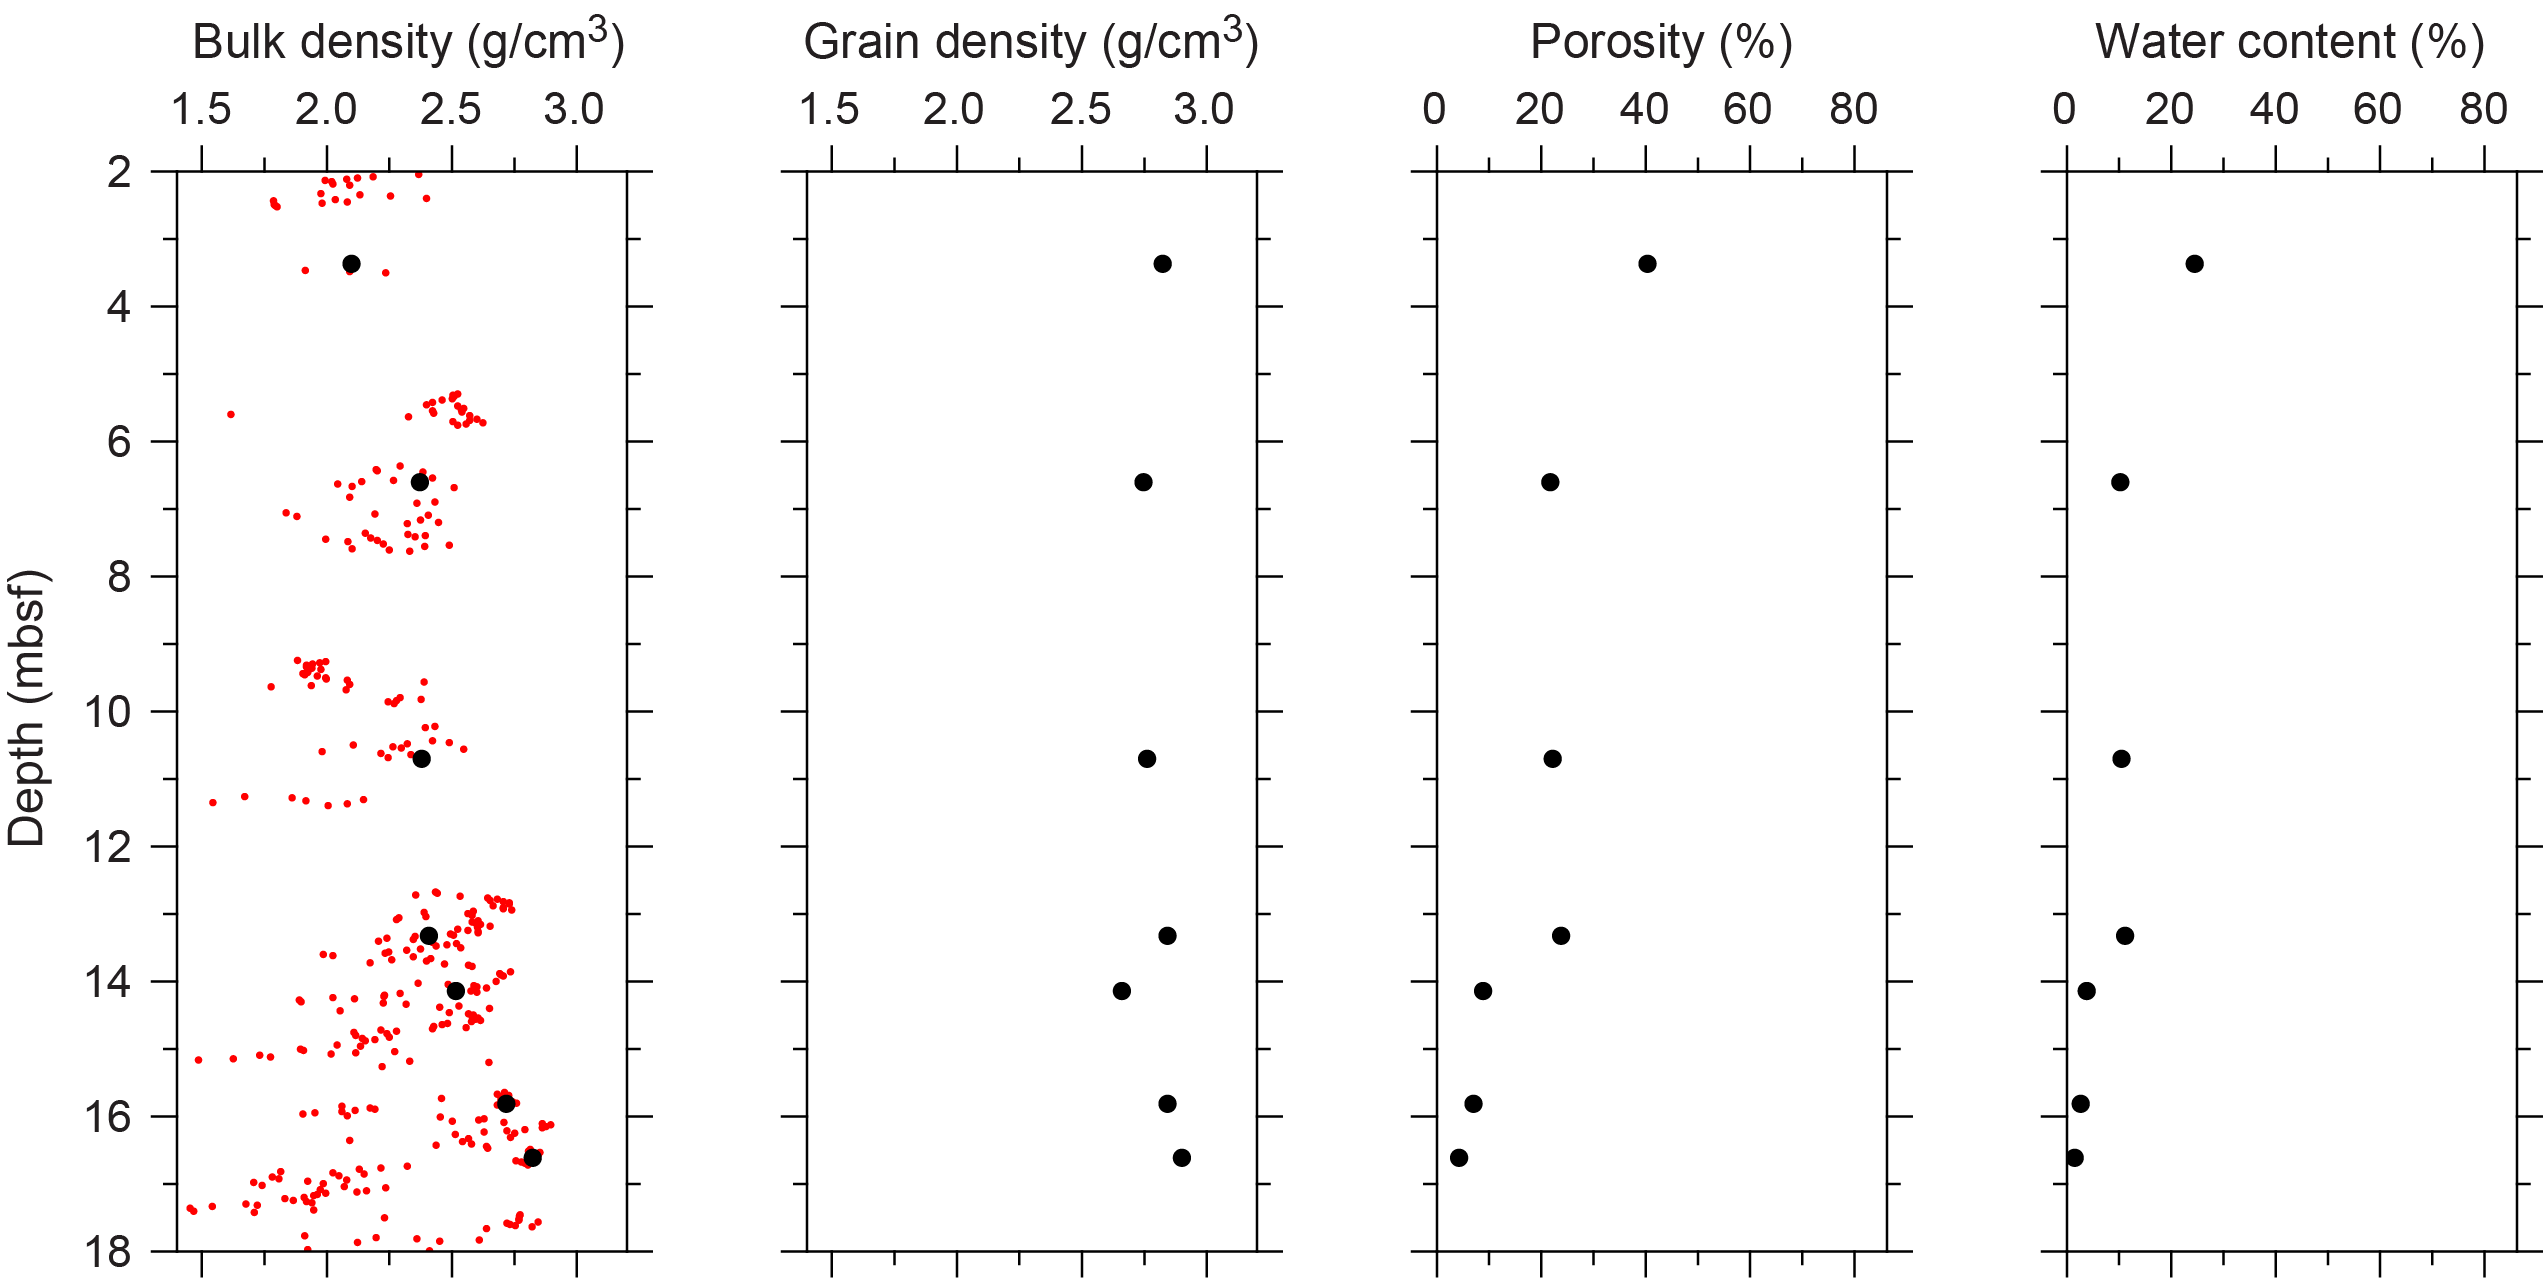
Figure F10. Physical properties, Hole M0110A.
3.1.2. P-wave velocity
MSCL P-wave velocity measurements yielded no data. A total of seven samples were measured using the discrete P-wave logger. Dry measurement values range 3126–5552 m/s (Figure F11) and increase with depth. P-wave velocities recorded for the same samples after resaturation range 3316–6789 m/s.
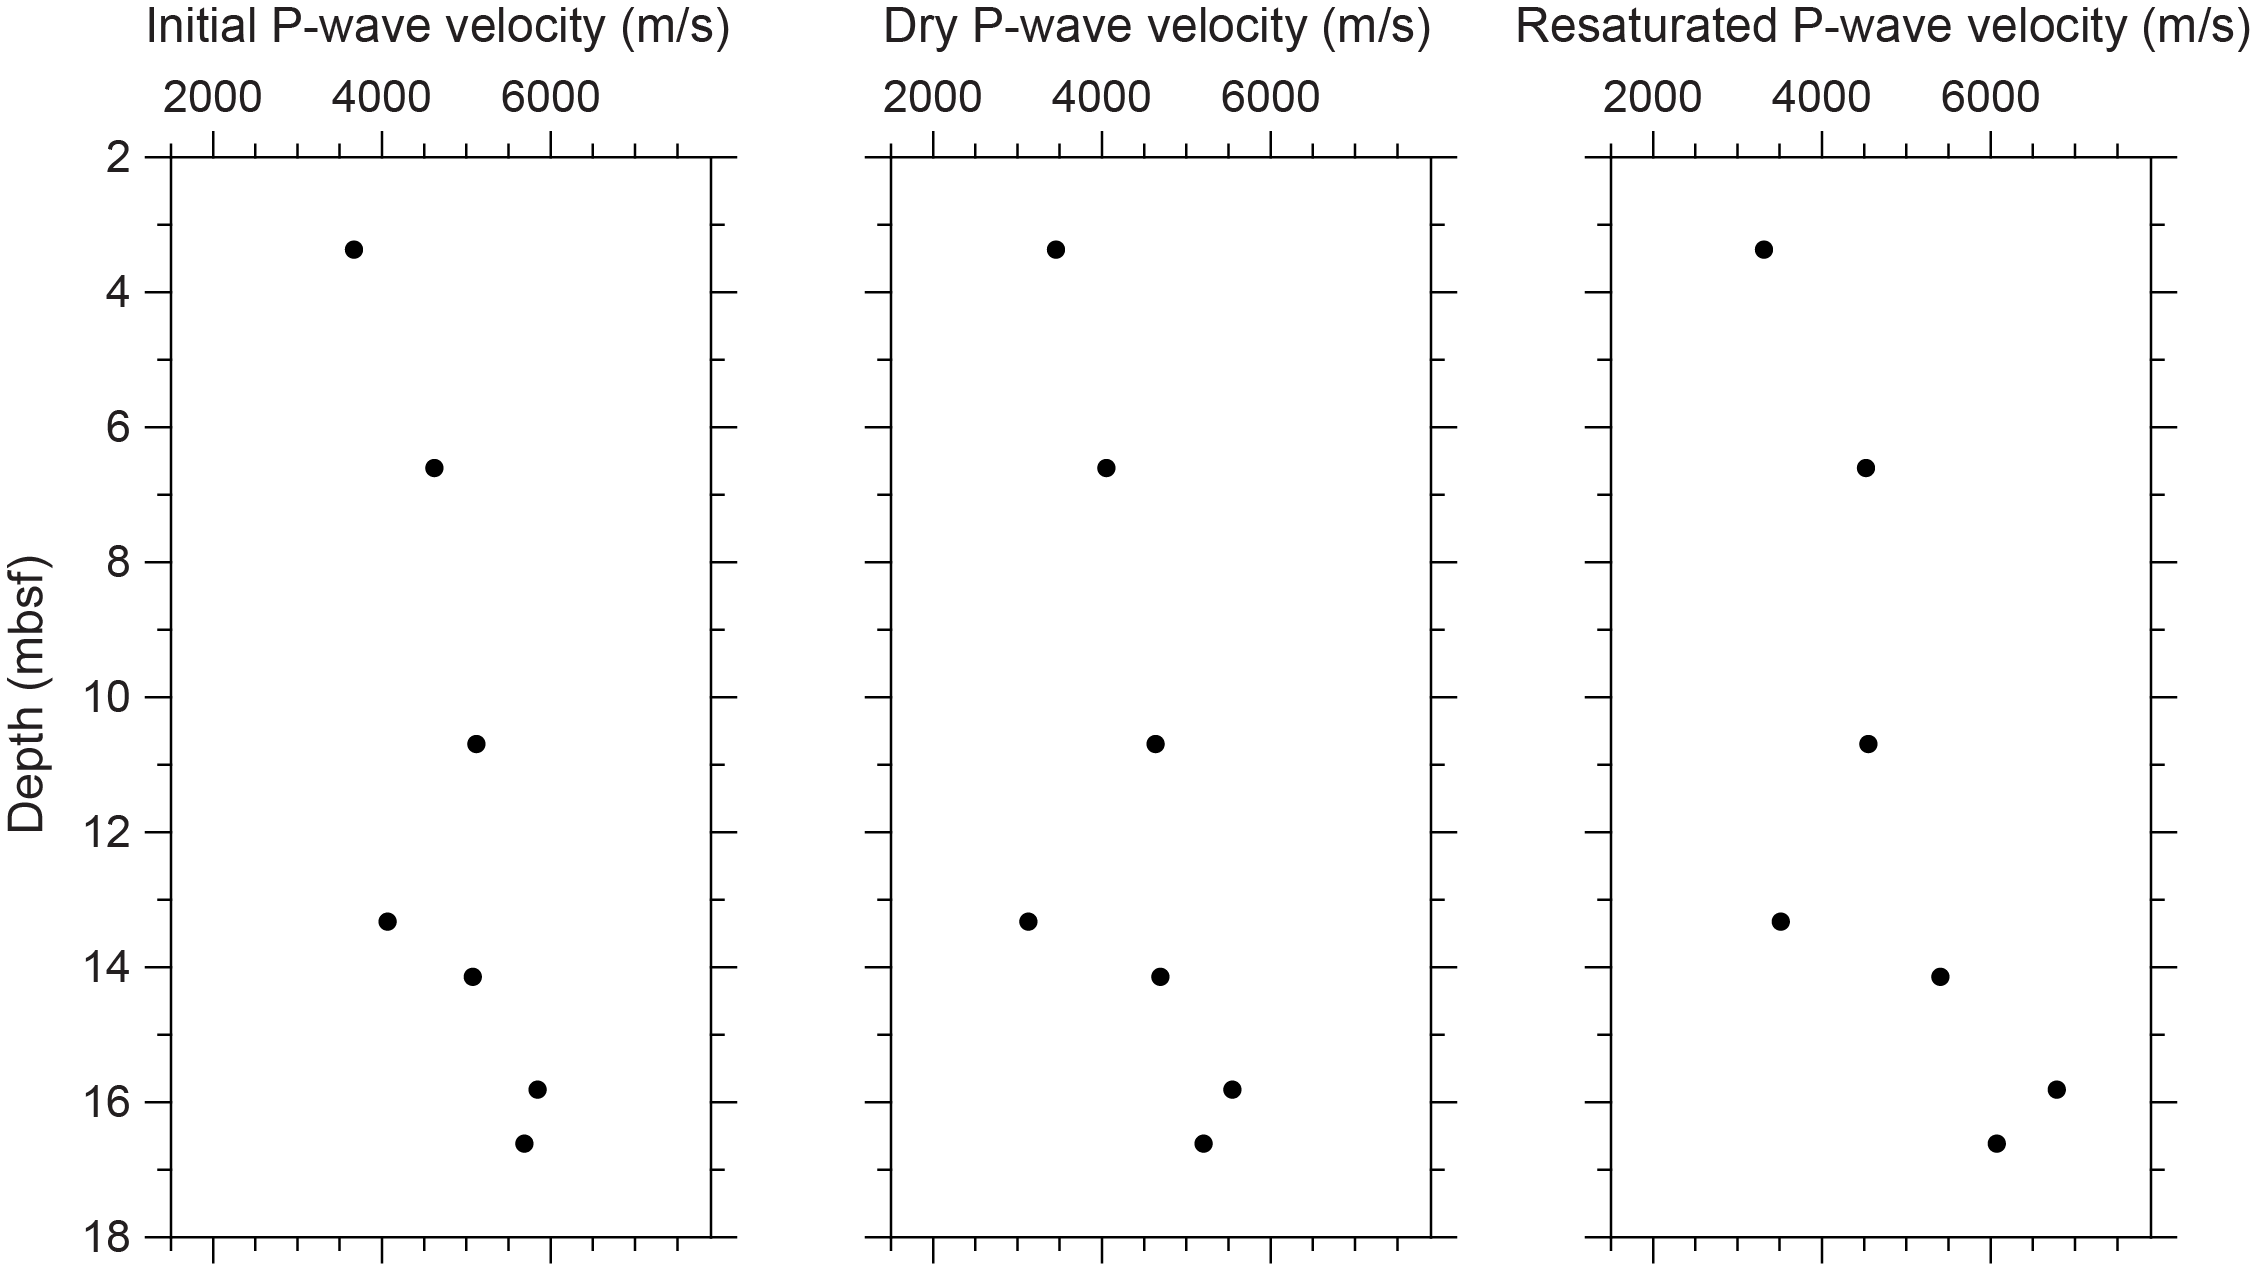
Figure F11. P-wave velocities, Hole M0110A.
3.1.3. Thermal conductivity
Thermal conductivity was collected on six cores (see Table T11 in the Expedition 389 methods chapter [Webster et al., 2025a]), and the data range 1.148–1.676 W/(m·K). The transition from carbonate to basalt was marked by a drop in resistivity. The resistivity of the carbonate facies exhibits higher variability compared to the volcanic facies.
3.1.4. Magnetic susceptibility
MSCL magnetic susceptibility data range −0.81 × 10⁻⁵ to 460.73 × 10⁻⁵ SI (Figure F2). However, the majority of MSCL magnetic susceptibility values fall close to 100.91 × 10⁻⁵ SI, with a distinct increase marking the transition from carbonate facies to lava in Core 389-M0110-14R (~12.66 mbsf).
3.1.5. Electrical resistivity
MSCL noncontact resistivity measurements yielded data ranging 0.89–354.16 Ωm (Figure F2).
3.1.6. Natural gamma radiation
MSCL natural gamma radiation (NGR) measurements range 24–35 counts/s (Figure F2) with an increase at the contact between the carbonate facies (coralgal-microbialite boundstone) and underlying lava at ~12.66 mbsf.
3.1.7. Digital linescans, color reflectance, and hyperspectral imaging
All cores were digitally scanned, measured for color reflectance (where appropriate), and imaged with the hyperspectral scanner (see HYPERSPECTRAL in Supplementary material). Color reflectance L* values are between 9.43% and 83.72%, a* varies between −2.70 and 4.81, b* varies between −2.06 and 22.23, and a*/b* varies between −1.02 and 3.60 (Figure F2). Variations in color reflectance parameters clearly show the transition to lava in this hole.
3.2. Hole M0110B
A total of 12.90 m of core from Hole M0110B was scanned with the MSCL, and because the core exhibited minor drilling-induced disturbance, 74% of the acquired data passed QA/QC (see Table T10 in the Expedition 389 methods chapter [Webster et al., 2025a]). A total of eight discrete samples for P-wave velocity and MAD measurements were taken. Digital linescans, color reflectance, and hyperspectral imaging were acquired on all cores.
3.2.1. Density and porosity
Data for density and porosity measurements are presented in Figures F2 and F12. MSCL bulk density measurements range 1.79–2.90 g/cm3. Eight discrete samples were analyzed for MAD and have bulk density values in the range of 2.10–2.87 g/cm3. Porosity values for the same samples range 5.9%–38.5%, and grain density values fluctuate between 2.766 and 3.129 g/cm3. An increase in bulk density with depth is found in both the MSCL and discrete data at the contact between the carbonate facies (coralgal-microbialite boundstone) and the underlying lava.
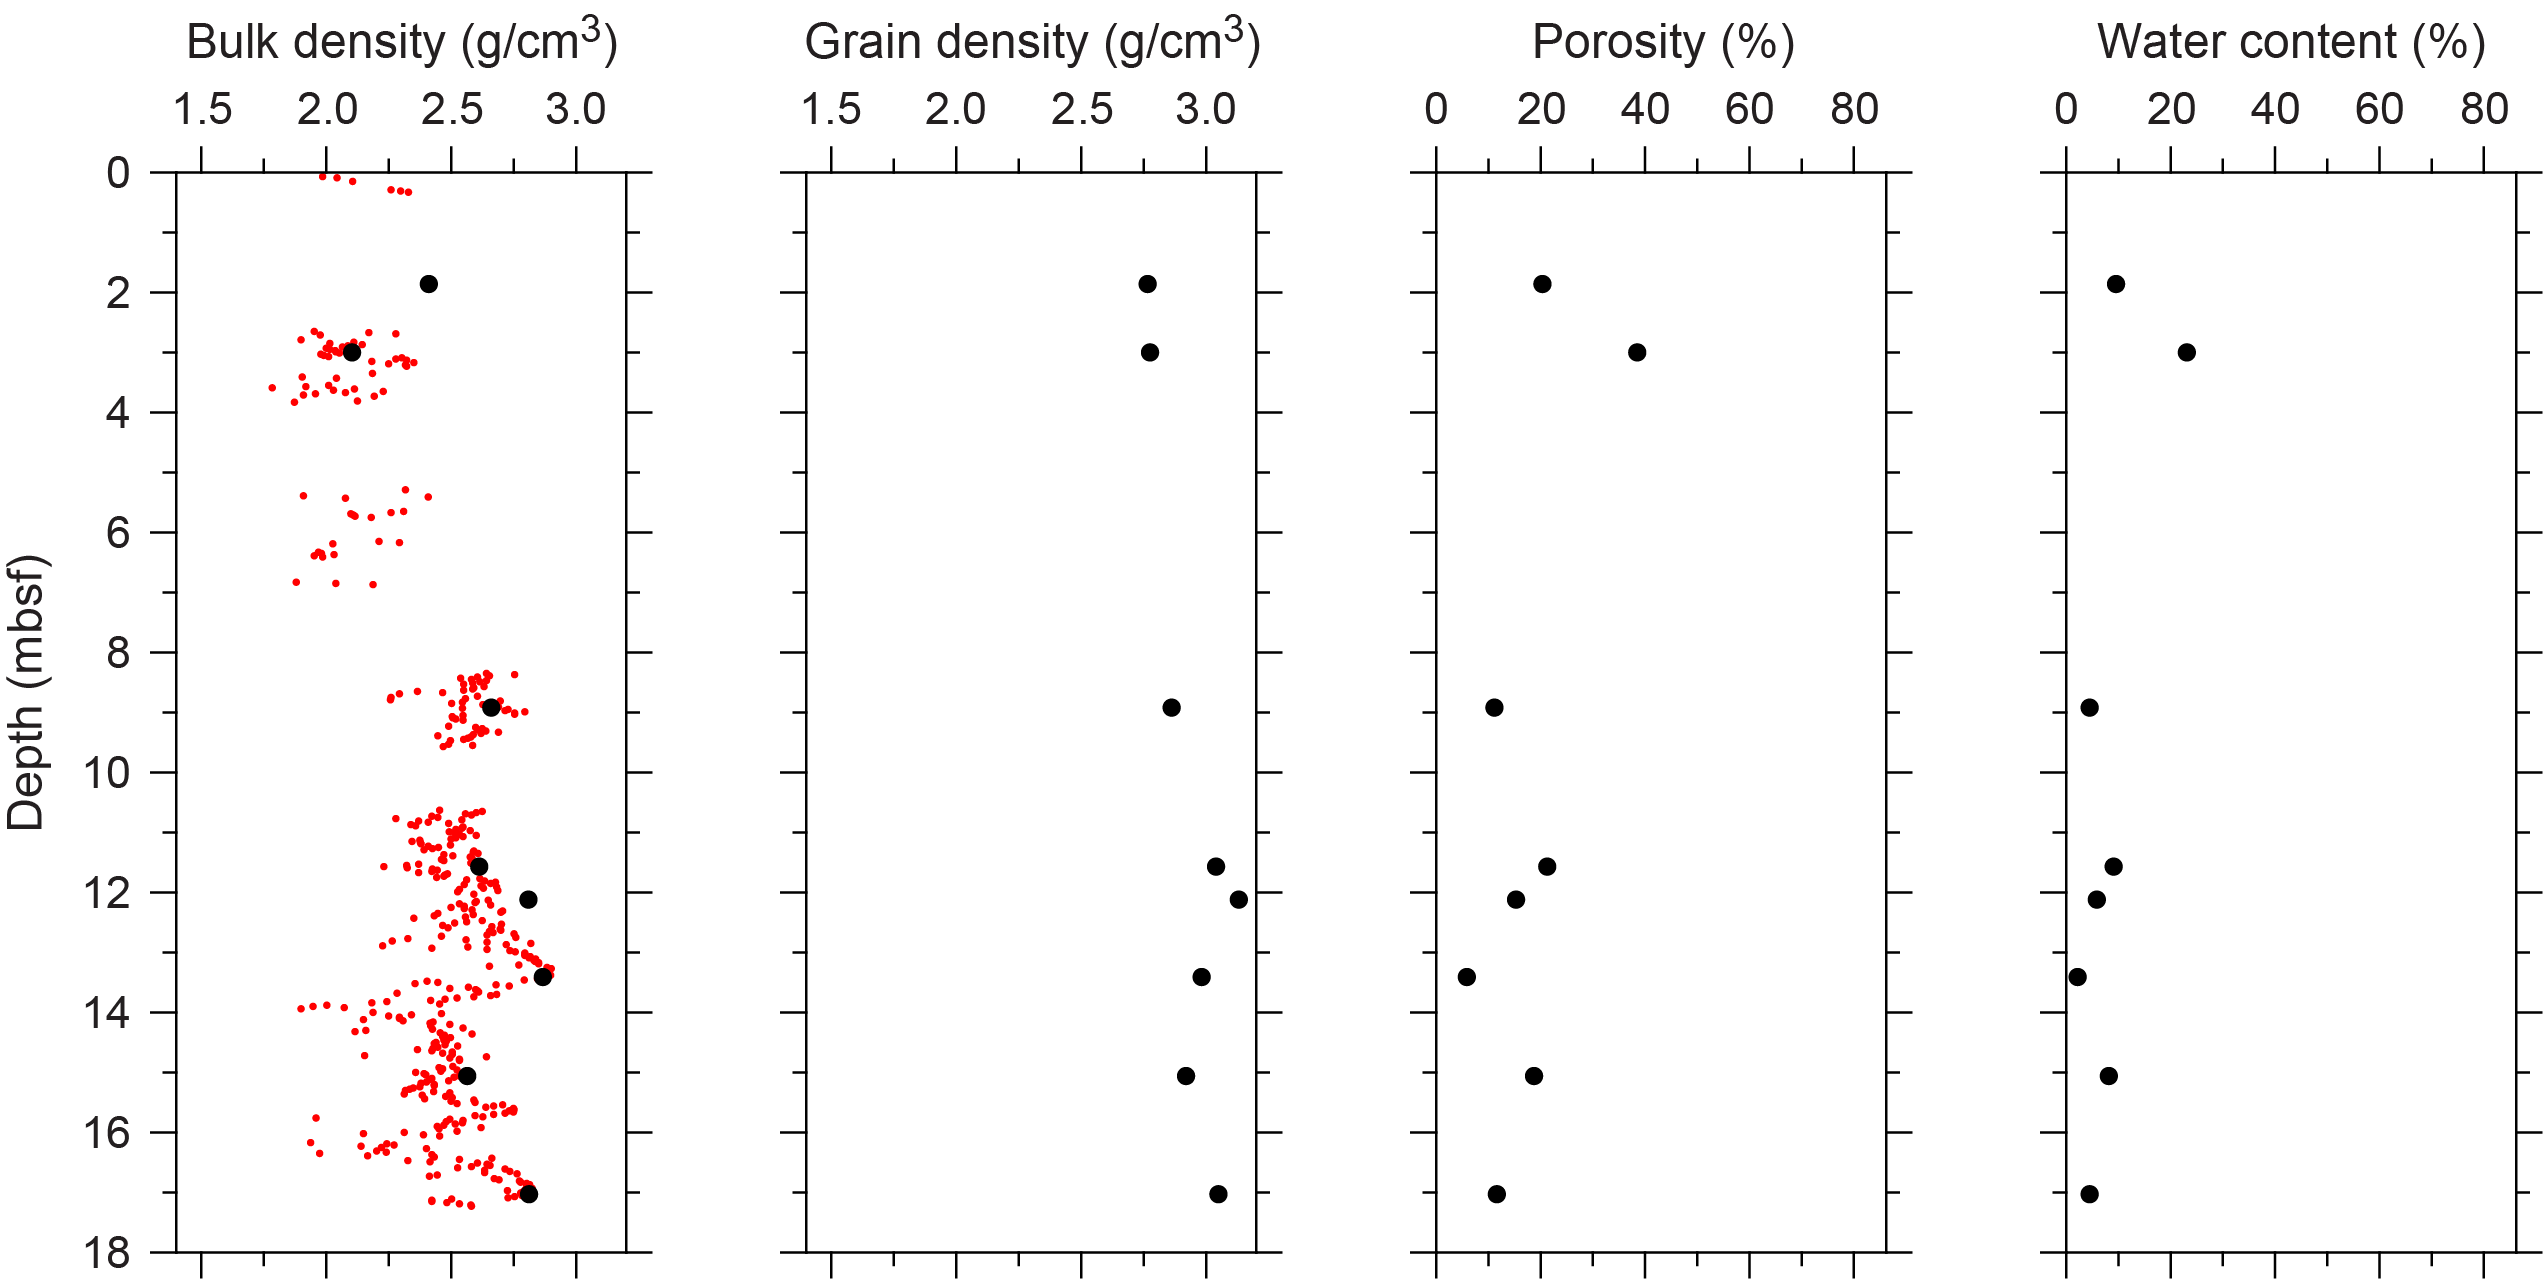
Figure F12. Physical properties, Hole M0110B.
3.2.2. P-wave velocity
MSCL P-wave velocity measurements yielded no data. A total of eight samples were measured using the discrete P-wave logger. Dry measurement values range 2113–5601 m/s (Figure F13) and show little trend with depth. P-wave velocities recorded for the same samples after resaturation are between 2942 and 6090 m/s.
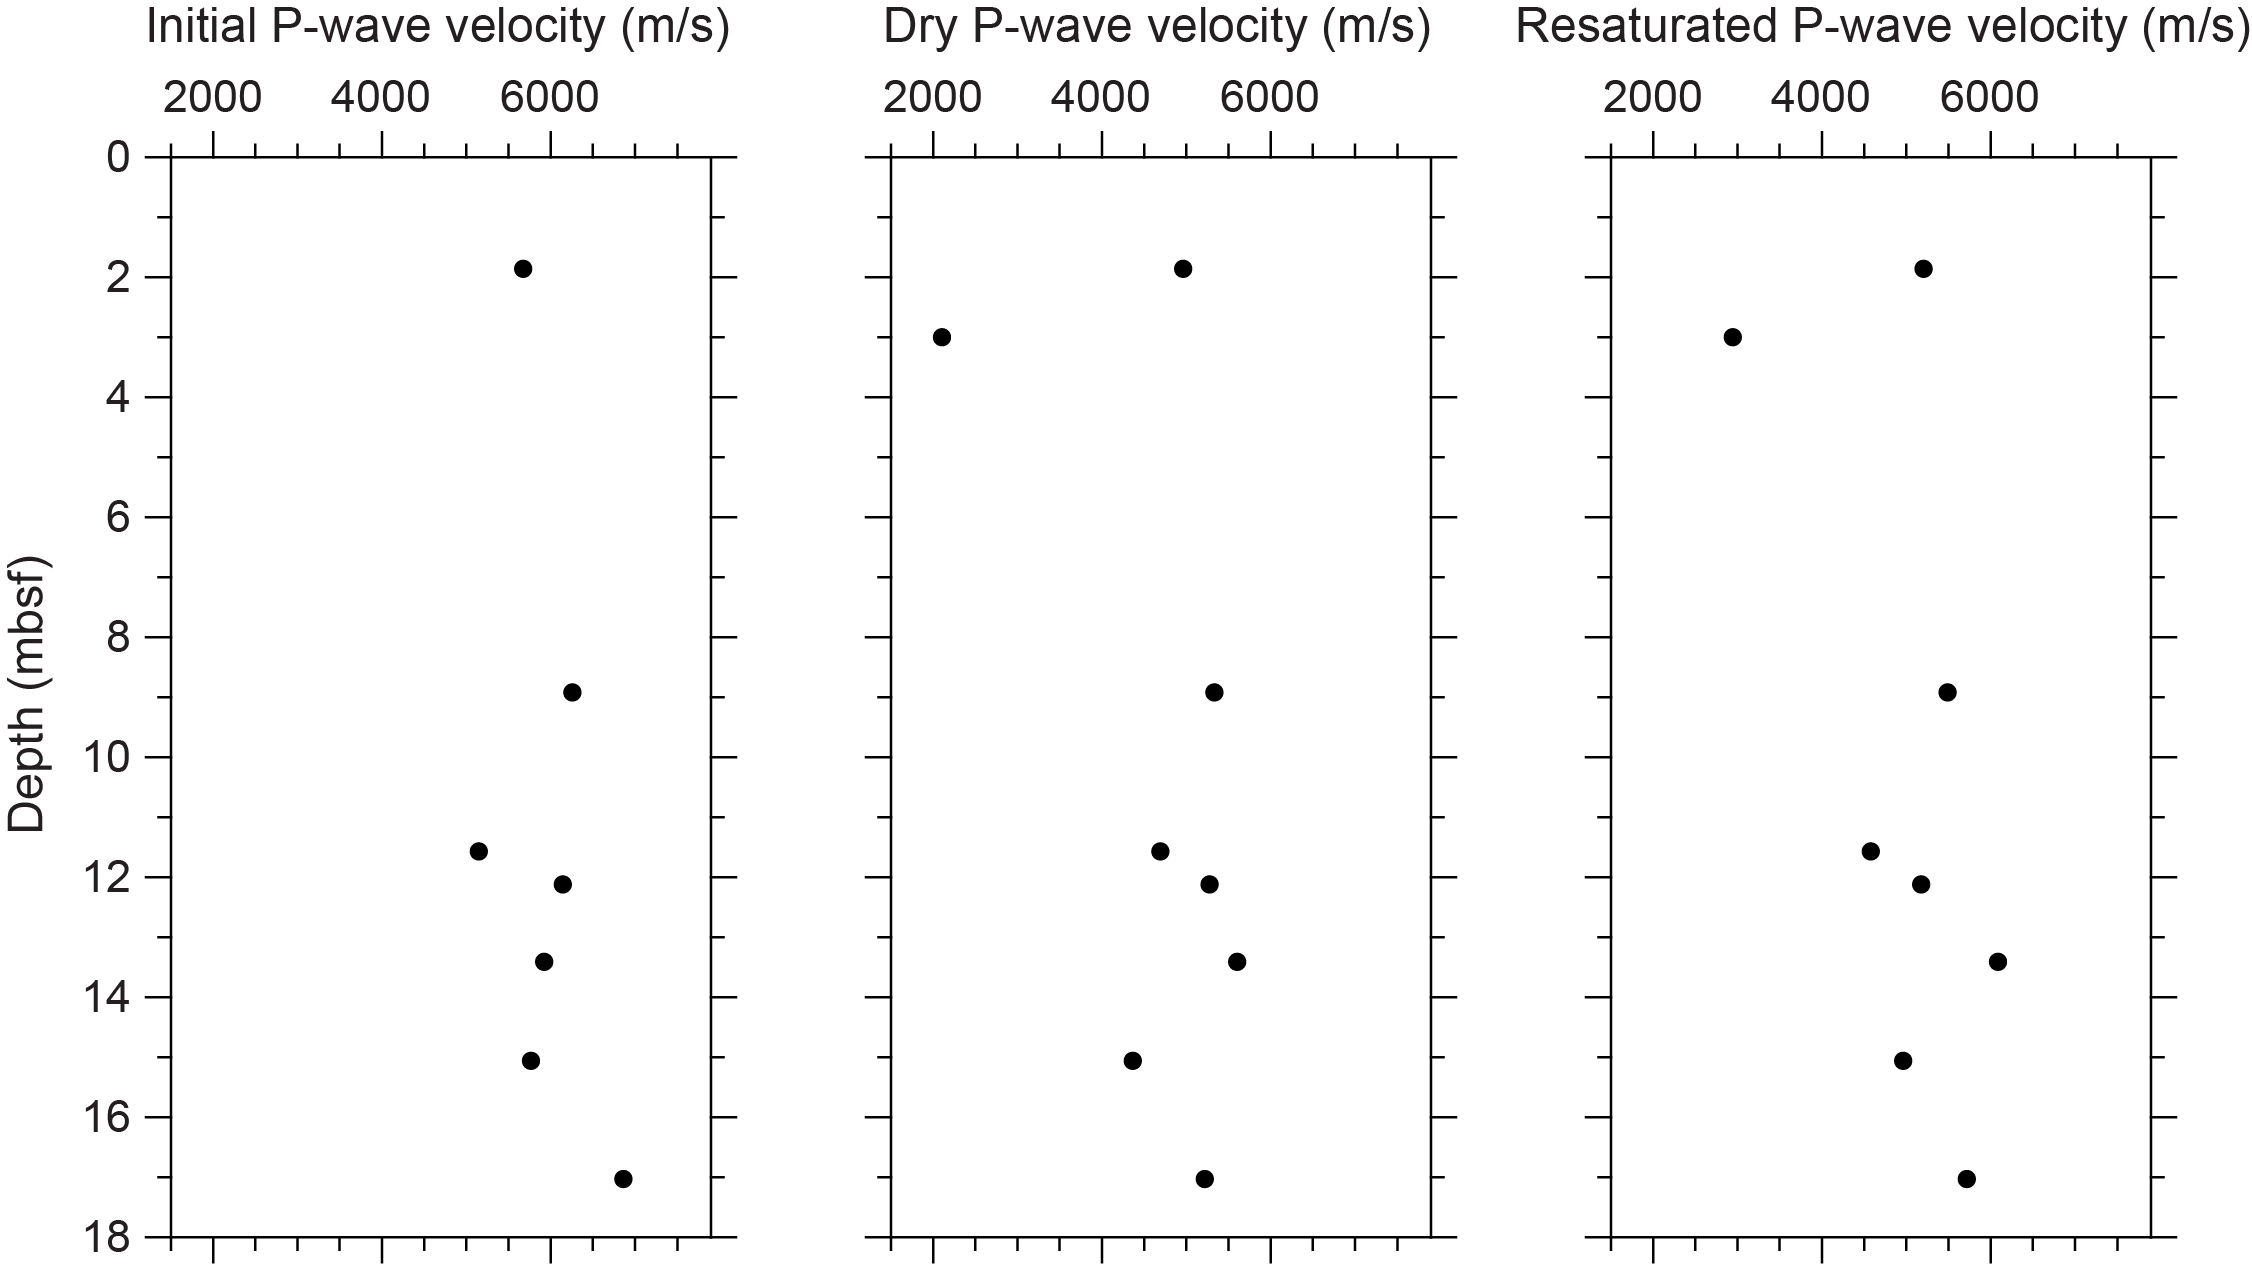
Figure F13. P-wave velocities, Hole M0110B.
3.2.3. Thermal conductivity
Thermal conductivity was collected on two cores (see Table T11 in the Expedition 389 methods chapter [Webster et al., 2025a]) with values of 1.683 and 1.706 W/(m·K).
3.2.4. Magnetic susceptibility
MSCL magnetic susceptibility data range −0.61 × 10⁻⁵ to 3525.64 × 10−5 SI (Figure F6) with mean values close to 1270.42 × 10−5 SI. These data clearly show the boundary between the carbonate facies to the underlying lava in Core 389-M0110B-7R (8.3 mbsf).
3.2.5. Electrical resistivity
MSCL noncontact resistivity measurements yielded data ranging 0.24–42.64 Ωm (Figure F6).
3.2.6. Natural gamma radiation
MSCL NGR measurements range 25–38 counts/s (Figure F6), with an increase found at the boundary between the carbonate facies and the lava unit below.
3.2.7. Digital linescans, color reflectance, and hyperspectral imaging
All cores were digitally scanned, and, where appropriate, measured for color reflectance and imaged with the hyperspectral scanner (see HYPERSPECTRAL in Supplementary material). Color reflectance L* values vary between 8.99% and 82.13%, a* varies between −1.64 and 3.67, b* varies between −1.28 and 24.38, and a*/b* varies between −1.76 and 1.00. (Figure F6). Variations in color reflectance parameters clearly show the transition from carbonate to lava in this core.
4. Geochemistry
4.1. Interstitial water
No interstitial water samples were collected from Site M0110.
4.2. Surface seawater
One surface seawater sample was collected from Site M0110 using a Niskin bottle deployed from the side of the vessel (see Figure F22 in the Expedition 389 methods chapter [Webster et al., 2025a]). The salinity, pH, alkalinity, and ammonium concentrations were analyzed off shore, and major cations and anions were measured during the Onshore Science Party. The salinity, pH, alkalinity, ammonium, and major element chemistry measured for this sample are consistent with the other surface seawater samples taken during Expedition 389 and align with the expected values for conservative elements in seawater (see Tables T15 and T17 in the Expedition 389 methods chapter [Webster et al., 2025a]).
4.3. Bulk sediment and rocks
Five bulk sediments from Holes M0110A and M0110B were analyzed for mineralogy and elemental composition. For each hole, one sample was collected and analyzed from coralgal-microbialite boundstone and one from lava facies (see Figure F10 in the Expedition 389 methods chapter [Webster et al., 2025a]). In addition, one sample from Hole M0110B (8R-1, 94–97 cm; 11.53 mbsf) was collected within the lava facies 4–6 cm centimeters below the boundary between two lava units, which has an altered surface at 11.40 mbsf (Figure F9B).
4.4. Mineralogy
The two carbonate samples from Site M0110 are a mix of high-Mg calcite (65% in Sample 389-M0110A-11R-1, 36–38 cm; 10.42 mbsf) and aragonite (77% in Sample 389-M0110B-4R-1, 1–3 cm; 5.20 mbsf) (Table T2). The coralgal-microbialite boundstone Sample 389-M0110A-11R-1, 36–38 cm (10.42 mbsf), contains 3% plagioclase.
The basalt samples from Site M0110 are mixtures of plagioclase (68%–81%) and pyroxenes (16%–27%). Basalt Sample 389-M0110A-16R-1, 29–31 cm (15.68 mbsf), contains 3% aragonite. Sample 9R-2, 76–78 cm (15.60 mbsf), contains 1% iwakiite (Fe1.3Mn1.7O4) and corundum, plus 2% iron oxide and hydroxide heavy minerals (Table T2).
Sample 389-M0110B-8R-1, 94–97 cm (11.53 mbsf), collected from 4–6 cm below the boundary between two lava units at 11.40 mbsf (Figure F9B), contains 1% gypsum, anhydrite, or jarosites.
4.5. Elemental abundances
The concentrations of major elements in bulk sediment and rock samples from Site M0110 are consistent with the lithologies of the samples (Table T3).
The Ca concentrations in the carbonate samples, both from coralgal-microbialite boundstone facies, have an average value of 345,786 mg/kg, and Mg concentrations in these samples have an average value of 28,067 mg/kg. The Mg concentration in Sample 389-M0110A-11R-1, 36–38 cm (10.42 mbsf), is 37,921 mg/kg, and the Sr concentration is 2,376 mg/kg. In contrast, the Mg concentration in Sample 389-M0110B-4R-1, 1–3 cm (5.20 mbsf), is 18,214 mg/kg, and the Sr concentration is 5,763 mg/kg. The concentrations of Mg and Sr in the carbonate samples are consistent with results from X-ray diffraction (XRD) mineralogy, which indicate predominantly high-Mg calcite and aragonite. Other elements in the carbonate samples are at minor concentrations or below the detection limit.
The elemental composition of basalt Samples 389-M0110A-16R-1, 29–31 cm (15.68 mbsf), and 389-M0110B-9R-2, 76–78 cm (15.60 mbsf), contain on average 67,173 mg/kg Ca, 77,360 mg/kg Al, and 85,481 mg/kg Fe. The altered basalt Sample 8R-1, 94–97 cm (11.53 mbsf), taken below the boundary between two lava horizons (Figure F9B), contains 101,351 mg/kg Ca, 64,916 mg/kg Al, and 74,880 mg/kg Fe. All three basalt samples have similar values for Mg, Mn, and Sr. Other elements (Ba, Br, K, P, S, Ti, Zr, Cr, Cu, Ni, Rb, V, and Zn) are minor constituents or below detection in the sample.
4.6. Carbon content
The results for total organic carbon (TOC), total carbon (TC), and total inorganic carbon (TIC) at Site M0110 are presented in Table T4. In the carbonate samples, TC ranges 11.4%–11.5%, and TIC ranges 11.2%–11.3%, which equates to a CaCO3 content of 93.7% and 94.3%, respectively. TOC values range 0.16%–0.18%.
In contrast, TC in the two basalts is <1%, as expected for this lithology. TOC content in all the basalt samples ranges 0.11%–0.12%, and TIC content ranges 0.63%–0.80%.
The basalt sample taken 4 cm below the boundary between two lava units (Sample 389-M0110B-8R-1, 94–97 cm; 11.53 mbsf) has a TC content of 1.91%, a TOC content of 0.11%, and a TIC of 1.80%, which calculates to a CaCO3 content of 15.0%. This CaCO3 content is consistent with the XRD (3% aragonite) and element analyses data for the sample. The 15.0% carbonate content in Sample 8R-1, 94–97 cm (11.53 mbsf), thus likely reflects the inclusion of carbonate material in the basalt sample and corroborates the visual observation of precipitation of calcite (see Lithostratigraphy).
5. Paleomagnetism
A total of 17 samples were obtained from Holes M0110A and M0110B. Measurements of low-field and mass-specific magnetic susceptibility (χ) were carried out for all samples. Natural remanent magnetization (NRM) was measured for all samples, as well as remanence following stepwise alternating field (AF) demagnetization up to a peak AF of 20 mT for carbonate samples and 100 mT for lava samples. For further details, see Paleomagnetism in the Expedition 389 methods chapter (Webster et al., 2025a).
5.1. Hole M0110A
Three carbonate and five lava samples were taken from Hole M0110A. The carbonate samples show low negative χ values of −9.38 × 10⁻⁹, −11.3 × 10⁻⁹, and −9.83 × 10⁻⁹ m3/kg. The lava samples are characterized by high positive χ values throughout, ranging 0.93 × 10⁻⁶ to 16.5 × 10⁻⁶ m3/kg with an arithmetic mean of 9.26 × 10⁻⁶ m3/kg. The initial NRM intensities of carbonate samples are 7.21 × 10⁻⁴, 8.83 × 10⁻⁴, and 2.09 × 10⁻⁴ A/m. The initial NRM intensity of basalt lava ranges 0.05–13.9 A/m with an arithmetic mean of 8.00 A/m. Patterns in χ and initial NRM of carbonate inversely correlate, whereas patterns in χ and initial NRM of lava mostly correlate throughout the hole, except for Sample 18R-1, 100–102.5 cm (18.65 mbsf). This suggests that concentration and properties of magnetic particles mainly drive these variations in the lava samples (Figure F14).
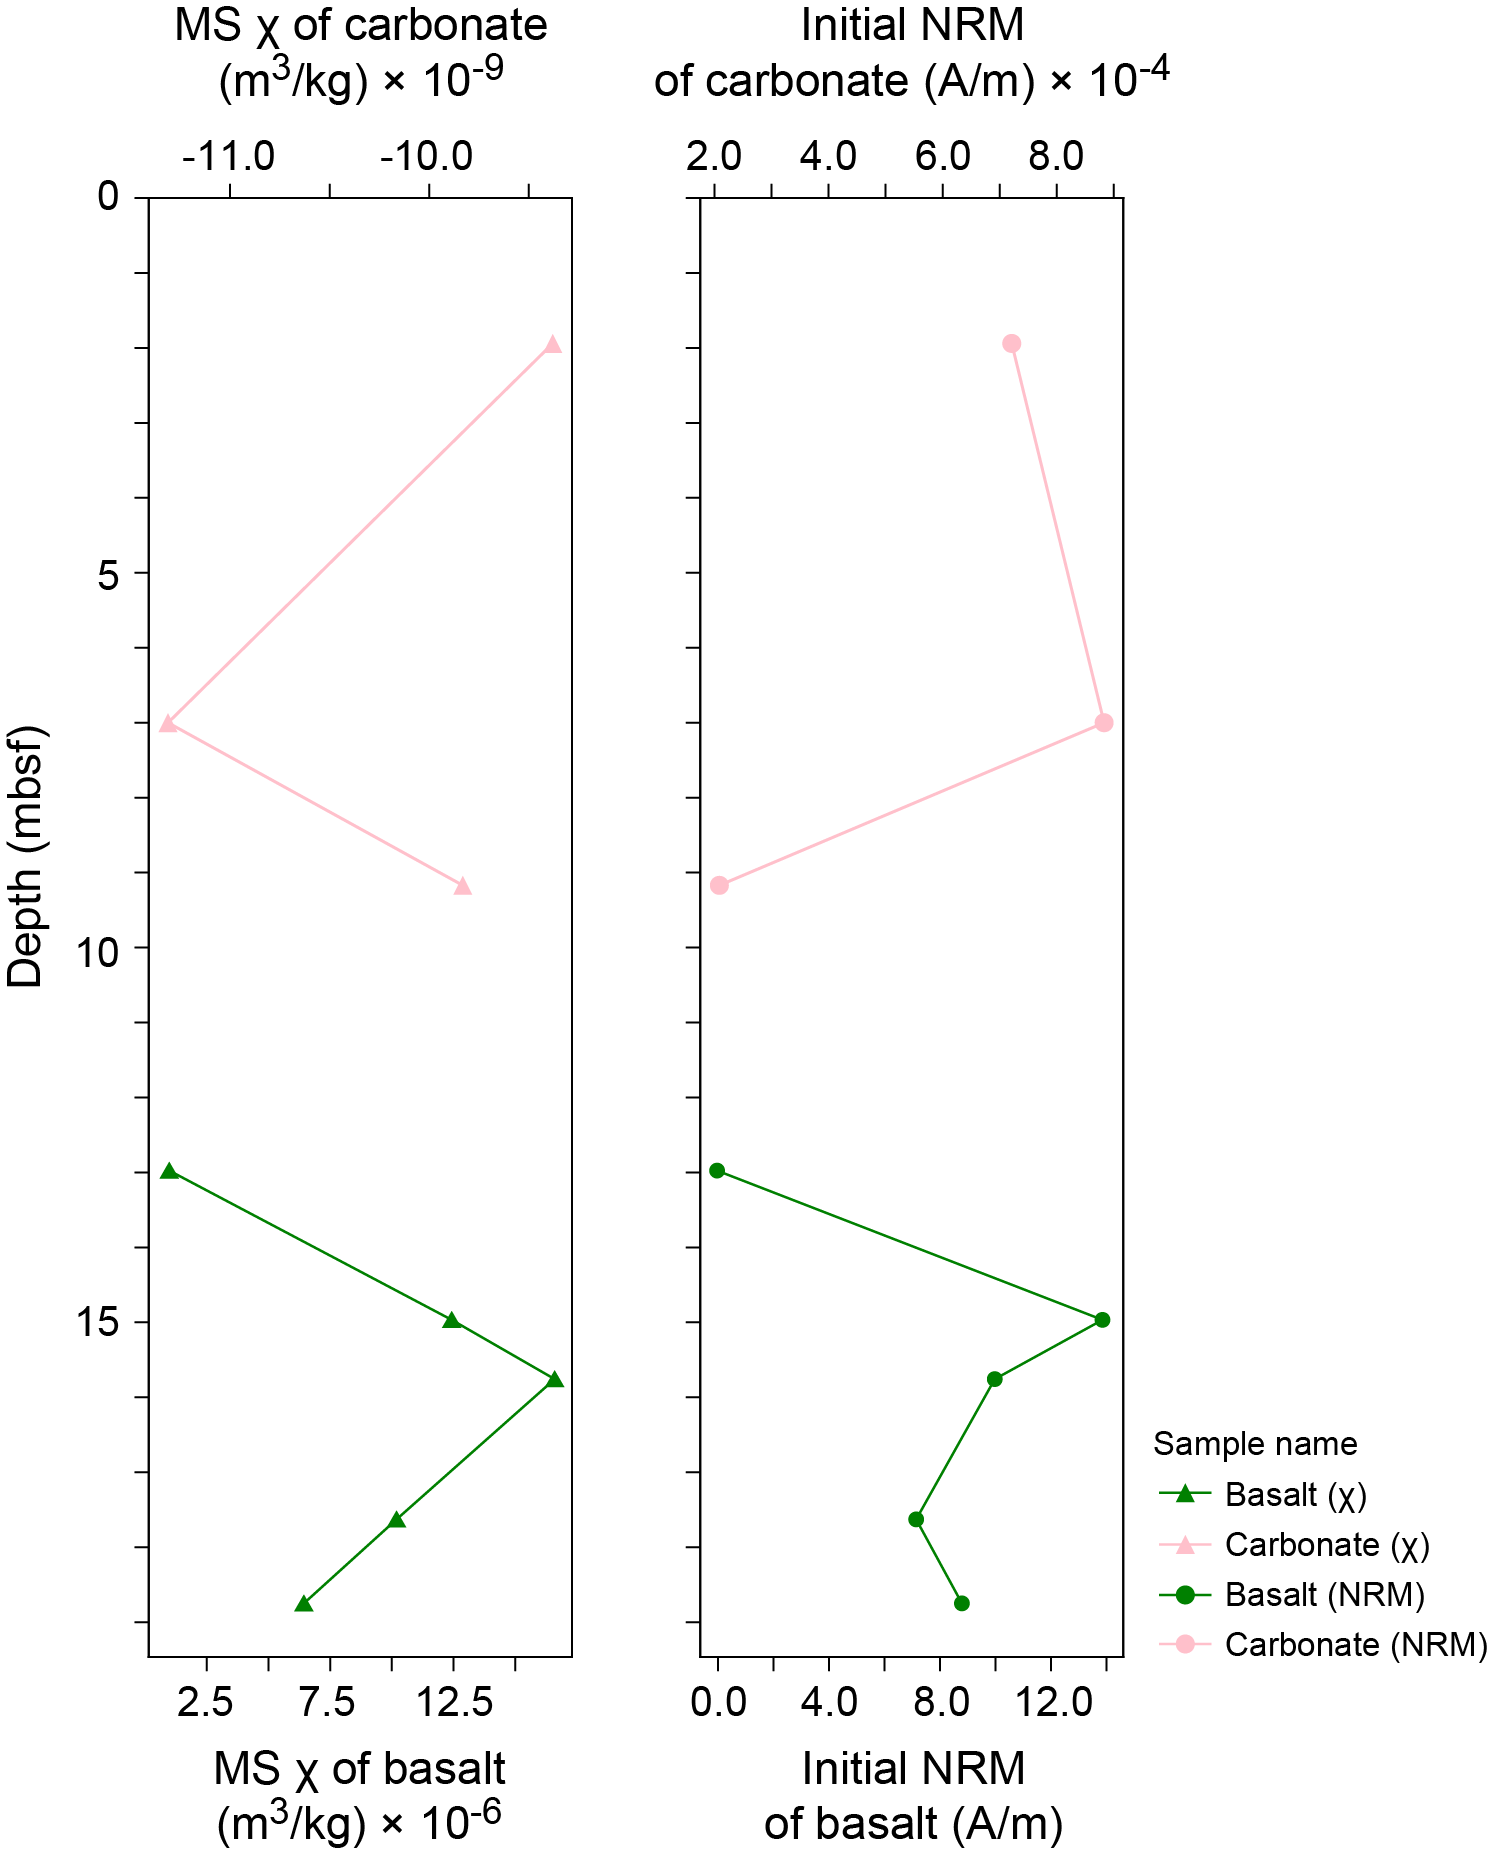
Figure F14. MS and NRM, Hole M0110A.
5.2. Hole M0110B
Two carbonate and seven lava samples were taken from Hole M0110B. The carbonate samples show low χ values at 2.84 mbsf (Sample 3R-1, 33–35 cm) and 6.03 mbsf (Sample 5R-1, 46–48 cm) of −1.10 × 10⁻⁸ and 1.70 × 10⁻⁸ m3/kg, respectively. The lava samples are characterized by high positive χ values throughout, ranging 1.40 × 10⁻⁵ to 13.1 × 10⁻⁵ m3/kg with an arithmetic mean of 6.36 × 10⁻⁵ m3/kg. The initial NRM intensities of the carbonate samples are 5.27 × 10⁻⁴ and 1.50 × 10⁻³ A/m, respectively. The initial NRM intensity values of basalt lava range 2.65 × 101 to 6.54 × 101 A/m with an arithmetic mean of 2.05 × 101 A/m. In contrast to the patterns observed in Hole M0110A, the χ and NRM values of lava do not correlate, likely reflecting changes in magnetic grain size. (Figure F15).
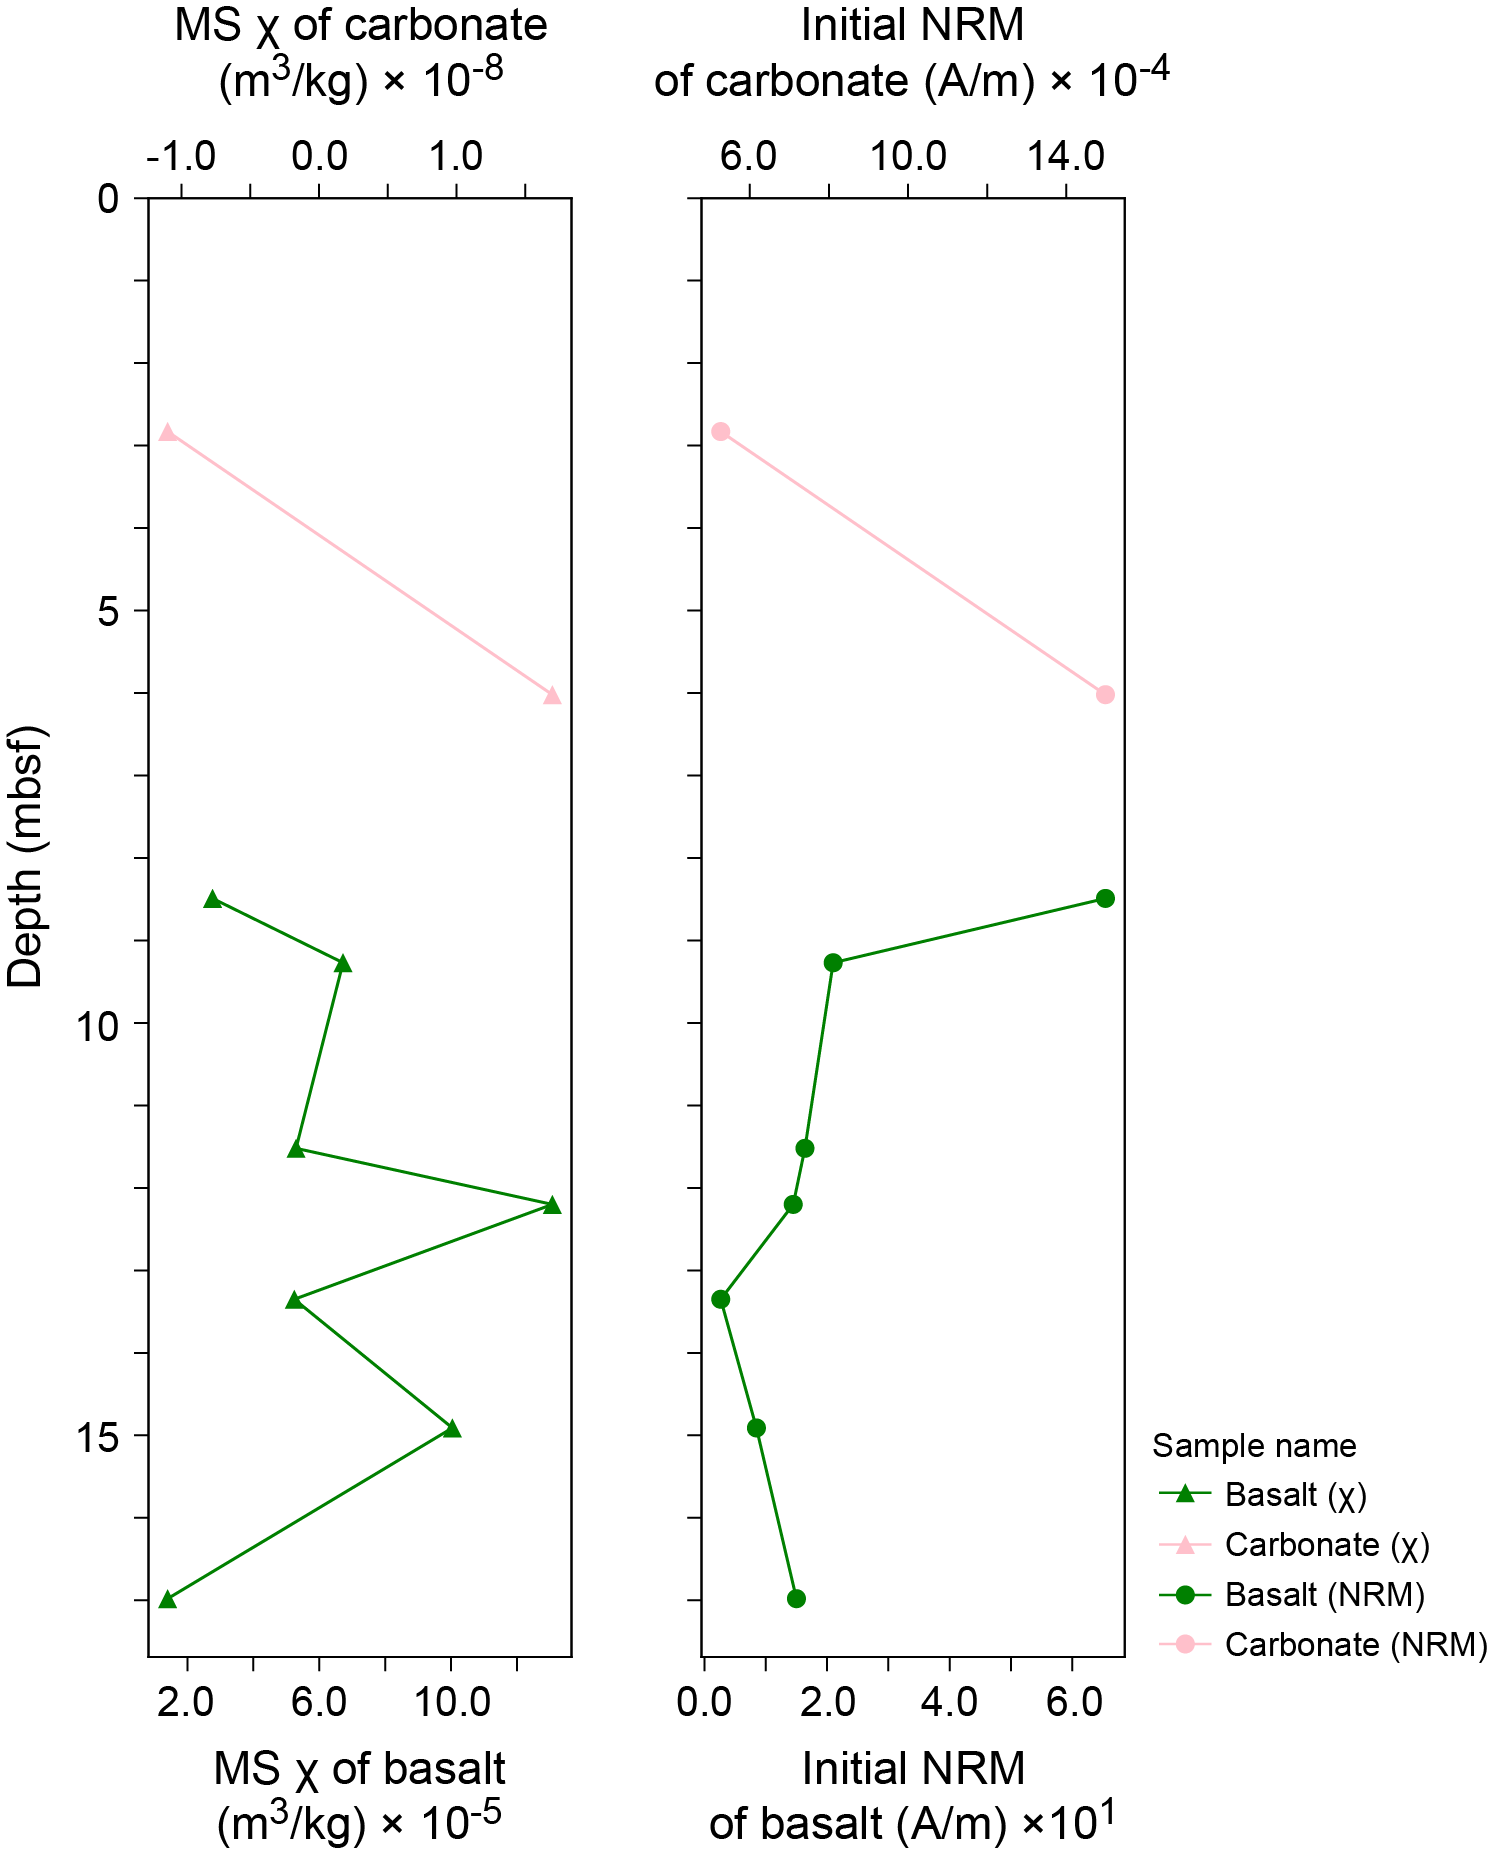
Figure F15. MS and NRM, Hole M0110B.
6. Geochronology
Four radiocarbon dates were obtained from Holes M0110A and M0110B. The uncalibrated radiocarbon dates are in stratigraphic order and range ~12–35 14C ky BP (see Table T23 in the Expedition 389 methods chapter [Webster et al., 2025a]). These data are consistent with the estimated age of the H1 terrace that spans Marine Isotope Stages 1–5 (Ludwig et al. 1991; Webster et al., 2009; Sanborn et al., 2017).
References
Ludwig, K.R., Szabo, B.J., Moore, J.G., and Simmons, K.R., 1991. Crustal subsidence rate off Hawaii determined from 234U/238U ages of drowned coral reefs. Geology, 19(2):171–174. https://doi.org/10.1130/0091-7613(1991)019<0171:CSROHD>2.3.CO;2
Sanborn, K.L., Webster, J.M., Yokoyama, Y., Dutton, A., Braga, J.C., Clague, D.A., Paduan, J.B., Wagner, D., Rooney, J.J., and Hansen, J.R., 2017. New evidence of Hawaiian coral reef drowning in response to meltwater pulse-1A. Quaternary Science Reviews, 175:60–72. https://doi.org/10.1016/j.quascirev.2017.08.022
Webster, J.M., Braga, J.C., Clague, D.A., Gallup, C., Hein, J.R., Potts, D.C., Renema, W., Riding, R., Riker-Coleman, K., Silver, E., and Wallace, L.M., 2009. Coral reef evolution on rapidly subsiding margins. Global and Planetary Change, 66(1–2):129–148. https://doi.org/10.1016/j.gloplacha.2008.07.010
Webster, J.M., Ravelo, A.C., Grant, H.L.J., and the Expedition 389 Scientists, 2025. Supplementary material, https://doi.org/10.14379/iodp.proc.389supp.2025. In Webster, J.M., Ravelo, A.C., Grant, H.L.J., and the Expedition 389 Scientists, Hawaiian Drowned Reefs. Proceedings of the International Ocean Discovery Program, 389: College Station, TX (International Ocean Discovery Program).
Webster, J.M., Ravelo, A.C., Grant, H.L.J., Rydzy, M., Stewart, M., Allison, N., Asami, R., Boston, B., Braga, J.C., Brenner, L., Chen, X., Chutcharavan, P., Dutton, A., Felis, T., Fukuyo, N., Gischler, E., Greve, S., Hagen, A., Hamon, Y., Hathorne, E., Humblet, M., Jorry, S., Khanna, P., Le Ber, E., McGregor, H., Mortlock, R., Nohl, T., Potts, D., Prohaska, A., Prouty, N., Renema, W., Rubin, K.H., Westphal, H., and Yokoyama, Y., 2025a. Expedition 389 methods. In Webster, J.M., Ravelo, A.C., Grant, H.L.J., and the Expedition 389 Scientists, Hawaiian Drowned Reefs. Proceedings of the International Ocean Discovery Program, 389: College Station, TX (International Ocean Discovery Program). https://doi.org/10.14379/iodp.proc.389.102.2025
Webster, J.M., Ravelo, A.C., Grant, H.L.J., Rydzy, M., Stewart, M., Allison, N., Asami, R., Boston, B., Braga, J.C., Brenner, L., Chen, X., Chutcharavan, P., Dutton, A., Felis, T., Fukuyo, N., Gischler, E., Greve, S., Hagen, A., Hamon, Y., Hathorne, E., Humblet, M., Jorry, S., Khanna, P., Le Ber, E., McGregor, H., Mortlock, R., Nohl, T., Potts, D., Prohaska, A., Prouty, N., Renema, W., Rubin, K.H., Westphal, H., and Yokoyama, Y., 2025b. Site M0096. In Webster, J.M., Ravelo, A.C., Grant, H.L.J., and the Expedition 389 Scientists, Hawaiian Drowned Reefs. Proceedings of the International Ocean Discovery Program, 389: College Station, TX (International Ocean Discovery Program). https://doi.org/10.14379/iodp.proc.389.103.2025