Coggon, R.M., Teagle, D.A.H., Sylvan, J.B., Reece, J., Estes, E.R., Williams, T.J., Christeson, G.L., and the Expedition 390/393 Scientists
Proceedings of the International Ocean Discovery Program Volume 390/393
publications.iodp.org
https://doi.org/10.14379/iodp.proc.390393.106.2024
Site U15581
![]() D.A.H. Teagle,
D.A.H. Teagle,
![]() J. Reece,
J. Reece,
![]() T.J. Williams,
T.J. Williams,
![]() R.M. Coggon,
R.M. Coggon,
![]() J.B. Sylvan,
J.B. Sylvan,
![]() E.R. Estes,
E.R. Estes,
![]() G.L. Christeson,
G.L. Christeson,
![]() E. Albers,
E. Albers,
![]() C. Amadori,
C. Amadori,
![]() T.M. Belgrano,
T.M. Belgrano,
![]() T. D'Angelo,
T. D'Angelo,
![]() N. Doi,
N. Doi,
![]() A. Evans,
A. Evans,
![]() G.M. Guérin,
G.M. Guérin,
![]() M. Harris,
M. Harris,
![]() V.M. Hojnacki,
V.M. Hojnacki,
![]() G. Hong,
G. Hong,
![]() X. Jin,
X. Jin,
![]() M. Jonnalagadda,
M. Jonnalagadda,
![]() D. Kuwano,
D. Kuwano,
![]() J.M. Labonte,
J.M. Labonte,
![]() A.R. Lam,
A.R. Lam,
![]() M. Latas,
M. Latas,
![]() W. Lu,
W. Lu,
![]() P. Moal-Darrigade,
P. Moal-Darrigade,
![]() S.F. Pekar,
S.F. Pekar,
![]() C. Robustelli Test,
C. Robustelli Test,
![]() J.G. Ryan,
J.G. Ryan,
![]() D. Santiago Ramos,
D. Santiago Ramos,
![]() A. Shchepetkina,
A. Shchepetkina,
![]() A. Villa,
A. Villa,
![]() S.Y. Wee,
S.Y. Wee,
![]() S.J. Widlansky,
S.J. Widlansky,
![]() M. Aizawa,
M. Aizawa,
![]() C. Borrelli,
C. Borrelli,
![]() J.D. Bridges,
J.D. Bridges,
![]() E.J. Carter,
E.J. Carter,
![]() J. Dinarès-Turell,
J. Dinarès-Turell,
![]() J.D. Estep,
J.D. Estep,
![]() W.P. Gilhooly III,
W.P. Gilhooly III,
![]() L.J.C. Grant,
L.J.C. Grant,
![]() M.R. Kaplan,
M.R. Kaplan,
![]() P.D. Kempton,
P.D. Kempton,
![]() C.M. Lowery,
C.M. Lowery,
![]() A. McIntyre,
A. McIntyre,
![]() C.M. Routledge,
C.M. Routledge,
![]() A.L. Slagle,
A.L. Slagle,
![]() M. Takada,
M. Takada,
![]() L. Tamborrino,
L. Tamborrino,
![]() Y. Wang,
Y. Wang,
![]() K. Yang,
K. Yang,
![]() W. Kurz,
W. Kurz,
![]() M. Prakasam,
M. Prakasam,
![]() L. Tian,
L. Tian,
![]() T. Yu, and
T. Yu, and
![]() G. Zhang2
G. Zhang2
1 Teagle, D.A.H., Reece, J., Williams, T.J., Coggon, R.M., Sylvan, J.B., Estes, E.R., Christeson, G.L., Albers, E., Amadori, C., Belgrano, T.M., D'Angelo, T., Doi, N., Evans, A., Guérin, G.M., Harris, M., Hojnacki, V.M., Hong, G., Jin, X., Jonnalagadda, M., Kuwano, D., Labonte, J.M., Lam, A.R., Latas, M., Lu, W., Moal-Darrigade, P., Pekar, S.F., Robustelli Test, C., Ryan, J.G., Santiago Ramos, D., Shchepetkina, A., Villa, A., Wee, S.Y., Widlansky, S.J., Aizawa, M., Borrelli, C., Bridges, J.D., Carter, E.J., Dinarès-Turell, J., Estep, J.D., Gilhooly, W.P., III, Grant, L.J.C., Kaplan, M.R., Kempton, P.D., Lowery, C.M., McIntyre, A., Routledge, C.M., Slagle, A.L., Takada, M., Tamborrino, L., Wang, Y., Yang, K., Kurz, W., Prakasam, M., Tian, L., Yu, T., and Zhang, G., 2024. Site U1558. In Coggon, R.M., Teagle, D.A.H., Sylvan, J.B., Reece, J., Estes, E.R., Williams, T.J., Christeson, G.L., and the Expedition 390/393 Scientists, South Atlantic Transect. Proceedings of the International Ocean Discovery Program, 390/393: College Station, TX (International Ocean Discovery Program). https://doi.org/10.14379/iodp.proc.390393.106.2024
2 Expedition 390/393 Scientists' affiliations.
1. Background and objectives
Site U1558 (30°53.7814′S, 24°50.4822′W; proposed Site SATL-43A) is in the central South Atlantic Ocean at a water depth of ~4334 meters below sea level (mbsl) ~1067 km west of the Mid-Atlantic Ridge (see Figure F1 and Tables T1, T2, all in the Expedition 390/393 summary chapter [Coggon et al., 2024c]) on crust that formed at a slow half spreading rate of ~19.5 mm/y (Kardell et al., 2019; Christeson et al., 2020) (see Figure F7 in the Expedition 390/393 summary chapter [Coggon et al., 2024c]). With an estimated age of 49.2 Ma, Site U1558 is the second oldest location of the South Atlantic Transect (SAT) campaign (International Ocean Discovery Program [IODP] Expeditions 390C, 395E, 390, and 393).
1.1. Geologic setting
Site U1558 is located on the main approximately east–west (085) Crustal Reflectivity Experiment Southern Transect (CREST) crossing Line 1B/1C at Common Depth Point 3252 about 1.9 km west of the north-south–trending (355) CREST Seismic Line 04 (Figures F1, F2) (Reece et al., 2016; Reece and Estep, 2019). Interpretation of multichannel seismic and ocean-bottom seismograph data in this region suggests that the ocean crust at the site is slightly thinner (~5.5 km; Christeson et al., 2020) than normal ocean crust (6.15 ± 0.93 km; Christeson et al., 2019). At a water depth of 4334 m, Site U1558 is significantly shallower (~450 m) than predicted by simple lithospheric cooling models (see Figure F4 in the Expedition 390/393 summary chapter [Coggon et al., 2024c]) (e.g., Parsons and Sclater, 1977; Korenaga and Korenaga, 2008; Marty and Cazenave, 1989). This difference presumably reflects the location of this site on a relatively elevated feature on the rugged faulted terrain of the western flank of the southern Mid-Atlantic Ridge.
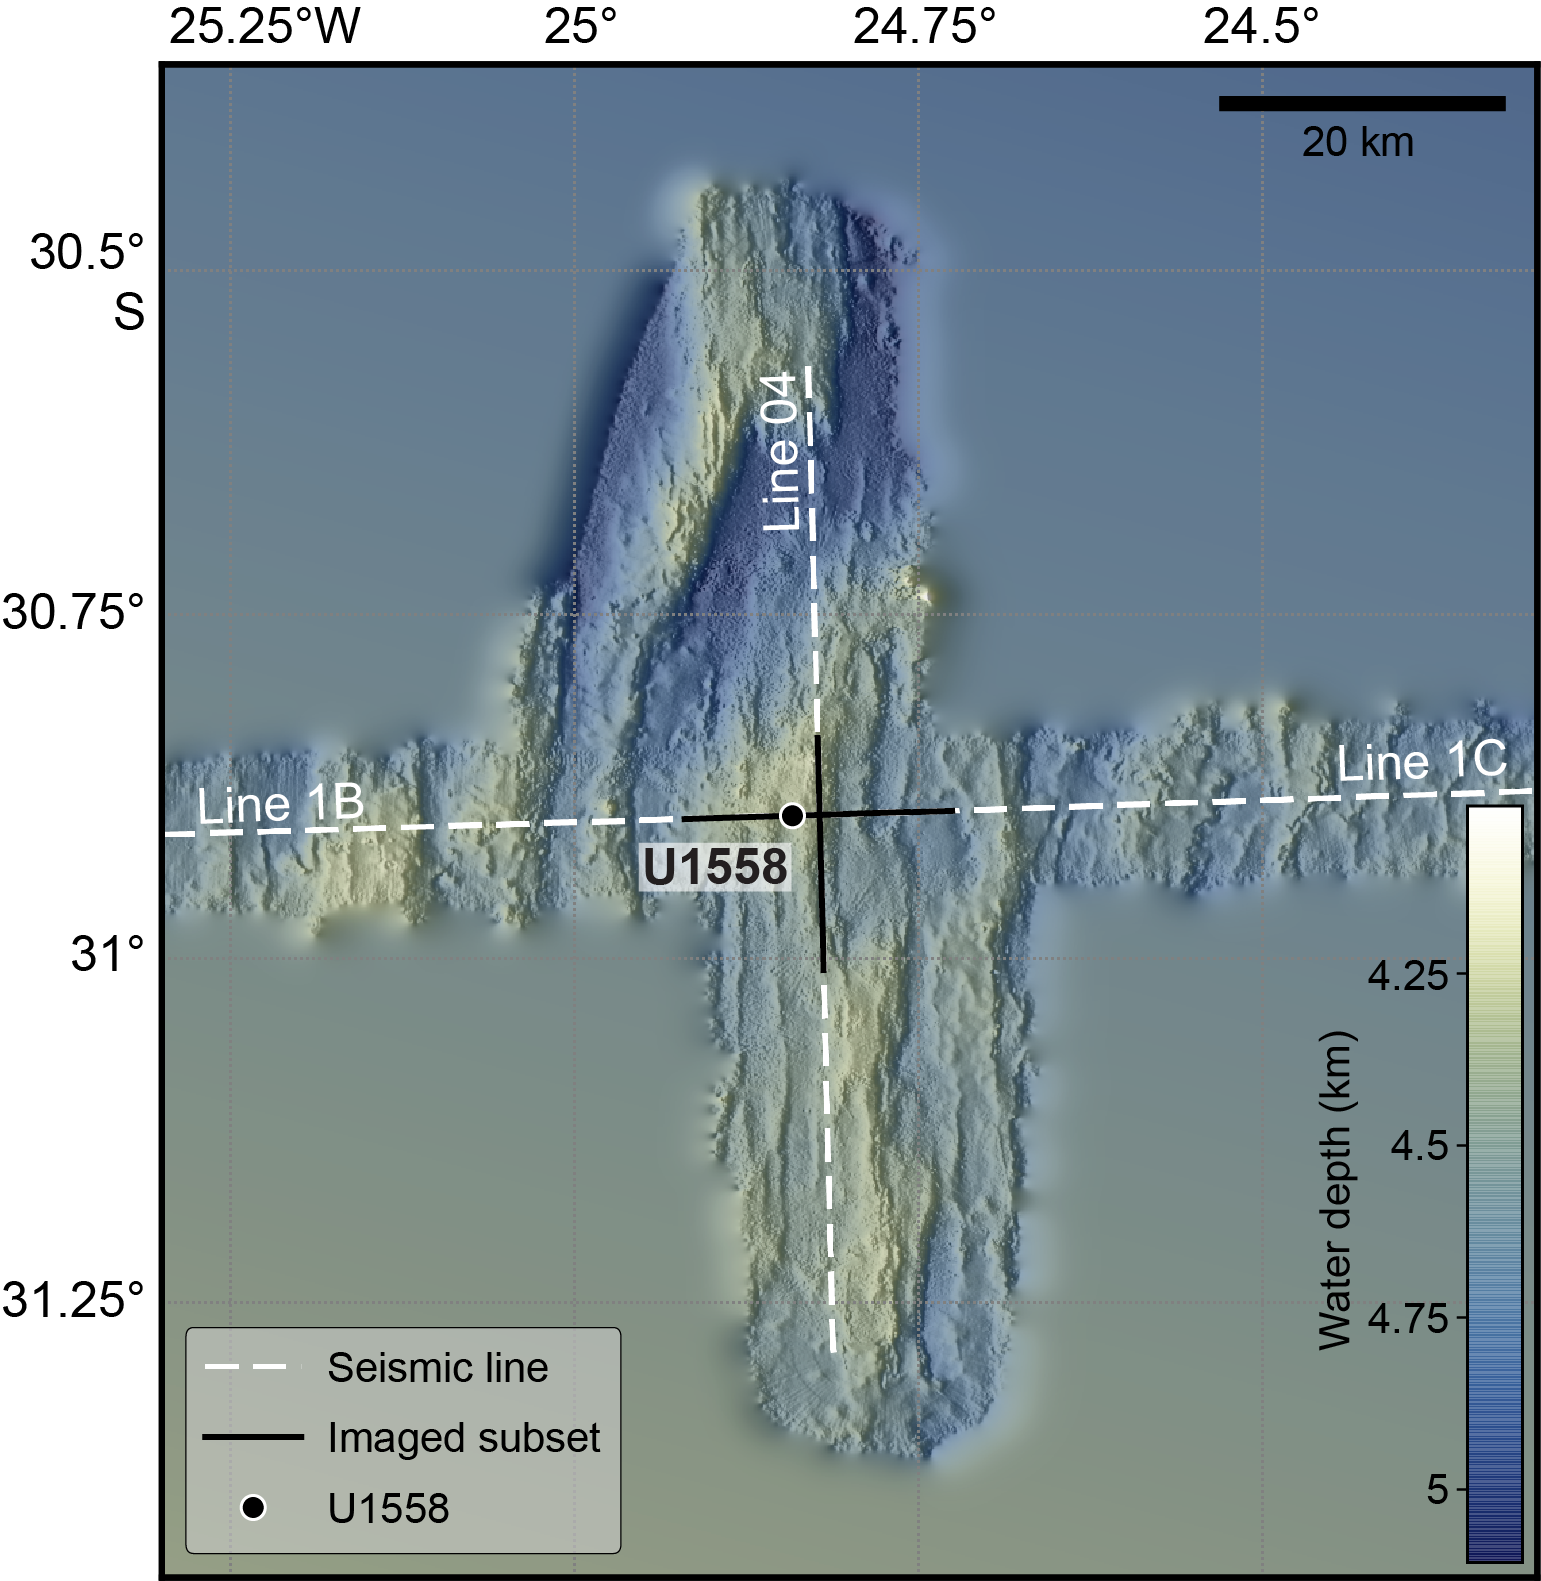
Figure F1. Bathymetric map.
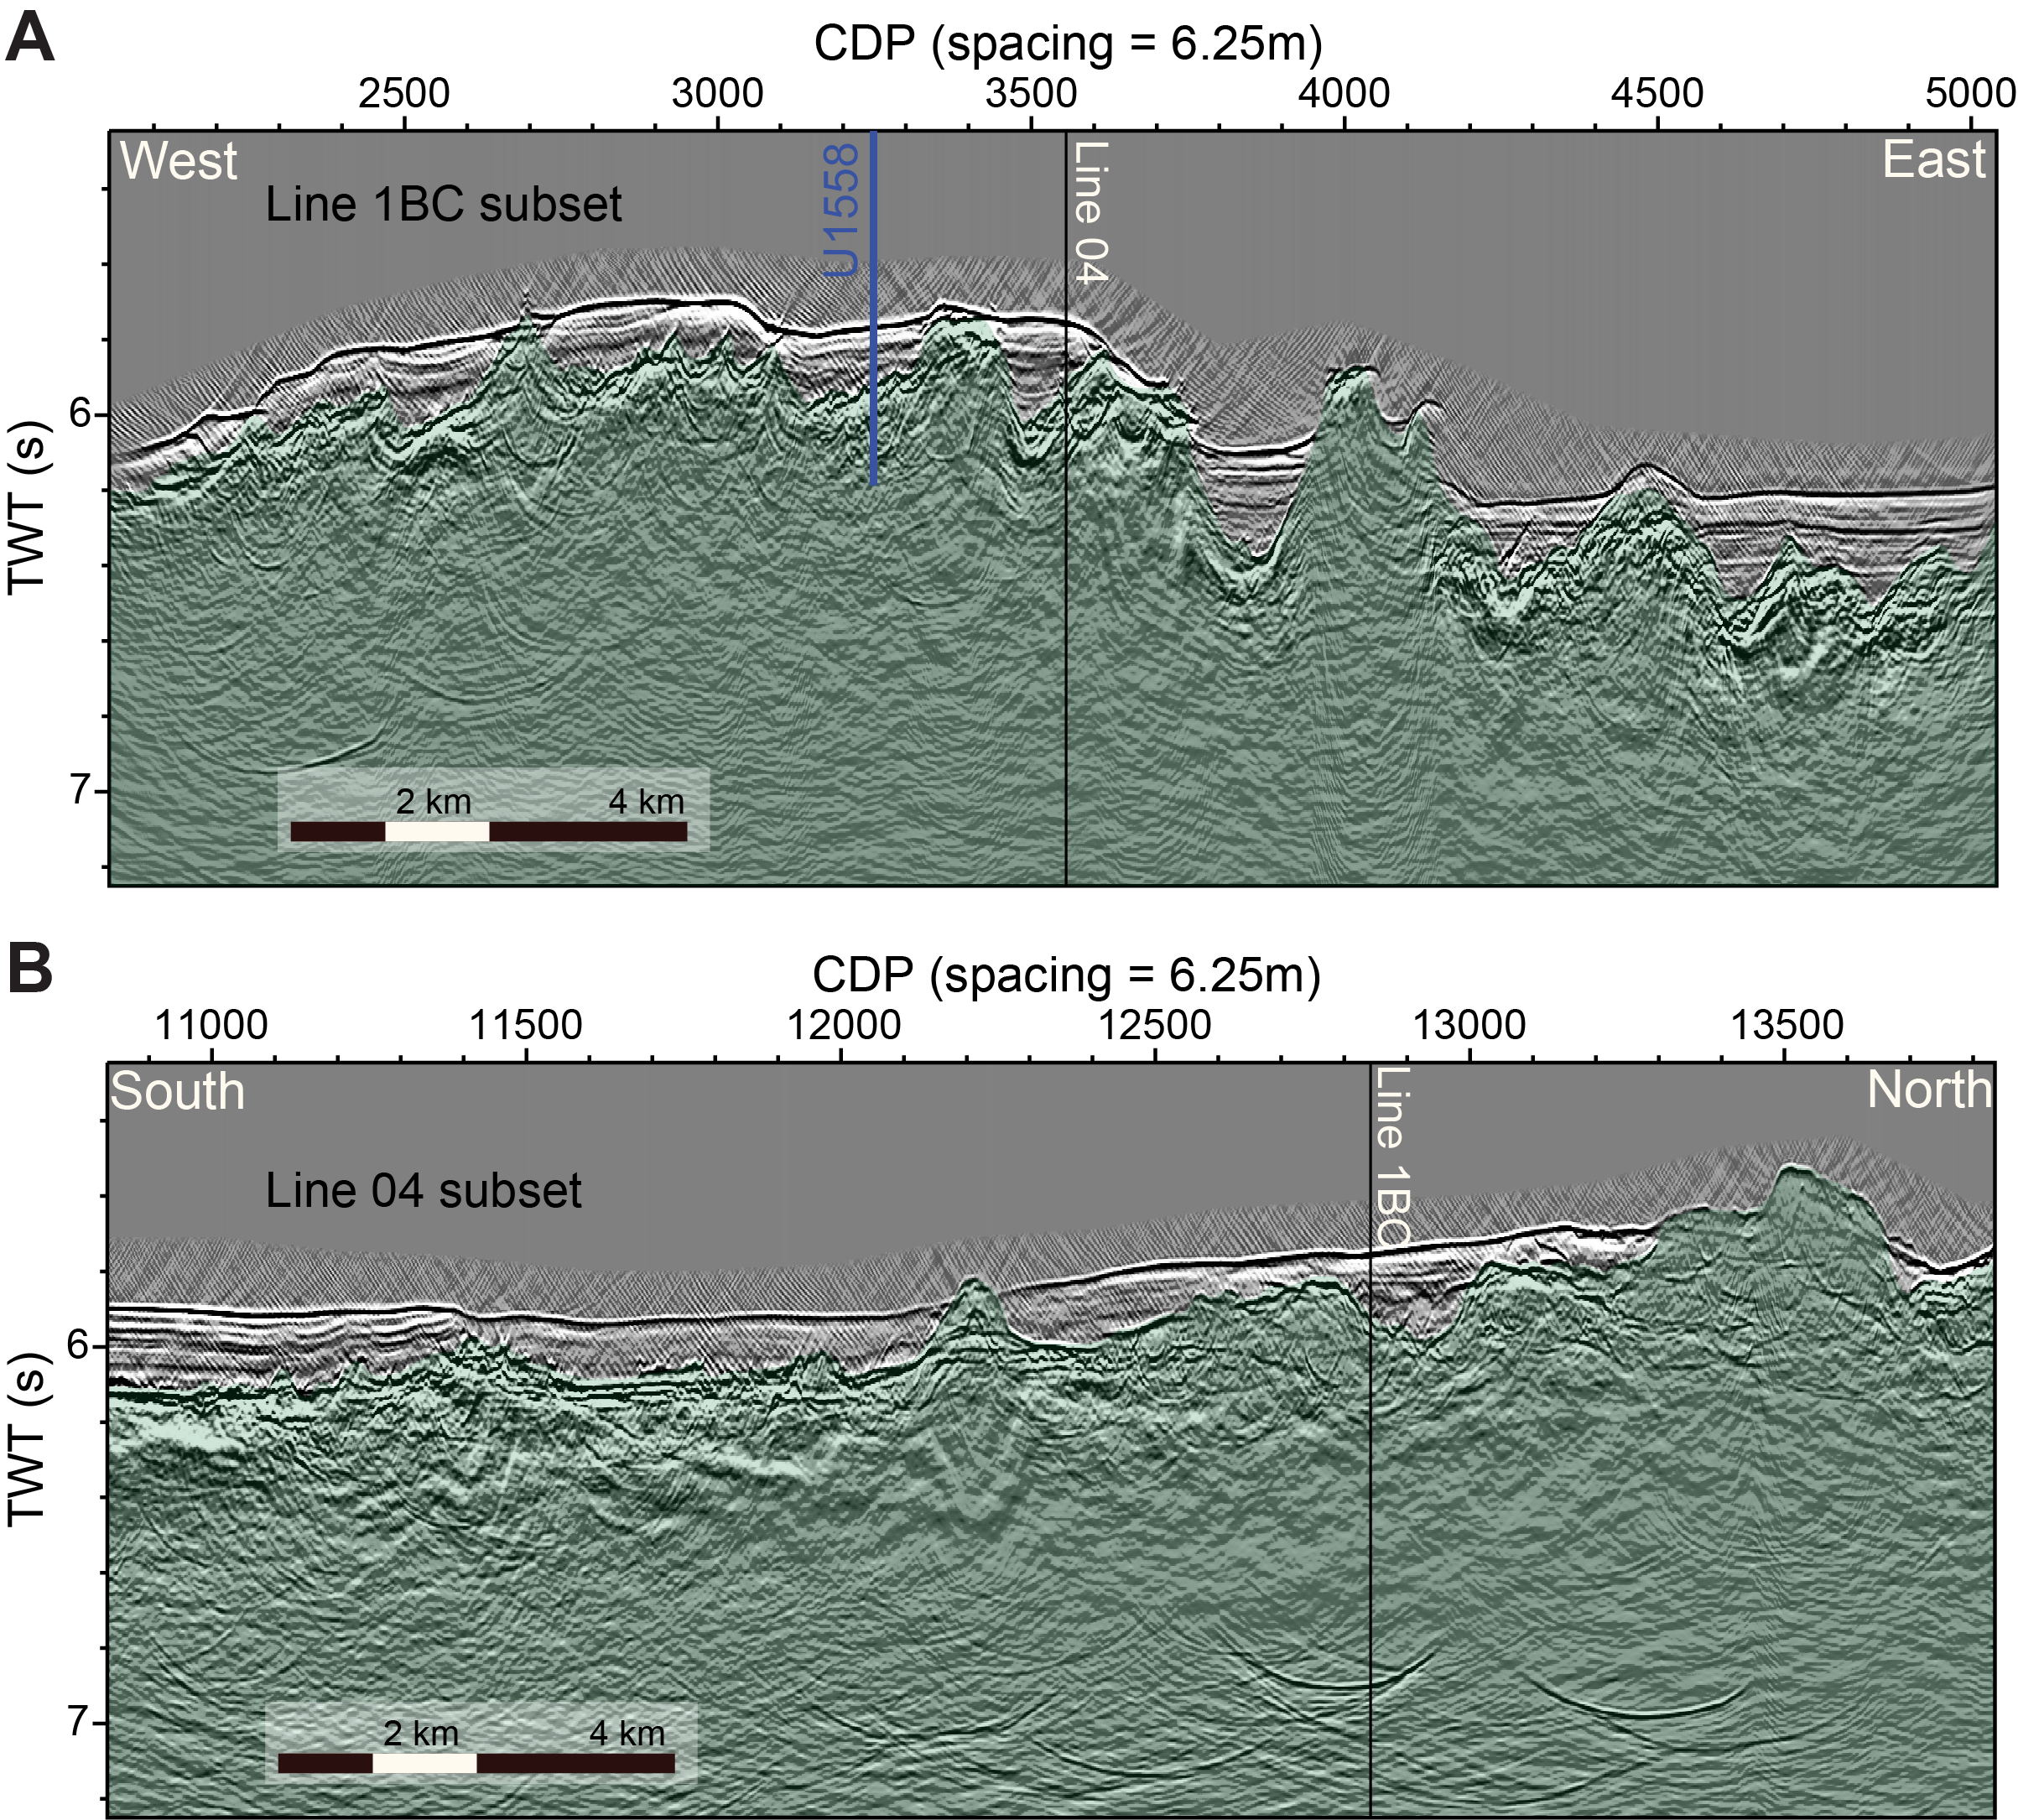
Figure F2. Seismic reflection profiles.
Site U1558 sits in a ~1 km wide sediment-filled subbasin on top of an irregular, near north-south–trending (355), ~20 km wide, 500 m high basement ridge elevated above the regional seafloor (Figures F1, F2, F3). This basement ridge is one of many subparallel and 30–40 km long ridges, although it is significantly higher than the neighboring 100–200 m high basement ridges. On the east–west seismic profile CREST Line 1B/1C, a number of these 1 km wide subbasins are imaged across the basement ridge, each filled with ~150 to ~270 m of sediment (Figure F2A) to a range of bathymetric levels between 4300 and 4700 mbsl (Figure F1). The subbasins are separated by basement highs, most of which are draped by sediments, resulting in almost continuous sediment cover across the ridge. However, some basement high points remain emergent or covered by only thin sedimentary cover. The basement ridge Site U1558 is located on deepens to the north into a ~5000 m deep basin (Figure F1).
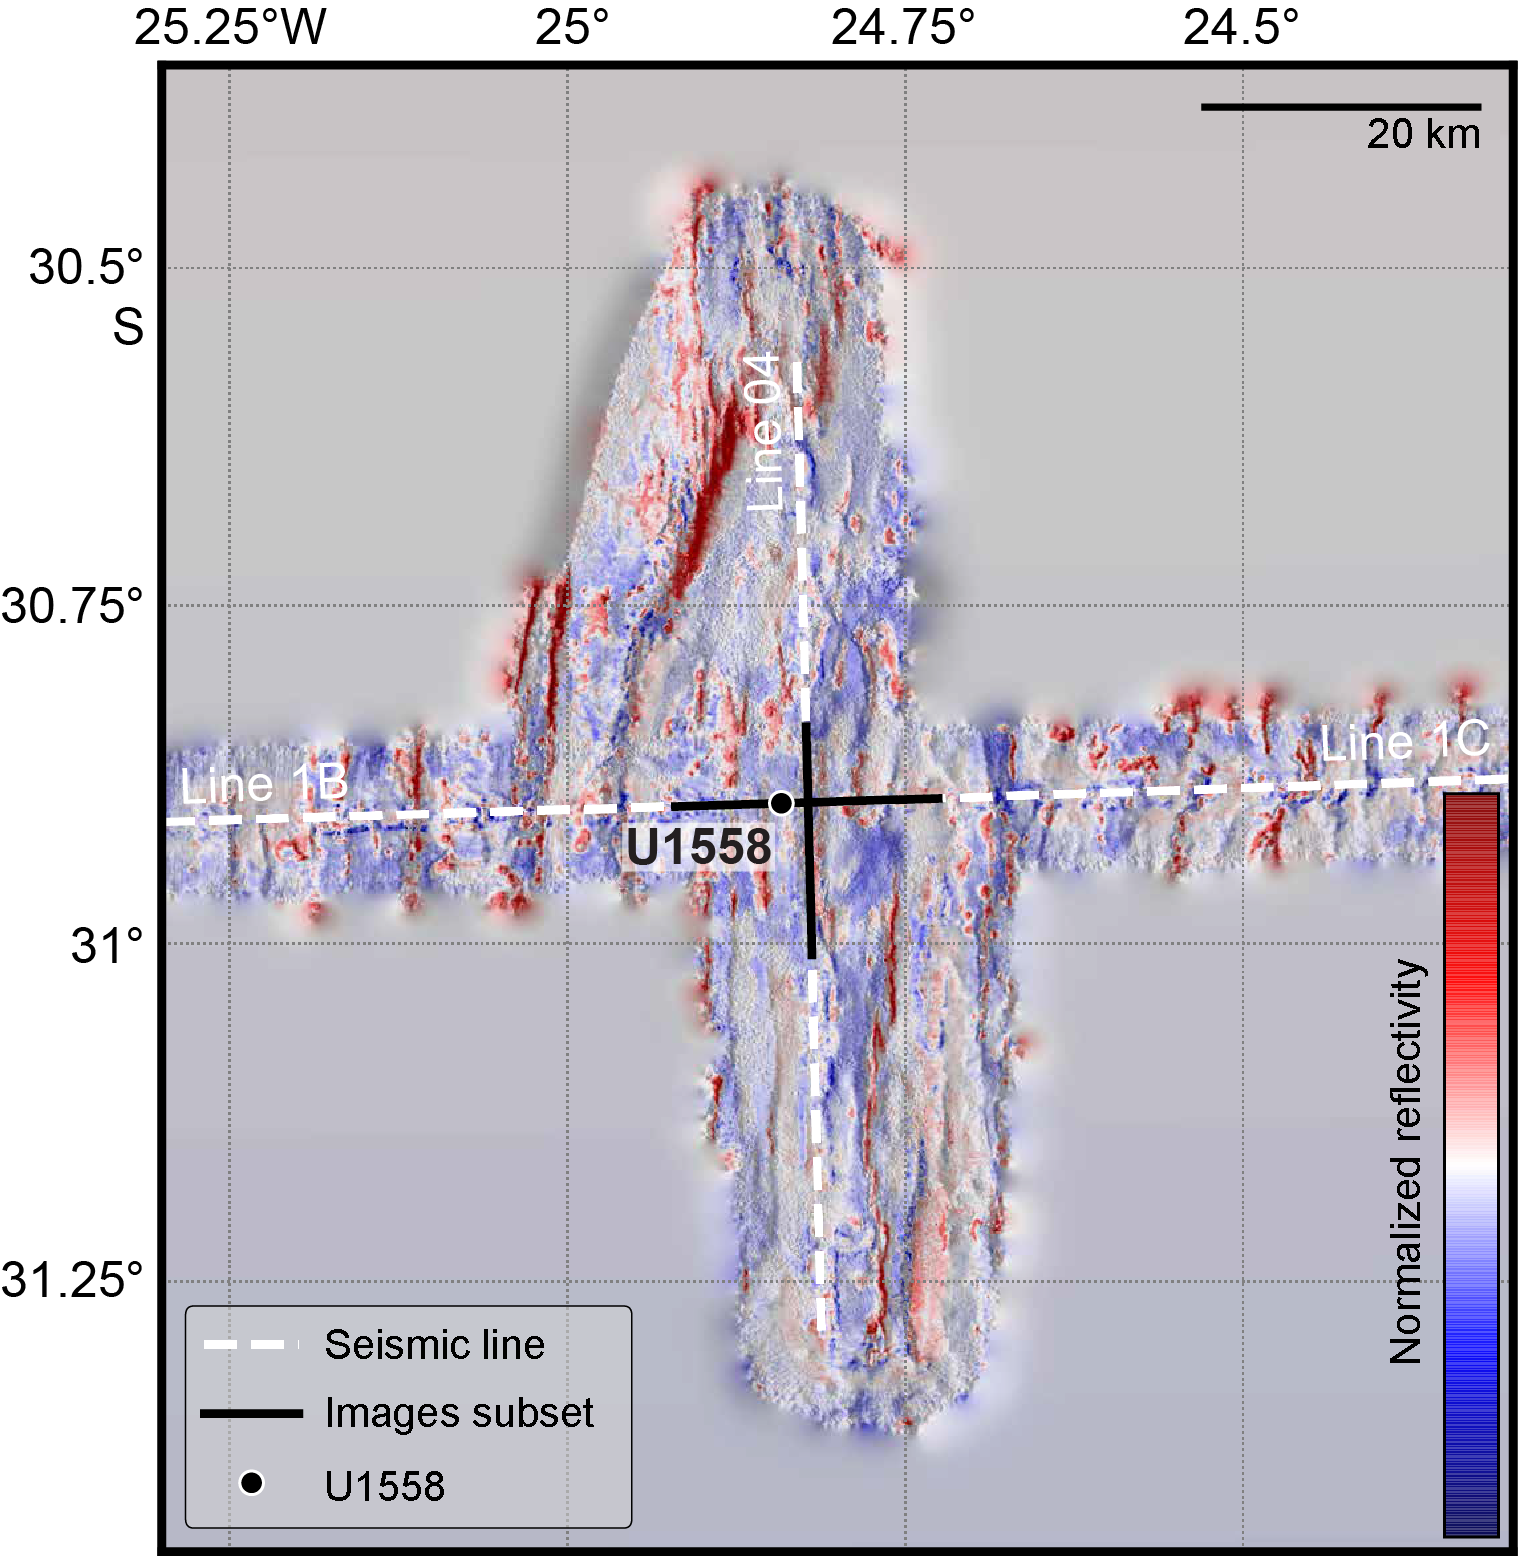
Figure F3. Backscatter reflections.
Seismic observations suggest that the ocean crust at Site U1558 has a sediment cover of 167 m (Reece et al., 2016; Reece and Estep, 2019), which is close to the global average overburden thickness for basement of this age (~150 m; Spinelli et al., 2004) and the reported mean sediment thickness encountered along CREST Seismic Line 1B for crustal ages between 48 and 63 Ma (132 m; Estep et al., 2019). However, a recent sedimentation thickness global synthesis suggests that ~50 Ma ocean crust should host between 200 and 360 m of sediment (cf. Olson et al., 2016; Straume et al., 2019, and references therein).
Backscatter reflections from multibeam profiles (Figure F3) reveal that a significant proportion of the seafloor near Site U1558 returns strong reflections and is either unsedimented or hosts only thin, discontinuous sediment cover. This may allow ventilation of the volcanic rocks of the upper ocean crust through the ingress of seawater and egress of seawater-derived low-temperature hydrothermal fluids, with consequent impacts on heat flow, sediment pore waters, basement hydrothermal alteration, and microbial communities in both the marine sediments and underlying basalts.
Site U1558 was first occupied during engineering Expedition 390C, during which Hole U1558A was cored using the advanced piston corer (APC) and extended core barrel (XCB) systems to a total depth of 163.9 meters below seafloor (mbsf), penetrating the entire sediment succession and ~4.5 m into basement (Figure F5; Table T1) (see Table T2 and Figure F15, both in the Expedition 390/393 summary chapter [Coggon et al., 2024c]) (Estes et al., 2021). After operations in Hole U1558A were complete, a reentry system and casing was supposed to be installed into basement in the next hole. However, the drill string could not be disconnected from the reentry system using the Dril-Quip running tool because the hard rock inhibited the complete transfer of weight off of the tool. After two failed attempts in Holes U1558B and U1558C, a reentry system with 13⅜ inch casing was finally installed to 146.1 mbsf in Hole U1558D about 10 m above the estimated basement depth (instead of into basement) and 21 m above the actual sediment/basement interface in this hole (~167 mbsf) (Figure F4). The basement/sediment interface is irregular at the site and varies more than 15 m between Holes U1558A (~159 mbsf), U1558D (~167 mbsf), and U1558F (~176 mbsf) (see Table T2 in the Expedition 390/393 summary chapter [Coggon et al., 2024c]). The age of Site U1558 was predicted to be ~49.2 Ma based on CREST site survey magnetic data (Kardell et al., 2019). However, preliminary biostratigraphy analysis of cores sampled during Expedition 390C suggest that the lowermost sediments in Hole U1558A are middle to late Eocene (~42 Ma), suggesting a long period of little or no sedimentation.
1.2. Objectives
The operational objectives at Site U1558 during Expedition 393 were to (1) core the entire sediment section and a few meters into basement with the APC/XCB system in Hole U1558F to collect material that addresses the paleoceanographic, paleoclimate, and microbiological objectives of the SAT expeditions; (2) core 250 m into basement with the rotary core barrel (RCB) system in Hole U1558D to collect material that addresses the petrologic, geochemical, and microbiological objectives of the SAT expeditions; and (3) collect wireline geophysical logging data through the basement sections.
2. Operations
Site U1558 was previously occupied in November 2020 during Expedition 390C with objectives to confirm the depth to basement by coring, conduct gas safety measurements, and set a reentry system consisting of a reentry cone and 13⅜ inch casing (Estes et al., 2021). Hole U1558A was cored with the APC and XCB systems to 163.9 mbsf, finding the sediment/basement contact at 158.9 mbsf. Holes U1558B and U1558C marked unsuccessful attempts to drill in and release the reentry system using the Dril-Quip running tool. While lowering the reentry system for Hole U1558D (Figure F4), the reentry cone and mud skirt became detached from the casing and fell to the seafloor the right way up and within a few meters of the intended location. The drill bit and casing assembly were lowered through the cone and drilled into Hole U1558D, setting the casing shoe at 146.1 mbsf and the base of the hole at 150.0 mbsf.
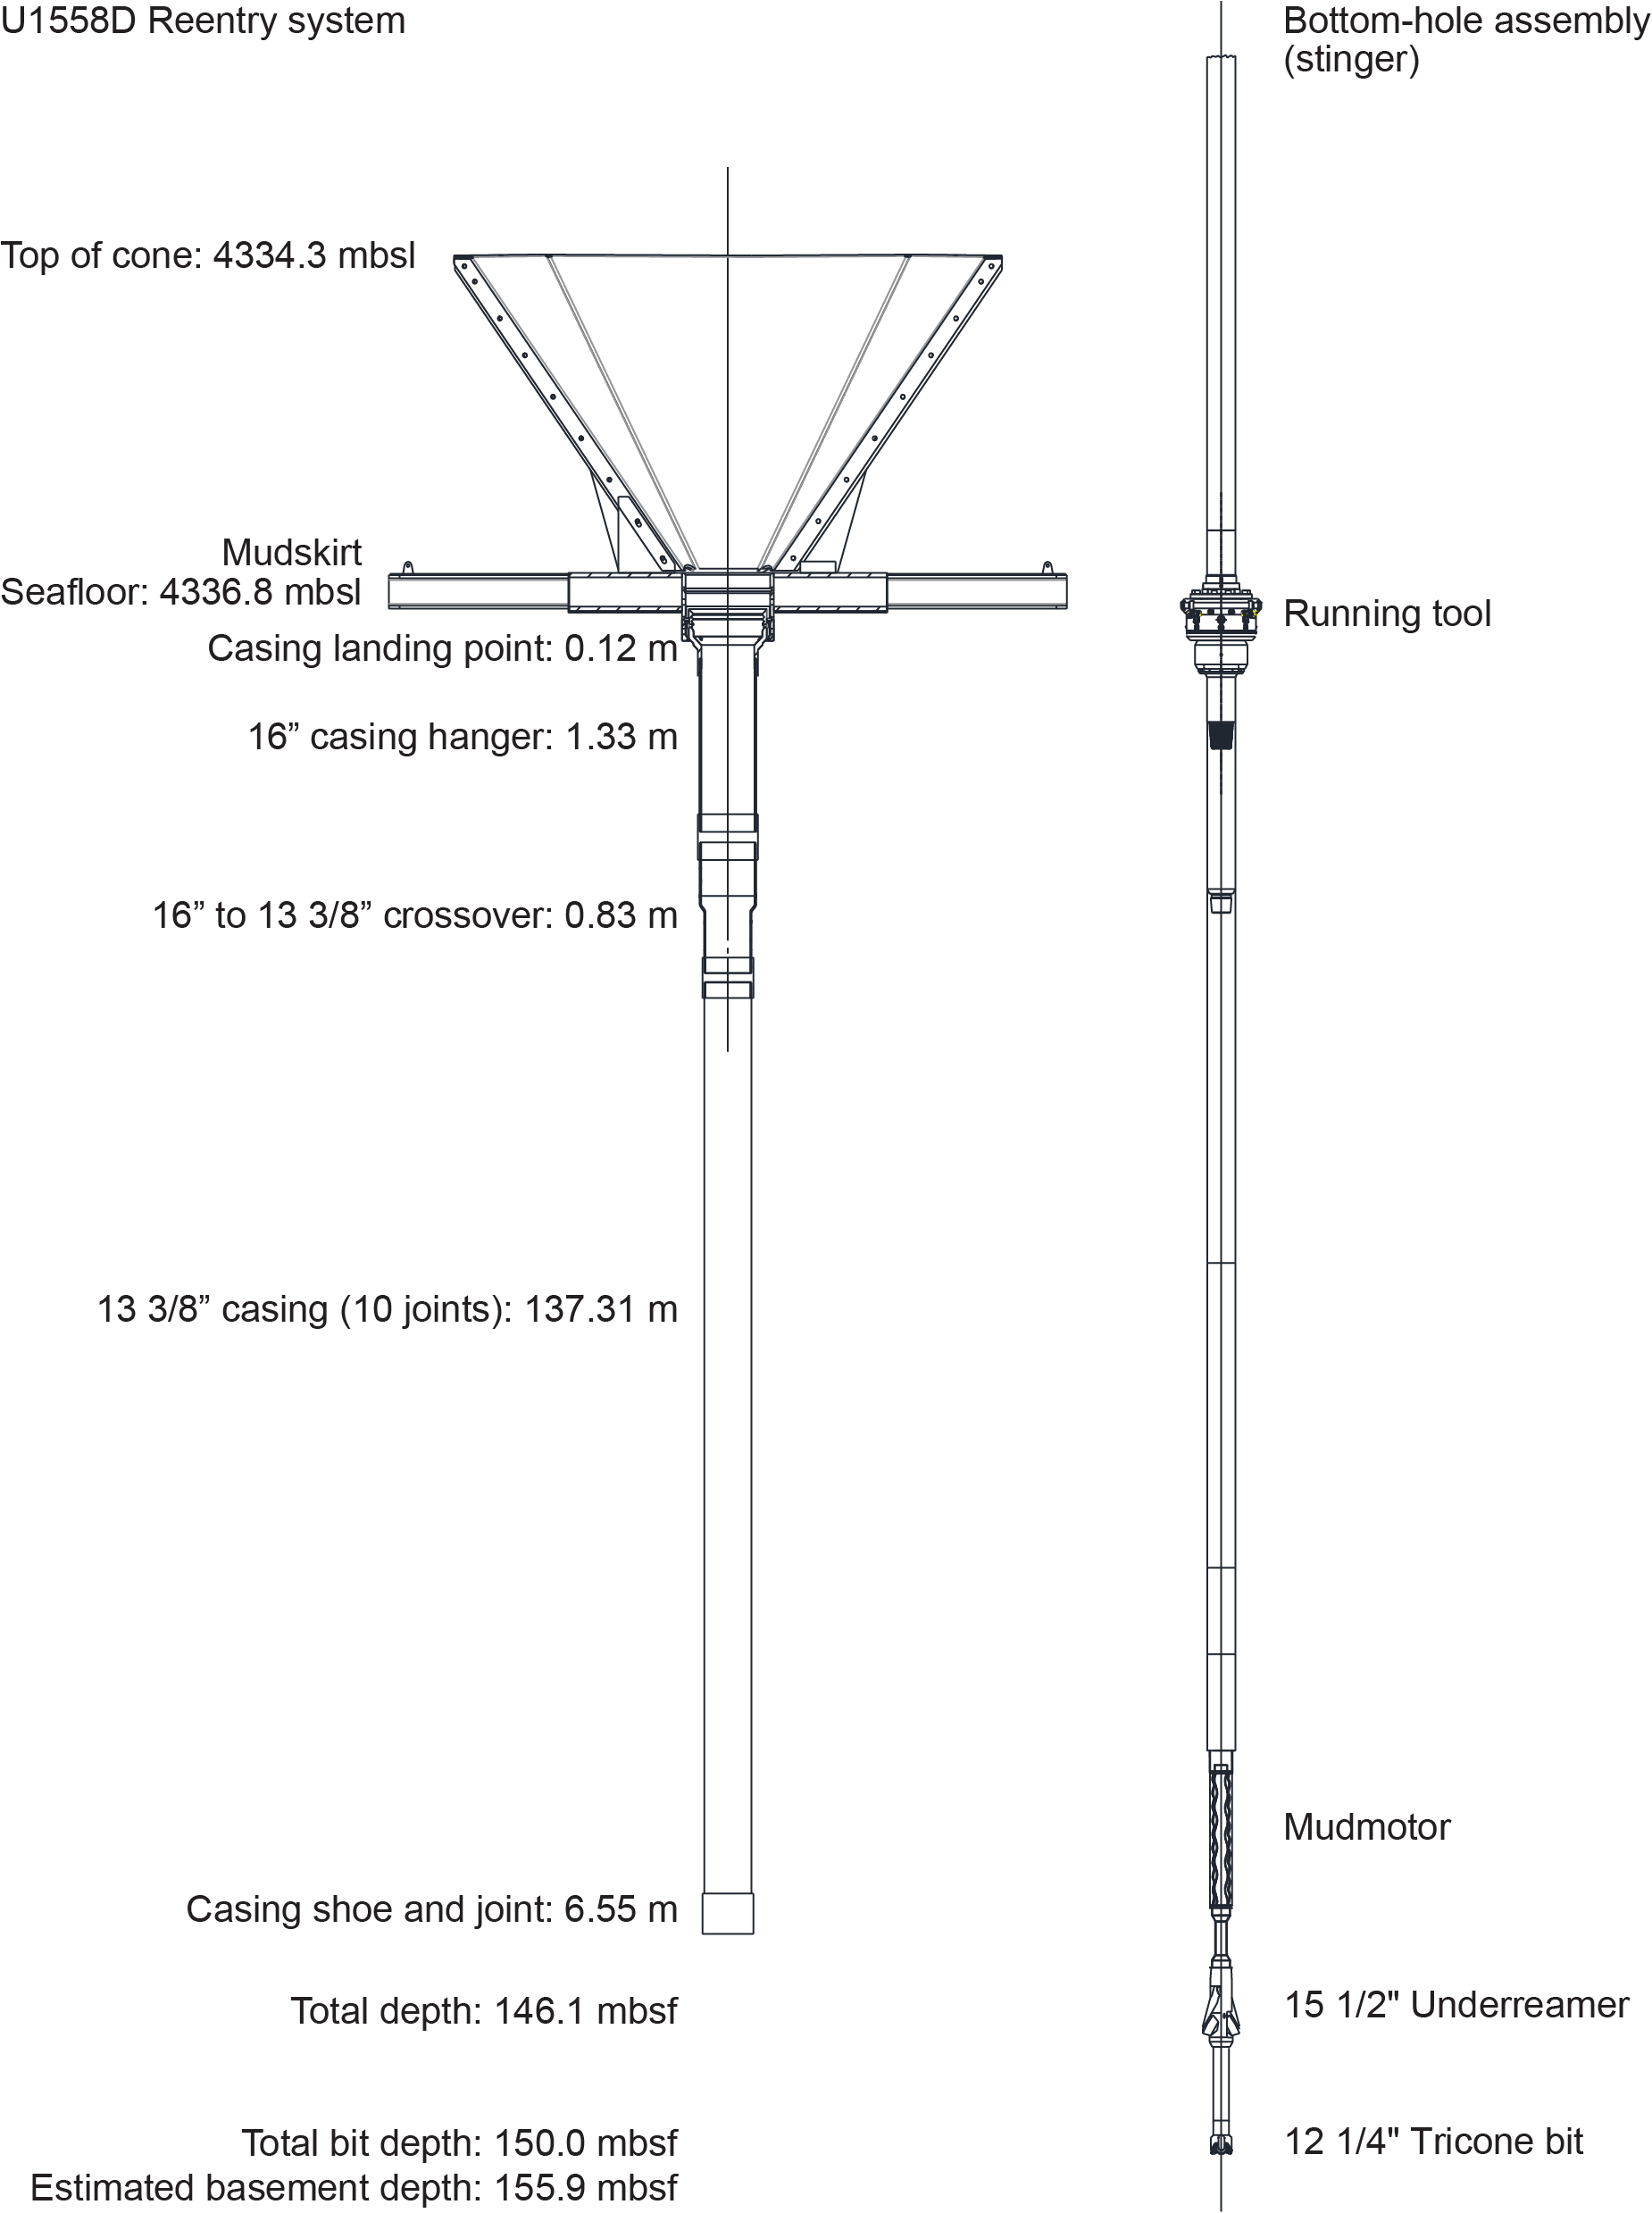
Figure F4. Reentry system.
During Expedition 393, three holes were cored at Site U1558 (Table T1; Figure F5). Hole U1558E consisted of one APC core that missed the mudline. Hole U1558F was cored with the APC/XCB system to 177.2 mbsf, with the sediment/basement contact at 176.0 mbsf. In Hole U1558D, the sediment/basement contact was found at 166.8 mbsf and the volcanic sequence was cored with the RCB system to 370.2 mbsf (203.4 meters subbasement [msb]). Unfortunately, while withdrawing the bit out of Hole U1558D to prepare for wireline logging, the reentry cone and some casing were pulled out the seafloor by the bottom-hole assembly (BHA), ending operations in that hole. The cased SAT holes were intended to be legacy holes for potential future deepening or other operations, but this is no longer possible at this site. This also precluded wireline logging of the volcanic sequences.
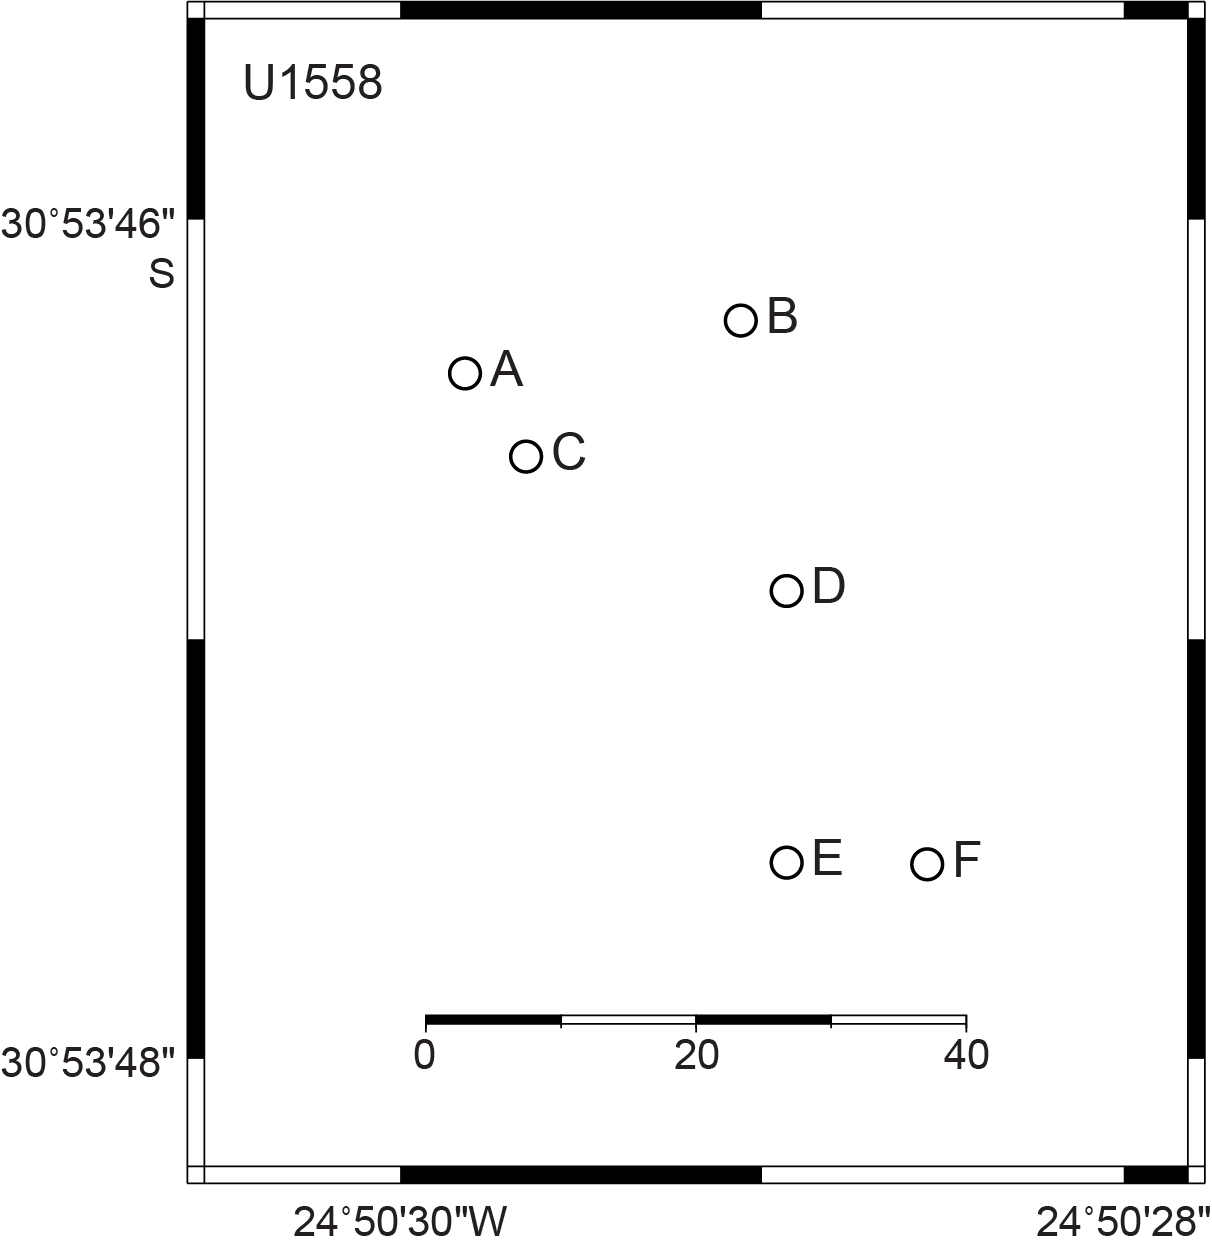
Figure F5. Map of holes drilled.
2.1. Transit
The ship completed the 508 nmi transit from Site U1559 to Site U1558 in 46.5 h (1.9 days), arriving on site at 1125 h on 25 June 2022. The ship was switched to dynamic positioning mode, beginning operations at Site U1558.
2.2. Hole U1558E
An APC/XCB BHA was assembled and deployed to 4321 meters below rig floor (mbrf). A pipe "pig" was circulated down through the drill pipe to remove any rust from the extra ~1300 m of pipe required to reach the seafloor at Site U1558, compared to the shallower Site U1559 drilled previously. Heavy weather and sea conditions delayed the start of coring in Hole U1558E by 3 h while waiting for the ship's heave to subside. The ship was positioned 20 m south of Hole U1558D (Figure F5). At 0440 h on 26 June 2022, Core 393-U1558E-1H penetrated 9.5 m and recovered 9.97 m (105%), but there was no mudline. Therefore, Hole U1558E was terminated at 0515 h.
2.3. Hole U1558F
The ship was offset 10 m east of Hole U1558E (50 m southeast of Hole U1558A; Figure F5), and we started Hole U1558F at 0610 h on 26 June 2022. Coring started with the full-length APC system, and a seafloor depth of 4337.3 mbsl was established based on the mudline in Core 393-U1558F-1H. After Core 3H, we drilled ahead 3 m in an effort to fill gaps in the stratigraphy recovered from Hole U1558A during Expedition 390C. APC coring continued through Core 10H at 86.9 mbsf, where 80,000 lb of overpull was required to free the barrel, marking APC refusal depth. All full-length APC cores were oriented, and the advanced piston corer temperature (APCT-3) tool was deployed for Cores 3H, 6H, and 10H. Unfortunately, the advance in Core 10H was overdrilled by 4.7 m, and core is missing from Hole U1558F from 82.2 to 86.9 mbsf. The half-length APC (HLAPC) was deployed for Cores 11F–19F. Core 19F needed to be freed by drilling over the core barrel at 129.2 mbsf, marking HLAPC refusal depth. The XCB coring system was deployed for Cores 20X–24X. The driller noted a formation change at 176.0 mbsf (the basement contact), and drilling was terminated at 177.2 mbsf approximately 1.2 m into volcanic rocks. Cores 1H–24X penetrated from 0 to 177.2 mbsf and recovered 164.3 m (94%). The drill string was recovered to the ship, and the drill bit cleared the rotary table at 0035 h on 28 June, ending Hole U1558F.
2.4. Hole U1558D
We then made up the RCB BHA with a new TransCo C-4 RCB bit and following a slip and cut, lowered it to Hole U1558D, where a reentry system had been installed in November 2020 during Expedition 390C. Guided by the subsea camera video feed, the ship maneuvered over the hole. At first, the bit entered the center of the cone, but it soon met resistance; the bit did not pass down into the casing and had to be pulled back above the cone. In retrospect, this was the first indication that there would be trouble with casing in this hole. The second attempt was successful, and the bit reentered Hole U1558D at 1505 h on 28 June 2022. We lowered the bit to the depth of the existing hole (150 mbsf) and started coring at 1845 h. The existing hole is designated as drilled interval 390C-U1558D-11. Cores 393-U1558D-2R and 3R penetrated from 150 to 166.5 mbsf and recovered 3.27 m (20%) of sediment. The sediment/basement contact was determined to be at 166.8 mbsf based on an abrupt slowing of the rate of penetration at that depth while starting to drill Core 4R. Coring continued, at first alternating between full- and half-length cores based on the rate of penetration and core recovery, and switching exclusively to half-length cores from Core 16R. Perfluorocarbon tracer was run on all cores. Core 39R reached a healthy 203.4 m into volcanic rock, and coring was stopped to enable wireline logging. Basement Cores 4R–39R sampled from 166.8 to 370.2 mbsf, recovered 97.53 m of core (~48%), and took 5.0 days to drill.
At 0330 h on 4 July, we set back the top drive and pulled the bit up to 126.3 mbsf, observing 20,000 lb of drag. At 0445 h, we deployed the subsea camera to observe the bit release and guide reentry in preparation for downhole logging. We pulled the bit out of the hole to 4317 mbsl, 17 m above the seafloor. However, at 0615 h the drill pipe was observed by the subsea camera to be still inside the reentry cone, with the cone much higher up than it should be. The extra weight on the drill string confirmed that the cone and some, perhaps all, casing had been pulled out of the hole by the BHA. From 0730 to 0830 h, we attempted unsuccessfully to free the casing by pushing into the seafloor. We raised the camera back up to the ship, and from 1030 to 1100 h we attempted to free the drill string from the casing by rotation. During this process, a weight decrease of 30,000 lb was observed on the hook load indicator, showing that at least part of the casing had come free. The subsea camera was deployed again, and at 1345 h we observed that the cone had fallen away and that some of the BHA drill collars appeared to be bent but the casing hanger and casing crossover were still attached (Figure F6). The decision was made to retrieve the drill string and deal with any casing at the surface. When the drill string reached surface, the casing hanger and casing were no longer attached and must have fallen away while being raised. The bit cleared the rotary on the rig floor at 0215 h on 5 July. We disassembled the BHA, examined it for damage, and set aside the bottom three drill collars, one of which was slightly bent. After 65.4 h drilling time, the C-4 bit had only minor wear, with a few worn teeth at the top of the roller cones. We then secured the rig floor for transit and raised the thrusters, ending operations in Hole U1558D and at Site U1558. The original operations plan included running three downhole logging tool strings in Hole U1558D, but they could not be undertaken. Unfortunately, Hole U1558D is no longer a legacy hole for potential future operations. At 0530 h on 5 July, we started the 227 nmi transit to Site U1583 (proposed Site SATL-33B).
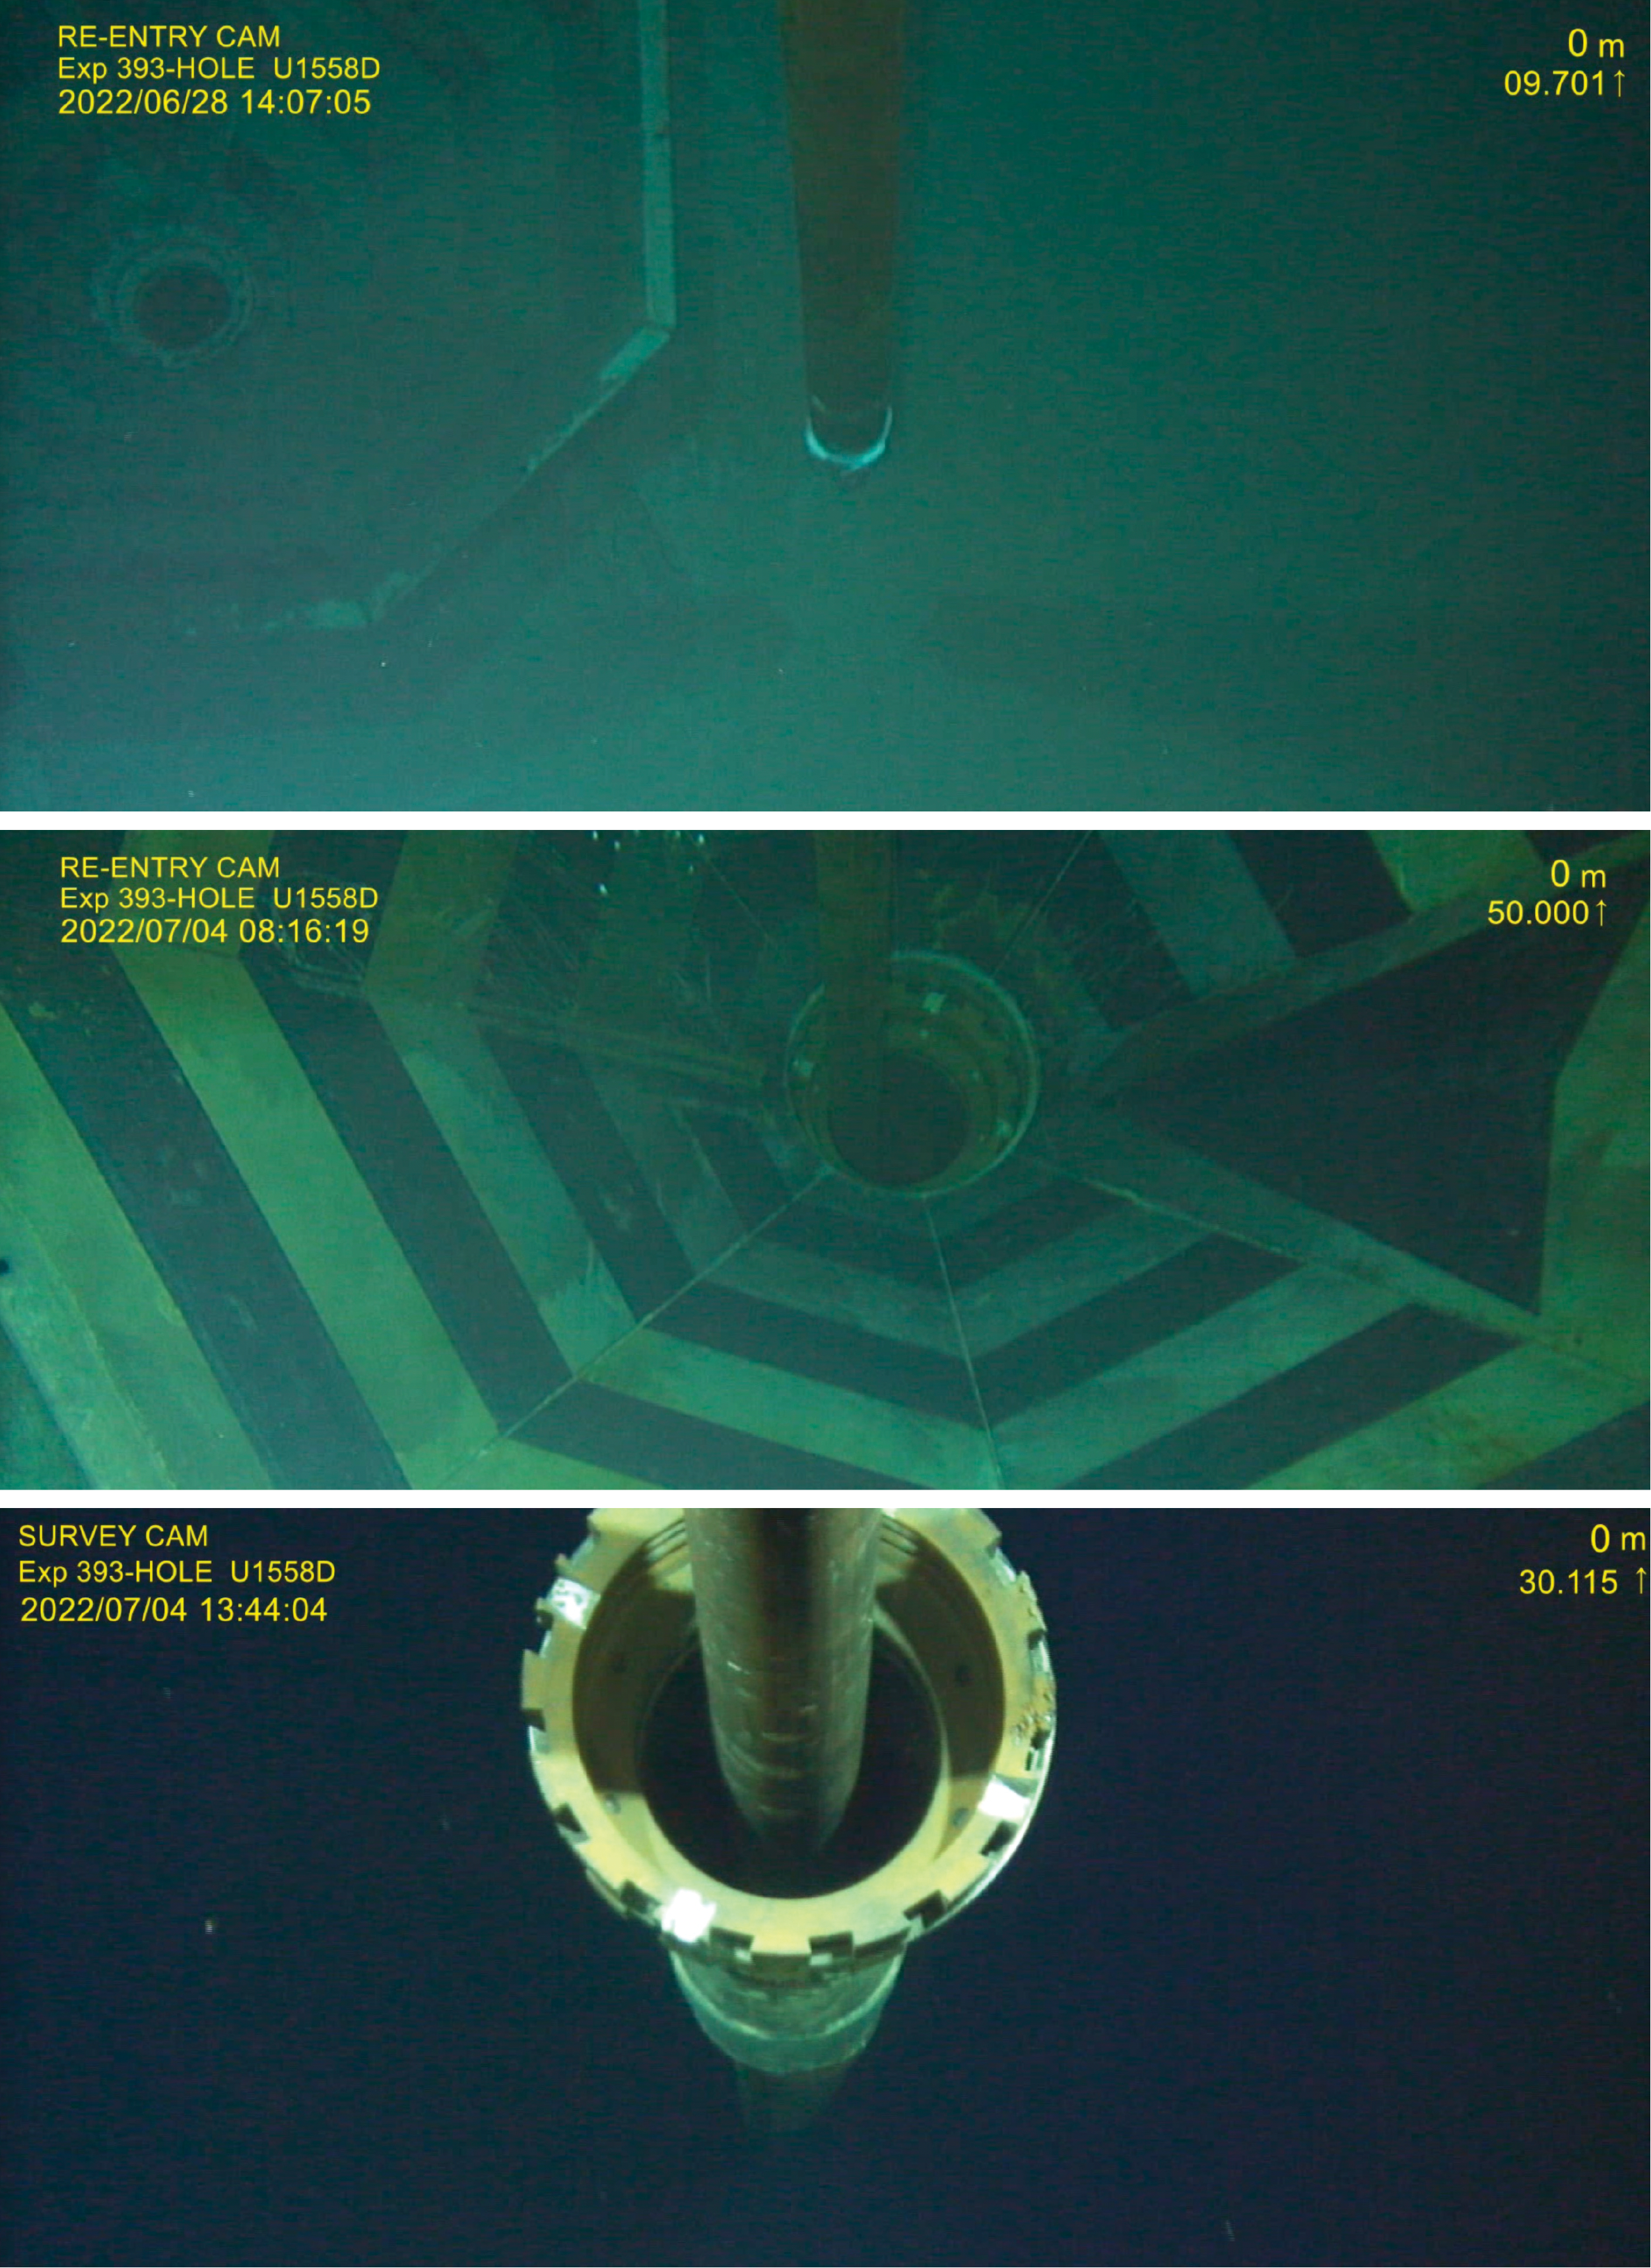
Figure F6. Casing hanger and casing stuck on drill string.
3. Stratigraphic unit summary
At Site U1558, we recovered 158.9 and 176.5 m of sediment in Holes U1558A and U1558F, respectively, before RCB coring in Hole U1558D penetrated 203.5 m of volcanic formations from the uppermost ocean crust (total depth of 370.3 mbsf). The cores recovered from the four holes (U1558A and U1558D–U1558F) comprise two major sedimentary units (Figure F7) overlying five basement units (Figure F8). These lithostratigraphic units are numbered from the top of the hole, with units in the sedimentary section designated by Roman numerals (e.g., I and II) and units in the basement (volcanic units) designated by Arabic numerals (e.g., 1 and 2); subunits are designated with letters (e.g., IA, IB, 2A, and 2B).
3.1. Sediment units
A near-complete 159–176 m thick sequence of siliciclastic and biogenic sediments was recovered from two sediment holes cored at Site U1558 (Holes U1558A and U1558F), principally comprising brown Early Miocene nannofossil-rich clay overlying pinkish middle Eocene to Early Miocene nannofossil ooze and chalk with clay and foraminifera.
Two sedimentary lithostratigraphic units (I and II) are defined at Site U1558 (Figure F7; Table T2). Unit I is composed of up to 10.11 m of Pleistocene to Early Miocene brown and reddish brown nannofossil-rich clay containing varying amounts of foraminifera and sponge spicules and subordinate nannofossil ooze with clay and foraminifera. Unit II is composed of up to 165.32 m of middle Eocene to Early Miocene biogenic sediments consisting primarily of pink, pinkish white, pinkish gray, and light brown nannofossil ooze and chalk with varying amounts of clay and foraminifera. Unit II is divided into three subunits based on their composition (clay, CaCO3, and foraminifera content) and color. Differences in constituent mineral assemblages between the units and with increasing burial depth are relatively subtle. There is a discernible increase in CaCO3 content with a concomitant decrease in clay content downhole. In lower portions of the sediment section, nannofossil ooze is moderately consolidated and is termed "chalk." Overall, clay content decreases downhole.
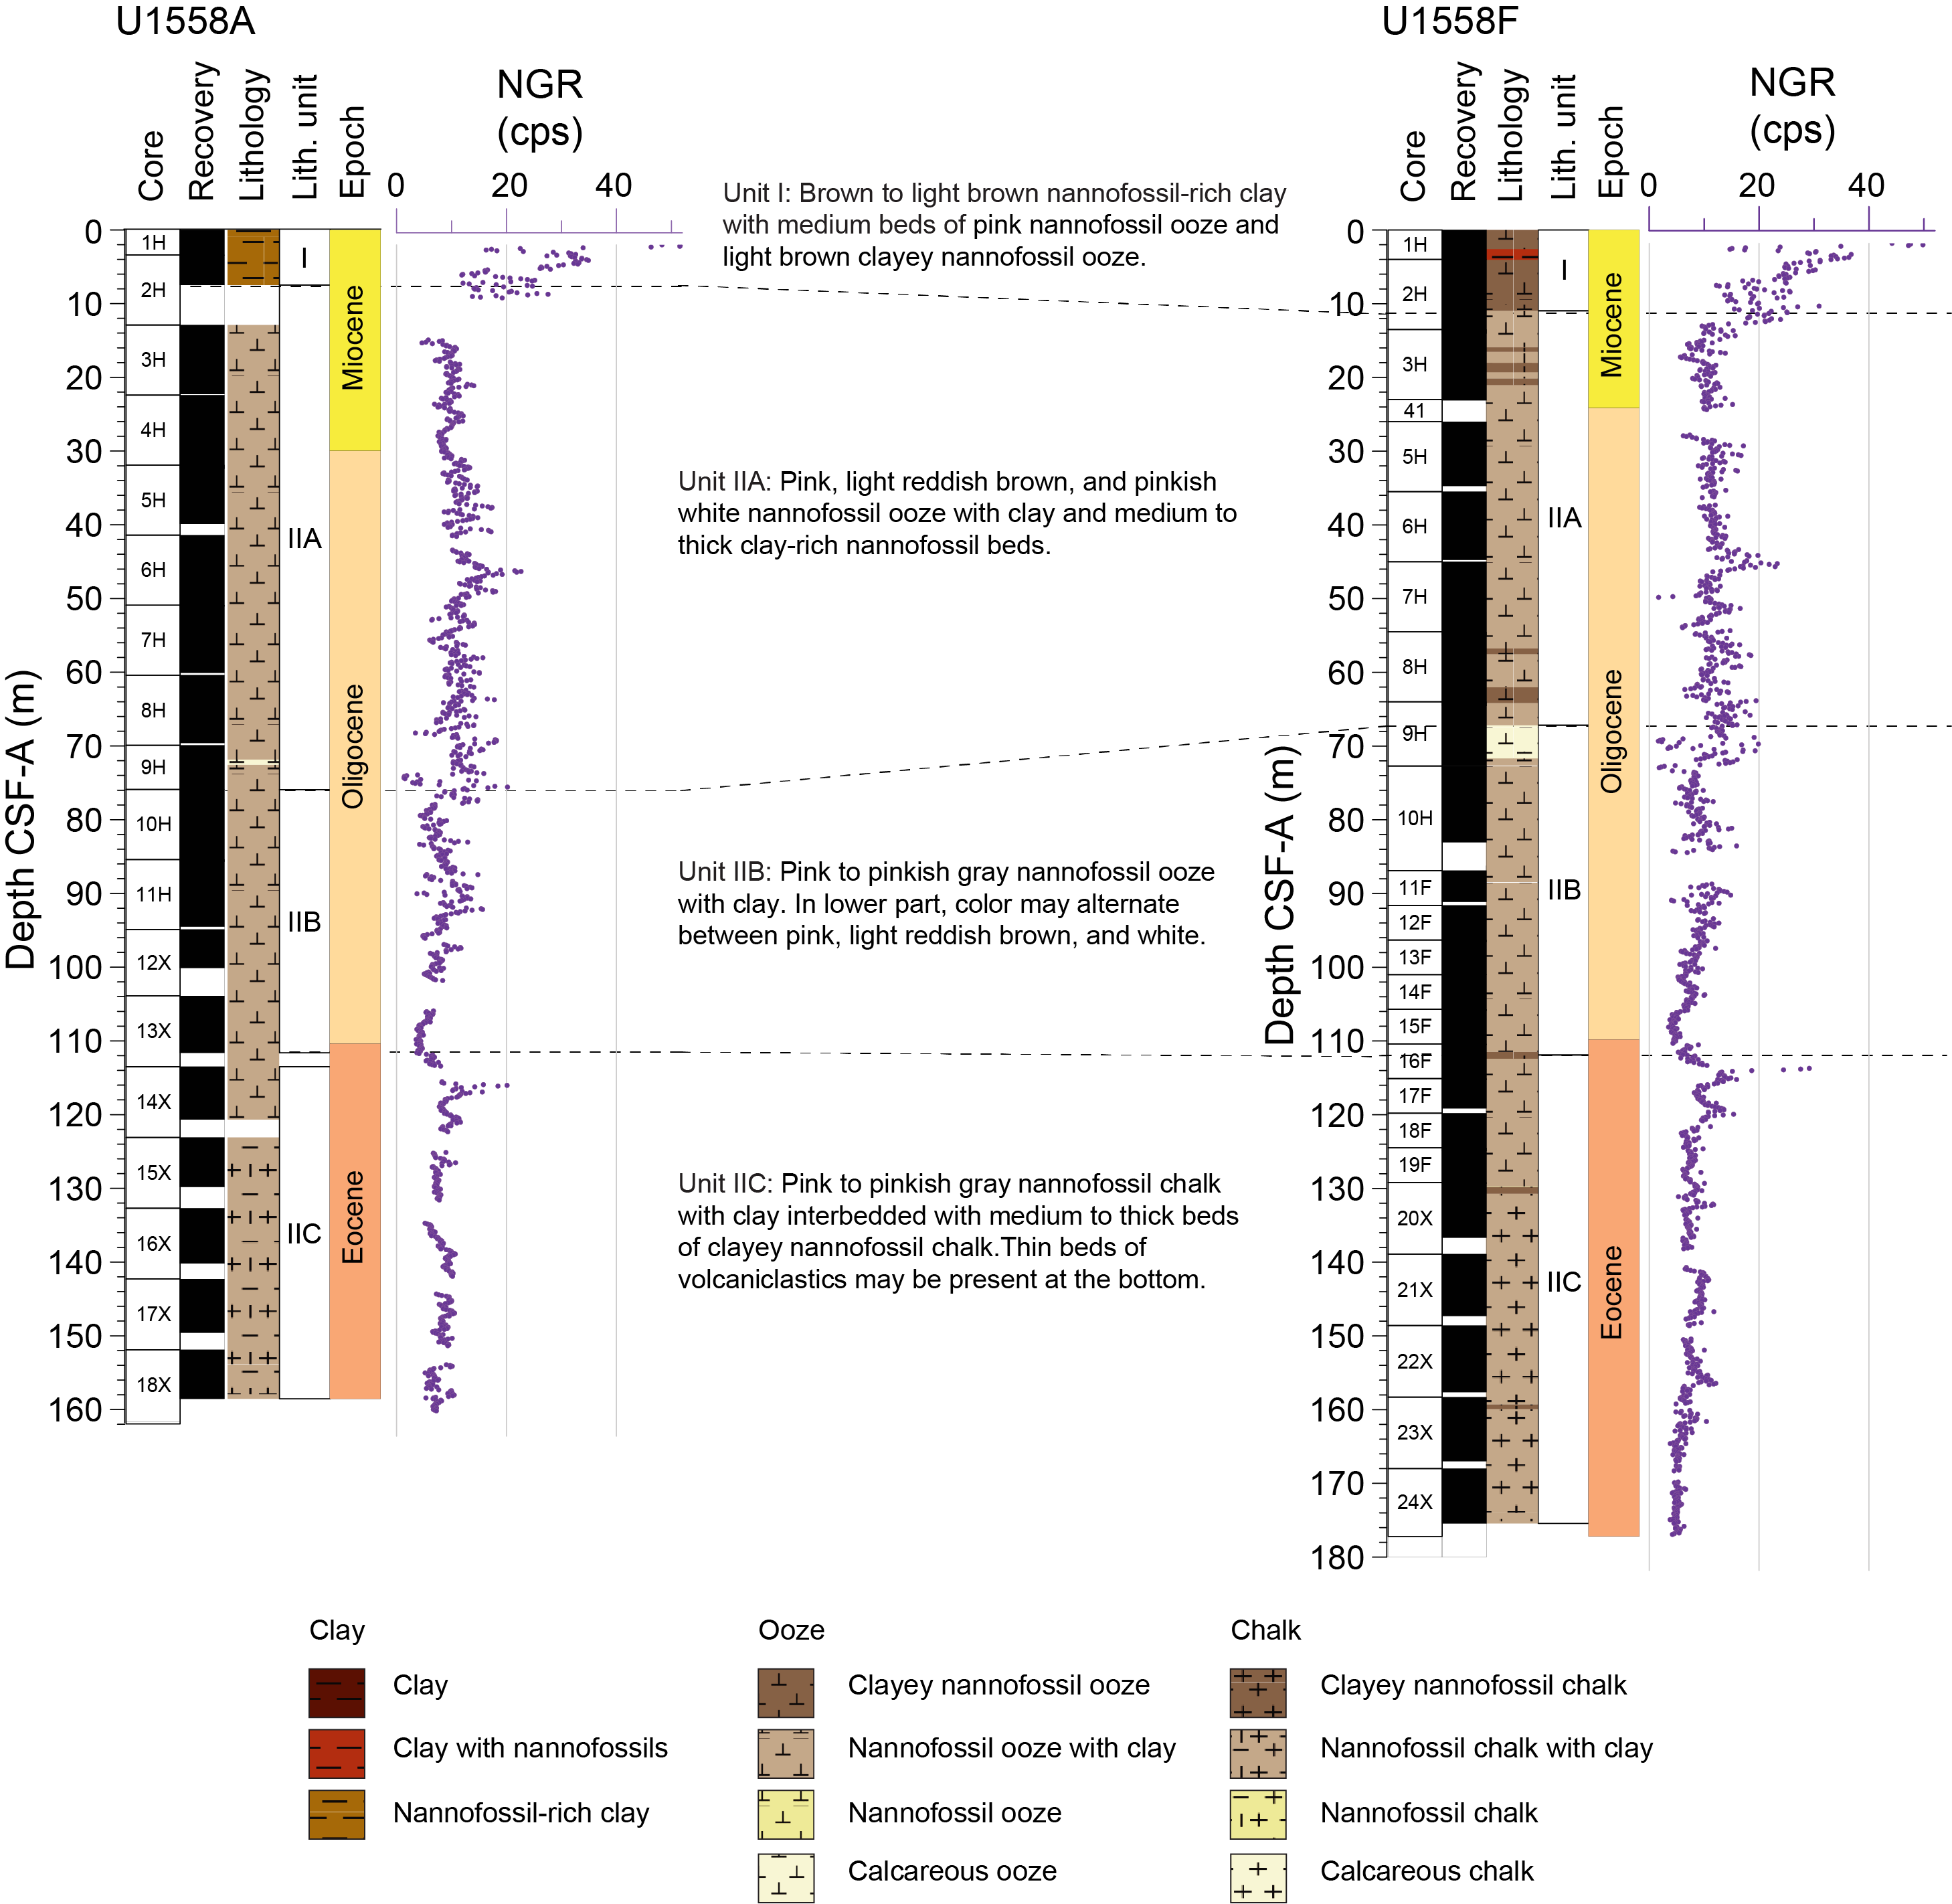
Figure F7. Lithostratigraphic summary, sedimentary units.
3.2. Volcanic sequences
In Hole U1558D, we drilled ~203 m of mid-ocean-ridge basalt (MORB) and intersected two distinct volcanic sequences separated by a ~1 m thick layer of indurated calcareous sedimentary breccia with volcanic debris that possibly indicates a hiatus in volcanism at this site on the order of tens of thousands of years (Figure F8; Table T5). The upper Sequence A (166.55–234.64 mbsf) includes volcanic Lithostratigraphic Units 1 and 2, which are moderately to highly plagioclase-olivine-clinopyroxene phyric microcrystalline basaltic lava mostly emplaced as lava pillows of varying comfort (diameter = 10–130 cm). Extremely sparse but distinctive green clinopyroxene phenocrysts are a characteristic feature of the Sequence A volcanic rocks. In contrast, the underlying Sequence B (234.65–370.20 mbsf) lacks these green phenocrysts, and its uppermost unit contains abundant interflow sediments and breccias, suggestive of a buried seafloor horizon. This change in phenocryst assemblage indicates that some aspect of the magmatic system changed between eruptive sequences. However, lava geochemistry as assessed by Cr/Ti ratios measured directly on the cores by portable X-ray fluorescence (pXRF) is relatively consistent downhole with little evidence for fractionated series apart from Unit 4, which has higher Cr concentrations than the other lava units.
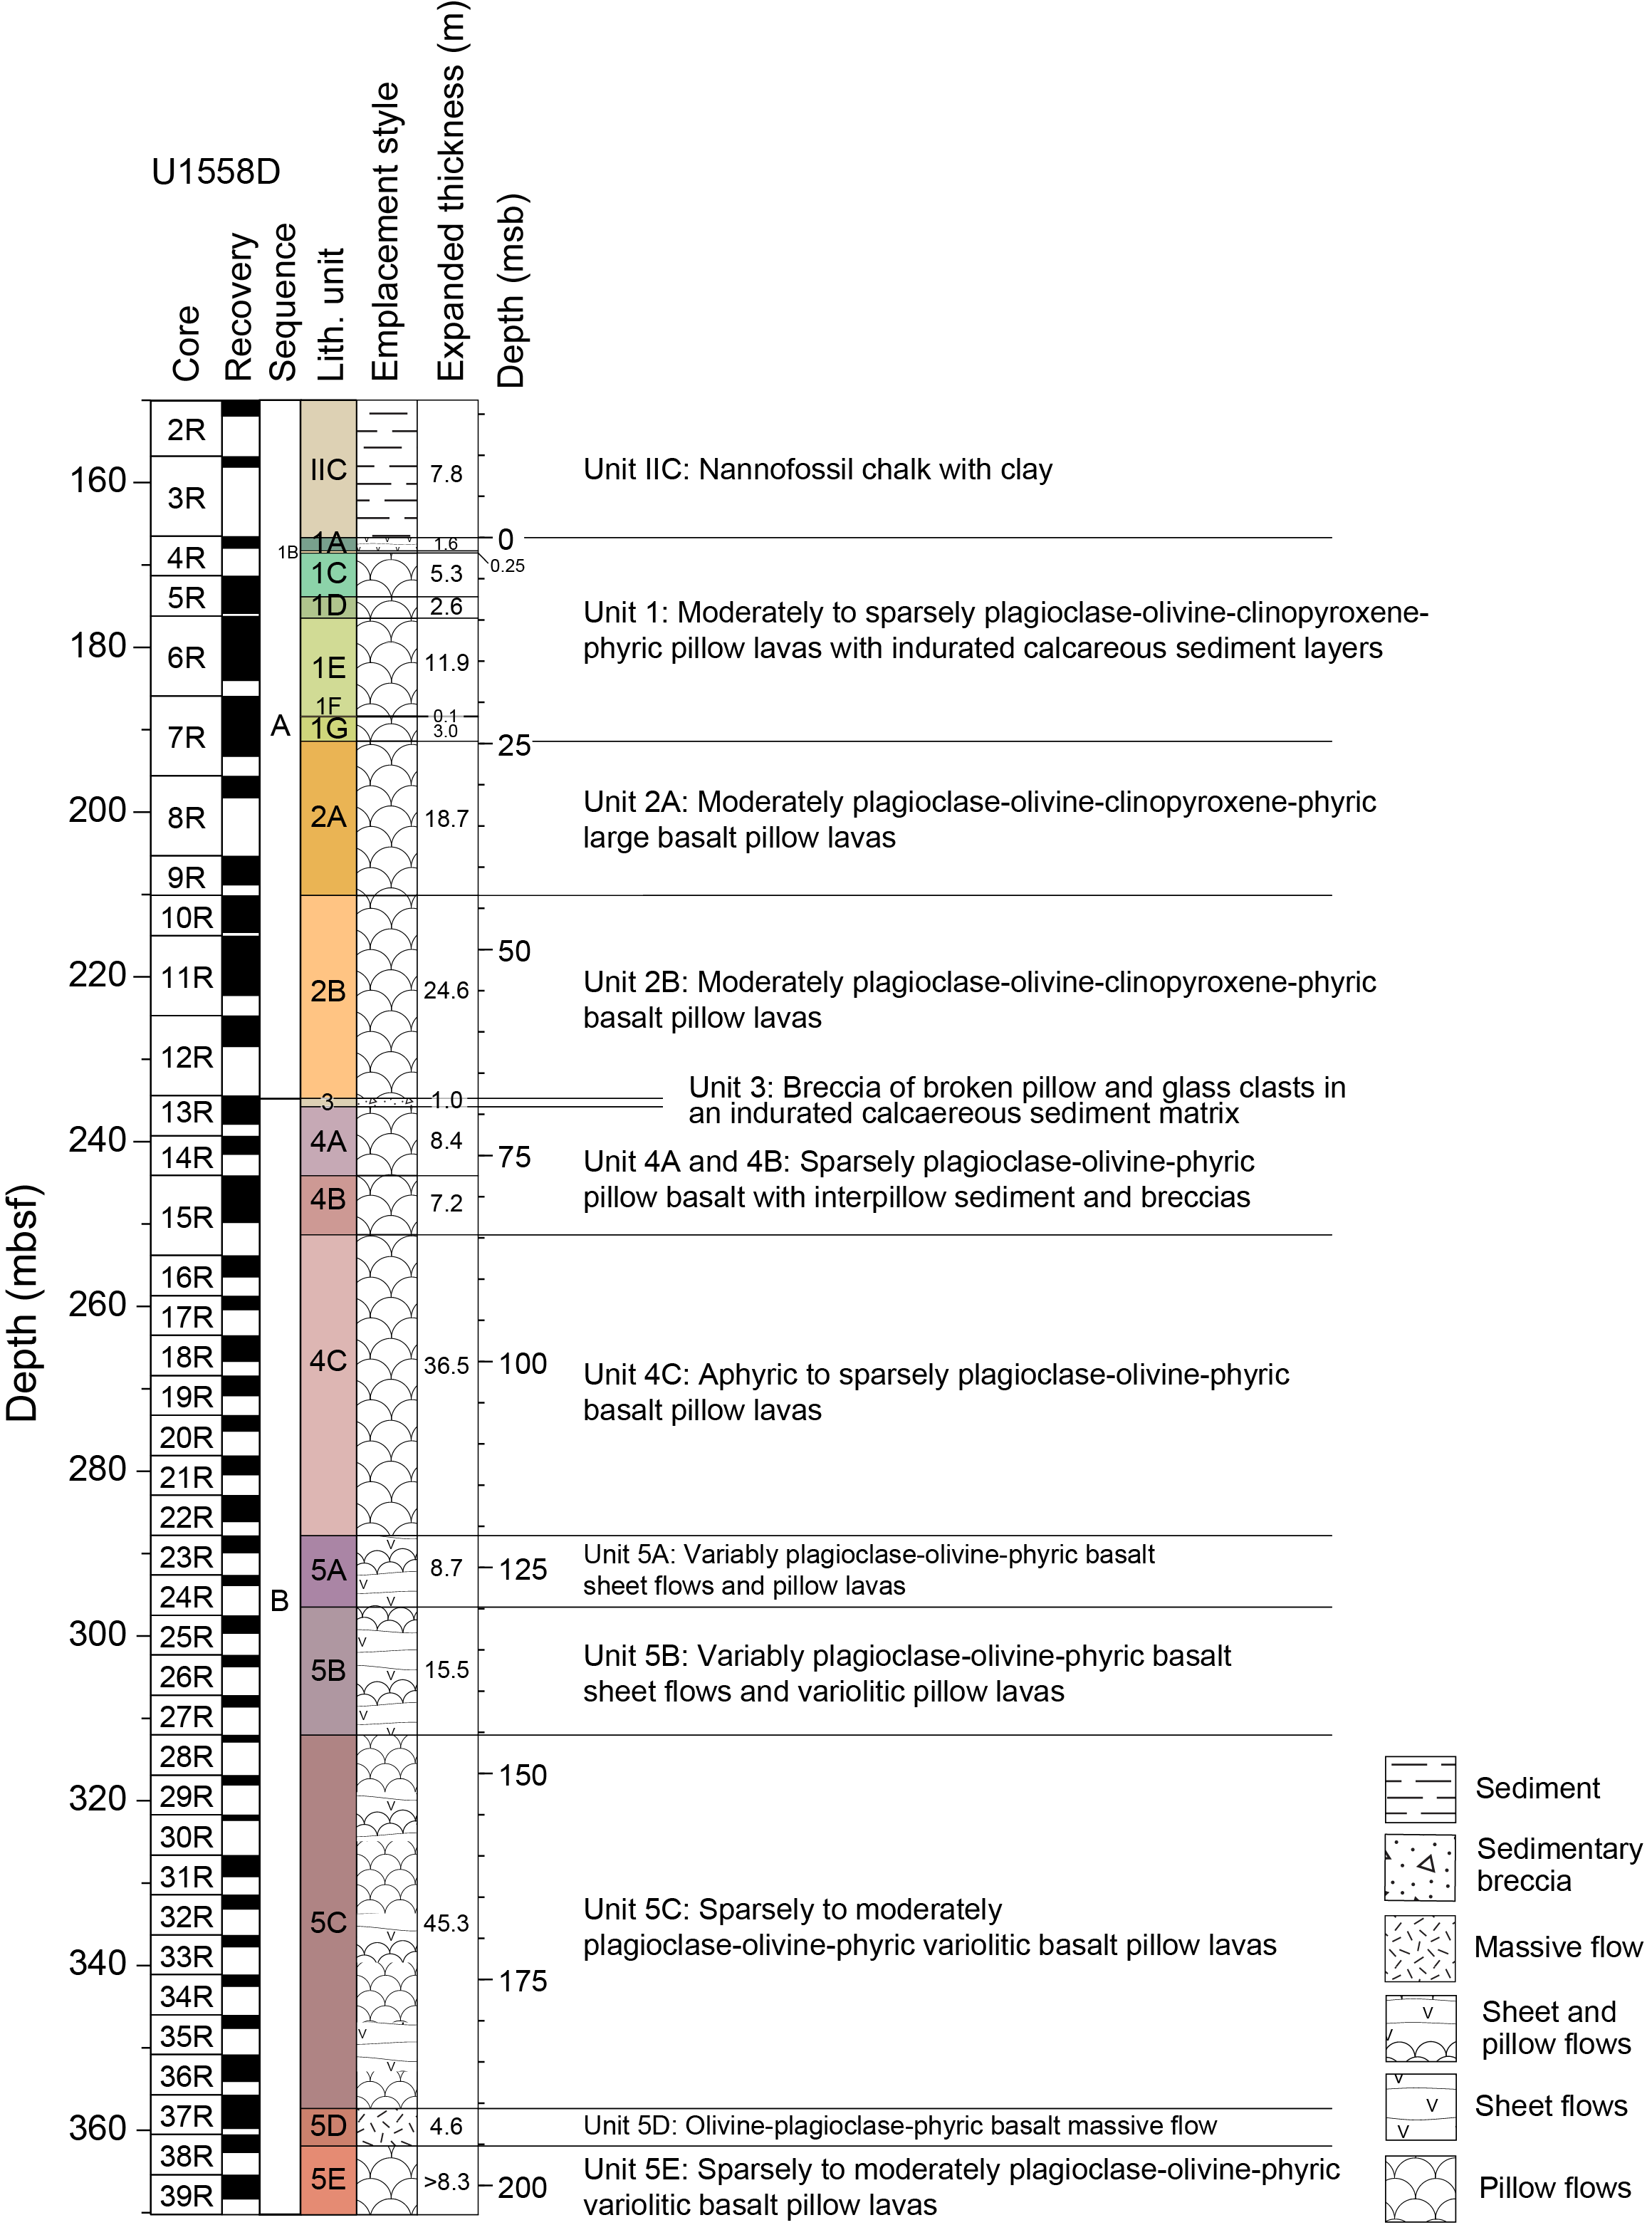
Figure F8. Lithostratigraphic summary, volcanic units.
3.3. Sediment/basement interface
Expeditions 390C and 393 recovered basement in Holes U1558A, U1558D, and U1558F, with the shallowest basalts recovered at depths between 158.44 and 175.29 mbsf. Hole U1558A continuously recovered a contact between nannofossil ooze and the top of a pillow lava flow, which, together with the other sites, suggests the sediments directly overlie lava flows at Site U1558. One small piece of indurated calcareous sediment was recovered above the interface in Hole U1558D, but sediments above the basement were otherwise unlithified. For stratigraphic correlation between SAT sites and with other sections of upper ocean crust recovered by scientific ocean drilling, we have defined a site sediment/basement interface depth for each of the SAT sites. The depth at which basement was encountered during drilling of the deepest hole, U1558D, was 166.8 mbsf (drilling depth below seafloor [DSF] scale) and is taken as the site interface depth at Site U1558.
4. Sedimentology
Two of the six holes at Site U1558 cored the entire sediment section: (1) Hole U1558A was cored during Expedition 390C (October–December 2020; Estes et al., 2021) and recovered 158.9 m of sediments, and (2) Hole U1558F was cored during Expedition 393 and recovered 176 m of sediments. Hole U1558D recovered 8.18 m of sediments above the sediment/basement interface before RCB coring of basement rocks, and Hole U1558E missed the mudline and recovered only one core (9.97 m) of sediments. The recovered sediments were described during Expedition 393 and predominantly consist of nannofossil ooze/chalk with clay and nannofossil-rich clay (in the upper 10 m) of Early Miocene to middle Eocene age.
The sediments were divided into two lithostratigraphic units (I and II; youngest to oldest) (Figures F9, F10, F11, F13, F14). Unit II is divided into three subunits (IIA–IIC) based on relative changes in the amount of clay and CaCO3, physical and biogenic sedimentary structures, and physical properties of the sediments.
It should be noted that some sedimentary intervals have slight color and bioturbation intensity differences between Holes U1558A, U1558D, U1558E, and U1558F. Hole U1558A was described about ~18 months after it was drilled in December 2020; therefore, any differences in the sediment coloration are due to oxidation and drying. As for biogenic structures, bioturbation intensity is higher in recently drilled Holes U1558D–U1558F compared to bioturbation intensity in Hole U1558A. It is assumed that such disparity is due to sediments drilled during Expedition 393 being fresher, resulting in better lithologic contrasts and visibility of trace fossils.
4.1. Unit descriptions
4.1.1. Unit I
- Intervals: 390C-U1558A-1H, 0 cm, to 2H-CC, 26 cm; 393-U1558E-1H, 0 cm, to 1H-CC, 18 cm; 393-U1558F-1H, 0 cm, to 2H-5, 94 cm
- Depths: Hole U1558A = 0–7.5 m core depth below seafloor, Method A (CSF-A); Hole U1558E = 0–10.0 m CSF-A; Hole U1558F = 0–11.0 m CSF-A
- Thickness: Hole U1558A = 7.5 m; Hole U1558E = >10.0 m; Hole U1558F = 11.0 m
- Age: Early Miocene
- Lithology: alternating nannofossil ooze with nannofossil-rich clay with foraminifera
Lithostratigraphic Unit I is composed of alternating layers of nannofossil ooze and nannofossil-rich clay (Figures F9, F10, F11, F12). The nannofossil ooze varies in clay content, ranging from clayey nannofossil ooze to nannofossil ooze with clay, reflected in the sediment color, ranging from dark reddish gray to reddish brown, brown, and light brown (Figures F9, F10). The nannofossil-rich clay contains varying amounts of foraminifera and sponge spicules. Overall, clay content decreases downhole throughout Unit I (Figures F9, F13). Hole U1558A is dominated by nannofossil-rich clay with a few up to 40 cm thick beds of nannofossil ooze in the bottom 3.5 m of Unit I. In contrast, Hole U1558F is dominated by nannofossil ooze with a few up to 40 cm thick beds of nannofossil-rich clay in the upper 4 m of Unit I.
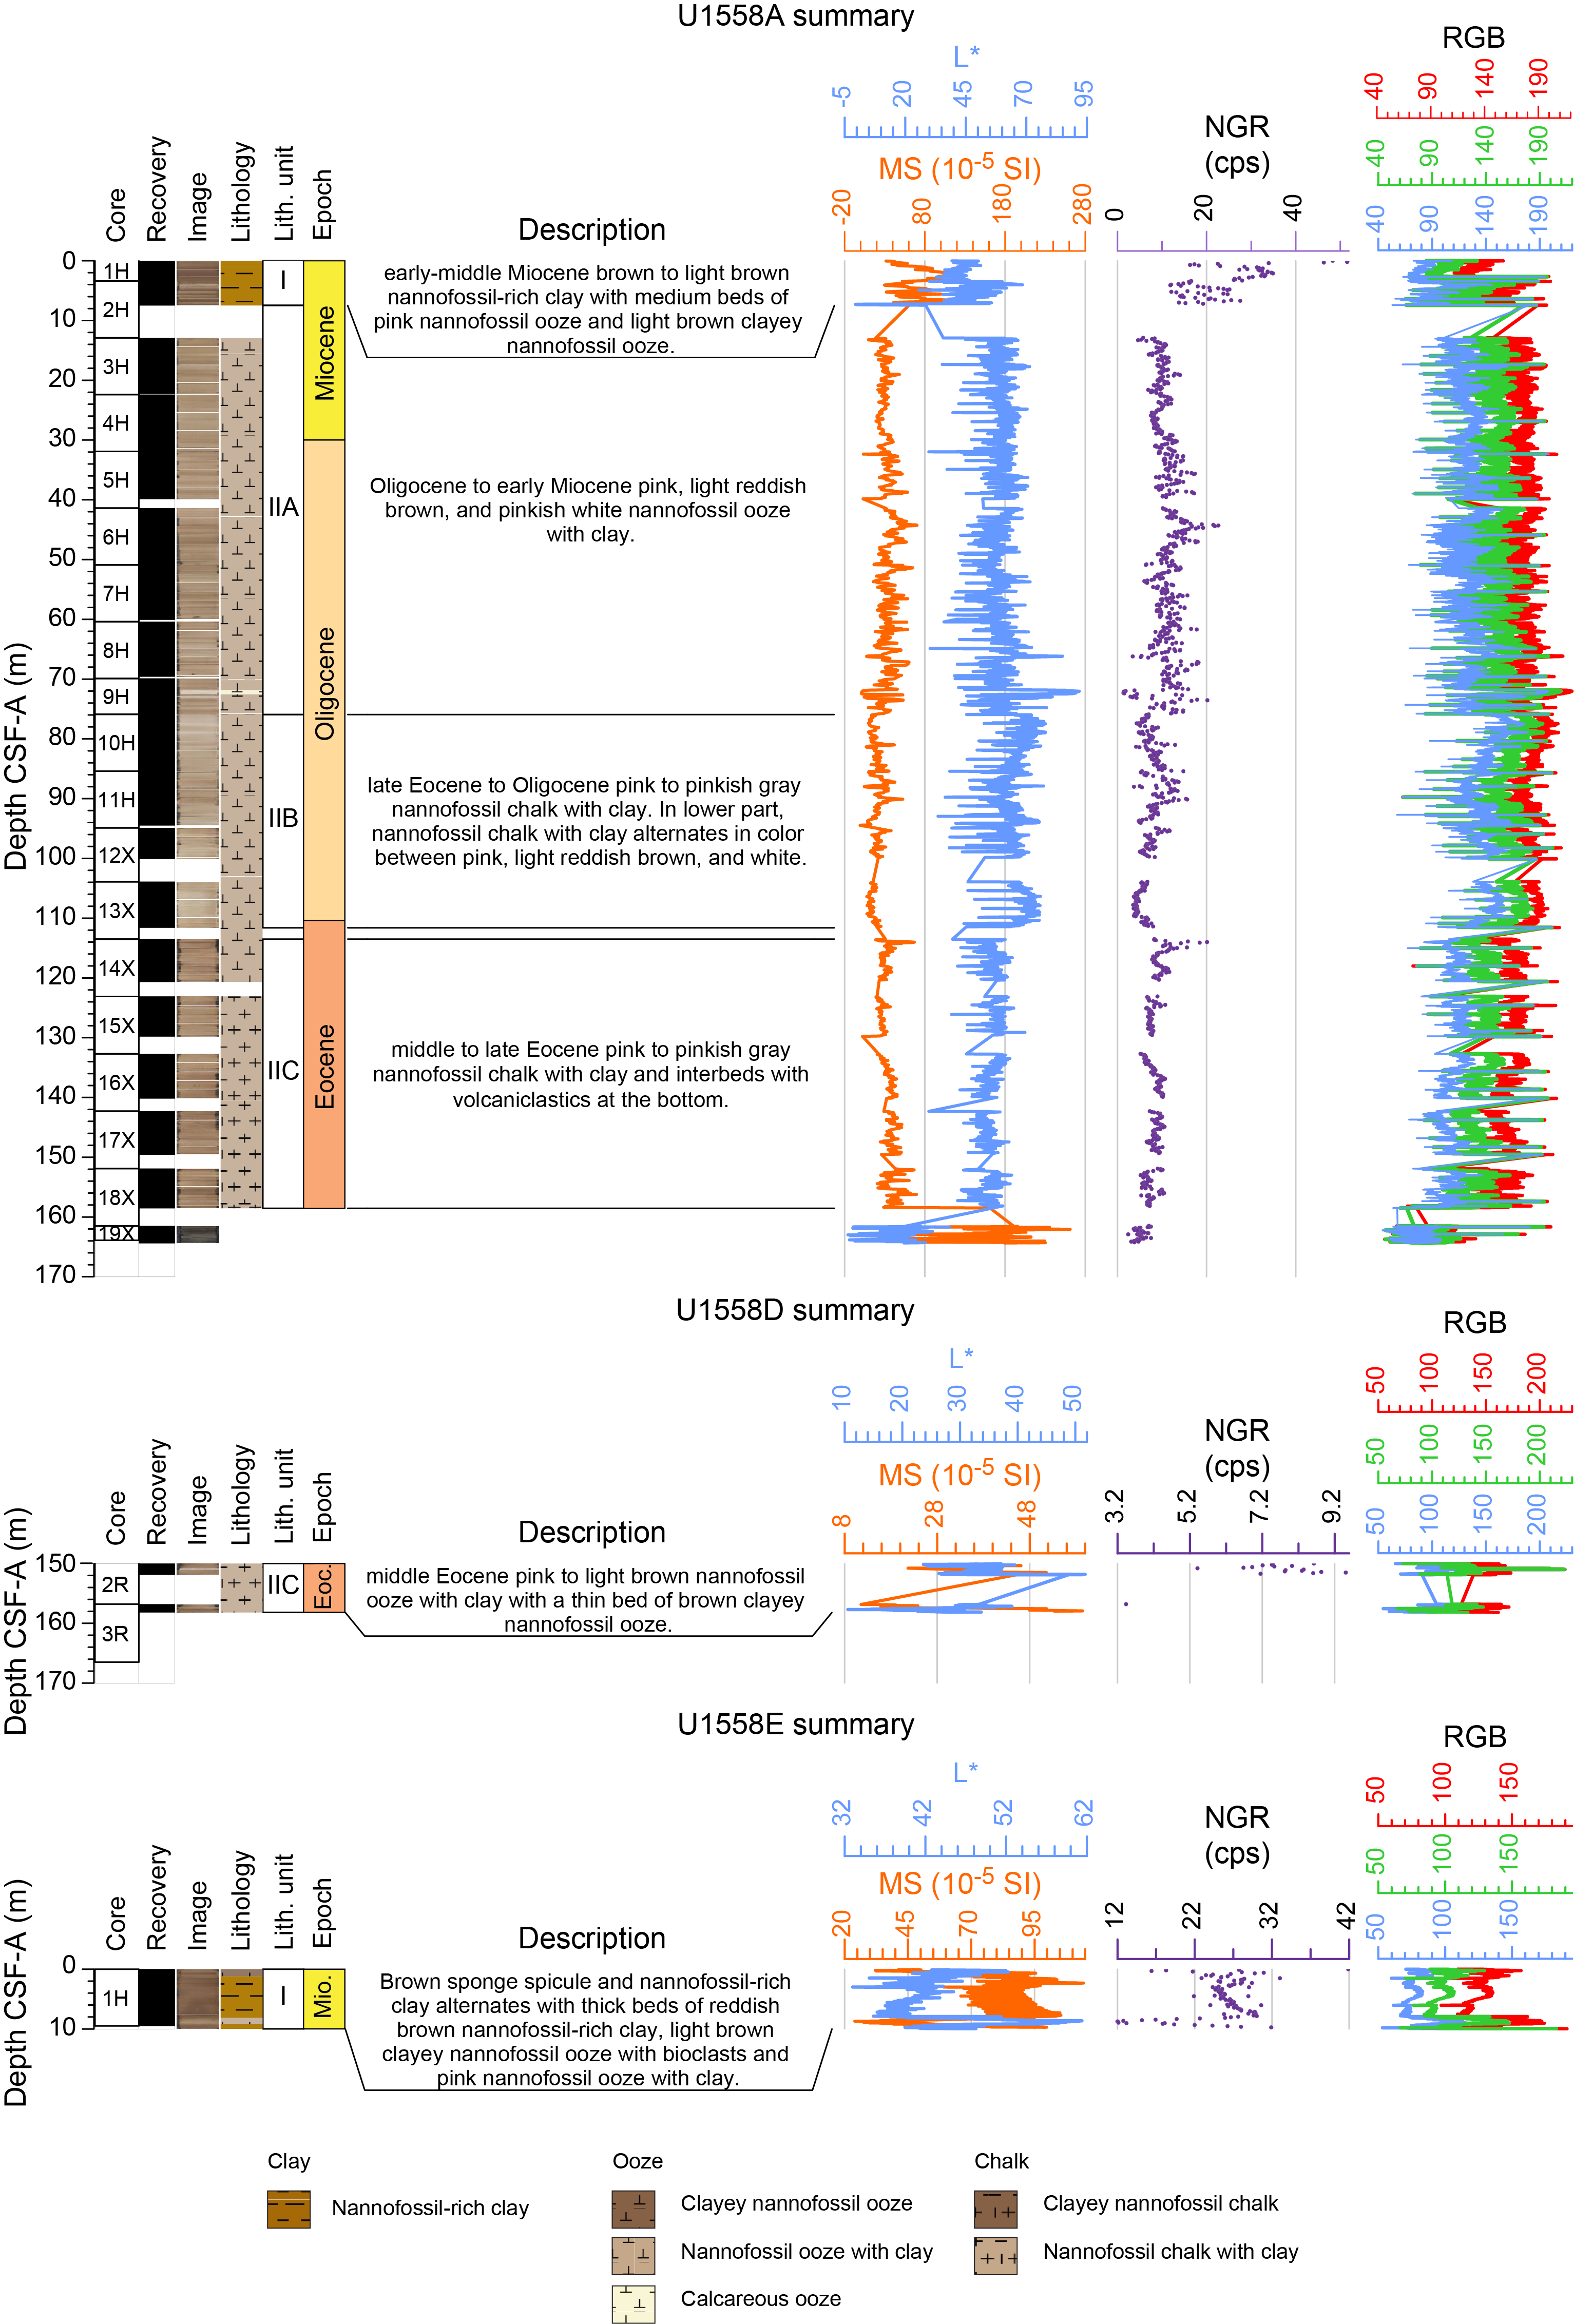
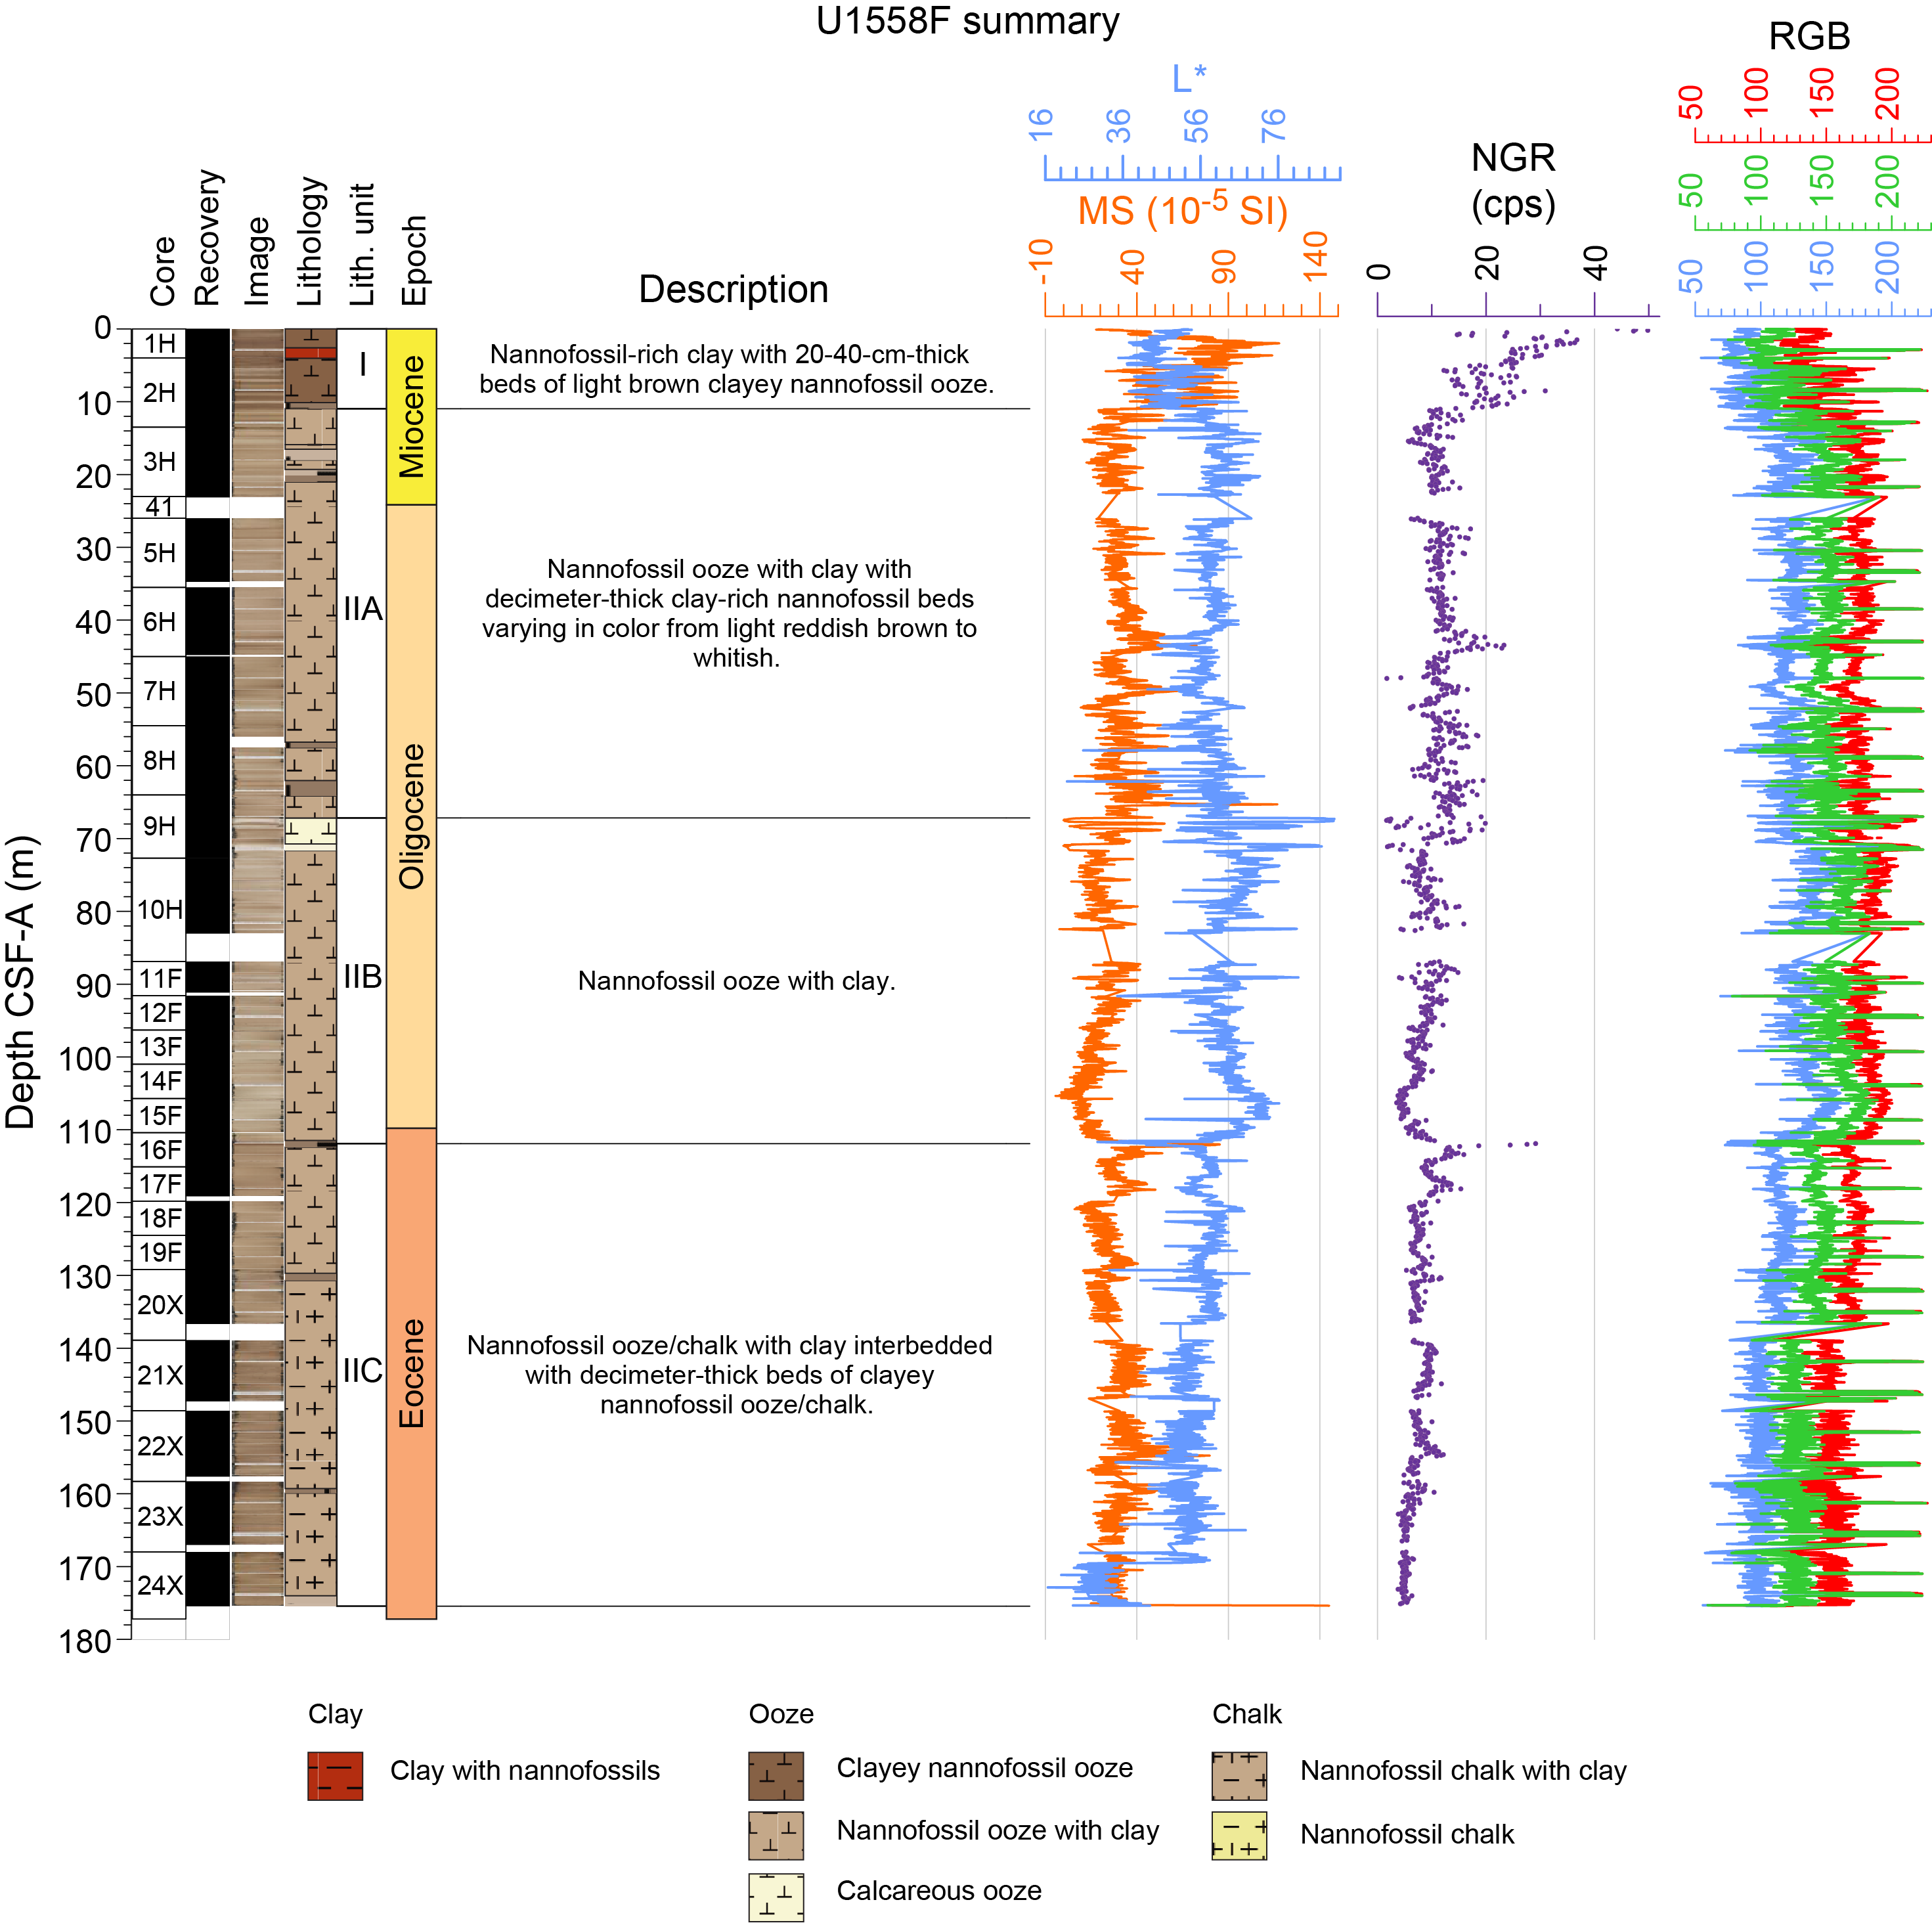
Figure F9. Lithologic summaries.
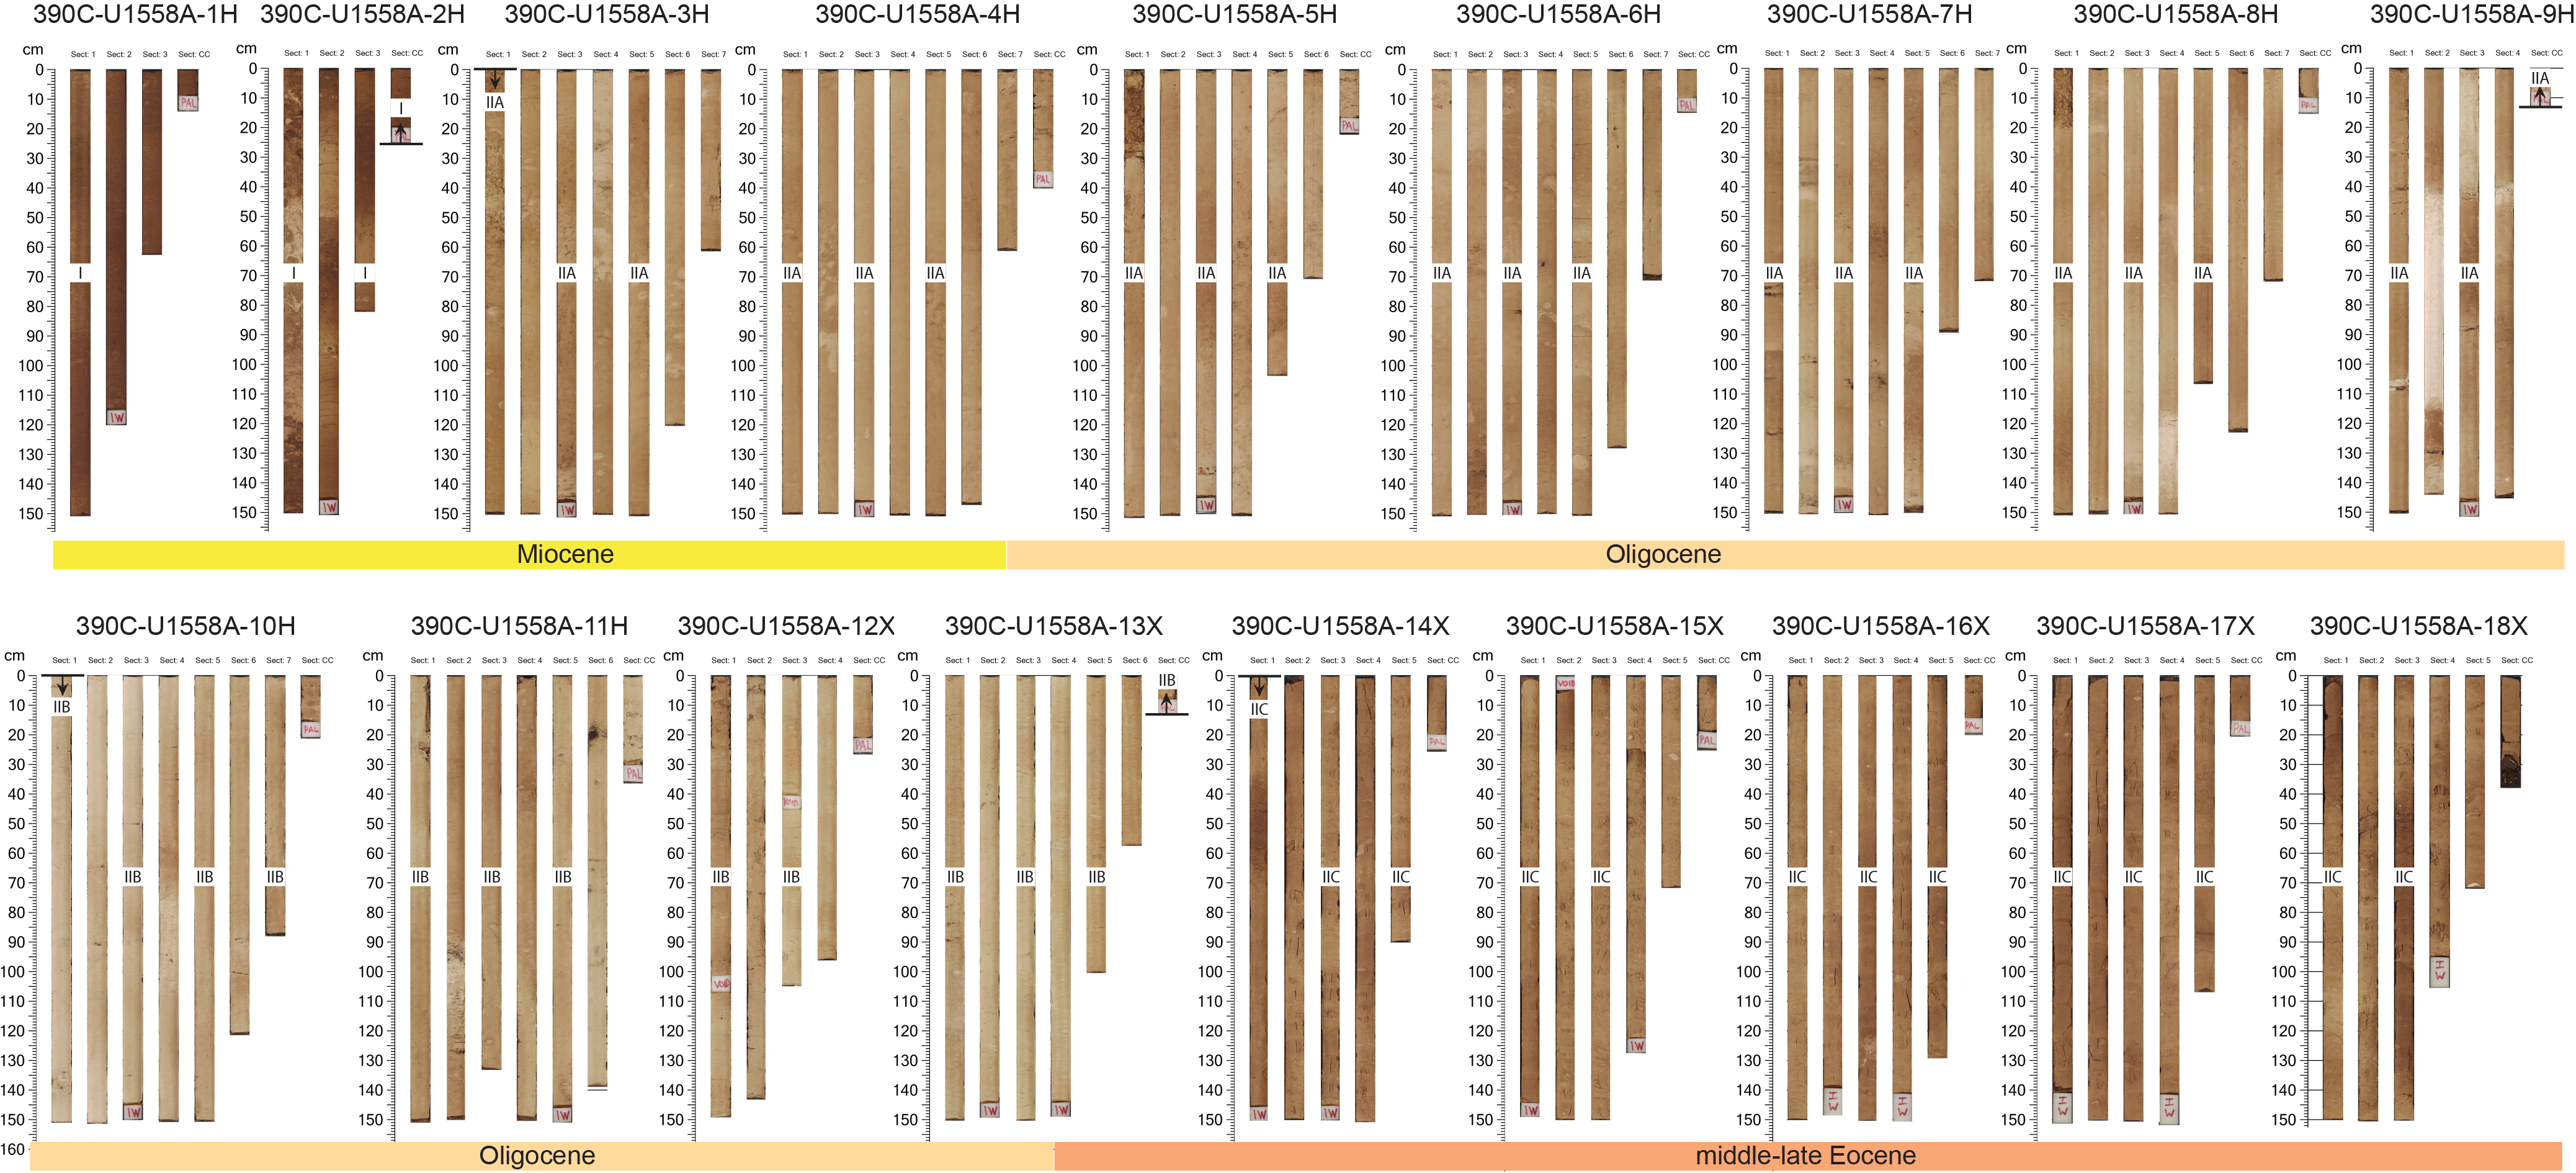
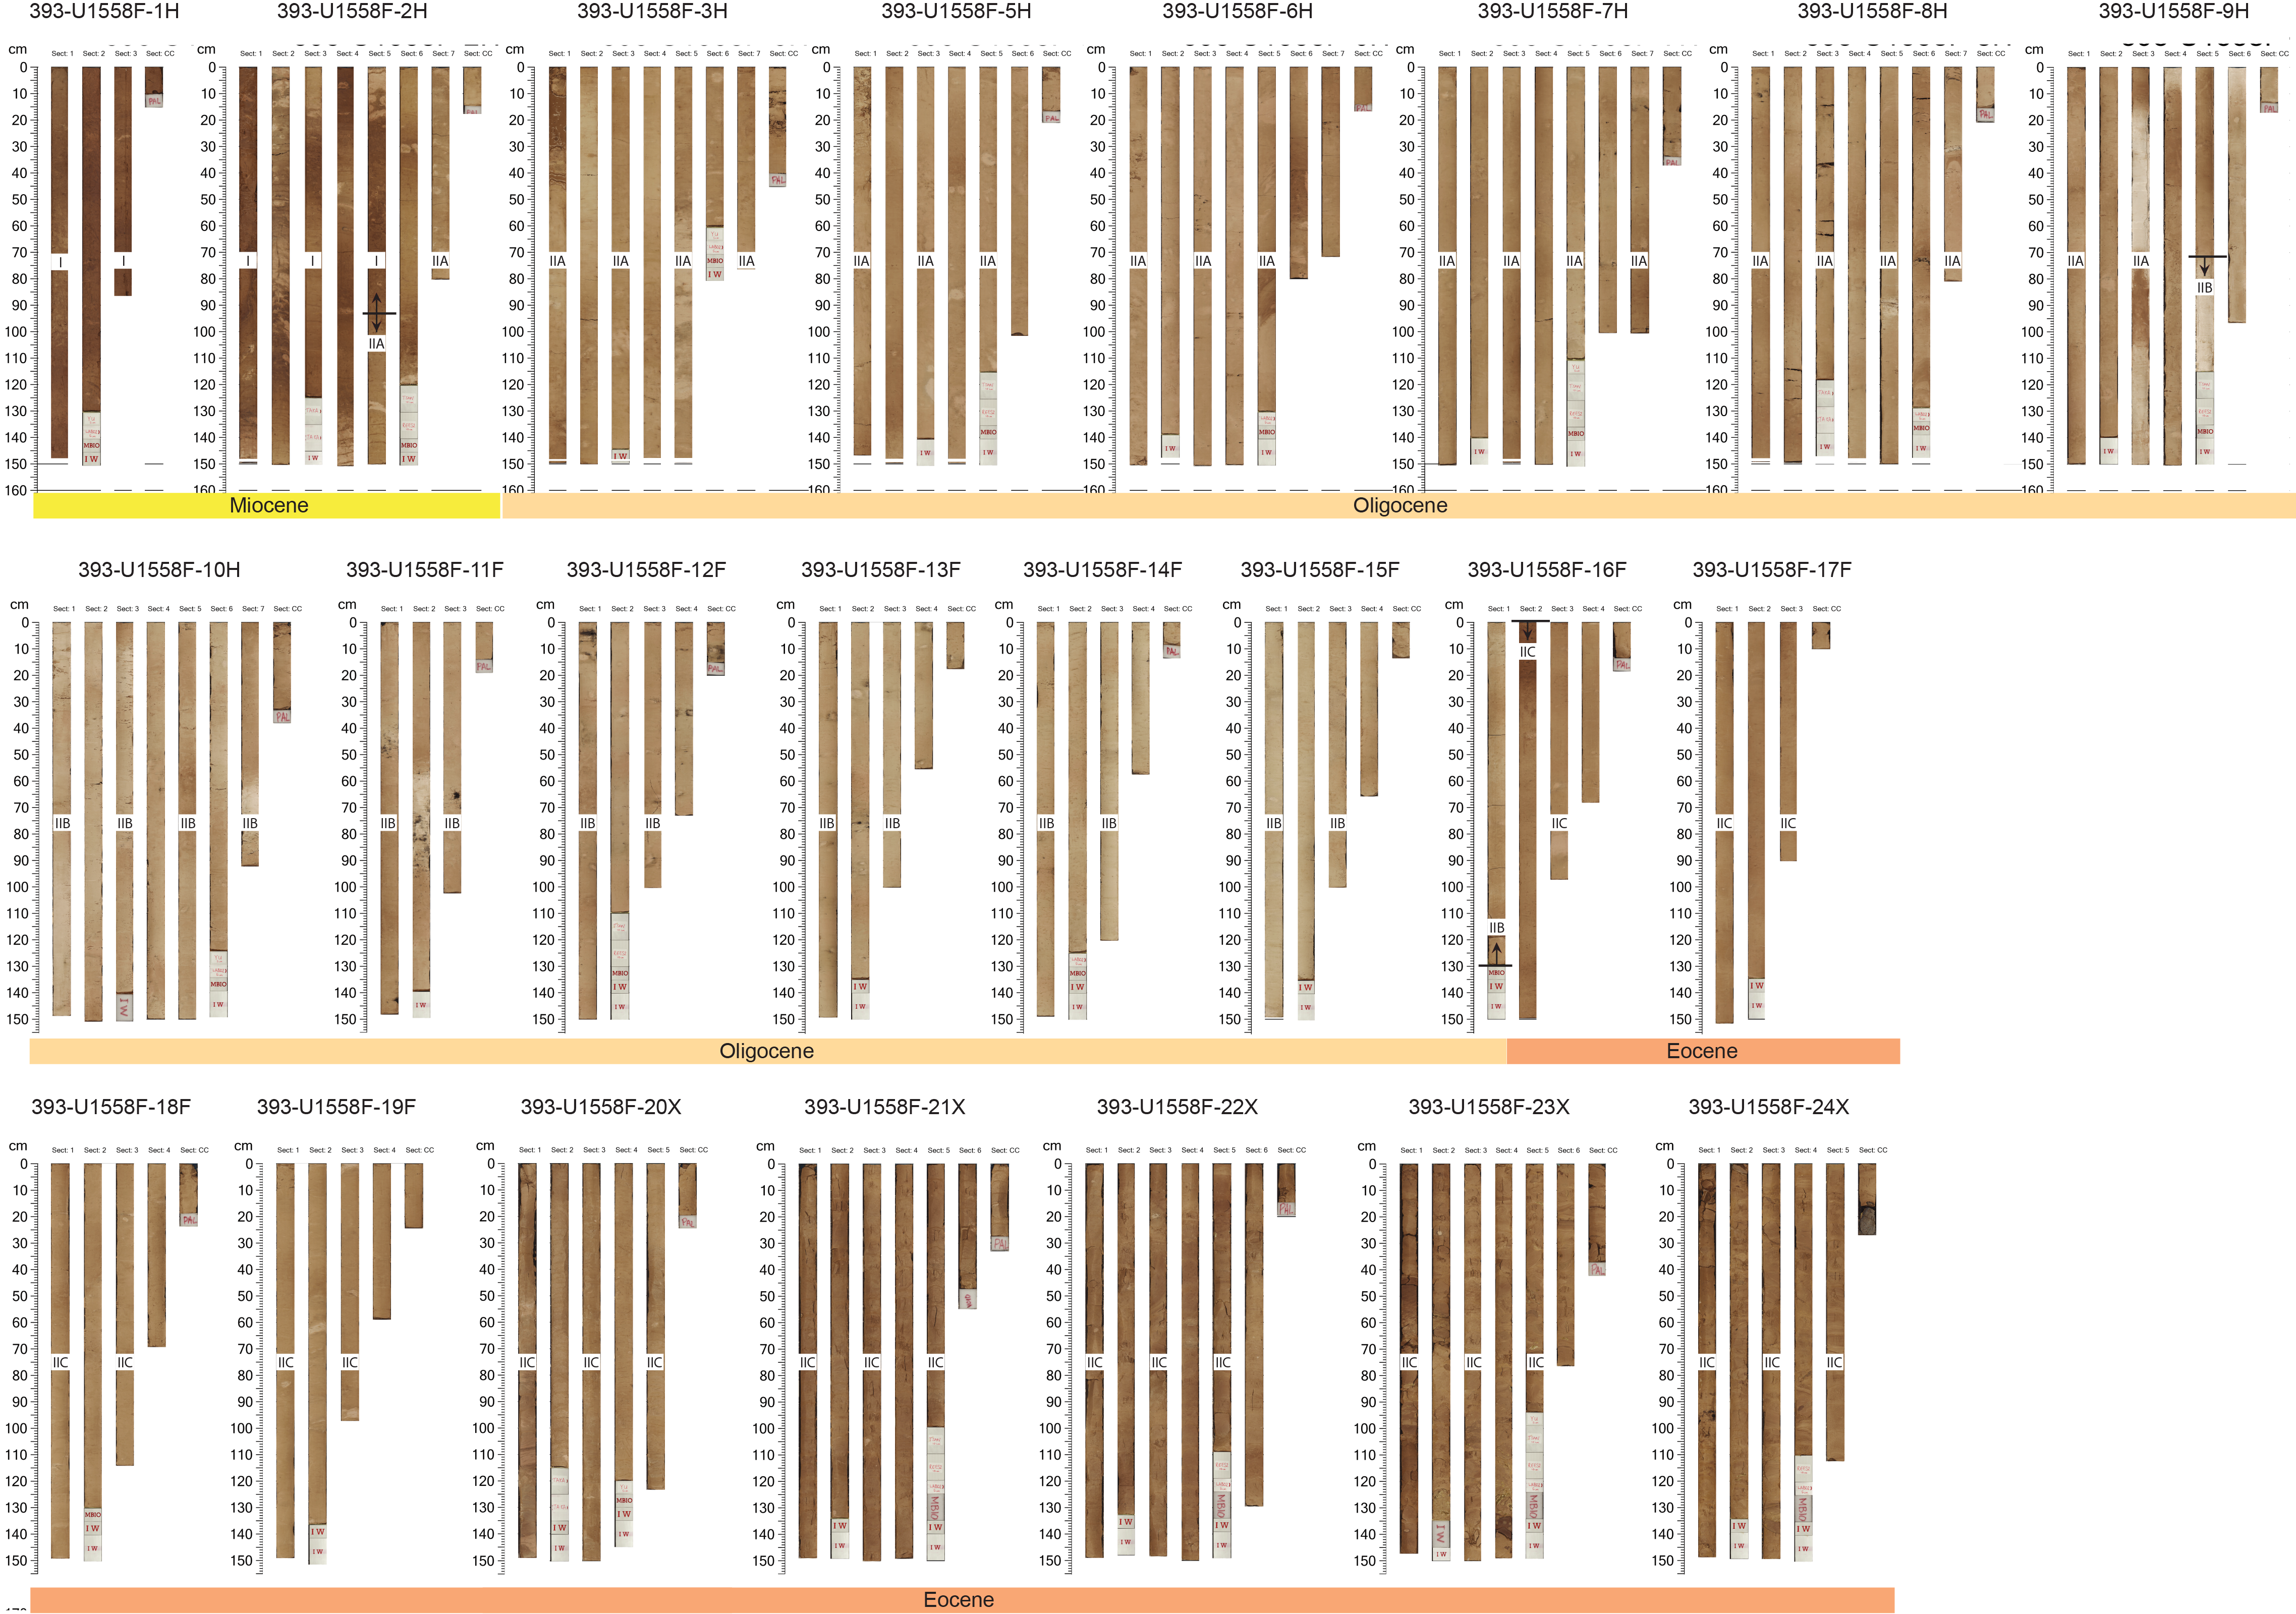
Figure F10. Core composite photographs.
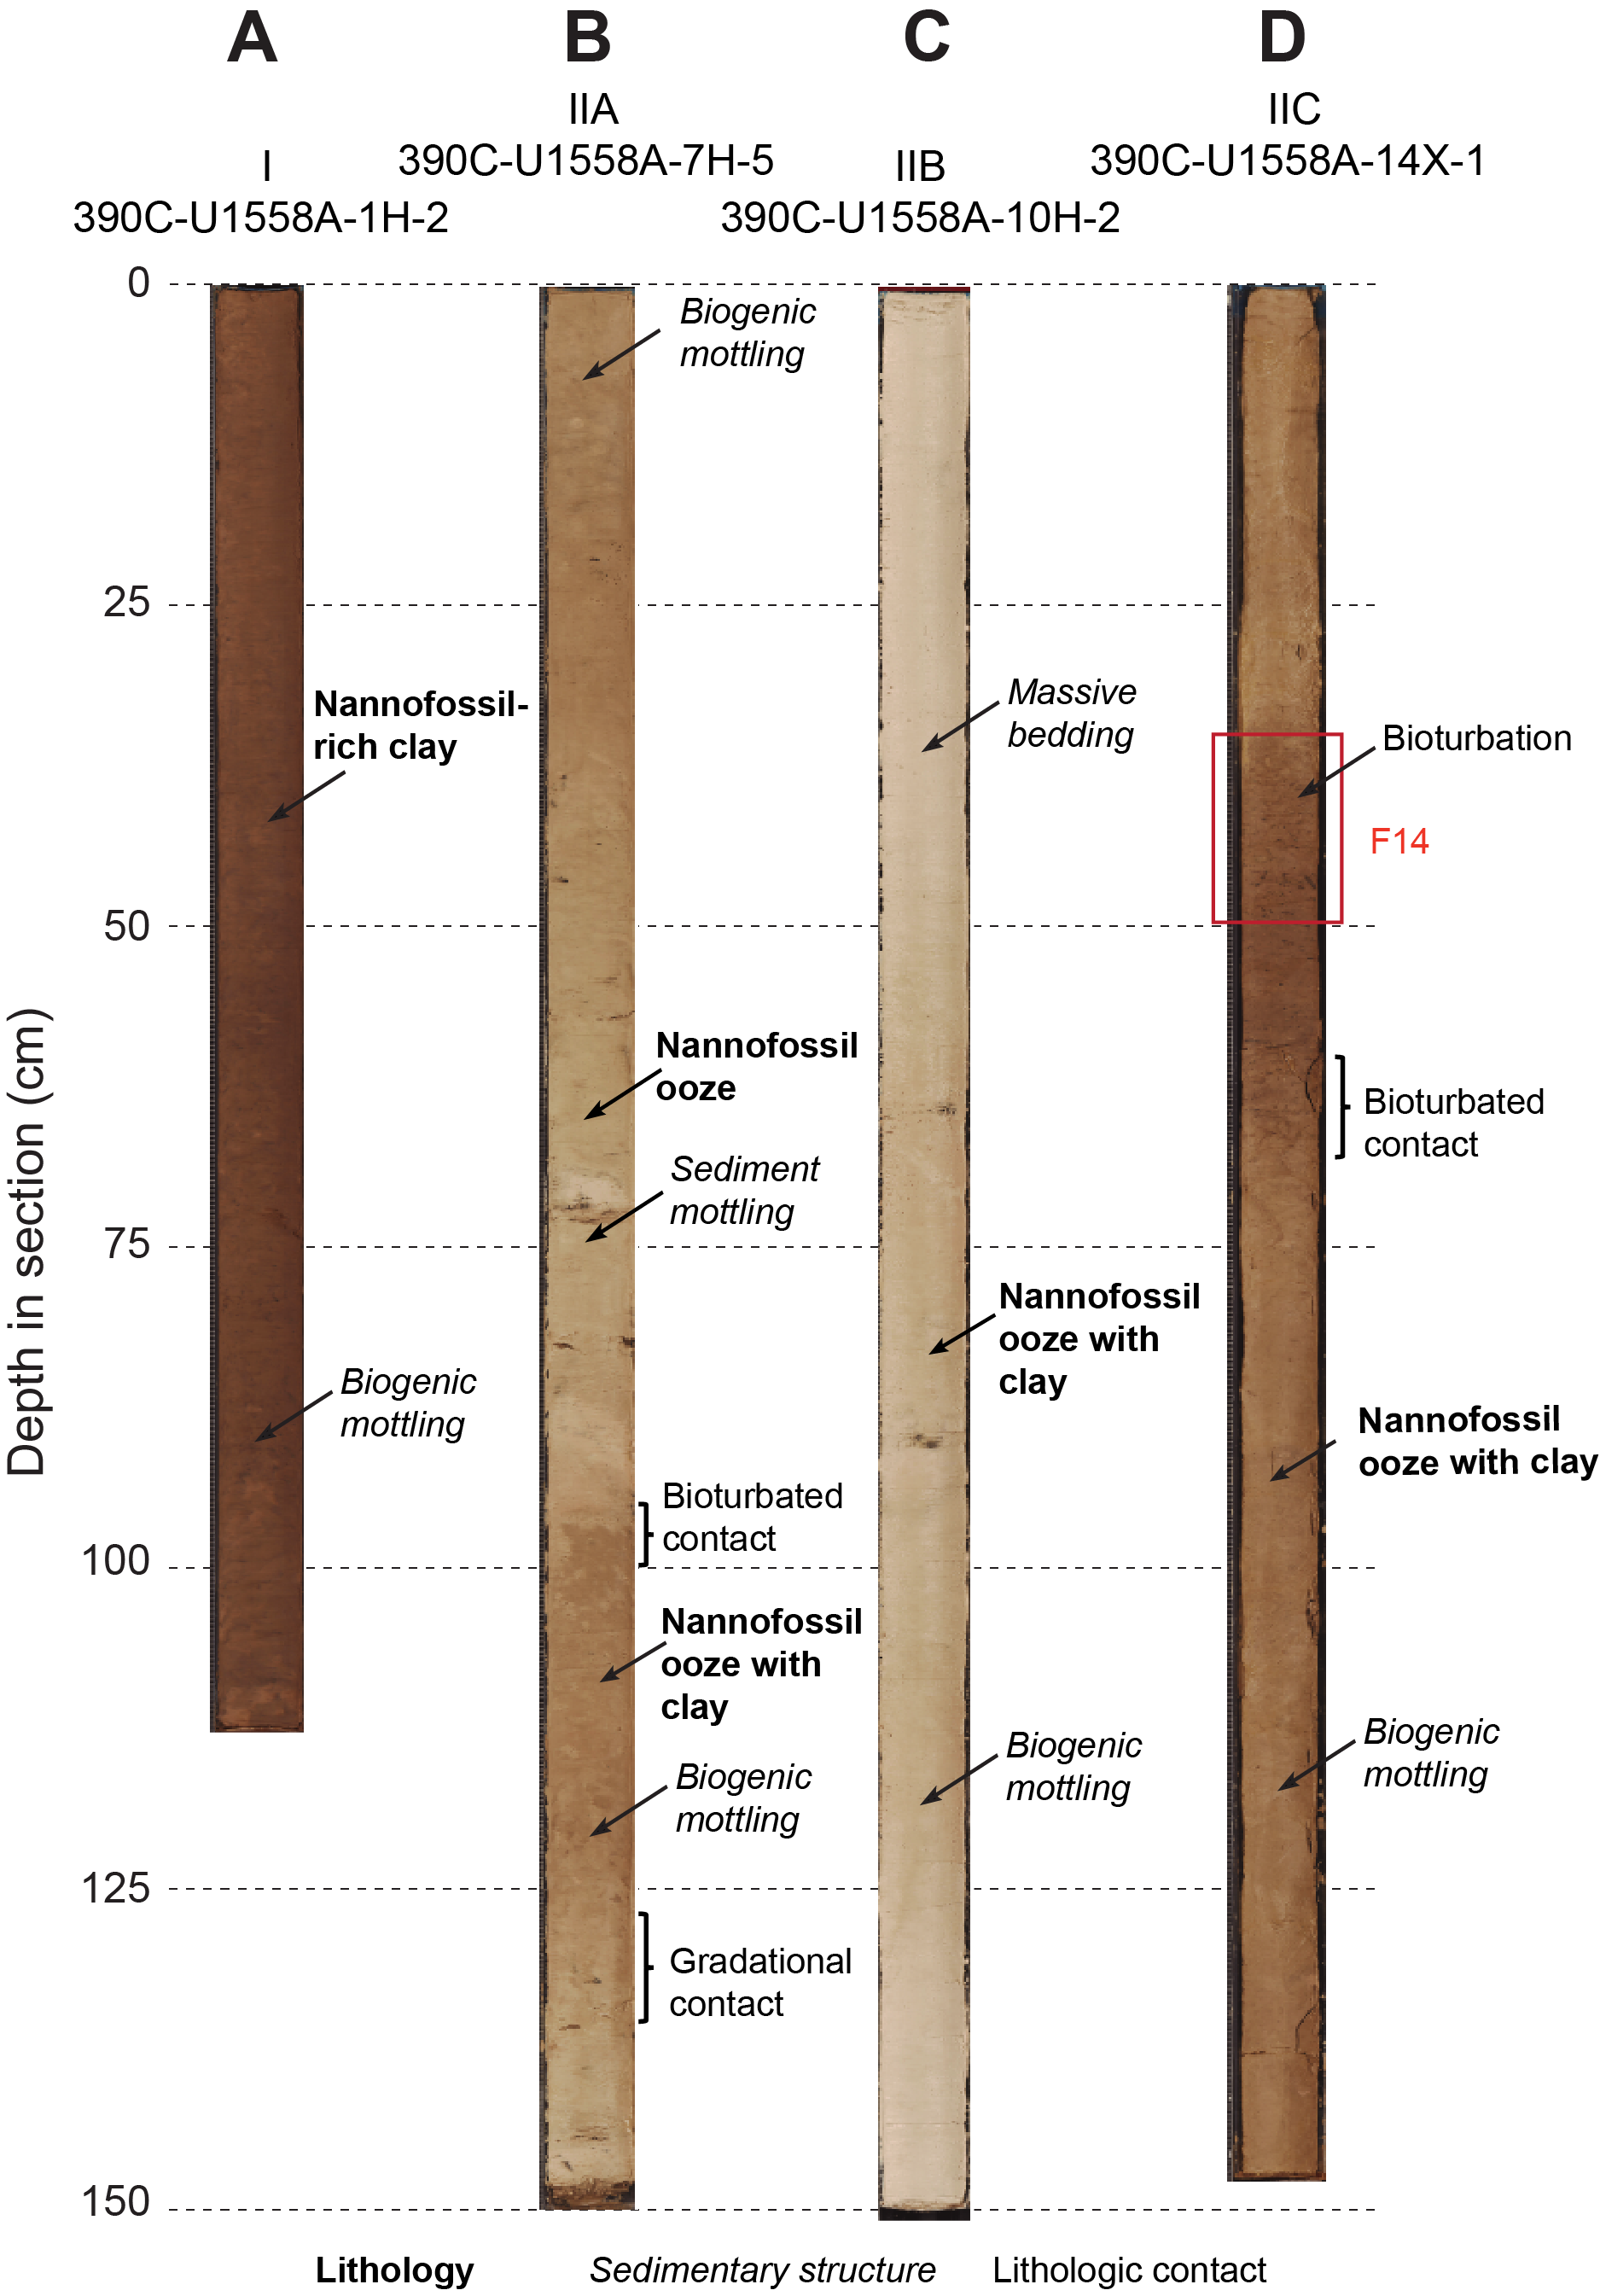
Figure F11. Typical lithologies of each unit.
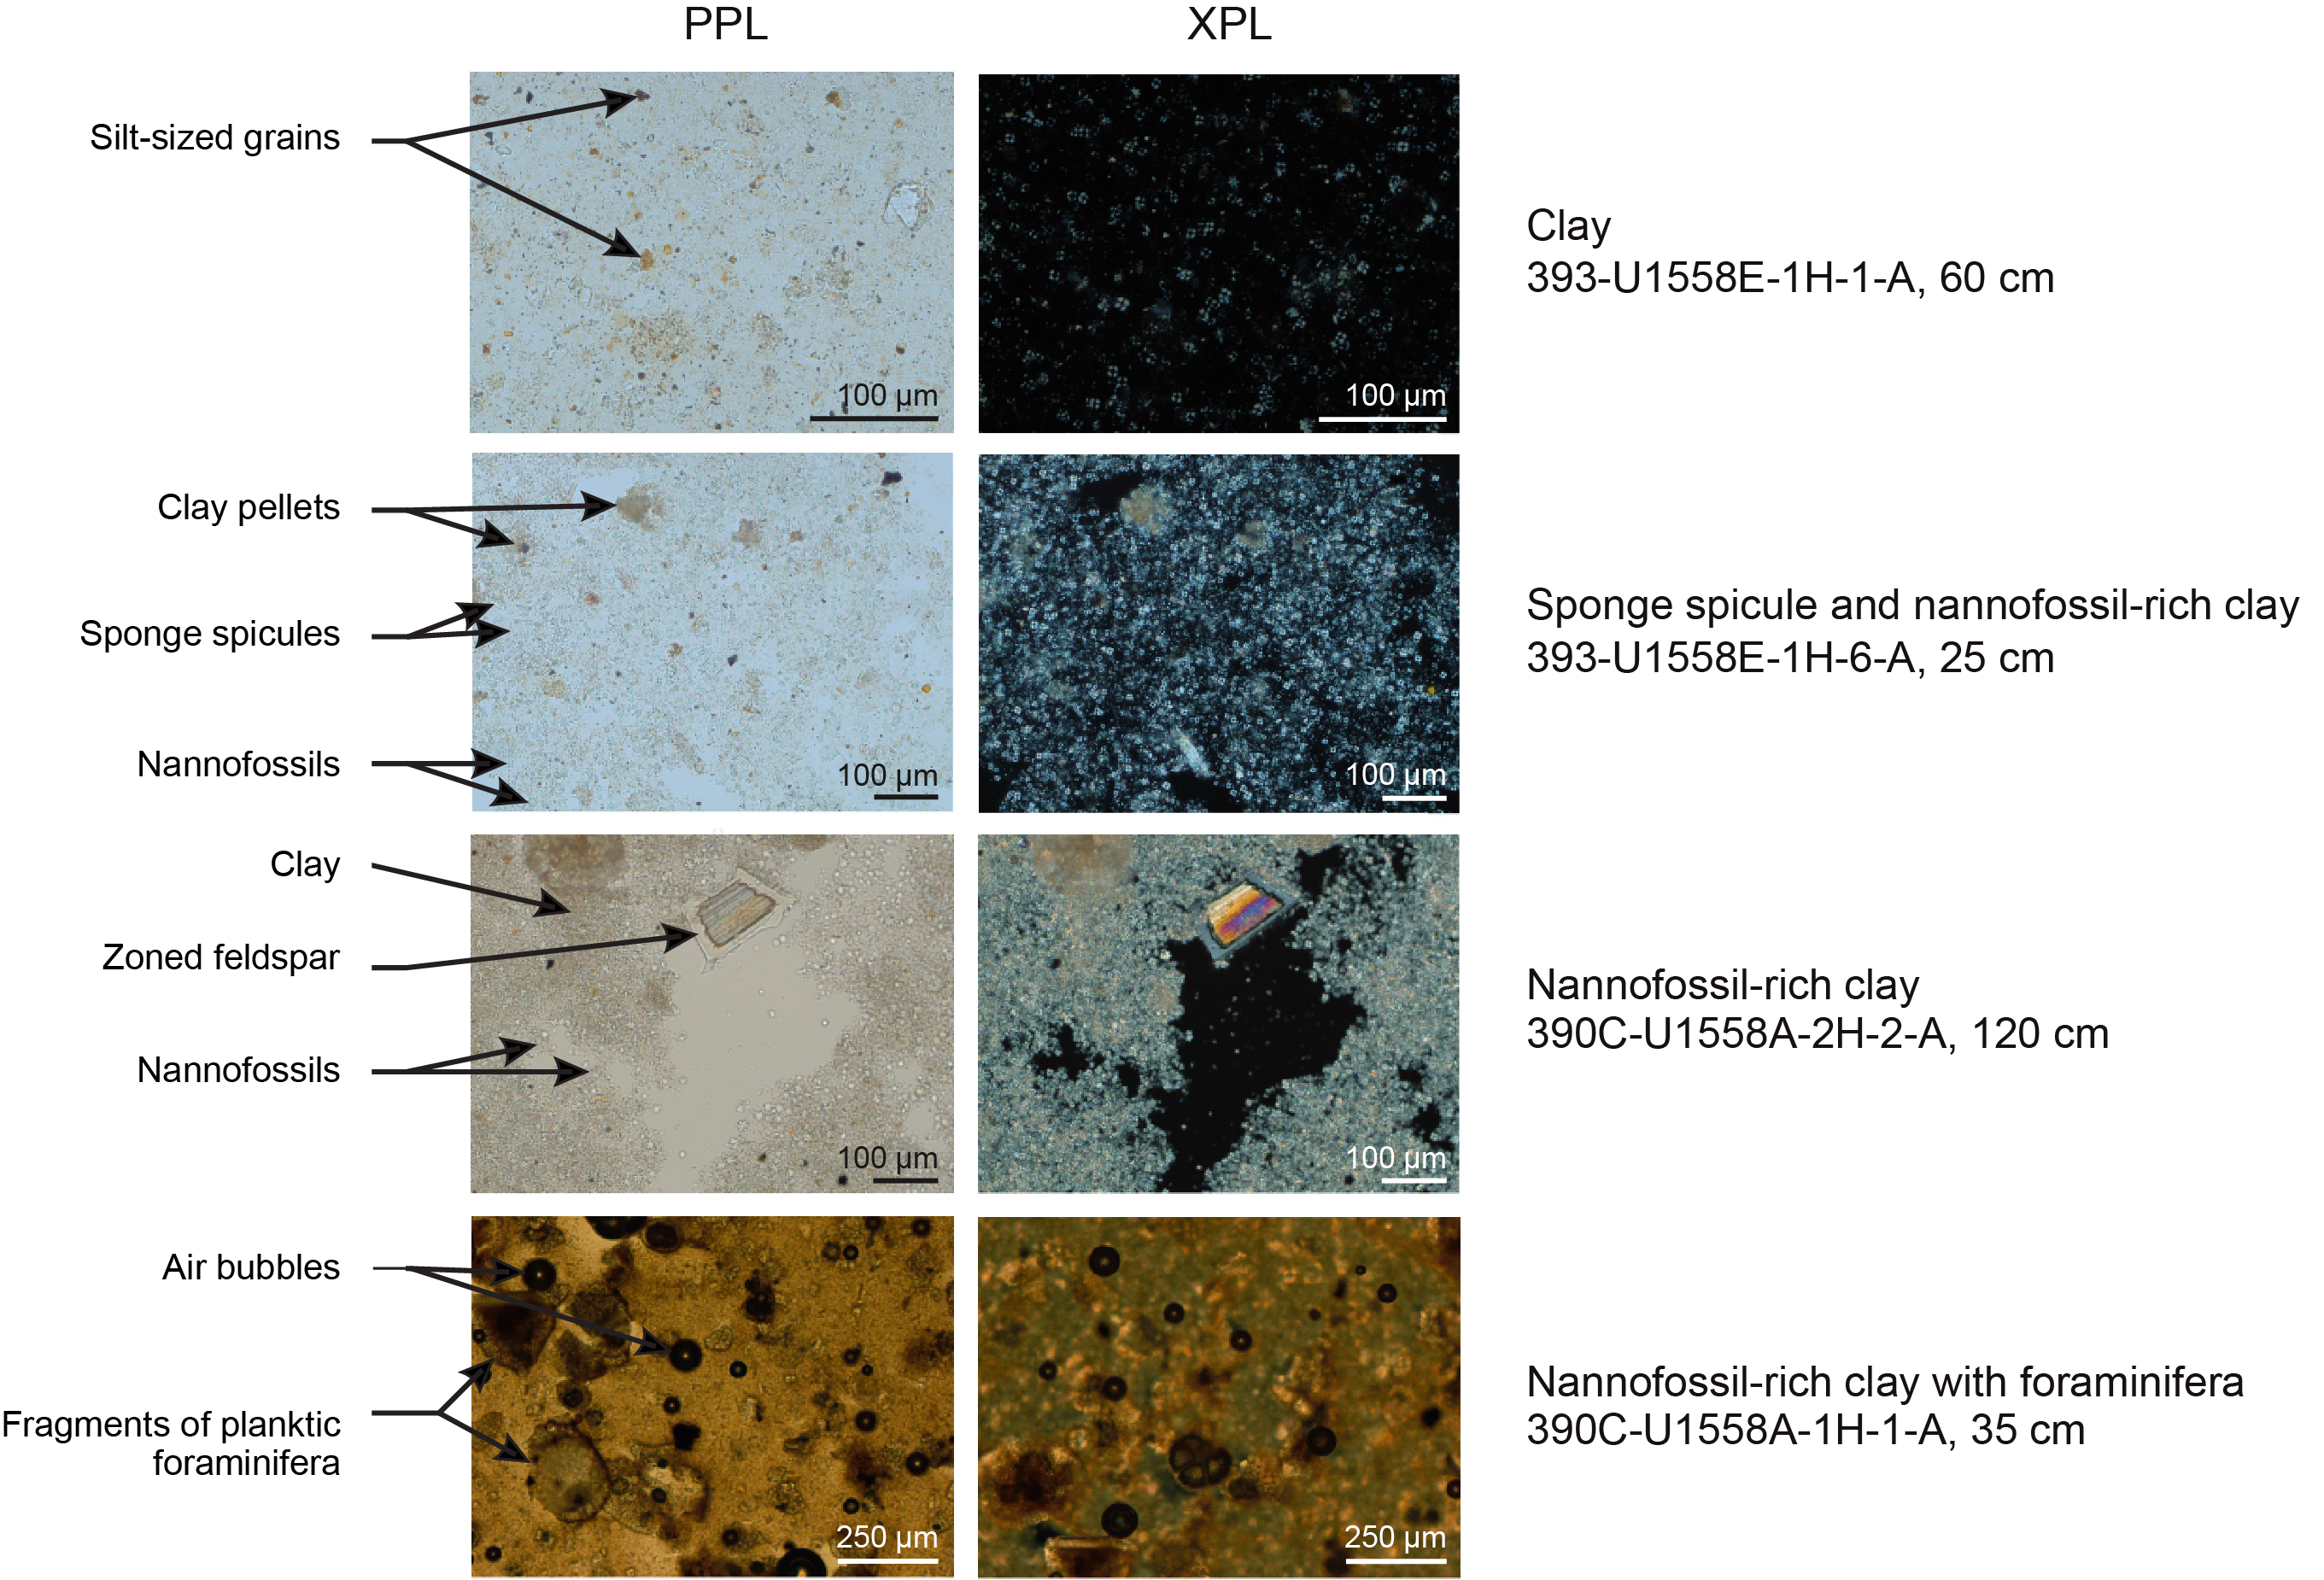
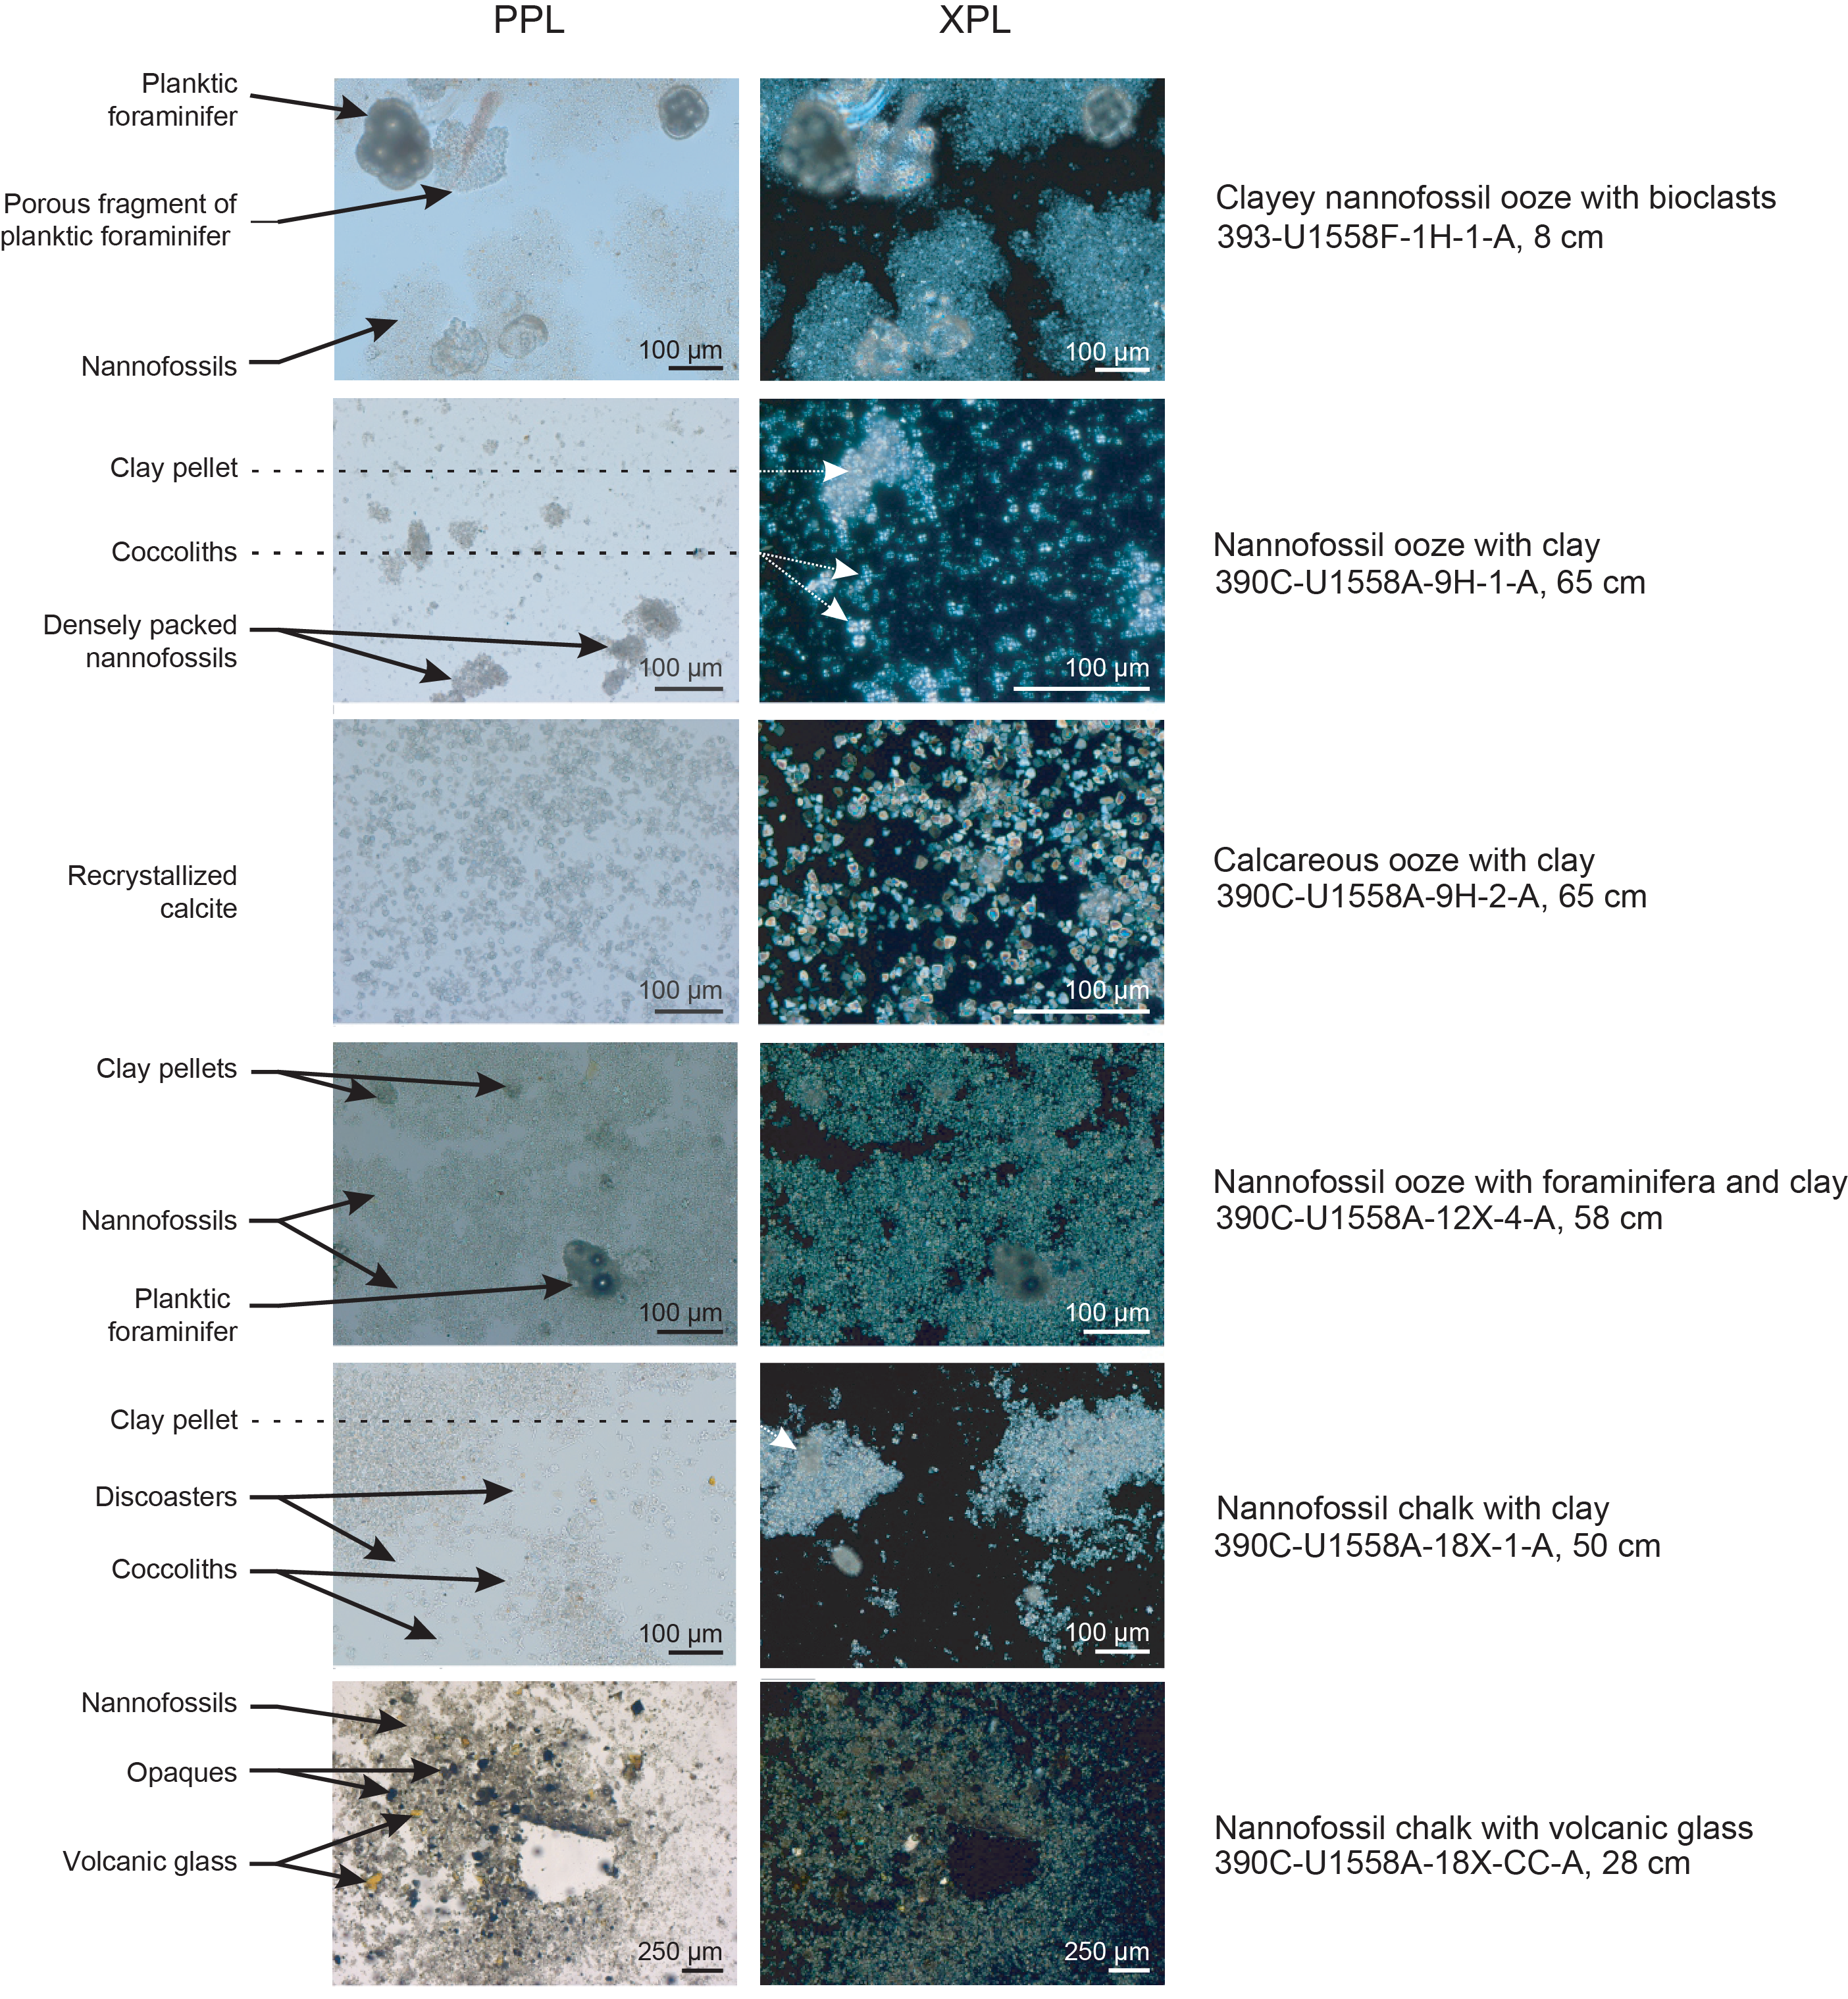
Figure F12. Principal sediment types.
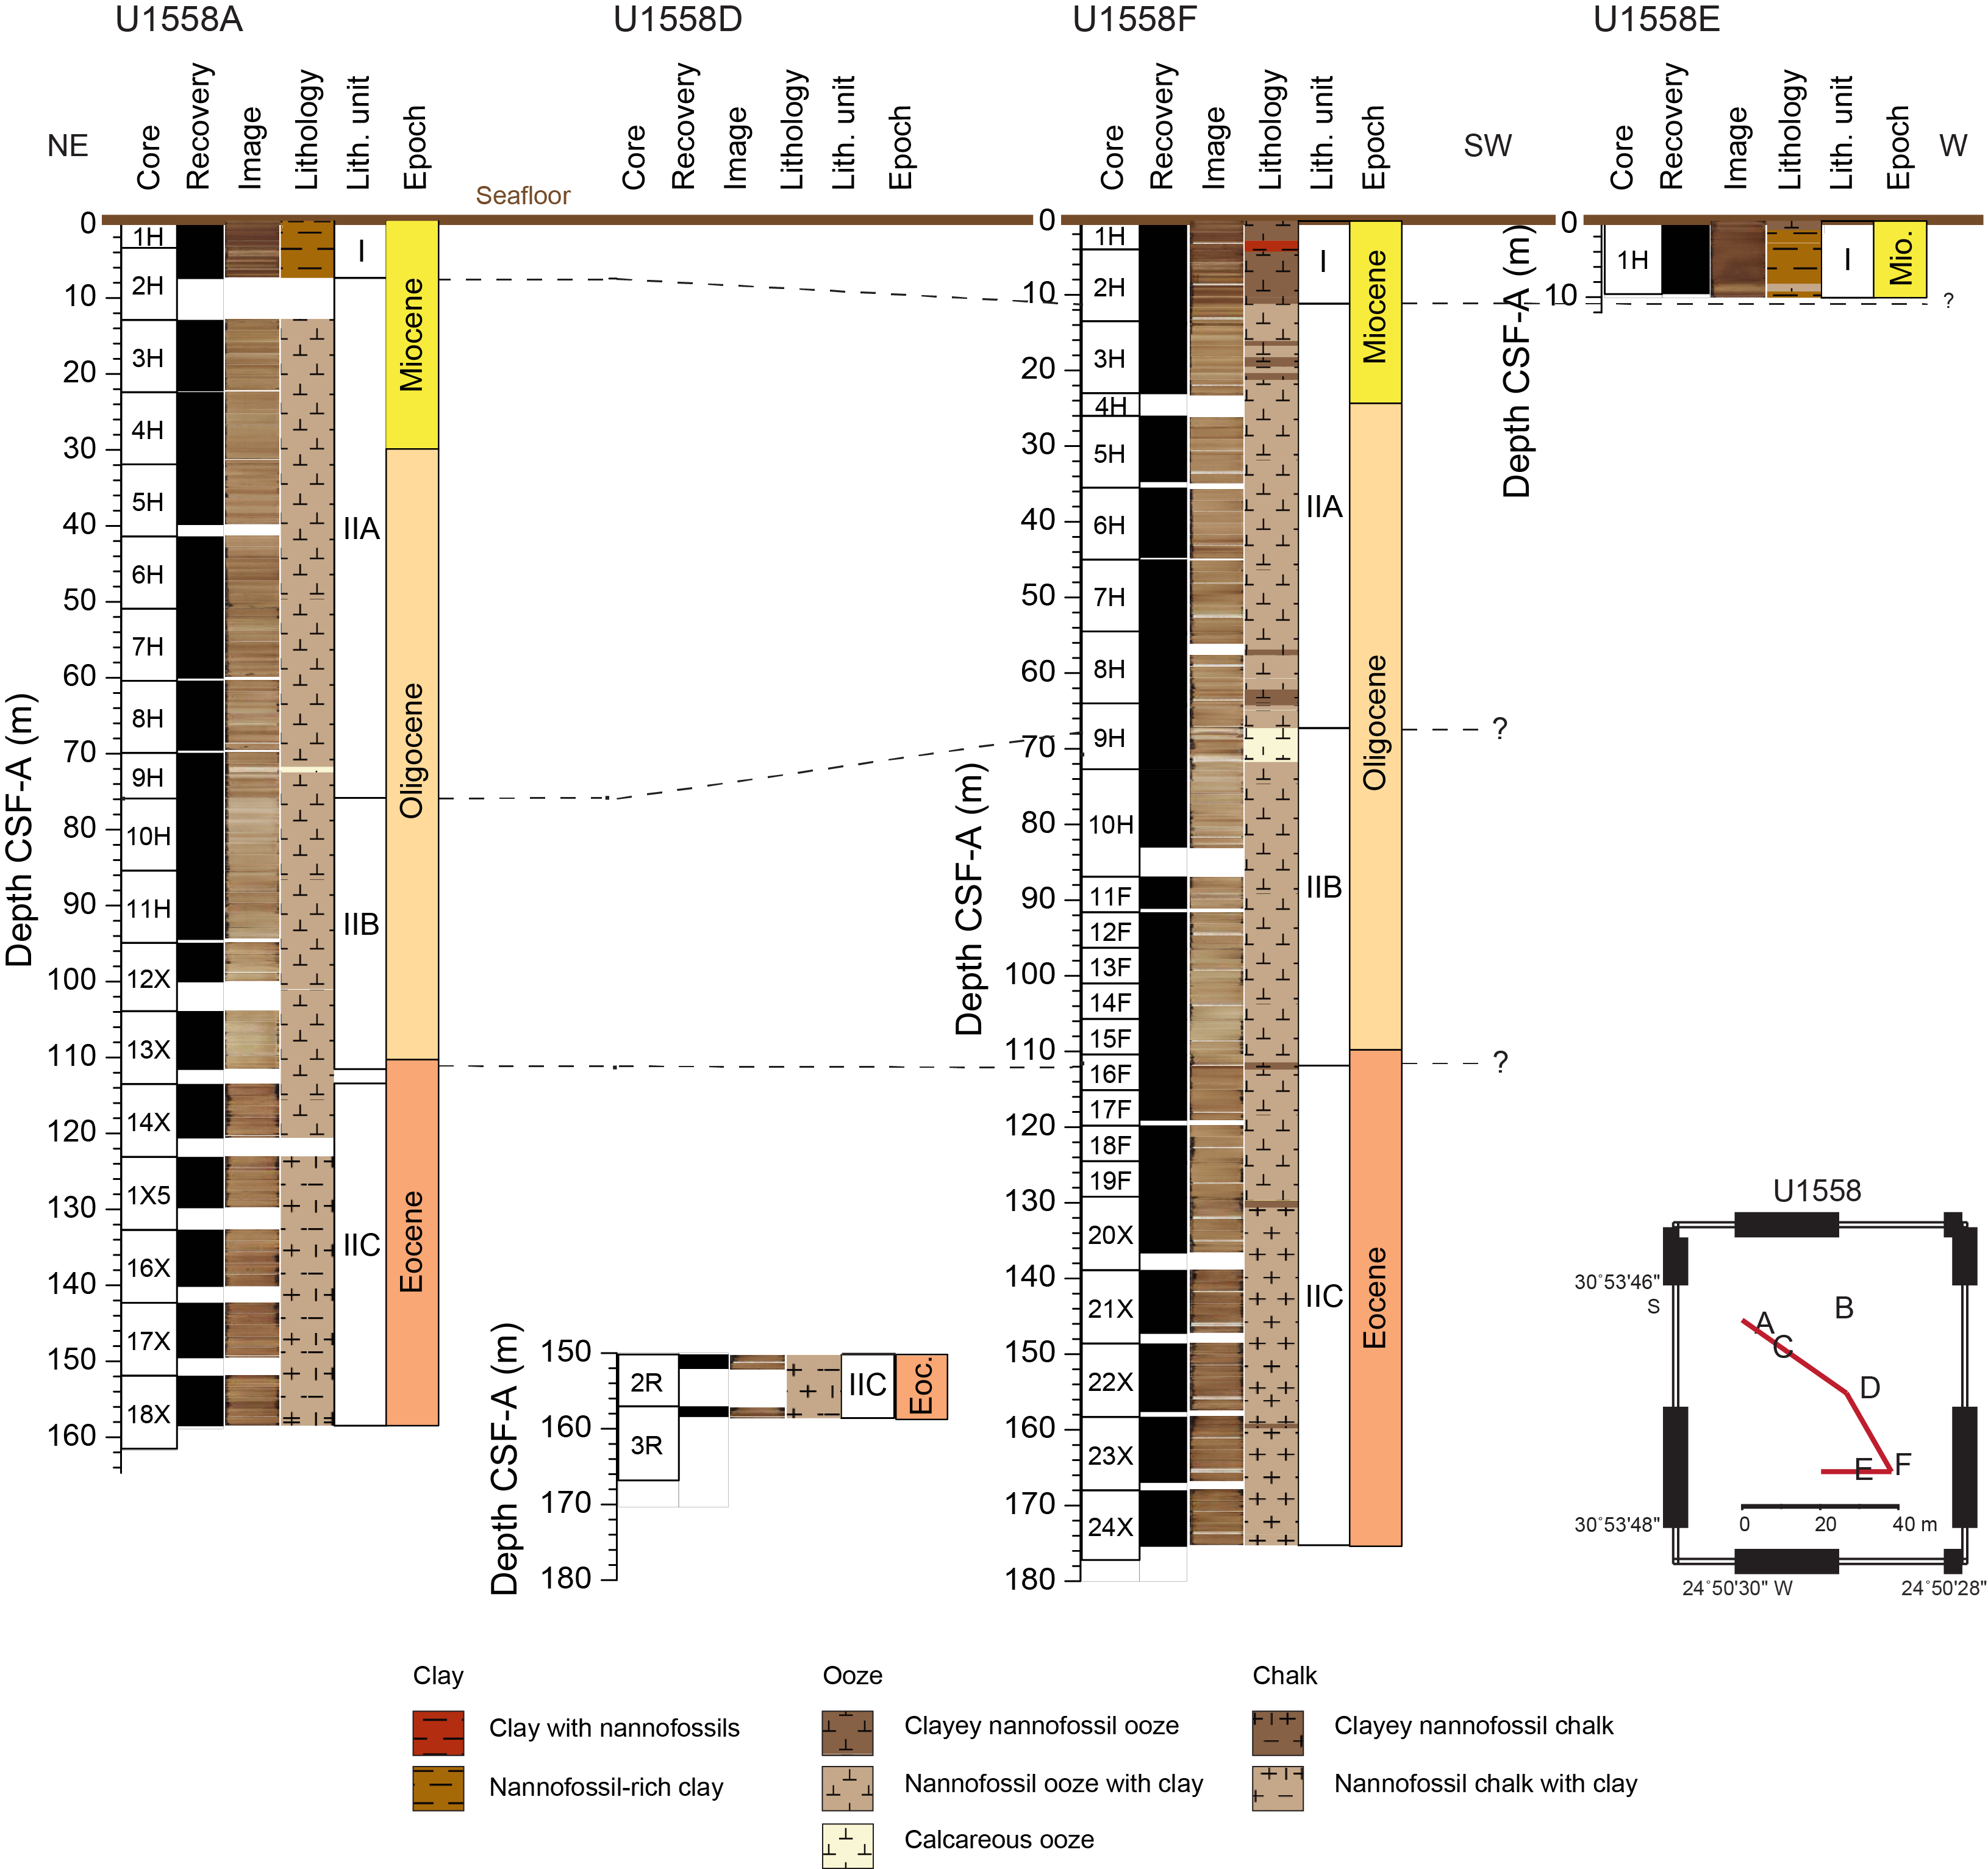
Figure F13. Lithologic correlation of sediment holes.
Lithologic contacts in Unit I are typically gradational, bioturbated, and horizontal and rarely subangular. Mottling is the dominant sedimentary structure where bedding is not present. Even though biogenic mottling is common, distinct ichnofossils can be identified in decimeter-thick intervals, including but not limited to Zoophycos, Planolites, Palaeophycus, Thalassinoides, Skolithos, Arenicolites, and Chondrites. Bioturbation intensity ranges between absent and complete (bioturbation index [BI] = 0–6) but is mostly common to high (BI = 3–4). Ichnofossil diversity is commonly 2–5 ichnogenera, with the maximum diameter ranging 1–20 mm (Figure F14). The boundary between Units I and II is marked by a decrease in clay content (Figure F10) based on a lightening in sediment color (i.e., higher luminosity/lightness [L*]; Figure F15), a decrease in magnetic susceptibility (MS) and natural gamma radiation (NGR) values (Figure F9), as well as a higher CaCO3 content. This boundary was not recovered in Hole U1558A.
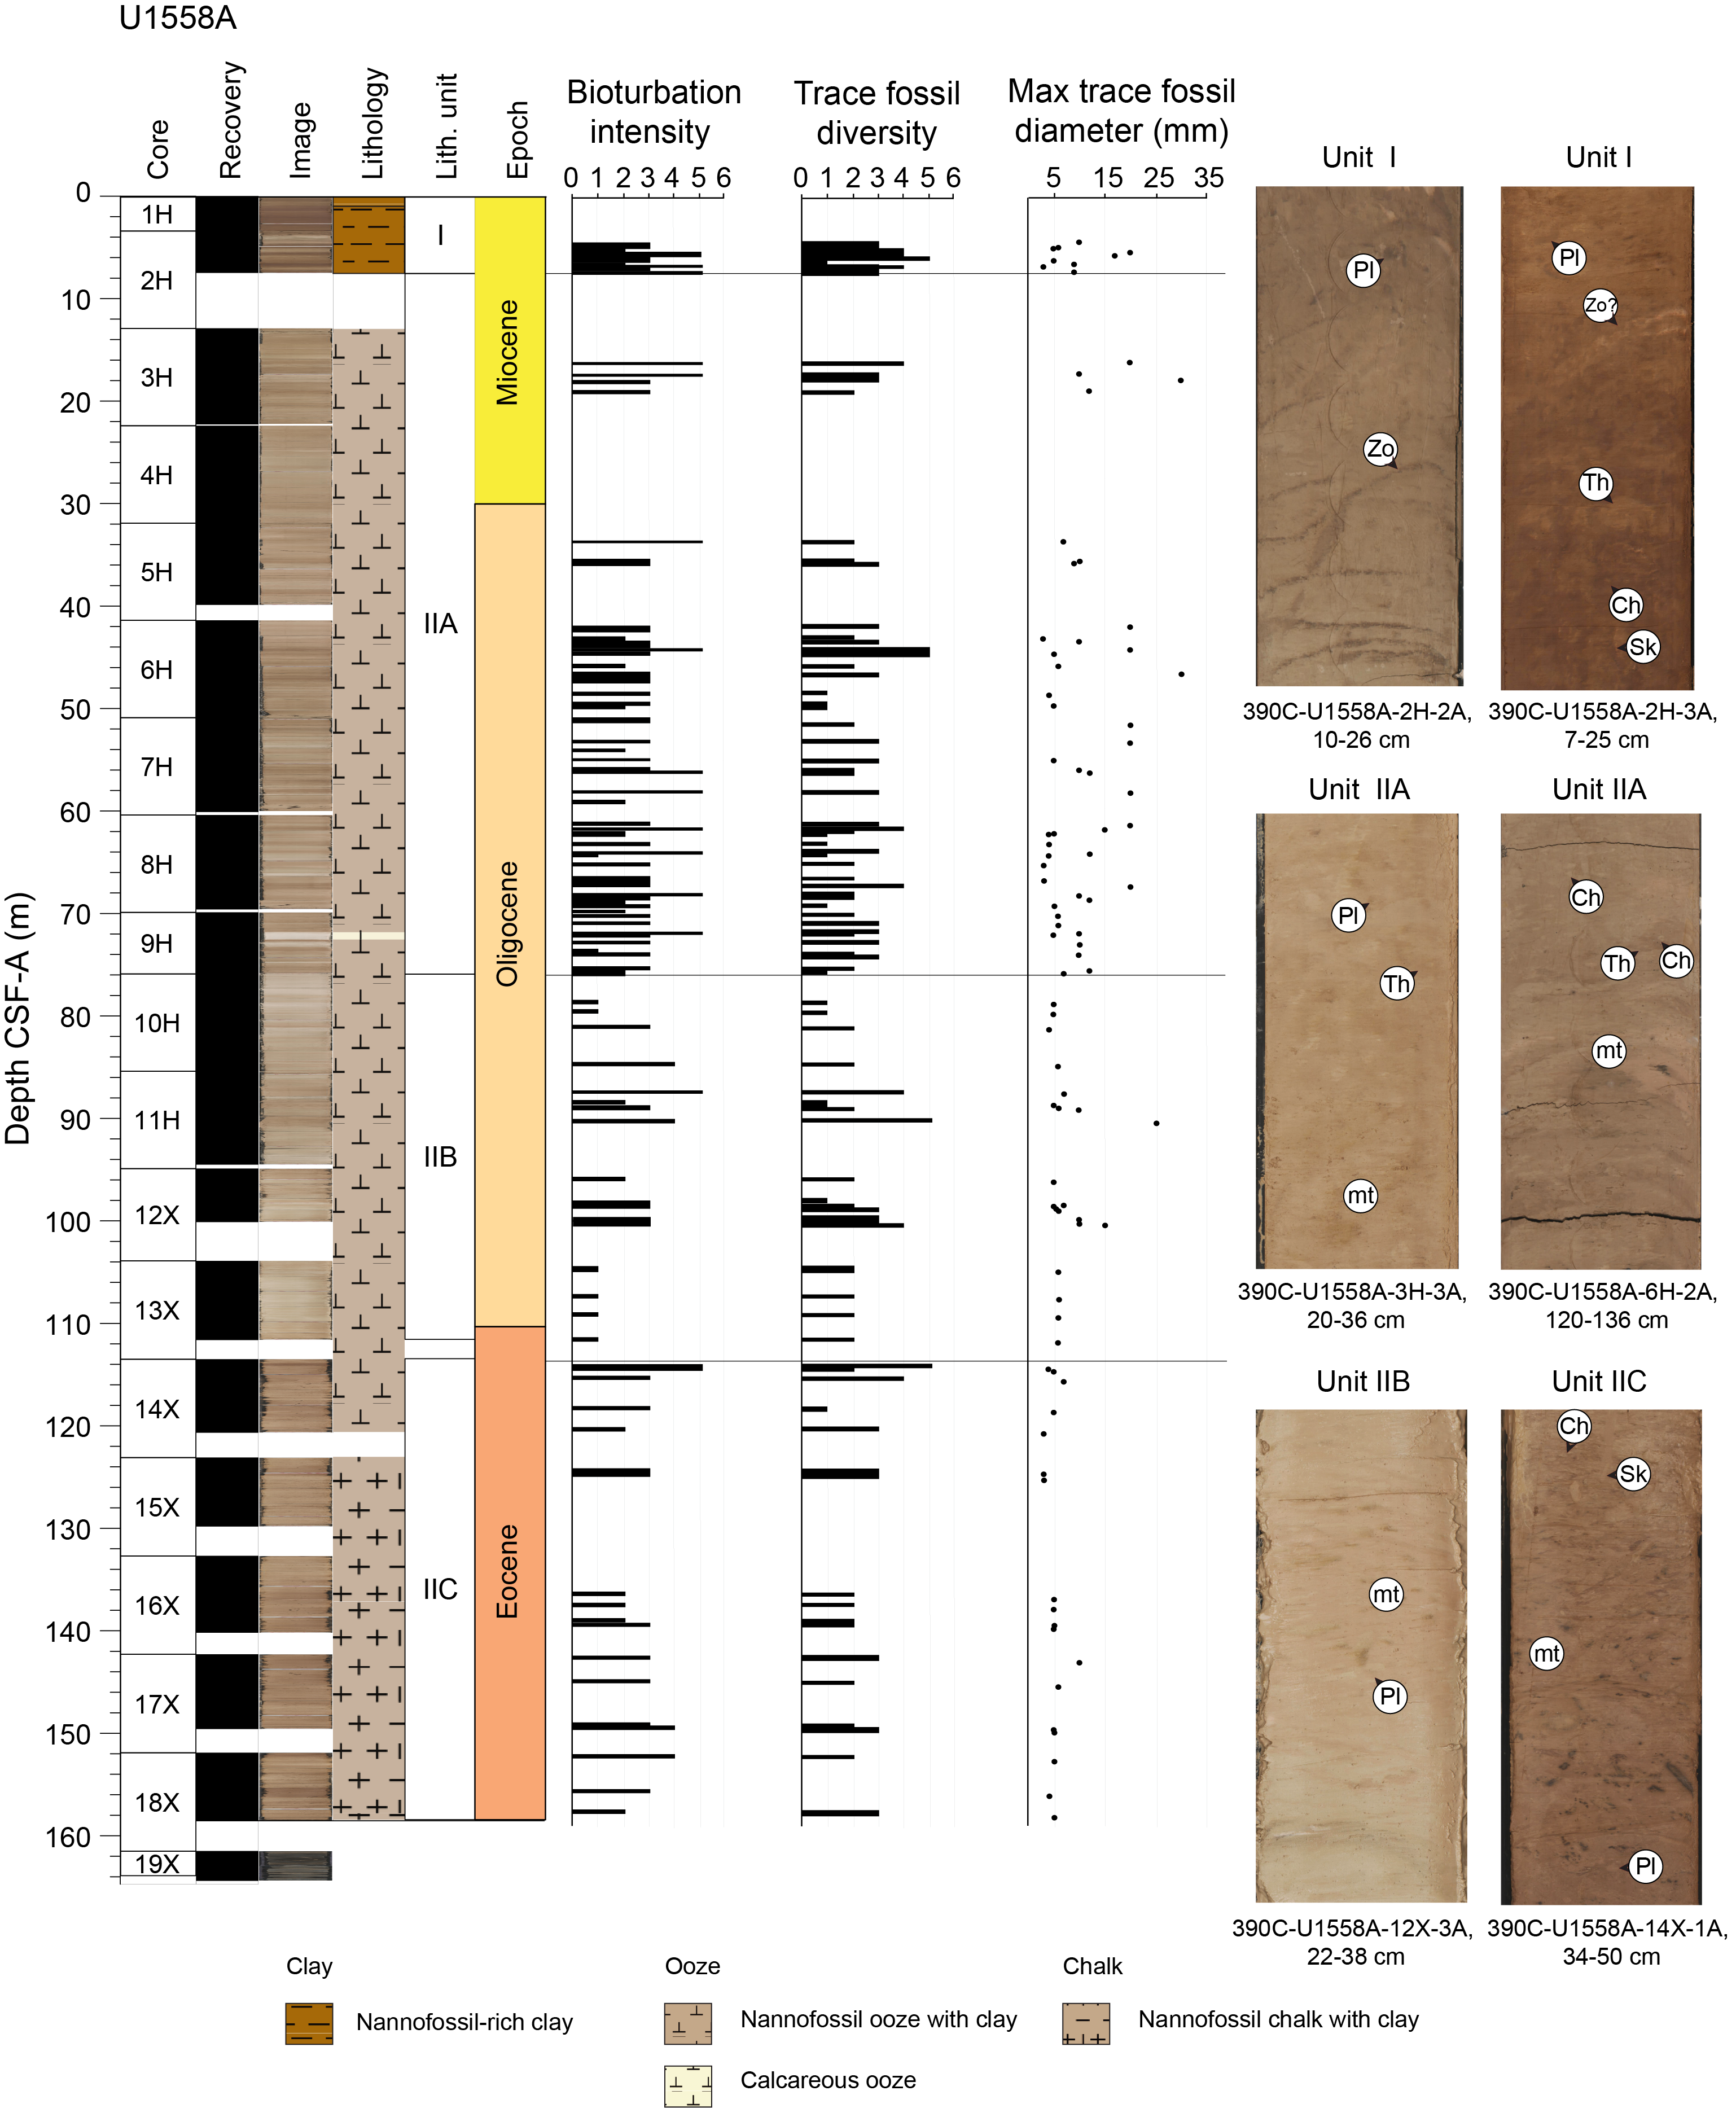
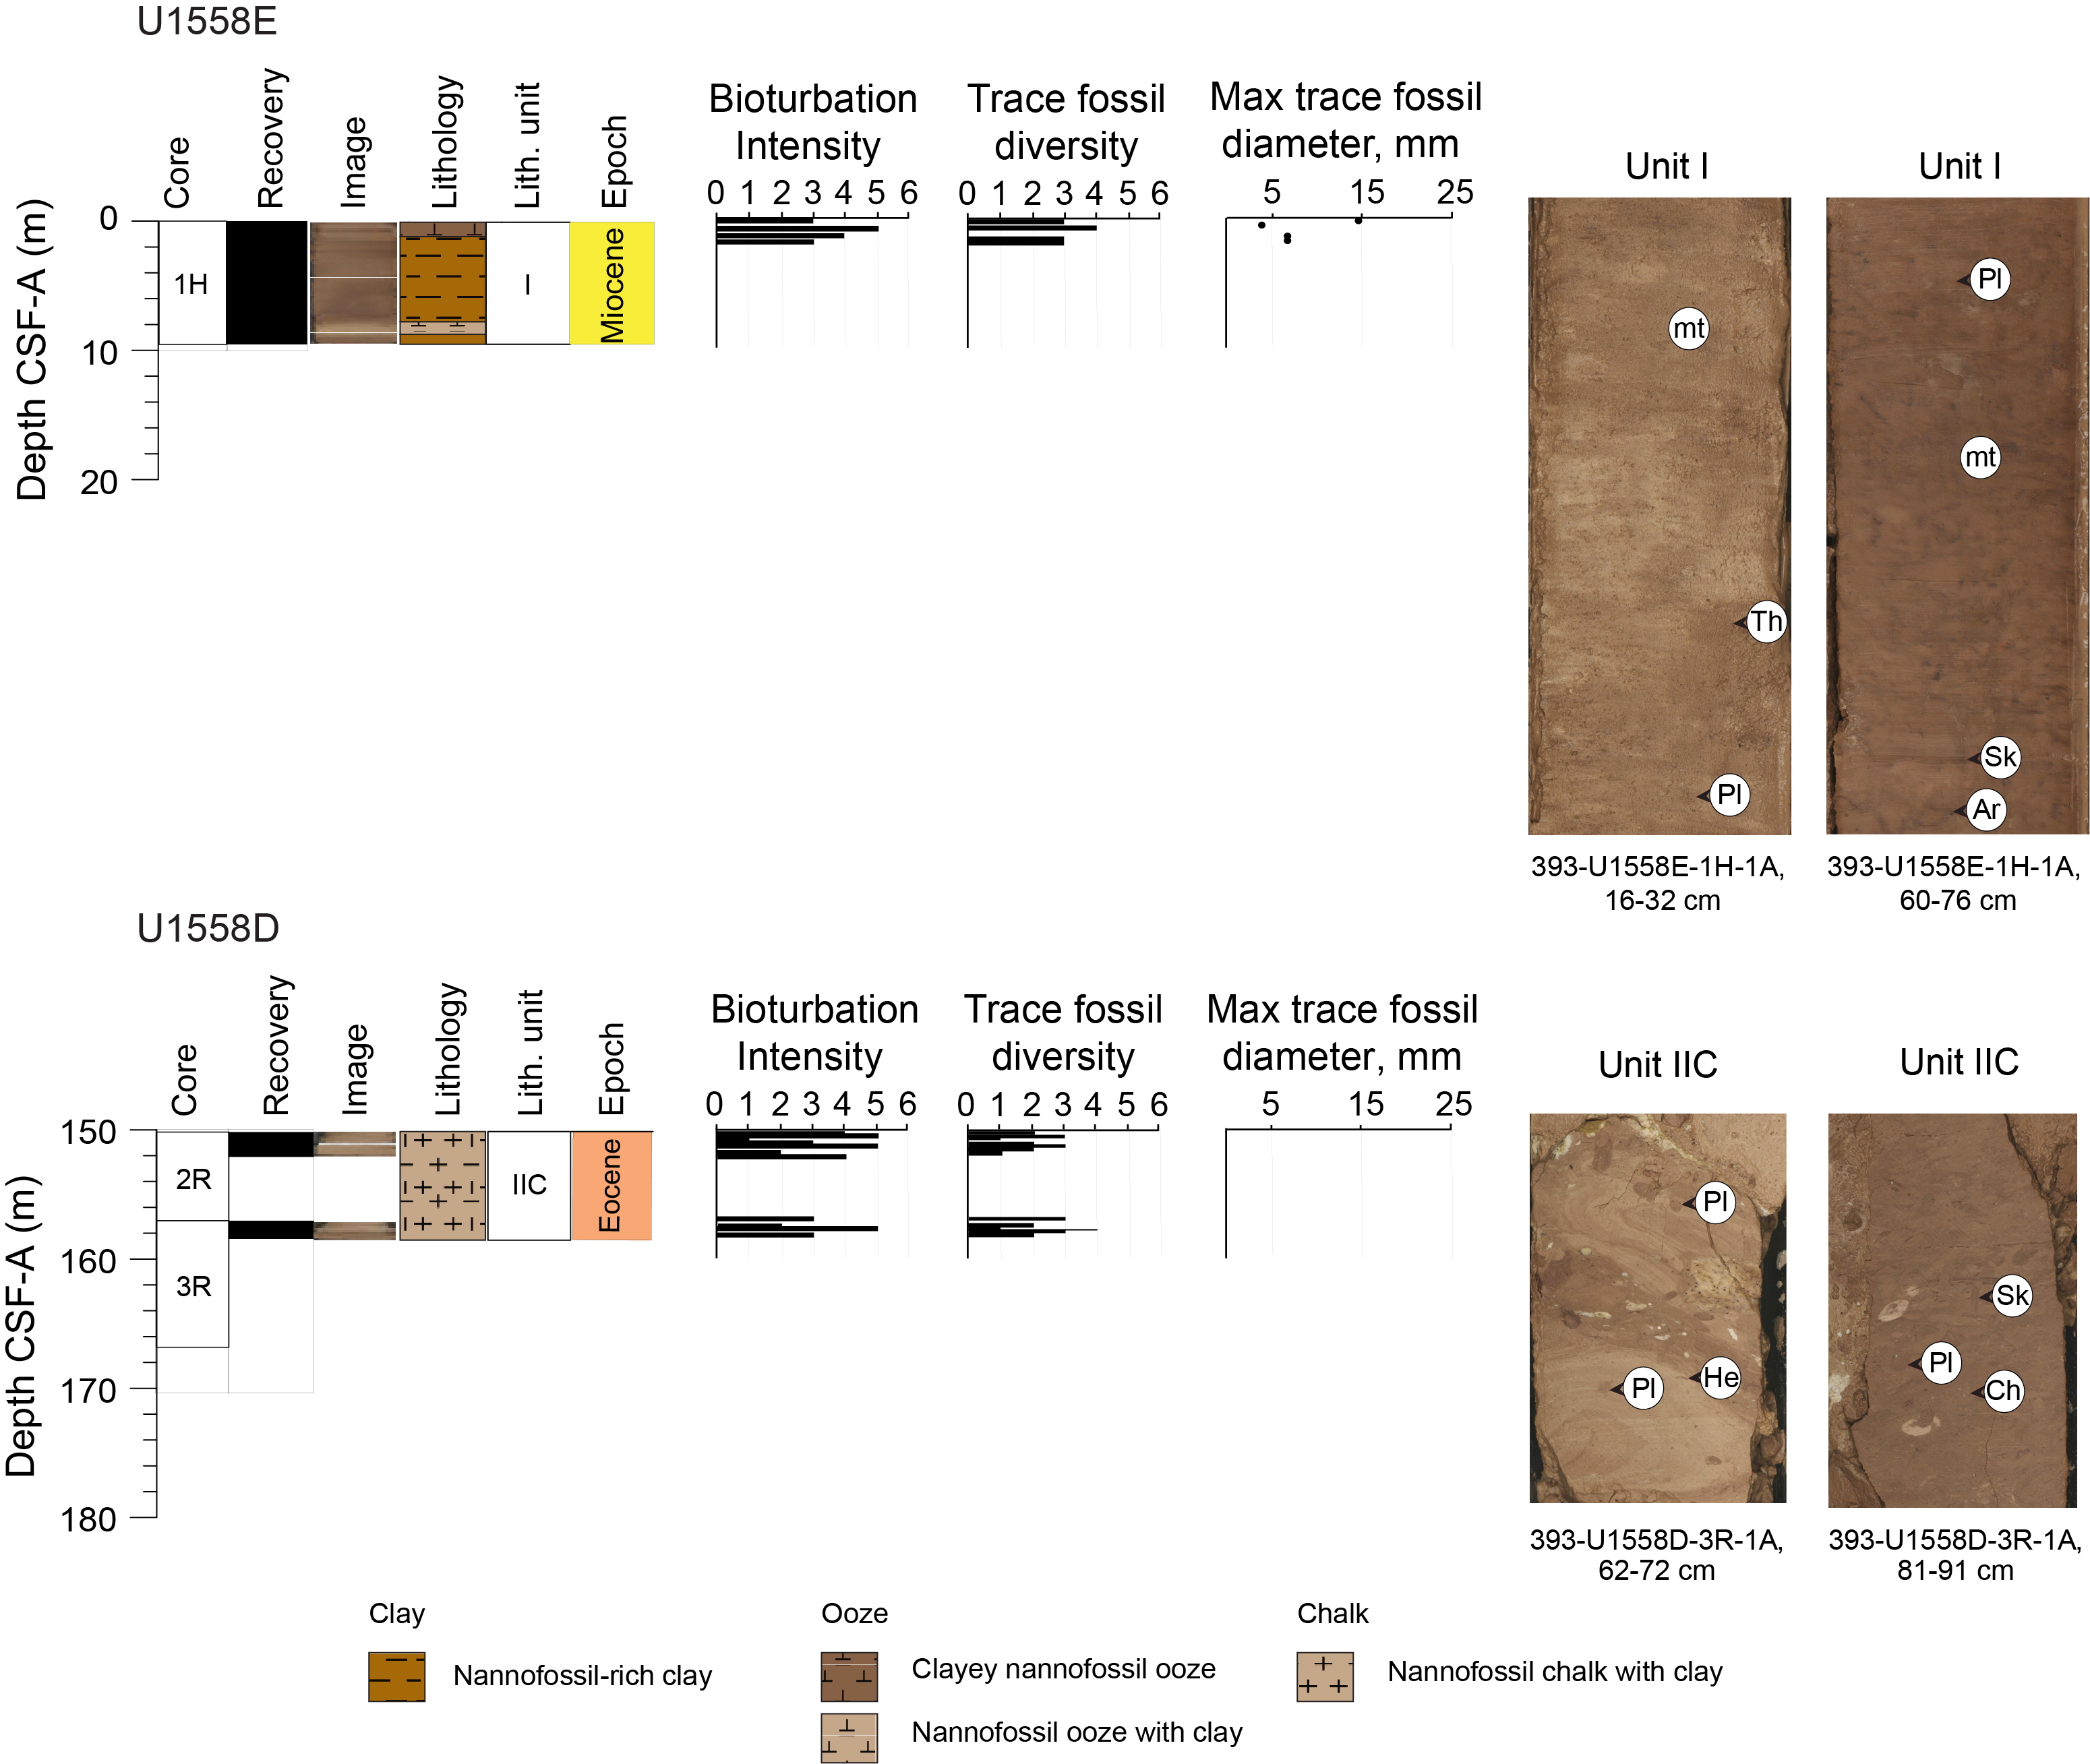
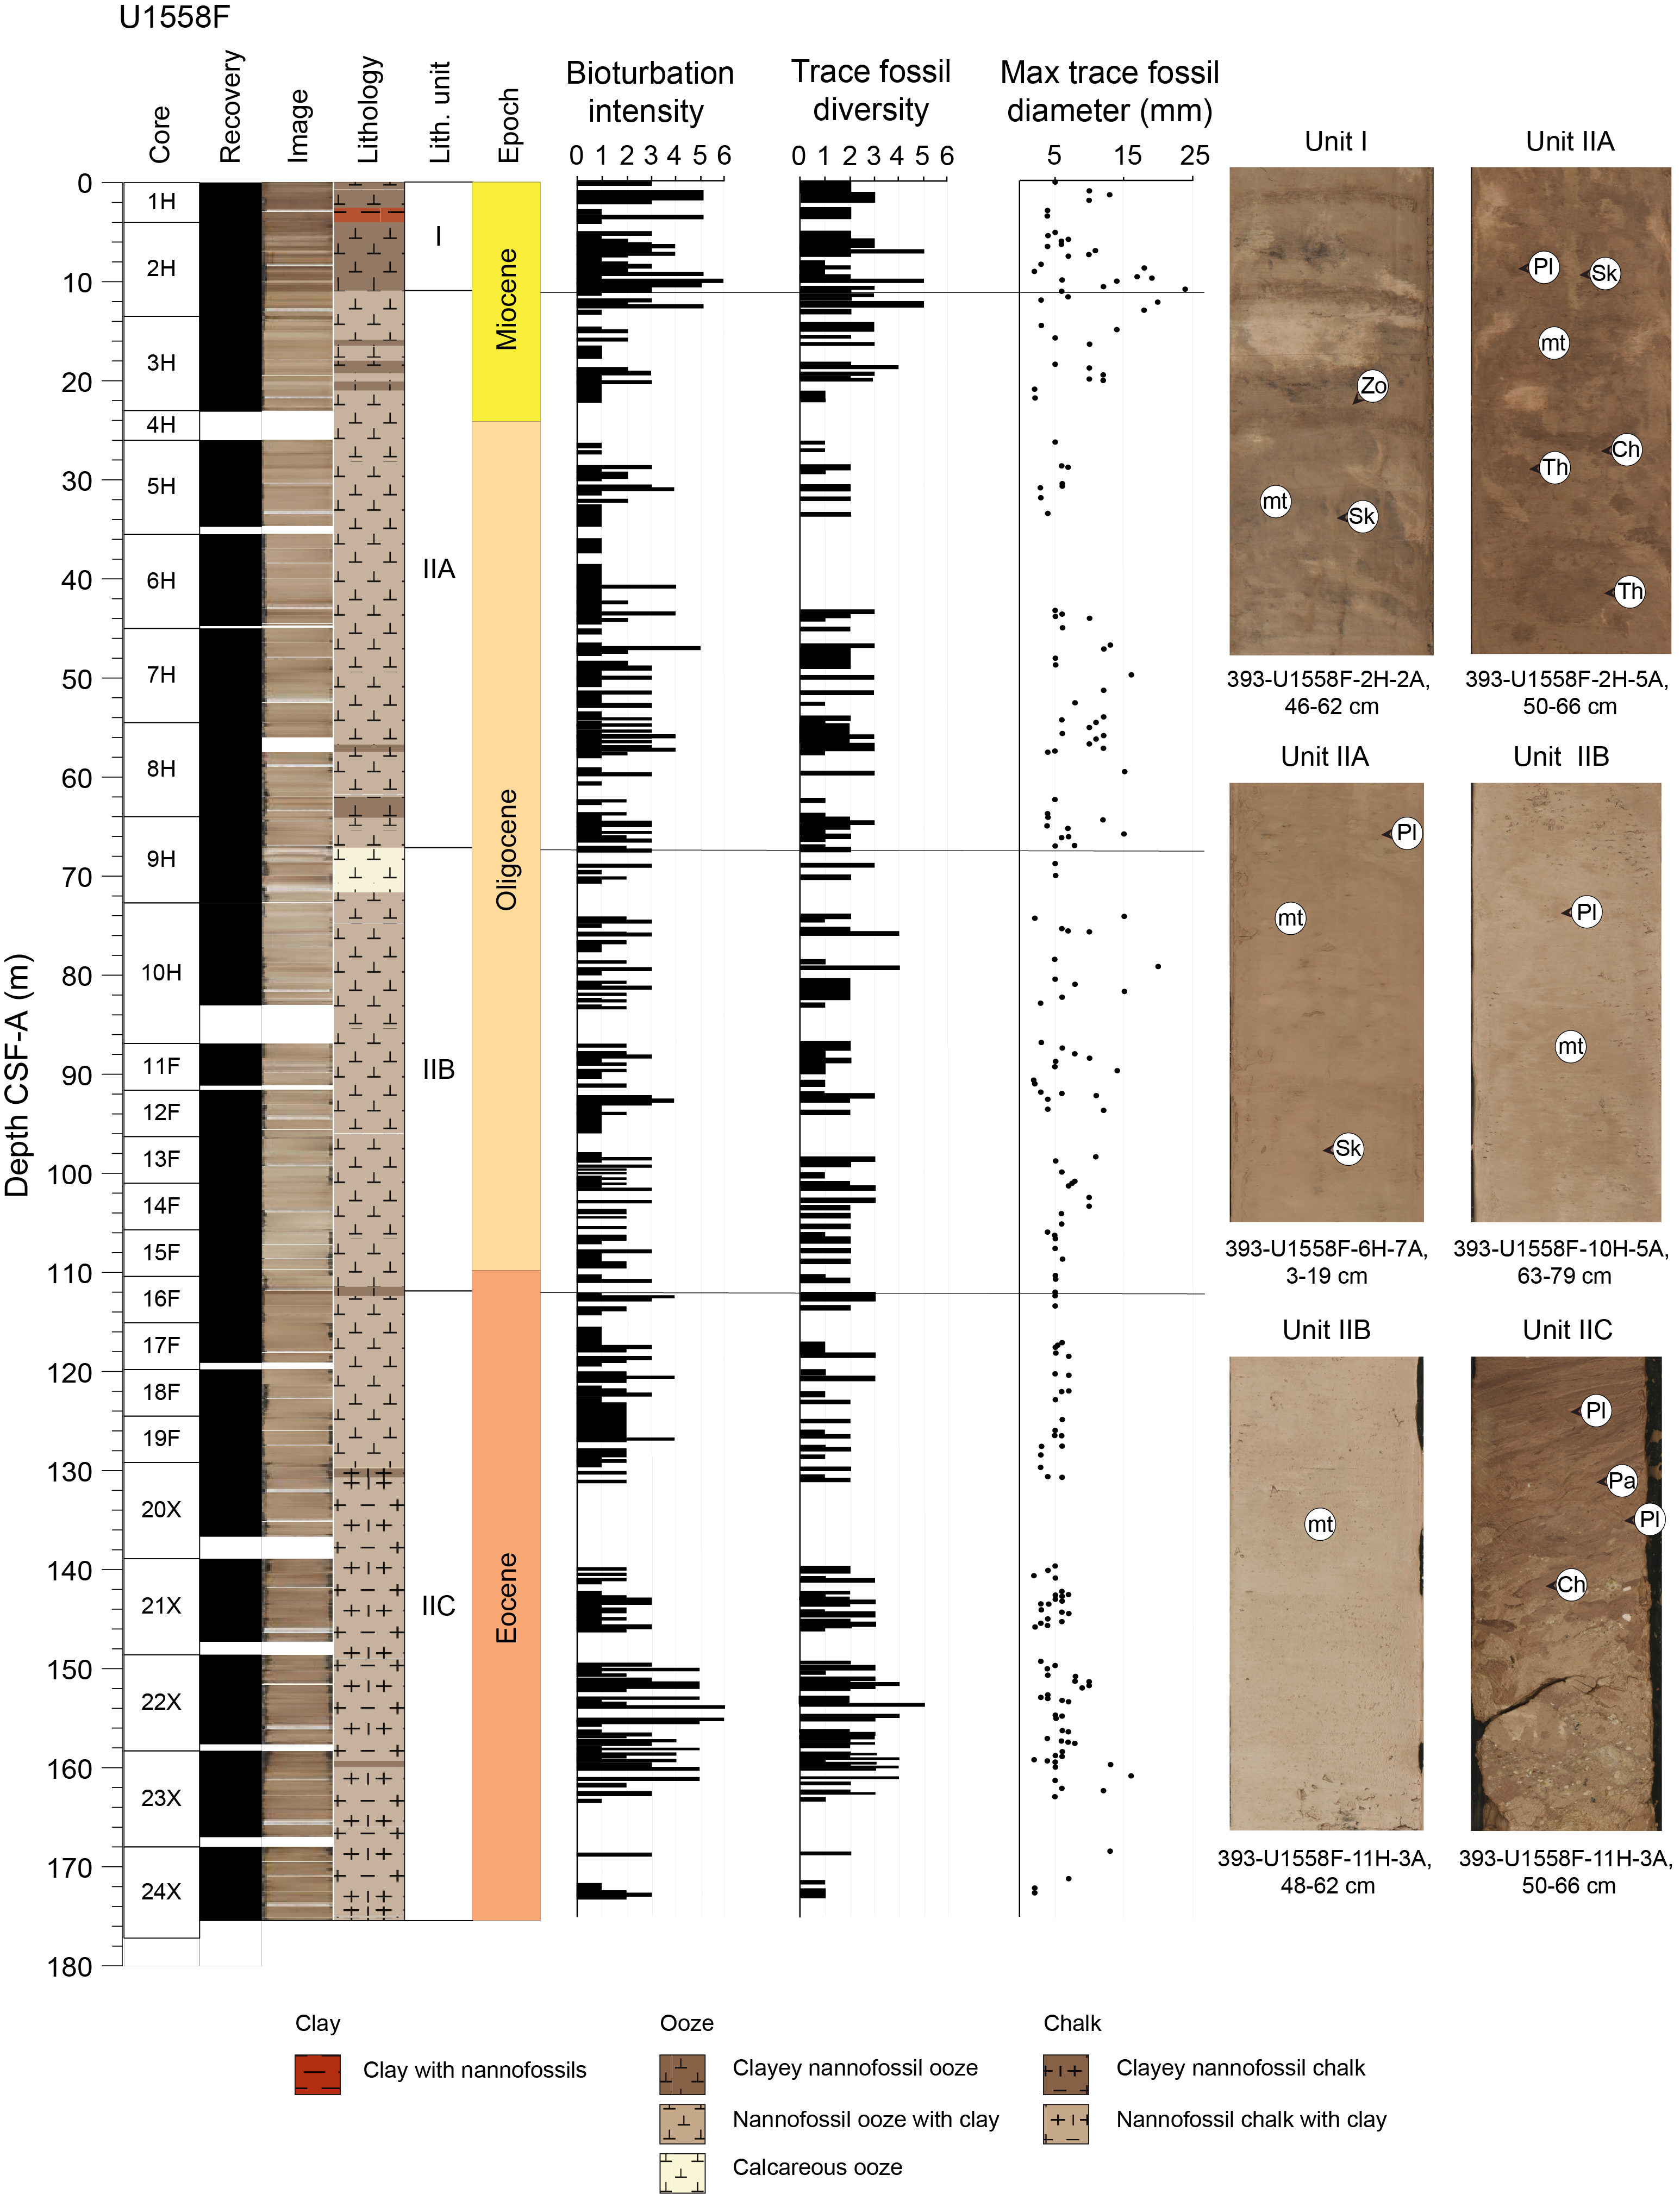
Figure F14. Typical trace fossil assemblages for each unit.
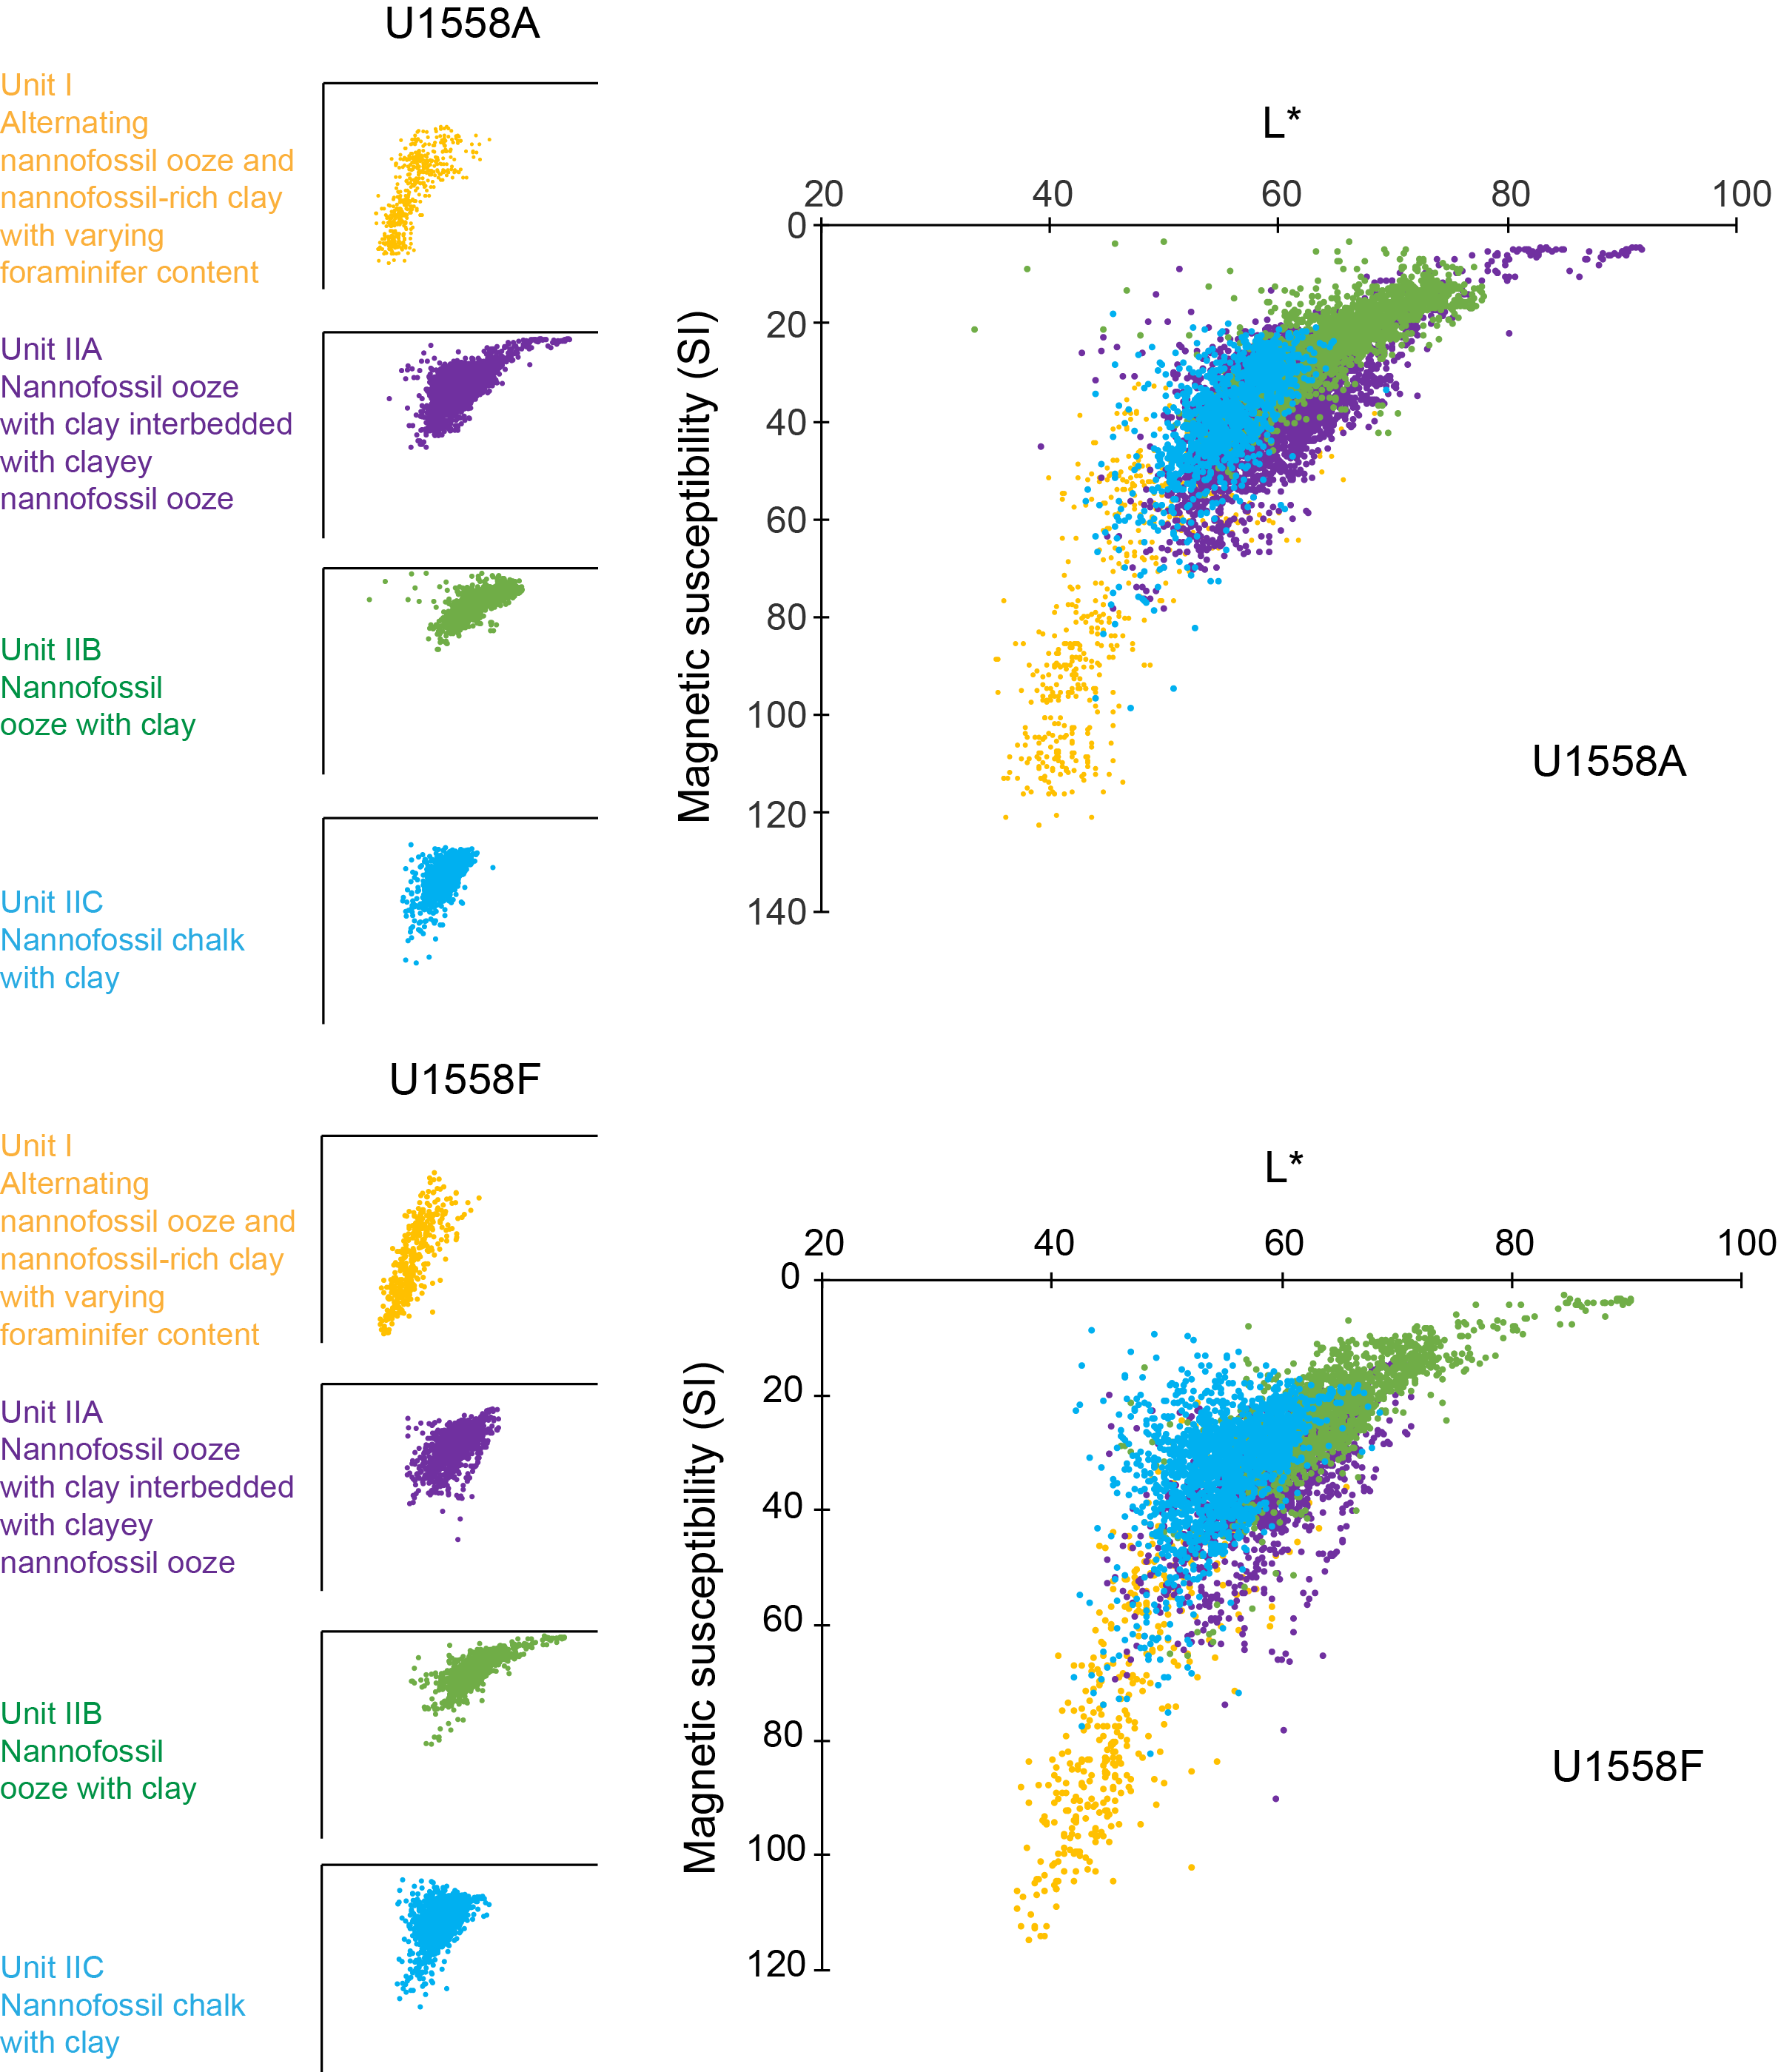
Figure F15. SHMSL MSP and L*.
The primary minerals identified with bulk X-ray diffraction (XRD) in Unit I include calcite, quartz, plagioclase, and clay minerals such as illite, kaolinite, and smectite (Figures F16, F17; Tables T3, T4). Calcite and quartz form the dominant peaks, with calcite being the largest. The characteristic double peak of plagioclase indicates that it is a significant component of Unit I. The typical mineral composition of Unit I is as follows: 38–62 wt% calcite (supported by 20–47 wt% CaCO3; see Geochemistry), 27–43 wt% total clay minerals, 6–9 wt% feldspar, and 4–10 wt% quartz (Figure F17; Table T4). In this deep marine environment, the relatively large amounts of clay and feldspar indicate a terrigenous influx of airborne material and dissolution of some calcite.
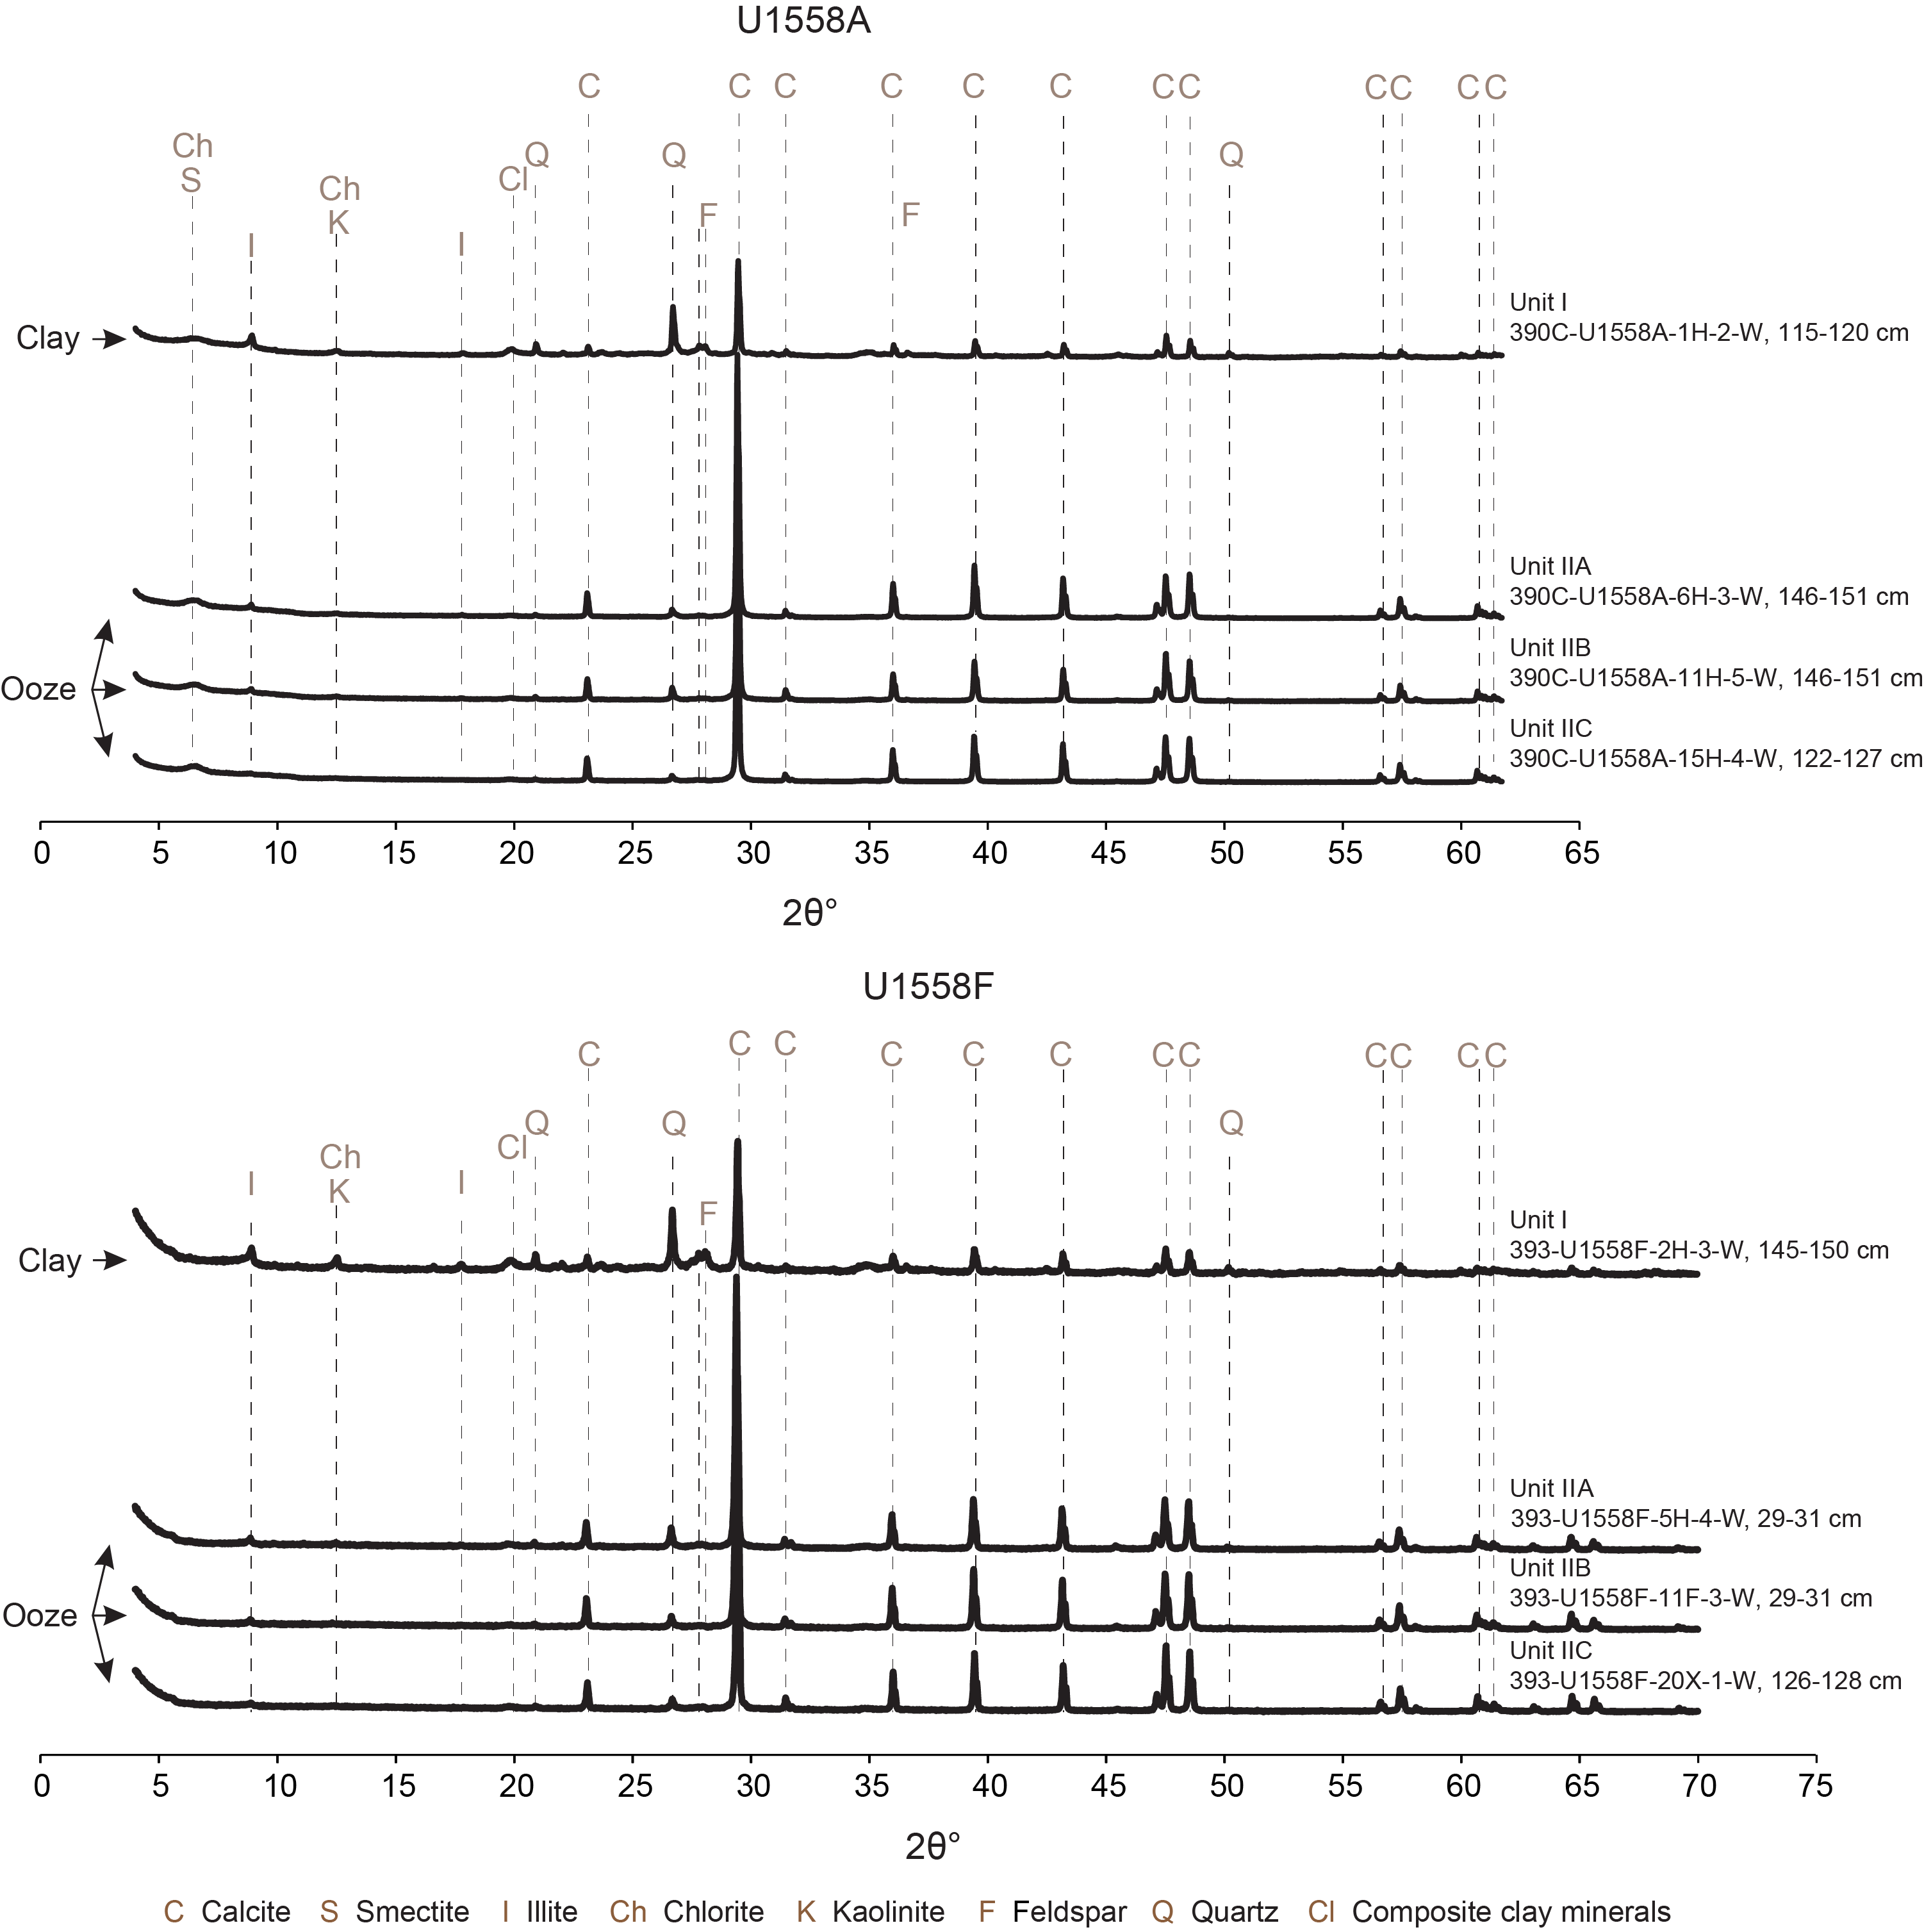
Figure F16. X-ray diffractograms.
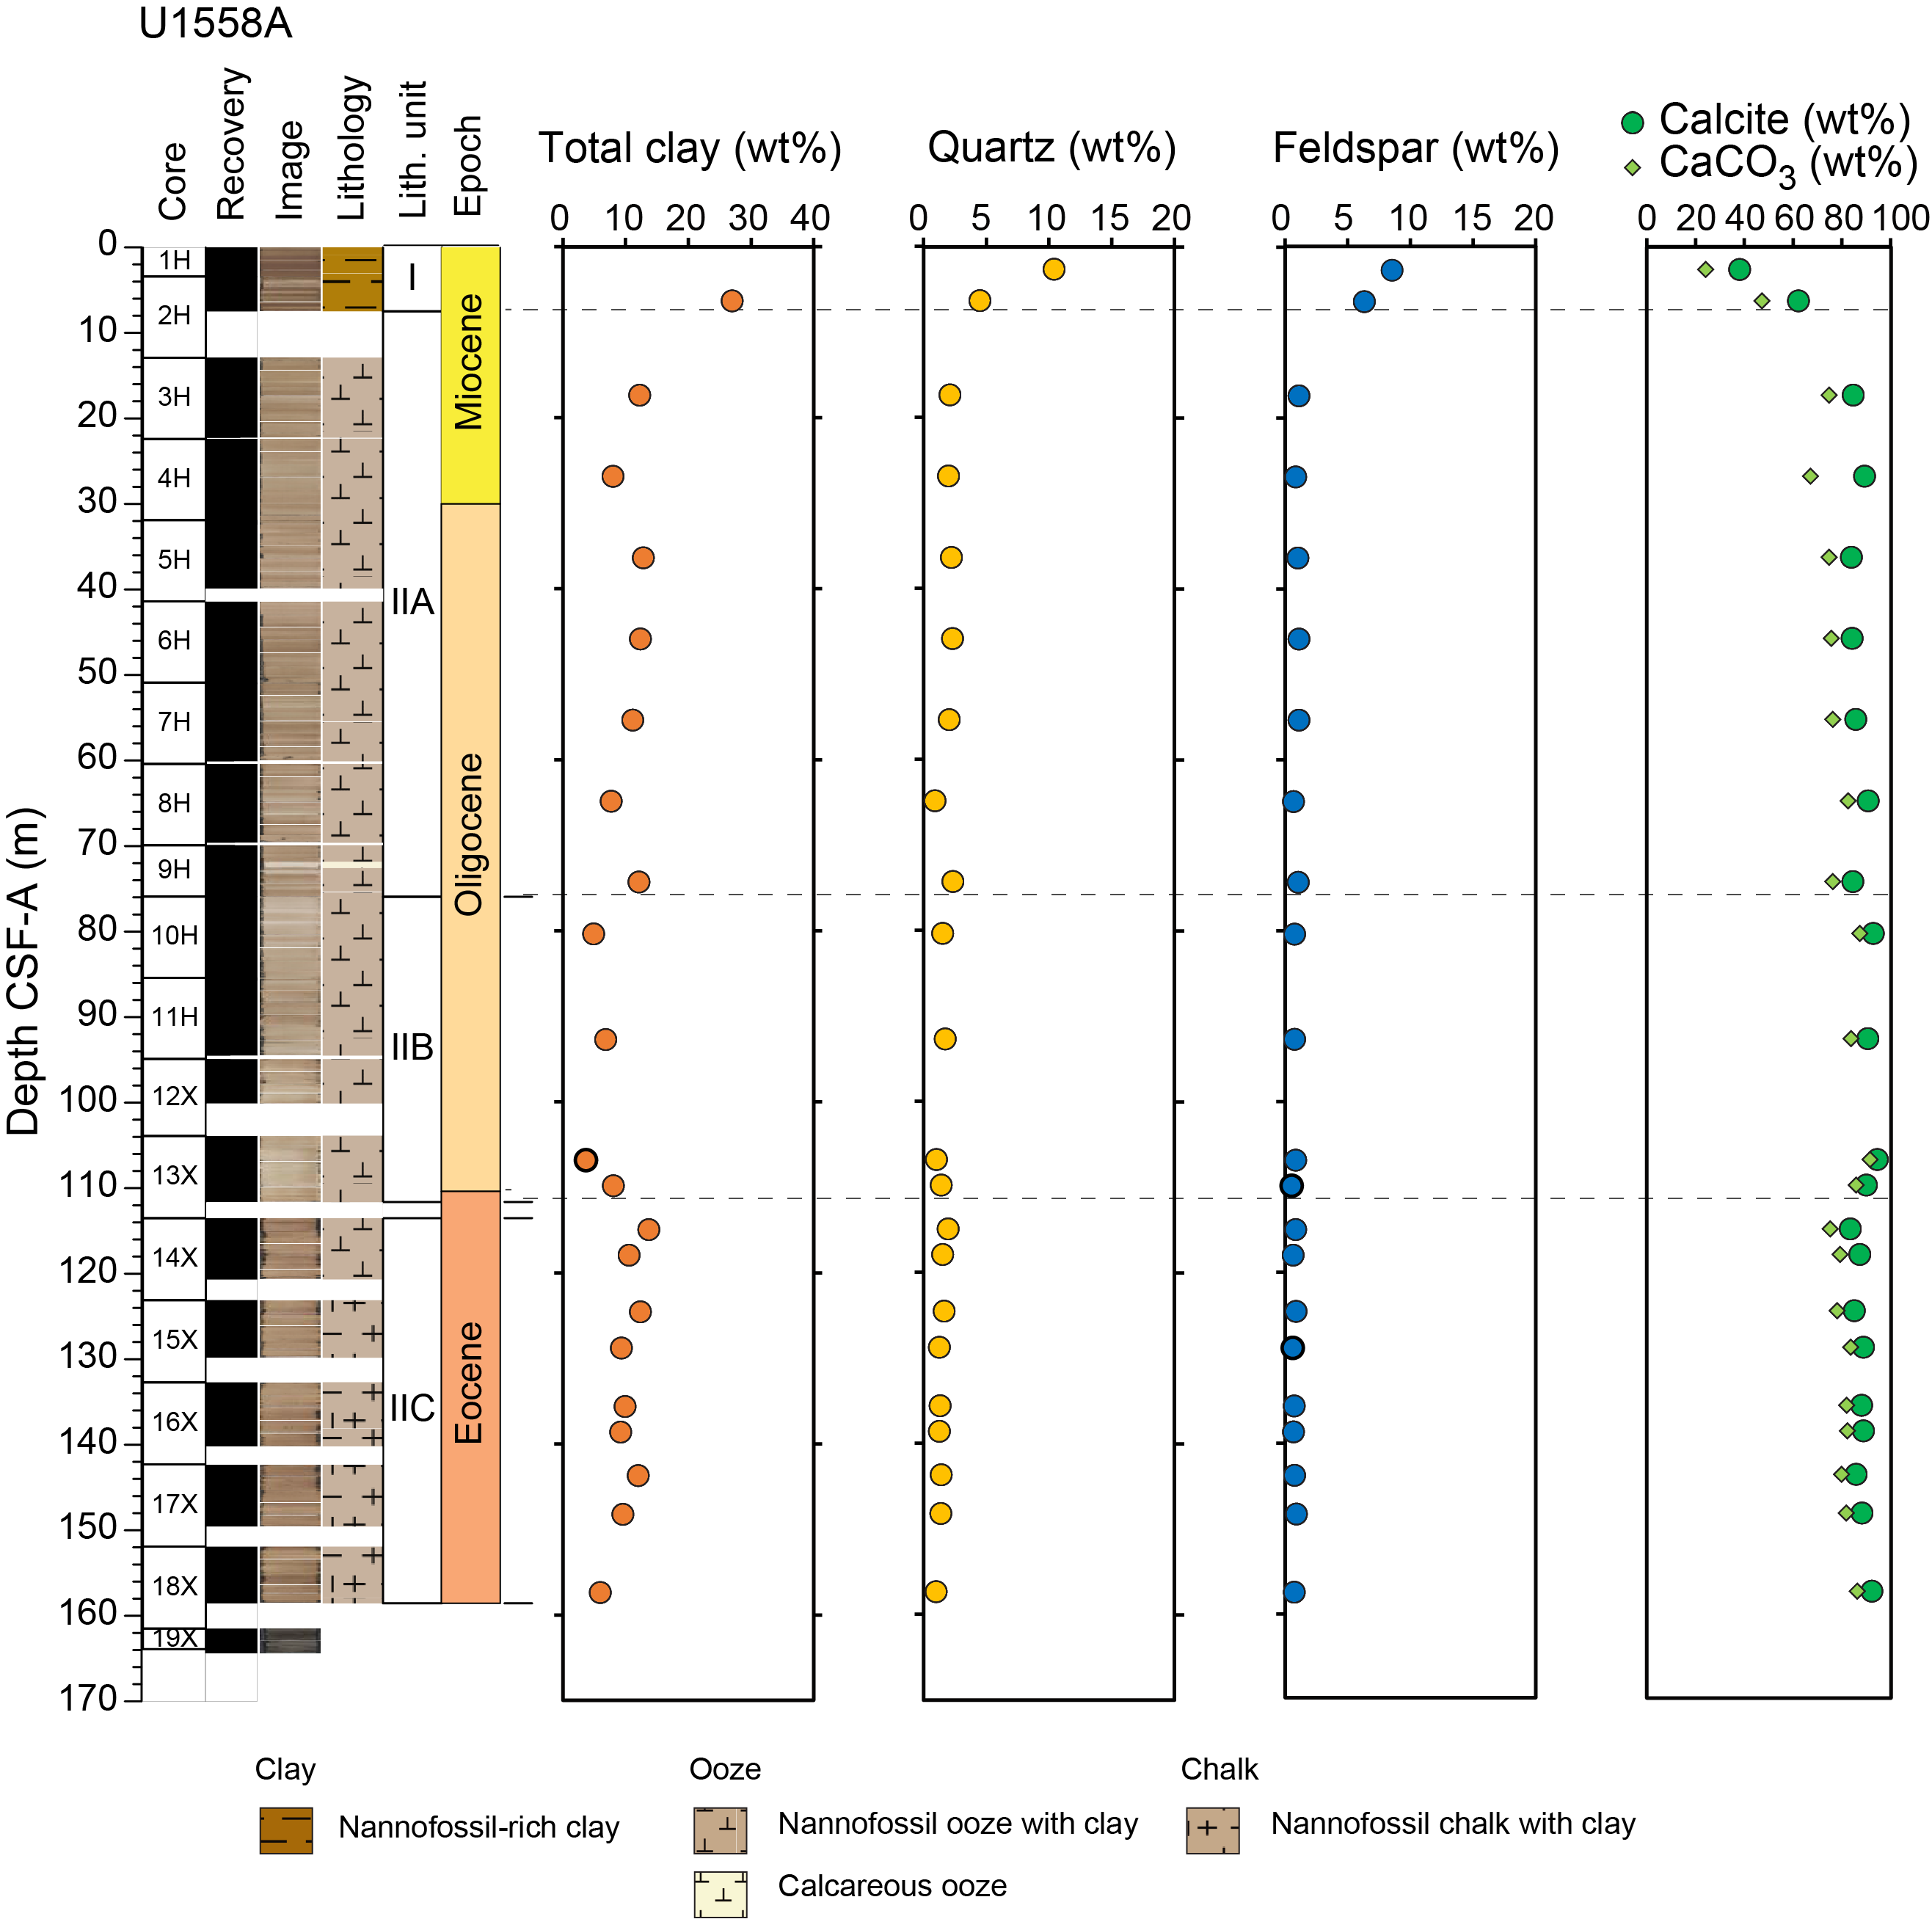
Figure F17. Changes in mineralogy, Hole U1558A.
4.1.2. Unit II
- Intervals: 390C-U1558A-3H-1, 0 cm, to 18X-CC, 28 cm; 393-U1558D-2R-1, 0 cm, to 3R-CC, 16 cm; 393-U1558F-2H-5, 94 cm, to 9H-5, 72 cm
- Depths: Hole U1558A = 12.9–158.5 m CSF-A; Hole U1558D = 150.4–158.2 m CSF-A; Hole U1558F = 11.0–175.4 m CSF-A
- Thickness: Hole U1558A = 145.6 m; Hole U1558D = >7.8 m; Hole U1558F = 164.5 m
- Age: Early Miocene to middle Eocene
- Lithology: nannofossil ooze transitioning into nannofossil chalk with varying amounts of clay and foraminifera
Lithostratigraphic Unit II is composed of nannofossil ooze overlying nannofossil chalk, both with varying amounts of clay (Figures F9, F10, F11, F13). The transition from nannofossil ooze to nannofossil chalk occurs at the top of Cores 390C-U1558A-15X and 393-U1558F-20X. In general, Unit II has <10% of foraminifera. There are no discernible breaks in the lithology, and no hiatuses were identified (see Biostratigraphy).
Lithologic contacts in Unit II are typically gradational to bioturbated, horizontal to subhorizontal, and rarely curved. Sediments are massive to mottled. Trace fossils are observed in decimeter-thick intervals and commonly include Thalassinoides, Planolites, Palaeophycus, Skolithos, Chondrites, and more rarely Arenicolites, Cylindrichnus, Zoophycos, and Phycosiphon. Bioturbation intensity ranges between absent and intense (BI = 0–5) and is predominantly sparse to common (BI = 1–3). Ichnofossil diversity ranges 1–5 and is commonly 2–3, with the maximum diameter ranging 3–30 mm (Figure F14). XRD data indicate a uniform mineralogy of Unit II (Figures F16, F17; Tables T3, T4). Calcite dominates the mineral assemblage with terrigenous minerals such as quartz, plagioclase, and clay minerals constituting minor components of this unit. However, slight variations in relative peak intensities exist, especially in kaolinite, illite, and smectite, indicating changes in clay mineral contents.
Unit II is divided into three subunits that are described below.
4.1.2.1. Subunit IIA
- Intervals: 390C-U1558A-3H-1, 0 cm, to 9H-CC, 13 cm; 393-U1558F-2H-5, 94 cm, to 9H-3, 16 cm
- Depths: Hole U1558A = 12.9–75.9 m CSF-A; Hole U1558F = 11.0–67.2 m CSF-A
- Thickness: Hole U1558A = 63.0 m; Hole U1558F = 56.2 m
- Age: Early Miocene to late Oligocene
- Lithology: nannofossil ooze with clay interbedded with clayey nannofossil ooze
Subunit IIA predominantly consists of nannofossil ooze with clay interbedded with clayey nannofossil ooze. The amount of clayey nannofossil ooze appears to be slightly higher in Hole U1558F compared to the amount in Hole U1558A. Color banding at the meter scale is present in most of Subunit IIA, ranging from pink and pinkish white to light brown (Figure F10). Quasicyclic patterns at the meter scale are also seen in MS and NGR data within this interval (Figure F9). A few decimeter-thick intervals of inclined laminations located between horizontal beds appear in Sections 393-U1558F-6H-1 and 6H-2 as well as in Section 8H-6. We suggest that these sedimentary structures represent localized soft-sediment deformation, as supported by magnetic fabric data (see Paleomagnetism).
The contacts between the beds are typically gradational and bioturbated. Massive bedding and mottling are the dominant sedimentary structures. Biogenic mottling is common, with the following ichnogenera identified: Thalassinoides, Planolites, Palaeophycus, Skolithos, and more rarely Arenicolites, Zoophycos, Chondrites, and Phycosiphon. Bioturbation intensity varies throughout the unit. It is generally higher (BI = 1–5) in the upper (~10–20 m CSF-A) and lower (~42–76 m CSF-A) parts of Subunit IIA and lower (BI = 1–3) in the middle part (~20–42 m CSF-A) of the subunit. Ichnofossil diversity ranges 1–5, commonly constituting 2–3. The maximum ichnofossil diameter ranges 3–30 mm (Figure F14).
The mineral composition of Subunit IIA is 84–91 wt% calcite, 8–13 wt% total clay minerals, 1–2 wt% quartz, and 1 wt% feldspar (Figures F16, F17; Tables T3, T4).
The boundary between Subunits IIA and IIB occurs in Section 393-U1558F-2H-5, 94 cm, and between Cores 390C-U1558A-9H and 10H based on a visual decrease in clay content (Figure F10), brightening in sediment color (i.e., higher L*; Figure F15), decreases in MS and NGR values (Figure F9), and higher CaCO3 content.
4.1.2.2. Subunit IIB
- Intervals: 390C-U1558A-10H-1, 0 cm, to 14X-1, 34 cm; 393-U1558F-9H-3, 16 cm, to 16H-2, 0 cm
- Depths: Hole U1558A = 75.9–113.8 m CSF-A; Hole U1558F = 67.2–111.9 m CSF-A
- Thickness: Hole U1558A = 37.9 m; Hole U1558F = 44.7 m
- Age: early Oligocene
- Lithology: nannofossil ooze with clay
Subunit IIB predominantly consists of pink to pinkish gray nannofossil ooze with clay. A few decimeter-thick layers of white recrystallized calcareous ooze appear in Cores 390C-U1558A-11H, 393-U1558F-9H, and 10H. Minor intervals of clayey nannofossil ooze were also observed in Hole U1558F. Subtle color banding at the meter scale is present in the upper 15 m of this subunit. A signature corresponding to this banding is also seen in the MS and NGR data (Figure F9).
Massive bedding is the dominant sedimentary structure, when not obscured by sediment mottling. Dark gray to black specs (millimeter scale), likely composed of sulfide and iron oxides, as defined by smear slide analysis, are sporadically spaced throughout this subunit. Subunit IIB is the least bioturbated subunit. It typically presents sparse to low bioturbation intensity (BI = 1–2). Even though biogenic mottling is commonly present, individual biogenic sedimentary structures are visible in several decimeter-thick intervals. The identified ichnofossils are Planolites, Palaeophycus, Skolithos, Thalassinoides, Chondrites, and rarely Cylindrichnus and Arenicolites. Trace fossil diversity ranges 1–5 ichnogenera, more commonly constituting 2–3. The maximum trace fossil diameter varies between 5 and 25 mm (Figure F14).
The mineral composition of Subunit IIB based on XRD analysis consists of 90–94 wt% calcite, 5–8 wt% total clay minerals, 1–2 wt% quartz, and 1% feldspar (Figures F16, F17; Tables T3, T4). The higher carbonate content of Subunit IIB compared to Subunits IIA and IIC has been supported by measured CaCO3 (68–97 wt%; see Geochemistry). XRD and carbonate (CARB) data indicate that Subunit IIB is more carbonate rich (CaCO3 = 84–91 wt%; see Geochemistry) than the overlying Subunit IIA.
The boundary between Subunits IIB and IIC occurs between Cores 390C-U1558A-13X and 14X and at the top of Section 393-U1558F-16H-2. It is recognized by a visual increase in clay content (Figure F10), darkening of sediment color (i.e., lower L*; Figure F15), higher MS and NGR values (Figure F9), as well as lower CaCO3 content. This boundary also marks the Eocene/Oligocene boundary (see Biostratigraphy).
4.1.2.3. Subunit IIC
- Intervals: 390C-U1558A-14X-1, 34 cm, to 18X-CC, 37 cm; 393-U1558D-2R-1, 0 cm, 3R-CC, 16 cm; 393-U1558F-16H-2, 0 cm, to 24X-CC, 29 cm
- Depths: Hole U1558A = 113.8–158.5 m CSF-A; Hole U1558D = 150.0–158.2 m CSF-A; Hole U1558F = 111.9–175.4 m CSF-A
- Thickness: Hole U1558A = 44.6 m; Hole U1558D = 7.8 m; Hole U1558F = 63.5 m
- Age: late to middle Eocene
- Lithology: nannofossil chalk with clay
Subunit IIC predominantly consists of pink to pinkish gray nannofossil chalk with clay. At the top of this subunit, a 6 and 16 m thick nannofossil ooze layer overlies the nannofossil chalk in Holes U1558A and U1558F, respectively. Additionally, decimeter-thick intervals of clayey nannofossil chalk and two thin interbeds with volcanic glass ~1 m above the sediment/basement interface are observed in Hole U1558F. In Hole U1558A, the sediment/basement interface occurs within Section 18X-CC based on the first appearance of ferromanganese crust, whereas in Hole U1558F, the sediment/basement contact is abrupt and occurs in Section 24X-CC, 29 cm.
Even though moderate to severe drilling disturbances, such as biscuits and fracturing, are common below Sections 390C-U1558A-17X-1 and 393-U1558F-20X-1, the intact sediments preserve intervals that contain thin laminations overlying bioturbation. The most common sedimentary structures in Subunit IIC are mottling and decimeter-scale massive bedding. Thin laminations can be present (e.g., interval 390C-U1558A-15X-2, 5–25 cm). The bedding contacts are described as ranging from bioturbated to irregular, with the surface appearing horizontal to curved. Subunit IIC is characterized by increased biogenic activity, with bioturbation intensity ranging from absent to intense (BI = 0–5) and more commonly low to high (BI = 2–4). Bioturbation intensity is low (BI = 1–2) in the upper part of Subunit IIC (~112–130 m CSF-A), absent in its middle part (BI = 0; ~130–140 m CSF-A), and increases in the lower part (BI = 2–5; ~140–175 m CSF-A). Typical trace fossils include Chondrites, Skolithos, Planolites, Zoophycos, and Nereites/Cosmorhaphe, with rare Palaeophycus and Helminthopsis. Trace fossil diversity ranges 1–2 ichnogenera in the upper part of Subunit IIC (~112–130 m CSF-A) and reaches 2–5 ichnogenera in the lower part (~140–175 m CSF-A). A similar trend is observed for the maximum trace fossil size: it increases from 3 to 5 mm in the upper part of Subunit IIC to 5–15 mm in the lower part of Subunit IIC (Figure F14).
The mineral composition of Subunit IIC consists of 83–92 wt% calcite, 6–14 wt% total clay minerals, 1–2 wt% quartz, and 1 wt% feldspar (Figures F16, F17; Tables T3, T4). These XRD results and measured CaCO3 amounts (57–86 wt%; see Geochemistry) support a slightly lower carbonate content in Subunit IIC compared to the overlying Subunit IIB.
5. Igneous petrology
Hole U1558D targeted ~49.2 Ma upper oceanic crust along the SAT, reached volcanic basement at 166.8 mbsf, and penetrated a further 203.4 m into igneous rocks, reaching 370.2 mbsf and recovering 97.5 m of basalt for an average basement recovery of 48% (Figure F8; Table T5). In the upper part of the hole, recovery was relatively high, with an average of 73% between Cores 393-U1558D-5R and 11R. Recovery dropped for the remainder of the hole to an average of 40% between Cores 12R and 39R, but within this interval several cores advanced through coarser grained massive lava flows and carbonate sediment-cemented pillows and recovery reached 60%–70%. Overall, this recovery was sufficient for unit boundaries, lava types, and volcanic emplacement styles to be determined with confidence throughout the hole.
Unless stated otherwise, all cores, sections, and intervals refer to Hole U1558D. Depths are described in meters below seafloor (mbsf; on CSF-A scale) and meters subbasement (msb; CSF-A depth minus 166.8 m). Sample, interval, and contact depths are curated depths unless mentioned otherwise. This section documents the lithostratigraphy of the volcanic basement at Site U1558 and then summarizes observations and results for the phenocryst phases, breccias, and igneous chemostratigraphy as measured on split core surfaces by pXRF.
5.1. Lithostratigraphic units
The basement volcanic sequence at Site U1558 was divided into two main eruptive sequences (A and B) and five main volcanic and intravolcanic sedimentary units. Unit 1 is divided into seven subunits (1A–1G), Unit 2 is divided into two subunits (2A and 2B), Unit 4 is divided into three subunits (4A–4C), and Unit 5 is divided into five subunits (5A–5E). These units and their thicknesses, emplacement styles, contacts, and lithologic details are summarized in Table T5, illustrated in Figure F8, and documented in detail in this section.
5.1.1. Sediment/basement interface
The shallowest occurrences of volcanic rocks and the deepest occurrences of sediment within the sediment/basement interface for all holes at Site U1558 are summarized in Table T6 and illustrated in Figure F18. Single cores containing both sediment (nannofossil chalk with clay [Subunit IIC; see Sedimentology] or indurated calcareous sediment) as well as basalt were recovered in three of the four holes at Site U1558 (Holes U1558A, U1558D, and U1558F; Figure F18).
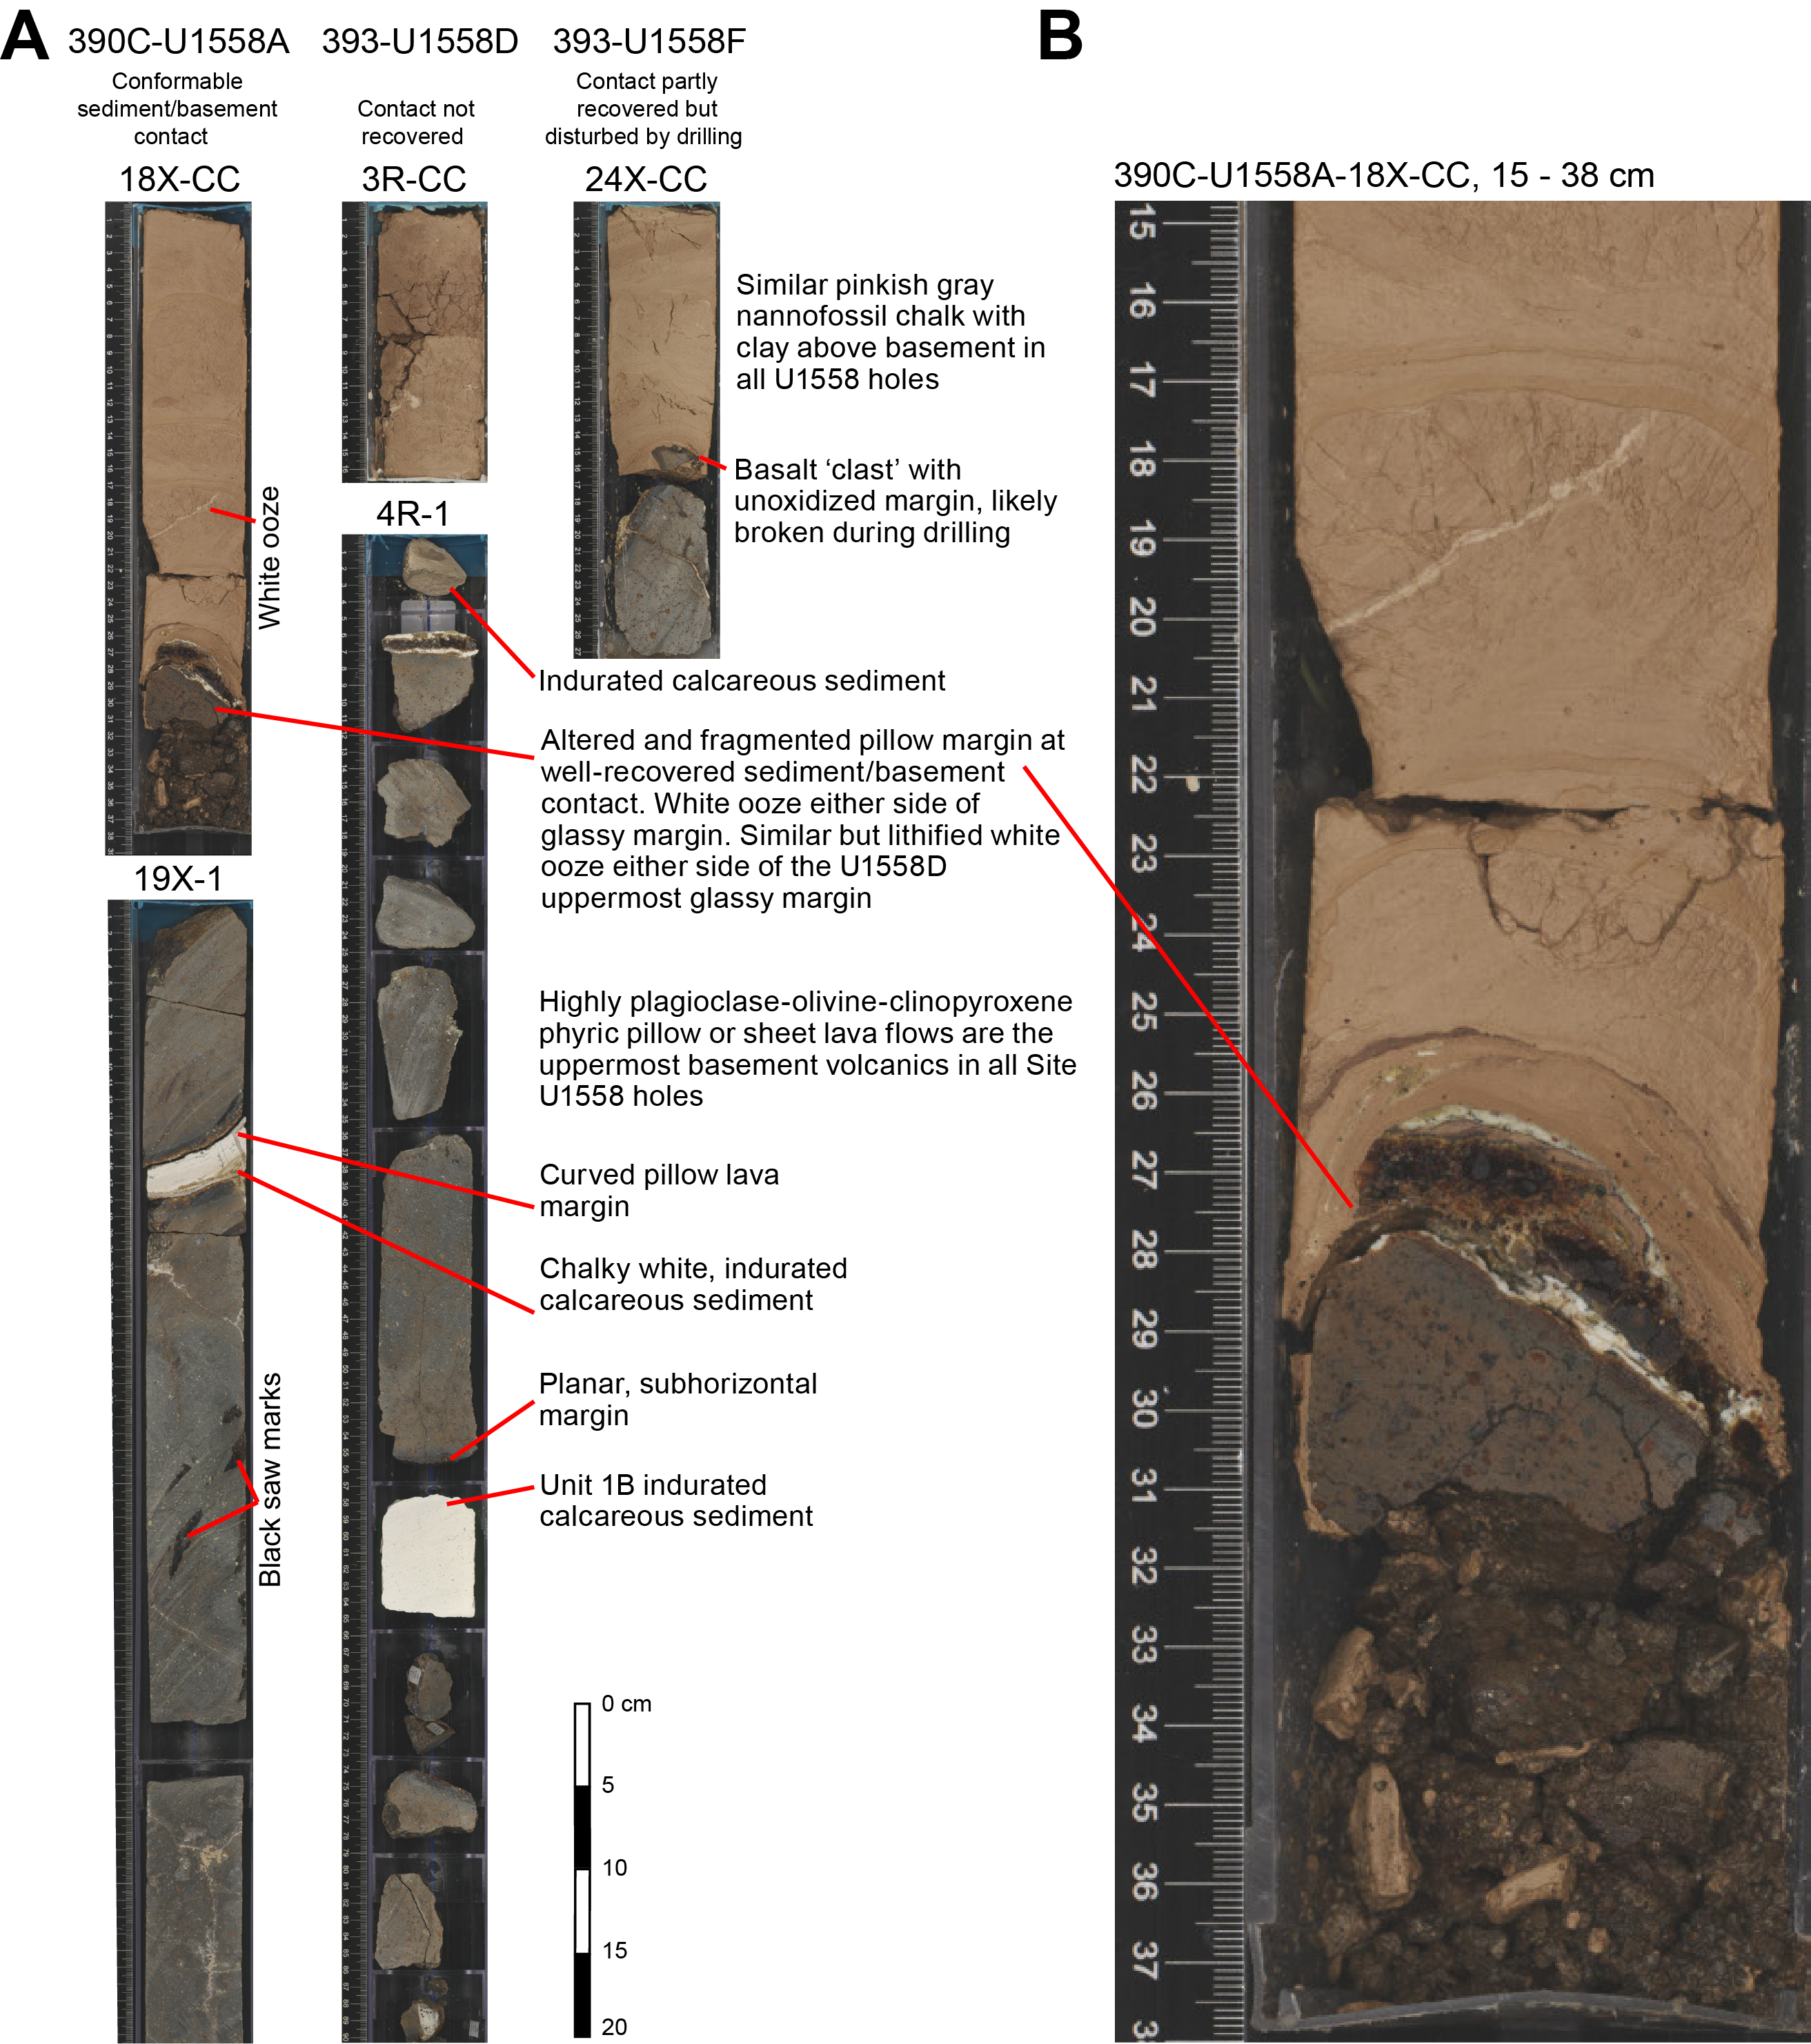
Figure F18. Sediment/volcanic basement interface.
In interval 390C-U1558A-18X-CC, 26–30 cm, a complete, sharp, and apparently conformable sediment/volcanic basement contact was recovered by XCB coring (Figure F18). Here, the uppermost lava flow is capped by a glassy pillow margin that is altered and incipiently brecciated, in direct contact with the overlying calcareous sediment. The bottom 1–2 cm of sediment is finely laminated and speckled with fragments of variably altered glass. Veins of white sediment cut beneath and above the glassy margin, and a 5 mm thick vein of similarly white sediment cuts the pale brown background sediment 10 cm up from the contact. There is no visual evidence for metalliferous sediment, and the overlying nannofossil chalk with clay reaches a stable background light brownish pink (7.5Y 7/3) that is seen in the other holes after this first few centimeters (Figure F18B). If this contact had not been continuously recovered, the fragile, unconsolidated glassy margin and sediment with glass fragments probably would have been washed away during drilling, supporting our interpretation of a near-continuous recovery of the sediment/basement interface in Hole U1558A.
The interface was not continuously recovered in Hole U1558D, but unlike the other holes, a 3 cm long piece of indurated calcareous sediment was recovered above the basalt (interval 393-U1558D-4R-1, 0–5 cm). The lack of similar indurated sediment in the better recovered Hole U1558A interface suggests that lithification of the sediments at the interface is laterally discontinuous. Bright white chalky veins cut above and below the upper glassy margin of the shallowest piece of volcanic basement in Hole U1558D (interval 4R-1, 5–12 cm).
Section 393-U1558F-24X-CC recovered sediment and volcanic basement (Figure F18), but evidence suggests that the interface was not continuously recovered. First, the shallowest piece of volcanic rock is a broken piece without any oxidation or alteration around its edges (Sample 24X-CC, 15–16 cm). This suggests that the piece was freshly broken during drilling because the edges of broken pillow clasts generally display some oxidation. Second, none of the nannofossil chalk is in contact or adheres to the underlying glassy margin, which itself is freshly broken at its top (Sample 24X-CC, 17 cm). Intravolcanic calcareous sediment within a few meters of the main interface is distinctly more lithified and brighter white than the overlying Subunit IIC light brownish pink nannofossil chalk with clay (e.g., intervals 390C-U1558A-19X-1, 16–18 cm, and 393-U1558D-4R-1, 57–66 cm).
5.1.2. Division of volcanic sequences
The volcanic basement in Hole U1558D was divided into two eruptive sequences. This division was made principally based on the presence of distinctive green clinopyroxene phenocrysts in Sequence A, described below, and the presence of an intervening ~1 m thick sedimentary breccia at 234.64 mbsf (69.09 msb), interpreted to have accumulated during a hiatus in volcanism and described in detail as Unit 3 below.
5.1.3. Sequence A
Volcanic Sequence A consists of Volcanic Units 1 and 2 that are similar aside from subtle variations in phenocryst abundance, pillow size, and proportion of interpillow sediment. The units in Sequence A are characterized by mostly pillowed lavas with variable pillow thicknesses (20–130 cm) and a moderate to high abundance of plagioclase and olivine phenocrysts together with sparse but distinctive dark olive-green clinopyroxene phenocrysts. Throughout Hole U1558D, including Sequence A, olivine phenocrysts were replaced by either a mixture of clay and Fe oxyhydroxides, pale greenish yellow clay, or calcite (Figure F19A). These pseudomorphic replacements are generally recognizable by their distinctive mineralogy and equant, commonly hexagonal habit, and all references to olivine in the following are based on interpretation of such pseudomorphs.
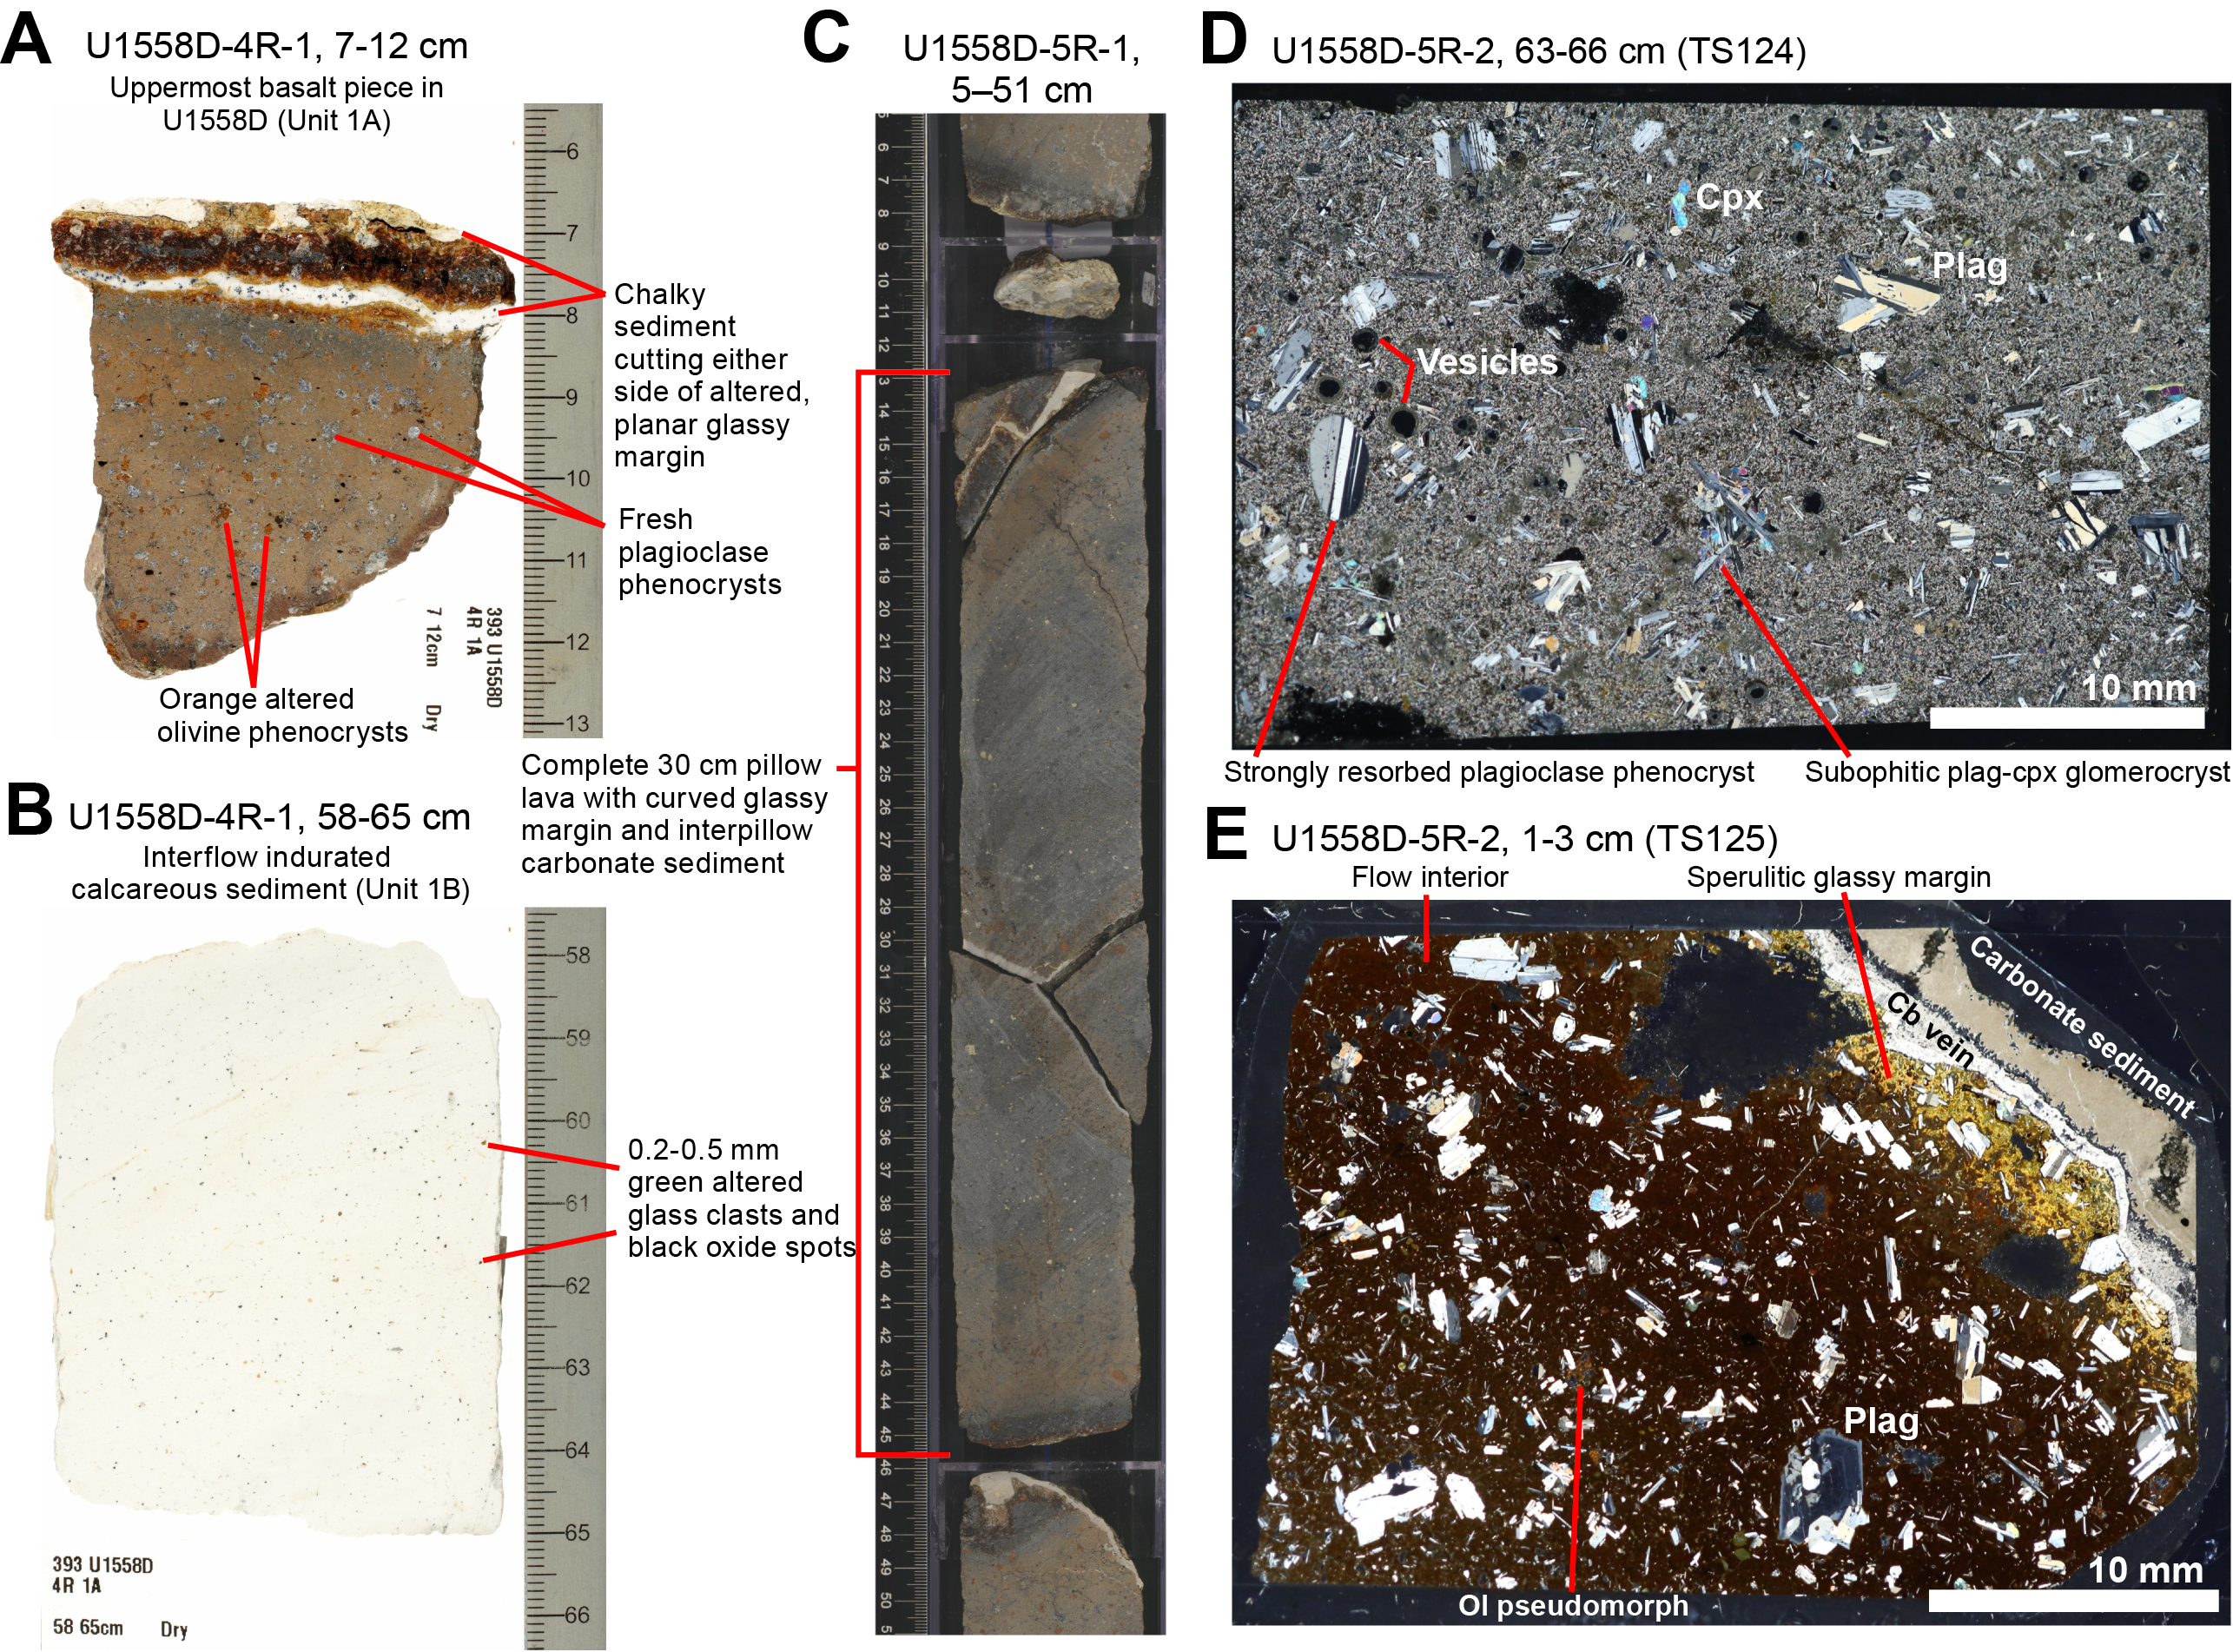
Figure F19. Volcanic Unit 1.
5.1.3.1. Subunit 1A
Subunit 1A consists of a cryptocrystalline basalt sheet flow that is highly plagioclase-olivine-phyric with extremely sparse (<0.5%) but distinctive dark olive-green (5GY 3/4) tabular clinopyroxene phenocrysts. The flow has an expanded thickness of 1.64 m, and its upper contact is the sediment/basement interface at 166.8 mbsf (Table T5). The Subunit 1A flow is interpreted to be a sheet flow because of its thin, planar, subhorizontal glassy margins (Figure F19A).
5.1.3.2. Subunit 1B
Subunit 1B is a 7 cm thick piece of indurated calcareous sediment with Mn oxide spots (Figure F19B; Table T5). The lower edge of the Subunit 1B sediment piece has altered volcanic material adhering to it, showing a sharp lower contact, but the upper margin has been ground during drilling. Micropaleontological analysis of a thin section from Sample 393-U1558D-4R-1, 62–65 cm, revealed the presence of planktic foraminifera tests and their fragments. These foraminifera belong to the common Eocene genera Subbotina, Acarinina, and Globigerinatheka that are consistent with the crustal age of 49.2 Ma. Unfortunately, specimen identification to the species level was not possible, precluding a more refined age estimate or biozone assignment. Analysis of the smear slide from the same sample revealed that Eocene nannofossil taxa were also present, but the assemblage was scarce and poorly preserved, without marker species that would permit precise age determination.
5.1.3.3. Subunit 1C
Subunit 1C consists of highly plagioclase-olivine-pyroxene-phyric basalt pillow lavas with an expanded thickness of 5.31 m (Figure F19C–F19E; Table T5). The sharp upper contact to the Subunit 1B sediment is partially preserved by the altered volcanic material adhering to its lower surface (Section 393-U1558D-4R-1, 65 cm).
Subunit 1C is lithologically like Subunit 1A, but Subunit 1C is clearly emplaced as pillow lavas (Figure F19C). Two continuously recovered lava pillows have apparent thicknesses of 35 and 60 cm. Indurated calcareous sediment filling interpillow spaces and fractures is common in this subunit (e.g., Figure F19C). A typical highly phyric Subunit 1C chilled glassy margin with adhering interpillow sediment is shown in thin section (Figure F19E).
5.1.3.4. Subunit 1D
Subunit 1D consists of highly plagioclase-olivine-pyroxene-phyric basalt pillow lavas with some sparsely phyric intervals or flows with a total expanded thickness of 2.6 m (Table T5). Lithologically, Subunit 1D is like Subunits 1A and 1C except for the occurrence of distinct sparsely phyric and even aphyric individual flows in Subunit 1D.
The thin section of a flow interior in Figure F19D shows a typical texture for the highly phyric portions of Subunit 1D. The thin section is representative of other highly phyric Unit 1 basalts. Plagioclase is the dominant phenocryst and, although mostly euhedral, rare examples of clearly resorbed phenocrysts with rounded corners and ovoid shapes were observed in thin section (Figure F19D). Thin sections also reveal the more common presence of clinopyroxene microphenocrysts (<0.5 mm) and glomerocryst components in Unit 1 basalts than apparent from macroscopic observations.
5.1.3.5. Subunit 1E
Subunit 1E is the thickest subunit in Unit 1 with an expanded thickness of 11.87 m and consists of well-recovered, moderately plagioclase-olivine-clinopyroxene-phyric basalt pillow lavas with some highly phyric intervals and common interpillow sediment infills (Table T5). The upper contact of Subunit 1E is not sharp or obvious because the volcanic lithology is broadly similar throughout Unit 1 but was placed at a subhorizontal glassy margin (Section 393-U1558D-6R-1, 21 cm). Interpillow carbonate sediments were well recovered throughout Subunit 1E (Figure F20A–F20C). These interpillow sediments exhibit repetitive internal layering of green altered hyaloclastite, commonly packed into the bottom of the interpillow space, with a variably pink to pinkish gray (5Y 8/3 to 7.5Y 7/2) indurated calcareous sediment matrix that increases in proportion upward through the interpillow interstices (Figure F20). These pink sediments commonly contain additional discrete layers of hyaloclastite that are abruptly terminated, and the overlying interpillow space is filled with porcelaneous carbonate material with black (Mn?) oxide layers and dendrites that may be a late sediment or precipitate (Figure F20B, F20C).
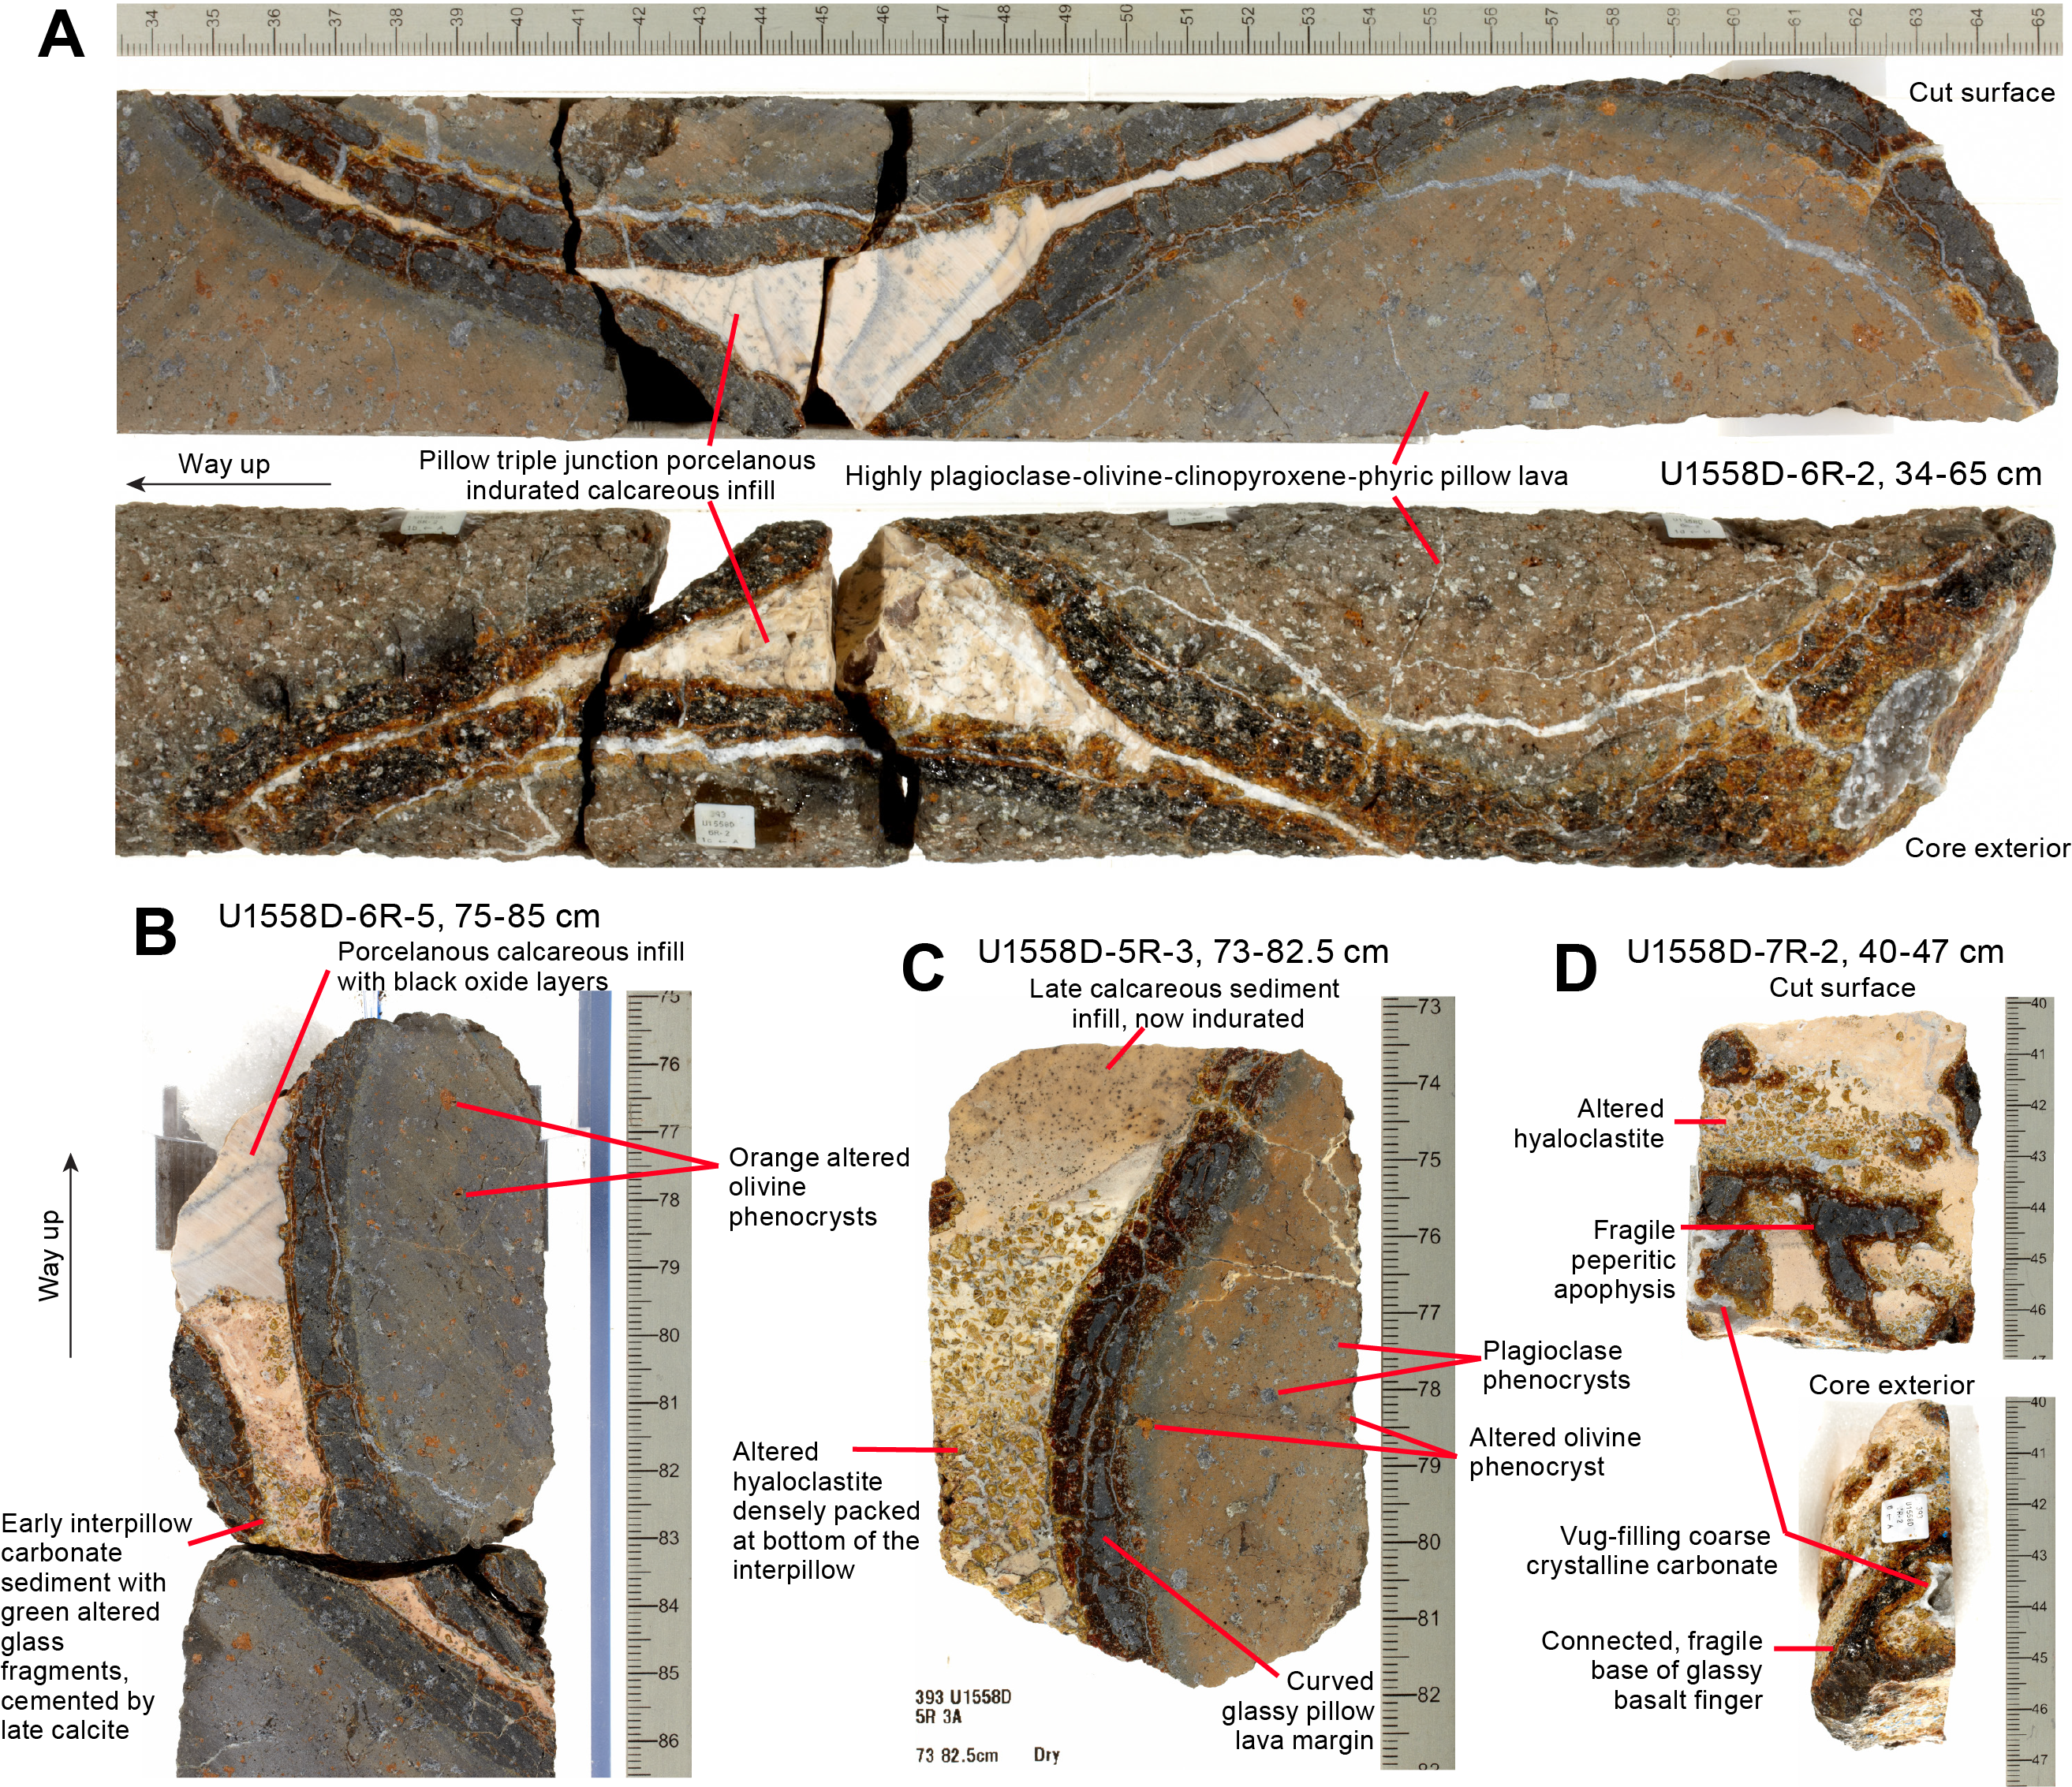
Figure F20. Pillow lava margins and interpillow sediments.
Figure F21 shows a set of typical macro- to microscopic textures for Subunits 1E and 1G, including a green clinopyroxene phenocryst in Subunit 1G that is like other examples in Subunit 1E and the Sequence A basalts, intergrown with plagioclase and altered olivine (Figure F21A). The Subunit 1E glassy pillow margin in Figure F21B contains phenocrysts in both the cryptocrystalline flow interior and glassy selvage. Similar to the macroscopic observations (Figure F20B, F20C), a folded glassy margin filled with altered hyaloclastite overlaid by calcareous sediment is exhibited in Figure F21B.
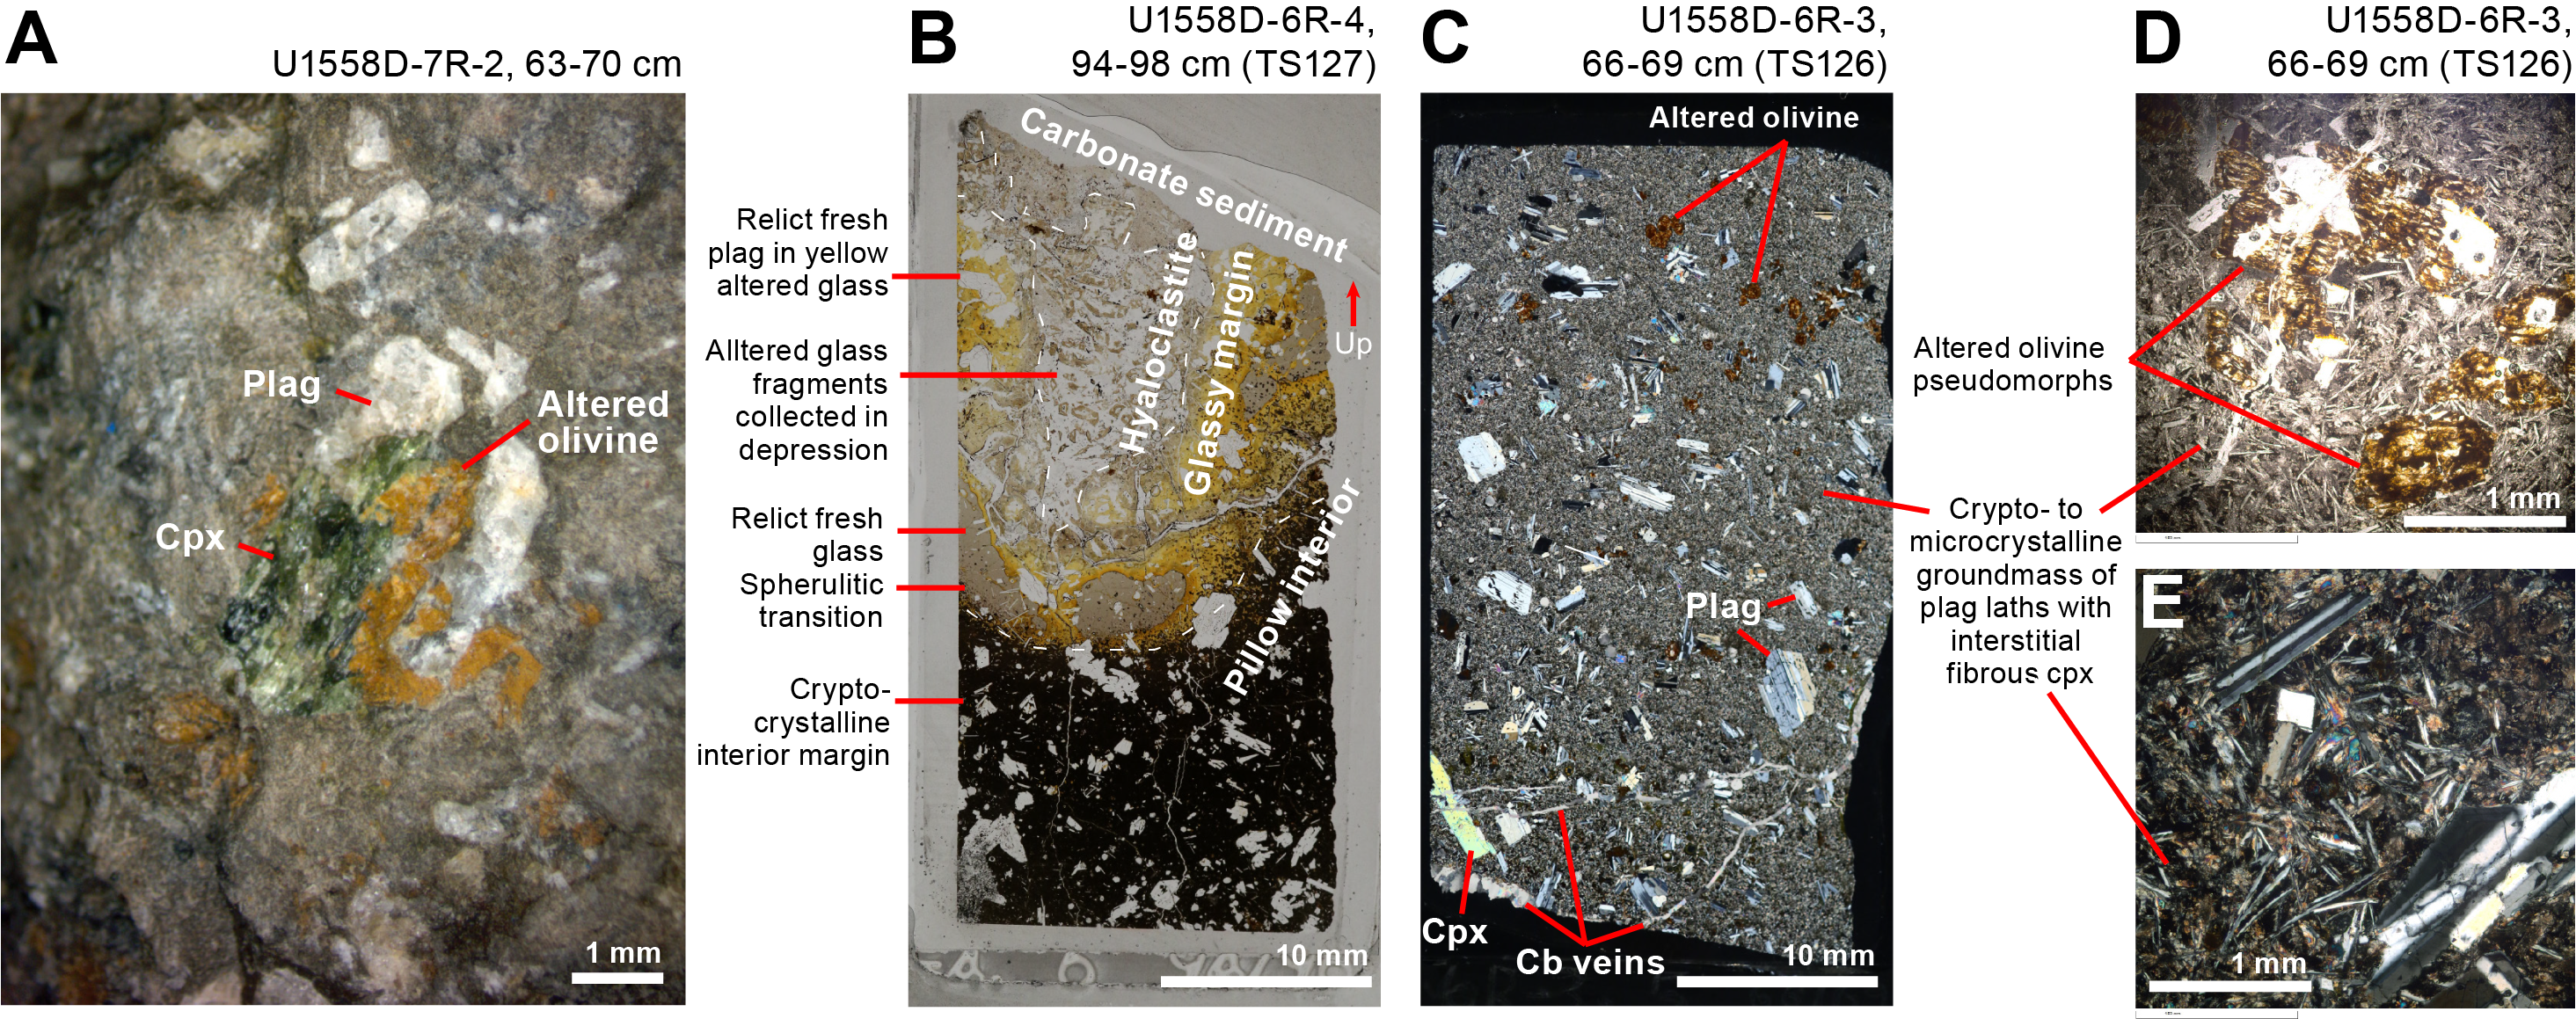
Figure F21. Altered olivine and glass.
The pillow flow interiors of Subunit 1E are cryptocrystalline to microcrystalline with randomly oriented plagioclase laths (Figure F21C). The macroscopic observations of millimetric plagioclase, olivine, and clinopyroxene phenocrysts are also evident in thin section, as is the presence of interstitial plumose clinopyroxene in the groundmass and the alteration of olivine to either clays and Fe oxyhydroxides or calcite throughout (Figure F21C, F21D).
5.1.3.6. Subunit 1F
Subunit 1F is a ~9 cm thick sedimentary breccia with variably altered glassy clasts and a peperitic injection connected to the wall-rock basalt (interval 393-U1558D-7R-2, 40–47 cm; Figure F20D; Table T5). This thin breccia unit was differentiated to allow any potential differences in lava composition to be examined across what may represent a short hiatus in volcanism. There are two types of breccia clasts: centimeter-sized subangular fresh glass with oxidized rims and millimeter-sized glassy fragments fully altered to a pale olive-green clay. The millimeter-sized fragments form layers that are laterally discontinuous, even at the core scale, one of which coarsens upward (Figure F20D). These clasts are supported by an indurated calcareous sediment matrix. A bifurcated glassy finger connects to the basalt at the base of the piece (Figure F20D). Given how fragile this finger would have been unsupported, it is interpreted to be a peperitic apophysis, injected prior to matrix induration.
5.1.3.7. Subunit 1G
Subunit 1G consists of moderately plagioclase-olivine-clinopyroxene-phyric basalt pillow lavas with some highly phyric intervals that are lithologically like Subunit 1E but with less interpillow sediment. The subunit has an expanded thickness of 3.0 m (Table T5).
5.1.3.8. Subunit 2A
Subunit 2A consists of moderately plagioclase-olivine-clinopyroxene-phyric basalt pillow lavas with a microcrystalline groundmass and distinctly high individual flow thicknesses, mostly between 50 and 130 cm. The upper contact of Subunit 2A is a doubly chilled margin at Section 393-U1558D-7R-4, 24 cm, and the unit has an expanded thickness of 18.72 m (Table T5).
Subunit 2A is differentiated from Unit 1 by its large pillow sizes and associated coarser, microcrystalline flow interior groundmass and less common glassy margins (Figure F22A). The phenocryst assemblage and character of Unit 2 is similar to Unit 1, including the presence of sparse green clinopyroxene phenocrysts, although on average phenocrysts are less abundant in Unit 2 (Figure F22D). A number of lava pillows were recovered in Subunit 2A, with most pillows having apparent thicknesses of >50 cm and up to 130 cm, much larger than the typical 20–40 cm thickness of pillows in the other units. Given common basal margin dips of ~30°, these apparent pillow thicknesses should be slightly greater than their true thicknesses.
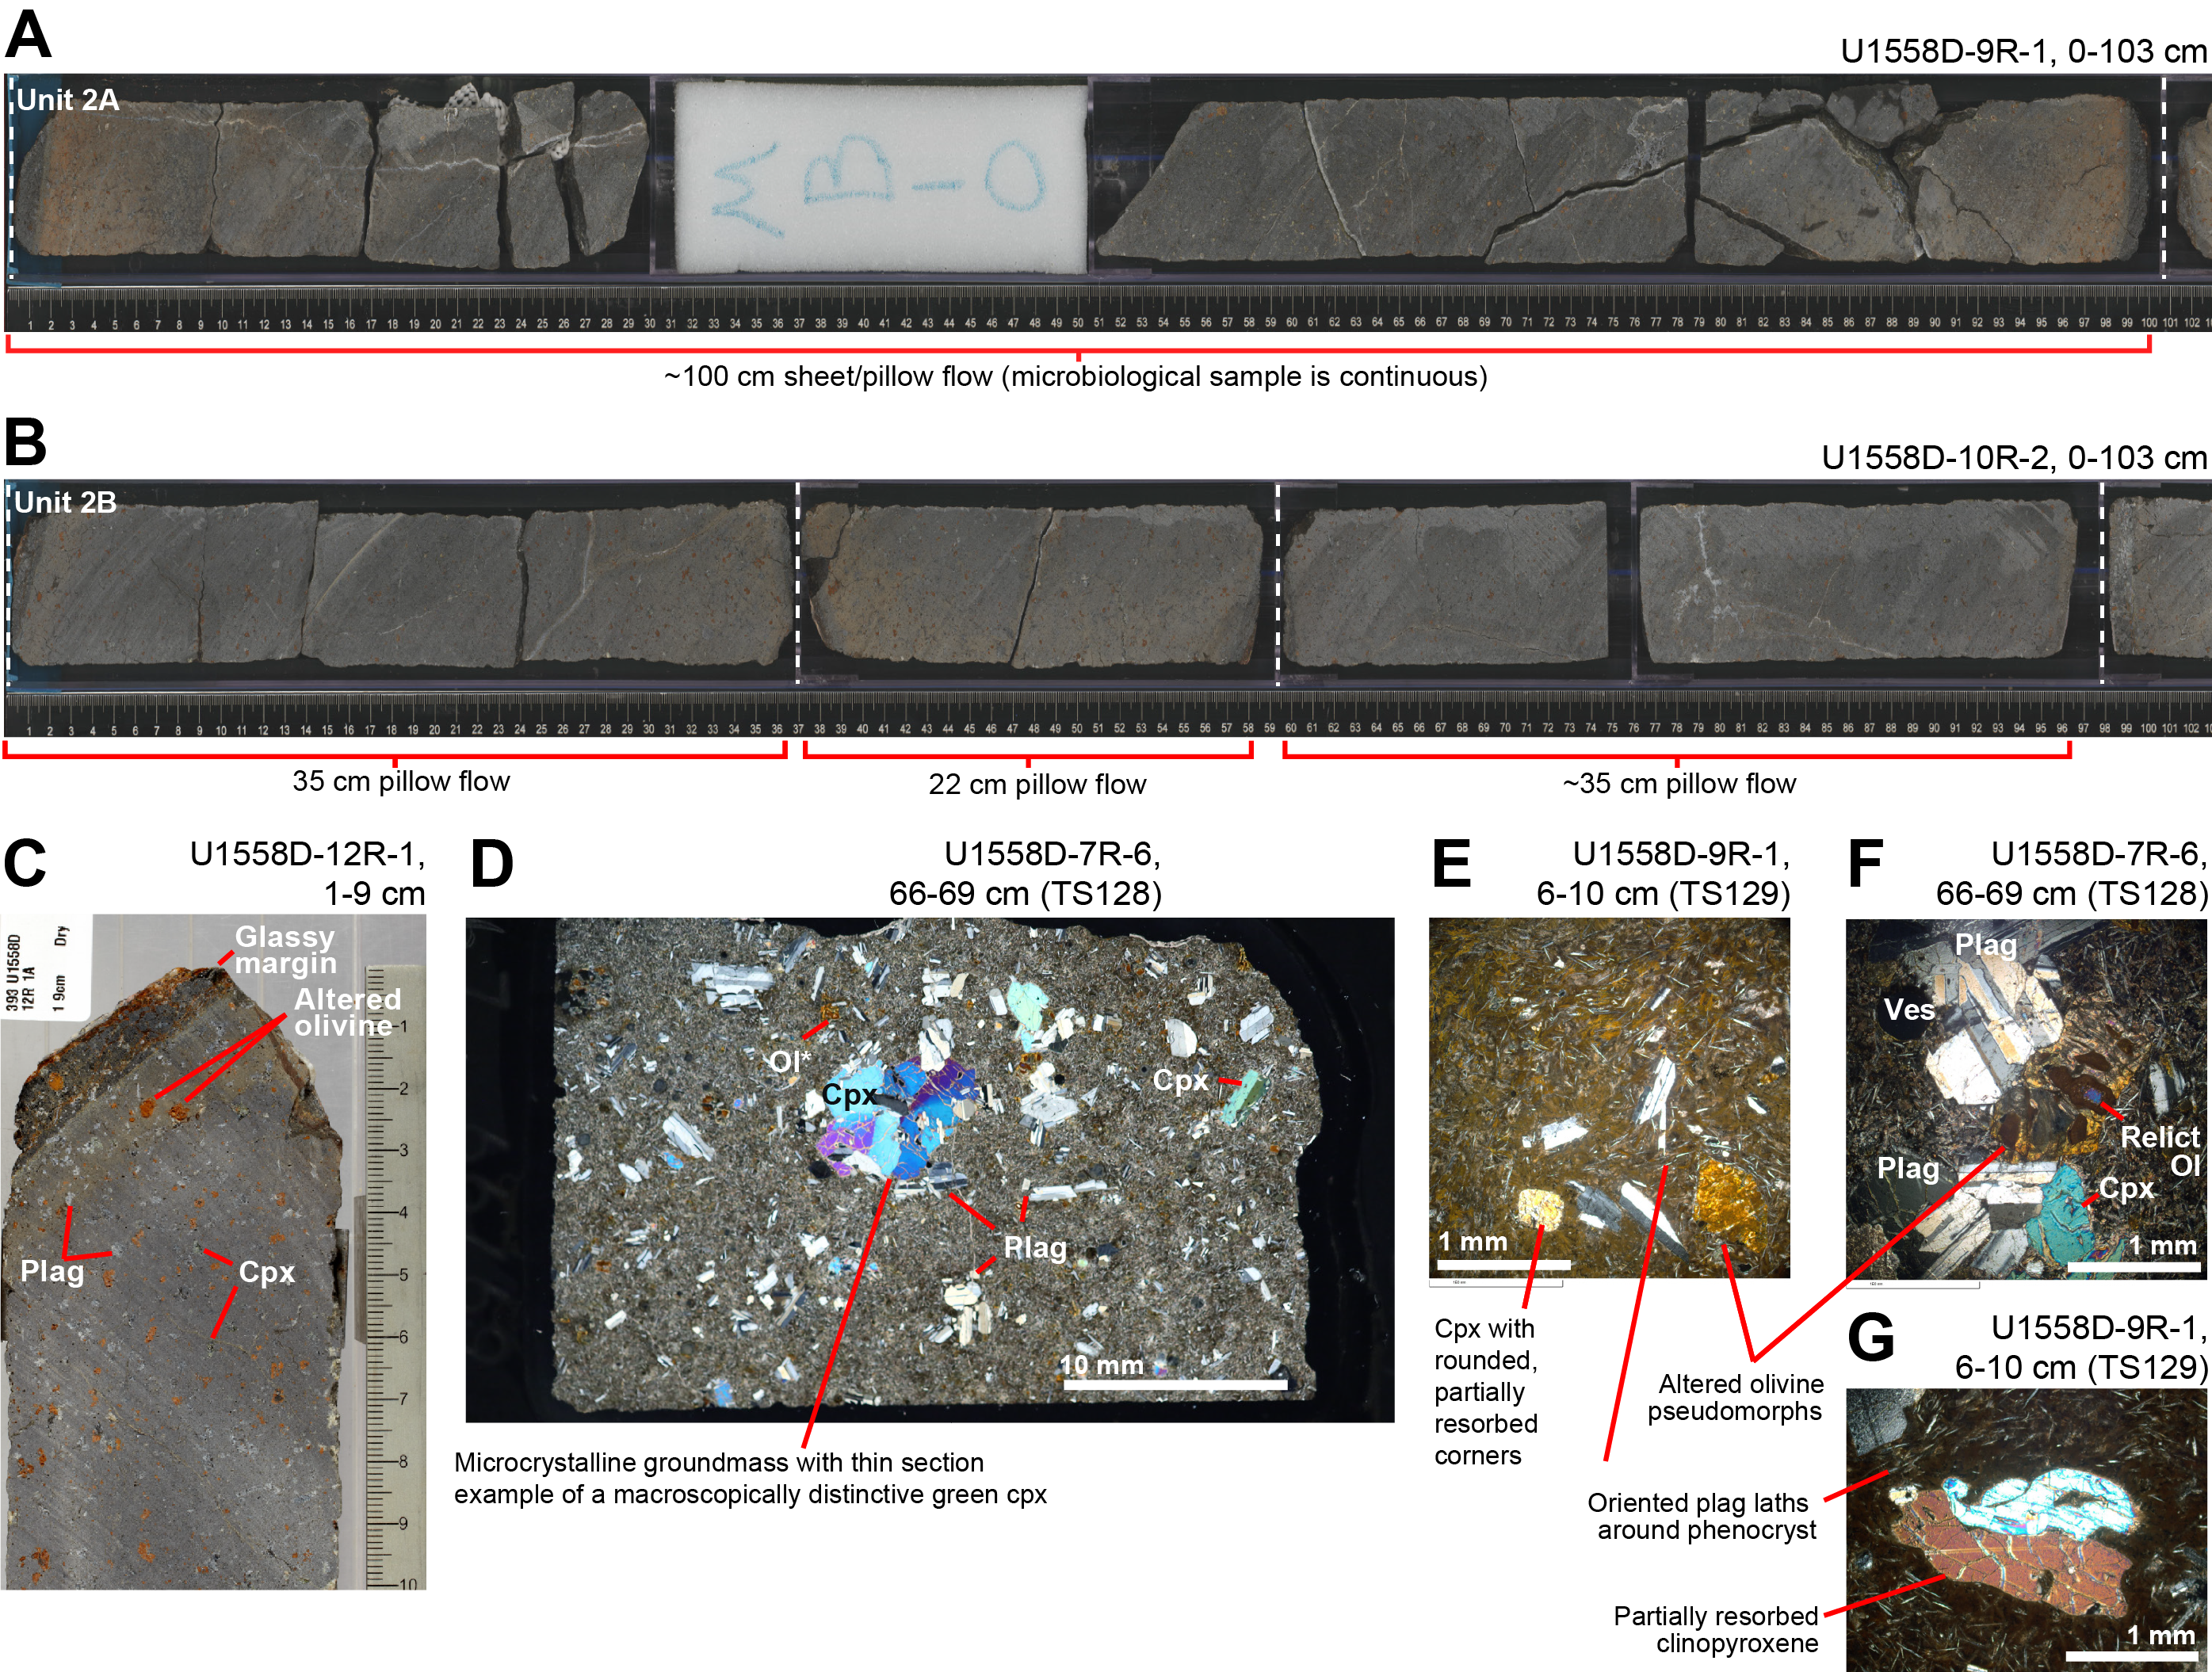
Figure F22. Volcanic Unit 2.
5.1.3.9. Subunit 2B
Subunit 2B consists of moderately to highly plagioclase-olivine-clinopyroxene-phyric basalt pillow lavas with common glassy margins (Figure F22B). The upper contact of Subunit 2B is likely gradational given the similar lithology in Subunit 2A, but it was not clearly recovered. It is defined to be located at Section 393-U1558D-10R-1, 0 cm, giving Subunit 2B an expanded thickness of 24.6 m (Table T5).
The basalt of Subunit 2B is very similar to Subunit 2A, with microcrystalline groundmass and moderately abundant plagioclase, olivine, and clinopyroxene phenocrysts; however, the pillows are of typical or relatively small size (Figure F22B). Phenocrysts include the extremely sparse but distinctive dark olive-green clinopyroxene present throughout Sequence A (Figure F22D). As observed in Unit 1, clinopyroxene phenocrysts tend to have rounded corners or otherwise resorbed rims and commonly occur as glomerocrysts with plagioclase ± olivine (Figure F22E–F22G). Olivine phenocrysts in Unit 2 are generally totally altered to clays both with and without Fe oxyhydroxide, and only rare fresh relict olivine is observable in thin section (Figure F22F).
5.1.4. Sequence B
- Lithology: plagioclase-olivine-phyric basalt pillow, sheet, and massive lava flows capped by sedimentary breccia
Volcanic Sequence B consists of sedimentary breccia Unit 3 and underlying Volcanic Units 4 and 5. These volcanic units have plagioclase and olivine phenocrysts but distinctly lack the green clinopyroxene phenocrysts that are present throughout Sequence A. Phenocryst proportions and habits, groundmass grain size, and emplacement style all vary significantly between the Sequence B volcanic units.
5.1.4.1. Unit 3
Unit 3 is sedimentary breccia consisting of broken pillow and glass clasts supported in a matrix of layered indurated calcareous sediment (Figure F23A). The upper contact of the Unit 3 breccia was not recovered, but the breccia has a minimum thickness of 75 cm and an expanded thickness of 1 m. At the average sedimentation rate for the Site U1558 basal sediments of 1 cm/ky (see Age model and mass accumulation rates), the ~30 cm true thickness of carbonate sediment in Unit 3 sedimentary breccia would represent a potential local volcanic hiatus on the order of 30,000 y.
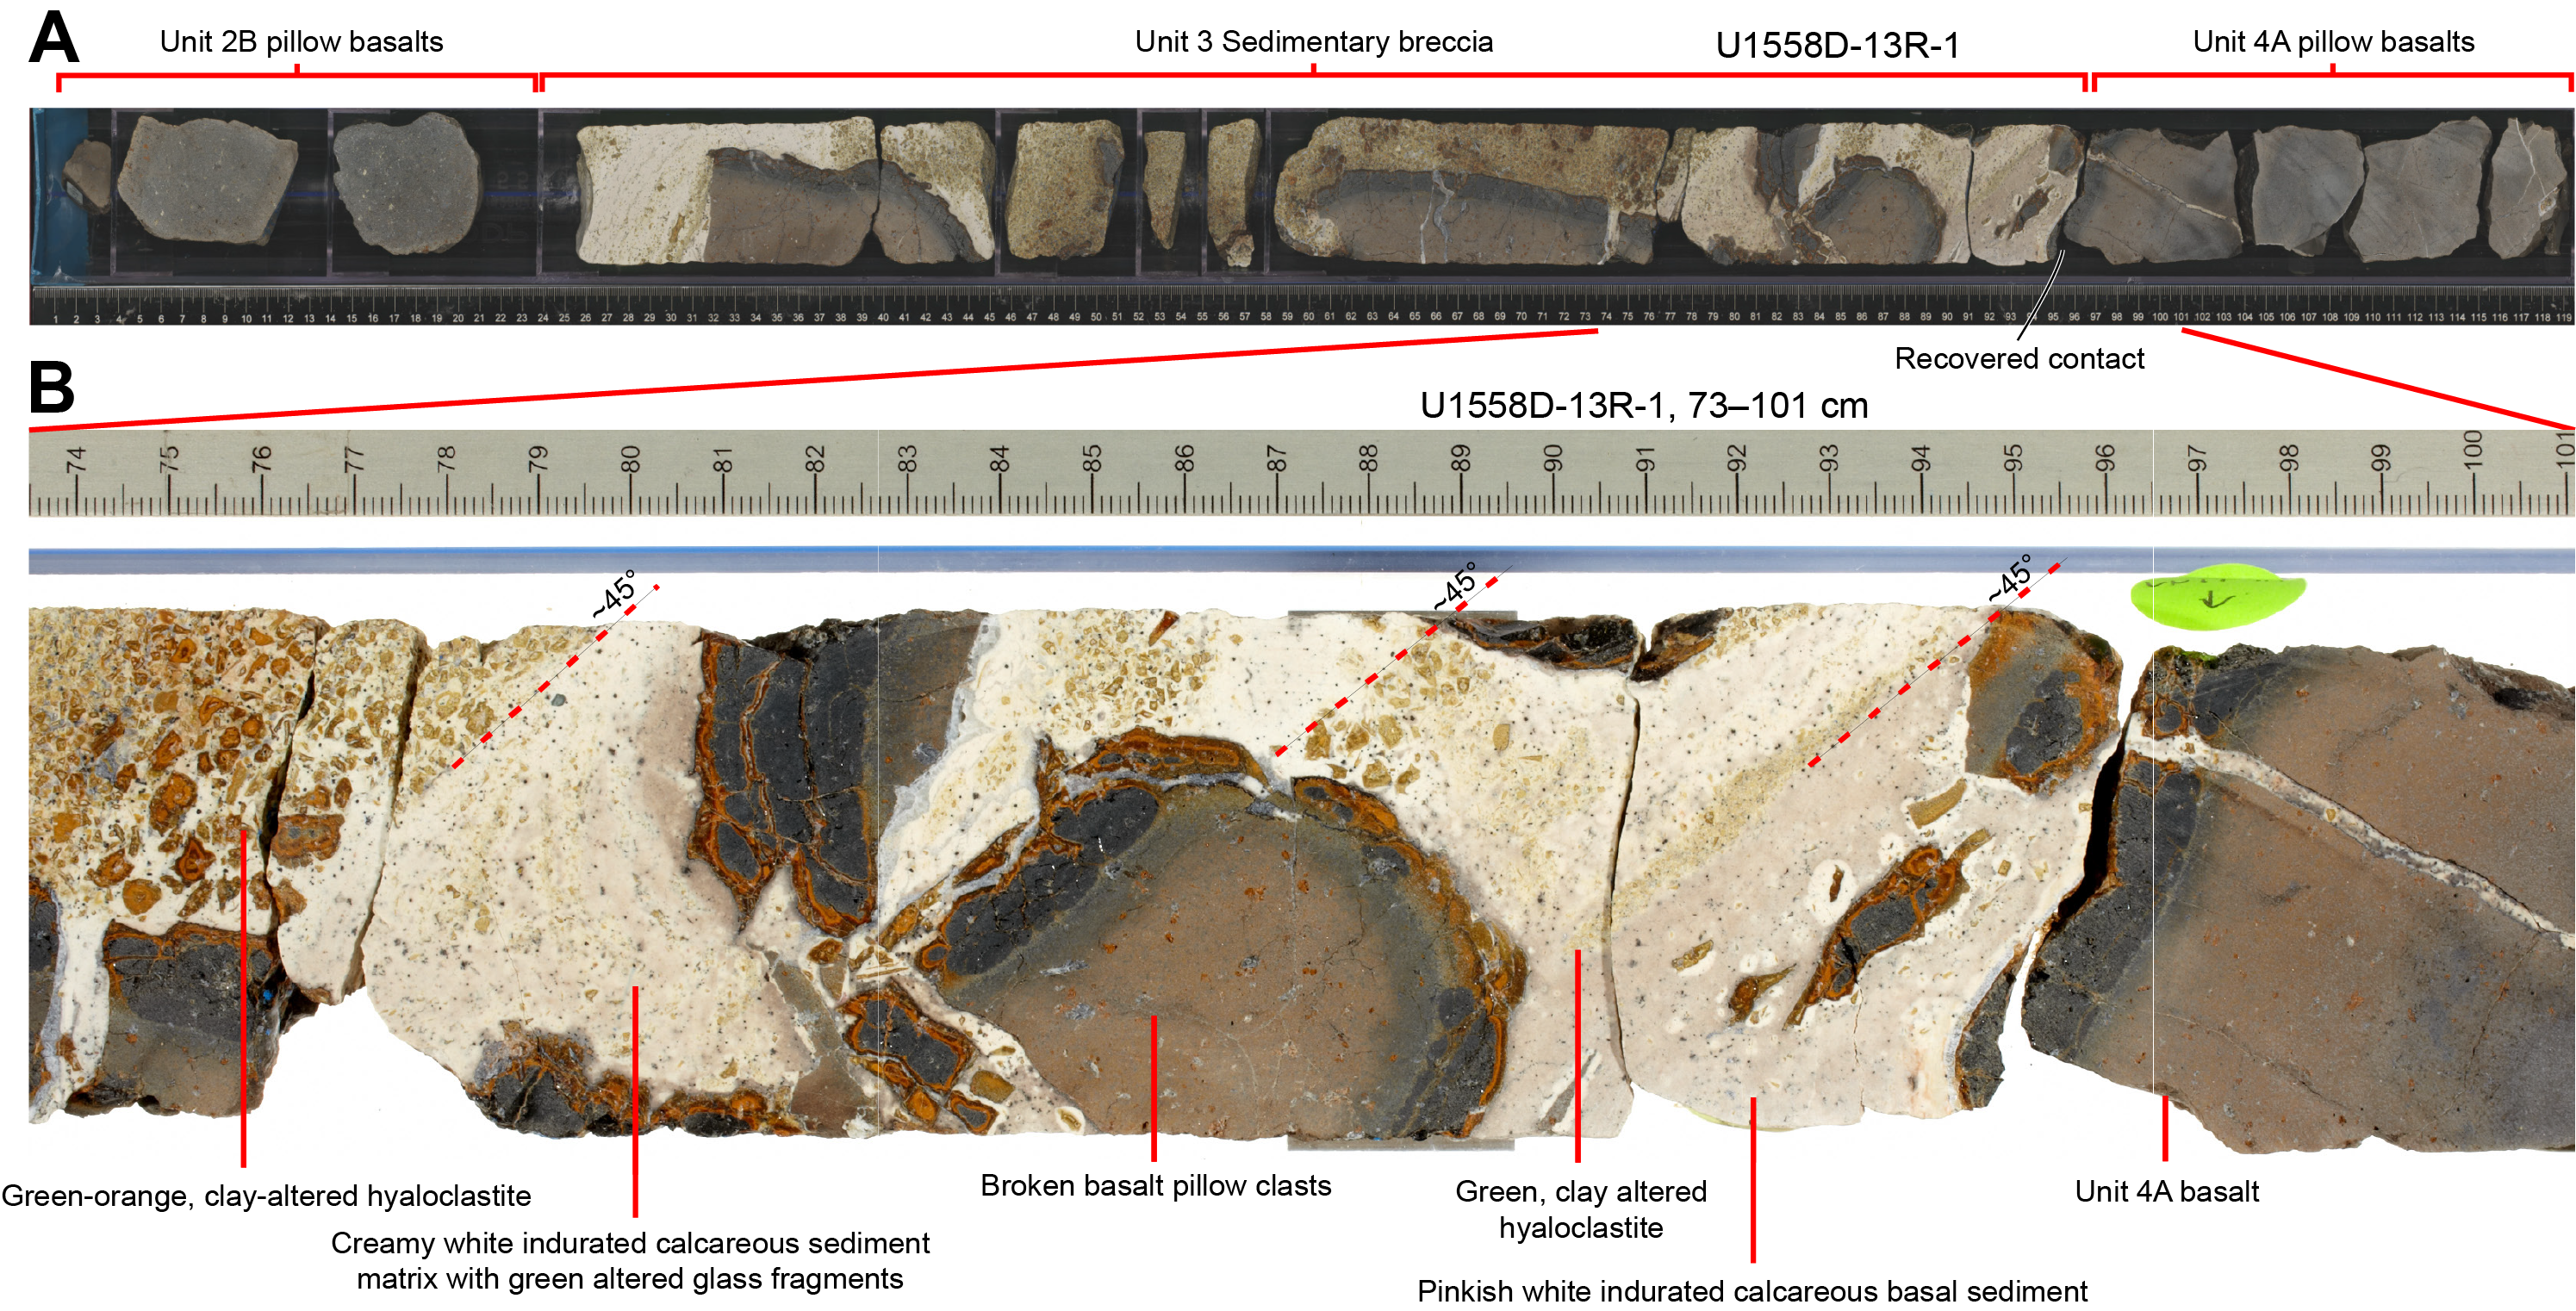
Figure F23. Sedimentary breccia, volcanic Sequence A/B boundary.
In the Unit 3 breccia, repeating layers show episodic deposition of hyaloclastite layers during this hiatus, but whether that is due to eruptive, current-driven, or downslope transport activity is unclear. The pillow basalt clasts are angular pieces of sparsely phyric pillow basalt from the underlying Unit 4, with some fragile glassy margins protruding from the clasts. Such features indicate that these clasts have not been transported far or at all from seafloor outcrops of the underlying unit.
5.1.4.2. Subunit 4A
Subunit 4A consists of sparsely plagioclase-olivine-phyric cryptocrystalline pillow basalts with common interpillow breccias and sediment. The upper contact of Unit 4 with the Unit 3 sedimentary breccia was continuously recovered at Section 393-U1558D-13R-1, 96 cm, giving Subunit 4A an expanded thickness of 8.4 m (Table T5).
The change from Unit 2 to Subunit 4A basalts is the most significant textural transition in the hole, with Subunit 4A having mostly cryptocrystalline groundmass, sparse phenocryst abundance, and no green clinopyroxene phenocrysts (Figures F23A, F24A, F24C, F25A, F25B). These changes are accompanied by a step upward in average Cr concentrations, indicating Unit 4 is potentially less evolved than the overlying units (see High-resolution chemostratigraphy below). Figure F25A shows the distinctly finer grained, cryptocrystalline groundmass and the sparsely plagioclase-olivine phyric character of Subunit 4A that is also typical of Subunit 4B.
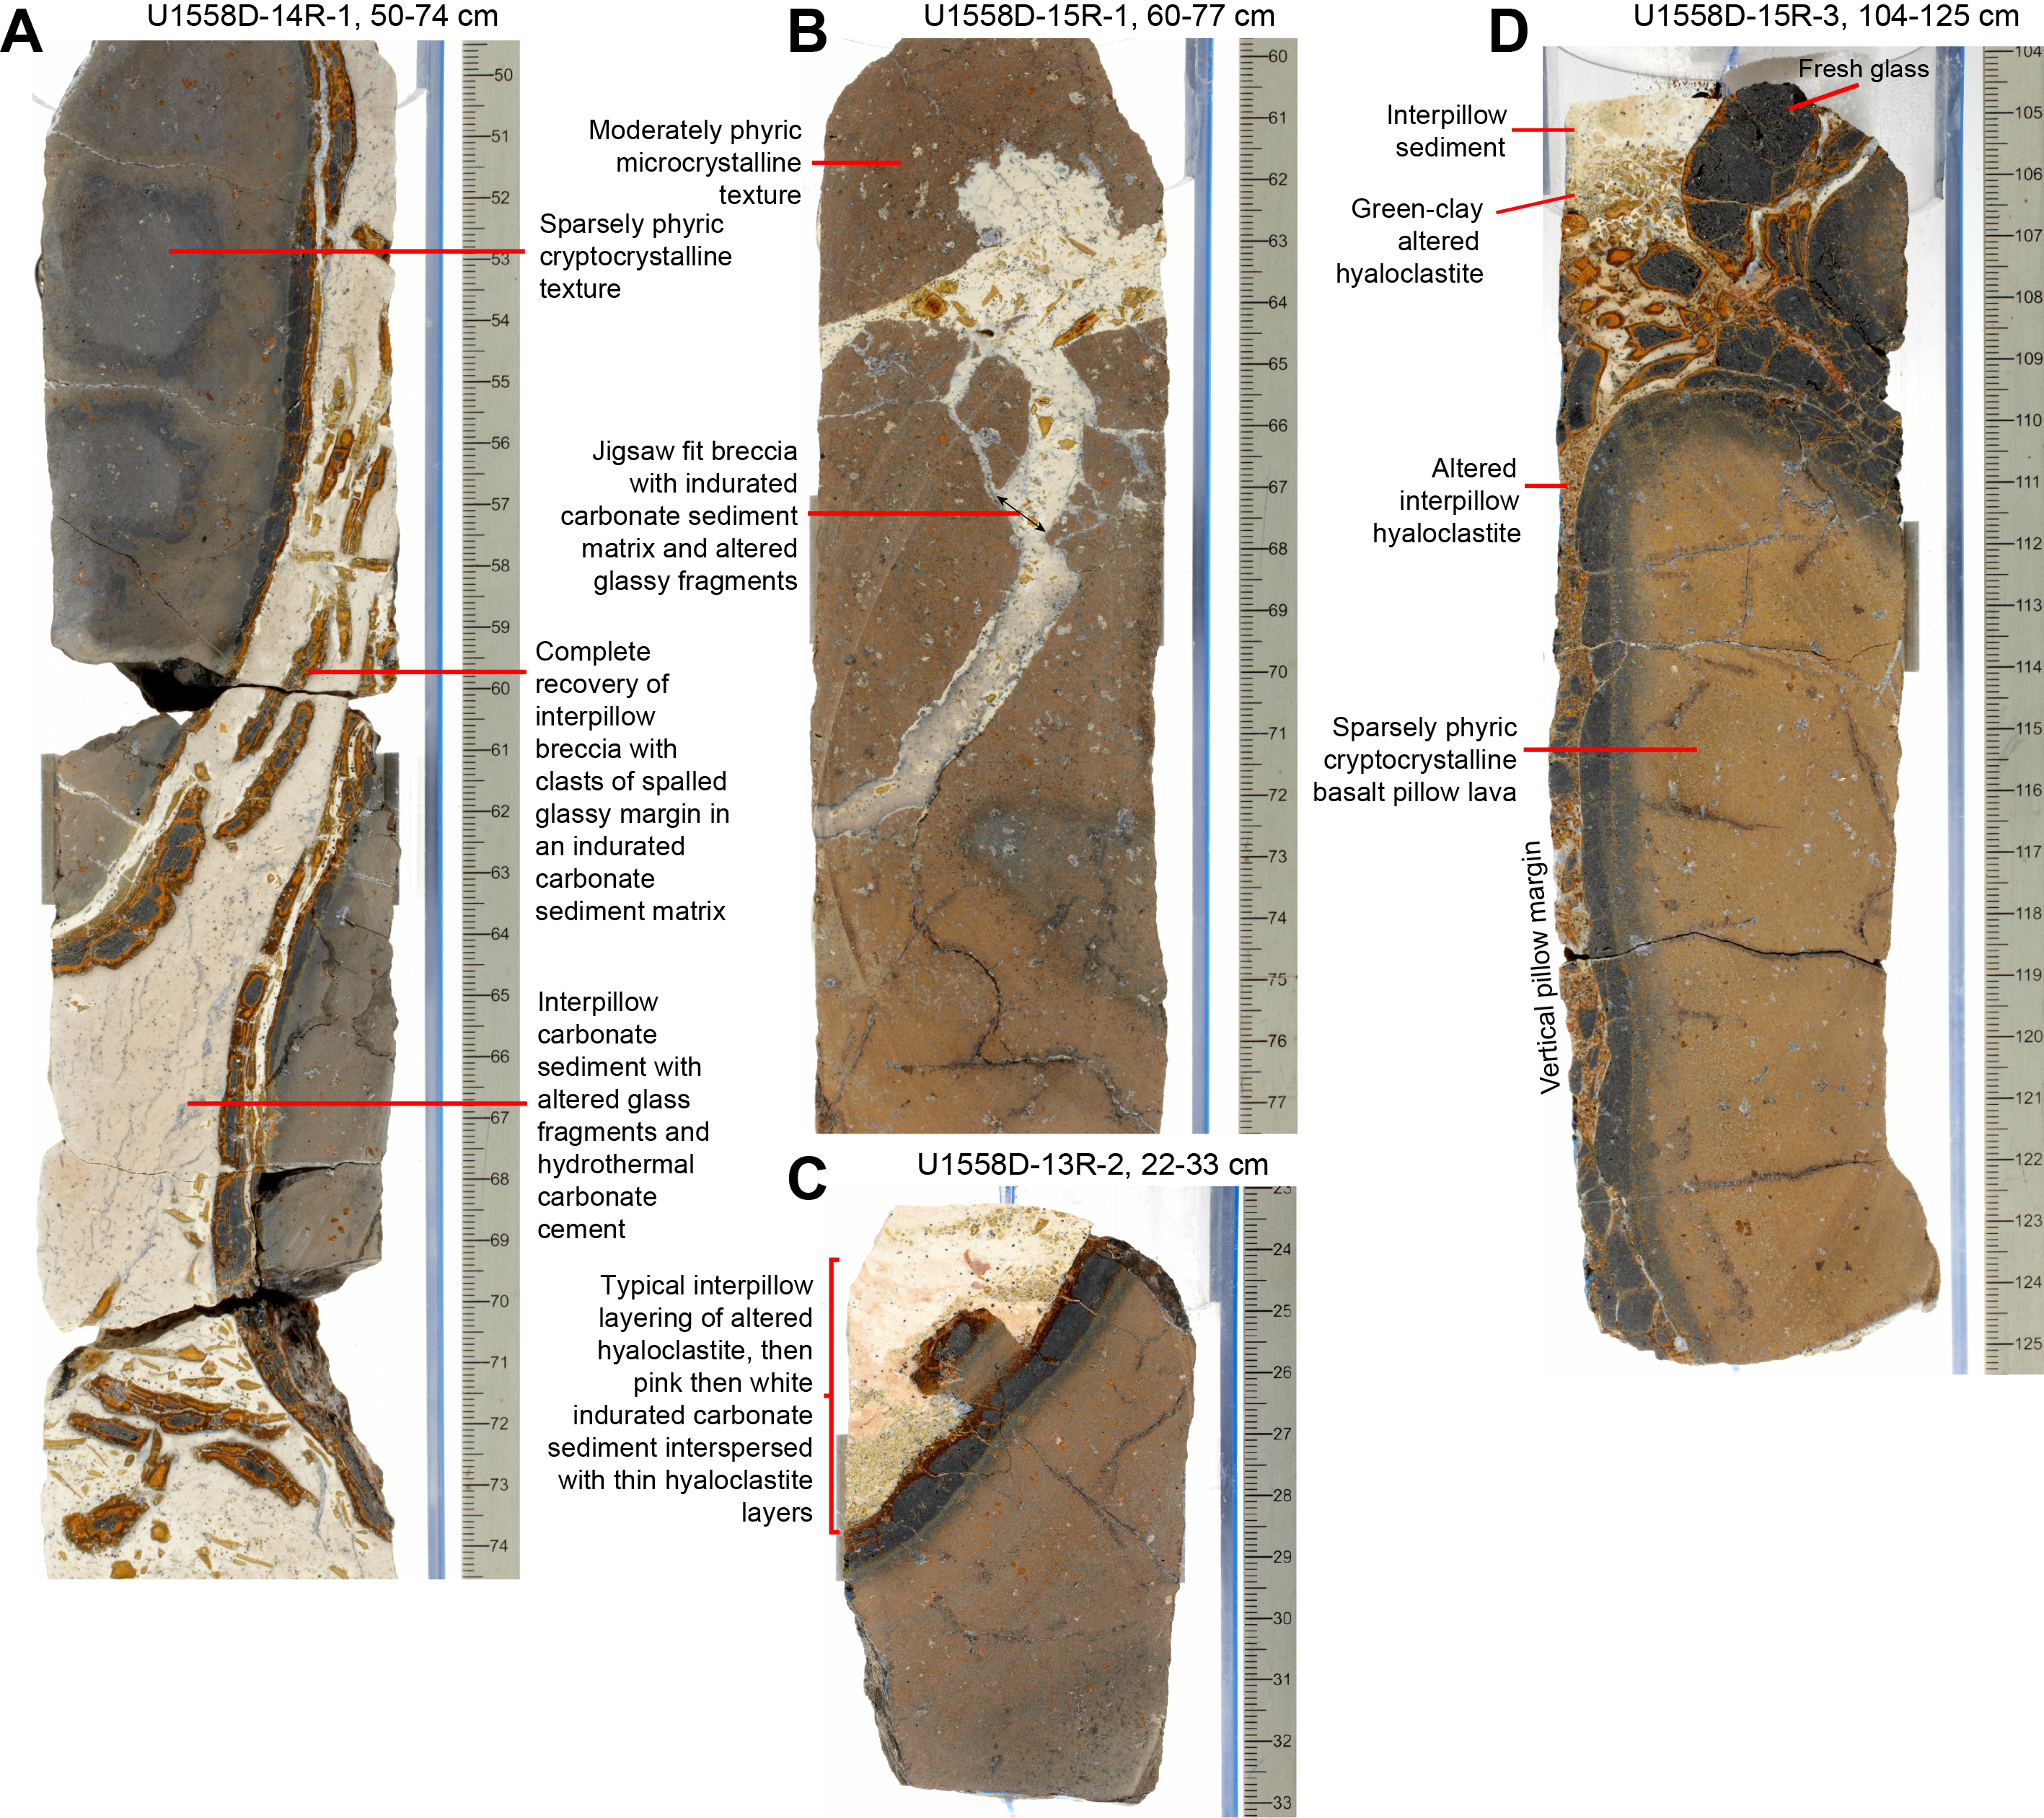
Figure F24. Interpillow sediments and breccias, Subunits 4A and 4B.
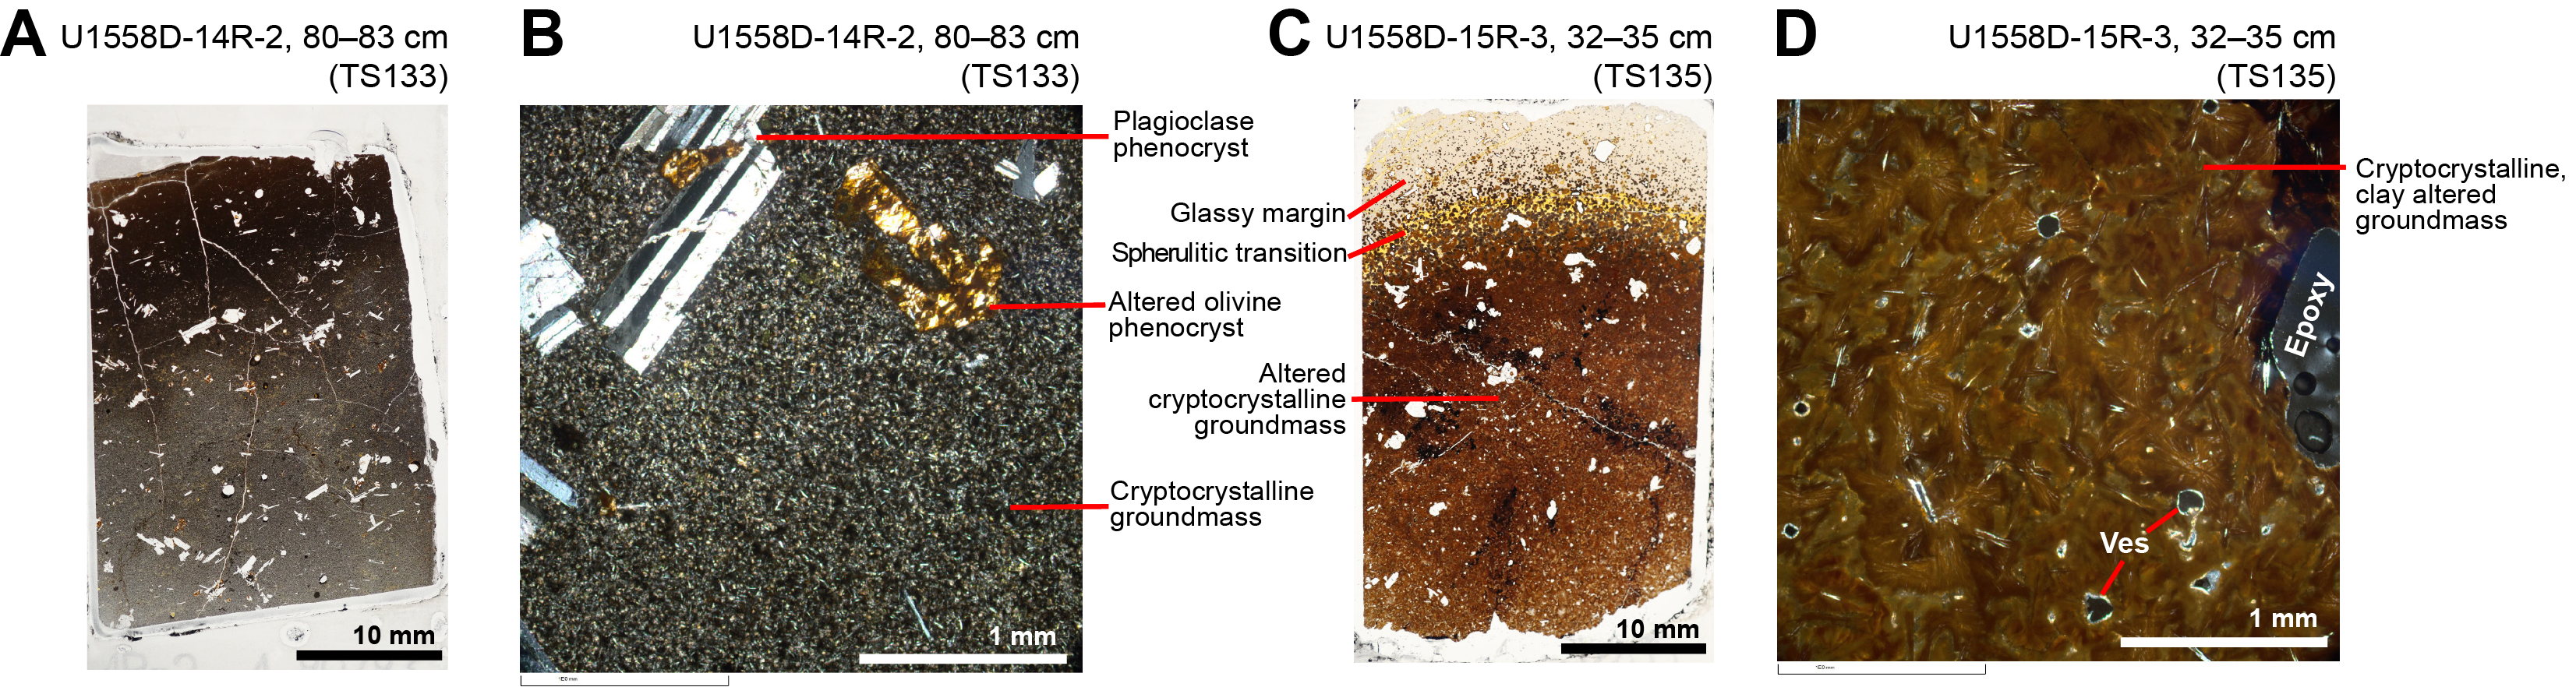
Figure F25. Volcanic Subunits 4A and 4B.
In addition to these textural and chemical changes, Subunit 4A is characterized by abundant, well-recovered interpillow carbonate sediments and breccias. The clasts in these interpillow breccias generally consist of variably altered glass that has spalled from pillow margins less than a few centimeters away, as shown by the closely fitting curvature of many of these clasts and the adjacent pillow margin (e.g., Figure F24A). Together with the sedimentary breccia in Unit 3 and the change in lava character, these interpillow sediments are interpreted to have infiltrated into the shallow basement subsurface during the volcanic hiatus over which Subunit 4A was exposed at the seafloor. This parallels the younger, near-interface sediments filling the pillow interstices in Unit 1.
5.1.4.3. Subunit 4B
Subunit 4B is a sparsely plagioclase-olivine-phyric, mostly cryptocrystalline basalt pillow lava unit with jigsaw-fit and interpillow breccias (Figure F24B, F24D), with an expanded thickness of 7.2 m. Subunit 4B is differentiated from Subunit 4a by the less common presence of interpillow sediments and breccias, interpreted as reflecting increasing depth beneath the Unit 3 paleoseafloor horizon. Intense Fe oxyhydroxide alteration of pillow interiors in close proximity to thick (1.5–2 cm) glassy margins are additionally distinctive of Subunit 4B (e.g., Figures F24D, F25C, F25D).
5.1.4.4. Subunit 4C
Subunit 4C comprises sparsely plagioclase-olivine phyric to aphyric basalt pillow lavas with a distinctive plagioclase lath–dominated microcrystalline groundmass. Recovered cores from this subunit lack the common breccia and interpillow sediment that characterize Subunits 4A and 4B (Figure F26). Subunit 4C has an unrecovered upper contact with Subunit 4B located approximately at Section 393-U1558D-15R-4, 0 cm, and an expanded thickness of 36.5 m, making it the second thickest unit in Hole U1558D.
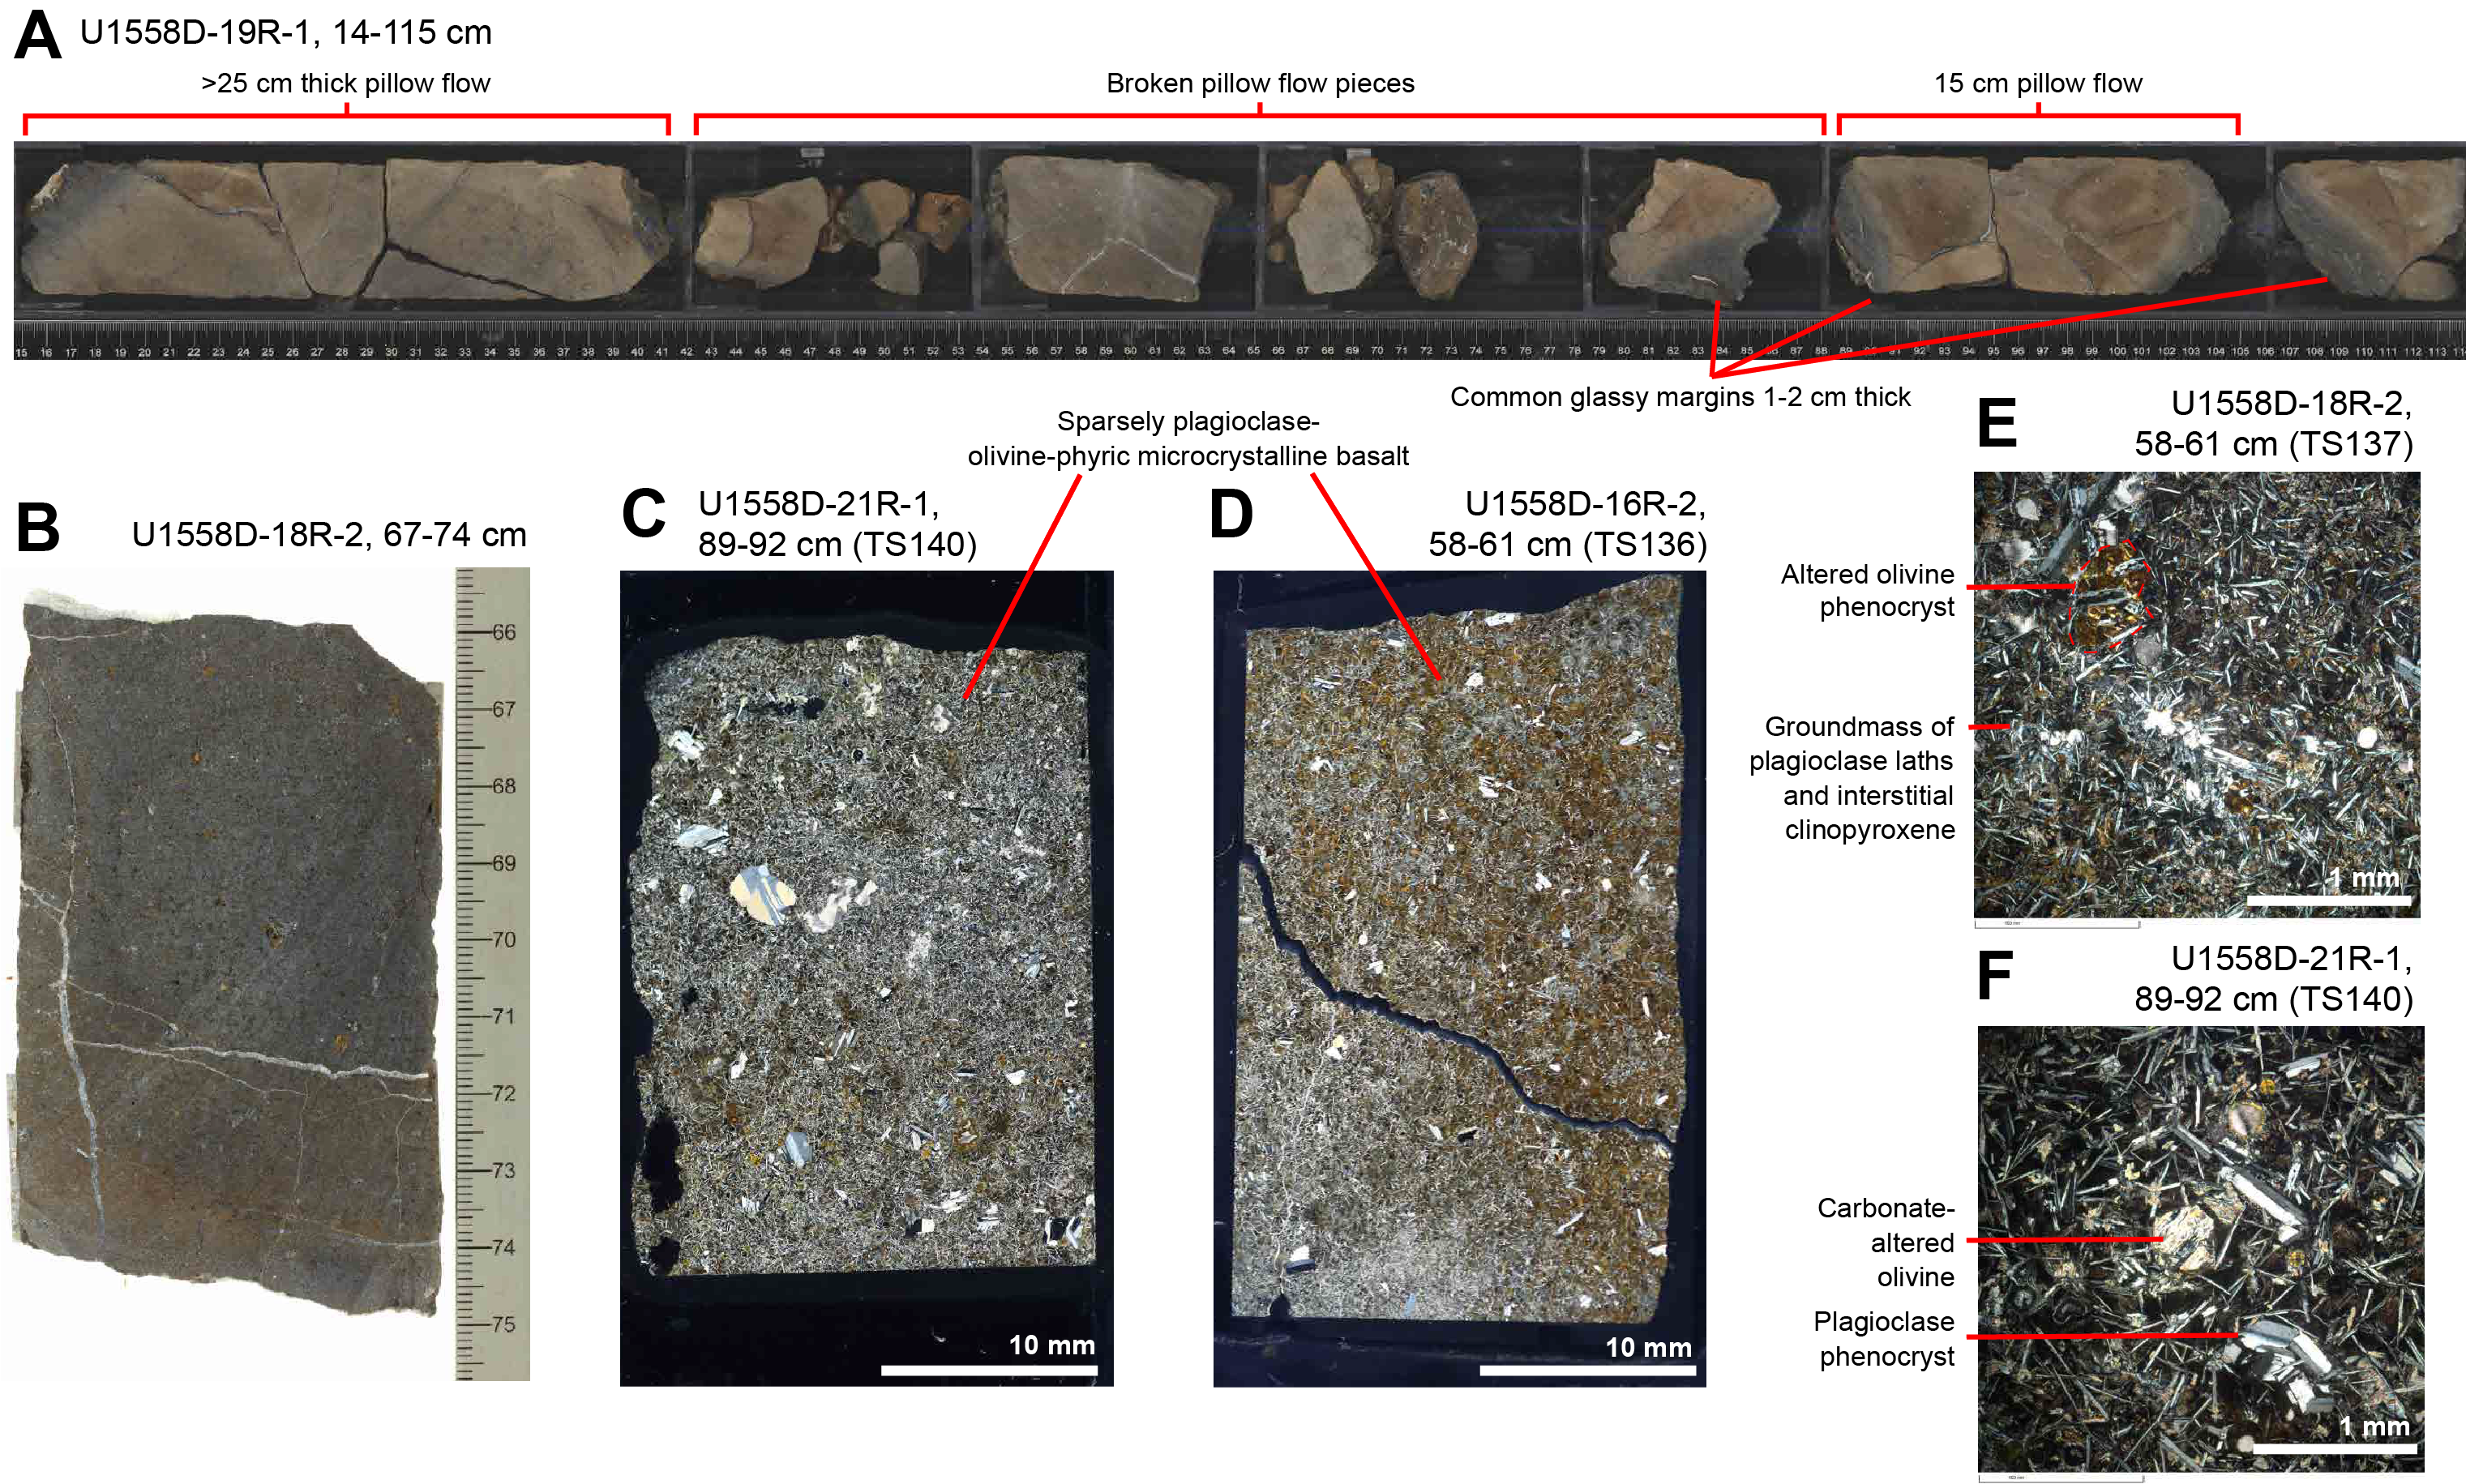
Figure F26. Volcanic Subunit 4C.
Common thick glassy margins and relatively small pillow lavas between 15 and 40 cm thick characterize the Subunit 4C lavas. Phenocryst abundance varies from flow to flow but is uniformly low and dominated by 2–4 vol% plagioclase with lesser altered olivine (Figure F26B–F26F). These phenocrysts are set in a microcrystalline groundmass of plagioclase laths with interstitial clinopyroxene that commonly exhibits a plumose texture (Figure F26E, F26F).
5.1.4.5. Subunit 5A
Subunit 5A consists of sparsely to moderately plagioclase-olivine-phyric basalt with a distinctive population of fine (0.2–1 mm) lath-shaped plagioclase phenocrysts in addition to the subequant plagioclase phenocrysts present in Unit 4. The upper contact of Subunit 5A was not clearly recovered but is well defined by pXRF analyses (see High-resolution chemostratigraphy) and was located at Section 393-U1558D-23R-1, 0 cm, giving an expanded subunit thickness of 8.7 m. Rare planar chilled margins and some long, continuous intervals (≤1 m) of microcrystalline lava without glass supports the interpretation of emplacement as sheet flows as well as pillow lavas (Figure F27A, F27B). One interpillow breccia of angular glassy clasts in an indurated calcareous sediment matrix was recovered from Subunit 5A in interval 393-U1558D-23R-1, 77–87 cm (Figure F27C).
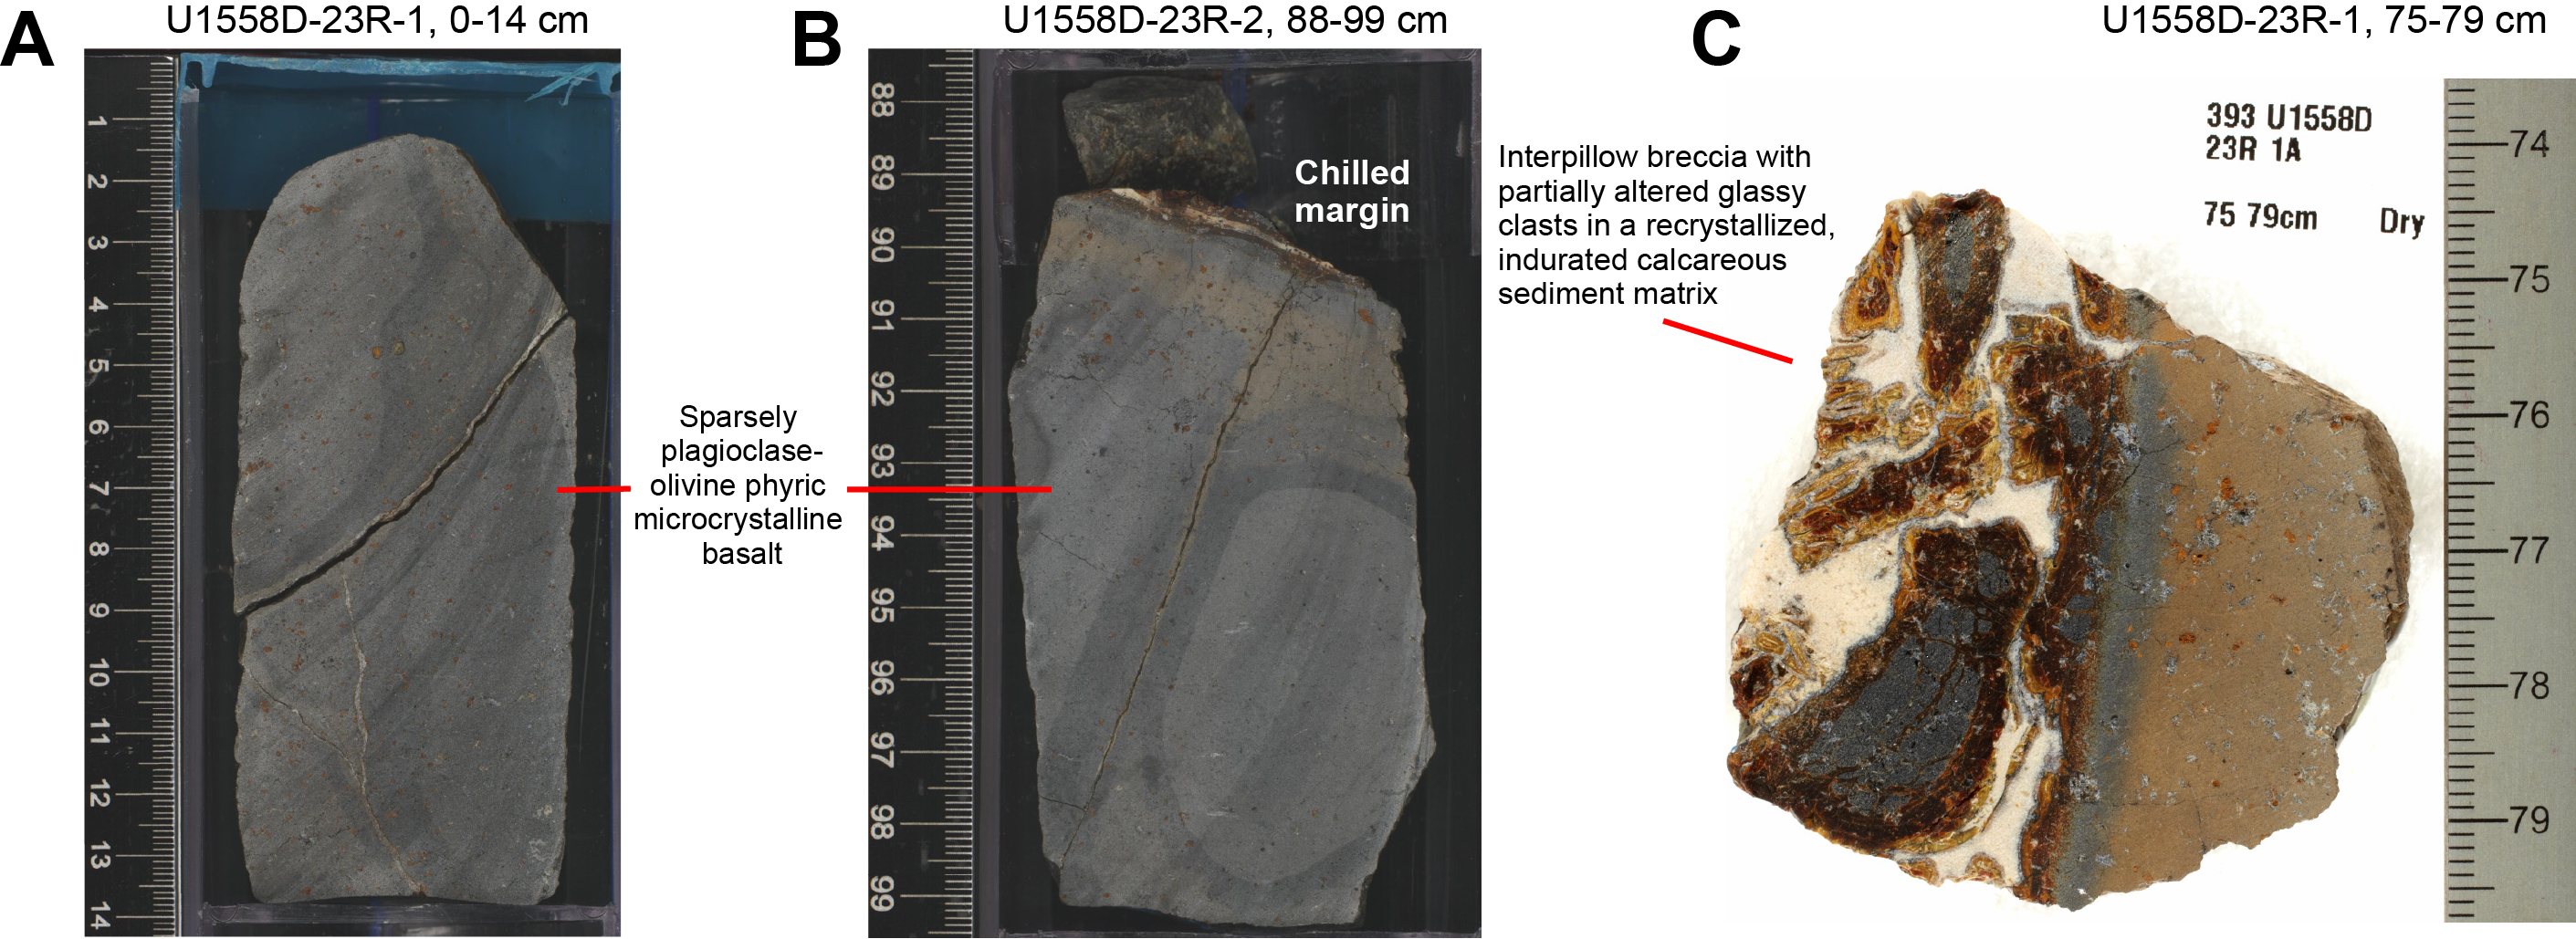
Figure F27. Volcanic Subunit 5A.
5.1.4.6. Subunit 5B
Subunit 5B is generally similar in lithology and emplacement style to Subunit 5A but is differentiated by the presence of pillow flows with mottled or variolitic interiors interlayered with nonvariolitic sheet flows (Figure F28A–F28C). The upper contact of Subunit 5B was not recovered but was located at the shallowest appearance of variolitic lava at Section 393-U1558D-24R-1, 105 cm, giving an expanded subunit thickness of 15.5 m (Table T5).
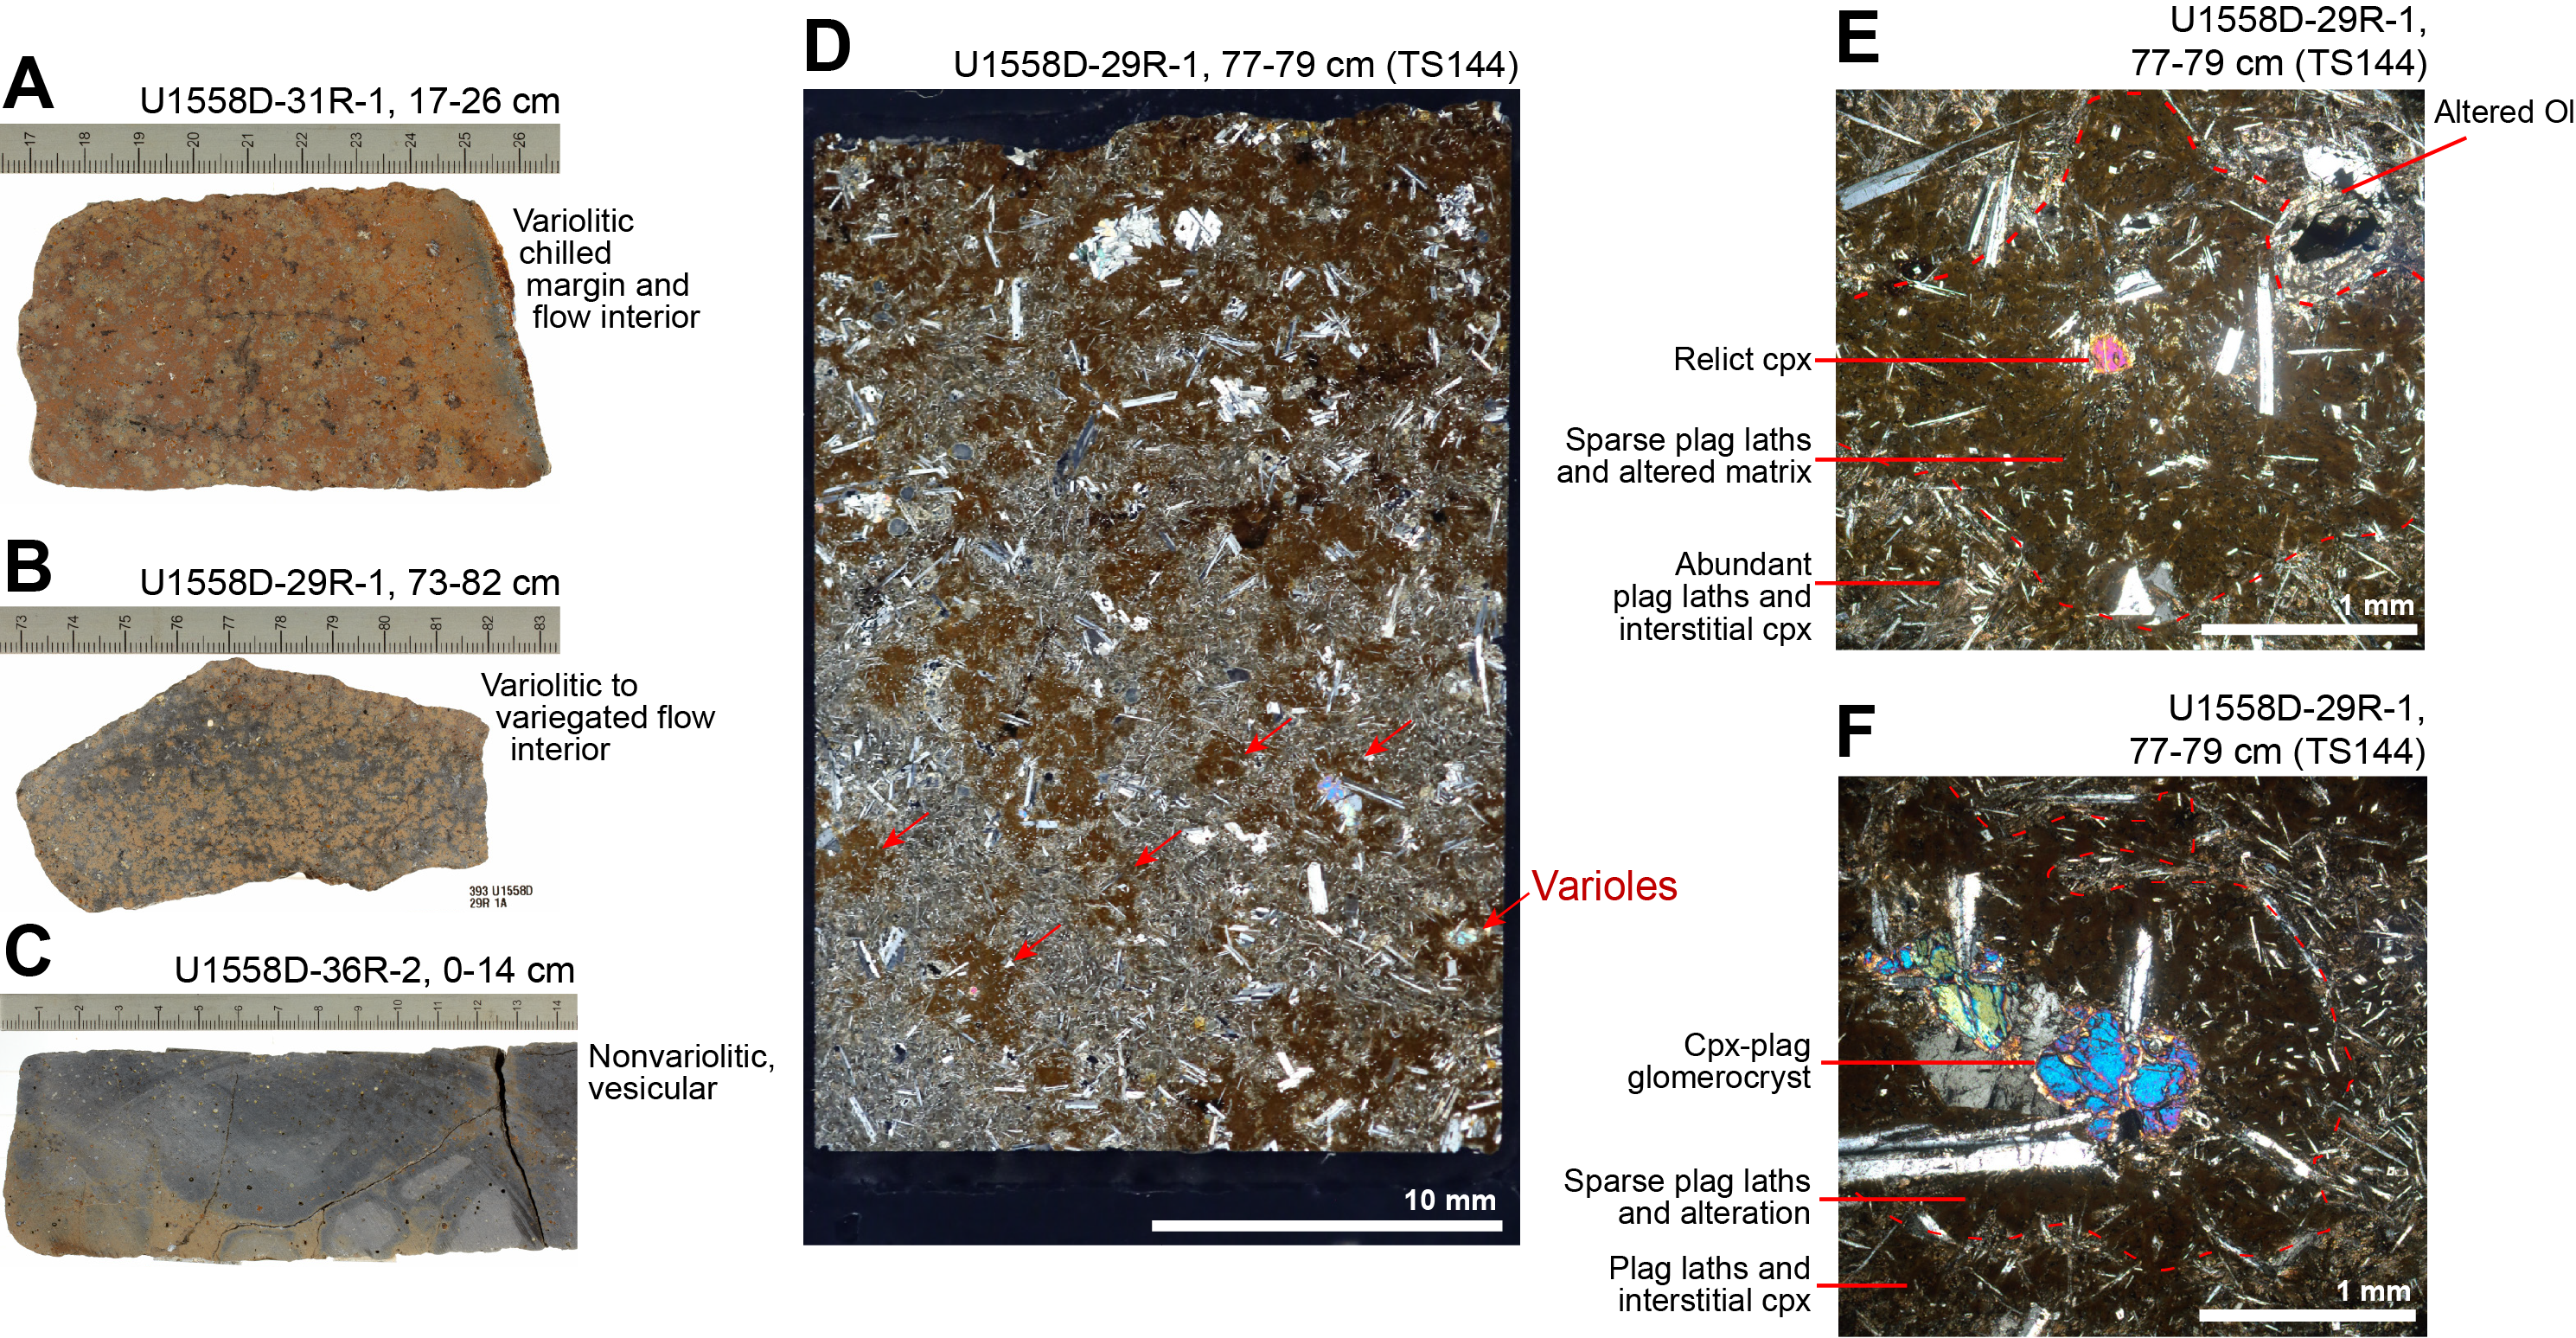
Figure F28. Volcanic Subunits 5B, 5C, and 5E.
The varioles and related mottled textures in Subunit 5B are defined by a reduced abundance of plagioclase laths that most commonly surround phenocrysts or glomerocrysts (Figure F28E, F28F). The groundmass inside these varioles is also more altered, appearing browner than the plumose clinopyroxene groundmass outside the varioles.
5.1.4.7. Subunit 5C
Subunit 5C has a similar phenocryst assemblage and groundmass texture to Subunits 5A and 5B but is dominated by pillow lavas with common glassy, curved margins and a pronounced variolitic flow interior texture. The upper contact of Subunit 5C was not clearly recovered and occurs over discontinuous pieces of broken lava but was located at the onset of more common glassy margins at Section 393-U1558D-28R-1, 0 cm, giving an expanded subunit thickness of 45.3 m and making it the thickest volcanic subunit in Hole U1558D.
The pronounced variolitic texture of Subunit 5C is accentuated by alteration in Subunit 5C (Figure F28A, F28B; see Alteration petrology). This texture is presumably quench crystallization related because it is only well developed in pillow lavas and is most pronounced in the interior domains of pillow margins. This could be related to the exceptionally thick glassy margins in Subunit 5C, which commonly exceed 2 cm and transition over <1 cm into altered variolitic pillow interior (Figure F28A).
5.1.4.8. Subunit 5D
Subunit 5D is the only clearly defined massive flow in Hole U1558D, with a minimum thickness of 2.9 m and an expanded thickness of 4.6 m. The Subunit 5D upper contact of the massive flow is at Section 393-U1558D-37R-2, 0 cm (Table T5).
The flow consists of moderately olivine-plagioclase phyric basalt, with olivine phenocrysts being slightly more abundant (~4%) than plagioclase phenocrysts (~2%) (Figure F29C). However, the groundmass contains abundant fine-grained plagioclase laths, such that the plagioclase content in the rock is actually much greater than olivine (Figure F29D).
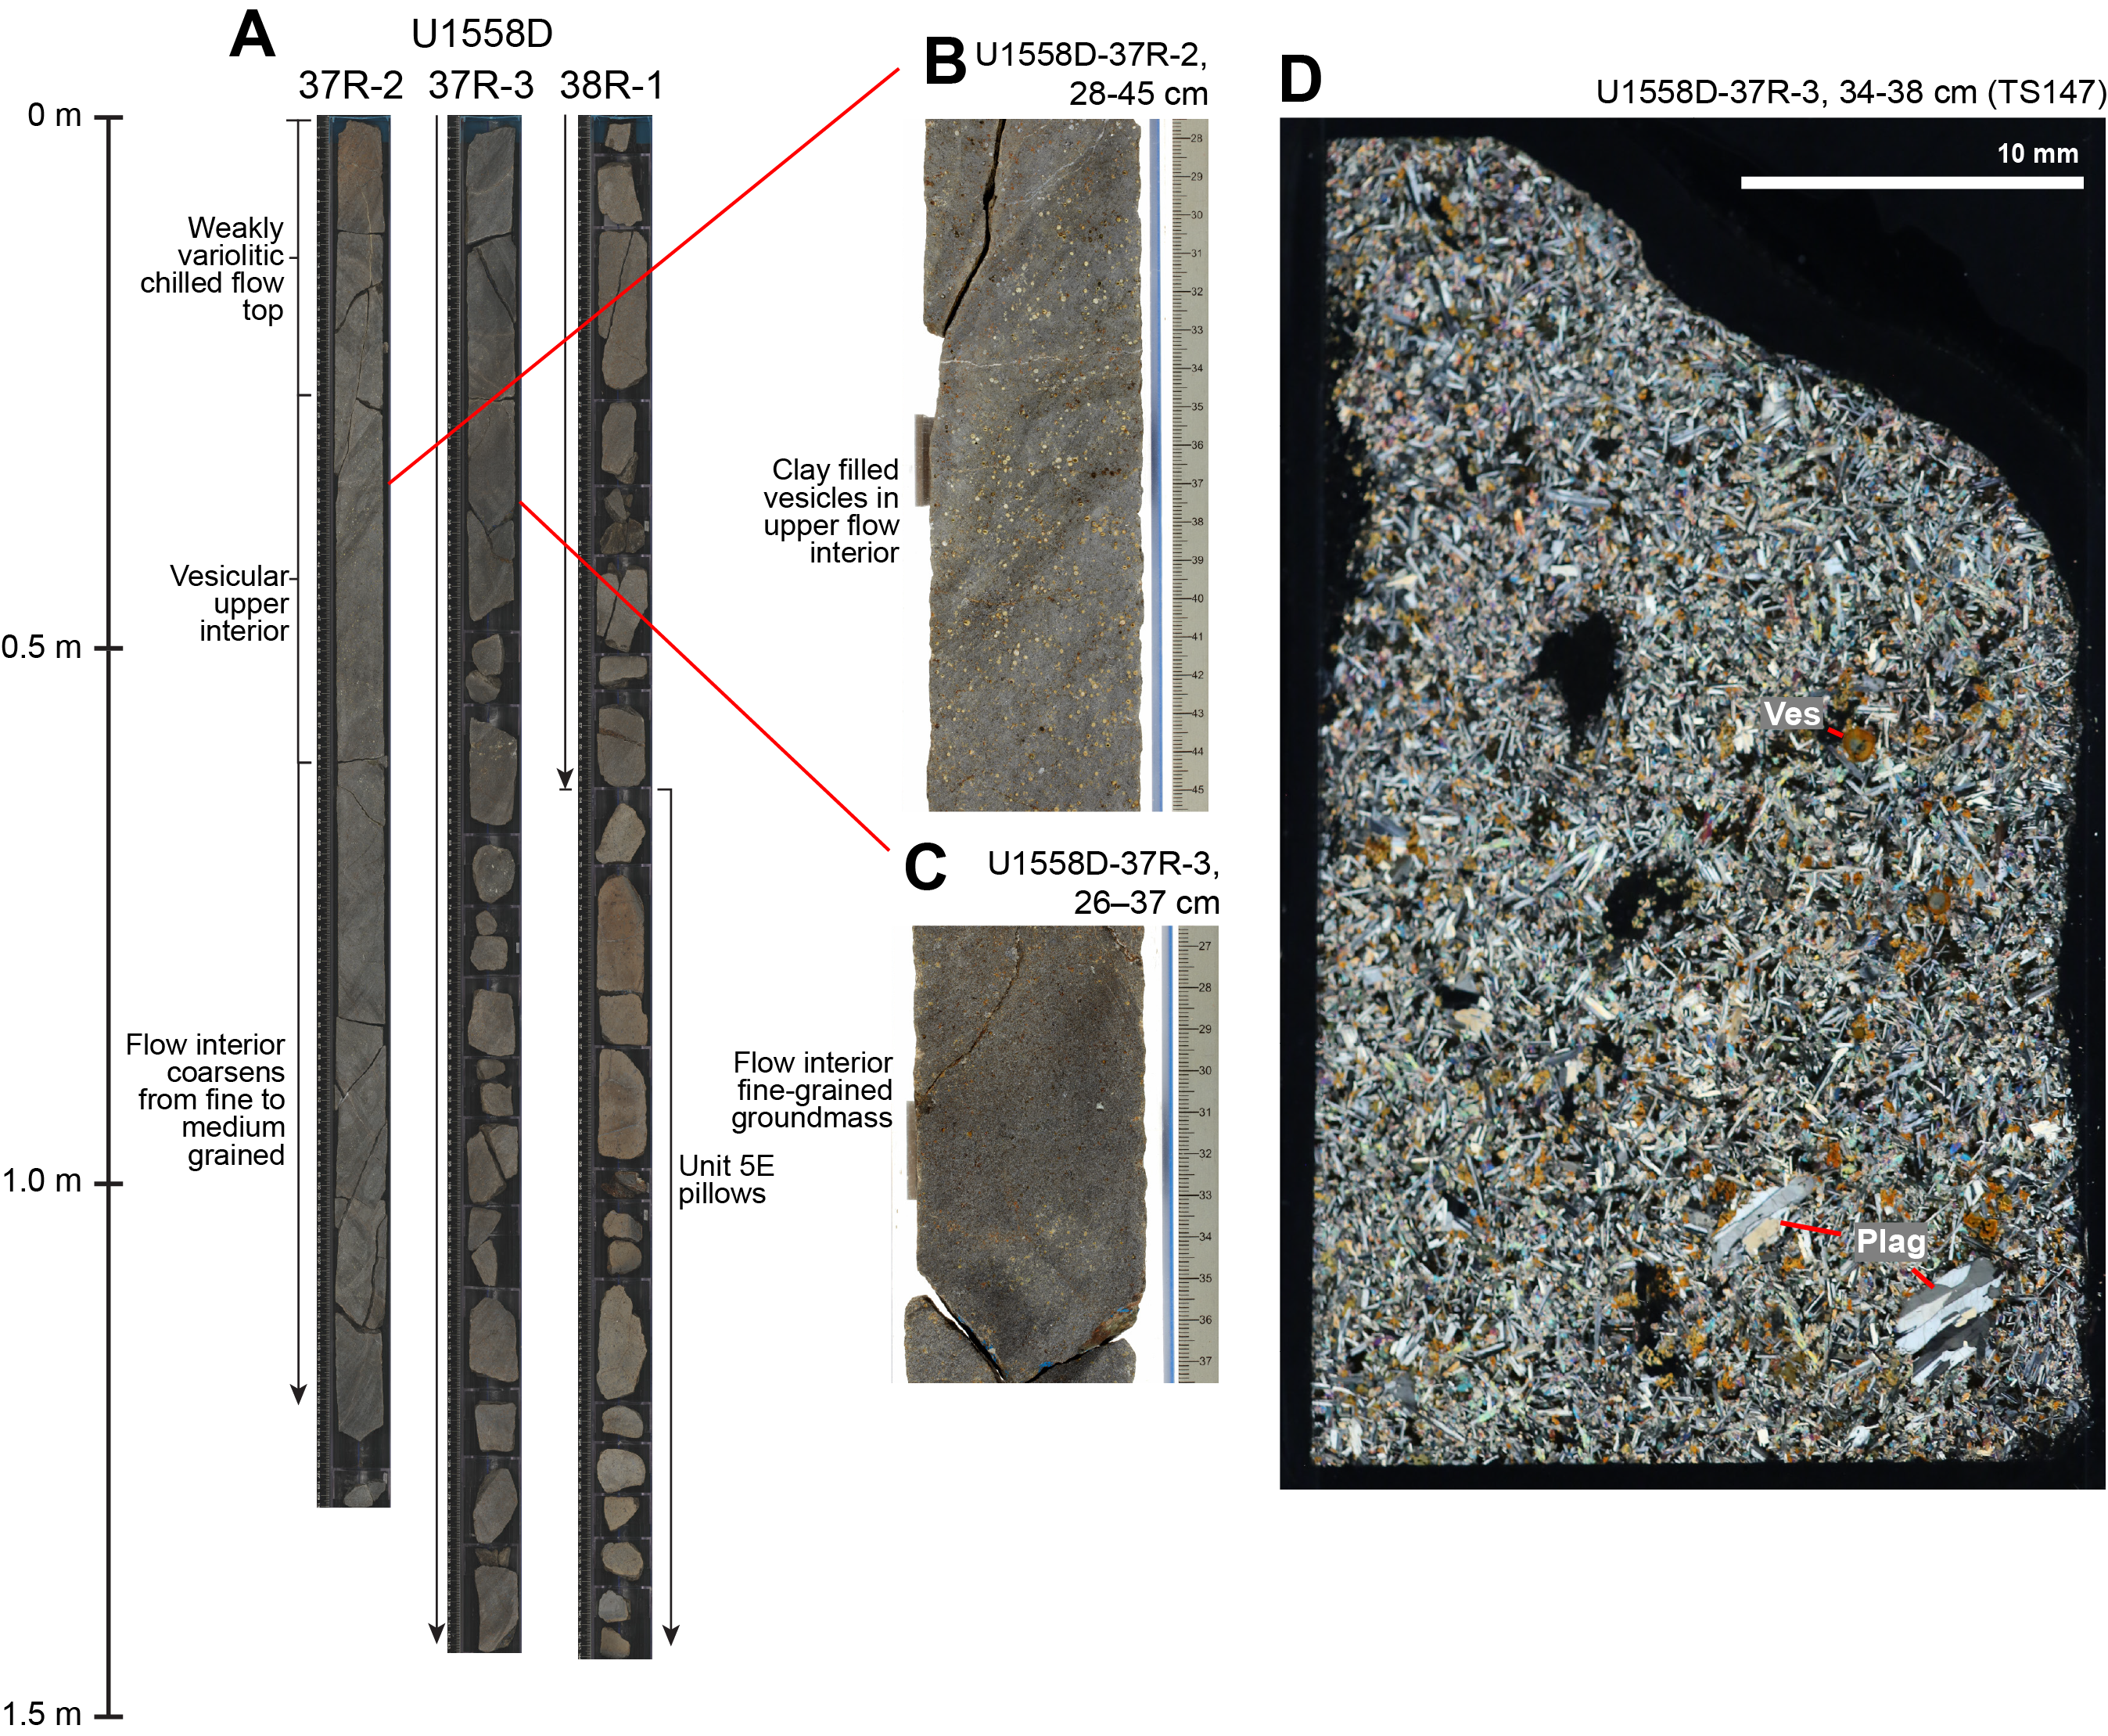
Figure F29. Massive lava flow, Volcanic Subunit 5D.
Glassy margins of the flow were not recovered, but emplacement as a single massive flow is interpreted on the basis of its gradational and asymmetric internal quench texture (Figure F29A). The top ~30 cm of the flow is chilled to a microcrystalline groundmass grain size with subtle variolitic texture that becomes moderately vesicular in the upper flow interior (Figure F29B). The groundmass gradually coarsens from microcrystalline to fine to medium grained toward the bottom of the flow (interval 393-U1558D-37R-3, 50 cm, to 38R-1, 60 cm). These features suggest more rapid cooling on the flow top than the flow bottom, which is more supportive of a flow emplaced on the seafloor than a hypabyssal sill. The vesicular upper interior is interpreted to be formed by volatiles degassing from the nonvesicular lower part of the flow that could not escape through the already chilled flow top (Figure F29B).
5.1.4.9. Subunit 5E
Subunit 5E is lithologically like Subunit 5C and is interpreted to have formed during the same volcanic episode punctuated by the eruption of the Subunit 5D massive flow. The upper contact of Subunit 5E was not clearly recovered but is located at the first piece of mottled, cryptocrystalline basalt that is texturally distinct from the massive flow at Section 393-U1558D-38R-1, 63 cm. Hole U1558D ends in Subunit 5E at 370.2 mbsf (203.13 msb), giving the unit a minimum thickness of 3.9 m and an expanded thickness of at least 8.3 m. One 2.5 cm thick interpillow breccia was recovered in Subunit 5E, with clasts of angular, variably altered glass in a carbonate-free clay and zeolite matrix (interval 39R-2A, 39–41.5 cm).
5.2. Phenocryst phases
Phenocryst character was a key discriminant of the Site U1558 units (Figure F30), and most of the volcanic rocks recovered have plagioclase-olivine-clinopyroxene-, plagioclase-olivine-, or olivine-plagioclase-phyric phenocryst assemblages with total abundances varying from aphyric to highly phyric levels (Figure F30B). In Figure F30, the aphyric to sparsely phyric character of Subunit 4C is apparent, as is the volumetric dominance of plagioclase over olivine except for short intervals in Subunits 5C–5E.
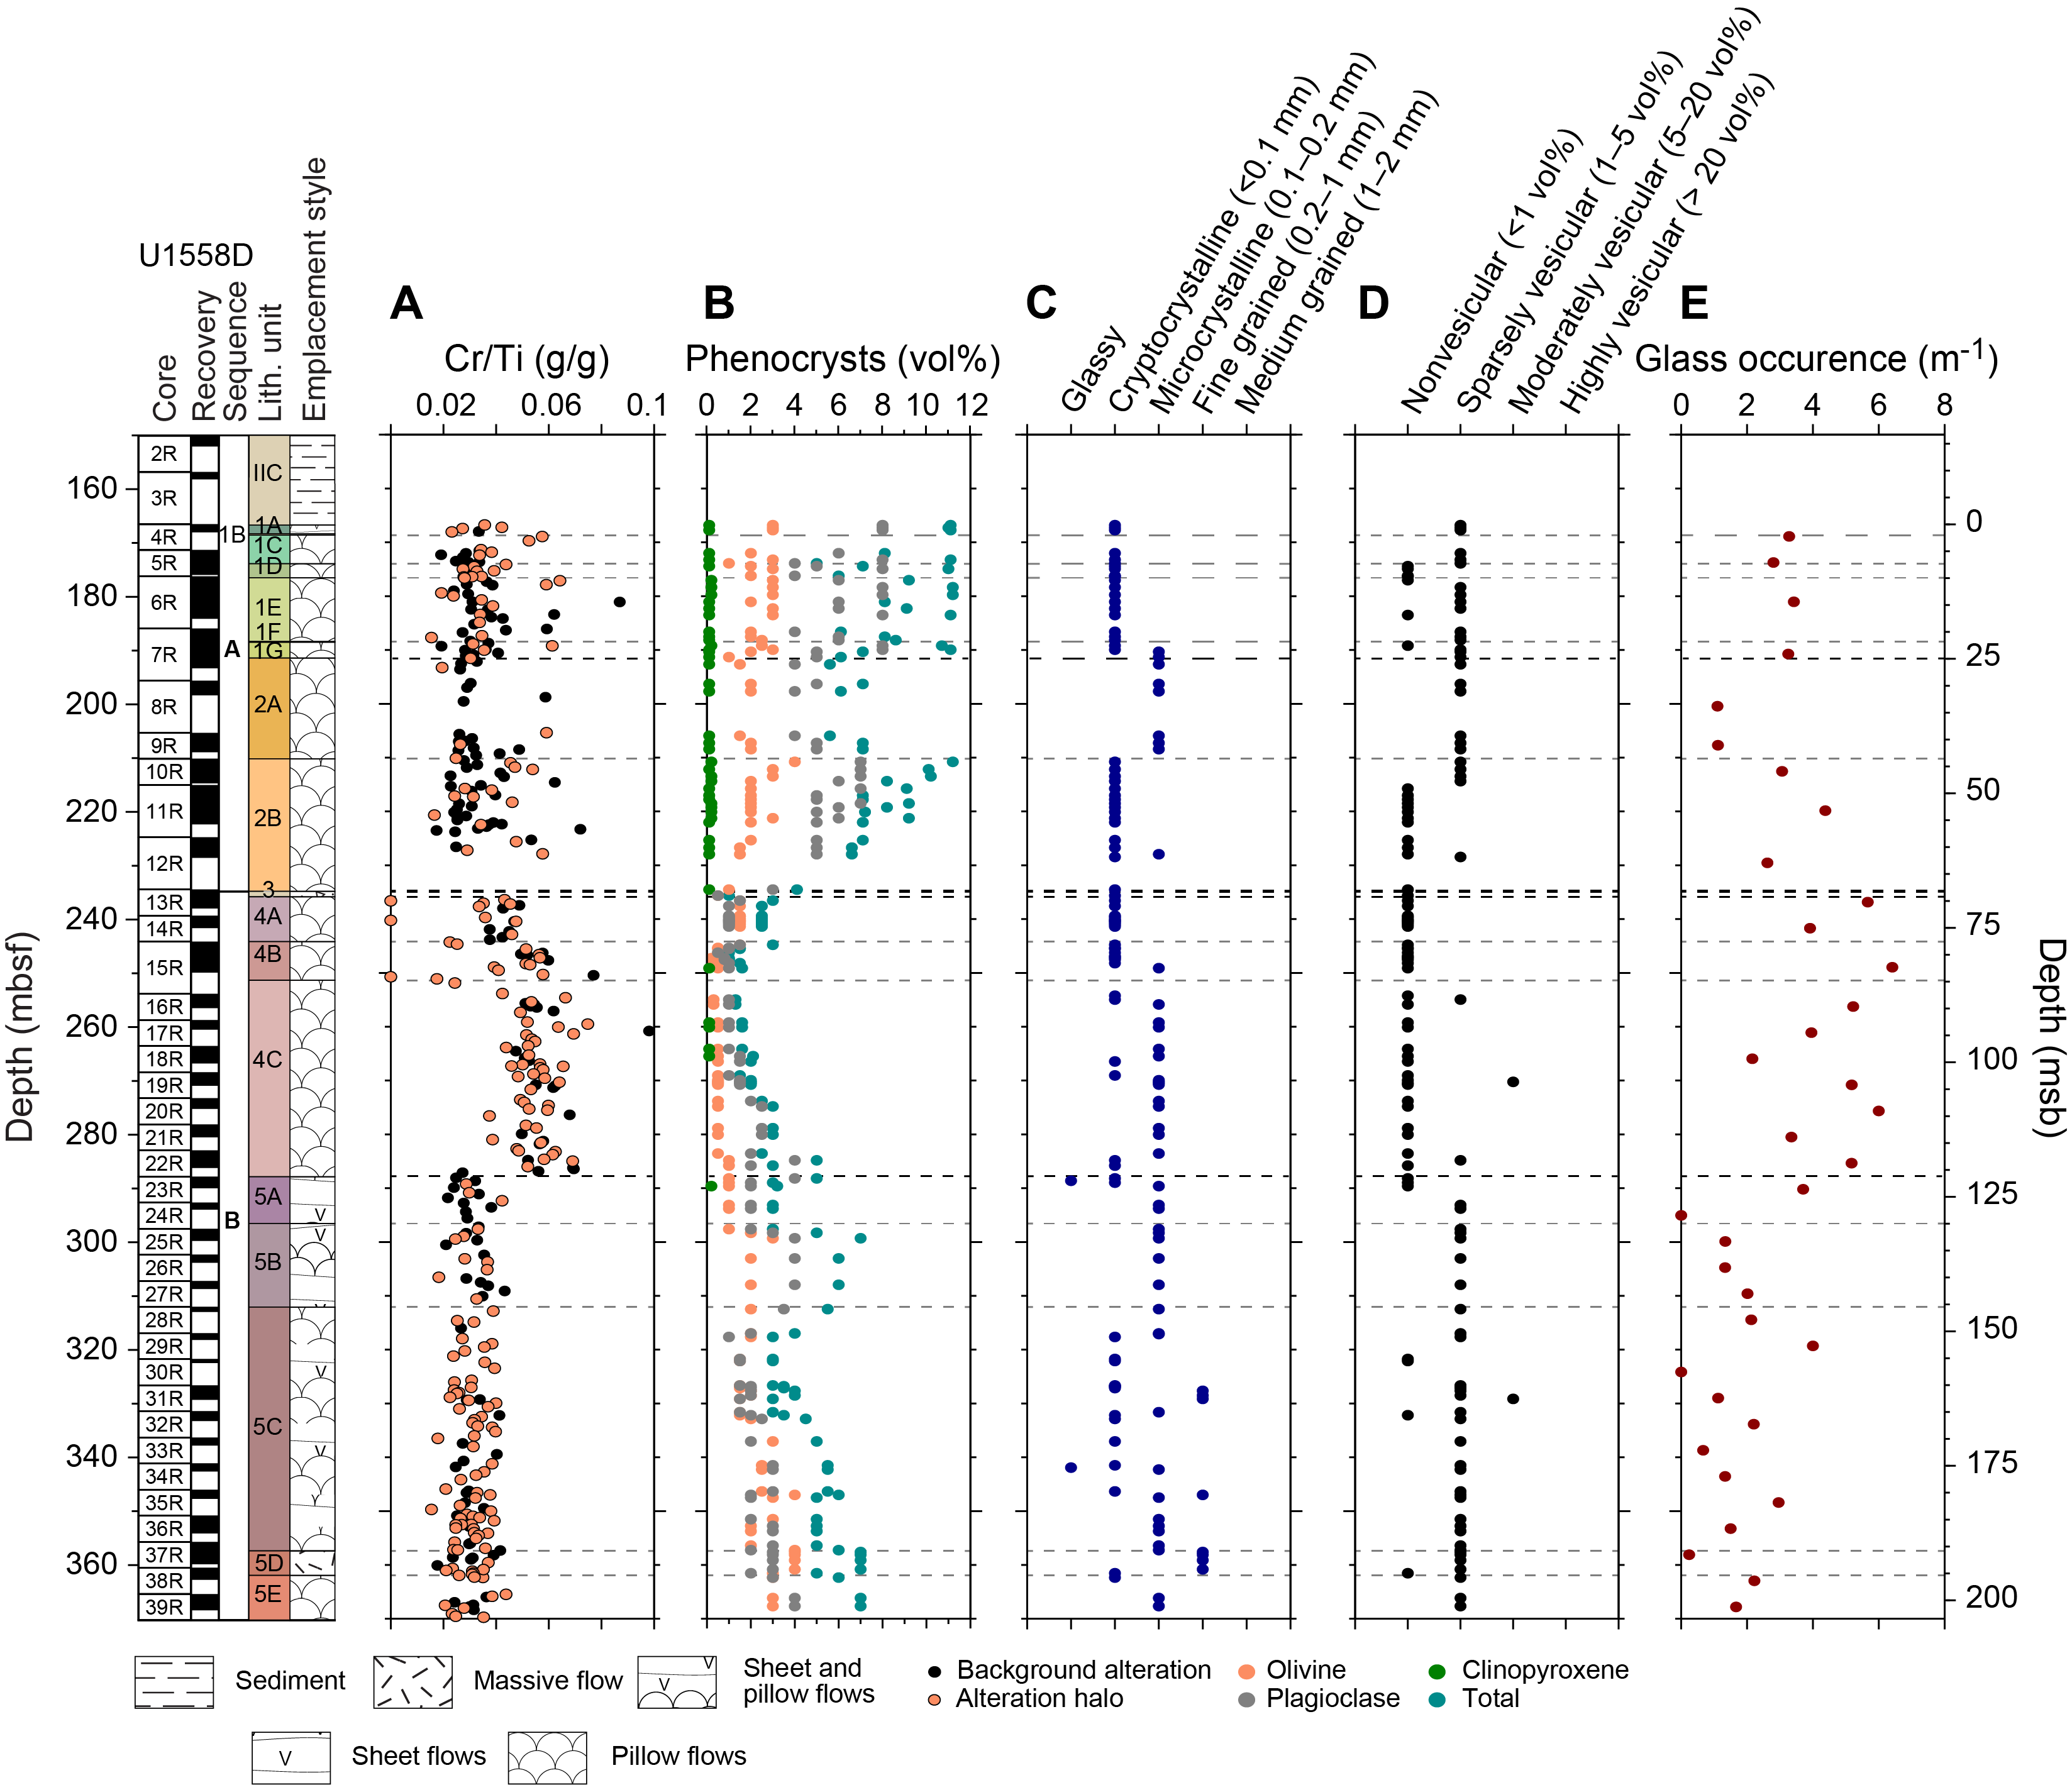
Figure F30. Macroscopic core observations.
The presence of extremely sparse but distinct dark olive-green clinopyroxene phenocrysts up to 15 mm is the most characteristic lithologic difference between Sequence A and B basalts (e.g., Figures F21A, F22), and this is reflected in the phenocryst abundances plotted downhole (Figure F30B). Identifying the composition of these green clinopyroxenes requires further microanalytical study; however, if their Cr-diopside–like color is an indication of their high Mg and Cr contents, they may have been sourced from a deep and relatively unfractionated part of the axial magmatic system. In thin section, these clinopyroxenes invariably show some evidence for resorption, such as rounded corners or ovoid or irregular, anhedral shapes (Figure F22E–F22G). Less commonly, plagioclase phenocrysts have also been resorbed (Figure F19D), whereas olivine pseudomorphs always appear to be euhedral. The Sequence A green clinopyroxenes also occur in microgabbroic glomerocrysts with olivine and plagioclase (Figure F21A). Together with their chrome diopside appearance, this strongly indicates these glomerocrysts are cognate and have been transported from a magma chamber or cumulate deeper in the magmatic system. Common resorption textures suggest that the magma that carried these phenocrysts is in disequilibrium with the clinopyroxene and plagioclase in this assemblage, with the magma resorbing minerals in the order clinopyroxene > plagioclase > olivine, the reverse order of crystallization for typical MORB (Grove et al., 1992).
The absence of green clinopyroxenes in Sequence B, together with its different geochemistry and phenocryst proportions and abundance suggests that it is derived from a different part of the axial magmatic system than Sequence A. This is consistent with the volcanic hiatus of tens of thousands of years thought to separate these sequences, as estimated from the sedimentary breccia thickness and sedimentation rates, as well as the clear step in Cr/Ti composition across the sequence boundary (Figure F30A).
5.3. Breccias
Hole U1558D recovered short intervals of different kinds of breccia from most volcanic units. Most of these are interpillow breccias in the interstices between pillow lavas, with the indurated sediment infill apparently making for more cohesive and recoverable rock (Figures F20B, F20C, F24A, F24D). However, breccias with widths across the entire core, too great for interpillow fills, also occur in the hole and are interpreted to be discrete breccia layers (Figures F20D, F23, F31A, F31C).
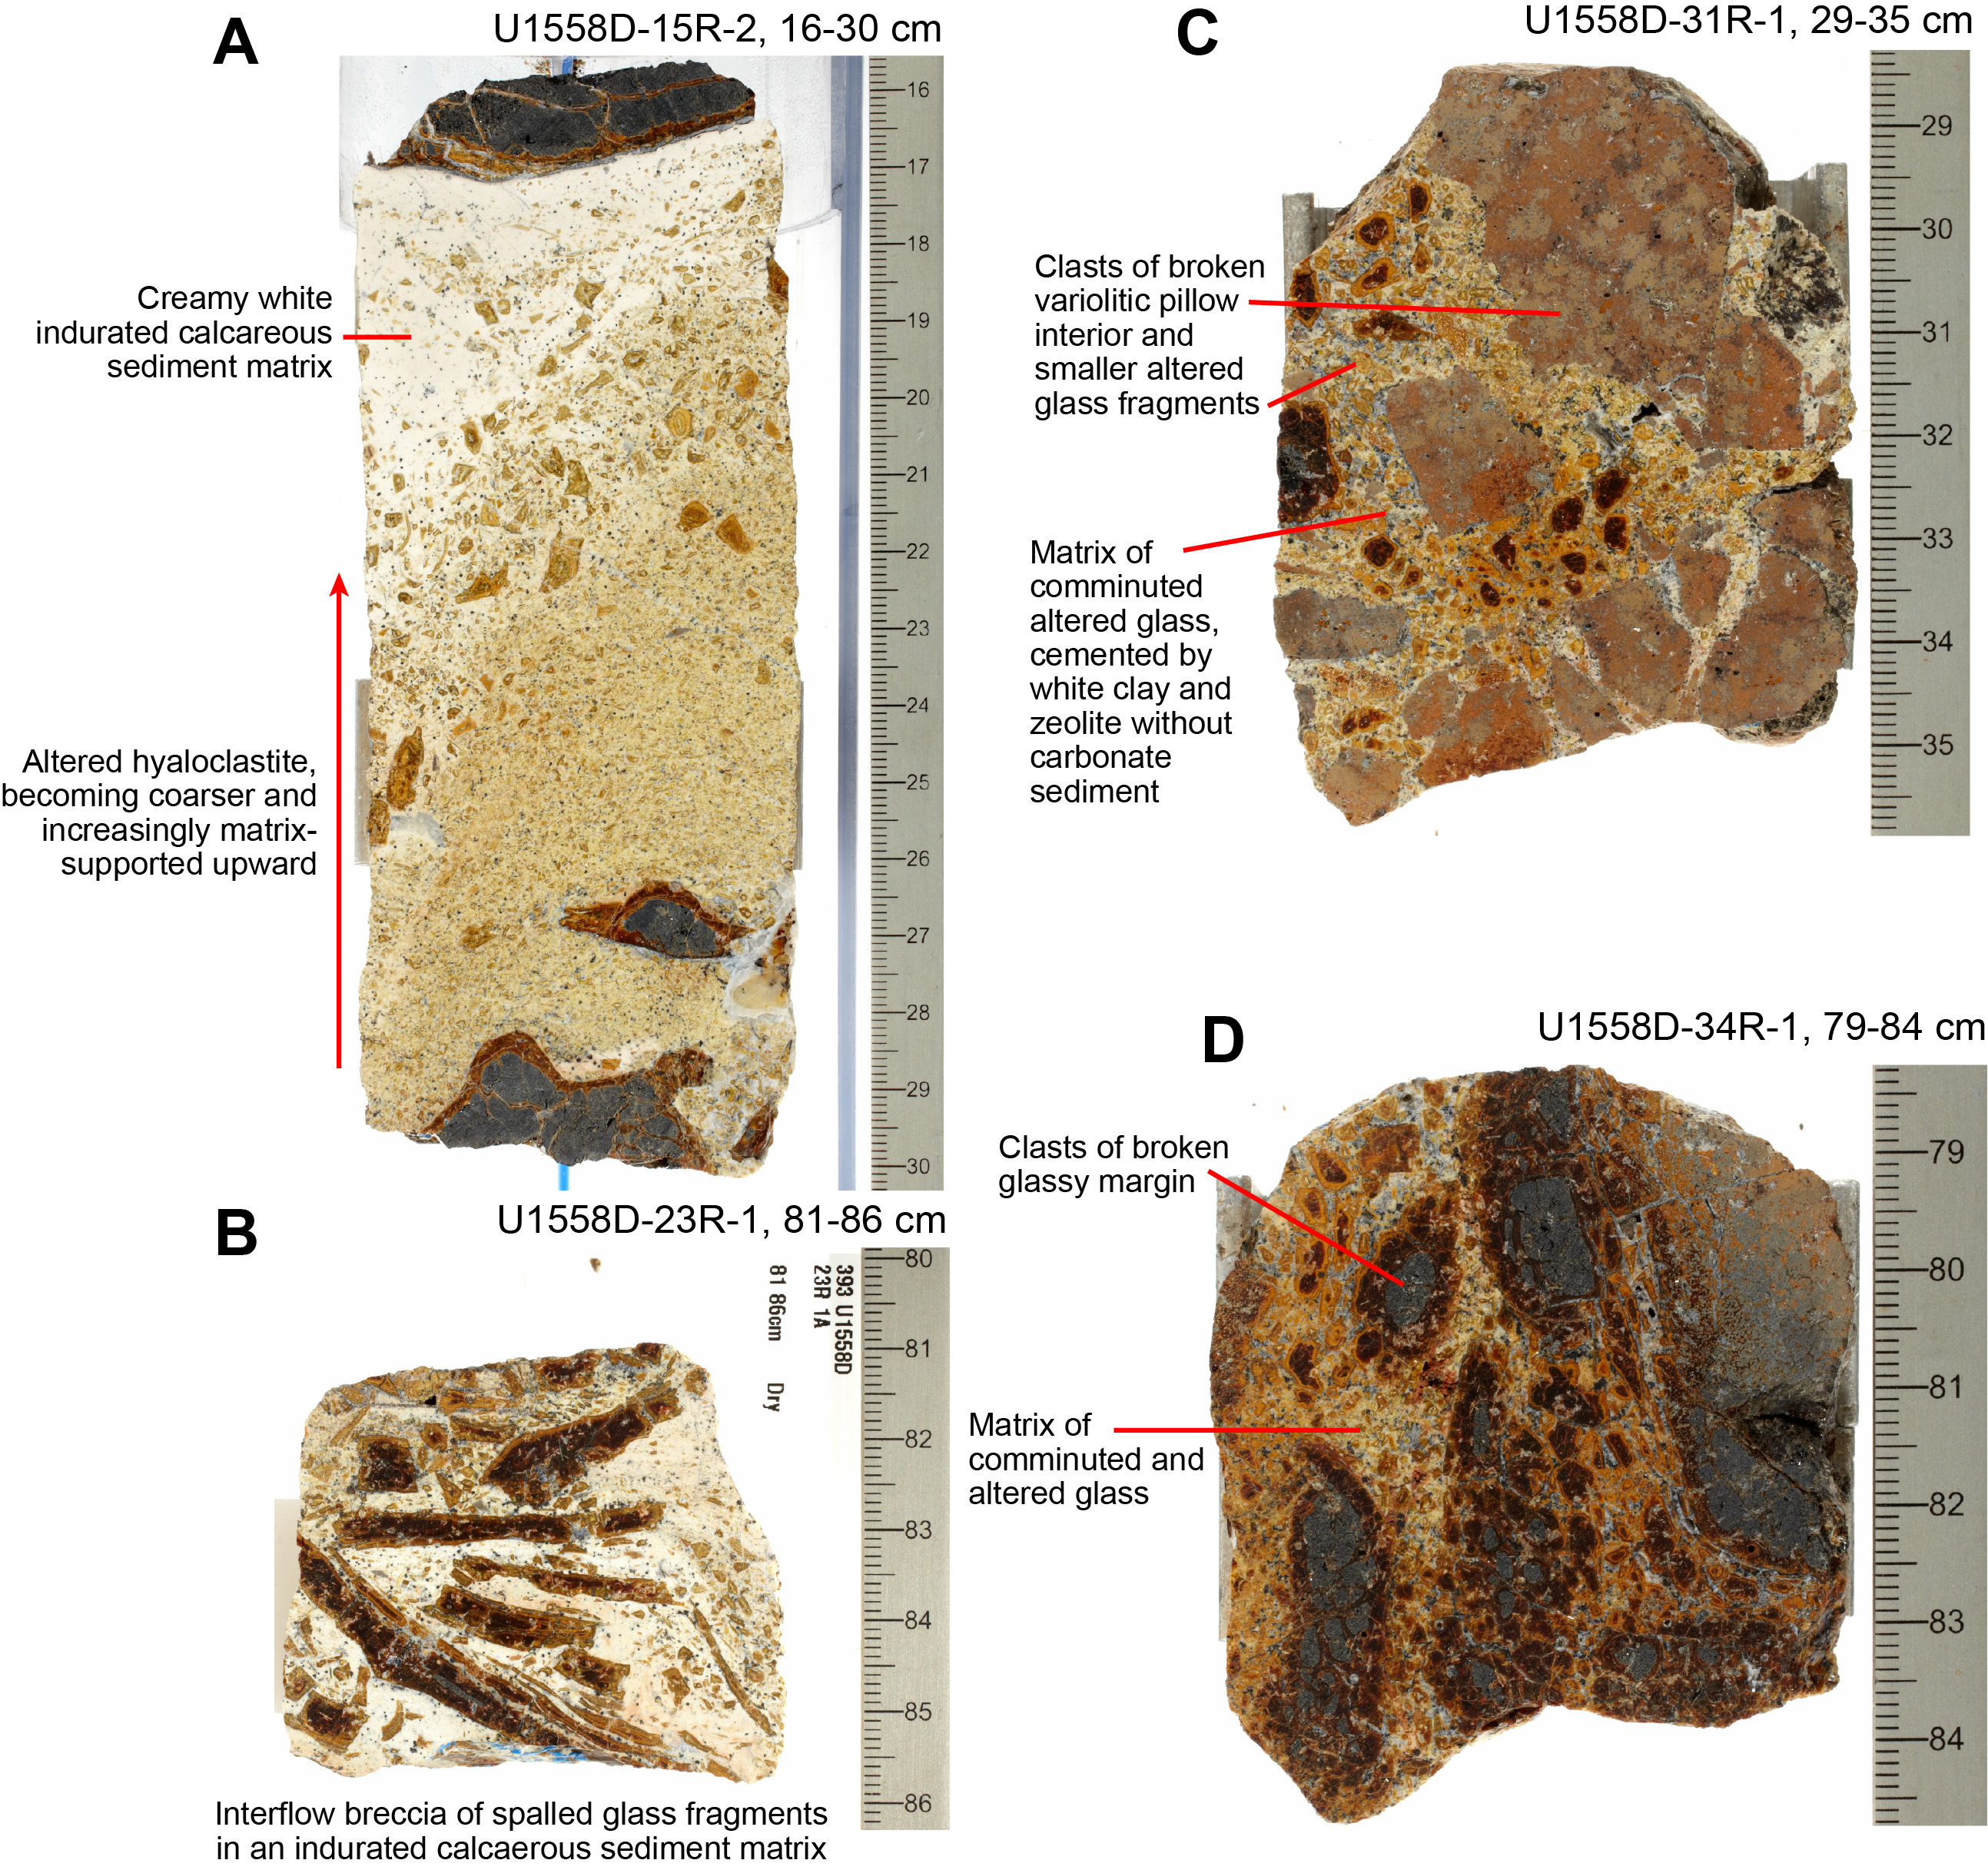
Figure F31. Different breccia types.
In volcanic Sequence A and the upper part of Sequence B (Unit 4–Subunit 5A), these breccias invariably have some component of indurated calcareous sediment matrix (e.g., Figures F20B–F20D, F24, F31A). This calcareous sediment component is mostly absent in the lower part of the hole (Subunits 5B–5E), where breccia is more clast supported or jigsaw fit with a matrix of comminuted and altered glass with cementation by clay and zeolite (Figure F31C, F31D).
5.4. High-resolution chemostratigraphy
We measured 363 locations on the cut surfaces of the archive section halves of Hole U1558D cores by pXRF. Measurements were made at locations with background levels of alteration and also from alteration halos around veins or flow margins (Table T7). This allows both primary igneous compositions and the chemical perturbations by hydrothermal alteration to be considered downhole.
5.4.1. Variation with depth
Figure F32 shows variation in key major element oxides and trace elements with depth for Hole U1558D, both measured by pXRF on split core surfaces (Table T7) and by inductively coupled plasma–atomic emission spectroscopy (ICP-AES) on powdered discrete whole-rock samples (Table T37). These two data sets agree well for most elements, with the ICP-AES powders showing less scatter. The average Cr contents and hence also Cr/Ti ratios, however, are higher for Units 1 and 2 for the ICP-AES results relative to the pXRF, with the ICP-AES-measured Cr being similar to the upper range of the pXRF-measured Cr. Figure F30A and F30B offers a possible explanation for this discrepancy because it coincides with particularly high phenocryst abundance in Units 1 and 2. The pXRF analyses are located where possible over areas of groundmass free of large phenocrysts, which would otherwise strongly and unpredictably affect the results over the ~1 cm2 analysis area. Avoidance of large, likely Cr-rich green clinopyroxene or Cr-spinel inclusion-bearing olivine phenocrysts may consequently have led to systematically lower Cr contents measured by the pXRF relative to the bulk powder ICP-AES method. Both data sets are still potentially accurate and useful, but this discrepancy requires further investigation and must be kept in mind when interpreting pXRF data for Units 1 and 2 and highly phyric lavas along the SAT in general.
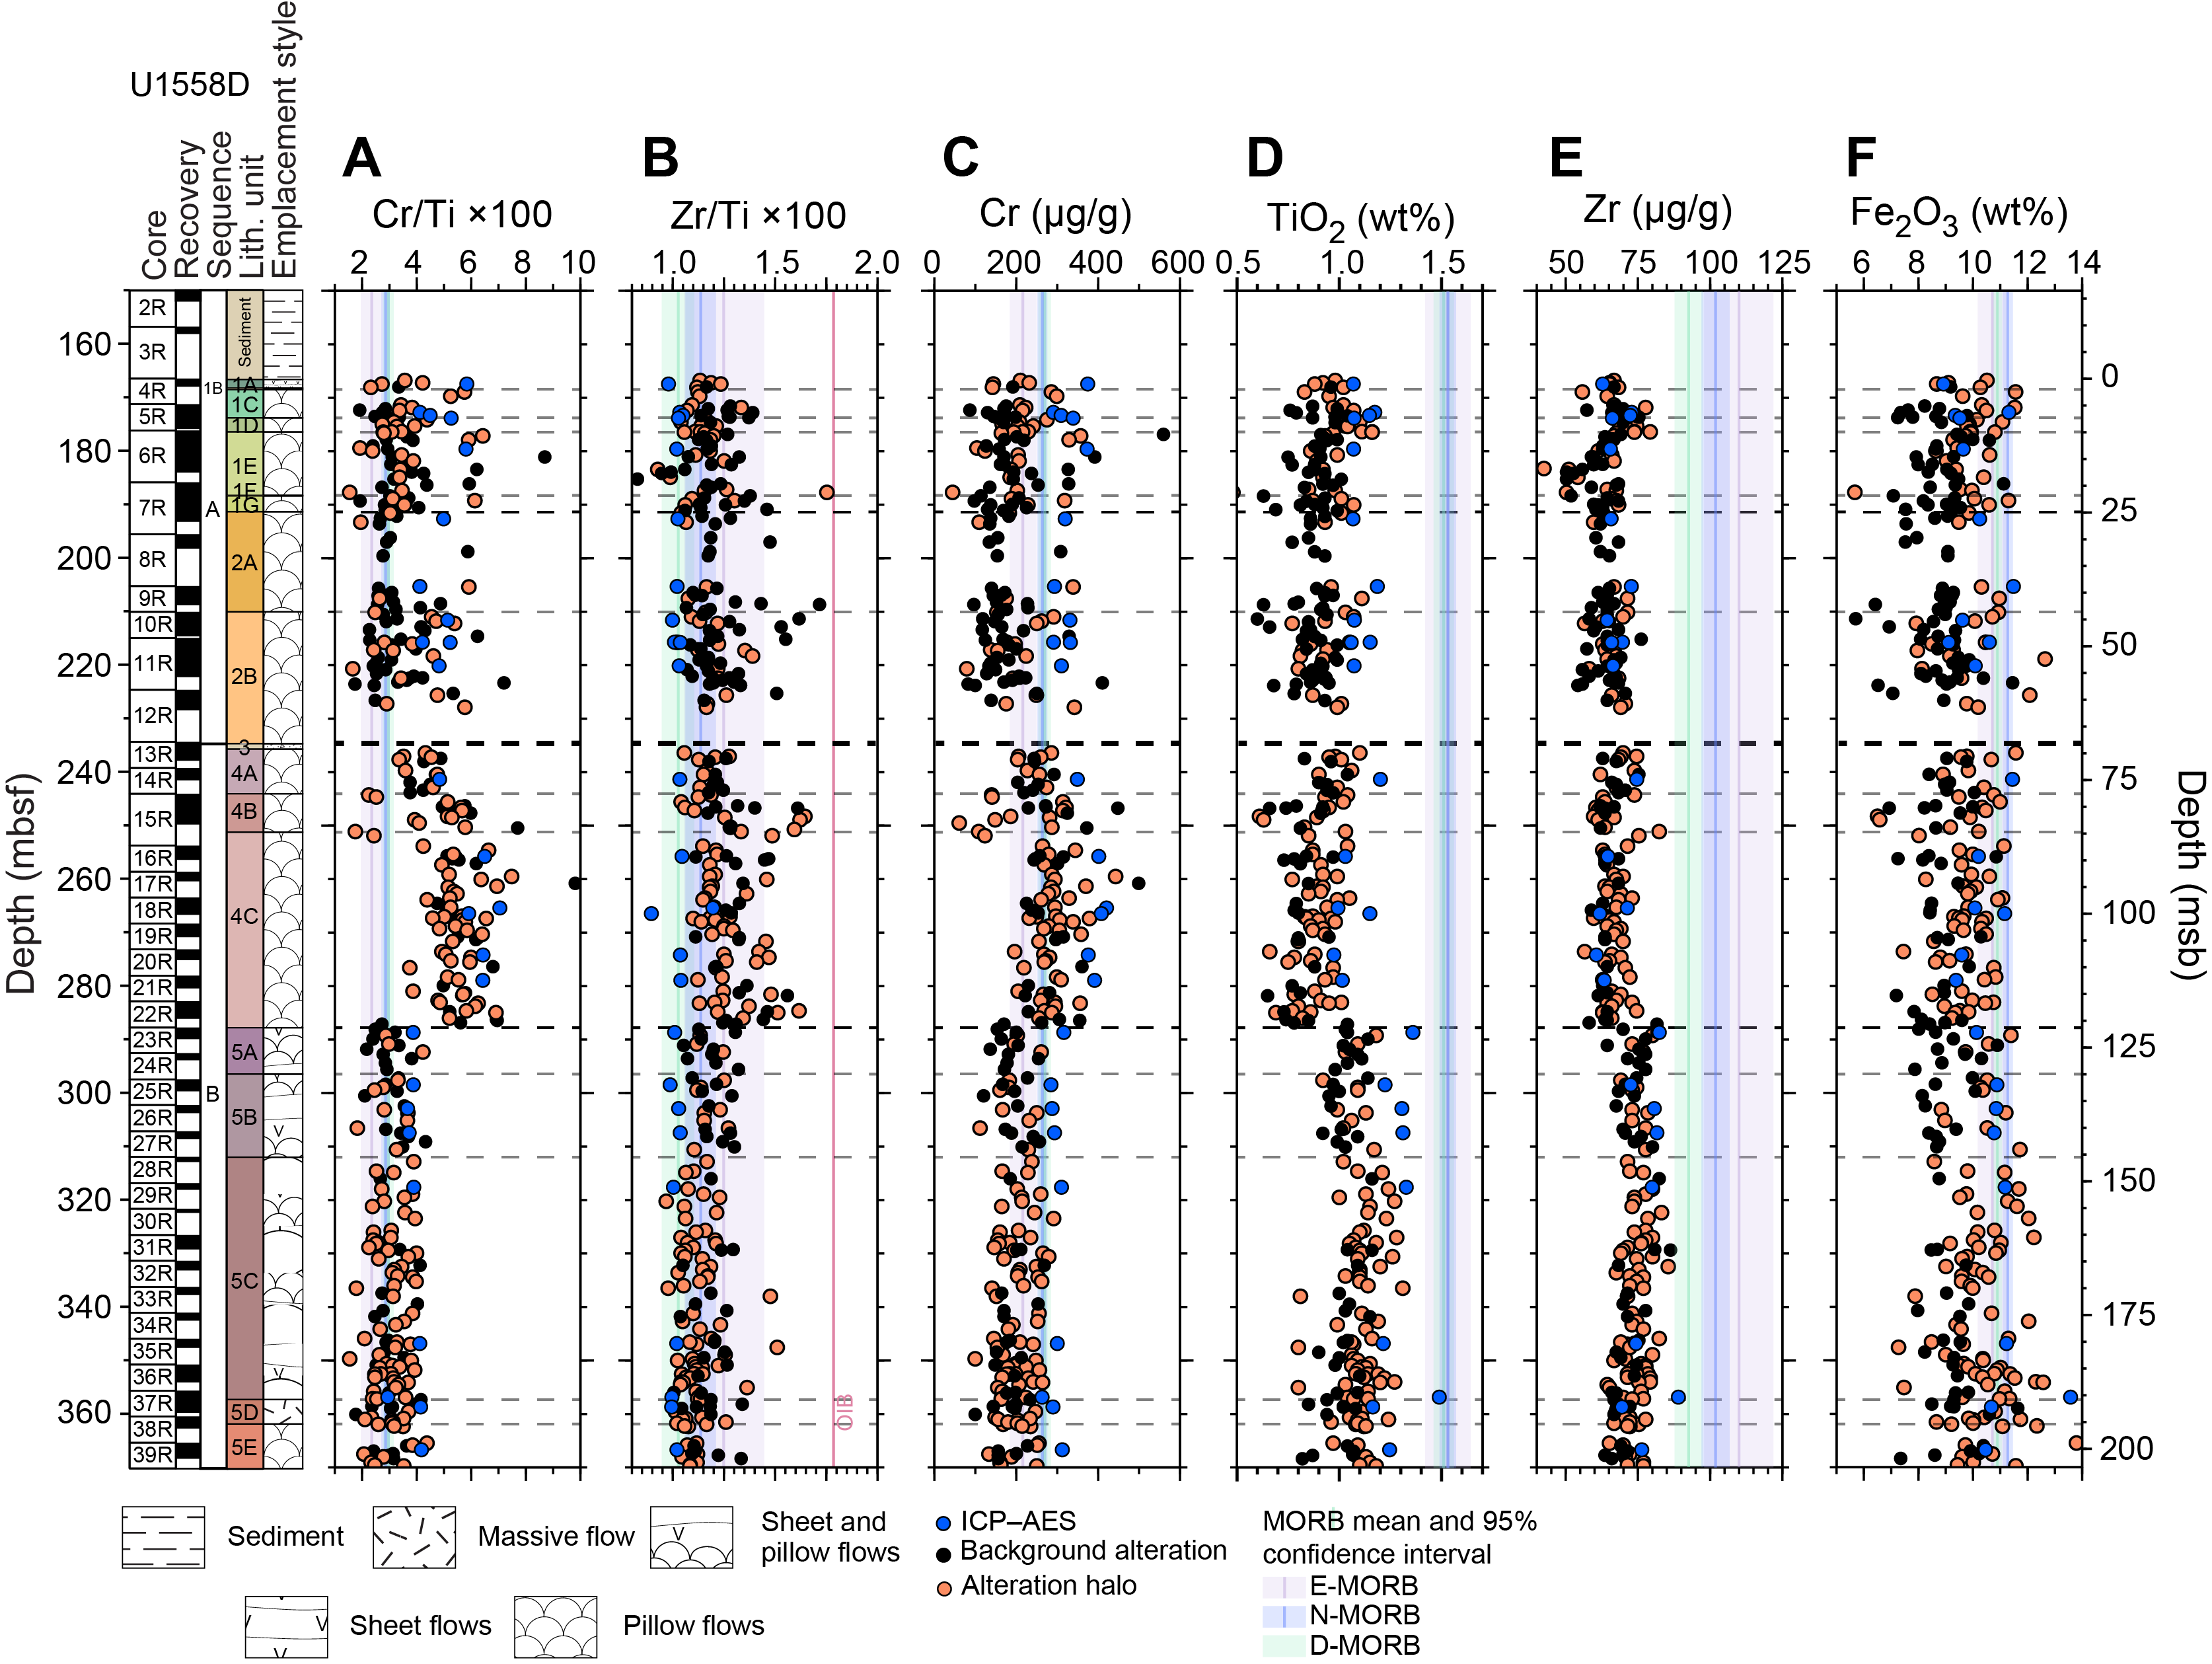
Figure F32. Major and trace element concentrations and ratios.
Despite this discrepancy, key major and trace element concentrations and ratios show clear changes across the unit and sequence boundaries, supporting their petrologic definitions described in the previous sections (Figure F32). In particular, high Cr/Ti ratios coupled with generally low concentrations of the incompatible elements Zr and Ti indicate that Unit 4 is less evolved than the other units. This composition evolves to lower Cr/Ti ratios in the upper 10 m of Unit 4, suggesting a transition during the waning stages of the eruption of Sequence B.
There is a subtle increase in Zr/Ti over the Unit 4/5 boundary (Figure F32B). This increase is not apparent in the limited ICP-AES data, so further analysis is required; however, if it is real, the occurrence of elevated Zr/Ti in the apparently less evolved lavas of Unit 4 is difficult to explain within a co-magmatic sequence. Given the greater incompatibility of Zr relative to Ti in the fractionating phases, this change should be in the other direction for different degrees of fractionation from the same parental melt. The change to higher Zr/Ti instead suggests that Unit 4 may have derived from a slightly different, more enriched parental melt than the other units.
In Unit 5, there are no clear differences between the Subunit 5D massive lava flow and the surrounding Subunit 5C and 5E pillow lavas for the elements plotted in Figure F32F. This compositional similarity provides a good opportunity for assessing the influence of contrasting grain size and emplacement style on alteration and the magnetic and physical properties of the lavas. Toward the top of Unit 5 in Subunits 5A and 5B, there is a clear decrease in Ti and subtle increase in Zr concentrations that is not accompanied by a detectable increase in Cr (Figure F32C–F32E).
Apart from slightly higher average values for Unit 4, Zr/Ti ratios are relatively uniform downhole, with ICP-AES-measured compositions scattering around the depleted MORB (D-MORB) mean and pXRF-measured compositions scattering around the normal MORB (N-MORB) mean for all the lavas in Hole U1558D (Figure F32).
5.5. Summary
Holes U1558A, U1558D, and U1558F all recovered volcanic basement at Site U1558, but only Hole U1558D advanced deeply into basement. After reaching the sediment/basement interface at 166.8 mbsf, Hole U1558D further advanced to 370.2 mbsf (203.4 msb), recovering 97.5 m of basement core for a total recovery of 48%, which reached up to 90% in some cores (Table T5).
Hole U1558D intersected two distinct volcanic sequences (A and B) separated by a ~1 m thick sedimentary breccia horizon indicating a hiatus in volcanism at this site potentially on the order of tens of thousands of years. The upper Sequence A (166.55–234.64 mbsf) includes Volcanic Units 1 and 2 that consist of moderately to highly plagioclase-olivine-clinopyroxene-phyric lavas mostly emplaced as pillow lavas of varying size (10–130 cm). Extremely sparse but distinctive dark olive-green clinopyroxene phenocrysts are a characteristic feature of the Sequence A volcanic rocks. Sequence B (234.65–360.20 mbsf) lacks these green clinopyroxene phenocrysts, and its uppermost Unit 4 contains abundant interflow sediments and breccias, suggestive of a buried seafloor horizon, with interesting implications for studying seafloor weathering beneath multiple horizons. This change in phenocryst assemblage indicates some aspect of the magmatic system changed between eruptive sequences. Lava composition assessed by pXRF, particularly for Cr, Ti, and Zr, varies both in a stepwise fashion across petrologically defined unit boundaries and gradually within the units. Zr/Ti ratios are consistent with D-MORB to N-MORB for the lavas at Site U1558.
6. Alteration petrology
The basement rocks recovered from Site U1558 all preserve evidence of reaction with seawater-derived hydrothermal fluids to varying extents. This alteration is manifested as secondary minerals in three main contexts: (1) replacing interstitial mesostasis and glass, (2) replacing groundmass and phenocrysts, and (3) precipitating in open porosity to partially or completely fill vesicles or fractures to form veins. These three manifestations occur in a range of spatial contexts in Site U1558 basement, namely background alteration representing fluid/rock reaction that has pervasively permeated the bulk rock and alteration halos that are generally related to previous open porosity that has facilitated more extensive fluid/rock reaction (e.g., around veins and vugs or along igneous margins). In addition, the breccias recovered from Site U1558 also record extensive alteration of clasts and matrix and are cemented by secondary minerals. The replacement minerals, styles, and intensity of alteration, along with the secondary minerals precipitated in veins, vesicles, and breccias provide a record of the hydrothermal alteration taking place across ~50 My of crustal aging. This section focuses on Hole U1558D, although similar alteration features were observed in the basement recovered by XCB coring in Hole U1558A.
Overall, Hole U1558D is characterized by low-temperature alteration with downhole variations in abundances and types of alteration halos and background alteration that are also accompanied by changes in the secondary minerals precipitating in veins (Figure F33).
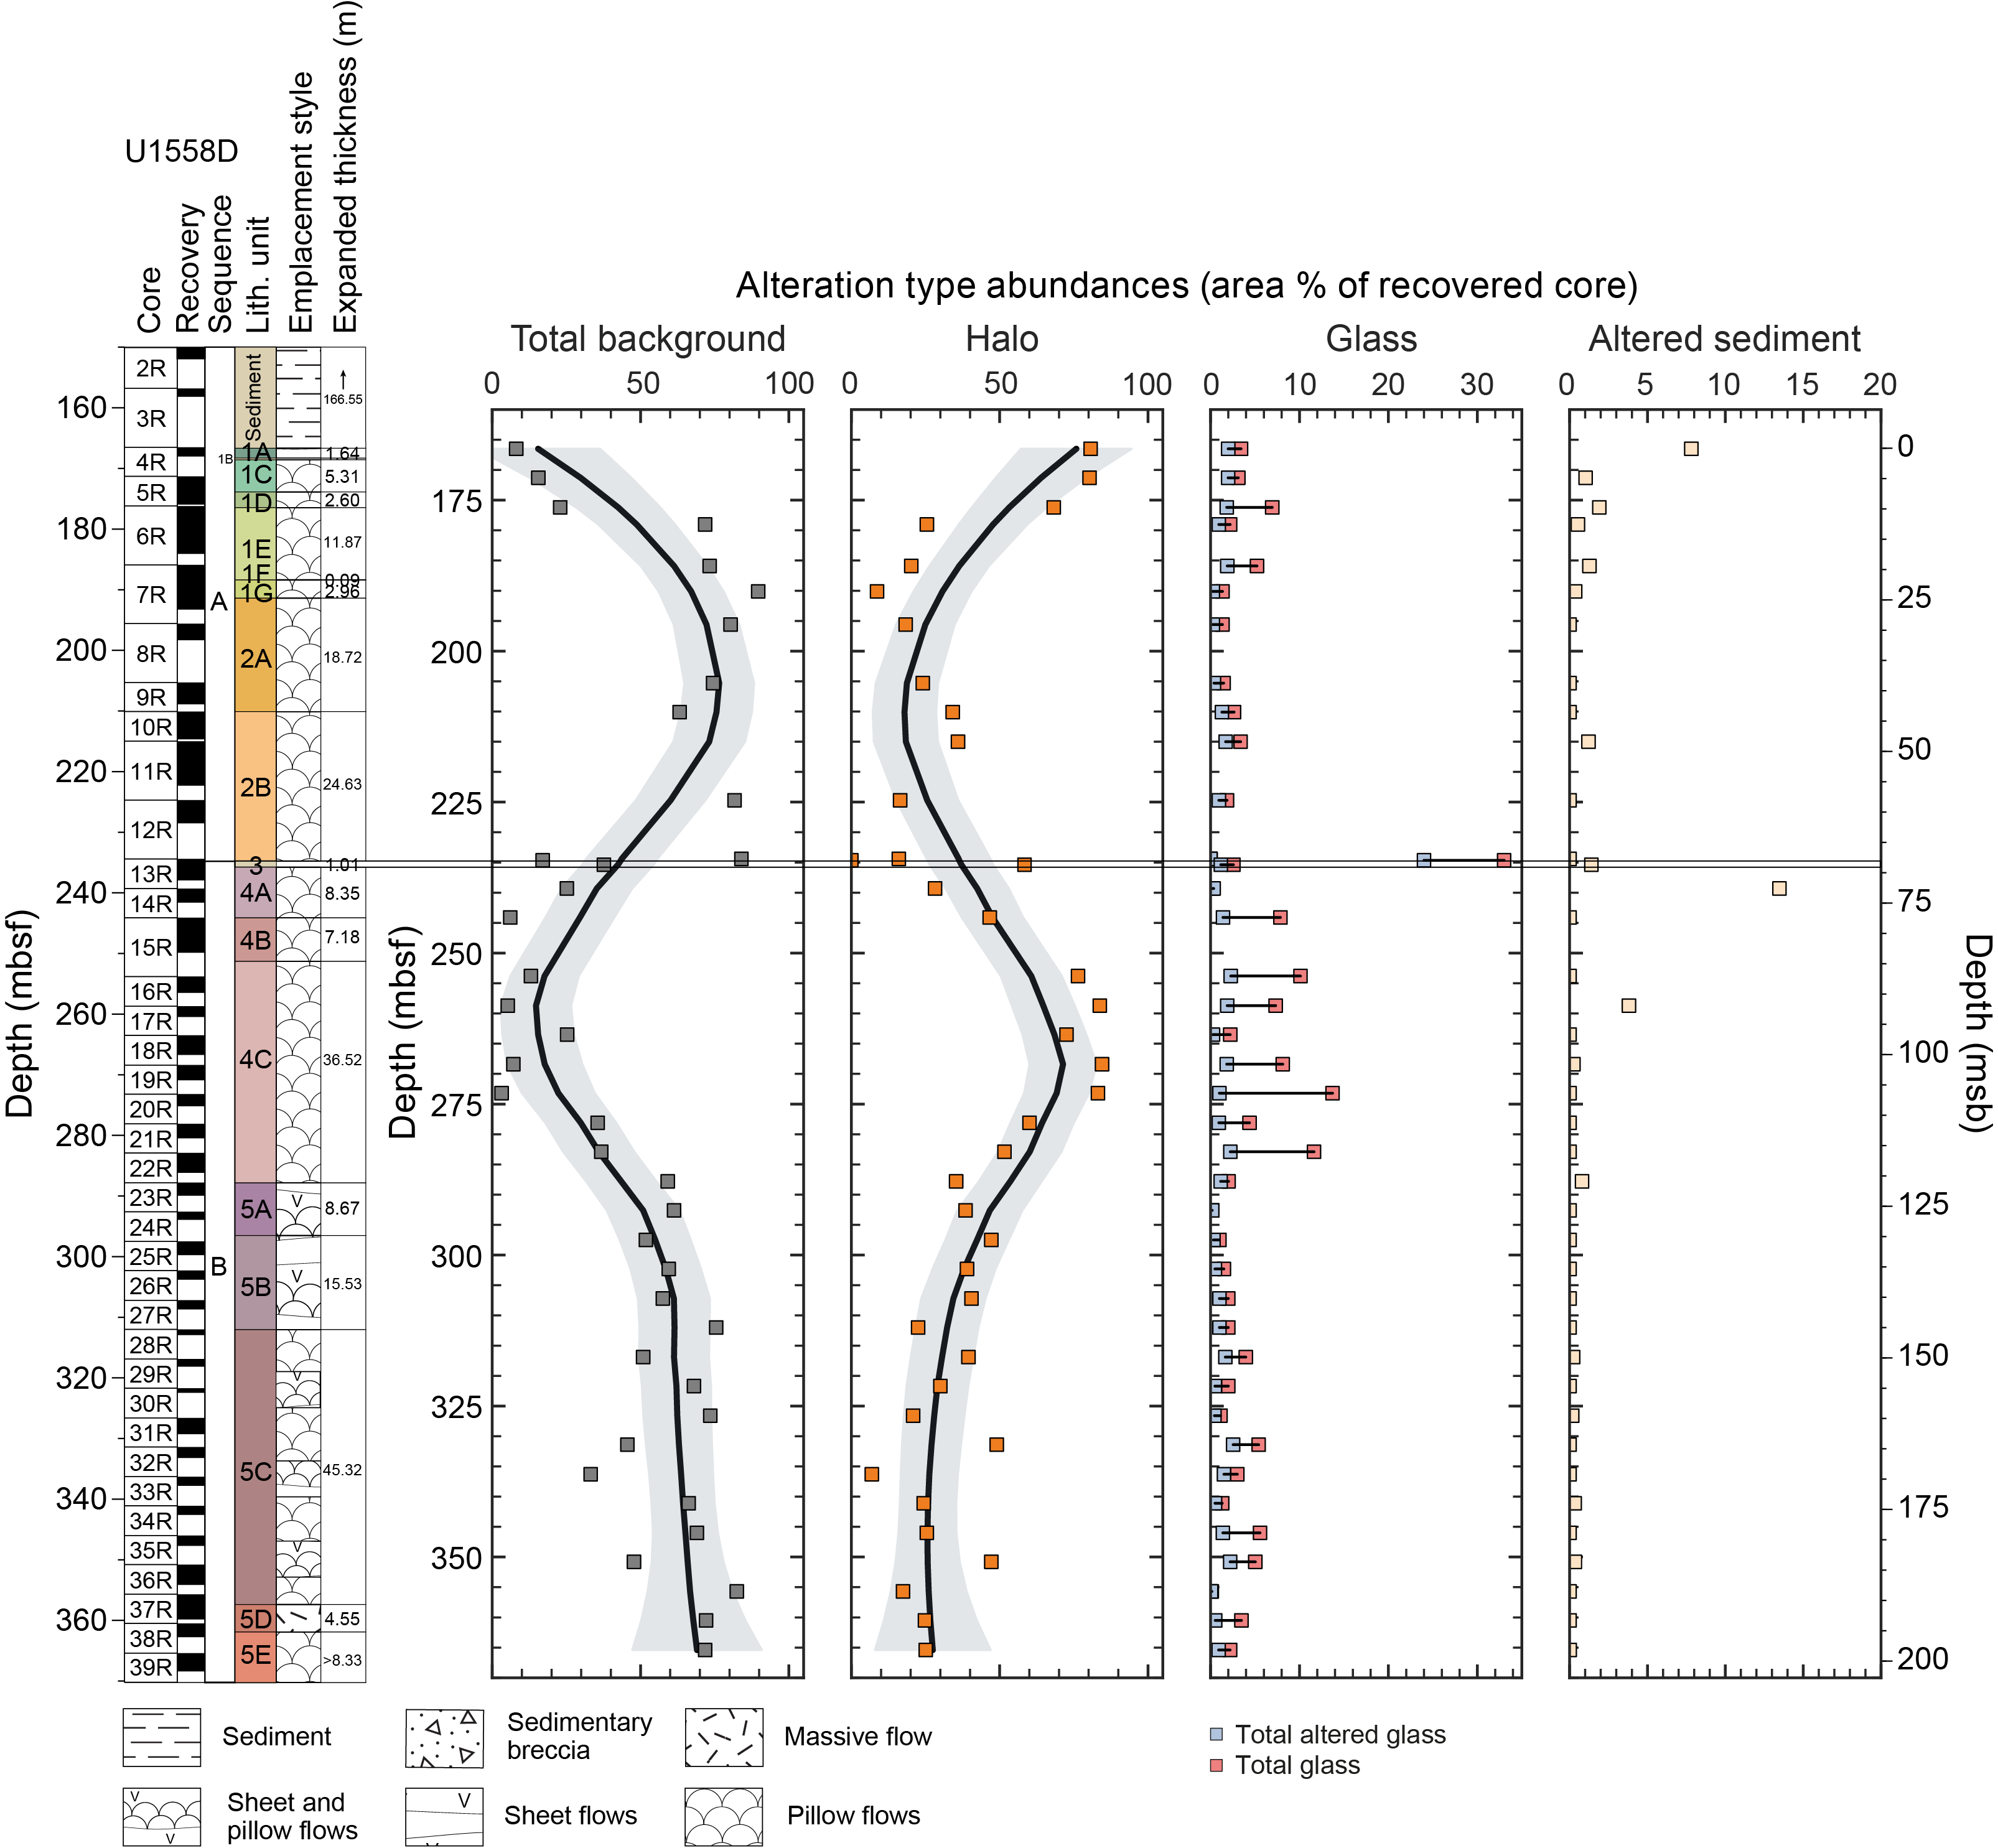
Figure F33. Alteration abundance.
6.1. Alteration of glass
Volcanic glass that occurs along flow margins and as clasts in breccia displays a full spectrum of alteration throughout Hole U1558D, from completely fresh to completely altered. At core section level (the scale of observation), there are no sections where the glass is completely replaced (Figure F33). On average, glass replacement is estimated at 35%–40%, but in Igneous Units 3 and 4 the volcanic glass shows alteration intensities below average. Intervals of fresh glass, several centimeters in length, are not uncommon in Hole U1558D, and interestingly, this fresh glass is commonly immediately juxtaposed with regions of highly altered and oxidized groundmass (Figure F34). Glass readily alters to clay minerals with a range of colors that correlate with the extent of alteration and progresses from dark brown to reddish brown to pale olive-green, with the latter being the most altered (Figure F35). Incipient alteration of glass begins with the development of brown to orange alteration halos around veins, but as reactions progress the glass alters to progressively lighter colors (Figure F36). This progression is also recognized by the development of concentric alteration bands (Figure F35D). In the sedimentary breccias, the smallest clasts of volcanic glass (<5 mm) are generally completely altered to pale olive-green (5Y 6/4) clay minerals (Table T8).
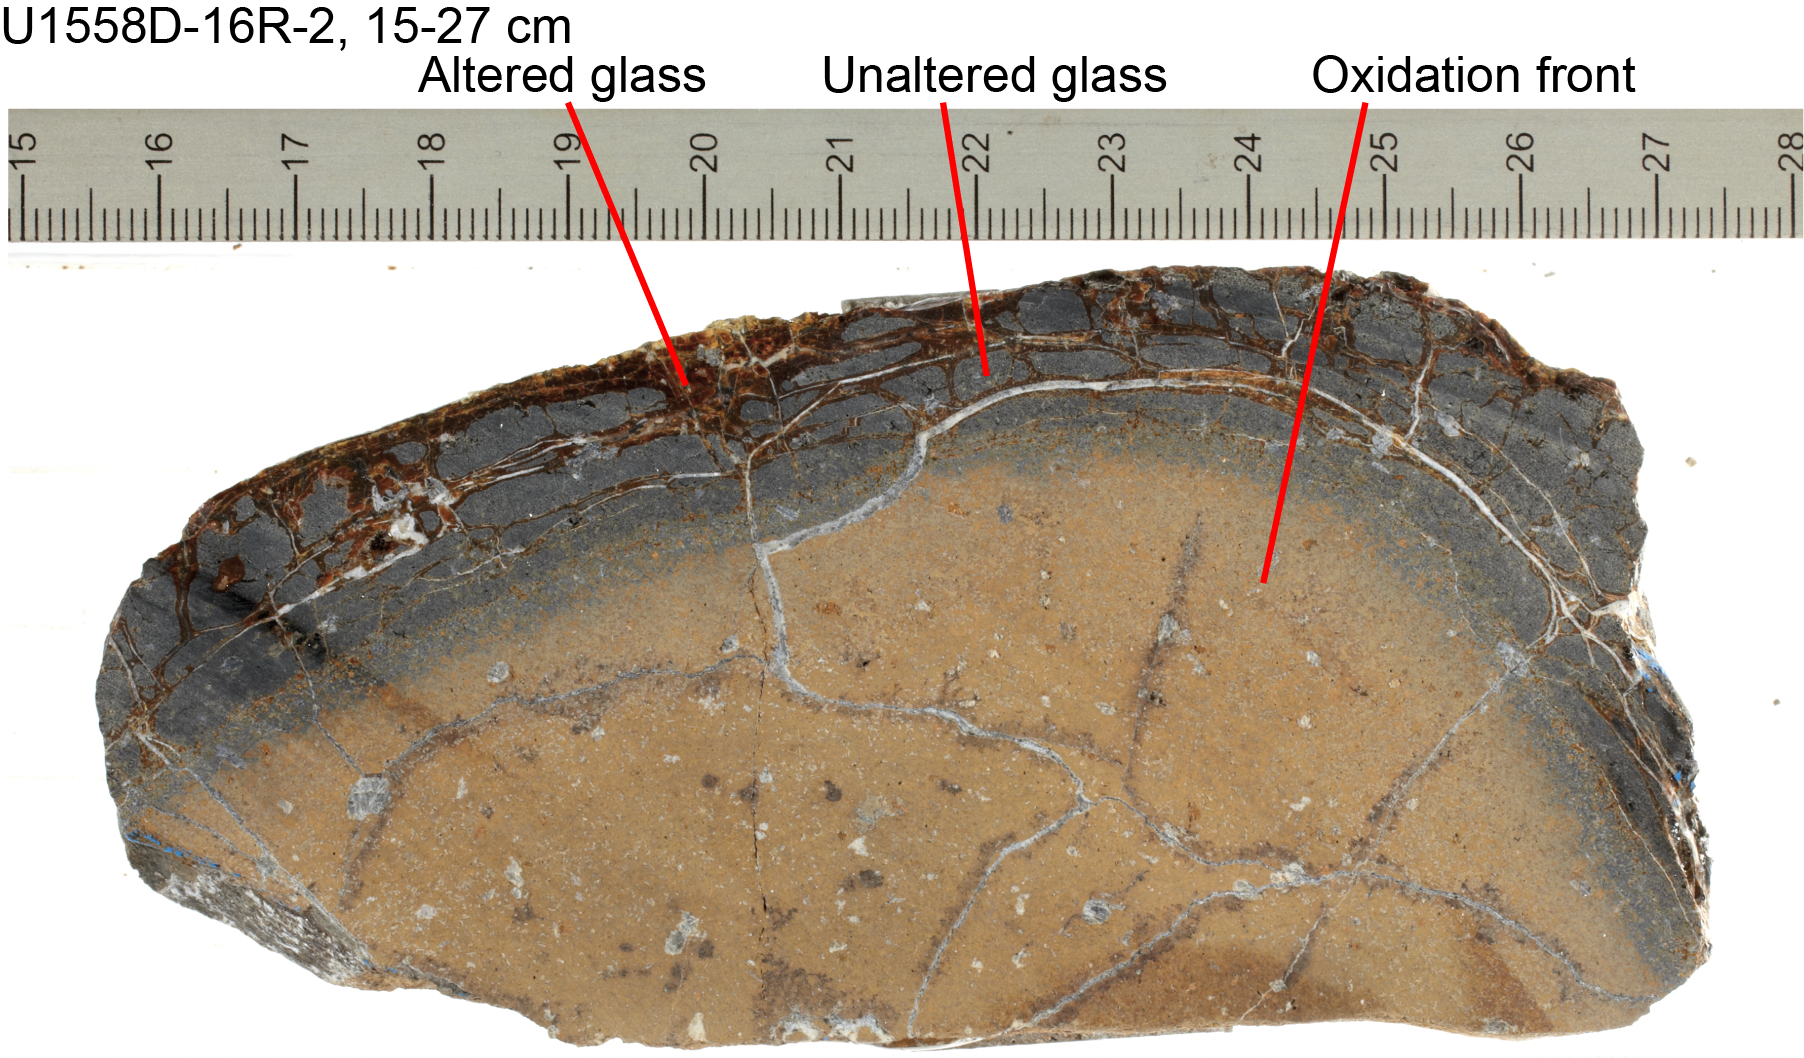
Figure F34. Thick glassy margin.
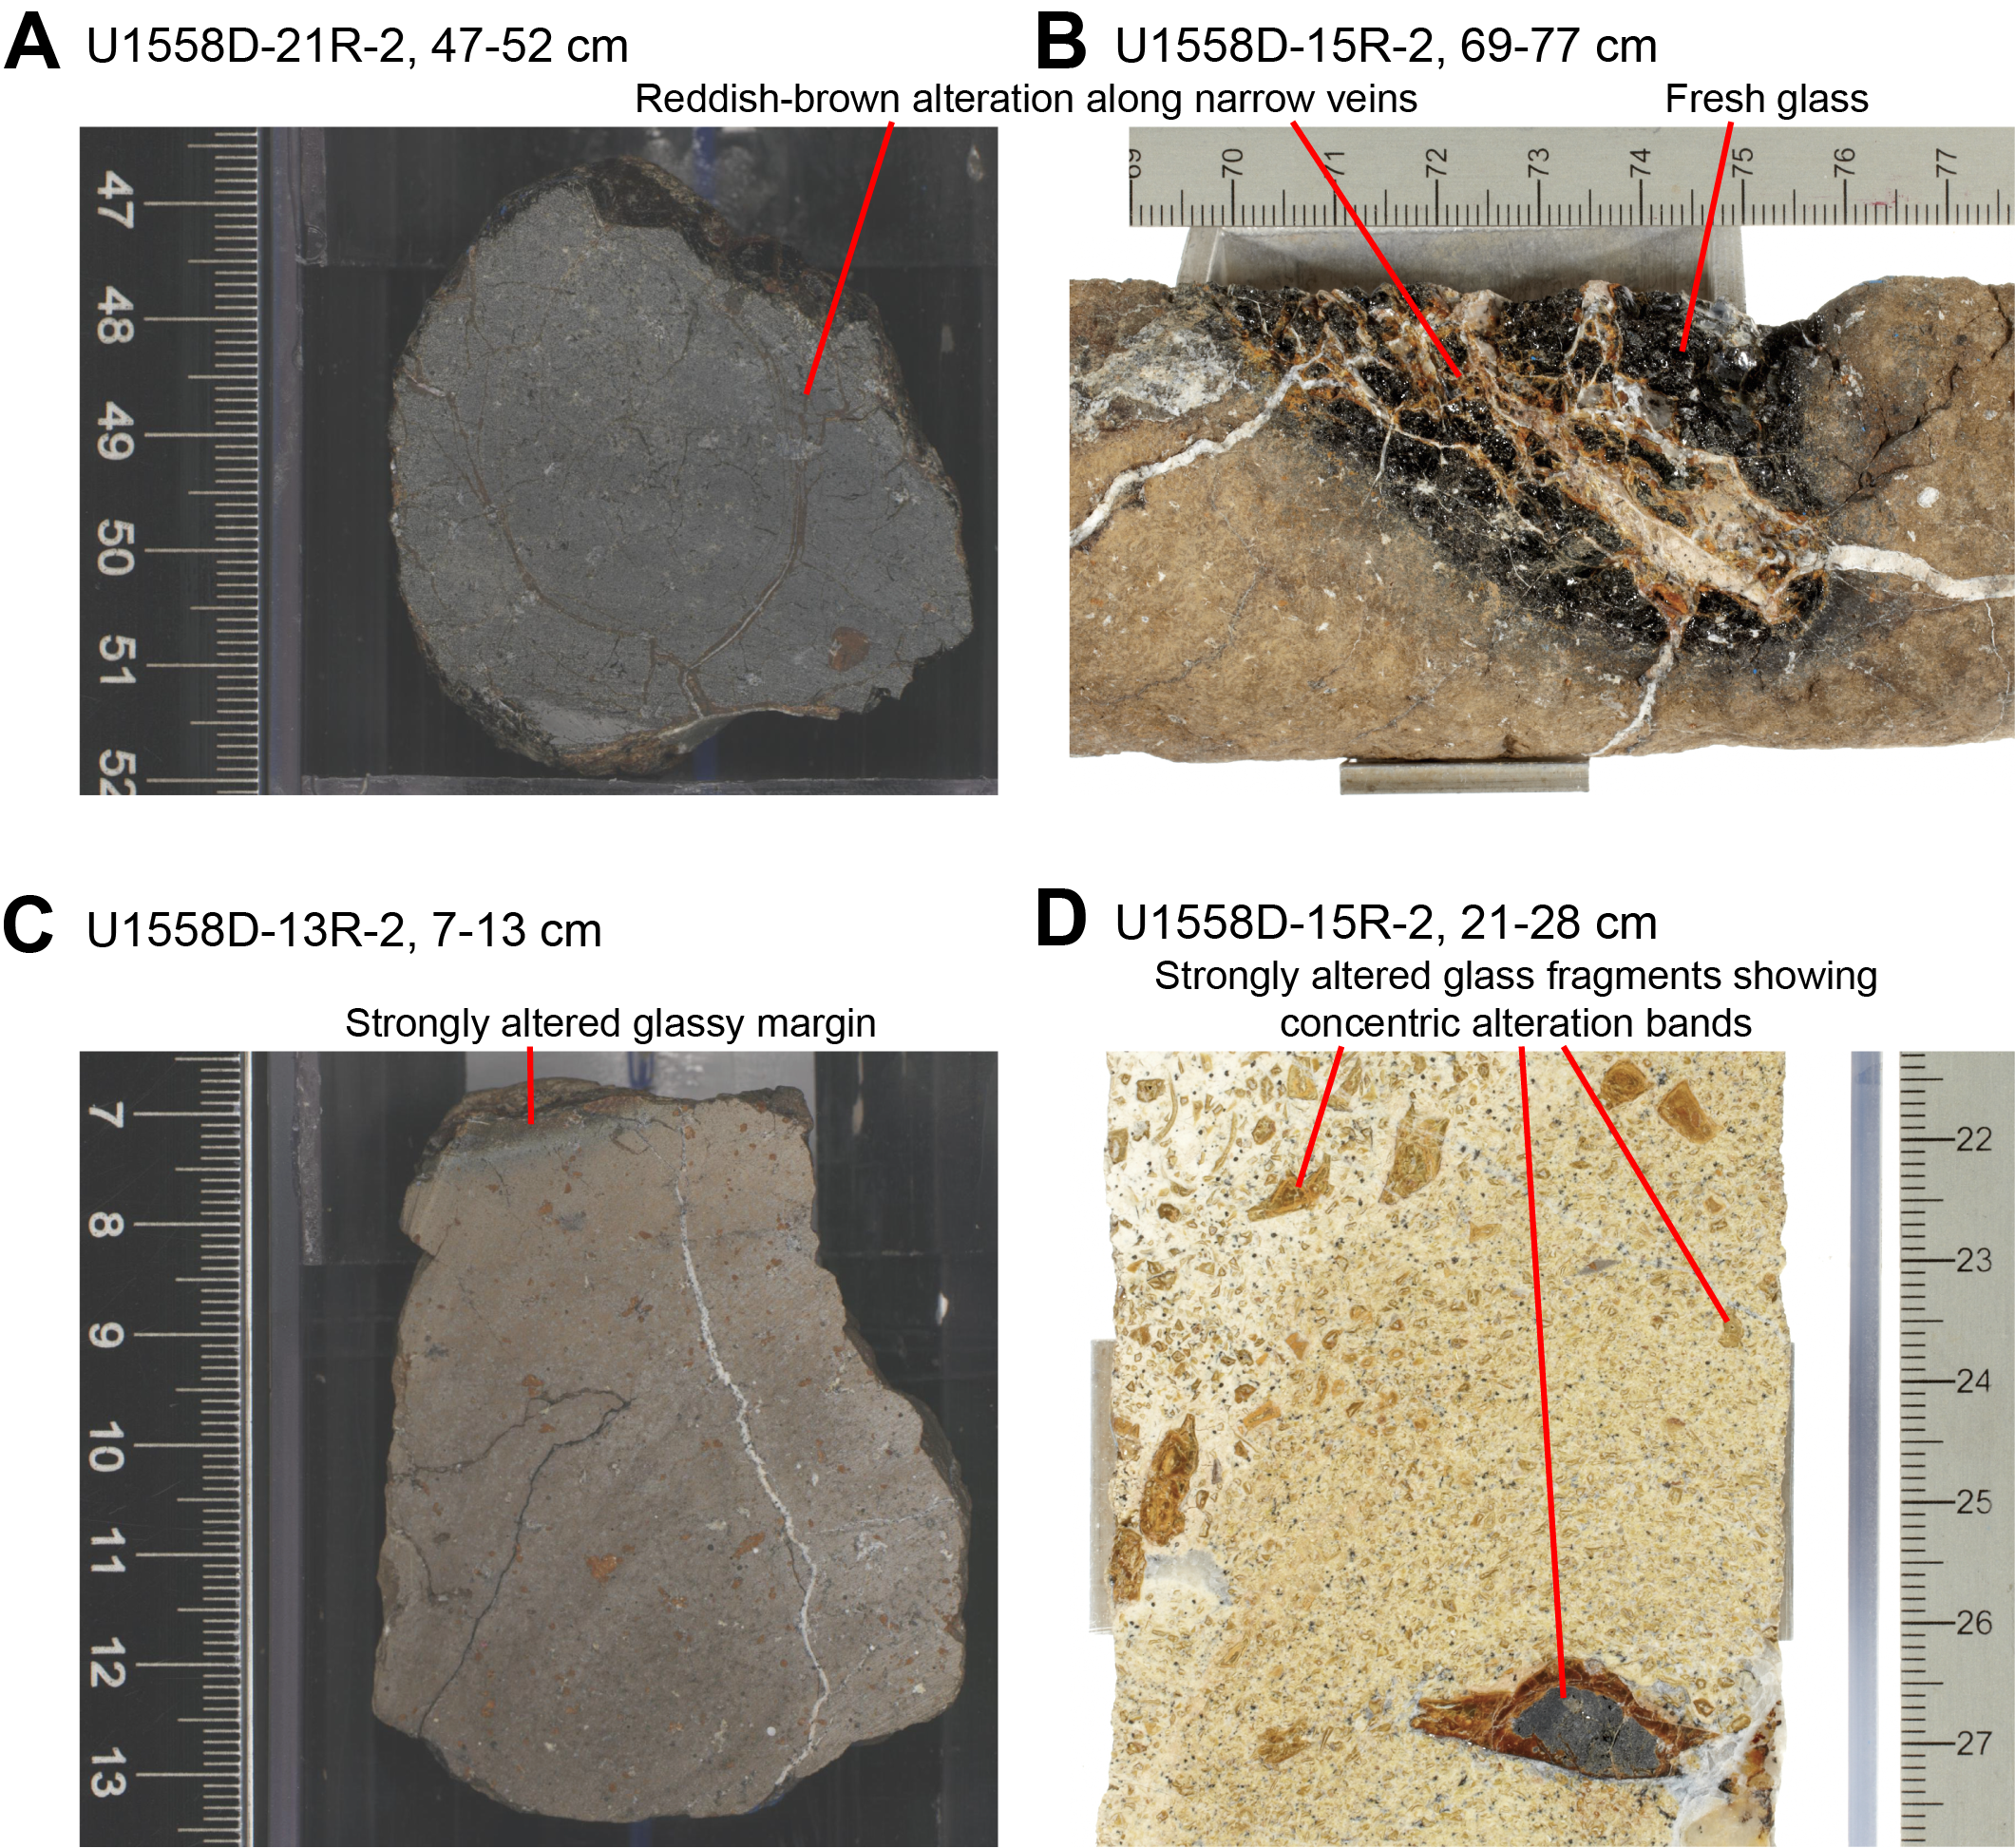
Figure F35. Variable degrees of volcanic glass alteration.
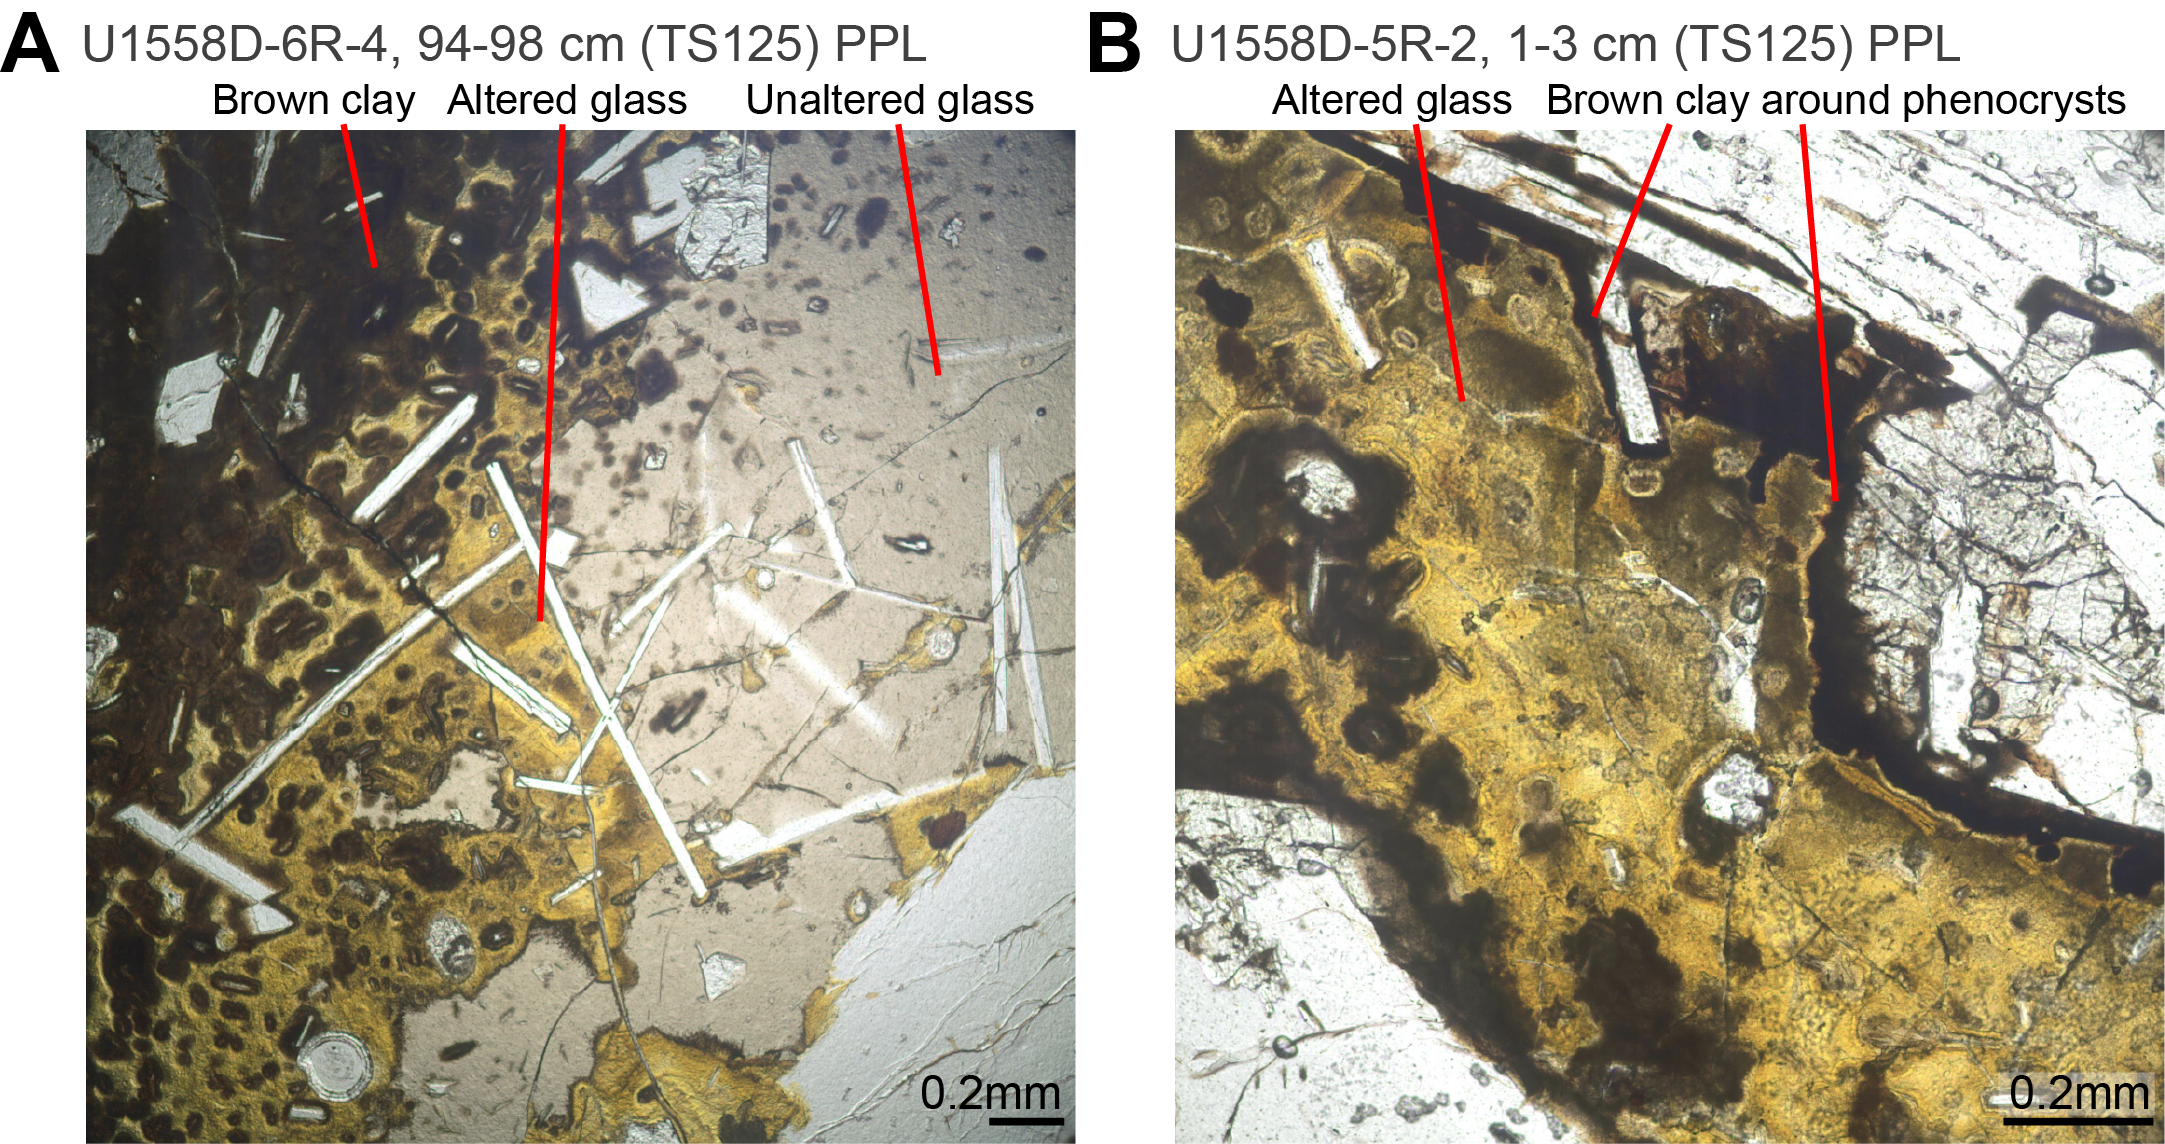
Figure F36. Different degrees of volcanic glass alteration.
6.2. Background alteration
Background alteration is present throughout Hole U1558D and occurs in four types: gray background, orange speckled background, mixed brown-gray background, and mottled gray chilled margin alteration.
6.2.1. Gray background
Gray background alteration is present throughout most of Hole U1558D and represents the least altered rocks in this hole and across the SAT. Gray background is uniform in appearance, generally showing GLEY 1 5/N color (Figure F37). Locally, gray background represents up to 70% of a recovered core, and on average occupies 20% of recovered cores (Figure F38).
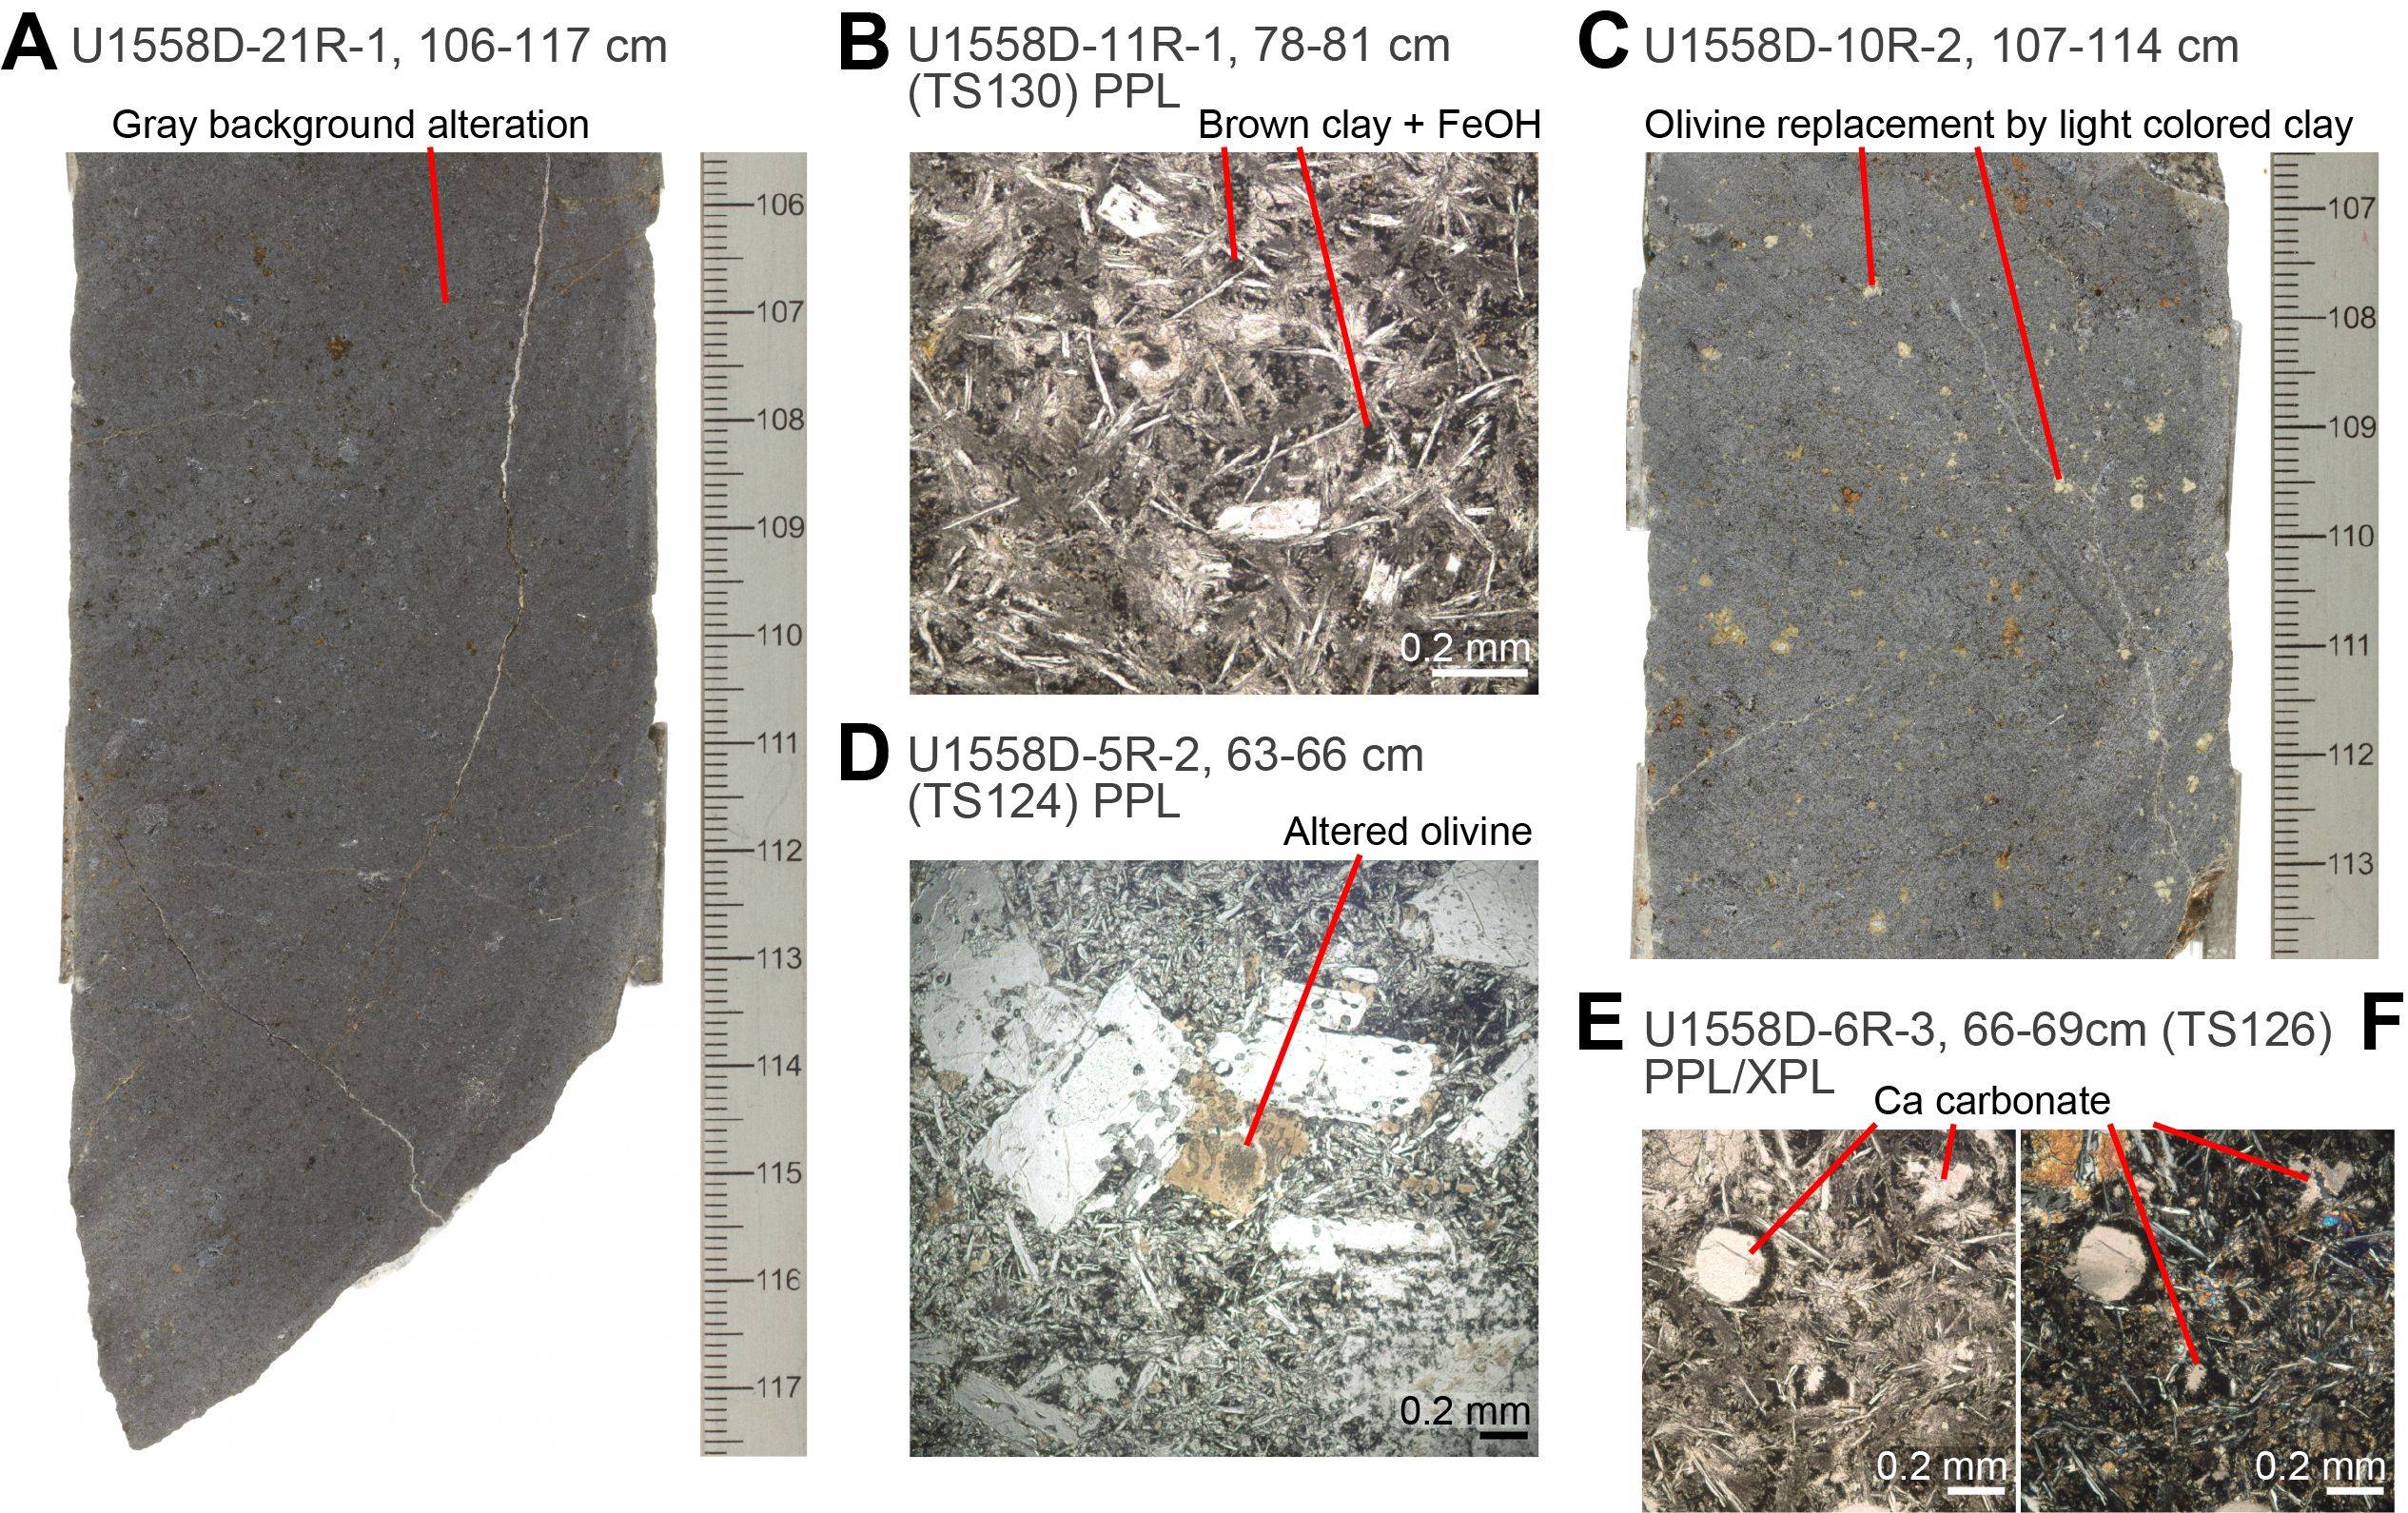
Figure F37. Gray background alteration.
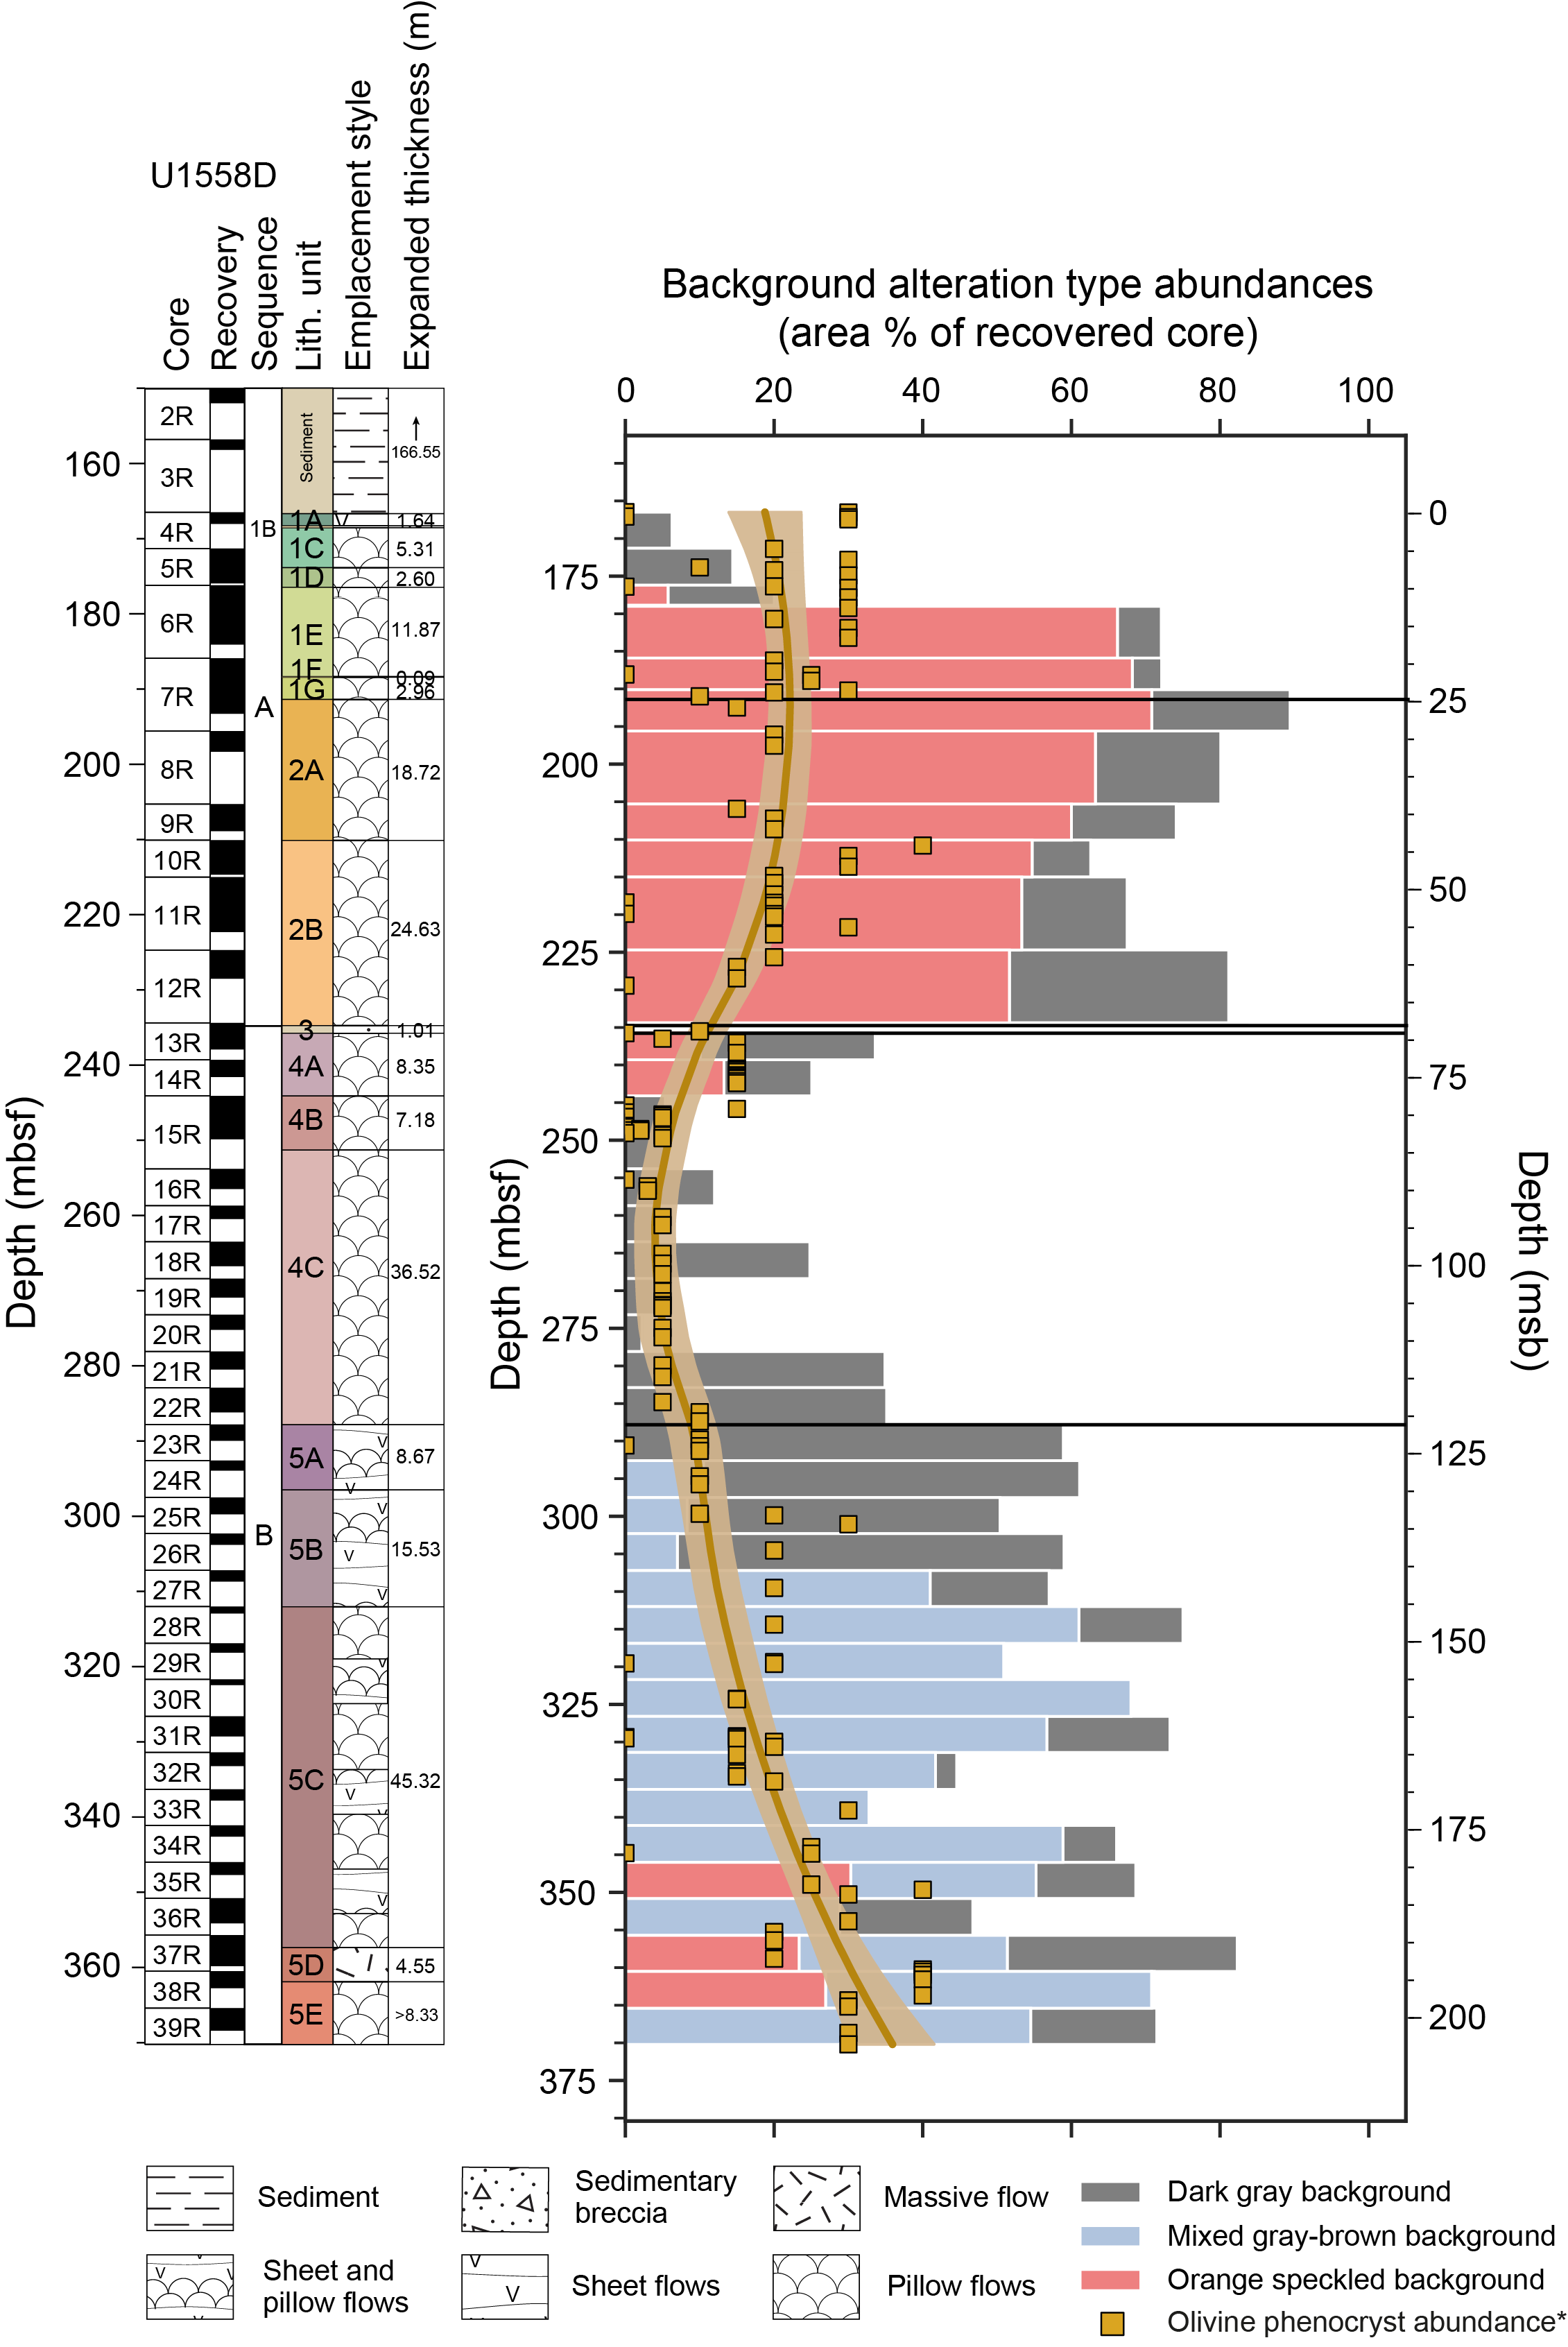
Figure F38. Distribution of background alteration types.
In thin section, gray background alteration is characterized by the pseudomorphic replacement of mesostasis and minor amounts of groundmass to brown clays (likely Mg-saponite), whereas any phenocrysts are mostly fresh. Vesicles in gray background are partially to fully filled with clays, Fe oxyhydroxides, and calcium carbonate. Some olivine phenocrysts are replaced by creamish clay minerals (Figure F37). In the vicinity of carbonate vesicles, some plagioclase and olivine phenocrysts and groundmass are pseudomorphically replaced by calcium carbonate (Figure F37).
6.2.2. Orange speckled background
Orange speckled background is a variant of gray background where the olivine phenocrysts are partially to completely replaced by orange clays and Fe oxyhydroxides (Figure F39). The groundmass remains the same uniform gray background as seen in hand sample (GLEY 1 5/N) and thin section (Figure F39). The alteration of olivine to orange clays and Fe oxyhydroxides is not unique to this background alteration type and is found elsewhere in the hole. This type of olivine alteration also occurs within various halo types (Figure F39C, F39D) and within the mixed brown-gray background alteration. It is distinguished here as a separate alteration type because it represents a progression of the uniform background alteration. The orange speckled alteration is most common in Subunit 1E through to Unit 2 (Figure F38) where olivine phenocrysts are abundant. This relationship is less strong deeper in the hole such as in Unit 5.
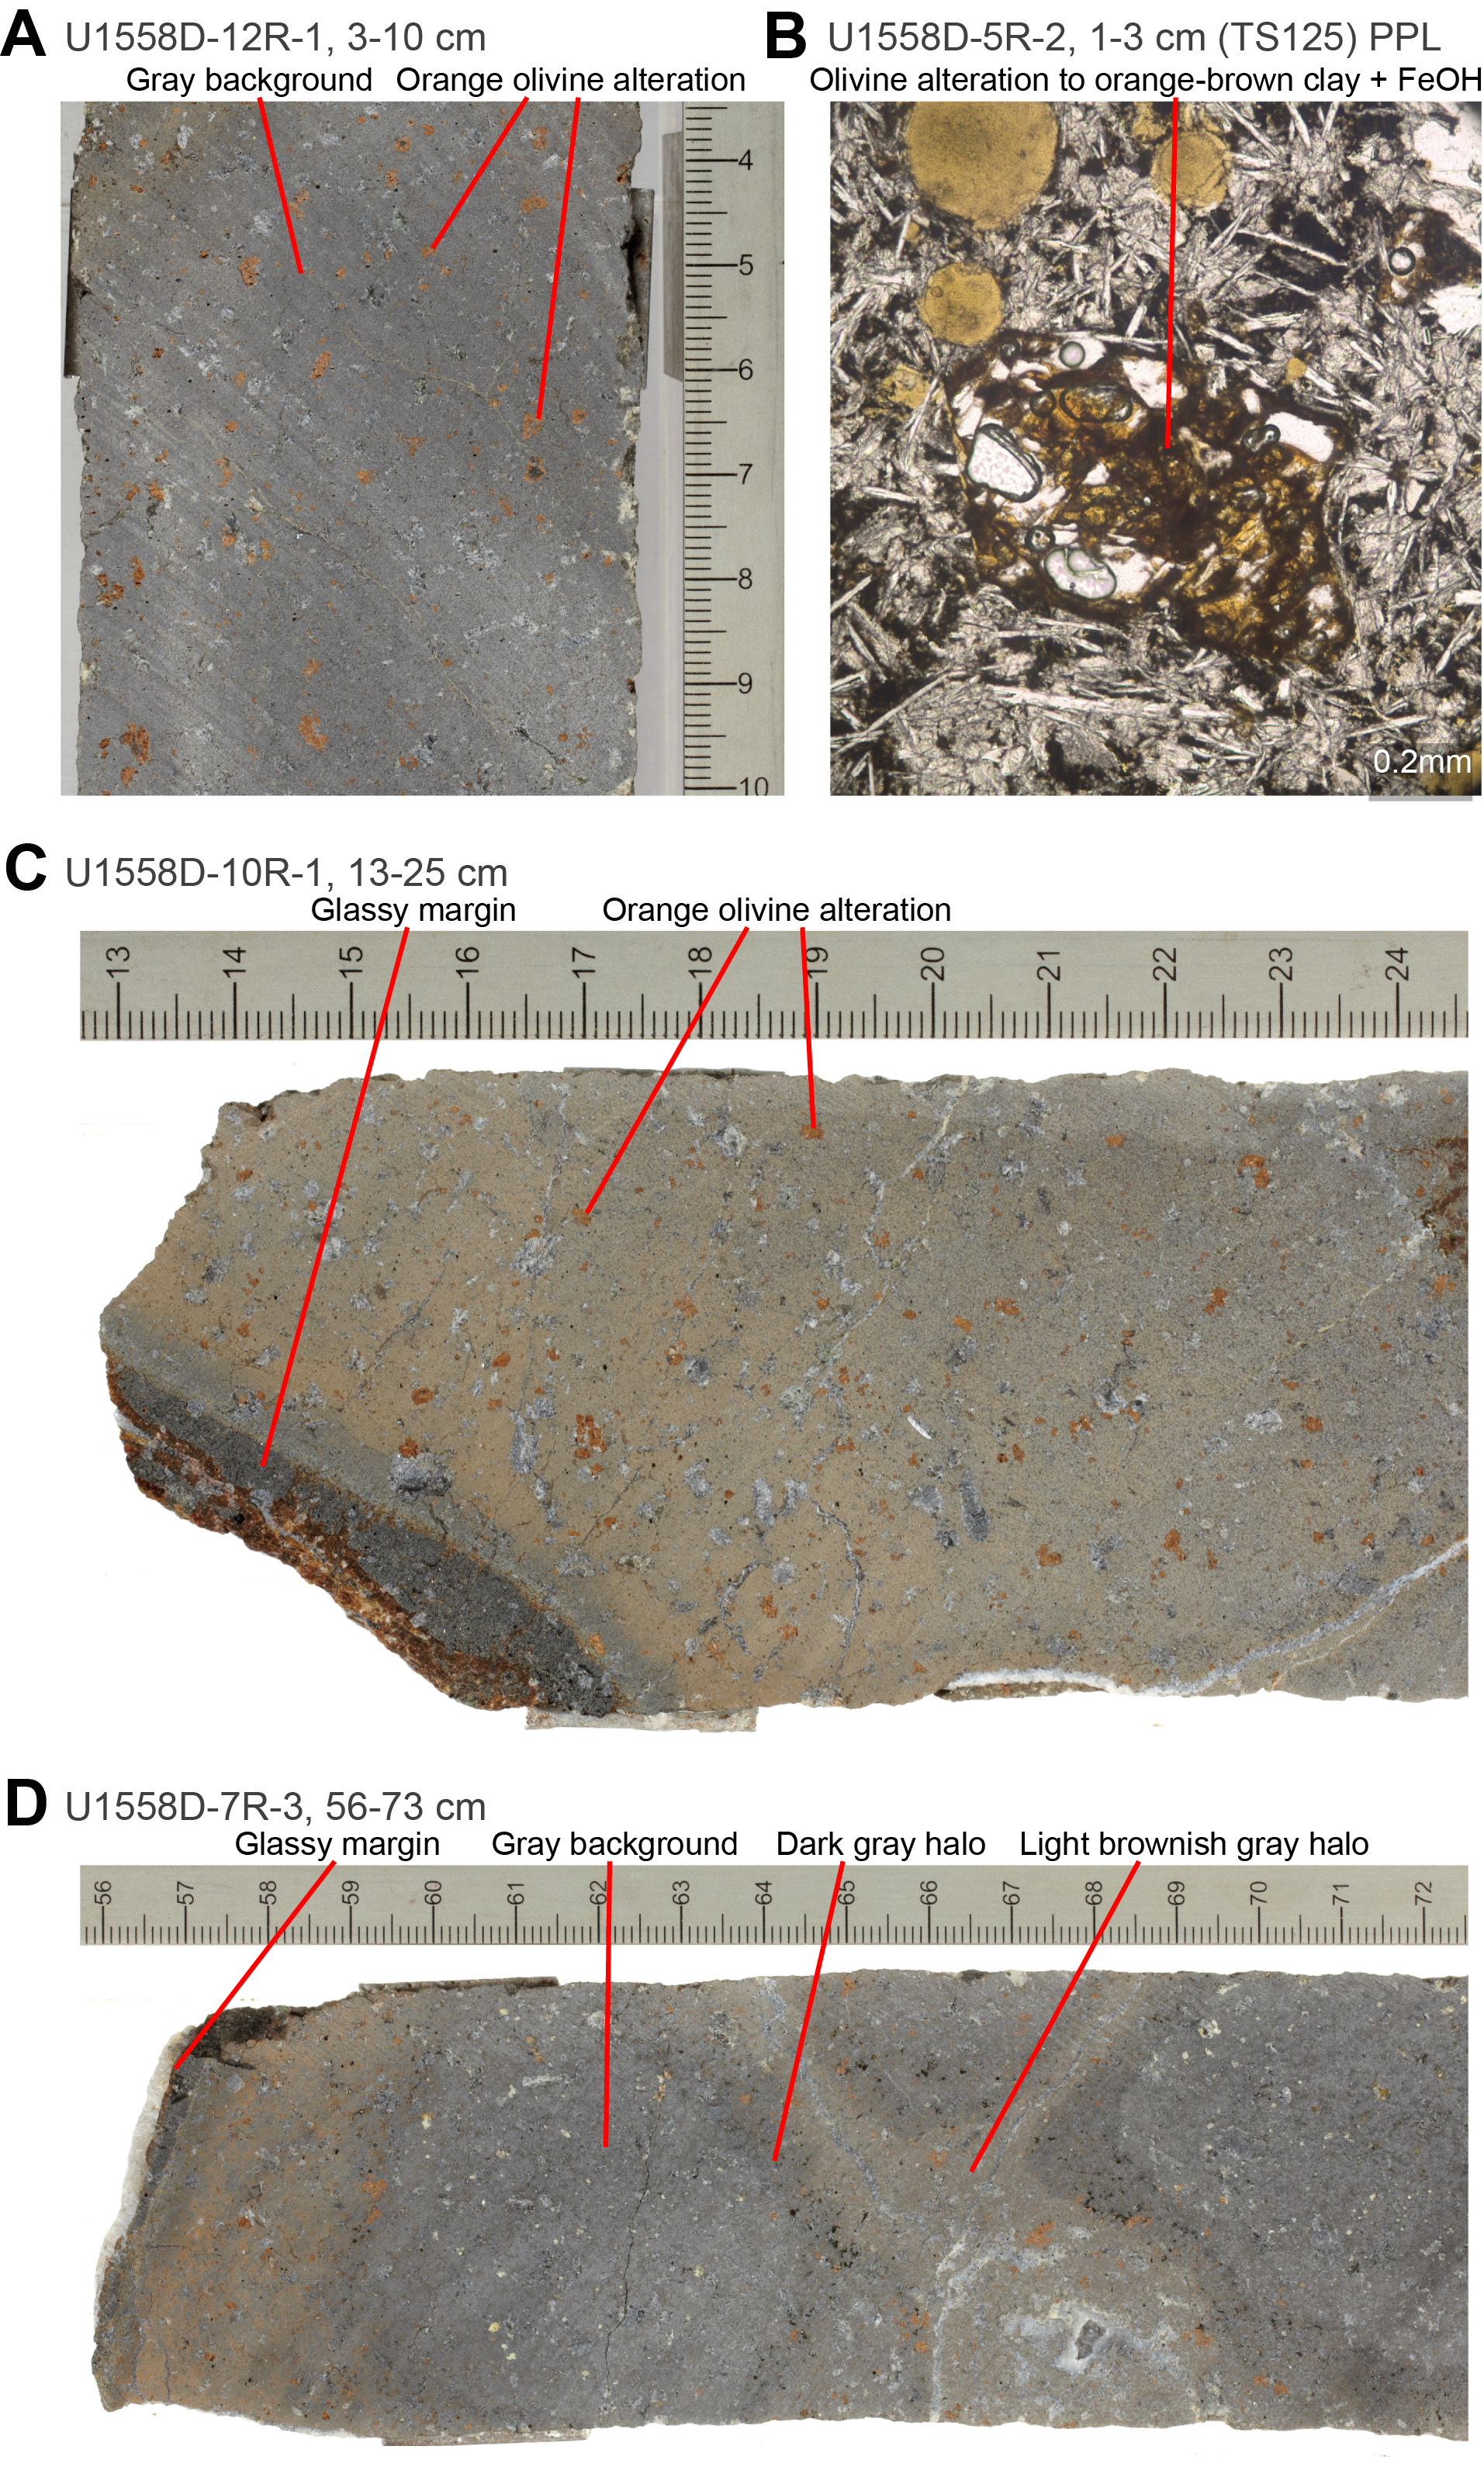
Figure F39. Orange speckled background.
6.2.3. Mixed brown-gray background
Mixed brown-gray background alteration is characterized by mixed background colors but is generally more brown (10YR 6/2 light brownish gray) than gray (GLEY 1 5/N). This alteration type shows a range of textures, from patchy to well-developed variolitic textures (Figure F40). This alteration type occurs in Unit 5 (Figure F38) where clear variolitic textures become a common feature. When a variolitic texture is present, the brown alteration forms <1–2.5 mm radiating areas surrounding varioles that have undergone extensive replacement to brown clay minerals that form an interconnected network of groundmass alteration that gives the characteristic patchy to mottled appearance (Figure F40). The examples where the variolitic texture is not well developed (e.g., interval 393-U1558D-31R-1, 81–108 cm) show the same color but without clear radial clusters of brown alteration, giving a more patchy appearance and likely represents variations in primary igneous textures. The mixed brown-gray background alteration has the highest alteration intensity (percentage replacement) of the three background alteration types, with 65%–75% secondary minerals compared to 15%–30% for most gray background samples and 18%–50% for most orange speckled background samples.
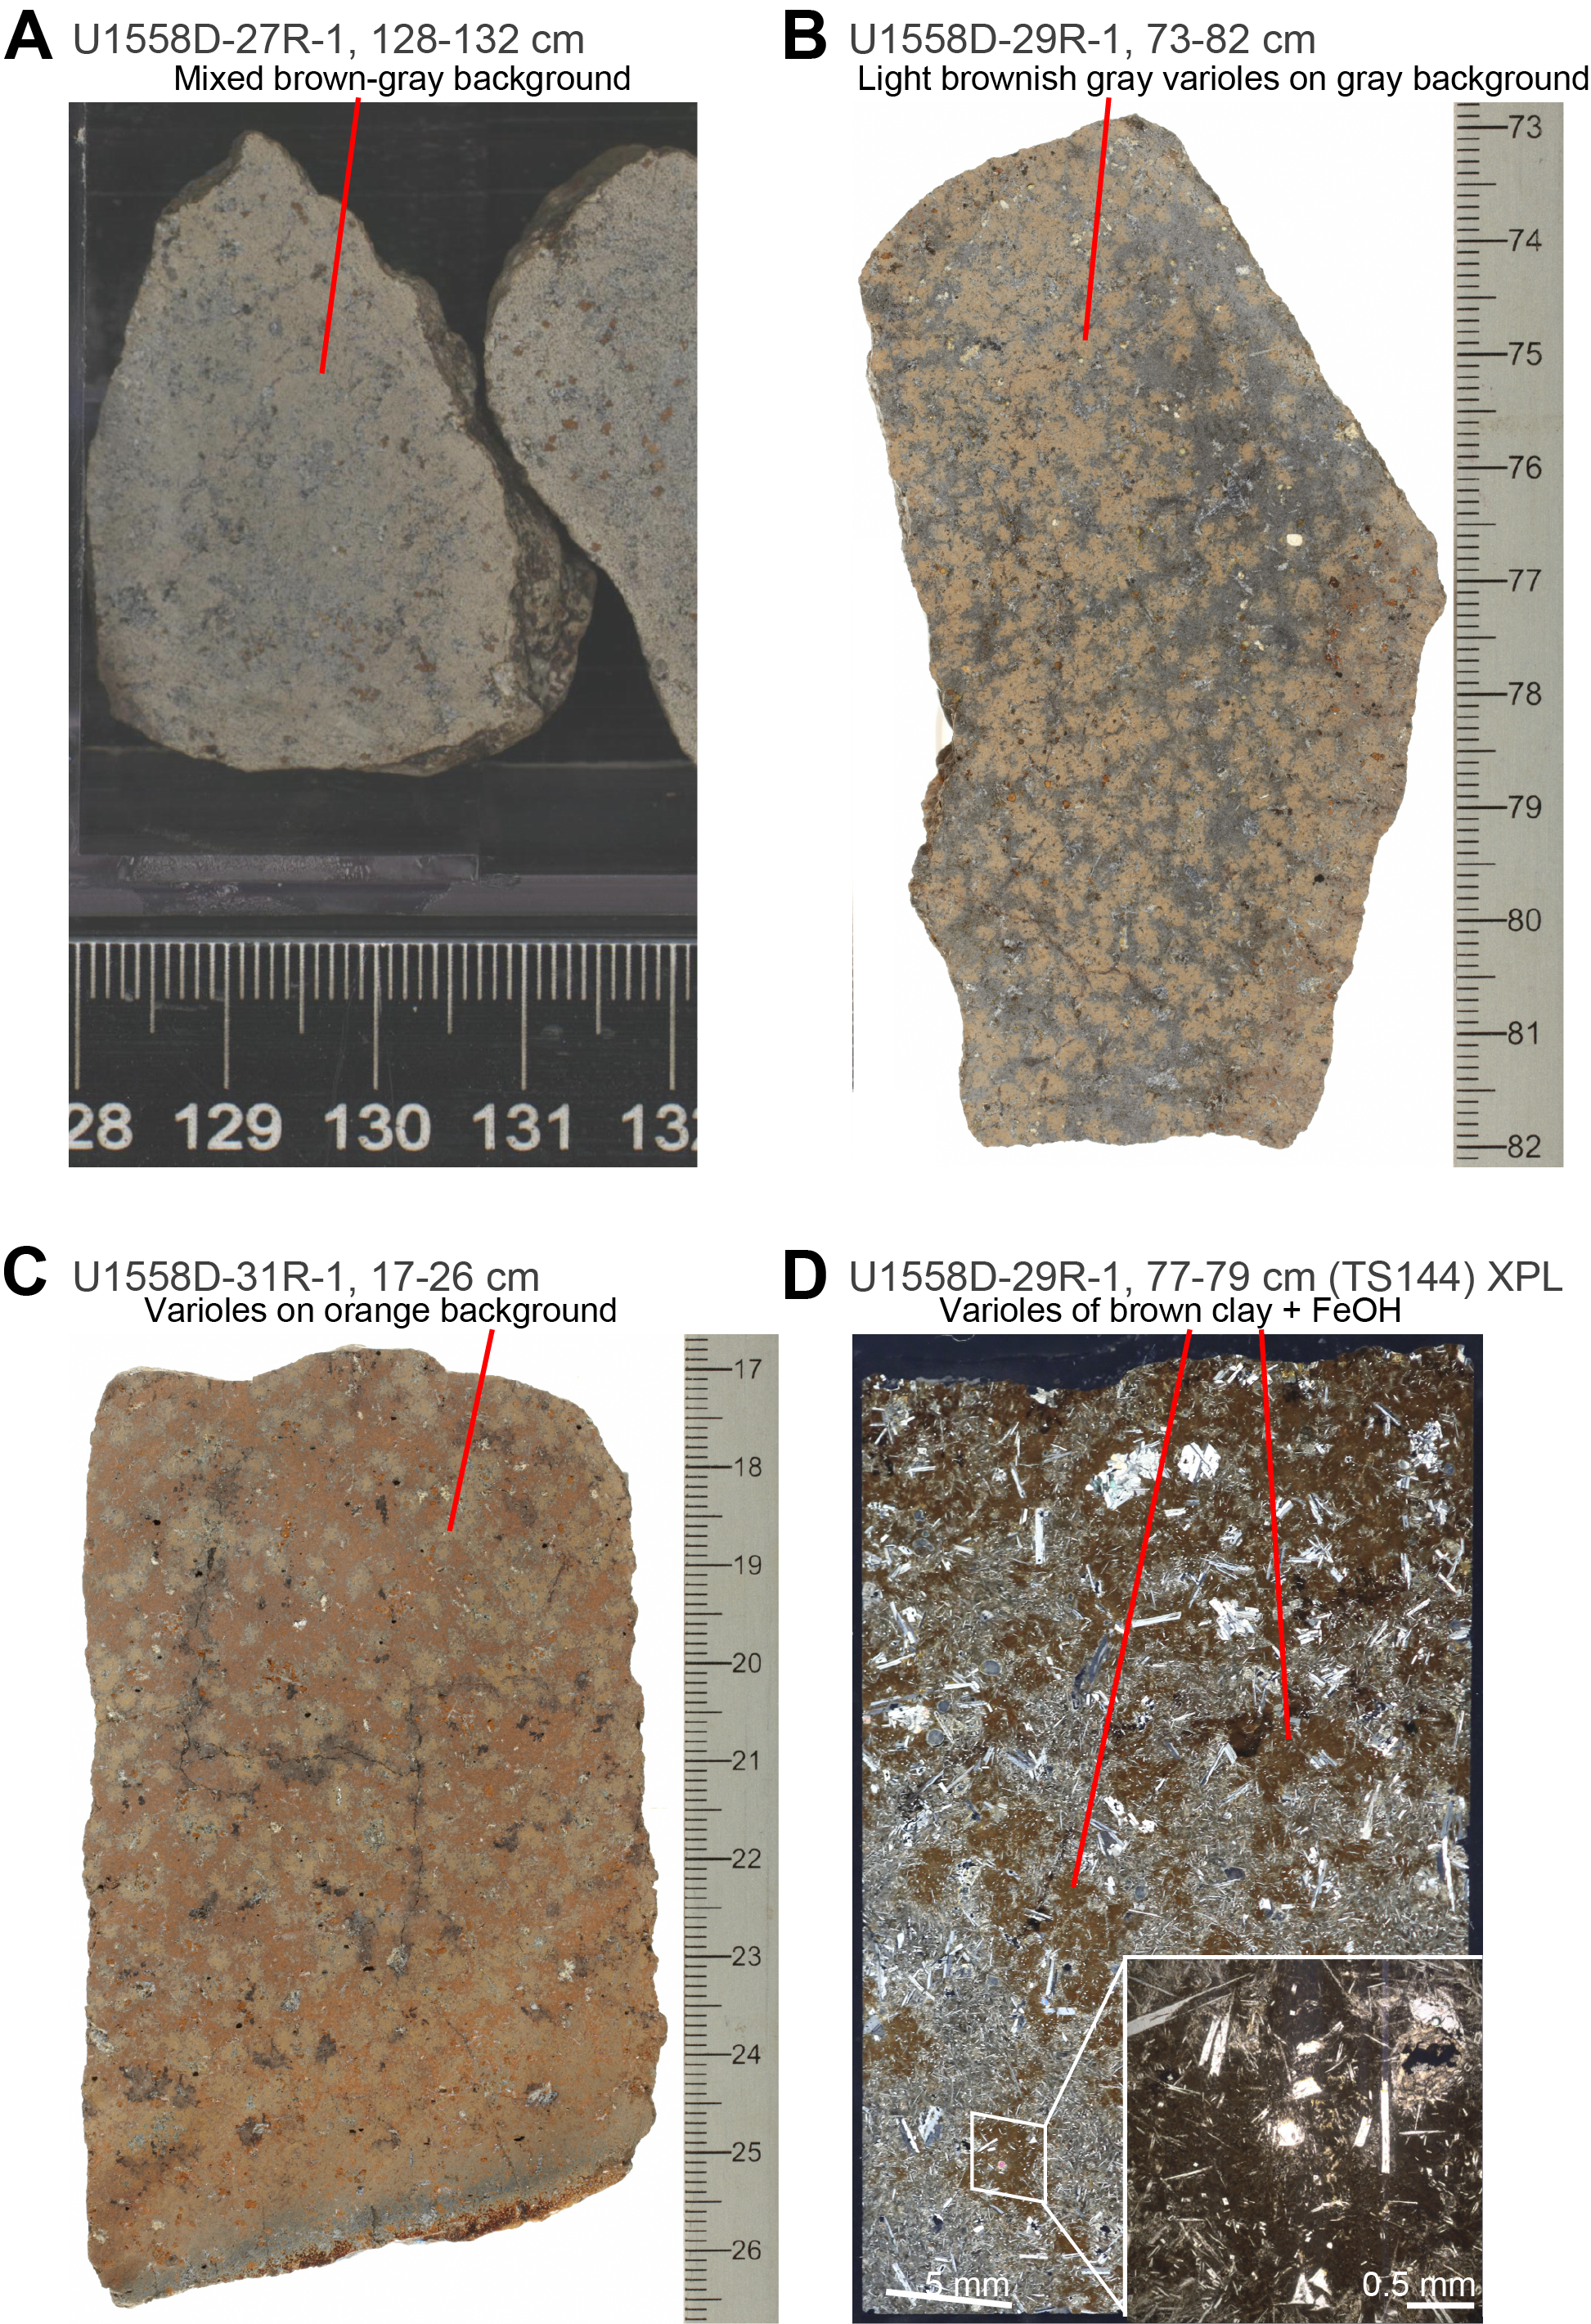
Figure F40. Mixed brown-gray background.
6.2.4. Mottled gray chilled margin background
Chilled margins are commonly associated with mottled gray alteration located between the glassy margin and the interior of the flow. These mottled gray chilled margins are not always present at chilled margins but occur irregularly throughout Hole U1558D (e.g., Sample 38R-2, 0–13 cm; Figure F41). This region varies in width from absent up to 1–2 cm, but most commonly it occurs as a thin 2–3 mm band. In the wider examples, the mottled appearance is more evident because of greater alteration of the varioles.
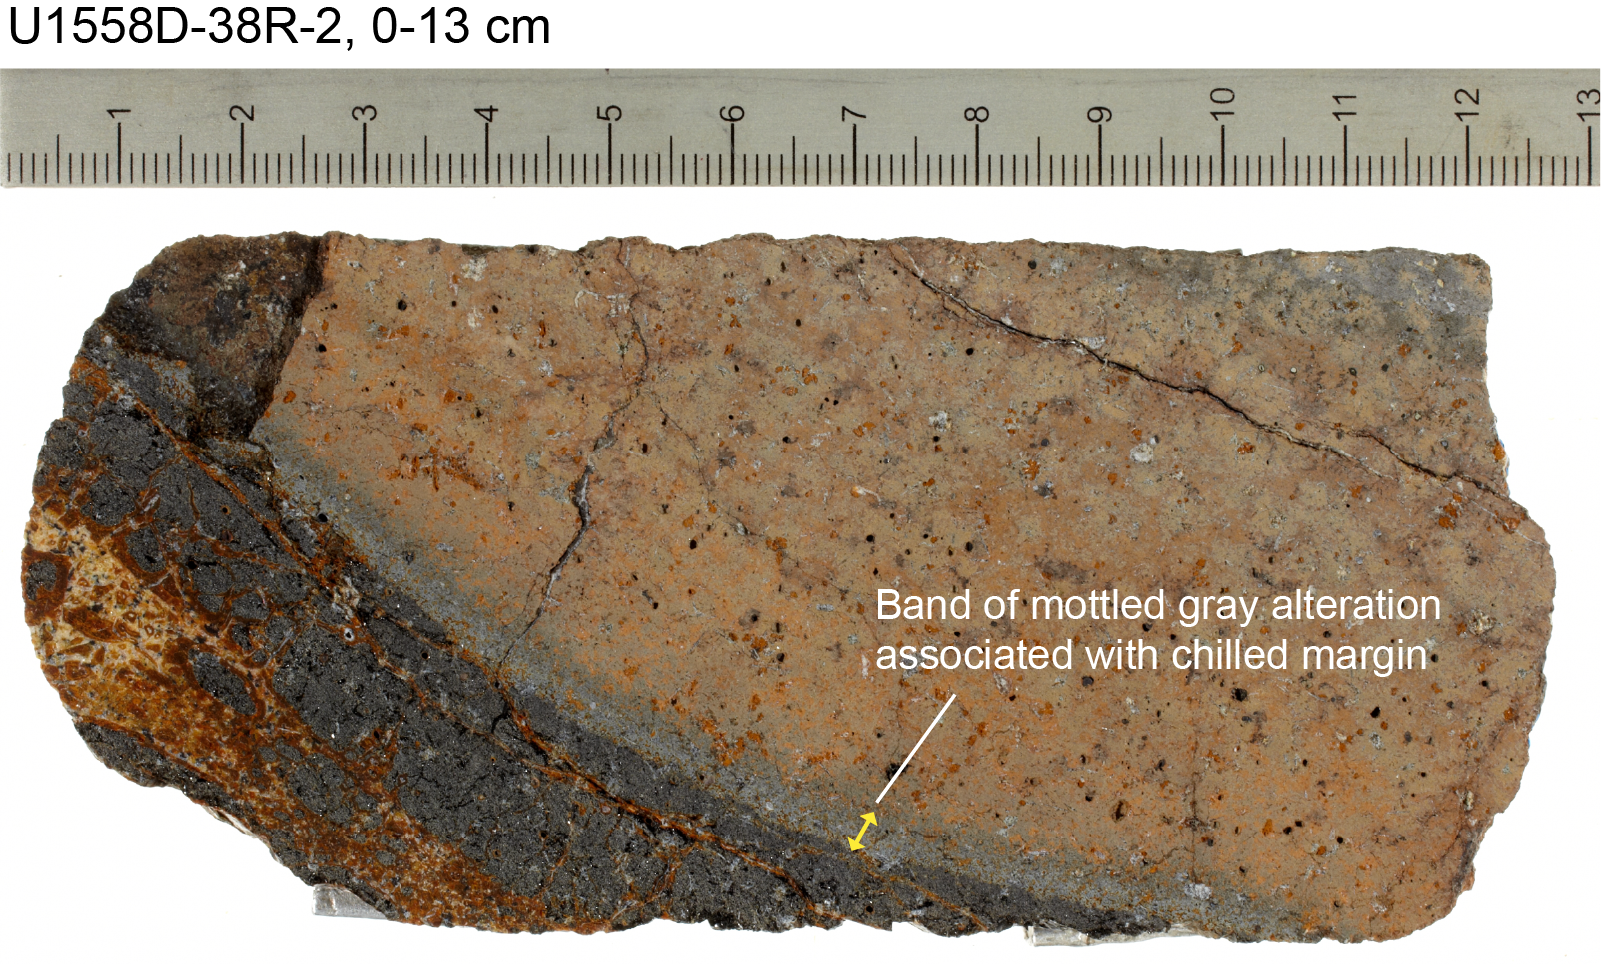
Figure F41. Mottled gray chilled margin alteration.
6.3. Alteration halos
Alteration halos are ubiquitous in Hole U1558D and occur in a range of colors, thicknesses, and textures (Figure F42). Halos surround recovered veins and chilled margins. In some instances, halos consume whole pieces and have no clear association to recovered veins or margins, although this is likely an artifact of recovery. Halo types are distinguished primarily on the dominant color that reflects the secondary groundmass minerals formed, leading to four main halo types. Textural and color variation within the types are discussed below.
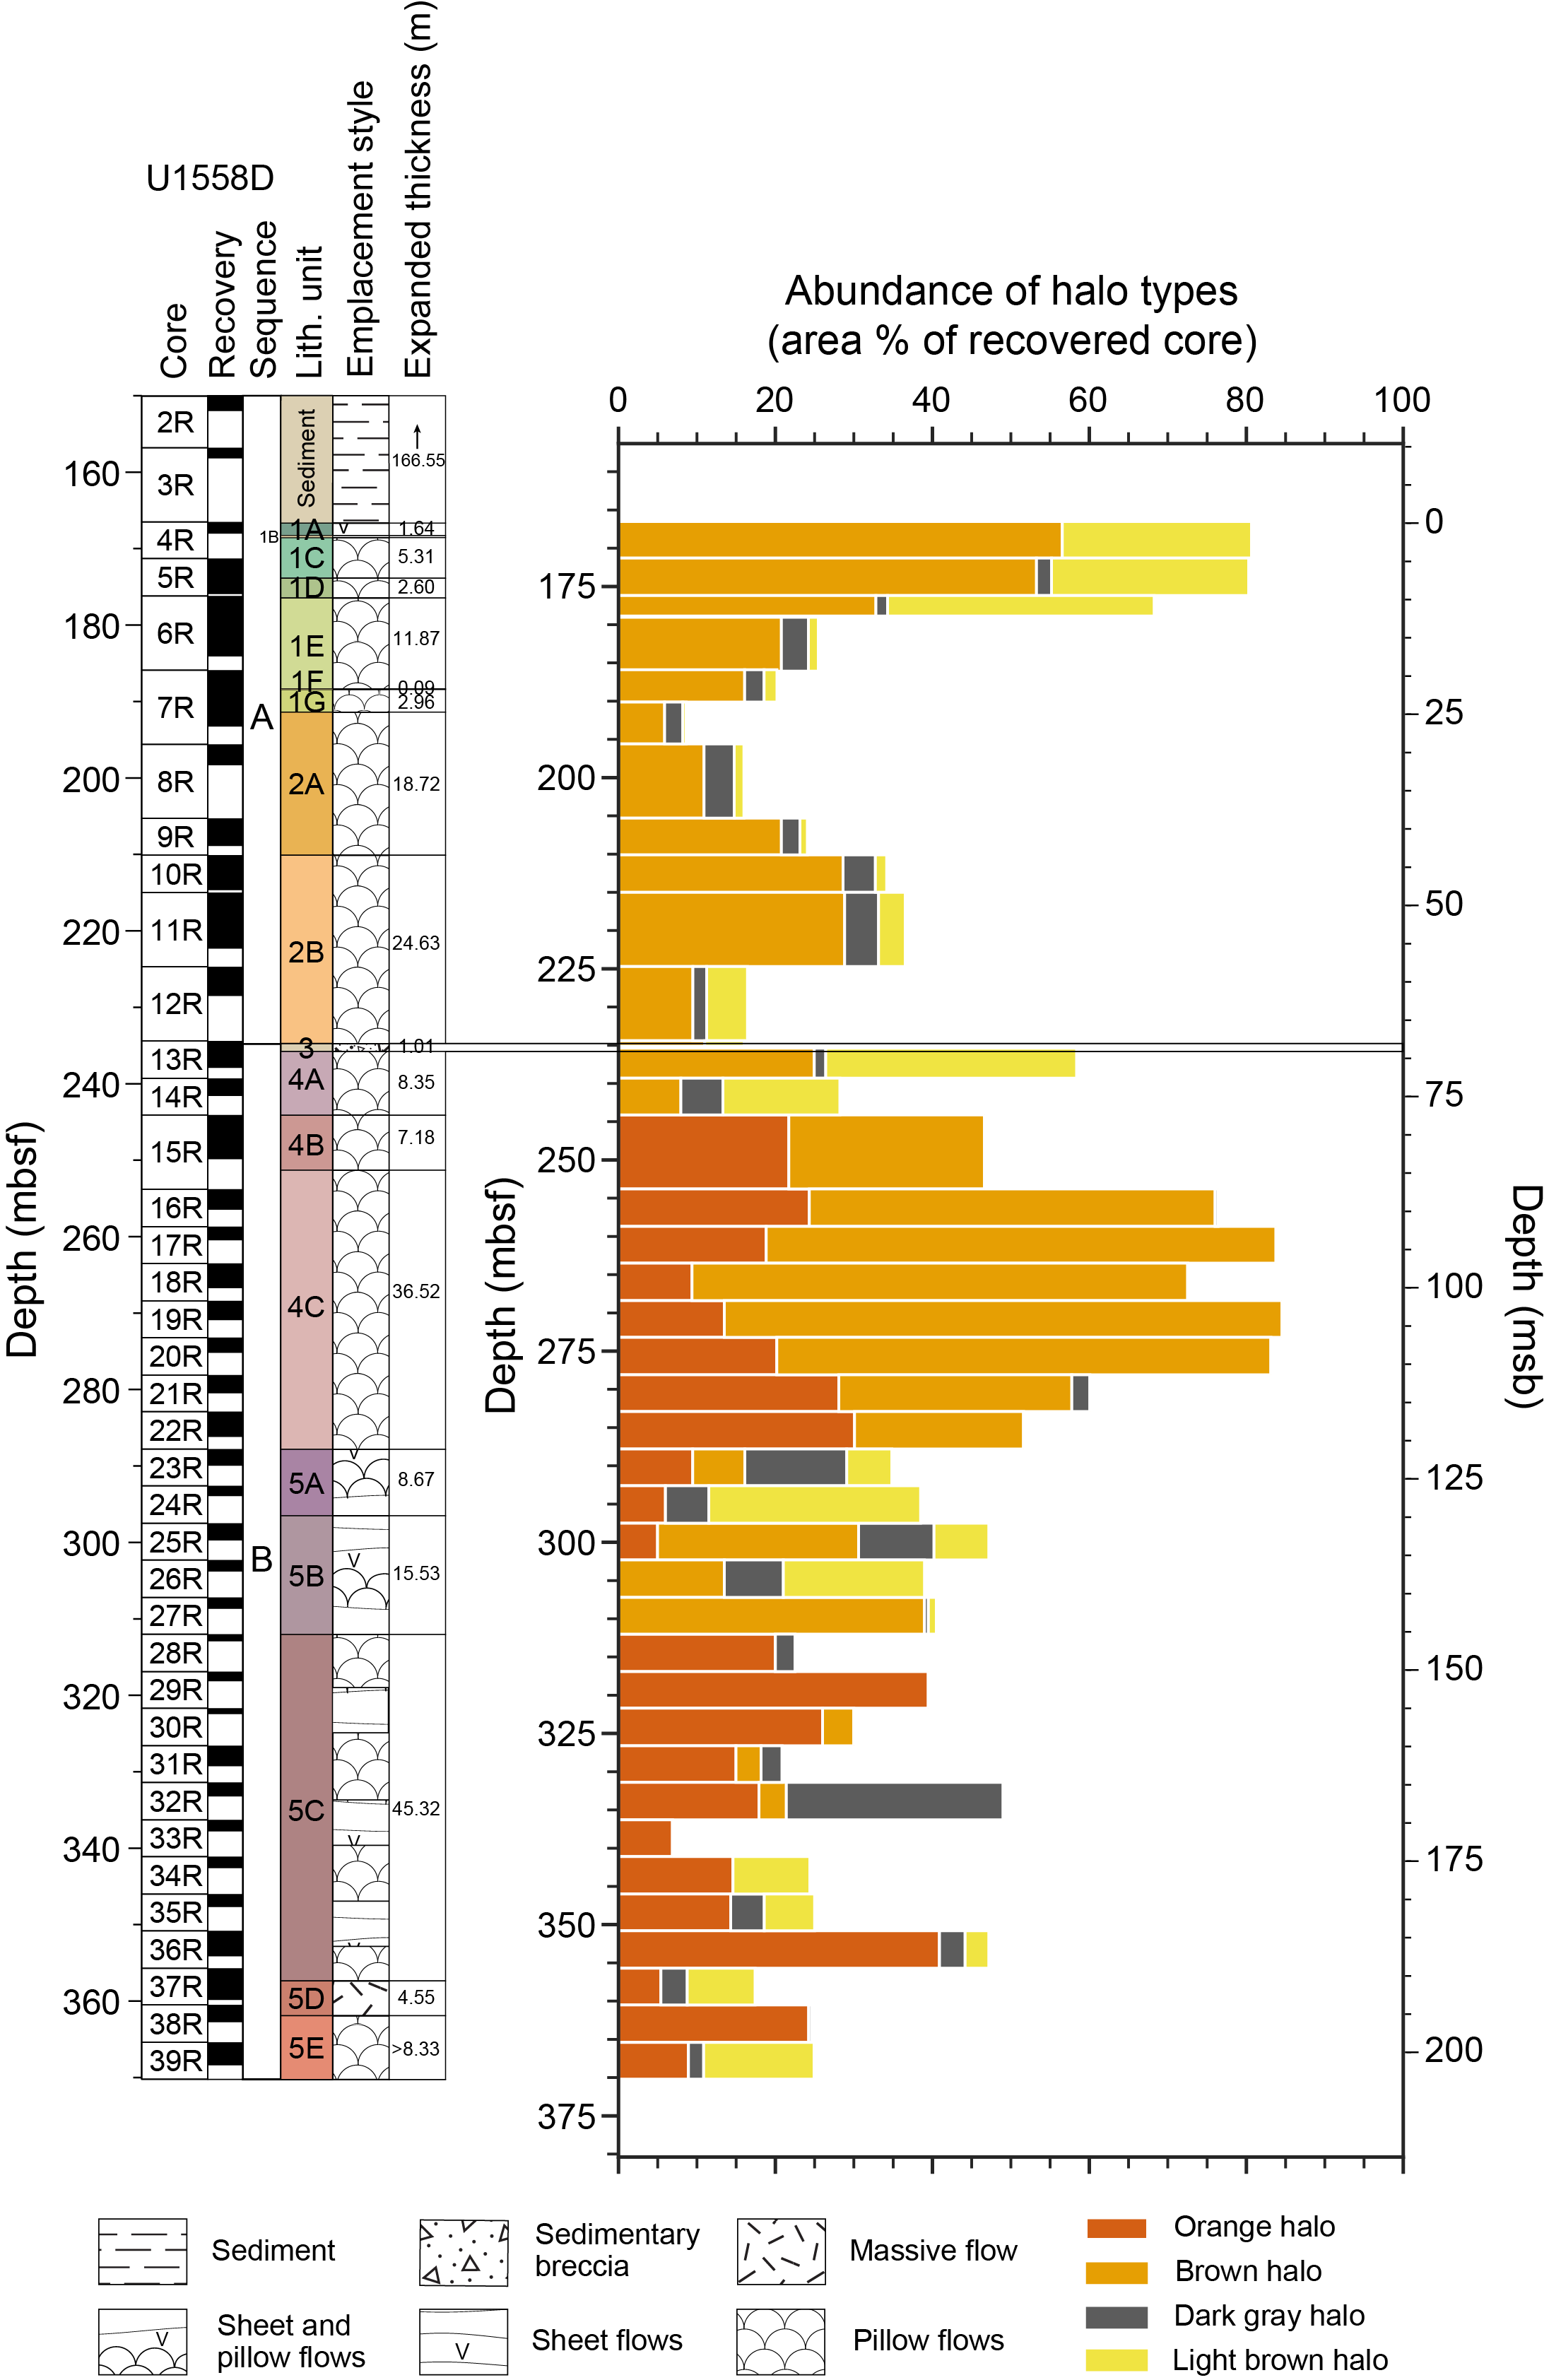
Figure F42. Area abundance of alteration halo types.
6.3.1. Dark gray halos
Dark gray halos are the least abundant halo type, occurring in only 10 of the 39 cores from Hole U1558D. They are largely absent between 225 and 280 mbsf, and none are found in Unit 4. They are distinguished by their uniform dark gray color (GLEY 15/N dark gray), and they predominantly occur bordering veins, although some examples formed adjacent to pillow margins (Figure F43). When they border veins, the dark gray halos are on average 3–4 mm wide. In the majority of occurrences (72%), dark gray halos occur together with light brownish gray halos. In thin section, the dark gray halos are characterized by the presence of yellow-brown clays that replace mesostasis and groundmass minerals and commonly fill vesicles (Figure F44). Dark gray halos are commonly overprinted by the other halo types (Figure F43) and appear to represent the earliest forming halo type.
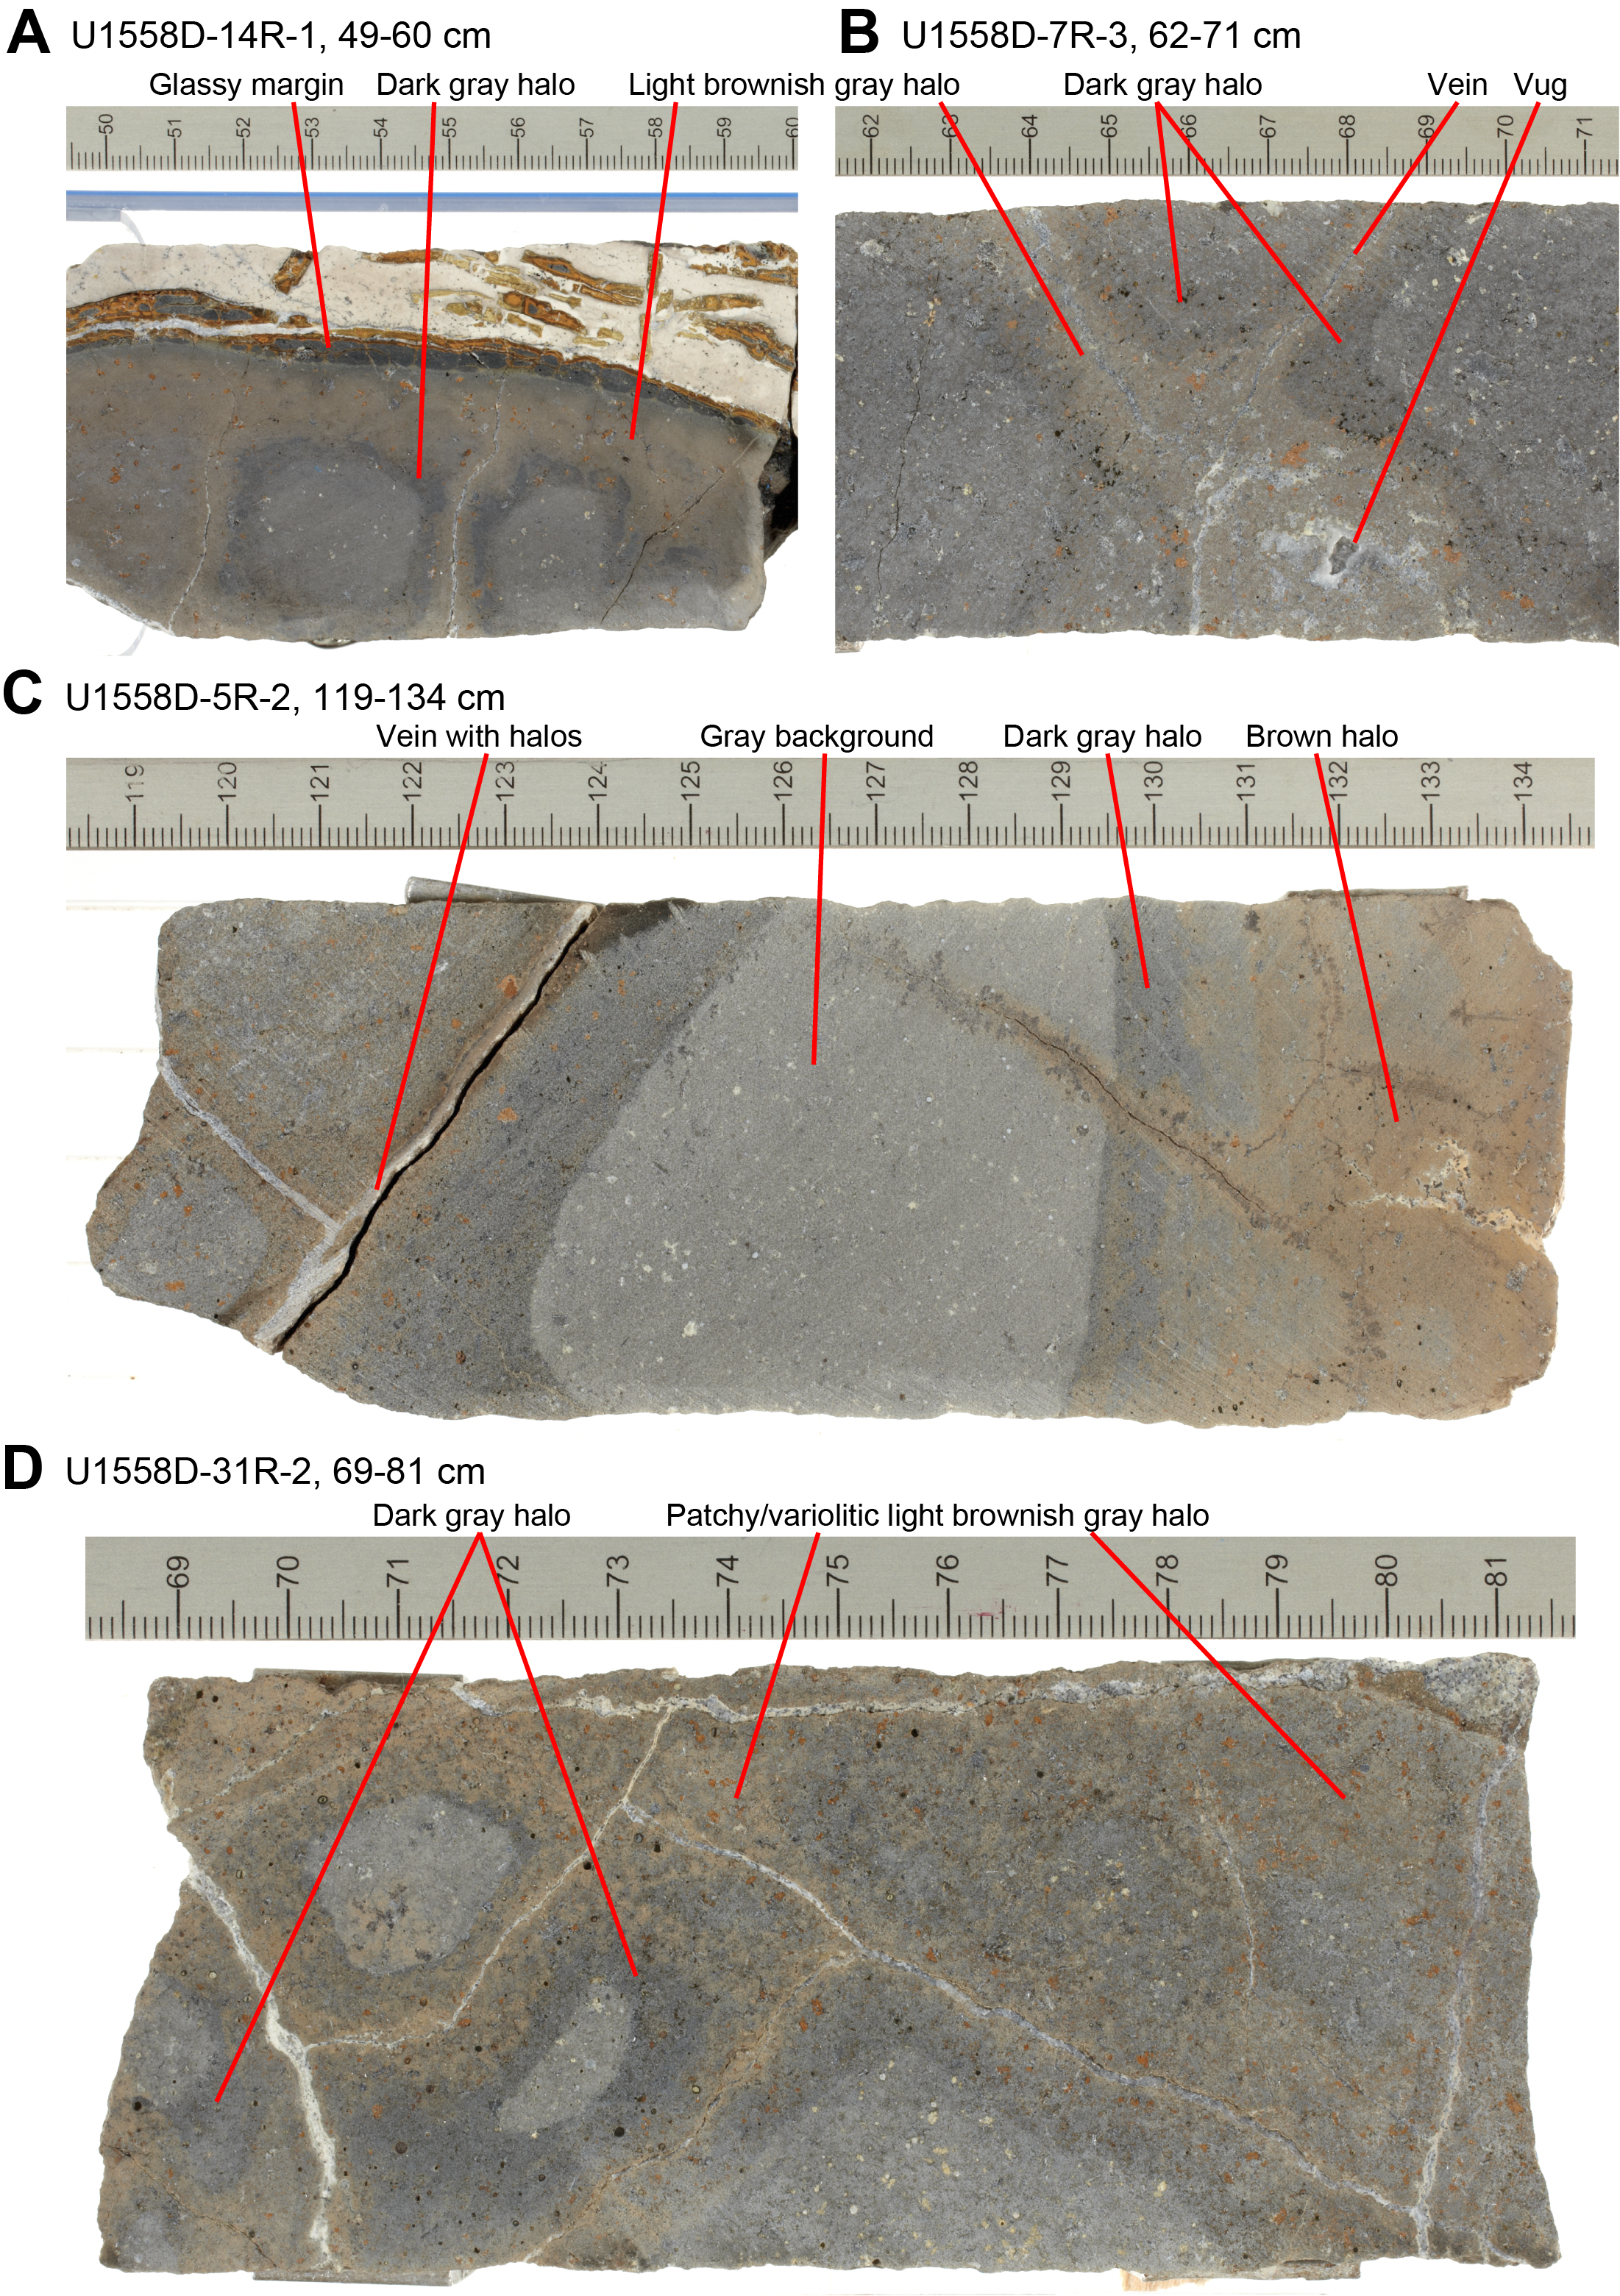
Figure F43. Dark gray and light brownish gray halos.
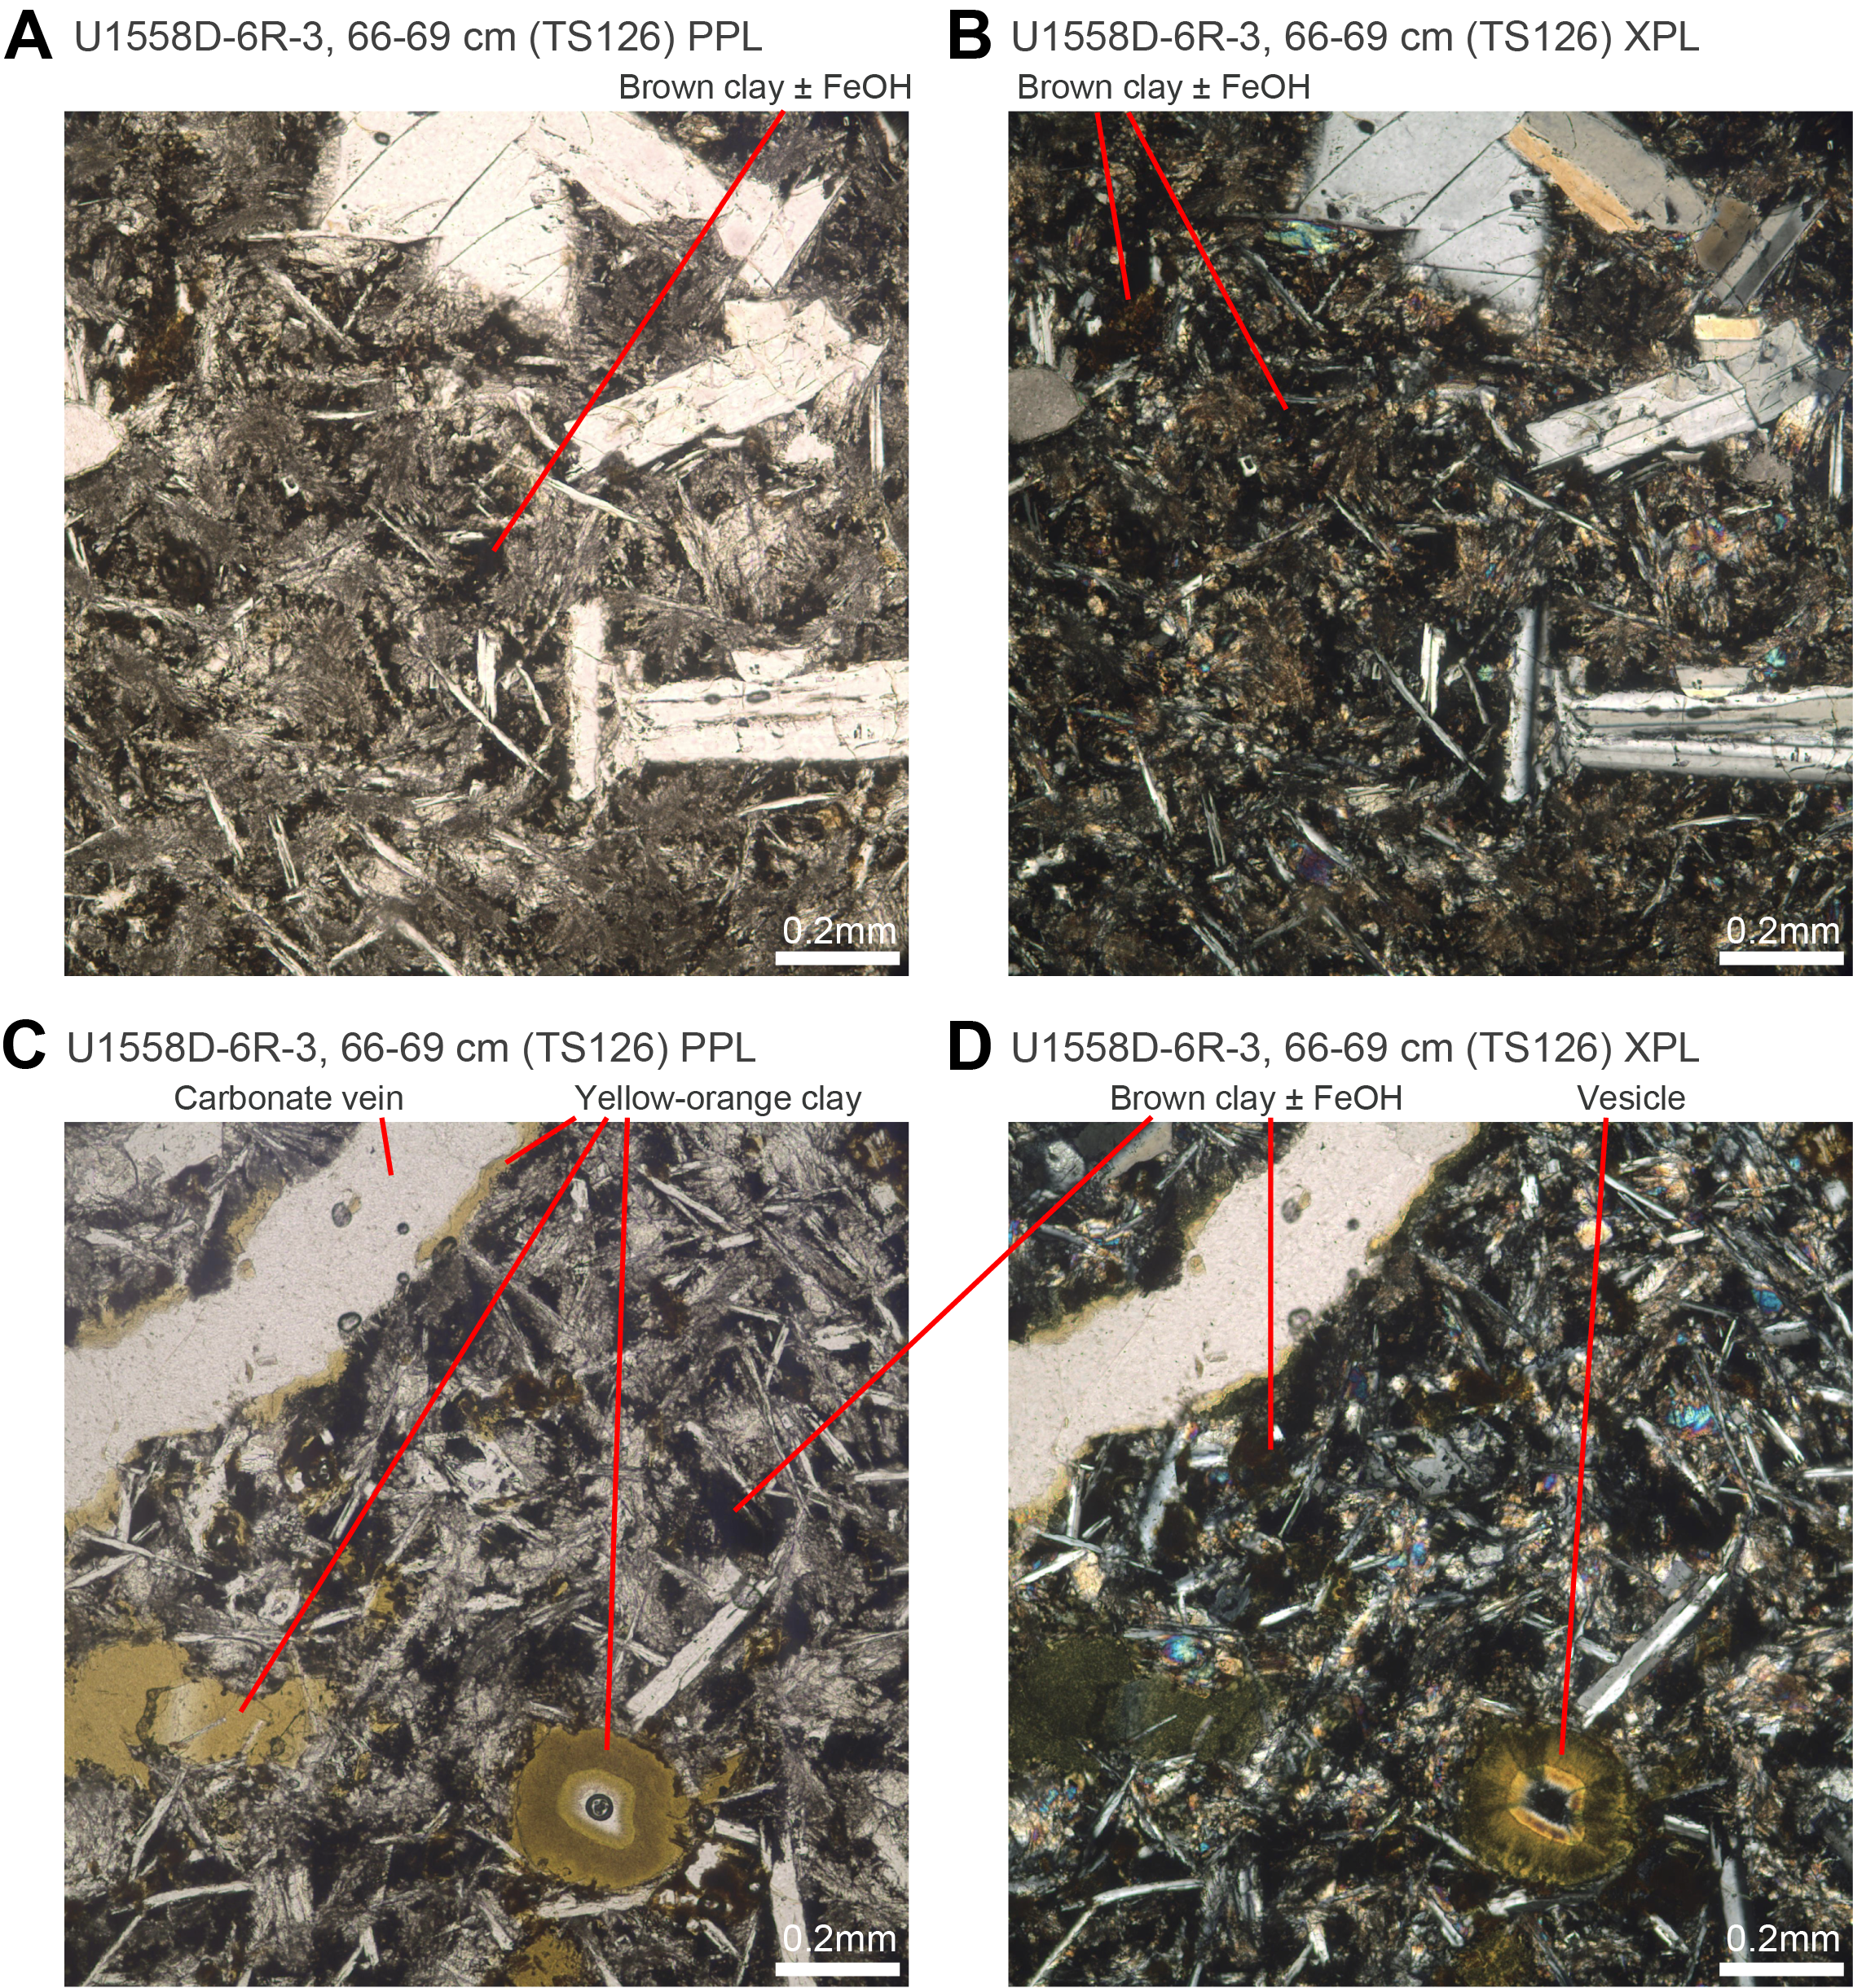
Figure F44. Alteration in dark gray and light brownish gray halos.
6.3.2. Light brownish gray halos
Light brownish gray halos occur in 20 of the 39 cores and are present in all igneous units, although they are absent for a significant part of Unit 4 (241.1–287.8 mbsf; Figure F42). They are light brownish gray (10YR 6/2 light brownish gray), which is the same color as the mixed brown-gray background (Figure F43). In Volcanic Sequence A, this halo type mostly occurs paired with dark gray halos around veins, where the light brownish gray (average 4 mm half-width) occurs closest to the vein indicating that they are overprinting the dark gray halos. They also occur as halos around vugs. In Unit 5 (Sequence B), some light brownish gray halos are associated with the variolitic mixed brown-gray background alteration, where they form larger halos (4–10 mm) but are not associated with dark gray halos. Because of the patchy to variolitic appearance of the background, the light brownish gray halos in this interval also show patchy texture.
6.3.3. Brown halos
Brown halos are found throughout Hole U1558D and show varying abundances and intensities (Figure F42). This halo type also occurs in Hole U1558A XCB cores. Brown halos occur bordering veins and as more altered groundmass regions within chilled margins (mostly pillow margins; Figure F45). These halos, when bordering veins, display a very broad size range (0.5–45 mm wide), and on average they are the widest halo type to border veins (average = 9 mm; Table T9). Brown halos developed from chilled margins generally extend up to 40 mm into the host rock where they show sharp and diffuse boundaries (Figure F45). The intensity of alteration is reflected by the variations in the depth of brown coloration from 7.5YR 5/2 brown, 7.5YR 5/3 brown, 7.5YR 3/3 dark brown, 5YR 6/6 brown, to 5YR 3/1 very dark gray. The 7.5YR 5/2 and 7.5YR 5/3 browns are the most common colors displayed. In some occurrences, these brown halos blend continuously with the orange halos.
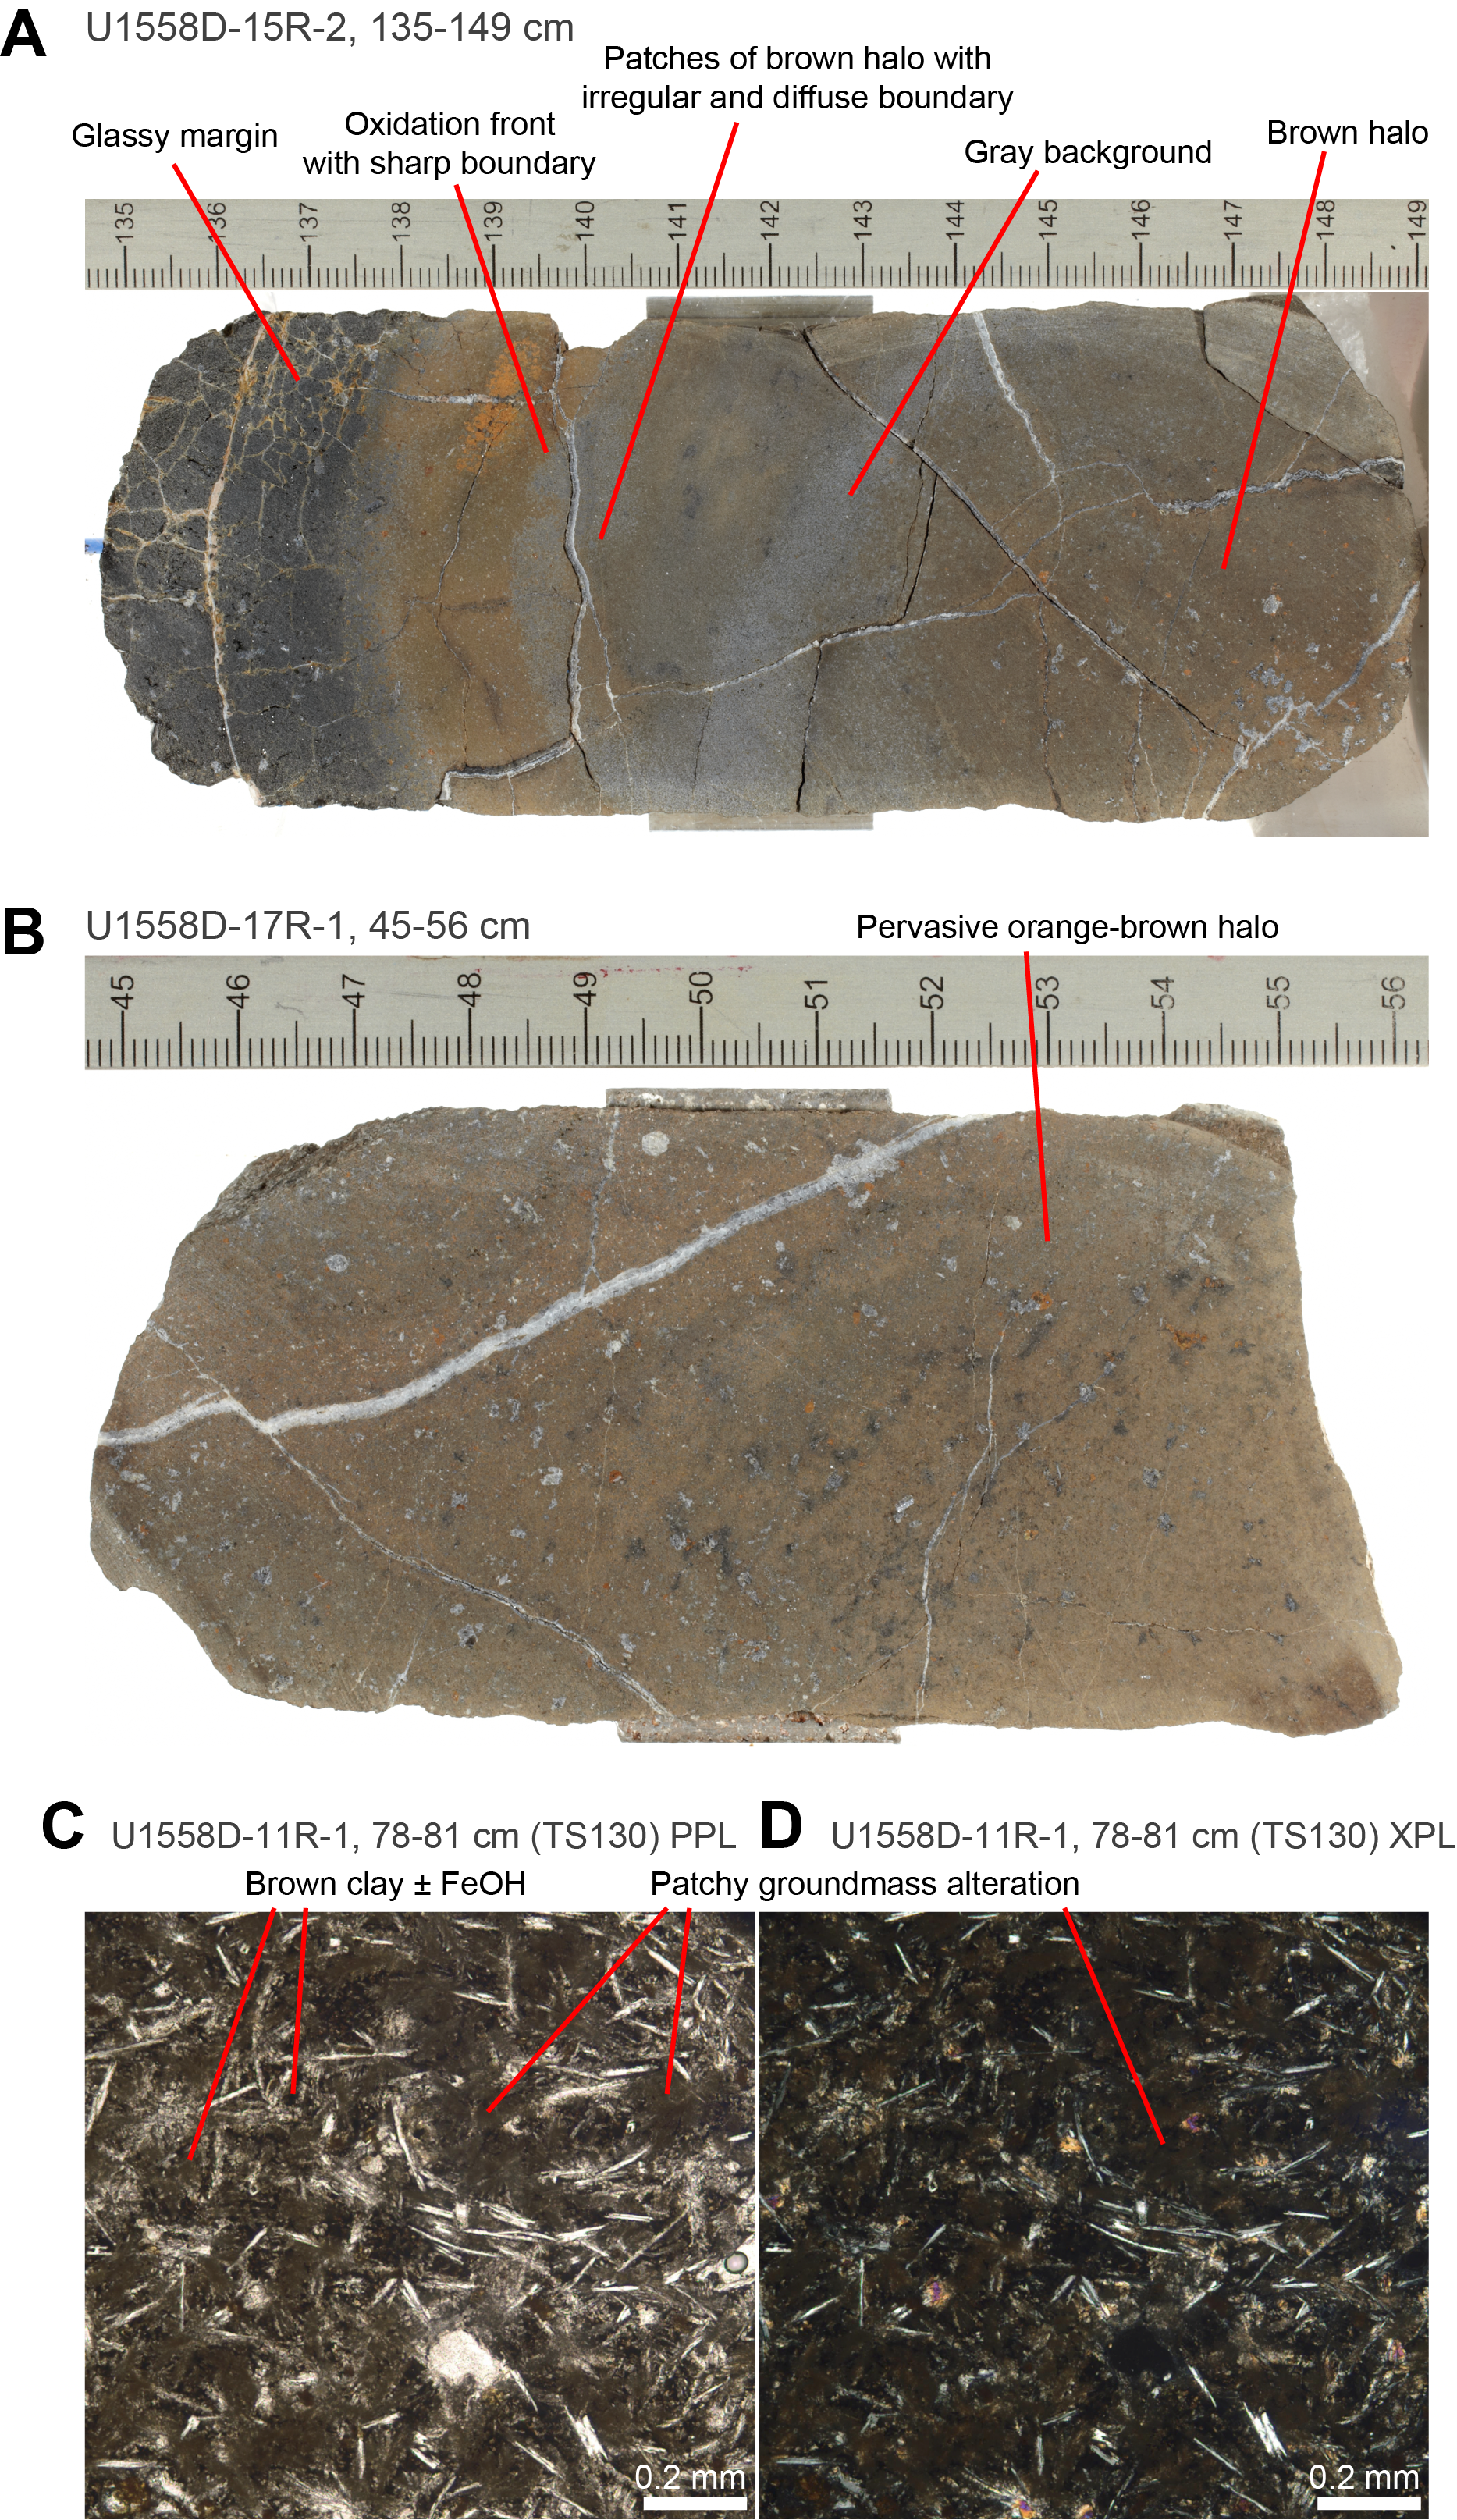
Figure F45. Brown halos.
In thin section, brown halos are 25%–69% secondary minerals and show heterogeneity in alteration intensity on the scale of a single thin section. Secondary minerals are dominated by brown to yellow clays ± Fe oxyhydroxides that replace olivine and the groundmass (Figure F45).
6.3.4. Orange halos
Orange halos are the most distinctive halo type in Hole U1558D with a reddish yellow (5YR 6/6 reddish yellow) color, and they are present from 244.55 mbsf (Section 393-U1558D-15R-1, 45 cm) to the base of the hole. Once this halo type appears downhole, it displays a reasonably consistent abundance within each core (range of 5%–40% of the area of the core, average = 18.3% of the area of the core). The strong coloration of this halo is a result of the formation of Fe oxyhydroxide and clay minerals that pervasively replace the groundmass and phenocrysts (Figure F46). The orange halos are commonly associated with the chilled margins of pillow lavas, but in some rare cases they occur around veins. Most commonly they consume small core pieces that preserve no vein or margin. As described in the alteration of the glass, this halo type commonly occurs with pillow lavas that preserve thick (~10–20 mm) rims of fresh glass (Figure F34). In Unit 5, the orange halos are present both along chilled margins and locally overprint whole pieces. In Unit 5, these halos show the patchy to variolitic texture that is also present in the background and light brownish gray halos (Figure F46).
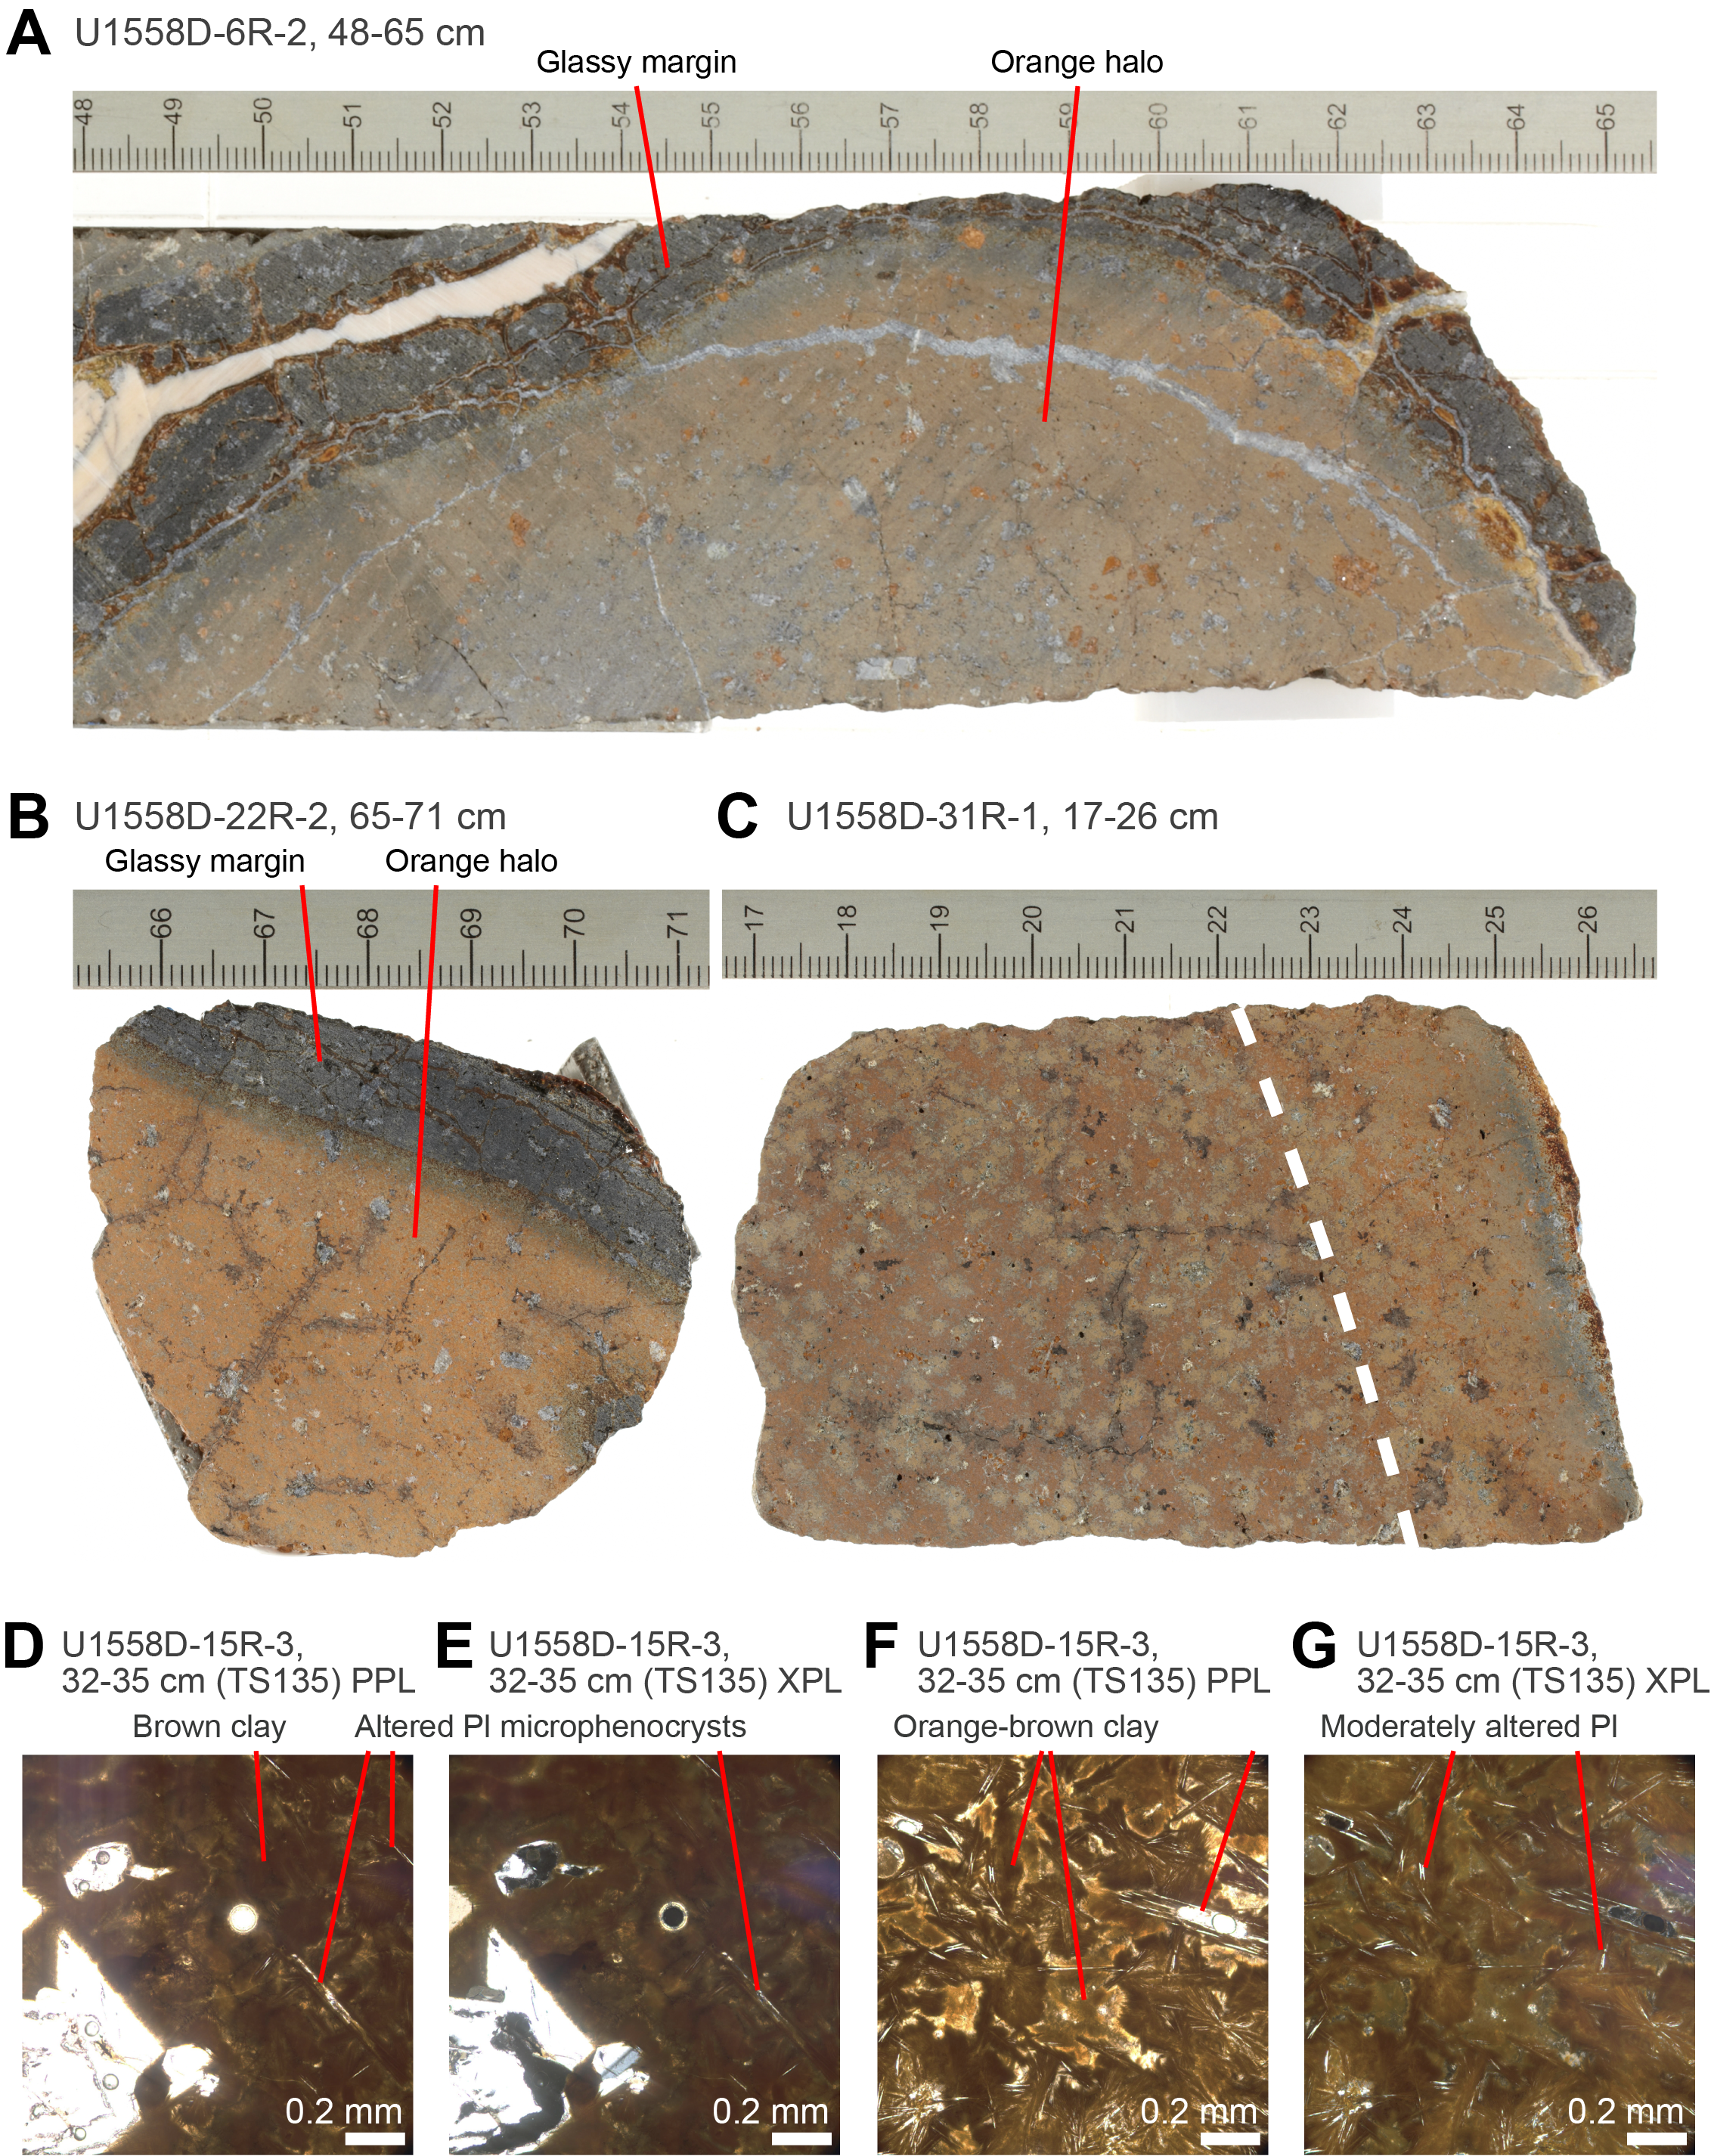
Figure F46. Chilled margin-related orange halos.
In thin section, the orange halos have secondary mineral abundances of 60%–70%. The groundmass is extensively replaced by orange-brown clay minerals and Fe oxyhydroxides, giving the strong orange color to the rocks (Figure F46). Plagioclase (micro)phenocrysts are also variably altered to orange-brown clays or show staining to orange colors. Although the extent of replacement is high, this is pseudomorphic in texture and there is little evidence for extensive recrystallization and loss of igneous texture.
6.4. Breccia
Breccias are commonly the most altered rocks recovered from the seafloor because their high porosity and abundance of reactive fresh surface area encourages fluid/rock reaction. Breccias occur throughout Hole U1558D and range from small pieces of interpillow breccia (e.g., Unit 3) to larger intervals of brecciation (239.3–248.8 mbsf). Based on the alteration characteristics of the component parts (clasts, matrix, and cement), two groups of breccias are present in Hole U1558D.
6.4.1. Type 1: sediment matrix with carbonate cement
The interpillow breccia present in Units 1 and 2 all contain a mixture of sediment matrix (Figure F20, F22, F24) and carbonate cement with clasts of volcanic glass and basalt. The sediment matrix is described in Unit 3. The extent of clast alteration is moderate to complete, with smaller clasts more strongly altered. Larger clasts show the least alteration, which is focused around the margins of the clasts, to orange clays (Figure F47). Clasts <10 mm are generally completely altered, predominantly to pale olive-green (5Y 6/4) clays. Some small clasts show concentric zonation from green to brown or orange clays with black residual cores of only moderately altered glass.
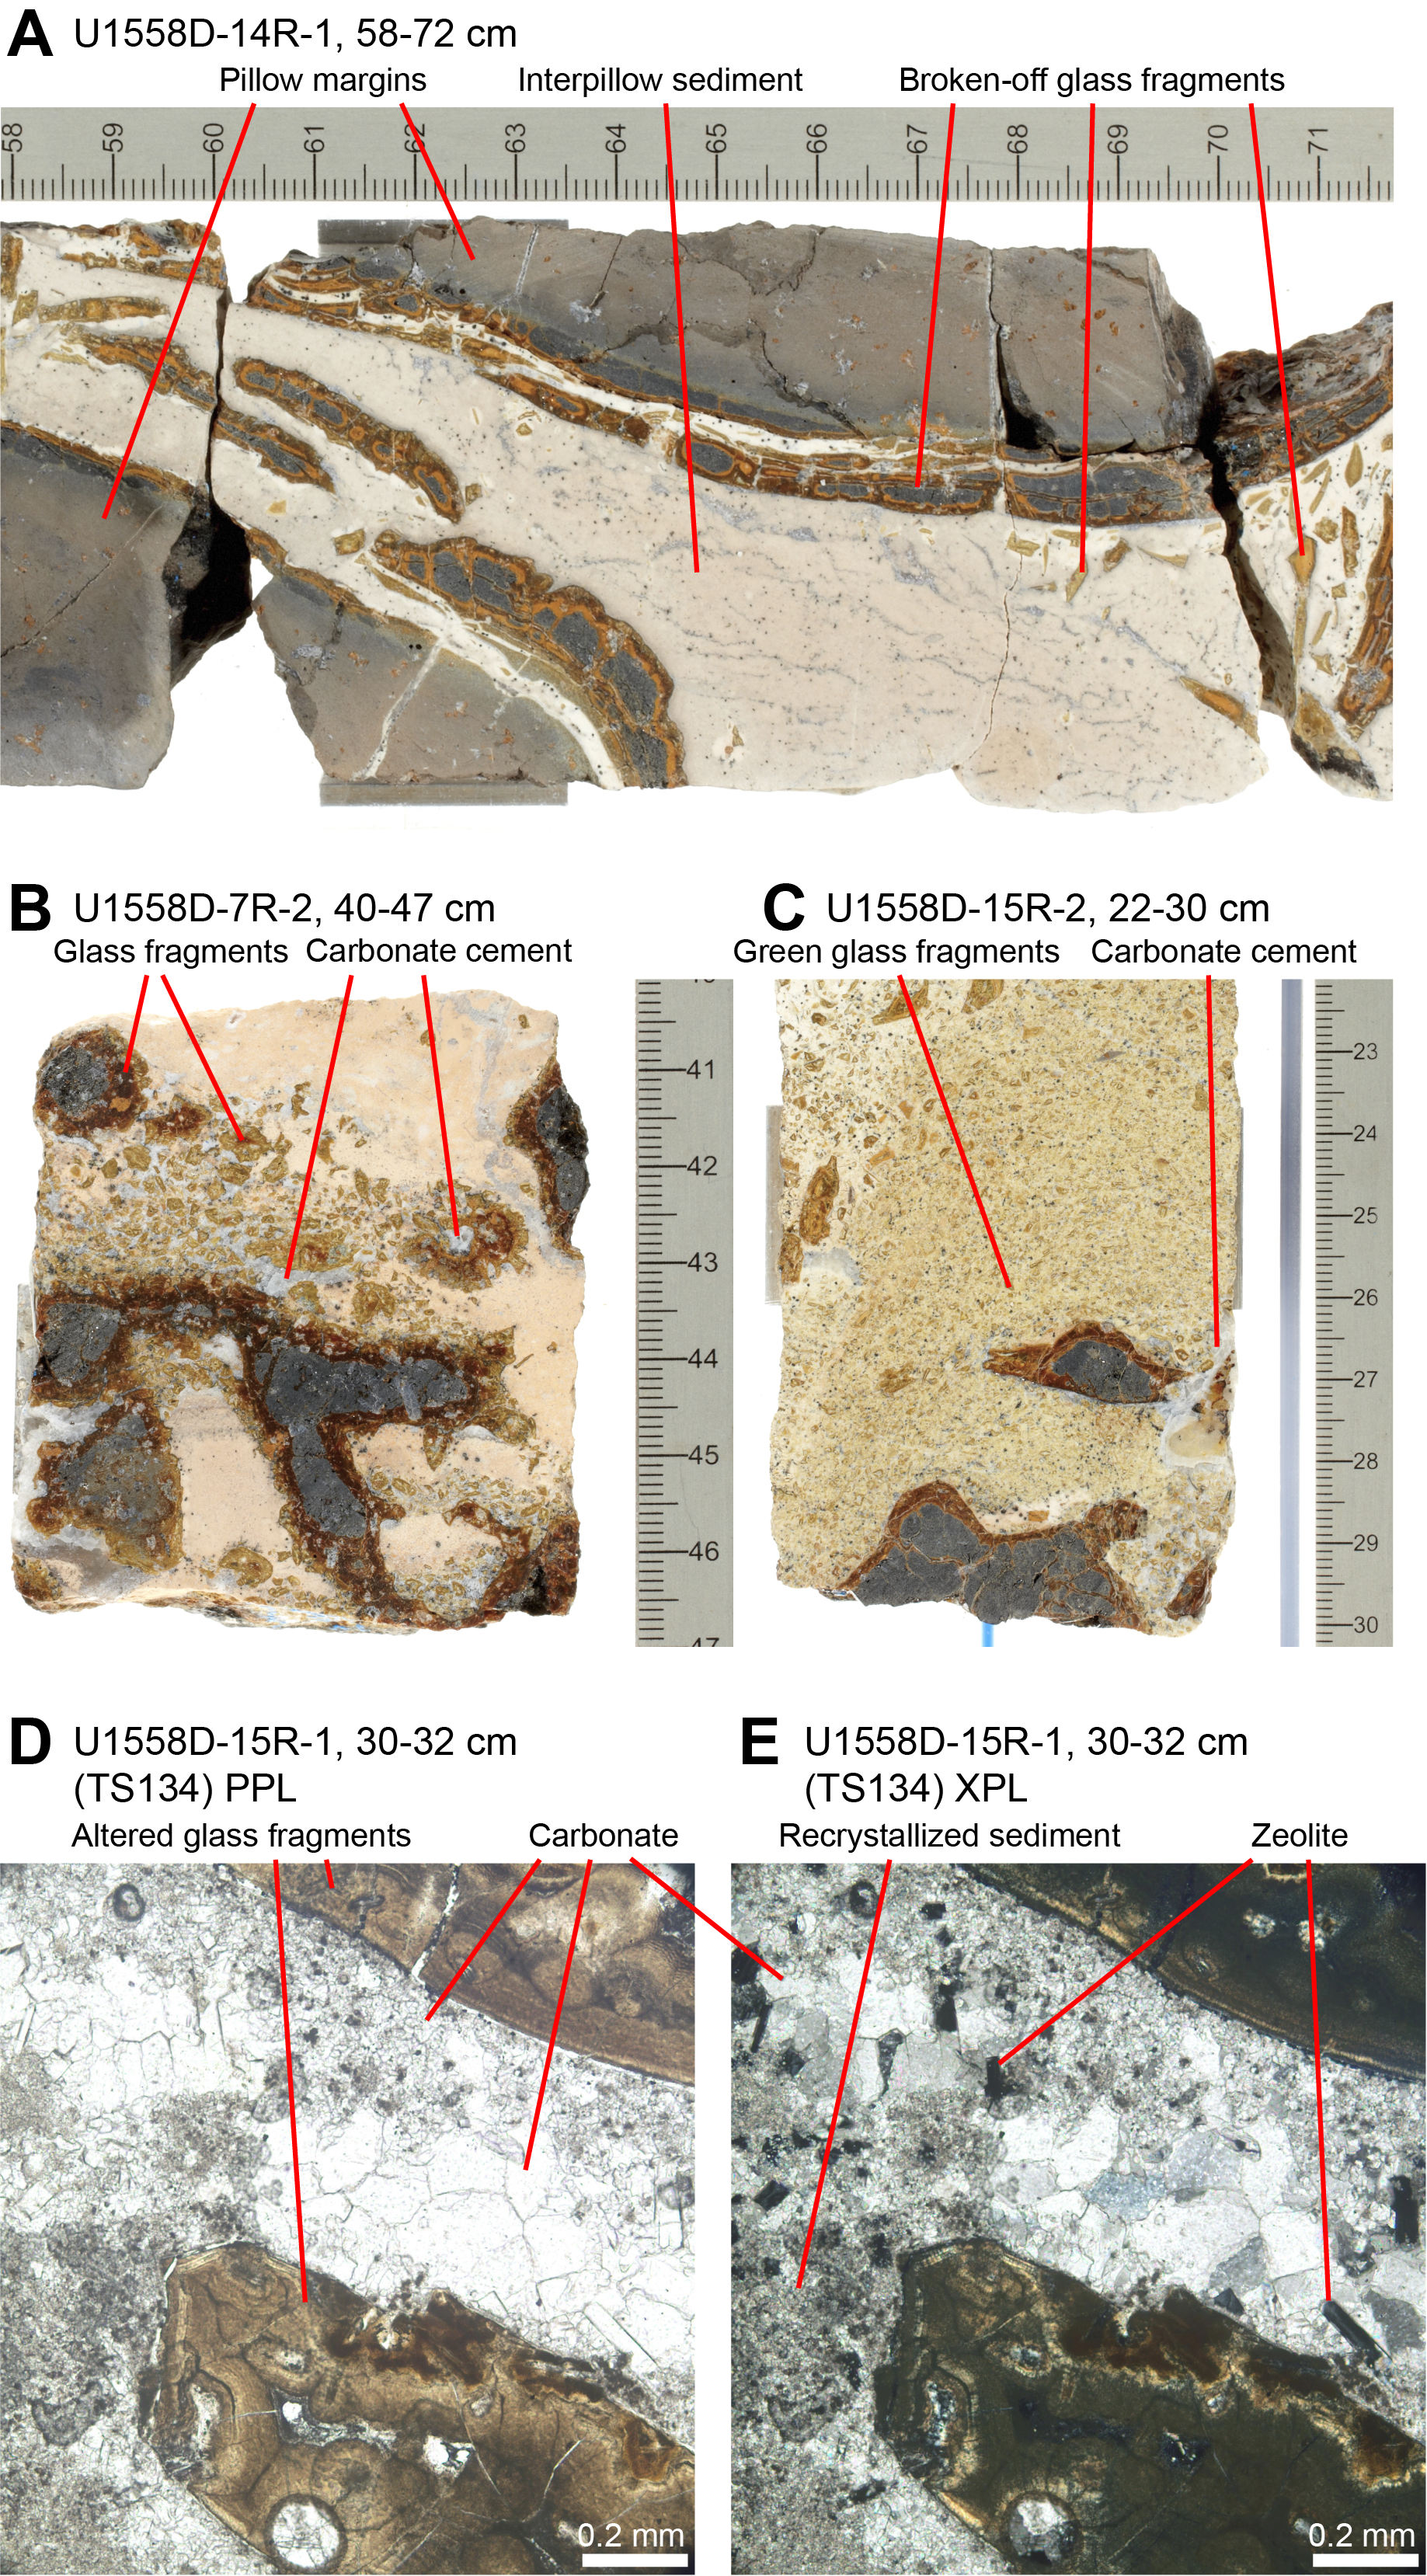
Figure F47. Breccias.
Calcite cements that have precipitated from fluids are a small proportion of these breccias (<5%), but locally on the scale of a single piece the cement may occupy up to 30%. The distribution of cement is highly variable, with patches that are cement free to areas dominated by calcite cement that locally retains open space. Another common feature are veins of calcium carbonate along clast edges that then continue into the interstitial space.
6.4.2. Type 2: clast dominated with clay + zeolite cement
In Unit 5, the interpillow breccias are clast dominated and the sediment-derived matrix common in the overlying units is absent (Figure F47D). These breccias comprise variable sizes of altered glass cemented by varying proportions of clay and zeolites. The clast alteration is highly variable with the interiors of centimeter-sized clasts still glassy, whereas small clasts are strongly to completely altered to clays (Figure F48). Cement volumes are low (1%–9%) and are predominantly phillipsite-Na with minor clay (montmorillonite; Table T8).
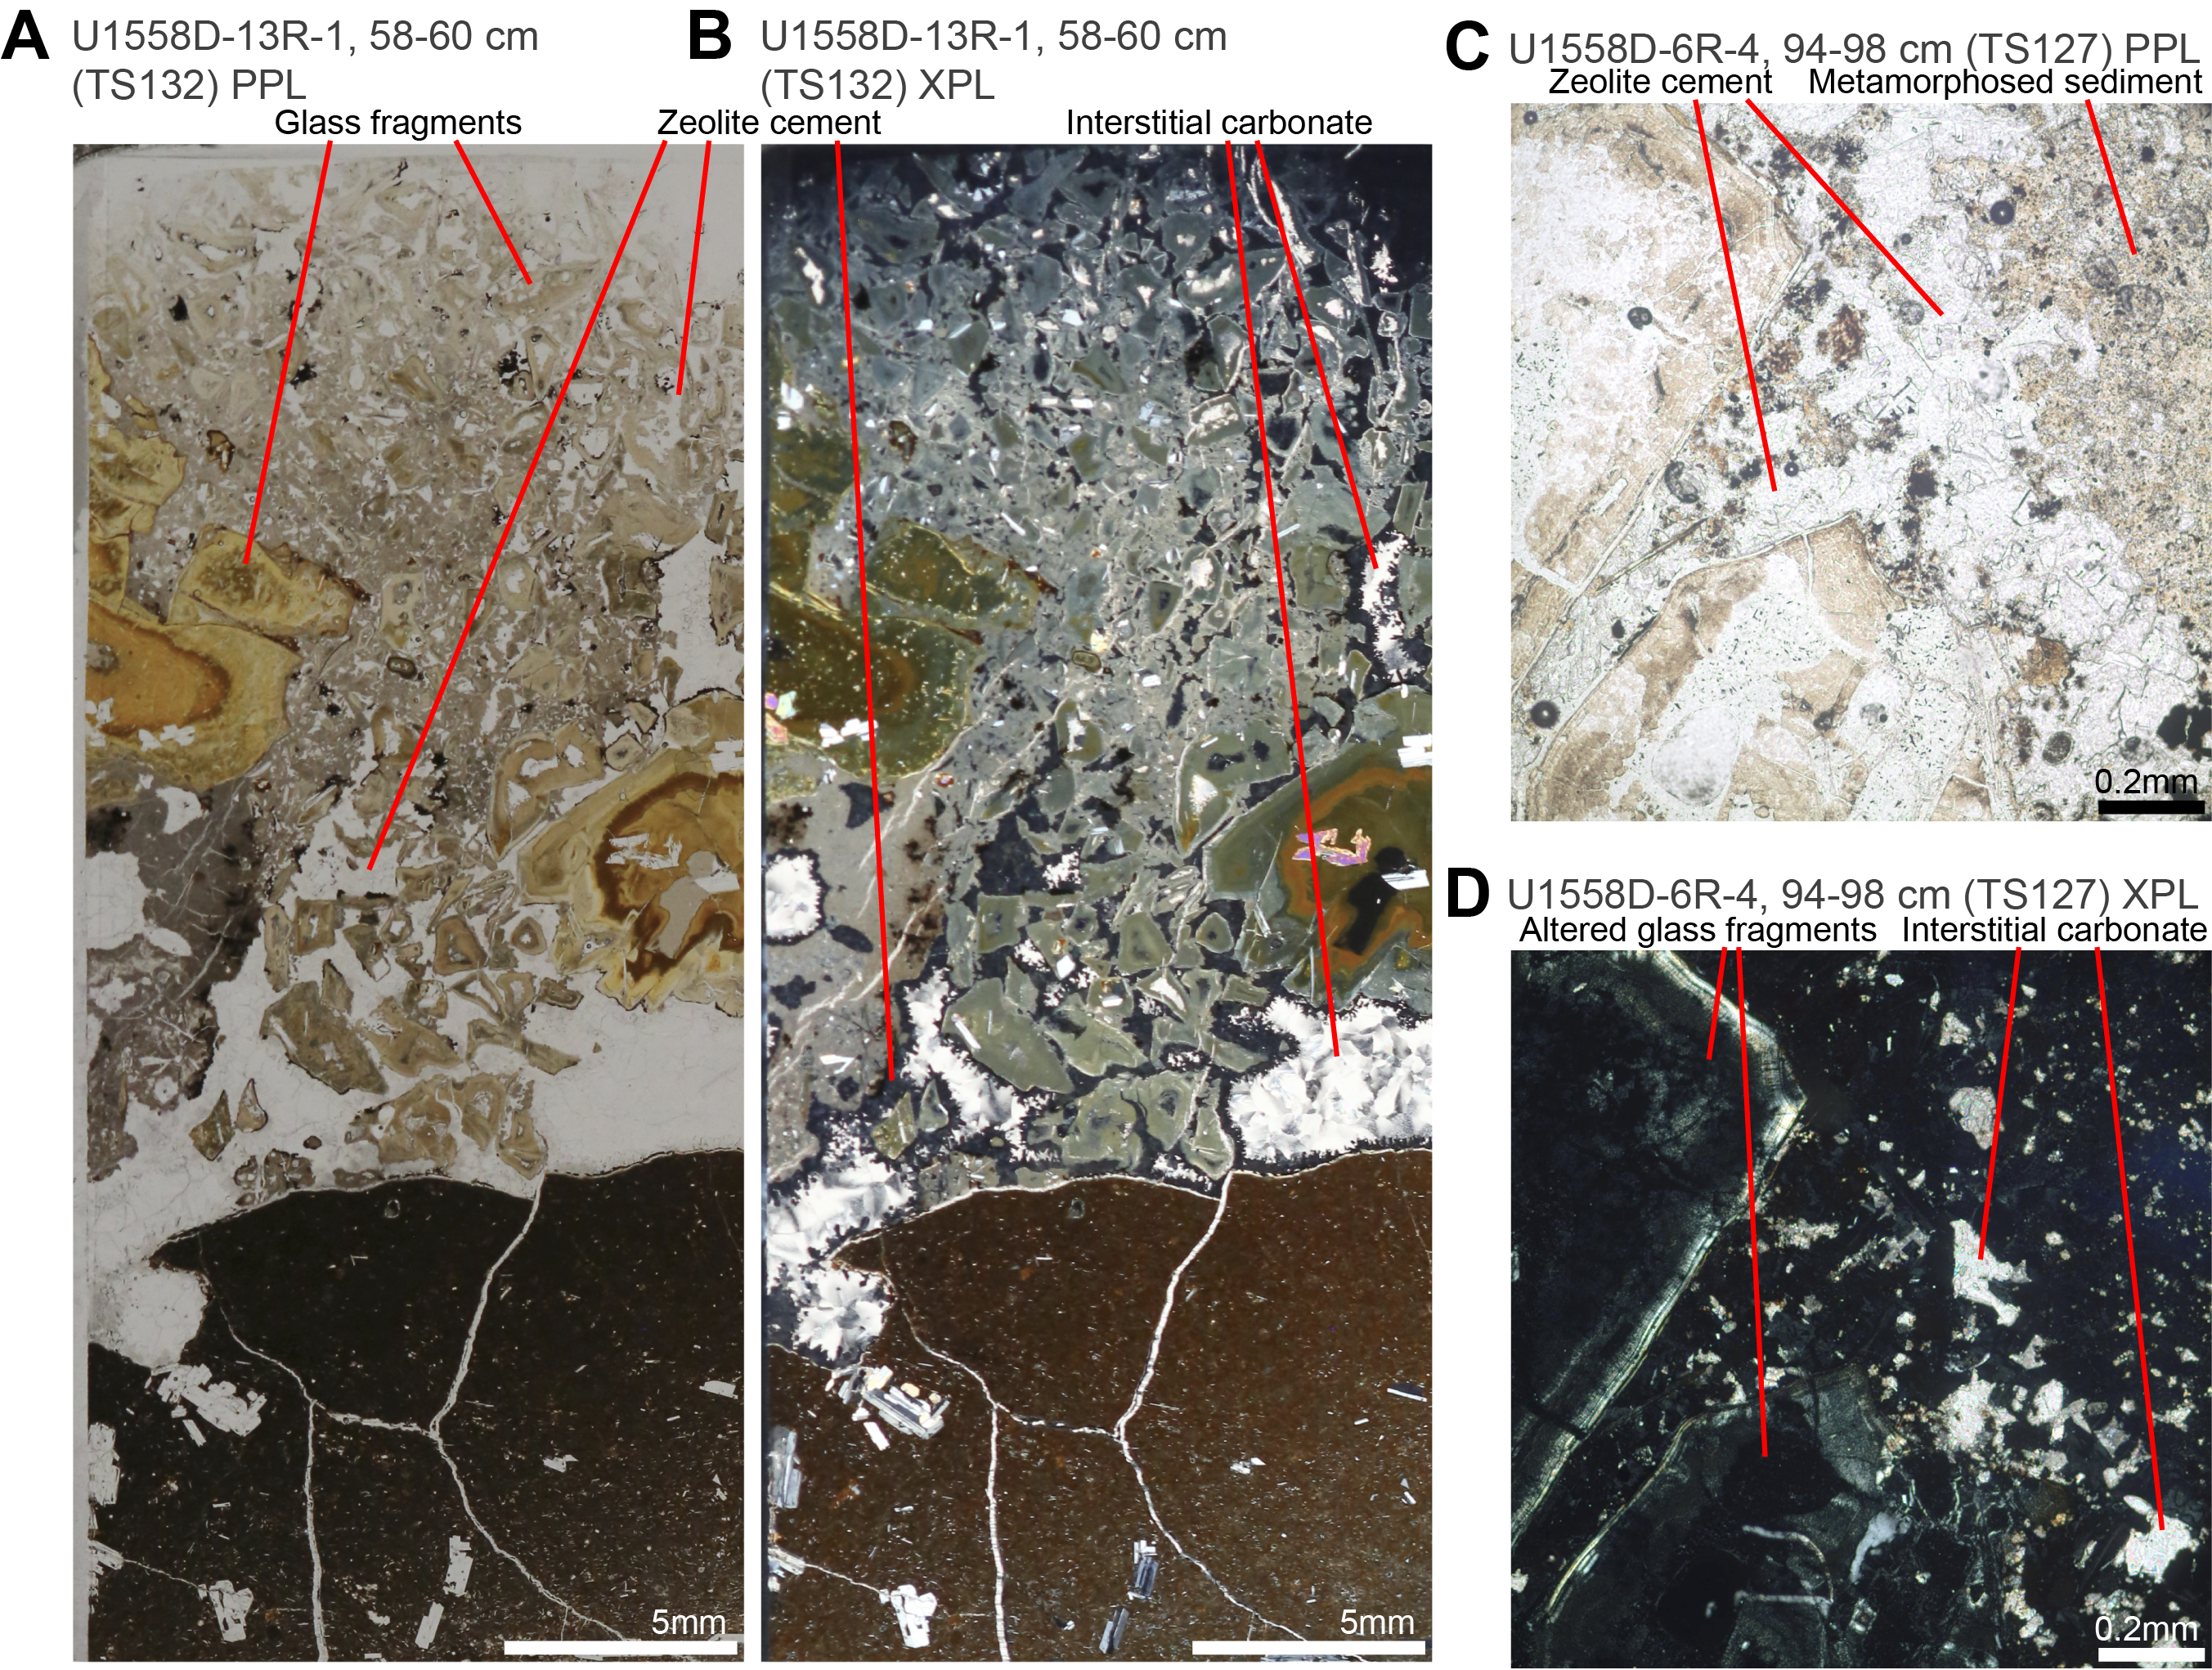
Figure F48. Zeolite-cemented breccias.
6.5. Veins
Hydrothermal veins are present throughout Hole U1558D and provide a record of the secondary minerals precipitated from seawater-derived hydrothermal fluids. The mineralogy and physical characteristics of 2963 veins were logged, including structural orientations for 903 veins. A total of 489 veins have associated alteration halos, of which 57% have a single halo type with others exhibiting multiple halos where several halo colors occur together. Vein widths range <0.1–9 mm (median = 0.2 + 1/− 0.2 mm [1σ equivalent], mean = 0.5 mm, and mode = 0.1 mm) and display a geometric distribution (Figure F49). Total vein density is variable downhole from 10 to 52 veins/m (median and mean = 30 veins/m; Figure F50). Veins occupy 2% of the volume of the core (Figure F51). Secondary minerals present include calcite, clays, zeolites, Fe oxyhydroxides, sediment, and manganese oxides (Figures F52, F53). Calcite is the dominant vein filling mineral. Approximately 30% of all veins are filled with only one mineral, 56% of veins are filled with two minerals, and the remaining veins are filled with three or four minerals.
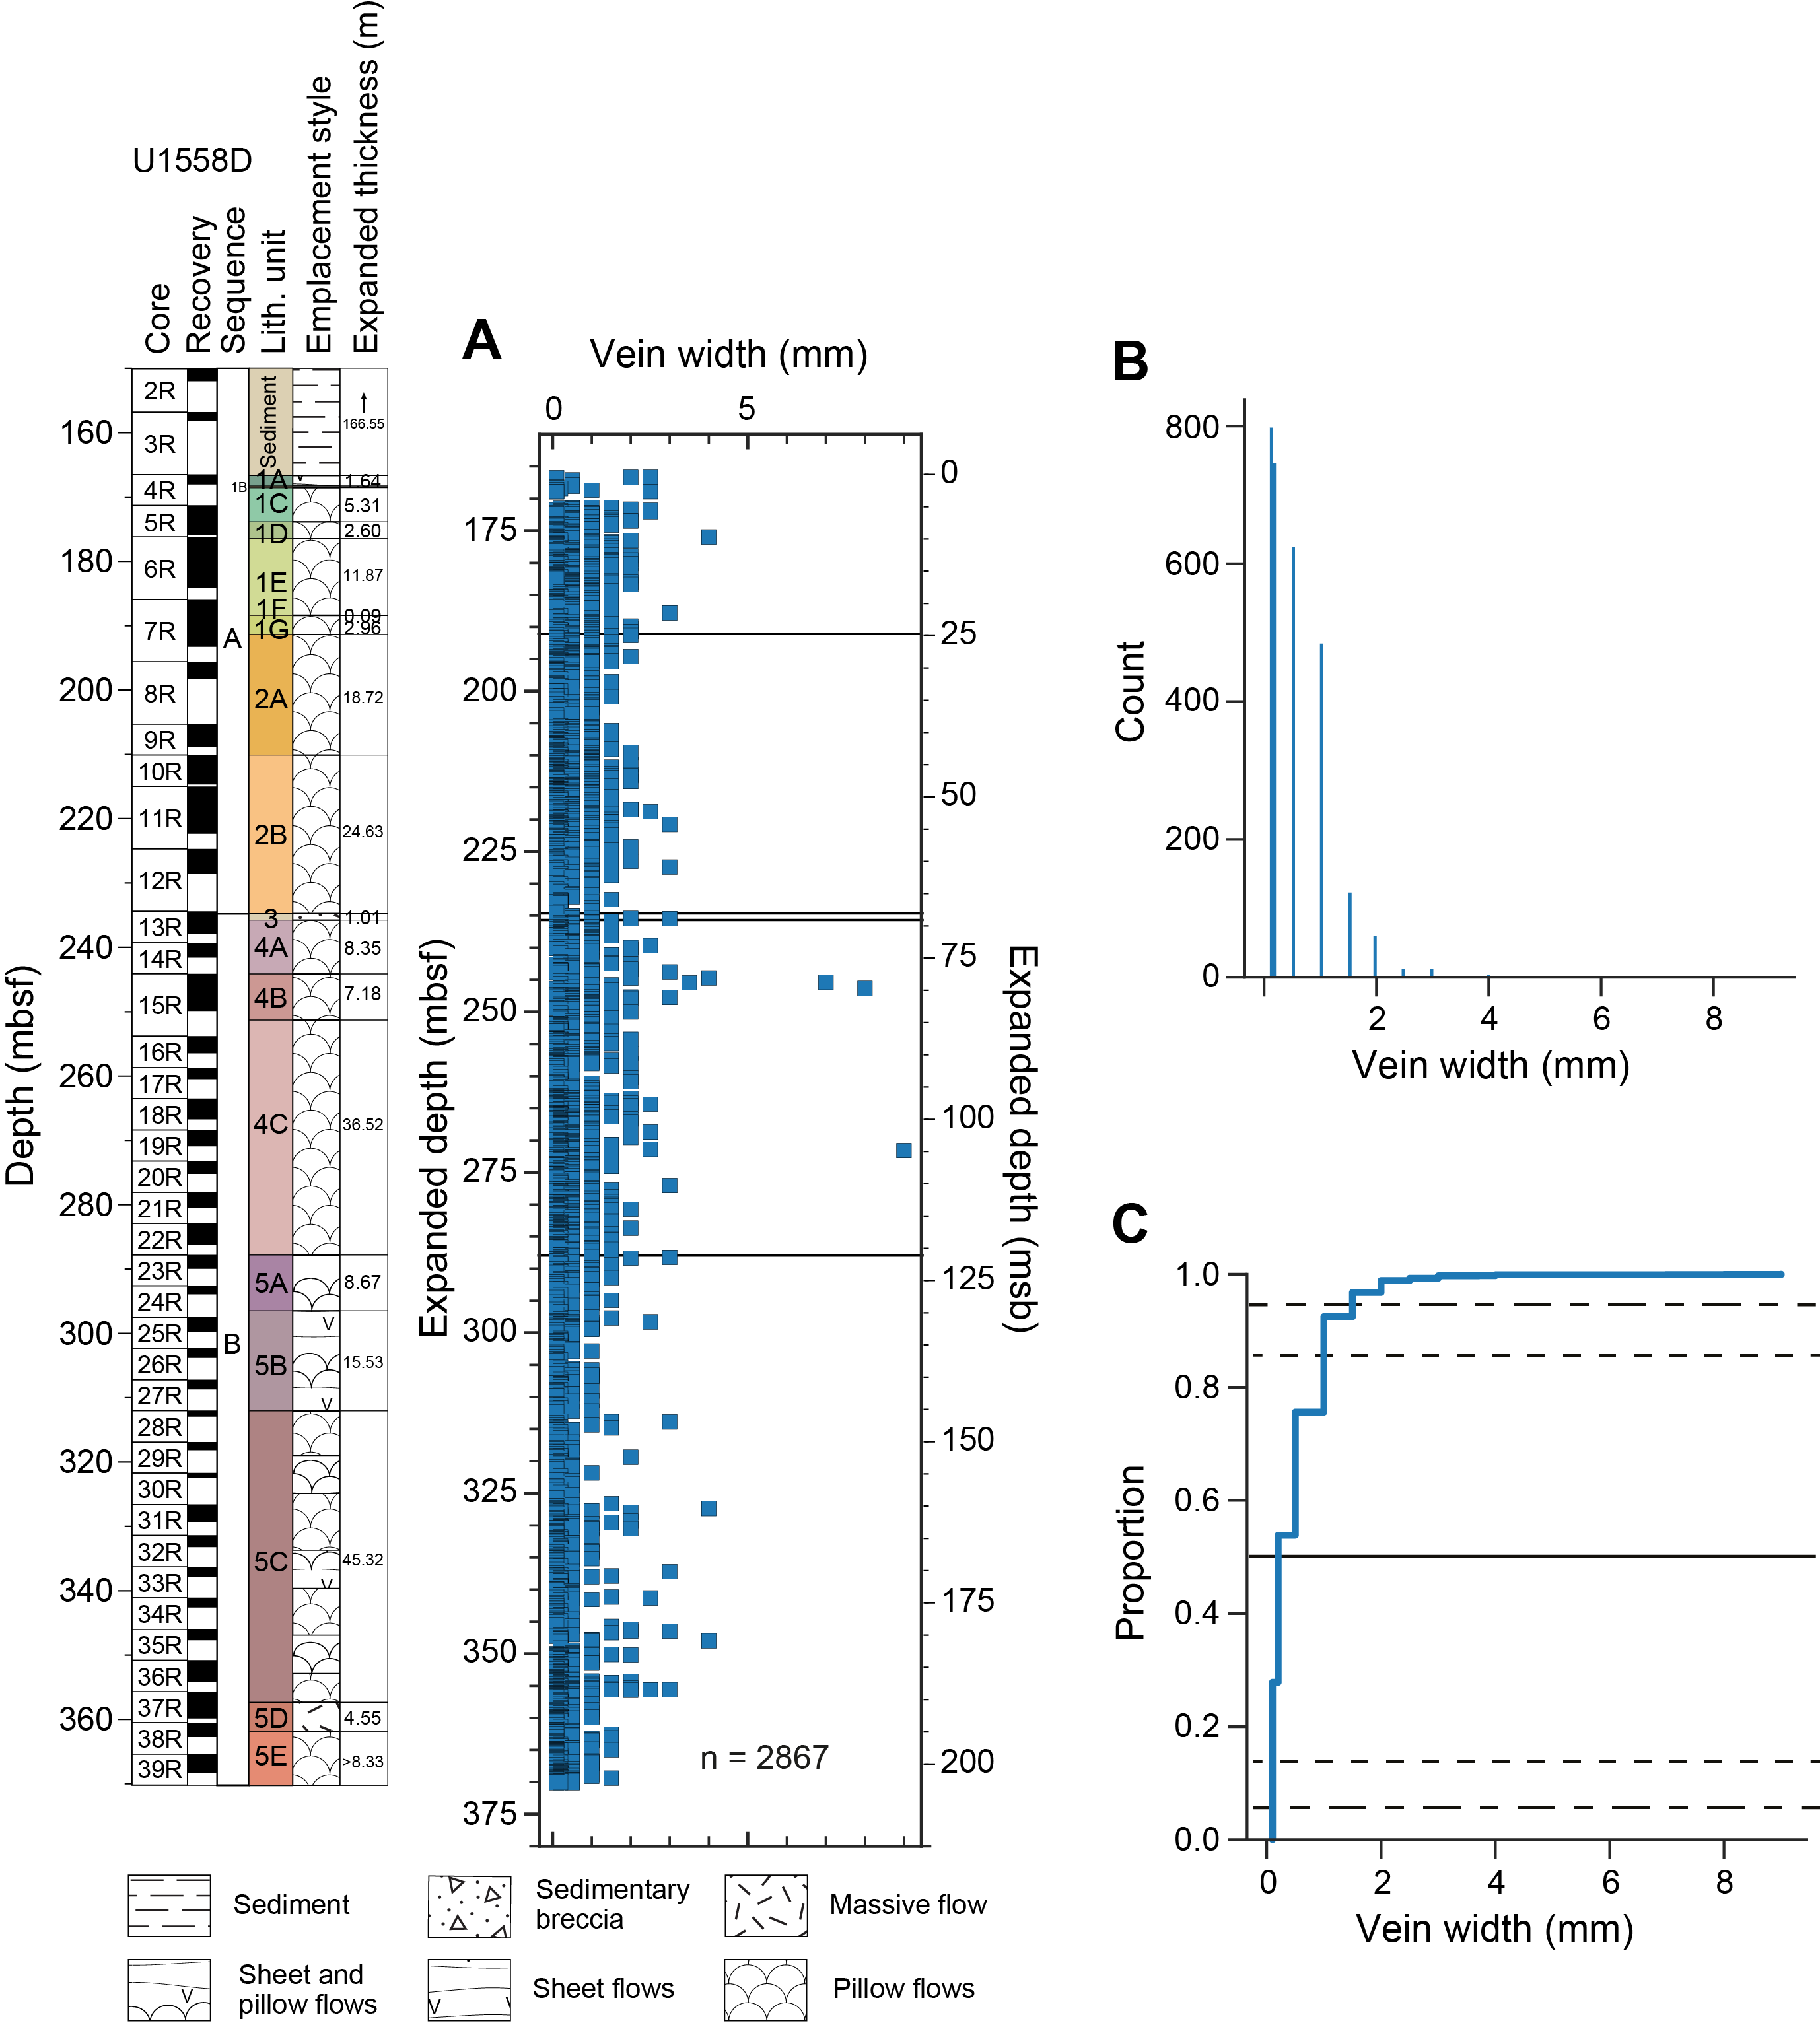
Figure F49. Vein width characteristics.
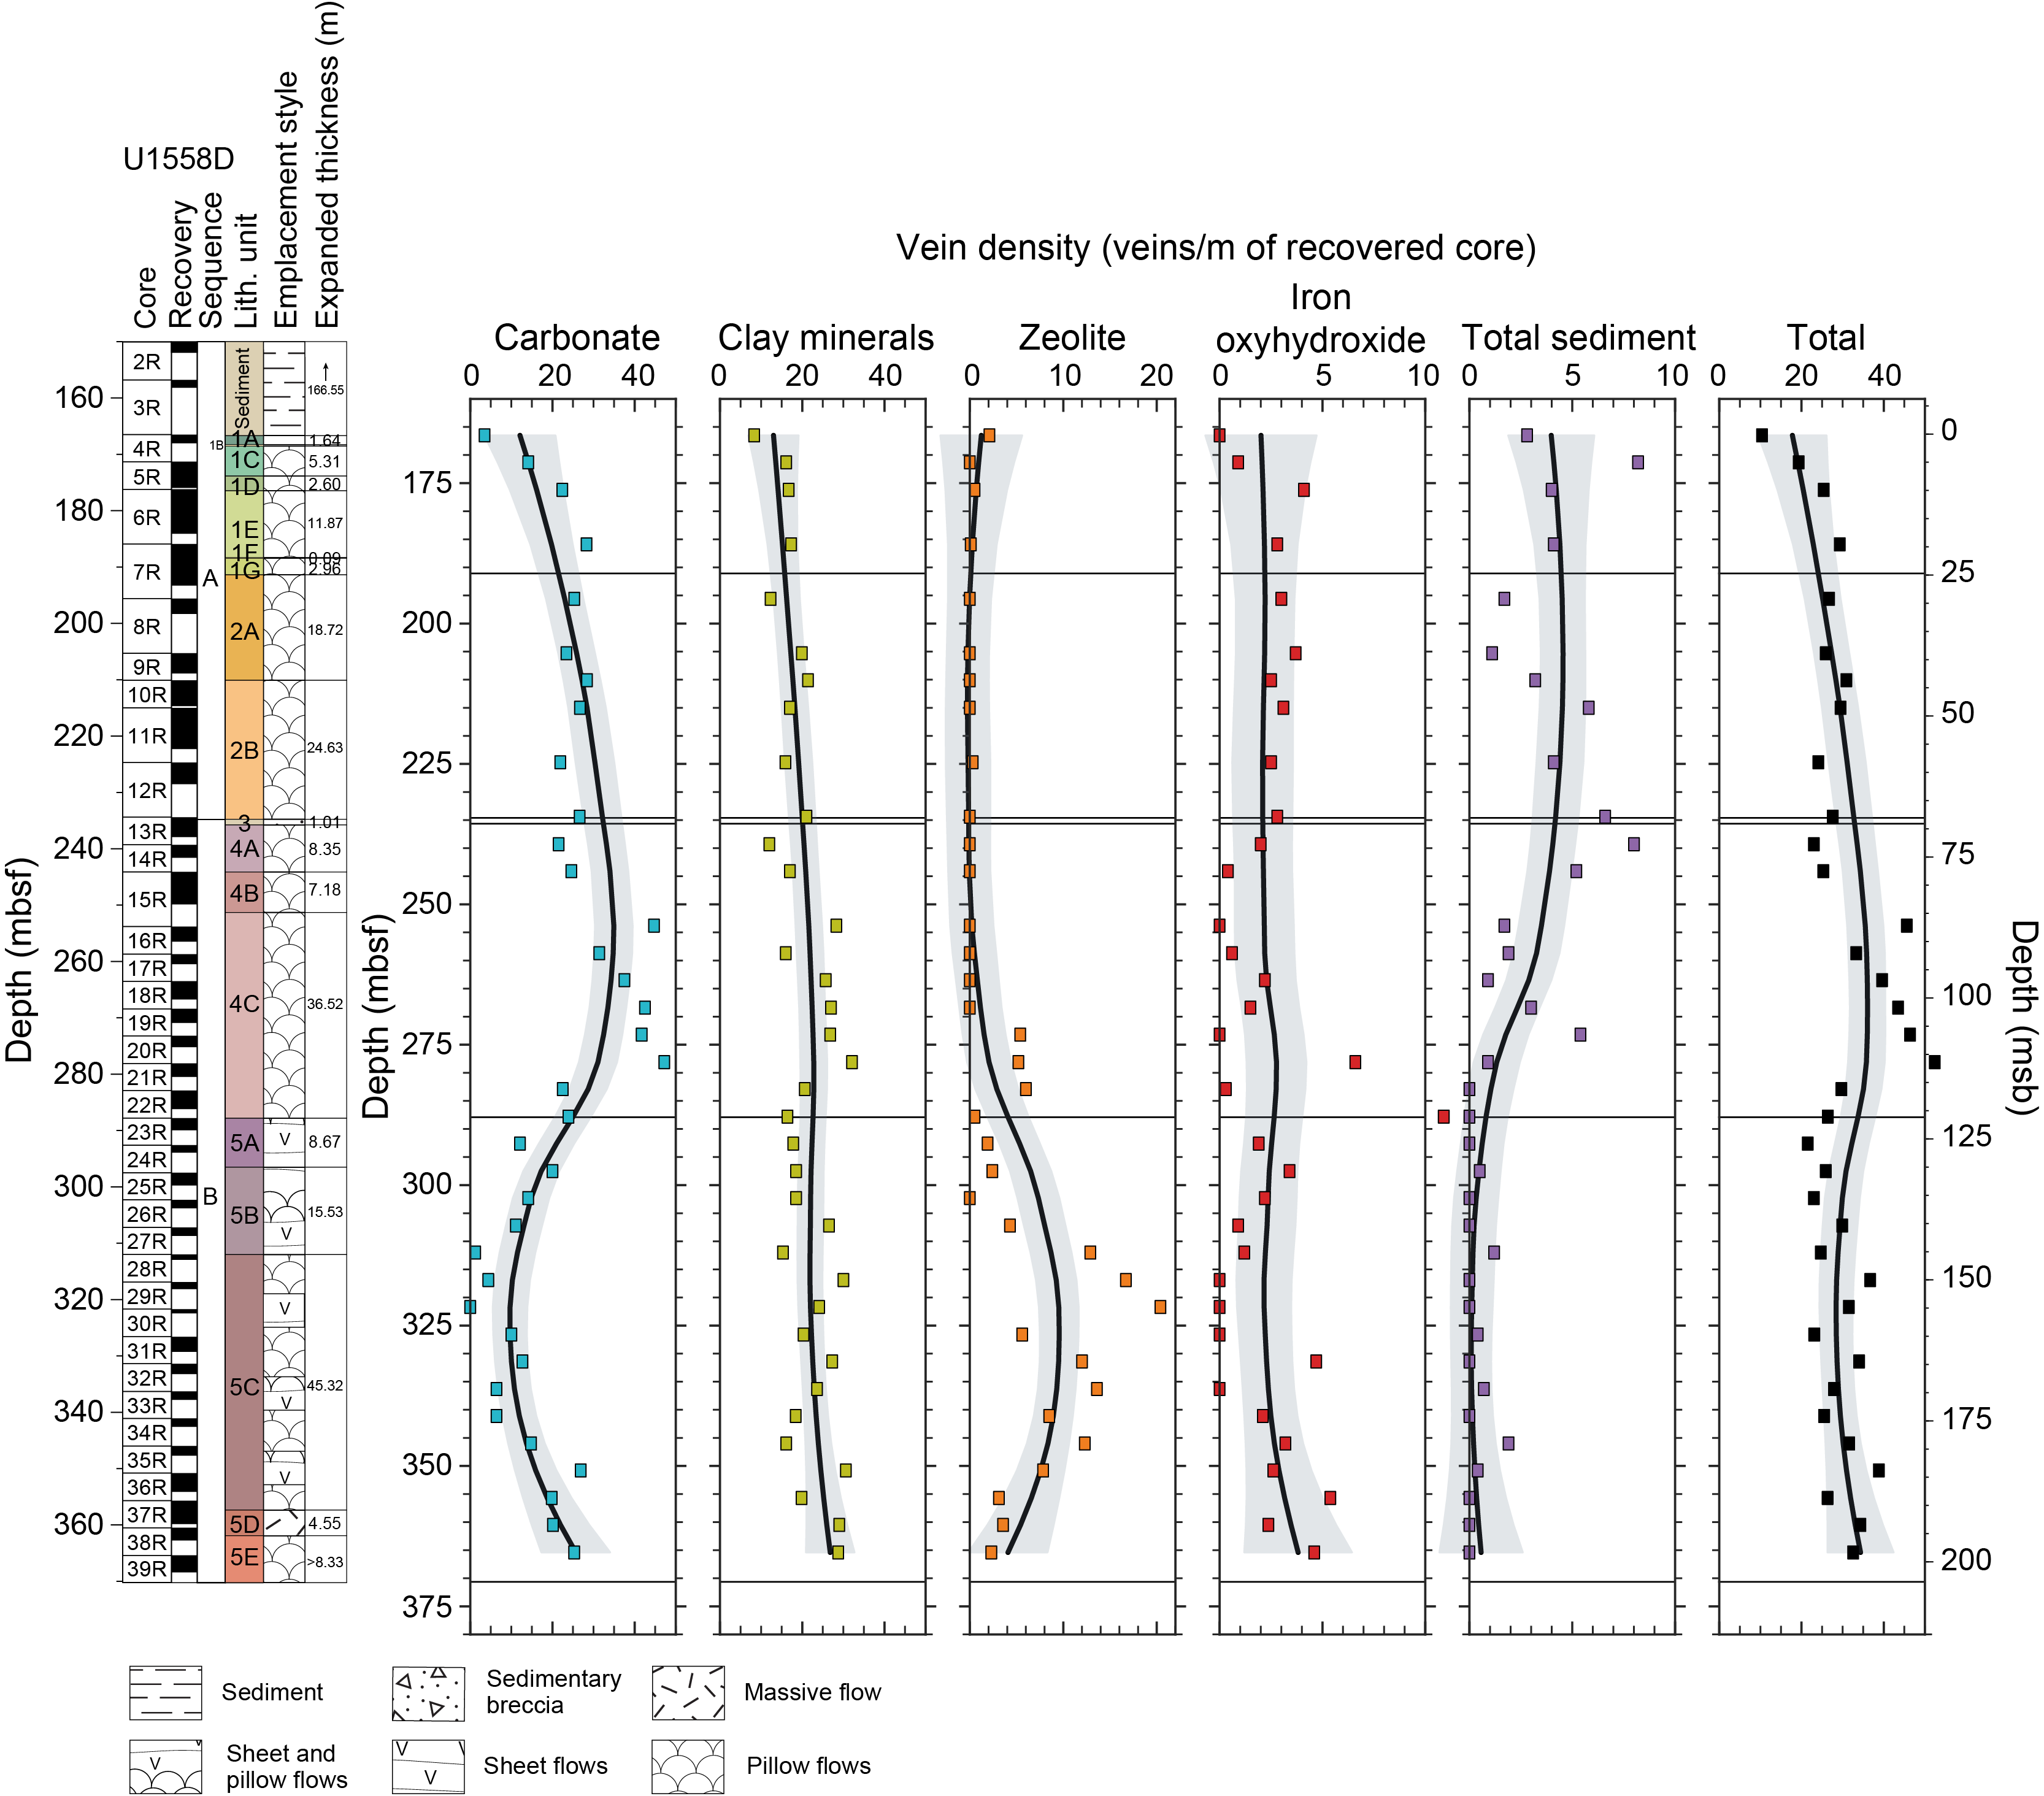
Figure F50. Vein density per meter normalized to core recovery.
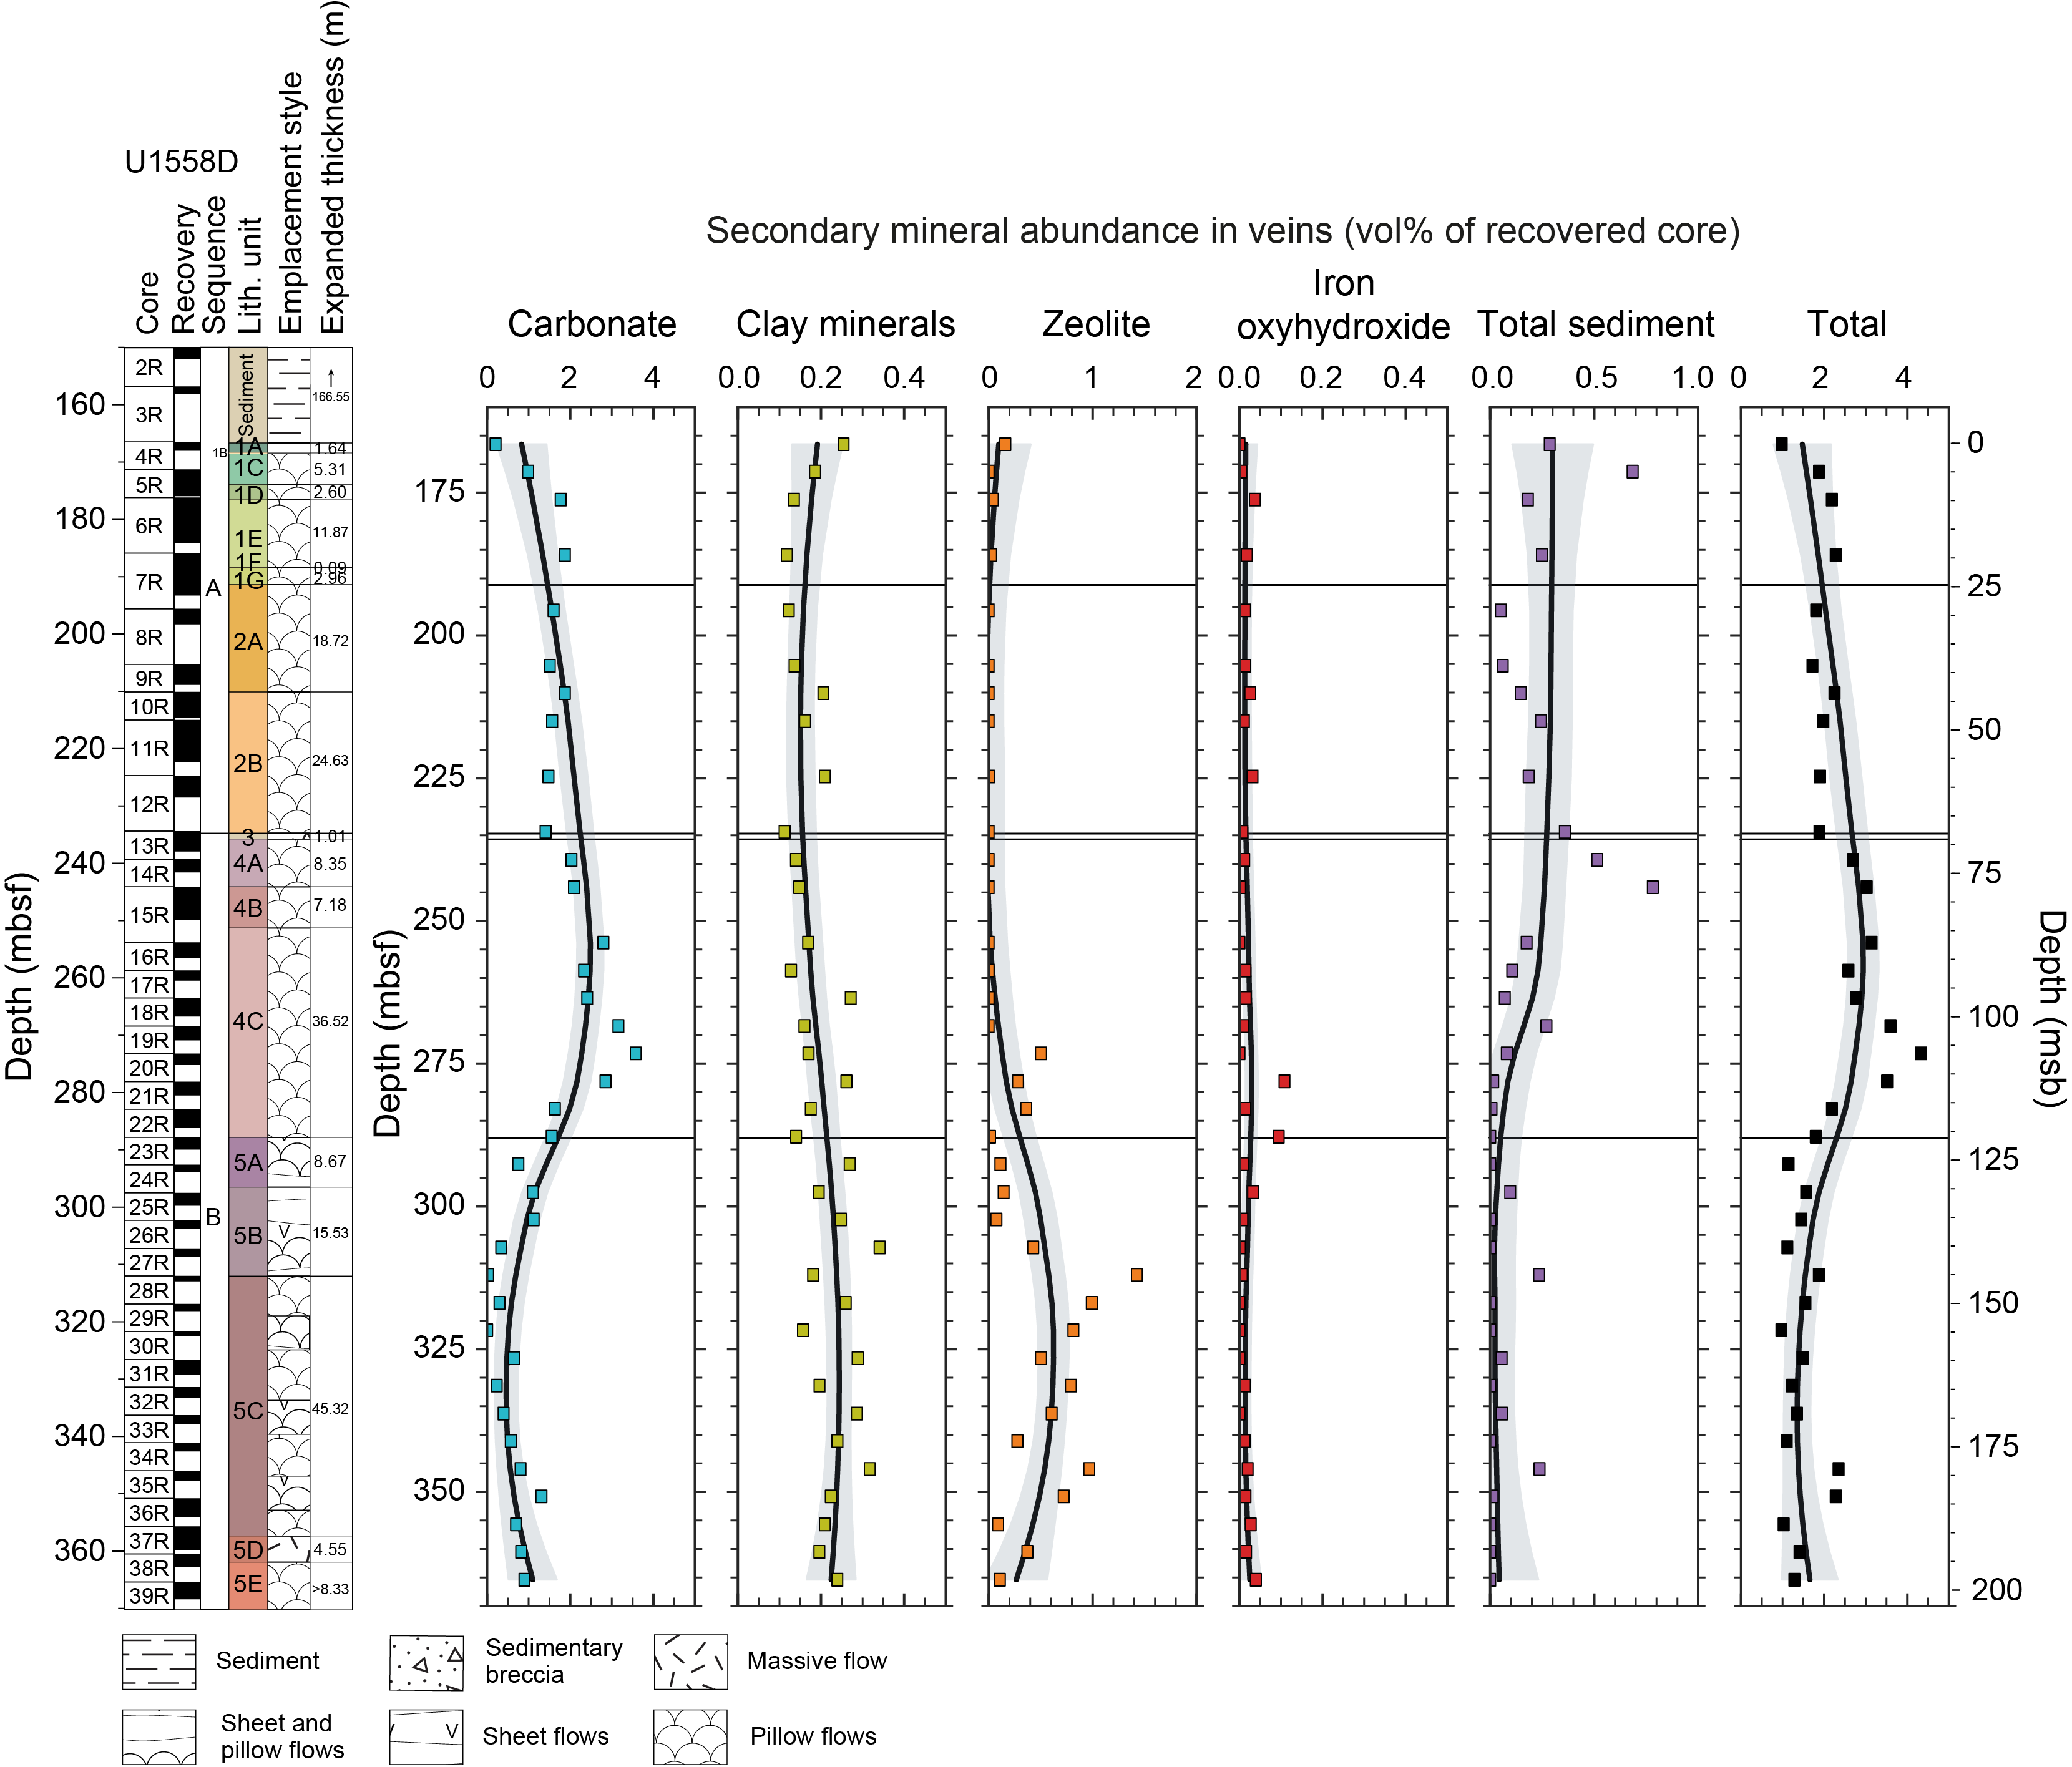
Figure F51. Secondary mineral abundance in veins.
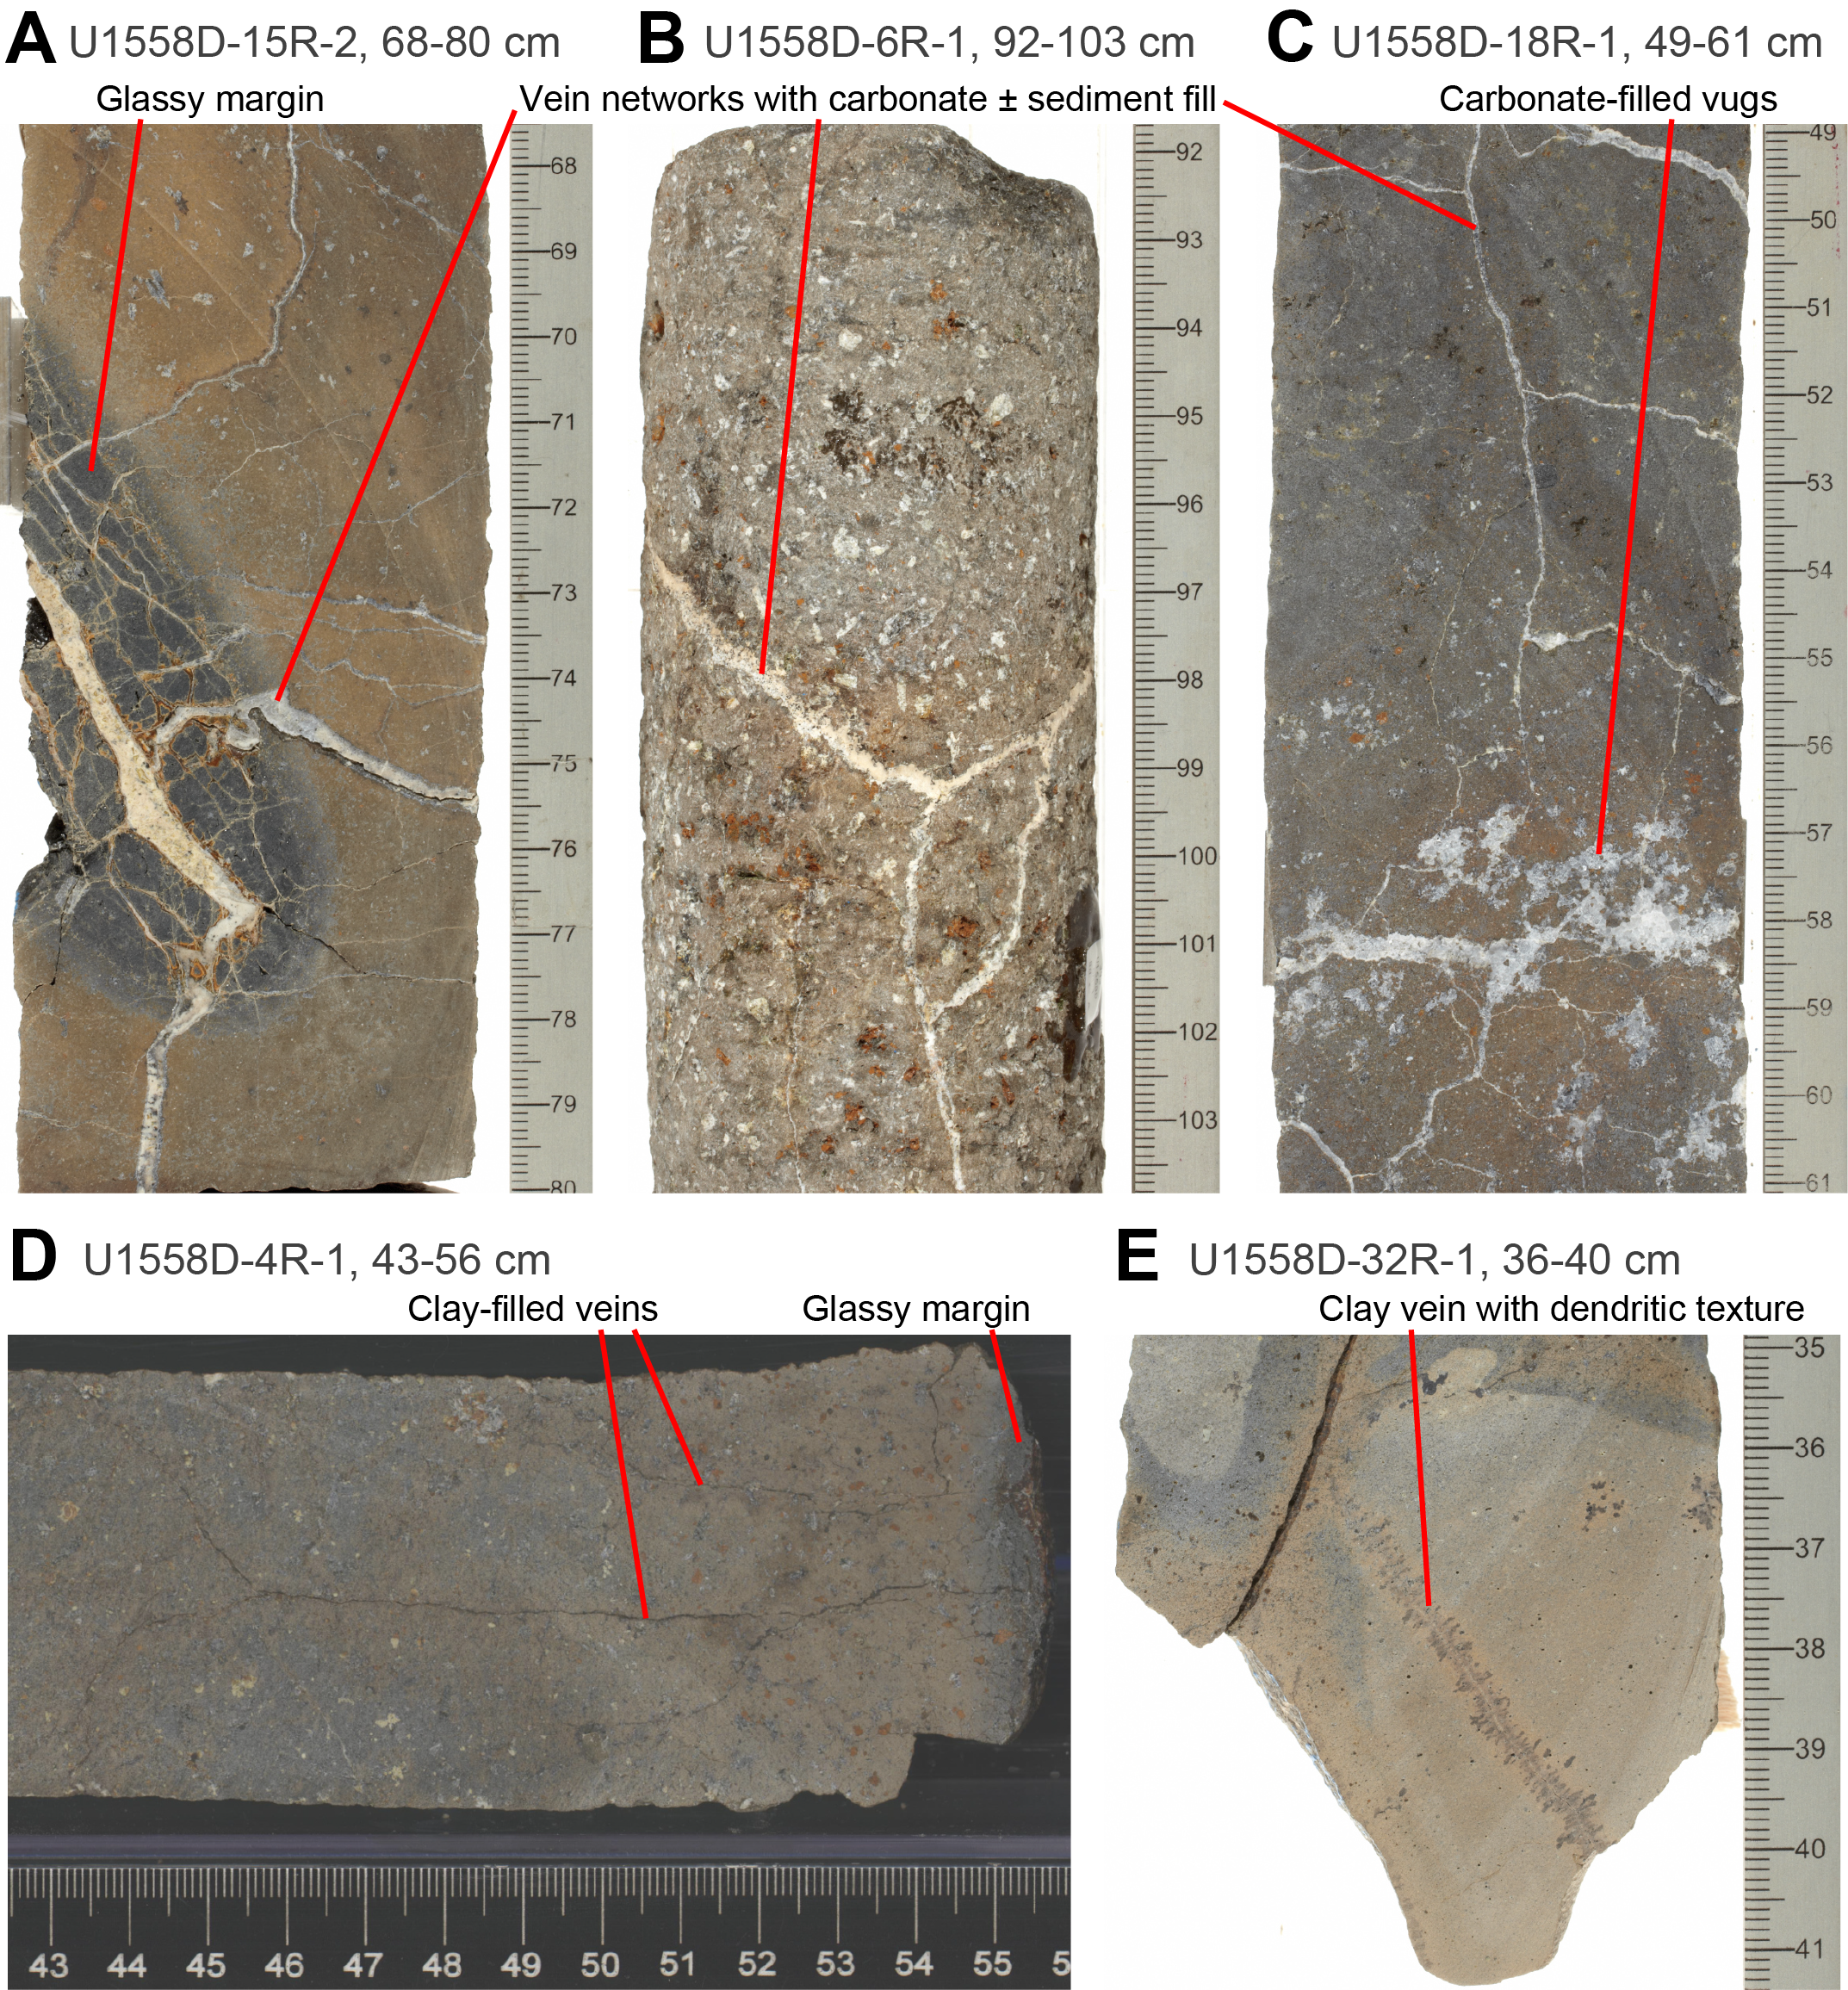
Figure F52. Mineral fillings in hydrothermal veins.

Figure F53. Sediment-filled veins.
The most common vein assemblage is clay + carbonate, where clay forms the lining of the vein. The downhole distribution of secondary mineral abundances (volume%) shows several interesting trends (Figure F51). First, the volume of calcium carbonate veins decreases overall downhole. Superimposed within this overall decrease, carbonate abundance increases from 160 to 270 mbsf and then shows a marked decrease in Unit 5. A small amount of zeolite is present at the top of the hole, but zeolite occurs most commonly below 275 mbsf. Zeolites (confirmed by XRD to be mostly phillipsite-Na; Table T8) are absent from Unit 2 and parts of Unit 3. The volume of clay minerals remains fairly uniform downhole, although clay vein density increases slightly downhole. The volume of clay does not show the same decrease deeper than 110 msb as calcium carbonate, even though these minerals commonly occur together. The volume of clay does not decrease because the drop in calcium carbonate veins is accompanied by an increase in the thickness of clay veins and the appearance of slightly greener and commonly powdery clay veins that appear to offset the decrease in calcium carbonate. Zeolite veins are predominantly associated with chilled margins and occur as thin <0.5 mm coatings on either fresh or altered glass. Some zeolite ± clay ± sediment–bearing veins penetrate through the glassy margin into the host rock, but they abruptly change to calcium carbonate veins within a few centimeters of the margin. These transitions in vein composition along the length of a vein are also observed in Hole U1556B (see Alteration petrology in the Site U1556 chapter [Coggon et al., 2024a]).
Calcium carbonate veins also host sediment infill, particularly where veins are close to pillow or flow margins. The abundance of sediment in veins decreases downhole, and sediment is rare below 275 mbsf (~110 msb). Sediment veins are common in Unit 4. An increase in sediment in veins is seen in Subunit 4A where sediment also occurs as matrix fill in breccias. Similar to the relationship with clay, the textural relationship between calcium carbonate and sediment is variable. The most common association is patches or zones within a vein that are sediment dominated, but examples of crack-seal morphology are also observed (Figure F53).
Vein textures indicate that 67% of all veins display evidence of multiple episodes of fracturing and precipitation as multiple minerals occur within a single discrete vein such as calcium carbonate (the most abundant vein filling material) occurring in the same vein assemblage with clay (Figure F54A). The incorporation of wall rock fragments into the vein fillings indicates repeated episodes of fracturing and precipitation within veins (Figure F54B).
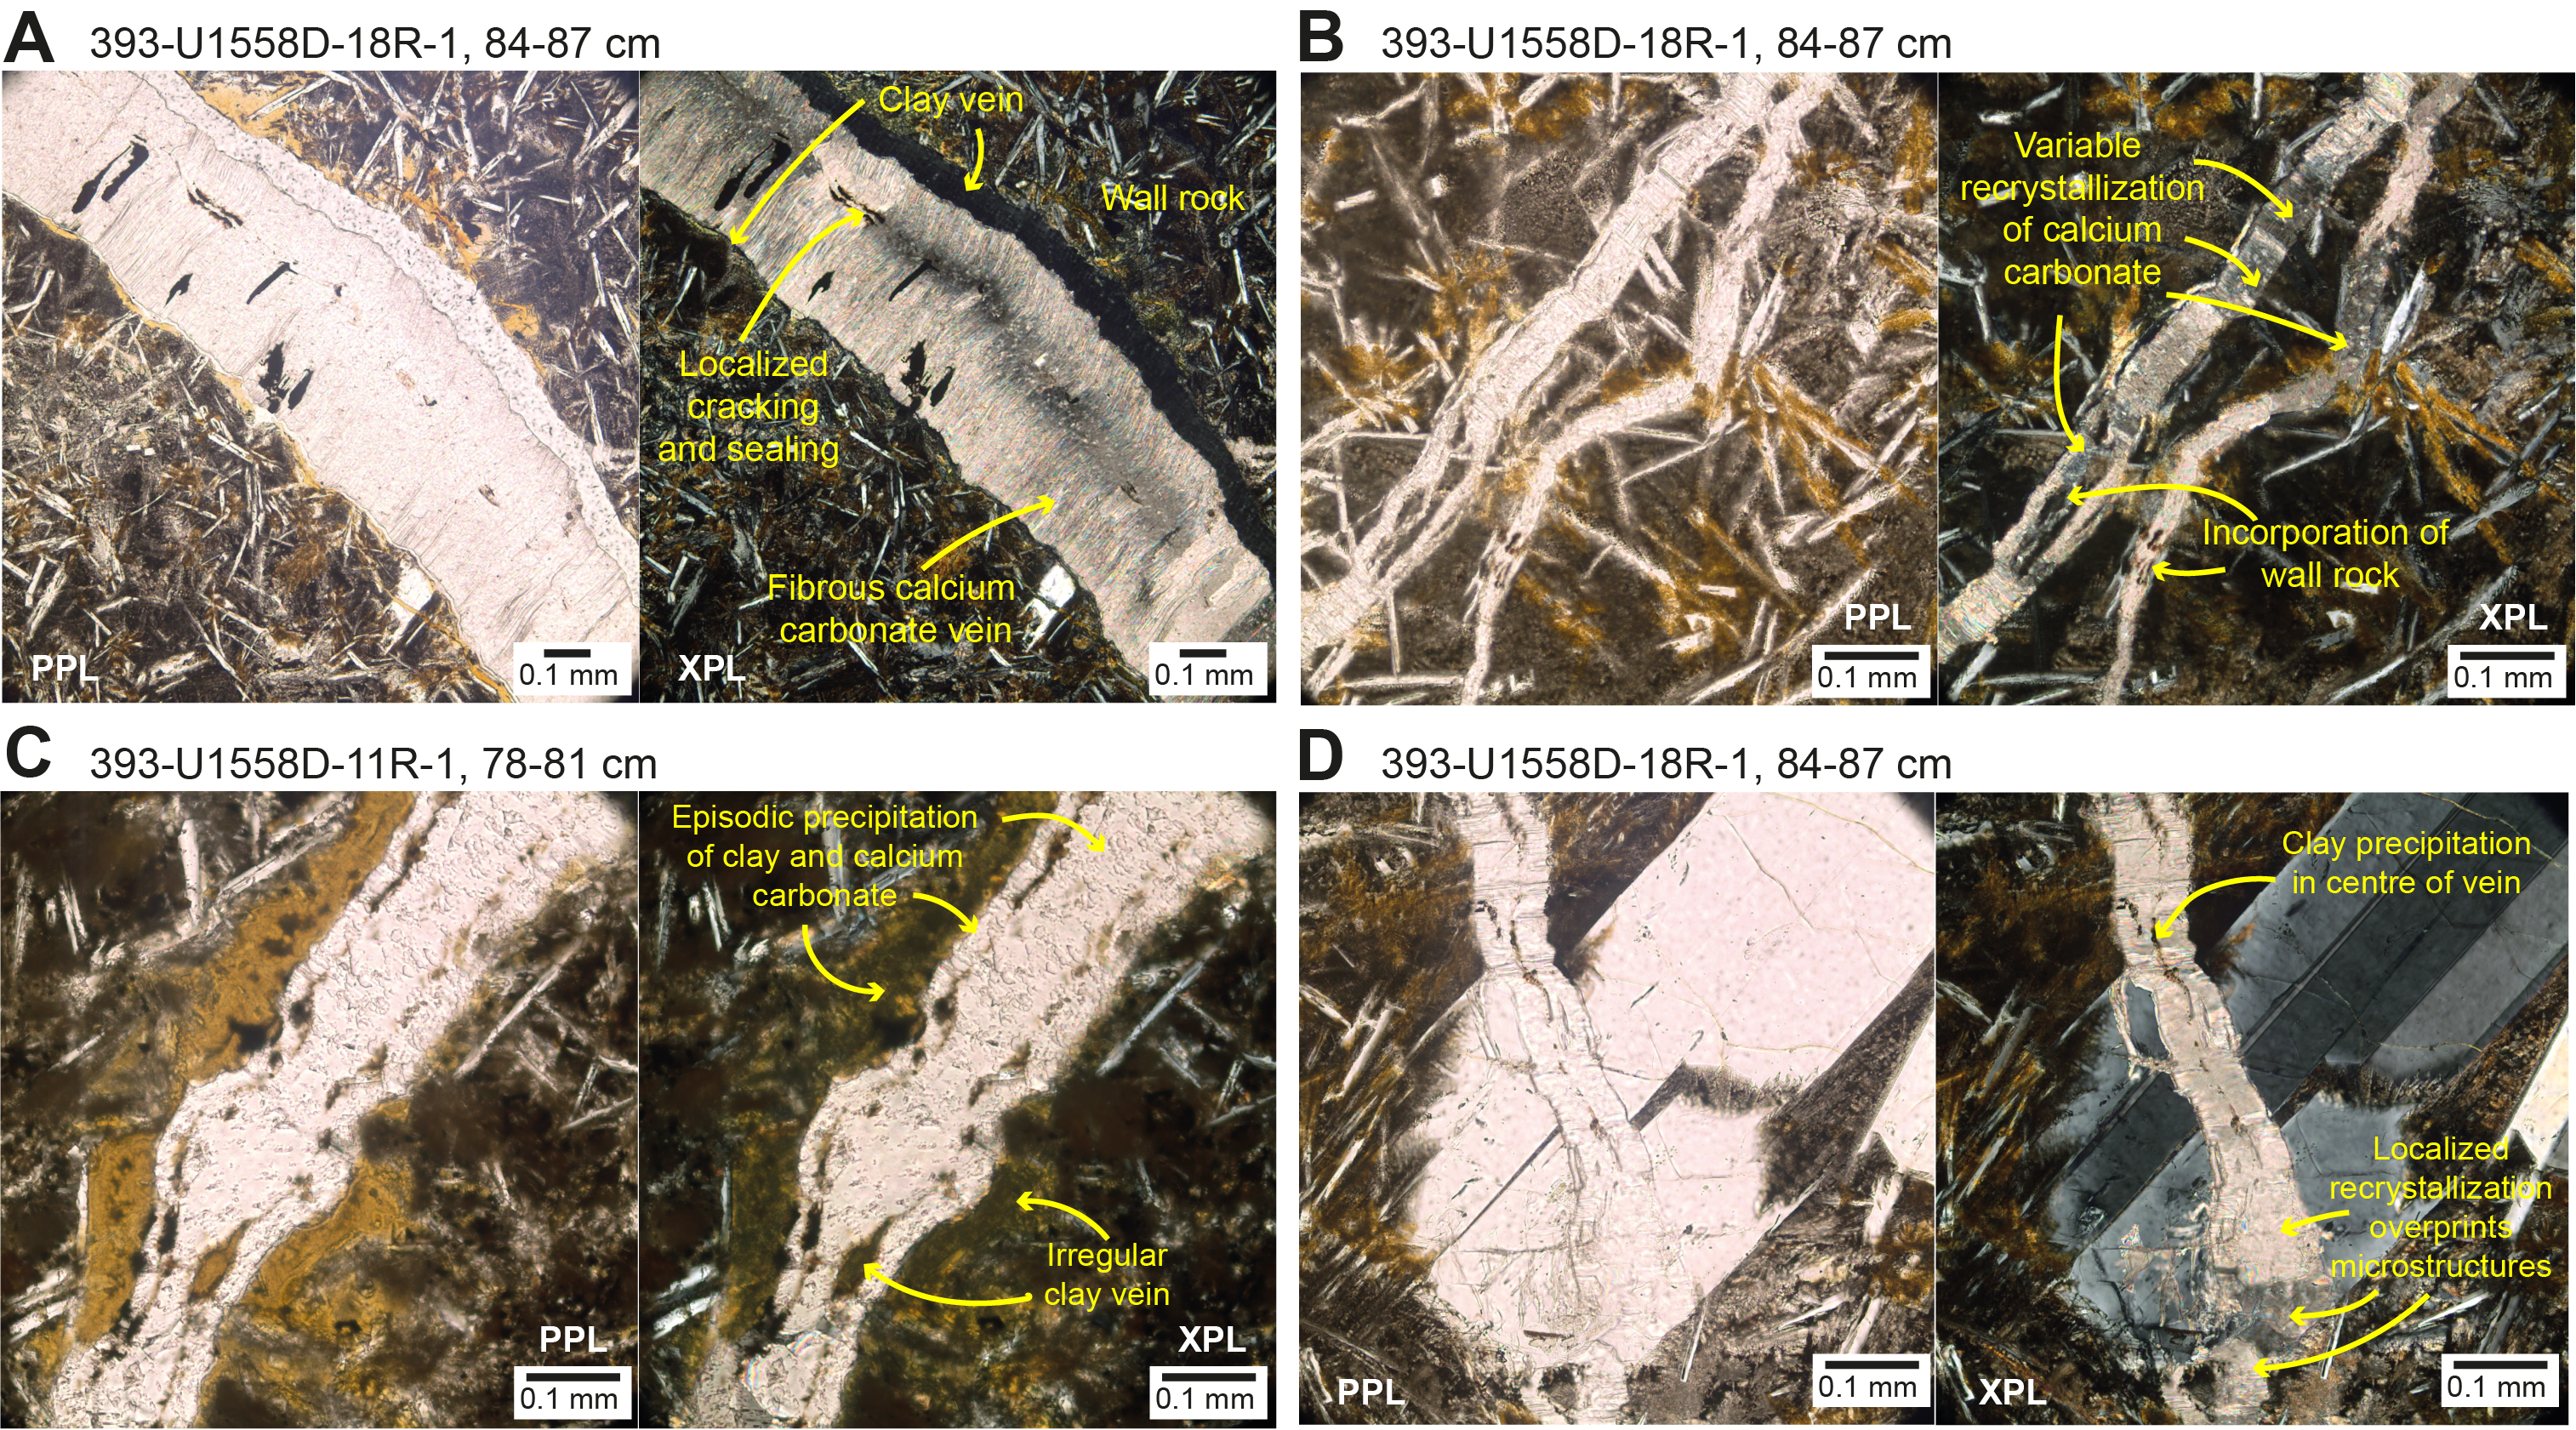
Figure F54. Vein microstructures.
Occurrences of veins that display clear crosscutting relationships are rare, and there is no systematic relationship between calcium carbonate and clay veins or fillings. In some calcite veins, clay lines vein margins, indicating that clays filled the initial fracture before subsequent opening and precipitation of calcium carbonate in the center of the vein (Figure F54C). However, in other examples, calcium carbonate lines the vein wall and clay occurs in the core, suggesting a contrasting fracture-precipitation sequence (Figure F54D). Crack-seal stretching veins occur and are differentiated by multiple successive episodes of fracturing and precipitation along differing arbitrary fracture planes, resulting in a heterogeneously stretched crystal morphology and the incorporation of wall rock into the vein assemblage (e.g., Figure F54B–F54D; Bons et al., 2012). Calcium carbonate veins preserve a range of internal microstructures from primary crack-seal syntaxial growth to crack-seal stretching veins (Figure F54B–F54D) including fibrous calcium carbonate antitaxial veins (Figure F54A). Some calcium carbonate veins display variable extents of recrystallization and preservation of original microstructures (Figure F54A–F54D).
6.6. Structural data
The dip direction and dip angle of 30% of logged veins were measured with true dip angles ranging between 2° and 90° (Figure F55). The median vein true dip angle of measured veins is 50°, and the mean vein true dip angle is 48° (Figure F55). The distribution of all measured vein true dip angles generally yields a weakly bimodal distribution (Figure F55B) with 31% of veins ranging 45°–67.5° and 26% of veins ranging 7.5°–30°. No systematic relationship between true vein dip angle and depth occurs (Figure F55). Single event veins generally yield a uniform distribution, whereas multiple event veins dominate the orientated logged vein budget and show a bimodal distribution, with a first mode between 20° and 30° and a second mode occurring between 50° and 70° (Figure F56). The lack of subvertical and subhorizontal veins is mostly an artifact of recovery and the inherently low likelihood of intersecting steeply dipping features during coring and core breaks with grinding along gently dipping veins.
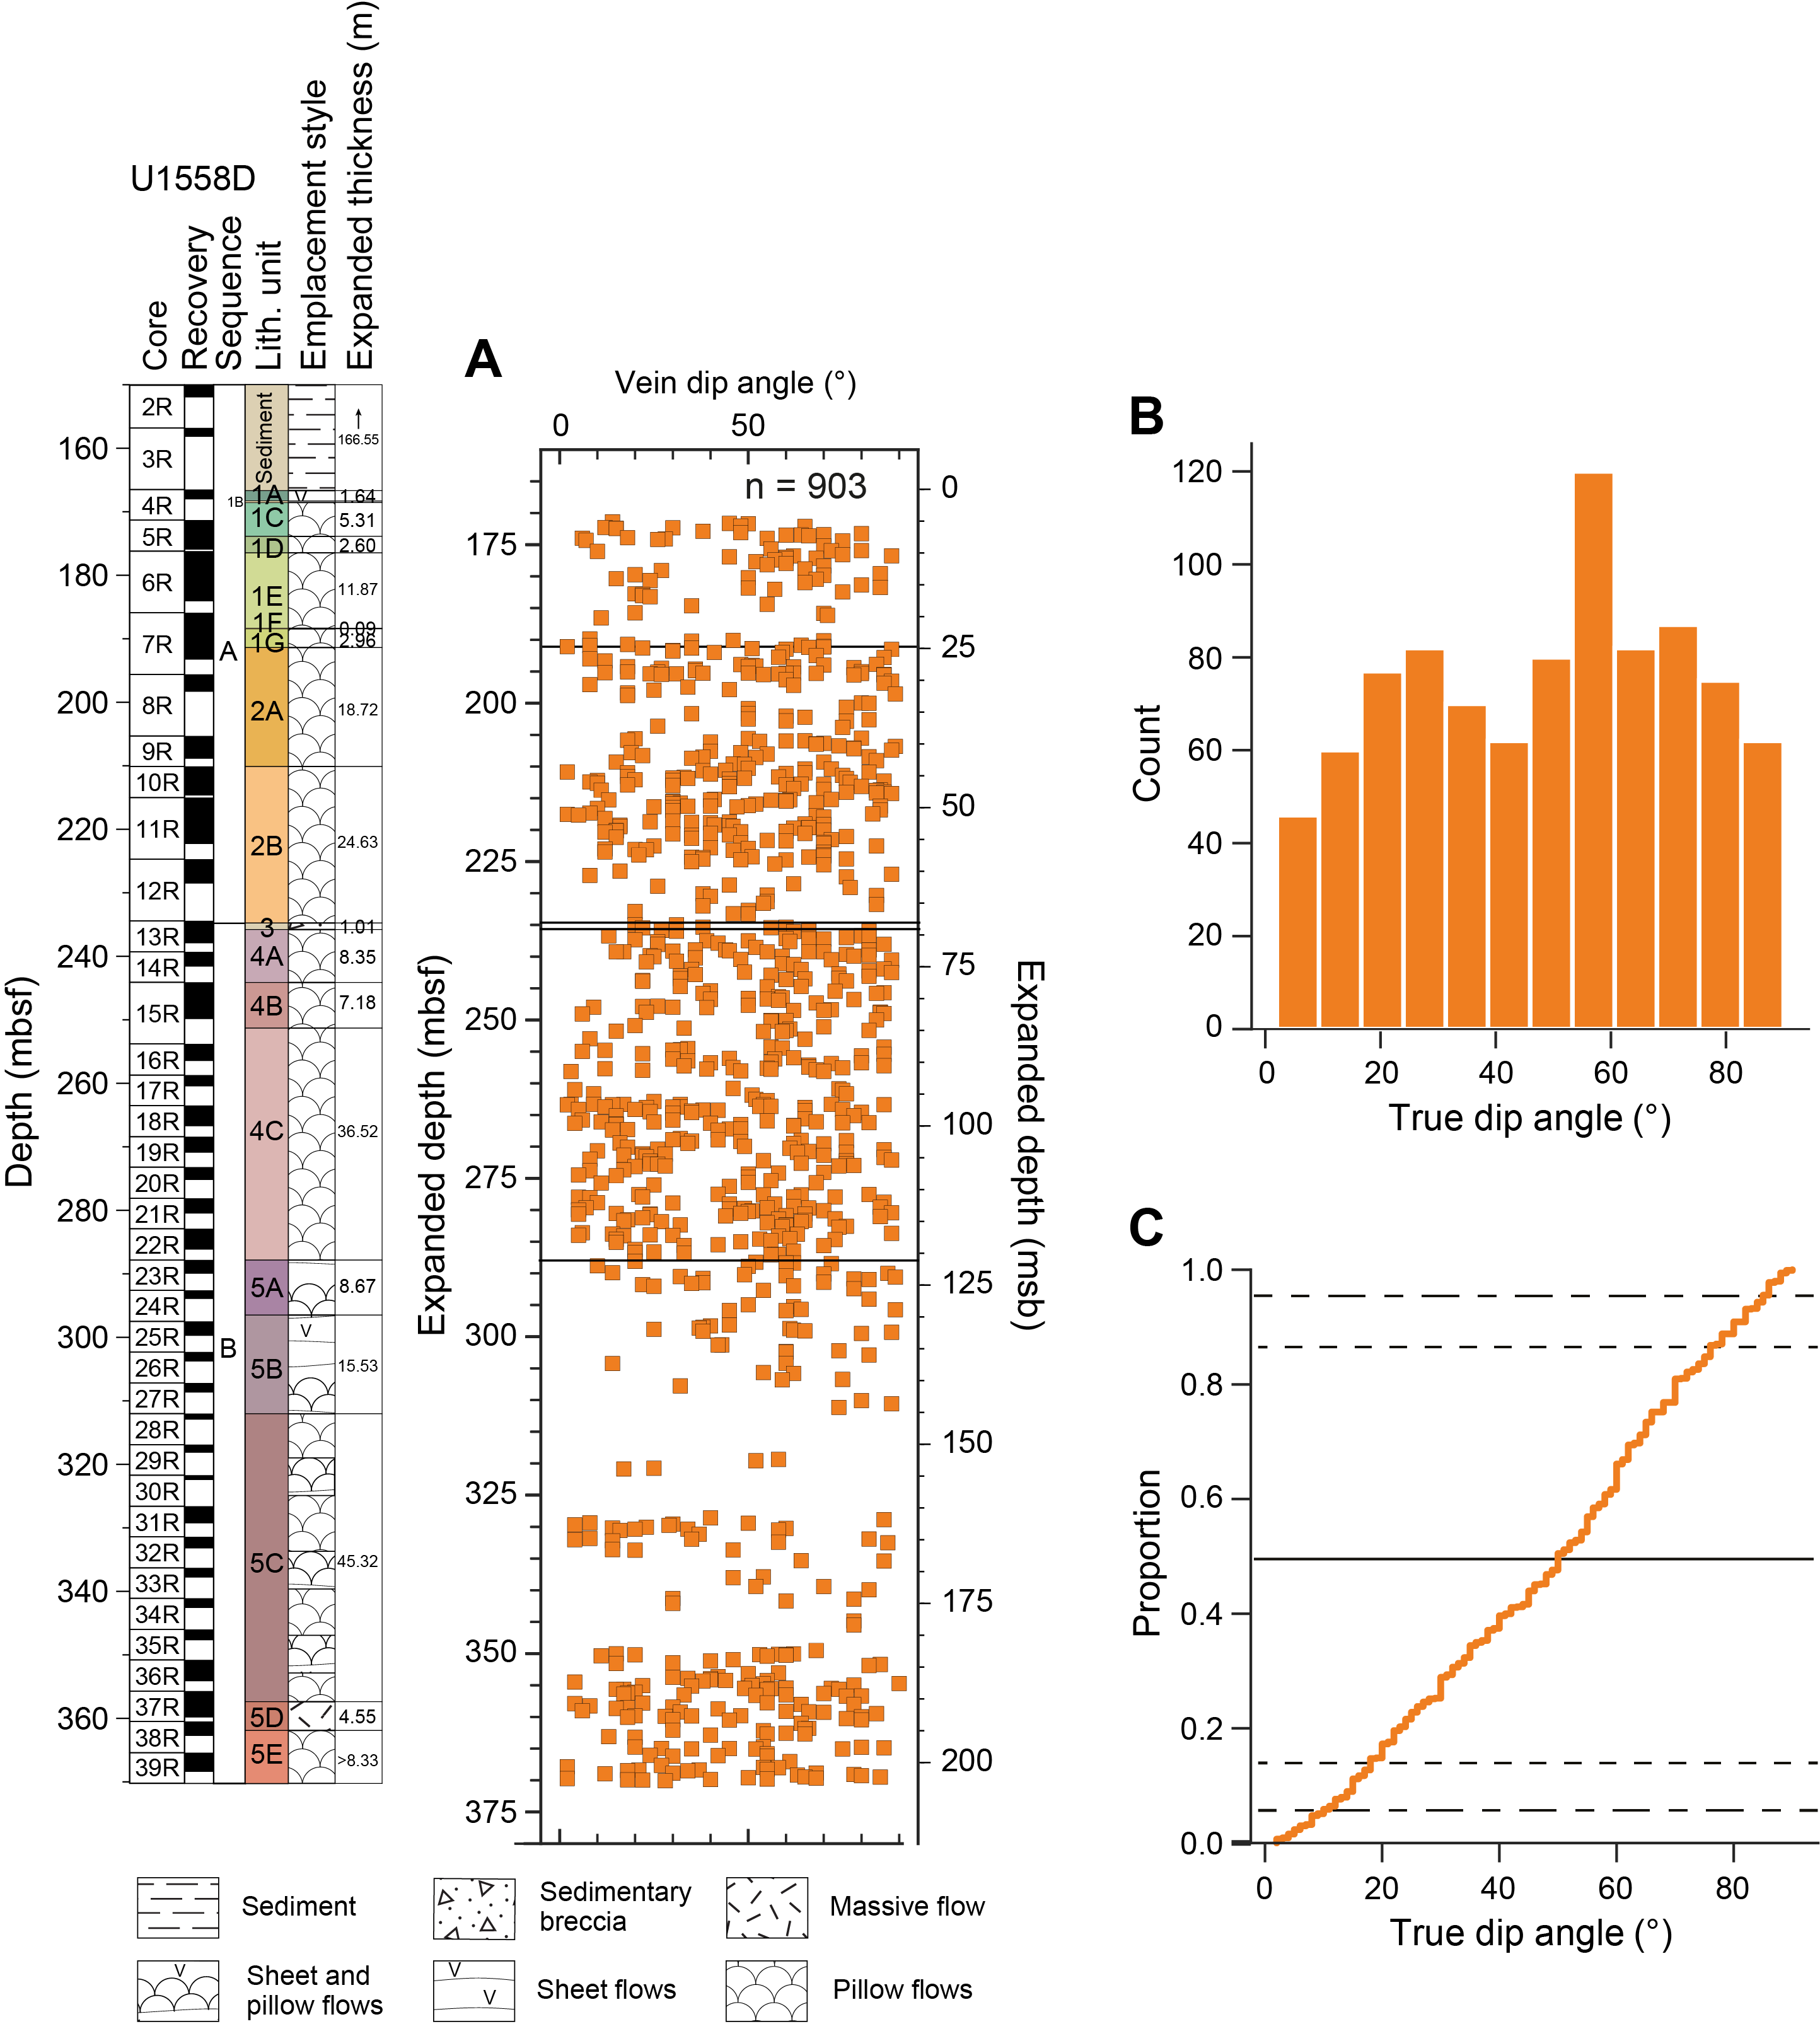
Figure F55. Vein dip angles.
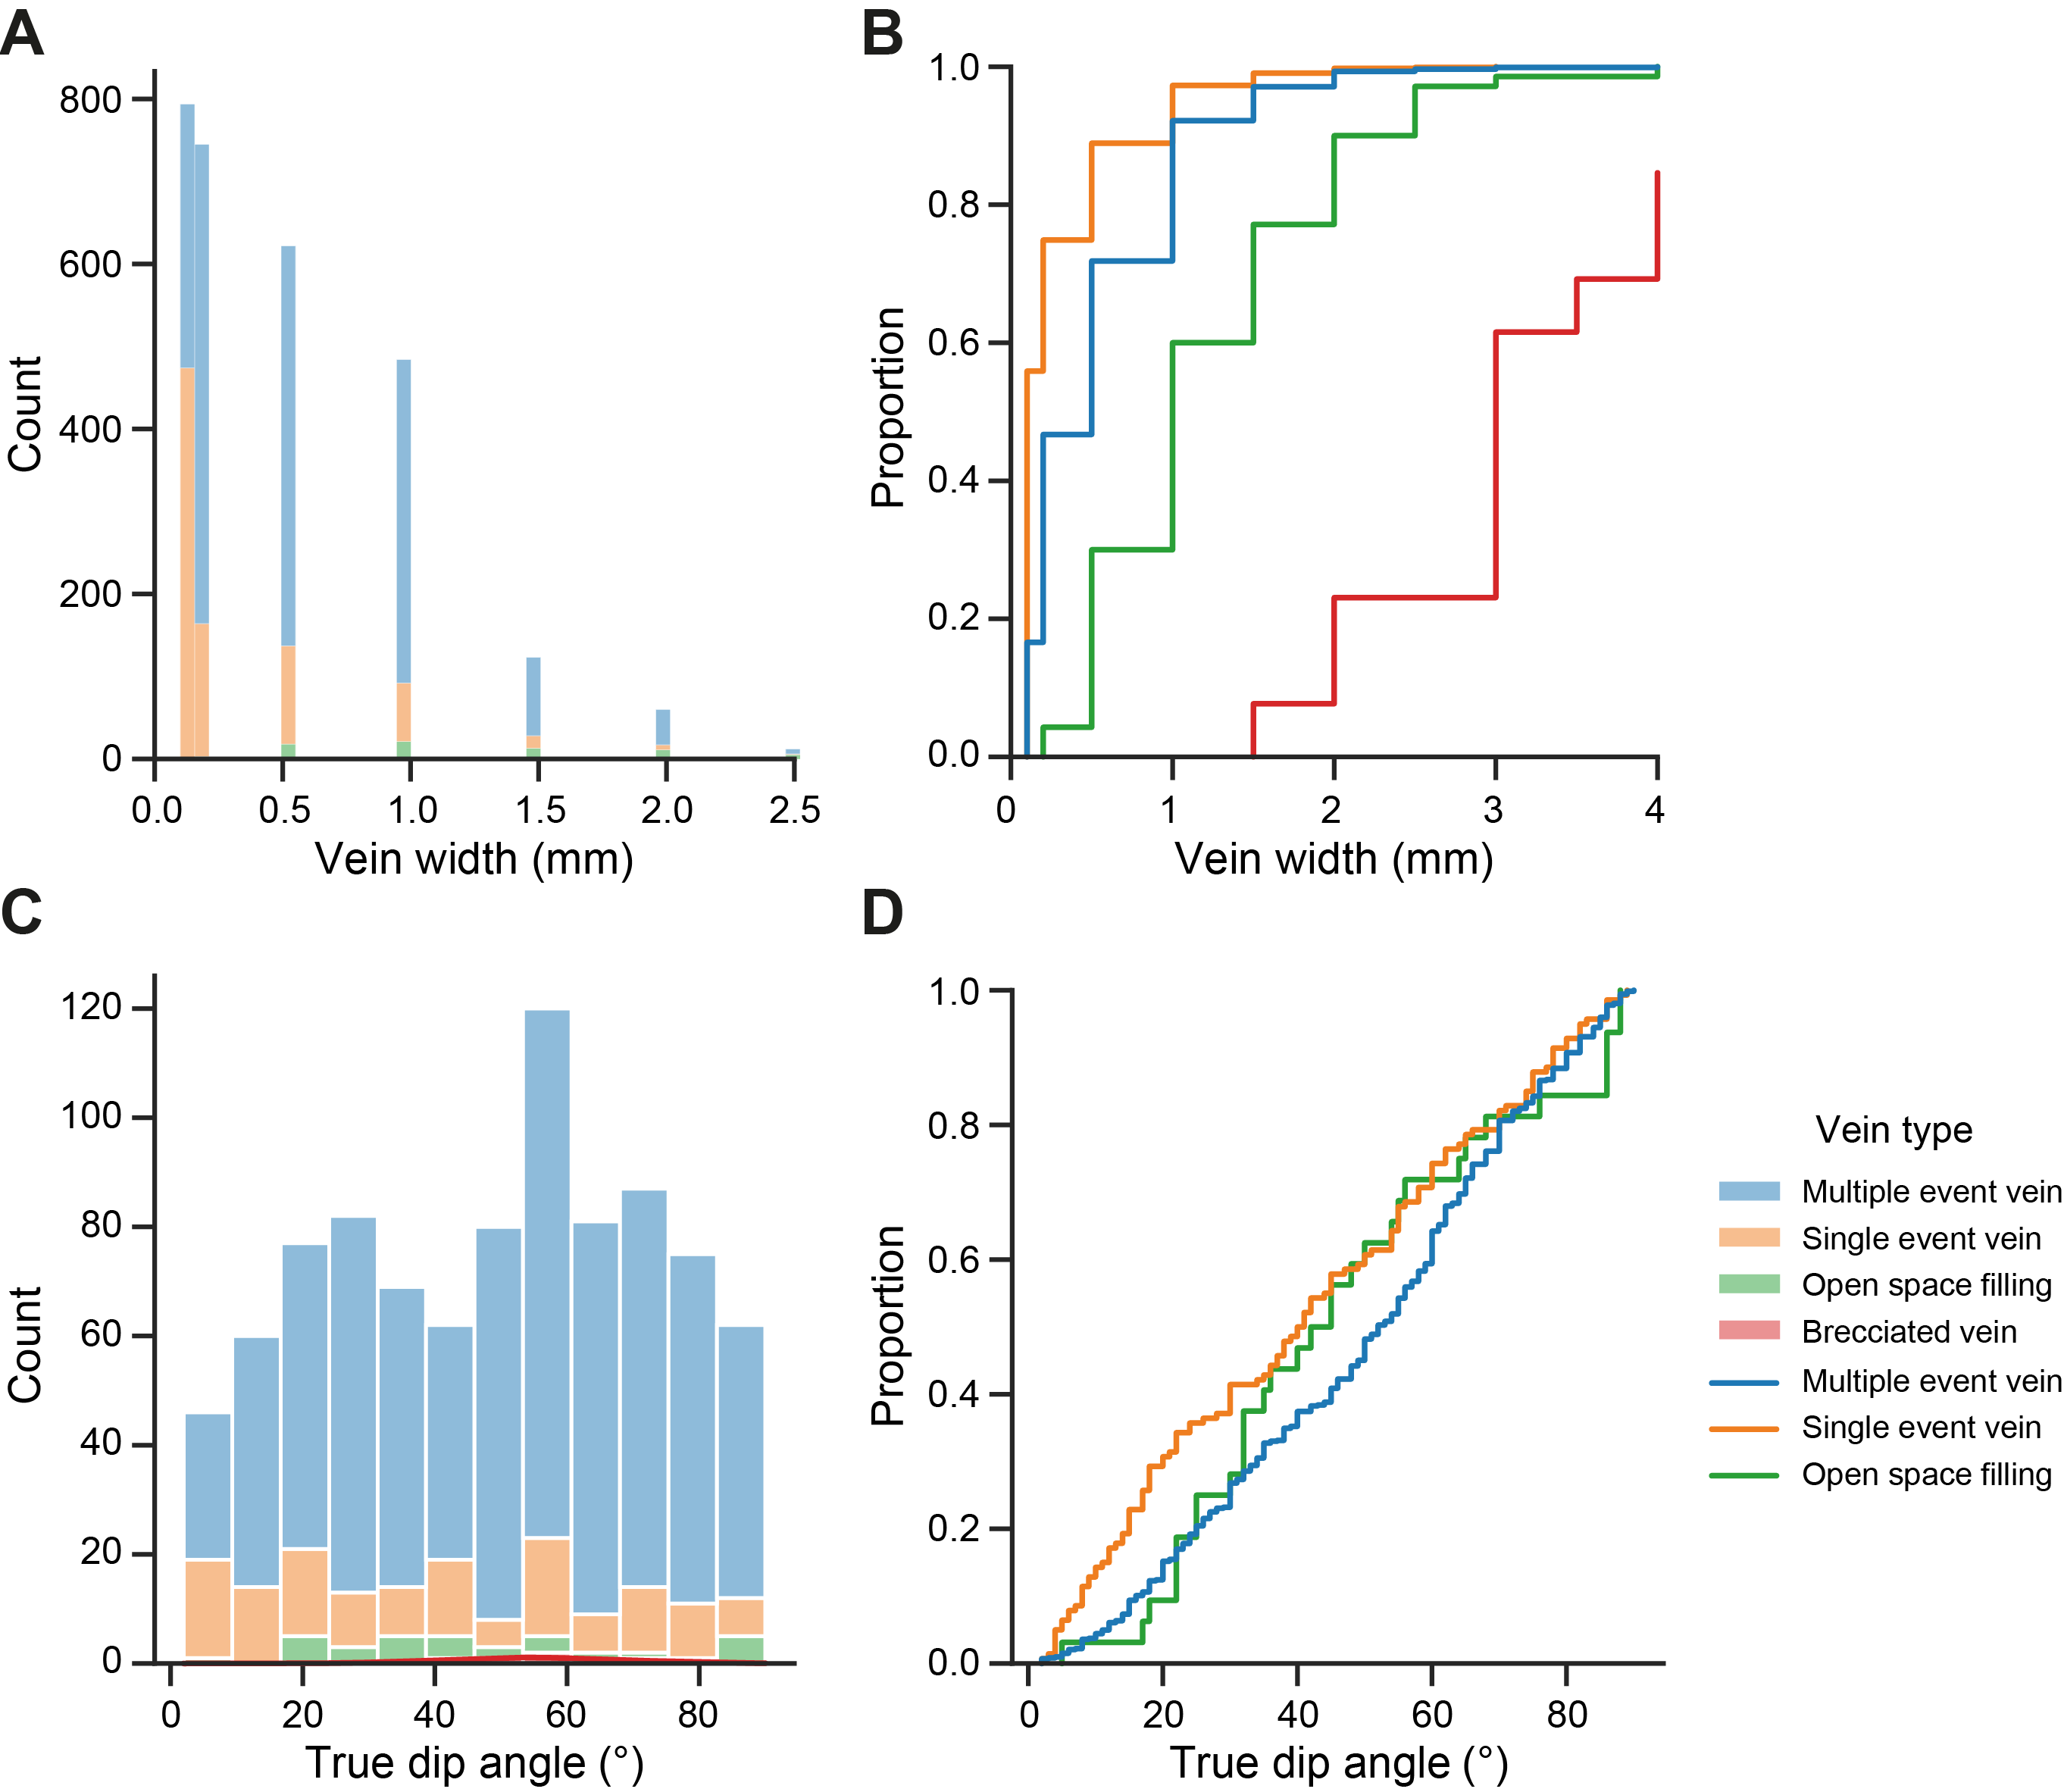
Figure F56. Vein width and dip angle statistics.
6.7. X-ray diffraction
To refine macroscopic observations of secondary mineralogy, XRD spectra were generated for powdered materials from veins, vugs, and fracture surfaces and for bulk rock powders. The spectra evaluation reveals dominantly (magnesian) calcite and/or phillipsite-Na and other zeolite minerals in vein, vug, and fracture surface fillings both within the interior of basaltic pillows/flows as well as in veins in glassy margins (Table T8). Spectra from interpillow sediments and breccia matrix and cement are chiefly representative of (magnesian) calcite and phillipsite-Na, but additional peaks suggest the presence of clays such as the smectite montmorillonite. Altered clasts within interpillow breccias further suggest an anorthite component. The results from XRD analyses of bulk rock powders (see U1558D_XRD.xlsx in ALTPET in Supplementary material) reveal mostly sodic feldspars and clinopyroxene as well as minor olivine, oxides, and additional spectral peaks that indicate the variable presence of clays, presumably montmorillonite.
6.8. Summary
Alteration in Hole U1558D can be distinguished into four zones (Figure F57). From the top of the hole to 179 mbsf in Unit 1, dominant brown halo alteration is associated with the chilled margins of pillow lavas. Between 179 and 234 mbsf (partway through Subunit 1E to the base of Subunit 2B), the second zone sees the abundance of all halo types drop and gray background alteration and orange speckled background alteration of the pillow lavas dominate the alteration. This shift from brown halo dominated to background alteration dominated is interpreted to represent a seafloor weathering overprint and suggests that the pillow lavas were exposed to open circulation of seawater for some period of time before becoming covered with sediment. The third zone (234–286 mbsf) is broadly associated with Units 3 and 4 and is marked by the first appearance of orange alteration within pillow lavas. This alteration represents the strongest color change in Hole U1558D and is generally associated with alteration fronts developing from the glassy margins of individual pillows. Macroscopically, several centimeters away from chilled margins, these orange alteration fronts transition into the more ubiquitous brown halos seen throughout Hole U1558D, suggesting this oxidative alteration exists along a spectrum of intensity. Some of the freshest volcanic glass is preserved where groundmass alteration of the pillow lavas is strongest, as previously documented (e.g., Honnorez, 1981). The abundance of breccia and sediment at the top of this interval suggests that these rocks were also exposed to seawater for a significant duration before becoming covered by the overlying lava sequences. The fourth alteration zone is defined by the onset of mixed gray-brown background alteration that has a common but not unique association with variolitic textures. The orange halos persist through this change in background alteration with orange examples of variolitic textures recovered. Although there are some associations between the igneous units and the different alteration zones, the onset of the key alteration features defining the zones do not generally follow igneous boundaries. The downhole changes in secondary minerals filling veins also do not follow the alteration zones, in particular with the dominance of zeolites toward the base of the hole occurring above the onset of the fourth (mixed gray-brown background alteration) zone.
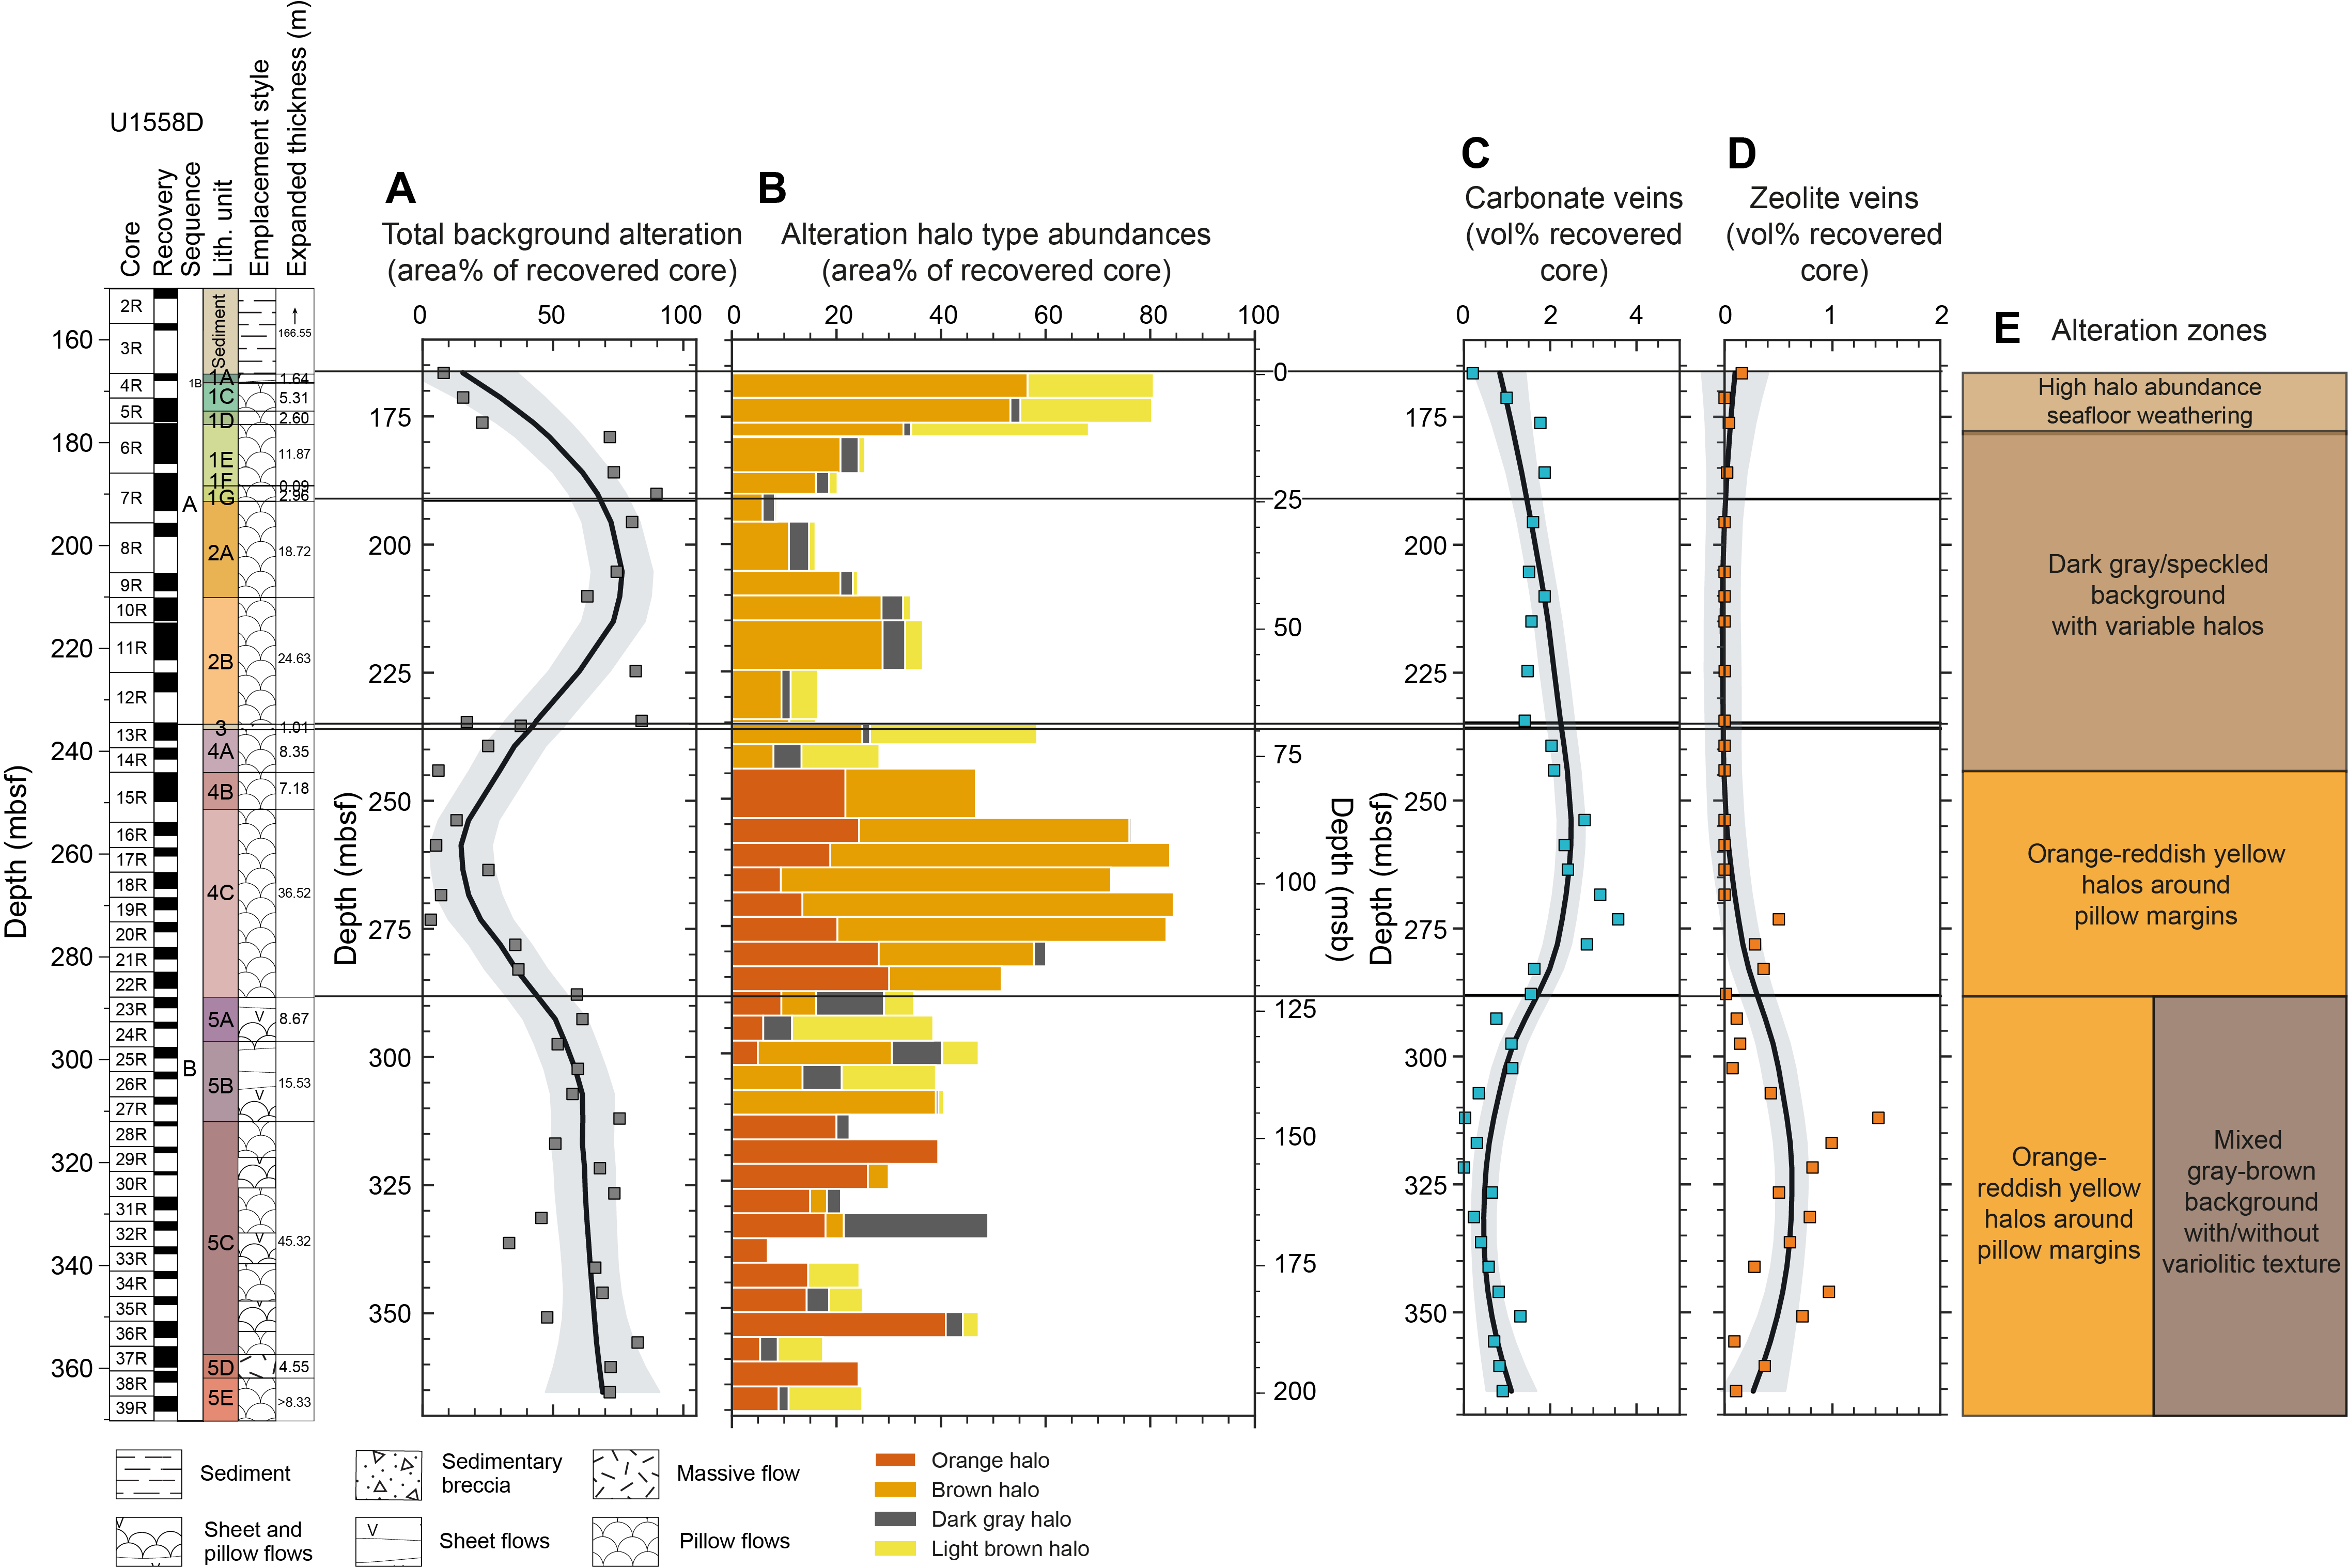
Figure F57. Alteration zones.
7. Biostratigraphy
The 158.5–175.4 m thick sedimentary succession of pelagic nannofossil oozes/chalks and nannofossil-rich clays at Site U1558 ranges in age from the Early Miocene to late Eocene (see Sedimentology). The integrated calcareous nannoplankton and planktic foraminiferal biozonation for Site U1558 is summarized in Figures F58 and F59 and Tables T10 and T11. The list of biostratigraphic datums and paleomagnetic reversals used to construct the age model for Holes U1558A and U1558F can be found in Age model and mass accumulation rates (Tables T23, T24; Figures F79, F80).
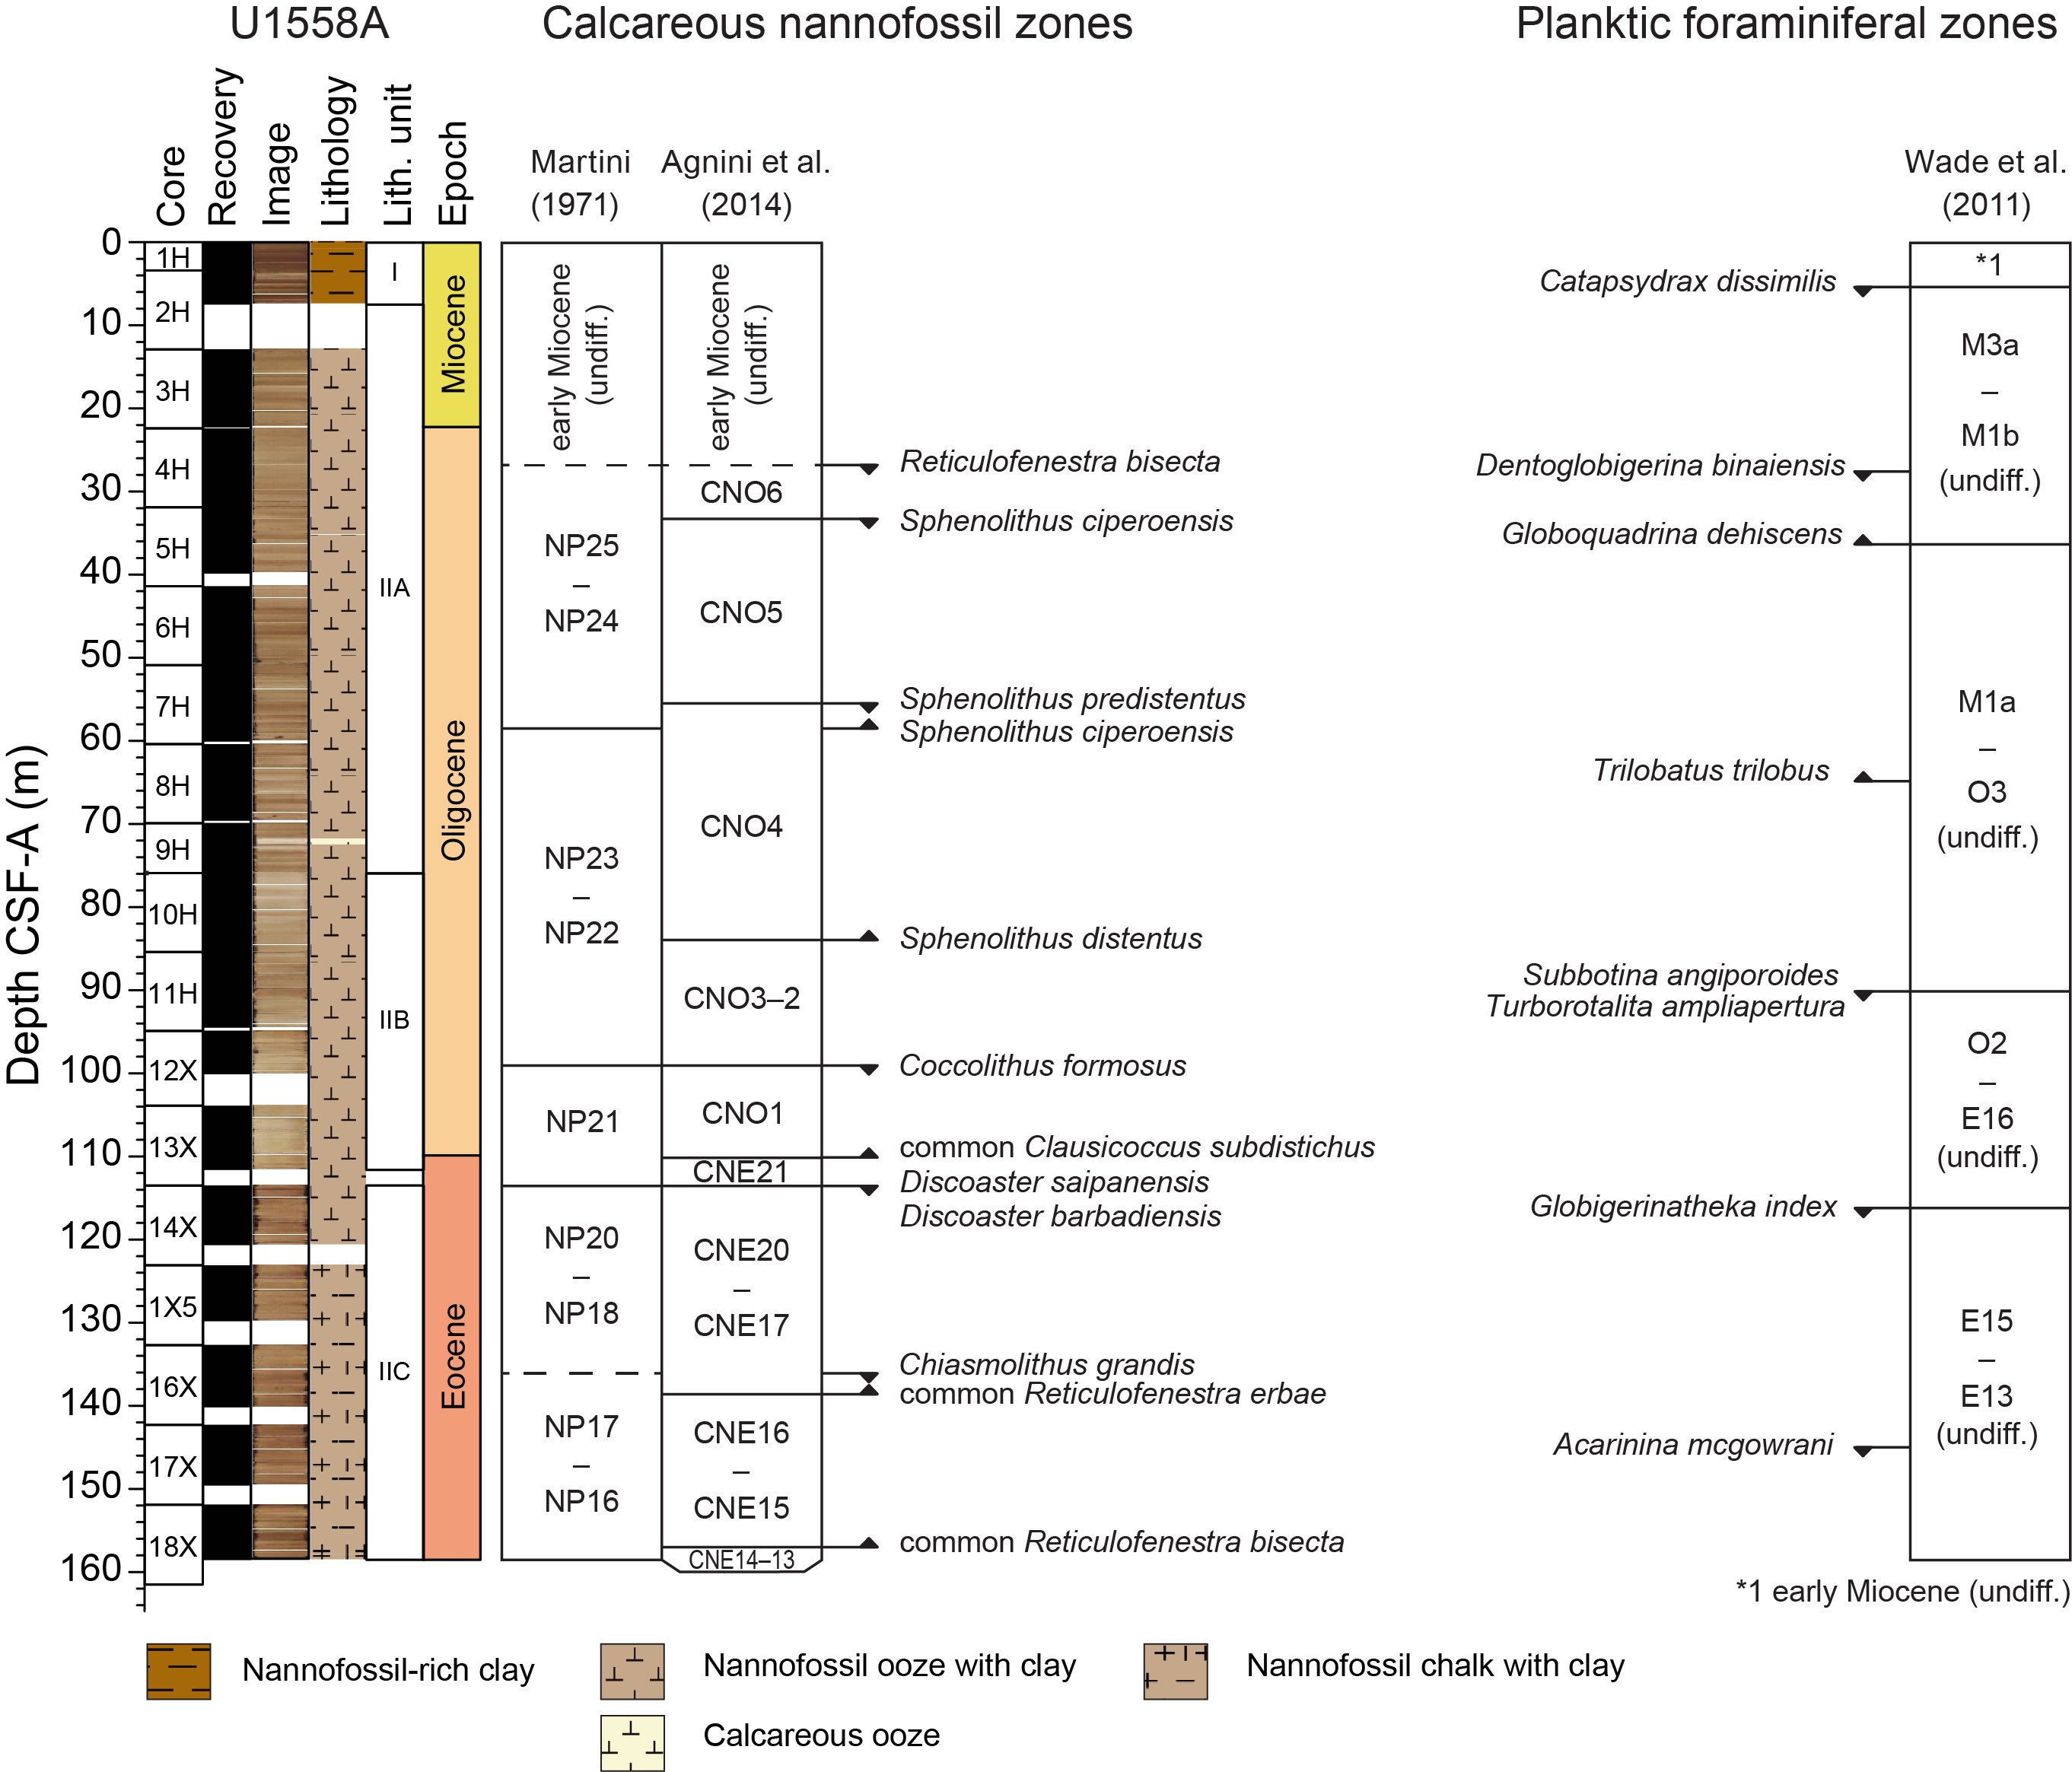
Figure F58. Biostratigraphic zones and datums, Hole U1558A.
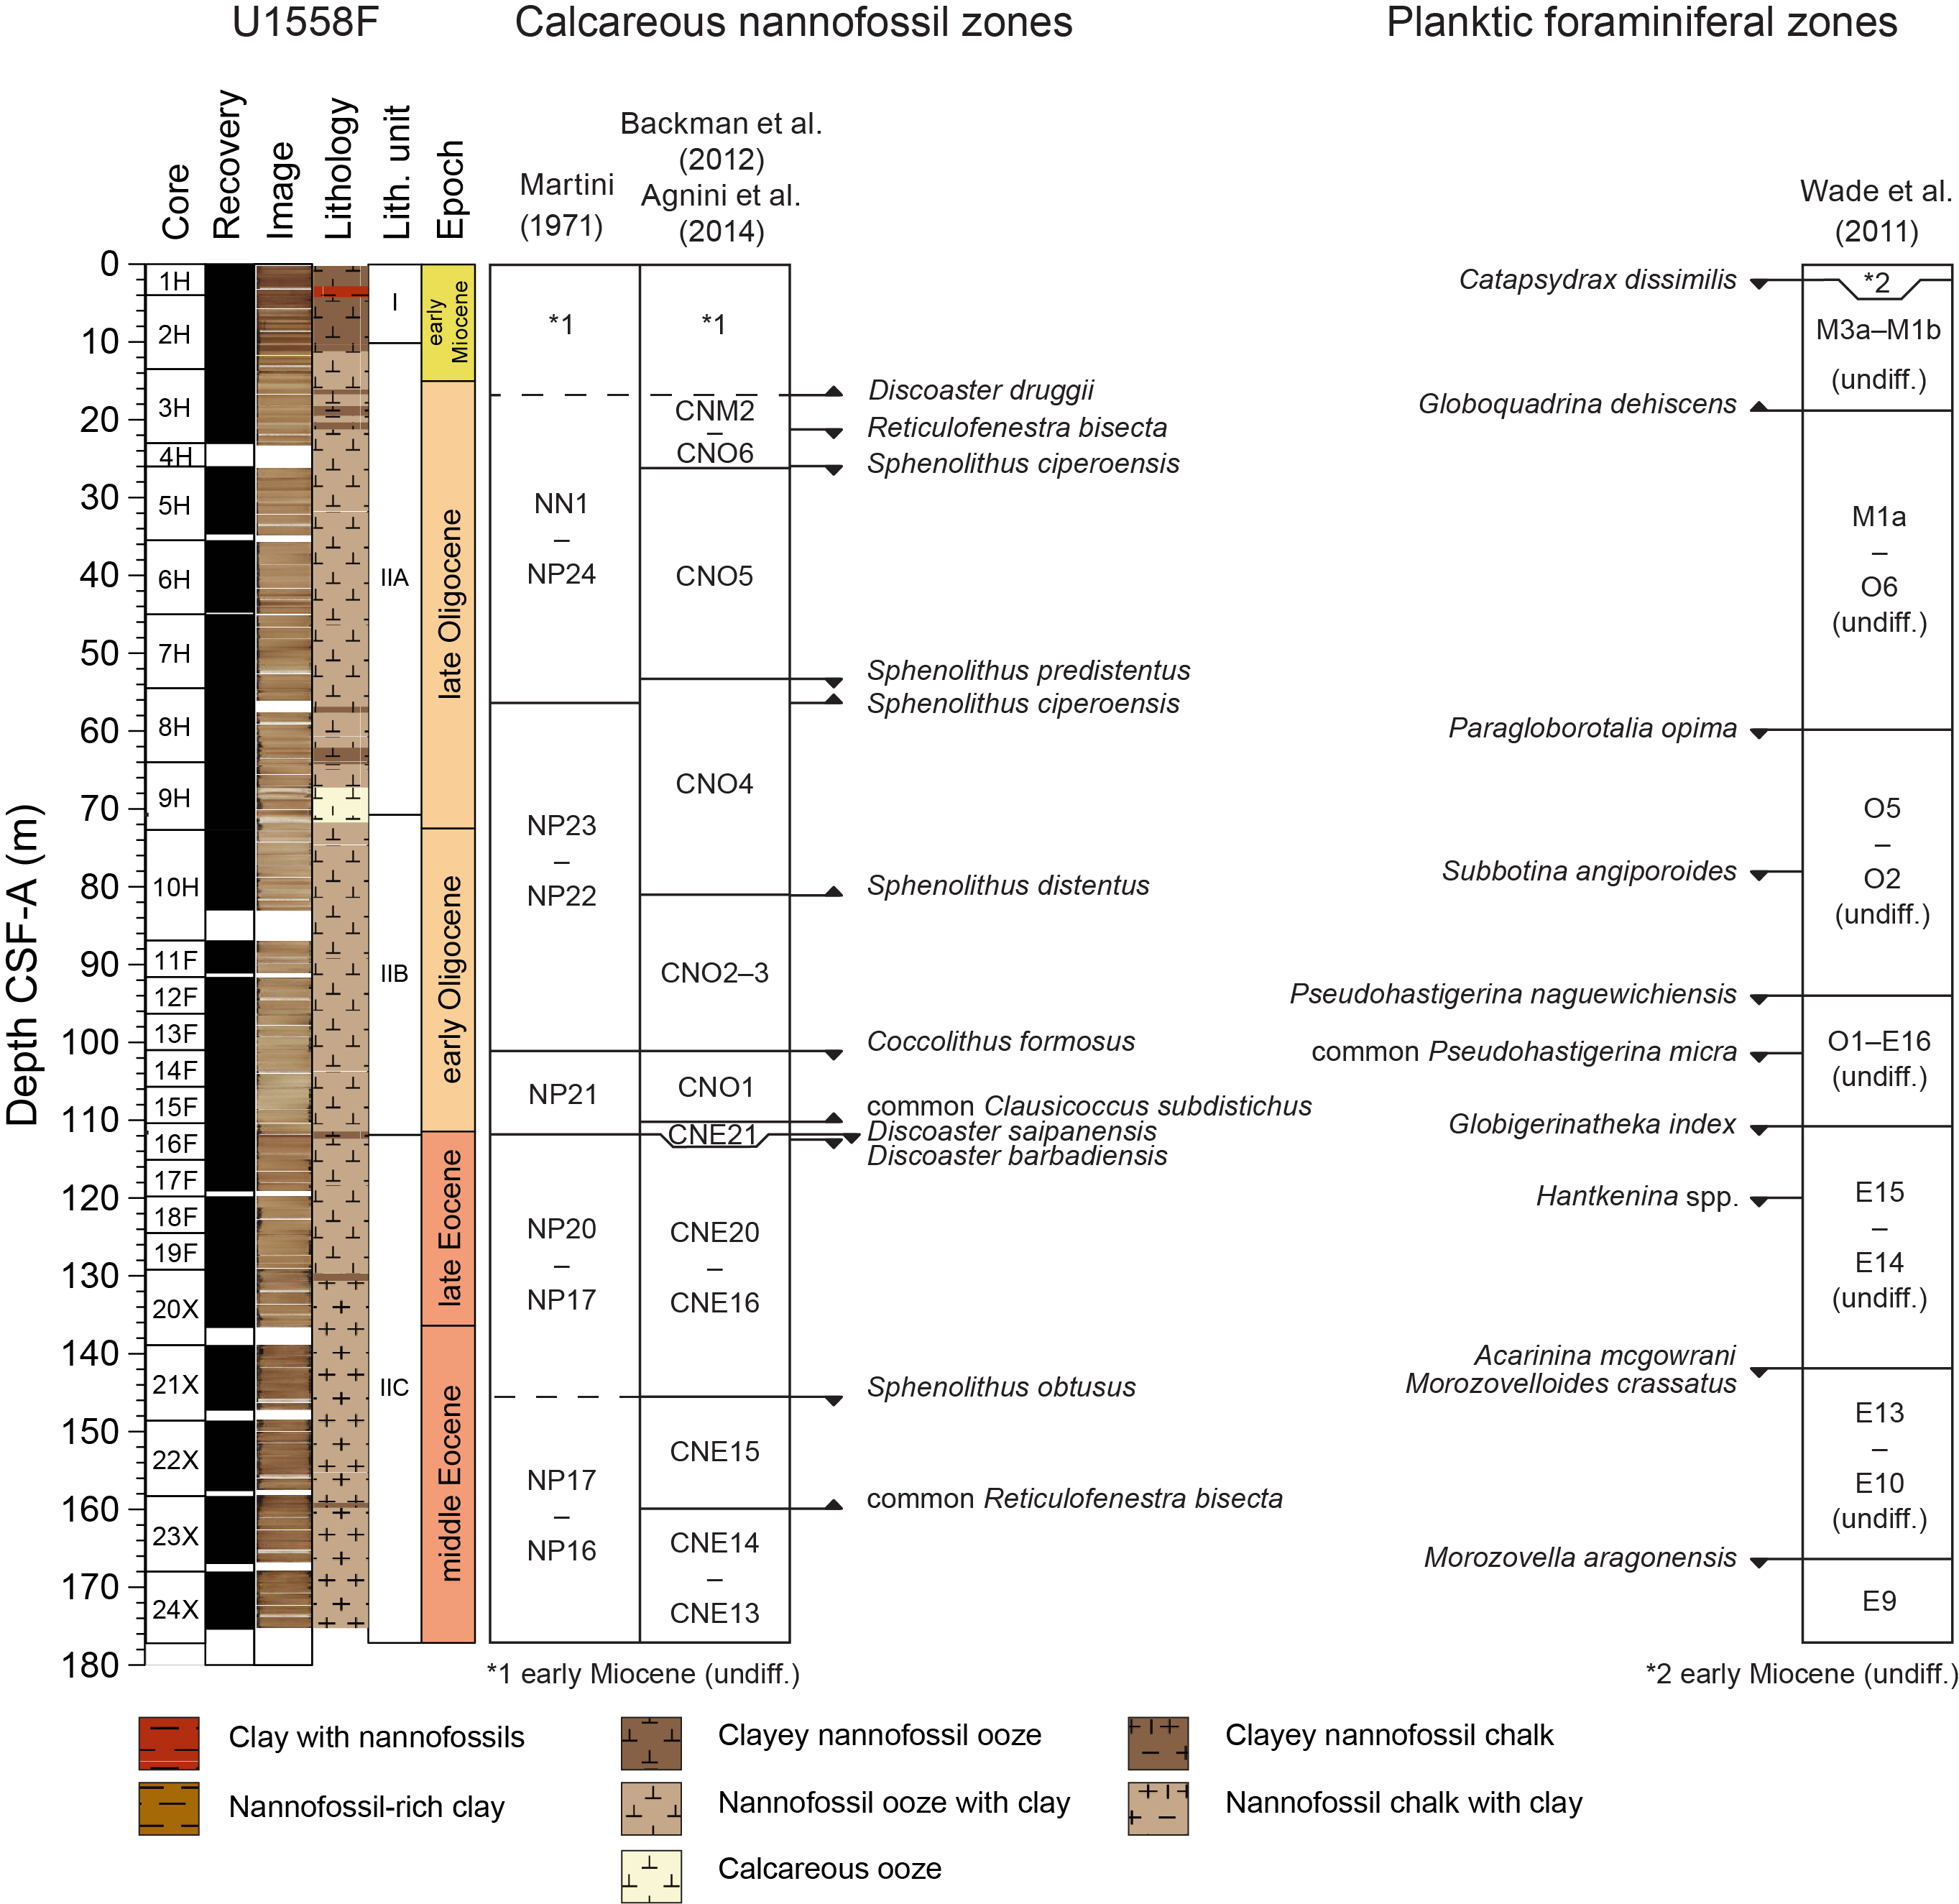
Figure F59. Biostratigraphic zones and datums, Hole U1558F.
Samples analyzed from Hole U1558A were primarily core catcher samples studied onshore following Expedition 390C (see Background and objectives). These samples were supplemented by nannoplankton smear slides taken on the ship during Expedition 393 from the archive halves of Hole U1558A. Samples analyzed from Hole U1558F, cored during Expedition 393, came from core catcher samples (some of which were only ~5 m apart because of half-length coring operations), and two additional smear slide samples for each full-length core (or one sample per half-length core) were taken from the working halves. These additional samples were taken at evenly spaced intervals, avoiding clay-rich intervals where possible.
The Hole U1558A mudline sample is barren; however, given the presence of microfossils in the Hole U1558F mudline sample, this is likely the result of some sort of sampling bias during Expedition 390C. The Pleistocene and Pliocene epochs are completely missing from Hole U1558A; Sample 390C-U1558A-1H-CC contains microfossils indicative of a Middle to Early Miocene age. In contrast, the Hole U1558F mudline sample contains Pleistocene planktic foraminifera, whereas calcareous nannoplankton assemblages comprise a predominantly modern assemblage mixed with some reworked Miocene and Paleogene taxa.
Biostratigraphic analyses indicate that Miocene sediments are recorded above 22.27 m core depth below seafloor, Method B (CSF-B), in Hole U1558A and above 13.50 m CSF-B in Hole U1558F. This corresponds to Lithostratigraphic Unit I and the uppermost part of Subunit IIA in both holes (Figures F58, F59). Oligocene-aged sediments are recorded from 31.85–108.90 m CSF-B in Hole U1558A and 28.83–110.40 m CSF-B in Hole U1558F. This generally overlaps with Subunits IIA and IIB (Figures F58, F59). The Eocene/Oligocene boundary is inferred in the lowermost part of Subunit IIB (at 108.90 m CSF-B in Hole U1558A and 109.45 m CSF-B in Hole U1558F).
Benthic foraminifera were analyzed onshore using core catcher samples from Hole U1558A. The data collected suggest that Site U1558 lay at upper abyssal depths (~2000–3000 m) during the Eocene and subsided to lower abyssal depths (>3000 m) by the early Oligocene.
7.1. Age of basement
The top of the sediment/basement interface in both Holes U1558A and U1558F contained Reticulofenestra umbilicus, suggesting these sediments are younger than 42.72 Ma. The planktic foraminifera Globigerinatheka index, which has a first occurrence at 42.9 Ma, is also present directly above basement in both holes. Together, these taxa indicate that the sediment/basement interface is between 42.72 and 42.9 Ma, substantially younger than the estimated crustal age of 49.2. A single limestone sample from the sediment/basement interface in Hole U1558D was analyzed for calcareous nannoplankton, but preservation was very poor and nannofossils did not yield any reliable age estimates. Thin section Sample 393-U1558D-4R-1, 62–65 cm (167.12 m CSF-B), taken from interpillow limestone, was analyzed for the presence of age-diagnostic planktic foraminifera. The sample largely contains fragments of planktic foraminiferal tests as well as a few whole specimens belonging to the common late Eocene genera Subbotina and Acarinina. Unfortunately, identification to the species level was not possible and no tighter age constraints are provided.
7.2. Calcareous nannofossils
Core catcher samples and additional smear slide samples from Holes U1558A and U1558F were analyzed to establish the calcareous nannofossil biostratigraphy at this site. Calcareous nannofossil preservation and abundance are presented in Figure F60. Nannofossil occurrence data are shown in Tables T12 and T13; note that the distribution chart is biased toward age-diagnostic and other notable taxa. Light photomicrographs of selected calcareous nannofossil specimens from Site U1558 are shown in Figure F61.
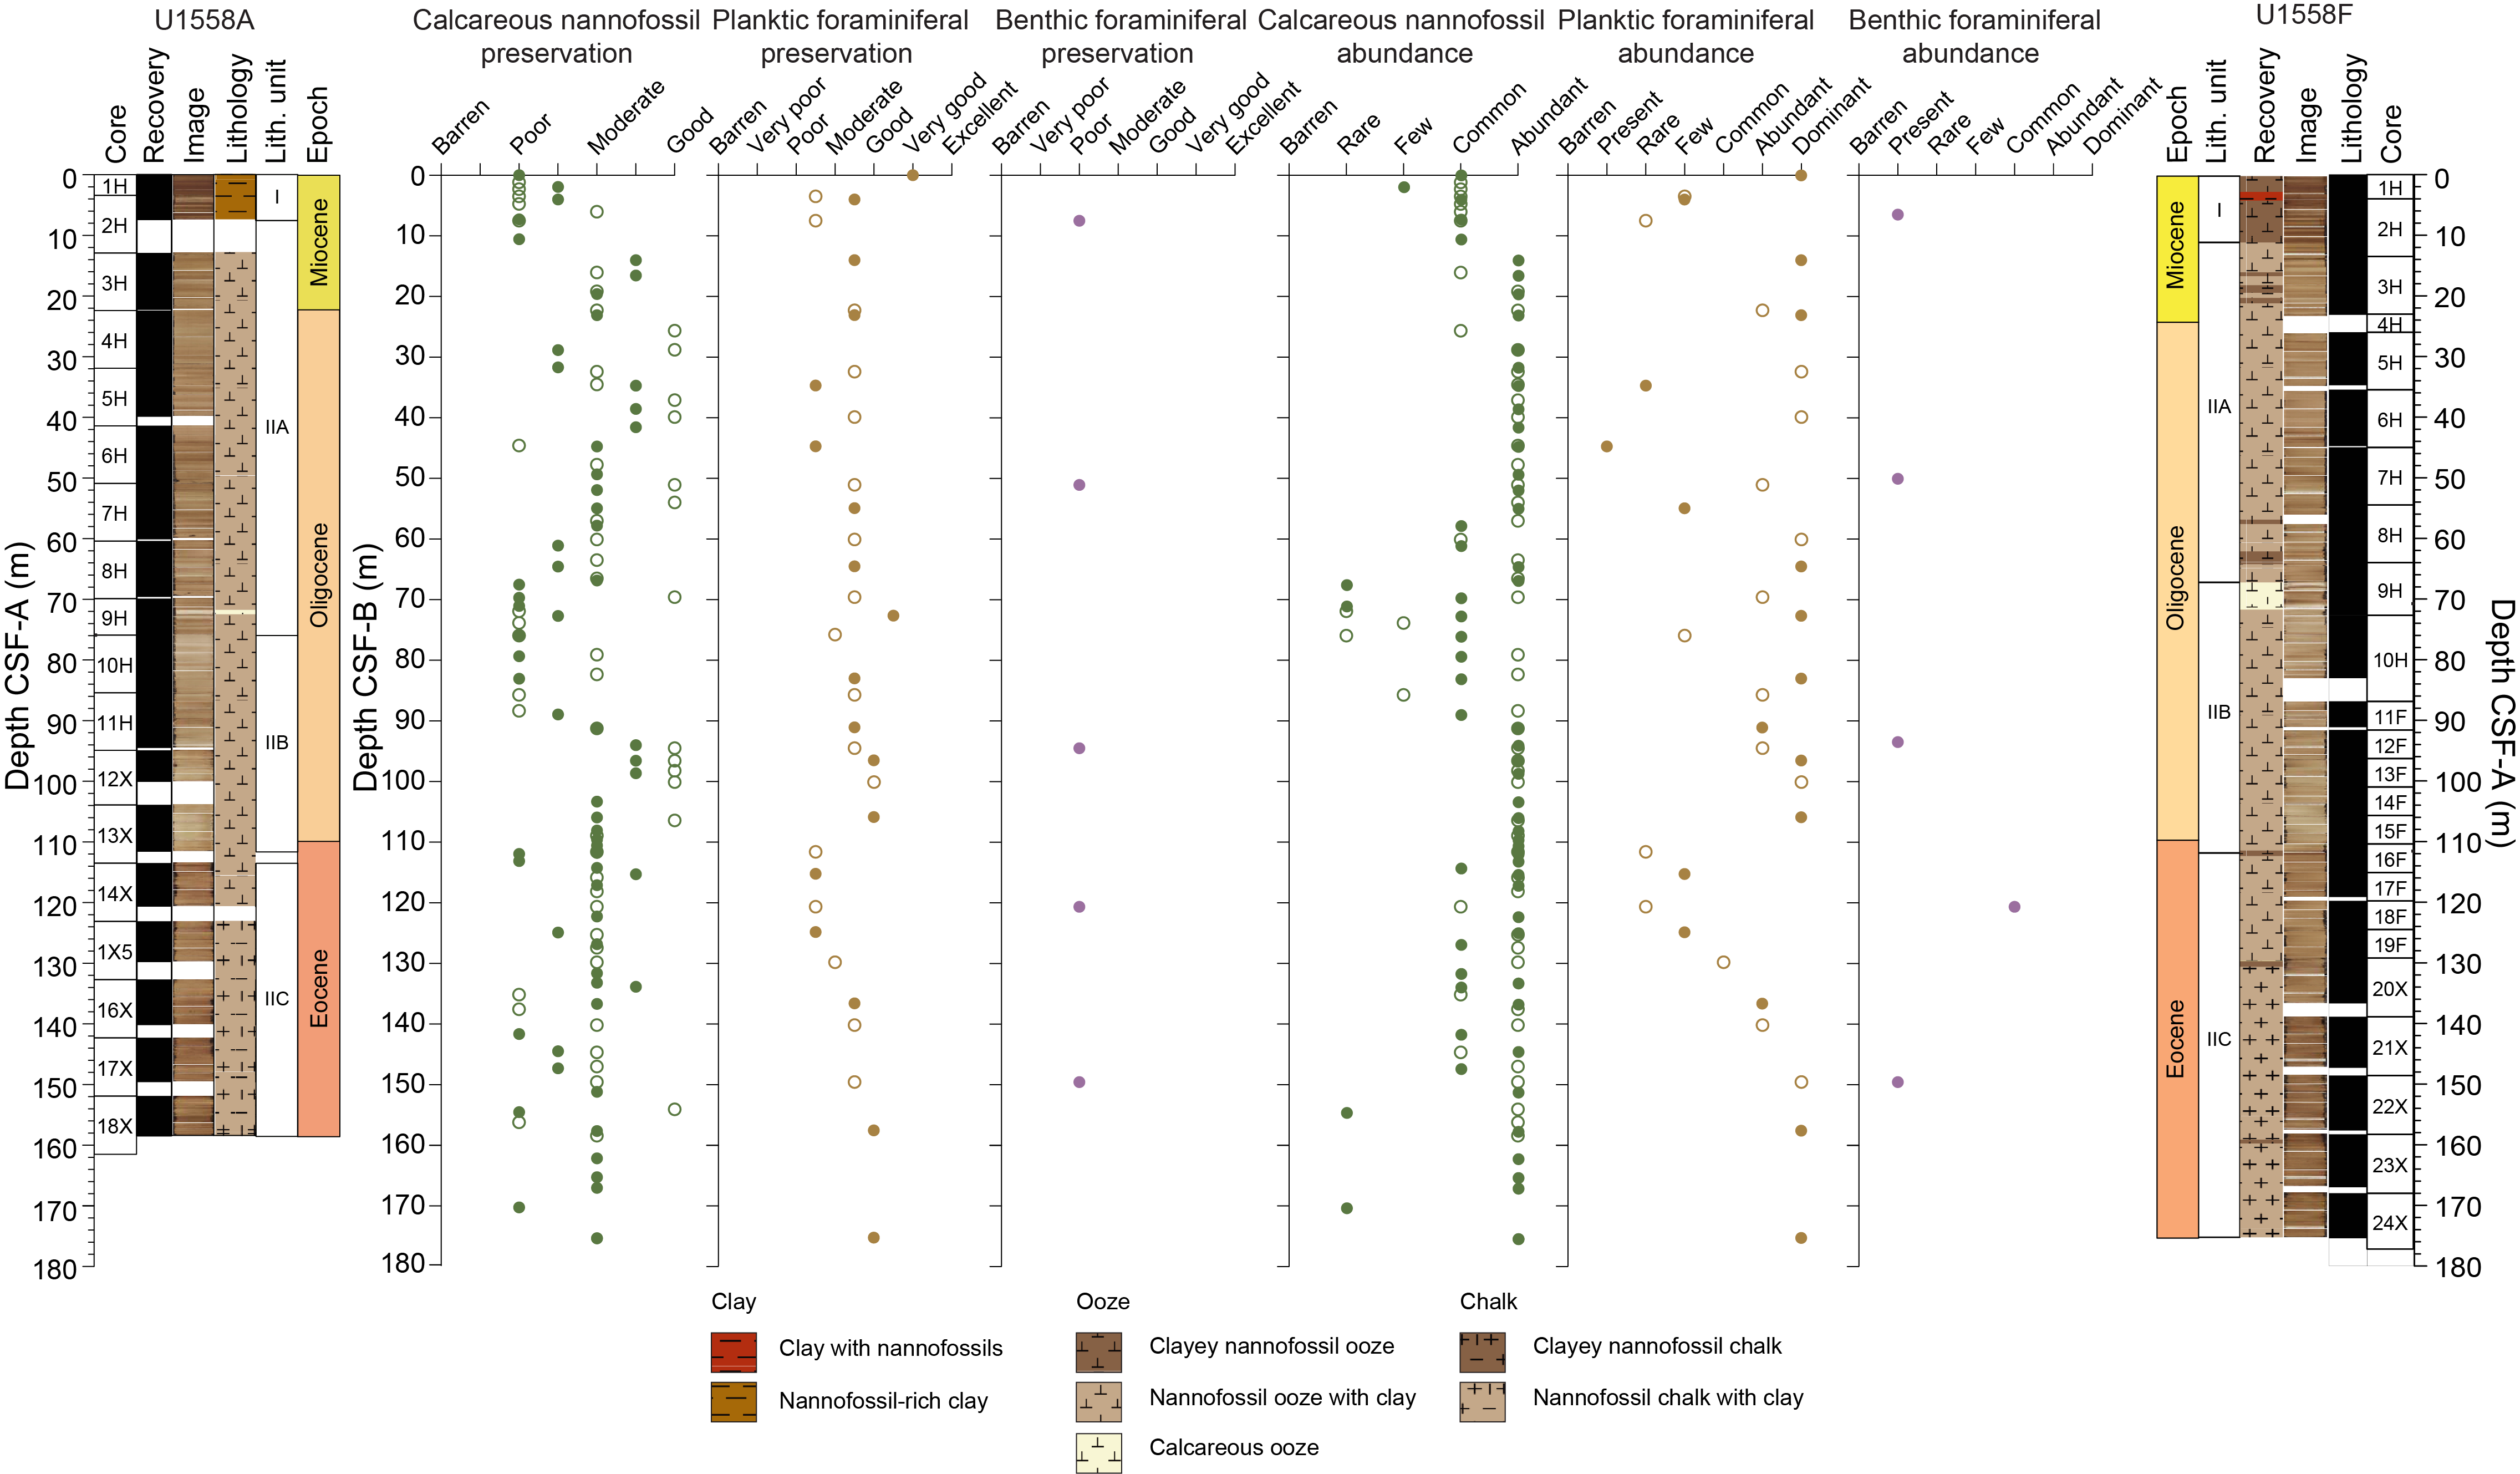
Figure F60. Group abundance and preservation, nannofossils and foraminifera.
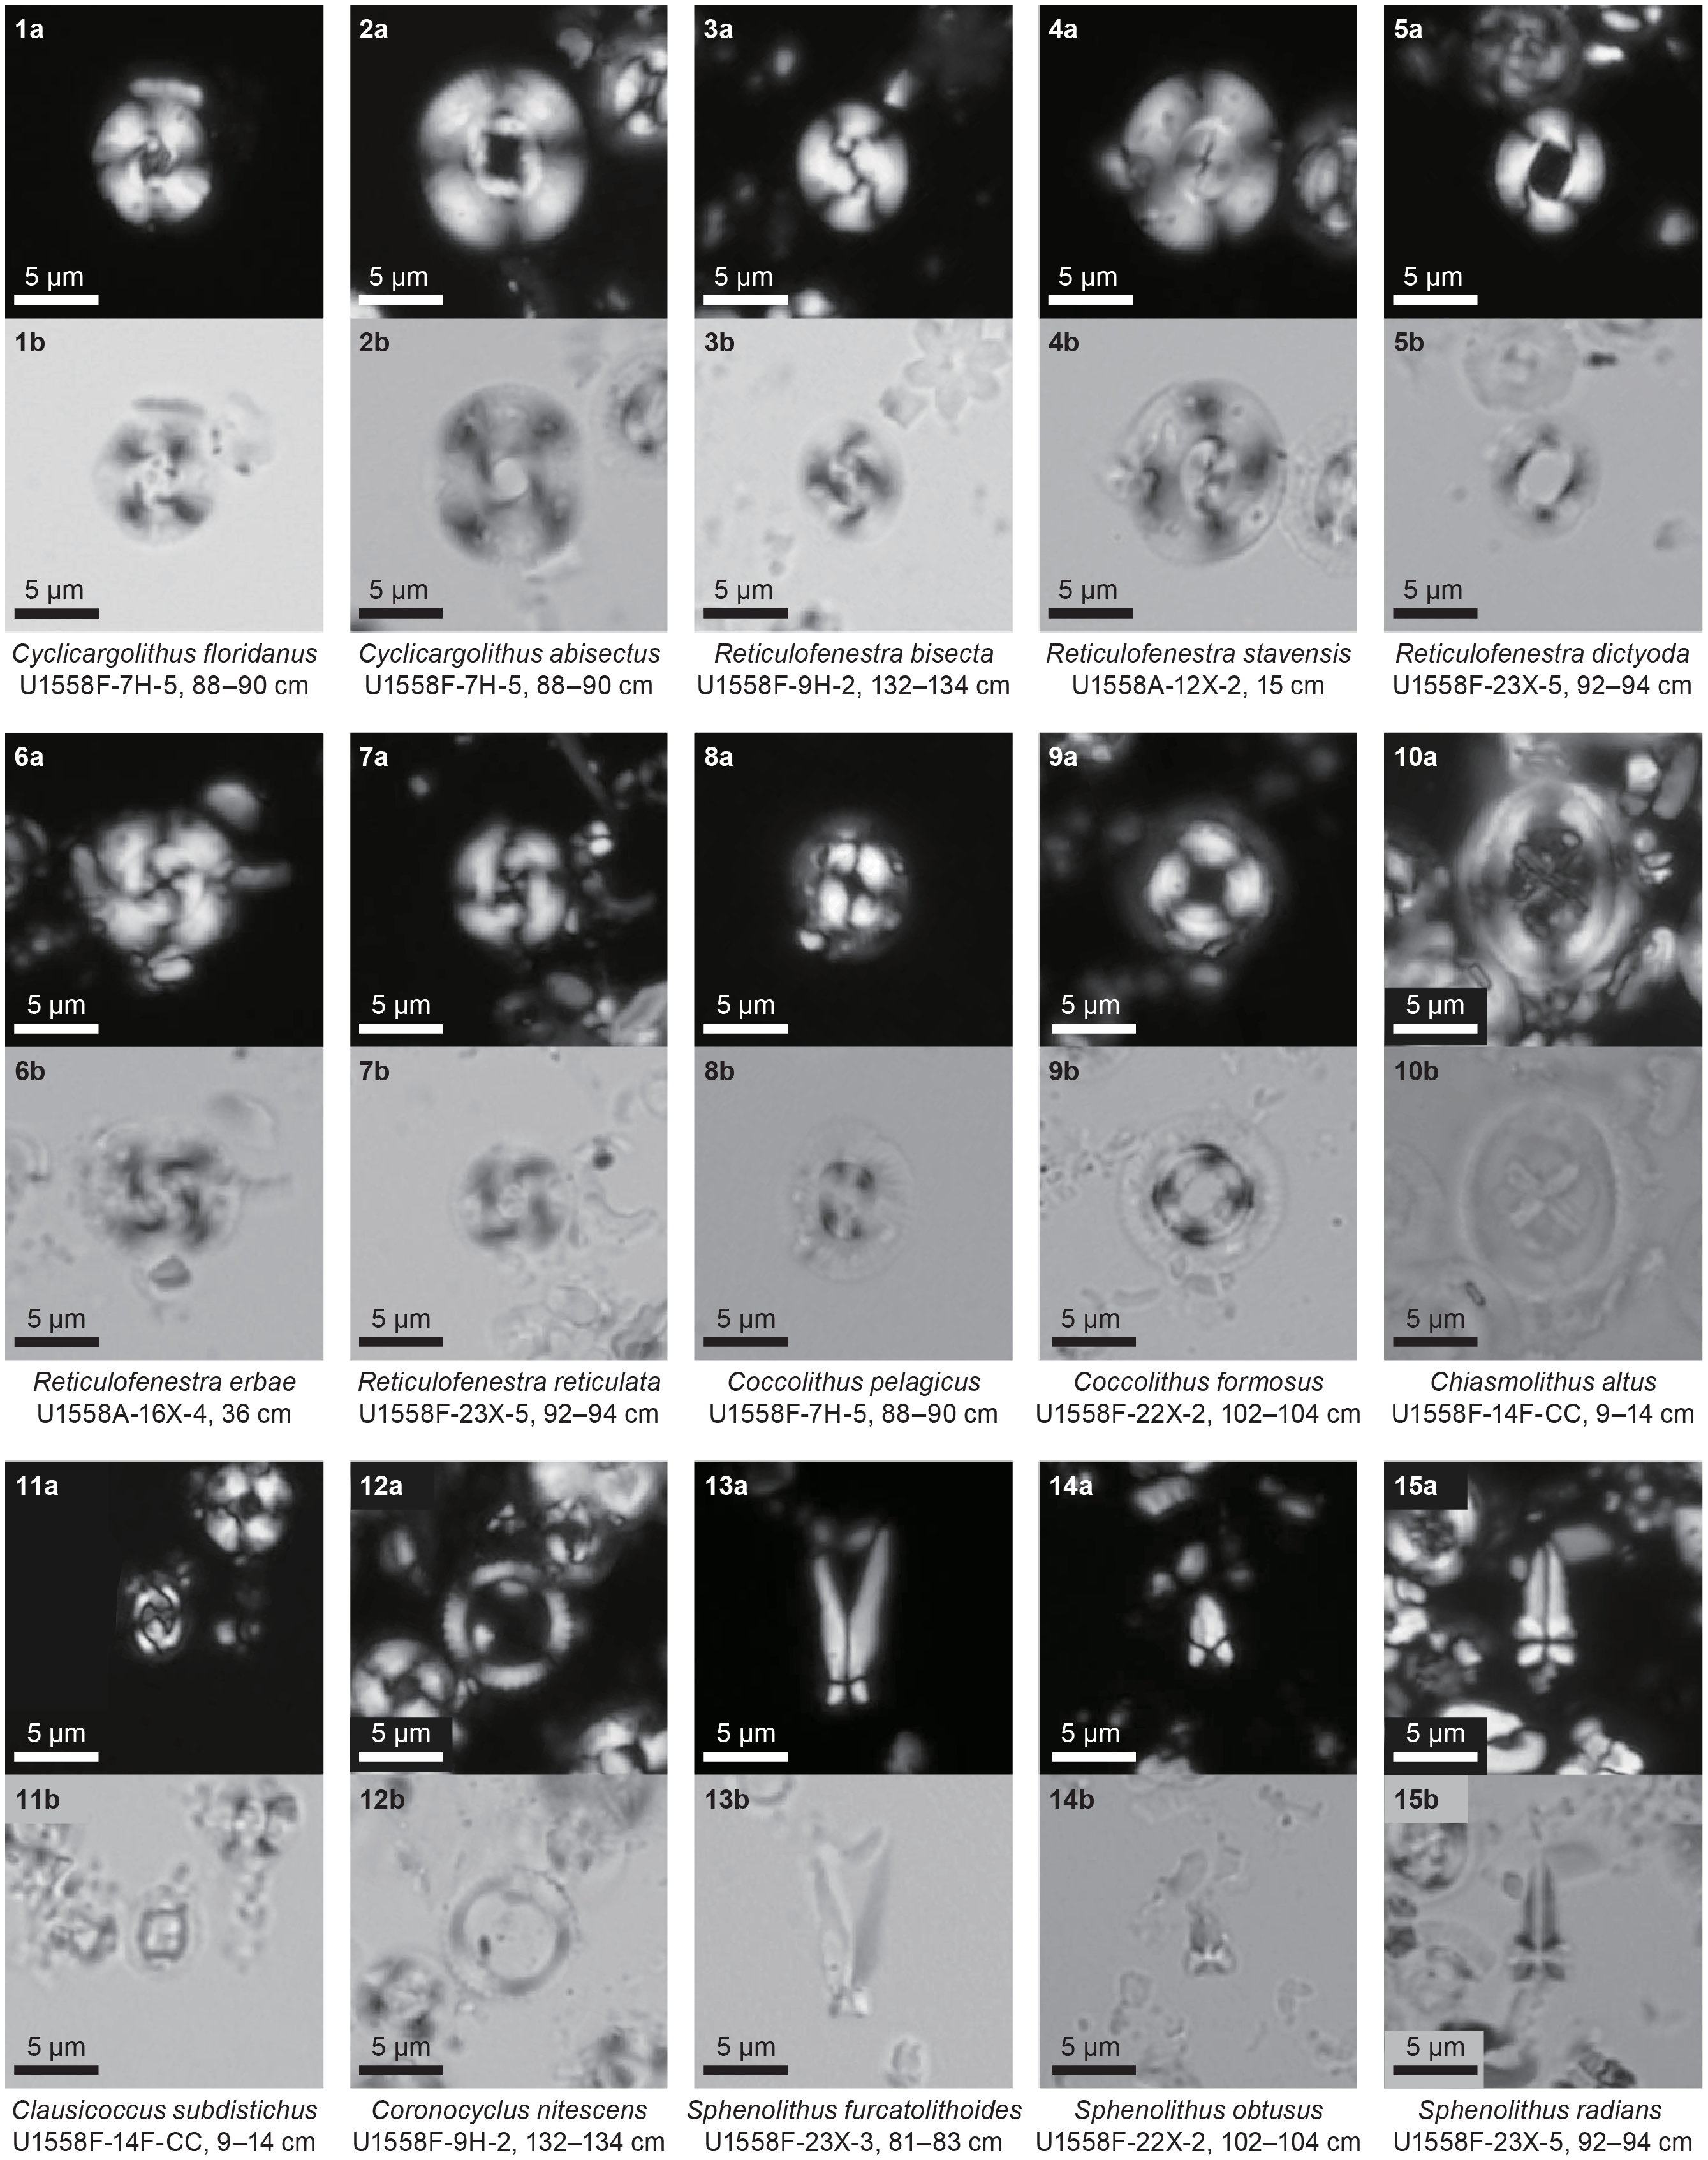
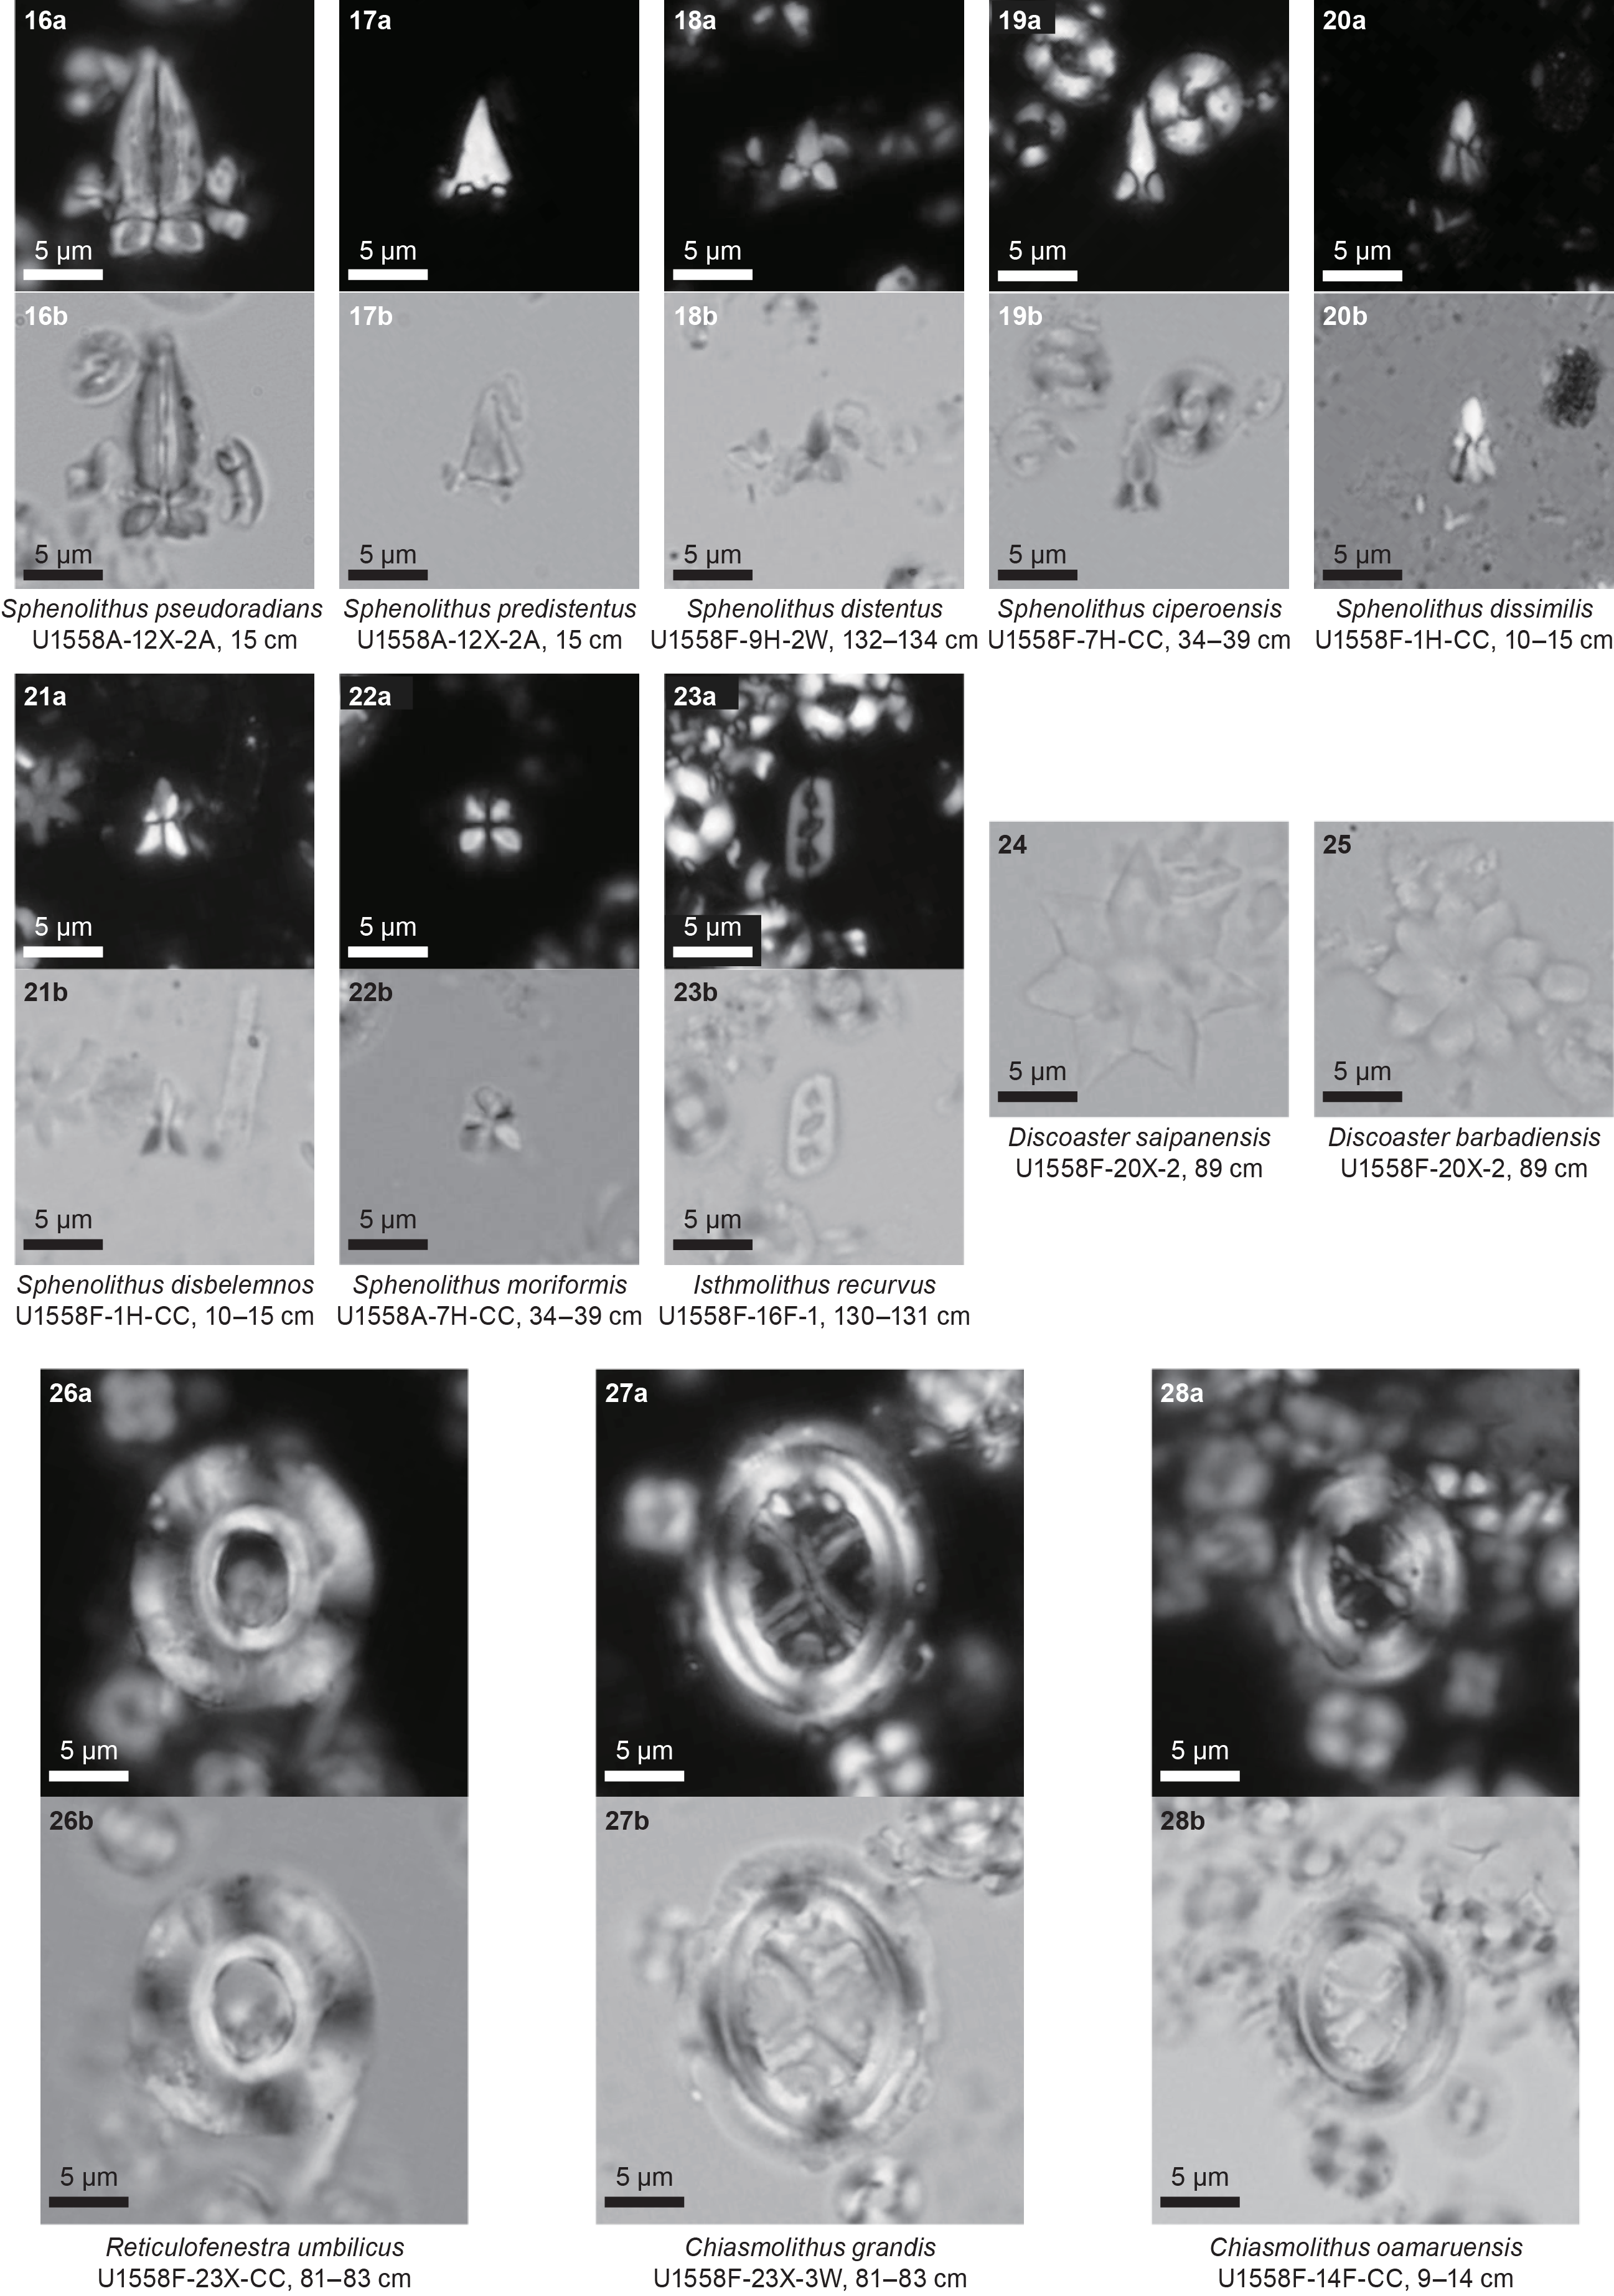
Figure F61. Important and notable nannofossil taxa.
Nannofossil preservation at Site U1558 varies from poor to good, and nannofossils are generally abundant (Figure F60). In nannofossil-rich clay samples (Lithostratigraphic Unit I; see Sedimentology), nannofossils are common to abundant with poor preservation. In contrast, nannofossils are abundant with varying degrees of preservation (poor to good) in the carbonate-rich samples (Lithostratigraphic Unit II). At this site, reworked specimens of Eocene and early Oligocene nannofossils, such as Discoaster barbadiensis, Discoaster saipanensis, and R. umbilicus are present in middle Oligocene–Neogene samples overlying Cores 390C-U1558A-11H and 393-U1558F-16F (~88 and ~111 m CSF-B).
Taxa that evolved after the Middle Miocene, such as Gephyrocapsa, Florisphaera, and Pseudoemiliania, are present above Sample 393-U1558F-1H-2, 43–45 cm (1.92 m CSF-B), but are mixed with reworked older taxa (i.e., Cyclicargolithus floridanus and Discoaster deflandrei). Above Samples 390C-U1558A-3H-CC, 0–5 cm (22.22 m CSF-B), and 393-U1558F-2H-CC, 15–20 cm (13.46 m CSF-B), the sediments are assigned to the Early Miocene because of the presence of C. floridanus and absence of Oligocene Sphenolithus specimens. No zonation could be assigned to these samples, as there are no age-diagnostic species in the assemblage, which also includes many reworked taxa.
Samples 390C-U1558A-4H-CC, 34–39 cm, through 13X-4, 51 cm (31.85–108.90 m CSF-B), and 393-U1558F-3H-CC, 41–46 cm, through 15F-CC (22.96–110.52 m CSF-B) are placed in the Oligocene. The youngest biohorizon in this interval is the top of Sphenolithus ciperoensis (top of Zone CNO5), identified in Samples 390C-U1558A-5H-2, 107 cm (34.48 m CSF-B), and 393-U1558F-5H-2, 136–138 cm (28.83 m CSF-B). The top of Sphenolithus predistentus defines the top of Zone CNO4 and is identified in Samples 390C-U1558A-7H-5, 6 cm (56.97 m CSF-B), and 393-U1558F-7H-CC, 34–39 cm (54.47 m CSF-B). The base of Zone CNO4 is defined by the base of Sphenolithus distentus located in Samples 390C-U1558A-10H-5, 40 cm (82.11 m CSF-B), and 393-U1558F-10H-5, 58–60 cm (79.31 m CSF-B). The top of Coccolithus formosus (top of Zone CNO1) is recorded within Samples 390C-U1558A-12X-CC, 21–26 cm (100.05 m CSF-B), and 393-U1558F-14F-2, 78–80 cm (103.21 m CSF-B).
The base common of Clausicoccus subdistichus (33.88 Ma) is the closest nannofossil datum to the Eocene/Oligocene boundary and is identified in Samples 390C-U1558A-13X-4, 51 cm (108.90 m CSF-B), and 393-U1558F-15F-3, 84–85 cm (109.47 m CSF-B). Samples 390C-U1558A-14X-2, 81 cm (115.81 m CSF-B), and 393-U1558F-16F-2, 1–2 cm (111.85 m CSF-B), through the bottom of the holes comprise an Eocene sequence with a diverse nannofossil assemblage. Two biohorizons close in age, the top of D. saipanensis (top of Zone CNE20; 34.44 Ma) and top of D. barbadiensis (34.77 Ma), are both recorded in Sample 390C-U1558A-14X-2, 81 cm (115.81 m CSF-B). However, in Hole U1558F, these biohorizons occur more than a meter apart with the top of D. saipanensis identified in Sample 393-U1558F-16F-2, 1–2 cm (111.85 m CSF-B), and the top of D. barbadiensis in Sample 393-U1558F-16F-2, 118–120 cm (113.02 m CSF-B). The top of Chiasmolithus grandis and base common of Reticulofenestra erbae (top of Zone CNE16) were identified in Sample 390C-U1558A-16X-4, 36 cm (137.55 m CSF-B). In Hole U1558F, the top of Sphenolithus obtusus was identified in Sample 393-U1558F-21X-CC, 28–33 cm (147.24 m CSF-B), and marks the top of Zone CNE15. The base common of Reticulofenestra bisecta was recorded in both holes in Samples 390C-U1558A-18X-3, 130 cm (156.20 m CSF-B), and 393-U1558F-22X-CC, 15–20 cm (157.58 m CSF-B). The deepest sample analyzed from each hole at Site U1558 contains common R. umbilicus, suggesting the sediment is younger than 42.72 Ma (above the base common of R. umbilicus). This age agrees with the planktic foraminiferal biostratigraphy as well as the magnetostratigraphy (see Sediment in Paleomagnetism; refer to Figures F79, F80). However, the basal sedimentary age of <42.72 Ma suggests that the overlying sediment is ~6.5 My younger than the estimated crustal age for Site U1558 of ~49.2 Ma.
7.3. Planktic foraminifera
Occurrences of biostratigraphically significant planktic foraminifera from Holes U1558A and U1558F are summarized in Tables T14 and T15. Planktic foraminiferal abundance and preservation at U1558 varies throughout the sedimentary sequence; preservation ranges from poor to very good and is typically good to moderate (Figure F60). Assemblages are often characterized by fragmented specimens and are dominated by robust taxa indicating corrosive conditions at the seafloor. Some samples are nearly barren of planktic foraminifera, in contrast to high numbers of benthic foraminifera, fish teeth, and planktic and benthic foraminiferal fragments, which is indicative of high-dissolution intervals. In most samples, a few robust species dominate the assemblage, including Catapsydrax spp., Subbotina senni, and Globigerinatheka spp. (Figure F62).
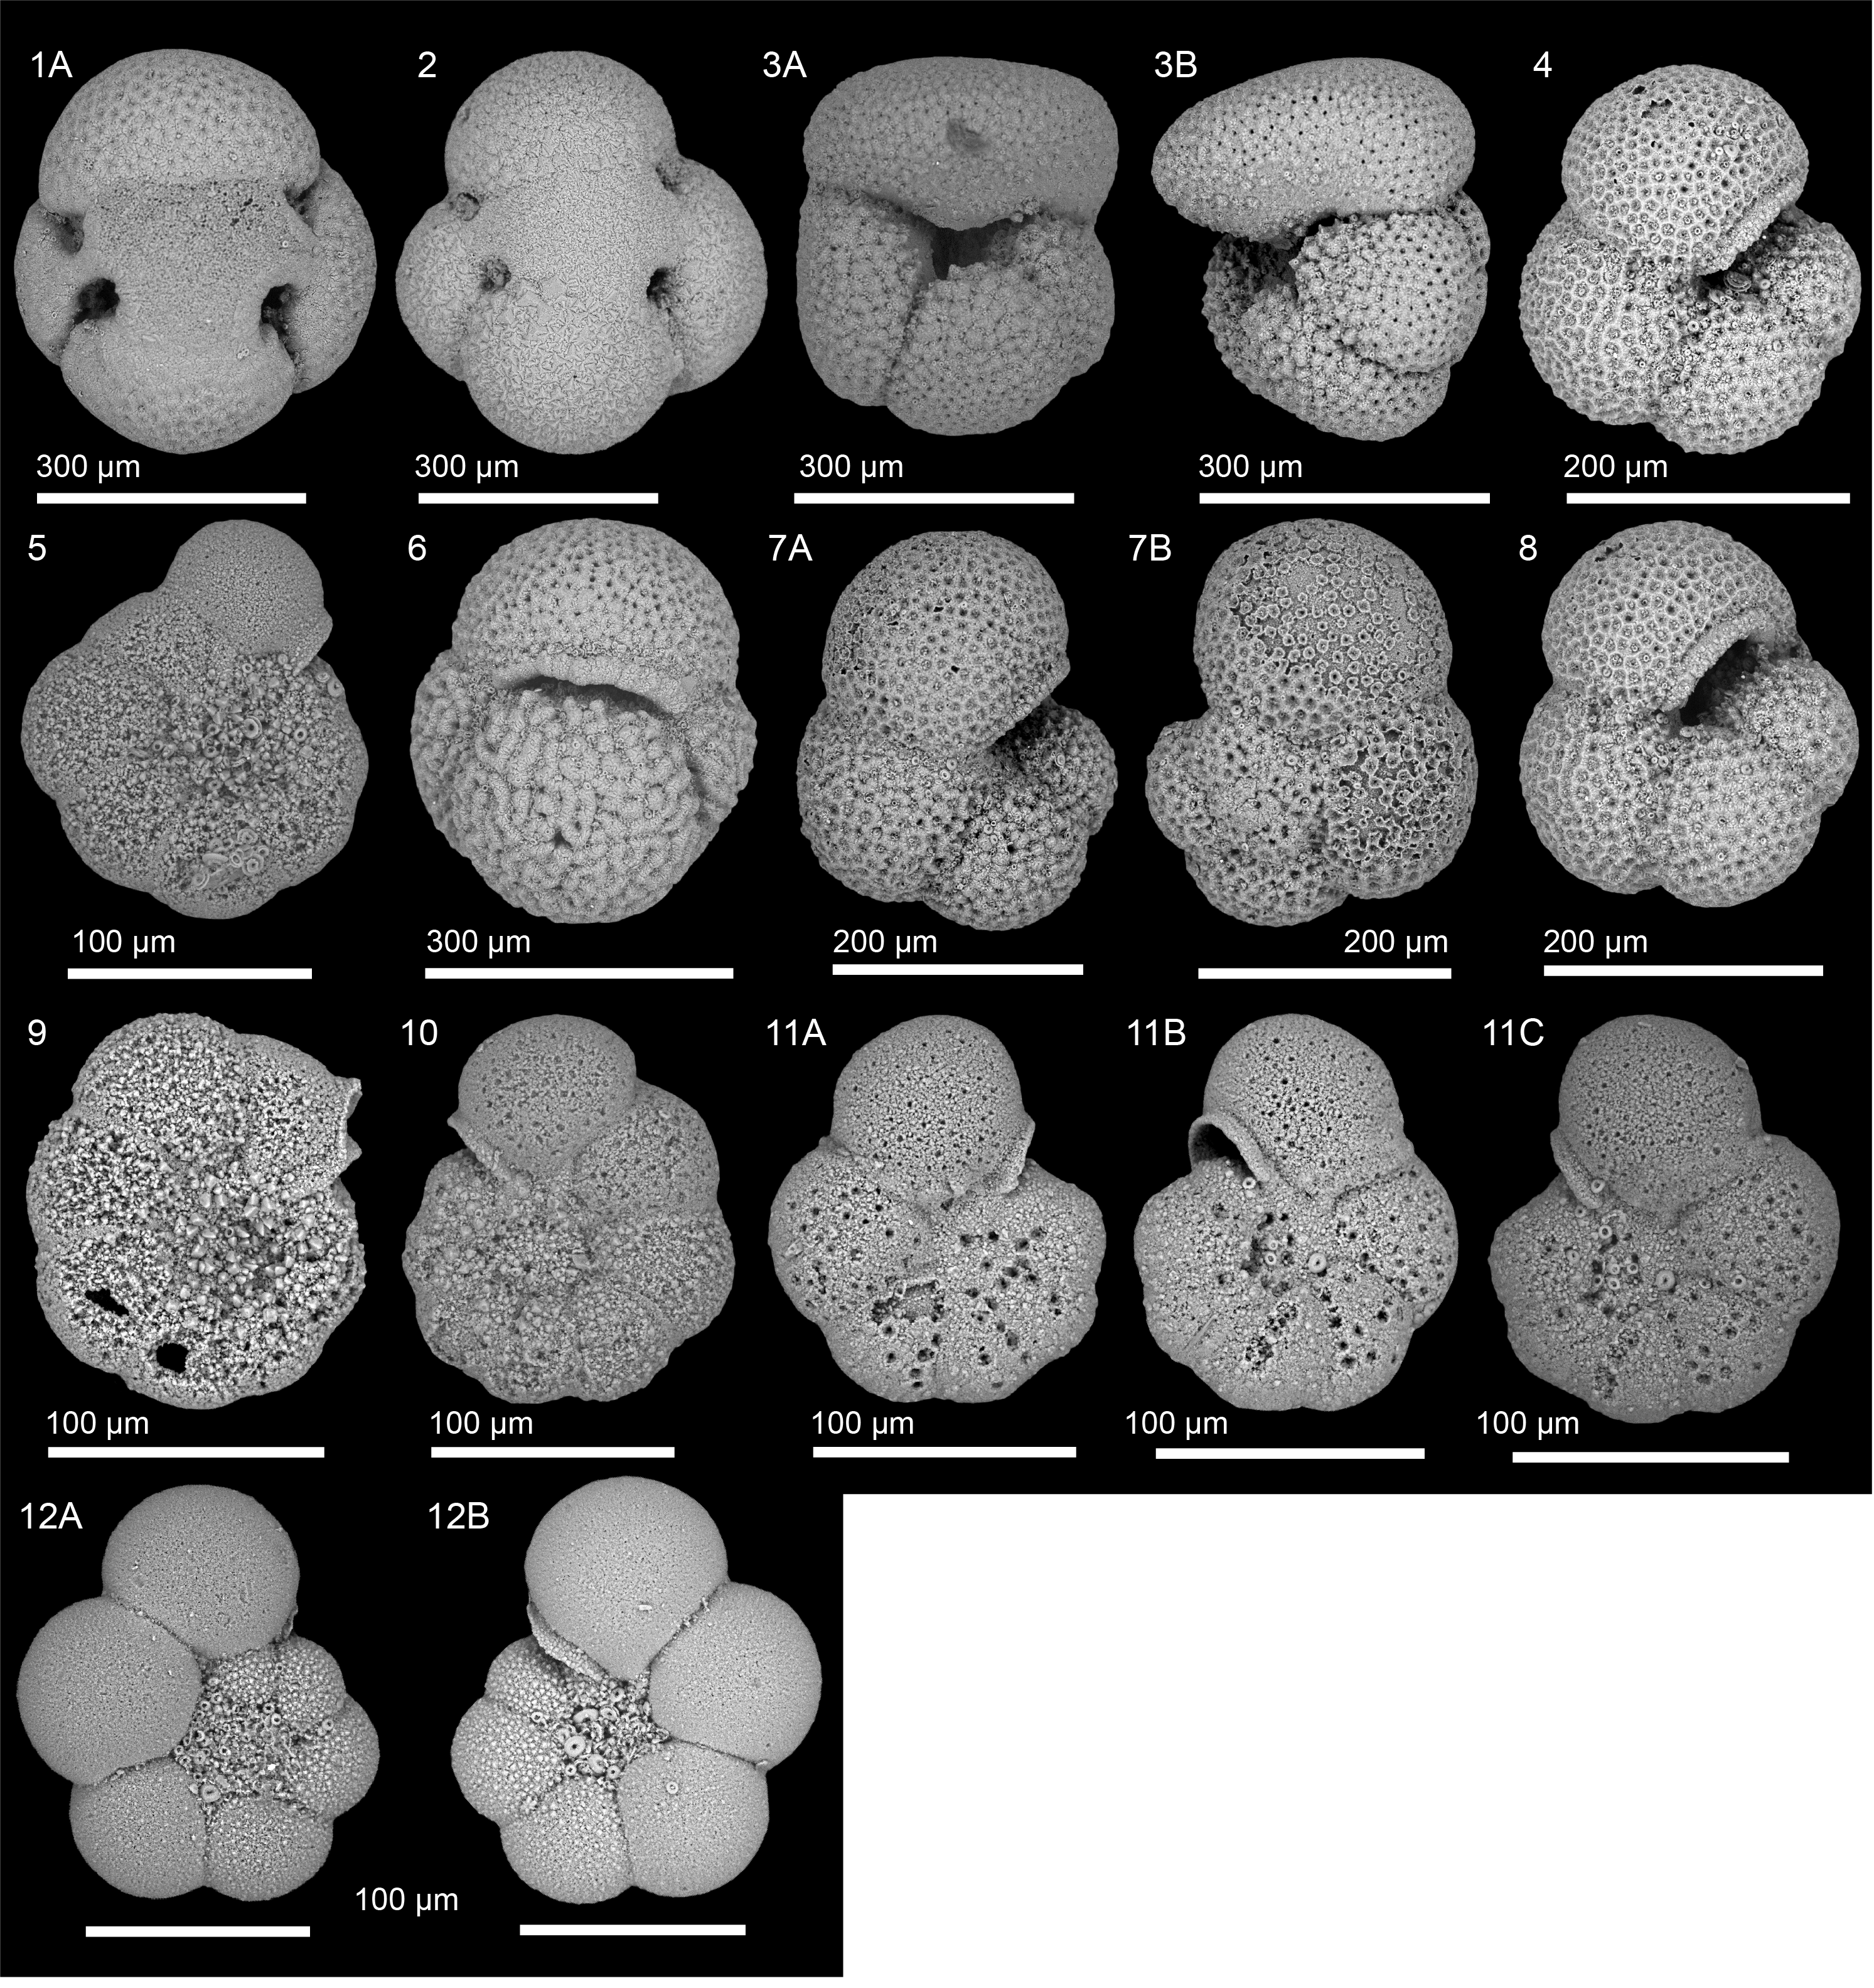
Figure F62. Important and notable foraminiferal taxa.
The Hole U1558A mudline sample had no particles larger than 63 µm, and as such, the age of the uppermost sediments could not be determined. In contrast, the Hole U1558F mudline sample contained Pleistocene assemblages including Globorotalia crassaformis, Globorotalia truncatulinoides, Globorotalia hirsuta, and Globorotalia tosaensis. The presence of G. hirsuta (0–0.45 Ma; King et al., 2020) and G. tosaensis (0.61–3.35 Ma; King et al., 2020) in the same sample indicates some degree of mixing. However, these species are noted to overlap in the midlatitudes of the Pacific Ocean (Lam and Leckie, 2020; Lam et al., 2022).
Sample 390C-U1558A-1H-CC, 9–14 cm (3.35 m CSF-B), is tentatively placed in Middle Miocene because of the presence of Globoconella miozea, a species that ranges from Zones M9a to M5b (13.2–15.9 Ma) in the midlatitudes of the South Pacific Ocean (Site 593; Lam et al., 2022) and has been previously recorded from the Middle Miocene of southwest Atlantic sites (e.g., Site 516; Berggren et al., 1983).
Samples 390C-U1558A-2H-CC, 21–26 cm (7.43 m CSF-B), and 393-U1558F-1H-CC, 10–15 cm (3.95 m CSF-B), both contain Catapsydrax dissimilis; the highest occurrence of this taxon marks the top of Zone M3. Samples 390C-U1558A-3H-CC, 0–5 cm, and 4H-CC, 34–39 cm, are unzoned, but Sample 4H-CC, 34–39 cm (31.85 m CSF-B), is likely younger than the base of Zone M1b (22.50 Ma) because of the presence of Globoquadrina dehiscens, a basal marker for that zone (King et al., 2020). The same bioevent occurs higher in the sedimentary sequence in Hole U1558F, where G. dehiscens is not found below Sample 393-U1558F-2H-CC, 15–20 cm (13.46 m CSF-B). In Hole U1558A, the base of G. dehiscens is located between Samples 390C-U1558A-4H-CC, 34–39 cm, and 5H-CC, 17–22 cm (31.85 and 39.83 m CSF-B, respectively). The next three consecutive core catcher samples in Hole U1558A (39.83–60.01 m CSF-B) are assigned to Zone M1a (22.50–22.88 Ma) based on the occurrence of Trilobatus trilobus, which has a base within that zone. No T. trilobus specimens were observed in Hole U1558F, but Sample 393-U1558F-8H-CC, 16–21 cm (63.96 m CSF-B), contains the top of Paragloborotalia opima, a late Oligocene taxon whose highest occurrence marks the top of Zone O5 (26.9 Ma). This means that five consecutive core catcher samples from above this bioevent in Hole U1558F (22.96–54.47 m CSF-B) are assigned to Zones M1a–O6 undifferentiated, representing a time span of 4.4 My (22.5–26.9 Ma).
In Hole U1558A, Sample 390C-U1558A-8H-CC, 10–15 cm (69.54 m CSF-B), does not contain T. trilobus and is thus no younger than the lower part of Zone M1a. Because this sample does not contain any other age-indicative species aside from long-ranging planktic taxa (e.g., Catapsydrax unicavus, C. dissimilis, and Dentoglobigerina tripartita), it is possible this sample could be Oligocene. Samples 9H-CC, 8–13 cm, and 10H-CC, 16–21 cm (75.85 and 85.35 m CSF-B), also lack age-diagnostic taxa and remain unzoned. The next biostratigraphically useful sample in Hole U1558A is Sample 11H-CC, 31–36 cm (94.45 m CSF-B), which contains the highest occurrences of Oligocene taxa Turborotalia ampliapertura (which defines the top of Zone O2) and Subbotina angiporoides (which ranges from Zone O3 to E11). Therefore, the Oligocene/Miocene boundary must occur somewhere between Cores 8H and 11H. The boundary likely falls closer to the top of this interval based on the occurrence of the late Oligocene species P. opima identified in Hole U1558F (Sample 393-U1558F-8H-CC, 16–21 cm; 63.96 m CSF-B). The top of S. angiporoides was also observed in adjacent Hole U1558F in Sample 10H-CC, 34–39 cm (83.00 m CSF-B), placing this sample in Zone O3. The calibrated age for this bioevent is 30.1 Ma (Wade et al., 2011), so the absence of S. angiporoides in Sample 9H-CC, 14–19 cm (72.65 m CSF-B), combined with the presence of P. opima suggests that this sample's age is between 26.9 and 30.1 Ma. T. ampliapertura was not observed in Hole U1558F.
Sample 390C-U1558A-12X-CC, 21–26 cm (100.05 m CSF-B), only contains T. ampliapertura and S. angiporoides; thus, this sample is also placed within Zone O2. Sample 393-U1558F-11F-CC, 15–20 cm (91.08 m CSF-B), is dominated by long-ranging taxa (e.g., Dentoglobigerina venezuelana and C. unicavus) and lacks any age-diagnostic taxa, precluding zonal assignments. Sample 393-U1558F-12F-CC, 16–21 cm (96.26 m CSF-B), contains the top of Pseudohastigerina naguewichiensis, which marks the top of Zone O1. This bioevent is followed by identification of the highest common occurrence of Pseudohastigerina micra in Sample 393-U1558F-14F-CC, 9–14 cm (105.66 m CSF-B). This bioevent is typically placed at the top of Zone E16, alongside the top of Hantkenina alabamensis with the same age calibration at 33.9 Ma. The top of Hantkenina spp. (often only represented in samples by a few broken tubulospines) is found deeper in the sedimentary sequence (Sample 393-U1558F-18F-CC, 19–24 cm; 124.47 m CSF-B), which may be an artifact of taxon rarity in the upper part of its range.
No bioevents of Pseudohastigerina or Hantkenina specimens are identified in Hole U1558A, which might be a result of the coarser sampling interval (core catcher samples from half-length piston cores in Hole U1558F versus full-length piston cores in Hole U1558A). Sample 390C-U1558A-13X-CC, 9–14 cm (111.56 m CSF-B), is unzoned because of the dissolution of planktic foraminifera and lack of primary and secondary marker species. This sample contains dominantly benthic foraminifera, fish teeth, and skeletal fragments and only rare whole planktic foraminifera. Sample 14X-CC, 21–26 cm (120.61 m CSF-B), contains rare specimens of G. index, placing this sample in the late Eocene Zone E15. Because Sample 13X-CC was devoid of marker species, we suspect the Eocene/Oligocene boundary is located between Samples 13X-CC and 14X-CC in Hole U1558A. However, because both T. ampliapertura and S. angiporoides occur in the late Eocene, we cannot rule out the possibility that Sample 12X-CC, 21–26 cm (100.05 m CSF-B), could potentially be Eocene in age. The lack of primary and secondary maker species and the presence of long-ranging taxa in this sample (e.g., C. dissimilis and C. unicavus) prohibits a more precise placement of the Eocene/Oligocene boundary in Hole U1558A.
In parallel Hole U1558F, the top of G. index is present in Sample 393-U1558F-16F-CC, 15–20 cm (115.06 m CSF-B), and marks the top of Zone E15. The top of Acarinina mcgowrani (calibrated at 37.7 Ma) is identified in Sample 22X-CC, 15–20 cm (157.58 m CSF-B), with the former marking the top of Zone E13. Samples 18F-CC, 19–24 cm, and 20X-CC, 20–25 cm (124.47 and 136.62 m CSF-B, respectively), contain G. index but lack additional marker species, so this interval is assigned to Zones E15–E14.
Similarly, in Hole U1558A Samples 390C-U1558A-15X-CC, 20–25 cm, and 16X-CC, 15–20 cm (129.77 and 140.14 m CSF-B), contain G. index with no additional marker species present in the sample. Thus, these samples occur in Zones E15–E14, undifferentiated. Sample 17X-CC, 15–20 cm (149.53 m CSF-B), contains two marker species: G. index and A. mcgowrani. The top of A. mcgowrani and co-occurrence of G. index places this sample in Zones E13–E10, undifferentiated. As G. index is still present in Sample 17X-CC and the base of this species occurs at 42.9 Ma, the bottom of the sediment sequence in Hole U1558A must be younger than 42.9 Ma.
7.4. Benthic foraminifera
Onshore analysis of benthic foraminifera was conducted on core catcher samples from Hole U1558A collected during Expedition 390C. The composition of the benthic foraminiferal assemblage, as well as the benthic foraminiferal abundance and preservation, is biased toward the qualitative analysis of depth-diagnostic calcareous species and other notable calcareous taxa. Agglutinated species are reported if identified. The occurrence of important benthic foraminiferal species is reported in Table T16.
Benthic foraminifera are present in all the samples analyzed, with highest abundance in Sample 390C-U1558A-14X-CC, 21–26 cm (120.61 m CSF-B), where benthic foraminifera are common (Figure F60). Overall, specimen preservation is poor, although it ranges from moderate to very poor depending on the species (Figure F60).
According to the site age model (see Figure F79), Sample 390C-U1558A-1H-CC, 9–14 cm (3.35 m CSF-B), is Early Miocene in age. In this sample, the benthic foraminiferal assemblage is dominated by Cibicidoides mundulus and Oridorsalis umbonatus. Other species include Cibicidoides bradyi, Cibicidoides havanensis, Globocassidulina subglobosa, Nuttallides umbonifera, Pullenia bulloides, and Stilostomella subspinosa.
The late Oligocene Sample 390C-U1558A-6H-CC, 10–15 cm (50.85 m CSF-B), and the early Oligocene Sample 11H-CC, 31–36 cm (94.45 m CSF-B), are dominated by Cibicidoides mundulus/praemundulus and O. umbonatus, similar to Sample 1H-CC. In addition, G. subglobosa, N. umbonifera, and P. bulloides are present in both samples. Anomalinoides pseudogrosserugosus, Cibicidoides laurisae, Epistominella exigua, and S. subspinosa characterize Sample 6H-CC, whereas Cibicidoides cf. dickersoni, Cibicidoides eoceanus, and Nonion havanense are observed in Sample 11H-CC.
Late Eocene Sample 390C-U1558A-14X-CC, 21–26 cm (120.61 m CSF-B), and late middle Eocene Sample 17X-CC, 15–20 cm (149.53 m CSF-B), contain Eocene assemblages, with Cibicidoides grimsdalei, Cibicidoides praemundulus, G. subglobosa, Nuttallides truempyi, and O. umbonatus being the most common species. Anomalinoides semicribratus and C. havanensis are present in both samples, but Plectofrondicularia cf. kerni, Plectofrondicularia lirata, and Pullenia eoceanica characterize only Sample 14X-CC. Anomalina spissiformis is present only in Sample 17X-CC.
Finally, we note the presence of Gyroidinoidids and Stilostomellids, as well as the presence of the agglutinated species Vulvulina spinosa in many of the analyzed samples.
The benthic foraminiferal assemblage in Samples 390C-U1558A-14X-CC and 17X-CC, in particular the presence of C. grimsdalei, suggests that Site U1558 was lying at lower upper abyssal depths (close to ~3000 m) during the Eocene. The presence of N. umbonifera in Sample 11H-CC constrains the timing of the transition of Site U1558 to lower abyssal depths (>3000 m) (Katz et al., 2003) in the early Oligocene.
8. Paleomagnetism
8.1. Sediment
Remanent magnetization was measured at 2 cm spacing using the superconducting rock magnetometer (SRM) on the archive half of the sedimentary core sections from Hole U1558F and the sediment/basement interface from Hole U1558D (Cores 393-U1558D-2R and 3R). Archive-half sections were also subjected to progressive alternating field (AF) demagnetization at three different steps up to a maximum peak field of 20 mT (see Paleomagnetism in the Expedition 390/393 methods chapter [Coggon et al., 2024b]). Strongly disturbed intervals of the XCB cores (a total of 105 cm) were excluded from the measurements to avoid generating spurious data. Discrete samples were taken from working halves as 7 cm3 J-cubes (see Paleomagnetism in the Expedition 390/393 methods chapter [Coggon et al., 2024b]) at a frequency of 2 samples per core. Only 1 sample per core was taken from HLAPC cores. Remanence before and after AF demagnetization and anisotropy of magnetic susceptibility (AMS) were measured on a total of 38 discrete samples. Acquisition of isothermal remanent magnetization (IRM) was performed on 8 selected samples, 2 from each lithostratigraphic unit/subunit. To establish the magnetostratigraphy at Site U1558, magnetic polarities were analyzed using the results from both Holes U1558F and U1558A.
8.1.1. Results
Measurement of the natural remanent magnetization (NRM) and remanence after in-line AF demagnetization of APC cores (Cores 390C-U1558A-1H through 11H and Cores 393-U1558F-1H through 19F) and XCB cores (Cores 390C-U1558A-12X through 19X and Cores 393-U1558F-20X through 24X) were carried out to define the magnetostratigraphy for the entire sediment section at Site U1558. AF demagnetization up to 20 mT was applied to remove any viscous remanent magnetization and isolate the characteristic remanent magnetization (ChRM). Remanence and inclination after 20 mT AF demagnetization will be referred to as 20 mT remanence and 20 mT inclination, respectively, hereafter. The NRM and 20 mT remanence intensities of the sediments at Site U1558 are relatively strong for pelagic sediments. Values are on the order of 10−2 A/m for NRM and 10−3 to 10−2 A/m for 20 mT intensity in both Holes U1558A and U1558F. Recurrent oscillations in remanence intensity can be observed throughout Holes U1558A and U1558F (Figures F63, F64). At the sediment/basement interface in Hole U1558D, only a small number of intervals could be measured and the variation in the remanence behavior was not clearly observed (Figure F65). Variations in the remanence intensity are more pronounced in Hole U1558F, as the 20 mT intensity is an order of magnitude lower than the NRM intensity (Figure F64). The presence of high NRM intensity is associated with an almost constant positive NRM inclination throughout Hole U1558F, pointing to a drilling overprint that was removed after the 5 mT demagnetization step. Moreover, there are differences in average values of 20 mT intensity between Holes U1558A and U1558F, which are about 1.6 × 10⁻² and 5.0 × 10⁻³ A/m, respectively. Overall, no specific variations in the remanence intensity are associated with differences between the lithostratigraphic units or depths at Site U1558. Clear variations in both NRM and 20 mT inclination are visible in both Holes U1558A and U1558F (Figures F63, F64), allowing for a good definition of polarity reversals (see Age model and sedimentation rates). The distribution of the 20 mT inclination is bimodal in both holes, with values clustered around ±56° in Hole U1558A and +60° and −51° in Hole U1558F (Figure F66). This is slightly steeper than the expected inclination based on the geocentric axial dipole (GAD; ±49.1° at 30°S).
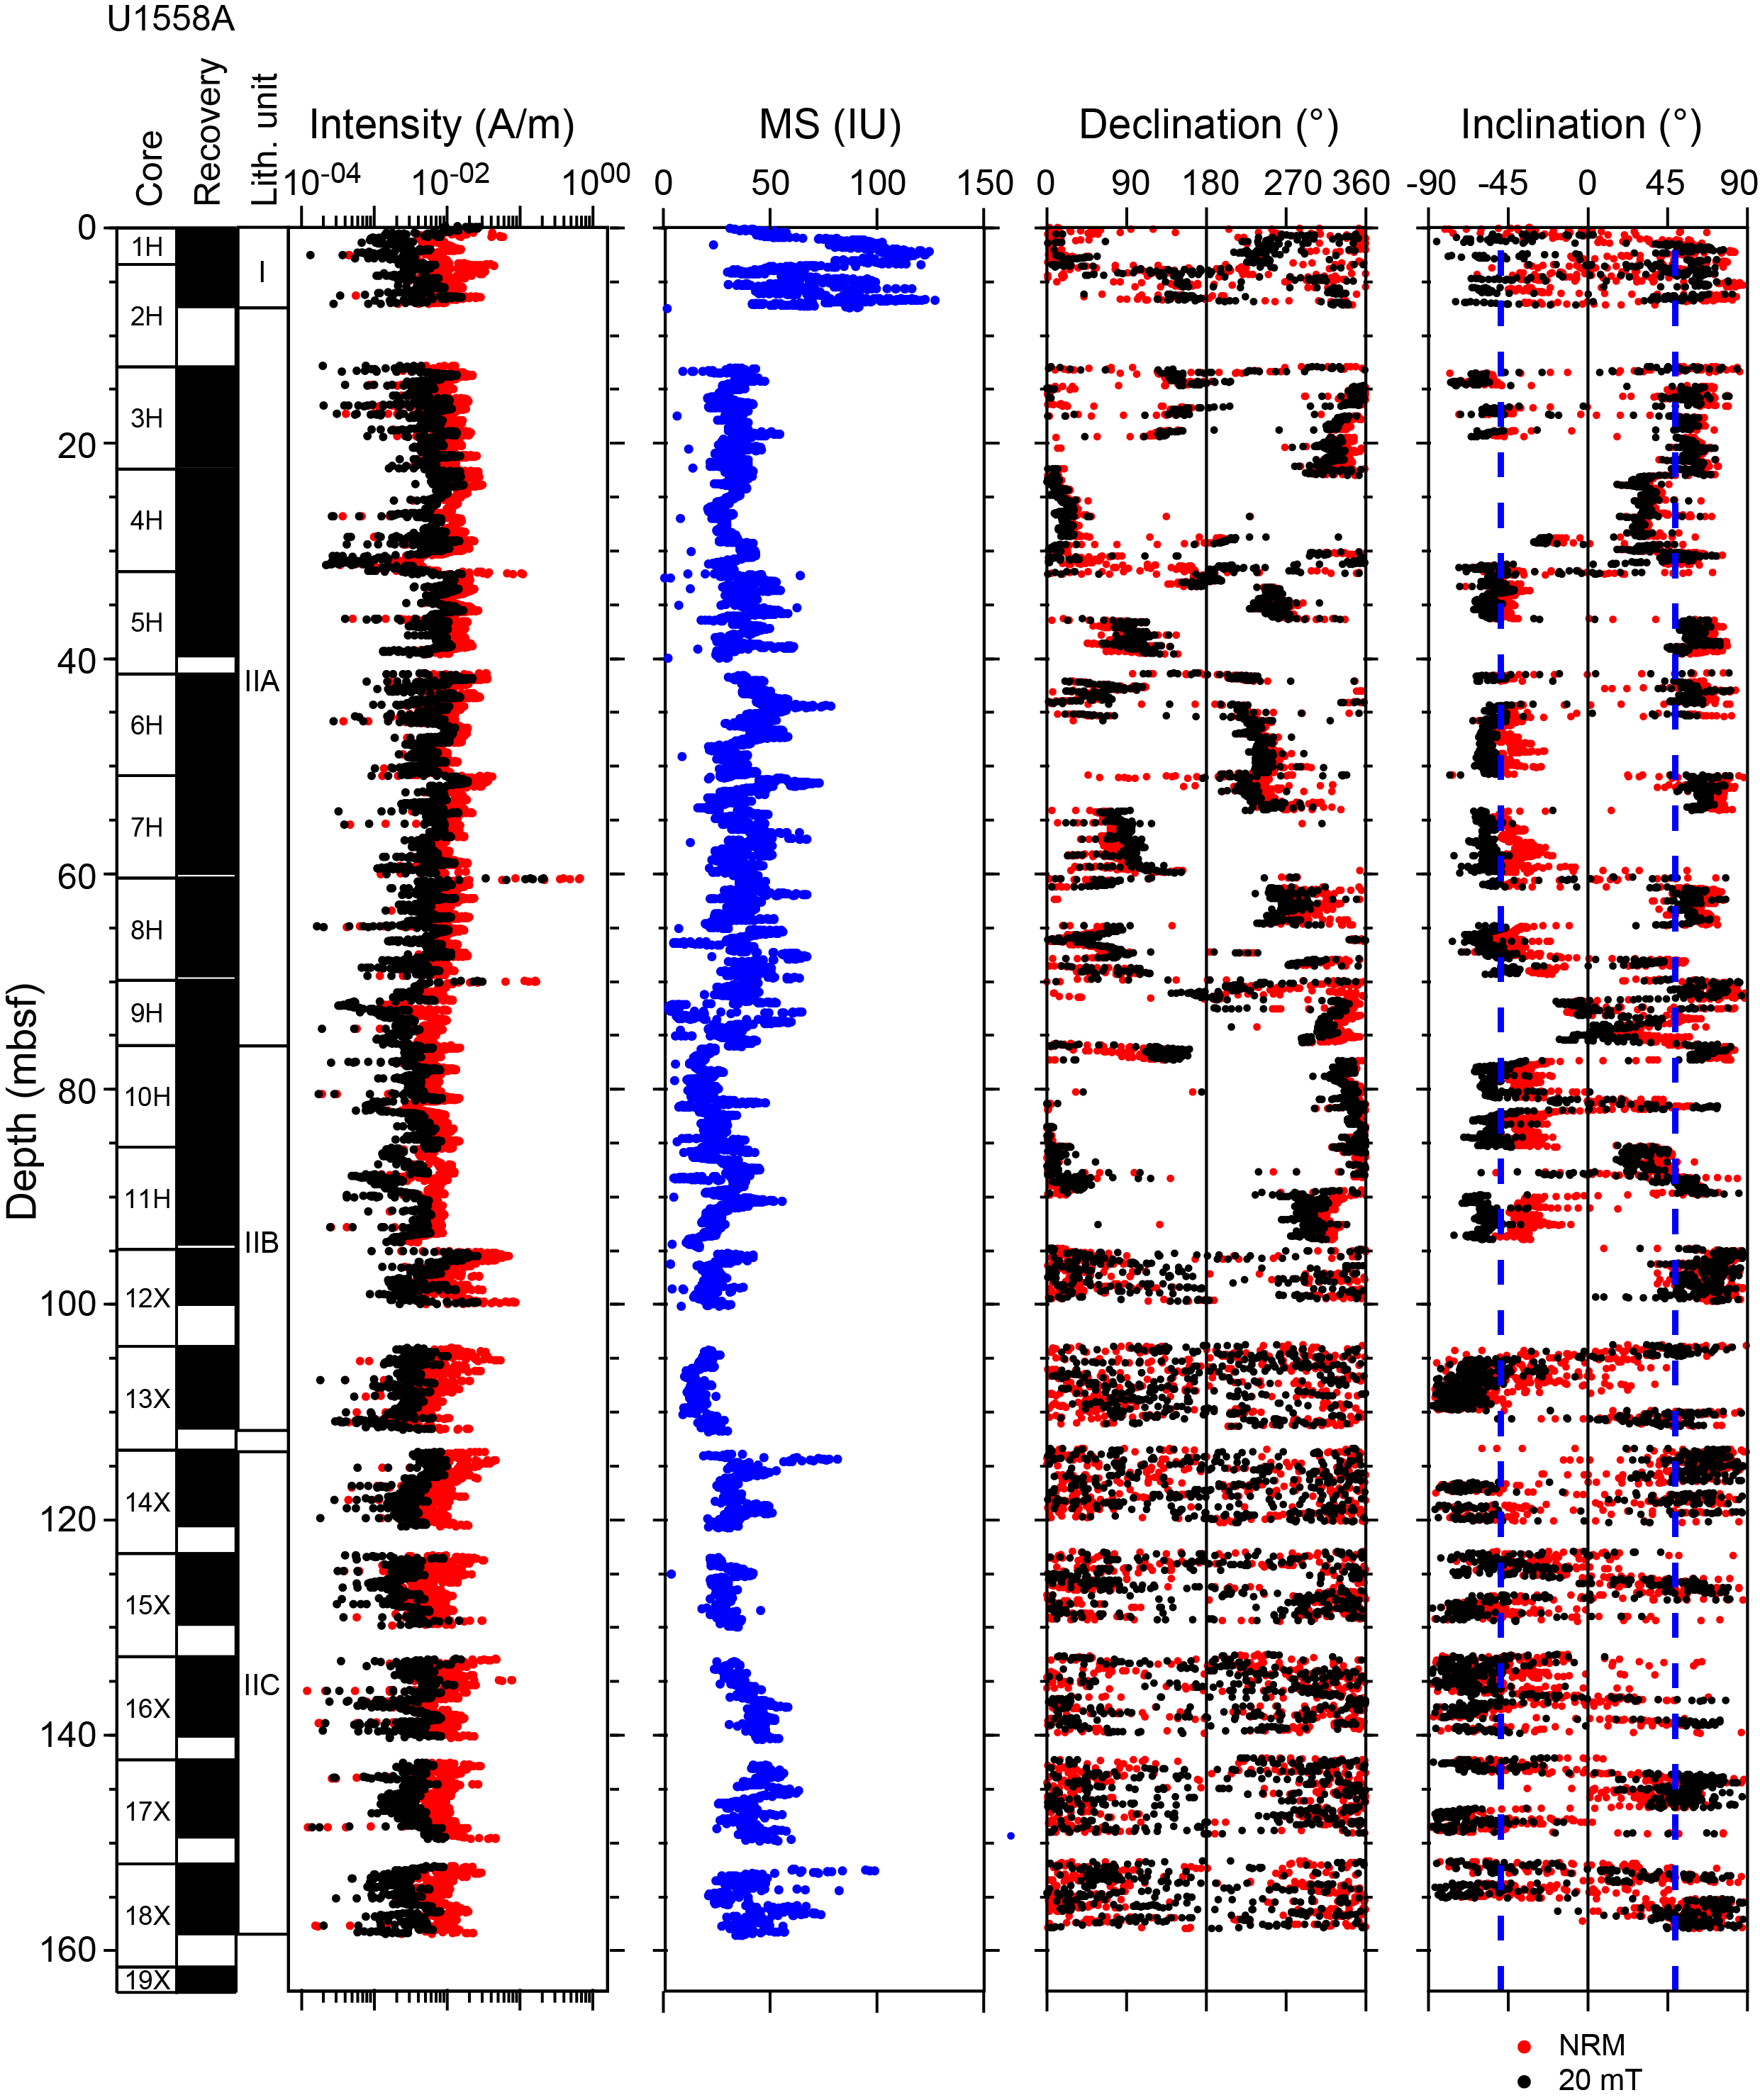
Figure F63. MSP and SRM measurements in sediments, Hole U1558A.
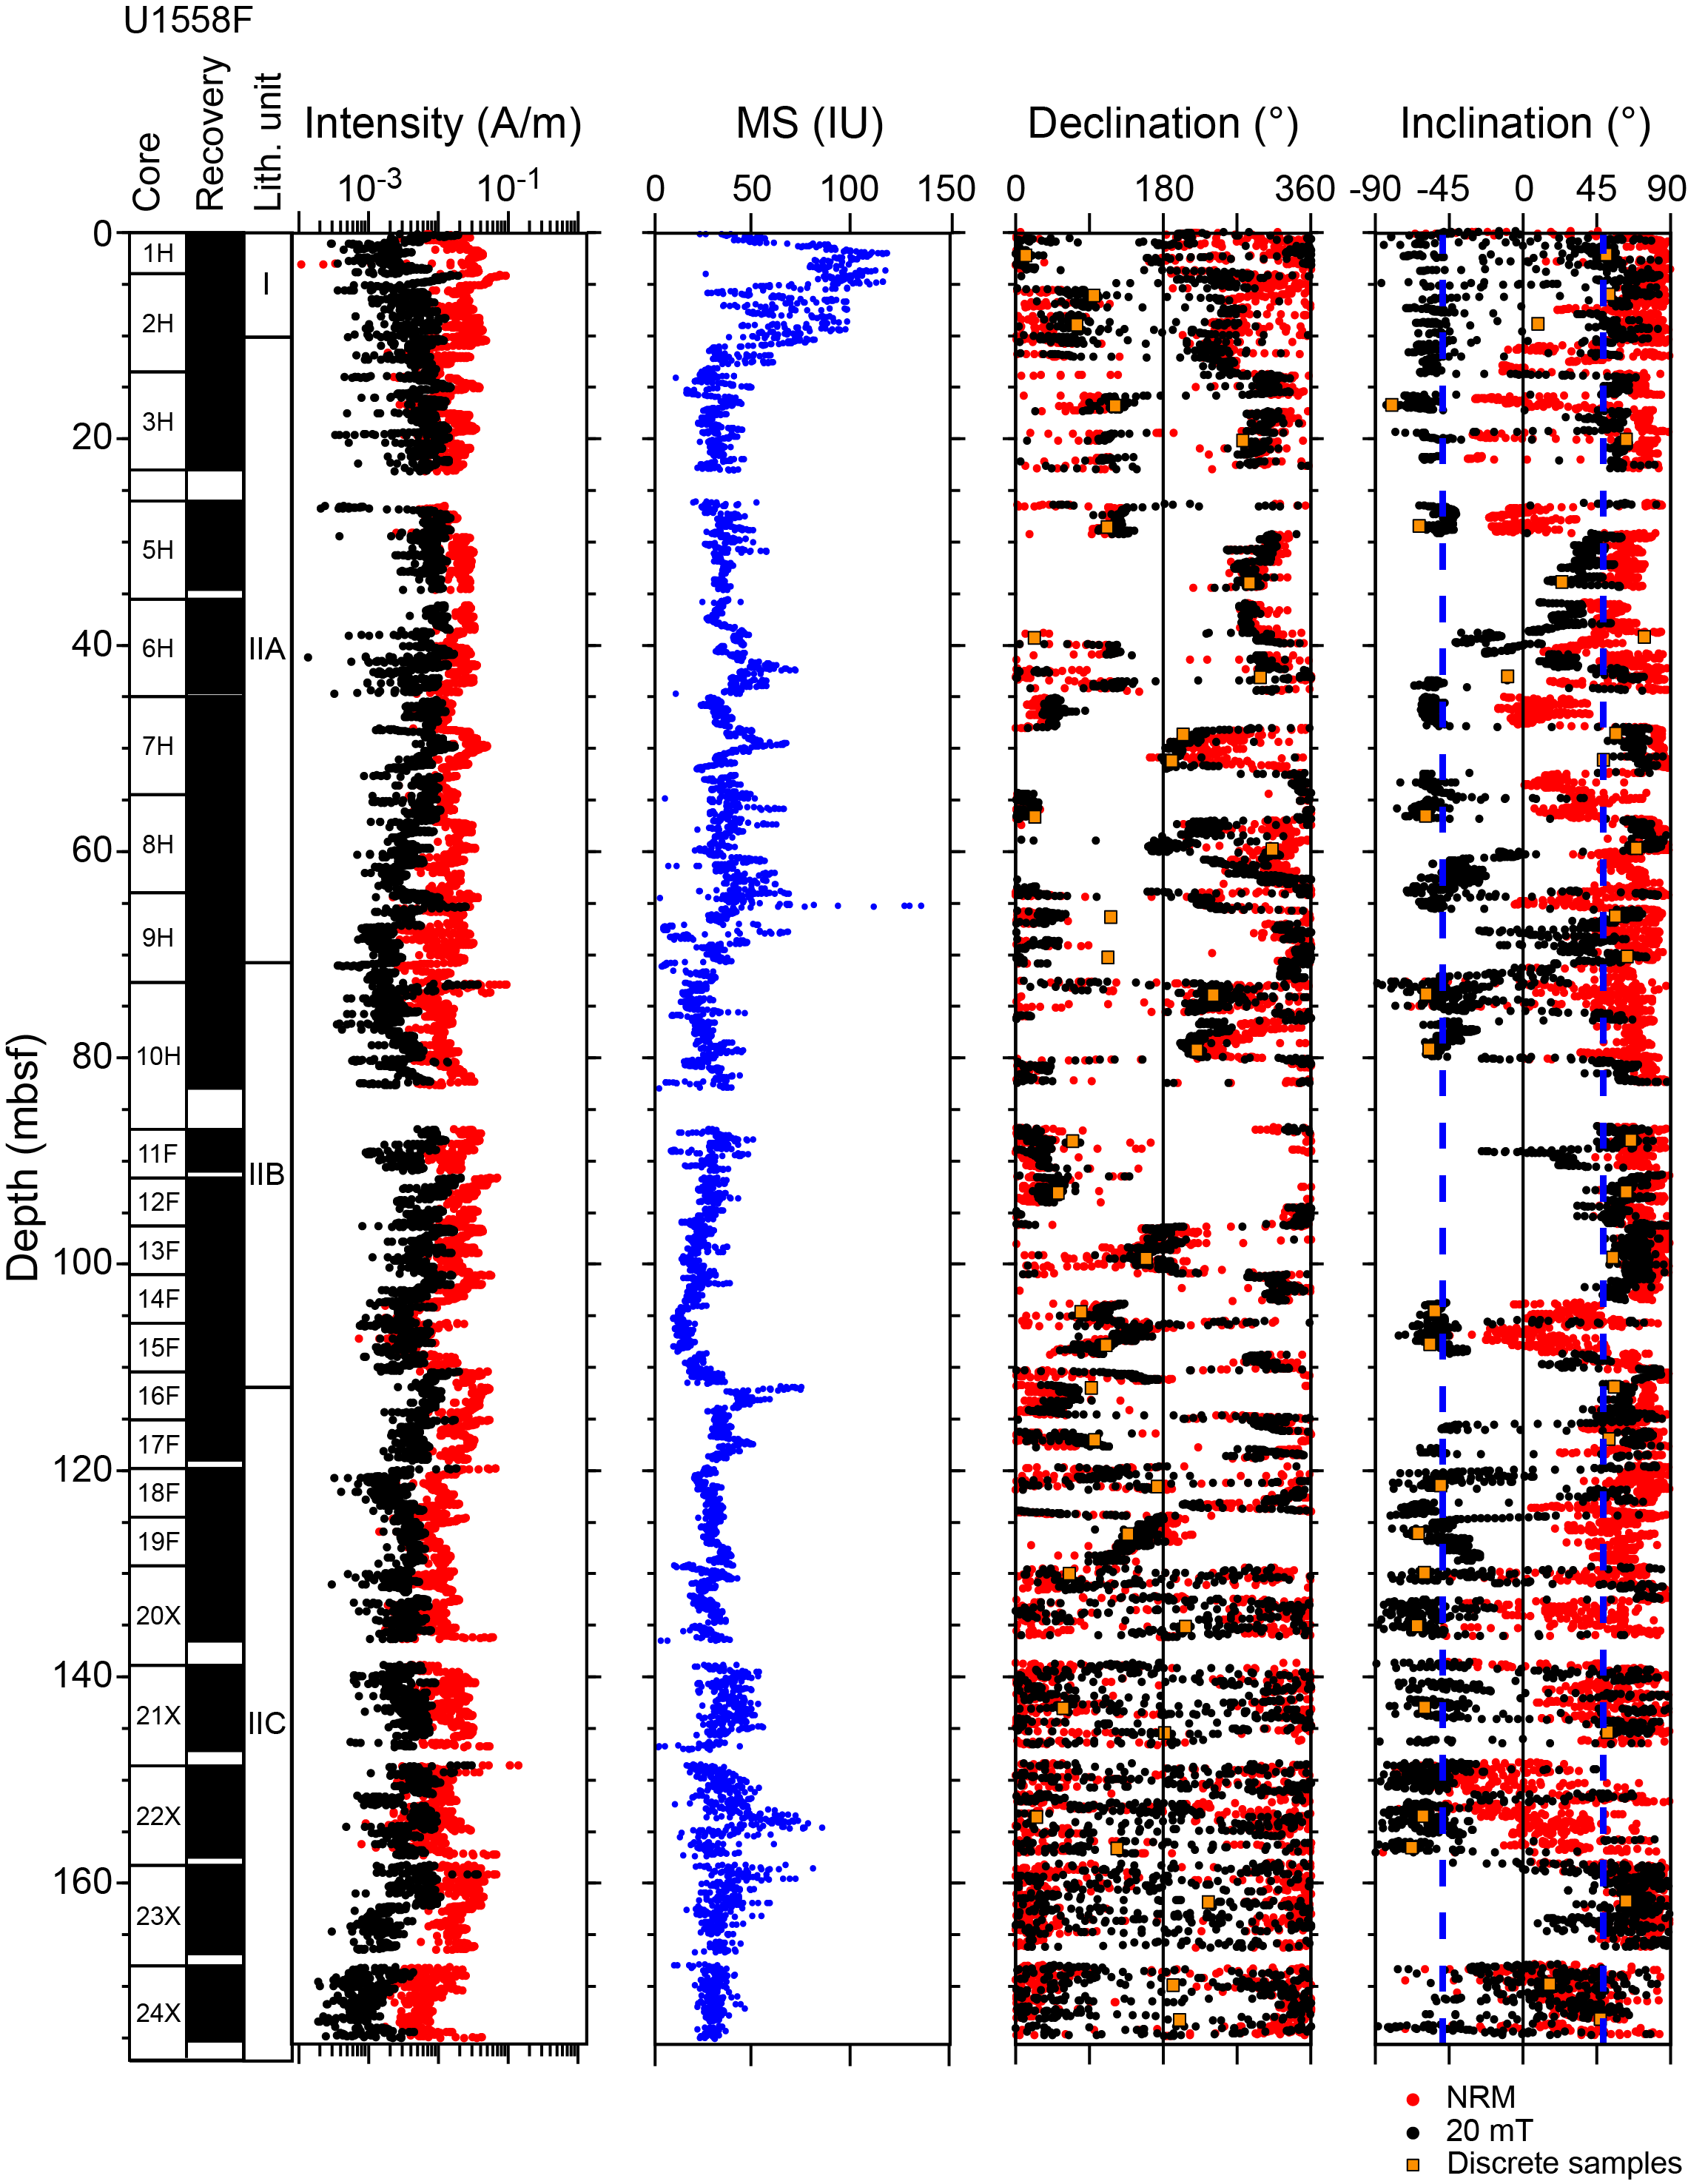
Figure F64. MSP and SRM measurements in sediments, Hole U1558F.
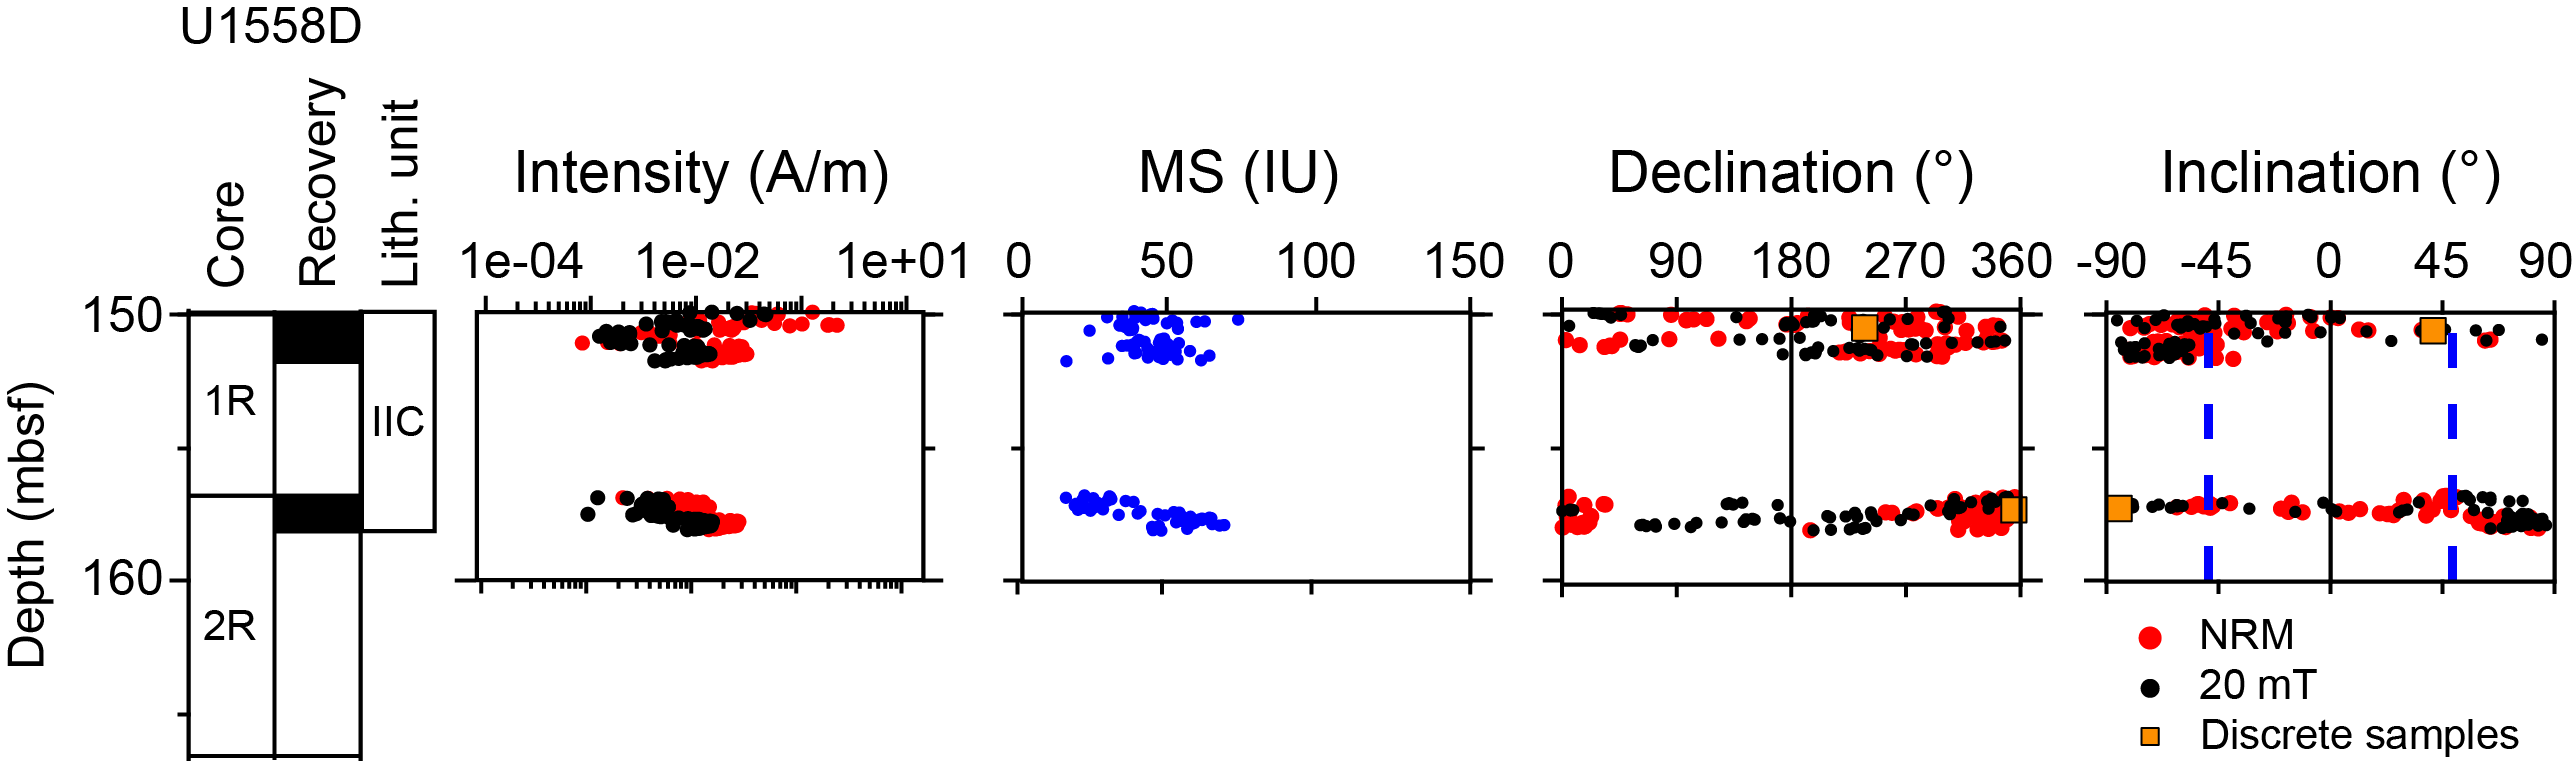
Figure F65. MSP and SRM measurements in sediments, Hole U1558D.
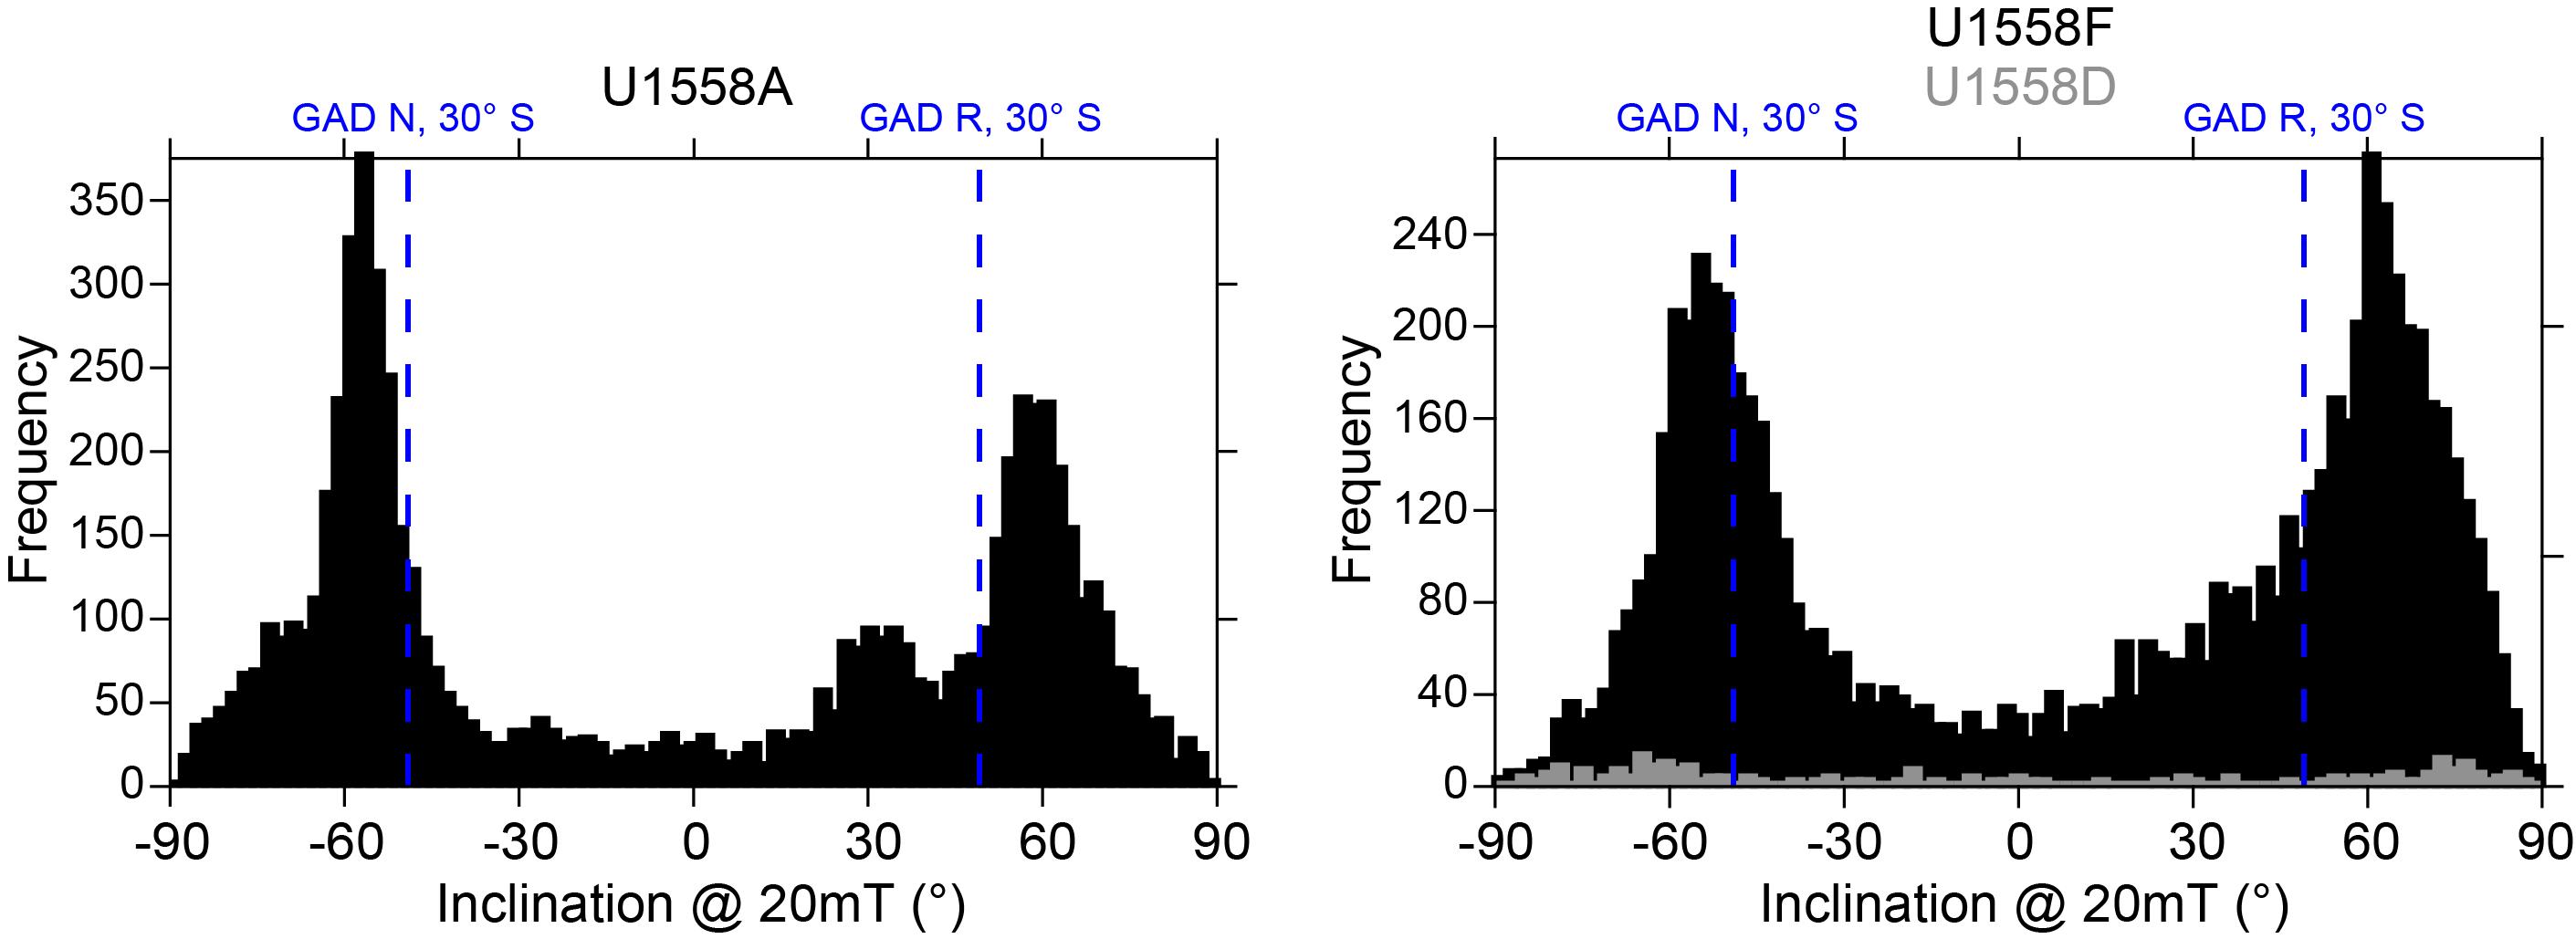
Figure F66. Inclination after 20 mT AF for sediment.
8.1.1.1. Discrete samples
We collected about 2 discrete cubes per core from Hole U1558F (38 in total), targeting the visible variations in color associated with changes in modal abundance of clay minerals (see Sedimentology). All lithostratigraphic units/subunits were sampled (Table T17). AF demagnetization up to a maximum of 100 mT was conducted on all discrete samples to identify the ChRM and provide constraints on the SRM data. Most of the samples reveal a single component after the 5 mT AF demagnetization step with maximum angular deviation angles spanning 1.9°–13.9° (Figure F67; Table T17). This indicates that ChRM components are generally well defined in Hole U1558F, as the values are less than the maximum uppermost cutoff, which is defined at 15° (Butler, 1992). In contrast, most of the discrete sediment samples from Unit I display noisy orthogonal vector plots (OVPs) or maximum angular deviation higher than 15°, suggesting that lithologic variation (see Sedimentology) may affect the efficiency of retaining a stable remanent magnetization. Overall, the ChRM directions derived from discrete measurements show both inclination and declination values similar to the SRM data (Figure F64), contributing to the robustness of the Site U1558 magnetostratigraphy.
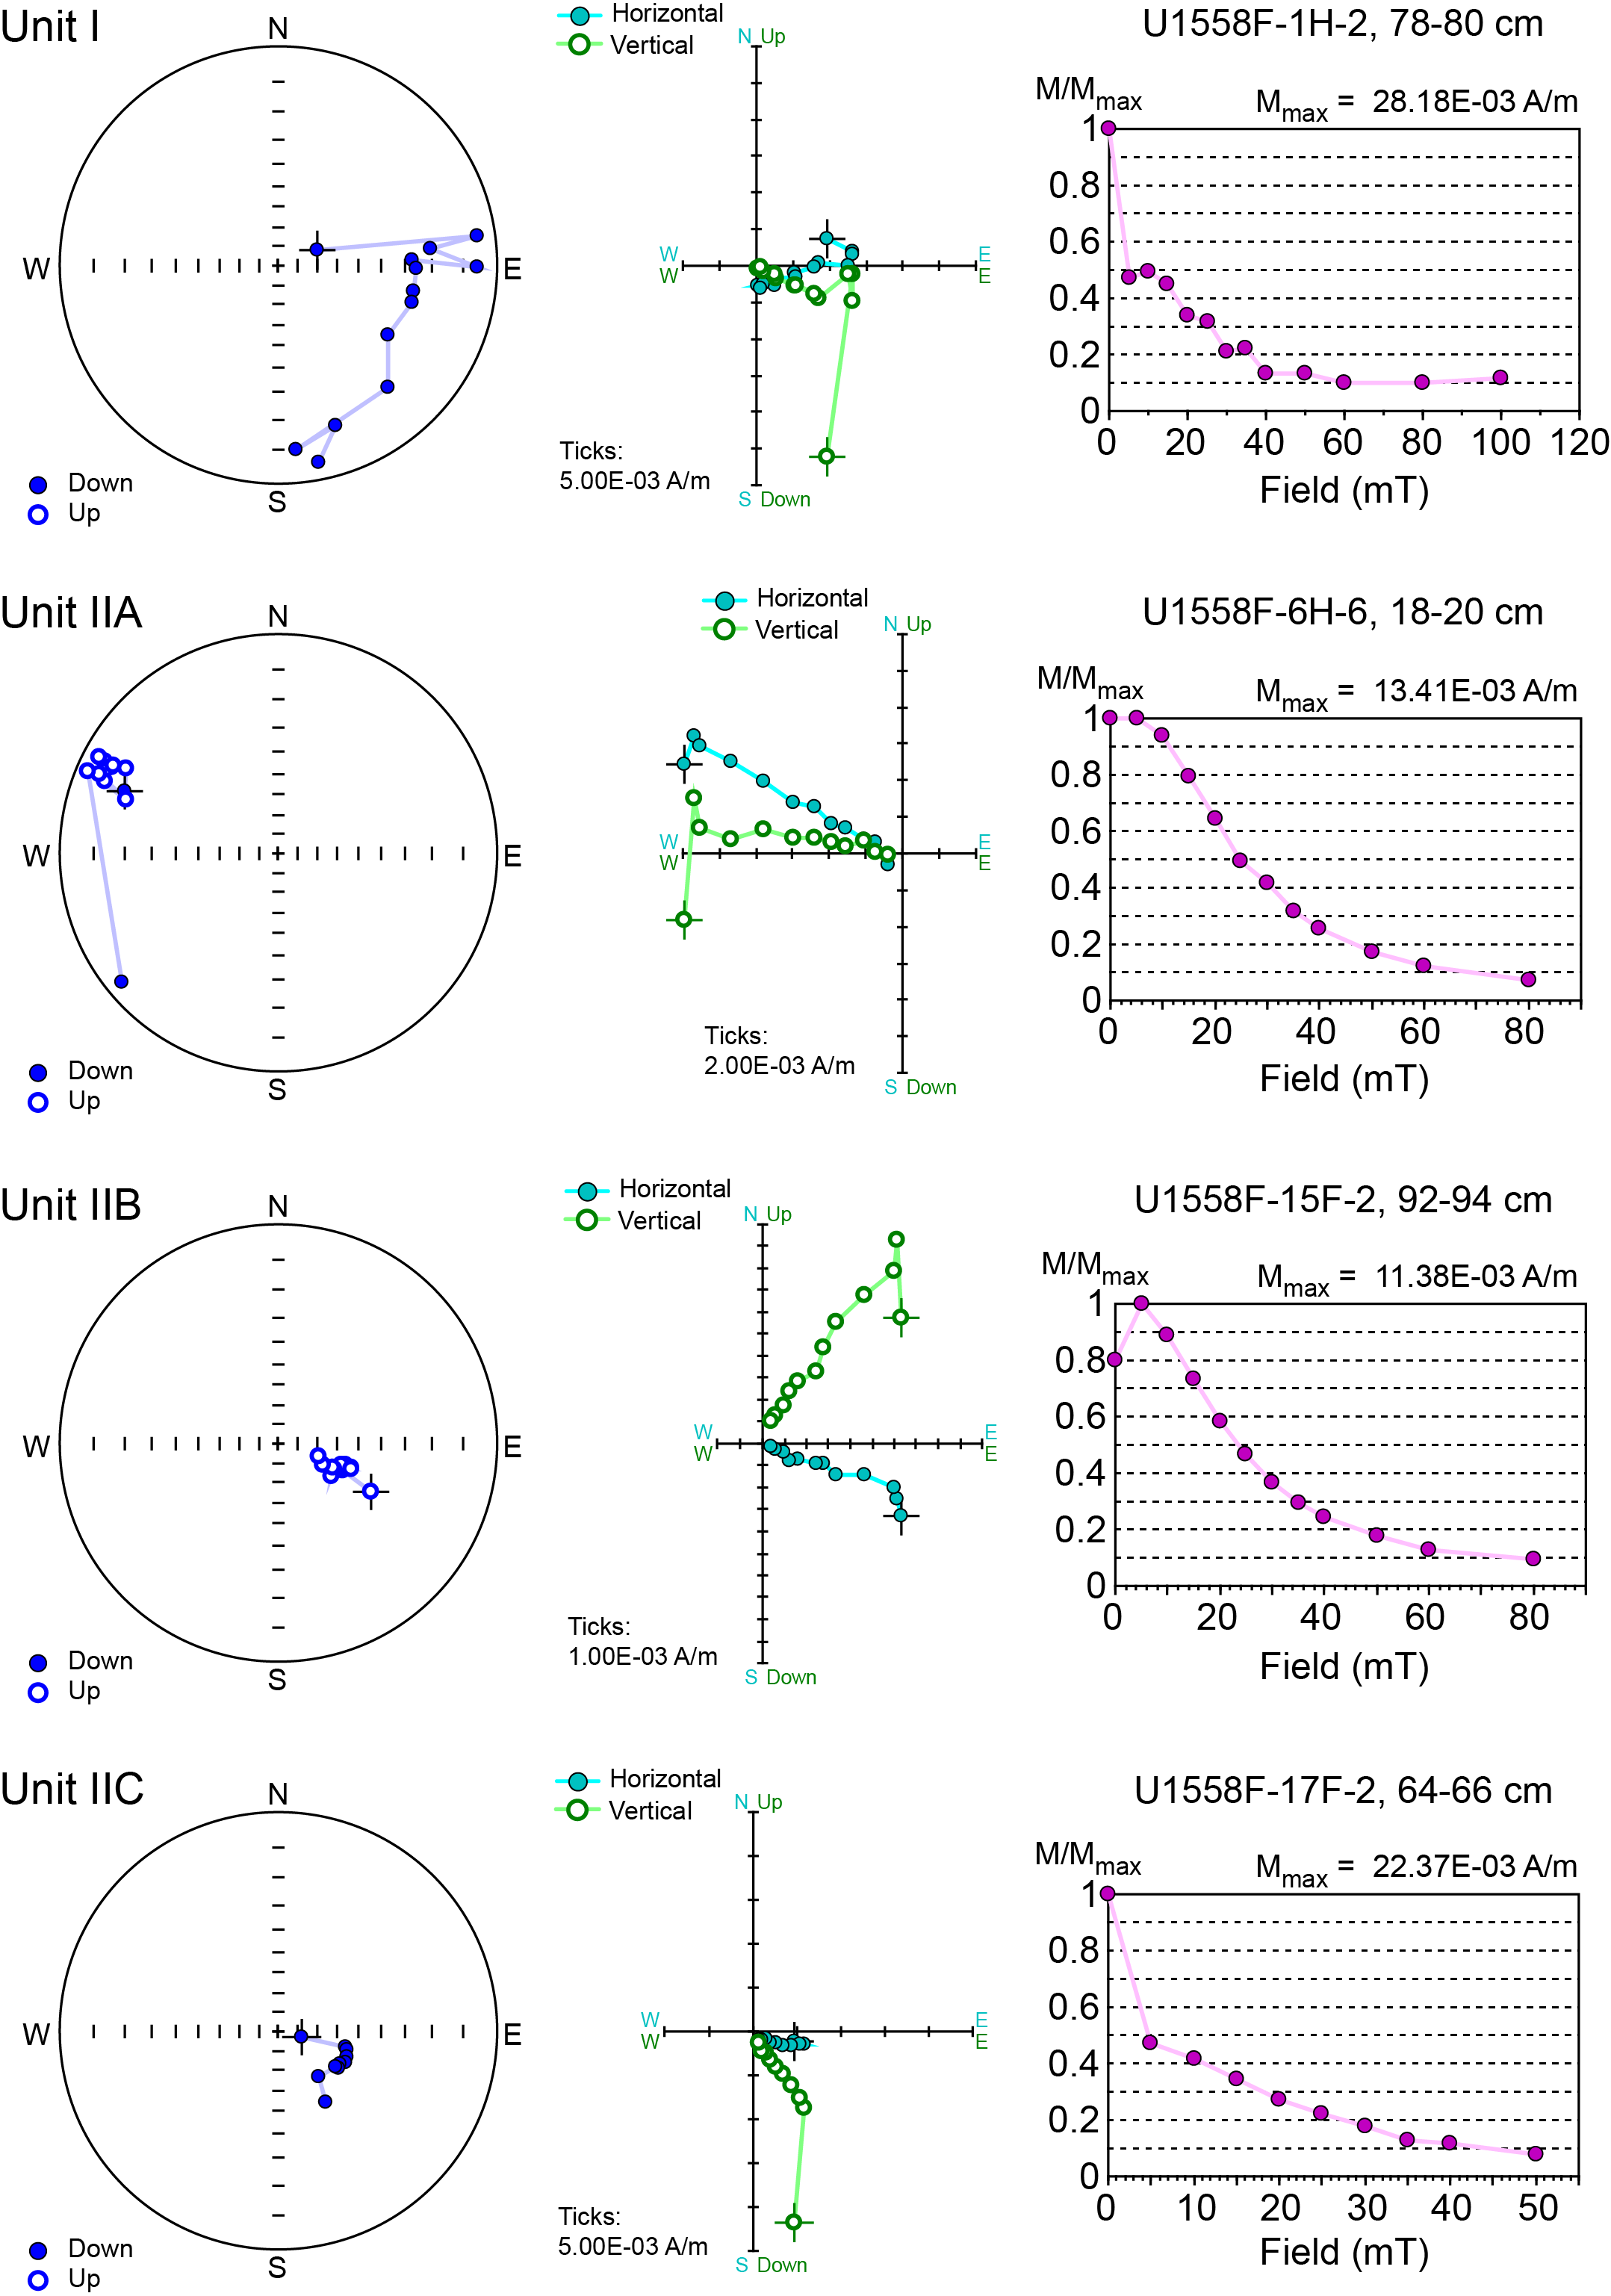
Figure F67. AF demagnetization results for each lithologic unit.
Acquisition of IRM and backfield experiments were conducted on 8 discrete samples, 2 from each lithostratigraphic unit/subunit, to characterize the magnetic mineral assemblages. Samples saturate at fields of 300–400 mT (Figure F68A), which implies the dominance of low-coercivity minerals. The intensity of saturation IRM (SIRM) is significantly higher in Unit I (Table T18). The trend of backfield curves generally shows a coercivity of remanence (Bcr) around 30 mT with no variations among lithostratigraphic units. Deconvolution of the IRM acquisition curves (Figure F68B) shows a best-fit model characterized by 2 components. A dominant low-coercivity component with a mean remanence coercivity (Bh) of ~1.57 log10 units and a minor (5%–10%) second component showing Bh values ~2.50–2.70 log10 units. Both IRM100/SIRM ratio (S0.1) and S ratio (S0.3) display values close to 1 on all measured samples with no variations with depth (Figure F69; Table T18), which supports the dominance of low-coercivity components such as magnetite (Bloemendal et al., 1992), typical of pelagic sediments. No specific trend is defined in the variation of the median destructive field (MDF) and the frequency-dependent magnetic susceptibility (Kfd%) (Figure F69). Only few samples show Kfd% values ~15% (Table T18), indicating the local dominance of superparamagnetic (SP) particles (Dearing et al., 1996).
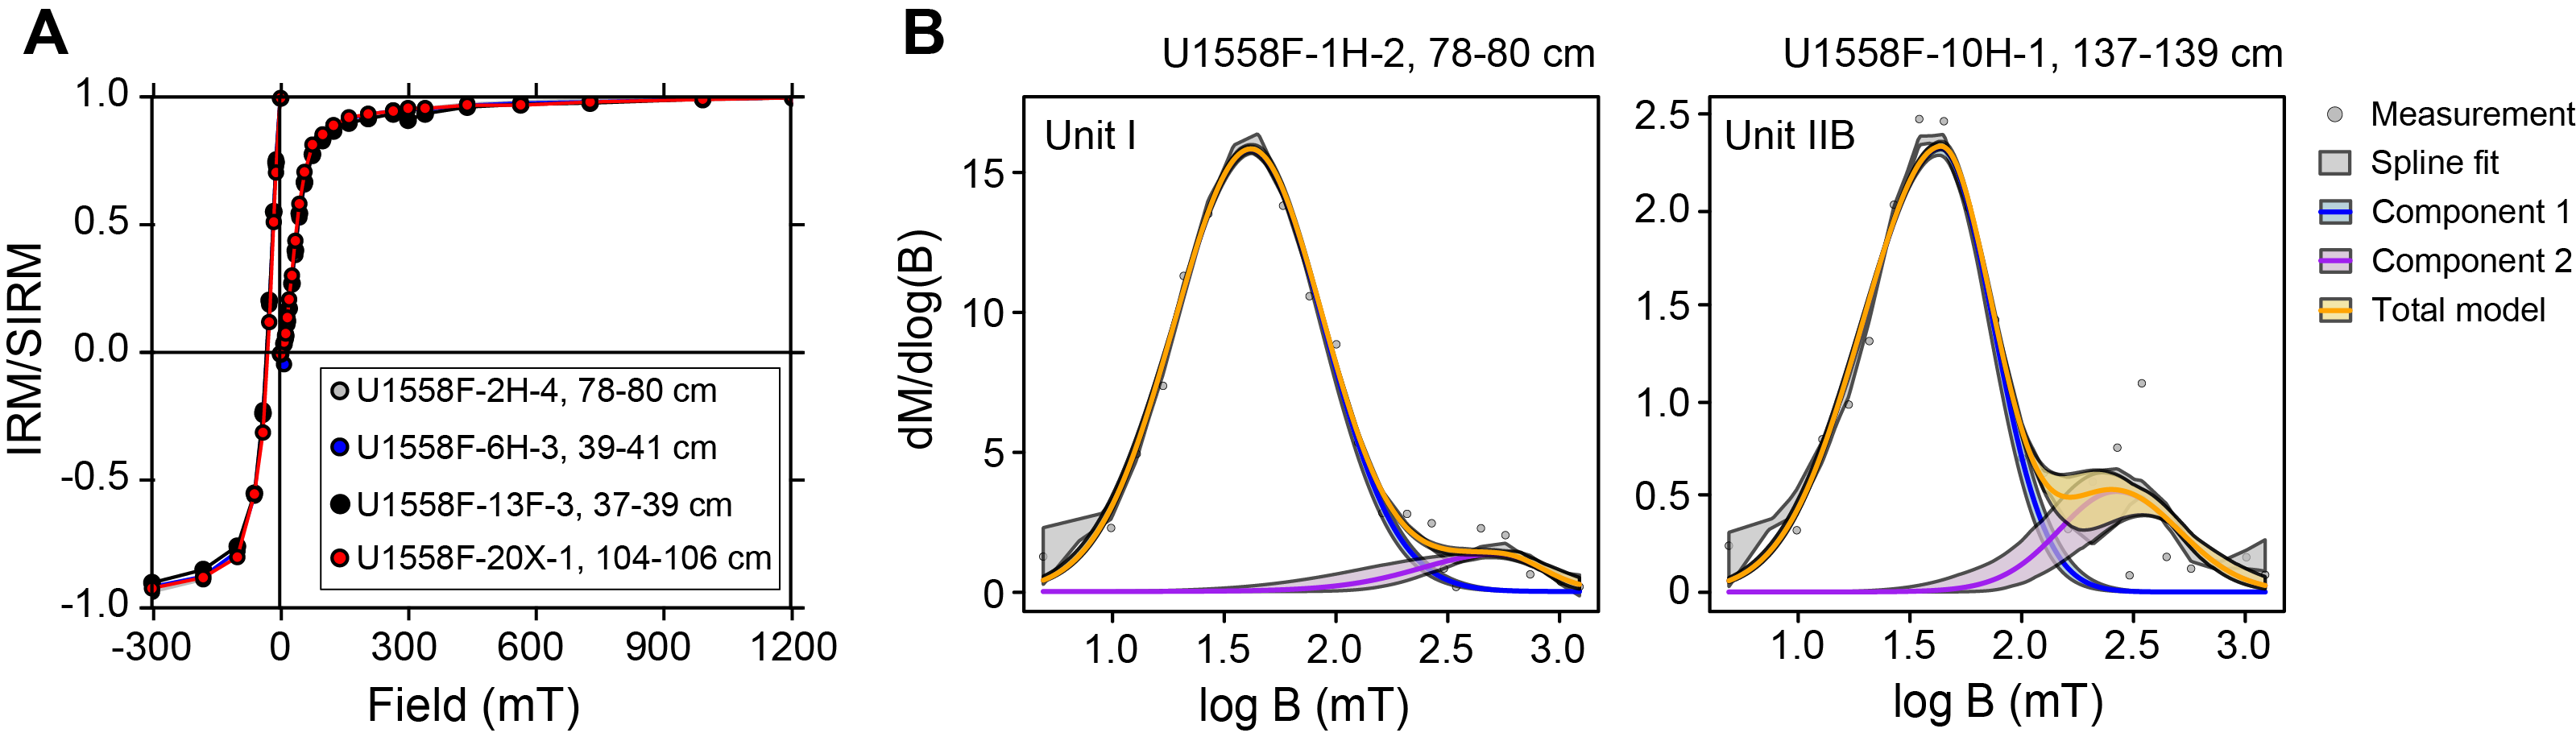
Figure F68. SIRM acquisition curves and coercivity distribution, Hole U1558F.
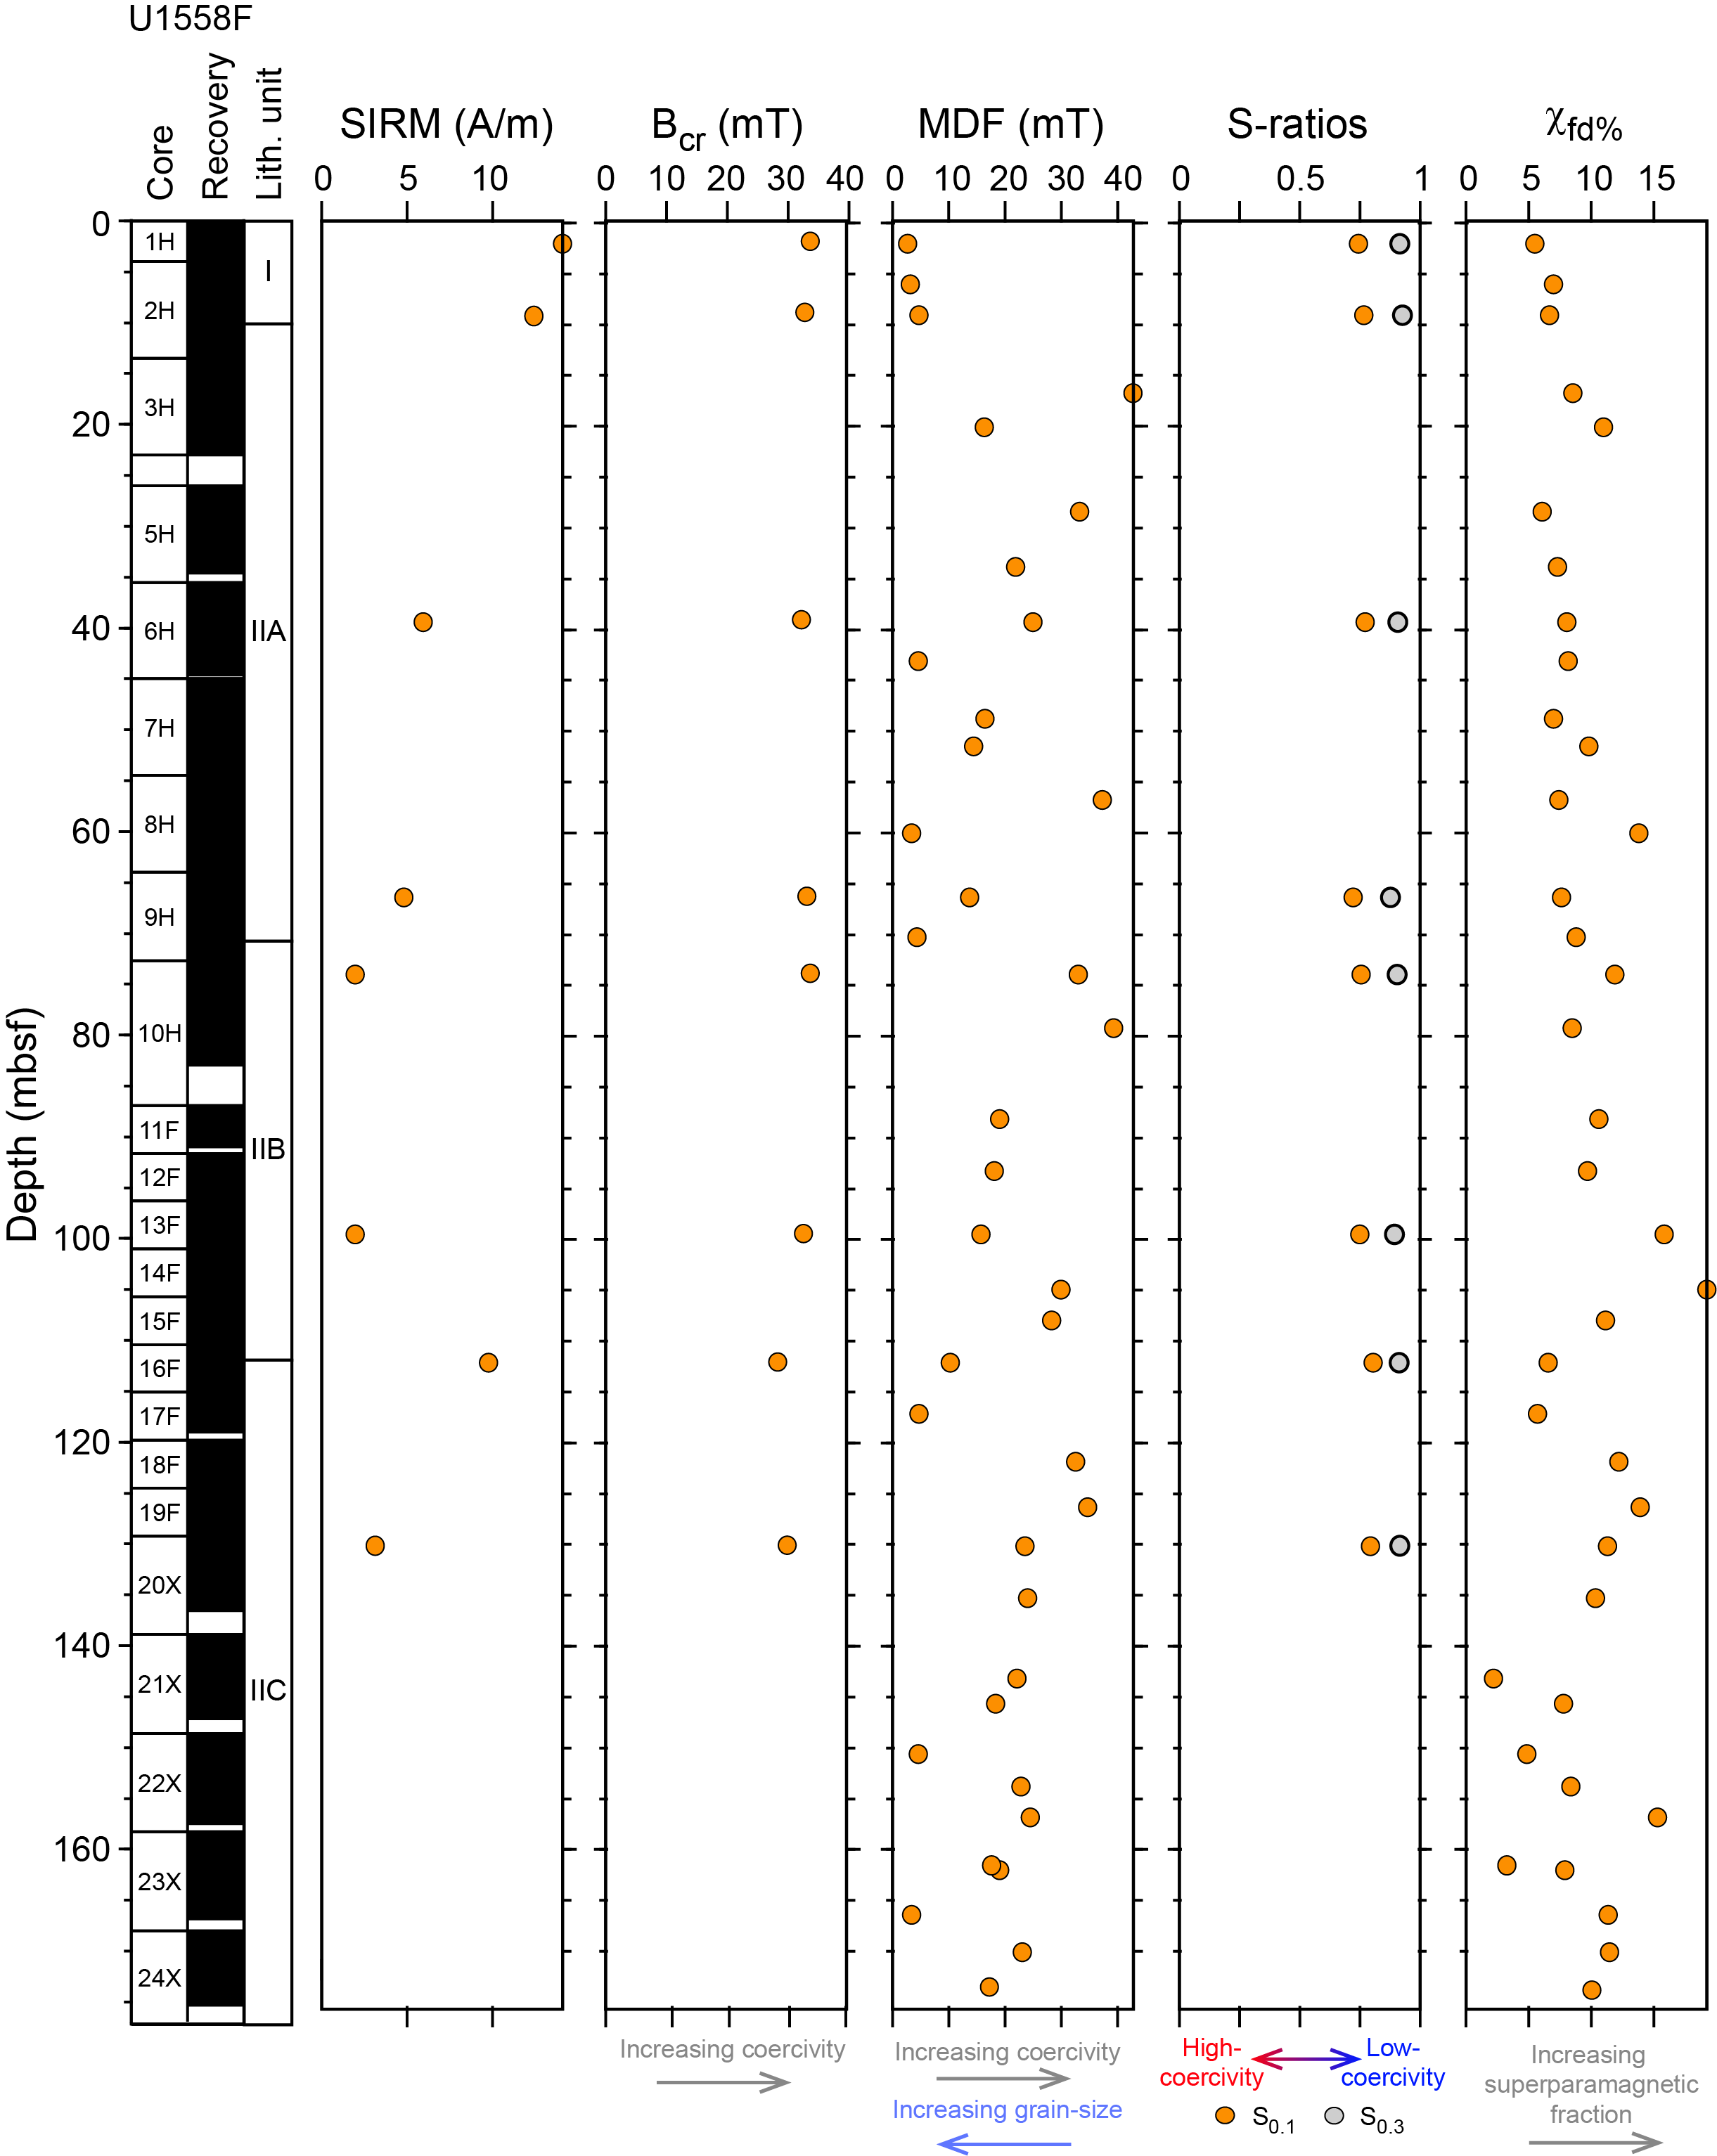
Figure F69. Magnetic mineralogy data, Hole U1558F.
AMS measurements display slight dispersion of the AMS axes in Hole U1558F. The pole of the magnetic foliation (Kmin axis) shows a bimodal distribution (Figure F70A). In particular, 70% of the samples show subhorizontal magnetic foliation characteristic of a primary depositional sedimentary fabric (Tarling and Hrouda, 1993). In contrast, the remaining samples display inclined magnetic foliation with the Kmin axis clustered around the north–south direction (in the core coordinate system). In addition, the magnetic lineation (Kmax axis) is well defined for these samples, which might represent a registration of incipient deformation rather than drilling/reworking. In fact, some of these samples are located in Cores 393-U1558F-6H through 8H, where evidence of soft-sediment deformation was detected (see Sedimentology).
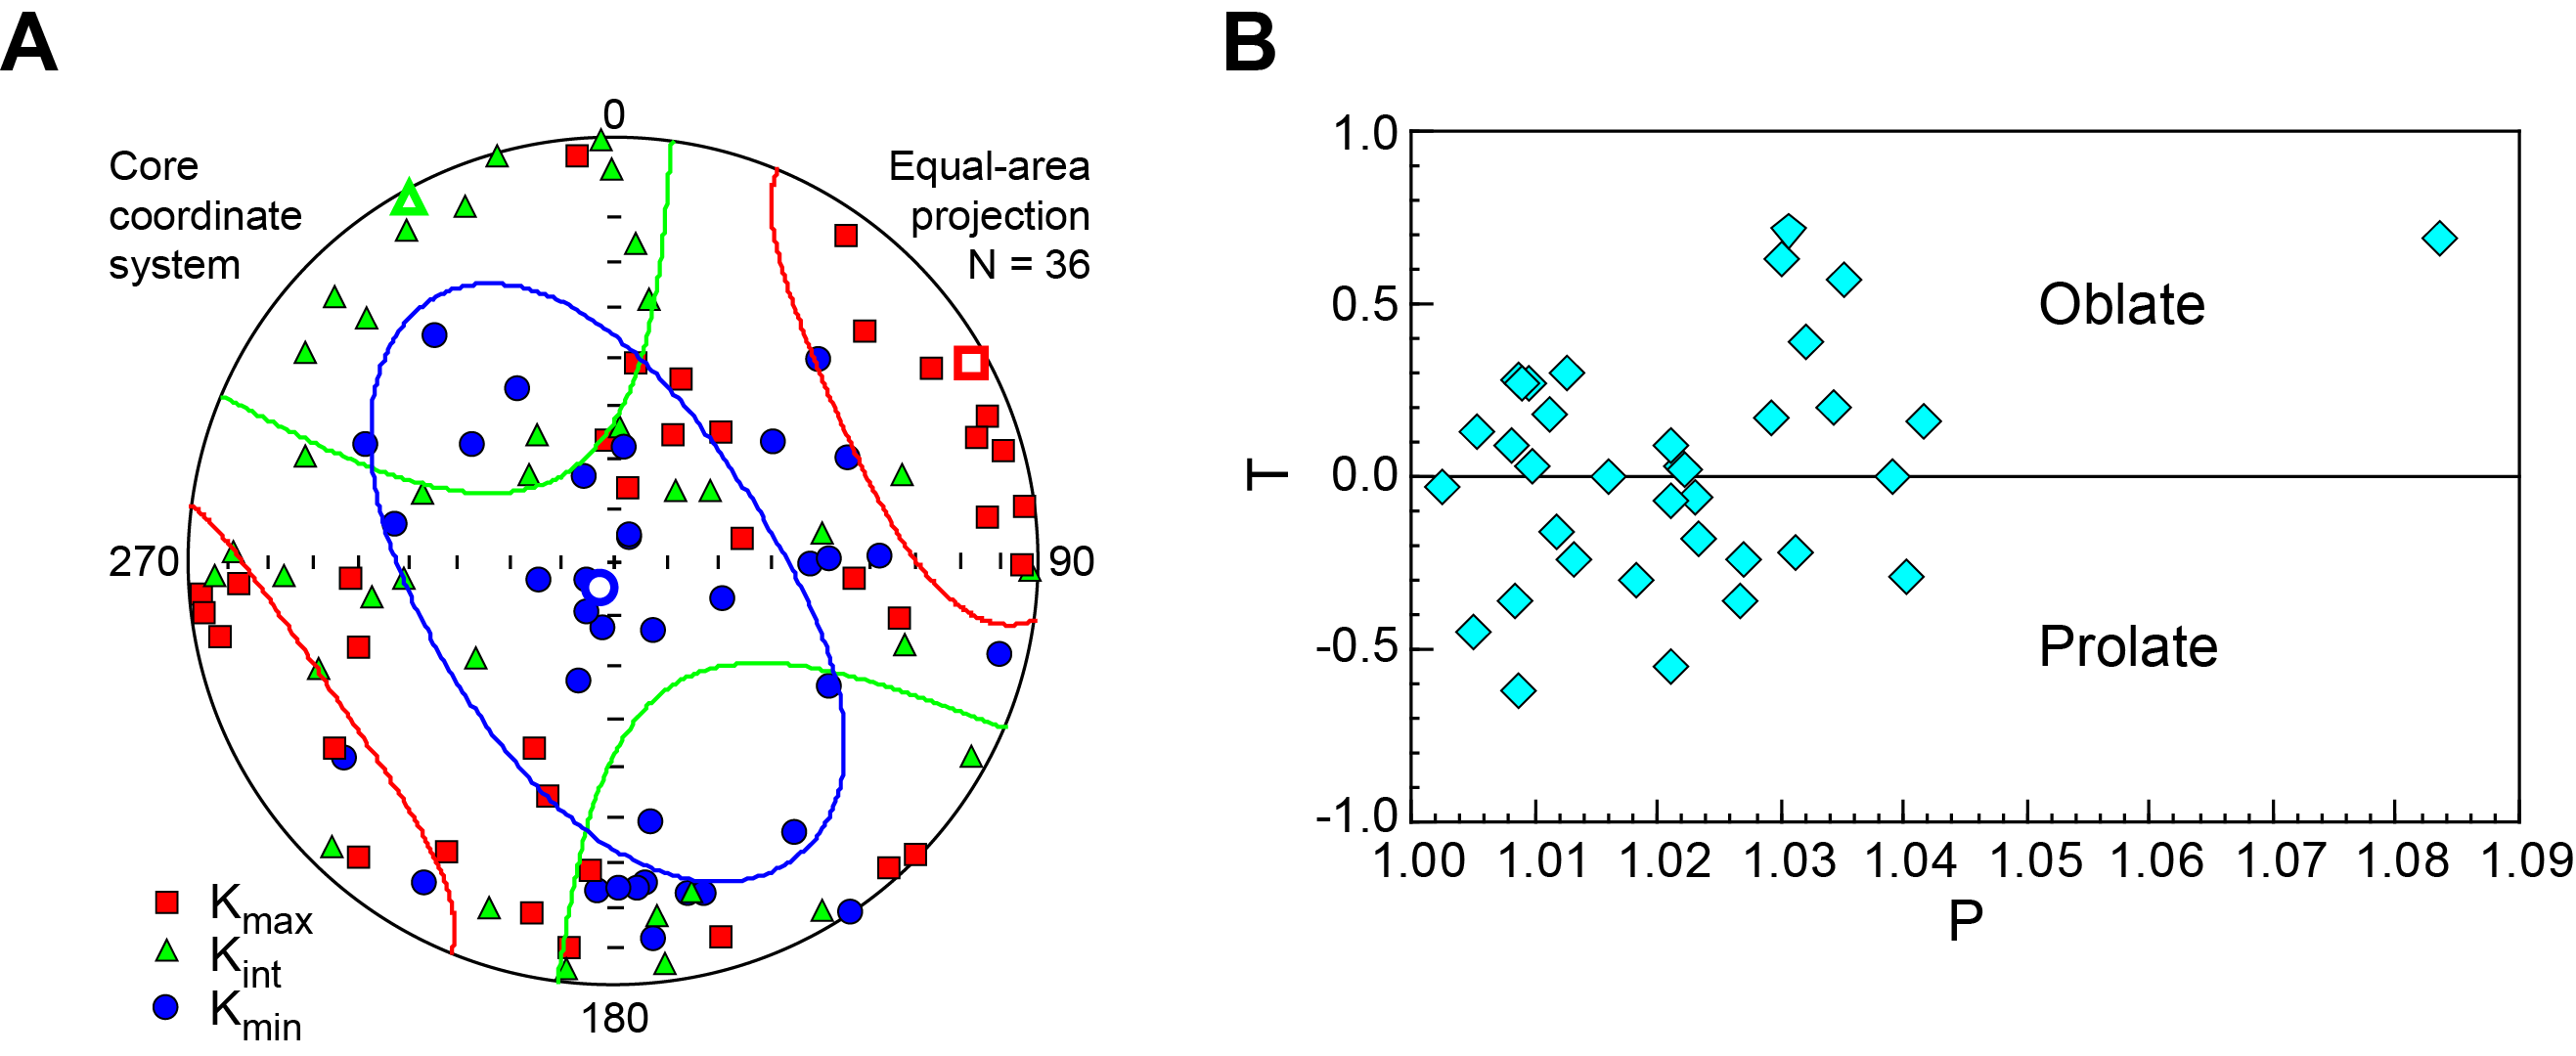
Figure F70. Principal magnetic susceptibility axes, discrete sediment samples.
The degree of anisotropy (P) is low to moderate (1.002–1.042), and the shape parameter (T) spans from prolate to oblate (Figure F70B; Table T19). In addition, the bulk susceptibility (Km) is higher in Unit I (Figure F71), which is in agreement with the higher clay mineral content. Similar values were observed at the top of Subunit IIC in discrete samples taken from Cores 393-U1558F-16F and 17F. Moreover, P and T show highest values within Lithostratigraphic Subunit IIC (below 110 m), where higher values can be related to increasing compaction with depth.
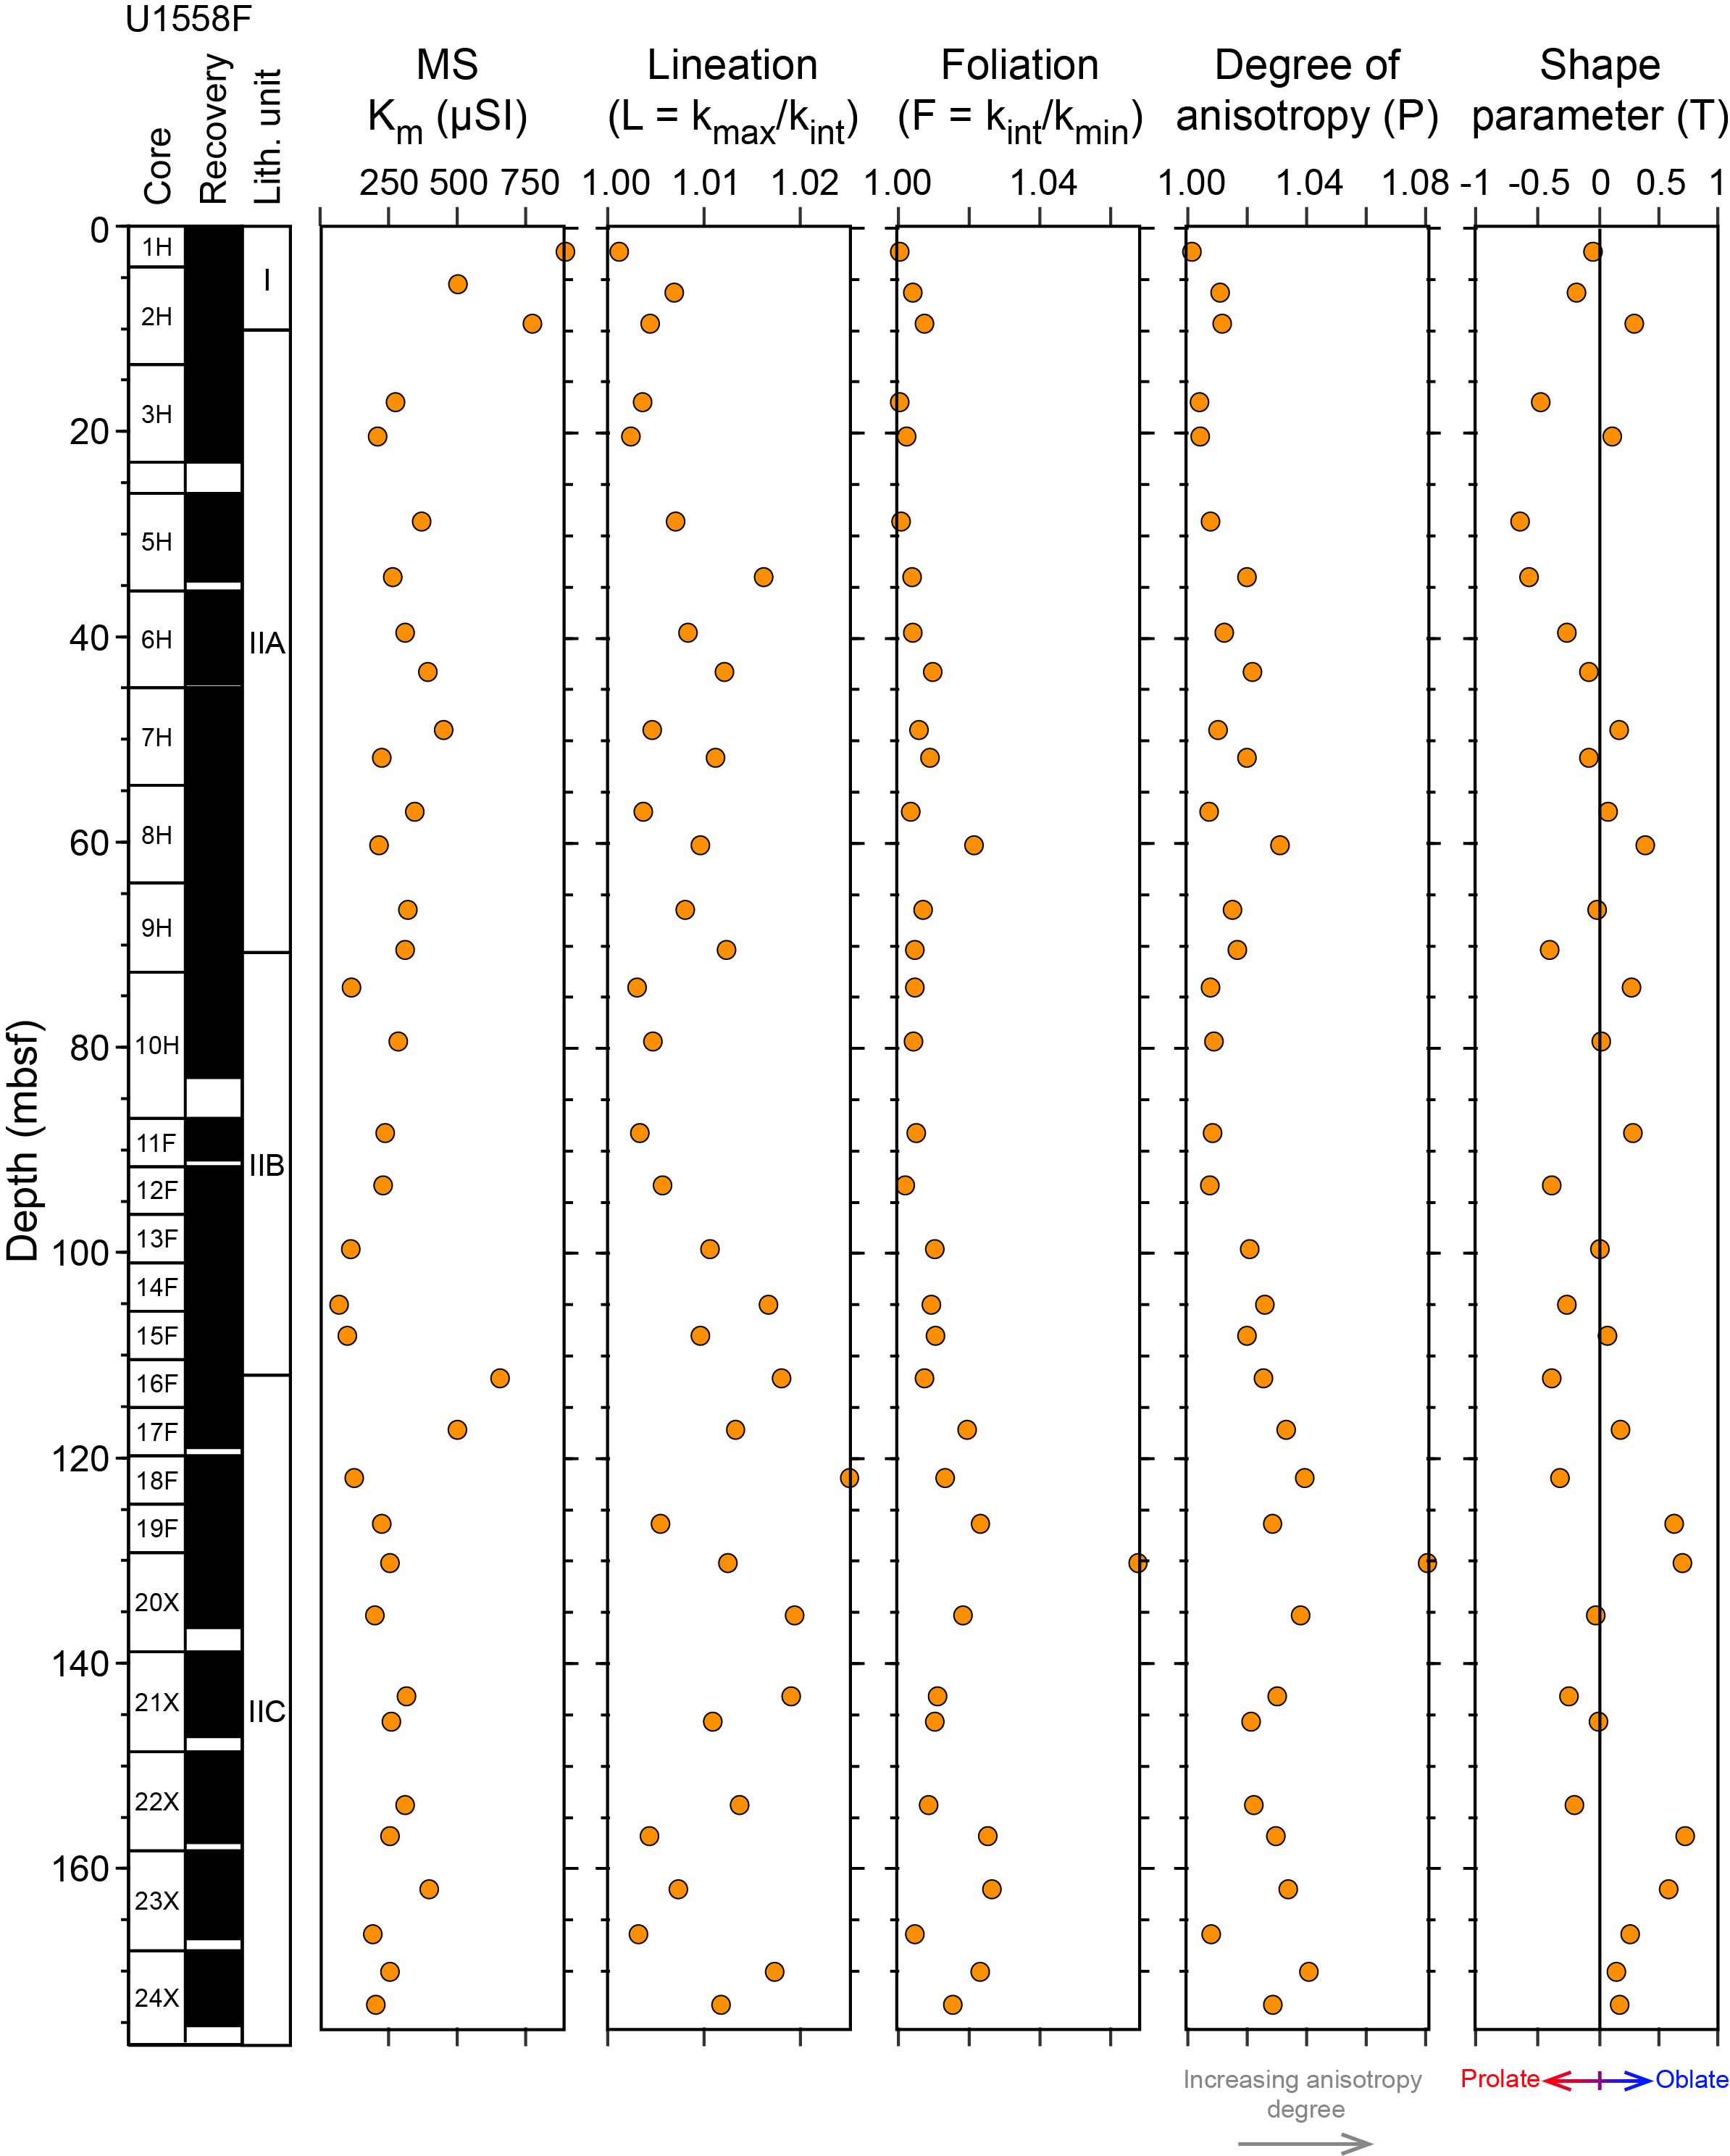
Figure F71. Bulk susceptibility and AMS parameters, Hole U1558F.
8.1.1.2. Magnetostratigraphy
SRM data from the archive halves of sediment cores from Holes U1558A and U1558F after AF demagnetization at 20 mT were used to define a partial polarity sequence for Site U1558. The interpretation of the polarity sequence was based on relative length of polarity intervals and the biostratigraphic datums from both nannofossils and foraminifera (see Biostratigraphy and Age model and sedimentation rates) (Figure F72). Inclinations of the calculated ChRM directions from discrete samples were used to verify the inclinations measured from SRM in Hole U1558F and support the polarity interpretations (Figure F64). Correlation of polarity reversals between sites was performed using the CSF-A depth scale. The spliced inclination reversal stratigraphy (see Physical properties and downhole measurements) was used to complete the remanence data, helping in the correlation of the magnetostratigraphy between Holes U1558A and U1558F. A preliminary correlation with the current geomagnetic polarity timescale (Gradstein et al., 2020) is reported in Figure F72.
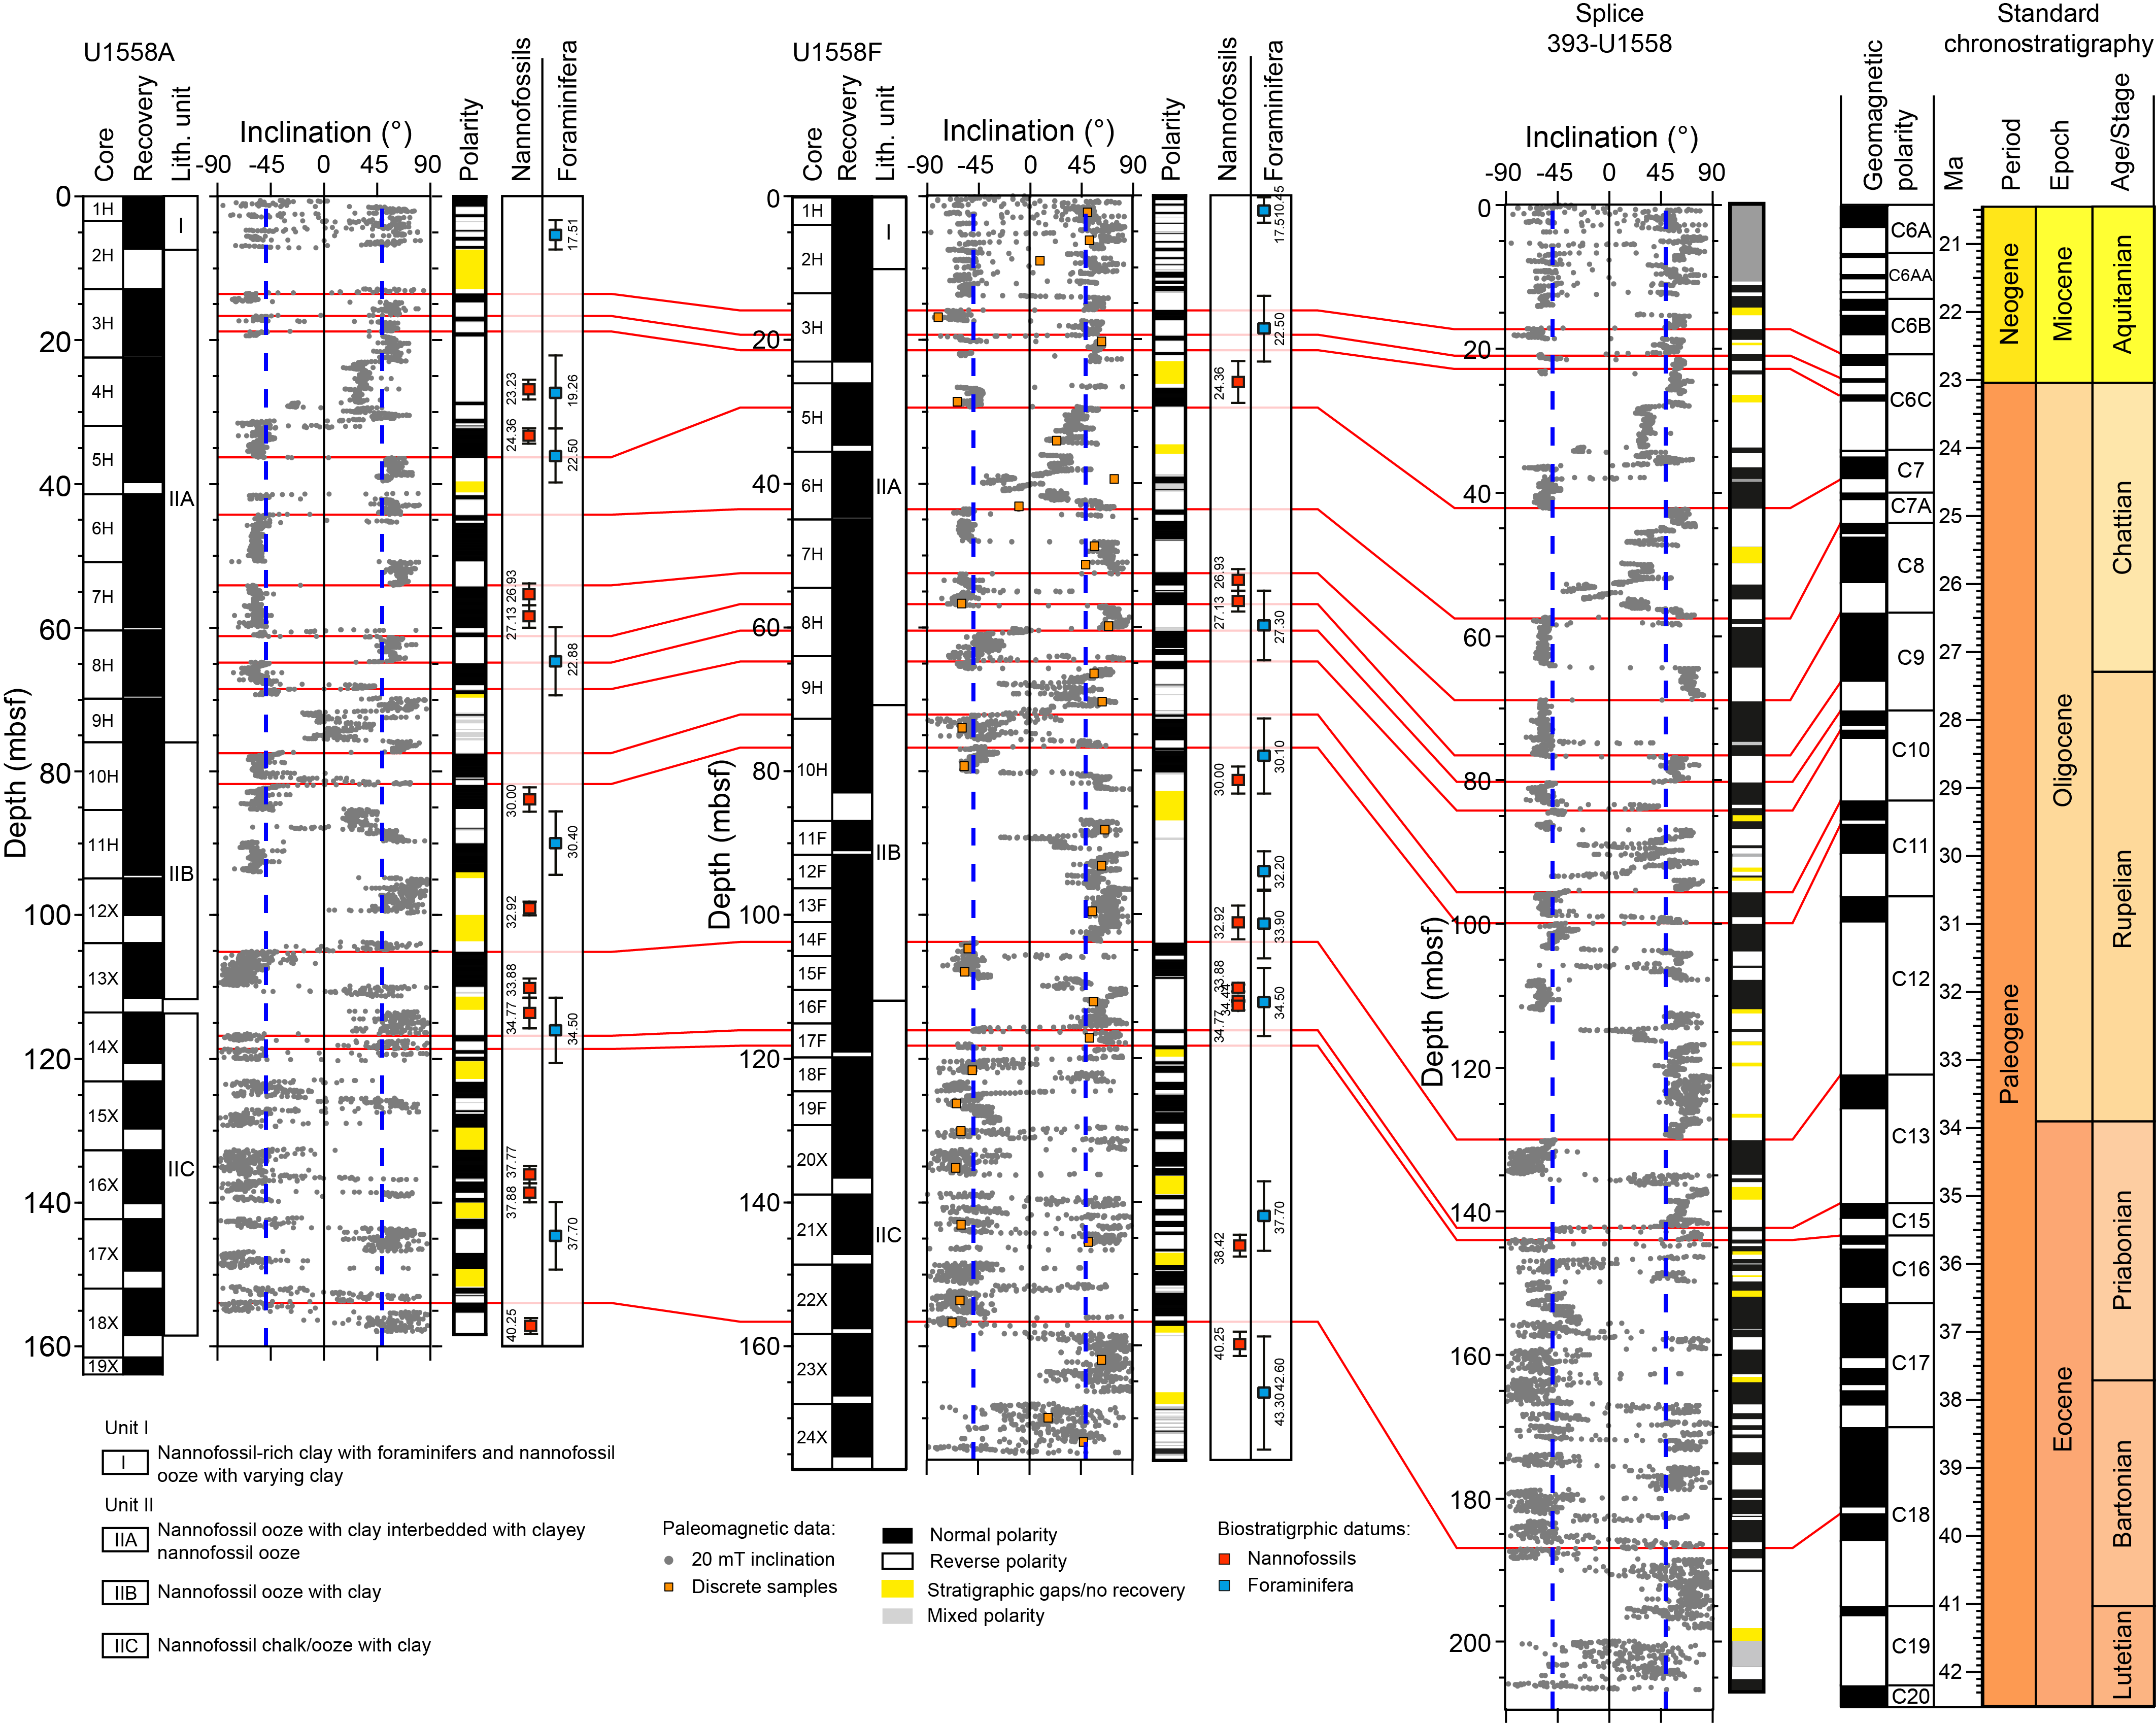
Figure F72. Inclination measurements after 20 mT with inclination splice.
At the top of the sedimentary sequence, between 2 and 10 m CSF-A, the presence of gaps in core recovery makes the correlation in polarity reversals between Holes U1558A and U1558F difficult. Remanence data are less clear in Unit I, as confirmed by the elevated maximum angular deviation values in the discrete sample OVPs (Figure F67; Table T17). From 10 to ~120 m CSF-A, both holes predominantly show clear polarity reversals that can be unambiguously correlated. Preliminary correlation with the geomagnetic polarity timescale (GPTS) was executed starting from ~15 m CSF-A. Despite the presence of gaps in Core 390C-U1558A-2H and the missing Core 393-U1558F-4H, the reversal pattern observed between 15 and 20 m CSF-A was tentatively correlated with the GPTS at the Neogene–Paleogene transition based on the reversal pattern and nannofossils (Figure F72). The well-defined polarity sequences allow detection of the Chattian/Rupelian boundary (28.1 Ma) (Gradstein et al., 2020) within Subunit IIB and the Oligocene/Eocene boundary at the transition between Subunits IIB and IIC.
Below 120 m CSF-A, due to the presence of stratigraphic gaps and uncertainties, correlations cannot be confidently made with the exception of the reversals at ~150 m CSF-A, where the biostratigraphic datums provide additional confidence in constraining the reversal pattern.
8.2. Basement
Measurements of the remanent magnetization of basement cores from Hole U1558D were made with the SRM on archive-half core pieces longer than 9 cm (see Paleomagnetism in the Expedition 390/393 methods chapter [Coggon et al., 2024b]). Remanent magnetization was measured at 2 cm intervals before and after AF demagnetization at three different steps (5, 10, and 20 mT). The amount of data collected with the SRM varies with recovery rate (11%–90%) in Hole U1558D. High resolution was achieved in Cores 393-U1558D-5R through 12R but was lower in Cores 24R–30R. Cores 22R, 28R–31R, and 35R were not subjected to SRM measurements, as no pieces were longer than 9 cm.
One to two 8 cm3 cubes per core were taken from the working halves of Hole U1558D basement cores for discrete measurements, making a total of 38 cubes. The cubes consisted of basalts with various degrees of alteration and include 1 sample of sedimentary breccia as well as 2 samples of sediments at the sediment/basement interface (Cores 393-U1558D-2R and 3R). Paleomagnetic studies on discrete samples were principally undertaken to better constrain the SRM data and to characterize the magnetic mineralogy. Both AF demagnetization and IRM experiments were conducted. In addition, AMS measurements were performed to clarify the dominant magnetic fabric.
8.2.1. Results
NRM and in-line AF demagnetization of cores from Hole U1558D were measured to characterize the remanent records of ~49.2 Ma basalts, whose age was calculated from magnetic data acquired during the CREST cruise (Kardell et al., 2019). AF demagnetization up to 20 mT removed most of the viscous remanent magnetization that generally comprises a small portion of the total remanence. This viscous overprint is presumably induced during RCB drilling. Remanence after 20 mT AF demagnetization will be referred to as 20 mT remanence hereafter. The intensities of NRM and 20 mT remanence of the igneous rocks show mean values of ~0.92 and 0.68 A/m, respectively (Figure F73). Significantly higher NRM intensity was detected in 4 of the measured cores (Cores 393-U1558D-12R, 14R, 31R, and 37R), which coincides with the highest MS values (see Physical properties and downhole measurements). The 20 mT remanence values predominantly show negative inclination (normal geomagnetic polarity at these latitude, 30°S) in measured intervals of Hole U1558D, in agreement with the expected polarity for a 49.2 Ma (Gradstein et al., 2020) basement. However, Cores 7R–12R and 31R–39R locally recorded positive (reversed) inclination values. Overall, the inclination values are densely clustered around −55° and display a Gaussian distribution skewed to the negative end (Figure F74). This inclination is ~6° steeper than the inclination expected based on the GAD (±49.1° at 30°S).
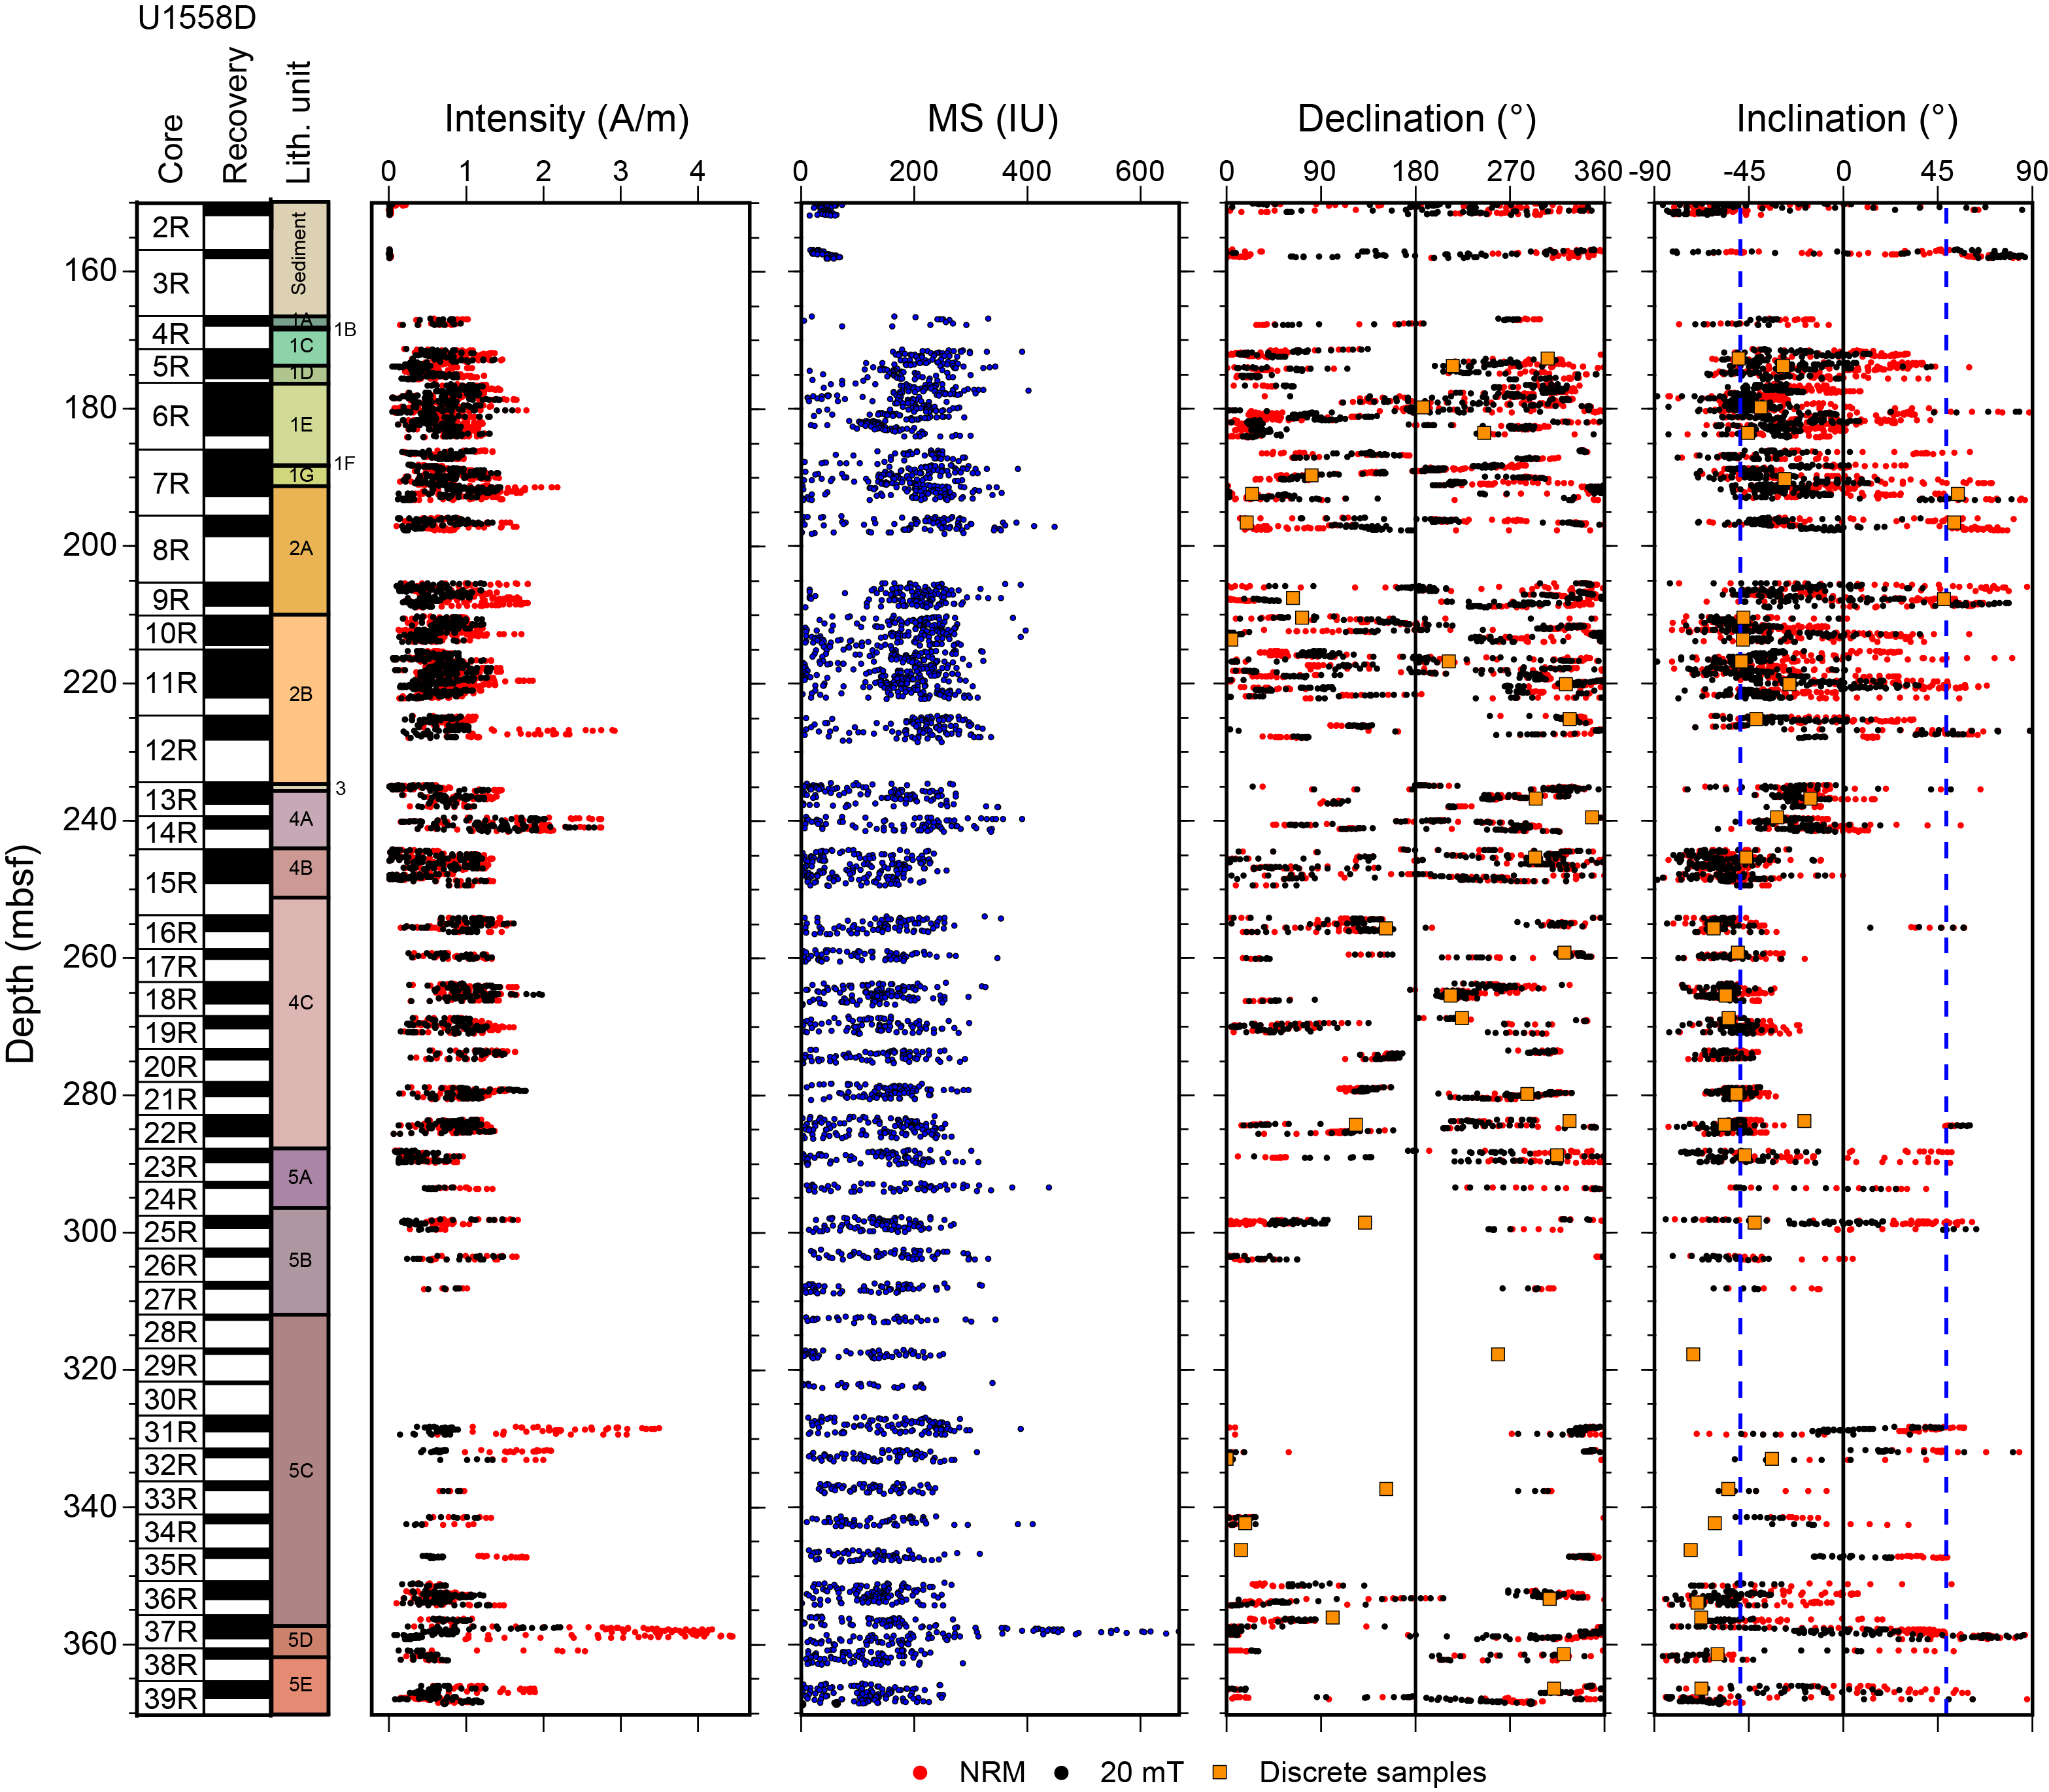
Figure F73. MSP and SRM measurements, Hole U1558D.
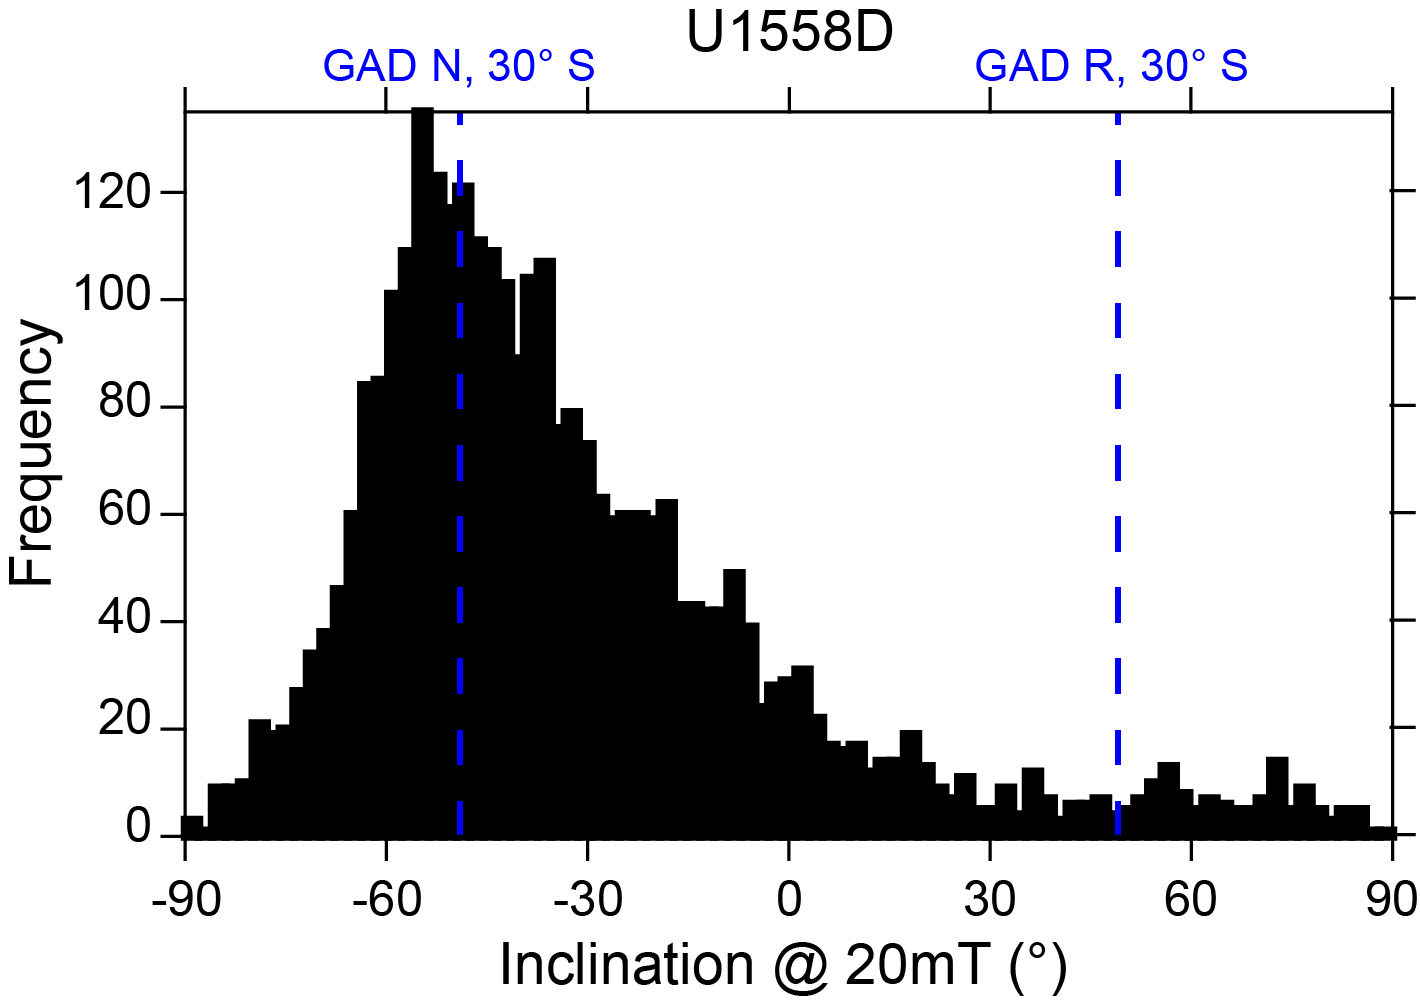
Figure F74. Inclination after 20 mT AF for basement.
8.2.1.1. Discrete samples
The discrete samples from basement cores of Site U1558 were selected from basalts with varying degrees of alteration, ranging from intervals of slightly altered gray basalts to strongly altered orange-brown basalts, totaling 38 samples (Tables T20, T21). We have also included a single sedimentary breccia sample to test for a possible chemically induced remanence due to alteration. AF demagnetization up to a maximum of 130 mT was conducted on 32 of the discrete samples to isolate the ChRM and constrain the SRM data.
After removing a low-coercivity (<20 mT) viscous remanent magnetization component, a single stable component was detected on the orthogonal vector projection (Zijderveld diagram), which should represent the ChRM. However, this component does not converge to the origin in most samples analyzed (Figure F75A), suggesting the presence of an overlapping high-coercivity component that cannot be completely separated using AF demagnetization.
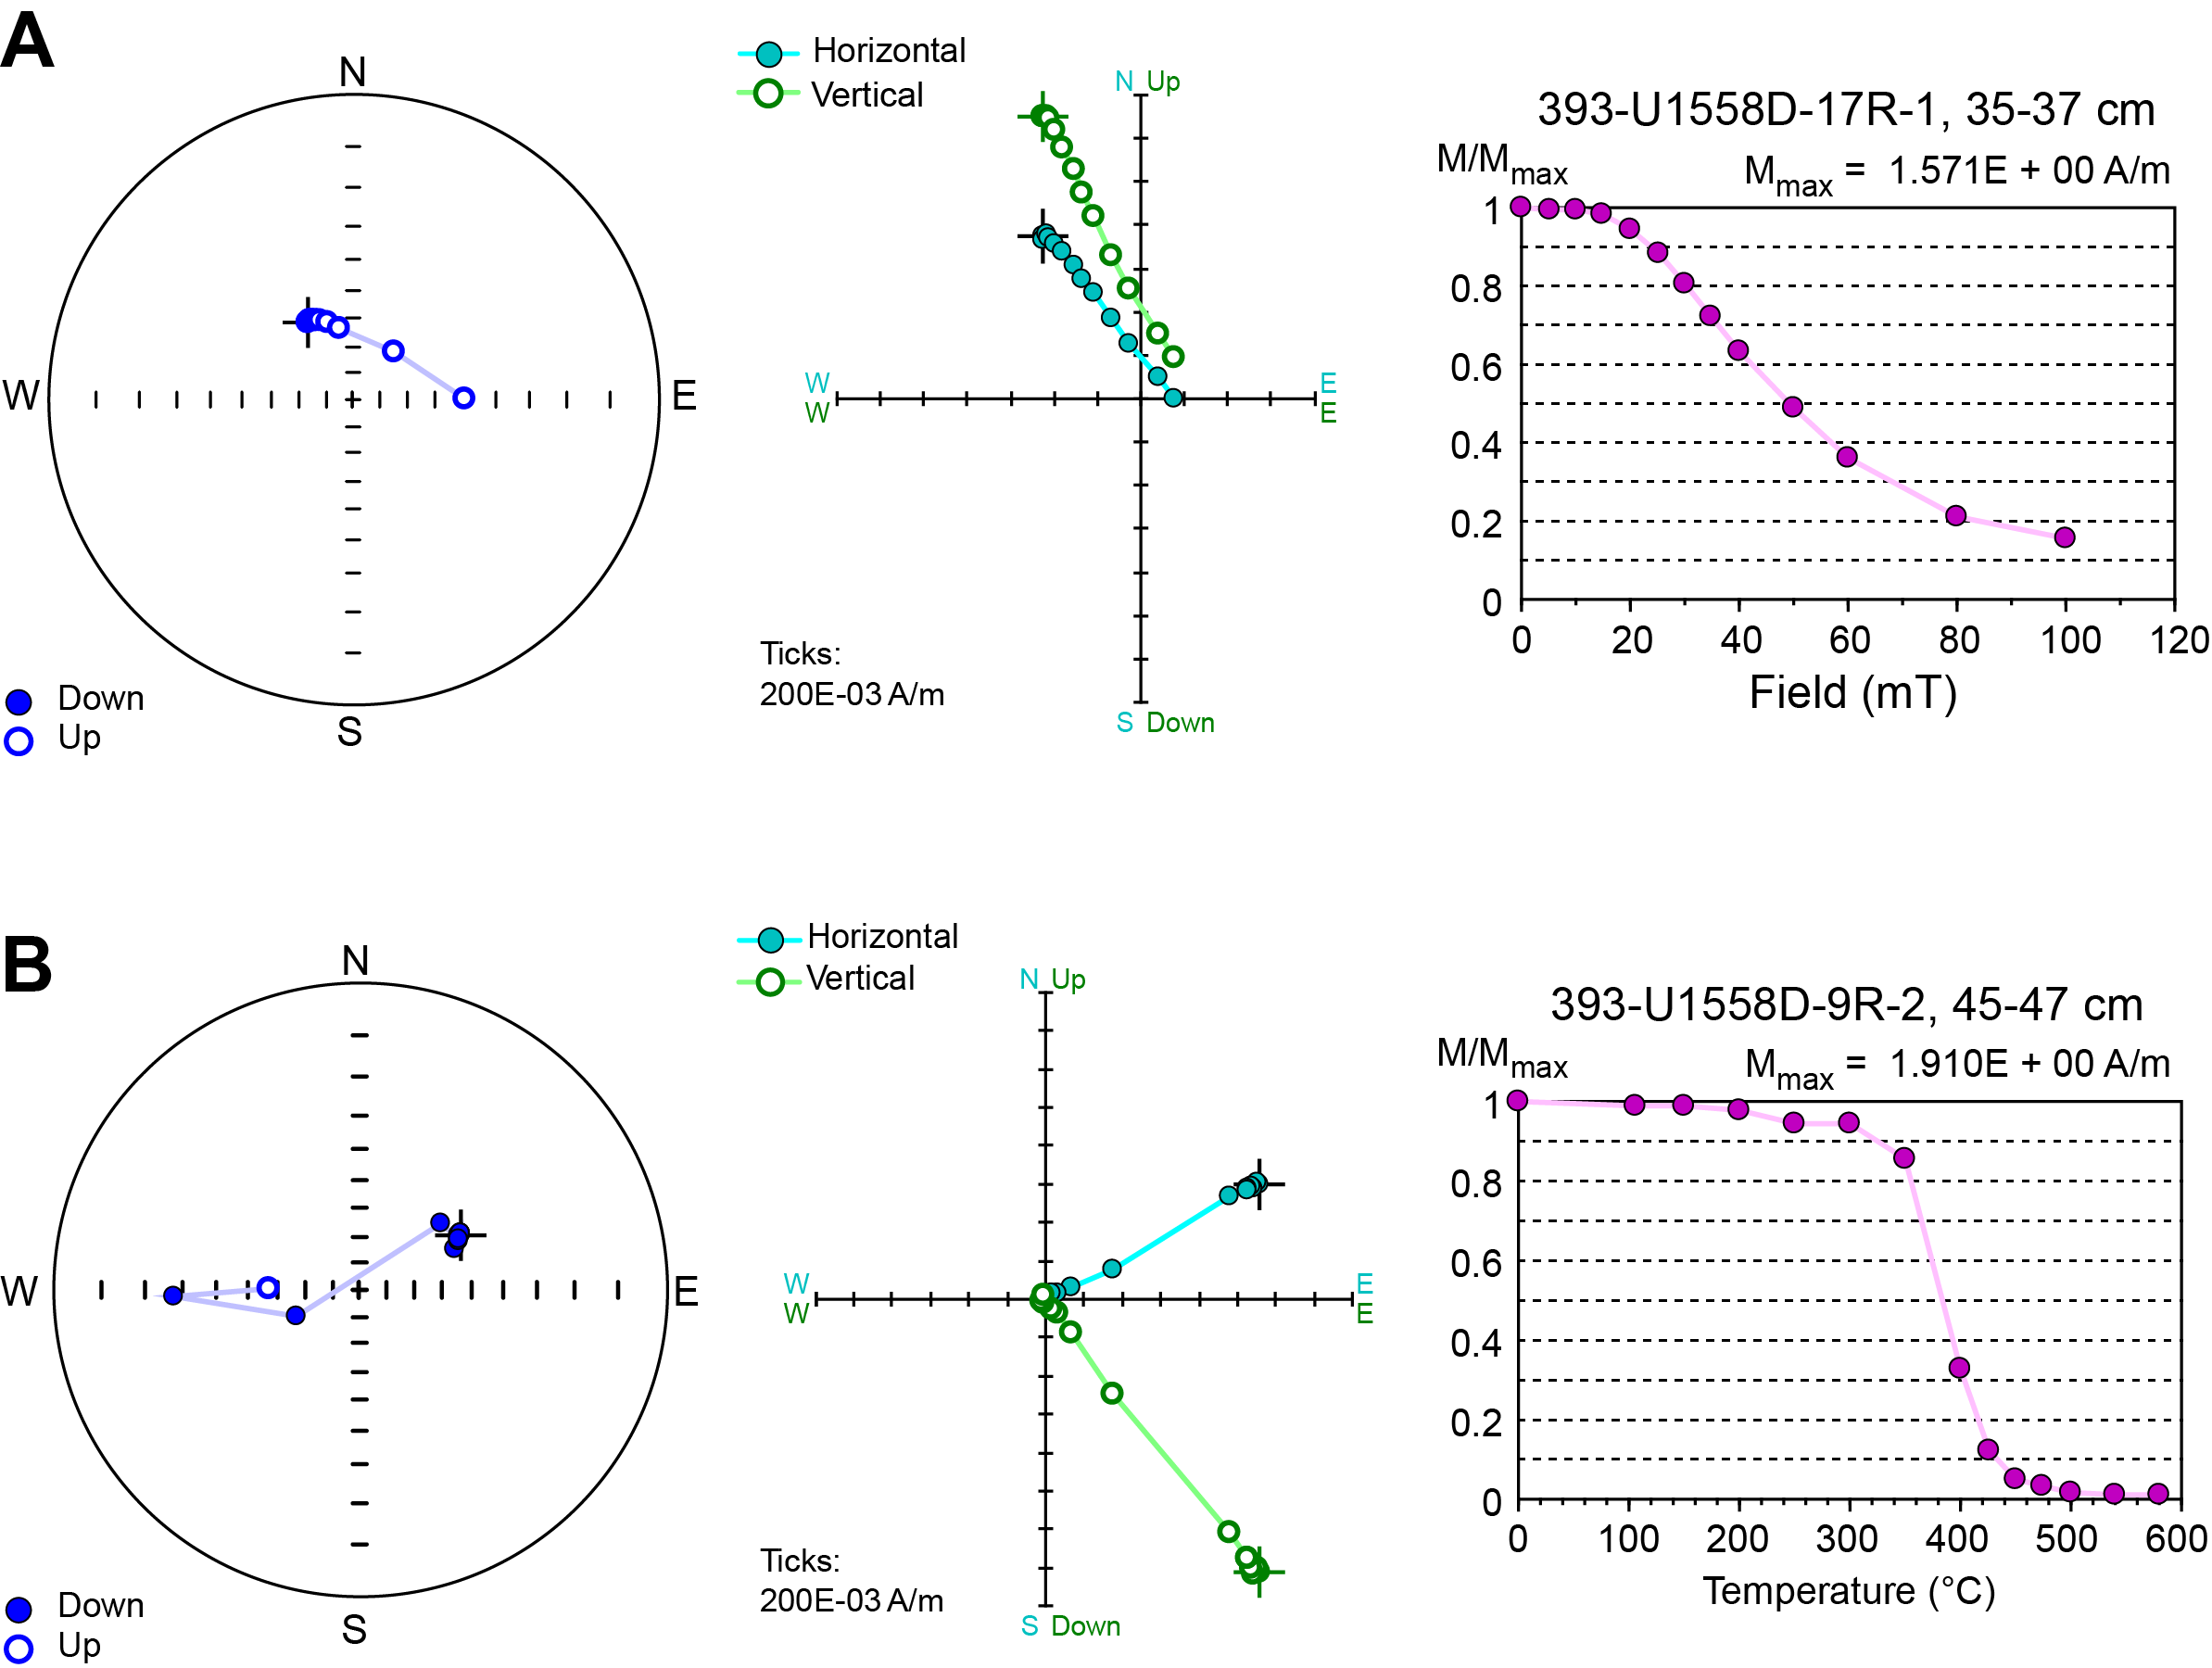
Figure F75. Demagnetization results, discrete samples.
Most of the samples display MDFs around or higher than 50 mT and require strong fields of more than 100 mT to be fully demagnetized (Figures F75, F76; Table T21). Two samples collected from cores at the sediment/basement interface (Samples 393-U1558D-2R-1, 67–69 cm, and 3R-1, 48–50 cm) and the sedimentary sample collected from Core 13R show significantly lower MDF, <20 mT, indicating the dominance of coarser grained low-coercivity phases (Table T21).
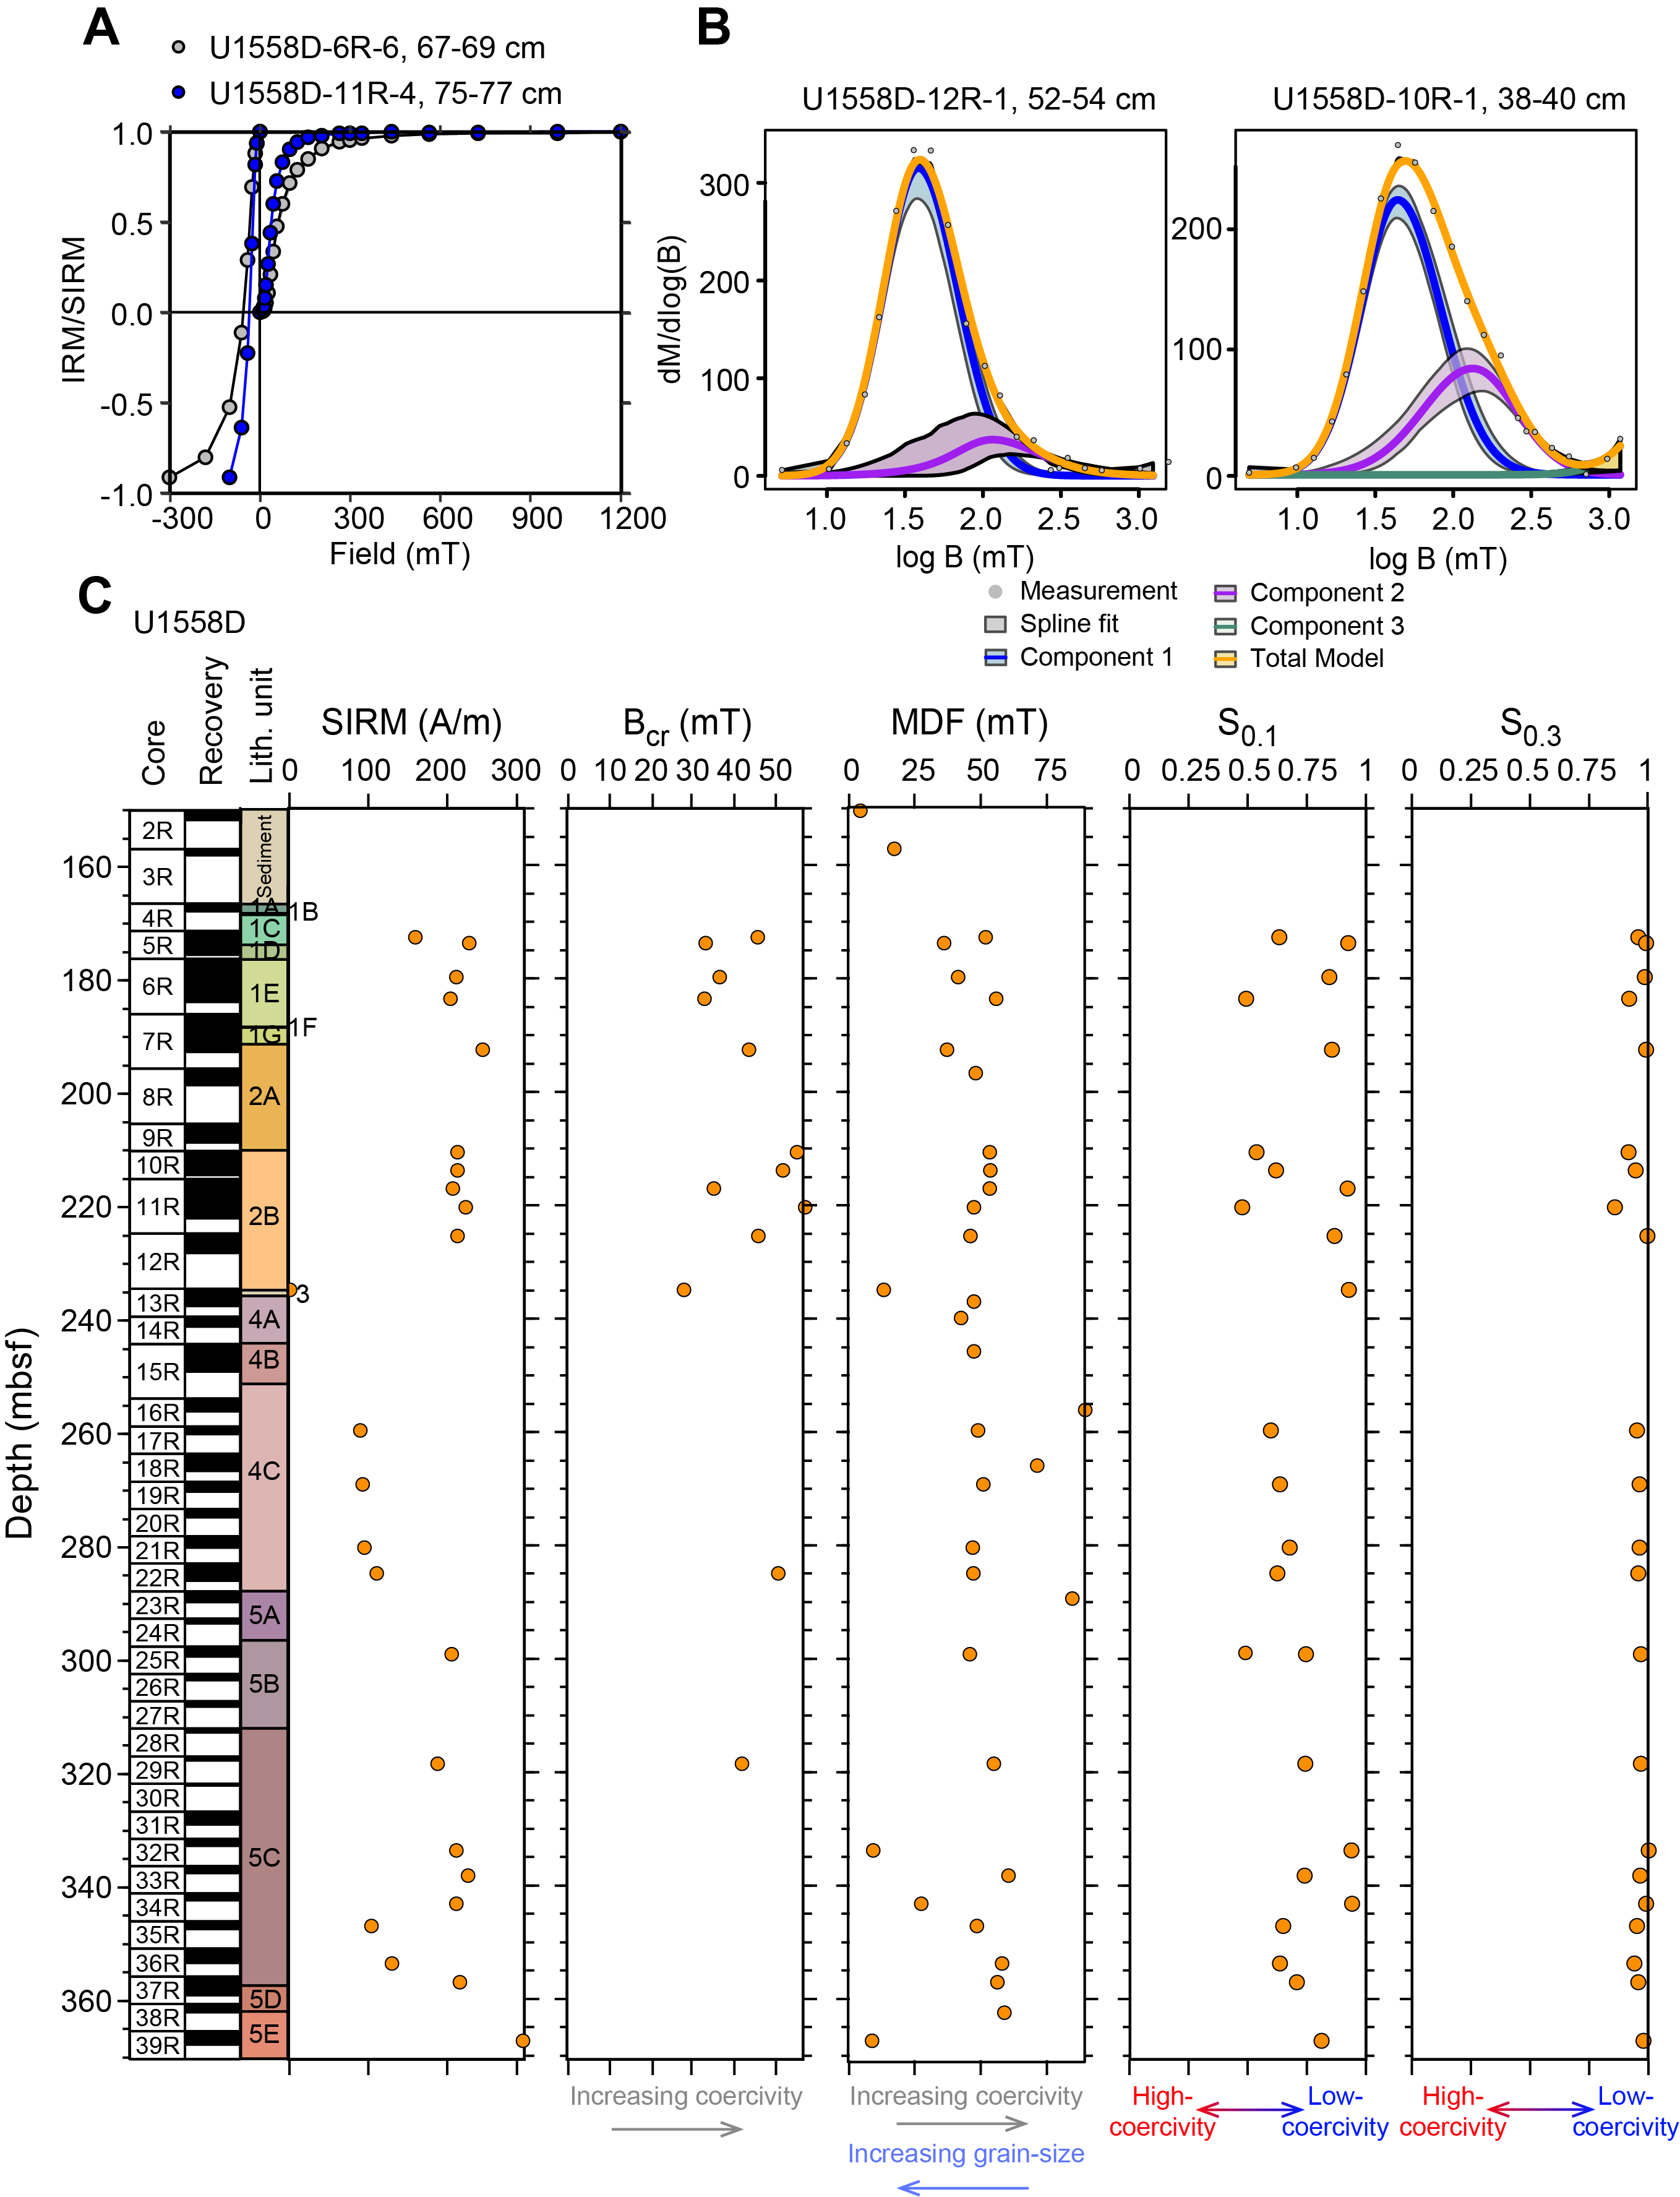
Figure F76. SIRM acquisition curves and coercivity distribution, Hole U1558D.
A subset of 6 samples, 3 of which retained >20% of the natural remanence after AF demagnetization of <100 mT field, were subjected to thermal demagnetization up to 580°C. Compared to AF demagnetization, thermal demagnetization trends reveal a clear single component that converges to the origin (Figure F75B). The derived components displayed maximum angular deviation angles between 0.4° and 5.9°, which indicates that ChRM directions are well defined in the measured samples (Table T20) (Butler, 1992). Inclinations of the ChRM, calculated with principal component analysis (PCA; Kirschvink, 1980), are consistent with the inclination measured on the SRM (Figure F73).
Acquisition of IRM and backfield experiments was conducted on 24 discrete samples to further distinguish their mineralogy. IRM acquisition results show saturation at fields of 150–300 mT, implying that magnetic minerals of different coercivity coexist within the cores (Figure F76A). Deconvolution of the IRM acquisition curves (Figure F76B) shows a best-fit model characterized by 2 components for most of the samples. A dominant low-coercivity component is characterized by a mean remanence coercivity (Bh) of 1.50–1.70 log10 units with a variable contribution (5%–15%) of a second component showing higher Bh values of ~2.3 log10 units (Figure F76B). In addition, Sample 393-U1558D-10R-1, 38–40 cm, shows the presence of a third component with high coercivity (>3 log10 units).
Variations in intermediate- to high-coercivity mineral content is indicated by the variability of the IRM100/SIRM (S0.1) ratio of 0.5–1 (Figure F76C; Table T21). The intensity of SIRM varies among igneous units, suggesting different content in ferromagnetic minerals, with lower values in the pillow lavas of Subunit 4C, at the base of Subunit 5C, and in the breccia sample (Sample 393-U1558D-13R-1, 29–31 cm). In particular, the lowest SIRM values were observed in the most altered samples, which display brown and orange-reddish halos of various intensities (alteration degrees 4 and 6; Figure F77A; Table T21). However, MDF and mass magnetic susceptibility (χm) display similar values among all samples, independent of the extent or style of alteration (Figure F77B, F77C). The intensity of the remanence after the 5 mT demagnetization step is the only parameter that varies depending on the alteration degree, with higher values in the light brownish gray halo samples (Figure F77D). We used the remanence at the 5 mT step instead of the NRM to avoid spurious data related to drilling overprint. Variations of remanence intensity and χm show no significant correlation with alteration degree (Figure F77E) but do appear to be linked to the different igneous units (Figure F77F; Table T21).
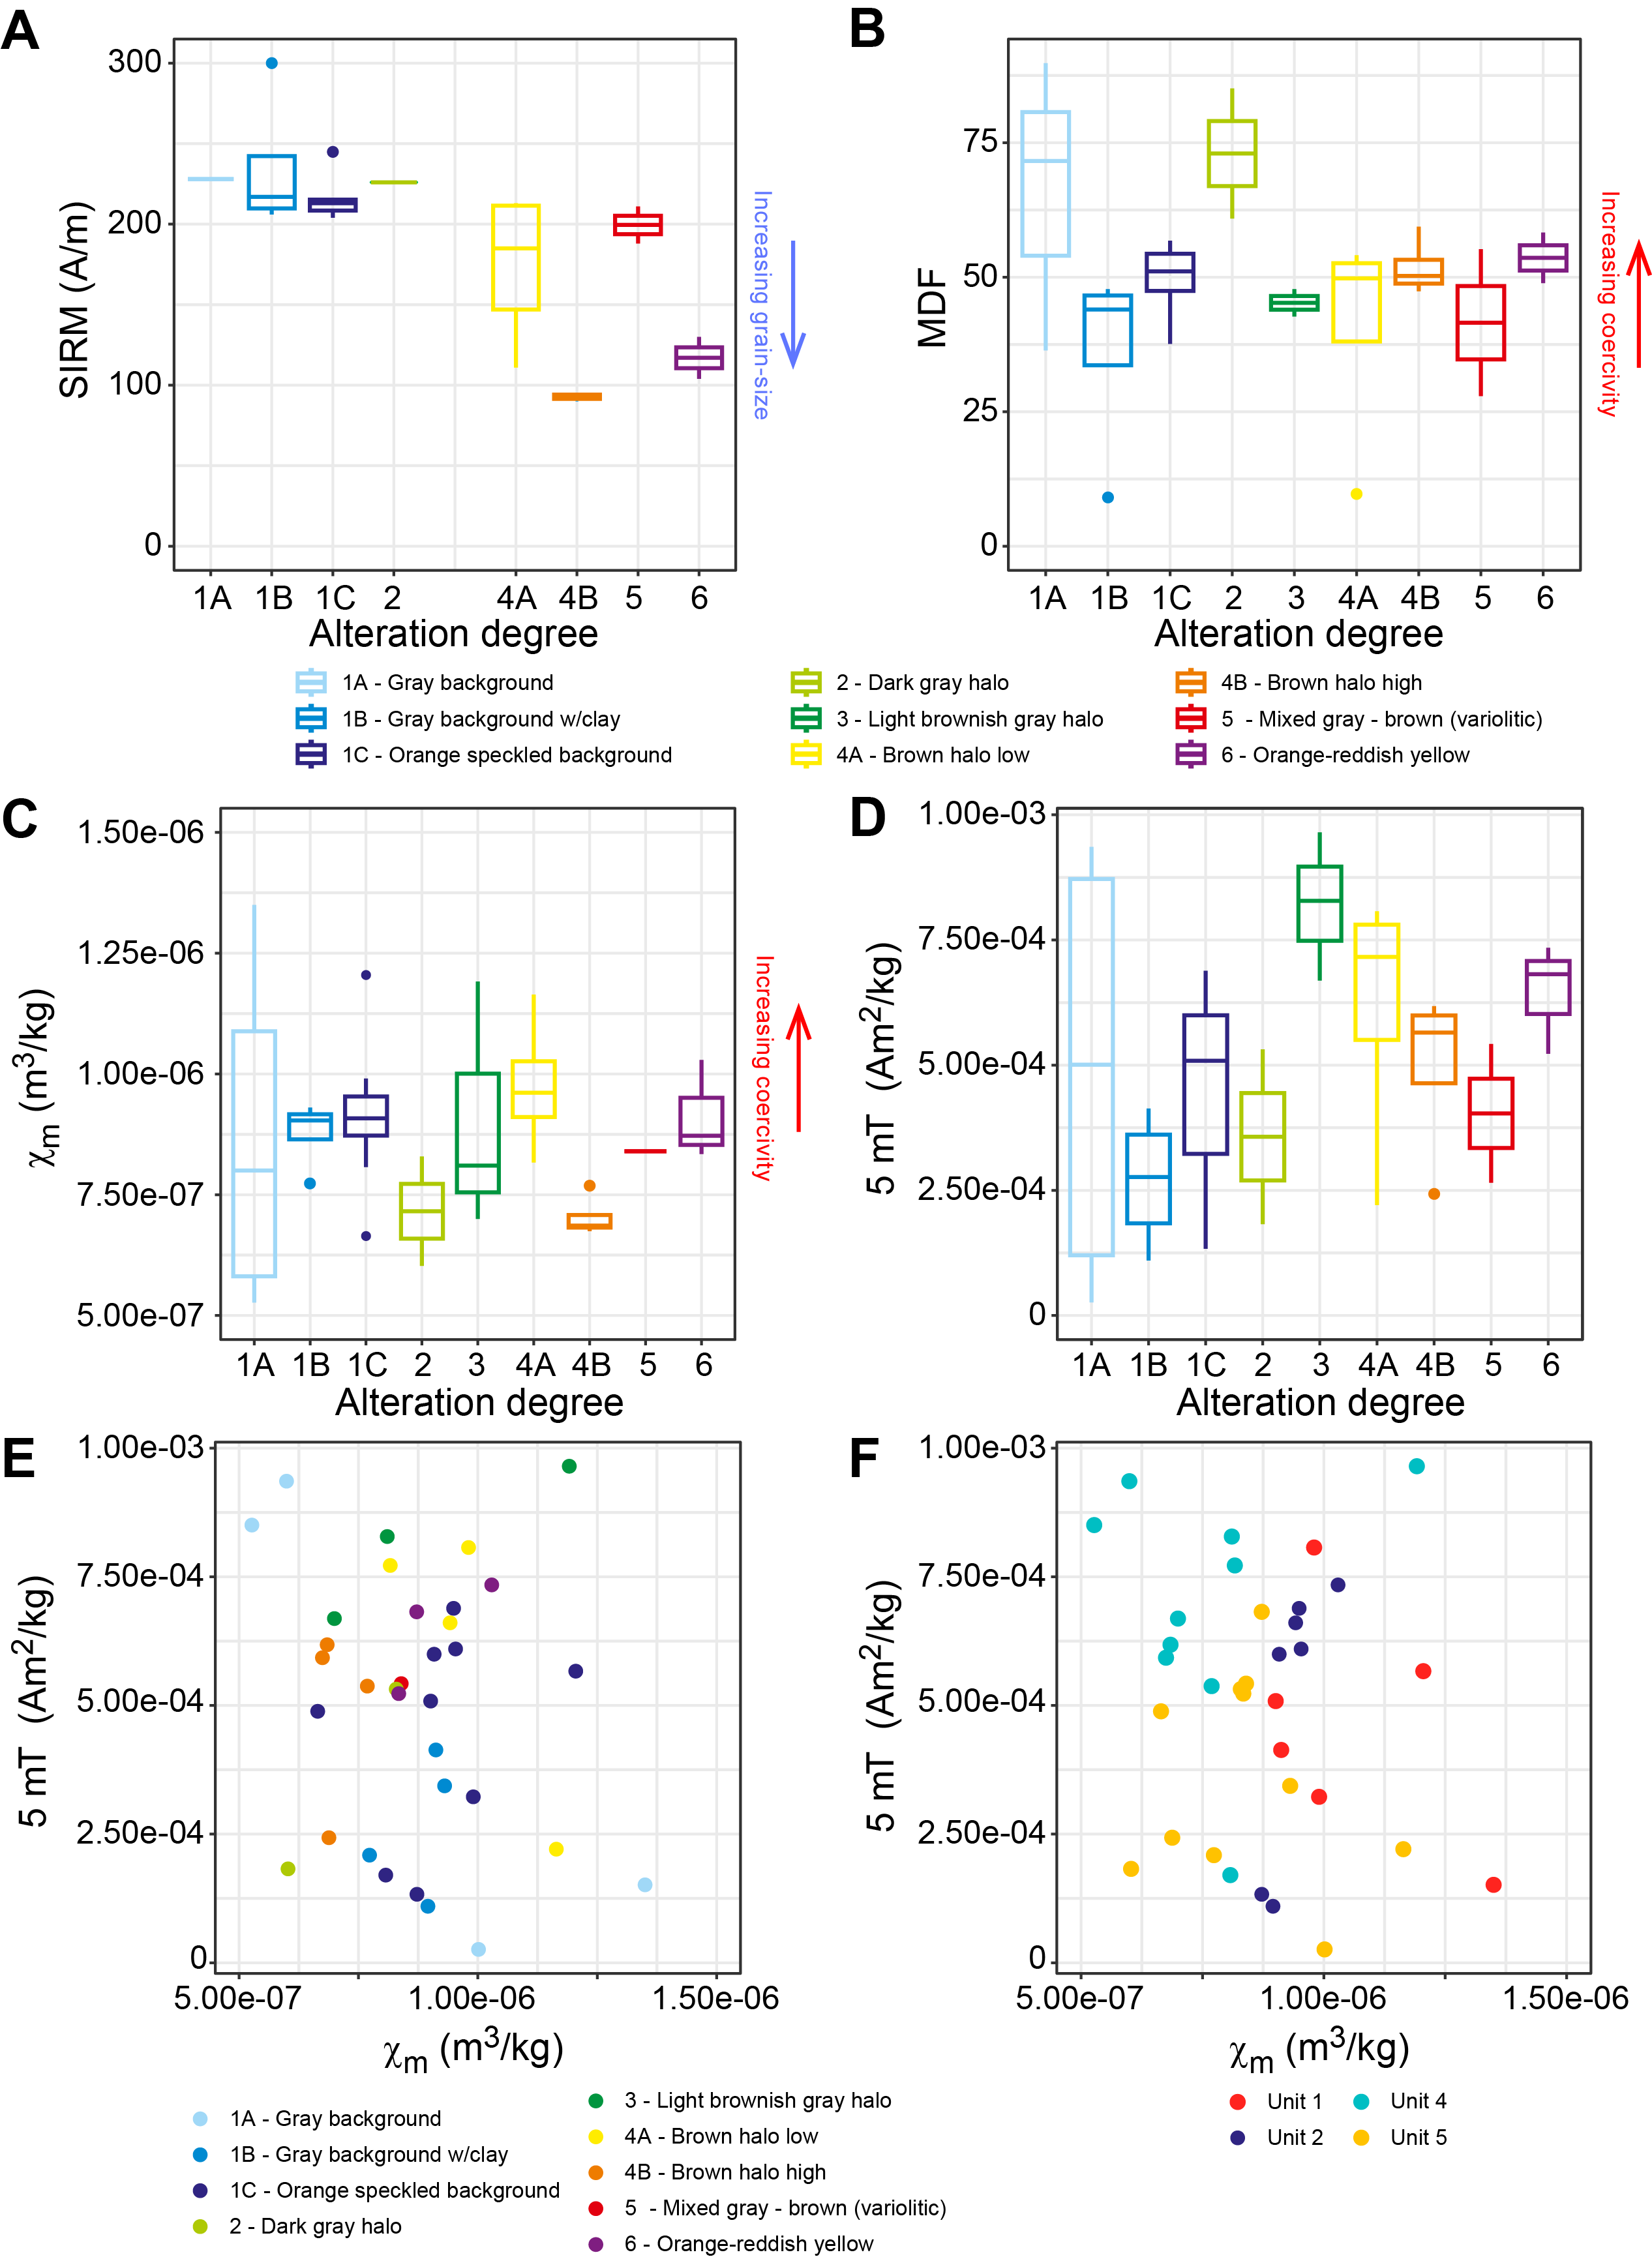
Figure F77. SIRM at 1200 mT, MDF, χm, and remanence intensity.
AMS was measured on all of the discrete samples collected. The resultant magnetic fabric is generally well defined with subhorizontal magnetic foliation and predominantly prolate shape of the anisotropy ellipsoid (−1 < T < 0) (Figure F78). Only 8 of the total 38 samples indicate an oblate magnetic fabric (Figure F78B; Table T22). The oblate fabric for the sediment samples at the sediment/basement interface indicates elevated vertical compaction compared to the overlying sedimentary package. However, no correlation between the shape of the magnetic fabric and the different igneous units was observed. Sample 393-U1558D-13R-1, 129–131 cm, which is the only sample taken from the sedimentary breccia unit, shows a bulk susceptibility (Km) value around 1.7 × 10⁻⁴, similar to the susceptibility of the sediments at the sediment/basement interface collected in Cores 2R and 3R (Figure F78C).
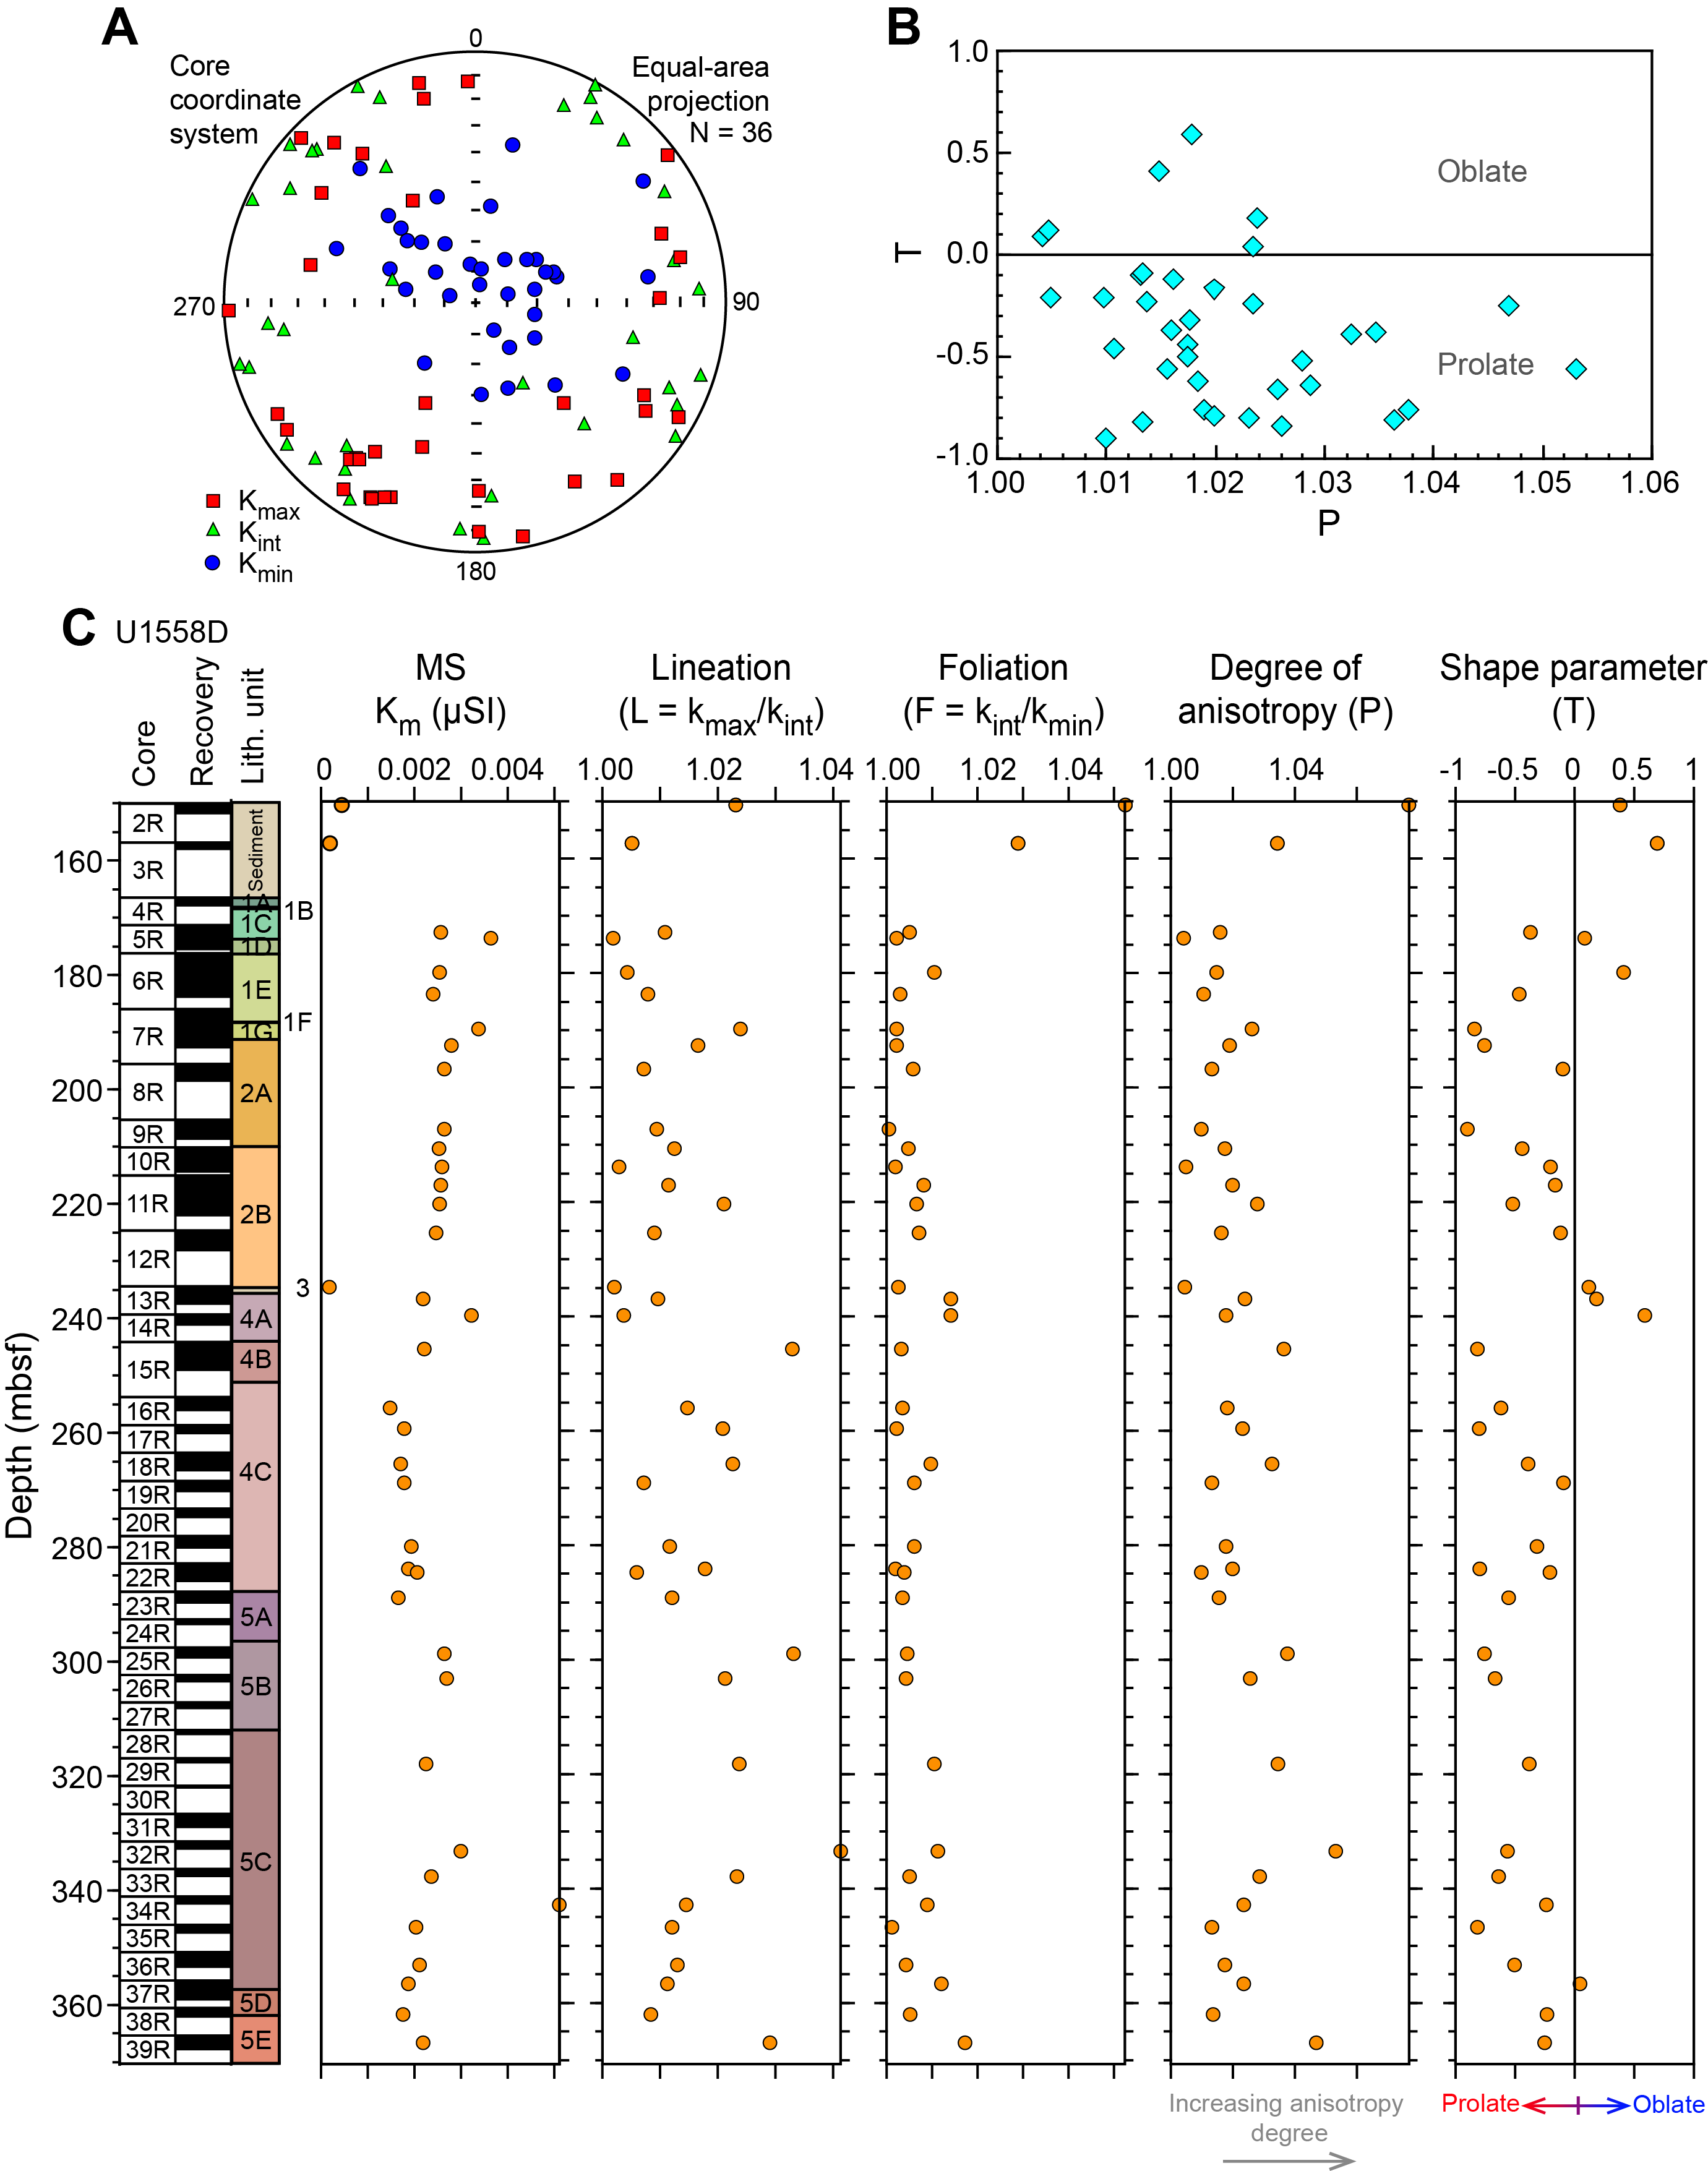
Figure F78. Shape of magnetic susceptibility axes, T vs. P, Km, and AMS parameters.
9. Age model and mass accumulation rates
9.1. Age model and linear sedimentation rates
The age model for Site U1558 is based on calcareous nannoplankton and planktic foraminiferal lowest (base) and highest (top) occurrence datums and paleomagnetic reversal datums from Holes U1558A and U1558F (Tables T23, T24; Figures F79, F80).
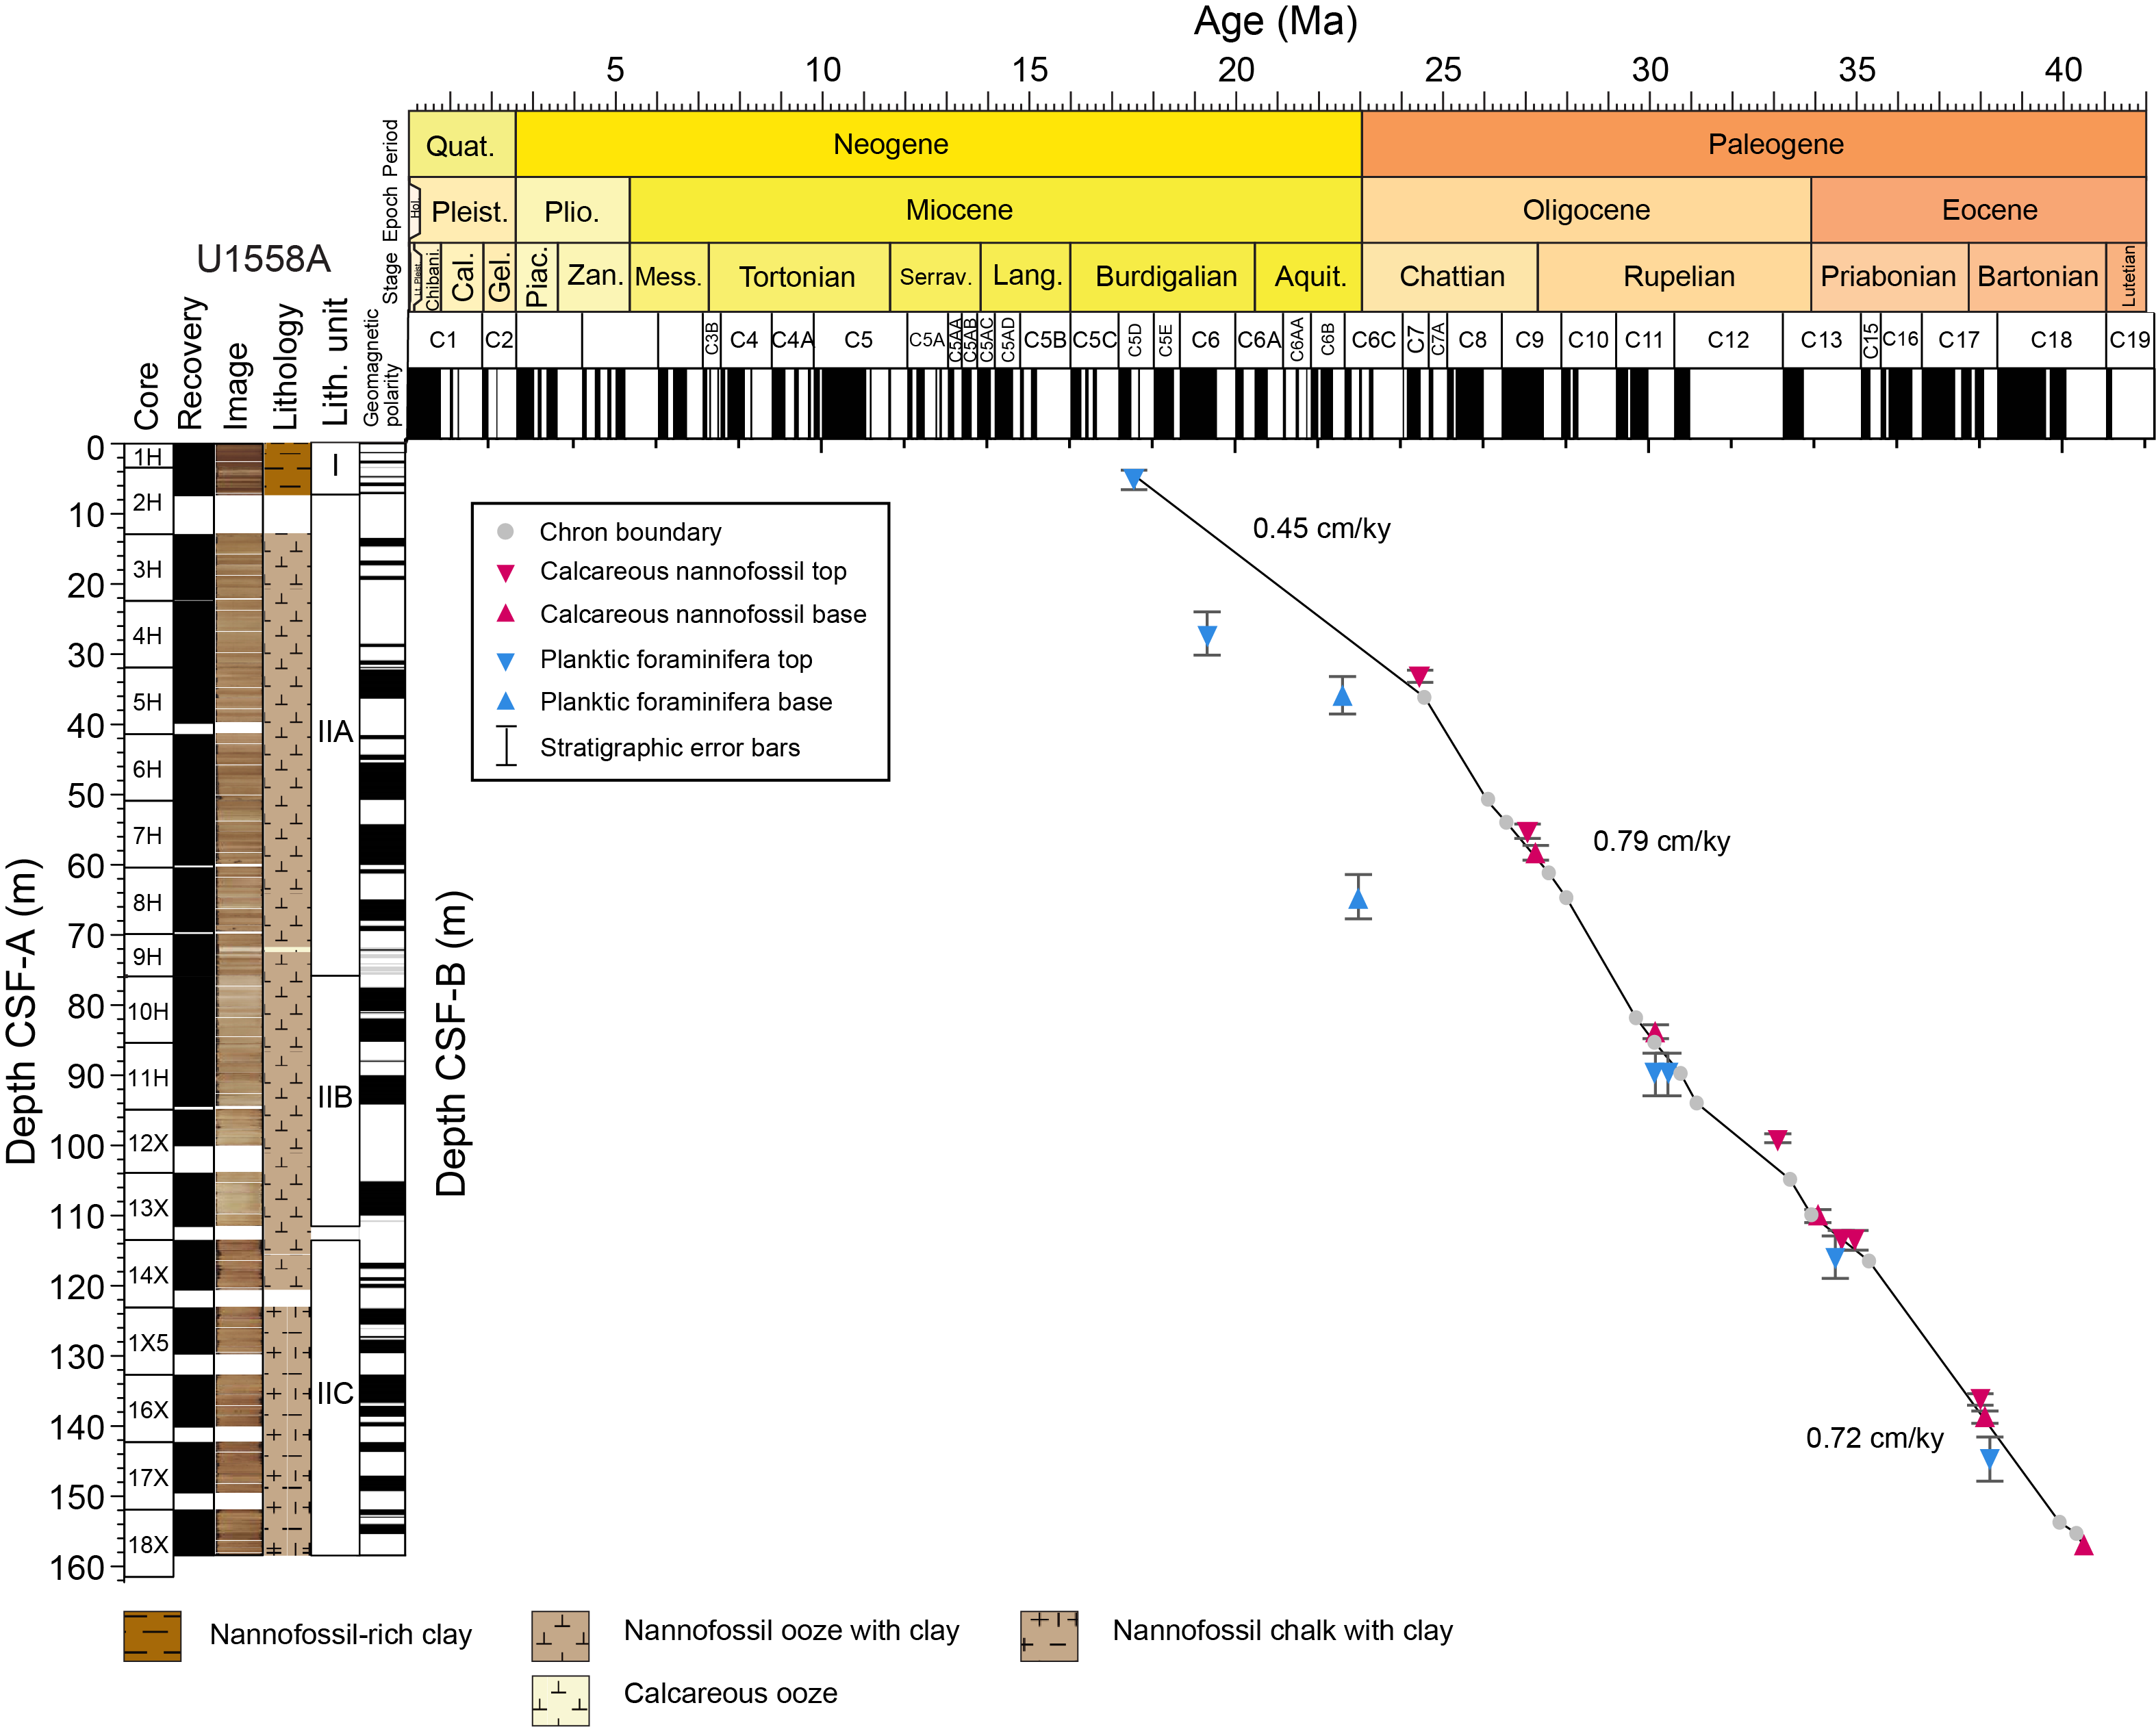
Figure F79. Age-depth model, Hole U1558A.
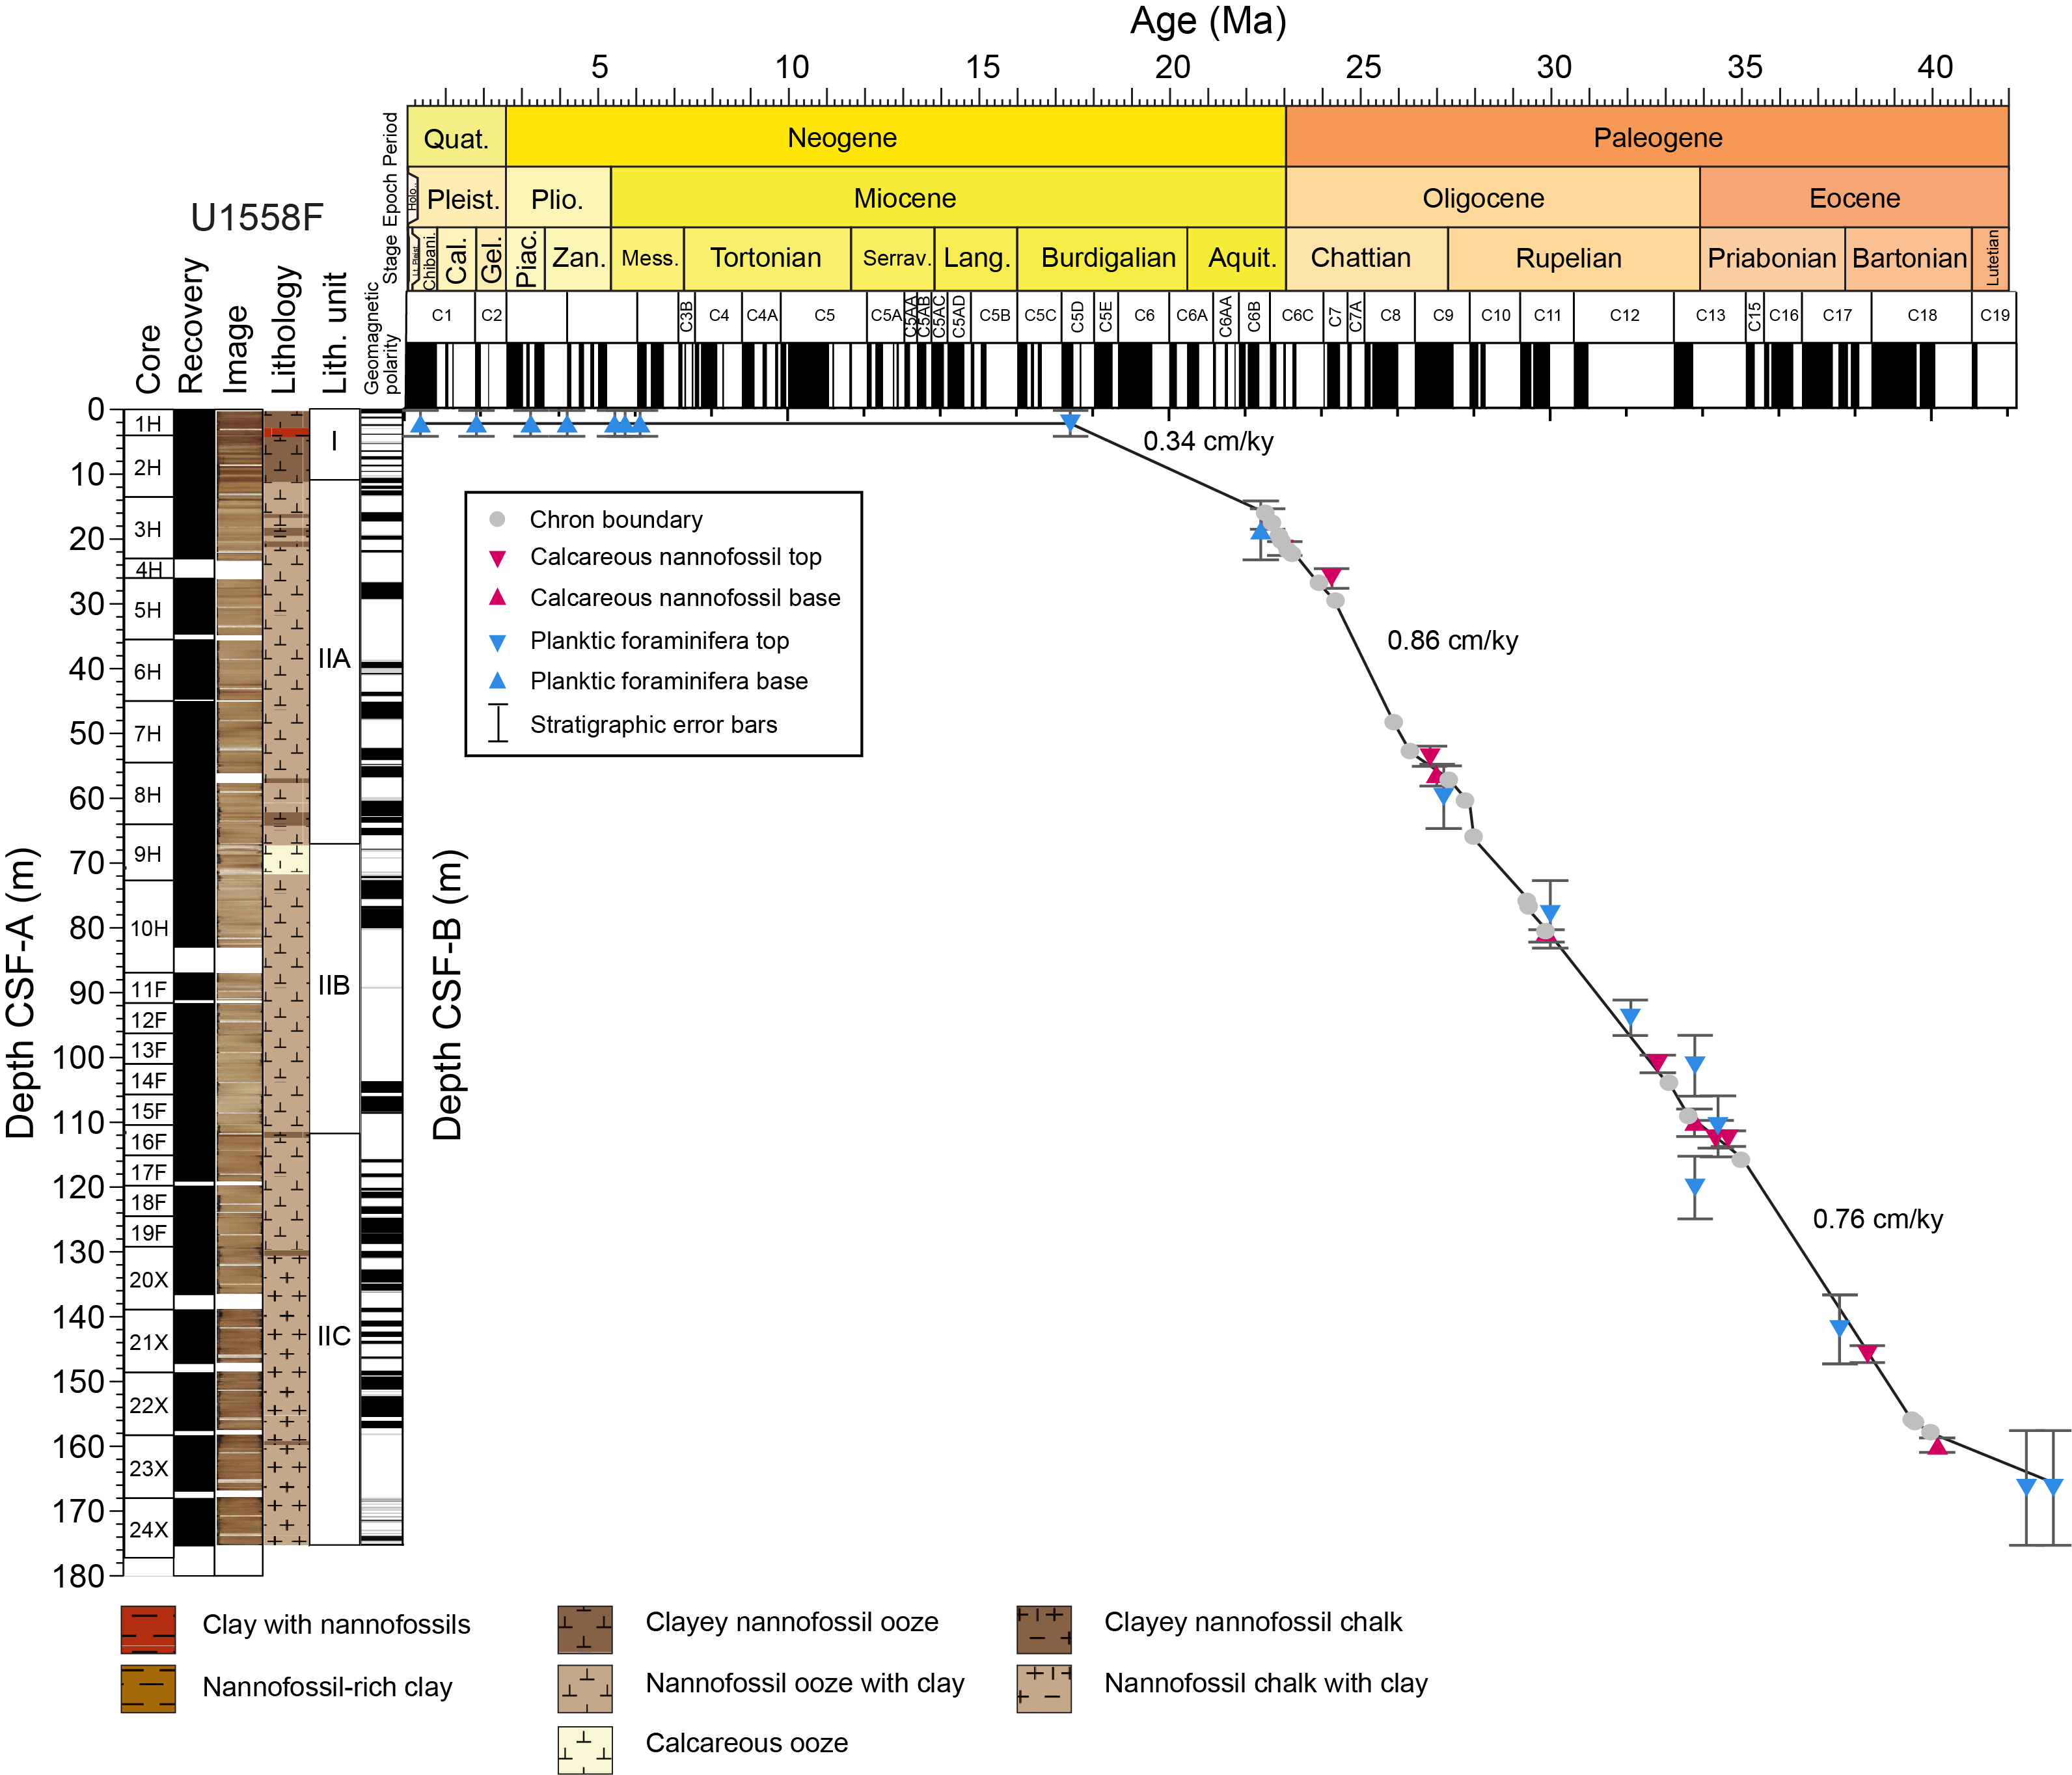
Figure F80. Age-depth model, Hole U1558F.
Planktic foraminifera and calcareous nannoplankton occur throughout the cored sediment sequence. Foraminifera tend to be largely absent in the upper portion of Holes U1558A and U1558F, corresponding to nannofossil-rich clays in Lithostratigraphic Unit I (see Sedimentology and Biostratigraphy). In Lithostratigraphic Subunit IIA (nannofossil ooze with clay) and much of Subunit IIB (nannofossil chalk with clay), foraminifera are present in greater numbers, but are sparse again in upper Subunit IIC across the Eocene–Oligocene transition (see Biostratigraphy). Calcareous nannofossils are common to abundant in nannofossil-rich clay samples but are poorly preserved (Lithostratigraphic Unit I), however, in the carbonate-rich intervals, such as Lithostratigraphic Unit II, nannofossils are more abundant with variable preservation.
Overall, we identified 7 planktic foraminifera and 12 calcareous nannoplankton bioevents in Hole U1558A and 18 planktic foraminifera and 13 calcareous nannoplankton bioevents in Hole U1558F. Magnetic reversals were recorded throughout the sedimentary sections, except for the early Neogene (Early to Middle Miocene) in Hole U1558A. Five magnetic reversal boundaries were identified in Hole U1558A between 14.77 and 19.52 m CSF-A, possibly corresponding to the late Oligocene to Early Miocene. However, we have refrained from interpreting these reversals because this interval contains short and frequent polarity reversals, and Hole U1558A contains few microfossil datums to constrain paleomagnetic interpretations. There is also a void in Core 390C-U1558A-2H, and significant drilling disturbances occur at the tops of Cores 2H and 3H, so the reversals lack sufficient support. In total, 14 and 22 magnetic reversal boundaries were identified from Holes U1558A and U1558F, respectively (Figures F79, F80).
There is good agreement between the fossil datums and paleomagnetic reversals in both holes, with the best agreement between microfossil datums and magnetic reversals occurring in Hole U1558F. In Hole U1558A, all planktic foraminiferal datums lie away from the calcareous nannofossil and magnetic reversal boundaries, which could be attributed to species' diachroneity in the midlatitudes. Planktic foraminiferal species used in biostratigraphy have been demonstrated to have different first and last occurrence dates in the midlatitudes of the Pacific compared to the ages of these datums reported in the tropical–subtropical zonation schemes (Wade et al., 2011; King et al., 2020), with ages differing by more than 3 My (Lam et al., 2022). Two of the planktic foraminiferal datums that lie outside of the calcareous nannofossil and magnetic reversal boundaries are bases (G. dehiscens and T. trilobus; Tables T23, T24) and therefore cannot be explained by reworking nor are the events artificially lower in the section because of poor preservation. Therefore, shore-based analyses and further refinement and calibration of planktic foraminiferal datums is required to fully understand the magnitude of such potential offsets in age. Hole U1558F may have recorded better fossil datum agreement with the age model because of different species used (e.g., P. opima) that may have less diachroneity than species used in Hole U1558A (e.g., T. trilobus).
Linear sedimentation rates (LSRs) were calculated using paleomagnetic reversal boundaries and microfossil datums. Datums used in LSR calculations are given in Tables T23 and T24. Average LSRs are fairly similar in both holes, with values in the Early Miocene of around 0.3–0.4 cm/ky, and values in the Oligocene and Eocene around 0.7–0.8 cm/ky (Figures F79, F80).
9.2. Mass accumulation rates
Mass accumulation rates (MARs) were calculated for Holes U1558A and U1558F using the LSRs and bulk density from gamma ray attenuation (GRA) measurements collected during Whole-Round Multisensor Logger (WRMSL) scans (see Age model and mass accumulation rates in the Expedition 390/393 methods chapter [Coggon et al., 2024b]; see also AGEMODEL in Supplementary material). The data presented in Figure F81 are binned into 1 My intervals. Gaps represent bins with no data.
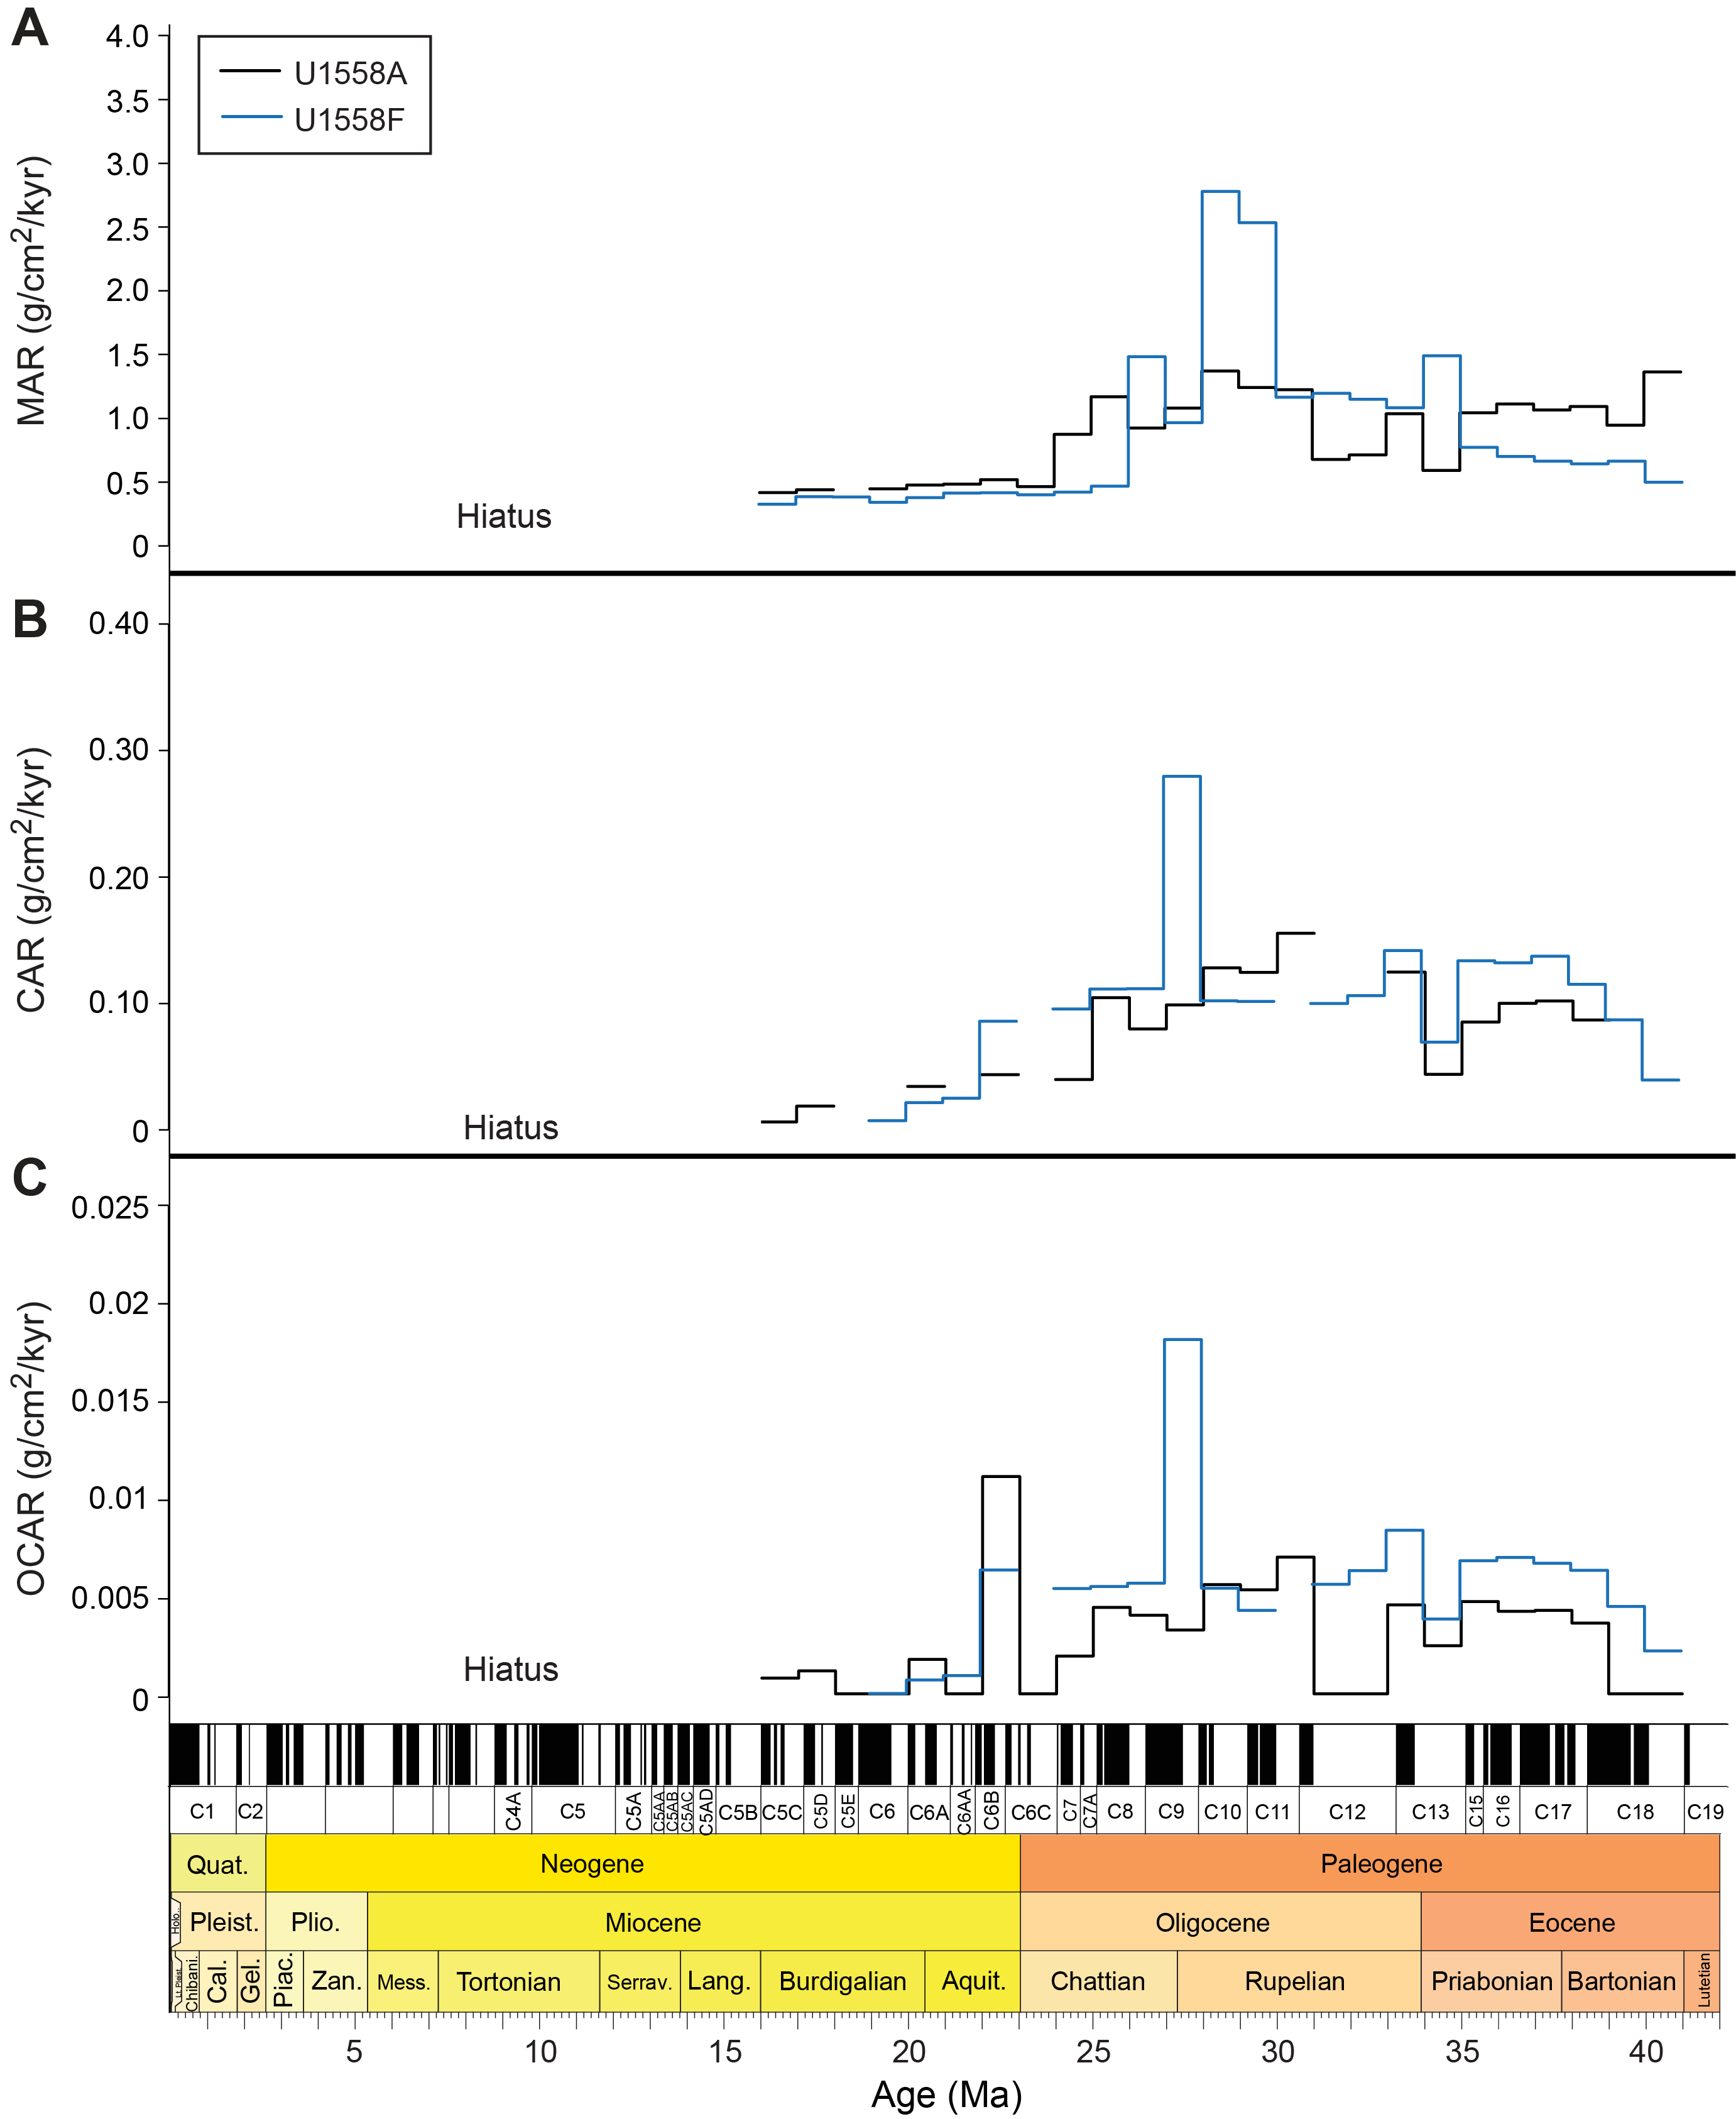
Figure F81. MAR, CAR, and OCAR.
MARs vary throughout the sedimentary succession in Holes U1558A and U1558F (Figure F81; see AGEMODEL in Supplementary material). Generally, MARs are highest in the mid-late Oligocene, with values peaking around 2.8 g/cm2/ky in Hole U1558F. This peak is not observed in Hole U1558A, where late Oligocene values generally hover between 0.9 and 1.4 g/cm2/ky. Interestingly, this relationship is reversed in the Eocene, with Hole U1558A MAR values higher (around 1.0 g/cm2/ky) than Hole U1558F values (around 0.65 g/cm2/ky). Values are lowest at both holes in the Early Miocene with values around 0.4 g/cm2/ky.
9.3. Carbonate and organic carbon accumulation rates
Carbonate accumulation rates (CARs) and organic carbon accumulation rates (OCARs) were calculated by multiplying the MAR by the weight percent of carbonate and total organic carbon (TOC), respectively (see AGEMODEL in Supplementary material). In Hole U1558A, carbonate analysis was performed on interstitial water (IW) squeeze cakes, which were taken at a resolution of one per core. One additional discrete sample per core for carbonate and organic carbon analysis was taken from the working halves of Cores 390C-U1558A-13X–17X. In Hole U1558F, three additional discrete carbonate and organic carbon samples were taken from Core 393-U1558F-1H, two from Core 2H, and one per core were taken from most cores (3H–10H, 13F, 15F, 16F, and 20X–24X).
9.3.1. Carbonate accumulation rates
CARs are variable throughout the sedimentary successions in Holes U1558A and U1558F (Figure F81; see AGEMODEL in Supplementary material). In both Holes U1558A and U1558F, CARs are highest for the Eocene and Oligocene, with values ranging 0.04–0.16 g/cm2/ky in Hole U1558A and 0.03–0.35 g/cm2/ky in Hole U1558F. Neogene CARs are slightly lower and variable throughout the sections, with values ranging 0.01–0.05 g/cm2/ky in Hole U1558A and 0.008–0.04 g/cm2/ky in Hole U1558F.
9.3.2. Organic carbon accumulation rates
OCARs are extremely low and variable throughout the sedimentary successions in Holes U1558A and U1558F (Figure F81; see AGEMODEL in Supplementary material). Through the Eocene and Oligocene, OCARs range 0.002–0.007 g/cm2/ky in Hole U1558A and 0.002–0.02 g/cm2/ky in Hole U1558F. Neogene OCARs are in general slightly lower, except for a peak in OCAR in Hole U1558A at 22 Ma (0.01 g/cm2/ky), and range 0.0009–0.01 g/cm2/ky in Hole U1558A and 0.0005–0.002 g/cm2/ky in Hole U1558F.
10. Physical properties and downhole measurements
10.1. Sediment
Physical properties characterization of the sediment sequence at Site U1558 was primarily based on cores from Holes U1558A (recovered during Expedition 390C) and U1558F (Expedition 393). Hole U1558E (Expedition 393) missed the mudline, so the physical properties data from this single core, although measured, are not part of the interpretation. Unless specified otherwise, all depths given are in meters below seafloor (mbsf) on the CSF-A scale. Holes U1558A and U1558F encountered basement rocks at 158.9 and 176.0 mbsf, respectively. Basement reentry Hole U1558D recovered the sediment/basement interface at 166.8 mbsf as well as ~3 m of sediment above the basement.
Whole-round core section measurements from Hole U1558F included NGR, GRA bulk density, MS, and compressional wave (P-wave) velocity (Figure F82). Split-core section measurements included discrete measurements of point magnetic susceptibility (MSP), P-wave velocity, thermal conductivity, and sediment shear and compressional strength (Table T25). Discrete sediment samples were taken from the working halves for moisture and density (MAD) analysis (Table T26; Figure F83). Only core logging (track) physical properties measurements were made on cores from Hole U1558A (Figure F84). Because coring with the APC system continued to greater depths in Hole U1558F than in Hole U1558A before switching to XCB and because data from both holes display similar features (see Stratigraphic correlation), the interpretation of Site U1558 sediment physical properties is predominantly based on Hole U1558F. Unless specified otherwise, mean values of all physical properties are represented as arithmetic means with ±1 standard deviation.
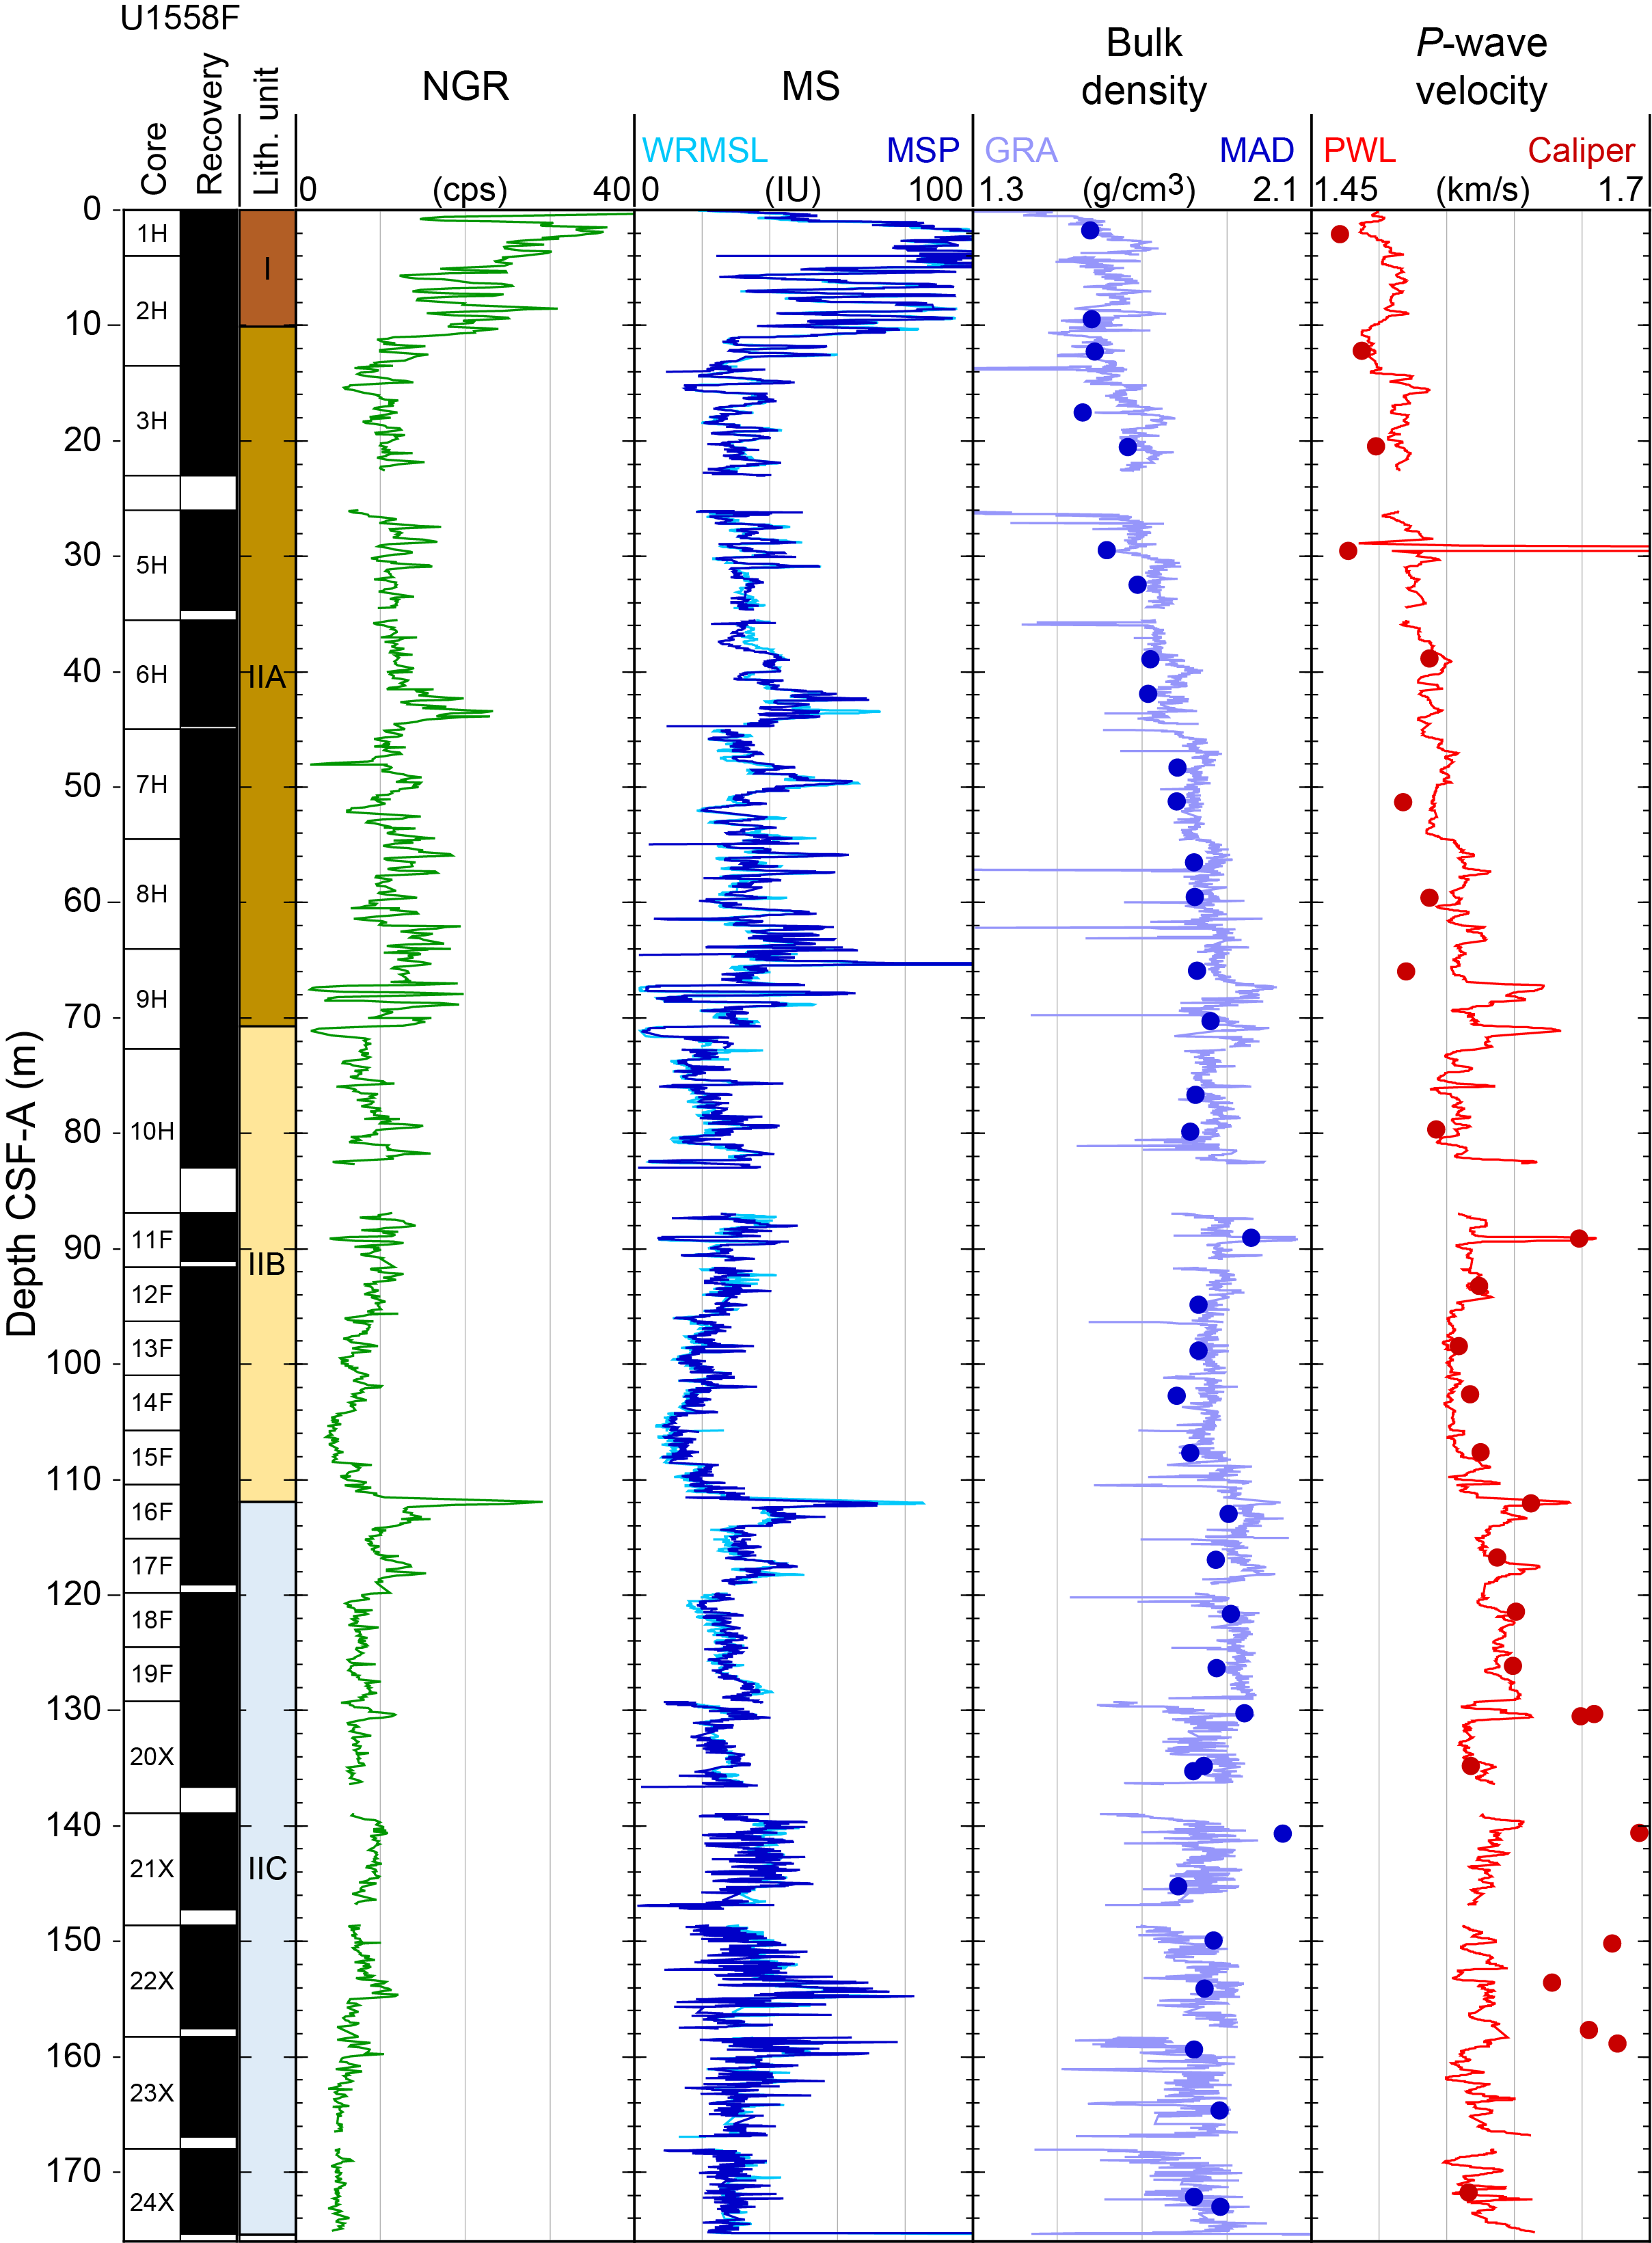
Figure F82. Core physical properties data, Hole U1558F.
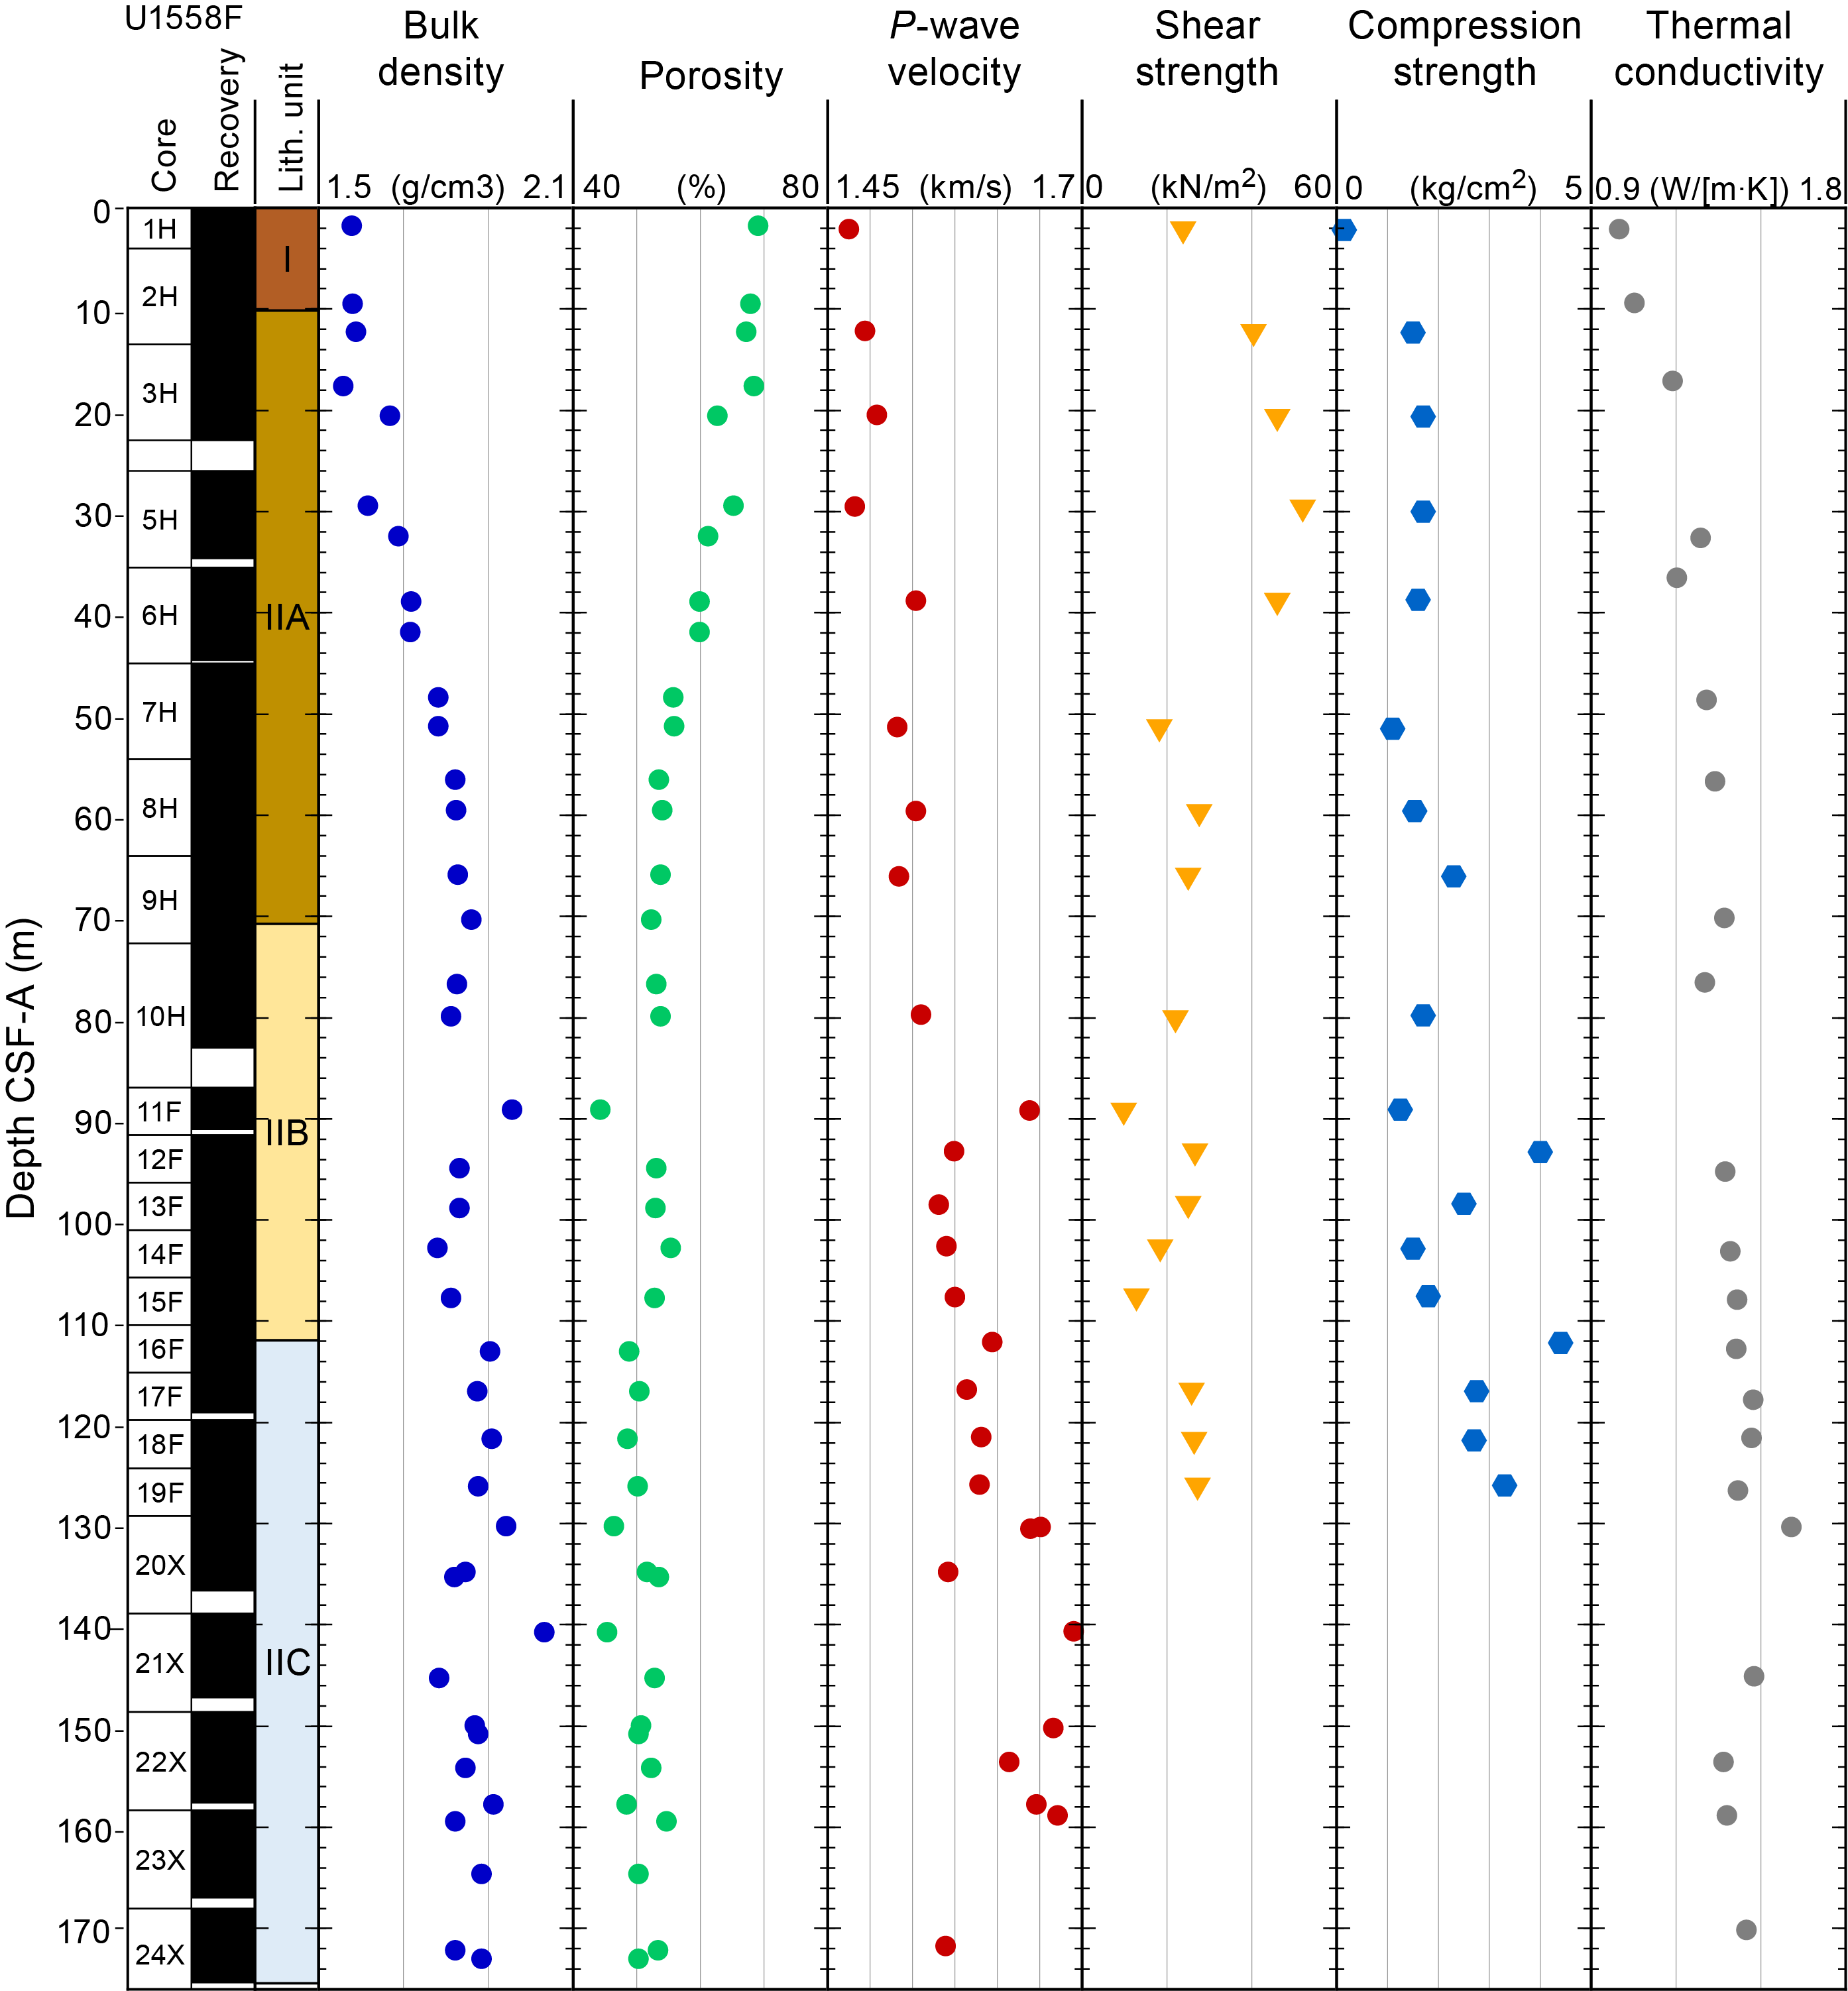
Figure F83. Discrete physical properties data, Hole U1558F.
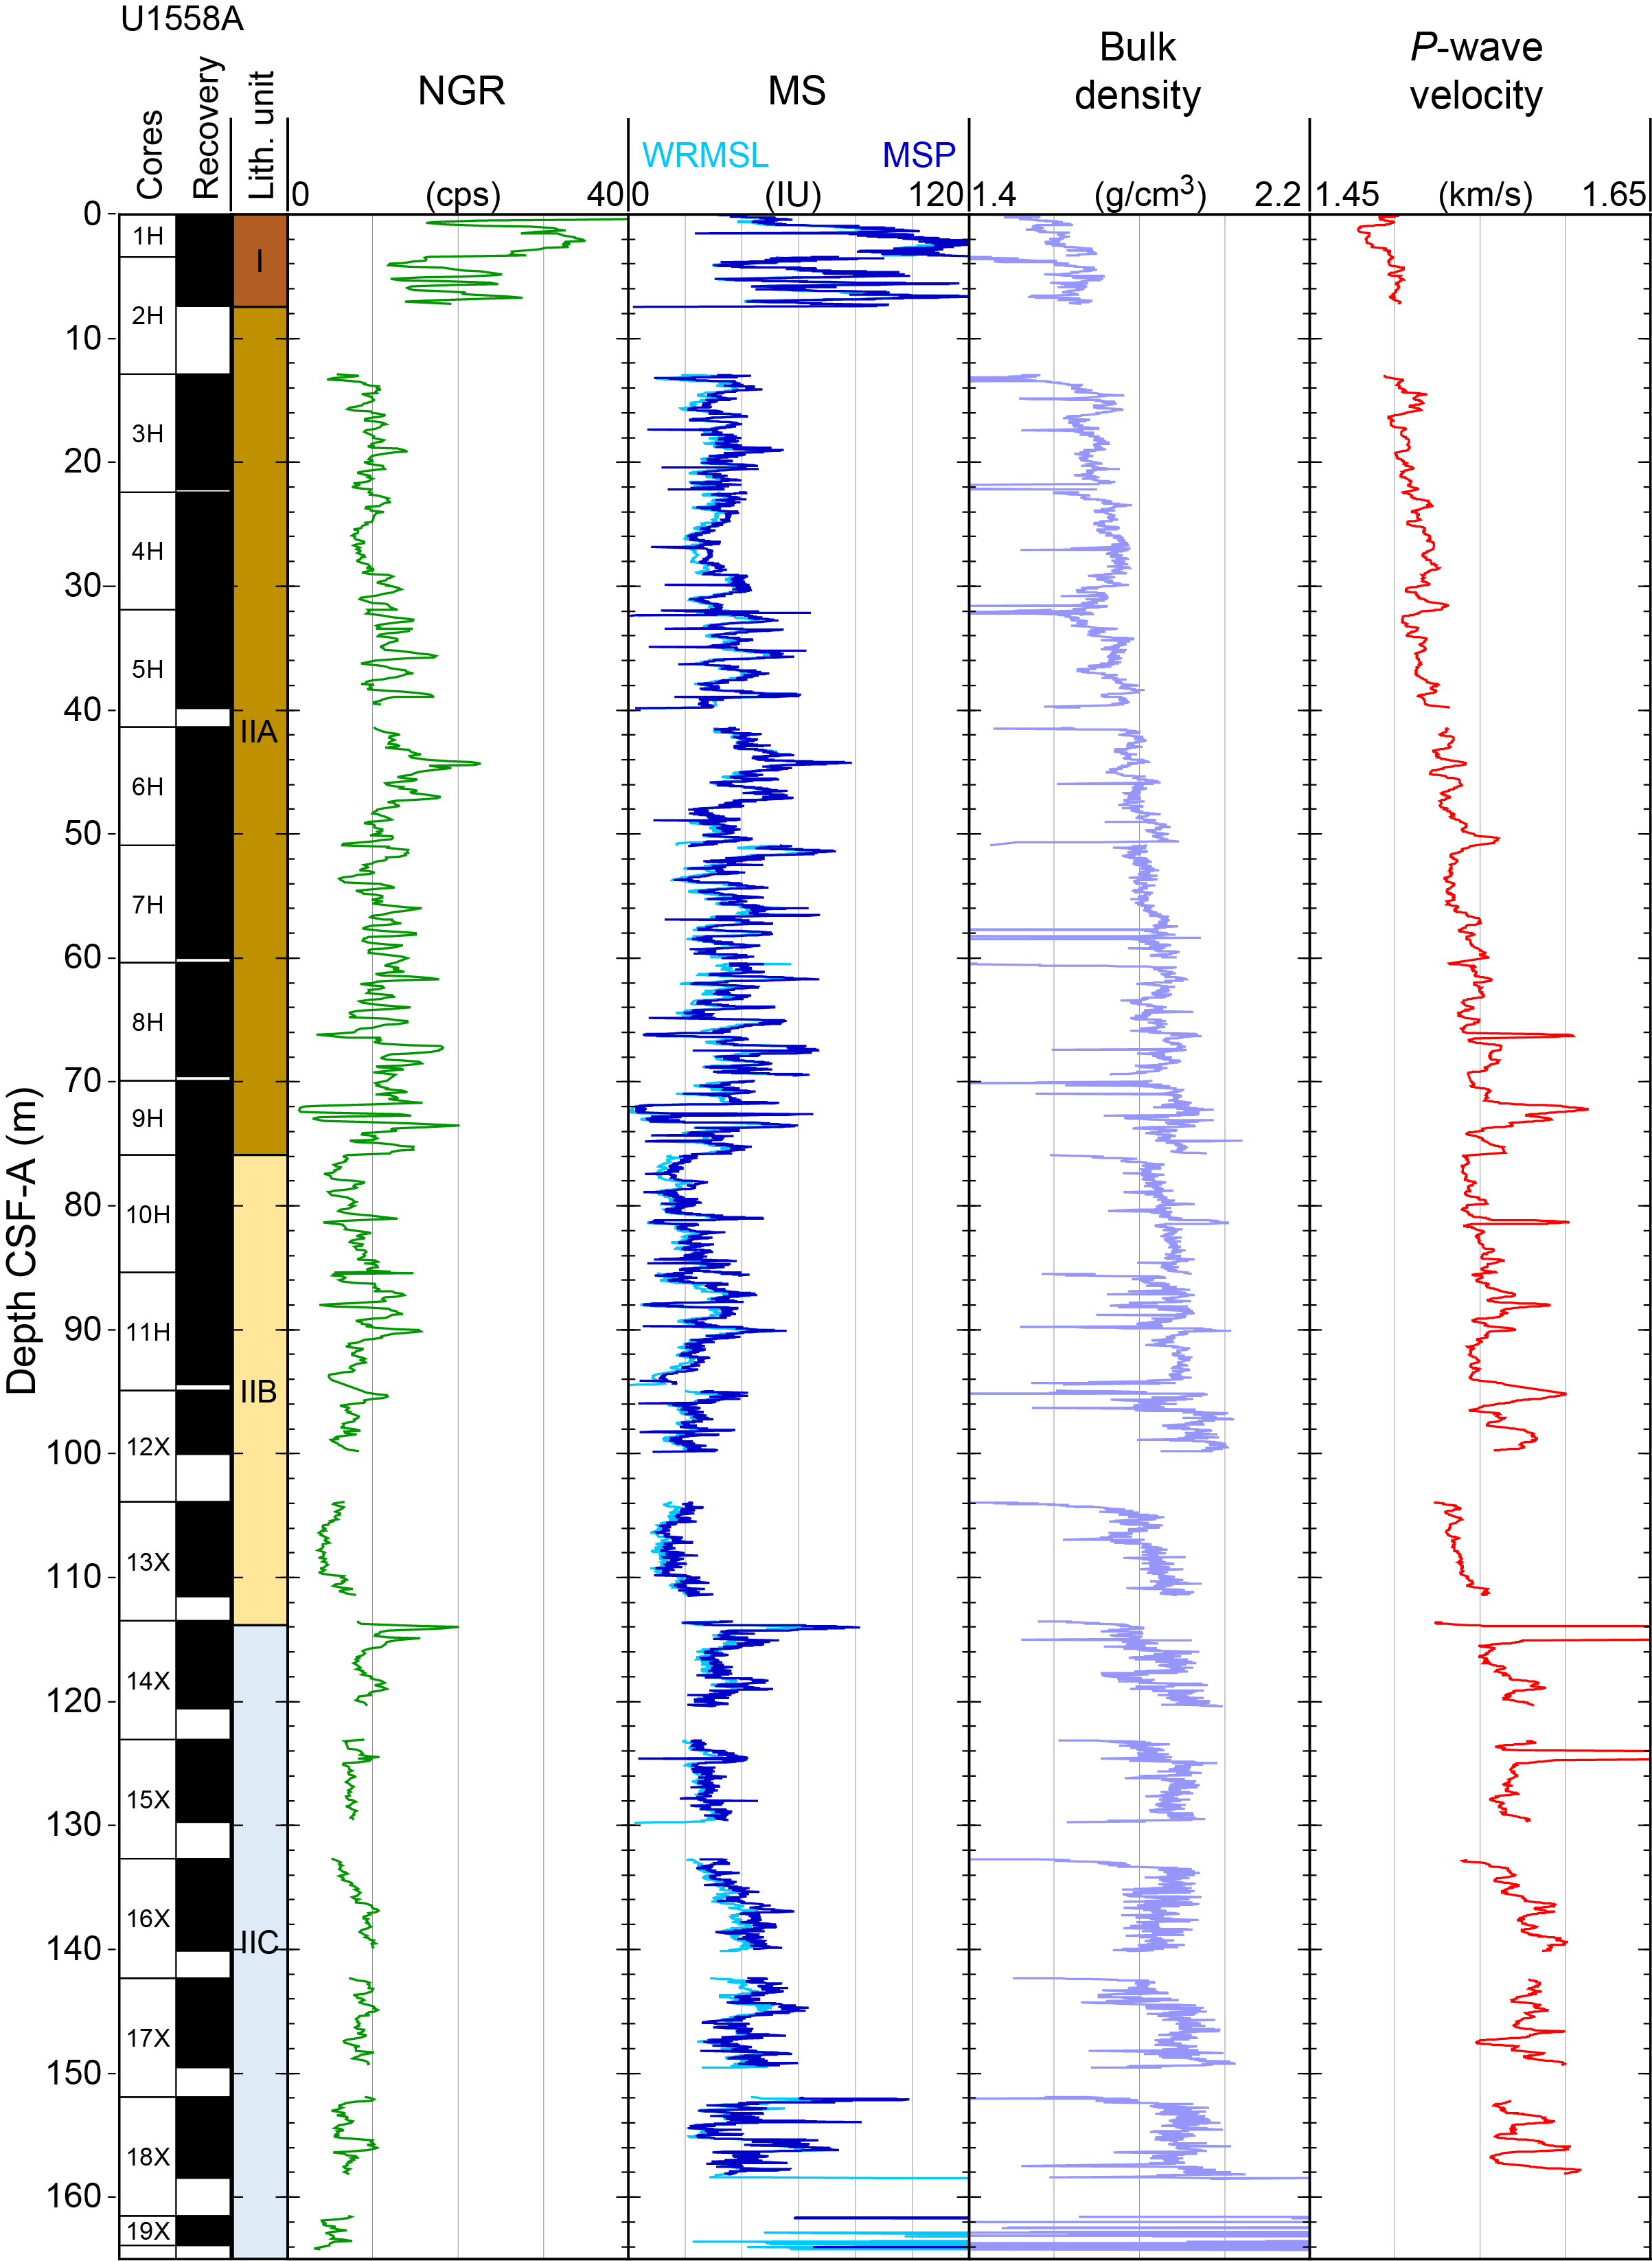
Figure F84. Core physical properties data, Hole U1558A.
10.1.1. Physical properties
10.1.1.1. Natural gamma radiation
NGR ranges 2–50 counts/s through the sedimentary section in Hole U1558F (Figure F82). The upper ~10 m shows the highest NGR values (range = 12–50 counts/s; mean = 24 ± 7 counts/s) compared to other depth intervals (mean = 9 ± 3 counts/s) (Table T27) and corresponds to nannofossil-rich clay and nannofossil ooze present in Lithostratigraphic Unit I (see Sedimentology). NGR ranges 2–24 counts/s in Subunit IIA (10.1–70.75 mbsf; mean = 12 ± 3 counts/s) and stays uniformly low in Subunits IIB and IIC (70.75–111.90 and 111.90–175.43 mbsf, respectively; mean [both subunits] = 8 ± 3 counts/s) (Table T27). These low NGR values (<15 counts/s) are typical of carbonate ooze (Dunlea et al., 2013). NGR shows an abrupt spike to 29 counts/s at 112 mbsf at the boundary between Lithostratigraphic Subunits IIB and IIC, nannofossil ooze with clay to nannofossil ooze/chalk with clay, respectively (Figure F82; see Sedimentology). A similar NGR spike is also found in Hole U1558A (114 mbsf; 20 counts/s) (Figure F84) and provides a key tie point for stratigraphic correlation (see Stratigraphic correlation). Intervals with elevated NGR are associated with separate peaks in U, Th, and K when the concentrations are examined separately (Figures F85, F86) (see Physical properties and downhole measurements in the Expedition 390/393 methods chapter [Coggon et al., 2024b]).
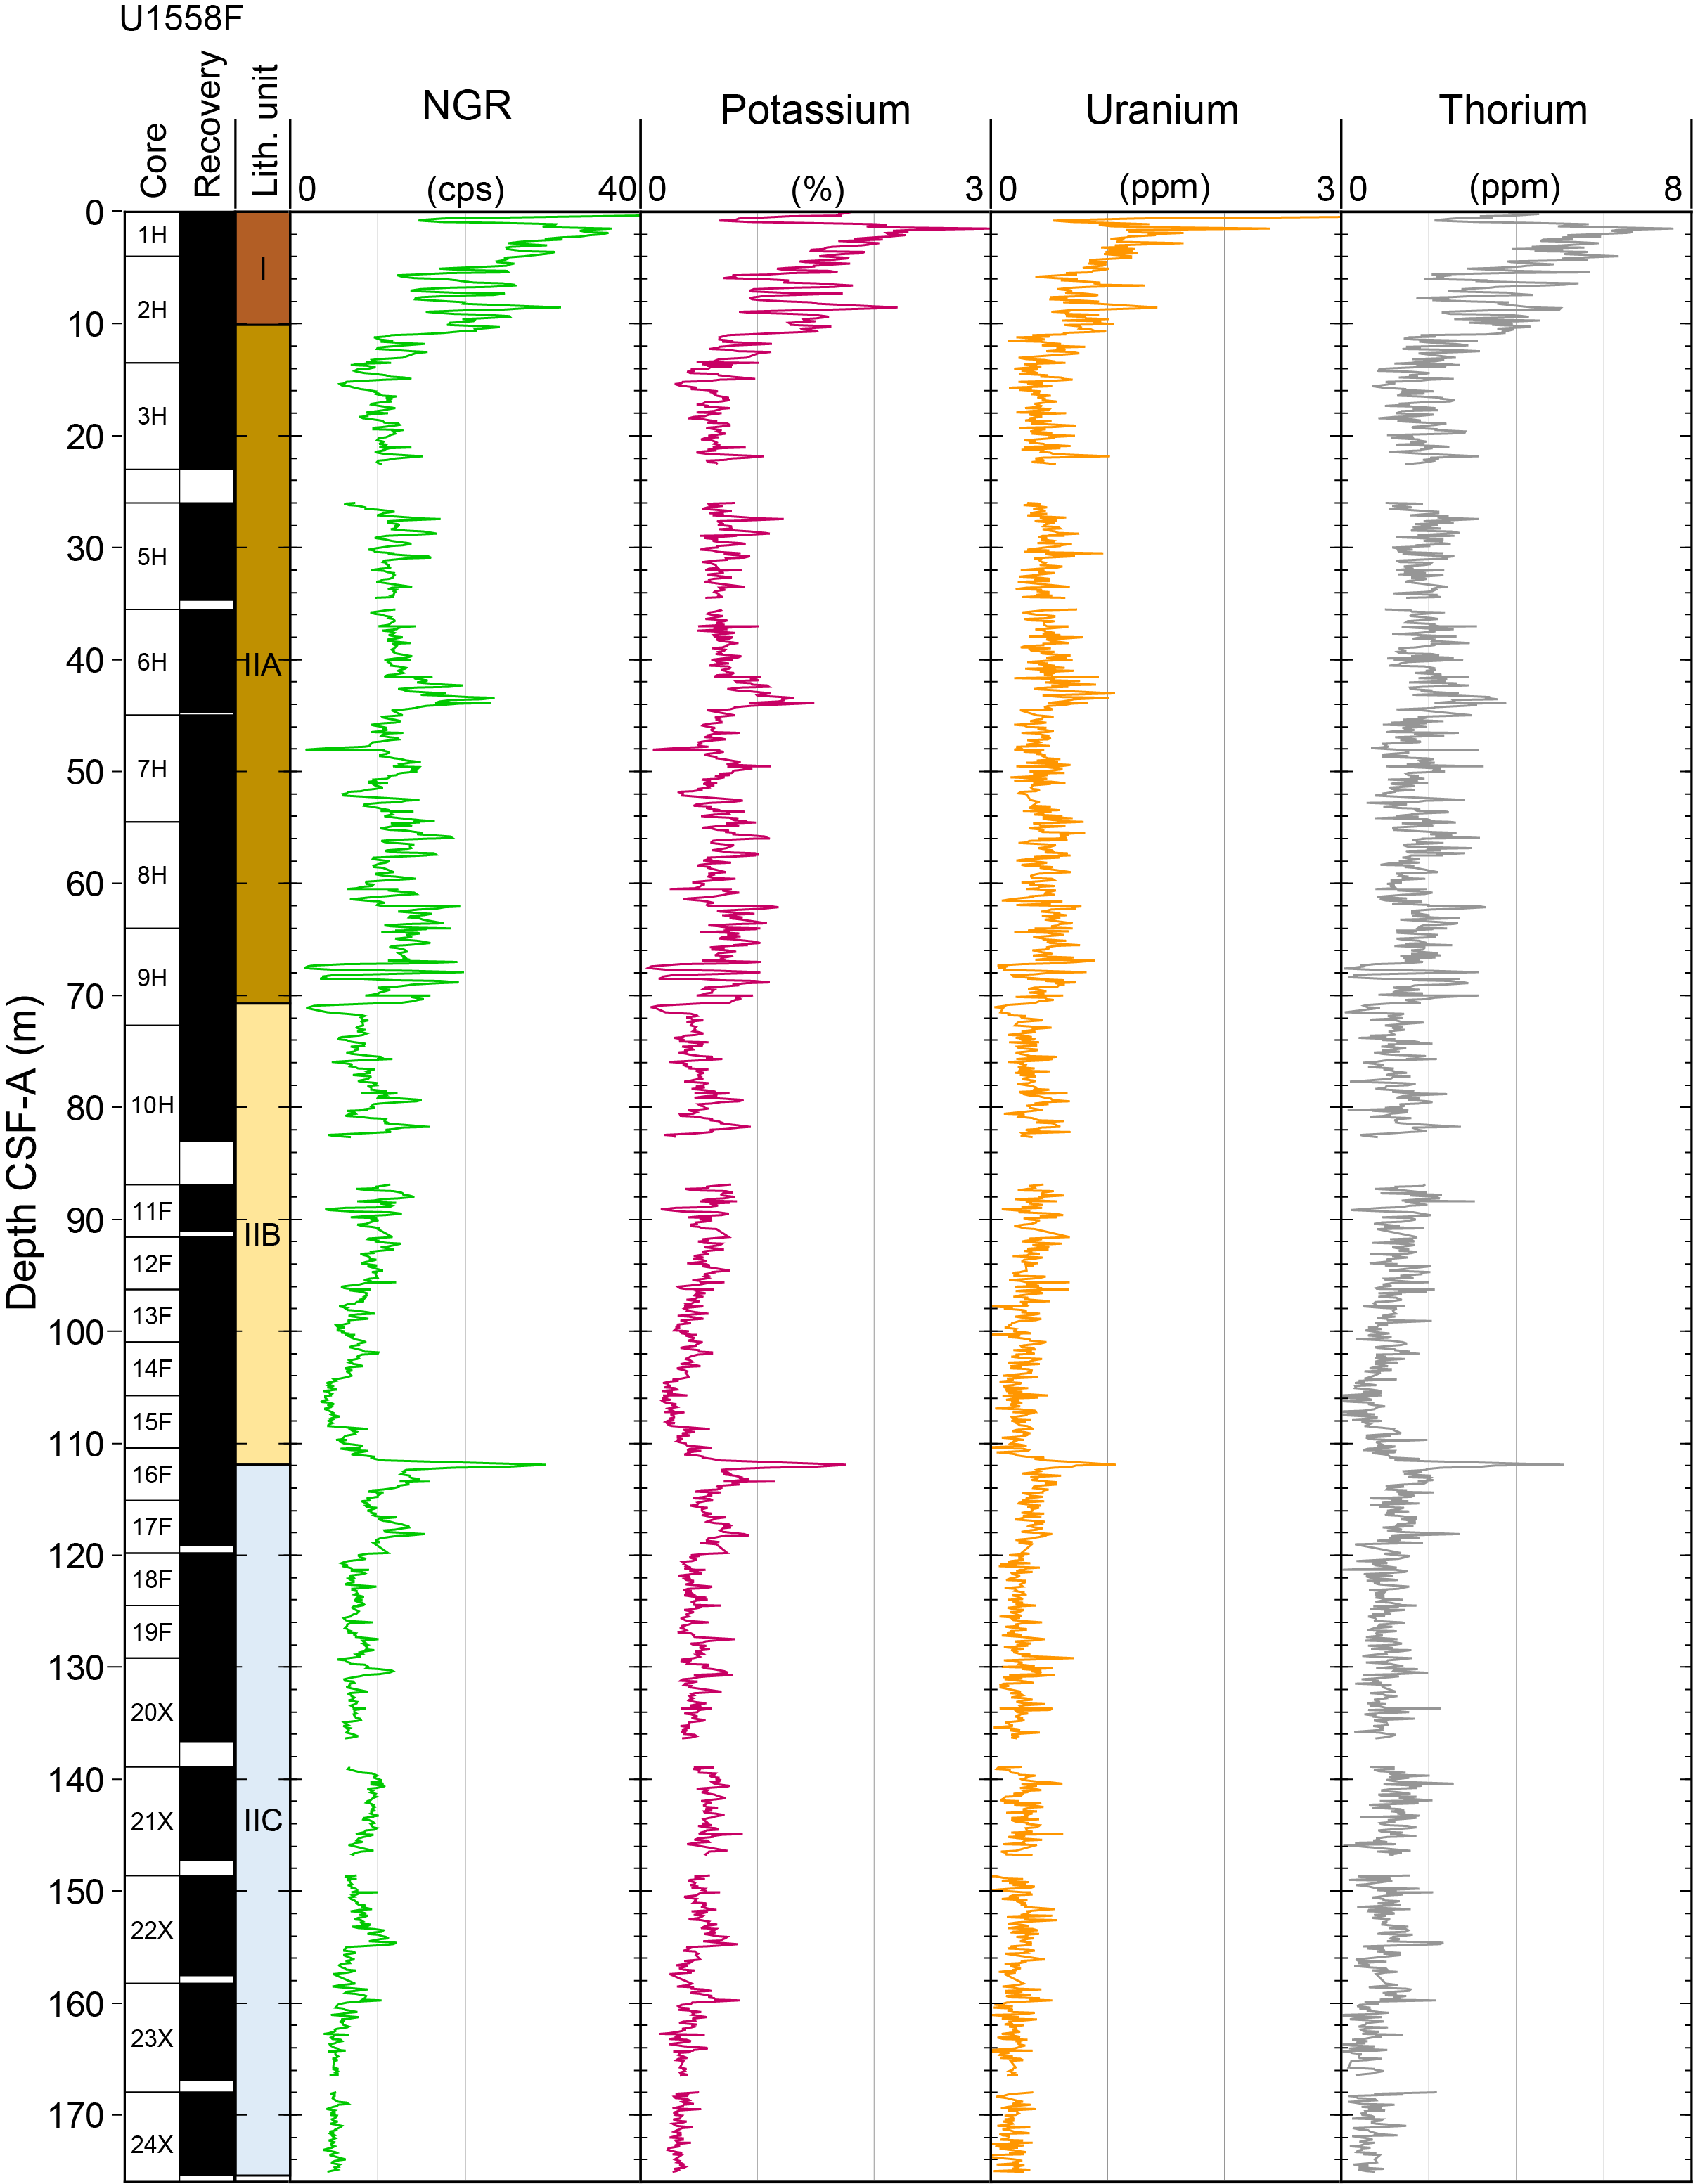
Figure F85. Potassium, uranium, and thorium, Hole U1558F.
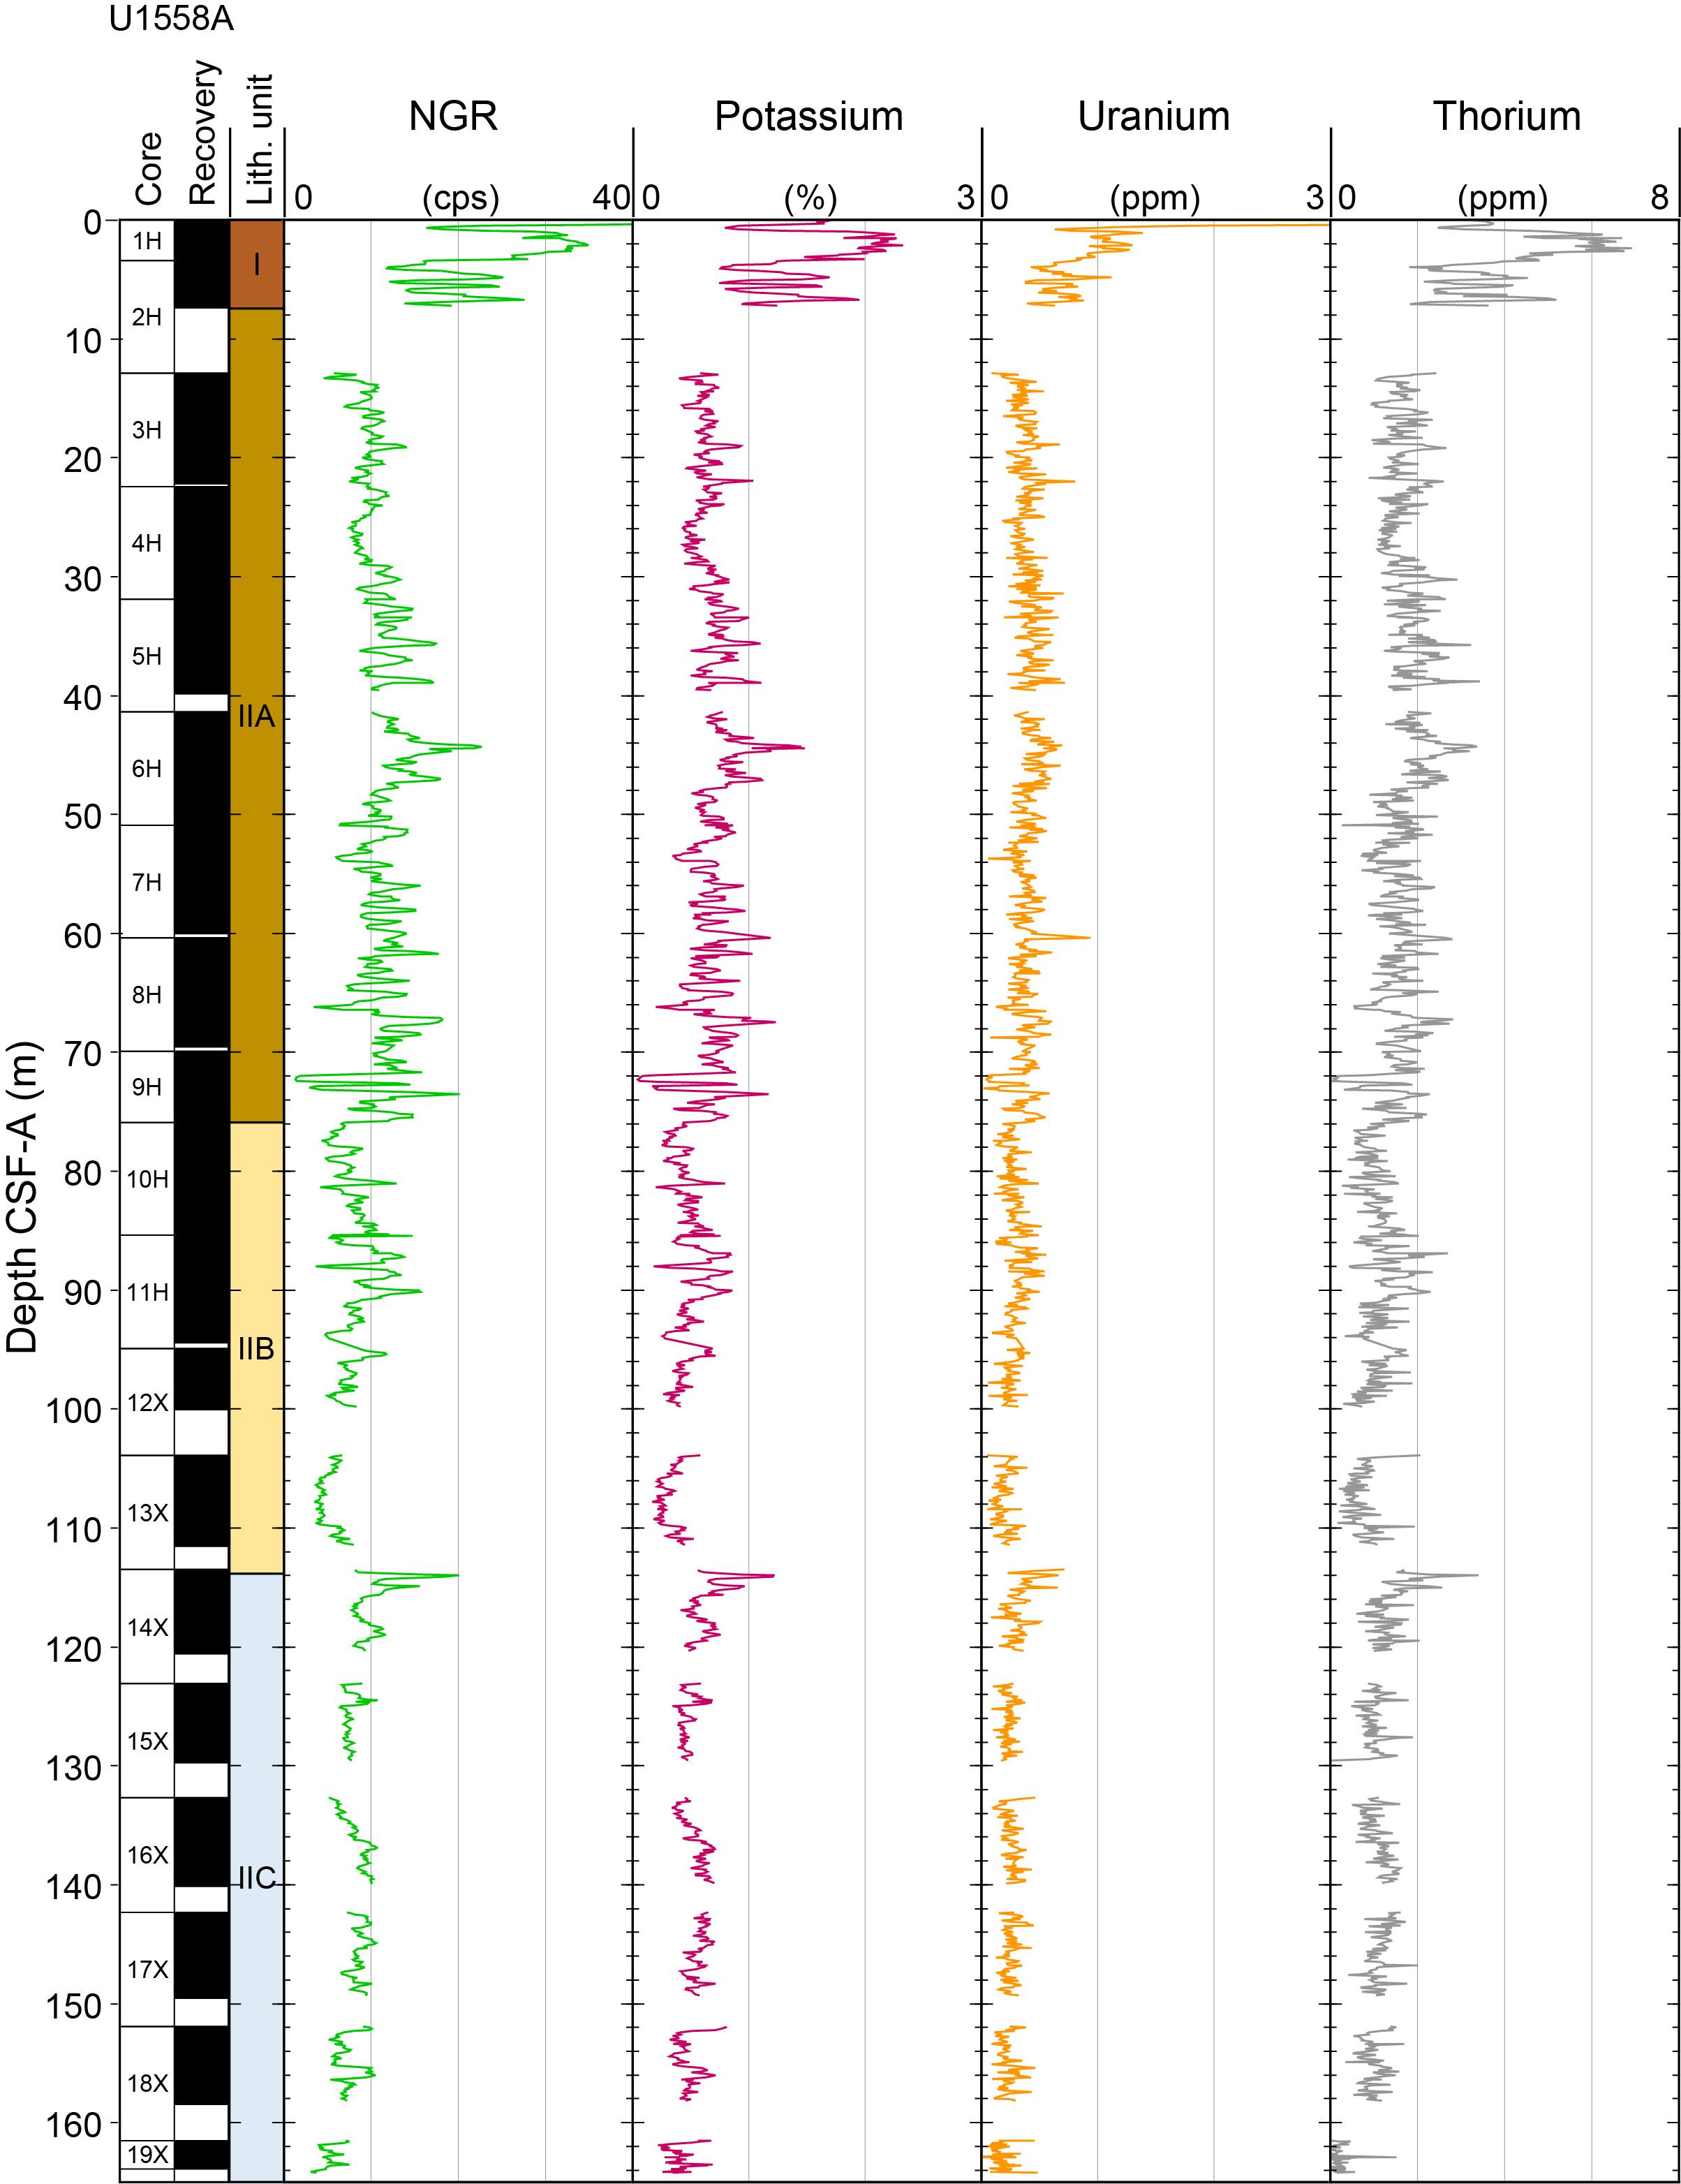
Figure F86. Potassium, uranium, and thorium, Hole U1558A.
10.1.1.2. Magnetic susceptibility
Despite differences in frequency and resolution between the two magnetic susceptibility systems (see Physical properties and downhole measurements in the Expedition 390/393 methods chapter [Coggon et al., 2024b]), both MS measured on the WRMSL and MSP data show similar downhole trends and magnitude of susceptibility throughout the sedimentary sections. Similar to the NGR record, magnetic susceptibility shows highest values in the upper ~10 m in Unit I (range = 18–118 instrument units [IU]; mean = 70 ± 22 IU) compared to other units, reflecting the characteristics of the clayey nannofossil ooze layers (Figure F82). Magnetic susceptibility decreases throughout Subunit IIA between ~10 and ~70 mbsf (mean = 34 ± 12 IU), and there are further reductions throughout Subunit IIB between 70 and 112 mbsf (mean = 19 ± 8 IU). This is followed by an increase in magnetic susceptibility in Subunit IIC to mean values of 31 ± 10 IU (Figure F82; Table T27). An abrupt spike (85 IU) marks the boundary between Subunits IIB and IIC (112 mbsf), and it is used as a tie point for stratigraphic correlation. The lower magnetic susceptibility values in all subunits of Unit II compared to Unit I are indicative of clay-poor carbonate oozes in these intervals.
10.1.1.3. Gamma ray attenuation bulk density
Bulk density measured from both GRA and MAD methods shows generally consistent results, ranging 1.0–2.4 g/cm3 throughout the sedimentary sections (mean = 1.8 ± 0.1 g/cm3), although MAD bulk densities are consistently around 2% lower than GRA (Figure F82). This may be due to sediment drying after exposure to air when the cores were split. The mean bulk density is lowest in Unit I (1.6 ± 0.1 g/cm3) compared to the other three subunits (1.8 ± 0.1 g/cm3). Bulk density shows an overall gradual increase from the seafloor to the basement (Figure F82) reflecting the increasing compaction of sediments with depth.
10.1.1.4. Moisture and density
A total of 37 discrete samples were taken for MAD analysis. Generally, two samples were chosen per core in representative lithologies (mostly nannofossil-rich clay and ooze) from Hole U1558F. Porosity of the sedimentary section shows a decreasing trend from ~70% at the seafloor to ~50% at 173 mbsf at the sediment/basement interface (Figure F87), mirroring the trend observed in bulk density (Figure F83). The mean values of porosity in Unit I and Subunit IIA (68 ± 1% and 59 ± 5%, respectively) are higher than those in Subunits IIB and IIC (52 ± 4% and 51 ± 3%, respectively).
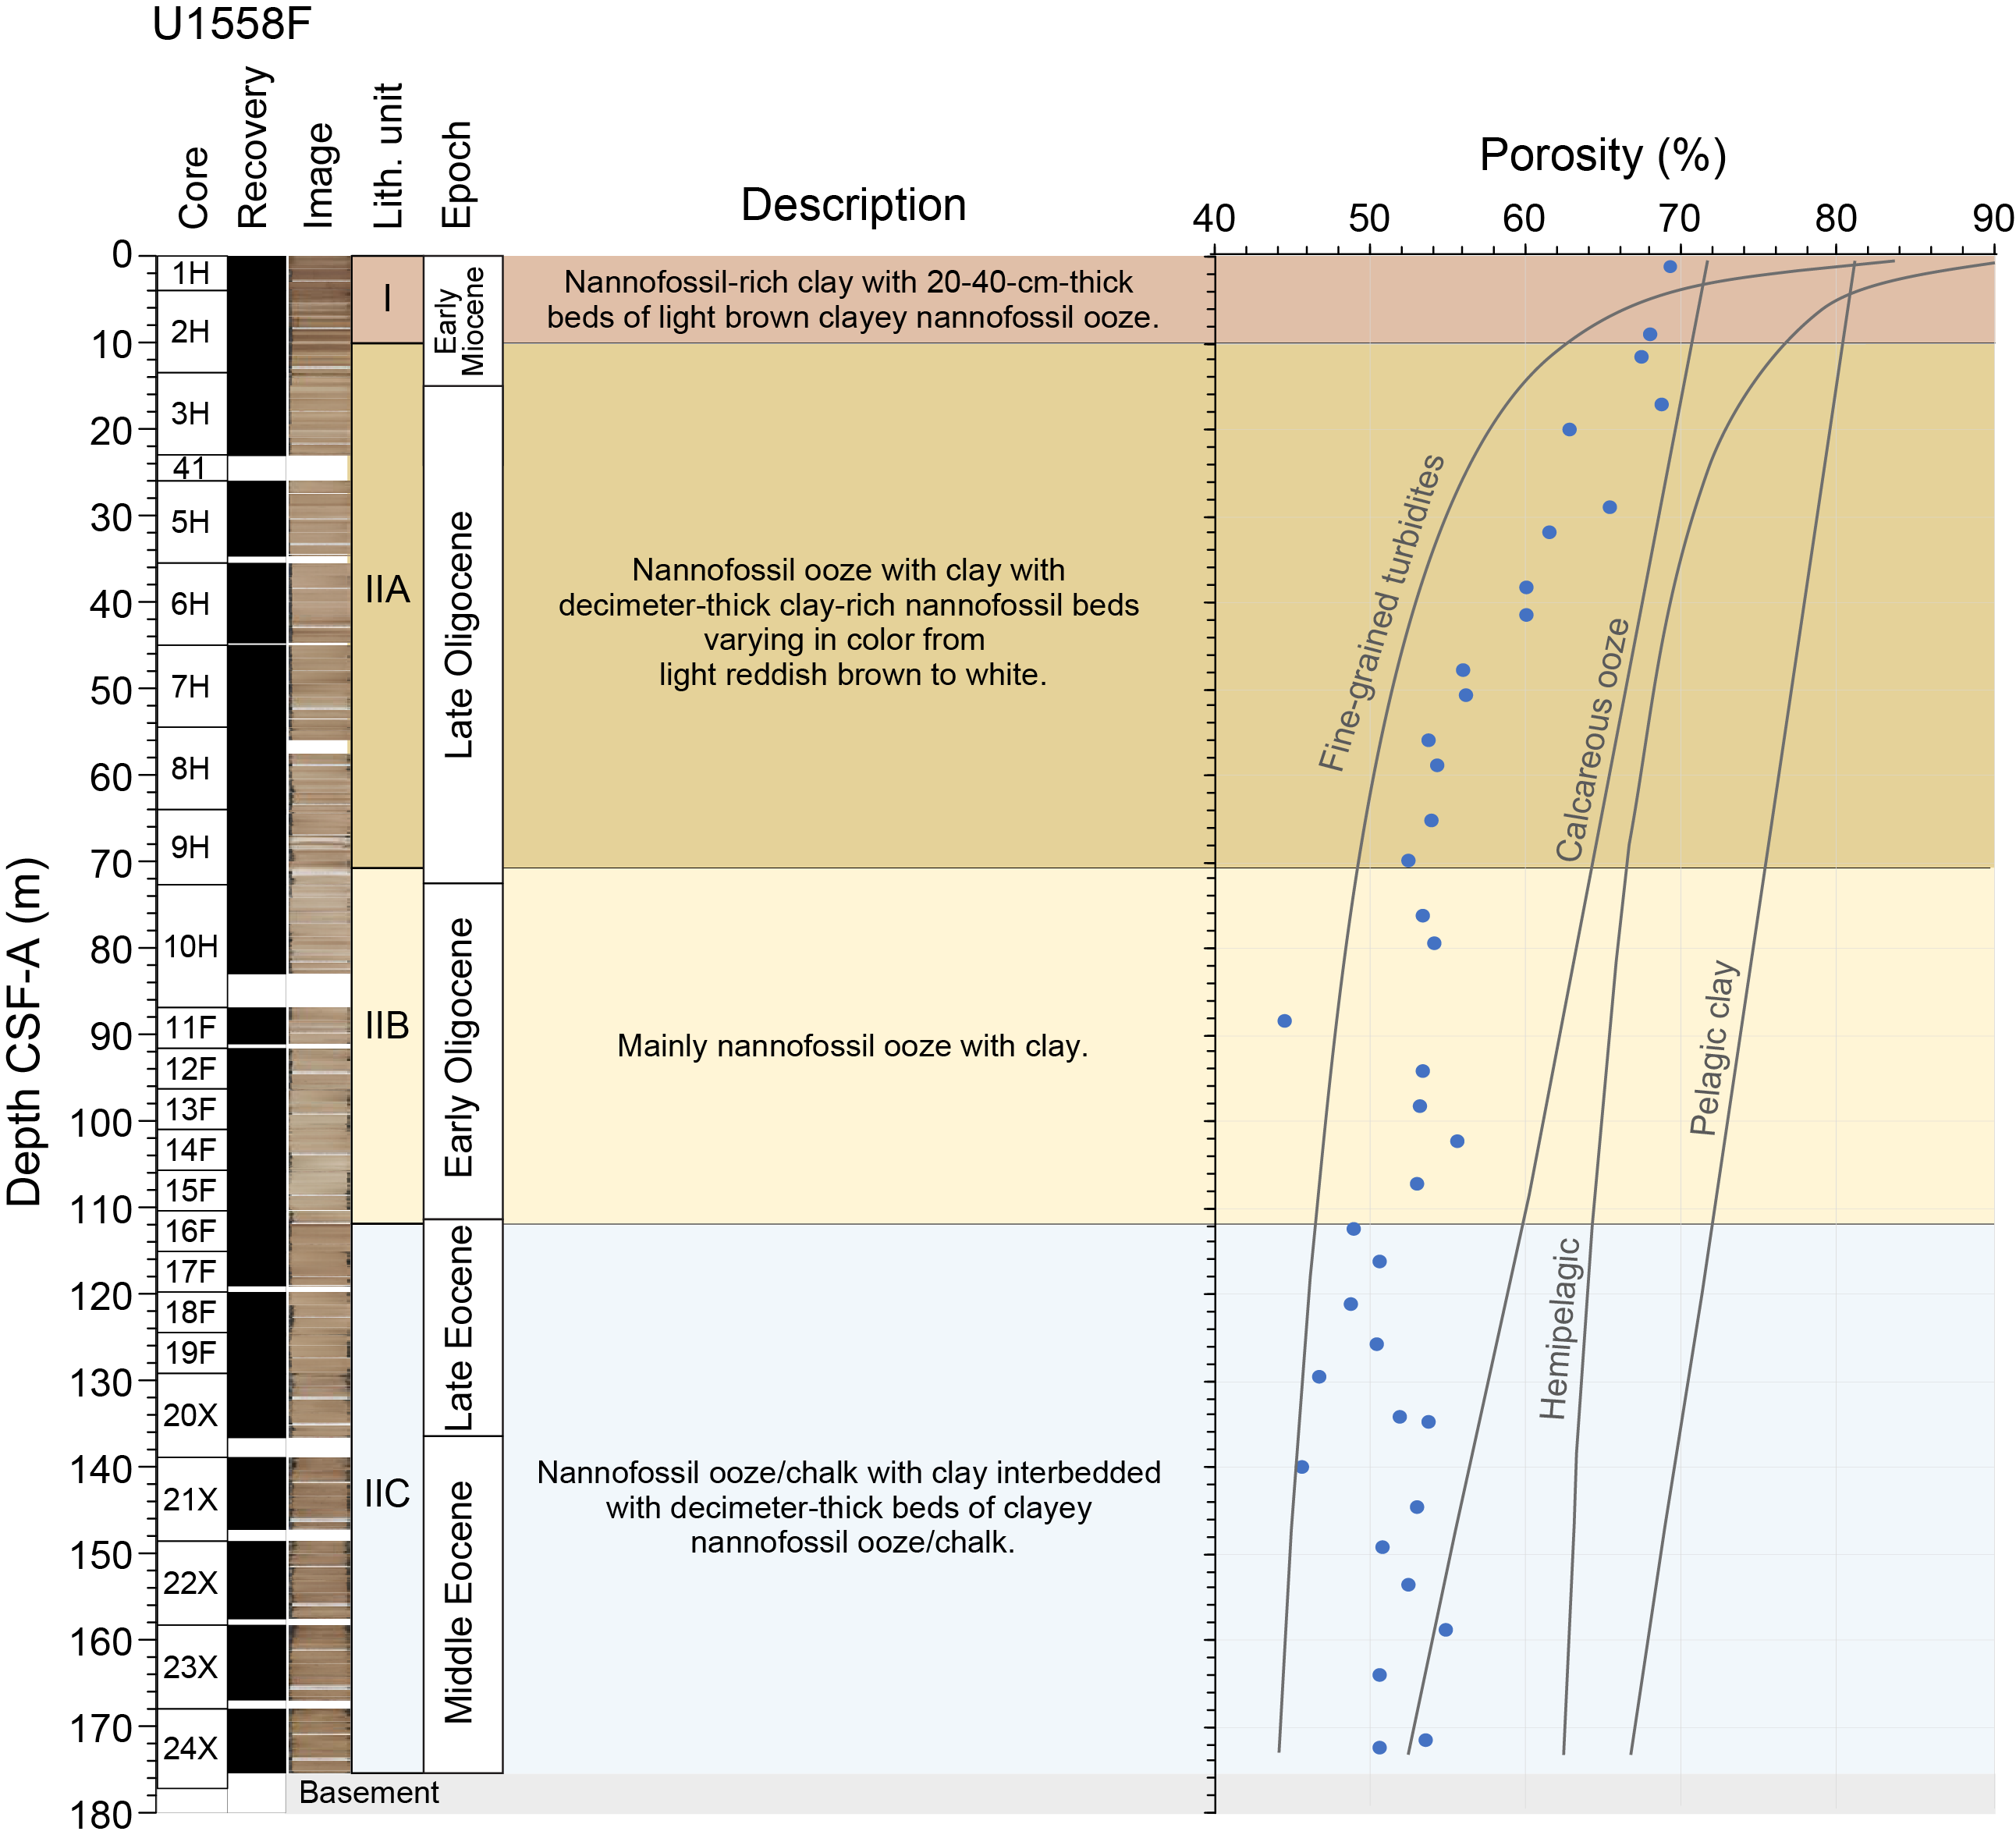
Figure F87. Hole U1558F porosity vs. typical sediment porosity profiles.
In Figure F87 we compare the porosities measured downhole by MAD with sediment porosity profiles for common seafloor sediment types (see Spinelli et al., 2004). Although the sediments recovered in Hole U1558F are predominantly nannofossil ooze (83–94 wt% CaCO3; see Sedimentology), their porosities have lower values and show a slightly steeper porosity profile with depth than calcareous ooze reported in published compilations (e.g., Spinelli et al., 2004) (Figure F87). This difference can likely be attributed to the limited amount of data the calcareous ooze curve in Spinelli et al. (2004) is based on (Hamilton, 1976) and to the nannofossil ooze having a lower porosity than other calcareous ooze such as foraminiferal ooze, due to its smaller grain size and reduced amount of intraparticle void space. For example, reported porosities in seafloor coccolith ooze (54%–67%) (Bennett et al., 1989) are significantly lower than suggested seafloor porosity of the calcareous ooze (~72%) in Spinelli et al. (2004). If sediments at Site U1558 entirely comprised nannofossil ooze, the projected seafloor porosity would fall within the Bennett et al. (1989) observed range. However, in Hole U1558F the uppermost 15 m includes Unit I sediments with up to 43% unconsolidated clay minerals that increase the porosity at the shallowest levels (see Figure F87).
10.1.1.5. P-wave velocity
Discrete measurements were chosen to target intact pieces and avoid the drilling mud from XCB coring, which is significantly softer (Figure F82, F83). Given the instrument uncertainties, we always consider the higher discrete P-wave values likely to be the better representation of the P-wave velocity (VP) of the formation (see Physical properties and downhole measurements in the Expedition 390/393 methods chapter [Coggon et al., 2024b]).
After filtering out unrealistic spikes >1.8 km/s (outside the typical range of pelagic sediments shallower than 200 mbsf and anomalous in the trends recorded here) and <1.45 km/s (below the velocity of water) from the WRMSL data, the P-wave velocity throughout the section ranges 1.45–1.74 km/s (Figure F82; Table T25) (mean = 1.56 ± 0.03 km/s; Table T27). P-wave velocity in Hole U1558F generally increases with depth, from a mean of 1.51 ± 0.02 km/s in Unit I to mean values of 1.54 ± 0.03 km/s, 1.56 ± 0.02 km/s, and 1.58 ± 0.02 km/s in Subunits IIA, IIB, and IIC, respectively; this is also in agreement with data from Hole U1558A (Figure F84; Table T27). The overall increasing trend is likely a result of an increasing degree of sediment consolidation with depth. The WRMSL method measures P-wave velocities that are generally consistent with results from the caliper method in Cores 393-U1558F-1H through 19F but shows much lower velocity values in Cores 20X–22X (Figure F82). This is likely due to the change to XCB coring from Core 20X. In XCB cores (20X–24X), the WRMSL cannot distinguish the intact "biscuits" of sediment from the surrounding ground-up "gravy" sediment material and measures values that are significantly lower than the discrete P-wave velocity measurements from the caliper system (see Physical properties and downhole measurements in the Expedition 390/393 methods chapter [Coggon et al., 2024b]). Conversely, shallower than ~80 mbsf, most of the WRMSL data are higher than the caliper measurements (Figure F82). In fact, in APC cores with good contact with the liner, the pinching of the sensors onto the liner may even introduce some amount of compression and increase these readings.
10.1.1.6. Sediment strength
Compressional strength and shear strength were only measured on Cores 393-U1558F-1H through 19F, where either the APC or half-length APC coring systems were used. These measurements could not be performed on sediments cored with the XCB system (Cores 20X–24X) because they were either too consolidated or too brittle for the automated vane or the penetrometer, reflecting the same lithologic changes that required the switch from APC to XCB coring.
The compressional strength is lowest in Unit I (0.2 kg/cm2) and increases with depth through Subunits IIA (1.6 ± 0.4 kg/cm2), IIB (2.1 ± 1.0 kg/cm2), and IIC (3.3 ± 0.8 kg/cm2) (Figure F83; Table T27). Shear strength is highest in the uppermost 30 m in Hole U1558F, increasing progressively from the top of the hole (Core 393-U1558F-1H; Unit I) to the maximum measurement of 52 kN/m2 at 30 mbsf (Core 5H; Subunit IIA). Below 30 mbsf, values decrease progressively until ~50 mbsf (lower Subunit IIA) then varies irregularly between ~10–30 kN/m2 through the rest of the APC cored record to ~125 mbsf (lower Subunits IIA–IIC) (Table T25). Based on sedimentologic descriptions (see Sedimentology), higher shear strength corresponds to intervals with higher clay content (Figure F83).
10.1.1.7. Thermal conductivity
A total of 21 discrete thermal conductivity measurements, approximately one per core, were conducted on representative lithologies from Hole U1558F using the half-space puck on split section halves. Thermal conductivity ranges 1–1.61 W/(m·K) (Table T25) throughout all sections (mean = 1.34 ± 0.14 W/[m·K]). Thermal conductivity gradually increases downhole with a similar trend to bulk density but with an inverse trend compared to porosity (Figure F83). Mean thermal conductivity for lithostratigraphic units ranges 1.03 ± 0.03 W/(m·K) in Unit I to 1.28 ± 0.07 W/(m·K) in Subunit IIA, 1.37 ± 0.05 W/(m·K) in Subunit IIB, and 1.44 ± 0.06 W/(m·K) in Subunit IIC (Table T27).
10.1.2. Lithostratigraphic unit comparison
Crossplot analyses of core logging (track) physical properties data from Hole U1558F show comparisons between P-wave velocity, GRA bulk density, MS, and NGR, sorted by lithostratigraphic units (Figure F88). Figure F88B shows an overall positive correlation between P-wave velocity and bulk density, consistent with compaction of sediments with depth; the deeper units correspond to higher values. Unit I clusters in a narrow range of low velocity and low density, whereas density data from Subunit IIA increase almost linearly with increasing P-wave velocity. Data from Subunit IIB plot in agreement with the Subunit IIA trend, albeit clustering only within higher ranges of P-wave velocity and density. Unlike the others, Subunit IIC (the deepest unit) is characterized by a widespread data set with high velocities but a large range of bulk density. This different physical behavior could be biased by the XCB coring system.
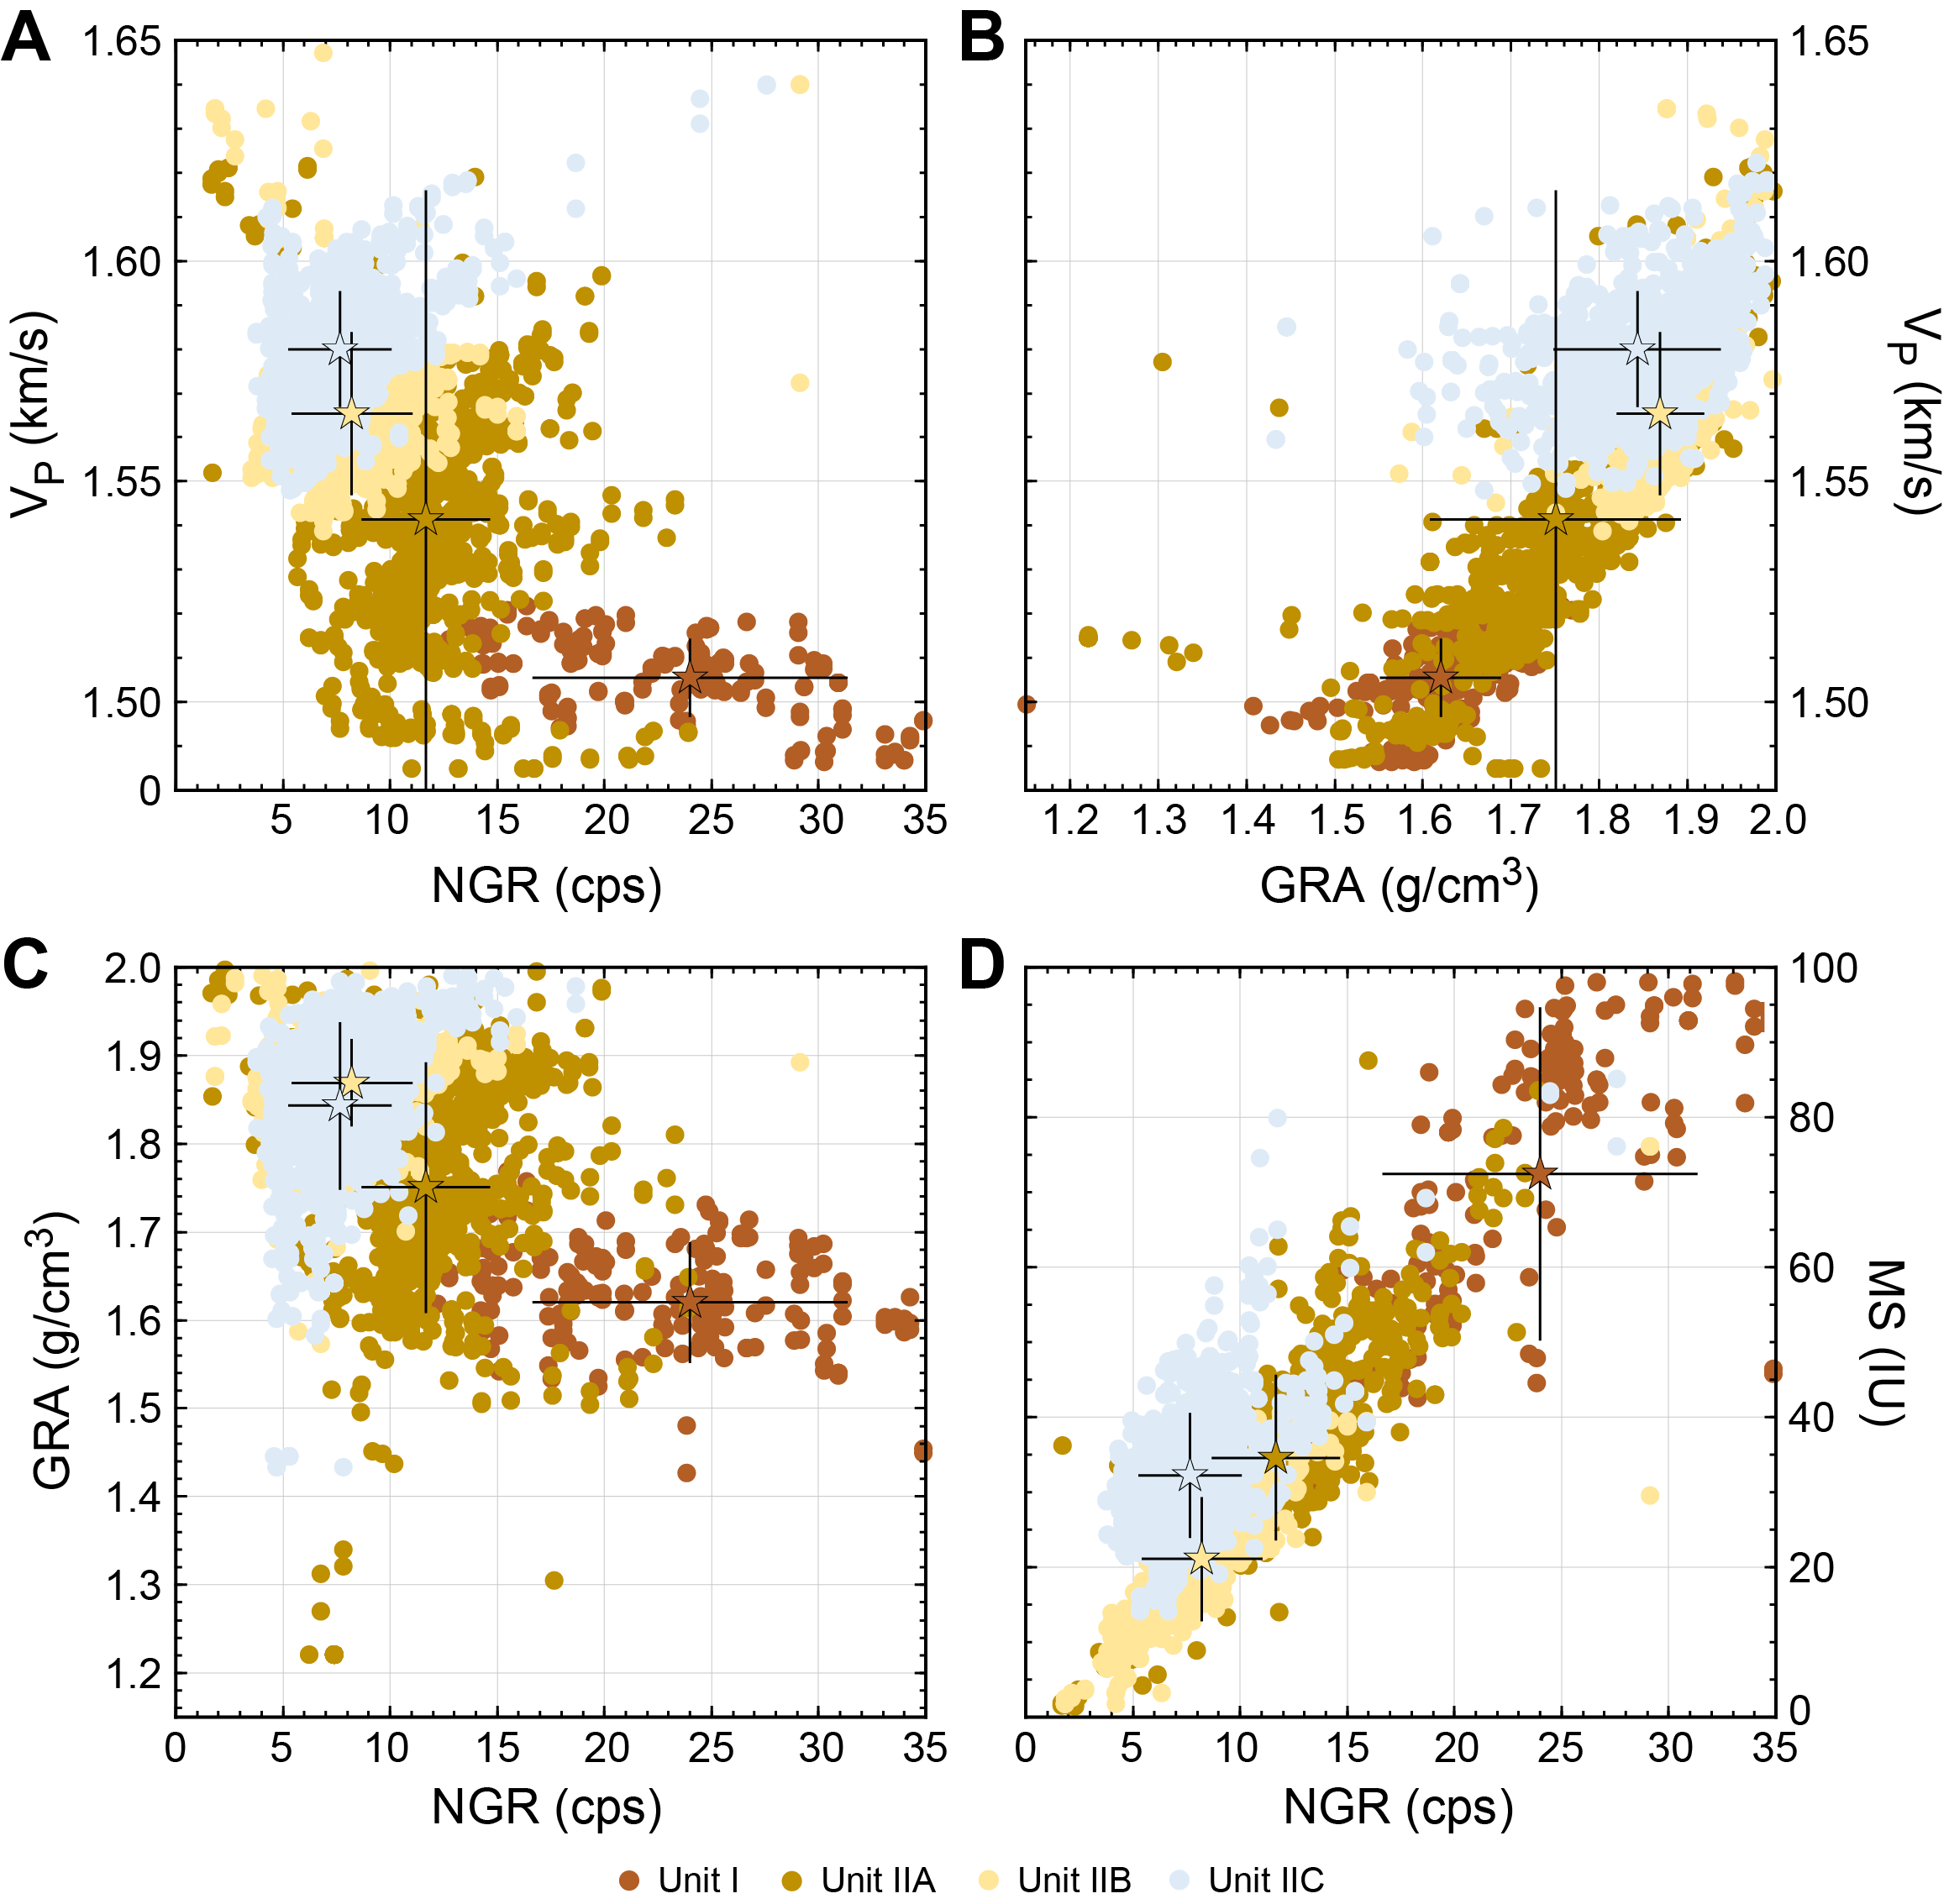
Figure F88. NGR and GRA bulk density vs. VP and NGR vs. GRA bulk density and MS.
Figure F88A and F88C shows the relationships between NGR and P-wave velocity and between NGR and GRA density, respectively. Although there are no clear trends between units, the figures illustrate the overall decrease in NGR in the deeper units, combined with higher velocity and density with depth. Plotting MS against NGR (Figure F88D) shows an almost linear relationship, where Unit I stands out with higher values and a wider range in both data sets, reflecting the influence of its higher clay content.
10.1.3. Downhole measurements
10.1.3.1. Downhole temperature
During APC coring in both Holes U1558A and U1558F, the APCT-3 temperature probe was deployed while coring Cores 390C-U1558A-4H, 7H, and 10H, as well as Cores 393-U1558F-3H, 7H, and 10H (Table T28). Figure F89 shows the intervals in the temperature records for each deployment that were used to estimate formation temperature by finding a best fit for a theoretical model to the temperature decay as a function of time (see Physical properties and downhole measurements in the Expedition 390/393 methods chapter [Coggon et al., 2024b]), as it recovers from the frictional heating generated when entering the formation with the APCT-3 temperature probe.
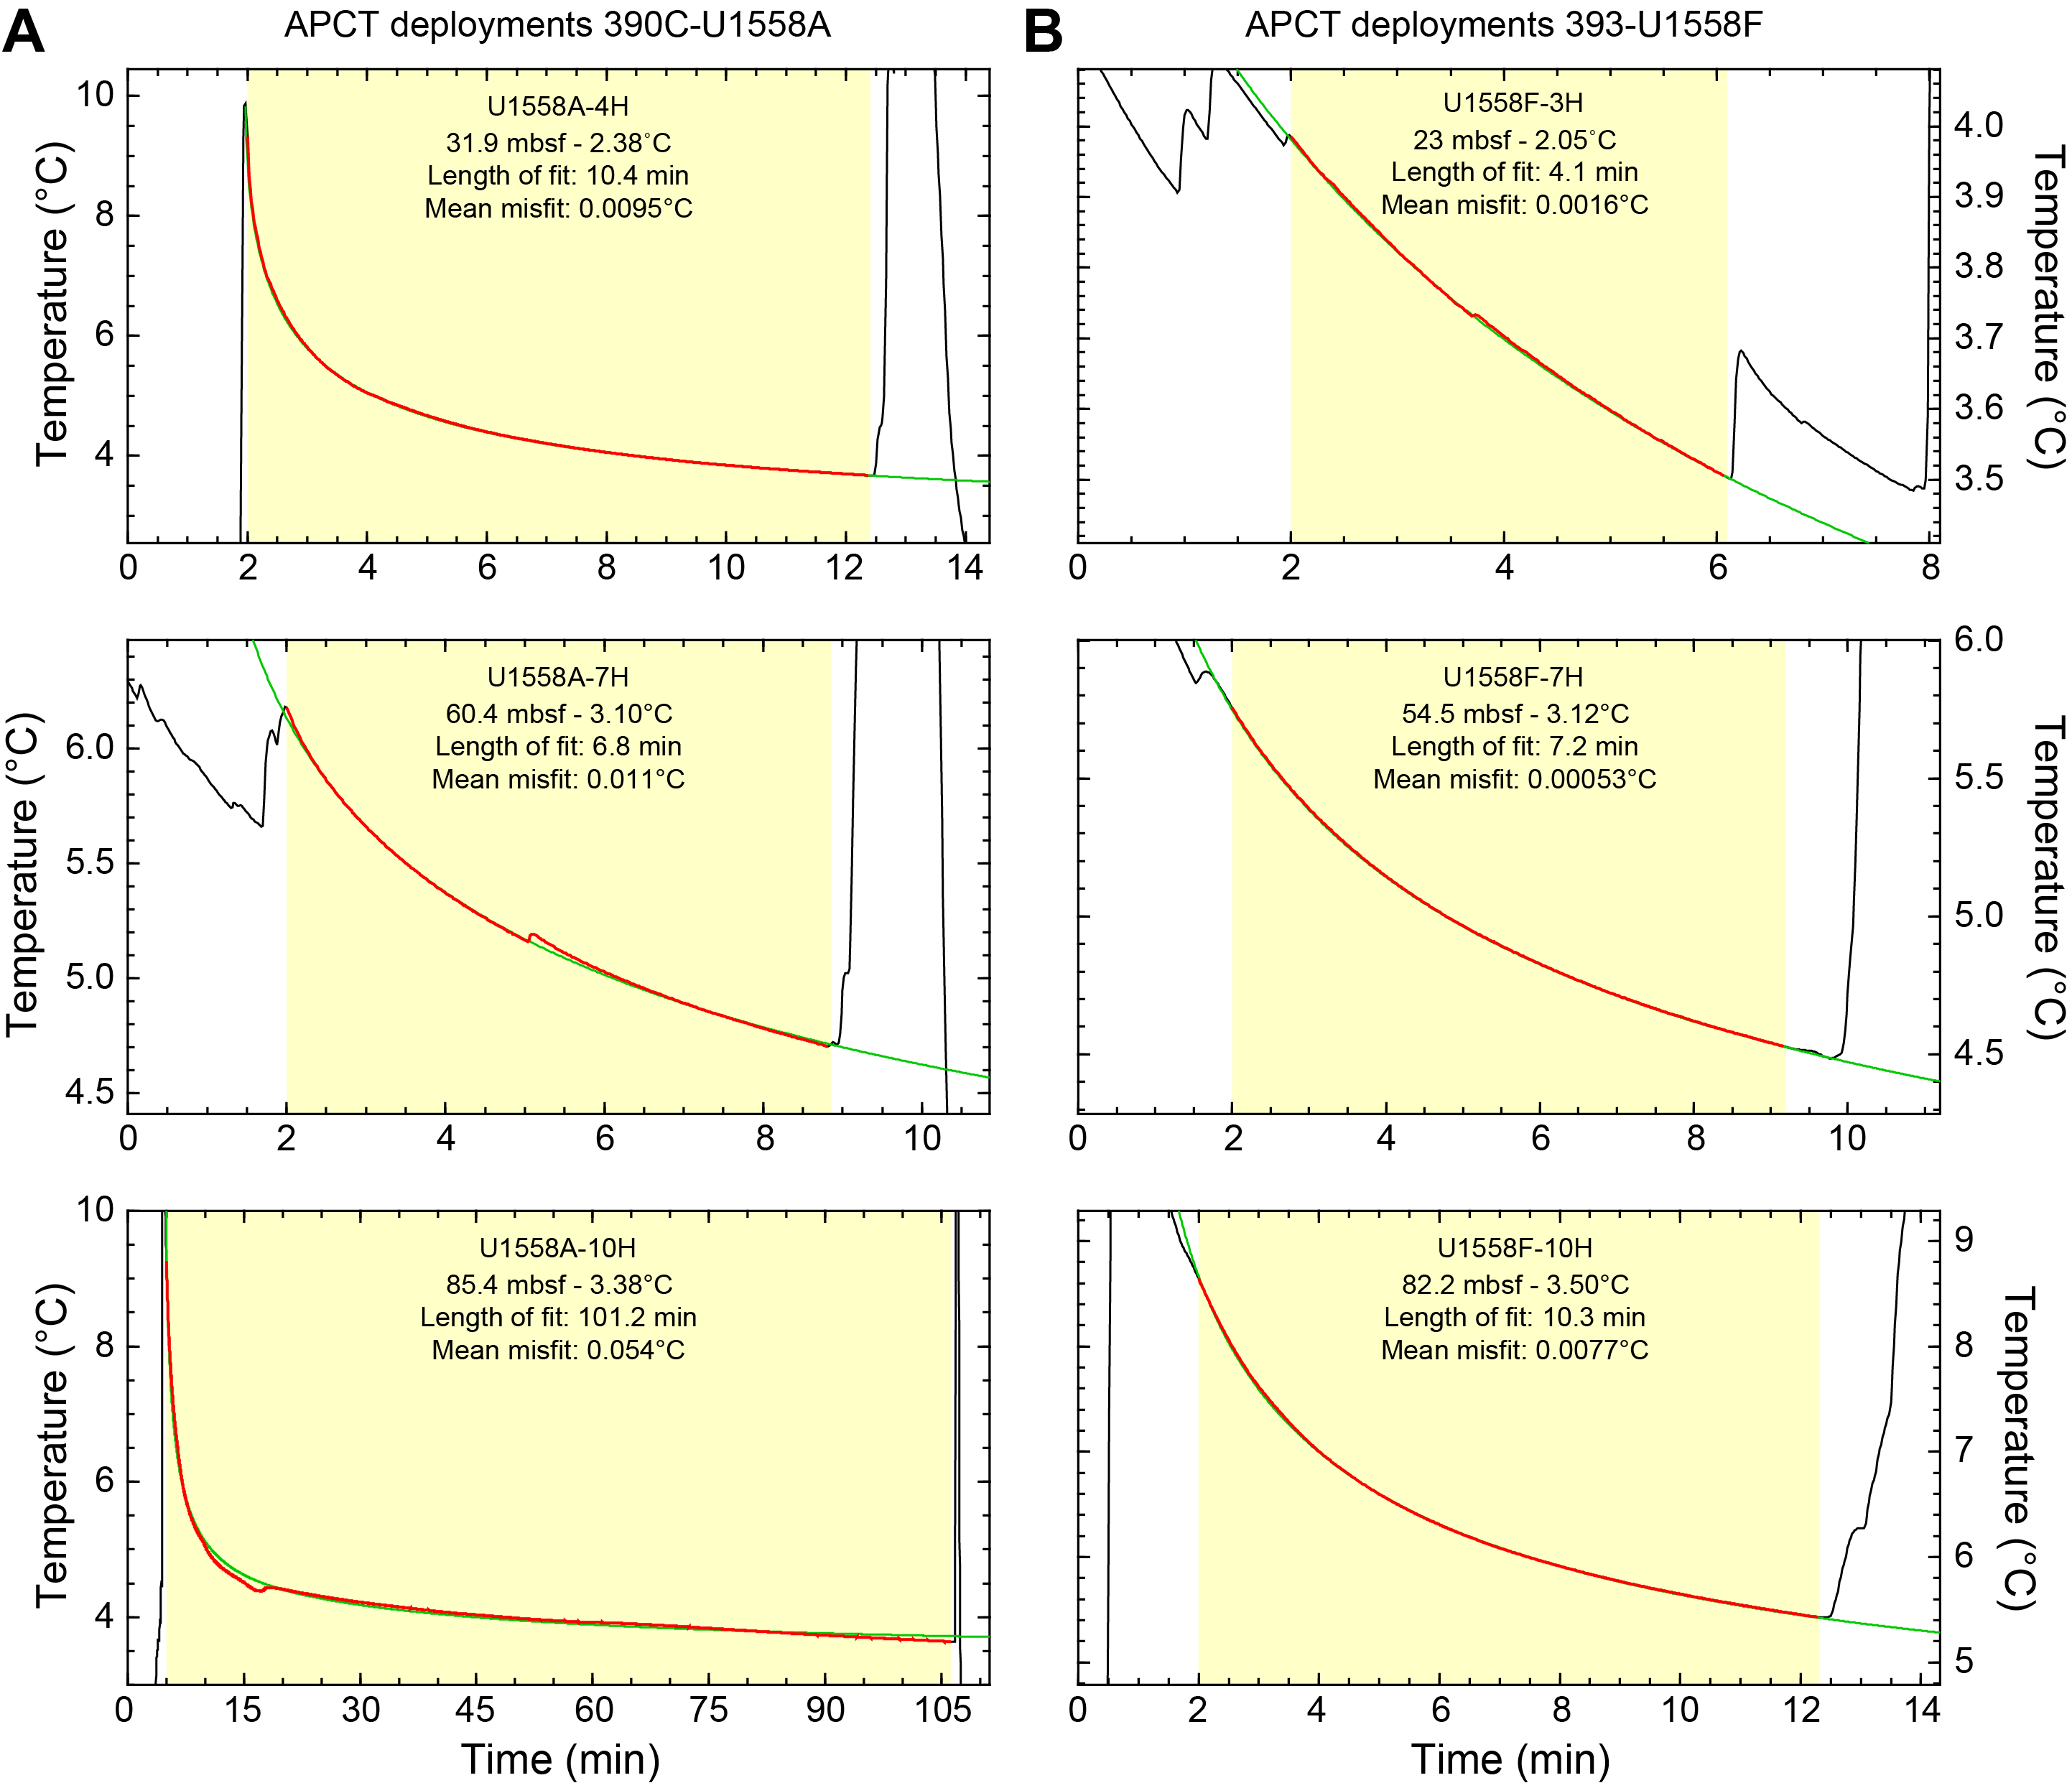
Figure F89. APCT-3 temperature records.
10.1.3.2. Heat flow
Although the temperature records show that some of the temperature stations were stable for only a few minutes (Core 393-U1558F-3H in particular; Figure F89), the resulting temperatures define a steadily increasing temperature profile with a least-squares linear fit gradient of 23°C/km (Figure F90C; Table T29).
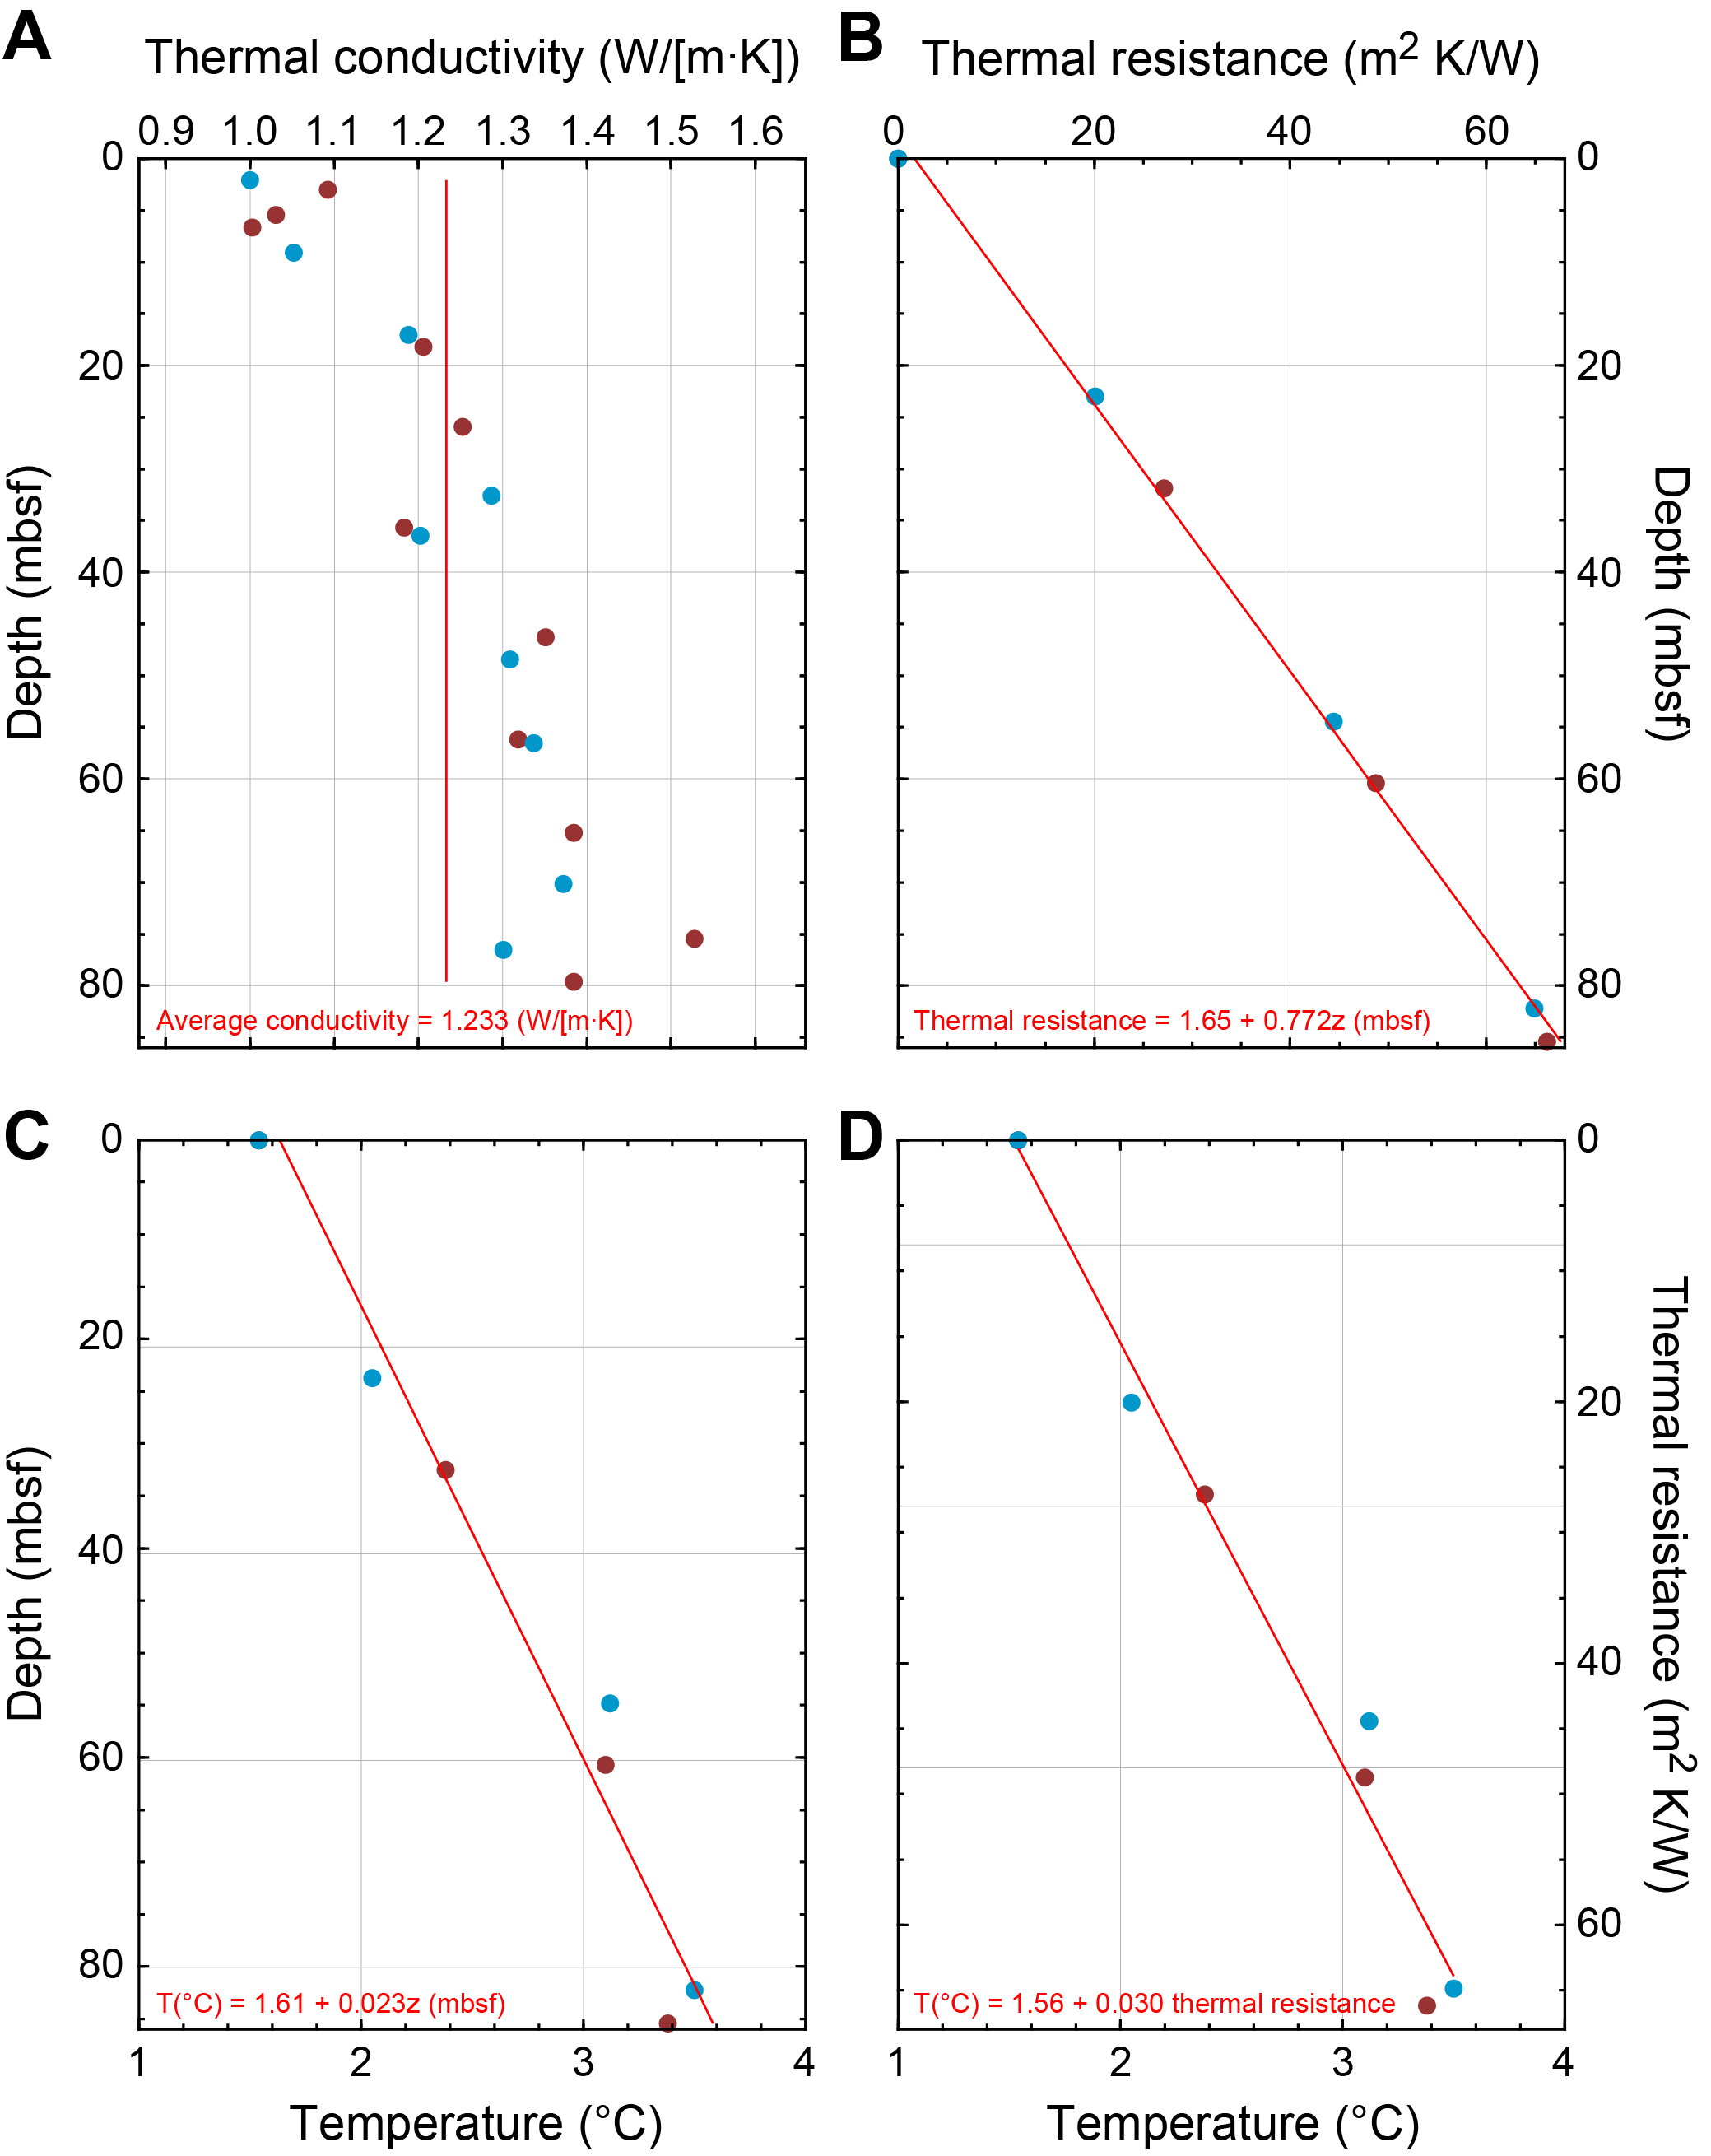
Figure F90. Sediment thermal conductivity data.
A simple estimate of the vertical conductive heat flow can be made by the product of this gradient with the mean thermal conductivity (1.23 ± 0.12 W/[m·K]) (Figure F90A) measured on the cores recovered over this interval, yielding an estimate of 28 mW/m2. The heat flow estimate defined by the Bullard plot method (see Physical properties and downhole measurements in the Expedition 390/393 methods chapter [Coggon et al., 2024b]), using the slope of the least-squares linear fit to the Site U1558 temperature data, is 30 mW/m2 (Figure F90D; Bullard, 1939), close to the estimate from the simpler approach above.
Table T29 summarizes these results as well as the results of the same calculation for each hole. It confirms that both holes display very similar temperature gradients and heat flow values, all lower than the 50 mW/m2 estimated for 50 Ma Southern Atlantic crust (Sclater et al., 1980) and results of heat flow modeling along the South Atlantic Profile (Kardell et al., 2021) but similar to the closest values (25 and 38 mW/m2) listed in the Fuchs et al. (2021) global heat flow compilation. The significant differences between the measurements and the predictions could be an indication of extensive hydrothermal advection at this site (Kardell et al., 2021).
10.1.4. X-ray imaging
X-ray imaging of sediment can be used to identify primary sedimentologic features, such as bedding, laminations, volcanic ash layers or glass fragments, and ichnofossils, based on density differences between lithology types. X-ray images can also help identify regions of slumping or drilling disturbance such as expansion cracks and fall-in at the top of cores. Archive halves of sediment cores from Hole U1558F were scanned using the X-ray Logger (XMAN), and the images were used to assist visual core description. Despite some irregularities in the grayscale within individual cores, sedimentologic features, including bioturbation and bedding, are visible in some of the images and highlight features (Figure F91) that are not readily apparent in the photographs from the Section Half Imaging Logger (SHIL) (see Sedimentology).
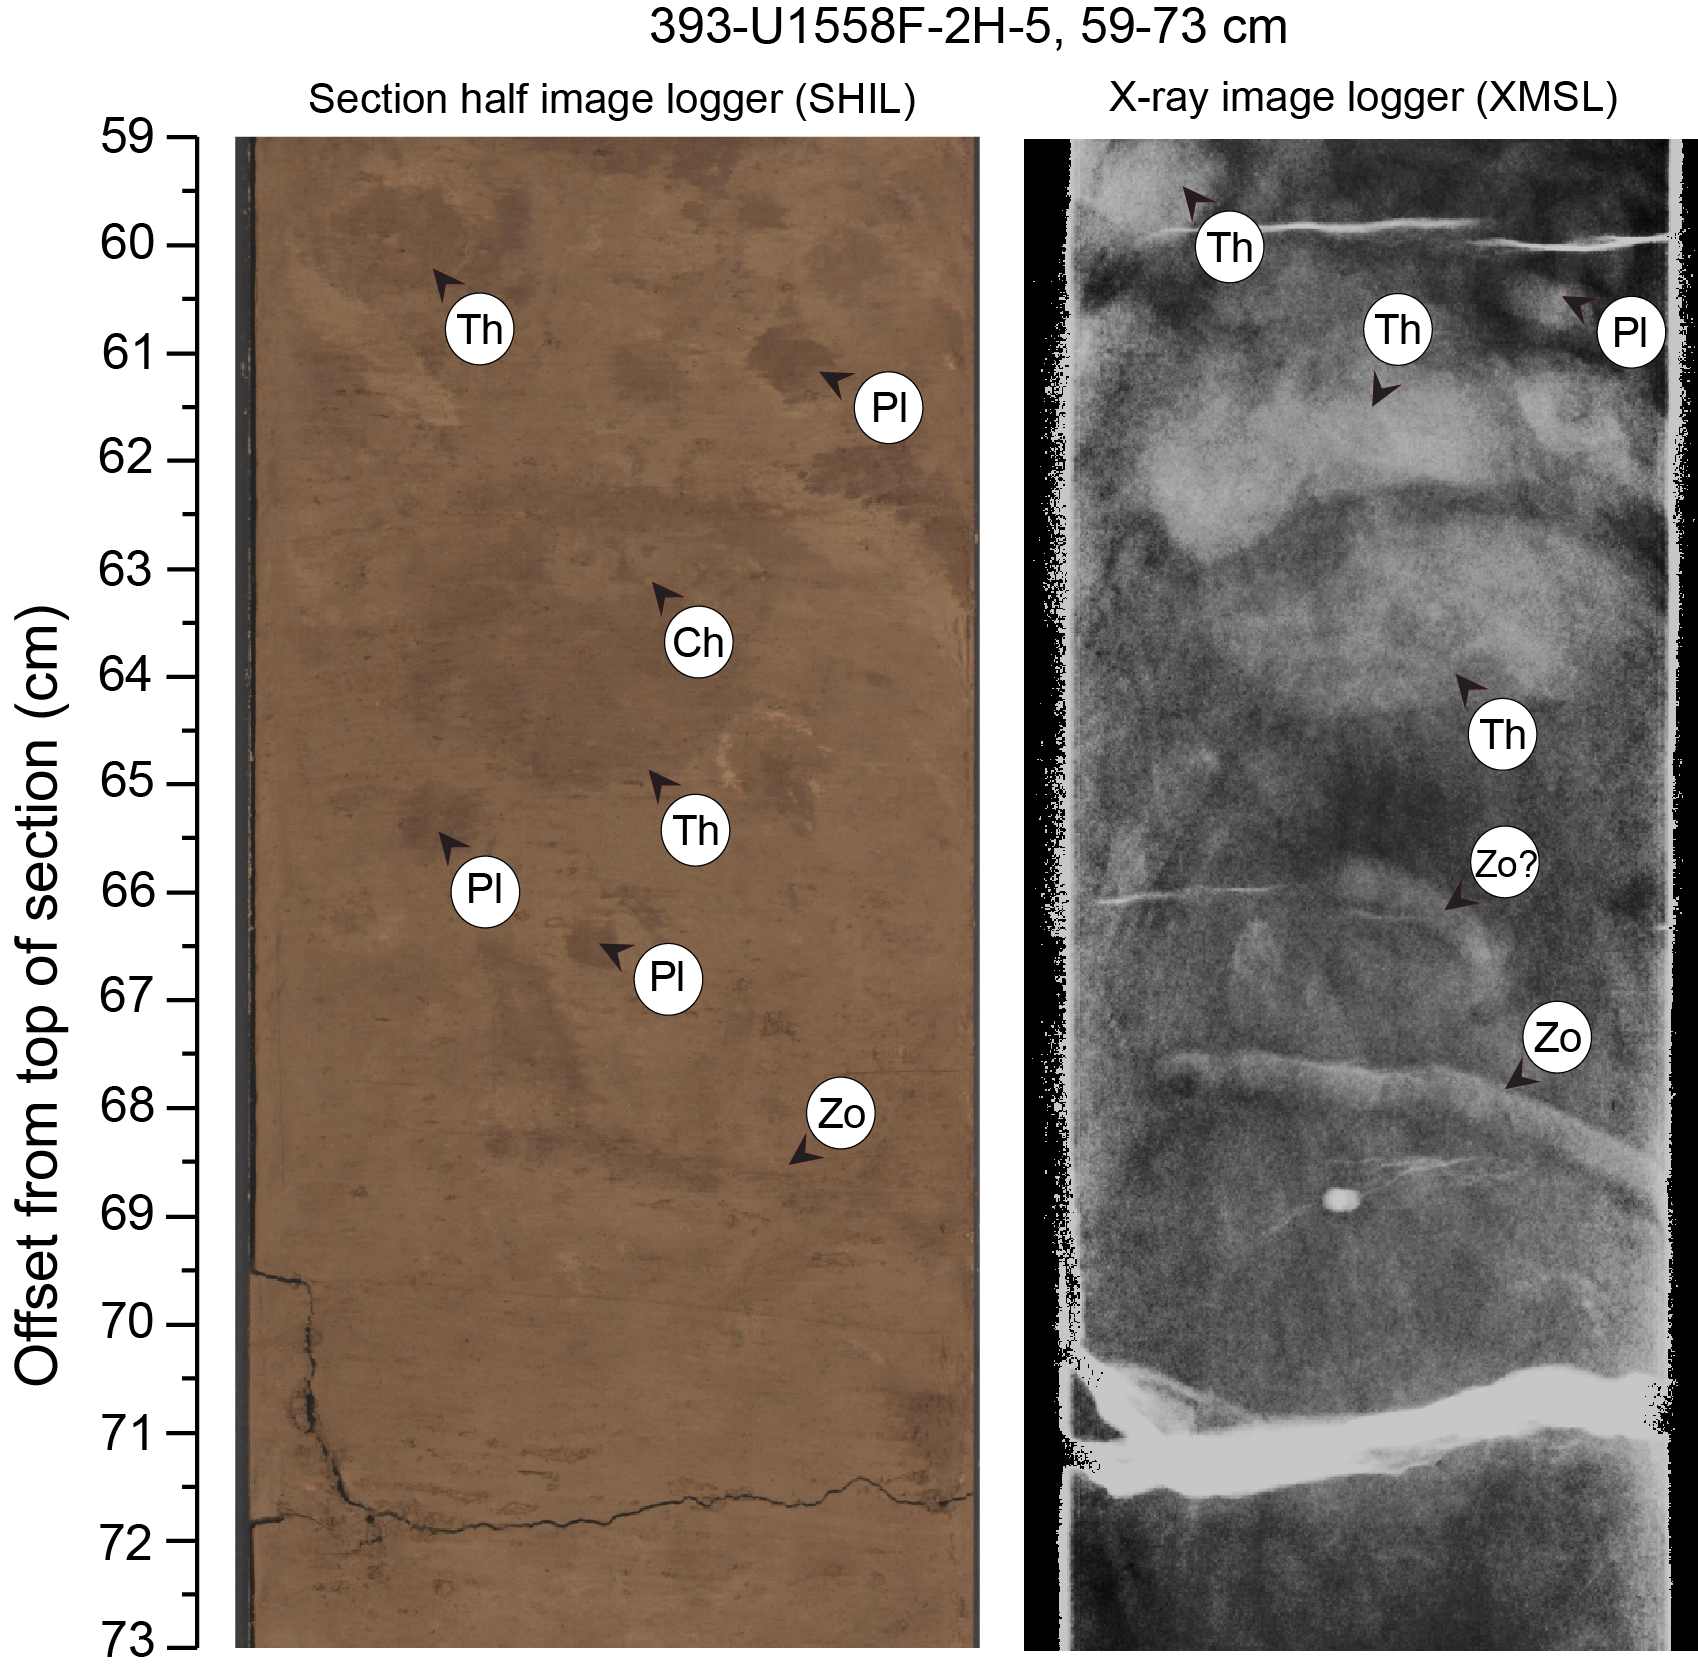
Figure F91. SHIL vs. XMAN images.
10.1.5. Seismic integration
One of the most basic applications of physical properties is to help relate some of the observations and descriptions made on the recovered core to the data and surveys that were used to identify and select the drilling sites. A synthetic seismogram can be generated from some of the most routine physical property data (P-wave velocity and density) to reproduce the signal that would be generated by a theoretical seismic wave going across Site U1558 and compare it with the seismic survey data that were used to select the drilling targets.
Figure F92 shows preliminary results of such an interpretation using the P-wave velocity data from the WRMSL and the GRA density data. The product of these two properties, the seismic impedance, was converted into a reflection coefficient series that was convolved with a 40 Hz Ricker wavelet, simulating the source used during the acquisition of CREST Line 1, to create the synthetic trace displayed at the location of the site. Disregarding the likely underestimation of in situ velocity in WRMSL velocity data (see Physical properties and downhole measurements in the Expedition 390/393 methods chapter [Coggon et al., 2024b]), this simulation suggests that the dipping reflector at ~5.9 s two-way traveltime coincides with the boundary between Lithostratigraphic Subunits IIB and IIC at ~112 mbsf, which corresponds to a marked change in the density and velocity trends downhole (Figure F82) that generates the reflector. The lack of a stronger reflector for the basement below is puzzling for now, but if, as originally interpreted, this reflector was the basement, encountered at 166.5 mbsf, it would require a mean velocity of >2 km/s in the sediments, much higher than the measured velocity. Possible factors to explain a shallower-than-expected basement reflection include a side reflection from the shallower basement to the east; a rugged basement surface topography where Site U1558 happens to be located in a relatively deep area; and/or an underestimate of the in situ velocity in laboratory measurements.
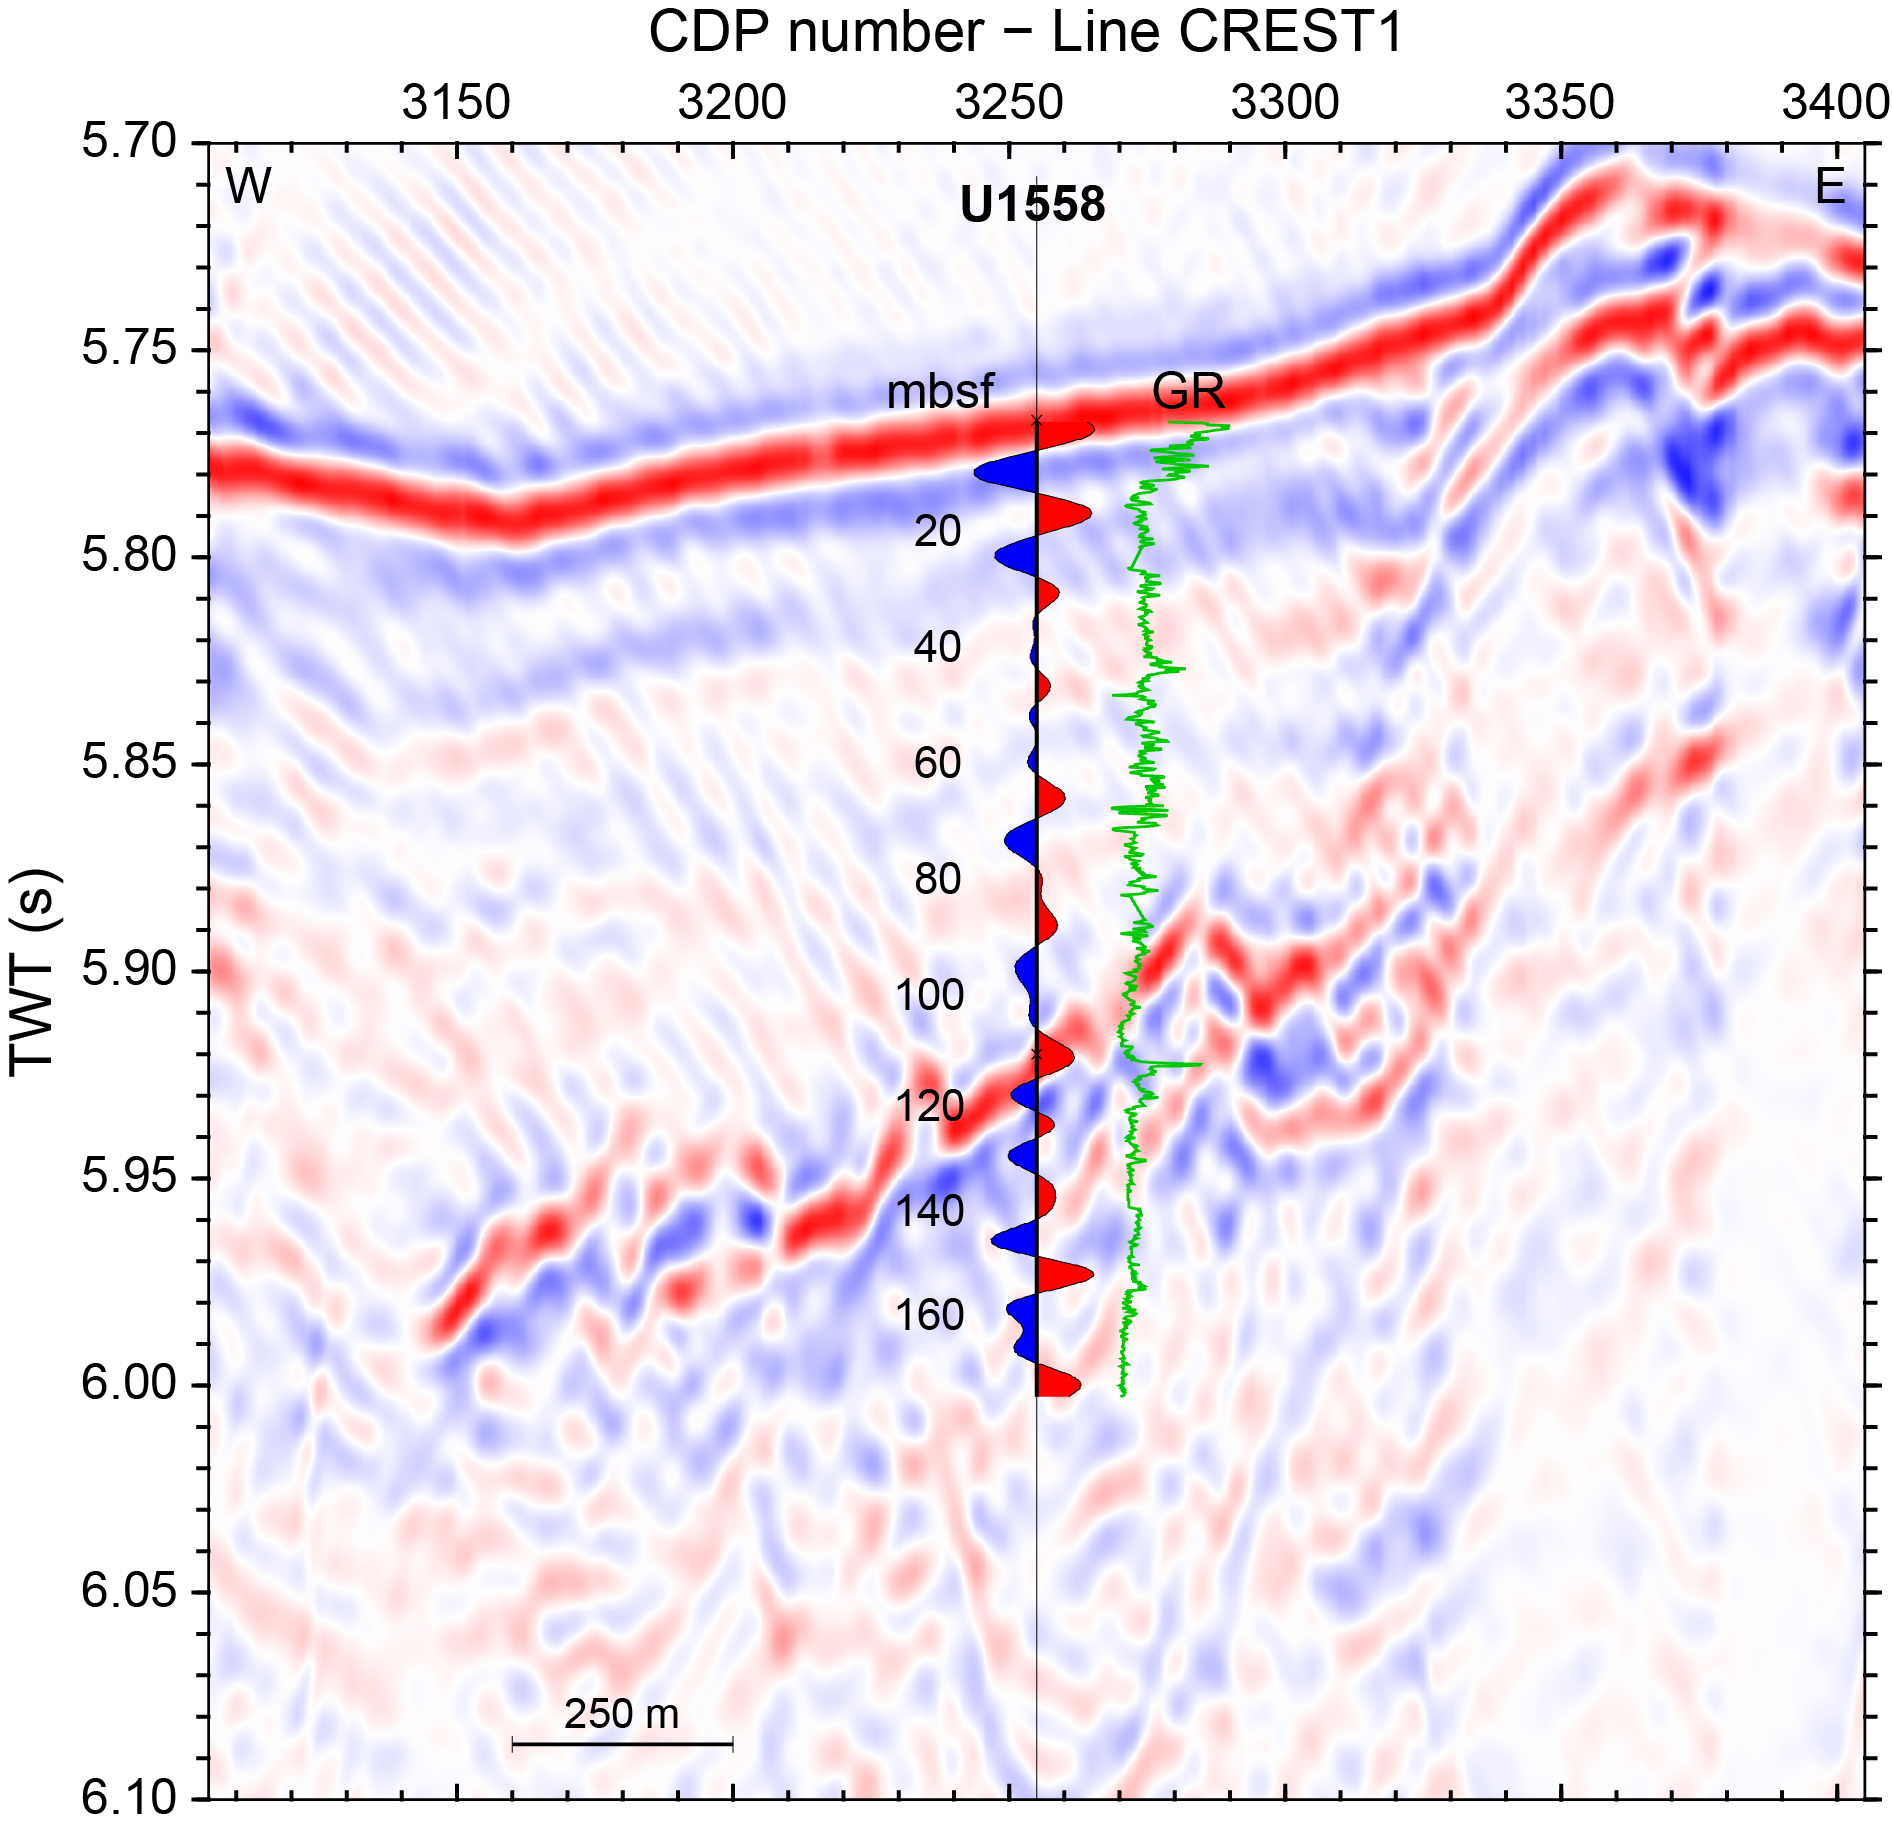
Figure F92. Preliminary synthetic seismogram.
10.1.6. Stratigraphic correlation
Recovery of sediments during ocean drilling is generally high; however, gaps in recovery between individual cores are inevitable. To compensate for this loss, at least two sediment holes were cored per site. Hole U1558A was cored during engineering Expedition 390C (Estes et al., 2021) (see Background and objectives) to 163.9 m and Hole U1558F was cored ~50 m to the southeast to 177.2 m DSF. The sediment/basement contact is recorded at 158.9 m DSF in Hole U1558A and at 176 m DSF in Hole U1558F, ~18 m deeper than in Hole U1558A. Equivalent stratigraphic layers in the lower part of the two holes were found to be thicker in Hole U1558F.
Before coring Hole U1558F, the bit was positioned 2 m above the predicted seafloor depth to attempt to recover the mudline and recovery gaps present within Hole U1558A. During drilling, the relative position of coring gaps in the two holes was monitored by correlating features in MS and GRA bulk density data obtained using the Special Task Multisensor Logger (STMSL; see Physical properties and downhole measurements in the Expedition 390/393 methods chapter [Coggon et al., 2024b]). To improve the offset of core gaps, after Core 393-U1558F-3H we drilled ahead by 3 m (drilled interval 393-U1558F-41).
10.1.6.1. Correlation and splice
Physical property data such as MS, GRA, NGR, and magnetic inclination (see Paleomagnetism) from Holes U1558A and U1558F were correlated to establish a composite depth scale (CCSF) at Site U1558 (see Figures F93, F94) that includes the core recovery summary and vertical core offsets (e.g., affine and splice tables; Tables T30, T31).
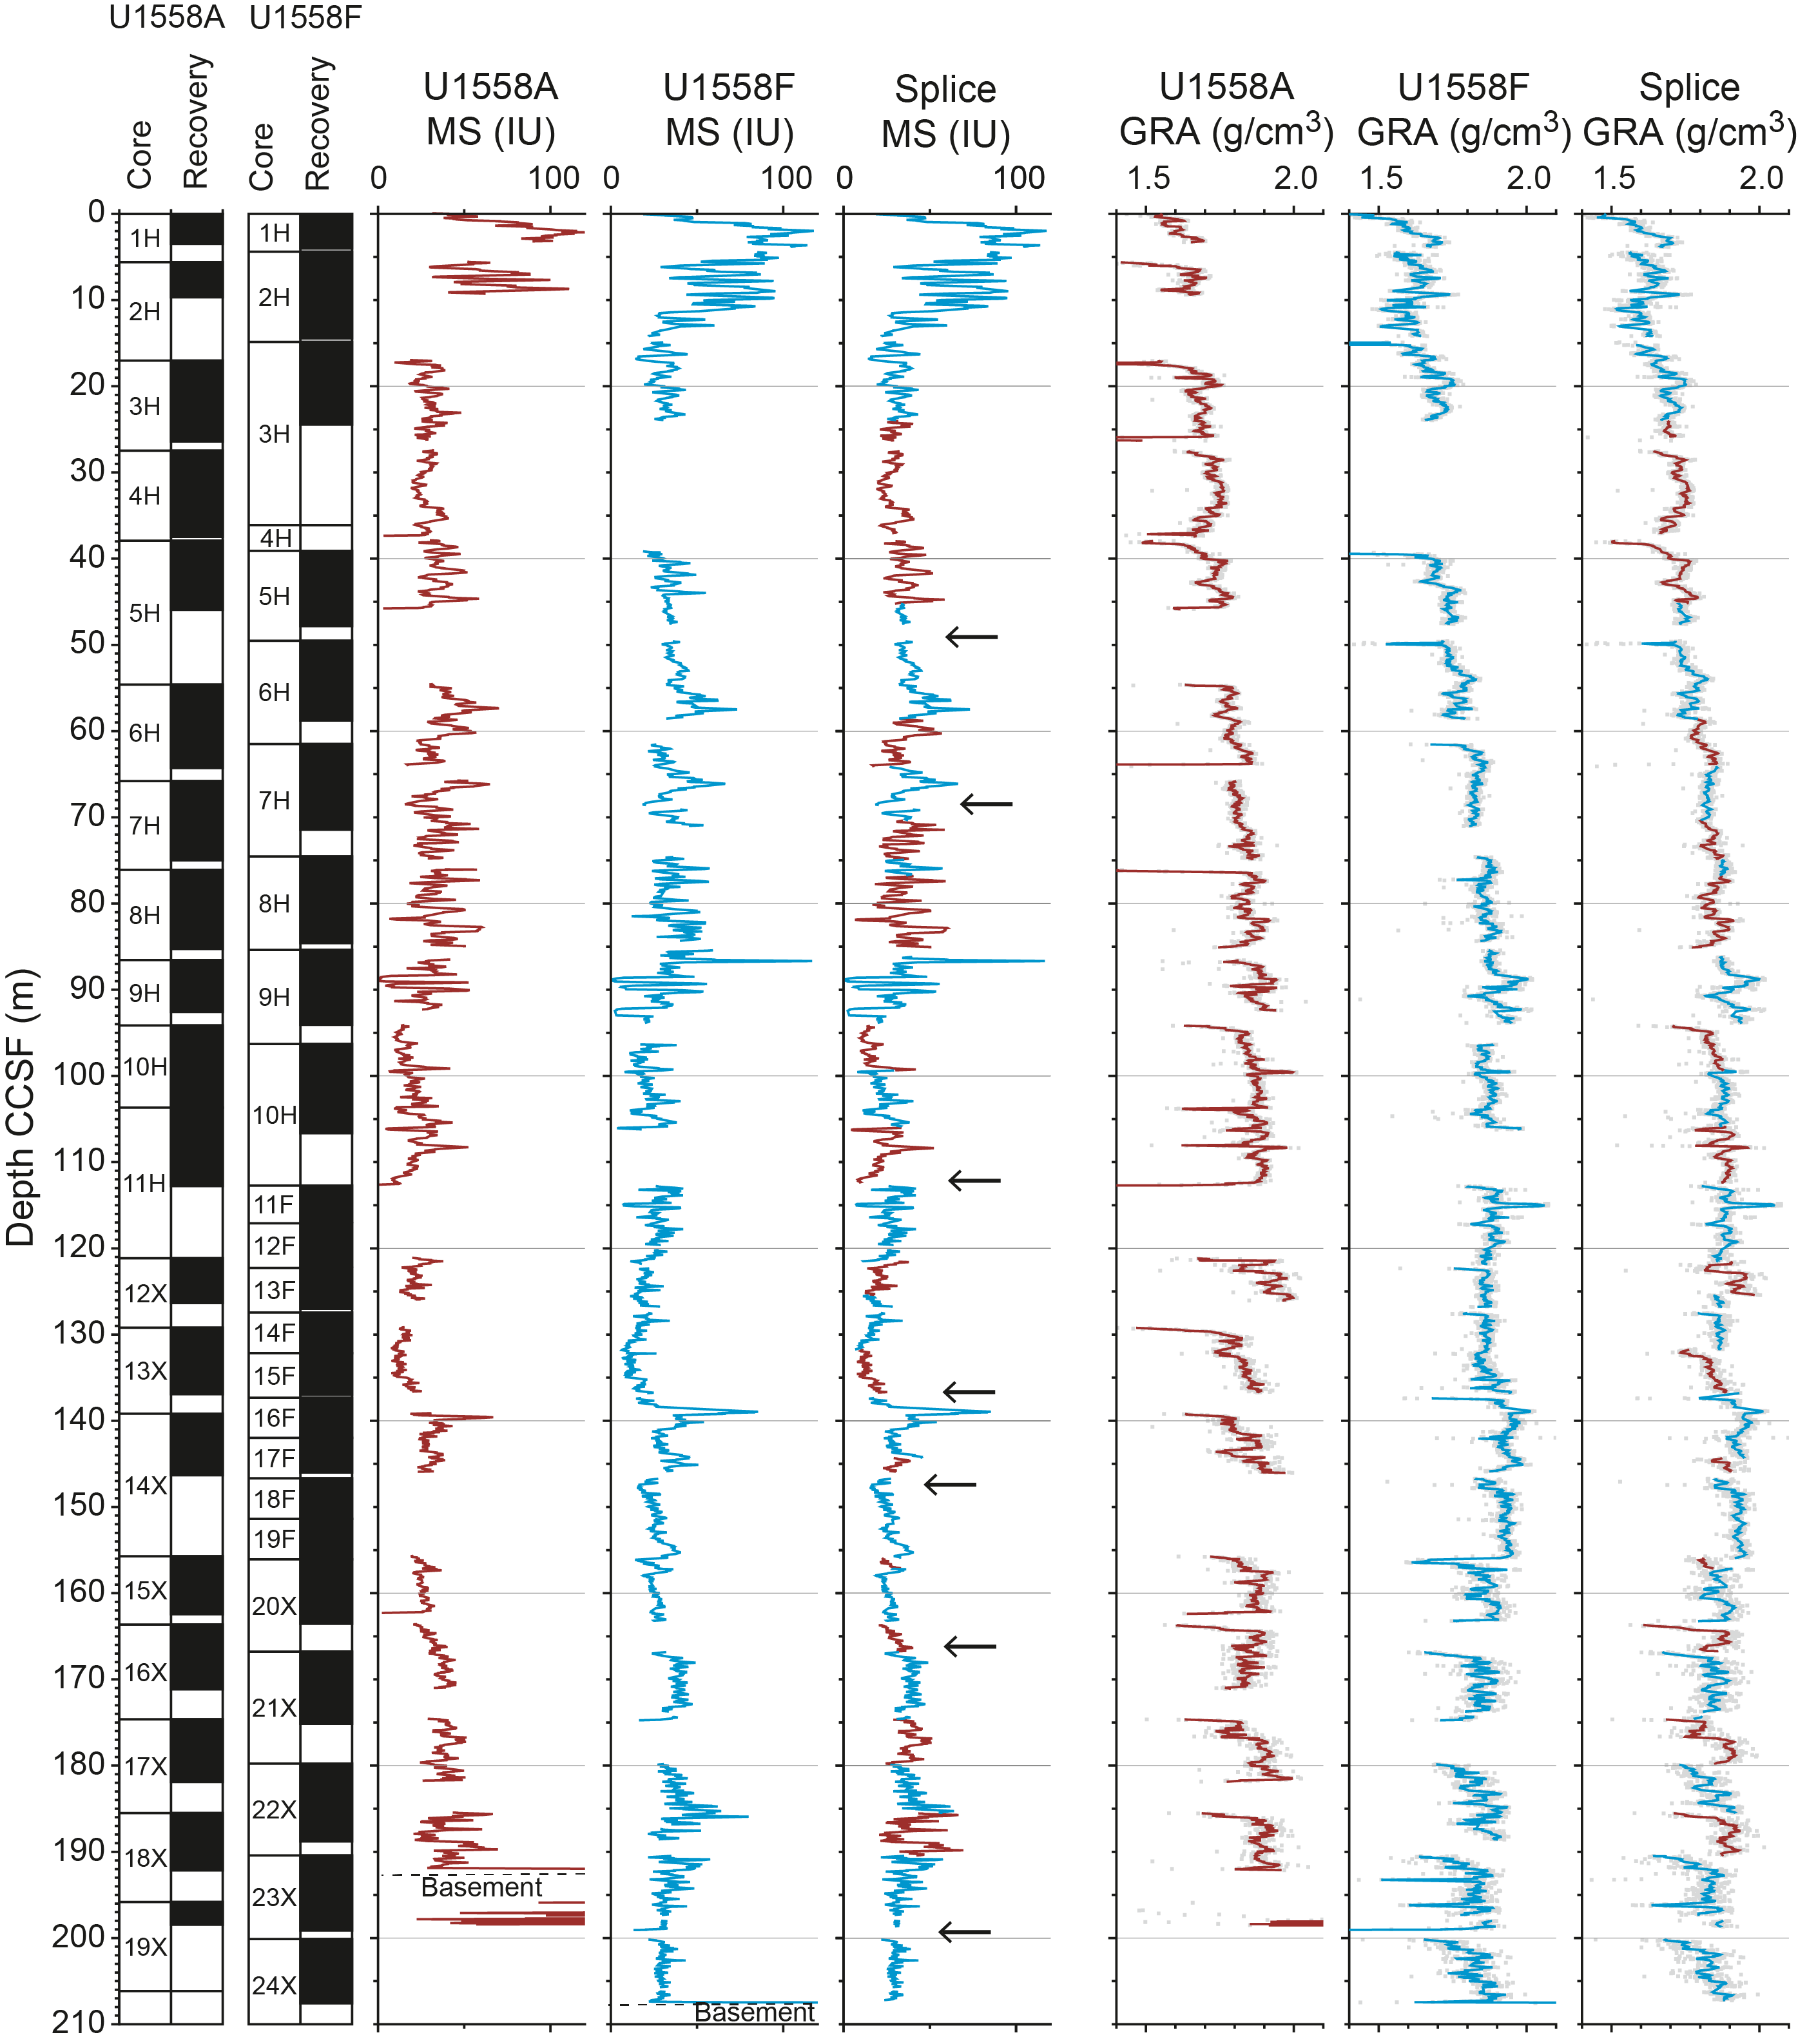
Figure F93. Composite depth scale and splice, using MS and GRA bulk density.
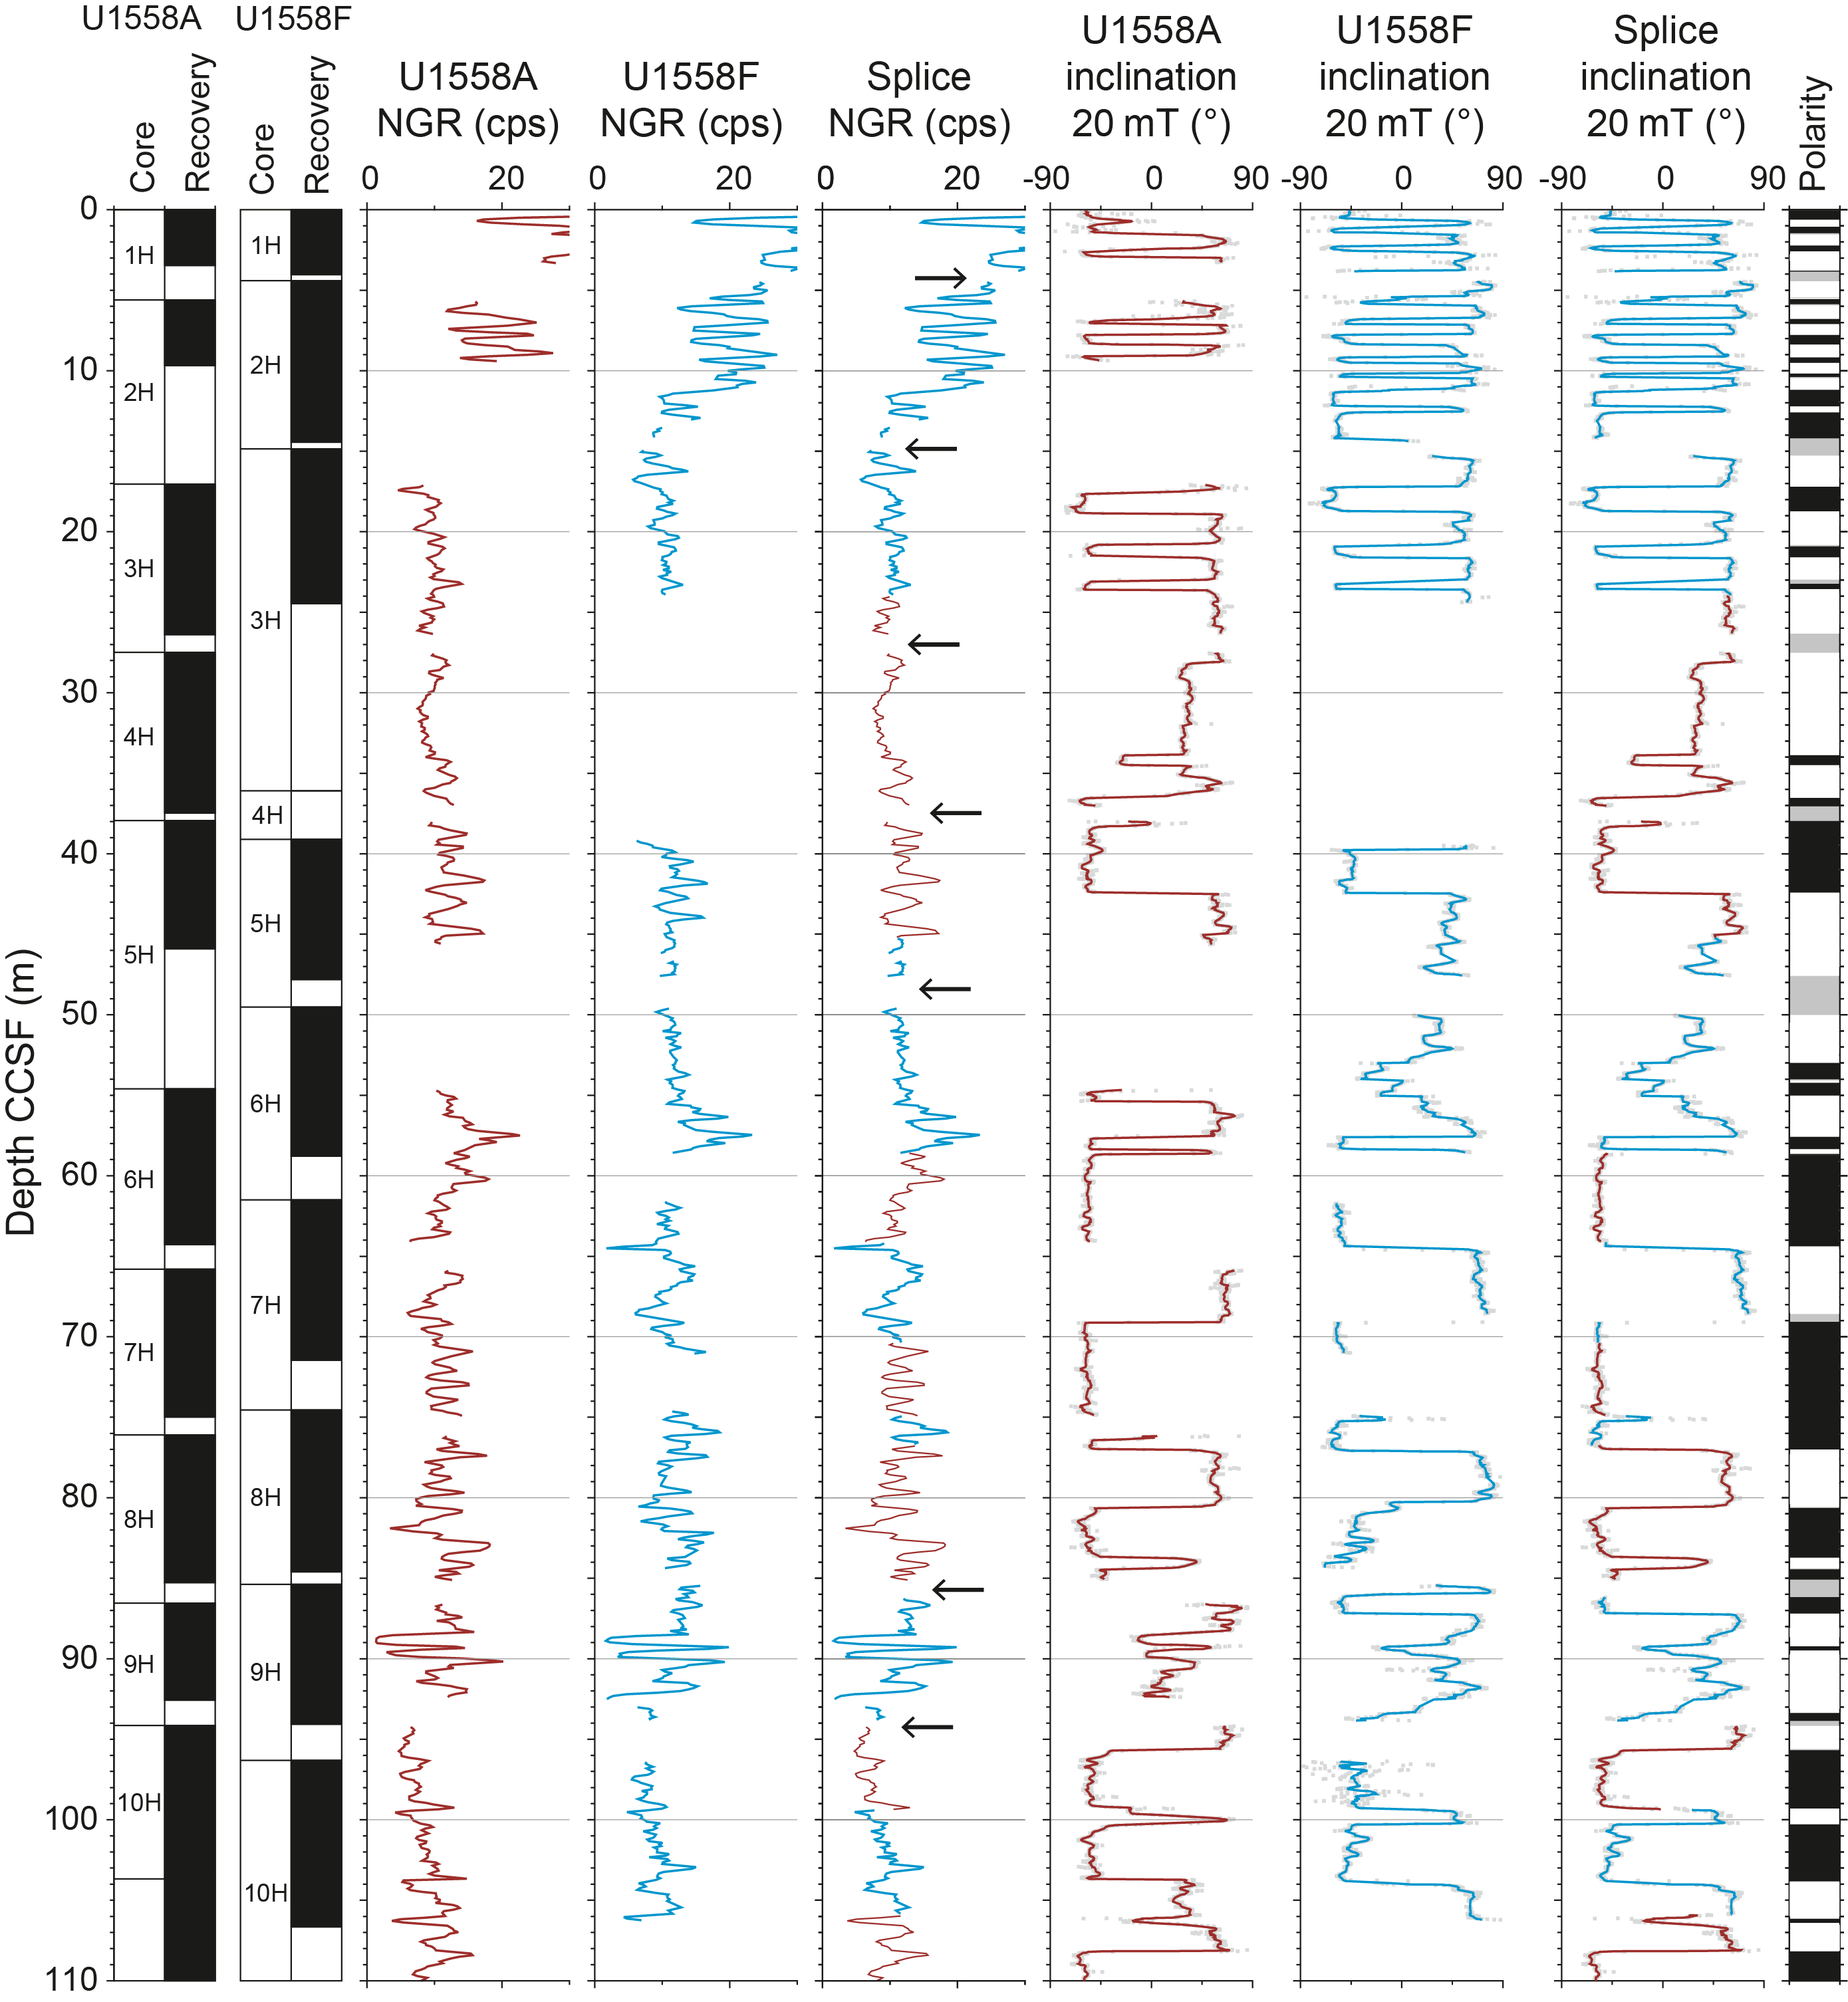
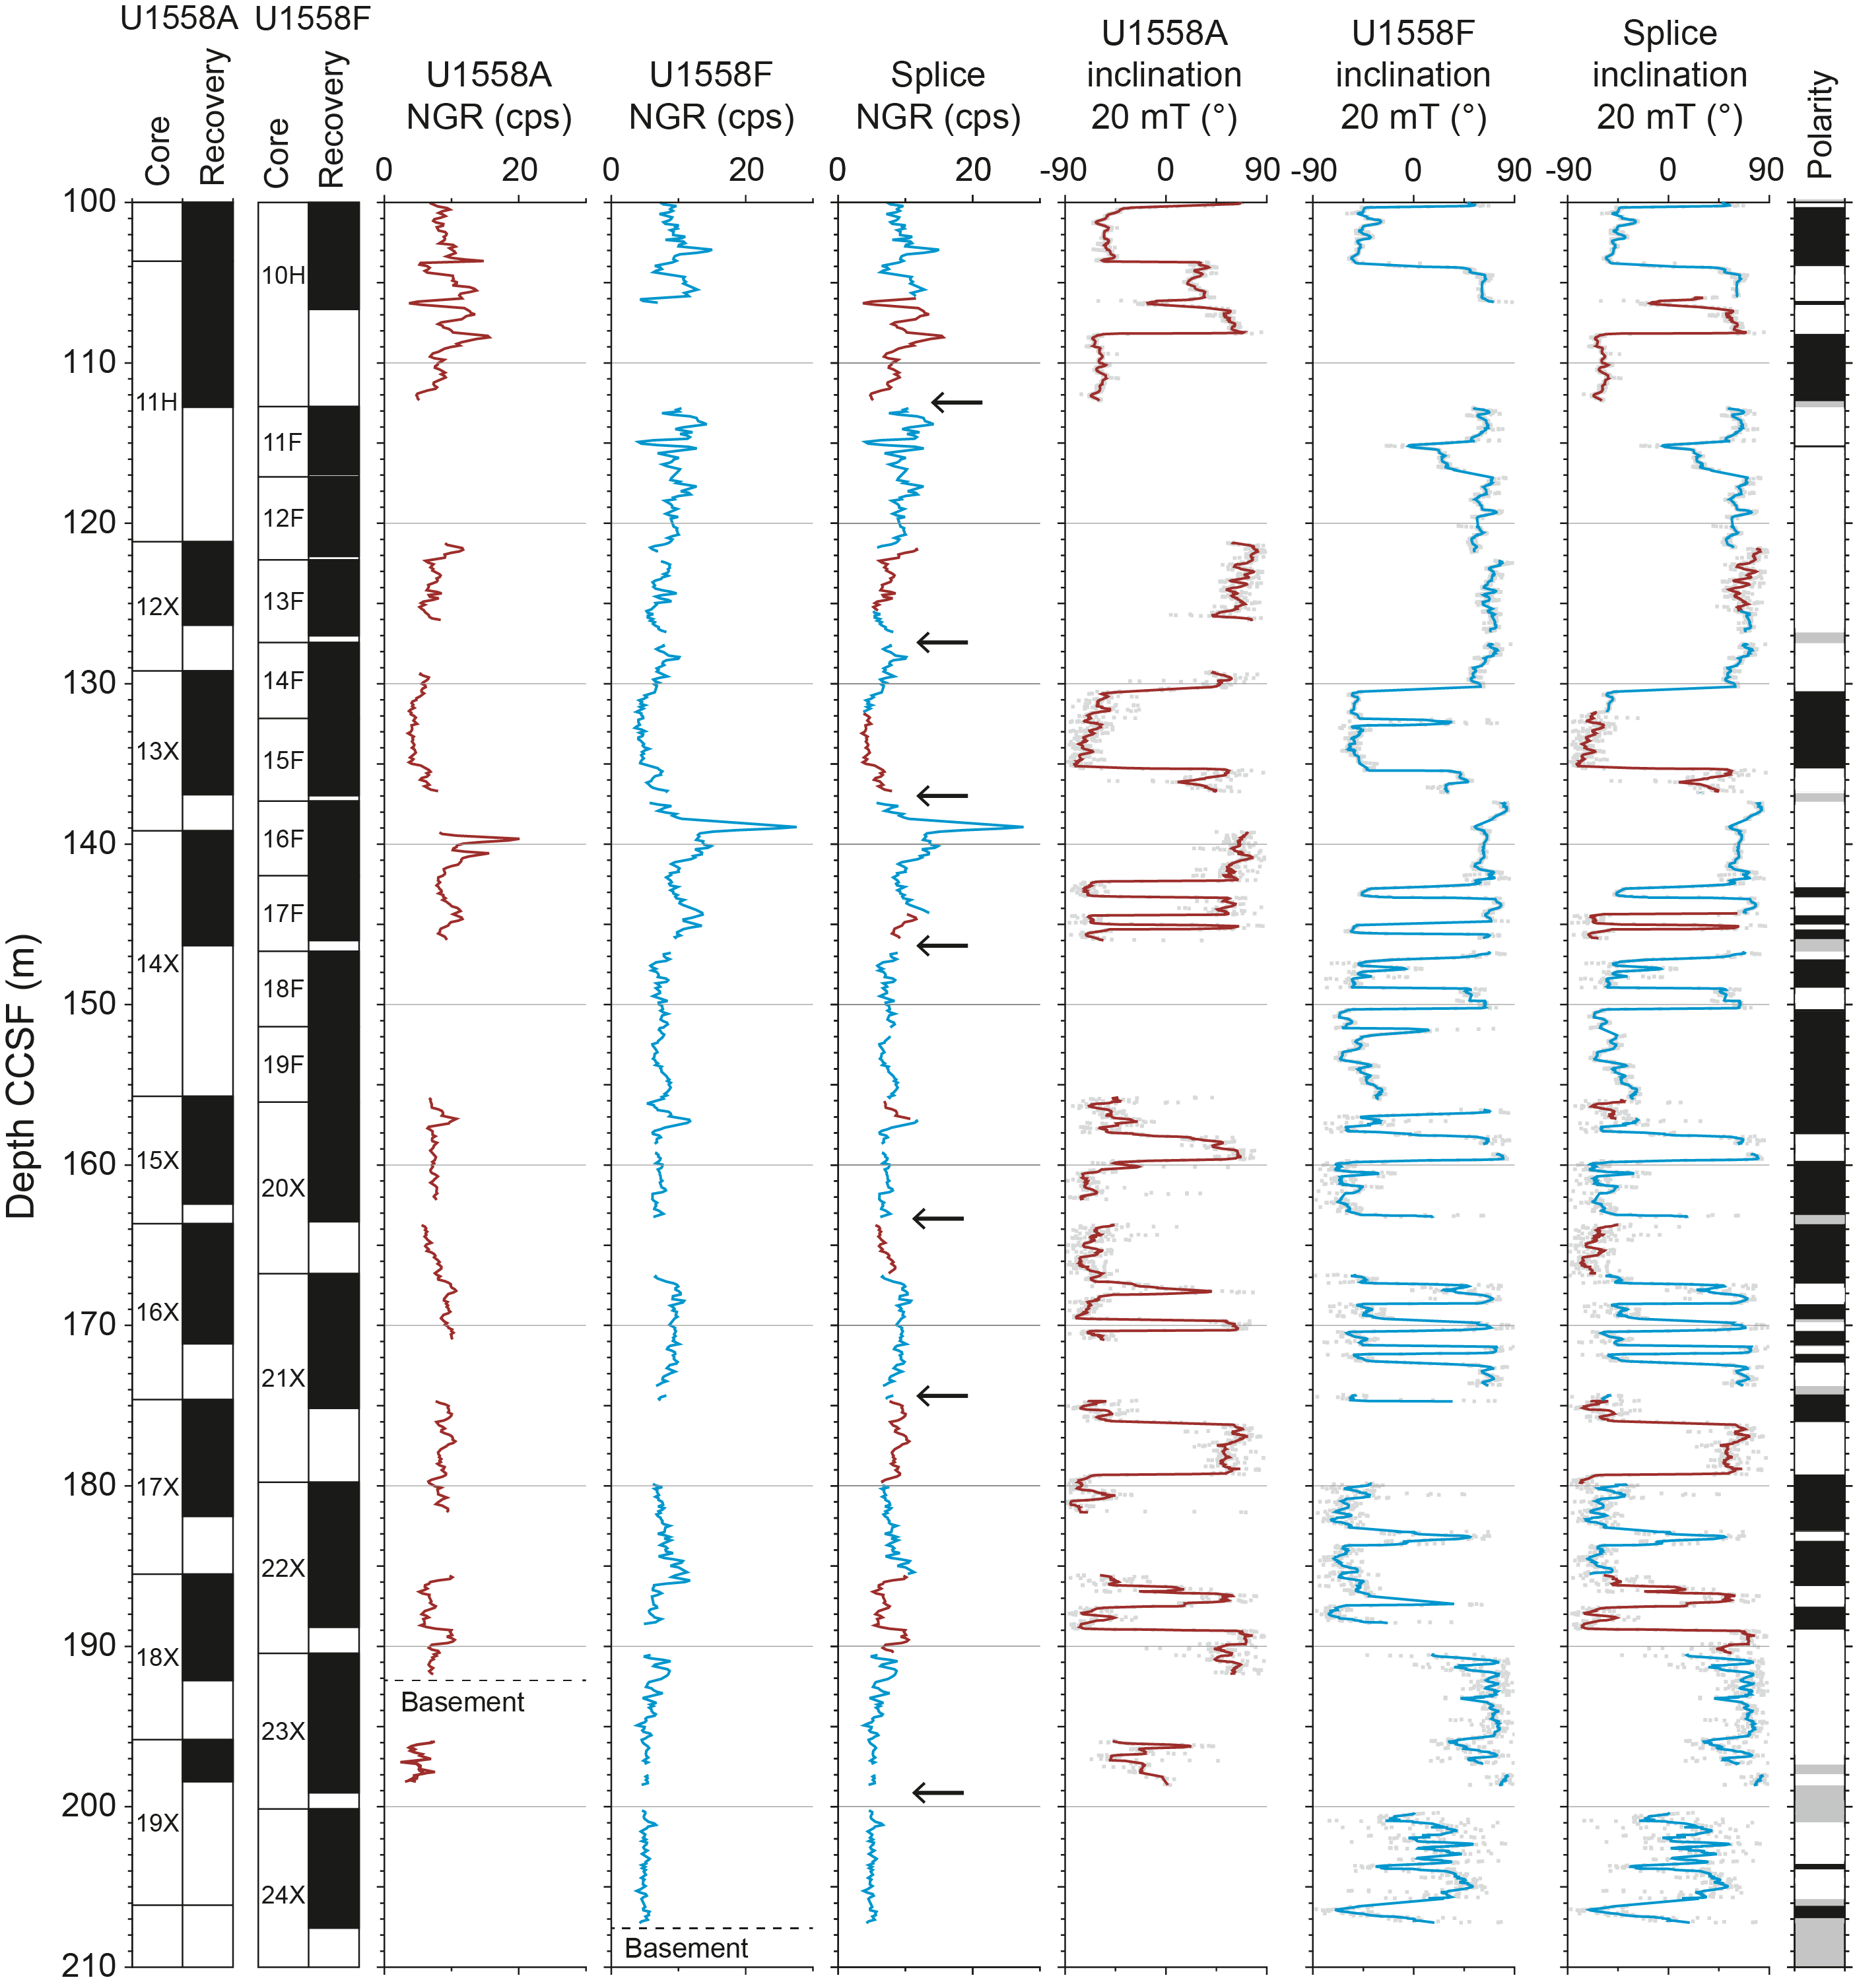
Figure F94. Composite depth scale and splice, using NGR and inclination.
Correlation of records from Holes U1558A and U1558F produced an almost continuous spliced record to 207 m CCSF. The records from each individual hole are characterized by major core gaps, the largest of which is ~15 m (located at 24–39 m CCSF) in Hole U1558F in Lithostratigraphic Subunit IIA (see Sedimentology). This gap results from half recovery of Core 393-U1558F-3H followed by ~3 m of core barrel advancement (drilled interval 393-U1558F-41) requested to improve the stratigraphic overlap between the holes. In both holes, larger missing intervals coincide where coring operations changed from APC to half-length APC (e.g., ~50% recovery in Cores 393-U1558F-10H and 390C-U1558A-11H) in Subunit IIB, and from half-length APC to the XCB system (Core 393-U1558F-20X), in Subunit IIC. However, during the correlation it was possible to fill the majority of those gaps, and the two holes are almost continuously tied to ~120 m CCSF with only ~12 m of total core gap in the splice (Figures F93, F94).
From ~140 to ~190 m CCSF in Hole U1558F, Subunit IIC (nannofossil ooze/chalk with clay; see Sedimentology) contains a few expanded intervals with respect to the equivalent intervals in Hole U1558A. Thickness variation (estimated to be ~2 m) is recognizable by physical properties data, especially NGR and MS, at 138–146 m CCSF where Core 390C-U1558A-14X is tied to Cores 393-U1558F-16F and 17F (Figures F93, F94). Sedimentologic characterization of Subunit IIC (see Sedimentology) supports the lateral correlation between the "condensed" Subunit IIC in Hole U1558A and the "expanded" counterpart in Hole U1558F. It was not possible to acknowledge this stratigraphic variation and correlate both the top and bottom of equivalent layers with different thickness because the Correlator software does not stretch or squeeze within individual cores. Despite being only ~50 m apart, due to basement topography Holes U1558A and U1558F show substantial differences in layer thickness. In the rugged ocean crust on the flanks of slow-spreading ridges, accommodation space and consequently sediment accumulation are also controlled by the local-scale bathymetry of the seafloor (e.g., Christeson et al., 2020). For these reasons (higher recovery, thicker units), the splice section preferentially consists of intervals from Hole U1558F (Table T31).
10.2. Basement
Petrophysical characterization of the 49.2 Ma ocean crustal section at Site U1558 is primarily based on cores from Hole U1558D that were recovered during Expedition 393. The uppermost basement was also recovered from Hole U1558A during Expedition 390C (Estes et al., 2021) and Hole U1558F during Expedition 393. Because of difficulties with the reentry system (see Operations), it was not possible to reenter Hole U1558D following the completion of coring. Consequently, the planned wireline logging at Site U1558 could not be undertaken.
10.2.1. Physical properties
Whole-round core section measurements included NGR, GRA bulk density, MS, and X-ray imaging. Archive halves of all split-core sections were measured for MSP. A total of 40 discrete sample cubes were taken for P-wave velocity and MAD measurements, including one sample of breccia matrix composed of sediment and altered glass (Table T32). All discrete samples were also used for paleomagnetic measurements (see Paleomagnetism). Thermal conductivity measurements were made on 39 individual pieces from working halves of split cores. Full circumference, true color images of whole-round core exteriors were recorded with the DMT CoreScan3 system. Approximately 72% of the basement material from Site U1558 could be scanned on the DMT system, including 100% of the basement material from Hole U1558F, 93% of the material from Hole U1558A, and 72% of the material from Hole U1558D. An additional ~3 m (total) of cylindrical, oriented pieces was used for microbiological sampling in Hole U1558D and removed from the core before scanning took place (see Microbiology). A summary of core section and discrete physical properties data from Hole U1558D is shown in Figure F95 and Tables T32 and T33. All depths in the tables and figures are in meters below seafloor (mbsf) on the CSF-A scale, and the means of all physical properties are arithmetic means presented with uncertainty ranges of ± 1 standard deviation (1σ).
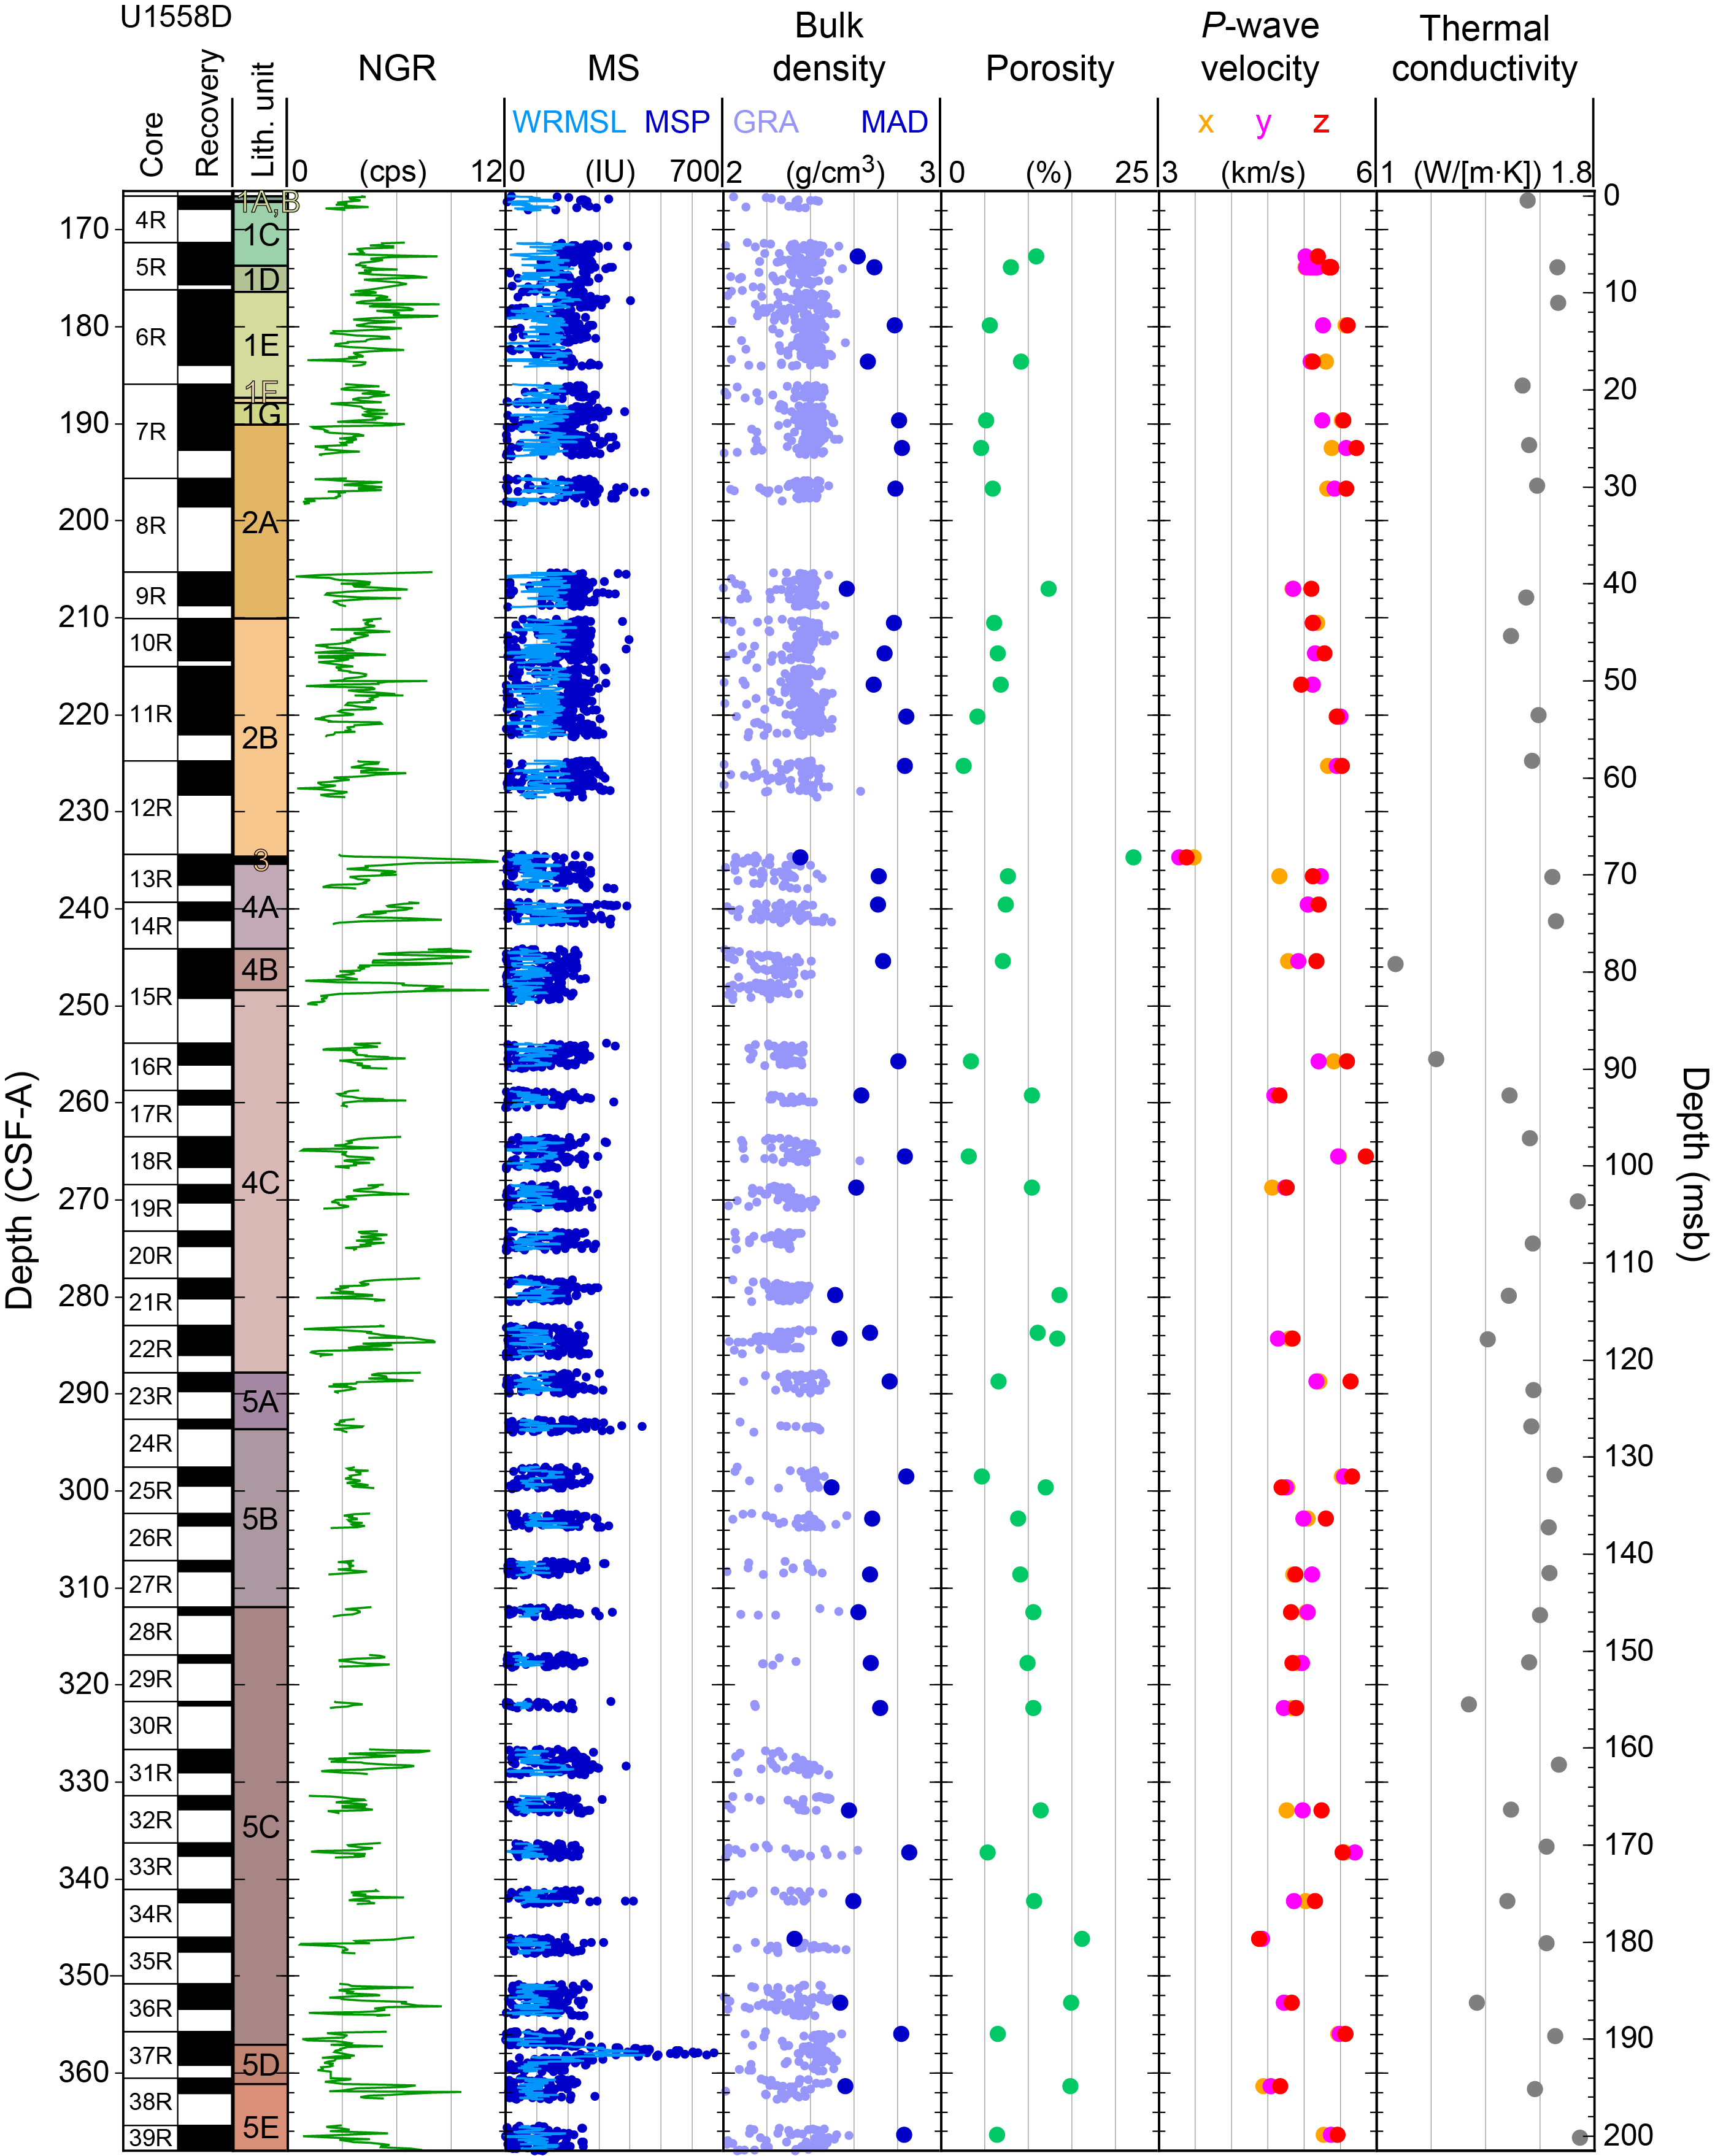
Figure F95. Physical properties, Hole U1558D.
10.2.1.1. Natural gamma radiation
In Hole U1558D, mean NGR is 4.0 counts/s (range = 0.15–11.60 counts/s) (Figure F95; Table T32). In the uppermost part of the sequence (Unit 1 and Subunit 2A) NGR decreases from ~8 counts/s at ~175–180 mbsf (Subunits 1D and 1E) to 2 counts/s at ~200 mbsf (Figure F95). NGR remains low (mean ~3 counts/s) in the lower half of eruptive Sequence A (Subunits 2A and 2B; mean = 3.4 ± 1.3 counts/s). NGR increases 4-fold (to 11.60 counts/s) in the sedimentary breccia (Unit 3) at 235.1 mbsf, which shows the highest mean values of 9.1 ± 1.9 counts/s (Table T33). Although highly variable, there are also prominent spikes in NGR in the underlying Subunits 4A and 4B.
NGR is lower in Subunit 4C (from ~248 to ~353 mbsf) and decreases downhole to <6 counts/s in Subunit 5B. Unit 5 is the thickest unit (expanded thickness of 73.33 m, see Igneous petrology) and has a low mean value of 3.8 ± 1.4 counts/s. The NGR has moderately low values in Subunit 5B and upper Subunit 5C, but there is low core recovery, especially in Cores 393-U1558D-24R through 30R, so it is possible that unrecovered rocks have higher NGR values (see Curatorial core procedures and sampling depth calculations in the Expedition 390/393 methods chapter [Coggon et al., 2024b]).
10.2.1.2. Magnetic susceptibility
MS at Site U1558 was measured on whole-round core sections using a pass-through sensor on the WRMSL and on split core sections using a MSP sensor on the Section Half Multisensor Logger (SHMSL). The pass-through and point-contact data show similar trends, though the MSP data tend to cover a wider range and reach higher values over the same depth interval compared to the WRMSL data (Figure F95). The lower WRMSL values may result from gaps and irregular shaped/small core pieces (heavily influencing the continuous measurements), and/or from the different frequency and resolution between the two magnetic susceptibility systems (see Physical properties and downhole measurements in the Expedition 390/393 chapter [Coggon et al., 2024b]). Thus, absolute differences between the two measurement systems should be interpreted with caution. As a whole, both the WRMSL and MSP measurements suggest that Units 1 and 2 have a higher mean magnetic susceptibility than Units 4 and 5, with the lowest magnetic susceptibility observed in sedimentary Unit 3 (Table T33).
MSP values from Hole U1558D range 1–669 IU (mean = 159 ± 88 IU). Although most magnetic susceptibility values fall below 300 IU, a small peak in magnetic susceptibility occurs at ~294 mbsf (near the Subunit 5A/5B boundary) and the highest magnetic susceptibility values (669 IU) were measured in Subunit 5D at 357.9 mbsf (Figure F95).
10.2.1.3. Gamma ray attenuation bulk density
Bulk density values <2 g/cm3 were culled from all figures and interpretations, as these values likely represent gaps due to incomplete filling of the core liner and are not representative of the recovered material. GRA bulk density from Hole U1558D ranges 2–2.6 g/cm3 (mean = 2.3 ± 0.1 g/cm3) (Figure F95; Tables T32, T33) and is relatively consistent across the different igneous units. It is noticeable though that GRA bulk density is slightly lower in Unit 4 and slightly higher deeper than ~300 mbsf in Subunits 5C–5E. GRA bulk density values are consistently lower than the discrete sample bulk densities (MAD). This is due in large part to calibration of the GRA instrument, which assumes that the core liner is completely filled. The narrower RCB core diameters leave an air-filled gap between core and liner that reduces the apparent GRA bulk density.
10.2.1.4. Moisture and density
Samples for MAD analysis were taken once per core or once per distinct lithology. These samples were selected to be representative of various levels of alteration of the basalts recovered at Site U1558. A total of 40 discrete samples from the basement sections of Hole U1558D were investigated (Table T32). MAD samples are typically taken from pieces appearing cohesive enough to withstand being cut into cubes, which may bias the data toward higher density rocks than the surrounding more heterogeneous intervals (see Physical properties and downhole measurements in the Expedition 390/393 methods chapter [Coggon et al., 2024b]).
The mean porosity for each lithostratigraphic unit from Hole U1558D ranges from 6.1% (Unit 2) to 9.9% (Unit 5) (Table T32) with an overall mean of 8.9% ± 4.1% (Table T33). The highest porosity is seen in the single sedimentary sample from Unit 3 (22.1%; 393-U1558D-13-1, 29–31 cm). Bulk density and grain density from Hole U1558D range 2.3–2.85 and 2.58–2.95 g/cm3, respectively (Table T32), with the lowest bulk and grain densities in the sedimentary sample from Unit 3, reflecting the high porosity in this sample. Among the igneous units, Units 1 and 2 have higher mean bulk and grain densities compared to Units 4 and 5, though these differences are subtle (Table T33; Figure F96). In summary, when MAD results from basalt sequences are correlated against each other and P-wave velocity (Figure F96), mean values from Units 1 and 2 always plot in the regions with low porosity and high bulk/grain density, and therefore also high P-wave velocity as well. In contrast, Units 4 and 5 plot in regions with higher mean porosity and higher bulk/grain density, and therefore lower P-wave velocity.
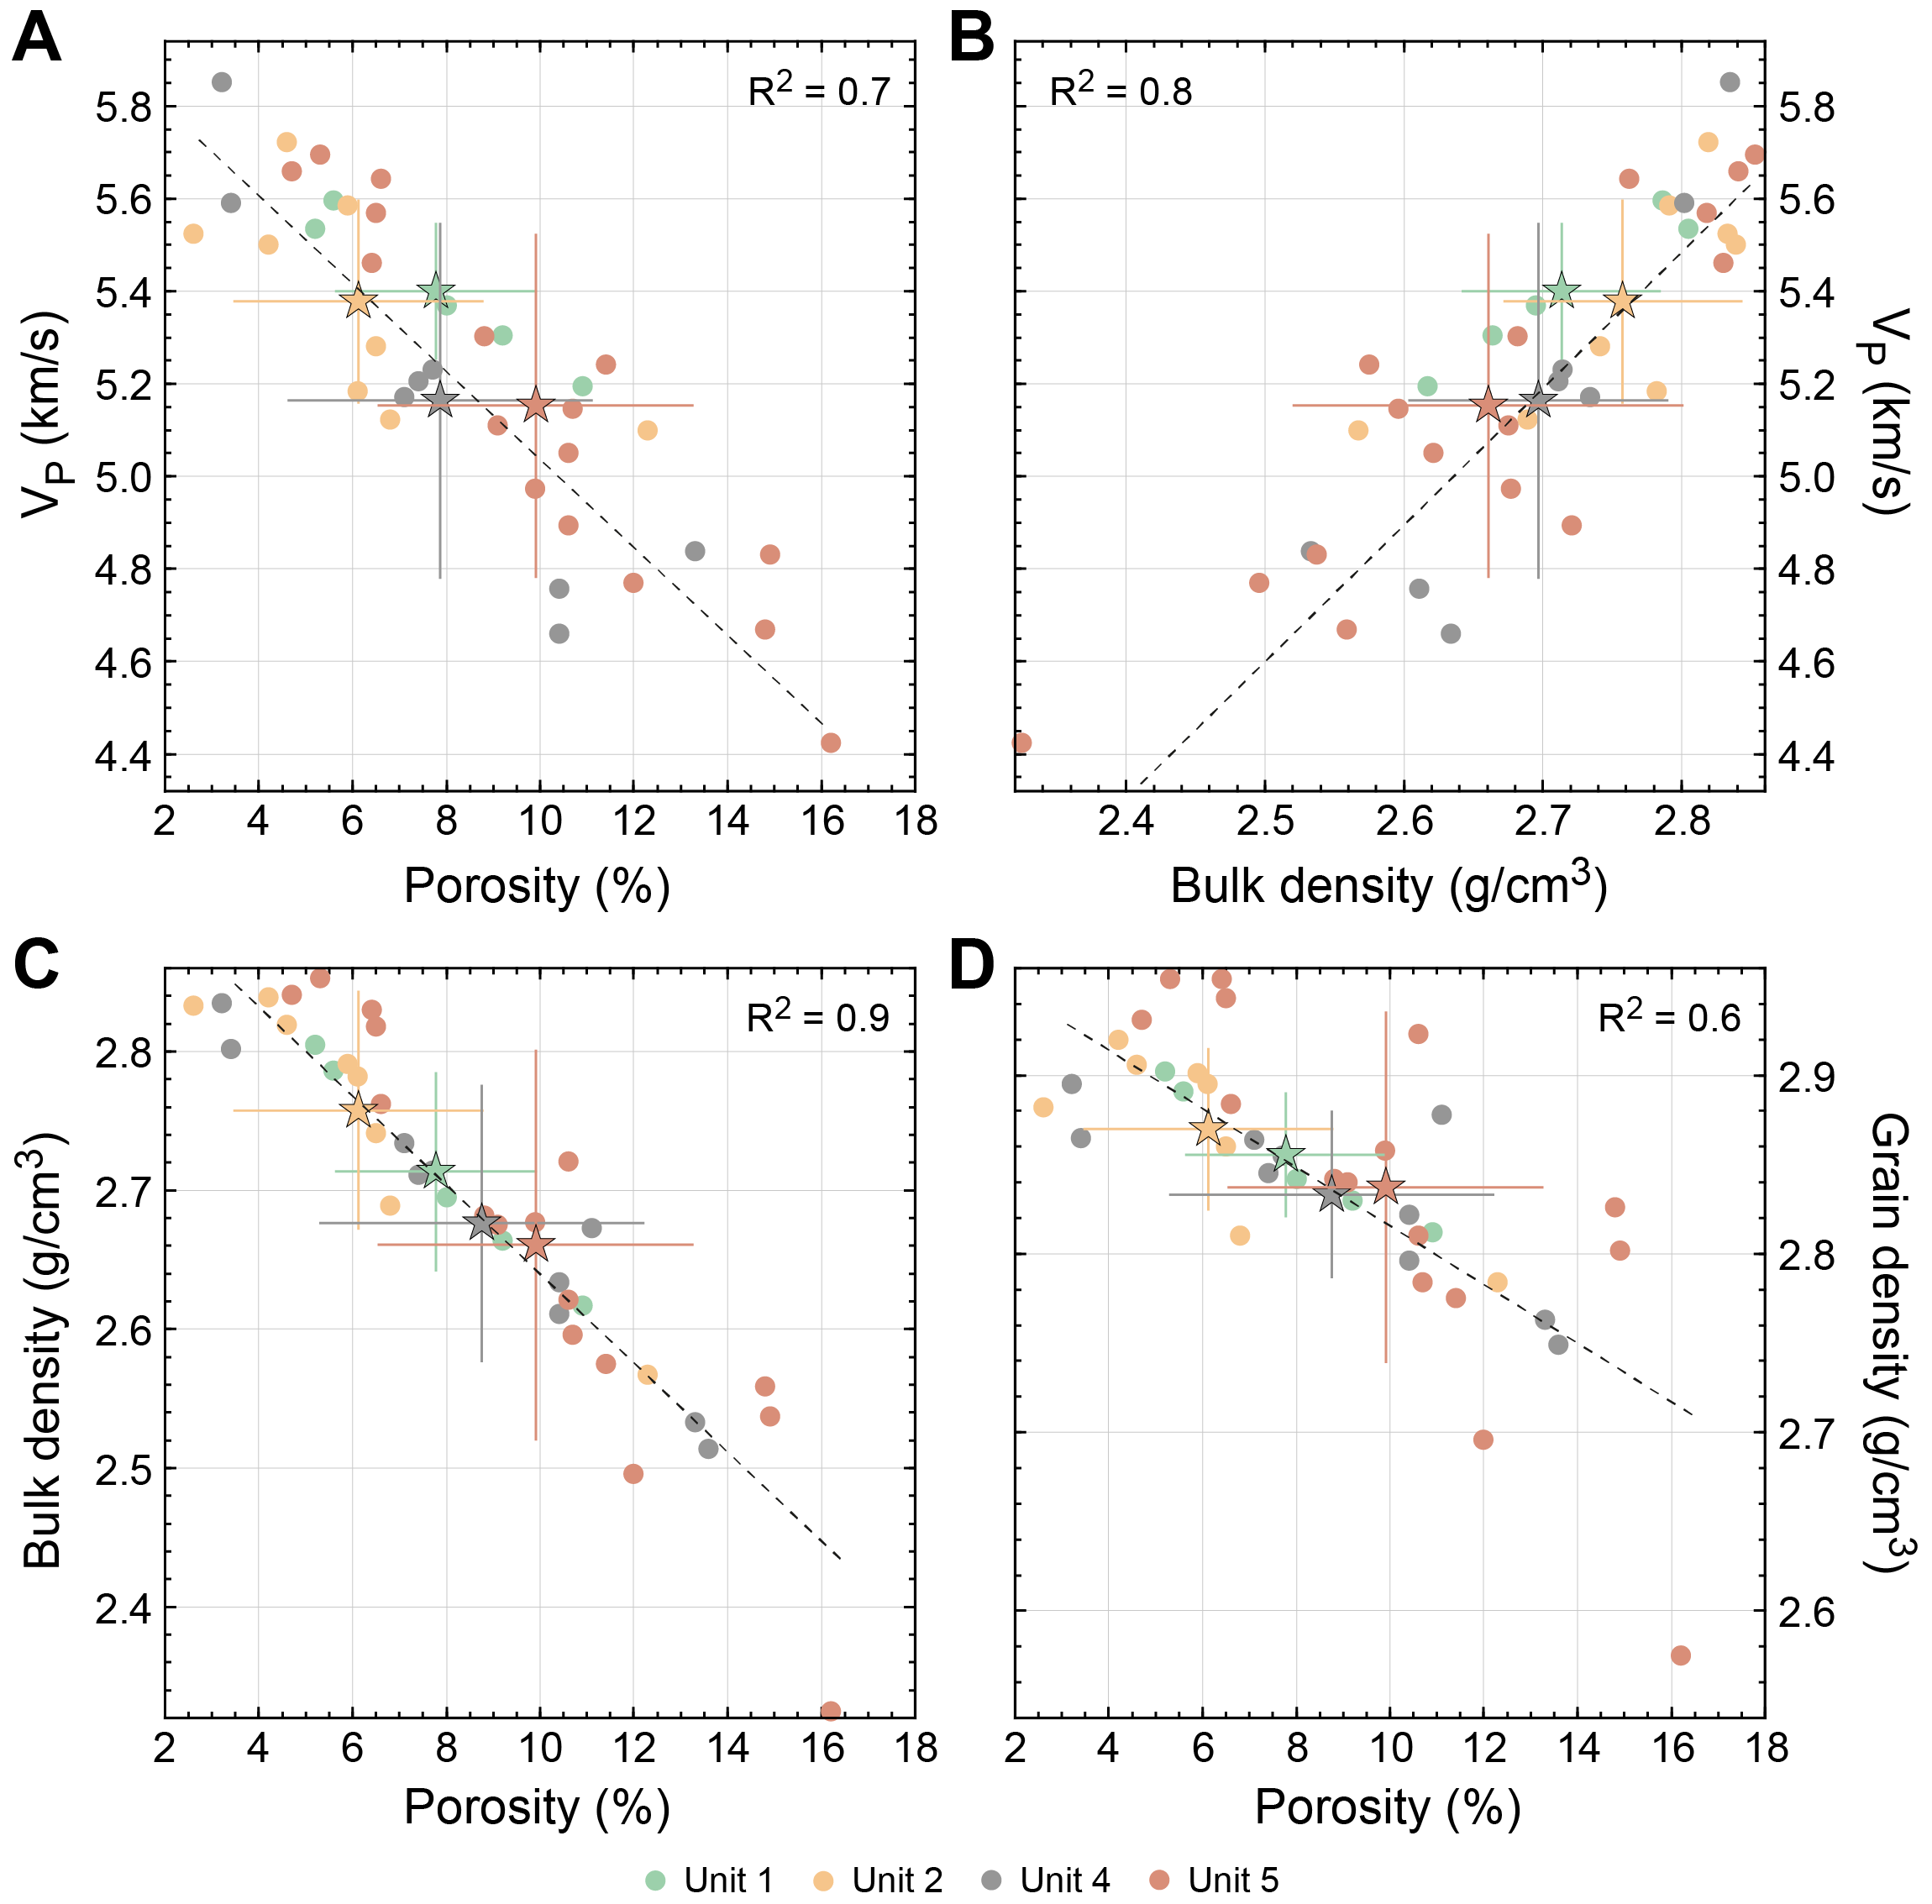
Figure F96. Hole U1558D discrete physical properties by lithostratigraphic unit.
The physical properties of these igneous rocks may also be influenced by primary lithologic features of the basalts such as their magmatic emplacement (pillow, sheet, or massive flows) or groundmass crystal size (see Igneous petrology) (Figure F97; Table T32). For example, throughout Hole U1558D the mean porosity for basalts described as "large pillows" (with microcrystalline groundmass crystal size) is 7.6% ± 4.1%. These large pillows also have the highest mean bulk density of the different emplacement types (2.73 ± 0.14 g/cm3). Basalts emplaced as "pillow flows" (mostly microcrystalline) show high variability in physical properties, with data defining a linear trend. They also show the highest mean porosity (8.6% ± 3.6%) and a slightly lower mean bulk density (2.69 ± 0.12 g/cm3) compared to the "large pillows." Sheet flows have variable groundmass grain size (from cryptocrystalline to fine-grained), but they are very similar to pillow flows in terms of porosity and density (Table T33; Figure F97).
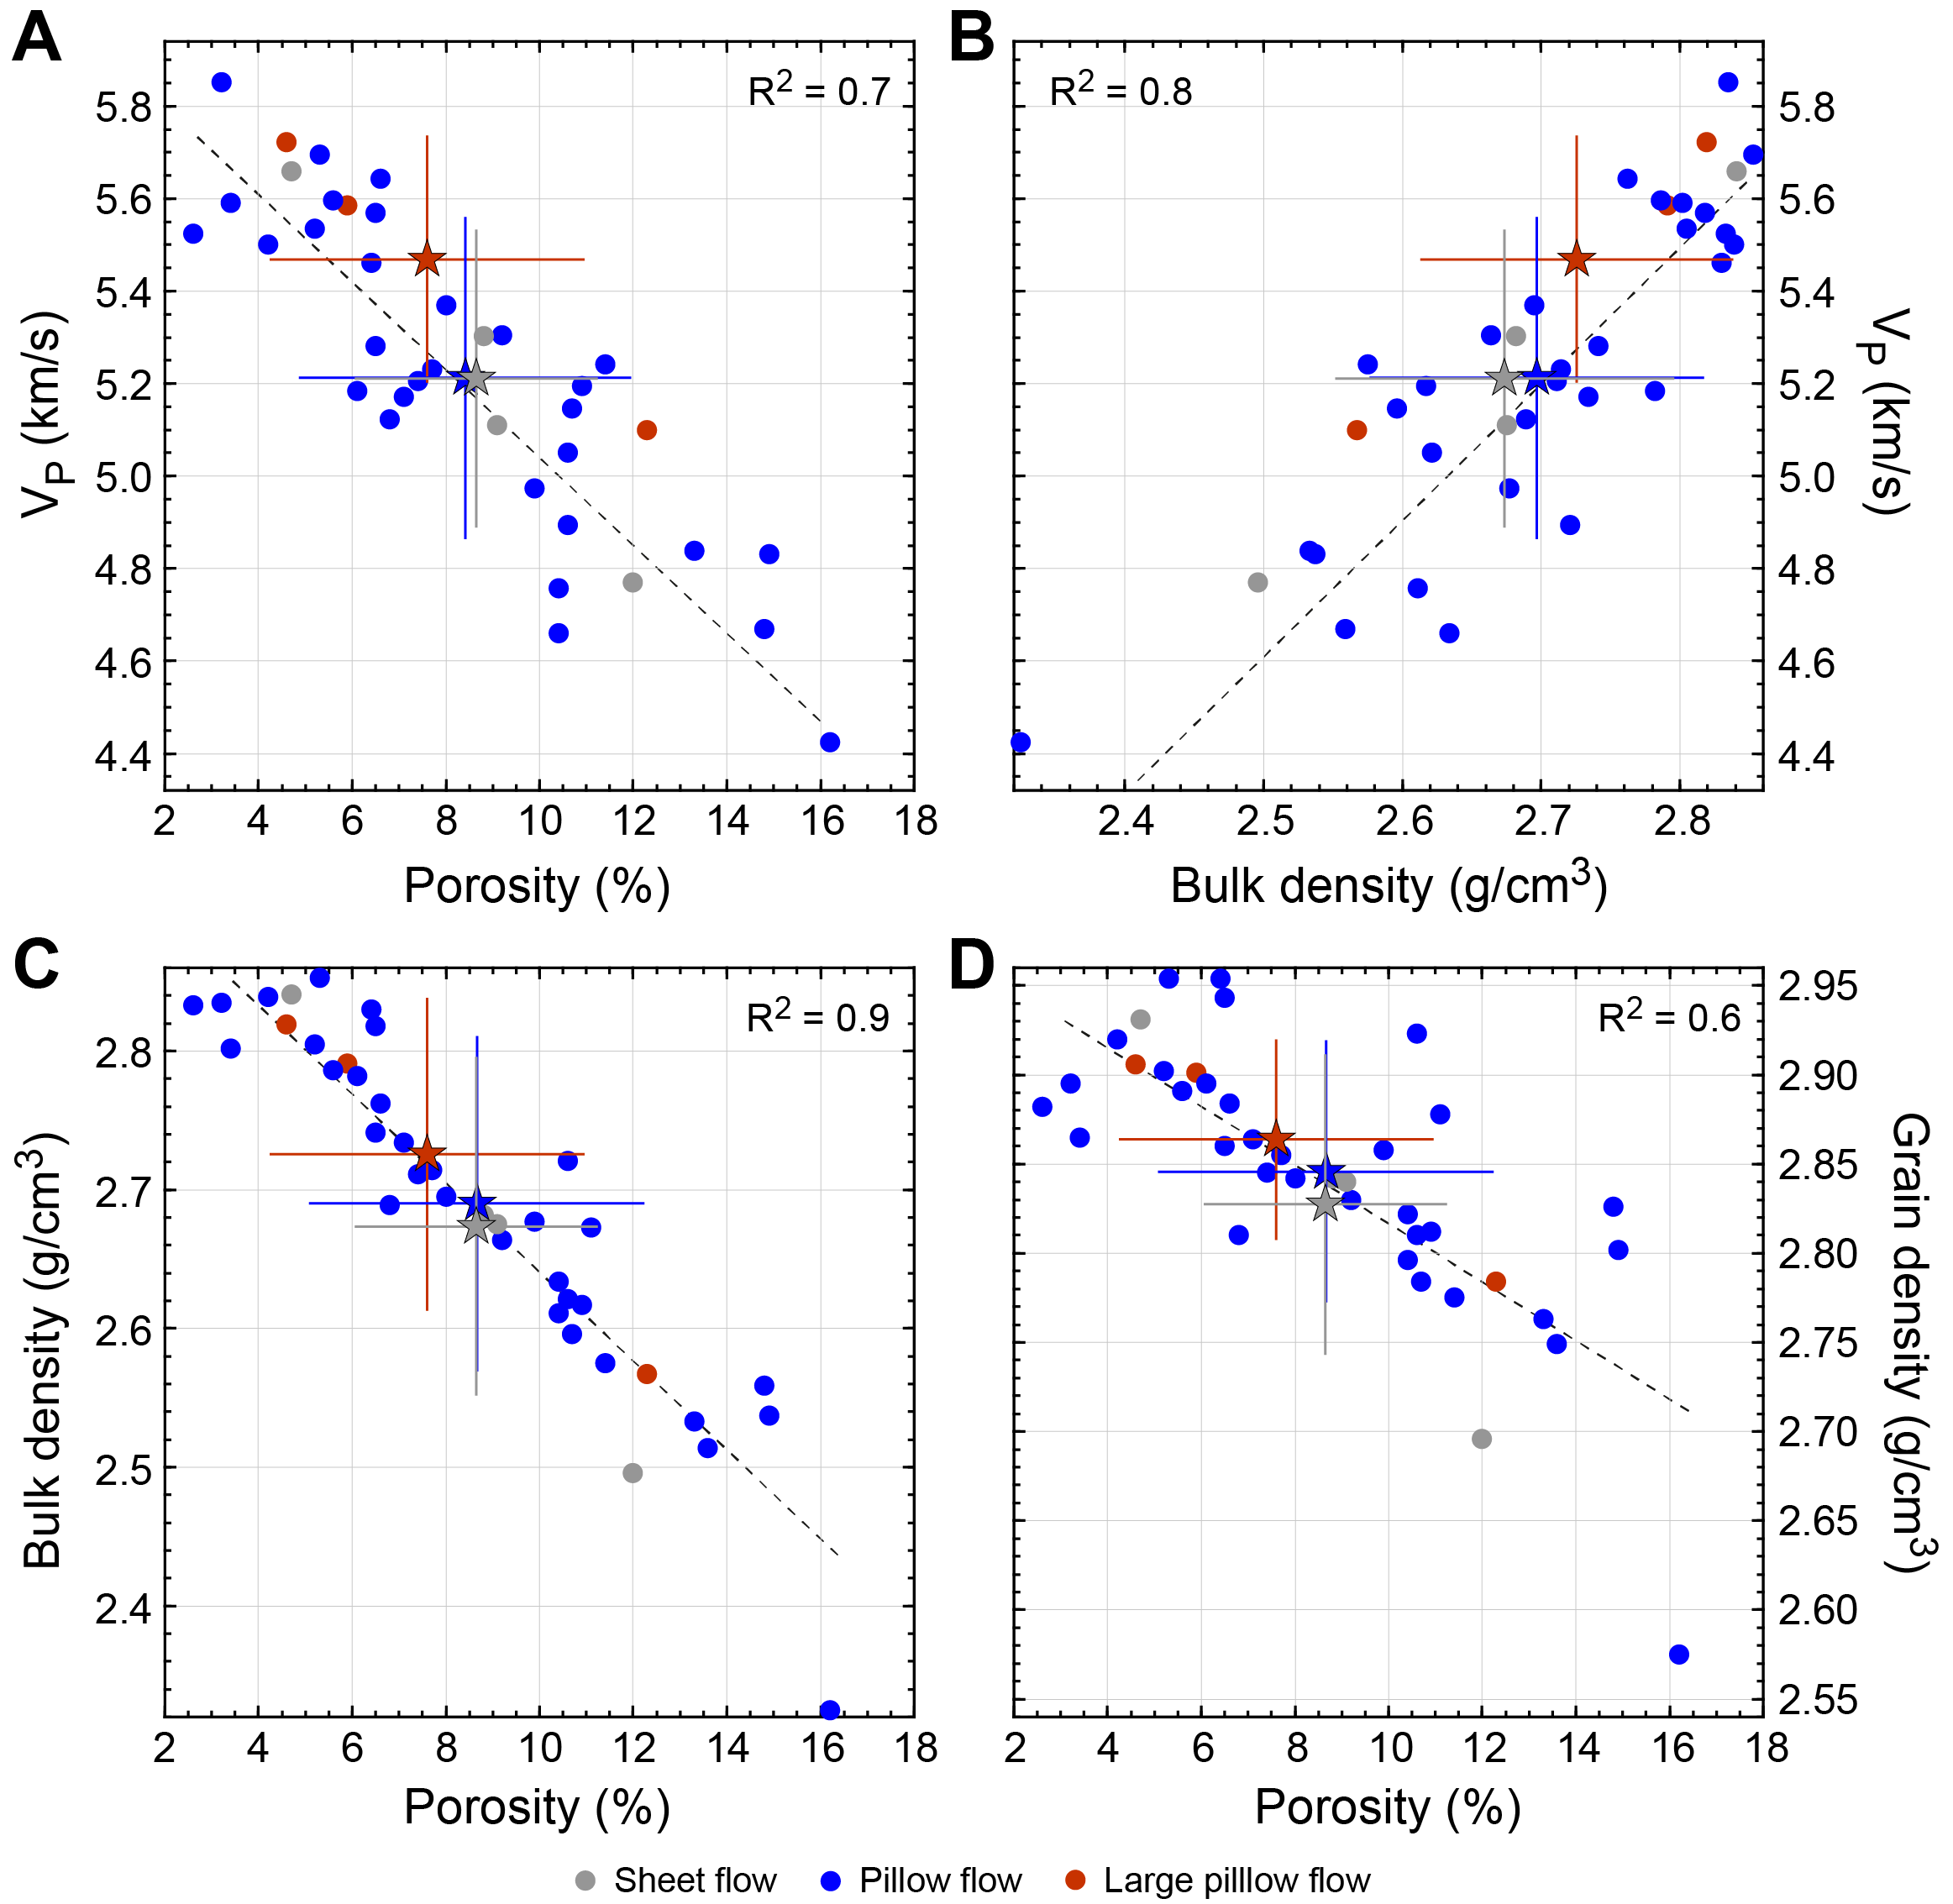
Figure F97. Hole U1558D discrete physical properties by magmatic emplacement style.
10.2.1.5. P-wave velocity
P-wave velocity was measured on the x-, y-, and z-axes of the discrete sample cubes. The standard deviation of the x, y, and z measurements for each sample varies by one order of magnitude (0.03–0.30 km/s) (Table T32). However, the standard deviations of repeated measurements on each axis (among different samples) are relatively consistent (0.42, 0.41, and 0.45 km/s for x-, y-, and z-axes, respectively). Without orientation of the core, the x- and y-directions are arbitrarily defined by the splitting plane and are likely to change from section to section. The z-axis, in contrast, is always oriented parallel to the coring direction. All three velocities measured for each sample are shown in Figure F95 and Table T32; however, only the highest value measured for each sample is used in the crossplots (see Physical properties and downhole measurements in the Expedition 390/393 methods chapter [Coggon et al., 2024b]).
P-wave velocity ranges 3.48–5.56 km/s on the x-axis, 3.28–5.70 km/s on the y-axis, and 3.38–5.85 km/s on the z-axis. P-wave velocity along the z-axis is generally greater than the x- and y-directions in 26 of the 40 discrete samples. The highest measured P-wave velocity (5.85 km/s) was recorded in a pillow flow from Subunit 4C at 265 mbsf (Sample 393-U1558D-18R-2, 70–72 cm) (Table T32; Figures F95, F96, F97). The lowest velocity was measured on a single sample from Unit 3, the sedimentary breccia made up of clasts of broken pillows and altered glass in an indurated calcareous sediment matrix (Sample 13R-1, 29–31 cm; see also Igneous petrology). The velocities along the x-, y-, and z-axes for this sample are all significantly lower (mean = 3.48 ± 0.10 km/s) than the lowest velocities measured in the basalt samples through the rest of the sequence (Tables T32, T33). Basalt samples from microcrystalline large pillows yield the highest mean velocity (5.47 ± 0.33 km/s), followed by pillow and sheet flows (5.22 ± 0.35 km/s and 5.20 ± 0.36 km/s, respectively) (Table T33; Figure F97). Postexpedition research could focus on further refining the relationship between emplacement style and P-wave velocity, particularly with respect to the observed differences in the x-, y-, and z-axes.
10.2.1.6. Thermal conductivity
Thermal conductivity in Hole U1558D ranges from 1.07 W/(m·K) (observed in Subunit 4B) to a maximum of 1.75 W/(m·K) (observed in Subunits 4C and 5E) (Table T32; Figure F95). The mean thermal conductivity of the entire data set is 1.54 ± 0.14 W/(m·K). Thermal conductivity remains relatively constant around 1.6 W/(m·K) from Unit 1 through Subunit 4A. A noticeable drop in thermal conductivity occurs between Subunits 4A and 4B, where the lowest value of 1.07 W/(m·K) is observed at ~245 mbsf (Sample 393-U1558D-15R-2, 25 cm). Below this, there are two broad peaks in thermal conductivity between ~260 and 320 mbsf, separated by a relative minimum very close to the boundary between Units 4 and 5. The upper broad peak has a maximum thermal conductivity of 1.74 ± 0.01 W/(m·K) in the middle of Subunit 4C (~270 mbsf; Sample 19R-2, 44 cm) below which values decrease gradually through the lower part of Unit 4 (Figure F95). The second broad peak is recorded from the top of Subunit 5A to the upper part of Subunit 5C, with a maximum of 1.65 ± 0.01 W/(m·K) at ~300 mbsf (Sample 25R-1, 85 cm). Further downhole, the deeper portions of Subunits 5C and 5D do not show any clear pattern in thermal conductivity with depth, and measurements are scattered around the Unit 5 mean of 1.6 ± 0.1 W/(m·K). Close to the bottom of Hole U1558D in Subunit 5E, the thermal conductivity is relatively high, with the deepest sample showing the highest value of the entire data set, along with Sample 19R-2, 44 cm, in Subunit 4C.
The mean thermal conductivity of large pillow and pillow flows (1.57 ± 0.02 and 1.54 ± 0.15 W/[m·K], respectively) falls within 1σ of the mean for the entire basement sequence (1.54 ± 0.14 W/[m·K]). In contrast, basalts emplaced as sheet flows show higher mean thermal conductivities (1.61 ± 0.05 and 1.66 W/[m·K], respectively) (Table T33).
10.2.2. Data integration
Discrete samples used for both MAD and P-wave analyses were classified into nine alteration levels based on color, texture, and presence of alteration halos following the scheme used in Hole U1558D macroscopic core descriptions (see Igneous petrology and Alteration petrology) (Tables T32, T33). From freshest to most altered basalt recovered at the site, the samples are ordered as follows:
- Group 1A: gray background.
- Group 1B: gray background with clay.
- Group 1C: orange speckled background.
- Group 2: dark gray halo.
- Group 3: light brownish gray halo.
- Group 4A: brown halo (weak).
- Group 4B: brown halo (strong).
- Group 5: mixed gray-brown (variolitic).
- Group 6: orange-reddish yellow.
The single interpillow sedimentary sample from Unit 3 was not included in this classification. This classification provides a way to compare independently measured physical properties attributes with alteration style for basalts recovered from Site U1558.
An inverse linear regression (R2 = 0.8) is seen between porosity and P-wave velocity, with "fresher" samples displaying higher P-wave velocity compared to more altered samples (Figure F98A). A positive linear relationship (R2 = 0.7) is seen when comparing P-wave velocity and bulk density, as expected (Figure F98B), with the more altered samples (Groups 4A–6) showing lower density and lower P-wave velocity. Similar to other sites along the transect, bulk and grain densities show inverse linear relationships with porosity (R2 = 0.9 and 0.6, respectively) in samples from Site U1558 (Figure F98C, F98D). Samples from fresh basalts (Groups 1A–1C) tend to show higher values of bulk density and lower porosity compared to the most altered basalt samples (Groups 4A–6), with alteration Levels 2 and 3 occupying a range of intermediate bulk density and porosity values, although there is considerable overlap among groups. This result is somewhat counterintuitive, as secondary minerals might be expected to decrease porosity in the samples (see Basement in Physical properties and downhole measurements in the Site U1556 chapter [Coggon et al., 2024a]). Postexpedition work will be necessary to fully characterize what is being captured by the shipboard porosity measurements.
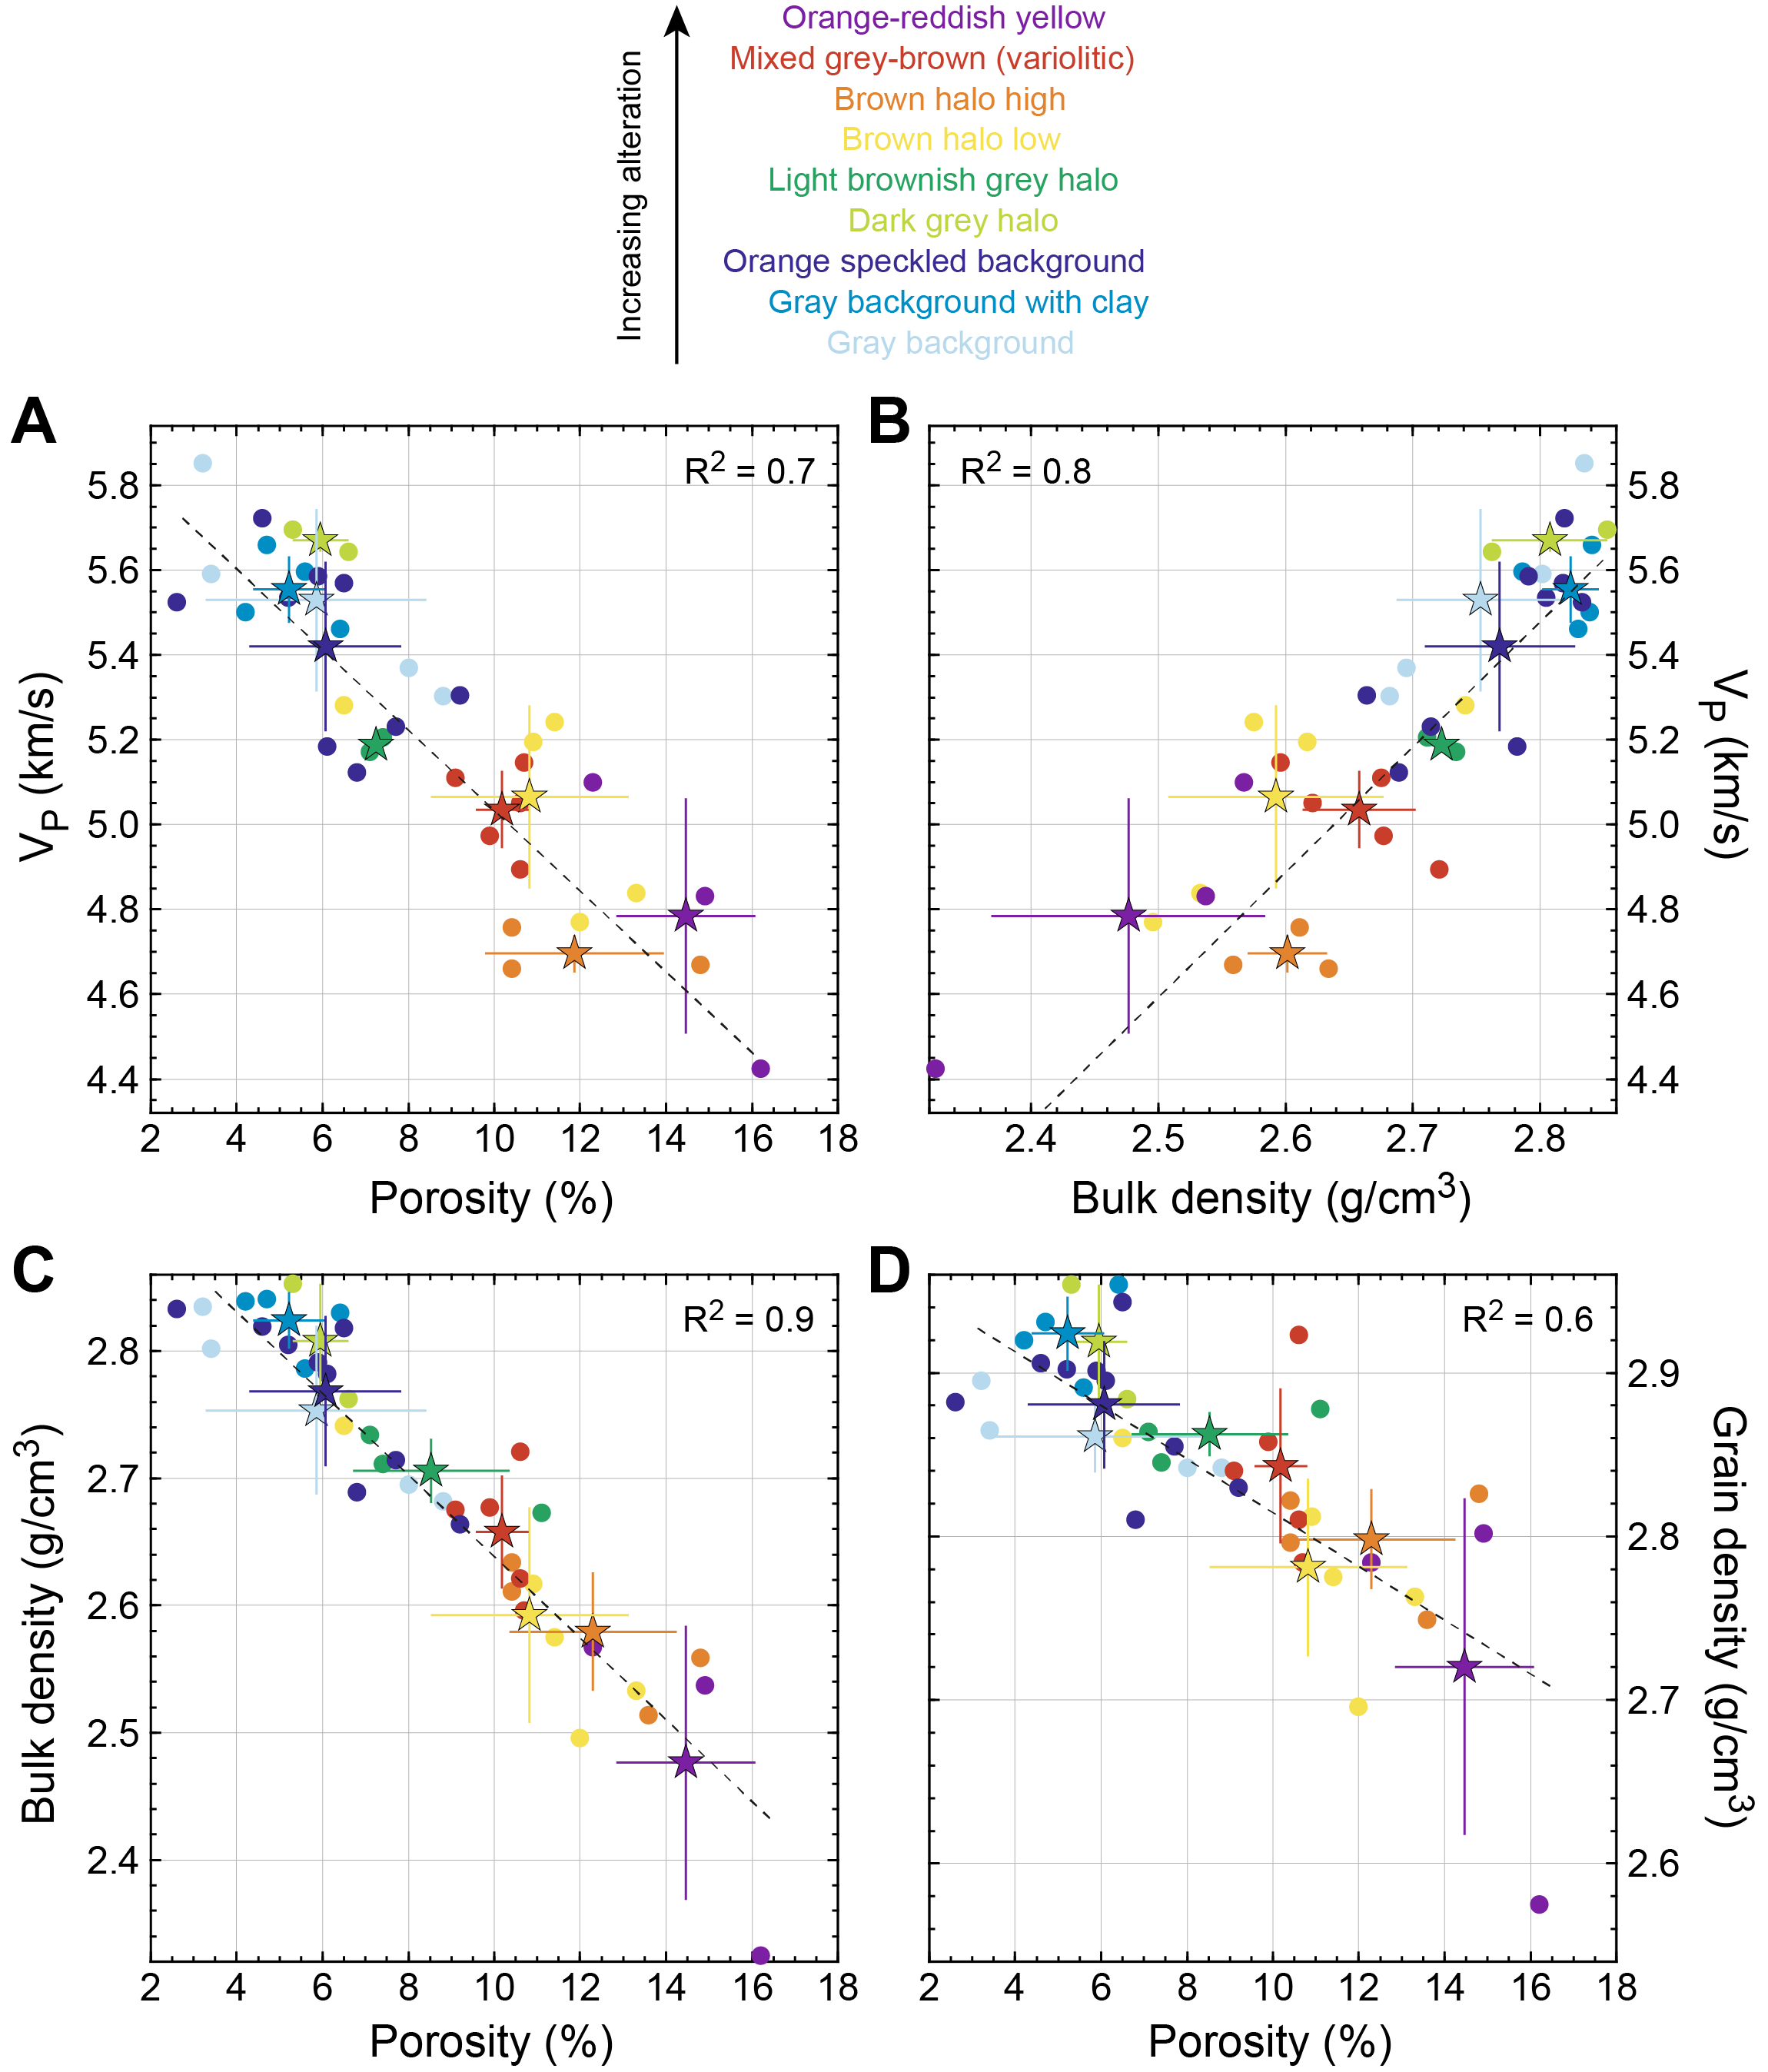
Figure F98. Hole U1558D discrete physical properties by level of alteration.
10.2.3. Comparison to ODP Hole 896A
We compare the discrete physical properties measurements made in Hole U1558D (MAD, P-wave velocity, and thermal conductivity) with the full data set of equivalent measurements from Ocean Drilling Program (ODP) Hole 896A in ~7 Ma ocean crust as a benchmark to evaluate changes in physical properties with crustal age across the SAT (Shipboard Scientific Party, 1993; see Physical properties and downhole measurements in the Expedition 390/393 methods chapter [Coggon et al., 2024b]). The basement in Hole 896A is ~42 My younger than that in Hole U1558D. Despite the age difference, there is not a wide offset in most of the physical properties trends from the two holes, except for the thermal conductivity (Figure F99). Bulk density in Hole U1558D is, on average, lower than in Hole 896A. Porosity at the two sites is similar in the upper ~100 m of basement; below this depth, porosity in Hole U1558D increases slightly beyond 1σ of the mean in Hole 896A. The P-wave velocities at the two sites are very similar, although the velocities measured in Hole U1558D decrease slightly below 1σ of the mean in Hole 896A from Subunit 5B to the bottom of the hole. Thermal conductivity in Hole U1558D is noticeably lower than 1σ of the mean in Hole 896A and covers a considerably wider range (Figure F99).
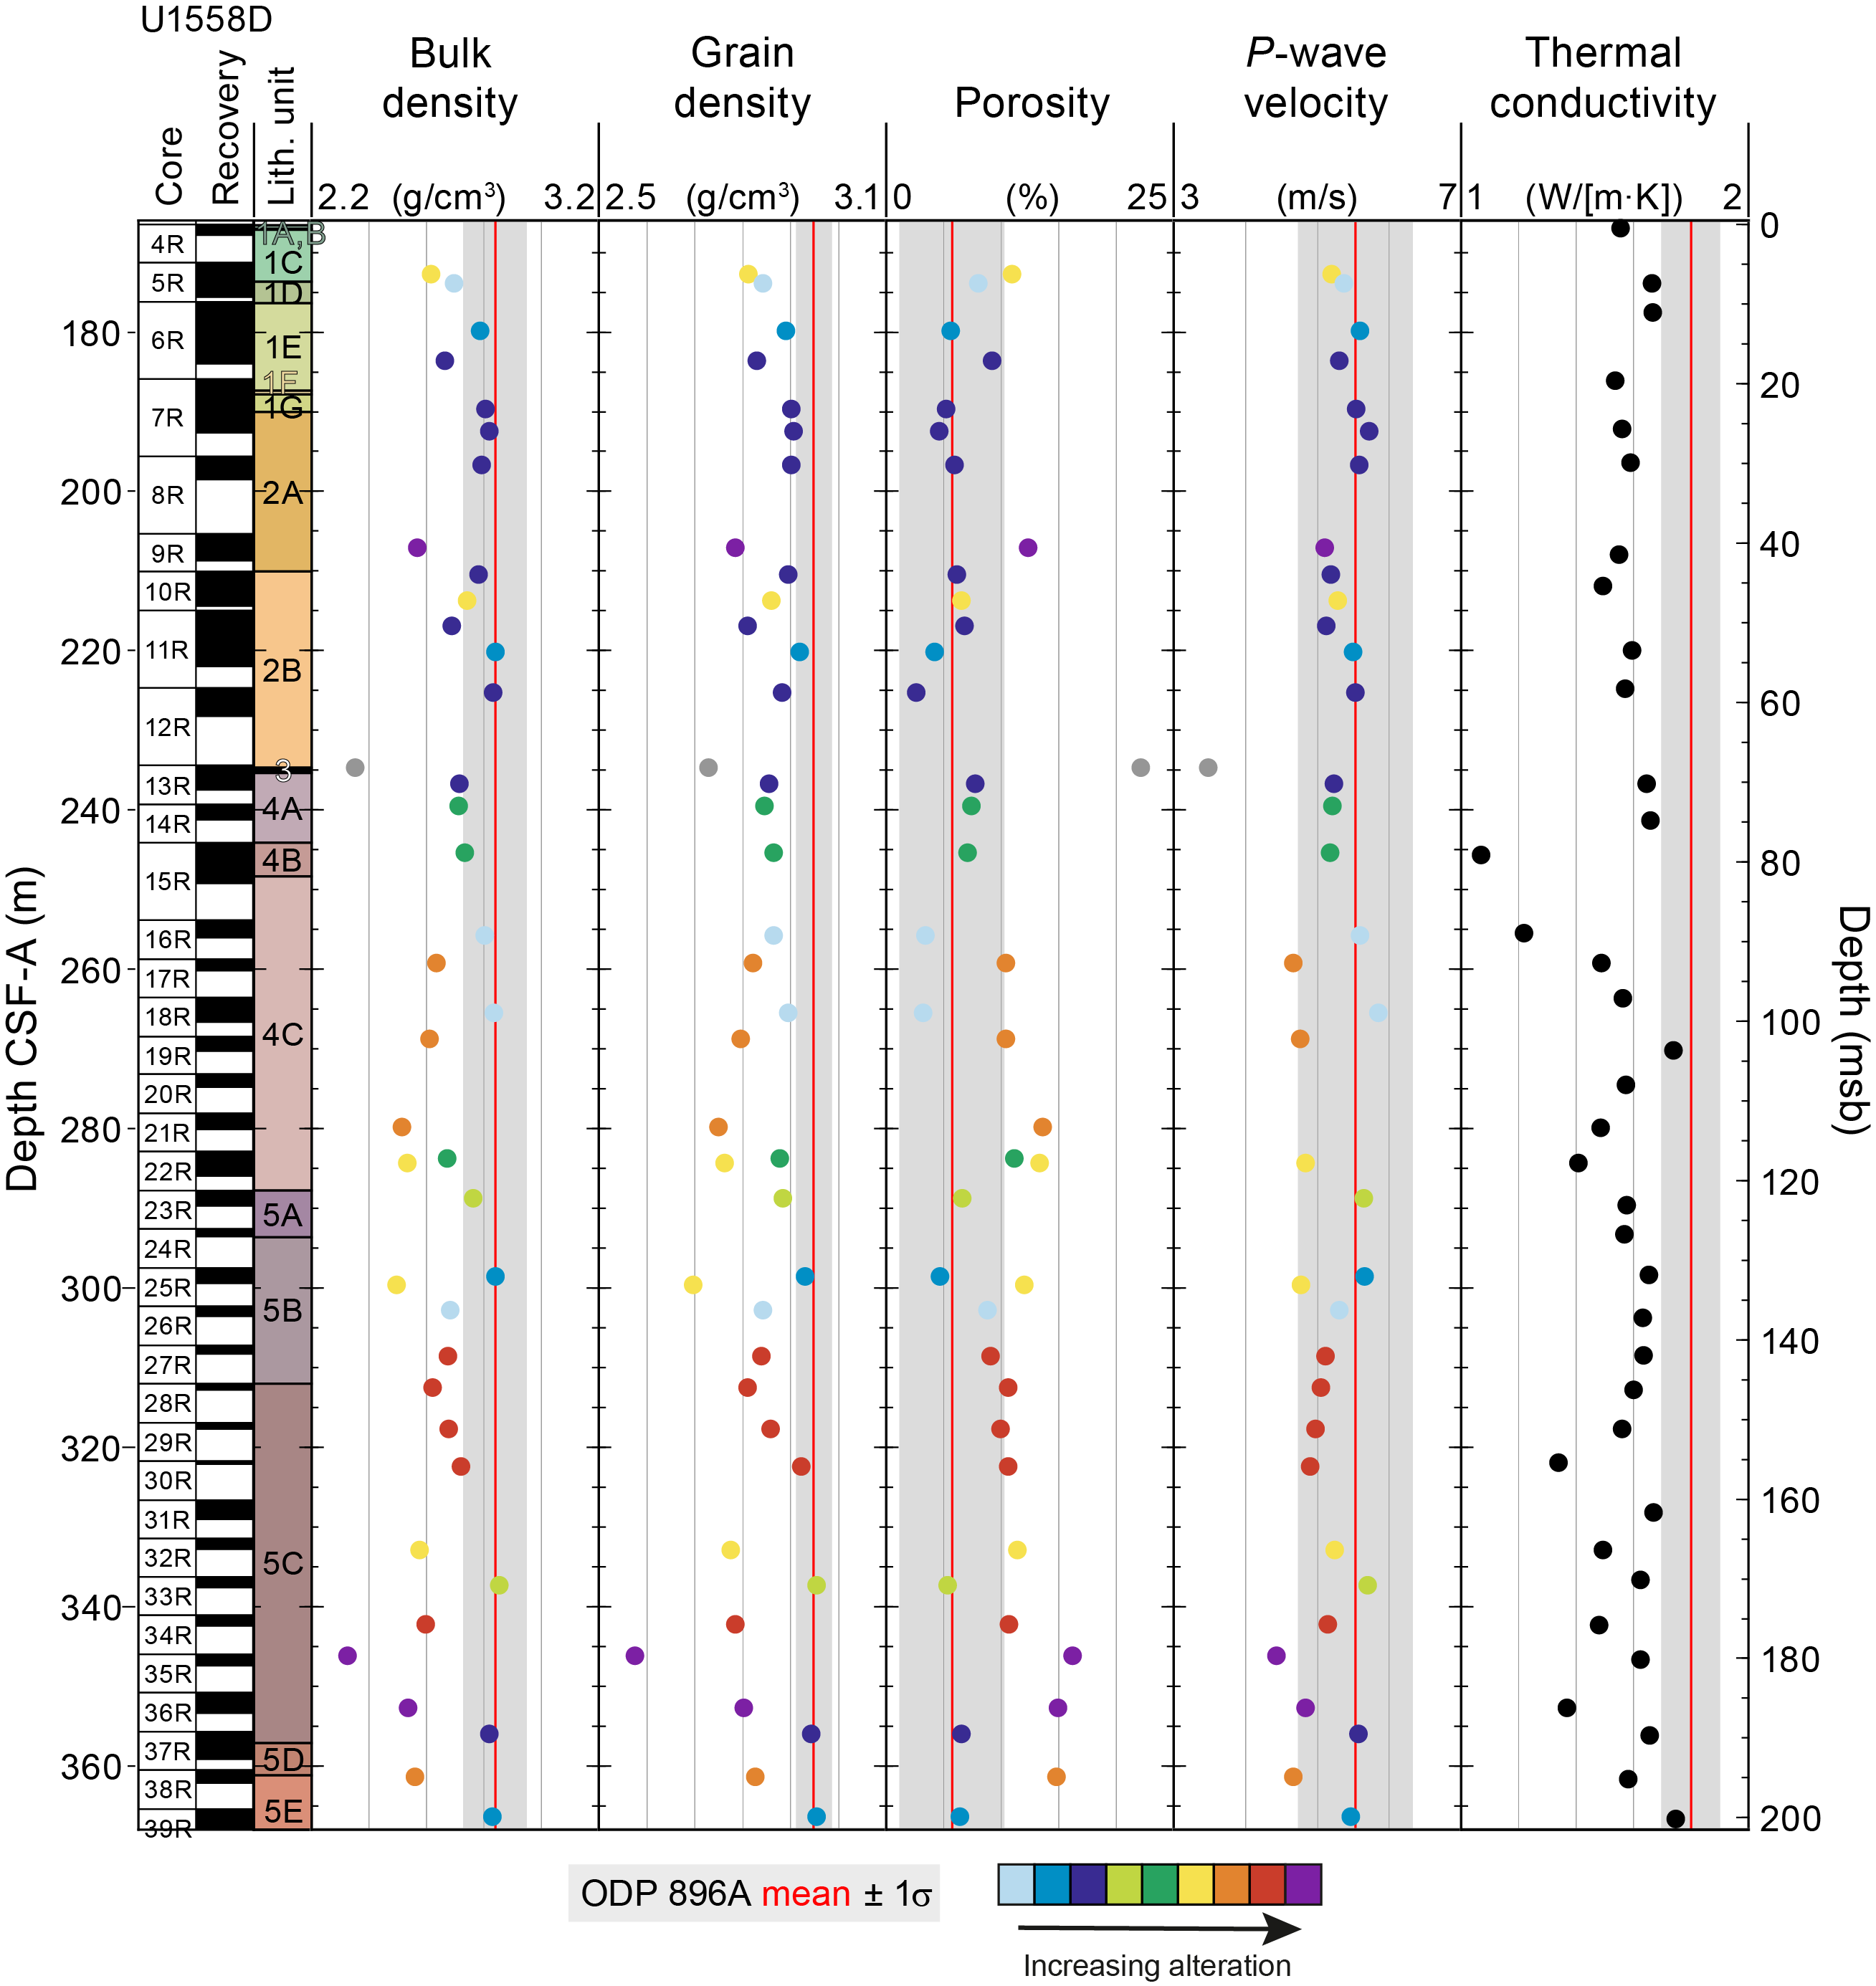
Figure F99. Discrete sample properties, Hole U1558D vs. Hole 896A.
11. Geochemistry
11.1. Sediment
11.1.1. Interstitial water and mudline sampling
From sediment cored in Holes U1558A, U1558D, and U1558F, IW was extracted via squeezing whole-round sediment cores under laboratory atmosphere (see Geochemistry in the Expedition 390/393 methods chapter [Coggon et al., 2024b]). Mudline water samples were collected from both Holes U1558A and U1558F. During Expedition 390C, squeezed IW was collected once per core from Cores 390C-U1558A-1H through 11H and 18X and twice per core from Cores 13X–17X; no IW was extracted from Core 12X. During Expedition 393, IW samples were collected once per core from Cores 393-U1558F-11F through 19F and 1H and twice per core from Cores 2H–10H and Cores 20X–24X. One IW sample was collected in Hole U1558D (Core 393-U1558D-2R). A total of 23, 1, and 37 IW samples were taken from Holes U1558A, U1558D, and U1558F, respectively (Table T34). Splits of squeezed IW and solid residue (squeeze cake) samples were saved for shipboard analyses and postexpedition research.
During Expedition 393, Rhizon samplers were also used to collect in situ interstitial waters from Hole U1558F prior to core splitting (see Geochemistry in the Expedition 390/393 methods chapter [Coggon et al., 2024b]). Fluid sampling was performed from Sections 1–6 (full cores) or 1–3 (half cores) in both APC and XCB cores. Volume yields ranged from 0 to ~21 mL, with particularly high volumes recovered for a number of XCB core sections (393-U1558F-20X-3, 20X-4, 21X-4, 22X-3, 22X-5, 23X-4, 23X-5, 24X-2, 24X-3, and 24X-4), likely resulting from drill fluid contamination. A total of 90 Rhizon IW samples were collected from Sections 1H-1 through 24X-5 and subsampled for postexpedition work (Table T34). A total of 17 Rhizon samples from Cores 1H–10H were analyzed shipboard during Expedition 393 to supplement and compare with IW pore water measurements. A small split (~0.5 mL) was allocated for these shipboard analyses, which included measurements of major cations (Na, Mg, K, and Ca) and anions (Cl, Br, and SO4) by ion chromatography (IC). No Rhizon samples were collected during engineering Expedition 390C. For Hole U1558F, oxygen was measured after the cores were run through the STMSL roughly within 30 min of the core arriving on the catwalk (see Geochemistry in the Expedition 390/393 methods chapter [Coggon et al., 2024b]). No in situ analyses of oxygen were performed during Expedition 390C.
Tables T34, T35, and T36 present all shipboard pore water and sediment analyses from Site U1558 collected during Expeditions 390C and 393, with selected concentration profiles illustrated in Figures F100, F101, F102, F103, F104, and F105. Although major cations (Na, Mg, K, and Ca) are measured by both IC and ICP-AES techniques, all plotted data correspond to IC values (see Geochemistry in the Expedition 390/393 methods chapter [Coggon et al., 2024b]). Reported errors are based on replicate measurements of the International Association for the Physical Sciences of the Oceans (IAPSO) seawater (for IC and ICP-AES) and IODP in-house (for ICP-AES and UV-Vis) standards. Instrumental detection limits are estimated as three times the standard deviation of blanks (Table T9 in the Expedition 390/393 methods chapter [Coggon et al., 2024b]).
The composition of the mudline sample (i.e., bottom seawater, 0 m CSF-A) from Hole U1558A was offset from the expected values (based on the IAPSO standard) for a number of analytes that are known to be homogeneous in the ocean (Na, Mg, Sr, Cl, and SO4). To resolve this discrepancy, a mudline correction factor was applied to the Expedition 390C data. For each analyte, this correction factor was calculated from the ratio between the expected bottom seawater concentration and the measured mudline value from Expedition 390C. These corrections resulted in changes (Δ, reported here in percent) beyond analytical precision for elements measured by IC (ΔSO4 = +3.4%, ΔCl = +2.1%, ΔNa = +1.8%, and ΔMg = +1.7%) and ICP (ΔSr = −6.4%). The corrected values show overall excellent agreement with data from Expedition 393. For the analytes that yield significant offsets between raw and corrected values, both data sets are plotted in Figures F100, F101, F102, F103, and F104 (light blue = raw values; dark blue = "mudline corrected" values) and reported in Table T34. No bromide data are plotted or reported from Hole U1558A because of poor IC recovery rates during Expedition 390C (as low as 86% for Br).
11.1.2. Measurement results of water samples
11.1.2.1. Salinity, sodium, chloride, and bromide
Mudline (i.e., bottom seawater, 0 m CSF-A) and pore water salinity in Holes U1558A and U1558F are largely uniform at the seawater value (35), with a few outliers both below (34, n = 2) and above (36, n = 3) this baseline (Table T34). The uppermost ~30 m of sediment in Hole U1558F shows a sharp increase (2.3%–2.5%) in pore water Na (479 to 491 mM), Cl (557 to 571 mM), and Br (0.84 to 0.86 mM) concentrations (Figure F100), although Na/Cl and Br/Cl ratios remain indistinguishable from those in seawater (0.86 and 1.5 × 10⁻³, respectively). Similar patterns are observed for Na (481 to 490 mM) and Cl (559 to 573 mM) in Hole U1558A. There is excellent agreement between shipboard analyses of squeezed IW and Rhizon-collected fluid samples for Na, Cl, and Br concentrations, and there appears to be no significant sampling bias for these elements (Figure F100; cf. Miller et al., 2014).
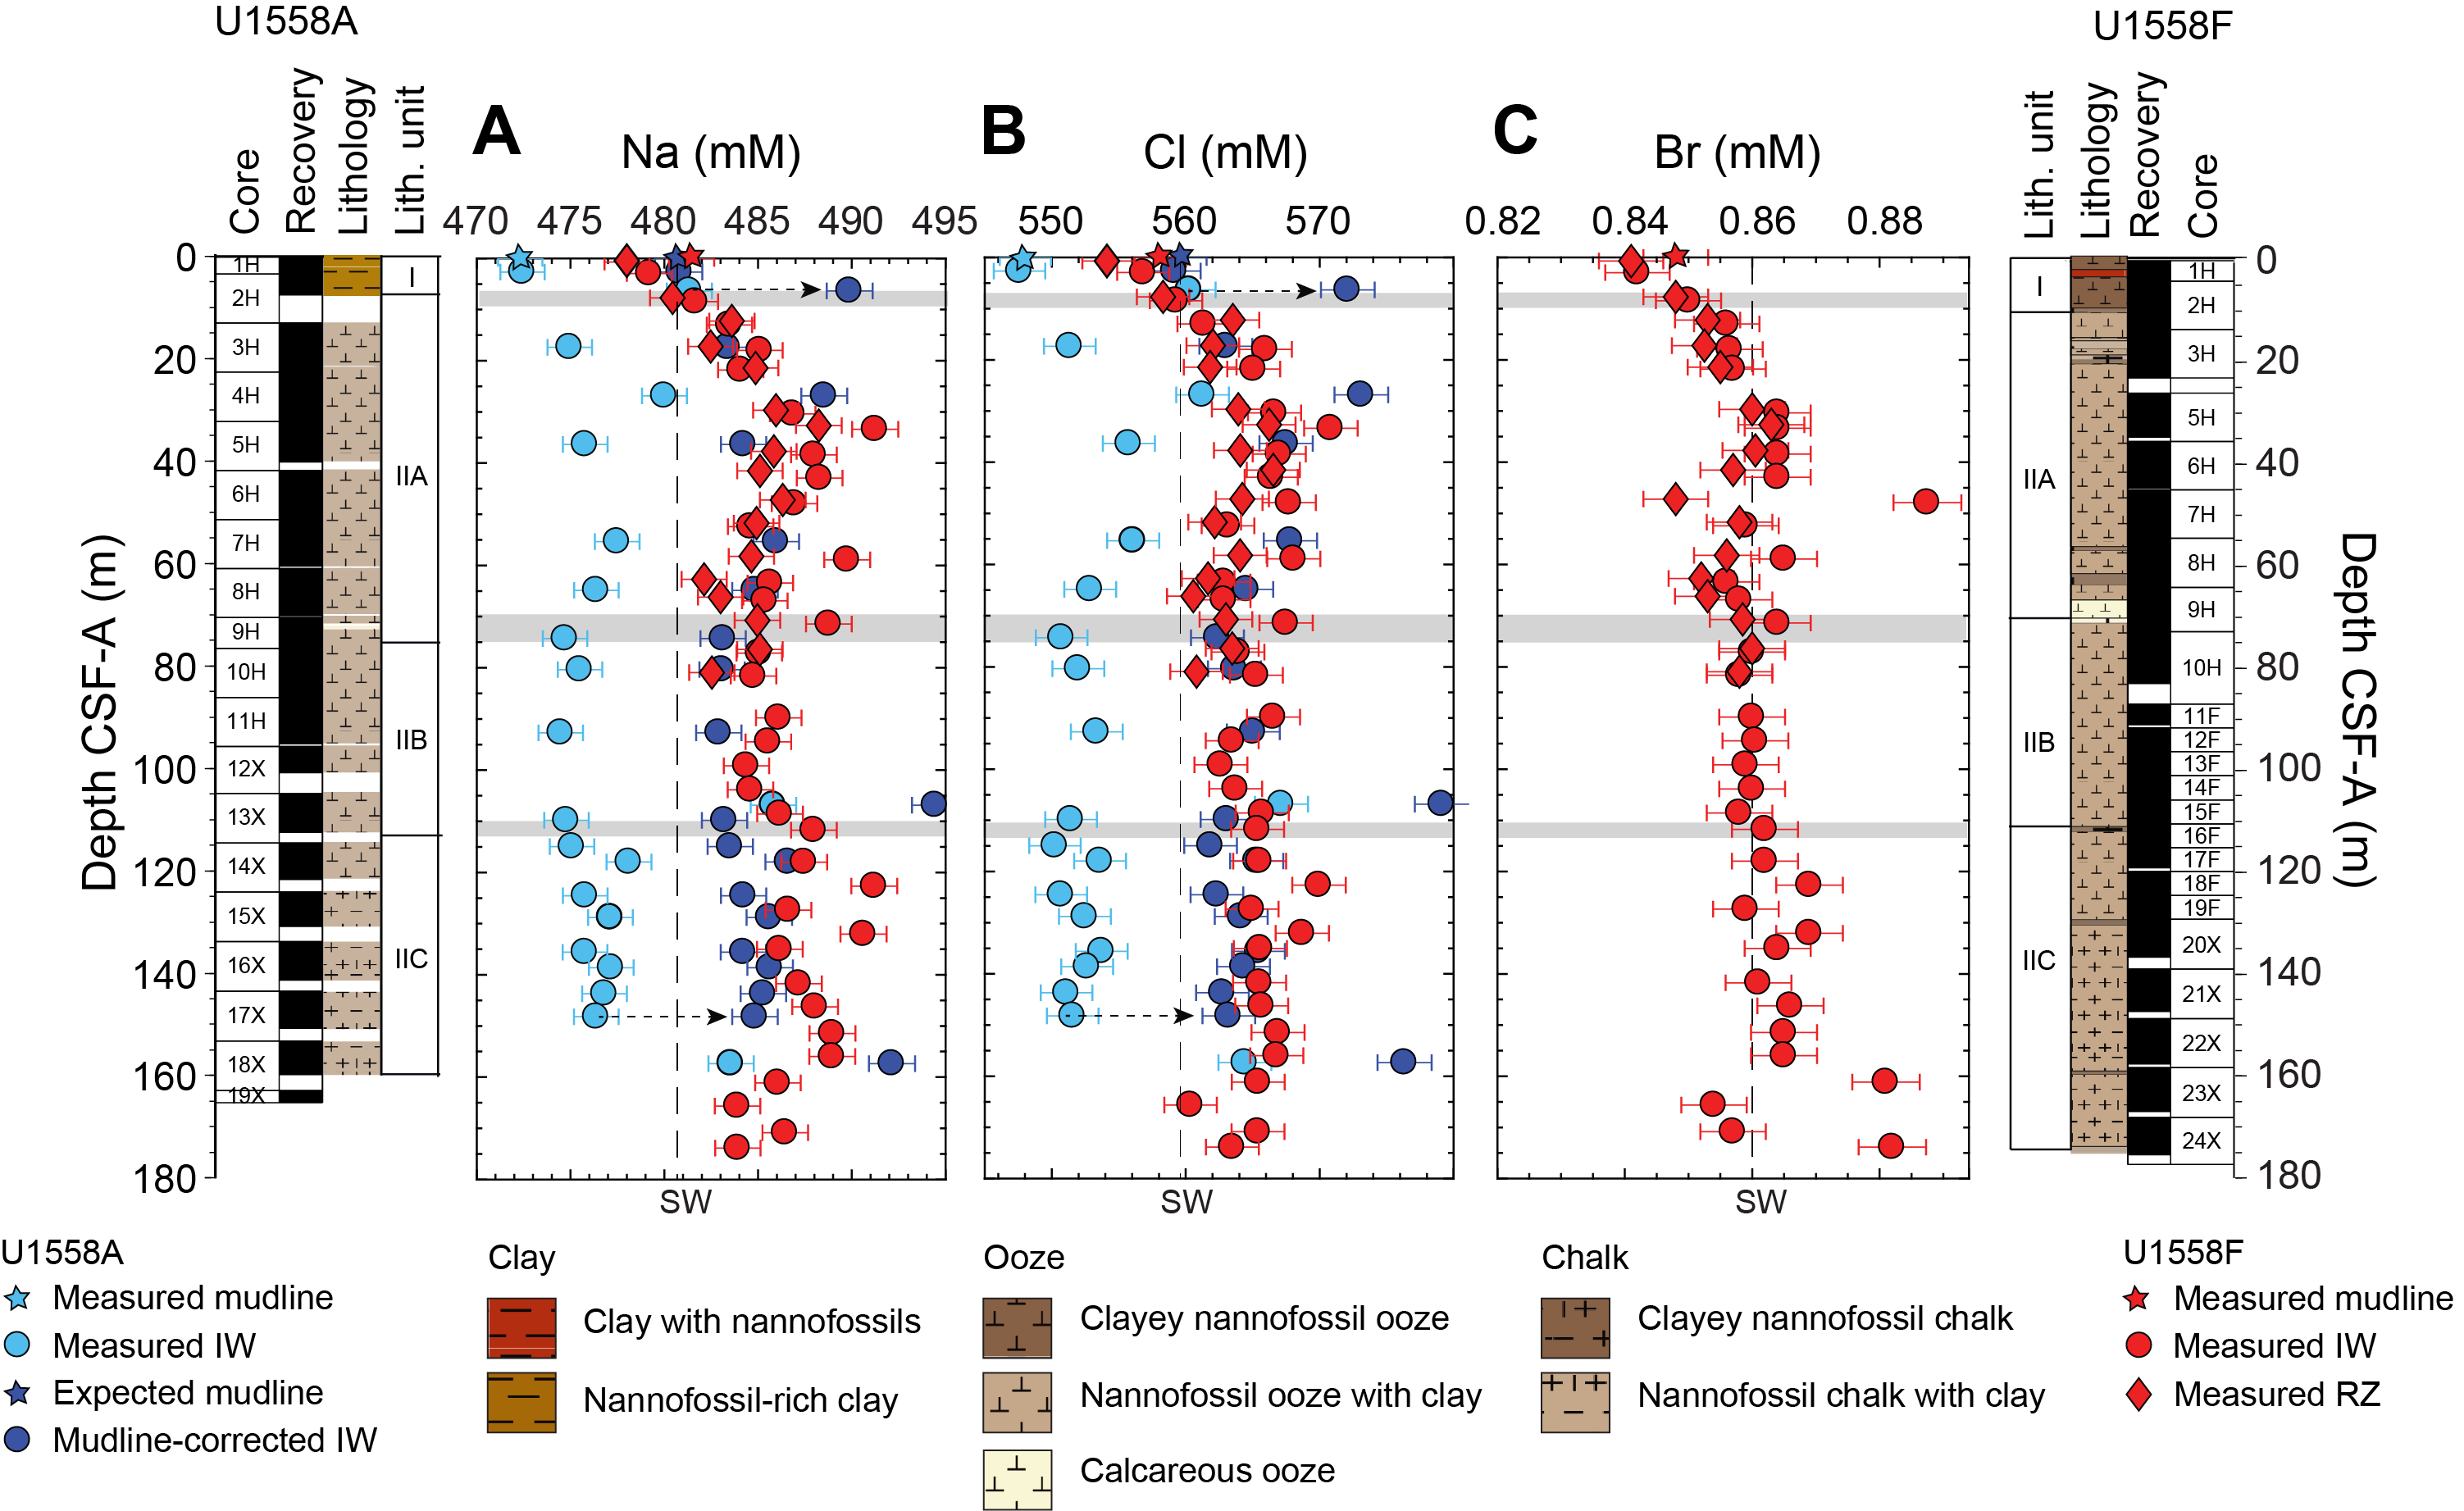
Figure F100. IW sodium, chloride, and bromide.
11.1.2.2. pH and alkalinity
Mudline (0 m CSF-A) pH values in Holes U1558A (7.8) and U1558F (7.6) are offset by 0.2 pH units but are mostly within error of the pH range (7.6–7.7) observed for the deep South Atlantic Ocean waters (~31°S; Ríos et al., 2015) (Figure F101A). Measured pH values tend to be higher in Hole U1558A (7.5–7.8) than in Hole U1558F (7.5–7.7) for any given depth. In both holes, pH decreases in Unit I (nannofossil-rich clay), and deeper values remain roughly constant throughout most of the sediment column, with the exception of a potential outlier in Hole U1558F (pH = 7.9 at 146.25 m CSF-A). The deepest sample in Hole U1558F (173.86 m CSF-A) increases back to the bottom seawater pH values reported for this latitude (7.6–7.7; Ríos et al., 2015).
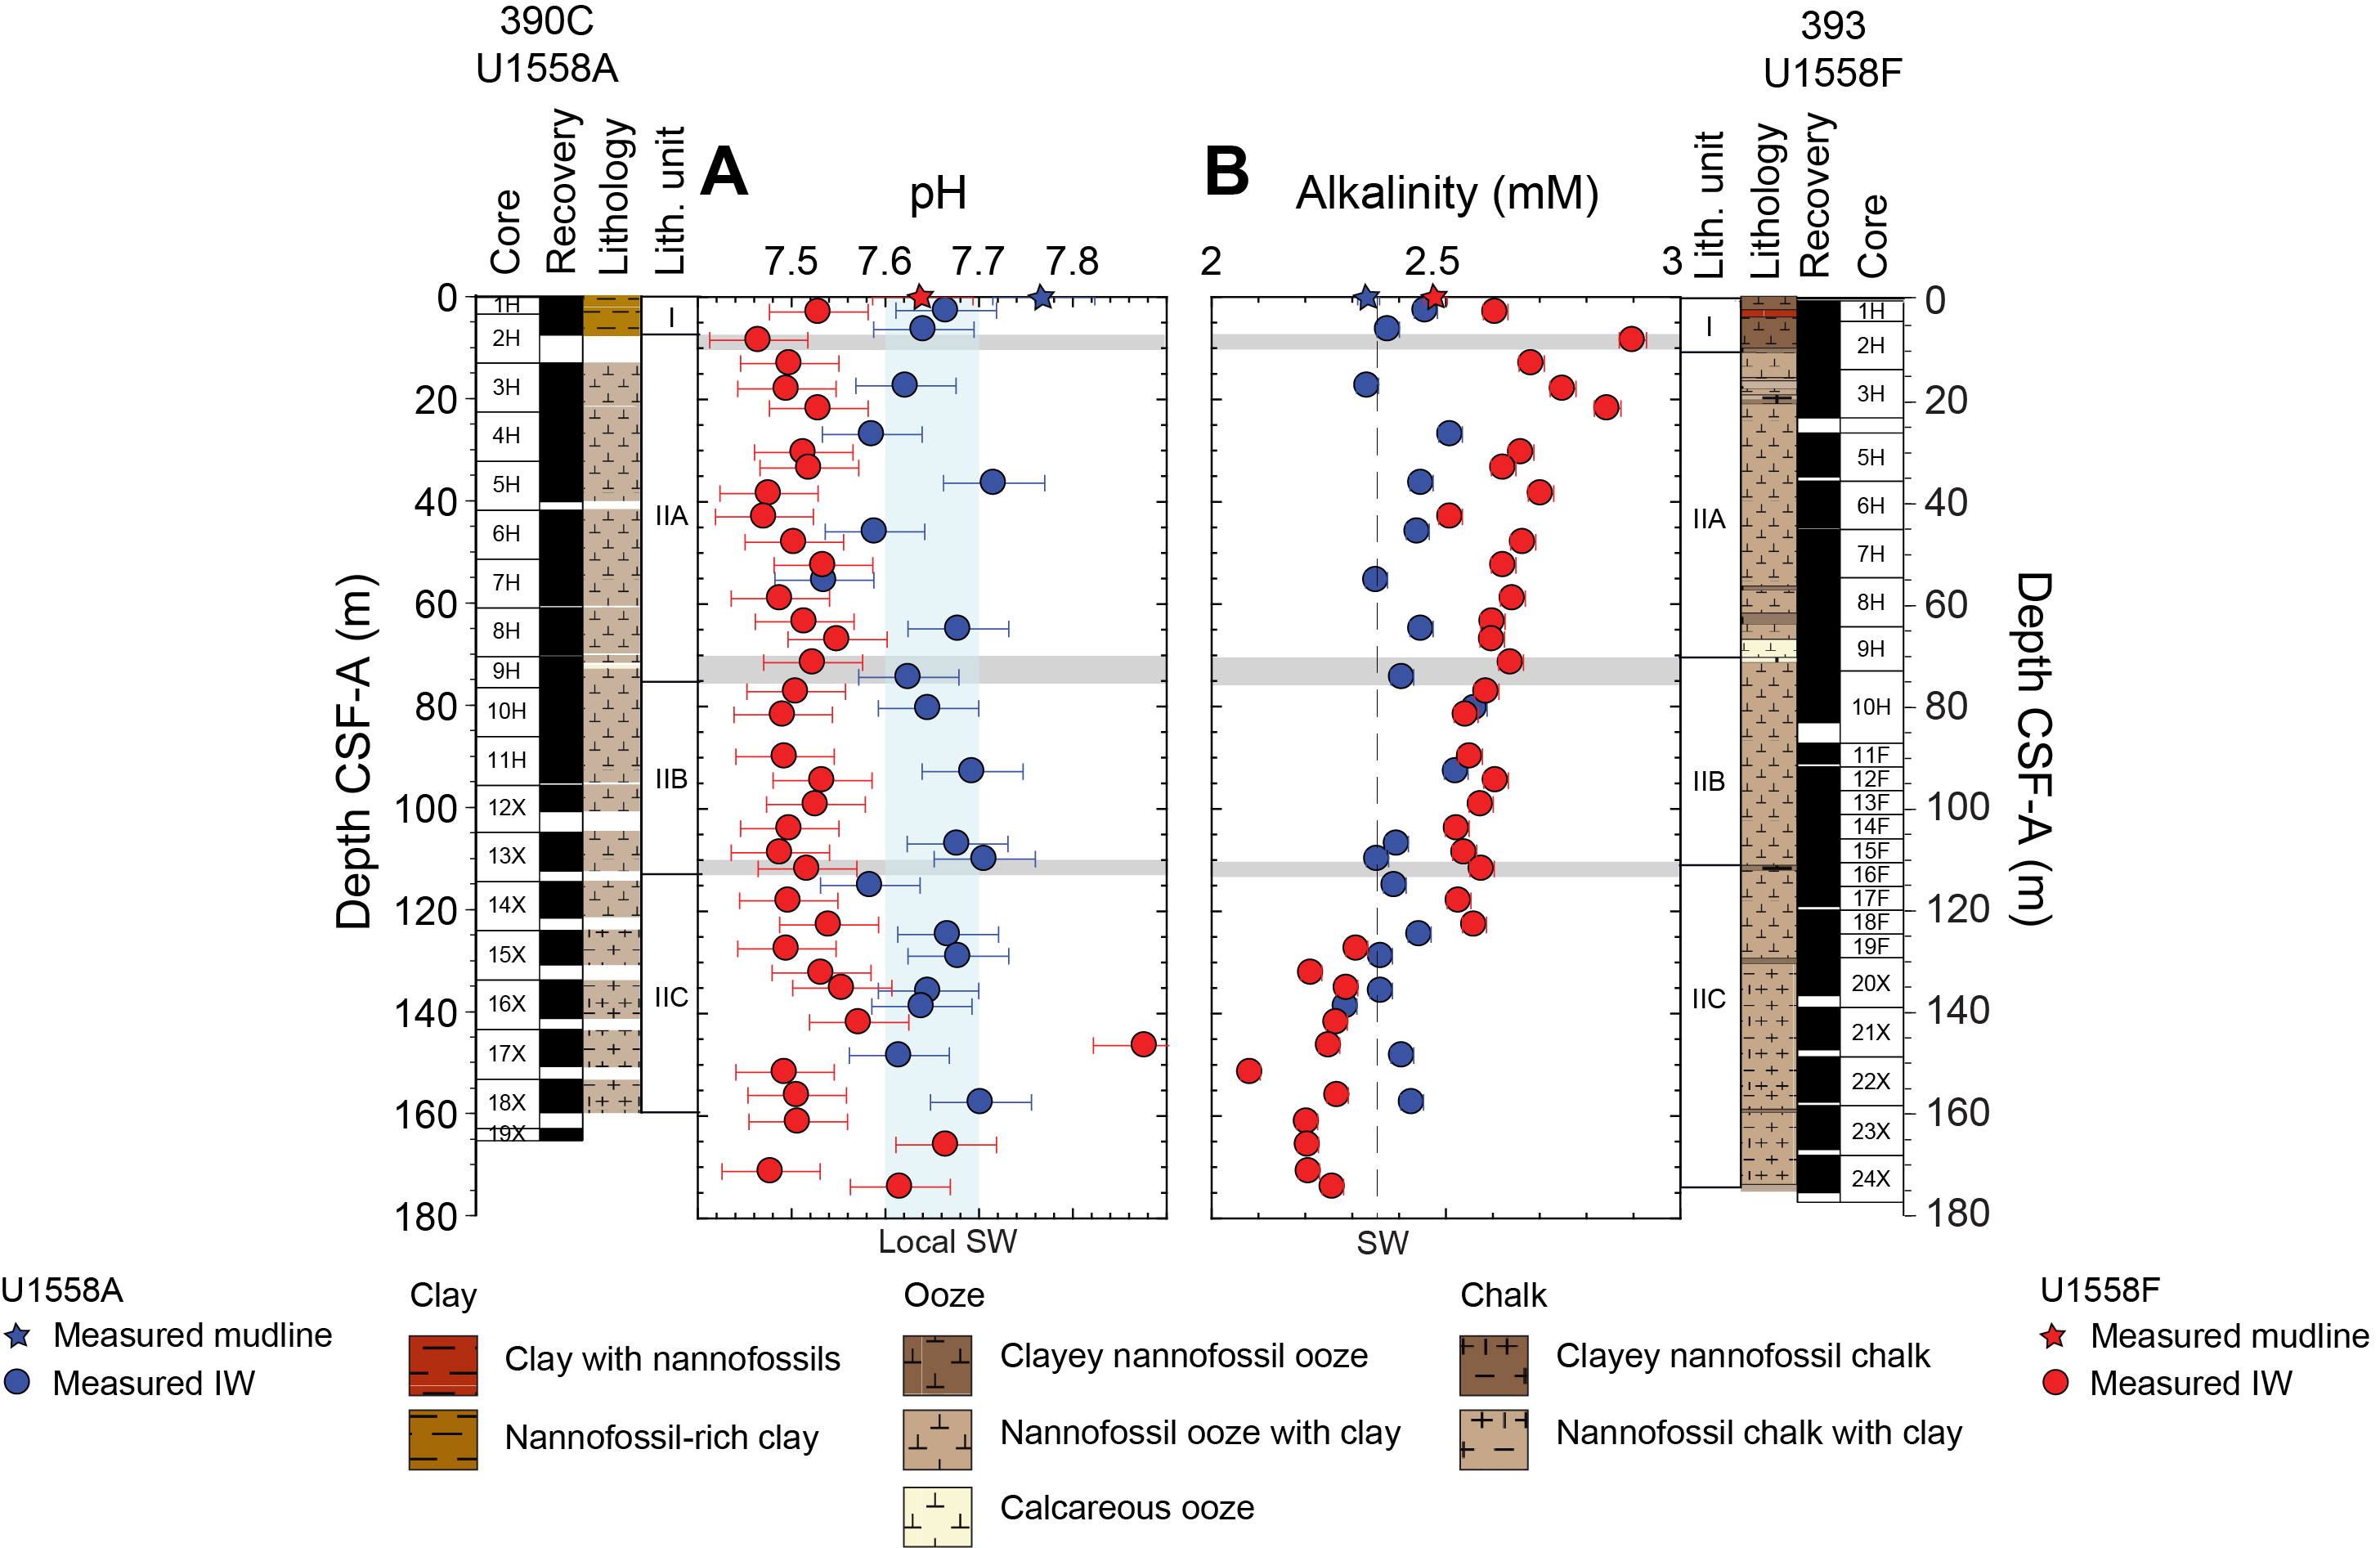
Figure F101. IW pH and alkalinity.
Mudline values for alkalinity are distinct between Holes U1558A (2.3 mM) and U1558F (2.5 mM). In Hole U1558A, alkalinity varies by ~12% with a minimum of 2.3 mM (138.6 m CSF-A; Subunit IIC, nannofossil chalk with clay and volcaniclastics) and a maximum value of 2.6 mM (80.36 m CSF-A; Subunit IIB, nannofossil chalk with clay), but there is no discernible pattern with depth (Figure F101B). In contrast, alkalinity in Hole U1558F increases from 2.5 to 2.9 mM (~17%) in the uppermost ~10 m (Unit I, nannofossil-rich clay), and remains high (2.7–2.8 mM) at the top of Unit IIA (nannofossil ooze with clay; 10–20 m CSF-A) before gradually decreasing to 2.6 mM at 122.66 m CSF-A (Subunits IIA, nannofossil ooze with clay, and IIB). The increase in alkalinity in Unit I coincides with overall decreases in Ca, Mg, Sr concentrations, and Sr/Ca ratios below their respective seawater values (Figure F102), suggesting possible precipitation of authigenic carbonate (e.g., Kastner, 1999; Turchyn et al., 2021). Within Subunit IIC in Hole U1558F, pore water alkalinity decreases sharply from 2.6 mM (122.66 m CSF-A) to 2.3 mM (127.35 m CSF-A), and again gradually below ~127 m CSF-A (values range between 2.1 and 2.3 mM; Figure F101B). Alkalinity values in Hole U1558A are generally lower than those observed in Hole U1558F, with the exception of the interval below ~125 m CSF-A. Below that interval, measured values in Hole U1558F drop below seawater and remain lower than those measured in Hole U1558A.
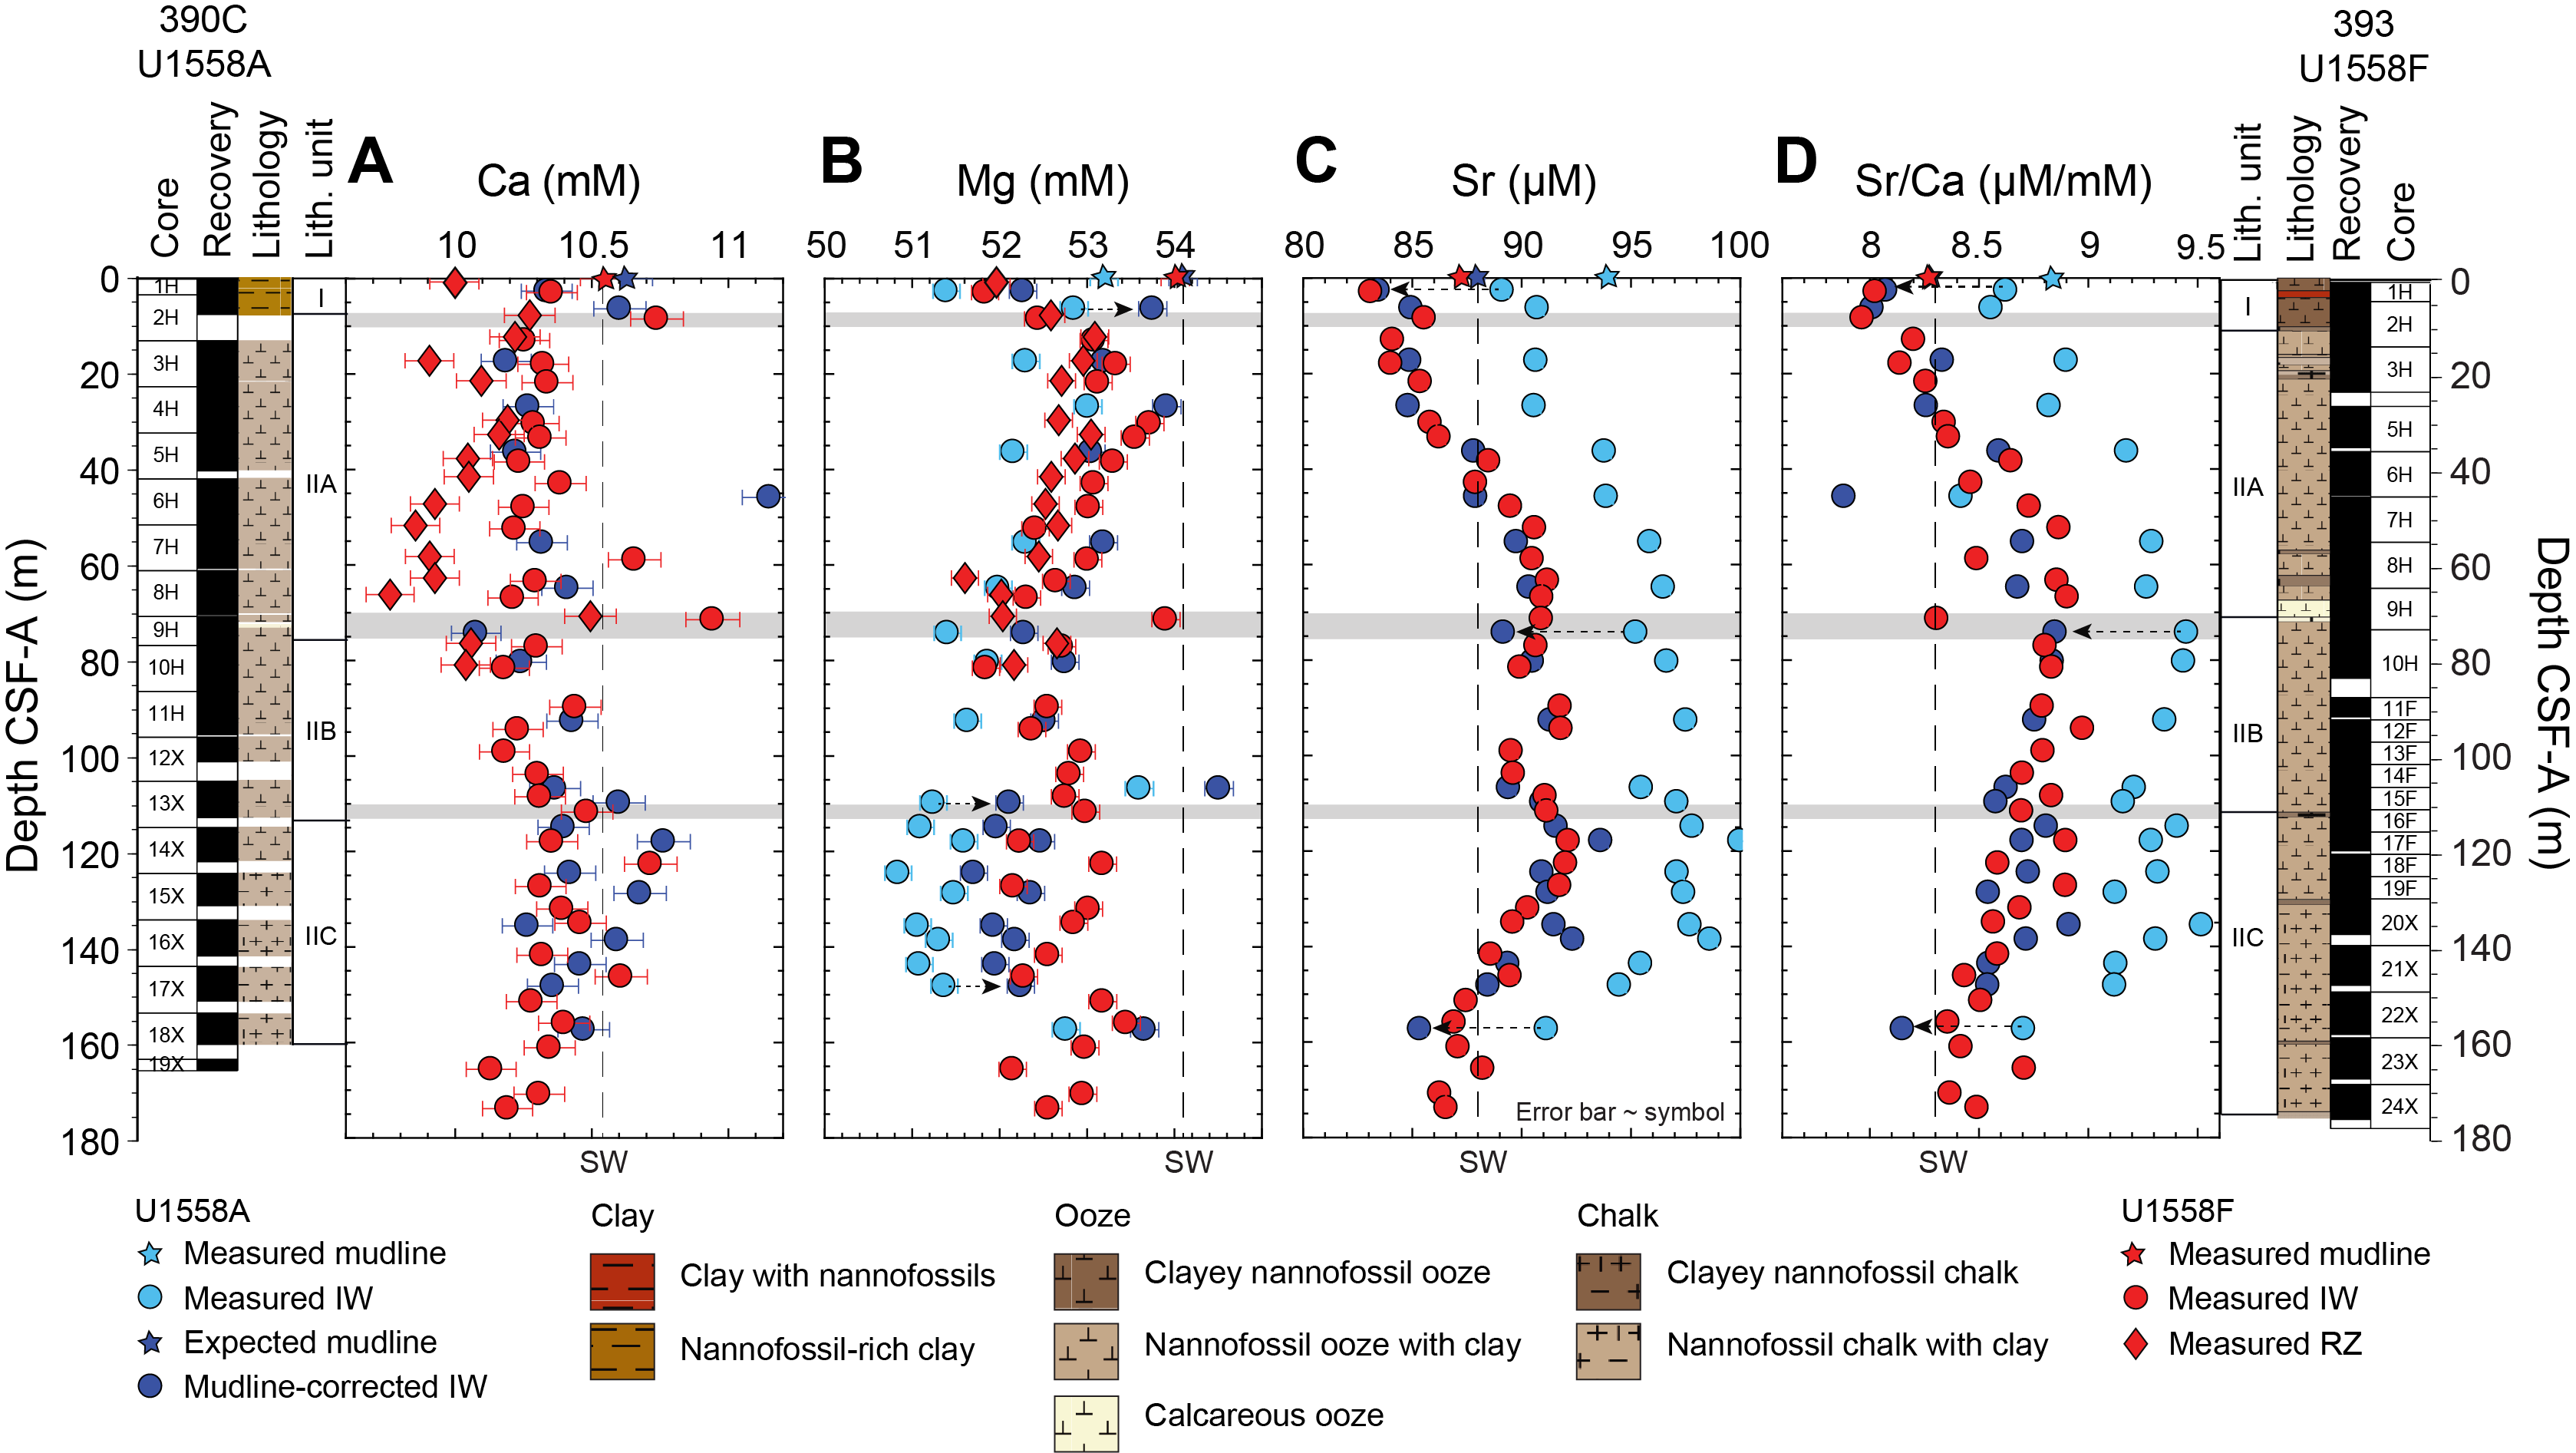
Figure F102. IW calcium, magnesium, strontium, and Sr/Ca ratios.
11.1.2.3. Calcium, magnesium, strontium, and Sr/Ca
Pore fluid Ca concentrations in Holes U1558A (10.1–11.2 mM) and U1558F (10.1–10.9 mM) follow similar trends (Figure F102A). Between 0 and ~20 m CSF-A in both holes (Unit I, nannofossil-rich clay, and the top of Subunit IIA, nannofossil ooze with clay), measured Ca concentrations in IW samples gradually decrease from the mudline value (10.6 mM in Hole U1558A and 10.5 mM in Hole U1558F, 0 m CSF-A) to 10.2 mM in Hole U1558A (17.36 m CSF-A) and 10.3 mM in Hole U1558F (17.96 m CSF-A). In Subunits IIA (nannofossil ooze with clay) and IIB (nannofossil chalk with clay), Ca concentrations in Holes U1558A (10.1–11.2 mM) and U1558F (10.2–10.9 mM) remain mostly below the seawater value (10.6 ± 0.4 mM, 2σ, n = 55) and do not vary systematically. In Hole U1558A, Subunit IIC (nannofossil chalk with clay and volcaniclastics) shows an overall increase in Ca concentrations with an average value (10.5 ± 0.3 mM, 2σ, n = 9) that is indistinguishable from the seawater Ca content. Although pore fluids from Hole U1558F also move toward seawater-like compositions in Subunit IIC (10.3–10.7 mM), values drop slightly (10.1–10.3 mM) below ~160 m CSF-A.
Mg concentrations decrease from 54.1 (2σ = 0.6, n = 2) to 52.3 mM (Hole U1558A; mudline corrected values) and from 54.0 to 51.8 mM (Hole U1558F) within the uppermost ~5 m of sediment in both holes (Figure F102B). Between 5 and ~30 m CSF-A, values increase to 53.9 mM in Hole U1558A and 53.7 mM in Hole U1558F. Below ~30 m CSF-A, concentration trends vary between the two holes. In Hole U1558A, pore fluid Mg concentrations show a broad decrease from 54.0 to 52.2 mM between ~30 and 150 m CSF-A. The Mg content of the lowermost sampled pore fluid from Hole U1558A is measurably higher at 53.7 mM (2σ = 0.6, n = 2). In Hole U1558F, Mg concentrations smoothly decrease from 53.7 to 53.0 mM between ~30 and 50 m CSF-A. Below ~50 m CSF-A, values remain lower than in seawater ([Mg]SW = 53.9 mM ± 0.7, 2σ, n = 55), ranging between 51.8 and 53.9 mM and showing no strong trend with depth.
Pore fluid Sr concentrations decrease at the top of Unit I (nannofossil-rich clay) from 88.0 to 83.2 µM in Hole U1558A (0–2.66 m CSF-A; mudline corrected) and from 87.2 to 83.1 µM in Hole U1558F (0–2.95 m CSF-A) (Figure F102C). Following this initial drop, Sr values broadly increase to 93.6 µM (117.95 m CSF-A; Hole U1558A) and 92.2 µM (117.97 m CSF-A; Hole U1558F) across Subunits IIA (nannofossil ooze with clay) and IIB (nannofossil chalk with clay). In Subunit IIC (nannofossil chalk with clay and volcaniclastics), Sr values again decrease, reaching 85.4 ± 1.6 µM in Hole U1558A (2σ, n = 2; 157.35 m CSF-A) and 86.6 µM in Hole U1558F (173.86 m CSF-A). Sr/Ca ratios broadly reproduce the trends observed in Sr concentrations in both holes (Figure F102D). In the uppermost ~20 m of sediment, pore water Sr/Ca ratios drop below the seawater value (8.3 µm/mM) and the lowest measured ratios (8.0 µm/mM; 6.35 m CSF-A in Hole U1558A; 8.46 m CSF-A in Hole U1558F) correspond to local minima in Ca, Mg, and Sr concentrations in both holes. Sr/Ca ratios increase across Subunit IIA, reaching local maxima (8.9 µm/mM) at the boundary between Subunits IIA and IIB (74.30 m CSF-A in Hole U1558A; 66.91 m CSF-A in Hole U1558F). Values remain above the seawater Sr/Ca ratio in Subunit IIB before decreasing again at the top of Subunit IIC.
Despite the lack of strong correlations between the Ca, Mg, and Sr profiles at Site U1558, the changes observed here are consistent with diagenetic reactions involving carbonate formation and recrystallization. In Hole U1558A, concomitant decreases in Ca, Mg, and Sr concentrations in Unit I (nannofossil-rich clay) may indicate the formation of authigenic carbonates. In Hole U1558F, the lower Ca, Mg, and Sr concentrations also coincide with higher pore water alkalinity, which favors in situ carbonate precipitation (e.g., Hein et al., 1979; Schrag et al., 2013; Turchyn et al., 2021). Throughout Subunits IIA and IIB in both holes, recrystallization from a low-Mg biogenic carbonate, typical of nannofossil ooze, to higher-Mg diagenetic calcite (e.g., Baker et al., 1982; Higgins and Schrag, 2012) may explain some of the observed profile changes. First, Mg substitution into diagenetic carbonates would lead to a decrease in pore fluid Mg contents, which is in line with Mg concentrations that are persistently lower than the seawater value in Subunits IIA and IIB in both holes (Figure F102B). Second, the lower Sr content of diagenetic calcite relative to its biogenic precursor (e.g., Baker et al., 1982) would result in increased pore water Sr/Ca ratios following carbonate recrystallization. Indeed, Sr/Ca ratios are overall higher than the seawater value (8.3 µM/mM) throughout Subunits IIA, IIB, and part of IIC in both holes (Figure F102D).
11.1.2.4. Boron, lithium, silica, and potassium
Very high to moderate concentration increases (relative to the mudline) are observed for B (67%), Li (18%–25%), Si (153%), and K (25%) in Unit I (nannofossil-rich clay) of Holes U1558A and U1558F (Figure F103). Following this initial increase, the pore fluid concentrations of these elements continue to change as a function of depth and sediment composition.
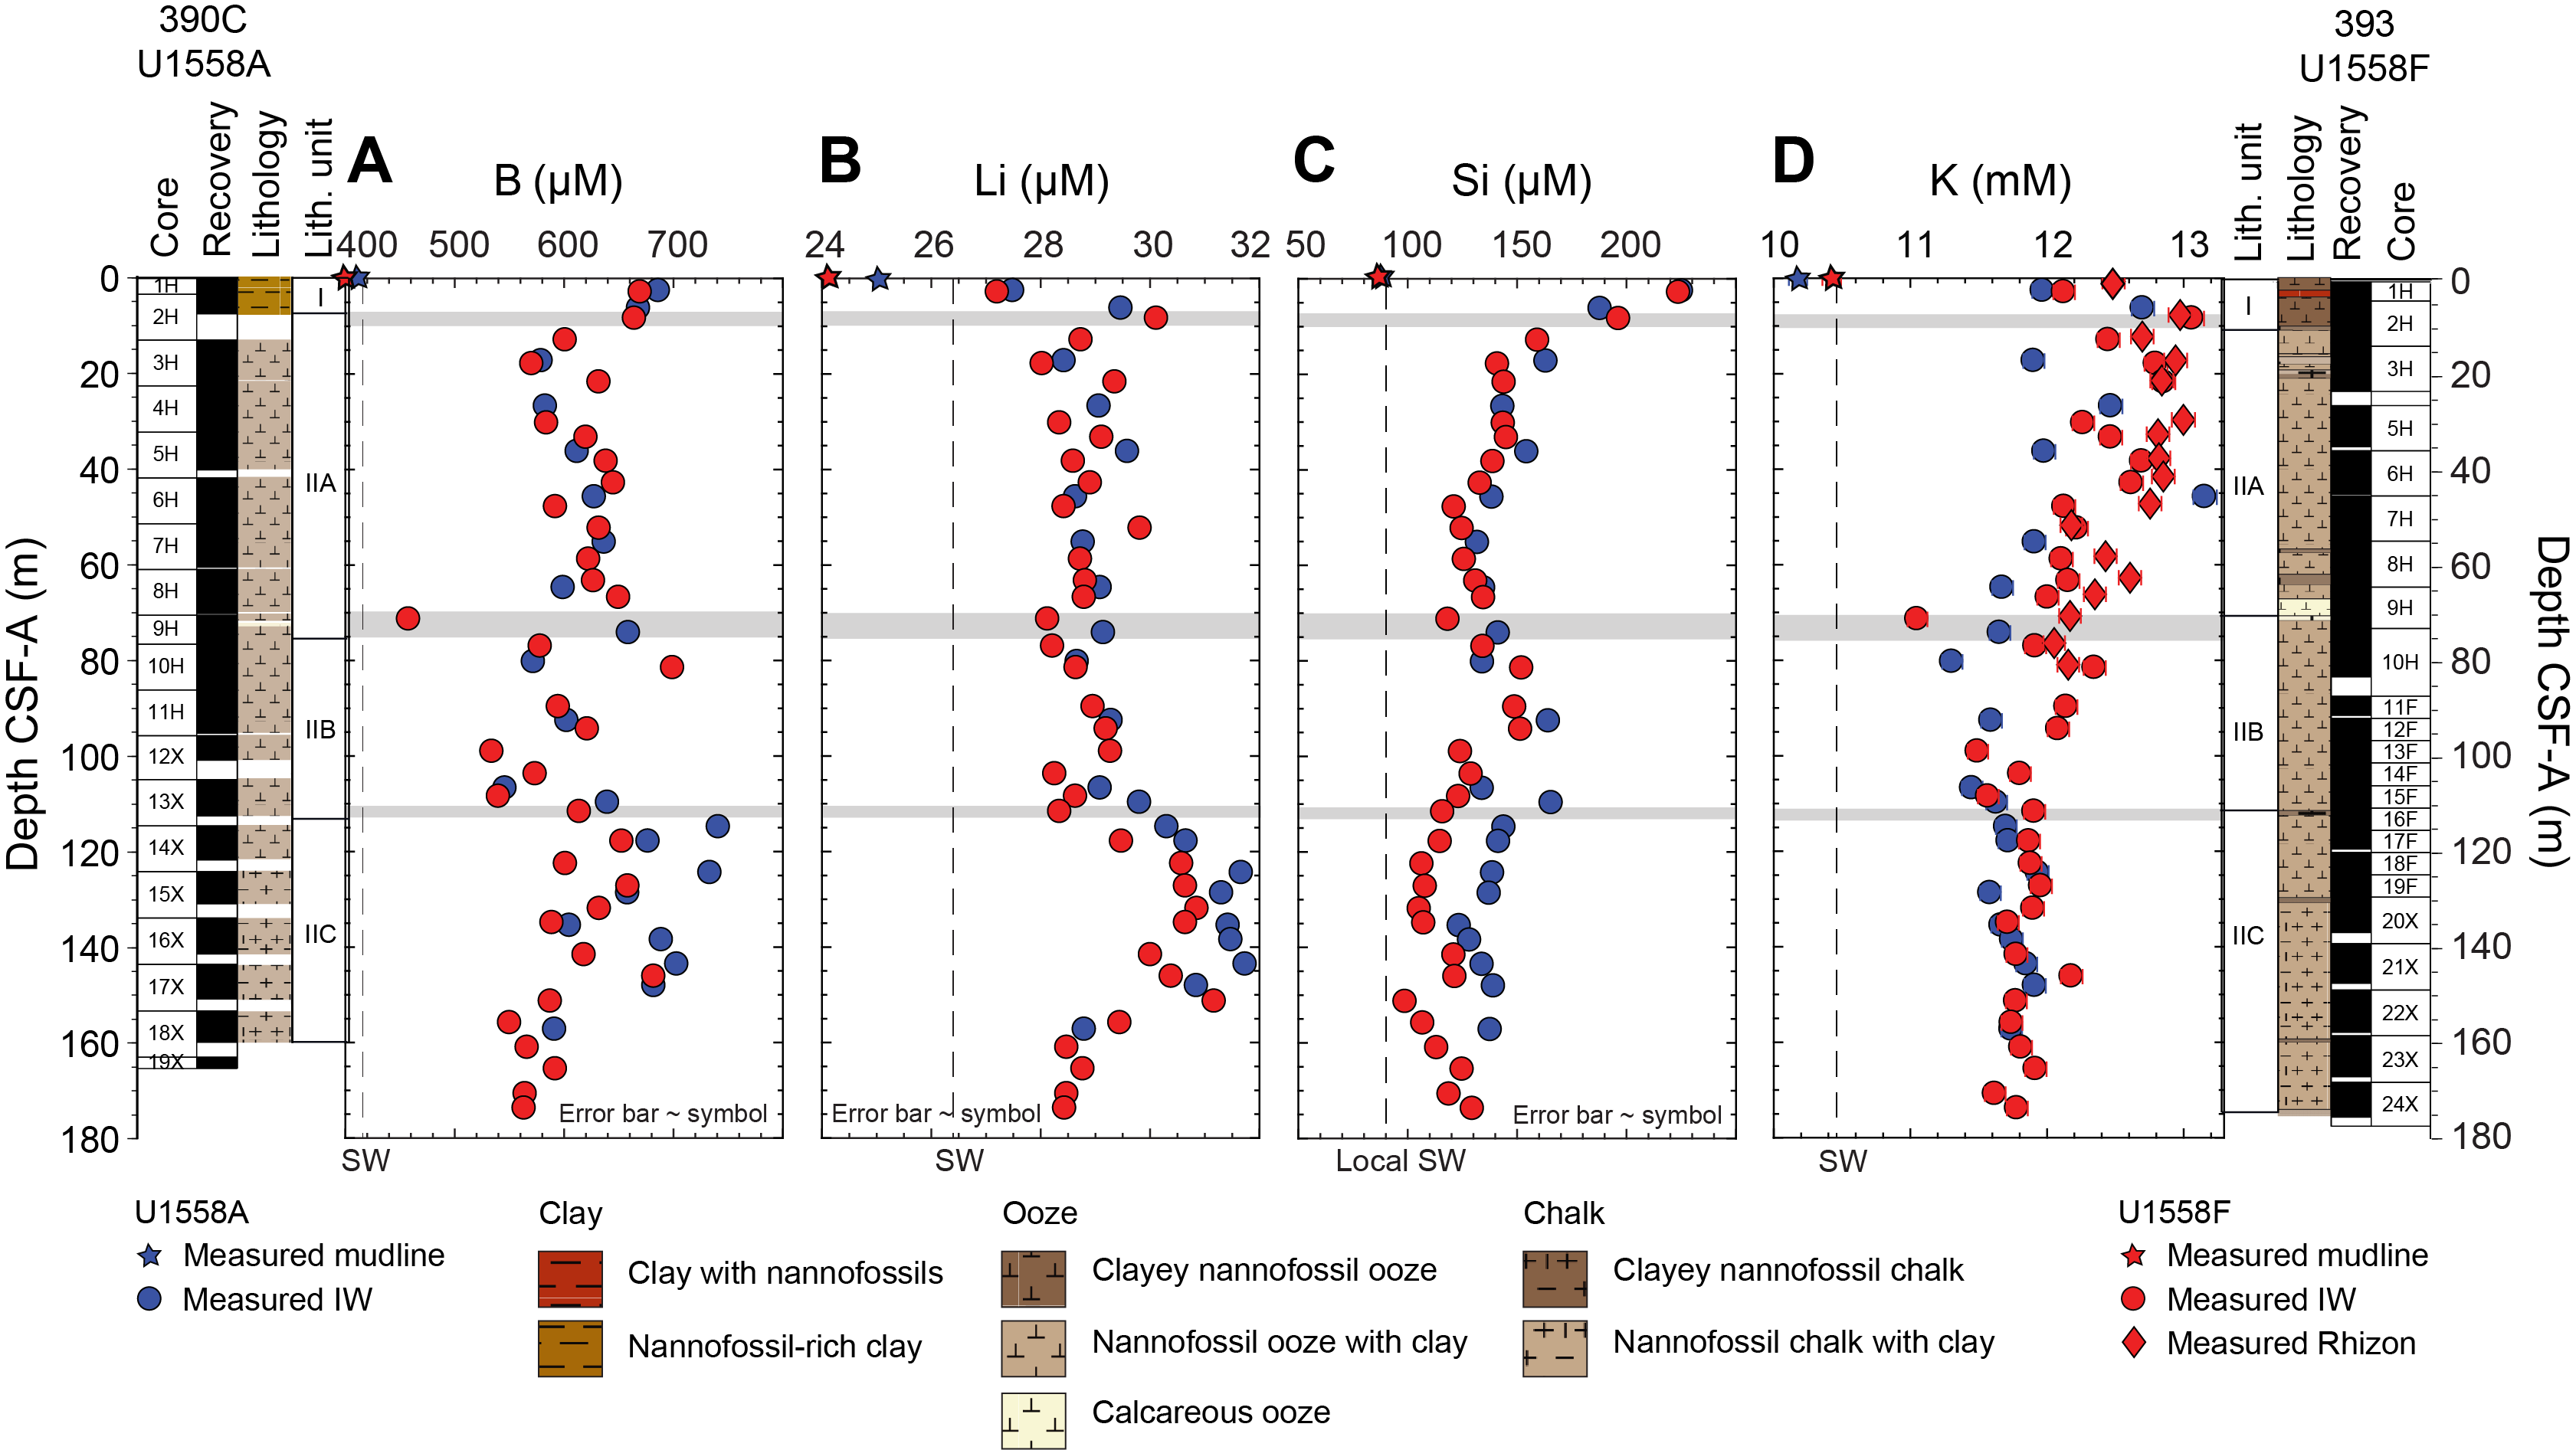
Figure F103. IW boron, lithium, silicon, and potassium.
B concentrations decrease between the nannofossil-rich clay in Unit I (669–687 µM in Hole U1558A; 665–670 µM in Hole U1558F) and the nannofossil ooze with clay in Subunit IIA (580–637 µM in Hole U1558A; 571–651 µM in Hole U1558F) and become more scattered in the nannofossil chalk with clay in Subunit IIB (547–659 µM in Hole U1558A; 458–700 µM in Hole U1558F) (Figure F103A). At the boundary between Subunits IIB and IIC (nannofossil chalk with clay and volcaniclastics), B values increase from 640 to 742 µM in Hole U1558A and from 541 to 615 µM in Hole U1558F, remaining high throughout Subunit IIC. In Hole U1558F, B concentrations decrease below 150 m CSF-A, ranging 551–593 µM (Figure F103A).
Pore-fluid Li concentrations also decrease between Unit I and Subunit IIA, but values remain fairly uniform (~28.0–30.0 µM) across Subunits IIA (nannofossil ooze with clay) and IIB (nannofossil chalk with clay) in both holes (Figure F103B). A smooth increase in Li concentrations is observed within the uppermost 40 m (~110–150 m CSF-A) of Subunit IIC (nannofossil chalk with clay and volcaniclastics; 29.8–31.8 µM in Hole U1558A; 28.4–31.2 µM in Hole U1558F) before concentrations decrease again below 150 m CSF-A (28.8 µM in Hole U1558A; 28.5 µM in Hole U1558F).
Following the sharp increase in Unit I (nannofossil-rich clay), Si concentrations decrease uniformly from ~10 to 70 m CSF-A (Subunit IIA, nannofossil ooze with clay), varying from 163.5 to 135.0 µM in Hole U1558A and from 159.7 to 135.0 µM in Hole U1558F (Figure F103C). The transition from Subunit IIA into IIB (nannofossil chalk with clay; ~65–90 m CSF-A) is marked by an increase in Si concentrations (135.0 to 164.6 µM in Hole U1558A; 135.0 to 151.9 µM in Hole U1558F). In Hole U1558A, measured Si values decrease throughout Subunit IIC (nannofossil chalk with clay and volcaniclastics) between 144 and 138 µM. In Hole U1558F, Si concentrations decrease from ~95 to 140 m CSF-A (151.9 to 107.6 µM) before increasing again toward the bottom of Subunit IIC (from 98.1 to 129.8 µM between 146 and 174 m CSF-A) (Figure F103C).
Pore-fluid K concentrations show a much simpler profile than those observed for B, Li, and Si. Measured K values decrease from 12.7 to 11.6 mM (Hole U1558A) and from 13.1 to 11.6 mM (Hole U1558F) between Unit I (nannofossil-rich clay; ~10 m CSF-A) and the bottom of Subunit IIB (nannofossil chalk with clay; ~110 m CSF-A) (Figure F103D). Throughout Subunit IIC (nannofossil chalk with clay and volcaniclastics), K concentrations are roughly uniform with depth and show great agreement between Holes U1558A (11.8 ± 0.2 mM, 2σ, n = 9) and U1558F (11.8 ± 0.3 mM, 2σ, n = 14) (Figure F103D).
The most significant changes observed in the concentration profiles of B, Li, Si, and K at Site U1558 correspond to the Unit I interval (0–7.48 m CSF-A in Hole U1558A; 0–9.98 m CSF-A in Hole U1558F) and the transition from Subunit IIB to IIC (~110–150 m CSF-A). Based on calcium carbonate measurements of sediments from Hole U1558F (Table T35), Unit I is characterized by relatively low calcite abundance (18–65 wt%) in comparison to Unit II (52–97 wt%) and occurs together with considerable amounts of total clays (27–43 wt%), quartz (4–10 wt%), and K-feldspar (6–9 wt%) (Table T3). Smear slide photomicrographs of Site U1558 sediments also indicate the presence of sponge spicules (i.e., biogenic silica) in Unit I (Figure F14), and gamma ray readings above 40 counts/s are also recorded in this interval (Figure F82). Together, these observations suggest that the concomitant increases in B, Li, Si, and K concentrations in Unit I could result from the combined effects of biogenic silica dissolution, weathering of detrital silicates, and/or ion exchange between clays and pore fluids. Diagenetic reactions involving silicates and/or biogenic silica may also explain the observed increases in B and Li concentrations at the boundary between Subunits IIB and IIC, which coincide with sharply elevated NGR counts (Figure F82) and an increase in the modal proportion of total clays (Figure F16). The observation that Si and K concentrations do not increase at the Subunit IIA/IIB boundary may suggest that this interval may act as a sink, rather than a source, of those elements. Other processes with potential to affect these cation concentration profiles at Site U1558 include the transformation of smectite to illite during burial, weathering of underlying oceanic crust (e.g., Gieskes, 1975), and advection of water masses with variable compositions.
11.1.2.5. Sulfate, manganese, ammonium, and phosphate
Depth profiles of SO4 and Mn show some variation between Holes U1558A and U1558F. In particular, the sulfate minimum happens at much shallower depths in Hole U1558F (62.73 m CSF-A; Subunit IIA, nannofossil ooze with clay) compared to Hole U1558A (124.54 m CSF-A; Subunit IIC, nannofossil chalk with clay and volcaniclastics) (Figure F104A), consistent with the overall higher TOC content in U1558F (Figure F105B). In both holes, SO4 contents increase toward the seawater value at depth.
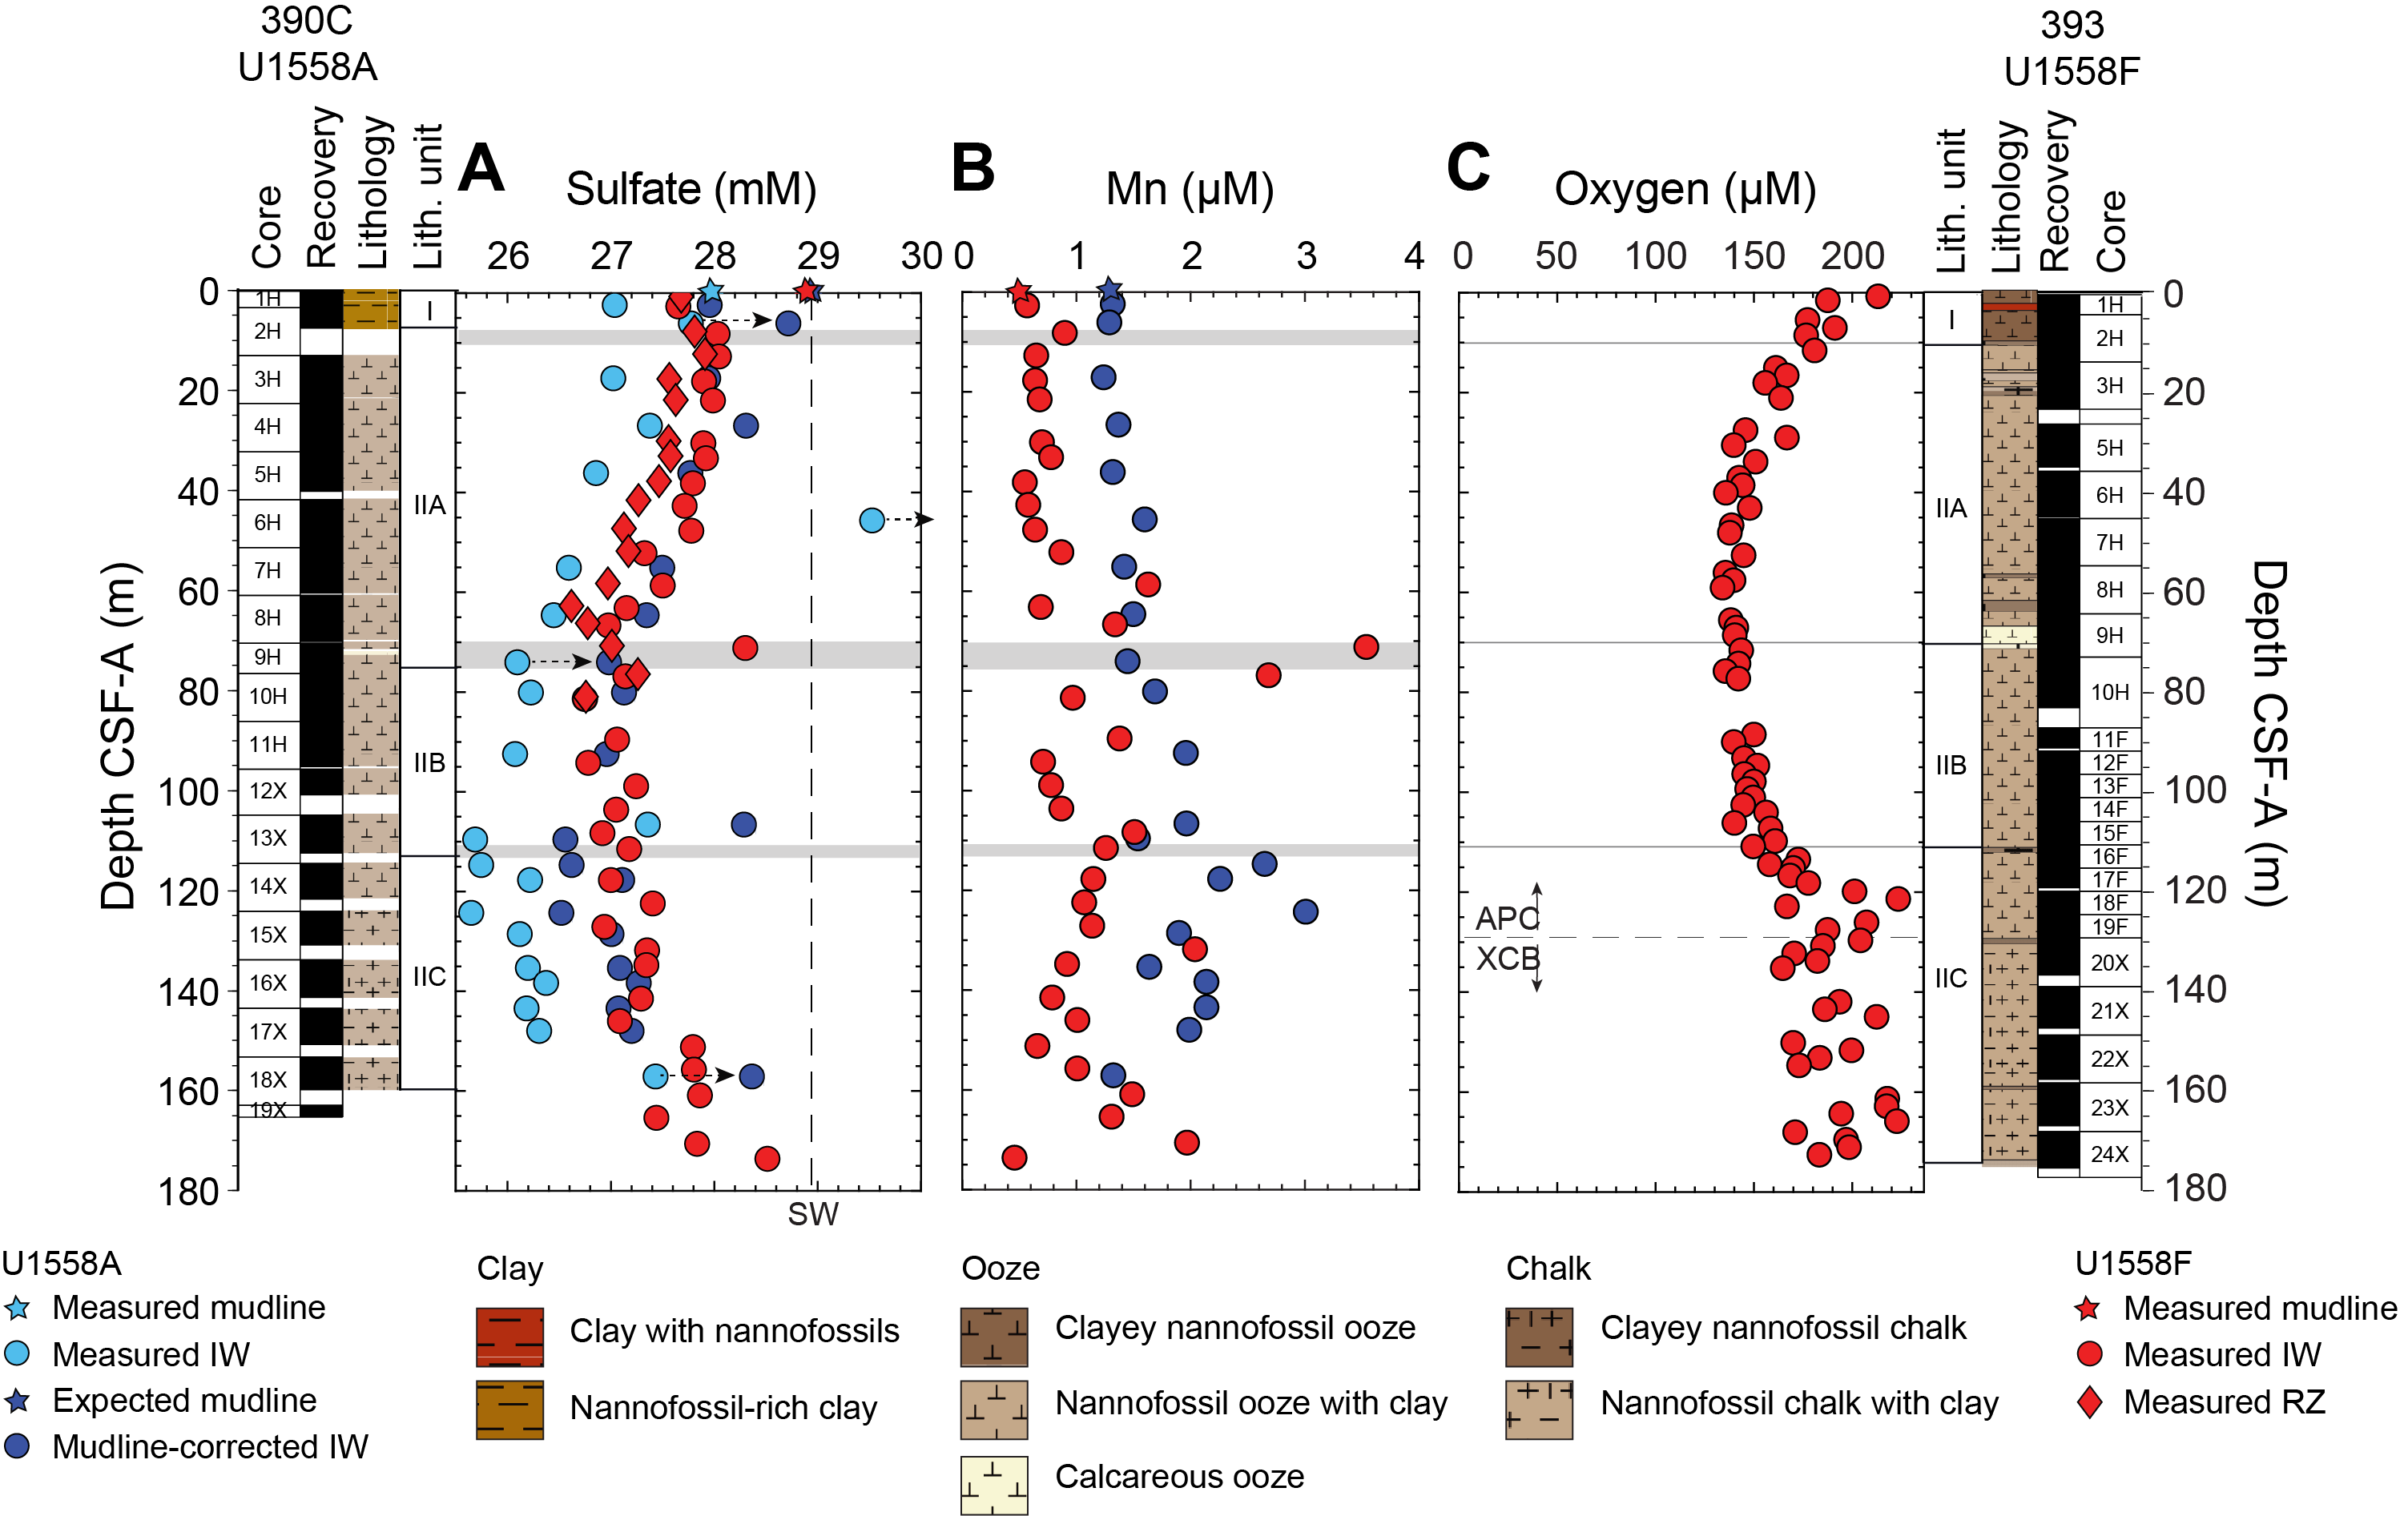
Figure F104. IW sulfate, manganese, and oxygen.
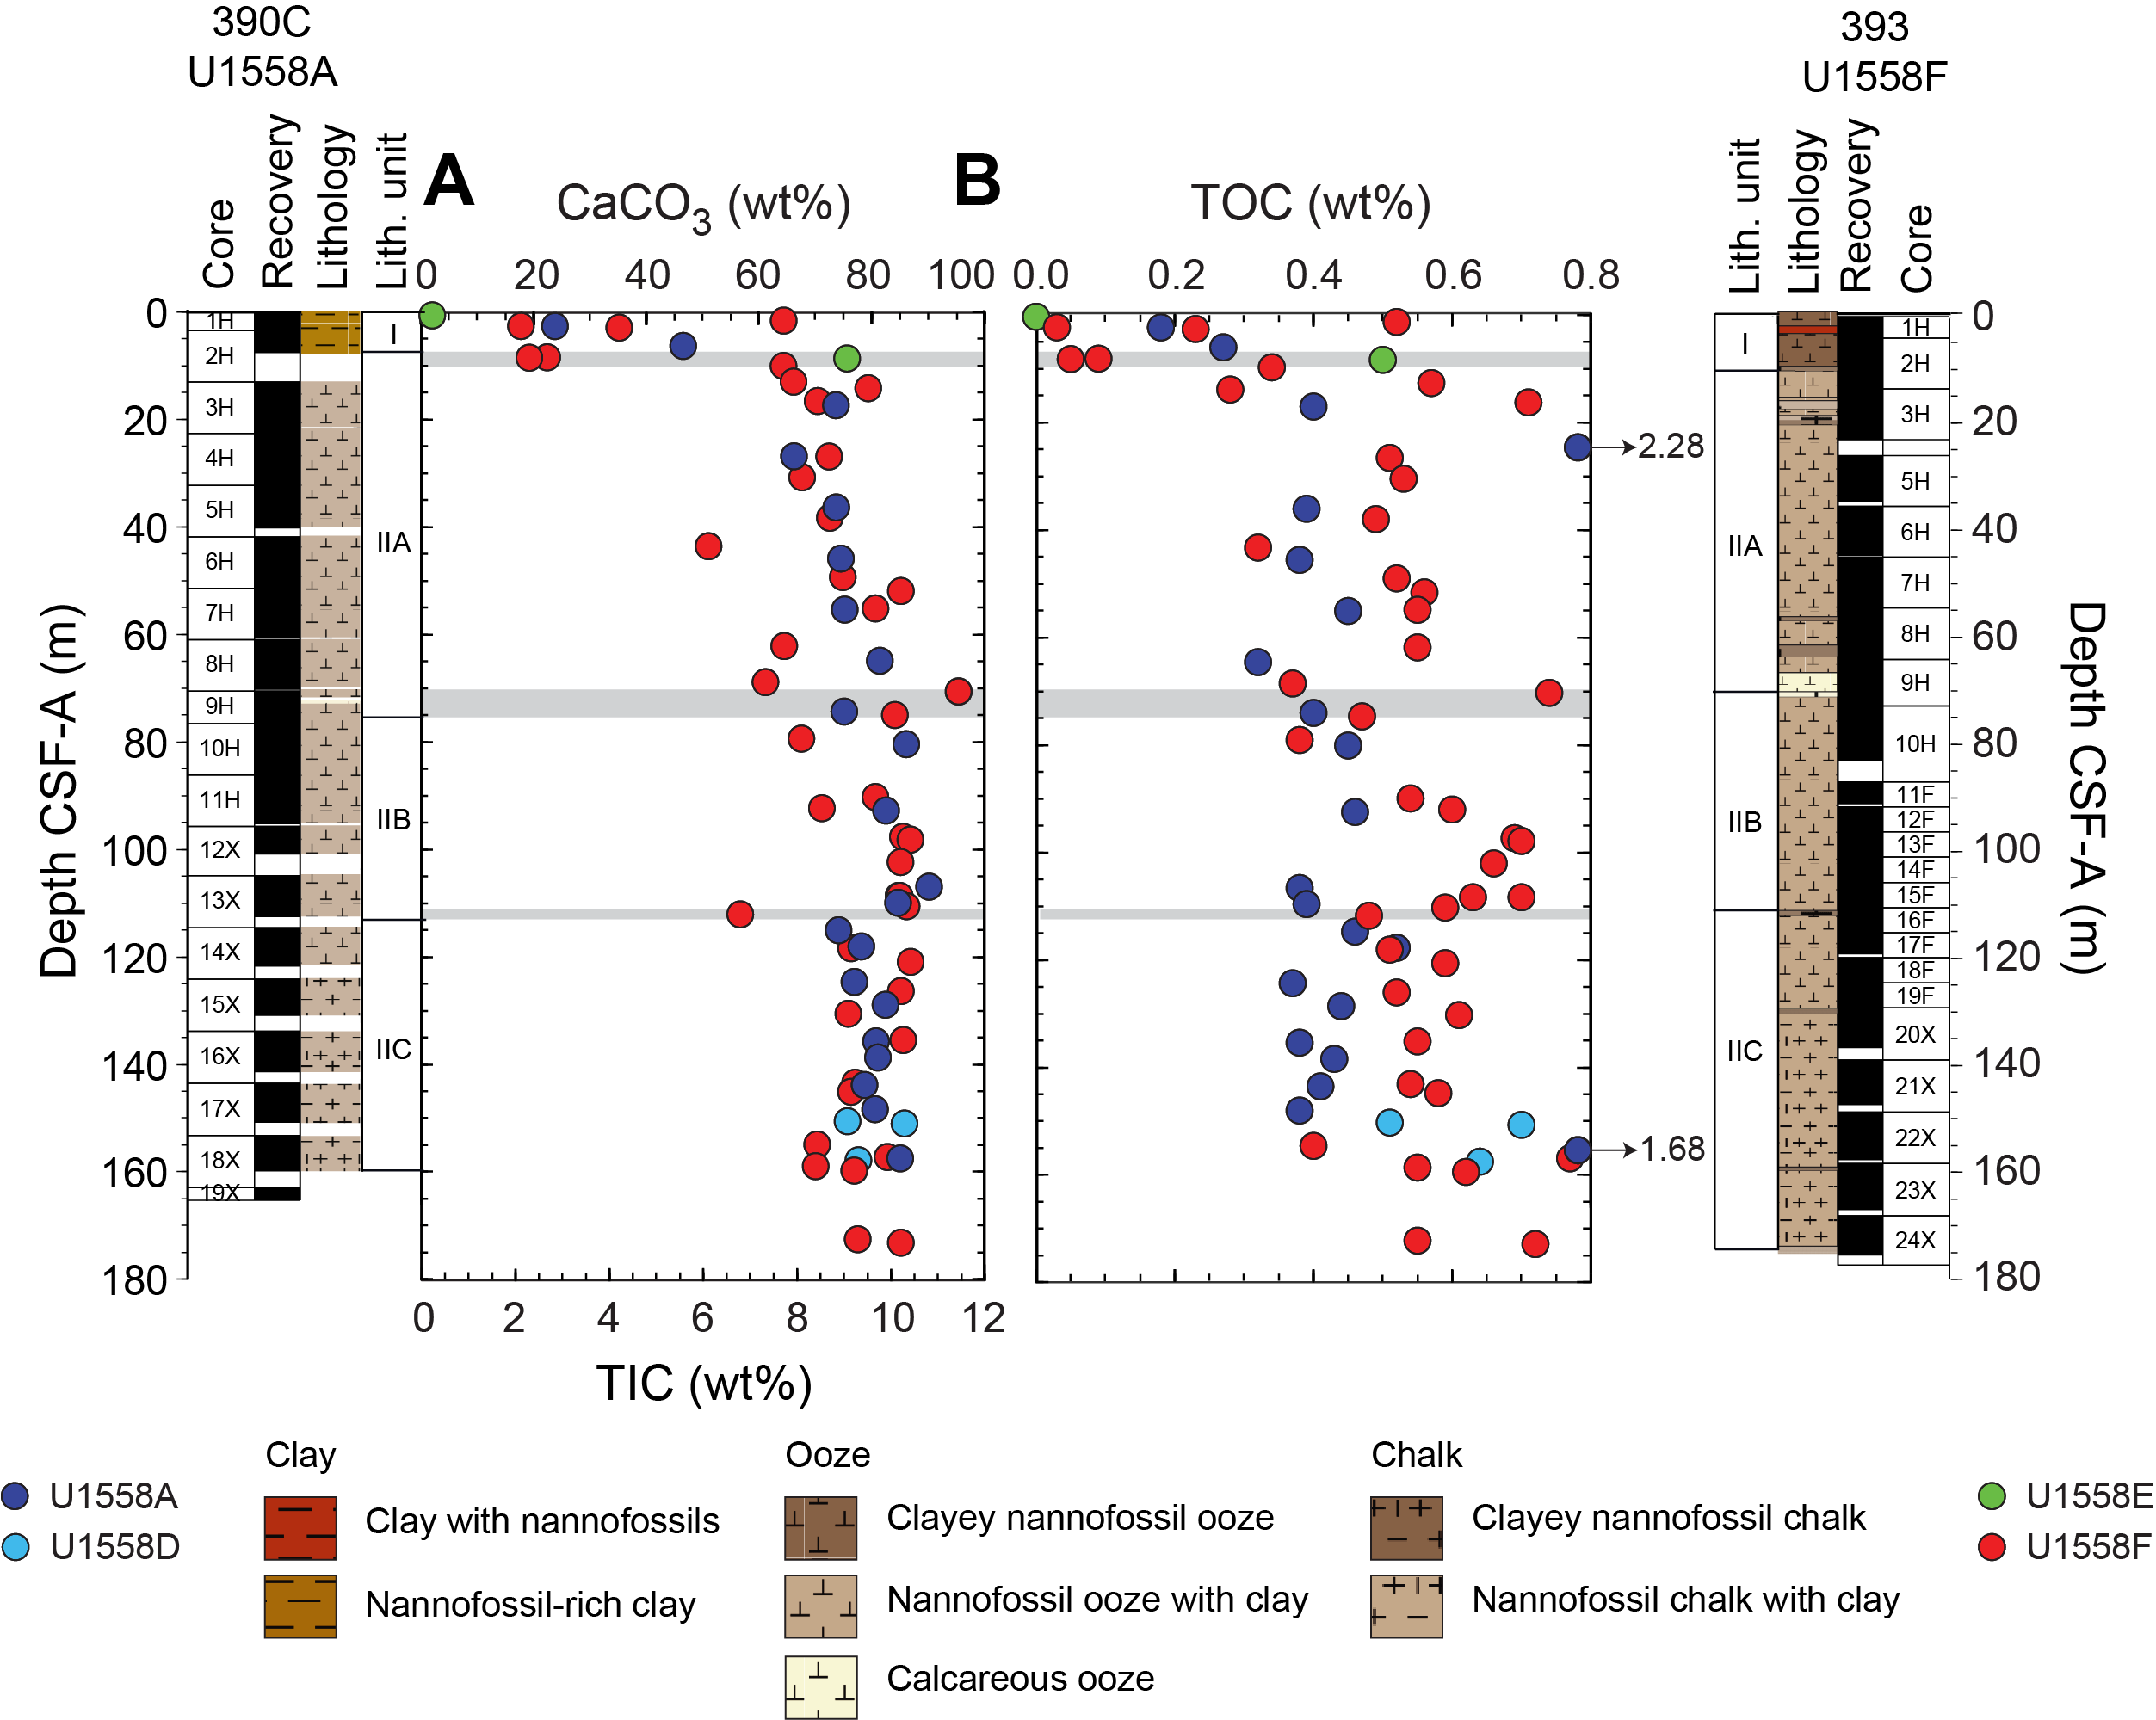
Figure F105. Sediment carbonate, TIC, and TOC.
Mn concentrations vary between 1.25 and 3.02 µM in Hole U1558A and from 0.47 to 3.55 µM in Hole U1558F (Figure F104B). In Hole U1558A, measured Mn values generally increase from the mudline (1.31 µM; 0 CSF-A) to the top of Subunit IIC (3.02 µM; 124.54 m CSF-A) and then decrease toward the bottom of the hole (1.34 µM; 157.35 m CSF-A). In Hole U1558F, the Mn profile shows intervals where concentrations both increase and decrease, with some local maxima at 58.91 m CSF-A (1.64 µM; Subunit IIA), 71.44 m CSF-A (3.55 µM; top of Subunit IIB), 108.56 m CSF-A (1.52 µM; bottom of Subunit IIB), and 170.85 m CSF-A (1.98 µM; bottom of Subunit IIC). Although no strong correlation is observed between SO4 and Mn, the highest Mn concentrations in Holes U1558A and U1558F coincide with their respective intervals of low SO4 (Figure F104). The sample from Section 393-U1558F-9H-5 (71.44 m CSF-A; Subunit IIB), with visibly higher SO4 and Mn contents, is likely an outlier. NH4 and PO4 concentrations in these pore fluids are close to or at the level of instrumental detection limits, an observation consistent with the low organic carbon content and the persistently oxic conditions at this site (see next section). For that reason, we report the data in Table T34 but do not discuss it any further here.
11.1.2.6. Oxygen
Oxygen is the pore water constituent measured with the highest reduction potential and is the first molecule reduced during microbial degradation of organic matter. Its profile provides insight into subseafloor biogeochemical and microbial processes. Oxygen concentrations in Hole U1558F decrease from a mudline concentration of ~210 to ~135 µM in Subunit IIA at ~60 m CSF-A (Table T36; Figure F104C). Oxygen concentrations remain nearly constant for most of Subunits IIA (nannofossil ooze with clay) and IIB (nannofossil chalk with clay) before increasing in Subunit IIC (nannofossil chalk with clay and volcaniclastics). Concentrations return to surface values (~200 µM) in Subunit IIC at the end of APC coring. The points below ~130 m CSF-A were collected during XCB coring, and the trend in the concentration data becomes more scattered, with measurements ranging 165–223 µM to basement (Figure F104C).
11.1.3. Sediment sampling
Sediment from Holes U1558A, U1558D, U1558E, and U1558F was analyzed for carbon and nitrogen concentrations from a combination of squeeze cake residues and samples selected by the sedimentologists from the core working halves (see Geochemistry in the Expedition 390/393 methods chapter [Coggon et al., 2024b]). During Expedition 390C, all sediment samples were taken from IW squeeze cake residues, totaling 22 samples. During Expedition 393, one sample was taken from the IW squeeze cake in Section 393-U1558D-2R-1, in addition to samples selected by sedimentologists from Cores 2R (n = 1), 3R (n = 1), and 393-U1558E-1H (n = 2). Although our samples from Holes U1558D and U1558E were only from single sediment cores, they were included in sample analyses to provide additional data at critical intervals such as the mudline and sediment/basement interface. In Hole U1558F, sediment was sampled once from the working halves in Cores 393-U1558F-11F, 12F, 14F, and 17F–19F and twice in Cores 3H–10H, 13F, 16F, and 20X–24X. Sediments from IW squeeze cake residues were analyzed once in Core 1H and twice in Cores 2H and 15F. During Expedition 393, a total of 48 samples were taken at Site U1558, 6 from IW squeeze cake residues and 42 from sediment working halves. In total, 70 sediment samples were analyzed at Site U1558 during Expeditions 390C and 393 (Table T35).
During Expedition 390C, sediment was sampled from whole-round sediment cores for hydrocarbon analyses (see Geochemistry in the Expedition 390/393 methods chapter [Coggon et al., 2024b]). Samples were taken at the top of Section 2 in Cores 390C-U1558A-14X, 15X, and 17X, Section 3 in Cores 1H, 2H, 13X, and 16X, Section 4 in Cores 3H–10H and 12X, Section 5 in Core 18X, and Section 6 in Core 11H. In total, 18 sediment samples were analyzed at Site U1558 (Table T35).
11.1.4. Sediment bulk geochemistry
11.1.4.1. Calcium carbonate
The carbonate content of the sediment in all holes at Site U1558 increases with depth in Unit I (0–10 m CSF-A; nannofossil-rich clay; 2–77 wt%, n = 9; Figure F105) and shows an invariant trend downhole in Unit II in all holes (>10 m CSF-A; nannofossil ooze/chalk with clay; 79 ± 17 wt%, 2σ, n = 60). Carbonate content from Hole U1558F (78 ± 20 wt%, ± 2σ, n = 48) displays greater scatter compared to analyses from Hole U1558A (80 ± 11 wt%, ± 2σ, n = 22).
11.1.4.2. Total organic carbon and nitrogen
TOC was calculated for all samples measured for CaCO3 as the difference between total carbon (TC) and total inorganic carbon (TIC) (see Geochemistry in the Expedition 390/393 methods chapter [Coggon et al., 2024b]). TOC concentrations (Figure F105) show a large range with depth in Unit I (0–10 m CSF-A, nannofossil-rich clay), varying between ~0 and 0.52 wt% across Holes U1558A, U1558E, and U1558F. In Unit II (>10 m CSF-A; nannofossil ooze/chalk with clay), TOC concentrations in Hole U1558F are more scattered and generally higher (0.56 ± 0.23 wt%, 2σ, n = 37) than those in Hole U1558A (0.41 ± 0.09 wt%, 2σ, n = 18, outliers excluded), aside from two data points that are greater than 1.5 wt% in Hole U1558A (Sections 390C-U1558A-4H-3 and 18X-4; TOC = 2.28 and 1.68 wt%, respectively).
Total nitrogen (TN) concentrations were measured on all samples analyzed for CaCO3 (n = 70). Total nitrogen concentrations throughout all holes at Site U1558 are close to or below detection levels and are not discussed further. Total sulfur (TS) and total hydrogen (TH) were not measured.
11.1.4.3. Headspace analysis of hydrocarbons
Sediment headspace was sampled once per core in Hole U1558A for hydrocarbon analysis. Concentrations of all hydrocarbons are below detection limit (1 ppmv) in all 18 sampled intervals (Table T35).
11.2. Basement
During Expedition 393, ~220 m of moderately to highly altered ~49.2 Ma basalts were drilled in Hole U1558D, recovering 98 m of volcanic rocks representing five major igneous units, including several zones of variably cemented volcano-sedimentary breccias (see Igneous petrology). A total of 29 basement samples were selected for shipboard geochemical study, which included 25 basalts and 4 breccias. These breccia samples are physically and hydrothermally perturbed, originally sedimentary mixtures of now-indurated calcareous sediments with abundant fragments of fresh to completely altered volcanic glass, and biogenic and clastic phases. Analyses included both solution analysis using ICP-AES and direct measurements of sample powders and sample surfaces using pXRF. In addition to data from Hole U1558D, Sample 390C-U1558A-19X-2, 45-40 cm, from the basalt/sediment interface in Hole U1558A was also analyzed.
11.2.1. Basement rock sampling and geochemical analysis
The geochemical samples selected included typical materials from each of the magmatic units identified (see Igneous petrology). Geochemical samples were taken adjacent to other sampling (thin sections, PMAG, XRD, etc.) to generate integrated data on these materials. In some cases, samples of more altered materials were selected to try and assay the geochemical range of downhole alteration effects. A powder mount of each freshly made sample powder was prepared for pXRF analysis (see Geochemistry in the Expedition 390/393 methods chapter [Coggon et al., 2024b]). ICP-AES measurements were completed on oxidized samples that had undergone loss on ignition (LOI) determinations, so ICP-AES data are reported on a volatile-free basis.
11.2.2. Bulk chemical compositions and trace element abundances of basalts
Table T37 lists the shipboard geochemical data collected on Site U1558 samples using ICP-AES analysis, and Table T38 presents pXRF data collected for the same samples from unignited powder mounts.
On the total alkalis versus silica diagram of Le Bas et al. (1986) (Figure F106), the Site U1558 samples all fall in the basalt field. The samples with the lowest LOI contents from this site are olivine tholeiites per the Yoder and Tilley (1962) basalt classification scheme, but some of the more altered samples, due to seawater-basalt exchange and other processes, now include normative nepheline, which in the Yoder and Tilley scheme categorizes them as alkali basalts (Table T37).
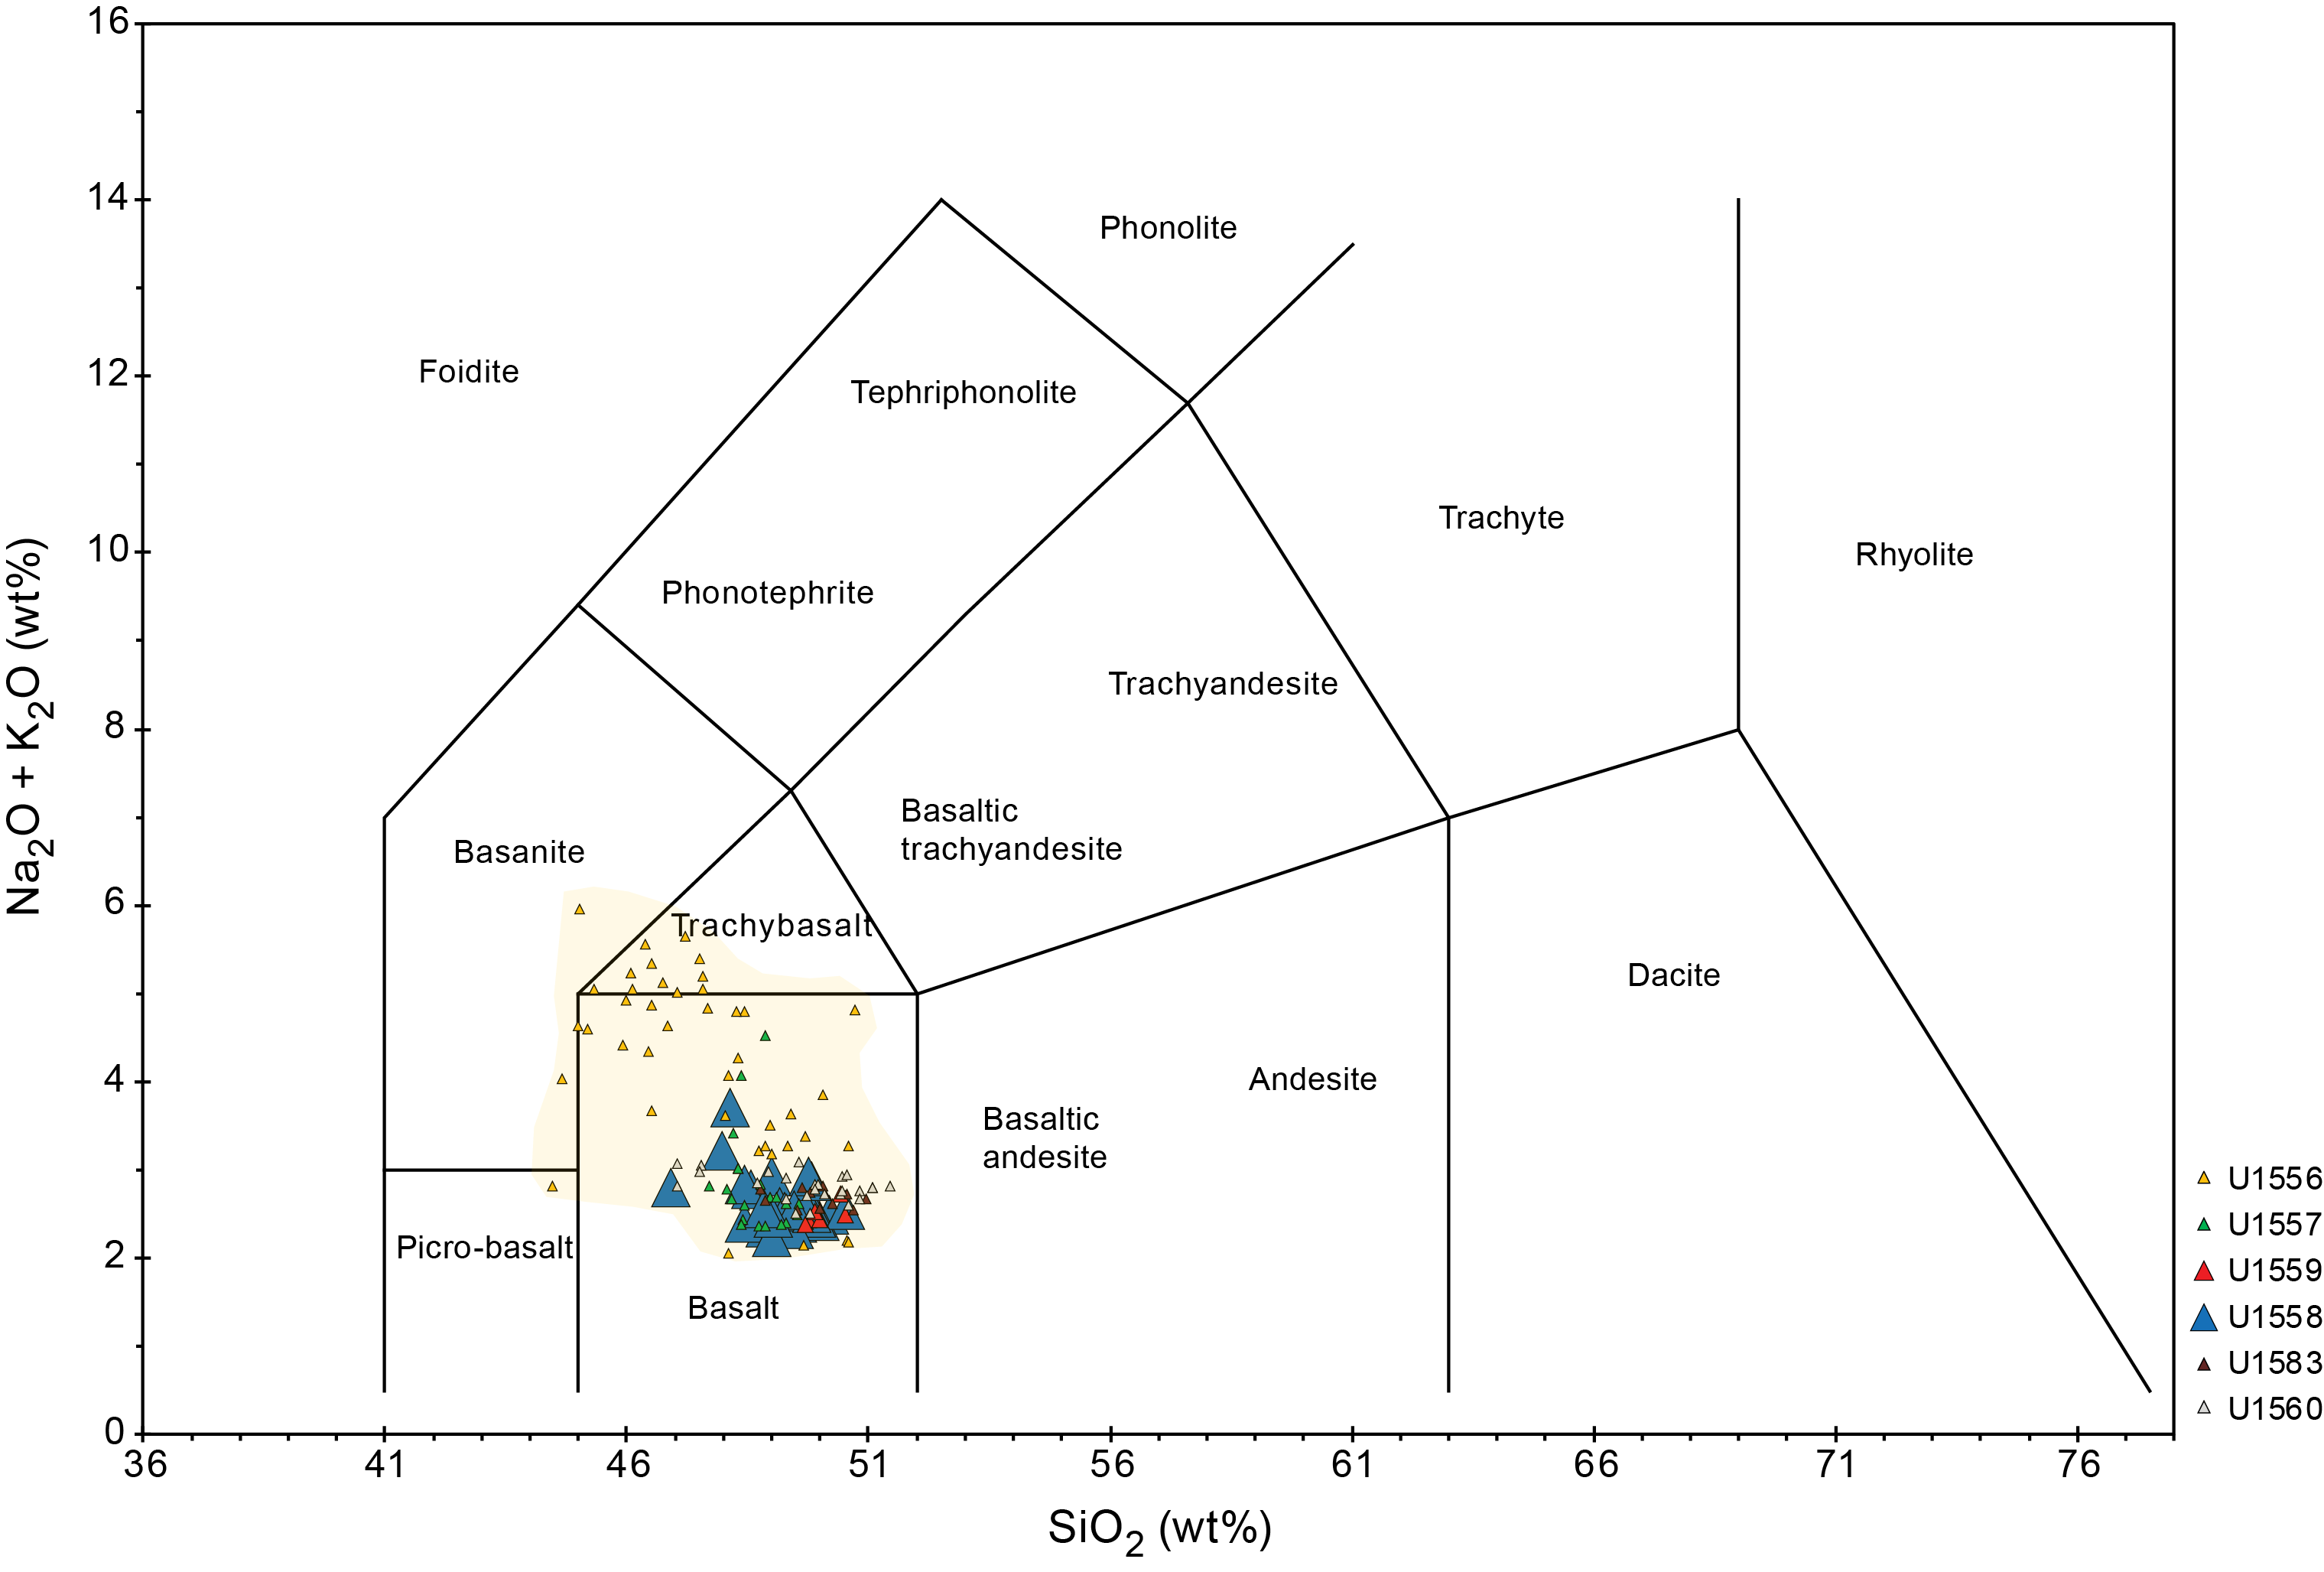
Figure F106. Total alkalis vs. silica diagram.
Figure F107 compares our Site U1558 basalt data to results for basalt glasses from the southern Atlantic compiled from the EarthChem Portal and MORBs from other SAT sites on a plot of Sr versus TiO2. Both Ti and Sr behave as incompatible elements in MORB systems, although Ti is generally immobile during low-temperature hydrothermal alteration and most other fluid-mediated chemical exchanges. Although Sr is sensitive to alteration, as documented by 87Sr/86Sr variations in ocean crustal lithologies (e.g., Teagle et al., 1996, 1998; Harris et al., 2015), Sr abundances are commonly not strongly modified in basalts except through carbonate precipitation. In Figure F107, the Site U1558 basalts plot largely within the field for South Atlantic MORBs, at broadly similar Sr and Ti abundances to basalts from Site U1559 but at higher abundances than the Site U1557 basalts or the basalts from the deepest section of Site U1556, Stratigraphic Sequence C.
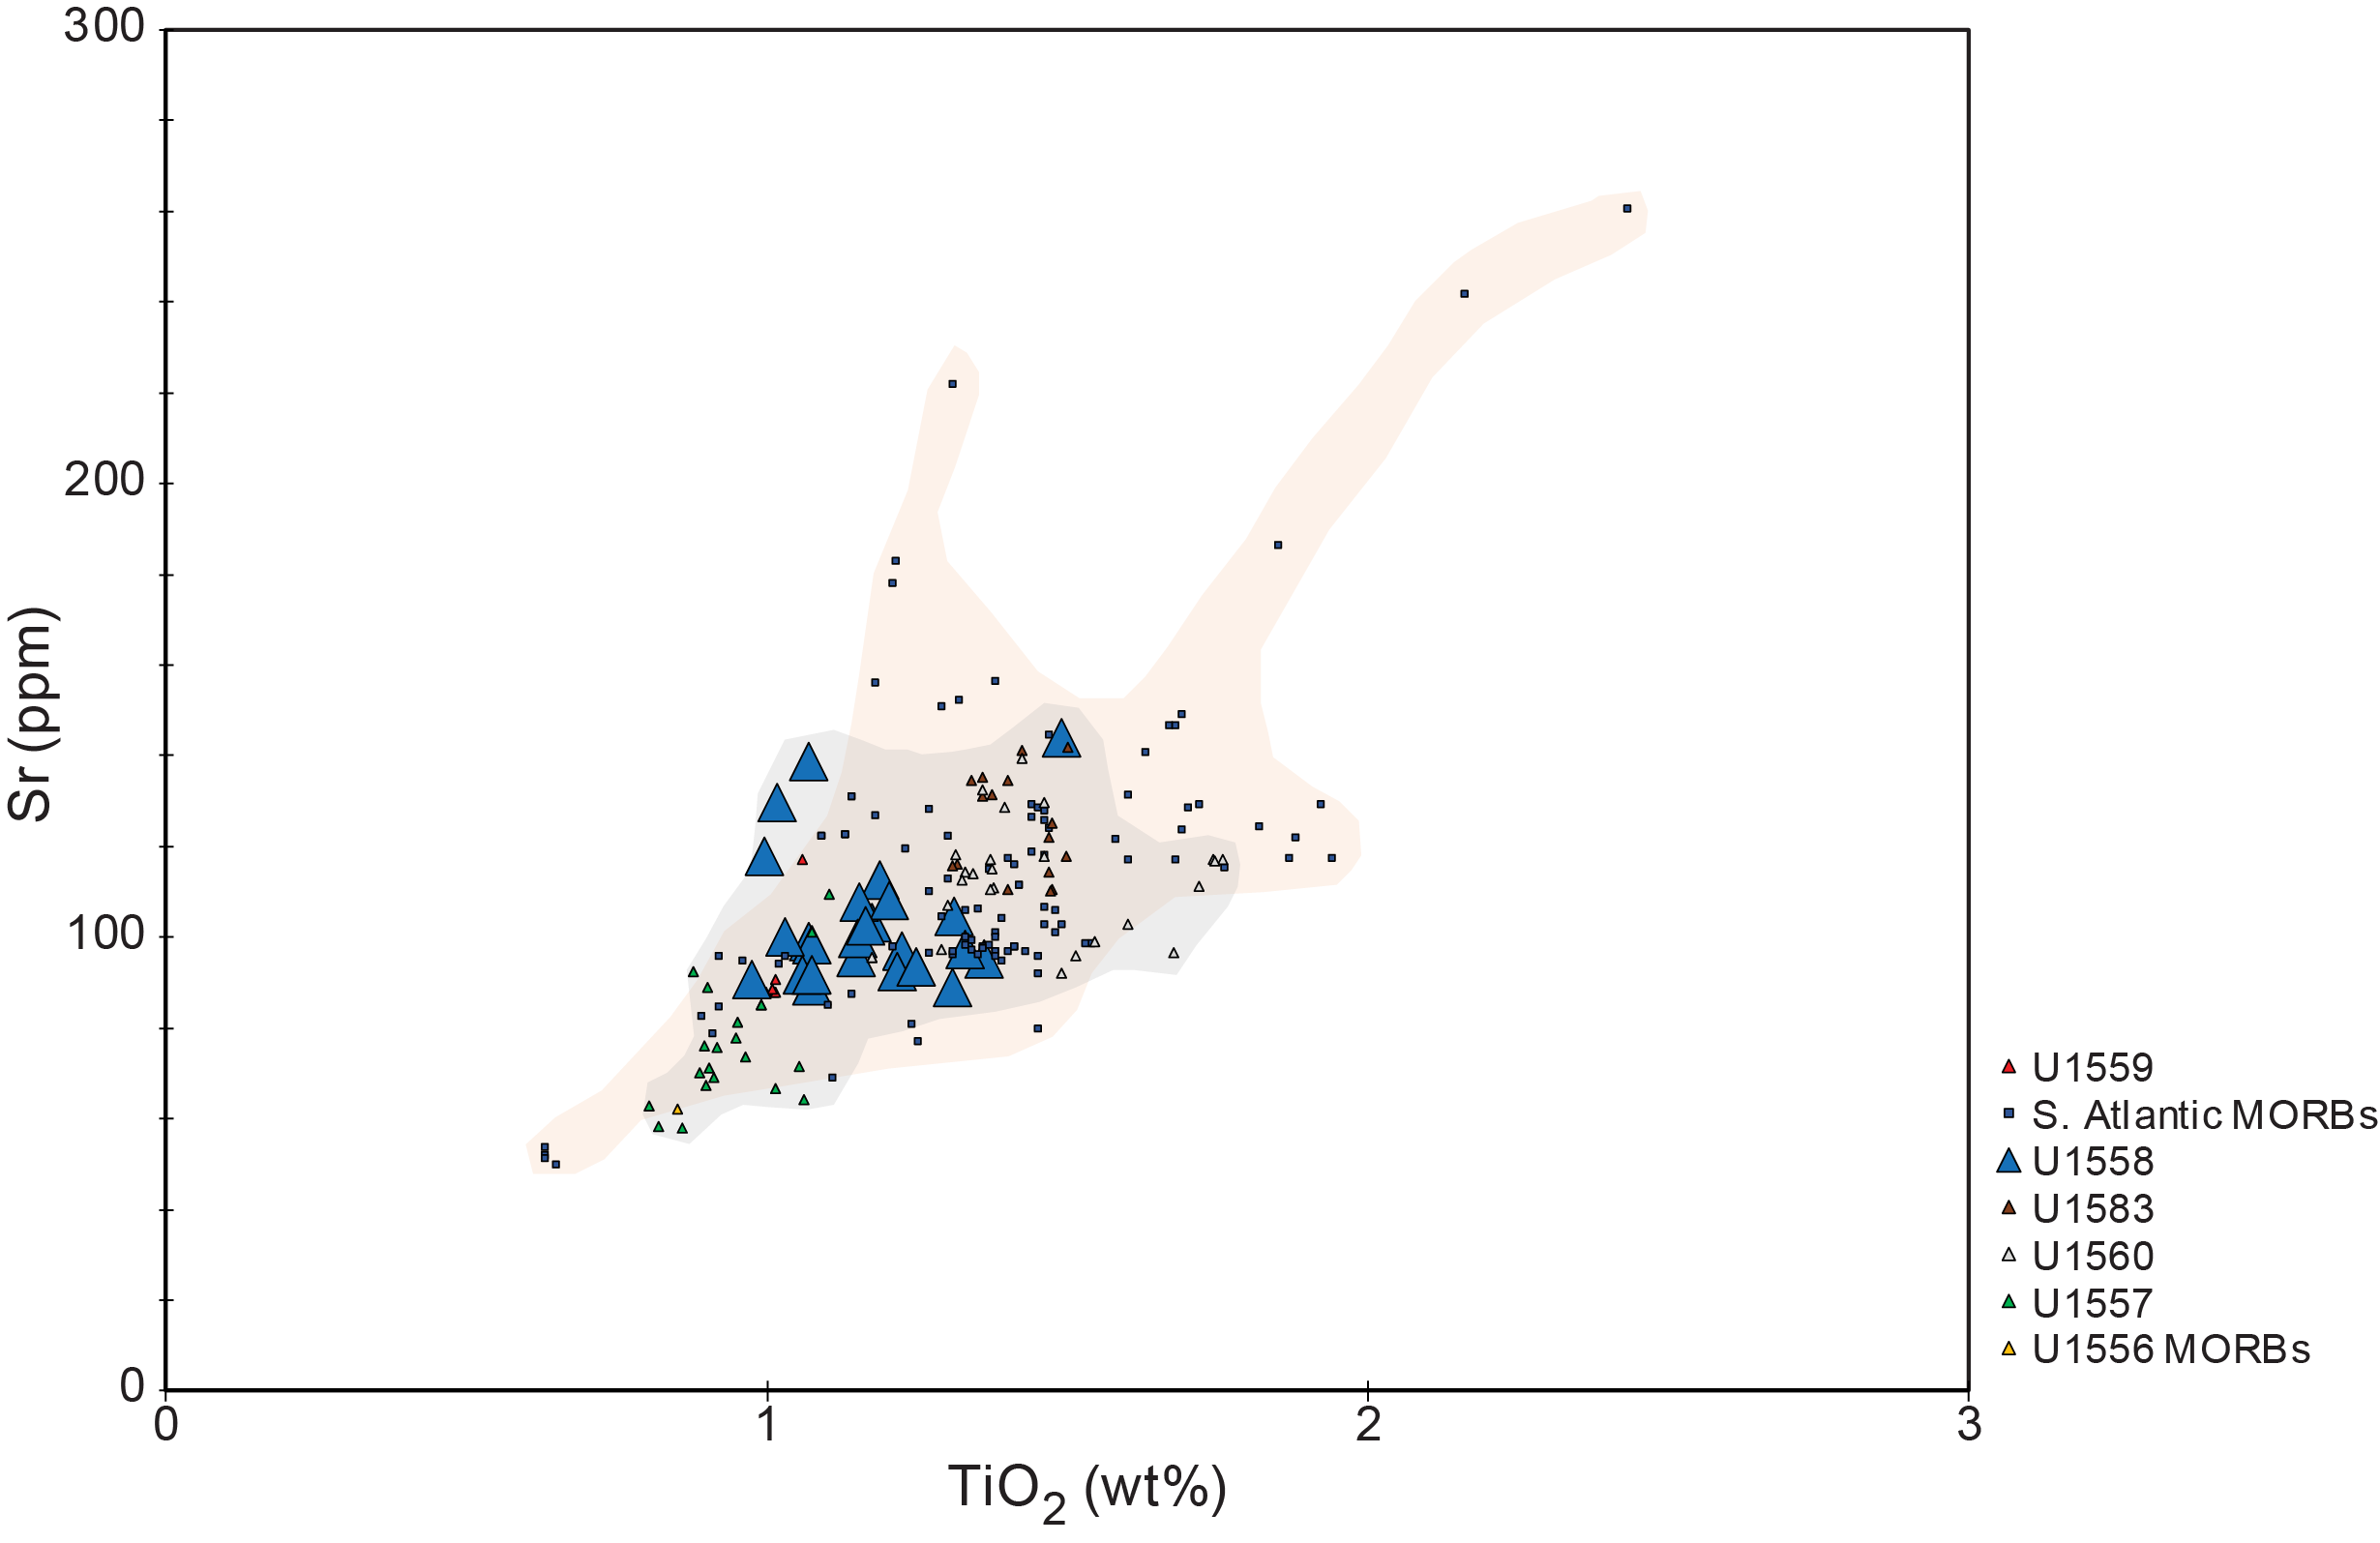
Figure F107. Sr vs. TiO2.
11.2.3. Downhole geochemical variations
Figure F108 presents downhole plots for several major elements analyzed by ICP-AES and pXRF analysis of both sample powders and sample surfaces. A clear downhole change in magmatic composition is evident at 288 mbsf (Subunit 4C/5A boundary), where the lavas become higher in TiO2. Also evident on these plots are the positions of basalt-sediment breccia zones and/or zones with thick interpillow sediments (Unit 3 and Subunits 4A and 4B), which presumably reflect breaks in magmatic activity, as they are associated with highly variable CaO and K2O contents and decreases in TiO2. These chemostratigraphic breaks match unit boundaries identified (Igneous petrology), though the finer-scale subunit boundaries are often not reflected in the downhole chemistry, partly due to the coarser resolution of our whole-rock sampling and partly because physical distinctions observable in the core may not relate to changes in chemical signature.
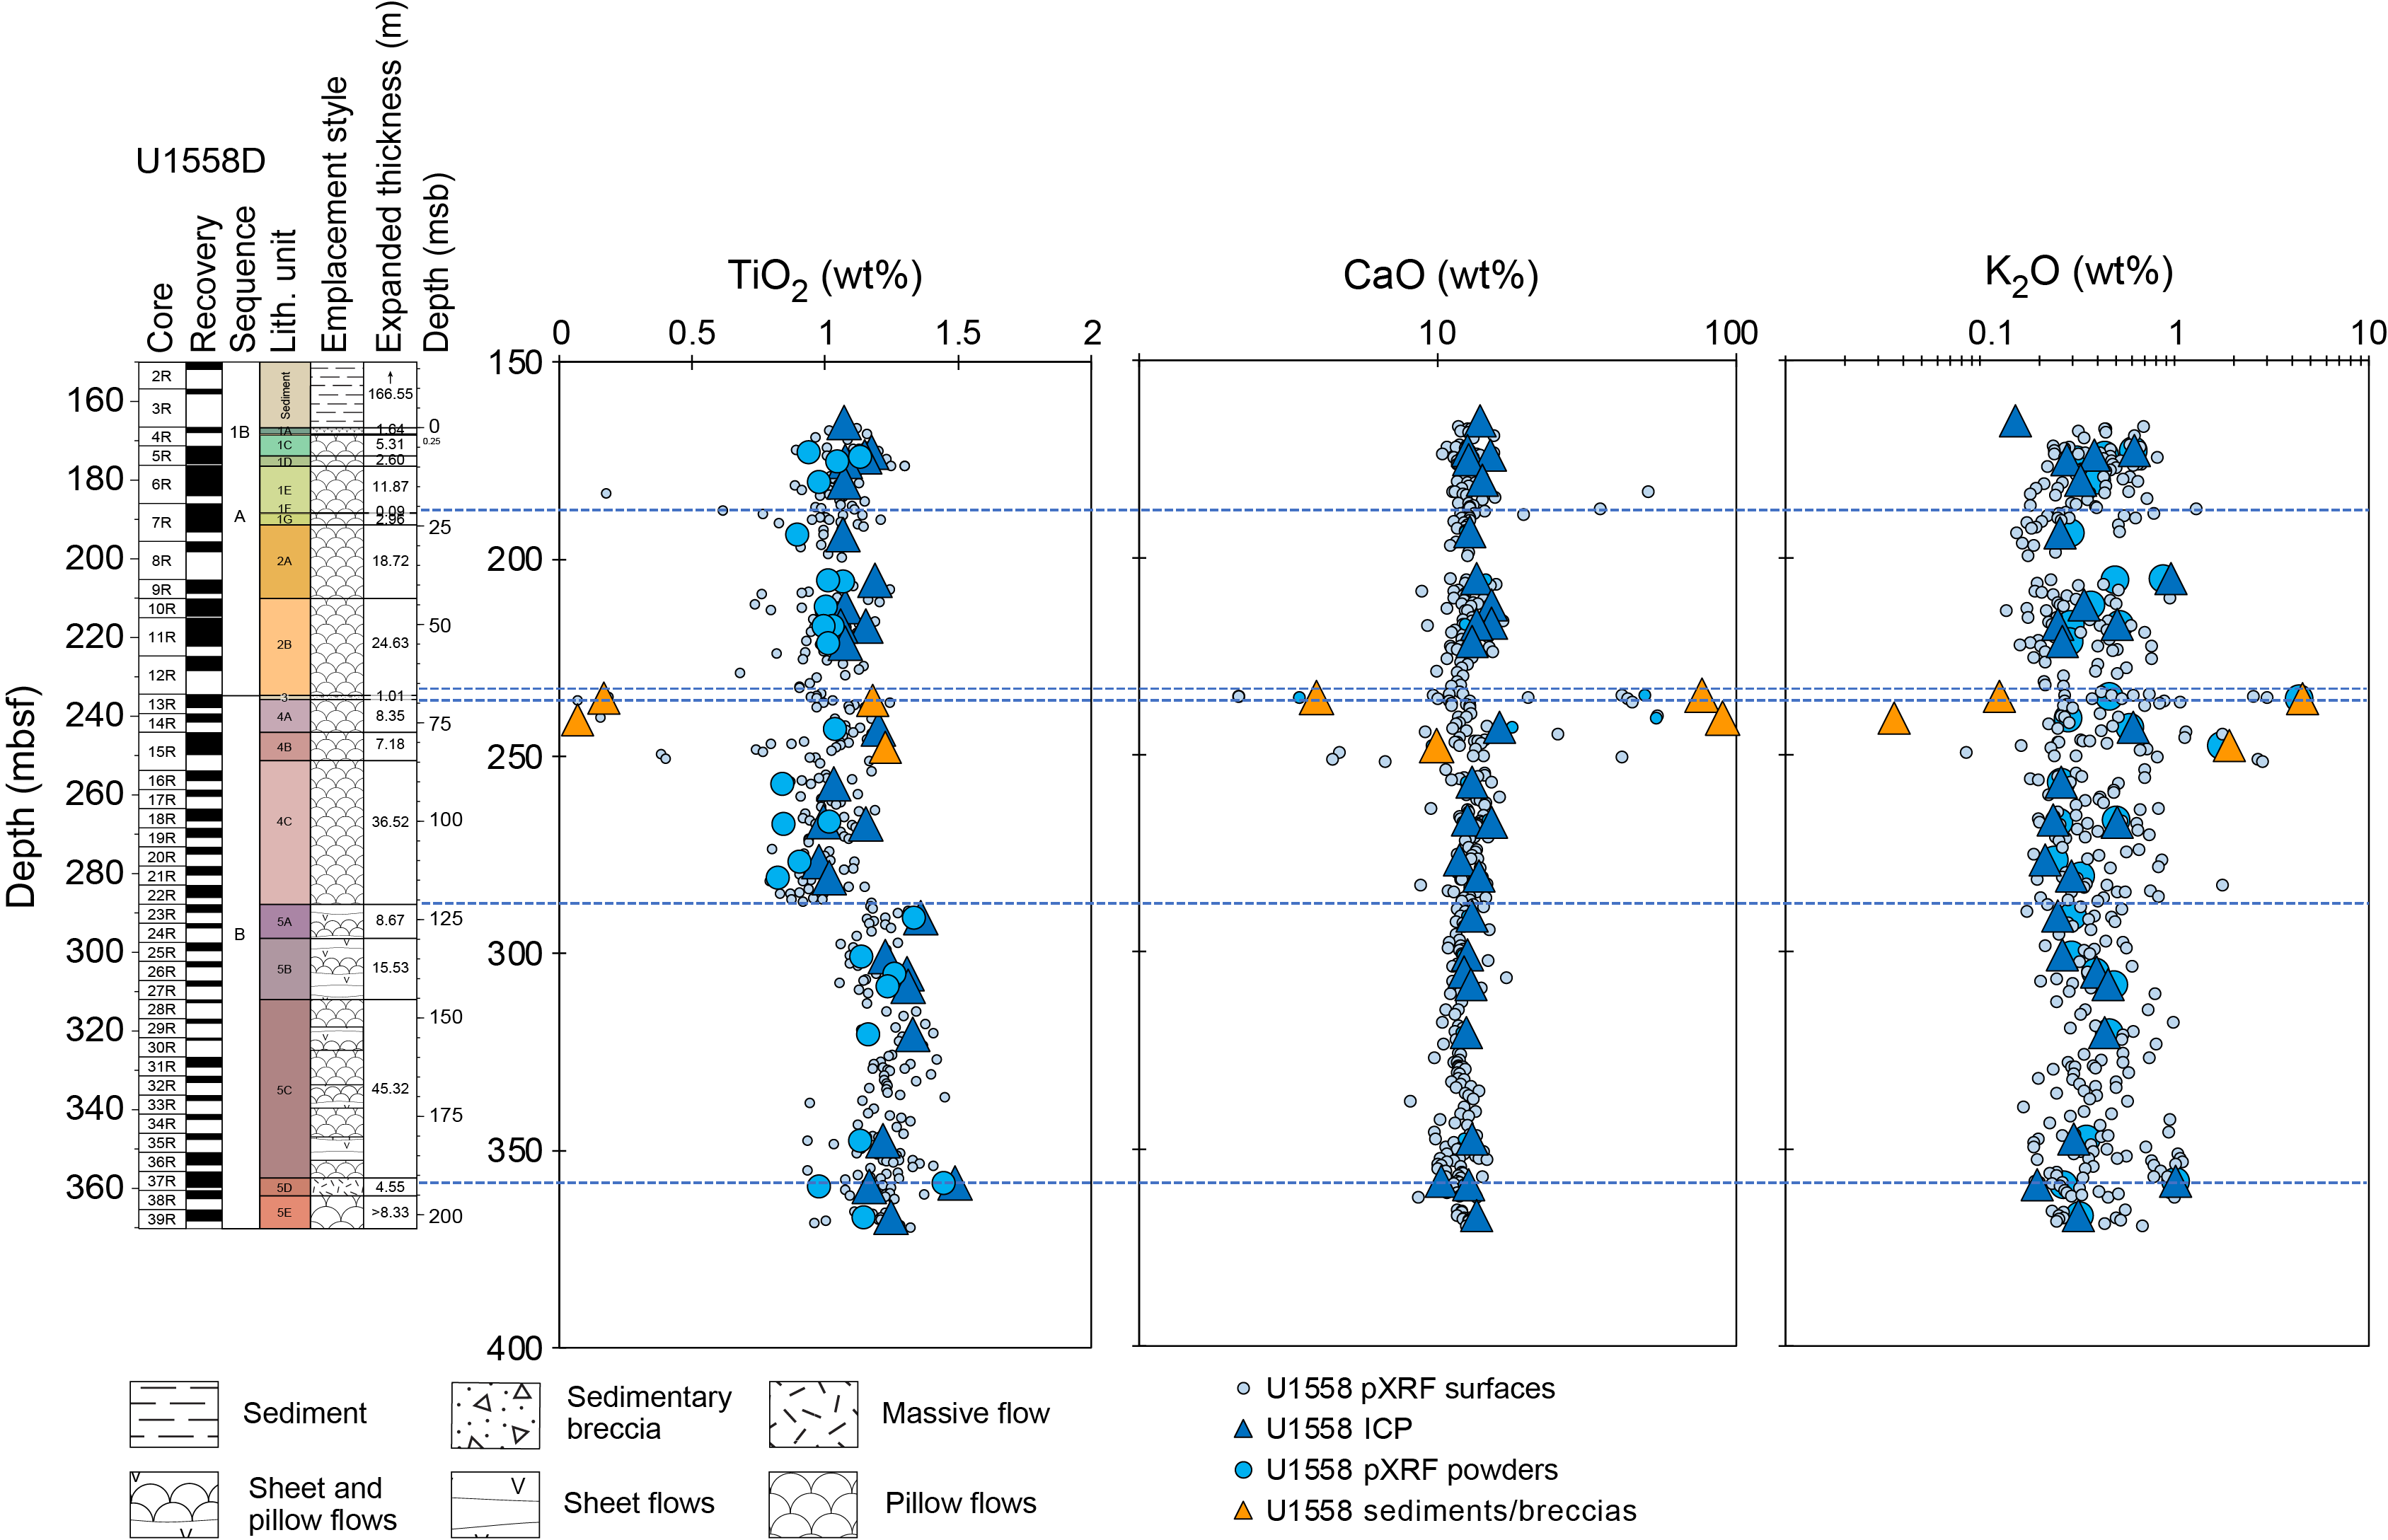
Figure F108. Key major elements, Hole U1558B.
11.2.4. Effects of alteration
As indicated by the downhole variations of both CaO and K2O in Figure F108, the Site U1558 basalts have been extensively altered through exchanges with seawater-derived fluids. This pervasive alteration is partly reflected in LOI values, which range 1.0–4.5 wt% in most of our samples. In plots of Rb and MgO versus depth (Figure F109), Rb concentrations are markedly high as compared to typical MORB values, presumably due to seafloor basalt alteration processes. In contrast, Mg concentrations are variably lower, presumably due to these same seafloor alteration processes. Alteration-related Mg losses are at odds with the observed Mg systematics in seafloor hydrothermal systems, where Mg is removed from the fluids and sequestered in the rock (e.g., Von Damm and Bischoff, 1987). However, similarly lowered MgO contents are observed in altered basaltic rocks from Deep Sea Drilling Project (DSDP) Holes 417A and 417D (Donnelly et al., 1980). Seafloor weathering processes have been suggested as a cause for variable Mg leaching from basalts in other oceanic settings (e.g., Hart et al., 1974; Pichler et al., 1999). The evidence for alteration at Site U1558 (age ~49.2 Ma) is far more substantial than that observed at Site U1559 (age ~6.6 Ma), where both MgO and Rb were found to have concentrations similar to those of fresh South Atlantic MORBs.
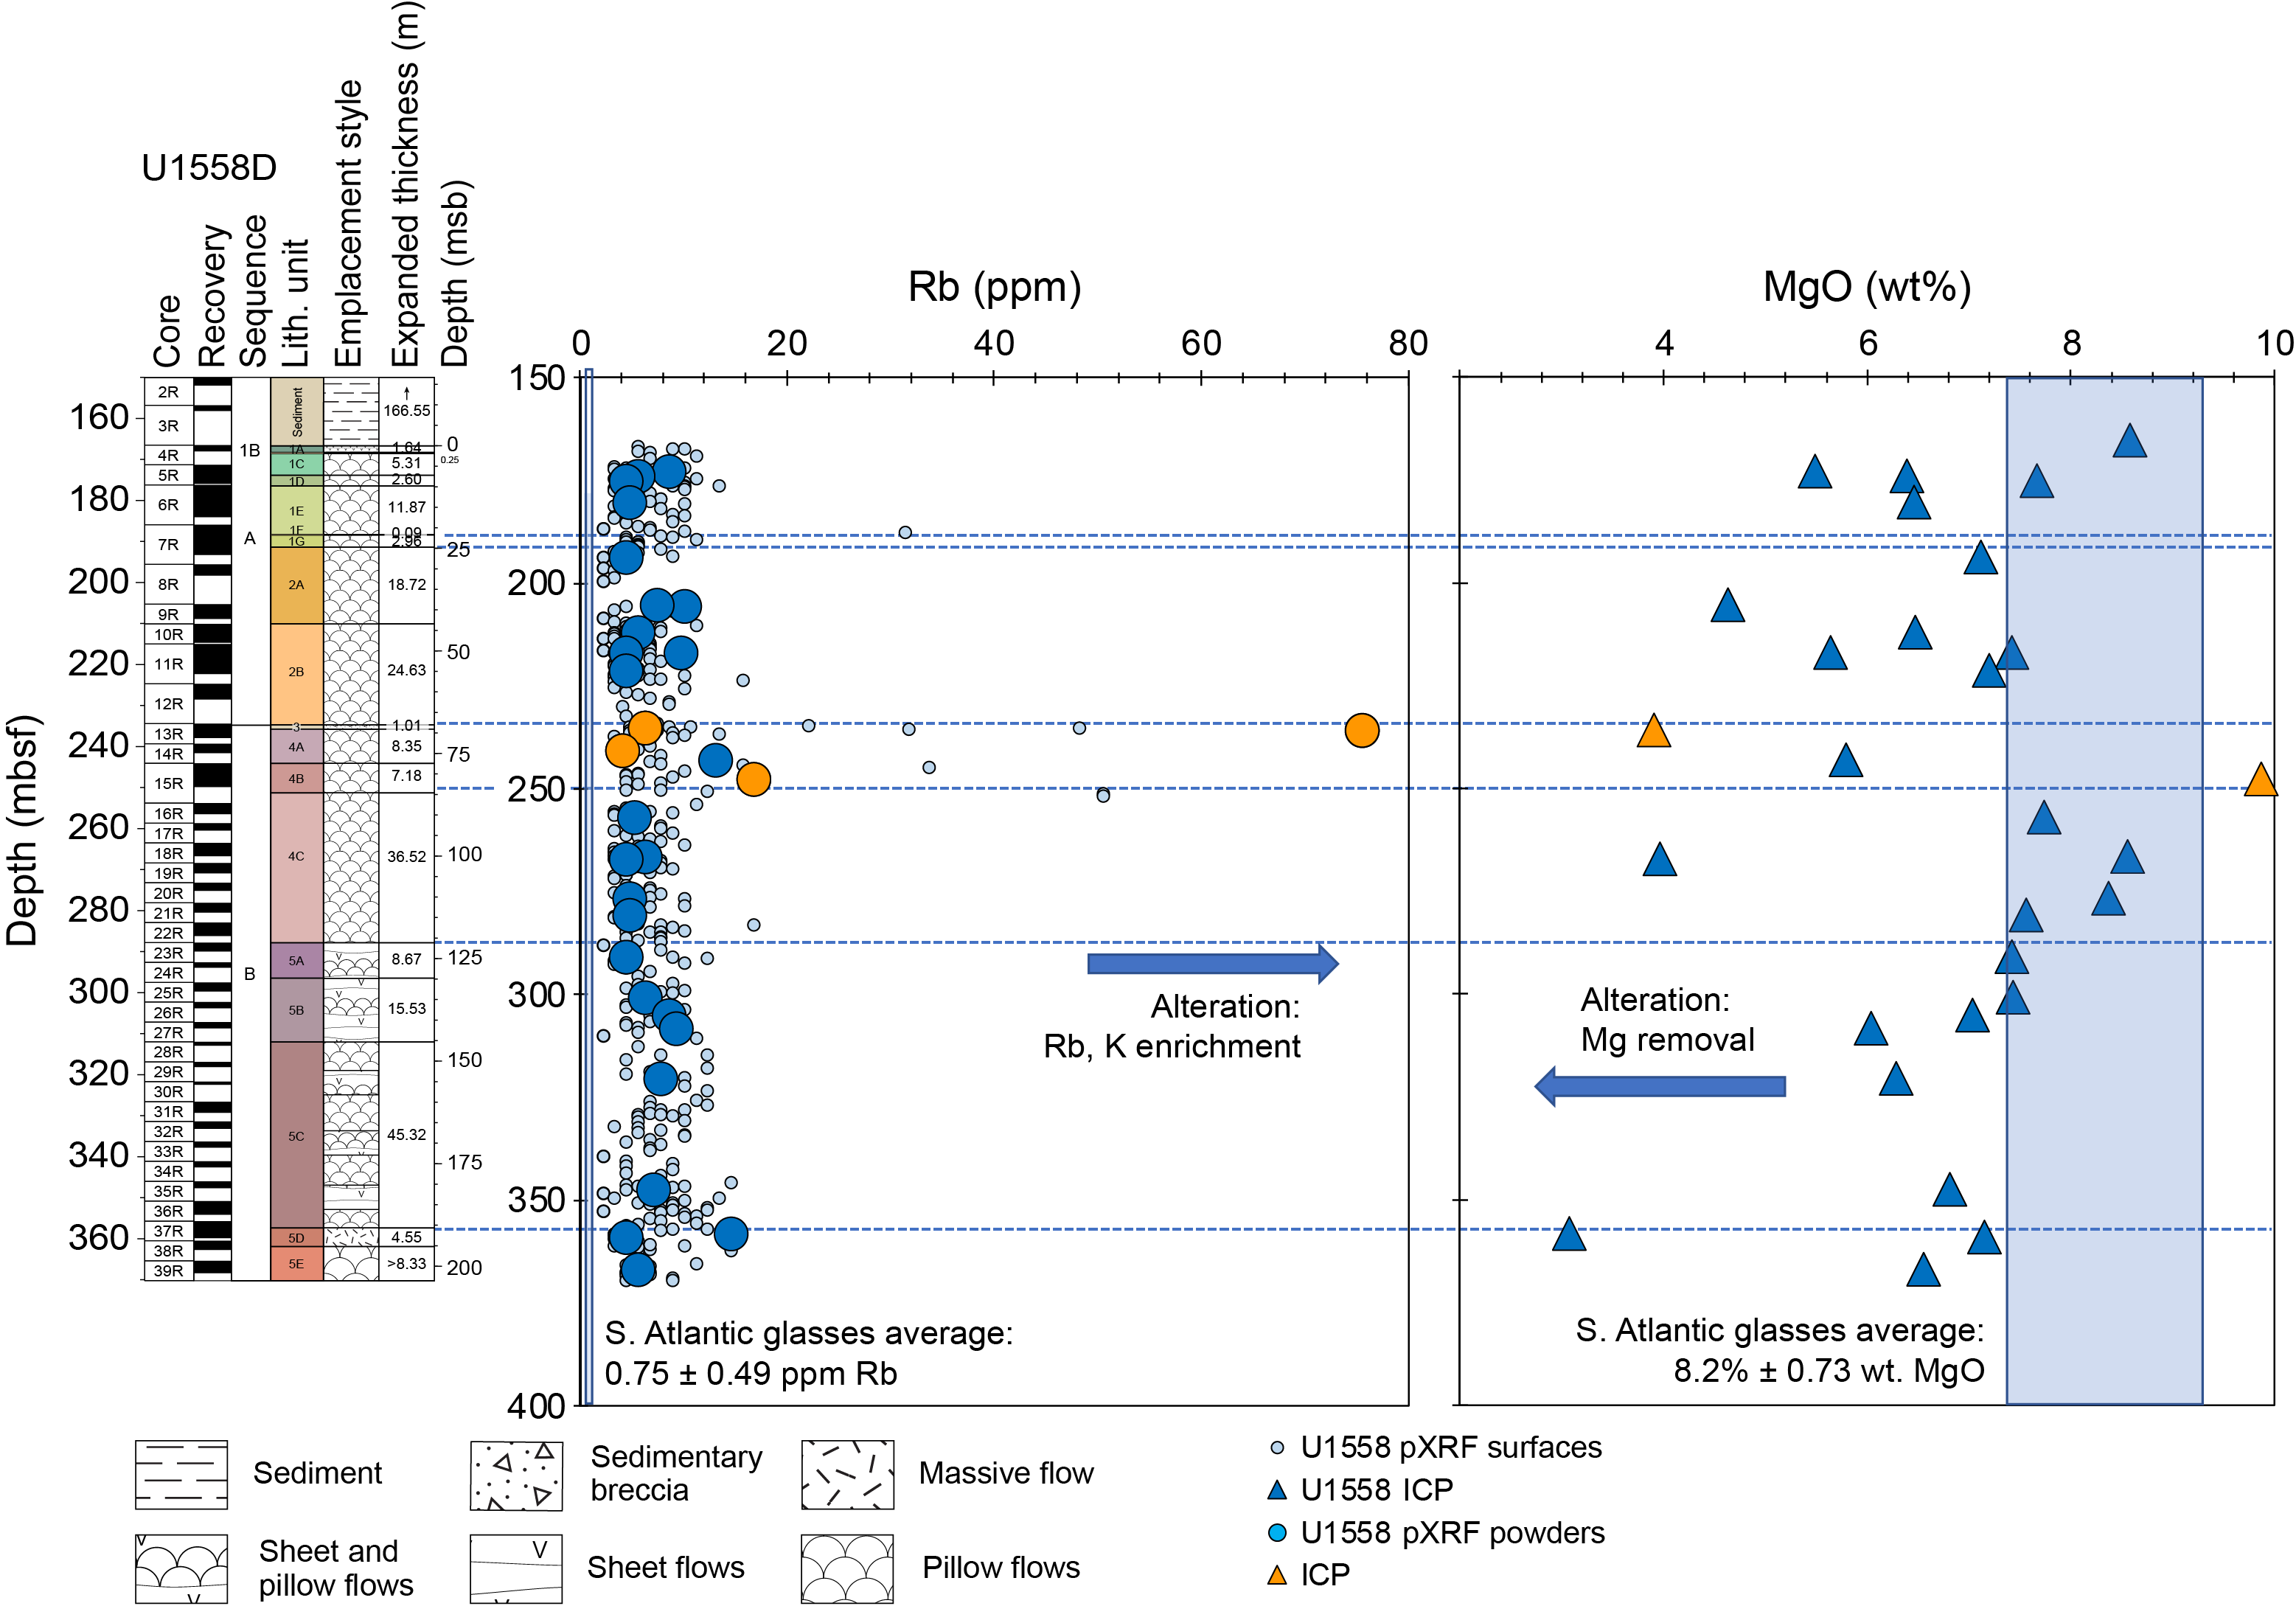
Figure F109. Rb and MgO.
Figure F110 reports these effects further through plots of MgO versus Al2O3 and K2O for the Site U1558 sample suite. Al2O3 is effectively immobile during fluid-rock exchanges, whereas K2O is high in seawater and partitions into low-temperature seafloor alteration phases. MgO forms clear inverse correlations with both Al2O3 and K2O, suggesting that the seafloor processes that remove MgO from these rocks enrich them in Al2O3 as well as K2O, particularly at the highest degrees of alteration (i.e., lowest MgO). These patterns are suggestive of the formation of K-rich, Mg-poor alteration phases during seafloor alteration at Site U1558 as opposed to the formation of abundant saponite and/or other Mg-rich alteration minerals, as has been observed in altered basalts at several different sites in the Pacific Ocean (Alt et al., 1986; Alt and Teagle, 2003; Teagle et al., 1996).
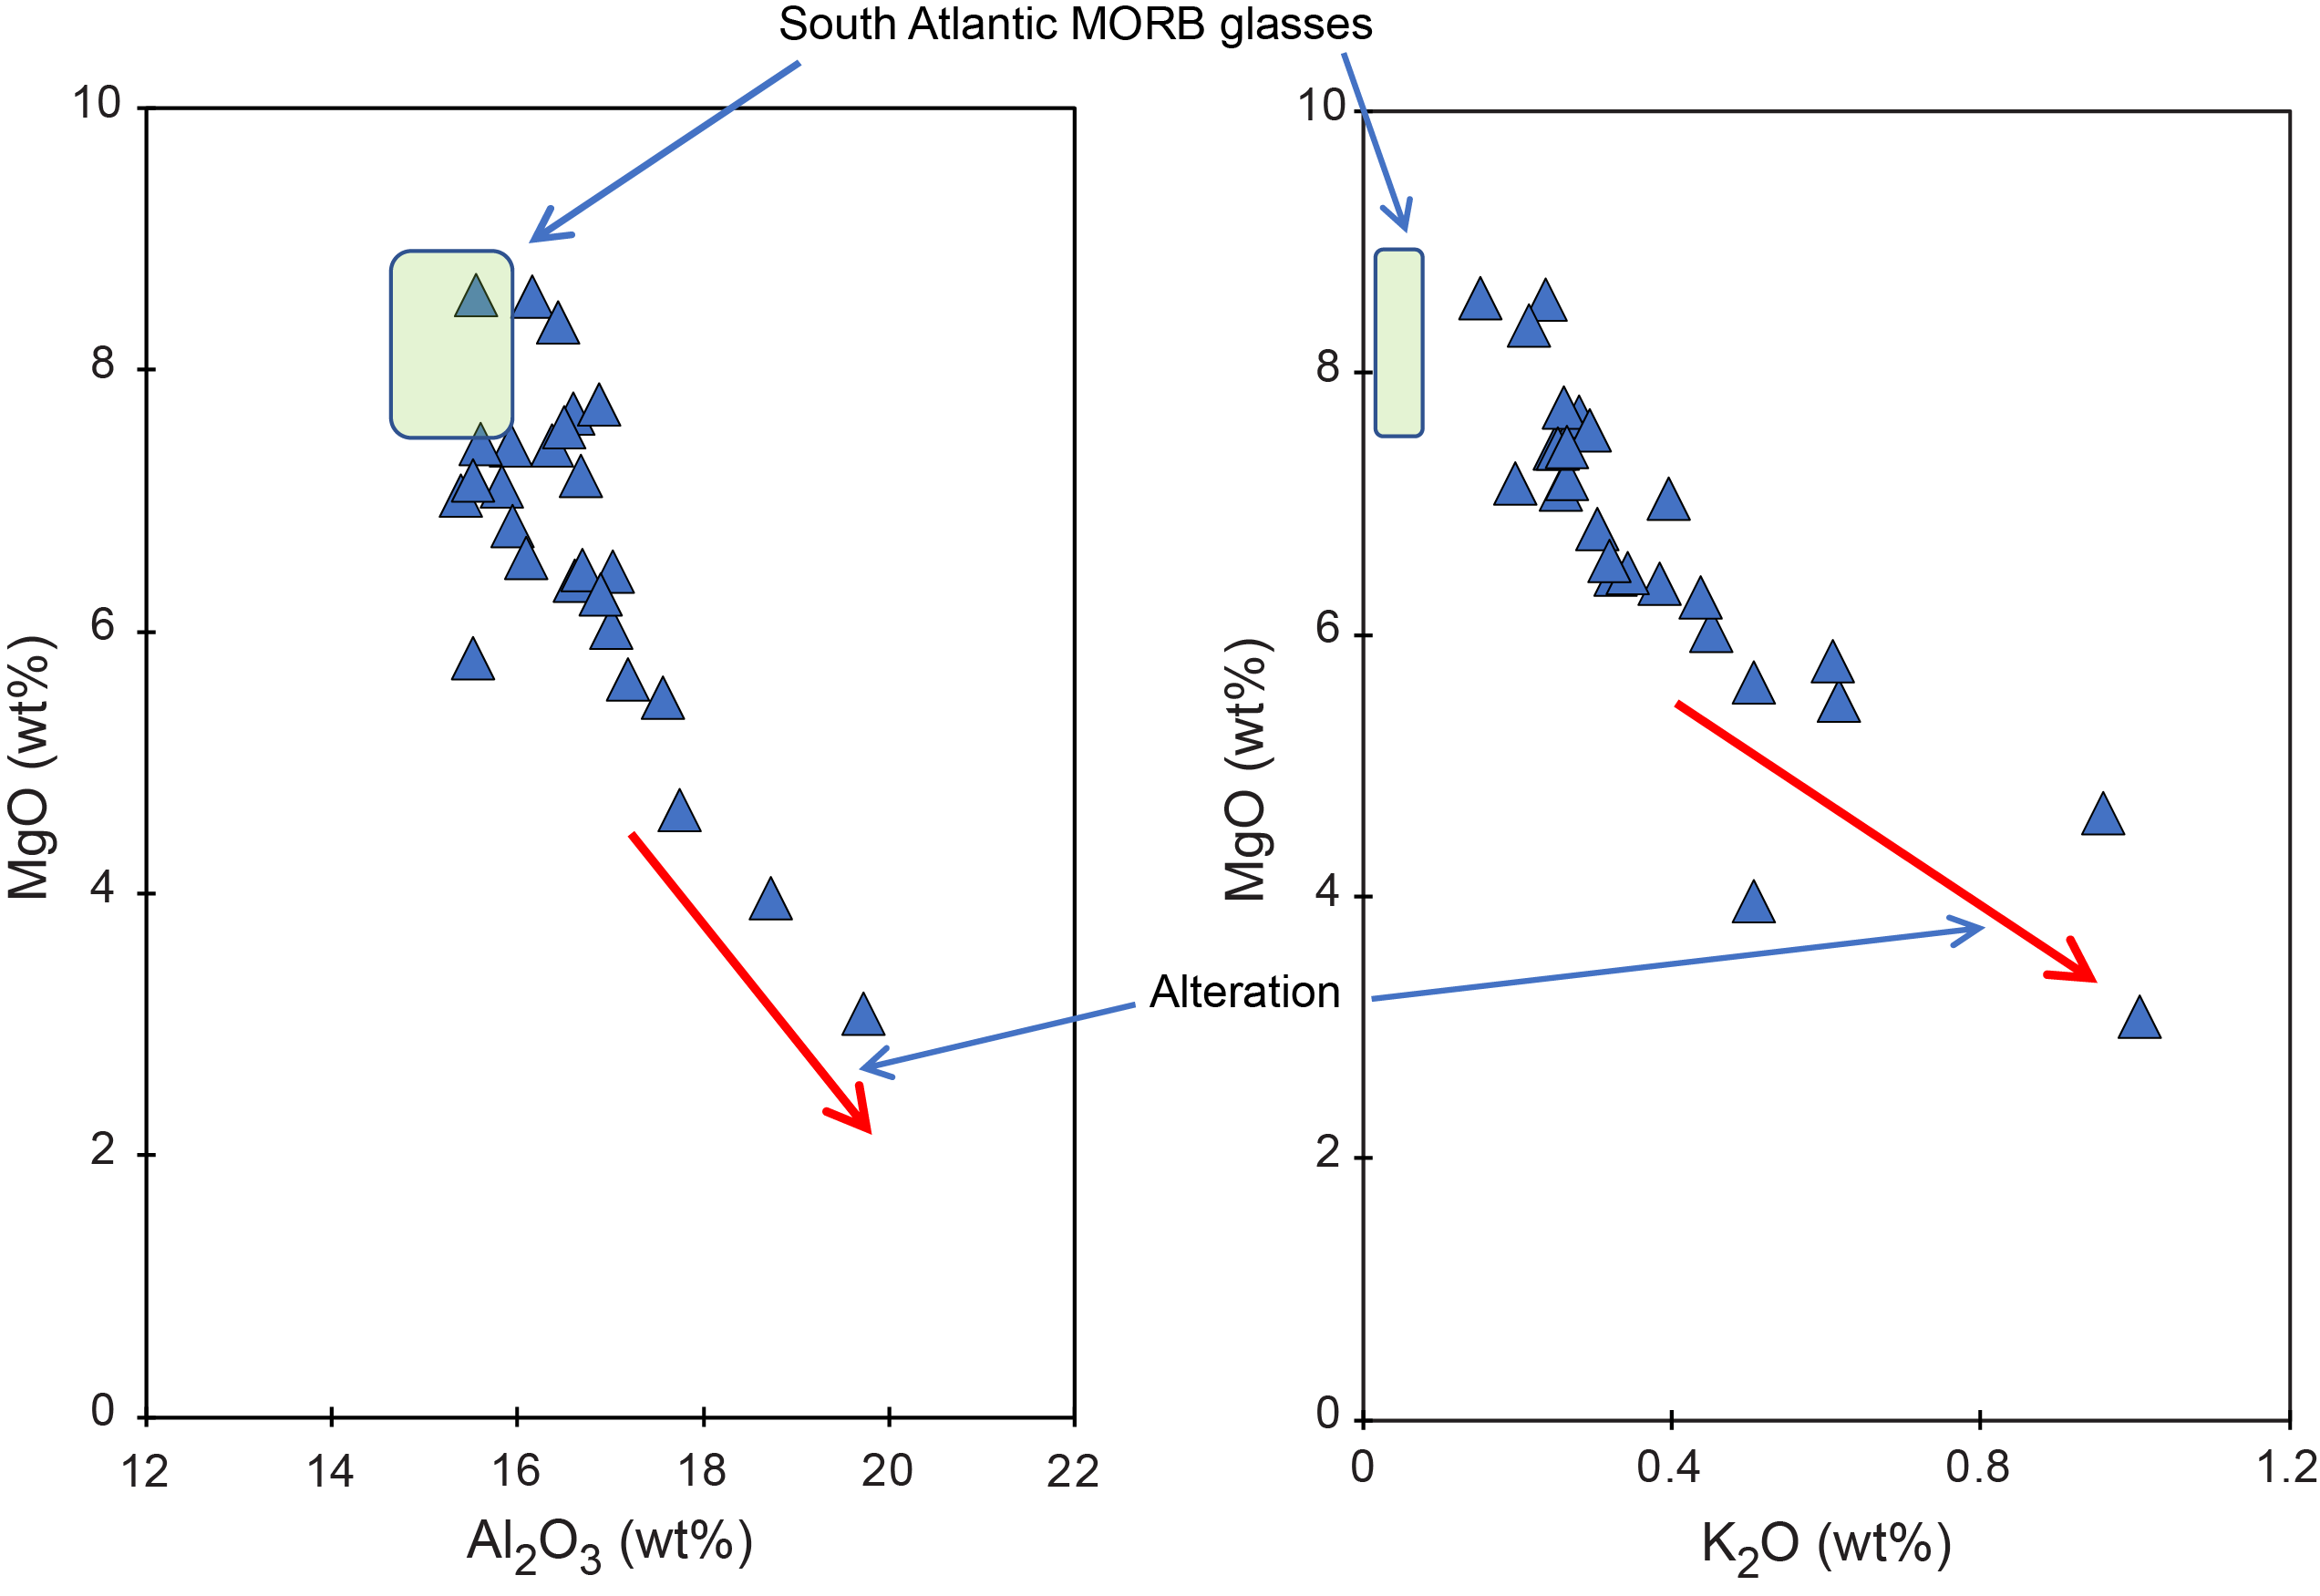
Figure F110. Al2O3 and K2O vs. MgO.
In Figure F111, K/Zr ratios, as a proxy for alteration effects, are plotted versus Cr/TiO2 ratios, as an indicator of magmatic source and differentiation effects. Our Site U1558 basalts are distinctively higher in K/Zr than D-MORB glasses from 26°N on the Mid-Atlantic Ridge and the much younger lavas (~6.6 Ma) recovered at Site U1559. However, Site U1558 samples are overall somewhat lower in K/Zr than the older (~61.2 Ma) MORB-like basalts recovered at Sites U1556 and U1557 during Expedition 390 and lower than the most altered ~107 Ma basalts recovered at Sites 417A and 417D during DSDP Leg 51 (Donnelly et al., 1980). Thus, although our ~49.2 Ma suite of Site U1558 samples shows extensive geochemical evidence for alteration, overall they appear to be not as modified as those from older Atlantic MORB crust.
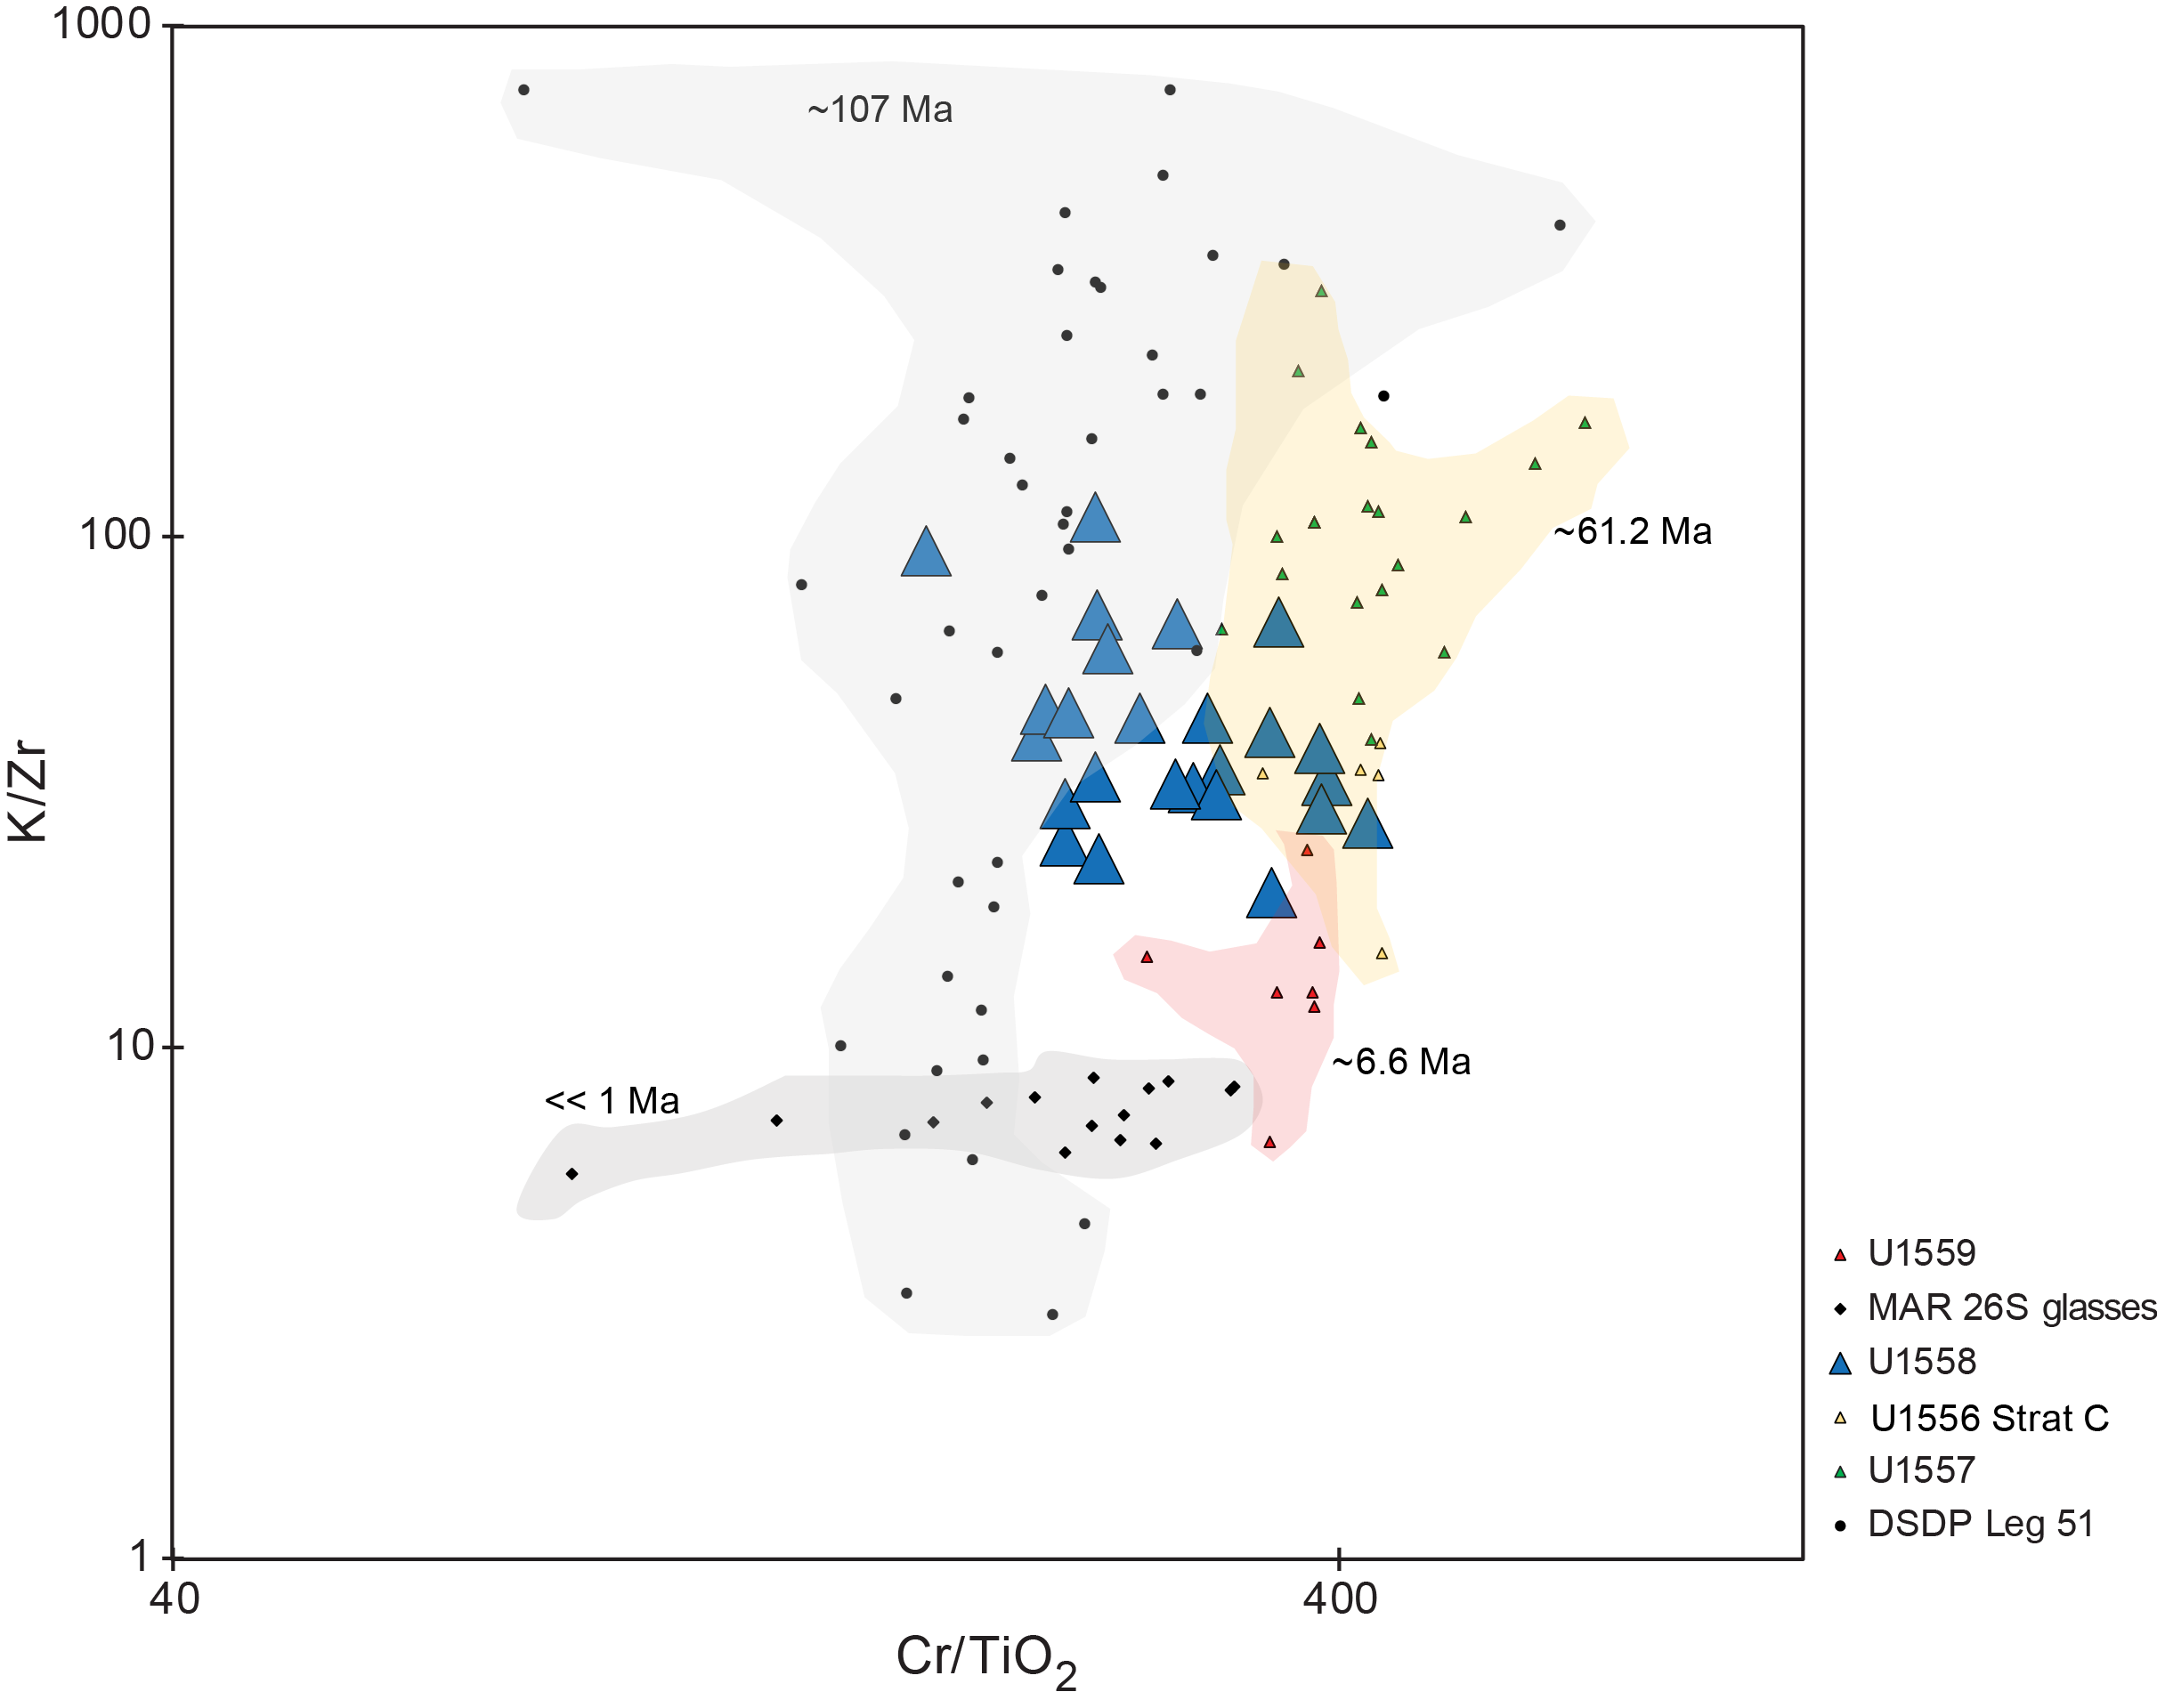
Figure F111. K/Zr vs. Cr/TiO2.
11.2.5. Breccia/sediment fill compositions
Unit 3 (Core 393-U1558D-13R) comprises a volcano-sedimentary breccia unit, and comparably modified interpillow sedimentary materials are encountered in Cores 14R and 15R in Subunits 4A and 4B. Several breccia and sedimentary fill samples were selected to better understand the compositional range of these materials. The breccia fill compositions are highly variable, ranging from very CaO rich for samples with large proportions of sediment-derived calcium carbonate (e.g., Samples 13R-1, 29–31 cm, and 14R-1, 42–48 cm) to compositions that are distinctively low in CaO and TiO2 but markedly high in SiO2, K2O, and Rb (up to 56.6 wt% SiO2, 4.5 wt% K2O, and 73 ppm Rb; Sample 13R-1, 55–58 cm) (Figures F108, F109; Tables T34, T35). Visually, the breccia zones in the Site U1558 suite appear to be mixtures of calcareous sediment and variably altered volcanic glass. However, their bulk elemental compositions, in particular their elevated SiO2 and K2O contents, indicate substantial postdepositional modification of these materials through seawater and hydrothermal exchanges.
11.2.6. Discriminator diagram systematics and anomalies
Pearce and others (Pearce and Cann, 1973; Pearce and Norry, 1979; Shervais, 1982) pioneered the use of tectonic discriminant diagrams utilizing immobile trace elements as a way of inferring protoliths and modes of origin for altered and/or metamorphosed units in the geologic record. Although the broader tectonic origins of the SAT lavas are largely agreed upon, such diagrams can also be used to spot anomalous trace element systematics among rock suites that may offer additional tectonic insights.
The Pearce and Norry (1979) Zr/Y vs. Zr discriminant diagram shows that basalts from Site U1558 consistently plot as MORBs irrespective of the data set examined (solution analyses, powders, rock surfaces), and solution, powder, and rock surface analyses show no offset relative to one another (Figure F112). Stratigraphic Sequences A and B from Site U1556, by contrast, show clear intraplate affinities, forming a trend into the within-plate basalt field, whereas basalts from Site U1556, Stratigraphic Sequence C, and Site U1557 plot largely in the MORB field but are offset from the Site U1558 and U1559 suites toward the island arc field. On the V vs. Ti/1000 diagram (Figure F113) (Shervais, 1982), the offset of the Site U1557 data is even more apparent, as these rocks, along with the MORB-like samples from the bottom of Hole U1556B (Stratigraphic Sequence C), fall within the arc field, even though they are clearly not arc related. Data for Site U1558 basalts, as best demonstrated by the higher-precision ICP-AES results, straddle the boundary between the MORB and arc fields. The lower Zr/Y and higher V/Ti ratios seen in the Site U1557 suite and in some Site U1558 samples suggest comparatively lower incompatible element concentrations in the protoliths of these older (~61.2–49.2 Ma) lavas.
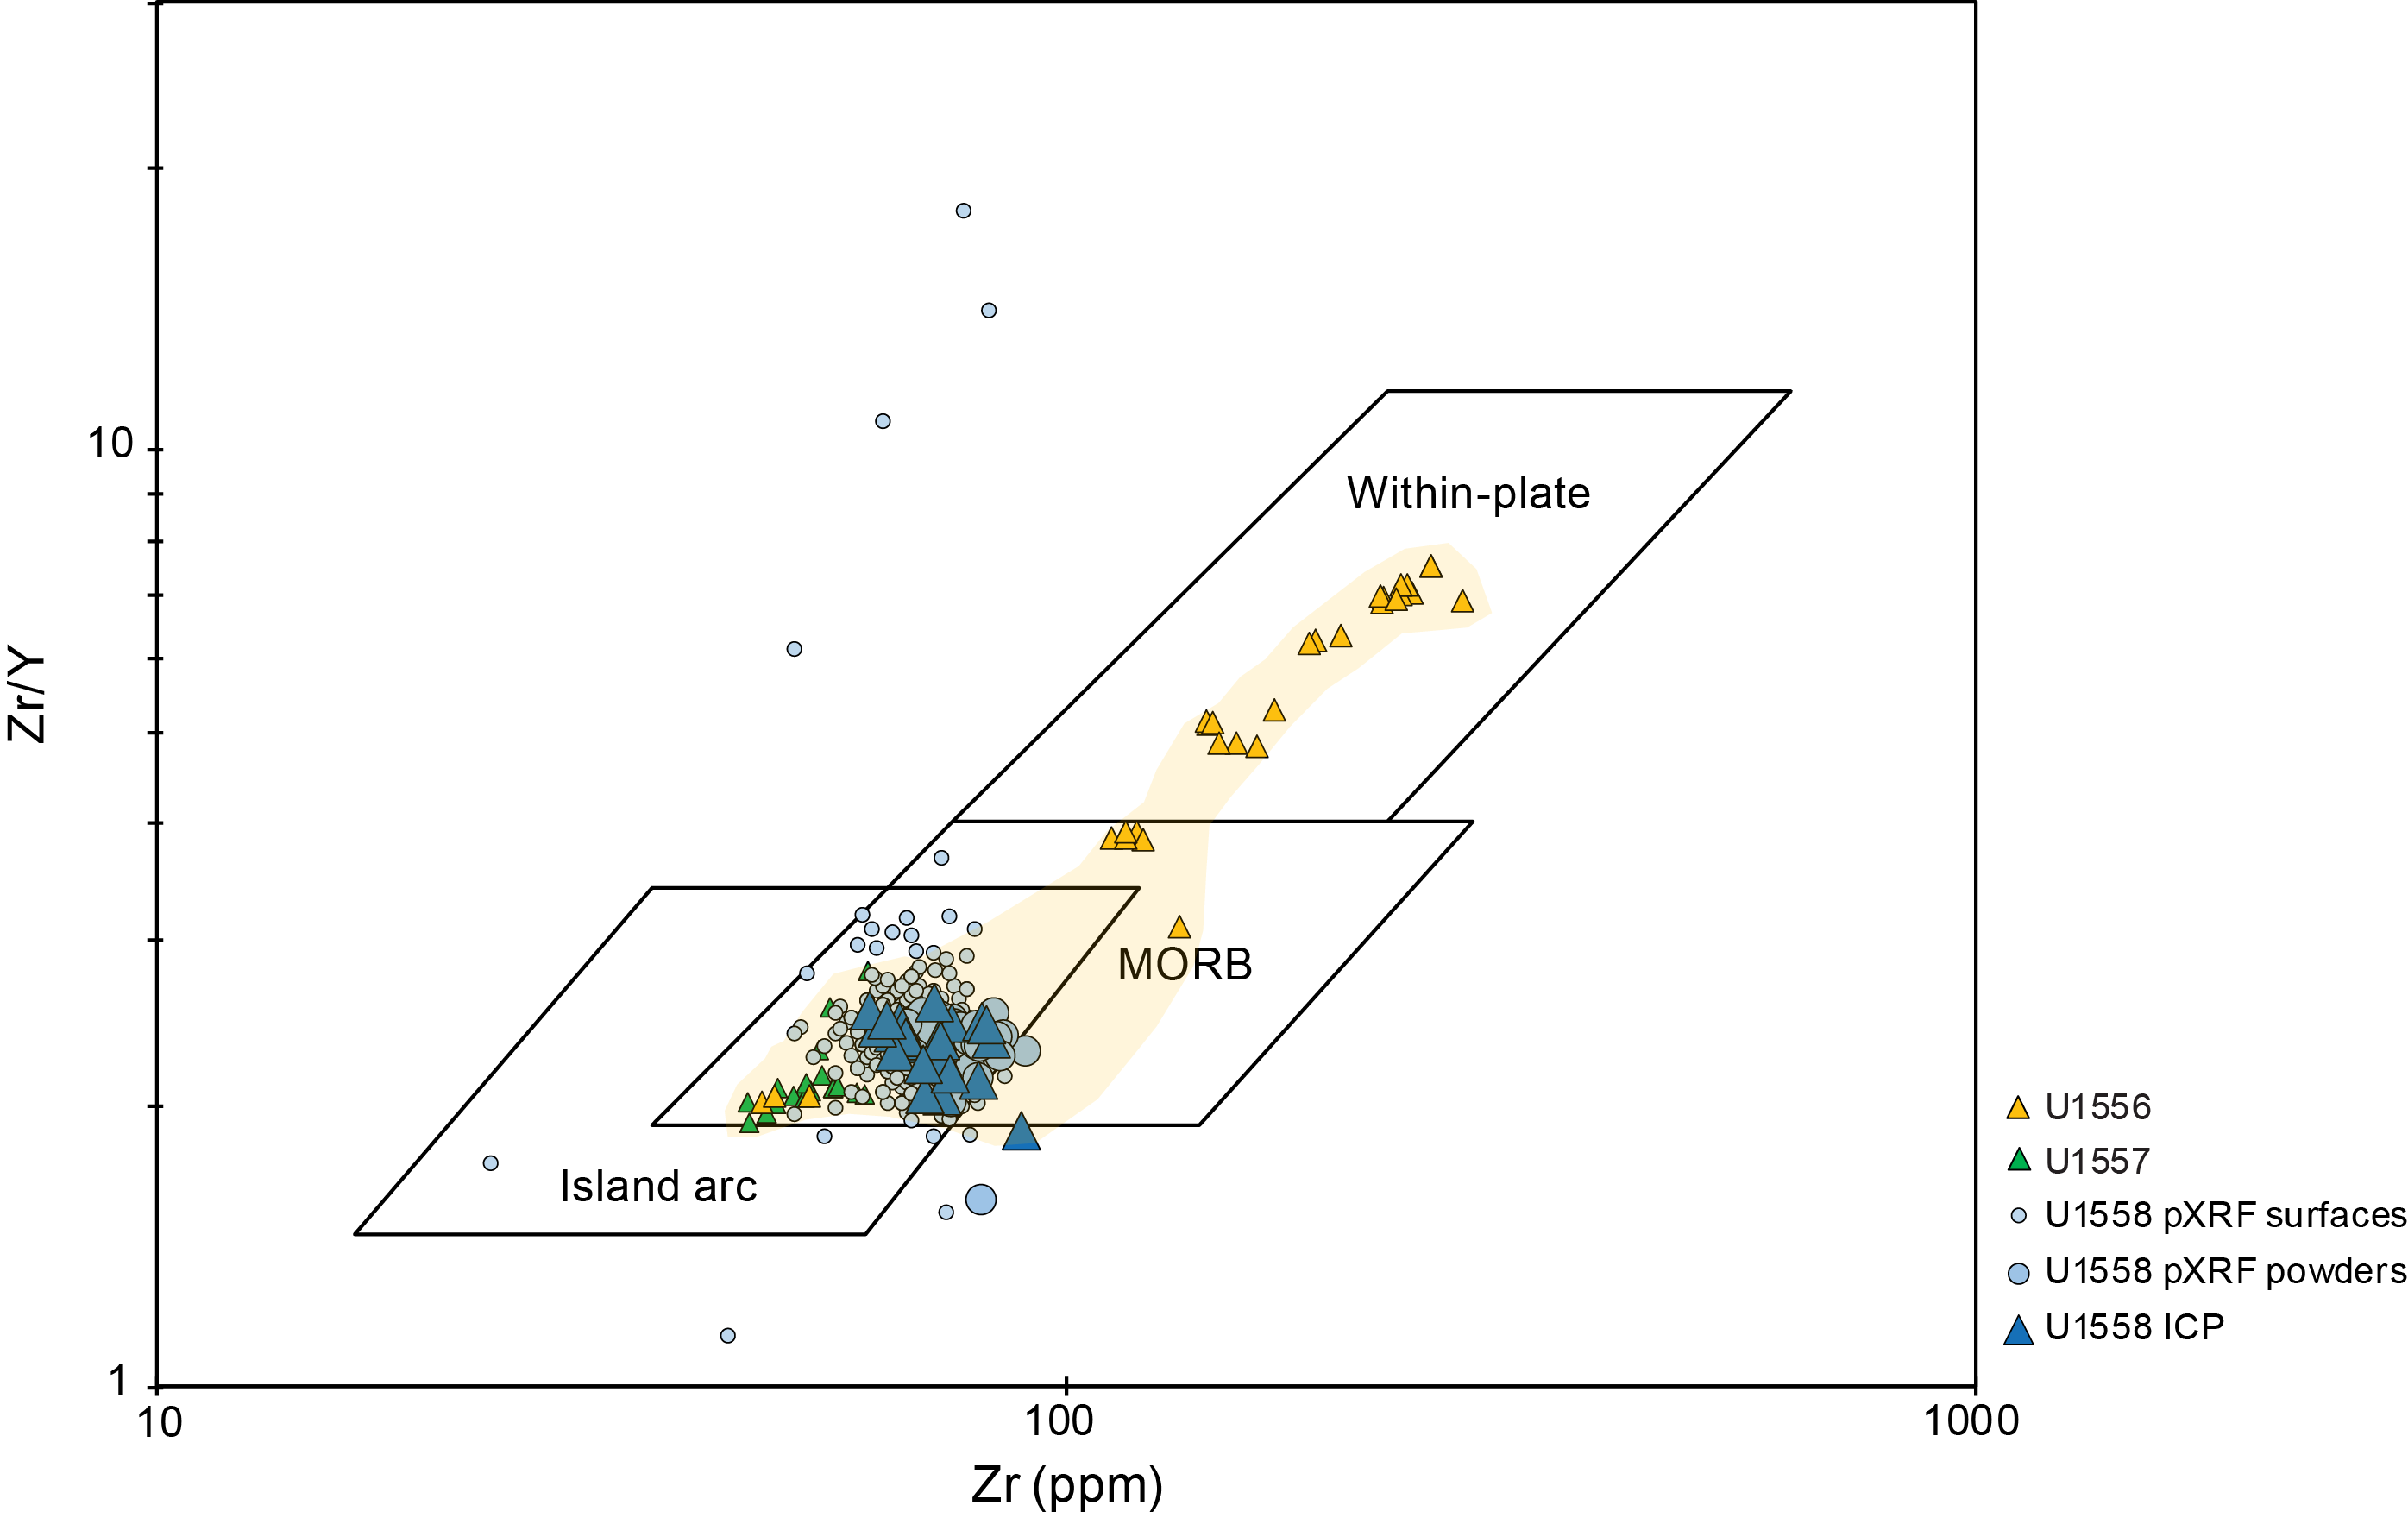
Figure F112. Zr/Y vs. Zr.
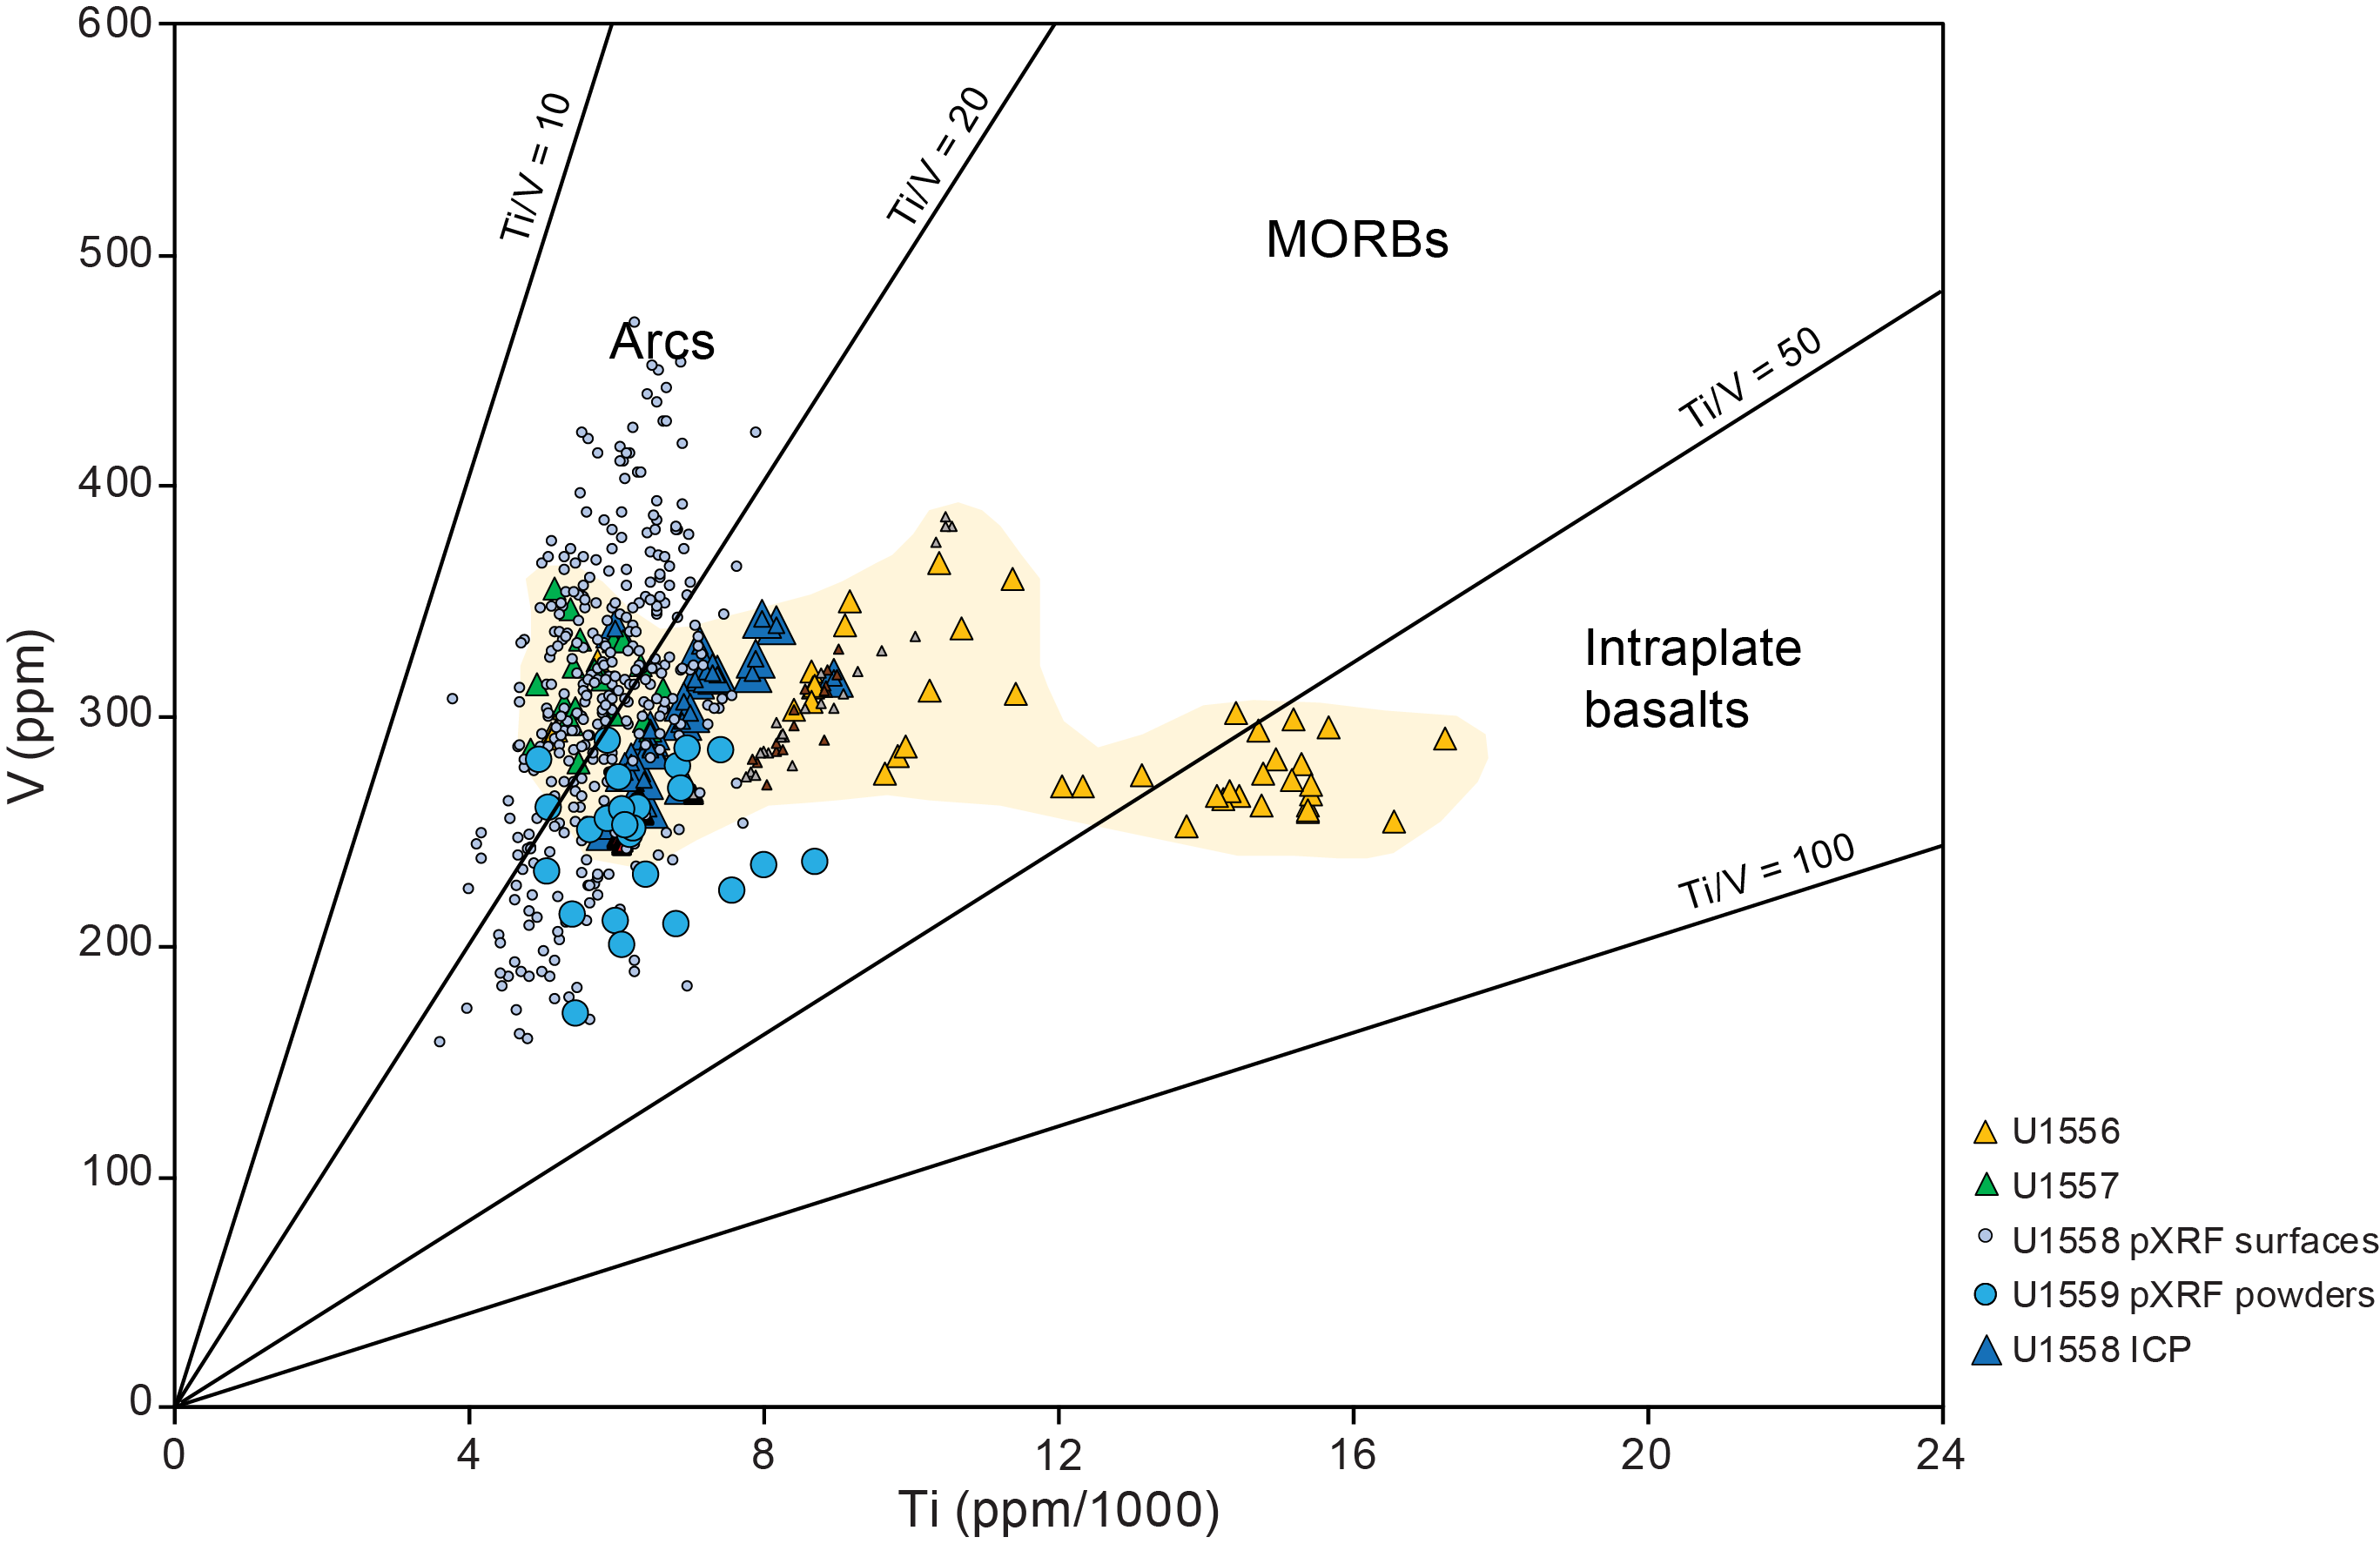
Figure F113. V vs. Ti/1000.
12. Microbiology
12.1. Sediment
Microbiology sampling in Hole U1558F during Expedition 393 focused on exploring evidence for life in the sediments and at the sediment/basement interface using culture-based and culture-independent approaches. In Hole U1558F, one standard microbiology whole-round sample (5–10 cm long) was collected from each 9.5 m core and subsampled for different shipboard and shore-based scientists, as described below (Table T39). Additional personal whole-round cores for specialized shore-based analyses were also taken (Table T39). In summary, 18 standard microbiology and 38 personal whole-round samples were taken from Hole U1558F.
12.1.1. Microbiological sample processing and experiments
12.1.1.1. Cell and viral counts
Subsamples for cell enumeration were taken in duplicate from every standard microbiology whole round. An additional subsample was taken for viral counts from each of the 10 cores that were sampled for viral metagenomic analysis. Conducting cell and virus counting is difficult on the R/V JOIDES Resolution because of the time required for microscopy sample preparation and counting. Therefore, shipboard cell counts were not attempted during the SAT expeditions; instead, samples were preserved for postexpedition analyses by diluting 1 cm3 of sample in 4 mL of 4% paraformaldehyde in 100 mM phosphate-buffered saline (PBS). Duplicate samples were collected to enable cross-calibration of cell count results between different laboratories, and a third sample was collected for virus counts from samples where viral metagenomes were also collected.
12.1.1.2. Microbial community structure
From the standard microbiology whole rounds, 38 samples were preserved for shore-based polymerase chain reaction [PCR] amplicon-based analysis (from DNA and RNA), 18 samples were preserved for single-cell genomics, 10 samples were preserved for viral production experiments, and 9 samples were preserved for high-throughput culturing. The following additional personal whole-round (5–10 cm long) samples were collected and preserved: 10 samples for viral metagenomics, 9 samples for sediment metagenomics, 7 samples for anaerobic enrichments, and 6 samples for the anaerobic enrichment of Archaea (Table T39). All samples were preserved as described in Microbiology in the Expedition 390/393 methods chapter (Coggon et al., 2024b) for postexpedition research.
12.1.1.3. Microbial incubation experiments
To determine the extent of viral activity, experiments were performed (see Microbiology in the Expedition 390/393 methods chapter [Coggon et al., 2024b]) in duplicate using 10 cm3 from the standard microbiology whole-round sample from Cores 393-U1558F-1H, 3H, 8H, 16F, 21X, and 24X (see Table T39 for specific sections and depths). Virus-induced microbial mortality and prophage induction experiments were initiated in a Coy anaerobic chamber (see Microbiology in the Expedition 390/393 methods chapter [Coggon et al., 2024b]). These samples were chosen to represent a range of oxygen and nutrient concentrations throughout the hole. The samples were incubated at room temperature (~18°C), and duplicate 1 mL subsamples were collected after 0, 3, 6, 12, 24, and 48 h and then at 7 and 14 days. The seawater that was used to dilute 1 cm3 sediment for samples from Cores 16F, 21X, and 24X (see Table T39 for specific sections and depths) was collected shortly after arrival at Site U1559 on 19 June 2022 using a field-rinsed bucket attached to a rope. This surface seawater was filtered through a 0.22 µm polyethersulfone (PES) membrane twice and autoclaved. The pH was 7.99 after autoclaving, and the salinity was 37. For samples from Cores 1H, 3H, and 8H, 0.22 µm filtered and autoclaved deep seawater (4333 m depth) was collected on 28 June at Site U1558 using a Niskin bottle attached to the subsea camera system frame. The pH of the deep water was 7.54, and the temperature was 13°C.
12.1.2. Microbiological contamination monitoring
To determine the number of microorganisms present in drilling fluid and also generate a database of potential contaminants, we collected drilling fluid from the standpipe on the rig floor two times during coring operations in Hole U1558F: (1) while drilling Core 4H (~126 mbsf) and (2) at the end of drilling Core 24X (~174 mbsf). Drilling fluid samples were collected for cell counts, and 500 mL was filtered onto a 0.20 µm pore size 47 mm diameter filter and frozen at −80°C for shore-based molecular biology analysis.
12.2. Basement
Microbiology sampling from volcanic rocks in Hole U1558D during Expedition 393 focused on culture-based and culture-independent approaches to characterize microbial communities and their activity near the sediment/basement interface and in underlying basement. Sampling efforts focused on collecting one whole-round core sample from each 9.5 m advance that would be processed and subsampled for different analyses. In total, 25 whole-round samples (12–23 cm long) were collected for microbiological analyses (Figure F114). The rock types collected were as follows (Figure F114) (see Igneous petrology):
- Moderately plagioclase-olivine-pyroxene-phyric, cryptocrystalline basalt pillow lava (1 sample);
- Highly plagioclase-olivine-pyroxene phyric, cryptocrystalline basalt pillow lava with glassy margin (1 sample);
- Moderately plagioclase-olivine-pyroxene phyric, cryptocrystalline basalt pillow lava with glassy margin (4 samples);
- Highly plagioclase-olivine-pyroxene phyric, cryptocrystalline basalt pillow lava with glassy margin (2 samples);
- Moderately plagioclase-olivine-pyroxene phyric, microcrystalline to locally cryptocrystalline basalt (1 sample);
- Sparsely olivine-plagioclase phyric, cryptocrystalline basalt pillow lava and interpillow sediment (1 sample);
- Fractured pillow lavas, pillow breccias, and hyaloclastite breccias (1 sample);
- Sparsely plagioclase-olivine-phyric, microcrystalline basalt pillow lava with cryptocrystalline to glassy margin (3 samples);
- Moderately plagioclase-olivine-phyric, microcrystalline basalt (1 sample);
- Sparsely plagioclase-olivine-phyric, microcrystalline basalt (1 sample);
- Moderately olivine-plagioclase-phyric, cryptocrystalline basalt (1 sample);
- Moderately olivine-plagioclase-phyric, variolitic basalt (3 samples); and
- Moderately plagioclase-olivine-phyric basalt (1 sample).
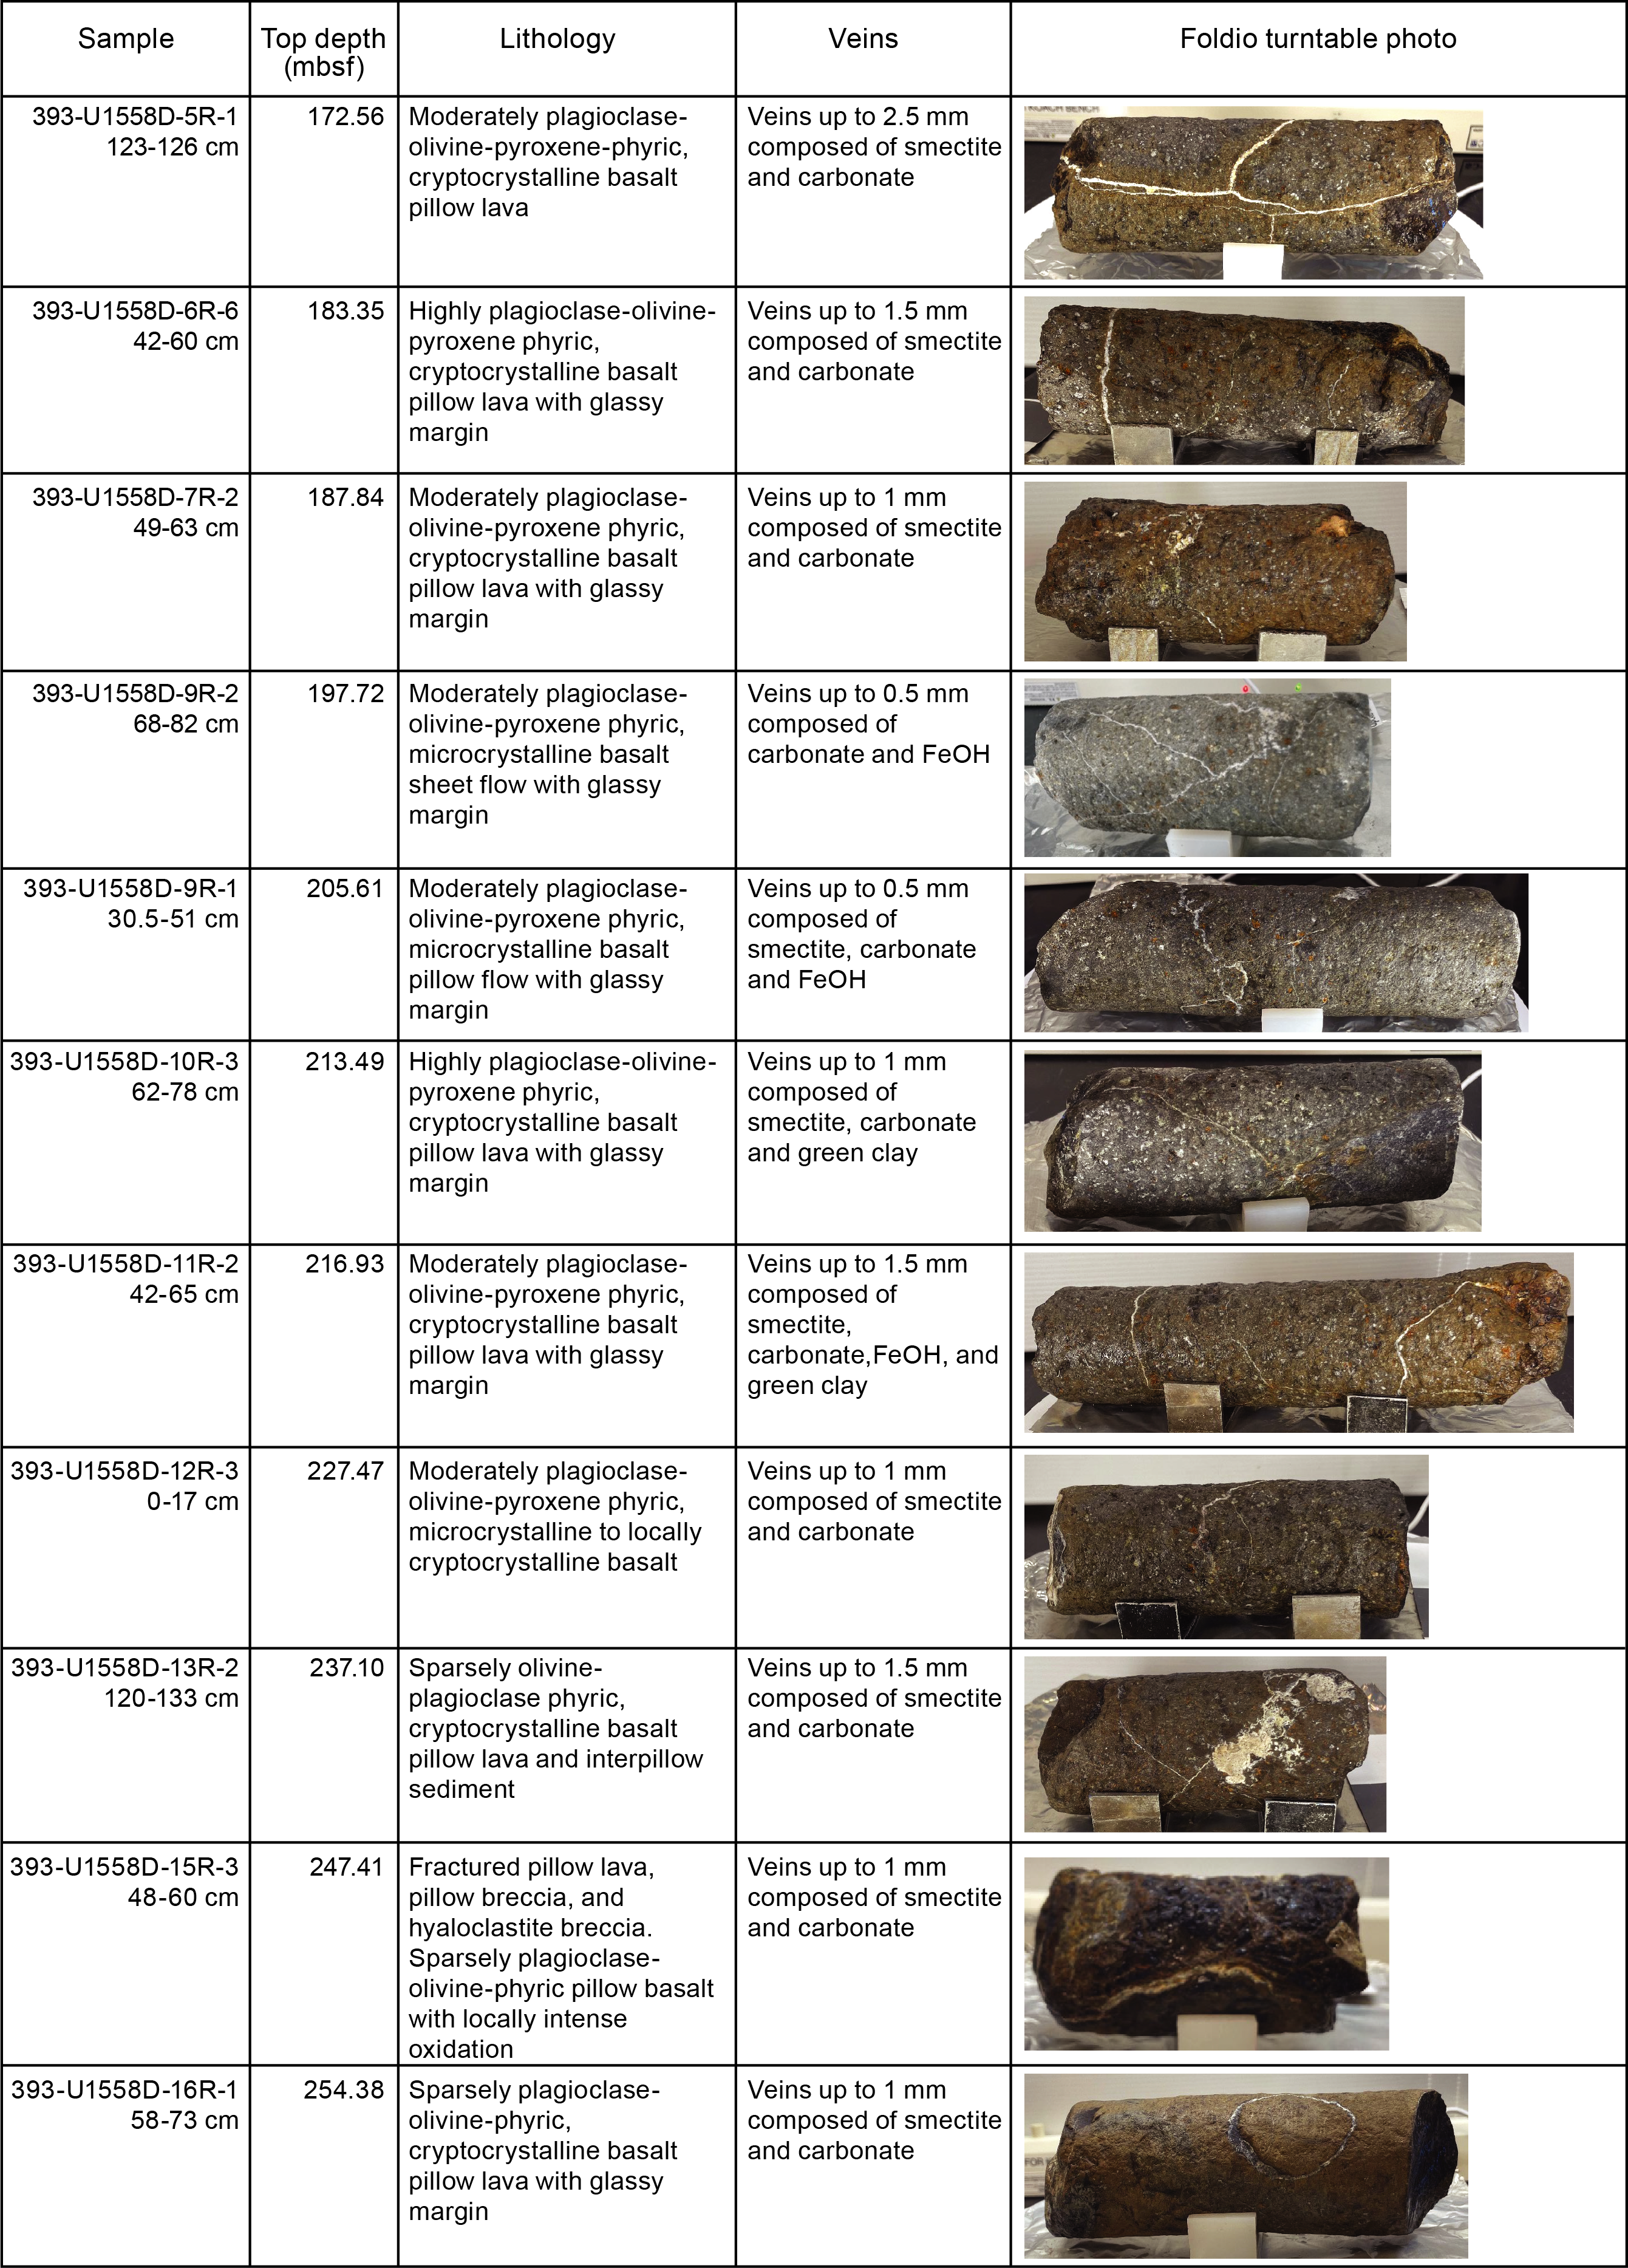
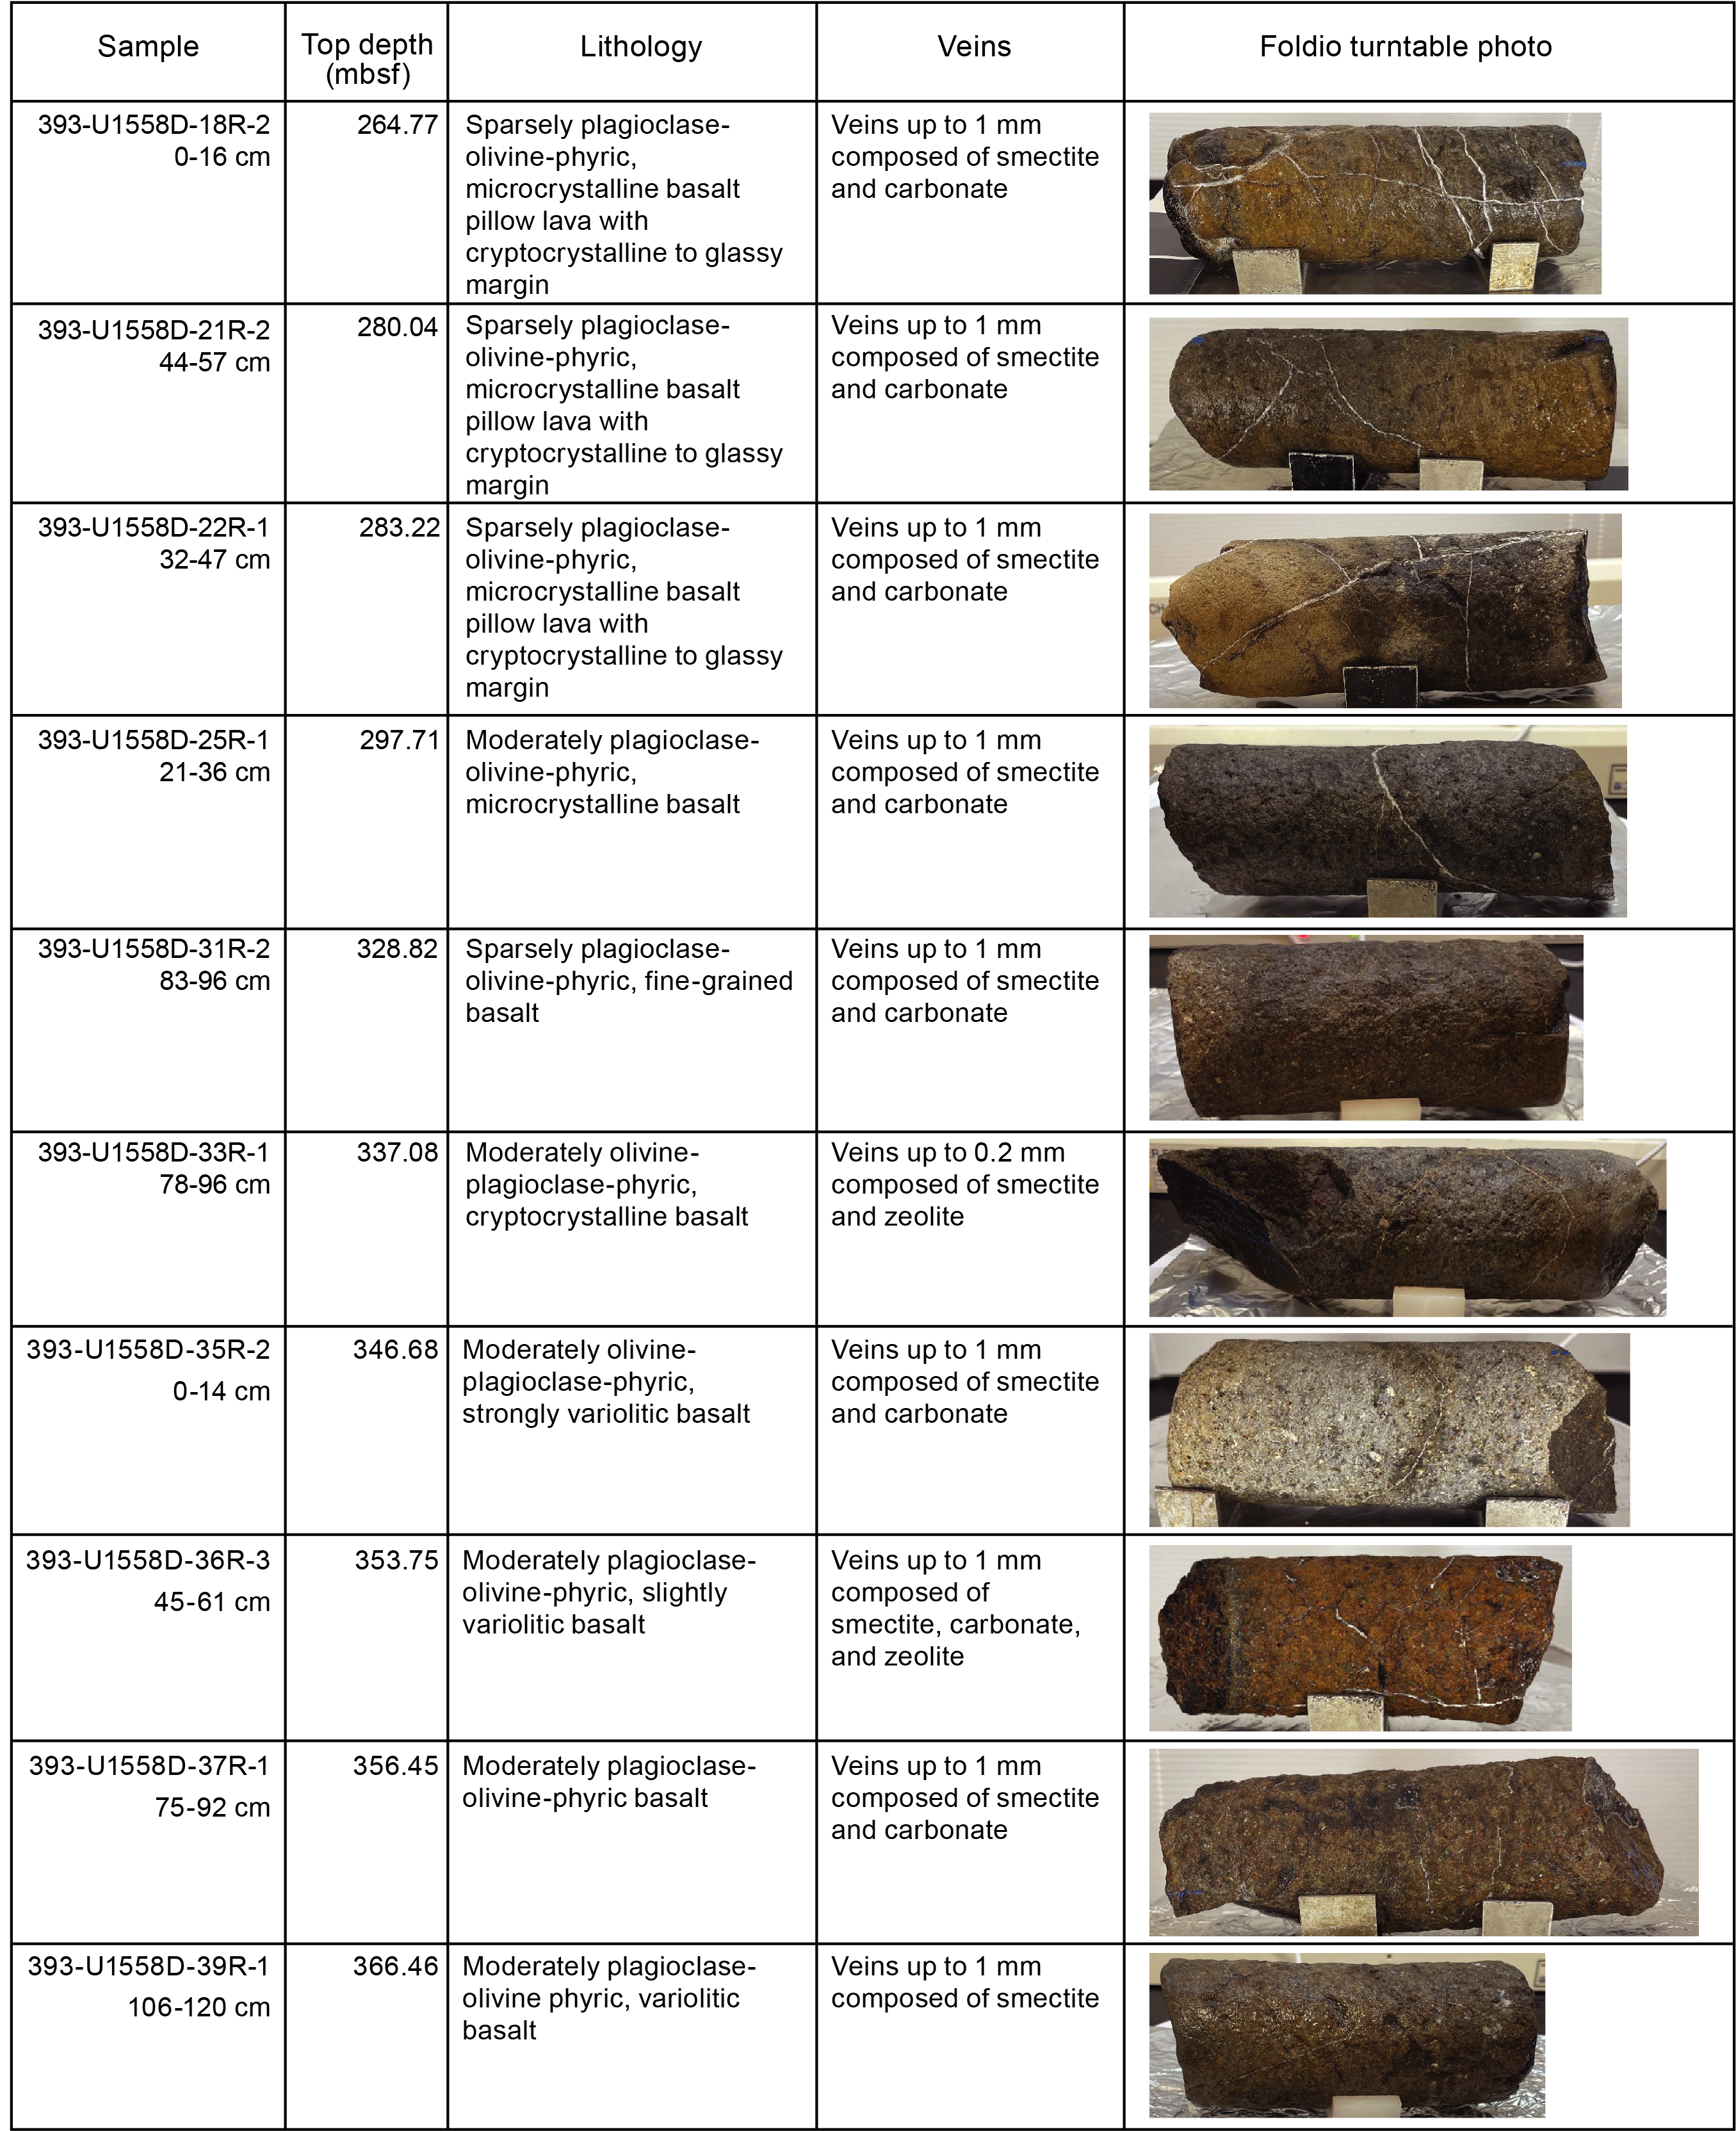
Figure F114. Samples for microbiology research.
After the exteriors of whole-round pieces were removed to avoid material contaminated during coring (see Microbiology in the Expedition 390/393 methods chapter [Coggon et al., 2024b]), the remaining material was split into subsamples that were prepared for different microbiological analyses. The number of subsamples depended on the amount of material available from each whole round (Table T40).
12.2.1. Microbiological sample processing and experiments
12.2.1.1. Cell and viral counts
A total of 22 samples were processed for cell counts. Performing shipboard enumeration from rock samples is difficult and time consuming; therefore, shipboard cell counts were not attempted during the SAT expeditions. Samples were broken into small chips and/or powder and preserved for postexpedition analyses (1 cm3 in 4 mL of 4% paraformaldehyde in 100 mM PBS). Duplicate cell count samples were prepared for all samples so that the measurements can be performed independently in two different laboratories. When samples were taken for viral metagenomics, a third replicate was added to allow for viral counts.
12.2.1.2. Microbial community structure
A total of 21 samples were processed for shore-based DNA (PCR amplicon based and metagenomes) and/or RNA (PCR amplicon based and/or metatranscriptomes) analysis, 22 samples were preserved for single-cell genomics, and 21 samples were collected for lipid analysis (Table T40). Material for DNA, RNA, and lipid-based analyses of microbial community composition, which will be performed as part of the postexpedition research, was collected and preserved following the procedures described in Microbiology in the Expedition 390/393 methods chapter (Coggon et al., 2024b).
12.2.1.3. Microbial incubation experiments
To determine the extent of viral activity in basement, incubation experiments were performed (see Microbiology in the Expedition 390/393 methods chapter [Coggon et al., 2024b]). The sample from Section 393-U1558D-5R-1 was used to initiate viral production and prophage induction experiments. Duplicates of approximately 4 g of pulverized rock (crushed with a sterile hammer inside a rock box) were resuspended in 40 mL of autoclaved deep seawater and sampled (duplicates of 1 mL) after 0, 3, 6, 12, 24, and 48 h and then 7 and 14 days. The deep seawater used was collected on 4 July 2022 at Site U1558 using a Niskin bottle attached to the subsea camera system frame. It was filtered through a 0.22 µm polyether sulfone (PES) membrane and autoclaved. The pH was 7.6, the temperature at collection was 1.3°C, and the salinity was 35.
To better understand nitrogen cycling across the sediment/basement interface, basement samples from Sections 393-U1558D-2R-1 and 5R-1 were used in ammonium enrichment incubation experiments (see Microbiology in the Expedition 390/393 methods chapter [Coggon et al., 2024b]). A total of 9 g of rocks was crushed with a sterile Diamonite mortar and pestle and diluted in 50 mL vials with deep water collected from Site U1558 (collected on 28 June and 4 July 2022, ~4300 mbsl and filtered twice through 0.22 µm pore size filter) to achieve a final volume of 40 mL. Samples will be incubated at 4°C for 6 months before shore-based analysis at Texas A&M University (USA).
12.2.2. Microbiological contamination monitoring
Circulating drilling fluid and mud are potential sources of contamination to cores collected for microbiological analyses (Sylvan et al., 2021). To determine the extent of contamination of the microbiology samples, the perfluorocarbon tracer perfluoromethyldecalin (PFMD) was injected into drilling fluid at a rate of 0.5 mL/min during circulation in Hole U1558D for the entirety of the hole. Samples from both the exterior and interior of whole rounds selected for microbiology analysis were collected to quantify the presence of PFMD. Ten exterior samples were additionally collected for PFMD analysis from rubble (core fragments <2 cm). Seven of the ten samples were taken in core intervals from which a microbiology sample was also collected, and three were taken from advances where no microbiology sample was taken (Tables T40, T41). These exterior rubble samples were chosen after the core was laid out in the splitting room, targeting rubble in the core catcher that was most likely in contact with drilling fluid and/or mud but not of high interest for further scientific analysis because of small size. For 12 of the whole-round cores where small rubble pieces were not available, a piece of the exterior of the rock was taken after the rock was rinsed and cleaned with ethanol, which may remove or dilute the PFMD but can also validate the cleaning process (Table T41).
An interior piece was also collected from the inside of every microbiology whole round for PFMD analysis to determine if any tracer infiltrated the interior of the cores. PFMD was detected on nearly half of the exterior samples (for the 23 tested samples, 4 samples were below detection level, 8 samples were 0 ng PFMD/g rock, and 11 samples were >0 ng PFMD/g rock) at an average concentration of 6.81 ng PFMD/g core and a median concentration of 0 ng PFMD/g rock (Figure F115; Table T41). The tracer was never detected in the interior microbiology samples, suggesting no or minimal contamination of the samples.
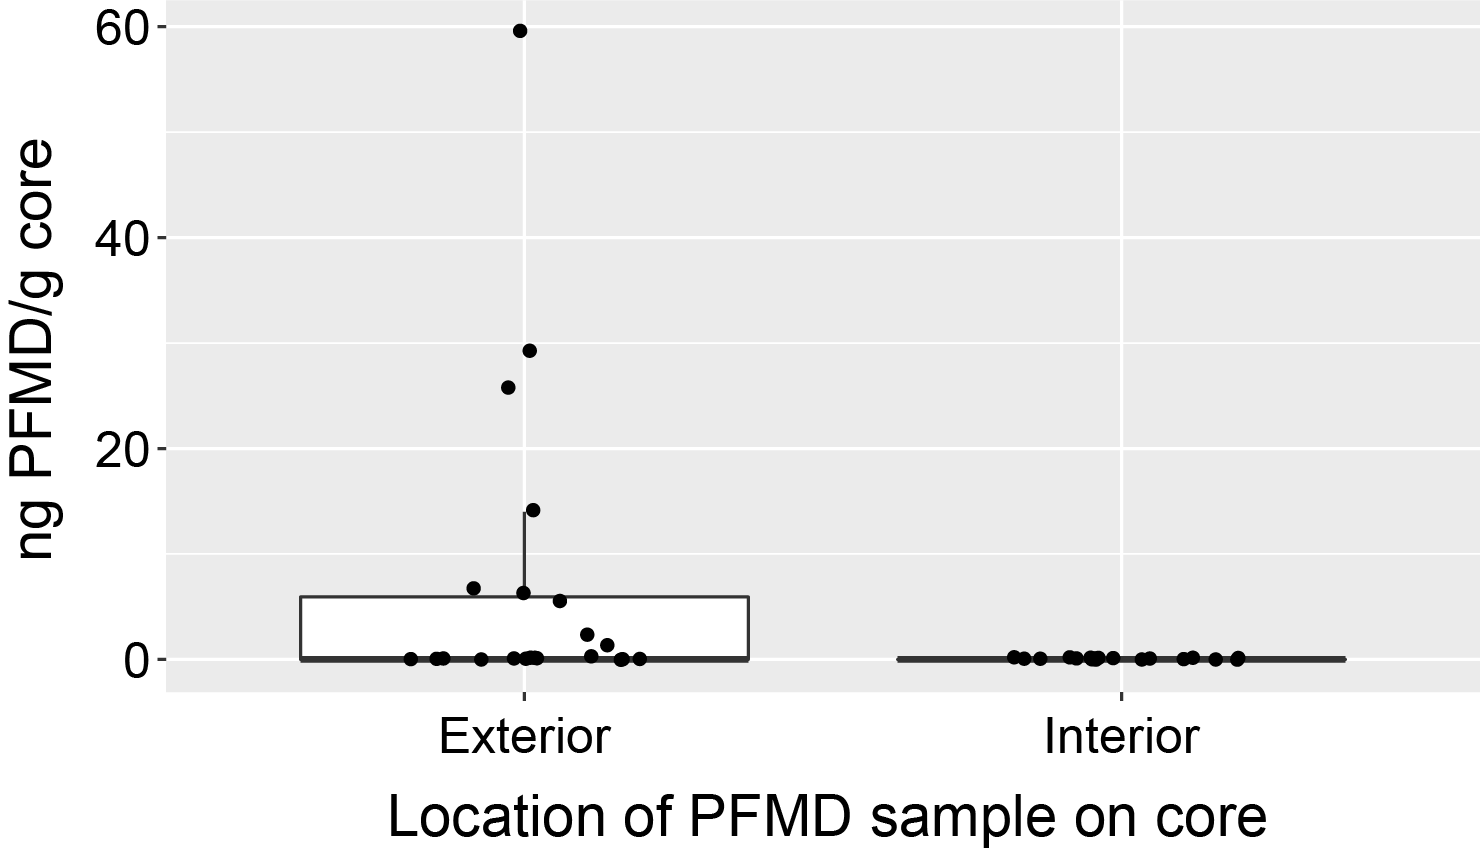
Figure F115. PFMD tracer concentrations.
To characterize the microorganisms present in drilling fluid and also generate a database of potential contaminants, we collected one sample of drilling fluid from a drill pipe on the rig floor at the end of coring operations in Hole U1558D. Samples were collected for cell counts (1 mL of drilling fluid in 4 mL of 4% paraformaldehyde in 100 mM PBS), and 500 mL of drilling fluid was filtered onto one 0.22 µm pore size 47 mm diameter filter and frozen at −80°C for shore-based molecular biology analysis.
References
Agnini, C., Fornaciari, E., Raffi, I., Catanzariti, R., Pälike, H., Backman, J., and Rio, D., 2014. Biozonation and biochronology of Paleogene calcareous nannofossils from low and middle latitudes. Newsletters on Stratigraphy, 47(2):131–181. https://doi.org/10.1127/0078-0421/2014/0042
Alt, J.C., Honnorez, J., Laverne, C., and Emmermann, R., 1986. Hydrothermal alteration of a 1 km section through the upper oceanic crust, Deep Sea Drilling Project Hole 504B: mineralogy, chemistry and evolution of seawater-basalt interactions. Journal of Geophysical Research: Solid Earth, 91(B10):10309–10335. https://doi.org/10.1029/JB091iB10p10309
Alt, J.C., and Teagle, D.A.H., 2003. Hydrothermal alteration of upper oceanic crust formed at a fast-spreading ridge: mineral, chemical, and isotopic evidence from ODP Site 801. Chemical Geology, 201(3):191–211. https://doi.org/10.1016/S0009-2541(03)00201-8
Backman, J., Raffi, I., Rio, D., Fornaciari, E., and Pälike, H., 2012. Biozonation and biochronology of Miocene through Pleistocene calcareous nannofossils from low and middle latitudes. Newsletters on Stratigraphy, 45(3):221–244. https://doi.org/10.1127/0078-0421/2012/0022
Baker, P.A., Gieskes, J.M., and Elderfield, H., 1982. Diagenesis of carbonates in deep-sea sediments; evidence from Sr/Ca ratios and interstitial dissolved Sr2+ data. Journal of Sedimentary Research, 52(1):71–82. https://doi.org/10.1306/212F7EE1-2B24-11D7-8648000102C1865D
Bennett, R.H., Fischer, K.M., Lavoie, D.L., Bryant, W.R., and Rezak, R., 1989. Porometry and fabric of marine clay and carbonate sediments: determinants of permeability. Marine Geology, 89(1–2):127–152. https://doi.org/10.1016/0025-3227(89)90030-3
Berggren, W.A., Aubry, M.P., and Hamilton, N., 1983. Neogene magnetobiostratigraphy of Deep Sea Drilling Project Site 516 (Rio Grande Rise, South Atlantic). In Barker, P.F., Carlson, R. L., Johnson, D. A., et al., Initial Reports of the Deep Sea Drilling Project. 72: Washington, DC (US Government Printing Office), 675–713. https://doi.org/10.2973/dsdp.proc.72.130.1983
Bloemendal, J., King, J.W., Hall, F.R., and Doh, S.J., 1992. Rock magnetism of late Neogene and Pleistocene deep-sea sediments: relationship to sediment source, diagenetic processes, and sediment lithology. Journal of Geophysical Research: Solid Earth, 97(B4):4361–4375. https://doi.org/10.1029/91JB03068
Bons, P.D., Elburg, M.A., and Gomez-Rivas, E., 2012. A review of the formation of tectonic veins and their microstructures. Journal of Structural Geology, 43:33–62. https://doi.org/10.1016/j.jsg.2012.07.005
Bullard, E.C., 1939. Heat flow in South Africa. Proceedings of the Royal Society of London, A: Mathematical and Physical Sciences, 173(955):474–502. https://doi.org/10.1098/rspa.1939.0159
Butler, R.F., 1992. Paleomagnetism: Magnetic Domains and Geologic Terranes: Oxford, England (Blackwell).
Christeson, G., and Reece, R., 2020. Bathymetric site survey gridded data in support of IODP Expeditions 390 and 393, South Atlantic Transect (MGL1601, CREST). Interdisciplinary Earth Data Alliance (IEDA). https://doi.org/10.26022/IEDA/327528
Christeson, G.L., Goff, J.A., and Reece, R.S., 2019. Synthesis of oceanic crustal structure from two-dimensional seismic profiles. Reviews of Geophysics, 57(2):504–529. https://doi.org/10.1029/2019RG000641
Christeson, G.L., Reece, R.S., Kardell, D.A., Estep, J.D., Fedotova, A., and Goff, J.A., 2020. South Atlantic transect: variations in oceanic crustal structure at 31°S. Geochemistry, Geophysics, Geosystems, 21(7):e2020GC009017. https://doi.org/10.1029/2020GC009017
Coggon, R.M., Sylvan, J.B., Estes, E.R., Teagle, D.A.H., Reece, J., Williams, T.J., Christeson, G.L., Aizawa, M., Borrelli, C., Bridges, J.D., Carter, E.J., Dinarès-Turell, J., Estep, J.D., Gilhooly, W.P., III, Grant, L.J.C., Kaplan, M.R., Kempton, P.D., Lowery, C.M., McIntyre, A., Routledge, C.M., Slagle, A.L., Takada, M., Tamborrino, L., Wang, Y., Yang, K., Albers, E., Amadori, C., Belgrano, T.M., D'Angelo, T., Doi, N., Evans, A., Guérin, G.M., Harris, M., Hojnacki, V.M., Hong, G., Jin, X., Jonnalagadda, M., Kuwano, D., Labonte, J.M., Lam, A.R., Latas, M., Lu, W., Moal-Darrigade, P., Pekar, S.F., Robustelli Test, C., Ryan, J.G., Santiago Ramos, D., Shchepetkina, A., Villa, A., Wee, S.Y., Widlansky, S.J., Kurz, W., Prakasam, M., Tian, L., Yu, T., and Zhang, G., 2024a. Site U1556. In Coggon, R.M., Teagle, D.A.H., Sylvan, J.B., Reece, J., Estes, E.R., Williams, T.J., Christeson, G.L., and the Expedition 390/393 Scientists, South Atlantic Transect. Proceedings of the International Ocean Discovery Program, 390/393: College Station, TX (International Ocean Discovery Program). https://doi.org/10.14379/iodp.proc.390393.103.2024
Coggon, R.M., Teagle, D.A.H., Sylvan, J.B., Reece, J., Estes, E.R., Williams, T.J., Christeson, G.L., Aizawa, M., Albers, E., Amadori, C., Belgrano, T.M., Borrelli, C., Bridges, J.D., Carter, E.J., D'Angelo, T., Dinarès-Turell, J., Doi, N., Estep, J.D., Evans, A., Gilhooly, W.P., III, Grant, L.J.C., Guérin, G.M., Harris, M., Hojnacki, V.M., Hong, G., Jin, X., Jonnalagadda, M., Kaplan, M.R., Kempton, P.D., Kuwano, D., Labonte, J.M., Lam, A.R., Latas, M., Lowery, C.M., Lu, W., McIntyre, A., Moal-Darrigade, P., Pekar, S.F., Robustelli Test, C., Routledge, C.M., Ryan, J.G., Santiago Ramos, D., Shchepetkina, A., Slagle, A.L., Takada, M., Tamborrino, L., Villa, A., Wang, Y., Wee, S.Y., Widlansky, S.J., Yang, K., Kurz, W., Prakasam, M., Tian, L., Yu, T., and Zhang, G., 2024b. Expedition 390/393 methods. In Coggon, R.M., Teagle, D.A.H., Sylvan, J.B., Reece, J., Estes, E.R., Williams, T.J., Christeson, G.L., and the Expedition 390/393 Scientists, South Atlantic Transect. Proceedings of the International Ocean Discovery Program, 390/393: College Station, TX (International Ocean Discovery Program). https://doi.org/10.14379/iodp.proc.390393.102.2024
Coggon, R.M., Teagle, D.A.H., Sylvan, J.B., Reece, J., Estes, E.R., Williams, T.J., Christeson, G.L., Aizawa, M., Albers, E., Amadori, C., Belgrano, T.M., Borrelli, C., Bridges, J.D., Carter, E.J., D'Angelo, T., Dinarès-Turell, J., Doi, N., Estep, J.D., Evans, A., Gilhooly, W.P., III, Grant, L.J.C., Guérin, G.M., Harris, M., Hojnacki, V.M., Hong, G., Jin, X., Jonnalagadda, M., Kaplan, M.R., Kempton, P.D., Kuwano, D., Labonte, J.M., Lam, A.R., Latas, M., Lowery, C.M., Lu, W., McIntyre, A., Moal-Darrigade, P., Pekar, S.F., Robustelli Test, C., Routledge, C.M., Ryan, J.G., Santiago Ramos, D., Shchepetkina, A., Slagle, A.L., Takada, M., Tamborrino, L., Villa, A., Wang, Y., Wee, S.Y., Widlansky, S.J., Yang, K., Kurz, W., Prakasam, M., Tian, L., Yu, T., and Zhang, G., 2024c. Expedition 390/393 summary. In Coggon, R.M., Teagle, D.A.H., Sylvan, J.B., Reece, J., Estes, E.R., Williams, T.J., Christeson, G.L., and the Expedition 390/393 Scientists, South Atlantic Transect. Proceedings of the International Ocean Discovery Program, 390/393: College Station, TX (International Ocean Discovery Program). https://doi.org/10.14379/iodp.proc.390393.101.2024
Coggon, R.M., Teagle, D.A.H., Sylvan, J.B., Reece, J., Estes, E.R., Williams, T.J., Christeson, G.L., and the Expedition 390/393 Scientists, 2024d. Supplementary material, https://doi.org/10.14379/iodp.proc.390393supp.2024. In Coggon, R.M., Teagle, D.A.H., Sylvan, J.B., Reece, J., Estes, E.R., Williams, T.J., Christeson, G.L., and the Expedition 390/393 Scientists, South Atlantic Transect. Proceedings of the International Ocean Discovery Program, 390/393: College Station, TX (International Ocean Discovery Program).
Dearing, J.A., Dann, R.J.L., Hay, K., Lees, J.A., Loveland, P.J., Maher, B.A., and O'Grady, K., 1996. Frequency-dependent susceptibility measurements of environmental materials. Geophysical Journal International, 124(1):228–240. https://doi.org/10.1111/j.1365-246X.1996.tb06366.x
Donnelly, T.W., Thompson, G., and Salisbury, M.H., 1980. The chemistry of altered basalts at Site 417, Deep Sea Drilling Project Leg 51. In Donnelly, T., Francheteau, J., Bryan, W., Robinson, P., Flower, M., Salisbury, M., et al., Initial Reports of the Deep Sea Drilling Project. 51/52/53: Washington, DC (US Government Printing Office), 1319–1330. https://doi.org/10.2973/dsdp.proc.515253.154.1980
Dunlea, A.G., Murray, R.W., Harris, R.N., Vasiliev, M.A., Evans, H., Spivack, A.J., and D'Hondt, S., 2013. Assessment and use of NGR instrumentation on the JOIDES Resolution to quantify U, Th, and K concentrations in marine sediment. Scientific Drilling, 15:57–63. https://doi.org/10.2204/iodp.sd.15.05.2013
Estep, J., Reece, R., Kardell, D.A., Christeson, G.L., and Carlson, R.L., 2019. Seismic Layer 2A: evolution and thickness from 0- to 70-Ma crust in the slow-intermediate spreading South Atlantic. Journal of Geophysical Research: Solid Earth, 124(8):7633–7651. https://doi.org/10.1029/2019JB017302
Estes, E.R., Williams, T., Midgley, S., Coggon, R.M., Sylvan, J.B.,Christeson, G.L., Teagle, D.A.H., and the Expedition 390C Scientists, 2021. Expedition 390C Preliminary Report: South Atlantic Transect Reentry Systems. International Ocean Discovery Program. https://doi.org/10.14379/iodp.pr.390C.2021
Fuchs, S., Norden, B., and the International Heat Flow Commission, 2021. The Global Heat Flow Database. GFZ Data Services. https://doi.org/10.5880/fidgeo.2021.014
Gale, A., Dalton, C.A., Langmuir, C.H., Su, Y., and Schilling, J.-G., 2013. The mean composition of ocean ridge basalts. Geochemistry, Geophysics, Geosystems, 14(3):489–518. https://doi.org/10.1029/2012GC004334
Gieskes, J.M., 1975. Chemistry of interstitial waters of marine sediments. Annual Review of Earth and Planetary Sciences, 3(1):433–453. https://doi.org/10.1146/annurev.ea.03.050175.002245
Gradstein, F.M., Ogg, J.G., Schmitz, M.D., and Ogg, G.M. (Eds.), 2020. The Geologic Time Scale 2020: Amsterdam (Elsevier BV). https://doi.org/10.1016/C2020-1-02369-3
Grove, T.L., Kinzler, R.J., and Bryan, W.B., 1992. Fractionation of mid-ocean ridge basalt (MORB). In Morgan, J.P., Blackman, D.K., and Sinton, J.M. (Eds.), Mantle Flow and Melt Generation at Mid-Ocean Ridges. Geophysical Monograph, 71: 281–310. https://doi.org/10.1029/GM071p0281
Hamilton, E.L., 1976. Variations of density and porosity with depth in deep-sea sediments. Journal of Sedimentary Research, 46(2):280–300. https://doi.org/10.1306/212F6F3C-2B24-11D7-8648000102C1865D
Harris, M., Coggon, R.M., Smith-Duque, C.E., Cooper, M.J., Milton, J.A., and Teagle, D.A.H., 2015. Channelling of hydrothermal fluids during the accretion and evolution of the upper oceanic crust: Sr isotope evidence from ODP Hole 1256D. Earth and Planetary Science Letters, 416:56–66. https://doi.org/10.1016/j.epsl.2015.01.042
Hart, S.R., Erlank, A.J., and Kable, E.J.D., 1974. Sea floor basalt alteration: some chemical and Sr isotopic effects. Contributions to Mineralogy and Petrology, 44(3):219–230. https://doi.org/10.1007/BF00413167
Hein, J.R., O'Neil, J.R., and Jones, M.G., 1979. Origin of authigenic carbonates in sediment from the deep Bering Sea. Sedimentology, 26(5):681–705. https://doi.org/10.1111/j.1365-3091.1979.tb00937.x
Higgins, J.A., and Schrag, D.P., 2012. Records of Neogene seawater chemistry and diagenesis in deep-sea carbonate sediments and pore fluids. Earth and Planetary Science Letters, 357–358:386–396. https://doi.org/10.1016/j.epsl.2012.08.030
Honnorez, J., 1981. The aging of the oceanic crust at low temperature. In Emiliani, C., The oceanic lithosphere. The Sea: Ideas and Observations on Progress in the Study of the Seas, 7: 525–588.
Jelinek, V., 1981. Characterization of the magnetic fabric of rocks. Tectonophysics, 79(3–4):T63–T67. https://doi.org/10.1016/0040-1951(81)90110-4
Kardell, D.A., Christeson, G.L., Estep, J.D., Reece, R.S., and Carlson, R.L., 2019. Long-lasting evolution of Layer 2A in the western South Atlantic: evidence for low-temperature hydrothermal circulation in old oceanic crust. Journal of Geophysical Research: Solid Earth, 124(3):2252–2273. https://doi.org/10.1029/2018JB016925
Kardell, D.A., Zhao, Z., Ramos, E.J., Estep, J., Christeson, G.L., Reece, R.S., and Hesse, M.A., 2021. Hydrothermal models constrained by fine-scale seismic velocities confirm hydrothermal cooling of 7–63 Ma South Atlantic crust. Journal of Geophysical Research: Solid Earth, 126(6):e2020JB021612. https://doi.org/10.1029/2020JB021612
Kastner, M., 1999. Oceanic minerals: their origin, nature of their environment, and significance. Proceedings of the National Academy of Sciences of the United States of America, 96(7):3380–3387. https://doi.org/10.1073/pnas.96.7.3380
Katz, M.E., Tjalsma, R.C., and Miller, K.G., 2003. Oligocene bathyal to abyssal benthic foraminifera of the Atlantic Ocean. Micropaleontology, 49(Suppl_2):1–45. https://doi.org/10.2113/49.Suppl_2.1
Kelley, K.A., Kingsley, R., and Schilling, J.-G., 2013. Composition of plume-influenced mid-ocean ridge lavas and glasses from the Mid-Atlantic Ridge, East Pacific Rise, Galápagos spreading center, and Gulf of Aden. Geochemistry, Geophysics, Geosystems, 14(1):223–242. https://doi.org/10.1002/ggge.20049
Kendrick, M.A., Hémond, C., Kamenetsky, V.S., Danyushevsky, L., Devey, C.W., Rodemann, T., Jackson, M.G., and Perfit, M.R., 2017. Seawater cycled throughout Earth's mantle in partially serpentinized lithosphere. Nature Geoscience, 10(3):222–228. https://doi.org/10.1038/ngeo2902
King, D.J., Wade, B.S., Liska, R.D., and Miller, C.G., 2020. A review of the importance of the Caribbean region in Oligo-Miocene low latitude planktonic foraminiferal biostratigraphy and the implications for modern biogeochronological schemes. Earth-Science Reviews, 202:102968. https://doi.org/10.1016/j.earscirev.2019.102968
Kirschvink, J.L., 1980. The least-squares line and plane and the analysis of palaeomagnetic data. Geophysical Journal International, 62(3):699–718. https://doi.org/10.1111/j.1365-246X.1980.tb02601.x
Korenaga, T., and Korenaga, J., 2008. Subsidence of normal oceanic lithosphere, apparent thermal expansivity, and seafloor flattening. Earth and Planetary Science Letters, 268(1):41–51. https://doi.org/10.1016/j.epsl.2007.12.022
Lam, A.R., Crundwell, M.P., Leckie, R.M., Albanese, J., and Uzel, J.P., 2022. Diachroneity rules the mid-latitudes: a test case using Late Neogene planktic foraminifera across the Western Pacific. Geosciences, 12(5):190. https://doi.org/10.3390/geosciences12050190
Lam, A.R., and Leckie, R.M., 2020. Subtropical to temperate late Neogene to Quaternary planktic foraminiferal biostratigraphy across the Kuroshio Current Extension, Shatsky Rise, northwest Pacific Ocean. PloS One, 15(7):e0234351. https://doi.org/10.1371/journal.pone.0234351
Le Bas, M.J., Le Maitre, R. W., Streickeisen, A., Zanettin, B., the IUGS Subcommission on the Systematics of Igneous Rocks, 1986. A chemical classification of volcanic rocks based on the total alkali-silica diagram. Journal of Petrology, 27(3):745–750. https://doi.org/10.1093/petrology/27.3.745
Le Roux, P.J., 2000. The geochemistry of selected mid-ocean ridge basalts from the Southern mid-Atlantic ridge (40°–55°S) [PhD dissertation]. University of Cape Town, Cape Town, South Africa. http://hdl.handle.net/11427/4207
Marschall, H.R., Wanless, V.D., Shimizu, N., Pogge von Strandmann, P.A.E., Elliott, T., and Monteleone, B.D., 2017. The boron and lithium isotopic composition of mid-ocean ridge basalts and the mantle. Geochimica et Cosmochimica Acta, 207:102–138. https://doi.org/10.1016/j.gca.2017.03.028
Martini, E., 1971. Standard Tertiary and Quaternary calcareous nannoplankton zonation. Proceedings of the Second Planktonic Conference, Roma, 1970:739–785.
Marty, J.C., and Cazenave, A., 1989. Regional variations in subsidence rate of oceanic plates: a global analysis. Earth and Planetary Science Letters, 94(3):301–315. https://doi.org/10.1016/0012-821X(89)90148-9
Maxbauer, D.P., Feinberg, J.M., and Fox, D.L., 2016. MAX UnMix: a web application for unmixing magnetic coercivity distributions. Computers & Geosciences, 95:140–145. https://doi.org/10.1016/j.cageo.2016.07.009
Michael, P.J., and Graham, D.W., 2015. The behavior and concentration of CO2 in the suboceanic mantle: inferences from undegassed ocean ridge and ocean island basalts. Lithos, 236–237:338–351. https://doi.org/10.1016/j.lithos.2015.08.020
Miller, M.D., Adkins, J.F., and Hodell, D.A., 2014. Rhizon sampler alteration of deep ocean sediment interstitial water samples, as indicated by chloride concentration and oxygen and hydrogen isotopes. Geochemistry, Geophysics, Geosystems, 15(6):2401–2413. https://doi.org/10.1002/2014GC005308
Olson, P., Reynolds, E., Hinnov, L., and Goswami, A., 2016. Variation of ocean sediment thickness with crustal age. Geochemistry, Geophysics, Geosystems, 17(4):1349–1369. https://doi.org/10.1002/2015GC006143
Parsons, B., and Sclater, J.G., 1977. An analysis of the variation of ocean floor bathymetry and heat flow with age. Journal of Geophysical Research (1896-1977), 82(5):803–827. https://doi.org/10.1029/JB082i005p00803
Paulick, H., Münker, C., and Schuth, S., 2010. The influence of small-scale mantle heterogeneities on Mid-Ocean Ridge volcanism: evidence from the southern Mid-Atlantic Ridge (7°30′S to 11°30′S) and Ascension Island. Earth and Planetary Science Letters, 296(3–4):299–310. https://doi.org/10.1016/j.epsl.2010.05.009
Pearce, J.A., and Cann, J.R., 1973. Tectonic setting of basic volcanic rocks determined using trace element analyses. Earth and Planetary Science Letters, 19(2):290–300. https://doi.org/10.1016/0012-821X(73)90129-5
Pearce, J.A., and Norry, M.J., 1979. Petrogenetic implications of Ti, Zr, Y, and Nb variations in volcanic rocks. Contributions to Mineralogy and Petrology, 69(1):33–47. https://doi.org/10.1007/BF00375192
Pichler, T., Ridley, W.I., and Nelson, E., 1999. Low-temperature alteration of dredged volcanics from the Southern Chile Ridge: additional information about early stages of seafloor weathering. Marine Geology, 159(1–4):155–177. https://doi.org/10.1016/S0025-3227(99)00008-0
Reece, R., Christeson, G., Amara, A., Estep, J., Greene, J., Koch, C., Henning, L., Worman, W., and Wright, A., 2016. CREST: Crustal Reflectivity Experiment southern transect South Atlantic multichannel seismic and ocean bottom seismometer experiment, 4 Jan–25 Feb 2016 Cruise Report. http://www.iris.washington.edu/data/reports/2016/16-003/CREST_2016-01-04-2016-02-25_MGL1601_CruiseReport.pdf
Reece, R., and Estep, J., 2019. Processed MCS (PSTM) data from the Mid-Atlantic Ridge (MAR) to the Rio Grande Rise, South Atlantic Ocean, acquired by the R/V Marcus G. Langseth in 2016 (MGL1601) https://doi.org/10.1594/IEDA/500255
Reekie, C.D.J., Jenner, F.E., Smythe, D.J., Hauri, E.H., Bullock, E.S., and Williams, H.M., 2019. Sulfide resorption during crustal ascent and degassing of oceanic plateau basalts. Nature Communications, 10(1):82. https://doi.org/10.1038/s41467-018-08001-3
Ríos, A.F., Resplandy, L., García-Ibáñez, M.I., Fajar, N.M., Velo, A., Padin, X.A., Wanninkhof, R., Steinfeldt, R., Rosón, G., and Pérez, F.F., 2015. Decadal acidification in the water masses of the Atlantic Ocean. Proceedings of the National Academy of Sciences, 112(32):9950–9955. https://doi.org/10.1073/pnas.1504613112
Sarmiento, J.L., Simeon, J., Gnanadesikan, A., Gruber, N., Key, R.M., and Schlitzer, R., 2007. Deep ocean biogeochemistry of silicic acid and nitrate. Global Biogeochemical Cycles, 21(1). https://doi.org/10.1029/2006GB002720
Schrag, D.P., Higgins, J.A., Macdonald, F.A., and Johnston, D.T., 2013. Authigenic carbonate and the history of the global carbon cycle. Science, 339(6119):540–543. https://doi.org/10.1126/science.1229578
Sclater, J.G., Jaupart, C., and Galson, D., 1980. The heat flow through oceanic and continental crust and the heat loss of the Earth. Reviews of Geophysics, 18(1):269-311. https://doi.org/10.1029/RG018i001p00269
Shervais, J.W., 1982. Ti-V plots and the petrogenesis of modern and ophiolitic lavas. Earth and Planetary Science Letters, 59(1):101–118. https://doi.org/10.1016/0012-821X(82)90120-0
Shipboard Scientific Party, 1993. Site 896. In Alt, J.C., Kinoshita, H., Stokking, L.B., et al., Proceedings of the Ocean Drilling Program, Initial Reports, 148. College Station, TX (Ocean Drilling Program), 123–192. https://doi.org/10.2973/odp.proc.ir.148.103.1993
Spinelli, G.A., Giambalvo, E.R., and Fisher, A.T., 2004. Sediment permeability, distribution, and influence on fluxes in oceanic basement. In Davis, E.E., and Elderfield, H. (Eds.), Hydrogeology of the Oceanic Lithosphere. Cambridge, UK (Cambridge University Press), 151–188.
Straume, E.O., Gaina, C., Medvedev, S., Hochmuth, K., Gohl, K., Whittaker, J.M., Abdul Fattah, R., Doornenbal, J.C., and Hopper, J.R., 2019. GlobSed: updated total sediment thickness in the world's oceans. Geochemistry, Geophysics, Geosystems, 20(4):1756–1772. https://doi.org/10.1029/2018GC008115
Sylvan, J.B., Estes, E.R., Bogus, K., Colwell, F.S., Orcutt, B.N., and Smith, D.C, 2021. Technical Note 4: Recommendations for microbiological sampling and contamination tracer use aboard the JOIDES Resolution following 20 years of IODP deep biosphere research. International Ocean Discovery Program. https://doi.org/10.14379/iodp.tn.4.2021
Tarling, D.H., and Hrouda, F., 1993. The Magnetic Anisotropy of Rocks: London (Chapman and Hall).
Teagle, D.A.H., Alt, J.C., Bach, W., Halliday, A.N., and Erzinger, J., 1996. Alteration of upper ocean crust in a ridge-flank hydrothermal upflow zone; mineral, chemical, and isotopic constraints from Hole 896A. In Alt, J.C., Kinoshita, H., Stokking, L.B., and Michael, P.J. (Eds.), Proceedings of the Ocean Drilling Program, Scientific Results. 148: College Station, TX (Ocean Drilling Program). http://doi.org/10.2973/odp.proc.sr.148.113.1996
Teagle, D.A.H., Alt, J.C., and Halliday, A.N., 1998. Tracing the evolution of hydrothermal fluids in the upper oceanic crust: Sr-isotopic constraints from DSDP/ODP Holes 504B and 896A. In Mills, R.A., and Harrison, K. (Eds.), Modern Ocean Floor Processes and the Geological Record. Special Publication - Geological Society of London, 148: 81–97. https://doi.org/10.1144/GSL.SP.1998.148.01.06
Turchyn, A.V., Bradbury, H.J., Walker, K., and Sun, X., 2021. Controls on the precipitation of carbonate minerals within marine sediments. Frontiers in Earth Science, 9:618311. https://doi.org/10.3389/feart.2021.618311
van der Zwan, F.M., Devey, C.W., Hansteen, T.H., Almeev, R.R., Augustin, N., Frische, M., Haase, K.M., Basaham, A., and Snow, J.E., 2017. Lower crustal hydrothermal circulation at slow-spreading ridges: evidence from chlorine in Arctic and South Atlantic basalt glasses and melt inclusions. Contributions to Mineralogy and Petrology, 172(11):97. https://doi.org/10.1007/s00410-017-1418-1
Von Damm, K.L., and Bischoff, J.L., 1987. Chemistry of hydrothermal solutions from the southern Juan de Fuca Ridge. Journal of Geophysical Research: Solid Earth, 92(B11):11334–11346. https://doi.org/10.1029/JB092iB11p11334
Wade, B.S., Pearson, P.N., Berggren, W.A., and Pälike, H., 2011. Review and revision of Cenozoic tropical planktonic foraminiferal biostratigraphy and calibration to the geomagnetic polarity and astronomical time scale. Earth-Science Reviews, 104(1–3):111–142. https://doi.org/10.1016/j.earscirev.2010.09.003
Yang, S., Humayun, M., and Salters, V.J.M., 2018. Elemental systematics in MORB glasses from the Mid-Atlantic Ridge. Geochemistry, Geophysics, Geosystems, 19(11):4236–4259. https://doi.org/10.1029/2018GC007593
Yoder, H.S., Jr., and Tilley, C.E., 1962. Origin of basalt magmas: an experimental study of natural and synthetic rock xystems. Journal of Petrology, 3(3):342–532. https://doi.org/10.1093/petrology/3.3.342
Zijderveld, J.D.A., 1967. AC demagnetization of rocks: analysis of results. In Runcorn, S.K.C., Creer, K.M., and Collinson, D.W. (Eds.), Methods in Palaeomagnetism. Developments in Solid Earth Geophysics, 3: 254–286. https://doi.org/10.1016/B978-1-4832-2894-5.50049-5