Sager, W., Hoernle, K., Höfig, T.W., Blum, P., and the Expedition 391 Scientists
Proceedings of the International Ocean Discovery Program Volume 391
publications.iodp.org
https://doi.org/10.14379/iodp.proc.391.106.2023
Site U15781
![]() W. Sager,
W. Sager,
![]() K. Hoernle,
K. Hoernle,
![]() T.W. Höfig,
T.W. Höfig,
![]() A.J. Avery,
A.J. Avery,
![]() R. Bhutani,
R. Bhutani,
![]() D.M. Buchs,
D.M. Buchs,
![]() C.A. Carvallo,
C.A. Carvallo,
![]() C. Class,
C. Class,
![]() Y. Dai,
Y. Dai,
![]() G. Dalla Valle,
G. Dalla Valle,
![]() A.V. Del Gaudio,
S. Fielding,
A.V. Del Gaudio,
S. Fielding,
![]() K.M. Gaastra,
K.M. Gaastra,
![]() S. Han,
S. Han,
![]() S. Homrighausen,
S. Homrighausen,
![]() Y. Kubota,
Y. Kubota,
![]() C.-F. Li,
C.-F. Li,
![]() W.R. Nelson,
W.R. Nelson,
![]() E. Petrou,
E. Petrou,
![]() K.E. Potter,
K.E. Potter,
![]() S. Pujatti,
S. Pujatti,
![]() J. Scholpp,
J. Scholpp,
![]() J.W. Shervais,
J.W. Shervais,
![]() S. Thoram,
S. Thoram,
![]() S.M. Tikoo-Schantz,
S.M. Tikoo-Schantz,
![]() M. Tshiningayamwe,
X.-J. Wang, and
M. Tshiningayamwe,
X.-J. Wang, and
![]() M. Widdowson2
M. Widdowson2
1 Sager, W., Hoernle, K., Höfig, T.W., Avery, A.J., Bhutani, R., Buchs, D.M., Carvallo, C.A., Class, C., Dai, Y., Dalla Valle, G., Del Gaudio, A.V., Fielding, S., Gaastra, K.M., Han, S., Homrighausen, S., Kubota, Y., Li, C.-F., Nelson, W.R., Petrou, E., Potter, K.E., Pujatti, S., Scholpp, J., Shervais, J.W., Thoram, S., Tikoo-Schantz, S.M., Tshiningayamwe, M., Wang, X.-J., and Widdowson, M., 2023. Site U1578. In Sager, W., Hoernle, K., Höfig, T.W., Blum, P., and the Expedition 391 Scientists, Walvis Ridge Hotspot. Proceedings of the International Ocean Discovery Program, 391: College Station, TX (International Ocean Discovery Program). https://doi.org/10.14379/iodp.proc.391.106.2023
2 Expedition 391 Scientists' affiliations.
1. Background and objectives
The strategy for International Ocean Discovery Program (IODP) Expedition 391 was to drill at three distributed locations on Walvis Ridge and one in the Guyot Province, providing an age transect along the Tristan-Gough-Walvis (TGW) hotspot track. Site U1578 (proposed Site CT-5A) is located on the deep northwestern flank of an unnamed guyot that is part of the Center track, a ridge between the Tristan and Gough seamount tracks, southwest of where Walvis Ridge splits (Figures F1, F2).
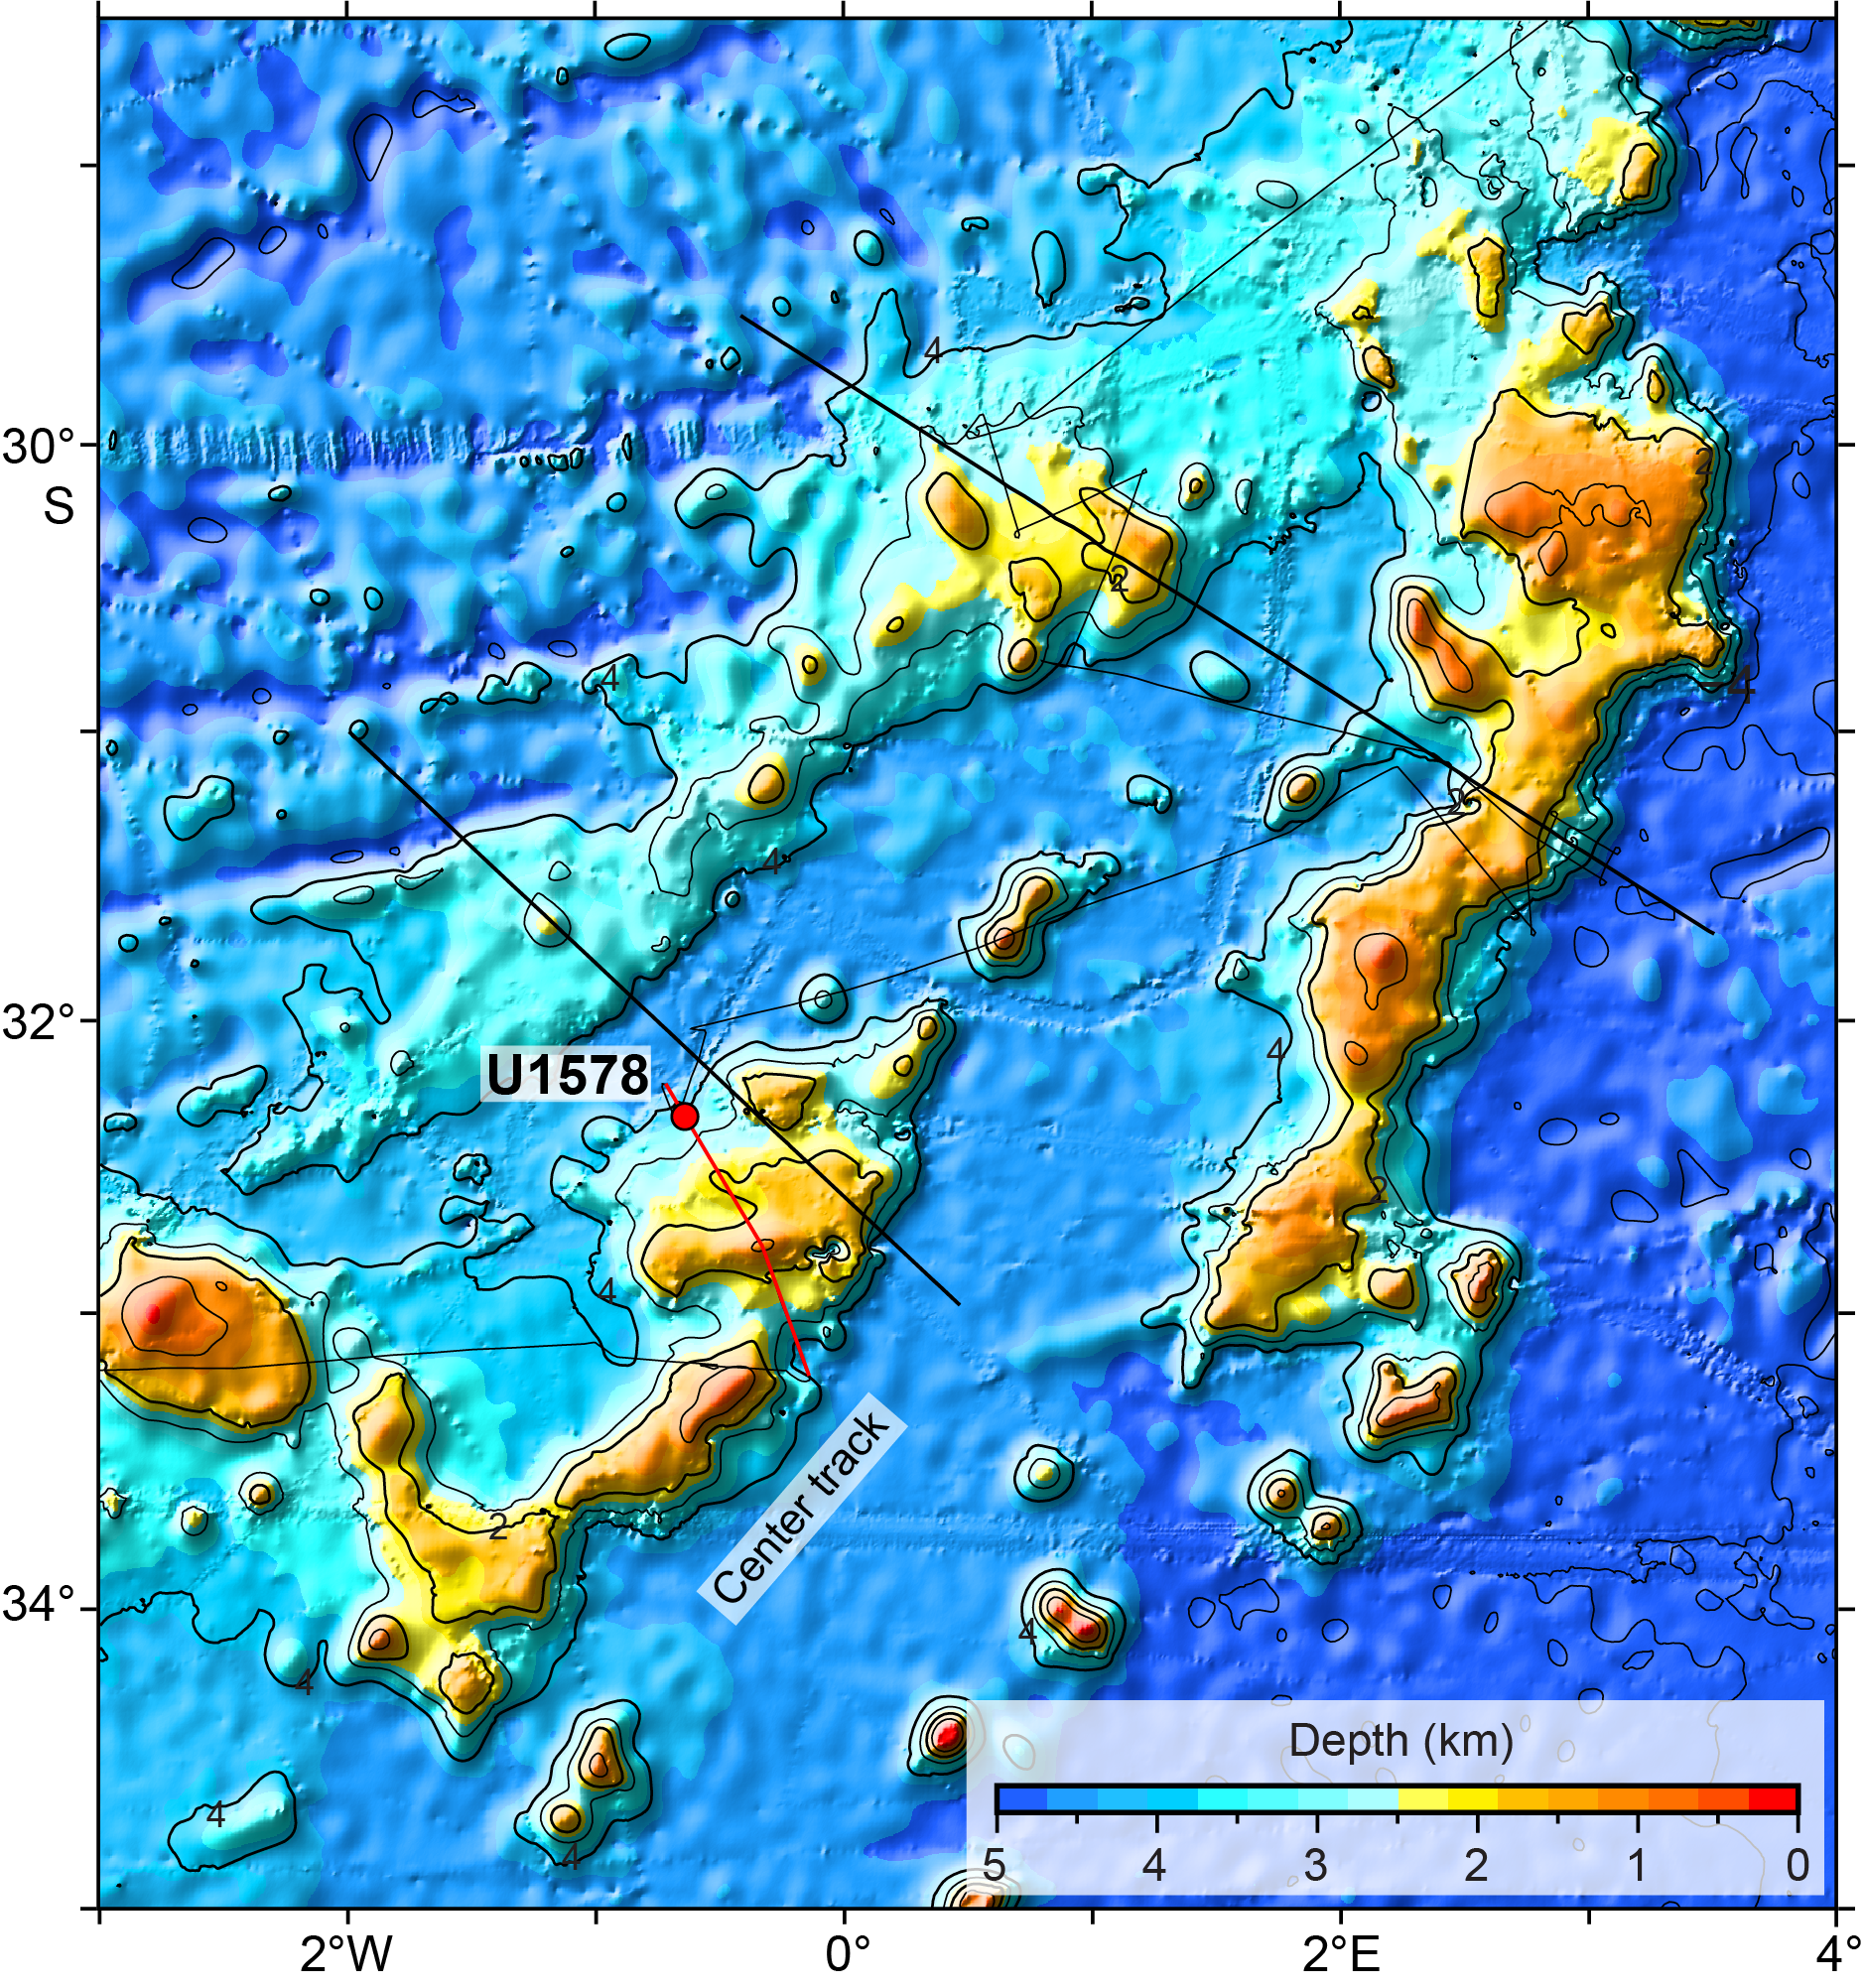
Figure F1. Bathymetry map.
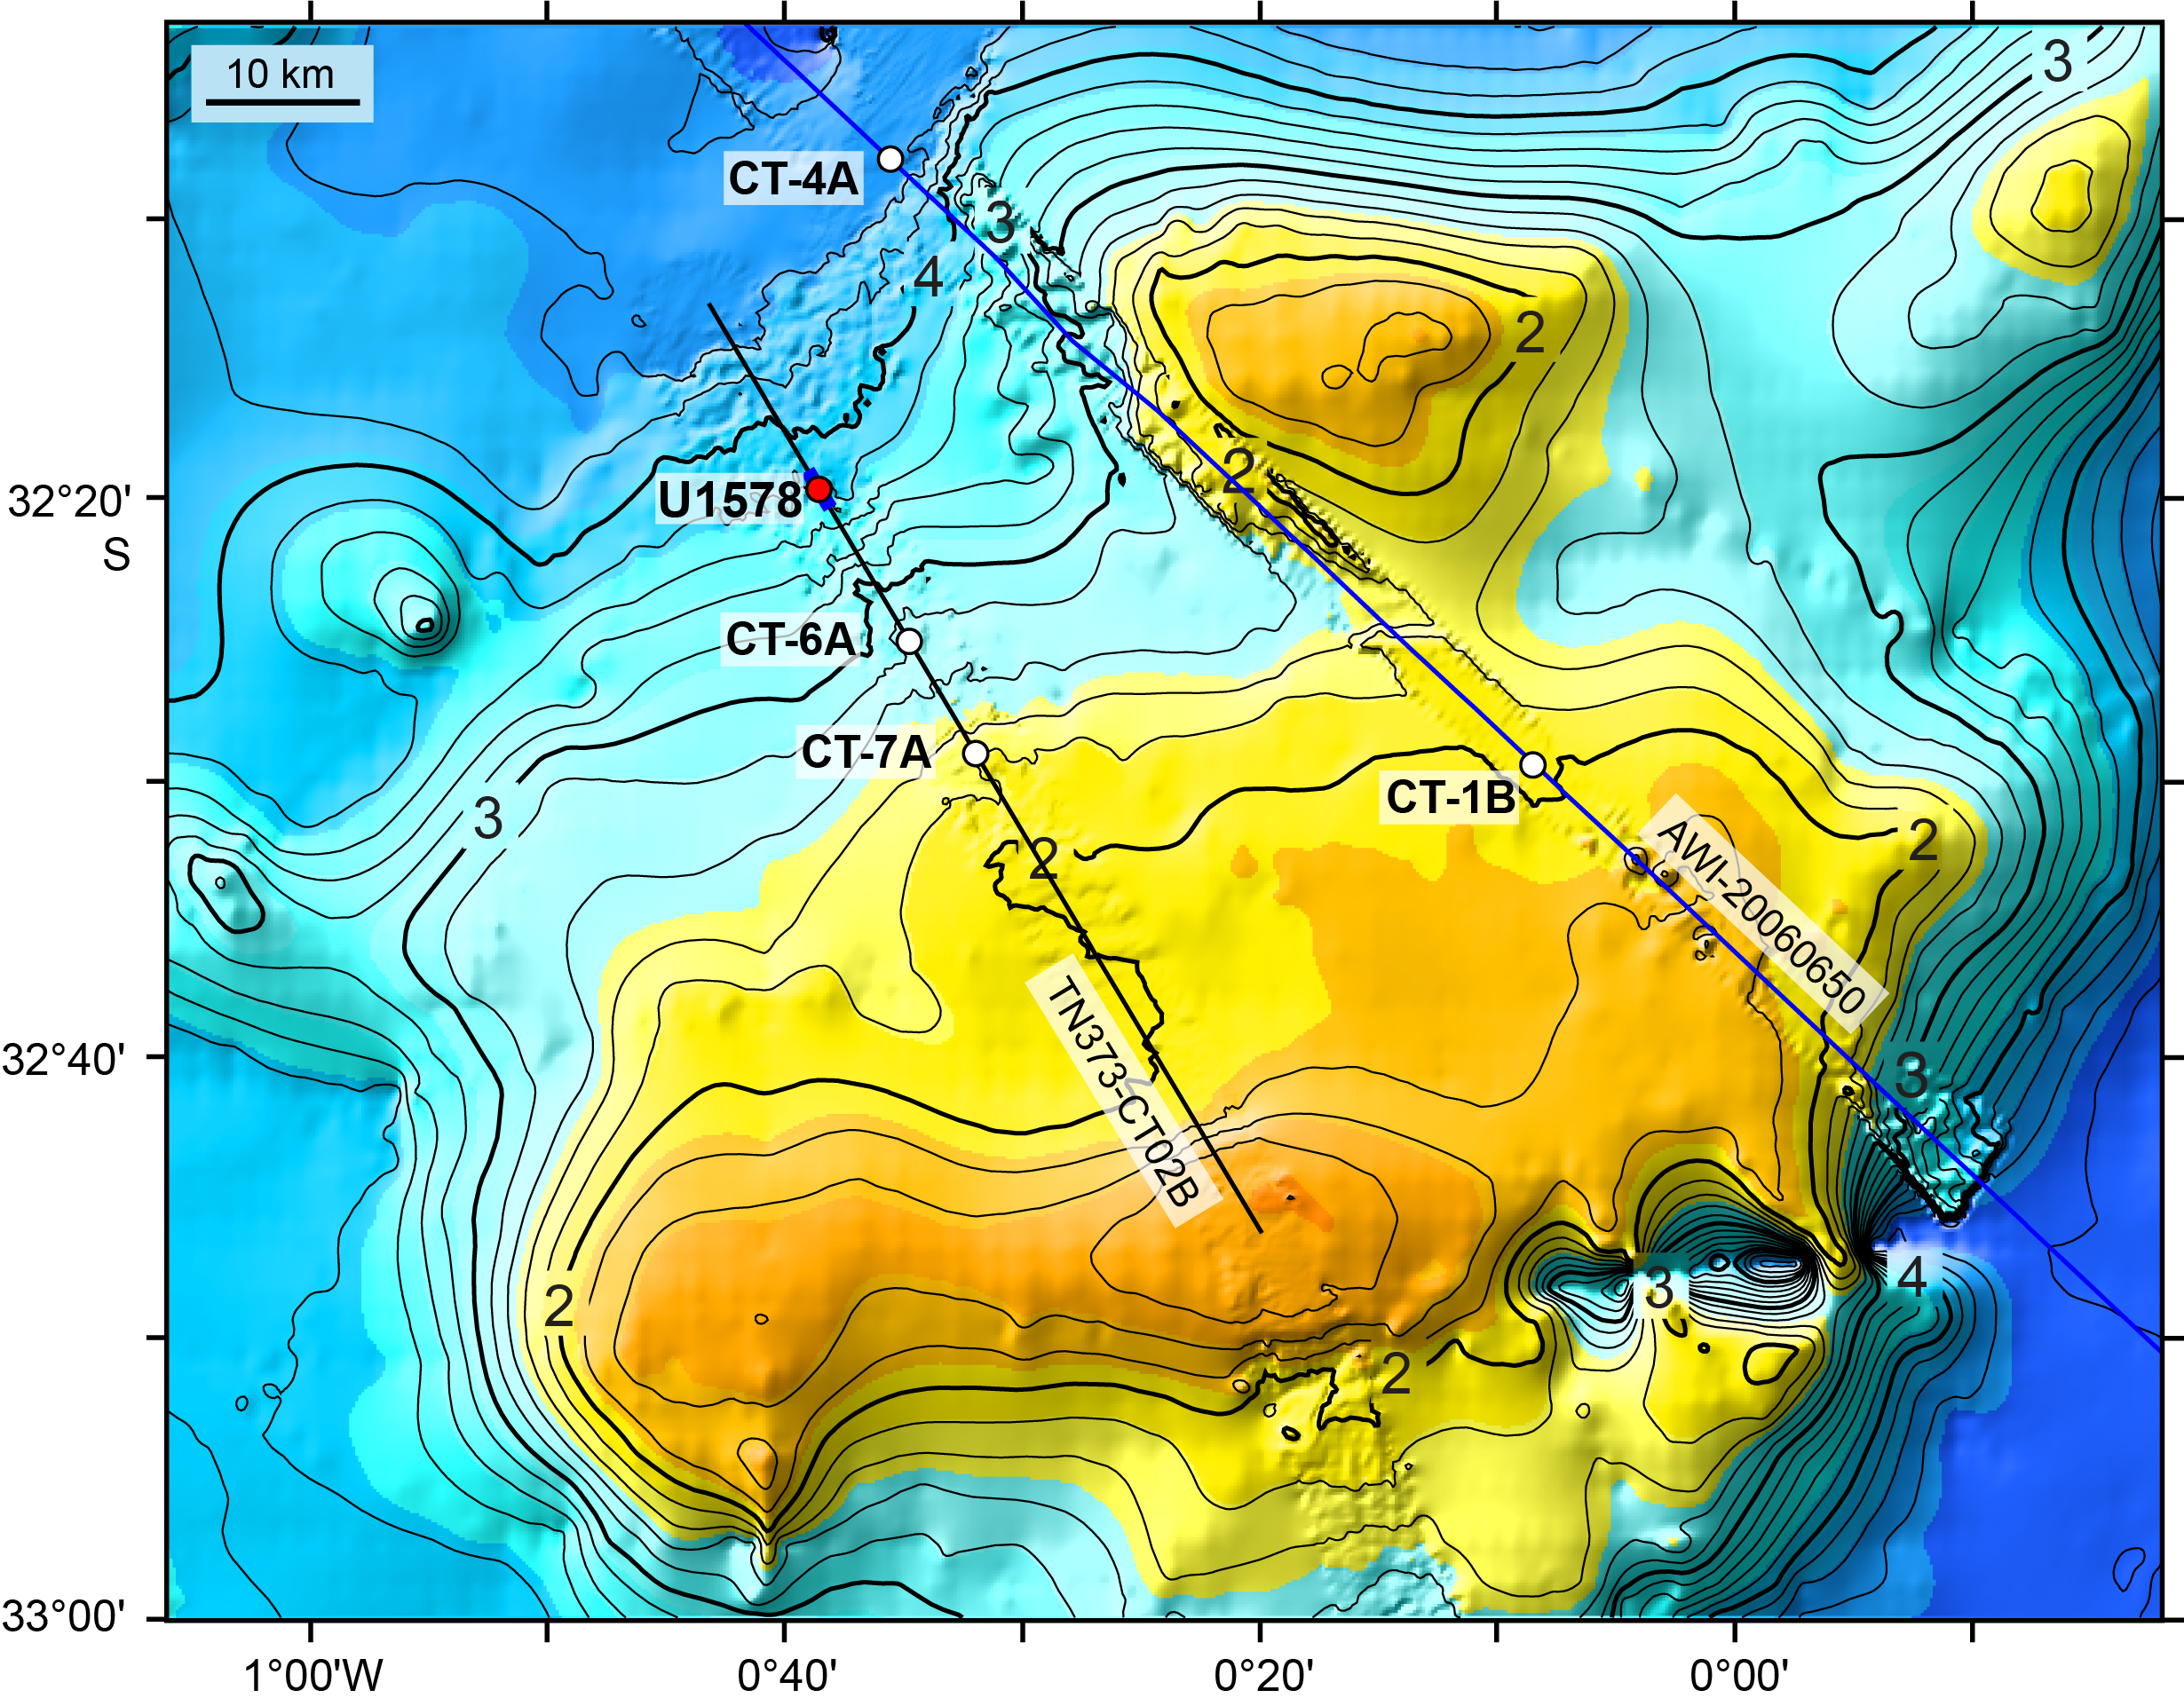
Figure F2. Multibeam bathymetry map.
The purpose of drilling this site was to extend the Expedition 391 transect into the Guyot Province, coring a central seamount of probable early Cenozoic age. This site provides critical samples for two important goals of the expedition: (1) to examine whether the intermediate geochemical composition of edifices along the boundary of the Tristan and Gough subtracks is caused by mixing or a distinct plume component and (2) to determine whether the earliest Cenozoic paleolatitude of the TGW hotspot is consistent with moving mantle plumes or true polar wander.
1.1. Operational strategy
Planning for Expedition 391 included using only the rotary core barrel (RCB) bit for all holes to save time. Unfortunately, this choice usually meant that soft-sediment cores underwent significant drilling disturbance. Site U1578 was planned as a two bit hole, meaning that the first drill bit would be swapped after a designated amount of use and the hole would be reentered to continue drilling. The objective with this approach was to core a deep hole to examine the temporal and geochemical evolution of the volcano and to gather enough lavas over a span of time sufficient to determine a reliable paleolatitude. Originally, the plan was to core proposed Site CT-4A, which is near the base of the guyot a few tens of kilometers northeast of the eventual location of the site. Site U1578 was cored at alternate Site CT-5A because the estimated sediment thickness at this site is half that of the originally proposed location. In addition, this site was located in shallower water, so it was possible to save time by coring less sediment and using a shorter drill string.
1.2. Objectives
1.2.1. Geochemical objectives
Site U1578 has the potential to provide important constraints on the geochemical evolution of TGW track volcanism. Beginning at Deep Sea Drilling Project (DSDP) Leg 74 Sites 527, 528, and 525 and continuing southwestward to the Tristan and Gough Islands, the TGW volcanic track shows geochemical zonation with enriched mantle one (EMI)-type compositions that can be divided into Tristan-type (low 207Pb/204Pb at a given 206Pb/204Pb isotope ratio) and Gough-type (high 207Pb/204Pb at a given 206Pb/204Pb) compositions (Rohde et al., 2013; Hoernle et al., 2015). Samples from volcanic edifices along the boundary between the two geochemical subtracks have intermediate compositions, posing the question as to whether they represent a distinct plume composition or a uniform mixture of the Tristan and Gough geochemical domains. As is the case at Sites 527, 528, and 525, stratigraphic (temporal) sequences of lavas often show significant geochemical variation that can provide insights into the mixing dynamics taking place in the underlying mantle plume, which generally cannot be provided by dredge samples due to limited outcrops on the volcanic edifices.
Another important question concerns the difference between the major and trace element contents of the lavas from Walvis Ridge, which were presumably formed by the interaction of TGW mantle plume with the Mid-Atlantic Ridge and lavas from Guyot Province formed through intraplate volcanism when the plume was no longer located directly beneath or close to the spreading center. Plume-ridge interaction is expected to reflect greater degrees of melting and mixing with depleted upper mantle. Both processes result in, for example, a decrease in incompatible element abundances in primitive melts. Lower degrees of melting and less interaction with the depleted upper mantle are expected for intraplate volcanism, for example, resulting in higher concentrations of incompatible elements in primitive melts. Both processes are also expected to affect the major element composition of primitive melts, which are difficult to discern in dredge samples because they are highly altered.
1.2.2. Geochronologic objectives
Site U1578 is located on the Center track at a location where the predicted age from hotspot models is uncertain but ranges within ~45–55 Ma (Figure F3). The age progression model of Homrighausen et al. (2019) predicts a slightly older age of ~60 Ma (Figure F4). This age model is constrained by samples from nearby seamounts, but additional radiometric ages are necessary to test and refine the age progression further, in particular to test models of hotspot drift and true polar wander. Furthermore, the age span over which the guyots in the province are active at a given location is poorly known because most guyots have only been successfully sampled by dredging at a single location, if at all. Only a few of these samples have been fresh enough or contained the appropriate fresh minerals to provide even a single age for the entire structure. By providing samples from a deep borehole, Site U1578 should help us understand the detailed temporal, volcanological, and geochemical evolution of a guyot, which is only possible with stratigraphically controlled sampling. The location of Site U1578 on the lower flank was chosen with the expectation that this location would experience less frequent eruptions than shallow portions of the central part of the guyot and therefore sample a large time span as well as some of the deeper units not exposed at the surface of the edifice.

Figure F3. TGW hotspot track bathymetry and fixed hotspot age models.

Figure F4. Age progression.
1.2.3. Paleomagnetic objectives
Site U1578 is an important location for examining the paleolatitude of the TGW hotspot and possible true polar wander because the expected guyot age matches the southernmost paleolatitude indicated by global paleomagnetic data (Figure F5). Analysis by Gordon and others (Gordon et al., 2019; Woodworth and Gordon, 2020) suggests that two true polar wander stillstands (i.e., no polar motion) occurred during the early Cenozoic, but during the Eocene, there was a true polar wander shift of ~5°. True polar wander was an early explanation for the paleolatitude difference between Suiko Seamount in the mid-Emperor chain relative to the present latitude of the hotspot (Gordon and Cape, 1981). Although southward hotspot motion has largely replaced true polar wander as an explanation for that shift (Tarduno et al., 2009; Expedition 330 Scientists, 2012), true polar wander cannot be completely ruled out due to the large uncertainty of the paleolatitude estimates for Emperor Seamounts north of Suiko Seamount. The determination of a reliable paleolatitude from Site U1578, with a small uncertainty estimate, can be used to test these two models. In addition, models of hotspot motion caused by mantle flow suggest that the TGW hotspot has moved south-ward by ~7° since the Cretaceous (Doubrovine et al., 2012), but the paleolatitude inferred from the global paleomagnetic data suggests northward motion (Figure F5). This northward post-Cretaceous motion of the TGW hotspot is the sense of motion that would be expected from true polar wander with the spin axis moving away from the Hawaiian hotspot. The Hawaiian and TGW hotspots, which are almost antipolar, should display different senses of motion (south in the Pacific; north in the Atlantic).
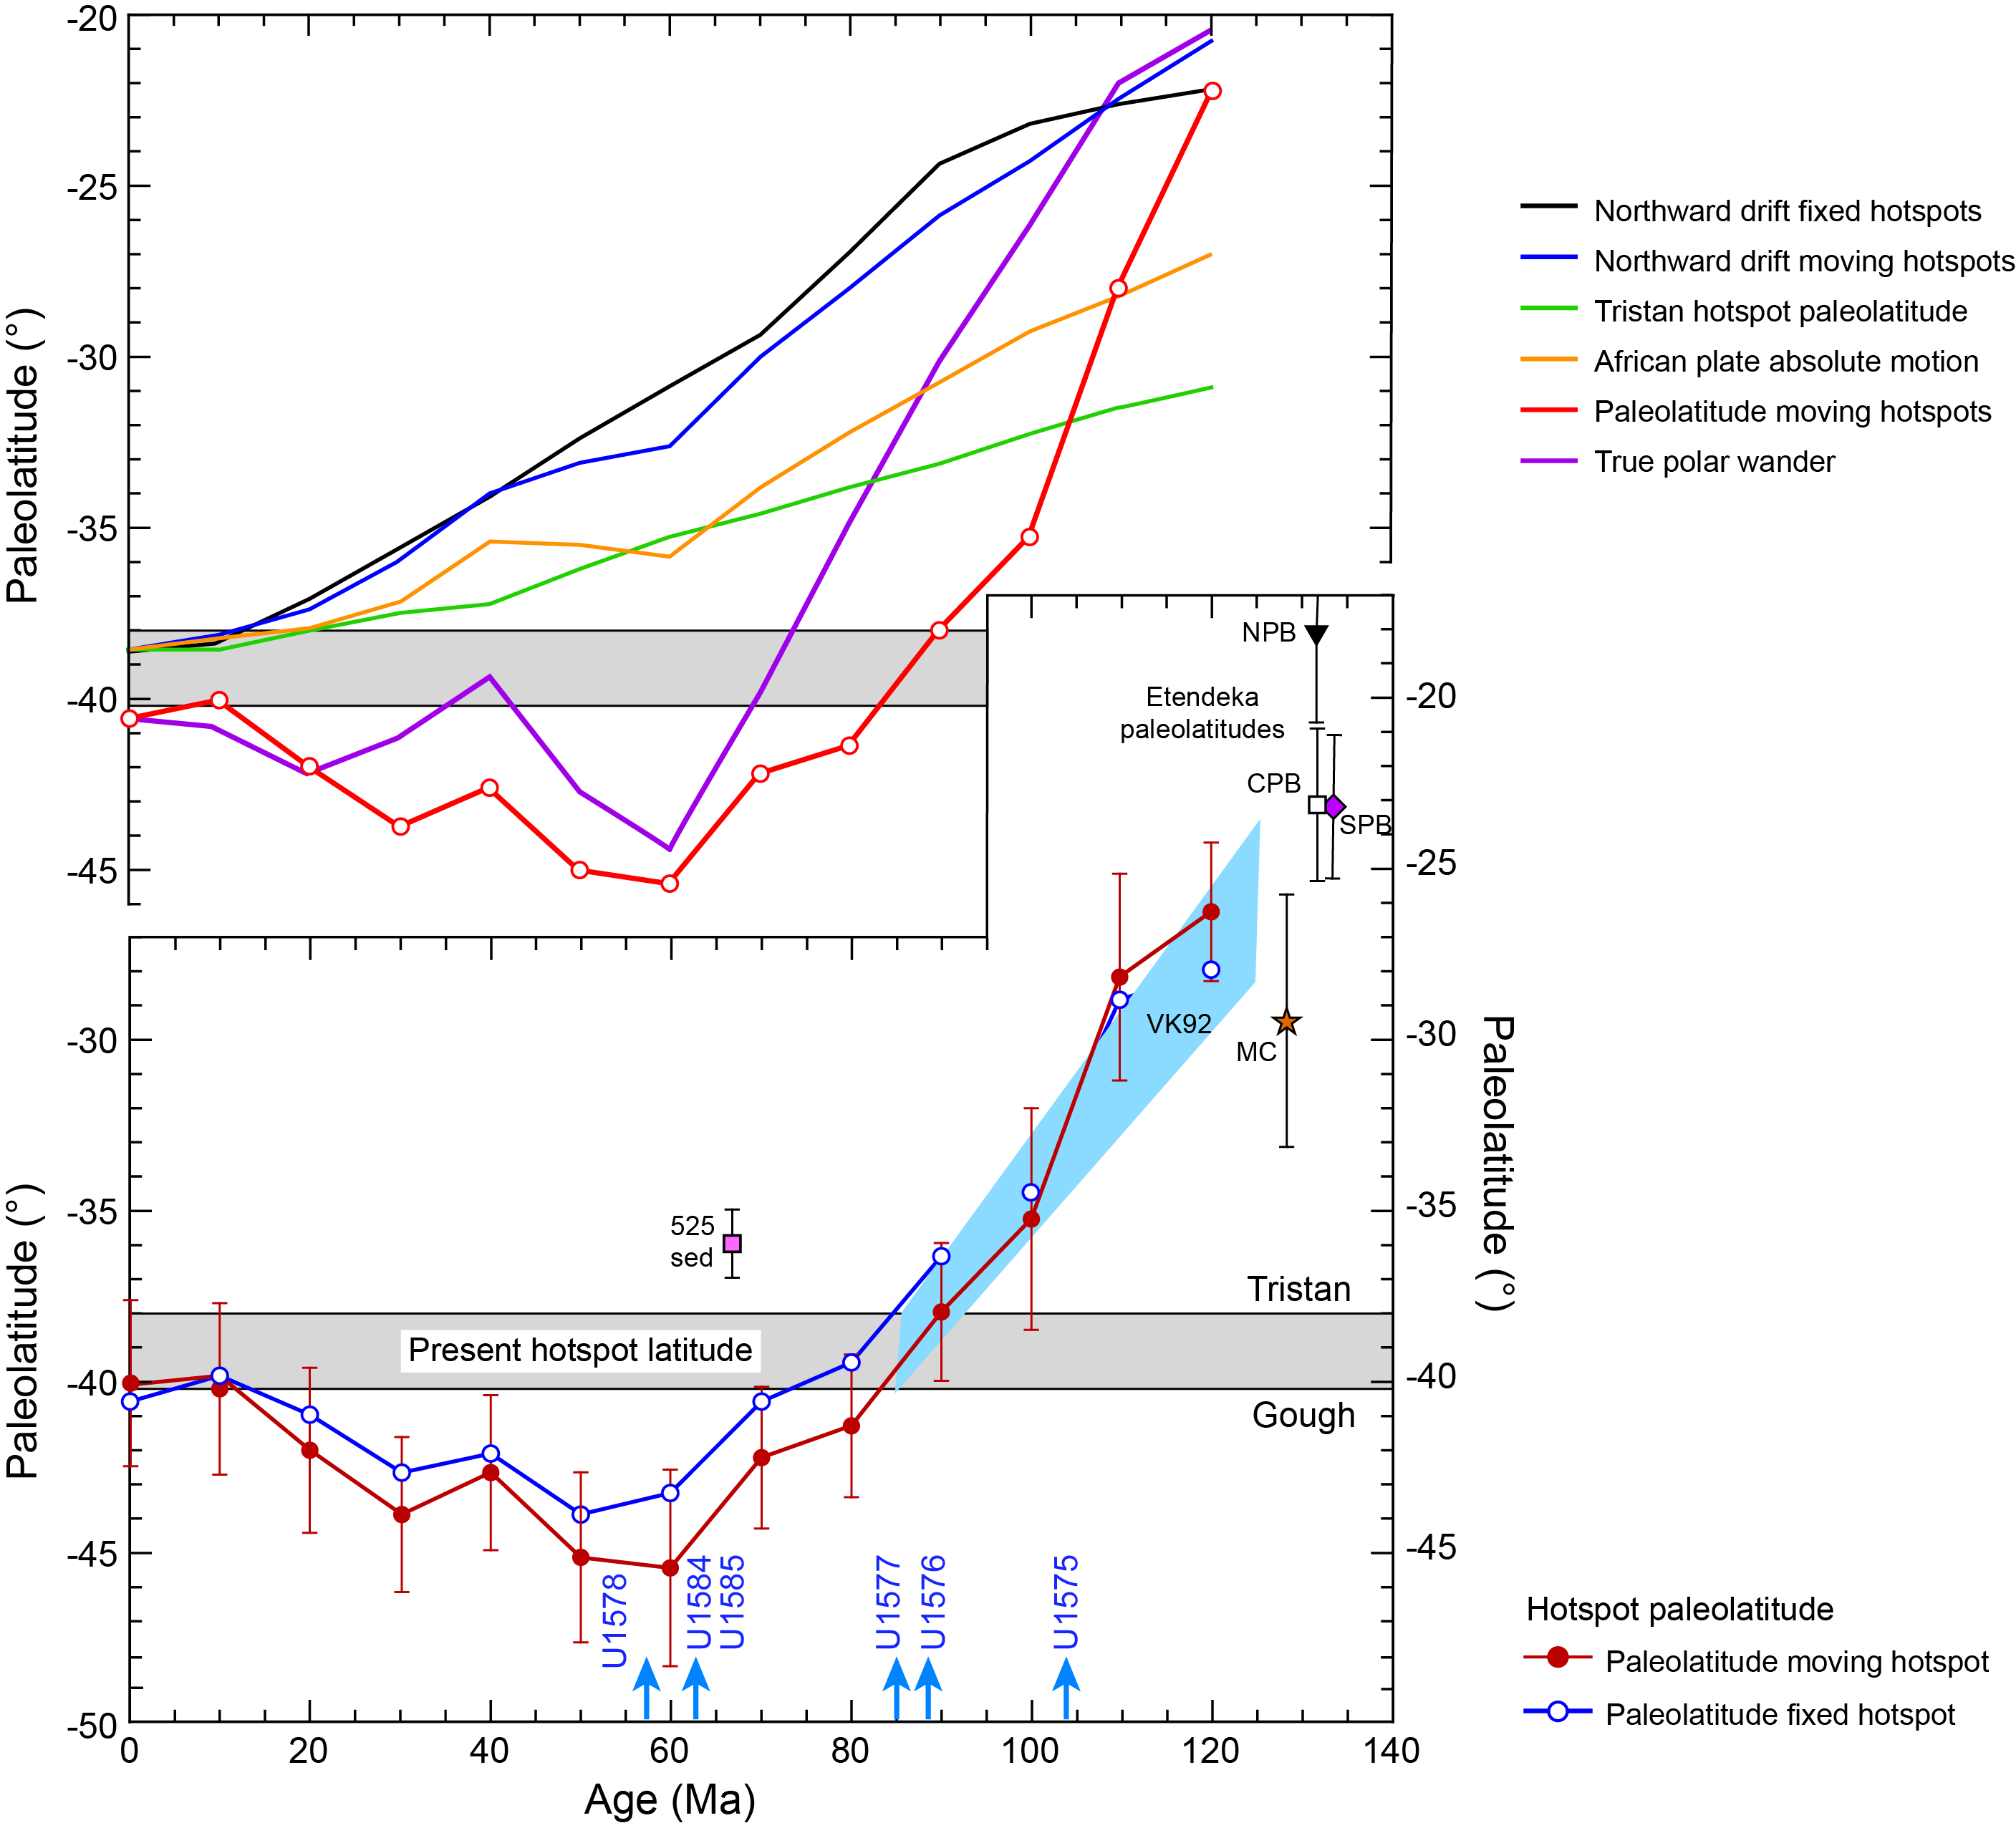
Figure F5. Predicted paleolatitude drift.
1.2.4. Volcanologic objectives
Site U1578 samples a guyot in the TGW hotspot track of the Guyot Province, where the volcanic edifices form individual flat-topped conical or ridge-like structures rather than a continuous (Walvis) ridge with plateau (Valdivia Bank). This difference reflects a transition from a mid-ocean ridge (plate boundary) centered above the plume to an internal part of the plate being located above the plume. These different scenarios imply very different volcanological processes of formation that are largely controlled by differences in magma production rates and tectonic processes associated with mid-ocean ridge spreading. Thus, we expect volcanism during the formation of the guyots to be fundamentally different from the older ridge volcanism at Sites U1575–U1577. This became clearly manifest, for example, in the high abundance of massive flows (with substantial thicknesses) drilled at Walvis Ridge sites compared to their much less frequent (and thinner) occurrence at Site U1578. Also, volcaniclastics, which are rare at Walvis Ridge sites, are more abundant in the Site U1578 cores but are still minor in overall abundance downhole. Studies of igneous units in the 300 m section drilled at this site will seek to understand the volcanological evolution of this guyot. Such studies are rare, so Site U1578 will provide important information about intraplate volcanism.
1.2.5. Sedimentologic objectives
Site U1578 is located ~1500 km from land in the middle South Atlantic Gyre. For this reason, sediments at Site U1578 may be different than those found on the older Walvis Ridge. Coring at other sites showed cycles of sediment color and other properties that may be caused by paleoenvironmental changes. Moreover, Valdivia Bank sites showed thick carbonate sediment sections even though the site is in deep water (e.g., Site U1577). Previous sites also demonstrated that the sediment sequence is often punctuated by lengthy hiatuses. The abbreviated nature of Site U1578 sediment as revealed by seismic data (Figure F6) implies a truncated sedimentary history, perhaps caused by mass wasting or erosion. Site U1578 sediments offer the opportunity for a comparison with other Walvis Ridge sites closer to land and a better understanding of South Atlantic sedimentation variations.

Figure F6. Seismic Line TN373-CT2B over Site U1578.
1.3. Site geophysics
Site U1578 is located on the northwestern flank of the unnamed Center track guyot at a water depth of ~3800 m (Figure F2). The drill site was picked on Seismic Line TN373-CT2B, collected in 2019 by the research vessel (R/V) Thomas G. Thompson. Bathymetric data show that the site is located on the lower flank of the guyot on the side of a low ridge that appears to be an erosional sediment remnant (Figure F2).
The TN373-CT2B profile shows a ~170 m thick sediment layer overlying a strong and undulating basement horizon (Figure F6). Sediment thickness varies greatly along the profile (Figure F7), implying that sedimentation is highly variable laterally. Based on recovery at Sites U1575 and U1576, as well as other drill sites in the region (e.g., Bartels et al., 2007), the uppermost layer was predicted to be Cenozoic pelagic ooze, whereas the lower section was thought to be early Cenozoic chalk.
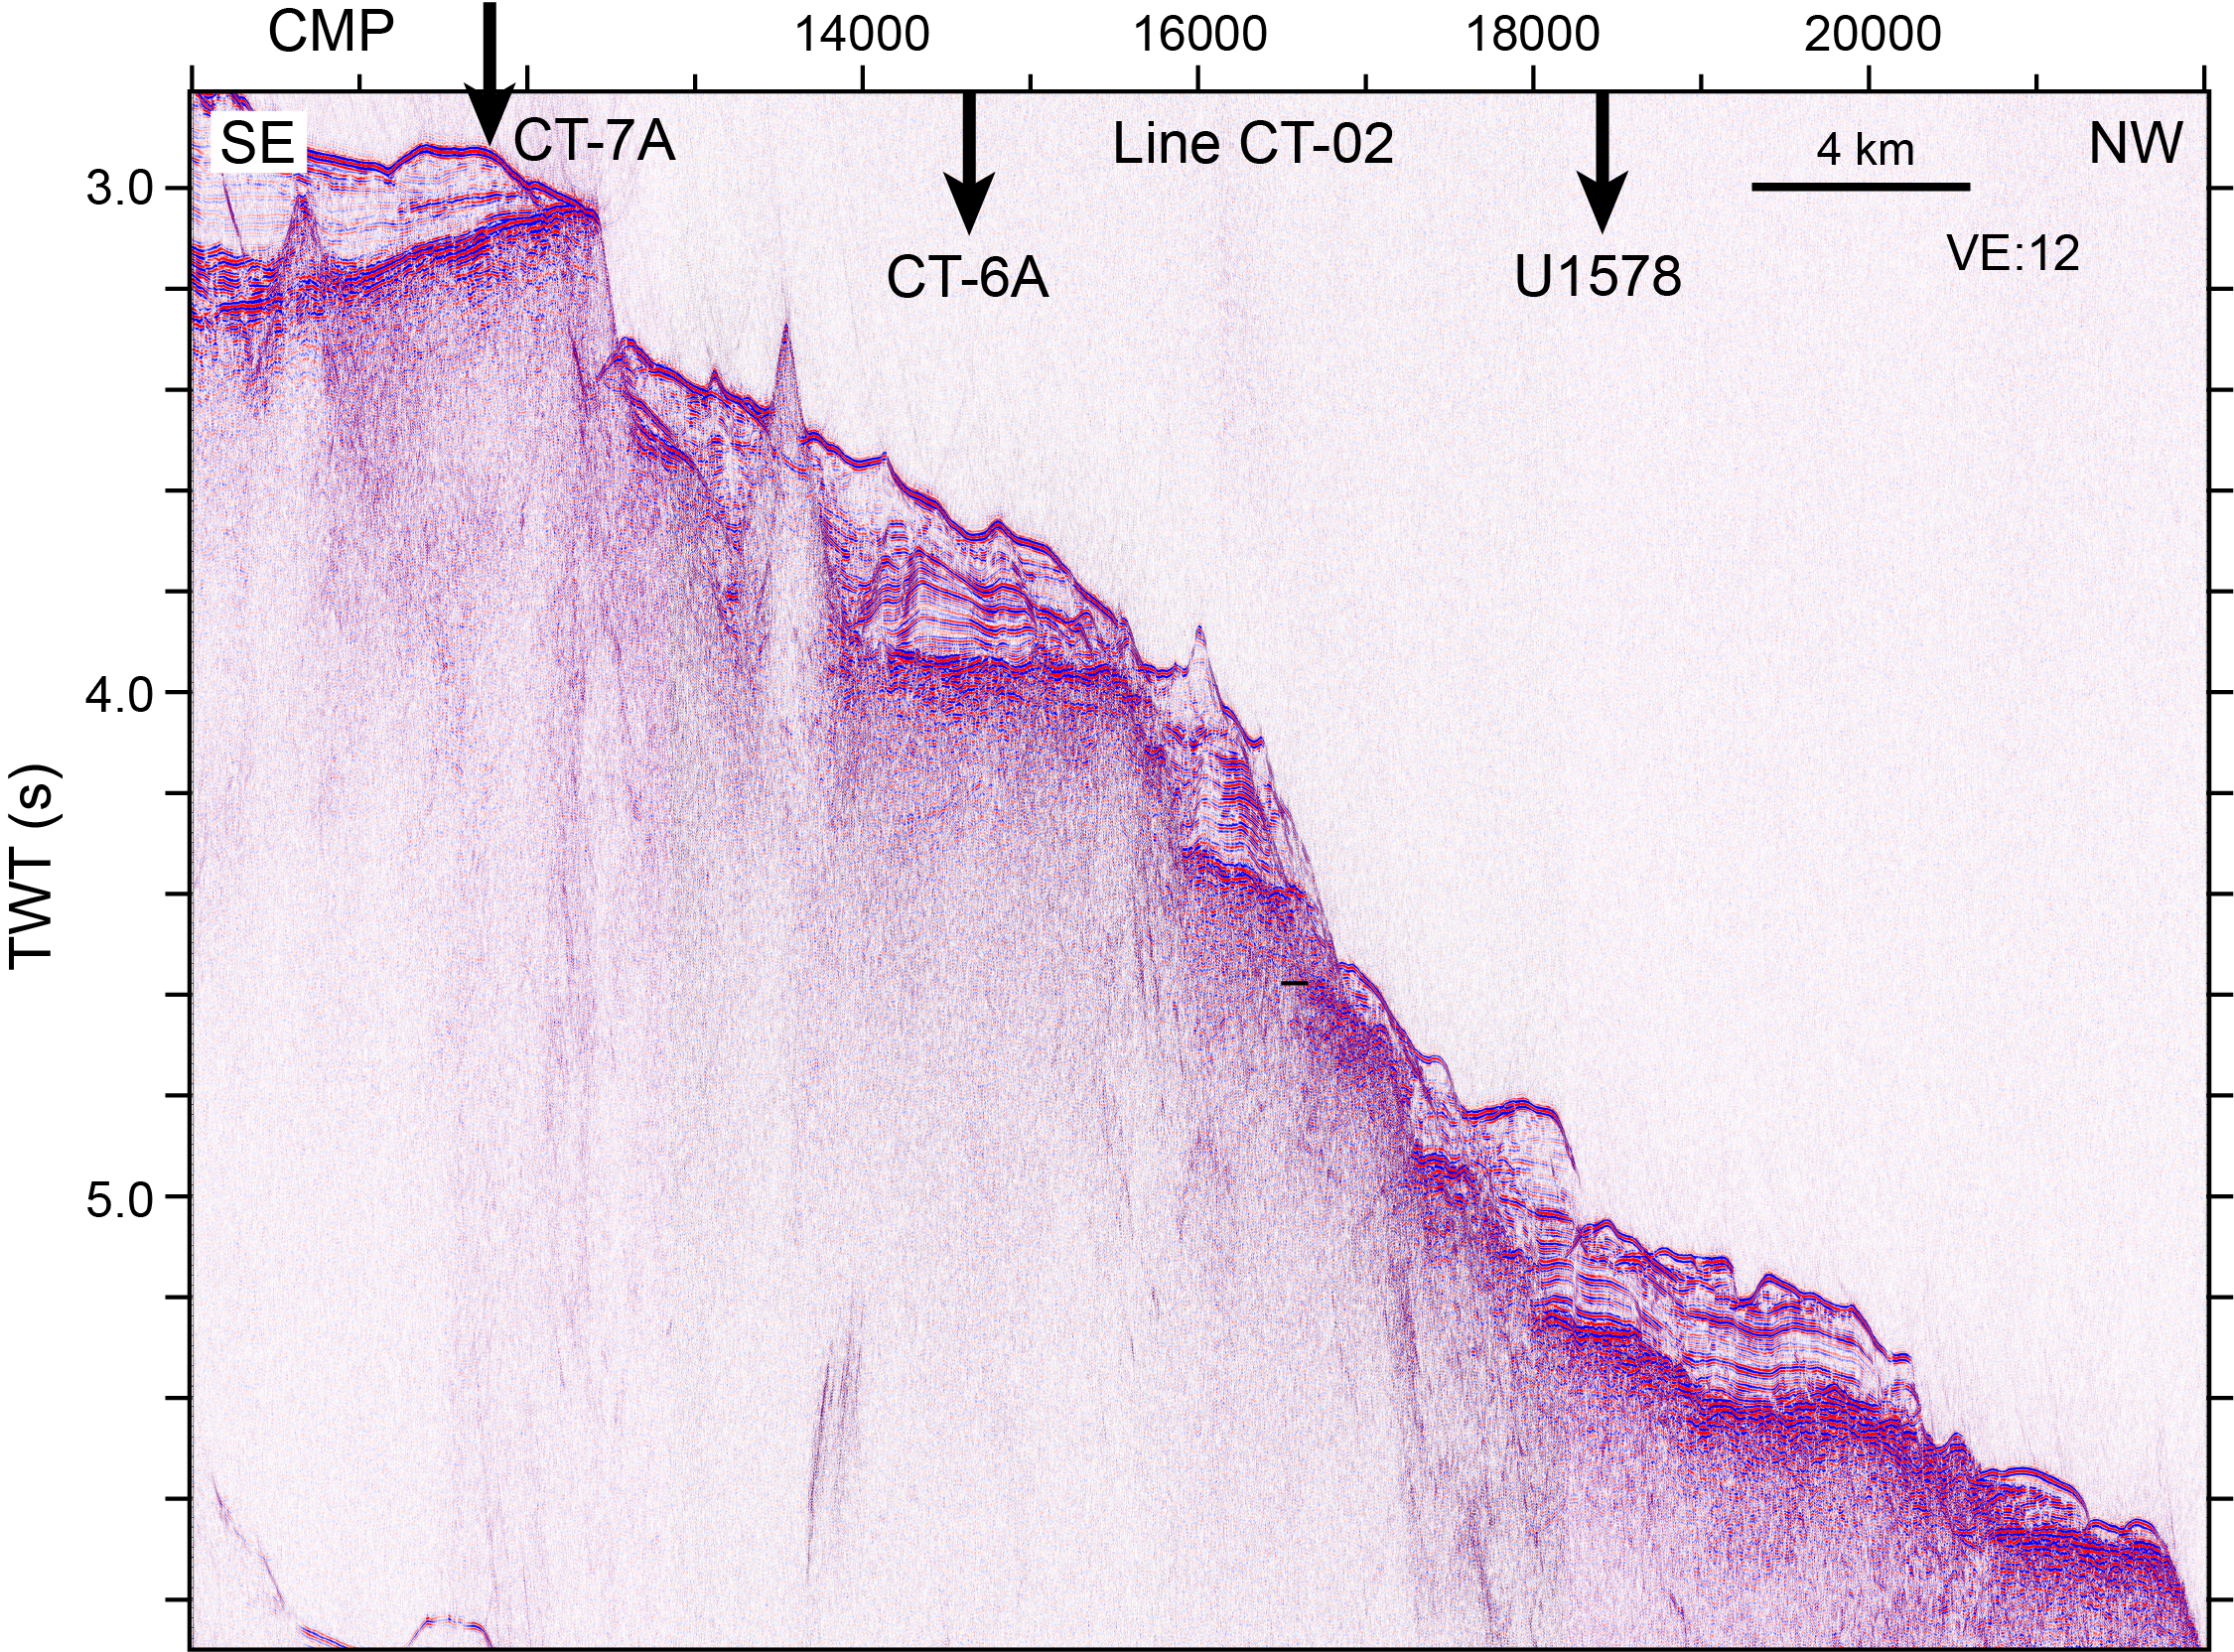
Figure F7. Seismic Line TN373-CT2B with flank of CT guyot.
Basement on the TN373 profile (Figure F6) is interpreted to be igneous rock at the top of the guyot basement. In places, this surface is undulatory, as is expected for a lava flow surface. However, in other places, the basement surface displays flat or low-slope portions separated by steep offsets (Figure F7) that strongly suggest faulting. The seismic source for the TN373-CT2B profile was small and does not penetrate deeply into the volcanic basement, so the nature of the basement is difficult to determine and subbasement reflectors are difficult to discern.
2. Operations
2.1. Transit to Site U1578
After securing the rig floor for transit at 2150 h (UTC + 2 h) on 19 January 2022, the hydrophones and thrusters were raised, and we switched the vessel from dynamic positioning (DP) to cruise mode at 2240 h. We then secured the vessel for transit to Site U1578. The sea passage began at 2300 h. The 605 nmi transit was completed at an average speed of 10.9 kt. The vessel arrived at Site U1578 at 0630 h on 22 January. After lowering the thrusters at 0655 h and switching from cruise mode to DP mode, the rig floor was released for operations at 0702 h, beginning Hole U1578A.
2.2. Site U1578
Site U1578 comprises one hole. The original plan for Site U1578 was for a single hole; Hole U1578A would be cored with the RCB system to a volcanic basement penetration of ~250 m, amounting to a total depth of 417 meters below seafloor (mbsf) that included a 167 m thick sediment cover as interpreted based on preexpedition seismic surveys. Actual operations fulfilled the plan and exceeded the targeted basement penetration by ~50 m (Table T1). Hole U1578A was RCB cored to 486.4 mbsf and intersected the sediment/volcanic basement contact at 184.26 mbsf. The time spent on Hole U1578A was 244.0 h, or 10.2 days.
2.2.1. Hole U1578A
Upon being cleared for operations, the RCB bottom hole assembly (BHA) was made up. The outer core barrel had already been assembled during the transit to Site U1578. We began lowering the drill string to the seafloor at 0800 h on 22 January 2022. The pipe trip to the seafloor was routine, and the pipe was filled with seawater twice while being lowered to 3764.0 meters below sea level (mbsl). Upon implementing a routine slip and cut of 115 ft (35.02 m) of the drilling line, we picked up the top drive at 1630 h and the drill bit was positioned at the seafloor depth of 3790.4 mbsl, as indicated by the precision depth recorder (PDR). A dressed nonmagnetic RCB core barrel was dropped and pumped down to land in the outer core barrel. The first two attempts to spud Hole U1578A returned water cores. On the third attempt, Hole U1578A was spudded at 1935 h on 22 January. The seafloor depth was calculated to be 3793.8 mbsl based on the core recovery. The difference between the PDR and the estimated seafloor depth was 15.3 m. RCB Cores 1R–45R advanced from the seafloor to 373.4 mbsf. Between Cores 22R and 45R, 480 bbl (76,340 L) of high-viscosity mud were used in 20 bbl (3,180 L) sweeps while cutting each core for hole cleaning. To reach the target penetration depth of ~250 m into igneous basement, a change of the coring bit was required. Thus, after recovering Core 45R at 1510 h on 27 January, we secured the coring equipment and began preparing the deployment of a free-fall funnel (FFF) for reentering Hole U1578A after the bit change.
The drill string was raised from 373.4 to 338.9 mbsf with the top drive installed. At 1545 h, we set back the top drive and continued raising the drill string to 105.8 mbsf. Upon pulling the upper guide horn at 1645 h, we rigged up and assembled the FFF. The moonpool doors were opened, and the FFF was deployed at 1835 h. We then lowered the subsea camera system to the seafloor and observed a cone of cuttings around the FFF. While monitoring the funnel, we continued pulling the drill string out of the hole, and the bit cleared the seafloor at 2135 h. The subsea camera system was retrieved, and it arrived in the moonpool at 2315 h on 27 January. After securing the subsea camera system, we continued raising the drill string. The BHA reached the surface at 0345 h on 28 January. The bit arrived at the rig floor at 0445 h. A new RCB coring bit was installed, and the outer core barrel assembly was checked.
At 0600 h, we began lowering the drill string with the BHA back to the seafloor. After deploying the BHA to 110.7 mbsl and servicing the rig, we continued lowering the drill string with drill pipe. When the drill string reached 3782.7 mbsl, we filled the drill pipe with seawater. At 1245 h, the subsea camera system was deployed in search of the reentry funnel of Hole U1578A. After we found the cuttings mound and funnel outline, we positioned the bit and maneuvered the vessel to reenter the hole. At 1705 h on 28 January, we reentered Hole U1578A and lowered the bit to 104.9 mbsf. The subsea camera system was retrieved to the surface and secured at 1915 h. Both deployments of the subsea camera system included successful bottom seawater sampling using a Niskin bottle attached to the frame of the camera system. We then lowered the drill string to 338.9 mbsf. At 2000 h, the knobby drilling joints and top drive were picked up. With the top drive installed, the bit was lowered to the bottom of Hole U1578A at 373.4 mbsf.
At 2100 h on 28 January, RCB coring resumed in Hole U1578A, cutting Core 46R. It continued through Core 51R, which was retrieved at 1625 h on 29 January. We then repaired a hydraulic hose failure on the top drive service loop. Coring operations resumed at 1800 h on 29 January and continued through 31 January, when Core 65R was retrieved. The hole cleaning program continued with another 20 bbl (3180 L) high-viscosity mud sweep pumped during each cored interval to keep the hole clean. In total, another 380 bbl (60,415 L) of high-viscosity mud were pumped during the second bit run. In view of the remaining expedition time, Core 65R was the last one cut in Hole U1578A and during Expedition 391. After retrieving Core 65R at 2315 h on 31 January, we flushed the drill string with freshwater and secured the coring equipment. We began pulling the drill string out of Hole U1578A with the top drive installed. When the bit reached 425.9 mbsf, we flushed the drilling service lines (e.g., mud pumps) with freshwater. At 0045 h on 1 February, the knobby drilling joints were removed, and the top drive was set back. We then continued pulling the drill string out of the hole, and the bit cleared the seafloor at 0200 h. When the drill string had been raised to a water depth of 1488.7 m at 0530 h, a repair of a detached wire on the piperacker skate was implemented. After raising the drill pipe to 170 mbsl by 0830 h, we started pulling the RCB BHA to the surface and laid out the drill collars to the drill collar rack. The bit arrived at the rig floor at 1040 h. The rig floor was secured at 1100 h on 1 February, ending Hole U1578A and, thus, Site U1578.
Overall, Cores 1R–65R penetrated from the seafloor to a final depth of 486.4 mbsf and recovered 239.9 m (49%) of sediment and igneous rock. The sediment/basement contact was intersected while cutting Core 20R at 184.3 mbsf. The total time spent on Hole U1578A amounted to 244.0 h, or 10.2 days.
2.3. Transit to Cape Town
After securing the rig floor, the thrusters were raised and the vessel was switched from DP to cruise mode. We then secured the ship for transit and began our sea passage back to Cape Town, South Africa, at 1130 h on 1 February 2022. Upon completing the 971 nmi voyage at an average speed of 10.4 kt, the vessel arrived at Repair Quay 3. The first line went ashore at 0918 h on 5 February, ending Expedition 391.
3. Lithostratigraphy
At Site U1578, a ~184 m thick succession of pelagic sediment interbedded with volcaniclastic layers lies on top of igneous basement. Two main lithostratigraphic units, the second divided into two subunits, were recognized based on macroscopic and microscopic (smear slide, thin section, and scanning electron microscopy [SEM]) lithologic observations together with changes in magnetic susceptibility (MS), natural gamma radiation (NGR), and biostratigraphic data (Figure F8). This sedimentary succession overlies an igneous basement that consists of 12 igneous units of massive flows alternating with and passing into increasingly thick pillow lava stacks that are intercalated with 10 sedimentary interbeds showing variable amounts of volcaniclastic and calcareous pelagic materials.
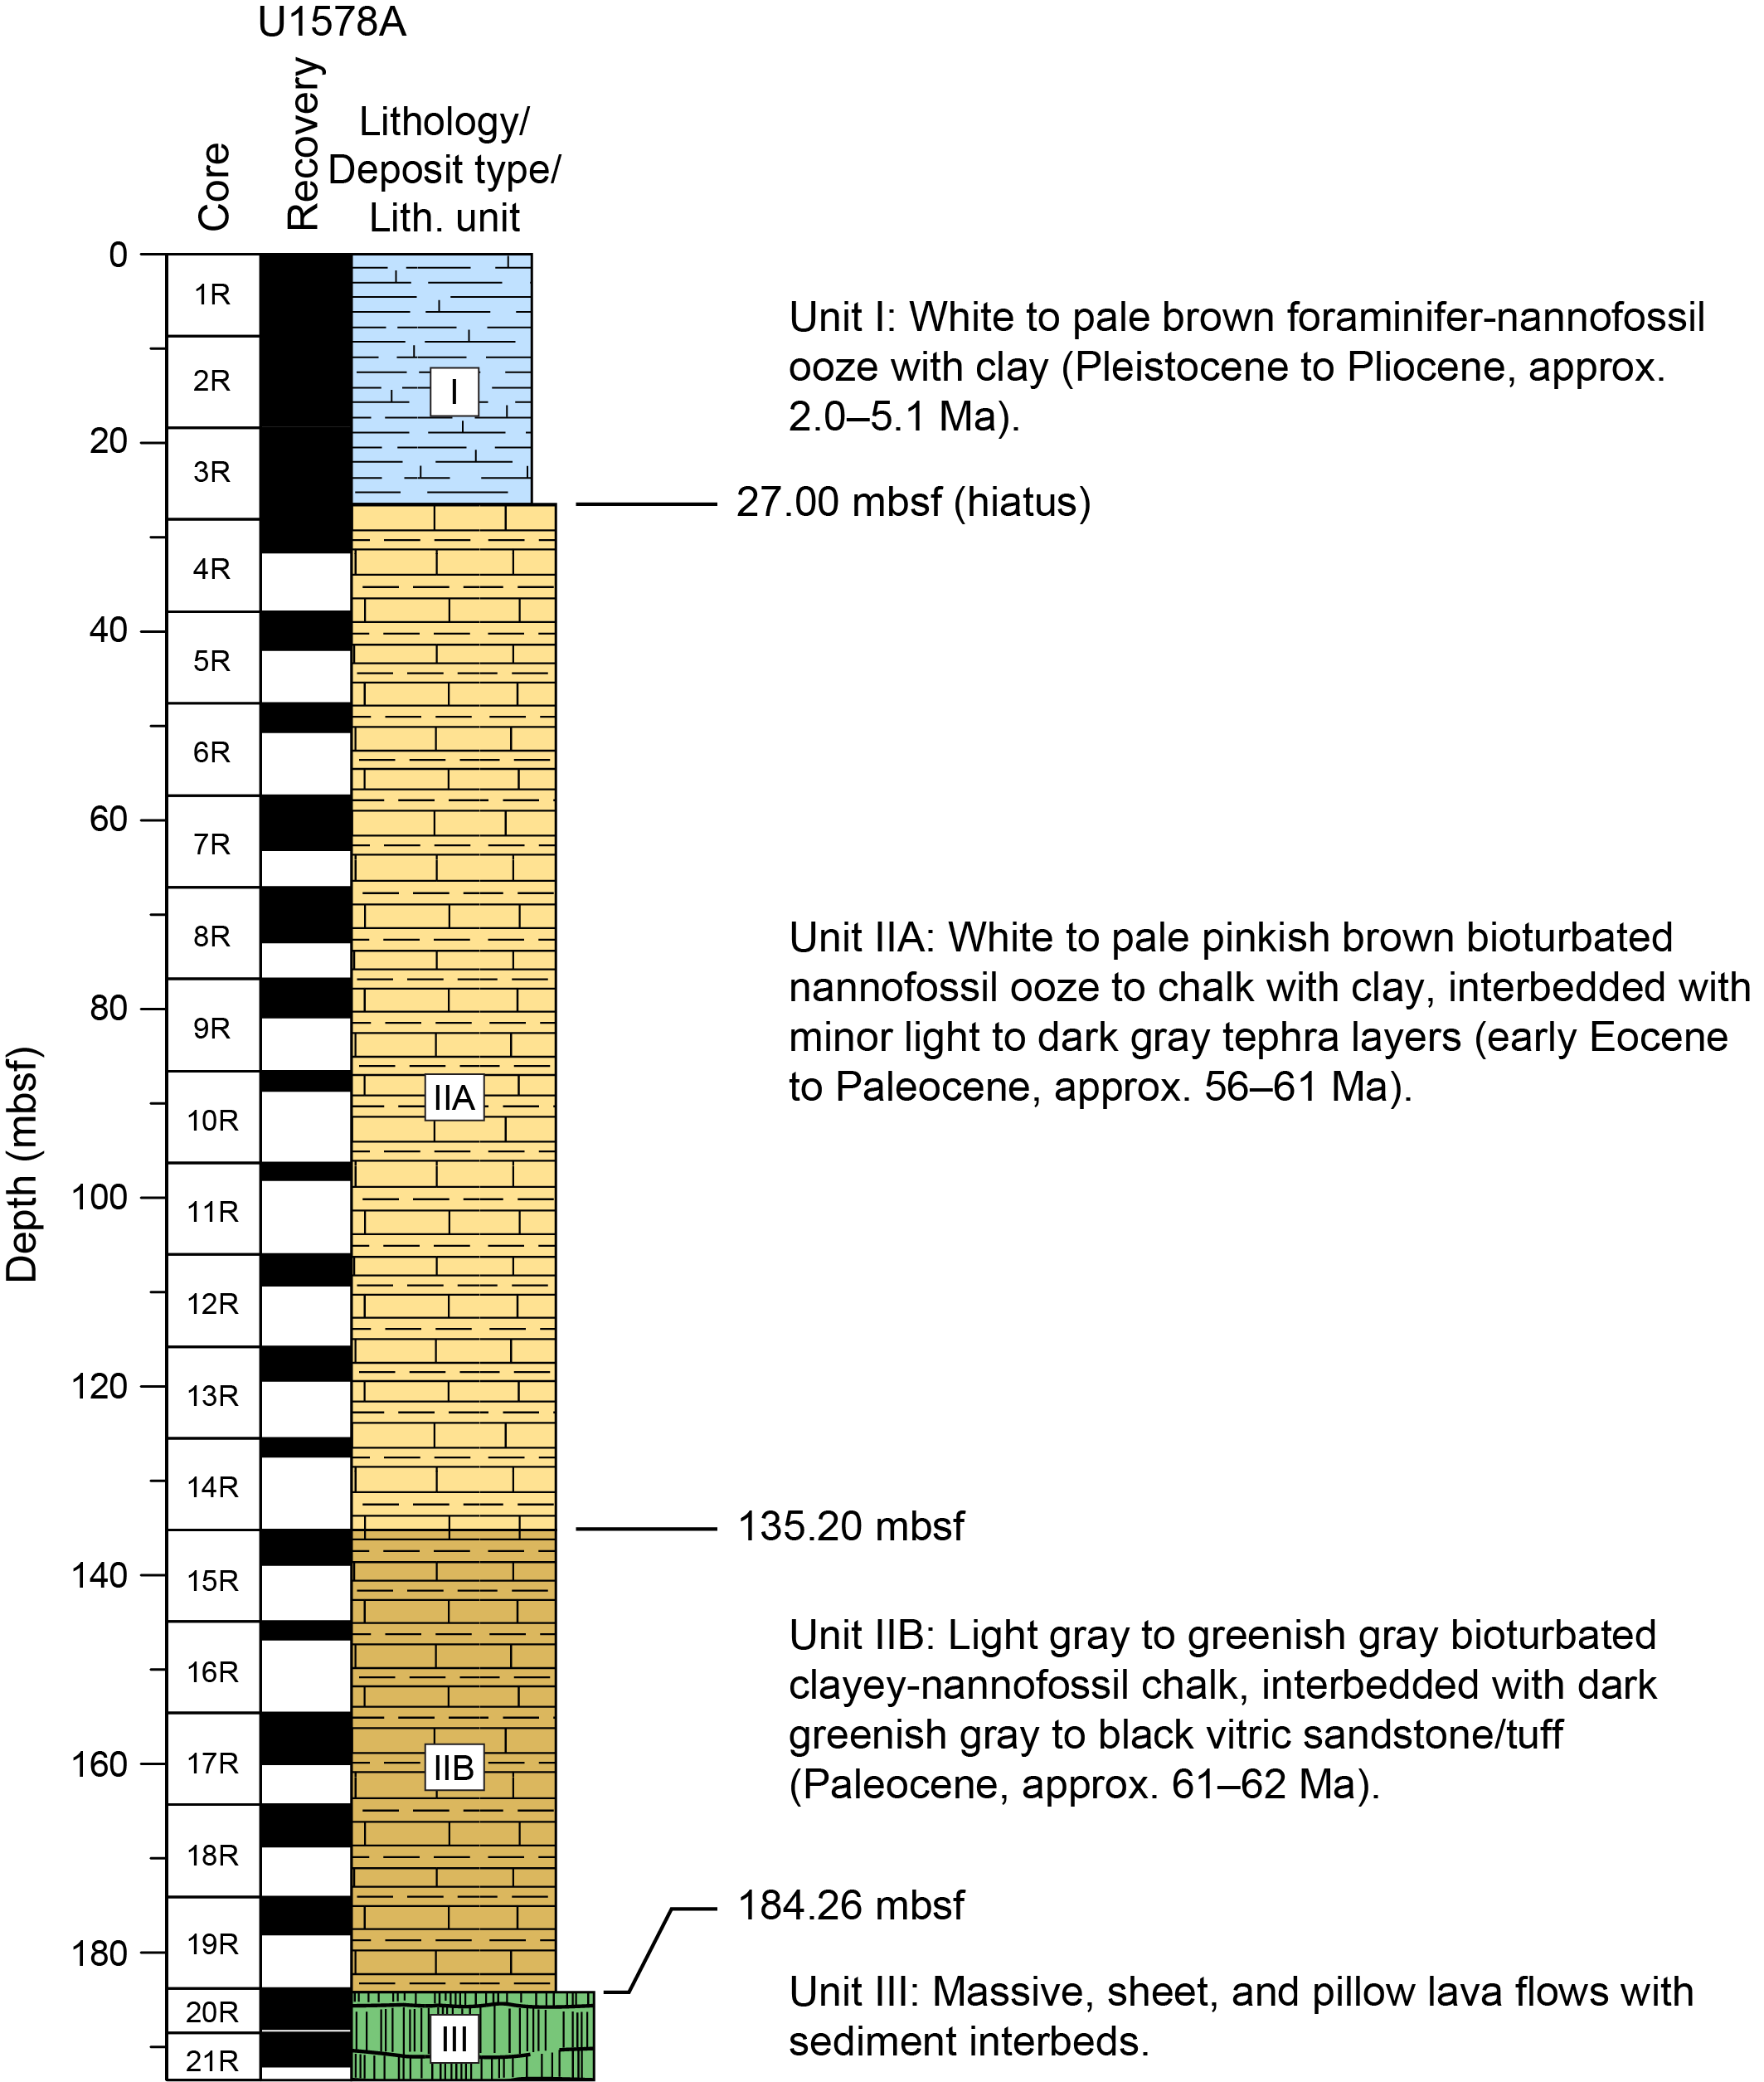
Figure F8. Lithostratigraphic synthesis.
The bulk of the sedimentary cover at Site U1578 is composed of two recurring key lithofacies that are referred to in all unit descriptions below. Lithofacies 1 consists of nannofossil ooze to chalk, which becomes increasingly clay rich with depth and has moderate to strong bioturbation (Figure F9). Lithofacies 2 consists of volcaniclastic layers (ash to tuff and vitric sand to sandstone) that are typically graded and occasionally cross-laminated to cross-bedded and can be slightly to strongly bioturbated (Figures F10). Tephra deposits were typically bioturbated and often appear as diffuse bands within the background pelagic sedimentary deposits. Usually, it was not possible to determine whether volcaniclastic deposits are primary/pyroclastic from nearby subaerial or submarine eruptions (locally partly reworked by bioturbation) or postvolcanic secondary/epiclastic material reworked by turbidity and/or bottom currents from older volcanic structures or associated existing volcaniclastic deposits. As at Sites U1575 and U1576, there was clear evidence of turbidites and possible reworking by bottom currents.

Figure F9. Chalk.
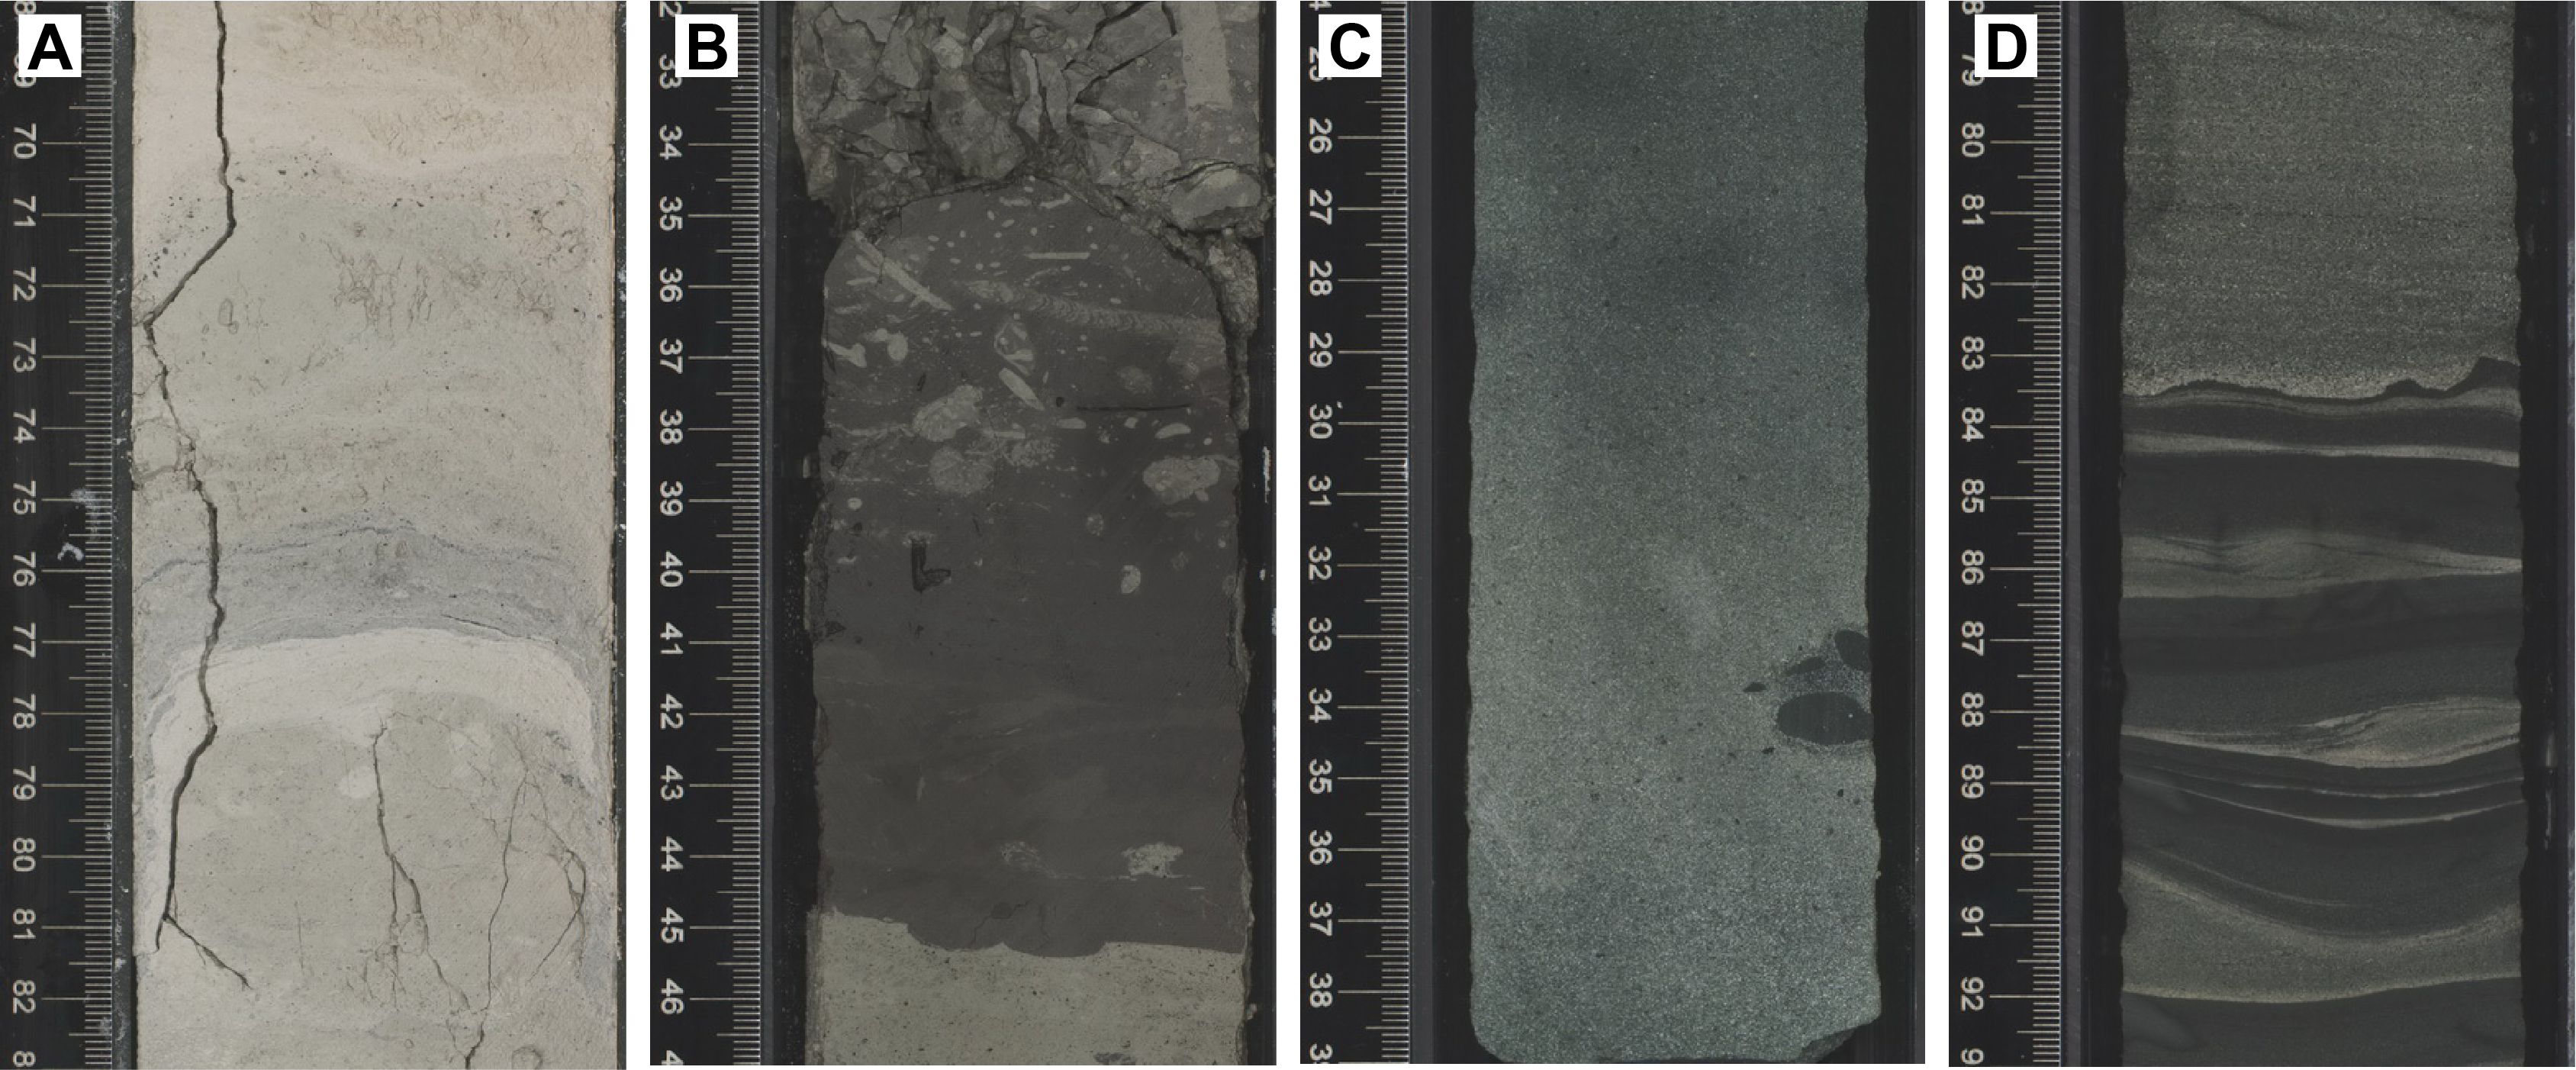
Figure F10. Volcaniclastic deposits.
3.1. Lithostratigraphic unit descriptions
3.1.1. Unit I
- Interval: 391-U1578A-1R-1, 0 cm, to 3R-6, 108 cm
- Depth: 0–27.00 mbsf
- Age: Pleistocene to Pliocene (~2.0–5.1 Ma)
Unit I is a ~27 m thick succession predominantly composed of pale brown to white bioturbated nannofossil ooze with clay (Lithofacies 1). Despite good recovery throughout the unit, there is significant drilling disturbance in this poorly consolidated sediment. Visual inspection suggests that the upper part of Unit I contains slightly increased proportions of clay, resulting in marginally higher NGR in the uppermost ~5 m (see Physical properties). However, the CaCO3 content of the ooze is commonly high in this unit (>90 wt%) (see Sediment geochemistry), which is consistent with pelagic sedimentation on the flank of the drilled seamount.
An unusual pinkish layer of more cohesive sediment with a clear increase in clay content occurs in interval 391-U1578A-2R-5, 27–106 cm (14.98–15.77 mbsf). Biostratigraphy reveals this interval to contain lower Oligocene with mixed Eocene nannofossils. The strata immediately above and below are Late and Early Pleistocene, respectively. Below this interval, the succession continues downhole to the Early Pliocene. Because Site U1578 lies close to the base of a fault scarp cutting the northwest margin of the seamount, this out-of-sequence package is likely a thin mass transport deposit (e.g., slump or olistostrome) derived from an adjacent, upslope exhumed section.
The base of Unit I is placed in Section 391-U1578A-3R-6, 108 cm, based on a change from earliest Pliocene ages in Section 3R-6, 53 cm (~26 mbsf) to Eocene/Paleocene ages in Section 3R-6, 130 cm (~27 mbsf), that indicates a major (~50 My) unconformity between the two units (see Biostratigraphy). Lithologically, the top of Unit II is regarded as the first downhole occurrence of tephra dispersed in calcareous ooze. In addition, smear slides reveal that foraminifera become scarce and small in Unit II and radiolarians and siliceous sponge spicules increase in abundance (Figure F11A). The boundary is additionally marked by an increase in NGR from ~3 to <20 counts/s and an increase in MS from ~0 to 22 × 10−5 SI. These changes are also correlated with a sustained increase in magnetic remanence downhole, as well as NGR peaks (see Physical properties and Paleomagnetism), which likely reflect the occurrence of less disturbed and more consolidated ooze with preserved tephra intervals in Unit II.
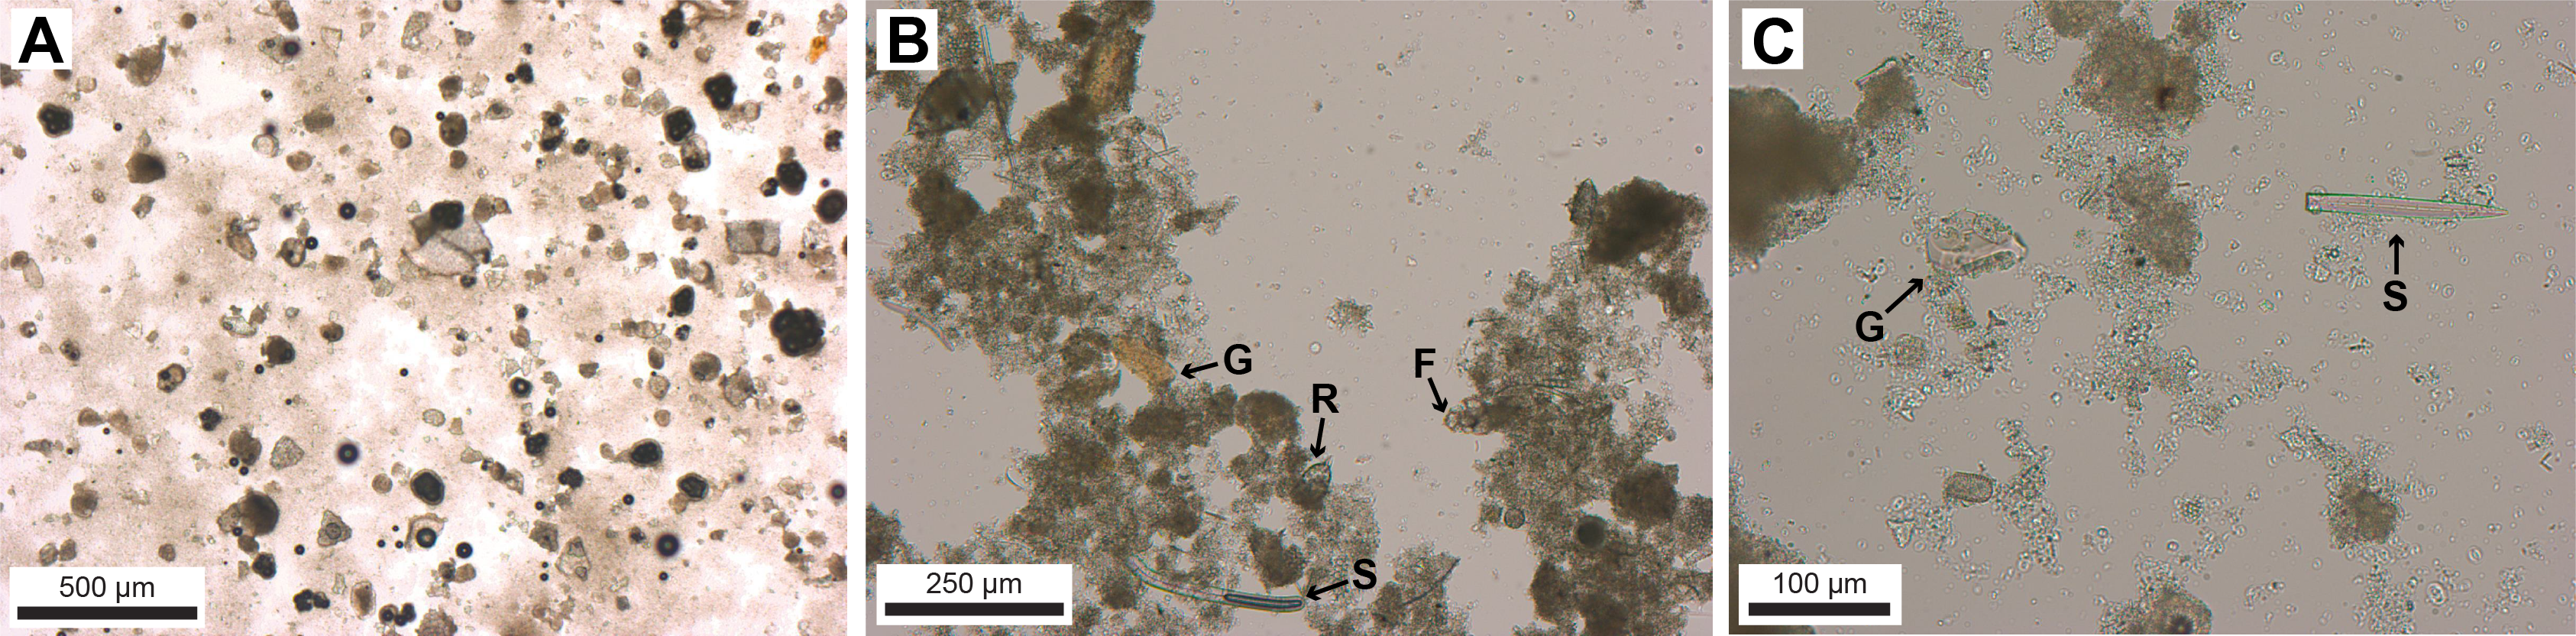
Figure F11. Ooze and chalk.
3.1.2. Unit II
- Interval: 391-U1578A-3R-6, 108 cm, to 20R-1, 46 cm
- Depth: 27.00–184.26 mbsf
- Age: early Eocene to Paleocene (~52 to ~62 Ma)
Unit II is a ~157 m thick succession of bioturbated nannofossil ooze to chalk with variable clay content and rare radiolarians, siliceous sponge spicules, and foraminifera (Lithofacies 1). The upper part of the unit includes white to pale pinkish brown ooze with clay that passes down into a light gray to increasingly greenish gray clayey nannofossil chalk. The occurrence and preservation of foraminifera is poor throughout and may be a function of paleoceanographic conditions. Paleontological observations indicate a possible lowermost Eocene interval in interval 391-U1578A-3R-6, 130 cm, through 3R-CC. This passes down into an apparently uninterrupted Paleocene succession from Thanetian (~55.5–57 Ma) in Core 5R to Danian in Section 18R-CC (see Biostratigraphy). The unit also includes minor (commonly disturbed) interbeds of light to dark gray volcaniclastic deposits (Lithofacies 2) that increase in abundance in the lowermost part of the unit toward the contact with the underlying volcanic basement. Recovery throughout Unit II was compromised by ocean swell causing significant heave, and accordingly there is significant drilling disturbance and section loss (particularly in the least consolidated layers) with intervening biscuiting of more lithified sections. Unit II was divided into two subunits based on a gradual darkening of the clayey nannofossil chalk downhole, corroborated by a step change in NGR from ~5 to 9 counts/s from Core 14R to Core 15R.
3.1.2.1. Subunit IIA
- Interval: 391-U1578A-3R-6, 108 cm, to 15R-1, 0 cm
- Depth: 27.00–135.20 mbsf
- Age: early Eocene to Paleocene (~56 to ~61 Ma)
Subunit IIA is a ~108 m thick succession of moderately to strongly bioturbated white to pale pinkish brown nannofossil ooze to chalk with clay (Lithofacies 1) (Figure F9A). This pelagic sediment includes rare radiolarians, siliceous sponge spicules, and small planktonic foraminifera (Figure F11B). Its CaCO3 content ranges 64–79 wt% (average = 74 wt%; n = 8) (see Sediment geochemistry), which is consistent with moderate clay content in the upper part of Unit II. Burrows commonly include dark volcaniclasts that are most likely altered glass reworked from tephra deposits. Similar volcaniclasts are locally dispersed in the ooze/chalk, probably due to more pervasive bioturbation.
Subunit IIA passes into somewhat darker chalk and includes minor <10 cm thick graded beds of light to dark gray tephra (Lithofacies 2) (Figure F10A). The tephra is fine to coarse ash that is predominantly composed of colorless to brownish vesicular glass shards and feldspars with occasionally colorless pumices and biotites, suggesting sourcing from an evolved source (Figure F12A); this evolved composition is reflected in higher NGR values at some of these discrete horizons. Fresh volcanic glass is locally preserved. The clast texture and componentry of the volcaniclastic beds suggests that they are primary (e.g., ash fall from subaerial or shallow marine eruptions), but it is also possible that some experienced postvolcanic reworking by turbidity and/or bottom currents. The tephra in Subunit IIA was deposited less than ~5 My after the emplacement of the lavas and associated interbedded sediment in the volcanic basement and thus may record a period of subaerial postshield volcanism on the drilled seamount.
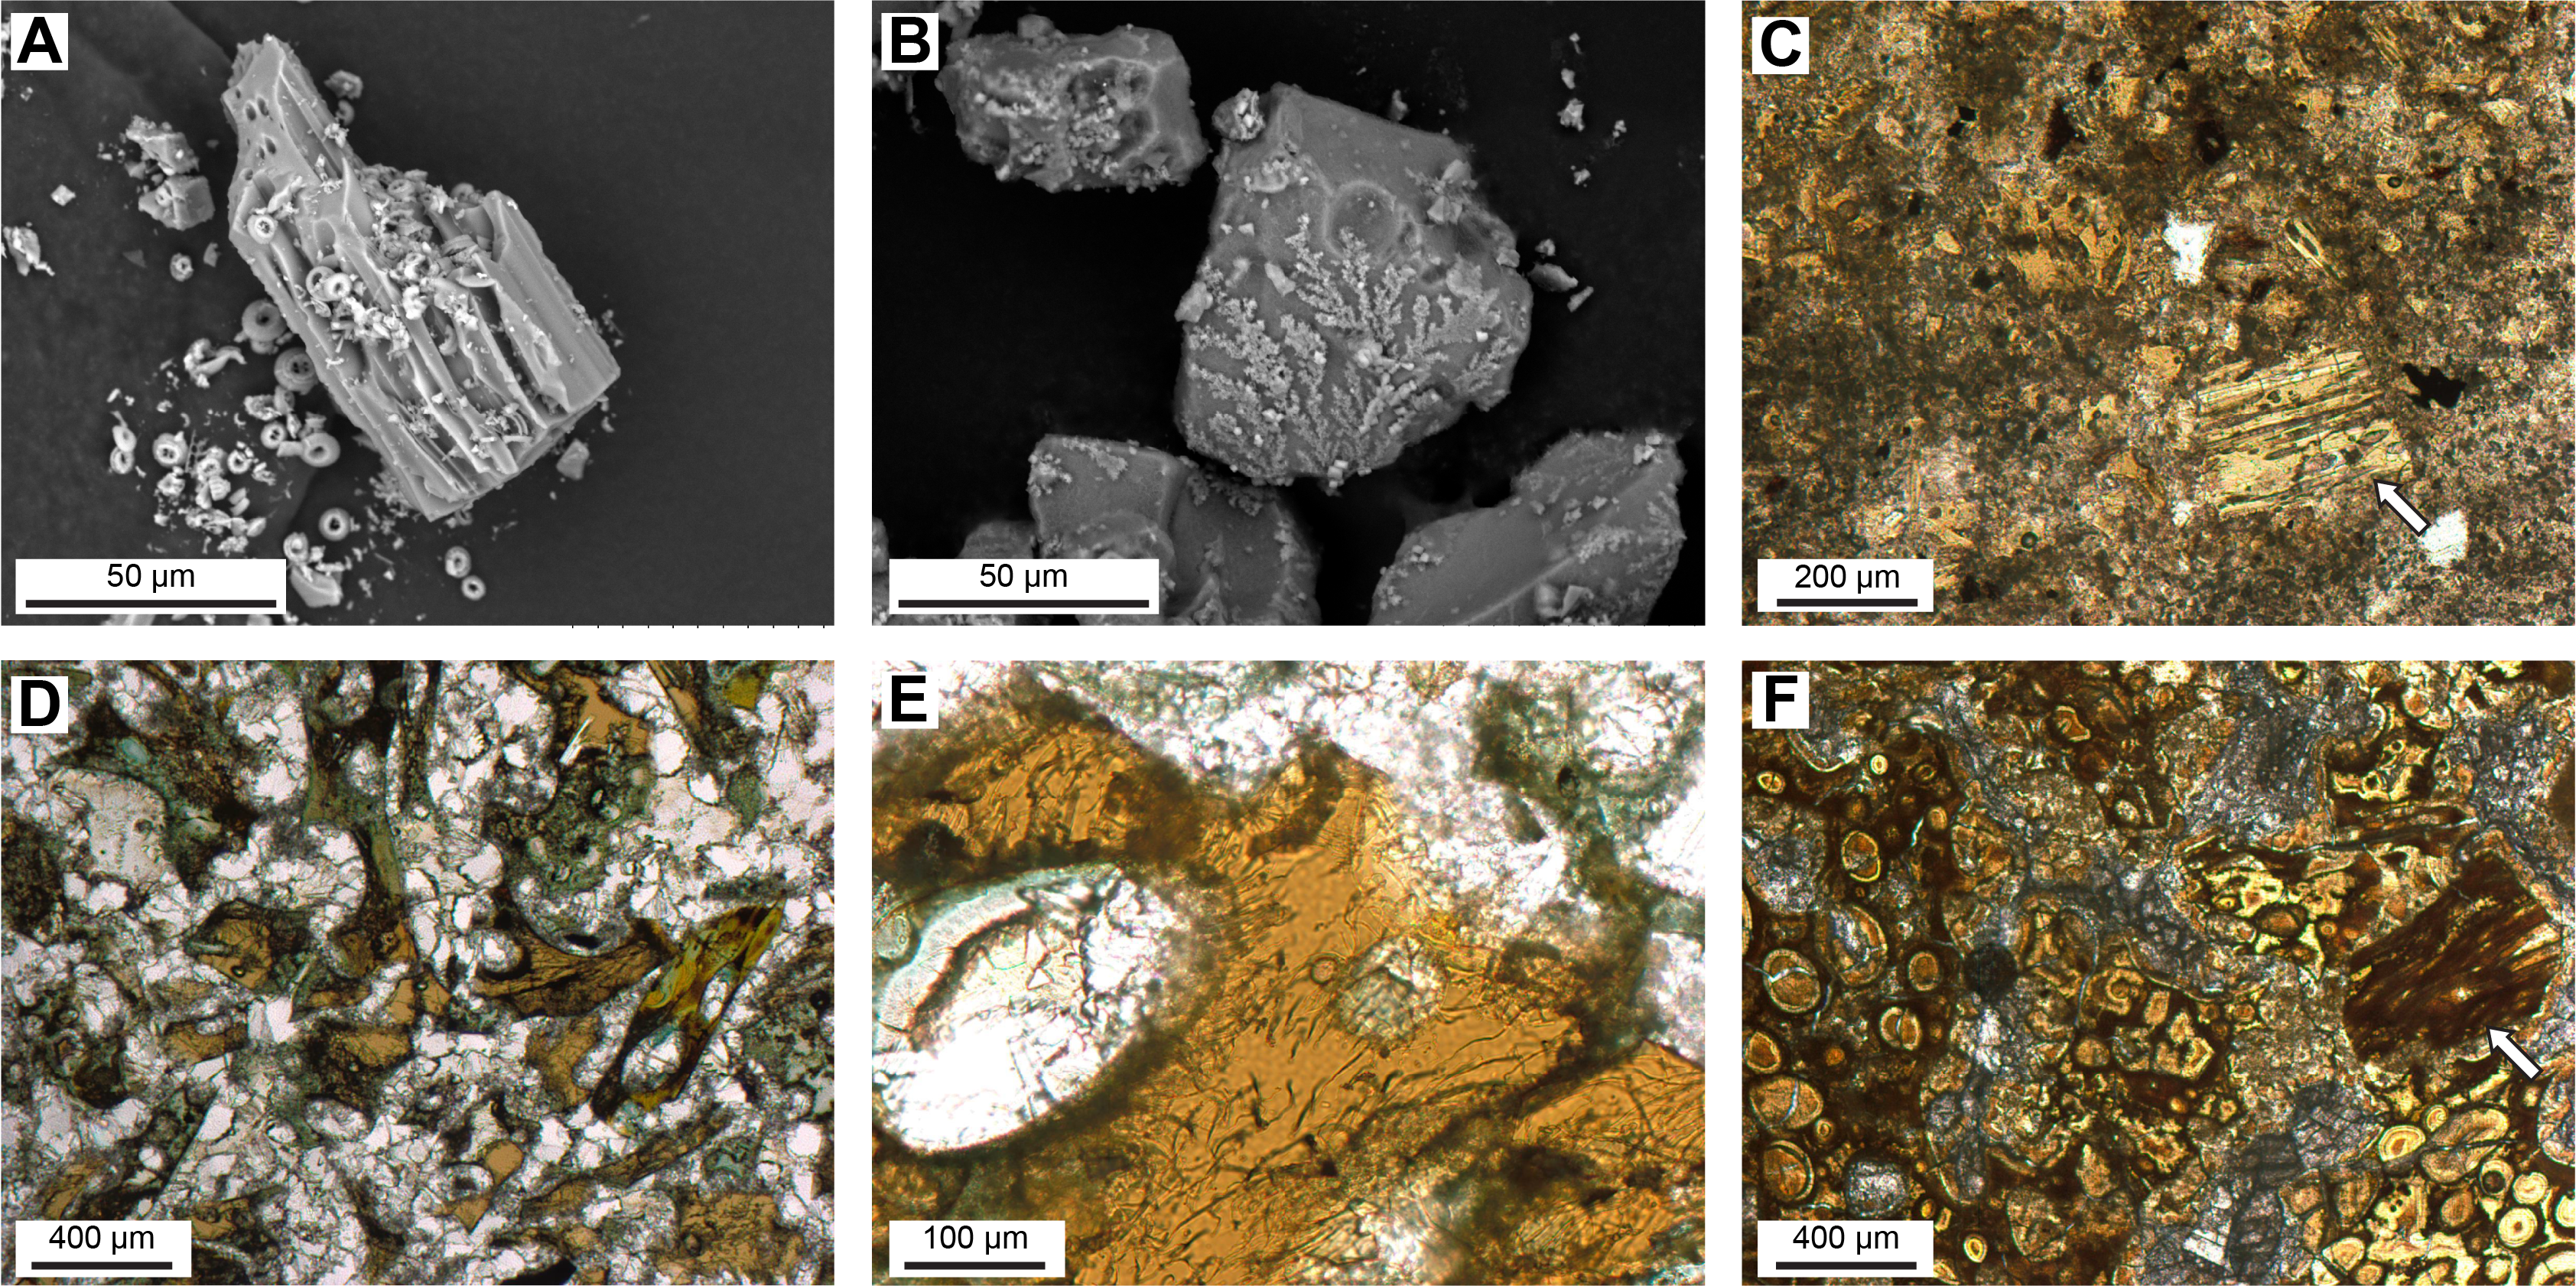
Figure F12. Volcanic glass.
The foraminifera and nannofossil biostratigraphy of the ooze/chalk indicate that Subunit IIA deposition primarily occurred during the Paleocene (see Biostratigraphy). However, in contrast to similar age deposits at Sites U1576 and U1577, lithologic observations at Site U1578 do not reveal any cyclic sedimentation during this period. Rather, there is a uniformity to the sediment and a gradual change to more clayey and darker chalk marking the transition toward Subunit IIB. The lower boundary of Subunit IIA was difficult to identify due to poor recovery. It is defined as the top of Core 391-U1578A-15R-1, where NGR values make a distinctive step increase downhole (see Physical properties).
3.1.2.2. Subunit IIB
- Interval: 391-U1578A-15R-1, 0 cm, to 20R-1, 46 cm
- Depth: 135.20–184.26 mbsf
- Age: Paleocene (~61–62 Ma)
Subunit IIB is a ~49 m thick succession of moderately to strongly bioturbated light gray to greenish gray clayey nannofossil chalk that is very similar to Lithofacies 1 in Subunit IIA (Figures F9B, F11C) and also records pelagic sedimentation on the flank of the drilled seamount. Foraminifera are small and scarce in the lower part of this unit (see Biostratigraphy). Subunit IIB is readily differentiated from the overlying units by its overall darker color and higher clay content, which is consistent with distinctively lower CaCO3 content of the chalk (42–56 wt%; n = 3) (see Sediment geochemistry).
Subunit IIB also includes minor gray volcaniclastic beds that are similar to Lithofacies 2 in Subunit IIA. However, volcaniclastic deposits in Subunit IIB additionally include dark olive-green to black coarse vitric tuffs and/or sandstones. These are relatively scarce in the upper part of the unit, but they increase in prominence and abundance from Section 391-U1578A-18R-3 to the top of the lava stacks in Unit III. These types of deposits are common and well developed in sedimentary intervals in the underlying volcanic basement; they are commonly normally graded and bioturbated (Figure F10B). Parallel laminae, cross-laminae, cross-bedding, and centimeter-sized stacks of graded sandy silty layers become more common toward the base of the unit, providing compelling evidence for reworking of most of these volcaniclastic materials by turbidity and/or bottom currents. Microscope and SEM observations indicate that the dark volcaniclastic deposits are dominated by angular vitric components with minor feldspars and rare dispersed foraminifera and nannofossils. Volcanic glass is only occasionally fresh, and when it is, it is typically dark brown. The vitric clasts are generally very vesicular (scoriaceous), with variable flattening of the vesicles and pervasive, albeit not necessarily abundant, occurrence of pumiceous textures (Figure F12B, F12C). These types of material may be indicative of explosive volcanism in shallow marine or subaerial environments with limited syn- and/or postvolcanic reworking by density currents; they do not display unusually elevated NGR, but they do show increased MS, which is consistent with a more mafic composition (see Physical properties).
The lower boundary of Subunit IIA is marked by the first downhole appearance of lavas in Unit III. The lowermost ~50 cm of recovered sediments above this volcanic basement were affected by oxidative alteration and associated formation of Mn dendrites (Figure F9C).
3.1.3. Unit III (volcanic basement)
The boundary between Unit III and the overlying sedimentary succession is placed at the top of the first igneous unit. The start of the igneous succession in Hole U1578A is an altered sheet lava flow immediately underlain by an alternating sequence of pillow lavas and sheet flows (Igneous Subunits 1a–1c); the igneous succession ends in a continuous thick stack (>67 m) of pillow lavas (Igneous Subunits 12a and 12b) (see Igneous petrology and volcanology). The contact between the lowermost sedimentary rocks of Lithostratigraphic Unit II and Igneous Subunit 1a is not recovered, and the top of this sheet flow consists of a thin chilled layer with a palagonized glass surface. The overlying recovered sediments are sand-sized vitric volcaniclastic deposits with complex alteration banding. Paleomagnetic analysis indicates that Chrons 27n and 27r are missing between the basalts and volcaniclastic deposits, presenting the possibility of a ~1 My unconformity between the lowest sediments of Lithostratigraphic Unit II and the top of the first sheet flow of Unit III (see Paleomagnetism). A total of 10 sedimentary interbeds ranging <0.5 to >10 m thick are recognized in Unit III and were dated as early Paleocene (Danian) downhole to Section 31R-5, 49 cm (i.e., Sedimentary Interbeds S1–S5) (see Biostratigraphy). Volcanic and petrographic details of the intervening igneous intervals are described in Igneous petrology and volcanology. The nature of the interbeds is typically defined by two major lithofacies similar to those described for Unit II. These interbeds represent the only sediments that host structural features in the overall sedimentary succession at Site U1577. Tilted bedding and sharp contacts as well as cross-beddings can often be observed (Figure F13). Their apparent dip angles range 0° to around 30°.

Figure F13. Sedimentary contacts and beddings.
3.1.3.1. Sedimentary Interbed S1
- Interval: 391-U1578A-22R-5, 28 cm, to 23R-2, 144 cm
- Depth: 198.94–206.10 mbsf
- Age: early Paleocene (~63.25–65.5 Ma)
Sedimentary Interbed S1 is a ~7 m thick succession of volcaniclastic deposits (Lithofacies 2) capped by a >22 cm thick interval of bioturbated clayey nannofossil chalk (Lithofacies 1). The volcaniclastic deposits are predominantly composed of coarse sand– to silt-sized highly vesicular vitric fragments that are typically (but not entirely) altered. Sections 391-U1578A-22R-5 through 23R-2 preserve a large diversity of sedimentary structures typical of a turbidite sequence, including convolute bedding, flame and other load structures, cross- and parallel laminae, cross-bedding, and normal grading. Although this interval is most likely predominantly composed of epiclastic and/or volcanogenic turbidites, thin intervals of finer volcaniclastic material may also represent tuffs. Interbed S1 is dark greenish gray to black and becomes pale brown to reddish brown in the uppermost ~0.5 m (Section 22R-5), where it underwent oxidation and bleaching below a thick massive lava flow. The interbed overlies a peperitic interval in the underlying igneous unit, where thin sheets/intrusions of basalt are mingled with a grain-supported polymictic volcanic microbreccia (Figure F14A) that caps the underlying pillow lava interval.
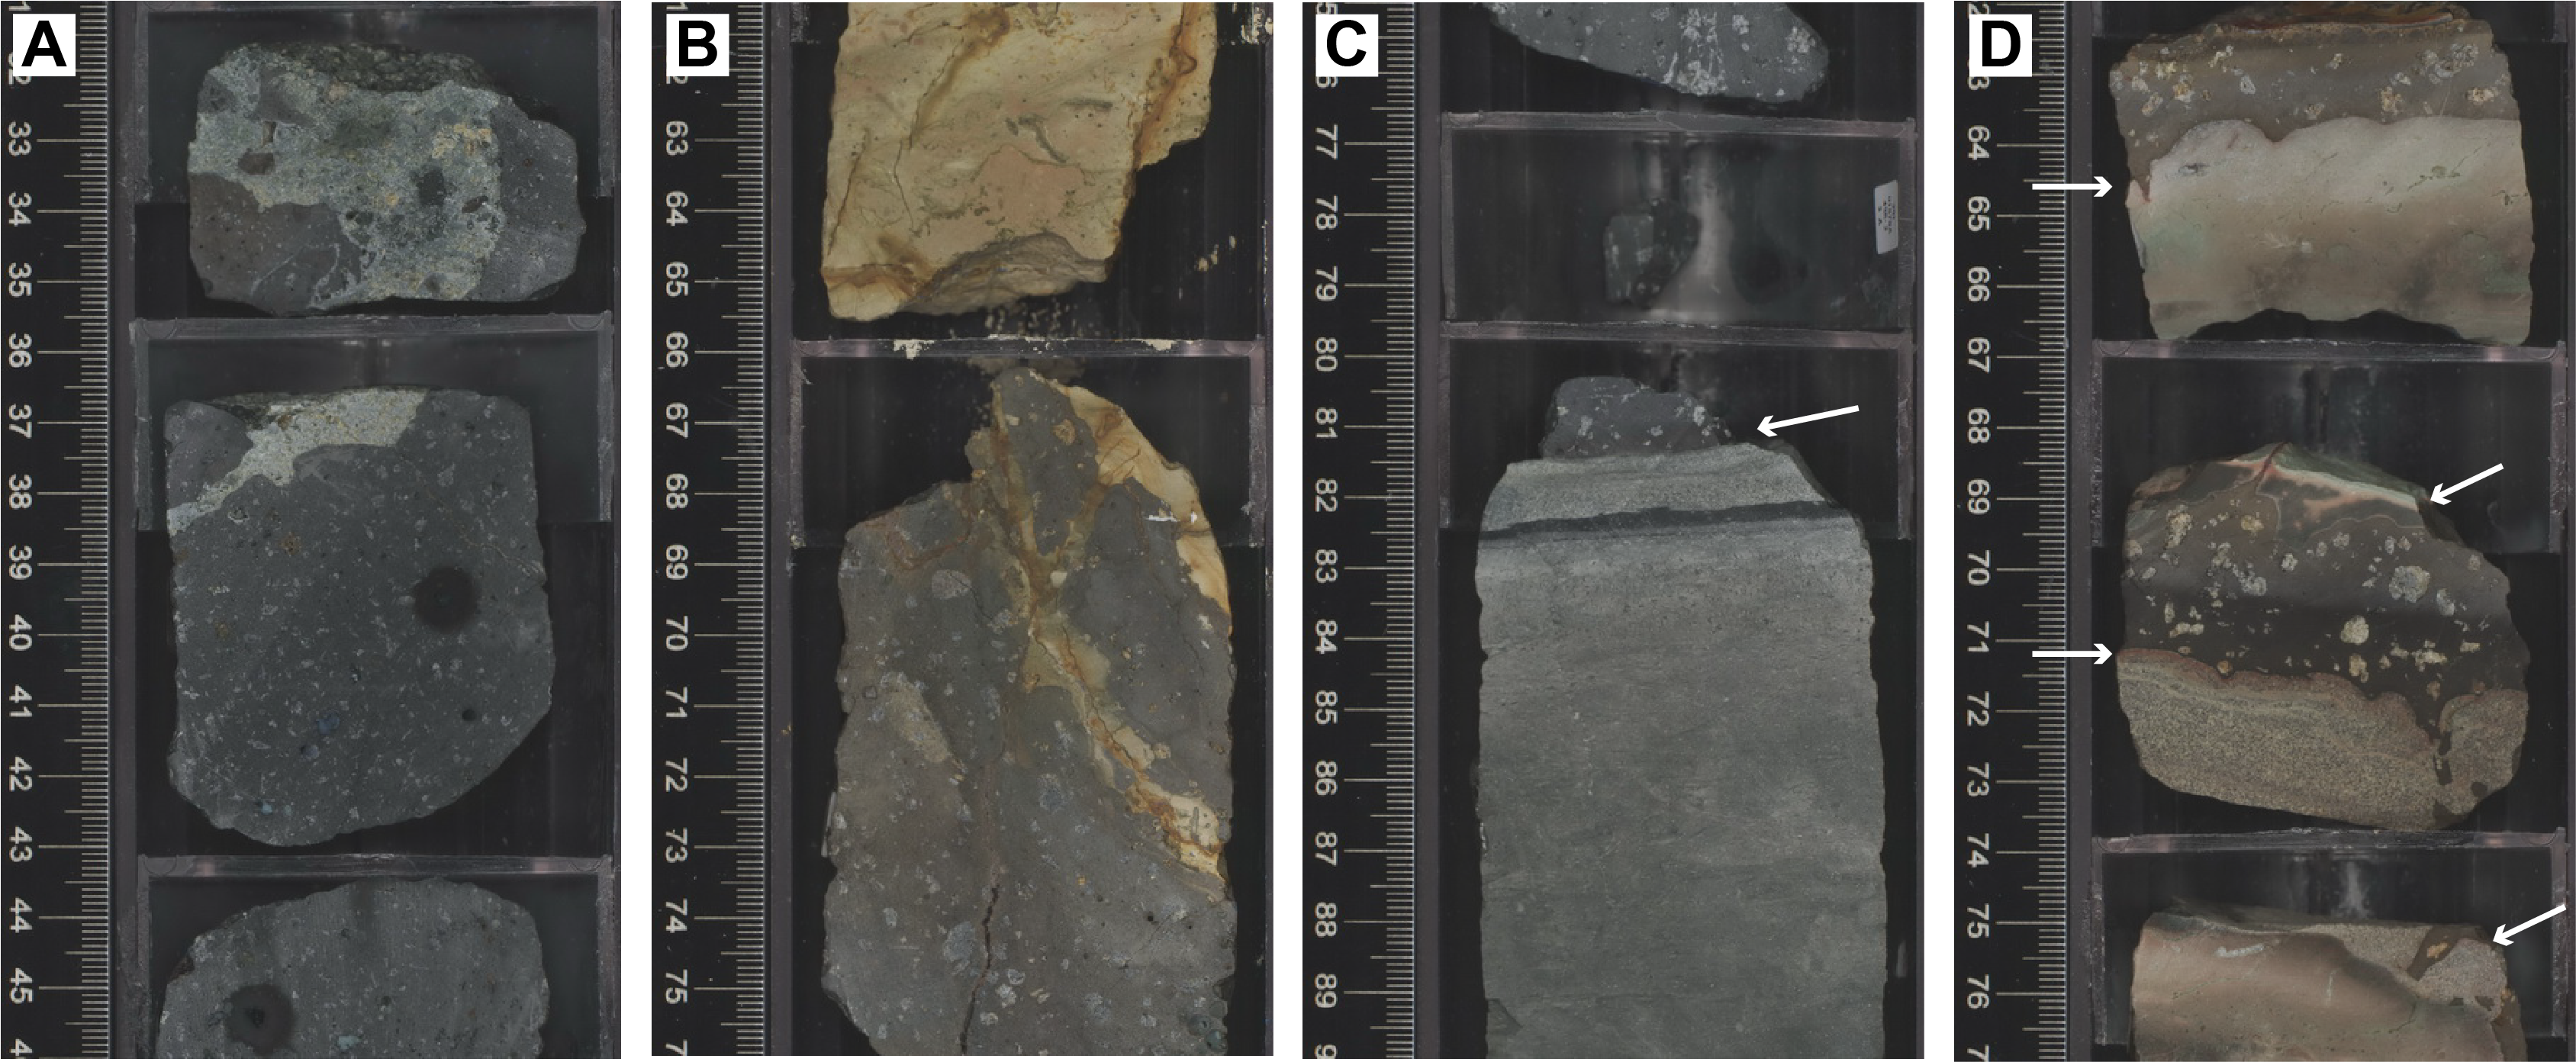
Figure F14. Sediment/lava interaction.
Significantly, Interbed S1 includes a vitric turbidite with rare rounded fragments of a red alga, shells, bryozoans, echinoderms, an aggregate of crustacean microcoprolites, basalts, and glass with feldspar (Sample 391-U1578A-22R-5, 103–106 cm) (Figure F15). These clasts are clear evidence for reworking of biogenic and volcanic components from the shelf of a volcanic island or volcanic shoal; this represents the only unequivocal, direct evidence found thus far in the drilled seamount for a shallow-water or island stage in its evolution.
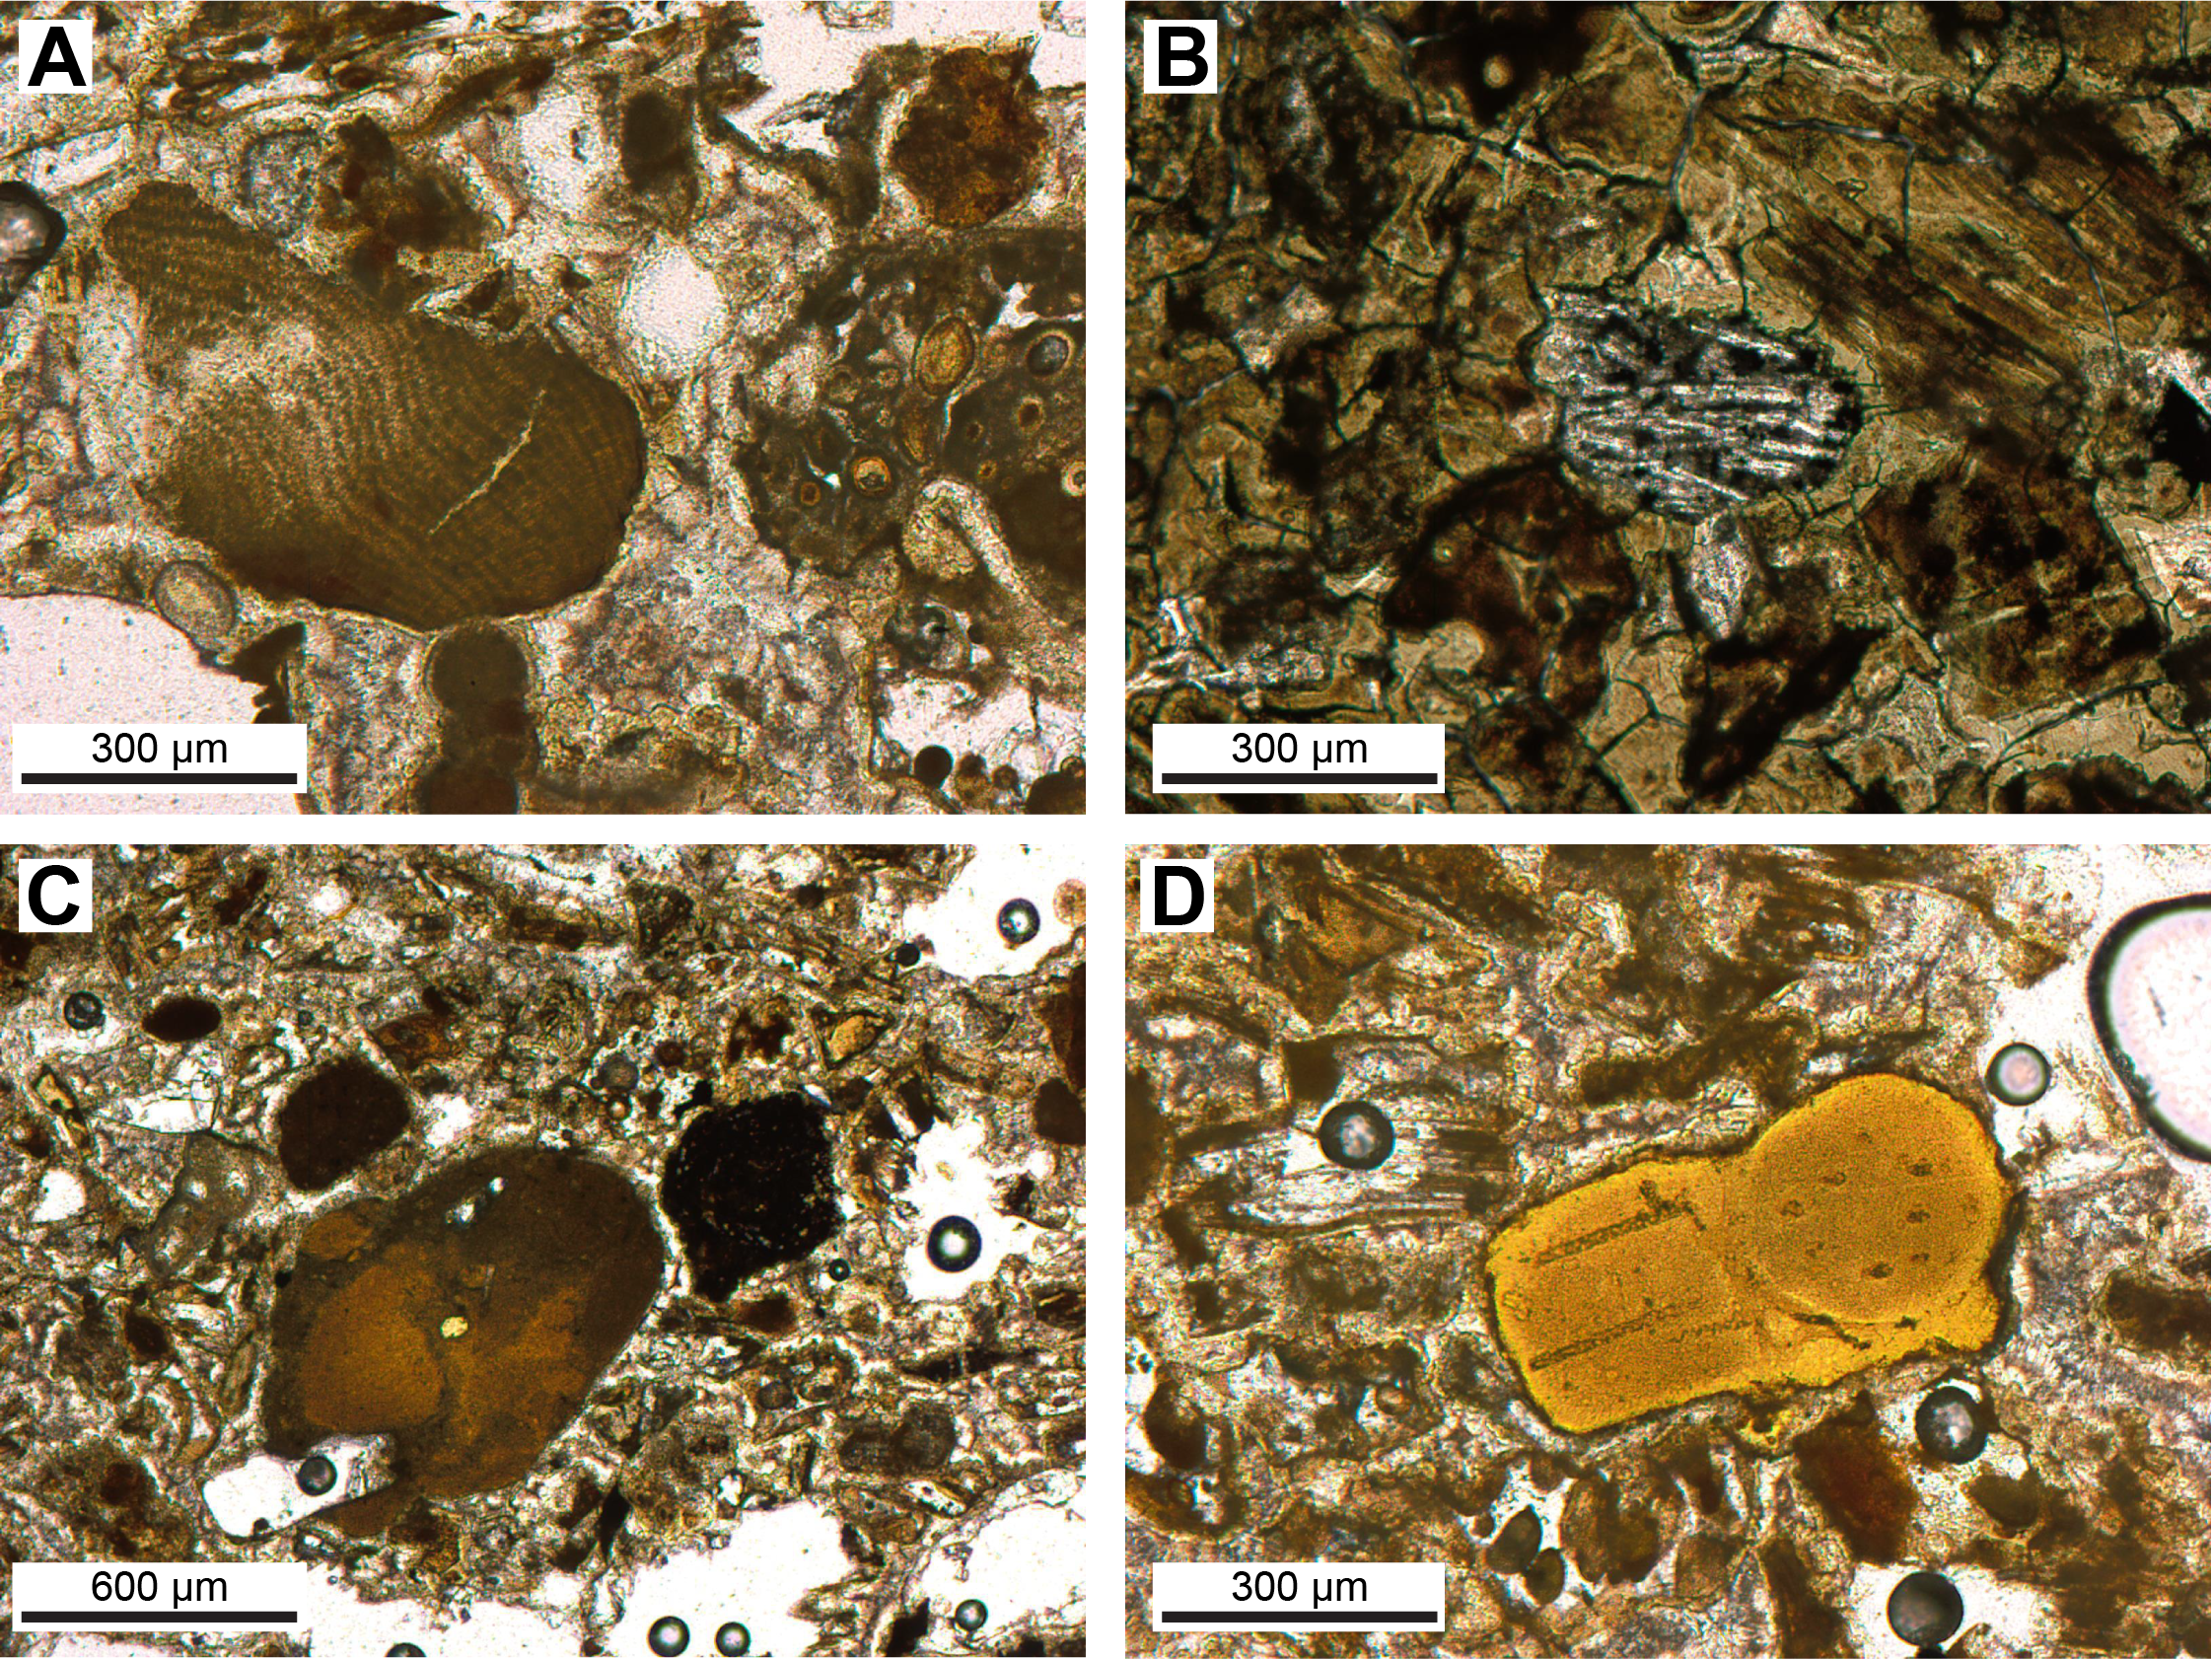
Figure F15. Sedimentary interbed.
3.1.3.2. Sedimentary Interbed S2
- Interval: 391-U1578A-24R-1, 0 cm, to 24R-1, 94 cm
- Depth: 213.00–213.94 mbsf
- Age: early Paleocene (~63.25–65.5 Ma)
Sedimentary Interbed S2 is composed of bioturbated clayey nannofossil chalk (Lithofacies 1) with subordinate laminated to cross-laminated vitric sandstone (Lithofacies 2) and sediment dikes. The recovered thickness of the sedimentary interbed is 94 cm; however, due to incomplete recovery in the overlying unit, its true thickness may extend to ~6 m (i.e., to the base of the overlying lava at 207.70 mbsf). The sediment in the interbed is pale brown, probably due to low-temperature oxidative alteration from the overlying pillow lavas. Given that this is an interval of pelagic sediment, its occurrence likely marks a relatively long volcanic lull in this part of the upper volcanic basement.
3.1.3.3. Sedimentary Interbed S3
Sedimentary Interbed S3 is a ~9 m thick succession mostly composed of dark greenish gray to black massive, graded, and layered coarse sand– to granule-sized volcaniclastic deposits (Lithofacies 2). The clasts are mostly composed of highly vesicular, fresh to altered volcanic glass (Figure F12D) with minor dark rip-up clasts of volcaniclastic claystone/siltstone and only exceptional nonvesicular blocky glass shards. Microbial tubules can locally be seen in the fresh glass (Figure F12E). The absence of basalt clasts and a geochemical composition distinct from the lavas below and above the sedimentary interbed (Table T7) do not support formation of these deposits by fragmentation of proximal lavas (i.e., hyaloclastite). Instead, they may represent debris flows or high-density turbidity currents originating from explosive submarine volcanism farther upslope or postvolcanic (epiclastic) reworking of explosive eruption products. The uppermost part of the sedimentary interbed includes 8 cm of bioturbated clayey nannofossil chalk with volcaniclasts (Lithofacies 1).
3.1.3.4. Sedimentary Interbed S4
- Interval: 391-U1578A-26R-1, 73–121 cm
- Depth: 233.13–233.61 mbsf
- Age: early Paleocene (~63.25–65.5 Ma)
Sedimentary Interbed S4 is a ~0.5 m thick succession of vitric sandstone (Lithofacies 2) similar to the volcaniclastic deposits in Interbed S3. It includes a distinctive spotted fabric resulting from patchy alteration and cementation by zeolite and calcite.
3.1.3.5. Sedimentary Interbed S5
- Interval: 391-U1578A-30R-1, 54 cm, to 31R-5, 49 cm
- Depth: 257.14–267.33 mbsf
- Age: early Paleocene (~63.25–65.5 Ma)
Sedimentary Interbed S5 is a ~10 m thick interval of interbedded bioturbated clayey nannofossil chalk (Lithofacies 1) and vitric sandstone to siltstone (Lithofacies 2) that occur in approximately equal proportions and are similar to sedimentary rocks found in Interbeds S1–S4. The volcaniclastic deposits contain a mixture of fine, dark silty layers and fine to medium sandy layers that typically grade upward into the very fine, homogeneous, dark green unbioturbated siltstone. The bases of these repeated intervals include cross-bedding in the basal sandy layers and erosive bases and/or sediment mingling and dewatering/flame structures and were likely emplaced as volcaniclastic turbidites. Similar to previous sedimentary interbeds, the coarser volcaniclasts are composed of fresh to altered highly vesicular glass (Figure F12F). The finer sediment was also sometimes mixed with sandy intervals to form diffuse convolute structures, or, where more lithified, it was incorporated as rip-up clasts within structureless sandy intervals (Figure F10C). Convolute bedding is also common below the ~15 m thick overlying massive flow (Igneous Unit 6). Disturbance and discoloration in the upper ~1 m of the turbidite succession upon which it was emplaced is probably the result of initial mechanical loading and then longer term hydrothermal interaction and exchange within the substrate of Interbed S5 during a protracted cooling period. A narrow chilled margin at the base of the flow is associated with a discolored sandstone with a distinctive patchy fabric resulting from differential alteration of fine and coarse volcanic glass. The base of this interbed (interval 391-U1578A-31R-1, 90 cm, to 31R-5, 50 cm) changes from dark green to a much paler brown; because this change is well below the overlying volcanic unit, it is likely unrelated to associated thermal effects and instead may reflect a more oxygenated depositional environment.
3.1.3.6. Sedimentary Interbed S6
Sedimentary Interbed S6 is a ~2 m thick, poorly recovered assemblage of gray to dark gray turbiditic volcanic silty sandstone beds (Lithofacies 1) and dark bioturbated clayey nannofossil pelagic chalk with volcaniclasts (or tuffaceous chalk; Lithofacies 2). The two facies occur in broadly equal abundance and closely resemble sedimentary deposits of overlying interbeds in terms of composition and sedimentary structures. The contact with the overlying (~9 m thick) massive lava unit (Igneous Unit 7) was not recovered. Interbed S6 lies stratigraphically above a thick pillow stack (Igneous Subunit 8a).
3.1.3.7. Sedimentary Interbed S7
Sedimentary Interbed S7 is a <1 m thick pale brown dominantly clayey nannofossil chalk with volcaniclasts (Lithofacies 1) and minor intercalations of layered to graded brown volcanic sandstone (Lithofacies 2). Glass shards in the volcaniclastic deposits are pervasively altered. Their morphology is distinct from that of shards in the upper part of the volcanic basement, with predominantly nonvesicular blocky and angular textures. This probably reflects reworking of quenched margins of lavas by spalling off during extrusion or postvolcanic (epiclastic) reworking of hyaloclastites.
The entire interbed is bleached, and the uppermost 40 cm of the bedding shows evidence of disturbance and/or erosive bases to the sandstone units. Disturbance and bleaching are likely caused by initial emplacement of the overlying pillow lava stack (Igneous Subunit 8b) over this sedimentary layer; the basal contact was not recovered. The contact at the base of Interbed S7 with the underlying sheet flow (Igneous Subunit 9a) was poorly recovered, but the top of this flow is fractured (likely cooling fractures), which has allowed ingress of the overlying pelagic sediment (Figure F14B).
3.1.3.8. Sedimentary Interbed S8
Sedimentary Interbed S8 is ~6 m thick and consists of an alternating succession of Lithofacies 1 and 2. Most of the series is volcaniclastic turbidites that typically grade upward from sandstone into a homogeneous dark green unbioturbated siltstone (Lithofacies 2) with only minor intervals of background pelagic sedimentation associated with deposition of a dark greenish gray bioturbated chalk (Lithofacies 1). The uppermost package of Interbed S8 occurs below a >7 m thick massive flow (Igneous Subunit 9c). The basal igneous/sedimentary contact of the flow was recovered and reveals a narrow (<5 mm) chill zone and no glass (Figure F14C). The sedimentary rock immediately below the flow is volcanic sandstone to siltstone (turbidites) and bioturbated chalk, which have been hydrothermally bleached; microfractures caused by the emplacement of the flow are evident in the turbiditic materials (interval 391-U1578A-49R-4, 12–18 cm), indicating these were lithified/consolidated prior to loading. Additional intervals of pelagic dark gray chalk sedimentation occur at the base of Interbed S8 below Section 49R-5, 107 cm (Figure F9D).
Intricately detailed sedimentary structures typical of low- to high-density turbidity currents are remarkably well preserved in Lithofacies 2 of Interbed S8 (Figure F10D). These include fining-upward features, parallel to cross-laminae, ripple cross-bedding (including climbing ripples), erosive features, and sediment mingling and dewatering/flame structures in the basal sandy layers. Within these sandy layers, it is evident that the very homogeneous silt of preceding turbidites did not achieve lithification before deposition of the subsequent turbidite package. Cross-bedding direction in core sections undisturbed by drilling indicates a different direction of transport, possibly reflecting different geographic sources. As with younger Interbed S7, the volcaniclasts of Interbed S7 are composed of typically altered, nonvesicular blocky angular shards. The turbidites also include black, rounded sandy grains locally concentrated in the laminae of the sandstone; these are possibly of fresh glass, basalt, or ripped-up siltstone, but they require conclusive identification. Using binocular observations of the section halves, rare sand-sized bioclasts of possible echinoderms, bryozoans, and shells were also observed in some turbidites (e.g., Section 391-U1578A-49R-5). Because thin sections were not available, further identification of this fossil debris and grain composition await postexpedition investigation.
3.1.3.9. Sedimentary Interbed S9
Sedimentary Interbed S9 is an approximately >0.5 m thick sequence of oxidized pelagic sediment (bioturbated clayey nannofossil chalk; Lithofacies 1) and is intercalated with the top of a thick pillow lava stack (Igneous Unit 11). Neither the upper contact with Igneous Unit 10 nor the lower contact with Igneous Unit 11 was recovered.
3.1.3.10. Sedimentary Interbed S10
Sedimentary Interbed S10 is an approximately >0.6 m thick succession of bioturbated clayey nannofossil chalk (Lithofacies 1) with a 2 cm thick interval of poorly sorted coarse volcanic sandstone to microbreccia (Lithofacies 2). Pale brown and orange coloration of this interbed suggests low-temperature hydrothermal alteration of the sedimentary rocks between the lava stacks above and below. The volcaniclastic layer within the chalk includes altered nonvesicular blocky glass shards derived from spalled lava (probably pillow) margins. The basal 20 cm of the interbed displays inclined layering, which may be a response to draping over the surface of the underlying pillow lava stack (Igneous Subunit 12a). The interbed lies beneath a lava stack that includes intricate fluidal interactions of pillow lava with soft sediment in Lithofacies 1 and 2 (Igneous Unit 11; intervals 391-U1578A-51R-1, 45 cm, to 51R-2, 134 cm, and 52R-2, 26–120 cm). Accordingly, this stack hosts remarkable examples of peperites and inclusions of pelagic sediment in the interstices between pillow lavas (Figure F14D). Interbed S10 is the last sediment interval recovered at Site U1578. Only thin intervals of altered hyaloclastite (i.e., primary volcaniclastic deposits) were found between pillow lavas in Cores 59R and 65R.
4. Igneous petrology and volcanology
Igneous rocks were recovered from Hole U1578A, which penetrated 302.14 m of igneous basement (interval 391-U1578A-20R-1, 46 cm, to the bottom of the hole at 486.4 mbsf) and recovered 181.26 m (59.9%). The igneous basement at Site U1578 represents Lithostratigraphic Unit III in the overall subseafloor succession (see Lithostratigraphy). Hole U1578A terminates in a pillow lava unit with a minimum thickness of 67 m.
4.1. Igneous unit descriptions, Hole U1578A
A total of 12 igneous units were identified in Hole U1578A (Figure F16). The units comprise pillow and lobate flows, sheet flows, and a massive flow with interbedded sediments. Because of low recovery in some key transitional intervals (e.g., massive basalt flows or pillow basalt flows to interlayer sediment), we report both drilled thickness (depth of drill bit advancement) and recovered thickness (length of core recovered) to be transparent regarding the confidence of the reported thicknesses. The changing eruptive style, changes in chemistry, and pelagic sedimentary interbeds suggest episodic volcanic activity.
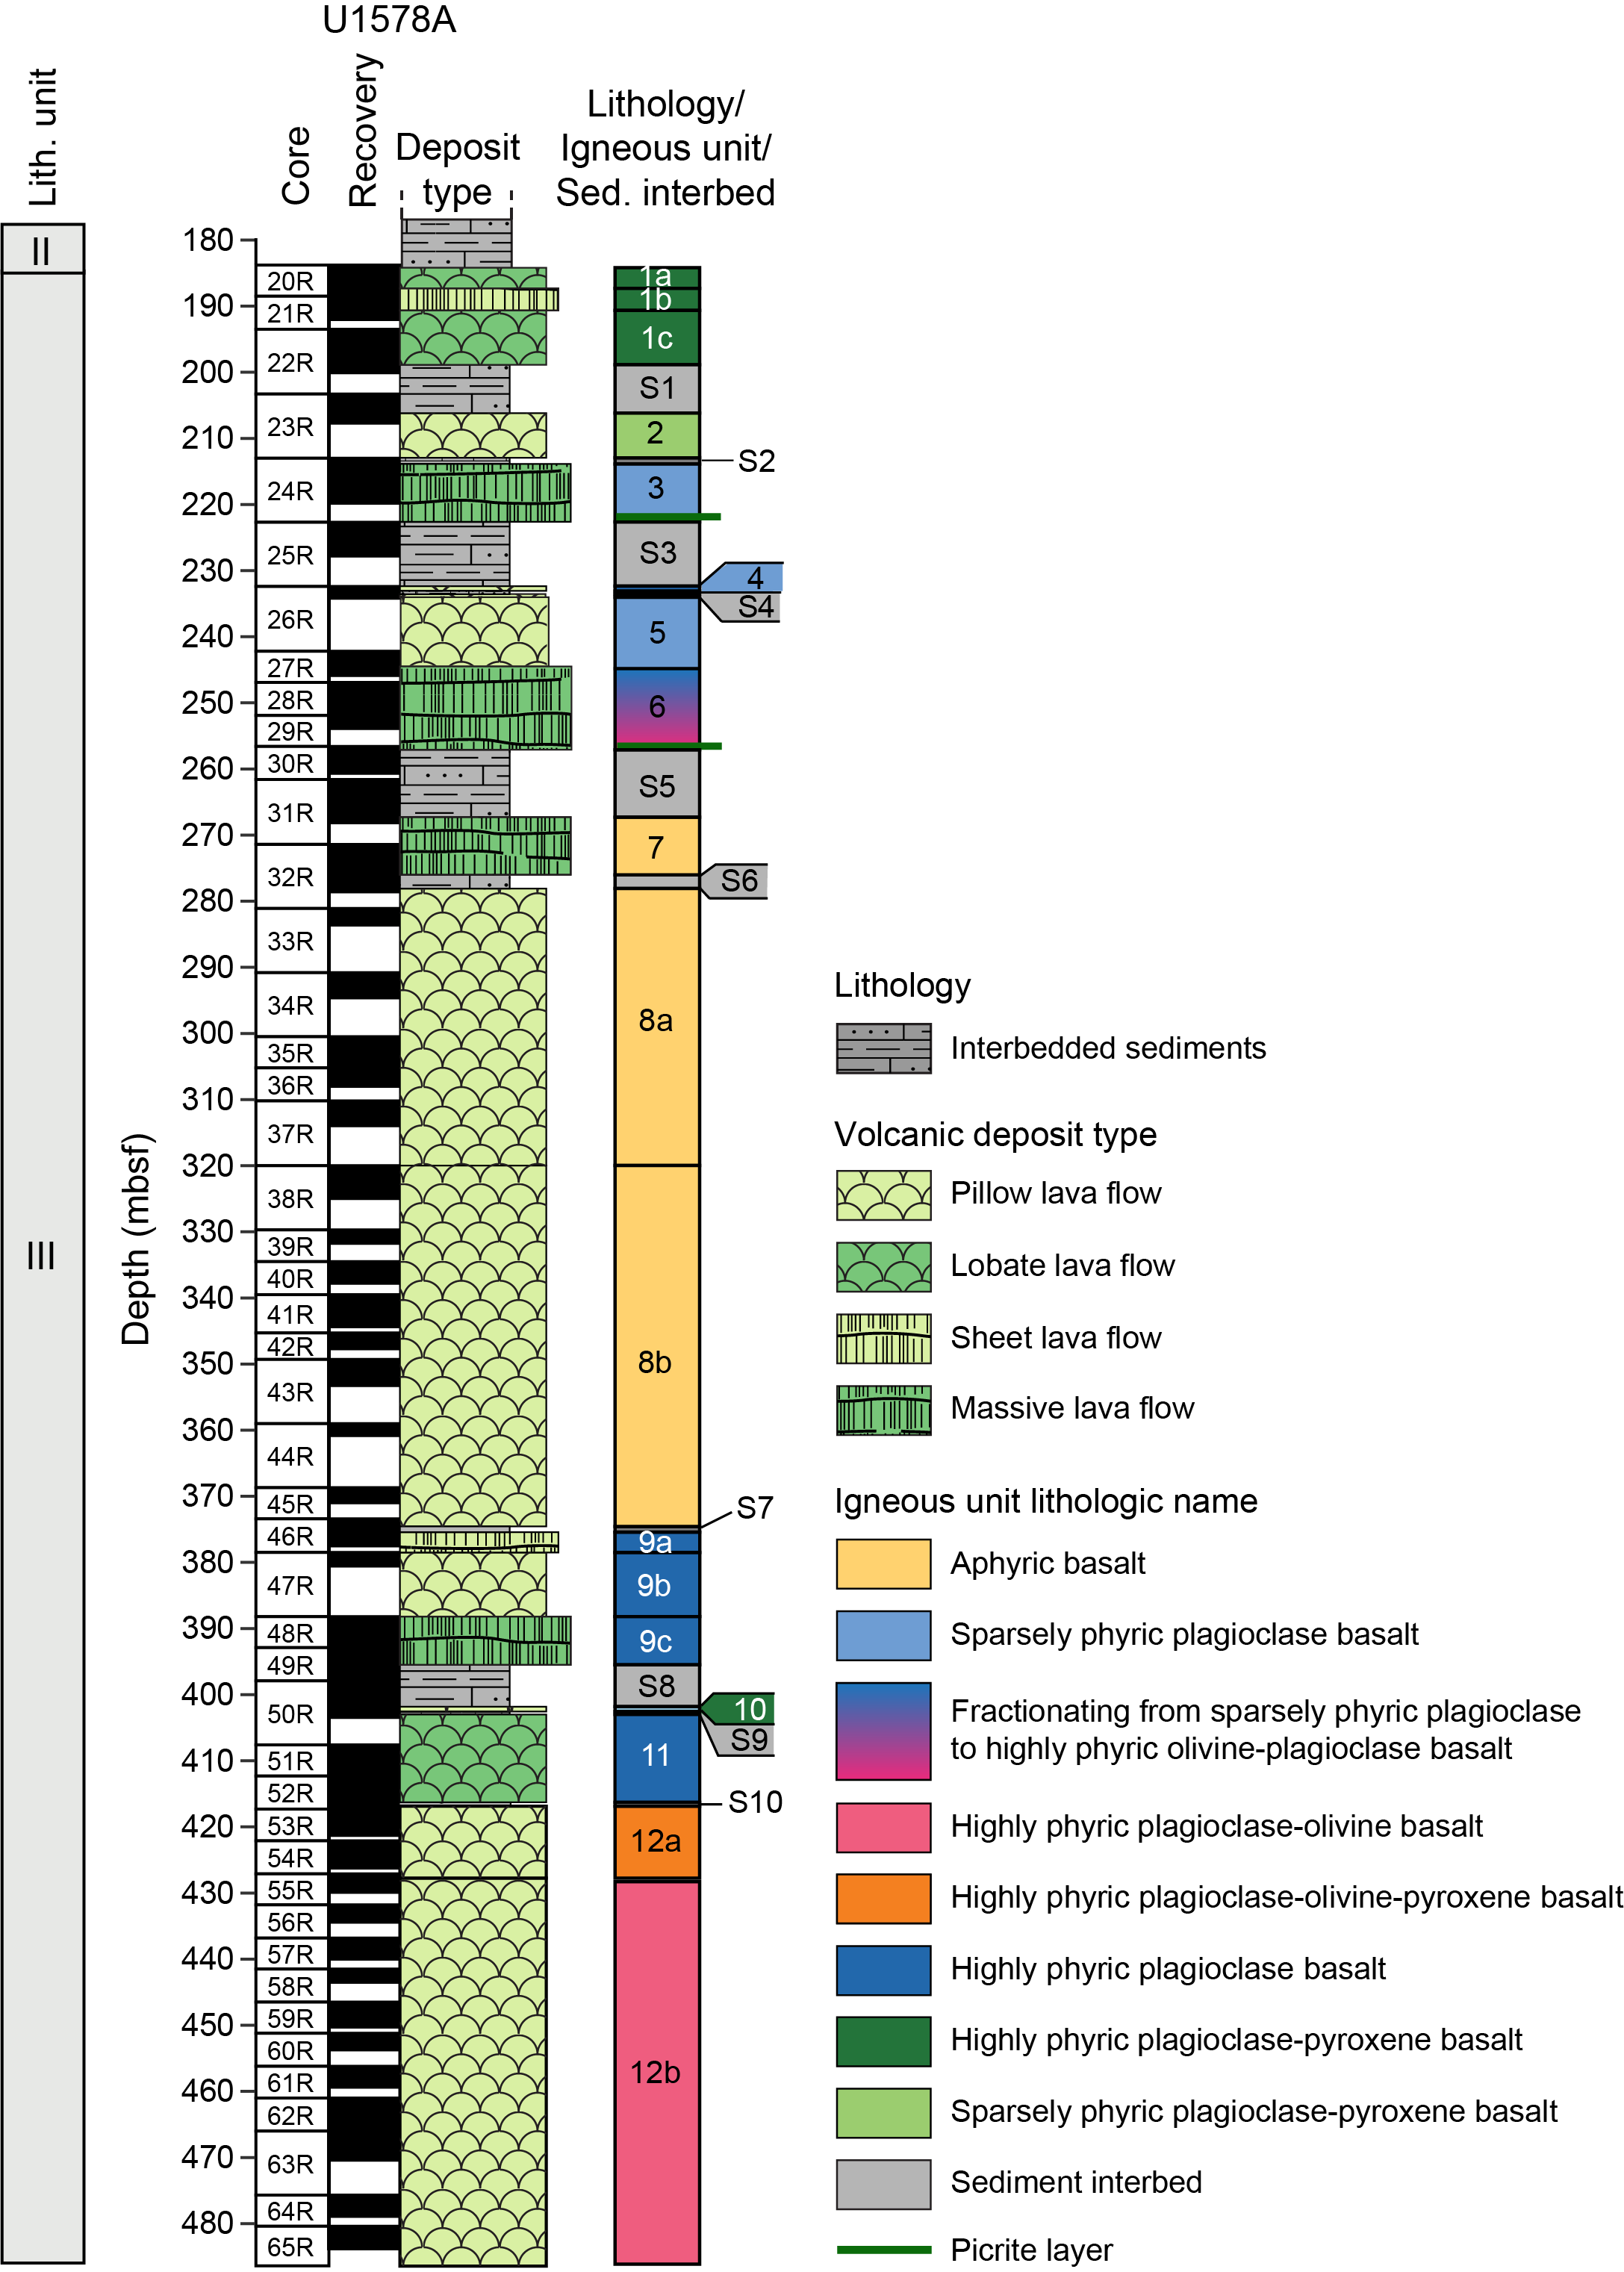
Figure F16. Stratigraphic column.
Geochemical monitoring using the portable X-ray fluorescence (pXRF) spectrometer shows that lavas in the upper and lower portions of Hole U1578A have TiO2 contents similar to high-TiO2 lavas at Sites U1575–U1577. However, the middle portion (interval 391-U1578A-31R-5, 49 cm, to 46R-1, 116 cm; Igneous Units 7 and 8) has higher TiO2 contents than lavas recovered at the previous sites (see Igneous geochemistry). These igneous units are classified as having very high TiO2.
4.1.1. Unit 1
- Interval: 391-U1578A-20R-1, 46 cm, to 22R-5, 28 cm
- Depth: 184.26–198.94 mbsf
- Drilled thickness: 14.68 m
- Recovered thickness: 12.99 m
- Rock type: highly phyric plagioclase-pyroxene basalt
- Deposit: lobate, pillow, and sheet flows
- Chemistry type: high TiO2
Unit 1 consists of subunits of three highly phyric (plagioclase-pyroxene) pillow, lobate, and sheet lava flows. Pillow and lobate flows are highly fragmented but contain glass fragments on intermittent pieces. Many lavas are mildly altered, and dogtooth calcite is often observed filling large vesicles.
4.1.1.1. Subunit 1a
- Interval: 391-U1578A-20R-1, 46 cm, to 20R-3, 73 cm
- Depth: 184.26–187.39 mbsf
- Drilled thickness: 3.13 m
- Recovered thickness: 3.13 m
- Rock type: highly phyric plagioclase-pyroxene basalt
- Deposit: pillow and lobate lava flows
- Chemistry type: high TiO2
Subunit 1a is a series of pillow and lobate basalt flows varying from <1 m (pillow flows) to ≤1.6 m (lobate flows) thick. Glassy and chilled margins are visible on some pieces. Coarse plagioclase phenocrysts (as long as 15 mm) and glomerocrysts dominate the macroscopic texture (12%–15%). Pyroxene phenocrysts are also present (2%–3%), and the groundmass is fine grained with a granular texture. Flows are sparsely to moderately vesicular, with vesicles ranging from round 1–2 mm gas bubbles to subround 20–30 mm long pipe vesicles. Most vesicles are lightly lined with goethite. Some contain dogtooth calcite crystals (up to 5 mm) on top of the goethite.
4.1.1.2. Subunit 1b
- Interval: 391-U1578A-20R-3, 73 cm, to 21R-2, 97 cm
- Depth: 187.39–190.72 mbsf
- Drilled thickness: 3.33 m
- Recovered thickness: 2.90 m
- Rock type: highly phyric plagioclase-pyroxene basalt
- Deposit: sheet lava flow
- Chemistry type: high TiO2
Subunit 1b is a single sheet flow (3.33 m thick) with chilled top and bottom margins; no glass was preserved. Coarse plagioclase phenocrysts (as long as 1.5 cm) and glomerocrysts dominate the macroscopic texture (12%–18%). Pyroxene phenocrysts are also present (2%), and the groundmass is fine grained with a granular texture. Flows are moderately vesicular with two populations of vesicles: small (<1–2 mm) round, ubiquitous vesicles and larger (3–5 mm) tear vesicles with angular, irregular shapes that are sporadic throughout the section. All vesicles are lined (and sometimes filled) with calcite and/or goethite. Some contain up to 0.5 cm dogtooth calcite crystals on top of the goethite.
4.1.1.3. Subunit 1c
- Interval: 391-U1578A-21R-2, 97 cm, to 22R-5, 28 cm
- Depth: 190.72–198.94 mbsf
- Drilled thickness: 8.22 m
- Recovered thickness: 6.76 m
- Rock type: highly phyric plagioclase-pyroxene basalt
- Deposit: pillow and lobate lava flows
- Chemistry type: high TiO2
Subunit 1c is a series of pillow and lobate basalt flows varying from <1 m (pillow flows) to ≤1.25 m (lobate flows) thick. Glassy and chilled margins are visible on some pieces. Groundmass varies from microcrystalline to cryptocrystalline depending on the proximity to a flow boundary. Phenocryst abundances also vary according to proximity to flow boundaries. Coarse plagioclase phenocrysts (up to 1.5 cm in length) and glomerocrysts range 5%–18%, whereas pyroxene phenocrysts vary less dramatically (1%–3%). Flows are sparsely to moderately vesicular, with vesicles ranging from round 1–2 mm gas bubbles to subround 20–30 cm long pipe vesicles. Most vesicles are lightly lined with Fe goethite. Some contain up to 0.5 cm dogtooth calcite crystals on top of the goethite.
4.1.2. Sedimentary Interbed S1
- Interval: 391-U1578A-22R-5, 28 cm, to 23R-2, 144 cm
- Depth: 198.94–206.24 mbsf (7.30 m drilled thickness; 4.09 m recovered thickness)
Sedimentary Interbed S1 is volcanogenic sand and silt.
4.1.3. Igneous Unit 2
- Interval: 391-U1578A-23R-3, 0 cm, to 23R-2, 146 cm
- Depth: 206.24–207.70 mbsf
- Drilled thickness: 6.76 m
- Recovered thickness: 1.46 m
- Rock type: sparsely phyric plagioclase-pyroxene basalt
- Deposit: hyaloclastite and pillow lava flow
- Chemistry type: high TiO2
Unit 2 is a pillow basalt stack with a hyaloclastite flowtop breccia. The hyaloclastite is 0.9 m thick and contains palagonite and small (3–9 cm) pillow fragments. The pillow lava (0.56 m recovered) is moderately phyric with plagioclase (4%) and pyroxene (2%) phenocrysts. The microcrystalline groundmass is sparsely vesicular. Small (1–2 mm) round vesicles are often lined with calcite and a light blue alteration mineral. Larger vesicles (>1 cm) are subrounded and partially to completely filled with secondary mineralization.
4.1.4. Sedimentary Interbed S2
- Interval: 391-U1578A-24R-1, 0 cm, to 24R-1, 94 cm
- Depth: 207.70–213.93 mbsf (0.94 drilled thickness; 0.94 recovered thickness)
Sedimentary Interbed S2 is clayey chalk with subordinate laminated vitric sandstone.
4.1.5. Igneous Unit 3
- Interval: 391-U1578A-24R-1, 94 cm, to 24R-5, 95 cm
- Depth: 213.94–219.82 mbsf
- Drilled thickness: 8.76 m
- Recovered thickness: 5.88 m
- Rock type: sparsely phyric plagioclase basalt with olivine cumulate layer
- Deposit: massive lava flow
- Chemistry type: high TiO2
Unit 3 is a massive lava flow (5.88 m recovered thickness) containing sparse (2%–4%) plagioclase phenocrysts and glomerocrysts in an aphanitic groundmass. Pyroxene (<1%) is also present, but it is rare and often associated with plagioclase glomerocrysts. The microcrystalline groundmass is sparsely vesicular and dominated by small (1–3 mm) round vesicles, some of which are lined with blue clay. Rare larger vesicles (up to 1 cm) are subrounded and lined with clay.
Olivine in the massive lower flow is concentrated in interval 391-U1578A-24R-4, 126–133 cm, with about 3%–5% olivine phenocrysts. Olivine abundance decreases downward through interval 24R-5, 0–95 cm. The zone of maximum accumulation lies about 1 m above the base of the flow, suggesting either a quenched lower margin or flow segregation in the lower 2 m of the flow. Elevated olivine abundance in the lower 1 m of the flow argues against a thick quenched lower margin and requires either flow segregation or accumulation above a quench zone that progressed upward through time as olivine accumulated above it. The olivine in this flow is relatively fresh, in keeping with the overall unaltered aspect of this flow. Some grains have minor serpentine alteration on rims or fractures.
4.1.6. Sedimentary Interbed S3
- Interval: 391-U1578A-25R-1, 0 cm, to 25R-4, 101 cm
- Depth: 222.70–227.79 mbsf (9.70 m drilled thickness; 5.09 m recovered thickness)
Sedimentary Interbed S3 is a volcaniclastic layer that lies below Igneous Unit 3.
4.1.7. Igneous Unit 4
- Interval: 391-U1578A-26R-1, 0 cm, to 26R-1, 73 cm
- Depth: 232.40–233.13 mbsf
- Drilled thickness: 0.73 m
- Recovered thickness: 0.73 m
- Rock type: sparsely phyric plagioclase basalt
- Deposit: pillow lava flow
- Chemistry type: high TiO2
Unit 4 is a thin pillow interbed between two volcanogenic sediment units. It is sparsely porphyritic with tiny plagioclase laths and rare pyroxene. The groundmass is cryptocrystalline near the upper glass contact and microcrystalline toward the interior. The glassy rim consists of 3–4 mm of fresh glass and 2–3 mm of altered glass.
4.1.8. Sedimentary Interbed S4
- Interval: 391-U1578A-26R-1, 73 cm, to 26R-1, 121 cm
- Depth: 233.13–233.61 mbsf (0.48 m drilled; 0.48 m recovered thickness)
Sedimentary Interbed S4 is a vitric sandstone similar to the volcaniclastic deposits in Interbed S3.
4.1.9. Igneous Unit 5
- Interval: 391-U1578A-26R-2, 0 cm, to 26R-2, 56 cm
- Depth: 233.62–242.20 mbsf
- Drilled thickness: 8.59 m
- Recovered thickness: 0.56 m
- Rock type: sparsely phyric plagioclase basalt
- Deposit: pillow lava and hyaloclastite
- Chemistry type: very high TiO2
Unit 5 is a thin pillow flow with associated hyaloclastite that overlies a thick massive flow and underlies volcanogenic sediment. The drilled thickness greatly exceeds the recovered thickness, showing that most of this unit was lost during drilling; much of the lost material may be sediment derived from overlying Sedimentary Interbed S4. The basalt of Unit 5 is sparsely porphyritic with slender euhedral plagioclase laths and rare pyroxene in glomerocrysts with plagioclase. The aphanitic groundmass is microcrystalline.
4.1.10. Unit 6
- Interval: 391-U1578A-27R-1, 0 cm, to 30R-1, 54 cm
- Depth: 242.20–257.14 mbsf
- Drilled thickness: 14.94 m
- Recovered thickness: 11.65 m
- Rock type: moderately phyric plagioclase basalt to highly phyric olivine-plagioclase picrite
- Deposit: massive lava flow
- Chemistry type: high TiO2
Unit 6 is a massive flow (Figure F17) showing significant within-flow crystal fractionation and accumulation from top to bottom. The upper zone is enriched with plagioclase phenocrysts (plagioclase = 5%–7%; pyroxene = 0.5%–1%). Sparse olivine (~1%) appears in the center of the flow (interval 391-U1578A-28R, 0 cm, to 28R-4, 142 cm). Below this, olivine abundance increases rapidly and is concentrated in the lower zone between interval 29R-1, 0 cm, and 30R-1, 54 cm, with up to 25% olivine phenocrysts (interval 30R-1, 6–21 cm); olivine abundance decreases below this interval through interval 30R-1, 21–54 cm. The zone of maximum accumulation lies about 0.3 m above the base of the flow. Plagioclase decreases with increasing olivine, contributing only 2% plagioclase phenocrysts, whereas olivine contributes 25% phenocrysts. Texturally, plagioclase forms tabular phenocrysts and glomerocrysts in a holocrystalline groundmass. In the center of the flow, the groundmass has a distinctive diktytaxitic texture with tiny angular vesicles located between plagioclase laths, which form a trellis-like framework. Pyroxene is rare and often associated with plagioclase glomerocrysts. The olivine in this flow is remarkably fresh, in keeping with the overall unaltered aspect of this flow. Some grains have minor serpentine alteration on rims or fractures, but >90% of the olivine is unaltered.
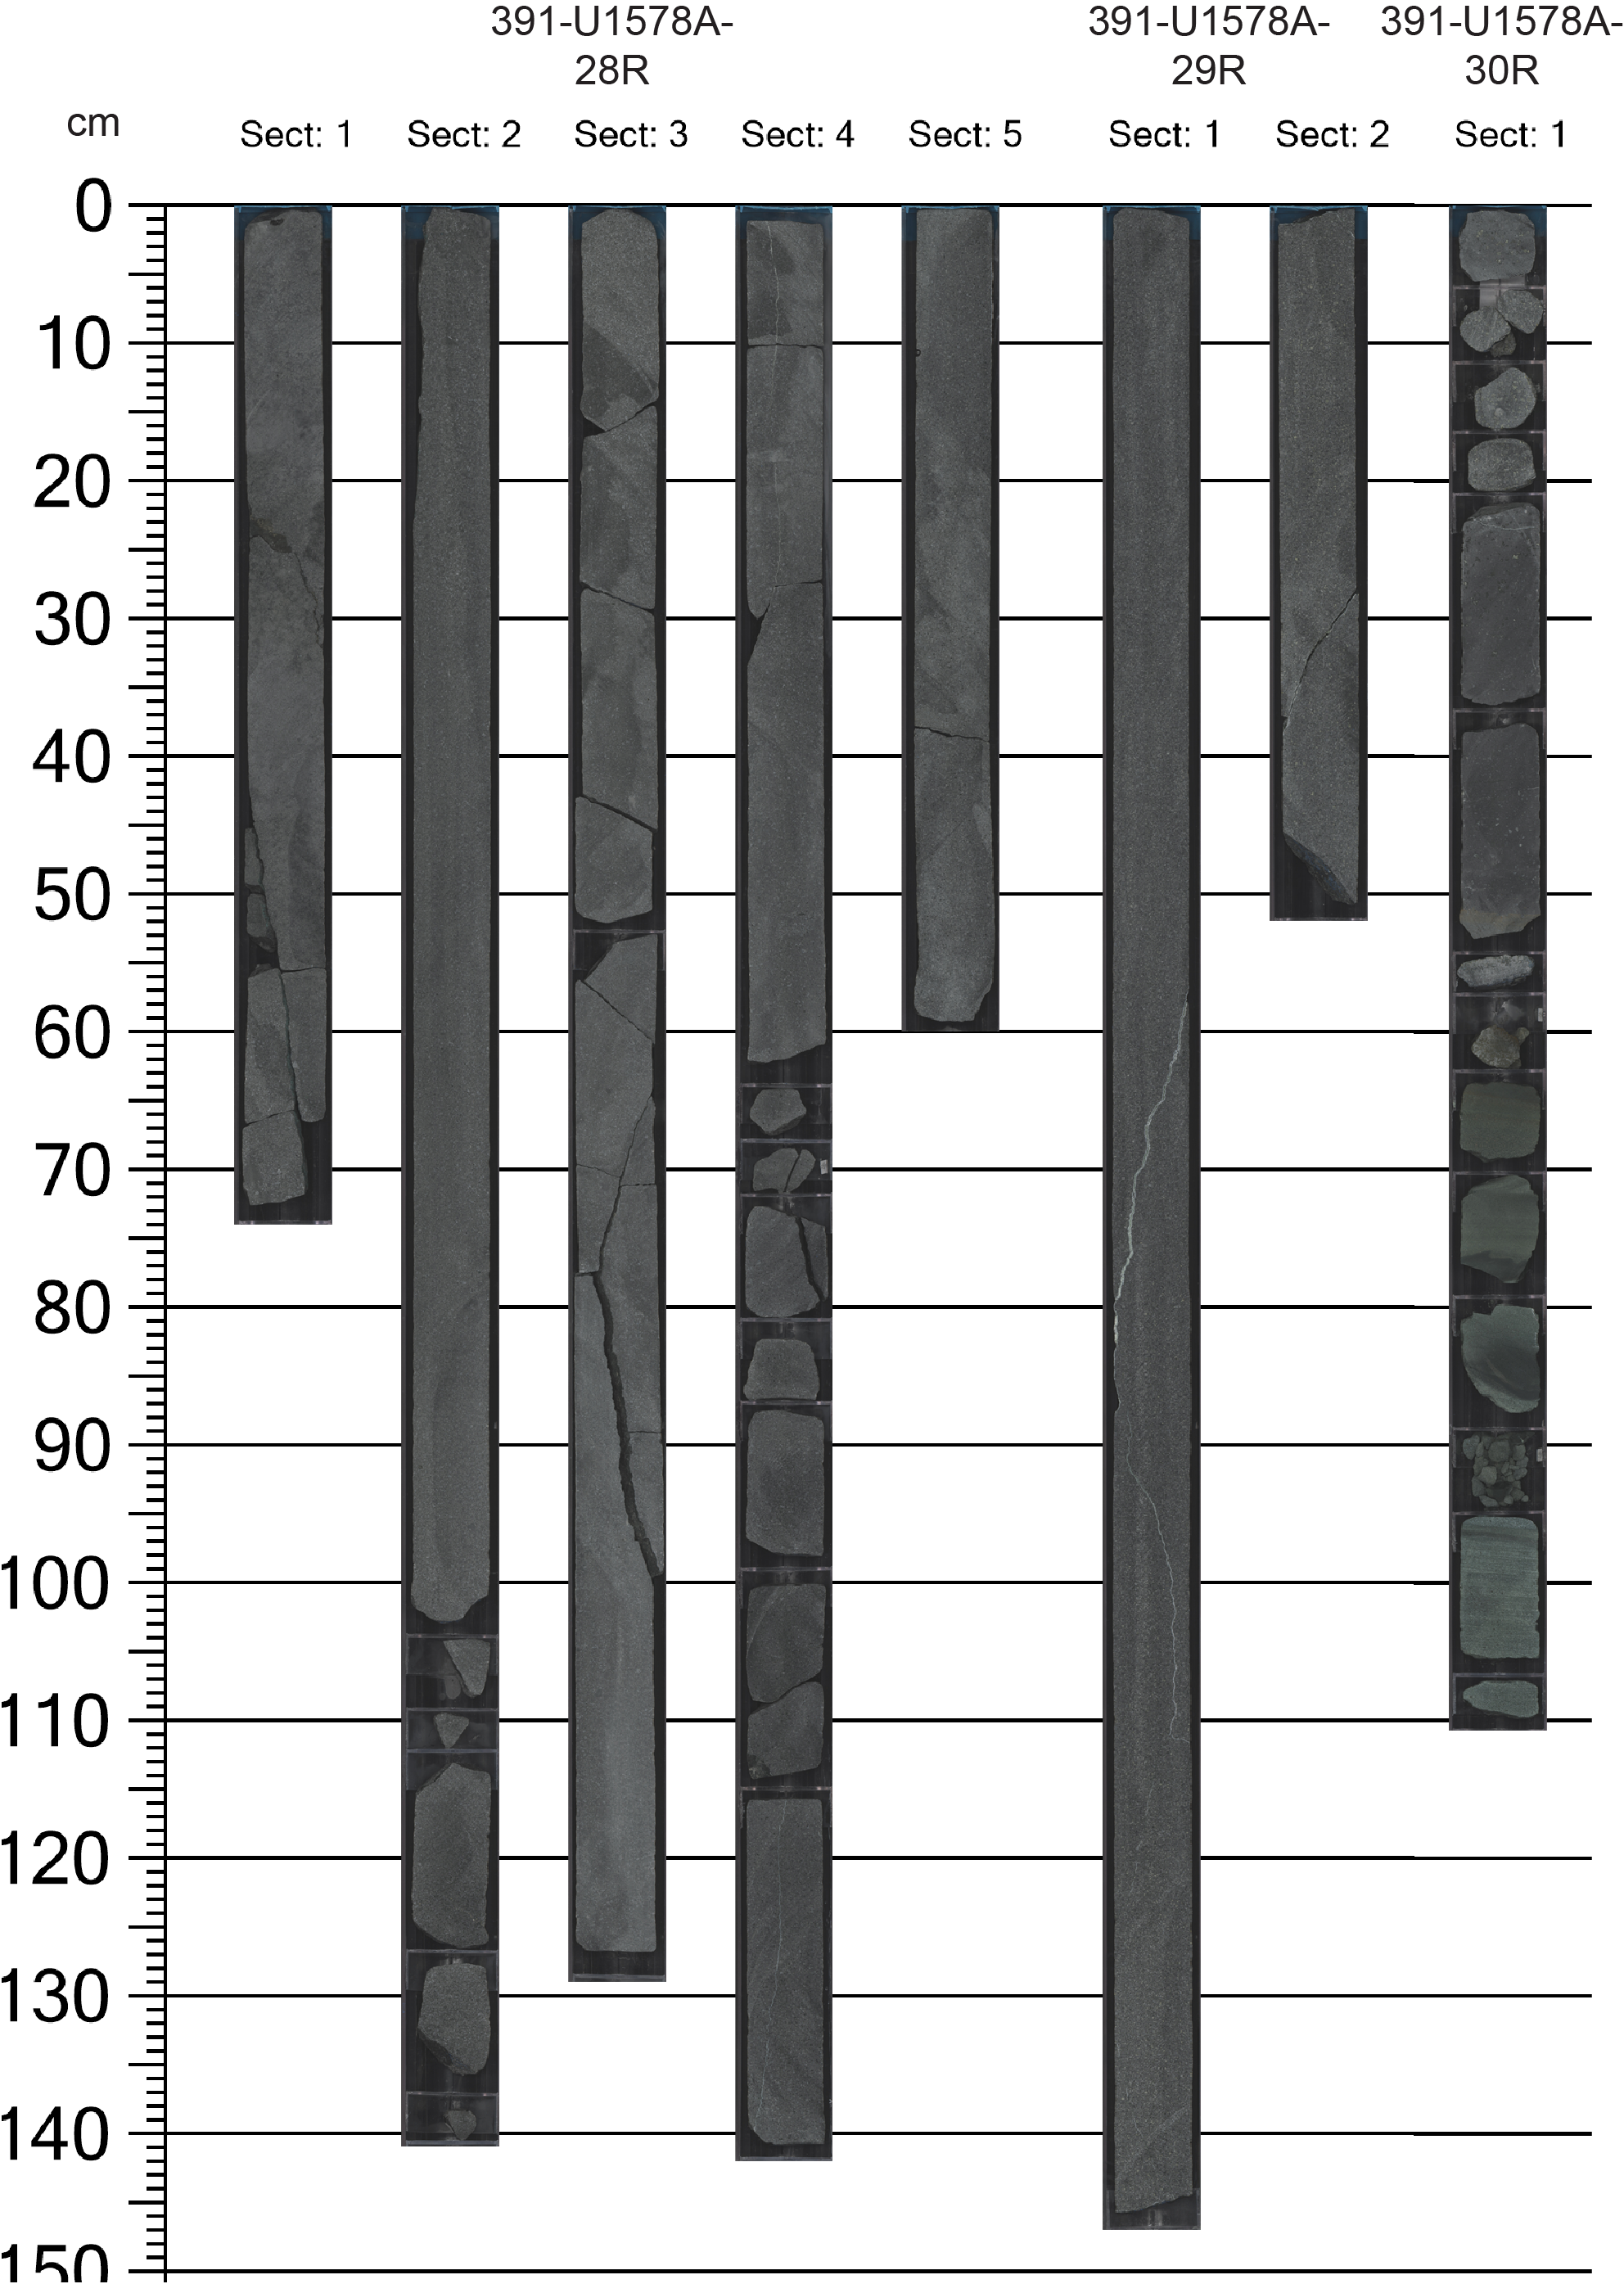
Figure F17. Massive basalt flow.
4.1.11. Sedimentary Interbed S5
- Interval: 391-U1578A-30R-1, 54 cm, to 31R-5, 49 cm
- Depth: 257.14–267.33 mbsf (10.19 m drilled thickness; 9.24 recovered thickness)
Sedimentary Interbed S5 is a ~10 m thick interval of clayey chalk and vitric sandstone/siltstone, which are similar to sedimentary rocks found in Interbeds S1–S4.
4.1.12. Igneous Unit 7
- Interval: 391-U1578A-31R-5, 49 cm, to 32R-4, 66 cm
- Depth: 267.33–276.05 mbsf
- Drilled thickness: 8.72 m
- Recovered thickness: 5.46 m
- Rock type: aphyric basalt
- Deposit: massive lava flow
- Chemistry type: very high TiO2
Unit 7 is an 8.7 m thick massive flow with chilled (microcrystalline) upper and lower margins overlain and underlain by sediment layers. There is a 3.26 m interval missing in the middle of this unit, suggesting it may comprise two distinct flow units separated by a sediment layer that was lost during drilling. This unit is remarkably aphyric, with typically <0.5% of both plagioclase and pyroxene in rare glomerocrysts. The fine-grained interior groundmass is gray, but pervasive pyrite filling voids demonstrate chemically reducing alteration. The texture changes to diktytaxitic in the center of flow, and there are tiny spaces between the groundmass plagioclase. Fractures are lined with calcite, pyrite, and/or a fine-grained secondary blue mineral (clay). Pipe vesicles are 4–5 cm long and 0.5 cm wide and run subparallel to the core, providing space for pyrite mineralization. Pipe vesicles are partially to completely filled with calcite and pyrite.
4.1.13. Sedimentary Interbed S6
- Interval: 391-U1578A-32R-5, 0 cm, to 32R-6, 101 cm
- Depth: 276.05–278.13 mbsf (2.08 m drilled thickness; 2.08 recovered thickness)
Sedimentary Interbed S6 consists of ~2 m of volcanic sandstone and dark pelagic chalk.
4.1.14. Igneous Unit 8
- Interval: 391-U1578A-32R-7, 0 cm, to 46R-1, 116 cm
- Depth: 278.13–374.56 mbsf
- Drilled thickness: 96.43 m
- Recovered thickness: 45.88 m
- Rock type: aphyric to sparsely phyric plagioclase basalt
- Deposit: pillow lava flows
- Chemistry type: very high TiO2
Unit 8 is an immense stack (96.4 m thick) of essentially aphyric pillow lava with ≤1% plagioclase phenocrysts, rare (<1%) pyroxene, and no olivine phenocrysts. Some glassy and chilled boundaries between pillows are preserved (Figure F18), including ductile boundaries (Figure F19). Pipe vesicles are present in some pillow interiors. The unit is divided into two subunits based on chemistry. Both units have very high TiO2, but Subunit 8b has somewhat higher TiO2 than Subunit 8a.

Figure F18. Pillow basalt.

Figure F19. Fractionating pillow interior.
4.1.14.1. Subunit 8a
- Interval: 391-U1578A-32R-7, 0 cm, to 37R-3, 80 cm
- Depth: 278.13–313.95 mbsf
- Drilled thickness: 41.87 m
- Recovered thickness: 17.78 m
- Rock type: aphyric to sparsely phyric plagioclase basalt
- Deposit: pillow lava flows
- Chemistry type: very high TiO2
Subunit 8a is a thick stack (~42 m thick) of essentially aphyric pillow lava with ≤1% plagioclase phenocrysts, rare (<0.3%) pyroxene, and no olivine phenocrysts. It is distinguished from Subunit 8b by chemistry; Subunit 8a has very high TiO2, but it is marginally lower than in Subunit 8b. Alteration becomes manifest in an oxidative discoloration (reddish brown) in the pillow margins, but is less intense in the massive pillow interiors. Vesicles are typically filled with clay minerals.
4.1.14.2. Subunit 8b
- Interval: 391-U1578A-38R-1, 0 cm, to 46R-1, 116 cm
- Depth: 313.95–374.56 mbsf
- Drilled thickness: 54.56 m
- Recovered thickness: 28.10 m
- Rock type: aphyric to sparsely phyric plagioclase basalt
- Deposit: pillow lava flows
- Chemistry type: very high TiO2
Subunit 8b is a thick (~55 m) stack of aphyric pillow lava with ≤1% plagioclase phenocrysts, rare pyroxene, and no olivine phenocrysts. It is distinguished from Subunit 8a on the basis of chemistry. Subunit 8b also has very high TiO2 and, on average, has moderately higher TiO2 than Subunit 8a. As with Subunit 8a, alteration manifests itself as an oxidative discoloration (reddish brown) in the pillow margins, but it is less intense in the massive pillow interiors. Vesicles are typically filled with clay minerals.
4.1.15. Sedimentary Interbed S7
- Interval: 391-U1578A-46R-1, 116 cm, to 46R-2, 66 cm
- Depth: 374.56–375.43 mbsf (0.87 m drilled thickness; 0.87 recovered thickness)
Sedimentary Interbed S7 consists of pale brown chalk with brown volcanic sandstone.
4.1.16. Igneous Unit 9
- Interval: 391-U1578A-46R-2, 66 cm, to 49R-3, 81 cm
- Depth: 375.43–395.49 mbsf
- Drilled thickness: 20.06 m
- Recovered thickness: 11.42 m
- Rock type: aphyric to sparsely phyric plagioclase basalt
- Deposit: pillow, sheet, and massive lava flows
- Chemistry type: high TiO2
Unit 9 consists of three subunits: a sheet flow, a pillow stack, and a massive flow of mineralogically and texturally similar lava.
4.1.16.1. Subunit 9a
- Interval: 391-U1578A-46R-2, 66 cm, to 46R-3, 129 cm
- Depth: 375.43–377.51 mbsf
- Drilled thickness: 3.07 m
- Recovered thickness: 2.08 m
- Rock type: highly phyric plagioclase basalt
- Deposit: sheet flow (single flow unit)
- Chemistry type: high TiO2
Subunit 9a is a sheet flow with abundant large plagioclase glomerocrysts and megacrysts up to 7 mm across set in a fine-grained holocrystalline groundmass. Plagioclase is moderately abundant (7%) near the chilled top and highly abundant (14%–20%) in the flow interior. Glomerocrysts may contain sparse pyroxene. The groundmass is oxidized in patches near the top of the flow but unaltered below that (dark gray in color). Vugs are lined with black and red crystals.
4.1.16.2. Subunit 9b
- Interval: 391-U1578A-47R-1, 0 cm, to 47R-2, 57 cm
- Depth: 378.50–380.55 mbsf
- Drilled thickness: 9.7 m
- Recovered thickness: 2.05 m
- Rock type: highly phyric plagioclase basalt
- Deposit: pillow lava
- Chemistry type: high TiO2
Subunit 9b is a small stack (<10 m thick) of pillow lava with 14%–18% plagioclase as large phenocrysts and glomerocrysts up to 5 mm across. The fine-grained holocrystalline groundmass is sparsely vesicular with vesicles <1 mm in diameter, creating an almost spongy texture. The edges of pieces sometimes contain a small patch of aphyric, highly vesicular material. This could represent flow tops (pillow breccia) or the edge of a pipe vesicle or channel. Pyrite mineralization is present in some of the larger vesicles.
4.1.16.3. Subunit 9c
- Interval: 391-U1578A-48R-1, 0 cm, to 49R-3, 81 cm
- Depth: 388.20–395.49 mbsf
- Drilled thickness: 7.29 m
- Recovered thickness: 7.29 m
- Rock type: highly phyric plagioclase basalt
- Deposit: massive flow
- Chemistry type: high TiO2
Subunit 9c is a massive flow (7.3 m thick) with 10%–15% plagioclase phenocrysts and glomerocrysts up to 5 mm across. It has a fine-grained holocrystalline groundmass and is sparsely vesicular with ~1–2 mm vesicles, although most are ≪1 mm in diameter, creating an almost spongy texture. Pyrite lines some of the vesicles. White vein networks (calcite?) cut subvertically through the core.
4.1.17. Sedimentary Interbed S8
- Interval: 391-U1578A-49R-3, 81 cm, to 50R-4, 21 cm
- Depth: 395.49–401.81 mbsf (6.32 m drilled thickness; 6.32 recovered thickness)
Sedimentary Interbed S8 consists of volcaniclastic turbidites with minor greenish gray chalk.
4.1.18. Igneous Unit 10
- Interval: 391-U1578A-50R-4, 21 cm, to 50R-4, 94 cm
- Depth: 401.81–402.54 mbsf
- Drilled thickness: 0.73 m
- Recovered thickness: 0.73 m
- Rock type: highly phyric plagioclase-pyroxene basalt
- Deposit: pillow lava flow
- Chemistry type: high TiO2
Unit 10 is a small, porphyritic pillow unit between sediment interlayers. It contains large plagioclase (10%) phenocrysts and glomerocrysts up to 5 mm across. Pyroxene (2%) is present as standalone phenocrysts and inside plagioclase glomerocrysts. The groundmass is largely microcrystalline (aphanitic), although it is cryptocrystalline near the lower chilled margin. The lava is moderately vesicular with large (3–5 mm) vesicles near the top of the flow and small (<1 mm) round vesicles throughout. Pipe vesicles are visible in the middle of the flow. Pyrite lines some of the vesicles, and clay fills others.
4.1.19. Sedimentary Interbed S9
- Interval: 391-U1578A-50R-4, 94 cm, to 50R-4, 140 cm
- Depth: 402.54–403.00 mbsf (0.46 m drilled thickness; 0.46 recovered thickness)
Sedimentary Interbed S9 is a clayey nannofossil chalk.
4.1.20. Igneous Unit 11
- Interval: 391-U1578A-50R-4, 140 cm, to 52R-3, 112 cm
- Depth: 403.00–416.28 mbsf
- Drilled thickness: 13.28 m
- Recovered thickness: 9.74 m
- Rock type: highly phyric plagioclase basalt
- Deposit: pillow and lobate lava flow
- Chemistry type: high TiO2
Unit 11 is a stack of porphyritic pillow and lobate lavas with fine-grained matrix and partially preserved chilled and glassy flow margins. The lavas are highly phyric; blocky plagioclase (12%–15%) is present as large phenocrysts and glomerocrysts (up to 10 mm across). Sparse (≪1%) pyroxene is present. Mostly fresh microcrystalline groundmass is nonvesicular to sparsely vesicular with <1 mm round vesicles filled with clay. A ~1.5 m peperite cuts the middle of the pillow stack. It contains a mix of thin lava layers and fine-grained baked sediment. The sediment layers are distorted by lava incursions.
4.1.21. Sedimentary Interbed S10
- Interval: 391-U1578A-52R-3, 112 cm, to 52R-4, 21 cm
- Depth: 416.28–416.87 mbsf (0.59 m drilled thickness; 0.59 recovered thickness)
Sedimentary Interbed S10 consists of clayey chalk with a 2 cm thick interval of poorly sorted coarse volcanic sandstone.
4.1.22. Igneous Unit 12
- Interval: 391-U1578A-52R-4, 21 cm, to 65R-3, 45 cm
- Depth: 416.87–486.40 mbsf
- Drilled thickness: 69.53 m
- Recovered thickness: 45.48 m
- Rock type: highly phyric plagioclase-olivine(-pyroxene) basalt
- Deposit: pillow lava flow
- Chemistry type: high TiO2
Unit 12 has two subunits of highly phyric plagioclase-olivine ± pyroxene pillow basalt stacks and a few hyaloclastite layers. The subunits were determined by a drop in average phenocryst abundances and the distinct shift to higher TiO2 (see Igneous geochemistry). The pillow basalts display intraflow crystal settling (Figure F19). Flow tops have moderate abundances of plagioclase, olivine, and pyroxene frozen in the chilled margin. Below that, sparse to moderate plagioclase is observed in a moderately vesicular layer; pyroxene and olivine are absent. Where the flow interior shifts from sparsely vesicular to nonvesicular, large olivine phenocrysts and glomerocrysts appear and, in some flows, plagioclase decreases. The olivine in the center of the flow is variably altered to serpentine, and some clusters preserve fresh olivine cores with serpentine rims. In other flows, alteration is complete. Olivine and serpentine are completely altered to iddingsite or a white clay mineral near the nonvesicular base of the flow.
4.1.22.1. Subunit 12a
- Interval: 391-U1578A-50R-4, 21 cm, to 55R-1, 63 cm
- Depth: 416.87–427.83 mbsf
- Drilled thickness: 10.86 m
- Recovered thickness: 10.17 m
- Rock type: highly phyric plagioclase-olivine-pyroxene basalt
- Deposit: pillow lava flow
- Chemistry type: high TiO2
Subunit 12a consists of a stack of pillow lavas preserving some chilled and glassy margins. These lavas are made up of porphyritic basalt with an aphanitic matrix. TiO2 is at the lower range of the high-TiO2 classification. The highly phyric phenocryst population changes throughout a single flow due to crystal settling; however, on average, the flows contain plagioclase (12%–17%), olivine (2%–5%), and pyroxene (1%–2%). Fresh olivine cores are present in the center of flows, but they are rimmed by serpentine. Near the flow margins, olivine is completely altered to iddingsite or white clay. Each flow also ranges in vesicle content; there are more vesicles toward the top of the flow (moderately vesicular), and vesicles are sparse to absent toward the bottom. The vesicles are often lined with goethite or clay. Pillow interiors are relatively fresh, but the margins and rims are affected by oxidative alteration (red-brown discoloration), which may be especially intense in the glassy rims and interpillow sediment.
4.1.22.2. Subunit 12b
- Interval: 391-U1578A-55R-1, 63 cm, to 65R-3, 45 cm
- Depth: 427.73–486.40 mbsf
- Drilled thickness: 58.67 m
- Recovered thickness: 35.31 m
- Rock type: highly phyric plagioclase-olivine basalt
- Deposit: pillow lava flow
- Chemistry type: high TiO2
Subunit 12b consists of a stack of porphyritic pillow basalts with fine-grained matrix that preserved some chilled and glassy margins. The TiO2 content is at the higher range of the high-TiO2 classification. The moderately to highly phyric phenocryst population changes throughout a single flow due to crystal settling and proximity to chilled margins, but overall, it is not as dramatic as in Subunit 12a. On average, the flows contain plagioclase (7%–12%) and olivine (1%–3%) with sparse (<1%) pyroxene phenocrysts. Fresh olivine cores are less common but can still be found in the center of flows, rimmed by serpentine. Near the flow margins, olivine is completely altered to iddingsite or white clay. Each flow also ranges in vesicle content; there are more vesicles visible toward the top of the flow (moderately vesicular), and vesicles are sparse to absent toward the bottom. The vesicles are often lined with goethite or clay. Sporadic injections of hotter magma created small increments of completely nonvesicular, aphyric, featureless basalt. The boundaries between the aphyric and phenocryst-bearing lavas are sharp but not chilled. Hyaloclastite with pillow fragments (up to 15 cm) and pillow breccia are found near the bottom of the subunit (Figure F19). Fresh and altered glass are present on the pillow rims and hyaloclastite pieces.
4.2. Petrography
4.2.1. Massive lavas and sheet flows
Massive lavas and sheet flows are highly to moderately phyric and primarily contain plagioclase and clinopyroxene ± olivine as phenocrysts and/or glomerocrysts (Figure F20). The groundmass textures are typically ophitic to subophitic or intersertal. Plagioclase and clinopyroxene occur as large glomerocrysts and groundmass phases. Olivine occurs frequently and is often observed as a groundmass phase. Olivine is also present as a phenocryst along with plagioclase and clinopyroxene at the base of some lava flows. Olivine phenocrysts often contain Cr-spinel inclusions. Plagioclase in glomerocrysts often exhibits oscillatory zoning at its rims and patchy zoning at its core. Some plagioclase crystals also have sieve-textured cores. Clinopyroxene zoning also is common and occurs as hourglass and oscillatory patterns. Both plagioclase and clinopyroxene often contain melt inclusions. Some massive lavas exhibit a clear divide between phenocrysts and groundmass; however, many exhibit seriate texture and continuously grade from small to large crystals. The groundmass often contains plagioclase, clinopyroxene, and skeletal Fe oxide crystals ± olivine. Fe oxide crystals appear to be titanomagnetite and ilmenite. Fresh glass can be found in some samples, but it is commonly more altered and replaced by clay minerals.

Figure F20. Massive lavas and sheet flows.
4.2.2. Pillow lavas
Pillow lavas are sparsely phyric, containing rare plagioclase and clinopyroxene phenocrysts and glomerocrysts (Figure F21). Plagioclase glomerocrysts occasionally exhibit oscillatory zoning and sieve-texture cores. Sector zoning patterns are often observed in groundmass clinopyroxenes. Fine-grained groundmass is abundant throughout the pillow lavas. Groundmass plagioclase exhibits flow fabric texture in some samples. Ilmenite and titanomagnetite are common groundmass phases. The concentration of ilmenite and titanomagnetite varies between lava flows. In pillow lavas with abundant ilmenite, reticulate ilmenite growth patterns dominate the groundmass. The reticulate pattern indicates abundant nucleation of ilmenite crystals in conditions that are conducive to rapid growth (i.e., many ilmenite needles form simultaneously and intersect as they grow rapidly).
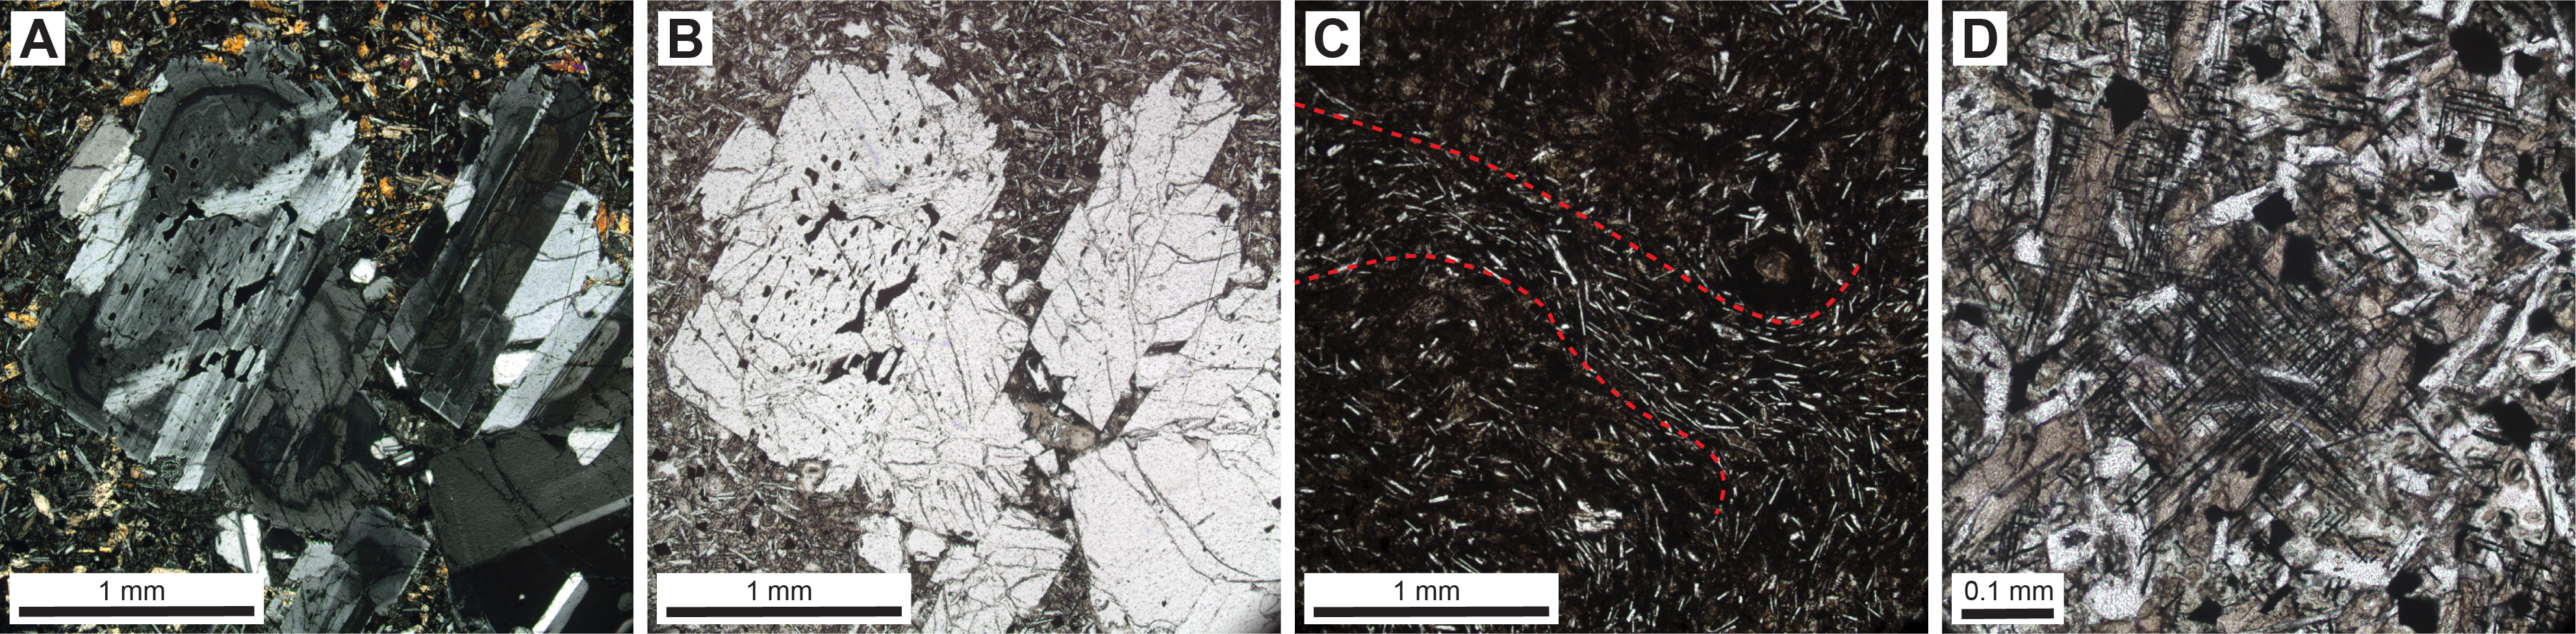
Figure F21. Pillow lava.
4.3. Alteration
Alteration in the basement basalt succession consists of more pervasive alteration of smaller eruption units and the tops and bases of the massive flows. There is also downhole variation in the nature of vesicle and vein infillings, which likely reflects different thermal regimes deeper in the succession. Overall, veins do not occur very frequently, and they are all less than 1 cm wide. They are usually wavy and sometimes form part of vein networks (Figure F22).
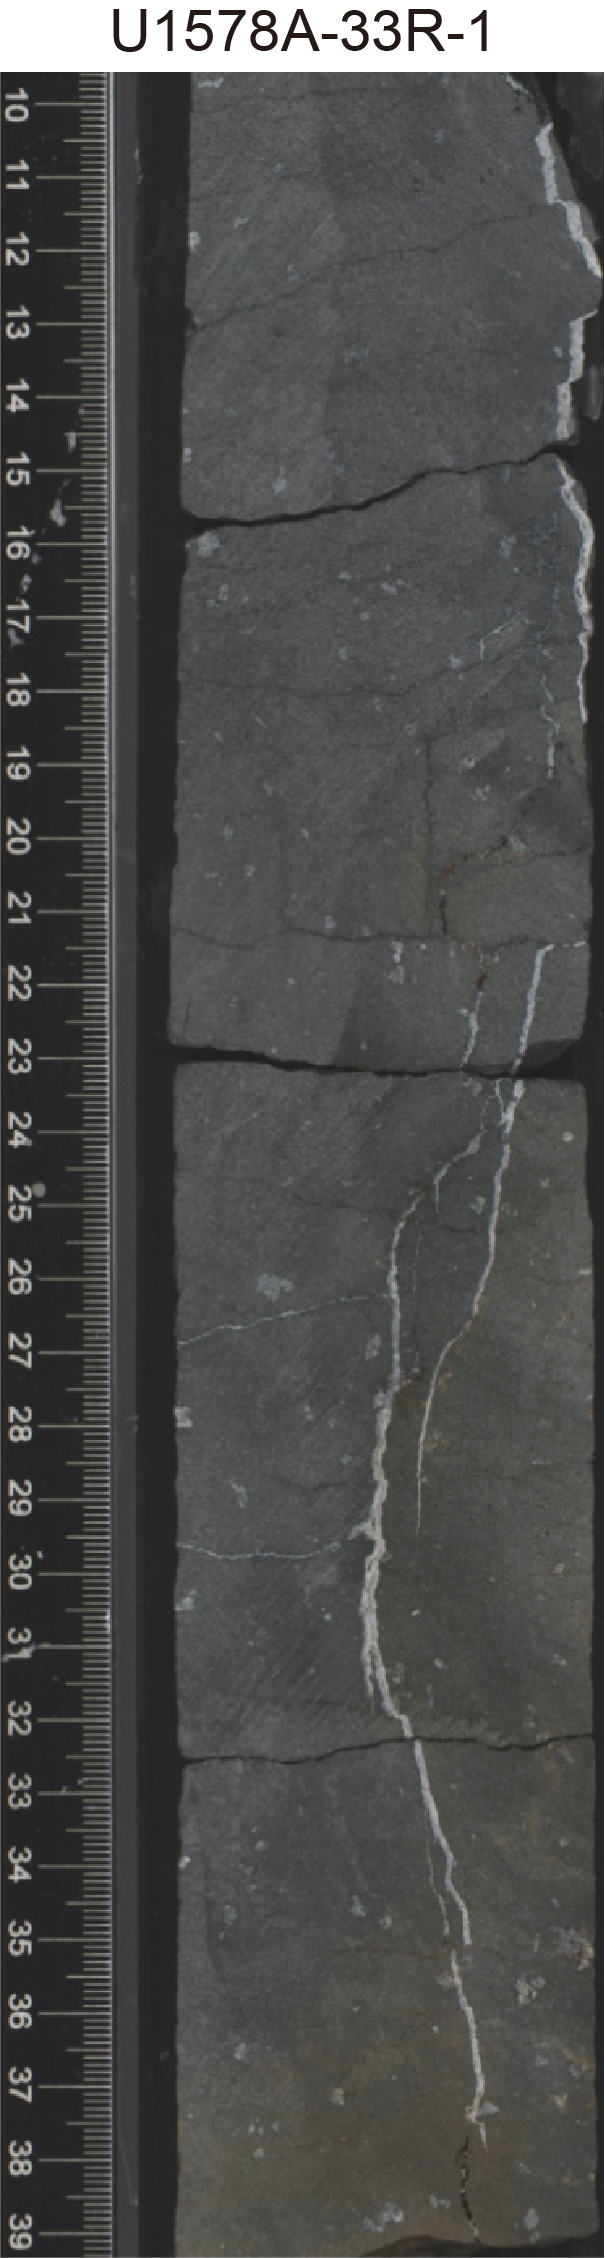
Figure F22. Calcite-filled vein network.
In Hole U1578A, a short pillow sequence underlain by a sheet flow is located at the top of the basement sequence. The sedimentary/basement contact is partially preserved and consists of a thin chilled layer with a palagonized glass surface. The overlying recovered sediments are sand-sized vitric volcaniclastic deposits with complex alteration banding. They display Mn dendrites, which may indicate a very slow accumulation rate and/or condensed sequence at this horizon. Paleomagnetic analysis suggests a significant hiatus between the basalts and the overlying volcaniclastic deposits. This may represent an unconformity between the lowest sediments of Lithostratigraphic Unit II and the top of the first pillow basalt flow of Unit III (see Paleomagnetism).
The igneous basement alternates between pillow lava flows, sheet flows, and massive flows intercalated by sedimentary intervals up to 10 m thick with variable amounts of volcaniclastic and calcareous pelagic materials. This presents the opportunity for exchange between and interaction with igneous and sedimentary units.
As observed at previous sites, the center of the larger massive flows preserves relatively fresh rock and pillow units are pervasively altered except for very fine-grained pillows, which preserve their internal mineralogy. The glassy and fine chilled margins of pillow units typically form a barrier to alteration, and phenocrysts of the original crystal cargo may be preserved. The lowermost pillow stacks (Igneous Units 12a and 12b) are phenocryst rich, containing both plagioclase and olivine glomerocrysts. In most instances, the olivine altered to a rusty orange color (i.e., iddingsite), conveying a distinctive change in magnetic properties (see Paleomagnetism), but in some portions of the flow, the olivine is quite fresh. By contrast, feldspar and pyroxene are relatively unaltered. Glassy outer layers of pillows and larger flow contacts are typically palagonized, and there are alteration clay-rich halos adjacent to fractures as well as in the sediment. Hyaloclastite fills voids in the pillow stack.
The middle to lower igneous succession is dominated by thick pillow stacks (e.g., Igneous Subunits 8a, 8b, 9b, 12a, and 12b) that present a nearly continuous section, interrupted only by a sheet flow (Subunit 9a) and a massive flow (Subunit 9c) and associated sedimentary intercalation (Sedimentary Interbeds S8–S10). The vesicular and fractured nature of pillow lava stacks makes them more prone to mineralization, which occurs through vesicle infilling and mineralization along the natural cooling fractures to form veins. Mineralization also occurs within sheet and massive flows, but it is restricted to the more vesicular regions toward the tops of massive flows and particularly along fractures and well-developed pipe vesicles in the middle (flow interior) regions of the larger pillow basalt flows. The nature of this secondary alteration changes downhole through the succession, with carbonate, calcite, and Fe oxyhydroxide dominating the upper igneous units and pyrite (marcasite) together with Cu-bearing coatings and zeolite infillings becoming more common downhole. Fractures in pillow lavas and linings of pipe vesicles within massive flow interiors are characterized by distinctive epidote and Fe oxyhydroxide mineralization. The broad mineral zonation of vesicle and vein infilling in this succession may be summarized as follows:
- Upper zone: Cores 391-U1578A-21R through 32R, Igneous Units 1–7 (~190–280 mbsf). Calcite and Fe oxyhydroxides and minor pyrite (marcasite). Larger vesicles contain sparry calcite.
- Middle zone: Cores 32R–40R, Igneous Subunit 8a and the upper part of Subunit 8b (~280–340 mbsf). Blue-gray microcrystalline lining of vesicles and vein infilling (celadonite) and dark green clay-like vein infilling (serpentine), together with calcite, Fe oxyhydroxides, white zeolite, and pyrite (marcasite) (Figure F23A, F23B).
- Lower zone: Cores 41R–47R, the lower parts of Igneous Subunits 8b, 9a, and 9b (~240–390 mbsf). Bright mossy-green microcrystalline lining and infilling of vesicles and vein infilling (epidote), dark green-brown clay-like vein infilling (serpentine), together with calcite and Fe oxyhydroxides (Figure F23C, F23D).
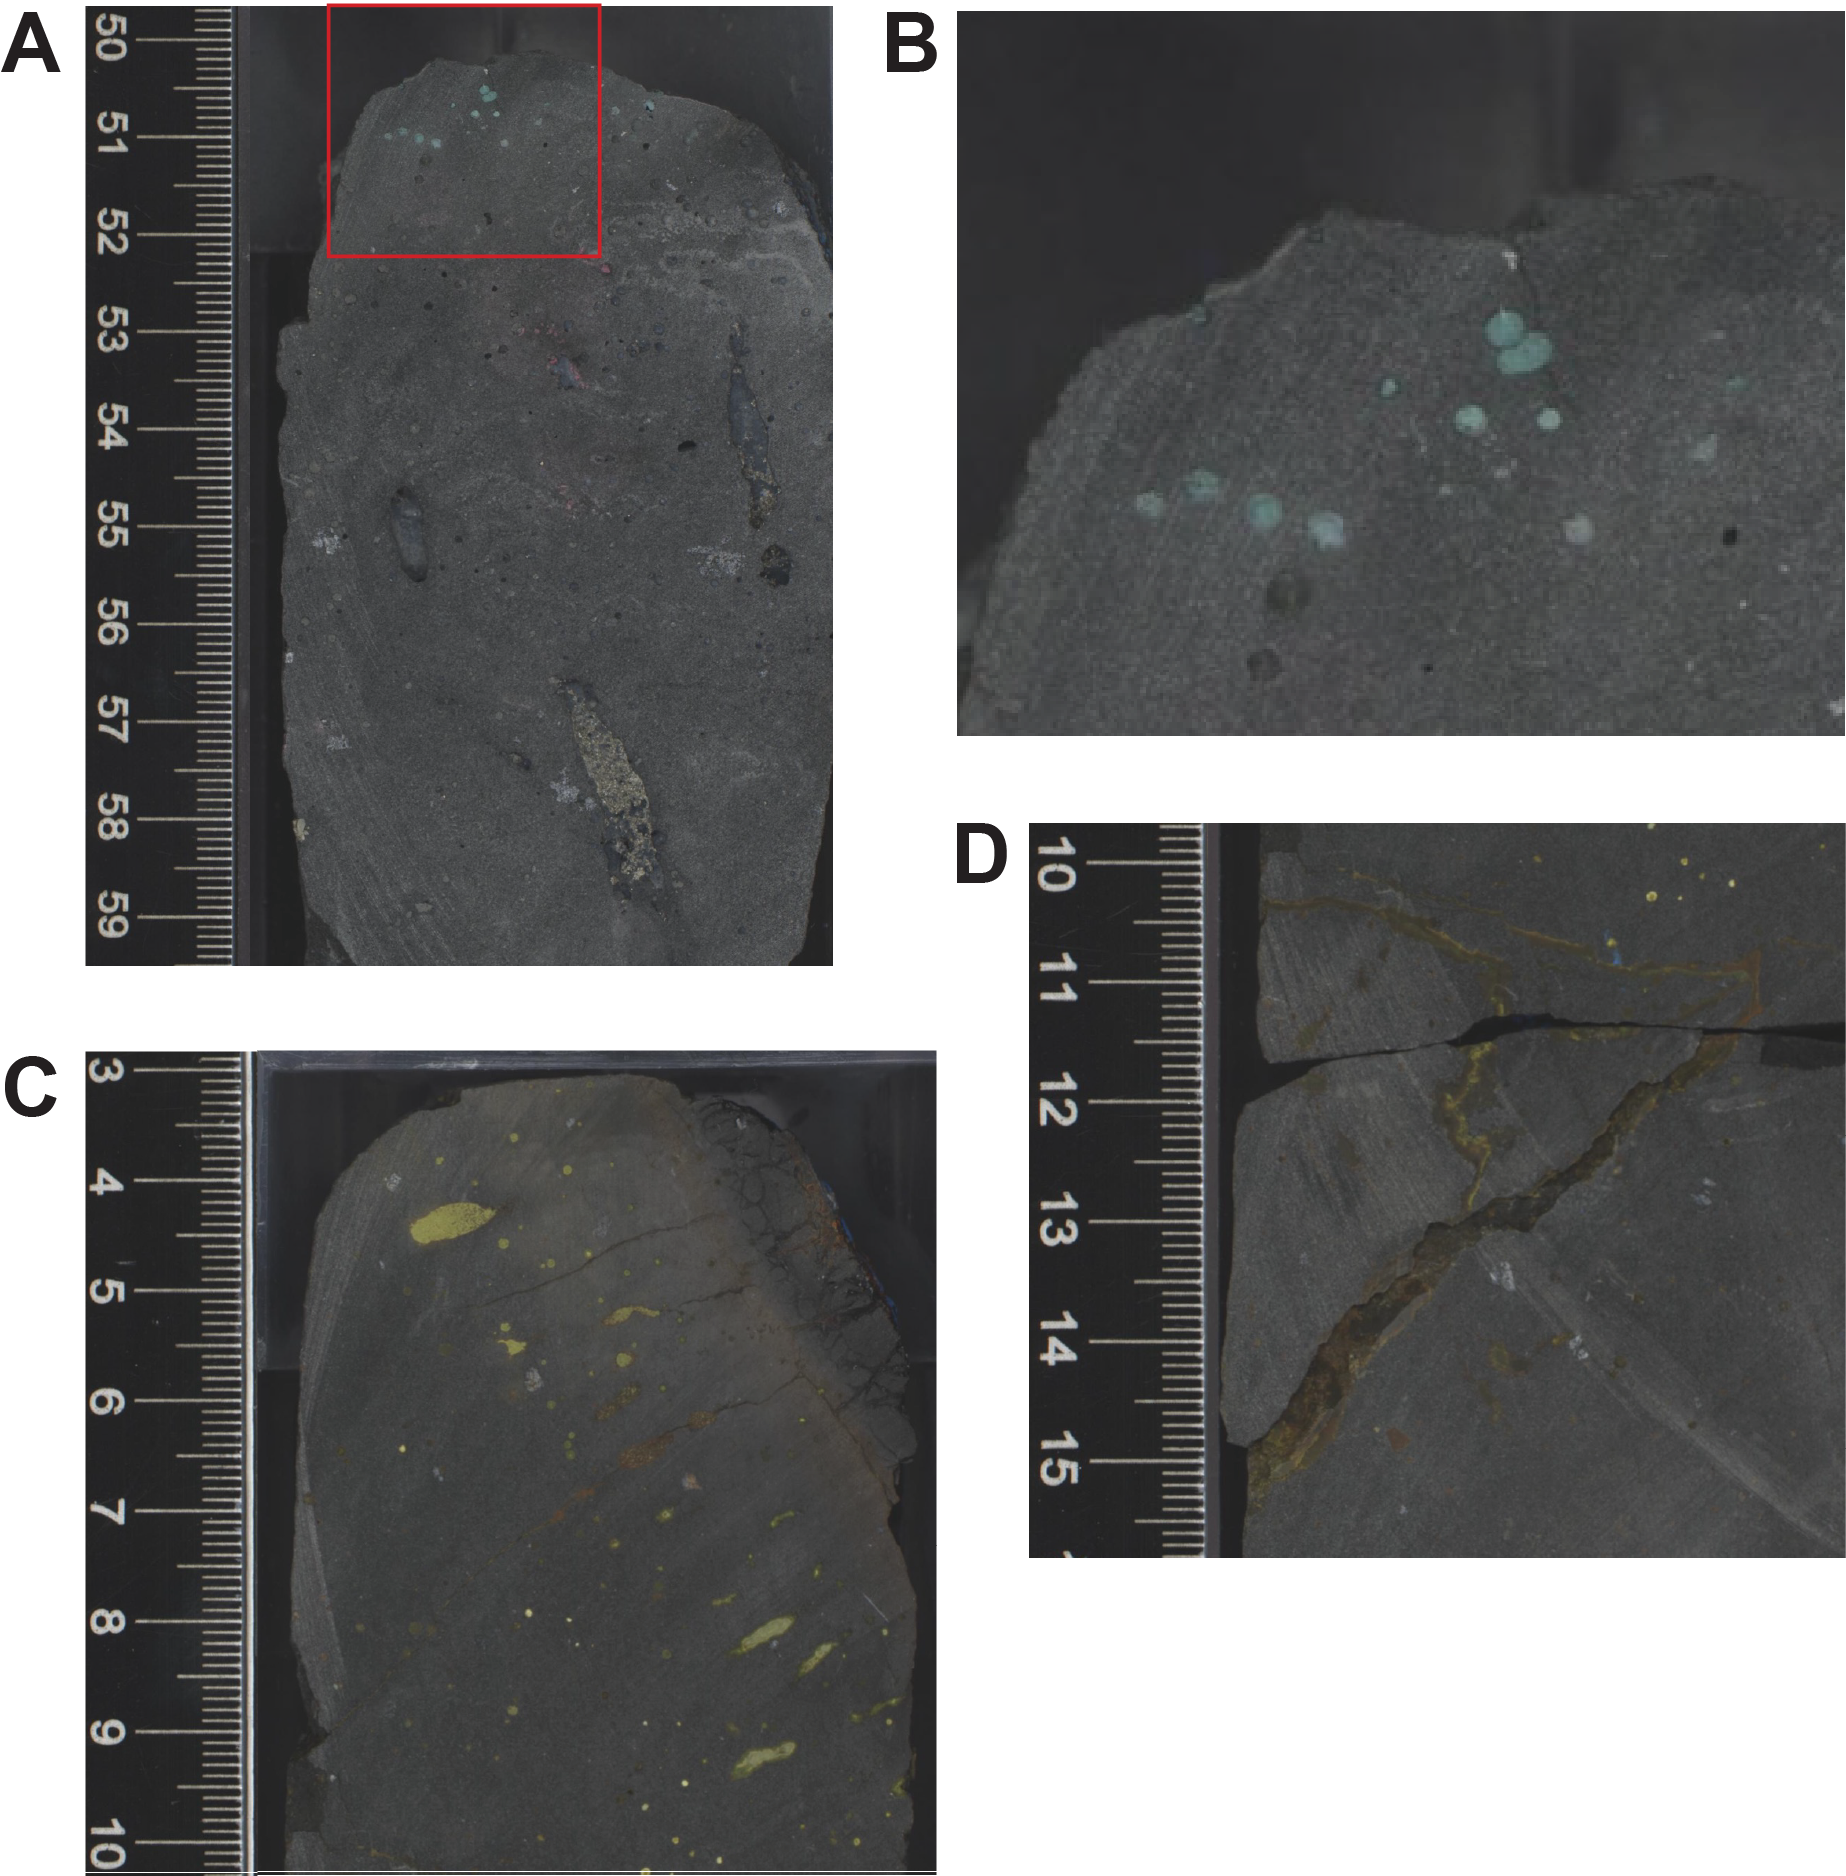
Figure F23. Alteration.
Basalt-seawater interaction can result in a variety of secondary minerals and changes in the primary minerals depending on temperature, pH, depth, and other environmental parameters. Early stage alteration at higher temperatures (>300°C) causes formation of calcic amphibole (actinolite and hornblende), epidote, serpentine, and talc; alteration at intermediate temperatures (>100° to <300°CS) causes formation of serpentine, chlorite, and sulfides; late-stage or low-temperature (<100°C) fluid-rock interaction produces quartz, zeolites (and prehnite), clays (smectite-saponite), celadonite, and Fe oxyhydroxides.
The thick pillow stacks at the base of Hole U1578A contain significantly fewer alteration minerals. This is likely due to these intervals having a different internal structure with sparse, small vesicles and relatively few cooling joints for fluid ingress. These units appear to be laterally extensive, thin sheet flows rather than pillow lavas sensu stricto (see Discussion) and thus offered less opportunity for alteration or development of secondary mineralization. Furthermore, because this stack lies below a major sedimentary interval (Sedimentary Interbeds S8 and S9), this lower pillow stack may represent an earlier stage of volcanism and a separate thermal regime.
Because of expedition limitations, it was not possible to characterize vein and vesicle alteration minerals beyond macroscopic observation. A number of X-ray diffraction samples of alteration materials were taken throughout this succession; the diffractogram data await postexpedition analysis.
Sediment-lava interactions are common in Lithostratigraphic Unit III and fall into two main types: those associated with direct magma-sediment lava interaction (e.g., peperites) and those resulting from the introduction of lava units onto the sedimentary substrate.
The sedimentary succession beneath the Igneous Unit 6 massive flow was affected by its emplacement. The underlying succession consists of sandy to silty turbidites, and the finer upper layers are often poorly preserved or mixed into overlying sandy intervals; in some examples where it is more lithified, this finer material has been incorporated as rip-up clasts or rafts within intervals of convolute and structureless bedding (e.g., interval 391-U1578A-30R-2, 0–80 cm; Figure F24). Convolute bedding is commonly ~1 m immediately below the particularly thick (~15 m) overlying massive flow (Igneous Unit 6); a narrow chilled margin at the base of the flow is associated with a discolored sandstone with a distinctive snowflake-like fabric resulting from patchy alteration and cementation by zeolite and calcite. Petrographic inspection reveals this flow has undergone internal mineralogical differentiation resulting from long-term cooling. The disturbance and discoloration in the turbidite succession upon which it was emplaced are likely the result of initial mechanical loading and then longer term hydrothermal interaction and exchange within the substrate of Sedimentary Interbed S5 during a protracted cooling period. The observed dismemberment and mixing of turbidite units suggests vigorous circulation occurred in the uppermost portion of Sedimentary Interbed S5, whereas lower (more lithified?) layers remained preserved.

Figure F24. Sedimentary substrate.
The Igneous Unit 11 pillow stack contains intricate fluidal interactions between pillow lava and the soft sediment of Lithofacies 1 and 2 (Igneous Unit 11, intervals 391-U1578A-51R-1, 45 cm, to 51R-2, 134 cm, and 52R-2, 26–120 cm), offering examples of peperites and inclusions of pelagic sediment in the interstices between pillow lavas (see Lithostratigraphy). Beneath this, Sedimentary Interbed S10 is an approximately >0.6 m thick succession of bioturbated clayey-nannofossil chalk and poorly sorted coarse volcanic sandstone. Its pale brown and orange coloration suggests low-temperature hydrothermal alteration of the sedimentary rocks between the lava stacks above and below. The basal 20 cm of the interbed displays inclined layering, which may be a response to draping over the surface of the underlying pillow lava stack (Igneous Subunit 12a).
4.4. Discussion
The igneous basement at Site U1578 is characterized by particularly thick successions of pillow lavas. The characteristic features outlined above were employed to help complete a detailed unit-by-unit reconstruction of these pillow stacks. However, after examination of pillow stack Igneous Subunits 12a and 12b (almost 70 m cored thickness), it became evident that the small eruptive bodies of approximately 0.5 to <2 m cored thickness that would normally be classified as pillow lava did not adequately satisfy the typically expected characteristic criteria (see Volcanology in the Expedition 391 methods chapter [Sager et al., 2023]).
Igneous Unit 3 and Subunits 12a and 12b contain a significant phenocryst cargo of plagioclase and olivine glomerocrysts (approximately 0.2–1 cm) that developed in the magma source prior to eruption. Examination of crystal distribution within these lava units revealed a broad physical separation of these two phases; this was most accentuated in the thicker units. Plagioclase dominated the upper part of the flow interiors and diminished in abundance down to the lower interior. By contrast, olivine was mostly absent from the upper portion of the core and increased gradually below the vesicular upper portion of the flow; the highest amounts of olivine crystals accumulated above the innermost chill margin of the flow base. This is best explained by gravitational settling of the denser and larger olivine crystals and agglomerates and/or by the preferential buoyancy of the least dense plagioclase crystal. Internal degassing and associated vesicle ascent may have also conferred buoyancy to the less dense components of any crystal cargo, thus leading to an accentuated physical separation of feldspar phenocrysts from ferromagnesian (pyroxene and olivine) phenocrysts. Importantly, this process requires that the eruptive unit remains internally molten. For this to happen, a protracted cooling period is a prerequisite, although this is inconsistent with typical pillow lava emplacement, in which cooling would normally be somewhat rapid compared with a larger-volume igneous body.
The composition of the mineralogically distinct Igneous Unit 3 and Subunits 12a and 12b is not dissimilar to other erupted units in the stack that might otherwise explain a different, slower cooling behavior. However, it is notable that although the core frequently intersected the top and base of the thin flows, there were scarce instances of inclined chilled margins that indicate the presence of edges and sides of rounded pillow bodies. This lack of vertical or subvertical chilled margins indicates that these particular pillow lavas were likely laterally extensive and thus volumetrically significantly larger than normal pillow lavas. This may explain why these bodies remained sufficiently liquid to permit internal differentiation. Accordingly, we suggest these mineralogically differentiated units represent a hitherto unrecognized form of unusually thin, extensive sheet flow, which possibly erupted at higher temperatures or was otherwise able to remain rheologically fluid and extend laterally, presenting only an upper surface during cooling but, most importantly, of significantly greater volume than conventional pillow lavas to allow opportunity for the observed internal differentiation. We consider these a form of sheet flow and suggest the term "small phyric sheet flow" (see Volcanology in the Expedition 391 methods chapter [Sager et al., 2023]).
Additionally, Site U1578 contains a remarkable record of ocean island basalt (OIB) volcanism from a dominantly volcanic constructional stage to a waning stage in which massive lava flows (and some pillow lavas) are intercalated with volcanic sandstones, siltstones, and tuffaceous chalks (see Lithostratigraphy). Sedimentary interbeds are also found deep in the section, enabling the potential for establishing a biostratigraphic timescale for construction of this guyot.
4.5. Structural geology
Site U1578 is structurally very quiet, and no faults or shear bands were observed. In interlava sedimentary units, tilted bedding, sharp contacts, and cross-beddings are often observed (Figure F24). Their apparent dipping angles range 0° to around 30°.
In the basalt layers, veins are developed but are not very frequent. They appear wavy and are sometimes in vein networks (Figure F22). Observed veins are all less than 1.0 cm wide.
5. Biostratigraphy
Shipboard analyses provided a biostratigraphic framework for Hole U1578A. Pleistocene to early Paleocene sediments were recovered from an incomplete sedimentary succession. This succession contains a major unconformity between Pliocene and early Paleocene (Danian) sediments. Preliminary zonal and stage assignments were determined using calcareous nannofossils and planktonic foraminifera. For shipboard analyses, we considered first occurrence (FO) and last occurrence (LO) datums for planktonic foraminifera and tops (T) and bases (B) for calcareous nannofossils, following the conventions of biozonation listed in Geologic Time Scale 2020 (Gradstein et al., 2012, 2020). Polarity chron boundaries are from the same source. A summary of biostratigraphic zonations for nannofossils and foraminifera can be found in Tables T2 and T3, respectively.
5.1. Calcareous nannofossils
Calcareous nannofossil analyses recorded sediments ranging in age from the Late Pleistocene (possibly as young as recent) to early Paleocene (Danian). As at all previous sites, a major unconformity is present between the Late Pliocene (Section 391-U1578A-2R-CC) and the Eocene/Paleocene (Section 3R-CC). A sedimentologic change in Section 2R-5 was suspected to be the location of the unconformity and was investigated via toothpick sampling. Analyses revealed a slump/landslide deposit within this core, and it is discussed in more detail below.
5.1.1. Recent–Pliocene
Sections 391-U1578A-1R-CC and 2R-CC recovered sediments from potentially recent to Piacenzian (Late Pliocene) age. An age of <0.43 Ma, which is above the top of Pseudoemiliania lacunosa, is recorded, indicating these sediments are younger than that age. More detailed analysis, including SEM observation, will further resolve this age during postexpedition research. SEM analysis (which was limited on board owing to time constraints) is useful in determining/confirming the presence of Emiliania huxleyi (B 0.29 Ma), which will confirm whether this sample is zoned as recent or latest Pleistocene.
Three toothpick samples were examined from Section 391-U1578A-2R-5, where an interesting sedimentologic change was observed. Examination of these samples revealed the presence of a mass transport deposit. Sample 2R-5, 15 cm, contains the highest observed Discoaster triradiatus (T 1.95 Ma; Gradstein et al., 2020), indicating an upper Gelasian (Early Pleistocene) age. Contaminants of older fossils (likely from mass transport) were also identified. The main contaminant fossils observed are Cyclicargolithus floridanus (11.85–46.29 Ma; Raffi et al., 2006; Gradstein et al., 2012) and Reticulofenestra bisecta (23.13–40.40 Ma; Perch-Nielsen, 1985b; Young, 1998). Sample 2R-5, 75 cm, was within the slump that contained early Oligocene and mixed Eocene flora. Major assemblage components observed are C. floridanus, R. bisecta, Reticulofenestra umbilica (T 32.02 Ma; Gradstein et al., 2020), Chiasmolithus altus (T 24.40 Ma; Perch-Nielsen, 1985a), Reticulofenestra circus (T 29.62 Ma; de Kaenel and Villa, 1996), assorted Eocene-aged Chiasmolithus spp., and Fasciculithus tympaniformis (T 55.5 Ma; Agnini et al., 2007). An assortment of other Oligocene and Eocene taxa were observed, but they are not recorded due to time constraints. Sample 2R-5, 130 cm, contains Early Pleistocene (lower Gelasian) markers Discoaster pentaradiatus (T 2.39 Ma; Gradstein et al., 2020) and Discoaster surculus (T 2.53 Ma; Gradstein et al., 2020).
Sedimentologic changes observed in Section 391-U1578A-3R-CC were investigated using toothpick samples to examine the potential presence of other mass transport sections above the apparent Pliocene–Eocene unconformity. Examination of Samples 3R-5, 75 cm; 3R-6, 55 cm; 3R-6, 90 cm; and 3R-6, 130 cm, revealed a succession of Zanclean (Early Pliocene) sediments positioned above Ypresian (early Eocene) sediments.
5.1.2. Eocene–Paleocene
Examination of Sections 391-U1578A-3R-CC through 18R-CC revealed a continuous succession of lowest Ypresian (early Eocene) to middle/lower Danian (early Paleocene) sediments. Section 3R-CC is tentatively zoned in the earliest Eocene because the latest Paleocene marker T Ericsonia robusta (56.78 Ma) is not identified until Section 5R-CC. Section 4R-CC straddles the Ypresian/Thanetian boundary of 55.81–56.66 Ma based on a low number (two total specimens) of Campylosphaera eodela observed during examination. This range is defined by the base of C. eodela (common) (55.81 Ma; Gradstein et al., 2012) and the base of C. eodela (56.66 Ma; Gradstein et al., 2012).
Sections 391-U1578A-5R-CC through 18R-CC recovered a sediment succession from the Thanetian (late Paleocene) to the Danian (early Paleocene). The number of biostratigraphic horizons observed in core catchers (Figure F25; Table T2) suggests a complete section over this interval. Core 19R did not recover a core catcher. The oldest age above basement is defined by the base of Sphenolithus primus (not present in assemblage) and the base of Chiasmolithus danicus (present in assemblage) at 61.98–62.07 Ma (Gradstein et al., 2012), which agrees with planktonic foraminifera and magnetostratigraphy data.
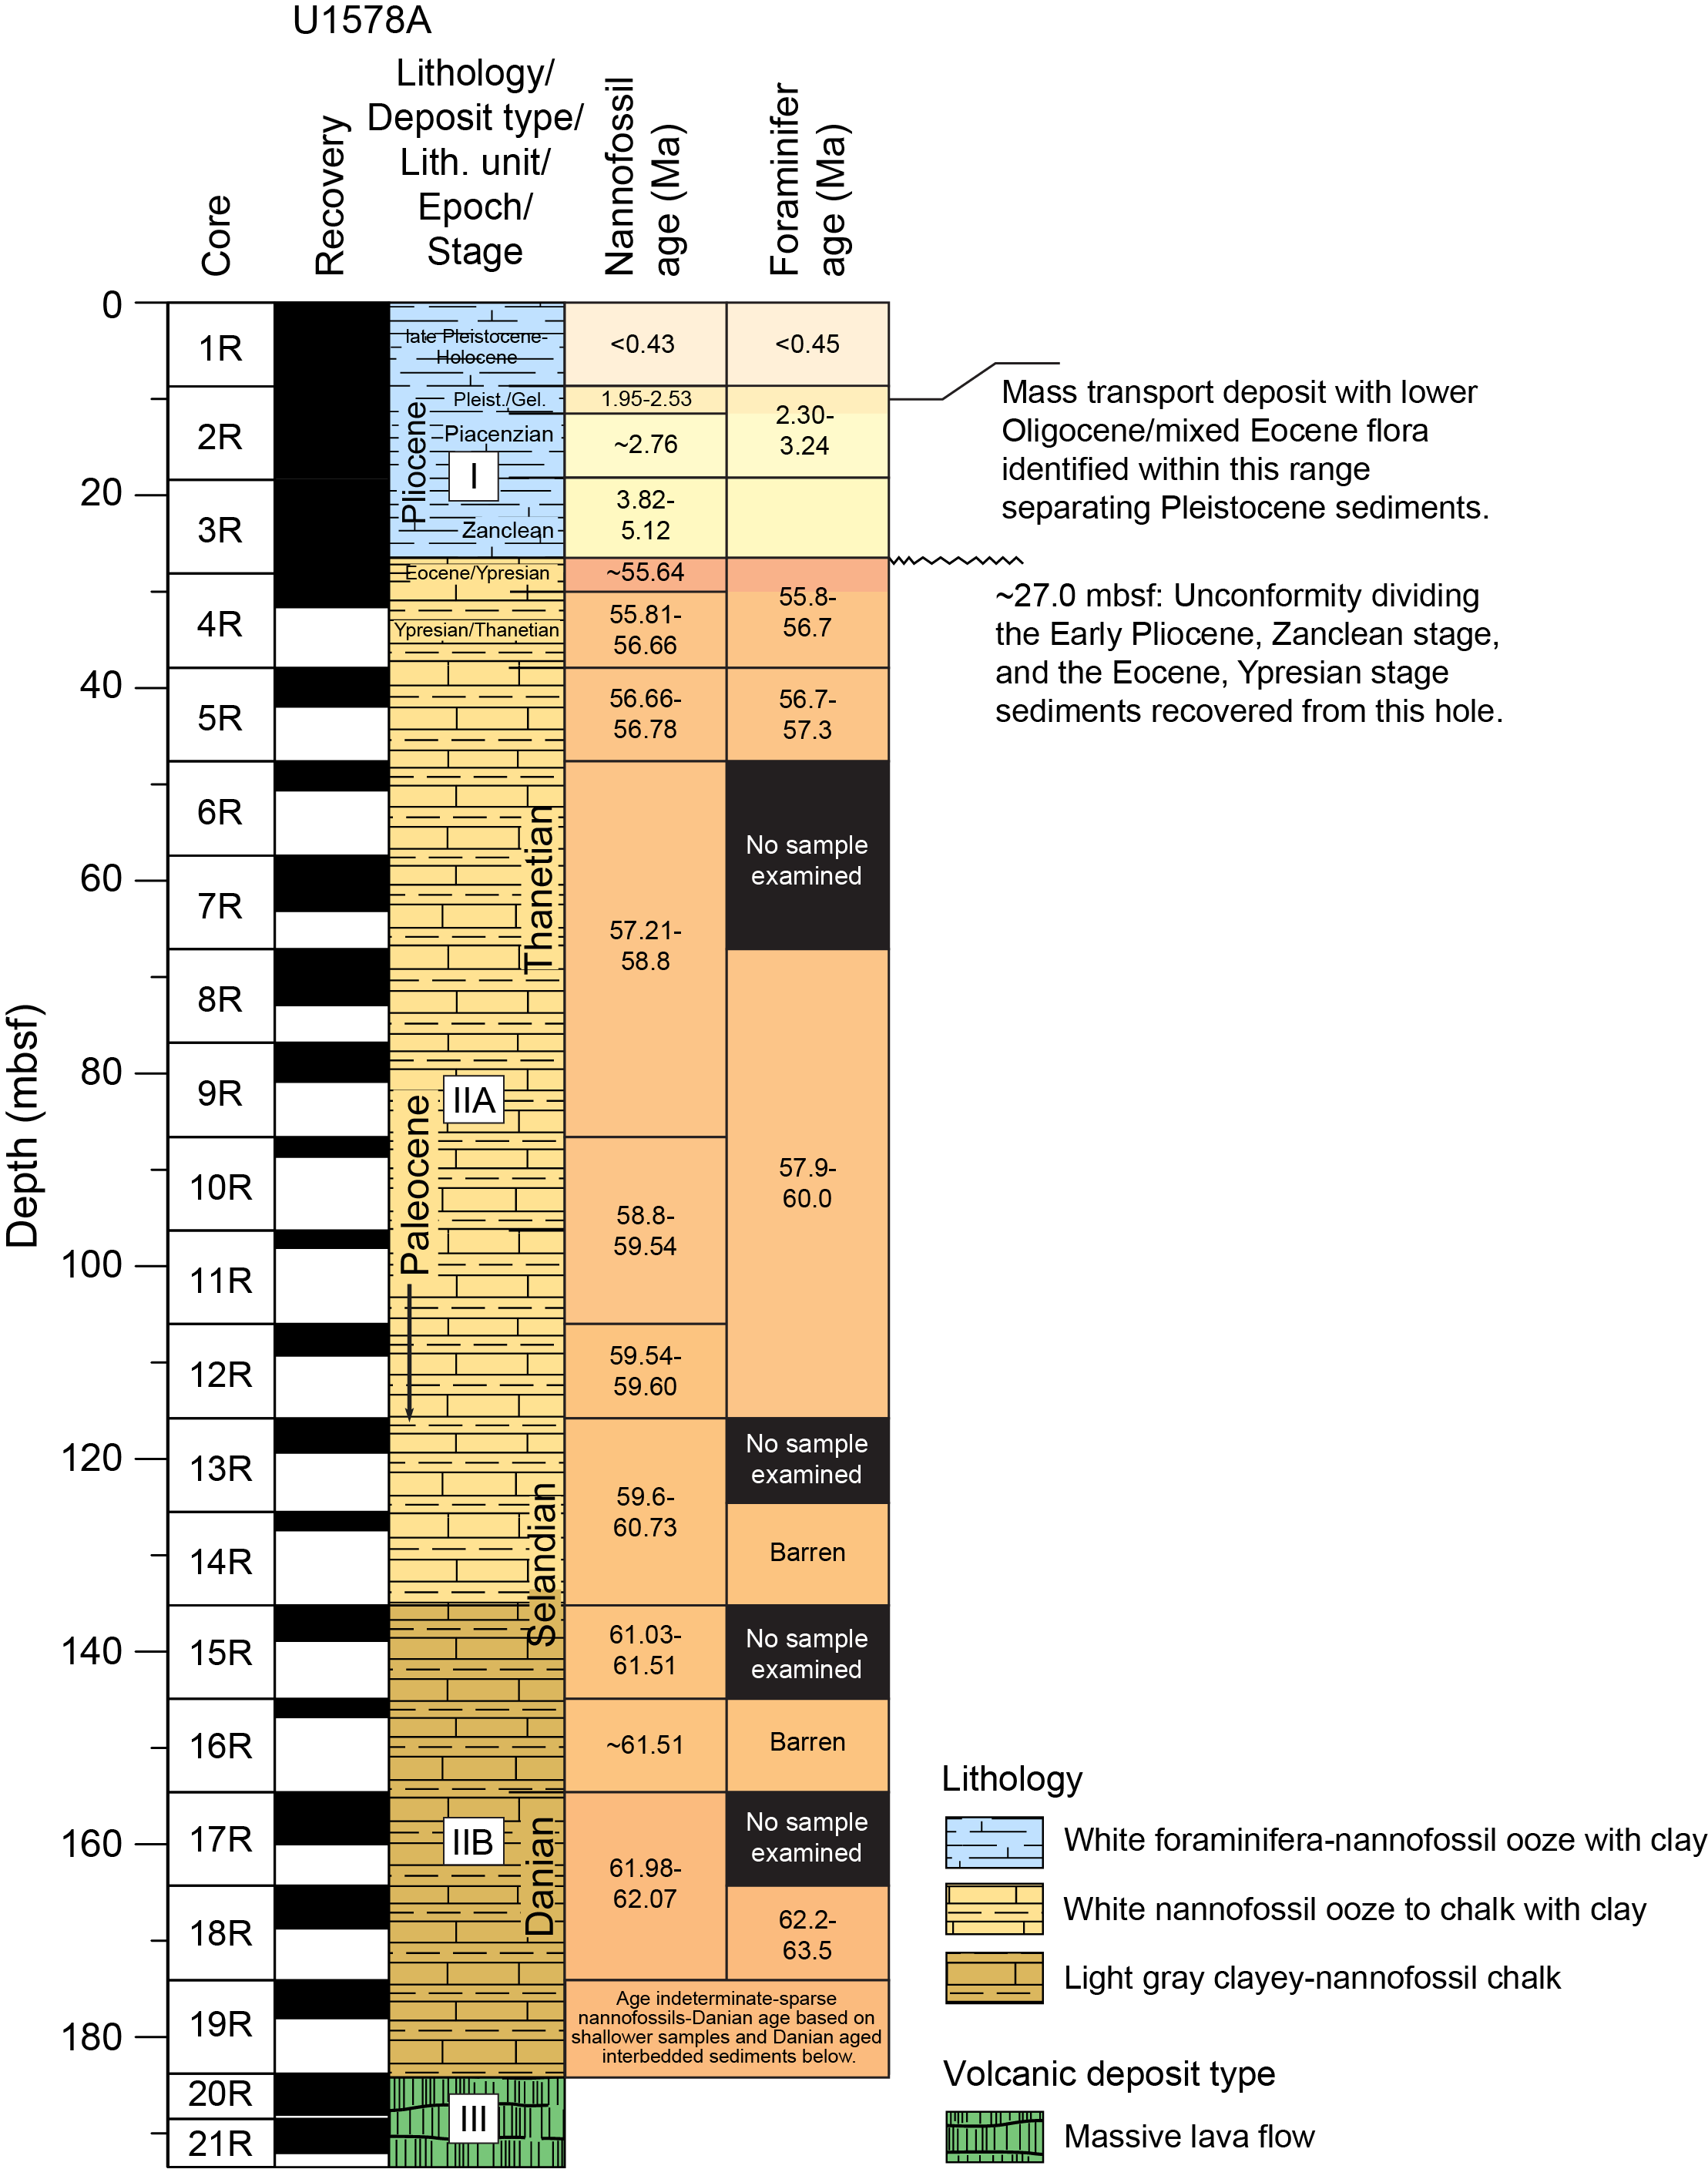
Figure F25. Correlated lithostratigraphy and biostratigraphy.
Two toothpick samples were investigated from the interbedded sediments within the basement section. Interval 391-U1578A-22R-5, 132–142 cm, and Sample 31R-5, 43 cm, contain similar assemblages. In each case, the genus Toweius was observed to no longer be present in assemblages, which differs greatly from shallower samples in which this genus tended to dominate assemblages. These intervals still contained Cruciplacolithus tenuis (B 64.81 Ma; Gradstein et al., 2012), allowing the interbedded sediment ages to be bounded from ~63.25 to 64.81 Ma. The age of 63.25 Ma is taken from the base of Ellipsolithus macellus (Gradstein et al., 2012), which is not observed in these intervals. This species was noted to be sporadic over its range within the borehole, however, and is deemed unreliable at present. This age is given as the upper bound because it is roughly coequal to the appearance of the genus Toweius (or disappearance moving downhole) in the geologic record. Postexpedition research will focus on high-resolution examination of this interval to provide improved biostratigraphic control, particularly in interbedded intervals where more refined ages may aid in basement research goals.
5.2. Planktonic foraminifera
Planktonic foraminifera were analyzed in 10 core catcher samples. The abundance of planktonic foraminifera varies in Hole U1578A. The assemblages at the top of the stratigraphic sequence (Sections 1R-CC and 2R-CC) are dominated by planktonic foraminifera with rare specimens of benthic foraminifera. Conversely, planktonic foraminifera abundance decreases downhole (Sections 3R-CC through 18R-CC) where the microfossil fauna contains abundant radiolarians and some sponge spicules. In the same interval, the number of benthic foraminifera slightly increases.
A decrease in planktonic foraminifera test size was also observed in Hole U1578A. Specifically, Paleogene fauna are characterized by the presence of abundant small specimens, which possibly represents a biotic response to stressful environmental conditions.
Preservation in Hole U1578A was extremely variable. In the uppermost part of the stratigraphic sequence (Sections 1R-CC and 2R-CC), planktonic foraminifera specimens are very well preserved with little fragmentation recorded, and almost all the specimens were identified at the species level. Preservation decreases in the Paleogene sediments (Sections 3R-CC through 18R-CC), where specimens appear partly dissolved and/or encrusted and primary morphological features are not always easily distinguishable. An increase in test fragmentation was also recorded for this interval.
Volcanic glass, basaltic lithic fragments, and fresh feldspar crystals were observed in the lowermost part of the lithologic sequence, particularly in Section 391-U1578A-18R-CC (Lithostratigraphic Unit II) (see Lithostratigraphy).
Planktonic foraminifera sample preparation was not challenging at the top of the sequence (Sections 391-U1578A-1R-CC and 2R-CC) where the lithology consists of pale brown to white calcareous nannofossil ooze (Lithostratigraphic Unit I). Conversely, hydrogen peroxide solution (30%) was required for the more lithified chalk sections (3R-CC through 18R-CC) in Unit II.
5.2.1. Pliocene–Pleistocene
A Late Pleistocene assemblage was recorded in Section 391-U1578A-1R-CC. Planktonic foraminifera dominate the assemblage, and a low number of benthic foraminifera was observed. Benthic species include the genera Cibicidoides (e.g., Cibicidoides wuellerstorfi) and Pyrgo. Preservation is good, and the planktonic foraminiferal fauna is rich and well diversified. Planktonic foraminifera species include common Globoconella inflata. Other species recorded were Globorotalia truncatulinoides, Globorotalia hirsuta, Globorotalia scitula, Globorotalia crassaformis, Globigerina bulloides, Globigerinoides ruber, Globigerinoides elongatus, Neogloboquadrina dutertrei, Globigerinella siphonifera, and Sphaeroidinella dehiscens. The sample is dated younger than 0.45 Ma based on the presence of G. hirsuta (FO 0.45 Ma; Wade et al., 2011). This allows the placement of the sample in the lower part of Pleistocene Zone PT1b (Gradstein et al., 2020).
Section 391-U1578A-2R-CC contains abundant planktonic foraminifera and a low number of benthic foraminifera. Preservation in Section 2R-CC is good with a well-diversified planktonic foraminifera assemblage. The planktonic fauna is composed of common G. inflata, G. crassaformis, G. bulloides, G. siphonifera, Orbulina universa, G. scitula, and Globoturborotalita woodi. Globorotalia menardi and N. dutertrei are rare components of the assemblage. The age of the sediments for Section 2R-CC is between 2.30 and 3.24 Ma based on the occurrence of G. woodi and G. inflata, respectively (Zone PL6/PL3; Gradstein et al., 2020). Globigerinoidesella fistulosa is absent in the analyzed material for this site; therefore, the age range of the sample could not be further constrained. Calcareous nannofossil analyses allowed the determination of the Pleistocene/Pliocene boundary.
5.2.2. Paleogene
A possible hiatus or unconformity spanning ~51 My between the Pliocene–Pleistocene and Paleogene deposits occurs between Sections 391-U1578A-2R-CC and 3R-CC. No macroscopic change in the sediment that might indicate a hiatus was identified by lithologic examination (see Lithostratigraphy). However, a change in magnetic remanence was recorded in Section 3R-6 at ~27 mbsf (see Paleomagnetism). Specifically, the increase in the intensity of magnetic remanence could occur at an unconformity.
The Paleogene assemblage is characterized by a high number of radiolarians. Planktonic foraminifera decrease in abundance compared to the Pliocene–Pleistocene interval. Specifically, Sections 391-U1578A-3R-CC, 5R-CC, and 8R-CC show a reduction in the total abundance of planktonic foraminifera, which become even scarcer in Sections 11R-CC through 18R-CC, in which several samples contain no planktonic foraminifera. Furthermore, the planktonic fauna are composed of very small specimens, mostly acarininids and morozovellids.
Section 391-U1578A-3R-CC contains a fragmented planktonic foraminiferal assemblage with several specimens affected by dissolution, which hides the essential features for a proper taxonomic distinction. The sample includes a large number of radiolarians, whereas benthic foraminifera are overall not abundant.
The planktonic foraminifera fauna in Section 391-U1578A-3R-CC contains Globanomalina australiformis, Acarinina sibaiyaensis, Acarinina soldadoensis, and Morozovella aequa. Specimens of Globanomalina pseudomenardii were also observed. The assemblage seems to be indicative of the Paleocene/Eocene boundary interval based on the overlap between typical early Eocene (G. australiformis and A. sibaiyaensis) and latest Paleocene (G. pseudomenardii) species. The section possibly records the latest upper Paleocene bioevent, the LO of G. pseudomenardii (56.7 Ma; Wade et al., 2011), and the lowermost Eocene bioevents, the FOs of G. australiformis and A. sibaiyaensis (55.8 Ma; Wade et al., 2011). Thus, we tentatively suggest an age between 55.8 and 56.7 Ma, which allows the placement of the analyzed depth interval in Zones E1/P5 (Wade et al., 2011).
Section 391-U1578A-5R-CC includes G. pseudomenardii, M. aequa, Subbotina triloculinoides, and Globanomalina chapmani. The LO of G. pseudomenardii and the FO of M. aequa were tentatively used to constrain the age of the sample between 56.7 and 57.3 Ma, assigning it to Zones P5/P4c (Wade et al., 2011).
The planktonic foraminiferal assemblage in Section 391-U1578A-8R-CC includes Igorina albeari, S. triloculinoides, G. chapmani, G. pseudomenardii, and Acarinina subsphaerica. The age of the sediments is possibly between 57.9 and 60.0 Ma based on the biostratigraphic range (FO and LO) of A. subsphaerica. (Zone P4c/P4b; Wade et al., 2011). Section 11R-CC contains only radiolarians and some sponge spicules. No planktonic foraminifera specimens were found in the sample.
The planktonic foraminiferal assemblage in Section 391-U1578A-12R-CC is poorly preserved; specimens are affected by dissolution, and several individual tests are filled with sediment. Foraminifera are still very small and low in abundance. The assemblage is not well diversified. Radiolarians are lower in number compared to the previous samples. Specimens of benthic foraminifera were also observed. Among planktonic foraminifera, specimens of I. albeari, A. subsphaerica, and G. chapmani were recorded, indicating a possible age between 57.9 and 60.0 Ma based on the presence of A. subsphaerica. Section 14R-CC includes very few radiolarians and rare benthic foraminifera. Planktonic foraminifera are not present within the sample. Section 16R-CC contains a good number of radiolarians with sporadic specimens of planktonic foraminifera. Thus, the sample is considered barren of planktonic foraminifera.
Section 391-U1578A-18R-CC contains few radiolarians and very rare planktonic individuals. Shipboard analyses indicate the presence of a high abundance of volcanic glass, basaltic lithic fragments, and fresh feldspar crystals. Rare specimens of Globanomalina compressa and S. triloculinoides were observed. A possible age between 63.5 and 62.2 Ma (Zone P1c; Wade et al., 2011) is proposed for this sample. However, due to the very low abundance of planktonic foraminifera specimens, the age is established with very low confidence.
5.3. Age-depth model
Figure F25 shows a plot of calcareous nannofossil and planktonic foraminifera biozonation ages compared to the lithostratigraphic column (see Lithostratigraphy). Hole U1578A recovered a short succession of Pliocene–Pleistocene sediments, possibly as young as the Holocene (further examination is required). Within this sediment package, a mass transport deposit was identified in Section 2R-5 after calcareous nannofossil examination was carried out on this section based on observation from sedimentologists. Examination revealed an older section that was Oligocene/mixed Eocene in age situated between late Gelasian and early Gelasian (Pleistocene) sediments. A major unconformity is also identified and is situated between Zanclean (Early Pliocene) and Ypresian (early Eocene) sediments. The exact age placement of the lower bound of this unconformity is somewhat unclear at this point. Preliminary examination indicates that the Ypresian sediments recovered are of the earliest possible Eocene and possibly straddle the Paleocene/Eocene boundary.
An age-depth plot was constructed to illustrate relative sedimentation rates. Magnetostratigraphic data was plotted with calcareous nannofossil and planktonic foraminifera ages for comparison (see Paleomagnetism). All three ages show excellent agreement in sediment packages below the unconformity. Magnetostratigraphic data are, as at all other sites, not available in the calcareous oozes recovered above the unconformity. Drilling disturbance and the unlithified nature of these sediments make any paleomagnetic data obtained from the section above the unconformity (shallower than 27 mbsf) highly unreliable (see Paleomagnetism). Thus, these data are not included in Figure F26. The unconformity is clearly illustrated on this plot, spanning a gap of ~49 My. Further examination of samples taken from the cores may alter this age gap slightly, but a significant change in the estimated time missing is not expected based on shipboard analysis of extra samples from Sections 391-U1578A-3R-5 and 3R-6 to resolve a more accurate location of the unconformity.
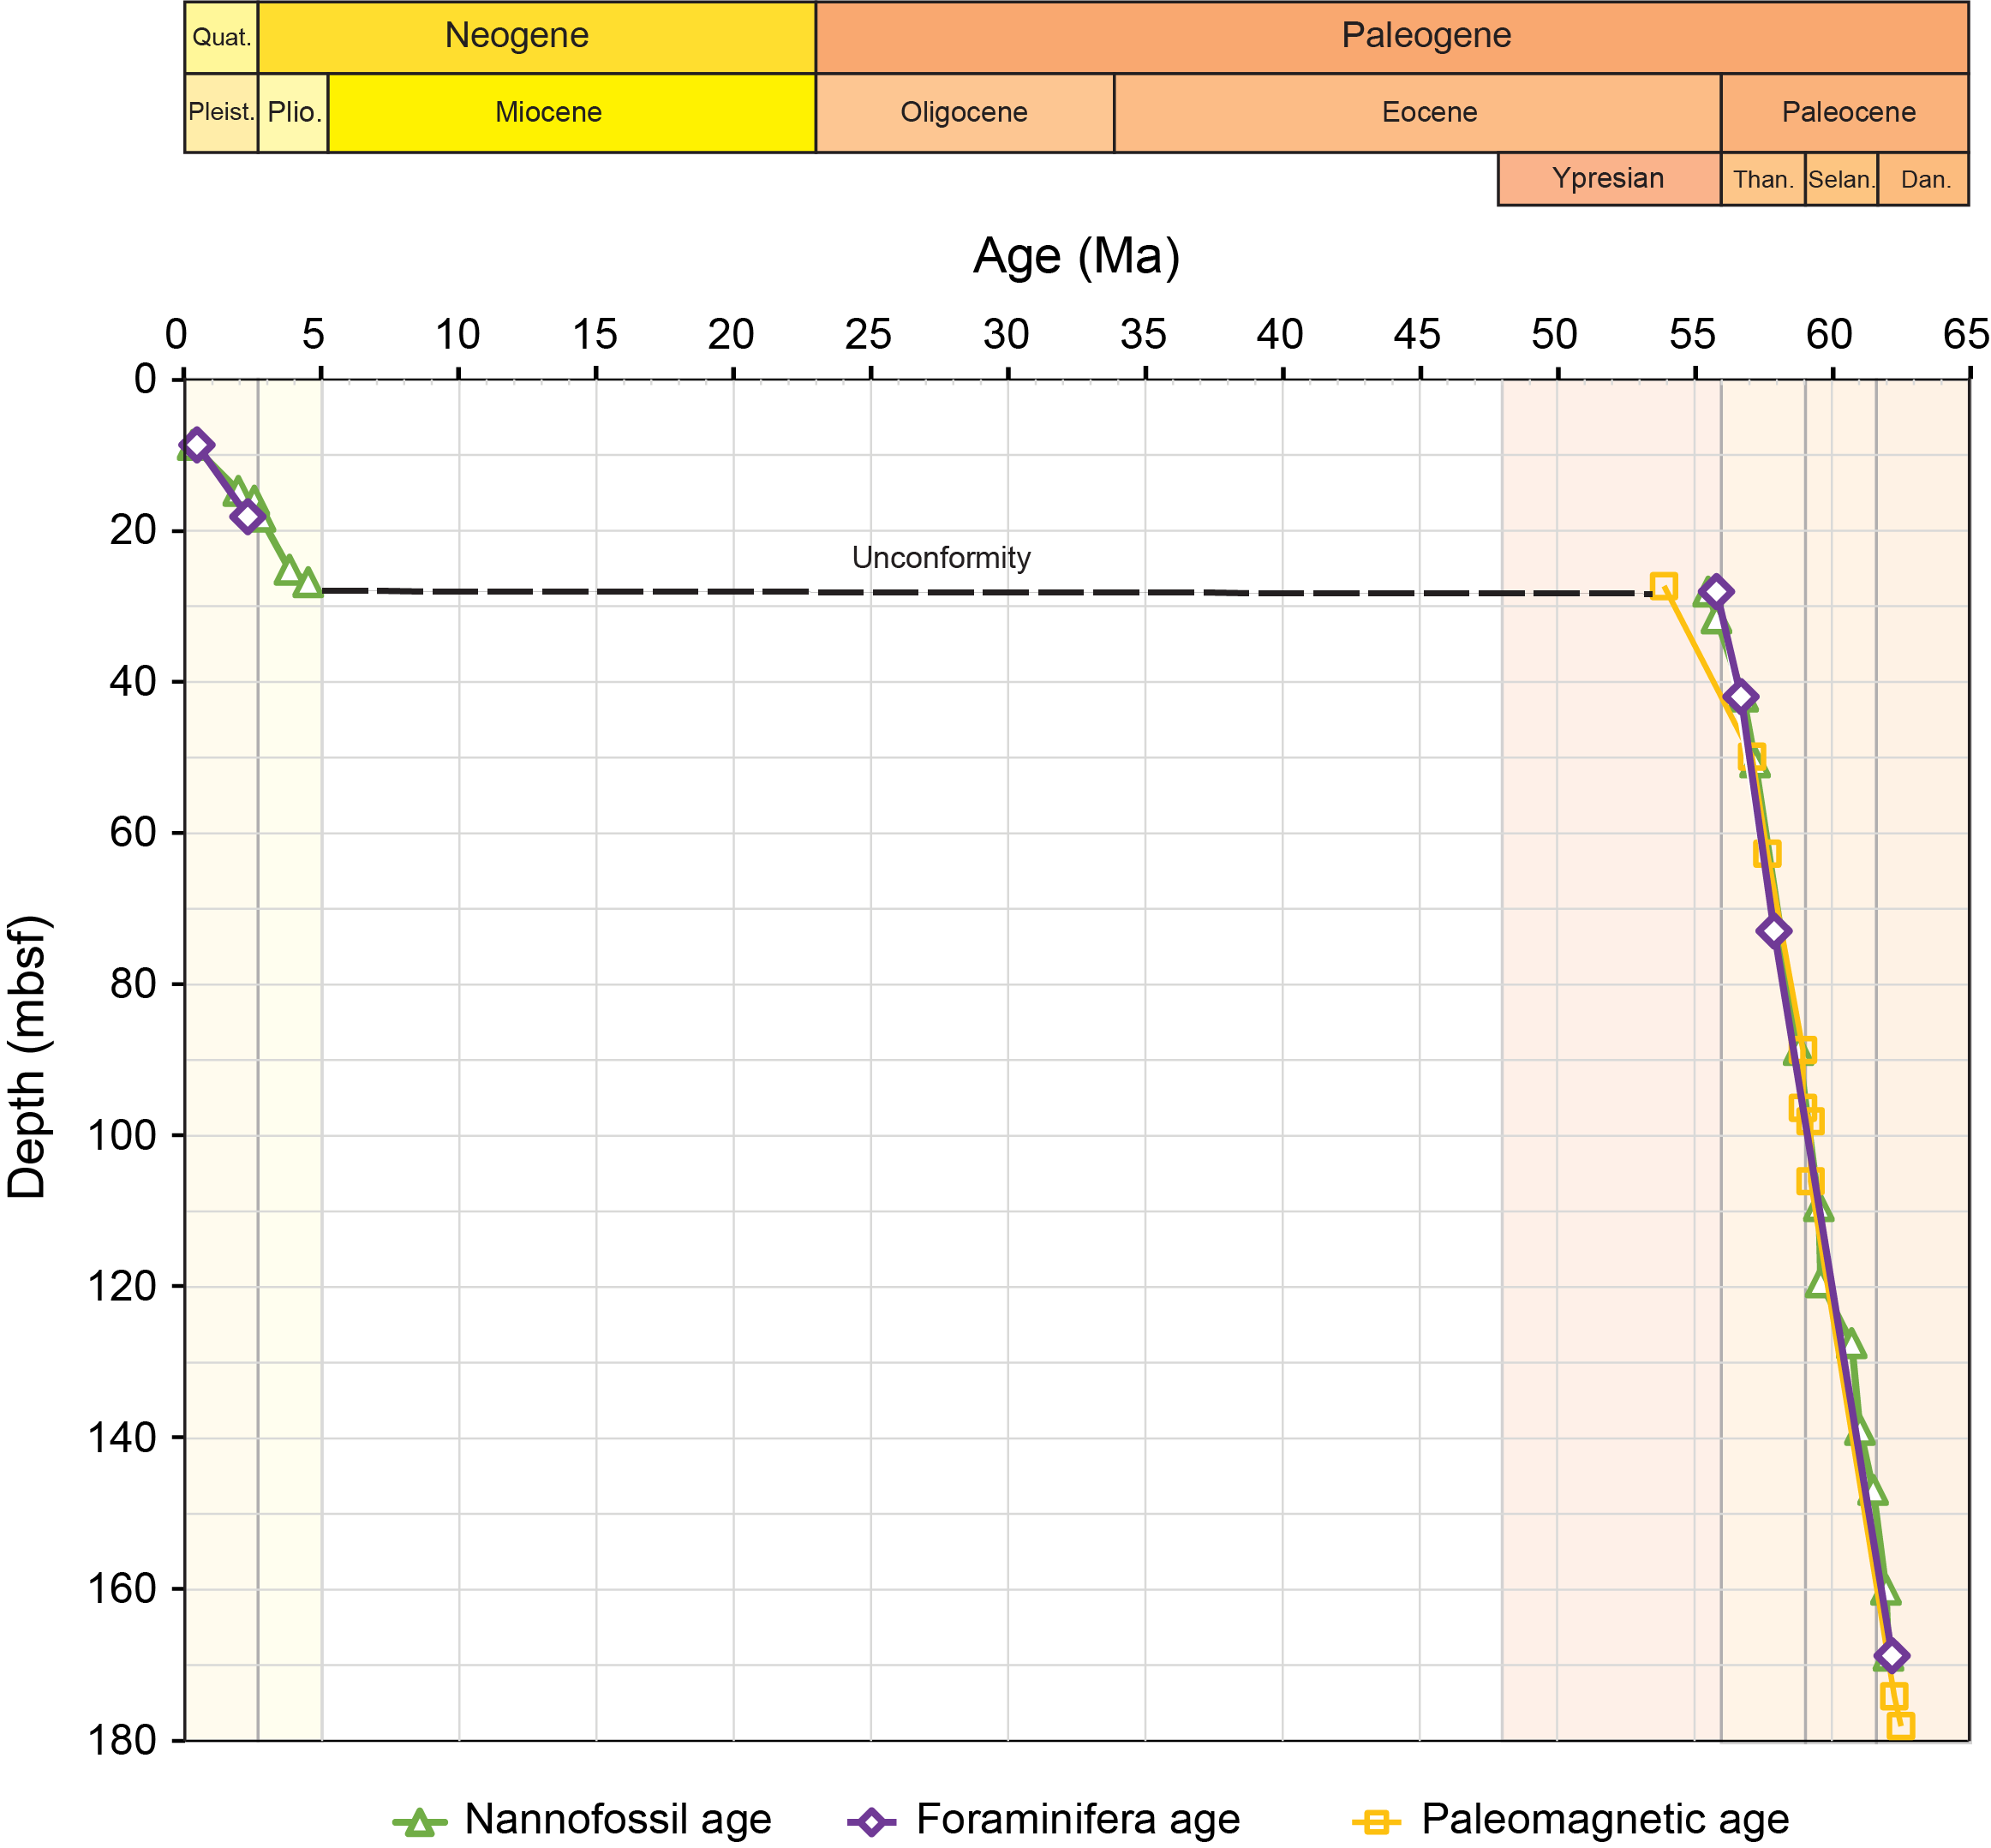
Figure F26. Age-depth model.
6. Paleomagnetism
6.1. Sediments and sedimentary rocks
6.1.1. Archive-half measurements
Paleomagnetic measurements of the archive halves of sediment RCB cores recovered from Hole U1578A (Cores 1R–19R) were conducted using the pass-through superconducting rock magnetometer (SRM) on board the ship. All sediment cores were treated with the same alternating field (AF) demagnetization steps of 10 and 20 mT after measurement of natural remanent magnetization (NRM). All recovered sediment cores consisted of partially to fully consolidated clay and chalk, which had measurable NRMs of 10−4 to 10−1 A/m. The lowest of these intensities is observed in the nannofossil ooze of Lithostratigraphic Unit I (Cores 1R–3R; see Lithostratigraphy) followed by a greater than tenfold increase in the intensity of magnetic remanence observed in Section 3R-6. After this increase in magnetization, the variation of magnetic inclinations measured by the SRM decreases dramatically and magnetic intensity continues to slowly increase with depth downhole. In all, 64 sediment archive halves totaling 85.8 m of core were demagnetized and measured (Figure F27).
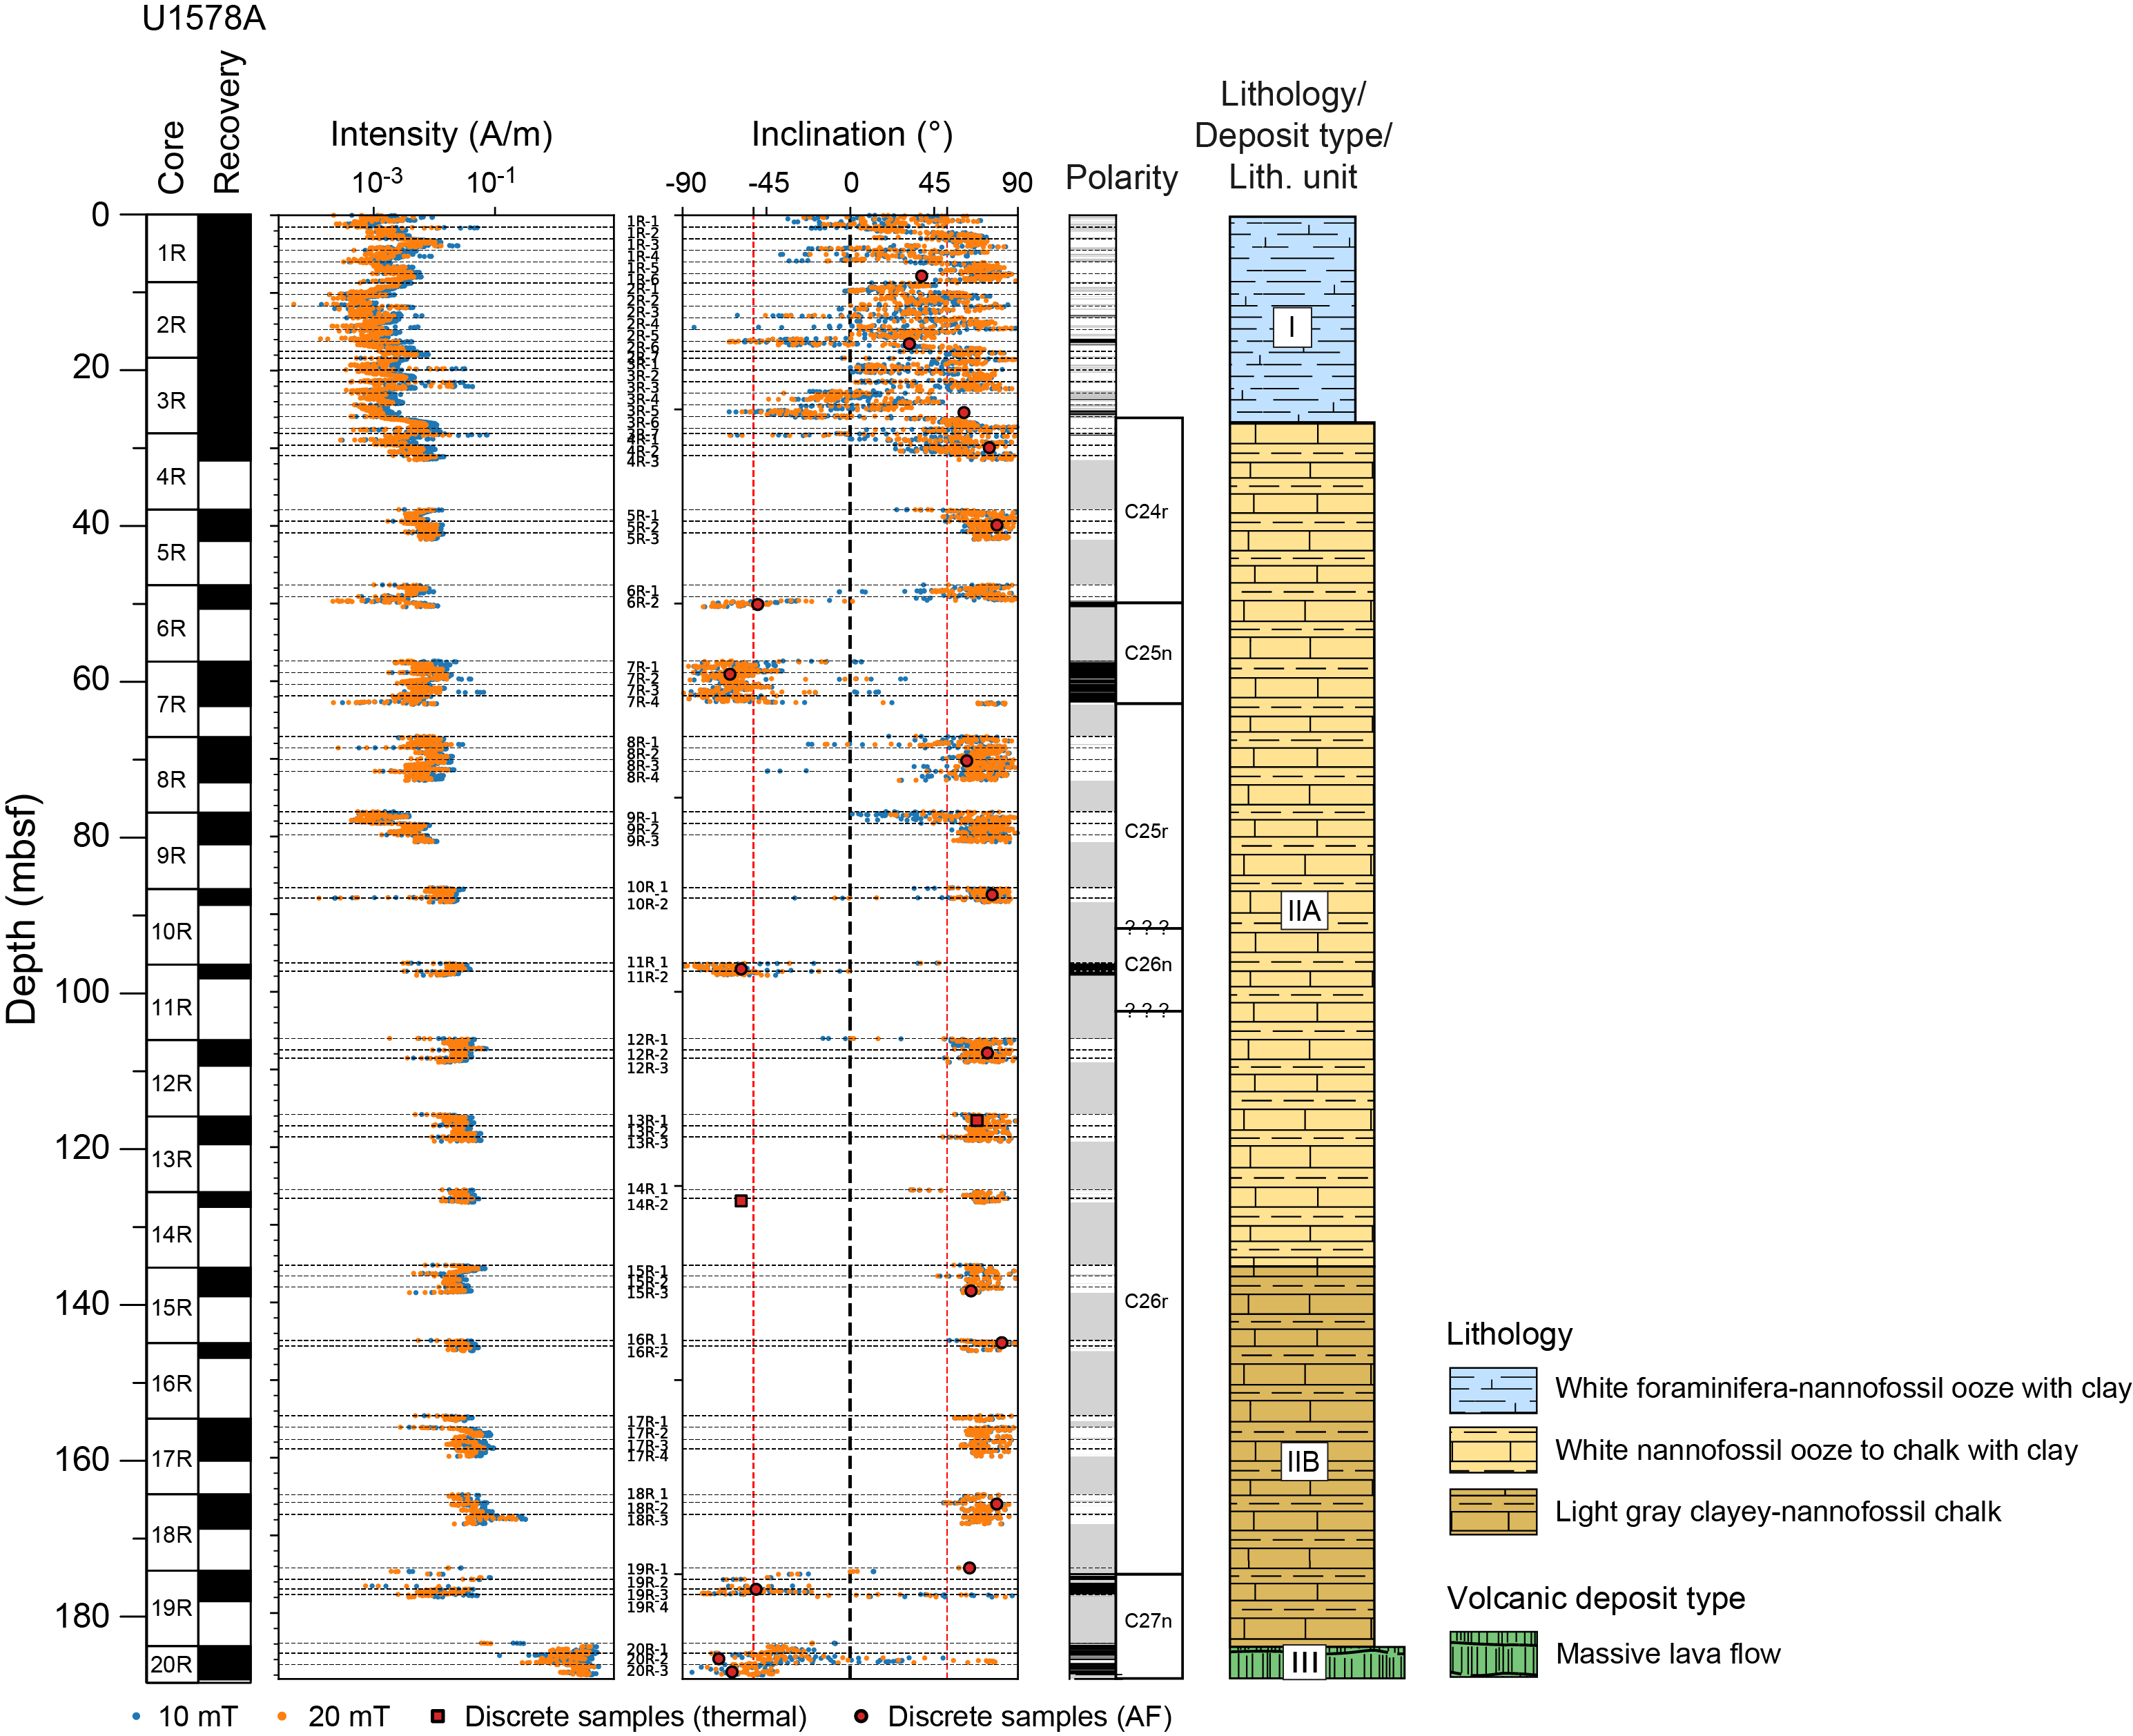
Figure F27. Magnetic intensity and inclination.
The average of the 20 mT step inclinations for the consolidated sediments from Hole U1578A was calculated using the method of McFadden and Reid (1982). We obtained average inclinations of 69.9° and −67.6° for sediments with positive and negative inclinations, respectively (Figure F28). The slightly steeper positive inclination is consistent with a drill string overprint in some of the sections that persisted after the 20 mT demagnetization step, although the inclinations are sufficiently steep that this likely does not affect our polarity assignments (Acton et al., 2002). Both of these inclination values are slightly steeper than the geocentric axial dipole (GAD) inclination of −51.6° for this site location. We did not assign an uncertainty to the average inclinations of the SRM data because the degree of independence of the 2 cm SRM measurements is questionable such that any uncertainty we could estimate would be of dubious reliability.
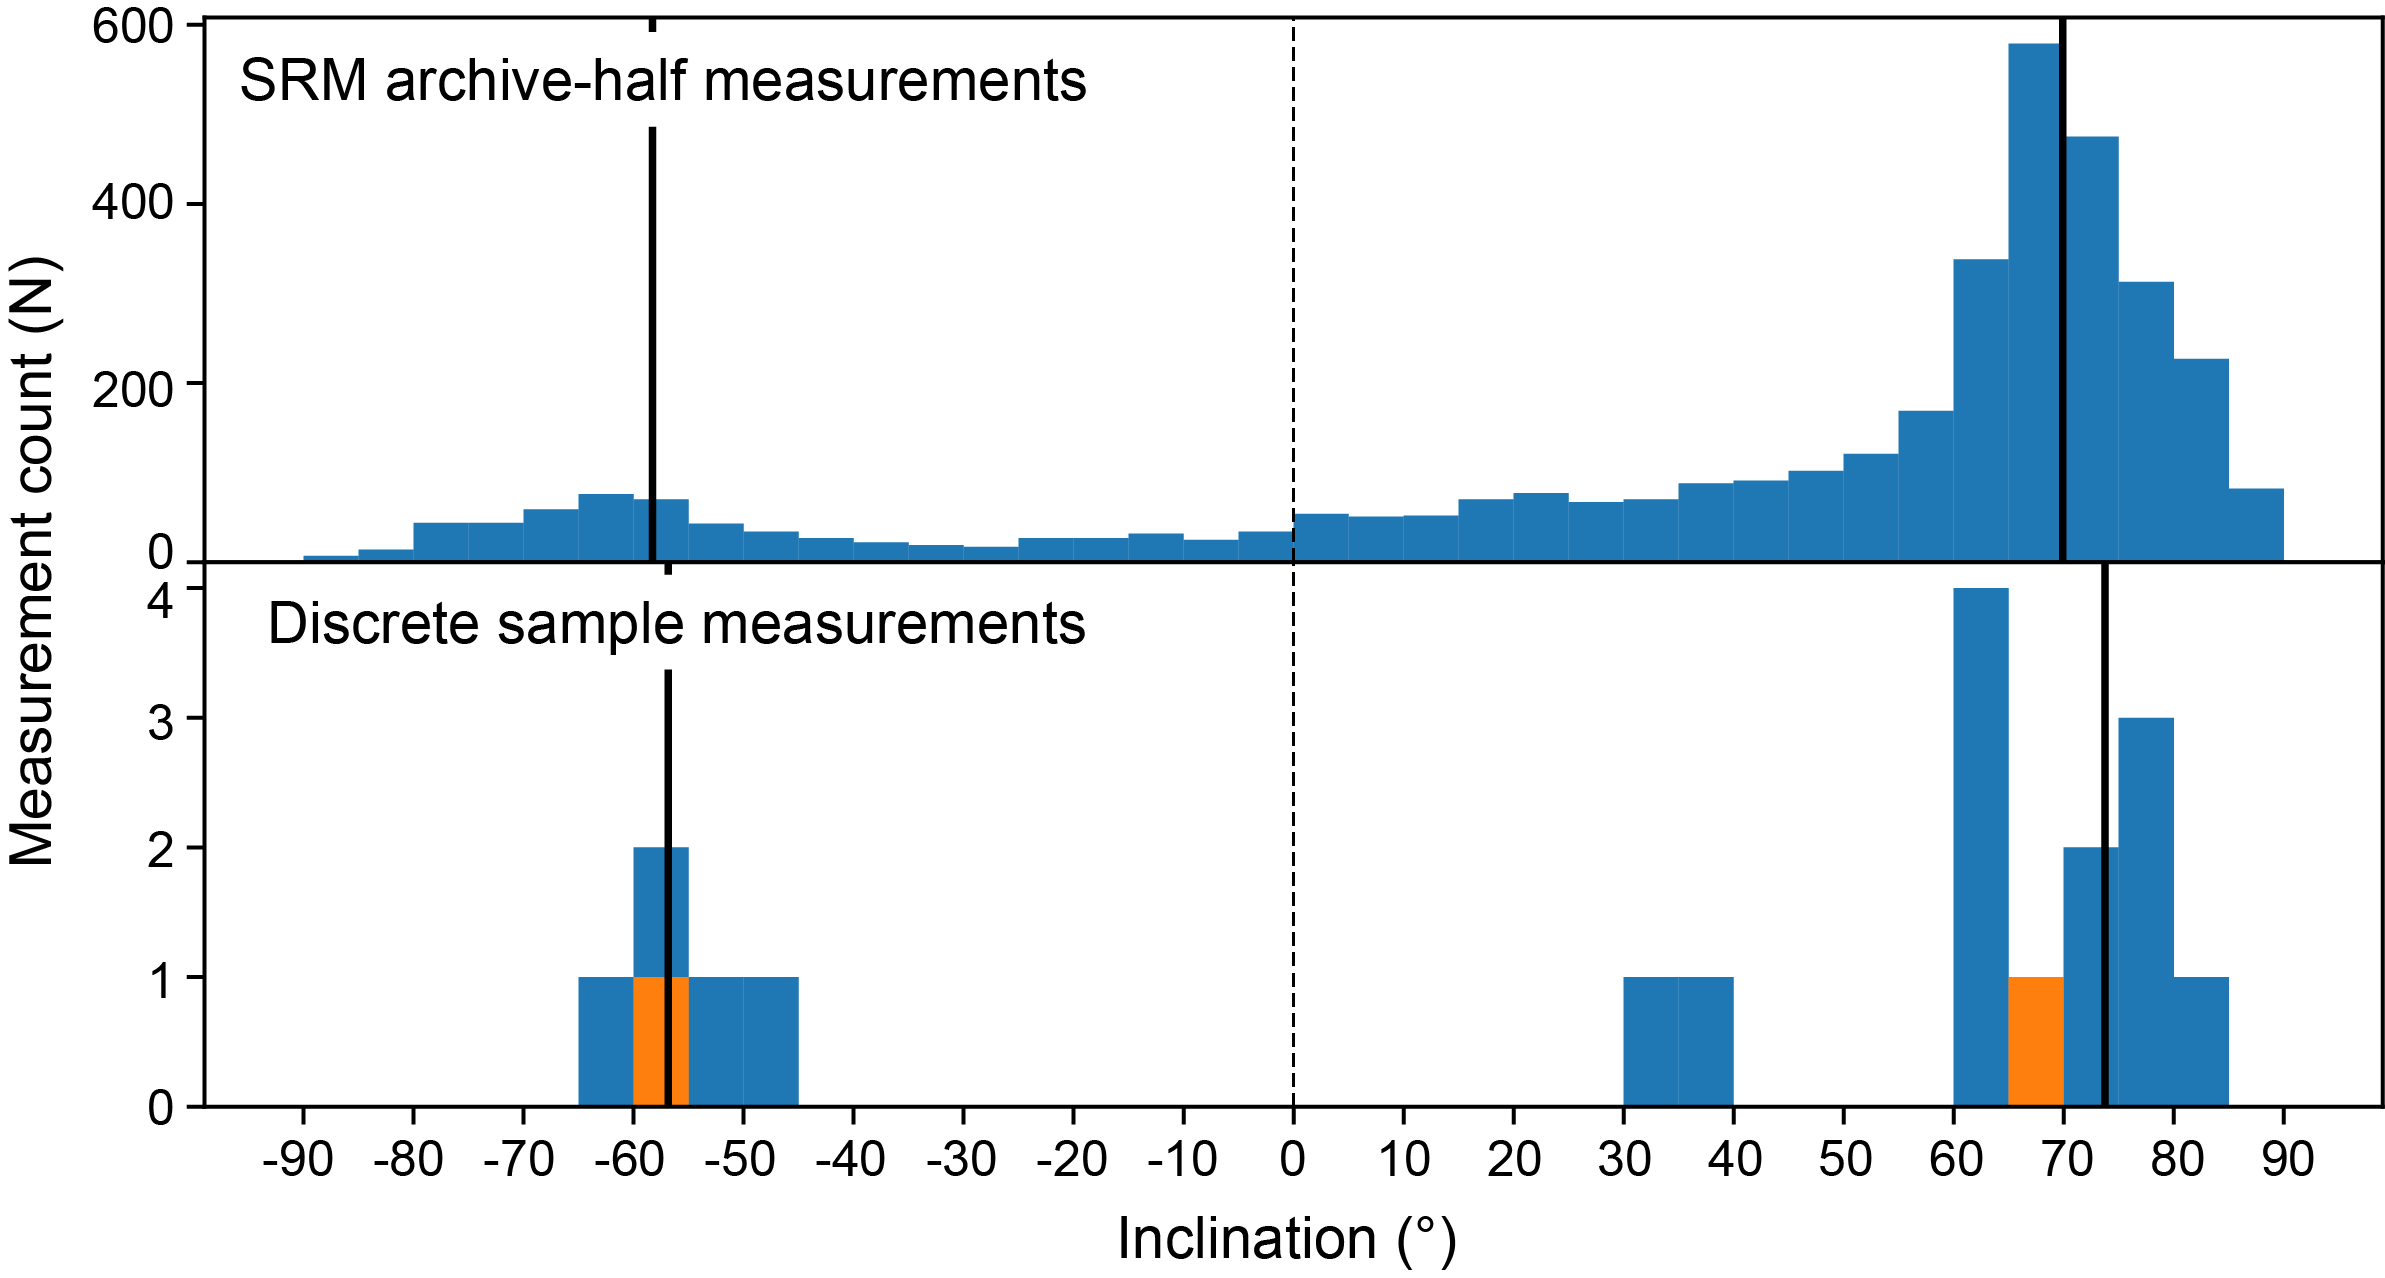
Figure F28. Distributions of inclination from sediments.
6.1.2. Discrete sample measurements
Discrete samples were collected from unconsolidated sediments using plastic 7 cm3 Japanese-style sediment cubes, whereas cubic discrete samples from more lithified sediments were prepared using a dual-bladed circular saw. We collected a total of 20 discrete samples from Hole U1578A sediments, including 11 plastic cubes, that were all used for AF demagnetization. Of the rest of the samples, three were thermally demagnetized and the remaining six were AF demagnetized.
Most samples had magnetizations strong enough to be measured using the AGICO JR-6A spinner magnetometer and had directions that were successfully fit with principal component analysis (PCA). AF demagnetization spectra are consistent through the sediment cores. Median destructive fields (MDFs) are quite high, ranging around 30 to 50 mT (Figure F29). Thermal demagnetization spectra show a large range of unblocking temperatures within each sample, from 200° or 300° to 600°C (Figure F30). This suggests the presence of a mixture of titanomagnetite with various Ti concentrations and magnetite as magnetization carriers.

Figure F29. AF demagnetization result for a representative sediment sample.
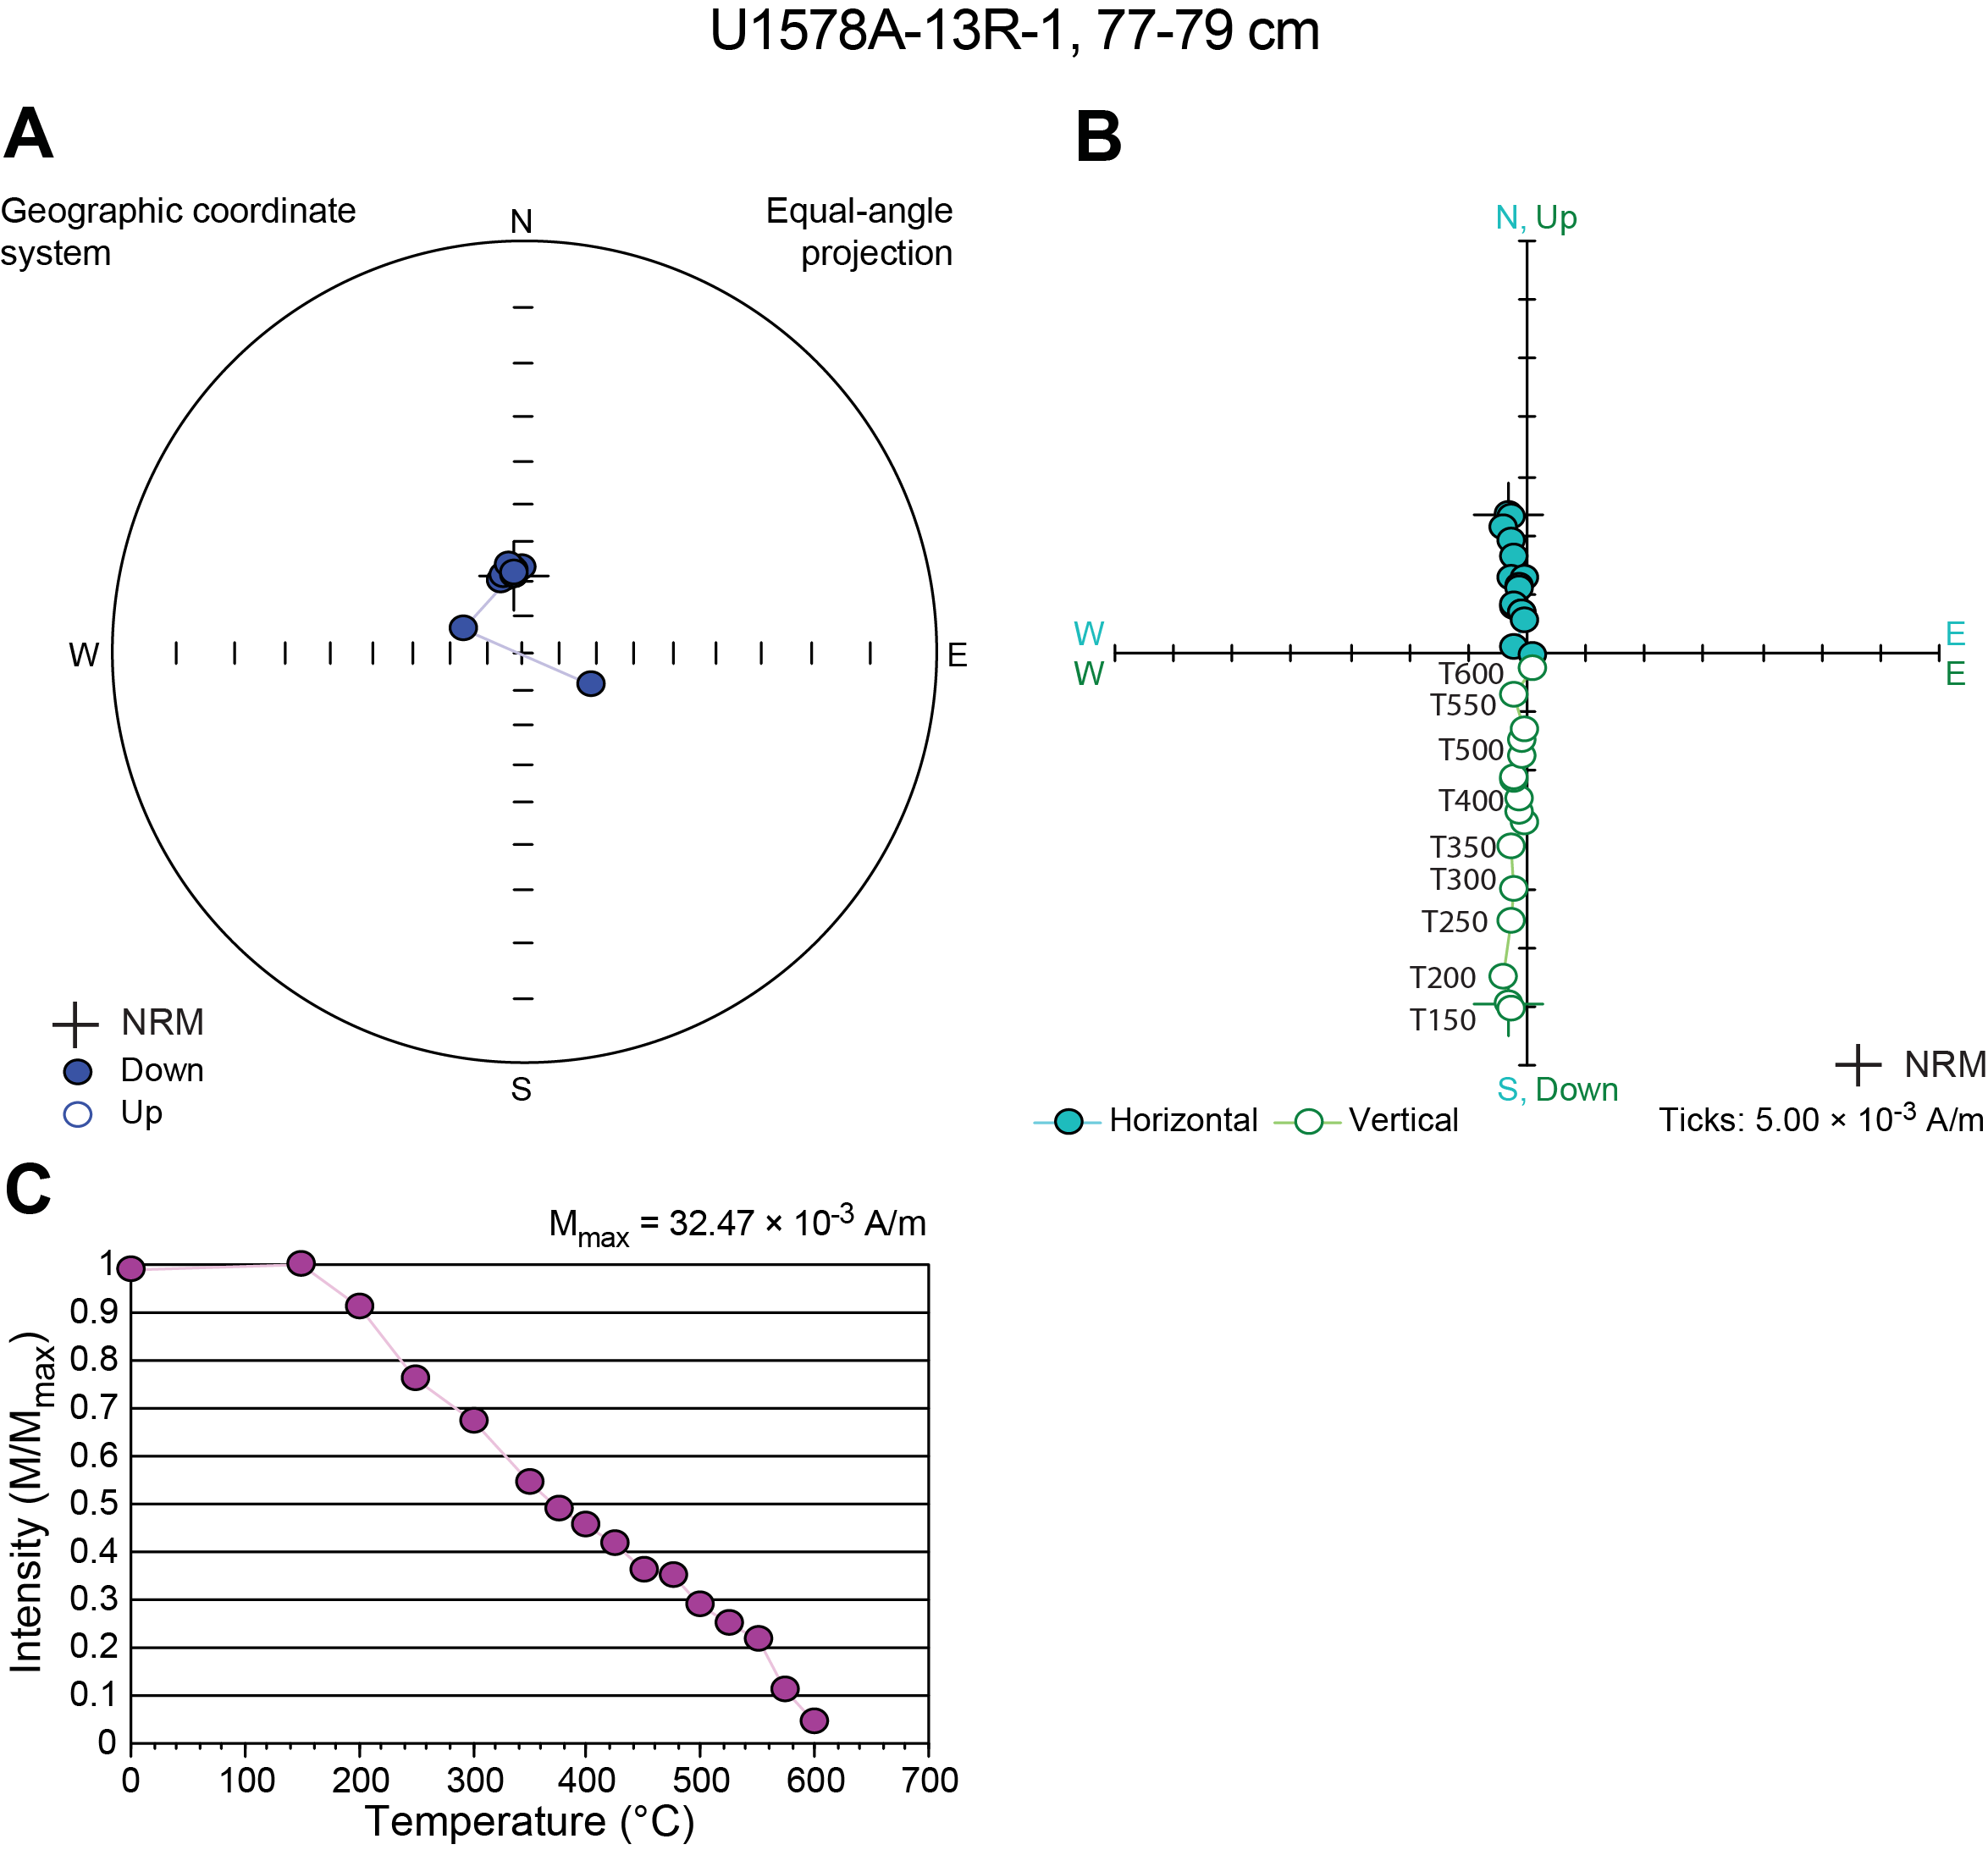
Figure F30. Thermal demagnetization result for a representative sediment sample.
In total, 16 AF demagnetized samples and 2 thermally demagnetized samples gave reliable inclination values (N > 4 data points included in the PCA fit and maximum angular deviation <15°), with surprisingly linear Zijderveld diagrams. One AF demagnetized sample yielded poor quality inclination values (maximum angular deviation >15°). The AF demagnetized samples generally contain low coercivity overprints that were typically removed by AF cleaning at 10 mT and are consistent with being drilling induced (e.g., Acton et al., 2002).
We identified 13 positive and 5 negative inclination characteristic remanent magnetizations (ChRMs), which may be indicative of magnetic polarities if these magnetizations represent primary detrital remanence. With the exception of one sample, the most reliable inclination values calculated with PCA agree well with the SRM inclinations after 20 mT AF demagnetization (Figure F27). The average inclination of the reversed polarity discrete sediment samples is 73.8° ± 12.5°, and the average inclination of the normal polarity discrete sediment samples is −56.8° ± 7.4° (95% confidence).
6.1.3. Magnetostratigraphy
Magnetic polarity was interpreted from paleomagnetic inclinations measured from archive halves after the 20 mT AF demagnetization step for most consolidated sediments. PCA fit directions obtained from ChRM components for discrete samples were checked against the SRM inclination values and the interpreted magnetic polarity, where available.
For Cores 391-U1578A-1R through 3R, we did not assign polarity zones partially because the dispersion of magnetic inclination is high, although the directions are consistent with a single reversed interval. More importantly, shipboard biostratigraphy revealed slumps of Oligocene sediments in an otherwise predominantly Pleistocene section, suggesting that interpreting this reversed interval as a single chron would be incorrect (see Biostratigraphy).
We assigned polarity zones to sedimentary Cores 391-U1578A-4R through 19R (Figure F27) following chron ages from Ogg (2020). In total, we observed six polarity chrons: Chron C24r (57.101–53.900 Ma) in Core 4R to the top of Chron C27n (62.278 Ma) in a hyaloclastite layer in Core 19R above the contact with the basement. This sequence of polarity chrons is consistent with a Ypresian to Danian interval (Paleocene) defined by biostratigraphy (see Biostratigraphy).
Despite sediment recovery of <50% for most of Cores 391-U1578A-4R through 19R, we did not see any major breaks in the magnetostratigraphy, and we managed to capture three of five reversals in the recovered sections. The magnetostratigraphy suggests that the Paleocene/Eocene boundary would be found somewhere in Cores 4R–6R if it was recovered. Cores 7R–19R represent a long Paleocene section that intersects the basement in the late Danian. The reversal between Chrons C26r and C27n (62.278 Ma) in Core 19R provides a bound on the basement age.
6.1.4. Magnetic properties
Bulk susceptibility measurements were conducted for 16 total discrete samples collected from Cores 391-U1578A-1R through 19R using an AGICO Kappabridge KLY 4 MS meter. MS values range 1.5 × 10⁻⁵ to 1.7 × 10⁻³ SI.
Stepwise isothermal remanent magnetization (IRM) curves and backfield remanence curves were acquired for eight discrete samples (Figure F31) to measure the coercivity of remanence Bcr (i.e., the field that must be applied to bring the saturation IRM to zero). Magnetization increased sharply when a field up to about 200 mT was applied and then increased more slowly until a field of 1.2 T was applied. This suggests the presence of principally titanomagnetite-like magnetic carriers as well as a second, higher coercivity magnetic mineral that is likely hematite because the thermal demagnetizations all show high unblocking temperatures. Because the magnetization was very close to saturation at 1.2 T, we were able to calculate the S-ratio as the ratio of IRM−0.3/IRM1.2, often used as a proxy for quantifying the fraction of hard-coercivity minerals. S-ratios vary from 0.730 to 0.953, with the smallest values mostly between Cores 391-U1578A-5R and 10R. These values show the presence of hematite in quantities that vary through the sediment cores. Bcr values range 30–50 mT for seven of the samples. The least saturated sample has a Bcr value as high as 65 mT. The high coercivity of the hematite component is likely responsible for increasing the bulk Bcr values.
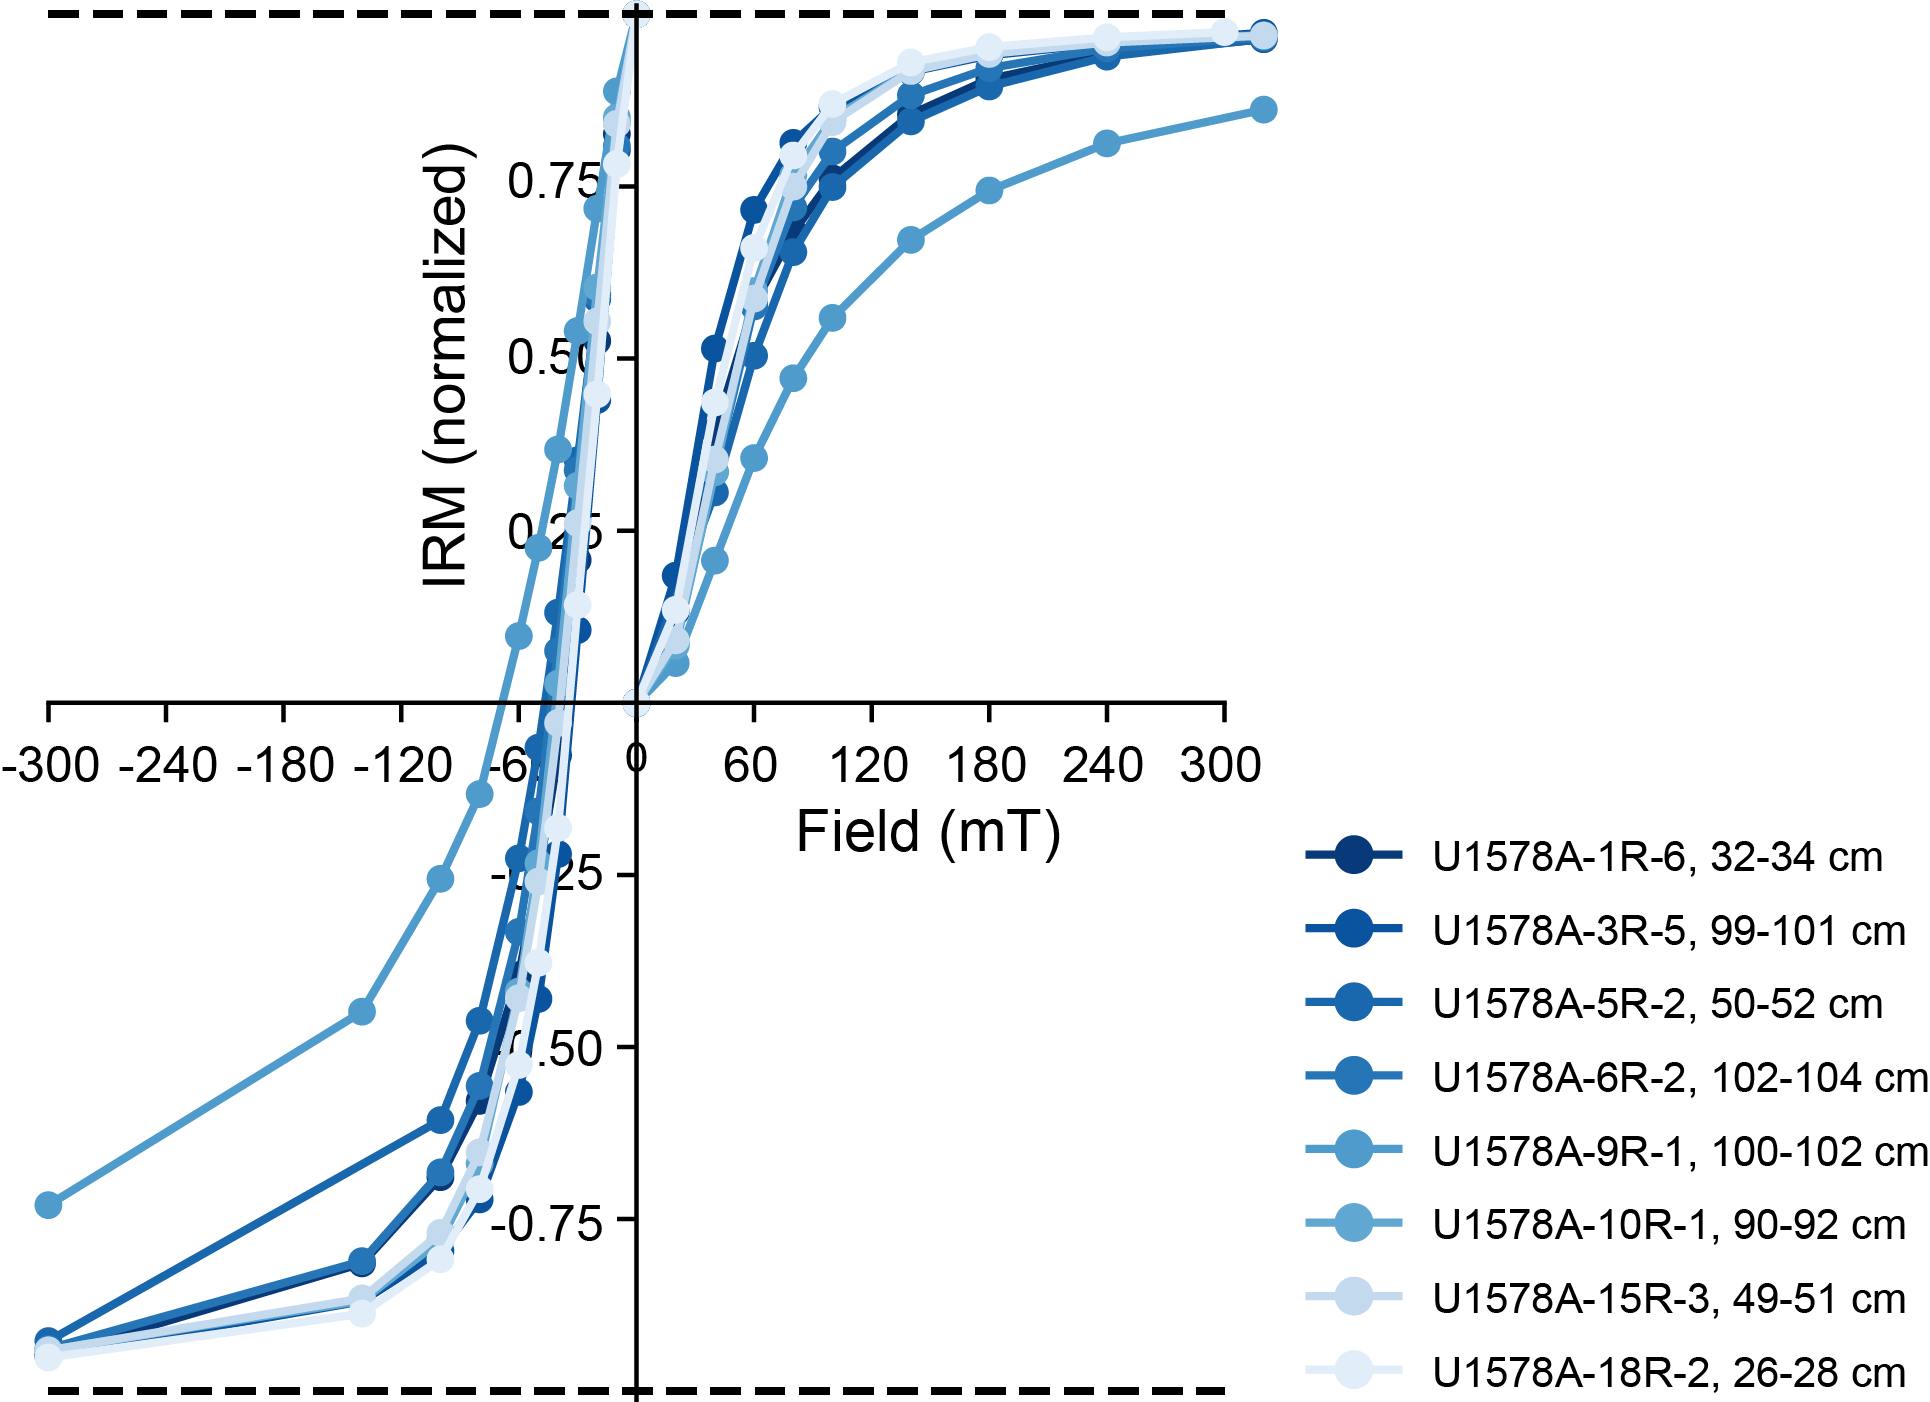
Figure F31. IRM acquisition curves and backfield curves for sediment samples.
6.2. Igneous rocks
6.2.1. Archive-half measurements
Paleomagnetic measurements of the archive halves of igneous RCB cores (391-U1578A-20R through 65R) were conducted using the pass-through SRM on board the ship. Archive halves were demagnetized at AF levels of 5, 10, 15, and 20 mT after the initial NRM measurements. When discussing the igneous RCB cores, we are referring to the dominantly igneous cores which contained igneous rock as well as occasional hyaloclastite and pelagic sediments interbedded between the basalt flows. In all, 151 igneous archive-half sections totaling 302.6 m of penetration were demagnetized and measured (Figure F32).

Figure F32. Magnetic measurements.
Most of the igneous RCB cores contain low-coercivity overprints that may be drilling induced (e.g., Acton et al., 2002). After AF cleaning to 20 mT, Cores 391-U1578A-20R through 45R typically exhibited a normal polarity magnetization, whereas Cores 46R–65R typically exhibited a reversed polarity magnetization. The average inclinations, calculated using the method of McFadden and Reid (1982) after cleaning the igneous cores to 20 mT, are 54.8° and −51.5° for the positive and negative inclinations, respectively (Figure F33). This average inclination is similar to the GAD inclination of −51.6°.

Figure F33. Distributions of inclination values from igneous rocks.
6.2.2. Discrete sample measurements
A total of 141 discrete sample cubes (7 cm3) were taken from the basalts and interbedded sediments at a frequency of approximately one sample per core section using a dual-bladed circular saw. A total of 55 cubes were subjected to thermal demagnetization, and the remaining 86 cubes were subjected to AF demagnetization. Samples from Cores 391-U1578A-20R through 26R and 31R–37R are characterized by MDFs ranging 15–35 mT (Figure F34) and thermal demagnetization spectra that show either a sharp unblocking around 550°C or a very progressive unblocking over a temperature range of 300°–600°C (Figure F35). Most samples from these cores gave reliable inclinations from PCA after the removal of a small overprint. Samples from Cores 27R–31R have Zijderveld diagrams for thermal demagnetizations with erratic behavior, but most AF demagnetizations still led to reliable inclination determinations. Demagnetizations of samples from Cores 37R–46R had a high failure rate; a ChRM could be defined for only about one quarter of the samples, either because the thermal demagnetization behaviors were erratic or because Zijderveld diagrams for AF demagnetizations did not point toward the origin due to acquisition of spurious remanence during the demagnetization experiment. Finally, samples from the lowermost part of the hole (Cores 50R–65R) gave magnificent results: all demagnetized samples have very linear Zijderveld diagrams, with MDFs between 10 and 60 mT and unblocking temperatures between 200° and 600°C, showing again the coexistence of magnetic phases with various contents of Ti within a single sample. Overall, reliable inclination values could be obtained from 73% of the discrete samples.
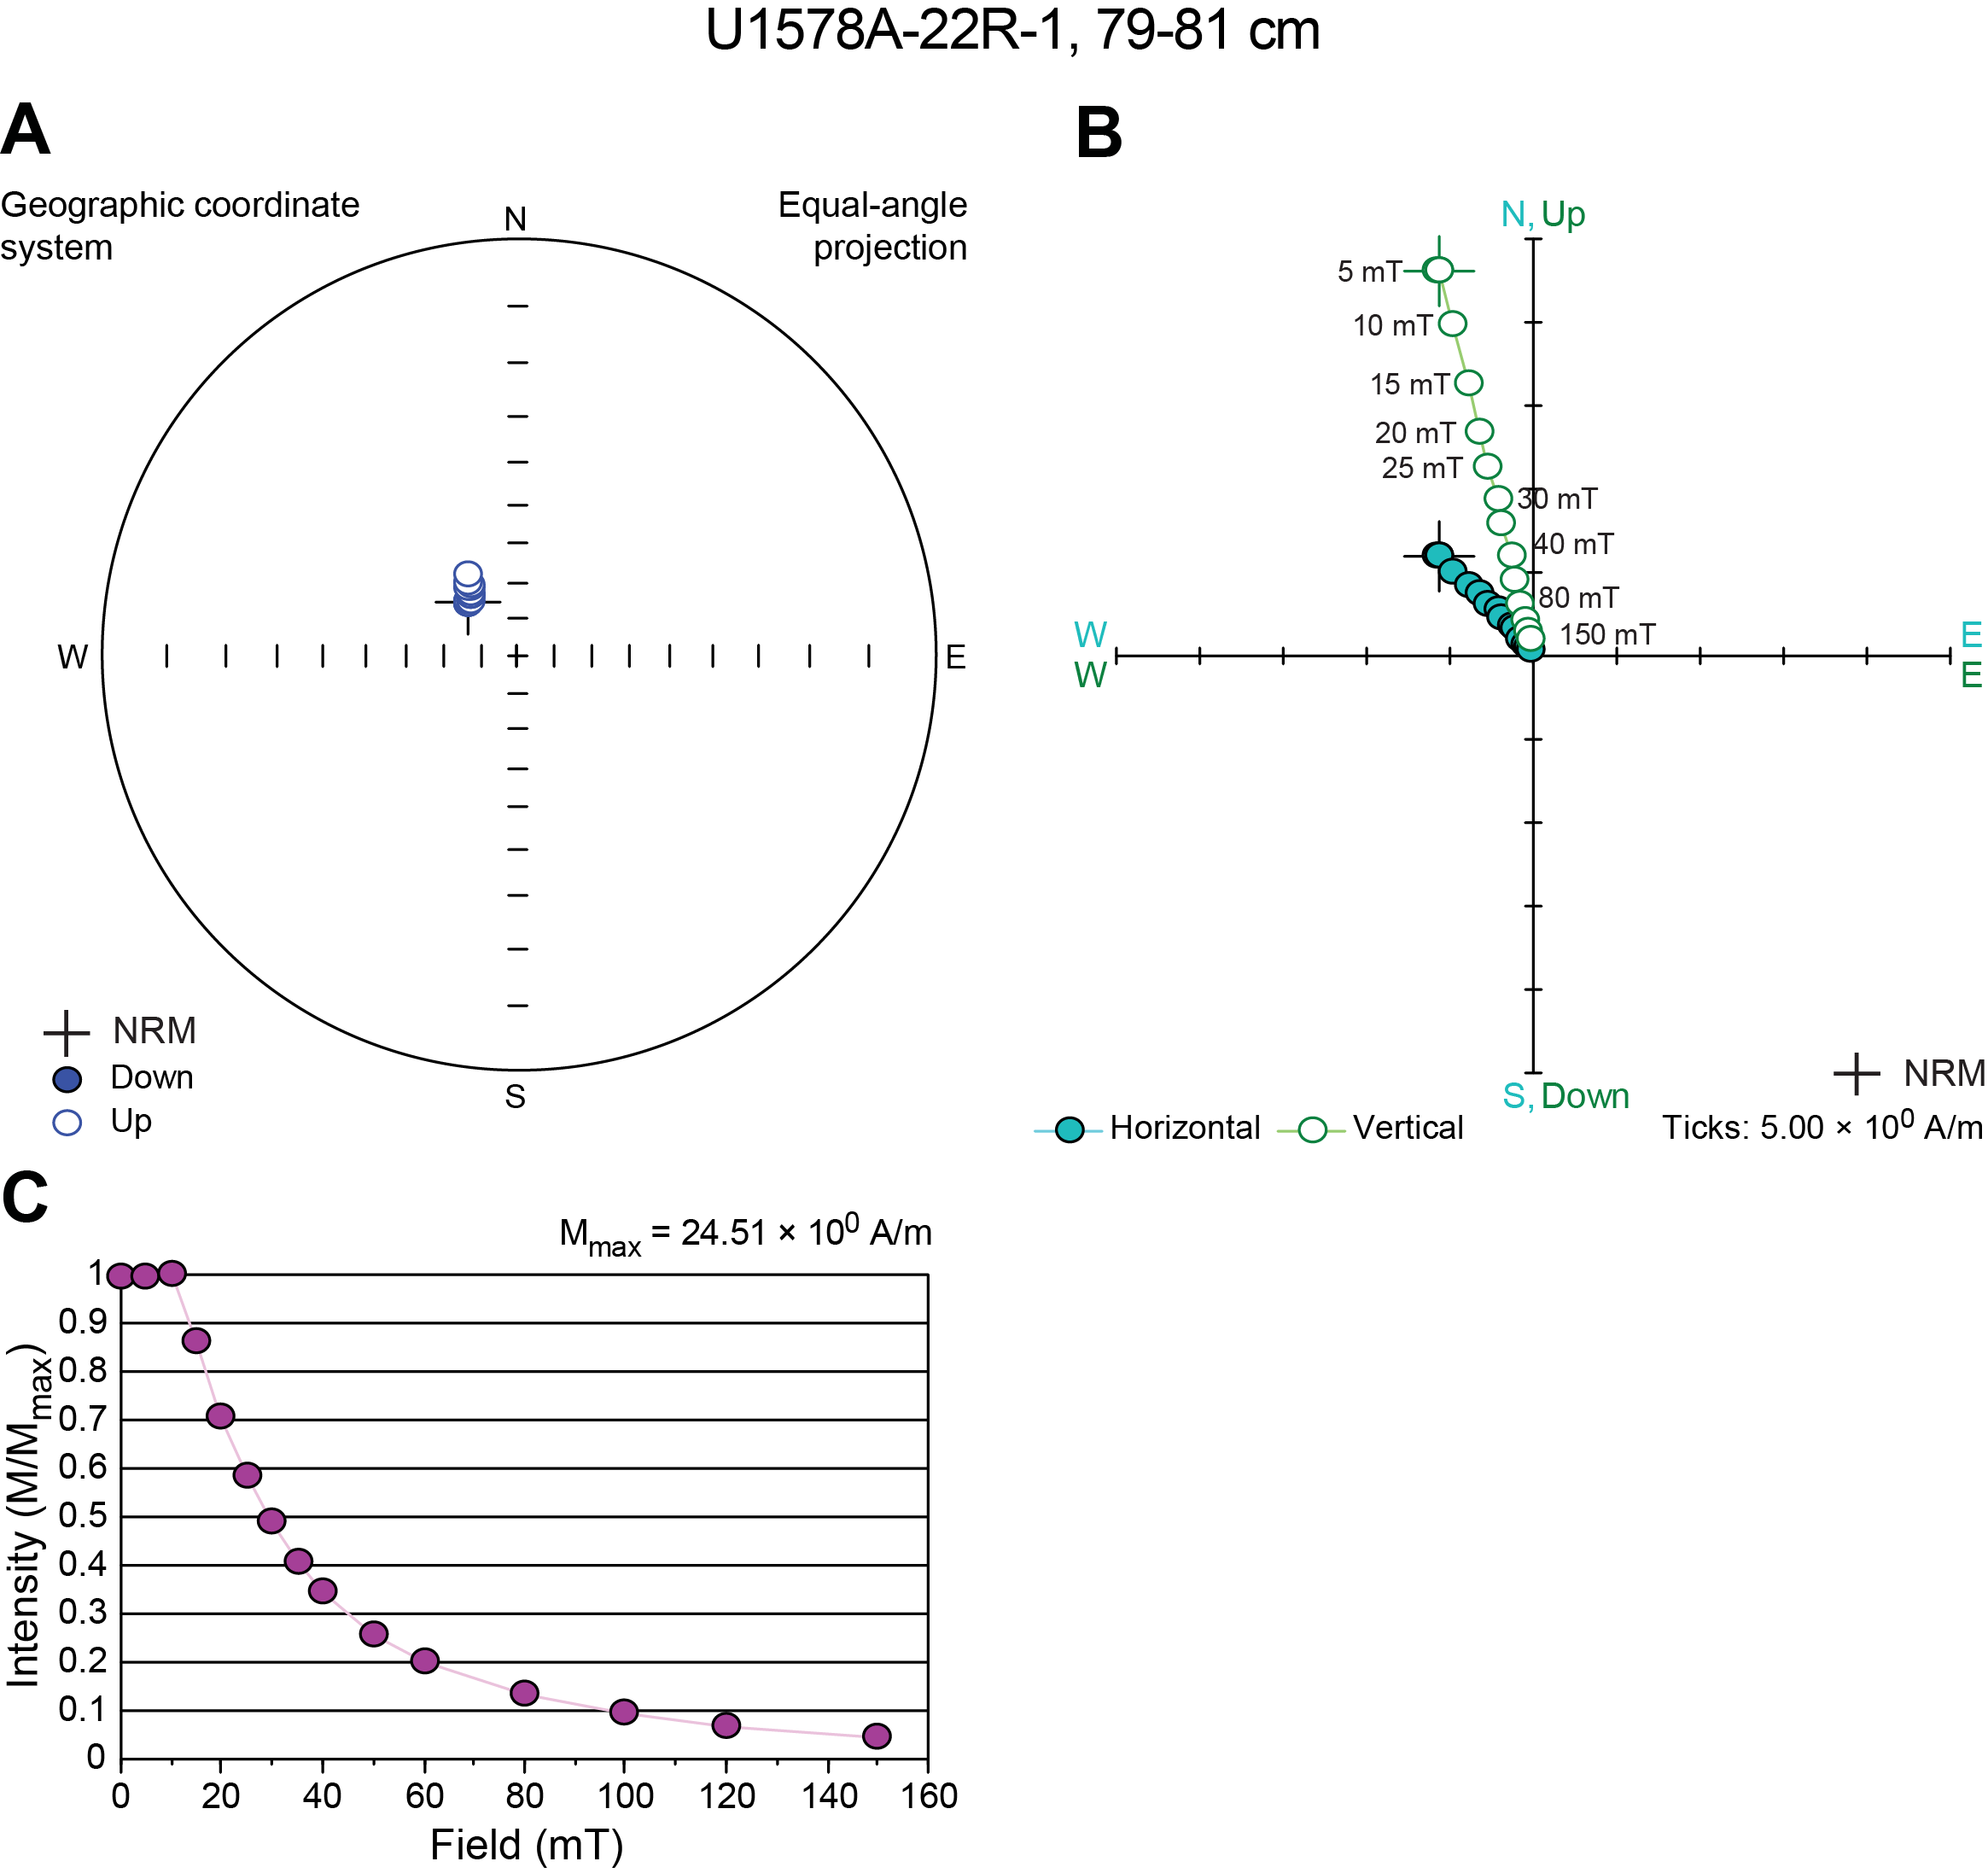
Figure F34. AF demagnetization result for a representative basalt sample.
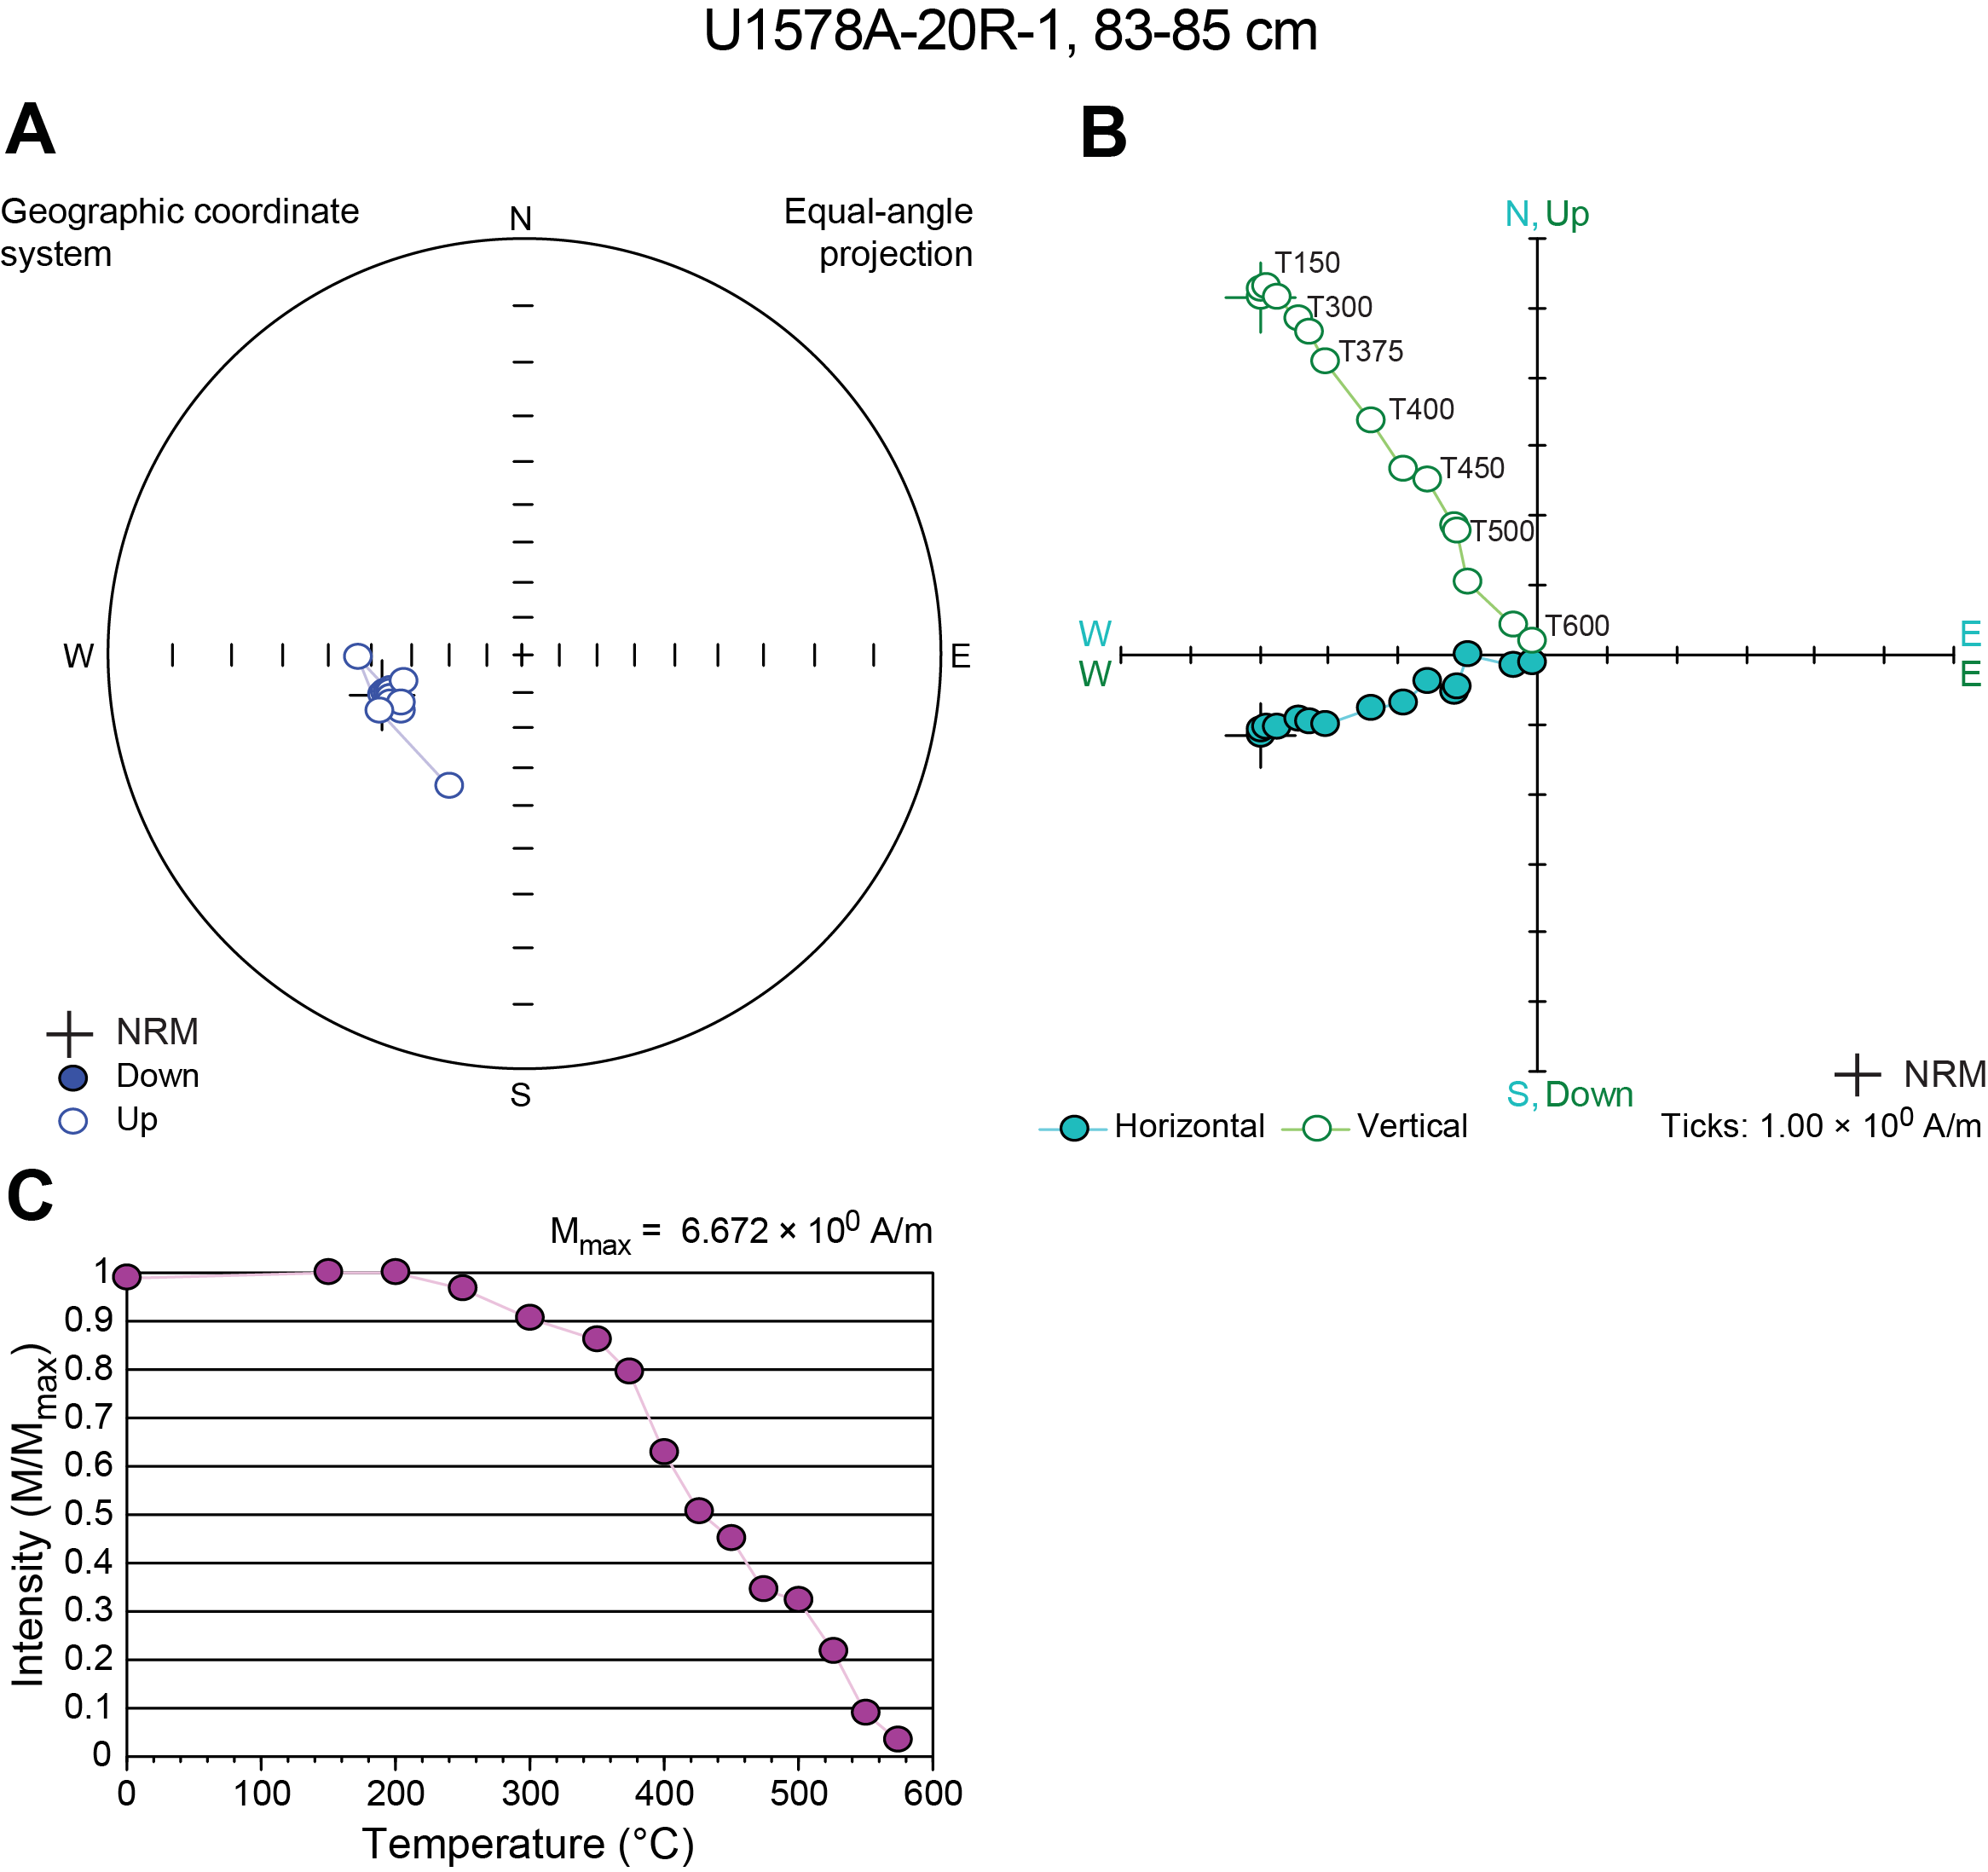
Figure F35. Thermal demagnetization result for a representative basalt sample.
In general, the discrete sample inclinations are in good agreement with the archive-half measurements of inclination after the 20 mT AF demagnetization step (Figure F32). The distribution of inclinations calculated from discrete AF and thermal demagnetizations are similar and comparable with the 20 mT AF step measured on archive halves (Figure F33). All average inclinations were calculated using the protocol of McFadden and Reid (1982). Inclination ChRM component directions with maximum angular deviation values <15° and N > 4 were used to calculate overall site mean inclinations of 51.7° and −55.8° for the positive and negative inclinations, respectively. Because we did not estimate cooling units, we do not report an uncertainty on this number, calculate a paleolatitude, or estimate the degree to which secular variation is averaged downhole.
6.2.3. Magnetostratigraphy
Igneous archive half measurements and discrete igneous rock samples from Hole U1578A typically show normal polarity in the upper two-thirds of the hole and reversed polarity in the bottom one-third of the hole (Figure F32). The sediment/basement contact in Core 391-U1578A-20R is interpreted to occur just below the reversal between Chrons C27n and C26r (62.278 Ma) observed in Core 19R. This would generally indicate, assuming no hiatus, that the normal polarity chron in Cores 20R–22R is Chron C27n (62.530–62.278 Ma). This is followed by a brief reversed polarity chron in Core 23R, which shifts back to normal polarity in the last section of the core. This brief reversal is entirely contained in intercalated Sedimentary Interbed S1 and possibly represents Chron C27r (63.5–62.5 Ma). The long normal polarity chron in most of the basement sequence (Cores 24R–45R) is then most likely Chron C28n (64.645–63.537). This interpretation is supported by a biostratigraphic marker from some intercalated sediment in Section 31R-5 constrained to >63.0 Ma (see Biostratigraphy). A final reversal, observed in Core 46R, marks the boundary between Chrons C28n and C28r (64.862–64.645). From there, Chron C28r continues downhole through Cores 46R–65R to the base of the drilled sequence. This observation implies that a geologic time span of >2.0 My was recovered from Hole U1578A, spanning from near the top of Chron C27n to about halfway through Chron C28r.
Although the above interpretation is favored, it is worth noting that it hinges on Chron C27r (63.5–62.5 Ma), a ~1 My duration chron nearly as long as Chron C28n (64.645–63.537; 1.1 My long), which makes up most of the succession and is contained entirely within Core 391-U1578A-23R and the unrecovered sediment overlying it. In contrast, if this layer is interpreted as being remagnetized or otherwise anomalous, then the most obvious interpretation is that the sediment/basement contact represents a ~1 My hiatus followed by Chrons C28n and C28r in the basement. This would imply >1 My of recovered volcanic history in Hole U1578A, about half of which is implied by our preferred interpretation.
6.2.4. Magnetic properties
Bulk MS and anisotropy of MS were measured on 70 discrete AF demagnetization specimens from the basement sequence, including basalts and volcaniclastic rocks but excluding intercalated sediments. Bulk susceptibility values range from 2.62 × 10⁻⁴ to 5.67 × 10⁻² SI. Corrected degree of anisotropy (Pʹ) ranges 1.00–1.09. Shape factors (T) vary between −0.79 and 0.86. Of 70 basalt specimens, 32 have 0 < T < 1, indicating that the anisotropy in these specimens is largely controlled by foliation. The remaining 38 specimens have −1 < T < 0, indicating that their anisotropy is lineation dominated.
IRM acquisition curves were obtained for five samples, as were backfield curves, to measure the coercivity of remanence Bcr (Figure F36). The IRM of four out of five samples saturates by 100 mT, which is a saturation field much smaller than that of the sediments and indicates the absence of high-coercivity minerals. The lowermost sample has a much higher saturation field; this sample did not fully demagnetize when subjected to an AF of 200 mT. Bcr values are between 10 and 20 mT, which are typical values for multidomain magnetite (e.g., Thompson and Oldfield, 1986). According to these results, the magnetization is most likely carried by pseudo–single domain to multidomain titanomagnetite with various Ti content.
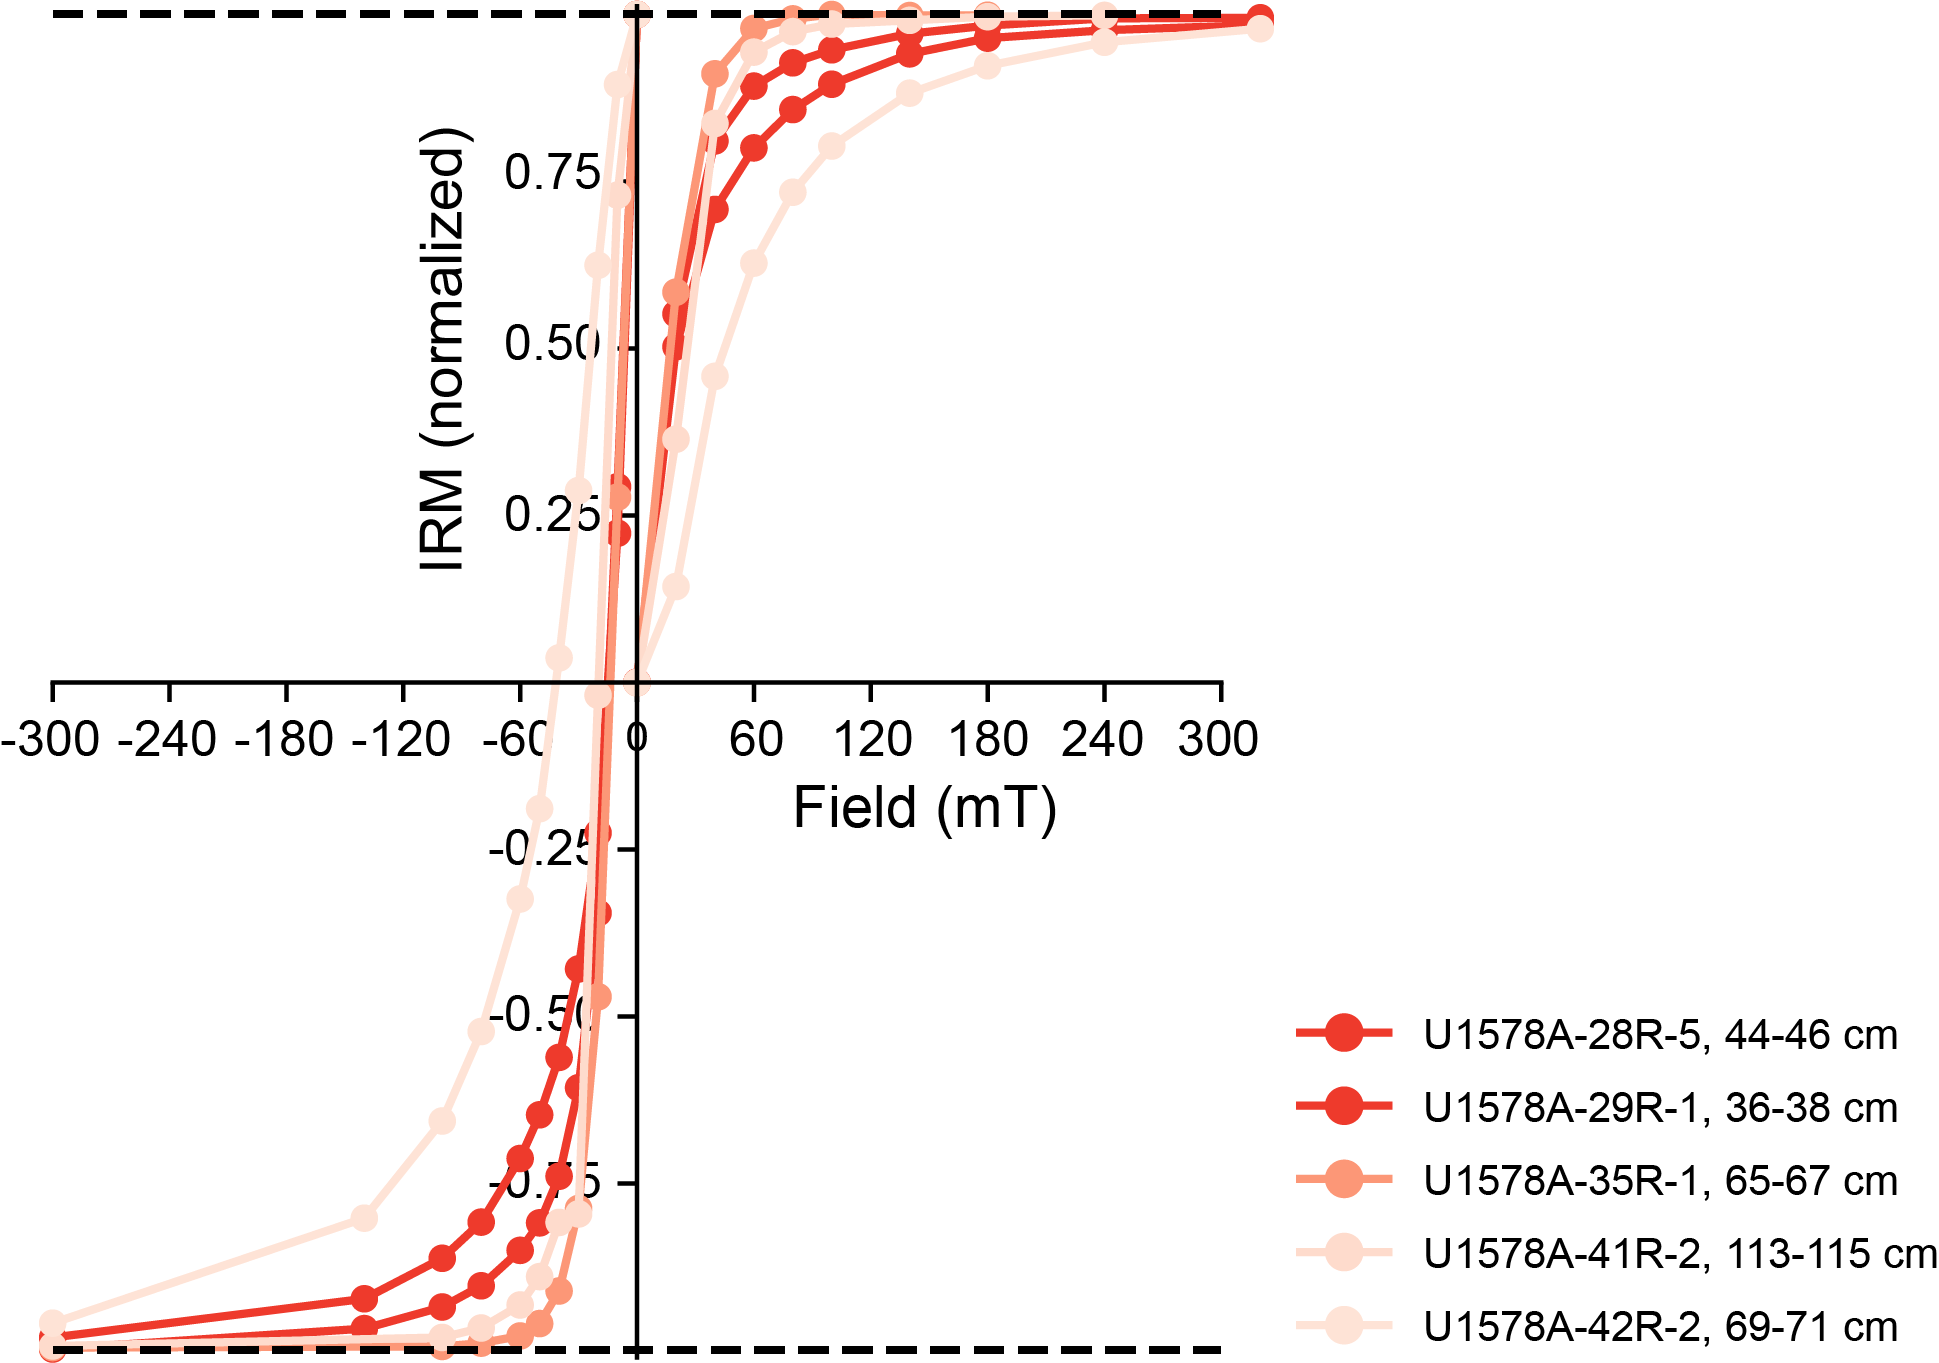
Figure F36. IRM acquisition curves and backfield curves for igneous samples.
7. Sediment and pore water geochemistry
7.1. Interstitial water chemistry
Interstitial water (IW) was collected from 20 whole-round samples from Hole U1578A (2.96–167.2 mbsf) for shipboard analyses. Chemical compositions of these samples were measured according to procedures outlined in Sediment and pore water geochemistry in the Expedition 391 methods chapter (Sager et al., 2023). All results are presented in Table T4 and Figure F37.

Figure F37. IW chemical compositions.
7.1.1. pH, alkalinity, chloride, and sodium
The pH value of IW at Site U1578 shows a narrow range of 7.63–7.74 and is nearly uniform in Lithostratigraphic Unit I (2.96–24.4 mbsf) with an average of 7.67 ± 0.02 (1σ standard deviation). In Subunit IIA (30.9–126.5 mbsf), pH is also uniform (average = 7.64 ± 0.01). Below 126.5 mbsf, pH shows a gentle increase toward a maximum of 7.74 at 157.5 mbsf. IW alkalinity gently increases from 2.59 mM at 2.96 mbsf to 2.87 mM at 24.4 mbsf in Unit I. In Subunit IIA, alkalinity ranges 2.43–2.97 mM. The minimum alkalinity of 1.85 mM was found at 157.5 mbsf in Subunit IIB.
IW chloride concentration varies between 562.2 and 572.4 mM with an average of 567.9 ± 2.5 mM. A slightly increasing chloride concentration trend of 562.2–570.9 mM is observed from the seafloor to 14.7 mbsf, remaining nearly constant with an average of 568.3 ± 1.8 mM farther downhole. The downhole profile of IW sodium is comparable to that of chloride. Sodium gradually increases from 482.9 to 486.7 mM in the top sediment layer from 2.96 to 14.7 mbsf, referring to a depth interval for sodium and chloride exchange between seawater and IW. Below this depth range, sodium concentration is uniform, ranging 486.2–489.2 mM (average = 487.0 ± 1.4 mM). Average chloride and sodium concentrations are close to mean values in the modern ocean (chloride = 559.5 mM; sodium = 480.7 mM) (Quinby-Hunt and Turekian, 1983), similar to Site U1575.
7.1.2. Calcium, magnesium, and potassium
IW calcium concentration is 10.7 mM at the seafloor, close to the average modern ocean value of 10.6 mM (Quinby-Hunt and Turekian, 1983). Calcium concentration increases nearly linearly from 10.7 mM at 2.96 mbsf to 11.4 mM at 30.9 mbsf in Lithostratigraphic Unit I and decreases thereafter linearly at a rate of 0.41 mM/100 m toward the bottom of the sediment succession. The minimum calcium content of 10.1 mM is found at 157.5 mbsf, which coincides with an alkalinity outlier (1.85 mM). IW magnesium concentration is 54.3 mM at 2.96 mbsf, which is close to the average modern ocean value of 54.0 mM (Quinby-Hunt and Turekian, 1983). Magnesium concentration increases in Unit I from 54.0 to 54.8 mM at 5.95–17.5 mbsf. In Unit II, magnesium concentration shows a decreasing trend, reaching the minimum concentration of 51.7 mM at 157.5 mbsf. At the bottom of the sediment column (167.2 mbsf), magnesium concentration slightly increases to 52.5 mM. IW potassium concentration generally displays a trend reversed from that of magnesium. Potassium linearly increases from 11.1 mM at 5.95 mbsf to 11.9 mM at 24.4 m in Unit I, followed by a gradual increase from 12.2 mM at 30.9 mbsf to 13.1 mM at 126.5 mbsf in Subunit IIA. The maximum potassium concentration of 14.0 mM is found at 157.5 mbsf in Subunit IIB.
The Site U1578 depth profiles of IW calcium and potassium are distinct from those of the previous sites. At Sites U1576 and U1577, linear increases in calcium concentrations were found in the sediment succession. At Site U1578, calcium increases downhole at shallow depths and then decreases slightly with continuing depth. This trend is reminiscent of Site U1575, which indicates that burial dissolution of calcite is restricted at Sites U1575 and U1578 compared to Sites U1576 and U1577. The trend could be due to the distinct carbonate composition at Sites U1575 and U1578 with low diagenetic potential. The increasing trend of potassium with sediment depth at Site U1578 could be attributed to the common presence of tephra and clay in Lithostratigraphic Unit II (see Lithostratigraphy).
7.1.3. Strontium, silicon, and lithium
IW strontium concentration shows a plateau-like bulge in the upper ~90 m of the sediment succession, increasing from 95.8 µM at 5.95 mbsf to the maximum of 129.1 µM at 17.5 mbsf in Lithostratigraphic Unit I and showing variation around this value to 50 mbsf. Below that depth, strontium content decreases to 101.1 mM at 87.9 mbsf in Subunit IIA. The increasing trend of strontium in the uppermost ~20 m suggests that biogenic calcite dissolution and reprecipitation are active in this interval at Site U1578 (Baker et al., 1982). The IW silicon concentration at Site U1578 ranges 198.2–804.4 µM (mean = 571 ± 217 µM). It rapidly increases from 198.3 µM at 5.95 mbsf to 386.0 µM at 24.4 mbsf in Unit I and gently increases from 520.0 µM at 30.9 mbsf to 804 M at 126.7 mbsf in Subunit IIA. In Subunit IIB, it slightly decreases to 695.8 µM at the bottom of the sediment succession. Overall, a broad peak of silicon observed below 50 mbsf indicates that dissolution of biogenic silica is prevalent in Unit II. This trend is contrary to the silicon profiles of Sites U1575–U1577, where shallow peaks of silicon are observed between the seafloor and 25 mbsf. In fact, the mean concentration of silicon is 220 µM at Site U1575, 265 µM at Site U1576, and 259 µM at Site U1577. Two times higher concentrations of silicon at Site U1578 (571 µM) compared to other sites are consistent with the higher abundance of siliceous biota (i.e., radiolarians and siliceous sponge spicules are observed in Unit II [see Lithostratigraphy]). IW lithium concentration overall decreases from 28.7 mM just beneath the sediment surface (2.96 mbsf) to a minimum value of 20.3 µM at 70.1 mbsf in Subunit IIA. Below this depth, lithium concentration is relatively constant (mean = 21.1 ± 0.4 µM), excluding one outlier at the bottom of the sediment sequence. The IW lithium profile generally mirrors the trend of silicon observed at Sites U1575 and U1577, hinting that lithium removal from IW might be related to dissolution of biogenic silica.
7.1.4. Manganese, sulfate, iron, ammonium, and phosphate
IW manganese concentration largely increases from 0.17 µM at 11.7 mbsf to a maximum of 2.9 µM at 14.7 mbsf in Lithostratigraphic Unit I. Below this depth, it is more or less consistent, with a mean of 1.66 ± 0.3 µM in Unit II. The enhanced manganese concentration observed in most of the sediment succession (except for the bottommost 12 m near the seafloor) indicates that Mn(IV) oxides are the main electron acceptors that oxidize organic matter at Site U1578. A 1.4 mM sulfate decline is observed between 30.9 and 70.1 mbsf in the upper part of Subunit IIA. Below this depth, IW sulfate concentration decreases and increases seemingly cyclically, which could be attributed to sulfate reduction followed by sulfide oxidation. This is perhaps facilitated by ferric reduction (Jørgensen et al., 2019) based on ferrous iron ranging 0.05–0.47 µM in Unit I and the upper part of Subunit IIA.
IW ammonium shows a maximum of 11.1 µM at 2.96 mbsf. Beneath the surface layer, it is consistent with a mean of 2.59 ± 1.09 µM in Units I and II. In the case of IW phosphate content, a surface peak is also observed with a concentration of 7.47 µM at 2.96 mbsf. Below this peak, a relatively consistent concentration is observed with a mean of 6.18 ± 0.30 µM throughout the sediment succession. The N:P ratios calculated using ammonium and phosphate concentrations in the overall IW sample data set are 6.54 at Site U1575, 6.11 at Site U1576, 0.99 at Site U1577, and 0.47 at Site U1578, indicating that IW is more depleted in nitrogen relative to phosphorous under lower burial conditions.
7.1.5. Bromide, barium, and boron
The IW bromide content changes little over the entire sediment succession (mean = 0.87 ± 0.01 mM). Bromide concentration at the seafloor is 0.86 mM, which is close to the average modern ocean value of 0.86 mM (Quinby-Hunt and Turekian, 1983). IW barium concentration shows a surface peak with a concentration of 1.66 µM at 2.96 mbsf. Between 5.95 and 167.2 mbsf, barium concentration is relatively constant (mean = 0.18 ± 0.14 µM). Barium concentration is variable between sites, and the lowest content is observed at Site U1578. The mean barium concentrations are 1.10 µM at Site U1575, 2.74 µM at Site U1576, 0.33 µM at Site U1577, and 0.26 µM at Site U1578. Considering that biogenic barite (BaSO4) can be used as a basis for reconstructing primary productivity (Henkel et al., 2012), burial rates of organic matter appear to be lowest at Site U1578. IW boron concentration ranges 416.5–487.7 µM with a mean of 449 ± 20 µM. The downhole profile is generally scattered but is elevated between 40.1 and 71.4 mbsf, with the maximum value of 488 µM observed at 40.9 mbsf. Relatively low boron concentrations observed below 150 mbsf could be a result of enhanced clay sorption in Lithostratigraphic Subunit IIB.
7.2. Hydrocarbons in gas phase
Gas phase samples were analyzed for C1 to C6 (methane, ethane, propane, butane, pentene, and hexane) for routine safety monitoring in Hole U1578A at a frequency of one sample per 9.6 m core. Methane concentration in 20 headspace samples analyzed from Site U1578 ranges 0–1.13 µL/L, which is lower than the atmospheric background level. No hydrocarbon gas contents higher than C1 were detected.
7.3. Sediment geochemistry
7.3.1. Inorganic carbon, total carbon, and organic carbon
Sediment samples were analyzed to determine the weight percent of CaCO3, total carbon (TC), total organic carbon (TOC), total nitrogen (TN), and total sulfur (TS) (Figure F38; Table T5). In Hole U1578A, the sampling frequency was one sample per core. In Lithostratigraphic Unit I, CaCO3 content is high, with a mean of 86.9 ± 11.1 wt%. The mean calcium carbonate content then decreases to 76.4 ± 7.32 wt% in Subunit IIA and 54.5 ± 10.6 wt% in Subunit IIB. The decreasing trend of CaCO3 agrees with the lithologic change from foraminifera-nannofossil ooze with clay in Unit I to clayey nannofossil chalk in Subunit IIB (see Lithostratigraphy). TC contents are nearly identical to inorganic carbon contents, with a narrow range of 8.92–11.28 wt% in Unit I. Farther downhole, TC content decreases to the minimum value of 5.20 wt% at 167.2 mbsf in Subunit IIB. The TOC content in the sedimentary succession ranges 0.019–0.21 wt% (0.12 ± 0.06 wt%) in the overall sediment succession without a specific downhole trend. TS and TN contents are below the instrumental detection limits for all samples.
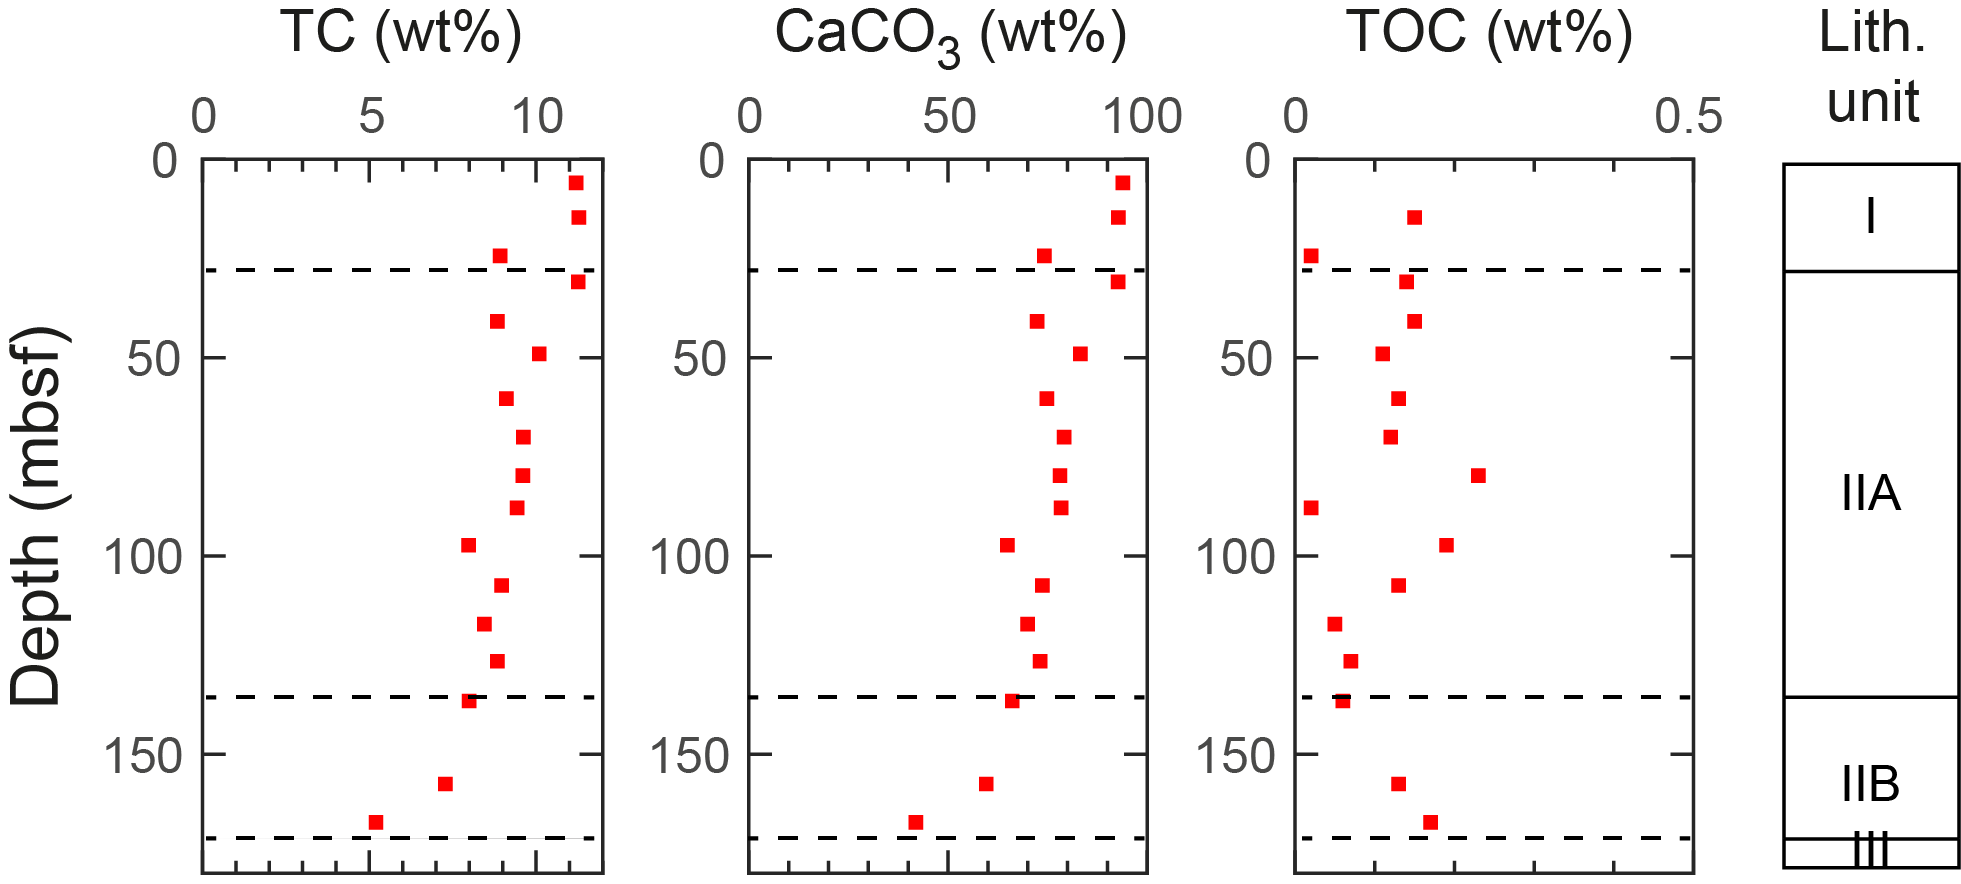
Figure F38. TC, CaCO3, and TOC.
8. Igneous geochemistry
At Site U1578, 12 igneous units comprising pillow and lobate flows, sheet flows, and massive flows interbedded with sediments were recovered from 184.26–483.72 mbsf (see Igneous petrology and volcanology). In total, 16 samples from 184.63 mbsf (Sample 391-U1578A-20R-1, 83–84 cm) to 352.79 mbsf (41R-4, 7–8 cm) were analyzed using inductively coupled plasma–atomic emission spectroscopy (ICP-AES) (Table T6) and pXRF spectroscopy (Tables T7, T8). Additionally, 253 pXRF measurements were conducted on the archive-half sections of the cores (Table T9). The selection of discrete samples was based on variations of lithology, pXRF measurement results on archive-half sections, and alteration extent (see Igneous petrology and volcanology). The selected samples are representative of the uppermost eight recovered igneous units, which can be briefly summarized as follows:
- Igneous Subunits 1a–1c: three samples from highly phyric plagioclase-pyroxene ± olivine basalt pillow, lobate, and sheet lava flows.
- Igneous Unit 2: one sample from a sparsely phyric plagioclase-clinopyroxene basalt pillow stack.
- Igneous Unit 3: one sample from a sparsely phyric plagioclase massive basaltic lava flow.
- Igneous Unit 4: one sample from a sparsely phyric plagioclase basalt pillow lava.
- Igneous Unit 6: three samples from a moderately to highly phyric olivine-plagioclase massive basalt lava flow.
- Igneous Unit 7: one sample from an aphyric massive basalt lava flow.
- Igneous Subunits 8a and 8b: six samples from aphyric to sparsely phyric plagioclase basalt pillow lava stacks.
Detailed sample preparation, analytical procedures, standard analyses, calibration, and drift corrections are reported in Igneous geochemistry in the Expedition 391 methods chapter (Sager et al., 2023). The volatile-free total sums of the major element oxides in weight percentages acquired using ICP-AES range 97.15–101.38 wt% (Table T6), which is comparable to Sites U1576 and U1577 and suggests that there were some minor issues with sample preparation. As at all other Expedition 391 sites, total iron was recalculated as Fe2O3t. Major element oxide concentrations determined using ICP-AES were normalized to 100% on a volatile-free basis (Table T6) to facilitate comparison with the respective Expedition 391 sites and literature data from previous drill and dredge sites along the submarine TGW hotspot track (e.g., Le Maitre, 1962; Richardson et al., 1984; Weaver et al., 1987; Le Roex et al., 1990; Cliff et al., 1991; Willbold and Stracke, 2006; Class and le Roex, 2008; Salters and Sachi-Kocher, 2010; Rohde et al., 2013; Hoernle et al., 2015; Homrighausen et al., 2018, 2019). For Hole U1578, pXRF section half measurements (n = 253) were conducted on the archive halves of the recovered cores (Table T9). Drift was monitored by running the BHVO-2 standard intermittently throughout the analytical process; no instrumental drift was detected (Table T10 in the Expedition 391 methods chapter [Sager et al., 2023]). In general, each point was analyzed twice to account for analytical error. Because this was the last site drilled during Expedition 391, there was insufficient time to complete sampling, preparation, and analyses of sample powders for loss on ignition (LOI) and ICP-AES for Igneous Units 9–12.
8.1. Comparison of ICP-AES and pXRF results
The ICP-AES and pXRF results display excellent linear correlation coefficients between the two methods (Figure F39), with R2 > 0.90 for TiO2, Fe2O3t, MnO, CaO, K2O, and Ni, whereas Zn has a relatively good R2 = 0.87. Sr, Y, and Zr also display excellent linear correlation coefficients, with R2 > 0.90 if Sample 391-U1578A-39R-2, 33–34 cm, is excluded. Sample 39R-2, 33–34 cm, shows much lower concentrations using pXRF compared to ICP-AES. For this sample, only a very small amount of powder was used for the pXRF measurements, and Sr, Y, Zr, and Cu have a high analytical uncertainty. Excluding Sample 39R-2, 33–34 cm, from the comparison between ICP-AES and pXRF increases the linear correlation coefficients (R2) between the two methods, particularly for Cu (from 0.73 to 0.85), Sr (from 0.49 to 0.95), Y (from 0.59 to 0.96), and Zr (from 0.46 to 0.94). Because only Sample 39R-2, 33–34 cm, deviates significantly and substantially from the overall excellent correlations, we will not consider this sample in the following comparison between the two methods. On average, the difference between the two methods is relatively small, with < ±10% for K2O, Zn, Sr, Y, and Zr. Fe2O3t, MnO, and CaO display systematically higher ICP-AES values compared to the pXRF data, whereas TiO2 and, to a lesser extent, Ni and Cu show the opposite. The origin of these systematic differences is unknown, but the secondary fluorescence effect in pXRF caused by the Fe atoms could explain some observations. Although Ni values display a significantly more dispersed correlation between the methods at the previous Expedition 391 drill sites than other elements, they are comparable between the two methods in this data set. Cr values obtained using pXRF are not considered because the Cr concentration of the samples is close to the detection limit of pXRF. For elements lighter than K, air absorption has a significant effect on pXRF measurements, so data for these elements are not discussed here (Figure F39).
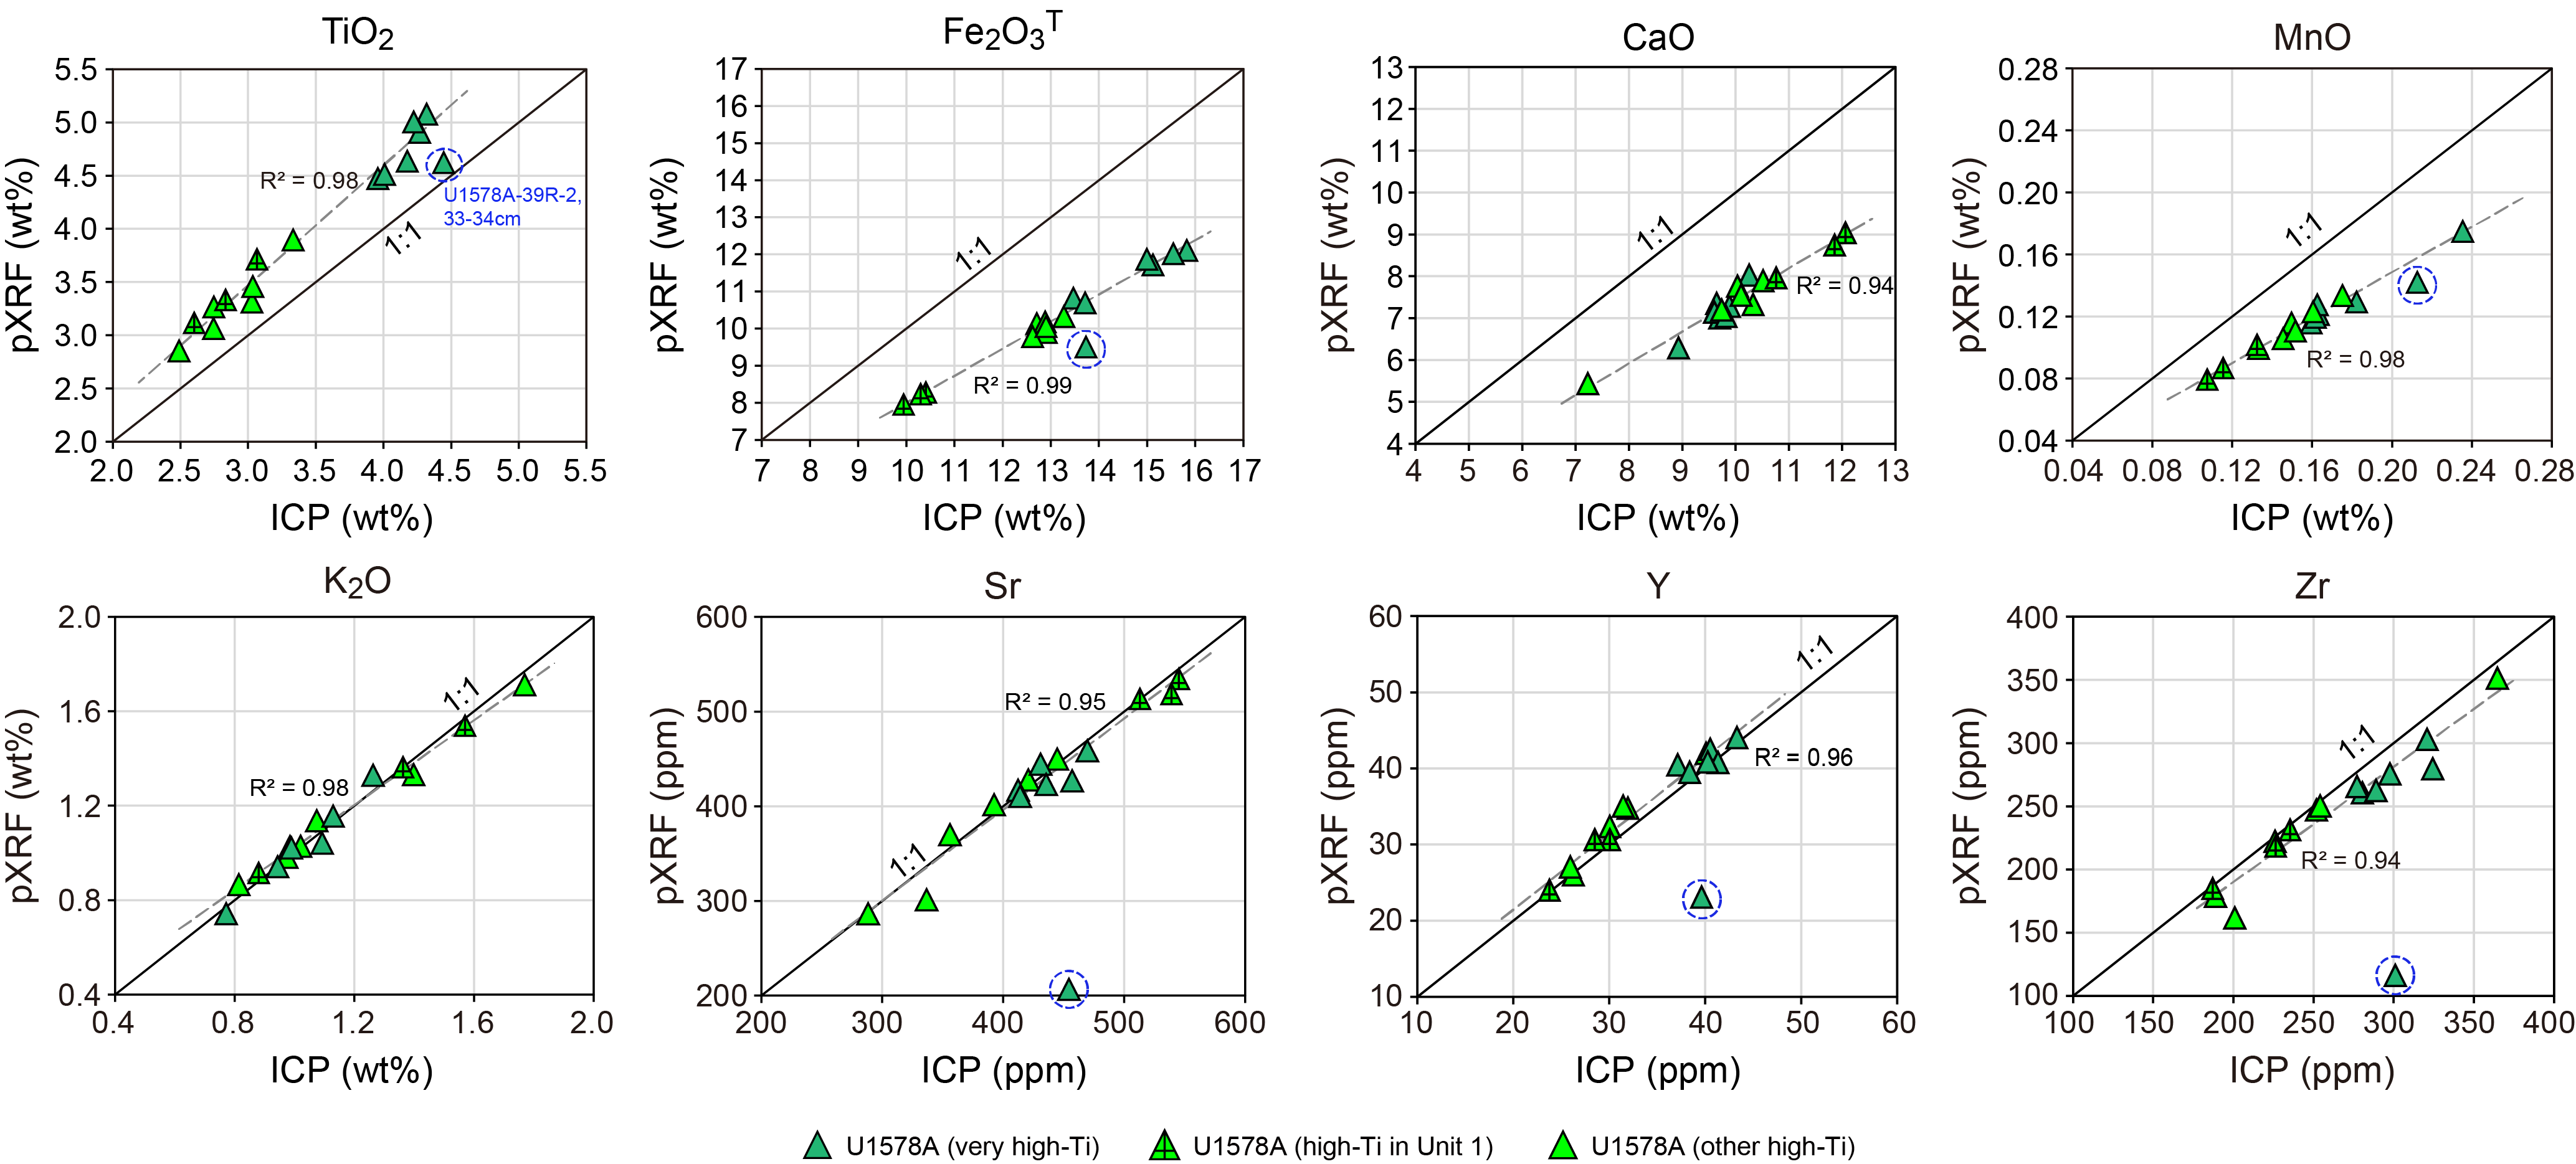
Figure F39. pXRF and ICP-AES results.
8.2. Alteration
Old submarine rocks are commonly modified by variable degrees of seawater alteration, which in particular affects fluid-mobile elements and oxide contents, such as Sr and K2O (e.g., Jochum and Verma, 1996). Based on petrographic observations, the recovered igneous units experienced variable degrees of alteration (see Igneous petrology and volcanology). In general, LOI is an indicator for the degree of alteration, and all measured powders of Site U1578 from Igneous Unit 1 through Subunit 8b seem to be relatively fresh, with LOI < 3 wt% for these presumably early Paleogene to Late Cretaceous submarine rocks (see Biostratigraphy). An overall increased scatter in K2O data might be due to limited mobility for potassium during seawater alteration (see Bivariate element plots and Downhole variations) (Figure F40; Table T6). Other than potassium, the geochemical data set shows no indication for element variability due to alteration, and the petrographic evidence for alteration might not be accompanied by significant element mobility.
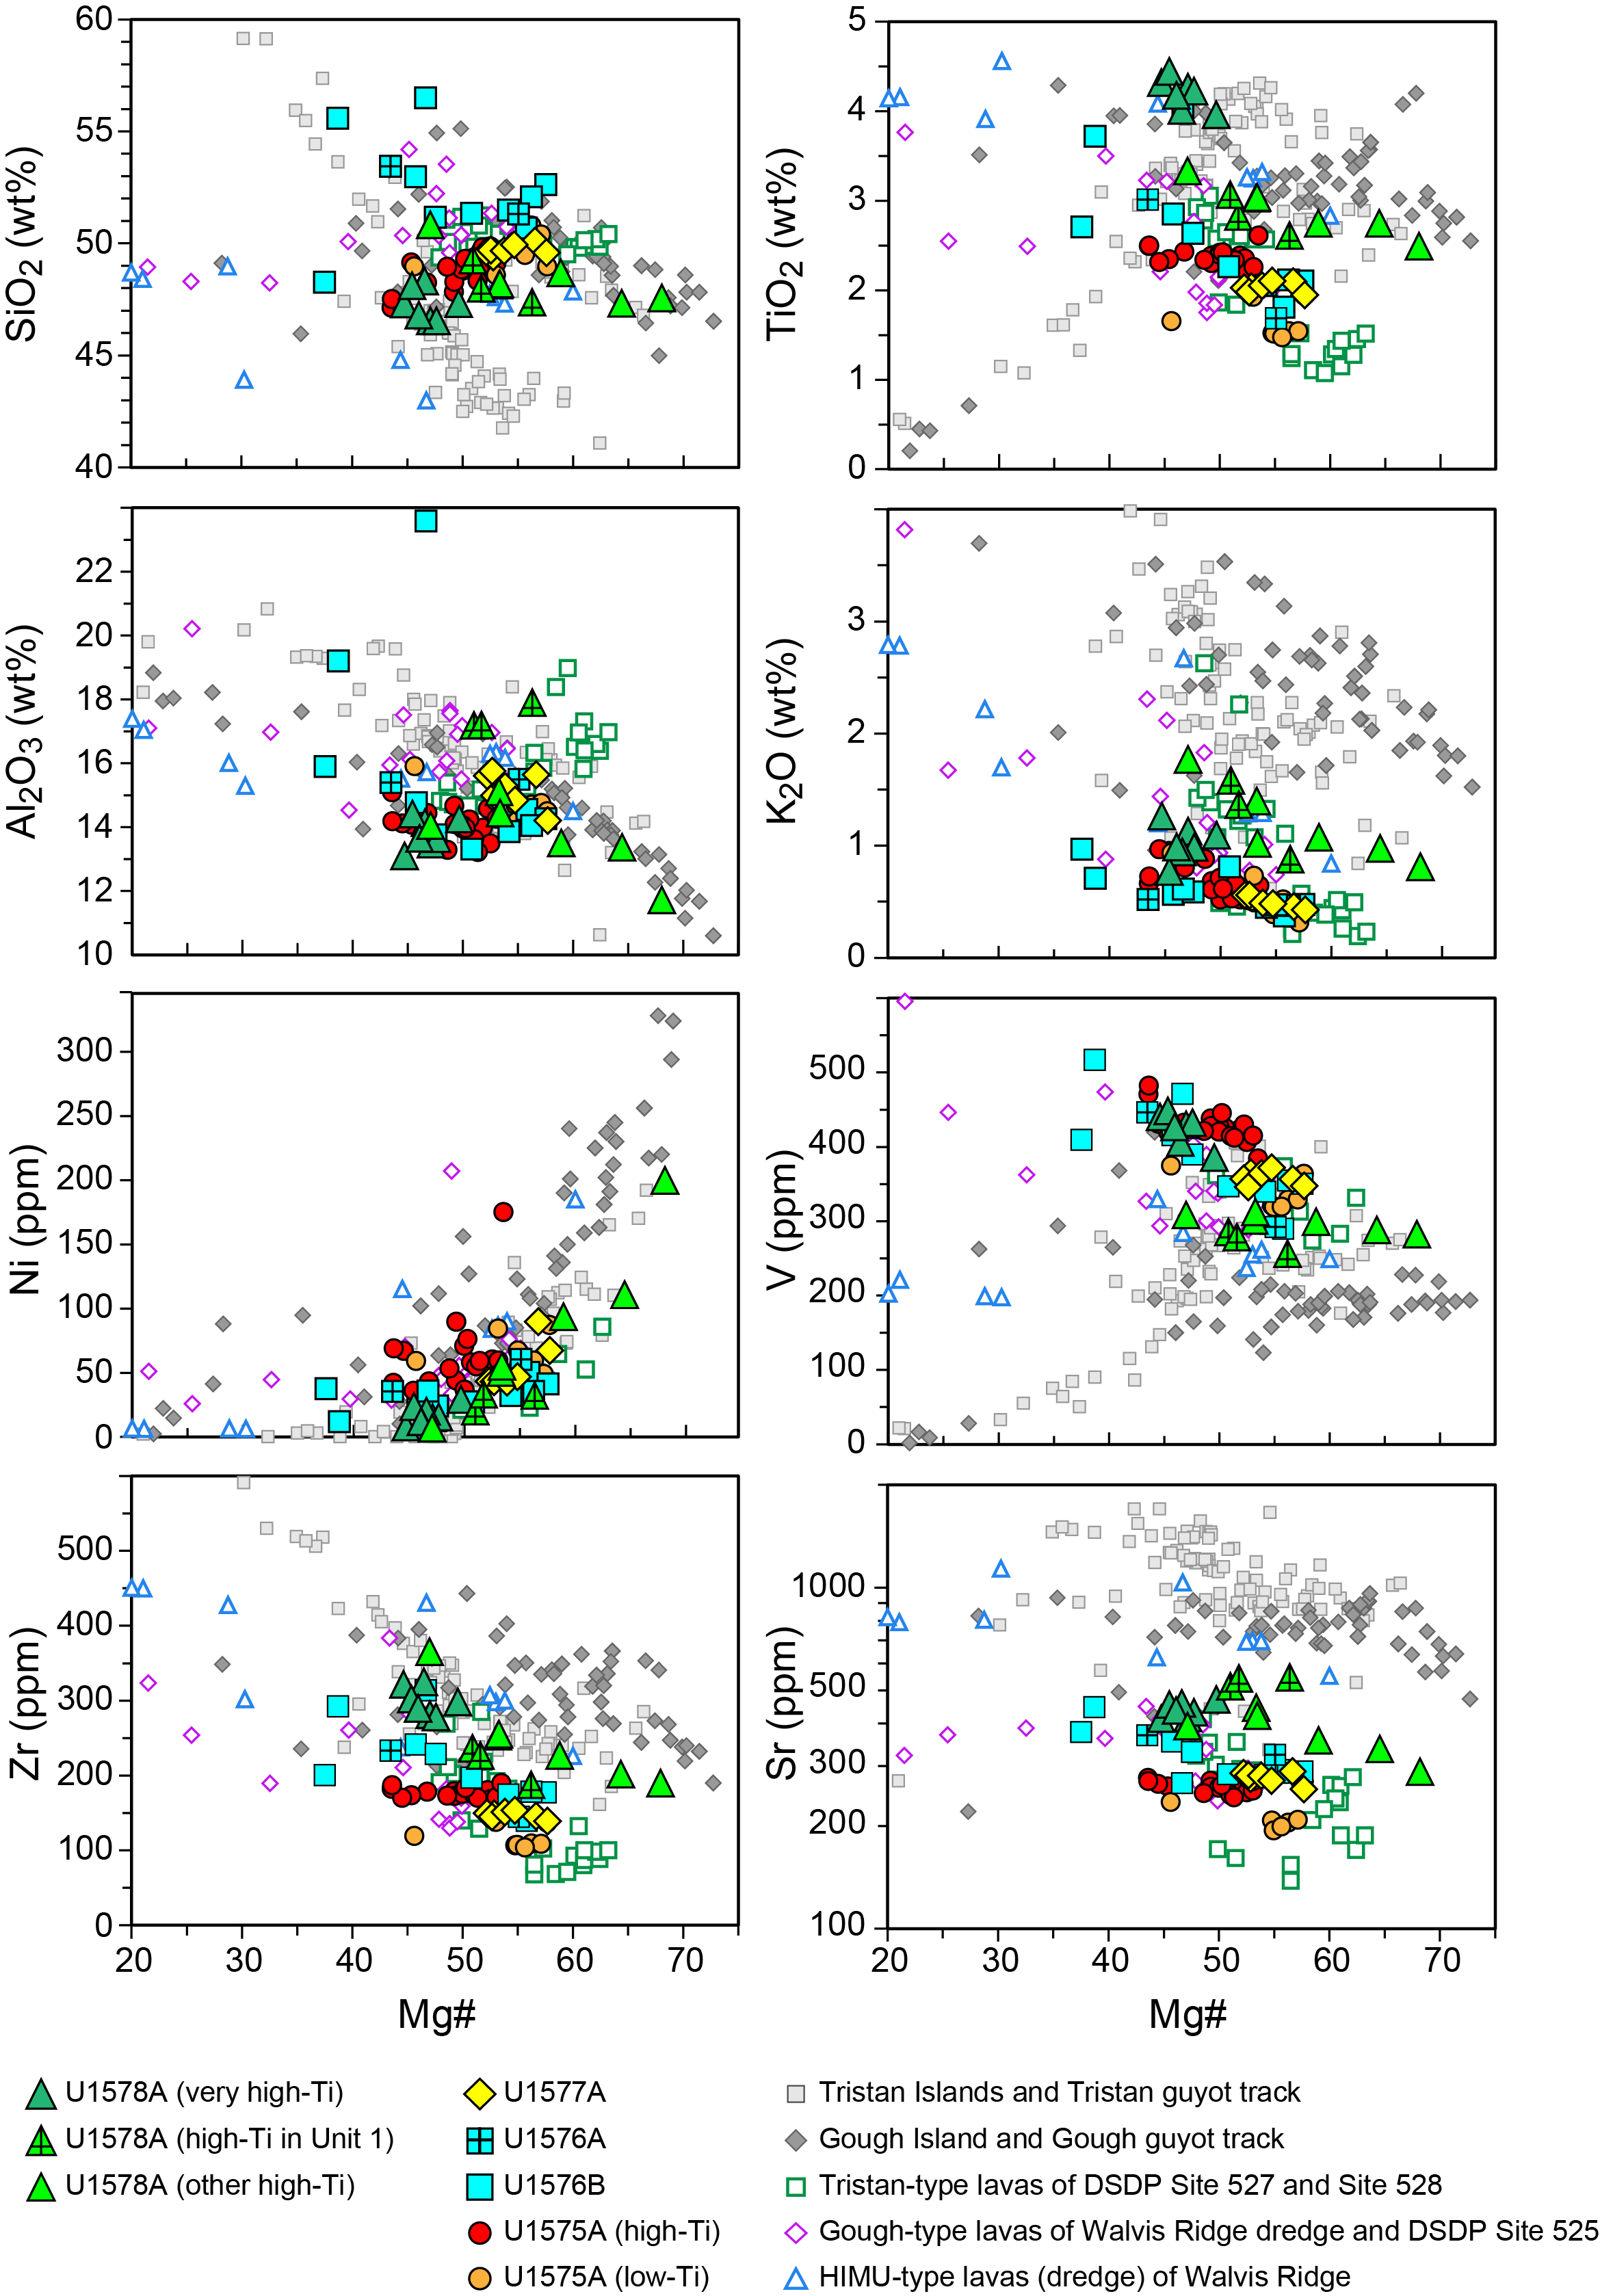
Figure F40. Mg# vs. major element compositions.
8.3. Classification
According to the total alkali versus silica (TAS) classification after Le Bas et al. (1986), all Site U1578 samples lie within the basalt compositional field except Sample 391-U1578A-32R-1, 101–102.5 cm, which has a hawaiitic composition (Figure F41A). Apart from one basalt (Sample 29R-2, 45–46.5 cm) that lies near the alkalic-tholeiitic division of MacDonald and Katsura (1964), all Site U1578 samples lie within the alkaline compositional series and thus can be termed alkali basalts. The alkali basalts from Site U1578 with very high TiO2 > 3.96 wt% (dark green) form a relatively tight cluster, whereas the basaltic to hawaiitic rocks with lower TiO2 values (bright green) of 2.5–3.3 wt% form a positive trend on the TAS diagram. It is important to note that the Site U1578 rocks with relatively low TiO2 contents still have higher TiO2 contents compared to the high-Ti basalts from Site U1575 (TiO2 = 2.2–2.6 wt%). Based on the TiO2 content, the samples are divided into high-Ti (TiO2 < 3.96 wt%) and very high–Ti rocks (TiO2 ≥ 3.96 wt%). Compared to the rocks recovered at other Expedition 391 sites, the basalts from Site U1578 partly overlap with the most primitive high-Ti basalts from Site U1575 and tend toward overall higher total alkali contents at a given silica concentration.

Figure F41. Alkali versus silica and Ti vs. V classifications.
On the Ti versus V classification diagram after Shervais (2022), all samples from Site U1578 lie within the intraplate OIB array and straddle the alkaline OIB field (Figure F41B). The relatively high Ti/V values (51–63) are overall higher than the ratios for samples from all other Expedition 391 sites, which lie predominantly within the mid-ocean-ridge basalt and ridge-centered OIB arrays. The high-Ti and very high–Ti lavas form distinct clusters in the Ti versus V classification diagram, but overall they form a subparallel trend to the OIB and alkaline OIB boundary. Site U1578 samples overlap with the previously reported alkaline EMI-type (Zindler and Hart, 1986) lavas from Walvis Ridge, Guyot Province, and the Tristan da Cunha and Gough Island groups.
8.4. Bivariate element plots
The basaltic and hawaiitic lavas from Site U1578 have normalized SiO2 values of 46.5–50.8 wt% and MgO contents of 4.4–11.8 wt% (considering only ICP-AES data), extending to more mafic compositions compared to the other Expedition 391 sites (Table T6). The high-Ti samples from Site U1578 trend to overall higher MgO contents relative to the very high–Ti rocks, which have a restricted compositional array (Figure F40; Table T6). At a given Mg# of ~45–50 on bivariate diagrams with Mg# (44.7–68.1) versus the other major and trace elements, the very high–Ti rocks are offset relative to the high-Ti rocks to overall higher TiO2, Fe2O3t, MnO, Sc, V, Co, Zn, and Y values but to lower SiO2, Al2O3, and K2O contents. On plots of Mg# versus major oxides and trace elements, the high-Ti samples (excluding the very high–Ti samples) form positive correlations with Ni and Cr and negative correlations with Al2O3, TiO2, K2O, Sr, and Zr (Figure F40). These trends are generally consistent with olivine, Cr-spinel, and clinopyroxene fractionation. Based on the bivariate diagrams (Figure F40), the fluid-mobile oxides and elements (K2O and Sr) display patterns similar to the fluid-immobile elements (i.e., Zr), except for samples from Igneous Unit 1 (indicated by a cross), which have relatively high Sr concentrations at a given Mg# (Figure F40). The high Sr values, combined with high CaO (not shown) and Al2O3 contents (Figure F42) of Igneous Unit 1 are consistent with accumulation of Ca-rich plagioclase in these samples, which is supported by the petrographic description (plagioclase crystals up to 15 mm long, which represent ~15% of the macroscopic texture; see Igneous petrology and volcanology).
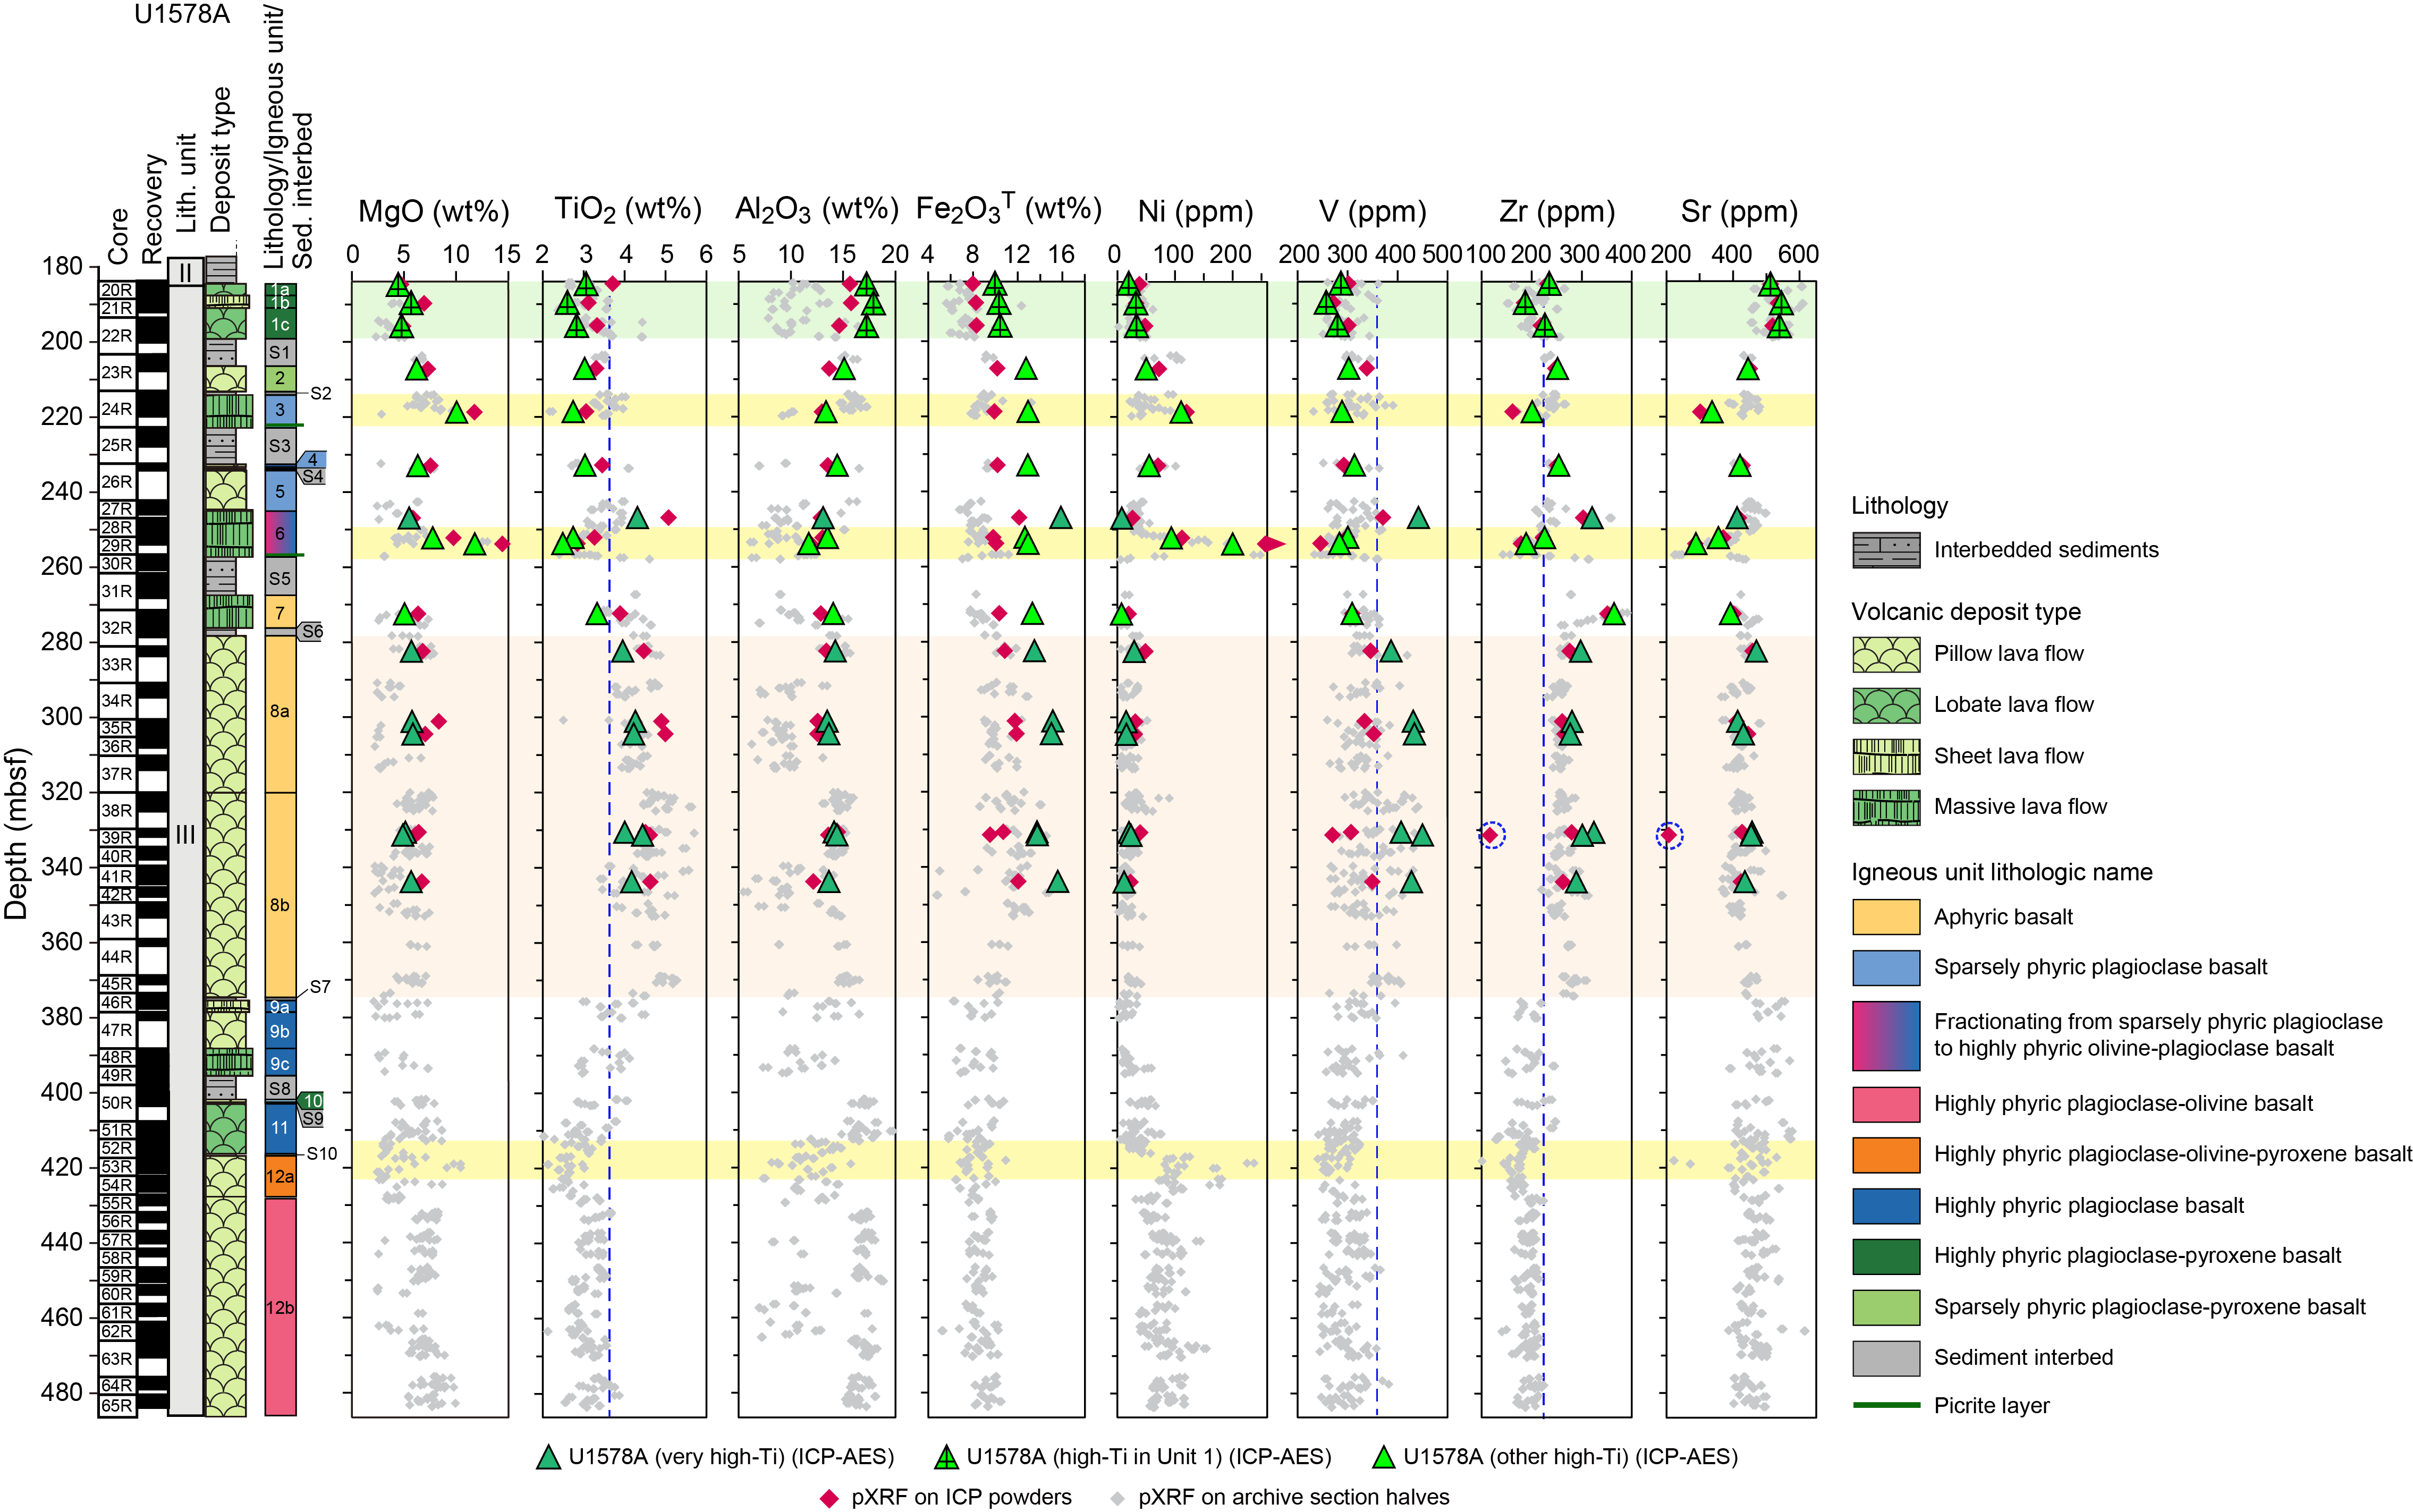
Figure F42. Downhole chemical variations.
Relative to the previous Expedition 391 sites, the lavas from Site U1578 have comparable SiO2, Al2O3, Fe2O3t, and Y values and trend to overall higher TiO2, K2O, Na2O, Sr, Zr, and Ba values but to lower Sc, V, Cu, and Ni values at a given MgO# (~45–60; total Mg# range = 44.7–68.1) (Figure F40). Excluding the very high–Ti rocks from Site U1578, the high-Ti rocks have intermediate compositions of incompatible minor oxides and trace elements (e.g., TiO2, K2O, Zr, and Sr) between Walvis Ridge and Guyot Province samples, consistent with the location of Site U1578 at the transition from Walvis Ridge to Guyot Province, which most likely represents the change from near ridge to intraplate setting.
8.5. Downhole variations
Hole U1578 represents the deepest basement penetration established during Expedition 391. Significant downhole variations are observed with a complexity that suggests that there is large compositional variability of related sources. This discussion is based on ICP-AES analyses, but due to the absence of ICP-AES data for Igneous Units 9–12, the downhole variations for those units are limited to pXRF data on section halves (Figure F42). Although the total range in MgO is 4.4–11.8 wt% in the ICP-AES data for Units 1–8, all but three samples fall in a narrow band of 4.4–6.3 wt%. The higher MgO values are most significant at 218.66 mbsf (MgO = 10.0 wt% for Sample 391-U1578A-24R-4, 123–125 cm) and 253.82 mbsf (MgO = 11.8 wt% for Sample 24R-4, 45–46.5 cm). These excursions are coupled with elevated Ni, Cr, and Sc (less pronounced) concentrations, as well as the lowest concentrations of Sr, Zr, Y, Ba, and Na2O. These geochemical anomalies are consistent with large olivine phenocryst accumulation (up to 3–5% and ~25% olivine phenocryst abundance in intervals 24R-4, 126–133 cm, and 30R-1, 6–21 cm, respectively) (see Igneous petrology and volcanology). Farther downhole and based on pXRF data on section halves, maximum MgO remains in the same range (≤6.7 wt%) as the upper part of the hole down to Igneous Unit 10. It then increases to maximum values in Units 11 and 12, reaching variable levels of MgO (7.7–10 wt%) with one excursion at the top of Subunit 12a up to 17.6 wt% MgO at 418.14 mbsf (not shown in Figure F42 because the MgO scale only goes to 15). Although the pXRF measurements for MgO varied widely due to air adsorption, the maximum value at each depth correlates with high Ni concentrations and may indicate similar geochemical anomalies as detected by ICP-AES.
The upper part of the recovered igneous units is characterized by high-TiO2 values (2.5–3.3 wt%) down to 272.4 mbsf in Igneous Unit 7, where it transitions to very high–Ti composition in Unit 8 (4.0–4.5 wt%) (Figure F42). Based on the ICP-AES analysis, it remains unclear whether the geochemical signature from high Ti to very high Ti occurs in the lower part of Unit 7 or at the transition to Unit 8. There is also a single sample with very high TiO2 (4.3 wt%) in Unit 6 (246.94 mbsf). Based on pXRF section half data, TiO2 in Unit 9 drops to values averaging ~3.6 wt% and then gradually decreases downhole to Unit 11, where TiO2 drops to its lowest values in Subunit 12a (average = ~2.6 wt%) and then stays constant in Subunit 12b (average TiO2 = ~3.2 wt%). Based on pXRF data in Unit 12, the TiO2 content seems to be even higher than in the high-TiO2 group at northern Walvis Ridge Site U1575 (2.2–2.6 wt%), which could indicate significant compositional differences in the parent melt.
As mentioned above, Igneous Unit 1 consists of highly plagioclase phyric rocks (see Igneous petrology and volcanology), which could explain the geochemical variation compared to the lower igneous units. The very high–Ti signature throughout Unit 8 is accompanied by overall higher Zr concentrations and, to a lesser extent, higher Y, Zn, and V values compared to the high-Ti units (Figure F42). Although the very high–Ti content is not coupled to changes in MgO content, it does have the lowest Mg# (Table T6), so some of the increase in TiO2 may result from fractionation of Ti-poor phases. Based on the pXRF data, it seems that Fe2O3t displays a relatively similar but less pronounced pattern downhole than TiO2.
Igneous Subunit 12a, which has the lowest TiO2 in the lower part of the unit (although still considered high Ti), is characterized by very low SiO2 (not shown) and Al2O3 compared to the rest of the recovered igneous units (Figure F42; Table T9). MgO is variable in this subunit, but it includes some of the highest Cr and Ni samples from Site U1578, which is consistent with accumulation of large olivine phenocrysts (up to 2–5 vol%) in this subunit (see Igneous petrology and volcanology). All the samples from this subunit are low in Al2O3 (reflecting dilution due to olivine accumulation) compared to the adjacent units, but contents of other oxides and trace elements show similar variations to other nearby units.
9. Physical properties
Physical properties measurements of MS, point magnetic susceptibility (MSP), NGR, gamma ray attenuation (GRA) and moisture and density (MAD) bulk densities, thermal conductivity, and P-wave velocity (x-, y-, and z-directions) were collected on whole-round cores, section halves, and discrete samples from Site U1578. Three general lithostratigraphic intervals were identified in Hole U1578A based on physical properties data (Figure F43): moderately lithified to lithified ooze and chalk (calcareous sediments) from the seafloor to ~184 mbsf, basalt flows and pillows from ~184 mbsf to the bottom of the hole (~484 mbsf), and interbedded volcaniclastic deposits from ~184 mbsf to the bottom of the hole. Based on NGR, MS, and MSP measurements, the uppermost calcareous ooze and clay interval can be further divided into two units (Lithostratigraphic Unit I and Subunit IIA; see Lithostratigraphy) at ~30 mbsf. At this depth, NGR values increase from a mean of 3.31 ± 1.19 counts/s to 6.17 ± 2.23 counts/s, and mean MS and MSP values increase from 6.39 ± 4.02 × 10⁻⁵ SI to 19.2 ± 15.3 × 10⁻⁵ SI below the contact. Thermal conductivity, porosity, and P-wave velocity values do not exhibit similar shifts at ~30 mbsf. Below the basement contact, relatively uniform MS, MSP, and NGR values define basalt units to the bottom of the hole, and abrupt shifts in both data sets image volcaniclastic interbeds. Porosity, P-wave velocity, bulk density, and thermal conductivity measurements reliably image contacts between volcaniclastic deposits and basalt lava flows (Figure F43). As at previous Expedition 391 sites, sharp decreases in GRA and MAD bulk density, NGR, MS, and MSP correlate to rubbly and fractured zones and/or low-quality or missing data.
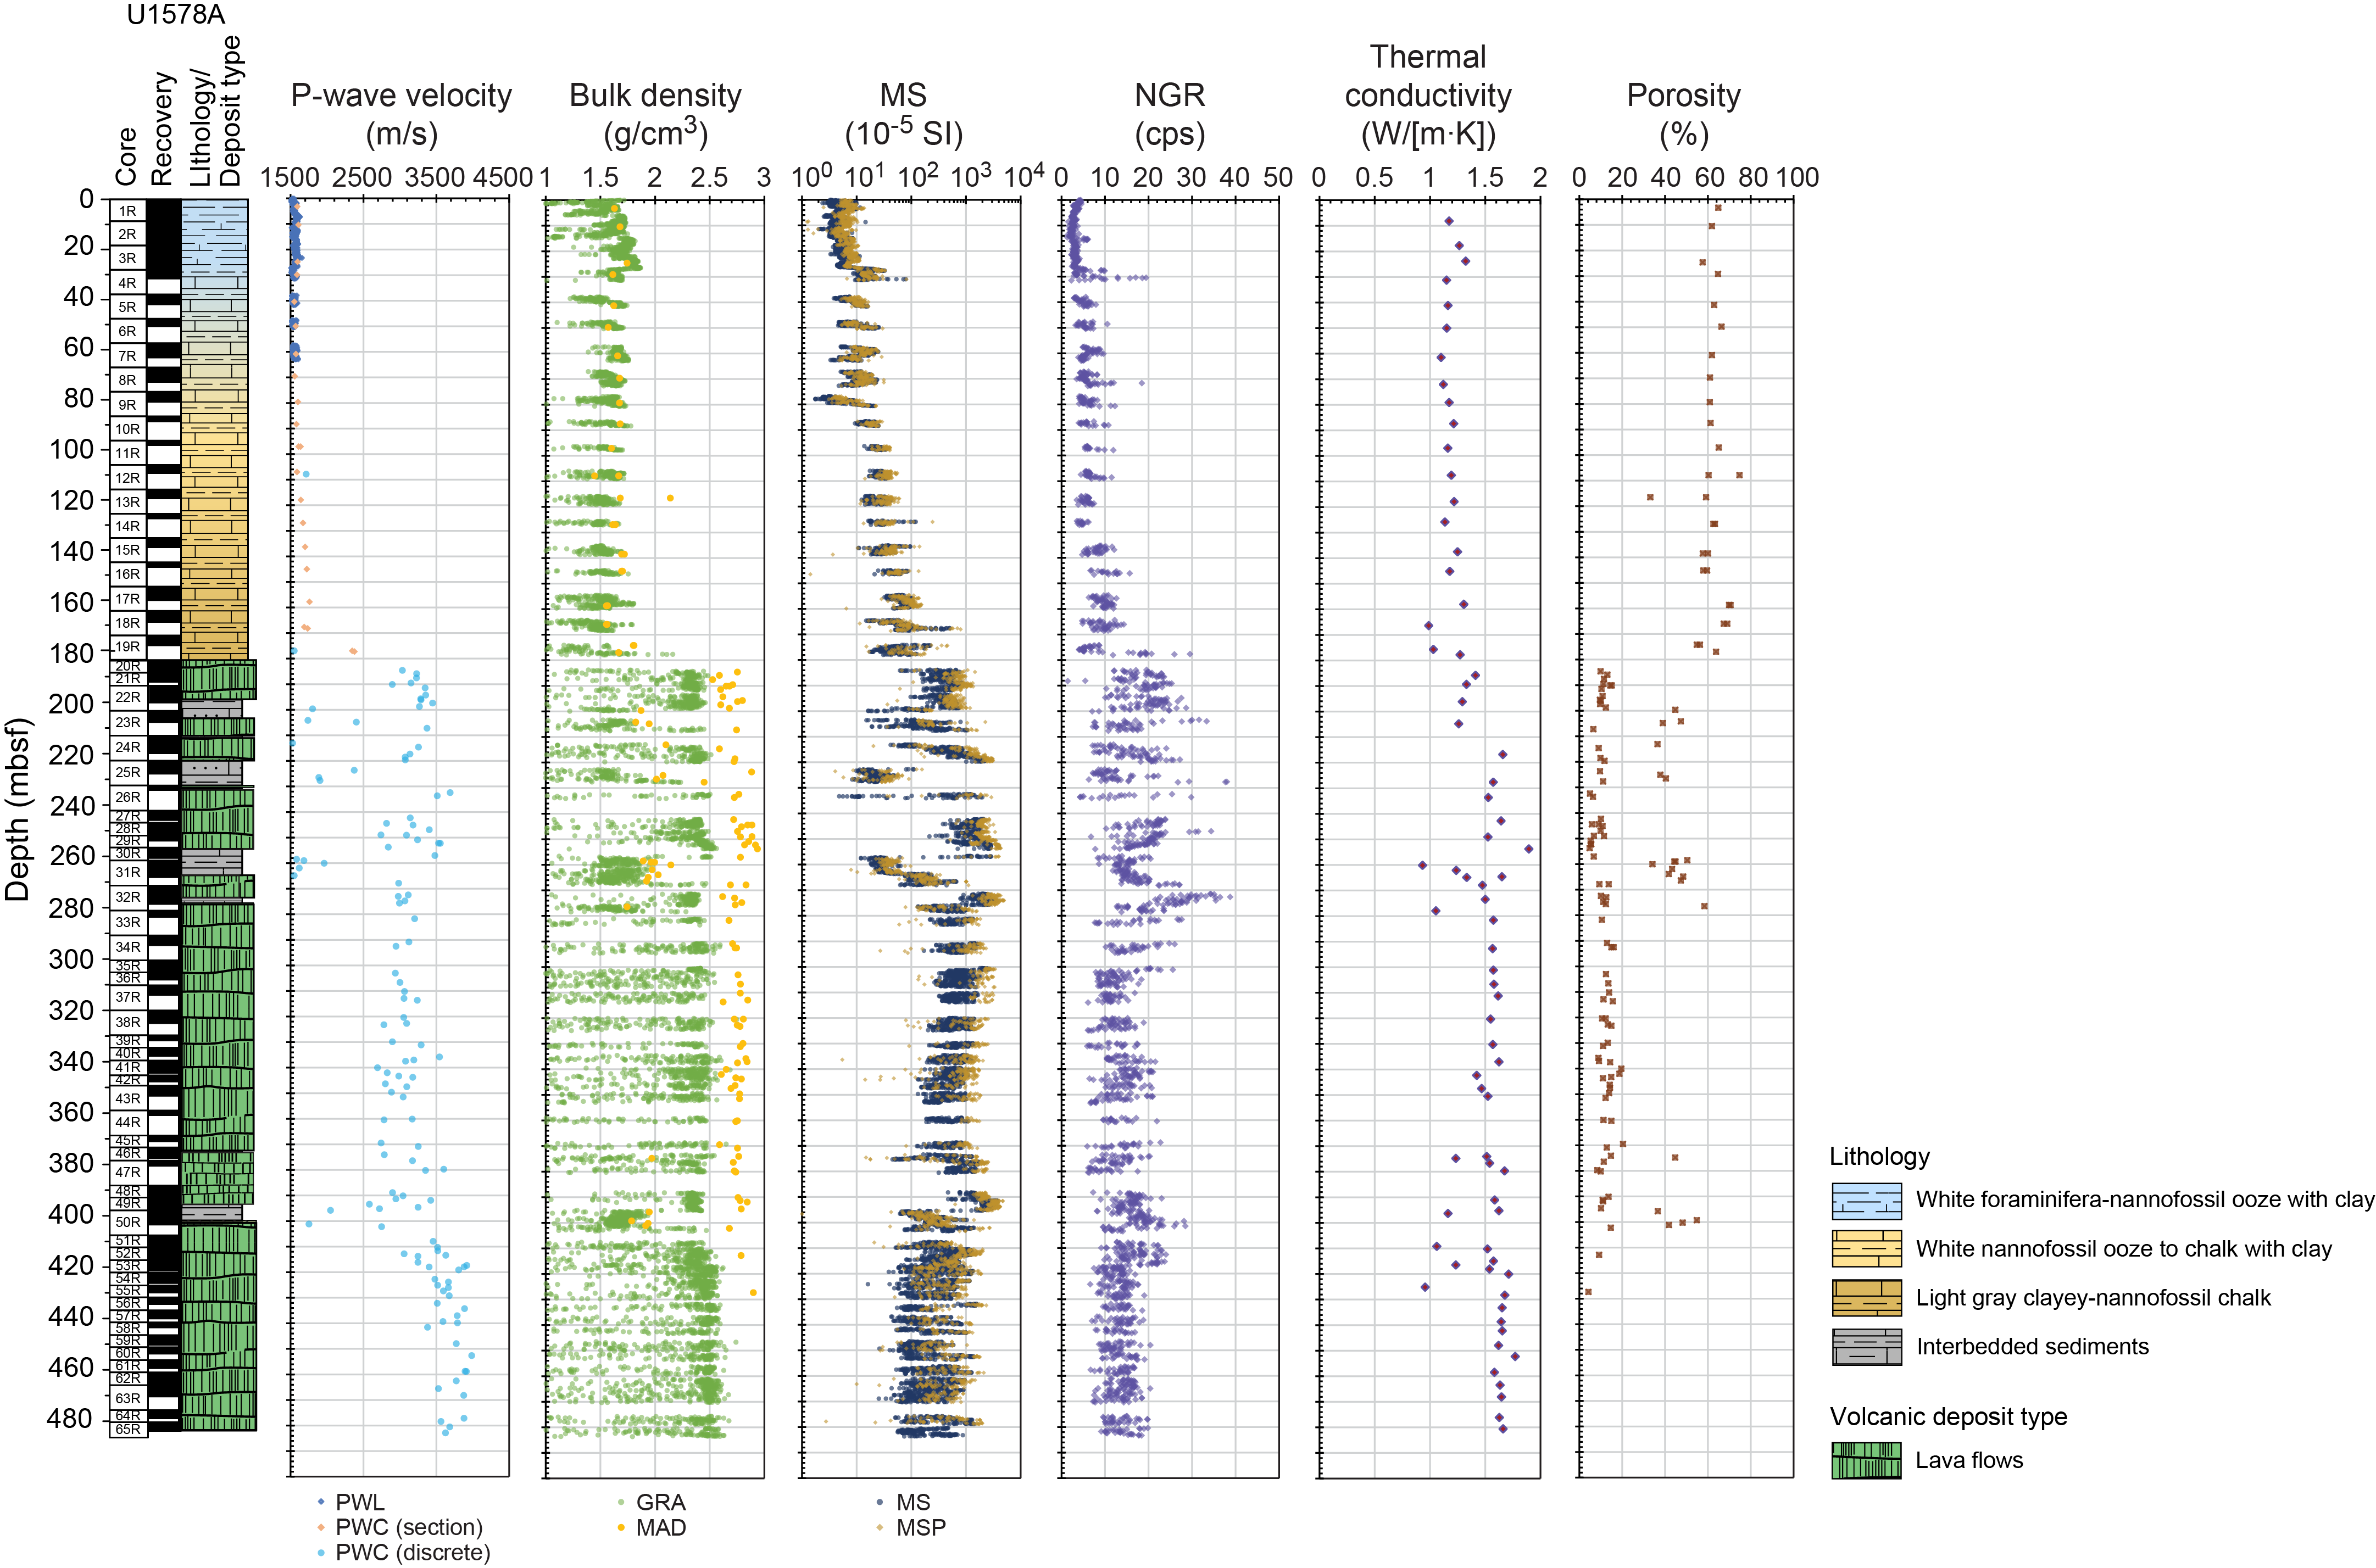
Figure F43. Physical properties.
9.1. Data acquisition
The Natural Gamma Radiation Logger (NGRL) and Whole-Round Multisensor Logger (WRMSL) were used to measure whole-round cores for NGR as well as MS, GRA bulk density, and P-wave velocity (x- and y-directions on ooze and unlithified core). P-wave velocity was also measured on section halves using the P-wave caliper (PWC; x-direction) and the P-wave bayonet (PWB; y- and z-directions) in ooze or unlithified sediment cores. The Section Half Multisensor Logger (SHMSL) was used to measure MSP. The shear stress of unlithified intervals was measured using the automated vane shear (AVS) system. Thermal conductivity was measured on whole-round cores of ooze using a needle probe and on section halves of lithified units using a needle probe puck. Finally, discrete sample cubes and wedges were measured using the PWC in the x-, y-, and z-directions. All section half and discrete sample measurements were obtained from representative units, at least one per core. As with all Expedition 391 sites, high-resolution sampling is critical to track physical properties variations and to correlate them to shipboard lithologic, geochemical, and paleomagnetic observations.
9.2. Thermal conductivity
Thermal conductivity values define the three general lithostratigraphic intervals in Hole U1578A (Figure F43). In the calcareous sediment interval, values are relatively consistent and range 0.988–1.323 W/(m·K). Thermal conductivity measurements do not distinguish sedimentary lithostratigraphic unit contacts at 27 mbsf and 135.2 mbsf (see Lithostratigraphy). The calcareous sediment/basalt contact at ~184 mbsf is distinguished by an increase in thermal conductivity from a mean of 1.20 ± 0.065 W/(m·K) (1σ standard deviation, used throughout) to a mean of 1.35 ± 0.061 W/(m·K). In basalt units below the contact, thermal conductivity ranges 1.36–1.66 W/(m·K) (mean = 1.54 ± 0.11 W/[m·K]). Volcaniclastic interbeds below the calcareous sediment/basalt contact are distinguished by thermal conductivity between 1.16 and 1.57 W/(m·K) (mean = 1.29 ± 0.19 W/[m·K]).
9.3. Rheology
Sediment shear strength was measured with the AVS instrument on seven cores recovered from Hole U1578A in ooze and unlithified chalk in the calcareous sediment interval from the seafloor to 60.9 mbsf. AVS measurements were not taken below this depth because of increased lithification. Shear strength gradually increases downhole from 4.90 kN/m2 (Section 1R-3; 3.25 mbsf) to 34.5 kN/m2 (Section 6R-2; 50.0 mbsf). Above the ~30 mbsf Lithostratigraphic Unit I/Subunit IIA boundary, mean shear strength is 6.99 ± 1.99 kN/m2. Below the ~30 mbsf contact, oozes and chalks have a mean shear strength of 21.7 ± 12.3 kN/m2. However, it is possible that this increase is a result of compaction and not related to rheological differences between Unit I and Subunit IIA.
9.4. Magnetic susceptibility
Lithologic variations in Hole U1578A are well defined using MS data from the WRMSL and MSP data from the SHMSL (Figure F43). Lithostratigraphic boundaries between Unit I and Subunit IIA and between Subunits IIA and IIB are defined by MS, MSP, and NGR (see Lithostratigraphy). Calcareous ooze and chalks in the uppermost sediment interval (seafloor to ~30 mbsf) have MS and MSP values of 1.25 × 10⁻⁵ to 33.16 × 10⁻⁵ SI (mean = 7.39 ± 1.4124.0 ± 39.1 × 10⁻⁵ SI). From ~30 to ~135 mbsf, Subunit IIA has MS and MSP values between 2.17 × 10⁻⁵ and 245 × 10−5 SI (mean = 17.4 ± 2.55 × 10⁻⁵ SI); from ~135 to ~185 mbsf, Subunit IIB has MS and MSP values between 3.68 × 10⁻⁵ and 1463 × 10−5 SI (mean = 84.8 ± 19.8 × 10⁻⁵ SI). As with previous Expedition 391 sites, higher values (greater than ~100 × 10−5 SI) in the calcareous sediment interval are correlated to volcaniclastic deposits (e.g., sediments and/or tephra; see Lithostratigraphy) between ~31 and ~175 mbsf (Figure F44). Interestingly, however, not all volcaniclastic deposits are revealed by high MS and MSP values. At the basement contact (~180 mbsf), mean MS and MSP values abruptly increase to 570 ± 151 × 10−5 SI, and below the basement contact, volcaniclastic interbeds and basalt units are stratigraphically distinguishable using MS and MSP data. Volcaniclastic interbeds below ~180 mbsf have MS and MSP values from 36.2 × 10⁻⁵ to 789 × 10−5 SI (mean = 341 ± 136 × 10−5 SI), whereas basalt units have MS and MSP from 351 × 10−5 to 2242 × 10−5 SI (mean = 1038 ± 179 × 10−5 SI).
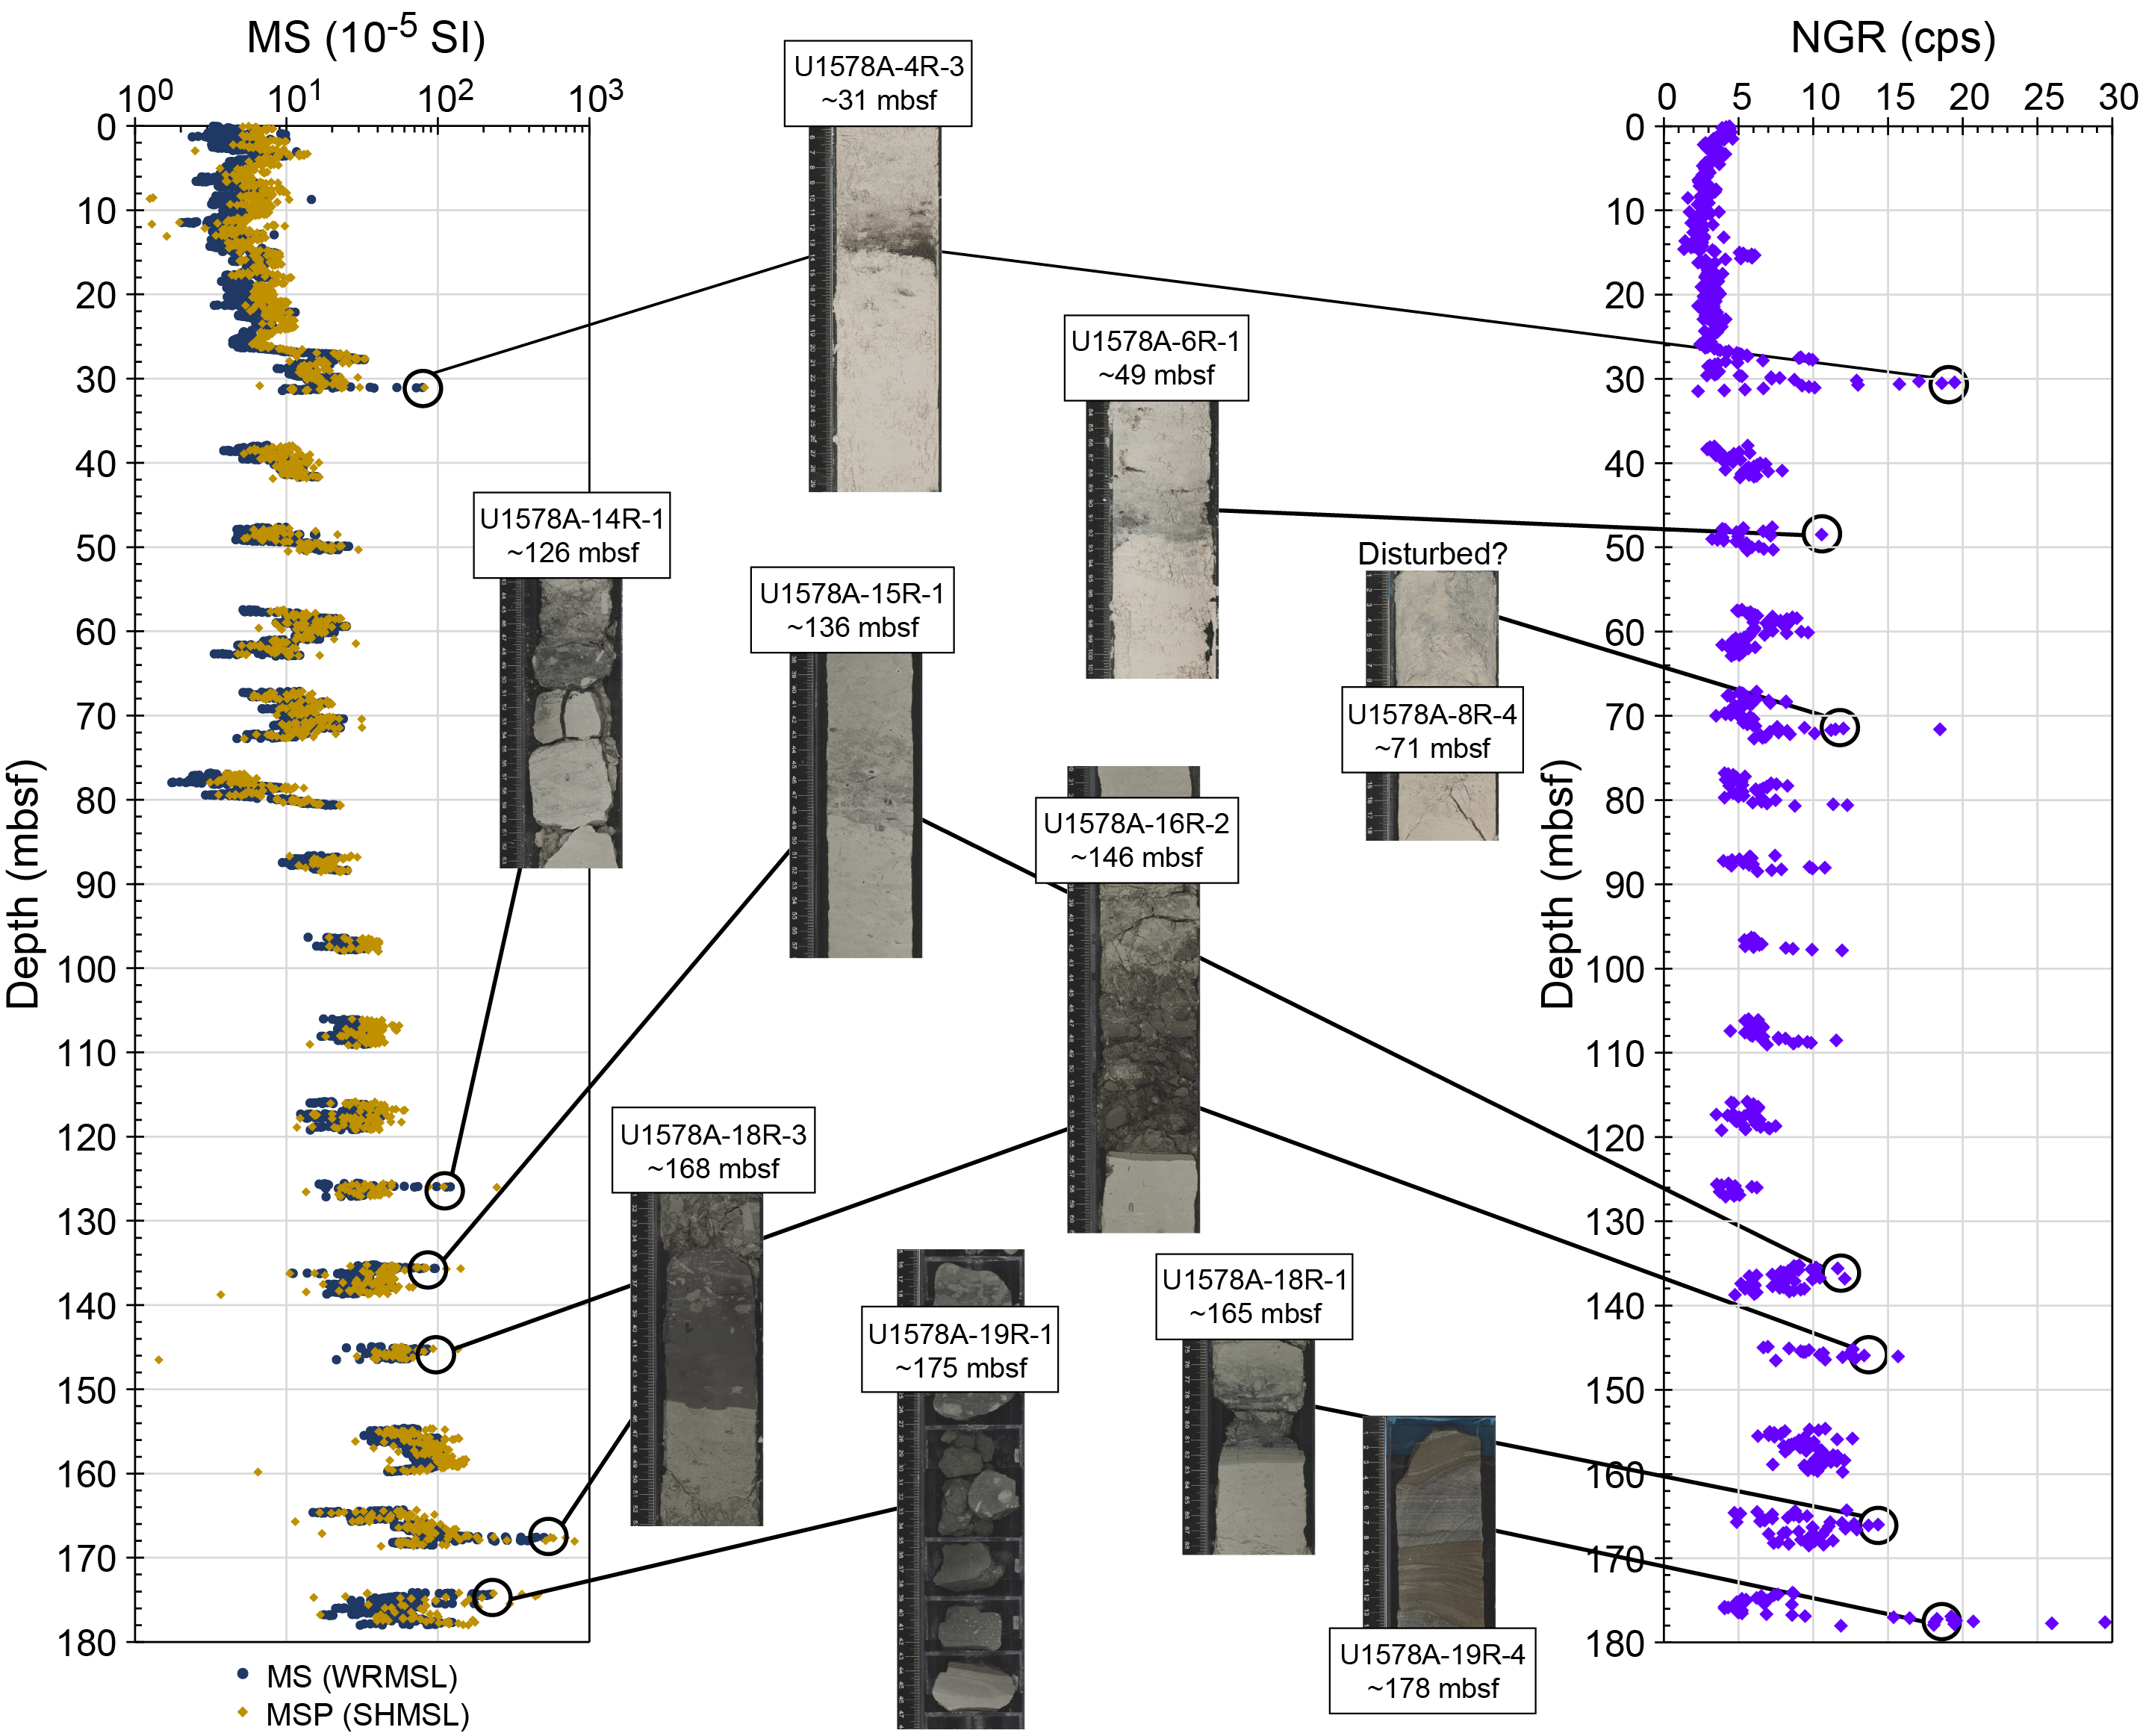
Figure F44. Tephra layers.
MS and MSP values also appear to correlate to petrologic characteristics. Olivine phyric basalts at ~218 and ~253 mbsf correlate to higher MS and MSP values (3110 × 10−5 SI and 4024 × 10−5 SI, respectively; see Igneous petrology and volcanology). As at other Expedition 391 sites, lower MS and MSP values in basalt intervals (<100 × 10−5 SI) appear to be associated with lower recovery and associated fractured and rubbly zones, whereas higher values (>1000 × 10−5 SI) appear to be coincident with longer (>20 cm), more coherent basalt fragments.
9.5. Bulk density and porosity
GRA and MAD bulk density data sets generally align along the profile of Hole U1578A and display similar trends as other physical properties measurements (Figure F43). The three general lithostratigraphic intervals (calcareous sediment, volcaniclastic deposits, and basalts) are well defined by GRA and MAD bulk density values. Above ~30 mbsf, mean bulk density values range 1.00–1.87 g/cm2 (mean = 1.65 ± 0.029 g/cm2). From ~30 mbsf to ~184 mbsf, bulk density values range 1.00–2.14 g/cm2 (mean = 1.61 ± 0.20 g/cm2). GRA and MAD bulk density values overlap in the calcareous sediment interval where void spaces between the core and the core liner are less prevalent. However, as at previous Expedition 391 sites, MAD bulk density analyses of discrete basalt and lithified sediment samples are more accurate than GRA bulk density values obtained during WRMSL whole-round core analyses. In harder lithologies, where void spaces are more common, MAD bulk density values are consistently higher than GRA bulk density in basalt and volcaniclastic intervals. Therefore, MAD bulk density values are used where possible. Basalt flows and pillows have bulk density 2.44–2.94 g/cm2 (mean = 2.74 ± 0.046 g/cm2), and volcaniclastic interbeds have bulk density 1.78–2.14 g/cm2 (mean = 1.91 ± 0.11 g/cm2). Anomalously low GRA bulk density (<1 g/cm2) in basalts (e.g., ~302 to ~361 mbsf) is likely a result of fragmentation (e.g., Cores 37R and 38R).
The porosity of Hole U1578A lithologies was also determined using MAD measurements, and porosity values are in accord with other physical properties and shipboard scientific observations (Figure F43). Although porosity values do not appear to distinguish lithostratigraphic contacts at ~30 and ~135 mbsf, the calcareous sediment/basalt contact at ~184 mbsf and contacts between basalt units and interbedded volcaniclastic sediments below ~184 mbsf to the bottom of the hole appear to be recorded in the porosity data set. Basalt units have porosity between 4.20 and 15.1 vol% (mean = 9.51 ± 2.67 vol%), and volcaniclastic interbeds have porosity between 34.1 and 58.4 vol% (mean = 44.5 ± 0.90 vol%). In the calcareous sediment interval, ooze, clays, and chalks have relatively uniform porosities between 33.1 and 74.7 vol% (mean = 61.9 ± 0.80 vol%). Mean porosity does not significantly vary between Lithostratigraphic Unit I and Subunits IIA and IIB, suggesting that porosity does not decrease with depth.
9.6. Sonic velocities
The P-wave logger (PWL), PWB, and PWC were used to measure P-wave velocities along the x-, y-, and z-axes in the calcareous sediment interval from the seafloor to 62.9 mbsf. Below this depth, x-axis P-wave velocity measurements were obtained from representative locations in section halves using the PWC. Discrete sample cubes of basalt were measured along the x-, y-, and z-axes. Wedge samples of basalt and lithified sediments were measured along the z-axis. All discrete measurements were conducted using the PWC.
As at previous Expedition 391 sites, the transition from the PWL to PWC results in a shift from continuous measurements to a wider sampling interval with increased depth (Figure F43). PWL and PWB measurements do not appear to image sedimentary lithostratigraphic contacts at 27 mbsf and 135.2 mbsf (see Lithostratigraphy). However, all P-wave velocity data sets agree in the calcareous sediment interval and record velocities 1550–2377 m/s (mean = 1699 ± 177 m/s). The calcareous sediment/basalt contact at ~184 mbsf is visible as an abrupt increase in P-wave velocity from 1549 to 3033 m/s. Below ~184 mbsf, basalt units and volcaniclastic interbeds are clearly imaged by similar shifts. Basalt units have uniformly higher P-wave velocities (2973–3613 m/s; mean = 3211 ± 221 m/s) than lithified volcaniclastic sediments (1527–2070 m/s; mean = 1825 ± 244 m/s). Below the final volcaniclastic sediment/basalt contact at ~402 mbsf, P-wave velocity in basalt units gradually increases downhole to a maximum of 3984 m/s at 452.6 mbsf.
9.7. Natural gamma radiation
NGR aligns with other physical properties measurements in defining three general lithologic intervals in Hole U1578A: calcareous sediment, basalt, and volcaniclastic interbeds. Furthermore, sedimentary lithostratigraphic units in the calcareous sediment interval are distinguished by gradually increasing NGR. At ~30 mbsf, the contact between Lithostratigraphic Unit I and Subunit IIA is imaged as an increase from a mean NGR of 3.32 ± 1.19 to 6.17 ± 2.23 counts/s. At ~135 mbsf, NGR increases to a mean of 10.0 ± 4.13 counts/s in Subunit IIB (see Lithostratigraphy). Volcaniclastic layers within the calcareous sediment interval are recorded as peaks in NGR between ~15.7 and ~19.4 counts/s, some of which align with MS and MSP peaks at the same depths (Figure F44). A palagonite deposit immediately above the calcareous sediment/basalt contact at ~178 mbsf (Section 19R-4) has the highest NGR (29.5 counts/s) in the calcareous sediment interval (see Igneous petrology and volcanology and Lithostratigraphy). At ~184 mbsf, the calcareous sediment/basalt contact is correlated to an increase in background NGR from a mean of 10.0 ± 4.13 counts/s above the contact to a mean of 19.0 ± 4.58 counts/s below the contact. Basalt units have wide-ranging NGR between 4.29 and 38.8 counts/s (mean = 17.9 ± 4.84 counts/s). Volcaniclastic interbeds below ~184 mbsf are distinguished by slightly lower NGR values (6.30–33.4 counts/s; mean = 14.9 ± 3.32 counts/s). NGR values in basalt units appear to correlate with ICP-AES geochemical analyses. The highest NGR recorded in Hole U1578A, ~38.8 counts/s at 272.63 mbsf, correlates to high (>1.5 wt%) K2O concentrations in an aphyric basalt at the same depth (see Igneous petrology and volcanology and Igneous geochemistry). As at previous Expedition 391 sites, low NGR values (less than ~7 counts/s) appear to be associated with fractured or rubbly basalt intervals and/or poor data quality.
9.8. Data integration and lithology correlation
Physical properties data sets correlate to lithologic distinctions and appear to correlate with geochemical observations from other shipboard scientific parties. Three general intervals were observed in Hole U1578A: calcareous sediments (ooze, clay, and chalk), igneous basement (basalt flows and pillows), and volcaniclastic interbeds below the basement contact at ~184 mbsf.
An abrupt increase in mean NGR, MS, and MSP at ~30 mbsf (3.31 to 6.17 counts/s and 8.39 to 19.2 × 10⁻⁵ SI, respectively) indicates the contact between Lithostratigraphic Unit I and Subunit IIA (see Lithostratigraphy). Throughout the calcareous sediment interval, NGR, MS, and MSP peaks (~25–35 counts/s and 94.4–502 × 10−5 SI, respectively) appear to correlate with the distribution of volcaniclastic layers in ooze, clay, and chalk units (see Lithostratigraphy) and high NGR (~39 counts/s) appears to correlate with potassium concentrations in an aphyric basalt at ~270 mbsf (see Igneous petrology and volcanology and Igneous geochemistry). High MS and MSP (>2000 × 10−5 SI) records olivine-phyric basalt units at ~218 and ~253 mbsf (see Igneous petrology and volcanology). Volcaniclastic interbeds below the calcareous sediment/basalt contact at ~184 mbsf are defined by a decrease in P-wave velocity, GRA and MAD bulk density, thermal conductivity, MS, and MSP and an increase in NGR and porosity. MS and MSP values greater than 30 × 10−5 SI in volcaniclastic interbeds may be related to dominantly mafic components. MS, MSP, P-wave velocity, NGR, GRA and MAD bulk density, porosity, and thermal conductivity measurements indicate relatively uniform physical properties in basalt units to the recovered bottom of the hole at ~484 mbsf.
References
Acton, G.D., Okada, M., Clement, B.M., Lund, S.P., and Williams, T., 2002. Paleomagnetic overprints in ocean sediment cores and their relationship to shear deformation caused by piston coring. Journal of Geophysical Research: Solid Earth, 107:2067–2081. https://doi.org/10.1029/2001JB000518
Agnini, C., Fornaciari, E., Raffi, I., Rio, D., Röhl, U., and Westerhold, T., 2007. High-resolution nannofossil biochronology of middle Paleocene to early Eocene at ODP Site 1262; implications for calcareous nannoplankton evolution. Marine Micropaleontology, 64(3–4):215–248. https://doi.org/10.1016/j.marmicro.2007.05.003
Baker, P.A., Gieskes, J.M., and Elderfield, H., 1982. Diagenesis of carbonates in deep-sea sediments; evidence from Sr/Ca ratios and interstitial dissolved Sr2+ data. Journal of Sedimentary Research, 52(1):71–82. https://doi.org/10.1306/212F7EE1-2B24-11D7-8648000102C1865D
Bartels, T., Krastel, S., and Spiess, V., 2007. Correlation of high-resolution seismic data with ODP Leg 208 borehole measurements. In Kroon, D., Zachos, J.C., and Richter, C. (Eds.), Proceedings of the Ocean Drilling Program, Scientific Results. 208: College Station, TX (Ocean Drilling Program). https://doi.org/10.2973/odp.proc.sr.208.204.2007
Chave, A.D., 1984. Lower Paleocene-Upper Cretaceous magnetostratigraphy, Sites 525, 527, 528, and 529, Deep Sea Drilling Project Leg 74. In Moore, T.C., Jr., Rabinowitz, P.D., et al., Initial Reports of the Deep Sea Drilling Project, 74: Washington, DC (US Government Printing Office), 525–531. https://doi.org/10.2973/dsdp.proc.74.110.1984
Class, C., and Lehnert, K., 2012. PetDB Expert MORB (Mid-Ocean Ridge Basalt) Compilation, Version 1.0. Interdisciplinary Earth Data Alliance (IEDA). https://doi.org/10.1594/IEDA/100060
Class, C., and le Roex, A.P., 2008. Ce anomalies in Gough Island lavas — trace element characteristics of a recycled sediment component. Earth and Planetary Science Letters, 265(3–4):475–486. https://doi.org/10.1016/j.epsl.2007.10.030
Cliff, R.A., Baker, P.E., and Mateer, N.J., 1991. Geochemistry of inaccessible island volcanics. Chemical Geology, 92(4):251–260. https://doi.org/10.1016/0009-2541(91)90073-Z
de Kaenel, E., and Villa, G., 1996. Oligocene-Miocene calcareous nannofossil biostratigraphy and paleoecology from the Iberia abyssal plain. In Whitmarsh, R.B., Sawyer, D.S., Klaus, A., and Masson, D.G. (Eds.), Proceedings of the Ocean Drilling Program, Scientific Results. 149: College Station, TX (Ocean Drilling Program). https://doi.org/10.2973/odp.proc.sr.149.208.1996
Doubrovine, P.V., Steinberger, B., and Torsvik, T.H., 2012. Absolute plate motions in a reference frame defined by moving hot spots in the Pacific, Atlantic, and Indian oceans. Journal of Geophysical Research: Solid Earth, 117(B9):B09101. https://doi.org/10.1029/2011JB009072
Ernesto, M., Pacca, I.G., Hiodo, F.Y., and Nardy, A.J.R., 1990. Palaeomagnetism of the Mesozoic Serra Geral Formation, southern Brazil. Physics of the Earth and Planetary Interiors, 64(2):153–175. https://doi.org/10.1016/0031-9201(90)90035-V
Ernesto, M., Raposo, M.I.B., Marques, L.S., Renne, P.R., Diogo, L.A., and de Min, A., 1999. Paleomagnetism, geochemistry and 40Ar/39Ar dating of the north-eastern Paraná Magmatic Province: tectonic implications. Journal of Geodynamics, 28(4):321–340. https://doi.org/10.1016/S0264-3707(99)00013-7
Expedition 330 Scientists, 2012. Expedition 330 summary. In Koppers, A.A.P., Yamazaki, T., Geldmacher, J., and the Expedition 330 Scientists, Proceedings of the Integrated Ocean Drilling Program. 330: Tokyo (Integrated Ocean Drilling Program Management International, Inc.). https://doi.org/10.2204/iodp.proc.330.101.2012
Gibson, S.A., Thompson, R.N., Day, J.A., Humphris, S.E., and Dickin, A.P., 2005. Melt-generation processes associated with the Tristan mantle plume: constraints on the origin of EM-1. Earth and Planetary Science Letters, 237(3–4):744–767. https://doi.org/10.1016/j.epsl.2005.06.015
Gordon, R.G., and Cape, C.D., 1981. Cenozoic latitudinal shift of the Hawaiian hotspot and its implications for true polar wander. Earth and Planetary Science Letters, 55(1):37–47. https://doi.org/10.1016/0012-821X(81)90084-4
Gordon, R.G., Woodworth, D.T., Gaastra, K., and Seidman, L.E., 2019. Paleogene true polar wander, origin of the Hawaiian-Emperor Bend, paleolatitude of Ellesemere Island and Cenozoic climate change. Presented at the Geological Society of American Annual Meeting, Phoenix, AZ, 22–25 September 2019.
Gradstein, F.M., Ogg, J.G., Schmitz, M.D., and Ogg, G.M. (Eds.), 2012. The Geologic Time Scale 2012: Amsterdam (Elsevier). https://doi.org/10.1016/C2011-1-08249-8
Gradstein, F.M., Ogg, J.G., Schmitz, M.D., and Ogg, G.M. (Eds.), 2020. The Geologic Time Scale 2020: Amsterdam (Elsevier BV). https://doi.org/10.1016/C2020-1-02369-3
Henkel, S., Mogollón, J.M., Nöthen, K., Franke, C., Bogus, K., Robin, E., Bahr, A., Blumenberg, M., Pape, T., Seifert, R., März, C., de Lange, G.J., and Kasten, S., 2012. Diagenetic barium cycling in Black Sea sediments – a case study for anoxic marine environments. Geochimica et Cosmochimica Acta, 88:88–105. https://doi.org/10.1016/j.gca.2012.04.021
Hoernle, K., Rohde, J., Hauff, F., Garbe-Schönberg, D., Homrighausen, S., Werner, R., and Morgan, J.P., 2015. How and when plume zonation appeared during the 132 Myr evolution of the Tristan Hotspot. Nature Communications, 6(1):7799. https://doi.org/10.1038/ncomms8799
Homrighausen, S., Hoernle, K., Geldmacher, J., Wartho, J.A., Hauff, F., Portnyagin, M., Werner, R., van den Bogaard, P., and Garbe-Schönberg, D., 2018. Unexpected HIMU-type late-stage volcanism on the Walvis Ridge. Earth and Planetary Science Letters, 492:251–263. https://doi.org/10.1016/j.epsl.2018.03.049
Homrighausen, S., Hoernle, K., Hauff, F., Wartho, J.A., van den Bogaard, P., and Garbe-Schönberg, D., 2019. New age and geochemical data from the Walvis Ridge: the temporal and spatial diversity of South Atlantic intraplate volcanism and its possible origin. Geochimica et Cosmochimica Acta, 245:16–34. https://doi.org/10.1016/j.gca.2018.09.002
Homrighausen, S., Hoernle, K., Zhou, H., Geldmacher, J., Wartho, J.-A., Hauff, F., Werner, R., Jung, S., and Morgan, J.P., 2020. Paired EMI-HIMU hotspots in the South Atlantic—starting plume heads trigger compositionally distinct secondary plumes? Science Advances, 6(28):eaba0282. https://doi.org/10.1126/sciadv.aba0282
Jochum, K.P., and Verma, S.P., 1996. Extreme enrichment of Sb, Tl and other trace elements in altered MORB. Chemical Geology, 130(3–4):289–299. https://doi.org/10.1016/0009-2541(96)00014-9
Jørgensen, B.B., Findlay, A.J., and Pellerin, A., 2019. The biogeochemical sulfur cycle of marine sediments. Frontiers in Microbiology, 10:849. https://doi.org/10.3389/fmicb.2019.00849
Koppers, A.A.P., Sano, T., Natland, J.H., Widdowson, M., Almeev, R., Greene, A.R., Murphy, D.T., Delacour, A., Miyoshi, M., Shimizu, K., Li, S., Hirano, N., Geldmacher, J., and the Expedition 324 Scientists, 2010. Massive basalt flows on the southern flank of Tamu Massif, Shatsky Rise: a reappraisal of ODP Site 1213 basement units. In Sager, W.W., Sano, T., Geldmacher, J., and the Expedition 324 Scientists, Proceedings of the Integrated Ocean Drilling Program, 324: Tokyo (Integrated Ocean Drilling Program Management International, Inc.). https://doi.org/10.2204/iodp.proc.324.109.2010
Le Bas, M.J., Le Maitre, R. W., Streickeisen, A., Zanettin, B., the IUGS Subcommission on the Systematics of Igneous Rocks, 1986. A chemical classification of volcanic rocks based on the total alkali-silica diagram. Journal of Petrology, 27(3):745–750. https://doi.org/10.1093/petrology/27.3.745
Le Maitre, R.W., 1962. Petrology of volcanic rocks, Gough Island, South Atlantic. Geological Society of America Bulletin, 73(11):1309–1340. https://doi.org/10.1130/0016-7606(1962)73[1309:POVRGI]2.0.CO;2
Le Roex, A.P., Cliff, R.A., and Adair, B.J.I., 1990. Tristan da Cunha, South Atlantic: geochemistry and petrogenesis of a basanite-phonolite lava series. Journal of Petrology, 31(4):779–812. https://doi.org/10.1093/petrology/31.4.779
MacDonald, G.A., and Katsura, T., 1964. Chemical composition of Hawaiian lavas. Journal of Petrology, 5(1):82–133. https://doi.org/10.1093/petrology/5.1.82
McFadden, P.L., and Reid, A.B., 1982. Analysis of palaeomagnetic inclination data. Geophysical Journal International, 69(2):307–319. https://doi.org/10.1111/j.1365-246X.1982.tb04950.x
O'Connor, J.M., and le Roex, A.P., 1992. South Atlantic hot spot-plume systems: 1. Distribution of volcanism in time and space. Earth and Planetary Science Letters, 113(3):343–364. https://doi.org/10.1016/0012-821X(92)90138-L
Ogg, J.G., 2020. Geomagnetic Polarity Time Scale. In Gradstein, F.M., Ogg, J.G., Schmitz, M., and Ogg, G. (Eds.), Geologic Time Scale 2020. Amsterdam (Elsevier), 159–192.
Perch-Nielsen, K., 1985a. Cenozoic calcareous nannofossils. In Bolli, H.M., Saunders, J.B., and Perch-Nielsen, K. (Eds.), Plankton Stratigraphy (Volume 1). Cambridge, UK (Cambridge University Press), 427–554.
Perch-Nielsen, K., 1985b. Mesozoic calcareous nannofossils. In Bolli, H.M., Saunders, J.B., and Perch-Nielsen, K., Plankton Stratigraphy (Volume 1). Cambridge, UK (Cambridge University Press), 329–426.
Quinby-Hunt, M.S., and Turekian, K.K., 1983. Distribution of elements in sea water. Eos, Transactions of the American Geophysical Union, 64(14):130. https://doi.org/10.1029/EO064i014p00130
Raffi, I., Backman, J., Fornaciari, E., Pälike, H., Rio, D., Lourens, L., and Hilgen, F., 2006. A review of calcareous nannofossil astrobiochronology encompassing the past 25 million years. Quaternary Science Reviews, 25(23):3113–3137. https://doi.org/10.1016/j.quascirev.2006.07.007
Renne, P.R., Scott, G.R., Glen, J.M.G., and Feinberg, J.M., 2002. Oriented inclusions of magnetite in clinopyroxene: source of stable remanent magnetization in gabbros of the Messum Complex, Namibia. Geochemistry, Geophysics, Geosystems, 3(12):1–11. https://doi.org/10.1029/2002GC000319
Richardson, S.H., Erlank, A.J., Reid, D.L., and Duncan, A.R., 1984. Major and trace element and Nd and Sr isotope geochemistry of basalts from the Deep Sea Drilling Project Leg 74 Walvis Ridge transect. In Moore, T.C., Jr., Rabinowitz, P. D., et al., Initial Reports of the Deep Sea Drilling Project. 74: Washington, DC (US Government Printing Office), 739–754. https://doi.org/10.2973/dsdp.proc.74.125.1984
Rohde, J., Hoernle, K., Hauff, F., Werner, R., O'Connor, J., Class, C., Garbe-Schönberg, D., and Jokat, W., 2013. 70 Ma chemical zonation of the Tristan-Gough hotspot track. Geology, 41(3):335–338. https://doi.org/10.1130/G33790.1
Ryan, W.B.F., Carbotte, S.M., Coplan, J.O., O'Hara, S., Melkonian, A., Arko, R., Weissel, R.A., Ferrini, V., Goodwillie, A., Nitsche, F., Bonczkowski, J., and Zemsky, R., 2009. Global multi-resolution topography synthesis. Geochemistry, Geophysics, Geosystems, 10(3):Q03014. https://doi.org/10.1029/2008GC002332
Sager, W., Hoernle, K., Höfig, T.W., Avery, A.J., Bhutani, R., Buchs, D.M., Carvallo, C.A., Class, C., Dai, Y., Dalla Valle, G., Del Gaudio, A.V., Fielding, S., Gaastra, K.M., Han, S., Homrighausen, S., Kubota, Y., Li, C.-F., Nelson, W.R., Petrou, E., Potter, K.E., Pujatti, S., Scholpp, J., Shervais, J.W., Thoram, S., Tikoo-Schantz, S.M., Tshiningayamwe, M., Wang, X.-J., and Widdowson, M., 2023. Expedition 391 methods. In Sager, W., Hoernle, K., Höfig, T.W., Blum, P., and the Expedition 391 Scientists, Walvis Ridge Hotspot. Proceedings of the International Ocean Discovery Program, 391: College Station, TX (International Ocean Discovery Program). https://doi.org/10.14379/iodp.proc.391.102.2023
Salters, V.J.M., and Sachi-Kocher, A., 2010. An ancient metasomatic source for the Walvis Ridge basalts. Chemical Geology, 273(3–4):151–167. https://doi.org/10.1016/j.chemgeo.2010.02.010
Shervais, J.W., 2022. The petrogenesis of modern and ophiolitic lavas reconsidered: Ti-V and Nb-Th. Geoscience Frontiers, 13(2):101319. https://doi.org/10.1016/j.gsf.2021.101319
Tarduno, J., Bunge, H.-P., Sleep, N., and Hansen, U., 2009. The bent Hawaiian-Emperor hotspot track: inheriting the mantle wind. Science, 324(5923):50–53. https://doi.org/10.1126/science.1161256
Thompson, R., and Oldfield, F., 1986. Environmental Magnetism: Dordrecht (Springer). https://doi.org/10.1007/978-94-011-8036-8
Torsvik, T.H., Müller, R.D., Van der Voo, R., Steinberger, B., and Gaina, C., 2008. Global plate motion frames: toward a unified model. Reviews of Geophysics, 46(3):RG3004. https://doi.org/10.1029/2007RG000227
Tozer, B., Sandwell, D.T., Smith, W.H.F., Olson, C., Beale, J.R., and Wessel, P., 2019. Global bathymetry and topography at 15 arc sec: SRTM15+. Earth and Space Science, 6(10):1847–1864. https://doi.org/10.1029/2019EA000658
Van Fossen, M.C., and Kent, D.V., 1992. Paleomagnetism of 122 Ma plutons in New England and the mid-Cretaceous paleomagnetic field in North America: true polar wander or large-scale differential mantle motion? Journal of Geophysical Research: Solid Earth, 97(B13):19651–19661. https://doi.org/10.1029/92JB01466
Verosub, K.L., 1977. Depositional and postdepositional processes in the magnetization of sediments. Reviews of Geophysics, 15(2):129–143. https://doi.org/10.1029/RG015i002p00129
Wade, B.S., Pearson, P.N., Berggren, W.A., and Pälike, H., 2011. Review and revision of Cenozoic tropical planktonic foraminiferal biostratigraphy and calibration to the geomagnetic polarity and astronomical time scale. Earth-Science Reviews, 104(1–3):111–142. https://doi.org/10.1016/j.earscirev.2010.09.003
Weaver, B.L., Wood, D.A., Tarney, J., and Joron, J.L., 1987. Geochemistry of ocean island basalts from the South Atlantic: Ascension, Bouvet, St. Helena, Gough and Tristan da Cunha. In Fitton, J.G., and Upton, B.G.J. (Eds.), Alkaline Igneous Rocks. Geological Society Special Publication, 30: 253–267. https://doi.org/10.1144/GSL.SP.1987.030.01.11
Willbold, M., and Stracke, A., 2006. Trace element composition of mantle end-members: implications for recycling of oceanic and upper and lower continental crust. Geochemistry, Geophysics, Geosystems, 7(4):Q04004. https://doi.org/10.1029/2005GC001005
Woodworth, D., and Gordon, R.G., 2020. Timing of Eocene true polar wander inferred from Pacific plate marine magnetic anomalies. Presented at the American Geophysical Union Fall Meeting, Virtual, 1–17 December 2020. https://abstractsearch.agu.org/meetings/2020/FM/DI011-0007.html
Young, J.R., 1998. Neogene nannofossils. In Bown, P.R., Calcareous Nannofossil Biostratigraphy. Dordrecht, The Netherlands (Kluwer Academic Publishing), 225–265.
Zindler, A., and Hart, S., 1986. Chemical geodynamics. Annual Review of Earth and Planetary Sciences, 14:493–570. https://doi.org/10.1146/annurev.ea.14.050186.002425