Parnell-Turner, R.E., Briais, A., LeVay, L.J., and the Expedition 395 Scientists
Proceedings of the International Ocean Discovery Program Volume 395
publications.iodp.org
https://doi.org/10.14379/iodp.proc.395.105.2025
Site U15621
![]() A. Briais,
A. Briais,
![]() R.E. Parnell-Turner,
R.E. Parnell-Turner,
![]() L.J. LeVay,
L.J. LeVay,
![]() Y. Cui,
Y. Cui,
![]() A. Di Chiara,
A. Di Chiara,
![]() J.P. Dodd,
J.P. Dodd,
![]() T. Dunkley Jones,
T. Dunkley Jones,
![]() D.P. Dwyer,
D.P. Dwyer,
![]() D.E. Eason,
D.E. Eason,
![]() S. Friedman,
S. Friedman,
![]() S.R. Hemming,
S.R. Hemming,
![]() K. Hochmuth,
K. Hochmuth,
![]() H. Ibrahim,
H. Ibrahim,
![]() C. Jasper,
C. Jasper,
![]() B.T. Karatsolis,
B.T. Karatsolis,
![]() S. Lee,
S. Lee,
![]() D.E. LeBlanc,
D.E. LeBlanc,
![]() M.R. Lindsay,
M.R. Lindsay,
![]() D.D. McNamara,
D.D. McNamara,
![]() S.E. Modestou,
S.E. Modestou,
![]() B. Murton,
B. Murton,
![]() S. OConnell,
S. OConnell,
![]() G.T. Pasquet,
G.T. Pasquet,
![]() P.N. Pearson,
S.-P. Qian,
P.N. Pearson,
S.-P. Qian,
![]() Y. Rosenthal,
Y. Rosenthal,
![]() S. Satolli,
S. Satolli,
![]() M. Sinnesael,
T. Suzuki,
M. Sinnesael,
T. Suzuki,
![]() T. Thulasi Doss,
T. Thulasi Doss,
![]() N.J. White,
N.J. White,
![]() T. Wu,
T. Wu,
![]() A. Yang Yang,
A. Yang Yang,
![]() V. dos Santos Rocha,
C. Pearman, and
C.-Y. Tian2
V. dos Santos Rocha,
C. Pearman, and
C.-Y. Tian2
1 Briais, A., Parnell-Turner, R.E., LeVay, L.J., Cui, Y., Di Chiara, A., Dodd, J.P., Dunkley Jones, T., Dwyer, D., Eason, D.E., Friedman, S.A., Hemming, S.R., Hochmuth, K., Ibrahim, H., Jasper, C., Karatsolis, B.T., Lee, S., LeBlanc, D.E., Lindsay, M.R., McNamara, D.D., Modestou, S.E., Murton, B., OConnell, S., Pasquet, G.T., Pearson, P.N., Qian, S.P., Rosenthal, Y., Satolli, S., Sinnesael, M., Suzuki, T., Thulasi Doss, T., White, N.J., Wu, T., Yang Yang, A., dos Santos Rocha, V., Pearman, C., and Tian, C.Y., 2025. Site U1562. In Parnell-Turner, R.E., Briais, A., LeVay, L.J., and the Expedition 395 Scientists, Reykjanes Mantle Convection and Climate. Proceedings of the International Ocean Discovery Program, 395: College Station, TX (International Ocean Discovery Program). https://doi.org/10.14379/iodp.proc.395.105.2025
2 Expedition 395 Scientists' affiliations.
1. Background and objectives
Site U1562 is located on Björn drift, on the eastern flank of the Reykjanes Ridge in the North Atlantic Ocean. It is located ~12 km east of Site U1554 (Figures F1, F2) on a basement high at the eastern edge of the main drift deposit. Site U1562 is located on crustal V-shaped ridge (VSR) 3, which is associated with a high in the free-air gravity anomaly, whereas Site U1554 is located on V-shaped trough (VST) 2b. Site U1562 sits on ocean crust with an age of 13.86 Ma estimated from magnetic anomalies.
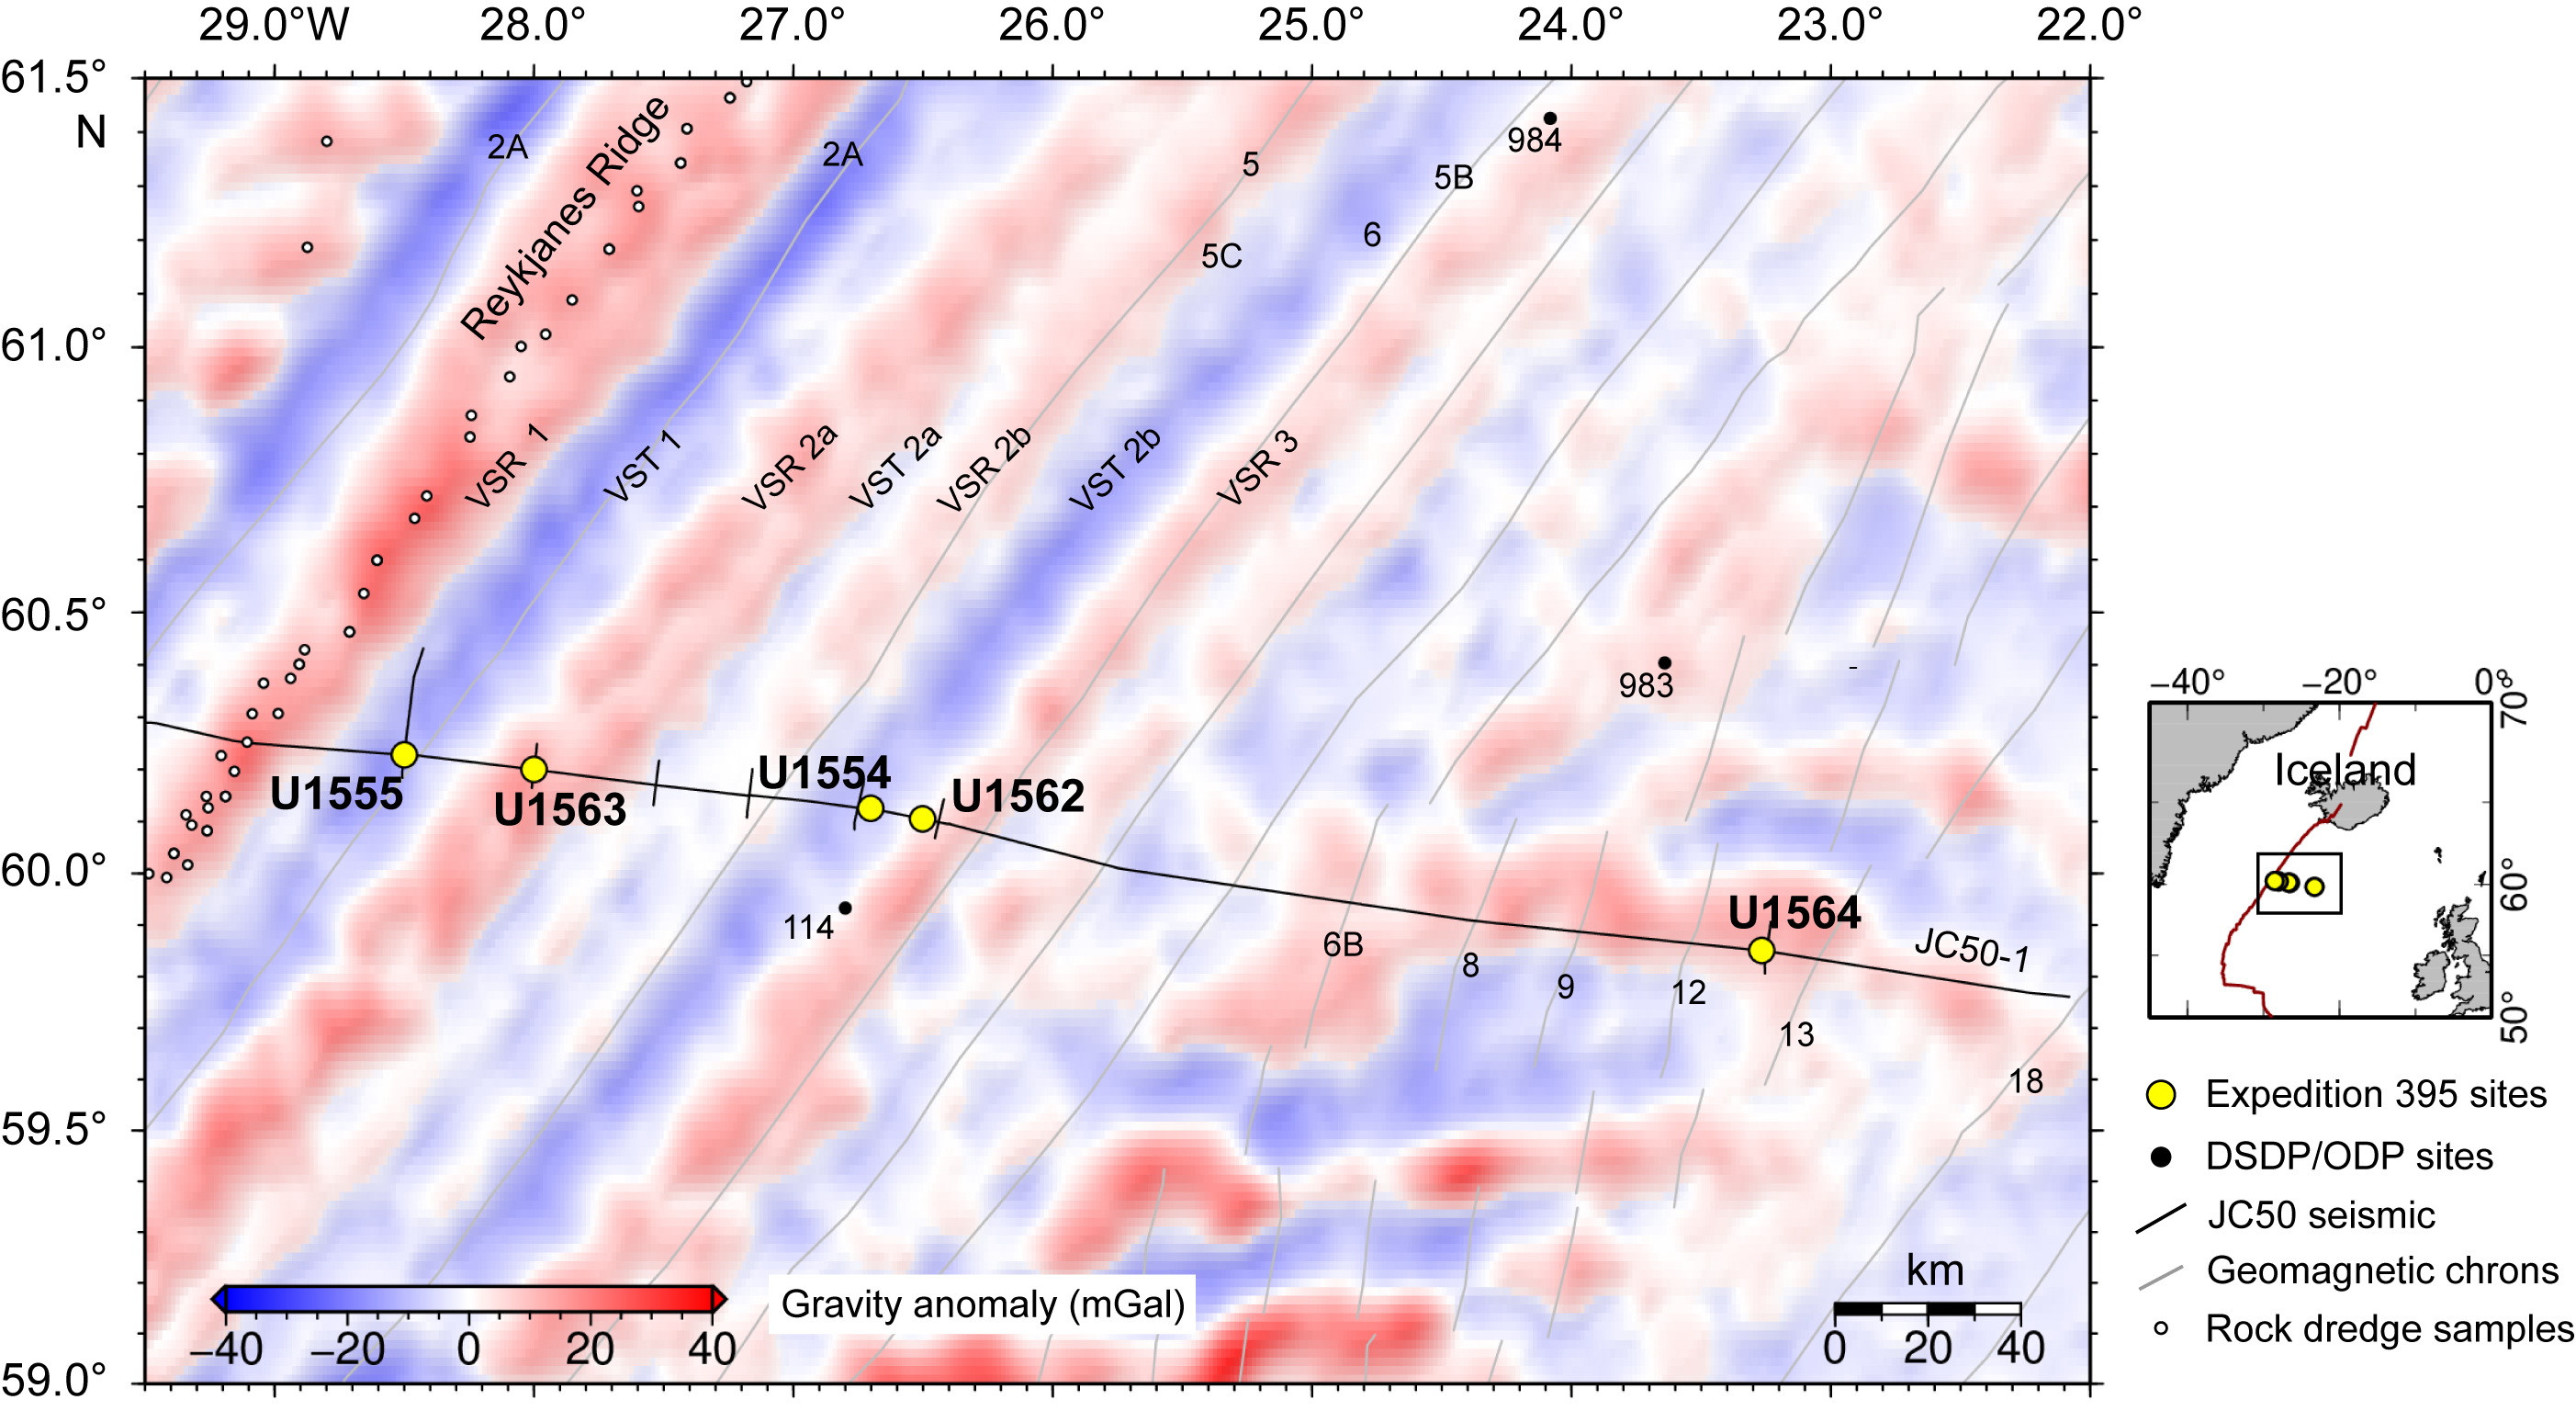
Figure F1. Satellite free-air gravity anomaly map.
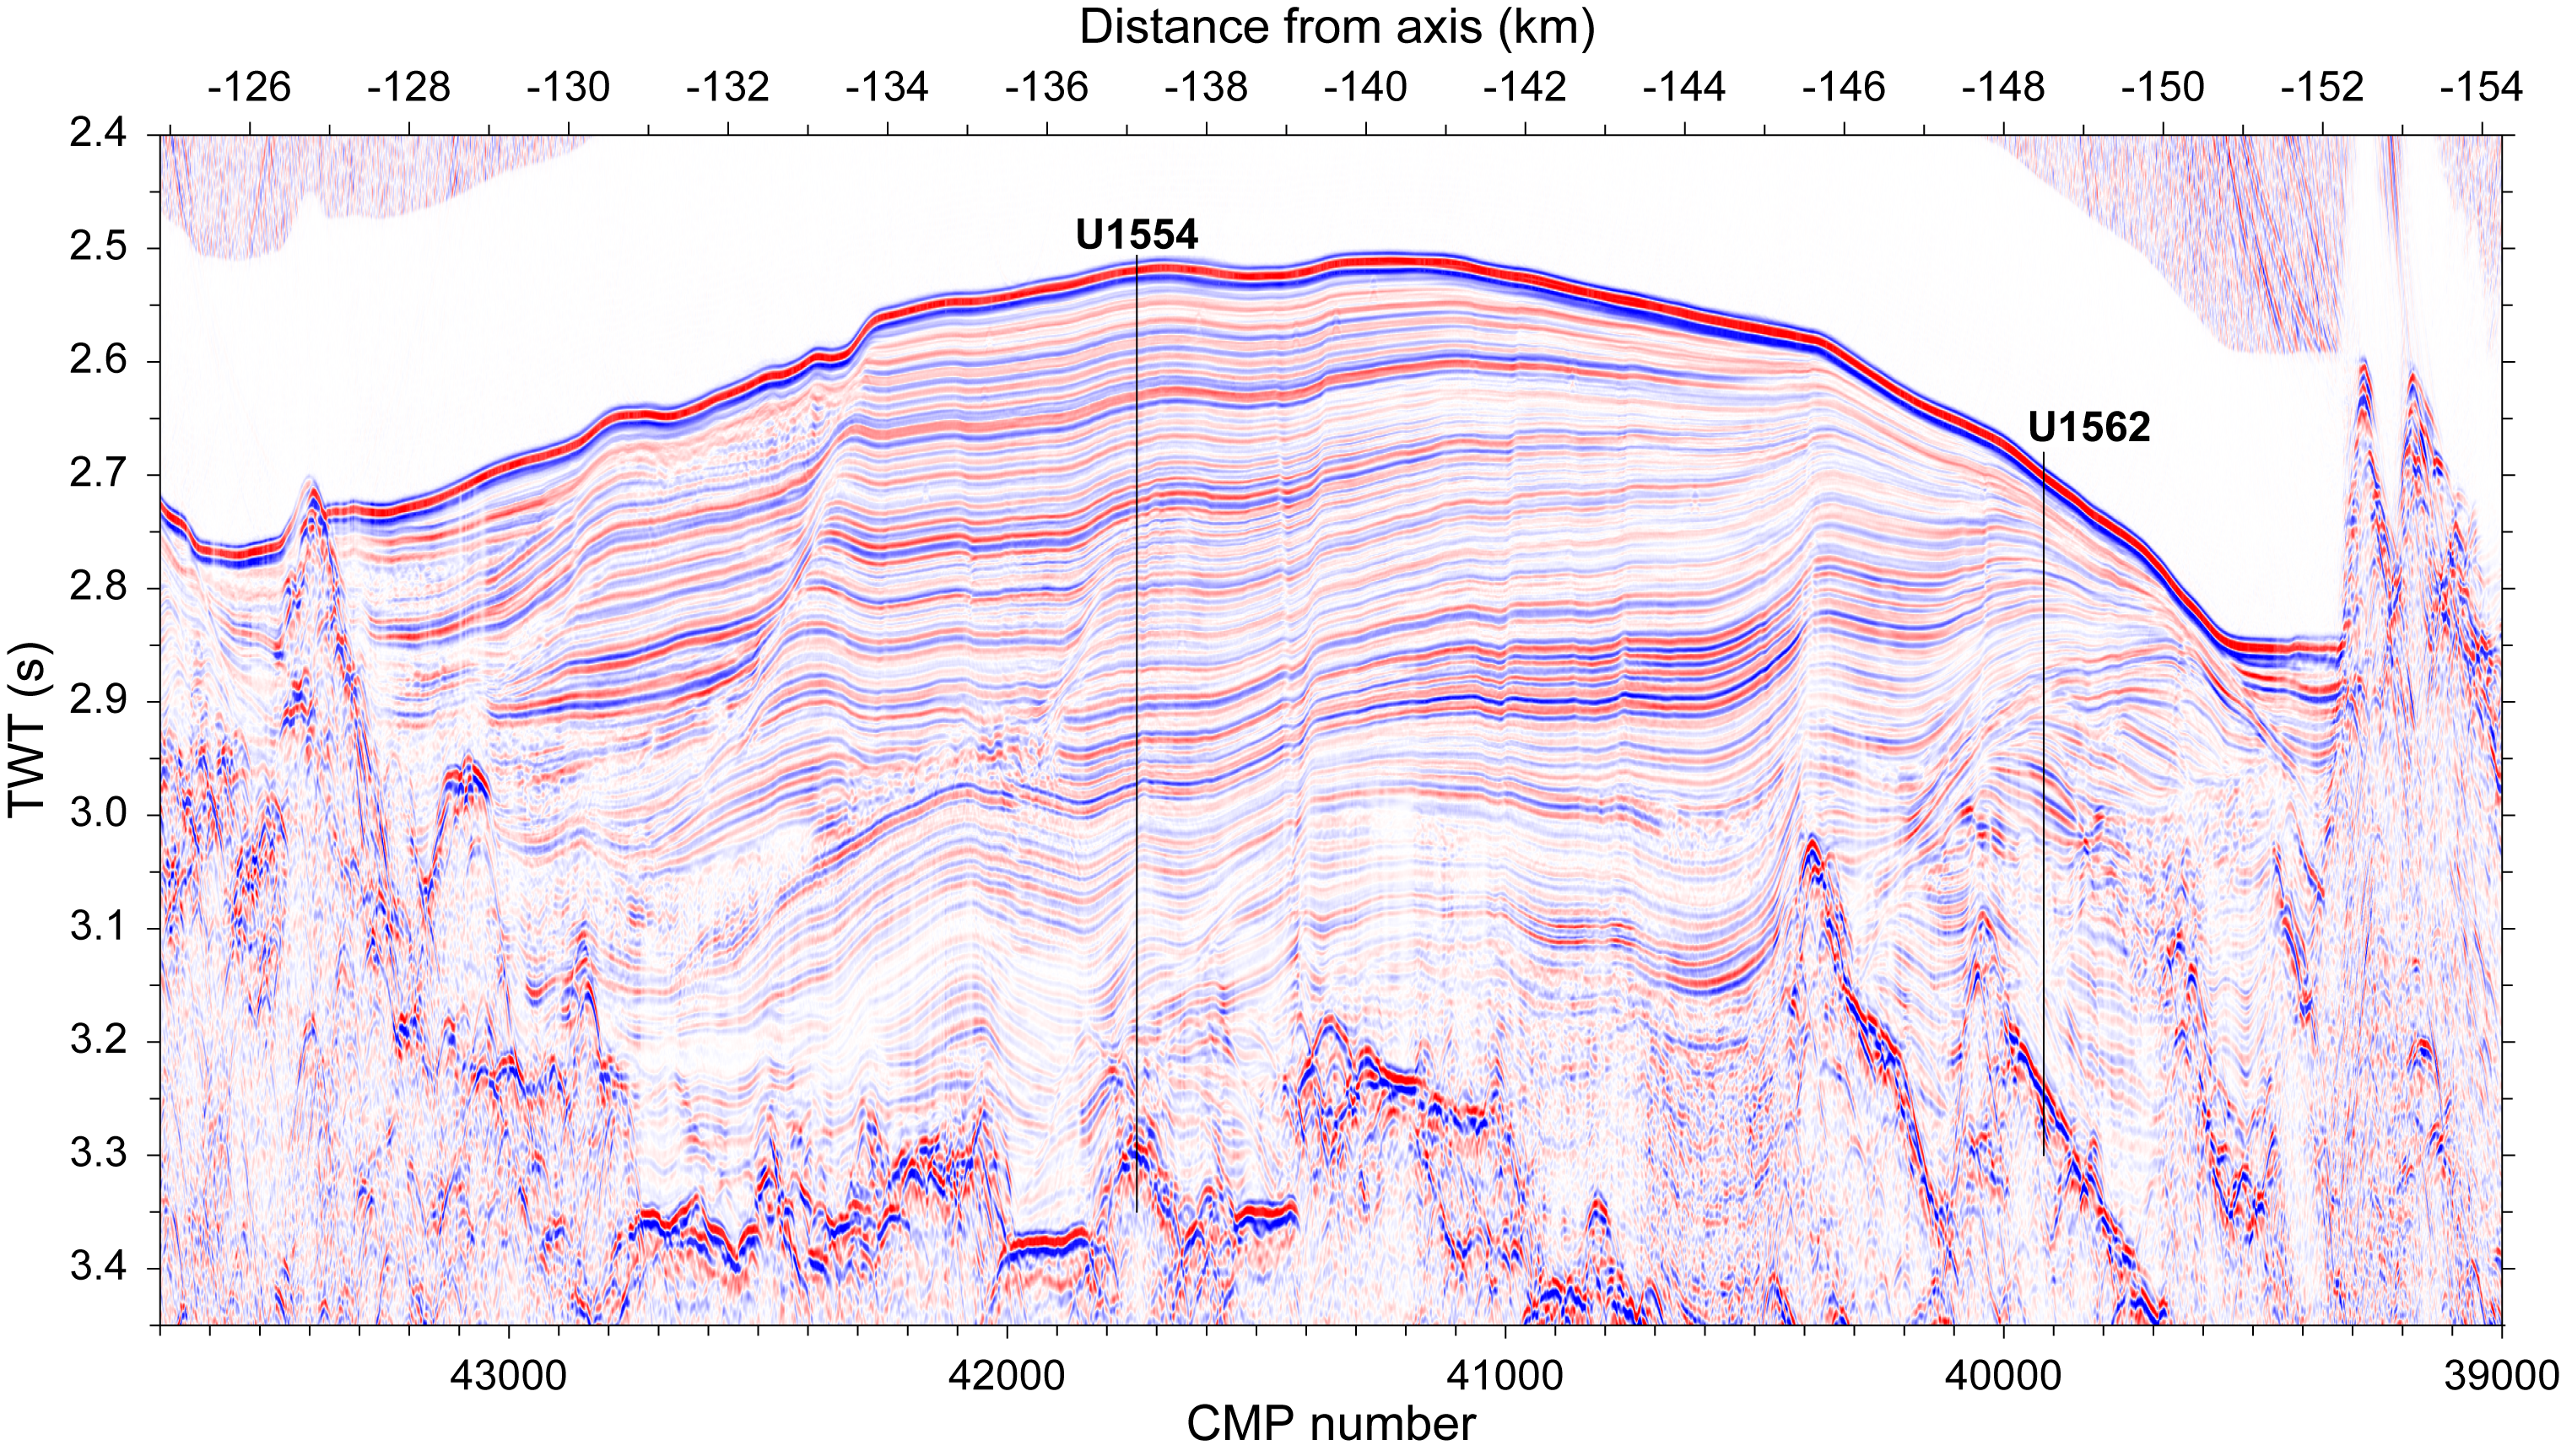
Figure F2. Seismic Profile JC50-1.
Site U1562 is located on Seismic Line JC50-1 (Common Midpoint [CMP] 39920) near the intersection with Seismic Line JC50-C2 (CMP 685) (Figures F2, F3); both lines were obtained in 2010 during RRS James Cook Cruise JC50 (Parnell-Turner et al., 2017). Sediment thickness at Site U1562 was expected to be ~465 m (3.237 s two-way traveltime [TWT]) based on seismic imagery. The sediment section at the site is marked by the pinching out of the Björn drift sedimentary deposit, a thicker section of which was cored at Site U1554. Several disruptions in the sediment succession on the seismic profile suggest the presence of unconformities and possible changes in the conditions of sediment deposition and evolution. One target for Site U1562 was to obtain a continuous sedimentary record of Björn drift, which will offer millennial-scale climate records. Another target was to core the basaltic crust at a VSR to provide constraints on mantle melting conditions and hydrothermal alteration of the crust, especially in comparison with basalt from Site U1554 located on a VST. Cores and data from this site will address all three of the primary science objectives: (1) crustal accretion and mantle behavior; (2) ocean circulation, gateways, and sedimentation; and (3) time-dependent hydrothermal alteration of oceanic crust.
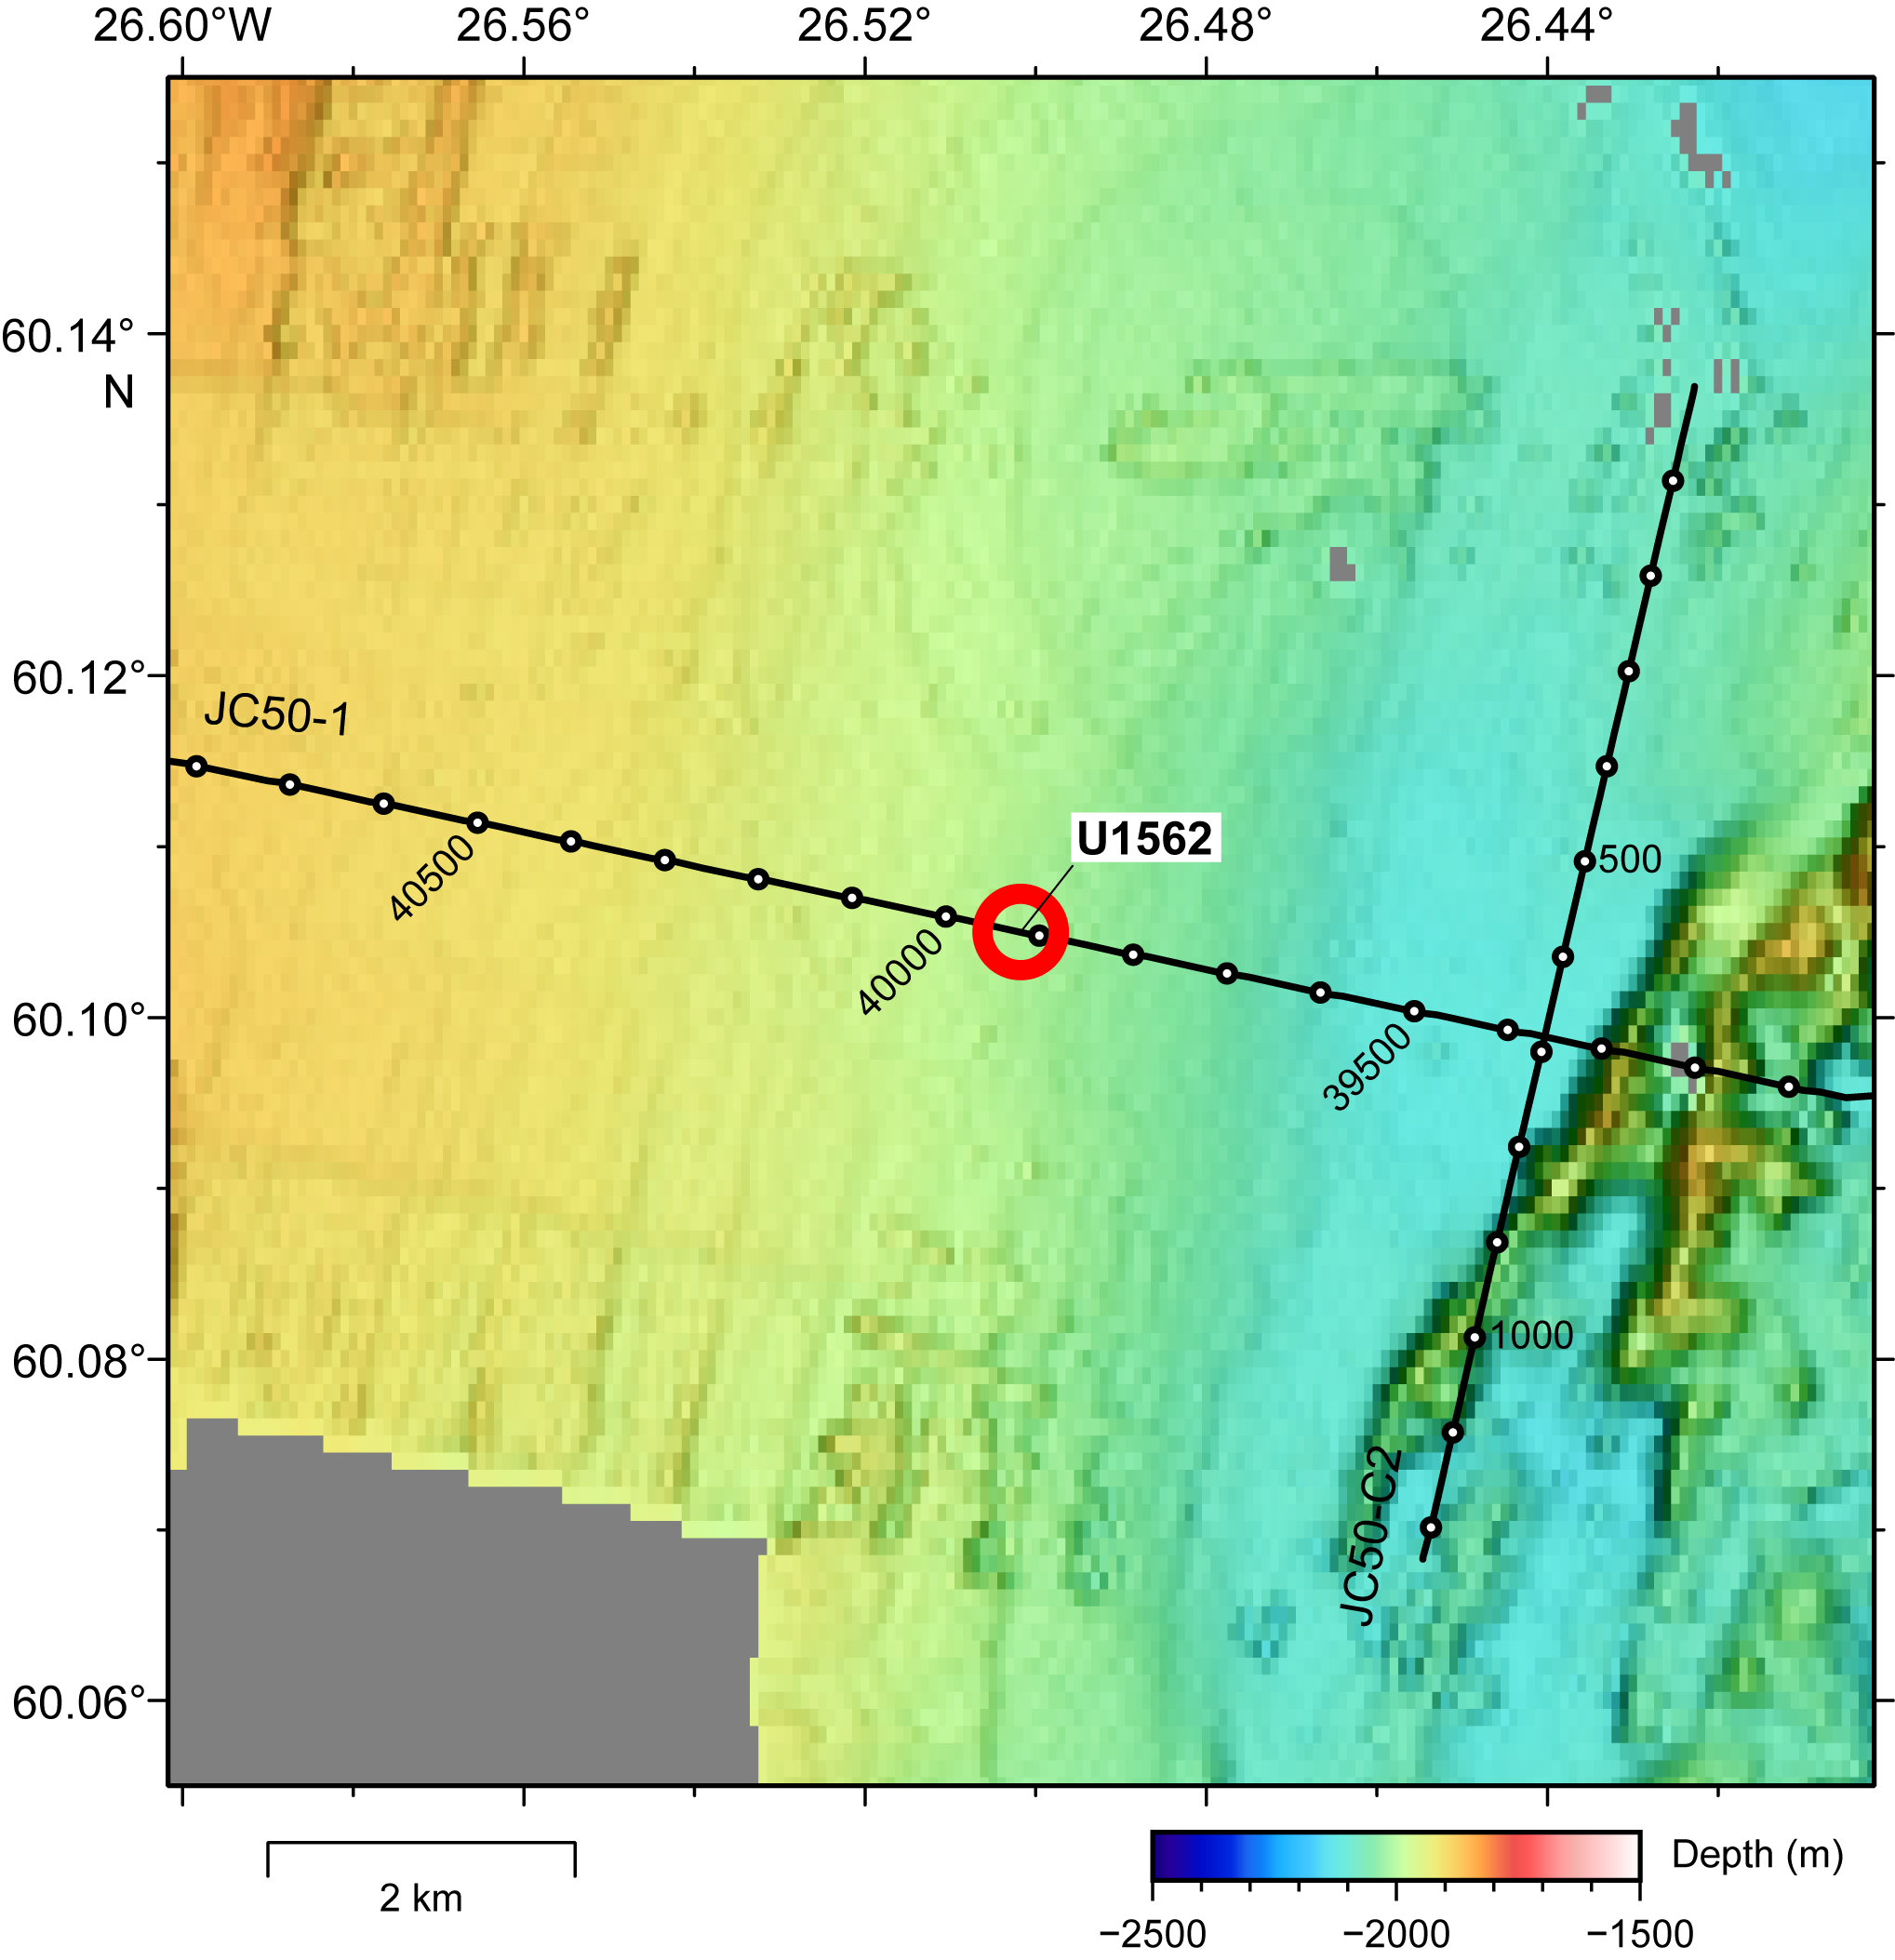
Figure F3. Bathymetric map.
The operational objectives for this site were to core the sedimentary section using the advanced piston corer (APC)/extended core barrel (XCB) system to the sediment/basement interface, use the rotary core barrel (RCB) system to core ~130 m into the basement, and use downhole wireline tools to log the borehole.
2. Operations
Site U1562 (60°06.3006′N, 26°30.1044′W) consists of three holes, 395C-U1562A, 395C-U1562B, and 395-U1562C, that extend to 300.4–561.5 m drilling depth below seafloor (DSF) (Table T1).
A total of 144 cores were recovered at Site U1562. These cores collected 792.57 m of sediment and basalt over a cored interval of 876.6 m (90% recovery). The APC system was used to collect 36 cores over a 330.0 m interval with 343.87 m of core recovered (104% recovery). The half-length APC (HLAPC) was deployed for 69 cores and recovered 337.83 m of sediment from a 324.3 m interval (104% recovery). The XCB system was deployed over a 68.6 m interval. The eight XCB cores recovered 37.79 m of sediment and basalt (55% recovery). The RCB system was deployed over a 153.4 m interval with 73.08 m of core recovered (48% recovery). A total of 31 cores were collected with the RCB system. Downhole wireline logging operations using four logging tools took place in Hole U1562B.
The total time spent at Site U1562 was 12.3 days.
2.1. Expedition 395C
2.1.1. Hole U1562A
The vessel began the 6.1 nmi transit from Hole U1554F to Site U1562 in dynamic positioning (DP) mode on 10 July 2021. The crew continued to pull up the drill pipe following the completion of operations in Hole U1554F during the transit. The end of the pipe cleared the rotary table at 1130 h UTC. At 1306 h on 10 July, the vessel arrived at Site U1562, and the APC/XCB bottom-hole assembly (BHA) was made up. The drill pipe was run to 1996 meters below sea level (mbsl) to take the first APC core.
Hole U1562A (60°06.3030′N, 26°30.1245′W), located 21 m west of the site coordinates, was spudded at 2115 h, and Core 1H recovered the mudline and 2.08 m of core, establishing a seafloor depth of 2003.4 mbsl. Cores 2H–21H were advanced from 2.0 to 192.0 m DSF using the APC system. Core 21H experienced significant overpull and was drilled over with the drill string to release the core barrel. HLAPC core barrels were made up, and coring continued with Cores 22F–57F (192.0–361.2 m DSF) with 4.7 m advances. HLAPC refusal was met with Core 57F, which also required the drill string to drill over the core barrel to release it from the sediment. The XCB core barrels were made up, and coring continued with Cores 58X–64X (361.2–429.1 m DSF). After coring Core 64X, the XCB cutting shoe was severely damaged and slightly melted and the base of the core catcher contained basalt. Another core barrel was deployed, and Core 65X was advanced to ensure that the bit had reached basement. The bit advanced 0.7 m over 1 h, and Core 65X recovered 0.68 m of basalt, confirming a basement depth of 429.1 m DSF. The final depth of Hole U1562A was 429.8 m DSF. The drill string was pulled from the hole, with the bit reaching the seafloor at 1535 h on 13 July. Hole U1562A ended when the bit reached the rotary table at 1935 h.
All APC cores were oriented, and formation temperature measurements using the advanced piston corer temperature (APCT-3) tool were collected for Cores 395C-U1562A-4H, 7H, 10H, and 13H. Samples for interstitial water (IW), microbiology, micropaleontology, and gas analyses were routinely collected on the catwalk.
A total of 411.04 m of core was recovered over a 429.8 m interval (96% recovery). The average recovery for piston cores was 104% with the APC system and 103% with the HLAPC system. The XCB system had an average recovery of 55%.
2.1.2. Hole U1562B
Following the end of Hole U1562A, an RCB BHA with a C-4 RCB bit was made up and the drill string was lowered to the seafloor. The ship was offset 21 m east-southeast of Hole U1562A, near the site coordinates, and Hole U1562B (60°6.2993′N, 26°30.1026′W; 2003.4 mbsl) was spudded at 0320 h on 14 July 2021 and advanced without coring to 408.1 m DSF. The center bit was recovered, and an RCB core barrel was deployed. Cores 2R–13R were advanced from 408.1 to 474.2 m DSF, recovering 48.65 m of sediment and basalt (55% recovery). The sediment/basement interface was recovered in Core 4R at 429.0 m DSF. Coring rates drastically sped up from ~2 to over 7 m/h while drilling Core 14R. The driller noted that there was a ~3 m interval that drilled extremely quickly. It was soon revealed that Core 14R recovered 0.6 m of carbonate ooze bracketed by basalt. Coring continued with Cores 15R–19R advancing from 479.2 to 500.7 m DSF (47% recovery). While coring Core 19R, the penetration rate dropped to 1 m/h and there was erratic torque on the bit. It was suspected that the drill bit was damaged, and the rig floor crew began pulling the pipe out of the hole. A free-fall funnel was deployed at 0220 h on 17 July to allow for the reentry of Hole U1562B. The bit cleared the seafloor at 0312 h and the rotary table at 0708 h. The bit was indeed damaged; a new C-7 RCB coring bit was made up to the BHA, and the crew assembled the drill string. The subsea camera was deployed at 1130 h to observe the reentry of Hole U1562B, which occurred at 1450 h. The subsea camera was retrieved, and the drill string advanced to 500.7 m DSF. After cleaning the hole with a high-viscosity mud sweep, Cores 20R–28R advanced from 500.7 to 561.5 m DSF. Coring operations concluded in Hole U1562B after coring 132.5 m into the basement section. The final depth of Hole U1562B was 561.5 m DSF.
A total of 73.08 m of core was recovered over a 153.4 m cored interval in Hole U1562B (48% recovery). In all, 31 RCB cores were collected from this hole. The average rate of penetration while coring the basalt was 2.1 m/h.
Following coring, the rotary shifting tool (RST) was run to release the bit into the bottom of the hole. The drill string was pulled up, and the end of the pipe was set at 89 m DSF. The triple combination (triple combo) tool string was made up and deployed at 1755 h on 19 July. After completing two successful passes of the entire hole, the tools were retrieved and reached the rig floor at 2310 h. After the triple combo tool string was laid out, the Formation MicroScanner (FMS)-sonic tool string was made up and deployed at 0100 h on 20 July. Following two passes that extended to the base of the hole, the FMS-sonic tool string was pulled from the hole and reached the rig floor at 0645 h. The next logging run used the Versatile Seismic Imager (VSI). The protected species observation protocols began at 0730 h, and the International Ocean Discovery Program (IODP) technical staff ramped up the air guns starting at 0834 h. The VSI was lowered to the base of the hole, and a total of four depth stations (420.5, 426, 459.9, and 556.6 m wireline log depth below seafloor [WSF]) were completed, two in the basement section, one at the sediment/basement interface, and one in the lowermost sediment. The VSI could not be successfully run throughout the sedimentary section because of the wide diameter (>16 inches) of the borehole. Following the VSI run, the air guns were put away, and the tool reached the rig floor at 1320 h. The final logging run, using the Ultrasonic Borehole Imager (UBI), began at 1445 h. The UBI made two passes of the basement section, acquiring 360° borehole images. The UBI was recovered at the rig floor at 2130 h. The drill string was pulled out of the hole to ~1489 mbsl, and the ship began the transit in DP mode to Hole U1554F at 2355 h on 20 July, ending operations at Site U1562.
2.2. Expedition 395
2.2.1. Hole U1562C
The vessel returned to Site U1562 on 1 July 2023. With the drill bit ~54 m above the seafloor, the vessel transited in DP mode from Site U1554 to Site U1562. Following a 6.1 nmi transit, the vessel was over the site coordinates at 1210 h, marking the start of Hole U1562C (60°06.3015′N, 26°30.0754′W), which was spudded at 1500 h. The mudline Core 1H recovered 5.37 m, establishing a seafloor depth of 2002.7 mbsl. Cores 1H–16H advanced the hole to 139.3 m DSF, and all APC cores were oriented using the Icefield MI-5 core orientation tool. One drilled interval of 1 m (395-U1562C-51) was used to offset coring gaps observed by the stratigraphic correlators.
Core 395-U1562C-16H had 100,000 lb of overpull and required a drill-over to free the core barrel. Refusal of the APC system was reached, and the HLAPC system was deployed for the remainder of the hole. Cores 17F–53F advanced the hole to 300.4 m DSF. Four short drilled intervals (1.5–2 m in length) were used to offset coring gaps between Holes U1562A and U1562C for stratigraphic correlation. After reaching the target depth of 300 m DSF, the drill pipe was pulled from the hole with the bit clearing the seafloor at 0405 h on 3 July. A total of 48 cores were collected in Hole U1562C, recovering 308.45 m of sediment over a 293.4 m cored interval (105% recovery). The BHA was broken down, and the rig was secured for transit. At 0900 h, the ship was switched from DP to cruise mode, ending operations at Site U1562.
3. Lithostratigraphy
The sediments at Site U1562 are primarily composed of silty clay with variable amounts of carbonate (Lithostratigraphic Units I–III), underlain by nannofossil ooze transitioning to chalk near the sediment/basement interface (Unit IV). Unit divisions were made based on (1) visual core description, (2) natural gamma radiation (NGR) measurements, (3) smear slide examination, (4) bulk calcium carbonate (CaCO3) measurements, and (5) L* reflectance (Figures F4, F5; Table T2). To assist understanding the sedimentologic patterns at this site, NGR and reflectance data were smoothed using an eighth-order lowpass Butterworth filter with a cutoff of 0.125 times the Nyquist frequency (Figure F5; this was applied to data that had undergone cleaning; see Physical properties in the Expedition 395 methods chapter [Parnell-Turner et al., 2025a]). This bidirectional linear digital filter avoids phase shift, maintaining correct peak positions (Butterworth, 1930; Lyons, 2011). Immediately below the transition between Units I and II, there are several sharp boundaries noted in the core sections. Unit III is defined by extensive evidence for soft-sediment deformation, possibly due to a series of slumps. There is a sharp contact between Units III and IV. Weight percent CaCO3 is highly variable, but average values increase downhole (note that CaCO3 measurements were spaced approximately one to three per 10 m and thus may not fully represent CaCO3 variability with depth). Small clasts of volcaniclastic material (pumice and scoria) are found throughout the sequence at Site U1562. All clasts larger than 2 cm are listed in Table T3.
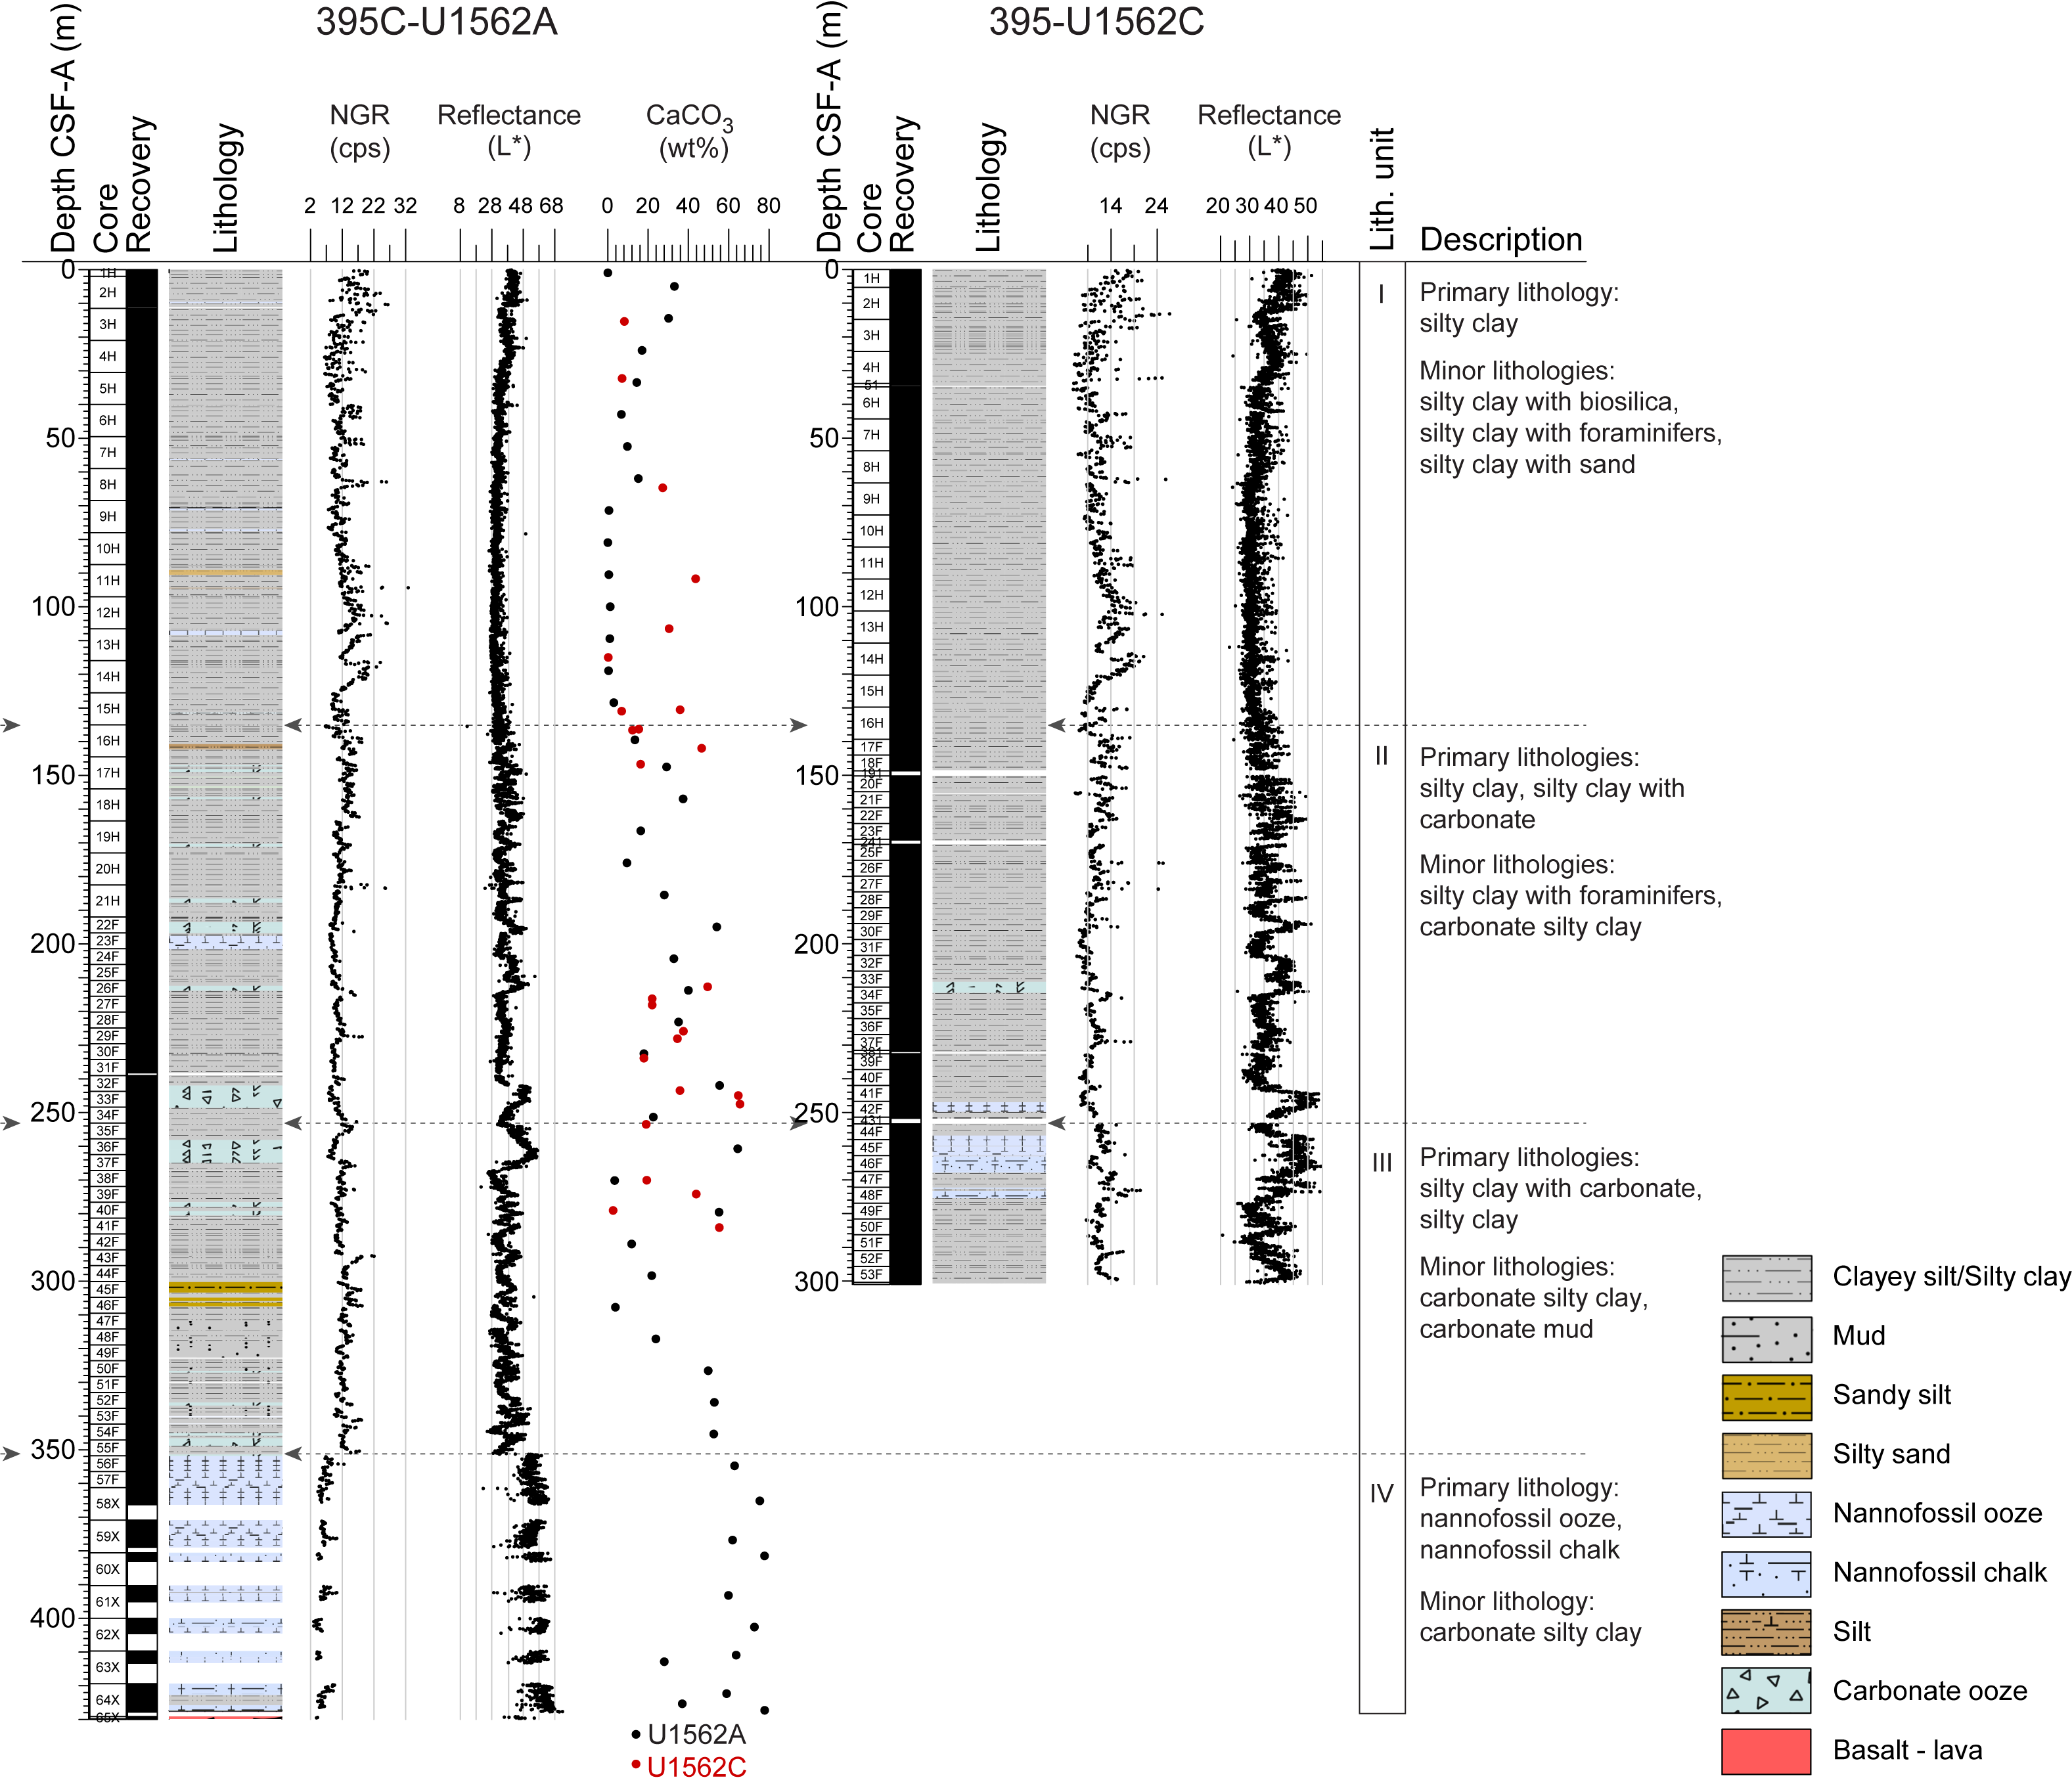
Figure F4. Lithostratigraphic summary, Site U1562.
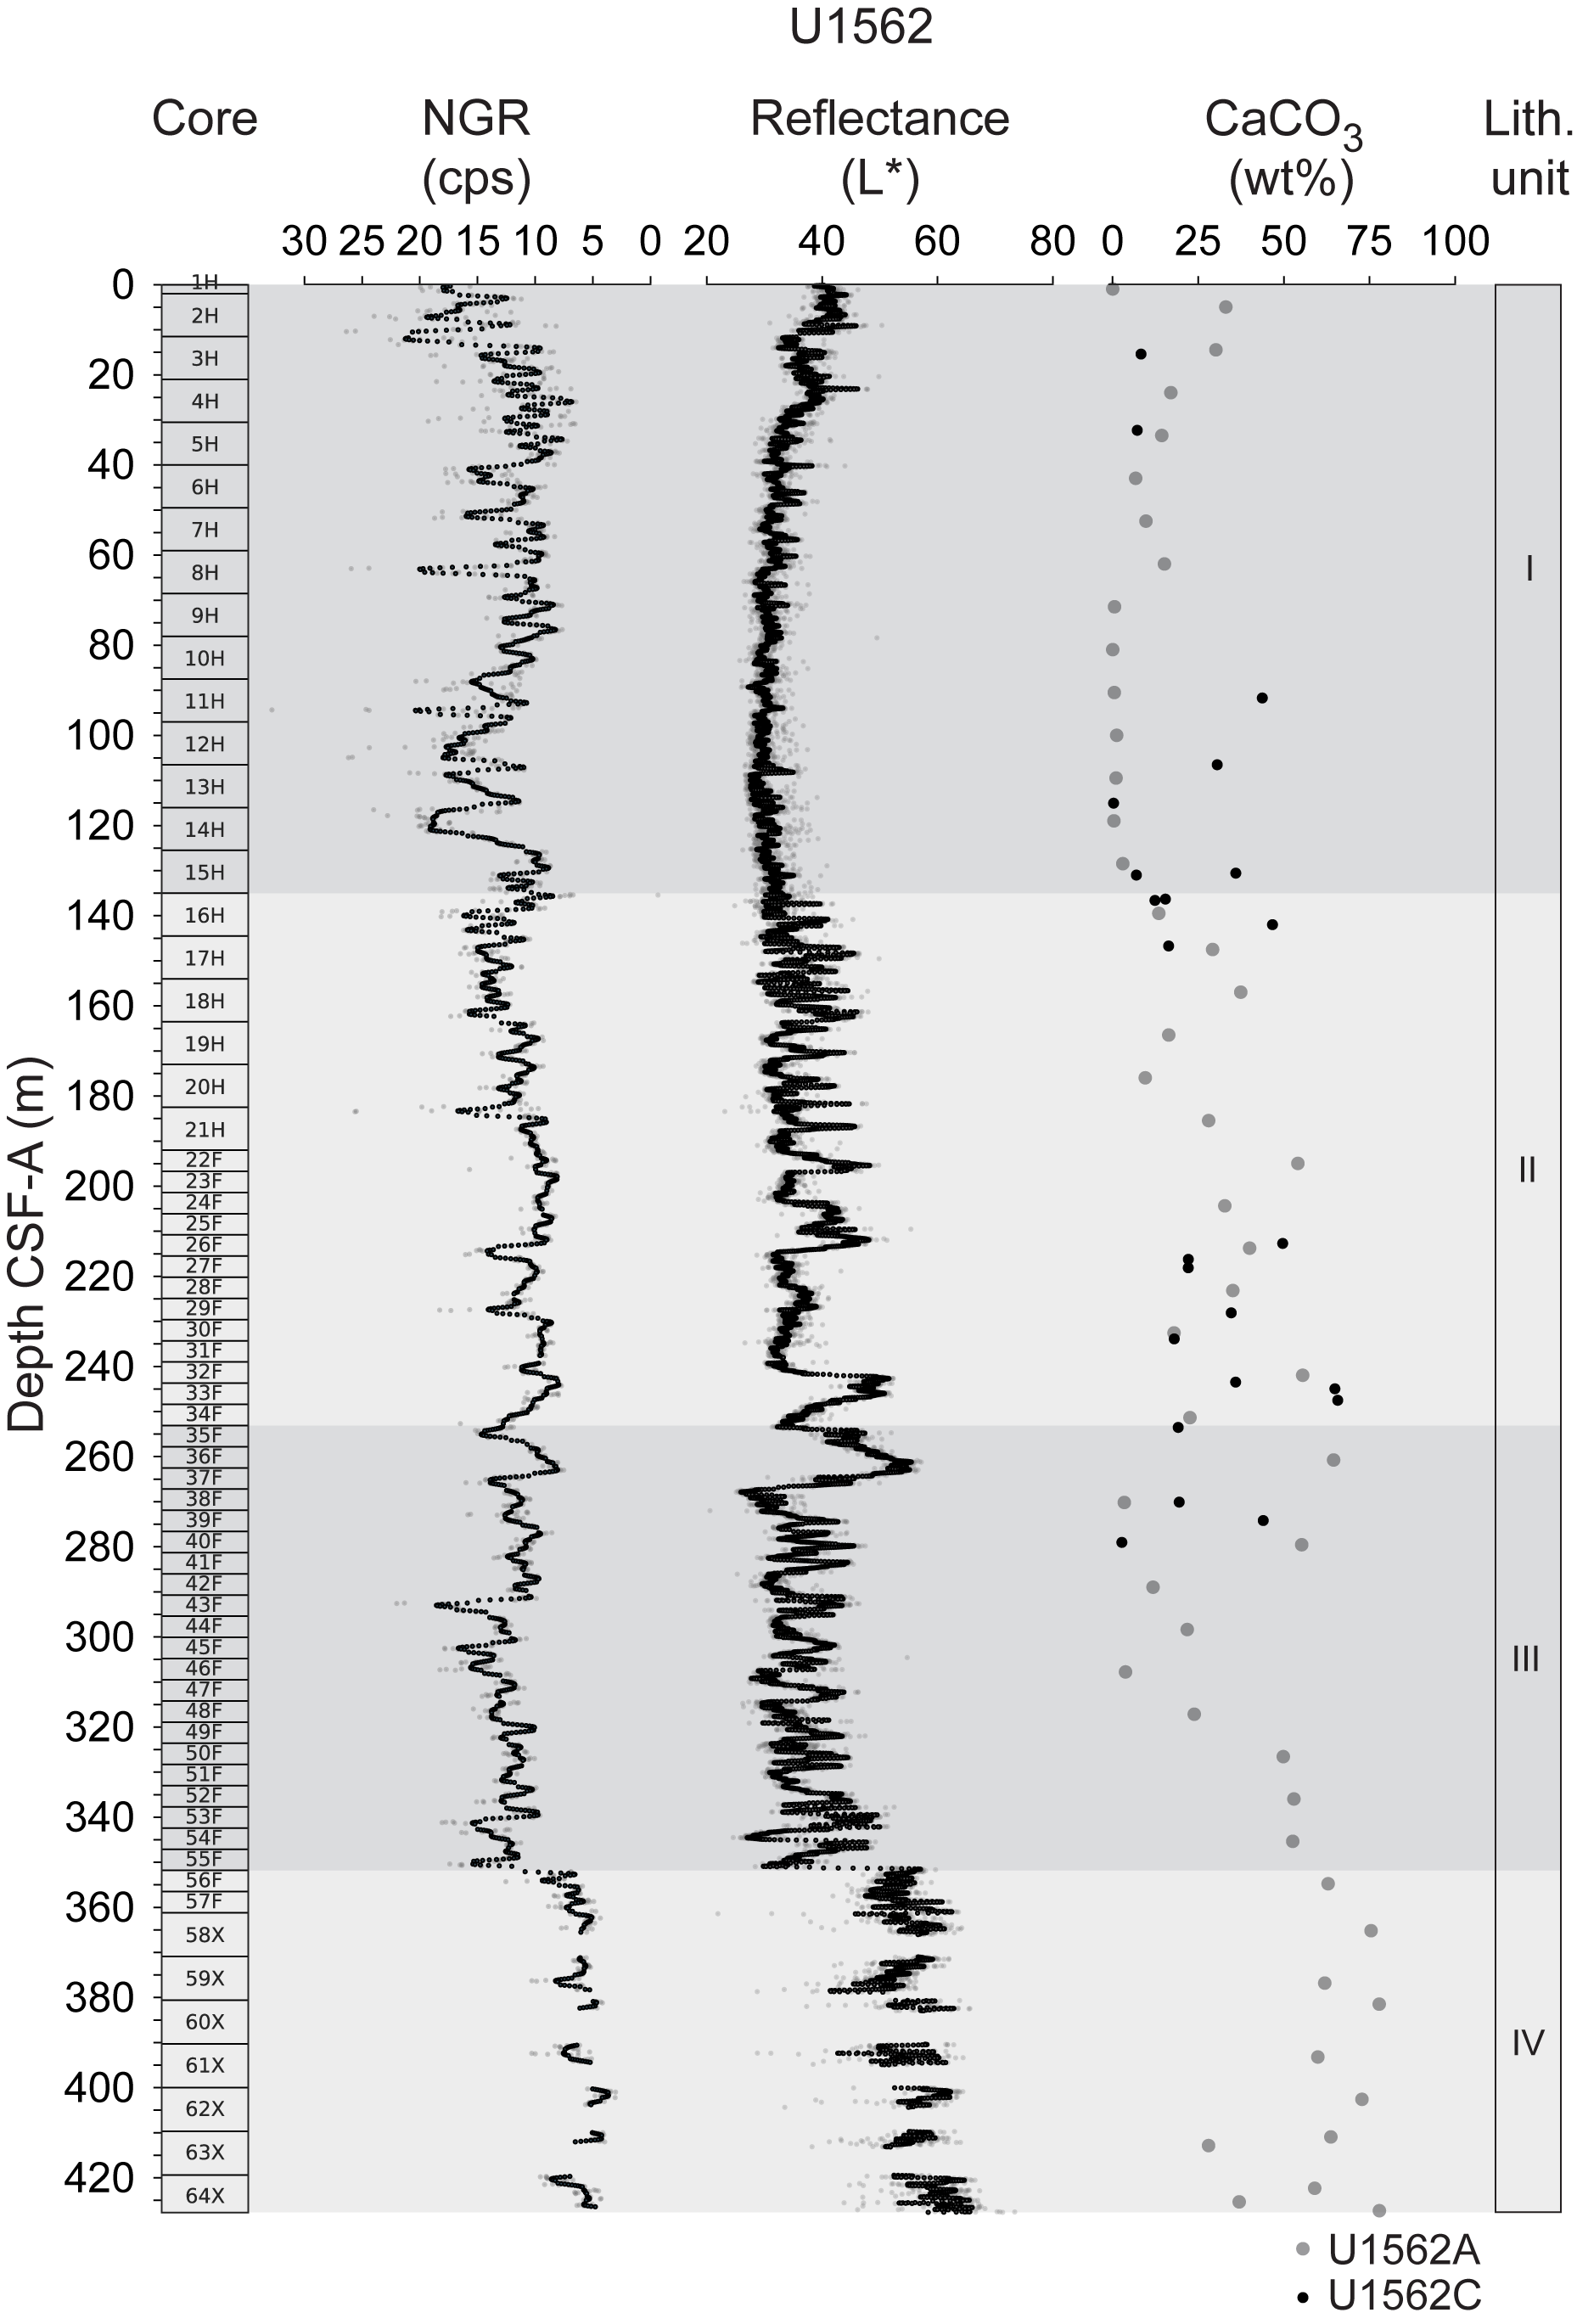
Figure F5. Lithologic unit definition parameters.
3.1. Lithostratigraphic Unit I
- Intervals: 395C-U1562A-1H, 0 cm, to 16H-1, 0 cm; 395-U1562C-1H-1, 0 cm, to 16H-4, 0 cm
- Depths: Hole U1562A = 0–135.0 m core depth below seafloor, Method A (CSF-A); Hole U1562C = 0–135.23 m CSF-A
- Thickness: Hole U1562A = 135.0 m; Hole U1562C = 135.23 m
- Age: Holocene to early Pliocene
- Lithology: silty clay
Unit I is primarily silty clay, most commonly grayish brown, gray, and light brownish gray in Hole U1562A (Figure F6). During Expedition 395, when cores were described soon after recovery, colors for these same sediments in Hole U1562C were predominantly very dark gray, olive gray, and brown. The discrepancy in color is likely due to oxidation of the sediments prior to core description for Expedition 395C (core description occurred ~10 months after core recovery). Unit I exhibits relatively high frequency and amplitude variation in NGR values. In contrast, reflectance (L*) values exhibit little variability throughout this unit. The exception is the upper 30 m of sediment in which reflectance values are slightly more variable (L*, a*, and b*), coinciding with an interval in which foraminifers and biogenic silica are slightly more abundant and colors are slightly brighter (yellowish brown, pale brown, and gray; Cores 395C-U1562A-1H through 4H and 395-U1562C-1H through 4H). Nannofossils and foraminifers are present throughout the unit, although in highly variable amounts, consistent with variable CaCO3 percent, which ranges from below ~1 to 83 wt% (average = 16 wt%). Biosilica is present throughout in varying but minor amounts. With respect to relative abundance within the biosiliceous component, sponge spicules are present in trace to abundant amounts, radiolarians are present in trace amounts, diatoms are present in trace to common amounts, and silicoflagellates are present in trace amounts. The terrigenous components are primarily quartz and feldspar. Glass, oxides, and uncommonly glauconite and inorganic calcite are also observed (Figure F6A–F6C). A thin glassy layer is observed in Section 395-U1562C-7H-5, 47 cm. Several sharp boundaries and graded beds with a fining-upward texture are present in Core 3H. Laminations are observed at the base of Section 12H-4 (128–148 cm), although these are clearer in X-Ray Linescan Logger (XSCAN) images than macroscopic observation (Figure F7). The cores of this unit show little drilling disturbance except for some soupy intervals in the topmost section of cores. Bioturbation is primarily sparse to moderate.
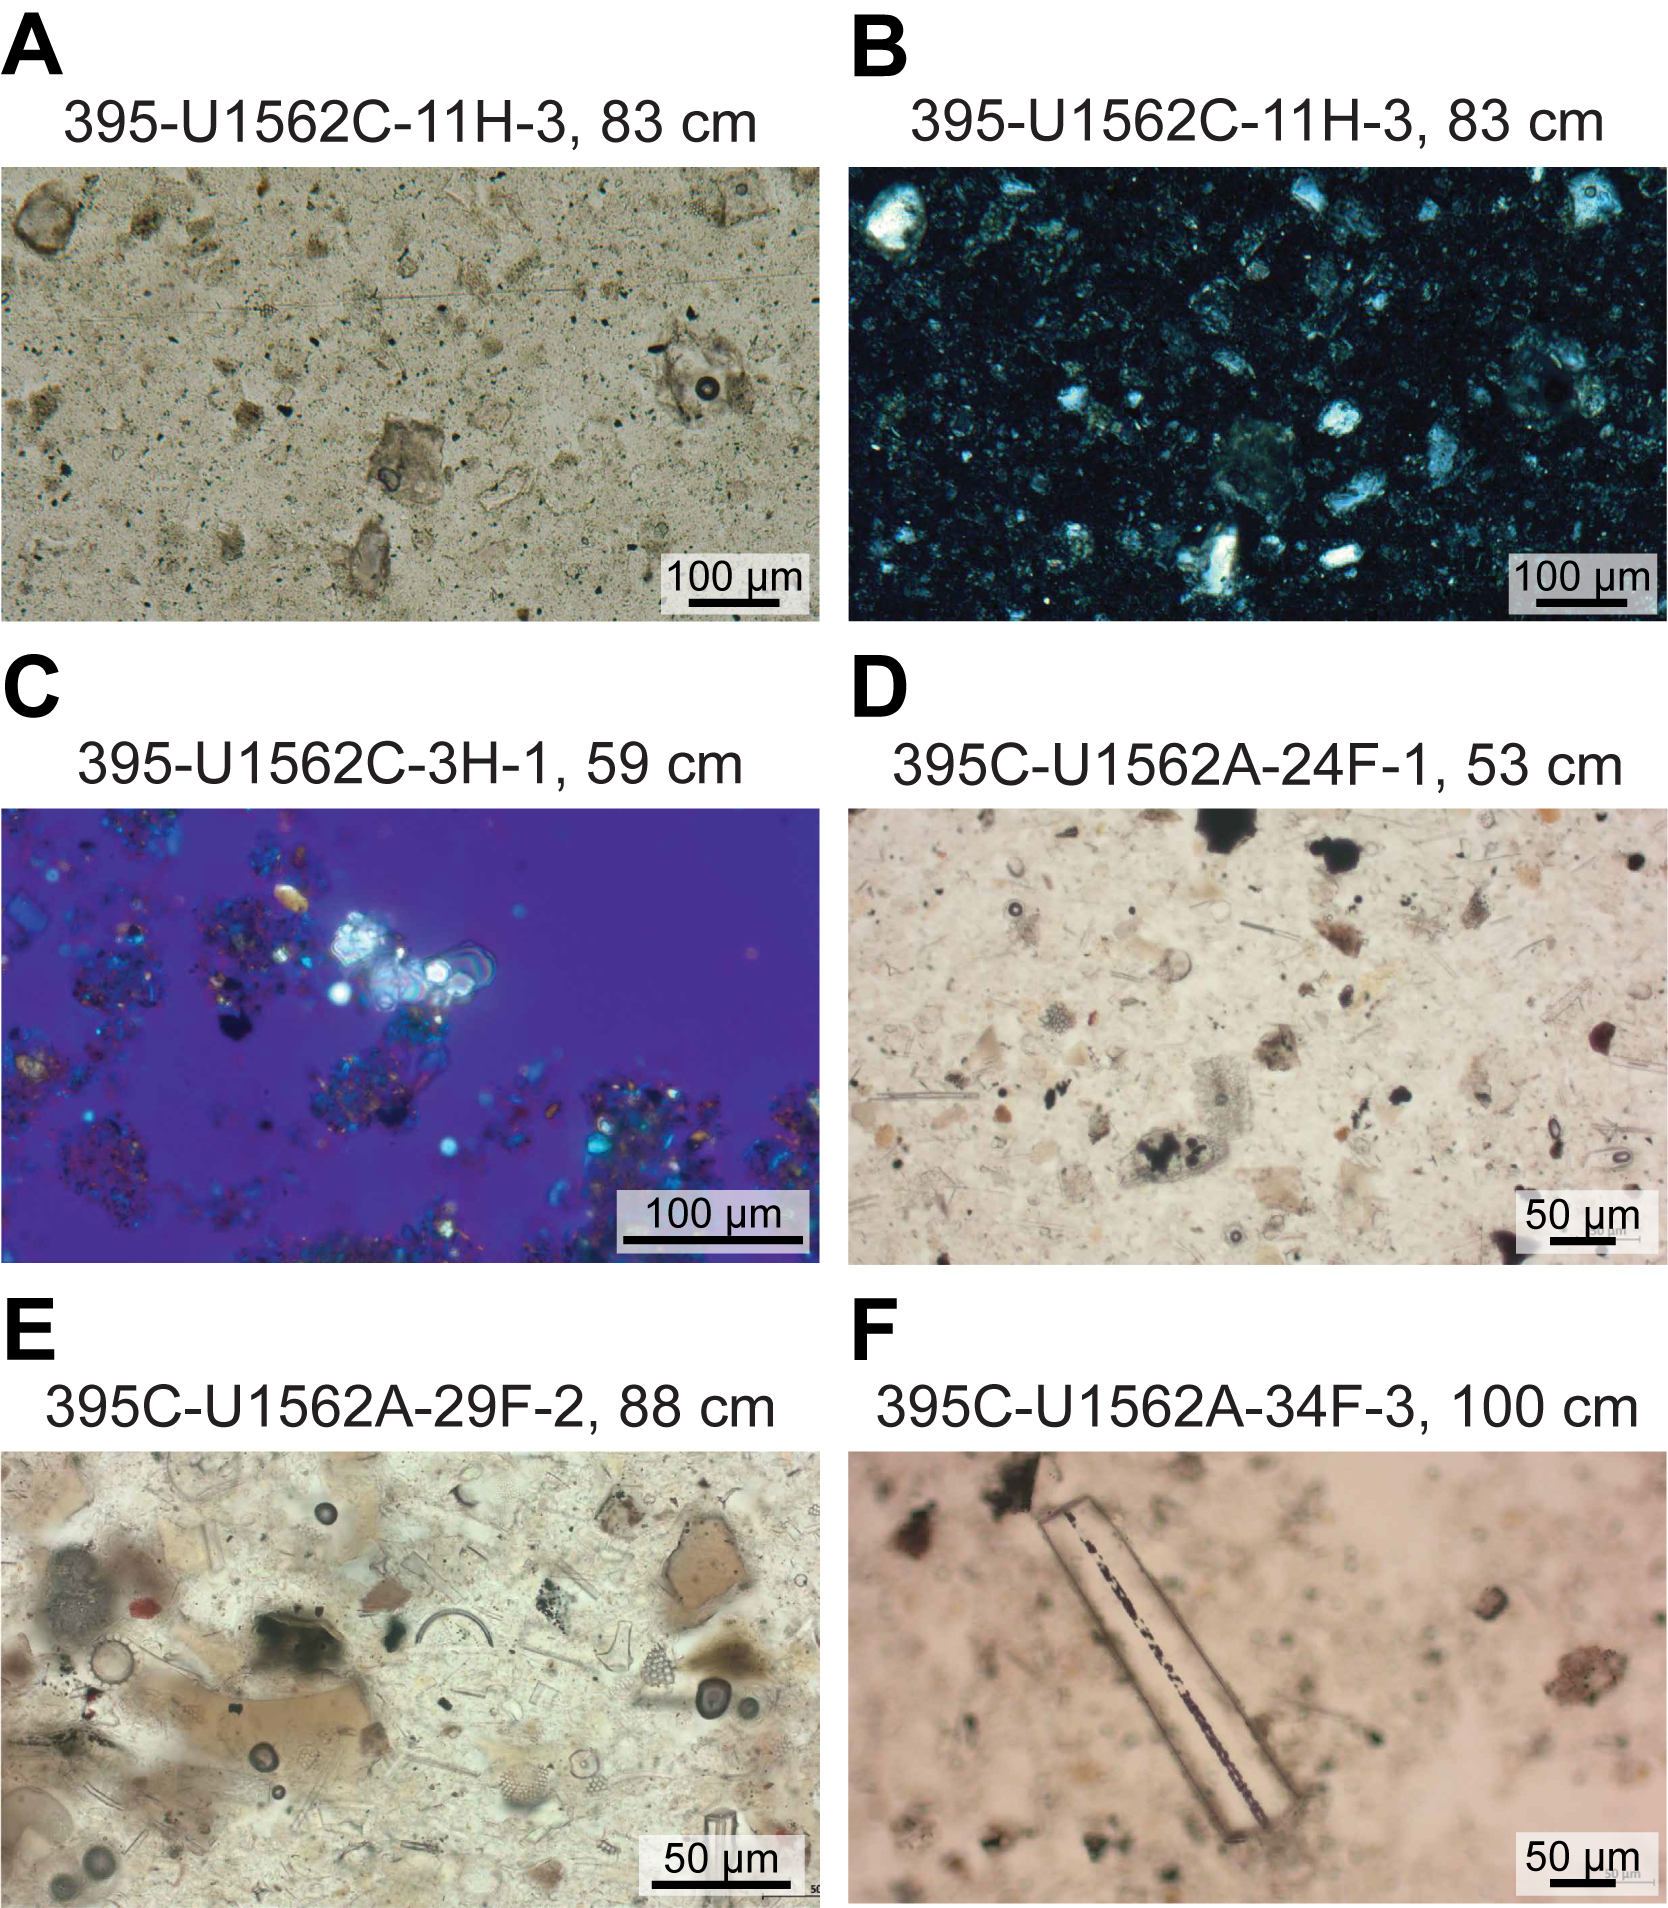
Figure F6. Unit I and II silty clay, calcite minerals, and sponge spicules.
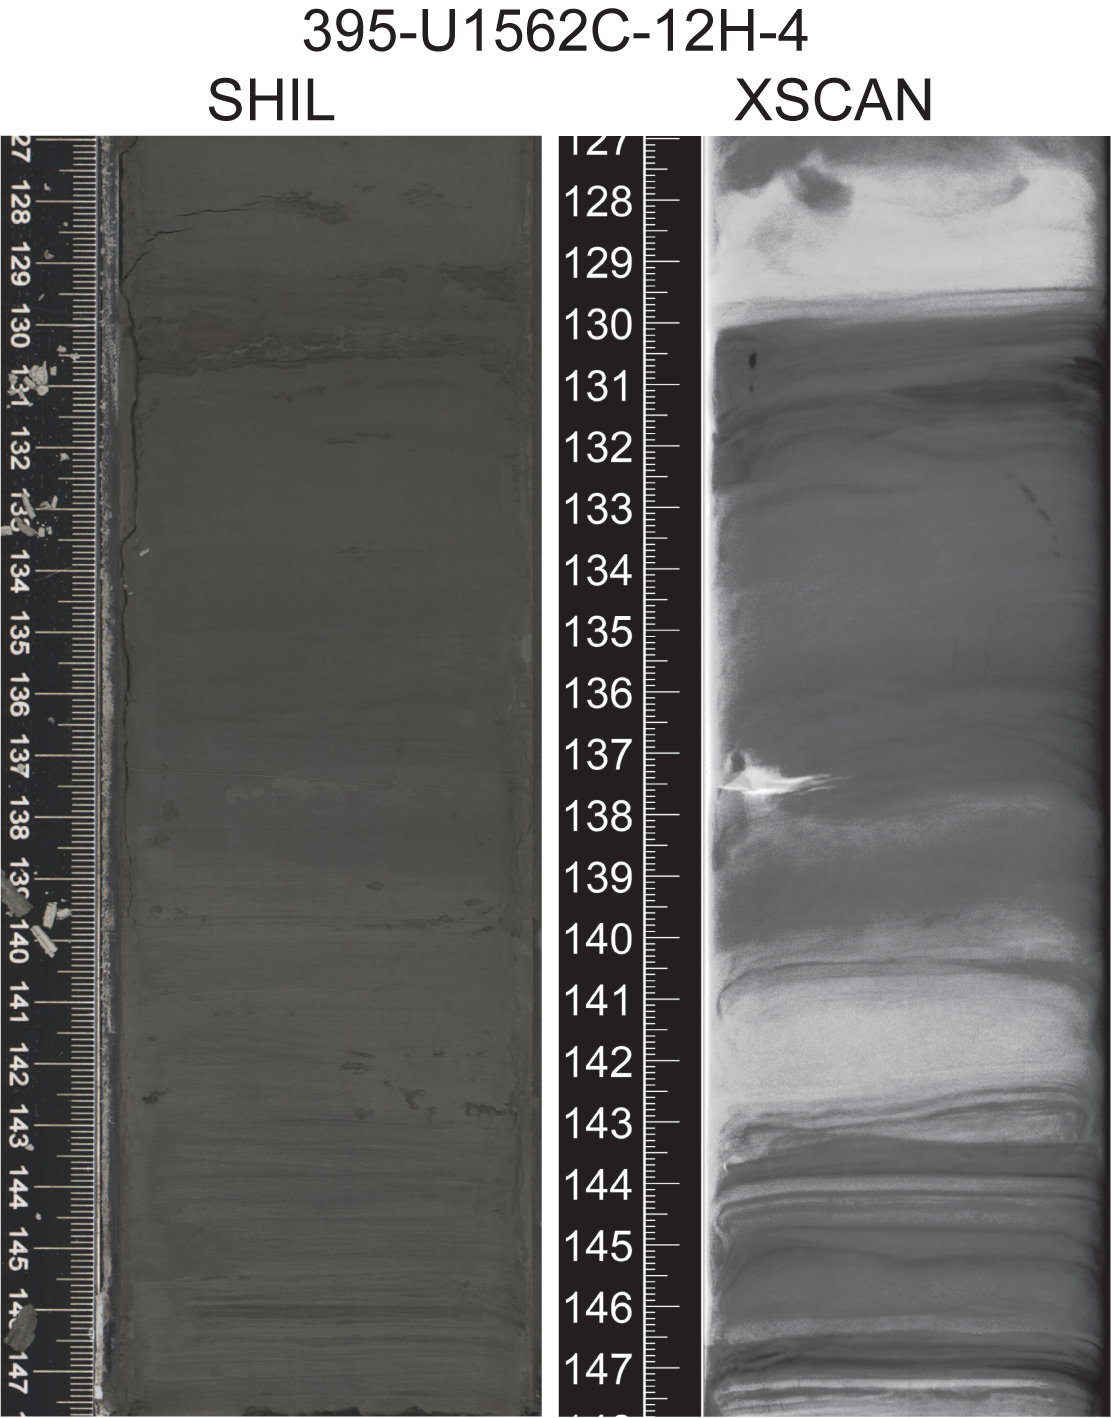
Figure F7. Laminations.
3.2. Lithostratigraphic Unit II
- Intervals: 395C-U1562A-16H-1, 0 cm, to 35F-1, 0 cm; 395-U1562C-16H-4, 0 cm, to 42F-CC, 22 cm
- Depths: Hole U1562A = 135.0–253.1 m CSF-A; Hole U1562C = 135.23–251.49 m CSF-A
- Thickness: Hole U1562A = 118.1 m; Hole U1562C = 116.26 m
- Age: early Pliocene to late Miocene
- Lithology: silty clay, silty clay with carbonate
Unit II is mainly light brownish gray, dark grayish brown, and grayish brown silty clay and silty clay with carbonate. As for Unit I, during Expedition 395 and for the same sequence of sediments from Hole U1562C, the colors described were more commonly dark or olive gray than brown. Although cycles in NGR values display lower amplitude and frequency in comparison to Unit I, reflectance (L*) values display higher amplitude variations (Figures F4, F5). CaCO3 measurements are again variable with depth in this unit, ranging 7–55 wt% (average = 28 wt%). Beds of carbonate silty clay and silty clay with foraminifers (light gray, dark gray, or greenish gray) are found at intermittent depths, including in Cores 395C-U1562A-22F, 32F, and 33F and 395-U1562C-17H, 18H, 19H, 33F, 34F, and 42F. Disseminated pyrite is commonly observed in smear slides in this unit, often infilling siliceous and carbonate microfossils (Figure F6D–F6F). Although present throughout Site U1562, glass is more abundant in smear slides in Unit II than in Unit I (Figure F6A, F6D, F6E).
Several sharp contacts are observed near the interface between Units I and II. These contacts occur at several depths in Cores 395C-U1562A-16H through 18H and 395-U1562C-16H through 21F (Figure F8A–F8H). The most prominent contact in Hole U1562C, located in Section 16H-4A, 102 cm, has a thin (<0.5 cm), bright orange layer that displays abundant iron oxides in smear slide (Figure F8F). Other layers display thin (~1–3 cm) intervals of dark green, very fine grained material (Figure F8E, F8G). Occasional evidence of soft-sediment deformation is present in Sections 18F-2, 18F-3, 20F-2, 20F-3, 26F-1, 26F-2, 28F-2, and 40F-3 (Figure F8I, F8J). Sediment layers with abundant glass are also observed macroscopically (e.g., intervals 395C-U1562A-17H-4, 14–16 cm; 20H-7, 40–45 cm; 21H-1, 95–101 cm; and 395-U1562C-34F-3, 30–35 cm). Diffuse, dark gray blebs or layers that may contain glass are present but were more difficult to assess macroscopically because they do not present as distinct layers; time constraints prohibited shipboard smear slide analysis for all of these features (e.g., intervals 395C-U1562A-18H-6, 14–15 cm, and 21H-4, 42–44 cm). Small pumice and scoria clasts (<2 cm) were observed in Sections 30F-1, 107 cm, and 30F-2, 2, 43, and 102 cm. Bioturbation is generally slight to moderate in this unit. Some drilling disturbance is present, ranging from slight to severe deformation, although this is generally confined to short intervals at or near the tops of core sections.

Figure F8. Sharp boundaries.
3.3. Lithostratigraphic Unit III
- Intervals: 395C-U1562A-35F-1, 0 cm, to 55F-4, 14 cm; 395-U1562C-44F-1, 0 cm, to end of hole
- Depths: Hole U1562A = 253.1–351.36 m CSF-A; Hole U1562C = 253.4–300.68 m CSF-A
- Thickness: Hole U1562A = 98.26 m; Hole U1562C = 47.28 m
- Age: late Miocene
- Lithology: silty clay with carbonate, carbonate silty clay
Unit III is predominately silty clay and silty clay with carbonate, with intervals of carbonate silty clay and carbonate mud. This unit is defined by the abundance of features consistent with soft-sediment deformation throughout. Because the sediments are clay rich and homogeneous in appearance and lack well-defined bedding features such as laminae or cross-bedding, the deformation is primarily recognized by color contrasts between soft clasts of silty clay. The features observed include several distinctive layers of centimeter-scale lumps of silty clay resembling brecciated mud clasts, with or without matrix. Where matrix is present, it is of a similar texture to the clasts. The variable coloration of the sediment clasts, with interlocking, irregular blobs in matrix resembles the Camouflage Central-Europe pattern in some cores (e.g., 395C-U1562A-35F, 43F, 49F, 50F, 53F, and 54F) (Figure F9A–F9C). Other expressions of soft-sediment deformation and disorganization, such as convoluted layers, high-angle contacts (often with curvature) between differently colored layers, flow structures, dragging structures, folding, arching, and squeezing are present in the cores listed previously as well as in Cores 37F, 46F, 52F and 395-U1562C-44F, 45F, 49F, 50F, 51F, 52F, and 53F (Figure F9D–F9F). The extensive deformation observed across Unit III, combined with thinner intervals of apparently undisturbed sediment, gives the impression of a thick series of slumps separated by short intervals of quiescence.
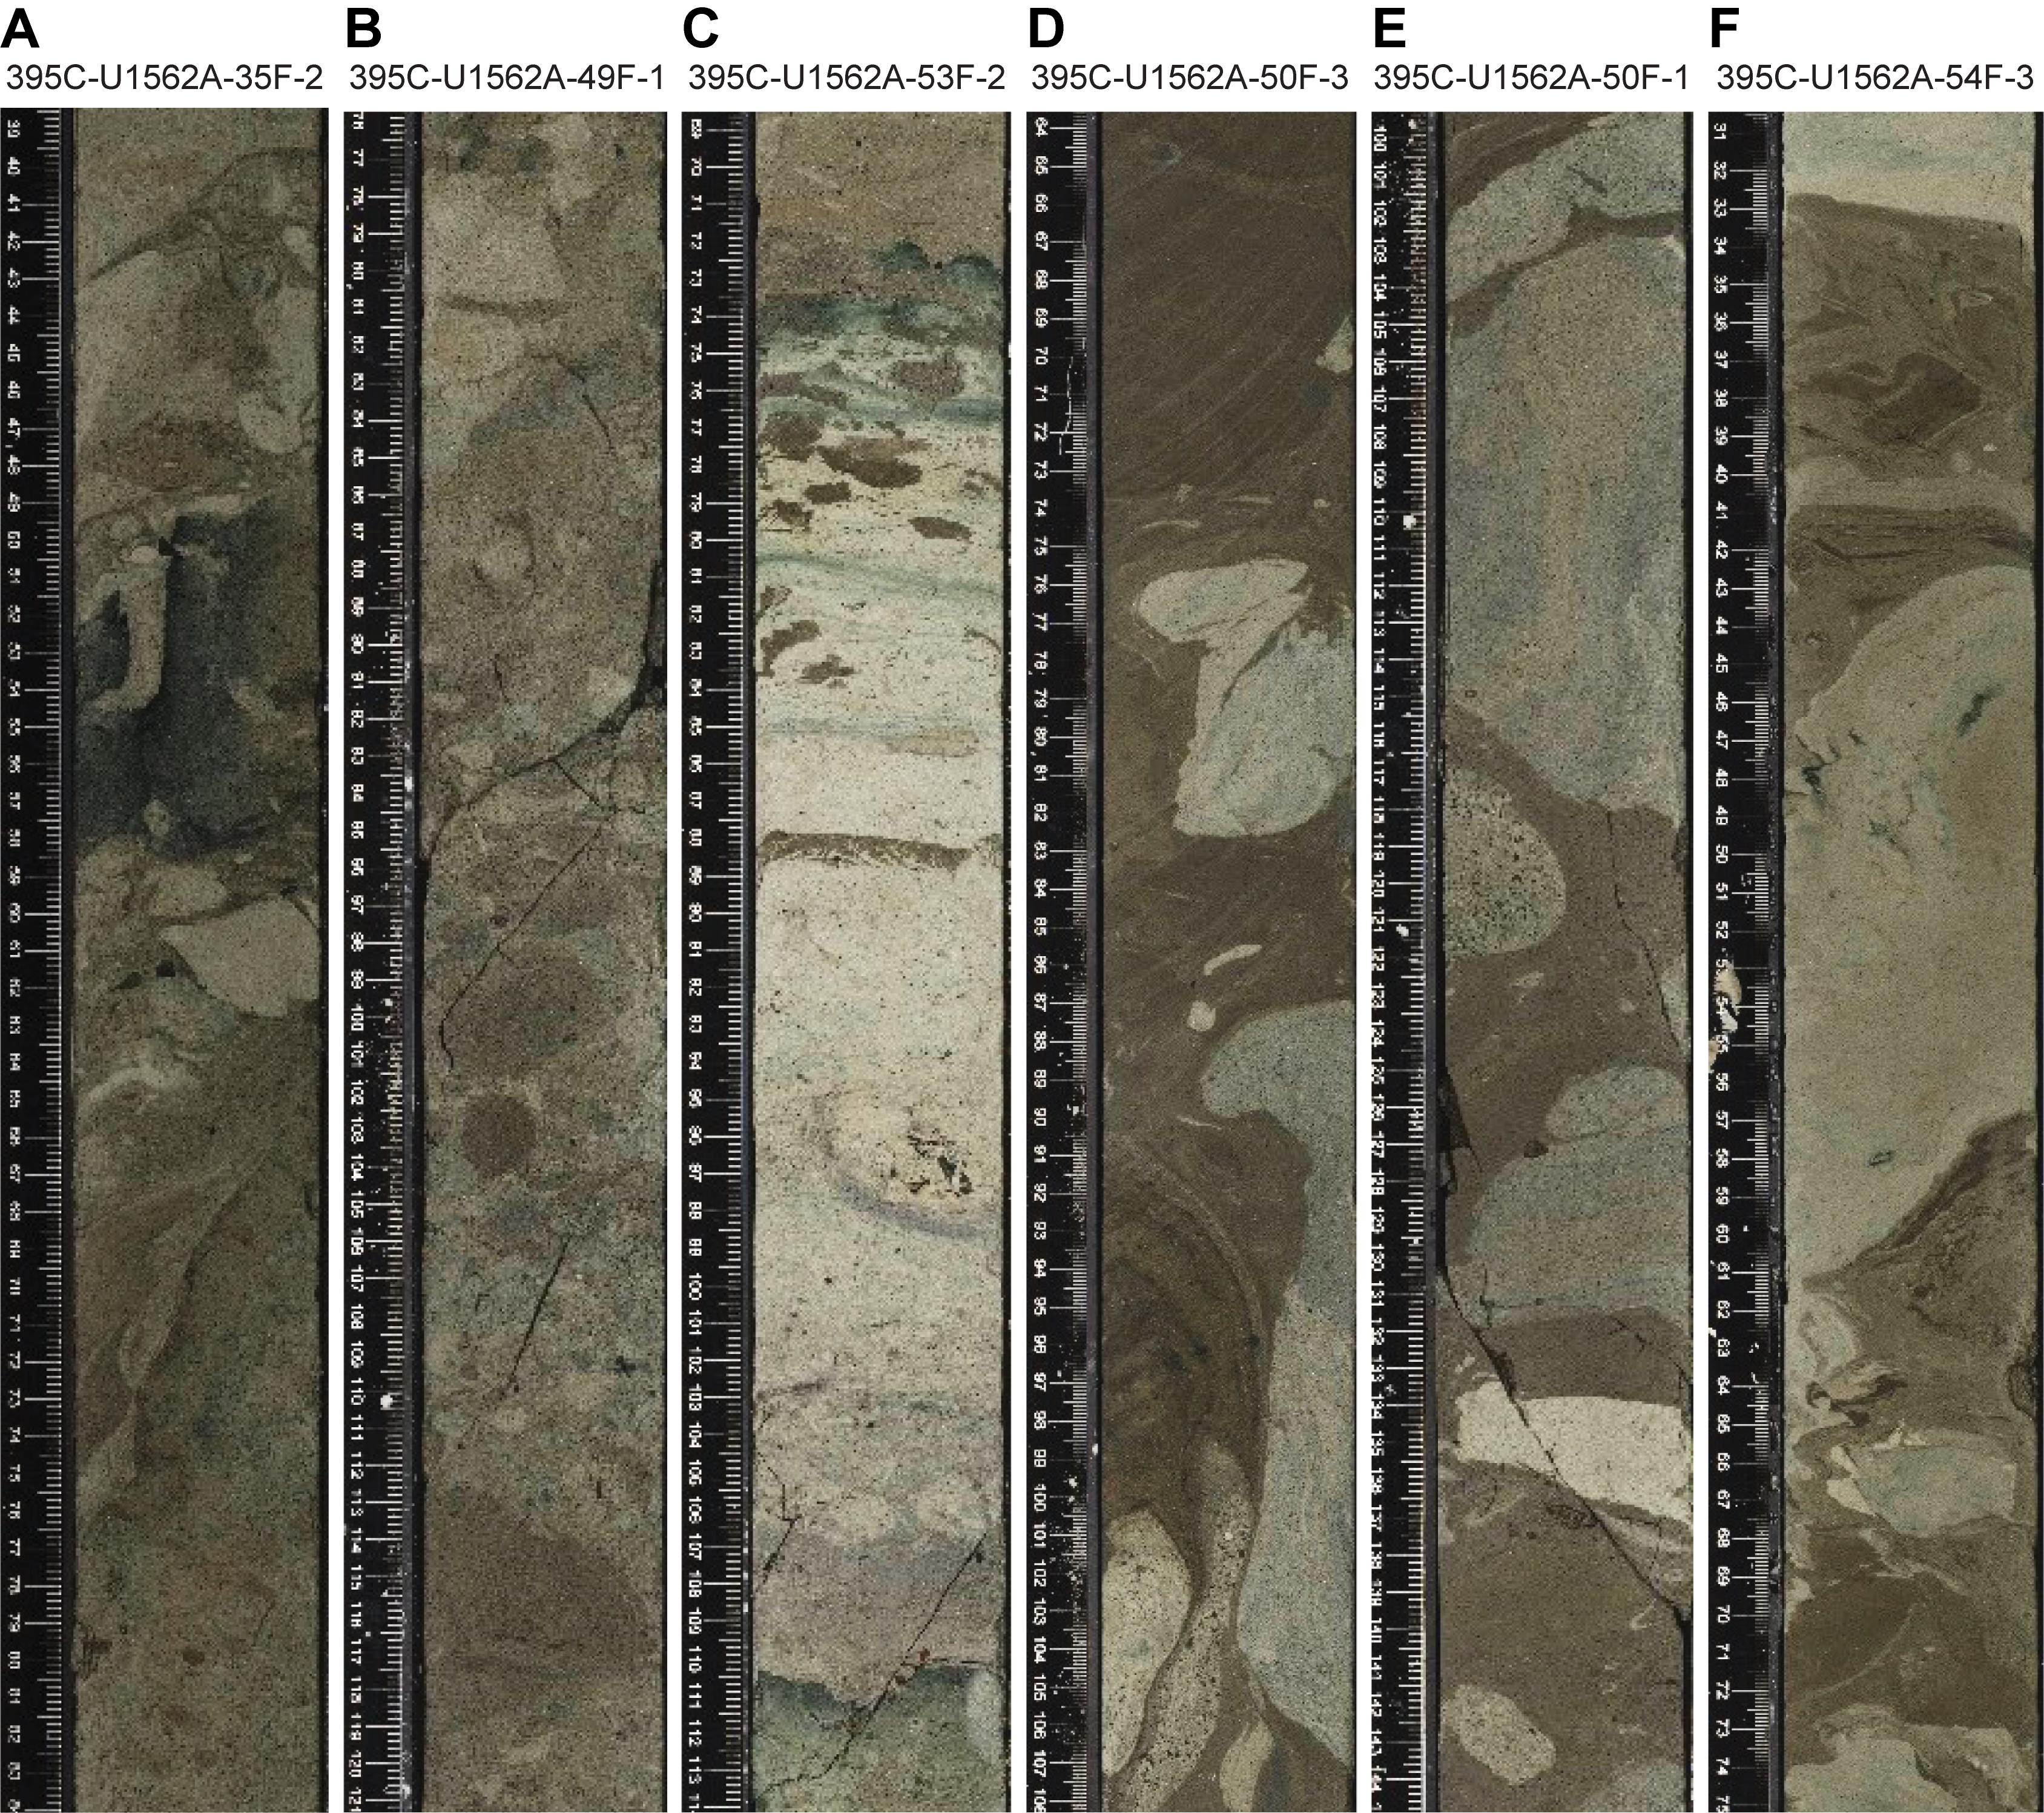
Figure F9. Soft-sediment deformation.
CaCO3 measurements are again highly variable in Unit III, ranging 3–65 wt% (average = 35 wt%), likely reflecting the incorporation of several layers of sediment with different initial depositional conditions into the slumps. Similar to Unit II, Unit III continues to present disseminated pyrite and glass in smear slides. A glass-rich layer is present at the base of a deformed layer in interval 395C-U1562A-37F-2, 66–68 cm. Small scoria clasts are present in Cores 37F, 53F, and 54F. Bioturbation ranges from absent to abundant. Drilling disturbance is minor in this unit; where present, it consists of slightly to moderately soupy or fragmented intervals, generally occurring in the uppermost few centimeters of cores.
3.4. Lithostratigraphic Unit IV
- Intervals: 395C-U1562A-55F-4, 14 cm, to 64X-CC, 33 cm; 395C-U1562B-2R-1, 3 cm, to 4R-1, 147 cm
- Depths: Hole U1562A = 351.36–427.73 m CSF-A; Hole U1562B = 408.13–428.57 m CSF-A
- Thickness: Hole U1562A = 76.37 m; Hole U1562B = 20.44 m
- Age: late Miocene
- Lithology: nannofossil ooze, nannofossil chalk
Unit IV is predominantly characterized by light gray nannofossil ooze, transitioning to nannofossil chalk toward the base of the unit. This unit begins in Section 395C-U1562A-55F-4, 14 cm, at a sharp contact between the overlying deformed silty clays and the underlying nannofossil ooze (Figure F10A). Subordinate beds (<3 m thick) of carbonate silty clay are also present near the upper and lower sections of this unit. The base of this unit is in Section 395C-U1562B-4R-1, at approximately 147 cm (428.57 m CSF-A), because Core 4R includes the interface between chalk and basalt basement between Sections 4R-1 and 4R-2. Bulk CaCO3 ranges 59–78 wt% (average = 64 wt%); however, one exception is an interval of carbonate clayey silt (Sections 395C-U1562A-64X-3 through 64X-5), which has approximately 37 wt% CaCO3. Unit IV is moderately to abundantly bioturbated, with greenish mottling associated with burrows (Figure F10B). Green banding is present in many intervals. Bands do not exhibit a different composition in smear slides from the surrounding sediments and appear to crosscut most burrows, implying they are the result of changes in sediment oxidation postdeposition (Figure F10C). Drilling disturbance in this unit presents as slight to severe fragmentation, with the severity and abundance of disturbance increasing downcore. Core recovery is also reduced for Unit IV in comparison to the upper units, which likely relates to degree of lithification (Figure F4).
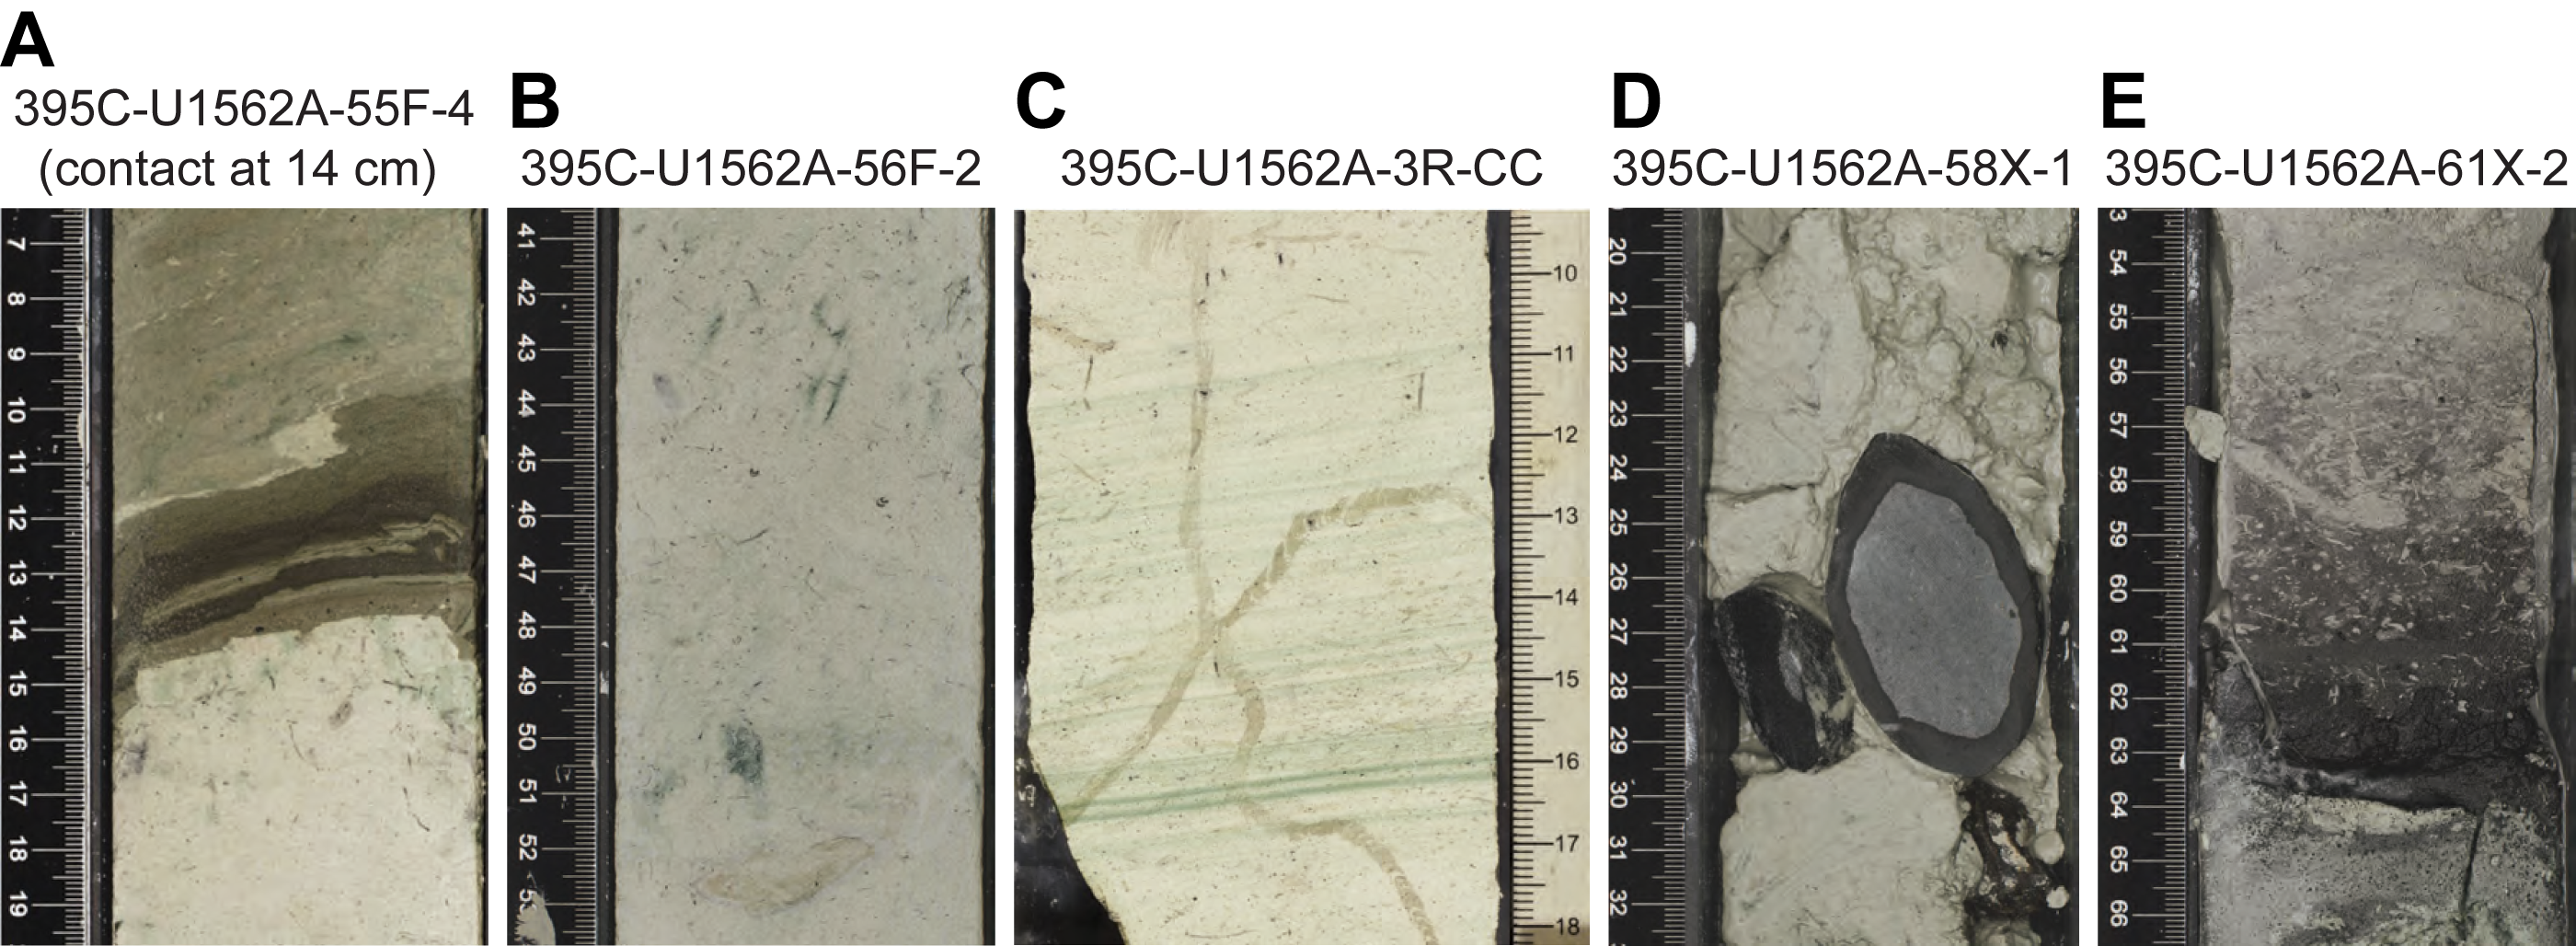
Figure F10. Selected sedimentary features, Unit IV.
Three clasts are present in Section 395C-U1562A-58X-1A, 28 cm (Figure F10D): a 6 cm subrounded basalt clast, a rounded 3 cm micrite clast, and a 2 cm subangular microgranular dark reddish clast. All three clasts are likely the result of fall-in from shallower depths in the hole, based on their position near the top of the core and the observed drilling disturbance at this depth, and hence are unlikely to be in place. A glassy layer with a diffuse upper boundary was identified near the base of the sedimentary column in Unit IV in interval 61X-2, 62–64 cm (Figure F10E).
In the underlying basalt basement units, a 65 cm thick layer of highly fragmented nannofossil chalk was recovered (interval 395C-U1562B-14R, 0–65 cm). This layer is pale brown, abundantly bioturbated and contains occasional greenish yellow and black glass throughout.
3.5. XRD results
A subset of squeeze cake residue samples (n = 10) were analyzed using X-ray diffraction (XRD). Results are consistent with smear slide and macroscopic observations (Figure F11; Table T4). The amount of calcite implied by the diffraction patterns is variable but consistent with CaCO3 weight percent measurements. Minerals identified at this site are consistent with the terrigenous and authigenic minerals observed in smear slide and include quartz, assorted feldspar and pyroxene, pyrite, and calcite. XRD samples were not specifically prepared for clay mineral analysis, and peaks with a 2θ of <15° should be treated with caution; however, most samples display peaks in this region, consistent with the presence of clay minerals. Future analysis of the clay mineralogy in these samples could be useful for determining shifts in deposition processes and sediment sources.
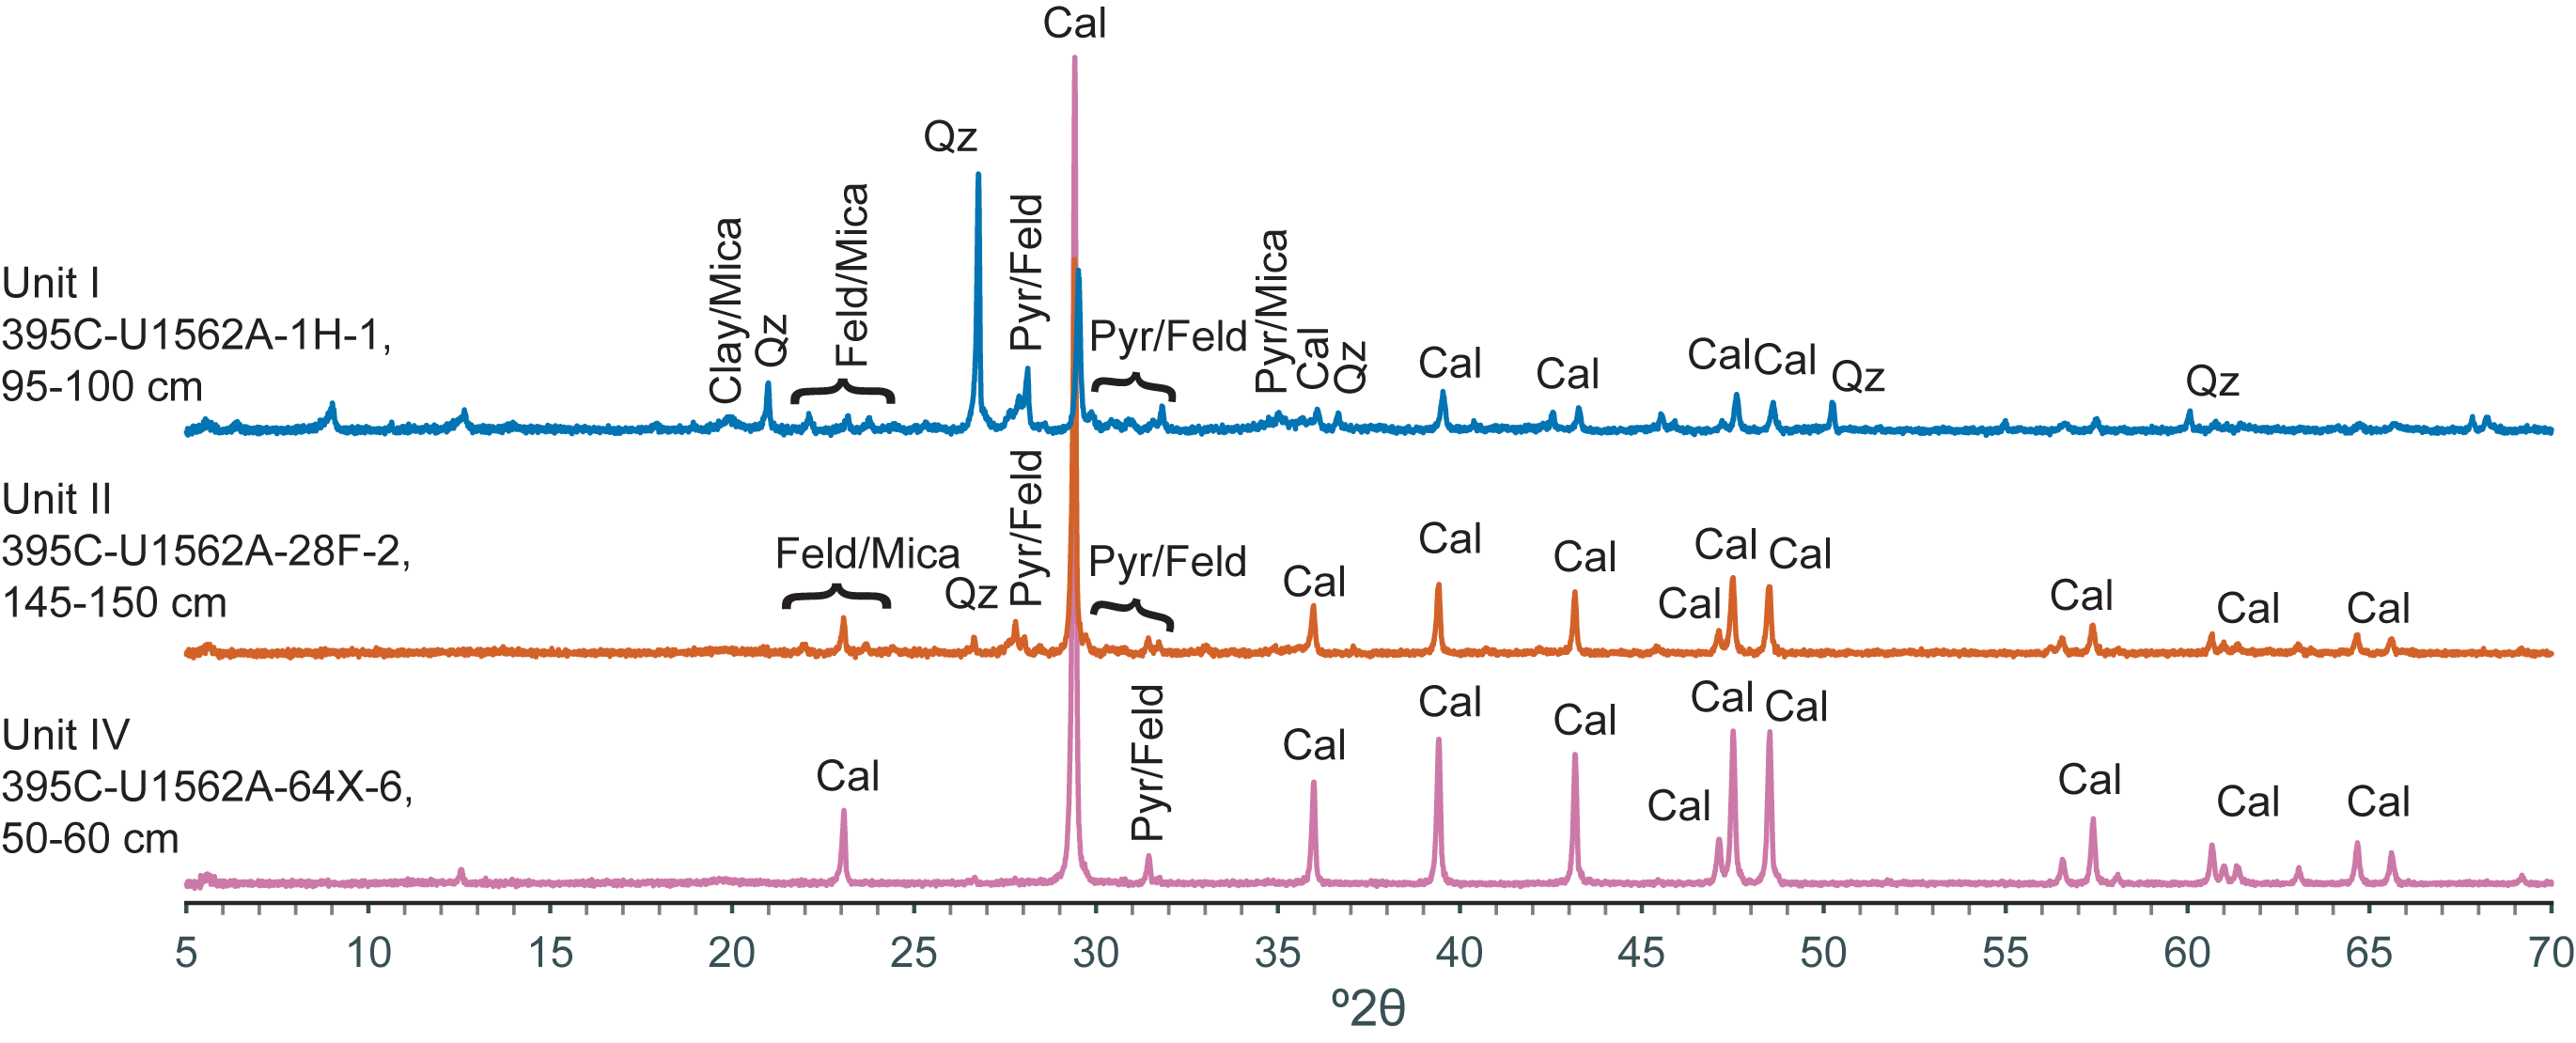
Figure F11. Powder XRD results.
4. Igneous petrology
Site U1562 is located on the western edge of VSR 3, where the estimated basement age is 13.9 Ma. This site is located near a series of normal faults that dip toward the northwest (Figure F12). Basalt coring in Hole 395C-U1562B reached ~560 m CSF-A (~130 m into basement) with 48% recovery (Figure F13). The sediment/basement contact was not recovered, but a quasi-interface with a small amount of glassy basaltic pillow fragments and breccia (<1 m) was sampled at the base of Hole 395C-U1562A.
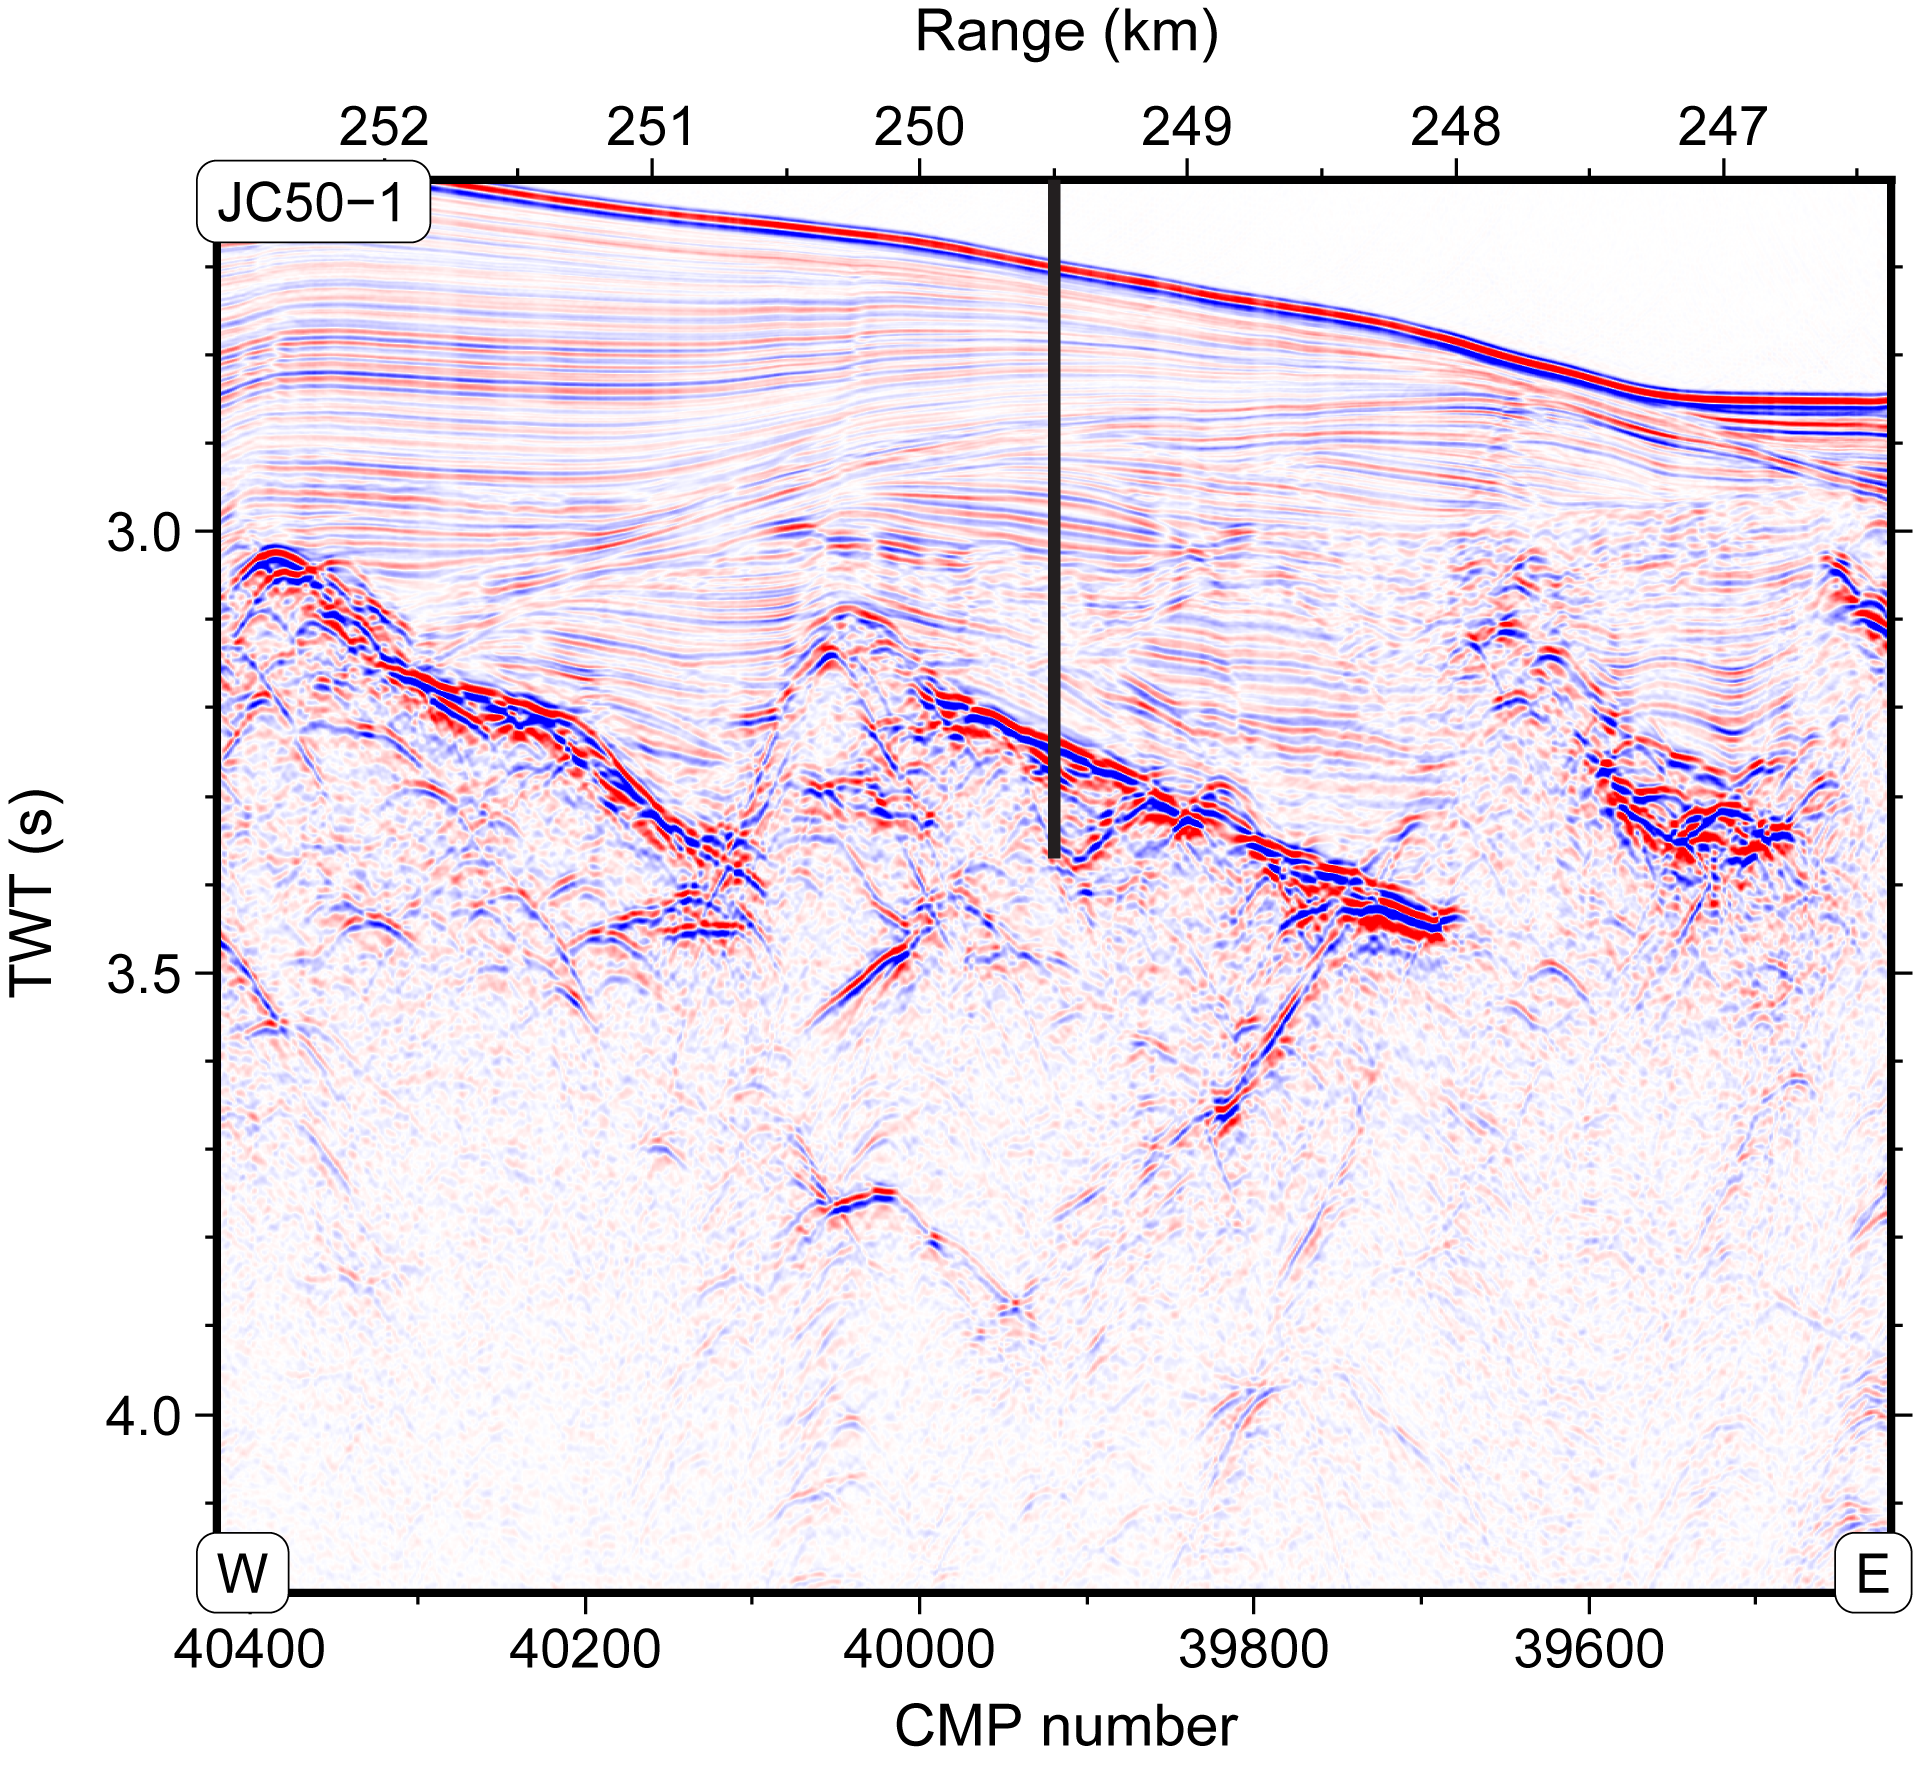
Figure F12. Site U1562 location on Seismic Line JC50-1.
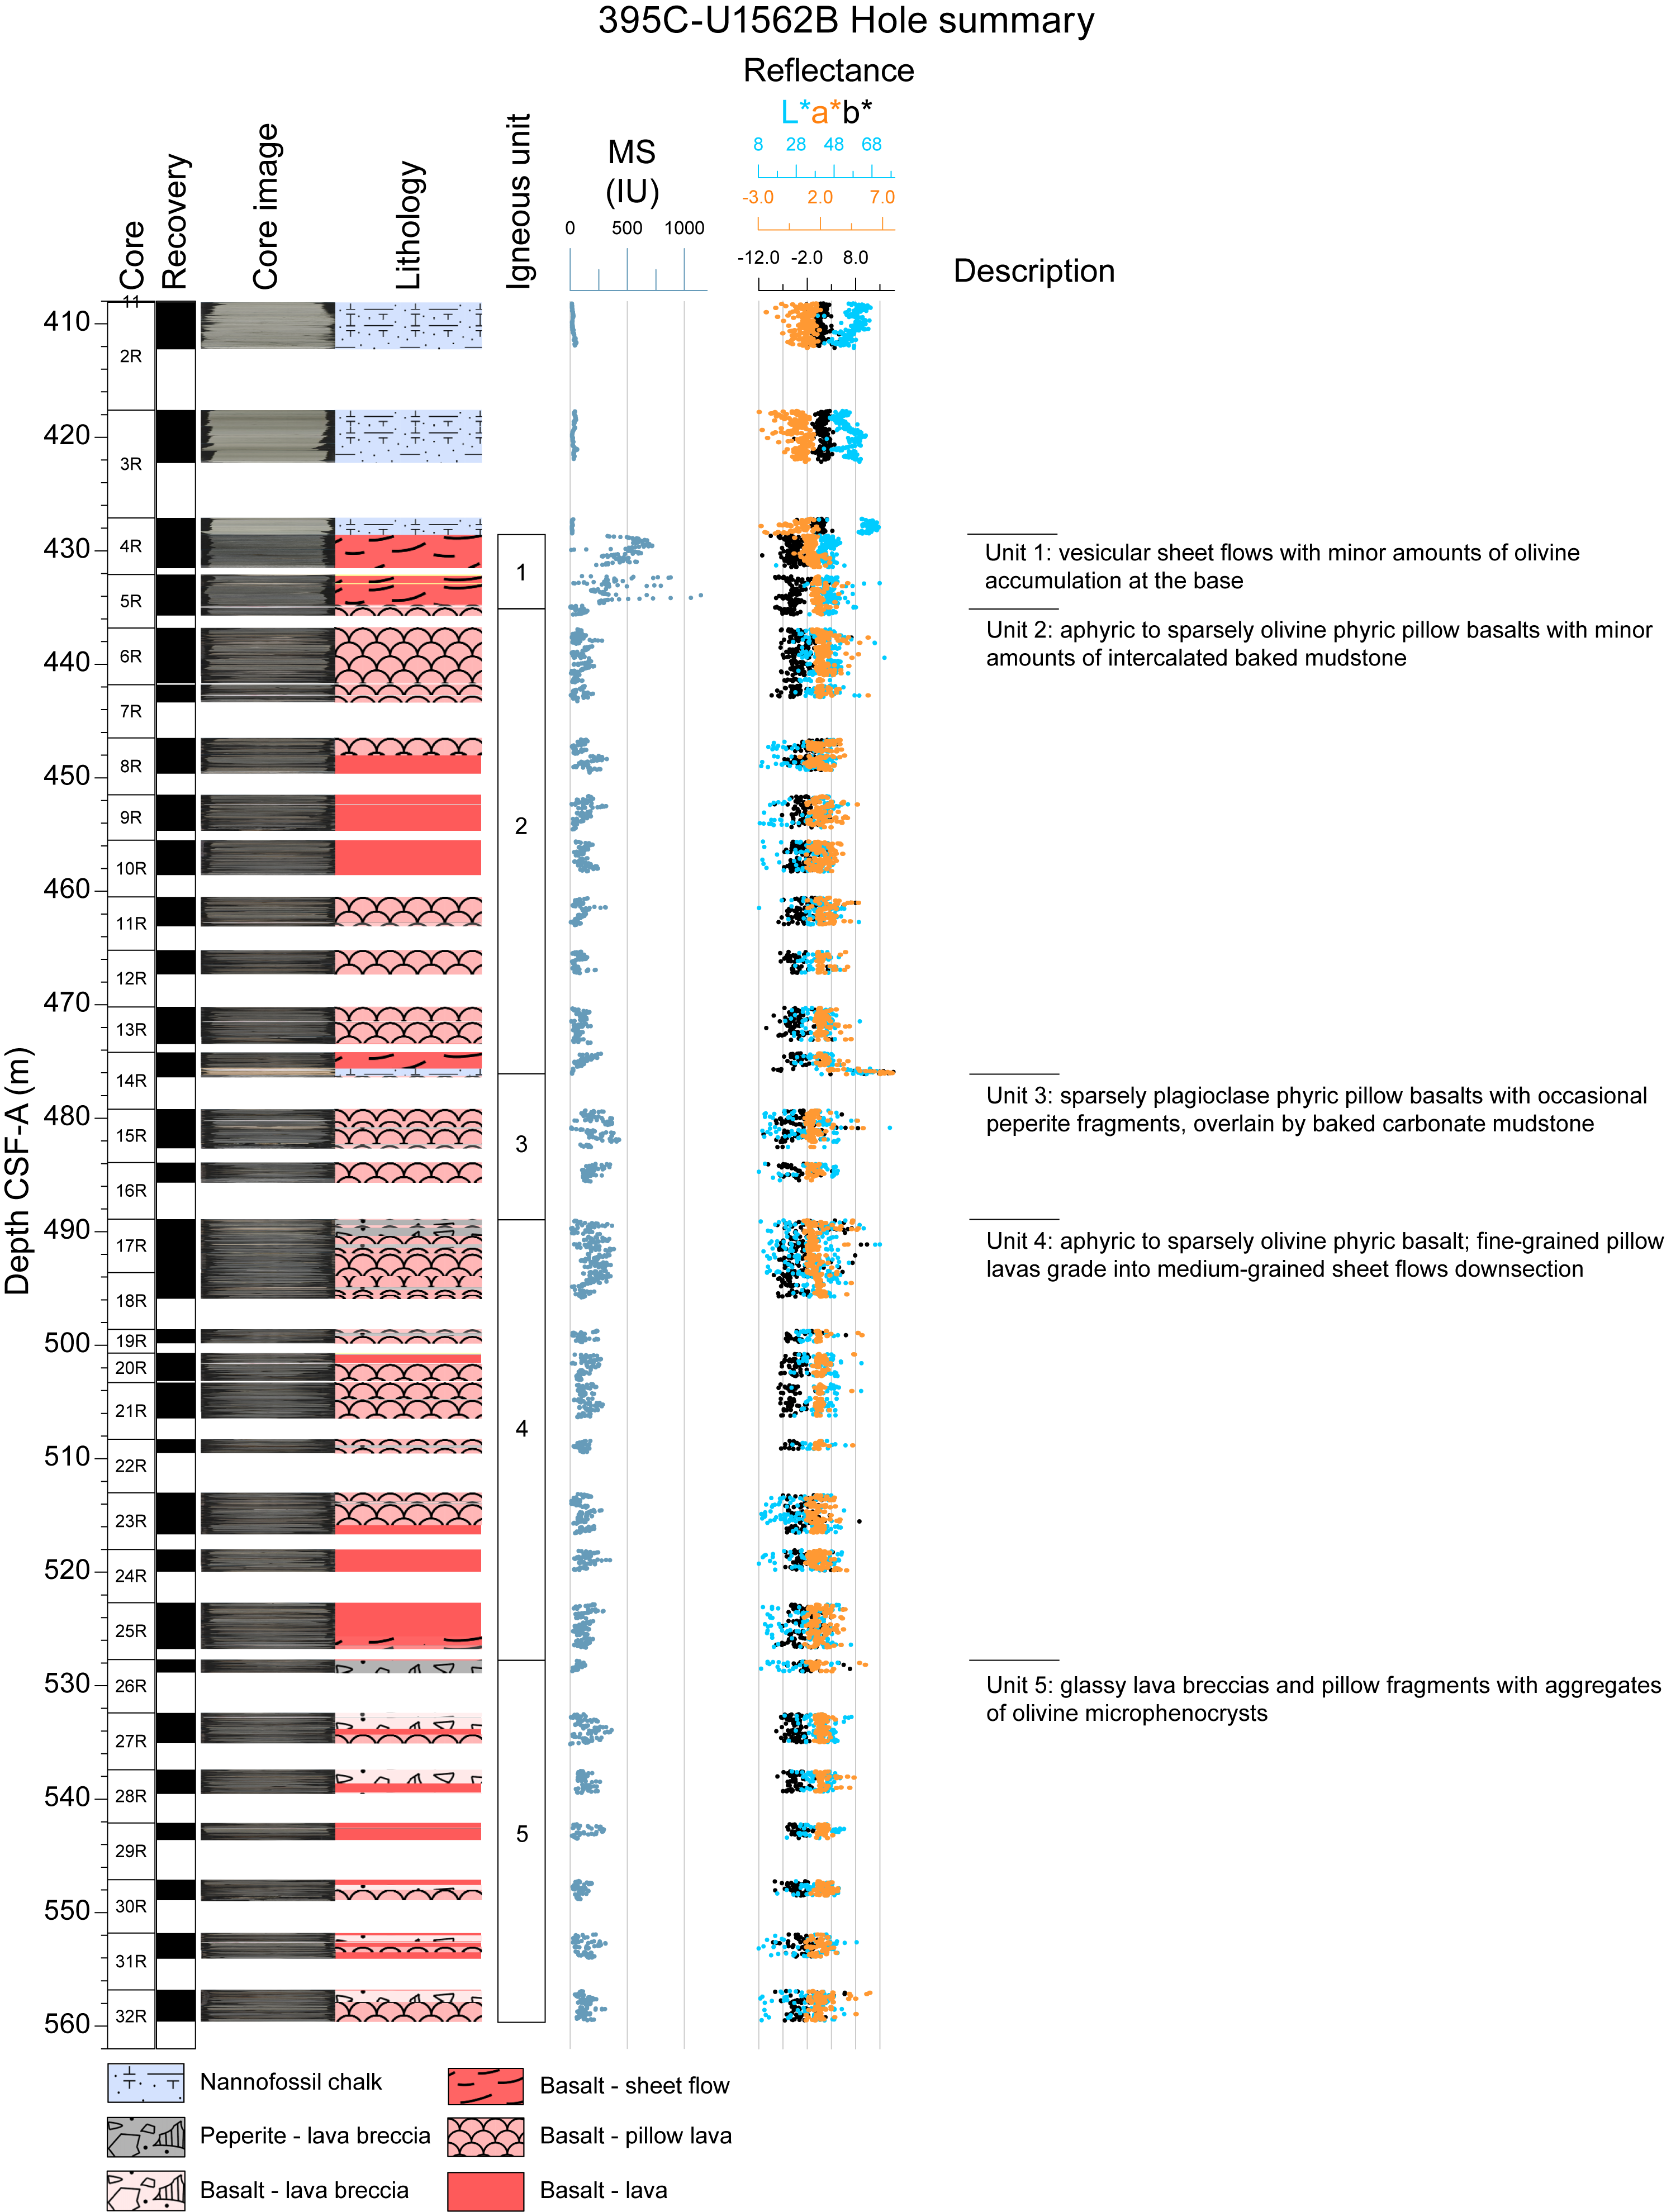
Figure F13. Lithostratigraphic summary, Hole U1562B.
4.1. Lithostratigraphy
Igneous rock cores from Site U1562 are mostly pillow basalts (>54%), with several thick sheet flow intervals recovered at 446–458 and 517–527 m CSF-A. Overall, the recovered basalts are sparsely to moderately olivine phyric, with some intervals also containing small plagioclase phenocrysts. Cores from this site also contain abundant peperite and intercalated sediment (Figure F13).
Hole U1562A reached the sediment/basement interface at ~427.7 m CSF-A, where white calcareous ooze lies on top of glassy basalt fragments in Section 64X-CC. The underlying core recovered a weathered vesicular sheet flow of sparsely olivine phyric basalt.
Hole U1562B encountered the sediment–basement transition at 428.6 m CSF-A and reached a maximum depth of 559.5 m CSF-A within basement. Recovered material is primarily composed of sparsely to moderately olivine phyric basalt with significant amounts of intercalated carbonate and peperite fragments. Material from this hole is mostly pillow basalt, which makes up more than half the total recovery. It is typically hypocrystalline with chilled margins and mottled devitrification. Thin glass rinds are common, with some larger glass rinds and shards up to 3 cm thick. The pillows are mostly sparsely vesicular, with a few intervals ranging up to ~10% vesicularity. Vesicles commonly occur in bands near the edges of flows or pillow lobes. Peperite and intercalated carbonates are also common, with multiple regions of sediment-rich recovery. Peperites and lava breccias make up ~12% of the total volume of volcanic recovery. The peperites exhibit a variety of features indicative of sediment-lava interaction (e.g., Skilling et al., 2002), including abundant basalt clasts with quenched glassy rims, fluidal margins, sediment intrusion into cracks and vesicles, and baked carbonate matrixes. There are several sheet flows (as thick as 10 m) that are generally nonvesicular aside from large sparse vesicles concentrated at flow boundaries. These flows are sparsely to moderately olivine phyric with medium-grained interiors that grade to fine-grained chilled margins at flow boundaries. As at other Expedition 395 sites, these sheet flows also exhibit higher magnetic susceptibility (MS) and higher L* color reflectance than pillow lava intervals (Figure F13; see Physical properties). Most basalts show slight to moderate alteration with carbonate veins throughout (see Alteration petrology and structural geology). Sections 395C-U1562B-8R-2 and 10R-1 have strongly altered vesicular flow tops.
4.2. Core descriptions
Descriptions are based on a combination of detailed macroscopic observations of core sections, microscopic thin section observations, and physical properties measurements (e.g., MS, color reflectance, and wireline logs). Significant characteristics are summarized in the visual core descriptions (VCDs).
Igneous lithologies at Site U1562 are divided into three principal morphologic categories: pillow lavas, sheet flows, and peperites (Figures F14, F15). Pillow lavas consist of aphyric to sparsely olivine-phyric basalt fragments characterized by chilled curved margins, concentric vesicle bands, and thin glass rinds. Sheet flows recovered at this site are 2–10 m thick with coarser groundmass interiors. Approximately ~25% of the recovered lava is not assigned a flow morphology because of ambiguity distinguishing thin sheet flows from large pillows and lobate flows. Vesicles are sparsely to moderately abundant, often filled, and commonly occur in aligned bands. Veins and fractures frequently contain clay, celadonite, and Fe-oxide, with variable extents of background alteration (see Alteration petrology and structural geology).
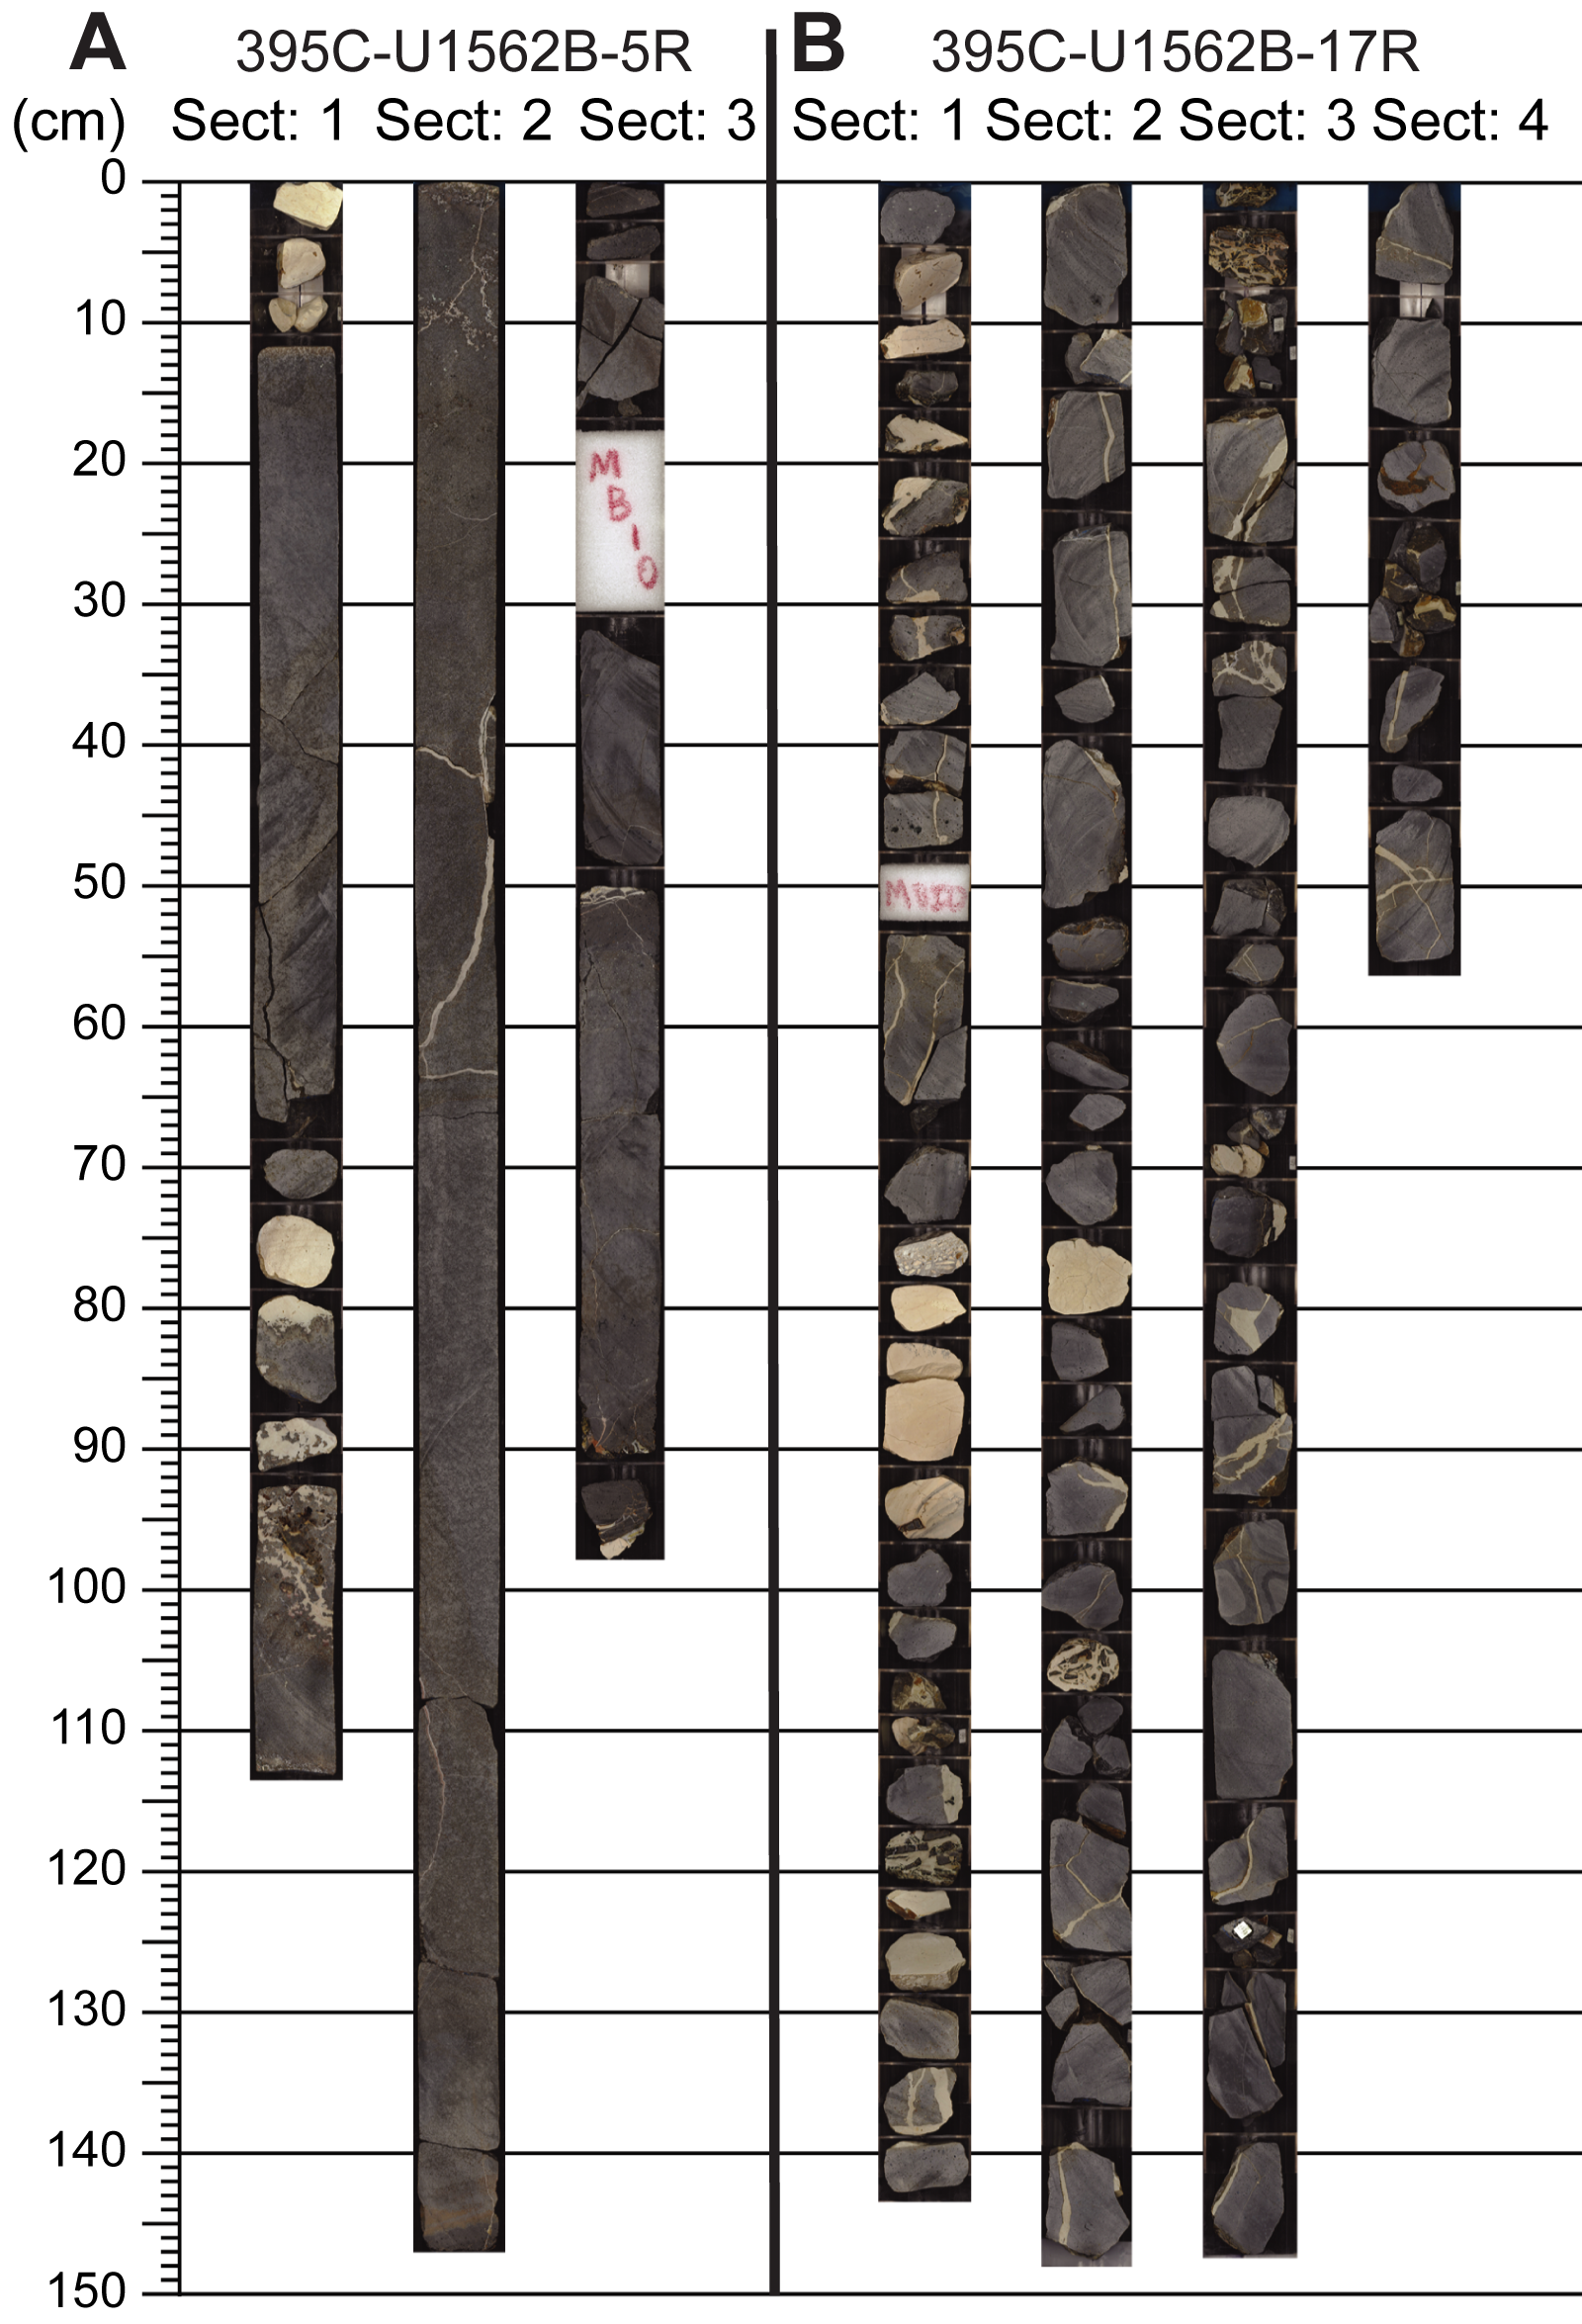
Figure F14. Common lithologies.
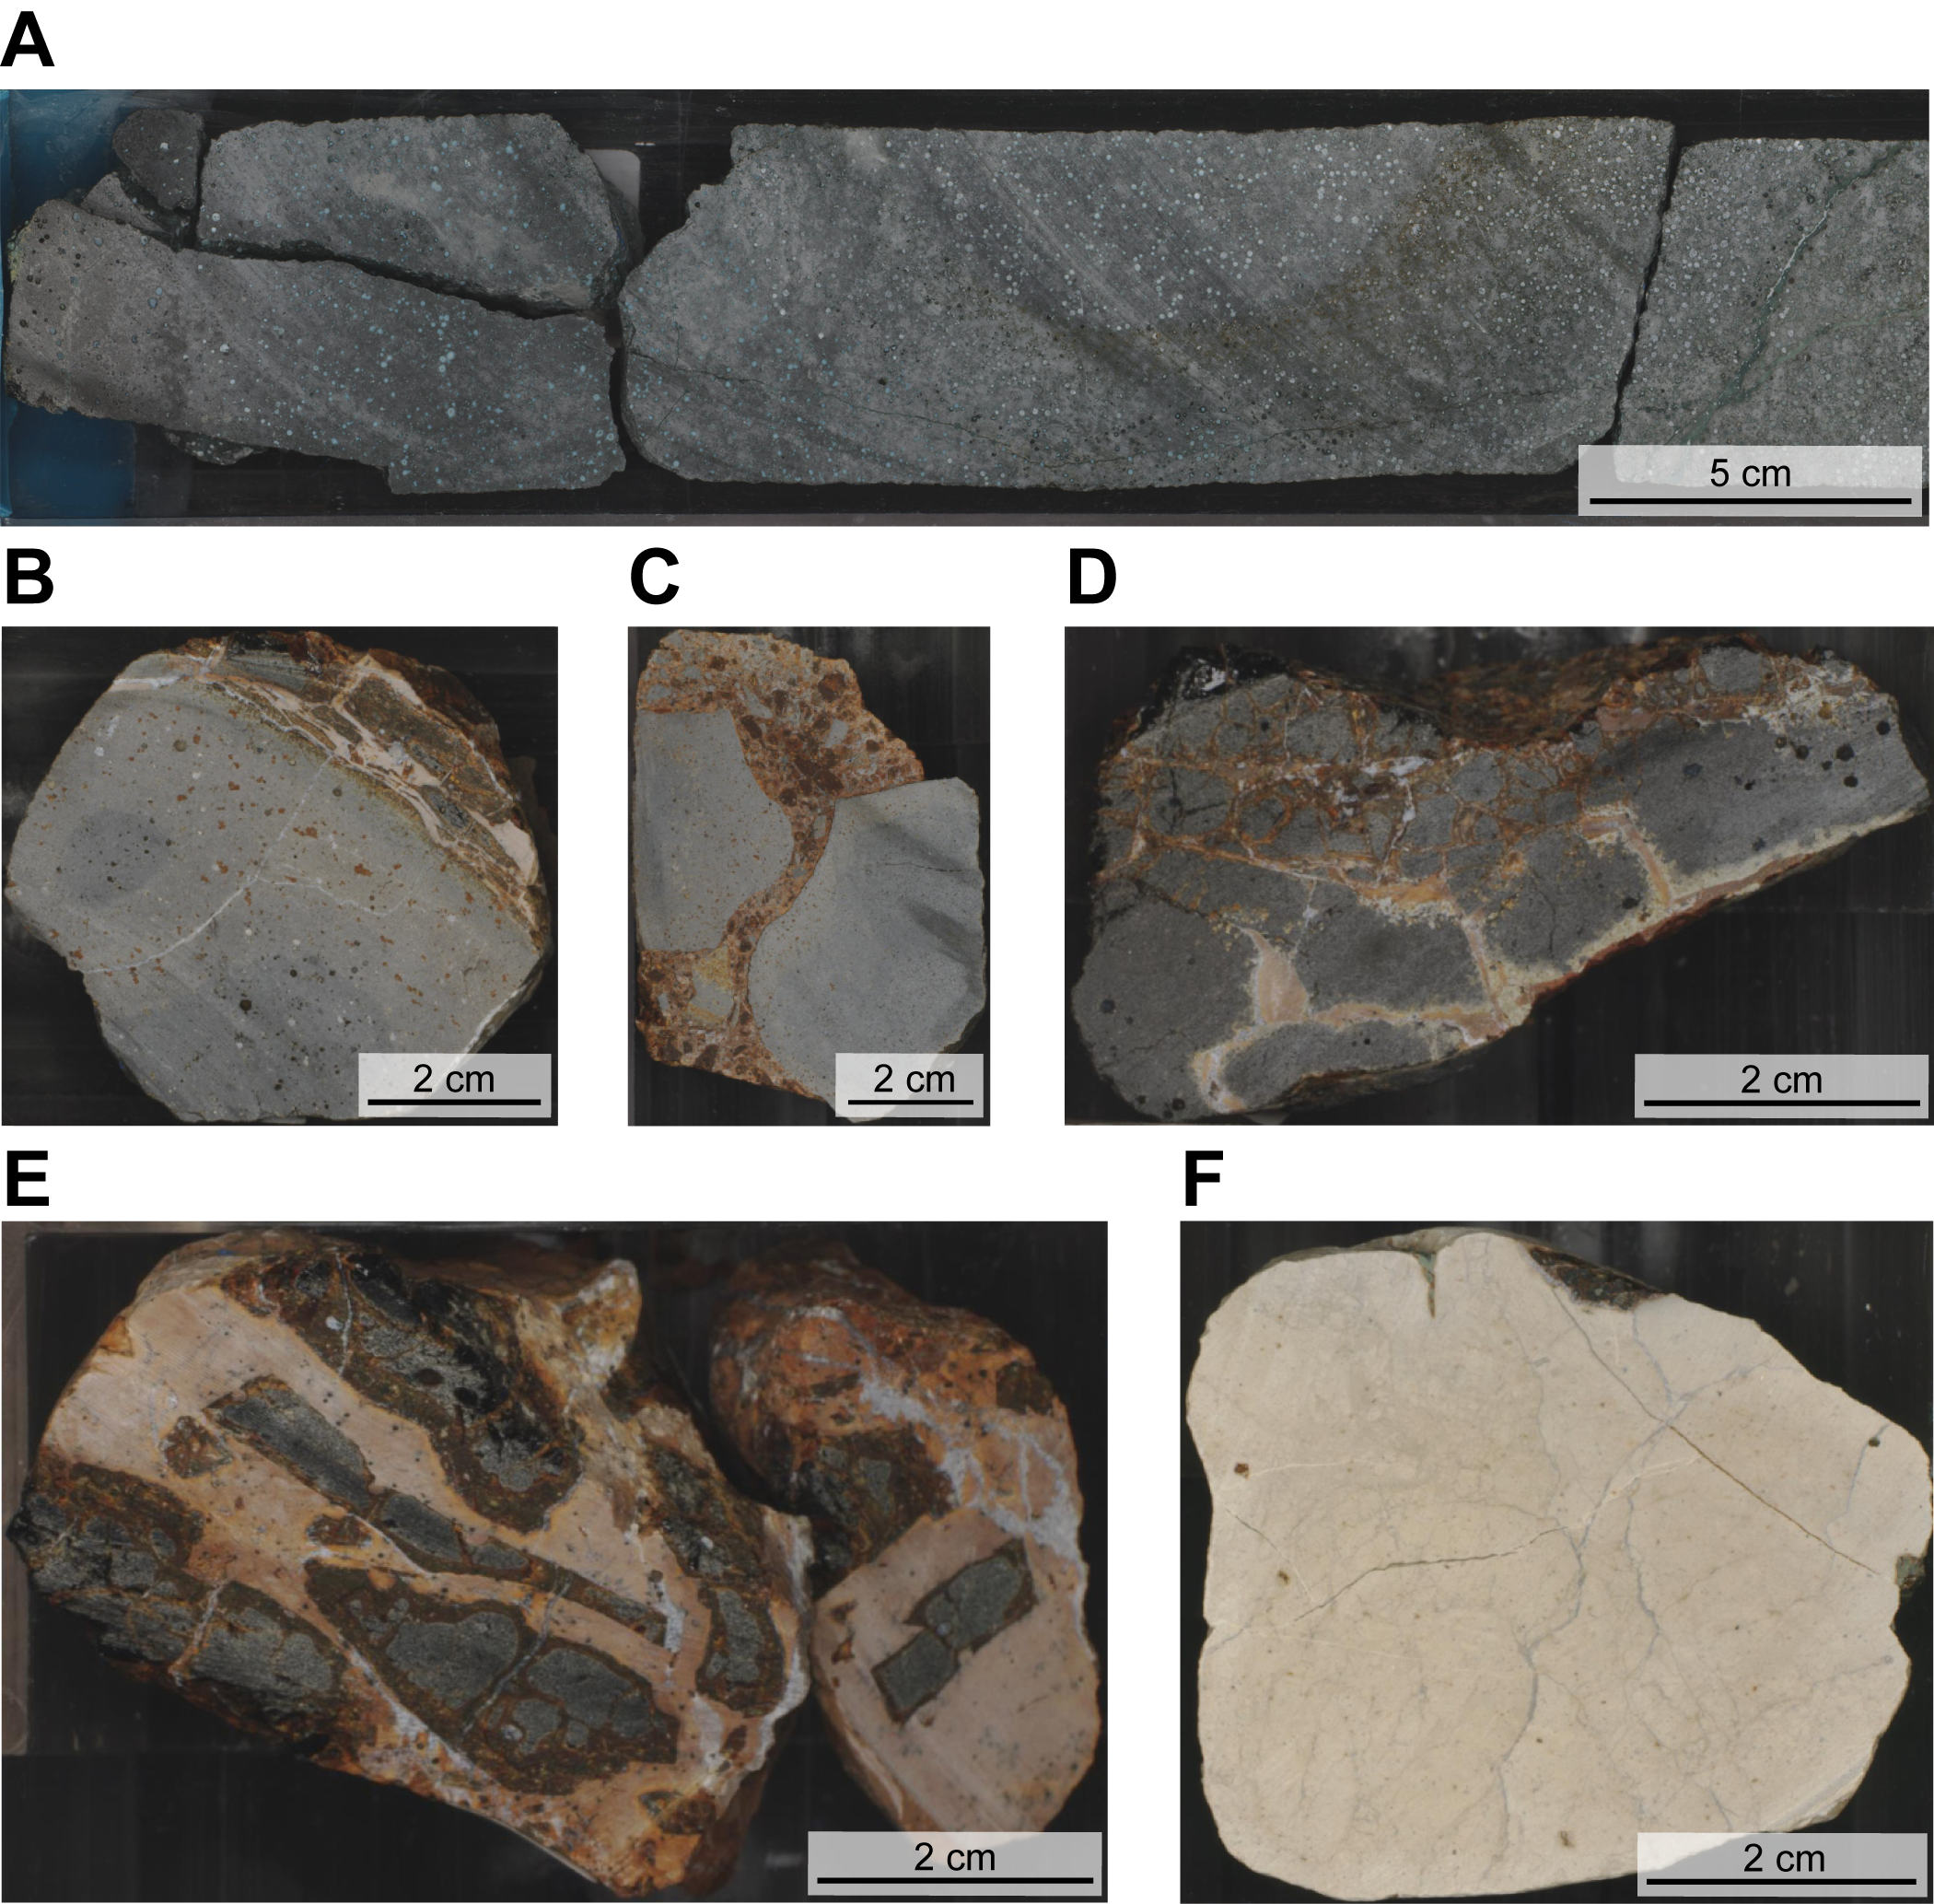
Figure F15. Typical lithologies.
Peperitic layers are characterized by glass shards and lava fragments in a carbonate matrix and show evidence for lava-sediment interaction (e.g., baked sediment, basalt fragments with quenched rims, and fluidal margins). These units often contain abundant fresh glass shards and fragments. Thick glass rinds (>1 cm) are relatively abundant in this core. In addition to peperitic intervals, some horizons contain lava breccias that lack clear evidence for lava-sediment interaction. Occasionally, there are thin layers of intercalated calcareous mudstone, which is sometimes brecciated. A 65 cm thick layer of mudstone was recovered in Section 395C-U1562B-14R-2 at ~475 m CSF-A.
We used the presence of sediment-rich horizons (i.e., significant intercalated sediment or peperite) and mineralogical changes (e.g., olivine-phyric to plagioclase-phyric basalt) to divide the basement succession into igneous lithologic units (Table T5). Because of incomplete recovery and a general lack of well-defined contacts, our unit boundary locations are approximate and preliminary. We note that the cores with the lowest recovery are associated with pillow fragments, peperites, and/or intercalated sediment. This pattern is consistent with preliminary observations from the downhole logging data (see Downhole measurements), which show broad correlations between recovery rate, rock density, and lava morphology.
4.2.1. Hole U1562A
Less than 1 m of basement was recovered at the base of Hole U1562A, consisting of glassy basalt fragments overlying a weathered and vesicular sheet flow.
4.2.2. Hole U1562B
This hole can be divided into five igneous lithologic units (Figure F13; Table T5). The top is marked by a ~6 m thick altered vesicular sheet flow with minor amounts of olivine accumulation at its base (Unit 1). This sheet flow is underlain by a series of aphyric to sparsely olivine phyric pillow lavas with a thin sheet flow at the base and minor amounts of intercalated baked mudstone (Unit 2). Unit 2 overlies over half a meter of variably baked mudstone with manganese spots at ~475 m CSF-A. This sediment horizon forms the boundary between Units 2 and 3. Unit 3 consists of ~12 m of pillow basalts with sparse plagioclase and olivine phenocrysts intermixed with occasional peperite fragments. This basalt interval is underlain by another sediment-rich peperite horizon, beneath which Unit 4 includes almost 40 m of aphyric to sparsely olivine phyric basalt dominated by fine-grained pillows, which grade into a medium-grained sheet flow near the base of the unit. Another notable peperite interval (>1 m thick) forms the boundary between Units 4 and 5. Unit 5 consists of glassy lava breccias and pillow fragments that contain olivine microphenocryst conglomerates. This lowermost unit had low recovery to the base of the hole.
4.3. Thin sections
Thin sections were sampled from Hole U1562B with an average spacing of ~7 m (see Core descriptions), resulting in 18 thin sections, mostly from pillow lavas. They are, on average, sparsely to moderately olivine phyric (<10%) with relatively little alteration (Figure F16). Olivine phenocrysts range from small microphenocrysts to large, euhedral olivines up to ~4 mm across. Skeletal and swallowtail olivines are common in the groundmass, indicating rapid cooling. Plagioclase is the most abundant groundmass mineral, usually forming acicular or skeletal crystals without significant zoning. Thin sections from Igneous Lithologic Unit 3 contain twinned plagioclase phenocrysts up to ~2 mm long. The groundmass usually exhibits intergranular and intersertal textures containing clinopyroxene-bearing mesostasis, opaque oxides, and altered glass. Thin sections sampled from sheet flows are variable but tend to have a more crystallized groundmass with plagioclase, clinopyroxene and opaque oxides. Vesicles occur in low abundances (usually <5%) and are often filled with secondary phases such as calcite and celadonite (see Alteration petrology and structural geology).
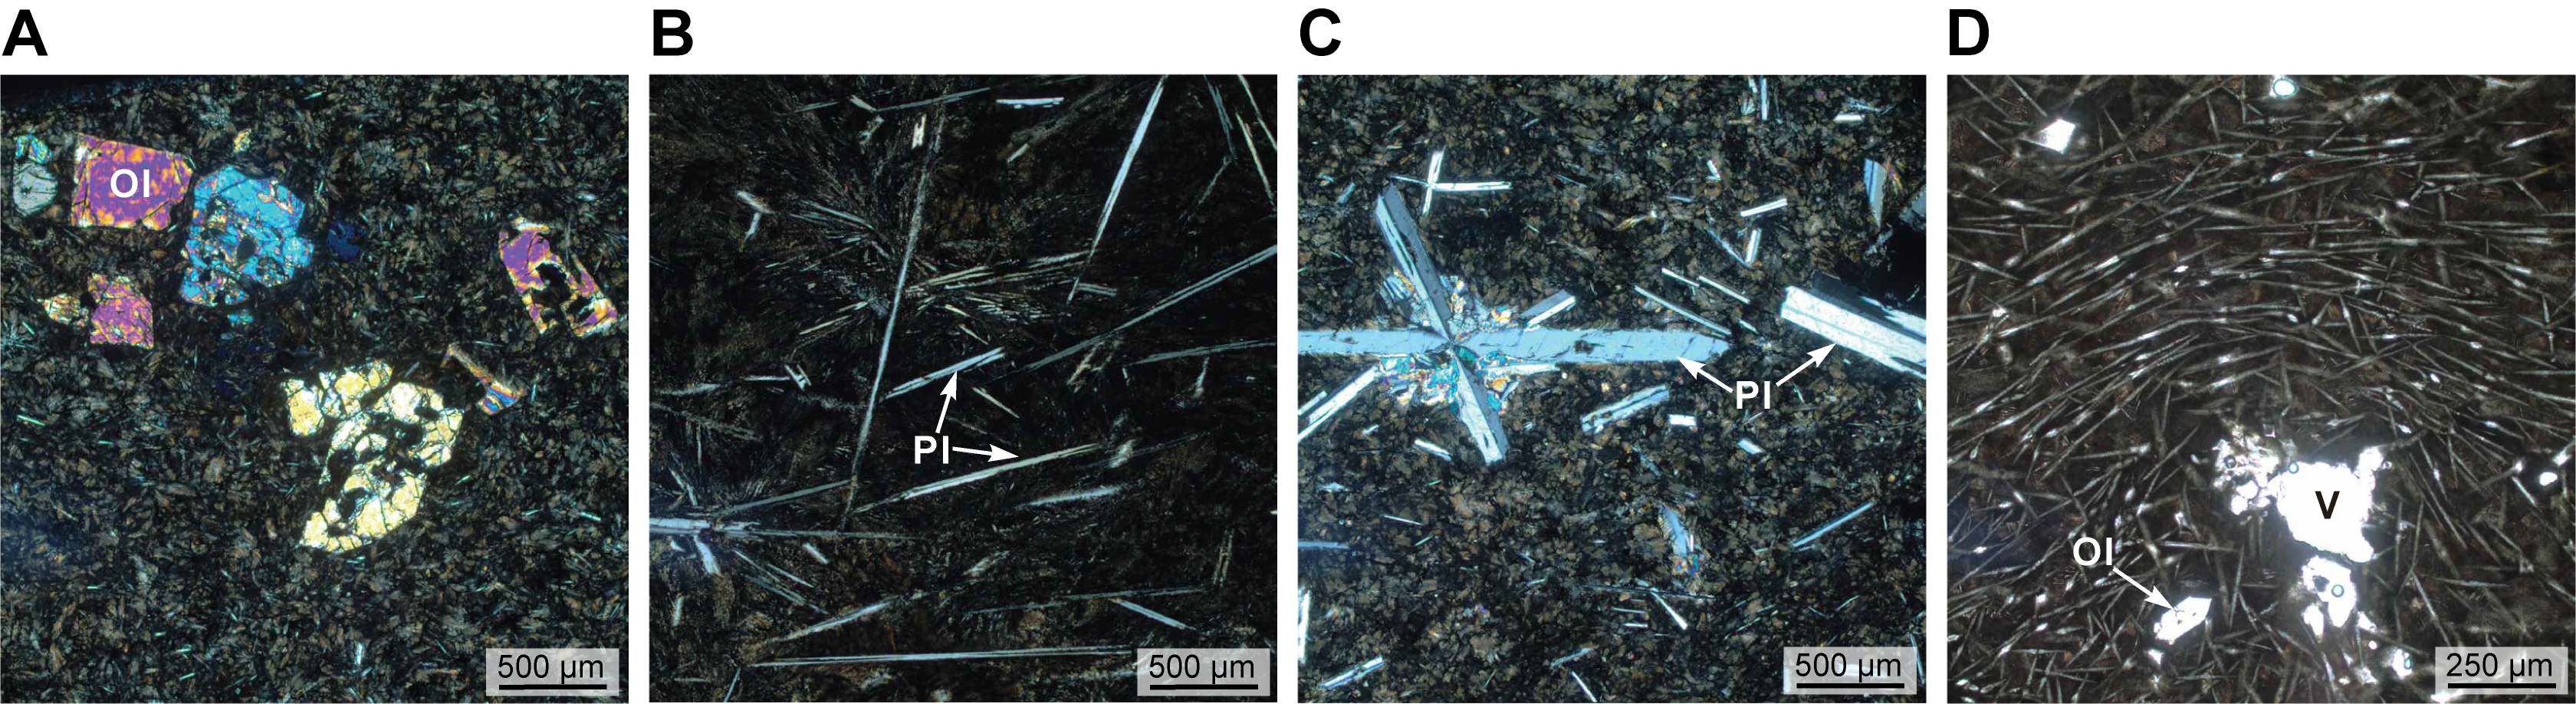
Figure F16. Basalt thin sections.
4.4. Geochemistry
Shipboard measurements on basalts from Hole U1562B include portable X-ray fluorescence (pXRF) and inductively coupled plasma–atomic emission spectroscopy (ICP-AES) analyses (see Geochemistry and microbiology in the Expedition 395 methods chapter [Parnell-Turner et al., 2025a]).
The pXRF analyses were primarily used for preliminary characterization of the hole during shipboard operations. Raw counts from pXRF analyses are shown in Figure F17. Despite significant scatter, major elements such as Mg, Al, and Si roughly group into several clusters with offsets that sometimes align with our lithostratigraphic unit boundaries. Although we caution against overinterpreting raw pXRF data, we note that the Unit 3 to 4 transition (~485 m CSF-A) is marked by slight increases in Mg, Al, and Si, as well as increases in incompatible trace elements such as Ti, Y, and Zr. On average, Unit 3 has slightly lower incompatible element concentrations than the other units, with another possible decrease in incompatible elements across the Unit 4–5 transition (~528 m CSF-A).
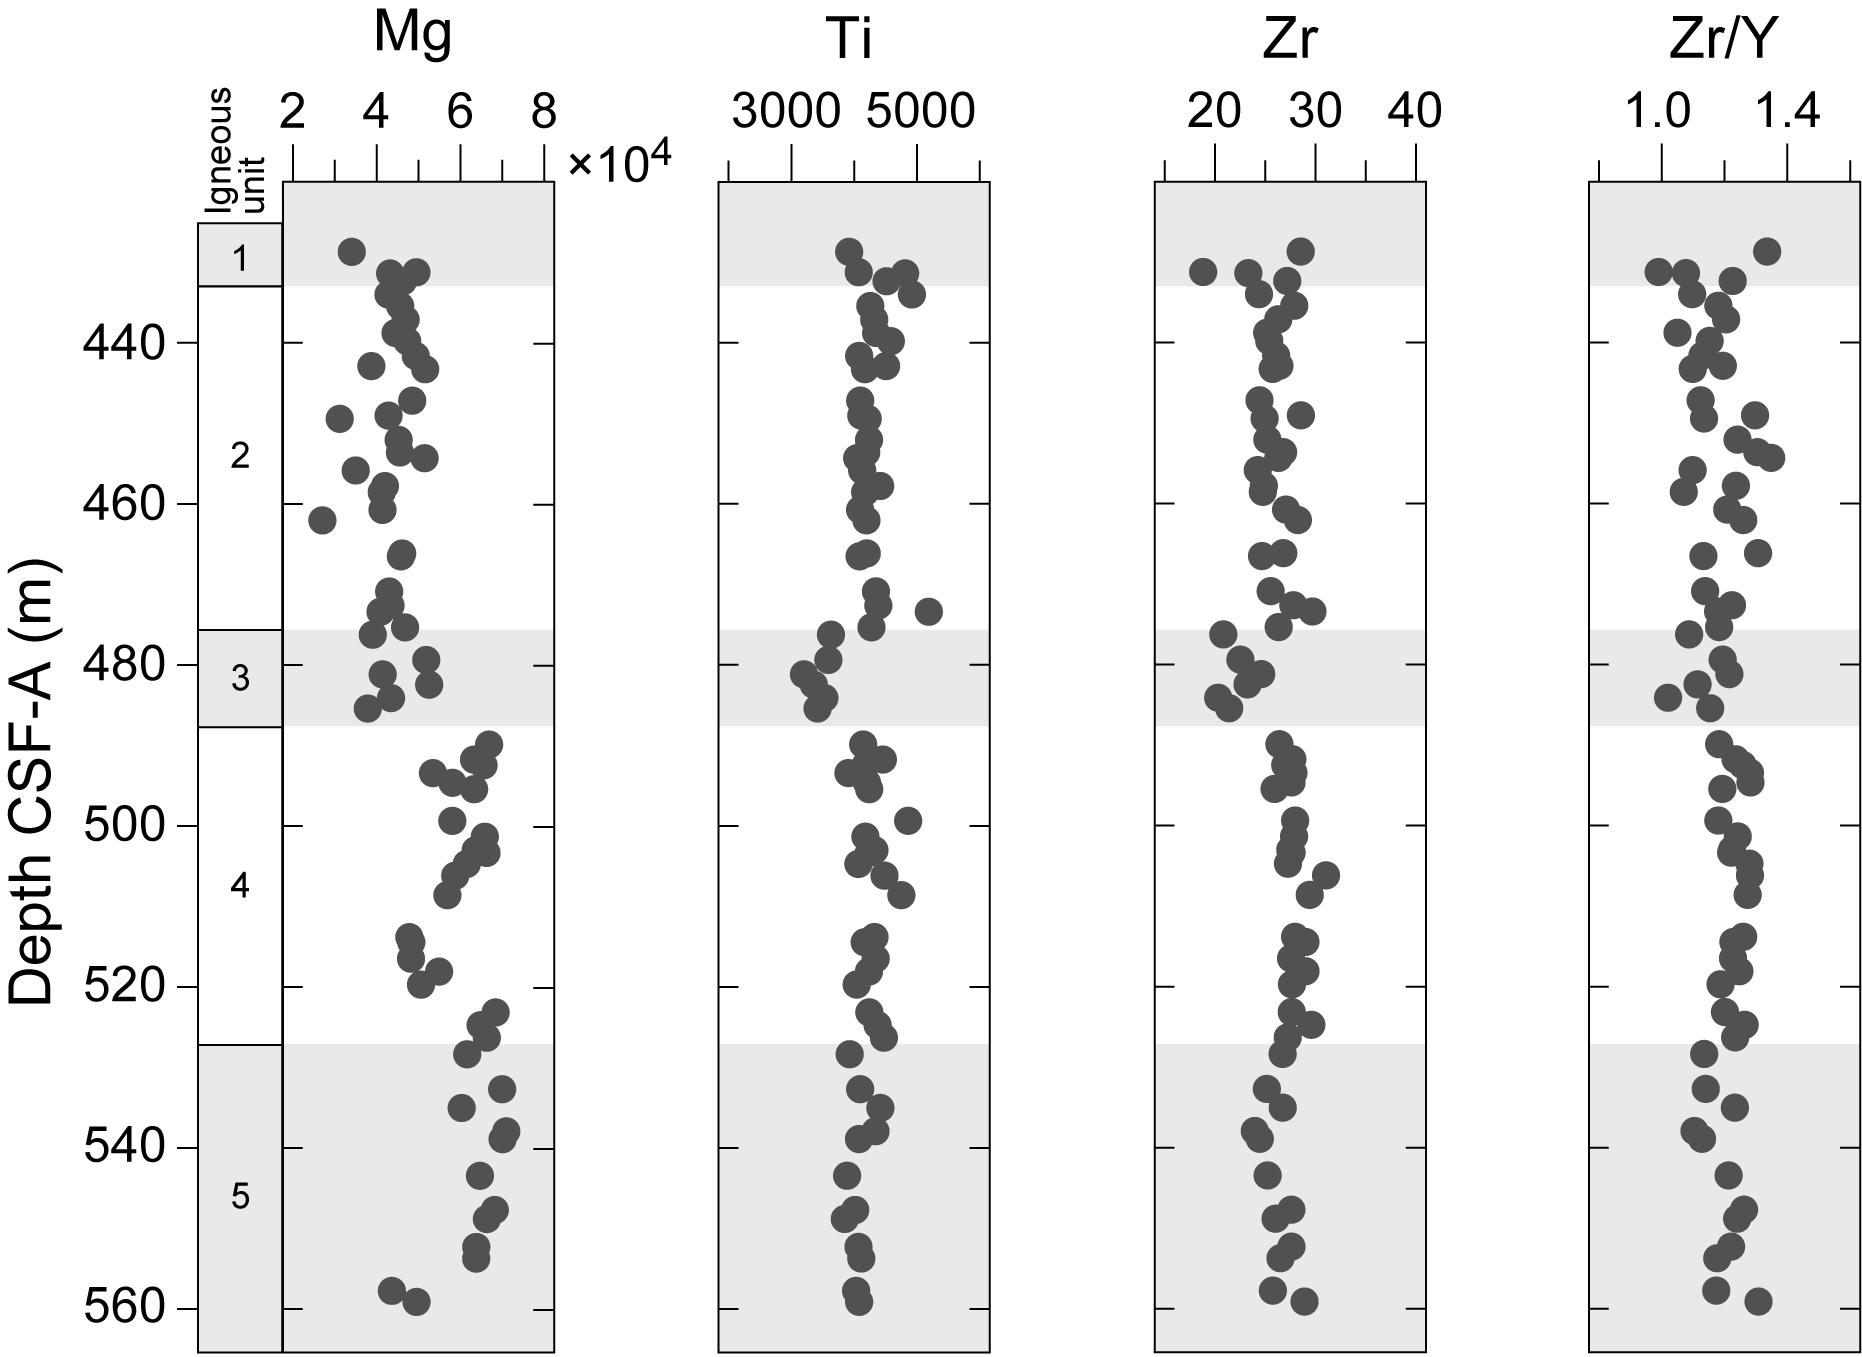
Figure F17. Major and trace element pXRF compositional data.
Similar geochemical offsets are also weakly reflected in ICP-AES analyses, which were performed on 18 samples that are co-located with the thin sections. Measurements of select major and trace elements are shown in Figure F18. MgO varies from 8.47 to 9.88 wt% with an average value of ~9.49 wt%. Average Zr/Y is ~1.9, consistent with values from VSR basalts dredged from the ridge axis (Murton et al., 2002; Jones et al., 2014).
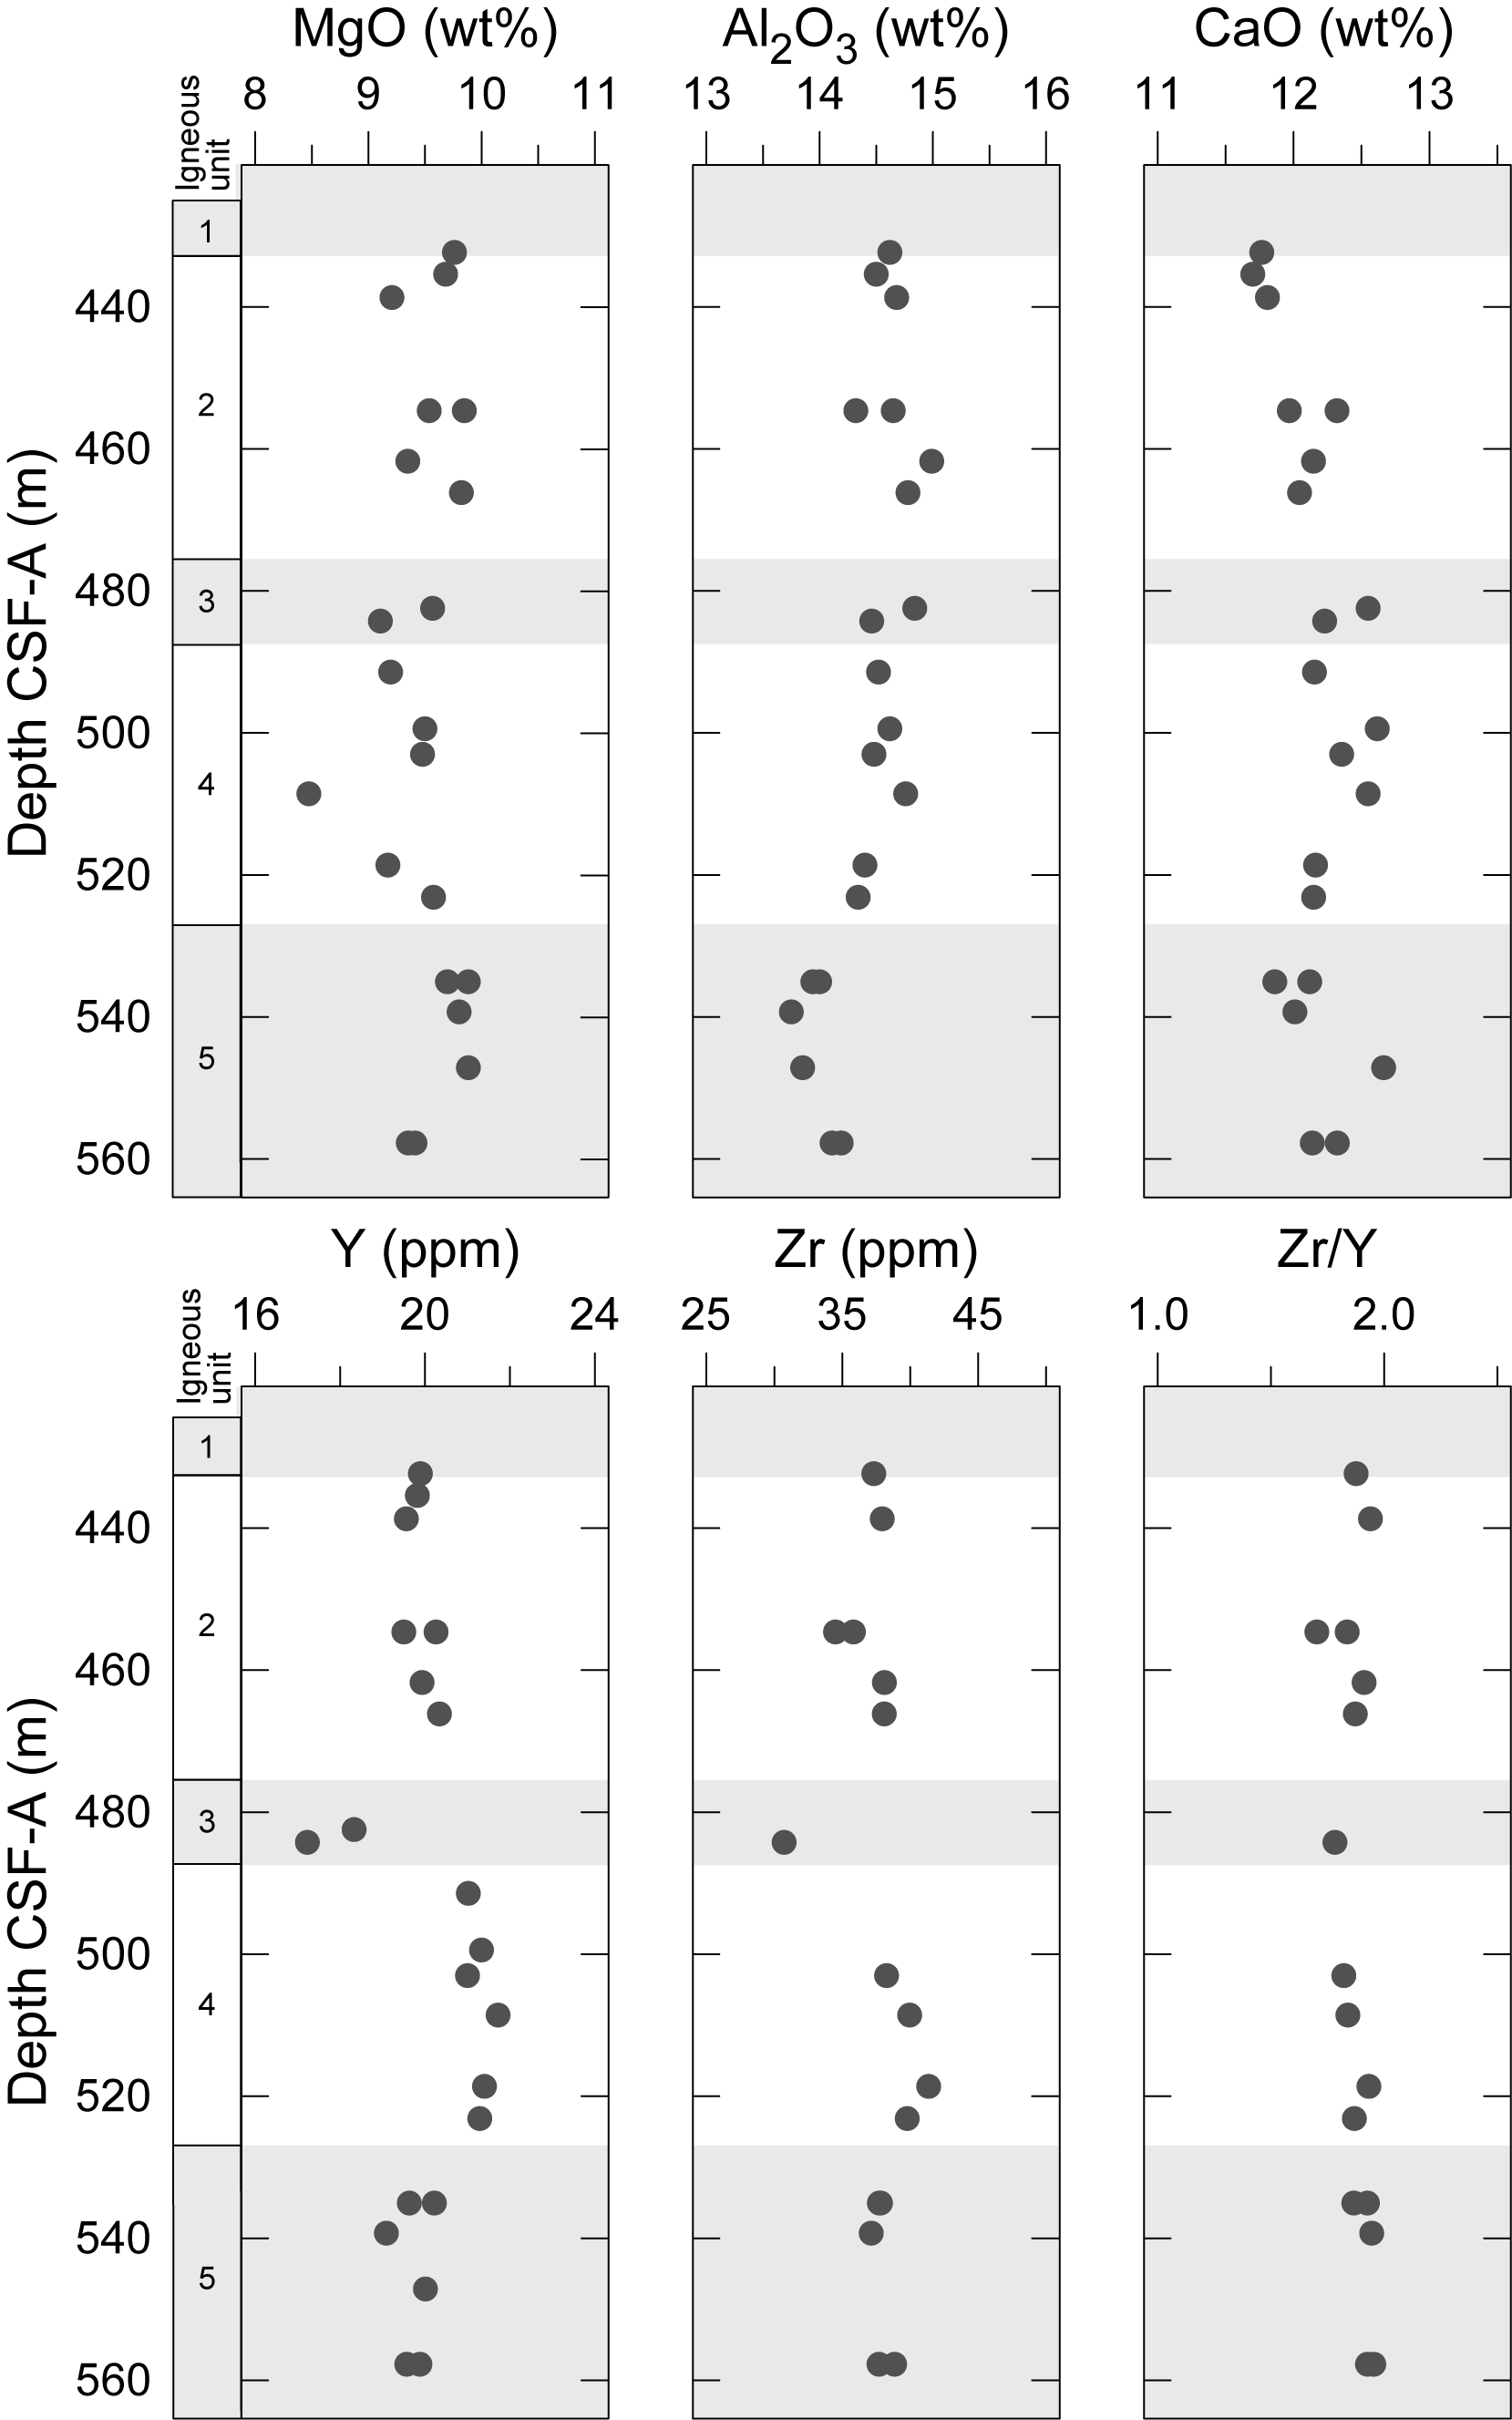
Figure F18. Major and trace element bulk rock ICP-AES.
4.5. Correlations and interpretation
Core description results are combined with thin section observations, physical properties, downhole logging results, and shipboard geochemical analyses to develop a preliminary interpretation of Site U1562. As found at other sites, there is a weak correlation between MS and lithology (see Physical properties), with sheet flows exhibiting higher MS on average than pillow lavas and peperites (Figure F13). This correlation is probably caused by greater abundance of Fe-oxides (e.g., magnetite and titanomagnetite) within sheet flows. Similarly, sheet flows exhibit slightly higher L* color reflectance (Figure F13) and alteration extents (see Alteration petrology and structural geology) on average.
Hole U1562B had a markedly higher recovery rate than the other VSR hole, Hole U1563B (48% and 29%, respectively). However, we note that Hole U1563B also had a significantly higher proportion of sediment and peperite in the cores, which tend to be associated with lower recovery. Coring may preferentially sample peperitic zones where the carbonate matrix is baked and rich in basalt clasts and much of the surrounding sediment material is lost. Similarly, recovery of the one known sediment horizon of any significant thickness is incomplete: a mudstone layer ~65 cm thick was recovered from ~475 m CSF-A, but the downhole image log suggests that this sediment layer is probably ~3 m thick (see Downhole measurements). This sediment layer defines the boundary between Igneous Lithologic Units 2 and 3 and likely represents a significant hiatus between eruptions for such thick sediment accumulation. Assuming the average sedimentation rate estimated for the base of Hole U1562A, it would take on the order of ~105 y to accumulate several meters of sediment, suggesting that the upper basalt sequence is significantly younger than the lower basalt sequence. This observation is also consistent with biostratigraphic analyses of foraminifers, nannofossils, and bolboforms, which indicate this sediment layer is older than the sediment near the sediment/basement contact (see Micropaleontology).
Multiple horizons of peperite were recovered, indicating that lava has repeatedly flowed or erupted into carbonate ooze at this site. The prevalence of sediment at Sites U1562 and U1563 is significant, given that both are VSRs and thus thought to have higher average magma supply than the VST sites. One might therefore expect more frequent eruptions with less time for sediment accumulation than at Sites U1554 and U1555. Instead, there must be a significant amount of sediment accumulation at this site to produce peperite and mudstone intervals multiple meters thick. We speculate that the VSR sites may be sampling late stage off-axis eruptions or eruptions that flowed off-axis into already sedimented areas.
5. Alteration petrology and structural geology
At Site U1562, ~0.78 and ~65.39 m of basement core was recovered from Holes 395C-U1562A and 395C-U1562B, respectively. Here, we provide a visual description of the style and composition of basalt alteration and secondary mineral fill of their vesicles and document the occurrence and mineral fill of fractures from the basement cores.
5.1. Basalt alteration
Basalt from Site U1562 contains numerous intervals of intermixed peperite and completely altered carbonate sediments, which comprise ~2.4% of the recovered basement core at this site. Peperites at Site U1562 have a matrix of altered carbonate sediments that contain fragments of basalt and basaltic glass (see Igneous petrology). The alteration reported here is for basalt core and the basalt fragments in the peperite intervals.
We estimate that ~72% of the basalt core obtained from Holes U1562A and U1562B is slightly altered, 18% moderately altered, 8% highly altered, ~2% completely altered, and <1% unaltered basalt (Figure F19). The predominant alteration style of the basalt at Site U1562 is pervasive (background) (Figure F20). Alteration halos around fractures appear frequently at ~461–533 m CSF-A in Hole U1562B, and localized patches of alteration are commonly observed at 434–461 and 533–553 m CSF-A. Alteration intensity at Site U1562 does not show any obvious correlation to basement core lithology (see Igneous petrology).
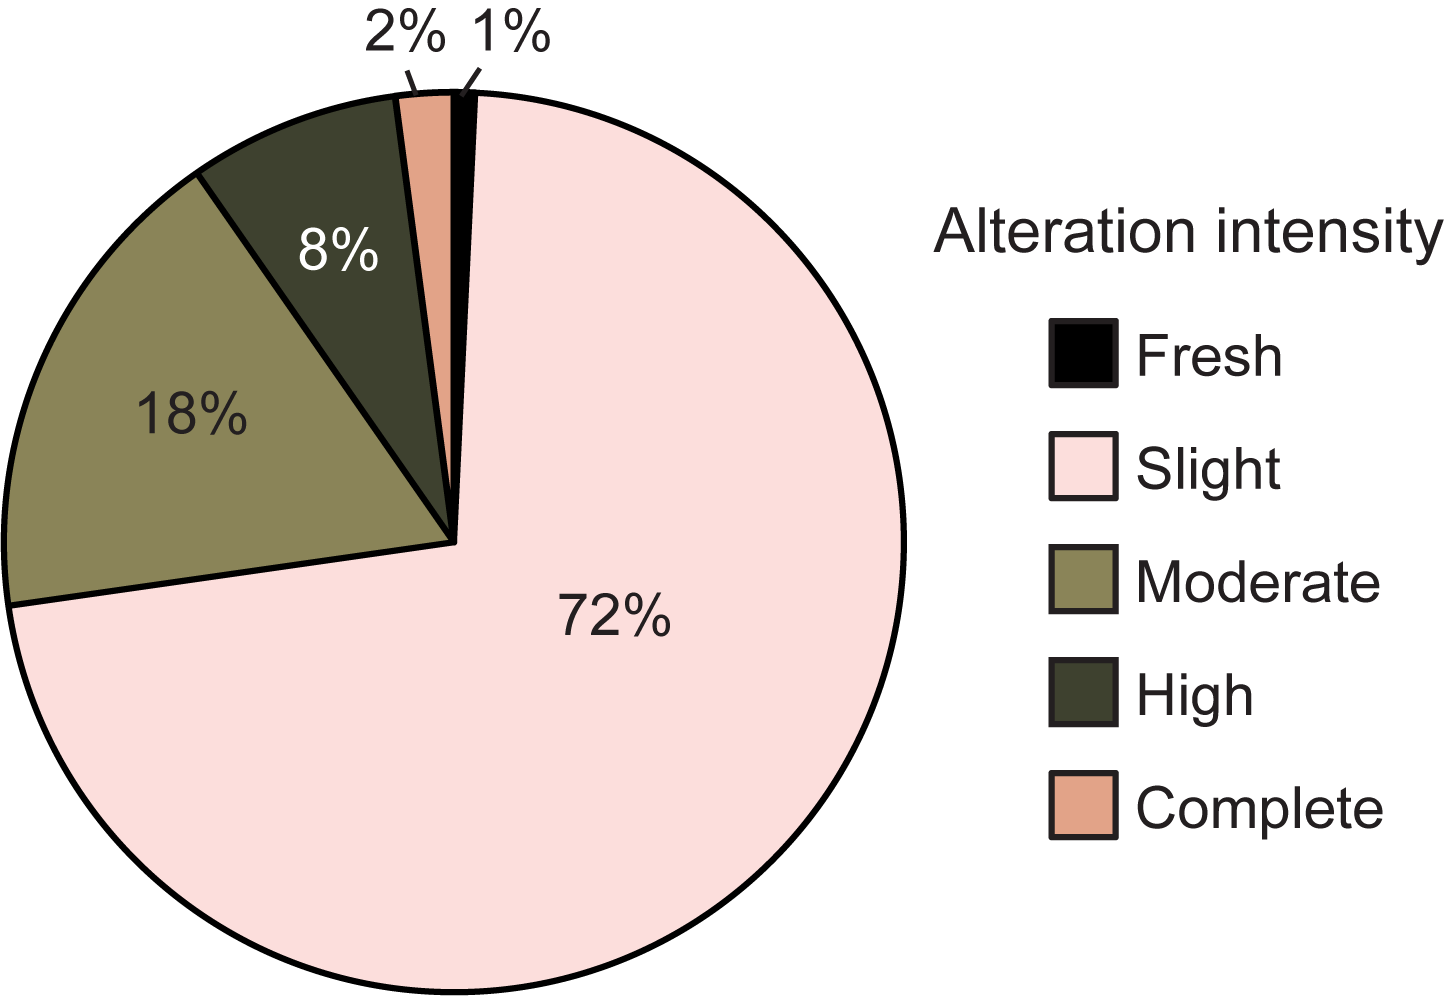
Figure F19. Proportional basalt alteration intensity.
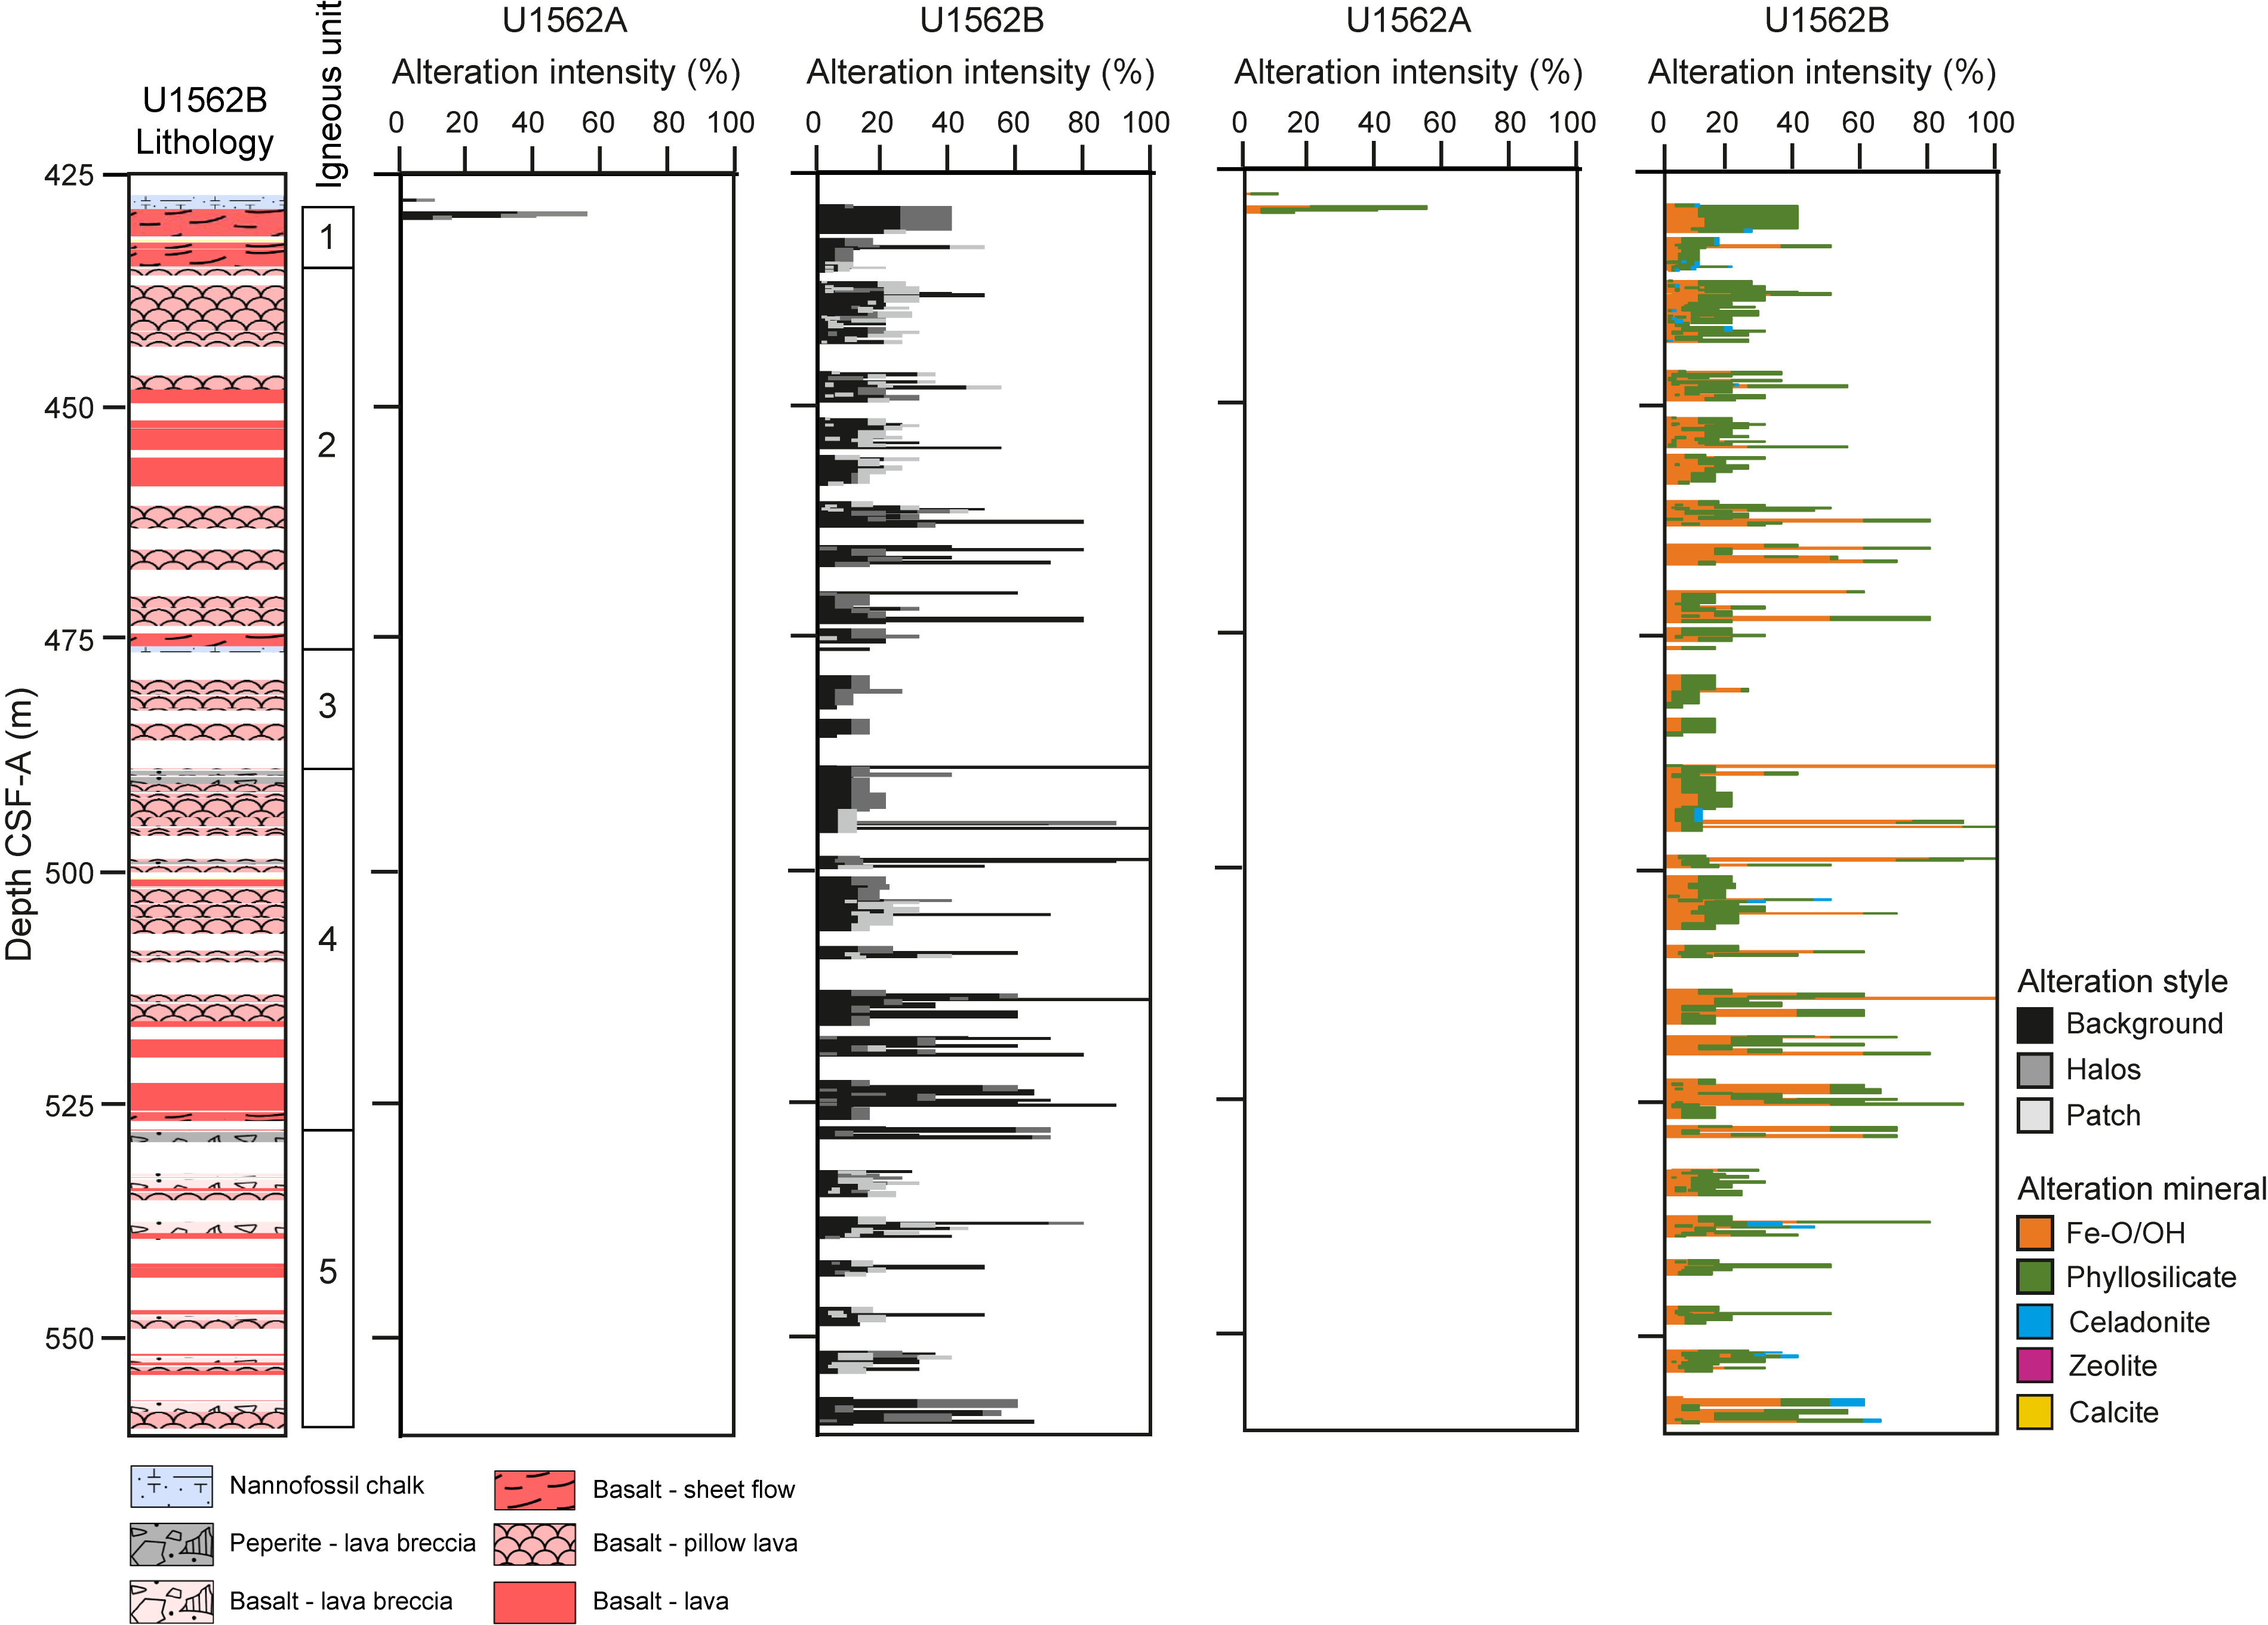
Figure F20. Lithologic interpretation and units and alteration intensity variation.
The most commonly occurring basalt alteration mineral assemblage at Site U1562 consists of Fe-oxide/oxyhydroxides + phyllosilicate and celadonite (Figure F20). Celadonite occurs as a minor component of the alteration assemblage at various depths in Hole U1562B. Rims of basalt clasts in peperite intervals display strong to complete alteration to palagonitic material (rich in Fe-oxide/oxyhydroxides), which in some clasts decreases in intensity toward their centers. In thin section, olivine phenocrysts are variably altered to a pale brown to green saponite phase or iddingsitized (Figure F21A, F21B). The basaltic groundmass appears variably altered mainly to smectite, likely saponite and Fe-saponite, celadonite, and Fe-celadonite (Figure F21C, F21D). Disseminated magnetite is observed, some of which has a dendritic morphology, along with common oxide phases.
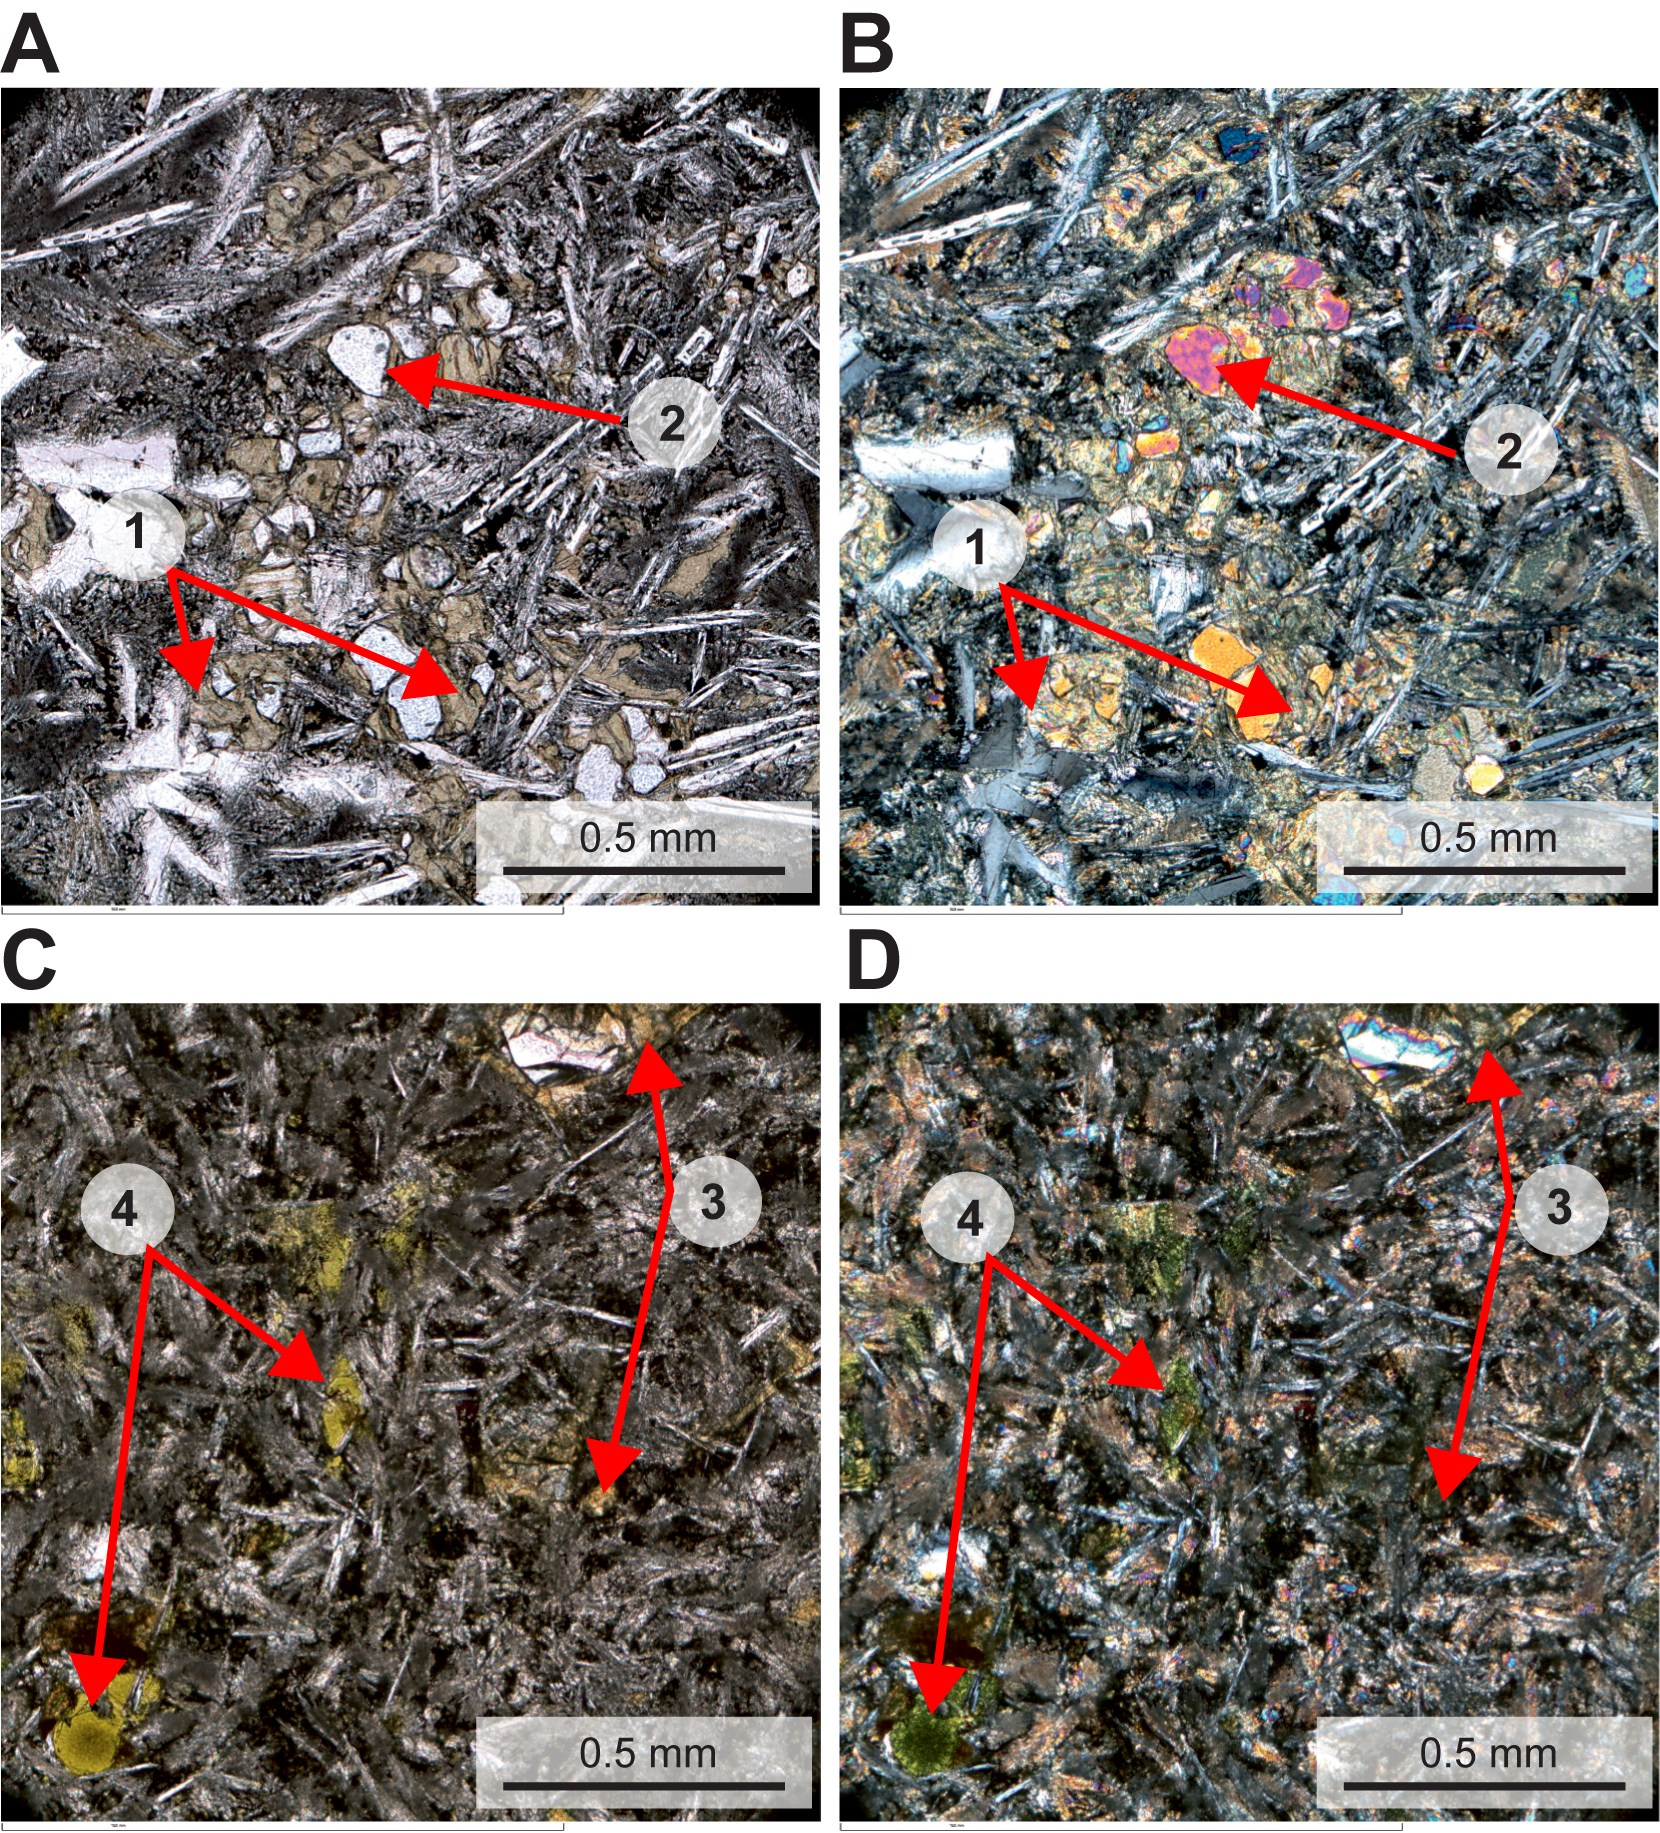
Figure F21. Alteration.
An altered olivine from thin section Sample 395C-U1562B-17R-2, 109–112 cm, was analyzed with energy dispersive spectrometry (EDS). Elemental maps of the altered olivine were acquired (Si, O, Al, Ca, Mg, Fe, K, and Na), and two zones of interest on the altered olivine were analyzed for their EDS spectra to better characterize the alteration (Figure F22). Zone 1 shows strong spectral peaks for Mg, Si, and O with minor Fe. Zone 2 shows strong spectral peaks for Si, Mg, and O with minor Al and Fe and very minor Ca. Zone 1 represents unaltered olivine, close to the forsterite end-member, and Zone 2 is interpreted to be parts of the olivine phenocryst undergoing saponitization by replacement of Mg with Si, Al, and Ca.
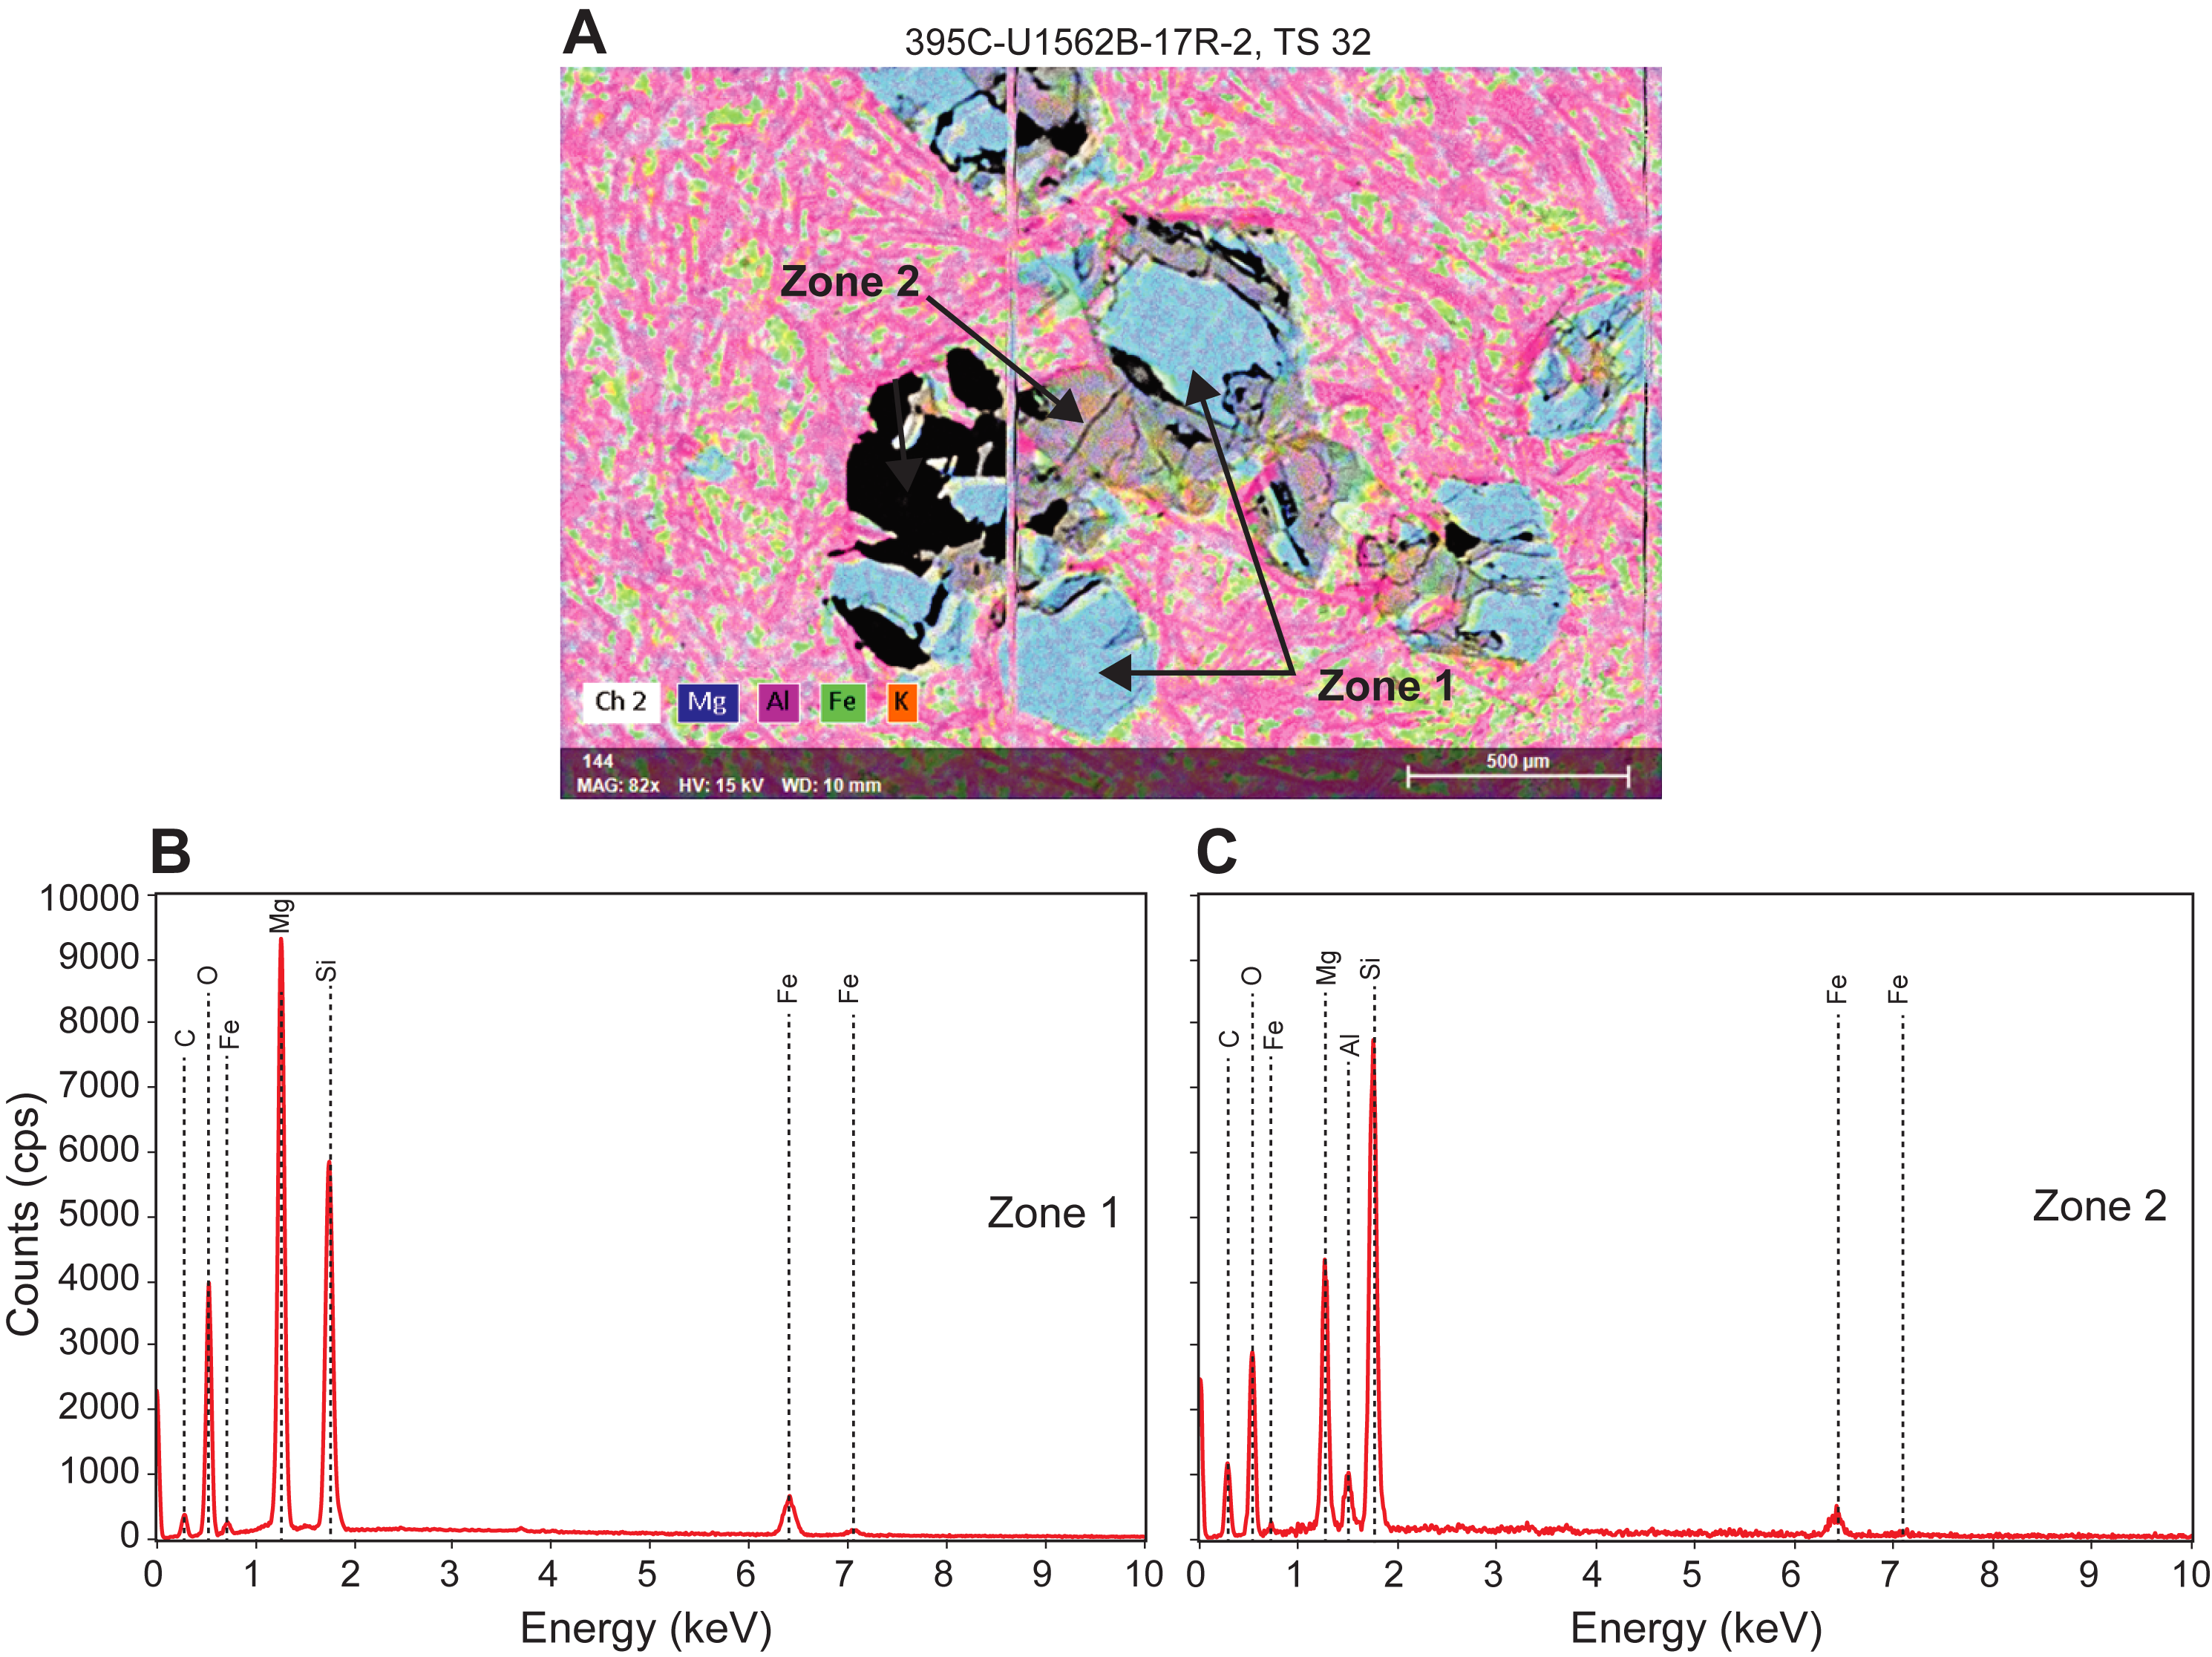
Figure F22. Altered olivine.
The fraction of vesicles filled with alteration minerals varies between 10% and 100% at Site U1562. Vesicle-filling minerals are mostly Fe-oxide/oxyhydroxides, celadonite, and calcite, with moderate saponite and minor zeolite (phillipsite) (Figure F23). Thin section Sample 395C-U1562B-30R-1, 4–7 cm, displays calcite-filled vesicles with saponite spherules on their rims, with an outer celadonite rim (Figure F23G, F23H), as well as other vesicles containing calcite and a zeolite phase tentatively identified as phillipsite (Figure F23C). The mineral fill of most vesicles shows a color zonation, with Fe-oxide/oxyhydroxides or saponite rims to celadonite-filled vesicles presenting a range of colors from pale blue to pale green. Dark blue celadonite is uncommon in vesicles from Hole U1562B. There is no correlation between the percentage of vesicles filled and the alteration intensity of the basalt core at Site U1562. Some vesicles show <1 mm wide alteration halos in the basalt around them.
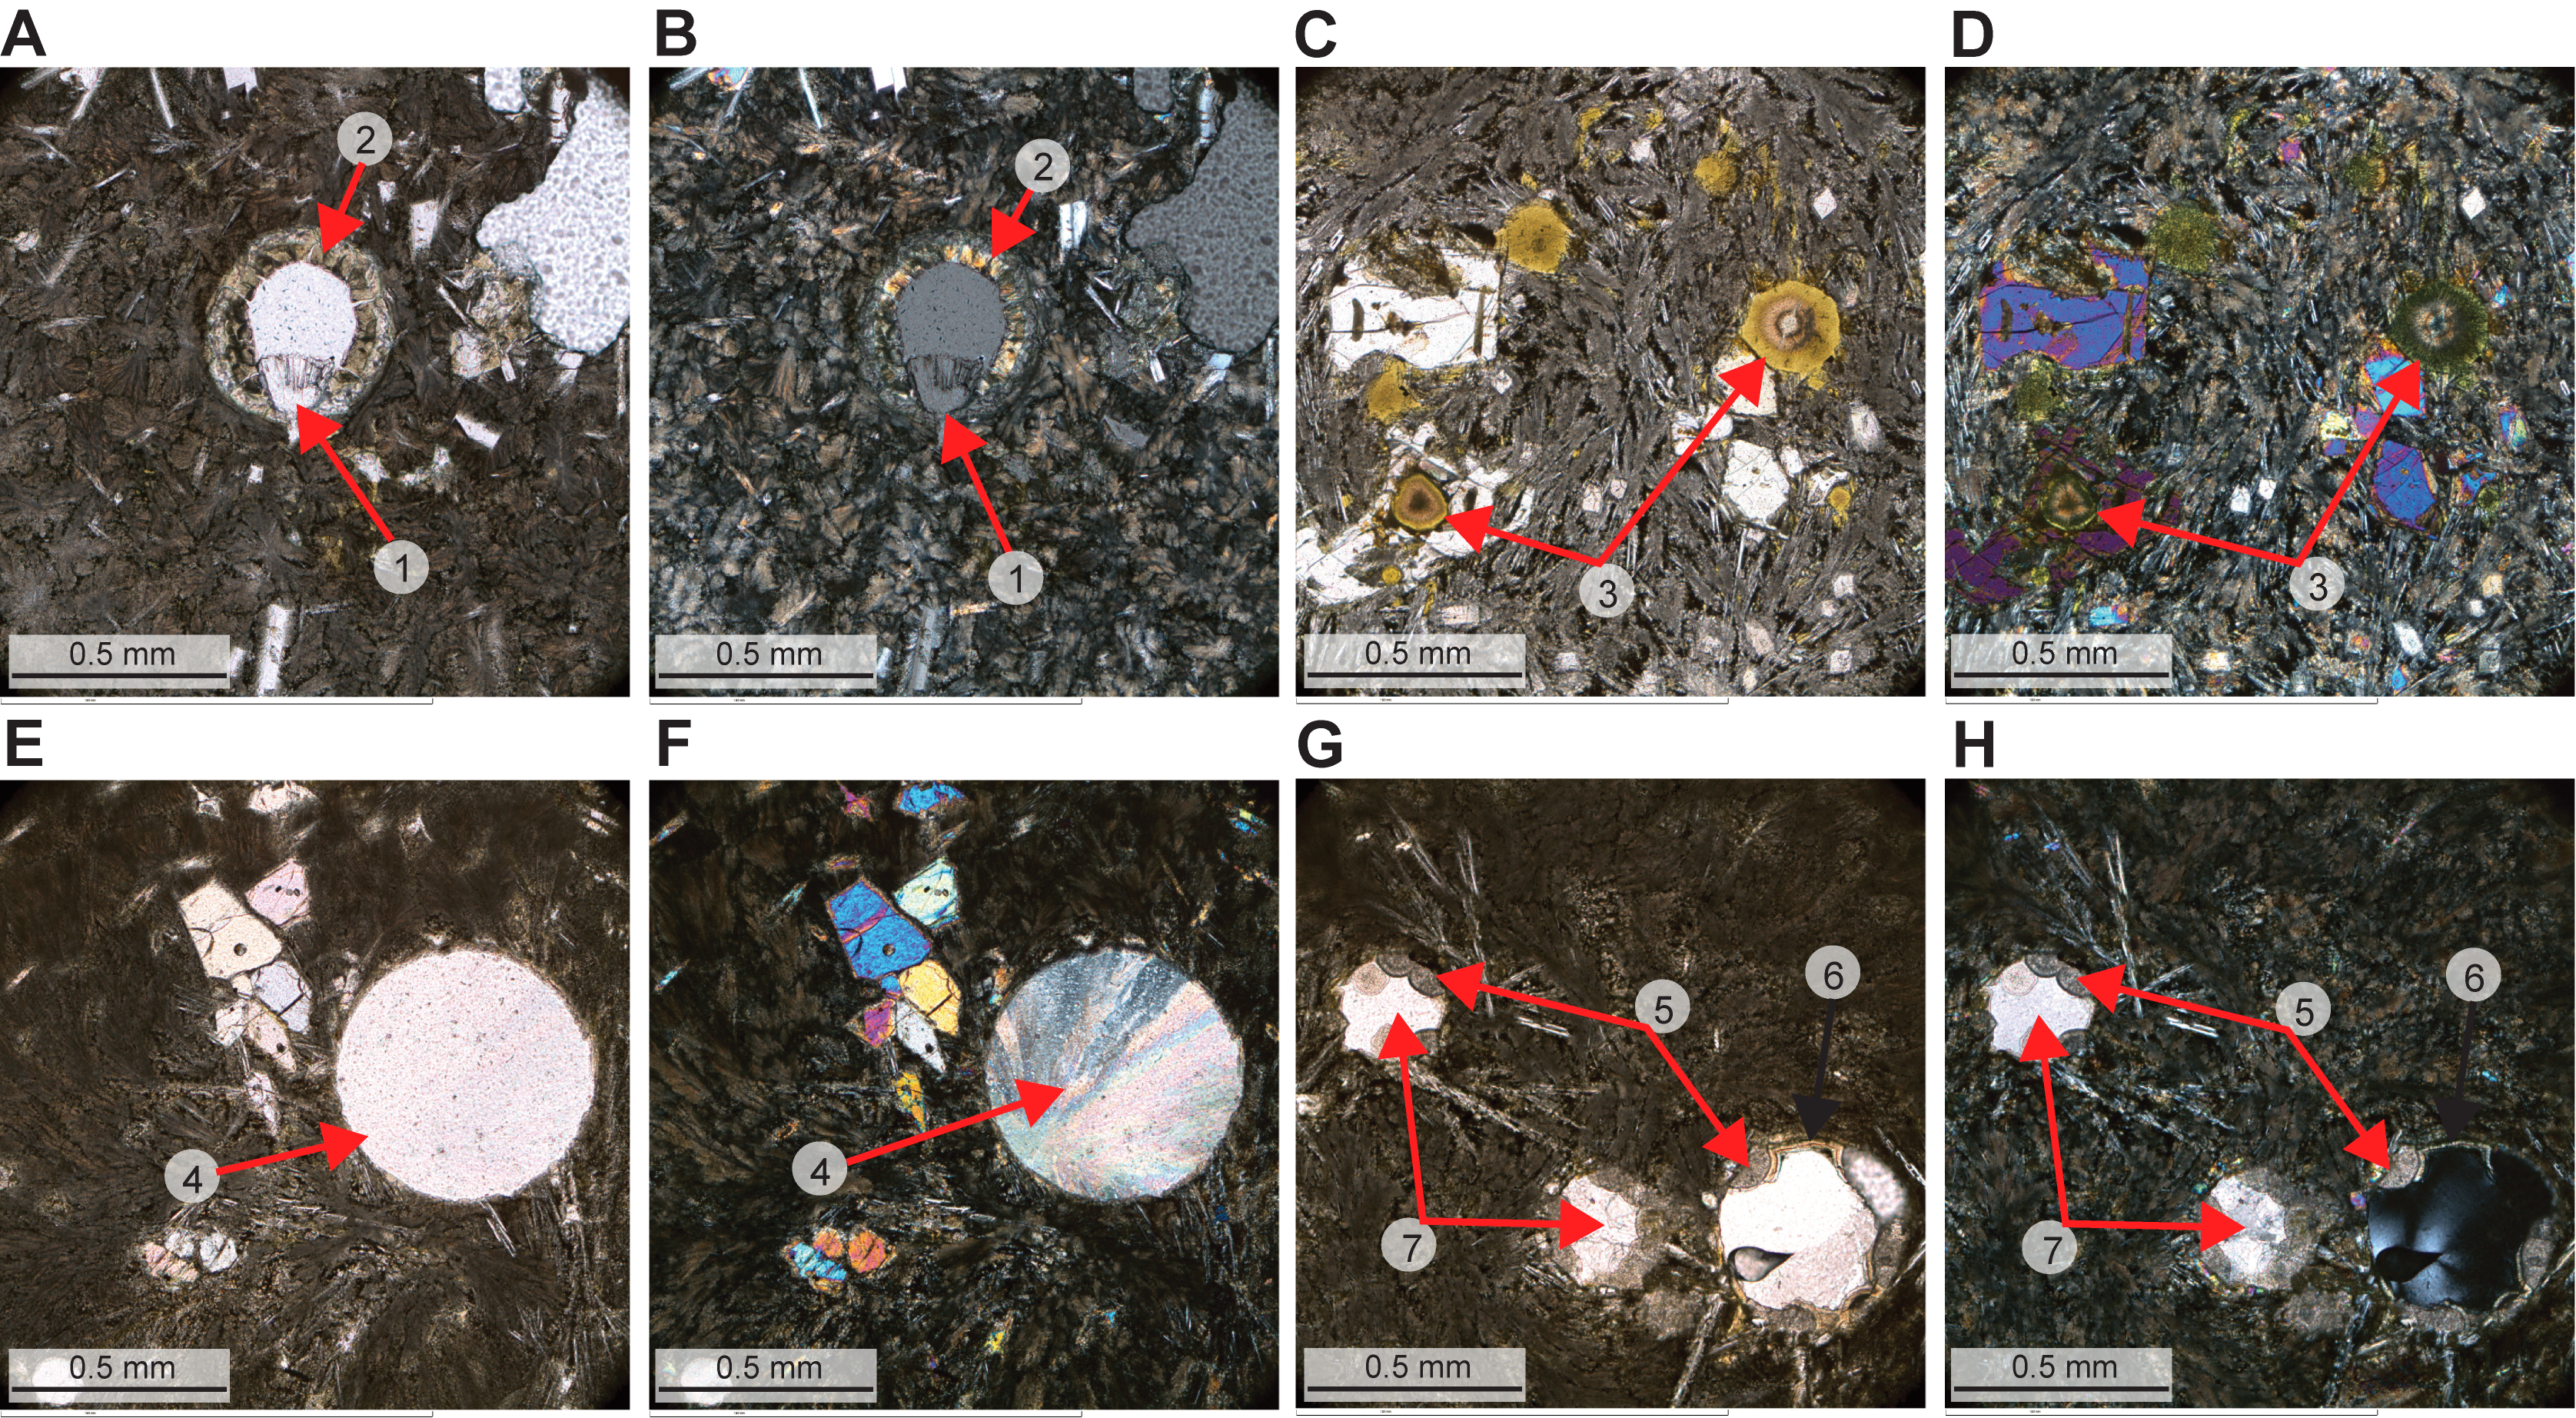
Figure F23. Vesicles.
Vesicles with multiple infilling minerals from thin section Sample 395C-U1562B-30R-1, 4–7 cm (shown in Figure F23G, F23H), were analyzed using EDS (Figure F24). Elemental maps (Si, O, Al, Ca, Mg, Fe, K, and Na) and EDS spectra from two zones of interest were examined to better characterize the vesicle alteration mineralogy (Figure F24C, F24D). In Zone 1, a spherule-like material in the vesicles shows strong spectral peaks for Ca and O and minor peaks for Si, Al, Mg, and Fe. Zone 2 shows strong spectral peaks for Ca and O with minor Mg. Zone 2 can be inferred to represent Mg-calcite, and Zone 1 may represent a chlorite/smectite composition for the spherules on the edge of the vesicle, although the EDS spectra also contain signals of the Mg-calcite infill that may extend underneath the clay on the thin section. The K map highlights the presence of celadonite around the vesicle rims (between the chlorite/smectite spherules and Mg-calcite fill).
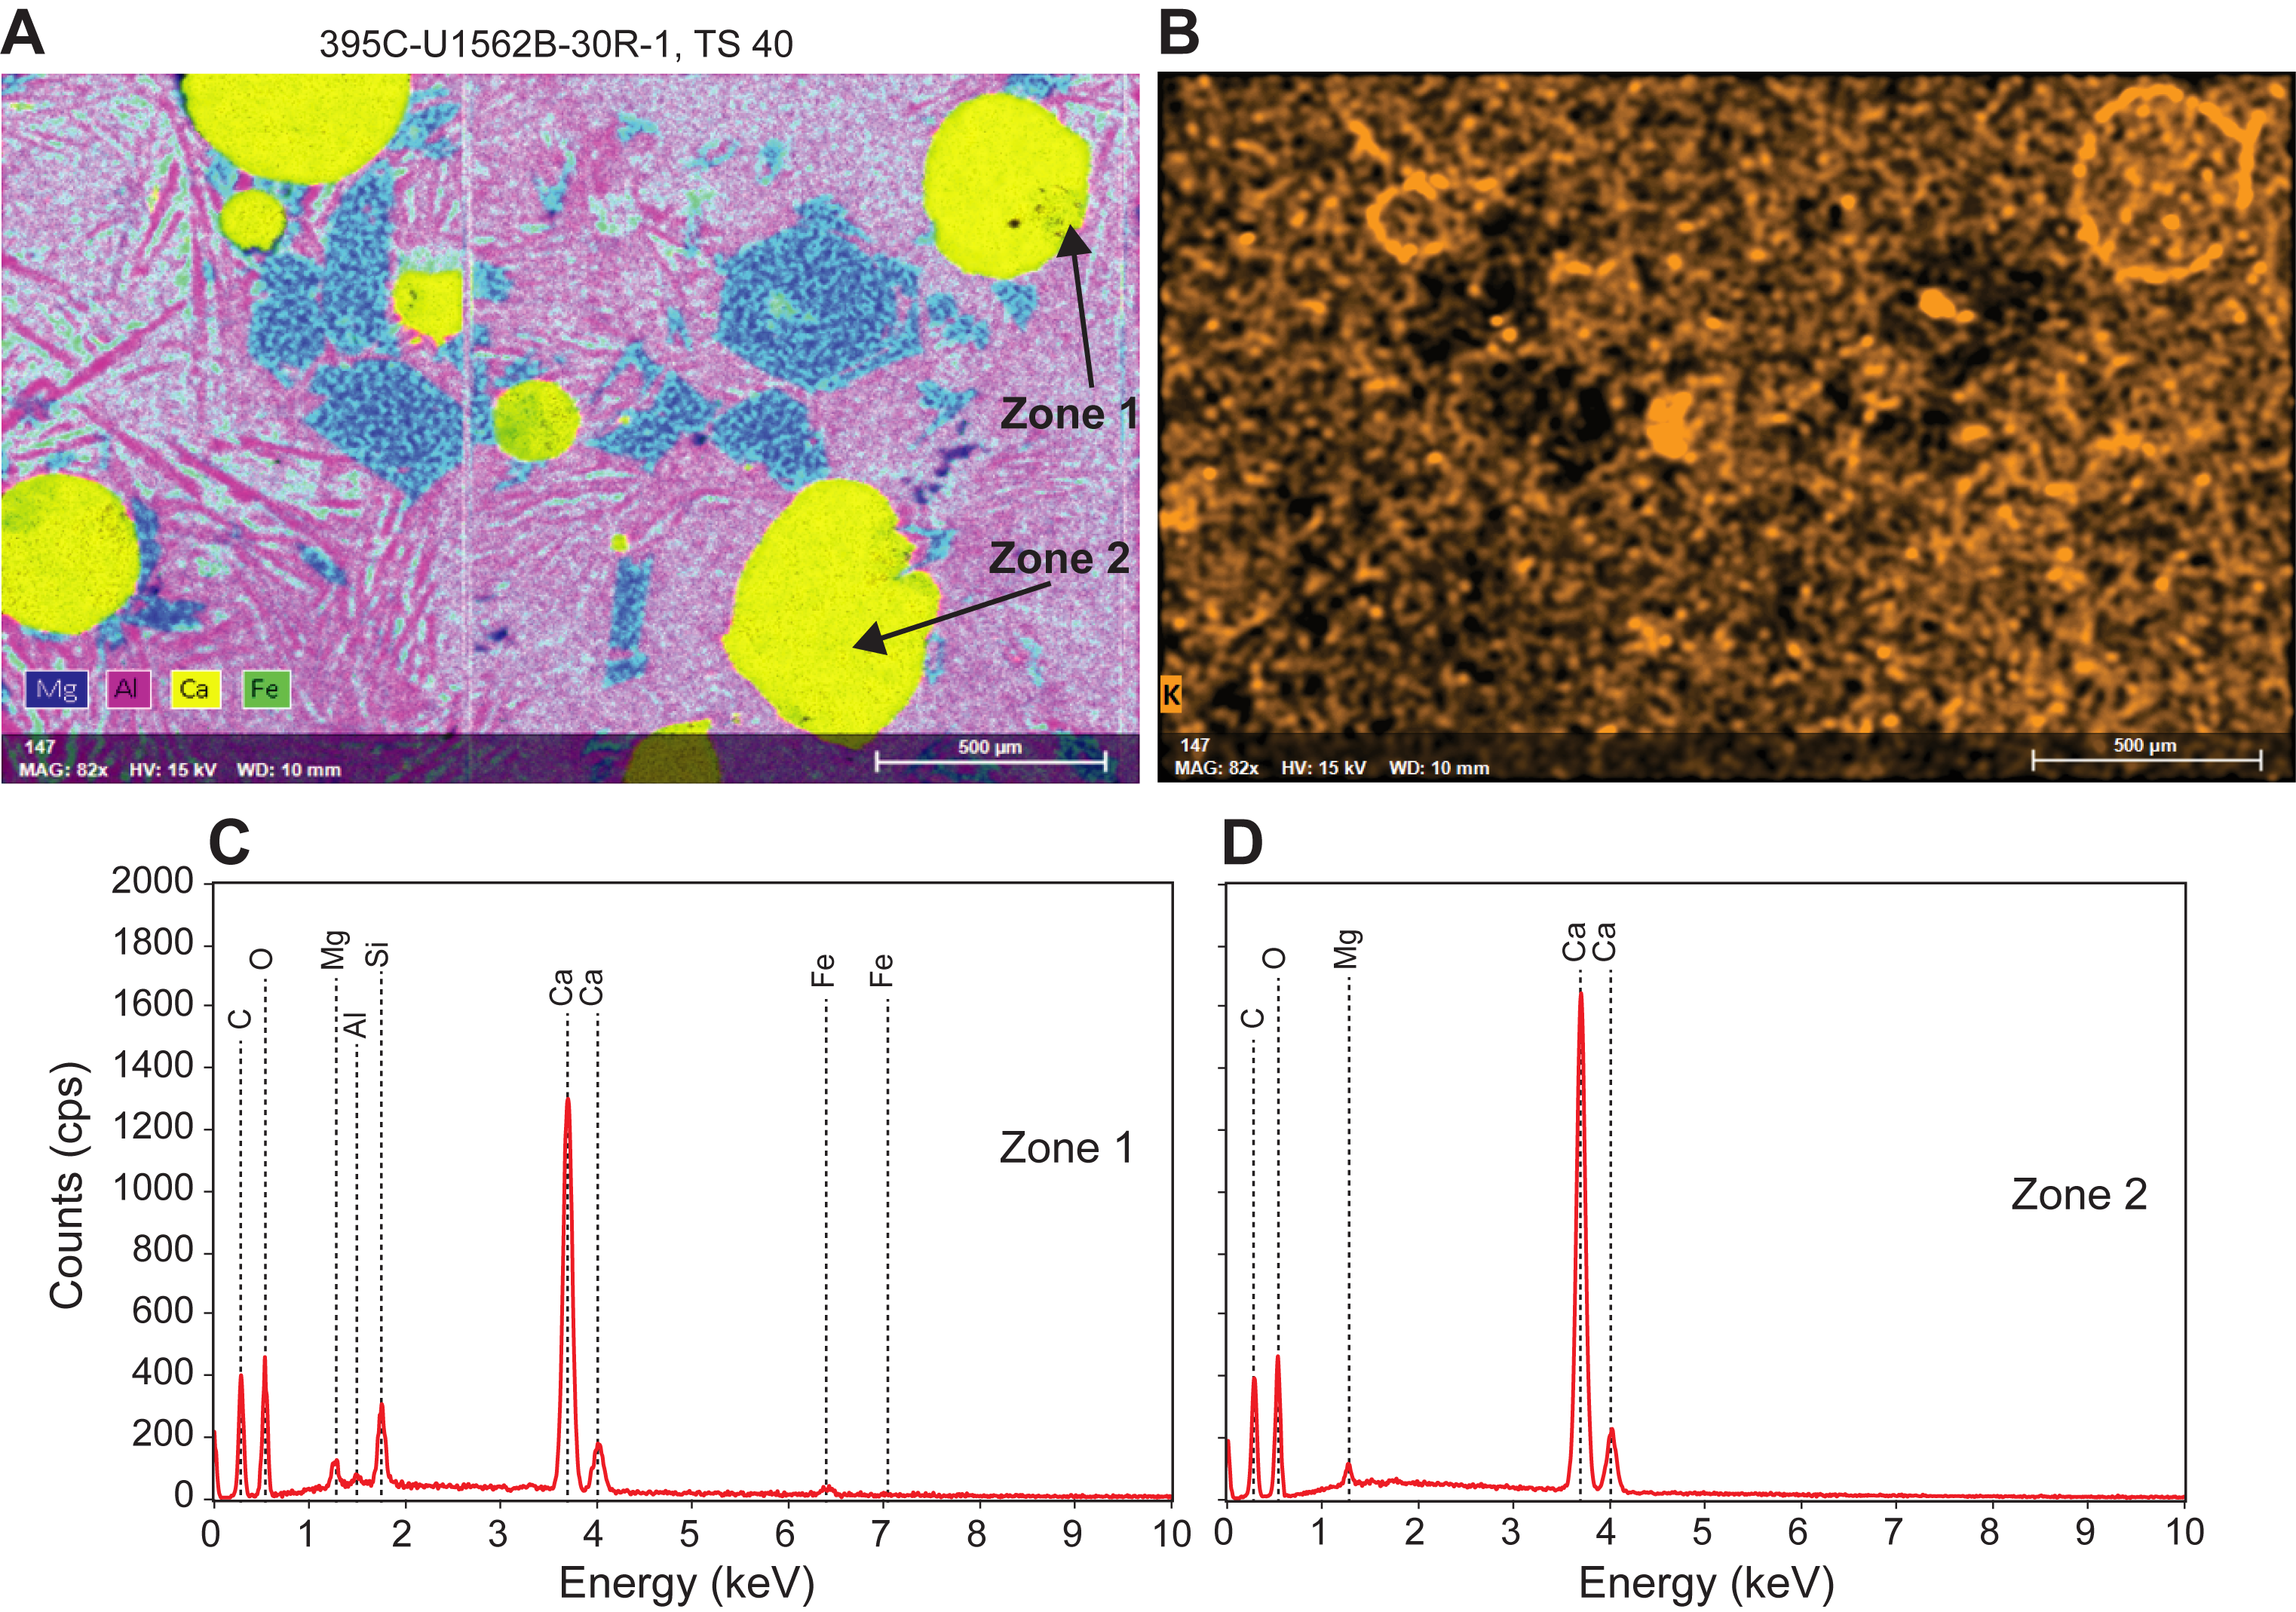
Figure F24. Calcite-filled vesicles.
5.2. Structural geology
Fracture analysis at Site U1562 revealed 6 fractures in Hole U1562A (Section 64X-CC and Core 65X) and 1399 fractures in basement core from Hole U1562B. For Hole U1562B, an occurrence rate of ~21 fractures per meter of recovered core is reported (~17–18 fractures per meter of curated core). Fracture density seems invariant with depth, with only few local exceptions of low-fracture density at ~432, ~454, ~475, ~485, and 548 m CSF-A (Figure F25). Most fractures recorded at Site U1562 have widths ≤0.5 mm (64%) (Figure F26). The widest fractures recorded include two 8–10 mm wide carbonate-filled fractures in Hole U1562B (Figure F27). Most fractures are classified as partially open (42.2%) or veins (37.6%) with anastomosing (41.4%) or planar (45.5%) shapes, and most fractures are observed to exist in a crosscutting network (52%) (Figure F28). Fracture attitude was not recorded for this site because of time constraints during core description.
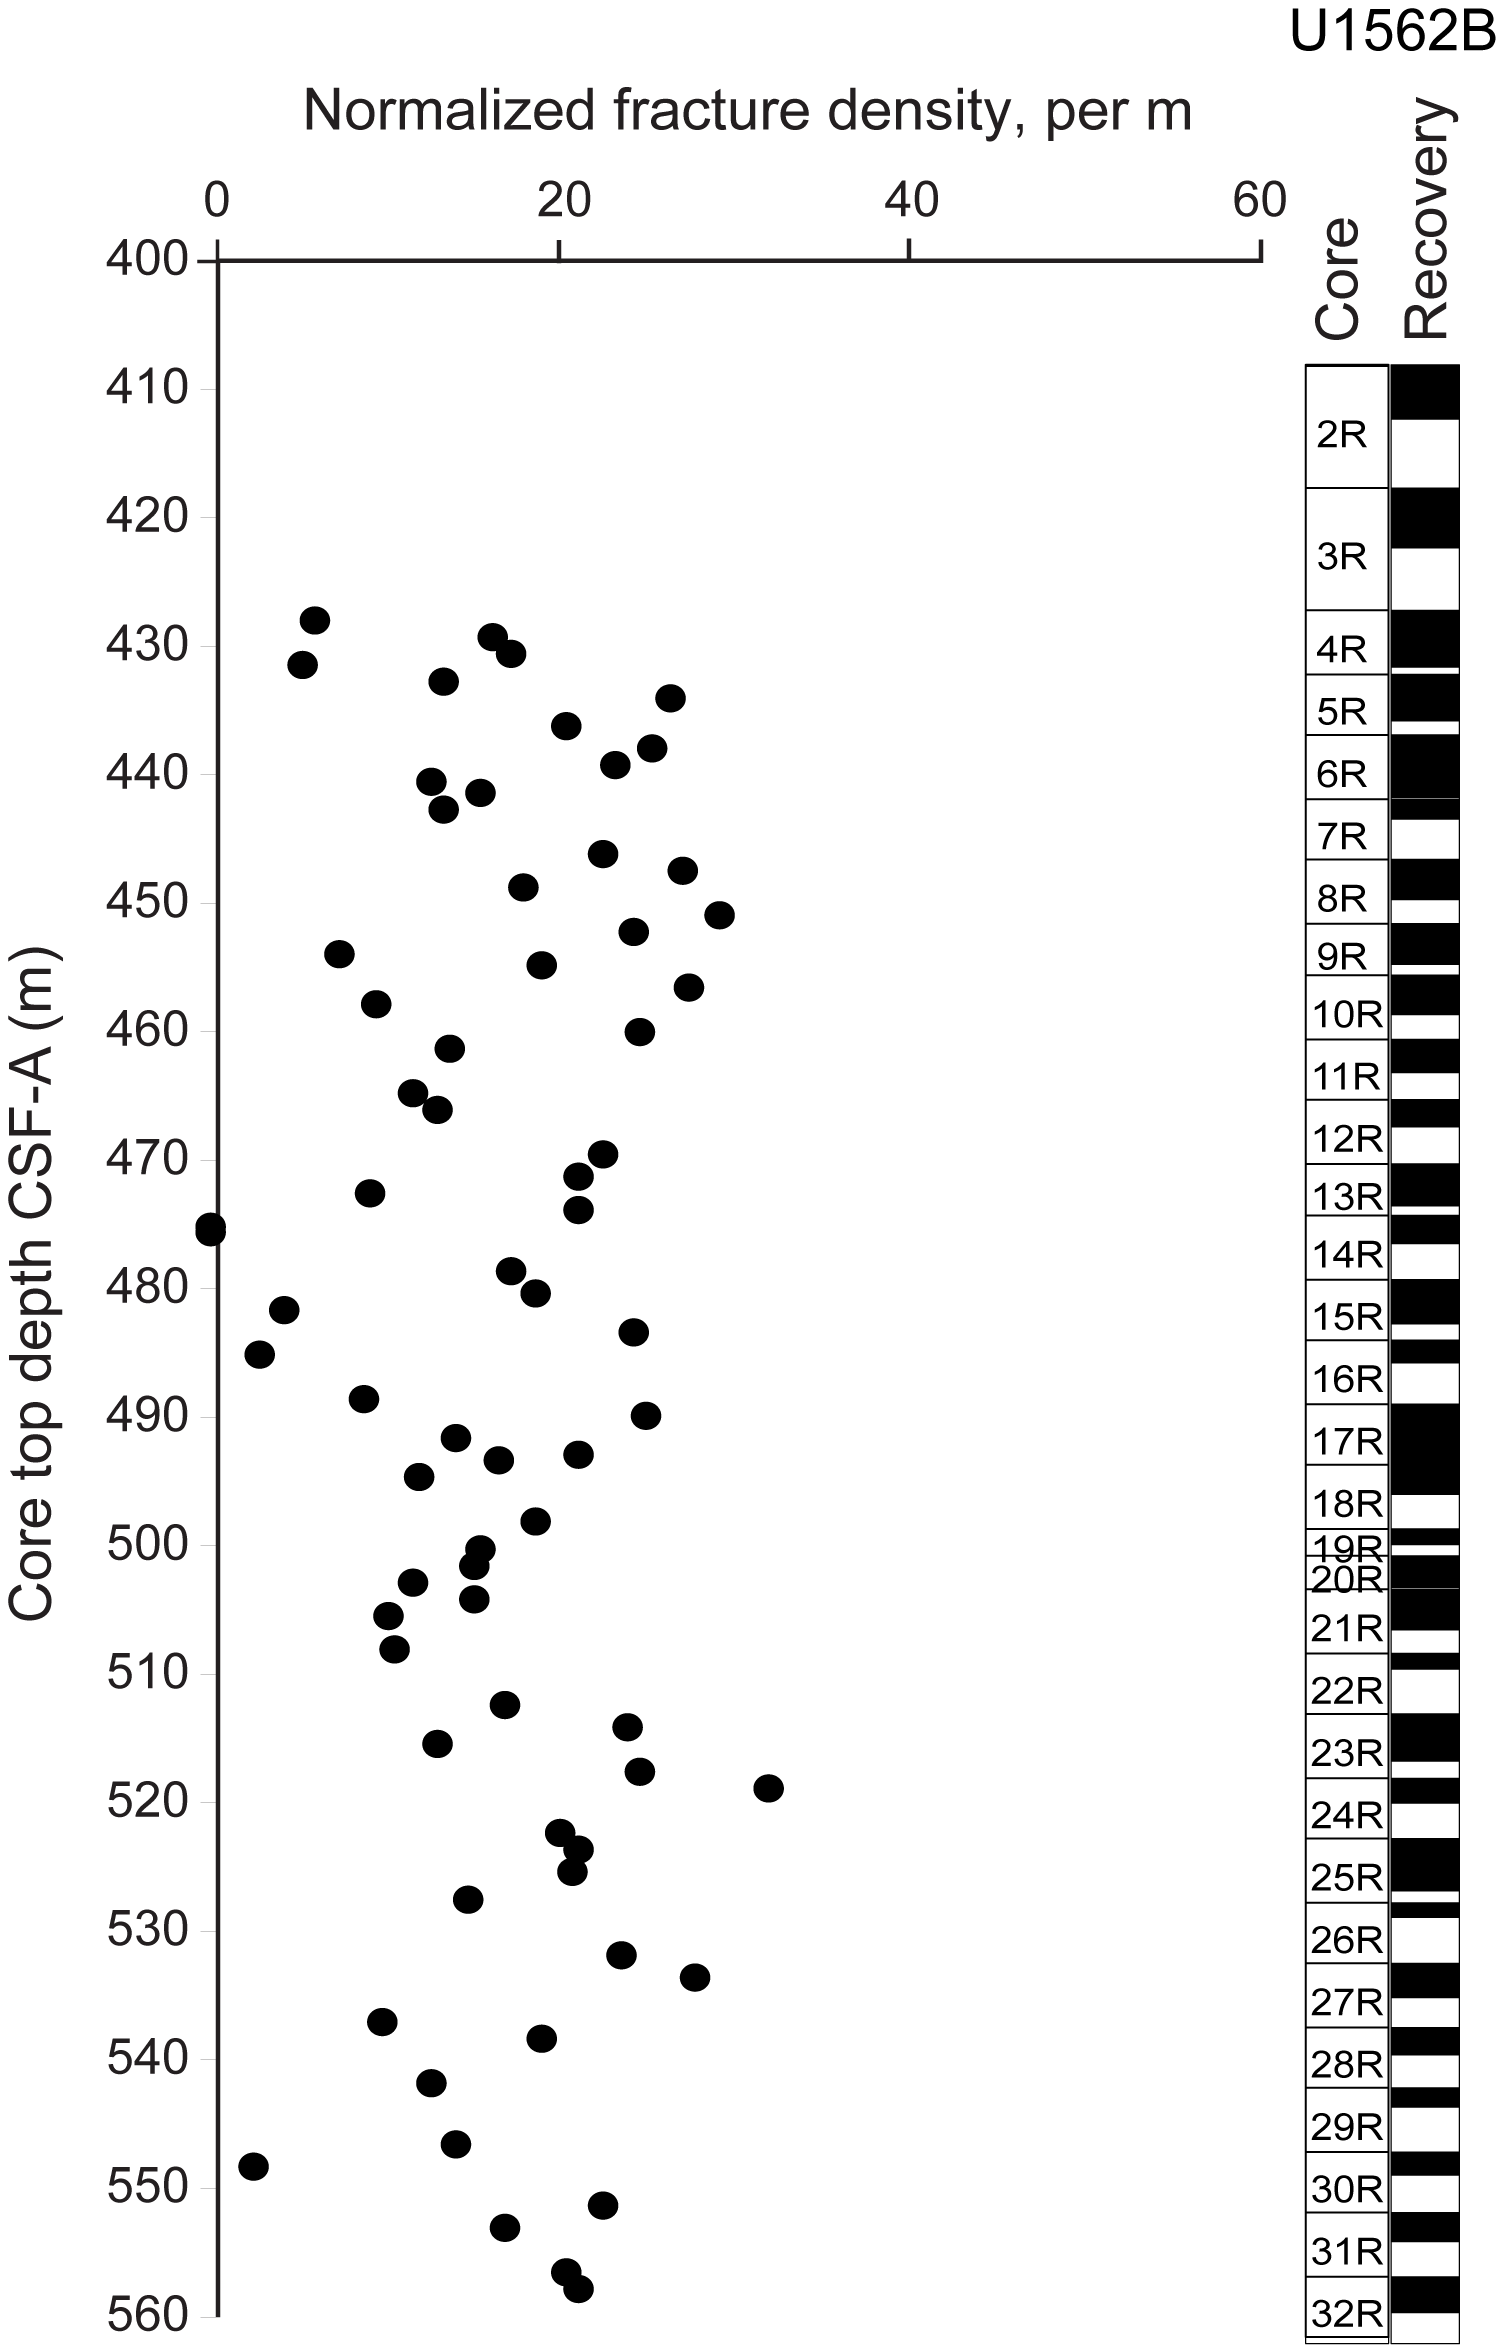
Figure F25. Fracture density.
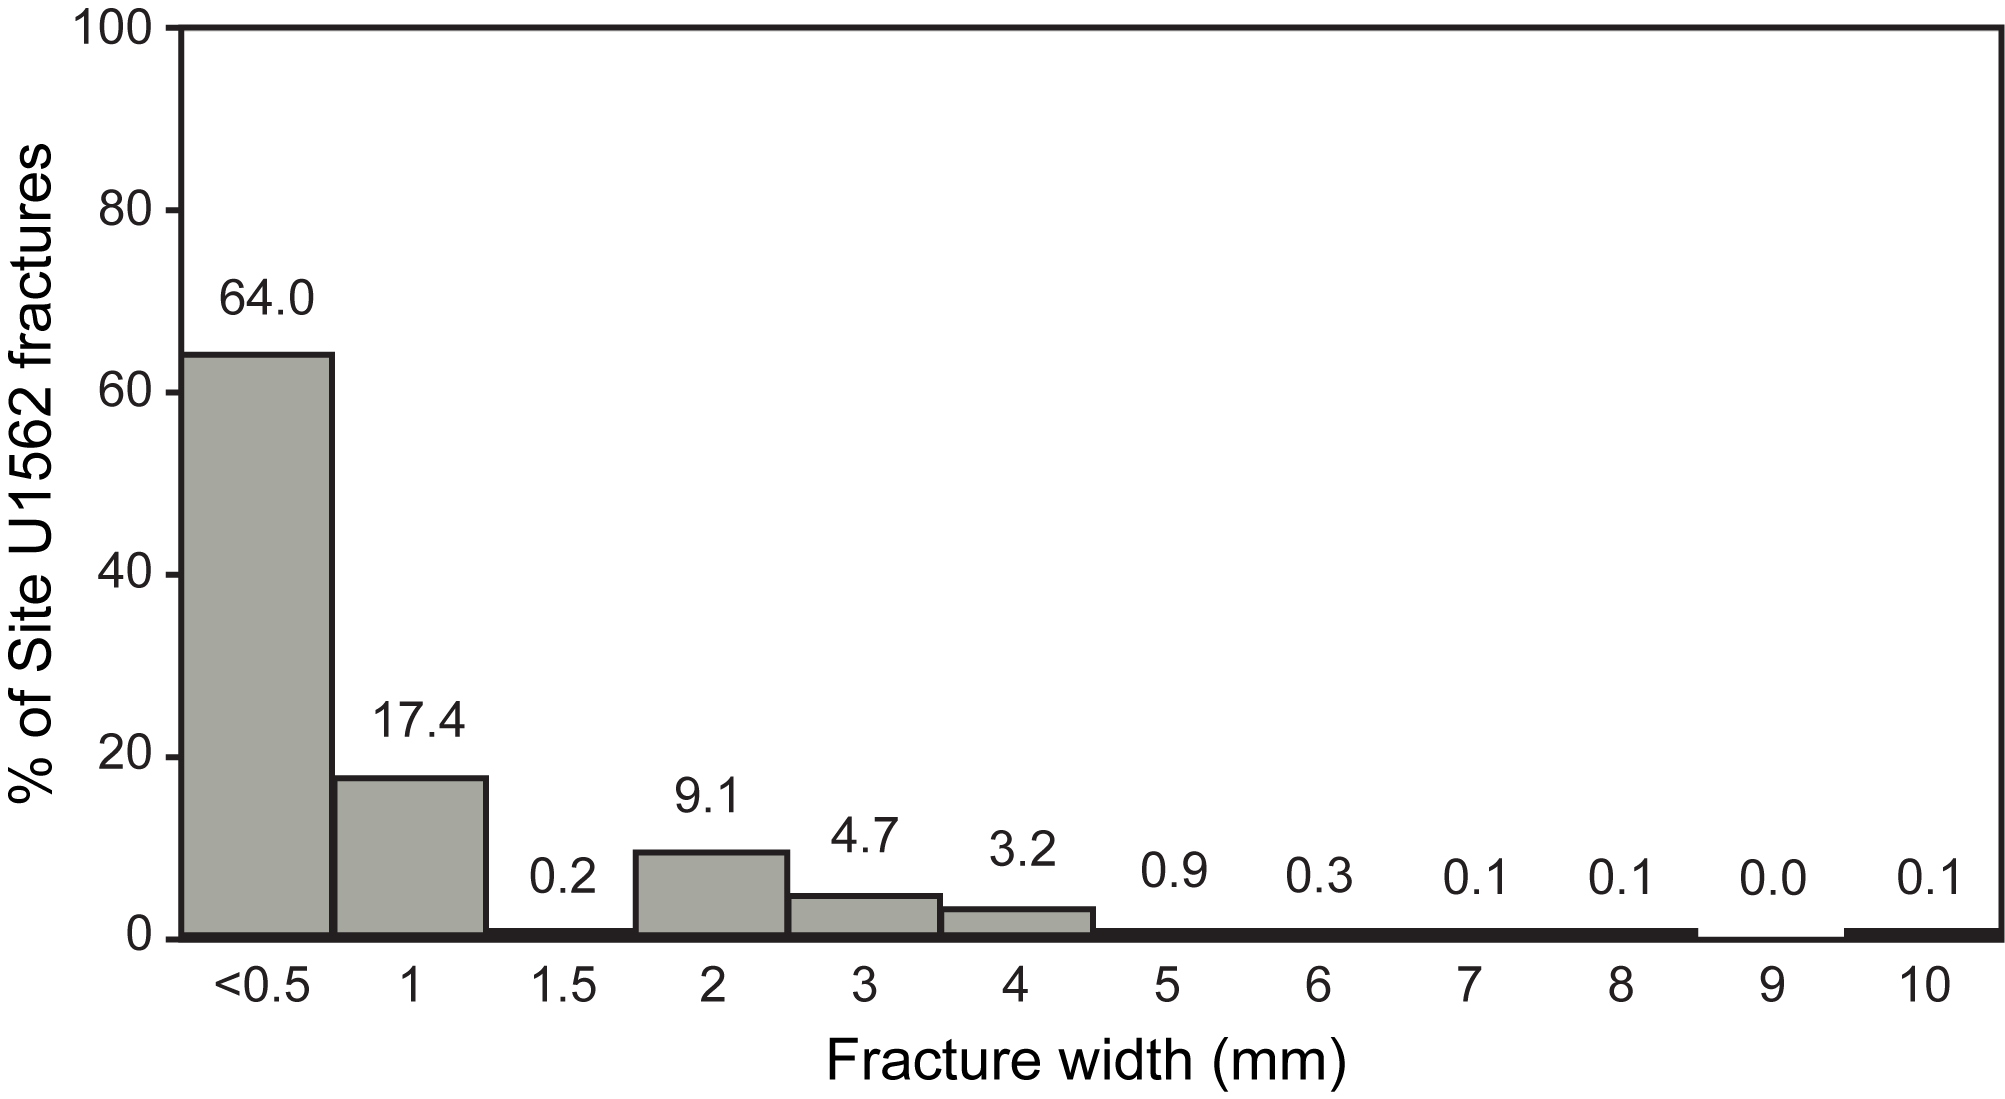
Figure F26. Fracture width distribution.
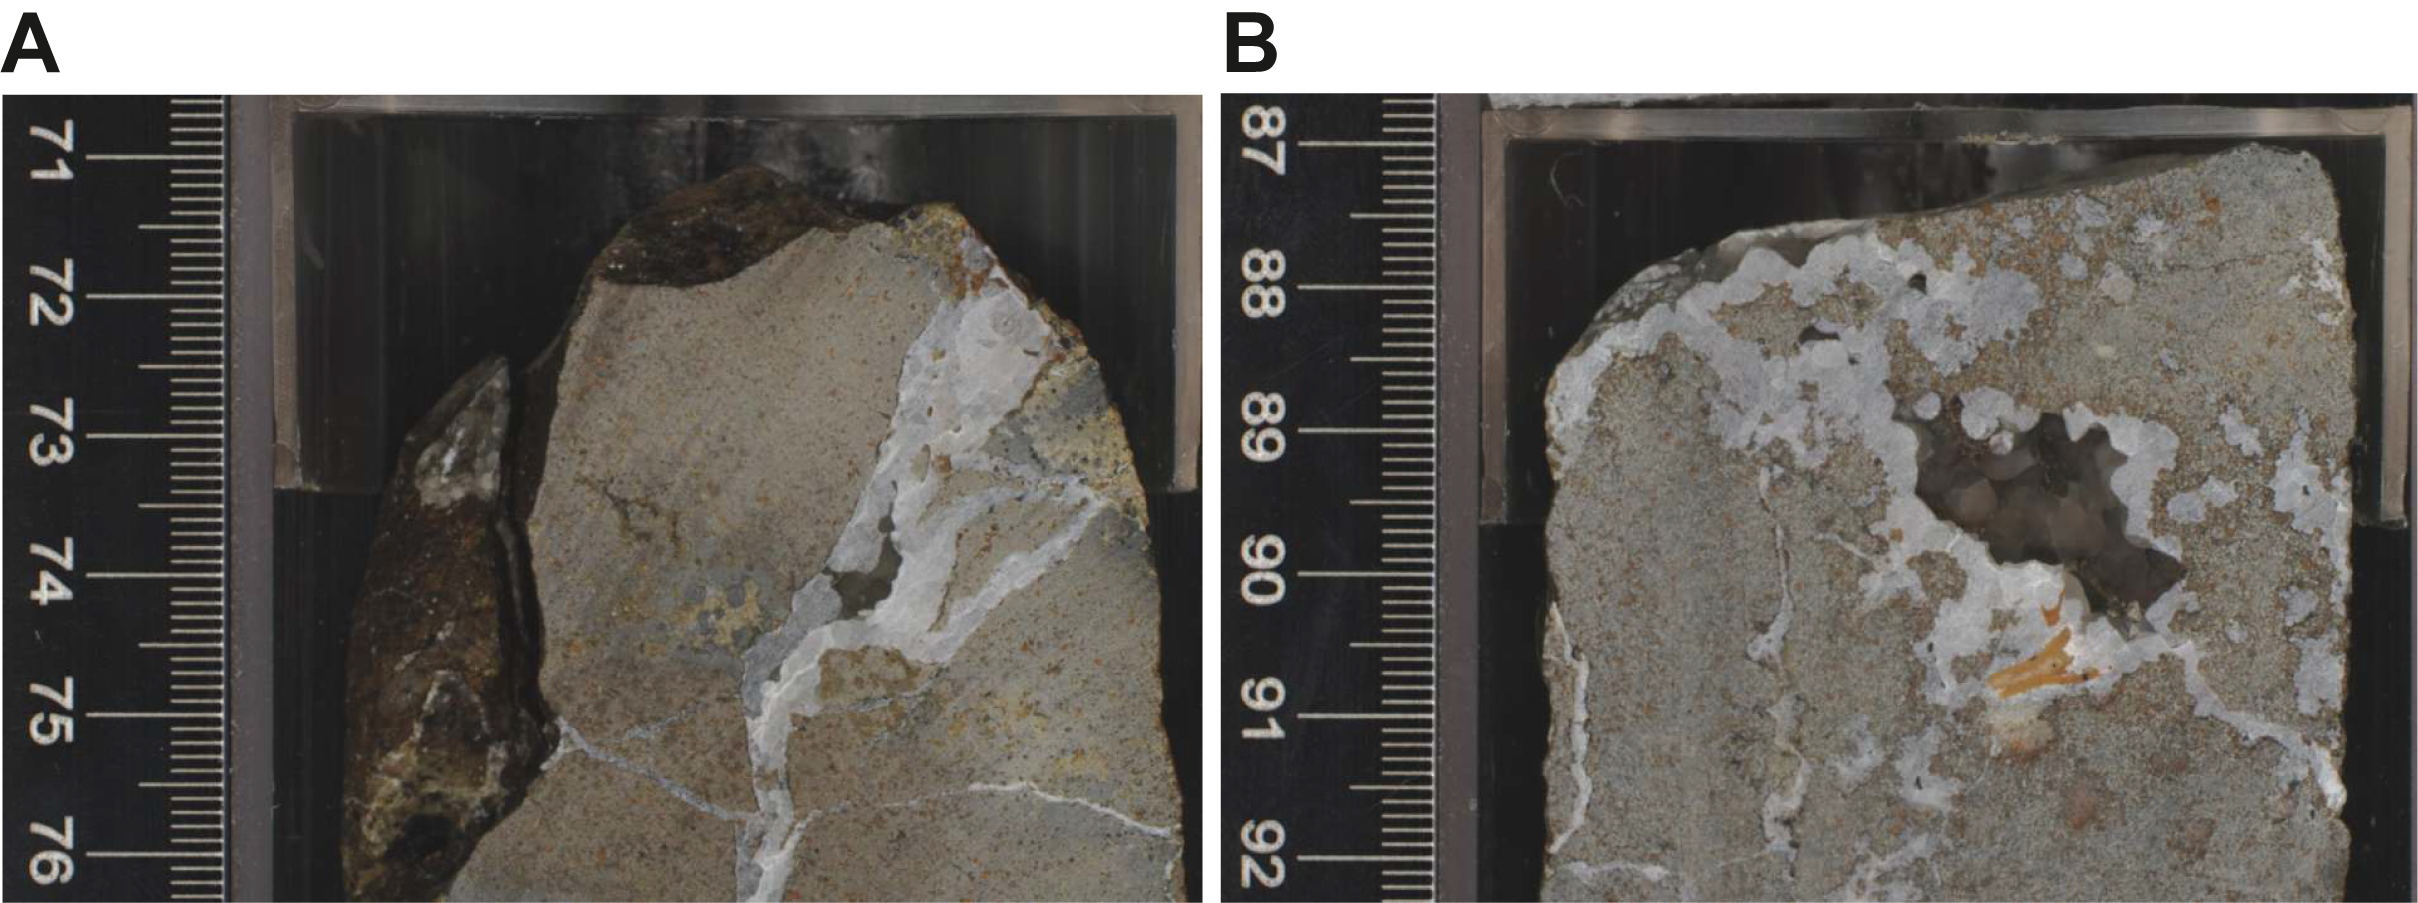
Figure F27. Carbonate filled fractures.
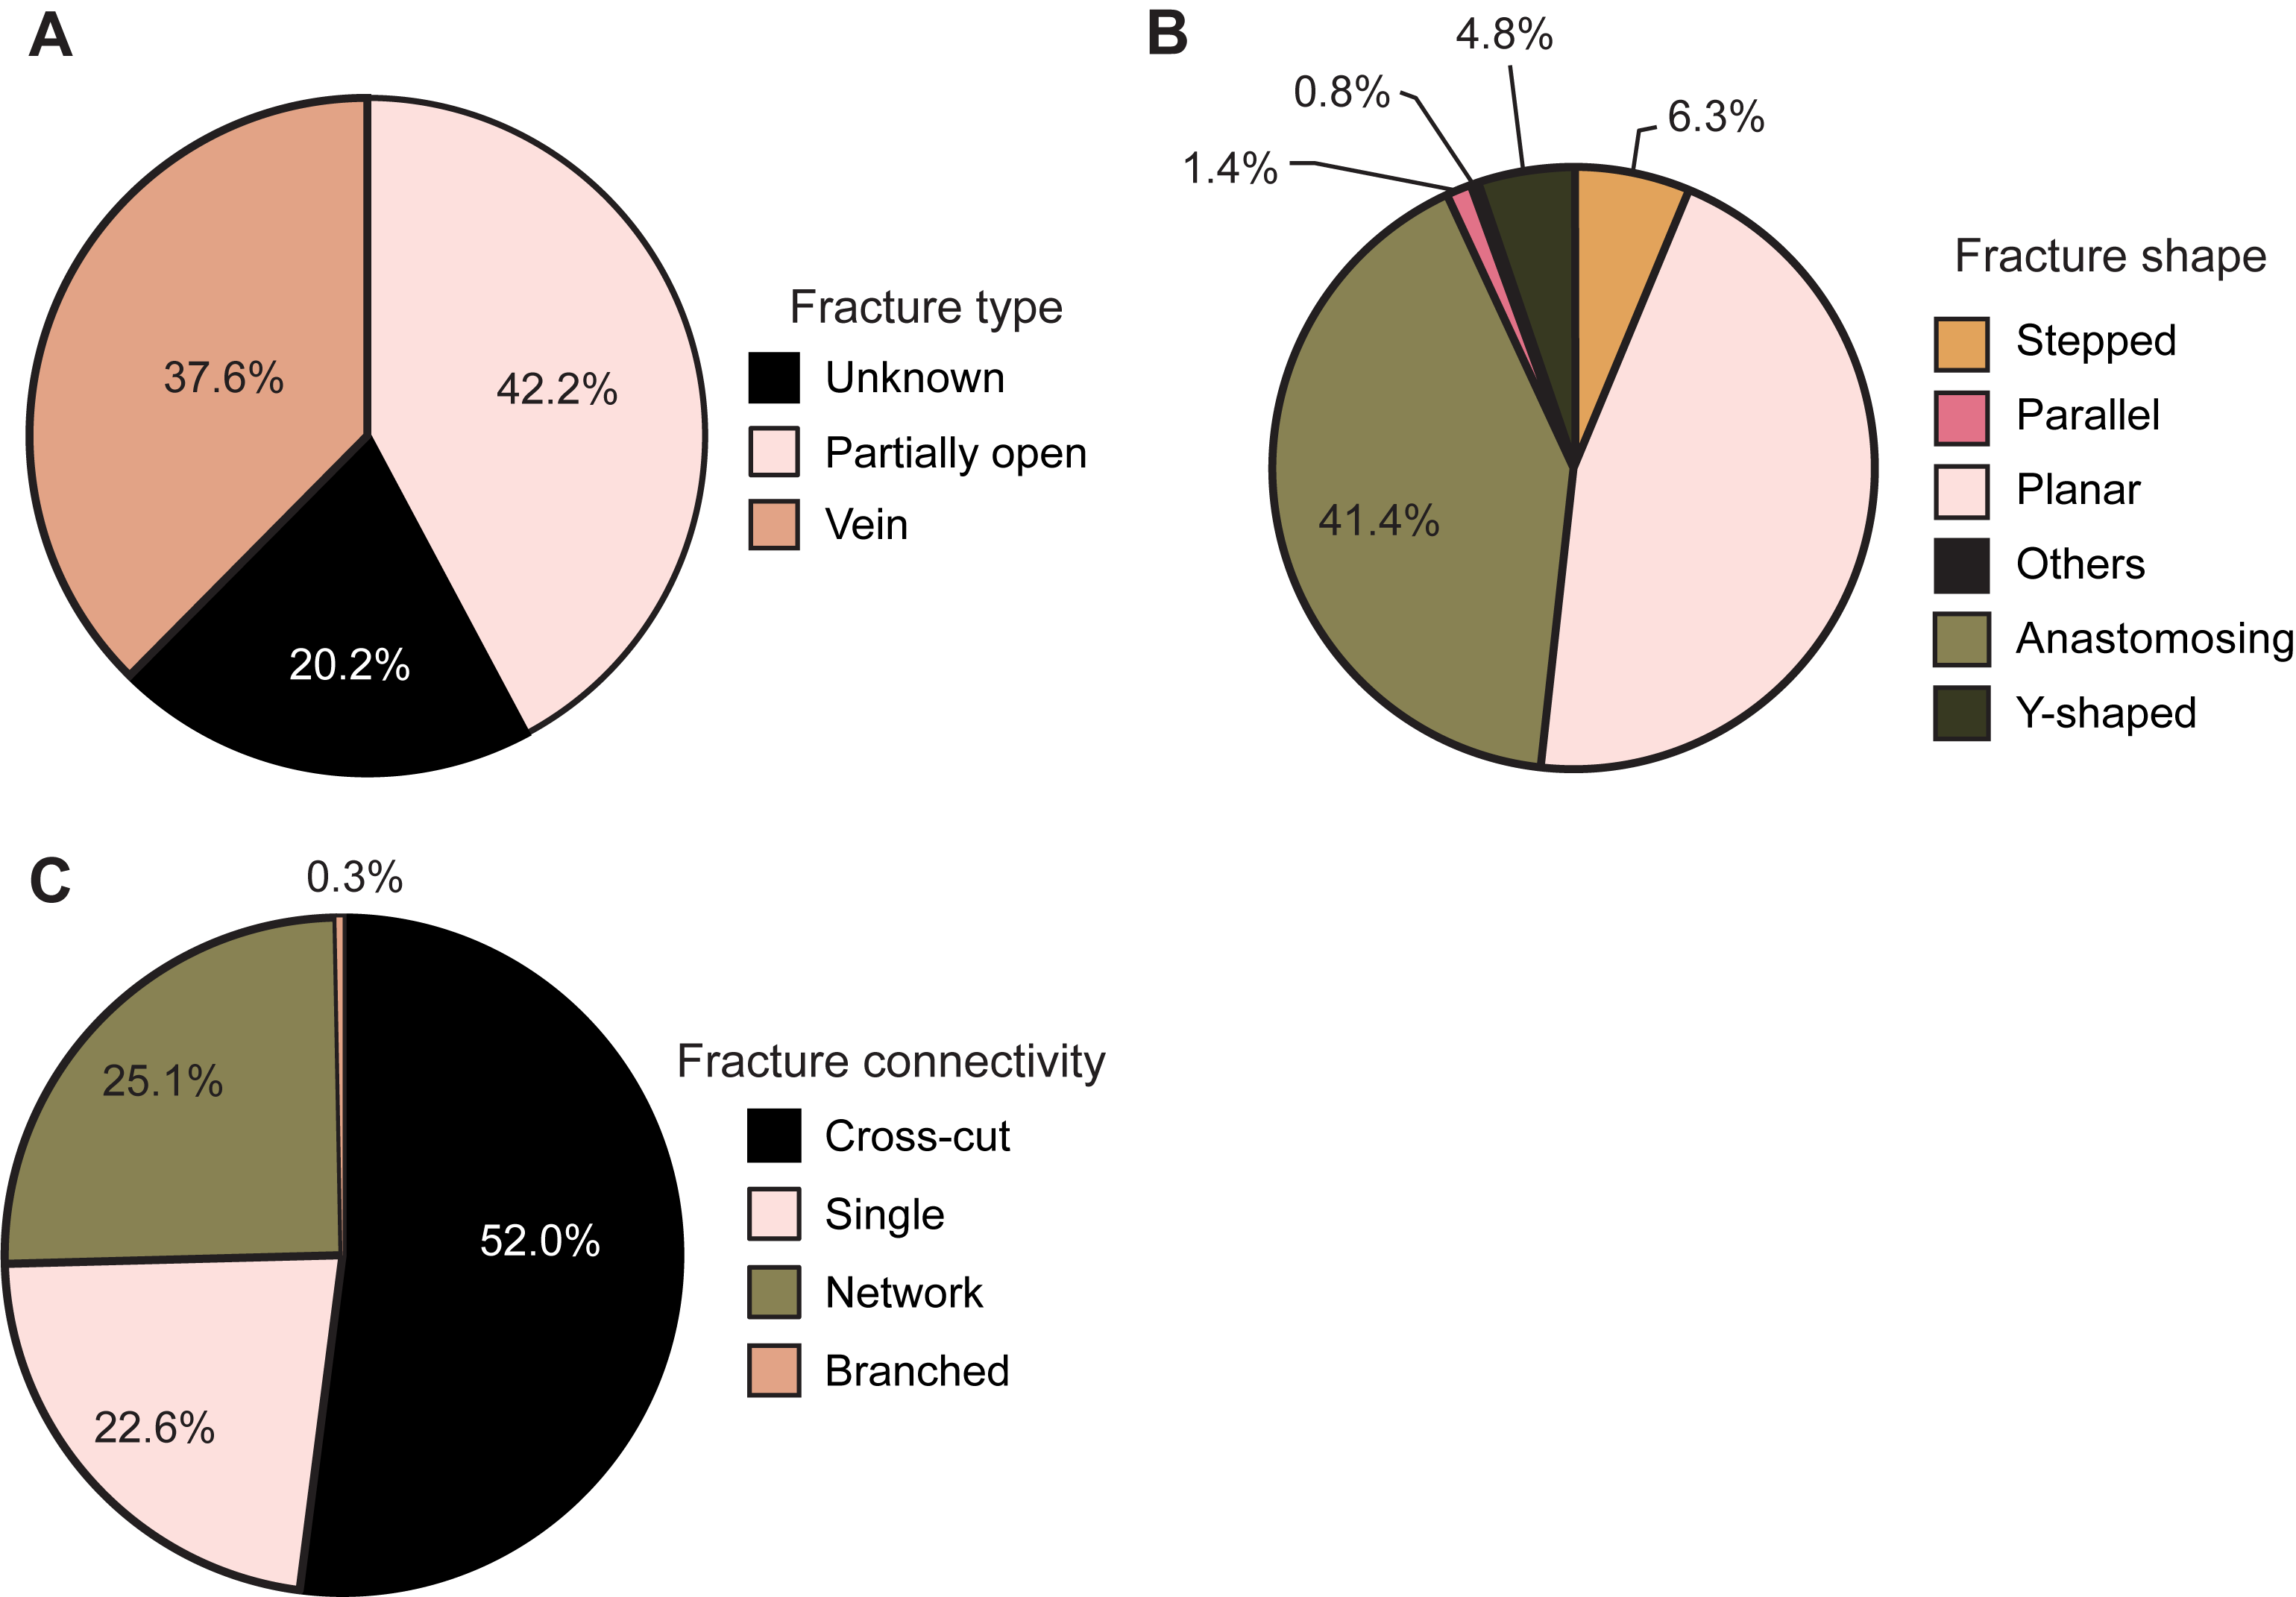
Figure F28. Basalt core fractures.
Fracture mineral fill classification was determined by color, visual inspection under a hand lens, and reaction to dilute HCl acid. In Hole U1562A, the mineral fill of the six fractures measured is primarily cryptocrystalline to microcrystalline carbonate ± Fe-oxide/oxyhydroxide ± celadonite. In Hole U1562B, the mineral fill of the 1399 documented fractures is mainly cryptocrystalline to microcrystalline carbonate ± Fe-oxide/oxyhydroxide with minor occurrences of phyllosilicate and celadonite (Figures F29, F30A). In thin section, some Fe-oxide/oxyhydroxide and celadonite fracture fills are observed (Figure F30B). Peperite and altered carbonate sediment intervals show a later stage of brittle deformation resulting in the formation of carbonate veins (Figure F30C). These carbonate veins commonly cut through the carbonate matrix around the basaltic fragments but occasionally also cut through the basaltic fragments. Fracture alteration halos range 1–20 mm wide with colors from brown, pale gray, green-gray, to green-brown. The mineral fill of vesicles in these alteration halos is mostly carbonate and phyllosilicate rich with some celadonite and Fe-oxide/oxyhydroxides.
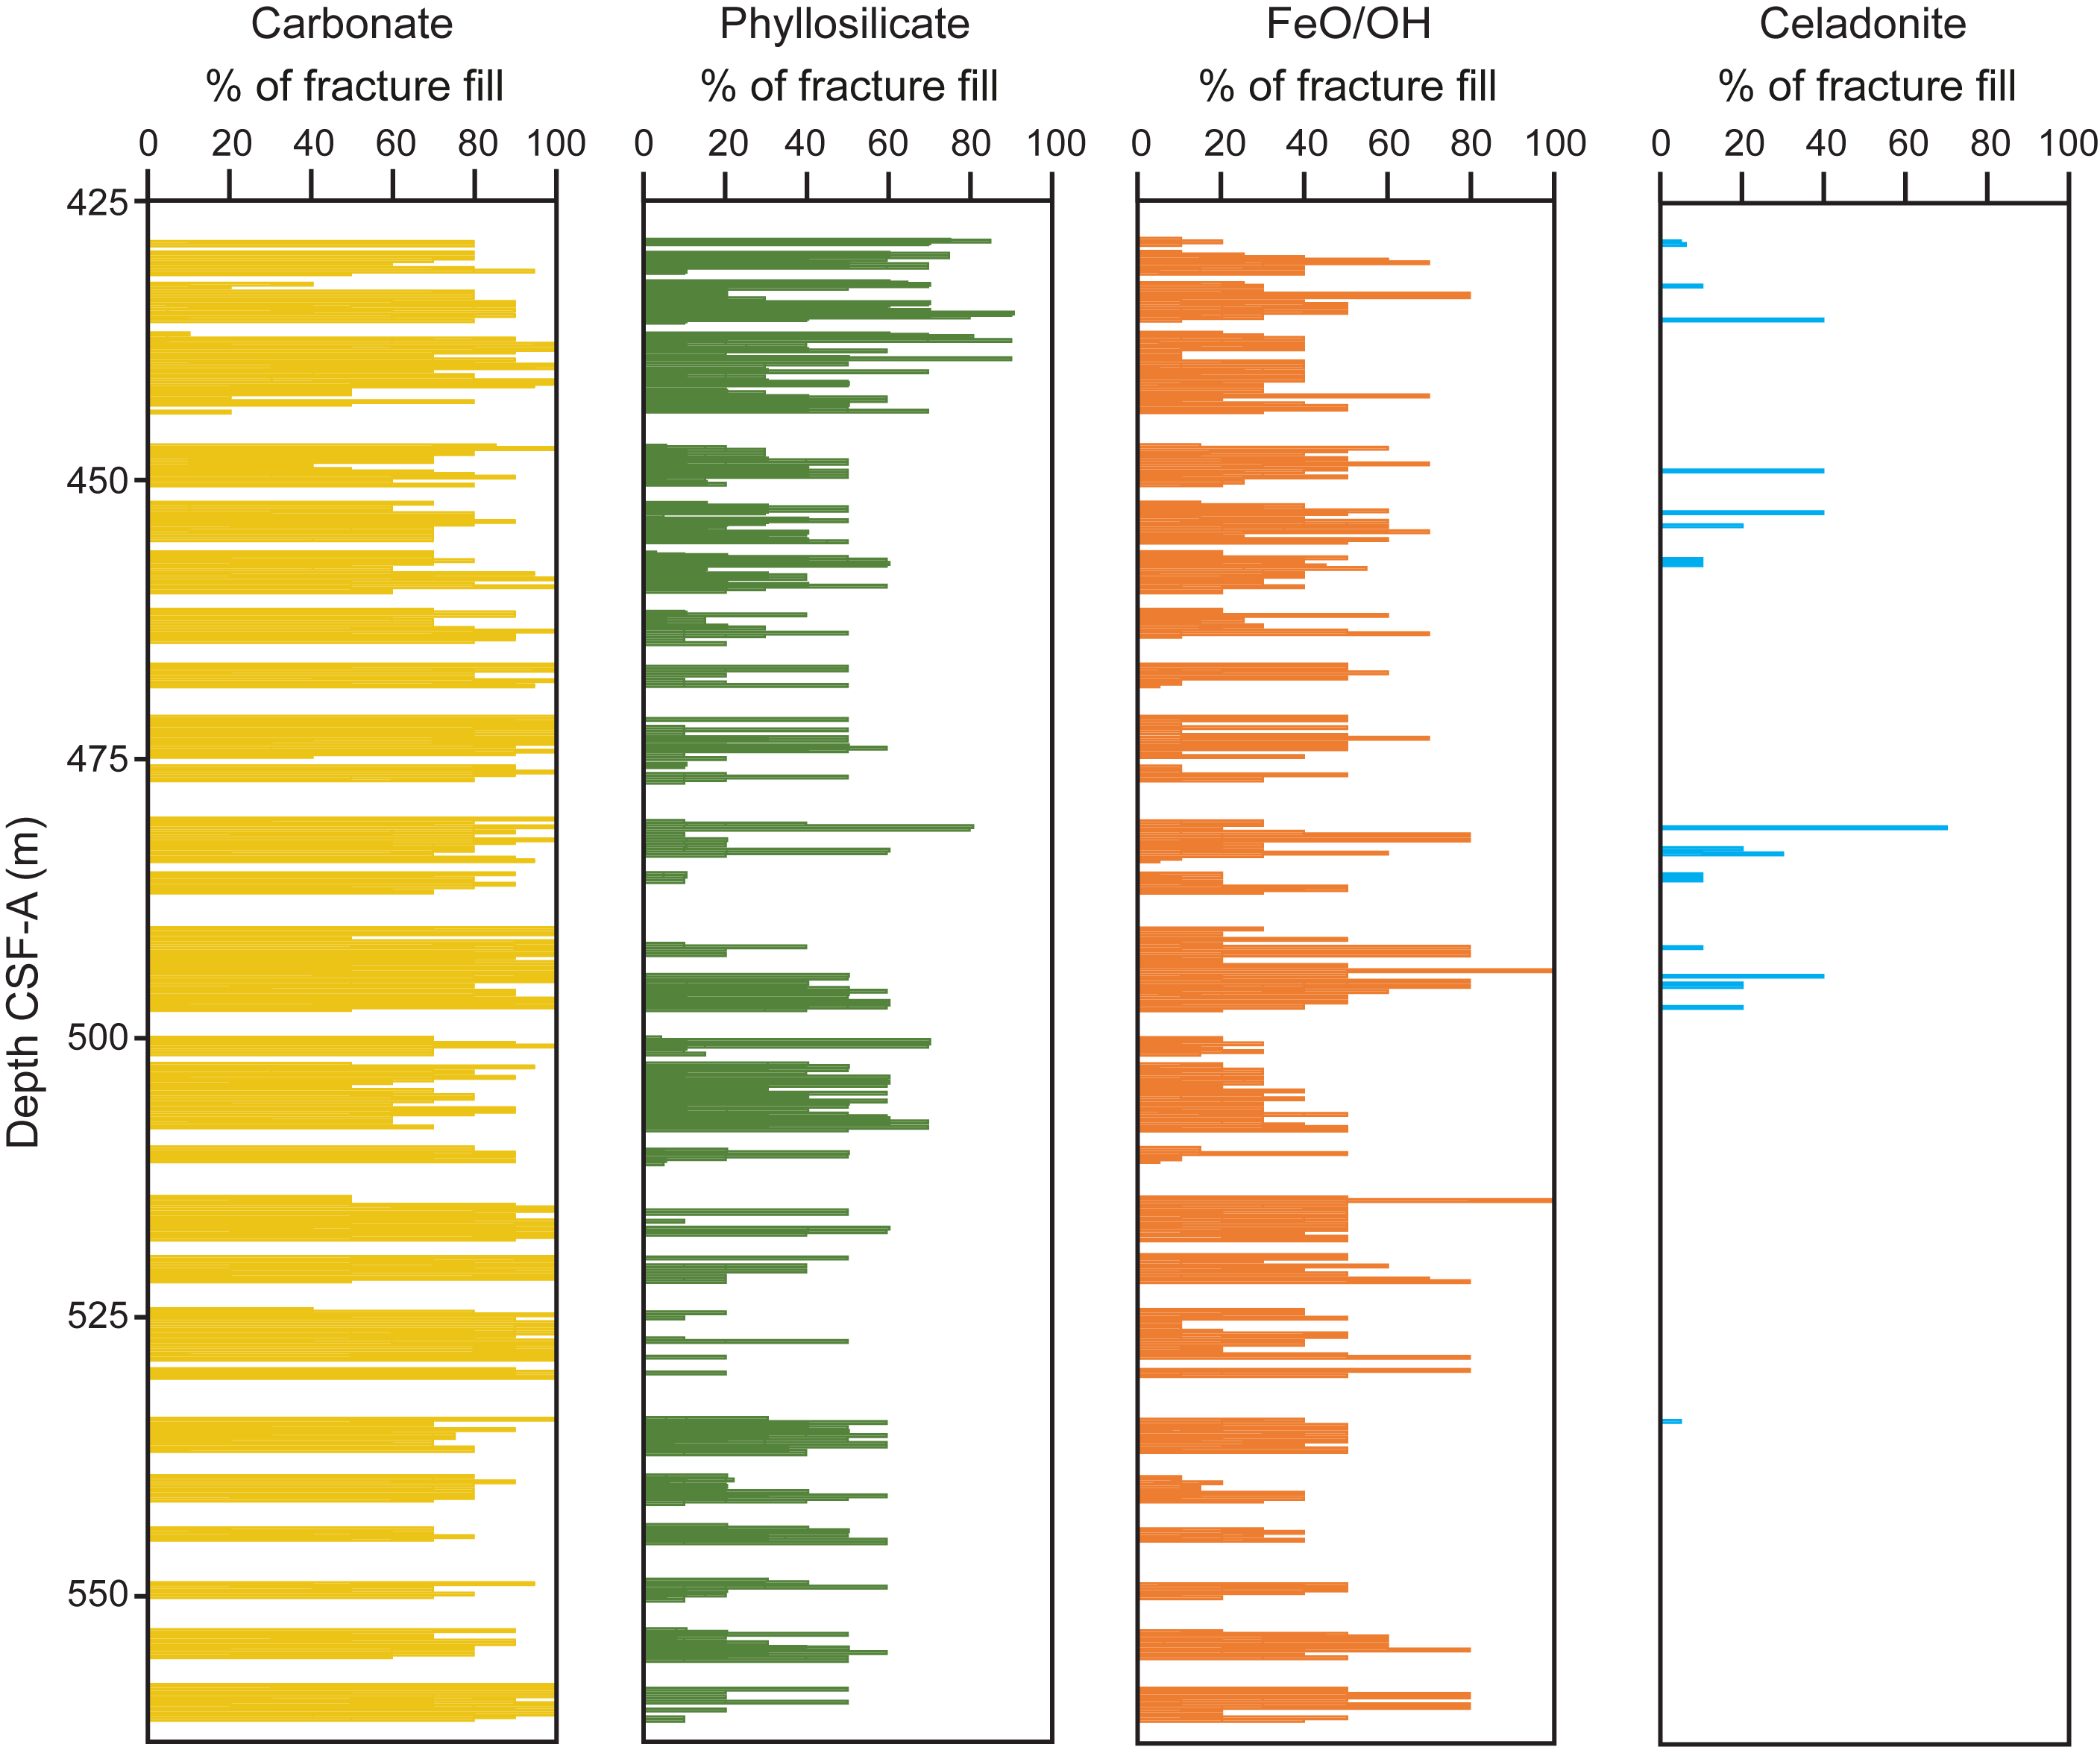
Figure F29. Mineral fill percentage.
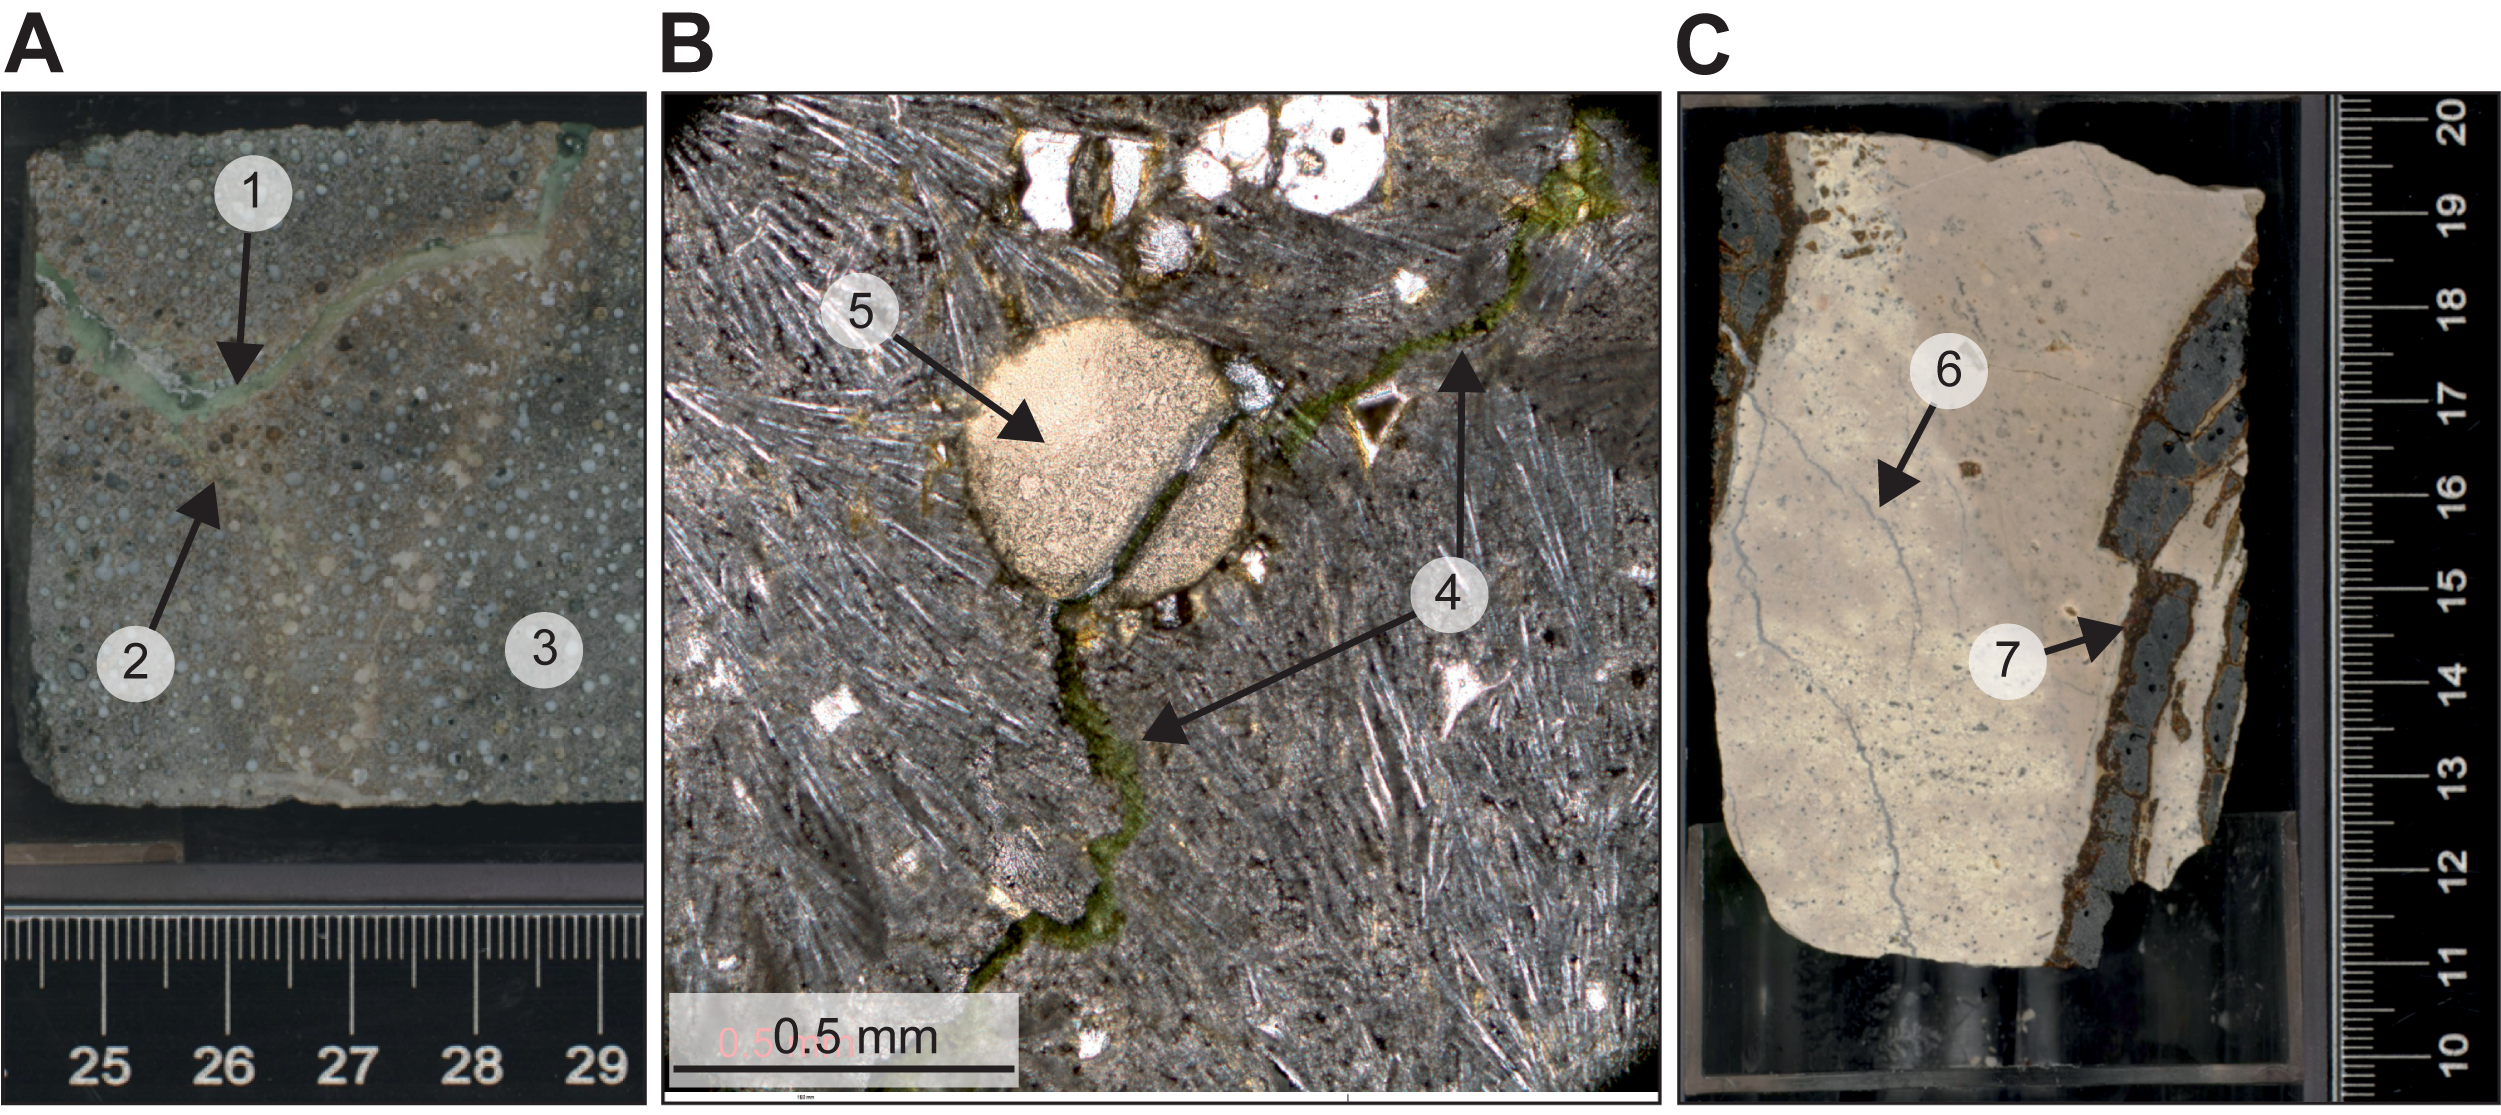
Figure F30. Alteration, vein, and fractures.
6. Micropaleontology
At Site U1562, a 429.8 m long interval of upper Miocene to upper Pleistocene silty clay and nannofossil chalk was recovered across multiple holes. Micropaleontological analyses were undertaken on samples from Hole 395C-U1562A, which recovered sediments in cores from 0 to 429.8 m CSF-A, and Hole 395-U1562C, which recovered core from 0 to 300.73 m CSF-A. The APC and XCB systems were used in both holes. In Hole U1562A, basement was encountered at ~430 m CSF-A in Section 64X-CC. Below this depth, Core 65X contains 0.68 m of basalt, confirming the transition from sediment to basement. Samples from the uppermost 300.73 m were analyzed for micropaleontology from Holes U1562A and U1562C, and below this depth only samples from Hole U1562A were available for study. Biohorizons used in the age model are based on calcareous nannoplankton, planktonic foraminifers, and bolboforms. Calcareous nannofossils and planktonic foraminifers are present with varying abundances, from barren or nearly barren samples to those with very high abundances. This change in abundance most likely reflects glacial–interglacial variability in temperatures, salinity, and/or ice cover in the Quaternary part of the succession. Bolboforms, when present, are generally rare or few.
6.1. Calcareous nannofossils
A total of 47 core catcher samples from Hole U1562A and 96 core catcher and working-half section samples from Hole U1562C were studied for calcareous nannofossils. One additional sample from Hole 395C-U1562B was taken from the mudstone found ~45 m below the top of the igneous succession. Observations were undertaken using plane-polarized light, cross-polarized light, and circular-polarized light. A list of calcareous nannofossil bioevents is provided in Table T6; these bioevents are mostly based on Hole U1562C where it overlaps in depth with Hole U1562A because the former was studied in more detail shipboard during Expedition 395. One biohorizon is included from Hole U1562A, top Coccolithus miopelagicus, because Hole U1562C was not drilled to this depth. Calcareous nannofossils are present in most samples although with distinctly differing abundances alternating in intervals downcore, from few (1–5 per field of view [FOV]) to dominant (hundreds per FOV). In a distinct interval between Samples 395-U1562C-7H-CC (54.2 m CSF-A) and 15H-CC (129.79 m CSF-A), more than half of the samples have very few to rare nannofossils or are barren of nannofossils. Preservation is mostly good in the uppermost ~130 m with occasional intervals of moderate preservation. An interval of very good preservation occurs between ~130 and ~250 m CSF-A, below which preservation is mostly good.
Samples from the Pleistocene succession recovered in Hole U1562C show distinct changes in the abundance of nannofossils and their species composition downcore. The base common Emiliania huxleyi biohorizon (0.09 Ma) is present in the first core between Samples 1H-1, 40 cm (0.4 m CSF-A), and 1H-2, 82 cm (2.31 m CSF-A). The biohorizon base E. huxleyi (0.29 Ma) is then placed between Samples 1H-3, 140 cm (4.39 m CSF-A), and 1H-CC (5.32 m CSF-A), followed by top acme Gephyrocapsa caribbeanica (0.28 Ma) between Samples 1H-CC (5.32 m CSF-A) and 2H-2, 100 cm (7.82 m CSF-A), and top Pseudoemiliania lacunosa (0.43 Ma) between Samples 2H-2, 100 cm (7.82 m CSF-A), and 2H-3, 142 cm (9.74 m CSF-A). Two biohorizons, base acme G. caribbeanica (0.56) and top Reticulofenestra asanoi (0.91 Ma) are both placed between Samples 3H-1, 59 cm (15.39 m CSF-A), and 3H-3, 130 cm (19.12 m CSF-A), and will need further sampling in the cores to be resolved. An interval with very few nannofossils that also contains two biohorizons, top Helicosphaera sellii (1.24 Ma) and top Calcidiscus macintyrei (1.60 Ma), occurs between Samples 3H-3, 130 cm (19.12 m CSF-A), and 4H-4, 86 cm (29.69 m CSF-A). No other Pleistocene or late Pliocene biohorizons were identified because of the very rare and sporadic occurrence of Discoaster species. The next, middle Pliocene biohorizon is top Reticulofenestra pseudoumbilicus (3.82 Ma) between Samples 17F-CC (144.17 m CSF-A) and 18F-CC (148.45 m CSF-A). Two calcareous nannofossil biohorizons, the top paracme of R. pseudoumbilicus (7.1 Ma) between Samples 39F-CC (237.52 m CSF-A) and 40F-CC (242.22 m CSF-A) and top C. miopelagicus (11.04 Ma) between Samples 395C-U1562A-59X-CC (378.93 m CSF-A) and 60X-CC (383.06 m CSF-A), were identified in the upper Miocene. The presence of C. miopelagicus constrains the bottom of the hole to be older than 11.04 Ma (see also Age model). Sample 395C-U1562B-14R-2, 12–17 cm, taken from the 65 cm thick mudstone below the top of the igneous succession, is dominated by a moderately preserved calcareous nannofossil assemblage consisting of R. pseudoumbilicus, medium sized Reticulofenestra species and Reticulofenestra perplexa, Sphenolithus sp., and Calcidiscus sp. The assemblage looks significantly different from the one found at the base of Hole U1562A (Sample 46X-CC; 427.4 m CSF-A). C. miopelagicus is present and gives an age estimate that is older than 11.04 Ma (top C. miopelagicus in Raffi et al., 2020).
6.2. Planktonic foraminifers
Samples at Site U1562 were studied in Holes U1562A–U1562C. Samples from Holes U1562A and U1562B were processed and studied in the micropaleontology laboratory at University College London, and those from Hole U1562C were processed and studied on board JOIDES Resolution. A total of 31 core catcher samples were studied from Hole U1562A in the depth interval 0–476 m CSF-A, spanning almost the entire sedimentary succession, including one sample from the mudline. A single sample was studied from Hole U1562B from a 65 cm thick layer of sediment located ~45 m below the top of the igneous basement succession at ~476 m CSF-A. A total of 47 core catcher samples were studied for planktonic foraminifers from Hole U1562C, spanning 0–301 m CSF-A. A list of planktonic foraminifer bioevents is provided in Table T7. Preservation is excellent or very good in most samples except for some samples from the deeper part of the succession, which are indurated and the tests are infilled but in which preservation is still rated as good. Planktonic foraminifers are common to dominant in all samples except for the interval between Samples 395-U1562C-10H-CC (82.70 m CSF-A) and 14H-CC (120.71 m CSF-A) and correlative levels in Hole U1562A, which are discussed further below.
Sample 395C-U1562A-1H-1, 0 cm, from the mudline, contains many iron-stained shells, which may indicate a component of reworked or disturbed material, as well as a similar proportion of fresh-looking specimens. The assemblage is diverse and indicative of interglacial conditions. Large Globigerina bulloides is abundant and shows apparent intergradation with Globigerina cariacoensis and Globigerina umbilicata. Both Neogloboquadrina incompta (dextral) and Neogloboquadrina pachyderma (sinistral) are present. The most interesting aspect of this sample is the presence of rare specimens of Globorotalia tumida, a species that was not found deeper in the sediment or in the mudline samples collected at other Expedition 395 sites. This species peaks in abundance at the equator and also occurs commonly in warm boundary currents, but it is generally absent or extremely scarce in higher latitudes (Siccha and Kucera, 2017). Its presence may be a function of warm Holocene conditions. It is unlikely to be an Anthropocene invader because most individuals are iron stained, probably indicating prolonged exposure on the seafloor.
Sample 395C-U1562A-1H-CC (1.99 m CSF-A) contains frequent to abundant encrusted sinistral N. pachyderma and is therefore attributed to the N. pachyderma Zone. Also present are G. bulloides, Turborotalita quinqueloba, G. cariacoensis, G. umbilicata, Globoconella inflata, Globorotalia scitula, and Globigerinita glutinata. The base common encrusted sinistral N. pachyderma, marking the base of the N. pachyderma Zone at 1.82 Ma, is most closely constrained in Hole U1562C between Samples 395-U1562C-3H-CC (24.62 m CSF-A) and 4H-CC (34.32 m CSF-A). Samples 395C-U1562A-4H-CC (31.06 m CSF-A) and 5H-CC (40.41 m CSF-A) contain G. inflata in the absence of encrusted N. pachyderma (although rare sinistral unencrusted specimens are present in the latter sample) and are therefore assigned to the G. inflata Zone. The base of G. inflata, marking the base of the G. inflata Zone at 2.06 Ma, is between Samples 5H-CC (40.41 m CSF-A) and 6H-CC (49.71 m CSF-A). Sample 6H-CC (49.71 m CSF-A) lacks G. inflata and G. umbilicata and is therefore assigned to the G. bulloides Zone. The bottom of G. inflata was found at a distinctly lower depth in Hole U1562C, between Samples 7H-CC (54.20 m CSF-A) and 8H-CC (63.78 m CSF-A), but this is considered less reliable because it is based on the presence of a single specimen.
Sample 395C-U1562A-9H-CC (78.44 m CSF-A) yielded a very small residue in the >63 µm fraction, possibly because this part of the sediment drift was subject to winnowing, and contains just two specimens of Neogloboquadrina atlantica. Because this species is usually common up to its top occurrence (Poore and Berggren, 1975), these specimens are interpreted as probably reworked and the top occurrence datum (2.26 Ma) is placed between Samples 9H-CC (78.44 m CSF-A) and 10H-CC (88.05 m CSF-A). An even more complex picture occurs around the same depth in Hole U1562C, in which a series of samples spanning from Sample 10H-CC (82.65 m CSF-A) through 14H-CC inclusive (120.71 m CSF-A) have only few or rare planktonic foraminifers or are barren. In the same interval, quartz and rock fragments interpreted as ice-rafted debris (IRD) vary from dominant (Sample 11H-CC; 92.35 m CSF-A) to absent (Sample 12H-CC; 101.75 m CSF-A). Observations of the sediment in this interval (see Lithostratigraphy) reveal that IRD presence varies greatly on a decimeter scale, such that the paleontological core catcher samples must inevitably alias a complex stratigraphic pattern. In Hole U1562C, the top of N. atlantica is placed between Samples 10H-CC (82.65 m CSF-A) and 12H-CC (101.75 m CSF-A), and the intervening sample (11H-CC; 92.35 m CSF-A) is barren and dominated by IRD.
The bottom extent of frequent to dominant quartz and rock fragments is constrained in Hole U1562C to between Samples 14H-CC (120.71 m CSF-A) and 15H-CC (129.79 m CSF-A). In Hole U1562A, the lowest abundant quartz is in Sample 14H-CC (125.61 m CSF-A). These observations constrain the lowest recorded evidence for significant ice rafting in our samples.
The washed residue >63 µm of Sample 395-U1562C-15H-CC (129.79 m CSF-A) contains large numbers of foraminifer tests, many of which are infilled with a speckled light greenish gray to glossy black material and coated with a thin reddish orange rind with a waxy appearance (Figure F31). The greenish gray to glossy black material also occurs as free rounded pellets and subangular clasts. Preliminary shipboard investigation with scanning electron microscope–energy dispersive spectrometry (SEM-EDS) and XRD indicates that it is likely glauconite, and the reddish orange coatings appear to be an iron- and titanium-rich amorphous silica. This mineralization is interpreted as authigenic, suggesting that the foraminifers may have been exposed on the seafloor for extended periods before being mixed with fresh unaltered specimens and concentrated by seafloor currents. Glauconite and glauconite-infilled foraminifers occur sporadically through the rest of the succession below this level.
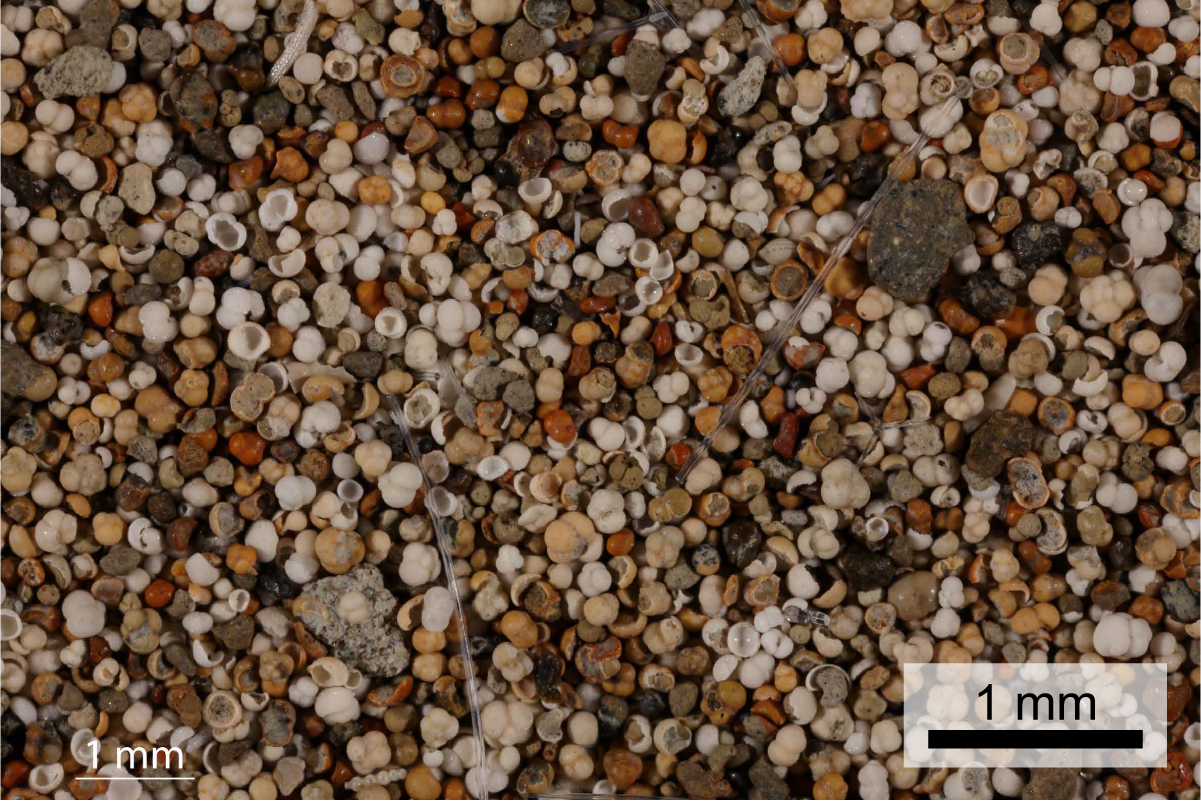
Figure F31. Foraminifer residue.
The base of the Globoconella puncticulata/N. atlantica Zone is marked by the base of G. puncticulata (4.54 Ma) between Samples 395C-U1562A-18H-CC (163.41 m CSF-A) and 19H-CC (173.47 m CSF-A) and at a similar depth in Hole U1562C between Samples 21F-CC (159.88 m CSF-A) and 22F-CC (164.51 m CSF-A). This event corresponds to the immigration and rapid dispersal of G. puncticulata across much of the Atlantic Ocean and Mediterranean Sea that is well constrained at 4.54 Ma in other sections (for discussion, see Micropaleontology in the Expedition 395 methods chapter [Parnell-Turner et al., 2025a]).
The interval from base G. puncticulata to Sample 395C-U1562A-52F-CC (337.84 m CSF-A) is relatively homogeneous in terms of planktonic foraminifer assemblages, with N. atlantica (sinistral), G. bulloides, and Globigerina falconensis generally common or abundant and G. scitula occurring sporadically. Scattered occurrences of specimens attributed to Globorotalia cibaoensis indicate an assignment to the G. cibaoensis Zone. Orbulina universa is consistently present, albeit in low numbers, which contrasts with its patchier occurrences at higher stratigraphic levels at the site.
A pronounced shift in the coiling direction of N. atlantica from dextral to sinistral dominance (going upcore) occurs between Samples 395C-U1562A-52F-CC (337.84 m CSF-A) and 54F-CC (347.37 m CSF-A) (Figure F32; Table T8). Although the species is very rare in the latter sample with just two specimens observed, both are dextral. The same sample is noteworthy in containing many large O. universa, which is much more common than it is anywhere else in the succession. The coiling shift is calibrated at 9.23 Ma based on the record of Aksu and Kaminski (1989) at Ocean Drilling Program (ODP) Site 646 in the Labrador Sea (see Micropaleontology in the Expedition 395 methods chapter [Parnell-Turner et al., 2025a]). N. atlantica is common or abundant in Samples 56F-CC (356.70 m CSF-A) through 64X-CC (427.40 m CSF-A), although it is dominated by the "primitive" morphotype that some authors prefer to recognize as N. atlantica praeatlantica (Foresi et al., 2002). Base G. cibaoensis, which marks the base of the G. cibaoensis Zone (9.44 Ma), is just below the coiling shift in N. atlantica and is located between Samples 54F-CC (347.37 m CSF-A) and 56F-CC (356.70 m CSF-A), but its relative rarity and the patchiness of its distribution gives the biohorizon low confidence.
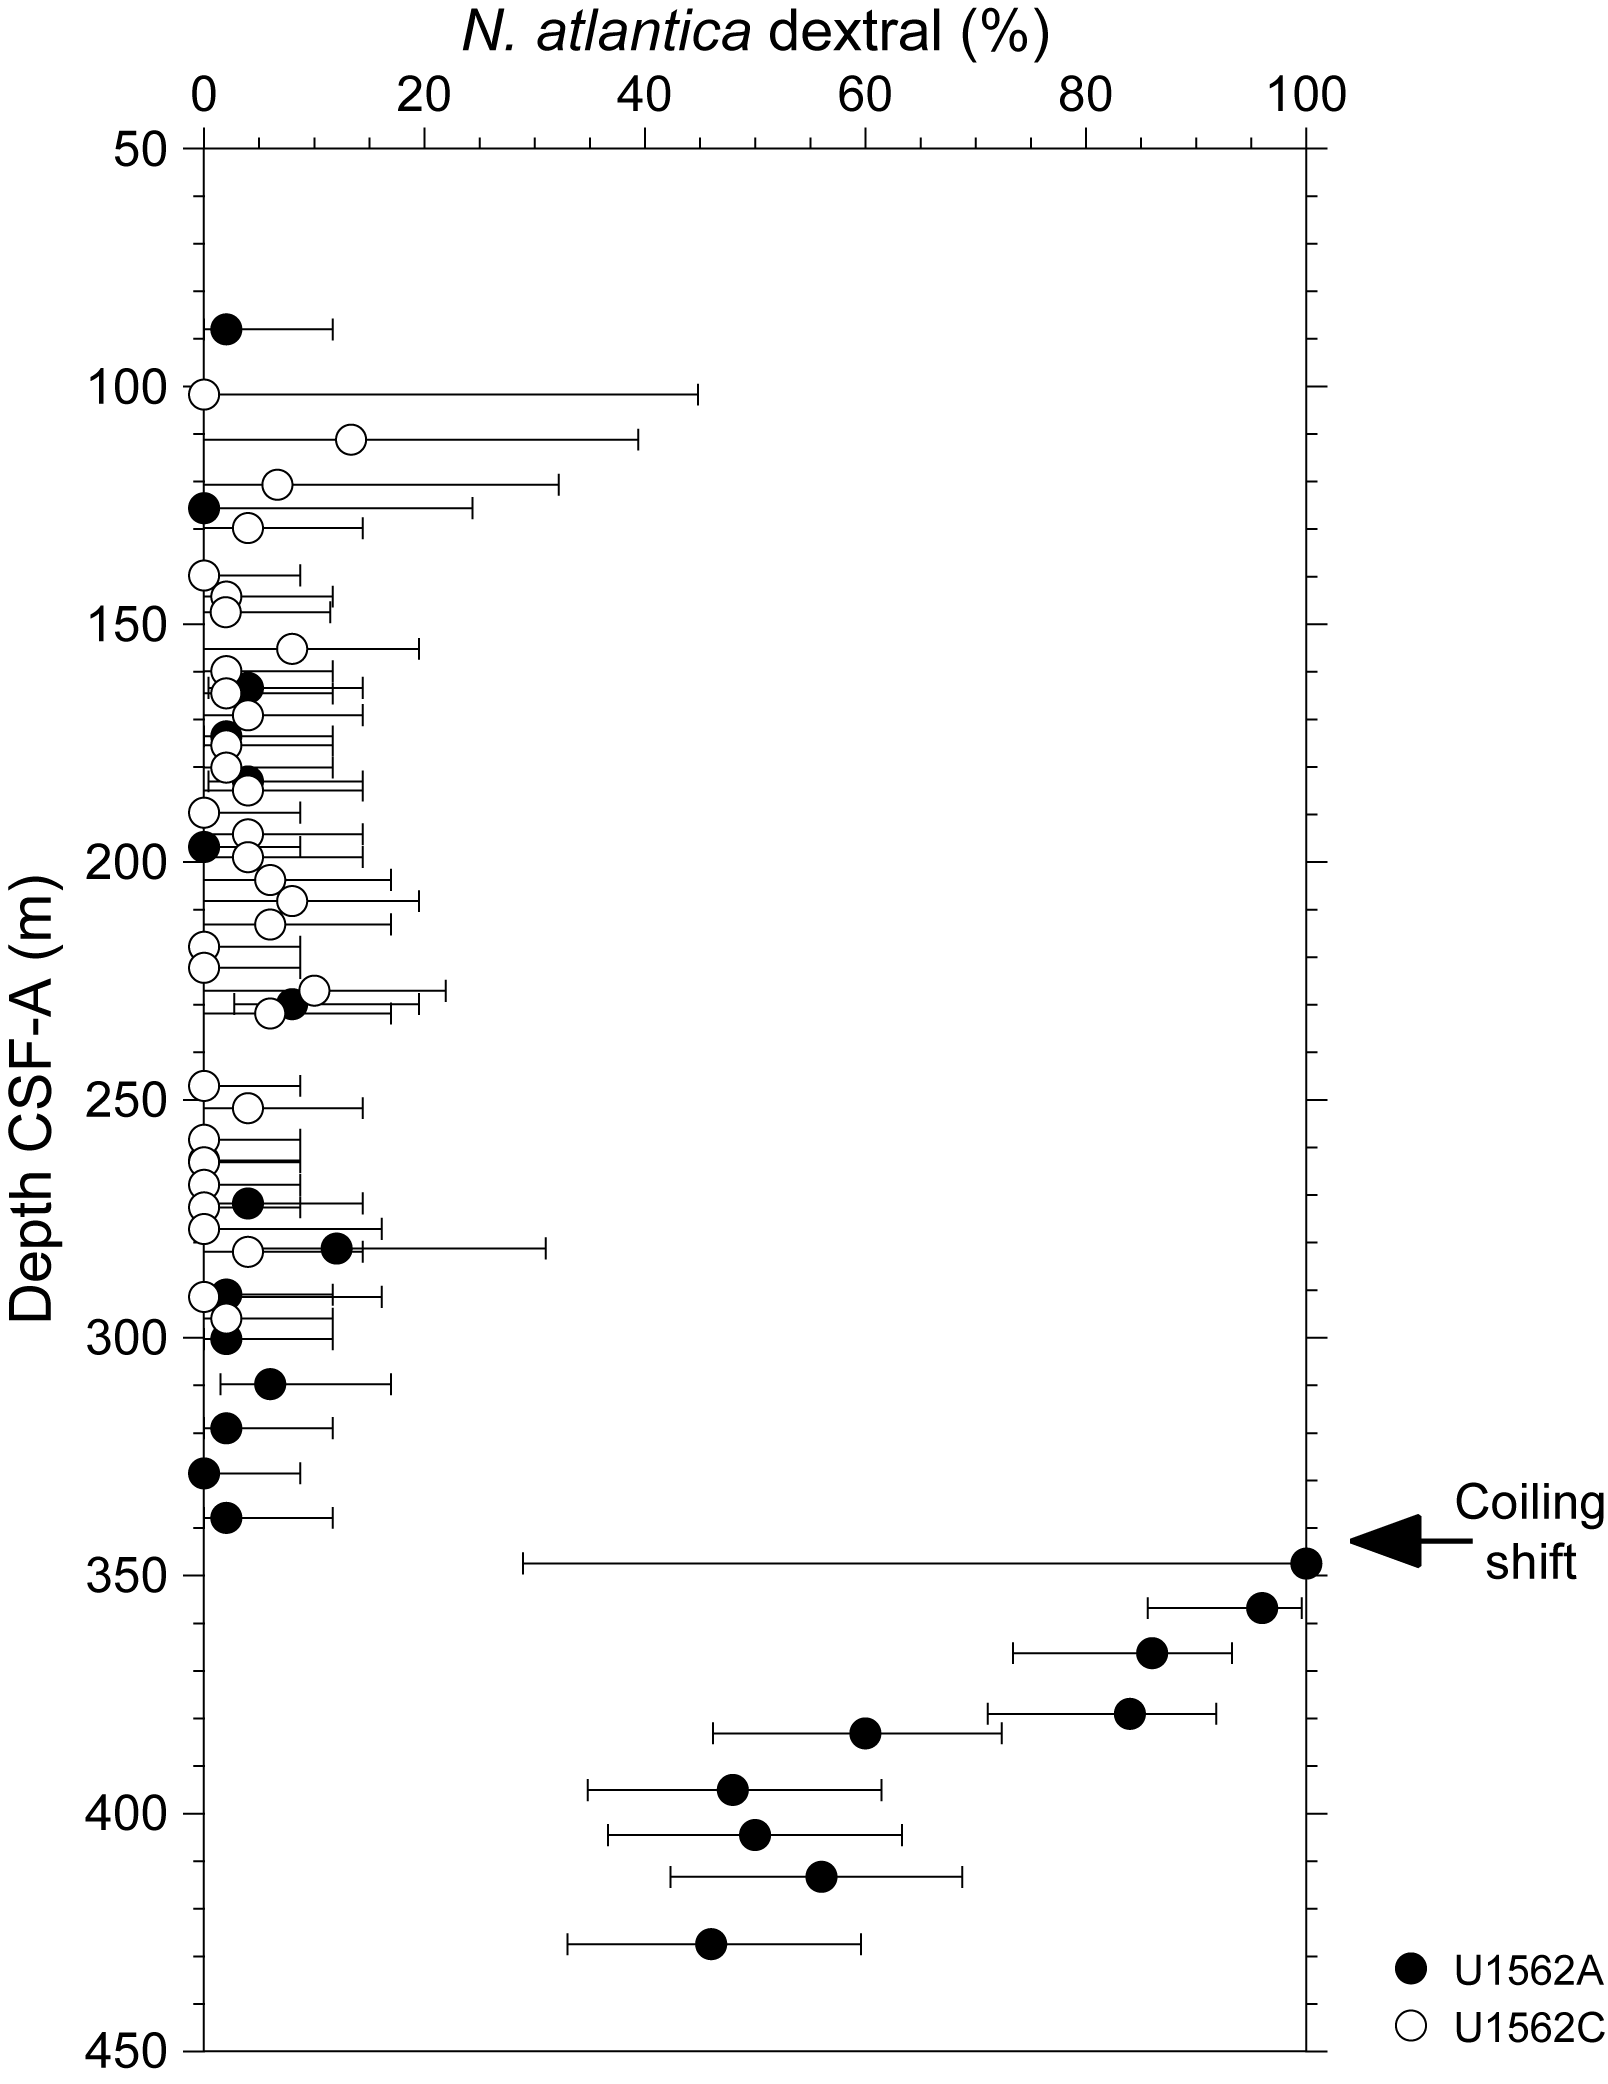
Figure F32. N. atlantica coiling ratios.
The top of Paragloborotalia mayeri (10.54 Ma), marking the base of the Paragloborotalia continuosa Zone, occurs between Samples 395C-U1562A-58X-CC (366.22 m CSF-A) and 59X-CC (378.93 m CSF-A). The species is rare below its disappearance level despite being common to abundant lower in the succession in Samples 63X-CC (413.27 m CSF-A) and 64X (427.40 m CSF-A). This pattern contrasts with ODP Site 926 in the tropical Atlantic, where the biohorizon is calibrated astronomically at 10.54 Ma and the species is abundant up to its extinction level (Chaisson and Pearson, 1997). There are complex taxonomic and biochronologic questions surrounding this potentially useful datum (see discussion in Raffi et al., 2020). Specimens at Site U1562 closely resemble those illustrated as P. mayeri at Deep Sea Drilling Project (DSDP) Site 407 on the Reykjanes Ridge by Poore (1979), with distinctly curved sutures on the spiral side and highly arched apertures. Samples from Site U1562 were directly compared under the microscope with an assemblage from near the top occurrence at Site 926. Those from Site U1562 are on average smaller with fewer chambers and more strongly curved spiral sutures, but very similar specimens occur among the range of variation at Site 926. It is likely that the top occurrence on the Reykjanes Ridge records the same biological extinction as occurs in the tropics.
An upsection change from random to dextrally dominant coiling in N. atlantica occurs between Samples 395C-U1562A-59X-CC (378.93 m CSF-A) and 60X-CC (383.06 m CSF-A) (Figure F32). This change may be useful for regional correlation. The lowermost sample examined in the regular sedimentary succession, Sample 64X-CC (427.4 m CSF-A), contains P. mayeri and is assigned to the P. mayeri highest occurrence zone. It also contains N. atlantica.
Hole U1562B was cored with the RCB system from the lowermost part of the sedimentary succession into basement. After penetrating over 45 m into basalt, a substantial interval of sediment was encountered, comprising the whole of Section 14R-2. Sample 14R-2, 12–17 cm (475.66 m CSF-A), contains a well-preserved foraminifer assemblage that is significantly older than the lowermost sample examined from the sedimentary succession described above. Of particular note is the frequent presence of a globorotaliid species of uncertain affinity. The species bears a general resemblance to Fohsella fohsi, a tropical form from the same time interval, except that it is heavily encrusted and invariably has five chambers per whorl rather than the six typical of F. fohsi. Also present in the sample is rare Trilobatus trilobus (the only observed occurrence in Expedition 395 samples of this common low- to mid-latitude species) and questionable Praeorbulina circularis. Another peculiarity of the assemblage compared with all overlying samples is the absence of Paragloborotalia species. These indications suggest that the sediment pocket is distinctly older than the lowermost part of the regular sedimentary succession at the site, but it is difficult to specify how much older (see Age model).
6.3. Bolboforms
Bolboforms were studied in the same set of sample residues used for foraminifers. In Hole U1562C, bolboforms occur from Sample 27F-CC (184.88 m CSF-A) downward. In Hole U1562A, they occur in every sample studied from Sample 22F-CC (196.87 m CSF-A) downward. They are generally very rare in comparison to foraminifers and other particles but become markedly more abundant downcore. Being small, they are difficult to identify with the light microscope, so all specimens were transferred to SEM stubs and imaged using the shipboard Hitachi TM3000 desktop SEM before taxonomic assignment. A list of biohorizons is presented in Table T9.
Top Bolboforma intermedia, marking the base of the Bolboforma costairregularis Zone, could not be identified because of very scarce occurrences. The base of B. intermedia, marking the base of the B. intermedia Zone (8.18 Ma), is located tentatively between Samples 395C-U1562A-48F-CC and 50F-CC (318.91–328.49 m CSF-A). Bolboforma metzmacheri is also rare in the succession, with its base marking the base of the B. metzmacheri Zone (9.89 Ma), tentatively placed between Samples 56F-CC (356.70 m CSF-A) and 58X-CC (366.22 m CSF-A). The top of Bolboforma subfragoris, which marks the base of the Bolboforma capsula Zone (10.82 Ma), is more confidently placed between Samples 59X-CC (378.93 m CSF-A) and 60X-CC (383.06 m CSF-A). Several bicamerate specimens of B. subfragoris were observed in Sample 61X-CC (395.04 m CSF-A).
The lowermost sample examined is Sample 395C-U1562B-14R-2, 12–17 cm, which was taken from the short section of sediment that occurs more than 45 m below the top of igneous basement (see Planktonic foraminifers). The bolboform assemblage in this sample is distinctly different from those taken from the regular succession above and contains Bolboforma laevis together with several specimens of Bolboforma clodiusi and the Bolboforma reticulata s.l. group. The latter species, which is the most abundant species in the sample, resembles the form illustrated as "Bolboforma oblongireticulata" by Spiegler (1999), which appears to be a nomen nudum because it was never formally described. If that identification is correct, the assemblage is most likely from the middle Miocene Bolboforma compressispinosa Zone of Spiegler (1999), although the nominate species of the zone was not found in the sample. If so, this observation would agree with the planktonic foraminifer and nannofossil evidence from the sediment pocket and could indicate a tentative age of ~12.33–12.43 Ma according to our recalibration of the short biostratigraphic range of "Bolboforma oblongireticulata" at ODP Site 982 reported in Spiegler (1999).
7. Physical properties
A range of whole-round, section-half, and discrete sample physical properties were measured on ~730 m of sediment core recovered from Holes 395C-U1562A, 395C-U1562B, and 395-U1562C and ~77 m of basement core recovered from Holes U1562A and U1562B (Table T10). Physical properties data were cleaned for half the response function corresponding to the instruments at the top and bottom of each section, and values deemed artifacts were removed from the respective figures (Table T11). All raw data are retained in the Laboratory Information Management System (LIMS) database.
7.1. Whole-round measurements
Variations in sedimentary physical properties in Hole U1562C are very similar to those measured in the overlapping stratigraphic interval of Hole U1562A (Figures F33, F34). The sediments in the uppermost 130 m gradually increase downhole in gamma ray attenuation (GRA) bulk density, MS, and NGR with superimposed meter-scale oscillations. These parameters drop sharply at 130 m CSF-A. Below 130 m CSF-A, bulk densities stay relatively constant with small variations around 1.6 g/cm3, and MS and NGR show a more variable pattern. Relatively large amplitude variations (hundreds of instrument units for MS and tens of counts per second for NGR) to ~350 m CSF-A, below which both parameters show lower values. Between 180 and 300 m CSF-A, the oscillations in MS and NGR are most prominent and occur on a scale of ~20 m. Whole-Round Multisensor Logger (WRMSL) P-wave velocity (VP) values increase slightly downhole and average around 1500 m/s.
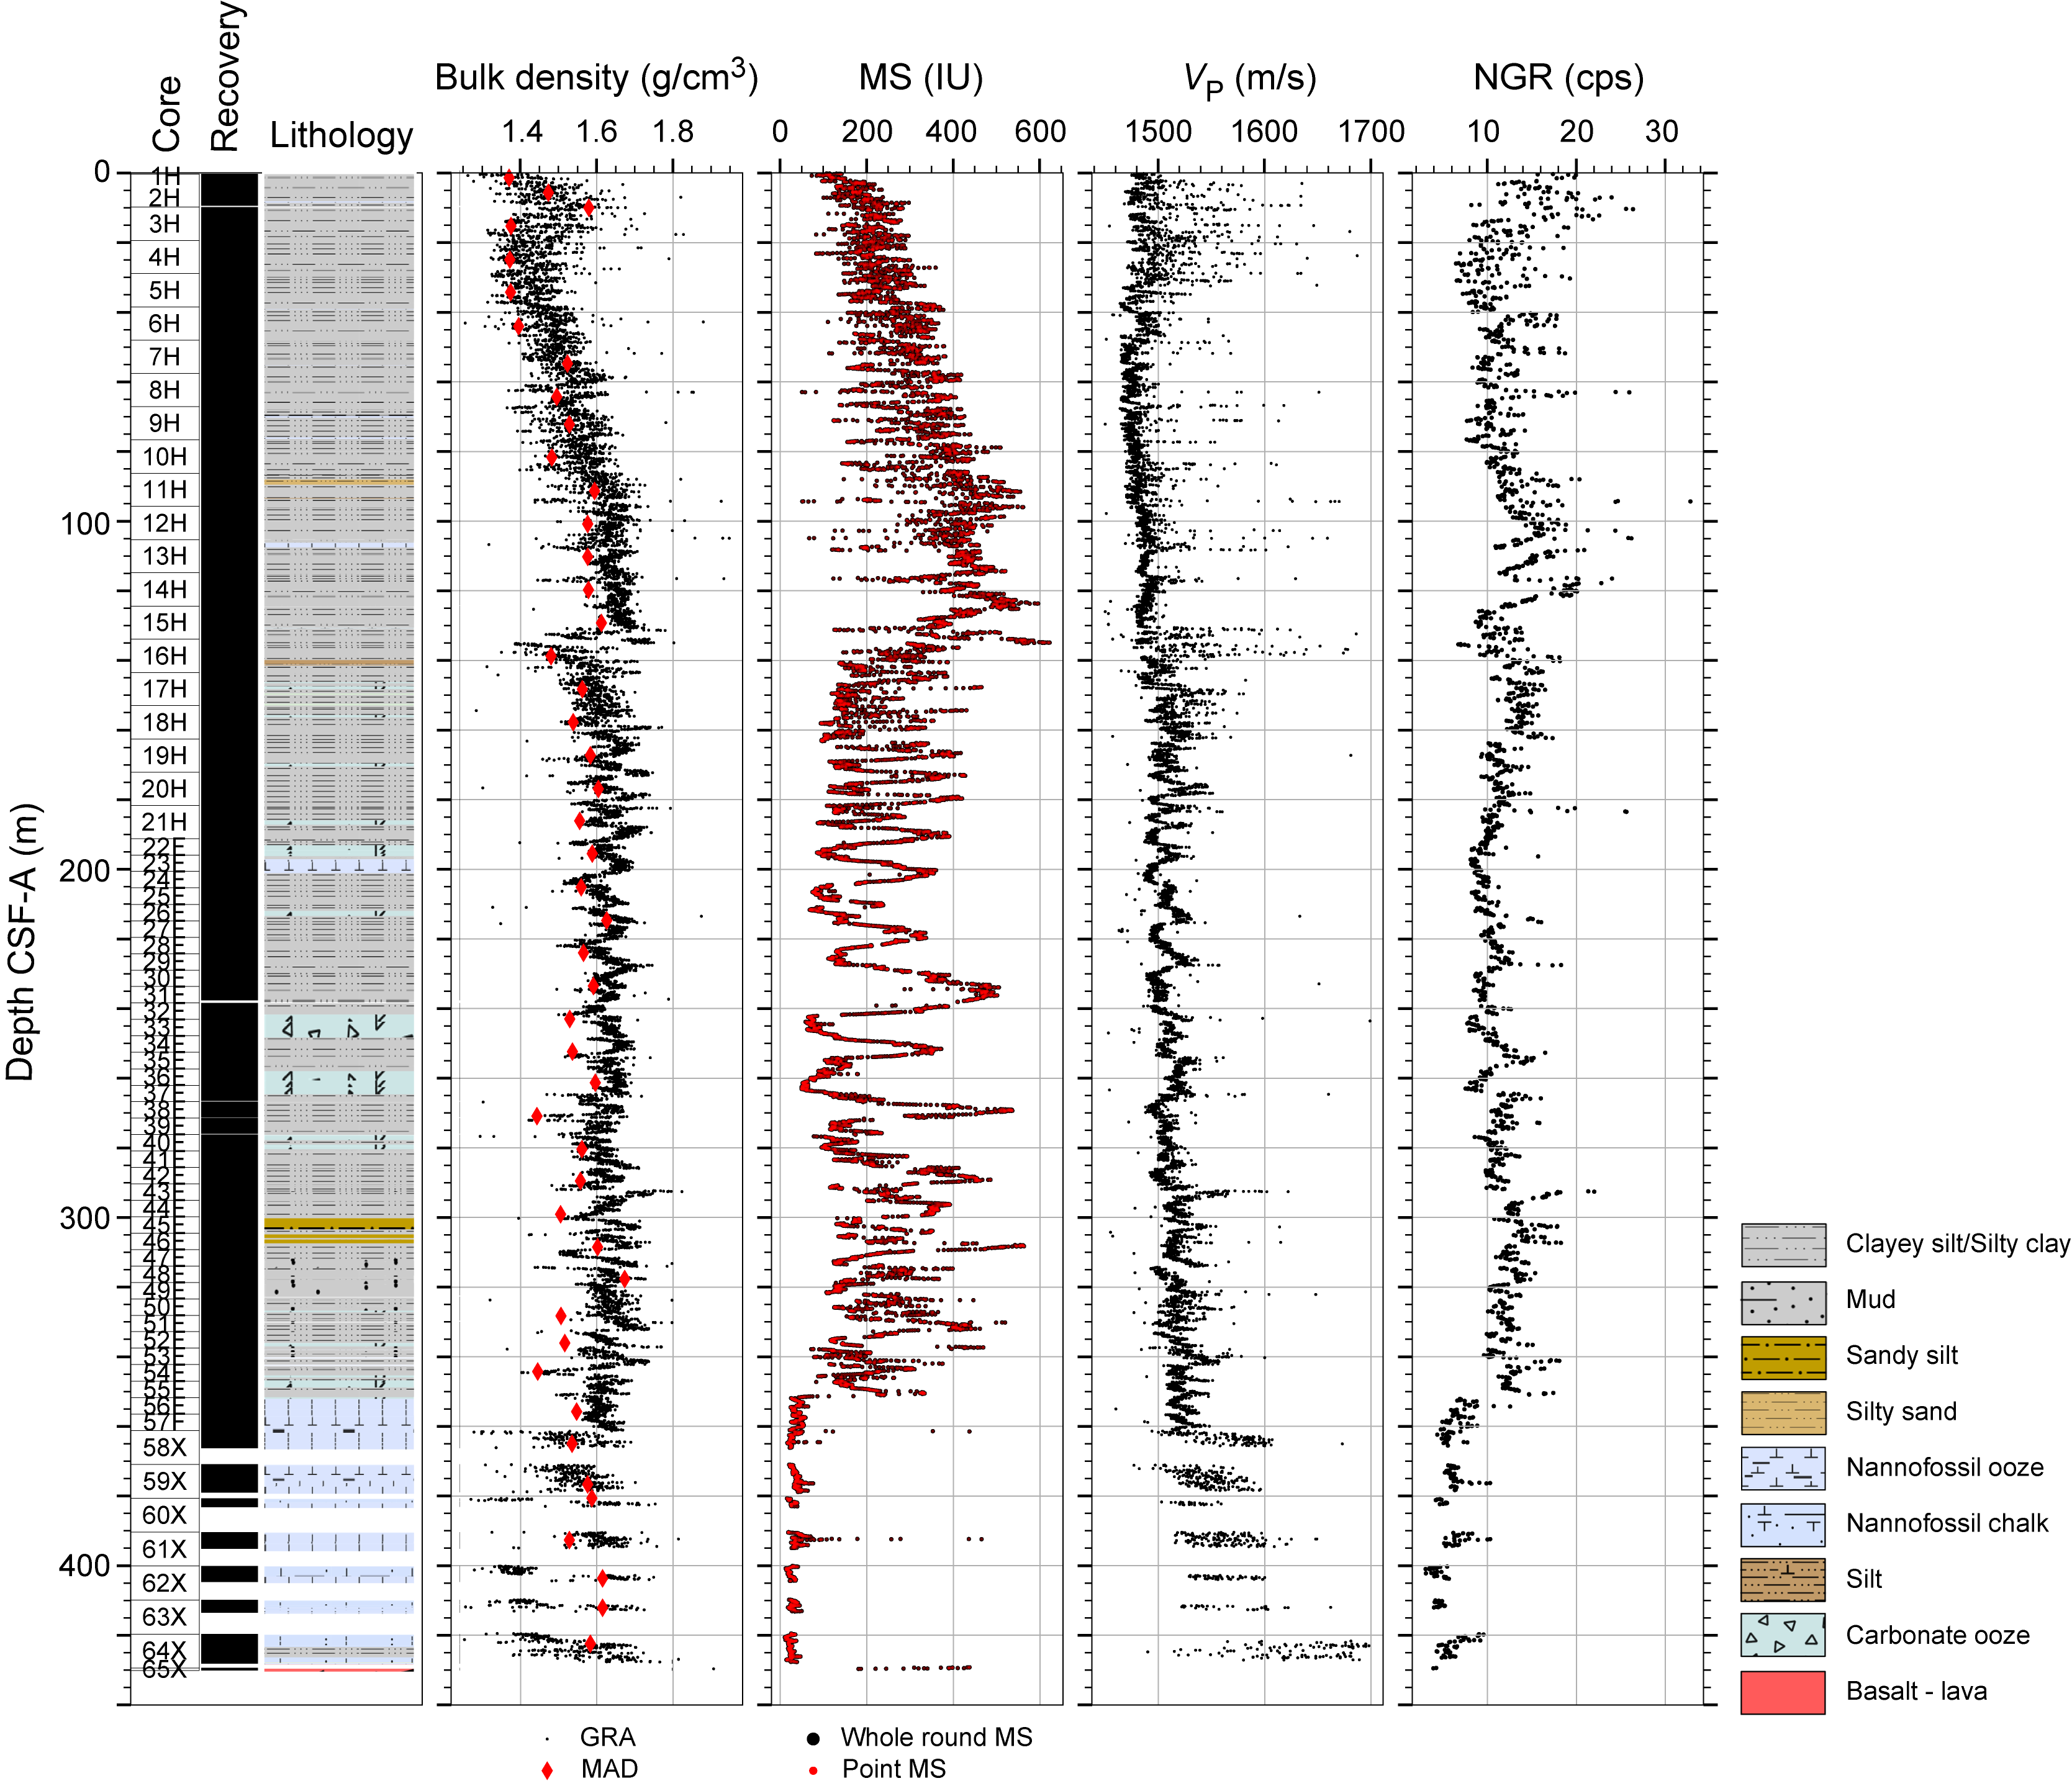
Figure F33. Physical properties measurements, Hole U1562A.
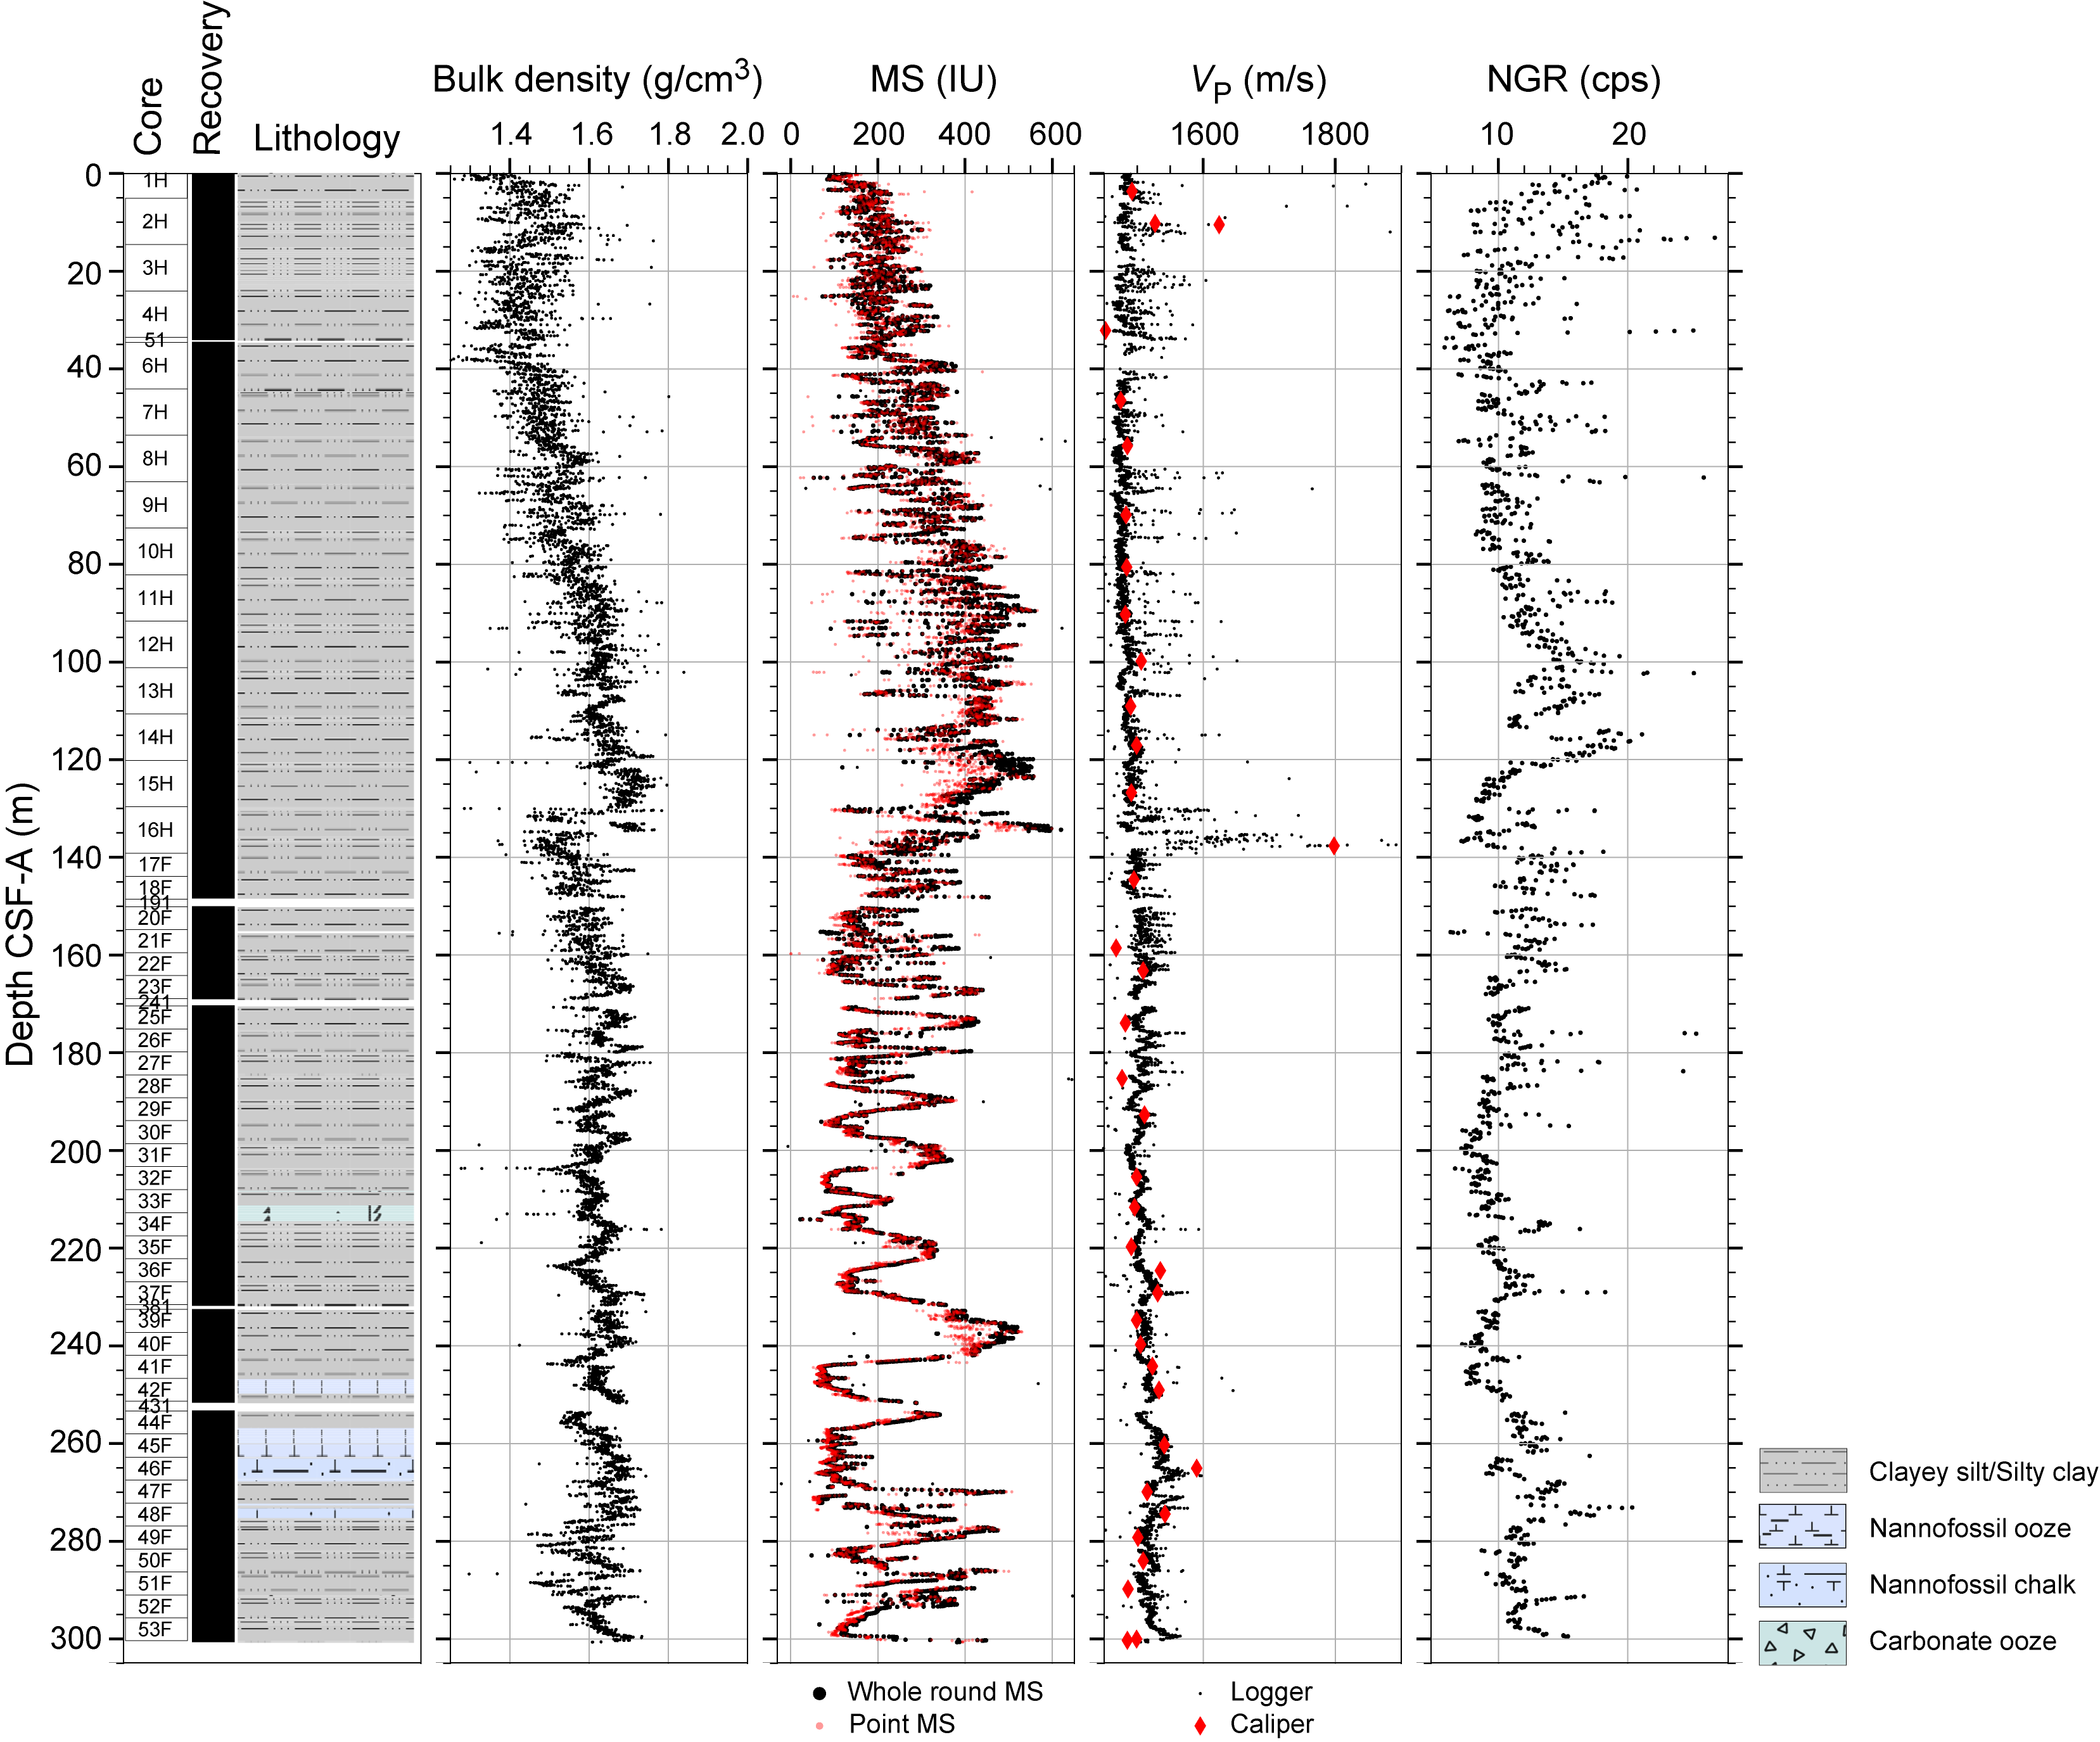
Figure F34. Physical properties measurements, Hole U1562C.
In Hole U1562B, voids and gaps between the core and liners in the basalt sections make the interpretation of physical properties profiles less straightforward (Figure F35). Nevertheless, intervals of higher MS seem to correspond to slightly lower values in bulk density and NGR. Measured values in the sedimentary interval (Cores 2R–4R) are comparable with the physical properties values for the deepest sediments in Hole U1562A.
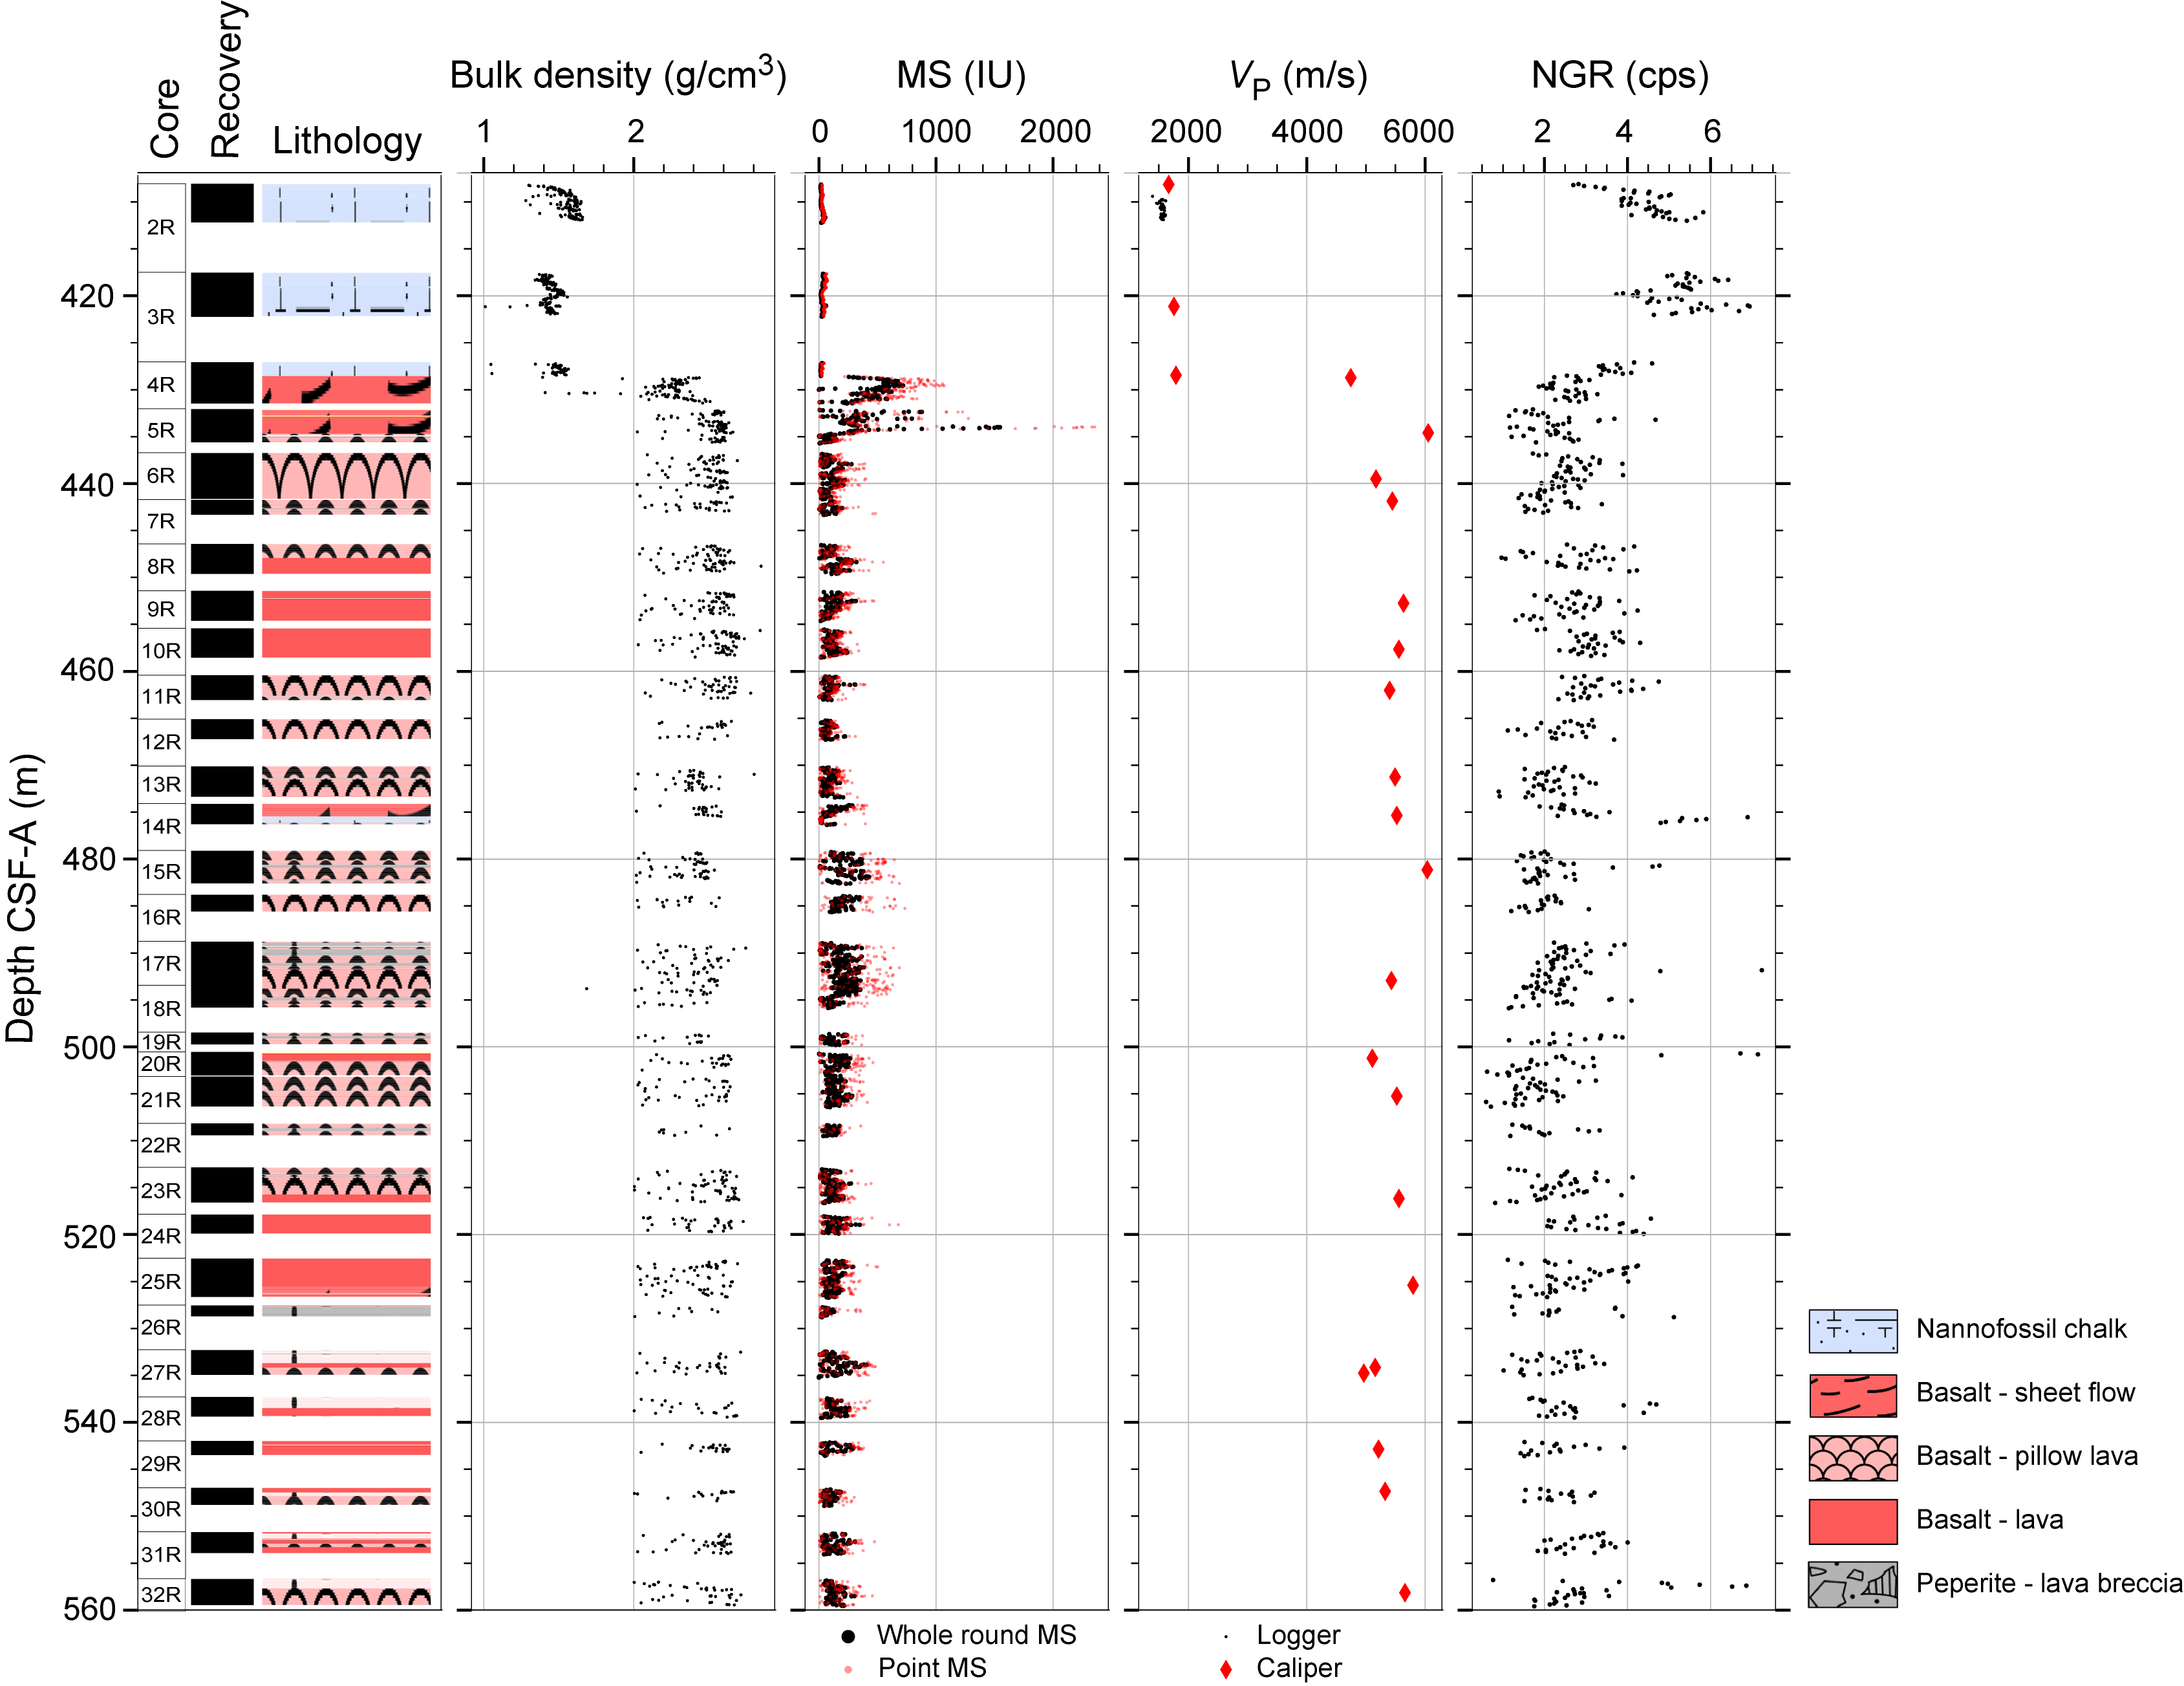
Figure F35. Physical properties measurements, Hole U1562B.
7.2. Split core measurements
The point MS (MSP) data show relative variations similar to those in the WRMSL MS data, and the absolute values for the sediments are alike, with the MSP values for the basalts slightly higher and lower in their relative extrema, probably because the WRMSL data integrate the volume of the whole core section (Figures F33, F34, F35). The changes in color reflectance properties in the sediments of Holes U1562A and U1562C are divided into stratigraphic intervals similar to those in the WRMSL profiles (Figures F36, F37). Two brownish layers (9 and 7 m thick) with higher R, a*, and b* values occur toward the top of the holes (0–30 m CSF-A), below which depth color changes are dampened and the general color trends to darker to 130 m CSF-A. The interval between 130 and 350 m CSF-A has pronounced color cycles of varying thicknesses between lighter and darker intervals (submeter to multimeter scales). Just above the contact with basalt (350–430 m CSF-A), the sediments are noticeably lighter in color than the sediments above.
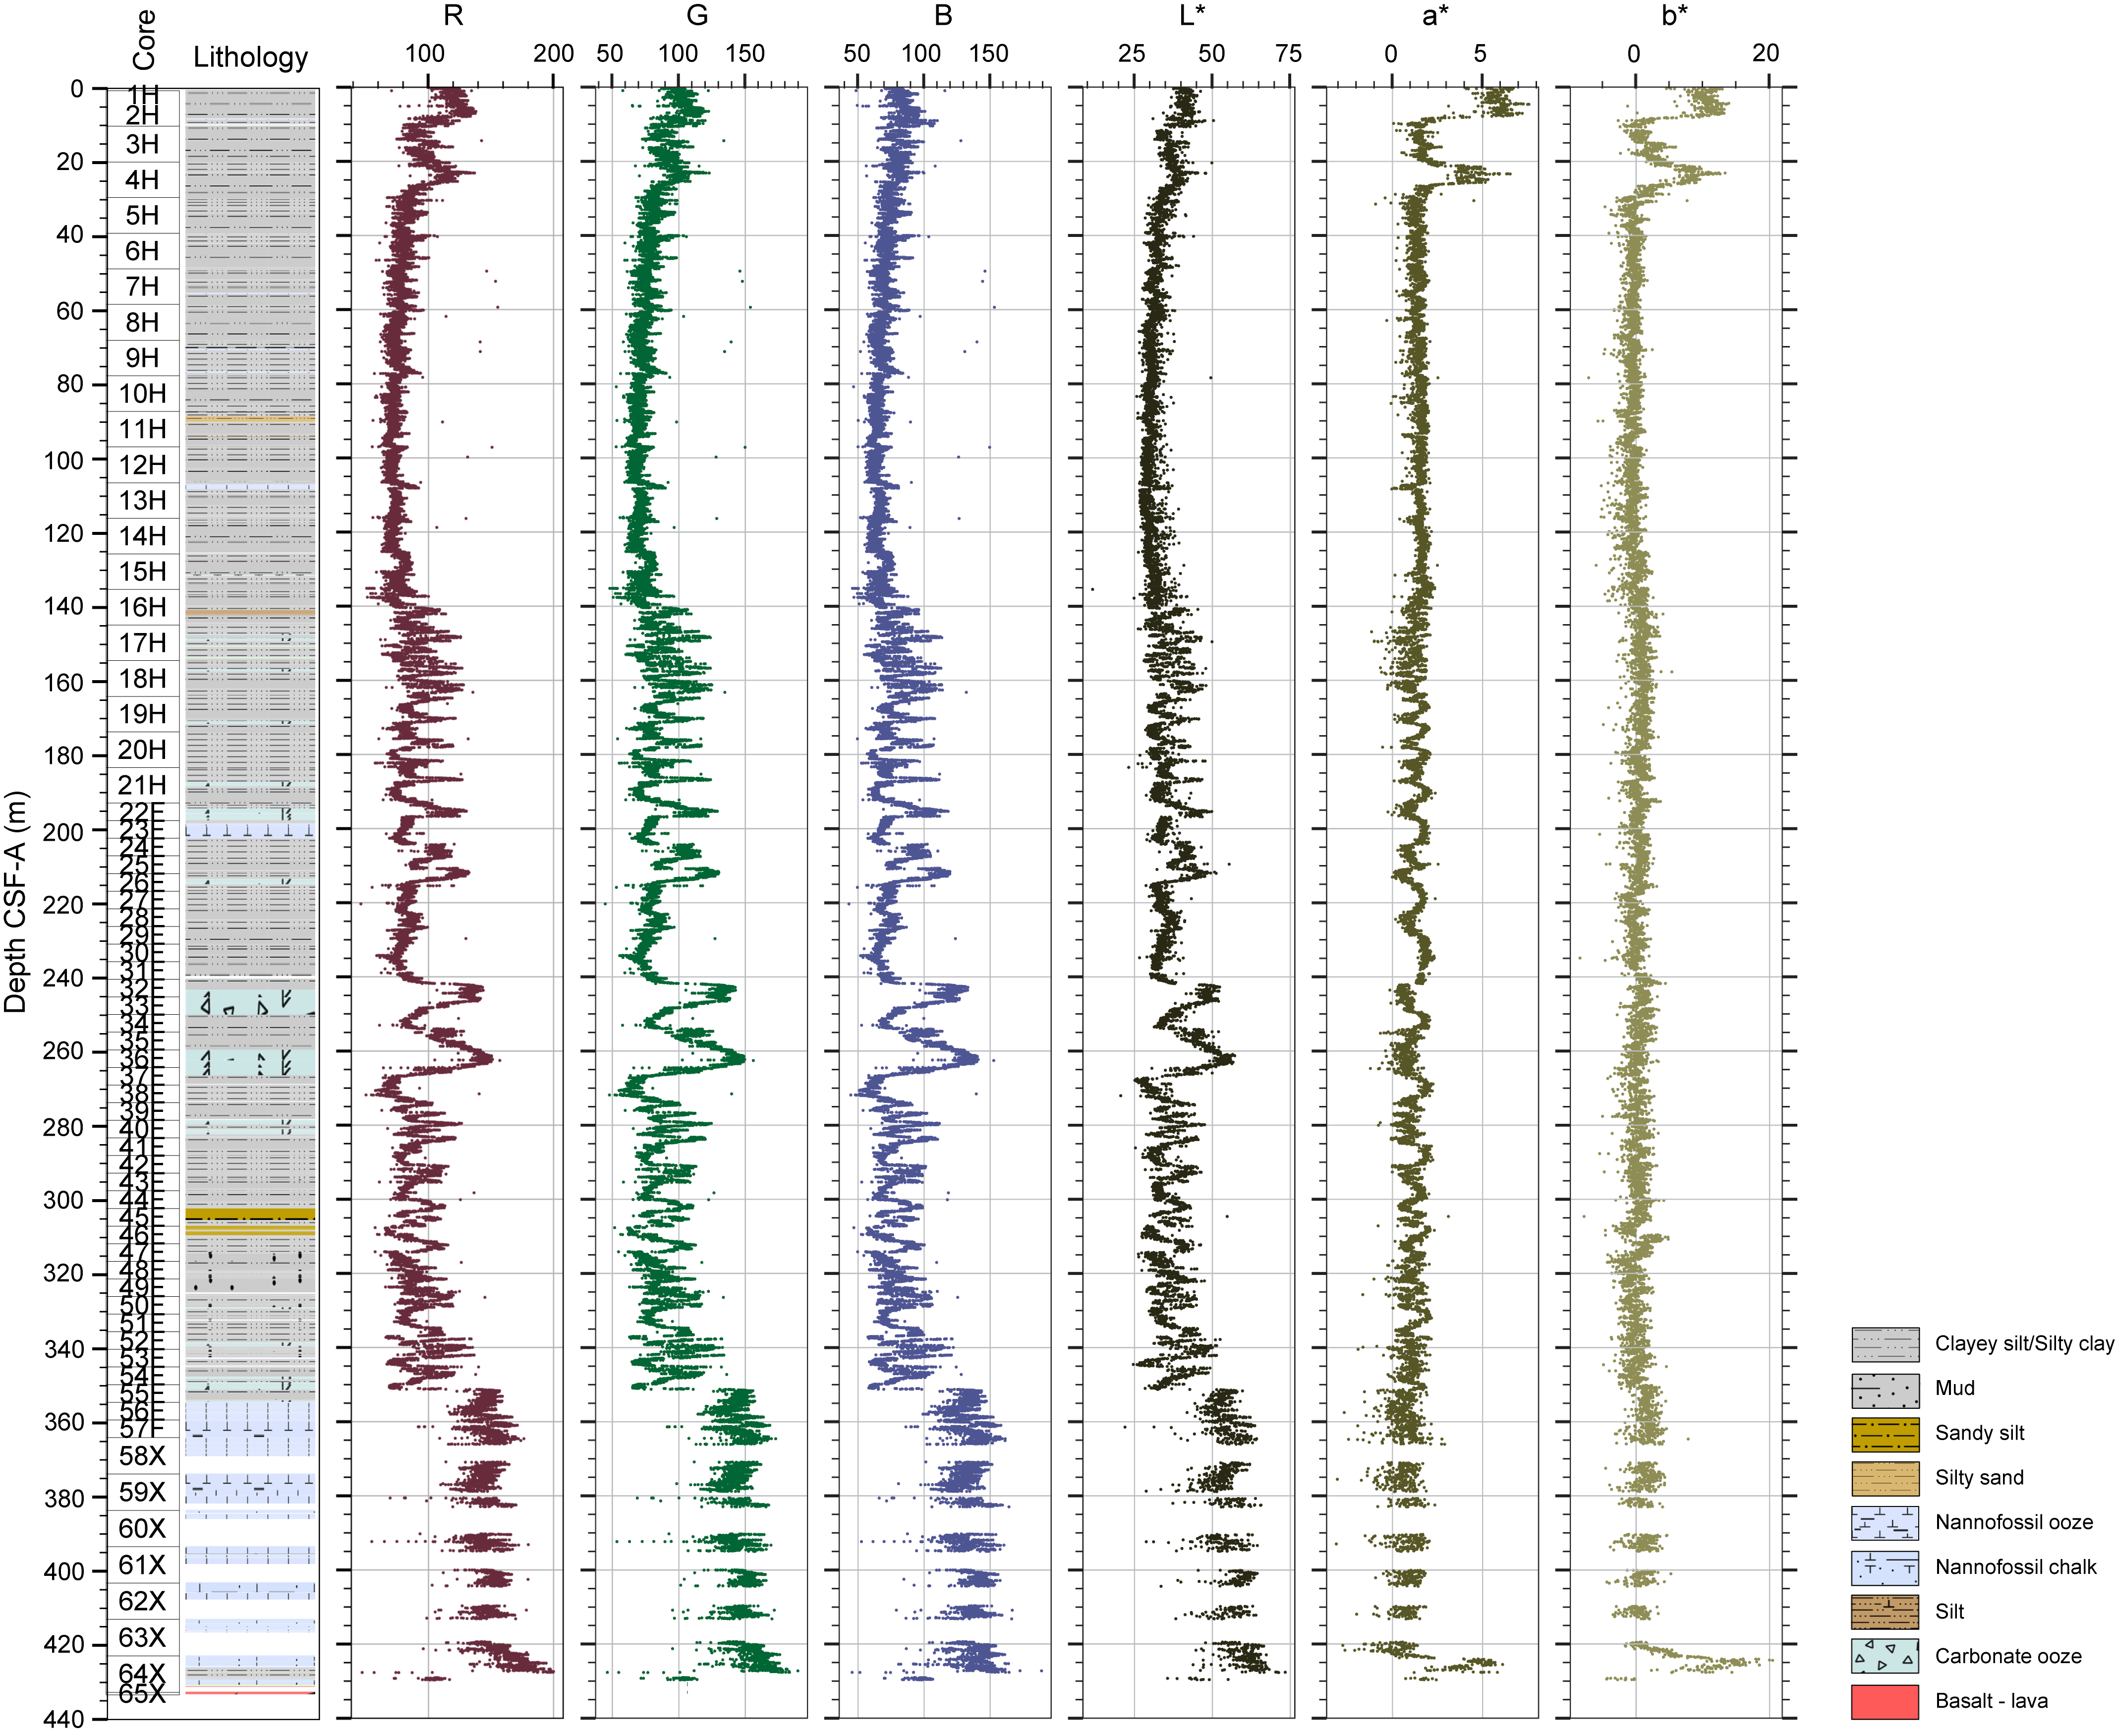
Figure F36. Archive-half colorimetry and reflectance measurements, Hole U1562A.
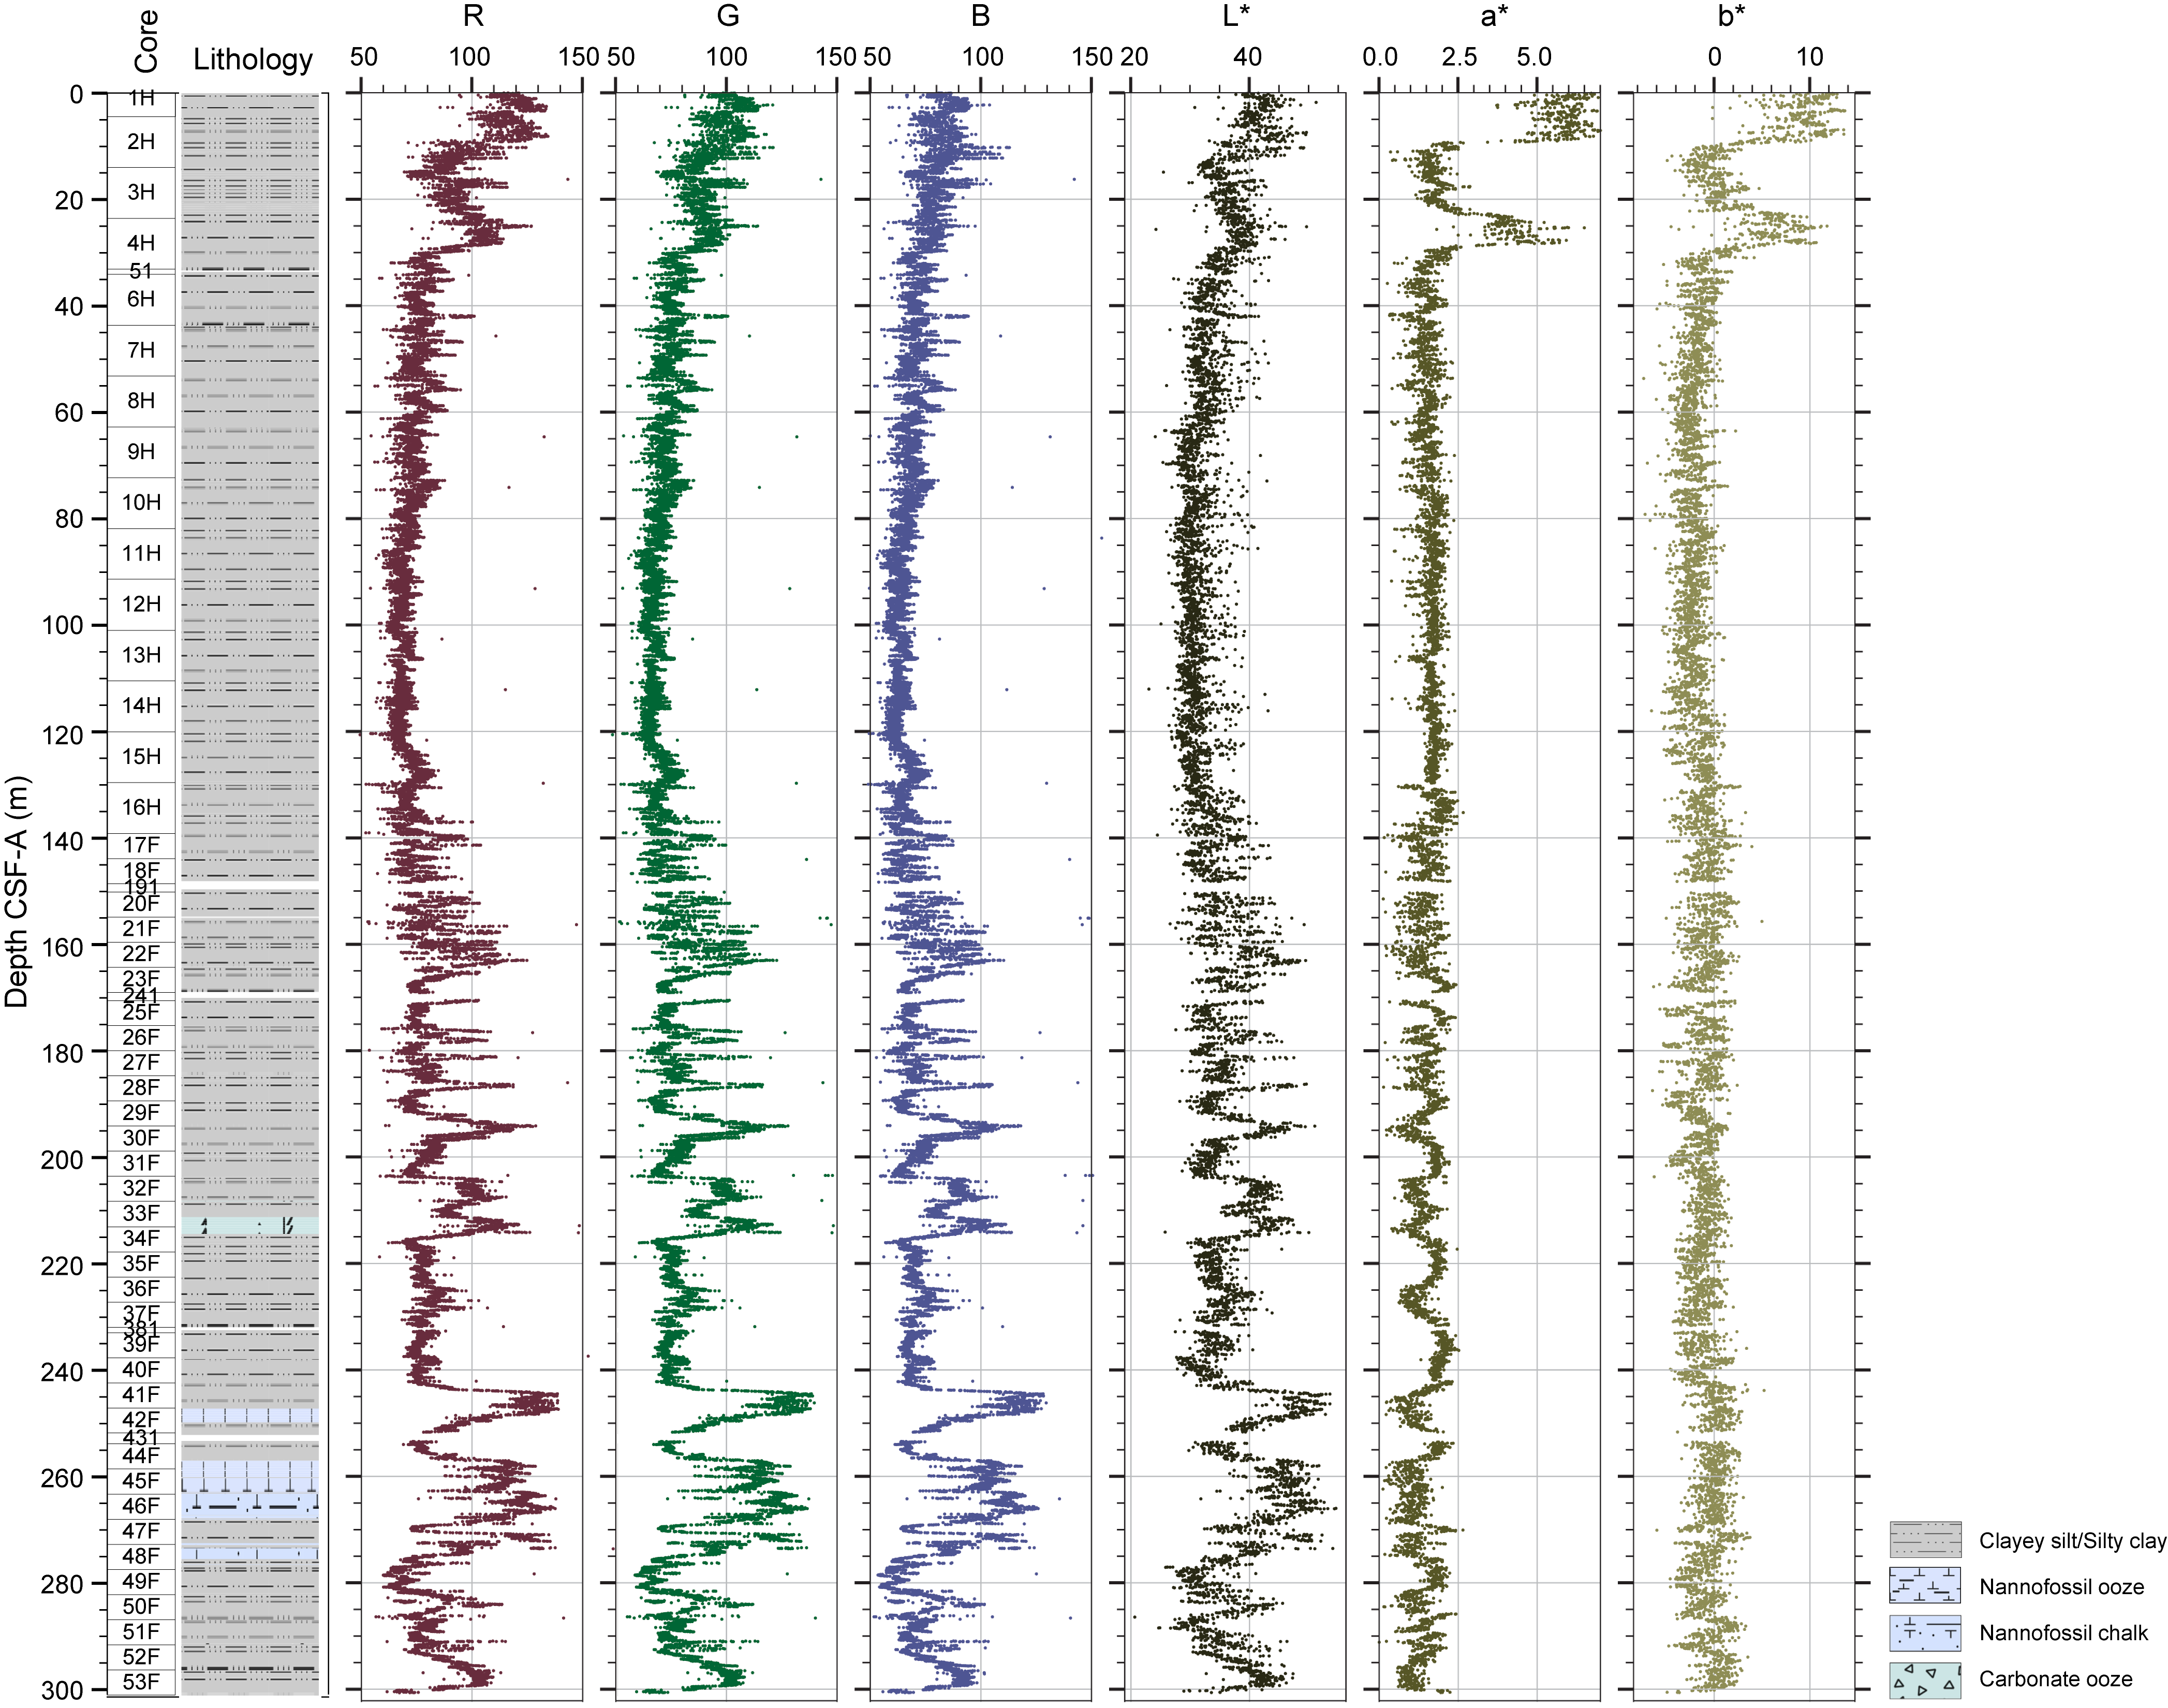
Figure F37. Archive-half colorimetry and reflectance measurements, Hole U1562C.
The presence of significant voids and uneven surfaces in the basalt sections of Hole U1562B leads to noisy color reflectance data (Figure F38). In the basement, the sedimentary and peperite units show up clearly in color records, with higher R, G, B, a*, and b* values (Figure F15). The L* reflectance record shows intervals of lower values, but a systematic relationship with basalt morphology is not observed.
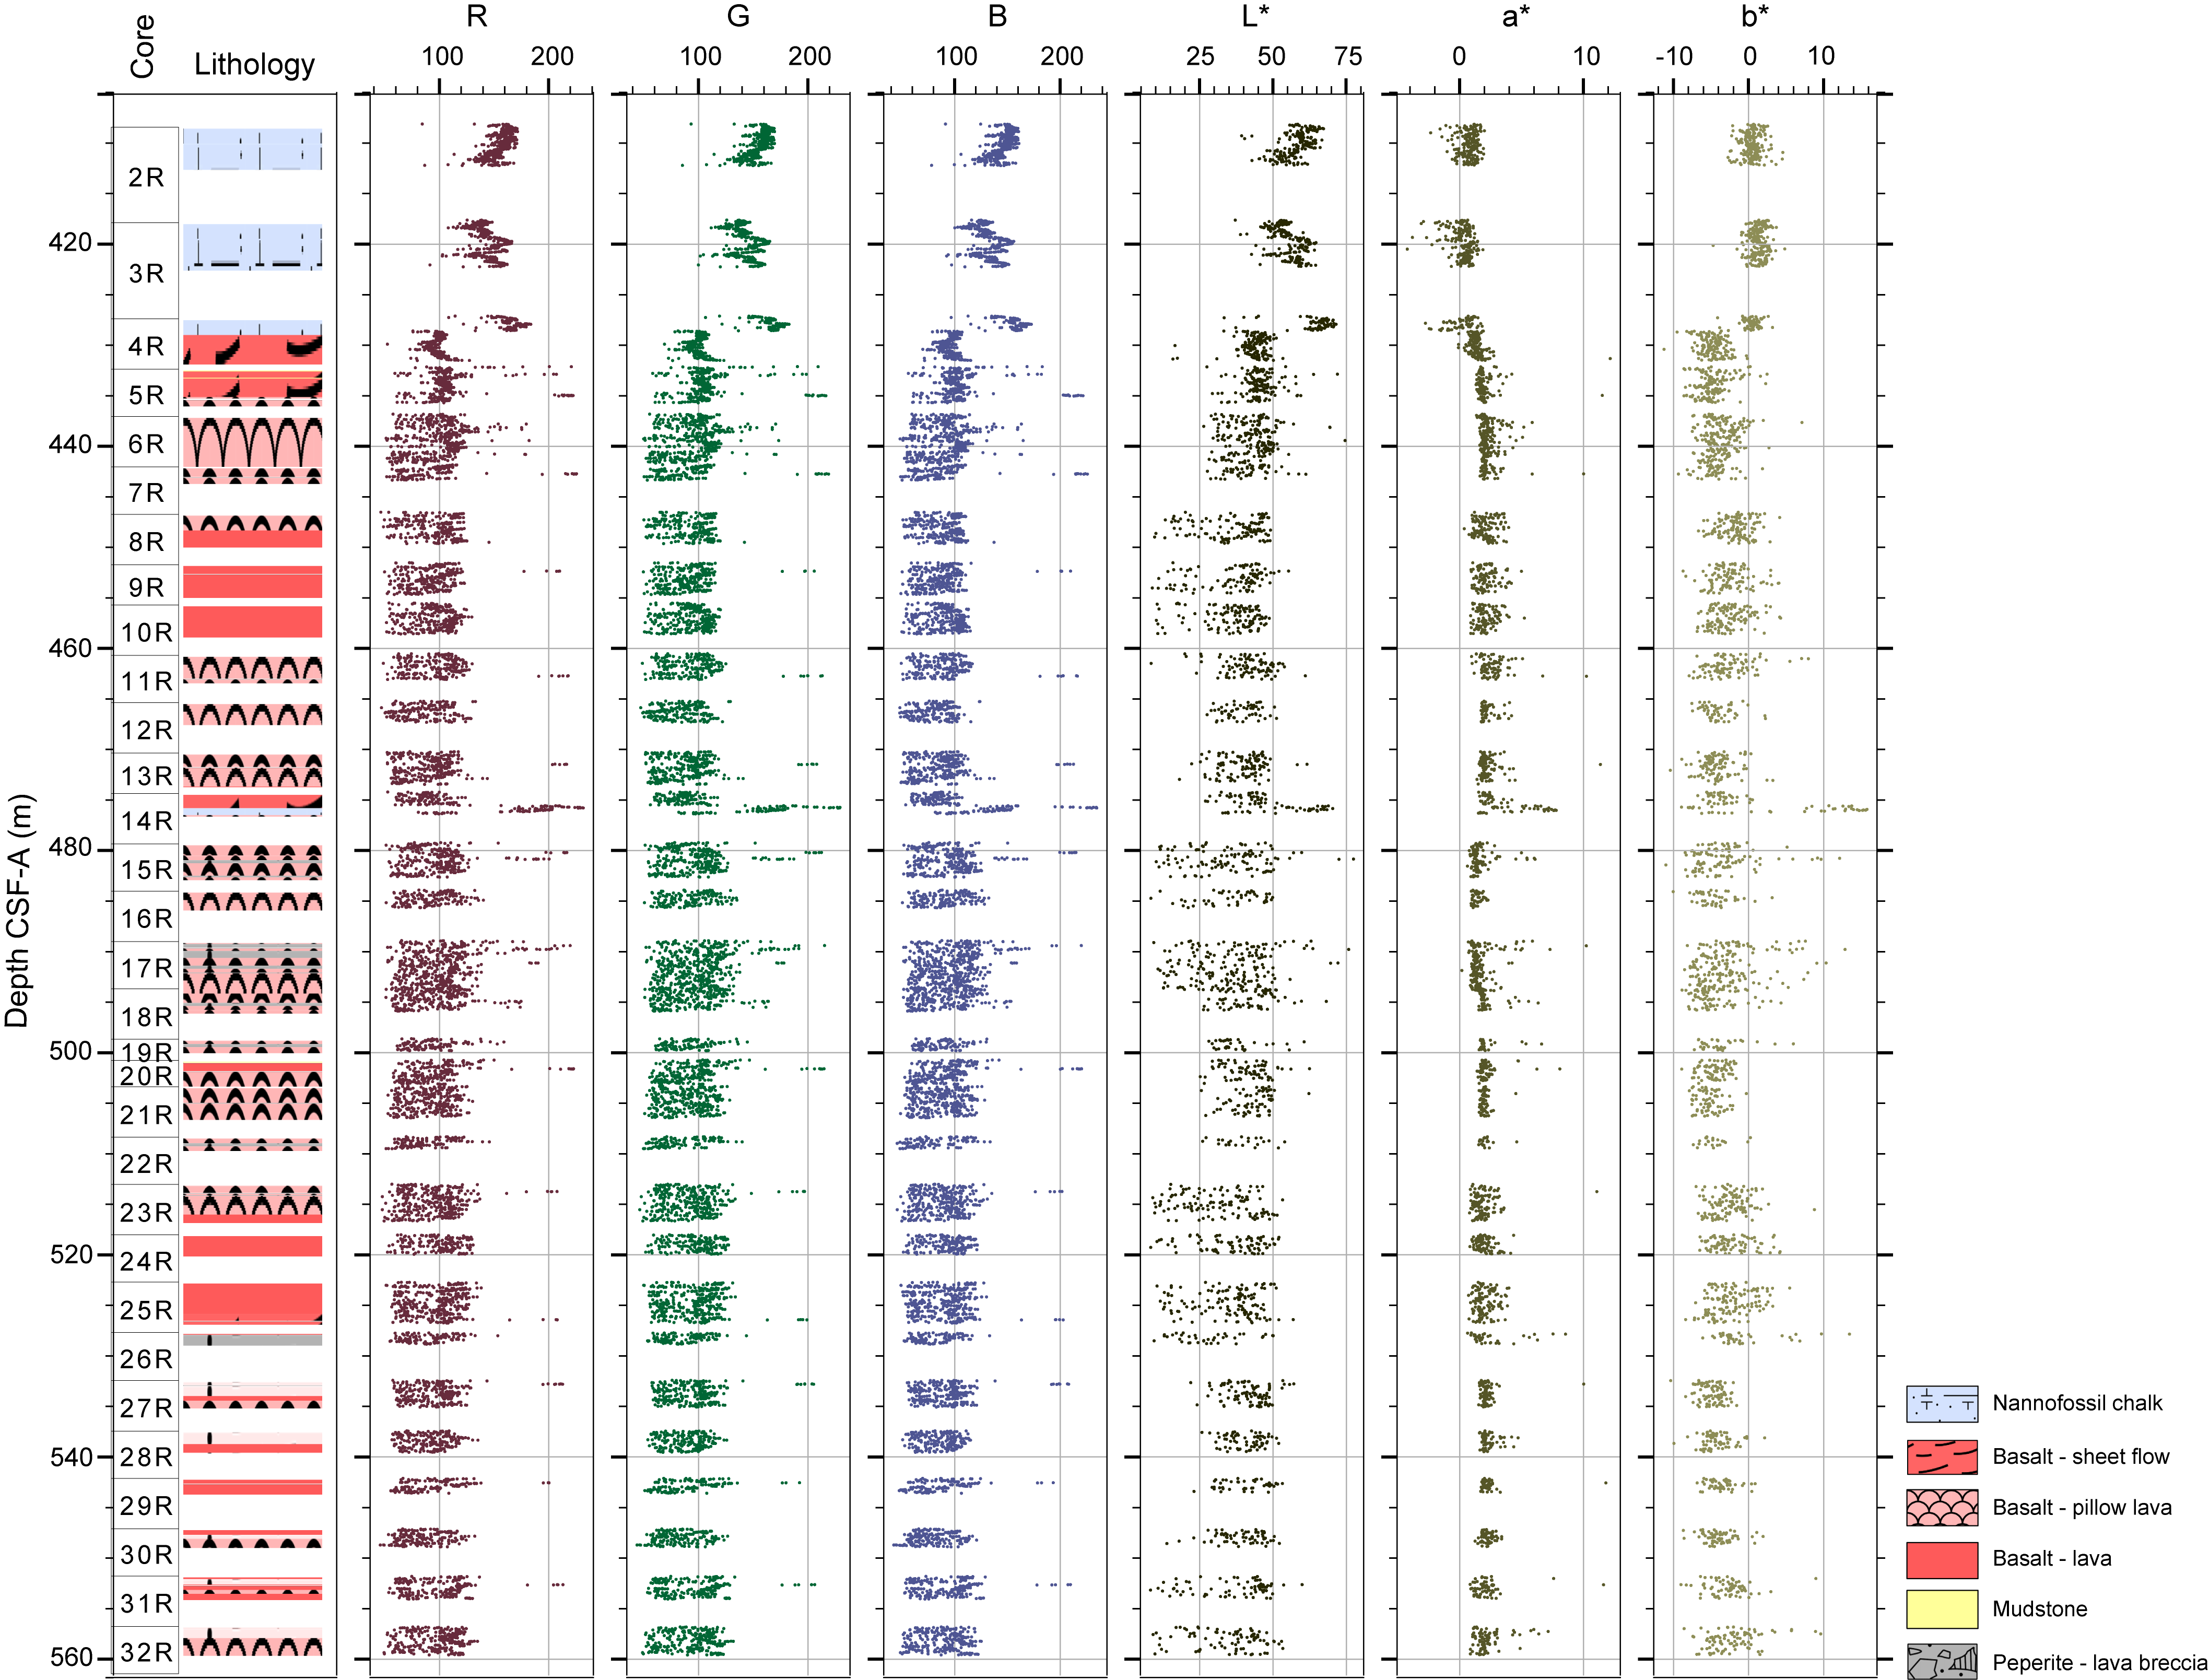
Figure F38. Archive-half colorimetry and reflectance measurements, Hole U1562B.
7.3. Discrete measurements
7.3.1. P-wave velocity
VP caliper (PWC) values (from measurements made in the x-direction, perpendicular to the core long axis) for sediments from Hole U1562B are about 1700 m/s, and for basalts they vary between 4725 and 6053 m/s (Figure F35). Sedimentary VP values in Hole U1562C average around 1500 m/s (Figure F34). One point measured in Section 395-U1562C-16H-6, 53 cm (137.65 m CSF-A), shows a higher value of 1798 m/s, which is consistent with the higher velocity measurements measured using the WRMSL in this interval. This observation might indicate condensation at a lithologic transition that might also be a disconformity (see Lithostratigraphy and Age model).
7.3.2. Moisture and density
Moisture and density (MAD) samples were measured on sediment cores from Hole U1562A at approximately one per 10 m. Bulk density values are shown in Figure F33 alongside the WRMSL bulk density estimates. MAD estimates of bulk density values in Hole U1562A range 1.4–1.7 g/cm3 and are in good agreement with GRA bulk density estimates from the WRMSL. Porosity ranges 63–81 vol% with an average of 70 vol% and a slightly decreasing trend downhole from around 80 to 65 vol%. Grain density varies from 2.6 to 2.9 g/cm3 with an average of 2.7 g/cm3 and shows a decreasing trend from around 2.9 to 2.6 g/cm3.
7.3.3. Thermal conductivity
Thermal conductivity measurements were made on working-half sections at a variable resolution for the different holes (Table T10). Thermal conductivity is typically 0.75–1.20 W/(m·K) for the sediments from Holes U1562A and U1562C and 1.40–1.80 W/(m·K) for Hole U1562B. Values slightly increase with depth for the sedimentary units and are relatively constant for the basement rocks. Thermal conductivity measurements of the sediments are combined with downhole formation temperature measurements to estimate heat flow (see Downhole measurements; Figure F57).
8. Stratigraphic correlation
The stratigraphic correlation reported here includes the main sedimentary targets of coring from Holes 395C-U1562A and 395-U1562C. Information from Hole U1562A was used to inform the position of the first core for Hole U1562C. MS data from whole-round measurements were used for near real-time correlation because they often reveal strong contrasts between lithologic sequences. These data were obtained shortly after the core is recovered on deck at 5.0 cm resolution using the Special Task Multisensor Logger (STMSL) to guide operational decisions. The whole-round MS data collected at 2.5 cm resolution using the WRMSL were used to construct the final splices. An overview of the MS data from Holes U1562A and U1562C and the wireline log data from Hole 395C-U1562B are presented in Figure F39.
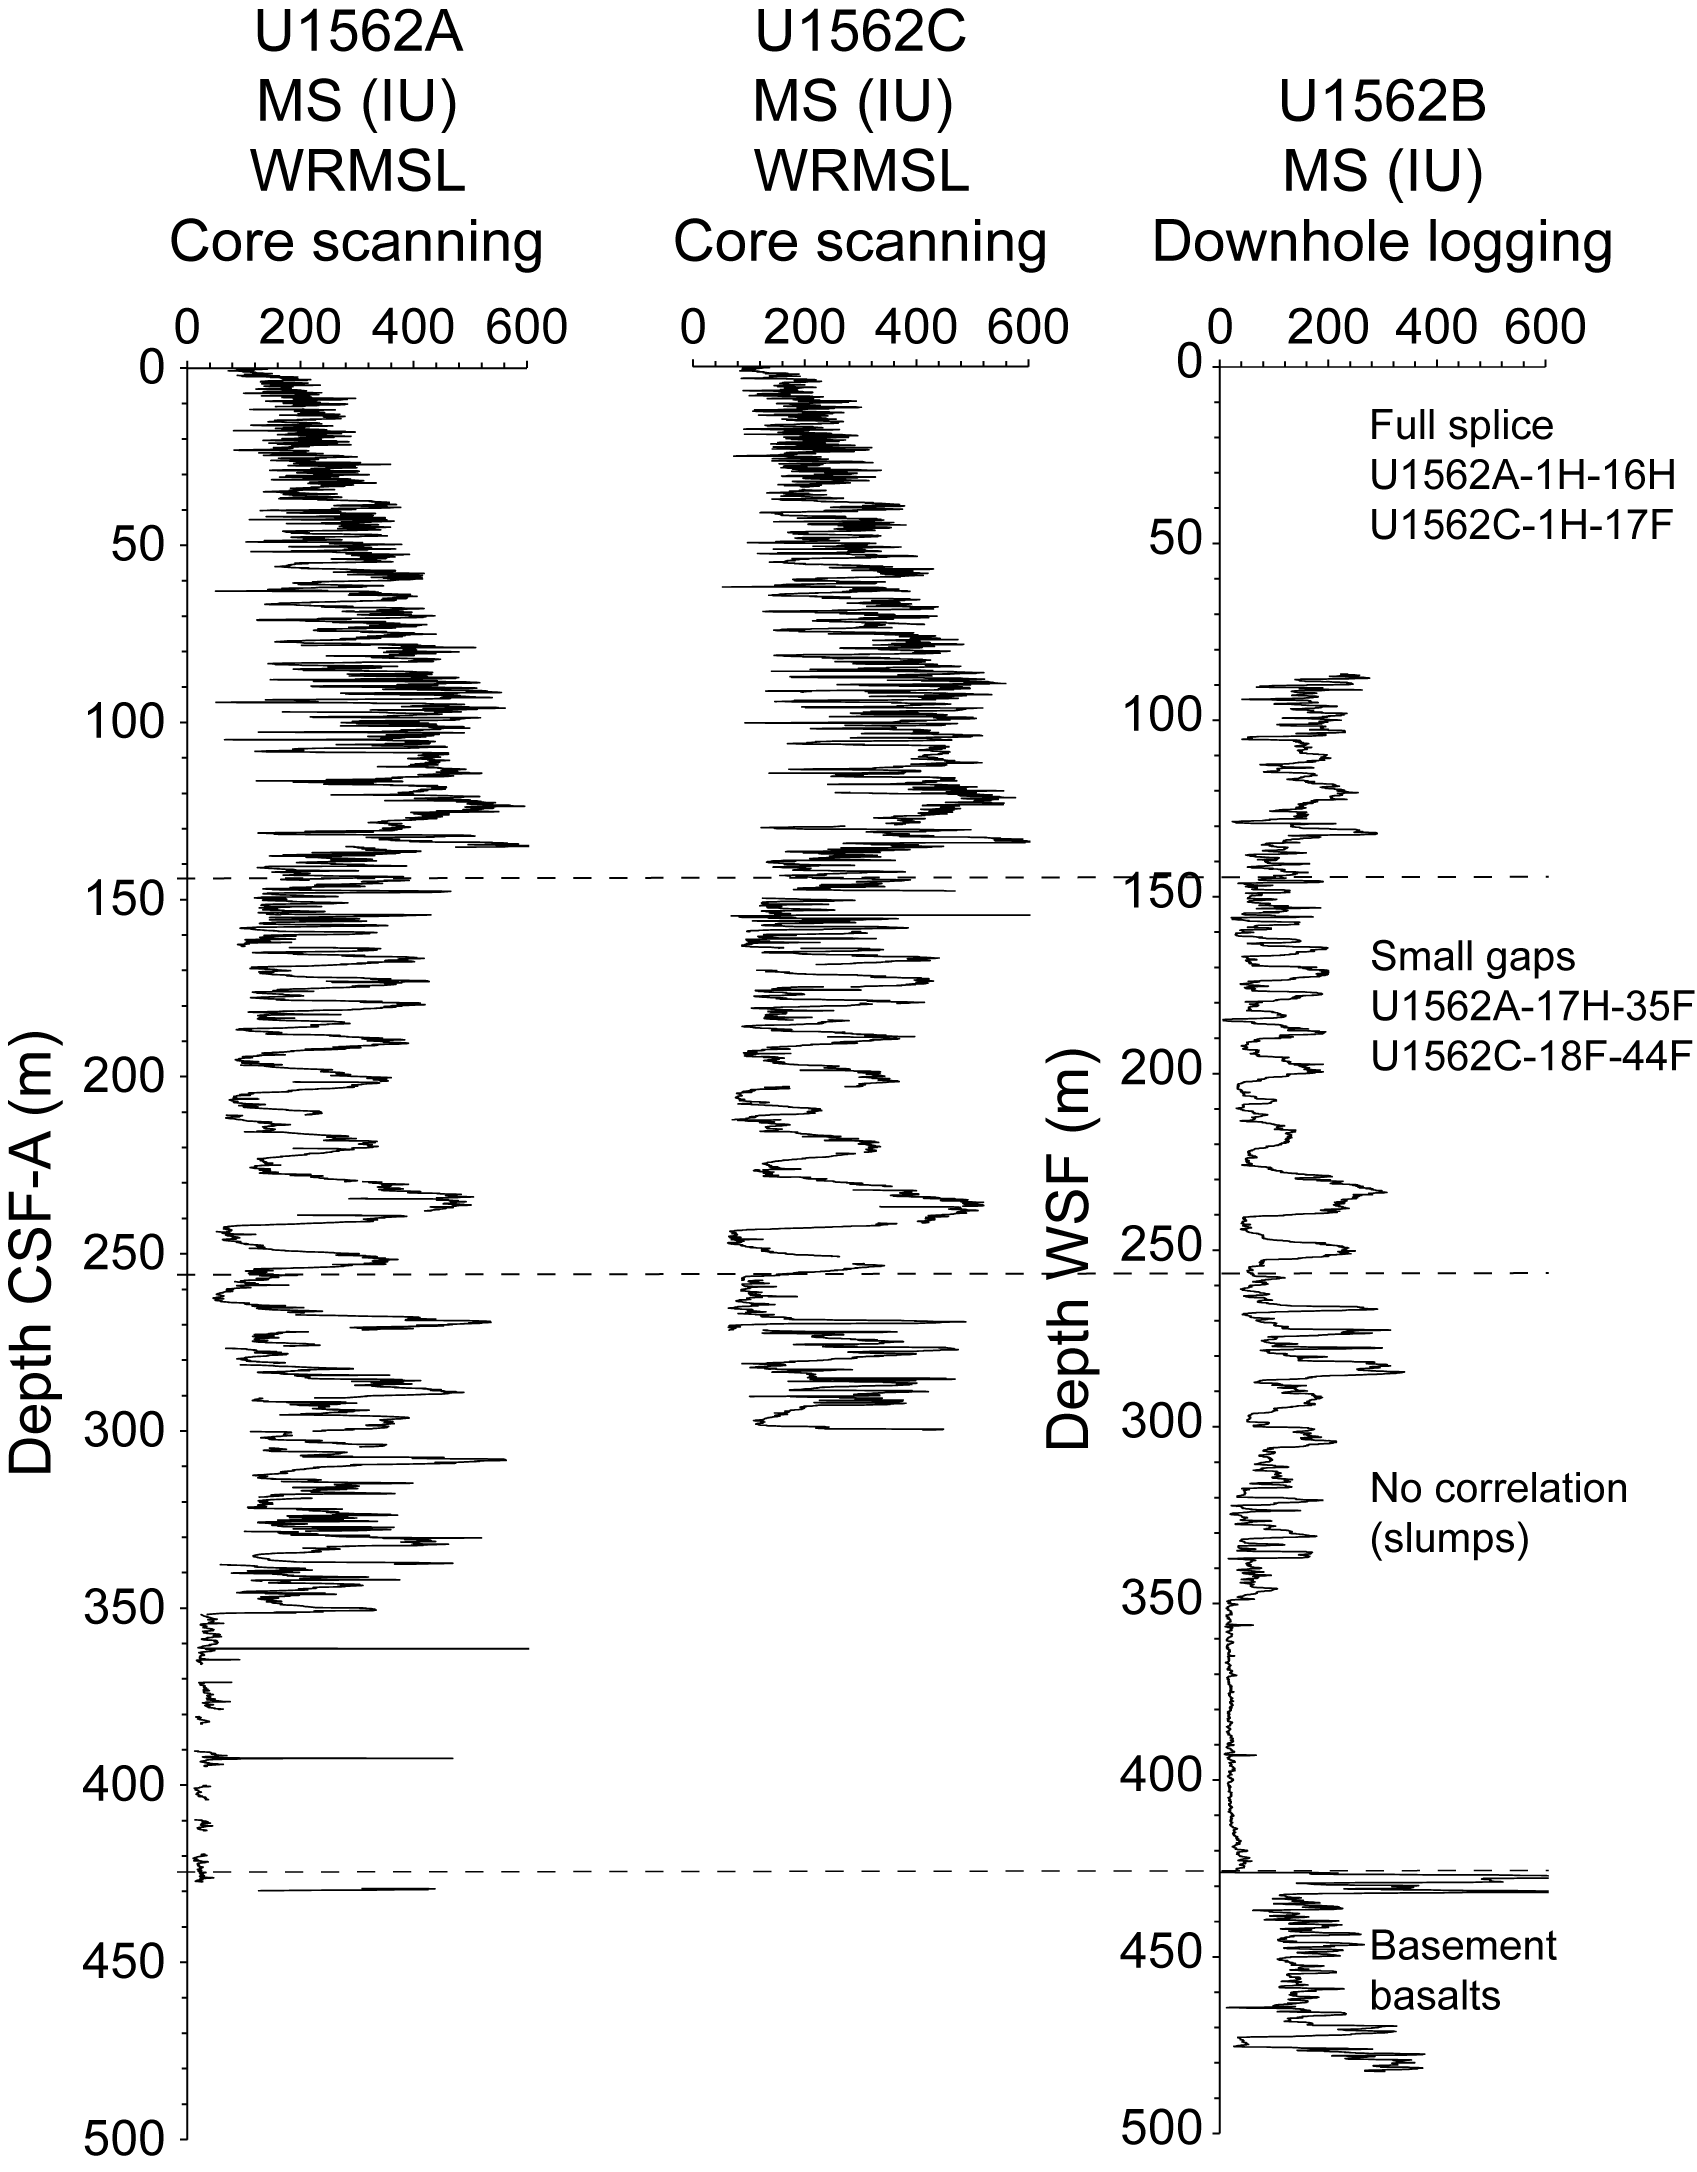
Figure F39. WRMSL and wireline logging MS.
8.1. Correlation between holes
Core 395-U1562C-1H recovered the mudline plus a length of 5.37 m, and this initial offset allowed filling gaps in recovery in Hole U1562A. Correlation was achieved without gaps through Cores 395C-U1562A-16H (144.63 m CSF-A; 155.125 m core composite depth below seafloor, Method A [CCSF-A]) and 395-U1562C-17F (144.22 m CSF-A) (Figure F40). The lower extent of these cores was too close to alignment to be able to tie on to any of the next cores, leading to a correlation gap. Based on the pattern of MS variability and correlation with the downhole wireline logging MS data collected in Hole U1562B, the gap is estimated to be approximately 1 m. Similar small gaps can be found between Cores 395-U1562C-20F and 395C-U1562A-18H and between Cores 395-U1562C-22F and 395C-U1562A-19H (Figure F41). Despite the small gaps, this interval can still be tied with some confidence based on the broad cyclical patterns and the comparison with wireline logging MS data from Hole U1562B. In Cores 395-U1562C-19H through 35F and 395C-U1562A-25F through 35F, ties can be made to ~280 m CCSF-A (Figure F42). Below Core 395C-U1562A-35F, correlation between holes becomes difficult, probably because of the presence of disrupted sedimentary sequences (see Lithostratigraphy).
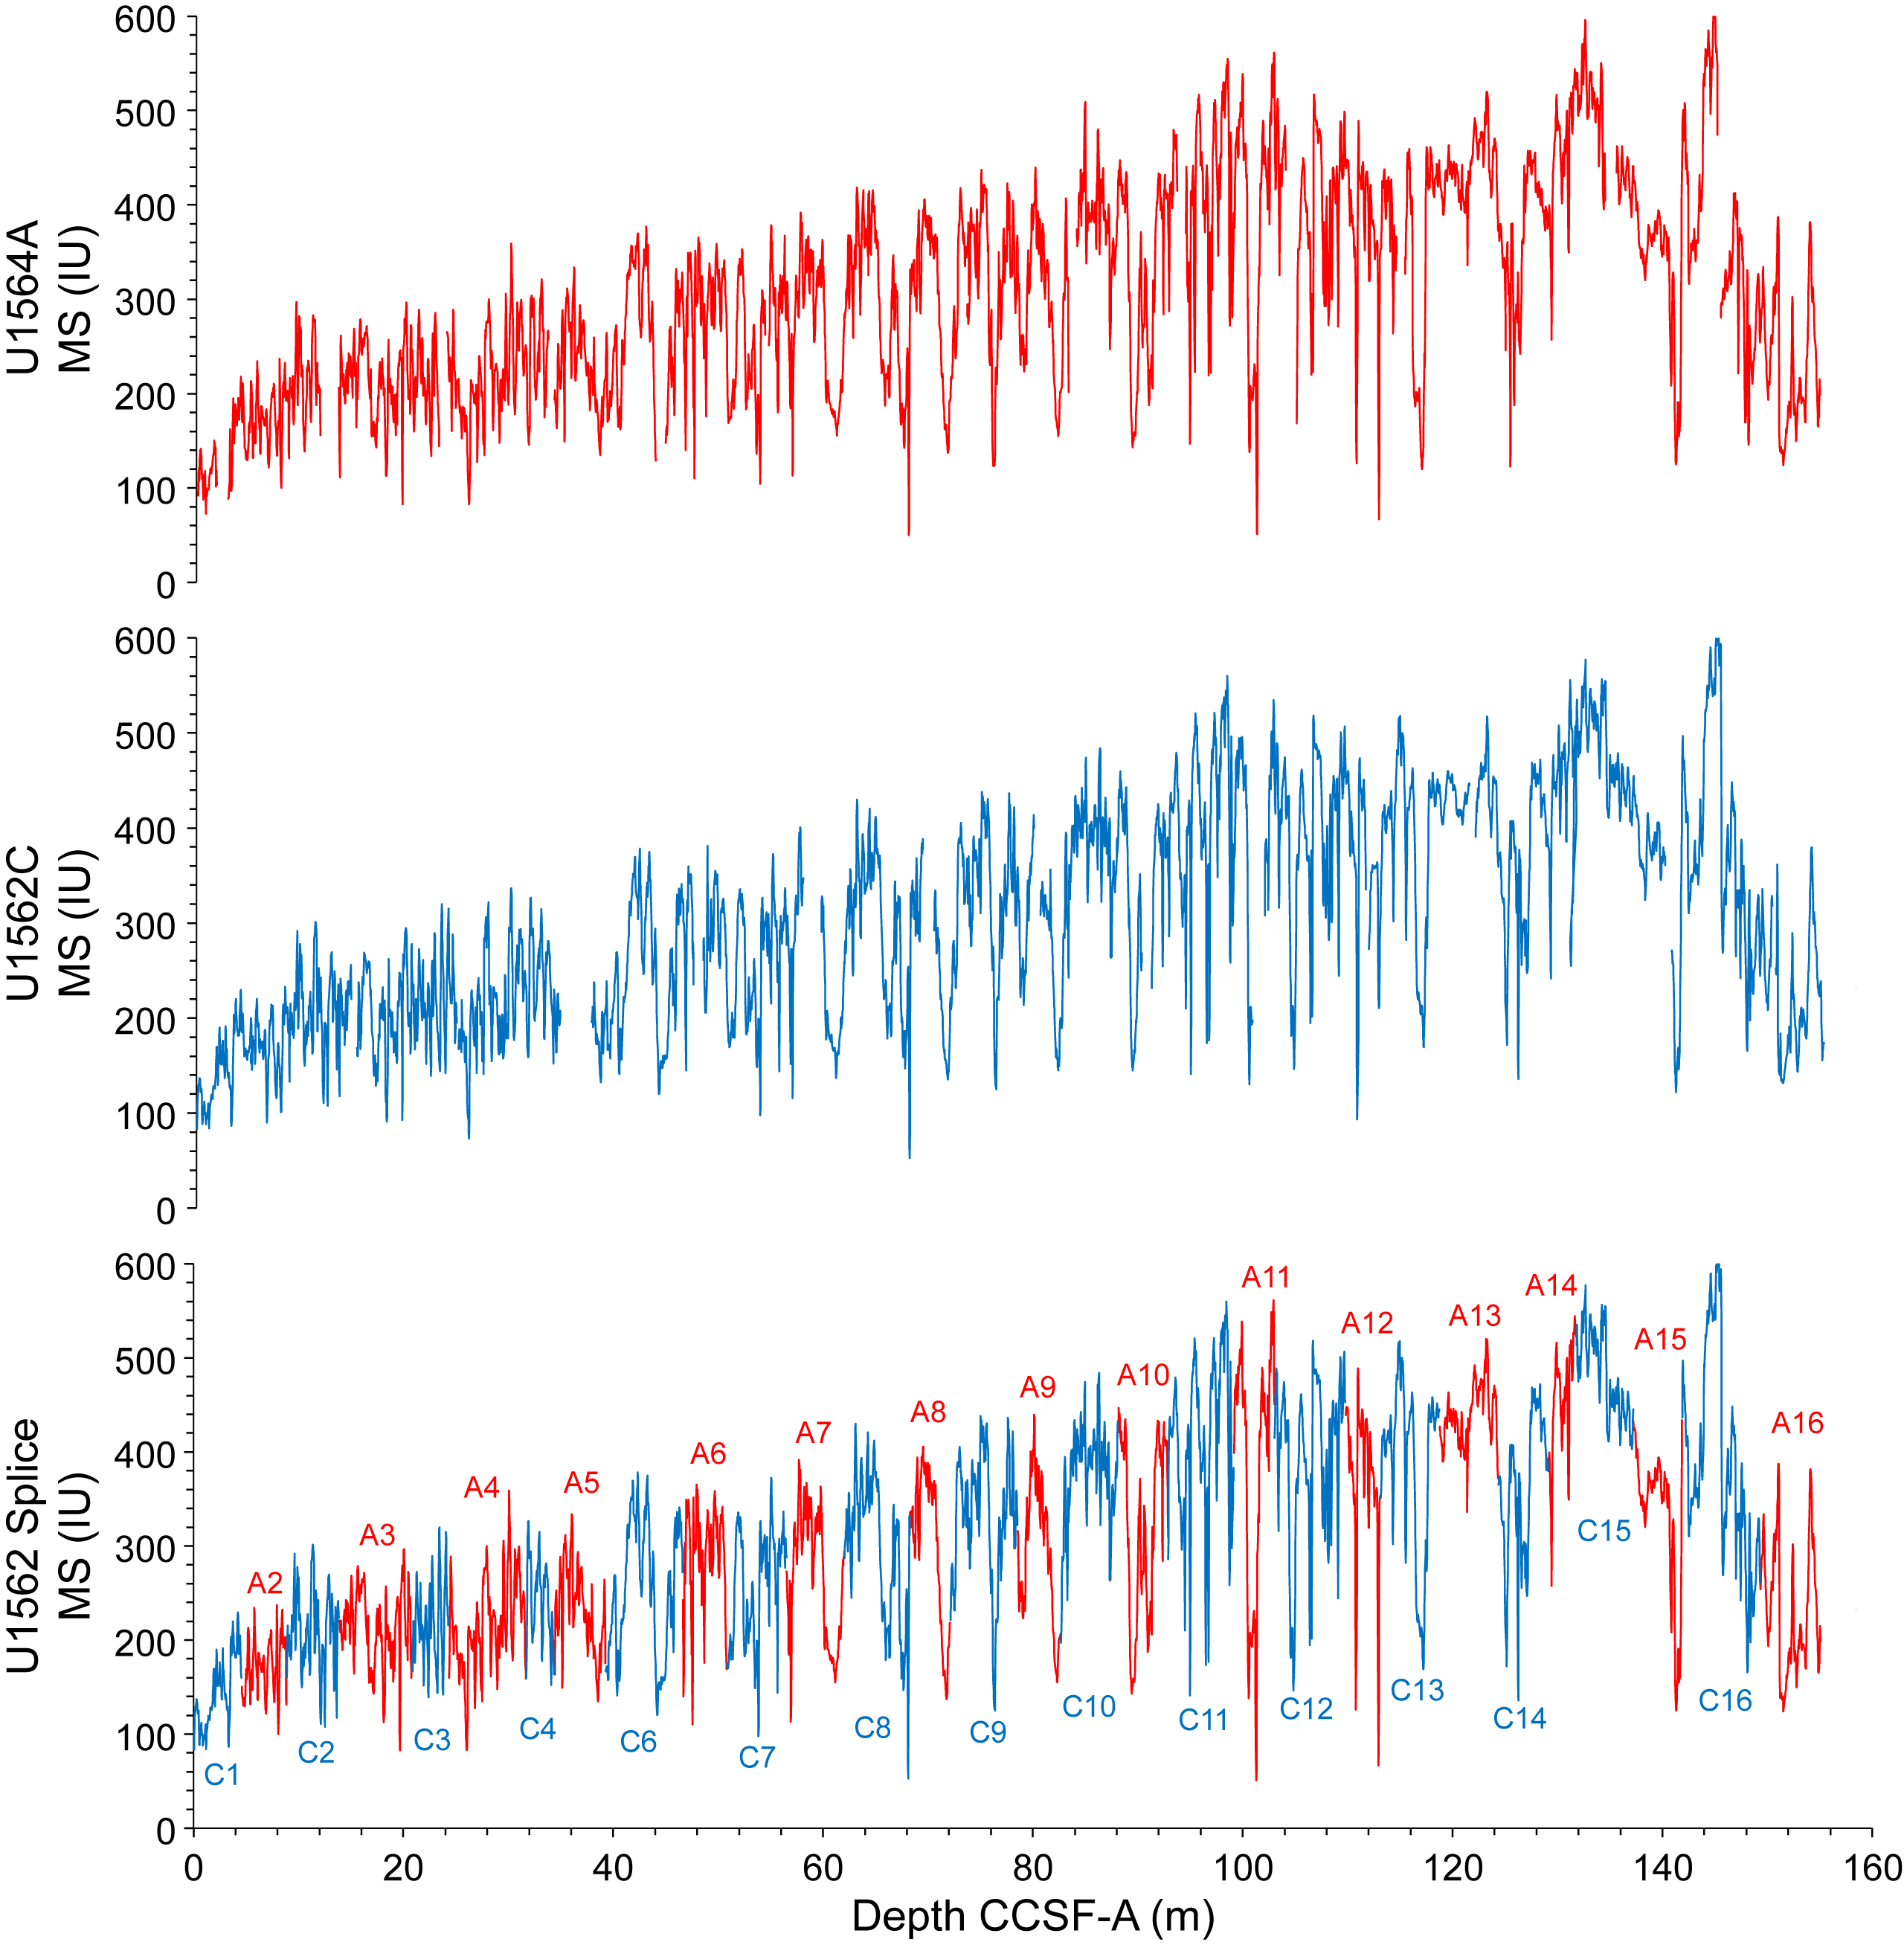
Figure F40. Splice for 0–160 m CCSF-A.
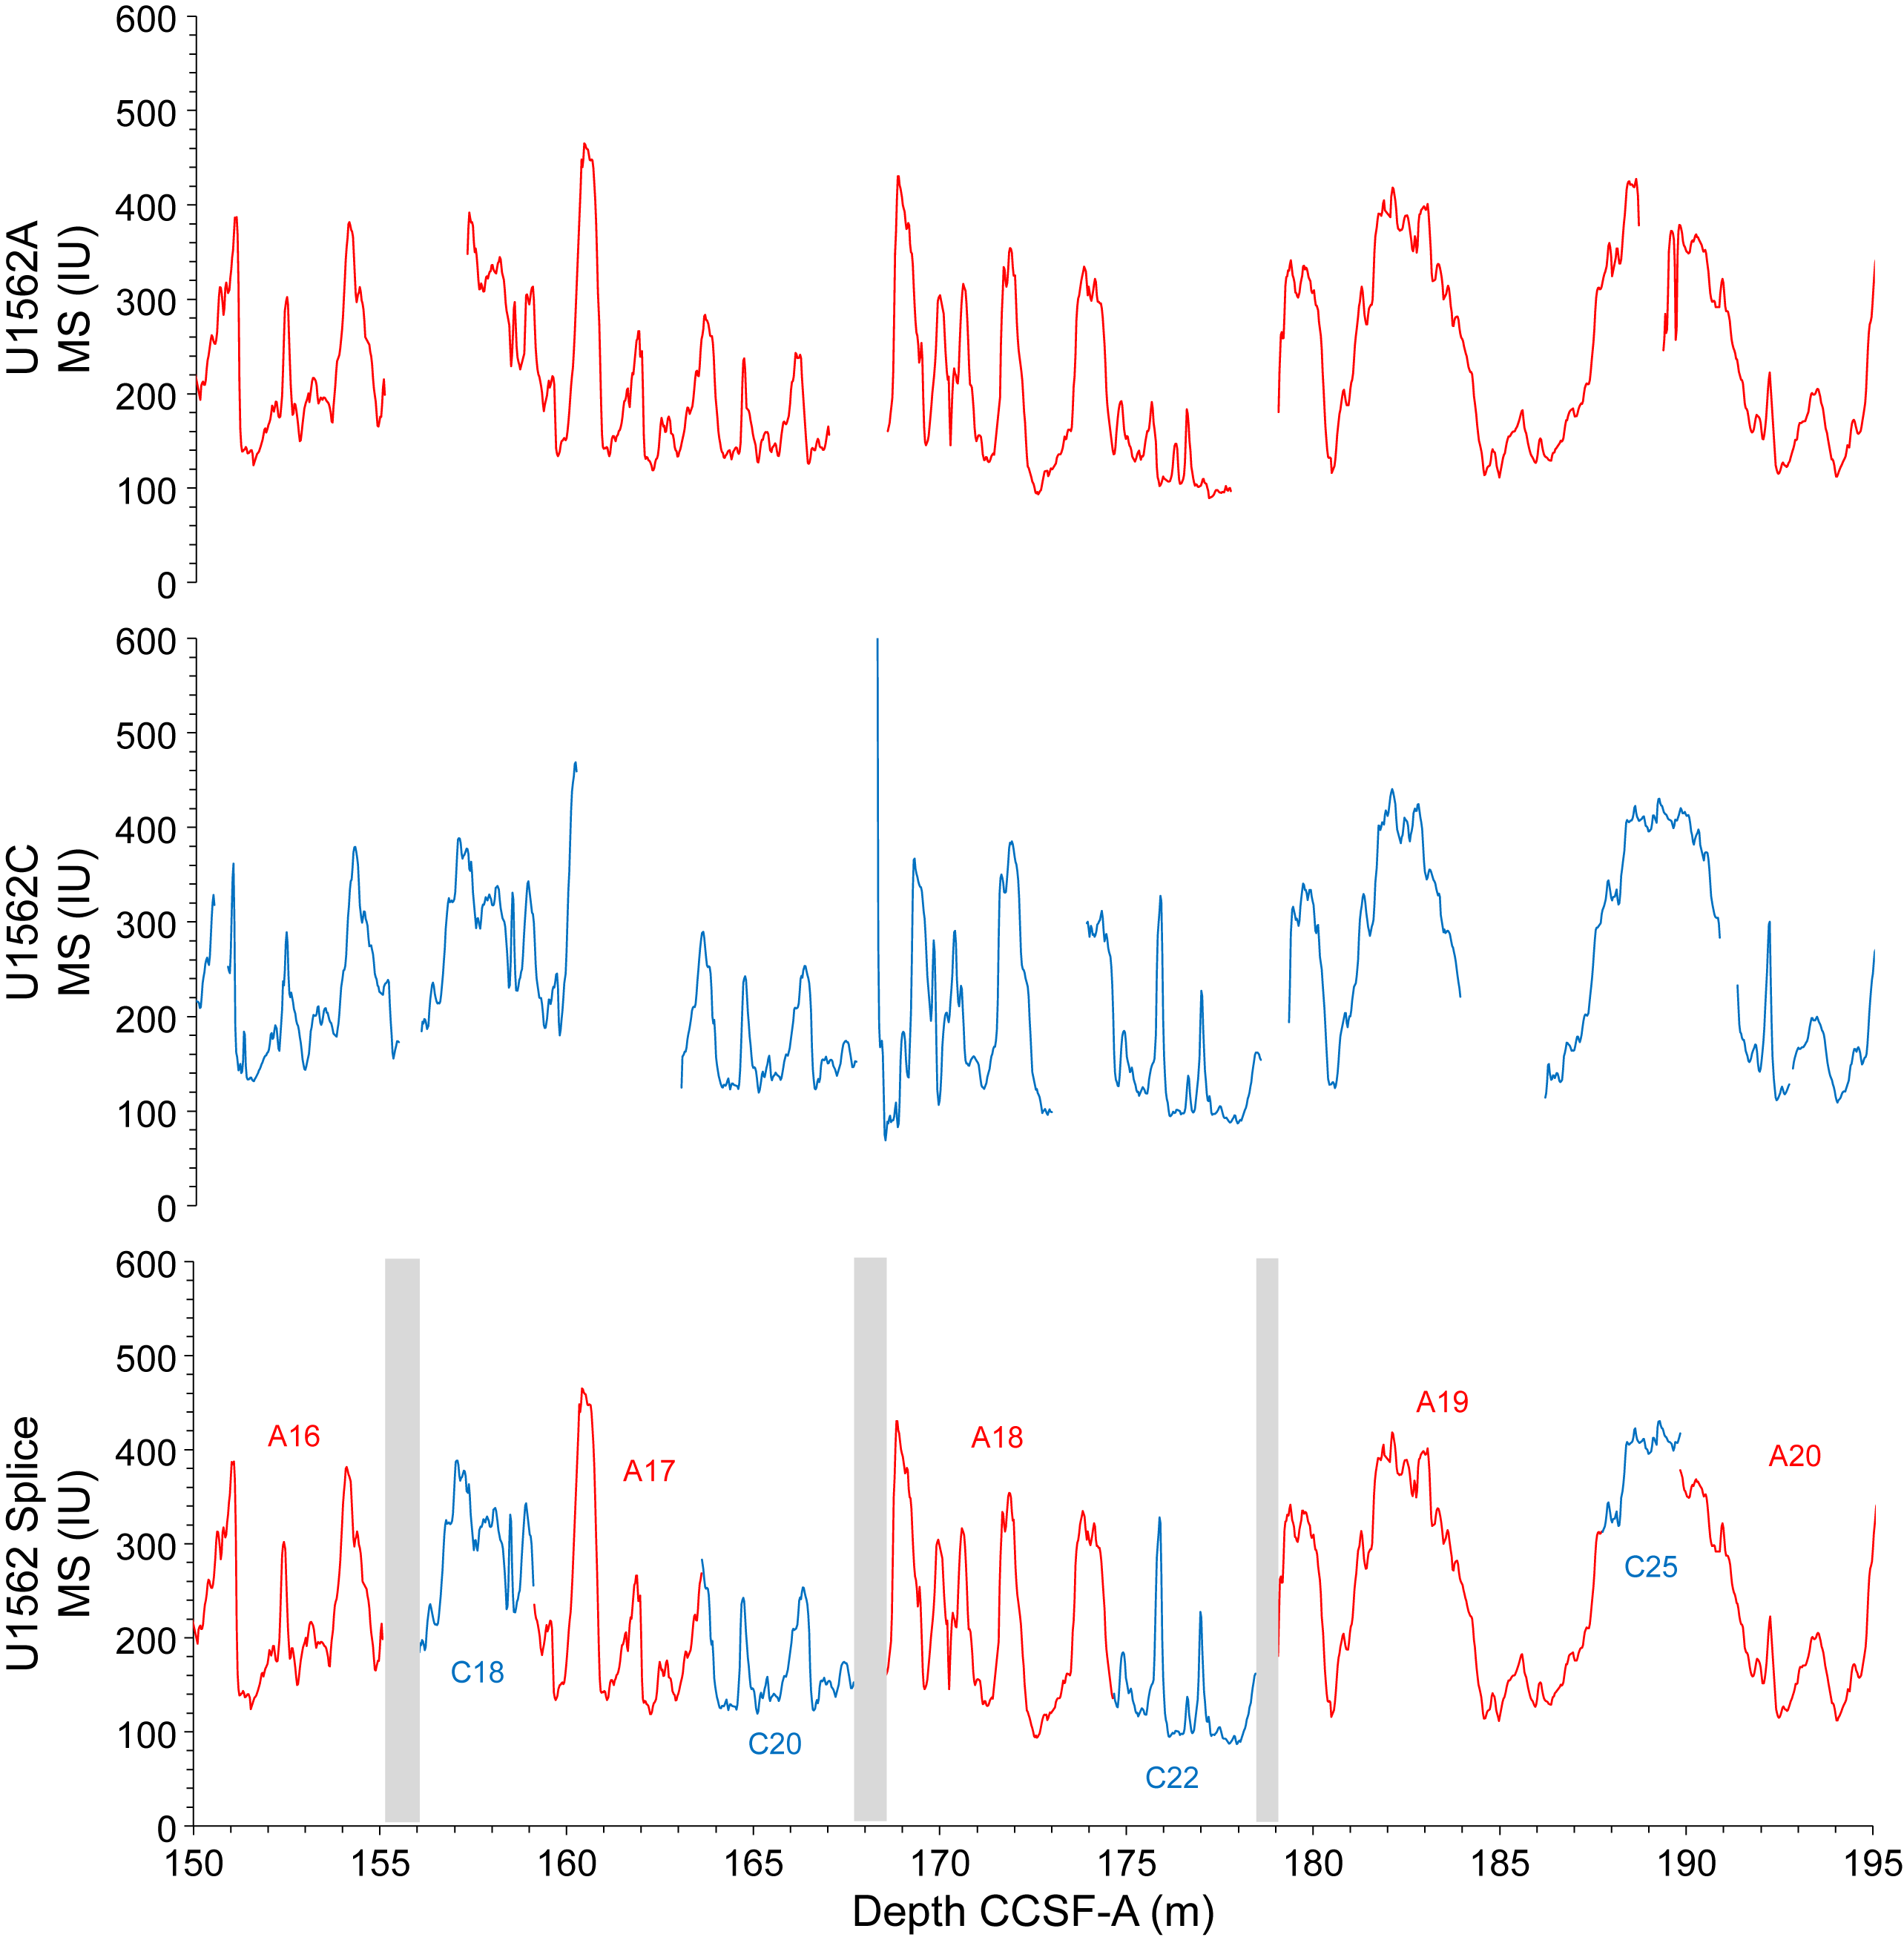
Figure F41. Splice for 155–195 m CCSF-A.
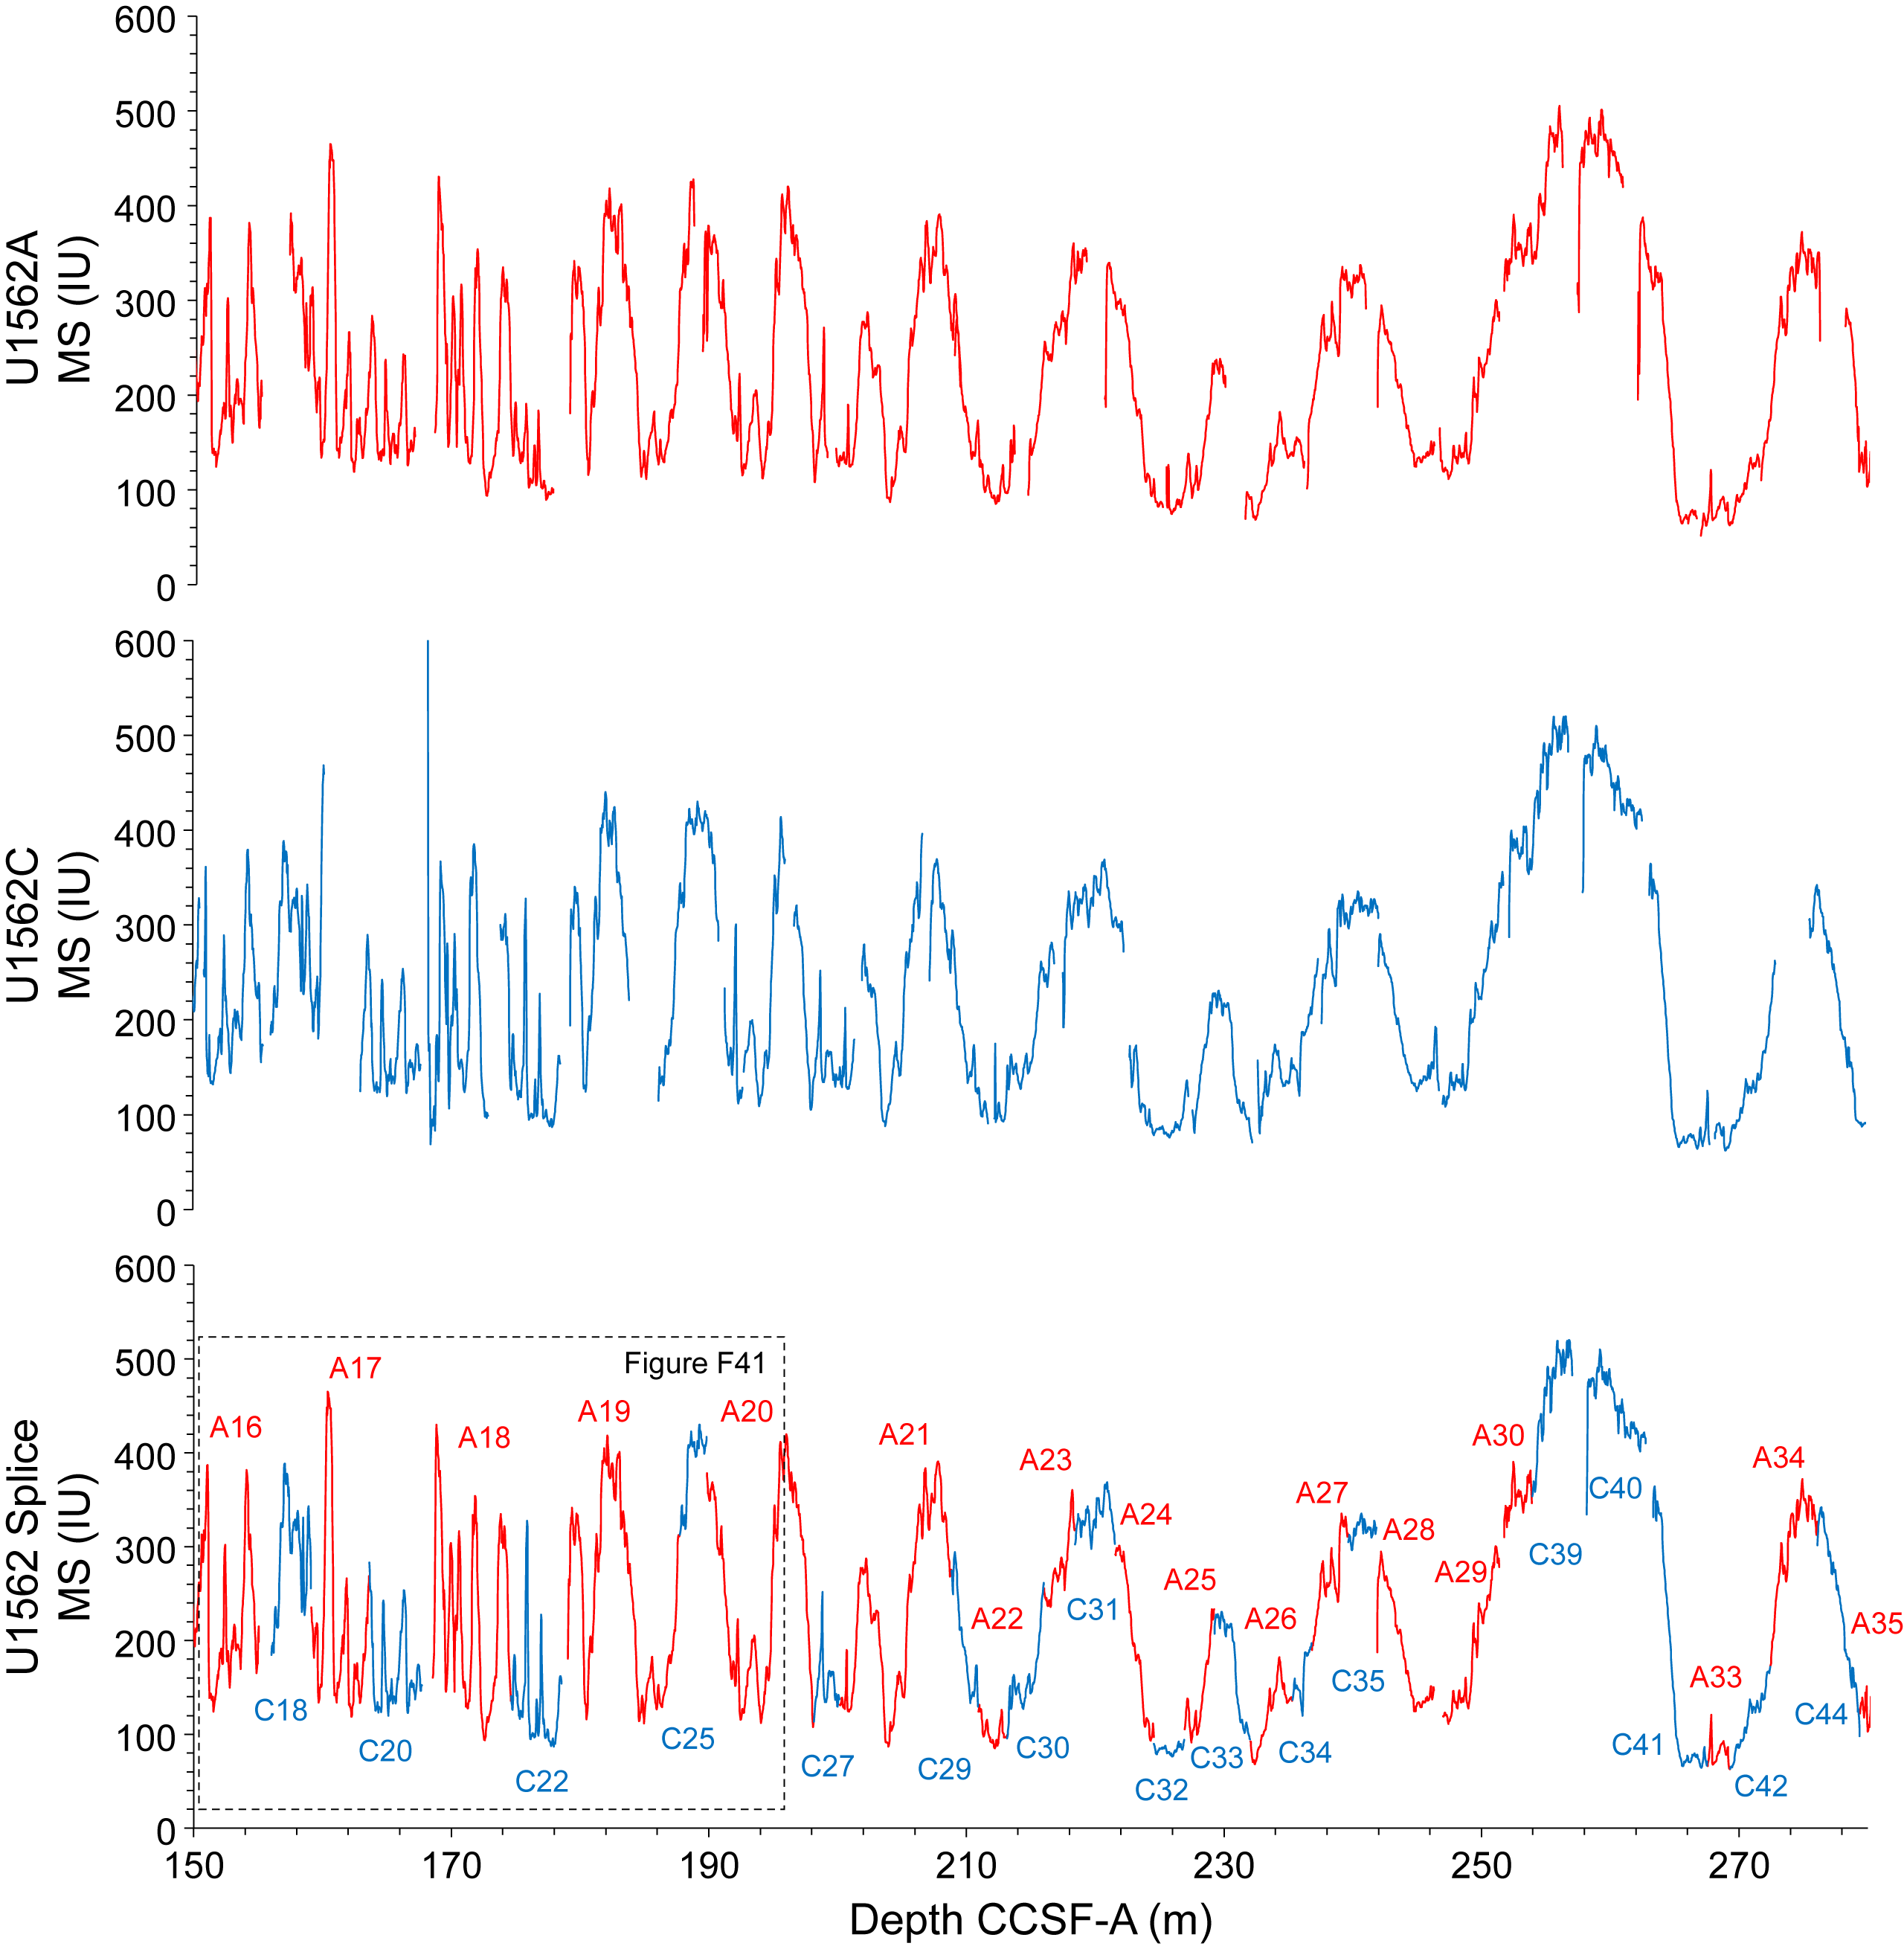
Figure F42. Splice for 150–280 m CCSF-A.
8.2. Construction of the splice
The continuous splice for the uppermost 155 m CCSF-A includes Holes U1562A and U1562C (Figure F40; Table T12). An appended splice is further extended to Core 395C-U1562A-35F by estimating the presence and magnitude of several small gaps (<1 m) (Figure F42). Core catcher sections were not included in the splice, and splice figures presented here do not include data collected in the core catcher sections.
9. Paleomagnetism
9.1. Shipboard measurements
Shipboard paleomagnetic investigations were conducted on archive-half sections from Holes 395C-U1562A, 395C-U1562B, and 395-U1562C (Figure F43; see Paleomagnetism in the Expedition 395 methods chapter [Parnell-Turner et al., 2025a]). For sediments from Hole U1562A, five demagnetization steps (0, 10, 15, 20, and 25 mT) at 2.5 cm spacing were performed, and for Hole U1562C four steps (0, 10, 15, and 20 mT) were adopted, using a resolution of 2.5 or 5 cm. For basalts from Hole U1562B, five steps of demagnetization (0, 10, 15, 20, and 25 mT) at 2 cm spacing were adopted.
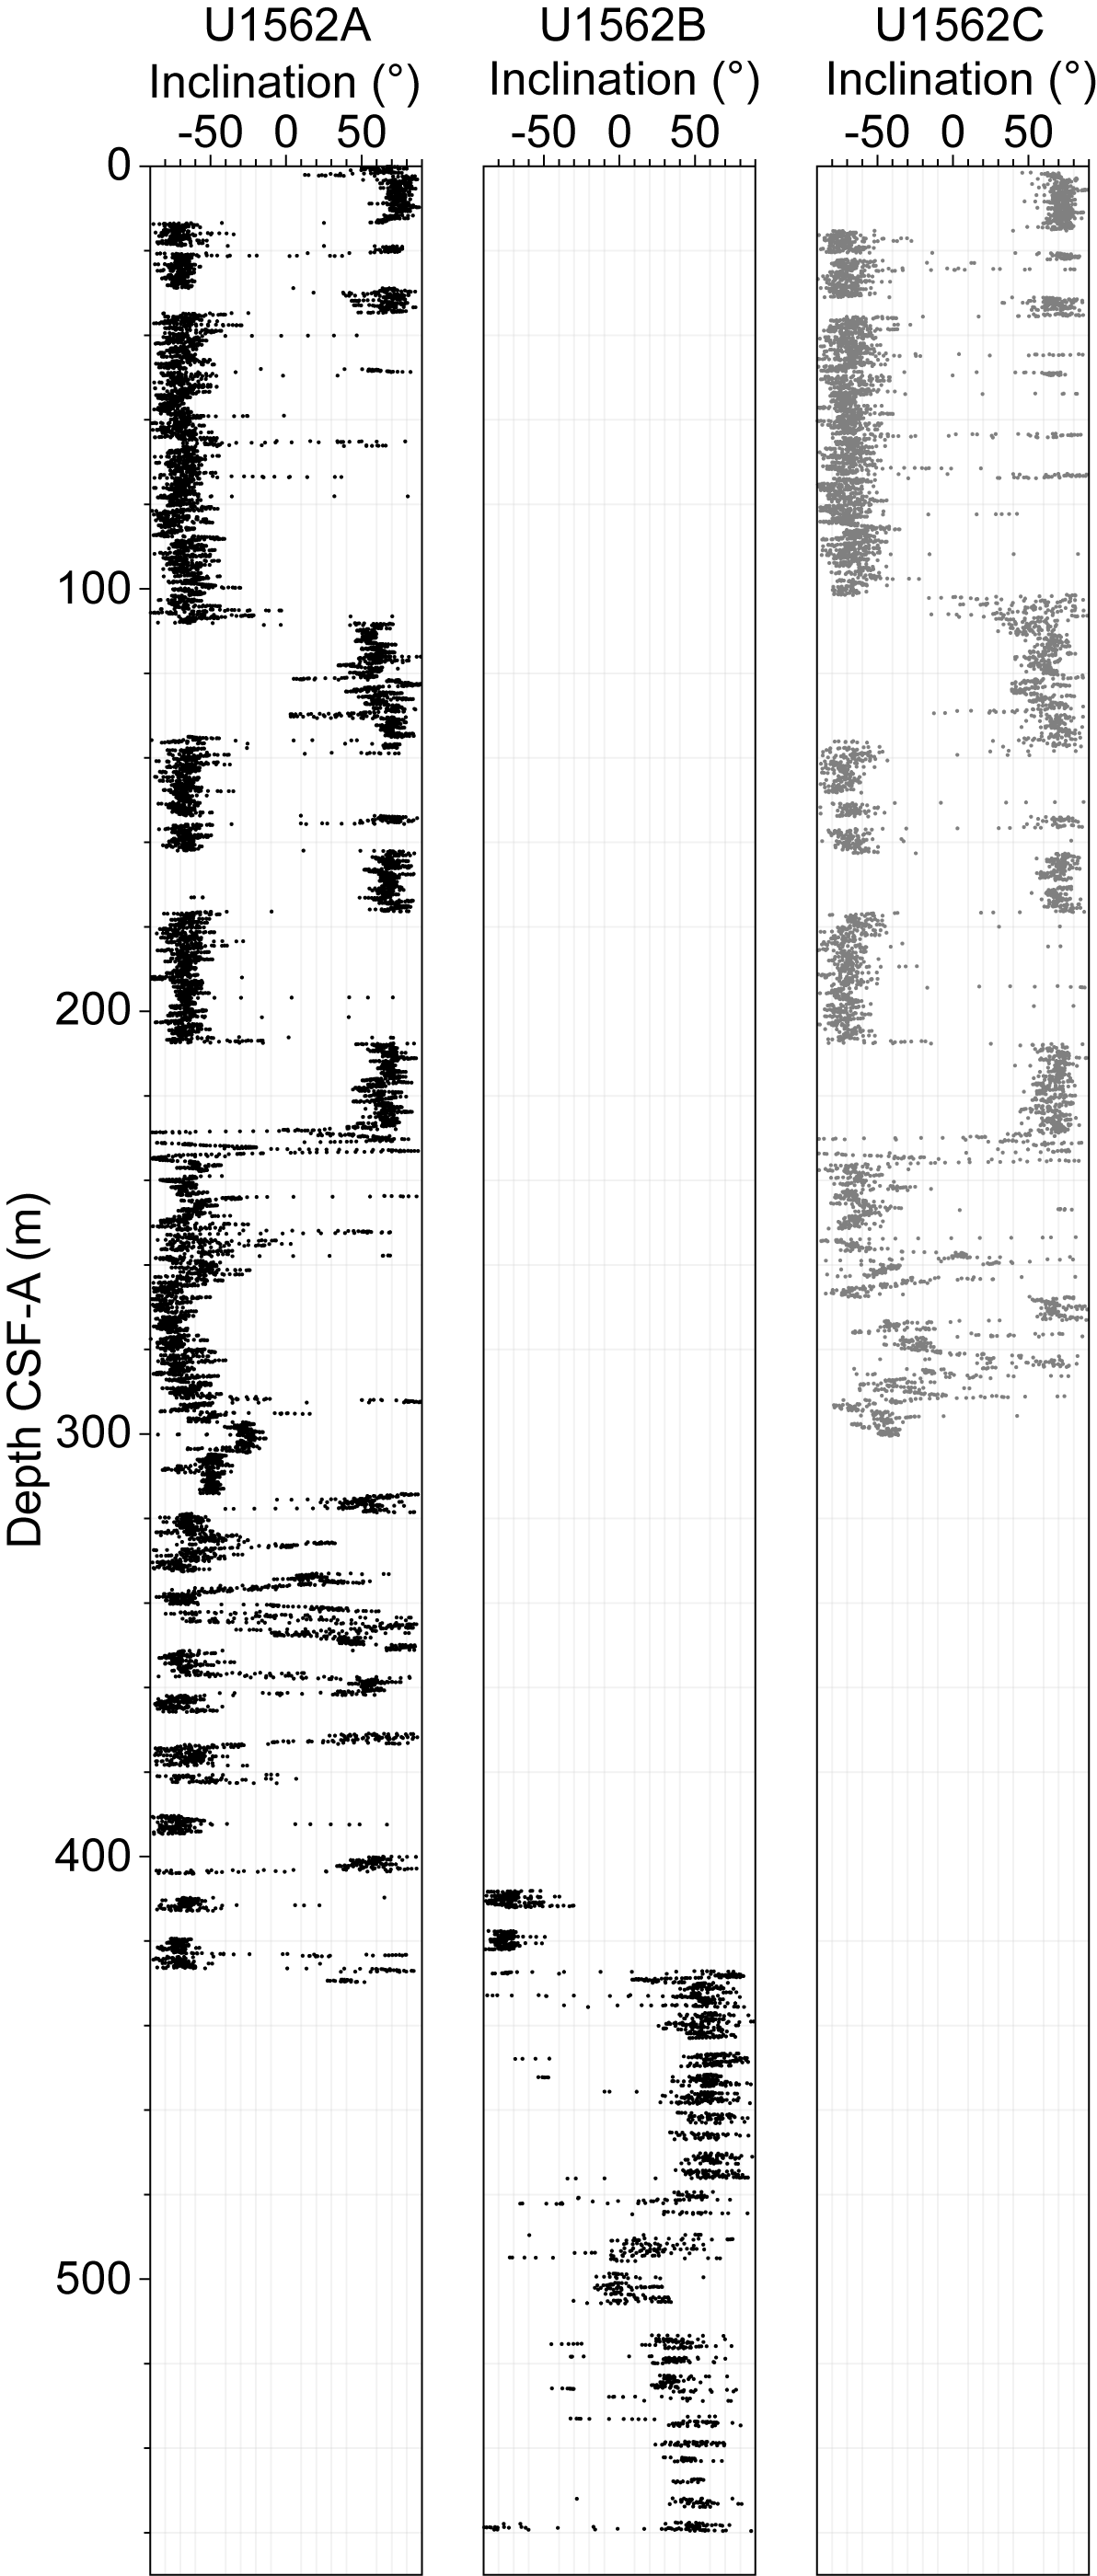
Figure F43. Inclination.
We used the directional data from archive halves measured after in-line alternating field (AF) demagnetization step (maximum demagnetization step of 20 or 25 mT) to determine magnetic polarities in each hole. Directional data were analyzed using Zijderveld diagrams (Zijderveld, 1967), and the characteristic remanent magnetization (ChRM) direction(s) were calculated using principal component analysis (PCA) (Kirschvink, 1980) using PuffinPlot software (Version 1.4.1; Lurcock and Florindo, 2019).
9.2. Demagnetization behavior of sedimentary rocks
After the removal of an overprint up to 10 mT, stepwise AF demagnetization performed up to 20 or 25 mT successfully isolated a stable ChRM directed to the origin of the Zijderveld plot, even if not completely demagnetized (Figure F44). Normal (Figure F44A, F44D) and reversed (Figure F44B, F44E) polarities were identified both in Holes U1562A and U1562C. In some cases, the natural remanent magnetization (NRM) was fully demagnetized within the 10 mT step (Figure F44C, F44F).
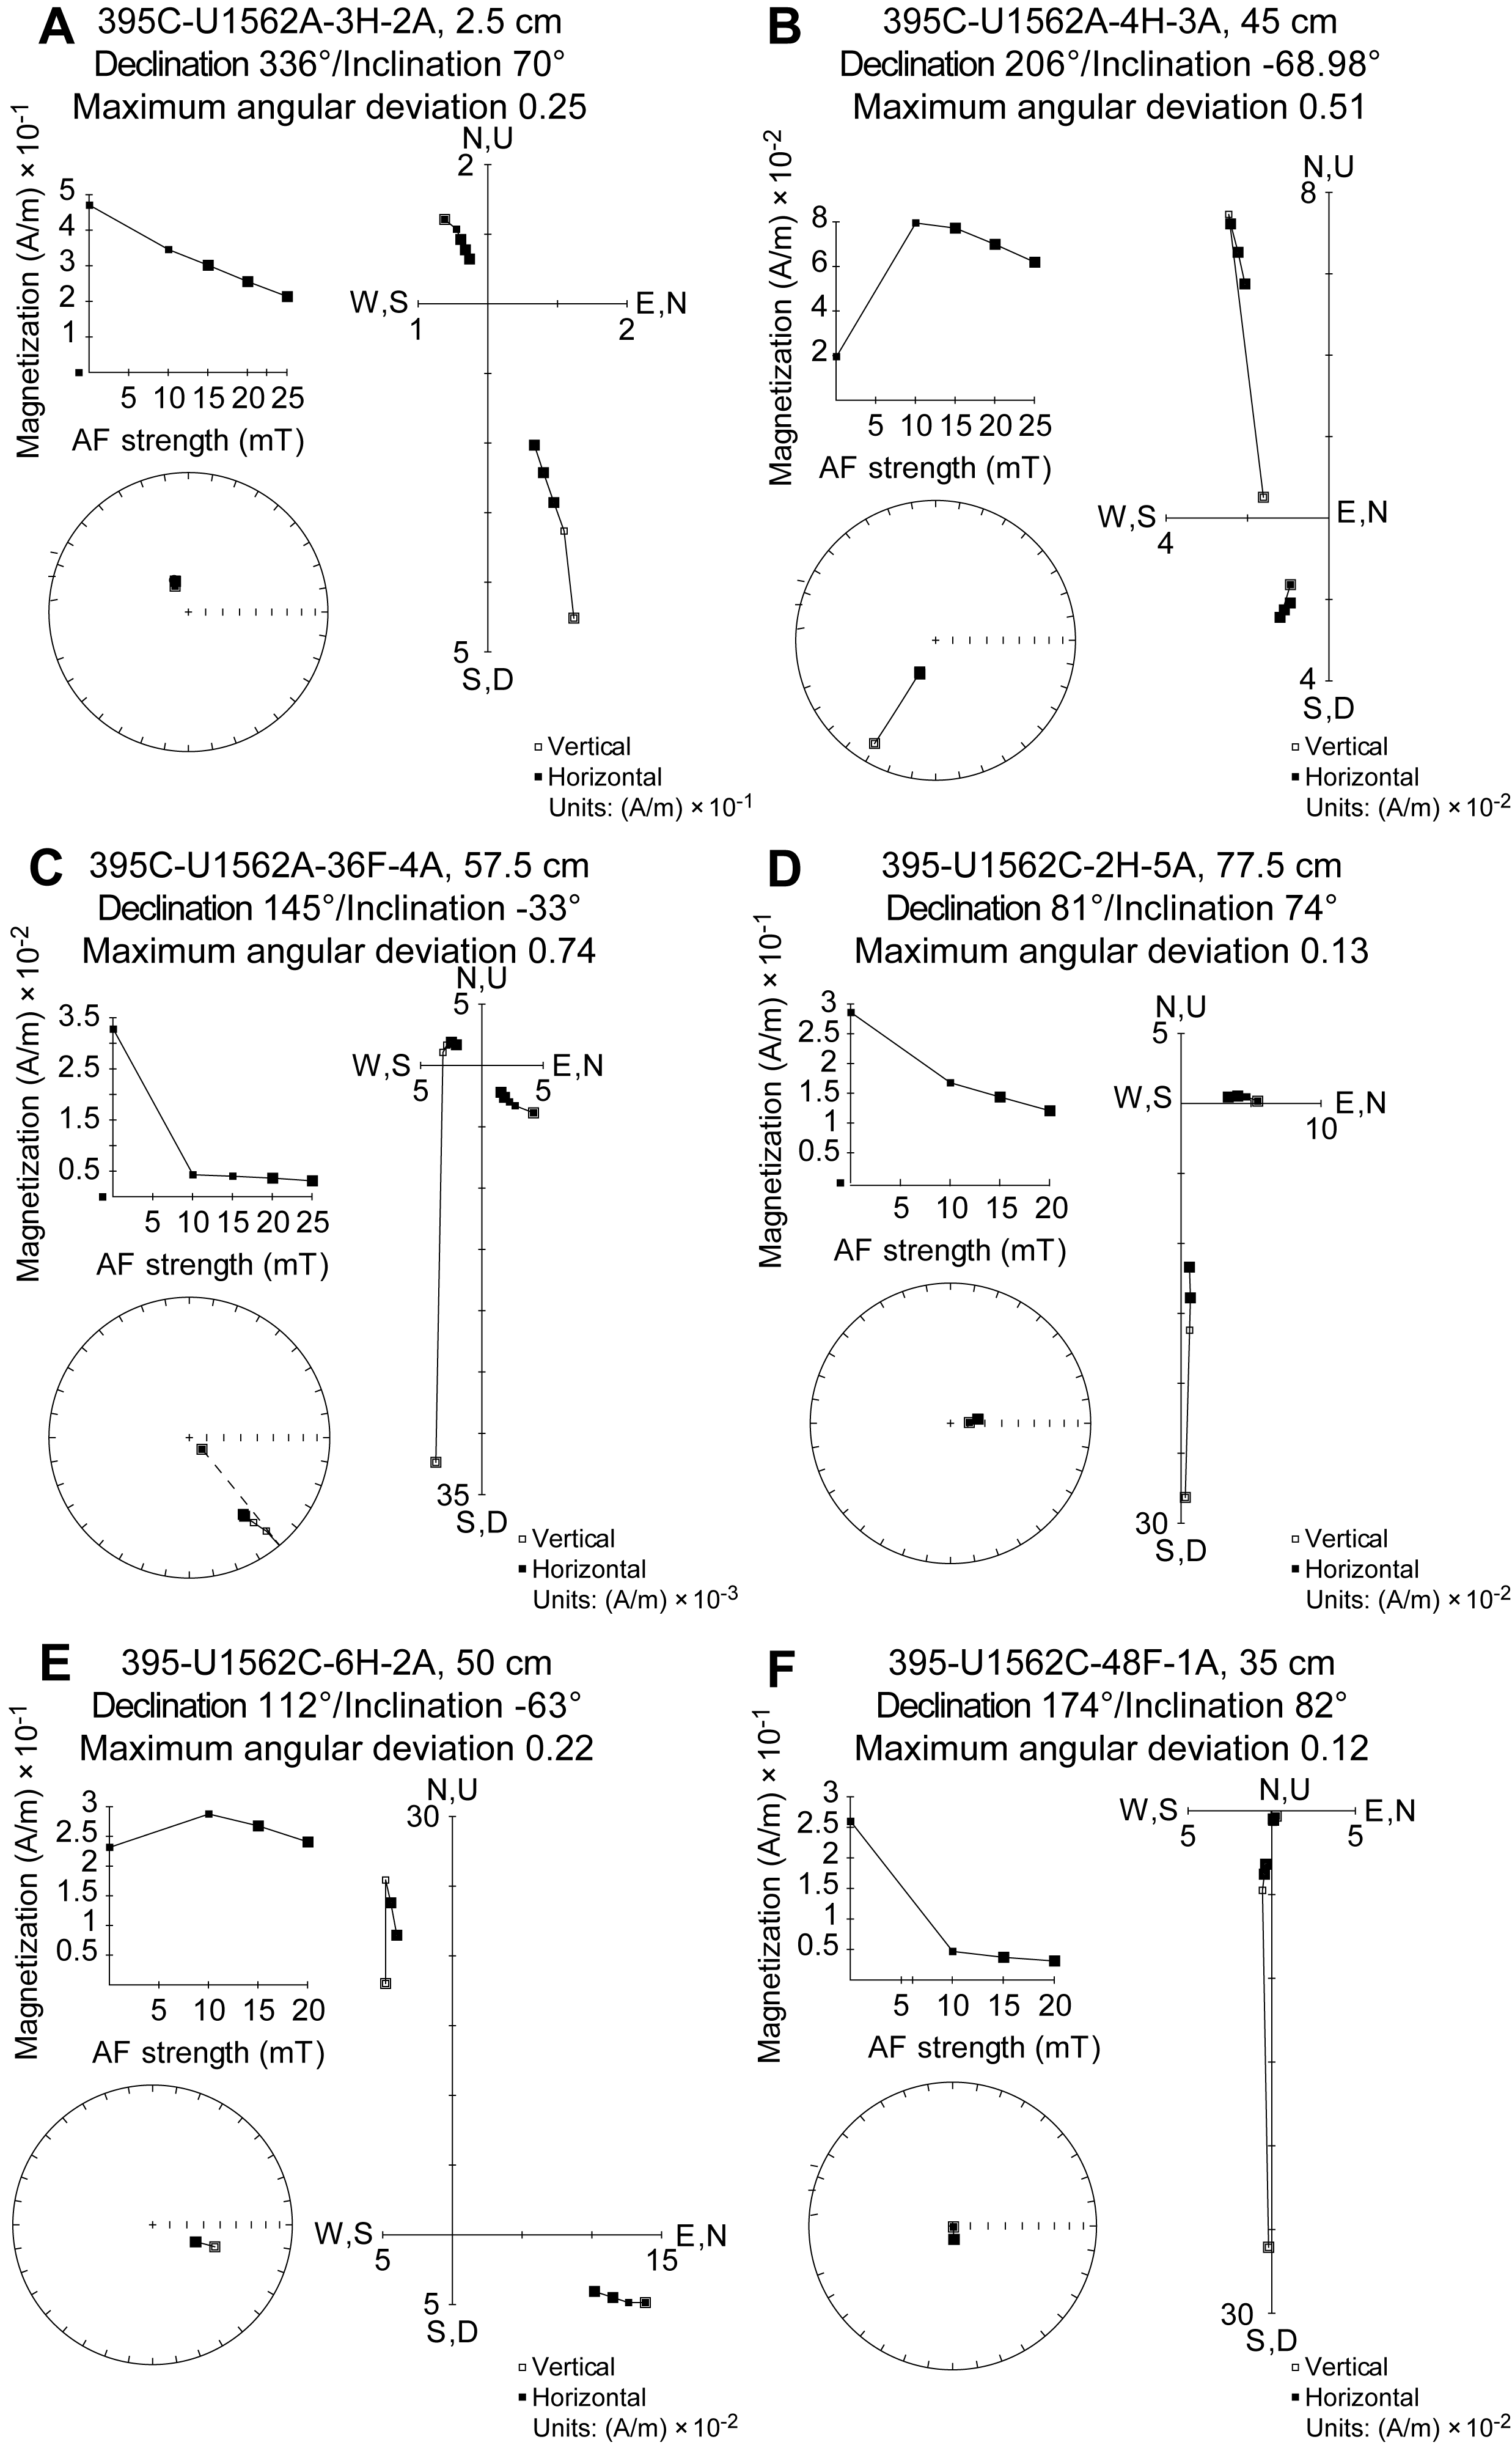
Figure F44. Demagnetization behaviors of sediments.
In Hole U1562A, NRM intensity varies from 4.8 × 10⁻⁵ to 4.3 A/m (average = 0.2 A/m). In Hole U1562C, NRM intensity ranges 4.9 × 10⁻³ to 2.21 A/m (average = 0.23 A/m) (Figure F45).
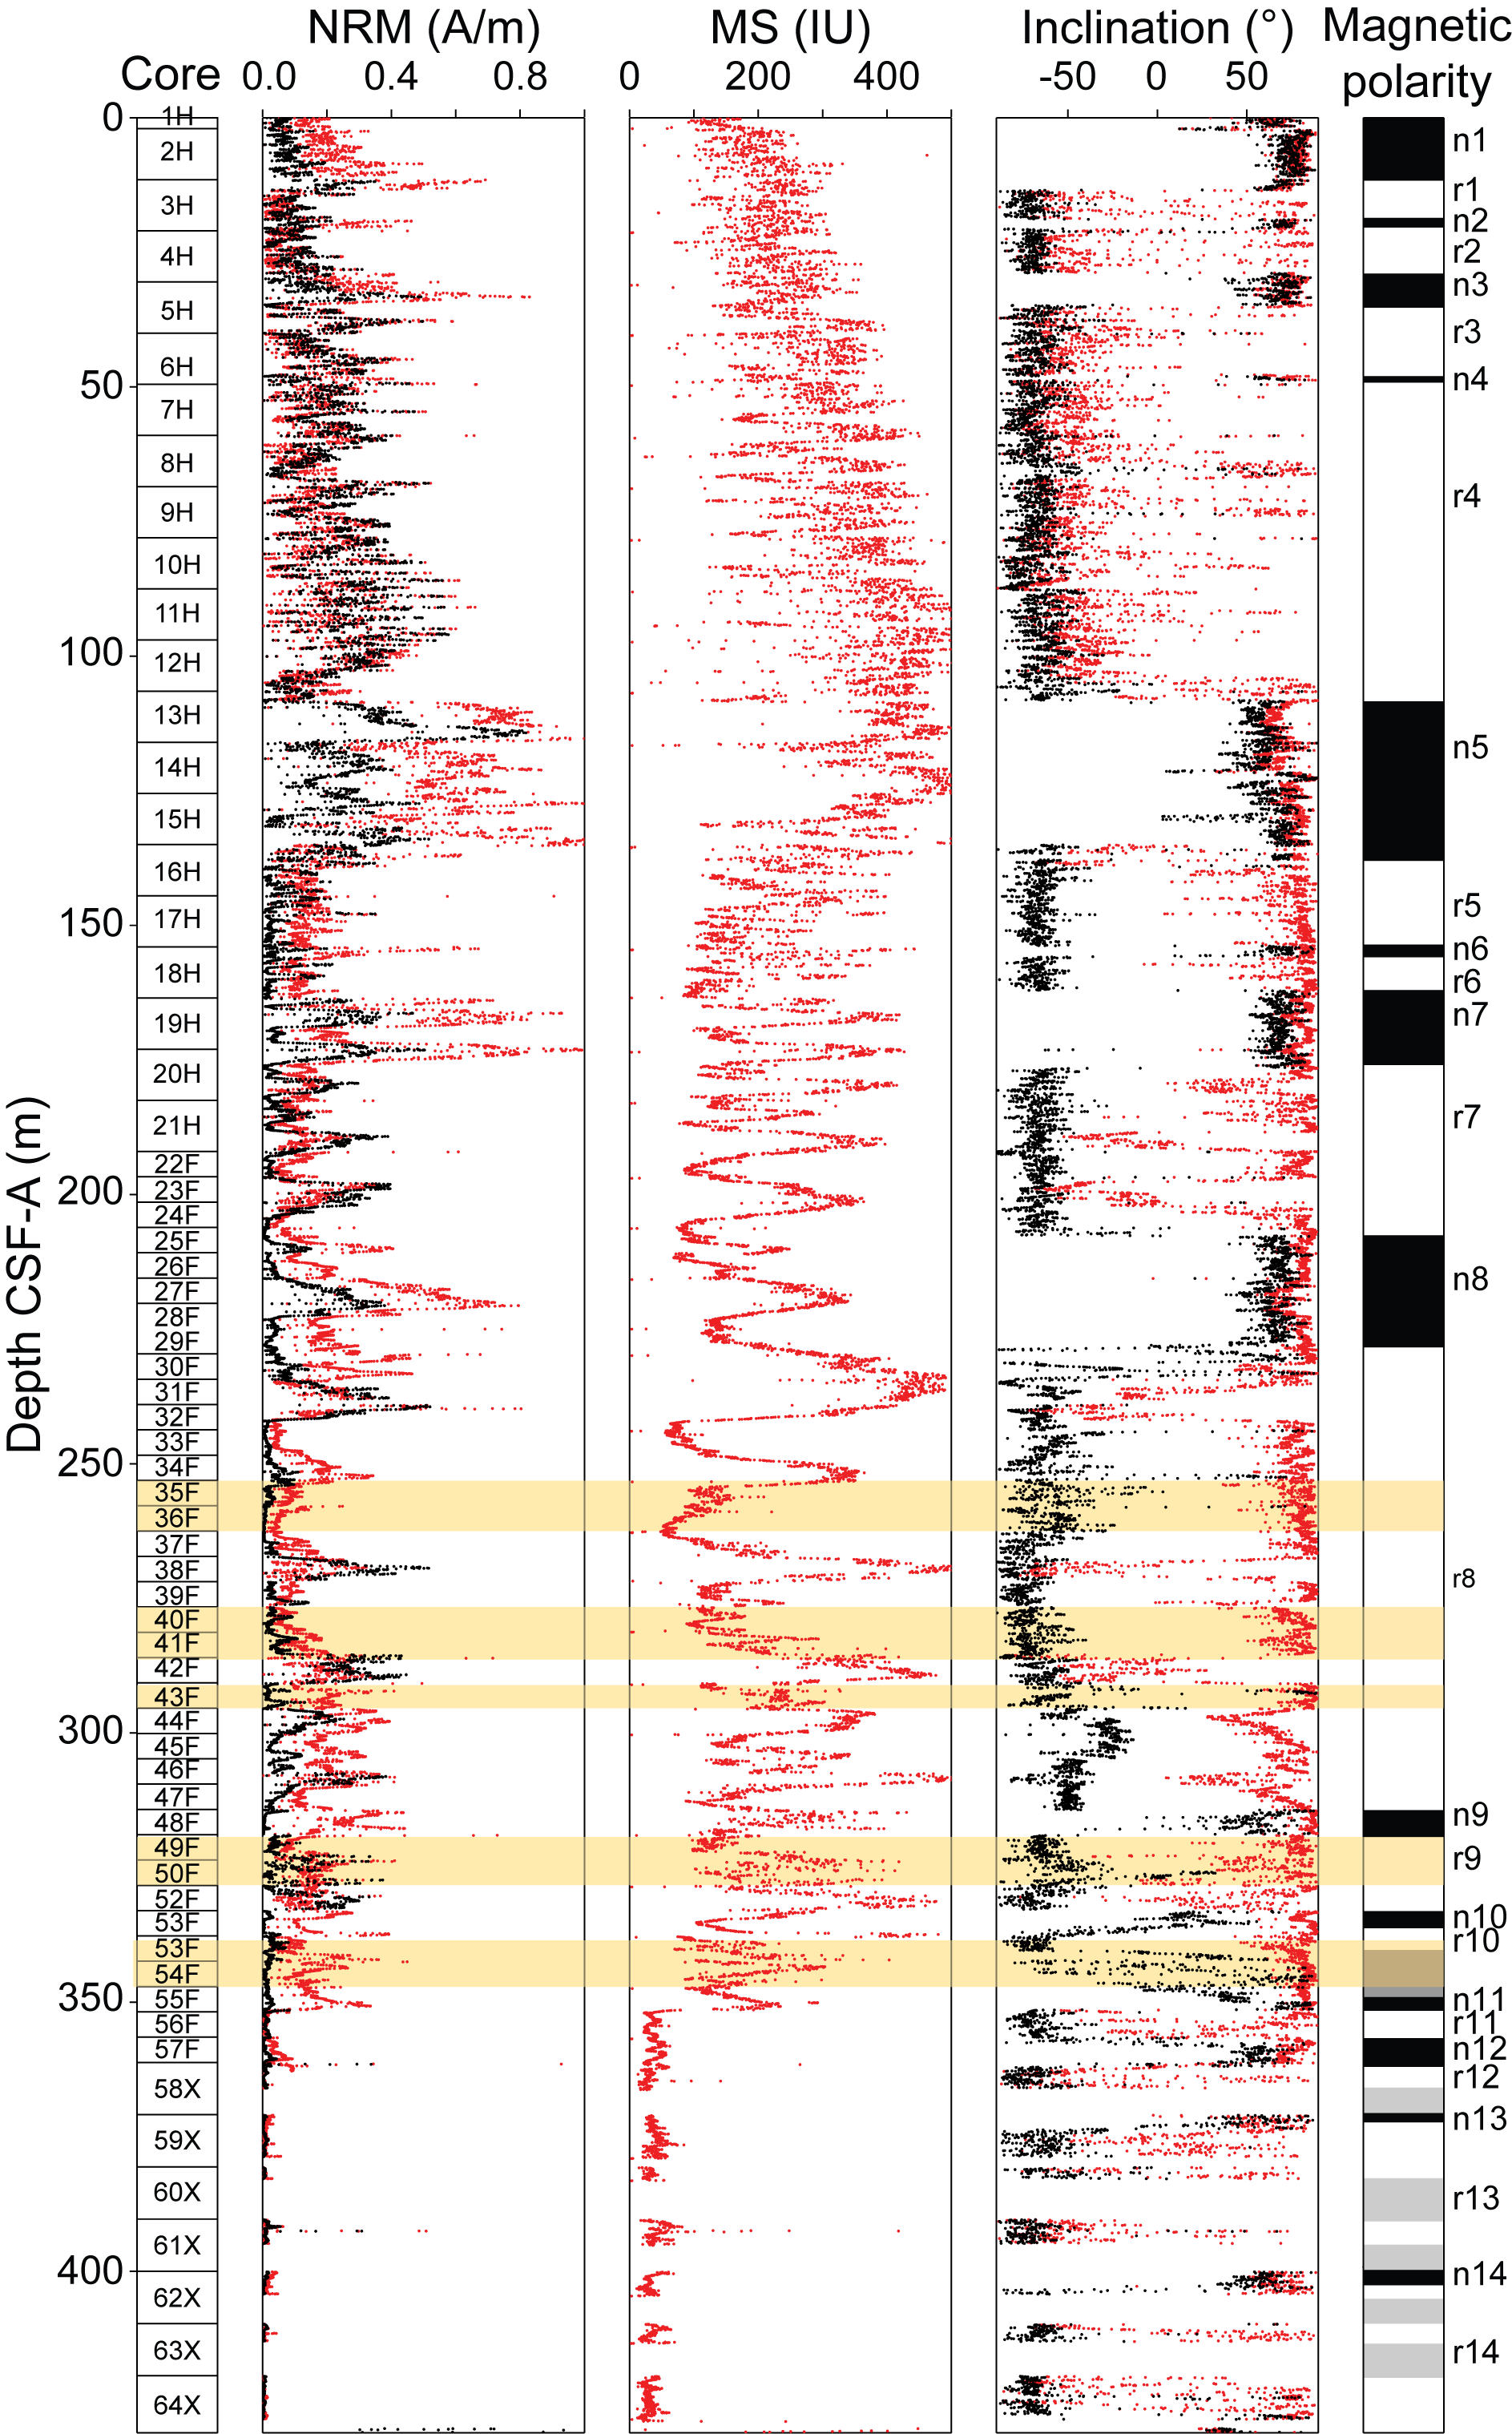
Figure F45. Paleomagnetic measurements, Hole U1562A.
In Hole U1562A, point MS obtained from section halves (see Physical properties) ranges 2.7–664.2 IU (average = 228.3 IU) (Figure F45). Three measurement points in interval 58X-1, 22.5–27.5 cm, are greater than 1000 IU and correspond to three large (>2 cm) basaltic clasts (not shown). In Hole U1562C, MS varies from 0.4 to 755.7 IU (average = 248.1 IU) (Figure F46).

Figure F46. Paleomagnetic measurements, Hole U1562C.
Both NRM and MS show considerable variability with depth (Figures F45, F46, F47), most likely due to changes in carbonate and silica content in sedimentary units. At 120–350 m CSF-A in Hole U1562A and 120–300 m CSF-A in Hole U1562C, both MS and NRM show a cyclicity that may reflect changes in carbonate content (see Lithostratigraphy). Below 350 m CSF-A in Hole U1562A, both NRM intensity and MS decrease considerably. Variations in inclination reflect changes in the magnetic polarities. Intervals of soft-sediment deformation (see Lithostratigraphy), which hamper magnetostratigraphic interpretation, are highlighted as yellow bands in Figures F45 and F46. Normal polarities (in black) are characterized by positive inclinations with short secular variations around values similar to the present-day field at Site U1562.
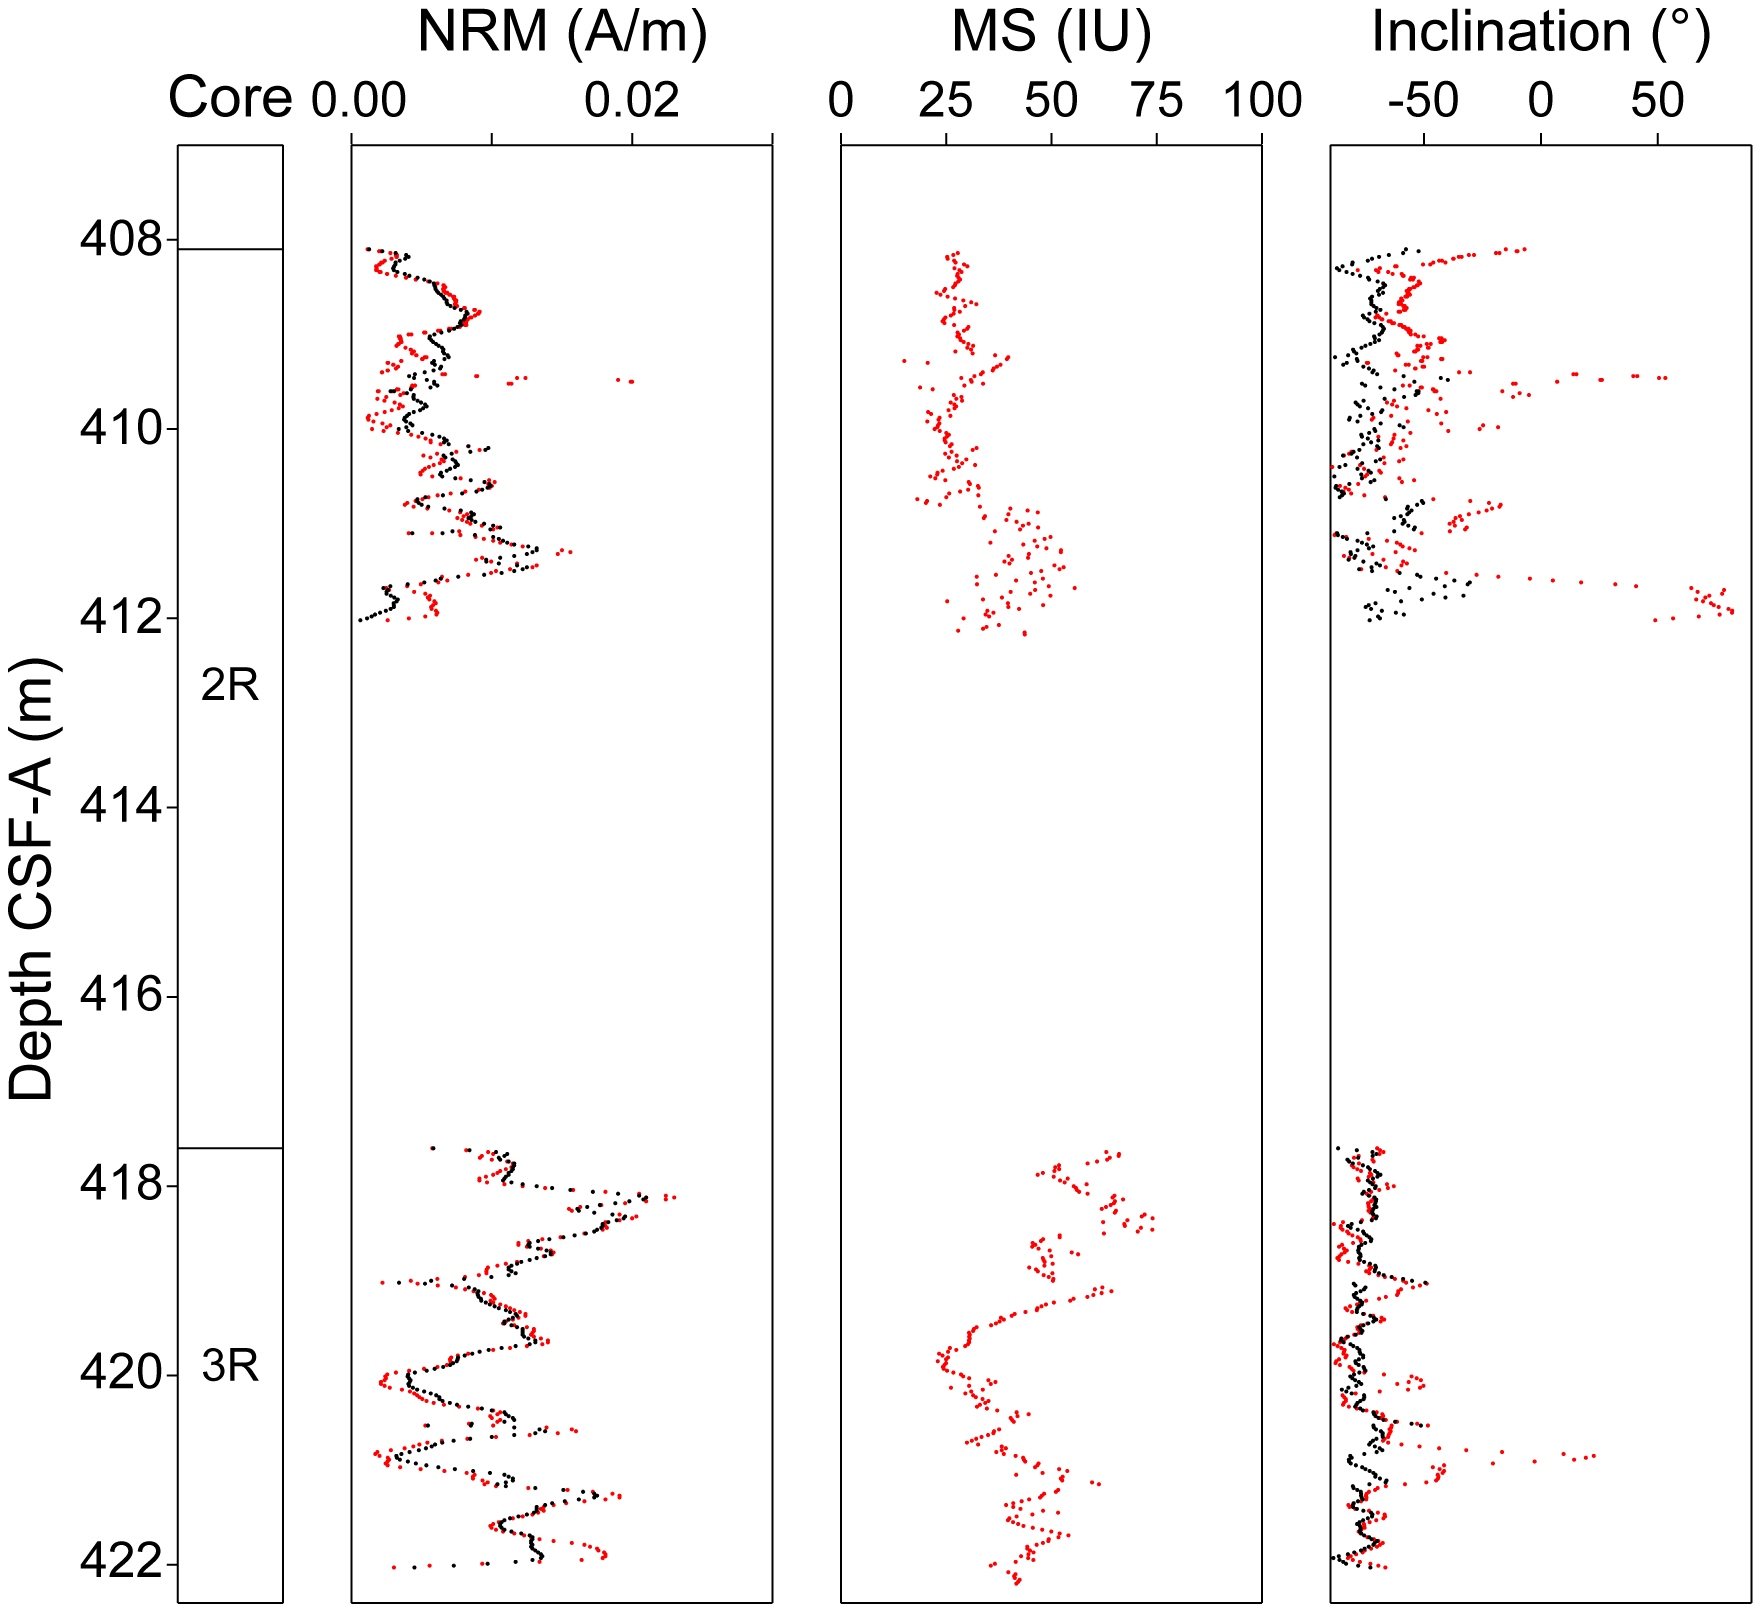
Figure F47. Paleomagnetic measurements from sediments.
9.3. Demagnetization behavior of basalts
The igneous rocks in Hole U1562B consist of pillow basalts and basalt flows (see Igneous petrology). Typical examples of demagnetization behavior are shown in Figure F48. After the removal of an initial overprint at 10–15 mT, usually a single component of magnetization can be isolated. AF demagnetization mainly shows two types of behavior with total magnetization loss before 20 mT (i.e., soft magnetization behavior; Figure F48B) or no significant loss of magnetization at 25 mT (i.e., hard magnetization behavior; Figure F48A, F48C, F48D). Most of the basalts show normal polarity (Figure F48D).
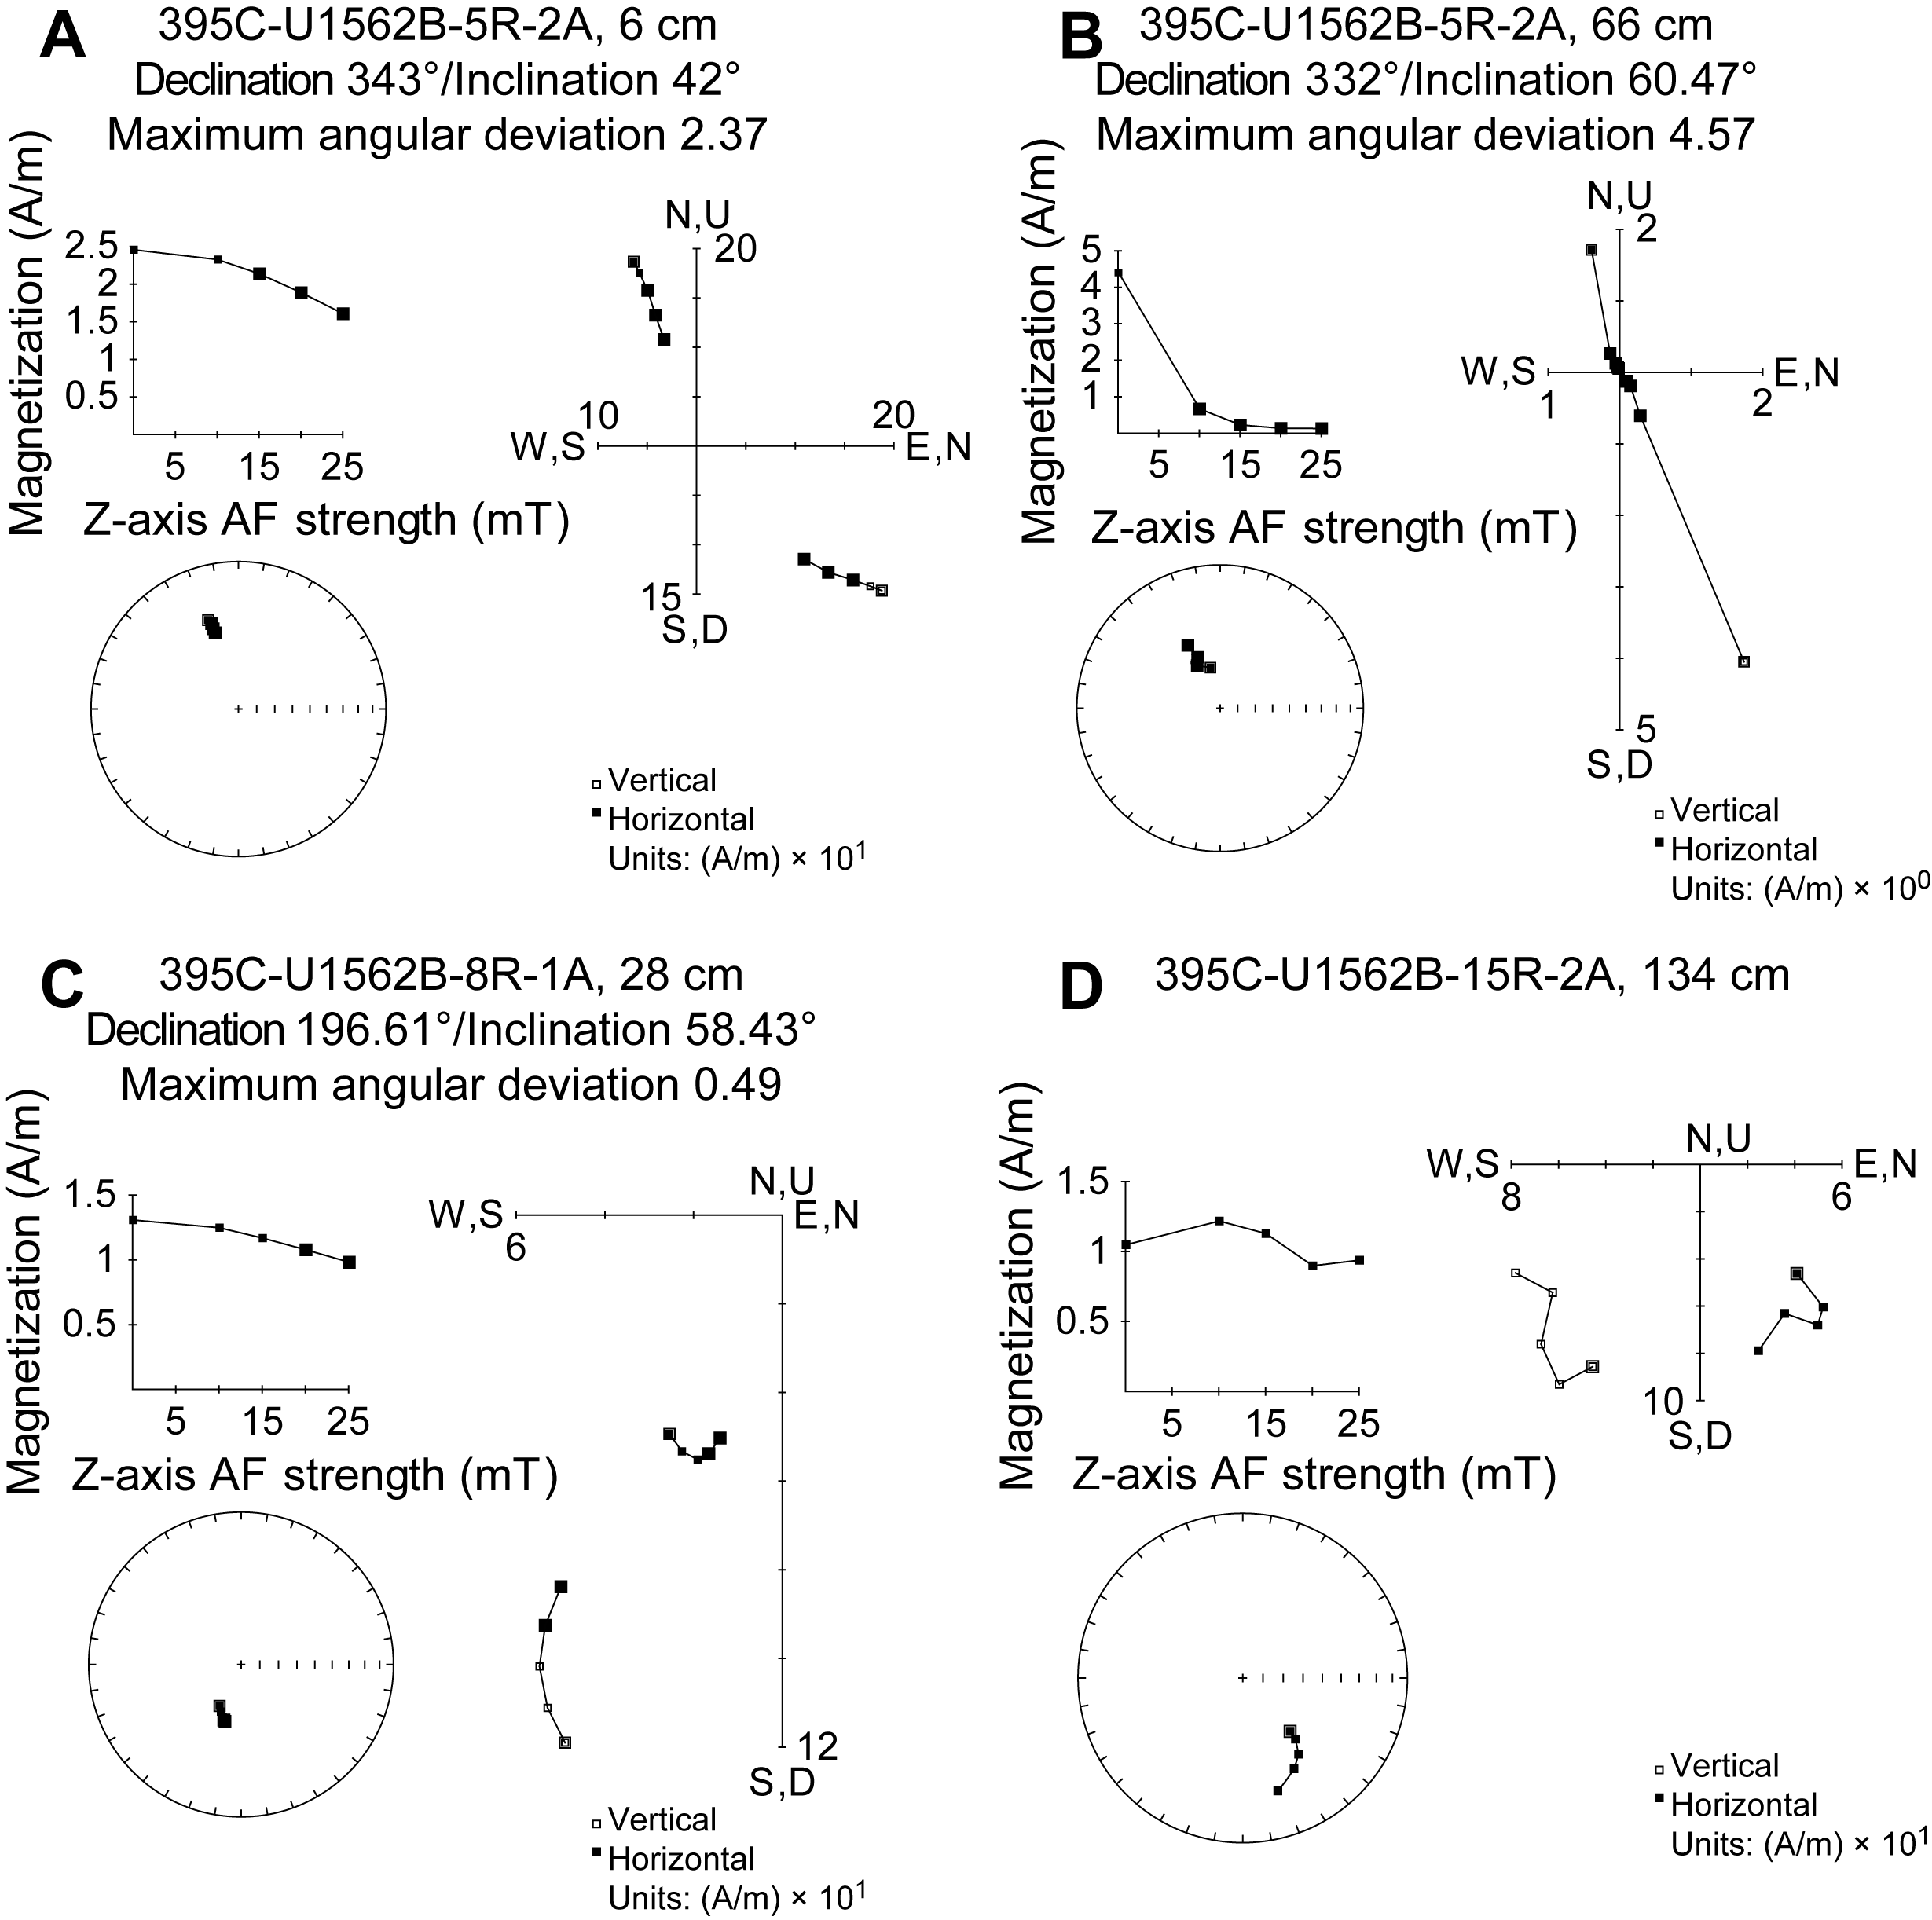
Figure F48. Demagnetization behaviors of basalts.
The transition from sedimentary to igneous rocks occurs at ~430 m CSF-A with considerable change in NRM intensity and two orders of magnitude increase in MS (Figure F49).
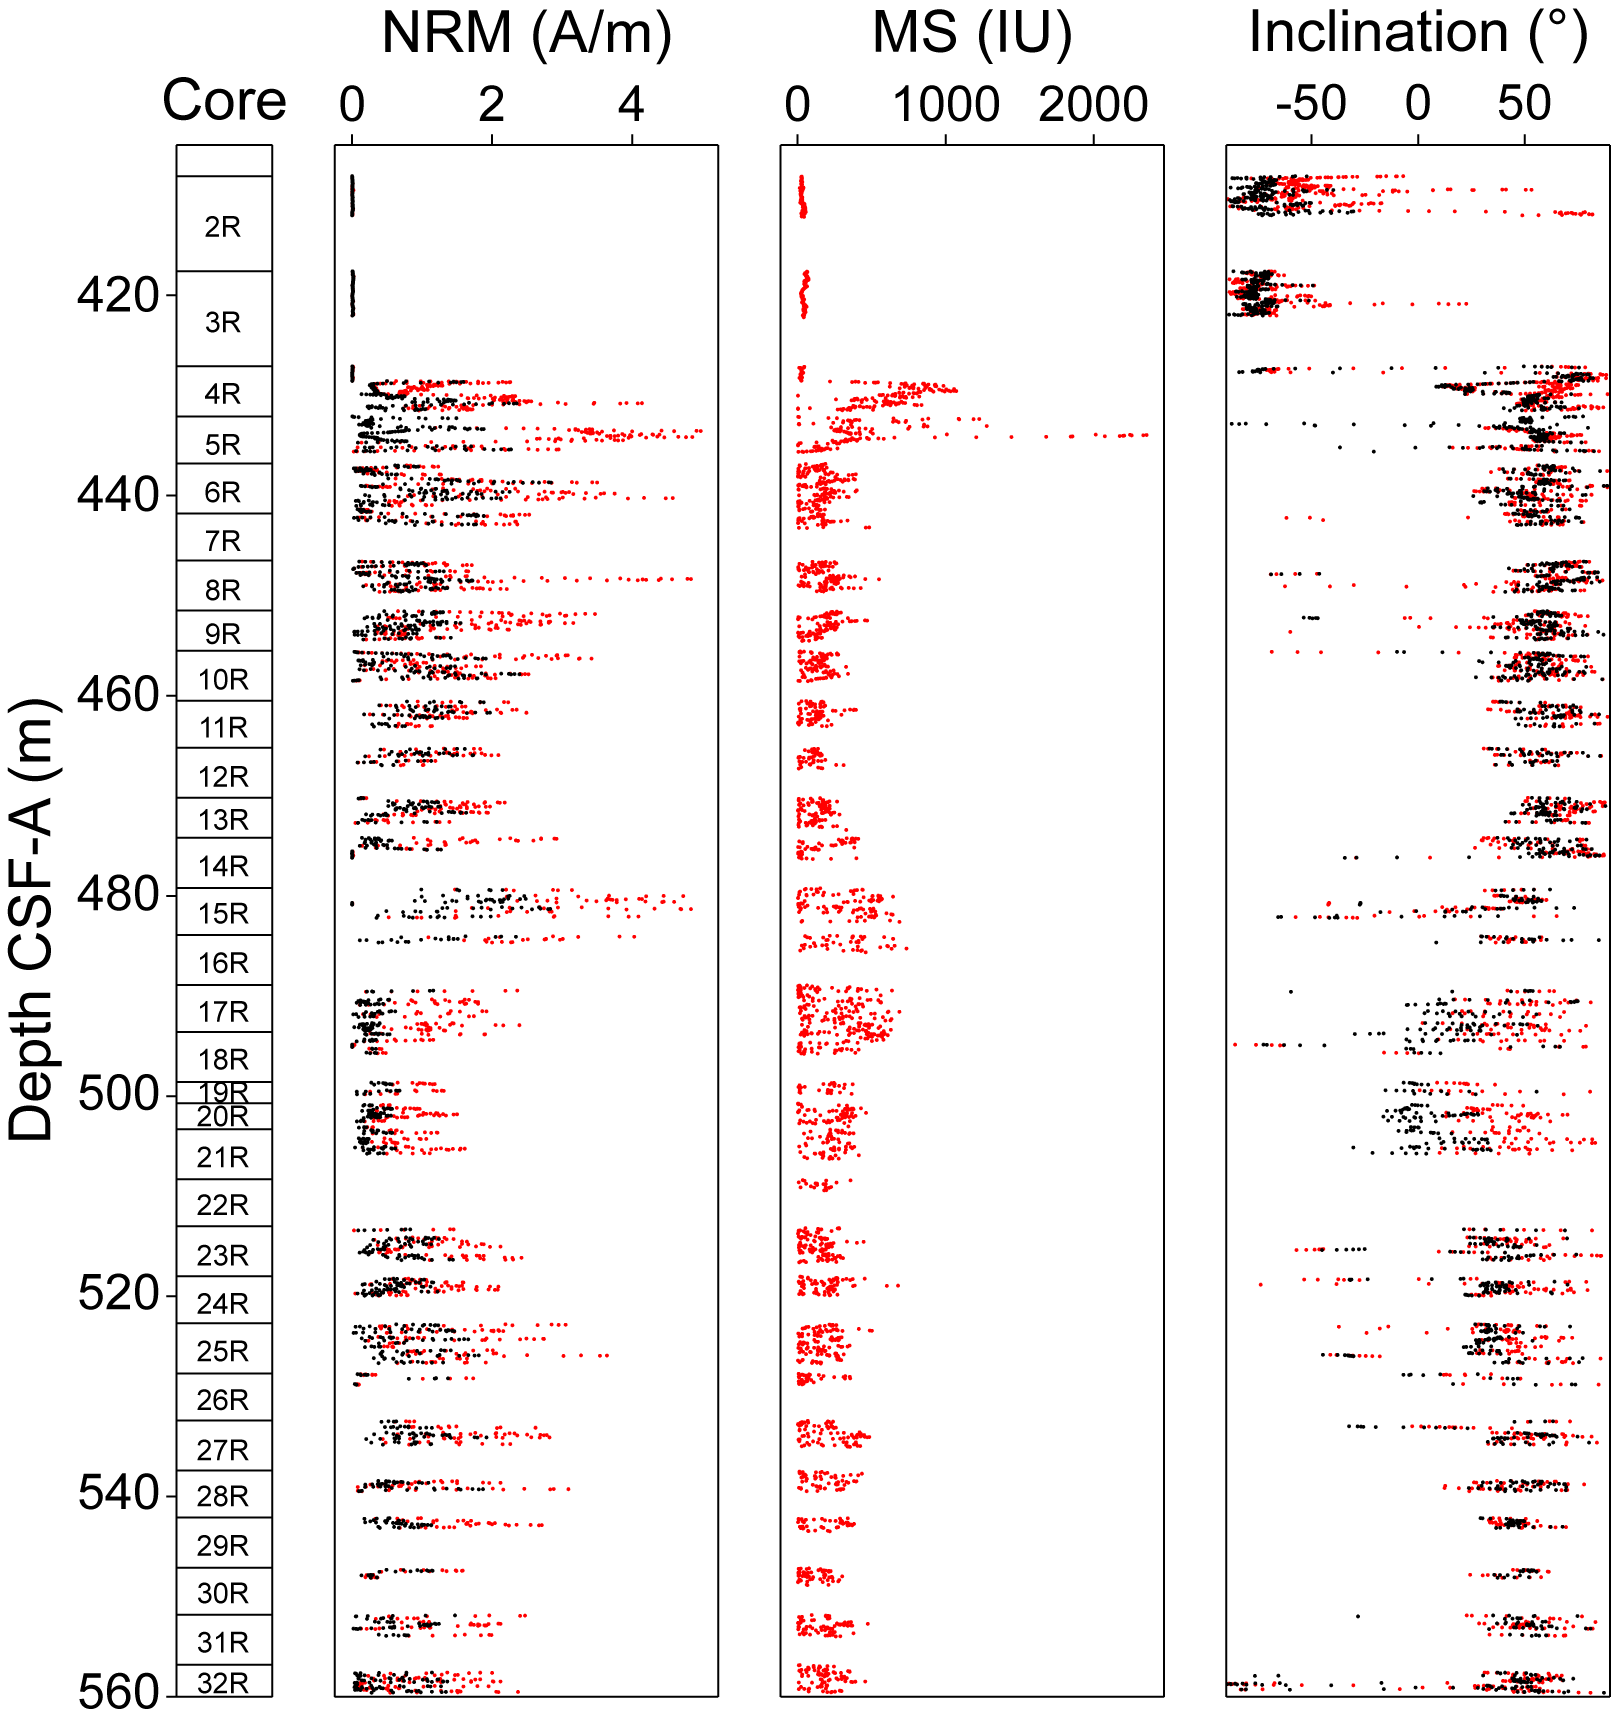
Figure F49. Paleomagnetic measurements, Hole U1562B.
9.4. Magnetostratigraphy
The magnetostratigraphy of Site U1562 is based on the correlation of the polarity assigned to the archive-half cores from Hole U1562A using inclinations after 25 mT demagnetization and the polarities reported in the reference geomagnetic polarity timescale (GPTS) (Table T13). Importantly, the magnetic events recognized in Hole U1562A (Figure F45) are also identified in Hole U1562C (Figure F46). In sections where soft-sediment deformation is present, the inclination record is most likely disturbed and not interpretable in terms of magnetic polarities.
The magnetostratigraphic data from Hole U1562A were correlated to the GPTS (Ogg, 2020) and plotted along with the tie points from the microfossil ages (see Age model). A succession of 14 normal and 14 reversed intervals was recognized (Figure F47).
The boundary between the Brunhes and Matuyama Chrons was interpreted at ~13 m CSF-A (0.773 Ma), and the transition from the Matuyama to Gauss Chrons was interpreted at ~108 m CSF-A (2.595 Ma) (Table T13).
10. Geochemistry and microbiology
Cores taken during Expedition 395C (Holes U1562A and U1562B) were analyzed for headspace gas, IW chemistry, and bulk sediment/basalt geochemistry. Cores taken during Expedition 395 (Hole U1562C) were analyzed for bulk sediment geochemistry. The geochemistry of basalts at Site U1562 is described in Igneous petrology. Headspace gas analyses were conducted on cores from Holes U1562A and U1562B; methane concentrations are low and range ~0 to 3 ppmv. Ethane was absent in all holes. IW calcium ion (Ca2+) concentrations are highest near the sediment/water and sediment/basement interfaces. Magnesium ion (Mg2+) concentrations display a generally decreasing trend with depth, with a small increase at the sediment/basement interface. Sulfate ion (SO42−) concentrations have seawater-like values at the top and bottom of the sedimentary sequence and a minimum around 250 m CSF-A. CaCO3 shows large variability but generally increases downcore, trending from ~0 to 33 wt% in the uppermost 100 m to ~83 wt% near the sediment/basement interface. Bulk sediment generally exhibits low total organic carbon (TOC), total nitrogen (TN), and total sulfur (TS) content.
10.1. Volatile hydrocarbons
Methane concentrations in the sedimentary section of Site U1562 (Holes U1562A and U1562B) increase from 0.4 ppmv at the sediment/water interface to a peak of 2.7 ppmv at 317.2 m CSF-A and then drop back to 0 ppmv at the sediment/basement interface (Figure F50). The slightly increased methane concentrations and the absence of ethane in the middle part of the sedimentary sequence suggest increased biogenic methane gas production and that thermogenic gas sources are unlikely.
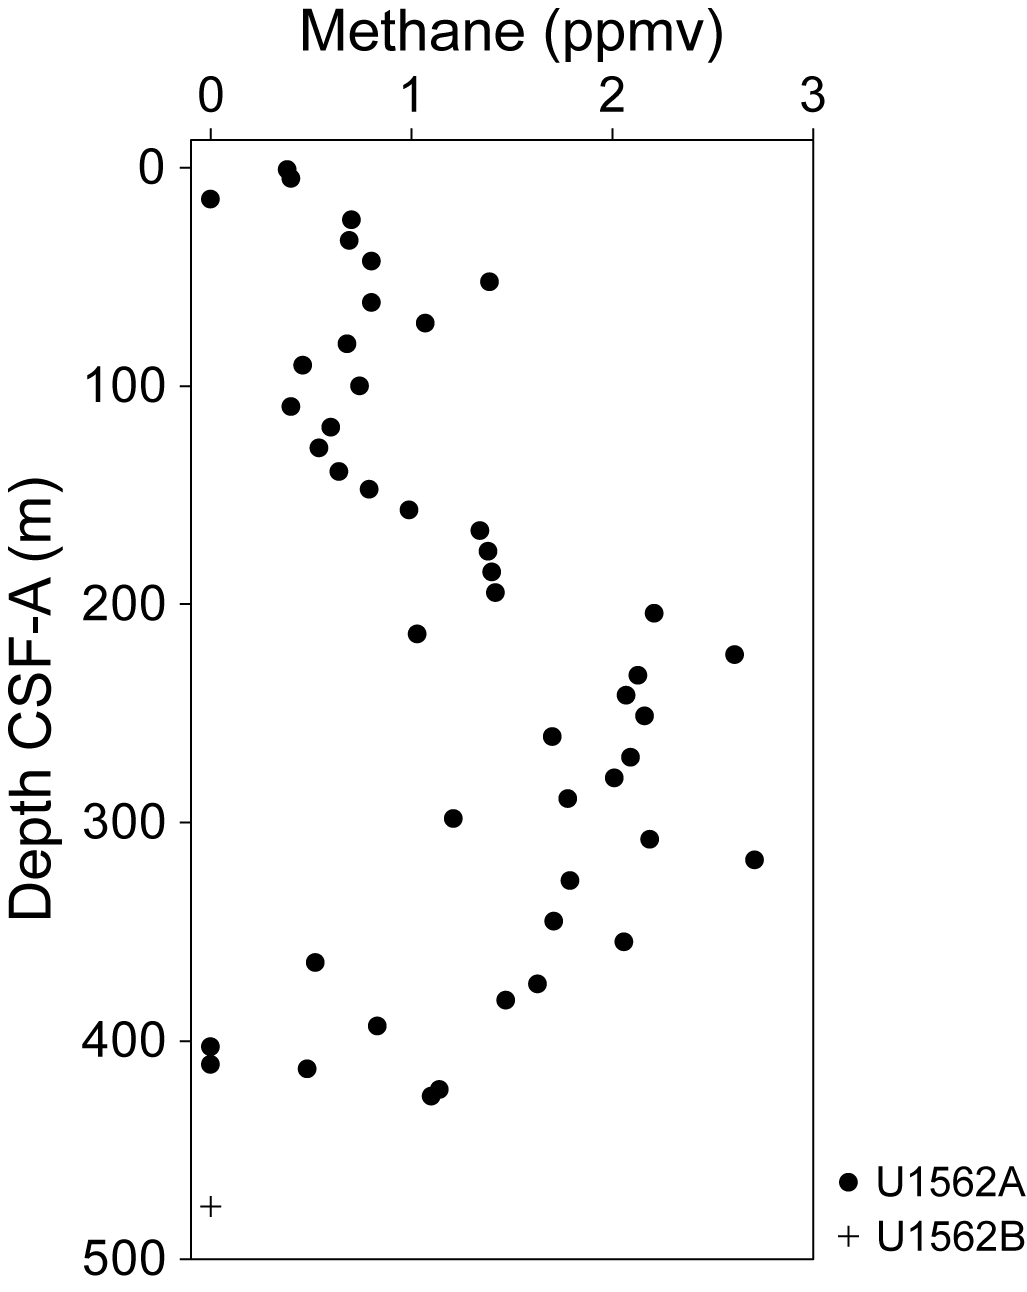
Figure F50. Composite gas analyses of methane concentrations.
10.2. Interstitial water chemistry
A total of 66 IW samples were squeezed from 5 or 10 cm long whole-round samples from 0.95 to 427.3 m CSF-A in Hole U1562A (Cores 1H–64X). One additional IW sample was collected from Section 395C-U1562B-14R-2, 17–27 cm, from an intercalated sediment layer in the basalt basement at 475.71 m CSF-A. Selected data acquired from analysis of IW in Holes U1562A and U1562B are shown in Figure F51. pH displays little variation throughout the sedimentary section (7.69 ± 0.07). Alkalinity varies from near seawater values at the top (Sample 395C-U1562A-1H-1, 95–100 cm; 3.0 mM) and bottom (Sample 64X-4, 142–152 cm; 3.6 mM) of the sediment to high values at 223.15 m CSF-A (e.g., Sample 28F-2, 145–150 cm; 7.9 mM). IW Mg2+ concentrations range 45.9–54.0 mM. Mg2+ concentrations are highest (~50 mM) at the top and bottom of the sedimentary sequence, with the lowest Mg2+ concentration (45.8 mM) occurring at 288.97 m CSF-A (Sample 44F-2, 146–151 cm). SO42− concentrations range 18.5–28.9 mM with the highest values observed at the top and bottom of the sediments. SO42− concentrations are also high in the intercalated basalt-sediment Sample 395C-U1562B-14R-2, 17–27 cm (28.9 mM). Ca2+ concentrations range 6.3–10.6 mM, with the lowest concentrations in the middle part of the sedimentary sequence. Sr2+ concentrations range from 84.9 µM at 0.95 m CSF-A to 154.3 µM at 425.34 m CSF-A; they generally increase toward the bottom of the sediments but decrease to 87.7 µM at 475.71 m CSF-A in Section 14R-2.
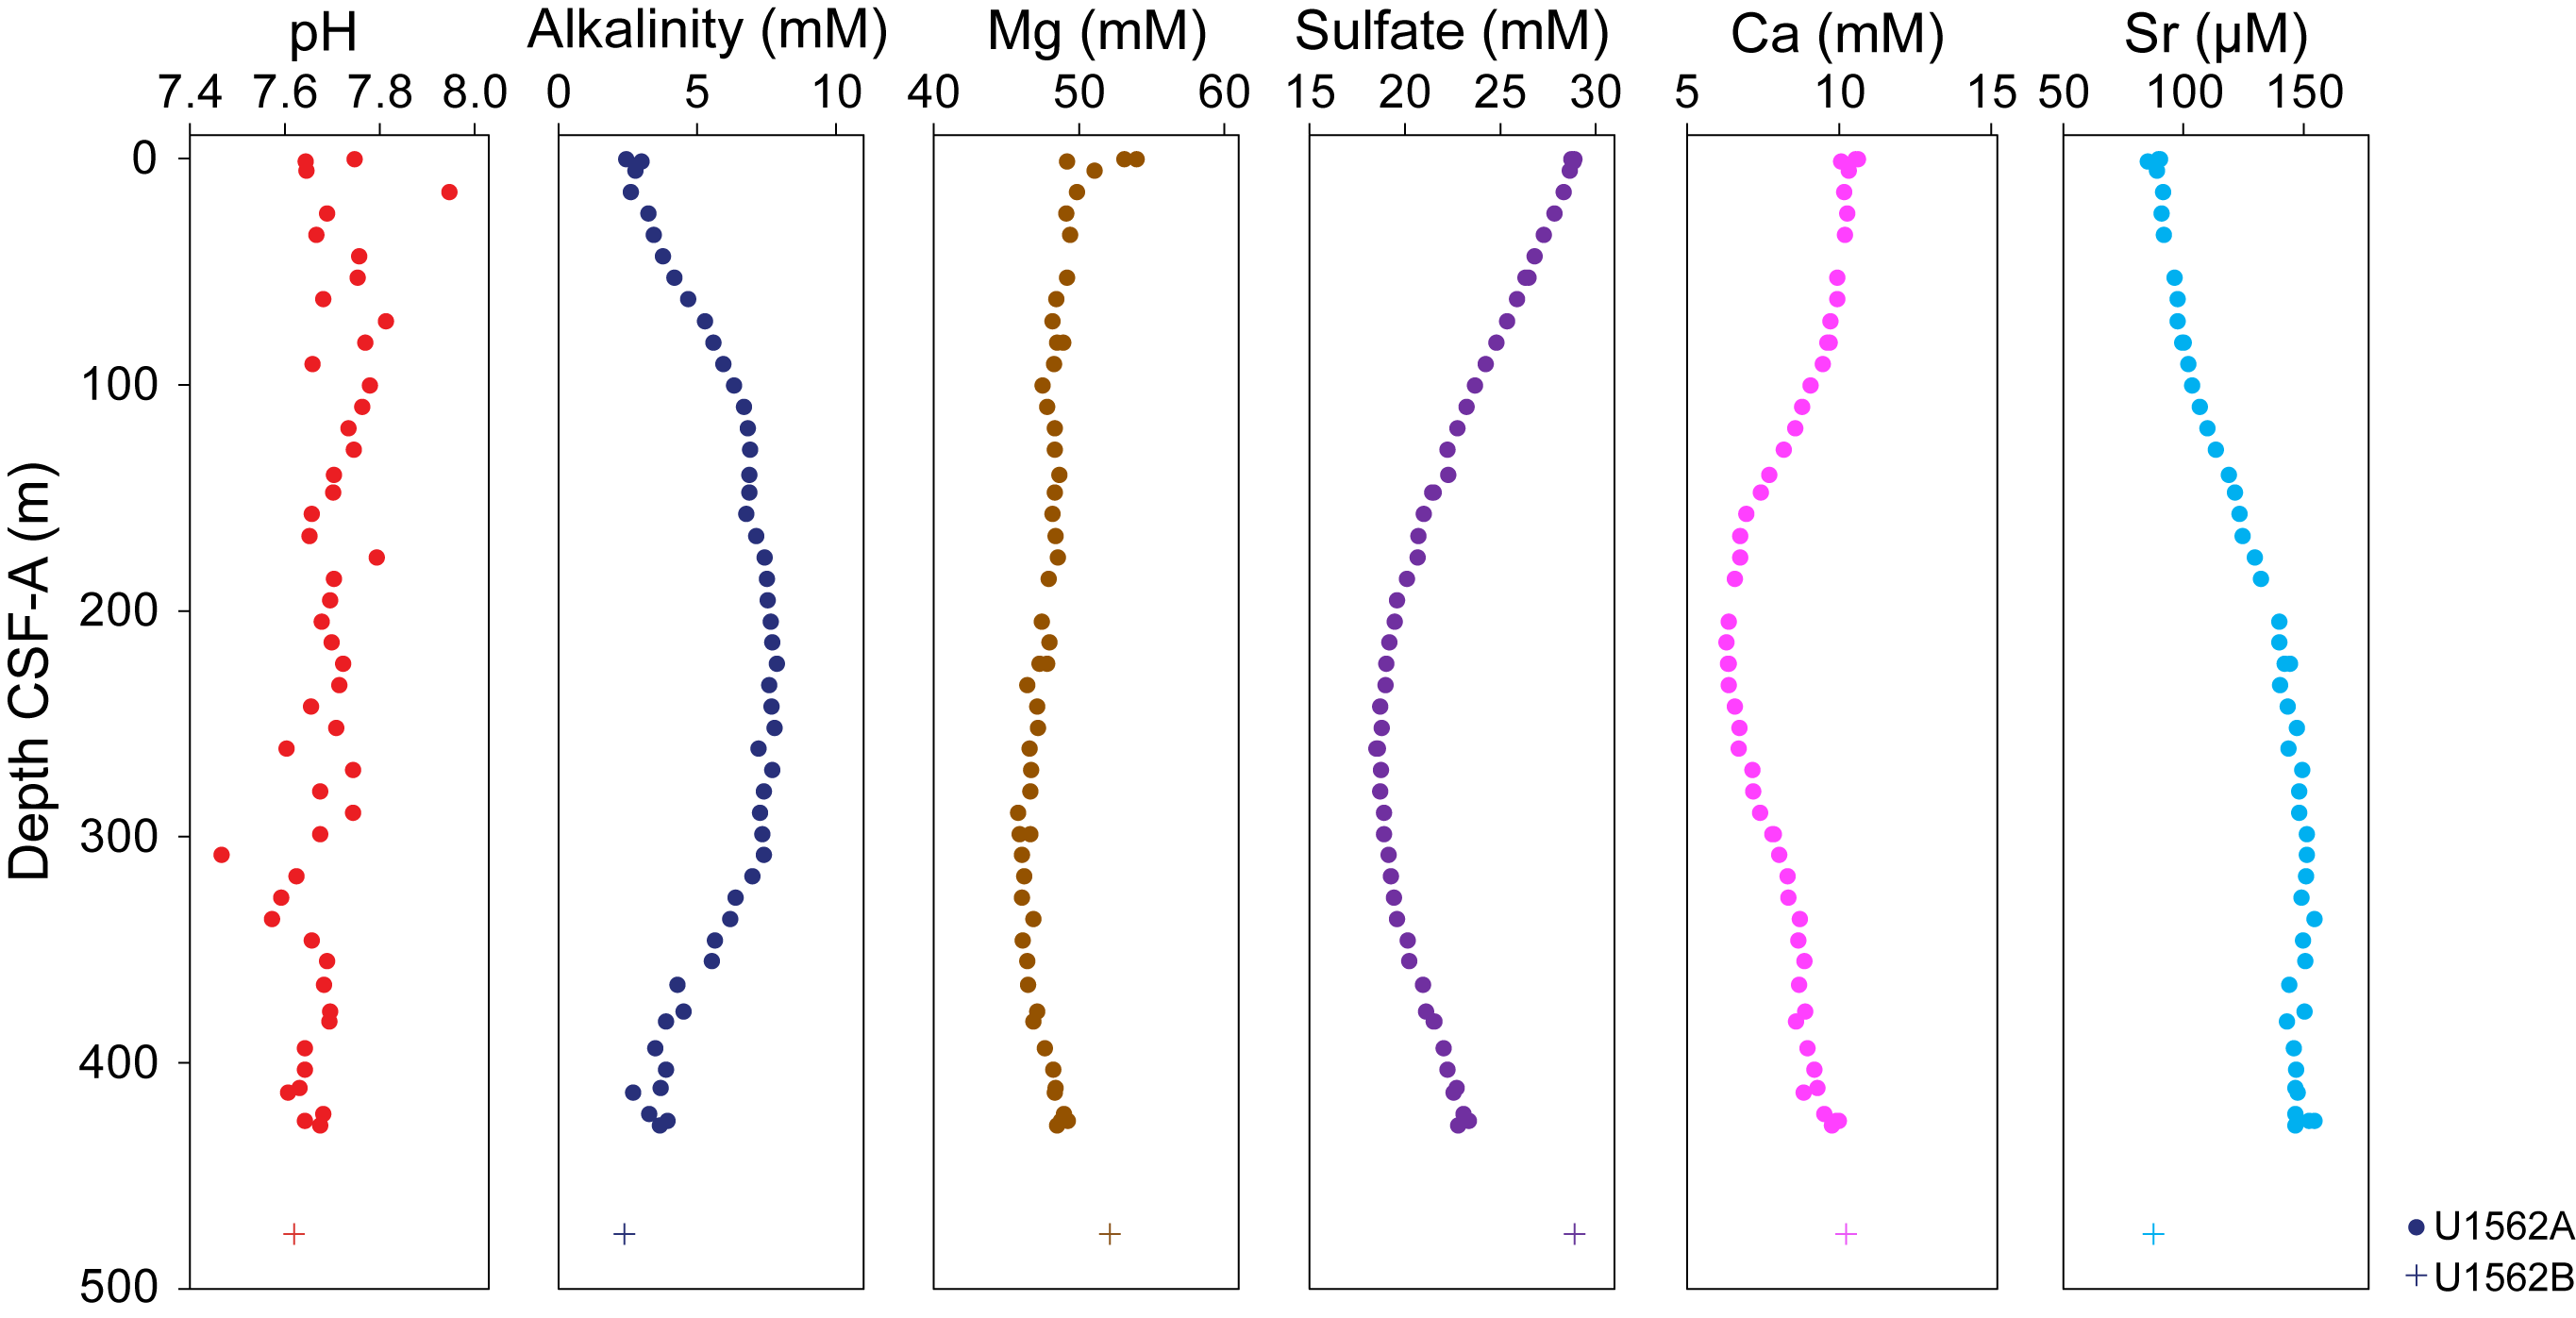
Figure F51. IW pH, alkalinity, and concentrations of selected ions.
10.2.1. Bulk sediment geochemistry
10.2.1.1. Carbonate, nitrogen, carbon, and sulfur
Discrete sediment samples (n = 76) were collected from squeeze cake residues and working-half sections during sediment description for Cores 395C-U1562A-1H through 64X (0.95–427.3 m CSF-A), 395C-U1562B-14R (475.71 m CSF-A), and 395-U1562C-3H through 50F (15.39–284.12 m CSF-A) and analyzed for total carbon (TC), TN, and total inorganic carbon (TIC). For Hole U1562C, sedimentary TS was also analyzed. TOC content and CaCO3 weight percent were subsequently calculated from TIC and TC measurements. CaCO3 varies from 0.04 to 82.9 wt%, with the highest content at 475.71 m CSF-A in the intercalated sediments from Section 395C-U1562B-14R-2, 17–27 cm (bottom sample in Figure F52). The sampling strategy for CaCO3 analyses (and as a result carbon, nitrogen, and sulfur analyses) differed between the holes. For Holes U1562A and U1562B, sediment was collected from the squeeze cake residues and was therefore sampled independent of lithology. No IW samples were collected for Hole U1562C; therefore, additional sediment samples were chosen so that the resulting geochemical information (e.g., CaCO3 content) could be used to aid in lithologic description. The apparent offset in the CaCO3 content between the two holes thus reflects the sampling bias and variable sedimentary CaCO3 content in different lithologic layers, not a general difference in CaCO3 content between the two holes. TOC is low (<1.21 wt%) and averages 0.38 ± 0.23 wt%. Four analyses for C and N fall outside of the upper quartile of data (above 2 wt%) and were excluded from the interpretation. TN is also very low (range = 0–0.08 wt%). TS was only measured for Hole U1562C (range = 0–1.09 wt%).
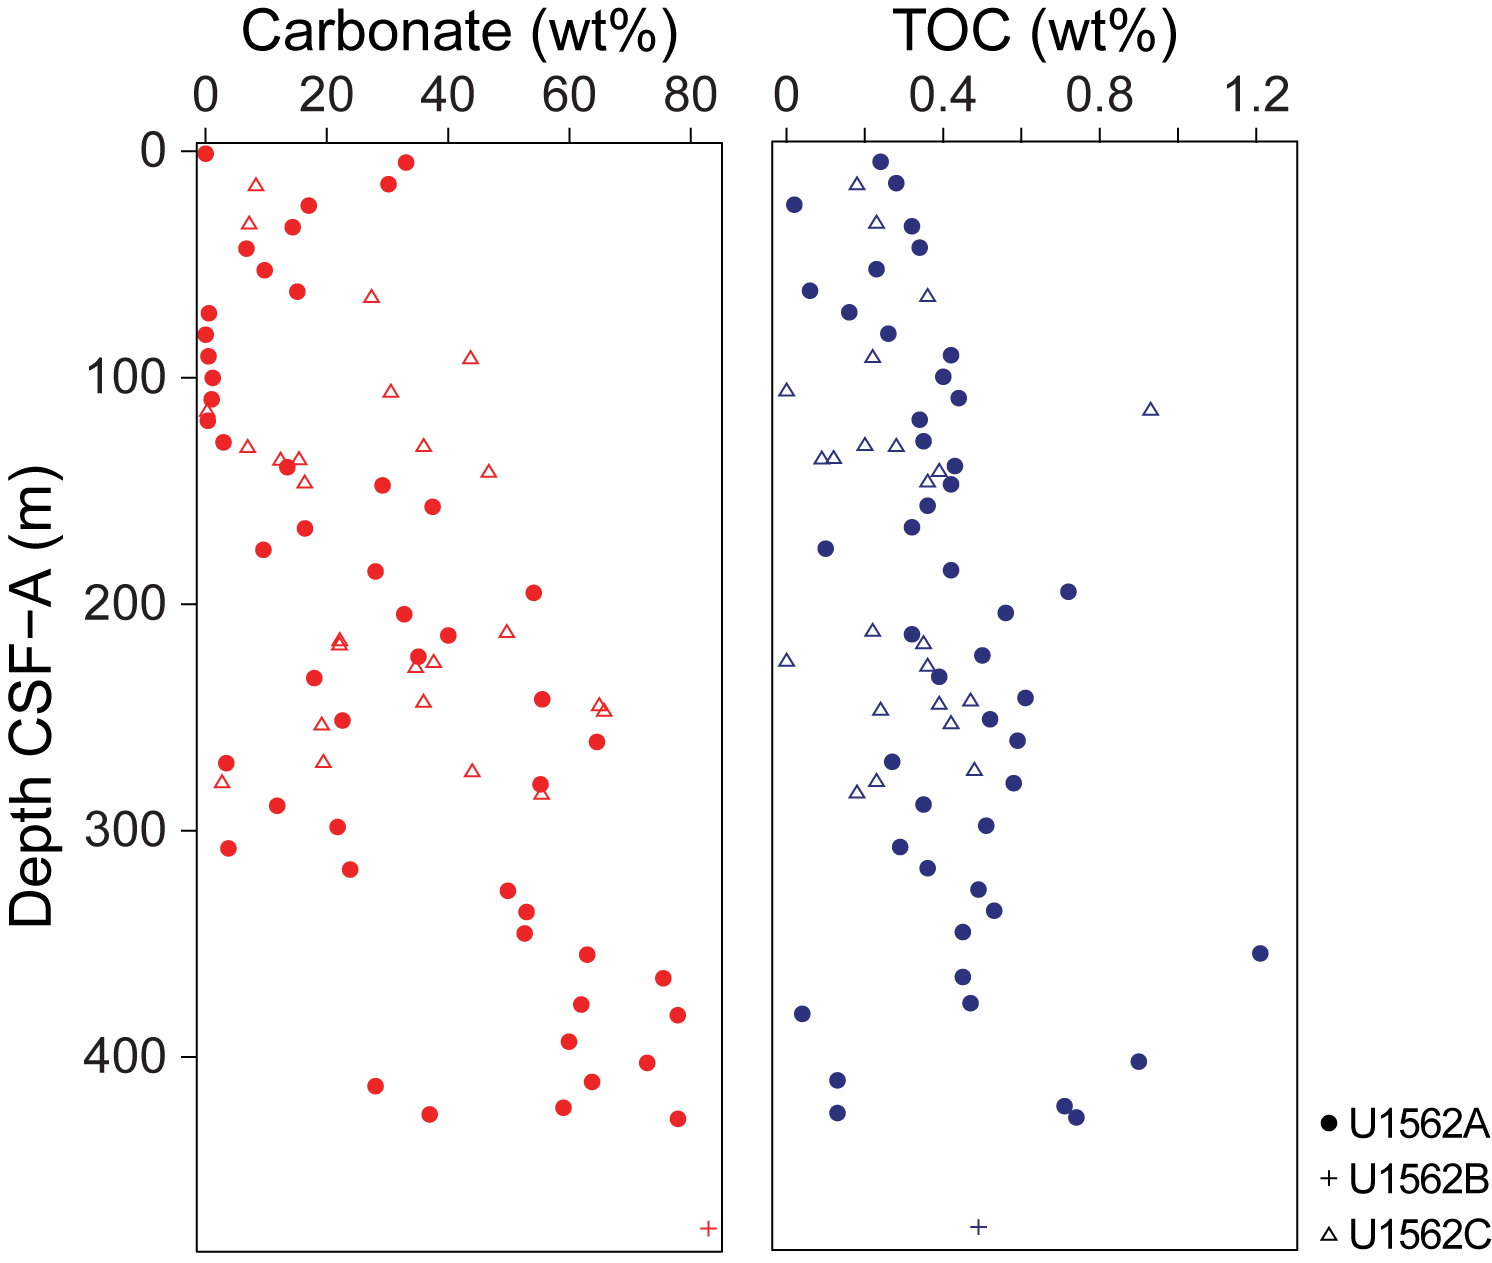
Figure F52. CaCO3 and TOC.
10.2.2. Microbiology
Microbiological sampling of sediments from Holes U1562A and U1562C was focused on collecting material for culture-independent approaches. A total of 49 sediment samples from Hole U1562A and 31 sediment samples from Hole U1562C, each 5 cm3, were collected with a sterile cut-end syringe. A total of 13 whole-round samples of hard rock were collected from Hole U1562B for shore-based microbiological analyses.
11. Downhole measurements
Details on tools and logging procedures can be found in Downhole measurements in the Expedition 395 methods chapter (Parnell-Turner et al., 2025a); only hole-specific procedures are detailed here. Downhole logging operations at Site U1562 were conducted in Hole 395C-U1562B, which was logged with the triple combo tool string (Magnetic Susceptibility Sonde [MSS], High-Resolution Laterolog Array [HRLA], Accelerator Porosity Sonde [APS], Hostile Environment Litho-Density Sonde [HLDS], and Hostile Environment Natural Gamma Ray Sonde [HNGS]), FMS-sonic tool string (FMS, Dipole Sonic Imager [DSI], General Purpose Inclinometry Tool [GPIT], and HNGS), UBI tool string (UBI, GPIT, and HNGS), and VSI tool string (VSI and HNGS) (Tables T14, T15). During coring in Hole 395C-U1562A, formation temperature measurements were acquired at four locations (Cores 4H, 7H, 10H, and 13H) using the APCT-3 tool (Table T16).
11.1. Logging procedure and log data processing and quality control
After coring operations were completed in Hole U1562B, the hole was cleaned and the pipe was raised to 89 m DSF (86 m WSF). The heavy mud used for drilling was then replaced with seawater. The triple combo tool string was deployed first and acquired a downhole log (Data Set 010LUP), a repeat uphole log (Data Set 011LUP) from 136 to 559 m WSF, and an uphole log to the seafloor (Data Set 017PUP). During the downhole logging pass, the calipers were closed and the APS was turned off; therefore, no APS or HLDS data were acquired in this logging pass. The FMS-sonic tool string was deployed and acquired a downhole log (Data Set 032PUP) with the calipers closed (no FMS image log acquired), a repeat uphole log from 419 to 558 m WSF (Data Set 033PUP), and a main uphole log (Data Set 034PUP) along the entire open hole (0–558 m WSF). The quality of the VP from the monopole transmitter was deemed acceptable for the basement interval (426–545 m WSF) by the Lamont-Doherty Earth Observatory Borehole Research Group (LDEO-BRG), but it was deemed poor in the sediment section, so VP data for depths above 426 m WSF are not discussed here. The dipole shear velocities were deemed to be of good quality in the sediment section (~85–426 m WSF) and are discussed here. The third tool string deployed was the VSI tool string. A brief uphole VSI logging pass was performed from 81 to 113 m WSF to depth match the station depths to the other logging tools. Seismic data from four VSI stations were acquired at 556.6, 459.4, 428.5, and 420 m WSF. The final logging pass in Hole U1562B was the UBI tool string. An initial uplog (Data Set 050LUP) was acquired without the UBI switched on to collect a gamma log for depth matching (408–553 m WSF). Two more uphole logs were conducted, one from 410 to 553 m WSF (Data Set 051LUP) and another from 0 to 407 m WSF (Data Set 052LUP), to acquire acoustic borehole image logs with the UBI. Because of enlargement of Hole U1562B in the sedimentary section (0–426 m WSF), the UBI did not acquire a good quality acoustic image log above the basement.
The gamma log of the triple combo tool string uphole log (Data Set 017PUP) is used as the reference log for depth matching all logging data from Hole U1562B. Once depth matched, all logging data were depth shifted to a seafloor depth of 2015 m WMSF (0.5 m difference from the driller's depth of 2014.5 m drilling depth below rig floor [DRF]), which was determined by a step in the gamma log from the uphole log of the triple combo tool string (Data Set 017PUP). During logging operations, the wireline heave compensator (WHC) was used to counter the 0.25–0.5 m of ship heave.
The borehole diameter was enlarged in the sediment section of Hole U1562B, generally between 13 and 17 inches, which is larger than bit size (~9.875 inches). Hole enlargement affects most measurements, especially those acquired with tools that require eccentralization and a good contact to the borehole wall. In the basement, the hole size is mostly close to the bit size with only short, localized enlargements.
Image log quality is mostly poor for both the acoustic and resistivity image logs in the sedimentary portion of Hole U1562B but is of higher quality in the basement section (>426 m WMSF). FMS caliper data show the hole is ovalized at 135–240 m WMSF, with shorter intervals of complete borehole widening to diameters of ~14.5 inches. From ~240 to 426 m WMSF, the hole is enlarged to diameters of ~15 inches. In the basement section, Hole U1562B has a diameter in good agreement with bit size (~9.875 inches) with only slight widening of the hole diameter between 464 and 476 m WMSF.
11.2. Logging units
Four logging units (Unit L1 = 0–136 m WMSF; Unit L2 = 136–350 m WMSF; Unit L3 = 350–426 m WMSF; Unit L4 = 426–560 m WMSF) are defined for Hole U1562B based on downhole logging responses (Figure F53). Logging subunits are defined in Unit L1 to account for logging in drill pipe and open hole and in Unit L2 based on further variations in the MS and shear wave velocity (VS).
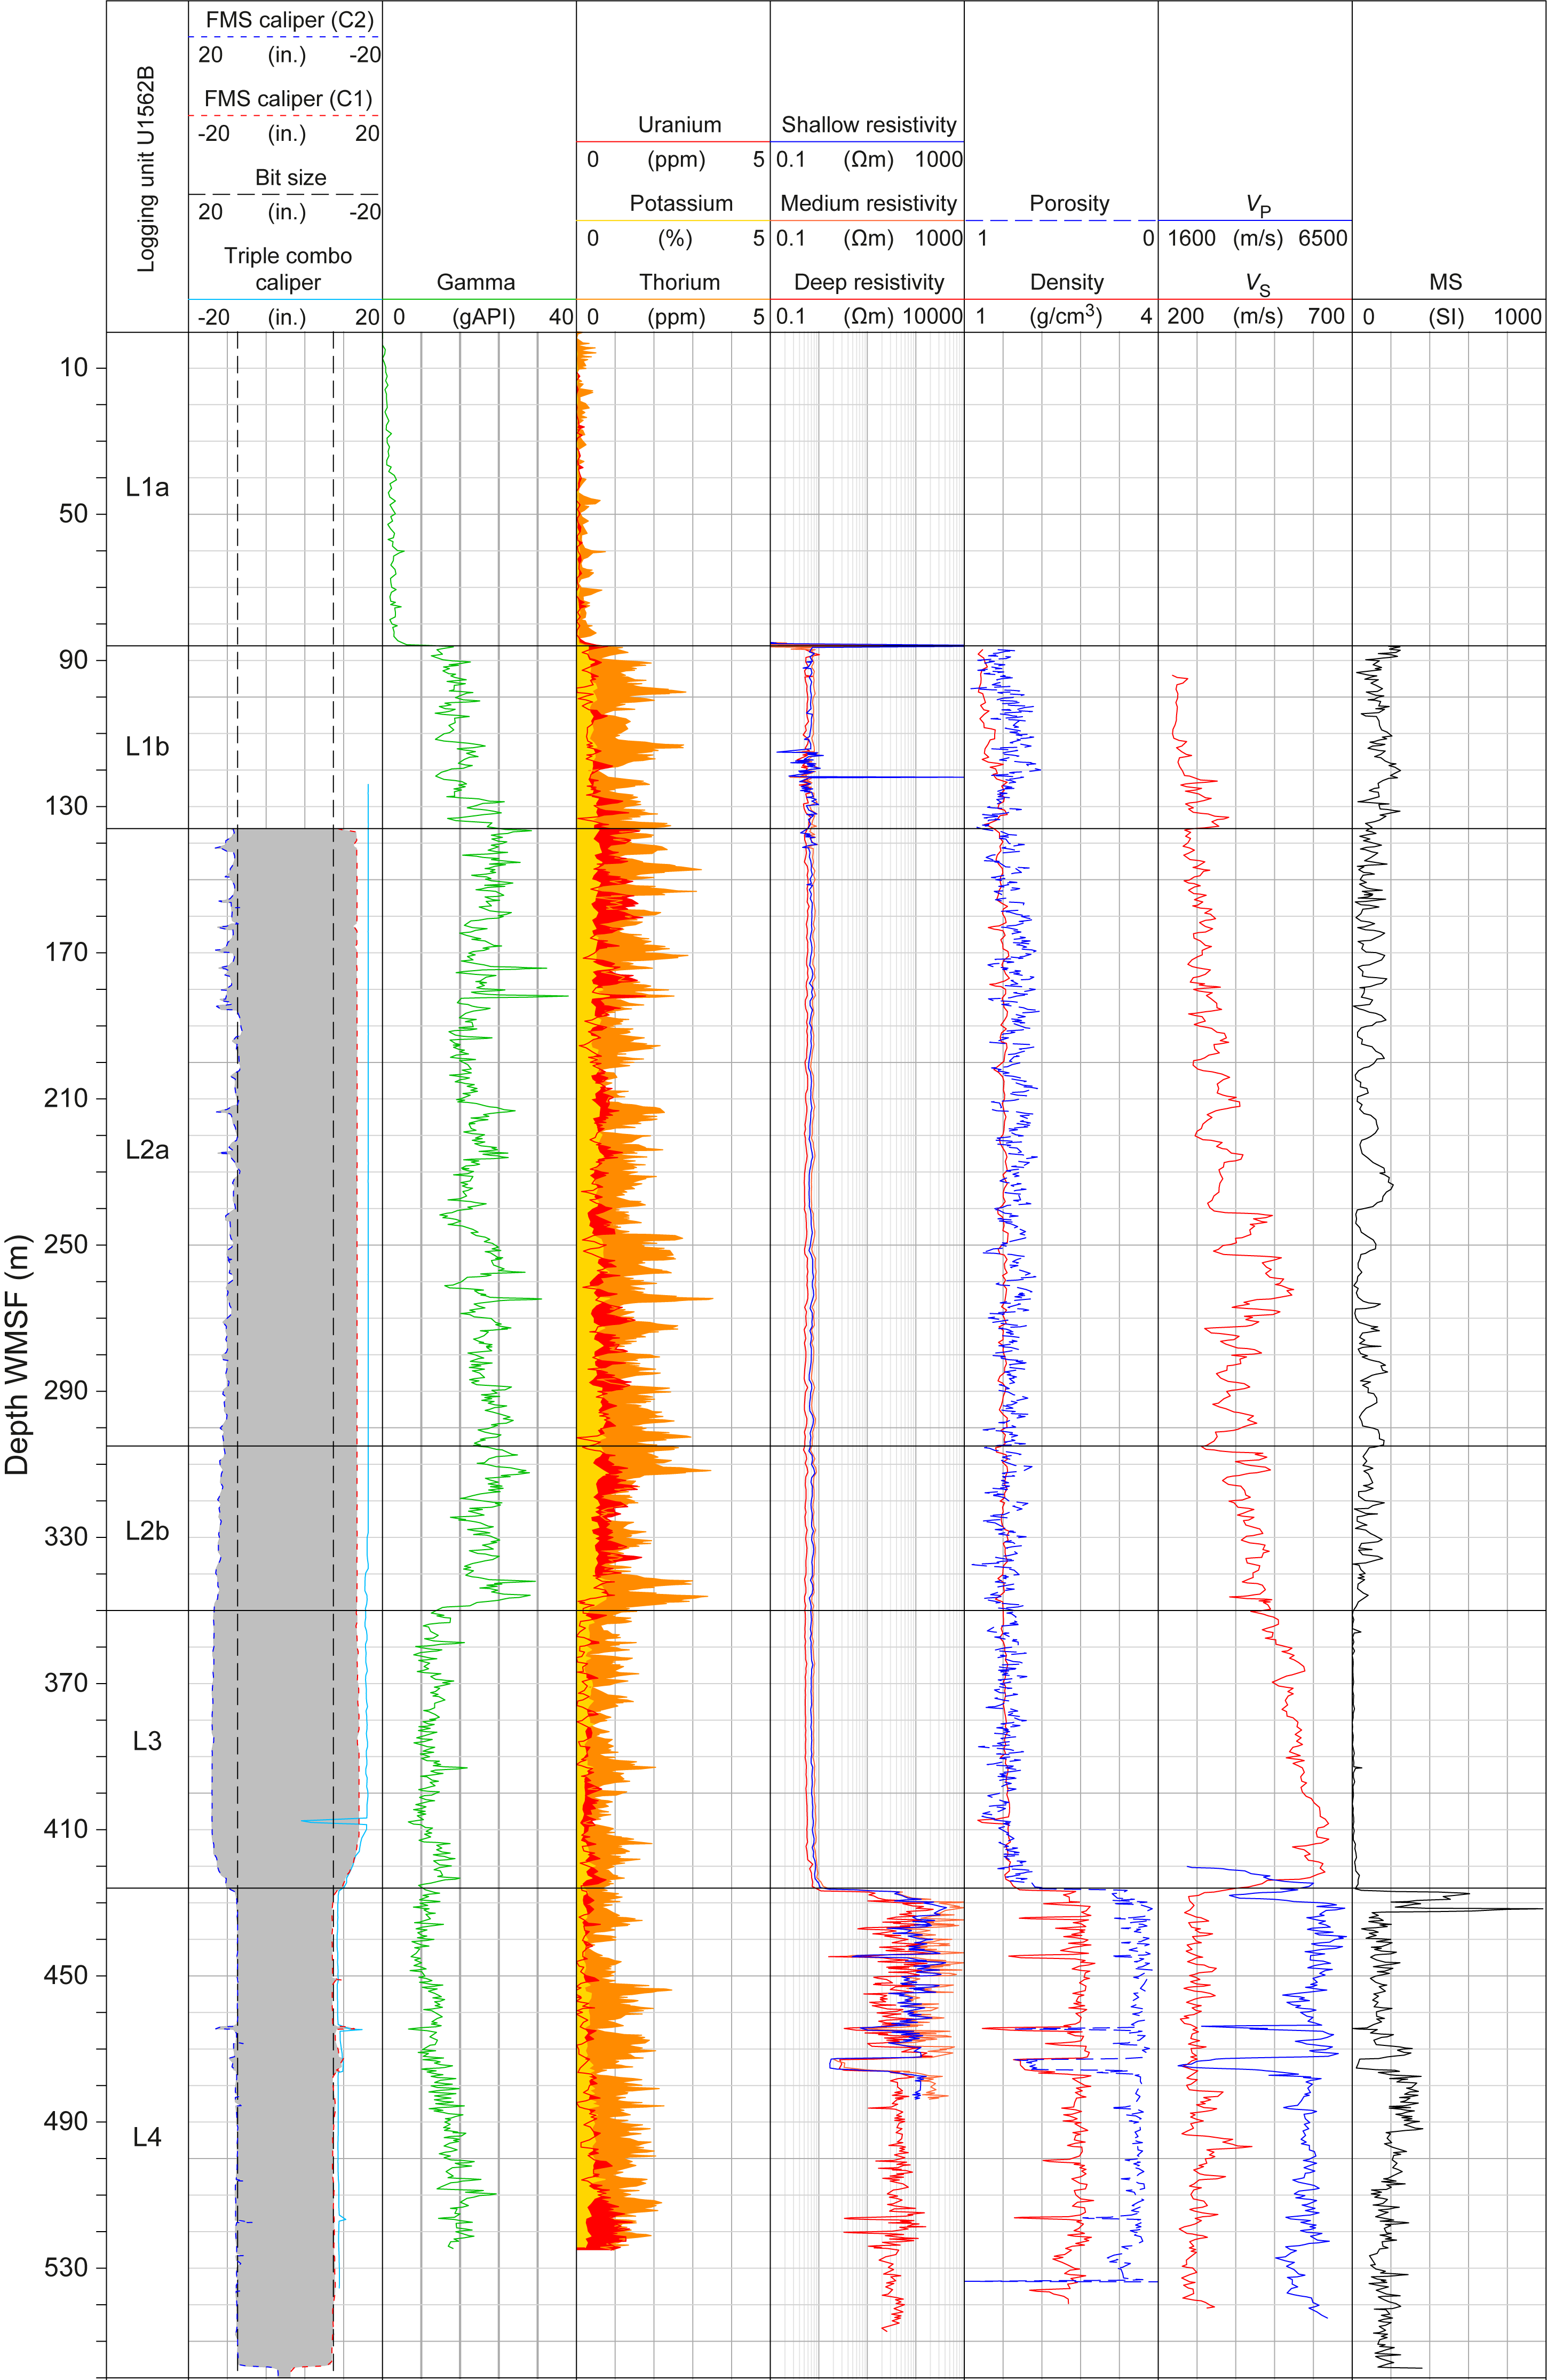
Figure F53. Downhole logging data.
11.2.1. Logging Unit L1
Logging Unit L1 starts at the seafloor, and its boundary with Unit L2 is defined by an increase in gamma radiation at ~136 m WMSF. Despite the drill pipe repressing the gamma measurements in the upper portion of Unit L1 (Subunit L1a), the overall character of the gamma log is similar throughout Unit L1. Furthermore, this logging unit correlates with Lithostratigraphic Unit I (0–135 m CSF-A) (see Lithostratigraphy), including Logging Subunits L1a and L1b.
11.2.1.1. Logging Subunit L1a
Downhole logging in the uppermost 86 m of Hole U1562B was acquired through drill pipe. Therefore, only suppressed gamma log measurements can be used to assess the formation. Logging Subunit L1a gamma logs show an average reading of 1.56 ± 0.7 American Petroleum Institute gamma radiation units (gAPI) (Figure F53).
11.2.1.2. Logging Subunit L1b
Below the drill pipe, Logging Subunit L1b was measured with a full suite of wireline logs except VP, which returned unreliable data for this interval (Figure F53). The gamma log increases to a mean value of 15.6 ± 2.5 gAPI and shows multiple peaks of up to ~25 gAPI. Spectral gamma log peaks are influenced by a Th signal of up to 2.8 ppm. Density increases with depth in Subunit L1b from ~1.2 to ~1.6 g/cm3. Electrical resistivity is variable in Subunit L1a, although values fluctuate little from ~0.7 Ωm. VS increases from ~235 m/s to 390 m/s with depth in Subunit L1b. MS is variable throughout Subunit L1b, ranging 15–275 SI.
11.2.2. Logging Unit L2
Logging Unit L2 is characterized by an overall high gamma signal (average = 20.5 ± 2.8 gAPI) that displays a cyclic pattern on a meter to decimeter scale (Figure F53). Peaks in the gamma signal are largely from a Th component. This cyclic logging response is also observed in the MS, VS, and porosity measurements of this logging unit. Electrical resistivity (~0.8 Ωm), density (1.6 g/cm3), and porosity (0.75) are largely invariable with depth in Unit L2. Subunits L2a and L2b are differentiated from each other based on the wavelength of these logging response cycles. Unit L2 correlates to Lithostratigraphic Units II and III (see Lithostratigraphy).
11.2.2.1. Logging Subunit L2a
Logging Subunit L2a shows cyclic behavior in both VS and MS, the length scale of which increases with depth from meter scale to decameter scale. MS and VS appear to show a negative correlation such that when the MS of the sediment increases, VS decreases and vice versa. VS also shows an overall increase with depth in Subunit L2a from ~280 m/s up to between 345 and 550 m/s.
11.2.2.2. Logging Subunit L2b
Logging Subunit L2b shows the same VS and MS cyclic behavior observed in Subunit L2a, although they occur at a shorter, meter scale, and the cycles appear to diminish with depth. MS and VS continue to show a negative correlation, and VS shows an initial drop from the bottom of Subunit L2a and then an increase with depth in Subunit L2b from ~300 to ~500 m/s.
11.2.3. Logging Unit L3
The boundary between Logging Units L2 and L3 is marked by a sharp drop in gamma radiation, and Unit L3 displays an average of 10.2 ± 1.7 gAPI (Figure F53). The gamma log shows increased peaks in this logging unit, which, like the units above it, is dominated by a Th signal, as shown by the spectral gamma log. Electrical resistivity reports the same values as Unit L2 (~0.85 Ωm) with a slight increase at the bottom of the unit as it approaches Unit L4. Density increases with depth in Unit L3 from 1.6 to 1.8 g/cm3. At ~407 m WMSF, the caliper shows a narrowing of the hole, which is also reflected in an artificial drop in density. VS increases with depth in Unit L3 from ~440 to ~650 m/s. The lowermost part of Unit L3 (420–426 m WMSF) produced reliable VP measurements that show a rapid increase downward toward the top of Unit L4, from ~2300 to 5500 m/s. MS is invariably low in Unit L3 (average = 7.9 SI) and only shows a slight increase of up to ~40 SI at the bottom of the unit. Unit L3 correlates to Lithostratigraphic Unit IV (see Lithostratigraphy).
11.2.4. Logging Unit L4
Logging Unit L4 represents the basement sequence drilled in Hole U1562B (Figure F53). The boundary between Units L3 and L4 is defined by marked changes in resistivity, density, porosity, VP, VS, and MS. The gamma log shows an initial decrease to ~7 gAPI at the top of Unit L4 that gradually increases with depth to as high as ~23 gAPI. The spectral gamma log has a strong Th signal to ~515 m WMSF, below which it becomes mostly a U signal. The transition from the sediment strata to the basement basalt is obviously marked by the previously mentioned increase in electrical resistivity (from deep-resistivity values of ~0.85 to ~51 Ωm), an increase in density (from 1.7 to 2.7 g/cm3), a decrease in porosity (from ~0.6 to 0.16), a decrease in VS (from 630 to 230 m/s), an increase in VP (from 3350 to 6090 m/s), and an initial large increase in MS (from ~13 to 605 SI). All logging responses show variability throughout the basement sequence, with increases in MS correlating to increases in VP, density, and resistivity and decreases in porosity and vice versa. A notable interval at 472–476 m WMSF with low resistivity (deep resistivity of ~6.5 Ωm), high porosity (~0.62), low density (~1.8 g/cm3), low VP (2400 m/s), and low MS (~30 SI) may correlate to an intermixed sediment layer recovered in the basement basalts (see Lithostratigraphy). Similar meter-scale logging signatures can be observed throughout Unit L4 (e.g., ~464 m WMSF) that may represent further sediment layers in the basement, most of which have not been recovered in the cored material.
11.3. Borehole imaging
The resistivity image log acquired in the sedimentary sequence in Hole U1562B shows alternating conductive and resistive layering (Figure F54), and a mottling pattern is particularly apparent from 300 to 430 m WMSF (Subunit L2b and Unit L3). Unit L2 displays some apparently cyclic behavior in the resistivity logs; however, the frequent ledges and borehole breakouts of the hole make it difficult to interpret the signal clearly. Both the acoustic and resistivity image logs are of excellent quality in the basement sequence in Hole U1562B (>430 m WMSF) (Figure F54). Both image logs show a mostly featureless basement with some fractured to very fractured intervals that are provisionally interpreted to be small pillow lava structures. An interval of sediment is observable on image logs at ~472–475 m WMSF (Figure F55). At some depths, wide fractures can be observed, marked by low acoustic and low resistivity values in the images (e.g., ~516 m WMSF; Figure F54).
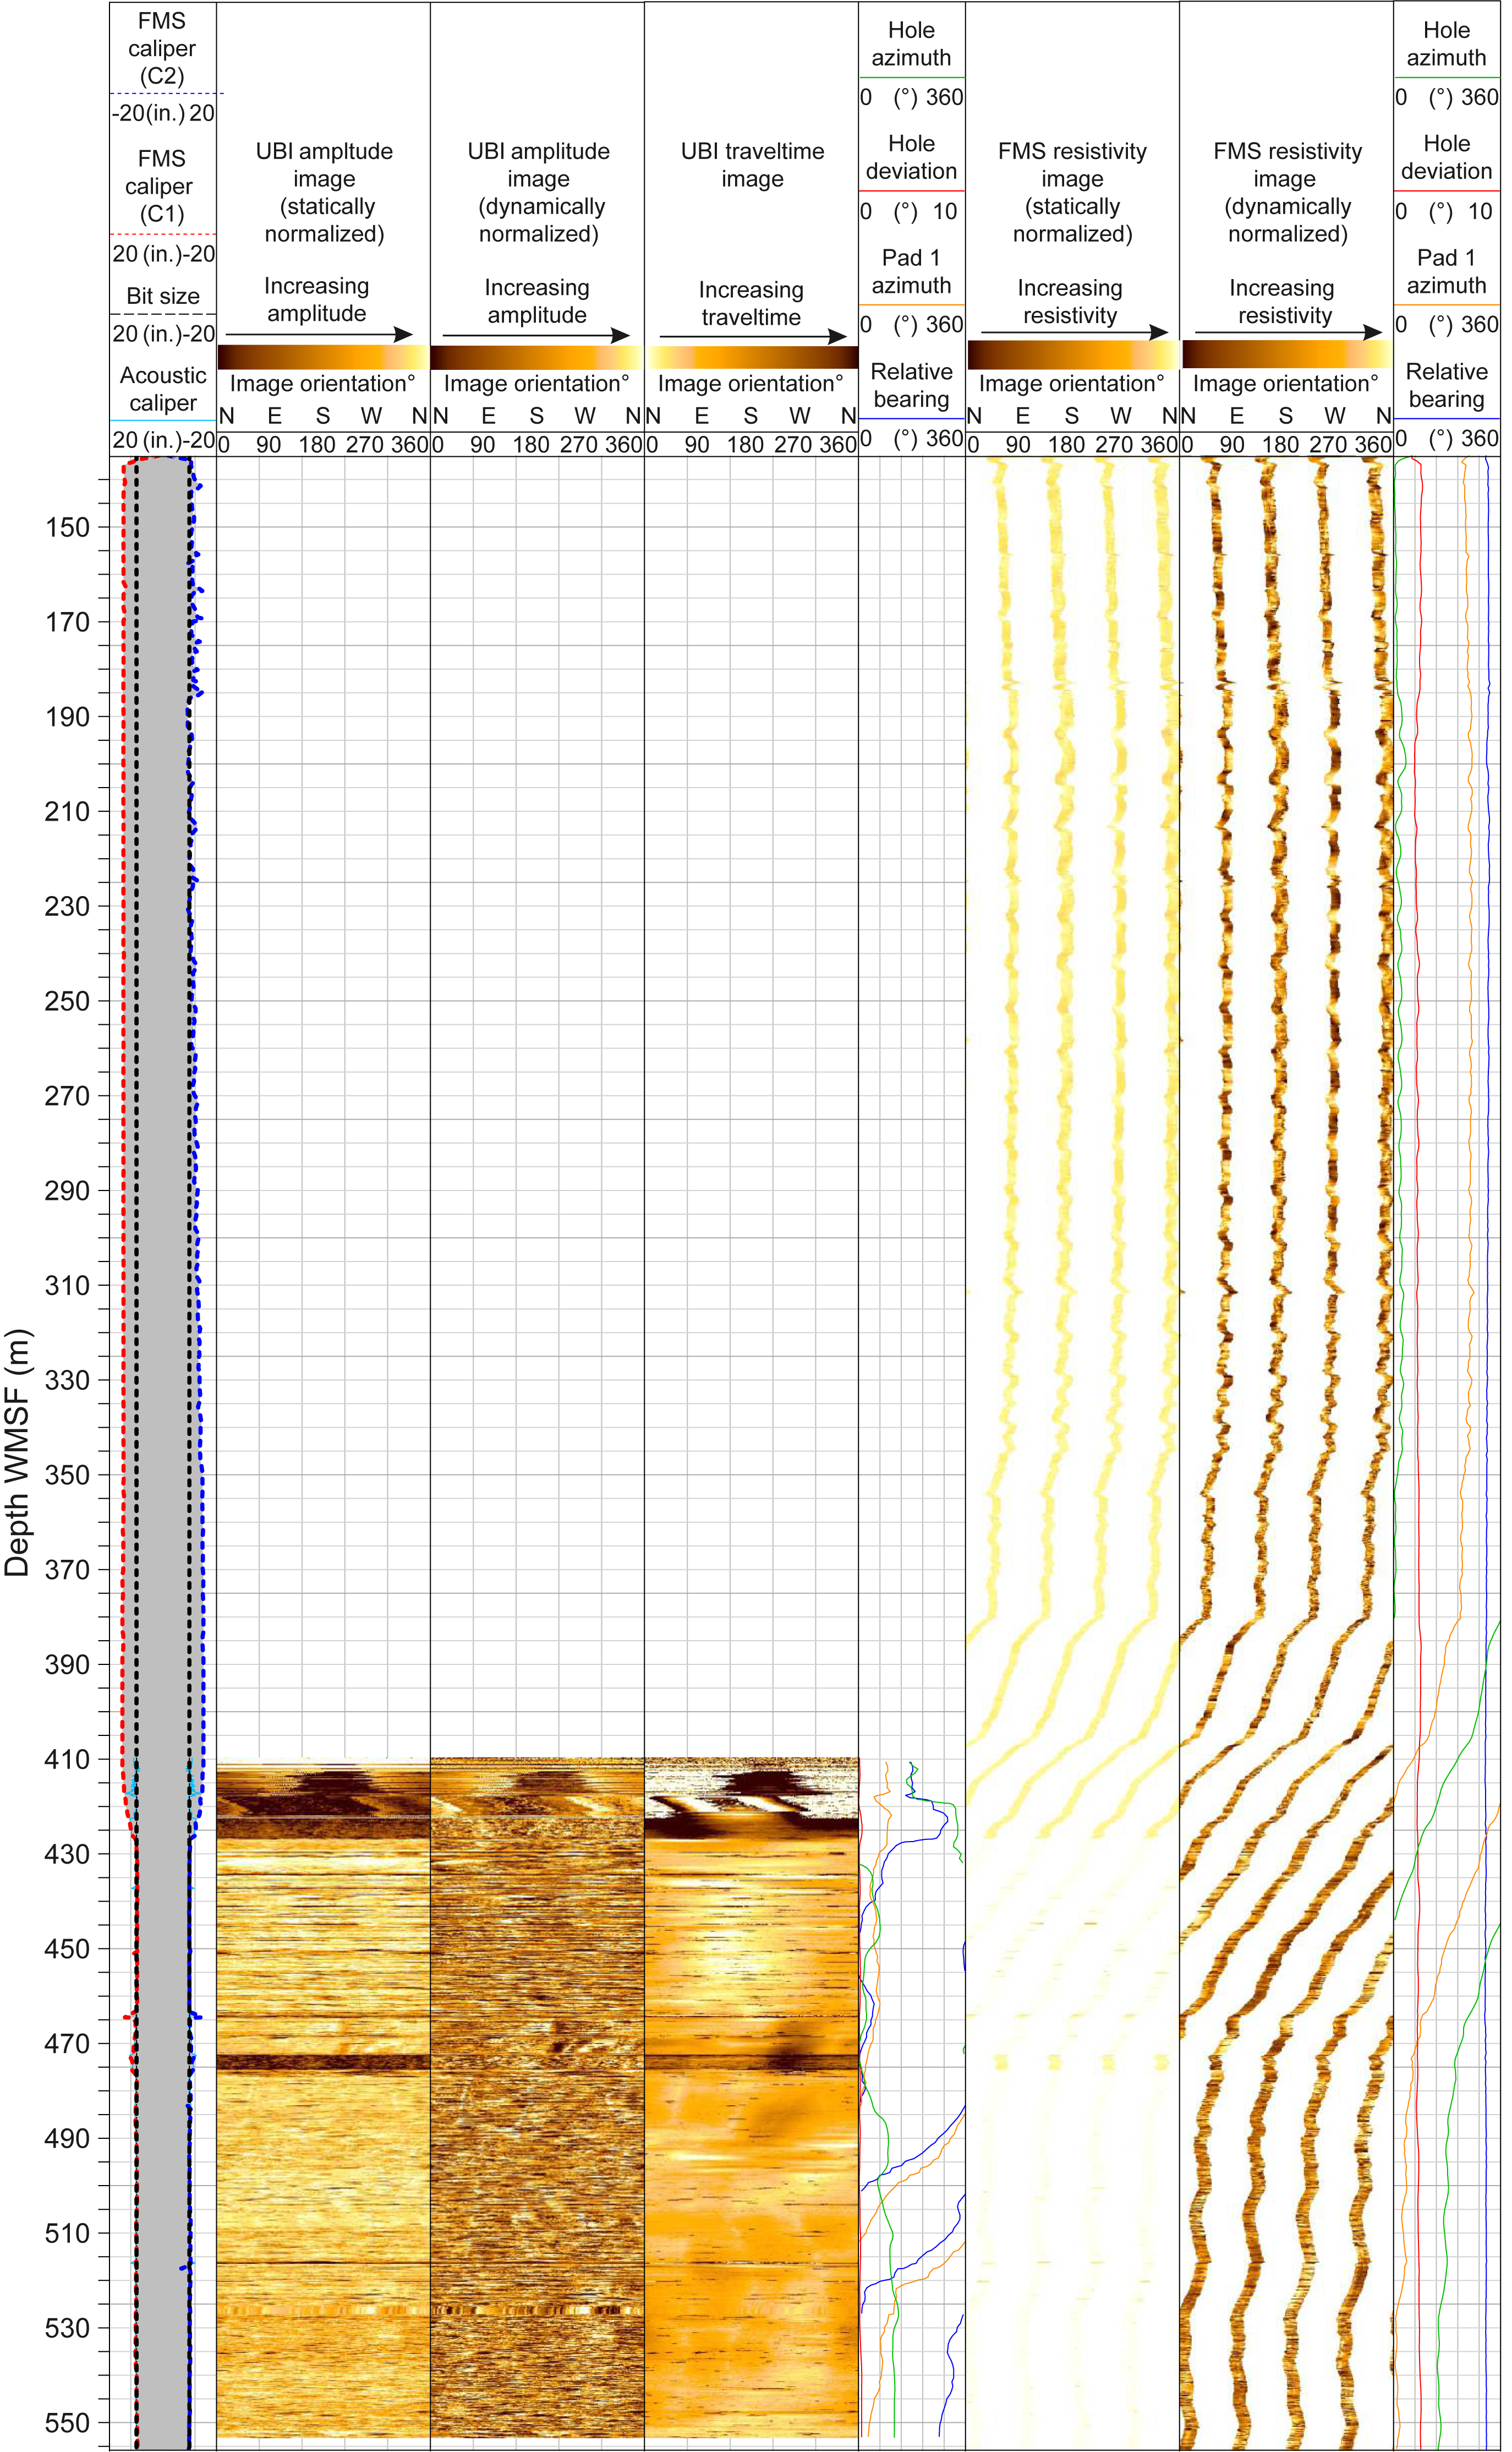
Figure F54. Wireline image data.
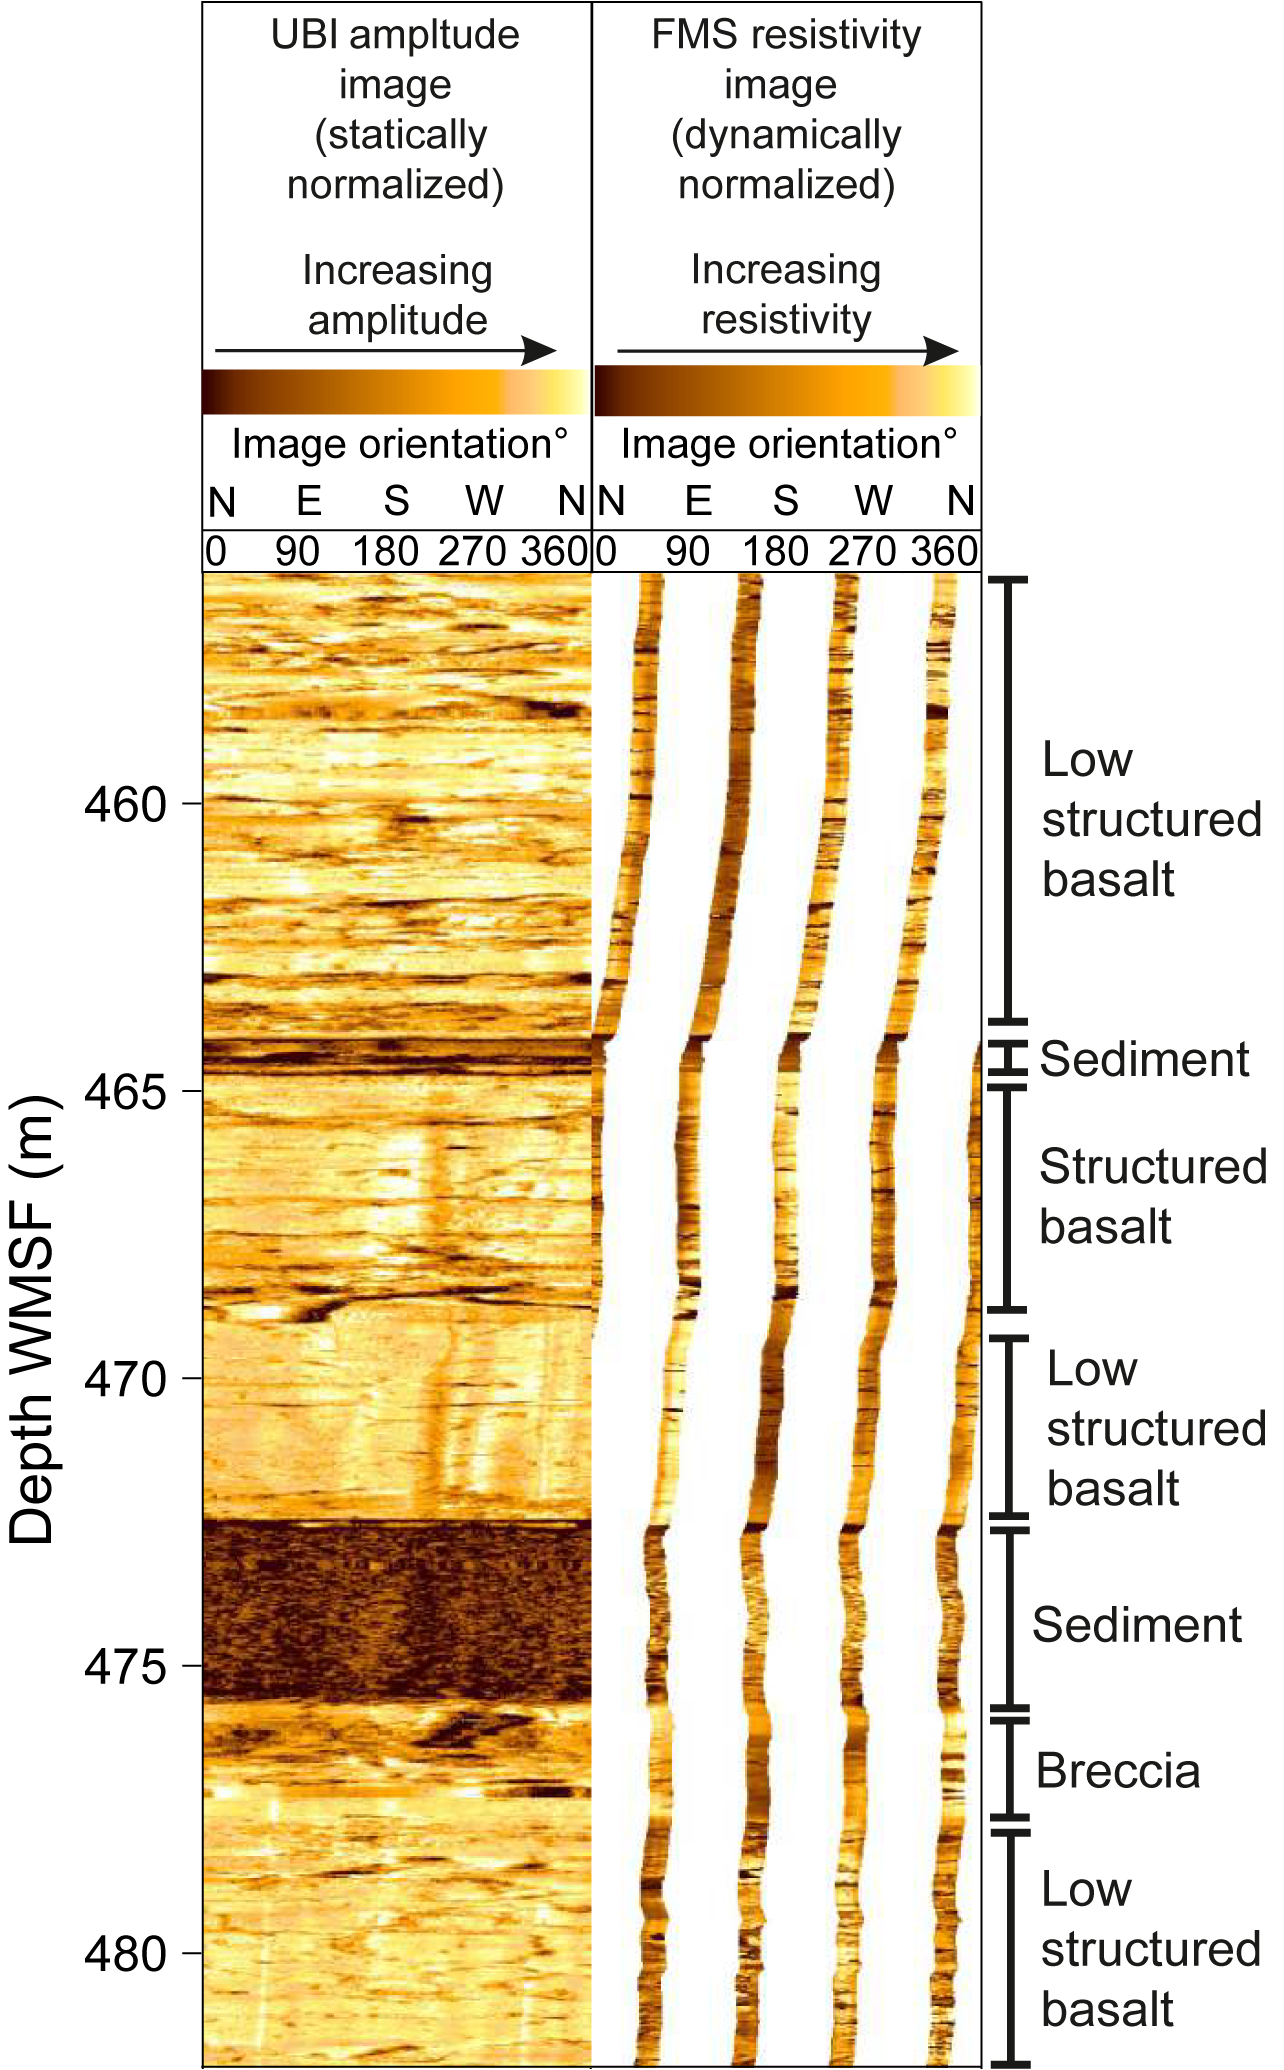
Figure F55. Basalt basement image features.
11.4. Downhole temperature and thermal conductivity
During coring in Hole U1562A, downhole temperature measurements were taken with the APCT-3 tool in Unit L1. The APCT-3 tool provided equilibration temperatures ranging from 4.27°C at 30.5 m CSF-A to 7.34°C at 116 m CSF-A (Figure F56; Table T16). These observations indicate a thermal gradient in the upper sediment section of 36°C/km (Figure F57A). Thermal conductivity under in situ conditions (K) was estimated from laboratory-determined thermal conductivity from Hole U1562A using the method of Hyndman et al. (1974); it varies slightly, but mostly has values around 0.8 to 0.9 W/m·K (Figure F57B). A linear function for depth-dependent thermal resistance (R) was obtained by integrating the inverse of the thermal conductivity over depth and applying a linear least-squares fit (Figure F57C). This function was used to estimate thermal resistance at each corresponding APCT-3 downhole temperature measurement depth. A heat flow of 33.5 mW/m2 was obtained from a linear least-squares fit of the relationship between temperature and thermal resistance (Bullard, 1939), whose slope is the vertical heat flow (Figure F57D).
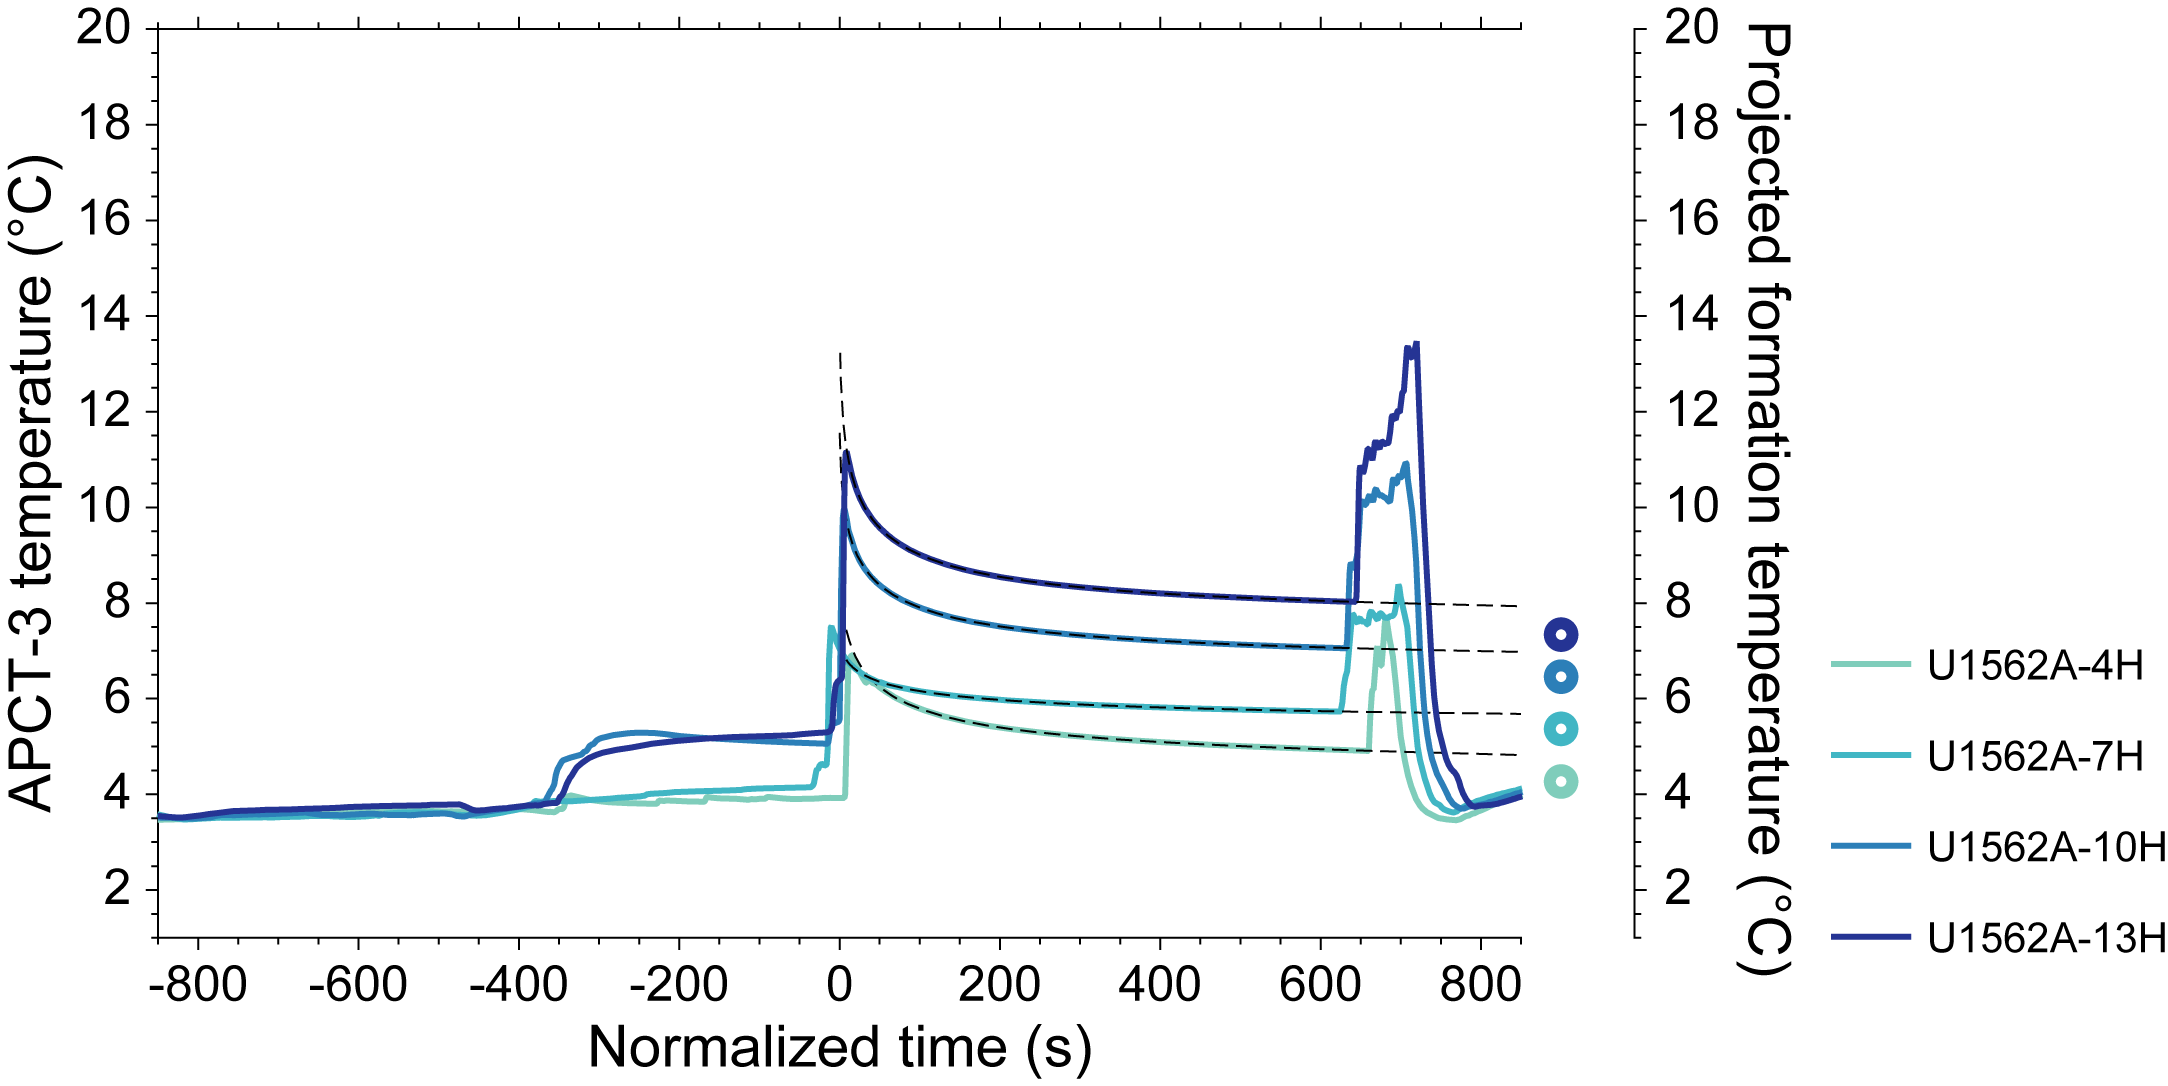
Figure F56. APCT-3 temperature-time series and projected formation temperatures.
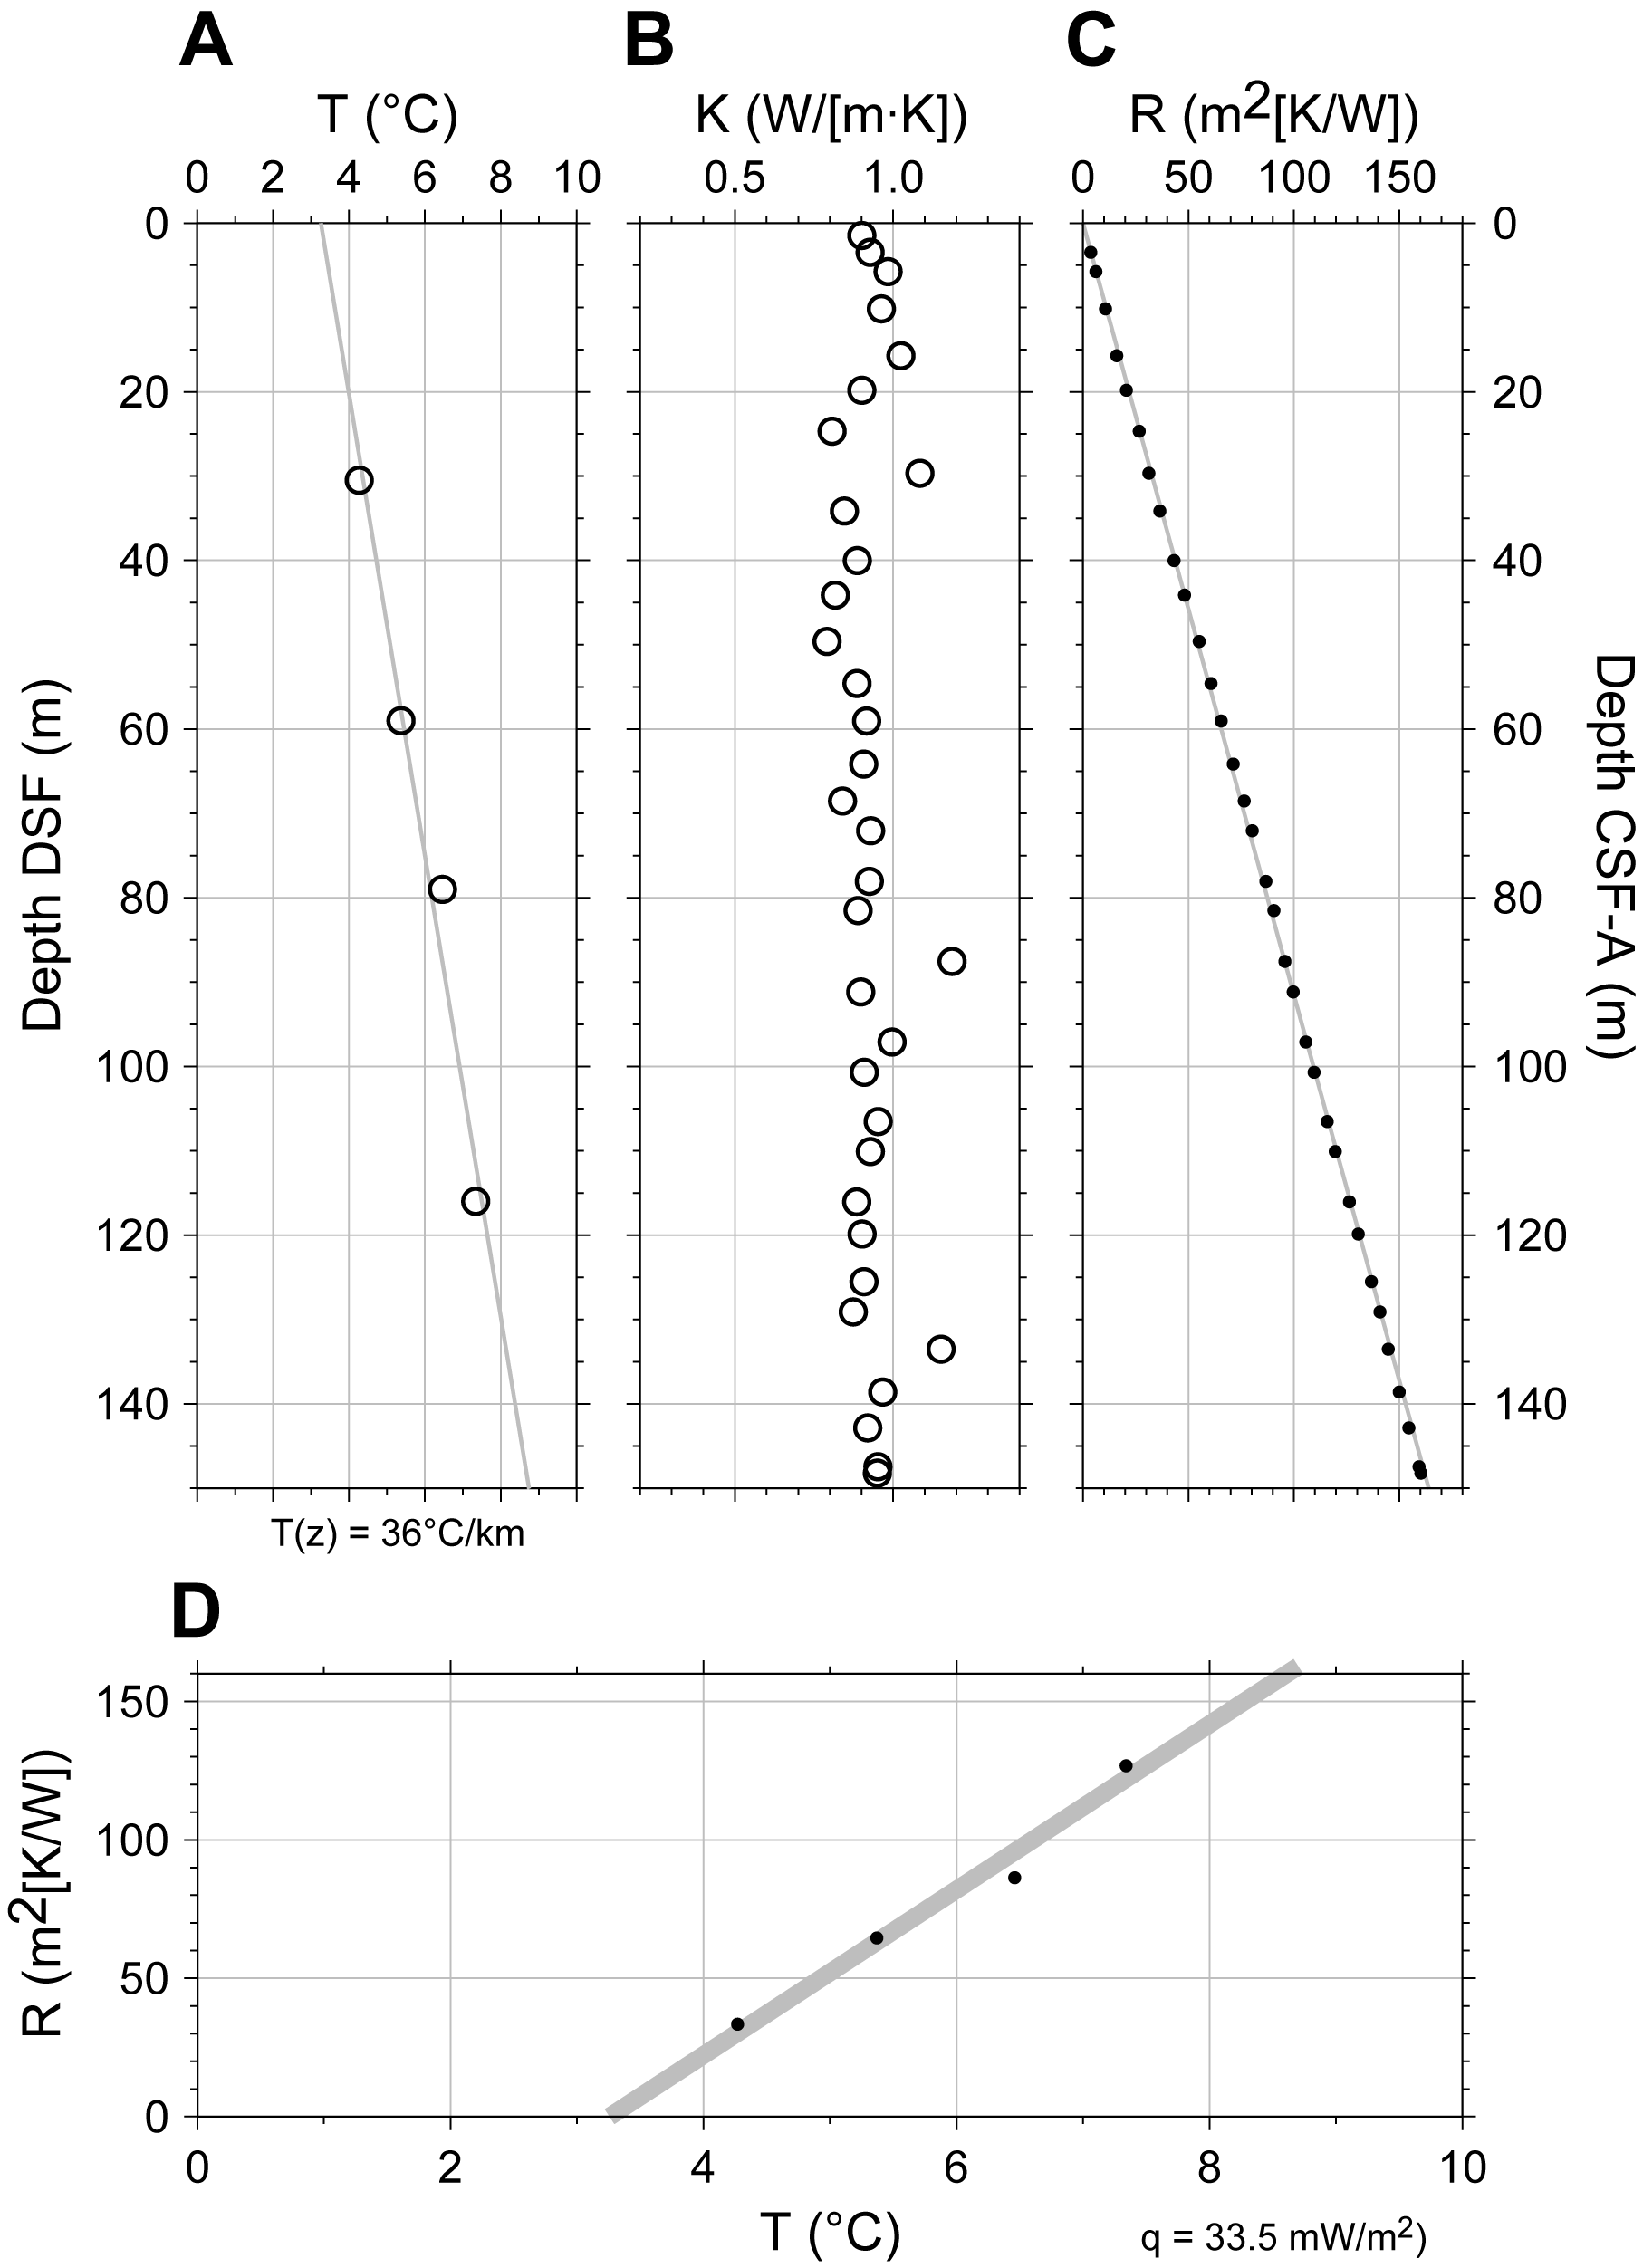
Figure F57. Thermal gradient and heat flow estimates.
12. Age model
Site U1562, located near the eastern edge of Björn drift, has a thinner sedimentary succession than Site U1554, which is located near the center of the drift as imaged on Seismic Profile JC50-1 (see Background and objectives). Seismic Profile JC50-1 indicates that the upper part of the succession at Site U1562, from the seafloor reflection at ~2.7 s TWT to an angular discordance at ~2.9 s TWT, corresponds to a package of sediment that can be traced along the profile to Site U1554. Cores recovered from Site U1554 showed that this part of the succession had rapid sedimentary accumulation rates (up to ~17 cm/ky) and sedimentary facies consistent with a contourite deposit (see Age model in the Site U1554 chapter [Parnell-Turner et al., 2025b]). This package of sediment, which we attribute to the Björn drift depositional system, thins out eastward along the seismic reflection profile in the direction of Site U1562, but the thinning is not uniform, and a substantial stratigraphic interval within it appears to be pinched out at Site U1562 around ~2.75 s TWT. In contrast to the upper part of the succession at Site U1562, below ~2.9 s TWT the succession appears substantially thicker than the stratigraphically equivalent strata at Site U1554. From ~2.9 to ~3.05 s TWT, the seismic profile shows a series of relatively continuous parallel reflections, but below that level the reflections are less coherent to ~3.15 s TWT and then more coherent again down to the prominent basement reflection at ~3.25 s TWT.
Magnetostratigraphic (see Paleomagnetism) and biostratigraphic (see Micropaleontology) age constraints for the sedimentary succession in Holes 395C-U1562A and 395-U1562C are combined as an age-depth plot in Figure F58. The selected age model tie points are listed in Table T17. The succession appears relatively continuous to ~22 m CSF-A with a sedimentation rate of ~1.8 cm/ky. From ~22 m CSF-A to the base of Subchron C1r.3r at 28.83 m CSF-A, the succession is evidently condensed and/or subject to hiatuses. Subchron C1r.2n (Cobb Mountain; 1.180–1.215 Ma) appears to be missing despite good recovery (see Paleomagnetism). The interval may correspond to the pinching out of seismic reflections at ~2.75 s TWT discussed above. Below 28.83 m CSF-A, there is a marked change in the character of the MS record from higher to lower frequency cyclicity downcore (see Stratigraphic correlation). The succession from this depth to the base of Lithostratigraphic Unit I at 135 m CSF-A contains a sequence of magnetic reversals in Chron 2 (Matuyama), providing constraints for a relatively rapid sedimentation rate of ~10 cm/ky.
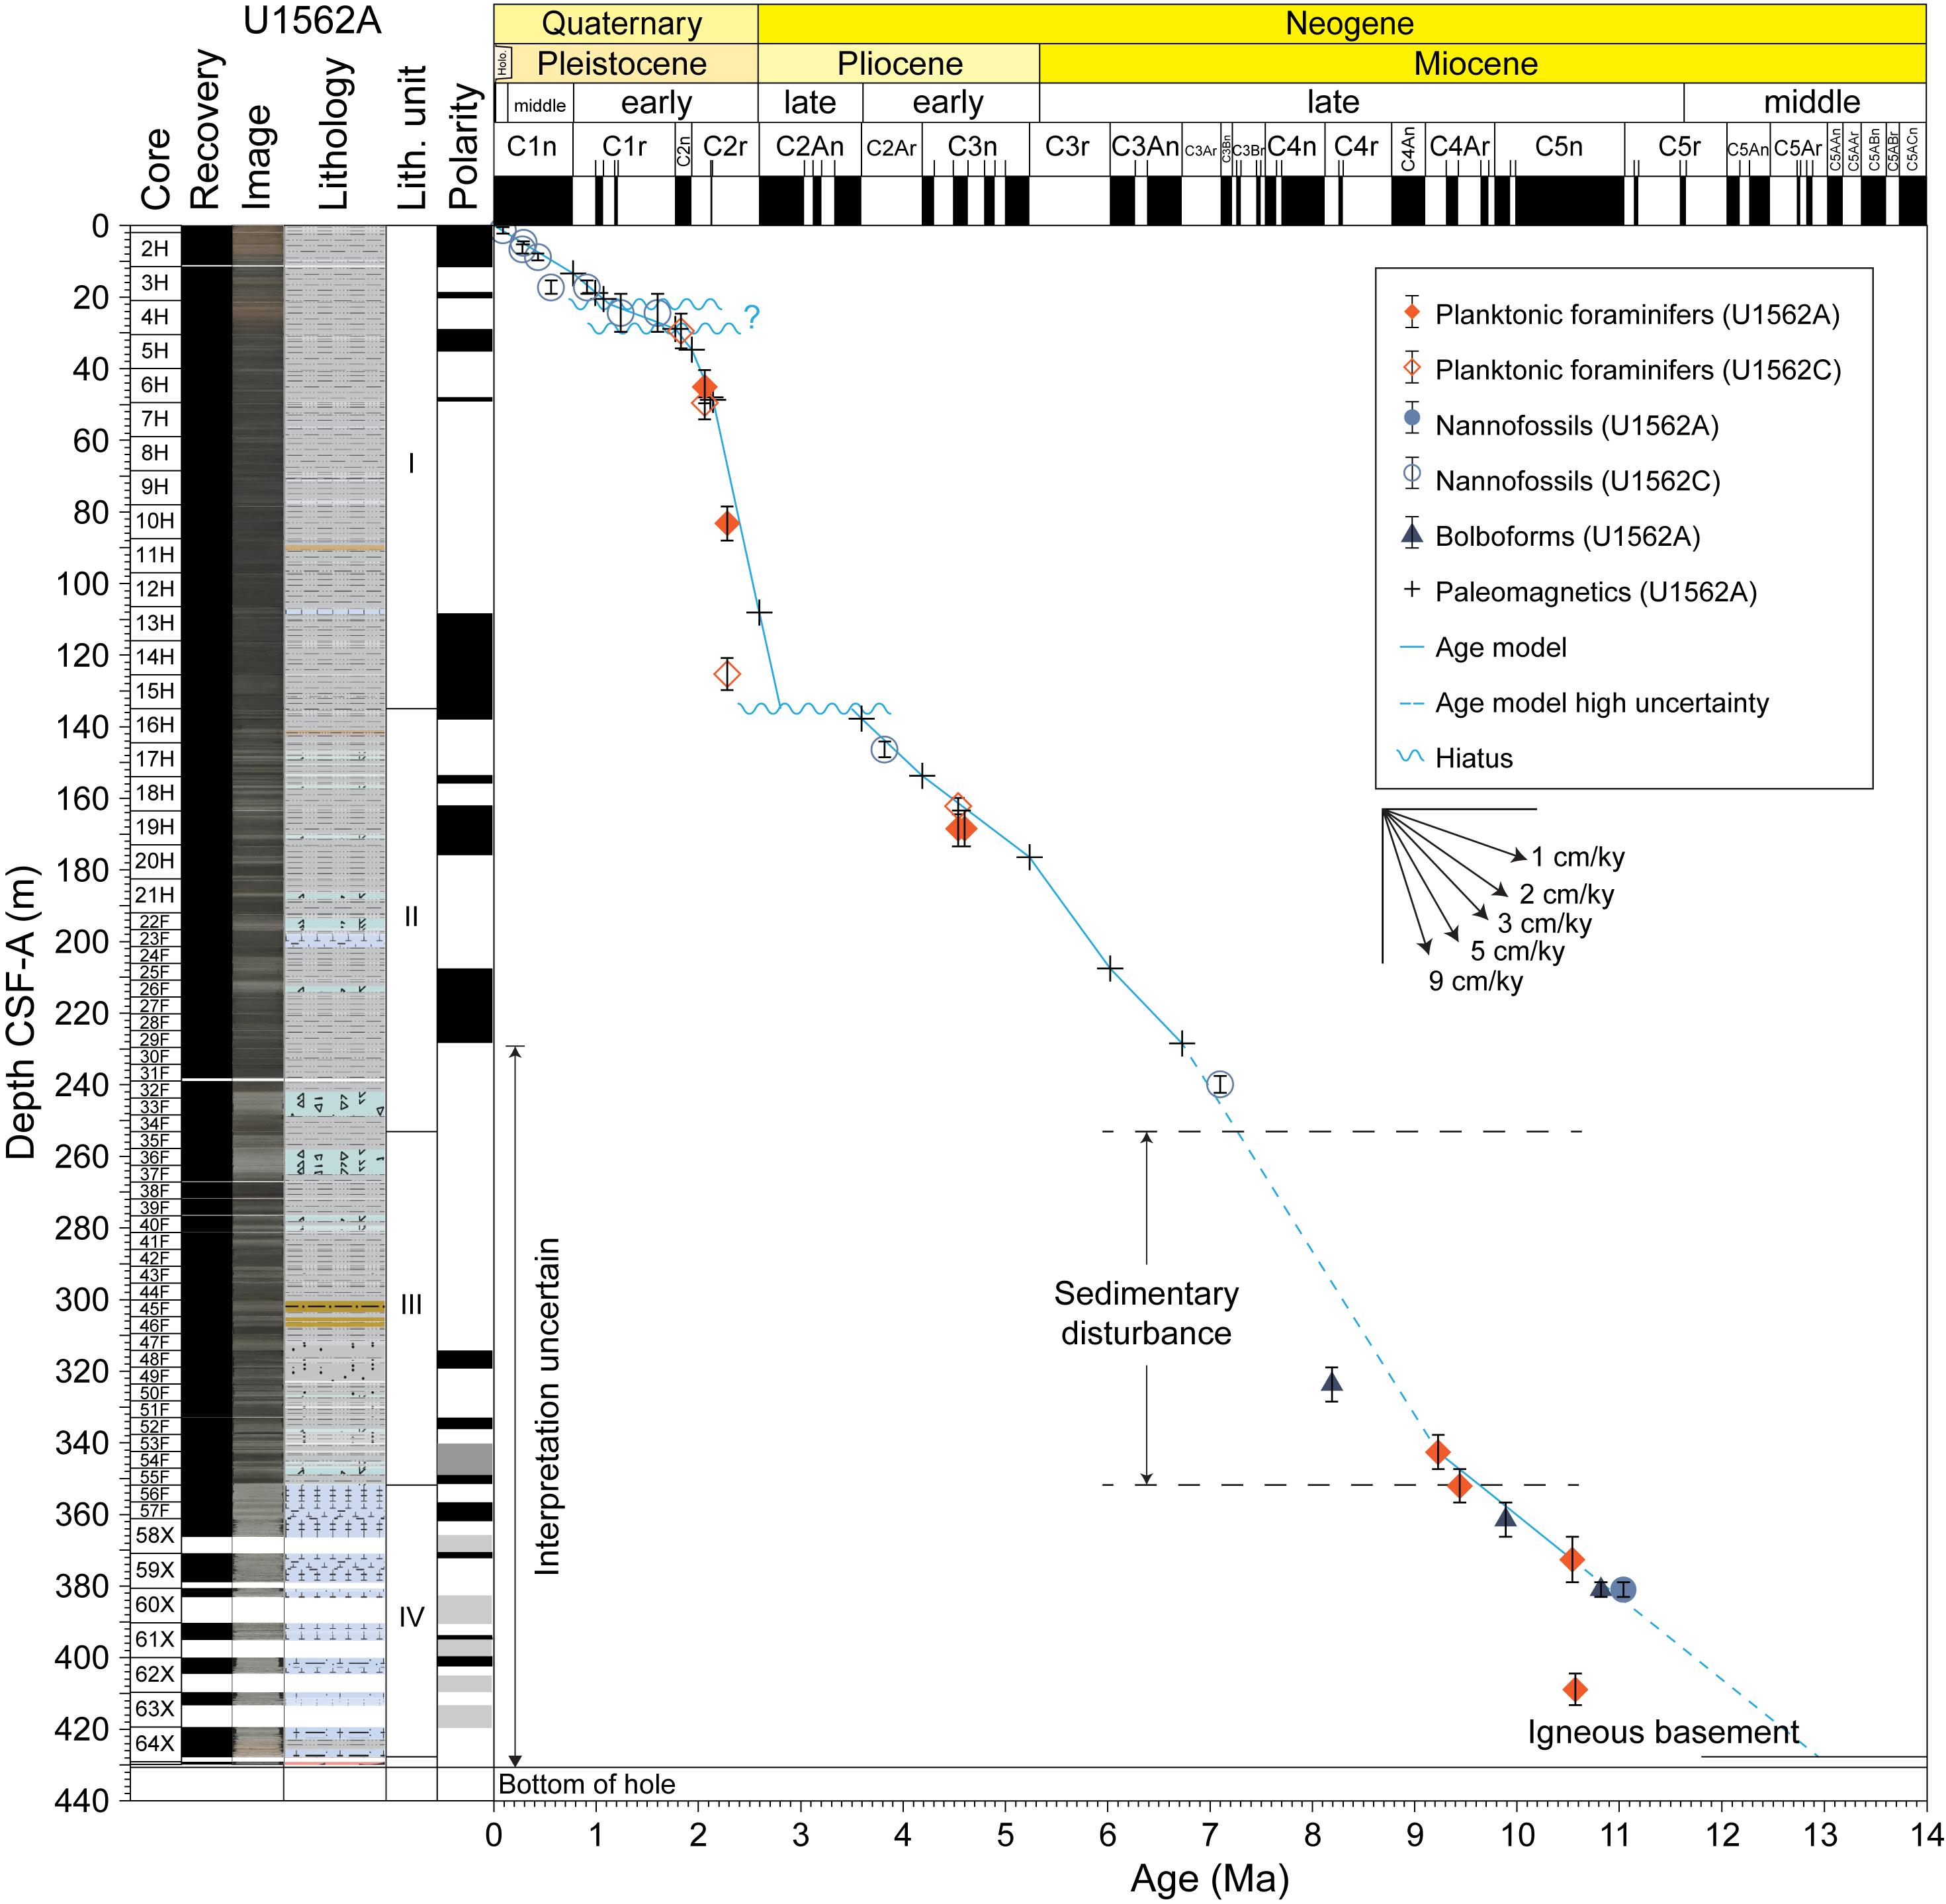
Figure F58. Age model.
The succession around the top of Lithostratigraphic Unit II at 135 m CSF-A is interpreted as a likely hiatus or series of closely spaced hiatuses that cut out or truncate a series of paleomagnetic reversals in the late Pliocene. It probably corresponds to the angular discordance in the seismic reflection profile at ~2.9 s TWT noted above. Below that level in Unit II, the biostratigraphic datums suggest a simple age-depth relationship that can be refined by the magnetostratigraphy to the base of Subchron C3An.2n (6.727 Ma) at 228.40 m CSF-A. The upper part of Unit II to the base of the Thvera Subchron C3r.4n (5.235 Ma) has an average sedimentation rate of ~2.4 cm/ky. The lower part of Unit II, from the base of Subchron C3r.4n to the base of Subchron C3An.2n, has a higher average sedimentation rate of ~3.5 cm/ky.
Lithostratigraphic Unit III (253.10 to 351.36 m CSF-A) is characterized by multiple intervals of severe soft-sediment deformation that likely indicate successive episodes of mass sediment transport (see Lithostratigraphy). This unit likely corresponds to the relatively incoherent part of the seismic reflection profile between ~3.05 and ~3.15 s TWT discussed above. Although the sedimentary succession registers a series of magnetic polarity reversals throughout the lower part of Unit III and Unit IV, the paleomagnetic interpretation relative to the GPTS is uncertain because of sedimentary complications and poor core recovery in Cores 395C-U1562A-58X through 64X (see Paleomagnetism).
The age model for the lower part of the succession in Hole U1562A is based on a series of foraminifer, bolboform, and nannofossil biohorizons. These constraints are considered to have low reliability for various reasons related to taxonomic uncertainty, low or variable abundances, and/or age calibration issues (see Micropaleontology). Taken together, however, they suggest a downward age progression with an average sedimentation rate of ~2.3 cm/ky. Lithostratigraphic Unit IV, from 351.36 m CSF-A to the basement at 427.73 m CSF-A, is characterized by sedimentary cyclicity of a fairly consistent character and wavelength as manifested in color reflectance and MS records (see Physical properties and Downhole measurements). Linear extrapolation of the age model trend to the base of Unit IV suggests an approximate age of 13.0 Ma for the oldest part of the regular sedimentary succession at the site. The age of the basement is estimated at 13.86 Ma from regional magnetic surveys (see Background and objectives).
A ~65 cm interval of laminated and bioturbated mudstone was found ~45 m below the top of the igneous succession in Section 395C-U1562B-14R-2 (see Lithostratigraphy). This interval corresponds to a highly distinctive ~3 m thick interval observed in the downhole resistivity and density image logs at 472.5–475.5 m WMSF (see Downhole measurements). The lithology is similar to Lithostratigraphic Unit IV at the base of the regular sedimentary succession but contains different assemblages of nannofossils, foraminifers, and bolboforms. The age difference from the sediment at the bottom of the regular sedimentary succession is currently difficult to constrain (see Micropaleontology), but the distinctive microfossil assemblage and apparently baked nature of the sediment suggest it is unlikely to have infiltrated from above, and therefore probably accumulated on the seafloor before being buried by lava flows. If the ~3 m of sediment accumulated at the same rate as Unit IV, it would imply ~130 ky of deposition.
References
Aksu, A.E., and Kaminski, M.A., 1989. Neogene and Quaternary planktonic foraminifer biostratigraphy and biochronology in Baffin Bay and the Labrador Sea. In Srivastava, S.P., Arthur, M., Clement, B., et al., Proceedings of the Ocean Drilling Program, Scientific Results. 105: College Station, TX (Ocean Drilling Program), 287–304. https://doi.org/10.2973/odp.proc.sr.105.122.1989
Bullard, E.C., 1939. Heat flow in South Africa. Proceedings of the Royal Society of London, A: Mathematical and Physical Sciences, 173(955):474–502. https://doi.org/10.1098/rspa.1939.0159
Butterworth, S., 1930. On the theory of filter amplifiers. Experimental Wireless and the Wireless Engineer, 7:536–541. https://www.gonascent.com/papers/butter.pdf
Chaisson, W.P., and Pearson, P.N., 1997. Planktonic foraminifer biostratigraphy at Site 925: middle Miocene-Pleistocene. In Shackleton, N.J., Curry, W.B., Richter, C., and Bralower, T.J. (Eds.), Proceedings of the Ocean Drilling Program, Scientific Results. 154: College Station, TX (Ocean Drilling Program), 3–31. https://doi.org/10.2973/odp.proc.sr.154.104.1997
Foresi, L.M., Iaccarino, S.M., and Salvatorini, G., 2002. Neogloboquadrina alantica preatlantica, new subspecies from late Middle Miocene. Rivista Italiana Di Paleontologia E Stratigrafia, 108(2). https://doi.org/10.13130/2039-4942/5479
Hartmann, A., and Villinger, H., 2002. Inversion of marine heat flow measurements by expansion of the temperature decay function. Geophysical Journal International, 148(3):628–636. https://doi.org/10.1046/j.1365-246X.2002.01600.x
Hyndman, R.D., Erickson, A.J., and Von Herzen, R.P., 1974. Geothermal measurements on DSDP Leg 26. In Davies, T.A., Luyendyk, B.P., et al., Initial Reports of the Deep Sea Drilling Project. 26: Washington, DC (US Government Printing Office), 451–463. https://doi.org/10.2973/dsdp.proc.26.113.1974
Jones, S.M., Murton, B.J., Fitton, J.G., White, N.J., Maclennan, J., and Walters, R.L., 2014. A joint geochemical–geophysical record of time-dependent mantle convection south of Iceland. Earth and Planetary Science Letters, 386:86–97. https://doi.org/10.1016/j.epsl.2013.09.029
Kirschvink, J.L., 1980. The least-squares line and plane and the analysis of palaeomagnetic data. Geophysical Journal International, 62(3):699–718. https://doi.org/10.1111/j.1365-246X.1980.tb02601.x
Lurcock, P.C., and Florindo, F., 2019. New developments in the PuffinPlot paleomagnetic data analysis program. Geochemistry, Geophysics, Geosystems, 20(11):5578–5587. https://doi.org/10.1029/2019GC008537
Lyons, R.G., 2011. Understanding Digital Signal Processing (Third edition): Upper Saddle River, NJ (Prentice Hall). https://www.iro.umontreal.ca/~mignotte/IFT3205/Documents/UnderstandingDigitalSignalProcessing.pdf
Murton, B.J., Taylor, R.N., and Thirlwall, M.F., 2002. Plume–ridge Interaction: a geochemical perspective from the Reykjanes Ridge. Journal of Petrology, 43(11):1987–2012. https://doi.org/10.1093/petrology/43.11.1987
Ogg, J.G., 2020. Geomagnetic Polarity Time Scale. In Gradstein, F.M., Ogg, J.G., Schmitz, M., and Ogg, G. (Eds.), Geologic Time Scale 2020. Amsterdam (Elsevier), 159–192. https://doi.org/10.1016/B978-0-12-824360-2.00005-X
Parnell-Turner, R., White, N., Henstock, T.J., Jones, S.M., Maclennan, J., and Murton, B.J., 2017. Causes and consequences of diachronous v-shaped ridges in the North Atlantic Ocean. Journal of Geophysical Research: Solid Earth, 122(11):8675–8708. https://doi.org/10.1002/2017JB014225
Parnell-Turner, R.E., Briais, A., LeVay, L.J., Cui, Y., Di Chiara, A., Dodd, J.P., Dunkley Jones, T., Dwyer, D., Eason, D.E., Friedman, S.A., Hemming, S.R., Hochmuth, K., Ibrahim, H., Jasper, C., Karatsolis, B.T., Lee, S., LeBlanc, D.E., Lindsay, M.R., McNamara, D.D., Modestou, S.E., Murton, B., OConnell, S., Pasquet, G.T., Pearson, P.N., Qian, S.P., Rosenthal, Y., Satolli, S., Sinnesael, M., Suzuki, T., Thulasi Doss, T., White, N.J., Wu, T., and Yang Yang, A., 2025a. Expedition 395 methods. In Parnell-Turner, R.E., Briais, A., LeVay, L.J., and the Expedition 395 Scientists, Reykjanes Mantle Convection and Climate. Proceedings of the International Ocean Discovery Program, 395: College Station, TX (International Ocean Discovery Program). https://doi.org/10.14379/iodp.proc.395.102.2025
Parnell-Turner, R.E., Briais, A., LeVay, L.J., Cui, Y., Di Chiara, A., Dodd, J.P., Dunkley Jones, T., Dwyer, D., Eason, D.E., Friedman, S.A., Hemming, S.R., Hochmuth, K., Ibrahim, H., Jasper, C., Karatsolis, B.T., Lee, S., LeBlanc, D.E., Lindsay, M.R., McNamara, D.D., Modestou, S.E., Murton, B., OConnell, S., Pasquet, G.T., Pearson, P.N., Qian, S.P., Rosenthal, Y., Satolli, S., Sinnesael, M., Suzuki, T., Thulasi Doss, T., White, N.J., Wu, T., Yang Yang, A., dos Santos Rocha, V., Pearman, C., and Tian, C.Y., 2025b. Site U1554. In Parnell-Turner, R.E., Briais, A., LeVay, L.J., and the Expedition 395 Scientists, Reykjanes Mantle Convection and Climate. Proceedings of the International Ocean Discovery Program, 395: College Station, TX (International Ocean Discovery Program). https://doi.org/10.14379/iodp.proc.395.103.2025
Parnell-Turner, R.E., Briais, A., LeVay, L.J., and the Expedition 395 Scientists, 2025c. Supplementary material, https://doi.org/10.14379/iodp.proc.395supp.2025. In Parnell-Turner, R.E., Briais, A., LeVay, L.J., and the Expedition 395 Scientists, Reykjanes Mantle Convection and Climate. Proceedings of the International Ocean Discovery Program, 395: College Station, TX (International Ocean Discovery Program).
Poore, R.Z., 1979. Oligocene through Quaternary planktonic foraminiferal biostratigraphy of the North Atlantic: DSDP Leg 49. In Luyendyk, B.P., Cann, J.R., et al., Initial Reports of the Deep Sea Drilling Project. 49: Washington, DC (US Government Printing Office), 447–517. https://doi.org/10.2973/dsdp.proc.49.115.1979
Poore, R.Z., and Berggren, W.A., 1975. Late Cenozoic planktonic foraminiferal biostratigraphy and paleoclimatology of Hatton-Rockall Basin; DSDP Site 116. Journal of Foraminiferal Research, 5(4):270–293. https://doi.org/10.2113/gsjfr.5.4.270
Raffi, I., Wade, B.S., Pälike, H., Beu, A.G., Cooper, R., Crundwell, M.P., Krijgsman, W., Moore, T., Raine, I., Sardella, R., and Vernyhorova, Y.V., 2020. The Neogene Period. In Gradstein, F.M., Ogg, J.G., Schmitz, M.D., and Ogg, G. (Eds.), Geologic Time Scale 2020. (Elsevier), 1141–1215. https://doi.org/10.1016/B978-0-12-824360-2.00029-2
Siccha, M., and Kucera, M., 2017. ForCenS, a curated database of planktonic foraminifera census counts in marine surface sediment samples. Scientific Data, 4(1):170109. https://doi.org/10.1038/sdata.2017.109
Skilling, I.P., White, J.D.L., and McPhie, J., 2002. Peperite: a review of magma–sediment mingling. Journal of Volcanology and Geothermal Research, 114(1–2):1–17. https://doi.org/10.1016/S0377-0273(01)00278-5
Spiegler, D., 1999. Bolboforma biostratigraphy from the Hatton-Rockall Basin (North Atlantic). In Raymo, M.E., Jansen, E., Blum, P., and Herbert, T.D., Proceedings of the Ocean Drilling Program, Scientific Results, 162. College Station, TX (Ocean Drilling Program), 35–49. https://doi.org/10.2973/odp.proc.sr.162.013.1999
Zijderveld, J.D.A., 1967. AC demagnetization of rocks: analysis of results. In Runcorn, S.K.C., Creer, K.M., and Collinson, D.W. (Eds.), Methods in Palaeomagnetism. Developments in Solid Earth Geophysics, 3: 254–286. https://doi.org/10.1016/B978-1-4832-2894-5.50049-5