Hodell, D.A., Abrantes, F., Alvarez Zarikian, C.A., and the Expedition 397 Scientists
Proceedings of the International Ocean Discovery Program Volume 397
publications.iodp.org
https://doi.org/10.14379/iodp.proc.397.104.2024
Site U15871
![]() D.A. Hodell,
D.A. Hodell,
![]() F. Abrantes,
F. Abrantes,
![]() C.A. Alvarez Zarikian,
C.A. Alvarez Zarikian,
![]() H.L. Brooks,
H.L. Brooks,
![]() W.B. Clark,
W.B. Clark,
![]() L.F.B. Dauchy-Tric,
L.F.B. Dauchy-Tric,
![]() V. dos Santos Rocha,
V. dos Santos Rocha,
![]() J.-A. Flores,
J.-A. Flores,
![]() T.D. Herbert,
T.D. Herbert,
![]() S.K.V. Hines,
S.K.V. Hines,
![]() H.-H.M. Huang,
H.-H.M. Huang,
![]() H. Ikeda,
H. Ikeda,
![]() S. Kaboth-Bahr,
S. Kaboth-Bahr,
![]() J. Kuroda,
J. Kuroda,
![]() J.M. Link,
J.M. Link,
![]() J.F. McManus,
J.F. McManus,
![]() B.A. Mitsunaga,
B.A. Mitsunaga,
![]() L. Nana Yobo,
L. Nana Yobo,
![]() C.T. Pallone,
C.T. Pallone,
![]() X. Pang,
X. Pang,
![]() M.Y. Peral,
M.Y. Peral,
![]() E. Salgueiro,
E. Salgueiro,
![]() S. Sanchez,
S. Sanchez,
![]() K. Verma,
K. Verma,
![]() J. Wu,
J. Wu,
![]() C. Xuan, and
C. Xuan, and
![]() J. Yu2
J. Yu2
1 Hodell, D.A., Abrantes, F., Alvarez Zarikian, C.A., Brooks, H.L., Clark, W.B., Dauchy-Tric, L.F.B., dos Santos Rocha, V., Flores, J.-A., Herbert, T.D., Hines, S.K.V., Huang, H.-H.M., Ikeda, H., Kaboth-Bahr, S., Kuroda, J., Link, J.M., McManus, J.F., Mitsunaga, B.A., Nana Yobo, L., Pallone, C.T., Pang, X., Peral, M.Y., Salgueiro, E., Sanchez, S., Verma, K., Wu, J., Xuan, C., and Yu, J., 2024. Site U1587. In Hodell, D.A., Abrantes, F., Alvarez Zarikian, C.A., and the Expedition 397 Scientists, Iberian Margin Paleoclimate. Proceedings of the International Ocean Discovery Program, 397: College Station, TX (International Ocean Discovery Program). https://doi.org/10.14379/iodp.proc.397.104.2024
2 Expedition 397 Scientists' affiliations.
1. Background and objectives
Site U1587 is the second farthest from shore drilled during Expedition 397 and located at a water depth of 3479 meters below sea level (mbsl) (Figures F1, F2, F3). It is the second deepest site along the bathymetric transect and is bathed today by a mixture of ~75% North Atlantic Deep Water (NADW) and 25% Lower Deep Water (LDW) sourced from the Southern Ocean (Figure F4) (Jenkins et al., 2015). The mixing ratio of these water masses and their vertical position in the water column has changed in the past, which has implications for ventilation and carbon storage in the deep Atlantic Ocean.
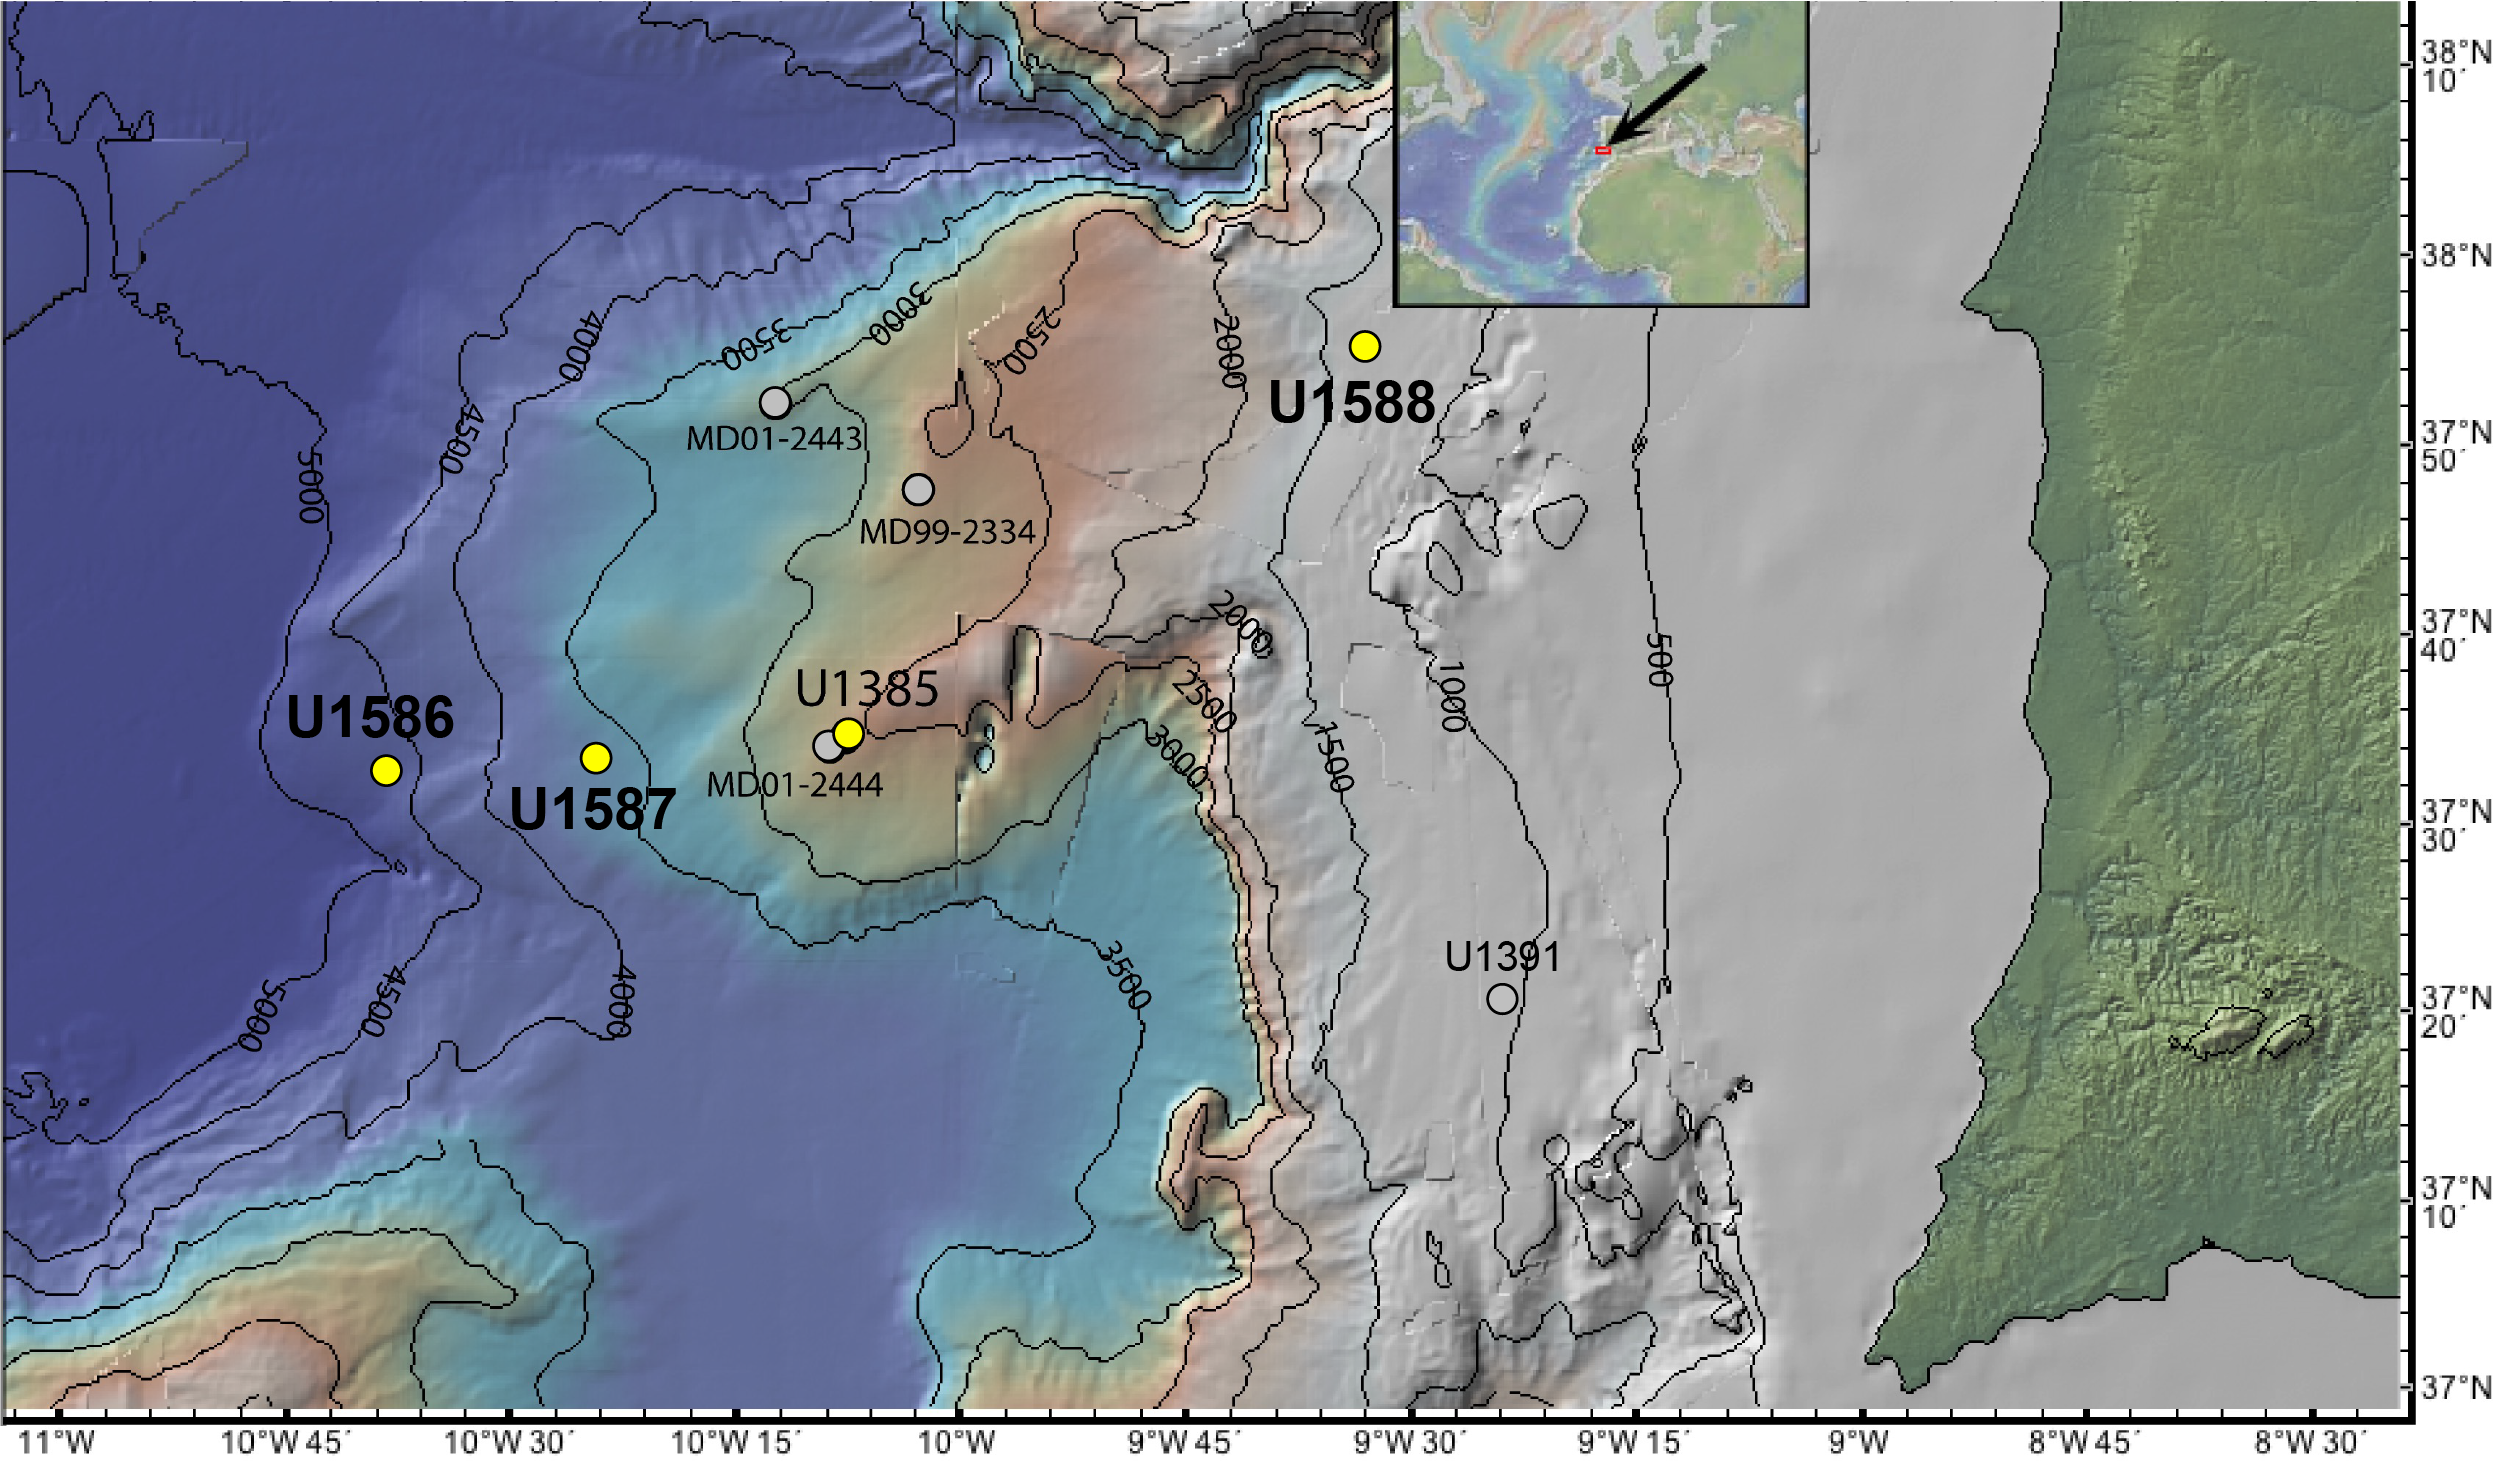
Figure F1. PPA bathymetry.
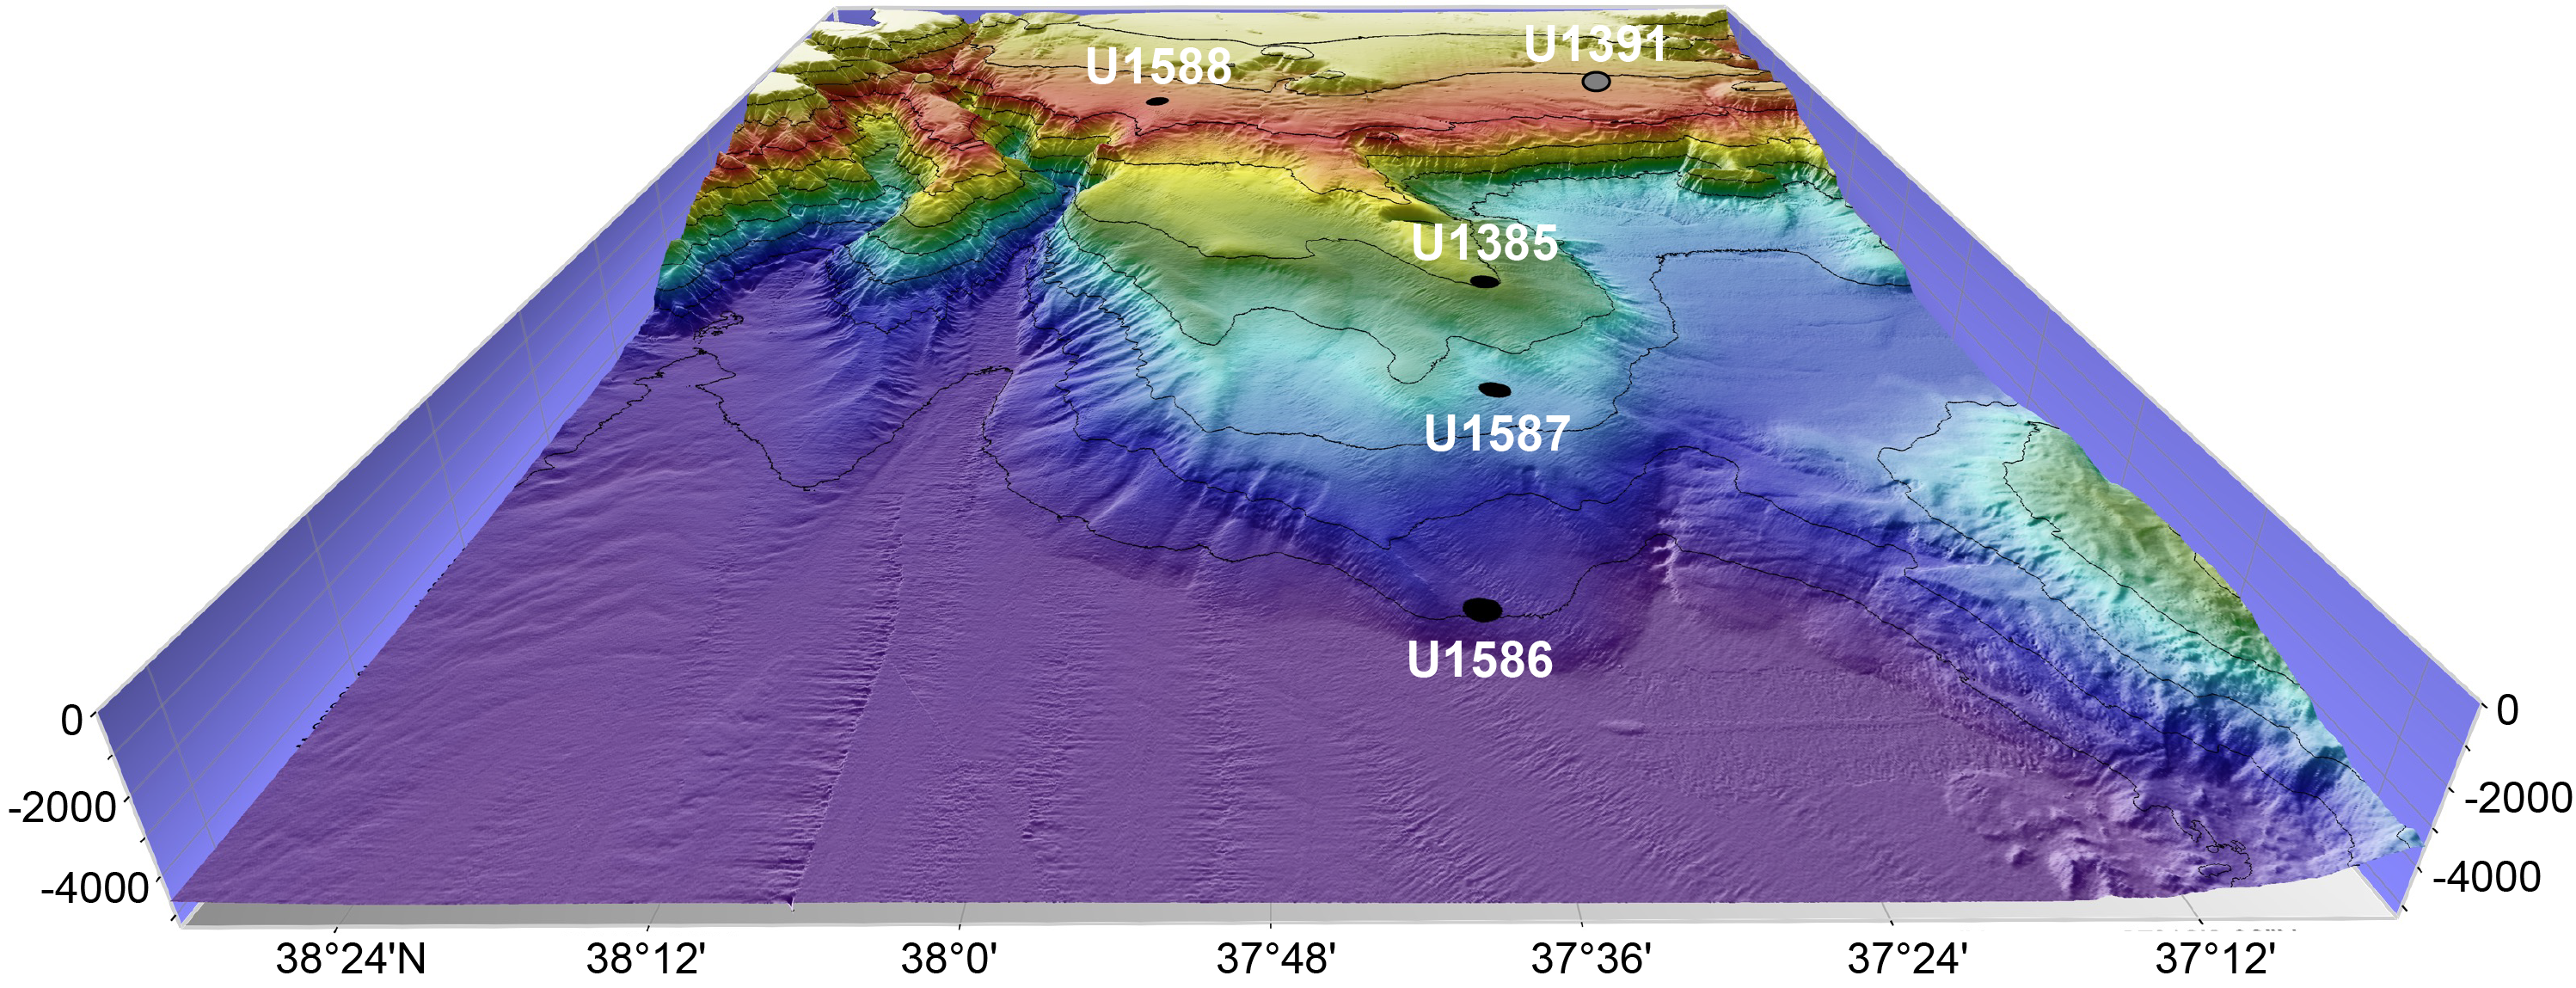
Figure F2. Expedition 397 drill site depth distribution.
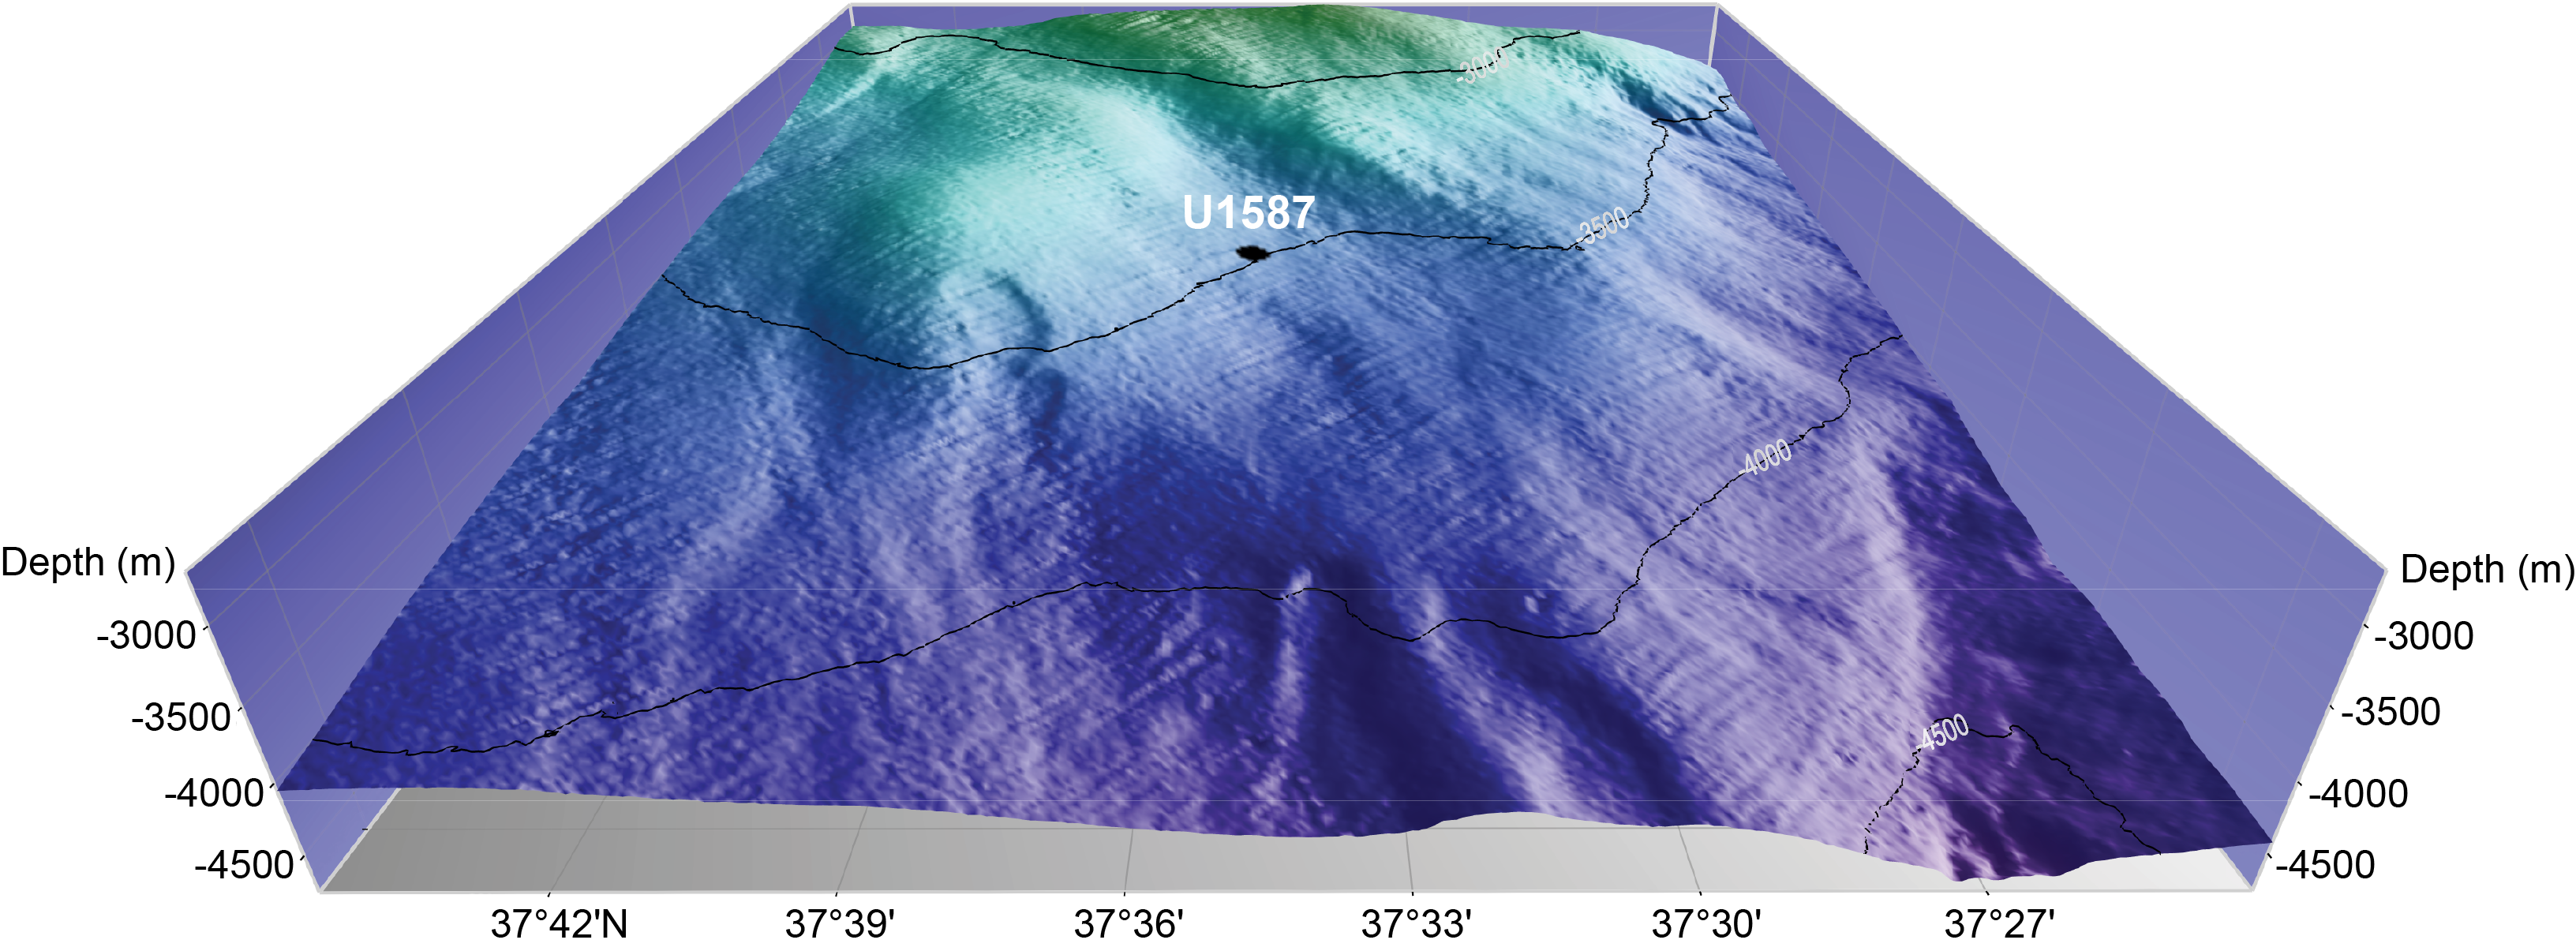
Figure F3. Site U1587 location.
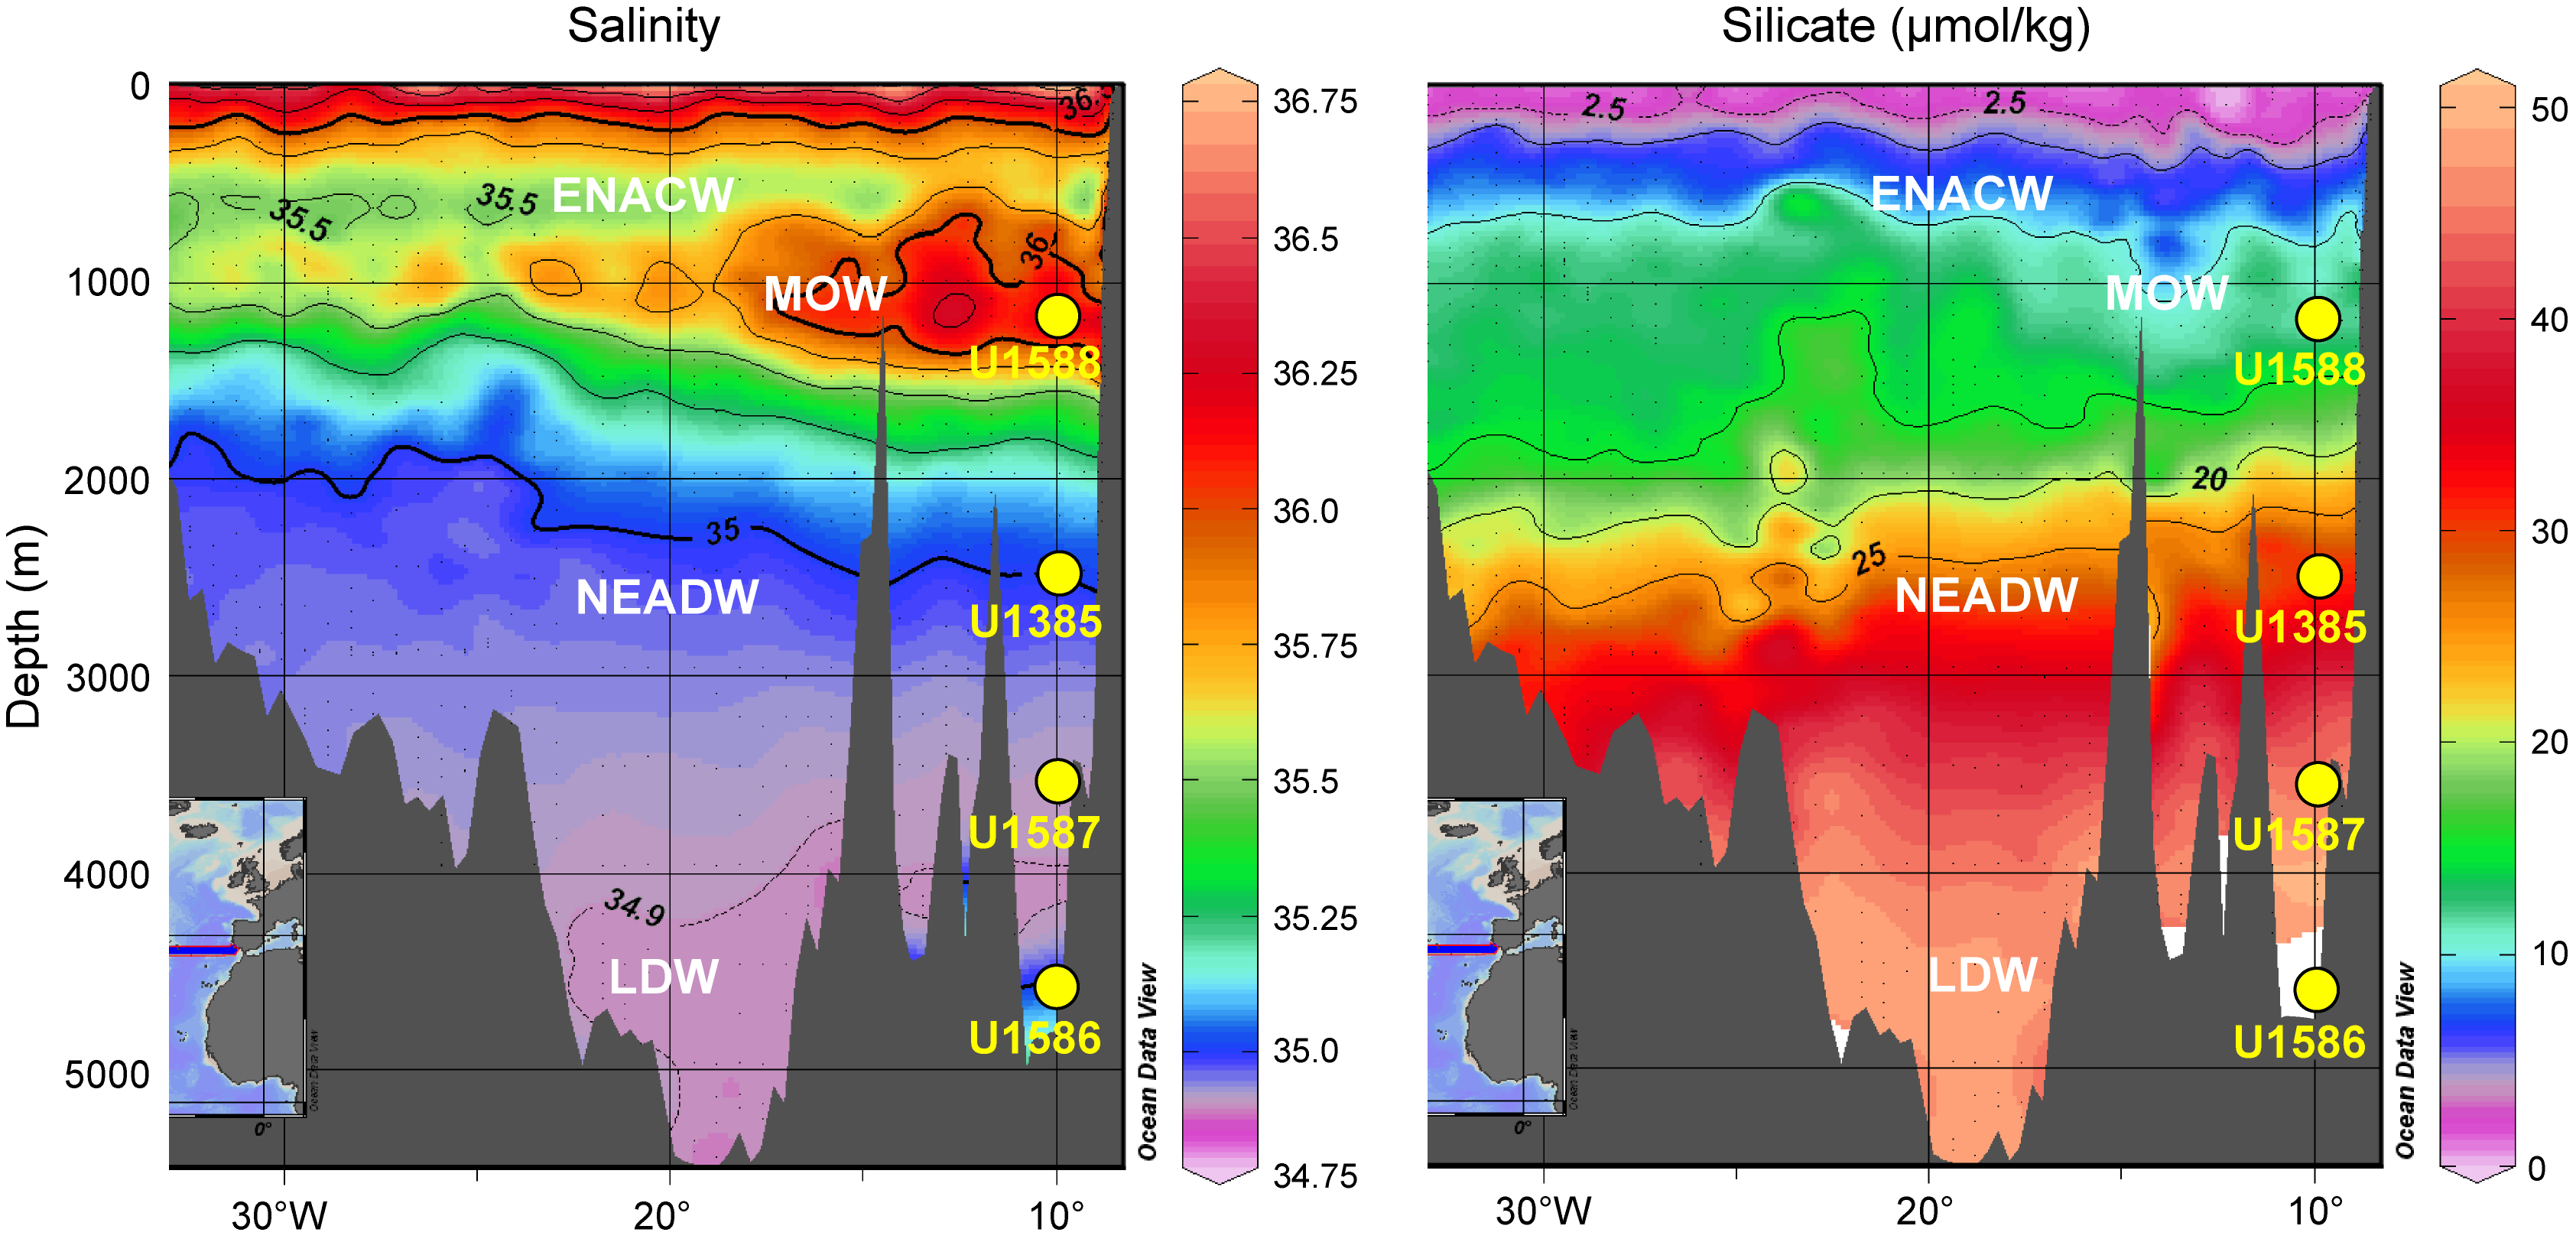
Figure F4. Salinity and silicate profiles.
The location of Site U1587 was motivated by the clear expression of millennial climate variability in proxy records of oxygen isotopes and sea-surface temperature in nearby Piston Core MD95-2042 (Shackleton et al., 2000, 2004; Bard et al., 2000; Pailler and Bard, 2002; Davtian and Bard, 2023). Isotopic, organic biomarker, and pollen results from this core demonstrated the potential of correlating Iberian margin sediments with ice cores from Greenland and Antarctica and with European terrestrial sequences (e.g., Sánchez-Goñi et al., 2000; Margari et al., 2010, 2014, 2020). The sediment record from Site U1587 provides the opportunity to develop sediment proxy records for the Greenland and Antarctic ice cores to the base of the Quaternary and beyond.
The piston core (JC089-04-2P) recovered near Site U1587 is 10.7 m long and has a sedimentation rate of 17 cm/ky (Figure F5). Ca/Ti and Zr/Sr show strong evidence of millennial variability during the last glacial cycle. The objective for Site U1587 is to study such variability for older glacial cycles throughout the Quaternary.
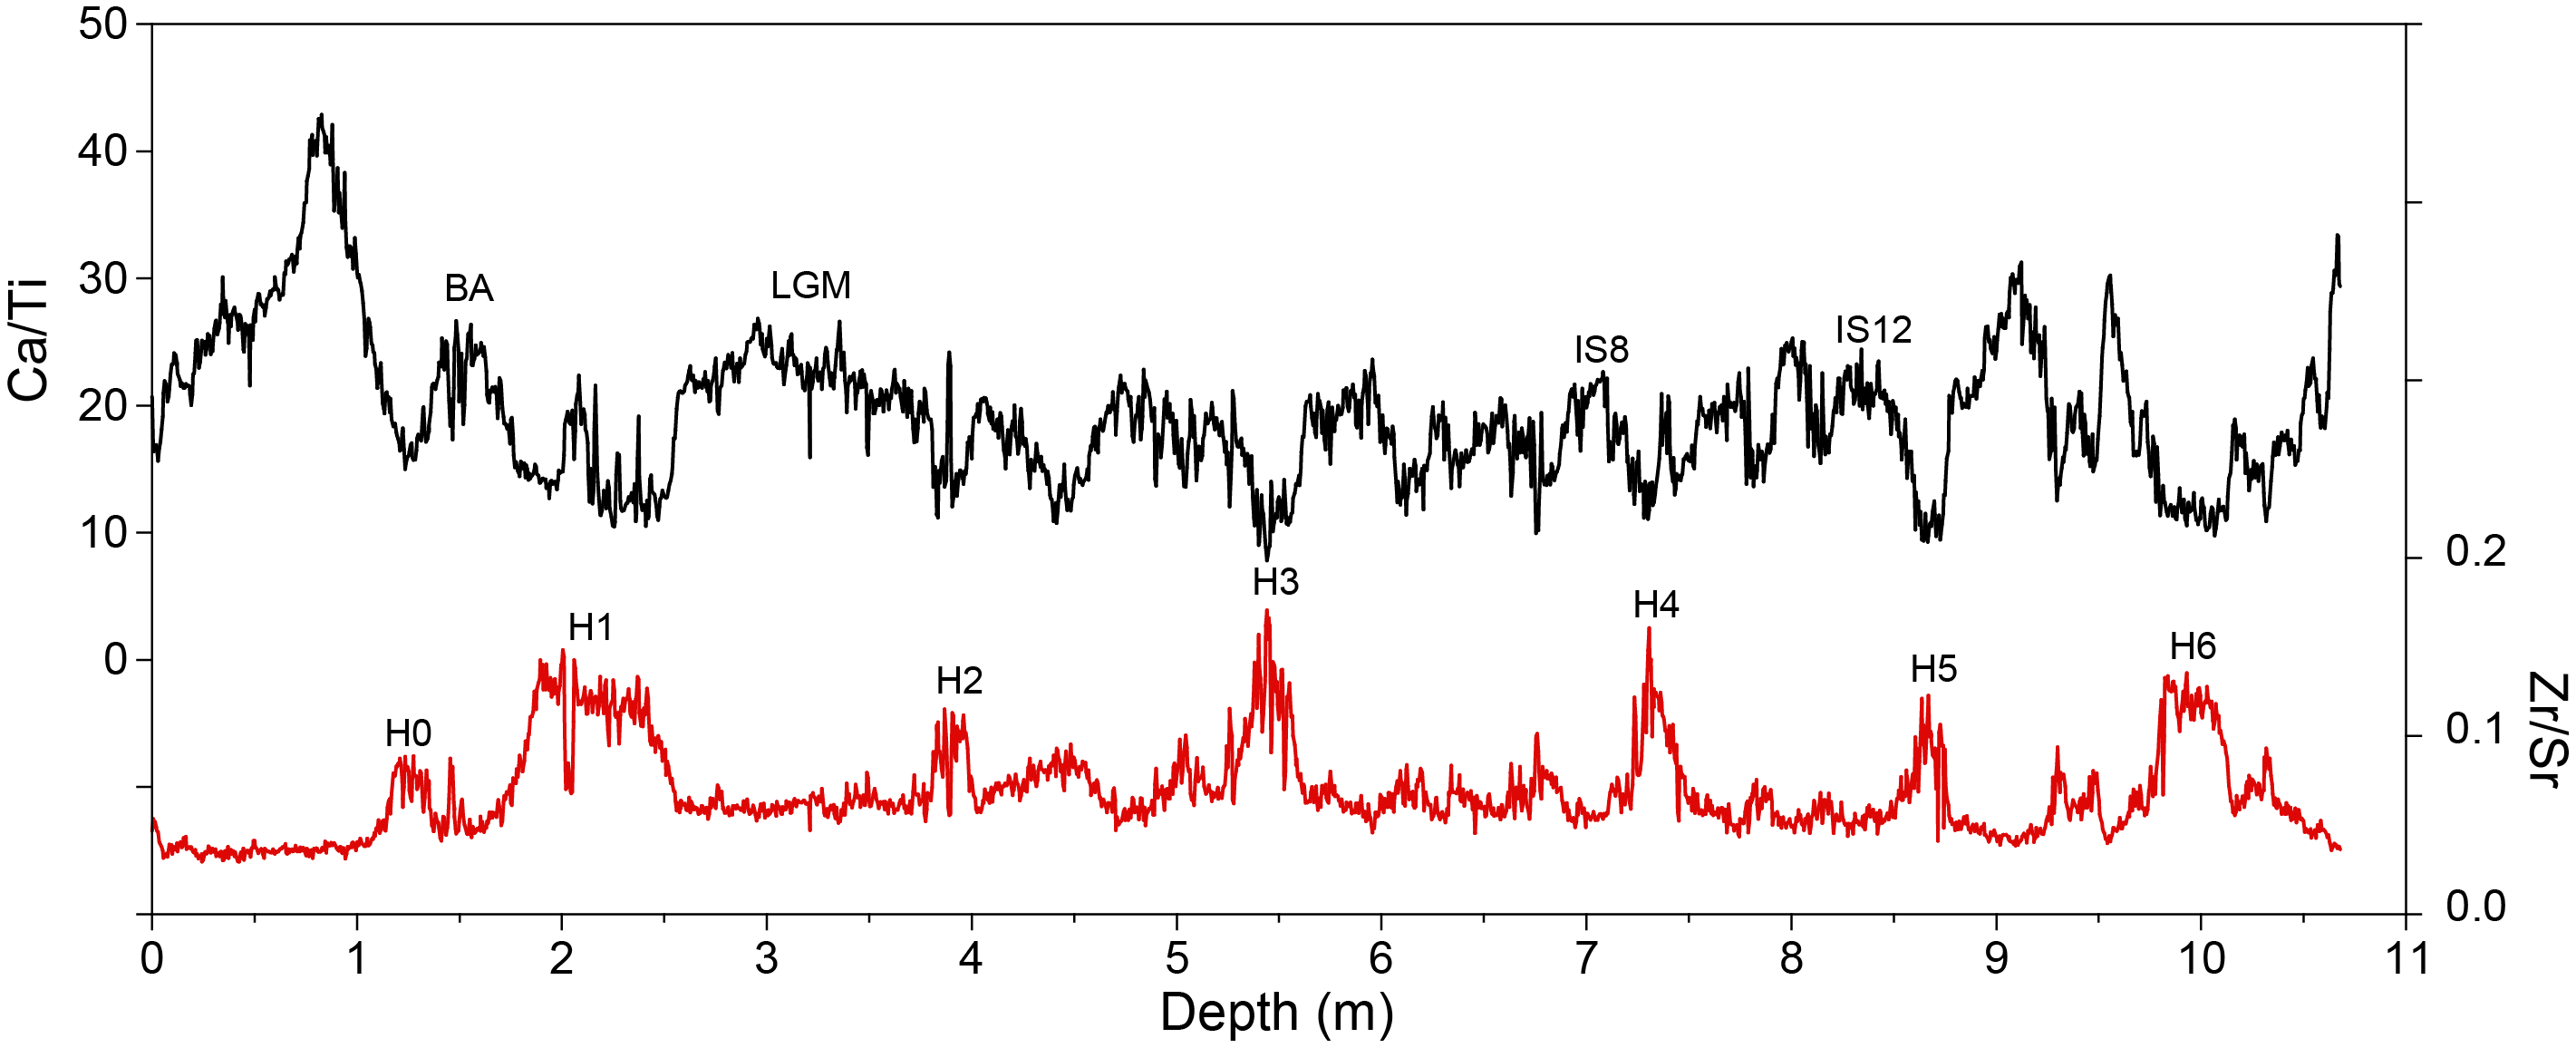
Figure F5. Ca/Ti and Zr/Sr.
Site U1587 is located at the intersection of Seismic Lines JC089-6 and JC089-7 (Figure F6). Although mass transport deposits or disturbed intervals are developed nearby, the continuity of reflections is good at Site U1587 (Figures F7, F8). The Upper Miocene to Quaternary sequence at Site U1587 is expanded relative to Site U1586 and is more than 500 m thick. Sedimentation rates are estimated to average ~10 cm/ky at Site U1587, or about twice that of Site U1586.
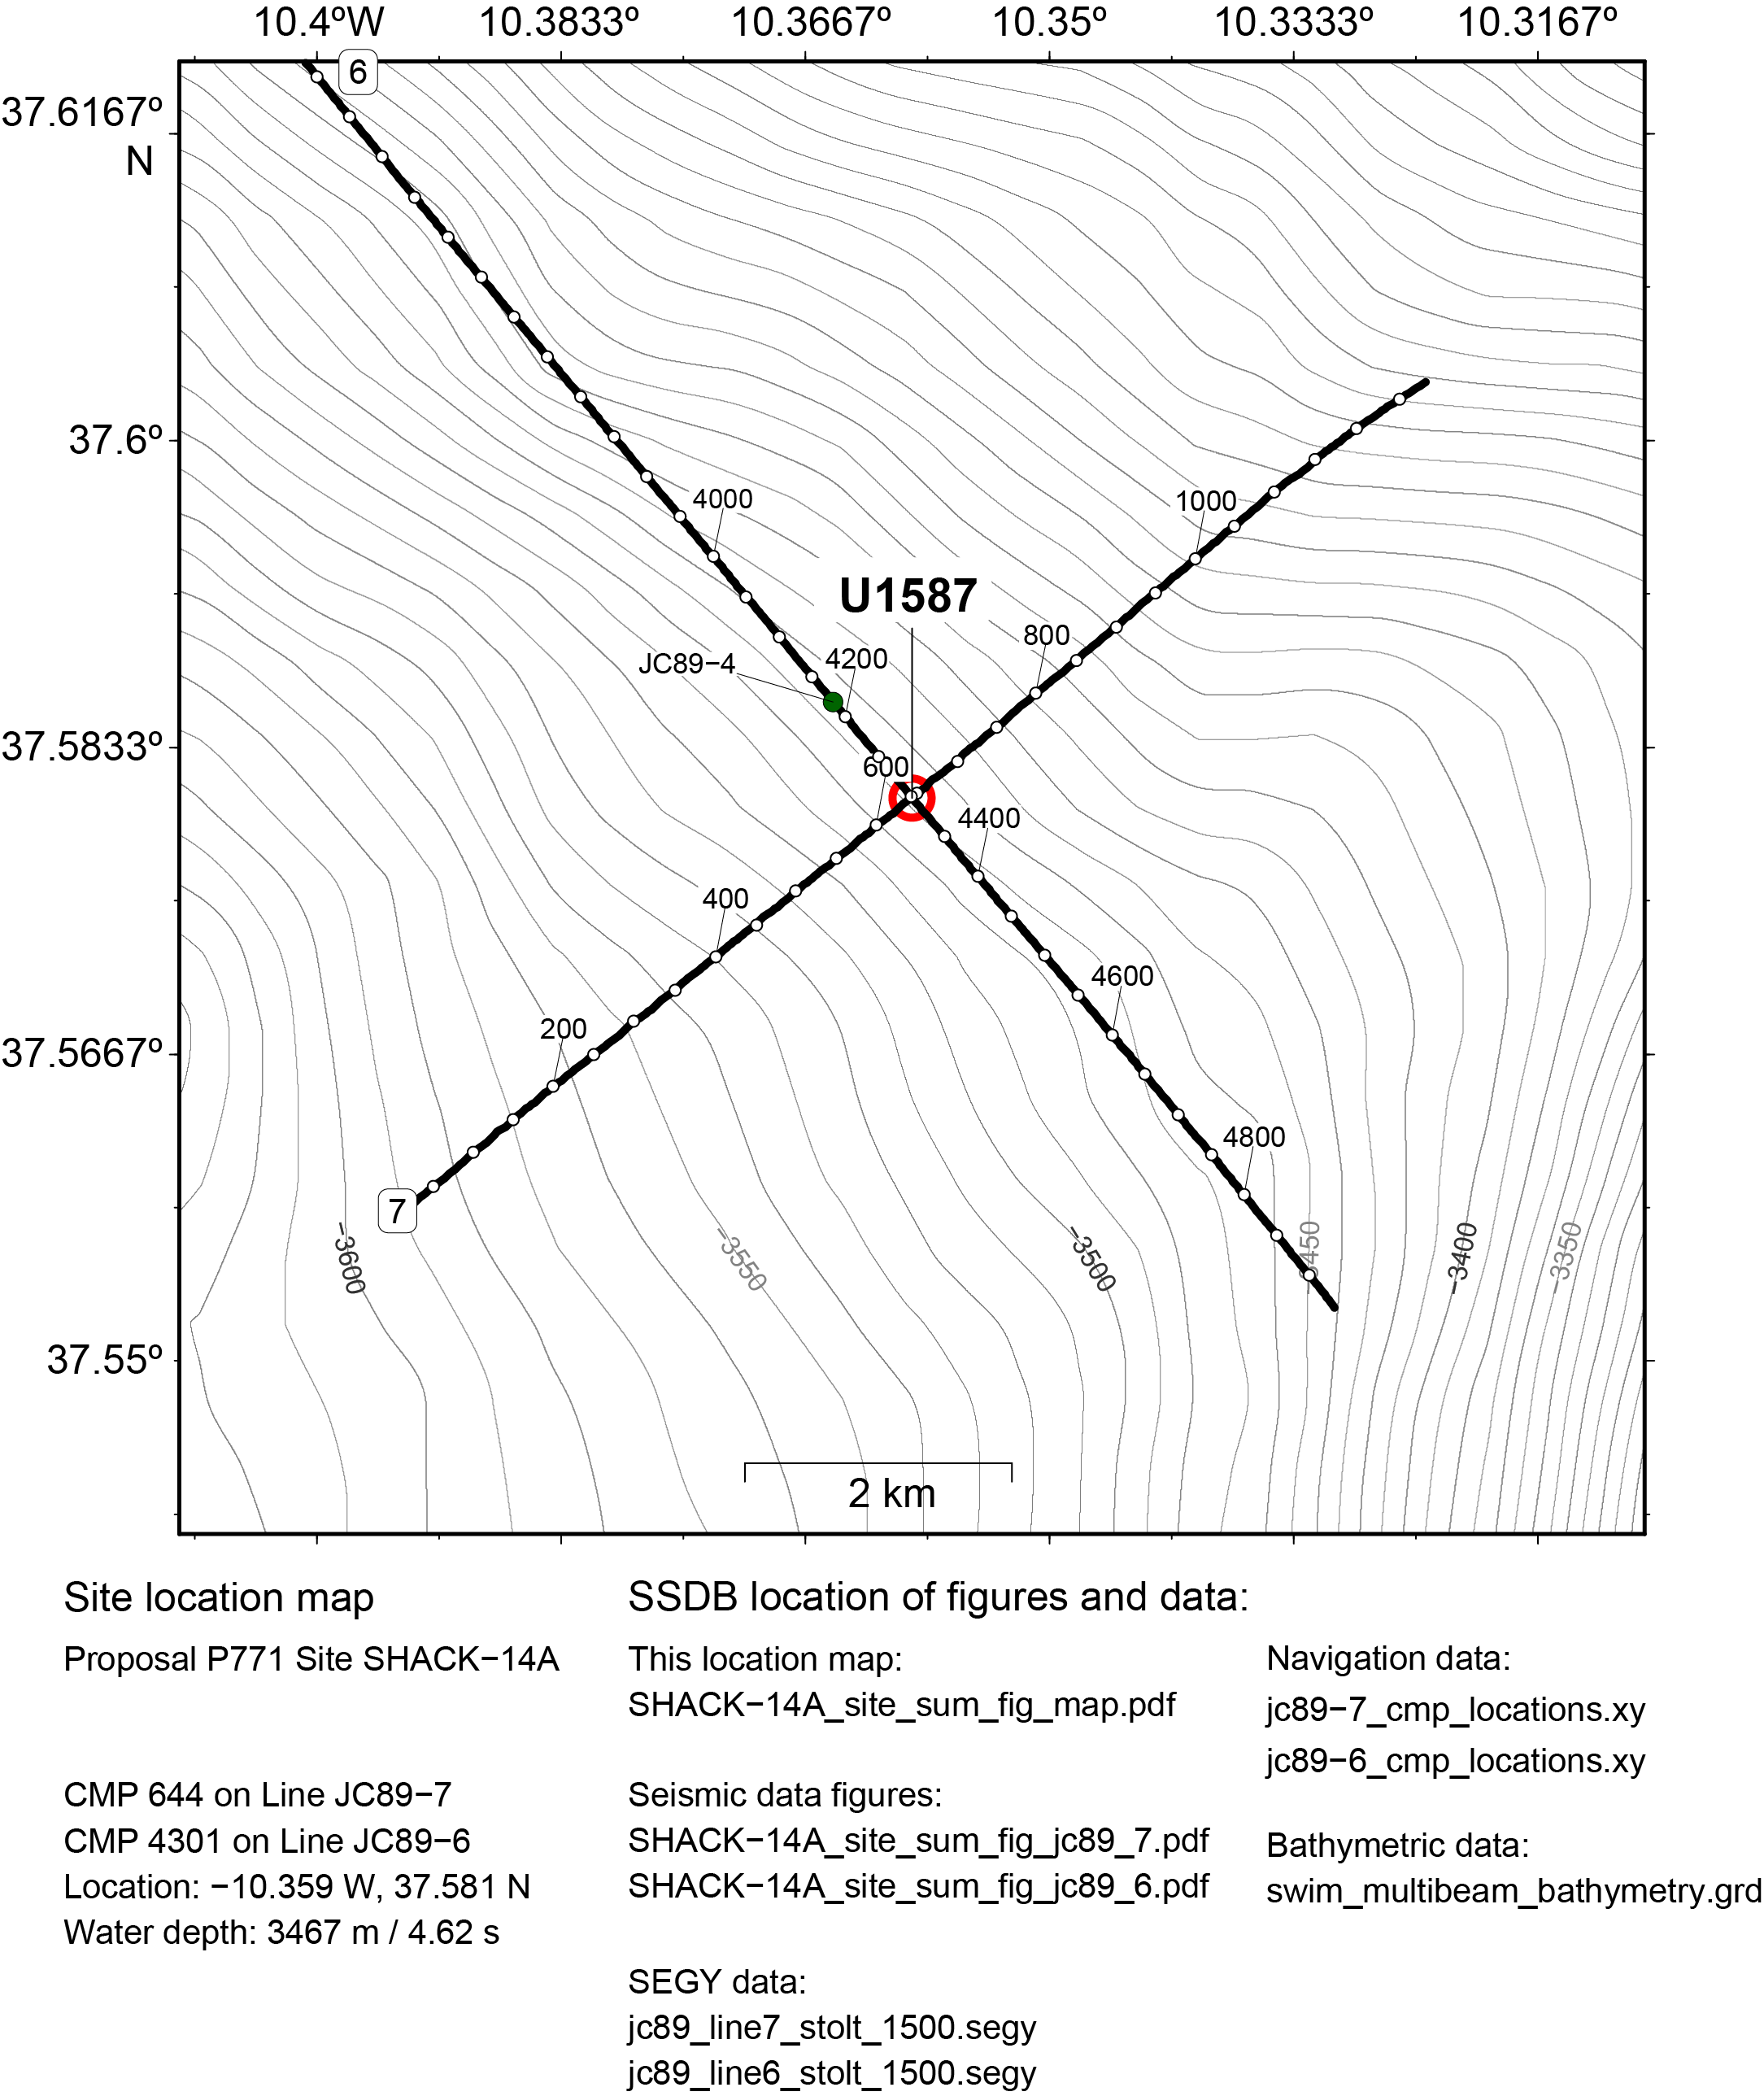
Figure F6. Seismic Lines JC89-6 and JC89-7.
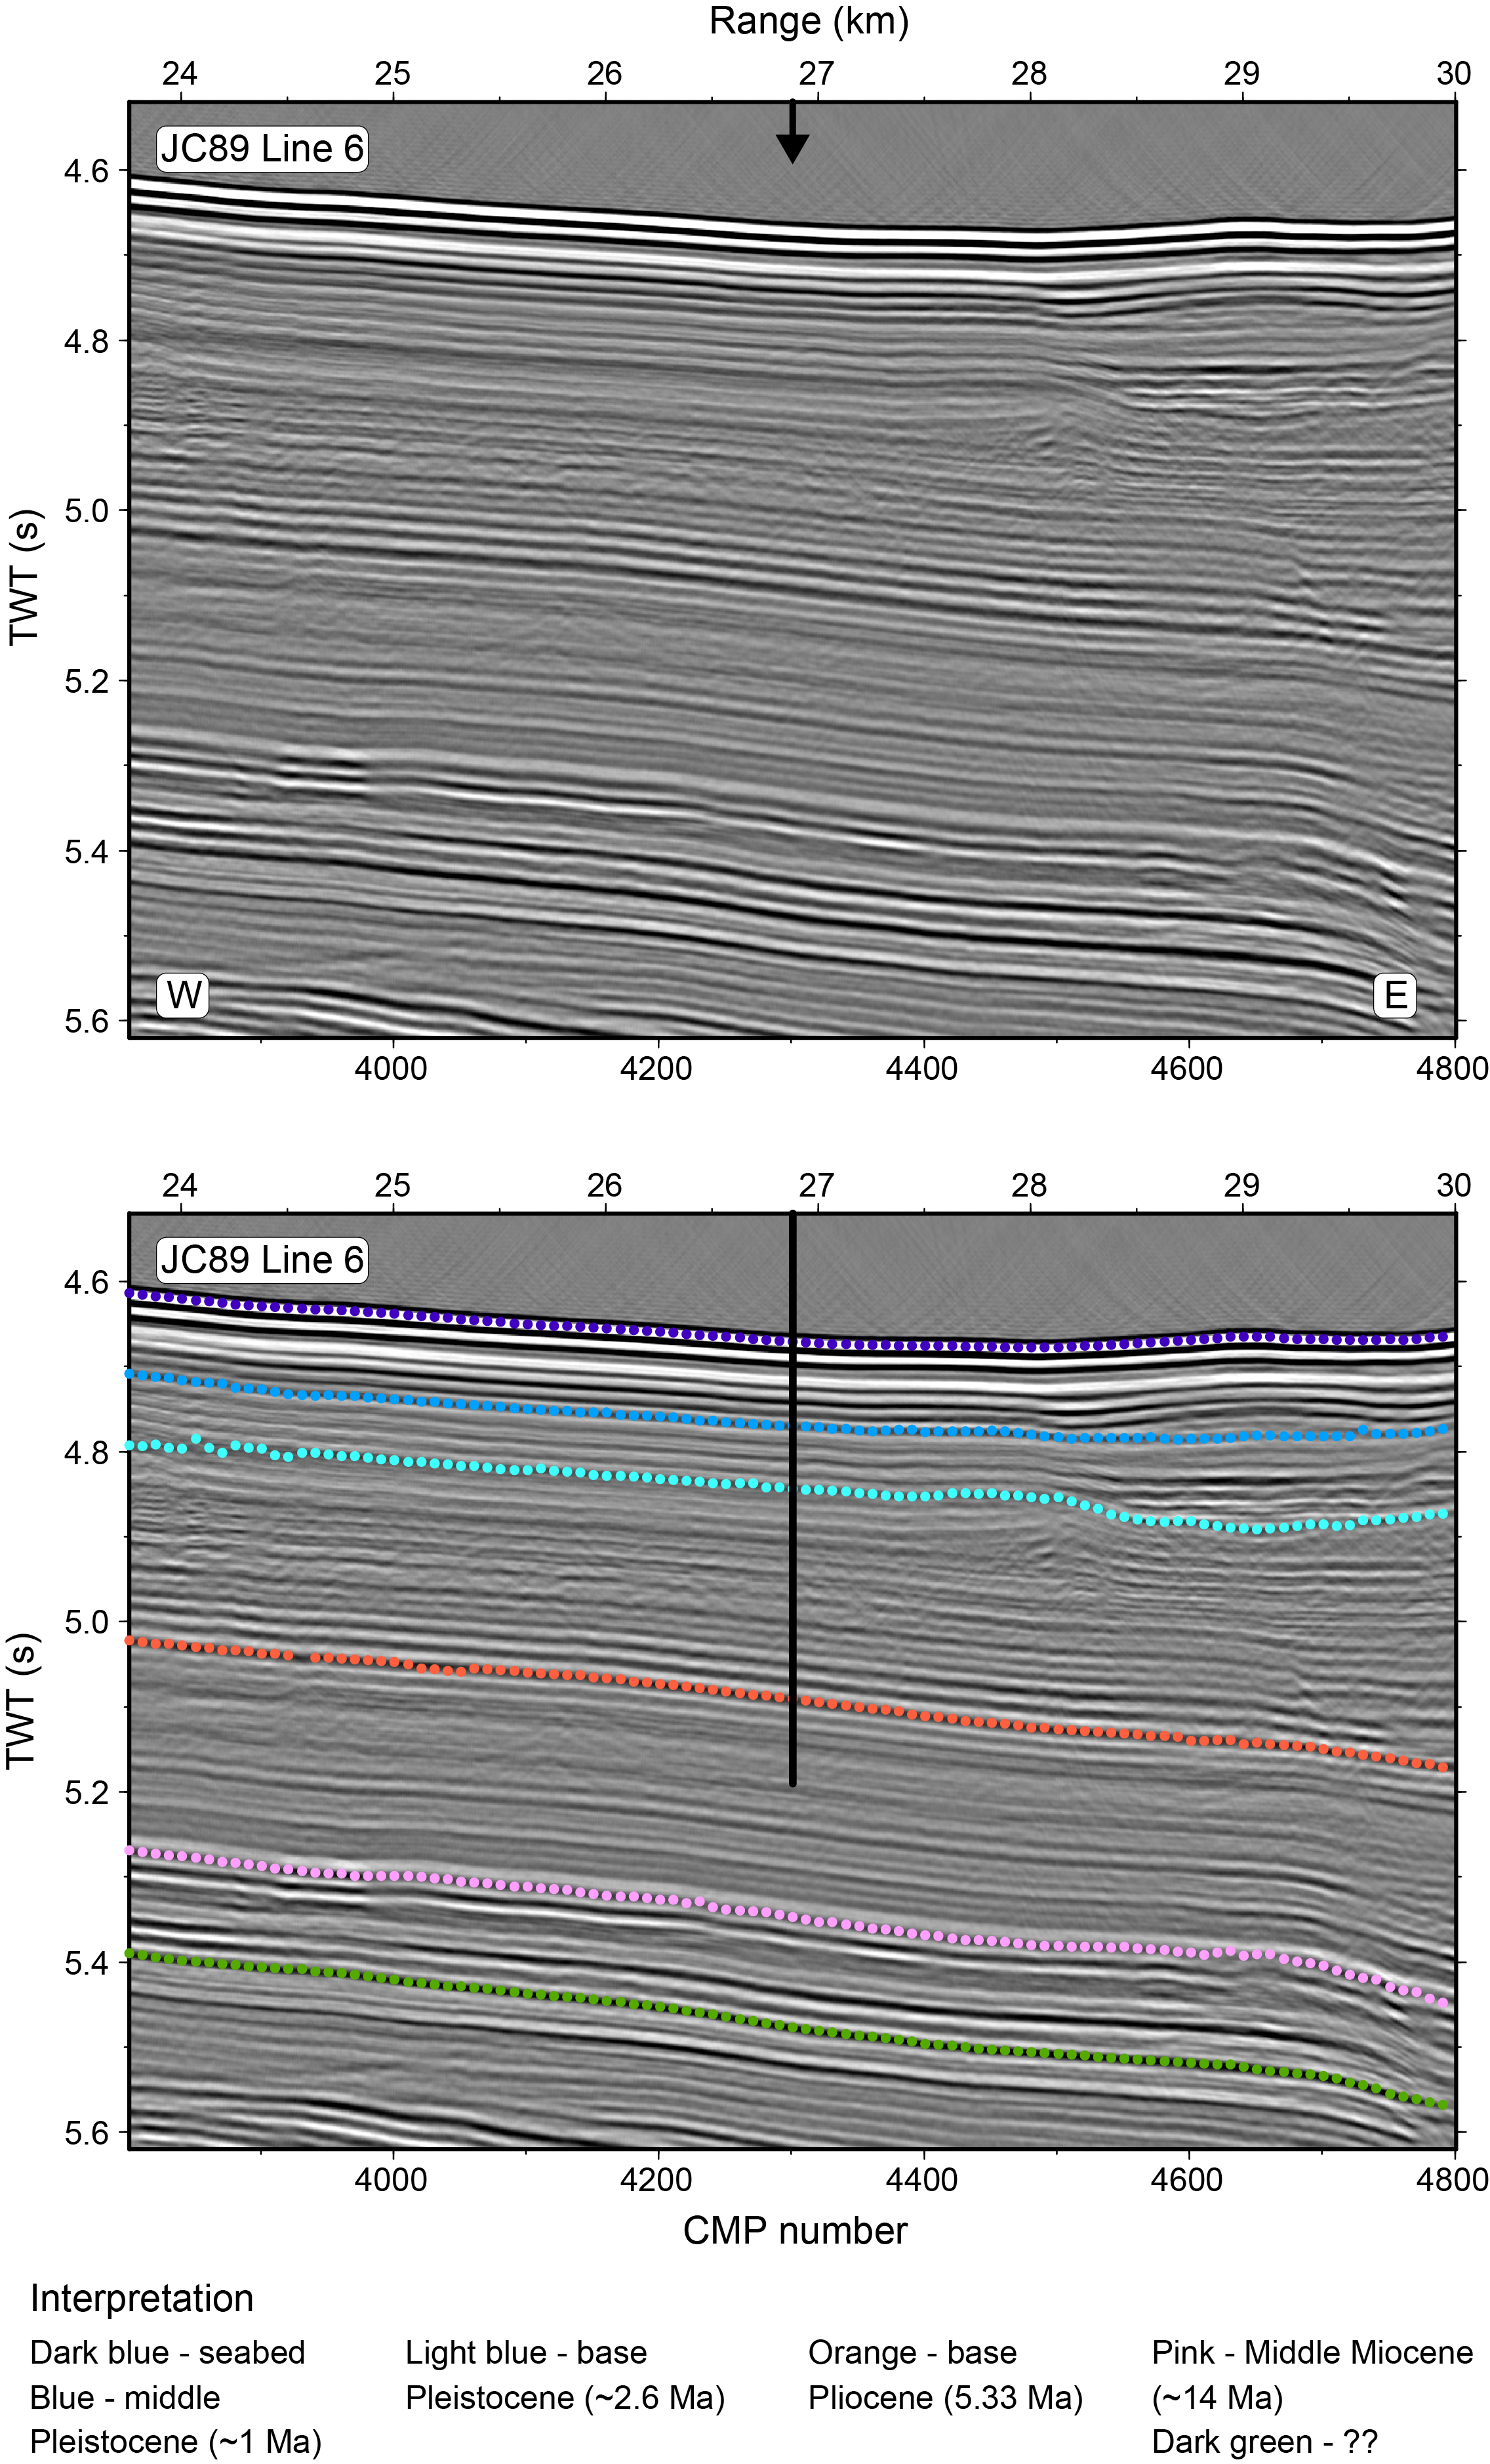
Figure F7. Seismic Profile JC89-6.
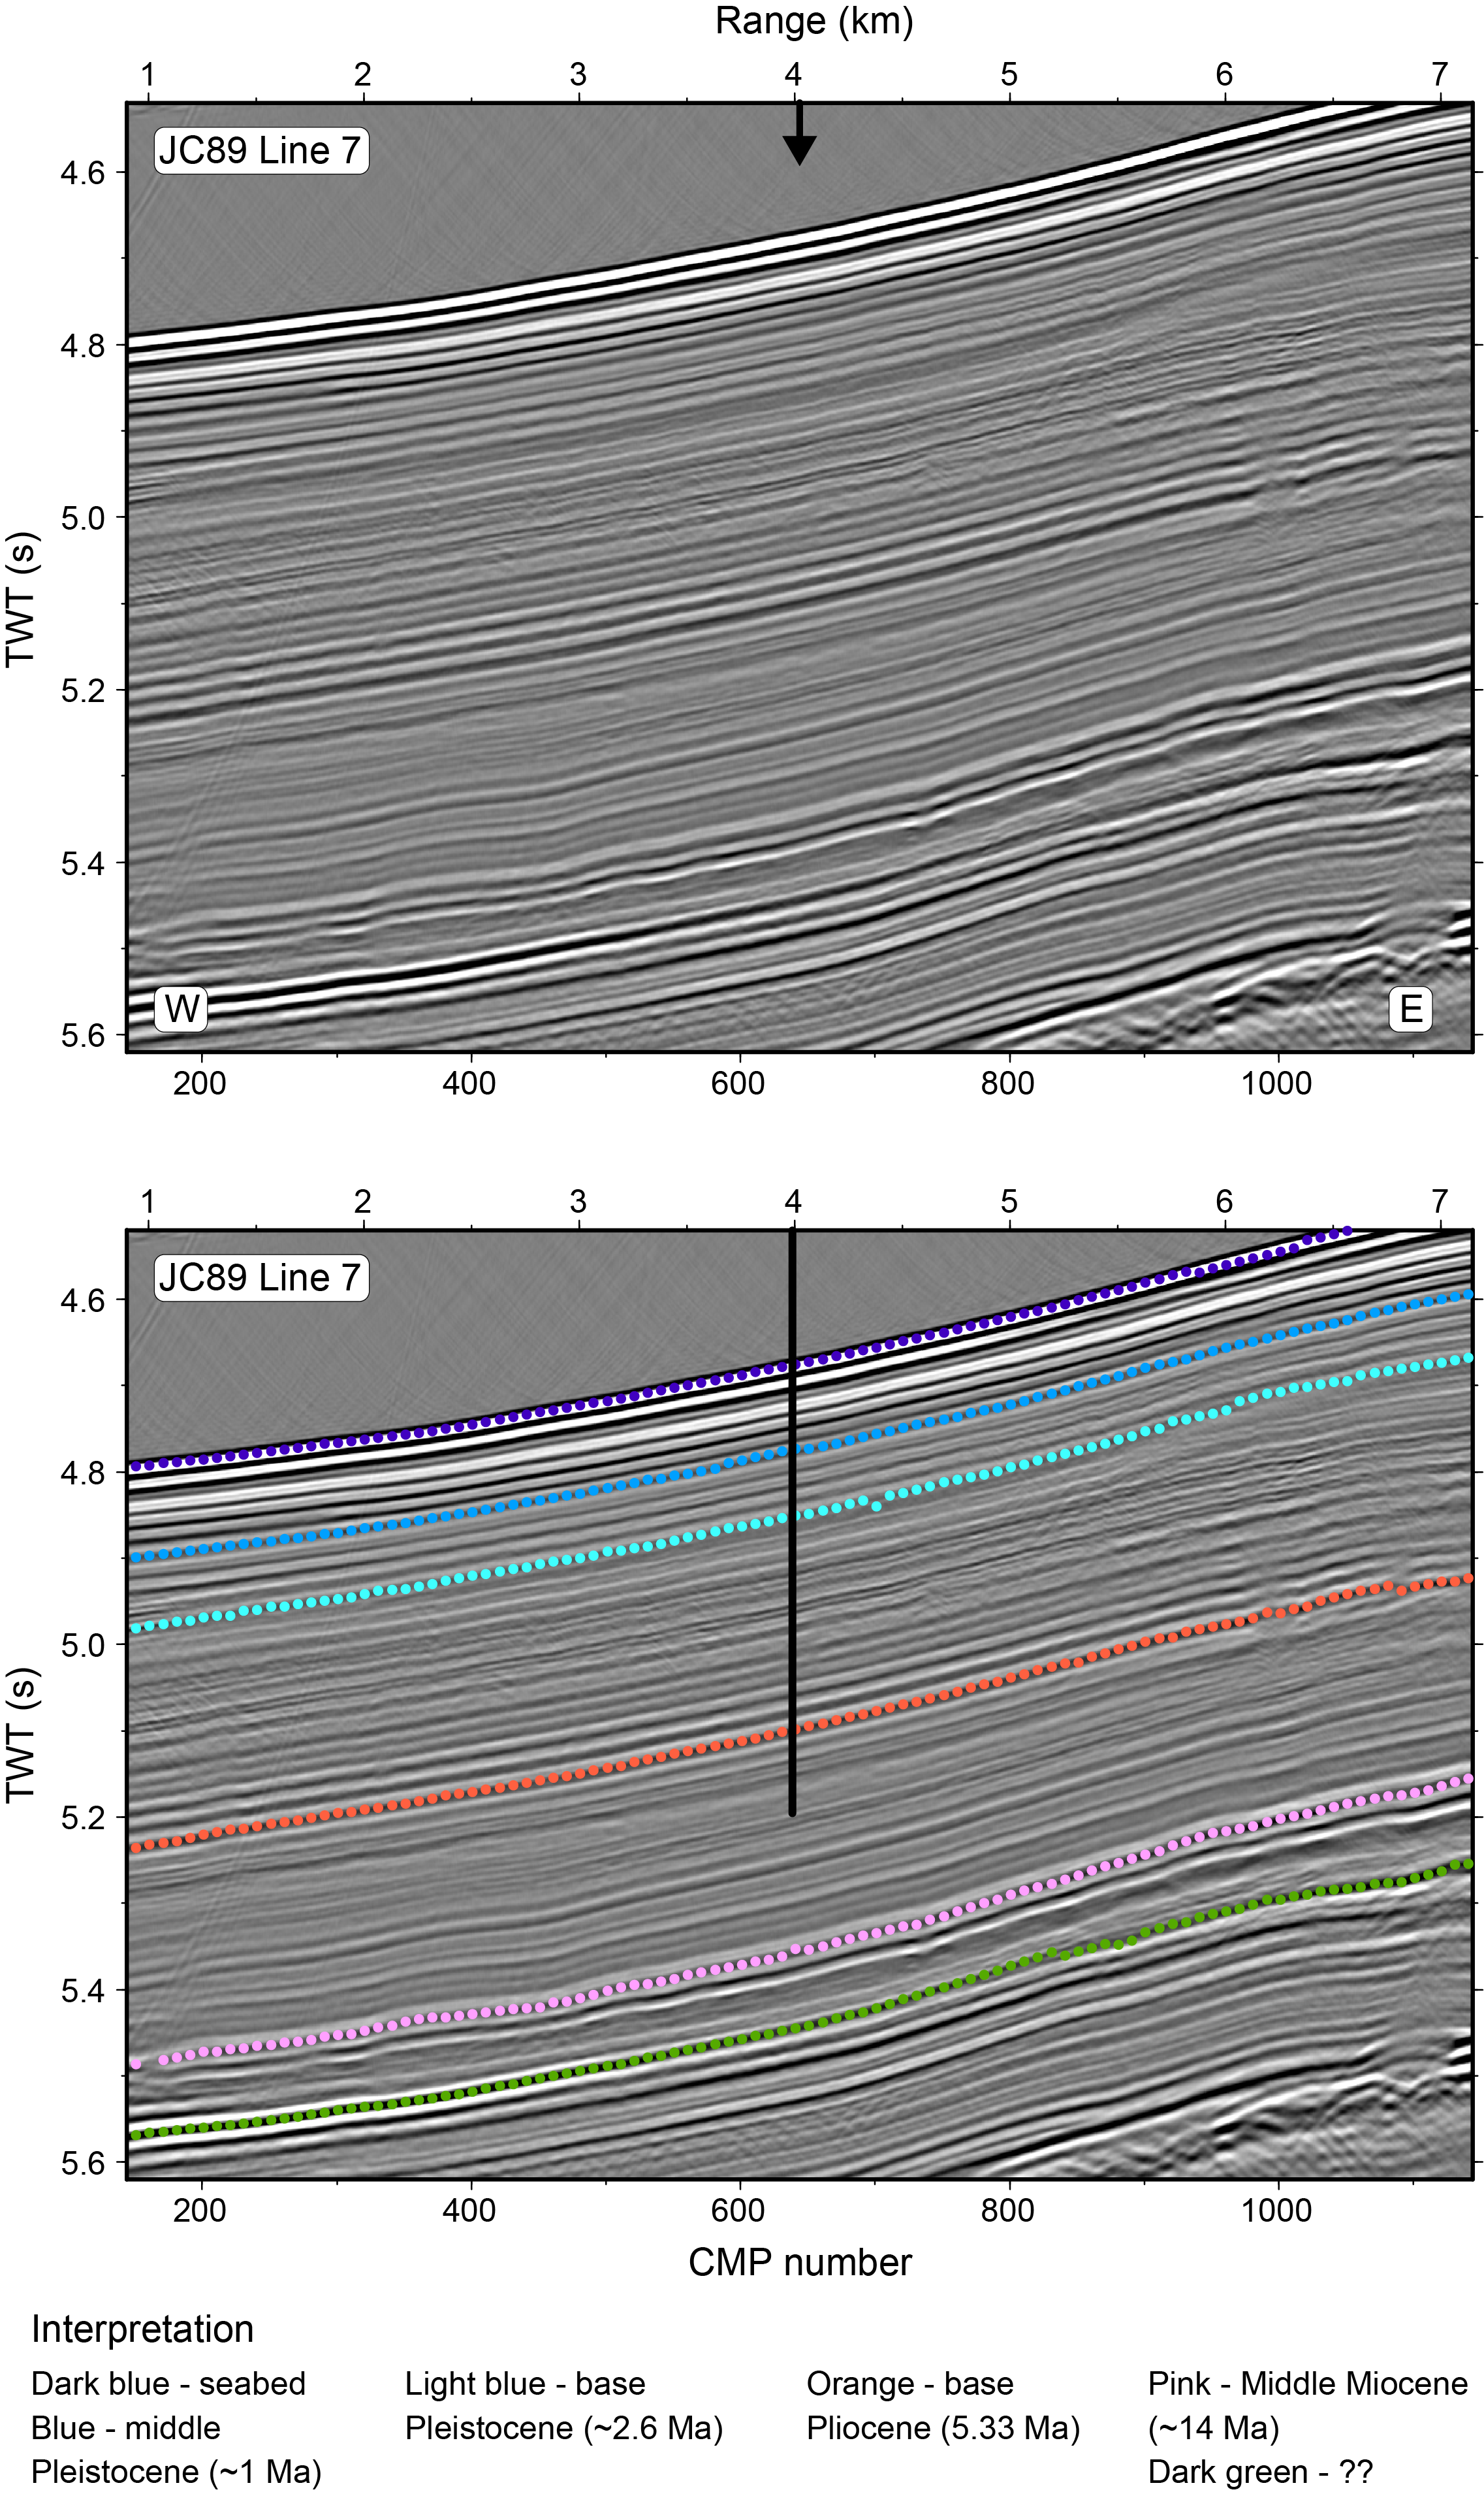
Figure F8. Seismic Profile JC89-7.
We had permission from the Environmental Protection and Safety Panel (EPSP) to drill to 500 meters below seafloor (mbsf), but we requested and were granted permission to drill an additional 50 m to extend the record well into the late Miocene. Site U1587 provides an expanded sequence of late Miocene to Quaternary sediments with which to address the following objectives:
- Document how millennial climate variability evolved during the glacial cycles of the Quaternary and Pliocene as boundary conditions changed with the progressive intensification of Northern Hemisphere glaciation (NHG).
- Reconstruct the history of changing local dominance of northern-sourced versus southern-sourced deep water, as well as ventilation and carbon storage in the deep Atlantic Ocean.
- Determine interhemispheric phase relationships (leads/lags) by comparing the timing of proxy variables that monitor surface (Greenland) and deepwater (Antarctic) components of the climate system.
- Investigate climate during past interglacial periods, including the warm Pliocene period prior to the intensification of NHG.
- Link terrestrial, marine, and ice core records by analyzing pollen and terrestrial biomarkers that are delivered to the deep-sea environment of the Iberian margin.
- Recover a complete record of the time leading up to, during, and following the Messinian Salinity Crisis, which complements objectives of International Ocean Discovery Program (IODP) Expedition 401 (Flecker et al., 2023) and will permit evaluation of the causes and consequences of this remarkable event in Earth's history.
- Develop an orbitally-tuned age model for Site U1587 by correlating physical properties to eccentricity-modulated precession and tying them into the record of Mediterranean cyclostratigraphy.
2. Operations
The original plan for Site U1587 was to core four holes with the advanced piston corer (APC) and half-length APC (HLAPC) systems to refusal (estimated at approximately 250 m core depth below seafloor, Method A [CSF-A]) and then core to a total depth of 500 m CSF-A using the extended core barrel (XCB) system. Temperature measurements were planned for the first hole using the advanced piston corer temperature (APCT-3) tool, and orientation was planned for APC cores in all four holes. Logging with the triple combination (triple combo) tool string was also planned for the last hole.
Once on site, weather conditions and high seas caused some delays, and the coring strategy was adjusted, removing the fourth hole from the plan after the site objectives had been met. Permission to deepen the site was requested and approved by the EPSP while coring Hole U1587B. The site ended up consisting of three holes. Hole U1587A was cored to 500 mbsf, Hole U1587B was cored to 547.8 mbsf, and Hole U1587C was cored to 567.9 mbsf (Table T1). As at Site U1586, the drilling strategy consisted of using the APC system until the first partial stroke and extending the hole to total depth using the XCB system. Hole U1587C was logged using the triple combo tool string.
All APC cores used nonmagnetic core barrels and were oriented with the Icefield MI-5 core orientation tool. In total, 1615.7 m were cored with the APC and XCB systems (97% recovery). Site U1587 took 335.5 h (14.0 days) to complete.
2.1. Hole U1587A
The R/V JOIDES Resolution completed the 16.9 nmi transit from Site U1586 to Site U1587 with the thrusters deployed and the vessel heading controlled by dynamic positioning (DP) at 1121 h on 1 November 2022. The drill crew made up an APC/XCB bottom-hole assembly (BHA) using the same polycrystalline diamond compact (PDC) bit used at Site U1586. The bit was deployed to 1881 meters below rig floor (mbrf) before a noisy roller in the traveling block dolly forced a stop in operations. The roller was changed out, and the bit was run to the seafloor. The top drive was picked up, and based on the depth reading with the ship's precision depth recorder (PDR), the bit was spaced to 3481 mbrf to spud. The spud attempt produced an empty core barrel, and the bit was lowered 4 m to 3485 mbrf for a second attempt. Hole U1587A was spudded at 2243 h on 1 November at 37°34.8602′N, 010°21.5400′W. The seafloor was calculated at 3491.7 mbrf (3480.5 mbsl) based on recovery in Core 1H (2.77 m). Coring continued using the APC system to 135.8 mbsf, where a partial stroke was recorded on Core 15H and the APC system reached refusal. The XCB was used to extend the hole to a total depth of 500 mbsf, recovering Cores 16X–53X. On 4 November, while XCB drilling, a kink in the forward core winch line caused coring to pause while the rig crew cut 1000 m of the forward core winch line and the wire was reheaded. After reaching 500 mbsf, the bit was raised, clearing the seafloor at 0350 h on 5 November and ending Hole U1587A.
In total, 53 cores were taken in Hole U1587A over a 500.0 m interval. The APC system was used for 15 cores over a 135.8 m interval (104% recovery), and the hole was extended to its total depth using the XCB system for the remaining 38 cores over a 364.2 m interval (93% recovery). The XCB system rate of penetration averaged 17 m/h.
2.2. Hole U1587B
The vessel was offset 20 m northeast from Hole U1587A, and the bit was spaced to 3489 mbrf. While running the sinker bars in, a kink in the forward winch line was noticed again. Approximately 350 m of wireline were spooled out and respooled onto the drum. The core barrel was lowered to the landing seat, and Hole U1587B was spudded at 0730 h on 5 November at 37°34.8650′N, 010°21.5314′W. Based on recovery from Core 1H, the seafloor was calculated at 3489.2 mbrf (3478.0 mbsl). Coring continued with the APC system through Core 11H at 104.3 mbsf, where a partial stroke signaled APC refusal. The XCB system was deployed, and coring continued to 303.3 mbsf with Core 33X, when high heave caused operations to stop while waiting for the seas to subside. The bit was pulled to 282.8 mbsf, and operations stopped for weather at 2330 h on 6 November.
By 0215 h on 8 November, the seas had settled enough to restart operations. A core barrel was dropped, and coring resumed with Core 397-U1587B-34X at 303.3 mbsf and continued through Core 46X at 421.7 mbsf, when high heave again caused a pause in coring operations. The bit was pulled off bottom until 1215 h, when the heave subsided enough to continue coring. Coring resumed at 421.7 mbsf with Core 47X and continued through Core 59X to a final depth of 547.8 mbsf. The bit was pulled clear of the seafloor at 1630 h on 10 November, ending Hole U1587B.
In total, 59 cores were taken in Hole U1587B over a 547.8 m interval. The APC system was used for 11 cores over a 104.3 m interval (105.5% recovery), and the hole was extended to its total depth using the XCB system for the remaining 48 cores over a 443.5 m interval (95.7% recovery). Operations were forced to stop because of high heave on two occasions for a total of 35 h. The first lasted 26.75 h from 2330 h on 6 November to 0215 h on 8 November. The second lasted 8.25 h on 9 November. The rate of penetration for the XCB system averaged 45 m/h. Hole U1586B took 132.75 h (5.5 days) to complete.
2.3. Hole U1587C
After clearing the seafloor, the vessel was offset 20 m northeast from Hole U1587B to spud Hole U1587C. The rig crew slipped and cut 115 feet of drill line prior to spudding Hole U1587C. The bit was spaced to 3486 mbrf, an APC core barrel was lowered, and Hole U1587C was spudded at 2042 h on 10 November 2022 at 37°34.8750′N, 010°21.5205′W. Seafloor was calculated at 3490.2 mbrf (3489.0 mbsl) based on recovery of Core 1H. Coring continued with the APC system until a partial stroke on Core 12H ended APC coring at 98.3 mbsf. The XCB system was then deployed, and coring continued with Cores 13X–61X, leaving Hole U1587C with a total depth of 567.9 mbsf on 14 November.
A total of 69 cores were taken in Hole U1587C over a 567.9 m interval. The APC system was used for 12 cores over a 98.3 m interval (105.1% recovery), and the hole was extended to its total depth using the XCB system for the remaining 49 cores over a 469.6 m interval (95.8% recovery). Nonmagnetic core barrels were used for all APC cores, and all APC cores were oriented using the Icefield MI-5. The forward core winch was used to retrieve Core 59X and was coated on the way out. The core line was not used for the rest of the expedition. The upper 1000 m of the aft core winch line was coated while pulling Core 61X because the final two sites would not be as deep. The rate of penetration for the XCB system averaged 33 m/h.
2.3.1. Downhole measurements
After coring was completed in Hole U1587C, a 30 bbl sweep of high-viscosity mud (sepiolite) was pumped to clean the hole and the bit was pulled to a logging depth of 81.0 mbsf. Scaffolding was rigged up on the rig floor for logging tool assembly, and the prejob safety meeting and toolbox talk were conducted.
The triple combo tool string was rigged up and deployed. The source was loaded before running in the hole. The tool was lowered to 3475 mbrf, just a few meters above the seafloor (3490 mbrf), and a downlog was started from that depth to observe the seafloor on the gamma ray curve. The downlog continued with the caliper closed to a maximum reachable depth of 4048 mbrf in Hole U1587C, roughly 10 m above the total depth of the hole (5679 mbsf). We then conducted an upward pass with the caliper open at a pace of 900 ft/h over the entire open hole interval to achieve the maximum possible data resolution from the Hostile Environment Natural Gamma Ray Sonde (HNGS) on the triple combo tool string. The caliper was closed before entering the pipe, and the main pass was completed above seafloor. Owing primarily to several spots where the hole was significantly undergauge and to the inability to close the caliper fully, it was not possible to make any additional passes, so the tools were pulled to the surface and rigged down at 0810 h.
The drill string was raised, clearing the seafloor and ending Hole U1587C and Site U1587 at 0850 h. The bit was raised to 2484 mbrf, and at 1115 h we started to transit to Site U1385 under DP mode. Hole U1586C took 114.50 h (4.8 days).
3. Lithostratigraphy
Two lithofacies were identified using visual descriptions, smear slides, and color (RGB values). Lithofacies 1 and 2 can be represented as a mixed ratio of two end-members: Lithofacies 1, which is 100% nannofossil ooze, and Lithofacies 2, which is 100% clay/silt. Three lithostratigraphic units were defined at Site U1587. Lithostratigraphic Unit I spans ~0–396 m CSF-A in Holes U1587A–U1587C and consists predominantly of Lithofacies 1. Bioturbation is sparse to heavy and dark patches are present in the upper meters of the holes. Other features include a single minor (<3 m) slumped interval in Hole U1587A and a laminated interval near 186 m CSF-A in Holes U1587A and U1587C. Lithostratigraphic Unit II spans 396–520 m CSF-A in Holes U1587A–U1587C, consists of Lithofacies 1, and is characterized by distinct light-to-dark color cycles, corresponding to alternating layers of nannofossil ooze with clay and nannofossil ooze. Bioturbation is sparse to heavy, and pyrite nodules are present. Unit II is divided into two subunits (IIA and IIB) based on the diminished color contrast of sediment cycles below 450 m CSF-A. Unit III consists of Lithofacies 1 and is also characterized by light-to-dark color cycles that are increasingly muted downhole. The abundance of nannofossil ooze with varying amounts of clay in Units I and III and Subunits IIA and IIB indicates the dominance of hemipelagic sedimentation at Site U1587 from the Pliocene through the Pleistocene. Drilling disturbance is present in most cores in all holes, varies from slight to severe, and is influenced by the drilling type and operation conditions.
3.1. Introduction
Two lithofacies were identified using visual observation of sediments, microscopic examination of smear slides, X-ray diffraction (XRD), portable X-ray fluorescence spectrometry (pXRF), carbonate analyses, and sediment physical properties. The sediments' categorization into two lithofacies was based on their primary lithologies: nannofossil ooze and clay. Two smear slides, two CaCO3 samples, and one XRD sample were taken per core for Hole U1587A and Cores 397-U1587B-54X through 59X and 397-U1587C-59X through 61X. Additional smear slides were taken in other holes to confirm lithologies. Site U1587 consists of three lithostratigraphic units that span the Quaternary to the late Miocene and in which color varies cyclically but decreases in intensity downcore.
Based on constraints from biostratigraphy and paleomagnetic data, the ages at the base of Holes U1587A, U1587B, and U1587C are estimated at approximately 7.4, 8.1, and 8.3 Ma, respectively. Using onboard age models, sedimentation rates at Site U1587 are estimated at ~10 cm/ky from 0 to 200 m CSF-A, ~6.5 cm/ky from 200 to 310 m CSF-A, ~3 cm/ky from 310 to 340 m CSF-A, and ~7 cm/ky from 340 to 562 m CSF-A (see Biostratigraphy). Drilling disturbance is present in many cores from all three holes, is ranked between slight and severe, and varies with the type of drilling system used.
3.2. Lithofacies description
Two lithofacies were identified at Site U1587 (Table T2). Lithofacies 1 consists of nannofossil ooze, which is the dominant lithofacies. Lithofacies 2 is composed of clay and is only observed in a few sections. Lithofacies 1 and 2 can be represented as a mixing ratio of two end-members: 100% nannofossils and 100% clay/silt comprising siliciclastics.
3.2.1. Lithofacies 1
Lithofacies 1 ranges from light to dark gray and greenish gray nannofossil ooze. The major modifying component (>25%–50%) is clay (as siliciclastic grains), and minor modifying components (>10%–25%) include clay, foraminifers (as the biogenic component), and detrital carbonate (Figure F9). Light sandy patches are disseminated in several cores. The primary sedimentary structure is color banding. Bioturbation is present throughout, and its occurrence ranges from sparse to heavy. Foraminifers, nodules, pyrites, and trace fossils such as Zoophycos, Chondrites, Planolites, Thalassinoides, and Ophiomorpha are commonly observed.
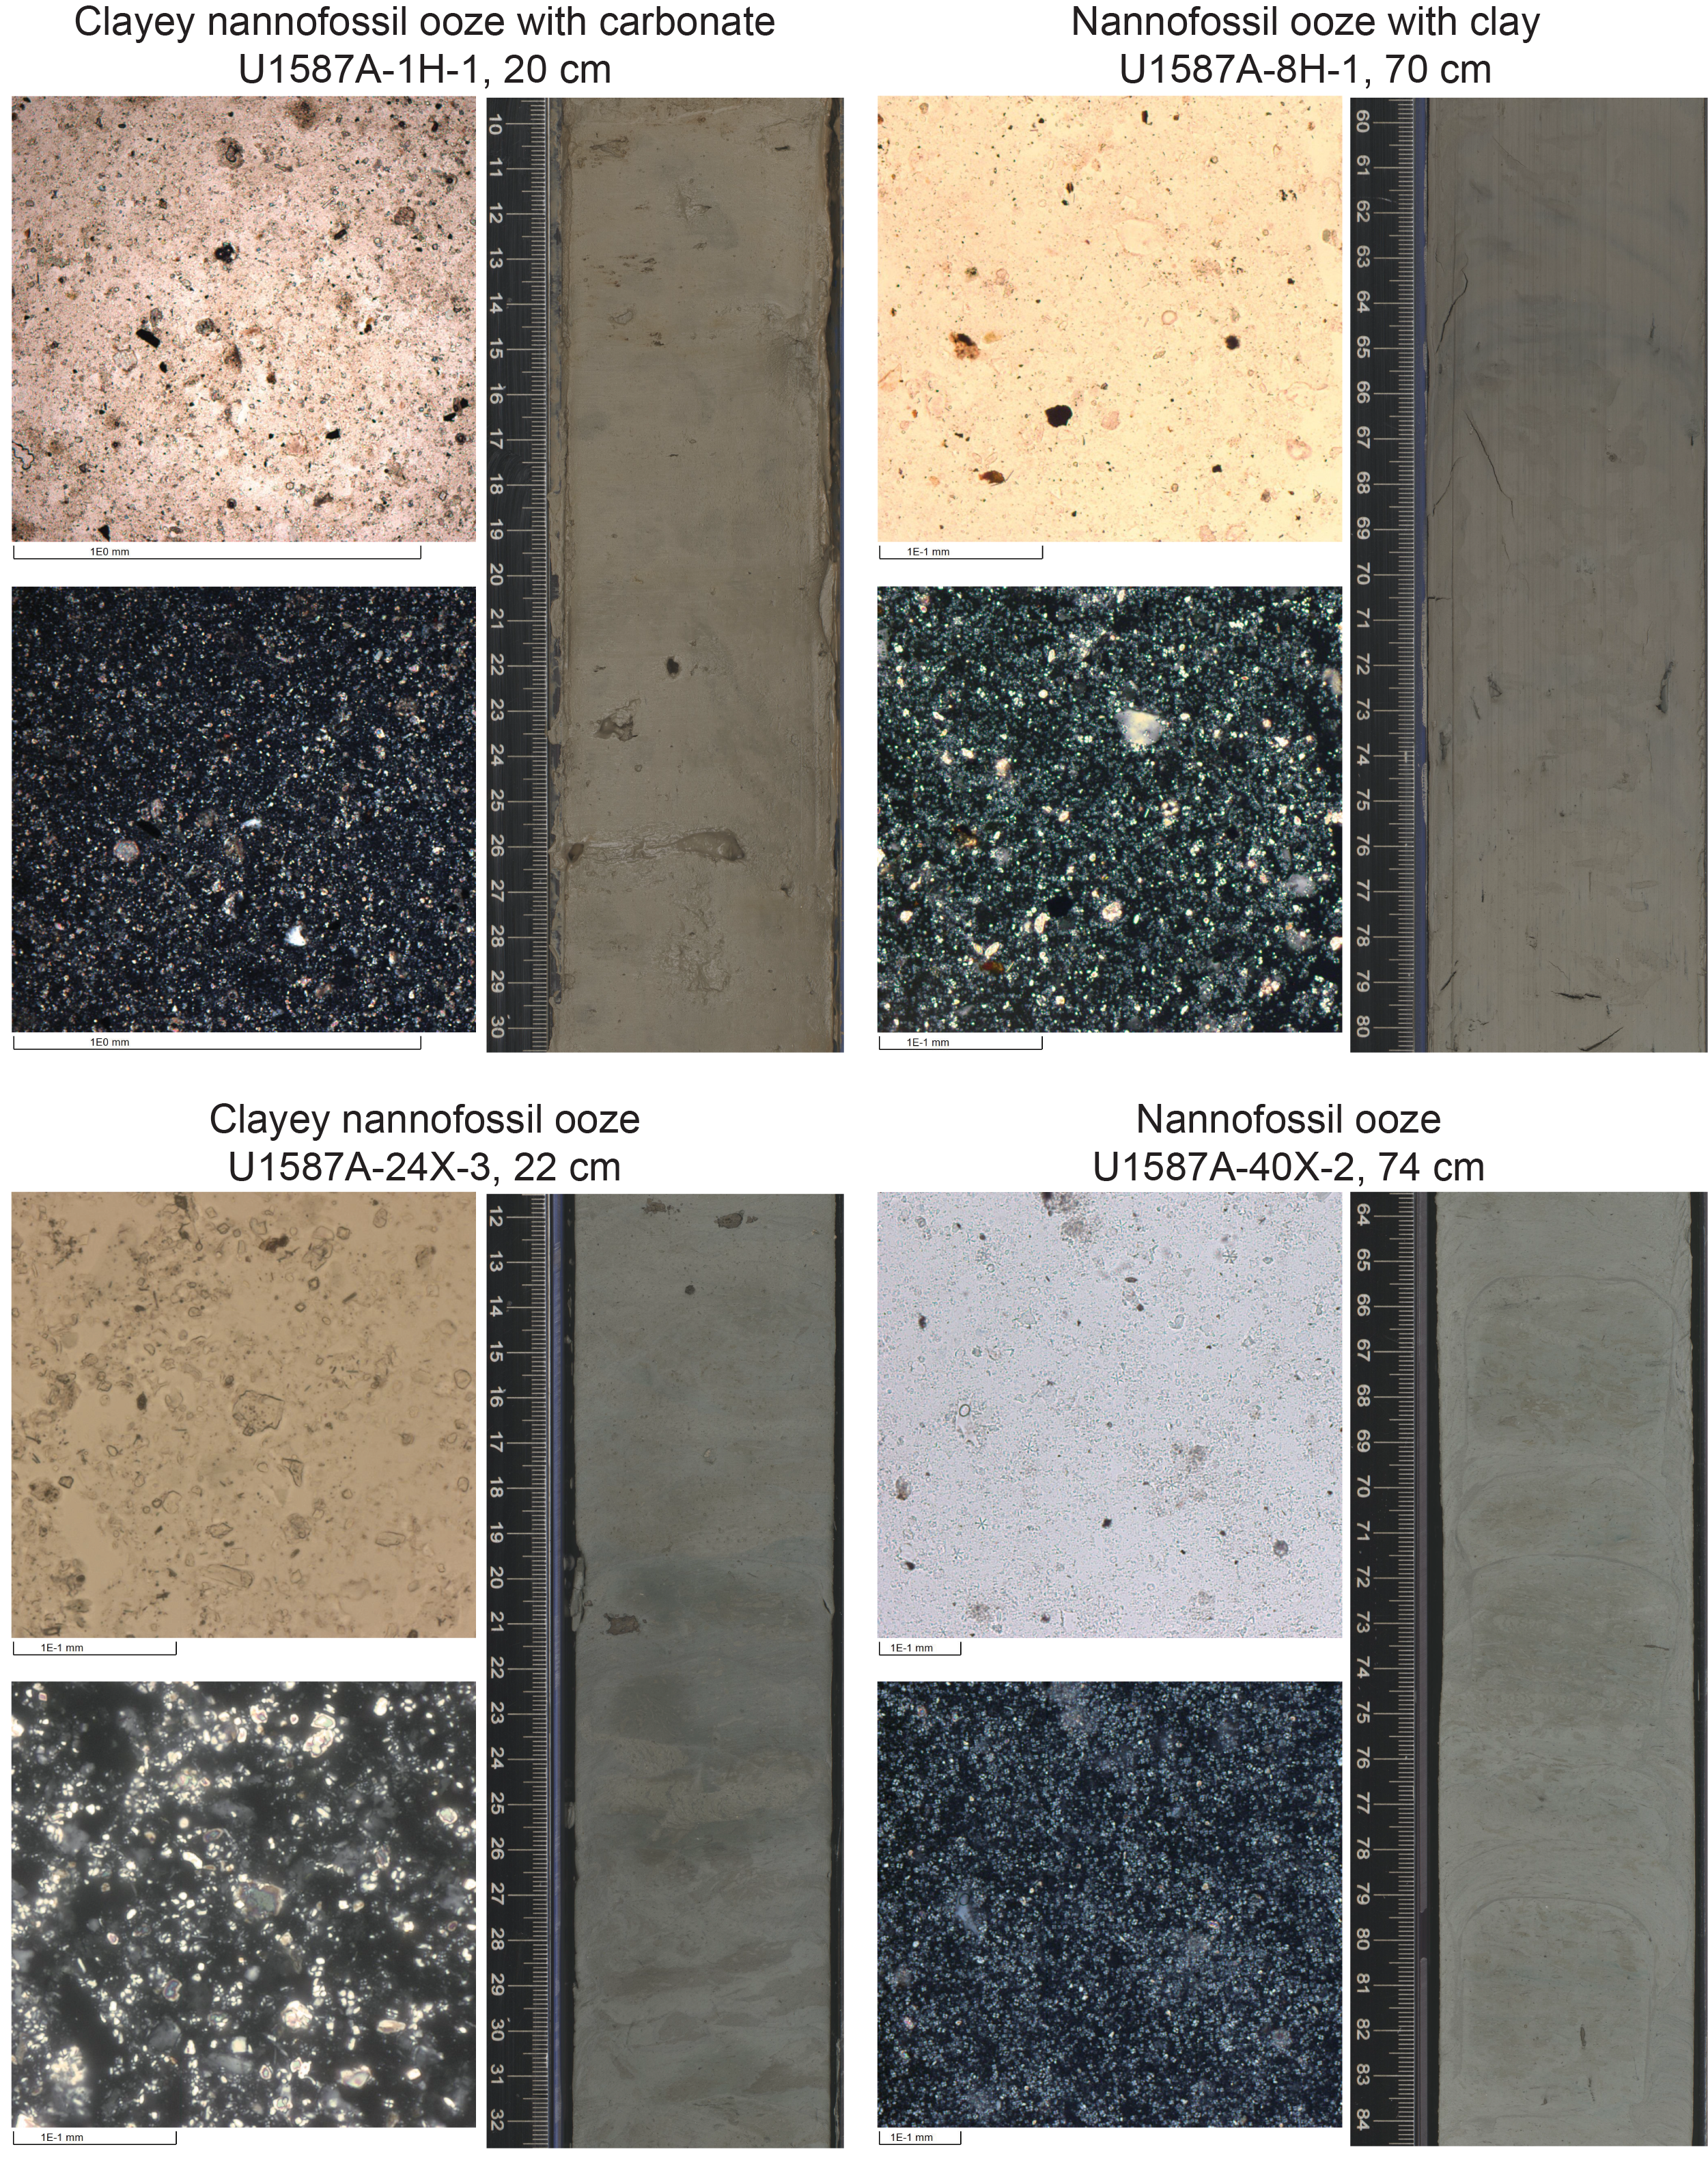
Figure F9. Lithofacies 1.
3.2.1.1. Smear slides
Nannofossils are the dominant (>50%) component in this lithofacies. The abundance of siliciclastic components and detrital carbonate ranges from trace (≤1%) to abundant (>25%–50%). Foraminifers range from trace (≤1%) to common (>10%–25%). Authigenic minerals (pyrite, glauconite, and iron oxides), organic matter, and sponge spicules range from trace (≤1%) to rare (>1%–10%). For all (biogenic and siliciclastic) components, 51%–94% of grains are in the clay-size fraction, 5%–45% are in the silt-size fraction, and 0%–25% are in the sand-size fraction.
3.2.2. Lithofacies 2
Lithofacies 2 is primarily dark gray, greenish gray, and dark brown clay. The major modifying components (>25%–50%) are silt and nannofossils, and the minor modifying component (>10%–25%) is nannofossils (Figure F10). This lithofacies only occurs as thin (less than 1 m) dark intervals in a few sections of each hole. Lithofacies 2 shares similar features with Lithofacies 1 in sediment structure, trace fossils, bioturbation, and diagenetic characteristics but is darker in color and has higher clay quantities.
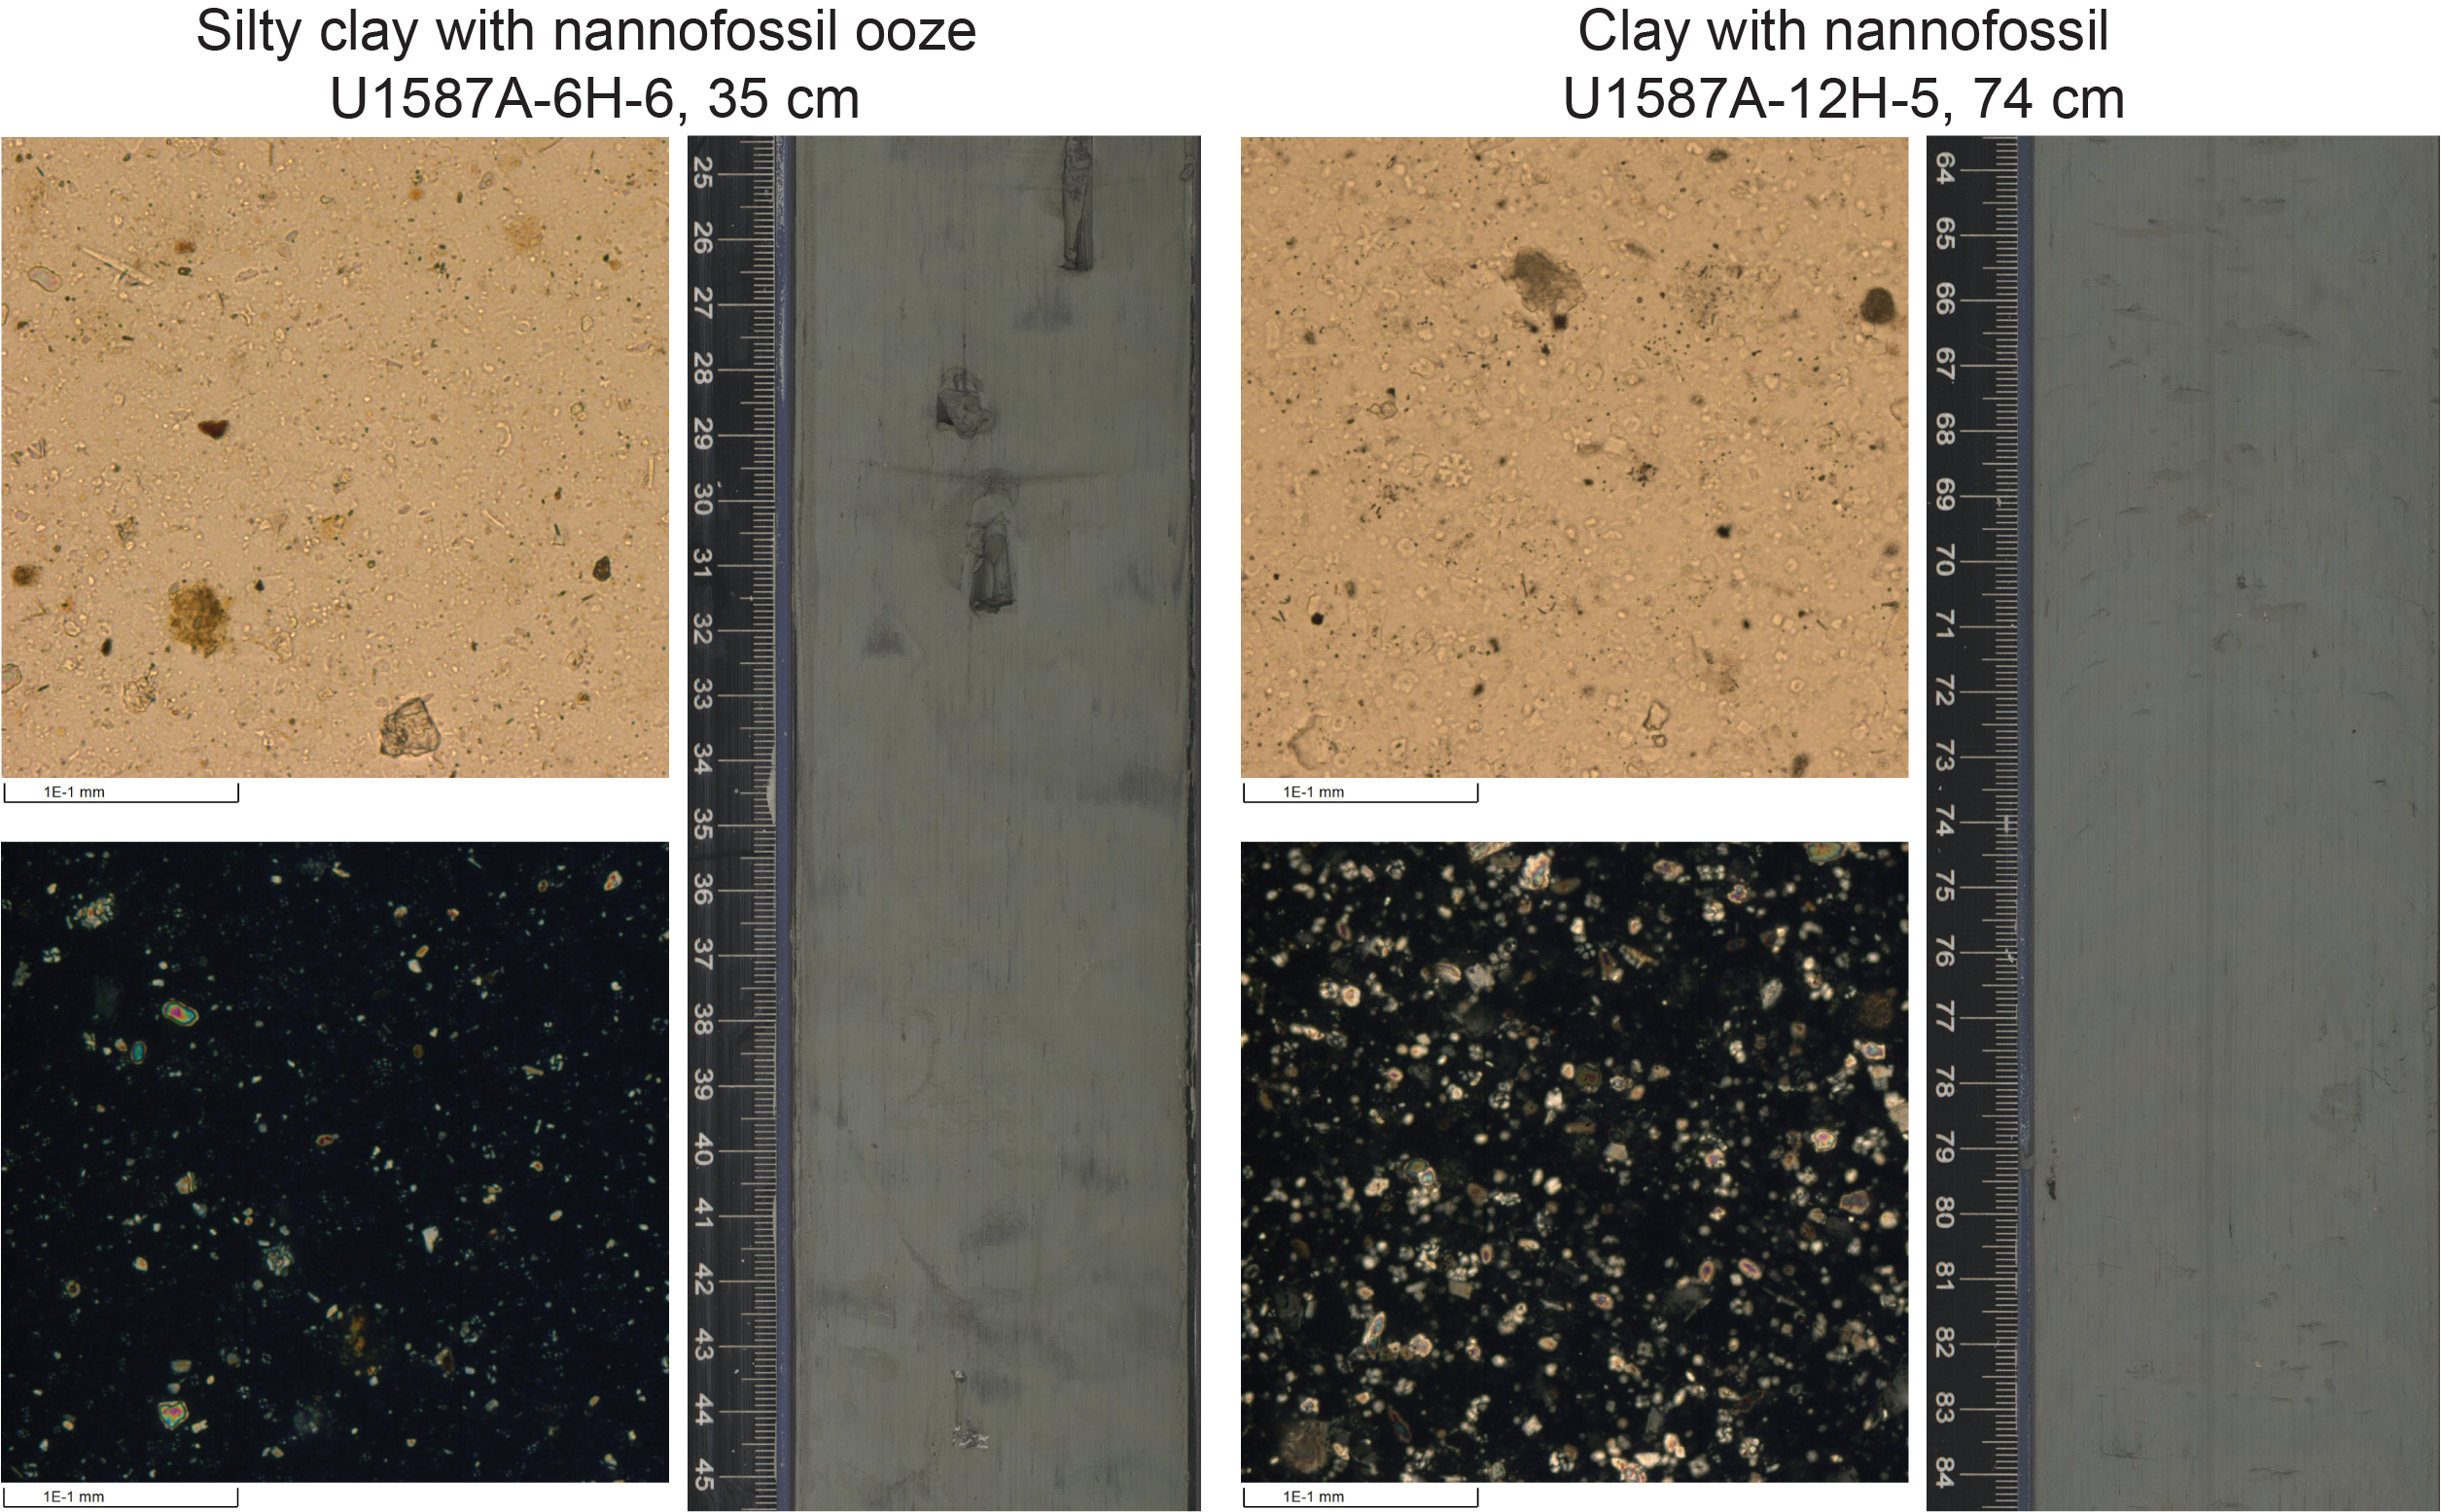
Figure F10. Lithofacies 2.
3.2.2.1. Smear slides
Siliciclastic grains are the dominant (>50%) component in this lithofacies. Detrital carbonate abundance ranges from rare (>1%–10%) to common (>10%–25%). Nannofossils range from common (>10%–25%) to abundant (>25%–50%). Foraminifers and authigenic minerals (pyrite, glauconite, and iron oxides) range from trace (≤1%) to rare (>1%–10%). Trace (≤1%) organic matter and sponge spicules are present. For all (biogenic and siliciclastic) components, 19%–80% of grains are in the clay-size fraction, 17%–46% in the silt-size fraction, and 1%–51% in the sand-size fraction.
3.3. Lithostratigraphic units
The sedimentary sequence at Site U1587 was divided into three stratigraphic units based on the frequency and occurrence of the two lithofacies and changes in color (Table T3).
3.3.1. Unit I
- Intervals: 397-U1587A-1H-1, 0 cm, to 43X-1, 19 cm; 397-U1587B-1H-1, 0 cm, to 44X-2, 141 cm; 397-U1587C-1H-1, 0 cm, to 43X-3, 94 cm
- Depths: Hole U1587A = 0–395.79 m CSF-A; Hole U1587B = 0–395.51 m CSF-A; Hole U1587C = 0–393.24 m CSF-A
- Thicknesses: Hole U1587A = 395.79 m; Hole U1587B = 395.51 m; Hole U1587C = 393.24 m
- Age: Holocene (~0 ka) to late Miocene (~5.7 Ma)
- Primary lithofacies: 1, 2
Unit I consists largely of Lithofacies 1 (98%), with Lithofacies 2 contributing a minor fraction (2%). The dominant lithology in Unit I is nannofossil ooze with clay intercalating with nannofossil ooze. Clay is only present as thin dark intervals in a few sections. Lithologic transitions are generally gradational. Banding is very indistinct and even nonexistent in places. Color banding is the primary sedimentary structure throughout. The most obvious secondary sedimentary structure, bioturbation, is present throughout Unit I, and its occurrence varies from sparse to heavy. Black patches are observed from 0 to ~125 m CSF-A in Hole U1587A, 0 to ~162 m CSF-A in Hole U1587B, and 0 to ~125 m CSF-A in Hole U1587C. White millimeter-sized patches consisting of fine sand and foraminifers (Figure F11) are disseminated in several cores. Pyrite nodules, burrows, and trace fossils are common (Figure F11). Burrows include Chondrites, Thalassinoides, Planolites, Zoophycos, and Ophiomorpha. Foraminifers are common throughout, and macrofossils (e.g., Figure F11) are rare.
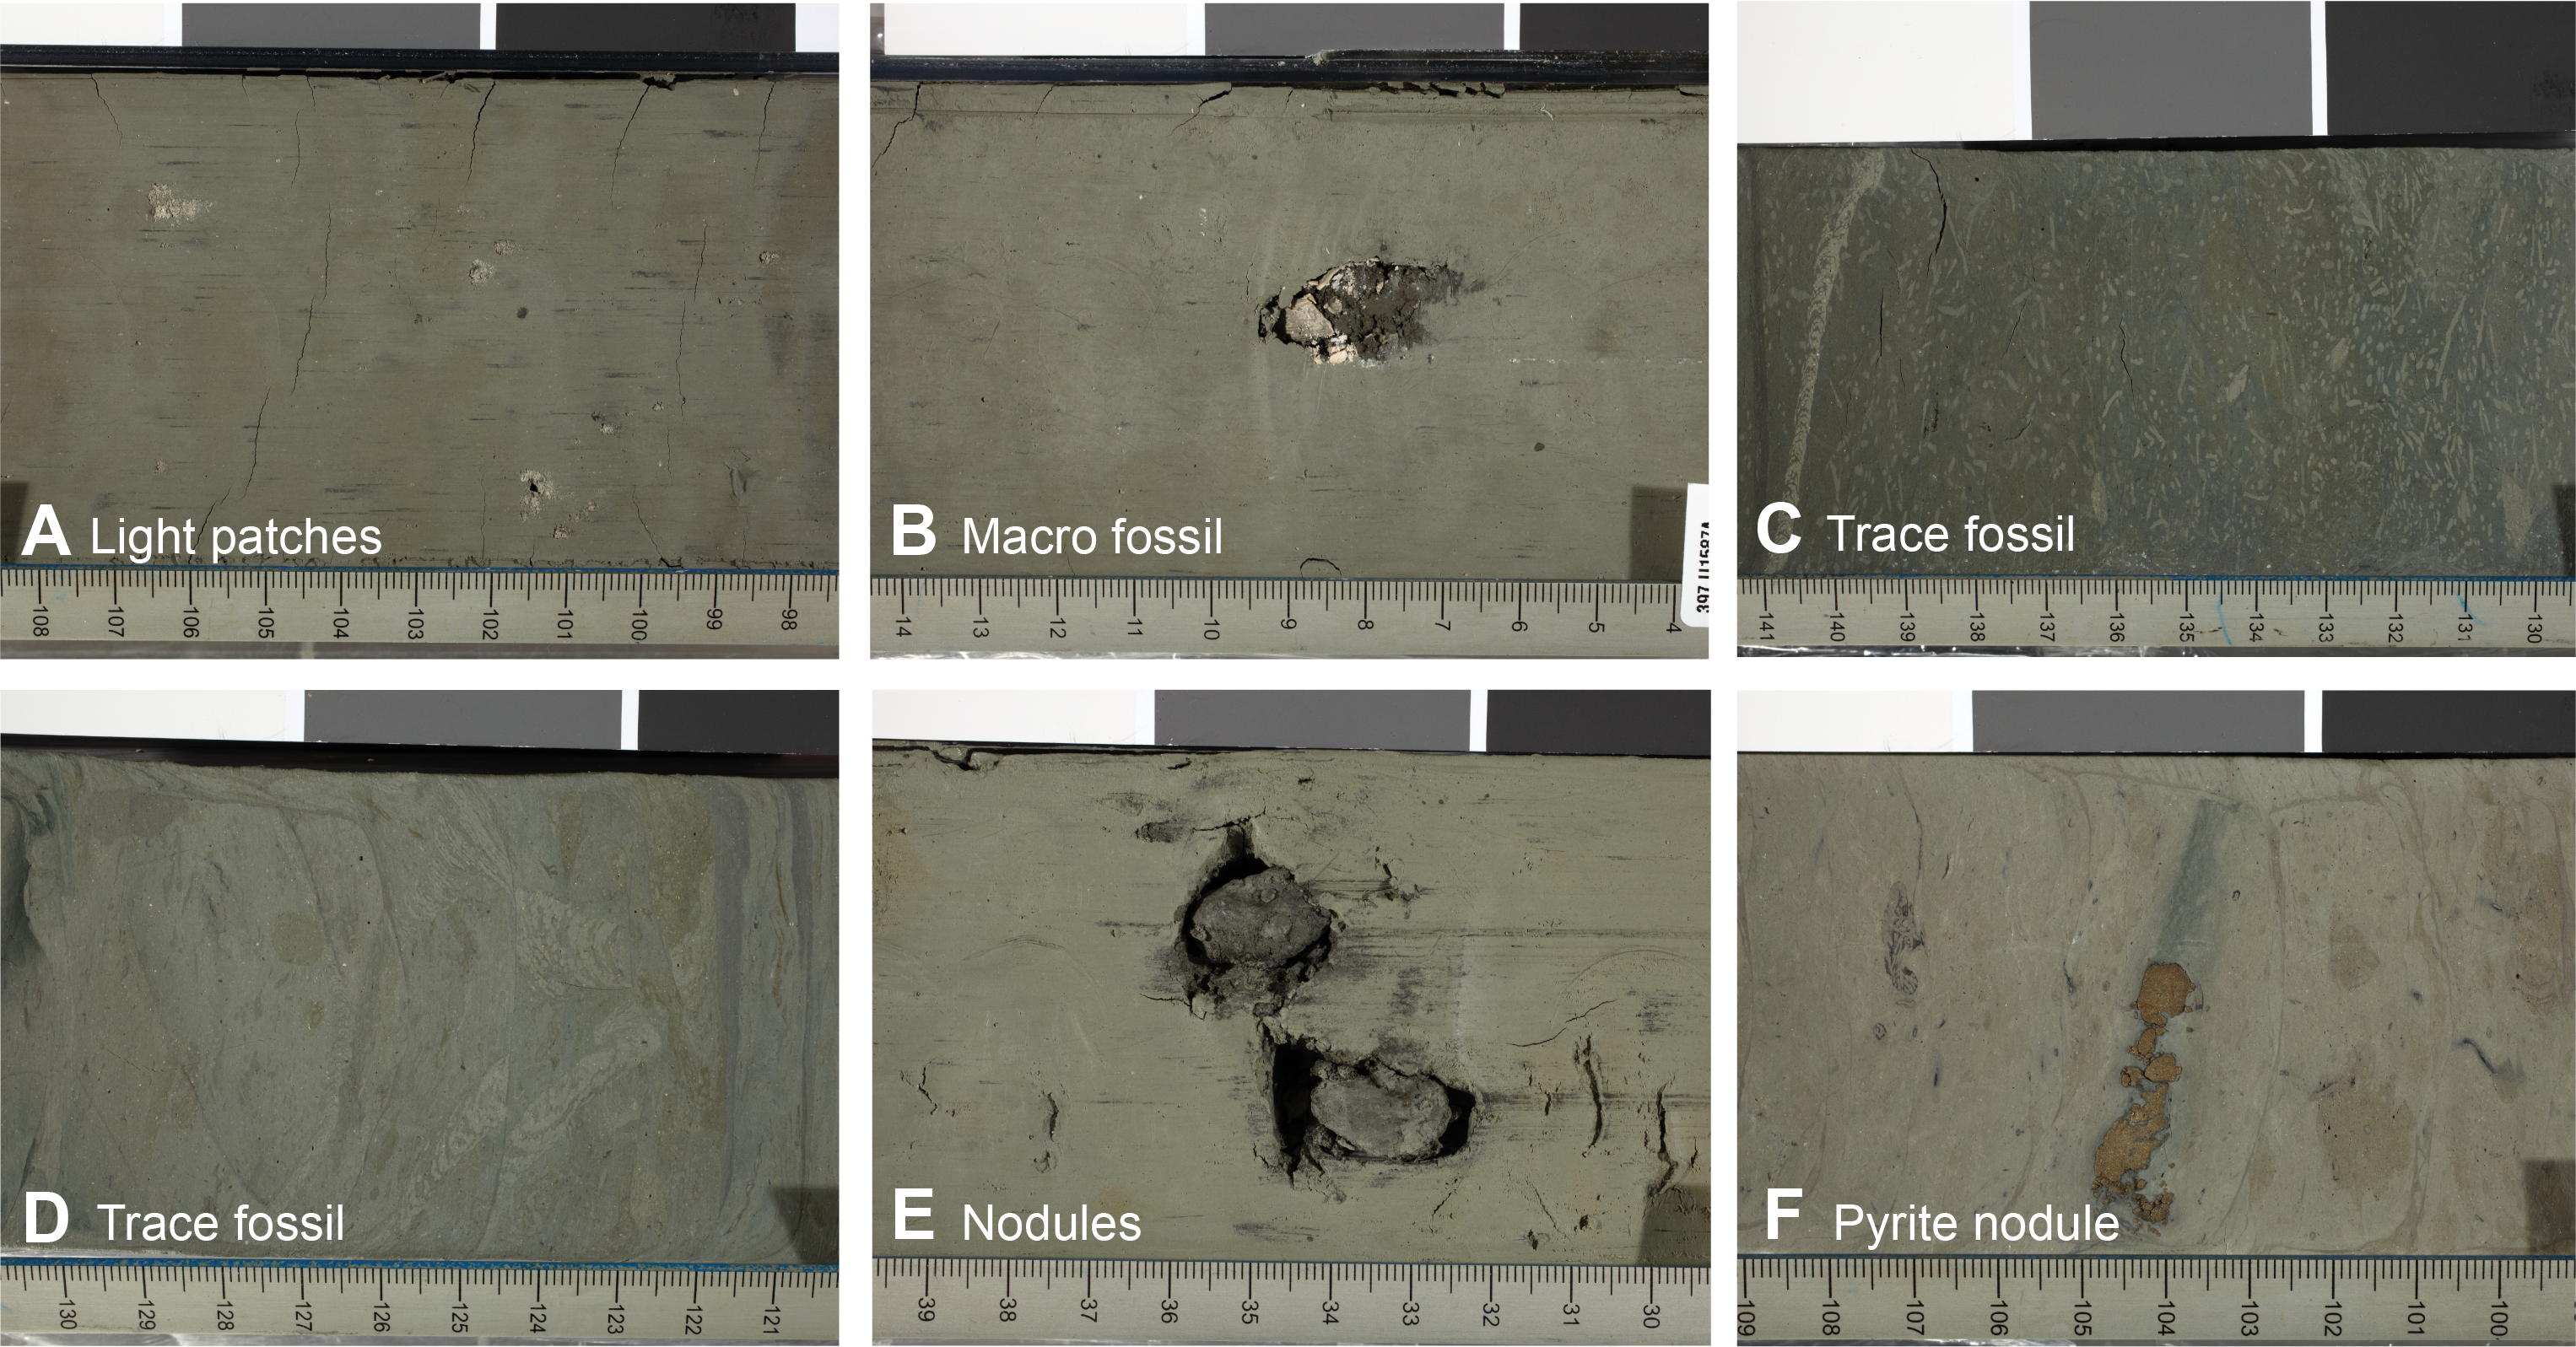
Figure F11. Core closeup photos.
Planar- and cross-laminated intervals are present in Sections 397-U1587A-21X-2 through 21X-6 (184.21–189.94 m CSF-A) and 397-U1587C-22X-1 (186.08–186.60 m CSF-A). In addition, contorted bedding and microfaults provide evidence for a minor slumped interval (2.2 m thick) in Sections 397-U1587A-3H-1, 0 cm, to 3H-2, 70 cm. However, these structures are not observed at similar core depths in Holes U1587B or U1587C.
Two sections in Unit I (397-U1587B-6H-1, 47.3 m CSF-A; 397-U1587C-7H-1, 46.3 m CSF-A) were sampled for smear slides, which contained trace-to-common occurrences of siliceous organisms, including diatom genera Chaetoceros and Thalassionema, as well as Chaetoceros resting spores, radiolarians, sponge spicules, and dinoflagellate cysts (Figure F12). This greenish, opal-bearing layer was located below a light white layer of nannofossil ooze and above a darker grayish layer of nannofossil ooze with clay. Smear slide analysis was not done for the equivalent sample in Hole U1587A, but layers of comparable color and lithology exist in Sections 397-U1587A-6H-5 (46.24 m CSF-A) and 6H-6 (47.75 m CSF-A).
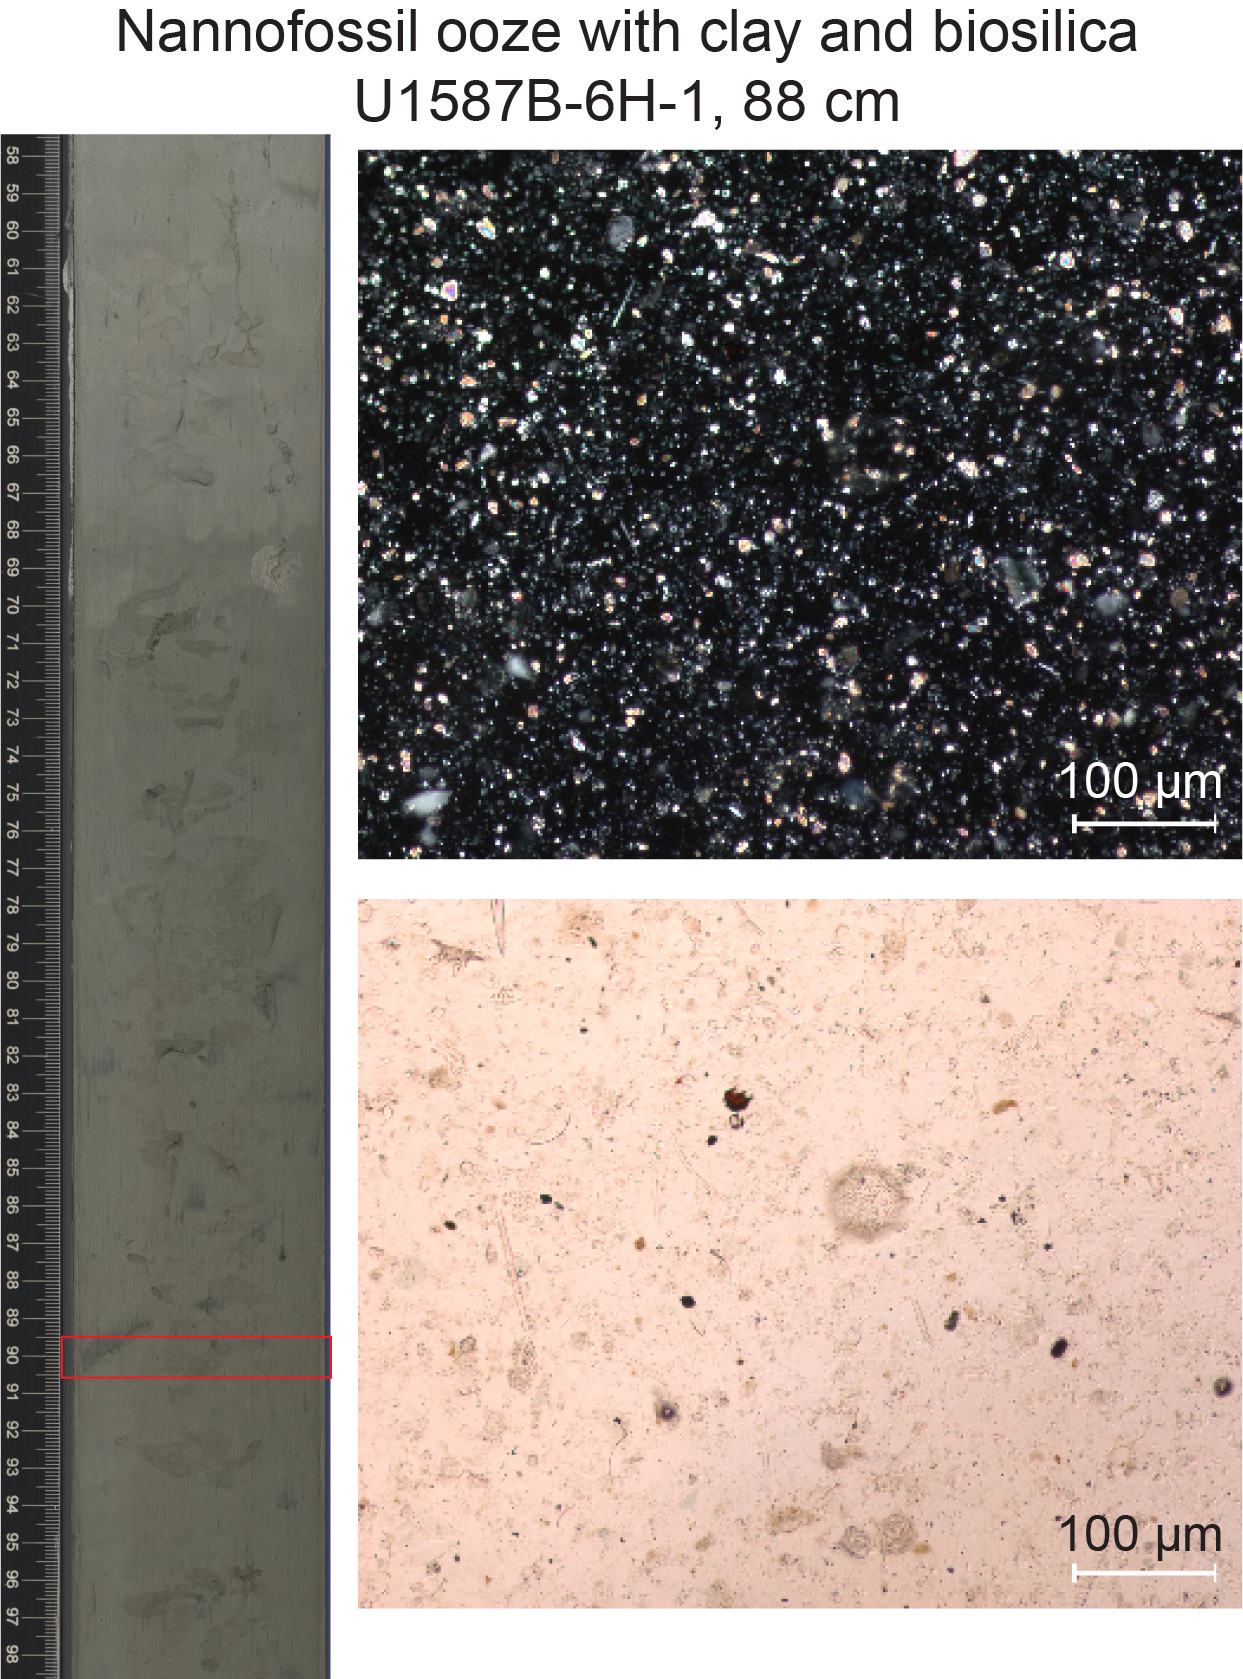
Figure F12. Nannofossil ooze.
3.3.2. Unit II
- Intervals: 397-U1587A-43X-1, 19 cm, to 53X-CC, 58 cm; 397-U1587B-44X-2, 141 cm, to 57X-1, 0 cm; 397-U1587C-43X-3, 94 cm, to 56X-5, 70 cm
- Depths: Hole U1587A = 395.79–499.25 m CSF-A; Hole U1587B = 395.51–518.70 m CSF-A; Hole U1587C = 393.24–516.36 m CSF-A
- Thicknesses: Hole U1587A = 103.46 m; Hole U1587B = 123.19 m; Hole U1587C = 123.12 m
- Age: late Miocene (~5.7–7.8 Ma)
- Primary lithofacies: 1
Unit II consists solely of Lithofacies 1 and is characterized by nannofossil ooze and nannofossil ooze with clay. Compared to Unit I, Unit II is marked by strengthened color contrast between dark layers of nannofossil ooze with clay and light layers of nannofossil ooze. Additionally, the color change is generally sharp from light layers to overlying dark layers in Unit II, which is reflected by increased color reflectance L* and magnetic susceptibility (MS) (Figure F13). Color banding is the primary sediment structure in Unit II. The degree of bioturbation varies from sparse to heavy. Pyrite nodules are commonly observed and are occasionally present within thin green layers (Figure F11). Biscuits induced by drilling disturbance are thinner in dark layers than in light layers. Unit II is divided into two subunits.
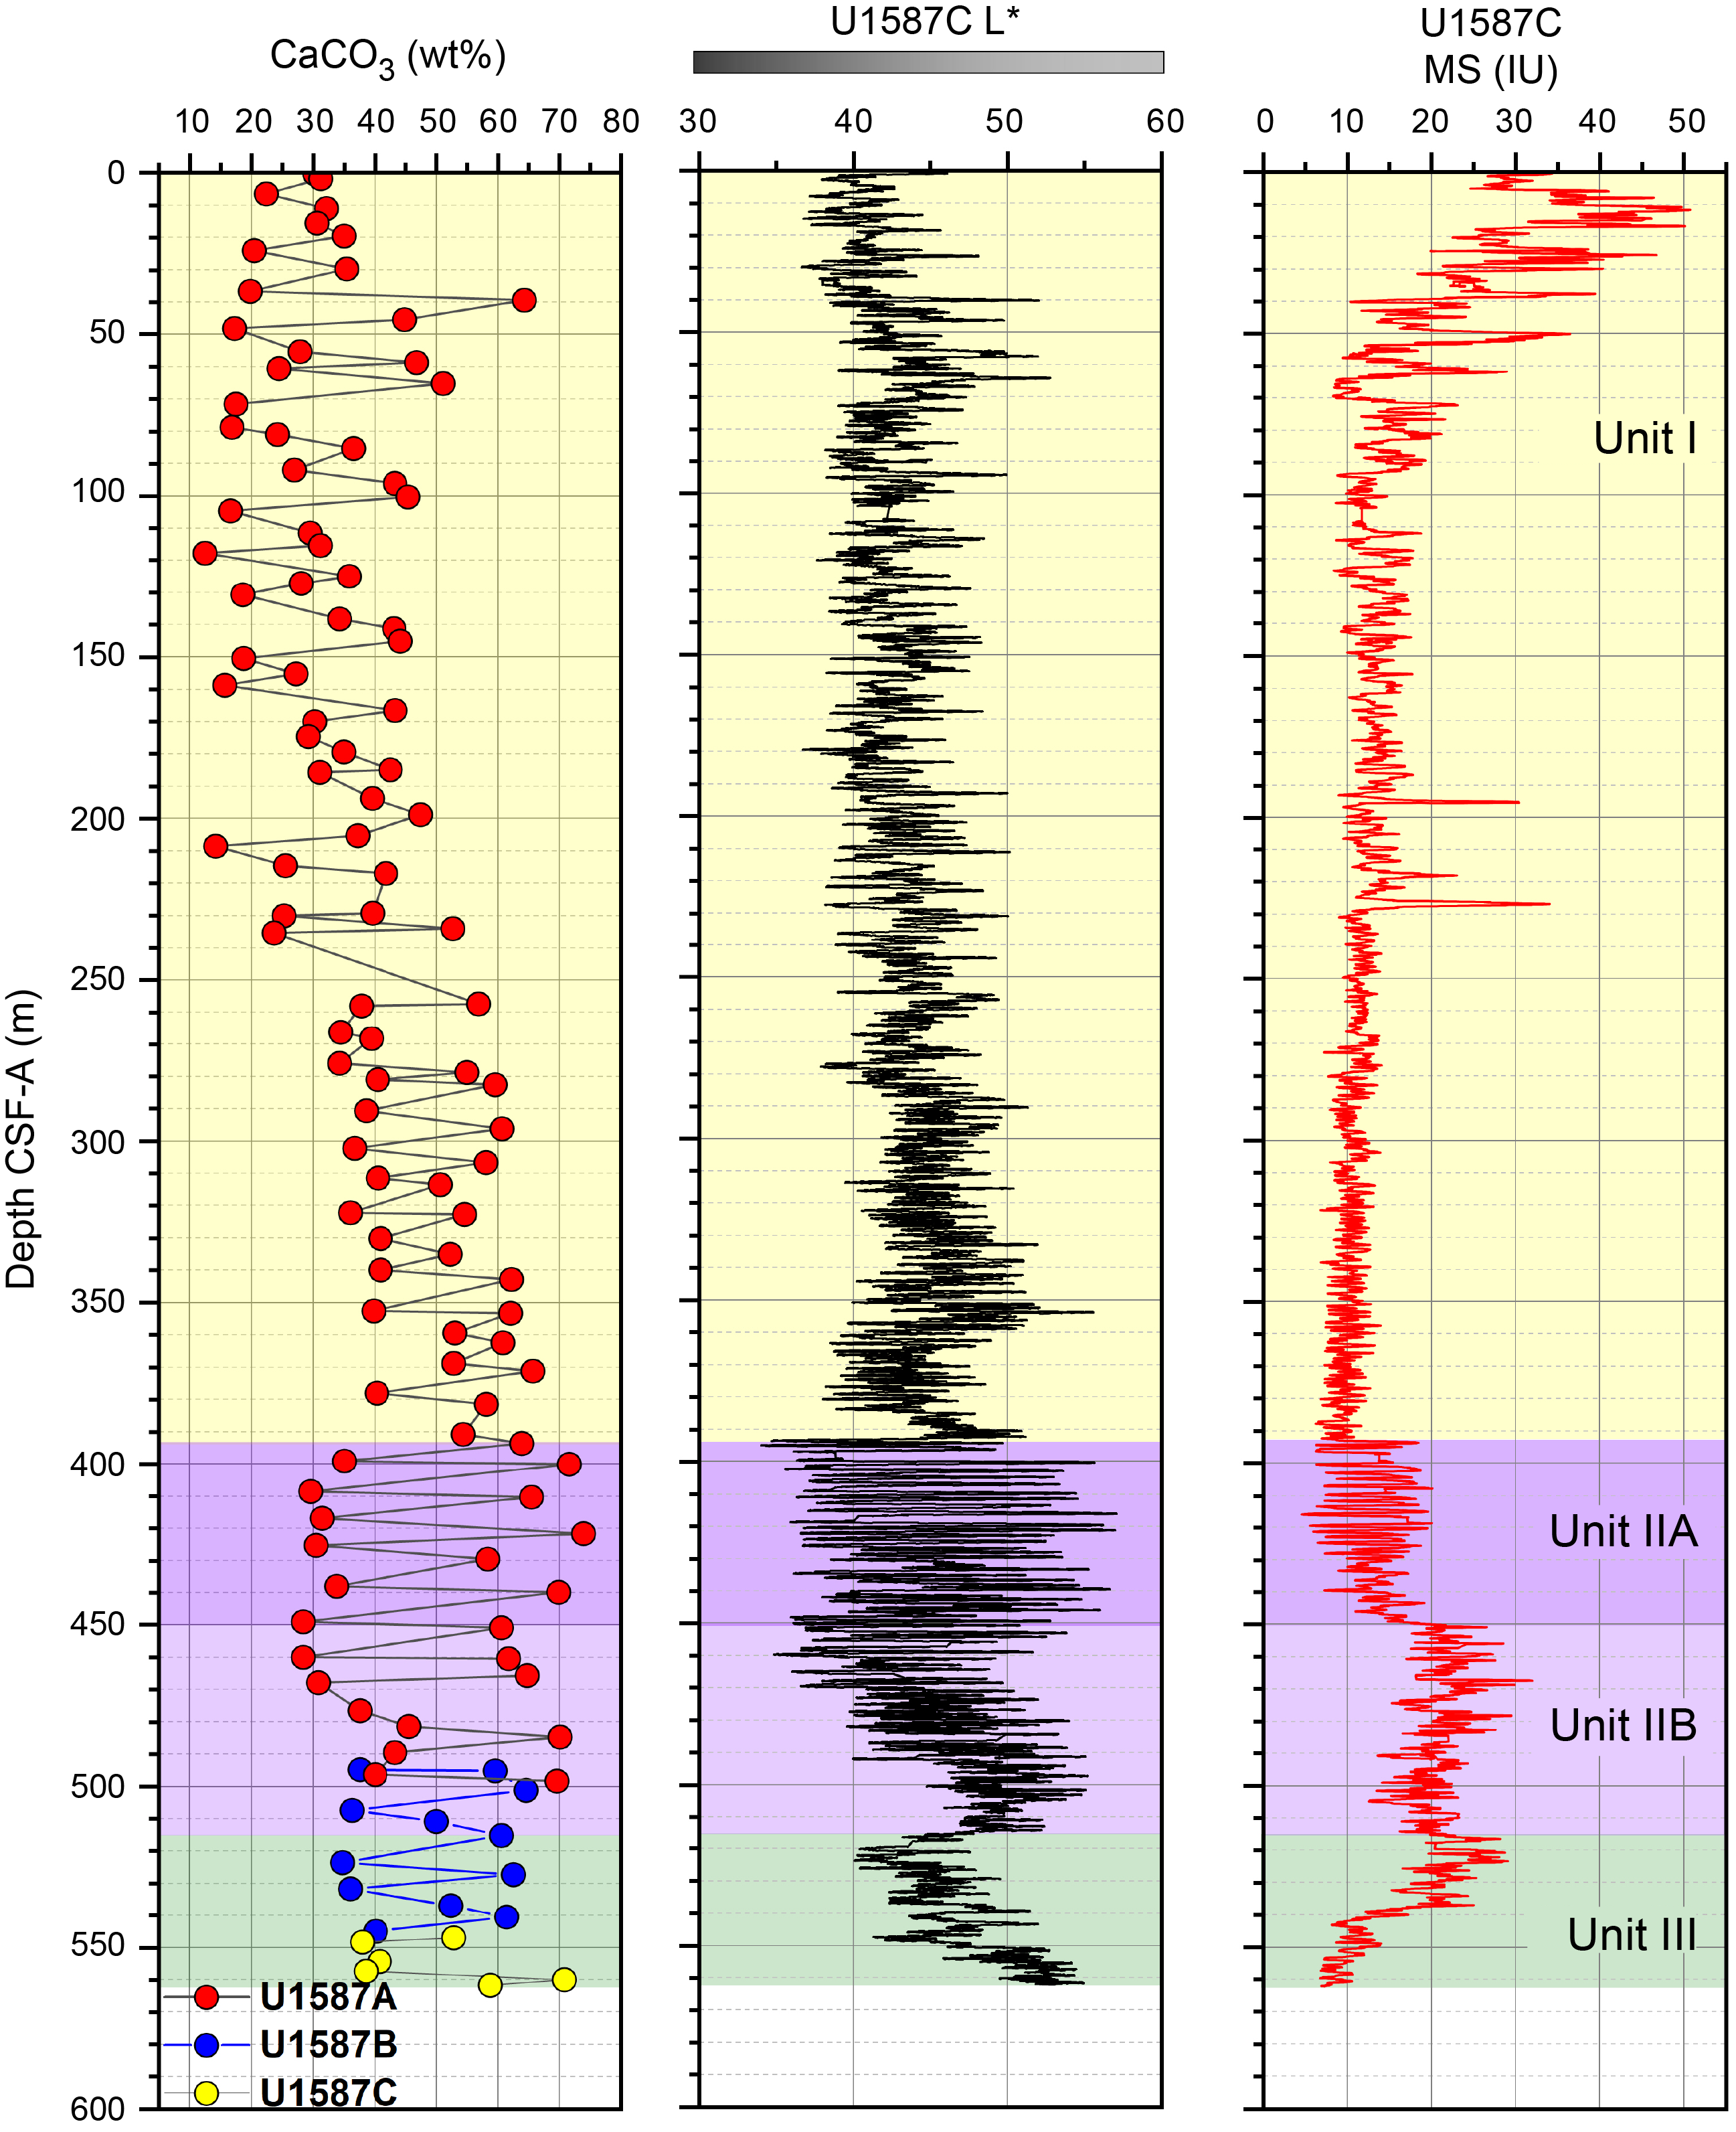
Figure F13. CaCO3 weight percent, L*, and MS.
3.3.2.1. Subunit IIA
- Intervals: 397-U1587A-43X-1, 19 cm, to 49X-1, 63 cm; 397-U1587B-44X-2, 141 cm, to 50X-4, 50 cm; 397-U1587C-43X-3, 94 cm, to 49X-2, 13 cm
- Depths: Hole U1587A = 395.79–454.43 m CSF-A; Hole U1587B = 395.51–455.82 m CSF-A; Hole U1587C = 393.24–449.12 m CSF-A
- Thicknesses: Hole U1587A = 58.64 m; Hole U1587B = 60.31 m; Hole U1587C = 55.58 m
- Age: late Miocene (~5.7–5.98 Ma)
- Primary lithofacies: 1
Subunit IIA is characterized by stark color contrasts between light gray and dark intervals, which is supported by increased amplitudes in L* and MS (Figure F13).
3.3.2.2. Subunit IIB
- Interval: 397-U1587A-49-1, 63 cm, to 53X-CC, 58 cm; 397-U1587B-50X-4, 0 cm, to 57X-1, 0 cm; 397-U1587C-49X-2, 13 cm, to 56X-5, 70 cm
- Depth: Hole U1587A = 454.43–499.25 m CSF-A; Hole U1587B = 455.82–518.70 m CSF-A; Hole U1587C = 449.12–516.36 m CSF-A
- Thickness: Hole U1587A = 44.82 m; Hole U1587B = 62.88 m; Hole U1587C = 67.24 m
- Age: late Miocene (~5.98–7.78 Ma)
- Primary lithofacies: 1
In contrast to Subunit IIA, light intervals are slightly brown in Subunit IIB, which is reflected by smaller changes in L*, and increased MS, a*, and b* (Figure F13; see Physical properties).
3.3.3. Unit III
- Intervals: Hole U1587A = not recovered; 397-U1587B-57X-1, 0 cm, to 59X-CC, 49 cm; 397-U1587C-56X-5, 70 cm, to 61X-CC, 31 cm
- Depths: Hole U1587A = not recovered; Hole U1587B = 518.70–546.01 m CSF-A; Hole U1587C = 516.36–562.03 m CSF-A
- Thicknesses: Hole U1587A = not recovered; Hole U1587B = 27.31 m; Hole U1587C = 45.67 m
- Age: late Miocene (~7.78–8.3 Ma)
- Primary lithofacies: 1
Unit III consists of only Lithofacies 1, with nannofossil ooze becoming more dominant over nannofossil ooze with clay downhole. As the clay fraction declines, L* increases and MS decreases. The Unit II/III boundary is defined by visual observation of muted light-dark color cycles below and muted accompanying changes in reflectance L* and MS (Figure F13). Color banding, pyrite nodules, and slight to moderate bioturbation are common features.
3.4. Complementary analysis
3.4.1. Drilling disturbance
At Site U1587, soupy/slurry conditions are present in the top intervals of a few APC cores, causing moderate to severe disturbance of sediments. Disturbance by gas expansion is visible in Cores 397-U1587A-7H through 12X, 397-U1587B-7H through 10H, and 397-U1587C-7H through 12X and can also be seen in X-ray images (Figure F37; see Physical properties). Up-arching drilling disturbance is generally slight and only observed in a few APC cores. Biscuiting drilling disturbance is present in most XCB cores. The degree of biscuiting increases downhole and/or with drilling conditions with general transitions from slight to moderate at about 289 m CSF-A in Hole U1587A, 284 m CSF-A in Hole U1587B, and 273 m CSF-A in Hole U1587C and moderate to strong at about 475 m CSF-A in Hole U1587A and 548 m CSF-A in Hole U1587C. A few XCB cores show severe fall-in drilling disturbance at the top of Section 1. Fragmentation, voids, and cracks occur occasionally in the deeper XCB cores. Examples of four types of commonly observed drilling disturbances at Site U1587 are shown in Figure F14. Drilling disturbance data for all three holes are summarized in Tables T4, T5, and T6 with all slightly disturbed strata omitted.
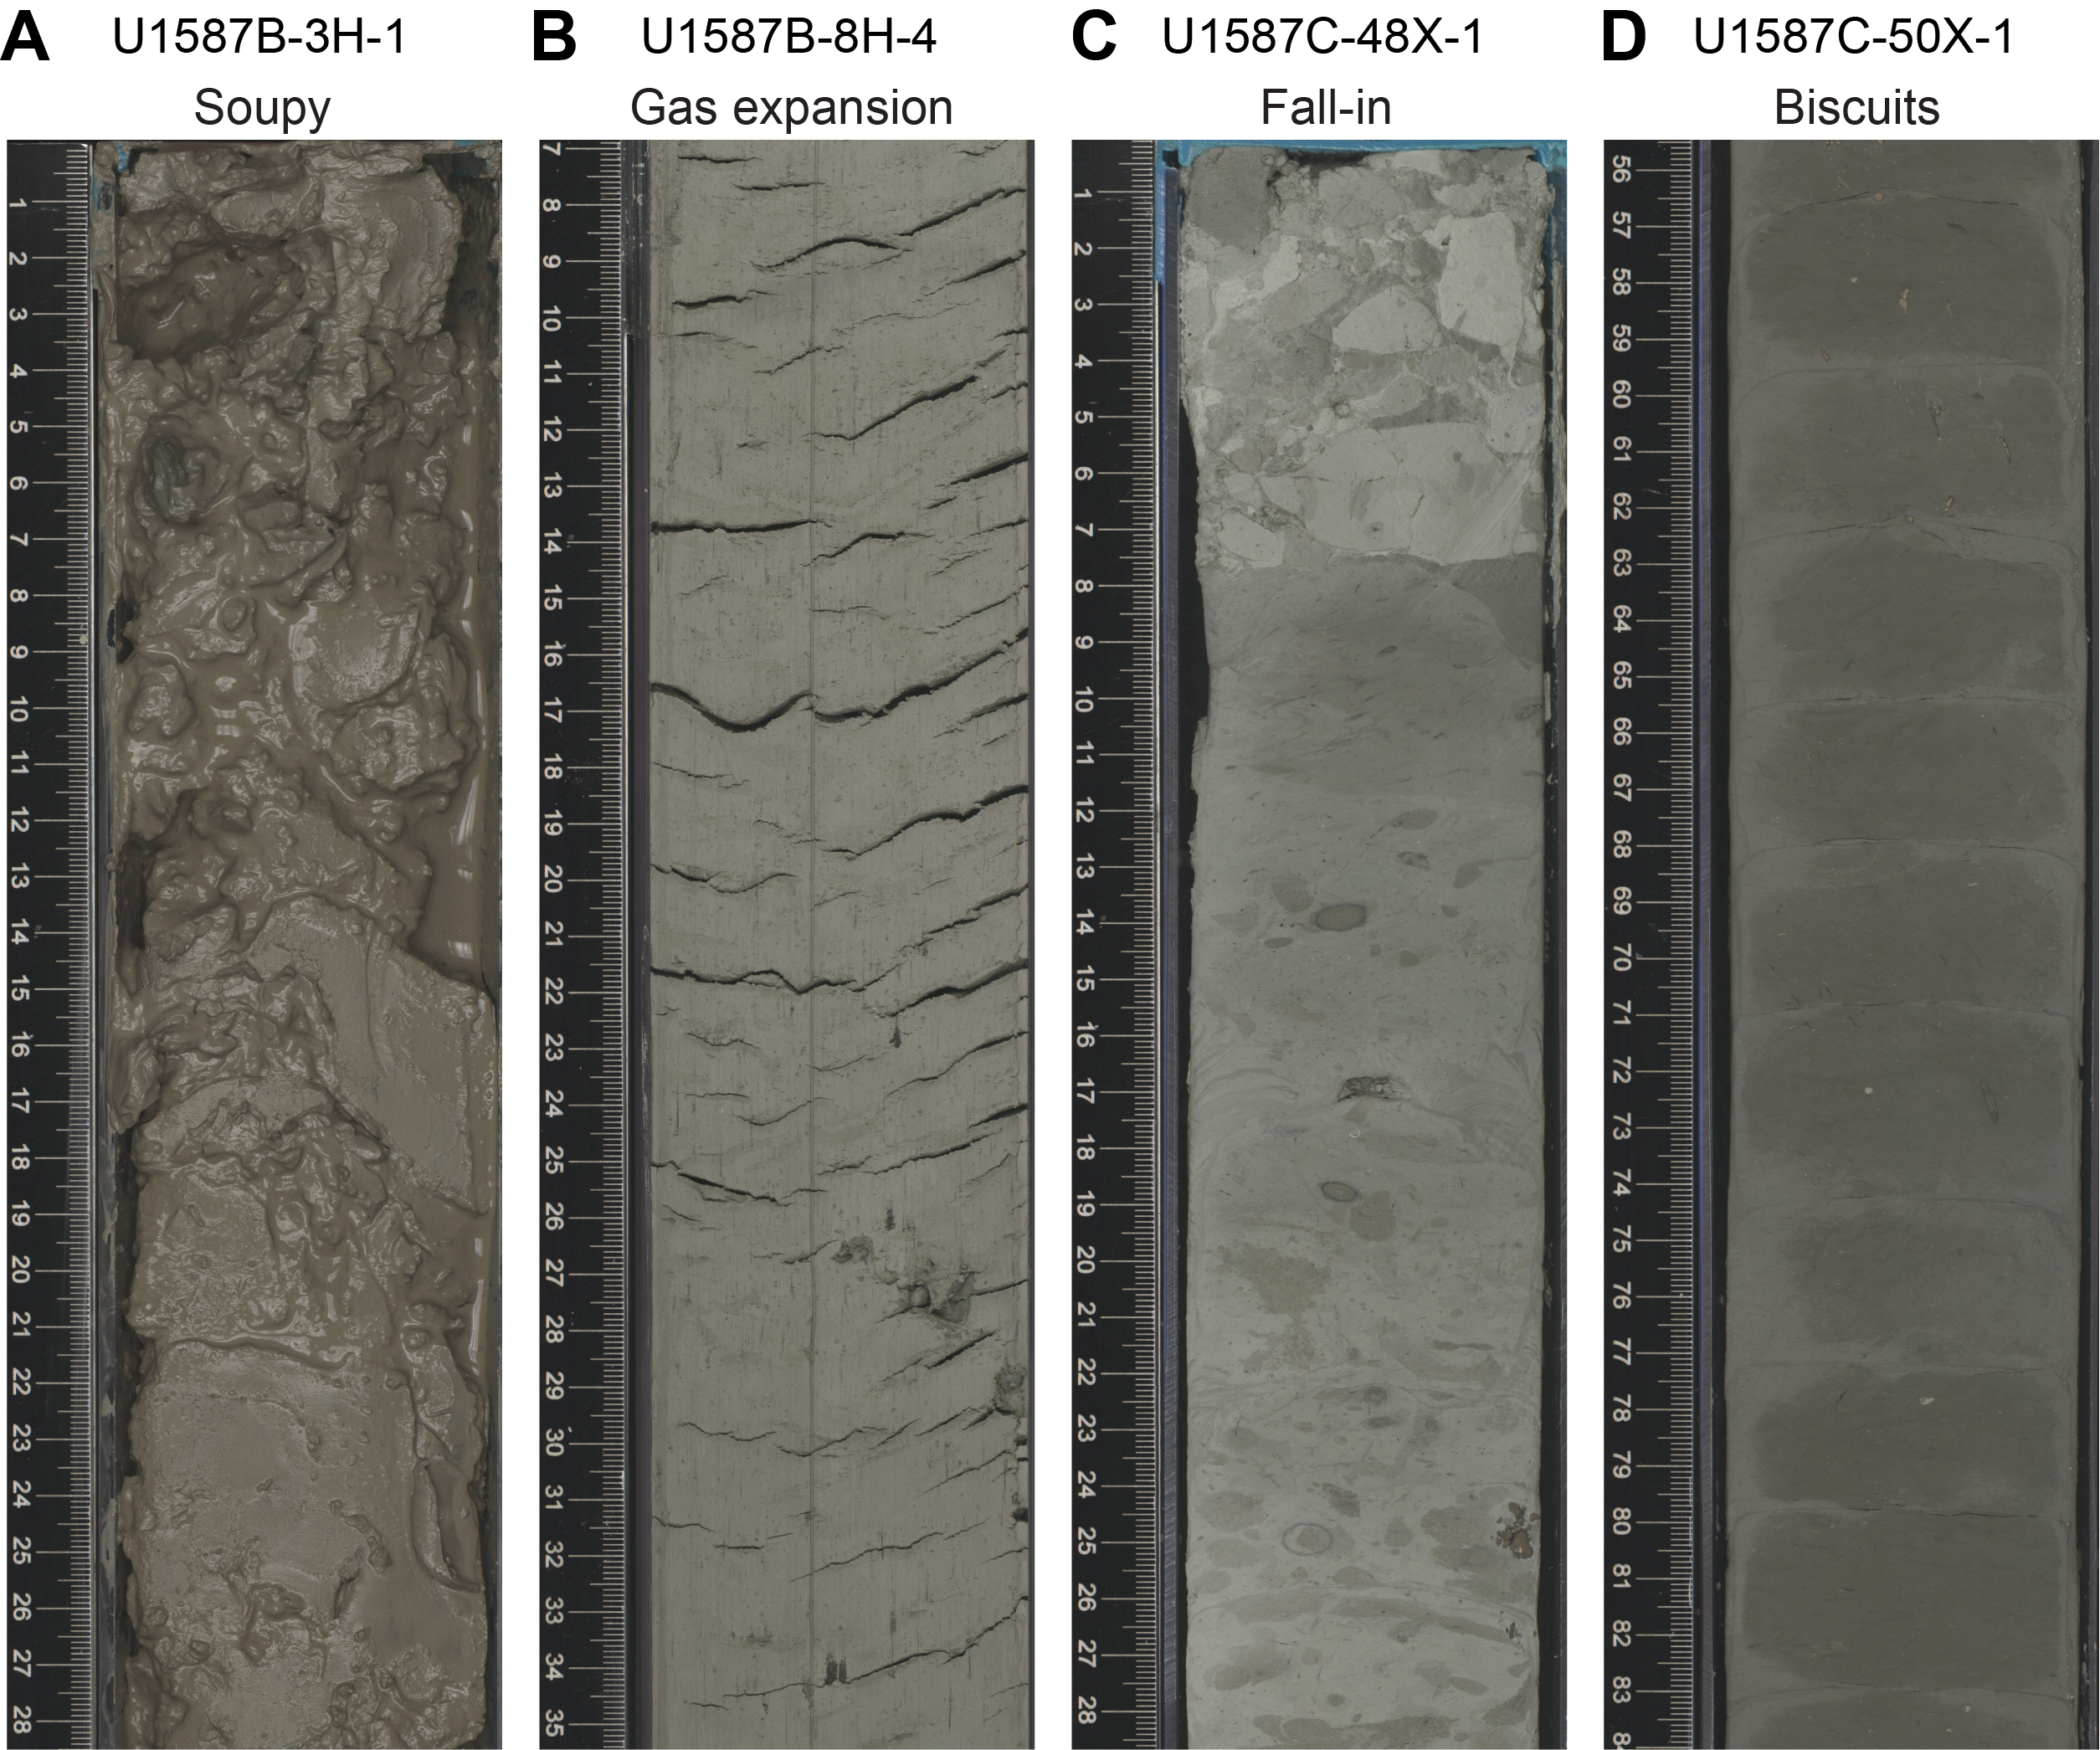
Figure F14. Drilling disturbance.
3.4.2. X-ray diffraction mineralogy
The major minerals identified using XRD analyses of sediments from Site U1587 are calcite, quartz, feldspars, mica (mainly muscovite), and various clay minerals (i.e., illite, kaolinite, smectite, and chlorite). The minor minerals include pyrite, glauconite, dolomite, ankerite, siderite, birnessite, anhydrite, and titanite. Pyrite and other sulfides are identified in sediments taken from Sections 397-U1587A-6H-6, 7H-4, 10H-2, 30X-7, and 32X-5. Mg-bearing calcite and/or dolomite is present in sediments taken from Sections 21X-2, 28X-5, 34X-4, 49X-5, and 397-U1587B-54X-4. Minor phases of titanite are found in Sections 397-U1587A-10H-2, 12H-5, 29X-5, and 397-U1587B-58X-3. Glauconite is observed in deeper Sections 397-U1587A-35X-3, 43X-3, 44X-3, 48X-5, 49X-5, 397-U1587B-58X-3, and 59X-2. Mn-related minerals such as siderite, birnessite, and Fe-rich chlorite are present in samples from Sections 397-U1587A-19X-3 through 28X-5. Anhydrite is first observed in Section 39X-2 and is commonly present in Sections 43X-3 through 53X-3.
3.4.3. Carbonate content
Based on shipboard analyses of discrete samples from 0 to 500 m CSF-A in Hole U1587A and 500 to 550 m CSF-A in Hole U1587B, total carbonate (CaCO3) contents range 12–74 wt% (Figure F13). For each core, two samples were taken, one from a light interval and one from a dark interval. This sampling renders strong CaCO3 content contrasts between adjacent samples, showing high (light layer) and low (dark layer) CaCO3 contents. This feature is most evident in Unit II, where visual light-dark contrasts are distinct. Overall, CaCO3 content increases downhole.
3.4.4. Portable X-ray fluorescence spectrometry analysis
Selected intervals were analyzed for bulk element compositions using pXRF in Sections 397-U1587B-22X-5 through 22X-7 (Figure F15). Al2O3, SiO2, K2O, and Ti contents are highly correlated (r > 0.9) and show higher values in darker intervals. In contrast, Ca is more abundant in lighter intervals. Thus, pXRF data support macroscopic observations and smear slide evidence, suggesting increased siliciclastics (mainly clay particles formed of aluminosilicates) in darker intervals compared to lighter ones.
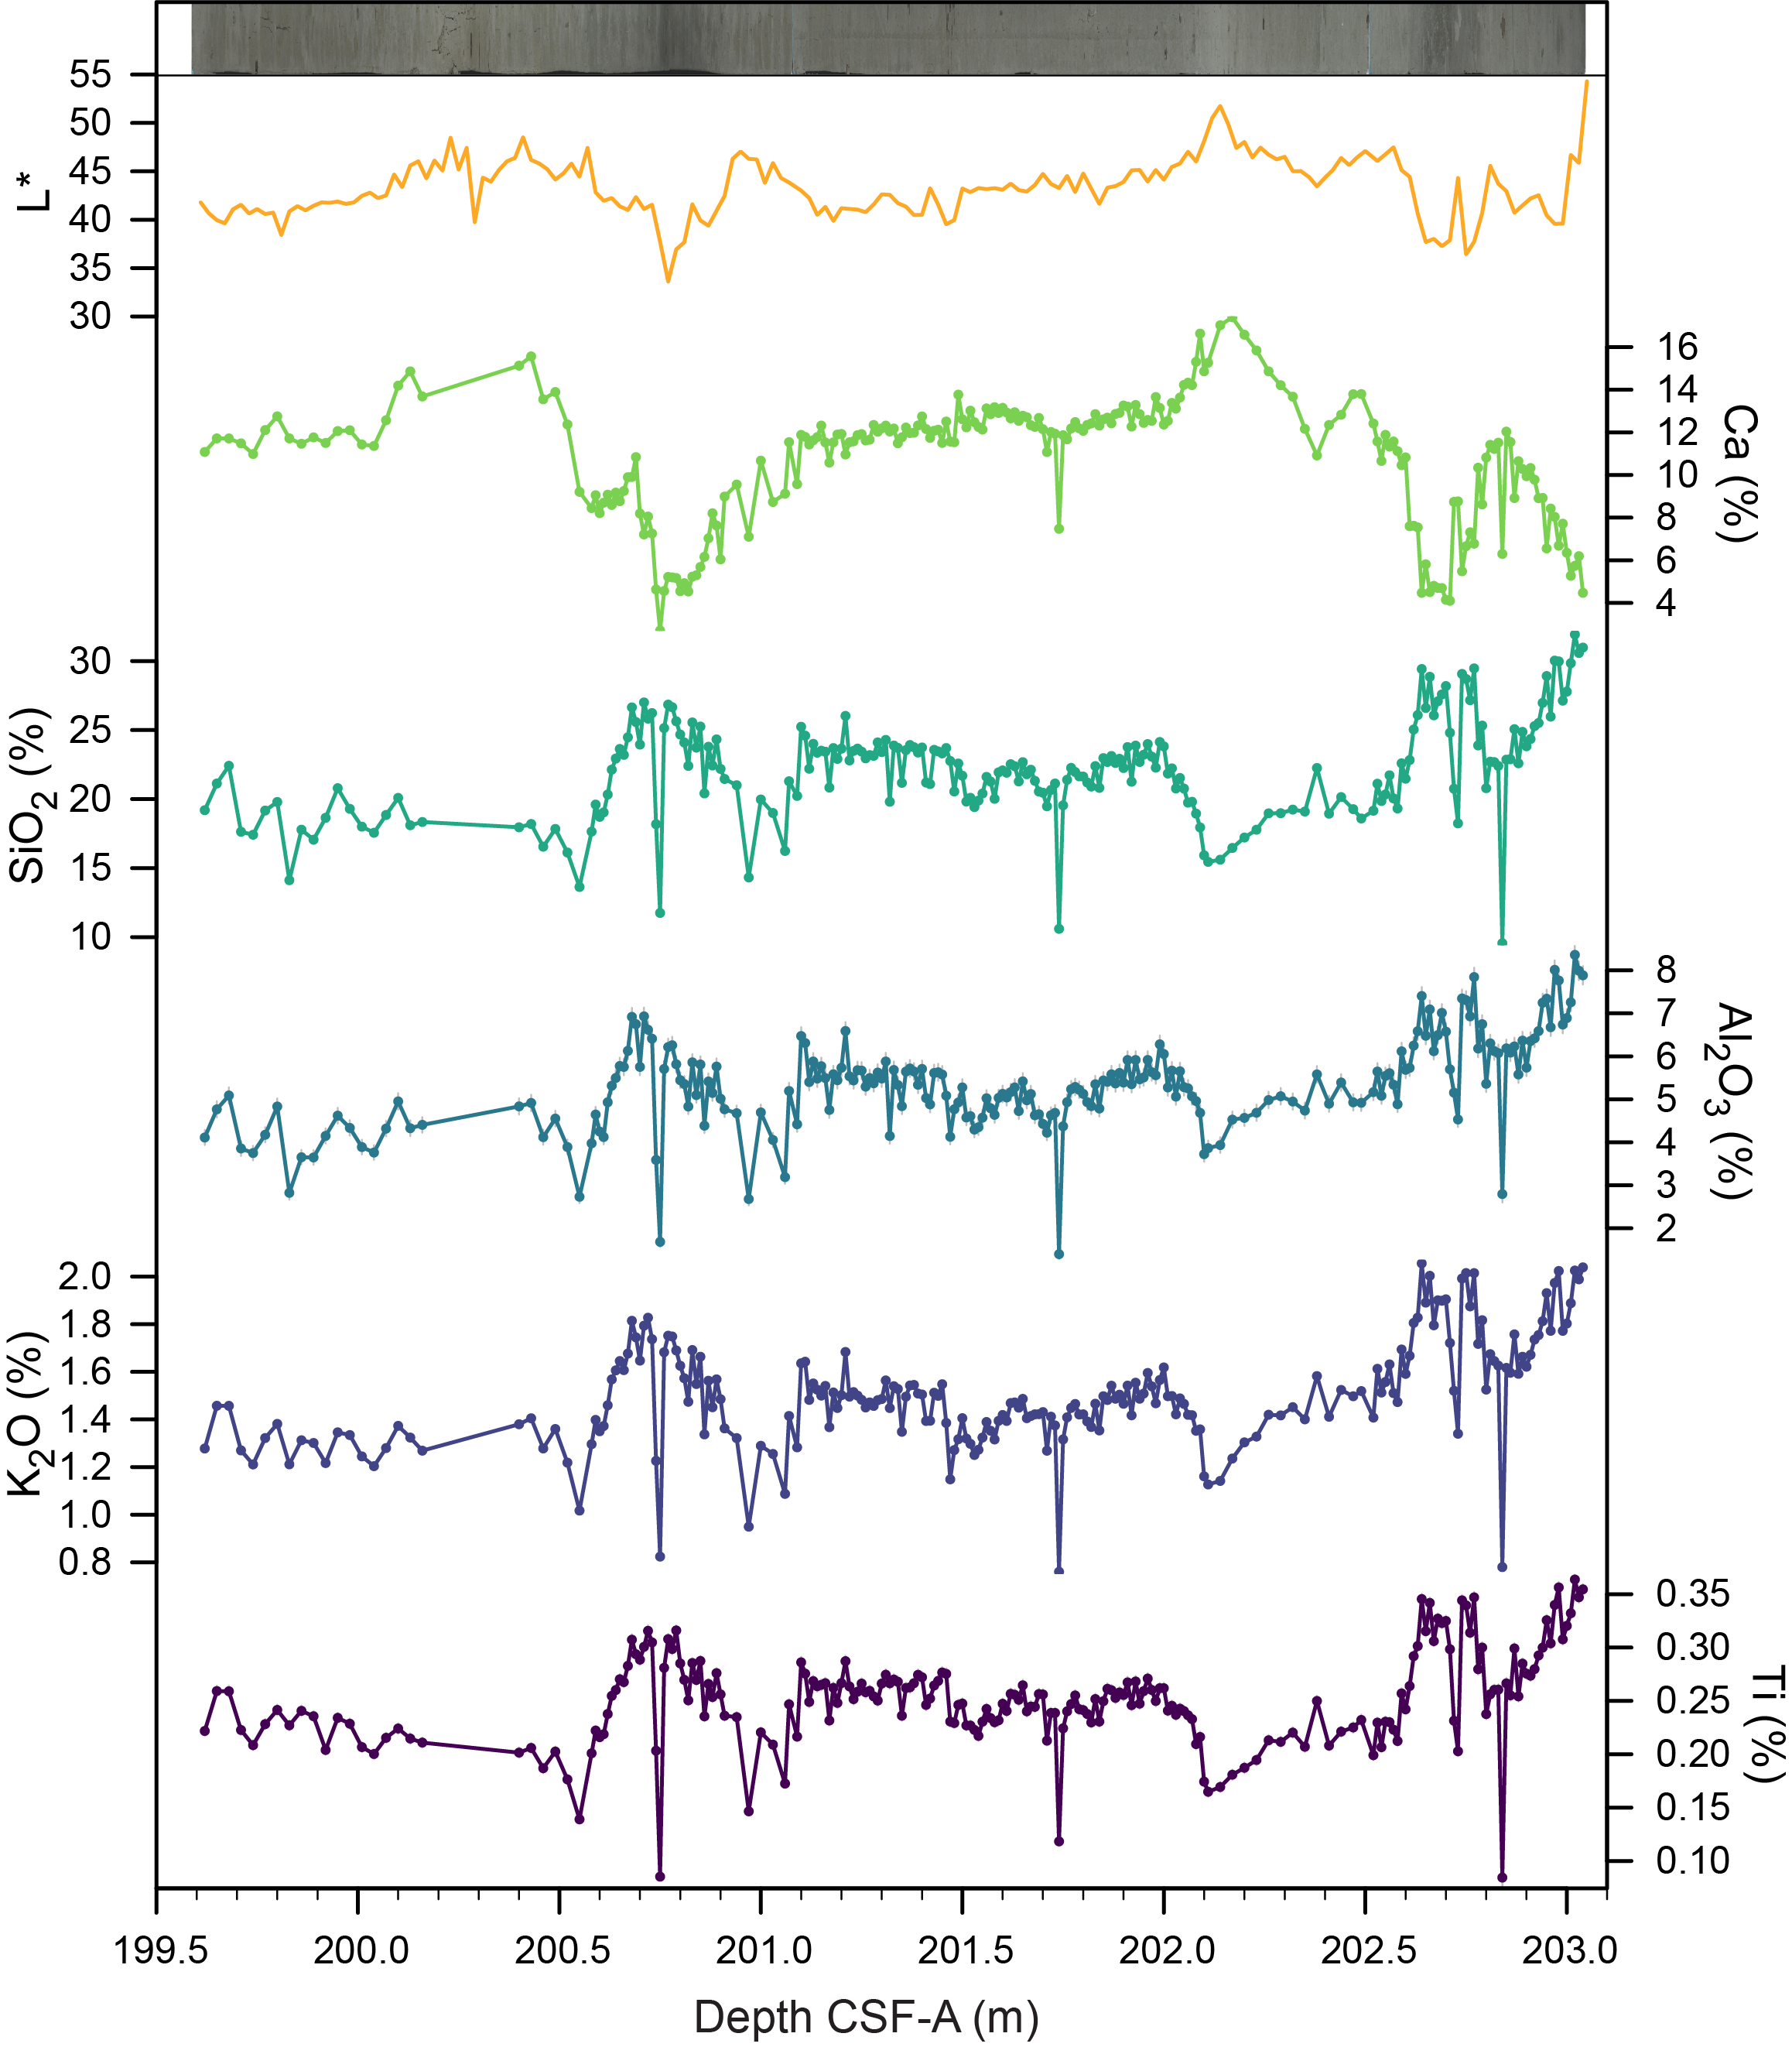
Figure F15. Bulk element compositions.
One measurement was made on a pyrite nodule in Section 397-U1587B-22X-7, 33 cm. Pyrite (FeS2) is known to incorporate trace elements such as Ni, As, and Zn (e.g., Huerta-Diaz and Morse, 1992). The pXRF data supports this, and the data show high contents of Fe (33.4% vs. background <3.5%), S (22.4% vs. background <0.1%), Ni (0.062% vs. background <0.005%), and As (0.009% vs. background <0.002%).
3.4.5. Integrating physical properties measurements with lithofacies observations
The different lithologies observed at Site U1587 were compared to downcore physical properties measurements, including natural gamma radiation (NGR) intensity, porosity and moisture and density (MAD), gamma ray attenuation (GRA) bulk density, MS from both loop (Whole-Round Multisensor Logger [WRMSL]) and point (Section Half Multisensor Logger [SHMSL]) detectors, RGB intensity, and color reflectance L*a*b* (see Physical properties).
Changes in physical properties are associated with the lithofacies of the three units. Downcore and particularly in the lower 150 m, Unit I is generally characterized by decreasing NGR and MAD porosity, increasing GRA and MAD bulk density and thermal conductivity, slightly increasing L*, and declining variations in MS. Several physical properties vary substantially in Unit II. NGR starts to increase and becomes more variable downcore in Unit II. Increases in MAD porosity and density persist but with greater variations. The amplitude of variations in MS increases sharply, changing on meter scales from somewhat lower to much higher values than those observed in the lower portion of Unit I (Figure F13). Reflectance L* displays a similarly striking shift, varying from somewhat lighter to much darker values on meter scales. The well-defined cycles in physical properties are also evident in visual descriptions and smear slides in Unit II. Subunit IIA is associated with persistent large-amplitude cycles that vary about an approximately constant mean, whereas L* drops initially at the top of Subunit IIB and then generally increases downcore through the subunit. The sediment color cycles continue throughout the subunit, although they are somewhat diminished in magnitude, and the lighter part of each cycle appears somewhat browner visually and is accompanied by higher values of a* and b*. MS increases in Subunit IIB and remains high throughout. As at the upper boundary of Subunit IIB, L* drops again at the top of Unit III and then increases downcore, reaching the highest values in the lowest section recovered in Hole U1587C. Color reflectance a* and b* and MS all decrease throughout Unit III, following the increasing dominance of nannofossil ooze over nannofossil ooze with clay.
3.5. Discussion
The abundance of Lithofacies 1 indicates dominant hemipelagic sedimentation throughout Units I–III (Figure F16). Visual observation of the rhythmic variations between lighter and darker intervals, caused by varying amounts of clay, on a scale of tens of centimeters to a meter, suggests a link between sediment color changes and orbital cyclicity (see Stratigraphic correlation). To evaluate this hypothesis, a refined age model derived from high-resolution oxygen isotope stratigraphy and/or X-ray fluorescence (XRF) analysis is necessary.
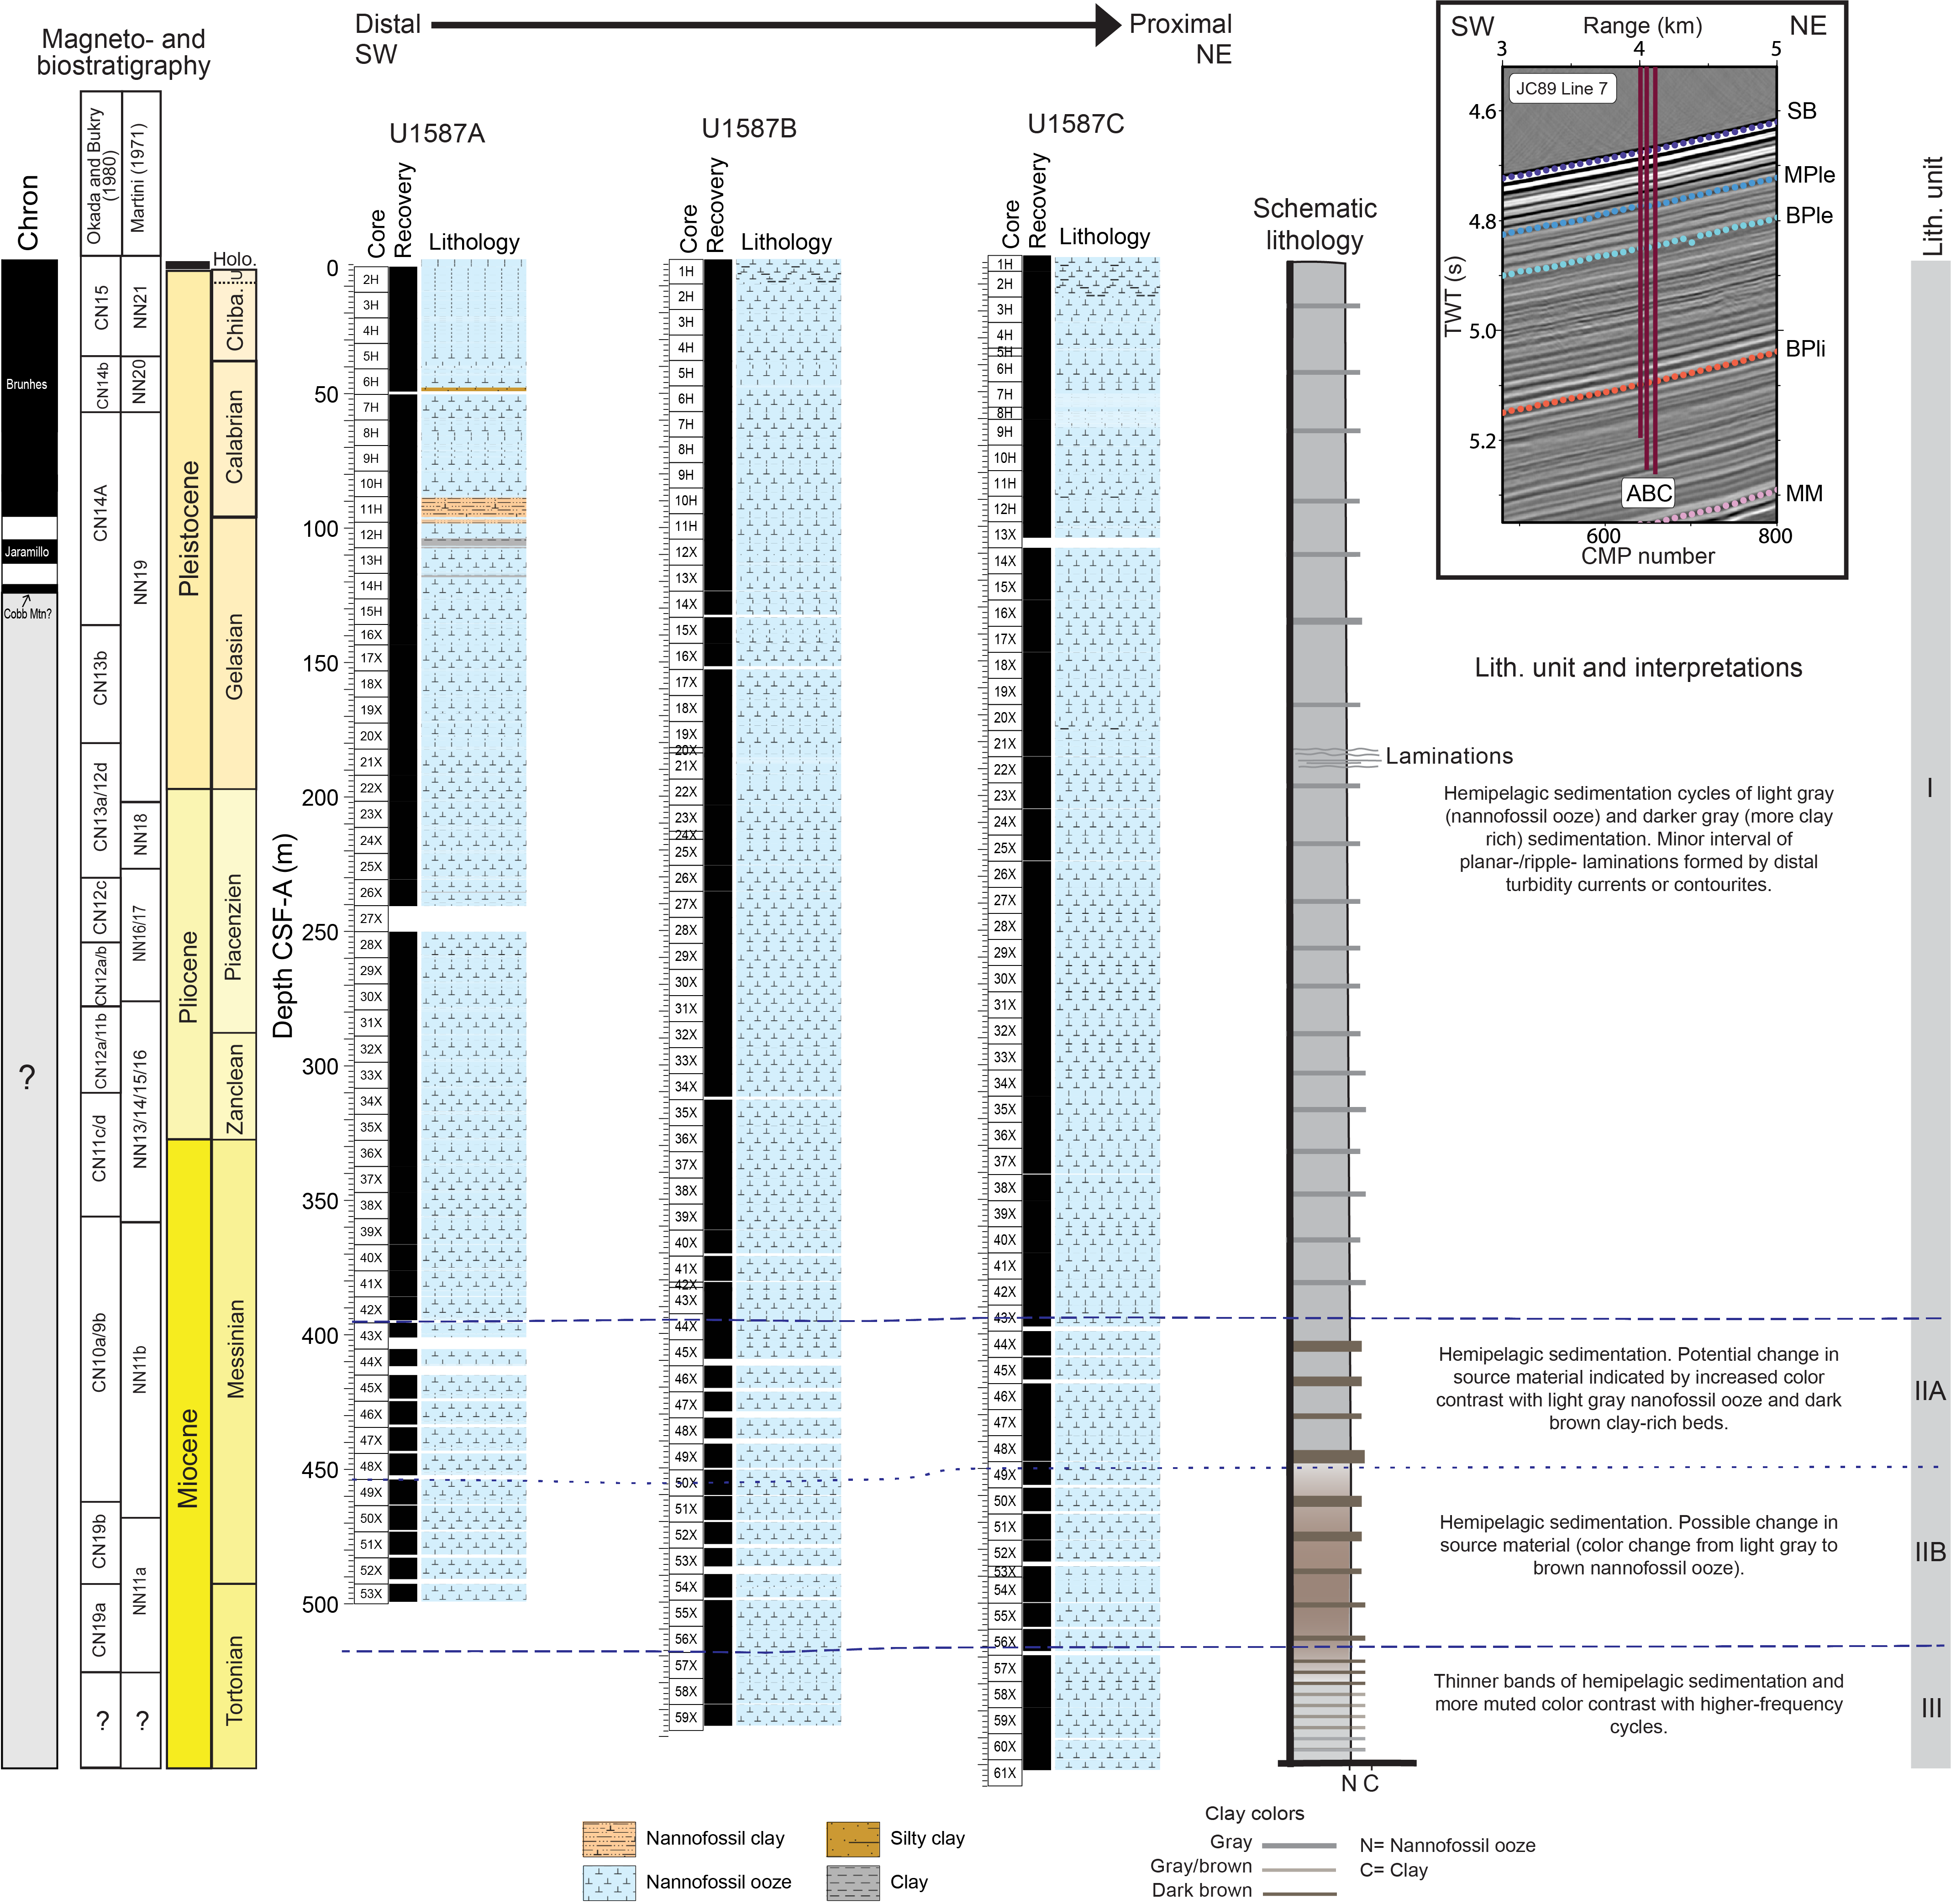
Figure F16. Lithologic summary.
The top core from all holes shows a color difference in the uppermost centimeters that is interpreted as a result of oxygen penetration into the sediment from the overlying deep waters and its utilization by respiration of the sedimentary organic matter. The gray sediments are reduced, leading to the mobilization in solution of redox-sensitive elements, including iron and manganese. These elements diffuse upward and precipitate out at the boundary with the oxic layer, generating a redox horizon that migrates upward as sediment accumulates under stable conditions. The redox boundary may migrate vertically through time relative to the seafloor in response to changes in deepwater ventilation and/or organic carbon export.
Iron sulfides are common throughout, occurring primarily as amorphous iron monosulfides (FeS) in the upper part of Unit I and as pyrite (FeS2) in various forms, often as burrow fill, downcore. Iron monosulfides are evident as widespread dark smudges along the surface of darker intervals containing more clay and presumably representing glacial intervals. FeS is prone to rapid oxidation once exposed to the atmosphere, and consequently, its dark color can fade away within minutes to hours (Burton et al., 2009; Choppala et al., 2017; Rickard and Luther, 2007). Pyrite occurs as discrete elongated burrow fills and isolated nodules, evident along the face of the split core and in X-ray images (Figure F37). Compared to FeS, pyrite is much more persistent under ambient conditions.
Planar- and cross-laminated intervals in Sections 397-U1587A-21X-2 through 21X-6 (184.21–189.94 m CSF-A) and 397-U1587C-22X-1 (186.08–186.60 m CSF-A) indicate reworking of hemipelagic sediment by currents. These suggest bottom current reworking (potentially contourites) or represent tractional reworking by distal low-density turbidity currents (Figure F16). Except for a potential 2.2 m thick slump solely in Core 397-U1587A-3H, no apparent deformation structure, such as microfaulting, folds, and contorted bedding, is observed. This implies minimal postdepositional disturbance due to slope instability at Site U1587, as opposed to those observed at Site U1586, most probably because this site is positioned on an elevated ridge-like structure of the Promontório dos Príncipes de Avis, away from the potential valley-like pathways (Figure F3). Nevertheless, a certain degree of vertical mixing is indicated by slight to heavy bioturbation throughout the sedimentary sequence at this site, as well as strong mixing of different age nannofossil marker species (see Biostratigraphy).
The opal-bearing layers in Sections 397-U1587B-6H-1 (47.3 m CSF-A) and 397-U1587C-7H-1 (46.3 m CSF-A) (Figure F12) are possibly located at a glacial termination, as indicated by a transition from dark nannofossil ooze with clay to light nannofossil ooze. The opal-bearing interval is bracketed by two nannofossil age markers, 348 ka (43.385 m CSF-A) and 430 ka (57.705 m CSF-A) (see Biostratigraphy), indicating its deposition during the transition from Marine Isotope Stage (MIS) 12 to MIS 11 (Termination V) in the mid-Brunhes. Past studies showed increased productivity in the Iberian margin and northwest Africa during glacial–interglacial transitions (Abrantes, 1991a, 1991b, 2000). Peaks in diatom abundance were observed at the MIS 10/9 (Termination IV), 6/5 (Termination II) (Thomson et al., 2000), and 26/25 boundaries (Termination XII) (Ventura et al., 2017). A possible mechanism to explain the increase in this primary production proxy during terminations is an increase in coastal upwelling conditions, as evidenced by the presence of Chaetoceros spores, possibly reflecting the reestablishment of the Canary Current upwelling system, a more nutrient-rich source water at times of deglaciation, enhanced run-off from land, or flooding of shelves by rising sea level (Abrantes, 2000; Thomson et al. 2000).
4. Biostratigraphy
The ~567 m of recovered sediment at Site U1587 spans the late Miocene to Holocene. Approximately 37 nannofossil bioevents and 15 foraminifer events (14 planktonic and 1 benthic) were identified. Nannofossils are very abundant to common, with moderate to good preservation, and are generally well distributed throughout the sequence. Planktonic foraminifers are abundant and well preserved, except at the bottom of the core (late Miocene).
The zonal schemes of calcareous nannofossils and planktonic foraminifers generally agree, with a potential divergence at the Miocene/Pliocene boundary. Integrated calcareous microfossil bioevents are provided in Figure F17, with nannofossil and planktonic foraminifer datums reported in Tables T7 and T8.
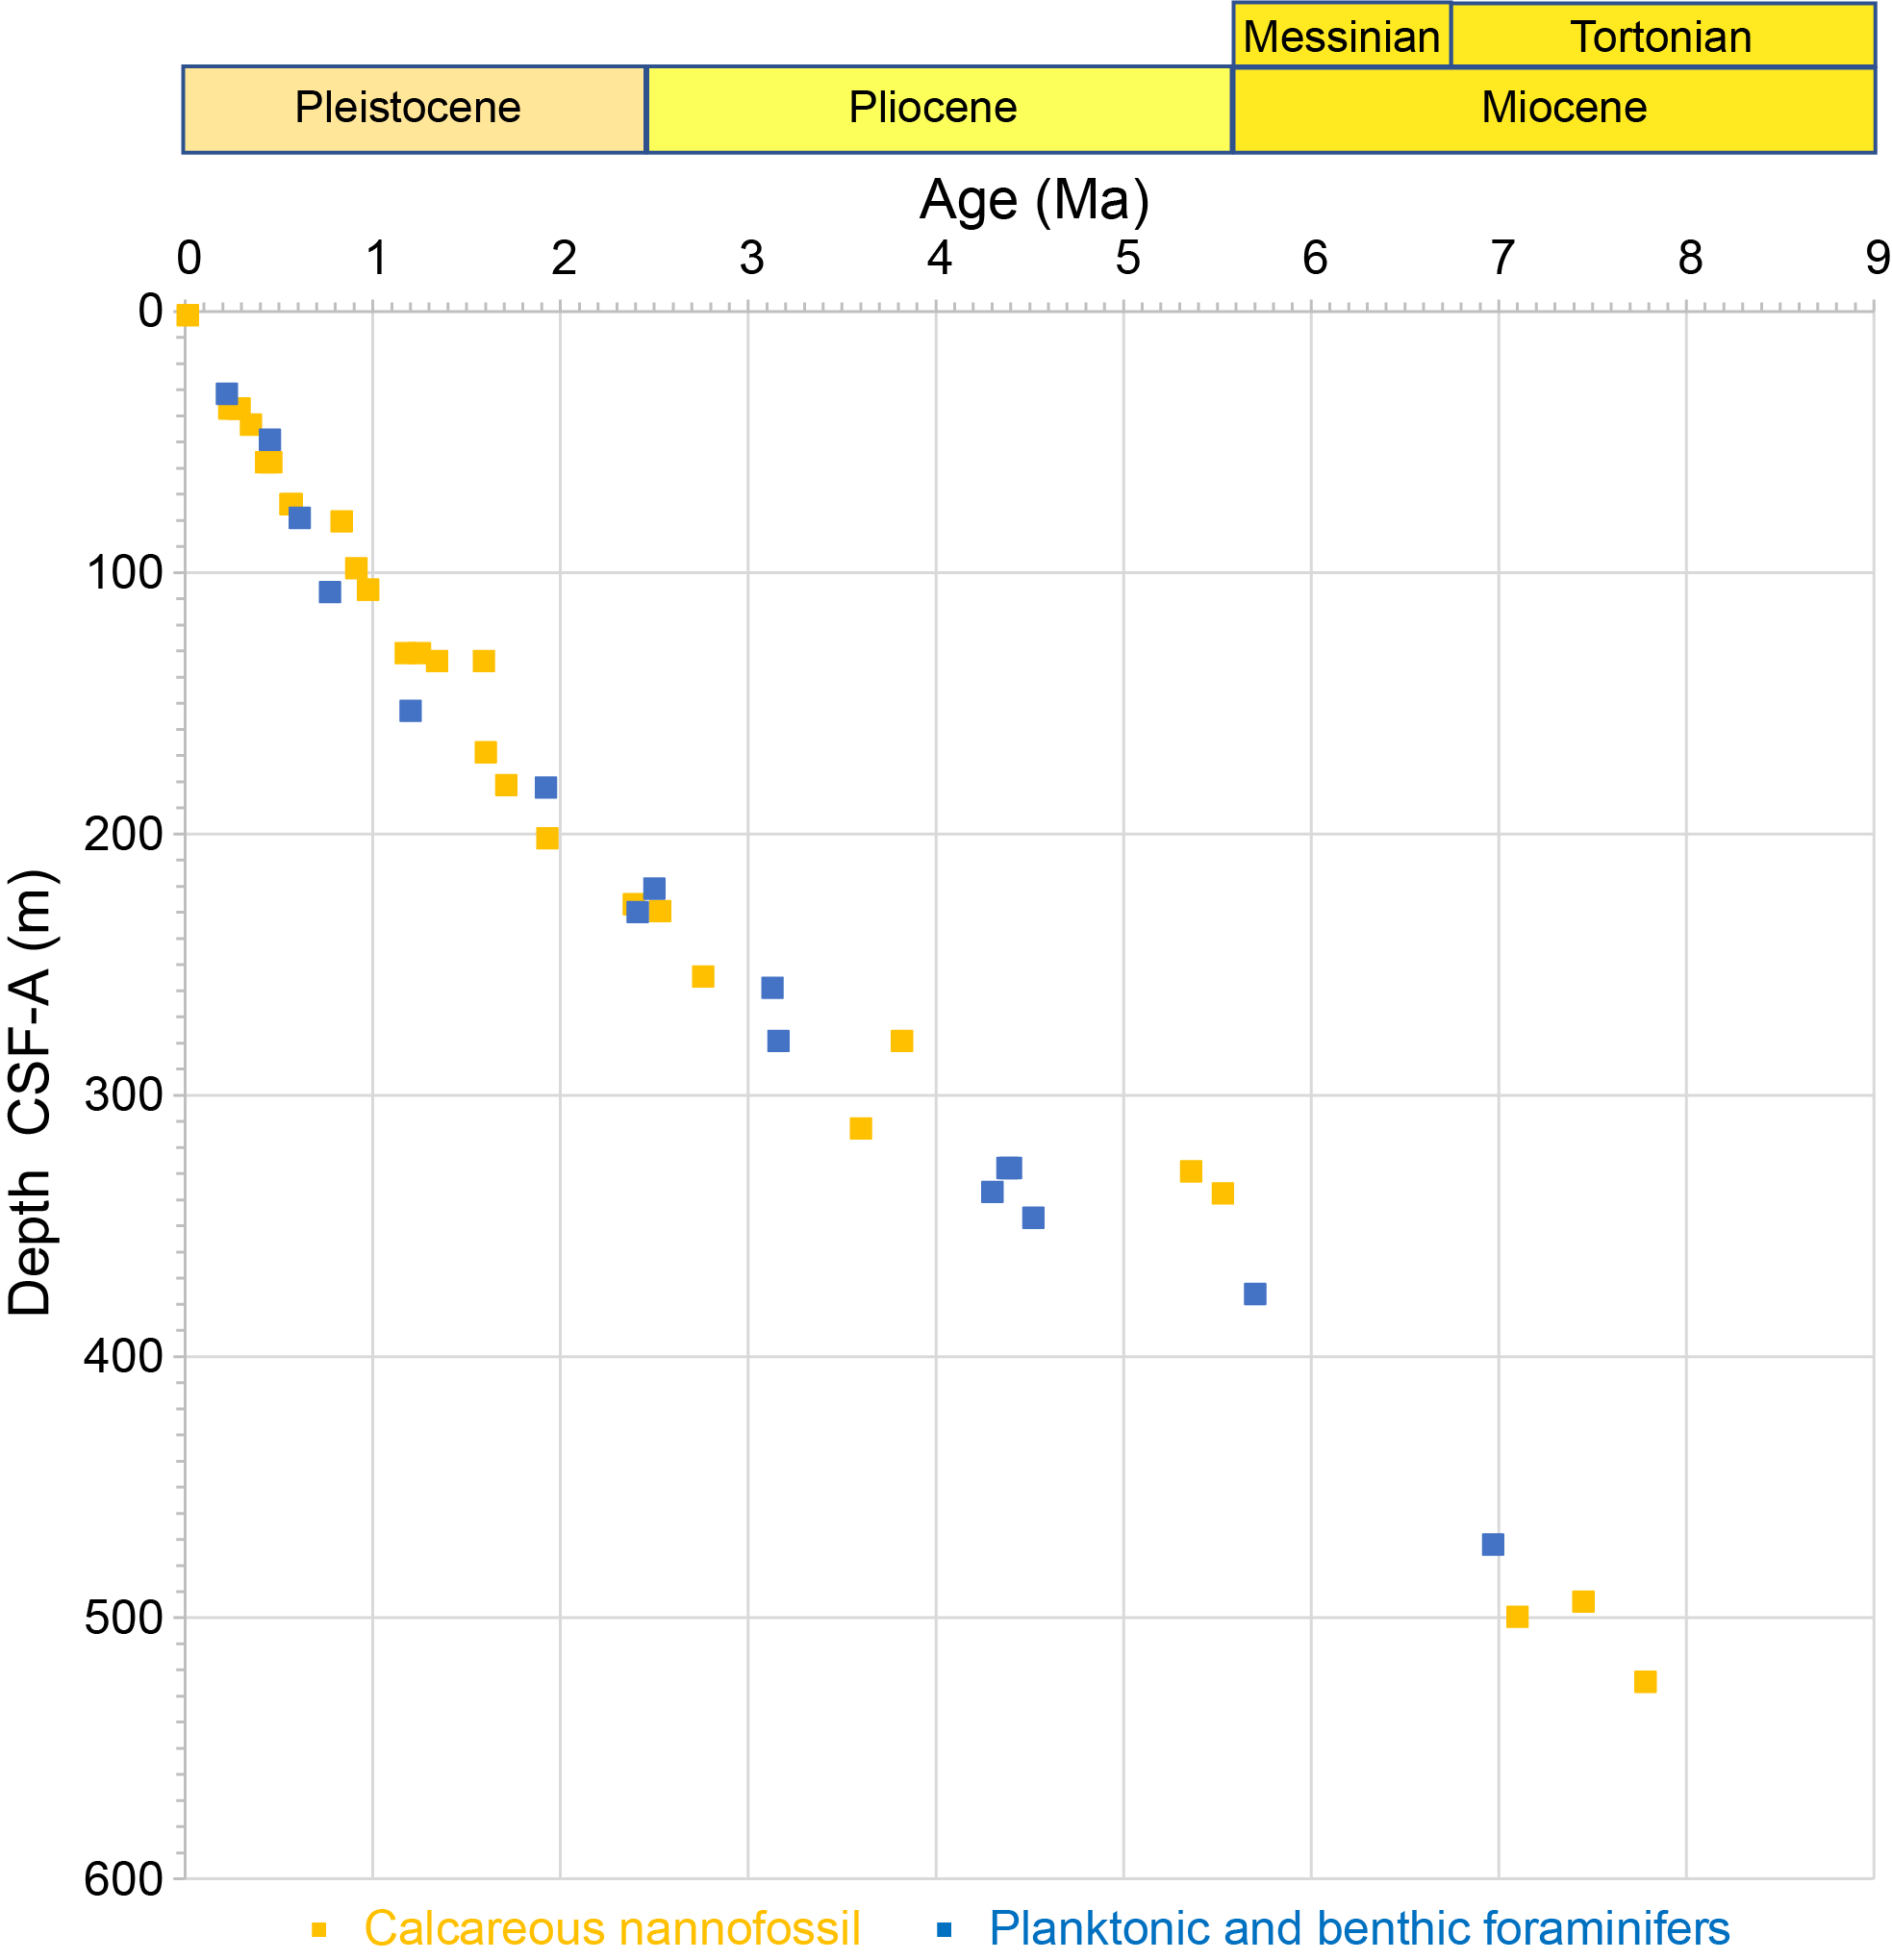
Figure F17. Preliminary age model.
Holocene biostratigraphy is identified in samples from Core 397-U1587A-1H to Section 1H-2, 75 cm. The Pleistocene is identified in Cores 4H–25X. Pliocene markers are identified in Cores 26X–40X. The late Miocene was identified in Cores 397-U1587A-40X through 54X, 397-U1587B-55X through 59X, and 397-U1587C-59X through 61X.
4.1. Calcareous nannofossils
Calcareous nannofossil biostratigraphy at Site U1587 is based on 59 core catcher samples and more than 400 split core samples taken from Holes U1587A–U1587C in selected intervals. All the samples were processed into smear slides using standard techniques.
The nannofossil assemblages in Holes U1587A–U1587C are defined by 37 groups/taxa and/morphotypes, including Emiliania huxleyi, Gephyrocapsa caribbeanica gr., Gephyrocapsa spp. (small <4 µm, medium and large >5.5 µm), Gephyrocapsa omega, Pseudoemiliania lacunosa, Reticulofenestra (<3, 3–5, 5–7, and >7 µm), Reticulofenestra asanoi, Reticulofenestra pseudoumbilicus, Reticulofenestra rotaria, Coccolithus pelagicus, Calcidiscus leptoporus, Calcidiscus macintyrei, Ceratolithus armatus, Helicosphaera inversa, Helicosphaera sellii, Minylitha convallis, Nicklithus amplificus, Orthorhabdus rugosus, Sphenolithus abies/neoabies, Syracosphaera spp., Scyphosphaera spp., Discoaster spp., Discoaster variabilis, Discoaster brouweri, Discoaster pentaradiatus, Discoaster surculus, Discoaster tamalis, Discoaster asymmetricus, Discoaster bellus, Amaurolithus primus, Amaurolithus delicatus, and occasionally less abundant taxa.
A total of 37 calcareous nannofossil events identified within the core were dated using age calibrations by Balestra et al. (2015), Raffi et al. (2006), and Gradstein et al. (2020) (Table T7; see also Plate P1 in the Site U1586 chapter [Abrantes et al., 2024b]). Additionally, the standard biozones of Martini (1971) and Okada and Bukry (1980) were identified. For this chapter, only taxa or morphotypes with biostratigraphic significance were considered (Table T9).
4.1.1. Pleistocene
Nannofossils are very abundant and show good preservation throughout the Pleistocene interval (0–227 m CSF-A; Samples 397-U1587A-1H-1, 75 cm, to 25X-7, 41 cm). The Holocene is identified from the top of the core to Sample 1H-2, 75 cm, after the highest occurrence (HO) of E. huxleyi >4 µm (Flores et al. 2010).
Zone CN14-15/NN20-21 is identified based on the lowest occurrence (LO) of E. huxleyi above Sample 397-U1587A-5H-5, 70 cm. Zone CN14b-14a/NN19-20 is based on the HO of P. lacunosa above Sample 7H-6, 60 cm. Zone CN14a/NN19 is identified based on the highest common occurrence (HcO) of R. asanoi above Sample 15H-4, 79 cm, and the LO of H. inversa in Sample 7H-6, 70 cm. Zone CN13b/NN19 is placed based on the HOs of large Gephyrocapsa (>5.5 µm), H. sellii, and C. macintyrei above Samples 15H-4, 79 cm, 15H-6, 76 cm, and 19X-5, 70 cm, respectively. Zone CN13a-12d/NN18 is based on the HO of D. brouweri above Sample 23X-1, 75 cm. Zone CN12c/NN17-18 is placed based on the HO of D. pentaradiatus in Sample 25X-5, 94 cm. Zone CN12c-b/NN16-17 is based on the HO of D. surculus in Sample 25X-7, 41 cm.
4.1.2. Pliocene
The Pliocene interval (227–337 m CSF-A; Samples 397-U1587A-25X-7, 41 cm, to 37X-1, 75 cm) contains abundant calcareous nannofossils with good preservation. Zone CN12b-a/NN16 is based on the HO of D. tamalis in Sample 397-U1587A-28X-4, 73 cm. Zone CN12a-11b/NN15-16 is based on the HO of R. pseudoumbilicus >7 µm in Sample 31X-1, 76 cm. This event is normally synchronous with the HO of Sphenolithus spp. (e.g., Raffi et al., 2006); however, at this site this occurrence was identified below, in Sample 34X-4, 75 cm. Zones CN11c-11d/NN13-14 are based on the lowest common occurrence (LcO) of D. asymmetricus in Sample 30X-1, 75 cm. The Miocene/Pliocene boundary, Zone CN10a-9b/NN11b-12, is marked by few to common abundance of HO Discoaster quinqueramus, identified in Sample 397-U1587A-37X-1, 75 cm. The presence of this taxon is irregular and generally scarce. The LO of C. armatus is also used to mark the Miocene/Pliocene boundary, but it has a sporadic distribution and was not considered for biostratigraphy of this interval.
4.1.3. Miocene
The Miocene interval (337–550 m CSF-A; Samples 397-U1587A-37X-1, 75 cm, to 397-U1587B-59X-CC, 66 cm) contains calcareous nannofossils of common abundance and moderate preservation. A partial Messinian section was recovered in Cores 397-U1587A-37X through 53X. Recovery of the Messinian/Tortonian boundary was completed using Cores 397-U1587B-55X through 59X. The preliminary age model is based on Hole U1587A and U1587B bioevents (Figure F17).
Zone CN9b/NN11b is defined by the HO of N. amplificus (scarce in this site), the HO of R. rotaria, and the LO of N. amplificus found in Samples 397-U1587A-50X-1, 73 cm, and 50X-4, 80 cm, and 397-U1587B-55X-6, 80 cm, respectively.
Zone CN9a/NN11a is defined by the LO of A. primus in Sample 397-U1587B-56X-1, 83 cm, and by the HcO of M. convallis in Sample 57X-5, 80 cm.
R. pseudoumbilicus (>7 µm) is recorded throughout the base of the core, preventing the correct identification at the top of paracme R. pseudoumbilicus (Raffi et al., 2006). However, the dramatic change in abundance of this taxon, observed between Samples 397-U1587A-53X-CC and 397-U1587B- 55X-1, 74 cm, could correspond to that event.
4.2. Planktonic foraminifers
Core catchers (54 from Hole U1587A, 11 from Hole U1587B, and 3 from Hole U1587C) were examined for planktonic foraminifer biostratigraphy. The relative abundance of taxa and estimation of assemblage preservation is presented in Table T10. Planktonic foraminifers are abundant and well preserved in the Pleistocene and Pliocene sections. In the Miocene, abundance varies between moderate and dominant. Preservation decreases with depth downcore as foraminifers become smaller in size and slightly recrystallized.
Fourteen bioevents were identified, and the key biostratigraphic species and associated ages are presented in Table T8 following the age calibrated by Wei (1994), Lourens et al. (2004), Wade et al. (2011, 2018), King et al. (2020), and BouDagher-Fadel (2015) (see also Plate P2 in the Site U1586 chapter [Abrantes et al., 2024b]). The upper part of the section, Samples 397-U1587A-1H-CC to 4H-CC, is assigned to the late Pleistocene (0.22 Ma) based on the LO of Globigerinella calida. The interval between Samples 397-U1587A-4H-CC and 6H-CC is assigned to the late Middle Pleistocene (0.45 Ma) based on the LO of Globorotalia hirsuta. Samples 397-U1587A-6H-CC to 8H-CC belong to the Middle Pleistocene (0.61 Ma) based on the HO of Globorotalia tosaensis. The interval between Samples 397-U1587A-8H-CC and 17X-CC is assigned to the Calabrian Stage (1.3 Ma) as evidenced by the HO of Globigerinoides obliquus. The LO of Globorotalia truncatulinoides is recorded during the Gelasian Stage (1.92 Ma) in Sample 397-U1587A-20X-CC. The Pliocene/Pleistocene boundary is estimated to be between Samples 397-U1587A-24X-CC and 25X-CC based on the HO of Globorotalia puncticulata (2.41 Ma) and Neogloboquadrina acostaensis (2.5 Ma).
The interval between Samples 397-U1587A-25X-CC and 30X-CC is assigned to the Piacenzian Stage based on the LO of G. tosaensis (3.35 Ma) and HO of Sphaeroidinellopsis seminulina (3.85 Ma). Four bioevents are recorded between Samples 397-U1587A-30X-CC and 37X-CC, the LOs of Globorotalia crassaformis (4.3 Ma) and G. puncticulata (4.5 Ma) and the HOs of Globoturborotalita nepenthes (4.36 Ma) and Sphaeroidinellopsis kochi (4.52 Ma); we assign this interval to the Zanclean Stage. The Miocene/Pliocene boundary is estimated to be in Core 40X because the HO of Dentoglobigerina baroemoenensis (5.7 Ma) (Wade et al., 2018) was found in Sample 40X-CC.
Samples 397-U1587A-40X-CC to 53X-CC, 397-U1587B-54X-CC to 59X-CC, and 397-U1587C-59X-CC to 61X-CC are tentatively assigned to the Messinian Stage, but identification is difficult because of the small size and sometimes low abundance and recrystallization of planktonic foraminifers.
4.3. Benthic foraminifers
Benthic foraminifers were examined in core catchers from Holes U1587A (20 samples) and U1587B (2 samples). The presence of benthic foraminifers in the >150 µm fraction is summarized in Table T11. Abundances are low except in the late Miocene. From Sample 397-U1587A-41H-CC downhole, the abundance of benthic foraminifers increases. The assemblages predominantly consist of rare agglutinated taxa, and their overall composition indicates lower bathyal to abyssal paleodepths throughout the Pleistocene, Pliocene, and late Miocene (see Plate P3 in the Site U1586 chapter [Abrantes et al., 2024b]). Benthic foraminifers are generally well preserved.
Stilostomellids (see Plate P3 in the Site U1586 chapter [Abrantes et al., 2024b]) markedly decrease in abundance at Sample 397-U1587A-12H-CC (98.4 m CSF-A), marking the Stilostomella extinction (0.70–0.58 Ma) (Hayward, 2002; Kawagata et al., 2005). The datum agrees well with an age of 0.90–0.46 Ma, as suggested by nannoplankton assemblages (Table T7).
A total of 51 benthic foraminifer taxa were identified. Species recorded almost continuously include Cibicidoides spp. (mainly Cibicidoides wuellerstorfi), Gyroidinoides spp., Melonis spp., Oridorsalis spp., and Uvigerina peregrina (Table T11; see also Plate P4 in the Site U1586 chapter [Abrantes et al., 2024b]). The presence of Globocassidulina, Epistomella, Bullimina, Bolivina, and Globobulimina species may suggest variability in organic flux and/or oxygen conditions relative to changes in surface productivity and bottom water oxygenation. High-resolution studies are needed to constrain the geochemical response factors of the benthic foraminifer assemblages.
Mudline core top samples from Holes U1587A–U1587C were gently washed to preserve fragile agglutinated specimens with extremely low fossilization potential. The mudline samples contain few benthic foraminifers, including tubular organically cemented agglutinated foraminifers, some of which were stained with Rose Bengal, hyaline, and porcelaneous benthic foraminifers. Mudline samples also contain several fish teeth and sponge spicules, which are regularly found in the downcore samples from Hole U1587A.
Notably, Sample 397-U1587A-22X-CC contains larger benthic foraminifers associated with a high abundance of fish skeletal debris (teeth and bones).
4.4. Ostracods
The sand fraction >250 µm of all 53 core catcher samples from Hole U1587A, Samples 22X-CC to 24X-CC and 53X-CC to 59X-CC from Hole U1587B, and mudline samples from all holes were examined for ostracods. Ostracods are common in the samples spanning the Pleistocene (Cores 397-U1587A-1H through 24X), decrease in abundance in the Pliocene (Cores 25H–34X), and are absent from all other samples thereafter to the base of the sequence (Miocene–Tortonian) except for Sample 397-U1587B-58X-CC, in which one valve of Henryhowella was found. The overall assemblage predominantly consists of deep-sea taxa Krithe (63%; seven species), Henryhowella (10%; two species), Pennyella rexi (6%), Xylocythere sp. (6%), Echinocythereis echinata (4%), Argilloecia (3%), and Poseidonamicus (3%). Interestingly, Xylocythere sp. was only found in Sample 397-U1587A-22X-CC in moderate abundance and as a monospecific population. This sample differs from others analyzed in that it contains abundant ichthyoliths. Xylocythere is a crawling ostracod genus known from chemosynthetic environments such as hydrothermal vents and cold seeps, and it has been found on whale and fish carcasses (Karanovic and Brandão, 2015; Tanaka et al., 2019) and in oligotrophic deep-sea sediments (Steineck et al., 1990). The ostracod range chart table is shown in Table T12.
5. Paleomagnetism
Paleomagnetic investigations of sediments from Site U1587 focused on measuring the natural remanent magnetization (NRM) of archive-half sections from all three holes at every 2 cm interval. NRM for most of the archive-half sections was measured before and after 20 mT alternating field (AF) demagnetization. NRM of a few archive-half sections from Hole U1587B was measured using more detailed (three to five) demagnetization steps (Table T13), and the results suggest that <20 mT demagnetization is often not sufficient to remove the drilling overprint. Cores 397-U1587A-1H through 13H, 397-U1587B-1H through 11H, and 397-U1587C-1H through 12H were oriented with the Icefield MI-5 core orientation tool (see Paleomagnetism in the Expedition 397 methods chapter [Abrantes et al., 2024a]). The APC core orientation data for all holes are reported in Table T14.
We collected and measured the NRM of 1, 134, and 7 cube samples from Holes U1587A, U1587B, and U1587C, respectively. We took most of the cube samples from Hole U1587B so that Hole U1587A archive-half superconducting rock magnetometer (SRM) data and hole-to-hole correlation could be used to guide cube sampling positions for magnetostratigraphy verification (i.e., more cube samples around possible polarity boundaries). Squares in Figures F18, F19, and F20 mark the depth levels where cube samples were collected. Demagnetization steps used for the NRM measurements of the cubes (14–22 steps with peak fields up to 50 or 80 mT) vary depending on what instrument was used (i.e., the SRM or the JR-6A spinner magnetometer) and are summarized in Table T13. In addition, four cube samples from Hole U1587B (i.e., Section 9H-4, Sample 11H-3, 49–51 cm, and Sections 16X-4 and 28X-3) were treated at low temperatures using liquid nitrogen before NRM measurement. The low-temperature treatment presumably removes the remanence carried by multidomain grains more effectively. There was no significant difference in NRM demagnetization behaviors between those four cube samples and other cube samples, so we did not apply the low-temperature treatment to additional cube samples.
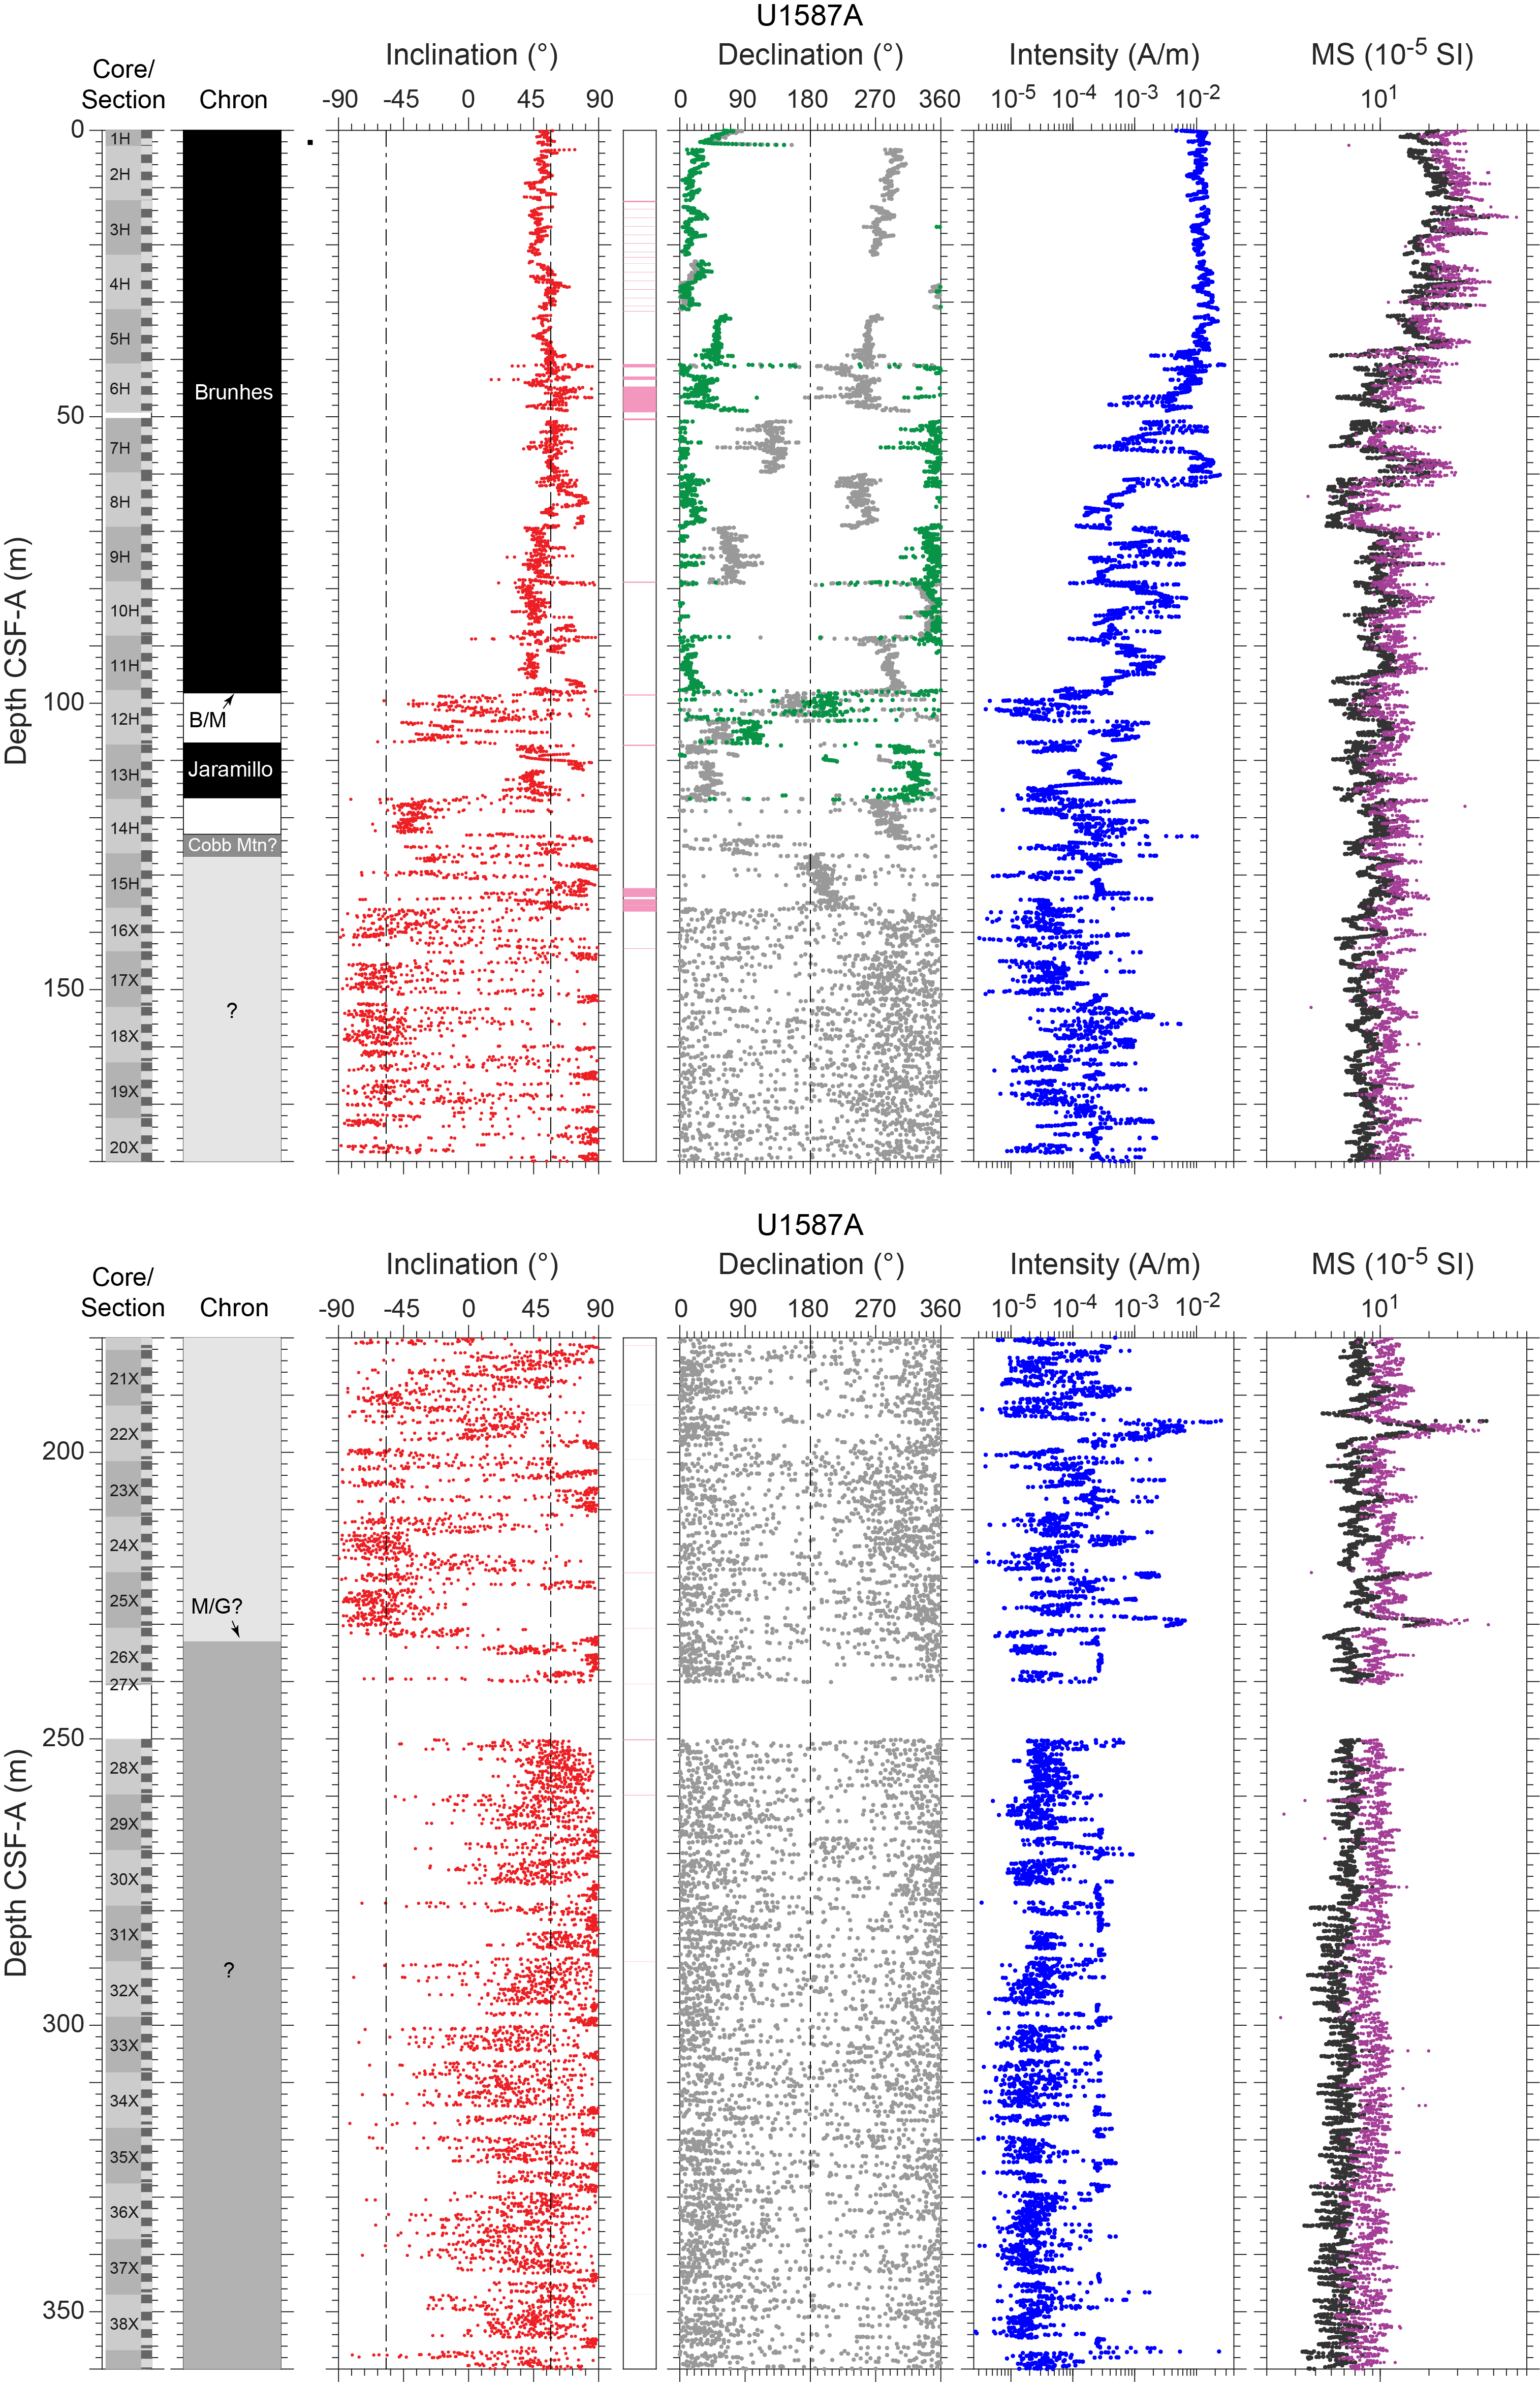
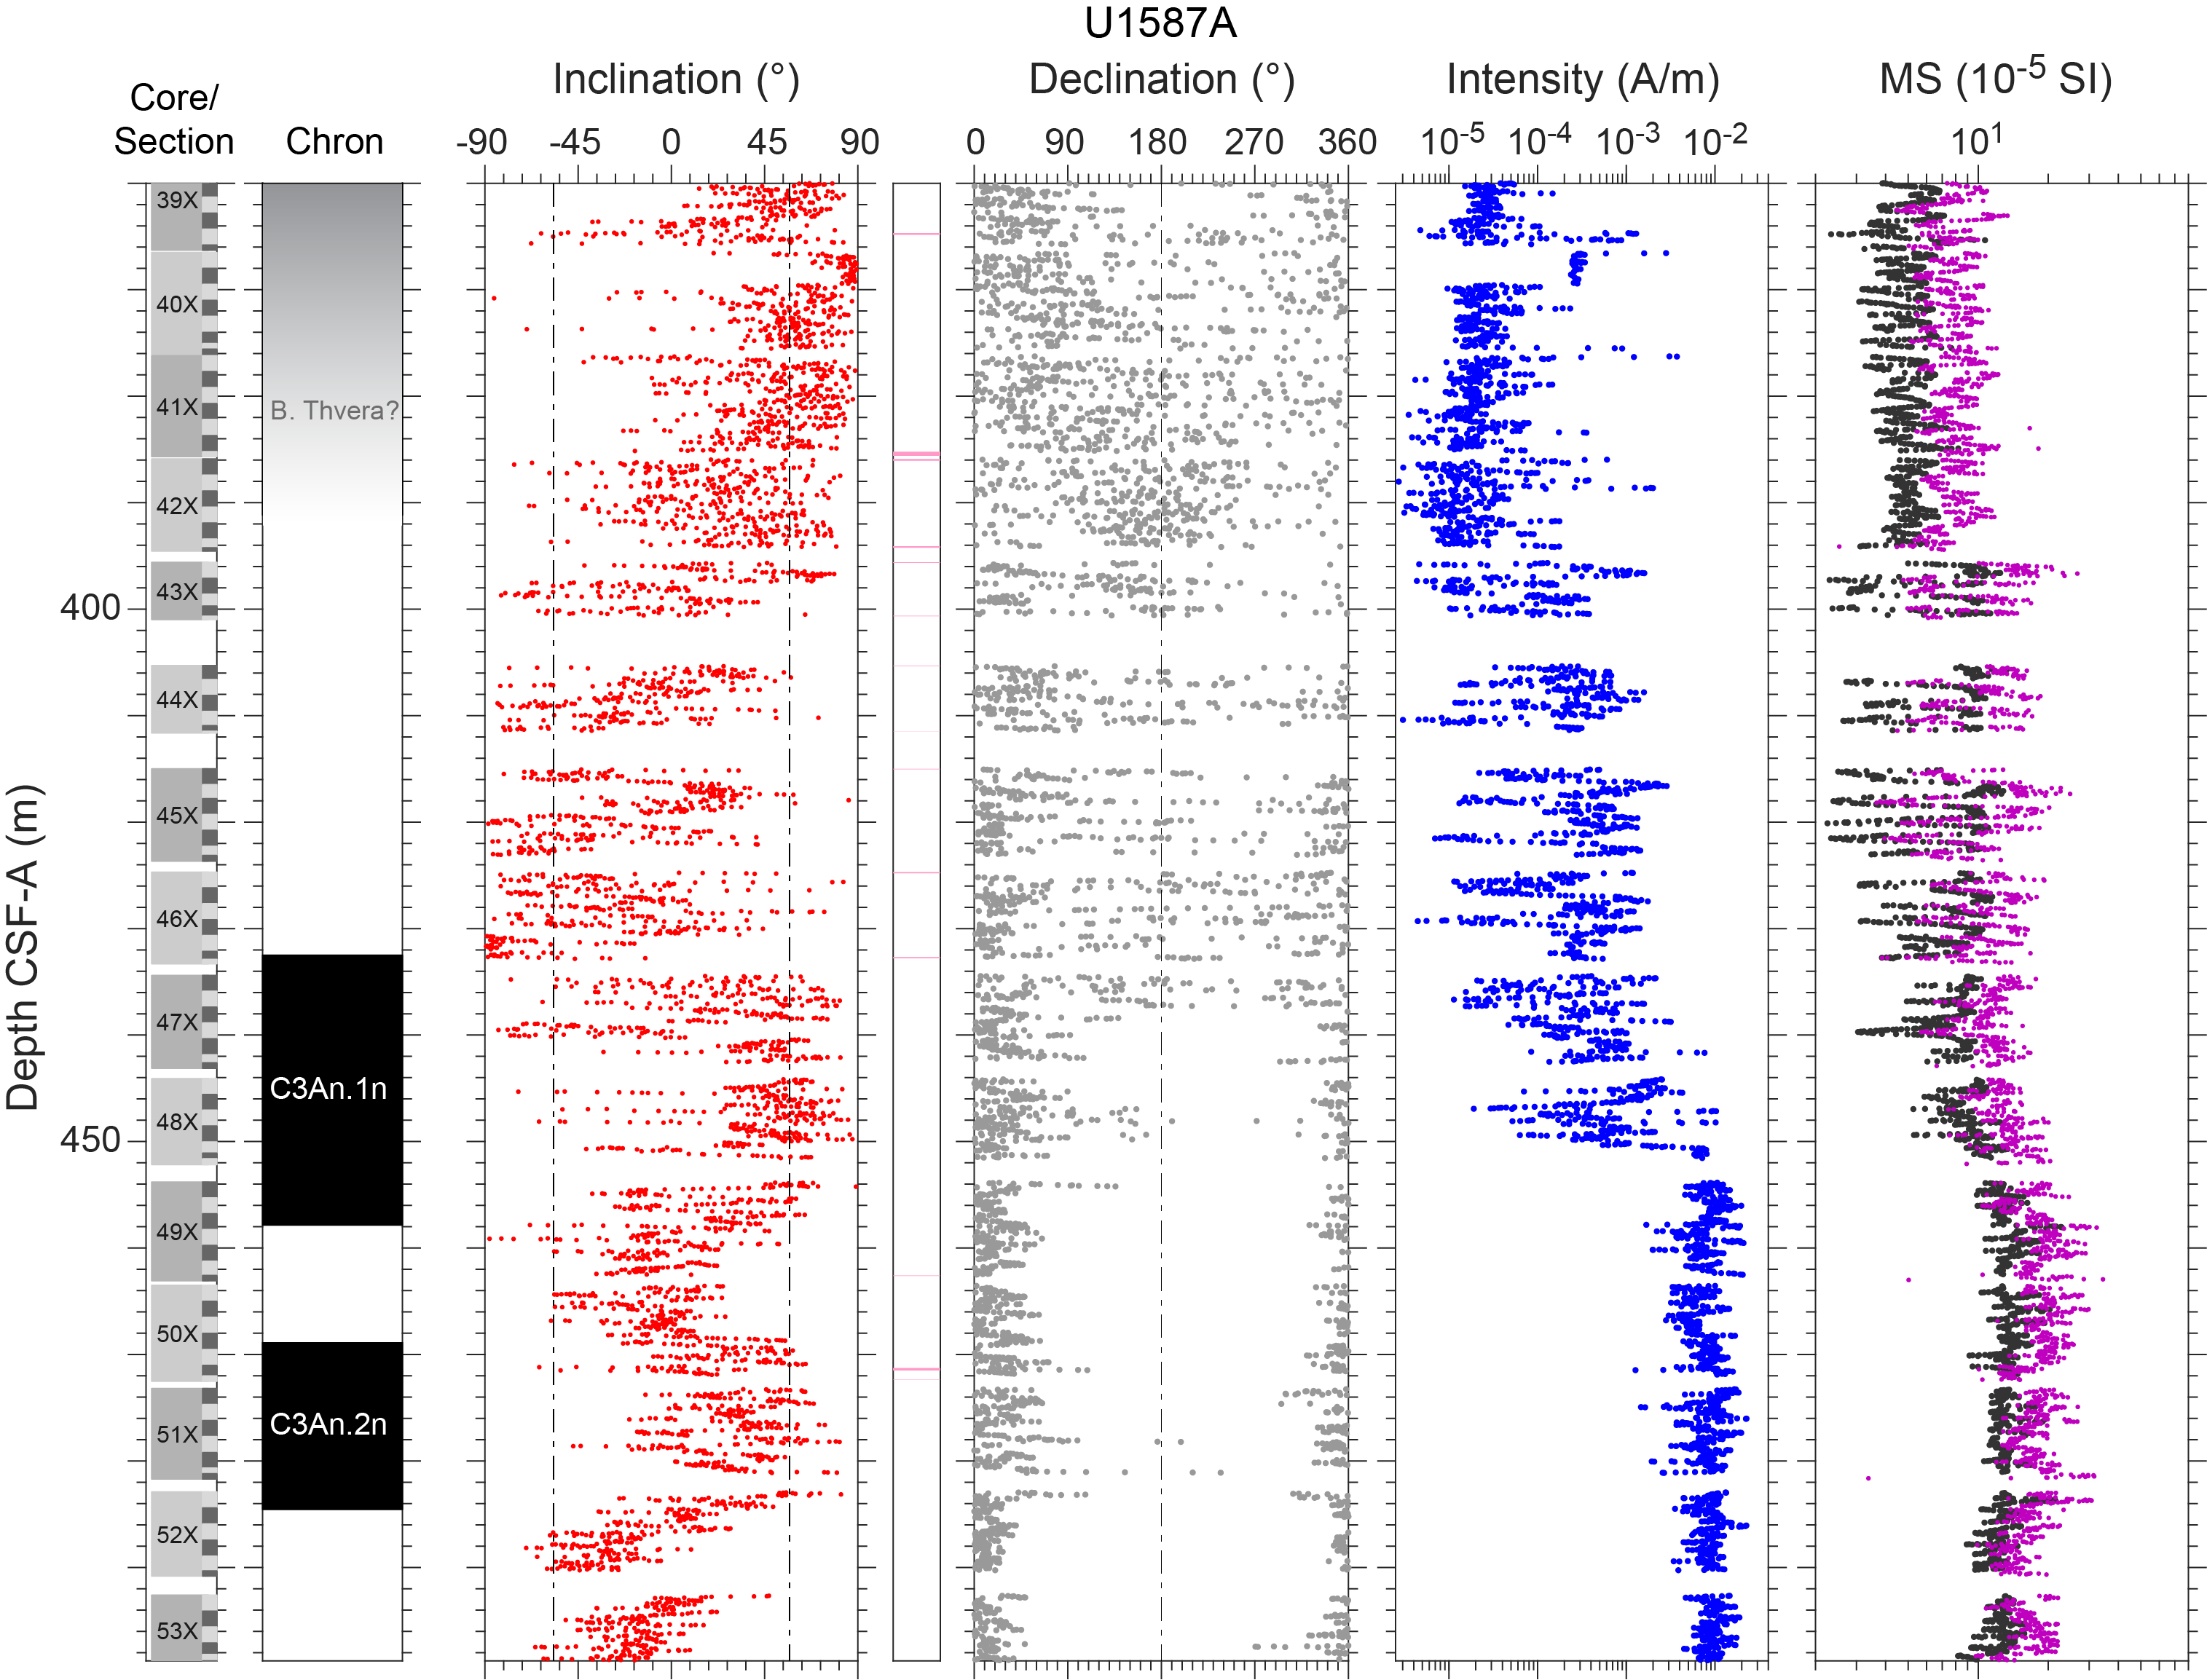
Figure F18. AF demagnetization, Hole U1587A.
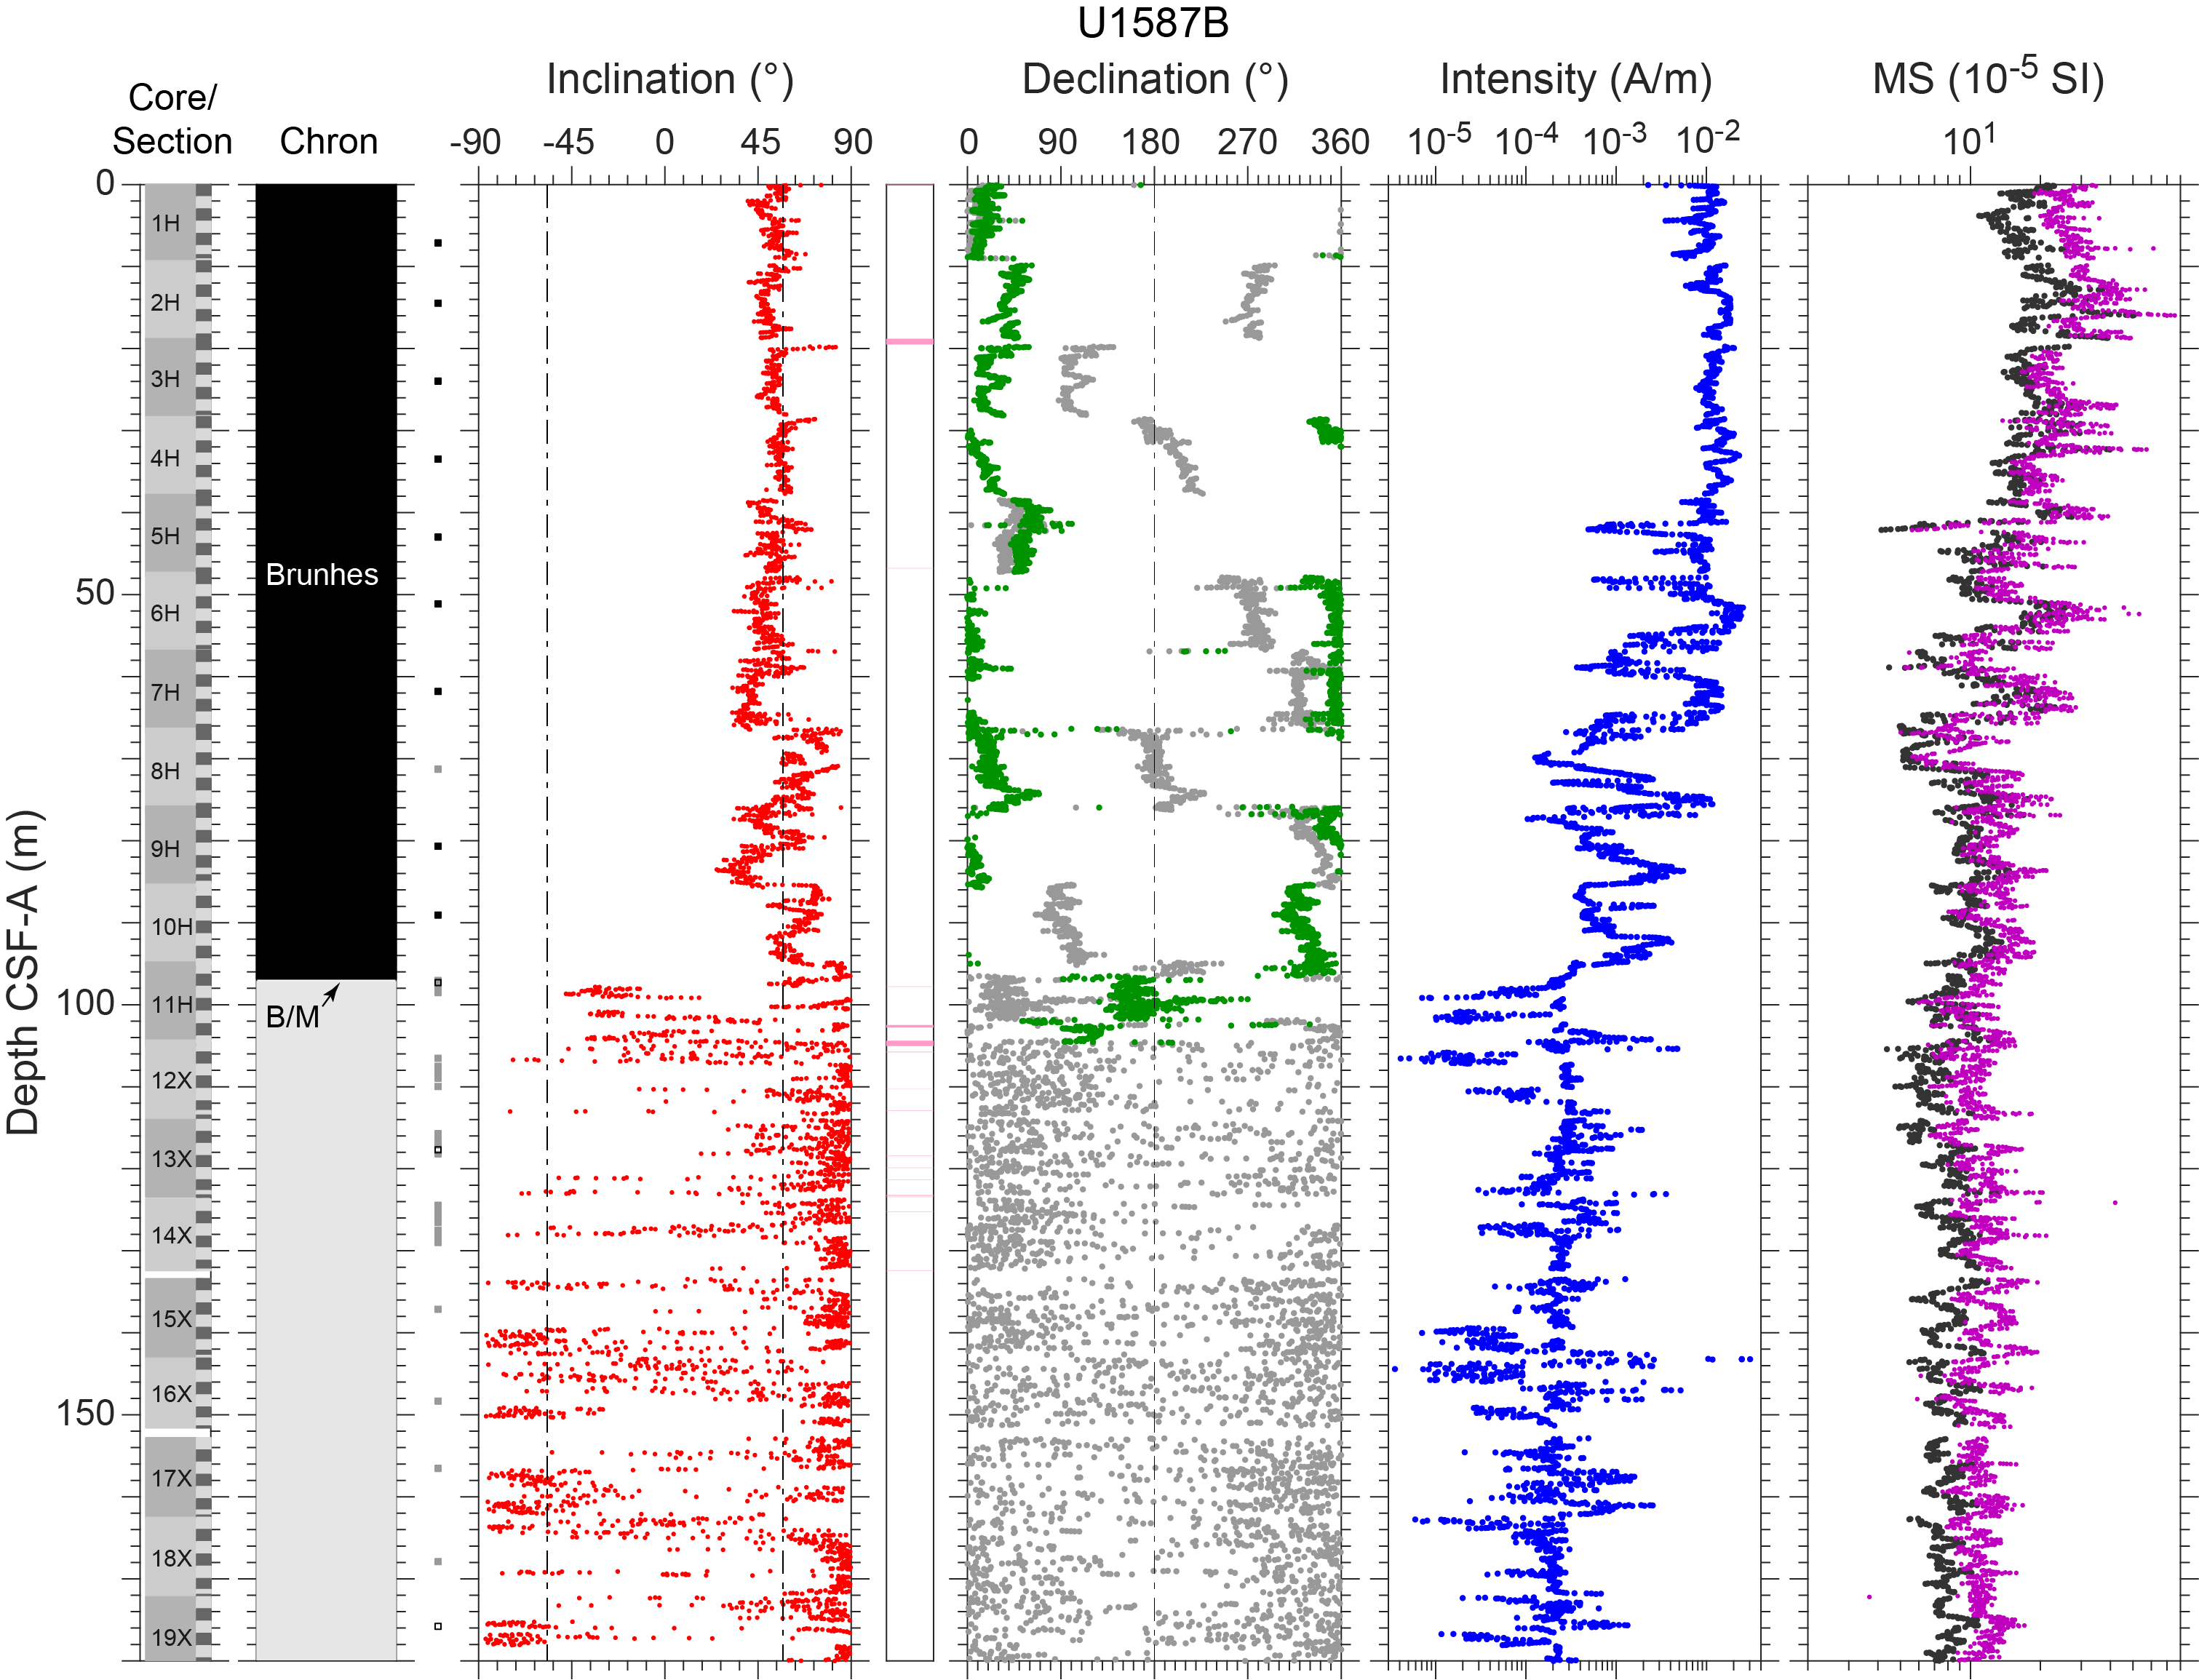
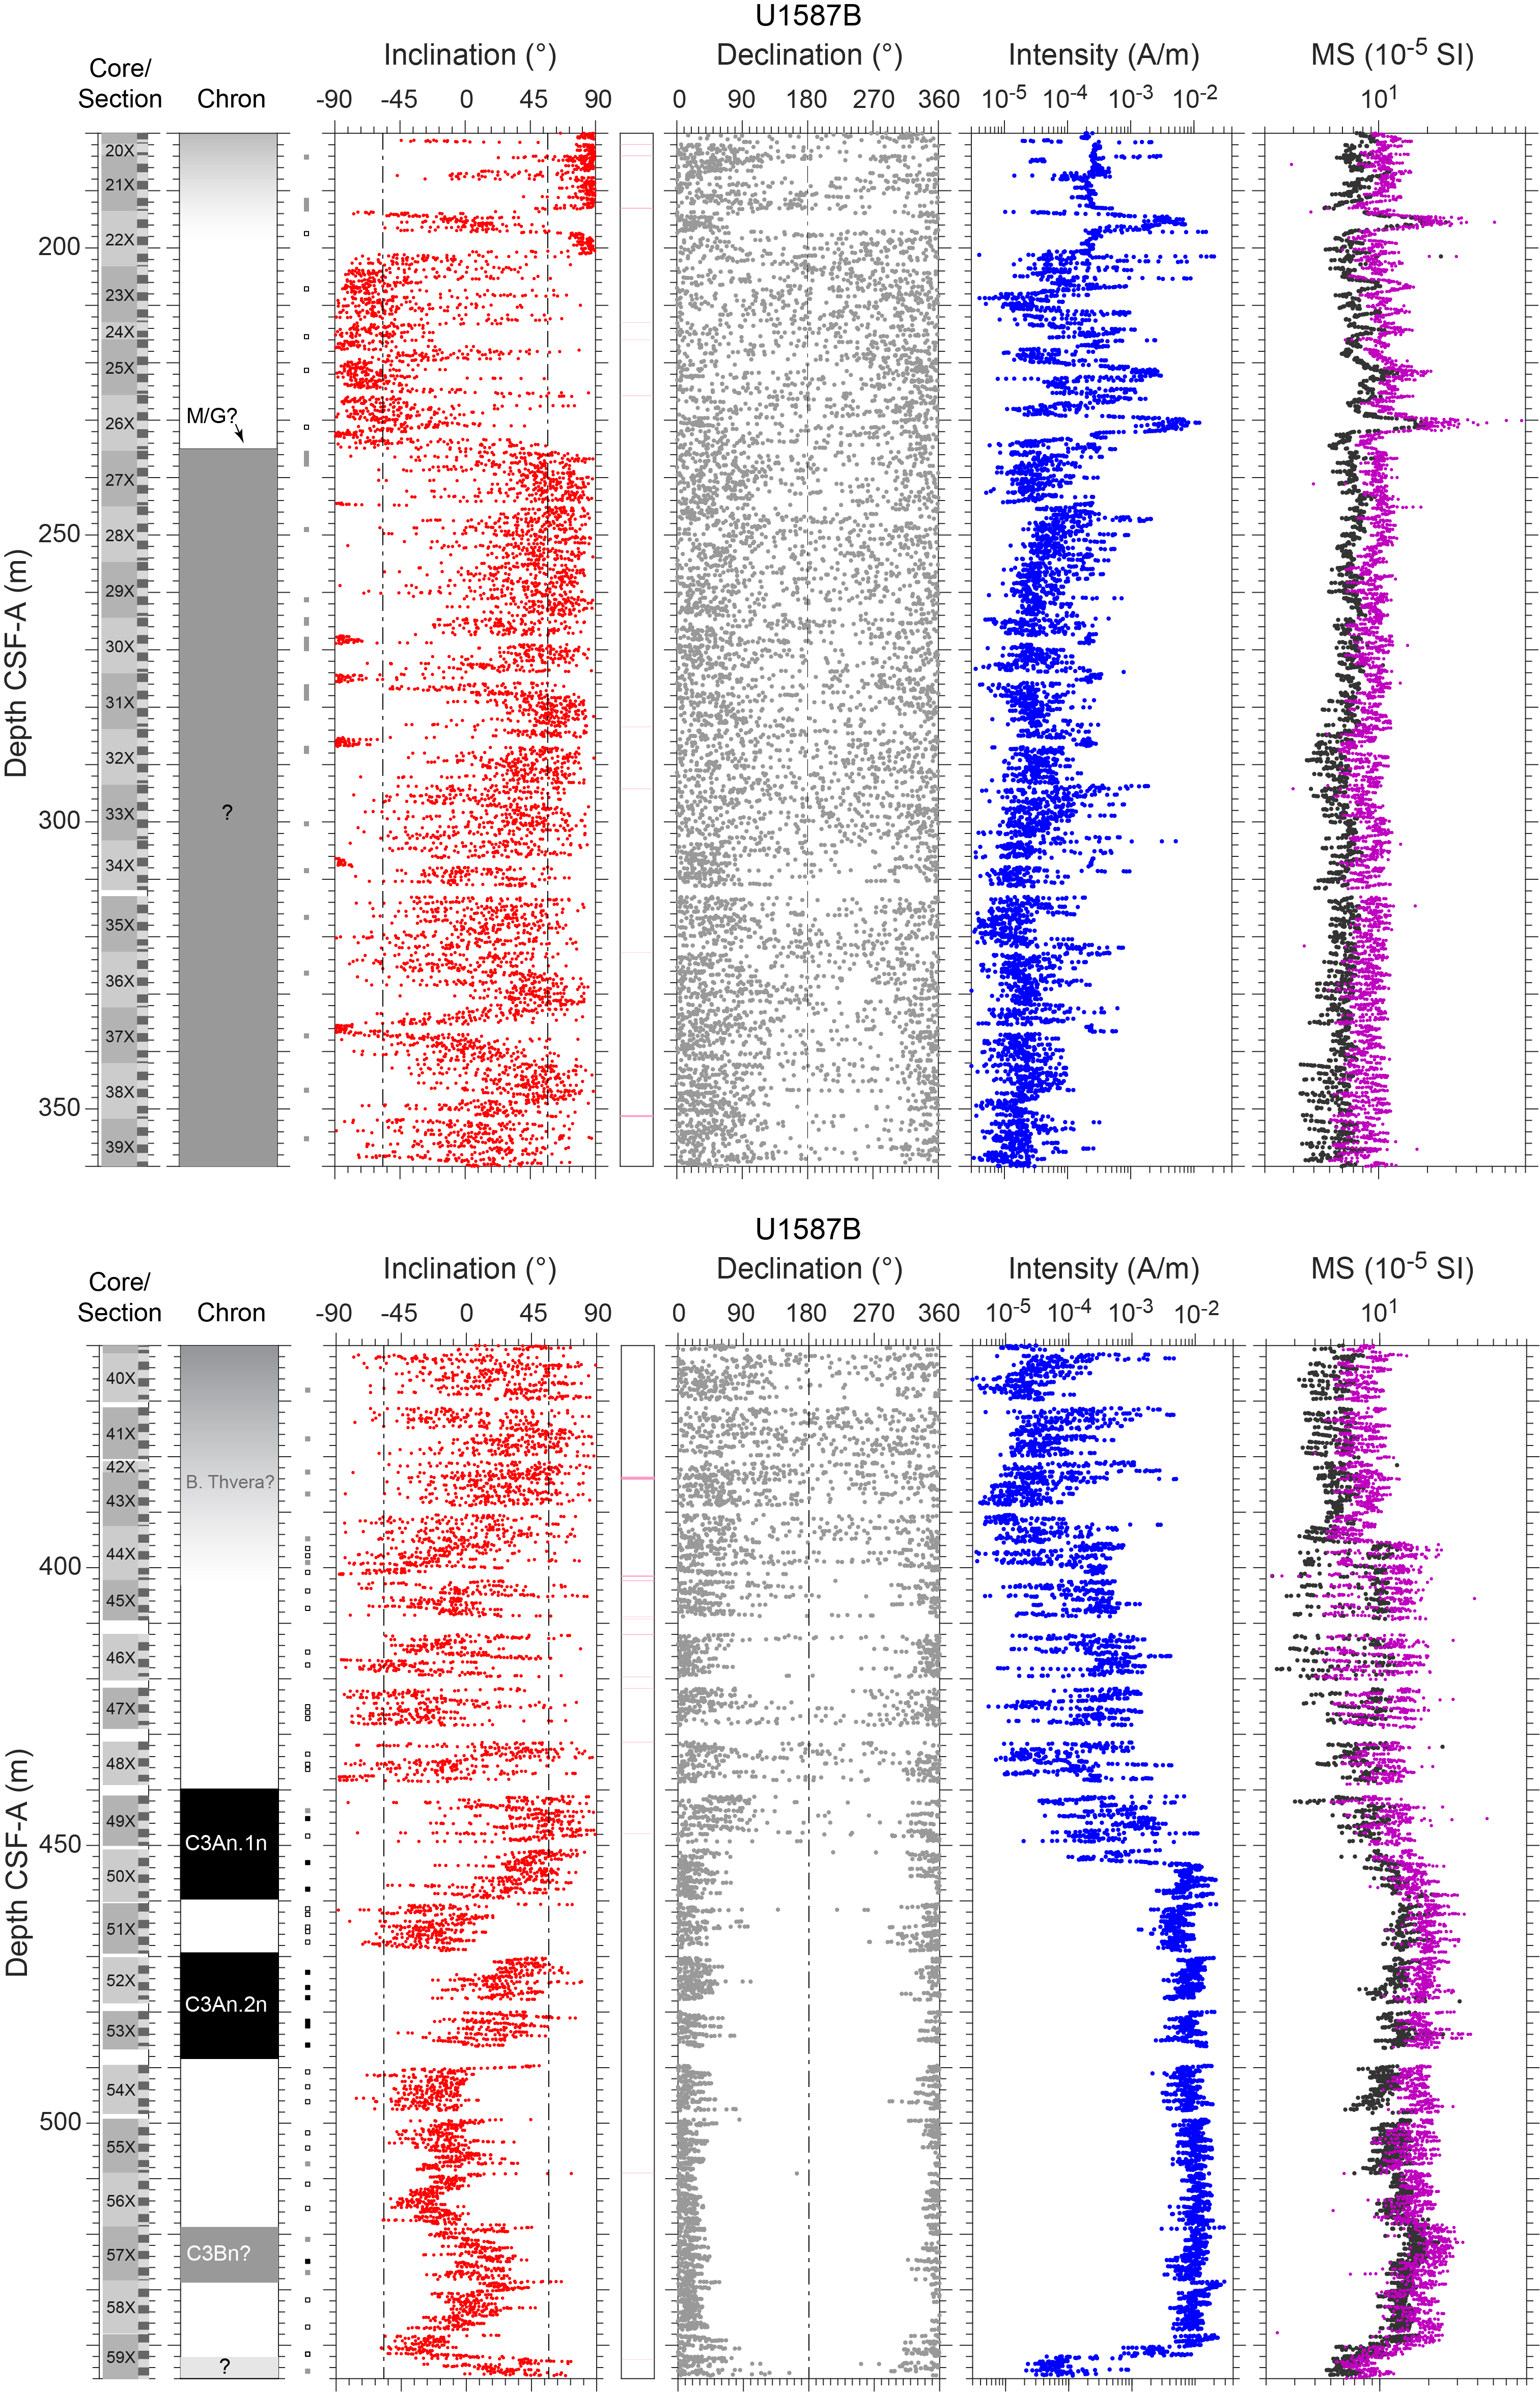
Figure F19. AF demagnetization, Hole U1587B.
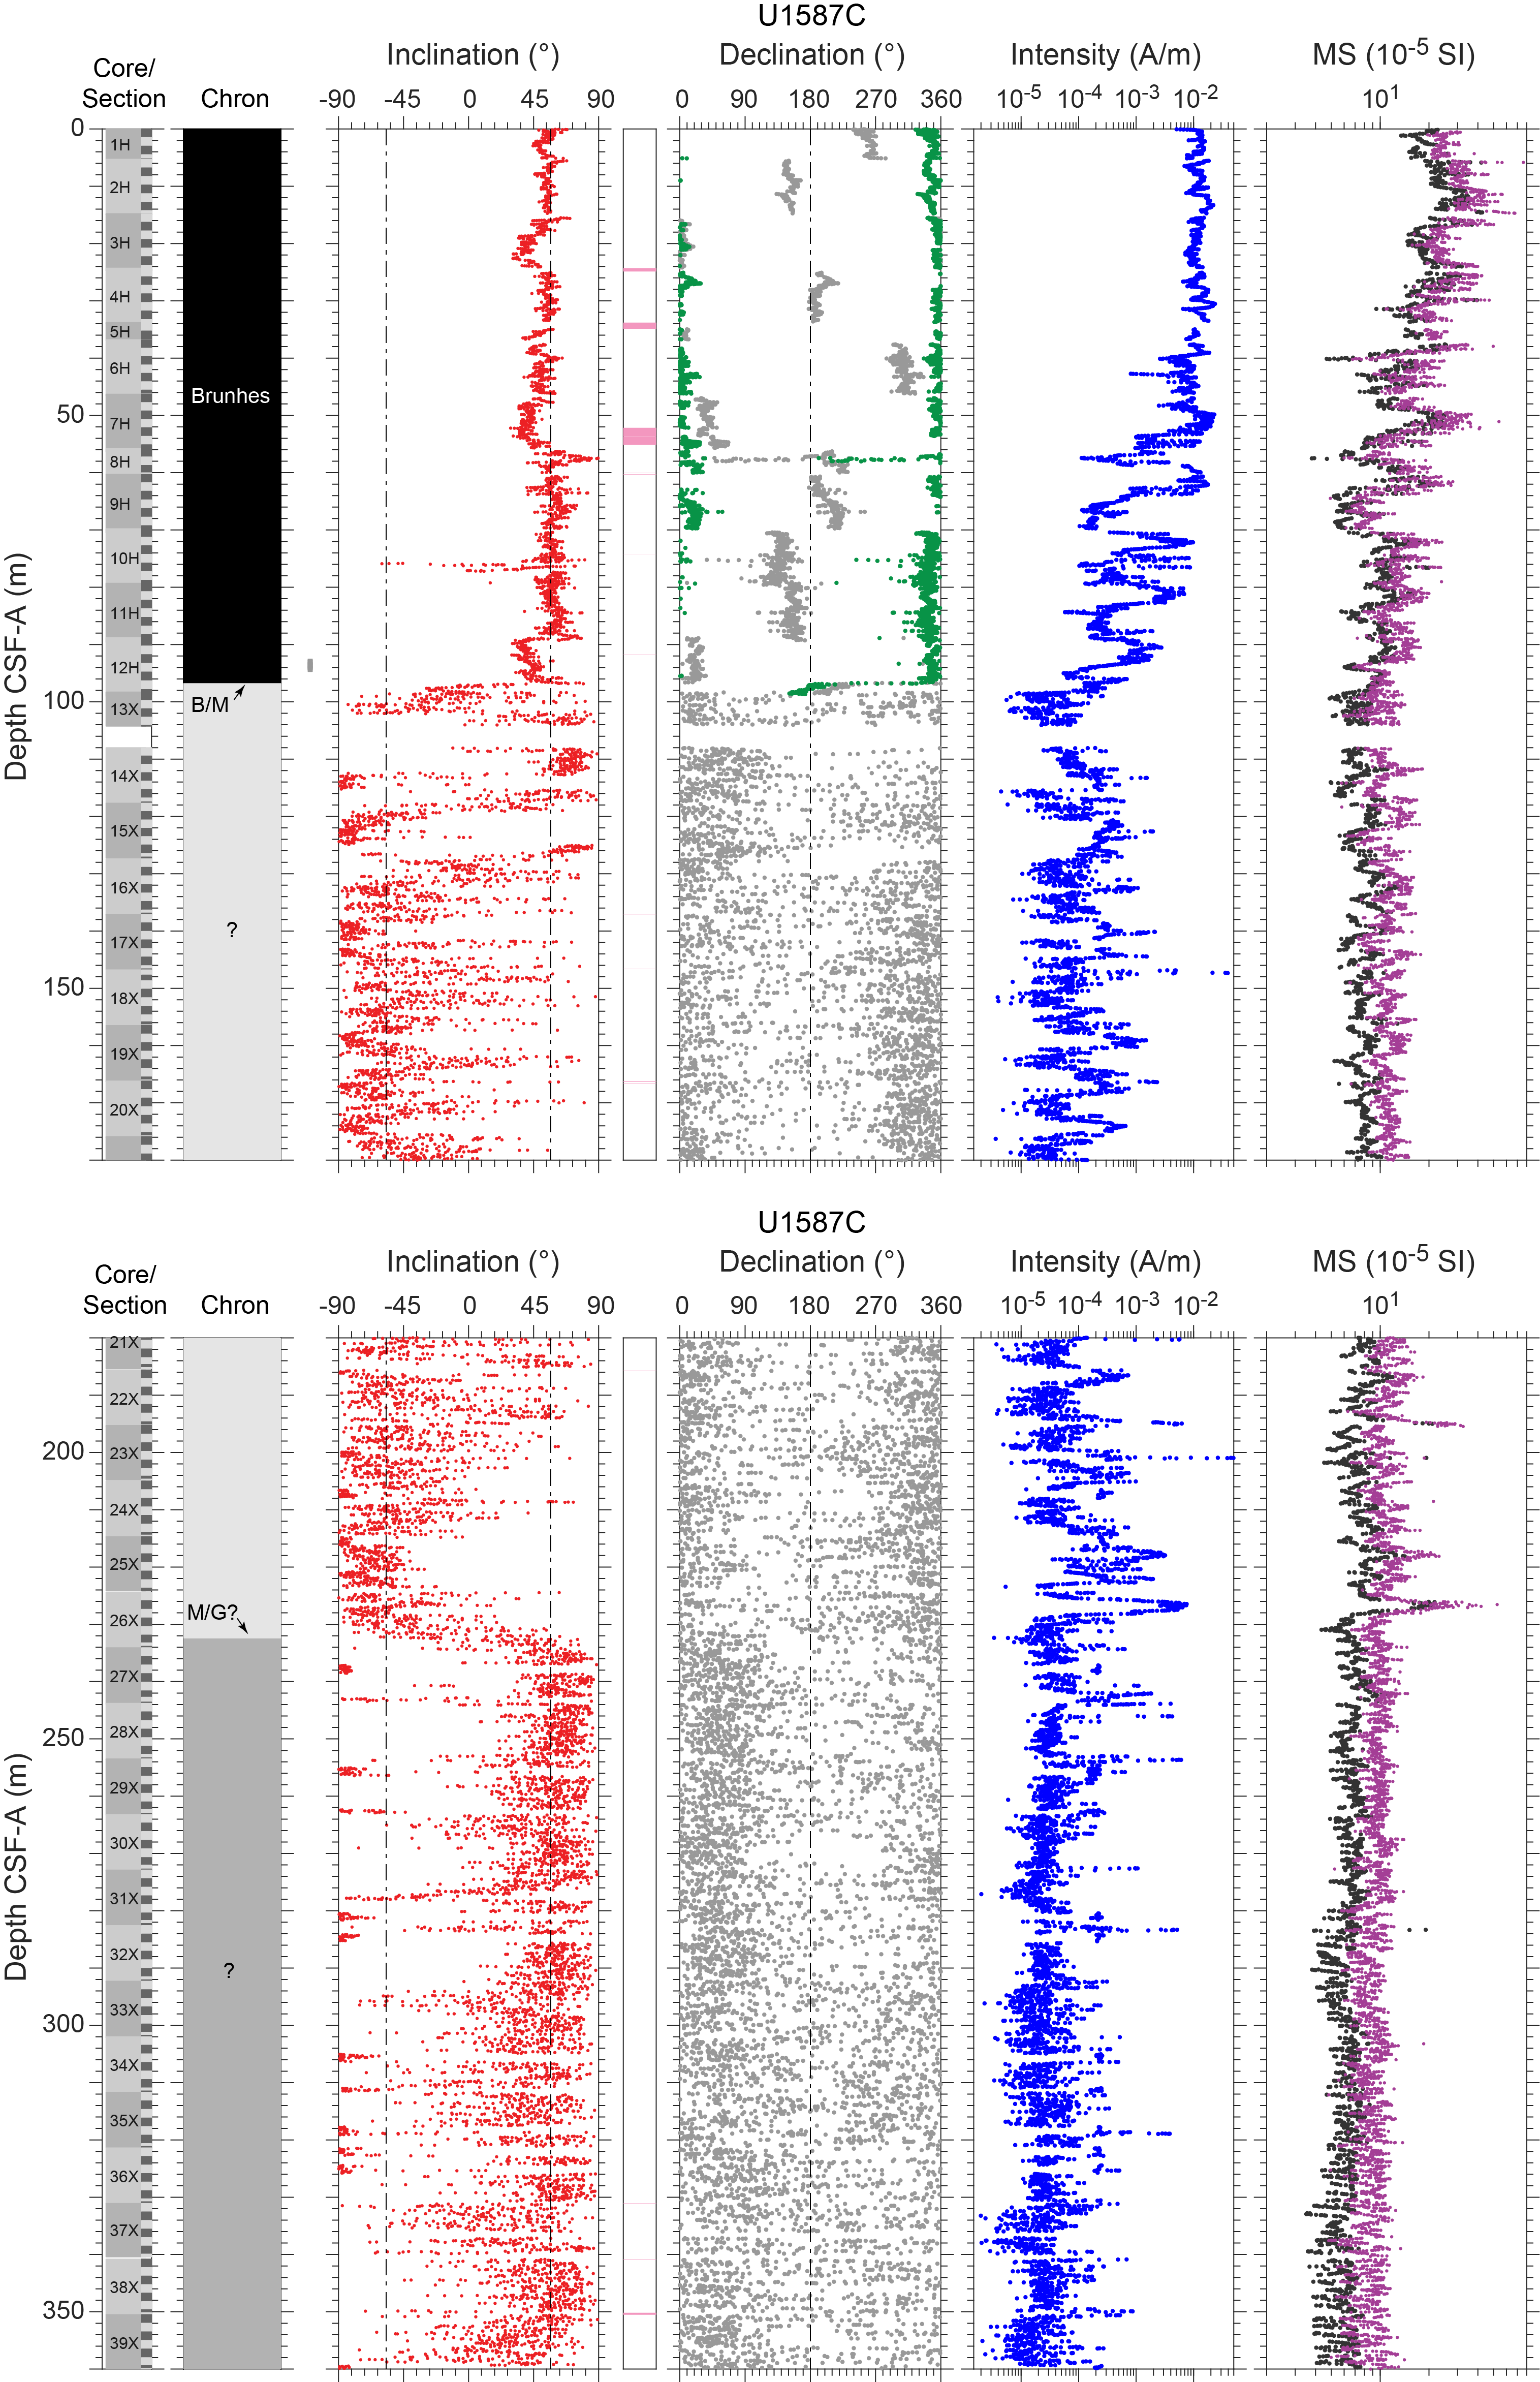
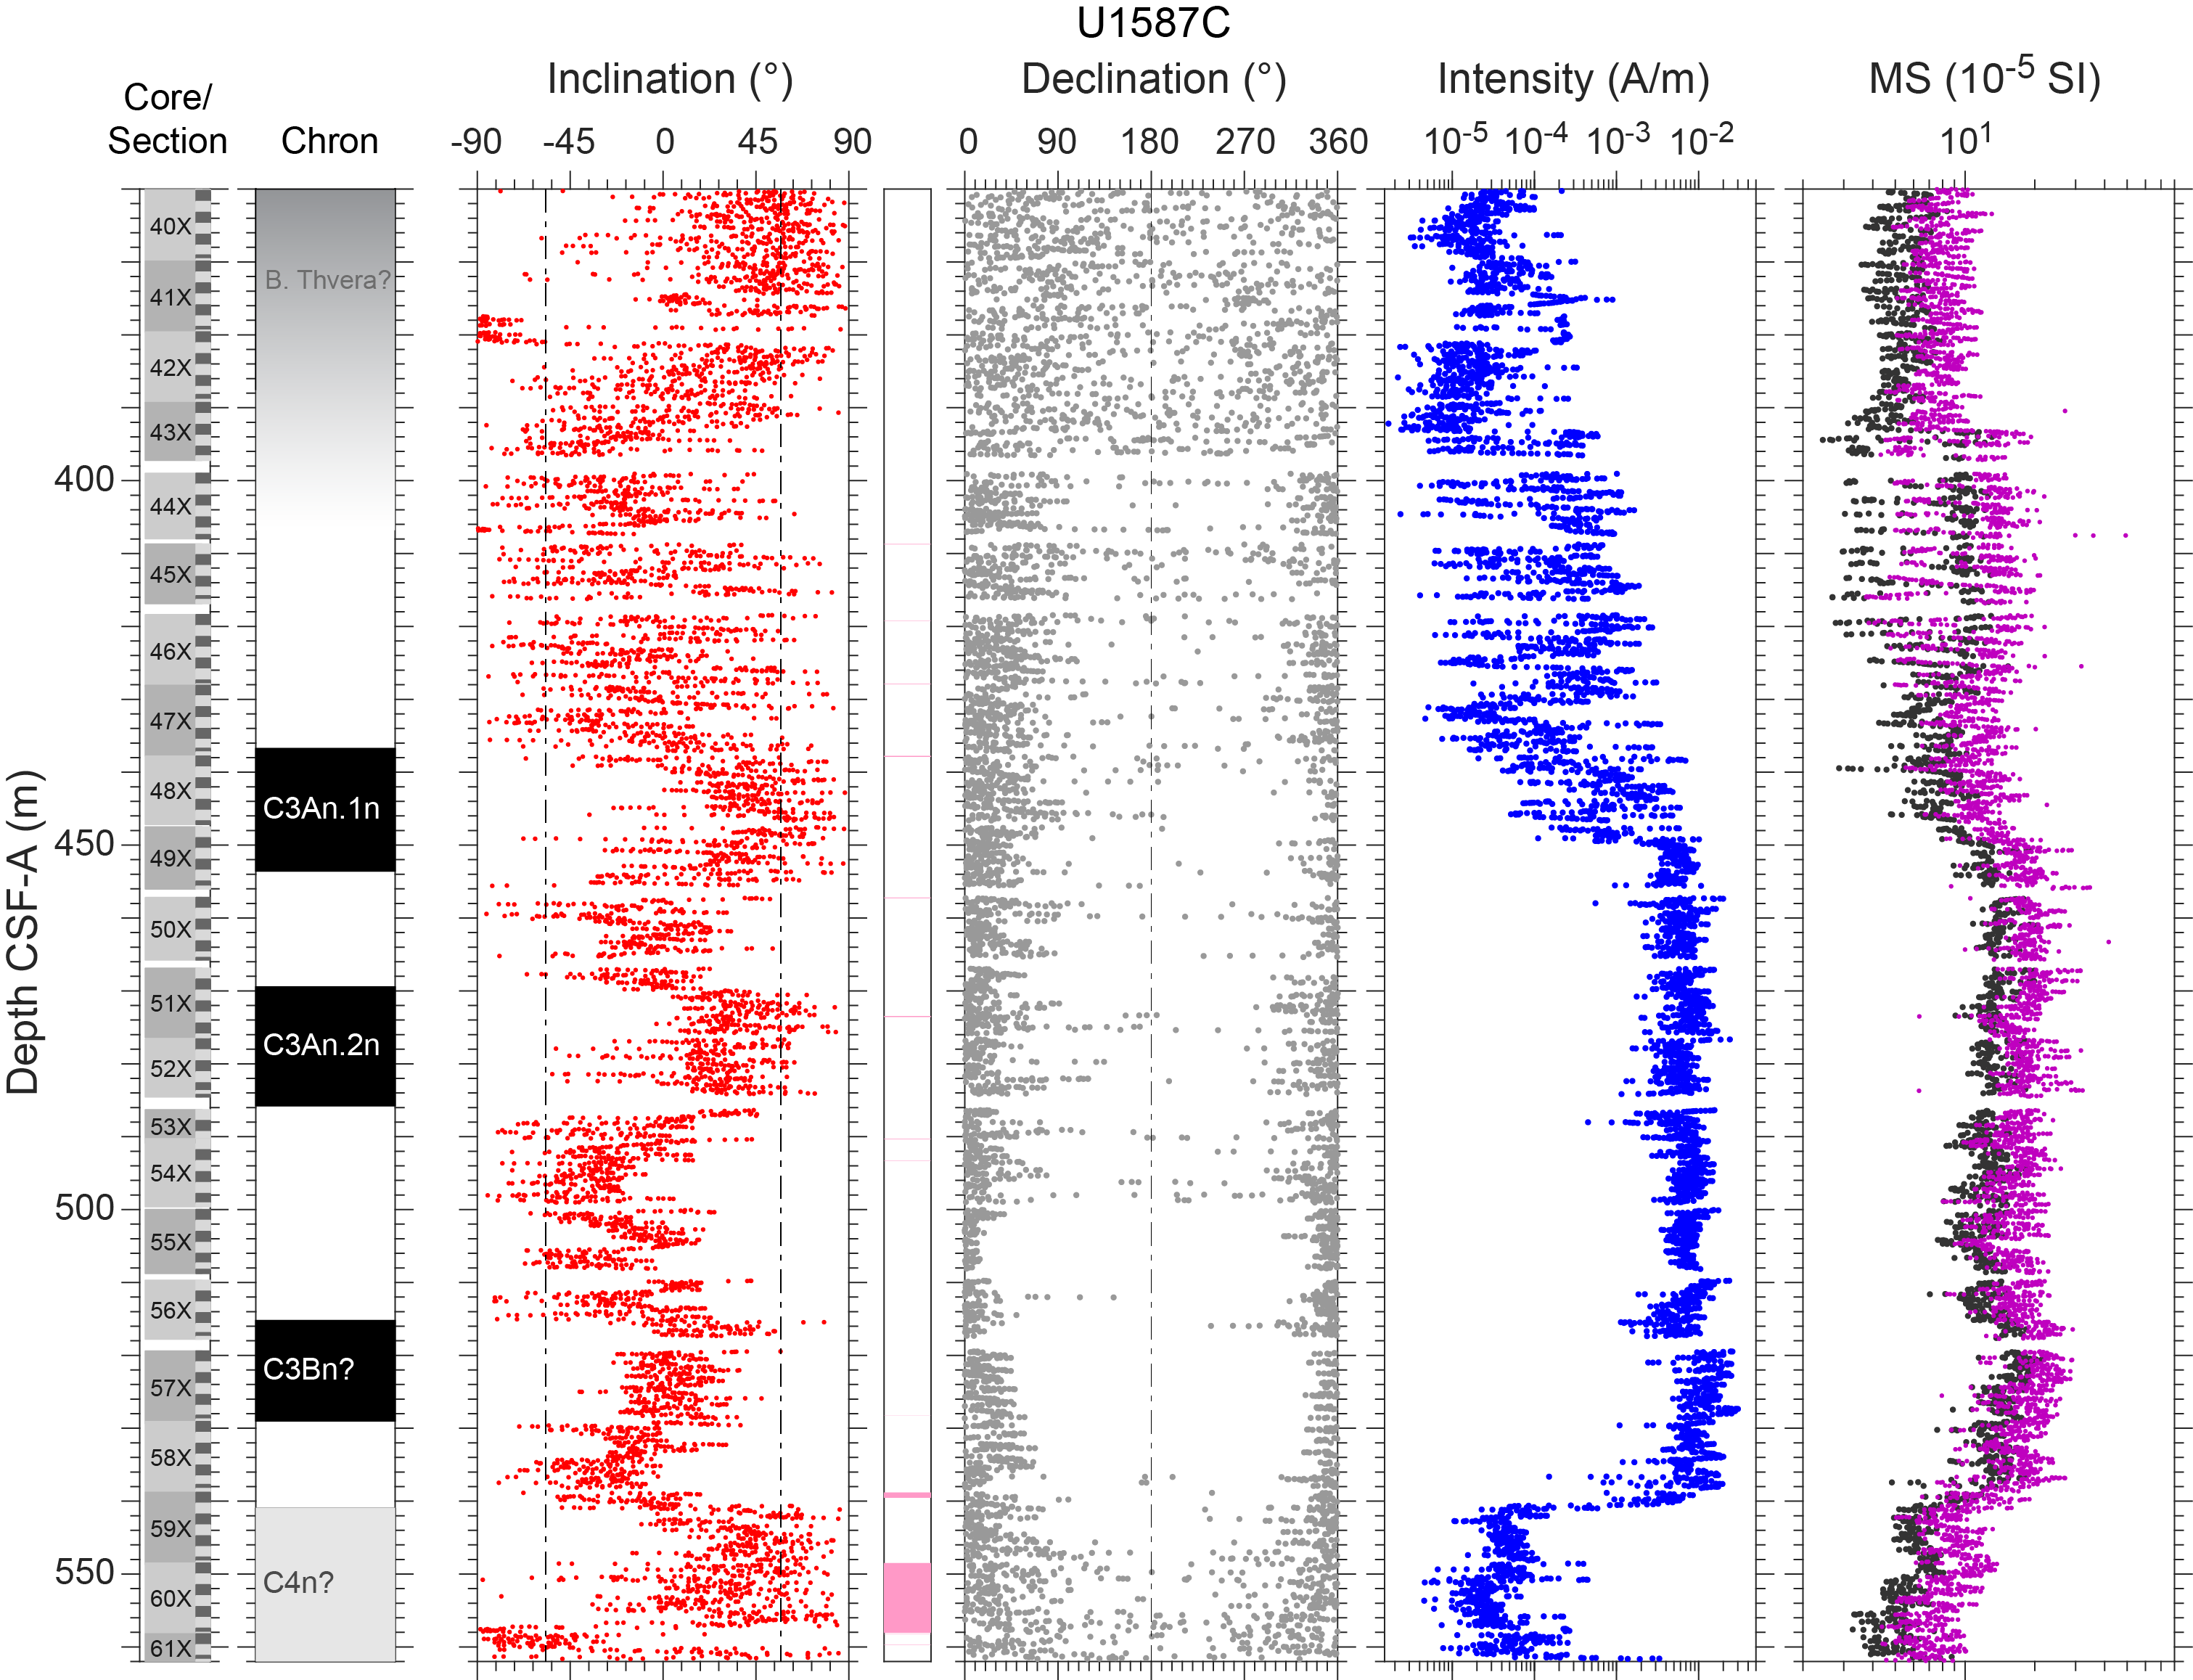
Figure F20. AF demagnetization, Hole U1587C.
We processed archive-half data extracted from the shipboard Laboratory Information Management System (LIMS) database by removing all measurements collected from (1) void intervals caused by whole-round core sampling (i.e., interstitial water [IW] and paleontology [PAL] samples), (2) disturbed core top intervals in APC cores (Table T15), and (3) the top and bottom 6 cm of each section and an extra 6 cm for the void and disturbed core top intervals. Intervals in each hole that were severely/strongly disturbed during coring (see Lithostratigraphy) are indicated in Figures F18, F19, and F20, and data from these intervals are typically not used for magnetostratigraphic interpretation. A significant amount of NRM data (after 20 mT) of sections from the weakly magnetized intervals (~100–400 m CSF-A) show steep inclinations (close to ±90°) with apparently higher intensities (~2 × 10⁻⁴ to ~3 × 10⁻⁴ A/m) than those from neighboring sections. We speculate the measurement of these sections on the SRM was affected by either the occasional existence of a bias field along the SRM's Z-axis during demagnetization or by flux jumps along the SRM's Z-axis before section measurements started. Repeated demagnetization and measurement often fixed the issue. NRM data of cube samples measured on the SRM show similar behaviors. On average, data with about 2–6 (out of 14–22) demagnetization steps show a jump in values on the Z-axis measurement. Jumps occur on all seven cube samples measured in the same batch and do not increase with demagnetization levels, suggesting the issue is more likely due to flux jumps along the SRM's Z-axis. We avoided using data from sections influenced by this measurement problem for interpretation and removed data from compromised demagnetization steps for NRM of cube samples.
Declination data from APC cores where Icefield MI-5 orientation data are available, were corrected for each core using the estimated orientation angles and the current declination value at the site according to the 2020 International Geomagnetic Reference Field (IGRF2020) (see Paleomagnetism in the Expedition 397 methods chapter [Abrantes et al., 2024a]). To analyze the NRM data of both the section-half and the discrete cube samples, we used a modified version of the UPmag software (Xuan and Channell, 2009). The processed NRM inclination, declination (including orientation-corrected declination where available), and intensity data after 20 mT AF demagnetization are shown in Figures F18, F19, and F20. The processed NRM data of the cube samples are shown in Figure F21.
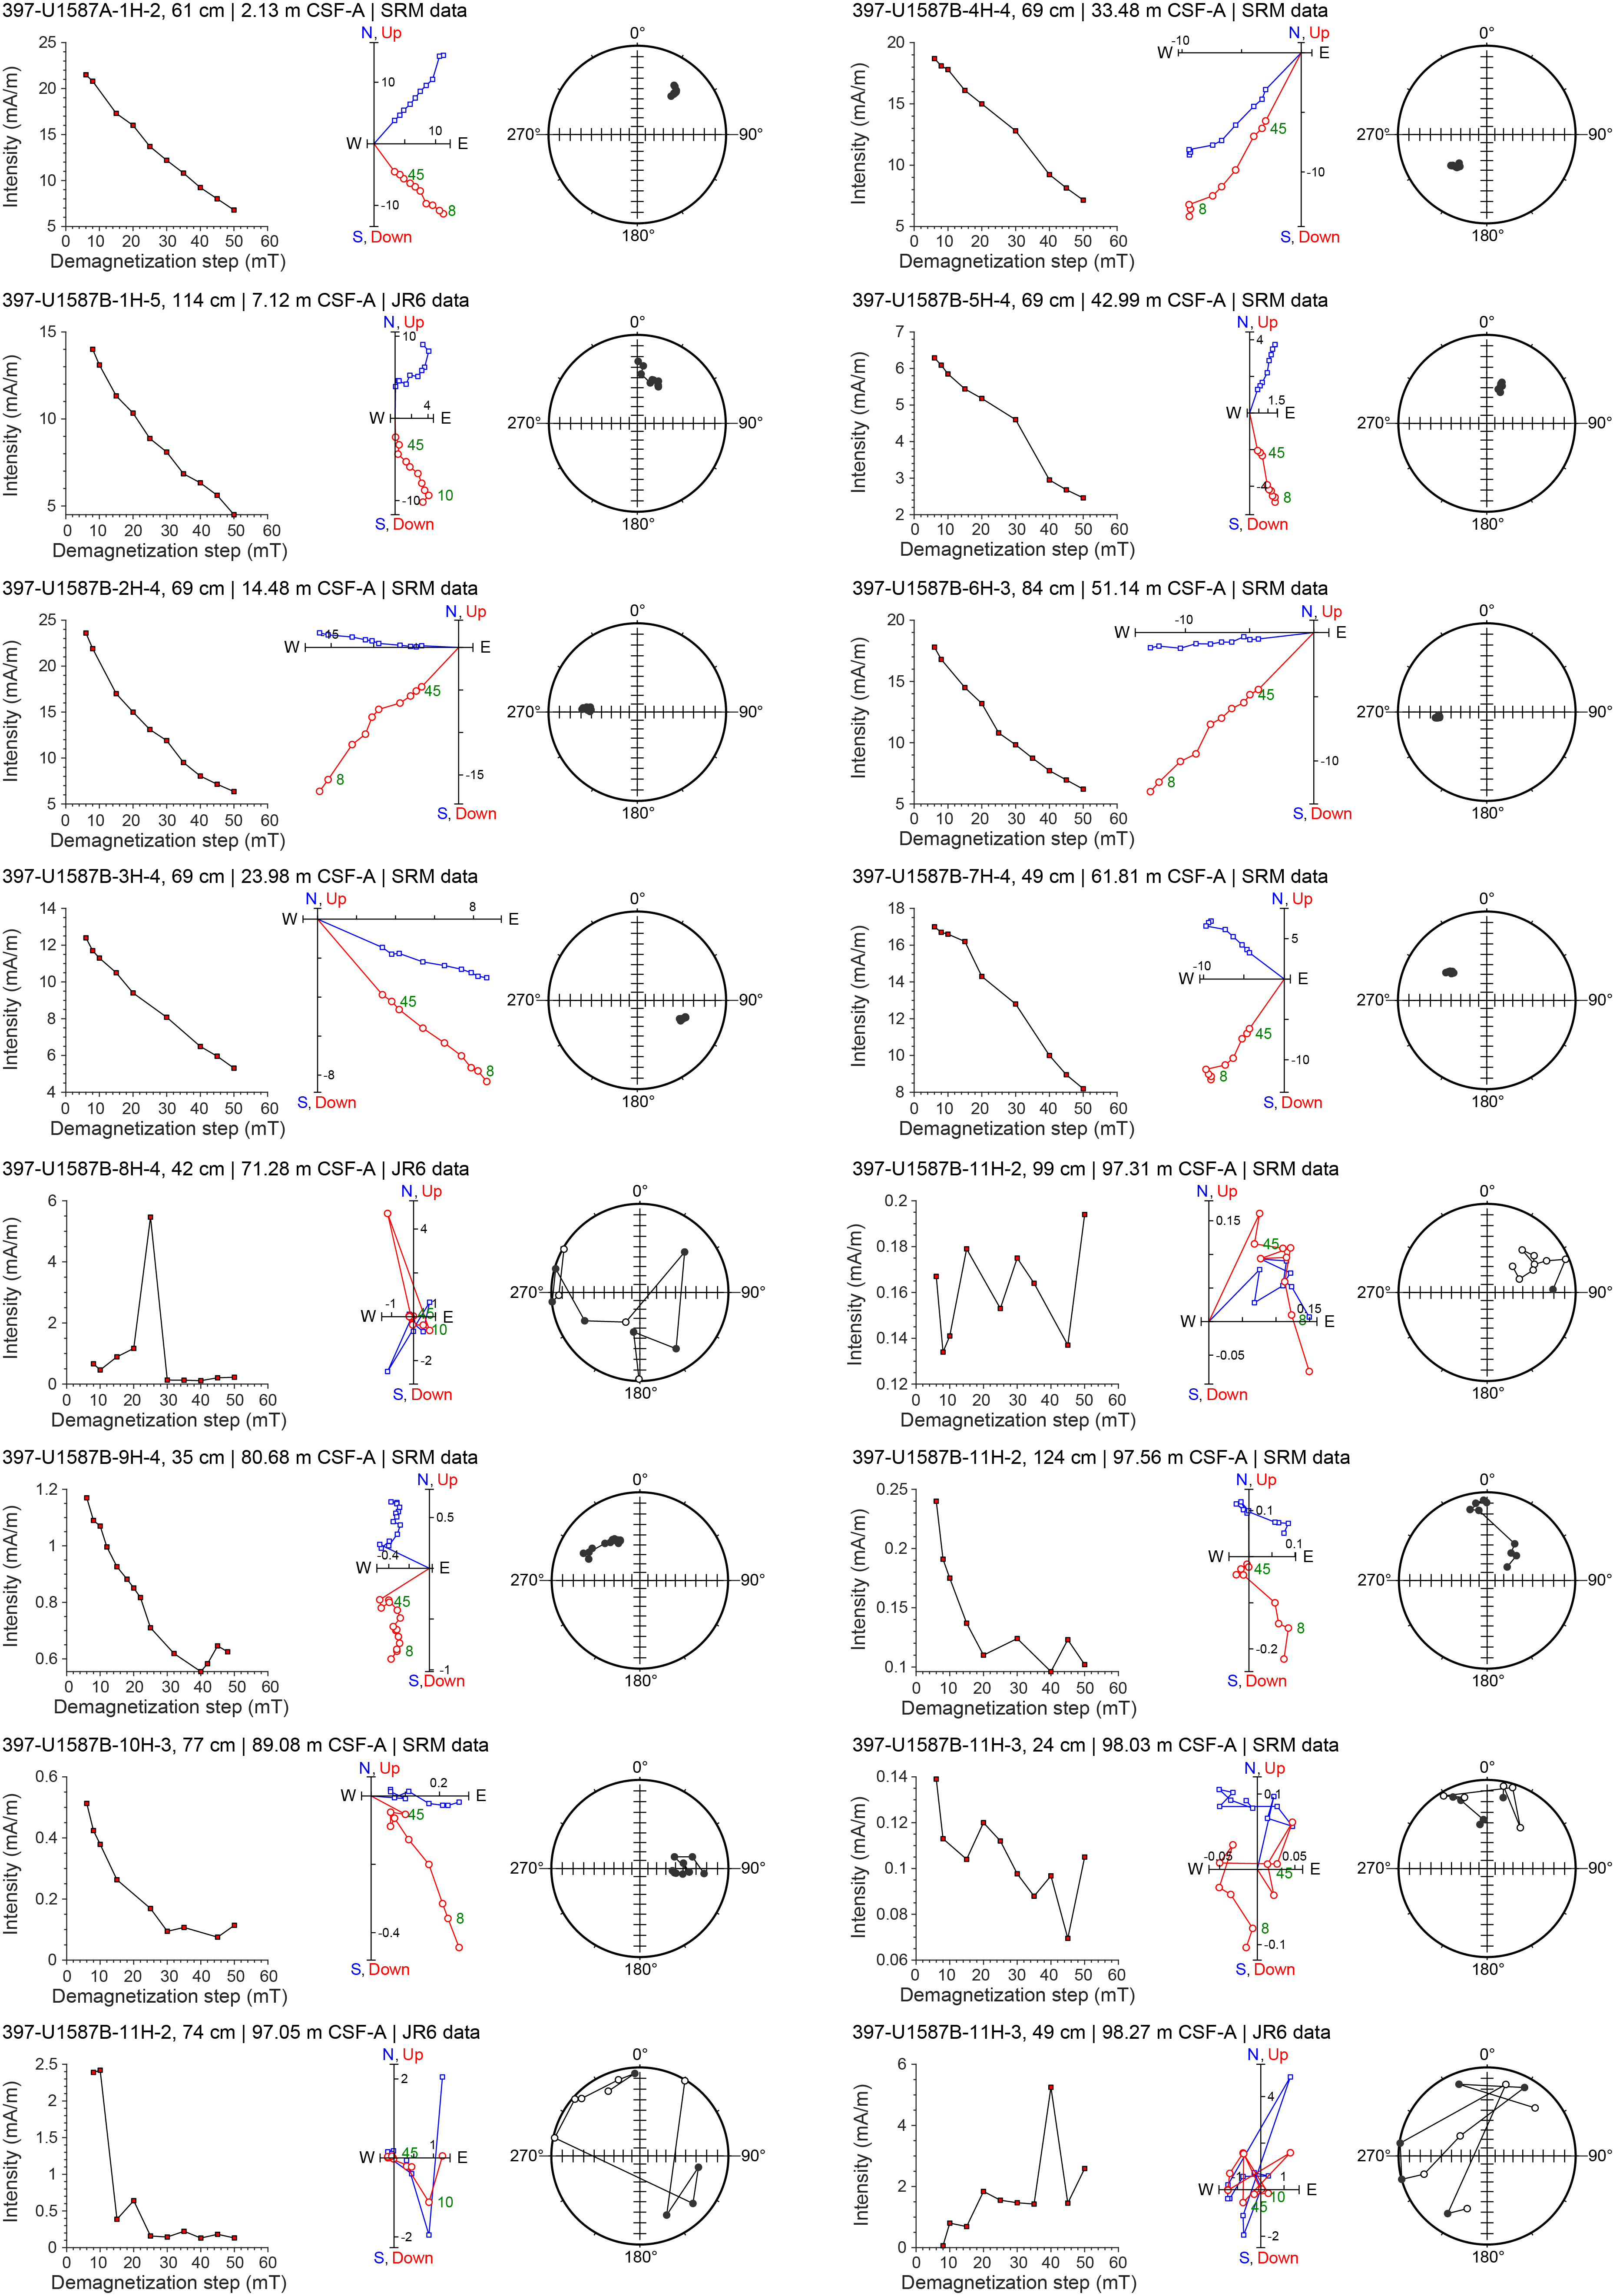
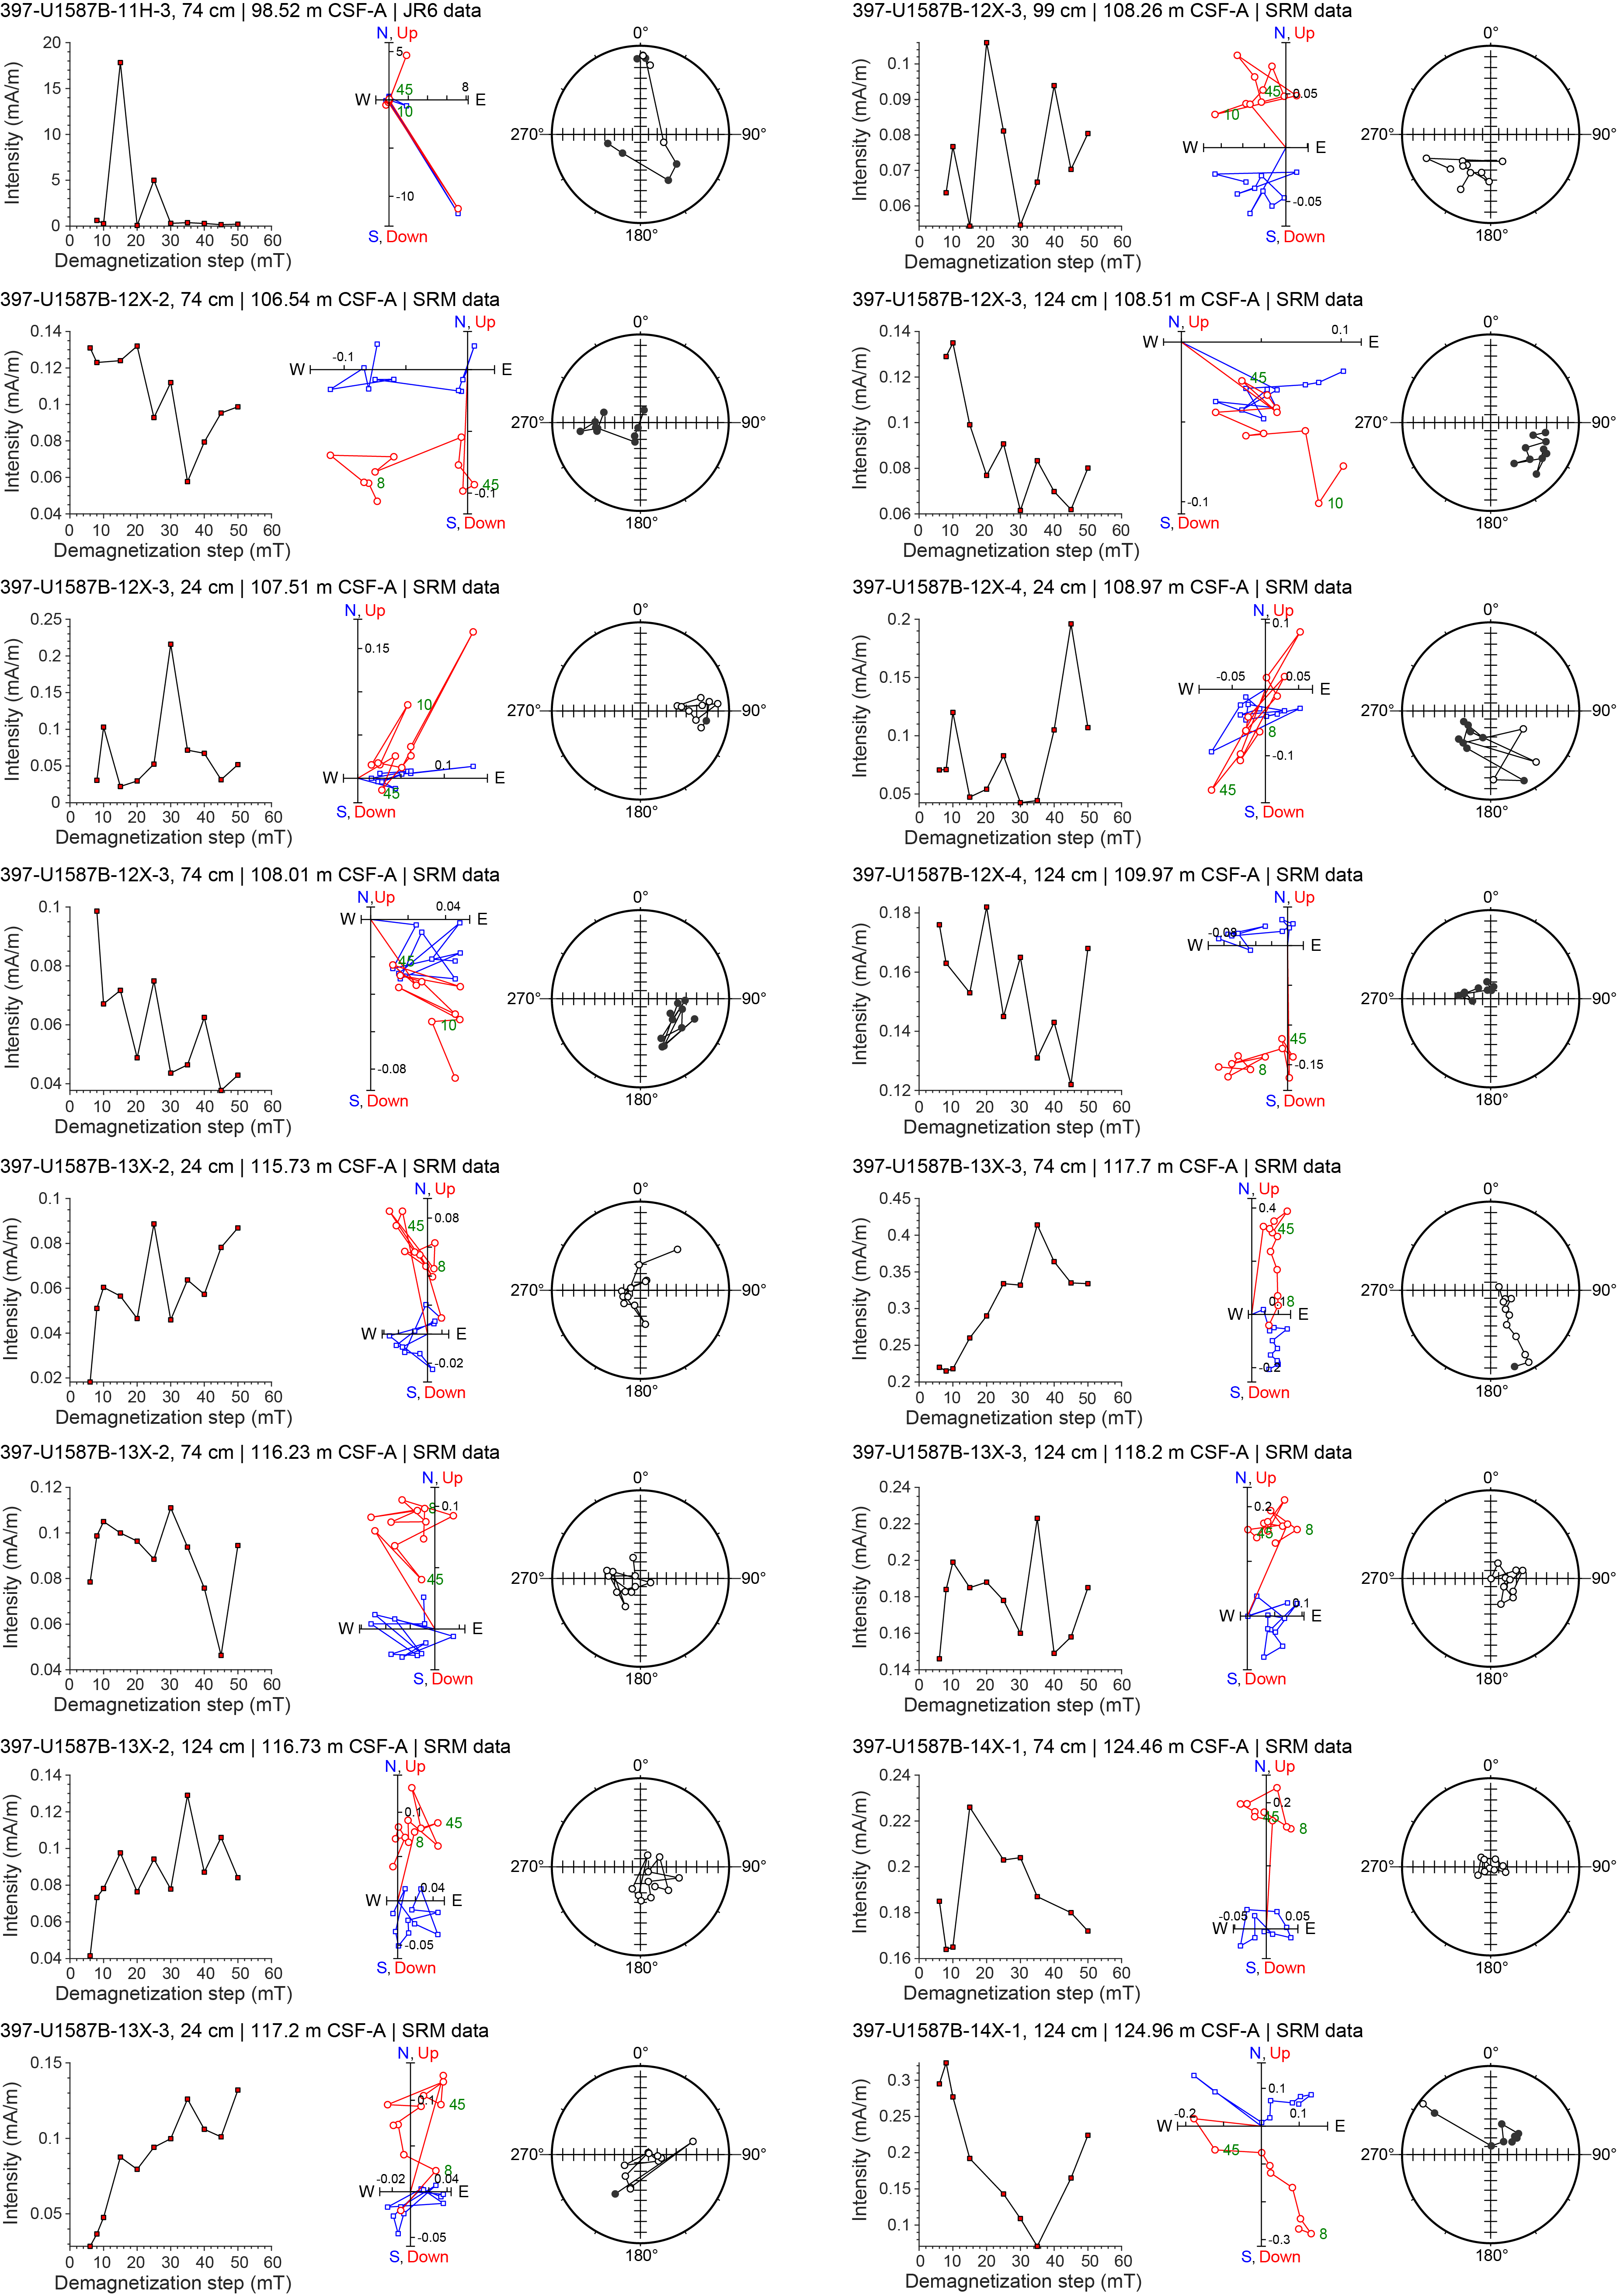
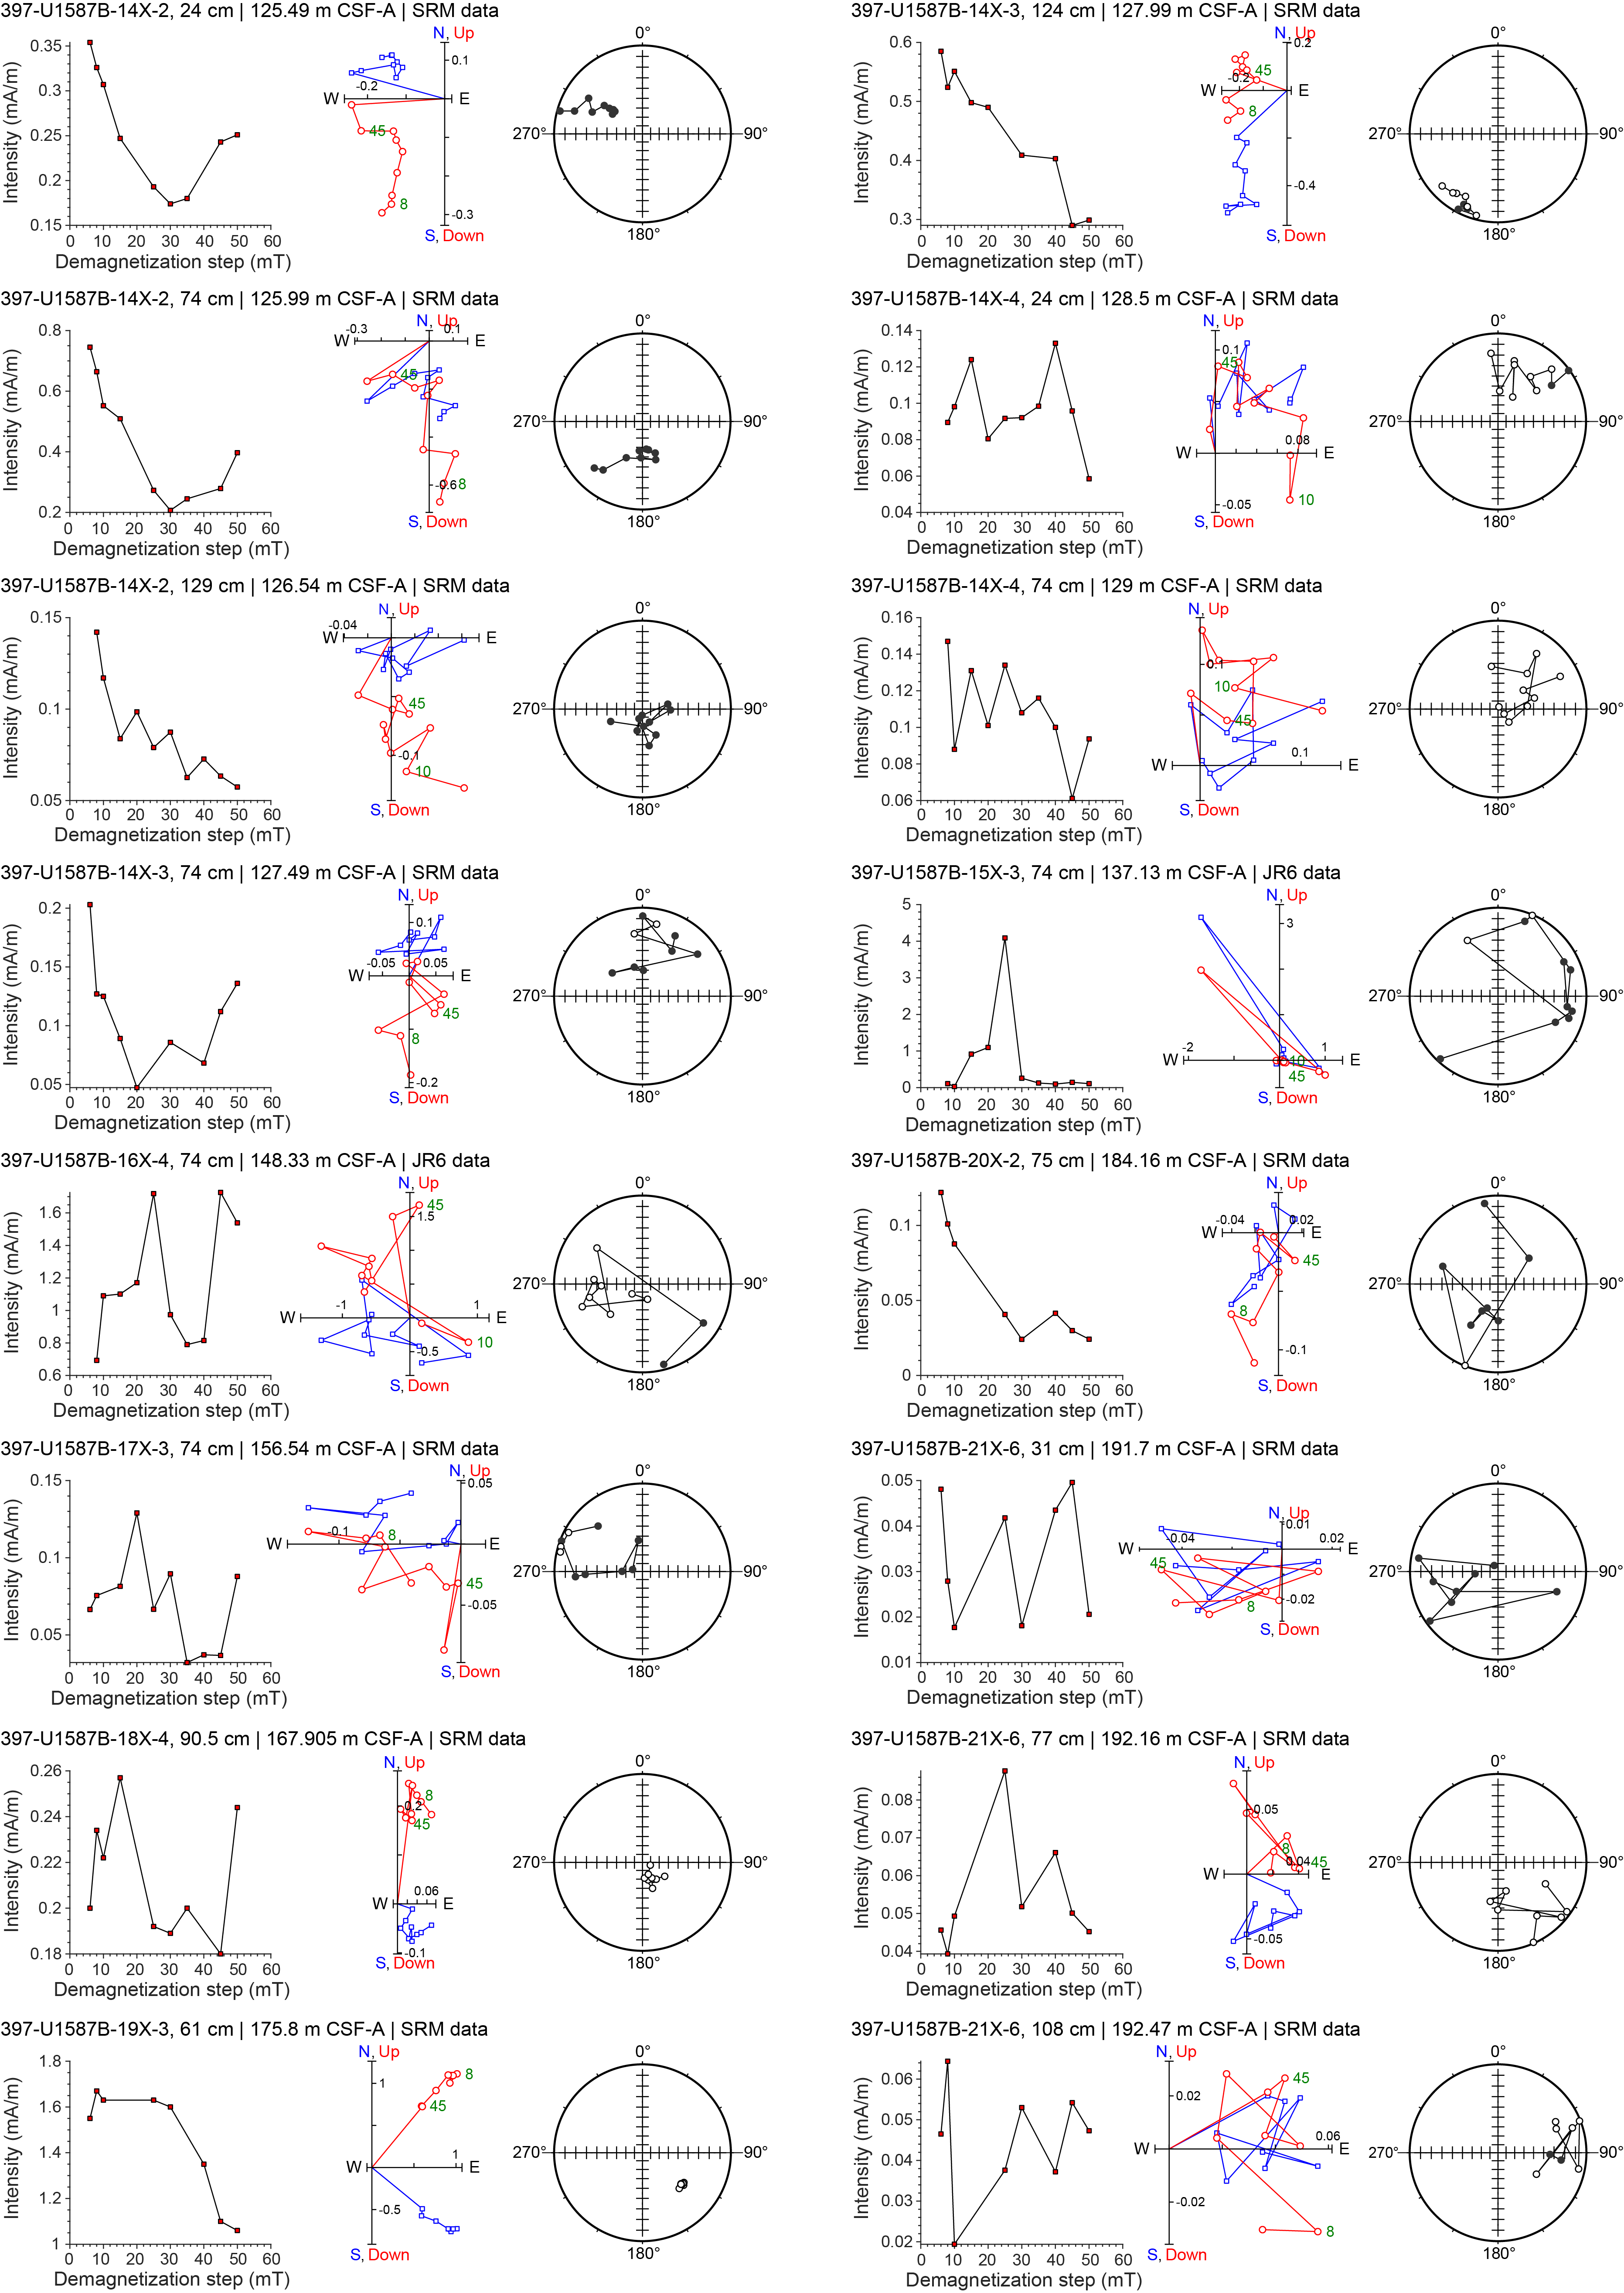
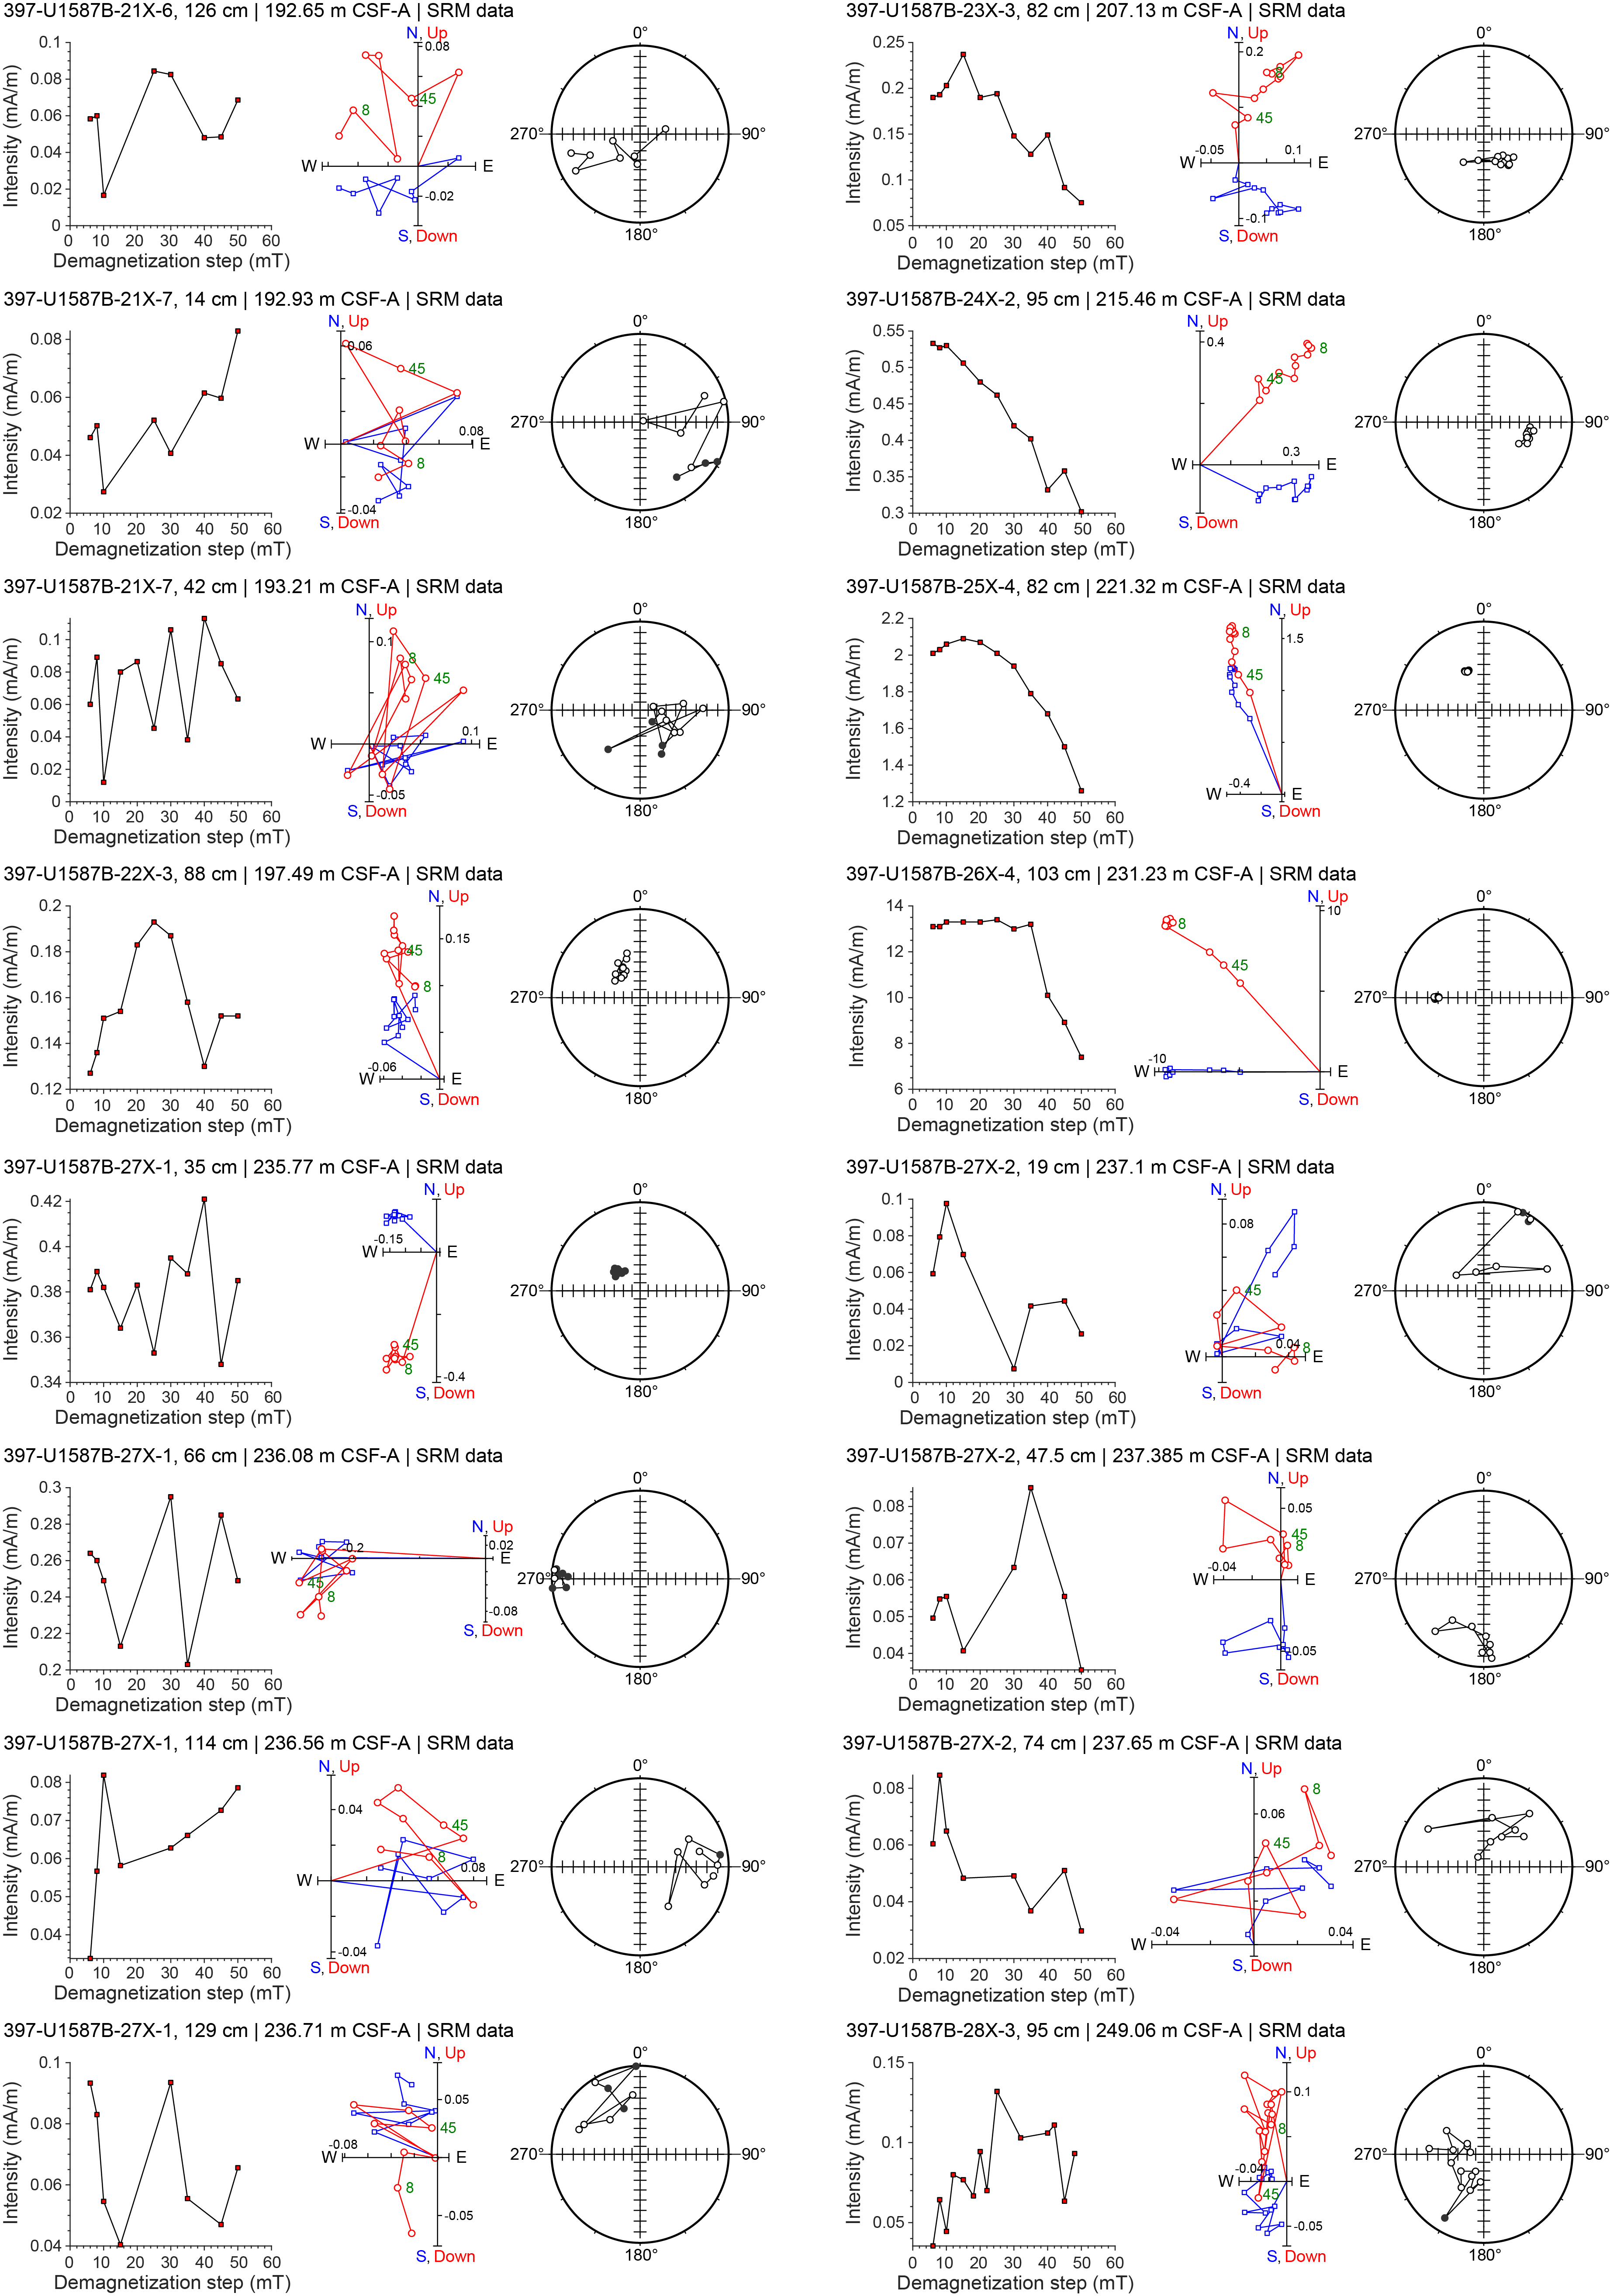
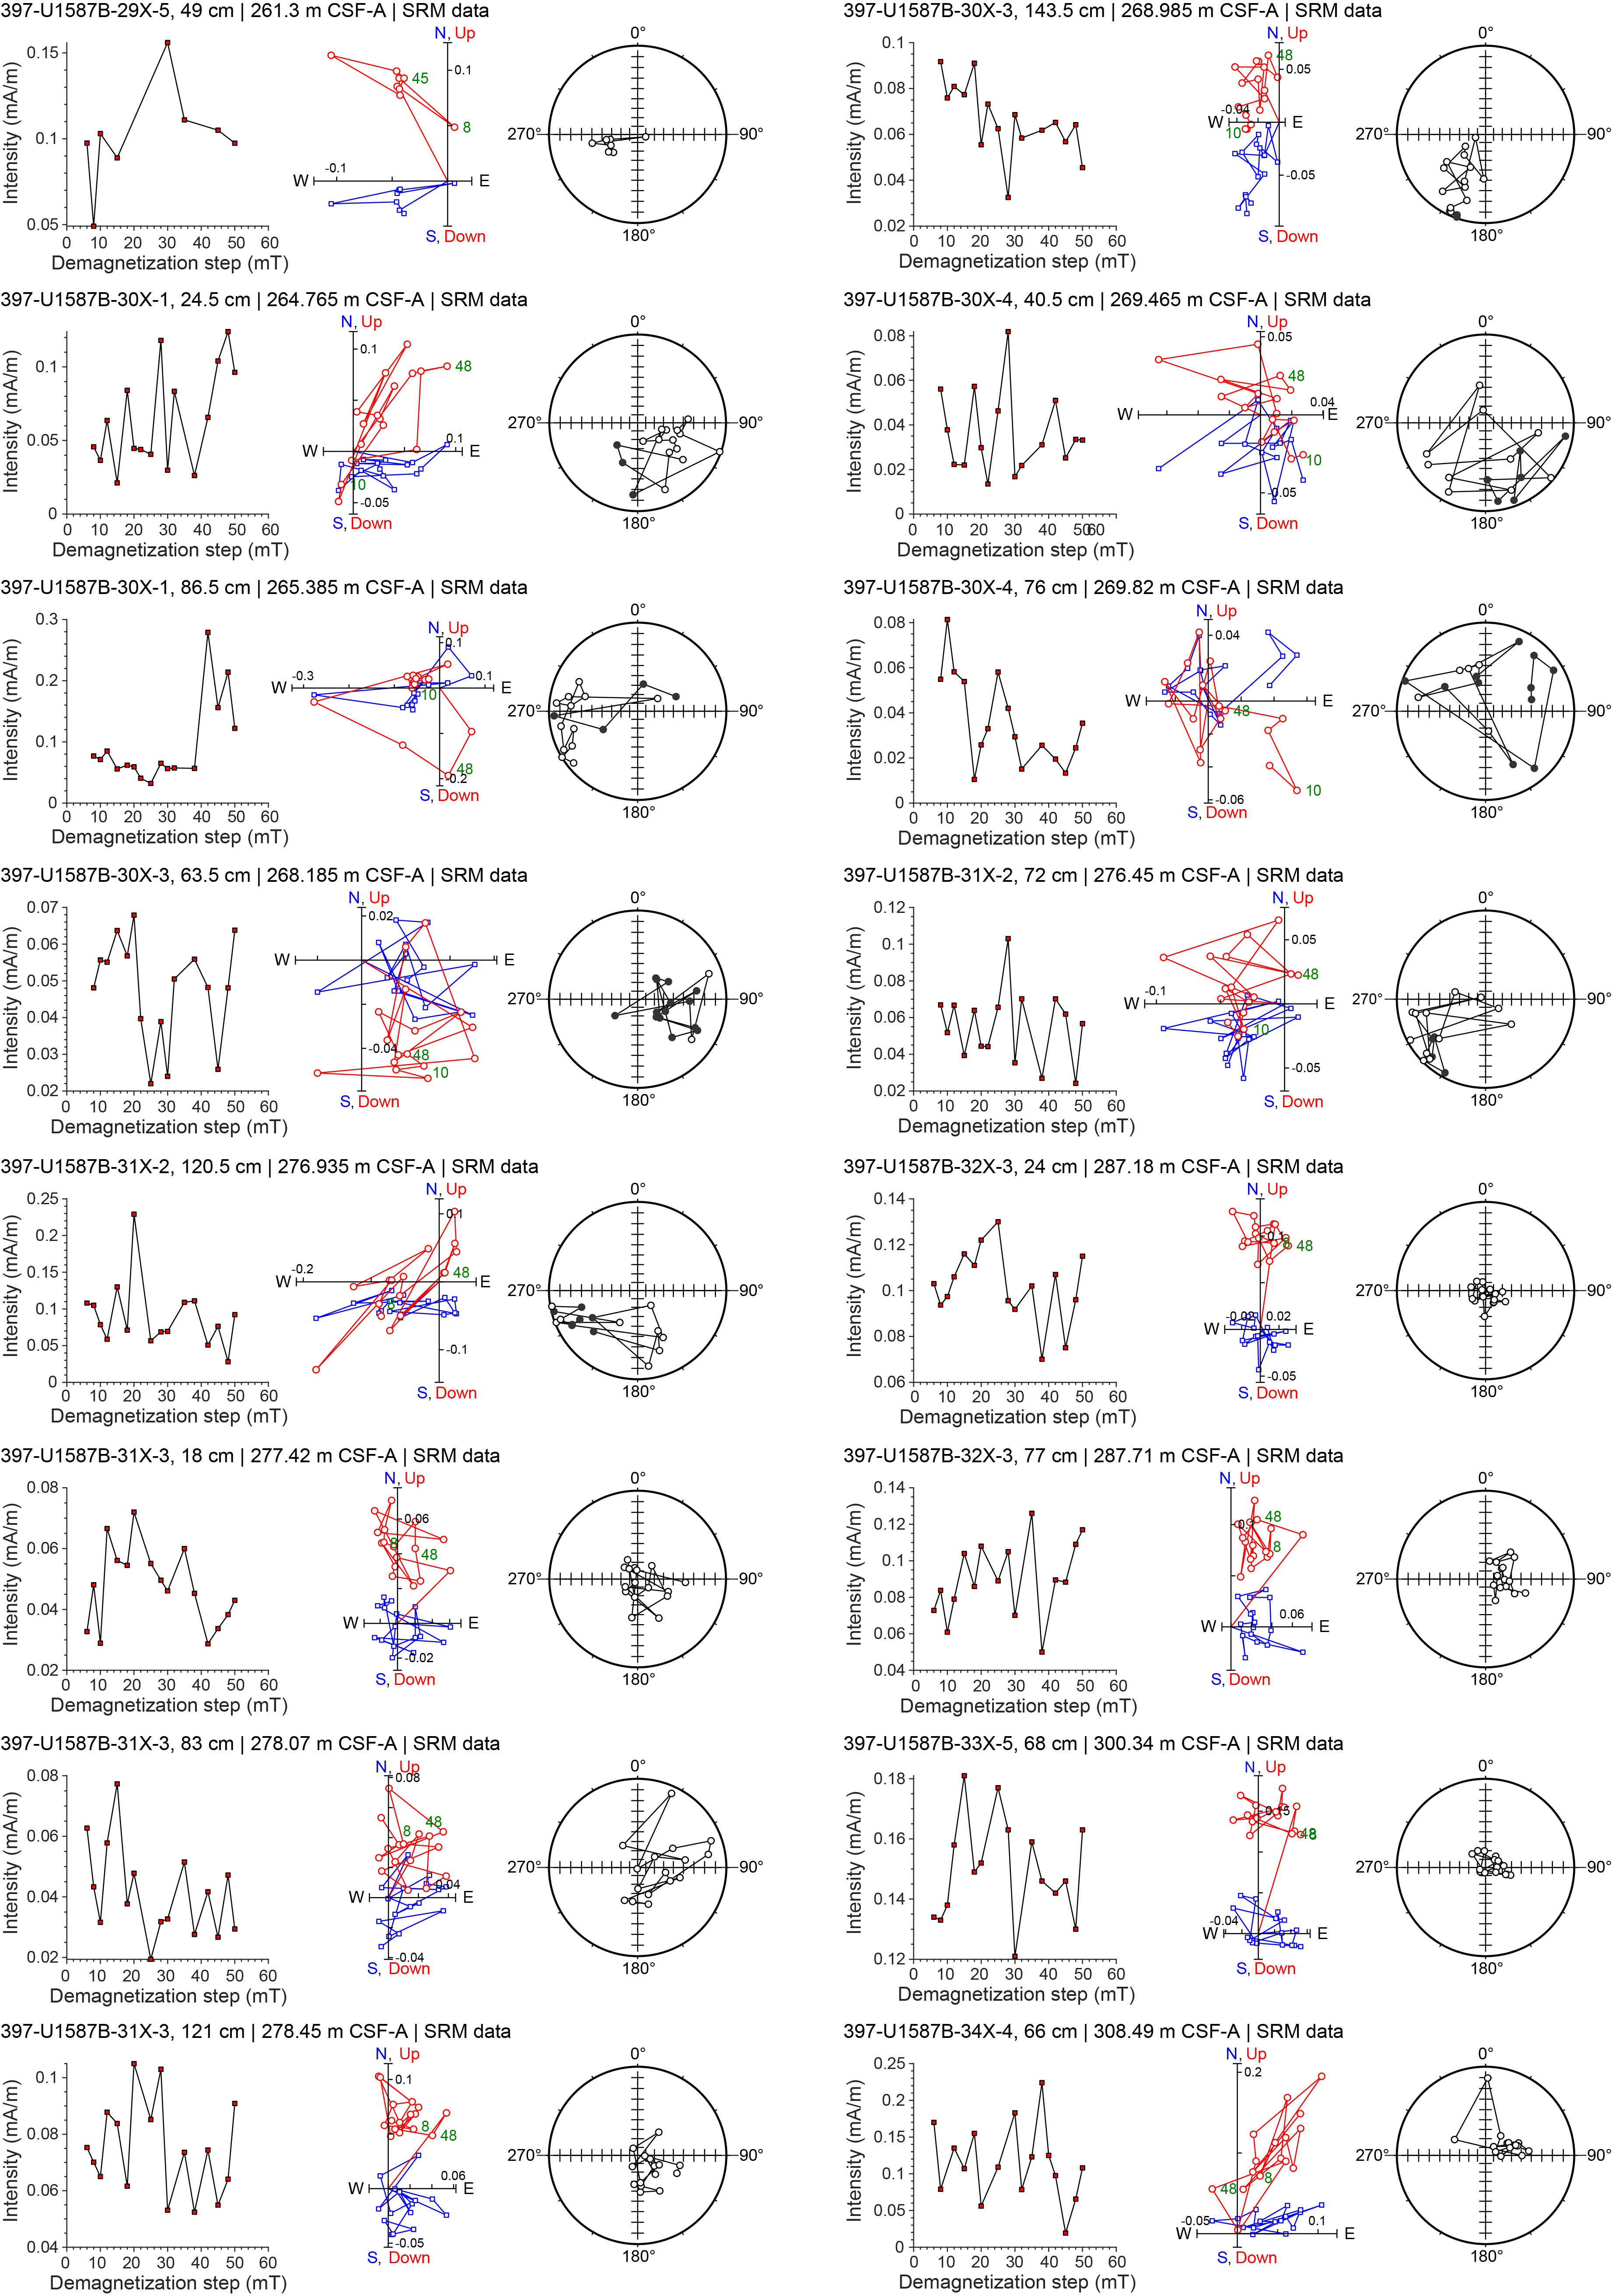
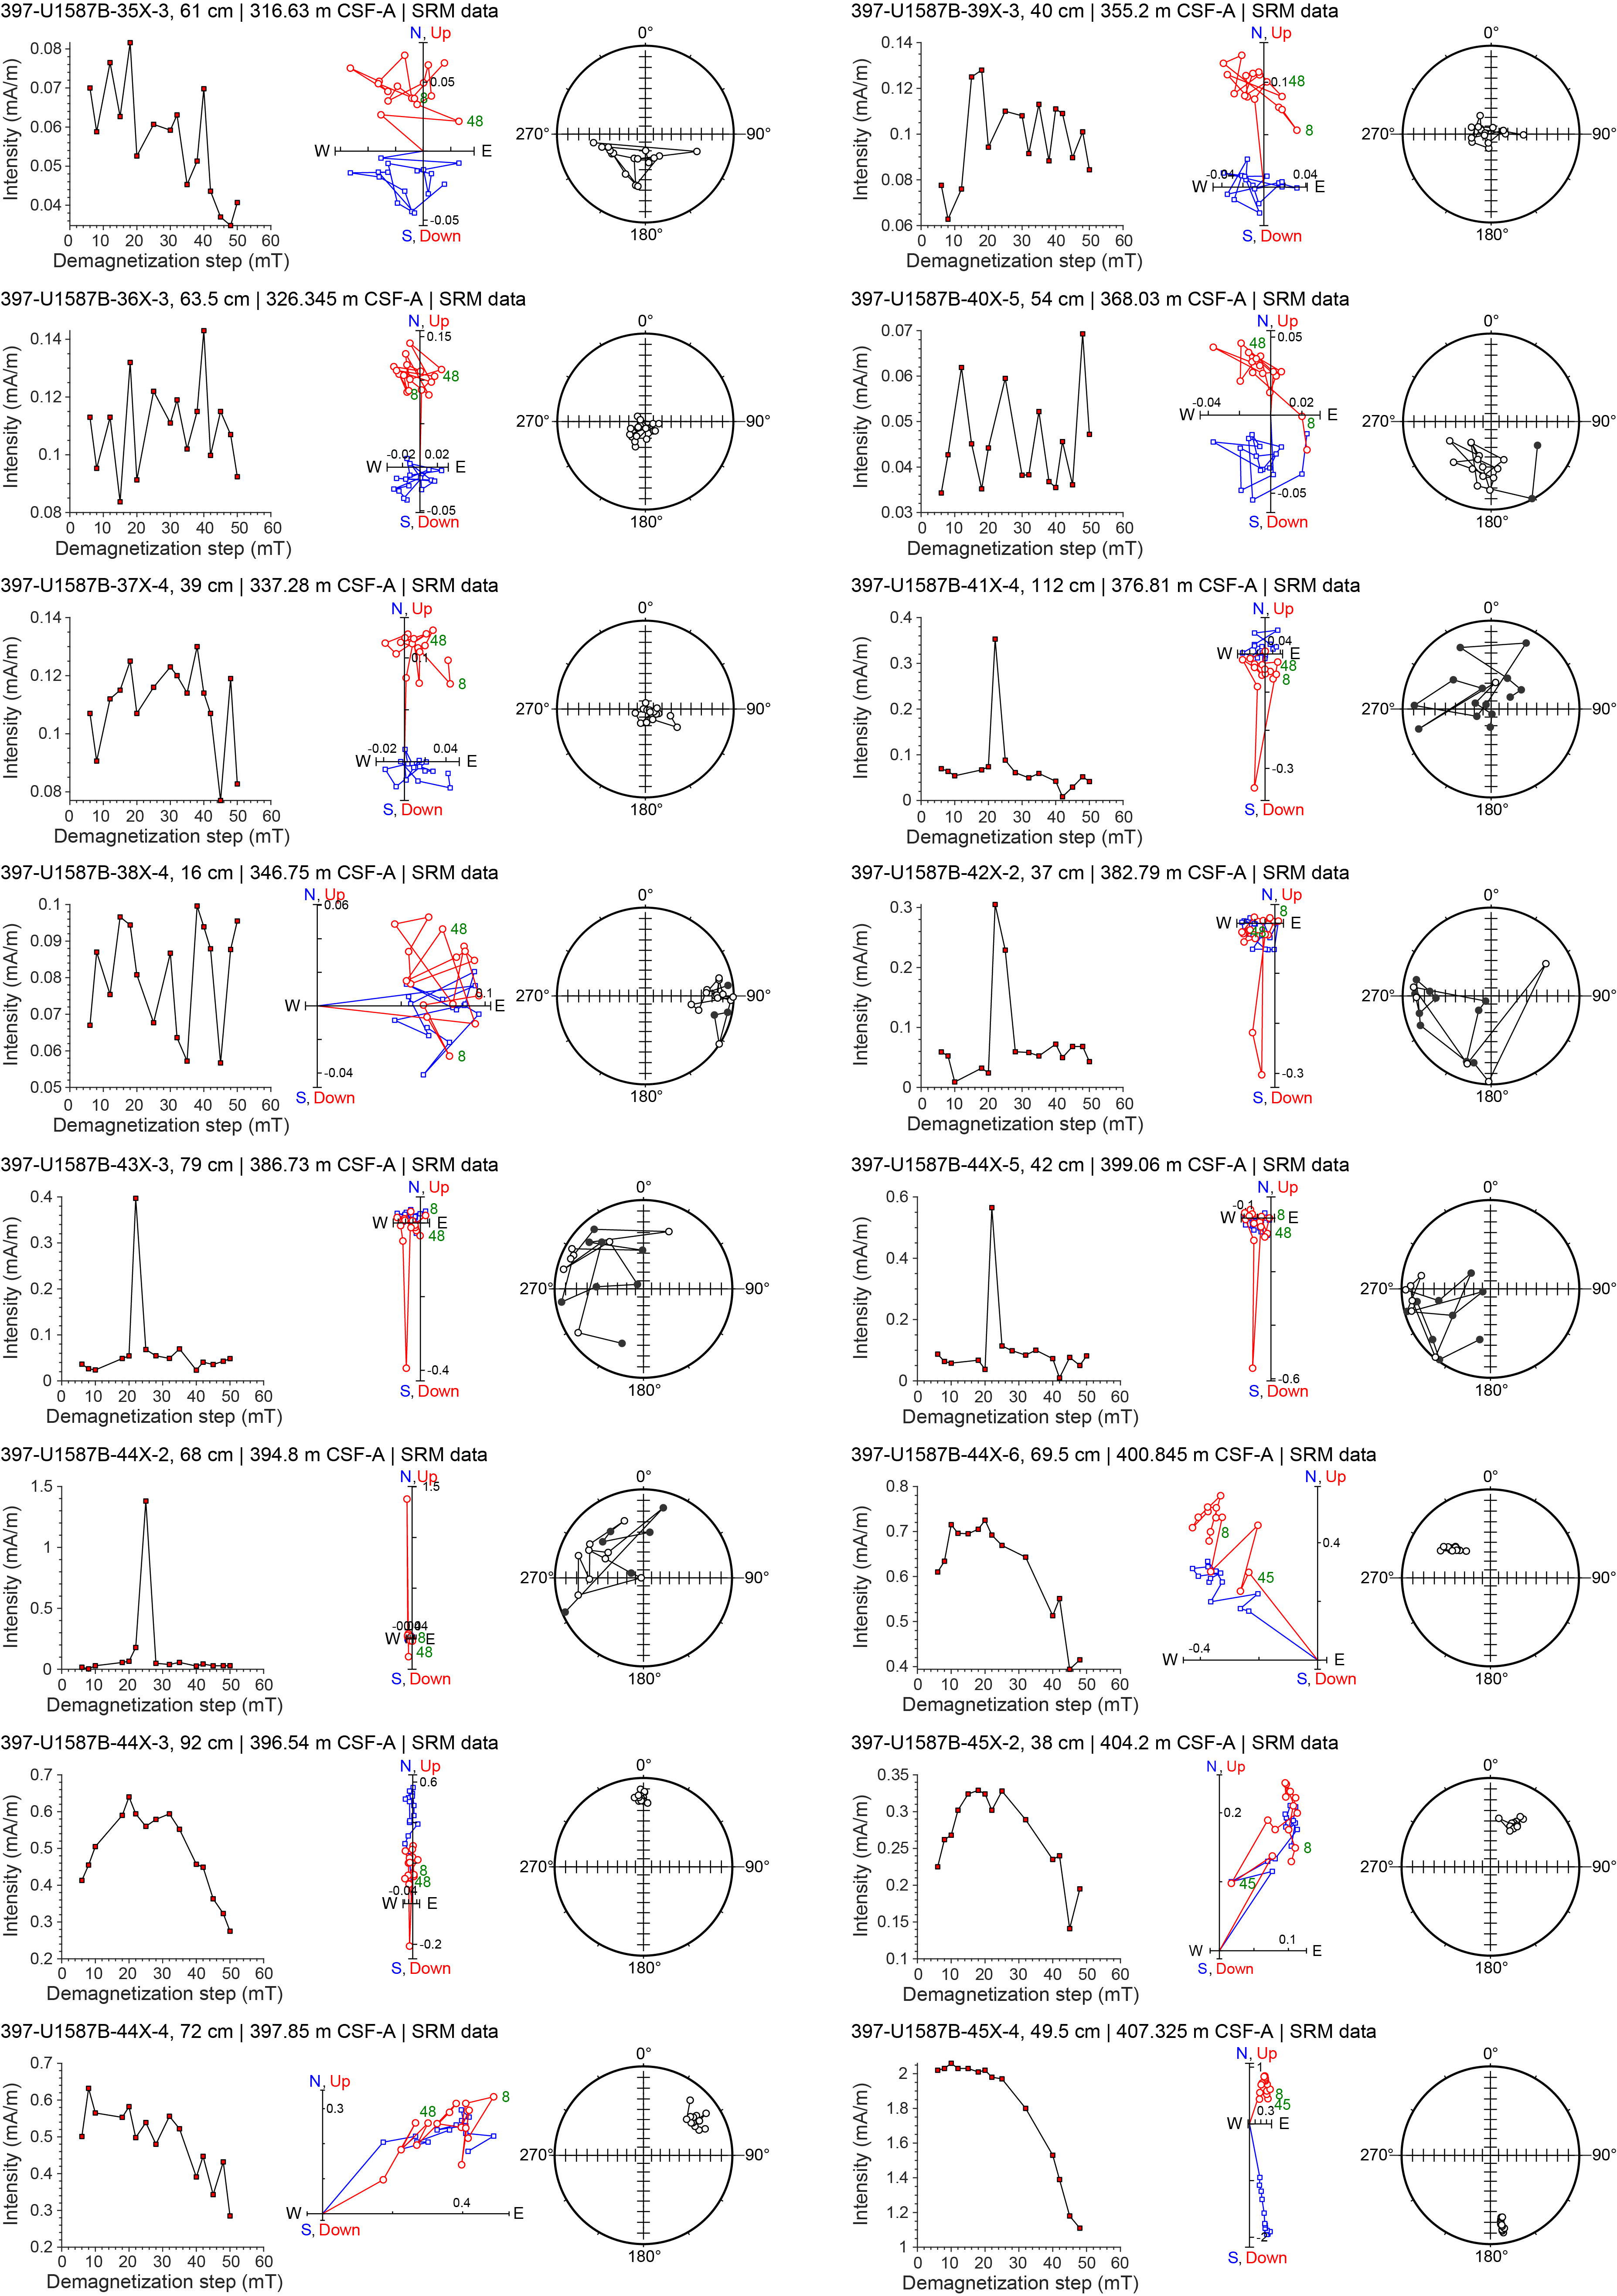
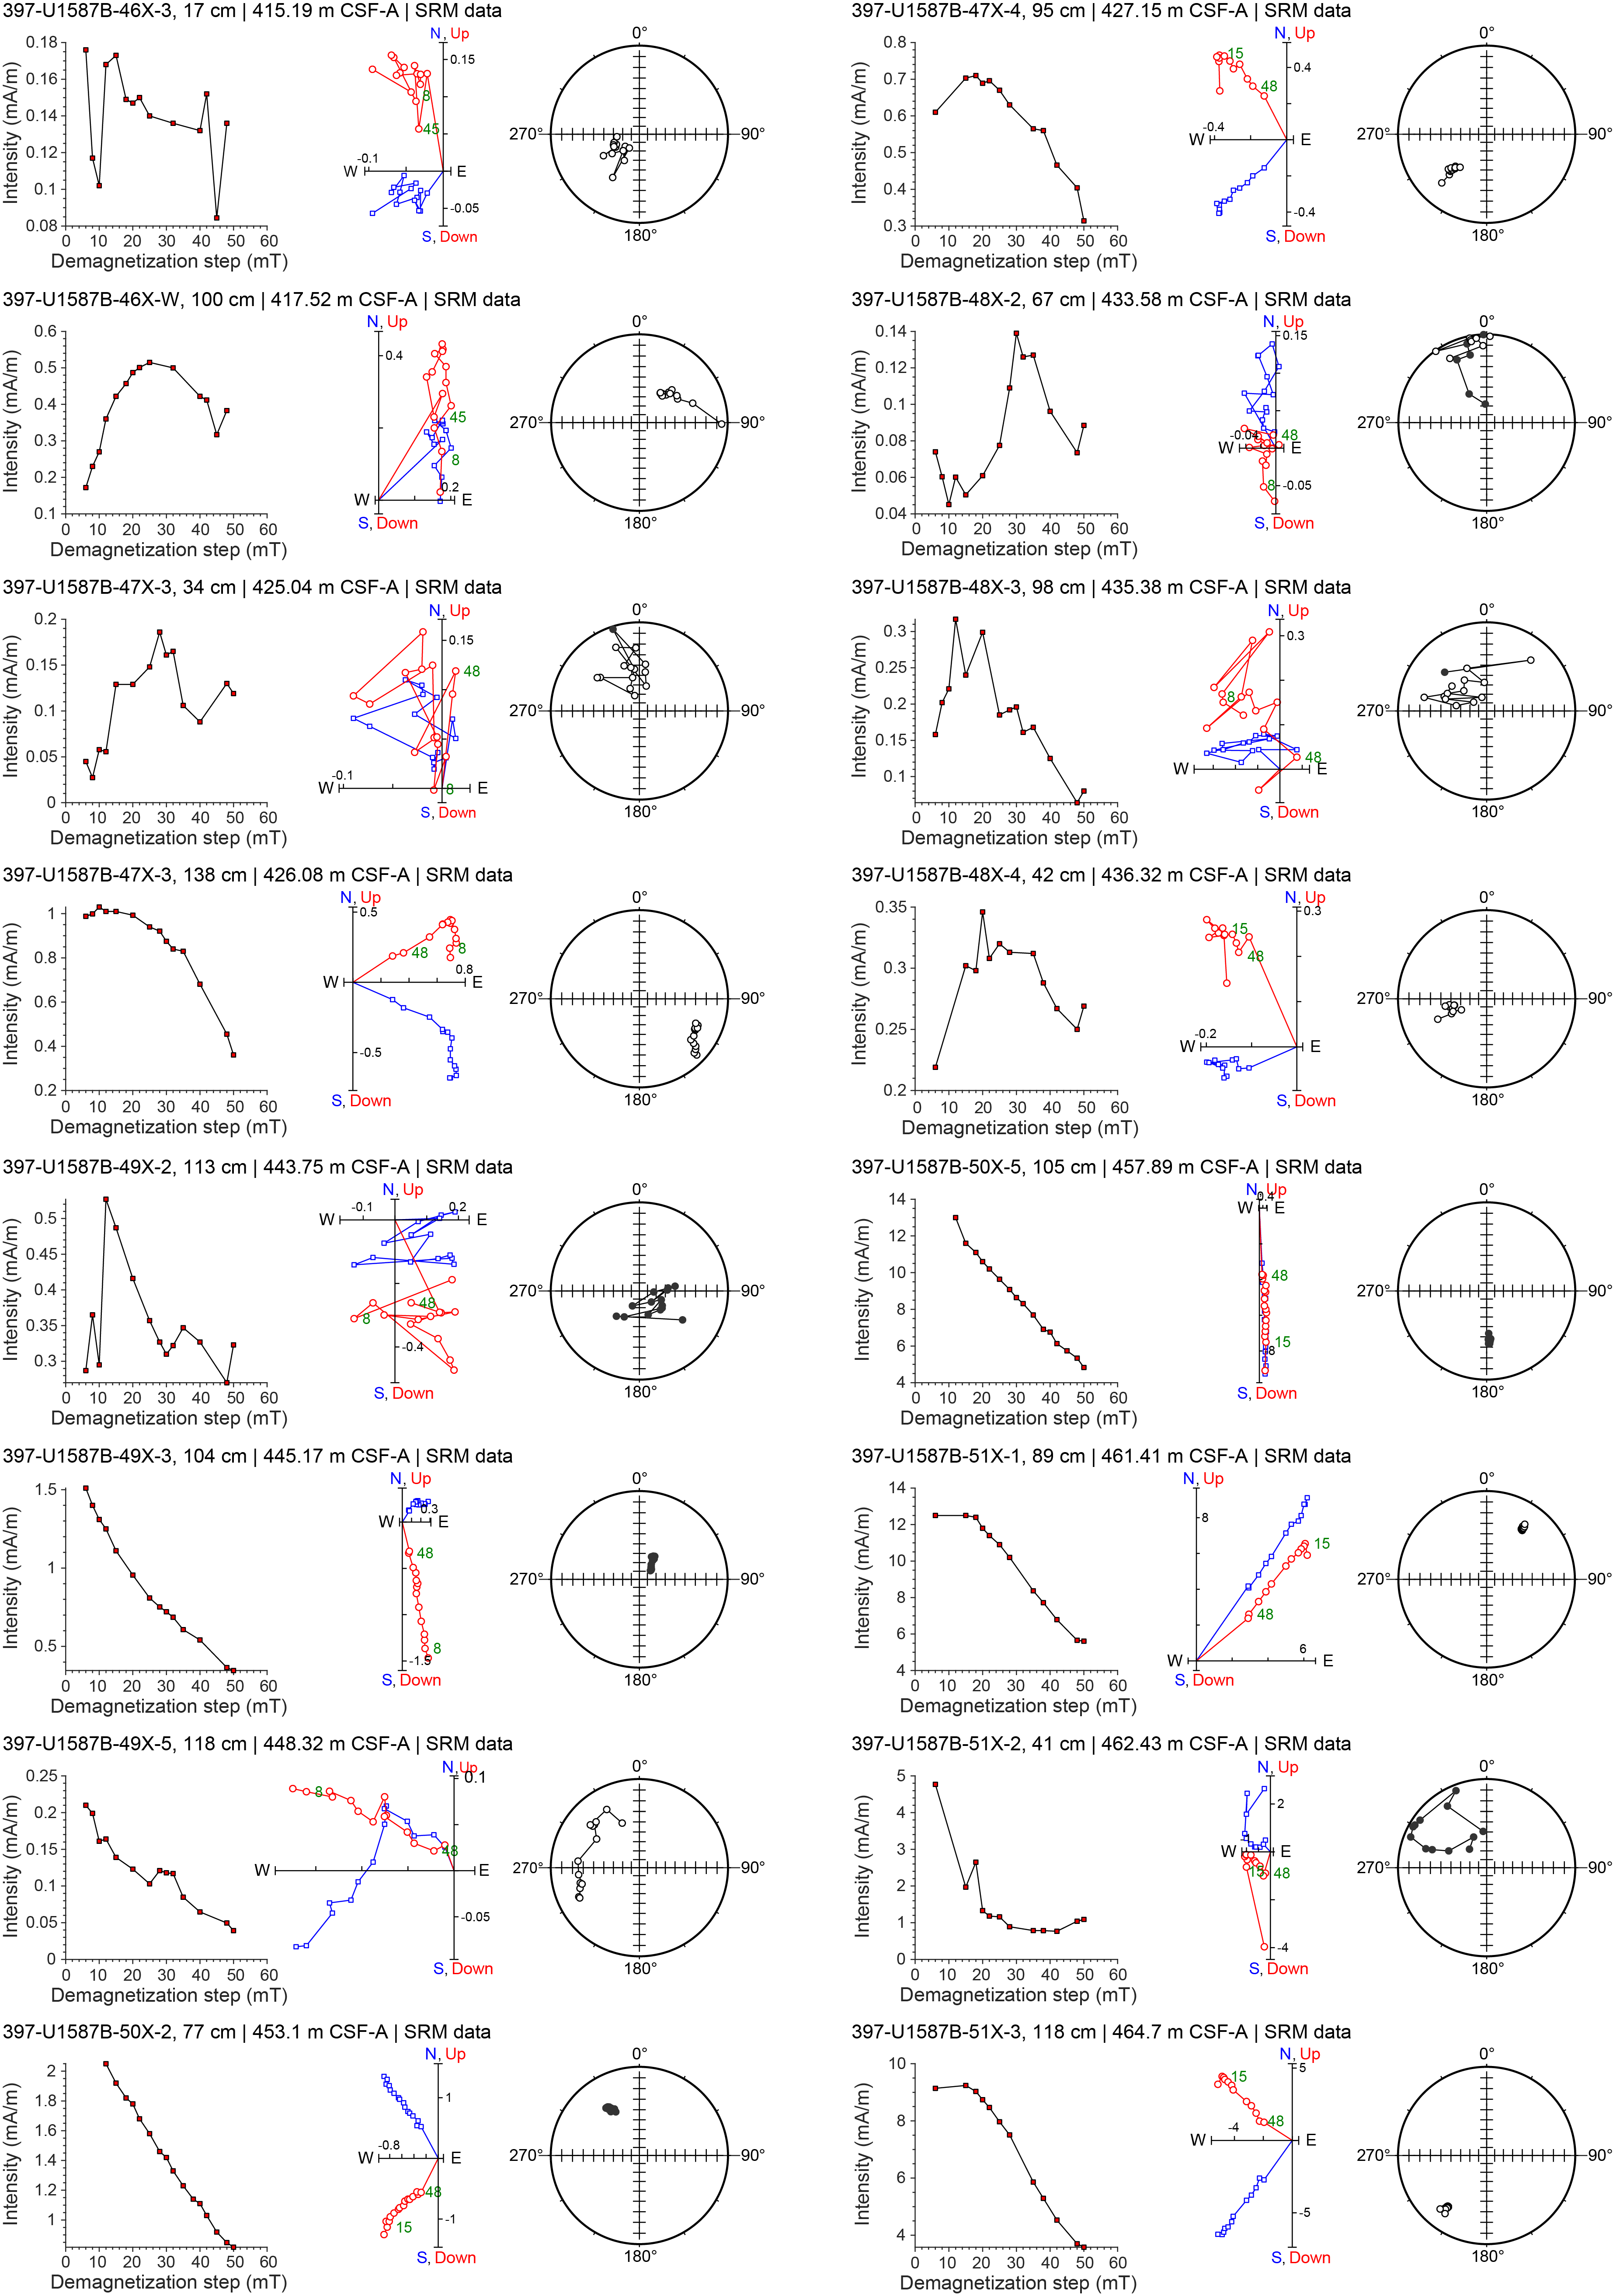
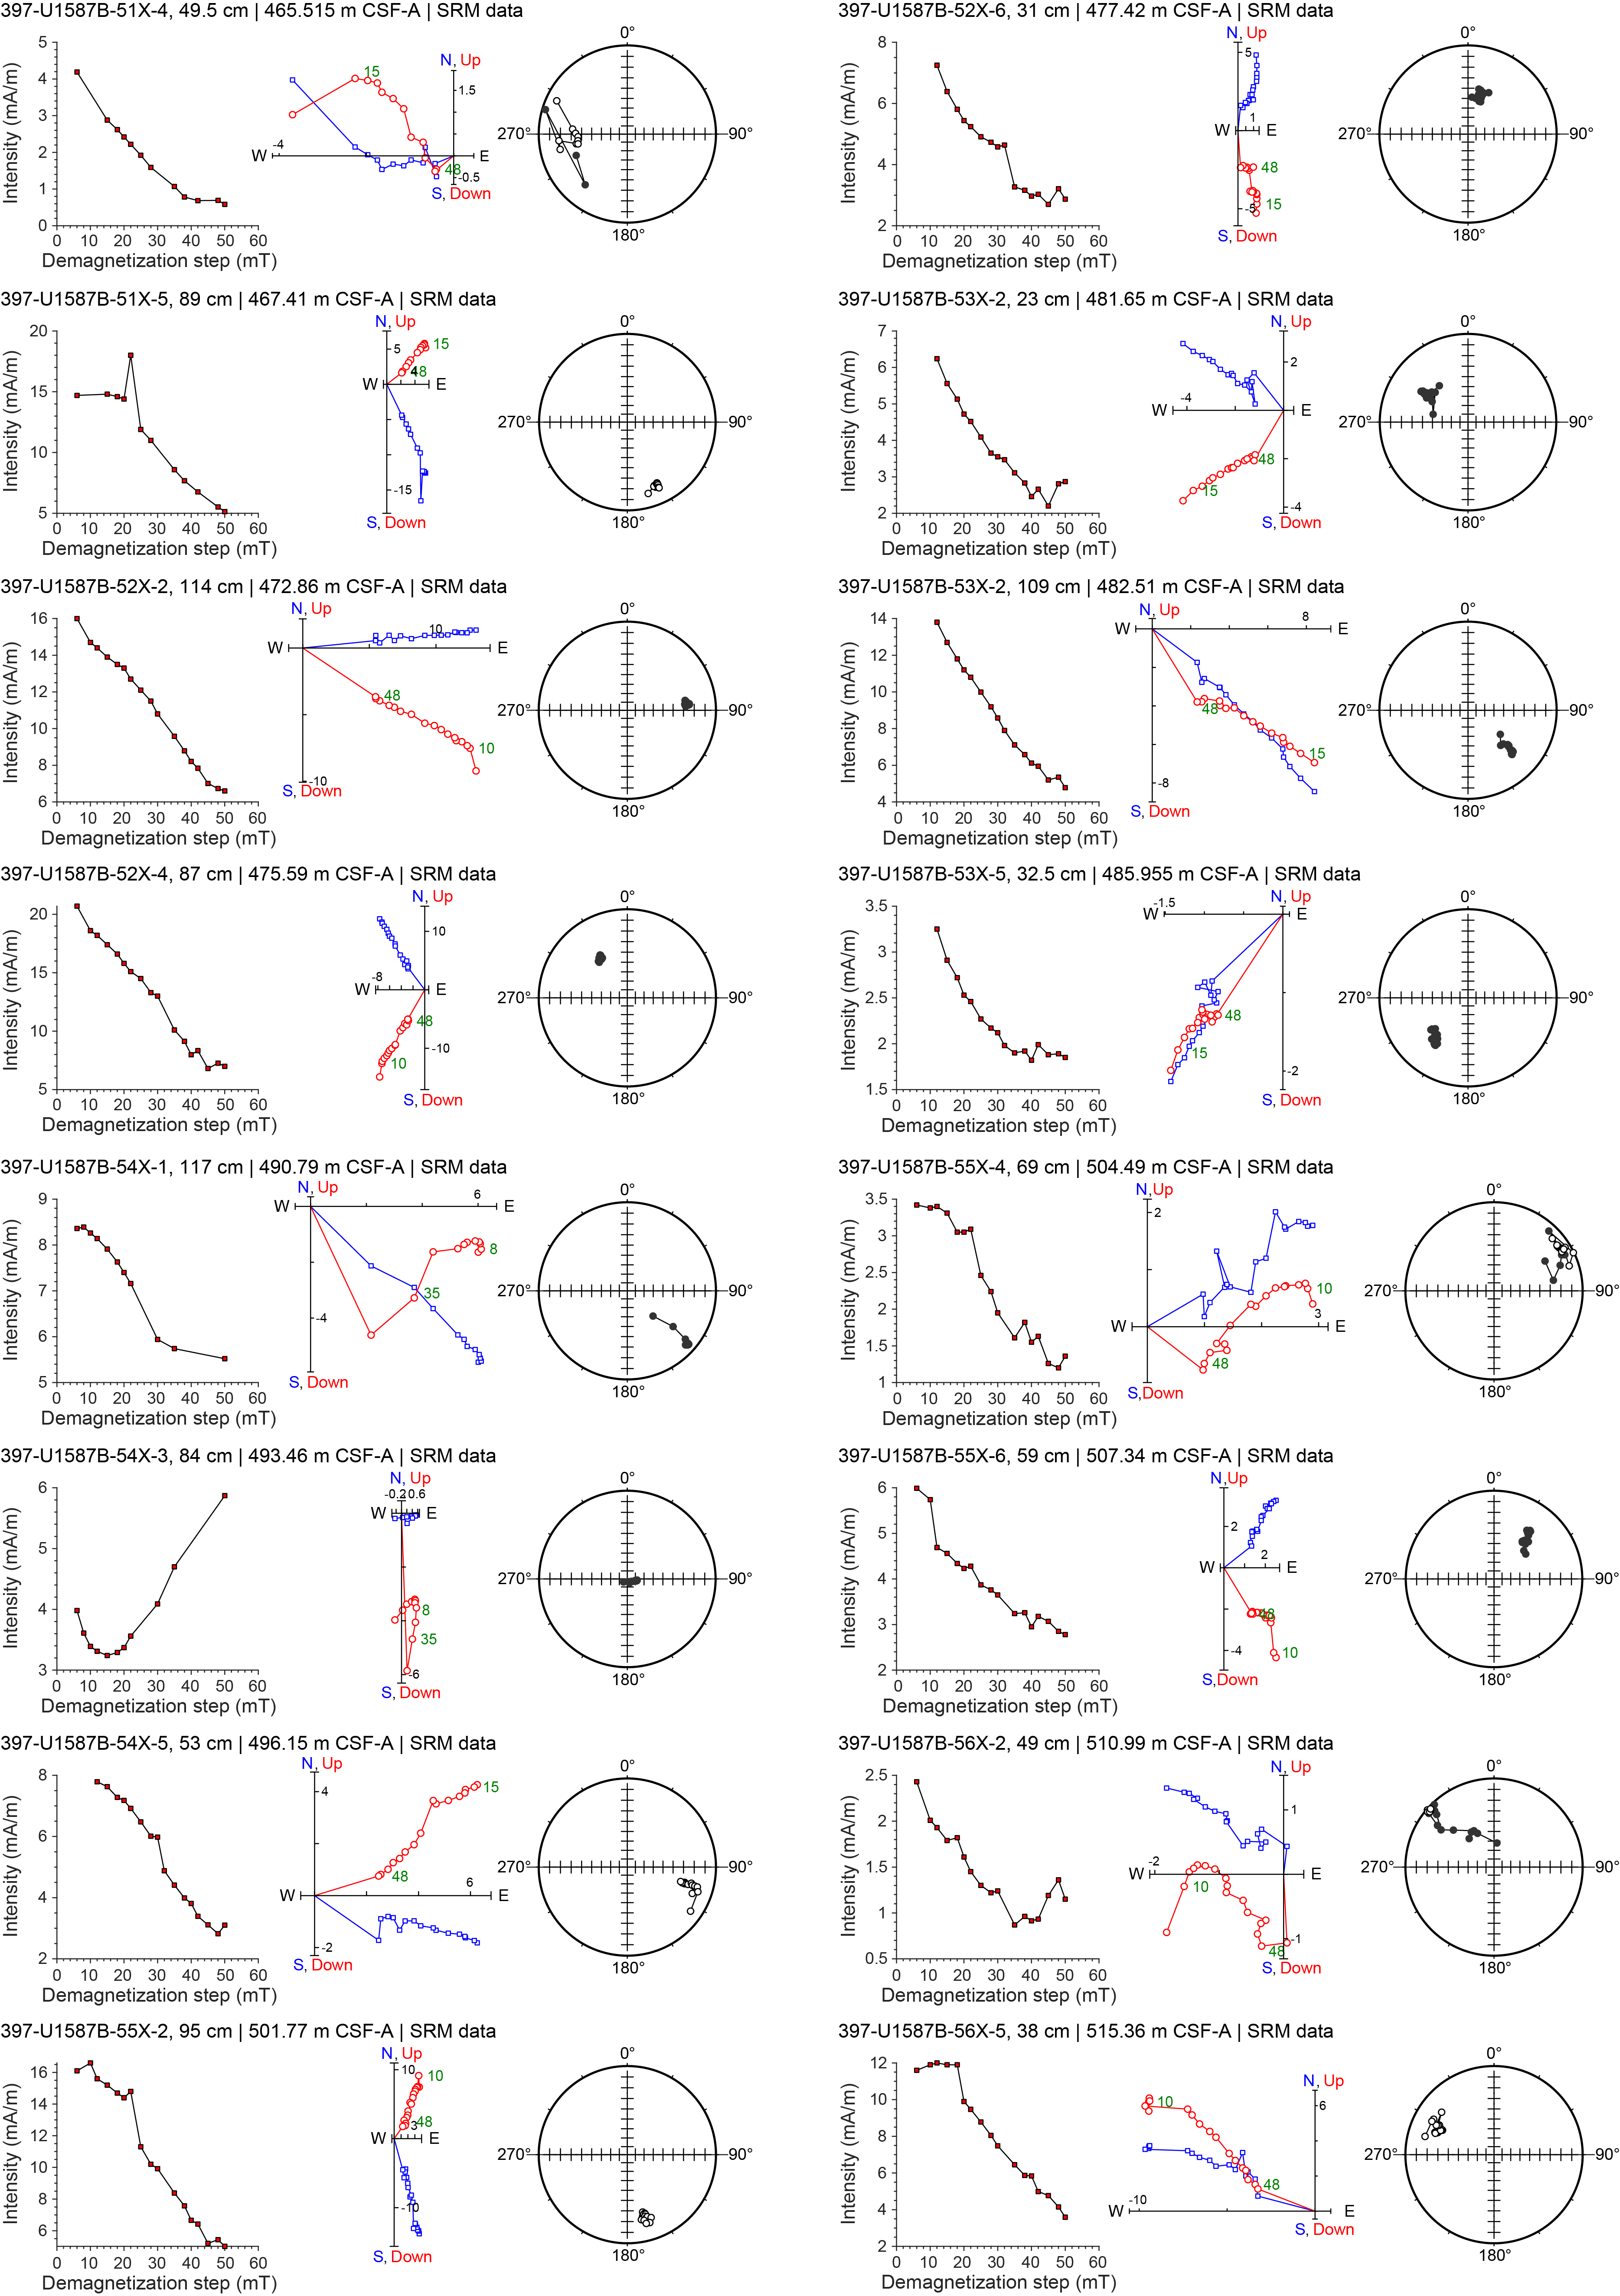
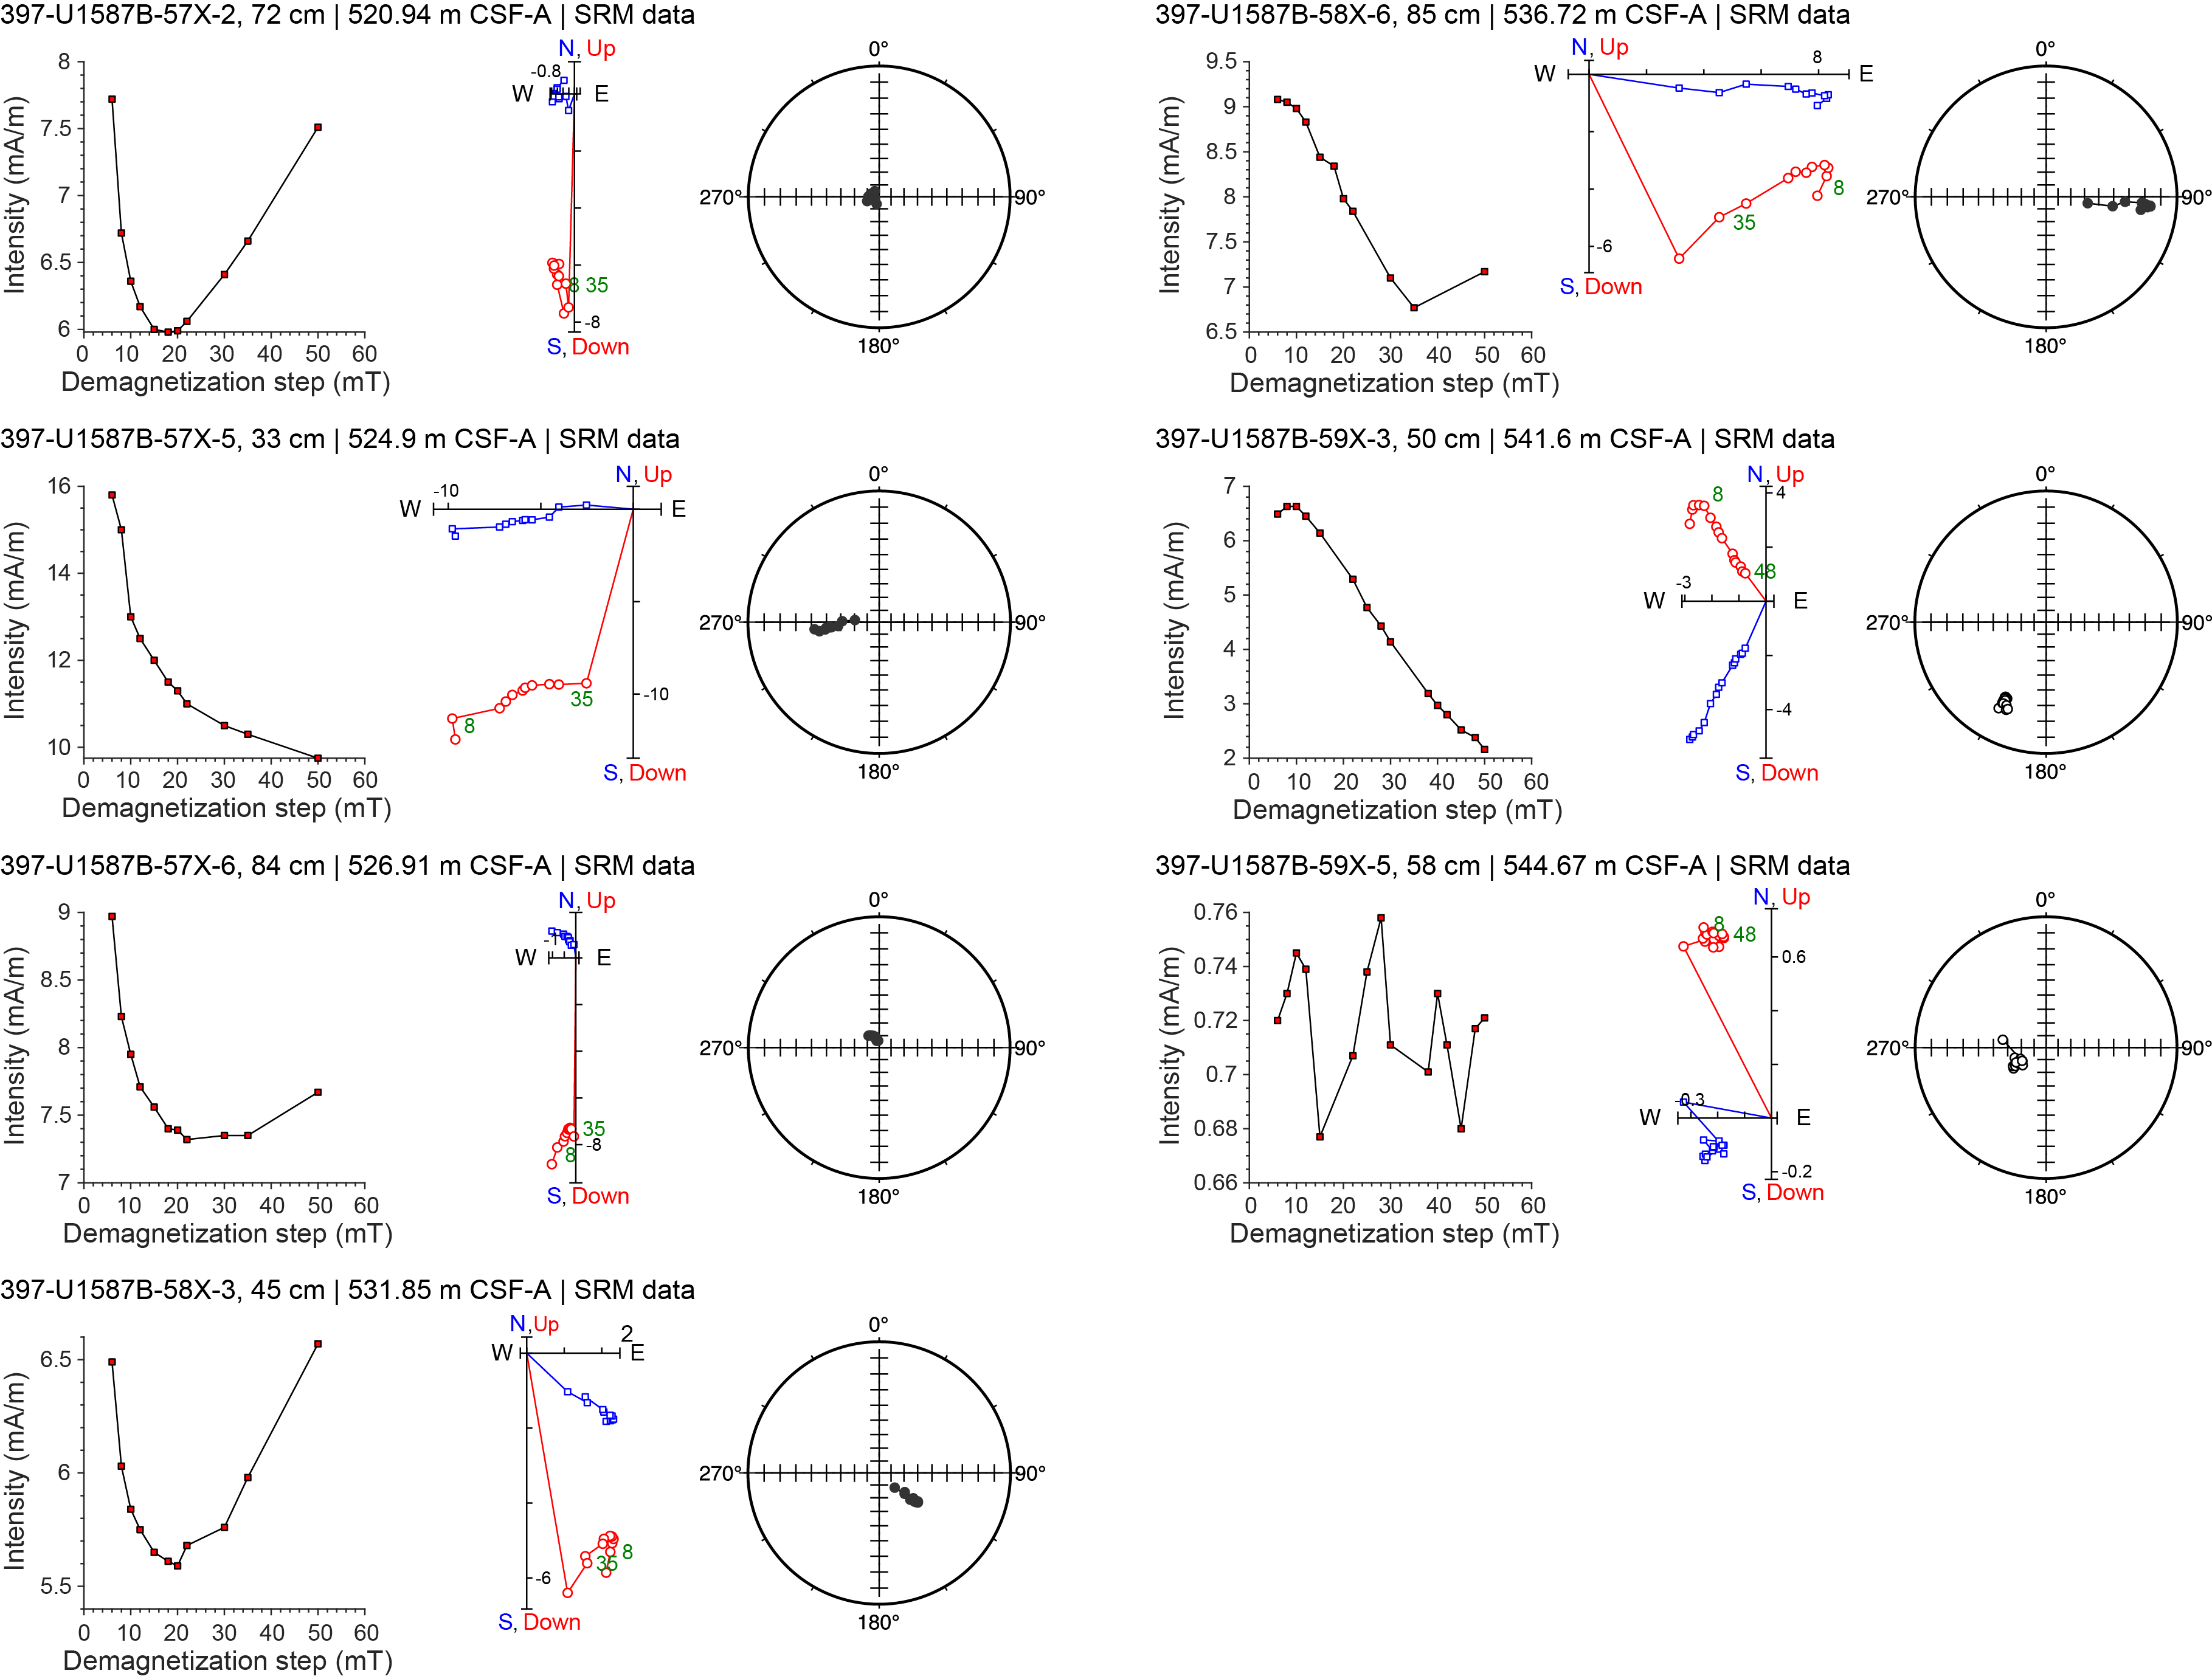
Figure F21. Discrete cube sample AF demagnetization.
5.1. Natural remanent magnetization intensity and magnetic susceptibility
NRM intensities after 20 mT AF demagnetization (NRM20mT) for cores from all three holes are similar in magnitude for overlapping depth intervals (Figures F18, F19, F20). NRM20mT intensity is on the order of 10−2 A/m for the upper ~40 m and decreases to the order of 10−4 to 10−3 A/m between ~40 and 100 m CSF-A. Between ~100 and 395 m CSF-A, NRM20mT intensity is low and mainly on the order of 10−5 to 10−4 A/m, increasing downhole to ~10−5 to 10−3 A/m between ~395 and 450 m CSF-A in all three holes. NRM20mT intensity appears to vary closely around 10−2 A/m between ~450 m CSF-A and the bottom of Hole U1587A (~500 m CSF-A) and between ~450 and 540 m CSF-A in Holes U1587B and U1587C. Beneath ~540 m CSF-A in Holes U1587B and U1587C, NRM20mT intensity decreases to the order of 10−5 to 10−4 A/m.
Figures F18, F19, and F20 also show MS measured on whole-round cores using the WRMSL and on archive-half sections using the SHMSL (see Physical properties). The WRMSL and SHMSL acquired susceptibility values were multiplied by 0.68 × 10⁻⁵ and (67/80) × 10−5, respectively, to convert to the dimensionless volume SI unit (Blum, 1997). MS measurements are generally consistent between the two instruments and across holes for overlapping depth intervals and vary mostly between 5 × 10⁻⁵ and 30 × 10−5 SI. WRMSL results appear to be generally lower than SHMSL results, especially for the XCB cores (see black and magenta curves in Figures F18, F19, and F20), possibly because the XCB cores often do not entirely fill the core liner. Two susceptibility peaks of ~50 × 10−5 SI are visible in all three holes at ~195 and ~230 m CSF-A. Variabilities in MS of the sediments generally mimic those of the NRM20mT intensity, suggesting that magnetic minerals in these sediments that carry NRM are similar to those that dominate MS.
5.2. Magnetostratigraphy
Magnetostratigraphic interpretations are based on combined NRM (after 20 mT demagnetization) inclination and (orientation-corrected) declination data from archive-half sections and stepwise NRM demagnetization (up to 50 or 80 mT) data from cube samples. The geomagnetic field at the latitude of Site U1587 (37.58°N) has an expected inclination of 57° (−57°) during normal (reversed) polarity, assuming a geocentric axial dipole (GAD) field model. The AF demagnetization behavior of cube samples is illustrated in Figure F21. A steep normal overprint appears to be largely removed after AF demagnetization with peak fields of ~5–20 mT (but potentially incompletely removed at even higher demagnetization steps). Polarity information determined from cube data is indicated by black (normal), white (reversed), and gray (uncertain) squares in Figures F18, F19, and F20. Identified polarity reversals at Site U1587 are shown in the Chron column on these figures and summarized in Table T16. The interpreted magnetostratigraphy is generally consistent with the biostratigraphy of the site (see Biostratigraphy).
The Brunhes/Matuyama (B/M) boundary (0.773 Ma) is recorded at ~98, ~97, and ~97 m CSF-A in Holes U1587A, U1587B, and U1587C, respectively. Above the B/M boundary, the NRM20mT inclination of all three holes varies closely around the expected GAD inclination of ~57° (Figures F18, F19, F20). Below the B/M boundary, NRM20mT of the sections is dominated by shallow/negative inclinations, except core sections for which NRM measurements were likely compromised by flux jumps and show very steep inclinations. Inclinations during the reversed polarity intervals are often shallower than the expected dipole inclination of −57°, possibly due to incompletely removed drilling overprint that orients vertically down. The B/M boundary in all three holes is accompanied by downhole changes in corrected declination values from ~0° (or ~360°) to ~180°. In Hole U1587B, cube samples from above the boundary show well-defined characteristic remanence with positive inclinations, whereas cube samples from below the boundary mostly show uncertain or reversed polarity (Figure F21). The seven cube samples from Hole U1587C near the B/M boundary (Figure F20) yielded generally positive inclination components, but due to heavy influence from flux jumps, we consider results from these cubes inconclusive and do not use them for interpretation.
The Jaramillo Subchron (0.99–1.07 Ma) is identified at ~107–116.5 m CSF-A only in the APC cores from Hole U1587A. This interval is characterized by positive inclinations varying around 57° and orientation-corrected declinations close to ~0° or ~360°. NRM20mT of sections from the top and bottom of these intervals is characterized by downhole shifts of negative/positive inclinations to shallow/opposite direction inclinations and ~180° changes in declinations. We speculate that the positive inclination interval at ~123–127 m CSF-A in Hole U1587A represents the Cobb Mountain Subchron (1.18–1.215 Ma). The top and bottom of this interval are associated with apparent shifts in inclination and ~180° changes in declination. The Jaramillo and Cobb Mountain Subchrons are not identified in other holes at the site because of heavy drilling overprint associated with the XCB coring at similar depth levels and the generally very weak magnetizations of sediments from these depth intervals (10−5 to 10−4 A/m). Cube samples from these depth intervals in Hole U1587B mostly yielded uncertain polarity (Figures F19, F21).
We placed the Matuyama/Gauss (M/G) boundary (2.595 Ma) at ~233, ~235, and ~232.5 m CSF-A in Holes U1587A, U1587B, and U1587C, respectively. The downhole inclination changes from dominantly negative to positive values in all three holes support this interpretation. Cube samples from above this boundary in Hole U1587B yielded clearly reversed components, and those from below the boundary yielded mostly uncertain polarities (Figures F19, F21).
The intervals at ~398–432.5 m CSF-A in Hole U1587A, ~397–440 m CSF-A in Hole U1587B, and ~393–437 m CSF-A in Hole U1587C are dominated by negative inclinations (Figures F18, F19, F20). Cube samples from this interval in Hole U1587B yielded clearly reversed components, whereas cube samples from below this interval yielded normal components (Figure F21). We interpret these intervals as part of Chron C3r (5.235–6.023 Ma). We note that the top of Chron C3r (i.e., the base of the Thvera Subchron) should be above these intervals but could not be identified due to XCB coring and the very weak magnetization (10−5 to 10−4 A/m) of sediments above these intervals. The bottom of these intervals likely recorded the base of Chron C3r (also the base of the Gilbert Chron).
Two normal polarity intervals can be identified in all three holes at the following depths based on generally positive inclination patterns: ~432–458 and ~469–485 m CSF-A in Hole U1587A, ~440–460 and ~469–488 m CSF-A in Hole U1587B, and ~437–454 and ~469–486 m CSF-A in Hole U1587C (Figures F18, F19, F20). Based on their relative depths and biostratigraphy, we interpret these two normal polarity intervals as Subchrons C3An.1n (6.023–6.272 Ma) and C3An.2n (6.386–6.727 Ma). Results of cube samples from Hole U1587B are consistent with this interpretation (Figures F19, F21).
We tentatively interpret the shallow and positive inclination intervals at ~518–528 and ~515–529 m CSF-A in Holes U1587B and U1587C, respectively, as Chron C3Bn (7.104–7.214 Ma) (Figures F19, F20). This interpretation is generally consistent with biostratigraphy. This interval is not recorded in Hole U1587A because it exceeds the maximum drilling depth of the hole (~500 m CSF-A). It is possible that the dominantly positive inclinations below ~540 m CSF-A in Hole U1587C represent part of Chron C4n (7.537–8.125 Ma), but we note that this interval coincides with a sharp drop in NRM20mT intensity and MS (Figure F20).
6. Geochemistry
Geochemistry at Site U1587 involved collection and measurement of IW samples for salinity, alkalinity, pH, major ions (Na, K, Ca, Cl, and SO4), nutrients (NH4 and PO4), and trace elements (Sr, Li, Fe, Mn, B, and Ba); headspace gases for methane (CH4) concentrations; and bulk sediment samples for total organic carbon (TOC), total inorganic carbon (TIC)/calcium carbonate (CaCO3), total nitrogen (TN), total sulfur (TS), and bulk mineralogical abundance (by XRD) and elemental composition (by inductively coupled plasma–atomic emission spectrometry [ICP-AES]). In total, 65 IW samples were taken from Hole U1587A (see Geochemistry in the Expedition 397 methods chapter [Abrantes et al., 2024a]). A 5 or 10 cm sample was taken at the base of every section for the upper 34 m, at the base of Sections 2 and 6 to 47 m CSF-A, and then at the base of Section 6 (i.e., the second to last section recovered from every core) through Core 397-U1587A-49X, after which sediment compaction prevented water recovery. Discrete samples from the working half of split cores (two per core) were measured for total carbon (TC), TN, TS, and TIC.
IW alkalinity, NH4, and PO4 increase in the upper 50 m, whereas SO4 correspondingly decreases rapidly in the upper 30 m, indicating organic matter respiration. Also, SO4 reaches zero and remains low. In contrast, CH4 concentrations increase to about 40,000 ppmv at 125 m CSF-A and remain high to 200 m CSF-A before gradually decreasing. IW samples show evidence of microbially mediated respiration and other diagenetic reactions.
CaCO3 content ranges 2.9–78.1 wt% (average = 37.4 wt%). The coulometer-determined CaCO3 content is consistent with stoichiometric CaCO3 calculated from the elemental Ca concentrations measured by ICP-AES. It is also positively correlated with L* reflectance and negatively with NGR. TOC, TN, and TS contents at Site U1587 are generally low, ranging 0–2.02 wt% TOC (mean = 0.48 wt%), 0–0.13 wt% TN (mean = 0.05 wt%), and 0–0.37 wt% TS (mean = 0.03 wt%). Organic C/N ratios (0–86.7; mean = 20.0) suggest that organic matter is of both marine and terrestrial origin.
Elemental SiO2, K2O, and TiO2 from the bulk sediment show strong positive correlations with Al2O3, indicating the dominance of terrigenous detritus. This is also observed for minor elements, including Zn, Cr, V, Sc, Y, and Zr. Fe2O3, MgO, and Na2O show a relatively weak correlation with Al2O3, likely caused by the widespread presence of authigenic and biogenic phases. The bulk sediment elemental Ca concentration primarily represents biogenic carbonate, and because of the incorporation of Sr into biogenic carbonates, both elements show an inverse relationship with Al. Ba is weakly correlated with Al or Ca, likely due to the presence of barite (BaSO4), and Mn seems to be associated with carbonate. Elemental ratios of Ca/Ti, K/Al, Si/Al, and Sr/Ca and estimated biogenic Ba are selected as proxies for provenance, weathering, and productivity.
6.1. Headspace hydrocarbon gases
Headspace samples were collected from the basal section of each core in Hole U1587A, Cores 397-U1587B-55X through 59X, and Cores 397-U1587C-59X through 61X to accommodate the additional drilled depth. CH4 concentrations peak between 100 and 200 m CSF-A at values around 34,000 ppmv (Figure F22). Ethane is detectable between 97 and 393 m CSF-A, but C1/C2 (i.e., CH4/C2H6) ratios remain high (3,700–46,000), indicating that there is no danger to drilling (Table T17).
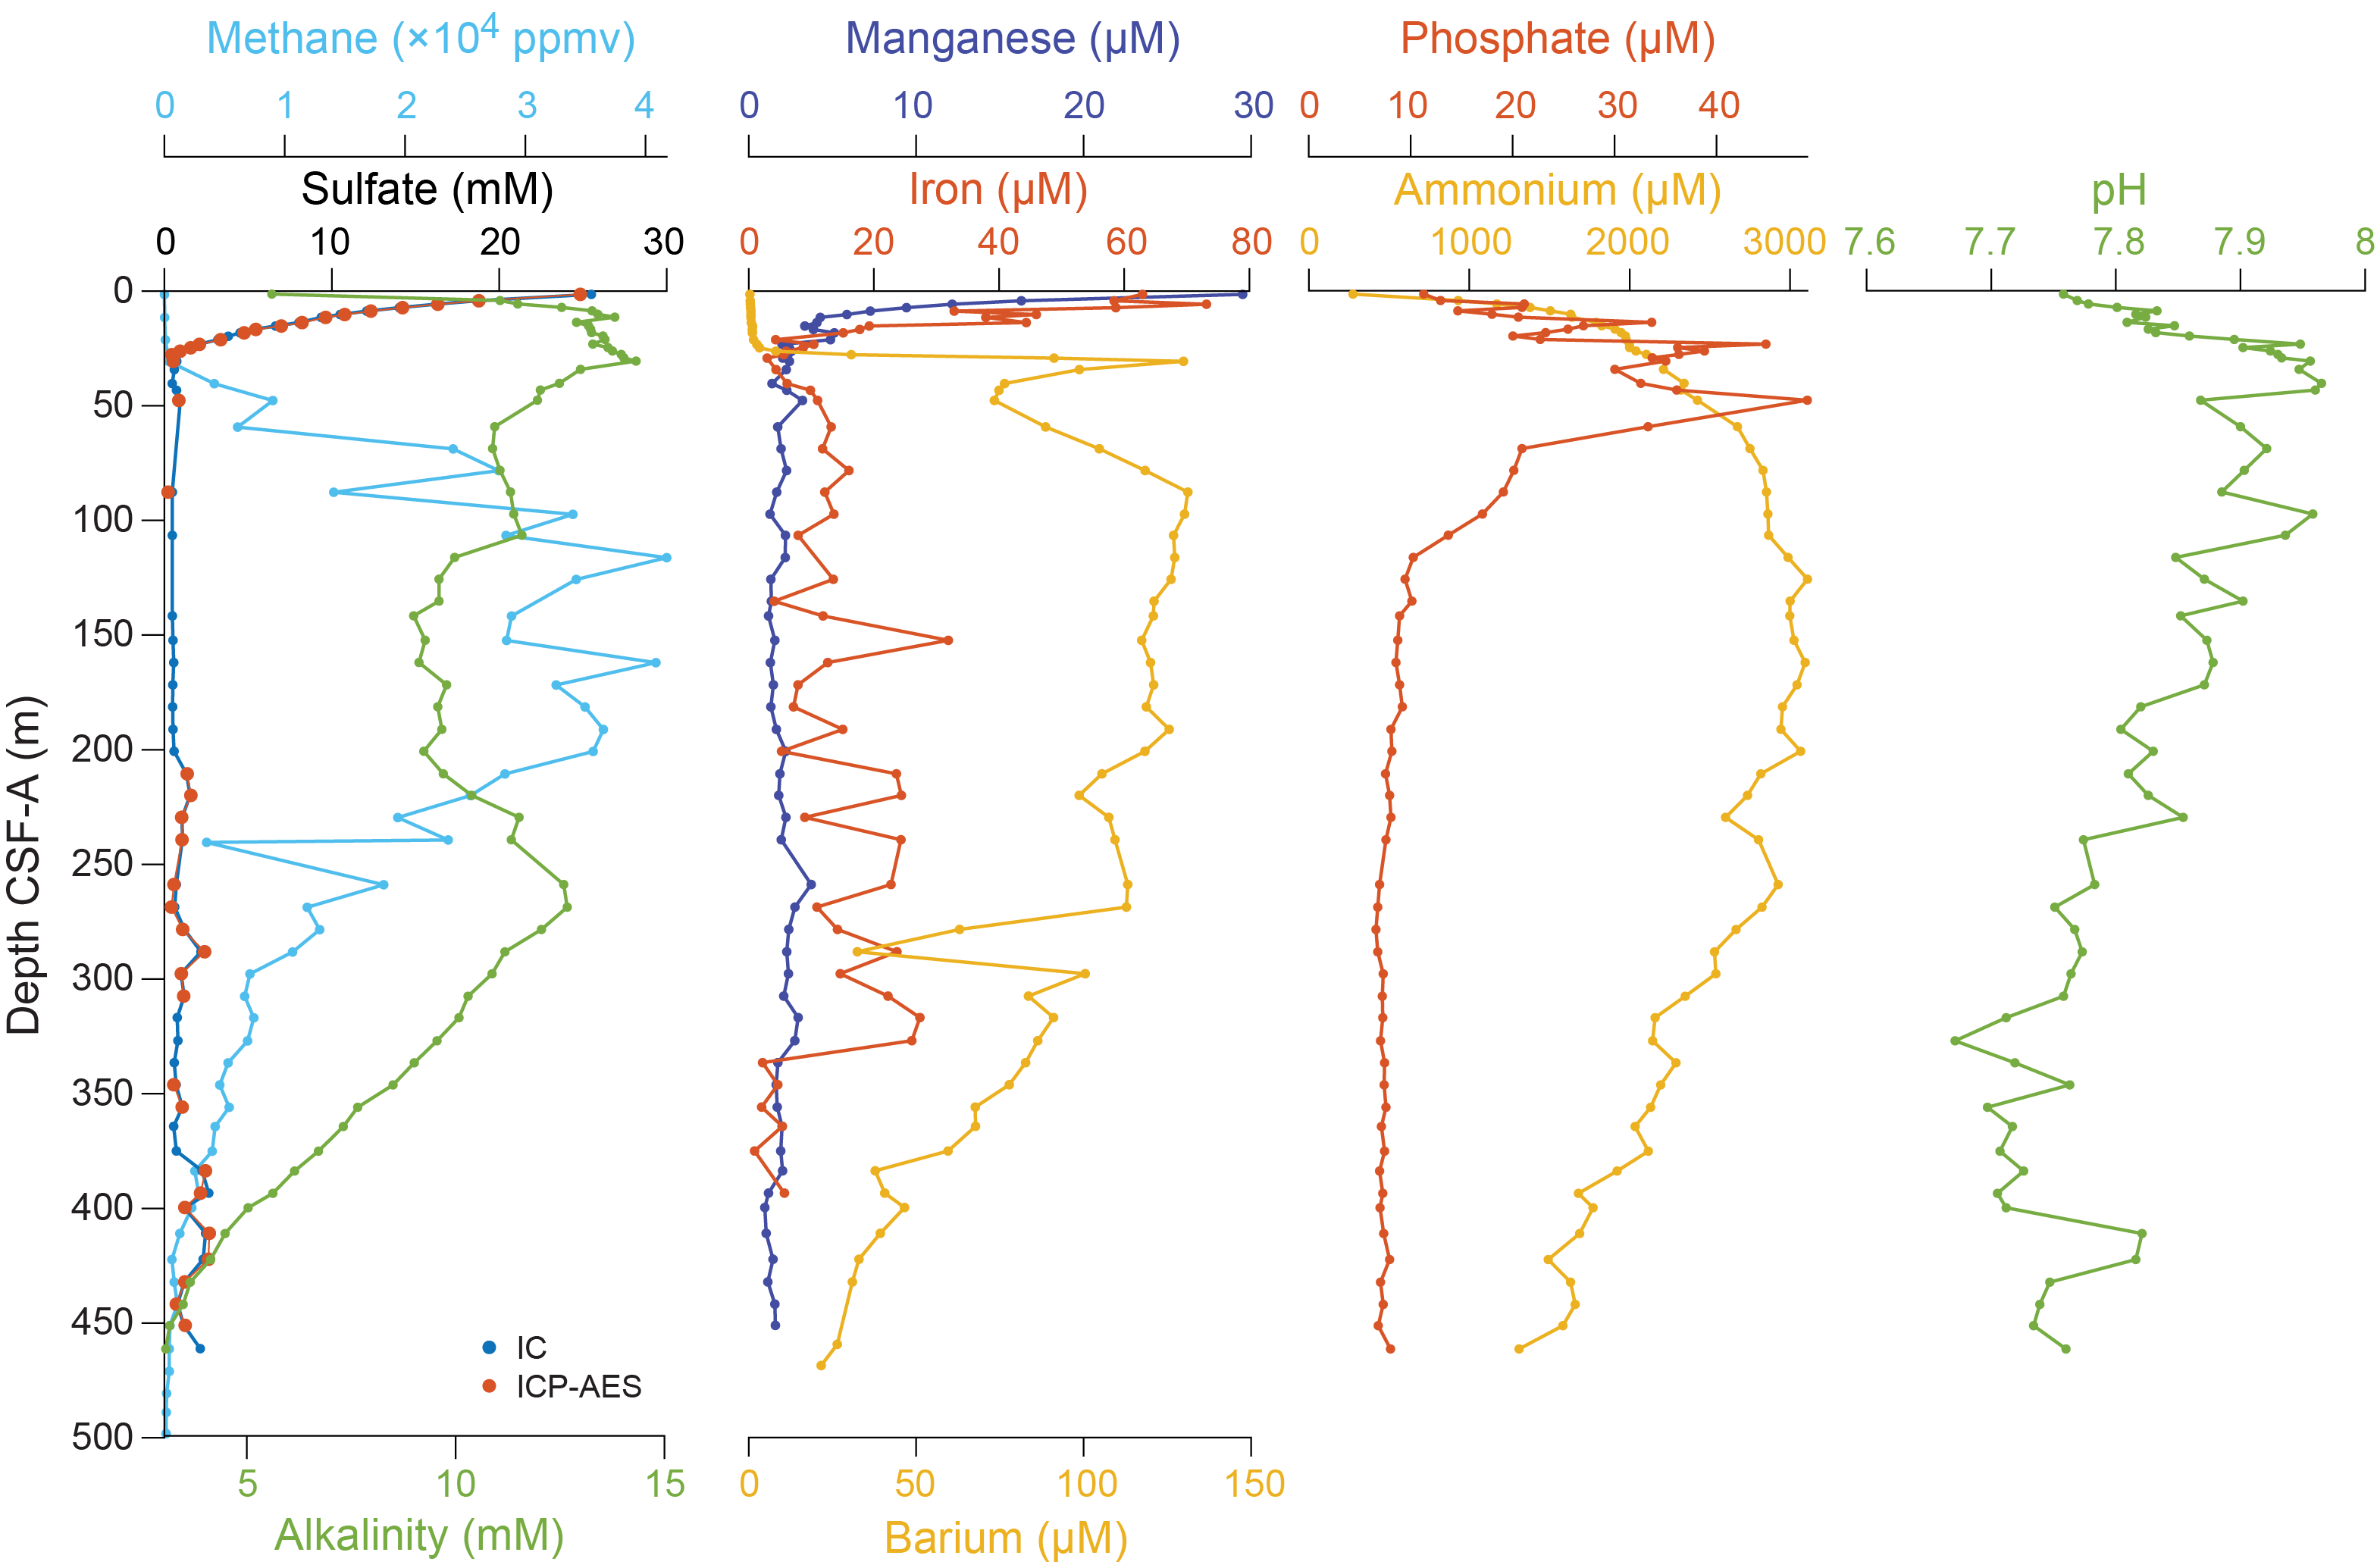
Figure F22. SO4, alkalinity, headspace CH4, Fe, Mn, Ba, NH4, PO4, and pH.
6.2. Interstitial water geochemistry
Shortly after squeezing for IW, aliquots of the recovered water were set aside for salinity, chlorinity, alkalinity, and pH measurements. In addition, major and minor elemental composition was measured by ion chromatography (IC) and ICP-AES and for NH4 and PO4 by spectrophotometry (Table T18). Some of the significant trends are highlighted below.
6.2.1. Salinity, sodium, potassium, and chloride
Salinity, Na, and Cl concentrations are relatively constant in Hole U1587A, with values close to seawater (Figure F23). Na has a mean value of 478.3 ± 2.6 mM, and Cl measured by IC has a mean value of 561.3 ± 4.8 mM (ICP-AES data were noisier than IC data, but mean values were nearly identical). Cl measured using AgNO3 titration has a similar mean value (565.2 mM) but is slightly noisier, with a 1σ (standard deviation) of 7.4 mM. K declines downhole from a value of 12 mM in the uppermost sample (397-U1587A-1H-1, 145–150 cm) to 6 mM in the lowermost sample (49X-5, 139–149 cm).
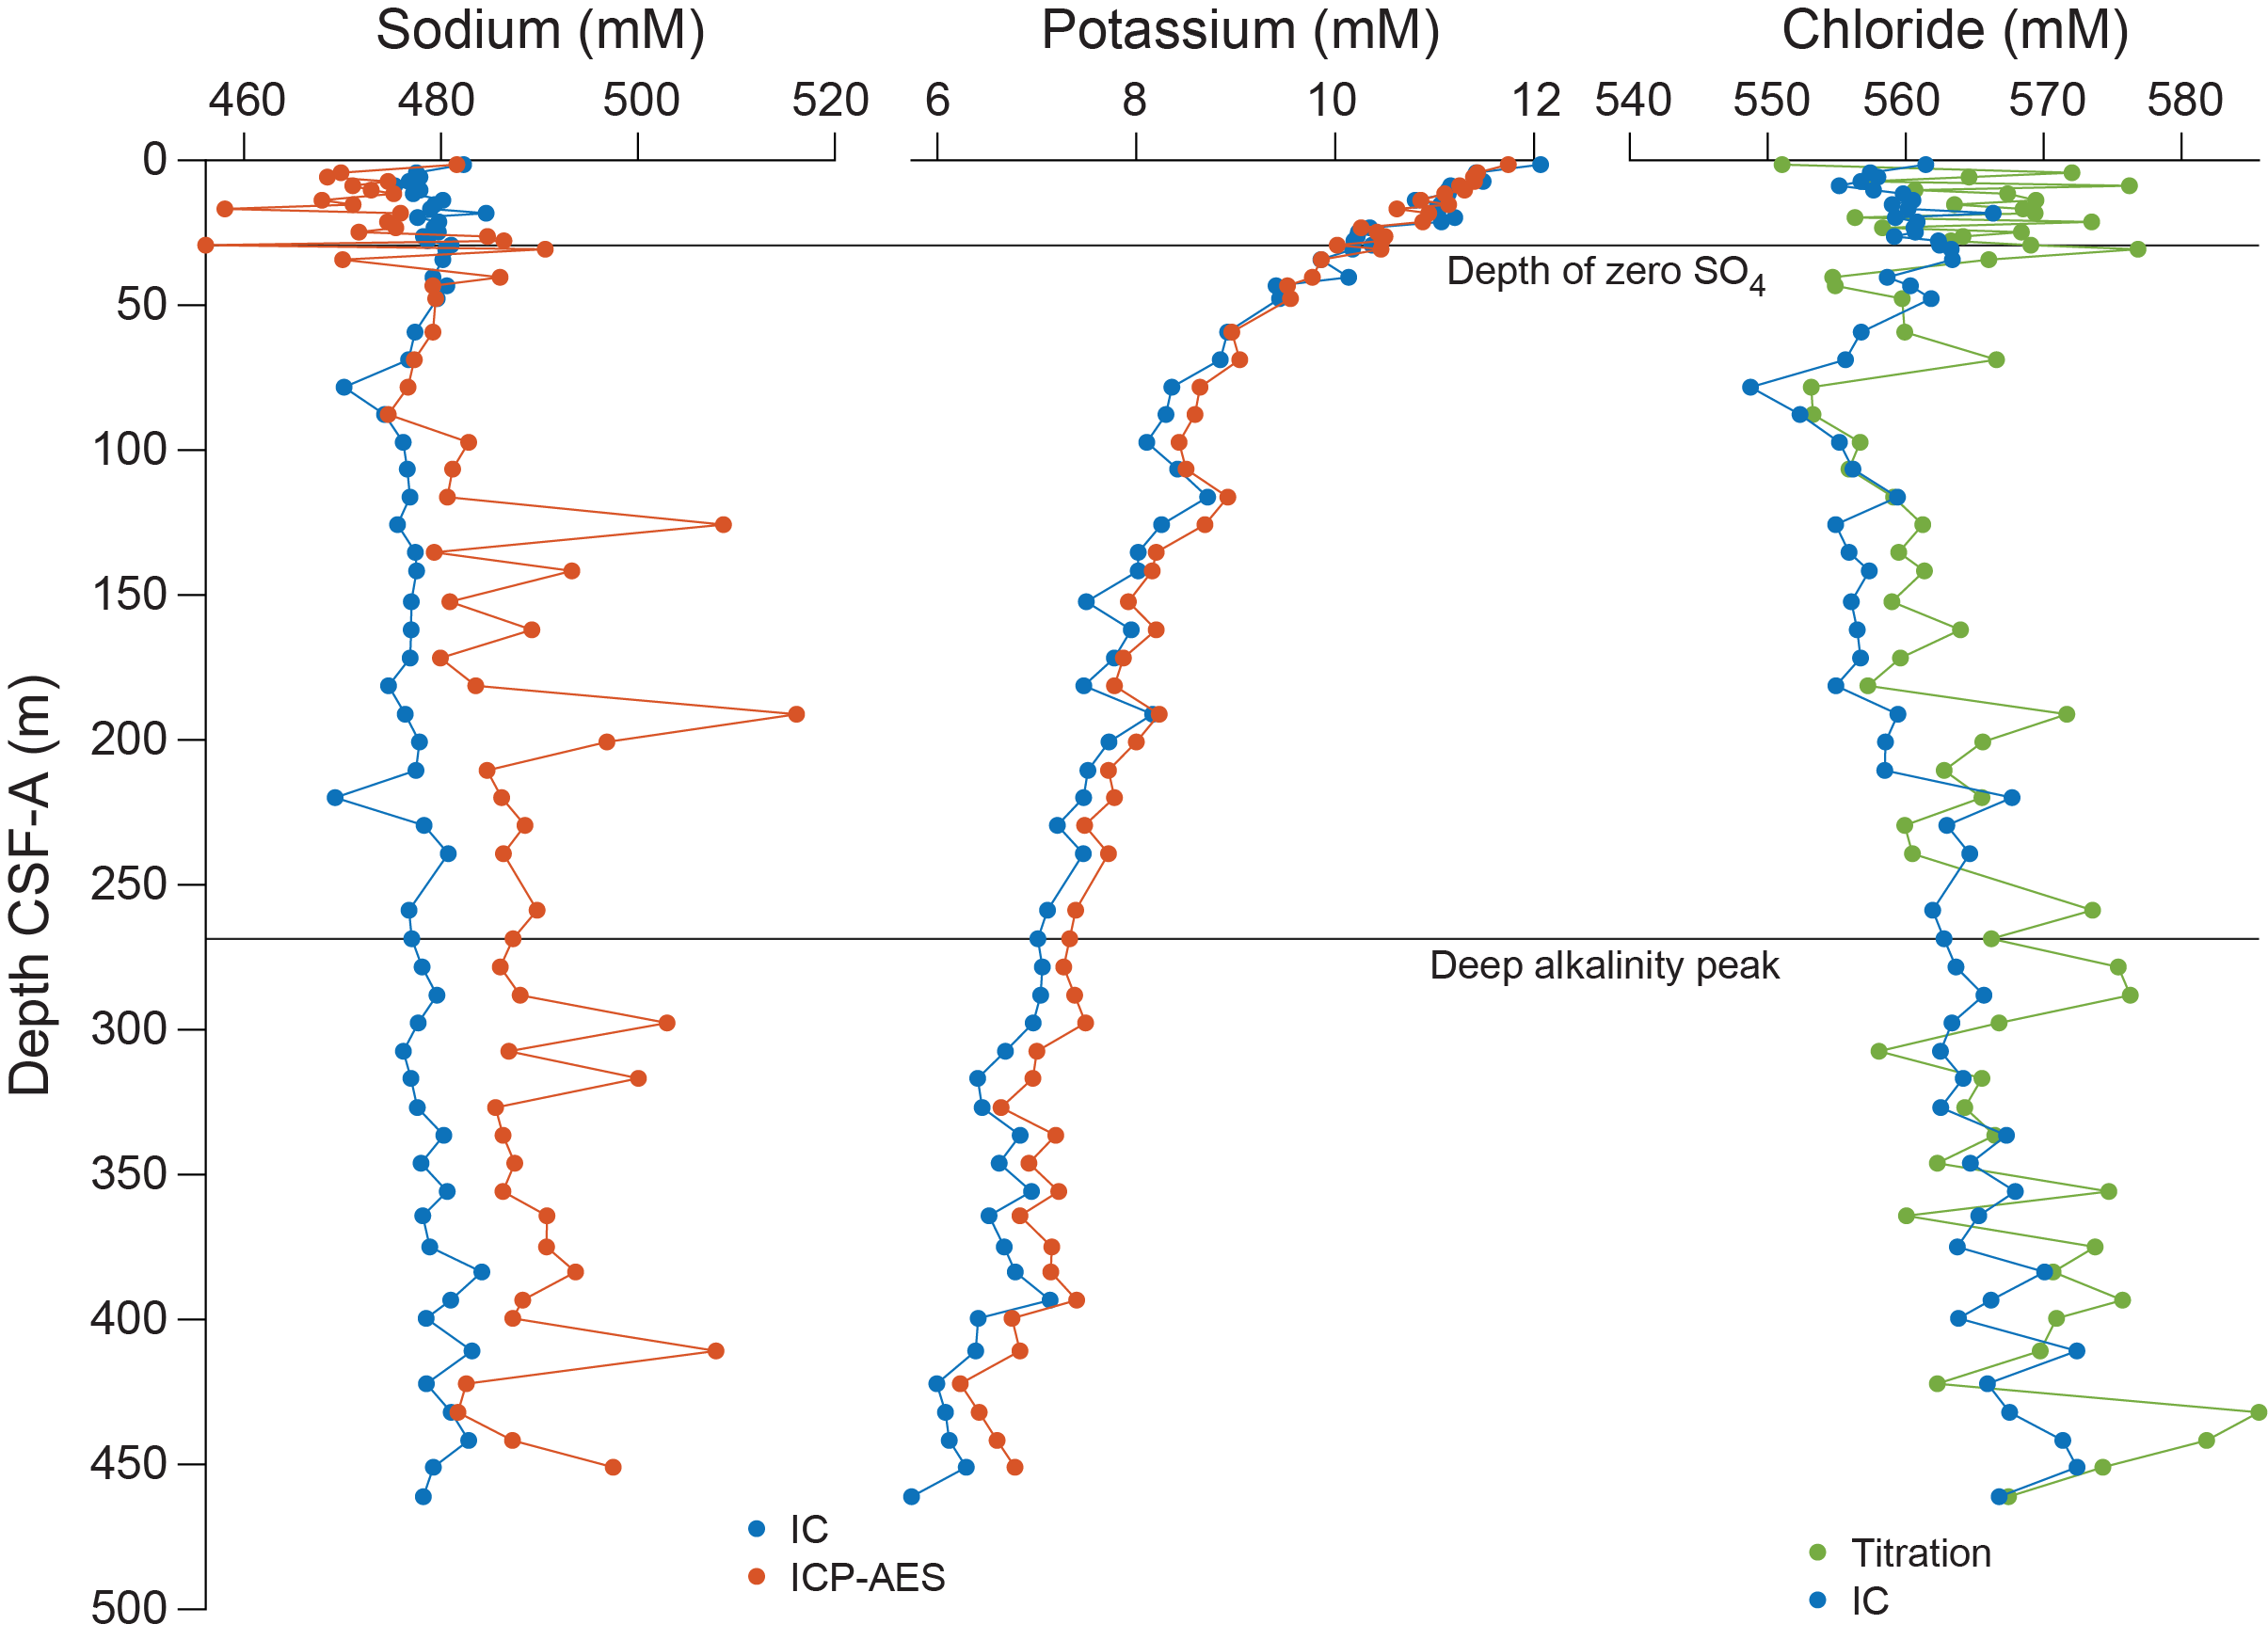
Figure F23. Na, K, and Cl.
6.2.2. Alkalinity, pH, ammonium, and phosphate
Alkalinity, pH, NH4, and PO4 increase rapidly from the top of the hole (Figure F22). Alkalinity increases rapidly from 5.6 mM at the top of the core to 13.5 mM at 34.3 m CSF-A, after which it declines then plateaus at 11.2 mM between 59.3 and 106.5 m CSF-A. This pattern of decline and plateau repeats again between 116.2 and 200.7 m CSF-A. This is then followed by an increase to a maximum of 12.7 mM at 268.6 m CSF-A and a decline to the bottom of the hole, reaching 3.1 mM. pH increases from 7.76 in the uppermost sample to a maximum of 7.97 at 40.3 m CSF-A and then steadily decreases to ~300 m CSF-A, after which it is relatively constant at 7.74 ± 0.04. NH4 concentrations are low in the uppermost sample (274.9 μM in Sample 397-U1587A-1H-1, 145–150 cm), increase to a maximum of 3022 ± 56 μM between 116.2 and 200.7 m CSF-A, and then decrease to 1311 μM at 461.2 m CSF-A. PO4 concentrations are 11.3 μM in the uppermost sample (1H-1, 145–150 cm), increase to a peak of 32.8 ± 7.6 μM between 13.8 and 59.2 m CSF-A, and decrease again to 10.3 μM at 116.2 m CSF-A. Below that depth, PO4 concentrations are relatively constant at 7.8 ± 0.9 μM.
The increases in alkalinity, NH4, and PO4 concentrations in the upper part of Hole U1587A are the result of organic matter respiration; assuming a generic composition of (CH2O)106(NH3)16(H2PO4), this produces alkalinity (in the form of HCO3−), PO4, and NH4.
6.2.3. Sulfate, iron, manganese, and barium
SO4 values are near seawater in the uppermost sample (25.5 mM in Sample 397-U1587A-1H-1, 145–150 cm), and then decrease rapidly, approaching zero by 29.25 m CSF-A (Figure F22). At this depth, CH4 increases, reaching maximum values of ~34,000 between 100 and 200 m CSF-A. A sharp peak in dissolved Ba corresponds with SO4 reaching zero. Below this depth, Ba concentrations are somewhat variable, remaining >100 µM to 268.5 m CSF-A and then declining. Fe and Mn concentrations decrease in the uppermost ~30 m, with Mn decreasing more quickly, likely reflecting the more favorable reduction of Mn oxides over Fe oxides under anoxic pore water conditions.
These trends, combined with the observed increase in alkalinity in the upper part of the sediment column, indicate intense SO4 reduction and methanogenesis. Peaks in redox-sensitive elements such as Fe and Mn indicate microbially mediated respiration reactions within the sediment. The peak in Ba concentrations at 30.7 m CSF-A is likely the result of BaSO4 dissolution under SO4− reducing conditions (Kasten and Jørgensen, 2000).
6.2.4. Calcium, magnesium, and strontium
Ca concentrations in the IW decrease in the upper 35 m from 10.4 mM in the uppermost sample (397-U1587A-1H-1, 145–150 cm) to 3.4 mM at 34.3 m CSF-A and then increase to around 10 mM at the bottom of the hole (Figure F24). Mg concentrations also decrease in the upper part of the hole, from 52.4 mM in the uppermost sample (1H-1, 145–151 cm) to ~40 mM at 34.3 m CSF-A. Below 50 m CSF-A, Mg concentrations are roughly constant at 35.0 ± 1.2 mM, whereas Sr concentrations are 84.7 µM in the uppermost sample and increase downhole to 590.3 µM in the lowermost sample (49X-5, 139–149 cm).
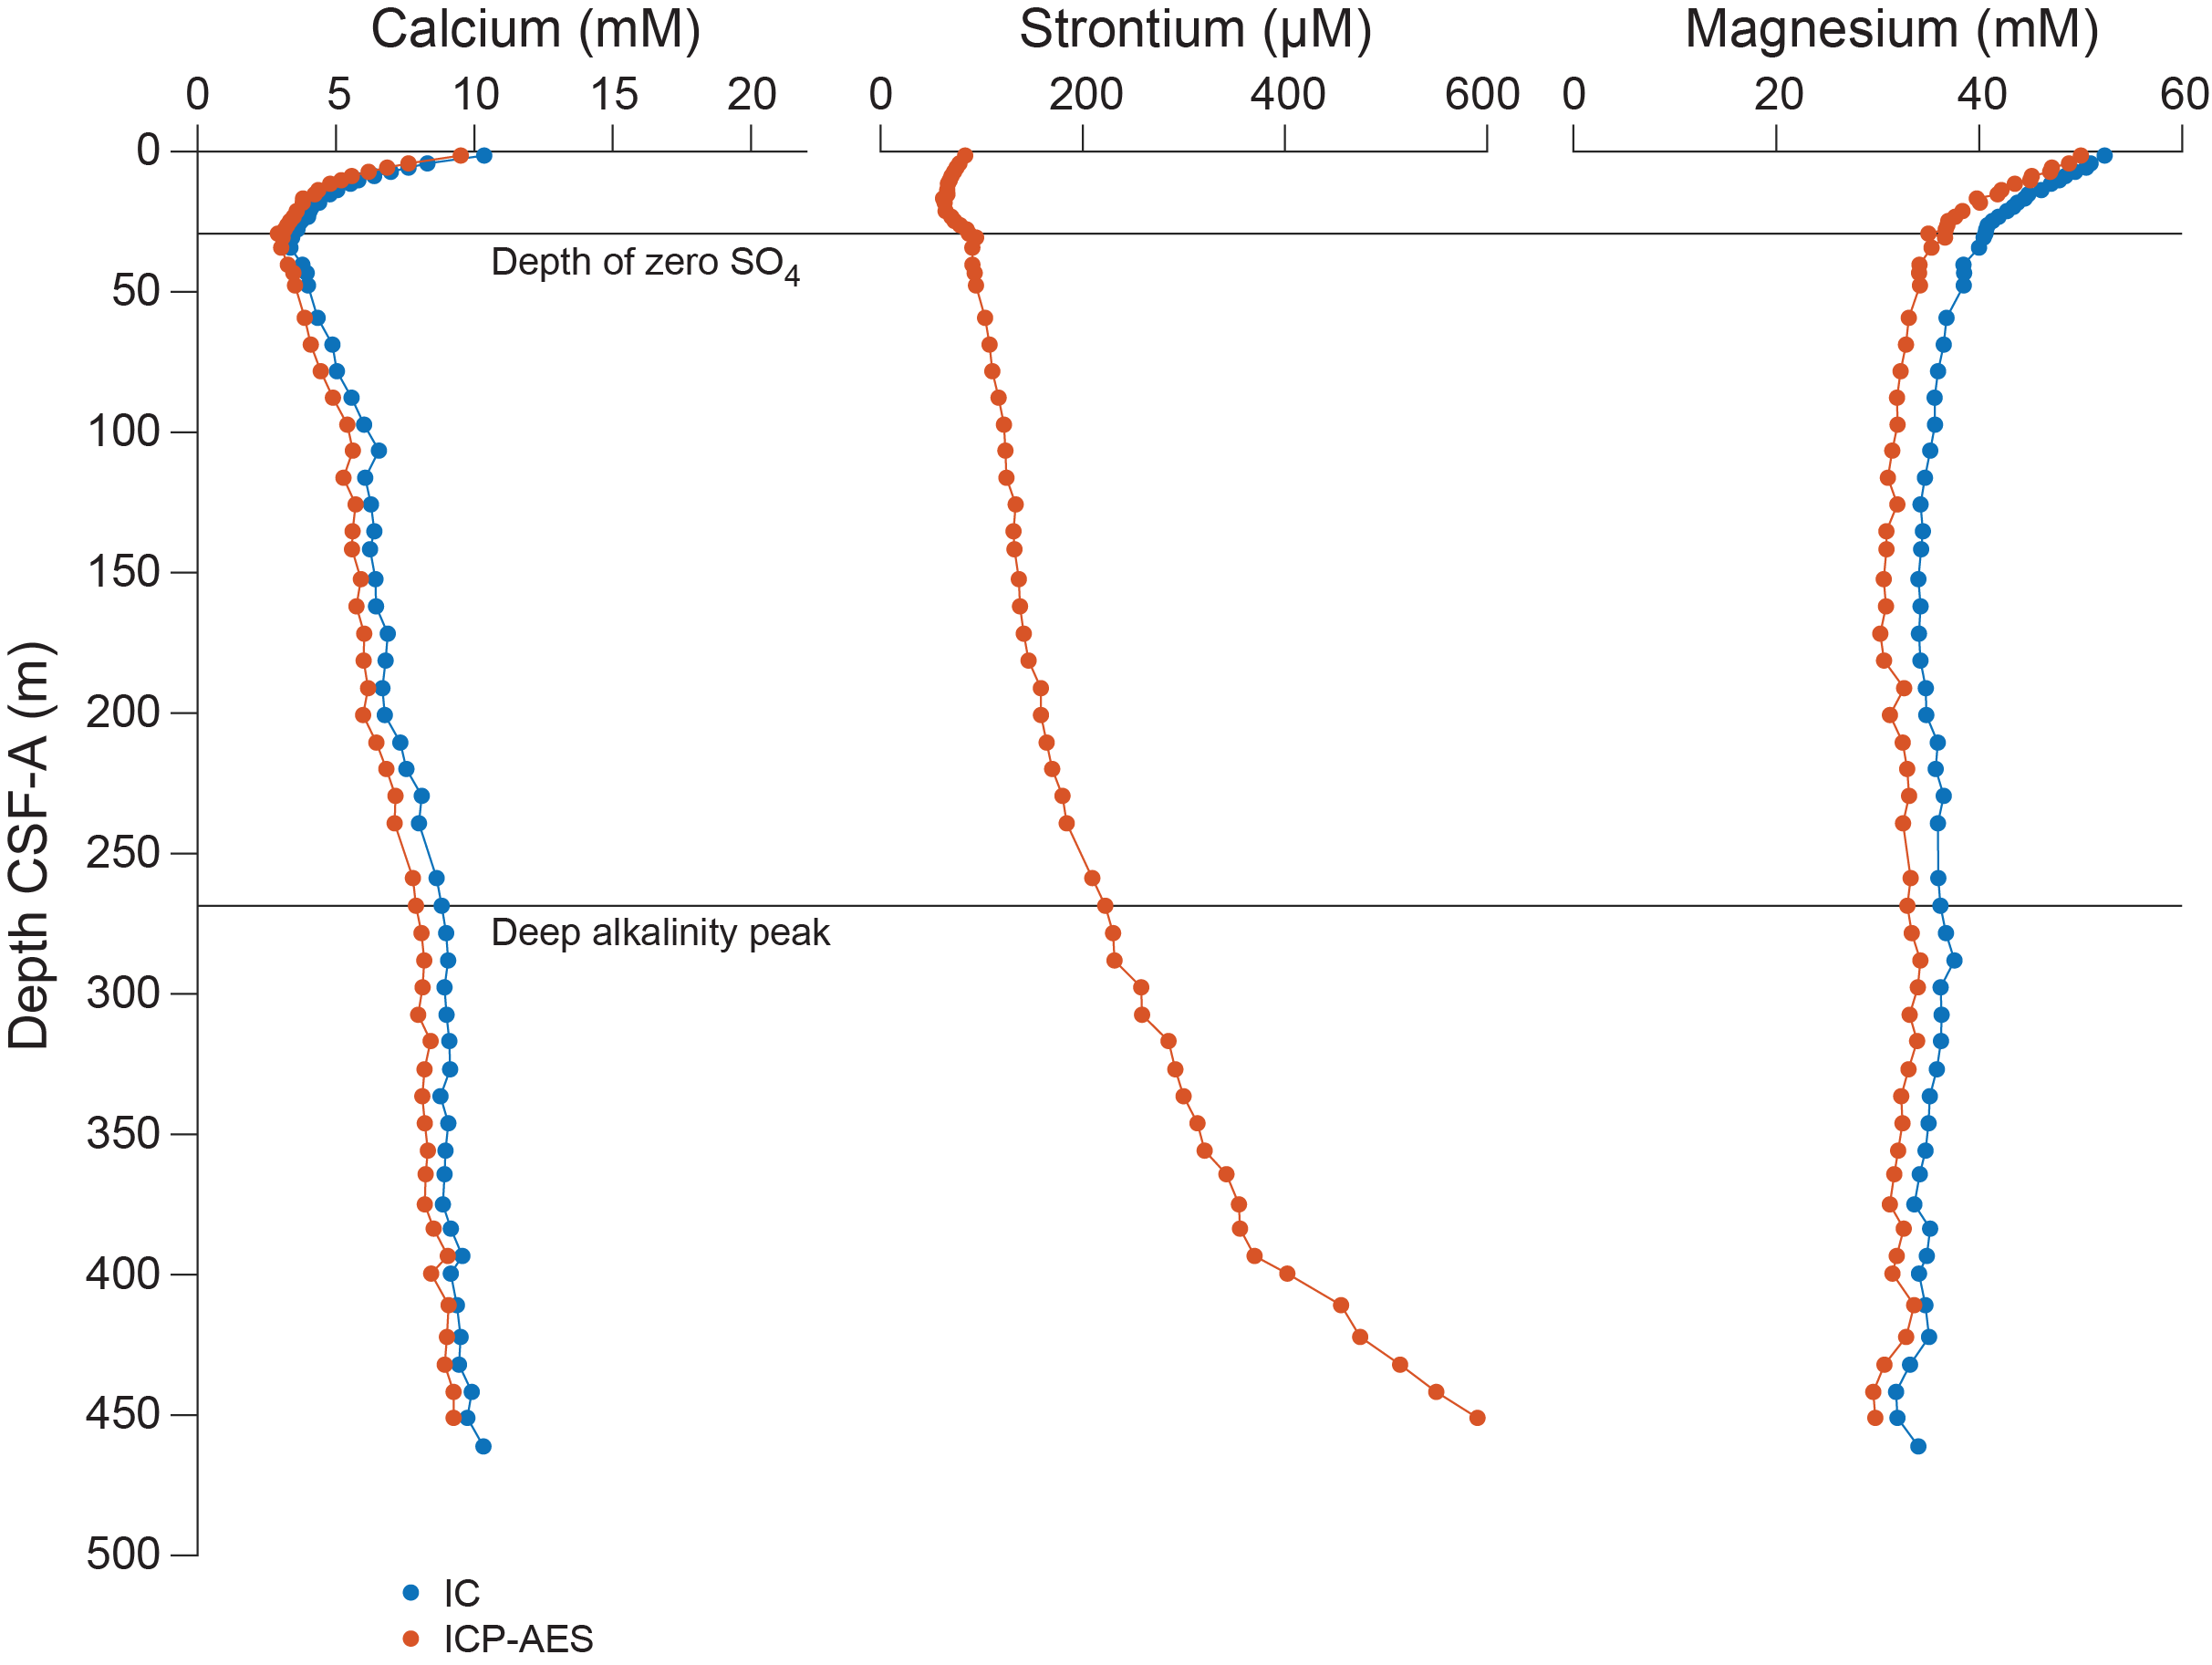
Figure F24. Ca, Mg, and Sr.
The decrease in Ca and Mg in the upper 50 m could result from authigenic carbonate precipitation driven by high pore water alkalinity associated with SO4 reduction.
6.2.5. Silicon, lithium, and boron
Si concentrations generally decrease downhole (Figure F25); variability is high in the uppermost 100 m, and then values decrease to the bottom of the hole. Li concentrations increase downhole from around 20 μM between 0 and 50 m CSF-A to 65 µM around 275 m CSF-A. Values are relatively constant around 65 μM to about 350 m CSF-A, at which point they slightly decline to 56.7 μM at 400 m CSF-A and then increase to 84 µM in the lowermost measured sample (397-U1587A-48X-5, 95–105 cm). At the top of the hole, B concentrations are around 600 µM before decreasing to ~368 ± 17 µM between 116 and 239 m CSF-A and then increasing again to 563 µM at the bottom of the hole (48X-5, 95–105 cm).
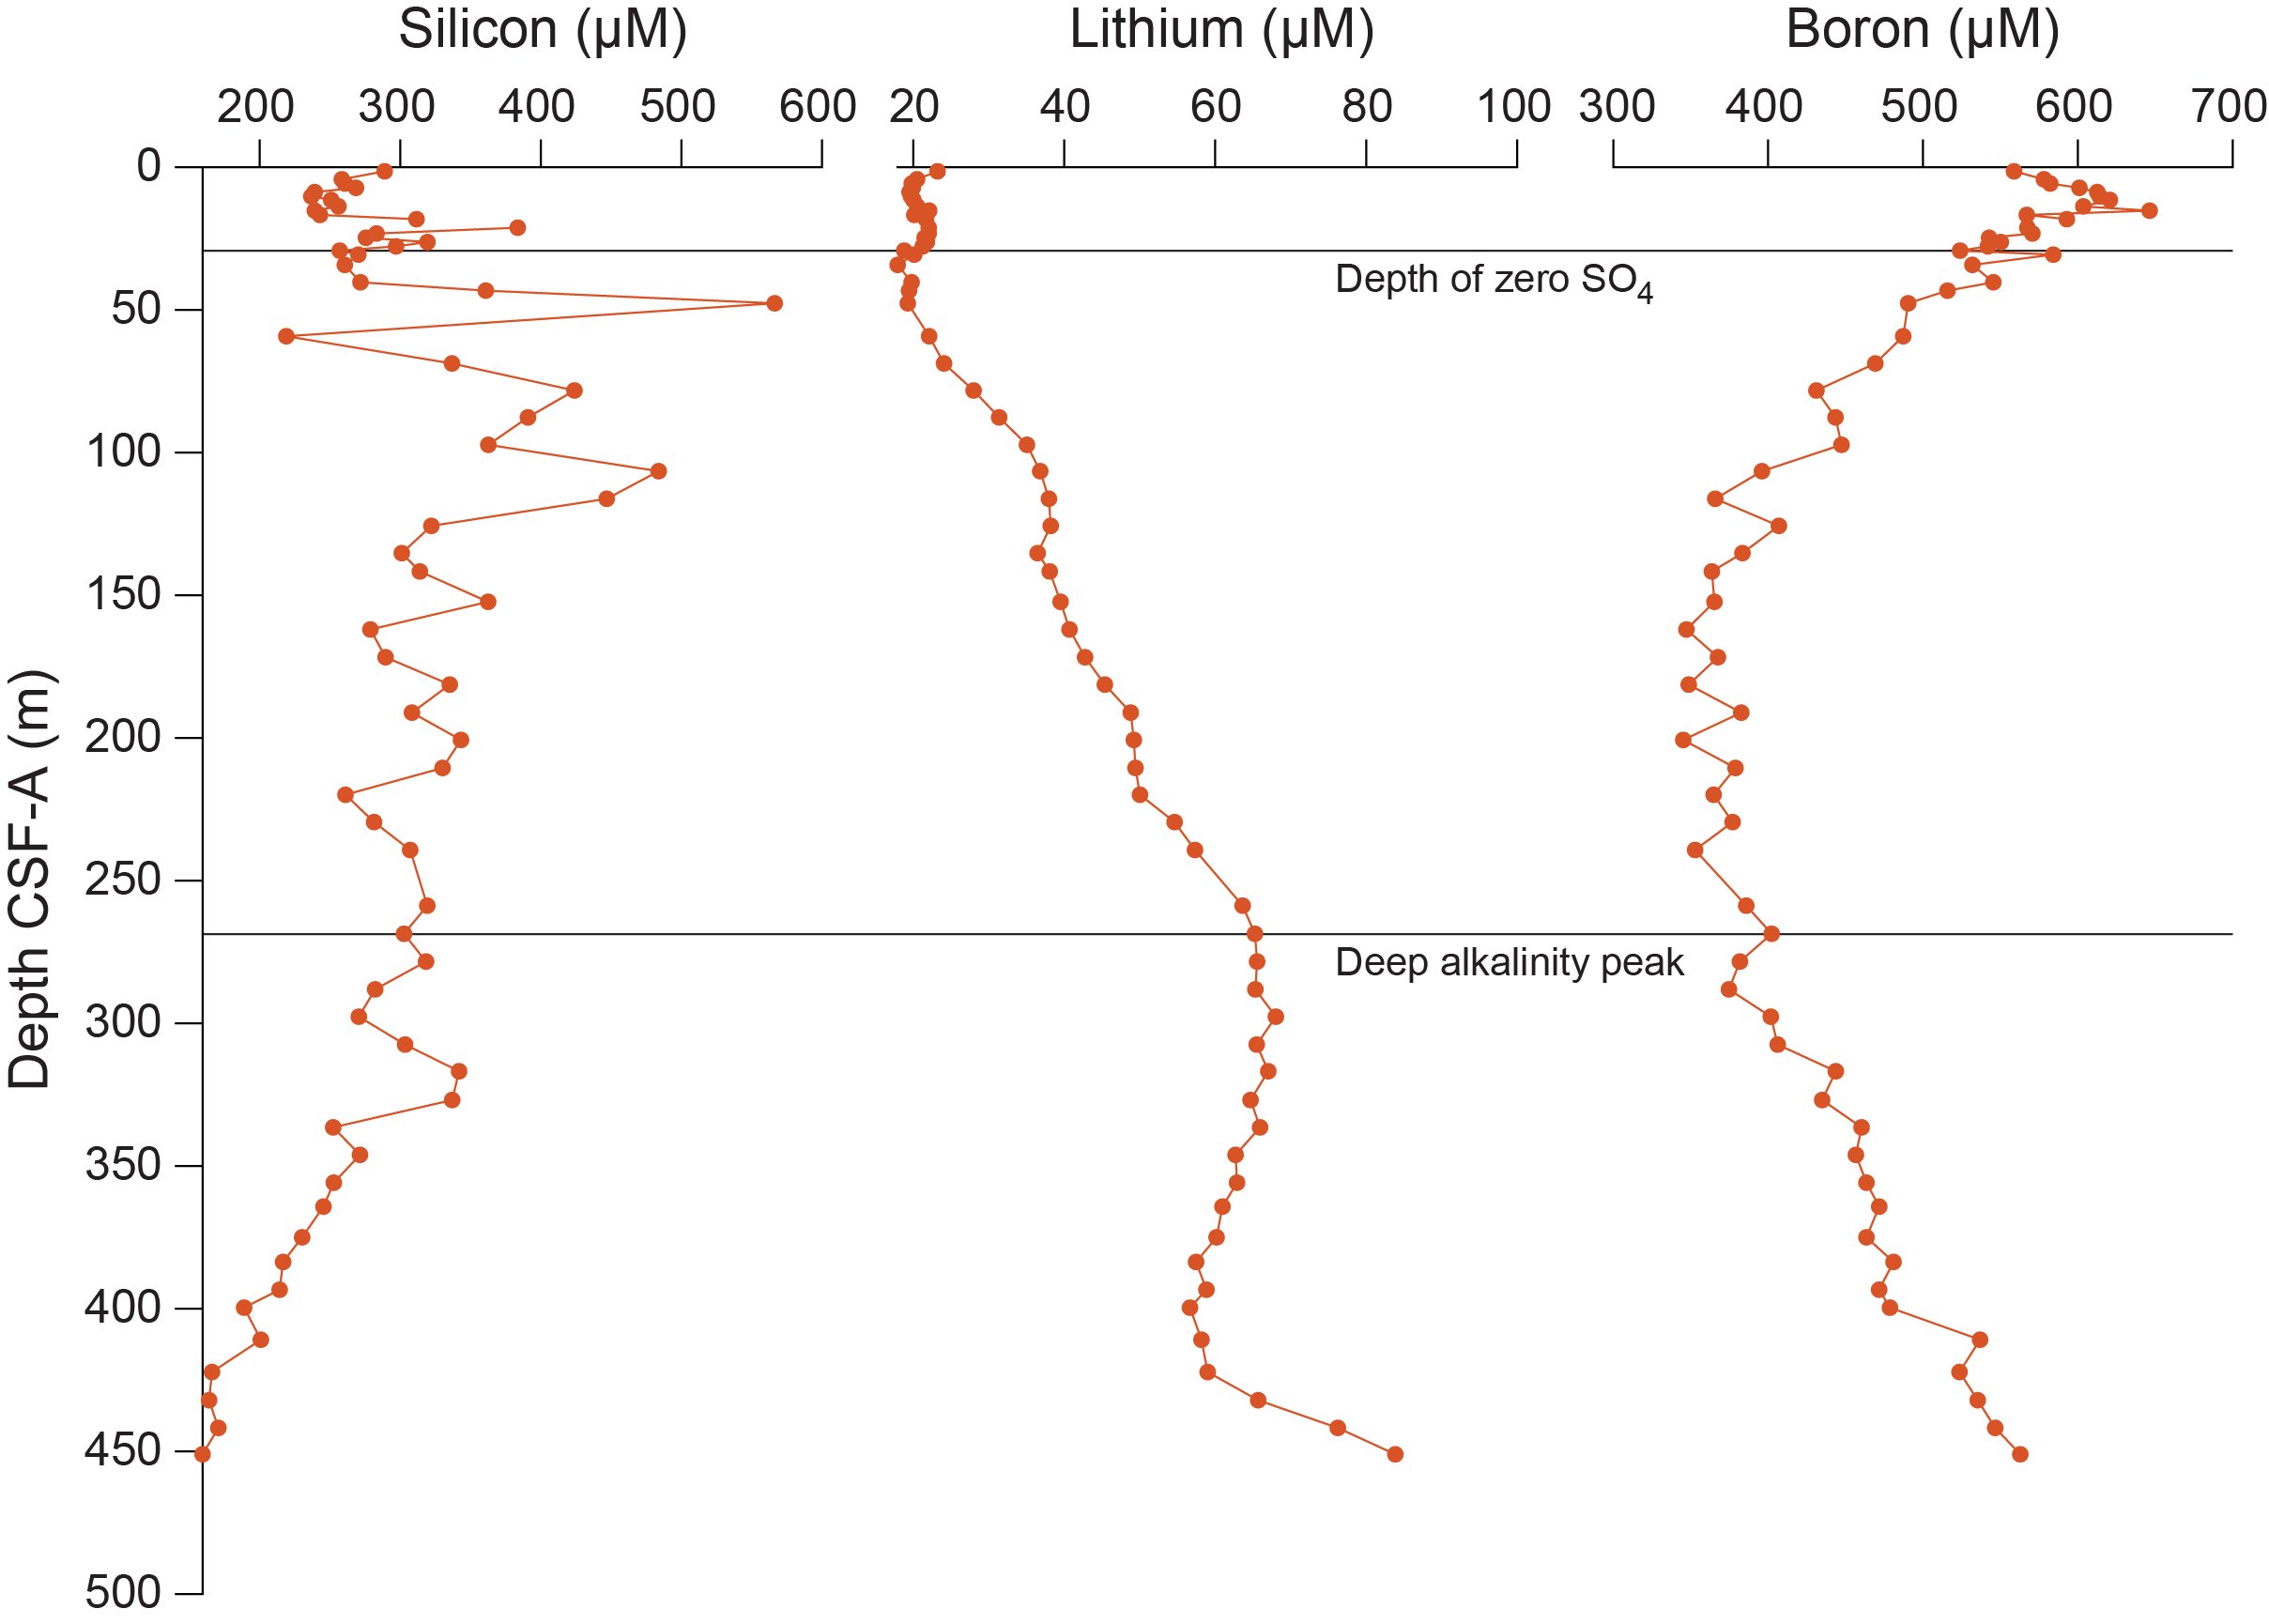
Figure F25. Si, Li, and B.
6.3. Bulk sediment geochemistry
6.3.1. Calcium carbonate (total inorganic carbon)
In Holes U1587A–U1587C, TIC and TC/TN/TS were measured in samples taken from the working half of split core sections at a resolution of two per core (Table T19). The light and dark intervals were targeted with the objective of improving correlations with other physical properties. A 100% CaCO3 standard was analyzed every ~10 samples (mean = 100.49 ± 1.81 wt%; n = 19) (Table T20). Samples were not measured until the standard was within ~1.5% of 100 wt%.
The mean CaCO3 content from Site U1587 is 41.9 wt%, but variability is high (±1σ = 15.0 wt%; range = 12.5–73.9 wt%). CaCO3 is relatively constant in the uppermost ~250 m (mean = 31.9 ± 11.3 wt%) but exhibits a stepwise increase to ~50.0 ± 13.5 wt% in the lowermost 250 m. Variability is relatively constant throughout (Figures F26, F27; Table T21). CaCO3 correlates positively with L* reflectance (adjusted R2 = 0.811) and negatively with NGR (adjusted R2 = 0.815) (Figures F26, F27, F28, F29). There is a change in the slope of the L* vs. CaCO3 relationship at ~235 m CSF-A, approximately corresponding to the Pliocene/Pleistocene boundary (see Biostratigraphy). The upper part of Site U1587 has a shallower slope, and the deeper part of Site U1587 has a steeper slope (Figure F28). Using the measured elemental Ca concentrations from the ICP-AES data, stoichiometric CaCO3 was calculated to compare with the shipboard measured total CaCO3 weight percent by the coulometer (Figures F26, F27). Although the absolute numbers are not the same, the data show a similar overall trend.
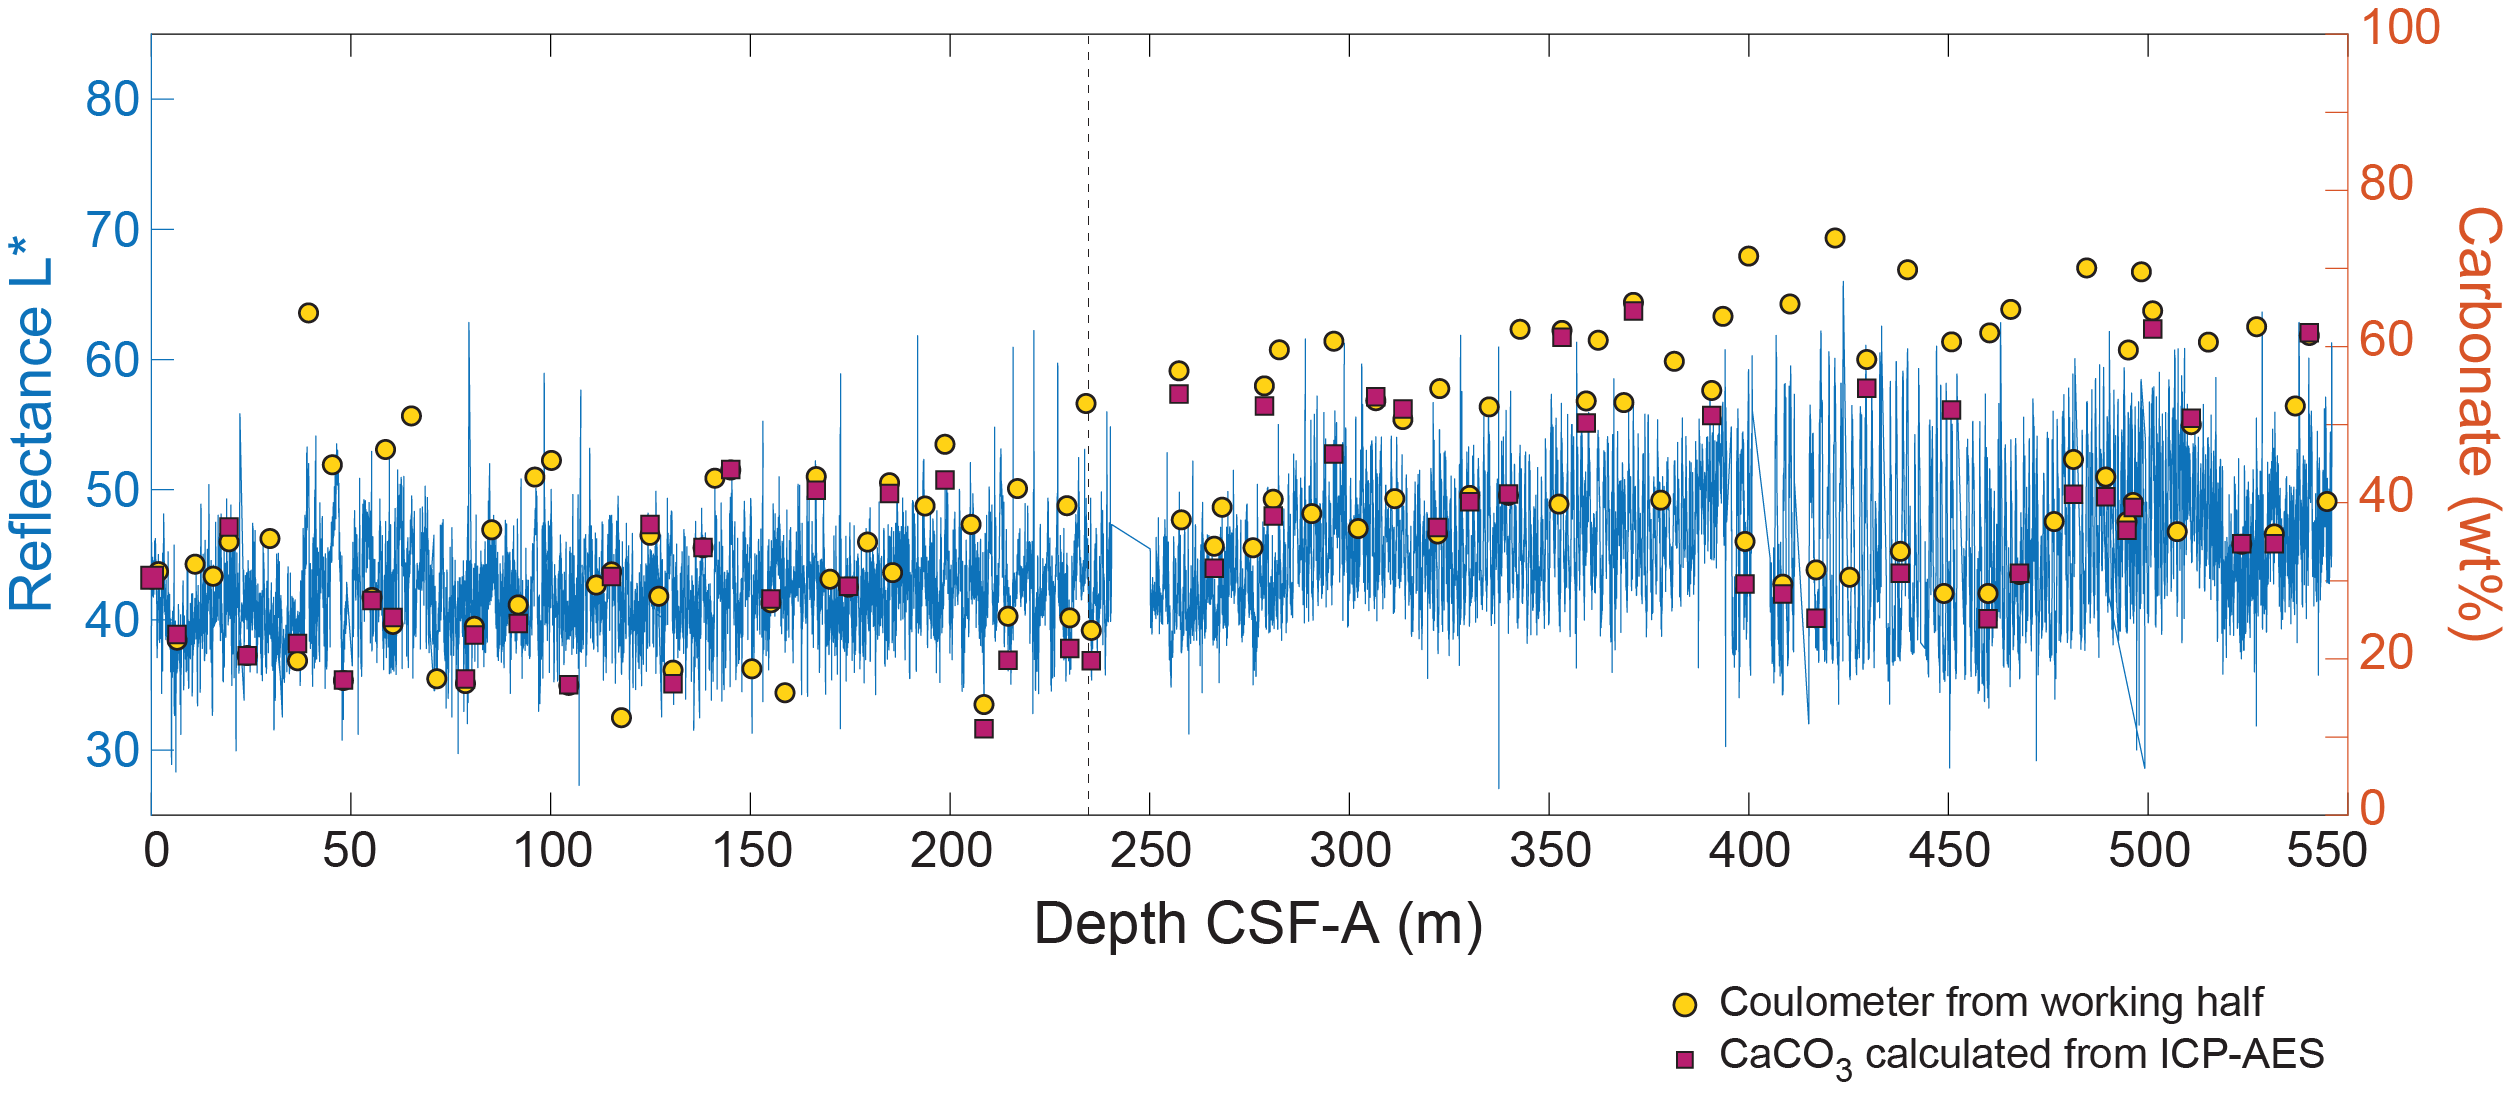
Figure F26. CaCO3.
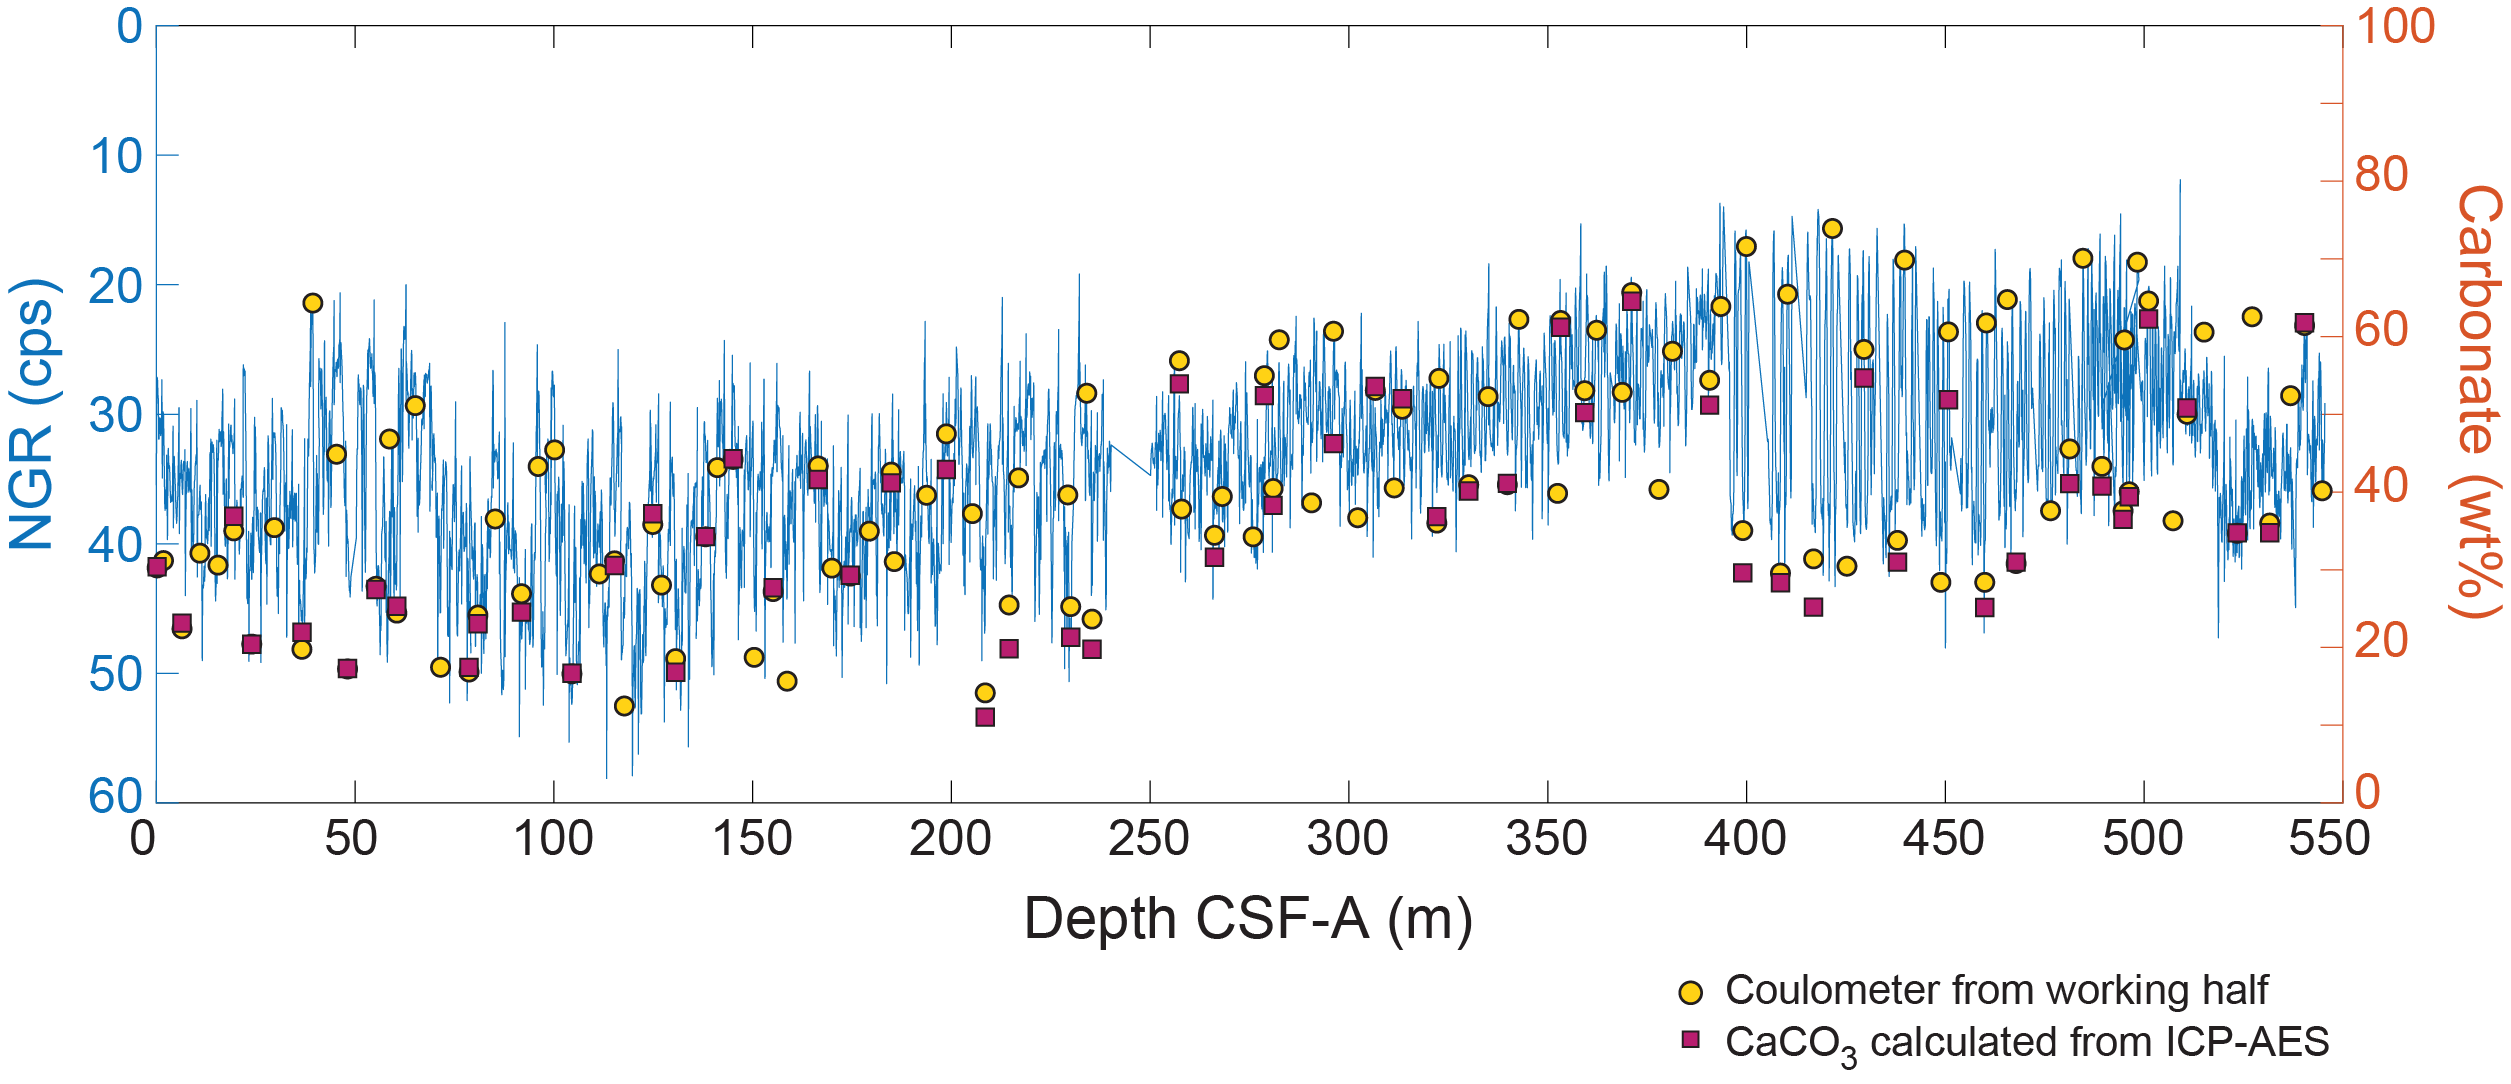
Figure F27. CaCO3 and NGR.
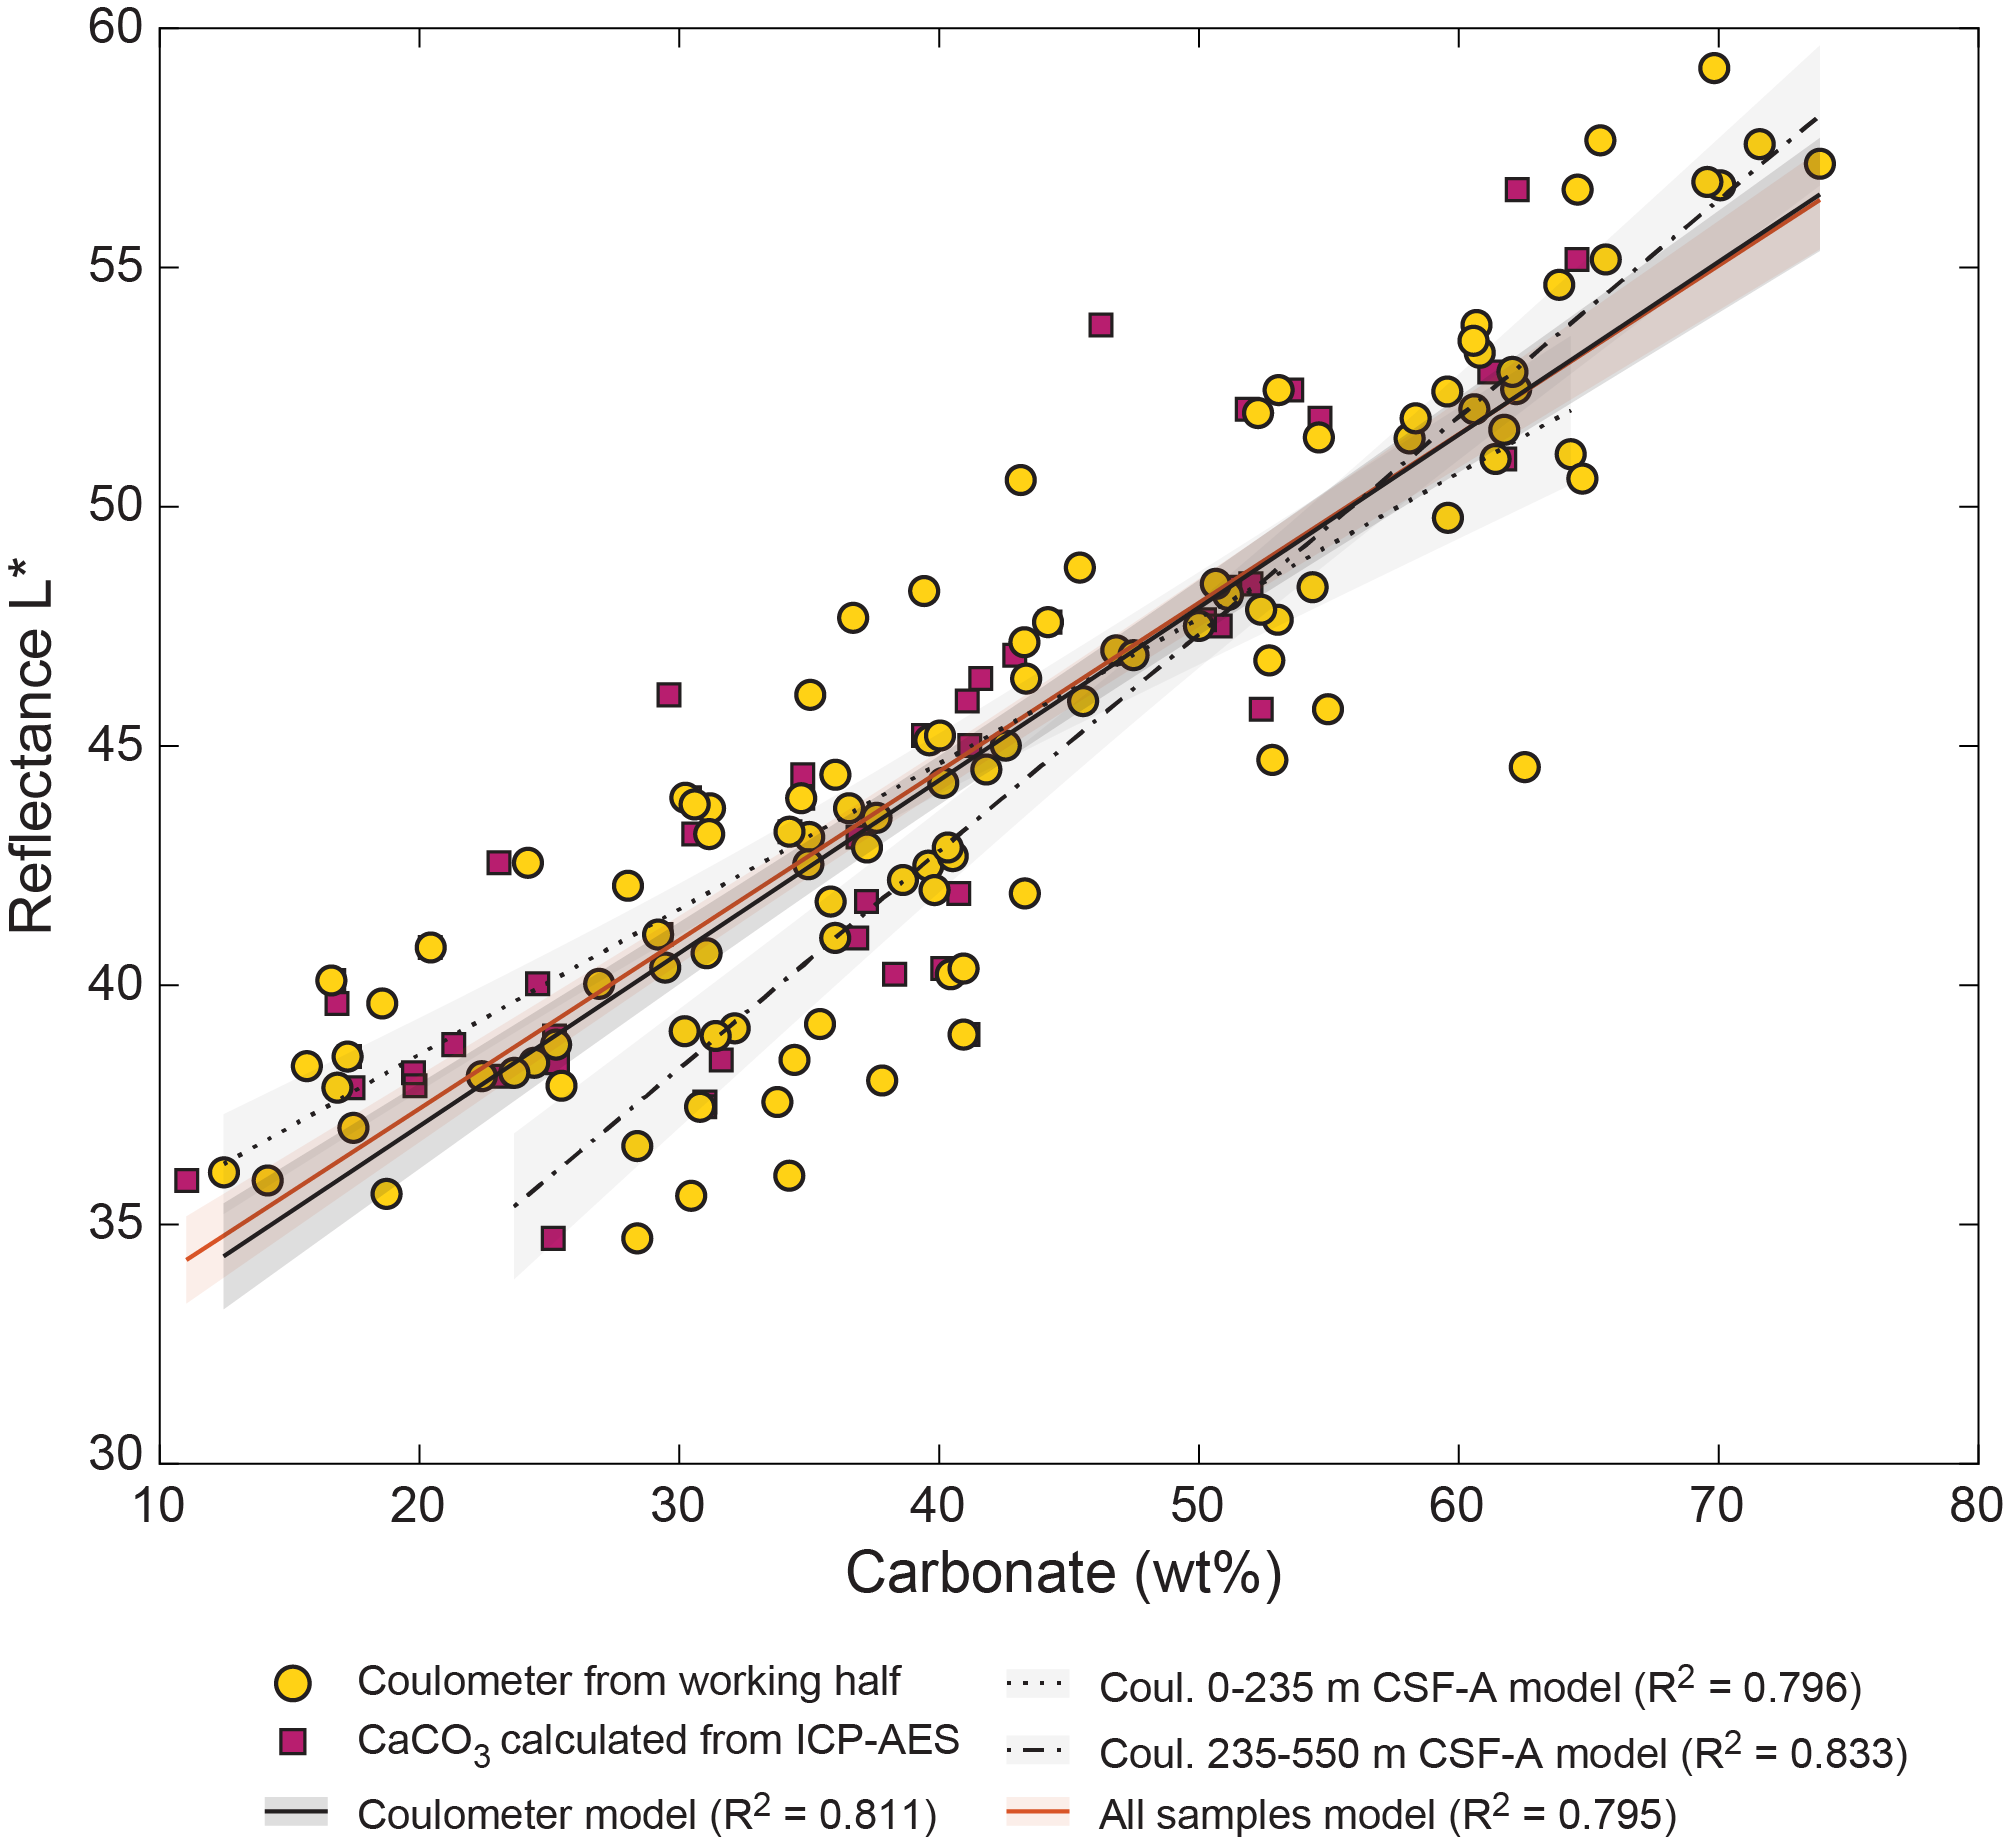
Figure F28. CaCO3 vs. L*.
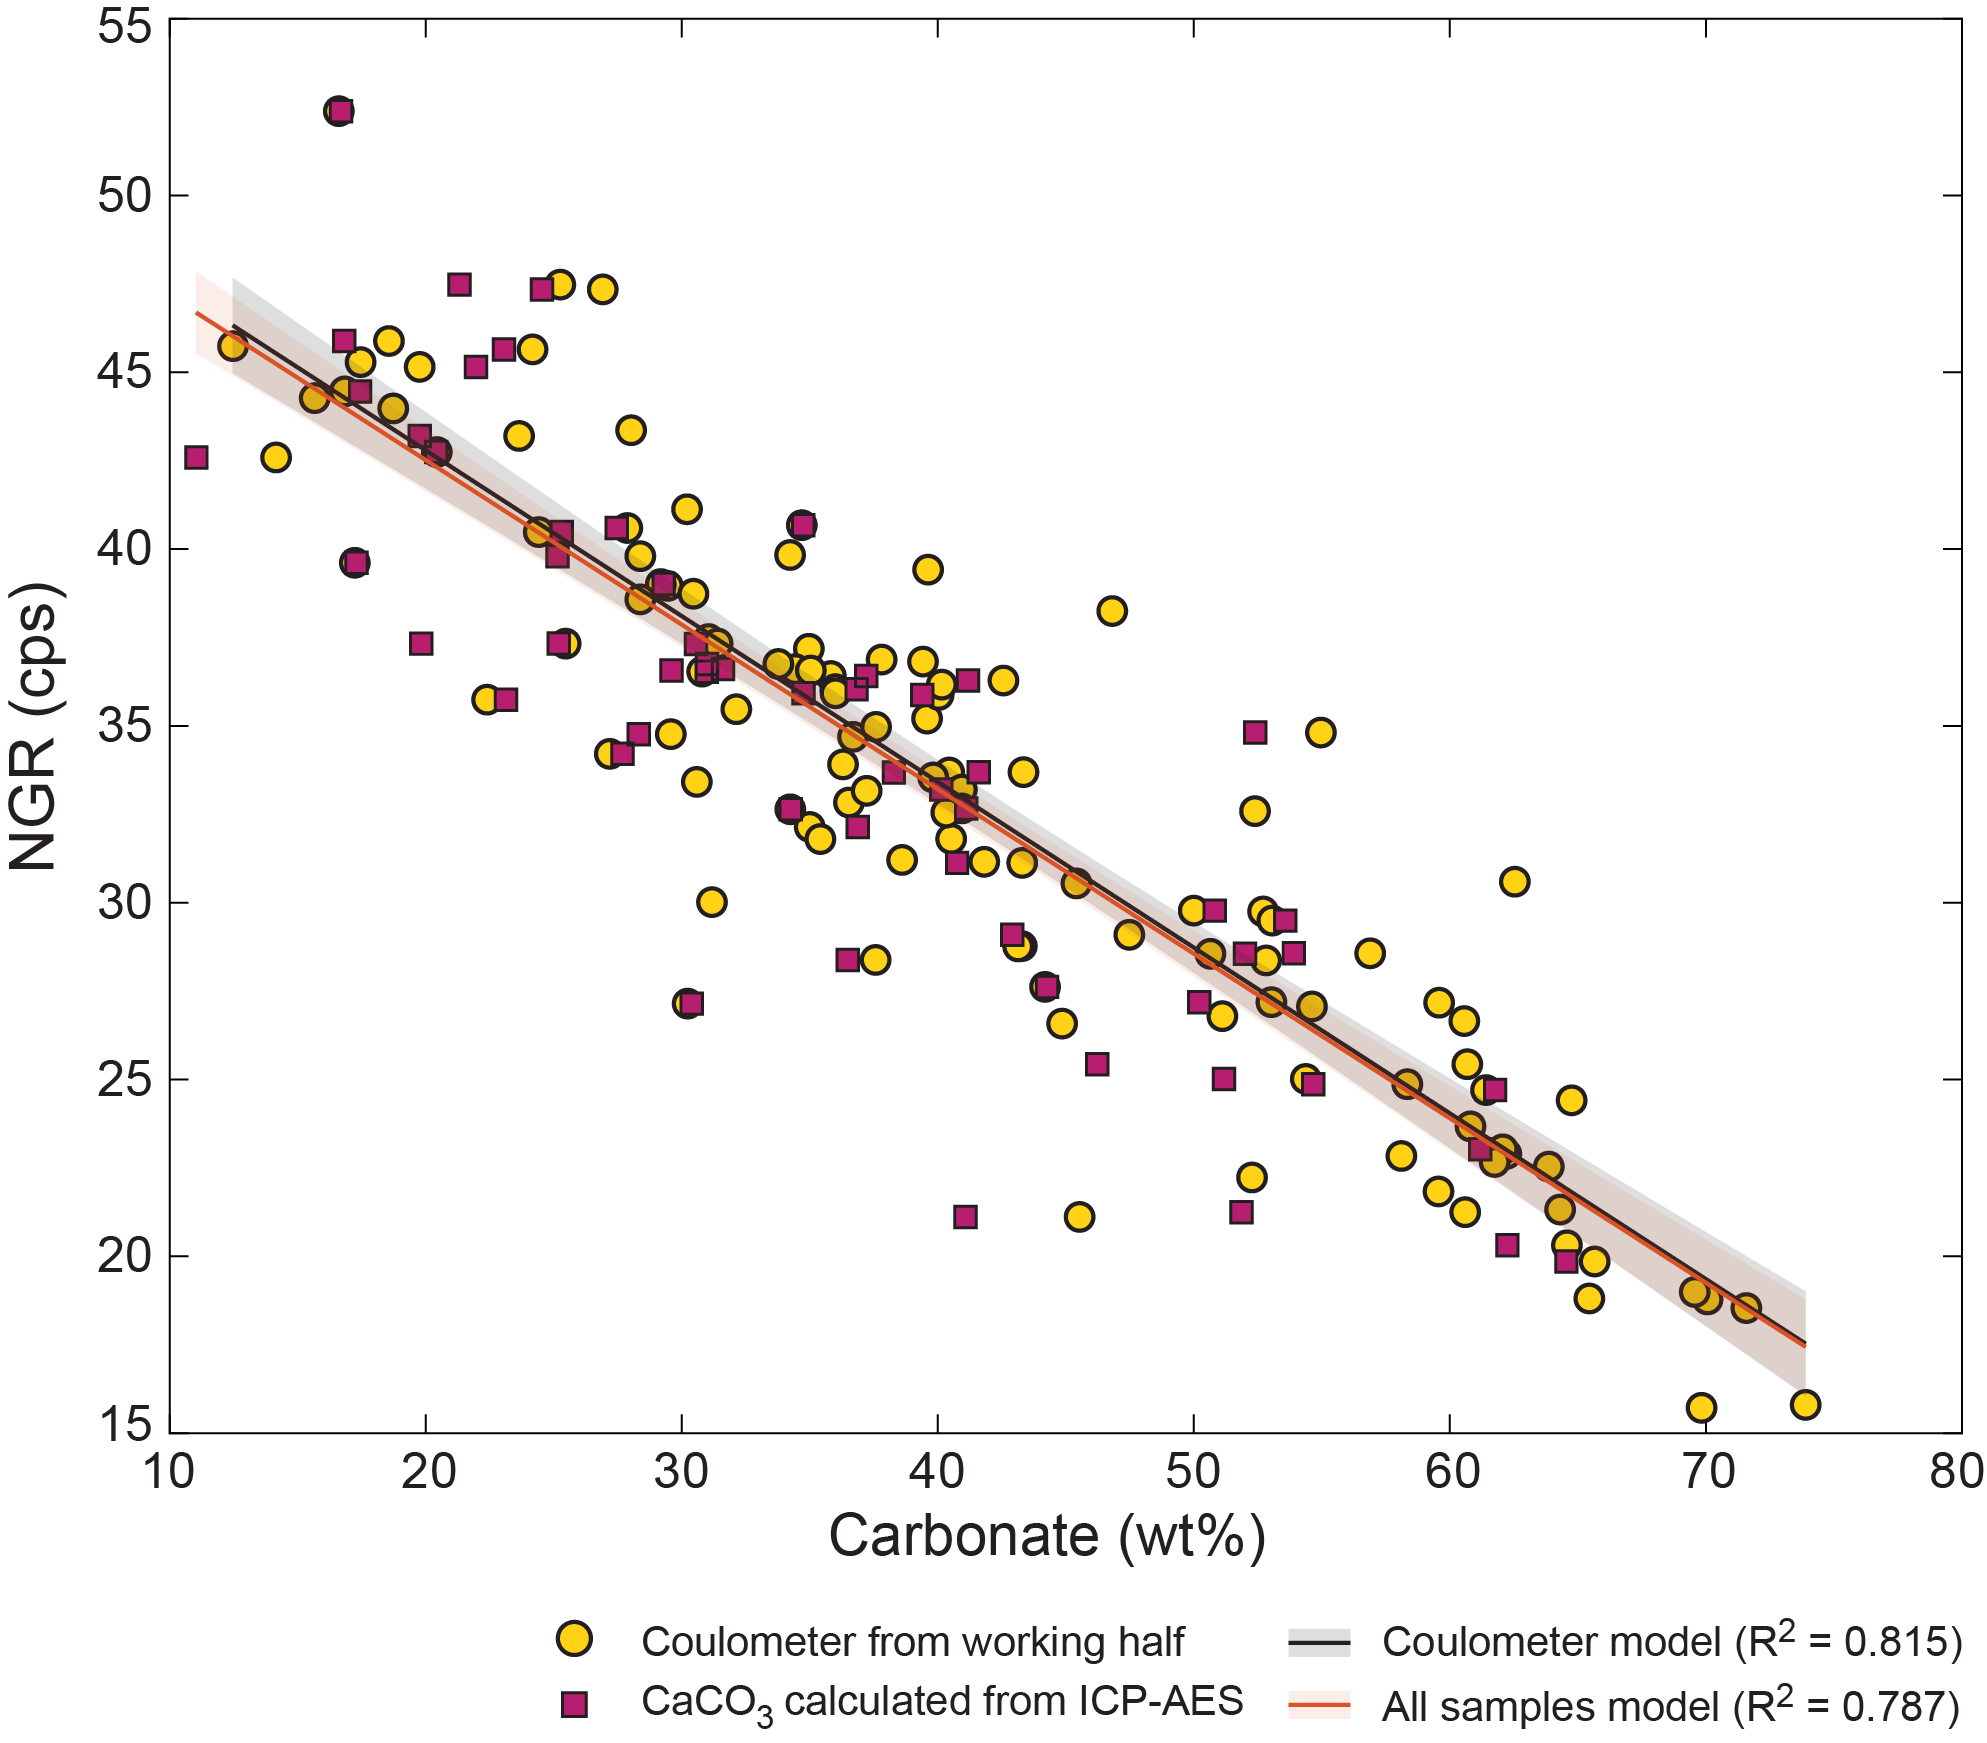
Figure F29. CaCO3 vs. NGR.
6.3.2. Total organic carbon
All samples were simultaneously analyzed for TC alongside TIC, TN, and TS (Figure F30). TOC is defined as the difference between TC and TIC.
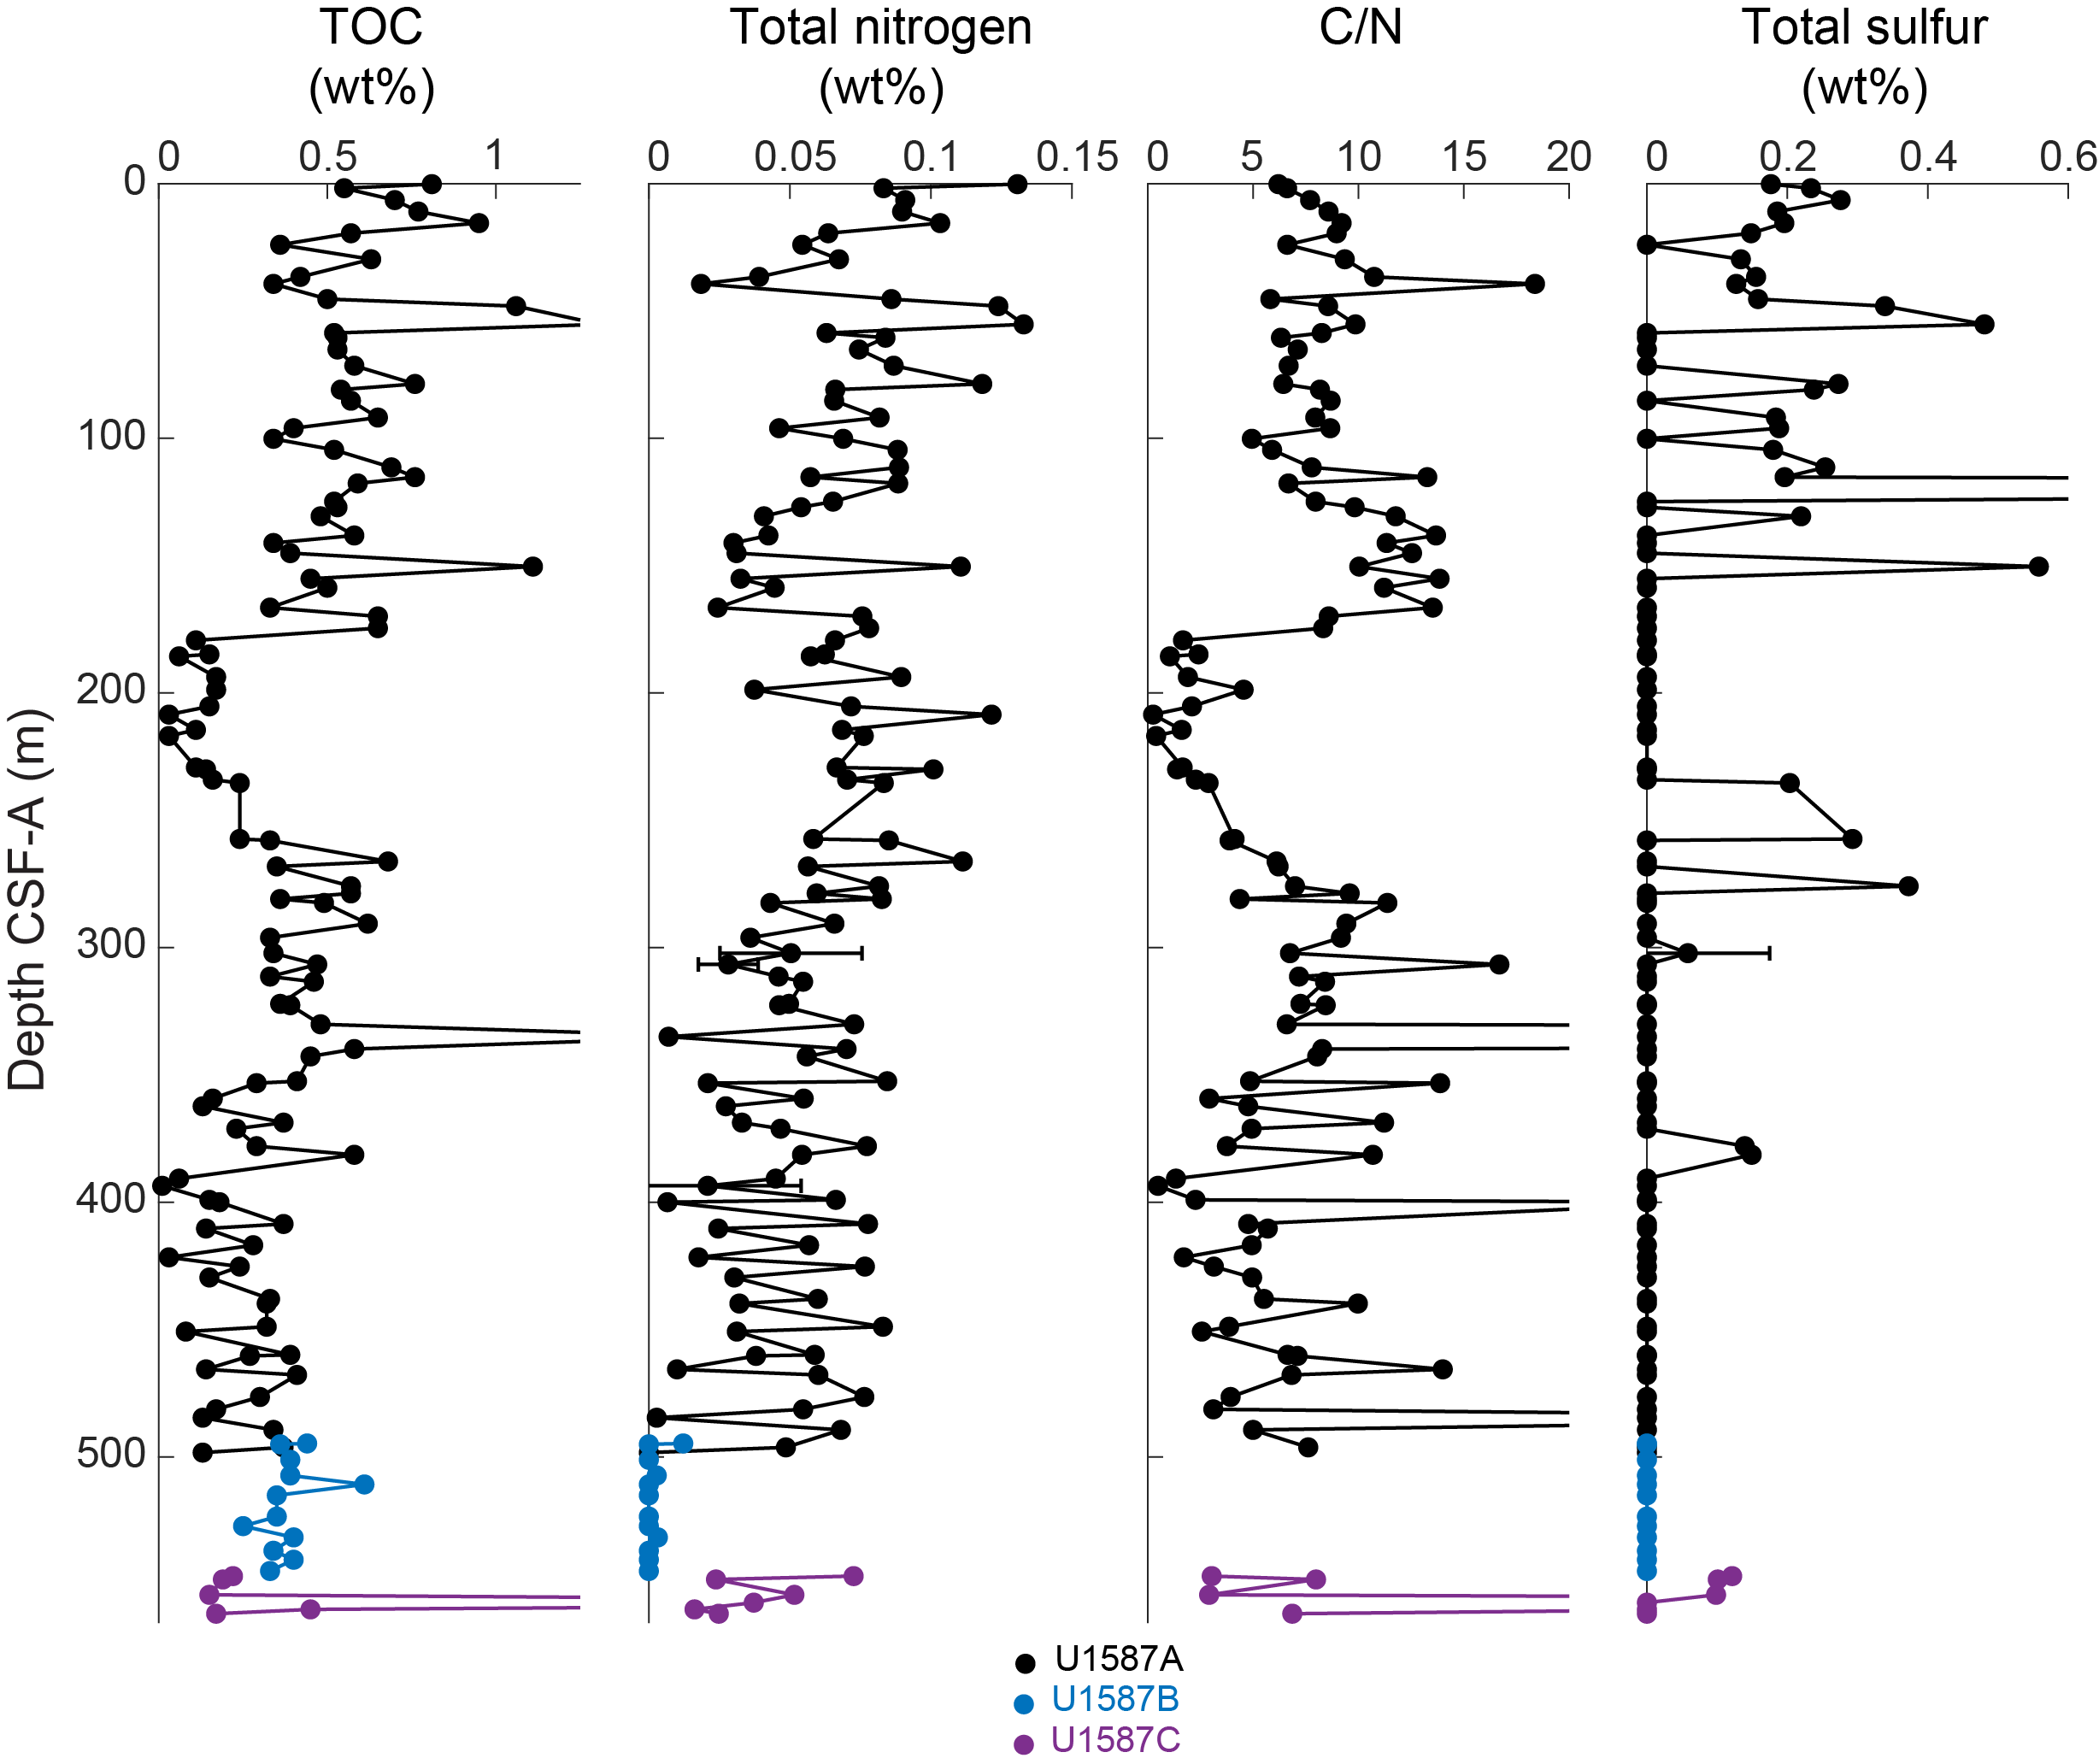
Figure F30. TOC, TN, C/N, and TS.
Two internal standards (sulfanilamide and Buffalo River Sediment [BRS]) were used to calibrate the elemental analyzer. BRS was used to assess the reproducibility of TC, TN, and TS and was run at least every ~10 samples; the 1σ of TC in NIST BRS (n = 22) and sulfanilamide (n = 4) are 0.057 and 0.768 wt%, respectively (Table T22). In addition, two samples were measured in duplicate and one in triplicate to assess analytical error; the 1σ range of the difference between replicate analyses was 0.031–0.245 wt% TC (Table T23).
TOC values in Holes U1587A and U1587B are generally low (mean = 0.43 ± 0.39 wt%; range = 0.01–3.68 wt%). They decline from 0.67 ± 0.18 wt% in the upper 30 m and again to ~0.20 wt% around 400 m CSF-A and then recover to 0.56 ± 0.91 wt% in the lowermost 50 m, with a short low-TOC (0.15 ± 0.08 wt%) interval between 175 and 260 m CSF-A (Figure F26; Table T24). CaCO3 and TOC are not strongly correlated (R2 = 0.06).
6.3.3. Total nitrogen
All sedimentary nitrogen is assumed to be organic. The 1σ of TN in BRS (n = 22) and sulfanilamide (n = 4) are 0.009 and 0.423 wt%, respectively (Table T22). Two samples were measured in duplicate and one in triplicate to assess analytical error; the 1σ range of the difference between replicate analyses was 0.011–0.033 wt% TN (Table T23).
TN content in Hole U1587A is also very low (mean = 0.054 ± 0.032 wt%; range = 0–0.133 wt%) (Table T25). TN declines from about 0.100 ± 0.019 wt% in the upper 10 m to around 0.036 ± 0.028 wt% in the lowermost 300–500 m (Figure F30).
6.3.4. Organic C/N ratios
The ratio of sedimentary TOC/TN (C/N) can fingerprint particulate organic matter: marine and lacustrine algae have ratios of 0–10, whereas terrestrial plants exist in a much broader C/N space (25–75) (Meyers 1994, 1997). Two samples were measured in duplicate and one in triplicate to assess analytical error; considering the duplicate and triplicate measurements done for TC, TIC, and TN, 1σ for C/N ranges 2.79–9.47 (Table T23).
After excluding the samples with 0 wt%, the C/N mean is 13.0 ± 29.2 (range = 0.25–240) (Table T26). C/N trends mirror TOC (Figure F30; see Total organic carbon), indicating that C/N is generally driven by TOC content, although 5–6 anomalously large C/N values result from very low TN rather than high TOC. C/N values are largely diagnostic of marine/lacustrine algal sources.
6.3.5. Total sulfur
The 1σ of TS in BRS (n = 22) and sulfanilamide (n = 4) are 0.141 and 0.462 wt%, respectively (Table T22). Two samples were measured in duplicate and one in triplicate to assess analytical error; only one replicate had TS above detection limits, with an interduplicate difference of 0.117 wt% (Table T23).
Similar to TOC and TN, TS contents are very low (mean = 0.087 ± 0.388 wt%; range = 0–4.178 wt%); TS levels were below the detection limit of the instrument for the majority of the samples from Holes U1587A–U1587C (Table T27). Excluding an anomalously high-TS sample (4.178 wt%) at 92 m CSF-A, TS ranges 0–0.558 wt% (mean = 0.054 ± 0.108 wt%). TS was highest in the upper 150 m of the hole (0.267 ± 0.705 wt%); below this, only nine samples had detectable amounts (Figure F30).
6.3.6. Major and minor elements
Major and minor element concentrations were measured on 57 samples from Site U1587 using ICP-AES (Table T28). Replicate analyses of eight international reference standards (n = 18) show relative standard deviations (RSDs) <3% for all major elements (except for P2O5) and <10% for most of the minor elements reported.
Elemental oxides SiO2, K2O, and TiO2 are strongly positively correlated with Al2O3, with a near-zero intercept indicating the dominance of terrigenous detritus (Figure F31). This is also generally observed for the minor elements, including Zn, Cr, V, Sc, Y, and Zr. Regressions of Fe2O3, MgO, and Na2O against Al2O3 exhibit high scatter due to the widespread presence of authigenic and biogenic phases, that is, respectively, pyrite (up to ~10 wt%), dolomite and/or Mg-bearing calcite, and halite (NaCl) precipitated from seawater. Bulk sediment Ca primarily represents biogenic carbonate, and because of the incorporation of Sr into biogenic carbonates, both elements show an inverse relationship with Al (one outlier contains >10% pyrite). Ba is weakly correlated with Al or Ca, likely due to the presence of BaSO4. Mn seems to be mainly associated with carbonate, as suggested by the weak positive relationship between Mn and Ca (Figure F31).
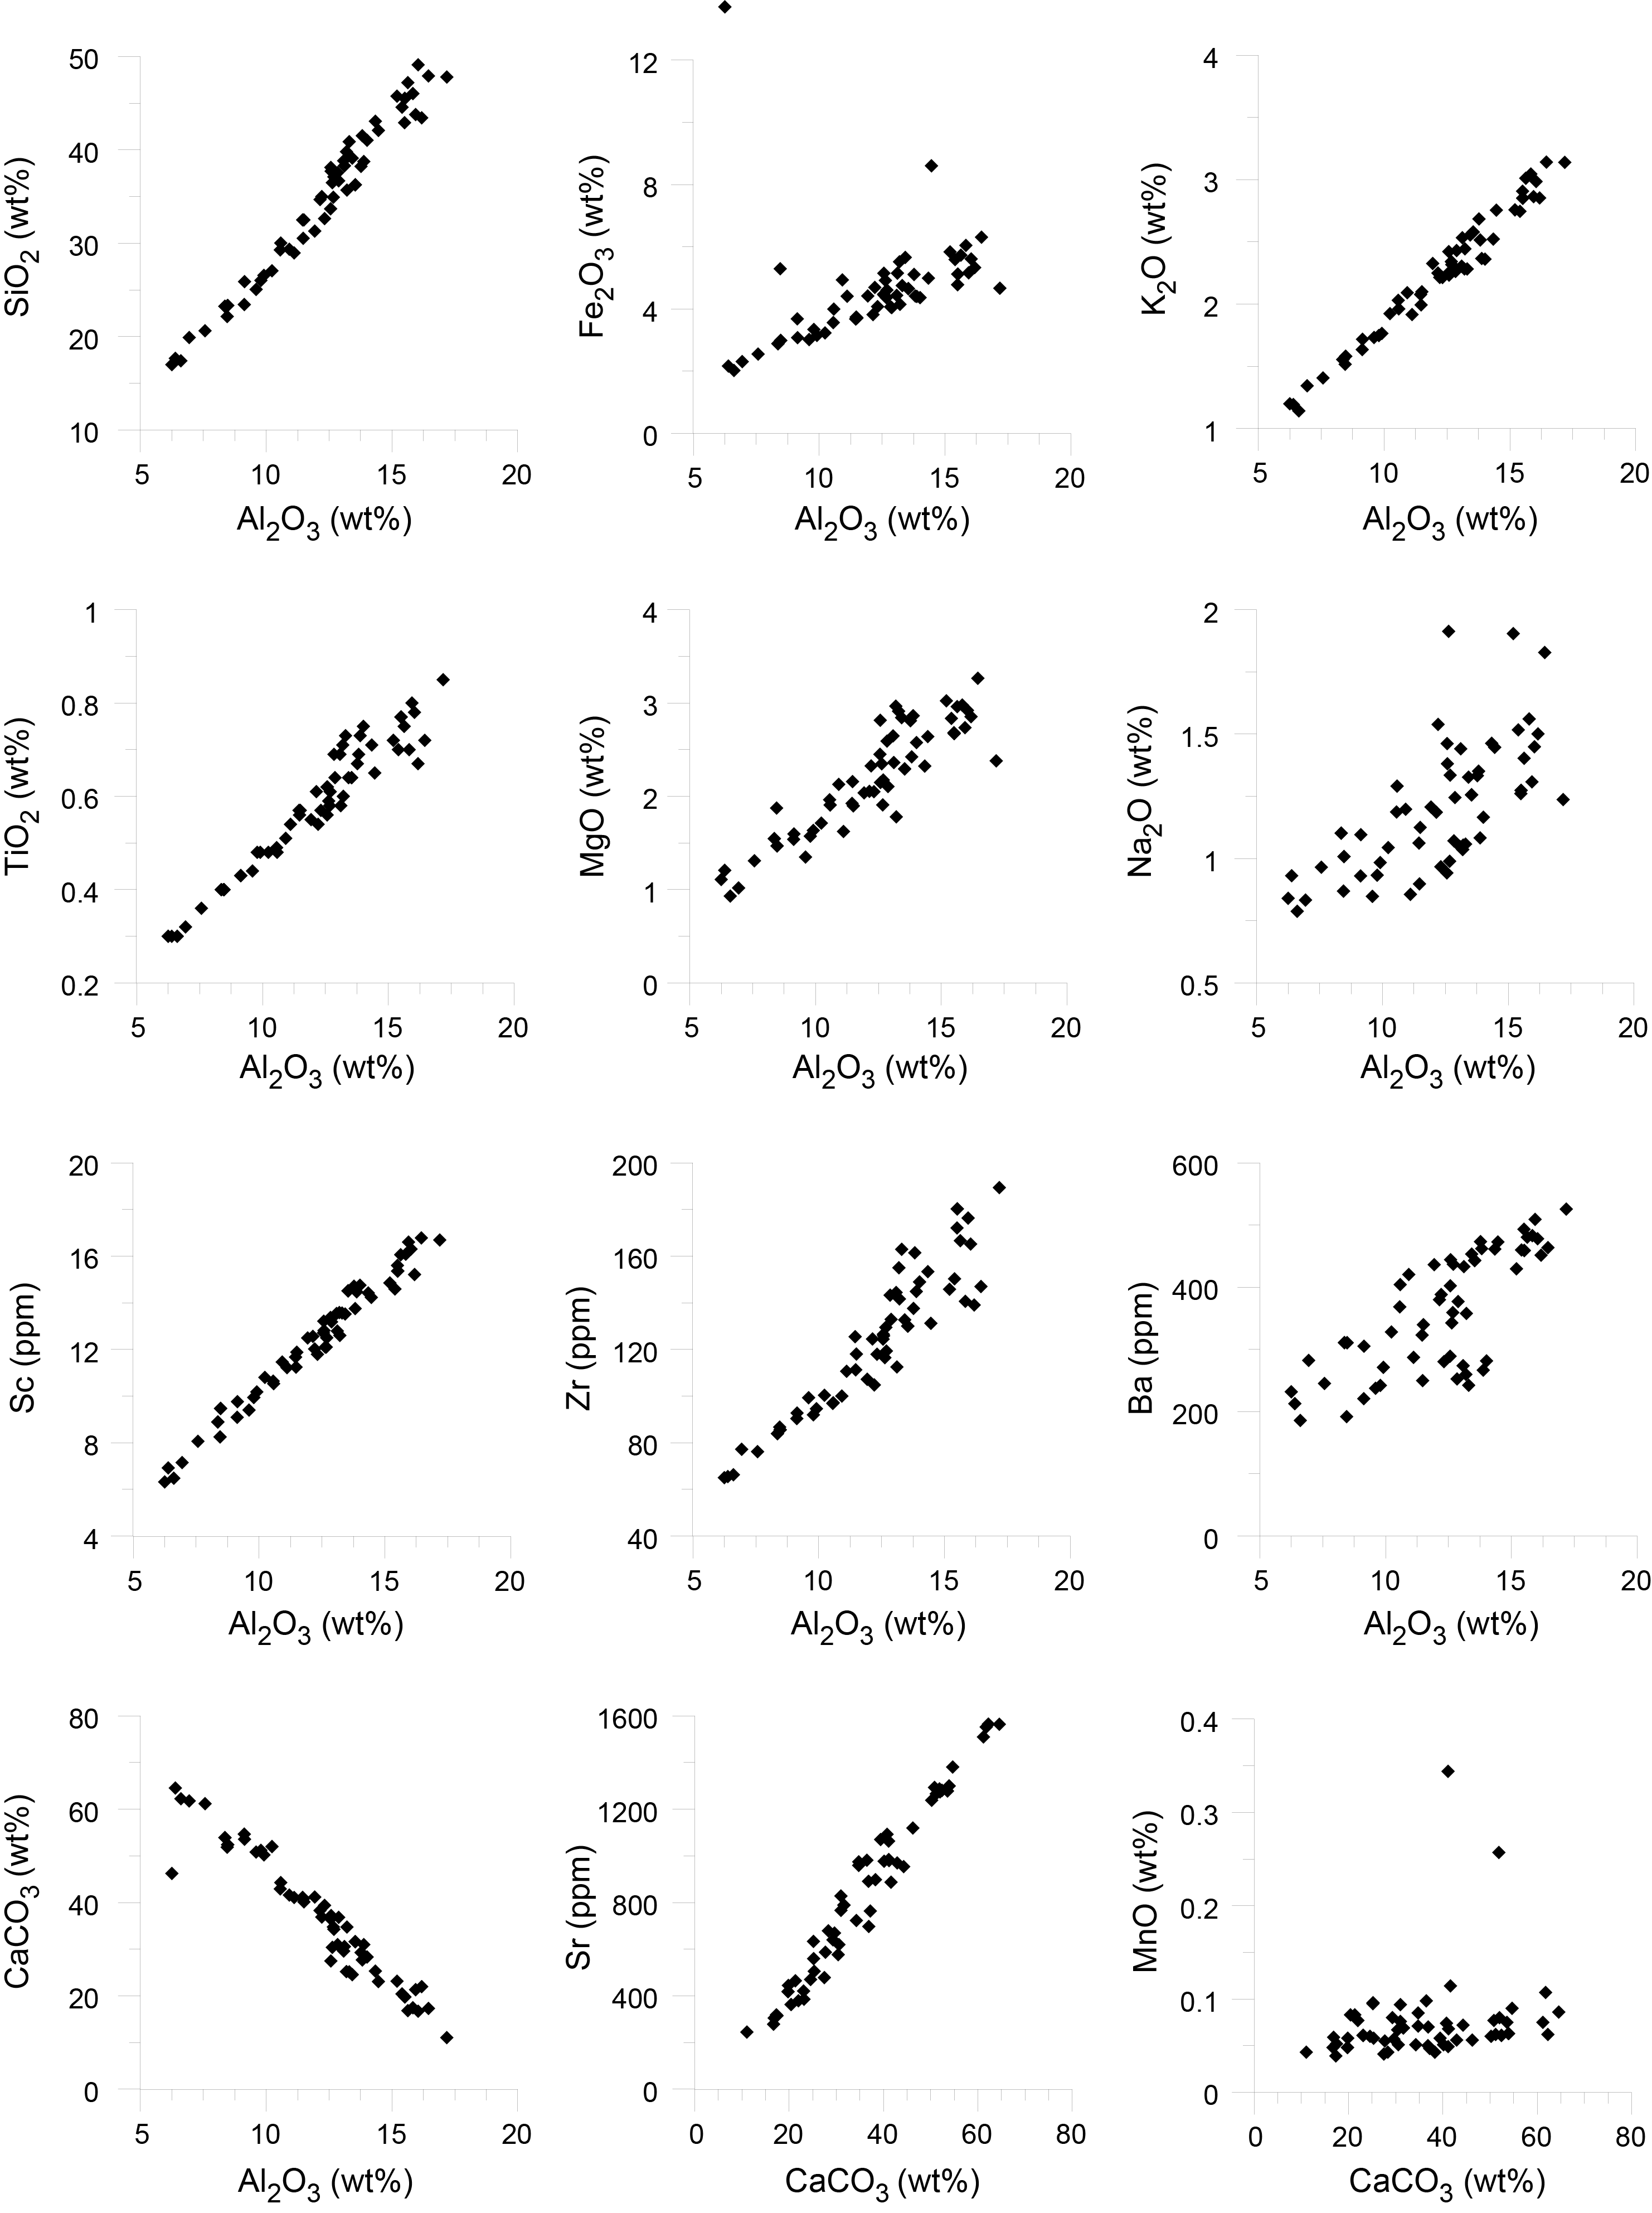
Figure F31. Major and minor element concentrations.
The Ca/Ti ratio reflects the relative contributions of CaCO3 versus terrigenous detritus in the sediments and shows a clear three-stage pattern downhole at Site U1587 (Figure F32). Specifically, Ca/Ti ratios are relatively low (~15–60) in the upper 200 m, with higher values and variation seen at ~120–200 m CSF-A. This is followed by a steady increase (up to 140) at ~200–400 m CSF-A and an interval with significant variations in Ca/Ti ratios (~20–140) to the bottom of the site.
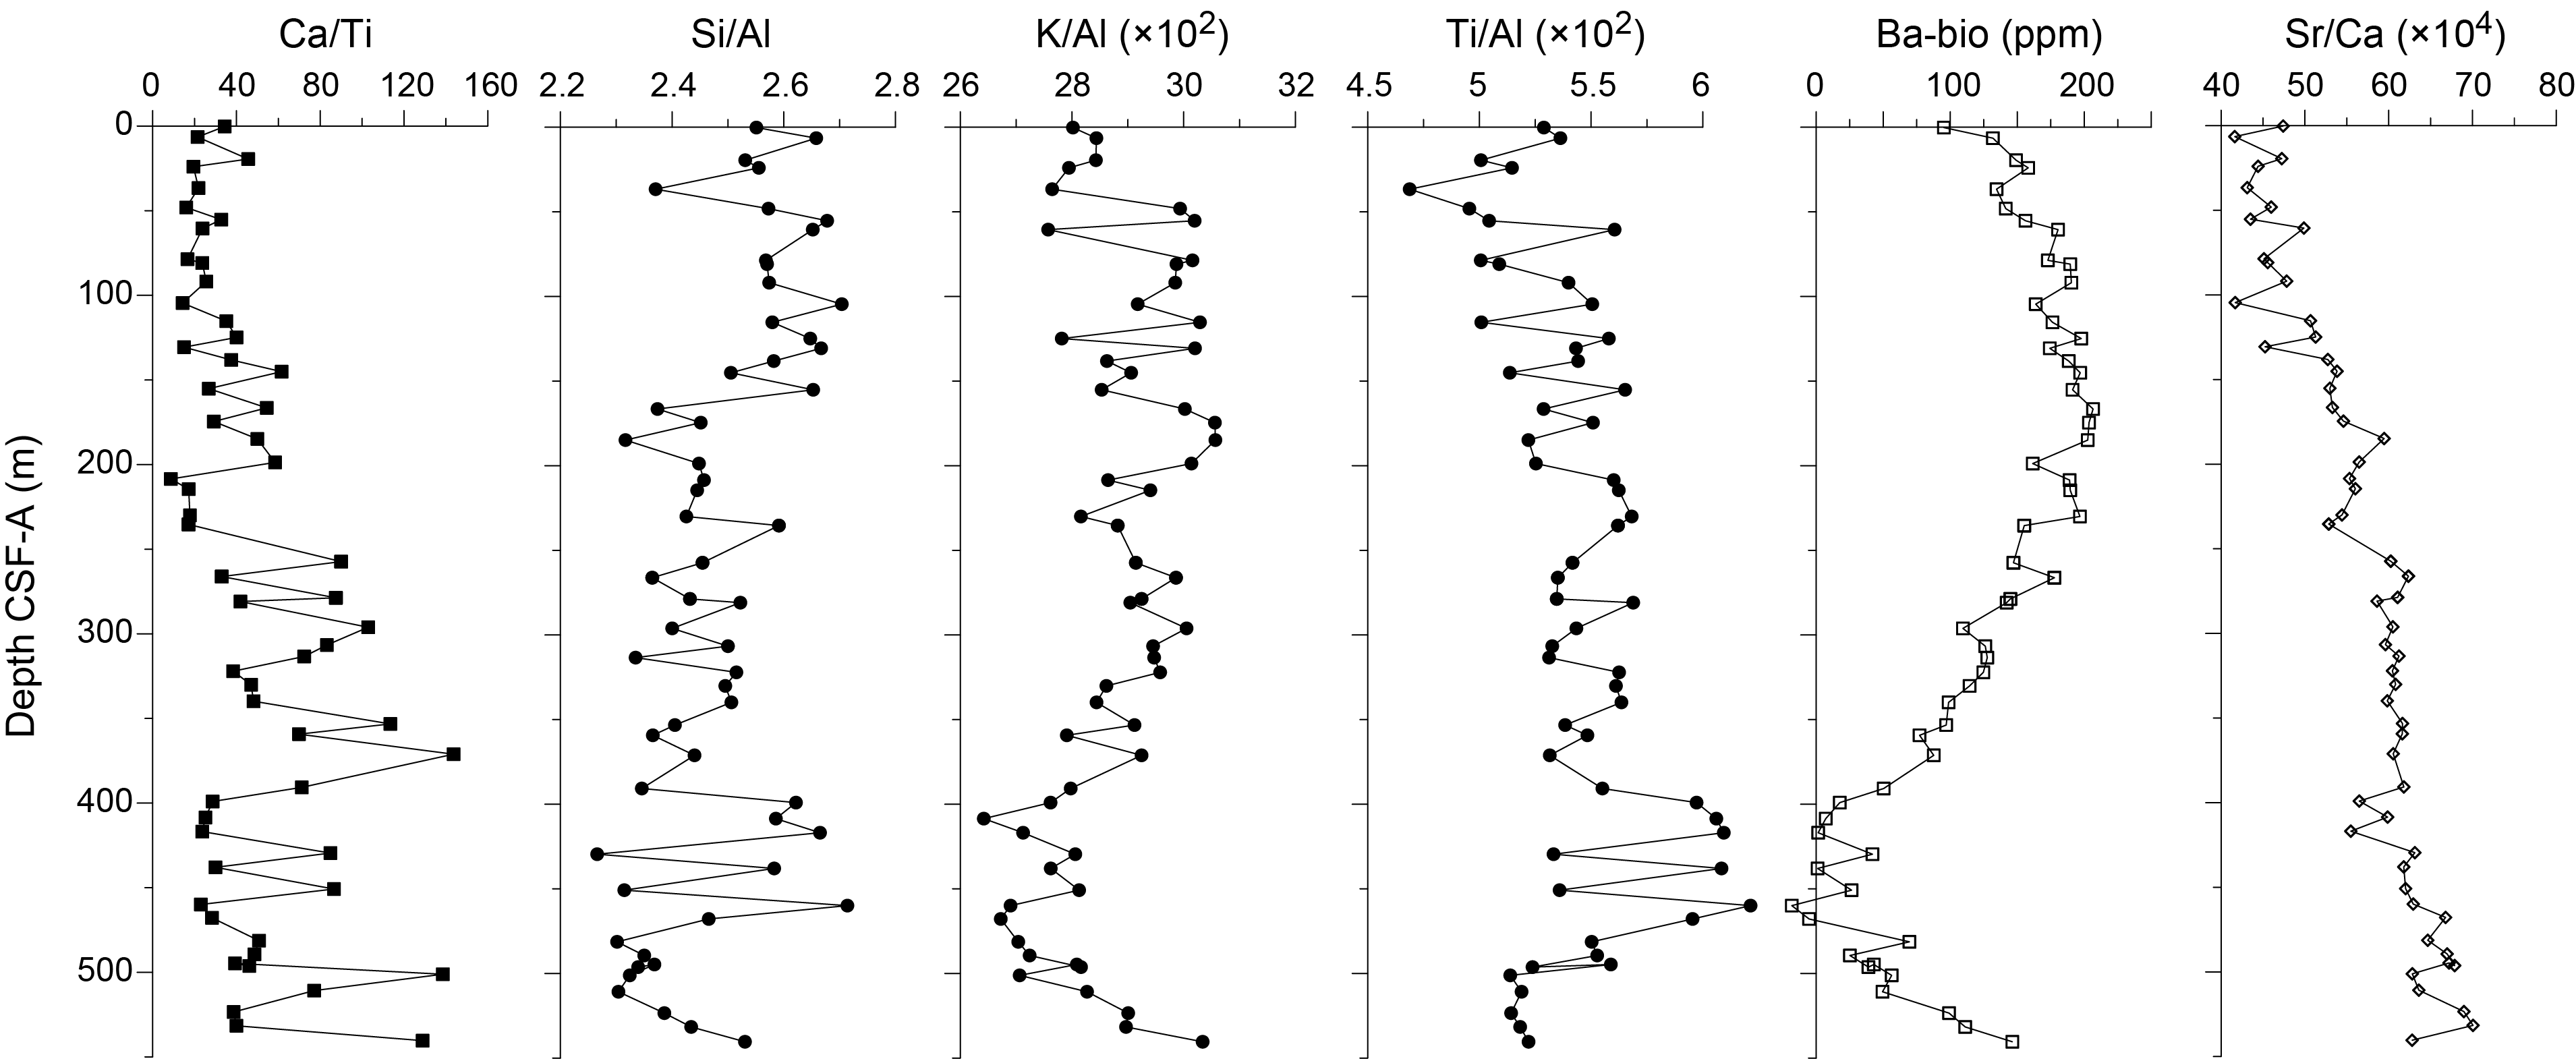
Figure F32. Bulk sedimentary Ca/Ti, Si/Al, K/Al, Ti/Al, biogenic Ba, and Sr/Ca.
Selected lithogenic elements are normalized to Al and serve as a proxy for provenance, weathering, and productivity (Figure F32). In addition, the Si/Al ratio may serve as a proxy for grain size, mainly reflecting the abundance of quartz versus clay minerals. The three-stage downhole pattern is also observed for Si/Al, which shows higher values in the upper 200 m and relatively low and stable values at 200–400 m CSF-A, followed by larger variations (~2.27–2.71) to the bottom of the site. The K/Al ratio is often used to reflect the input of river-borne material and associated chemical weathering intensity, whereas Ti/Al and Zr/Al ratios in this area are widely recognized as indicators of North African dust (Wu et al., 2016). The K/Al ratios show larger variations for the upper 200 m, gradually decreasing to ~0.26 at about 400 m CSF-A and increasing to ~0.30 at the bottom of the site. Ti/Al values gradually increase to 0.056 around 200 m CSF-A and remain relatively constant to 400 m CSF-A; a persistent downhole increase in Ti/Al and Ti/Al variability occurs to the bottom of Hole U1587A (Figure F32).
BaSO4 content in marine sediments is a widely recognized proxy for export productivity (Paytan and Griffith, 2007). Assuming a constant Ba/Al ratio of 0.0037 for the terrigenous aluminosilicate component (Reitz et al., 2004), the biogenic Ba (i.e., Ba-bio, mostly BaSO4) can be calculated. Ba-bio increases at about 200 m CSF-A (~100–200 ppm), followed by a gradual decrease to 0 at about 400 m CSF-A, where it again increases to the bottom of the site (Figure F32). However, the Ba-bio profile shows little similarity to that of TOC. The Sr/Ca profile shows a persistent increase downhole, probably linked to changes in aragonite content.
7. Physical properties
Physical properties measurements were made on whole-round cores, split cores, and discrete samples. High-resolution (2 or 4 cm steps) nondestructive measurements of GRA bulk density and MS were made on whole-round sections from all holes. NGR was measured at a 10 cm resolution for all whole-round sections. P-wave velocity was measured using the P-wave logger (PWL) at 2 cm steps on the whole-round sections from Hole U1587A that were cored using the APC system (Cores 1H–15H). P-wave caliper (PWC), thermal conductivity, and MAD measurements were taken at a resolution of one measurement per core for all cores from Hole U1587A, 500–550 m CSF-A in Hole U1587B, and 550–568 m CSF-A in Hole U1587C. Color reflectance spectrophotometry and split core point MS (MSP) measurements were carried out at 2 cm steps on all archive halves. X-ray images of whole-round sections were taken for all cores from Hole U1587A (0–500 m CSF-A) and for Cores 397-U1587C-53X through 61X (487–568 m CSF-A).
7.1. Bulk density
Bulk density values were measured using the WRMSL for GRA bulk density and by taking discrete samples for MAD bulk density.
GRA bulk density was measured on all whole-round sections from all holes using the WRMSL. For Hole U1587A, the measuring interval was 2 cm, and for Holes U1587B and U1587C we switched the measuring interval to 4 cm. Changing the GRA bulk density measuring intervals after Hole U1587A was needed to acquire presplitting measurements before core expansion by gas release. Measured GRA bulk density gradually increases from ~1.55 g/cm3 at the top of the holes to ~1.9 g/cm3 around 110 m CSF-A (Figure F33). At 140 m CSF-A, GRA bulk density drops from ~1.9 to ~1.7 g/cm3, but this trend is not observed in MAD bulk density measurements. This decrease in GRA bulk density may reflect the change from the APC to the XCB system. The WRMSL does not correct for the difference in the diameter between APC and XCB cores. Additionally, GRA bulk density decreases where there is drilling disturbance such as core expansion, cracks, voids, soupy textures, and basal flow-ins (see Lithostratigraphy).
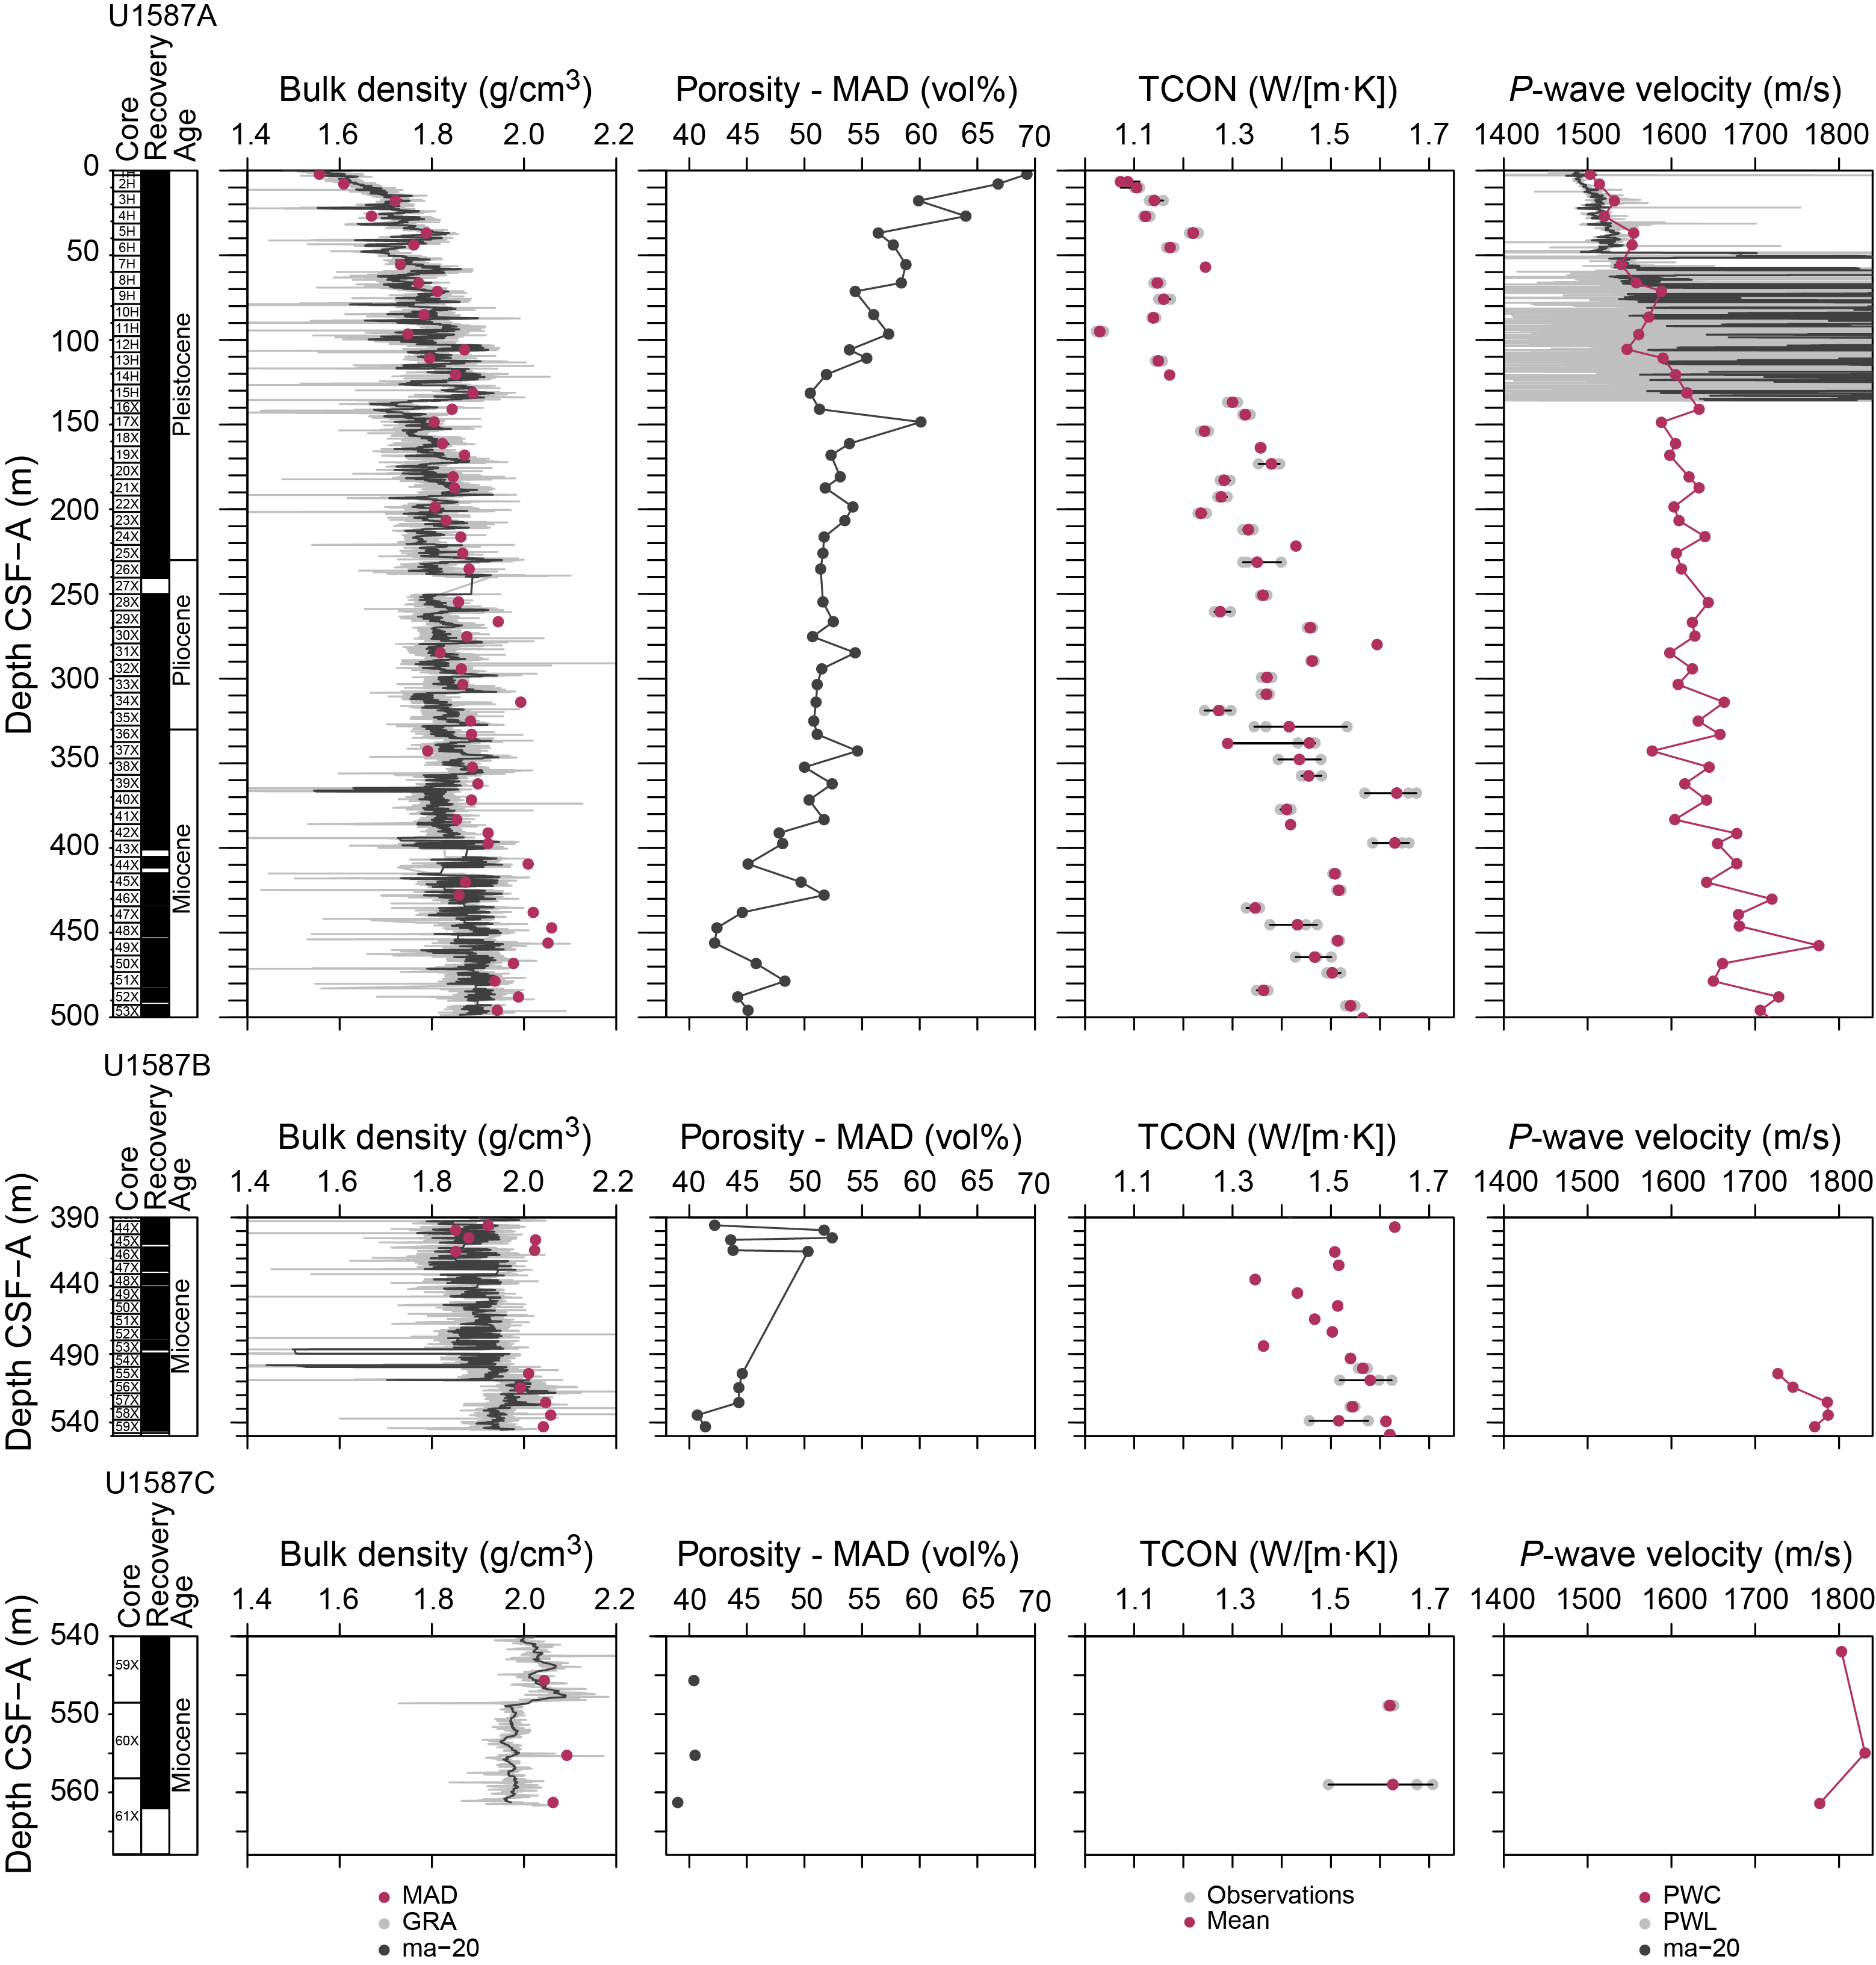
Figure F33. GRA and MAD bulk density, porosity, thermal conductivity, and P-wave velocity.
MAD was measured using 10 cm3 discrete samples taken at a sampling resolution of one per core for all cores from Hole U1587A, 500–550 m CSF-A in Hole U1587B, and 550–568 m CSF-A in Hole U1587C. MAD samples were taken from fine-grained sections while avoiding locations of noticeable drilling disturbance. These samples were measured for wet mass, dry mass, and dry volume to calculate wet density, dry density, grain density, porosity, and void ratio. The measured bulk densities from the discrete samples range 1.56–2.06 g/cm3 (Figure F33). The bulk densities of the discrete samples increase with depth from 1.56 g/cm3 at the top of the hole to >1.8 g/cm3 below 100 m CSF-A.
GRA and MAD bulk density measurements show a downhole-increasing trend reflecting sediment compaction. Slight offsets between GRA and MAD bulk densities are recognized between 400 and 500 m CSF-A, where discrete sample bulk densities were slightly higher than those measured by GRA bulk density. This discrepancy is likely due to discrete samples being taken from darker sediment intervals. Discrete MAD samples were taken from light and dark sediment intervals from 395 to 415 m CSF-A in Hole U1587B to investigate changes in bulk densities and porosities. The measurements confirm that darker sediments have greater densities and lower porosity than light sediments at similar depths (Figure F34).
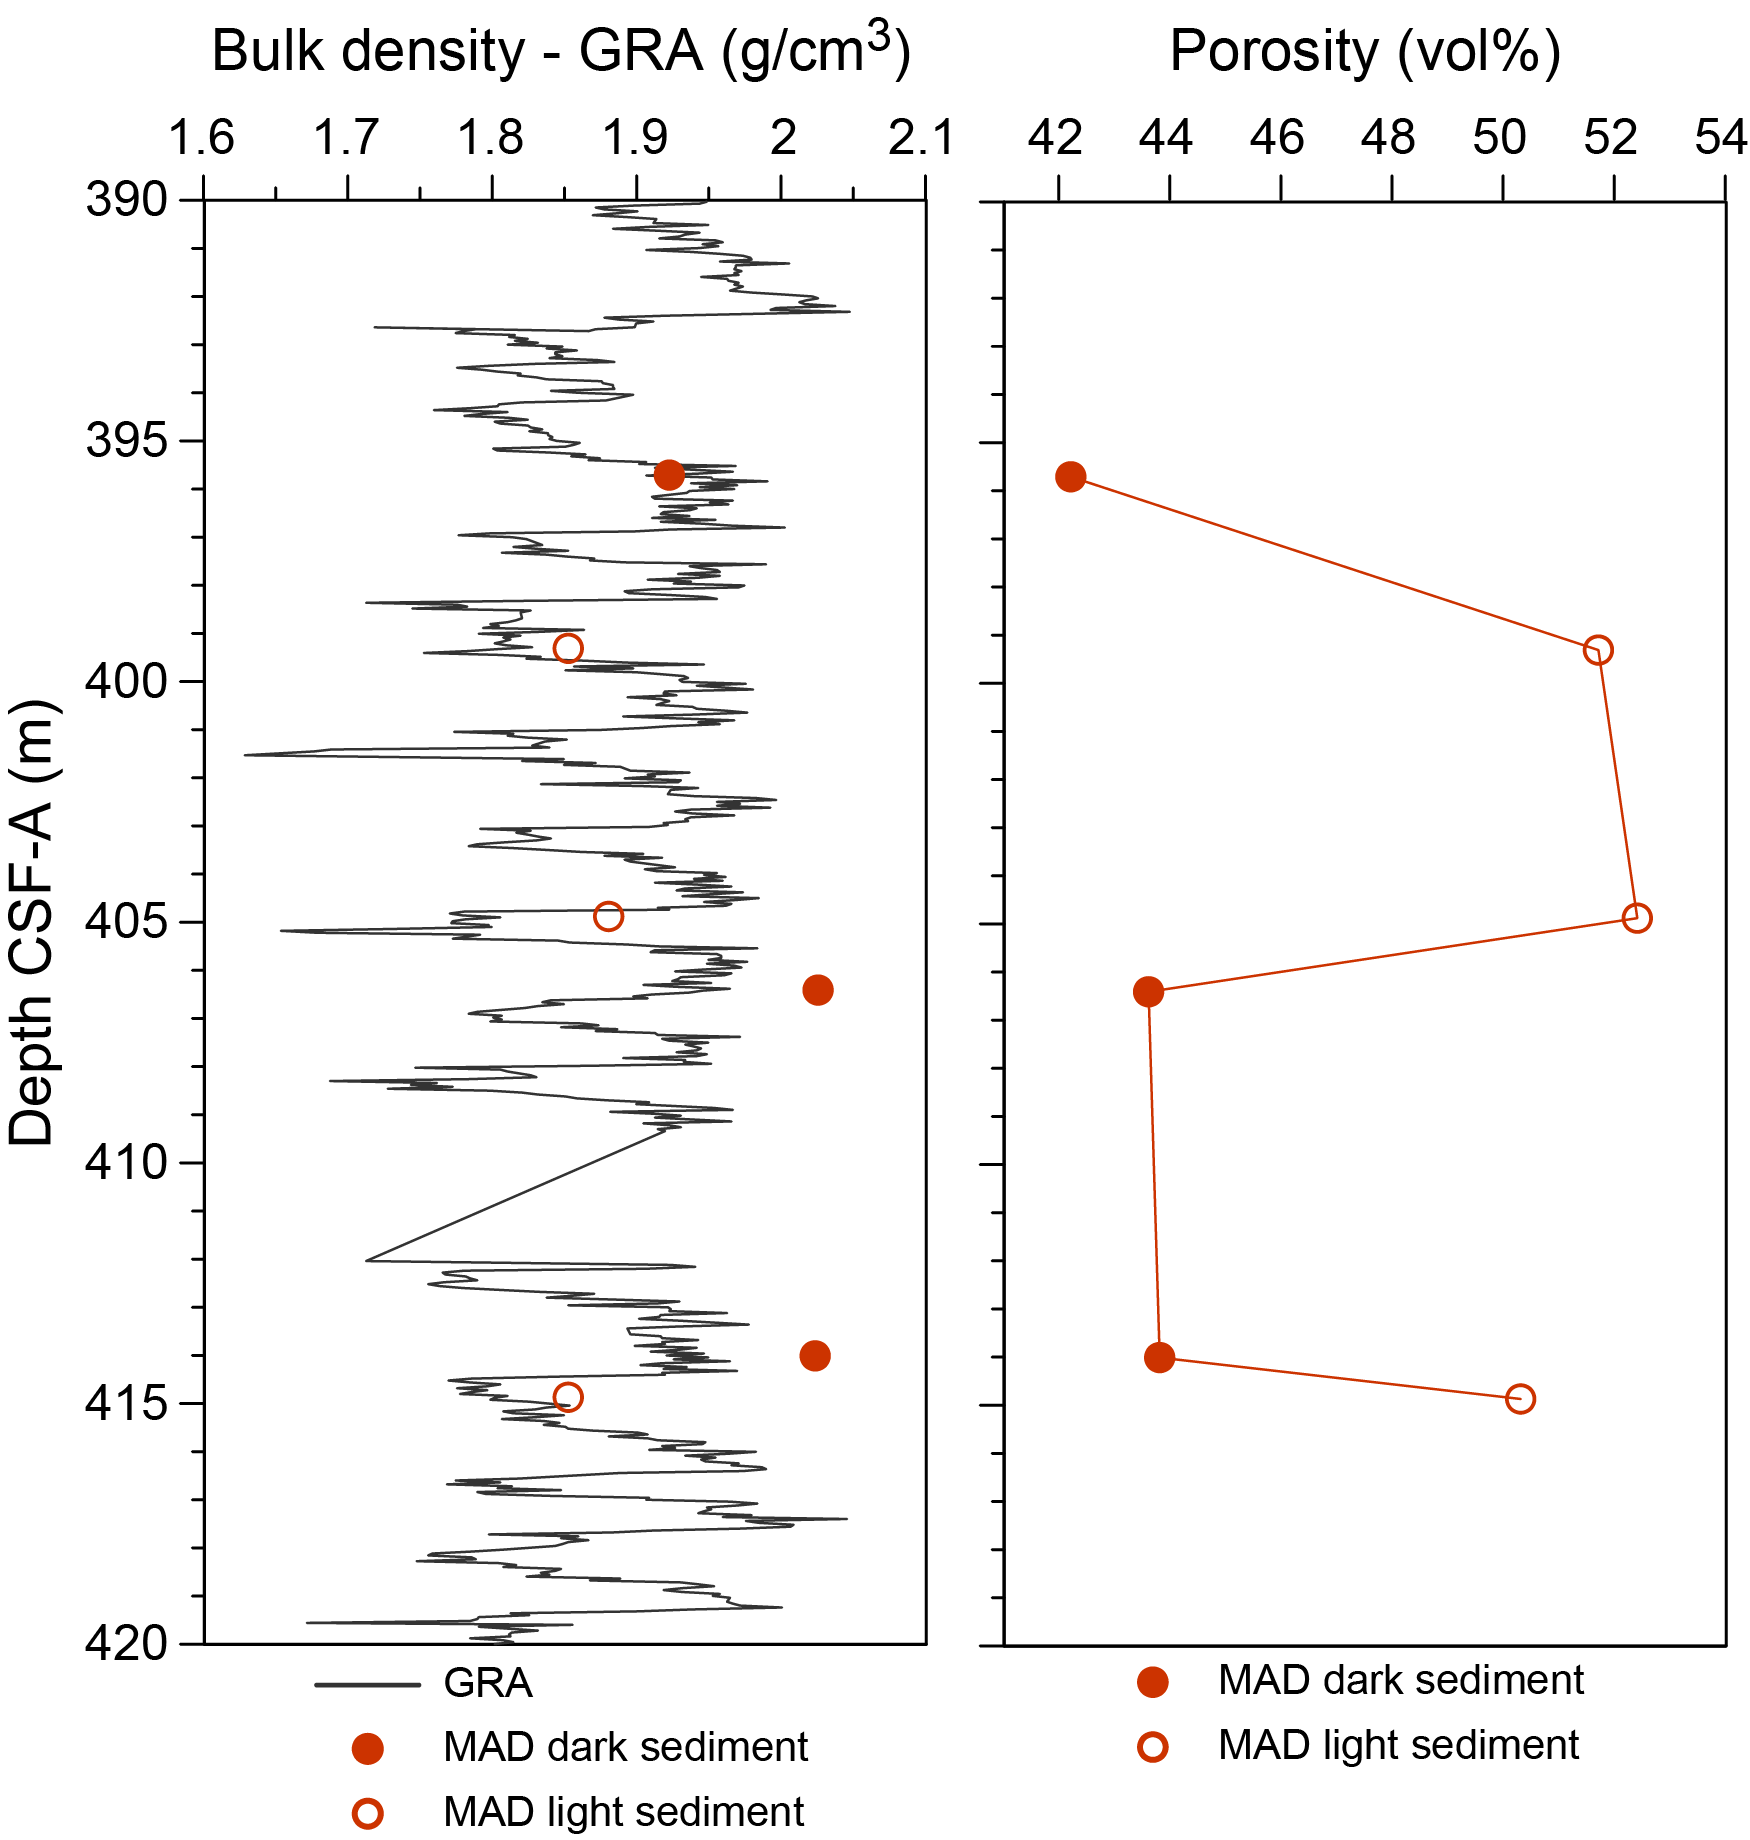
Figure F34. GRA and MAD bulk density and porosity.
7.2. Magnetic susceptibility
MS was measured on all cores using the WRMSL at 2 or 4 cm resolution, the Special Task Multisensor Logger (STMSL) (fast track) at 4 cm resolution, and the SHMSL at 2 cm resolution (Figure F35). The measured MS is characterized by cyclic variations on the order of tens of centimeters to a few meters.
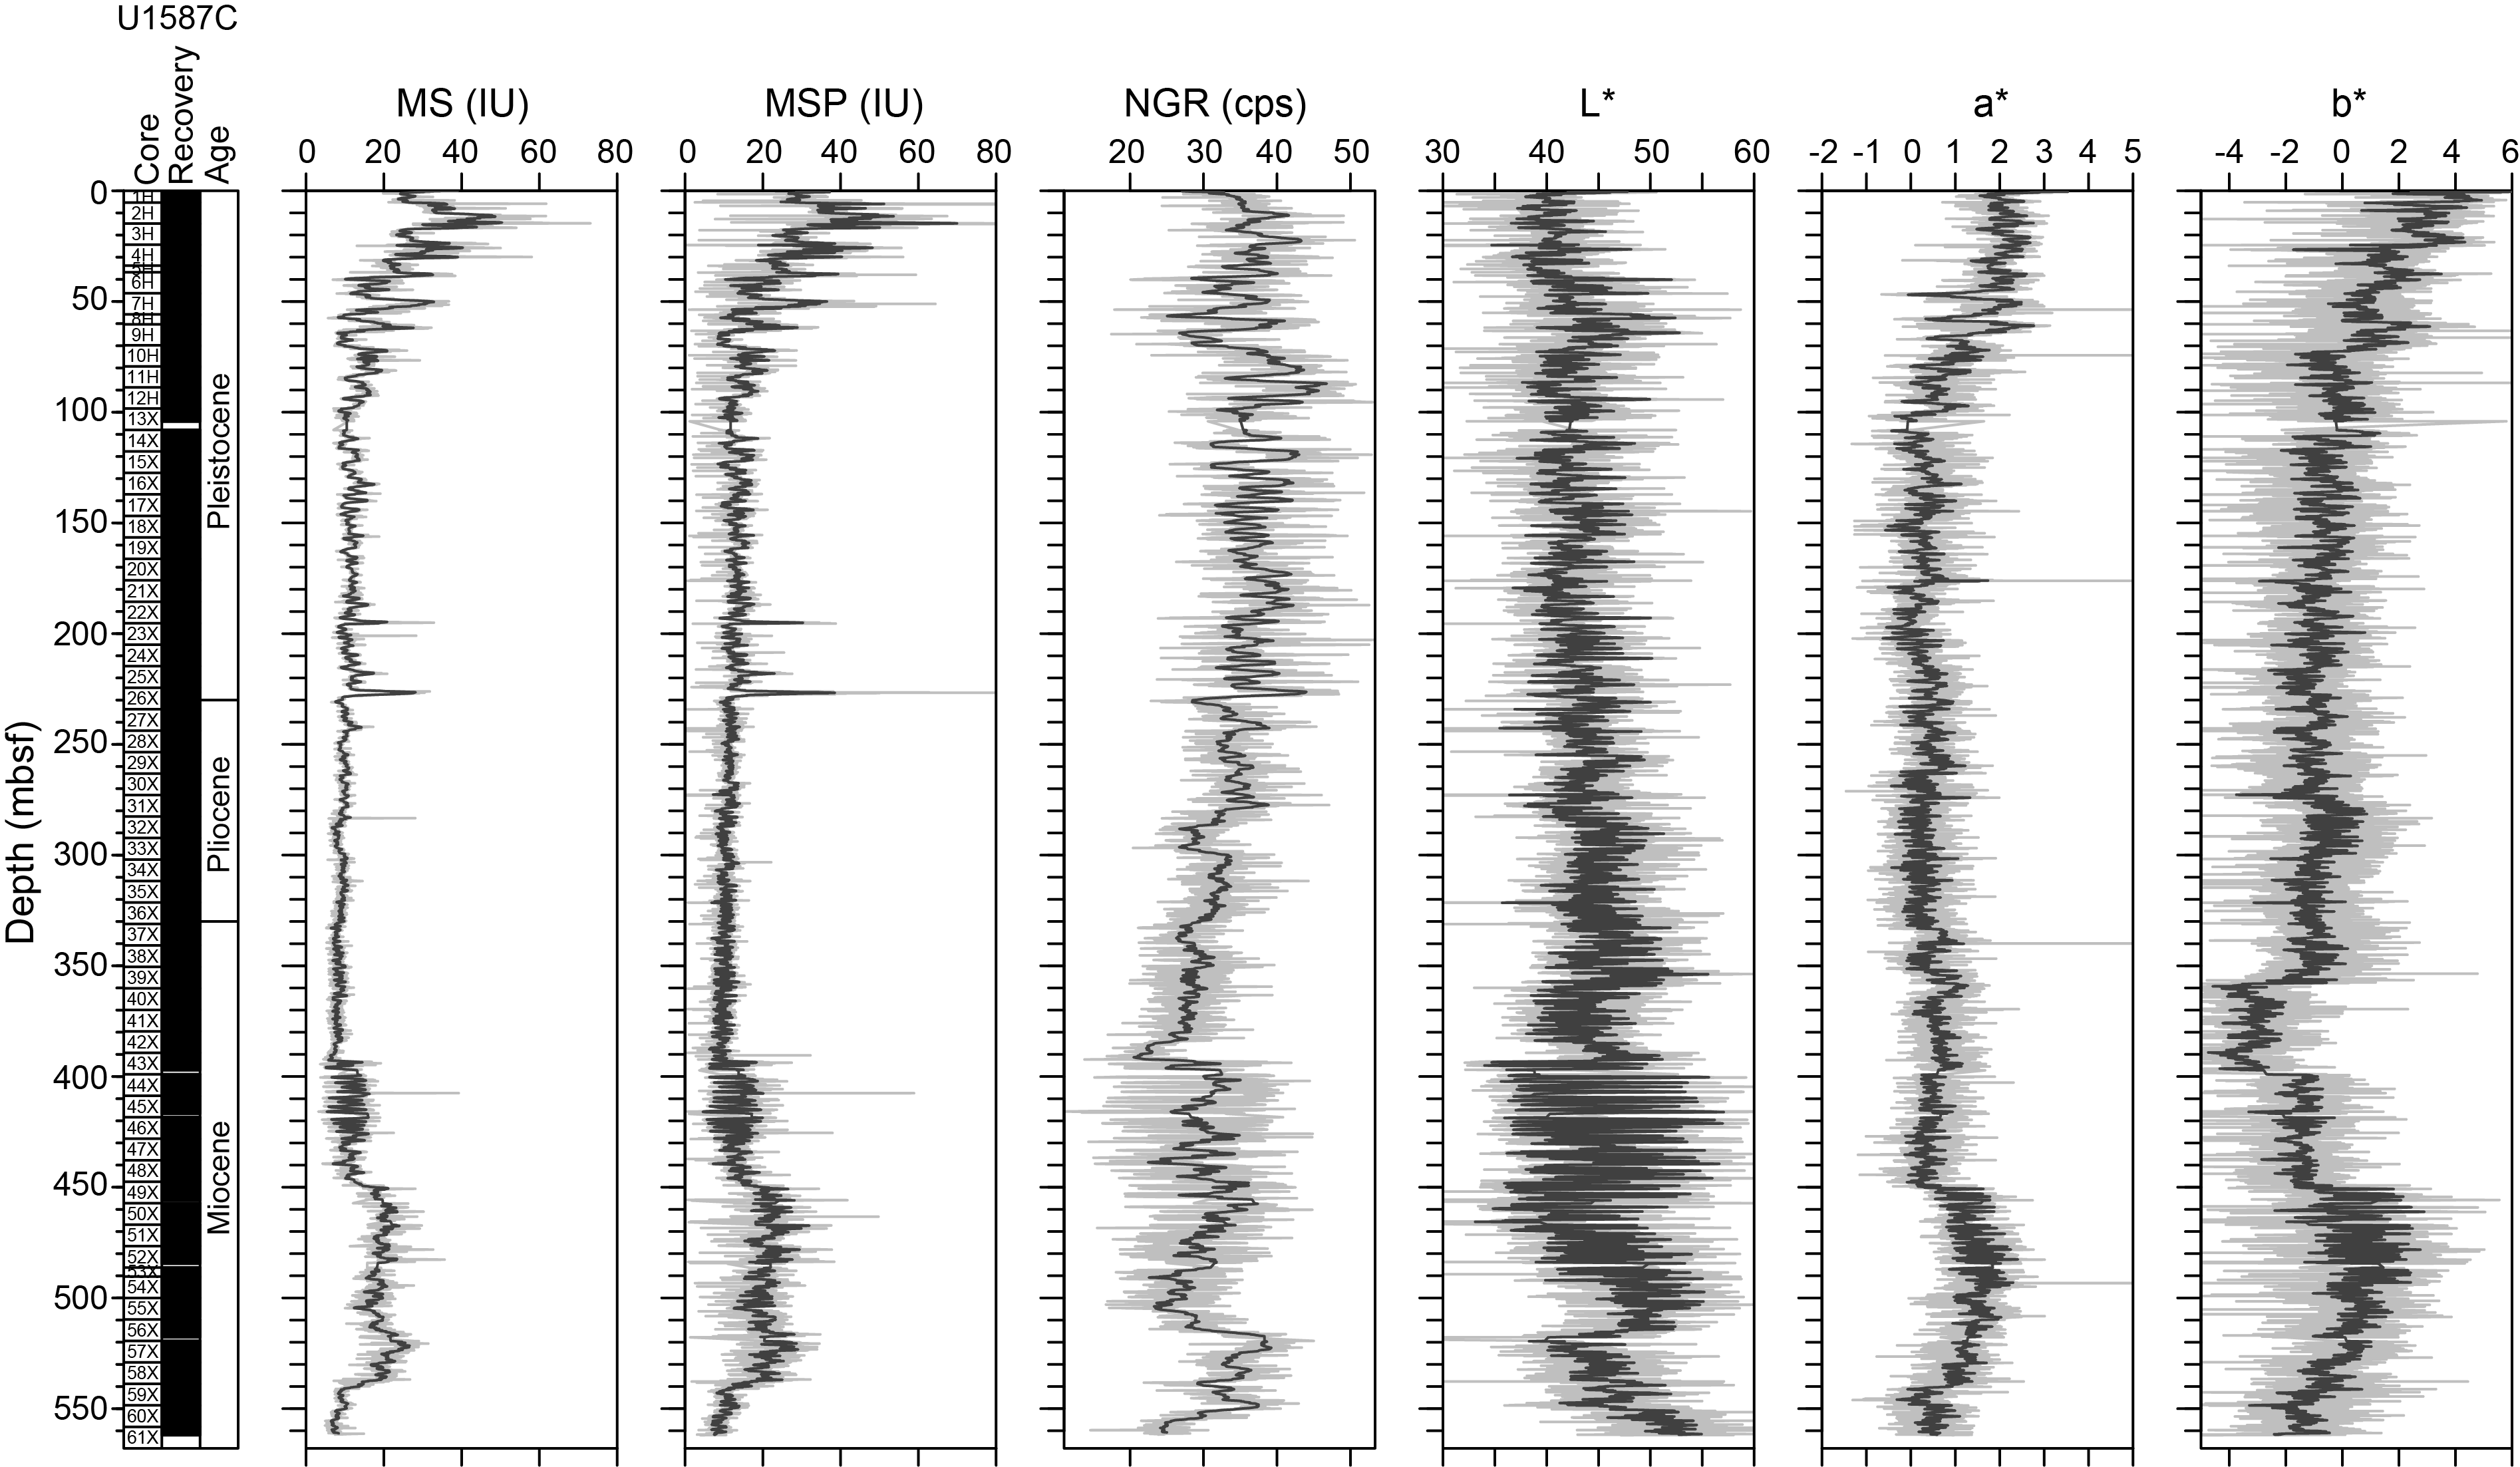
Figure F35. MS, MSP, NGR, and L*a*b*.
The overall downhole trends at Site U1587 include five main intervals: (1) a reduction of MS values from ~70 to ~10 IU with decreasing amplitude of cyclic variations from 30 to 70 m CSF-A, (2) a consistently low MS signal of ~10 IU from 70 to 390 m CSF-A, (3) increasing MS values from ~5 to ~20 IU and cyclic amplitude between 390 and 450 m CSF-A, (4) a consistent high MS plateau of high amplitude varying from ~10 to ~30 IU between 450 and 530 m CSF-A, and (5) a reduction of MS values from ~30 to ~10 IU between 530 and 550 m CSF-A (Figure F35). The reduction of MS in the upper 70 m is synchronous with sulfate reduction and increasing concentrations of methane (see Geochemistry).
In addition to the overall trends, there are also two sharp peaks of MS, an increase in MS by over 60 IU, identified in all holes within the consistent low MS interval (70–400 m CSF-A). Those sharp peaks occur around ~190 and ~230 m CSF-A (Figure F35). These peaks differ in approximate age from the prominent MS peak at Site U1586 at ~150 m CSF-A (see Stratigraphic correlation).
MS values are generally relatively higher in darker layers, showing quasiperiodic variation throughout the hole. However, this is not the case at 450–490 m CSF-A, where MS values are high in light layers. Furthermore, in these light layers with high MS values, a* values are also high (Figure F35), suggesting that reddish mineral grains such as hematite may be responsible for the high MS values in the light layers at 450–480 m CSF-A.
Whole-round MS data for Holes U1587B and U1587C were acquired before the cores were equilibrated to room temperature, which may result in an underestimation of MS absolute values. It is therefore recommended that postcruise quantitative analyses should use section-half MS data (MSP) from Holes U1587B and U1587C because they are expected to be the most accurate MS measurements.
7.3. Porosity
Porosity was calculated using the MAD of 10 cm3 discrete samples taken at a sampling resolution of one per core from Hole U1587A, 500–550 m CSF-A in Hole U1587B, and 550–568 m CSF-A in Hole U1587C. Porosity ranges 40.7%–69.3% and decreases gradually with depth. At the top of the hole, porosity is 69.3% (2.2 m CSF-A) and reaches <55% below 160 m CSF-A (Figure F33). The decreasing porosity trend downhole is likely to primarily reflect compaction and dewatering of the sediment. Discrete MAD samples were taken from light and dark sediment intervals from 395 to 415 m CSF-A. The measurements indicate that lighter sediments have a 10% higher porosity than dark sediment at similar depths (Figure F34).
7.4. P-wave velocity
P-wave velocity was measured in all APC core sections from Hole U1587A at 2 cm intervals on the WRMSL (Figure F33). Poor coupling between the liner and sediment when using the XCB system resulted in unreliable whole-round P-wave velocity measurements from the WRMSL system. Therefore, P-wave velocity was not measured on XCB cores. Split core halves from Hole U1587A were also measured for P-wave velocity at a sampling interval of once per core with the PWC.
Whole-round P-wave velocity values show a gradual increase from 1490 to 1530 m/s from 0 to 50 m CSF-A in Hole U1587A (Figure F33) and compare well with measurements obtained using the PWC system, assuring the reliability of the whole-round data. P-wave velocity measurements from 50 to 140 m CSF-A are highly variable and inaccurate due to methane increasing with depth below 50 m (see Geochemistry), which leads to core expansion and, thus, small gas pockets within the core. However, the PWC data show a steady increase from 1500 m/s at the top to >1720 m/s toward the bottom of the hole. The gradually increasing P-wave velocity reflects the compaction of sediments with depth.
7.5. Natural gamma radiation
NGR measurements were made with the Natural Gamma Radiation Logger (NGRL) on all core sections from all holes at two positions 10 cm apart and analyzed with an integration time of 10 min per section (300 s/measurement). Overall, NGR values range 10–60 counts/s with clear cyclicity in intensity for most of the cores. There is a prolonged gradual decrease of NGR from 70 to 390 m CSF-A from 60 to 20 counts/s. From 400 m CSF-A to the bottom of the hole, NGR is highly variable and ranges ~15–45 counts/s. The cyclic variation of NGR intensity correlates with MS and mirrors L* values (Figure F35). Because L* is often related to carbonate content (see Geochemistry), dilution of potassium- and thorium-bearing detrital material (clay) by higher carbonate contents likely explains a low NGR and MS signal. That is, physical properties parameters such as MS and NGR are closely tied to changes in lithology. Lower NGR and MS values can be interpreted as sediments dominated by calcareous microfossils (nannofossil ooze), whereas higher NGR and MS are interpreted as sediments with higher clay content (e.g., clayey nannofossil ooze).
Concentrations of K, Th, and U were extracted from the NGR spectra using the method of De Vleeschouwer et al. (2017). Downhole trends of K and Th are similar to that of NGR, and U concentrations decrease in the uppermost 70 m of Hole U1587B (Figure F36). U/Th ratios also decrease in the uppermost 70 m and are typically ~0.2–0.4 below 100 m CSF-A. K/Th ratios are essentially constant throughout the hole.
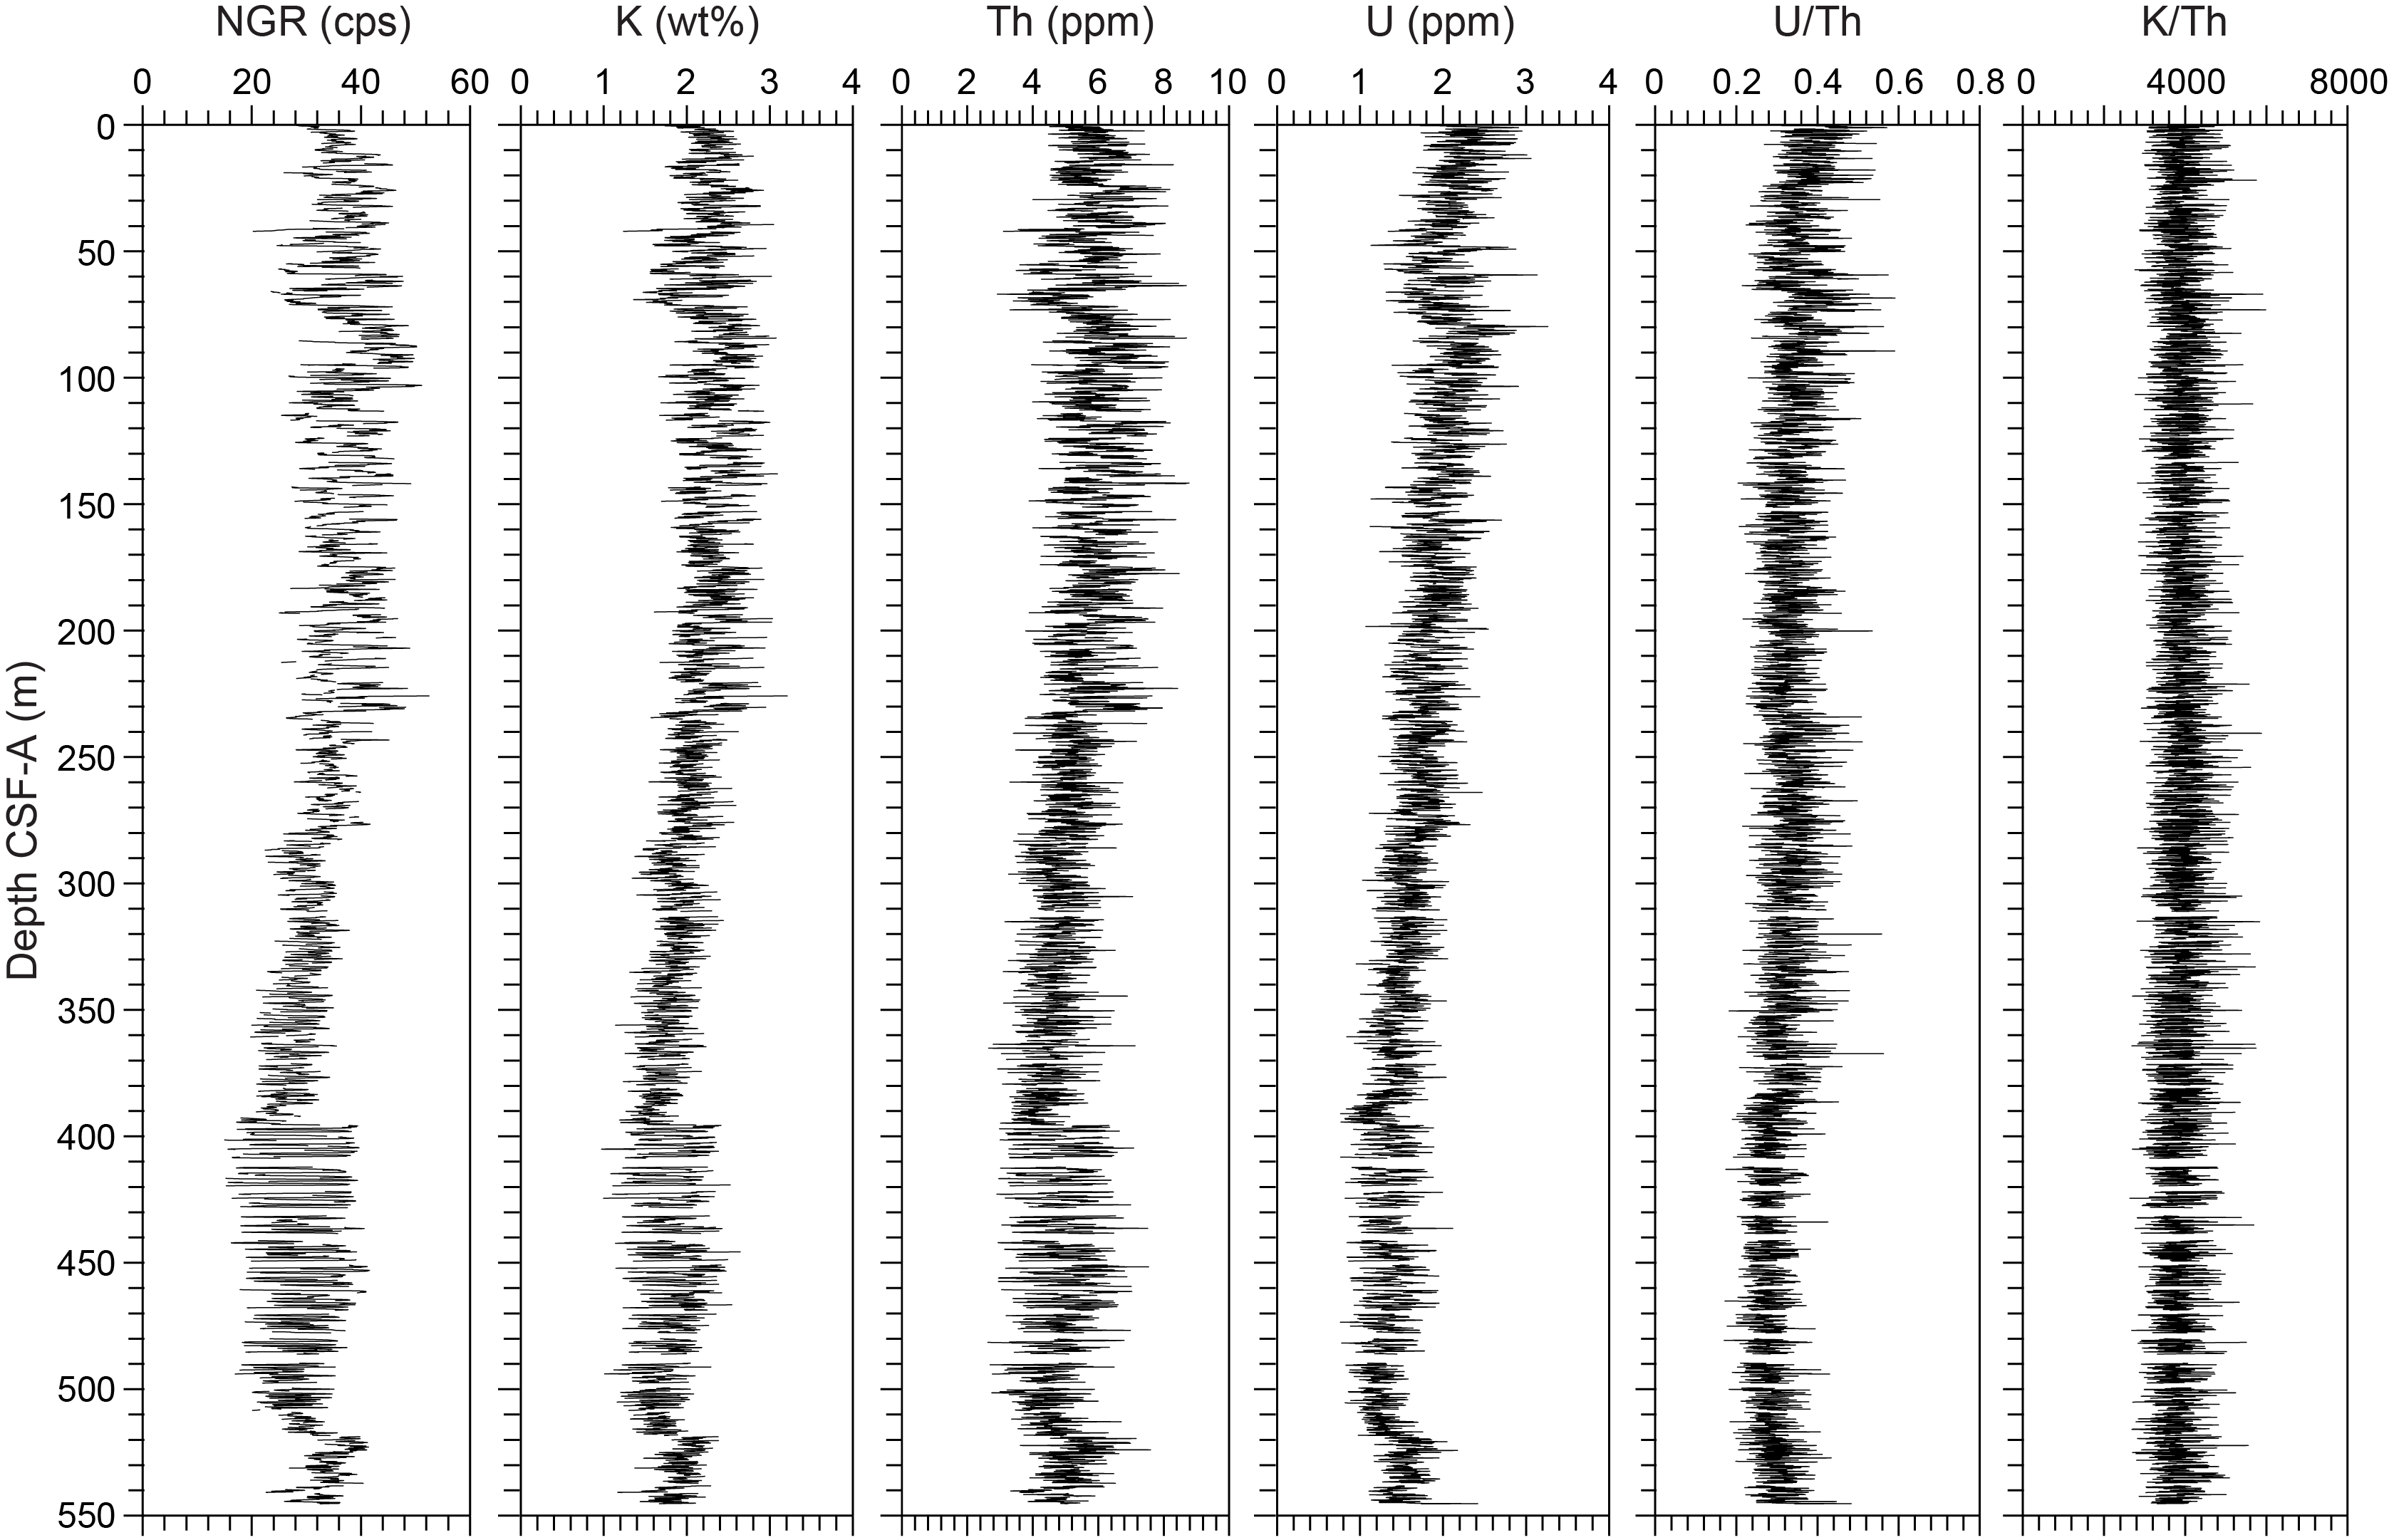
Figure F36. NGR; K, Th, and U deconvolved from NGR spectra; and U/Th and K/Th.
7.6. Thermal conductivity
Thermal conductivity was measured in triplicate at one position per core using a needle probe for soft sediments and a puck and mini puck sensor for stiffer sediments. Thermal conductivity ranges 1.139–1.634 W/(m·K), showing an increasing trend with depth (Figure F33), similar to the patterns of bulk density and P-wave velocity. The downhole trend of the thermal conductivity values may thus reflect the compaction and consolidation of sediments with depth.
7.7. Color reflectance
Color reflectance data was collected at 2 cm intervals using the SHMSL. Values for a* and b* show a significant shift below 450 m, where the sections record higher amplitudes of color changes, reflecting beds with higher a* and b* values in the late Miocene than during younger periods (Figure F35). Amplitudes of L* values are greater below 300 m. L* values are negatively correlated with MS and NGR. Calcium carbonate concentrations (see Geochemistry) are high in intervals where L* values are high, suggesting that the change in sediment lightness is related to the carbonate content.
7.8. X-ray imaging
At least one whole-round section from all depths in Hole U1587A was imaged using the X-ray Logger (XMAN). X-ray images were also taken from selected archive-half sections. The X-ray images revealed the presence of authigenic mineral grains, the morphology of lithologic contacts, burrows, and drilling disturbances such as biscuits and gas expansion. Gas expansion was imaged on cores from 3 to 180 m CSF-A, and the most extreme gas expansion was observed from 50 to 100 m CSF-A (Figure F37). Authigenic mineral grains, likely pyrite, were found throughout Site U1587 and were more common from 126 to 500 m CSF-A. Those grains were generally a few millimeters to 2 cm in size and were present as discrete grains and burrow fillings.
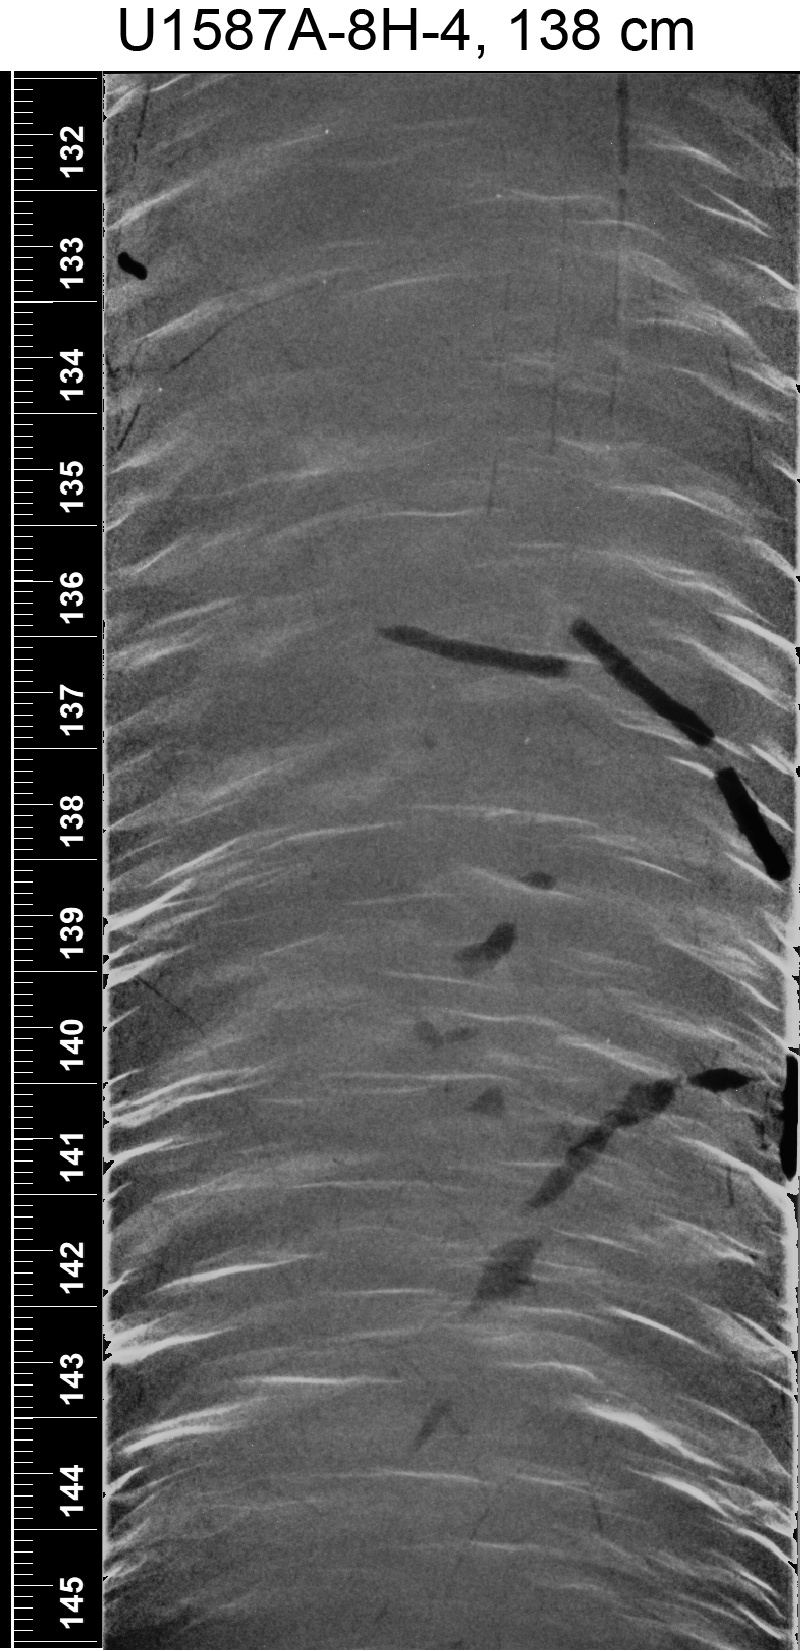
Figure F37. Pyrite.
8. Downhole measurements
8.1. Downhole logging data processing and quality check
After the completion of coring operations in Hole U1587C, the triple combo tool string, consisting of the HNGS, Hostile Environment Litho-Density Sonde (HLDS), High-Resolution Laterolog Array (HRLA), Magnetic Susceptibility Sonde version B (MSS-B), and Enhanced Digital Telemetry Cartridge (EDTC), was deployed for downhole logging (see Operations). The raw logging data were sent to the Lamont-Doherty Earth Observatory Borehole Research Group (LDEO-BRG) for processing, quality control, and depth matching. The raw logs were first depth-matched using the total spectral gamma ray (HSGR) log from the downlog pass as a reference log and then shifted to a seafloor depth reference, resulting in a unified wireline log matched depth below seafloor (WMSF) depth scale. In Hole U1587C, the seafloor depth was determined using the gamma ray (GR) step observed at 3489.6 m wireline log depth below rig floor (WRF), which is in good agreement with the seafloor depth of 3490.2 m drilling depth below rig floor (DRF) given by the drillers. The depth-matched log data revealed that the bottom depth of logging was ~560 m WMSF and the pipe depth was ~80 m WMSF (Figure F38).
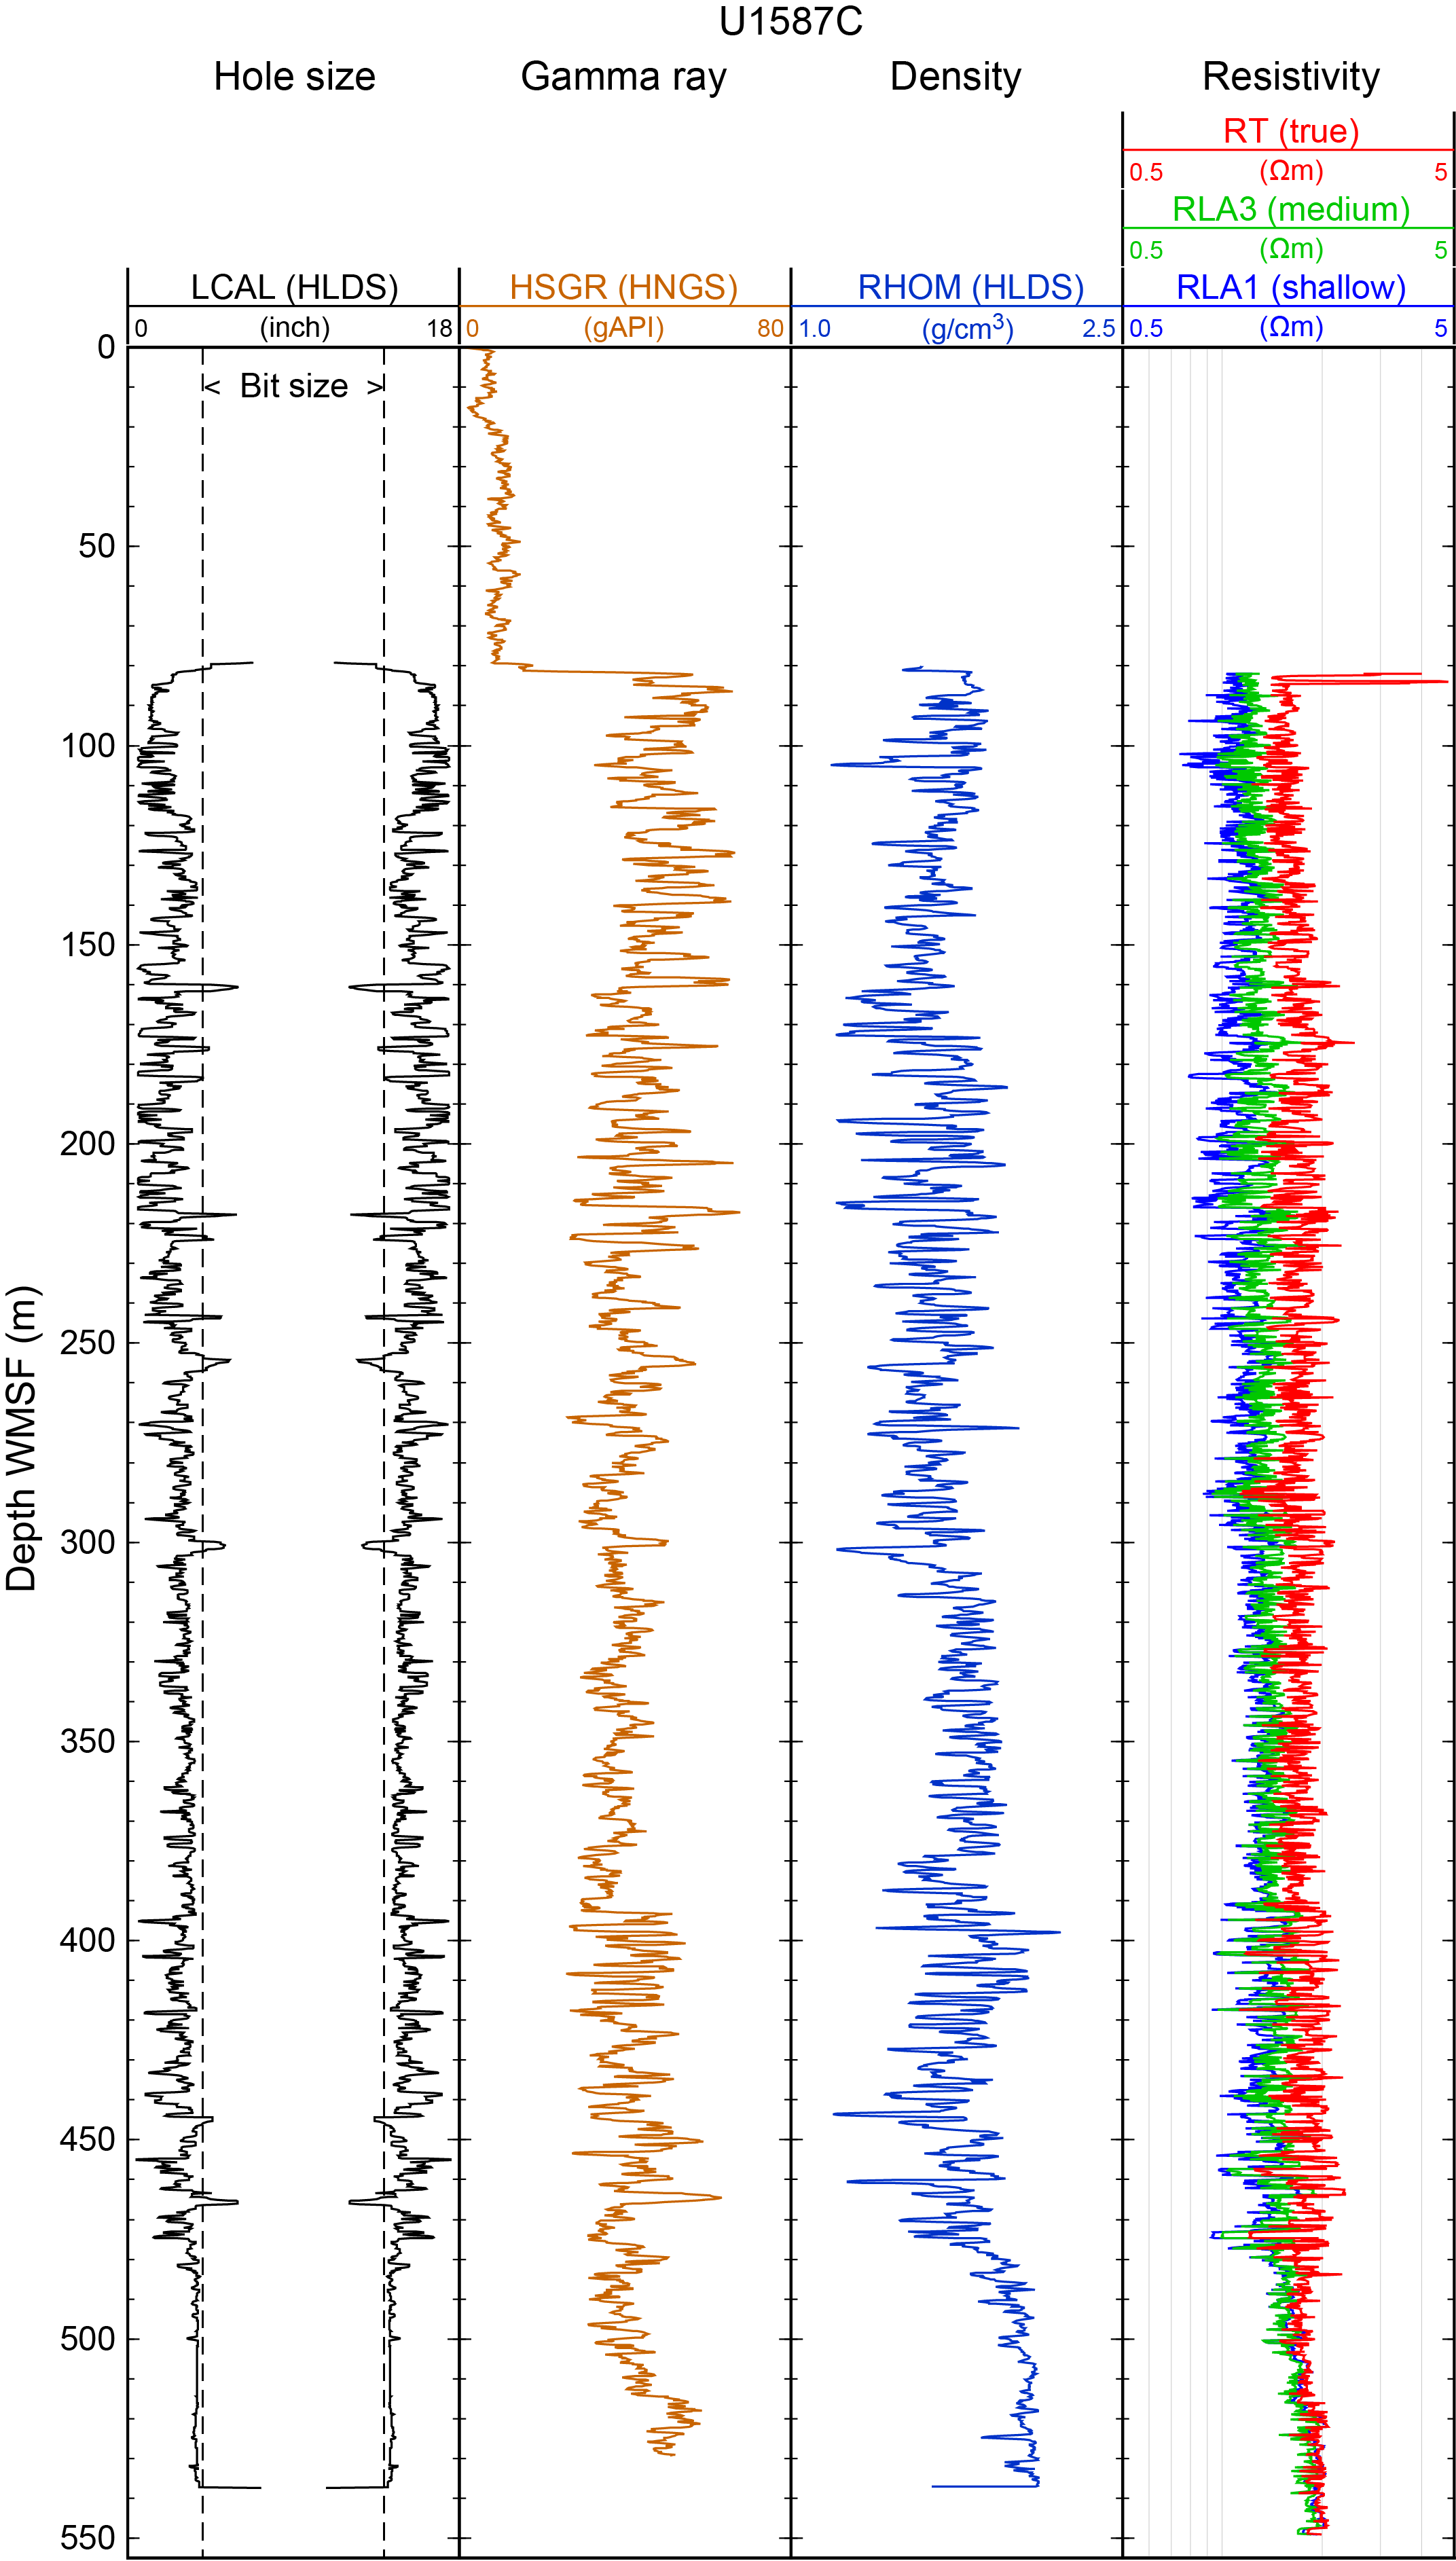
Figure F38. Logging data.
The borehole diameter was recorded using the hydraulic caliper on the HLDS tool. The caliper was mainly in-gauge (~12 inches) for most of the logged hole interval (220–530 m WMSF), but hole size was relatively large between 80 and 220 m WMSF with caliper reaching 13–17 inches (Figure F38). As a result, above this depth level uplog data such as GR, density, and MS should be used with caution.
8.2. Gamma ray
GR values obtained during wireline logging in Hole U1587C range 30–80 American Petroleum Institute gamma radiation units (gAPI) in the logged depth interval (Figure F38). Downhole variations of GR are in strikingly good agreement with the NGR from cores recovered from Hole U1587C. For example, amplitudes of periodic fluctuations in GR values are larger at 80–220 and 390–490 m WMSF for both downhole logging and core measurements (Figure F39B, F39C). Downhole logging GR values are relatively low and less variable between 240 and 390 m WMSF, which also agrees with the core measurements. Detailed examination reveals that each cycle can be correlated between core measurement NGR and logging data GR between 85 and 155 m WMSF and between 390 and 420 m WMSF (Figure F40).
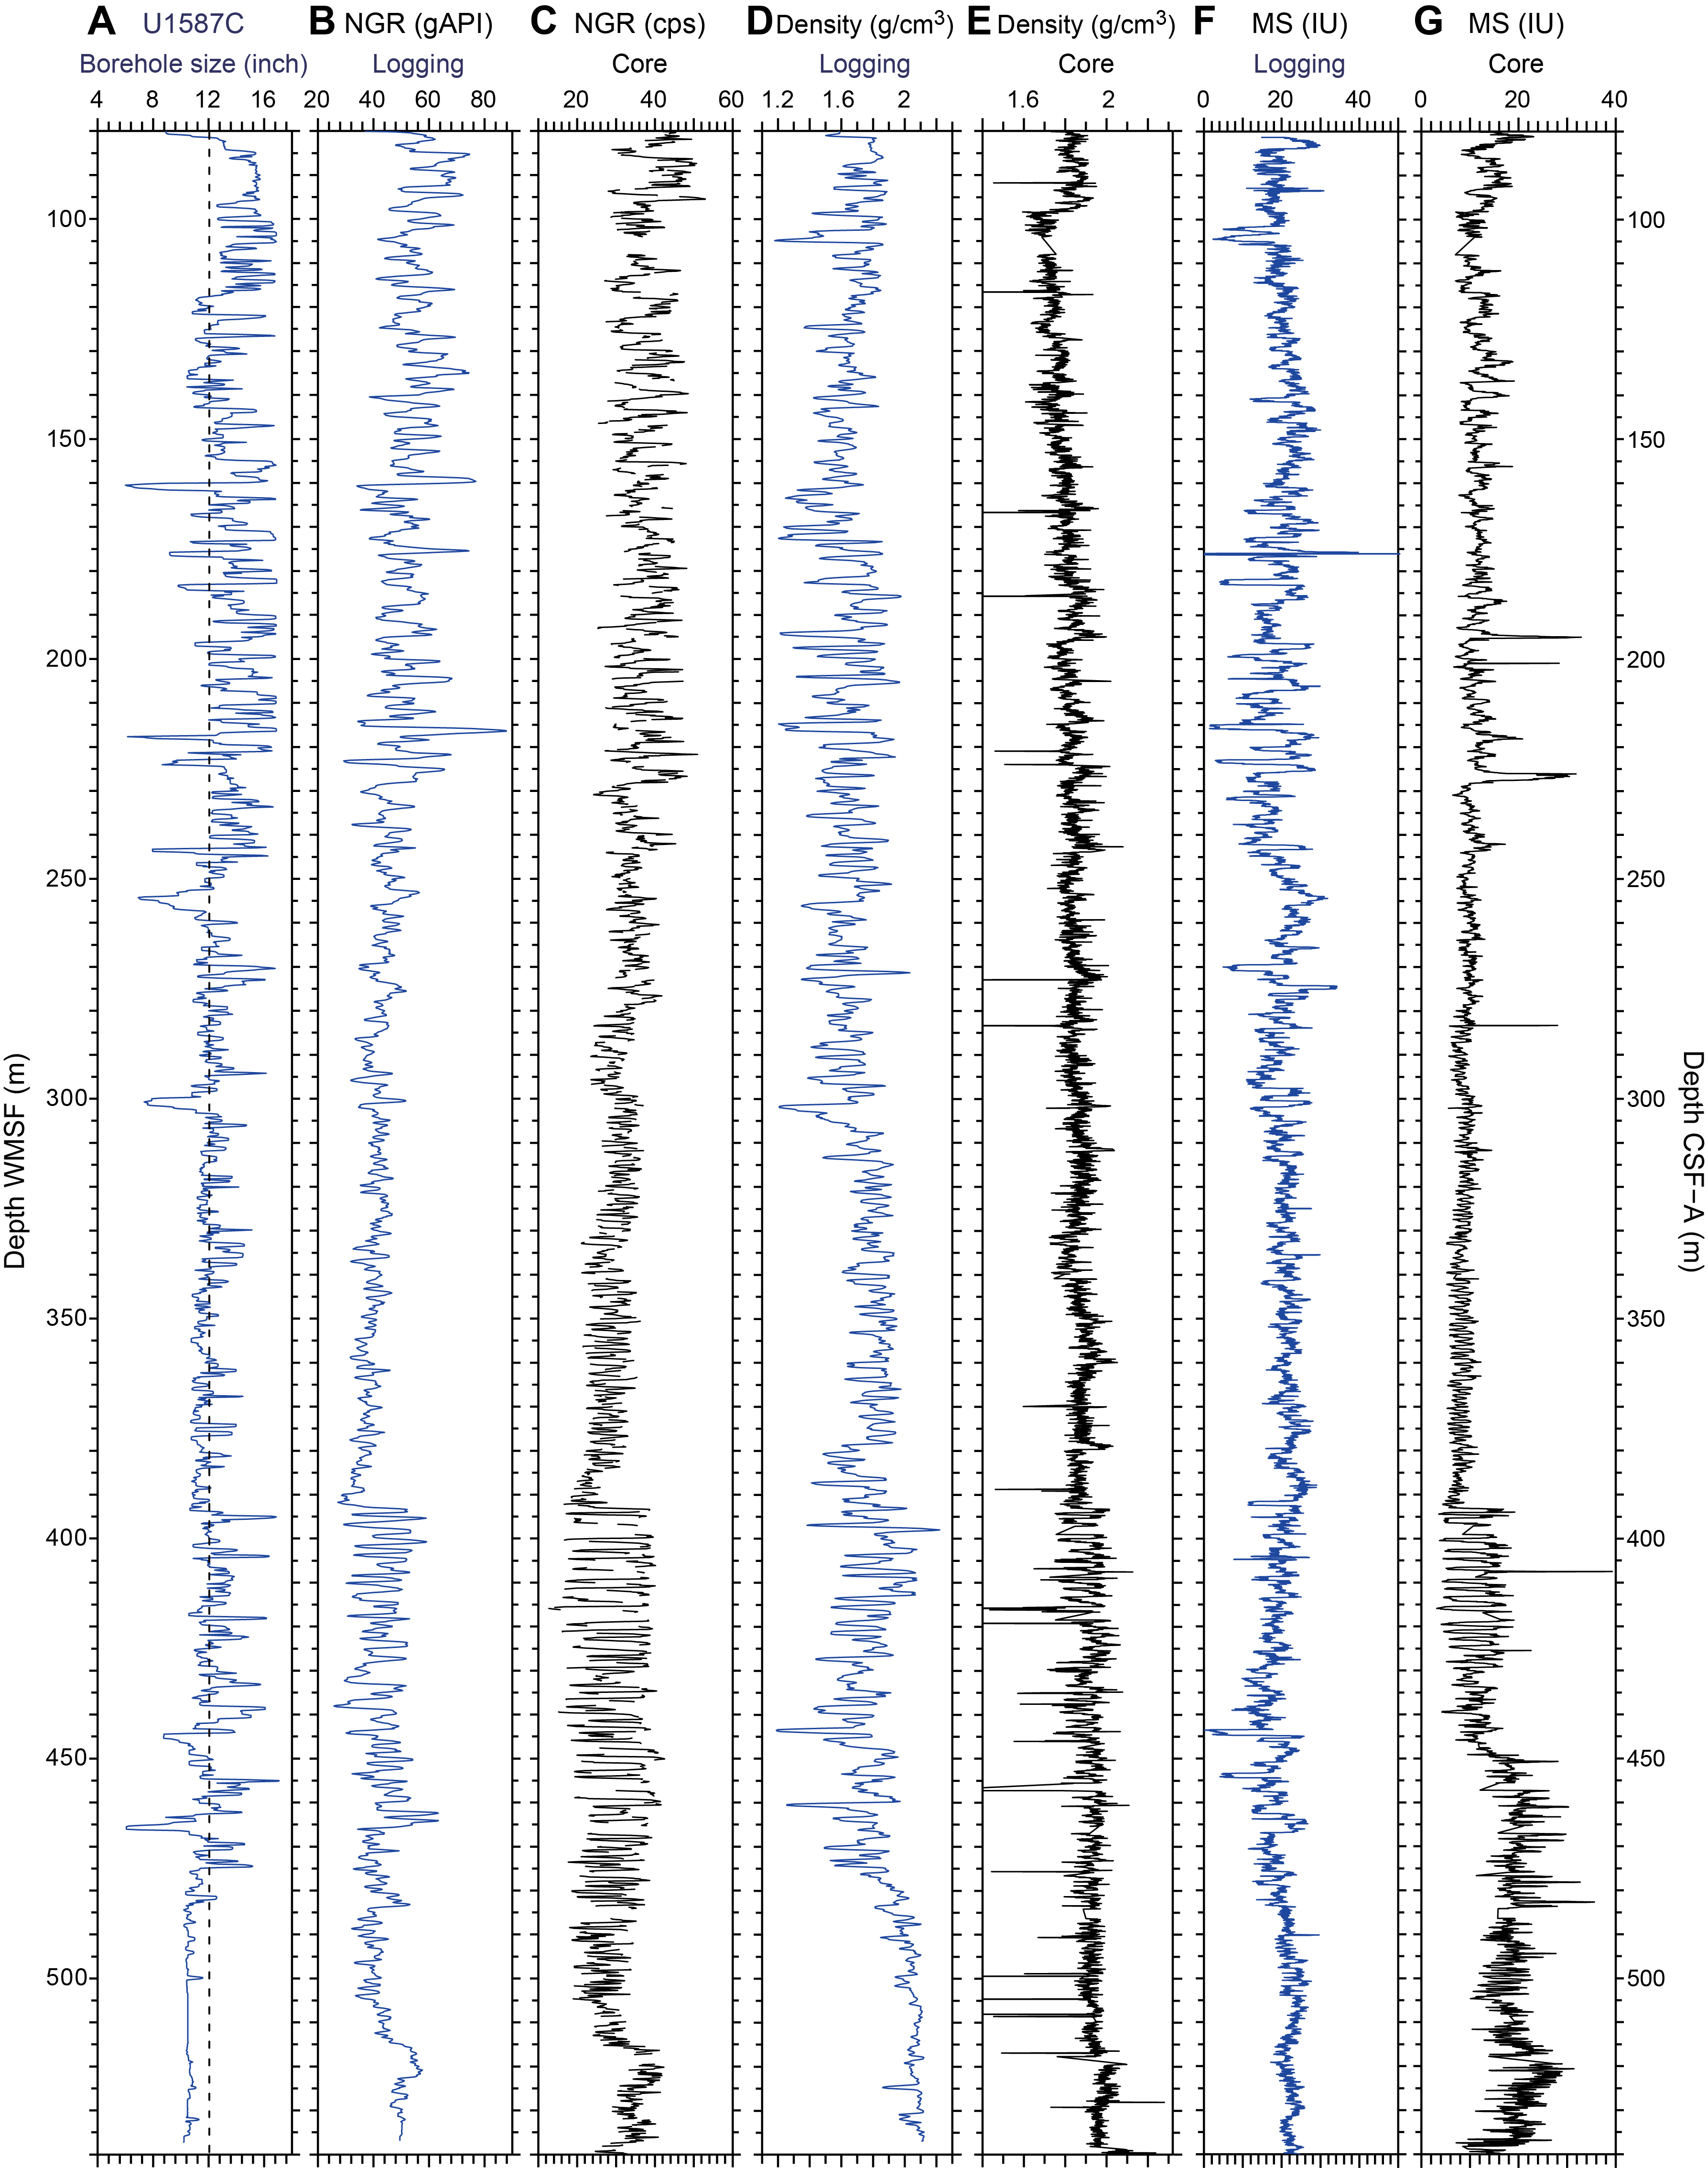
Figure F39. Downhole logs vs. core physical properties.
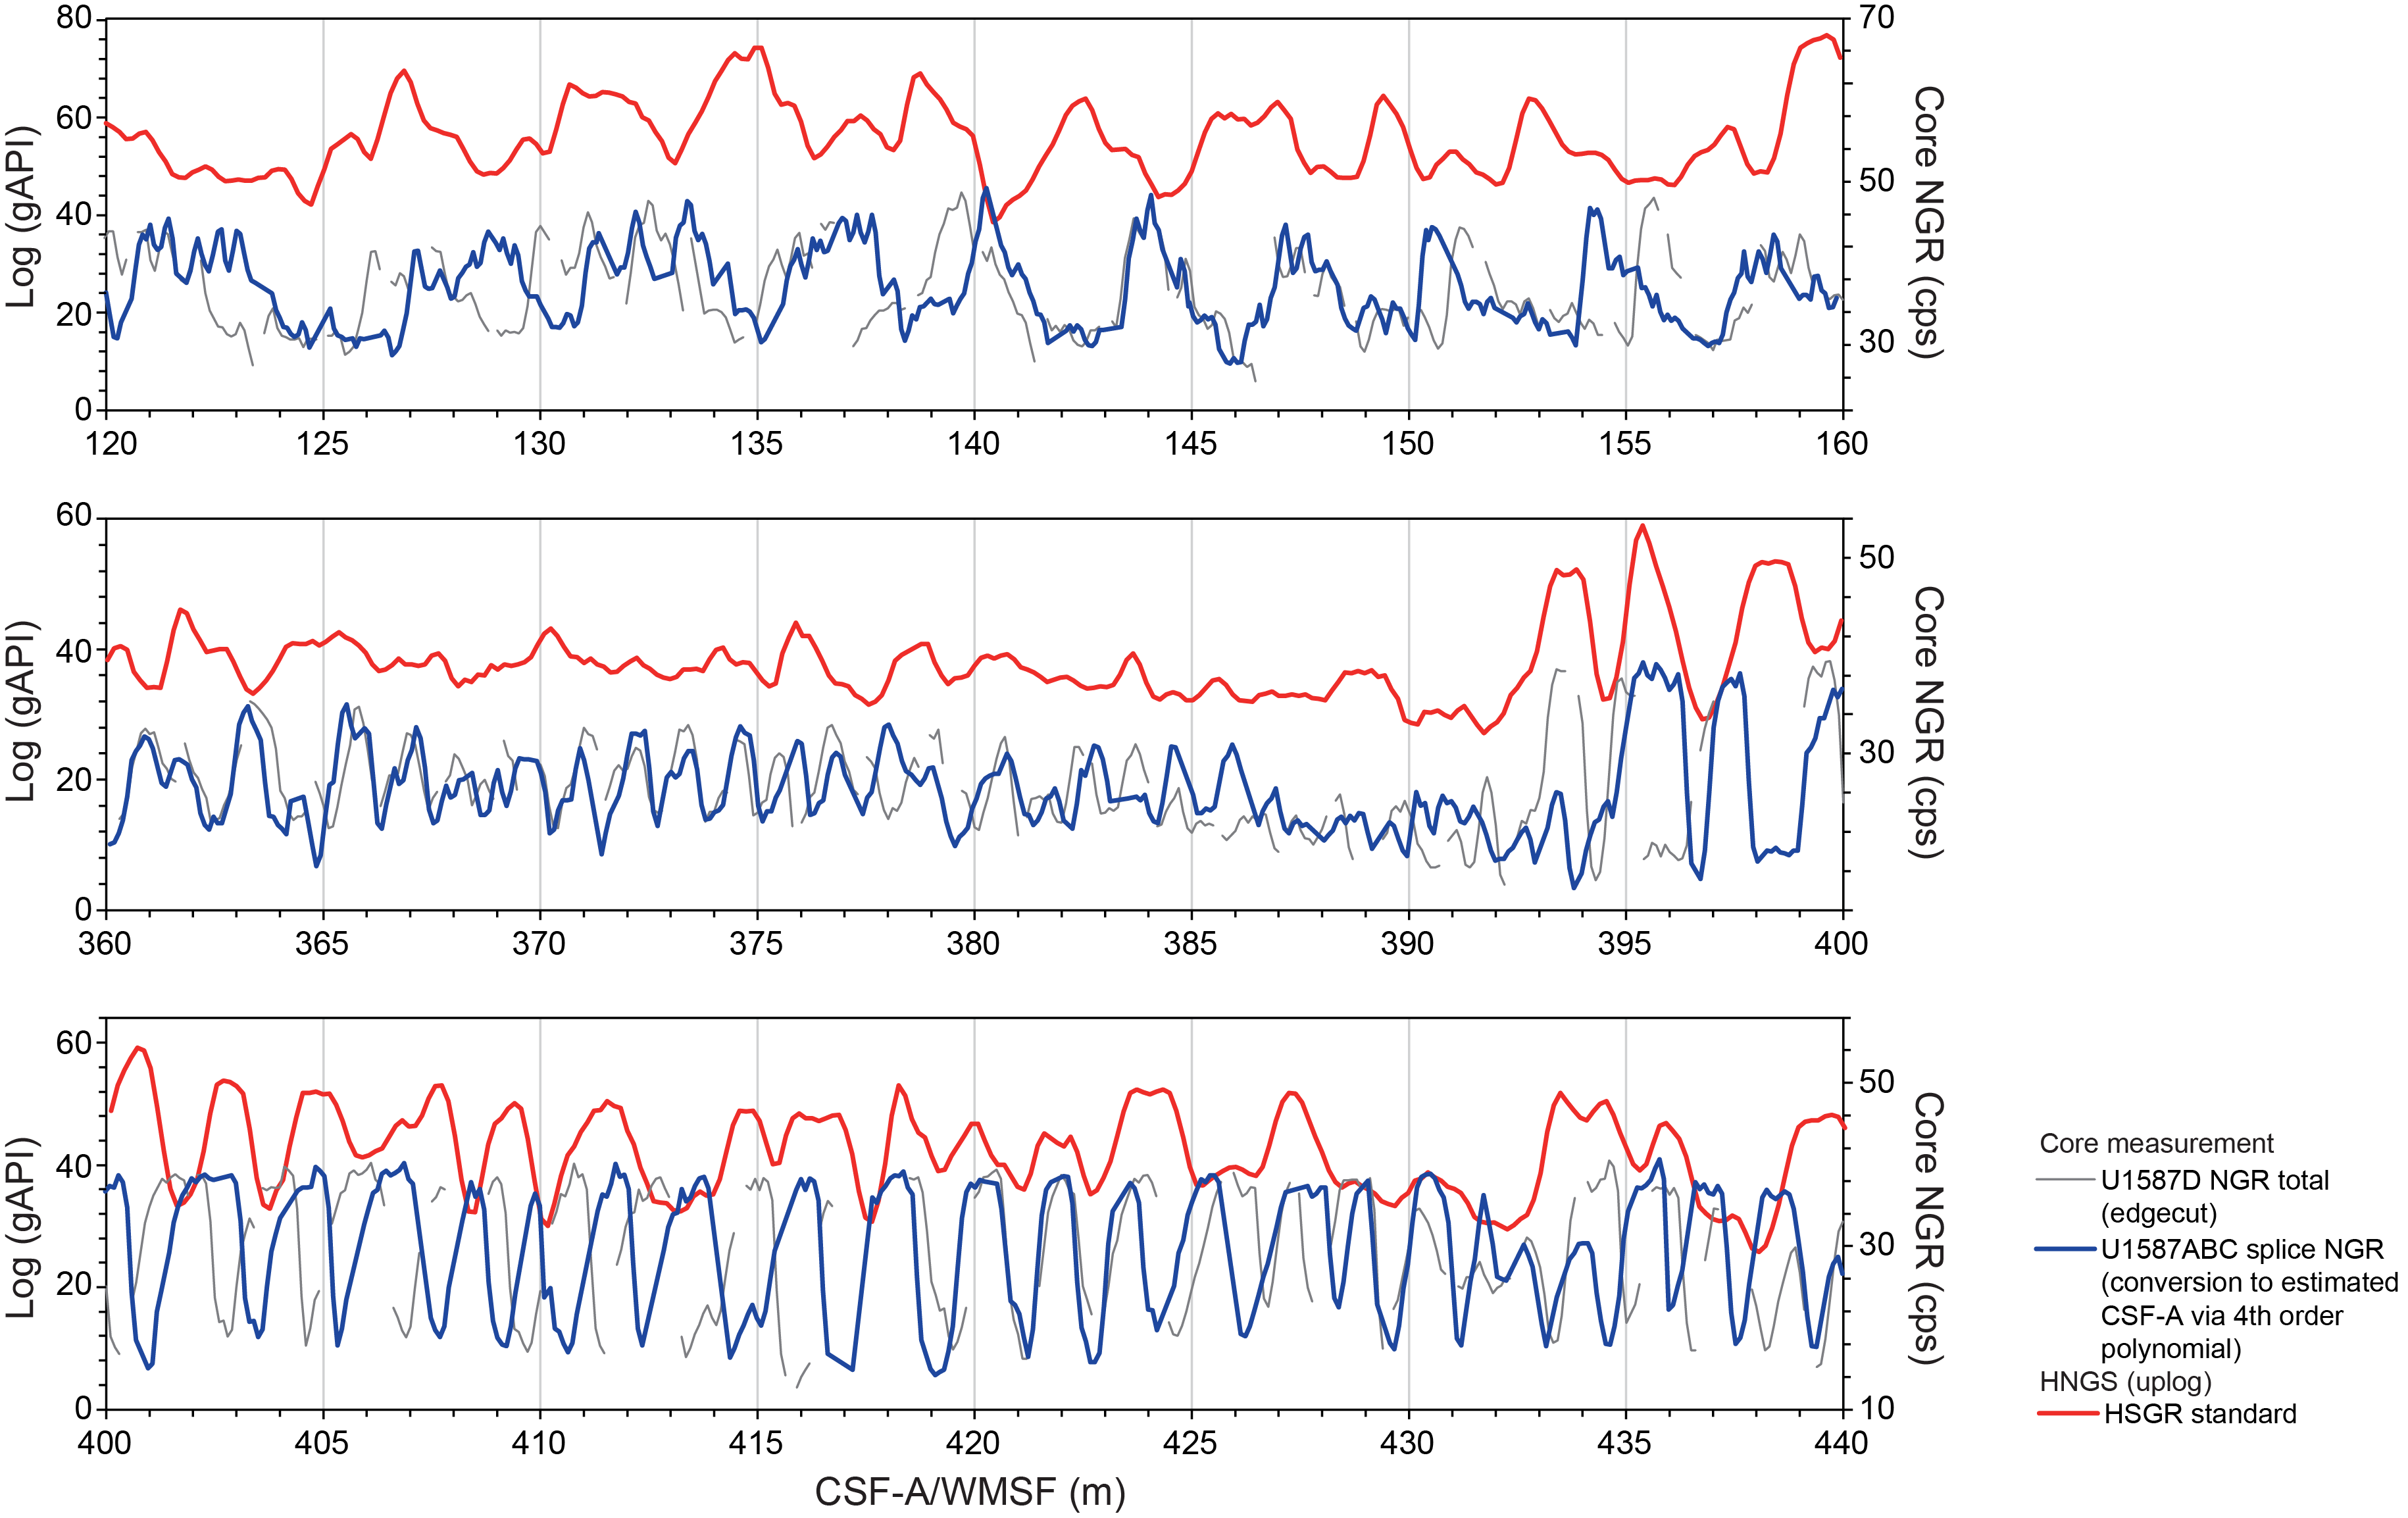
Figure F40. HNGS uplog vs. core NGR.
The five-window spectroscopy of the HNGS tool also allows the determination of approximate K, Th, and U contents. K and Th contents range 0.6%–2.4% and 2.8–10.5 ppm, respectively (Figure F41) and correspond to overall downhole GR trends (Figure F39). The overall K and Th concentration trends are similar between downhole log and core measurements. For example, in both logging and core data, a rapid increase in K and U concentrations and amplitudes of periodic variations are recorded around 390 m WMSF and CSF-A (Figure F41). U contents estimated from the HSGR logging tool range 0.1–2.6 ppm, and their downhole profile is independent of the HSGR values and K and Th concentrations (Figure F41). Some discrepancies exist despite the good agreements between wireline logging and core measurements. For example, downhole logging GR values and K and Th concentrations increased at ~160, ~175, ~217, ~254, ~300, and ~464 m WMSF, but such increases are not obvious in the core section data (Figures F39, F41). The cause of the discrepancies between downhole logging and core measurements is unknown but might be attributed to borehole conditions (diameter and morphology) because the caliper measurements suggested the narrowing of borehole diameter at these depths (Figure F39).
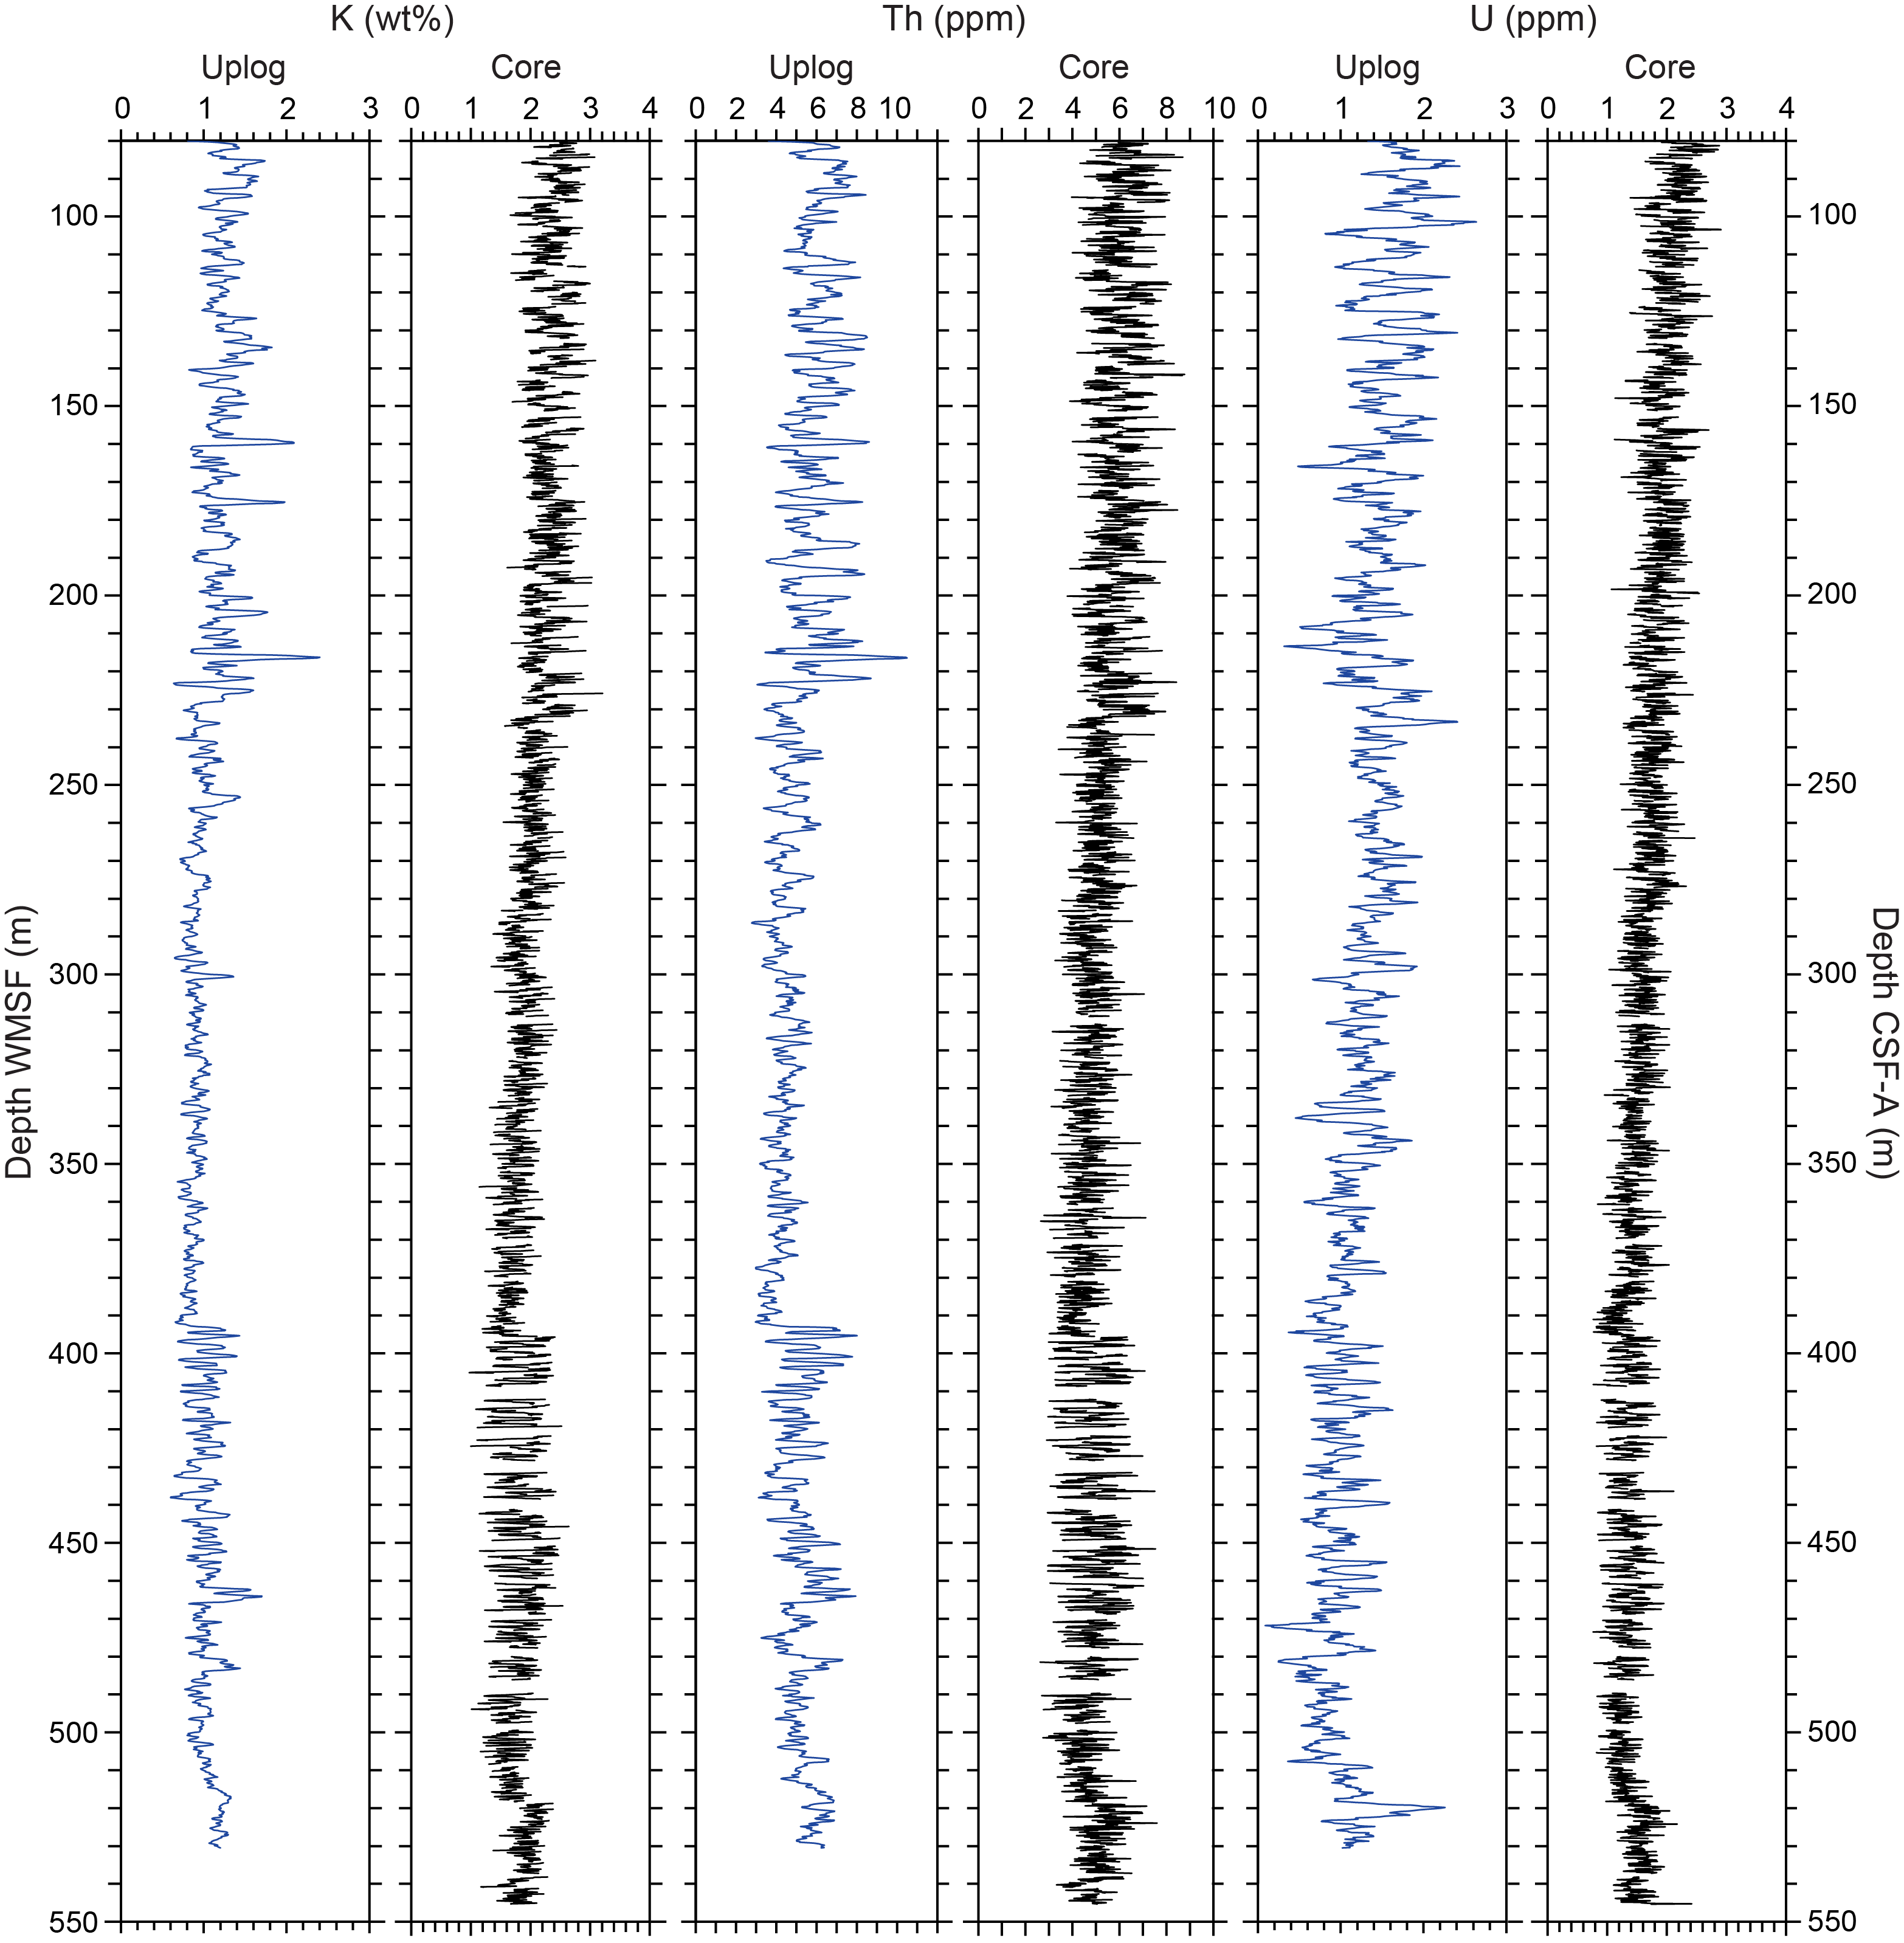
Figure F41. K, Th, and U concentrations.
8.3. Density
Downhole density values from the wireline logging in Hole U1587C range 1.2–2.2 g/cm3 (Figure F38). Wireline logging densities gradually increase with depth, with small-scale (~2–4 m) variations superimposed on the gradual trend. The wireline logging density is less variable between 320 and 370 m WMSF and below 490 m WMSF. The overall increasing trend of the wireline logging densities agrees roughly with that of the GRA bulk densities obtained from the whole-round sections (Figure F39), which may reflect compaction and consolidation of the sediment with depth. However, fine-scale variations of these two bulk densities do not match consistently, which might be attributed to the variations in borehole size that could significantly affect the wireline logging density.
8.4. Resistivity
Most resistivity values throughout the logged interval range 1.3–2.0 Ωm, showing a gradual increasing trend with depth (Figure F38). Small-scale variations are superimposed on the gradual increasing trend, with larger amplitude variations between 160 and 250 m WMSF and 390 and 480 m WMSF. As with bulk density, the downhole trend to higher resistivity may reflect the compaction and consolidation of sediment.
8.5. Magnetic susceptibility
Downhole MS mostly ranges 10–35 IU (Figure F39). The overall trend of the downhole logging MS is not well correlated to the core MS data. For example, the cyclic variations of MS values were clear in the core sections from 390 to 430 m CSF-A (wavelengths were typically ~2–3 m), but such variations were not obvious in the downhole logging MS data (Figure F39). This discrepancy may suggest that the downhole logging MS signal has been biased either by instrumental-specific aliasing or borehole conditions.
8.6. In situ temperature and heat flow
Four APCT-3 downhole formation temperature measurements were made in Hole U1587A. The calculated in situ sediment temperatures range from 3.93°C at 31.3 m CSF-A to 7.78°C at 116.8 m CSF-A (Table T29), resulting in a geothermal gradient of 43.4°C/km (Figure F42). The bottom water temperature (mudline temperature) was 2.74°C and was calculated by taking the average of the minimum temperatures of the four APCT-3 profiles. In situ thermal conductivity was estimated using laboratory-determined thermal conductivity established methods (Pribnow et al., 2000; Hyndman et al., 1974; see Physical properties in the Expedition 397 methods chapter [Abrantes et al., 2024a]). Thermal resistance was calculated by cumulatively adding the inverse of the in situ thermal conductivity values from 0 to 120 m CSF-A (Figure F42). A calculated heat flow of 49.6 mW/m2 for Hole U1587A was obtained from the slope of linear fit between in situ temperature and thermal resistance (Figure F42) (cf. Pribnow et al., 2000). This value is comparable with the heat flow of 47.5 mW/m2 obtained at Site U1385 (water depth = 2587 mbsl) during Integrated Ocean Drilling Program Expedition 339 (Expedition 339 Scientists, 2013) and is within the normal range of heat flow on the Portuguese margin (45–76 mW/m2) (Grevemeyer et al., 2009).
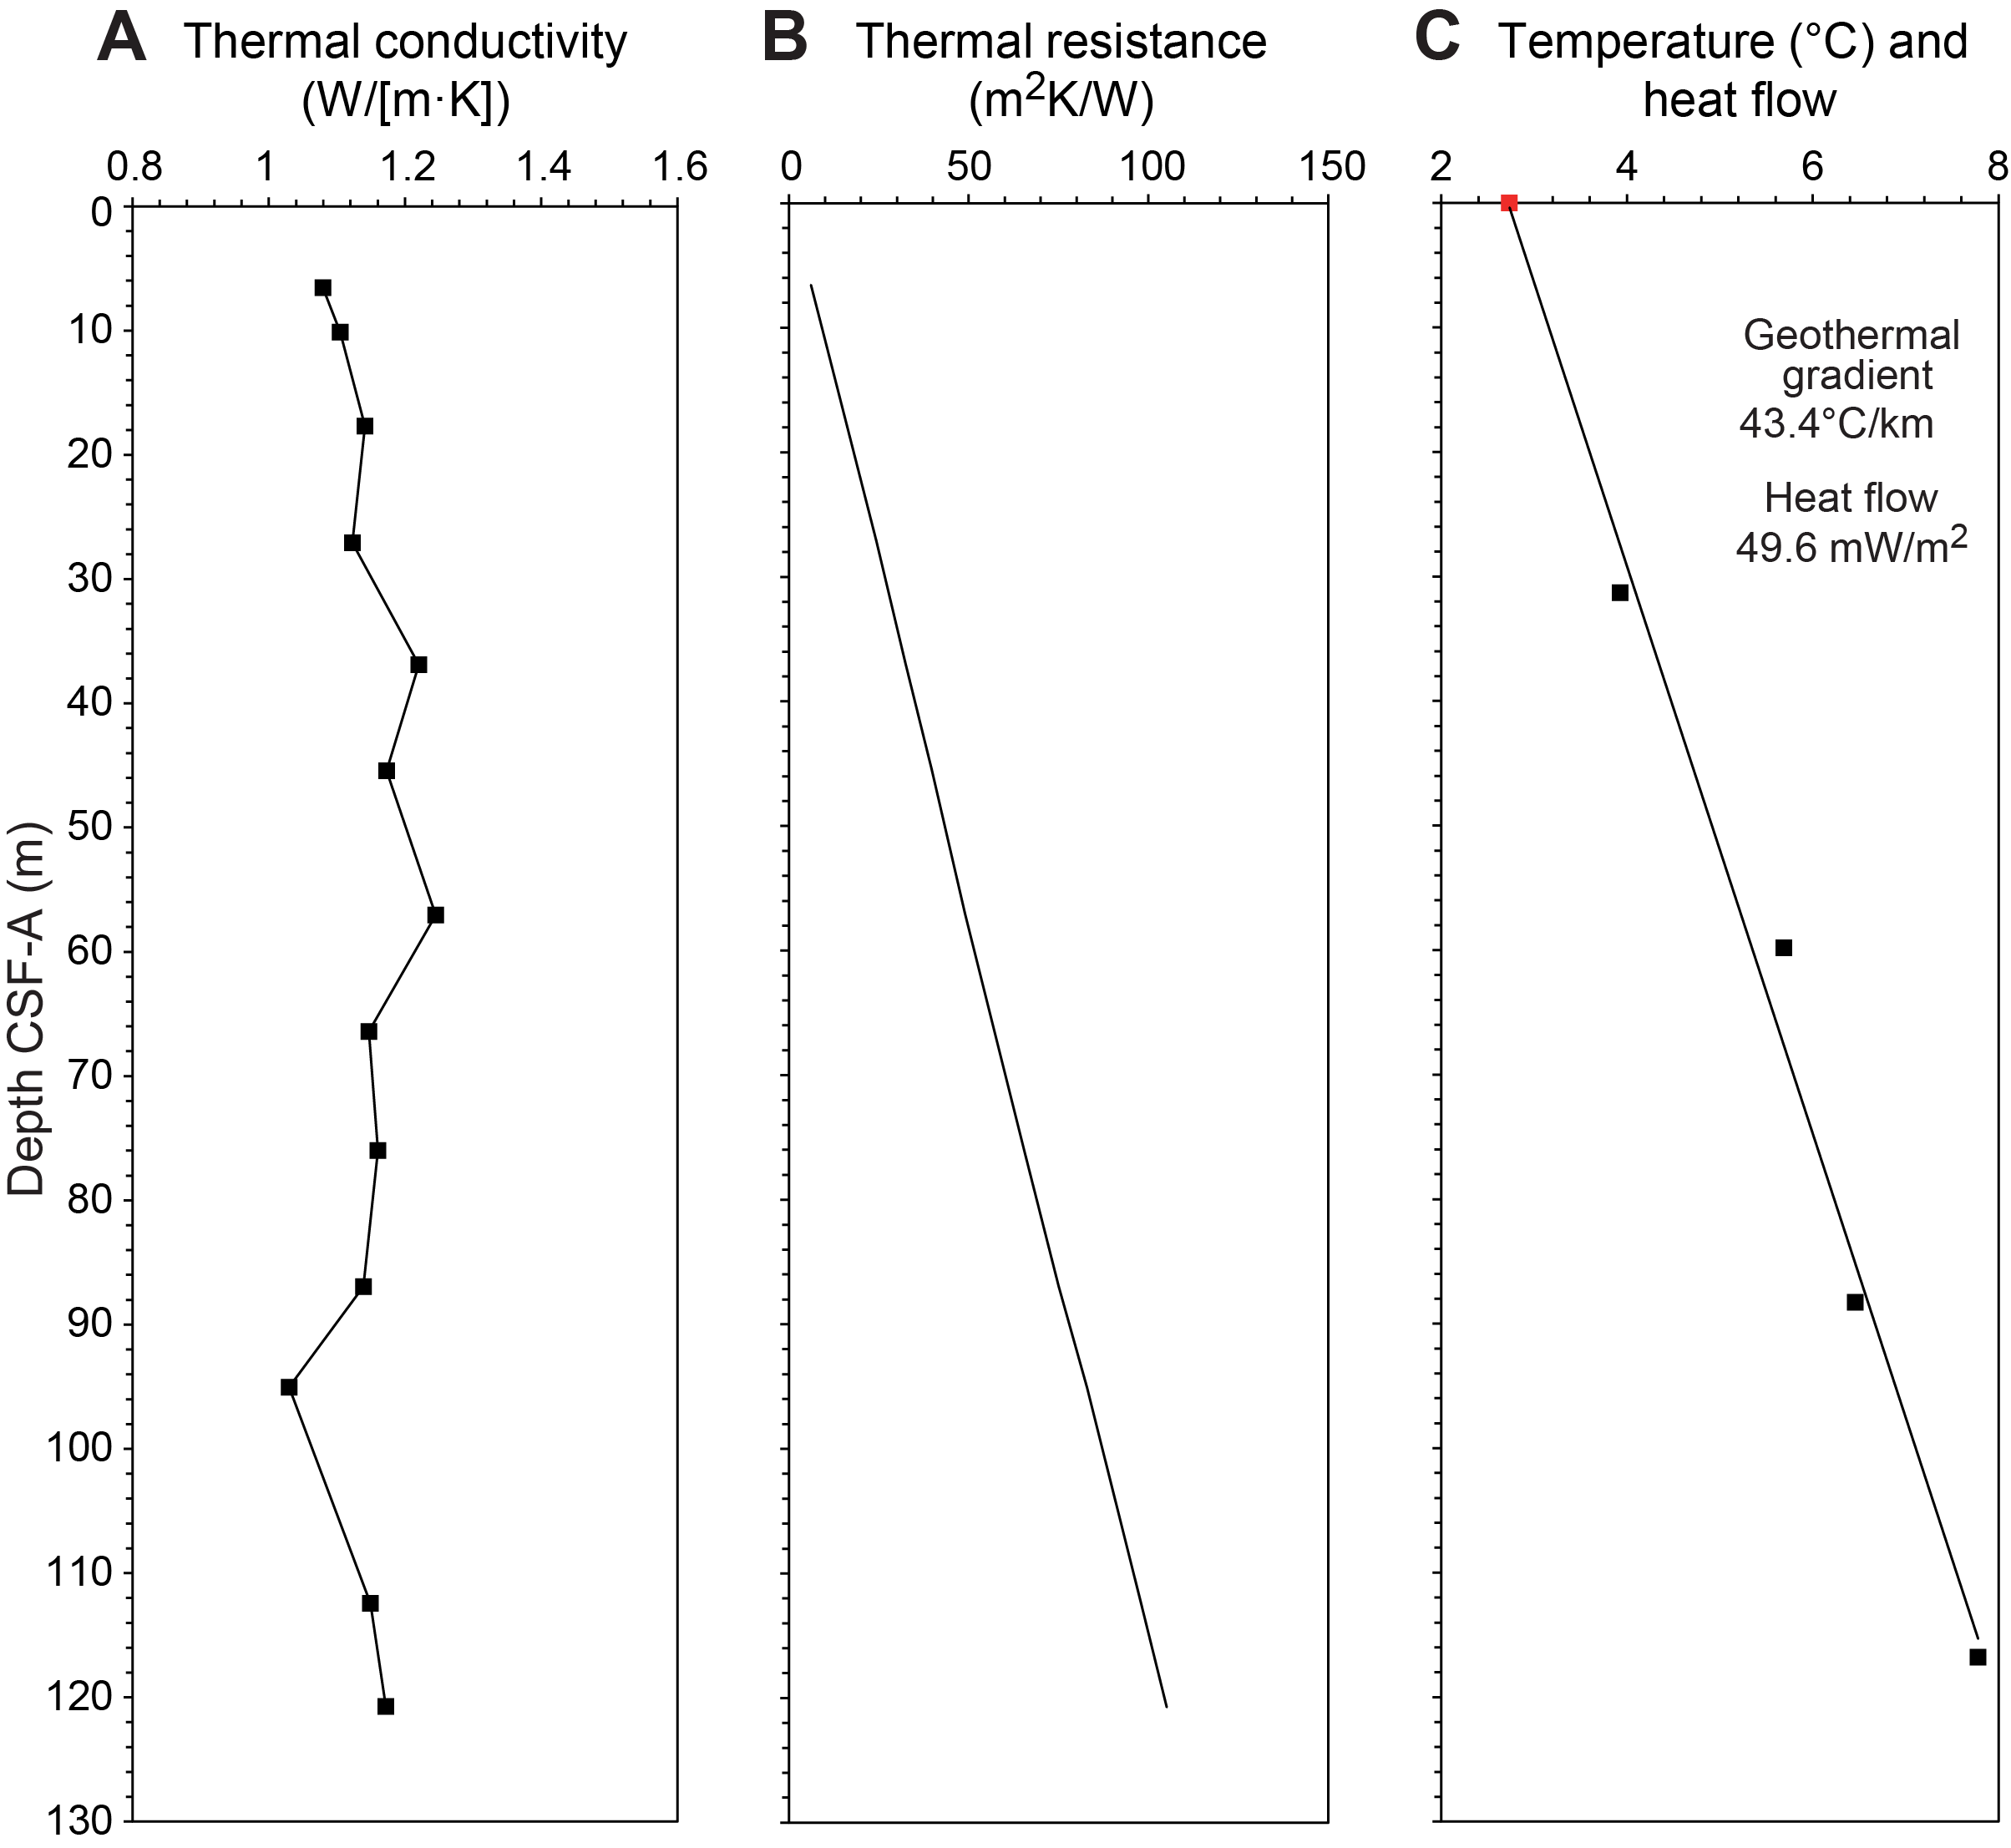
Figure F42. APCT-3.
9. Stratigraphic correlation
Correlations between holes at Site U1587 were accomplished using Correlator Software (Version 4.0.1). Tie points were established using L* color reflectance, whole-round MS, and the blue color channel extracted from the core images (RGB blue) (Figure F43; Table T30). We constructed a splice from 0 to 593 m core composite depth below seafloor, Method A (CCSF-A), using Holes U1587A–U1587C (Figures F43, F44, F45; Table T31). A possible slumped or disturbed interval observed at ~198–210 m CSF-A interrupts a lithologic sequence that is otherwise readily correlated to late Pliocene and Pleistocene MISs (Figure F46). The disturbance is at a similar stratigraphic level to one identified at Site U1586, but it affects a shorter section of the record. The late Miocene (Tortonian)–Pliocene sequence is without apparent stratigraphic gaps. The Pliocene sequence correlates cycle-for-cycle to Sites U1586 and U1385. An interval of expanded sedimentation with high-amplitude 1.5 m thick cycles is observed in the late Messinian section. Gaps in core recovery and coring distortion were highly variable during XCB coring.
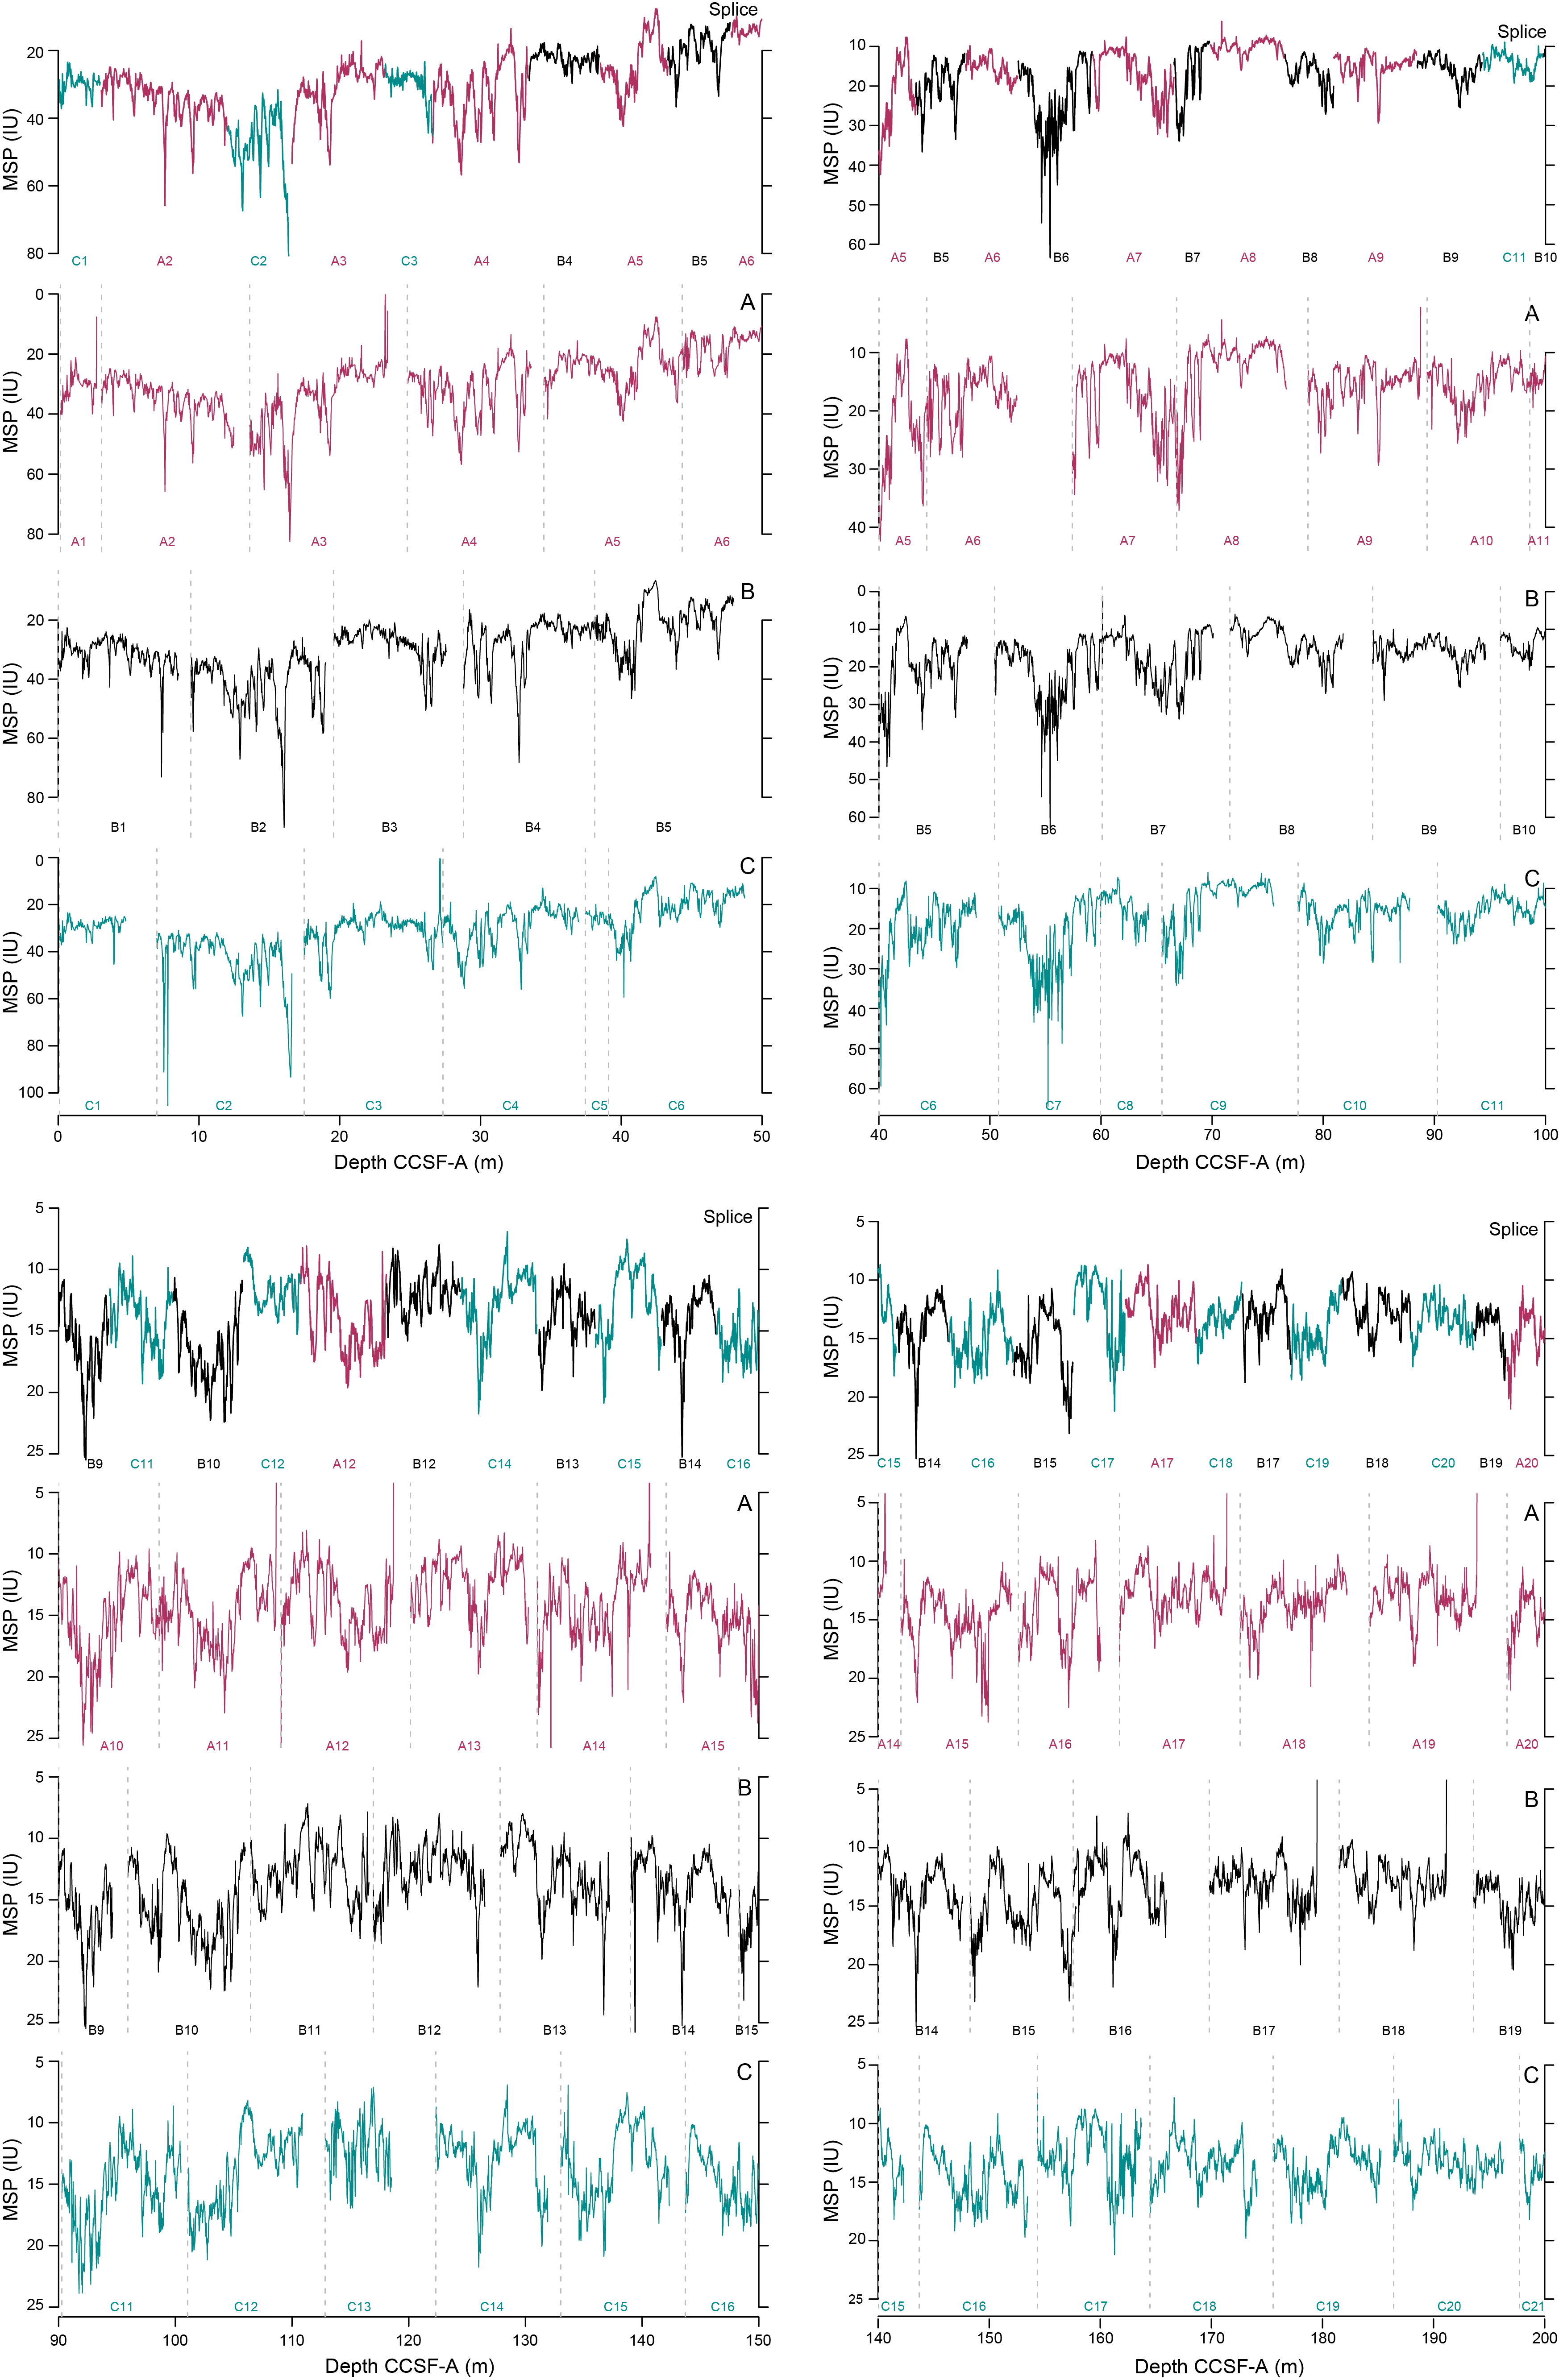
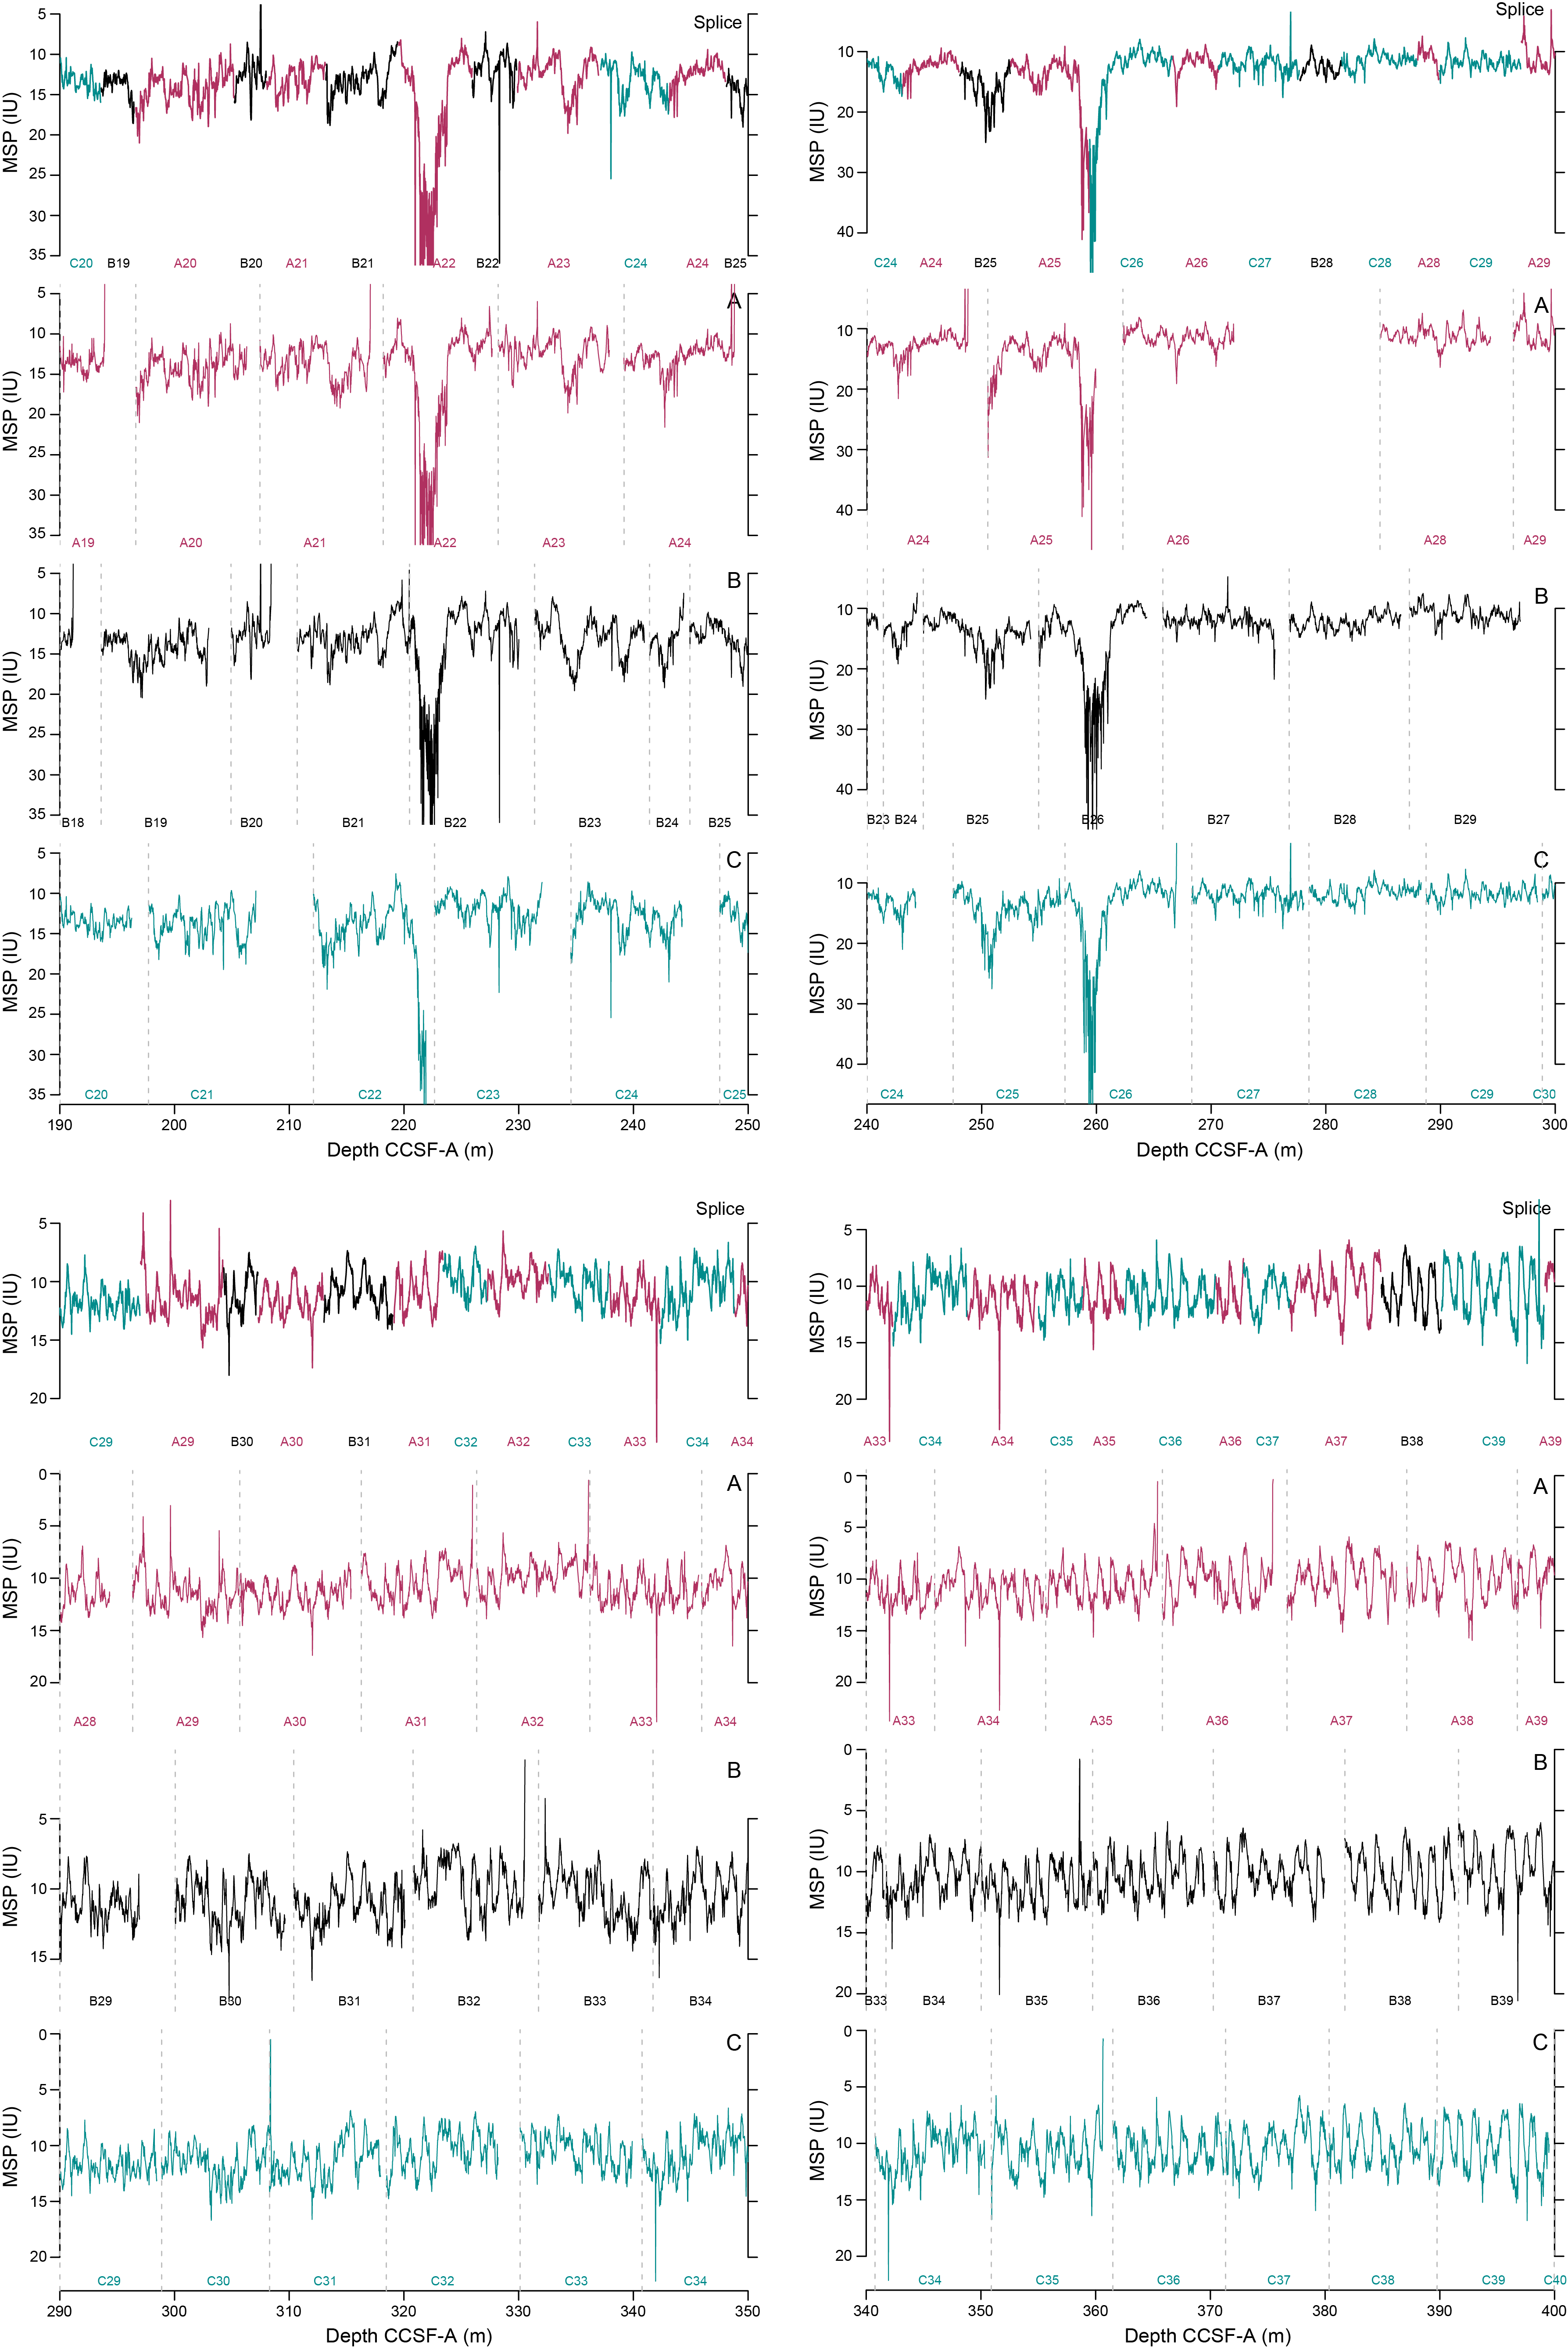
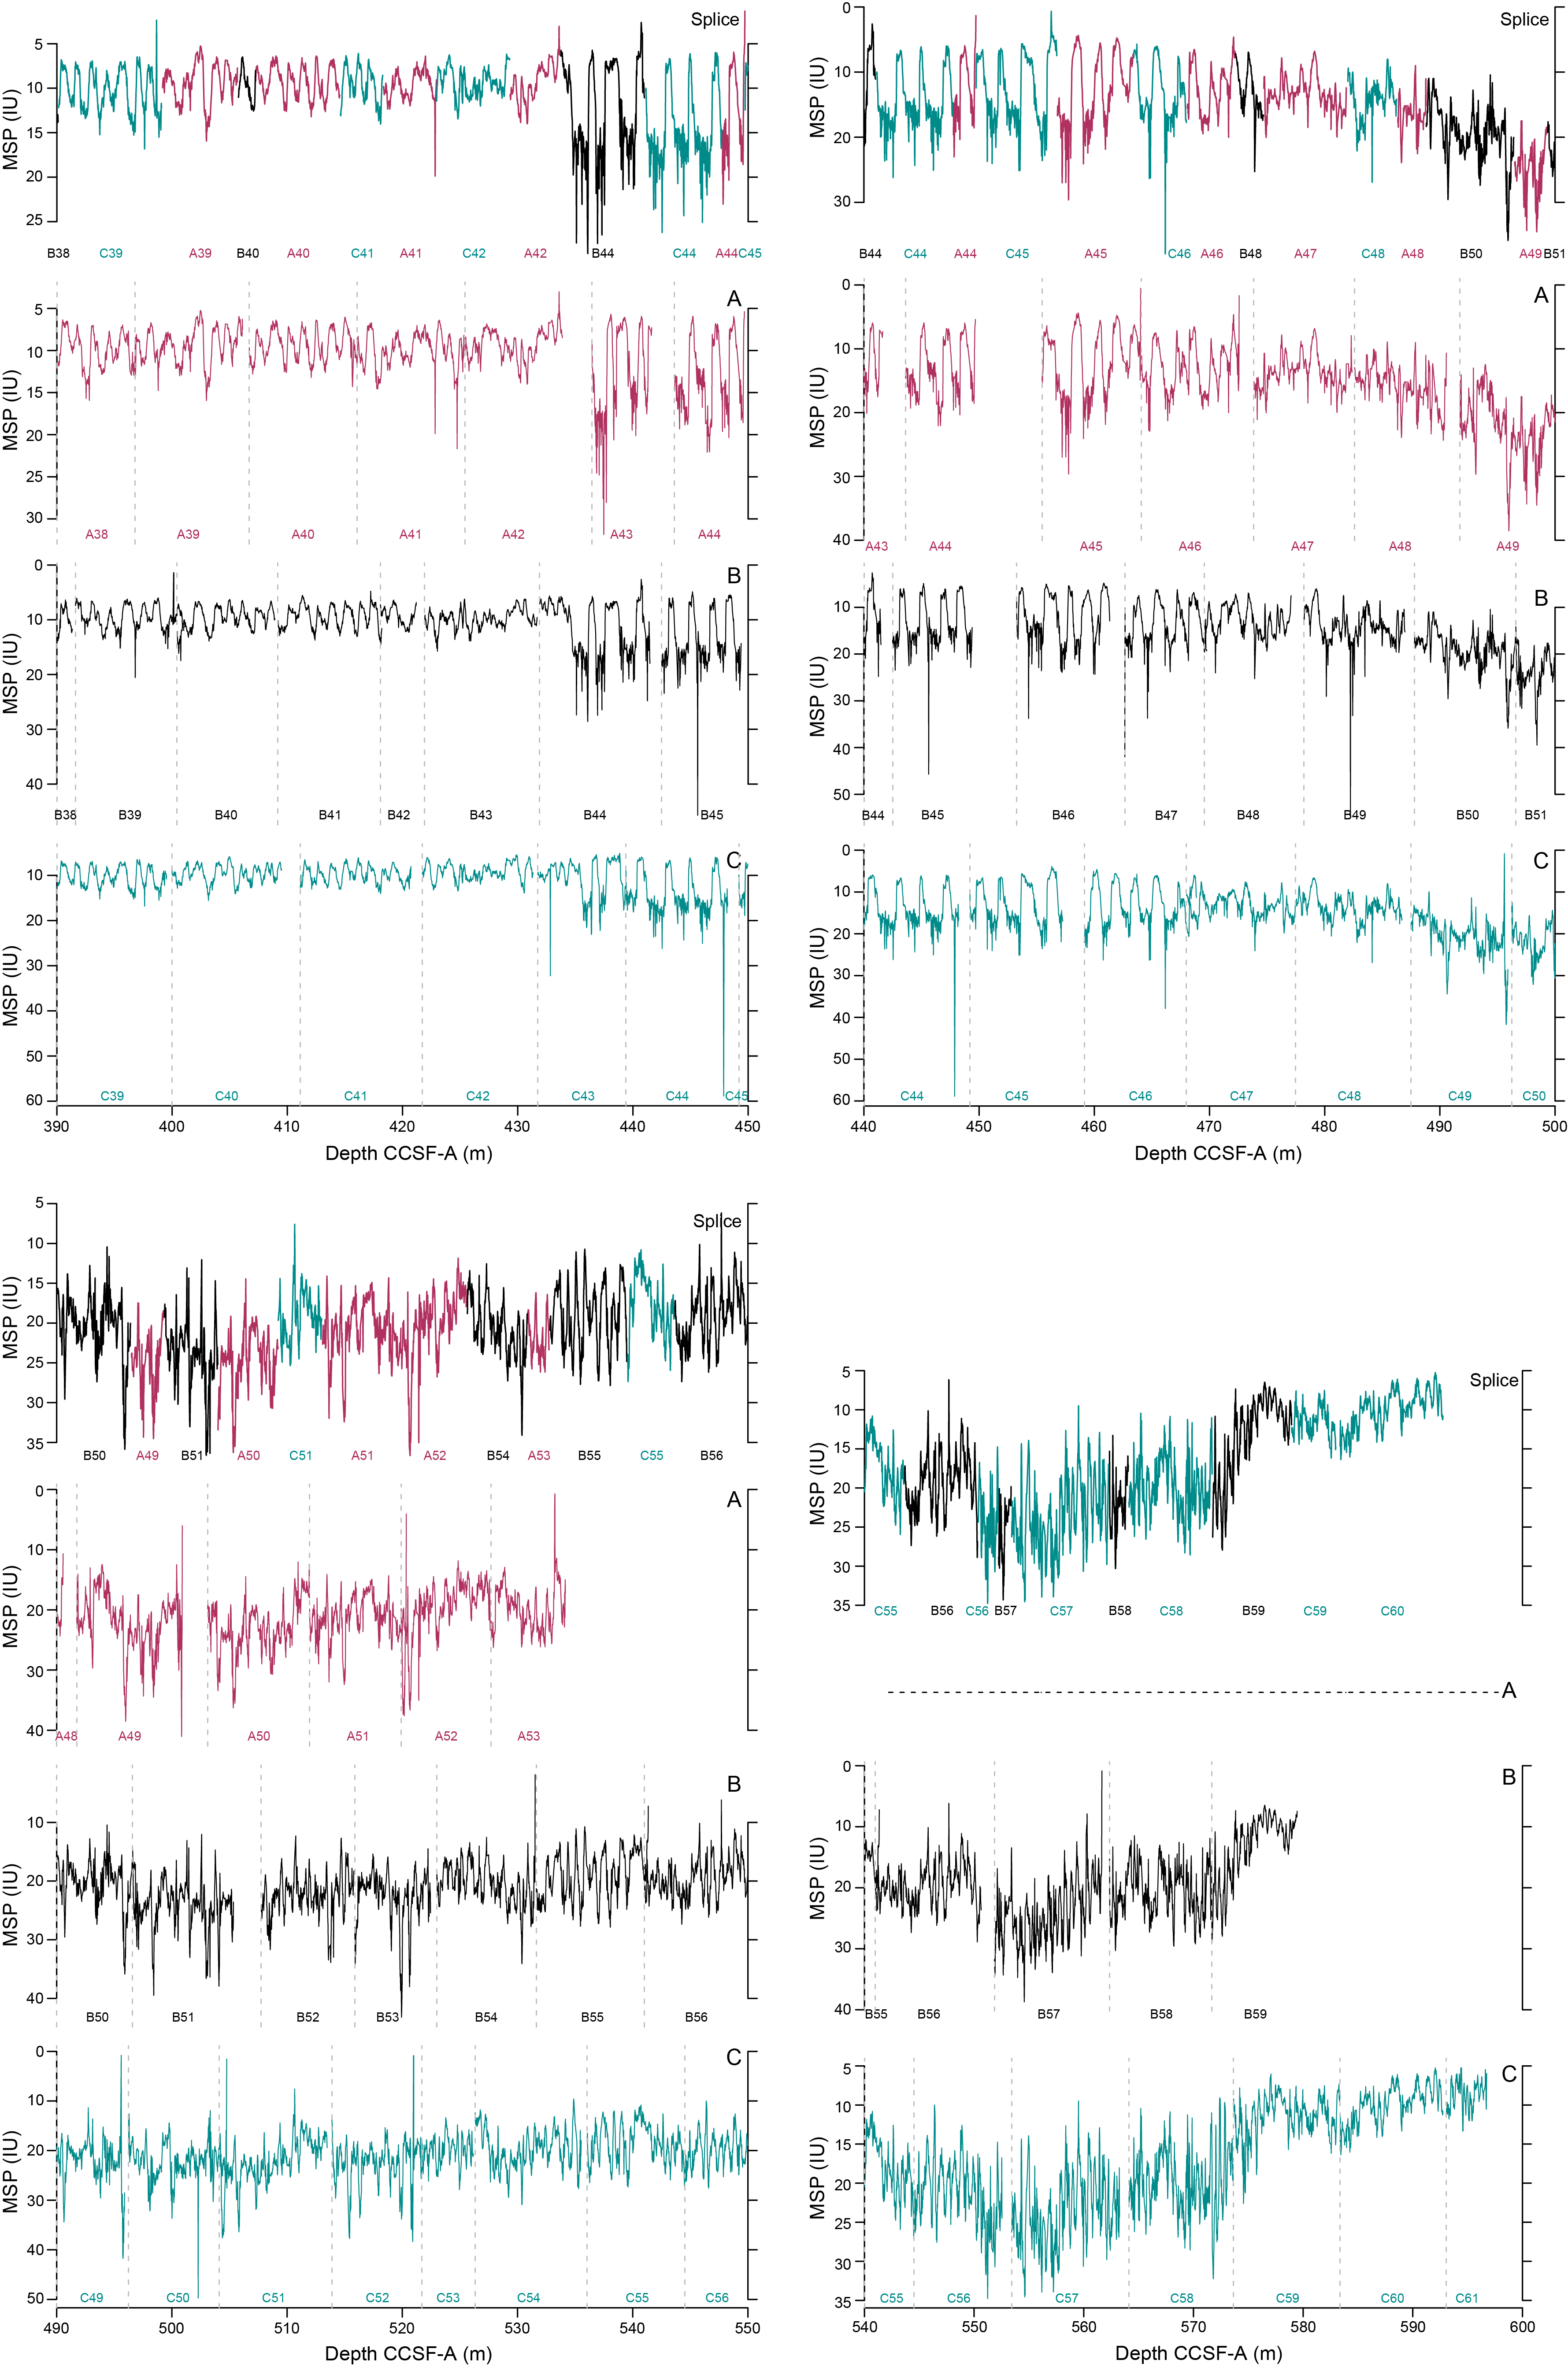
Figure F43. Composite construction.
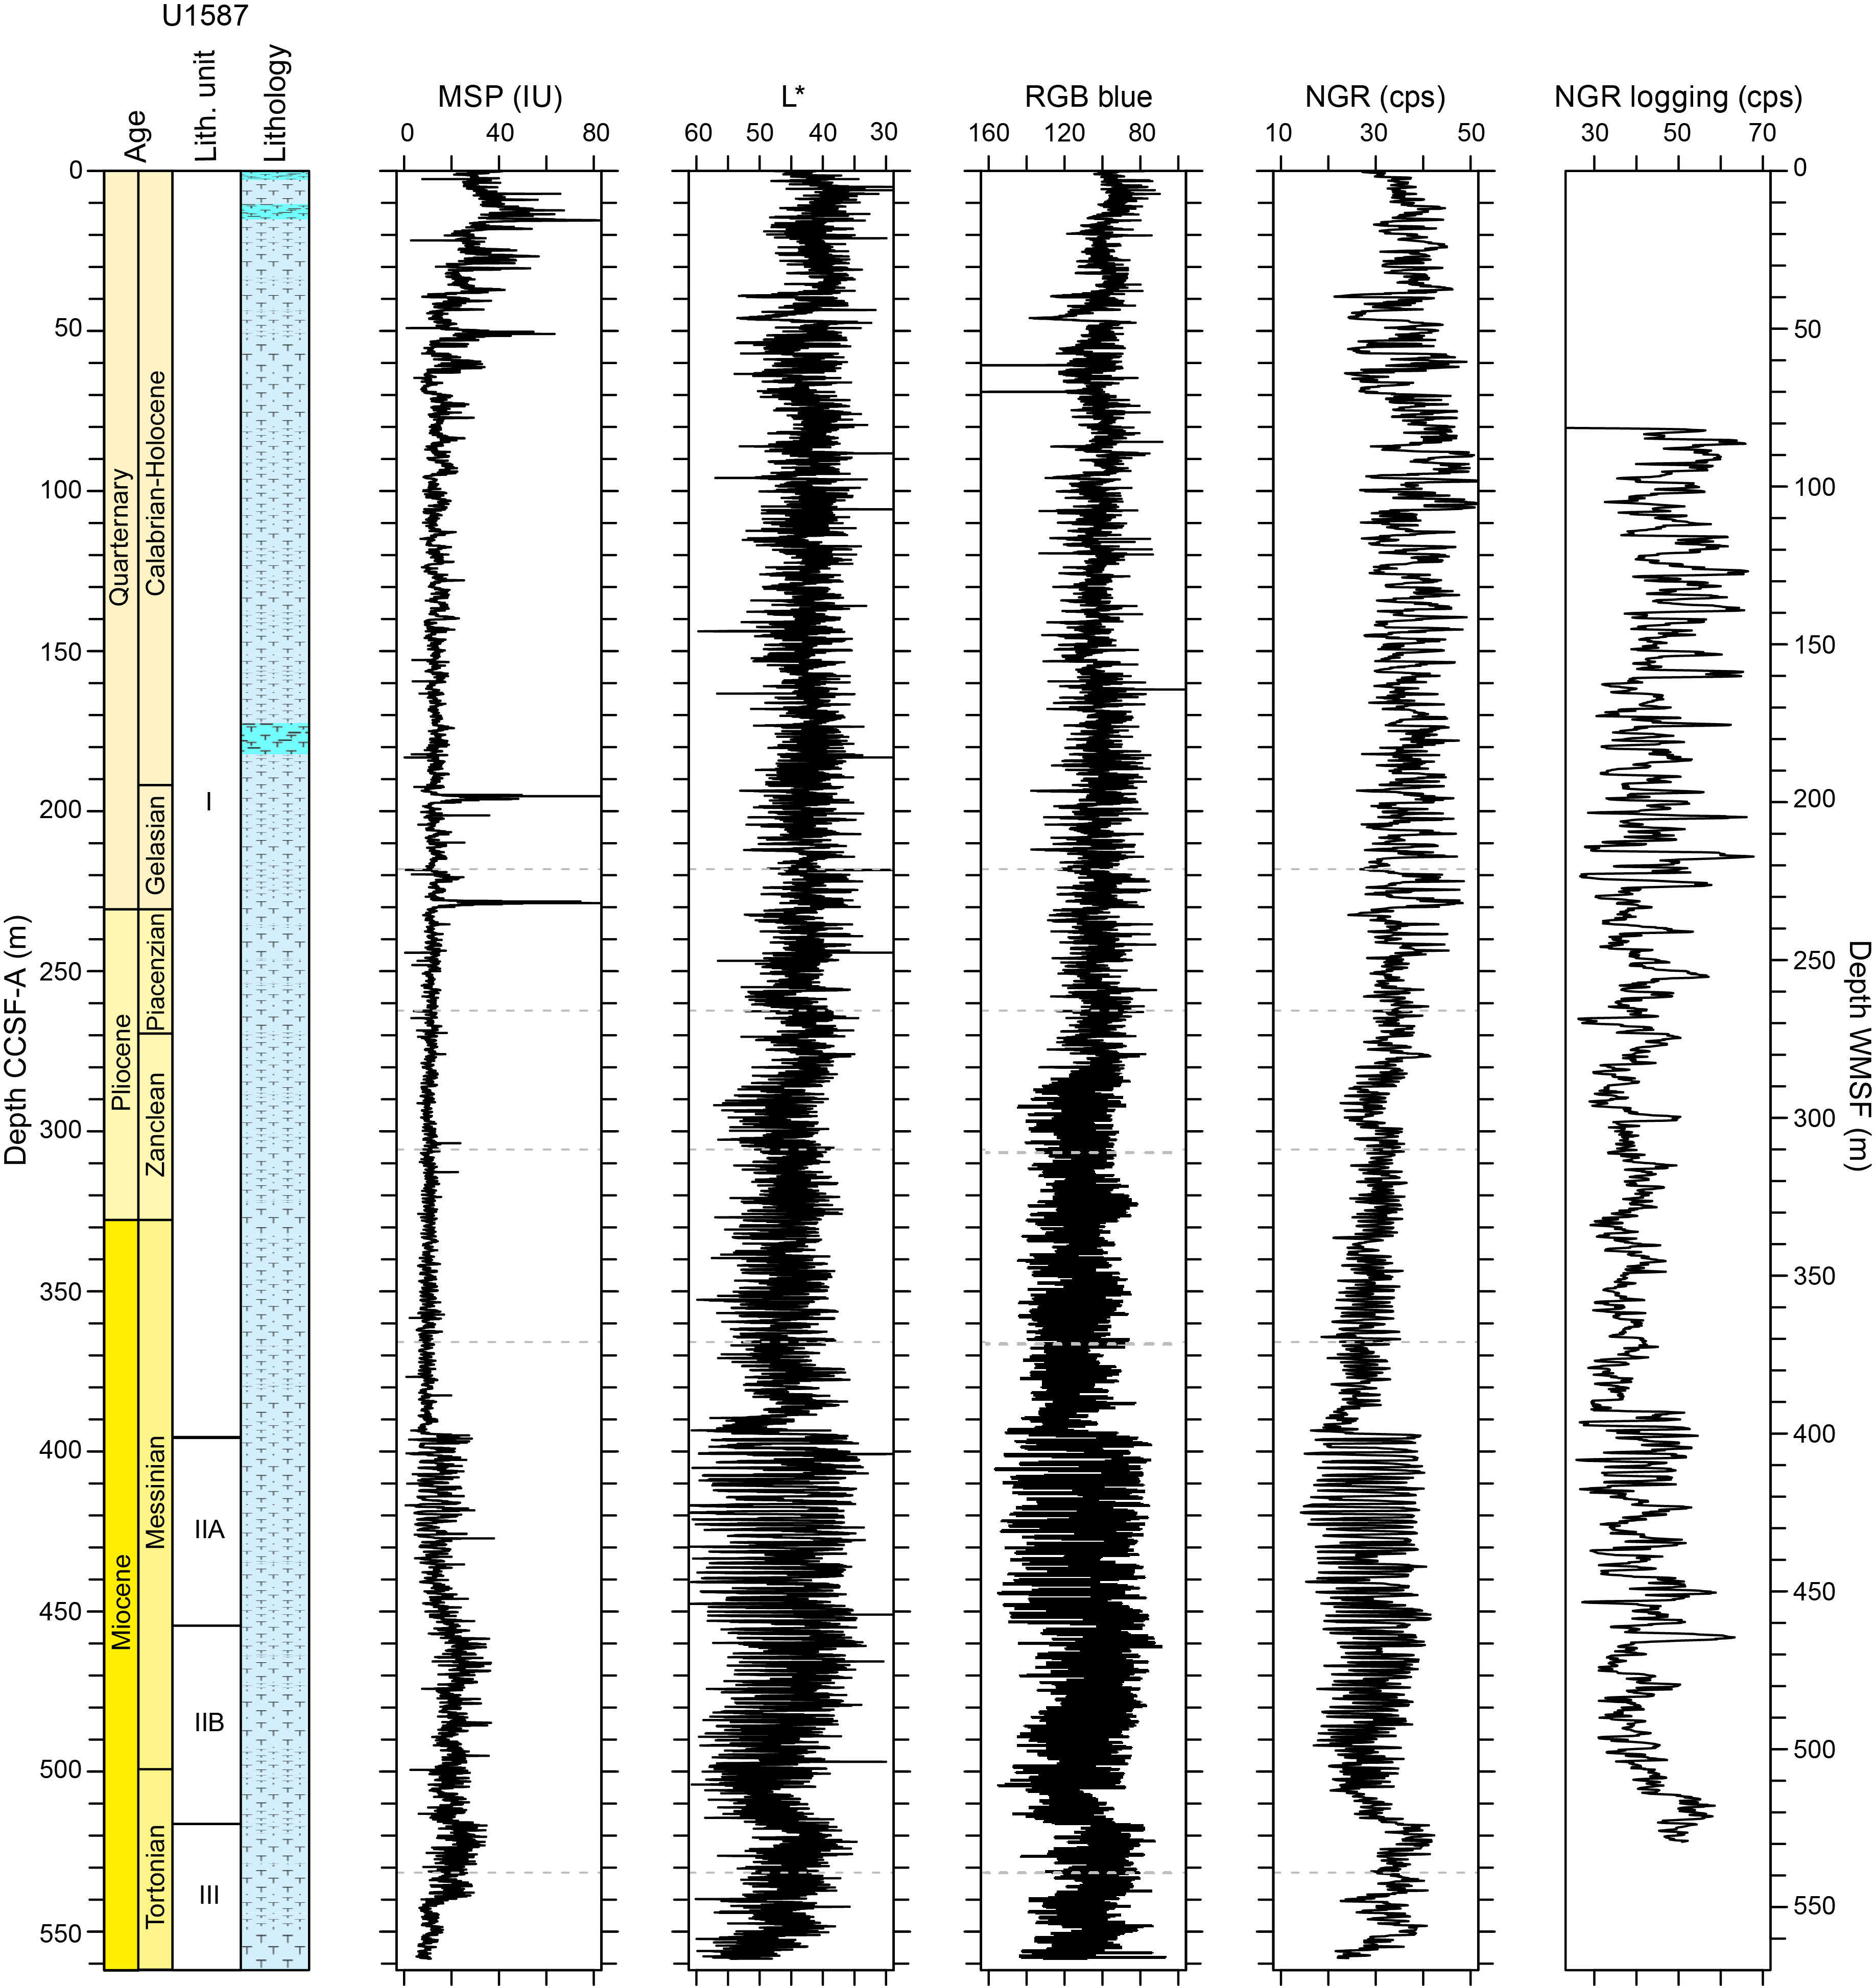
Figure F44. Spliced composite records of SHMSL MSP, L*, RGB blue, NGR, and lithology.
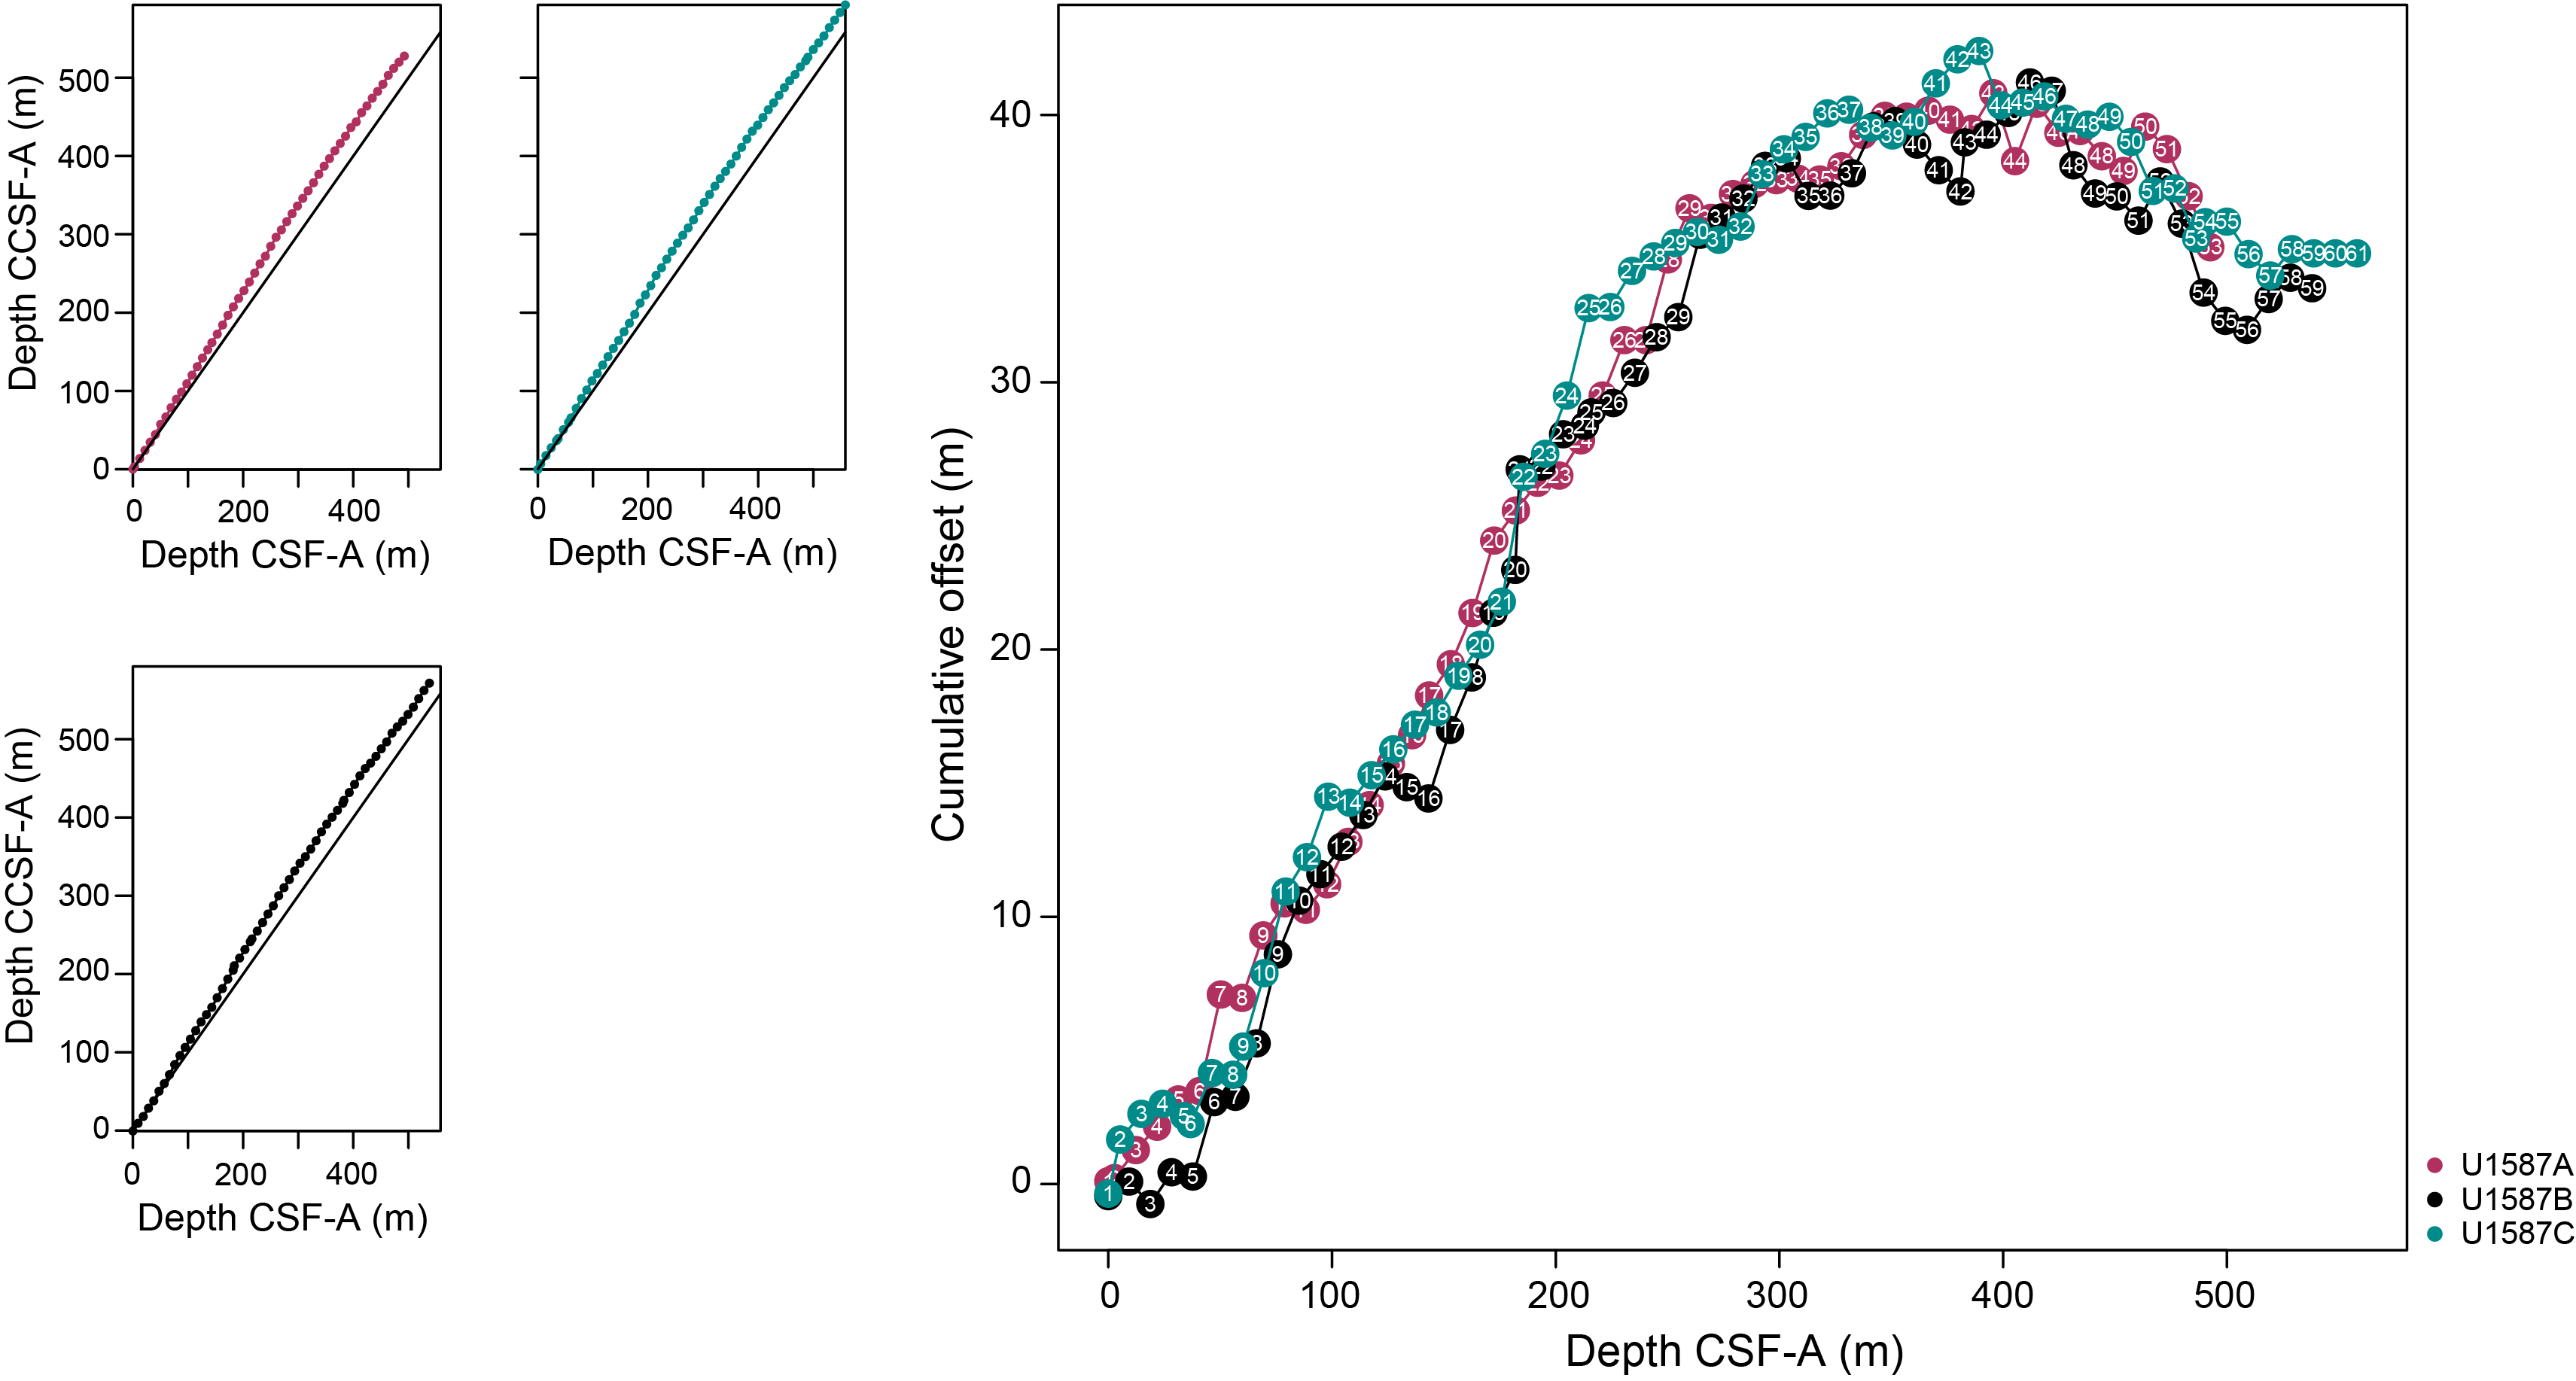
Figure F45. Depth scale comparison.
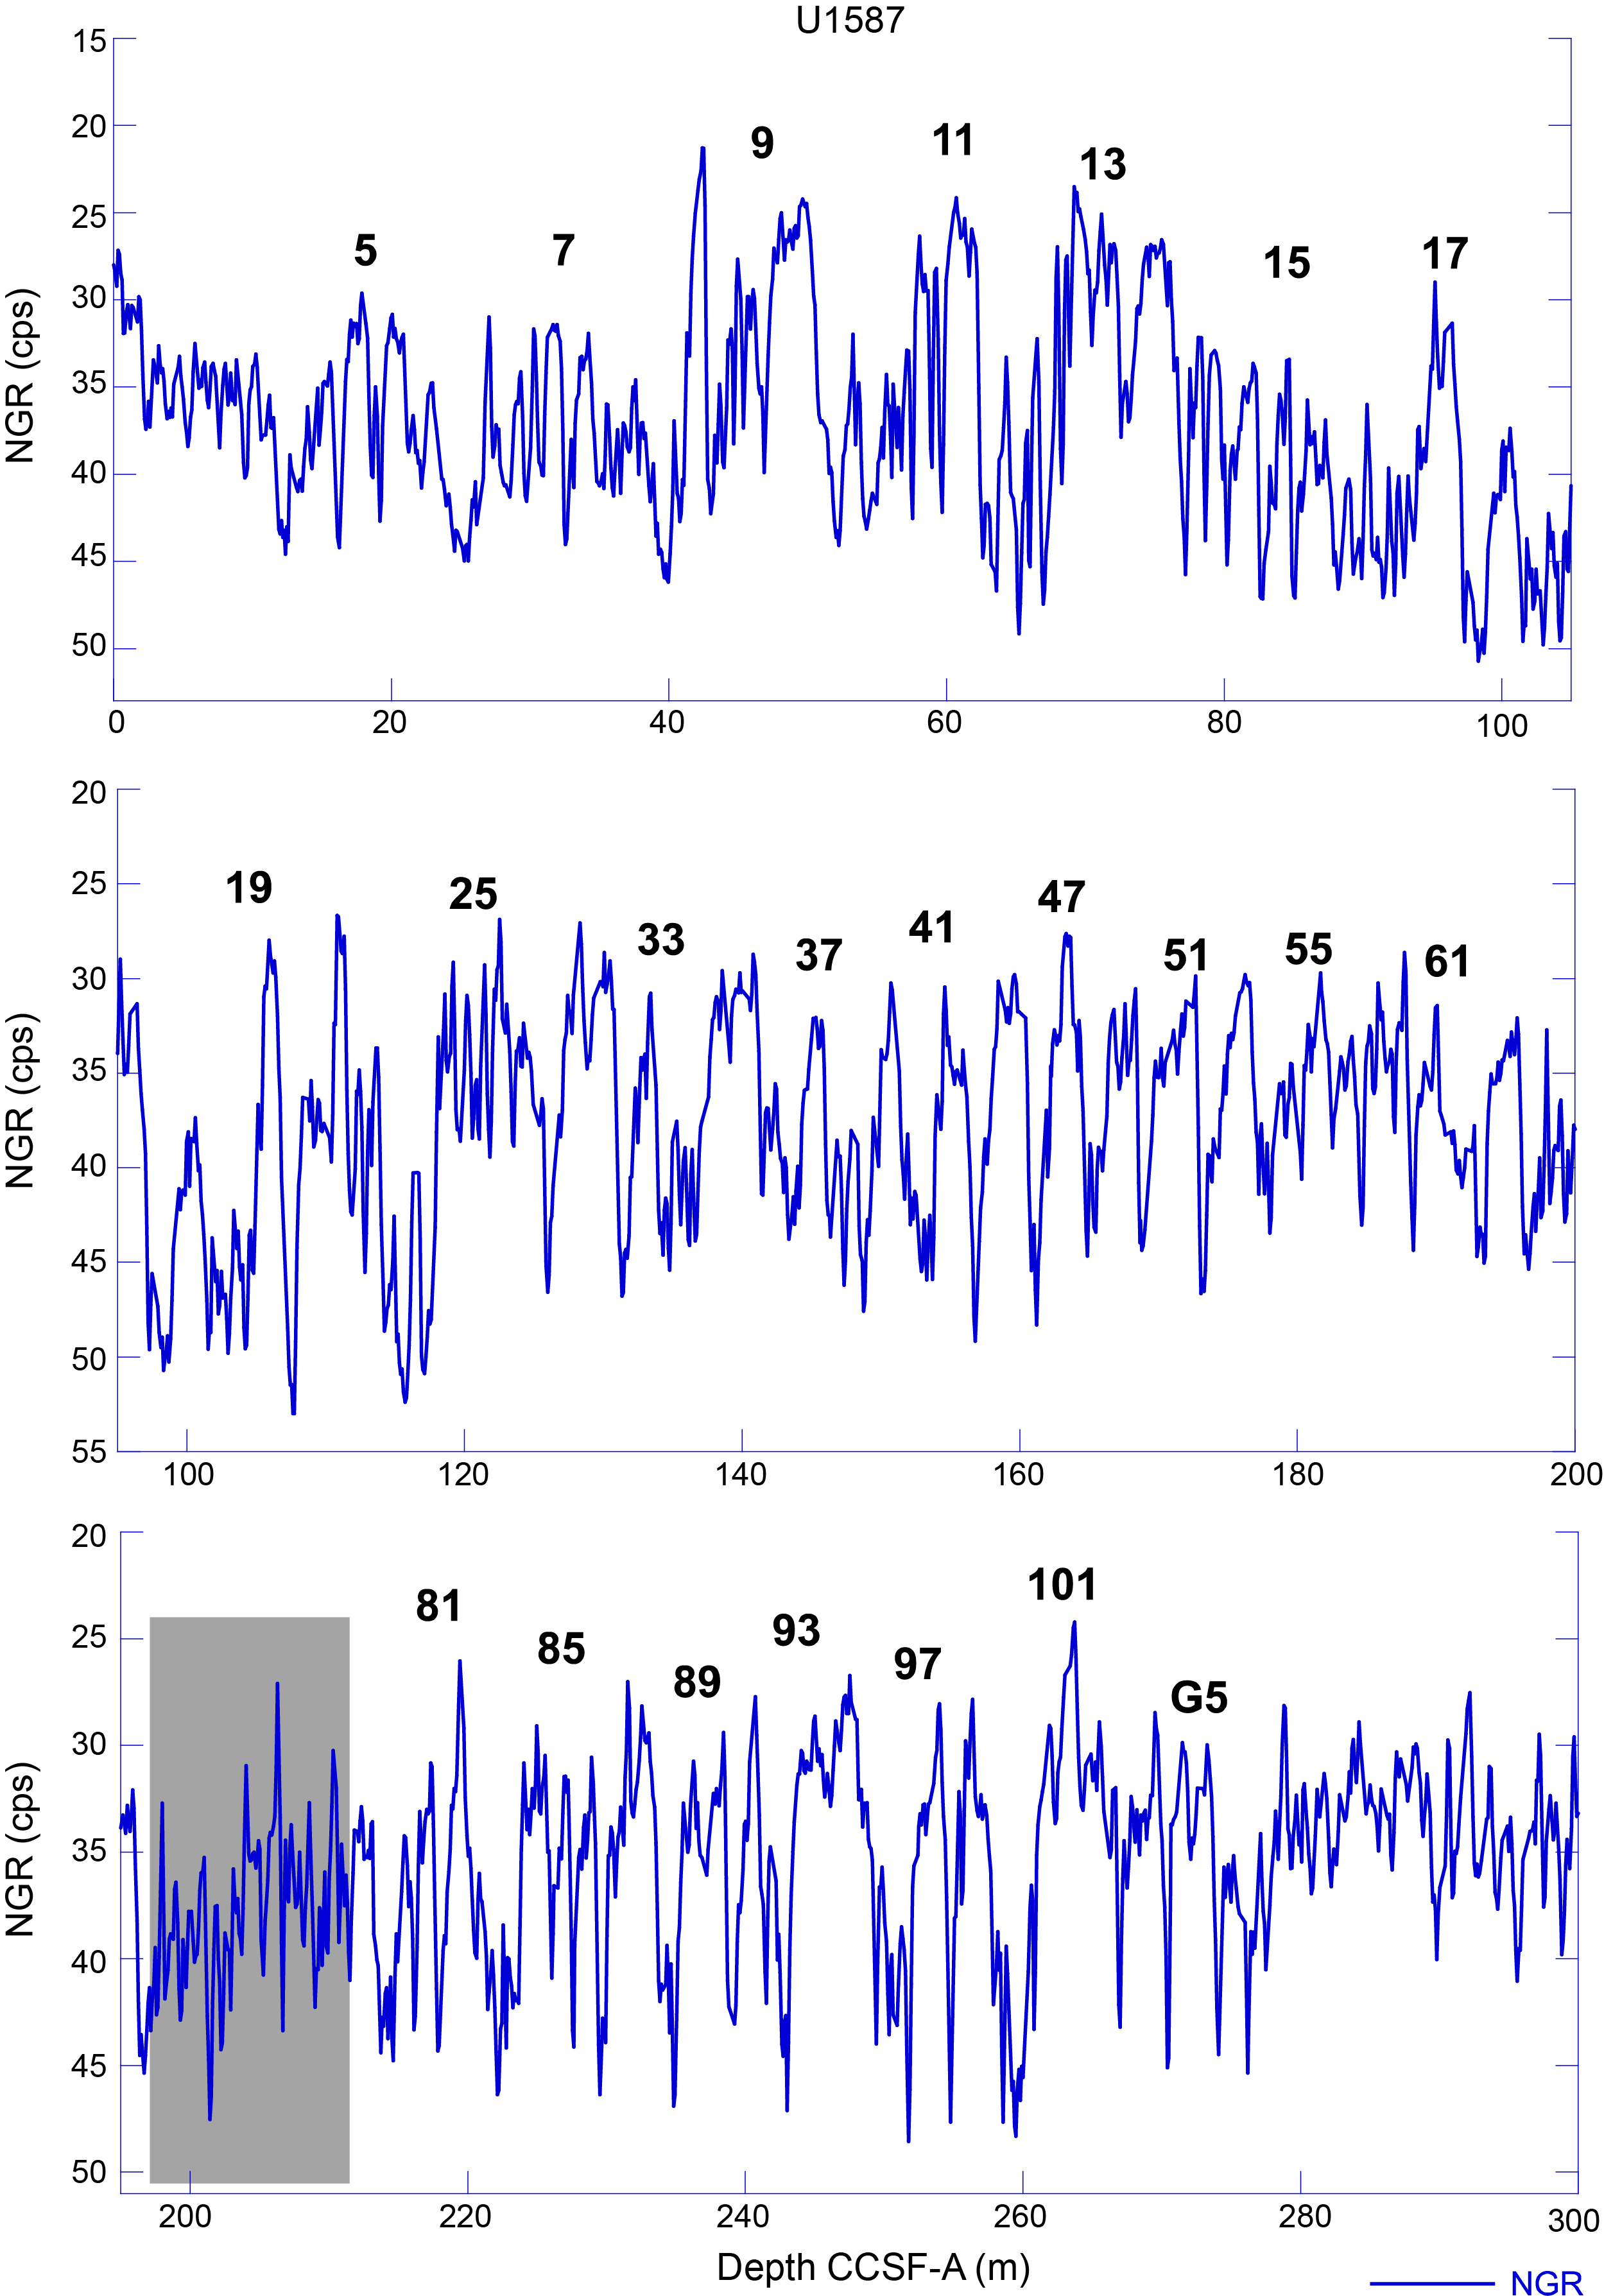
Figure F46. Blue color reflectance splice.
9.1. Approach
The CCSF-A depth scale is anchored to the mudline of Core 397-U1587A-1H, which is assigned to 0 m CCSF-A. From this anchor, we worked downhole using Correlator to establish a composite stratigraphy on a core-by-core basis. Our general approach was to avoid placing ties (1) near section edges as much as possible, (2) in sections sampled for IW measurements, and (3) in core catcher sections.
A major aid in correlation came from strong high-frequency variability in all physical properties signals (MS, NGR, and color reflectance) (Figure F44). All are controlled to the first order by calcium carbonate content. In the Pleistocene, this led to a recognizable sequence of events that could be correlated to the oxygen isotope (MIS) template (Figure F46). In the Pliocene and Miocene, strong amplitude modulation by eccentricity was observed, likely from lithologic control by precessional pacing. The modulations led to diagnostic packets of higher and lower amplitude lithologic cycles that aided correlations between offset holes.
Upon completion of the site splice using Correlator, we came to terms with two aspects of core measurements that will require correction of raw data values of whole-round MS, MSP measurements, and NGR values. The first comes from the reduced diameter and volume of XCB cores relative to APC cores. We observed a step drop by ~0.2 g/cm3 in the GRA bulk density when coring was switched to the XCB system. This reduction in core volume will affect the values of all mass-dependent measurements. Although MSP measurements may be slightly less sensitive to core diameter changes than whole-round MS measurements, they generally fall close to the whole-round values, suggesting that they average over a nearly equivalent volume/distance and also require a volume/diameter correction. A comparison of the NGR measurements also shows an abrupt drop when coring was switched to the XCB system; values at equivalent sections of XCB cores are comparable between offset holes but noticeably lower than equivalent cores recovered using the APC system. The possibility of correcting mass- and volume-dependent measurements using the GRA bulk density logs will be explored postcruise.
The second artifact in initial data comes from the effect of core temperature on MS readings taken using the WRMSL. The temperature of the cores significantly affects the sensitivity of the MS sensor; experiments showed differences between cores run before and after thermal equilibration. Raw values of whole-round MS logs are therefore much less consistent between holes than MSP measurements. As above, we hope to correct raw pass-through MS measurements by reference to the MSP measurements on the same cores.
Strong drilling distortion is observed in much of the Miocene sequence because of variable compression/expansion of low carbonate beds that occur frequently in that interval. The distortion was particularly severe in the interval of expanded sedimentation in the upper Messinian, presumably because of the large difference in coring behavior of the relatively firm carbonate-rich beds alternating with thick, highly clay rich beds. Correlation was challenging at first, but we noticed that similar features could be recognized, either expanded or contracted by up to 45%, between offset holes. A strategy of decompressing each core approximately by the inverse of its nominal recovery led to a successful correlation using Kaleidagraph to verify correlation points; the resulting ties then guided the Correlator splice, which follows the usual CCSF-A composite section procedure. The implication is that the nominal recovery is not an accurate measure of the completeness of the cored section; for example, Core 397-U1587A-43X (55% recovery) contains an identical sequence to Core 397-U1587B-44X (100% recovery). Physical compression is unlikely because the GRA bulk density recorded for the two cores is very similar; the explanation for the discrepancy in stratigraphic thickness lies elsewhere in the XCB coring process.
We also observed an interesting change in the behavior of MS measurements with lithology in the Messinian–Tortonian sequence (Lithostratigraphic Subunits IIA and IIB; see Lithostratigraphy). Following the diagenetic reduction in MS in the upper ~100 m, MS generally closely follows the lithologic variations between more carbonate-rich and carbonate-poor units and closely corresponds to NGR measurements. However, as MS values increase in Subunits IIA and IIB, they diverge strongly from the Pliocene–Pleistocene pattern. This behavior can be illustrated by normalizing MSP to NGR counts; this ratio gives an indication of the MS of the nonbiogenic component of the sediment and removes the influence of carbonate dilution. In Subunit IIB, MS on a carbonate-free basis actually follows an inverse pattern with respect to the carbonate cycles and is high in the carbonate-rich beds where NGR counts are low. In Subunit IIA, the pattern shifts to nearly symmetrical spikes of high MS at the contacts of the carbonate-rich and clay-rich layers. Although this behavior could result from primary inputs of magnetically susceptible minerals at the time of deposition, it most likely results from diagenetic mobilization of iron phases from the carbonate beds and reprecipitation at chemical interfaces in the adjacent layers. Regardless of the cause, the interpretation of MS as a detrital proxy may be complicated by diagenesis in Subunits IIA and IIB.
9.2. Gaps
The composite section is very robust with a few exceptions. The splice between Cores 397-U1587A-20X through 21X and 397-U1587B-20X is poorly constrained because the latter was a short (3.5 m) core. There is also a very small overlap at the splice between Cores 397-U1587B-27X through 28X and 397-U1587C-27X through 28X. We also had difficulty confidently splicing the intervals between Cores 397-U1587A-43X through 46X, 397-U1587B-44X through 47X, and 397-U1587C-43X through 46X, where core distortion seems large. Postcruise XRF analysis of cores may help clarify these ambiguous splice tie points.
9.3. Growth rate and cumulative offset
The cumulative offset between the CSF-A and CCSF-A depth scales is nearly linear for Holes U1587A–U1587C (Figure F45, left). The growth factor averages 1.09 but varies by core and hole. It grows about 12% in the upper 400 m (440 m CCSF-A) and then negligibly below 500 m CSF-A (550 m CCSF-A) in a pattern very similar to that seen at Site U1586 (see Figure F56 in the Site U1586 chapter [Abrantes et al., 2024b]). To compensate for composite section growth, we adopted a similar strategy to that used during Expedition 339 (Expedition 339 Scientists, 2013): inverting the CSF-A depth scale to the CCSF-A depth scale to bring measurements back to a scale closely approximating driller's depth. Because of the significant curvature in the depth-depth relationship, a sixth-order polynomial (Table T32) was required to achieve a good relationship that ran through the mudline at the top of the Site U1587 sequence (Figure F47; Table T32). This core composite depth below seafloor is used in Figure F44 because it represents the closest match to data presented elsewhere in the CSF-A depth scale and because it compares well to the borehole logs. Calculation of mass accumulation rates based on the CCSF-A depth scale should account for differential expansion by dividing apparent depth intervals by the appropriate growth factor or by using the modified CCSF-A (CCSF-A*) depth scale.
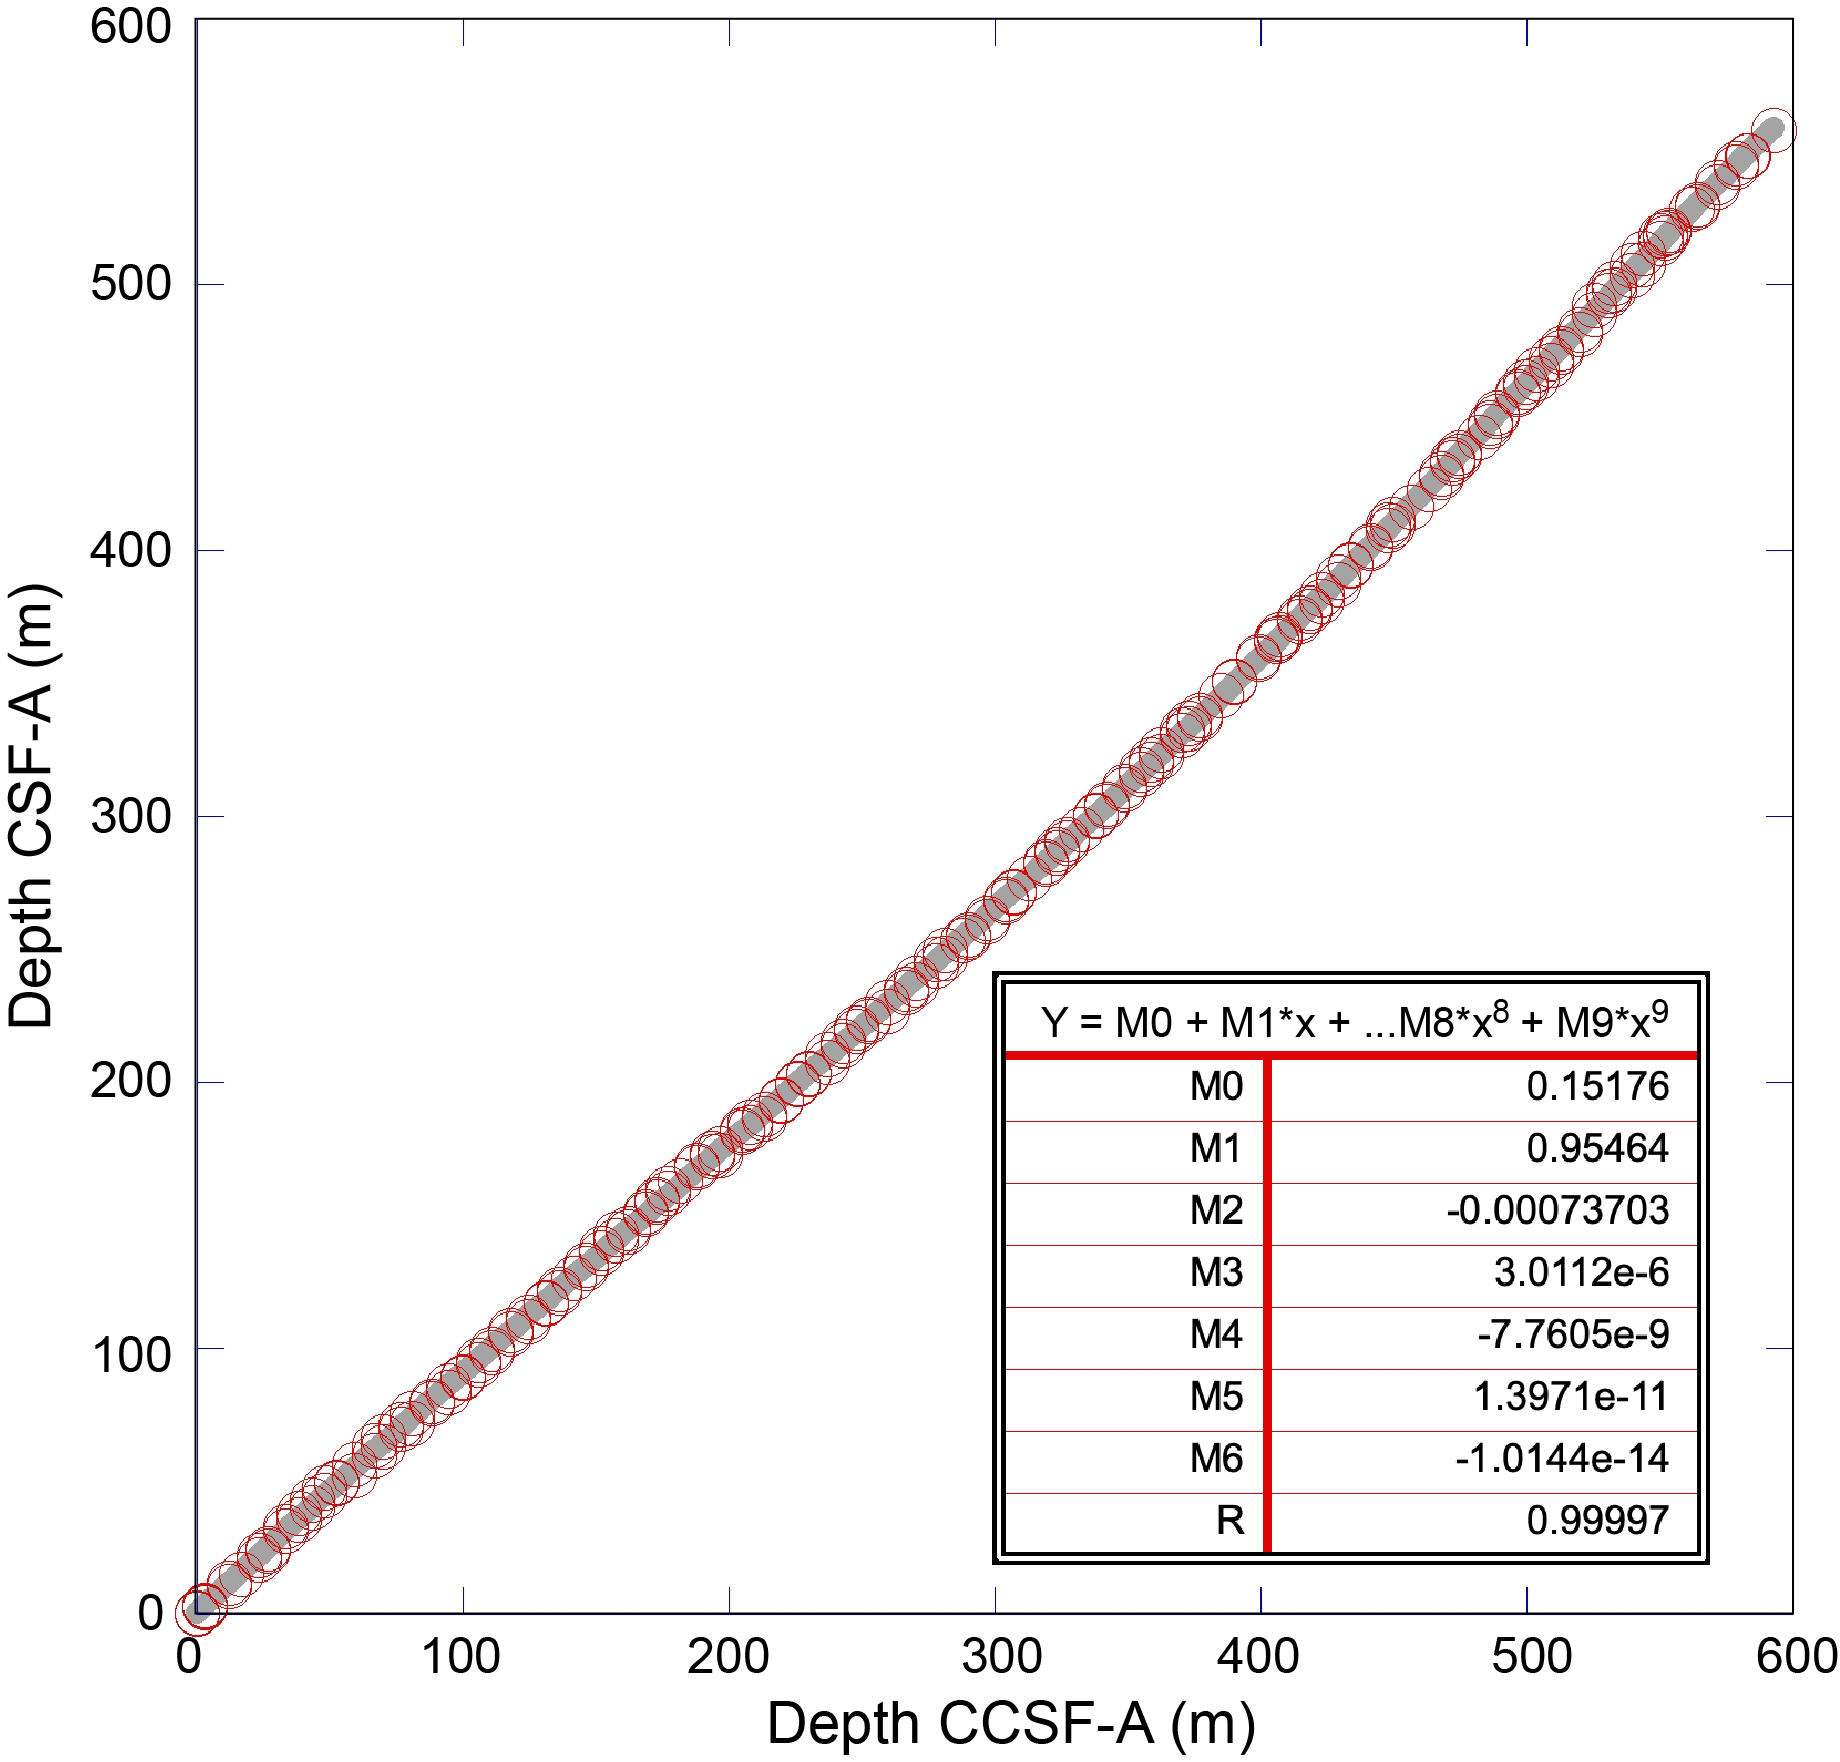
Figure F47. Correlation of splice depth to driller's depth.
References
Abrantes, F., 1991a. Increased upwelling off Portugal during the last glaciation: diatom evidence. Marine Micropaleontology, 17(3–4):285–310. https://doi.org/10.1016/0377-8398(91)90017-Z
Abrantes, F., 2000. 200,000 yr diatom records from Atlantic upwelling sites reveal maximum productivity during LGM and a shift in phytoplankton community structure at 185 000 yr. Earth and Planetary Science Letters, 176(1):7–16. https://doi.org/10.1016/S0012-821X(99)00312-X
Abrantes, F., Hodell, D.A., Alvarez Zarikian, C.A., Brooks, H.L., Clark, W.B., Dauchy-Tric, L.F.B., dos Santos Rocha, V., Flores, J.-A., Herbert, T.D., Hines, S.K.V., Huang, H.-H.M., Ikeda, H., Kaboth-Bahr, S., Kuroda, J., Link, J.M., McManus, J.F., Mitsunaga, B.A., Nana Yobo, L., Pallone, C.T., Pang, X., Peral, M.Y., Salgueiro, E., Sanchez, S., Verma, K., Wu, J., Xuan, C., and Yu, J., 2024a. Expedition 397 methods. In Hodell, D.A., Abrantes, F., Alvarez Zarikian, C.A., and the Expedition 397 Scientists, Iberian Margin Paleoclimate. Proceedings of the International Ocean Discovery Program, 397: College Station, TX (International Ocean Discovery Program). https://doi.org/10.14379/iodp.proc.397.102.2024
Abrantes, F., Hodell, D.A., Alvarez Zarikian, C.A., Brooks, H.L., Clark, W.B., Dauchy-Tric, L.F.B., dos Santos Rocha, V., Flores, J.-A., Herbert, T.D., Hines, S.K.V., Huang, H.-H.M., Ikeda, H., Kaboth-Bahr, S., Kuroda, J., Link, J.M., McManus, J.F., Mitsunaga, B.A., Nana Yobo, L., Pallone, C.T., Pang, X., Peral, M.Y., Salgueiro, E., Sanchez, S., Verma, K., Wu, J., Xuan, C., and Yu, J., 2024b. Site U1586. In Hodell, D.A., Abrantes, F., Alvarez Zarikian, C.A., and the Expedition 397 Scientists, Iberian Margin Paleoclimate. Proceedings of the International Ocean Discovery Program, 397: College Station, TX (International Ocean Discovery Program). https://doi.org/10.14379/iodp.proc.397.103.2024
Abrantes, F.F., 1991b. Variability of Upwelling Off NW Africa During the Latest Quaternary: Diatom Evidence. Paleoceanography, 6(4):431–460. https://doi.org/10.1029/91PA00049
Balestra, B., Flores, J.A., Hodell, D.A., Hernández Molina, F.J., and Stow, D.A.V., 2015. Pleistocene calcareous nannofossil biochronology at IODP Site U1385 (Expedition 339). Global and Planetary Change, 135:57–65. https://doi.org/10.1016/j.gloplacha.2015.10.004
Bard, E., Rostek, F., Turon, J.-L., and Gendreau, S., 2000. Hydrological impact of Heinrich events in the subtropical northeast Atlantic. Science, 289(5483):1321–1324. https://doi.org/10.1126/science.289.5483.1321
Blum, P., 1997. Physical properties handbook: a guide to the shipboard measurement of physical properties of deep-sea cores. Ocean Drilling Program Technical Note, 26. https://doi.org/10.2973/odp.tn.26.1997
BouDagher-Fadel, M.K., 2015. Biostratigraphic and Geological Significance of Planktonic Foraminifera: London (UCL Press). https://doi.org/10.14324/111.9781910634257
Burton, E.D., Bush, R.T., Sullivan, L.A., Hocking, R.K., Mitchell, D.R.G., Johnston, S.G., Fitzpatrick, R.W., Raven, M., McClure, S., and Jang, L.Y., 2009. Iron-monosulfide oxidation in natural sediments: resolving microbially mediated S transformations using XANES, electron microscopy, and selective extractions. Environmental Science & Technology, 43(9):3128–3134. https://doi.org/10.1021/es8036548
Channell, J.E.T., Hodell, D.A., Crowhurst, S.J., Skinner, L.C., and Muscheler, R., 2018. Relative paleointensity (RPI) in the latest Pleistocene (10–45 ka) and implications for deglacial atmospheric radiocarbon. Quaternary Science Reviews, 191:57–72. https://doi.org/10.1016/j.quascirev.2018.05.007
Choppala, G., Bush, R., Moon, E., Ward, N., Wang, Z., Bolan, N., and Sullivan, L., 2017. Oxidative transformation of iron monosulfides and pyrite in estuarine sediments: implications for trace metals mobilisation. Journal of Environmental Management, 186(Pt 2):158–166. https://doi.org/10.1016/j.jenvman.2016.06.062
Davtian, N., and Bard, E., 2023. A new view on abrupt climate changes and the bipolar seesaw based on paleotemperatures from Iberian margin sediments. Proceedings of the National Academy of Sciences, 120(12):e2209558120. https://doi.org/10.1073/pnas.2209558120
De Vleeschouwer, D., Dunlea, A.G., Auer, G., Anderson, C.H., Brumsack, H., de Loach, A., Gurnis, M.C., Huh, Y., Ishiwa, T., Jang, K., Kominz, M.A., März, C., Schnetger, B., Murray, R.W., Pälike, H., and Expedition 356 Shipboard Scientists, 2017. Quantifying K, U, and Th contents of marine sediments using shipboard natural gamma radiation spectra measured on DV JOIDES Resolution. Geochemistry, Geophysics, Geosystems, 18(3):1053–1064. https://doi.org/10.1002/2016GC006715
Expedition 339 Scientists, 2013. Site U1385. In Stow, D.A.V., Hernández-Molina, F.J., Alvarez Zarikian, C.A., and the Expedition 339 Scientists, Proceedings of the Integrated Ocean Drilling Program. 339: Tokyo (Integrated Ocean Drilling Program Management International, Inc.). https://doi.org/10.2204/iodp.proc.339.103.2013
Flecker, R., Ducassou, E., and Williams, T., 2023. Expedition 401 Scientific Prospectus: Mediterranean Atlantic Gateway Exchange. International Ocean Discovery Program. https://doi.org/10.14379/iodp.sp.401.2023
Flores, J.-A., Colmenero-Hidalgo, E., Mejía-Molina, A.E., Baumann, K.-H., Henderiks, J., Larsson, K., Prabhu, C.N., Sierro, F.J., and Rodrigues, T., 2010. Distribution of large Emiliania huxleyi in the central and Northeast Atlantic as a tracer of surface ocean dynamics during the last 25,000 years. Marine Micropaleontology, 76(3–4):53–66. https://doi.org/10.1016/j.marmicro.2010.05.001
Gradstein, F.M., Ogg, J.G., Schmitz, M.D., and Ogg, G.M. (Eds.), 2020. The Geologic Time Scale 2020: Amsterdam (Elsevier BV). https://doi.org/10.1016/C2020-1-02369-3
Grevemeyer, I., Kaul, N., and Kopf, A., 2009. Heat flow anomalies in the Gulf of Cadiz and off Cape San Vincente, Portugal. Marine and Petroleum Geology, 26(6):795–804. https://doi.org/10.1016/j.marpetgeo.2008.08.006
Hayward, B.W., 2002. Late Pliocene to middle Pleistocene extinctions of deep-sea benthic Foraminifera ("Stilostomella extinction") in the Southwest Pacific. Journal of Foraminiferal Research, 32(3):274–307. https://doi.org/10.2113/32.3.274
Huerta-Diaz, M.A., and Morse, J.W., 1992. Pyritization of trace metals in anoxic marine sediments. Geochimica et Cosmochimica Acta, 56(7):2681–2702. https://doi.org/10.1016/0016-7037(92)90353-K
Hyndman, R.D., Erickson, A.J., and Von Herzen, R.P., 1974. Geothermal measurements on DSDP Leg 26. In Davies, T.A., Luyendyk, B.P., et al., Initial Reports of the Deep Sea Drilling Project. 26: Washington, DC (US Government Printing Office), 451–463. https://doi.org/10.2973/dsdp.proc.26.113.1974
Jenkins, W.J., Smethie, W.M., Boyle, E.A., and Cutter, G.A., 2015. Water mass analysis for the U.S. GEOTRACES (GA03) North Atlantic sections. Deep Sea Research, Part II: Topical Studies in Oceanography, 116:6–20. https://doi.org/10.1016/j.dsr2.2014.11.018
Karanovic, I., and Brandão, S.N., 2015. Biogeography of deep-sea wood fall, cold seep and hydrothermal vent Ostracoda (Crustacea), with the description of a new family and a taxonomic key to living Cytheroidea. Deep Sea Research, Part II: Topical Studies in Oceanography, 111:76–94. https://doi.org/10.1016/j.dsr2.2014.09.008
Kasten, S., and Jørgensen, B.B., 2000. Sulfate reduction in marine sediments. In Schulz, H.D., and Zabel, M. (Eds.), Marine Geochemistry. Berlin, Heidelberg (Springer Berlin Heidelberg), 263–281. https://doi.org/10.1007/978-3-662-04242-7_8
Kawagata, S., Hayward, B.W., Grenfell, H.R., and Sabaa, A., 2005. Mid-Pleistocene extinction of deep-sea foraminifera in the North Atlantic Gateway (ODP Sites 980 and 982). Palaeogeography, Palaeoclimatology, Palaeoecology, 221(3):267–291. https://doi.org/10.1016/j.palaeo.2005.03.001
King, D.J., Wade, B.S., Liska, R.D., and Miller, C.G., 2020. A review of the importance of the Caribbean region in Oligo-Miocene low latitude planktonic foraminiferal biostratigraphy and the implications for modern biogeochronological schemes. Earth-Science Reviews, 202:102968. https://doi.org/10.1016/j.earscirev.2019.102968
Lourens, L., Hilgen, F., Shackleton, N.J., Laskar, J., and Wilson, D., 2004. The Neogene period. In Smith, A.G., Gradstein, F.M. and Ogg, J.G., A Geologic Time Scale 2004. Cambridge, UK (Cambridge University Press), 409–440. https://doi.org/10.1017/CBO9780511536045.022
Margari, V., Skinner, L.C., Hodell, D.A., Martrat, B., Toucanne, S., Grimalt, J.O., Gibbard, P.L., Lunkka, J.P., and Tzedakis, P.C., 2014. Land-ocean changes on orbital and millennial time scales and the penultimate glaciation. Geology, 42(3):183–186. https://doi.org/10.1130/G35070.1
Margari, V., Skinner, L.C., Menviel, L., Capron, E., Rhodes, R.H., Mleneck-Vautravers, M.J., Ezat, M.M., Martrat, B., Grimalt, J.O., Hodell, D.A., and Tzedakis, P.C., 2020. Fast and slow components of interstadial warming in the North Atlantic during the last glacial. Communications Earth & Environment, 1(1):6. https://doi.org/10.1038/s43247-020-0006-x
Margari, V., Skinner, L.C., Tzedakis, P.C., Ganopolski, A., Vautravers, M., and Shackleton, N.J., 2010. The nature of millennial-scale climate variability during the past two glacial periods. Nature Geoscience, 3(2):127–131. https://doi.org/10.1038/ngeo740
Martini, E., 1971. Standard Tertiary and Quaternary calcareous nannoplankton zonation. Proceedings of the Second Planktonic Conference, Roma, 1970:739–785.
Meyers, P.A., 1994. Preservation of elemental and isotopic source identification of sedimentary organic matter. Chemical Geology, 114(3–4):289–302. https://doi.org/10.1016/0009-2541(94)90059-0
Meyers, P.A., 1997. Organic geochemical proxies of paleoceanographic, paleolimnologic, and paleoclimatic processes. Organic Geochemistry, 27(5–6):213–250. https://doi.org/10.1016/S0146-6380(97)00049-1
Okada, H., and Bukry, D., 1980. Supplementary modification and introduction of code numbers to the low-latitude coccolith biostratigraphic zonation (Bukry, 1973; 1975). Marine Micropaleontology, 5(3):321–325. https://doi.org/10.1016/0377-8398(80)90016-X
Pailler, D., and Bard, E., 2002. High frequency palaeoceanographic changes during the past 140 000 yr recorded by the organic matter in sediments of the Iberian Margin. Palaeogeography, Palaeoclimatology, Palaeoecology, 181(4):431–452. https://doi.org/10.1016/S0031-0182(01)00444-8
Paytan, A., and Griffith, E.M., 2007. Marine barite: recorder of variations in ocean export productivity. Deep Sea Research, Part II: Topical Studies in Oceanography, 54(5–7):687–705. https://doi.org/10.1016/j.dsr2.2007.01.007
Pribnow, D.F.C., Kinoshita, M., and Stein, C.A., 2000. Thermal data collection and heat flow recalculations for ODP Legs 101–180: Hannover, Germany (Institute for Joint Geoscientific Research, GGA). http://www-odp.tamu.edu/publications/heatflow/
Raffi, I., Backman, J., Fornaciari, E., Pälike, H., Rio, D., Lourens, L., and Hilgen, F., 2006. A review of calcareous nannofossil astrobiochronology encompassing the past 25 million years. Quaternary Science Reviews, 25(23):3113–3137. https://doi.org/10.1016/j.quascirev.2006.07.007
Reitz, A., Pfeifer, K., de Lange, G.J., and Klump, J., 2004. Biogenic barium and the detrital Ba/Al ratio: a comparison of their direct and indirect determination. Marine Geology, 204(3–4):289–300. https://doi.org/10.1016/S0025-3227(04)00004-0
Rickard, D., and Luther, G.W., 2007. Chemistry of iron sulfides. Chemical Reviews, 107(2):514–562. https://doi.org/10.1021/cr0503658
Sánchez-Goñi, M.a.F., Turon, J.-L., Eynaud, F., and Gendreau, S., 2000. European climatic response to millennial-scale changes in the atmosphere–ocean system during the Last Glacial period. Quaternary Research, 54(3):394–403. https://doi.org/10.1006/qres.2000.2176
Shackleton, N.J., Fairbanks, R.G., Chiu, T., and Parrenin, F., 2004. Absolute calibration of the Greenland time scale: implications for Antarctic time scales and for Δ14C. Quaternary Science Reviews, 23(14–15):1513–1522. https://doi.org/10.1016/j.quascirev.2004.03.006
Shackleton, N.J., Hall, M.A., and Vincent, E., 2000. Phase relationships between millennial-scale events 64,000–24,000 years ago. Paleoceanography and Paleoclimatology, 15(6):565–569. https://doi.org/10.1029/2000PA000513
Steineck, P.L., Maddocks, R.F., Coles, G.P., and Whatley, R.C., 1990. Xylophile ostracoda in the deep sea. In Whatley, R.C., and Maybury, C. (Eds.), Ostracoda and Global Events. London (Chapman and Hall), 307–319.
Tanaka, H., Lelièvre, Y., and Yasuhara, M., 2019. Xylocythere sarrazinae, a new cytherurid ostracod (Crustacea) from a hydrothermal vent field on the Juan de Fuca Ridge, northeast Pacific Ocean, and its phylogenetic position within Cytheroidea. Marine Biodiversity, 49(6):2571–2586. https://doi.org/10.1007/s12526-019-00987-3
Thomson, J., Nixon, S., Summerhayes, C.P., Rohling, E.J., Schönfeld, J., Zahn, R., Grootes, P., Abrantes, F., Gaspar, L., and Vaquiero, S., 2000. Enhanced productivity on the Iberian margin during glacial/interglacial transitions revealed by barium and diatoms. Journal of the Geological Society, 157(3):667–677. https://doi.org/10.1144/jgs.157.3.667
Ventura, C., Abrantes, F., Loureiro, I., and Voelker, A.H.L., 2017. Data report: diatom and silicoflagellate records of marine isotope stages 25–27 at IODP Site U1387, Faro Drift. In Stow, D.A.V., Hernández-Molina, F.J., Alvarez Zarikian, C.A., and the Expedition 339 Scientists, Proceedings of the Integrated Ocean Drilling Program. 339: Tokyo (Integrated Ocean Drilling Program Management International, Inc.). https://doi.org/10.2204/iodp.proc.339.202.2017
Wade, B.S., Olsson, R.K., Pearson, P.N., Huber, B.T., and Berggren, W.A., 2018. Atlas of Oligocene Planktonic Foraminifera. Special Publication - Cushman Foundation for Foraminiferal Research, 46.
Wade, B.S., Pearson, P.N., Berggren, W.A., and Pälike, H., 2011. Review and revision of Cenozoic tropical planktonic foraminiferal biostratigraphy and calibration to the geomagnetic polarity and astronomical time scale. Earth-Science Reviews, 104(1–3):111–142. https://doi.org/10.1016/j.earscirev.2010.09.003
Wei, K.-Y., 1994. Stratophenetic tracing of phylogeny using SIMCA pattern recognition technique: a case study of the late Neogene planktic foraminifera Globoconella clade. Paleobiology, 20(1):52–65. https://www.jstor.org/stable/2401150
Wu, J., Böning, P., Pahnke, K., Tachikawa, K., and de Lange, G.J., 2016. Unraveling North-African riverine and eolian contributions to central Mediterranean sediments during Holocene sapropel S1 formation. Quaternary Science Reviews, 152:31–48. https://doi.org/10.1016/j.quascirev.2016.09.029
Xuan, C., and Channell, J.E.T., 2009. UPmag: MATLAB software for viewing and processing u channel or other pass-through paleomagnetic data. Geochemistry Geophysics Geosystems, 10:Q10Y10. https://doi.org/10.1029/2009GC002584