Druitt, T.H., Kutterolf, S., Ronge, T.A., and the Expedition 398 Scientists
Proceedings of the International Ocean Discovery Program Volume 398
publications.iodp.org
https://doi.org/10.14379/iodp.proc.398.104.2024
Site U15901
![]() S. Kutterolf,
S. Kutterolf,
![]() T.H. Druitt,
T.H. Druitt,
![]() T.A. Ronge,
T.A. Ronge,
![]() S. Beethe,
S. Beethe,
![]() A. Bernard,
A. Bernard,
![]() C. Berthod,
C. Berthod,
![]() H. Chen,
H. Chen,
![]() S. Chiyonobu,
S. Chiyonobu,
![]() A. Clark,
A. Clark,
![]() S. DeBari,
S. DeBari,
![]() T.I. Fernandez Perez,
T.I. Fernandez Perez,
![]() R. Gertisser,
R. Gertisser,
![]() C. Hübscher,
C. Hübscher,
![]() R.M. Johnston,
R.M. Johnston,
![]() C. Jones,
C. Jones,
![]() K.B. Joshi,
K.B. Joshi,
![]() G. Kletetschka,
G. Kletetschka,
![]() O. Koukousioura,
O. Koukousioura,
![]() X. Li,
X. Li,
![]() M. Manga,
M. Manga,
![]() M. McCanta,
M. McCanta,
![]() I. McIntosh,
I. McIntosh,
![]() A. Morris,
A. Morris,
![]() P. Nomikou,
P. Nomikou,
![]() K. Pank,
K. Pank,
![]() A. Peccia,
A. Peccia,
![]() P.N. Polymenakou,
P.N. Polymenakou,
![]() J. Preine,
J. Preine,
![]() M. Tominaga,
M. Tominaga,
![]() A. Woodhouse, and
A. Woodhouse, and
![]() Y. Yamamoto2
Y. Yamamoto2
1 Kutterolf, S., Druitt, T.H., Ronge, T.A., Beethe, S., Bernard, A., Berthod, C., Chen, H., Chiyonobu, S., Clark, A., DeBari, S., Fernandez Perez, T.I., Gertisser, R., Hübscher, C., Johnston, R.M., Jones, C., Joshi, K.B., Kletetschka, G., Koukousioura, O., Li, X., Manga, M., McCanta, M., McIntosh, I., Morris, A., Nomikou, P., Pank, K., Peccia, A., Polymenakou, P.N., Preine, J., Tominaga, M., Woodhouse, A., and Yamamoto, Y., 2024. Site U1590. In Druitt, T.H., Kutterolf, S., Ronge, T.A., and the Expedition 398 Scientists, Hellenic Arc Volcanic Field. Proceedings of the International Ocean Discovery Program, 398: College Station, TX (International Ocean Discovery Program). https://doi.org/10.14379/iodp.proc.398.104.2024
2 Expedition 398 Scientists’ affiliations.
1. Background and objectives
Site U1590 (proposed Site CSK-03A) is located 5 km northwest of the submarine Kolumbo crater on its flank in the Anhydros Basin at 397 meters below sea level (mbsl) (Figure F1). It lies on the intersection of Seismic Lines HH06-22 and HH06-34 (Figure F2). Drilling took place in two holes (U1590A and U1590B) to a maximum recovery depth of 627.8 meters below seafloor (mbsf) (all depths below seafloor are given using the core depth below seafloor, Method A [CSF-A], scale, except in Operations, where the drilling depth below seafloor [DSF] scale is used). Average core recovery in Hole U1590A was moderate (61%), but recovery in Hole U1590B was poor (14%).
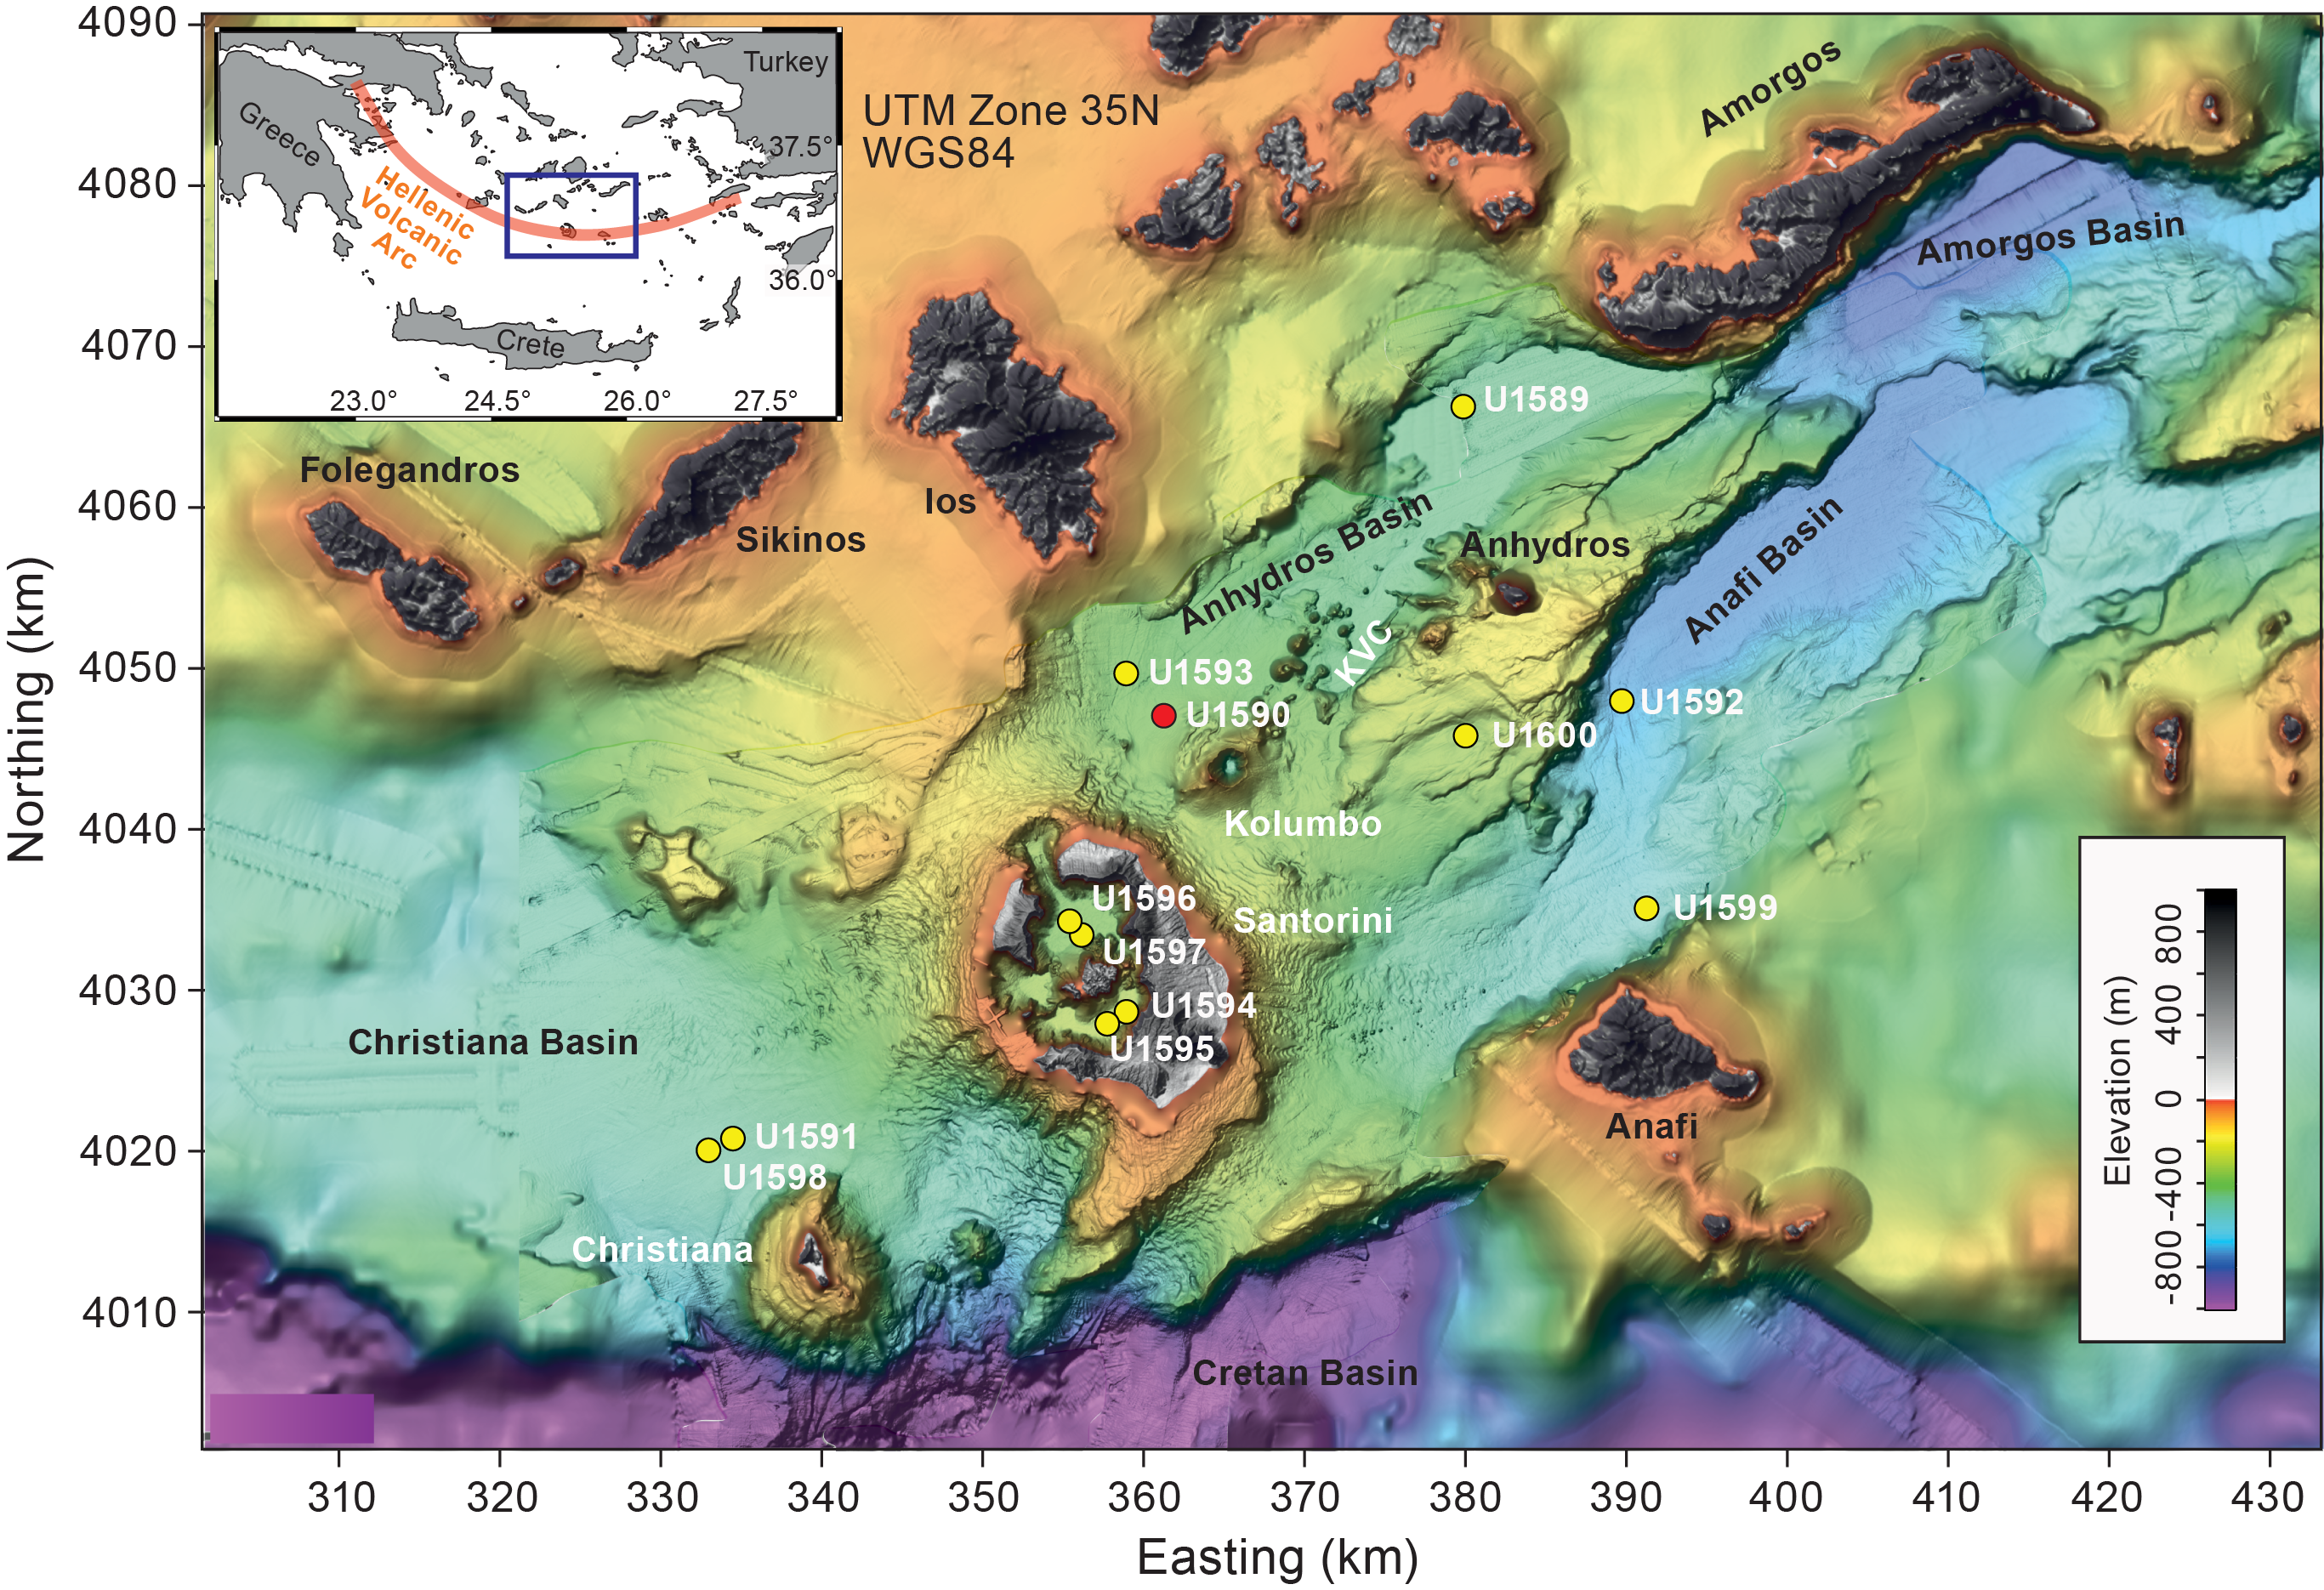
Figure F1. Site map.
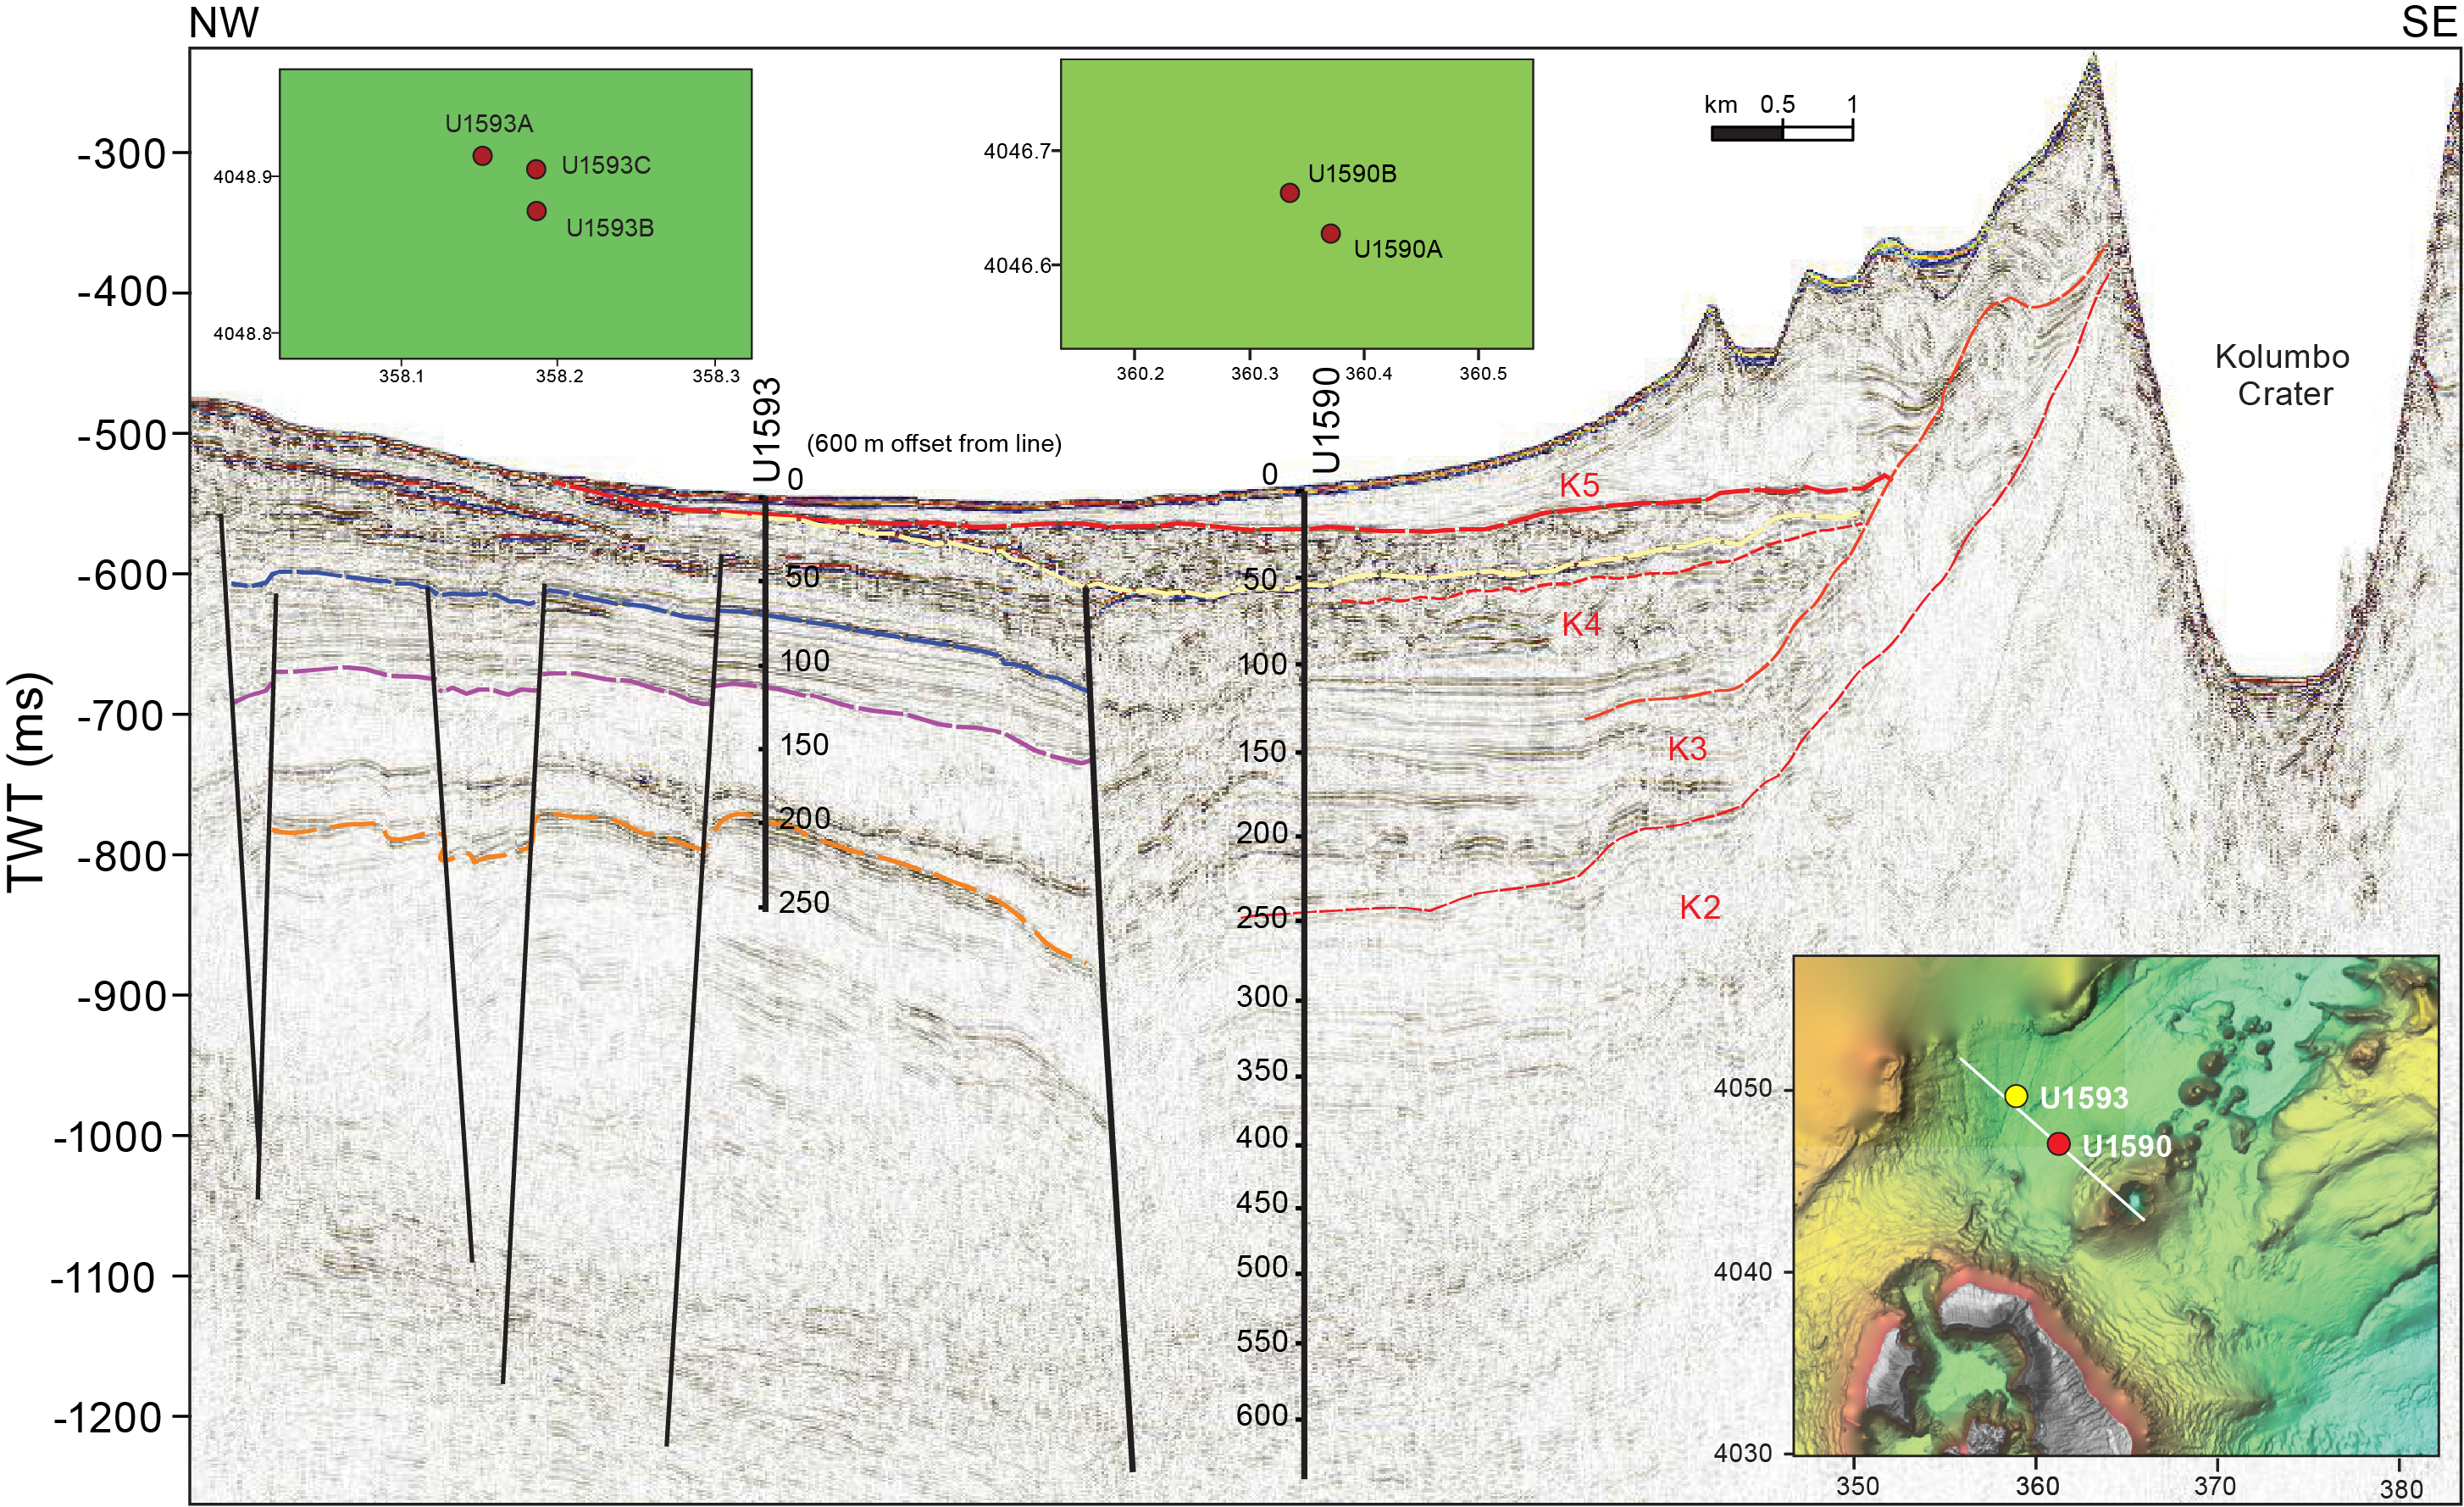
Figure F2. Seismic profile.
The seismic profiles across the Kolumbo edifice reveal five units interpreted as Kolumbo-derived volcaniclastics (K1–K5, from the base up; Figure F2) with Unit K5 representing the 1650 Common Era (CE) eruption (Hübscher et al., 2015; Preine et al., 2022). The submarine cones northeast of Kolumbo postdate Unit K2 on seismic profiles, but their products are not expected to be prominent in our drill cores.
The aim of drilling on the flanks of Kolumbo was to penetrate the different seismically recognized volcanic eruption units from that volcano (K1, K2, K3, and K5 or their thin, lateral equivalents) as well as many eruption units from Santorini and traces from the submarine cones northeast of Kolumbo. This enabled characterization of the products of the Kolumbo eruptions and construction of a coherent stratigraphy for Santorini and the submarine Kolumbo volcano chain together. The anticipated lithologies were volcaniclastics, muds, and turbidites. Site U1590 lies at the foot of the Kolumbo edifice; it allowed us to drill Seismic Units K1, K2, K3, and K5 and therefore nearly the entire history of Kolumbo Volcano. Intercalated seismic units are believed to contain the products of Santorini eruptions, including potentially those of smaller magnitude than recorded at the more distal basin sites.
2. Operations
The sea passage to Site U1590 started at 1818 h (all times local; 2 h ahead of UTC) on 31 December 2022. The vessel arrived on location and started lowering the thrusters at 1946 h. All thrusters were down and secured at 2012 h. The vessel was switched to dynamic positioning (DP) mode and auto control at 2020 h, officially starting Site U1590. The transit to Site U1590 took only 1.9 h, covering 14.5 nmi at an average speed of 7.6 kt.
2.1. Hole U1590A
The rig crew assembled the advanced piston corer/extended core barrel (APC/XCB) bottom-hole assembly (BHA) in preparation to start Hole U1590A. At 0115 h on 1 January 2023, the trip in the hole began with the APC/XCB BHA. The sinker bars were loaded along with the APC barrel. Hole U1590A was spudded with Core 1H from 403 meters below rig floor (mbrf) at 36°33.2938′N, 25°26.3888′E. Recovery was 4.3 m, giving a calculated seafloor depth of 397.1 mbsl (Table T1). Coring continued to 89.8 mbsf. Various levels of overpull (maximum = 50,000 lb) were observed on the core barrels. The advanced piston corer temperature (APCT-3) tool was run with Core 4H (see Physical properties).
At 1200 h, the drill string took weight when trying to lower it, indicating ~8 m of fill had fallen into the hole. Core 11H was retrieved, and the sinker bars were pulled.
The driller worked the drill string from 1230 to 1500 h with 50,000–70,000 lb overpull. Despite all efforts, the drill string was stuck—little to no vertical movement, no rotation, and 2000 psi standpipe pressure immediately upon pumping. The driller continued to work the drill string while preparations for the severing operation began.
The severing tool was assembled and run into the hole to 4.6 mbsf. The BHA was severed at the top of the tapered drill collar at 1700 h. The severing tool was retrieved, and the drill string was pulled up and clear of the seafloor at 1735 h. The drill string cleared the rotary table at 2025 h, and the vessel was secured for transit. All thrusters were raised at 2136 h, and the sea passage to Site U1591 started at 2148 h, ending coring at Hole U1590A.
2.2. Hole U1590B
Site U1590 was revisited on 10 January 2023 with the intention of coring a rotary core barrel (RCB) hole to the target depth of 566 mbsf. Despite fairly significant hole trouble early, through careful coring and the liberal use of mud sweeps, the target depth was surpassed, reaching an approved deepening to 634.7 mbsf. (Approval to 850 mbsf was granted by the International Ocean Discovery Program [IODP] Environmental Protection and Safety Panel.) At 1852 h, the vessel came onto location at Site U1590. The transit of 20.3 nmi was completed in 2.4 h at an average speed of 8.5 kt. All thrusters were down and secured at 1912 h. The ship was switched to DP control at 1924 h, marking the return to Site U1590. The vessel was offset 50 m northwest of Hole U1590A. An RCB BHA with bit was again assembled and run in the hole to 373.9 mbrf. Hole U1590B was spudded at 0030 h on 11 January and drilled to 93.0 mbsf. High torque was observed at 26.4 and 83.8 mbsf.
At 0700 h, RCB coring started with Core 2R from 93.0 mbsf (Table T1). As expected, the recovery was extremely low in the upper sections, but the decision to use the RCB system was made so as to reach the target depth. However, because of the low recovery and as a precaution, a bit deplugger (tool to make sure no obstructions block the bit opening) was run before dropping the Core 12R barrel, with no noticeable effect. Coring continued through 12 January, and recovery was mostly very poor.
On 13 January, RCB coring was completed with Core 57R to 634.7 mbsf, the final depth for Hole U1590B. Coring was terminated in favor of other objectives at the following sites. The drill string was tripped up with the top drive from 634.7 to 546.5 mbsf. The top drive was racked back, and the trip continued, with the bit clearing the seafloor at 2355 h. On 14 January, the pipe trip continued; the bit cleared the rotary table at 0155 h, and the drill floor was secured at 0215 h.
The vessel was out of DP mode and under bridge control at 0224 h. All thrusters were brought up and secured. The sea passage started at 0230 h, ending Site U1590.
3. Lithostratigraphy
A coherent stratigraphy was recovered from 0 to 91.45 mbsf in Hole U1590A (Cores 1H–11H), and a partial stratigraphy was recovered from 93 to 627.76 mbsf in Hole U1590B (Cores 2R–57R) (Figure F3). The recovered sediment succession in the uppermost ~90 m is dominated by volcanic ash, lapilli-ash, and lapilli, with minor tuffaceous muds and nannofossil oozes. The recovered material from the remaining ~540 m consists of calcareous ooze/mud/sand and tuffaceous sediments with intermittent ash or lapilli layers (pumice and scoria). Smear slides prepared for microscopic analyses supported the macroscopic descriptions by identifying small-scale changes in lithology and componentry such as vitric ash particles in tuffaceous lithologies or crystals in ash layers. We identified two units at Site U1590: Unit I is dominantly volcanic (Hole U1590A), and Unit II includes nonvolcanic, tuffaceous, and minor volcanic intervals (Hole U1590B).
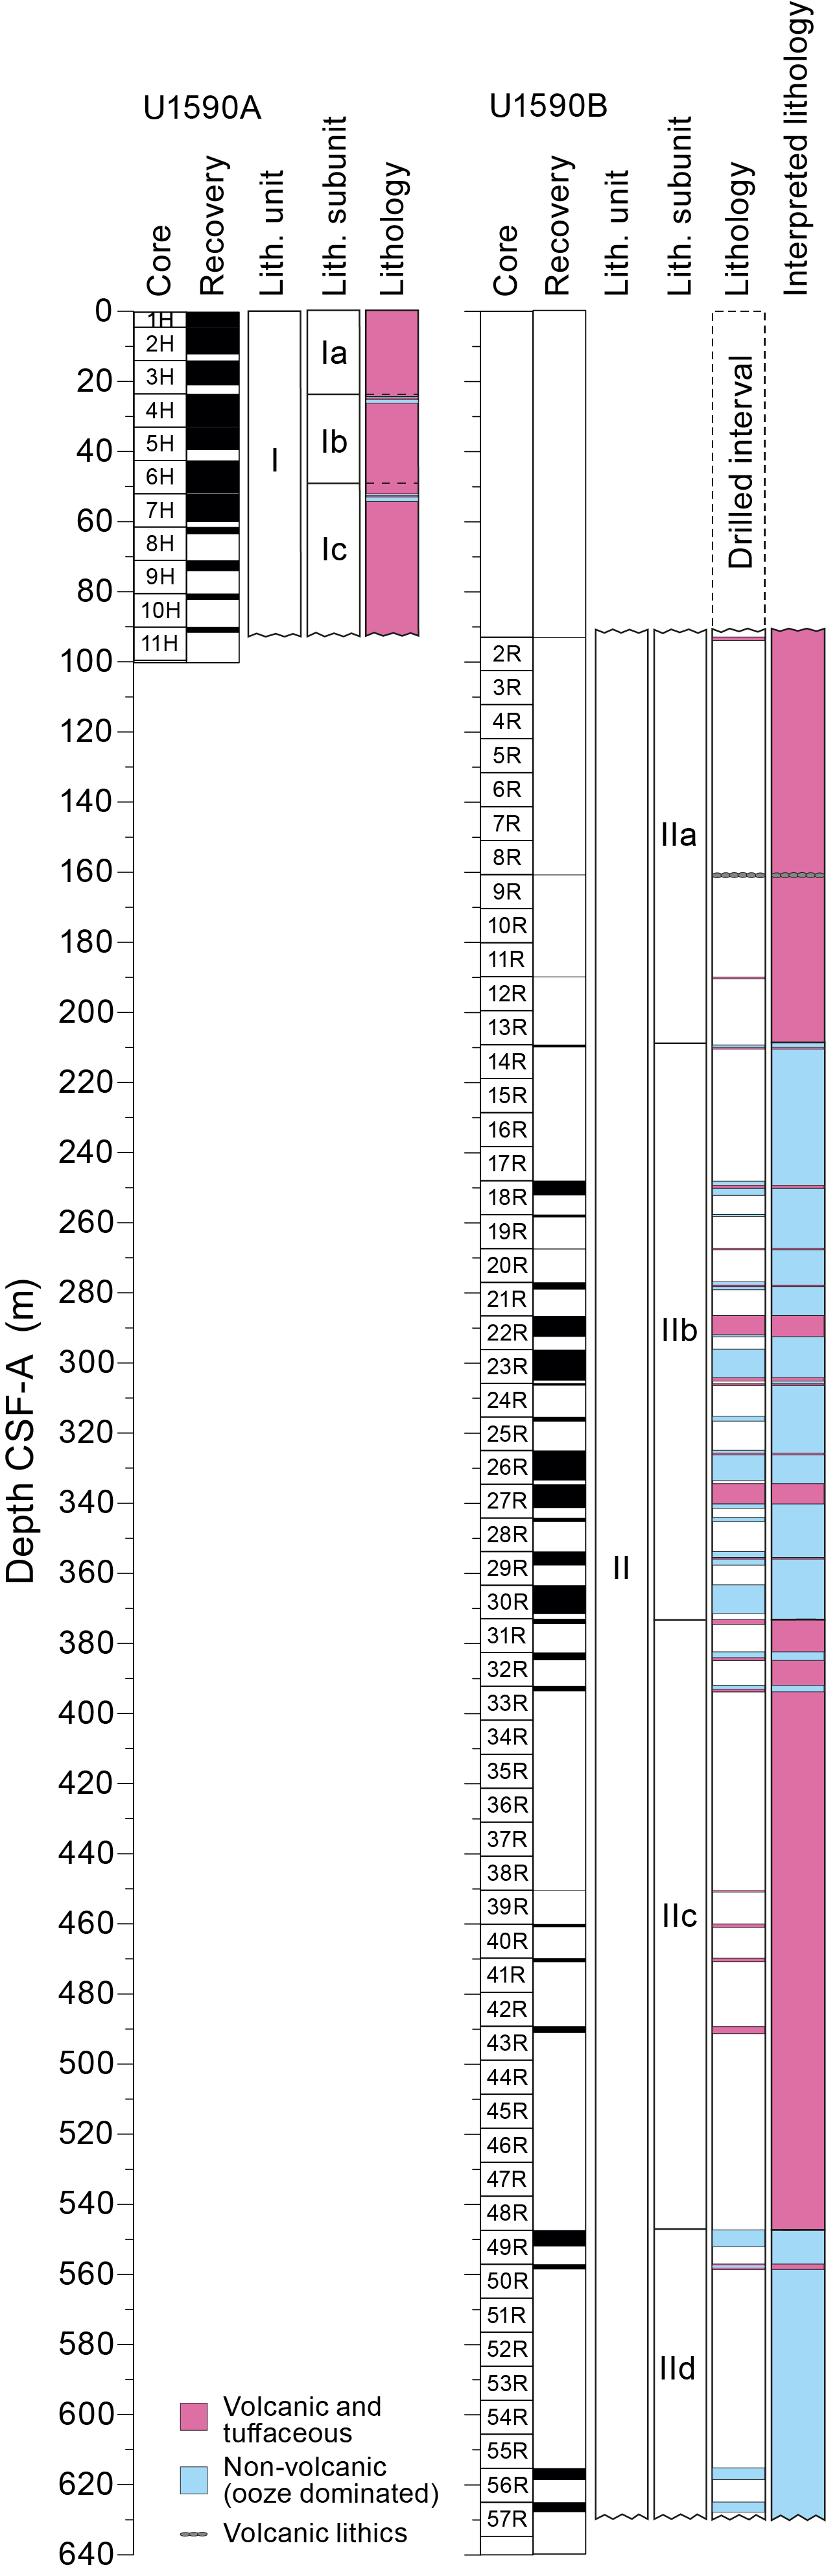
Figure F3. Lithostratigraphy.
In the good recovery of Unit I, we identified three subunits (Ia–Ic) based on the occurrence of tuffaceous muds and oozes in the predominantly volcanic succession in Hole U1590A. In contrast, recovery was poor (<20%) in Hole U1590B, which limited the ability to observe systematic changes in lithology downcore in Unit II. Nonetheless, Unit II was divided into four subunits (IIa–IId) that were interpreted based on the recovered lithology. Note that because of the poor recovery, Unit II subunits should be utilized and interpreted cautiously.
Figure F3 summarizes the complete lithostratigraphy of Site U1590, displaying core recovery and individual lithostratigraphic units and subunits in Holes U1590A and U1590B. Table T2 provides the upper and lower boundaries of the lithostratigraphic units, identified subunits, and stratigraphic ages. Figure F4 highlights the core recovery at Site U1590 coupled with the relative abundance of tuffaceous muds/oozes, volcanic sediments (ash, lapilli-ash, and lapilli), and nonvolcanic sediments. The relative grain size of volcanic, tuffaceous, and nonvolcanic lithologies is shown in Figure F5.
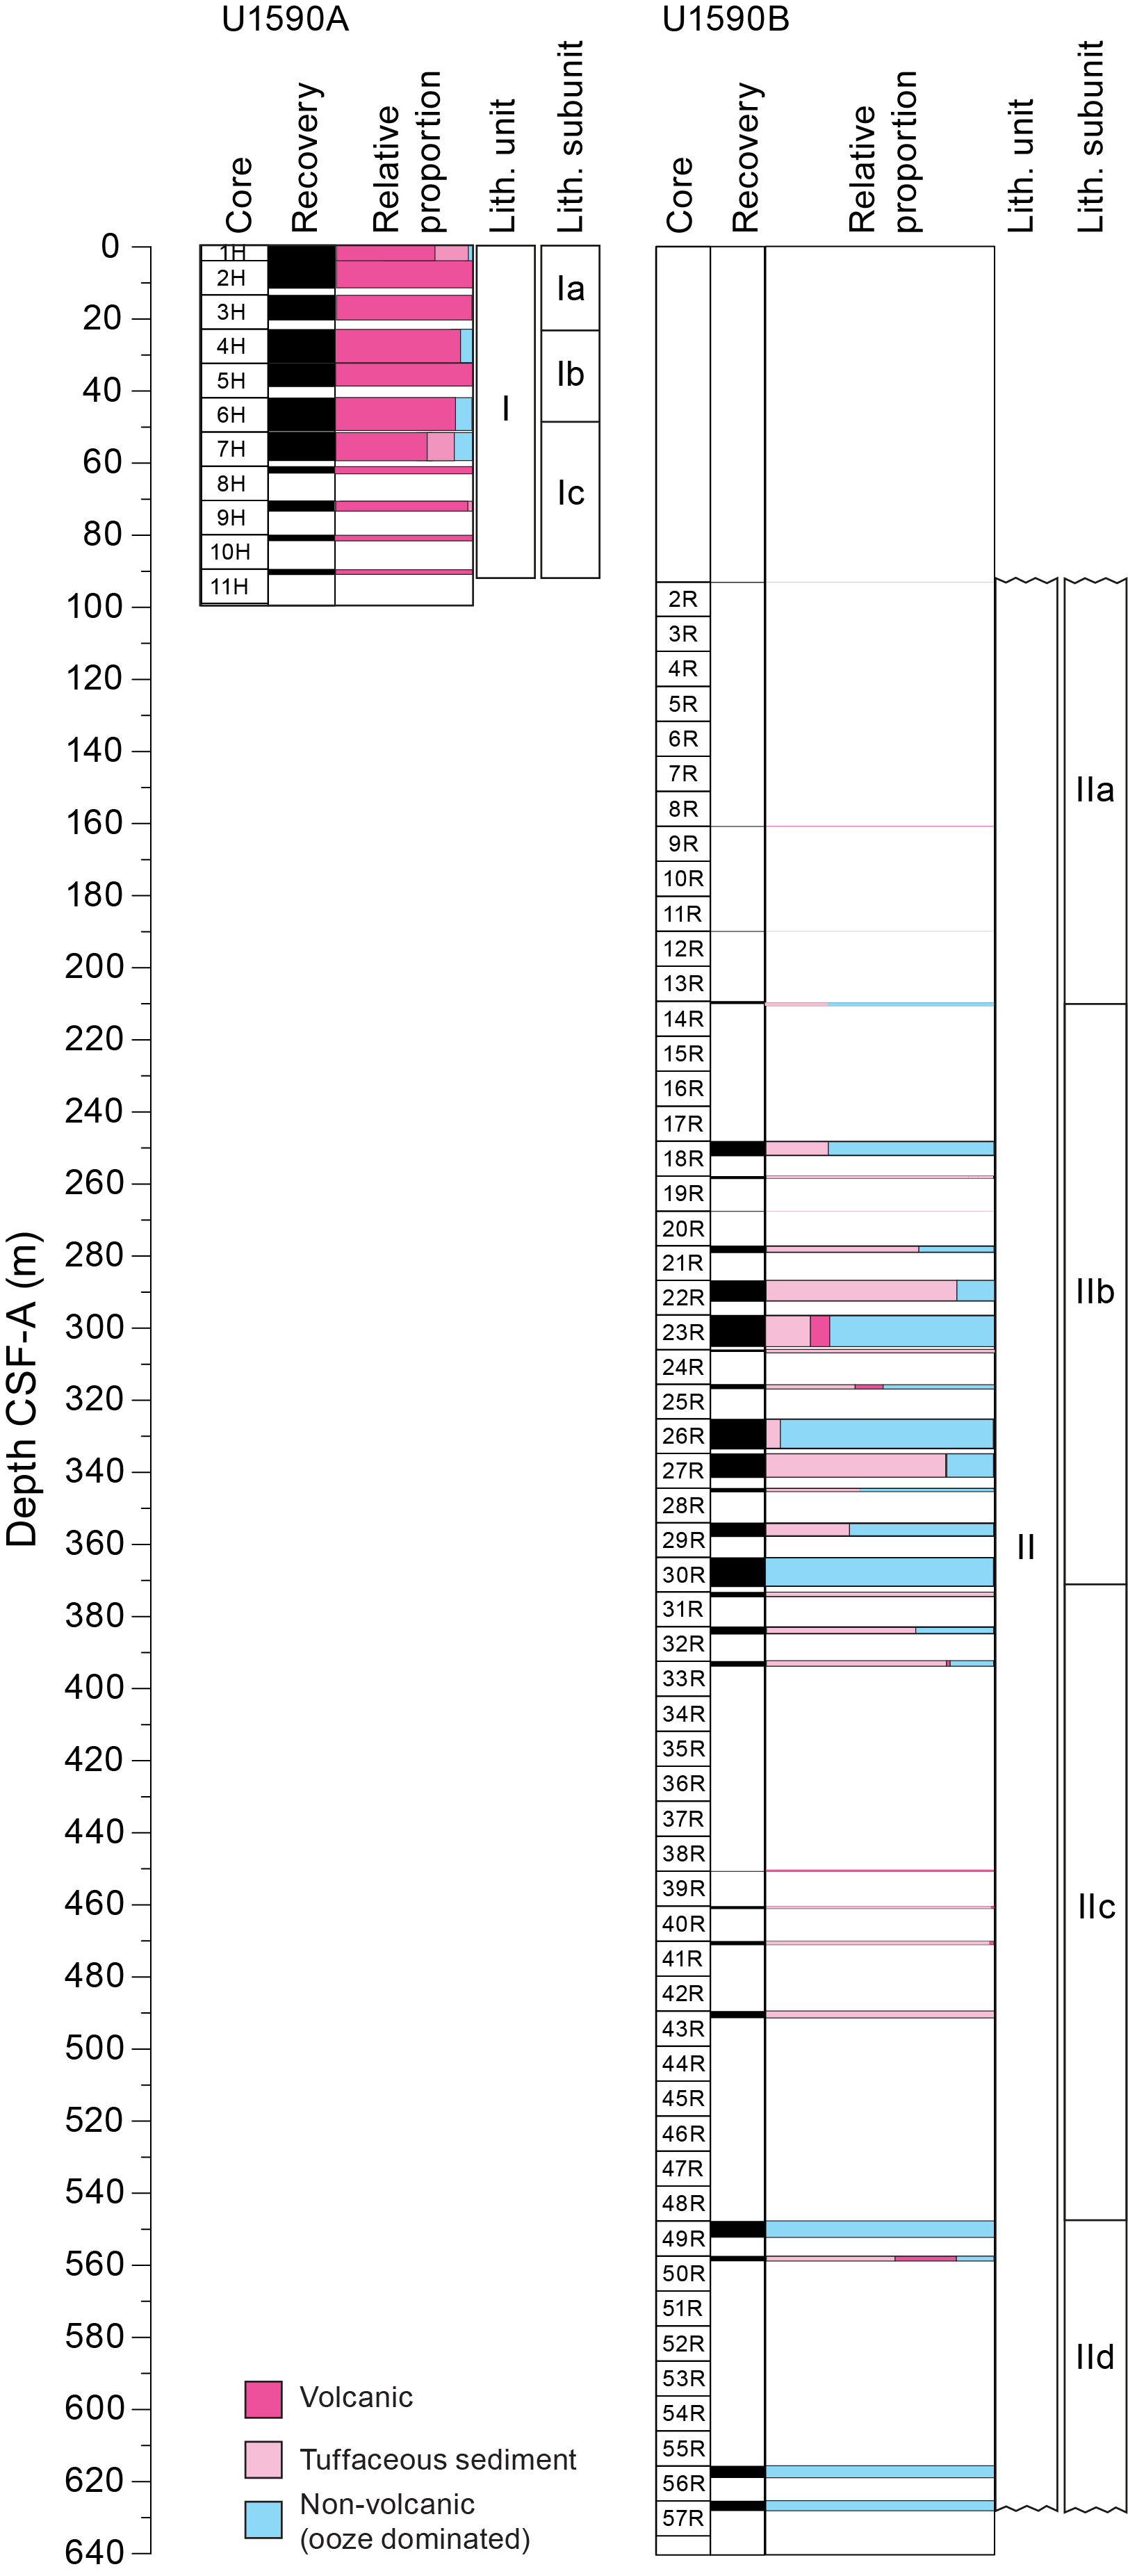
Figure F4. Volcanic, tuffaceous, and nonvolcanic lithologies.
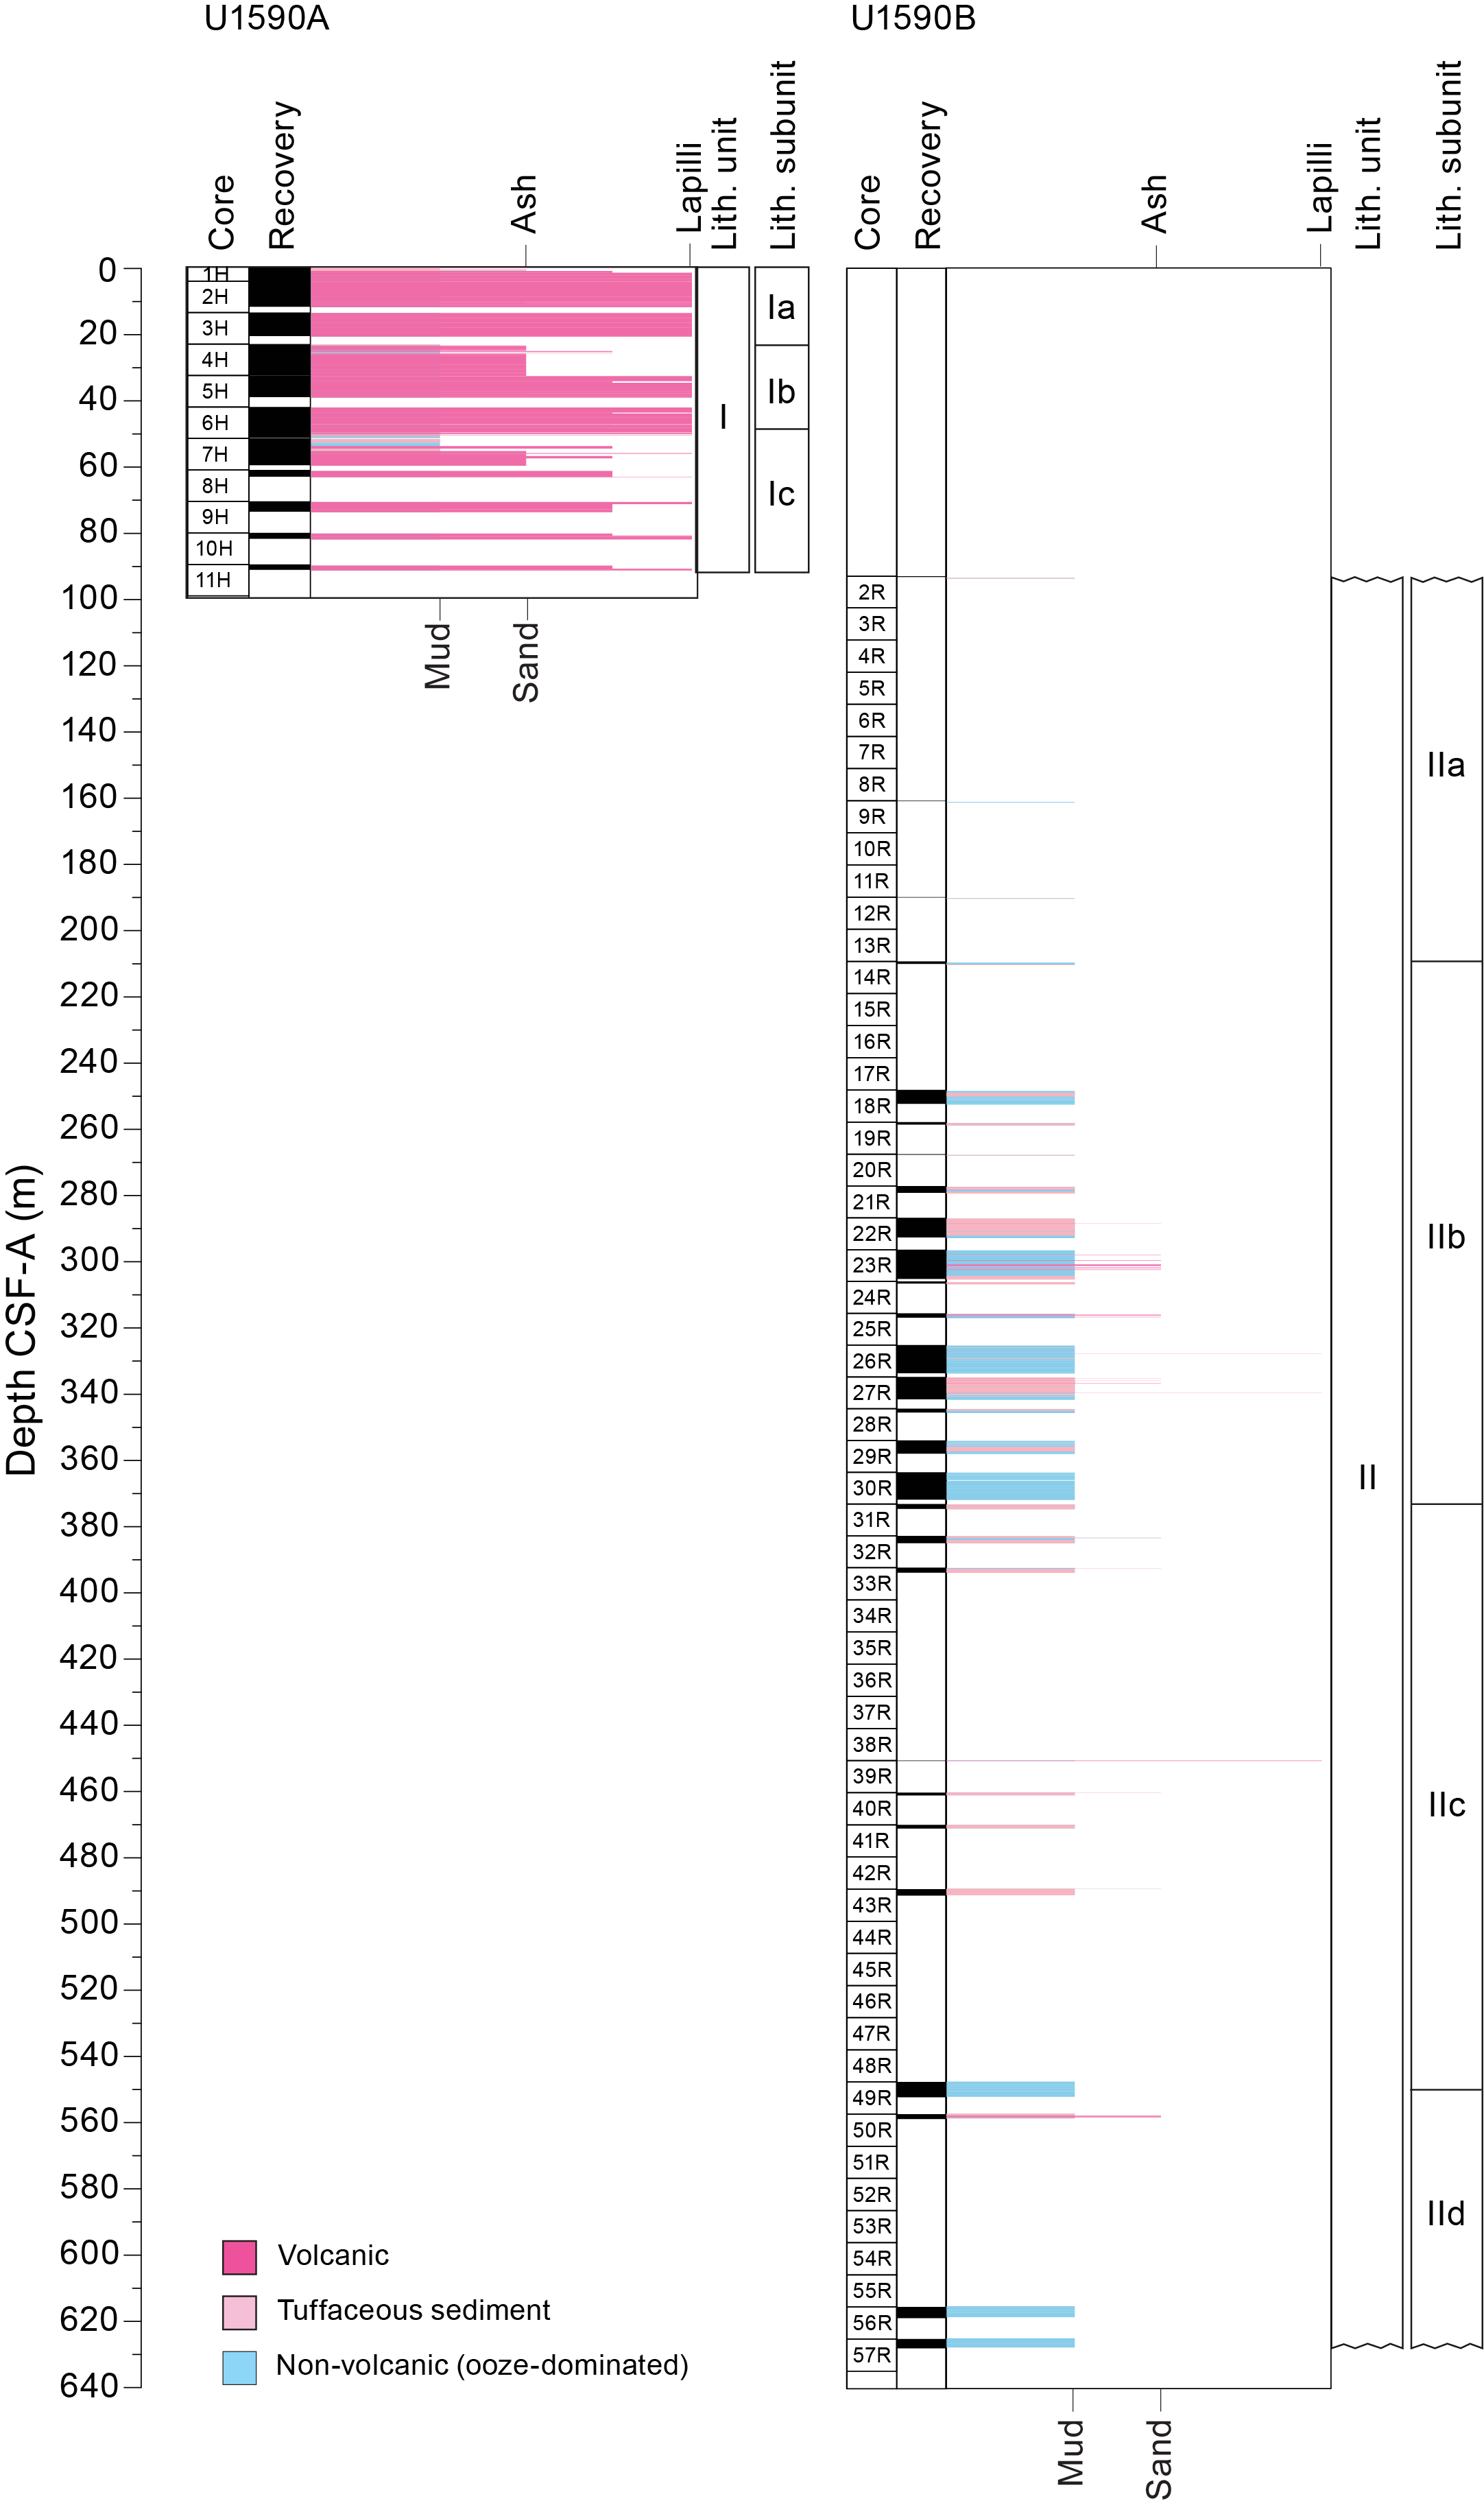
Figure F5. Average grain size distribution.
The following sections describe (1) the effects of core disturbance, (2) the lithostratigraphic units and subunits, and (3) X-ray diffraction (XRD) results from Site U1590.
3.1. Core disturbance
Several types of core disturbance disrupt the lithostratigraphy at Site U1590 (Figure F6):
- Fall-in: coarse clast-supported intervals at the tops of several cores (Figure F6A). These intervals may extend up to 20 cm in thickness.
- Mixed sediment: grains and clasts that flow and mix in water-saturated, granular core sections, producing moderately to severely disturbed original sedimentary structures and stratigraphy (Figure F6B).
- Biscuiting: fractured disc-shaped pieces ranging from a few centimeters to more than 10 cm thick, often packed with sheared and remolded core material mixed with drill slurry, filling gaps between brittle biscuits (Figure F6C).
- Cracking and breaking (seen only in RCB cores from Hole U1590B): horizontal cracking and breaking of core into blocks that range 5–20 cm thick (Figure F6D) and show slight to severe disturbance.
- Artificial size and density segregation: likely to occur during drilling or with postrecovery core handling processes on board (e.g., inclining, shaking, and plunging cores on the catwalk to compact sediments). Jutzeler et al. (2014) also described pseudohorizontal density grading that can occur while the core is lying flat on deck, resulting in vertical structures once the core is turned upright. Such core disturbance is observed most often in volcanic sediments because increased porosity allows sucking in of seawater during hydraulic piston coring. The resulting soupy texture allows material to flow within the core liner. Secondary normal or reverse grading, or density separation of clasts, may occur as a result of this disturbance and obscure primary sedimentary features.
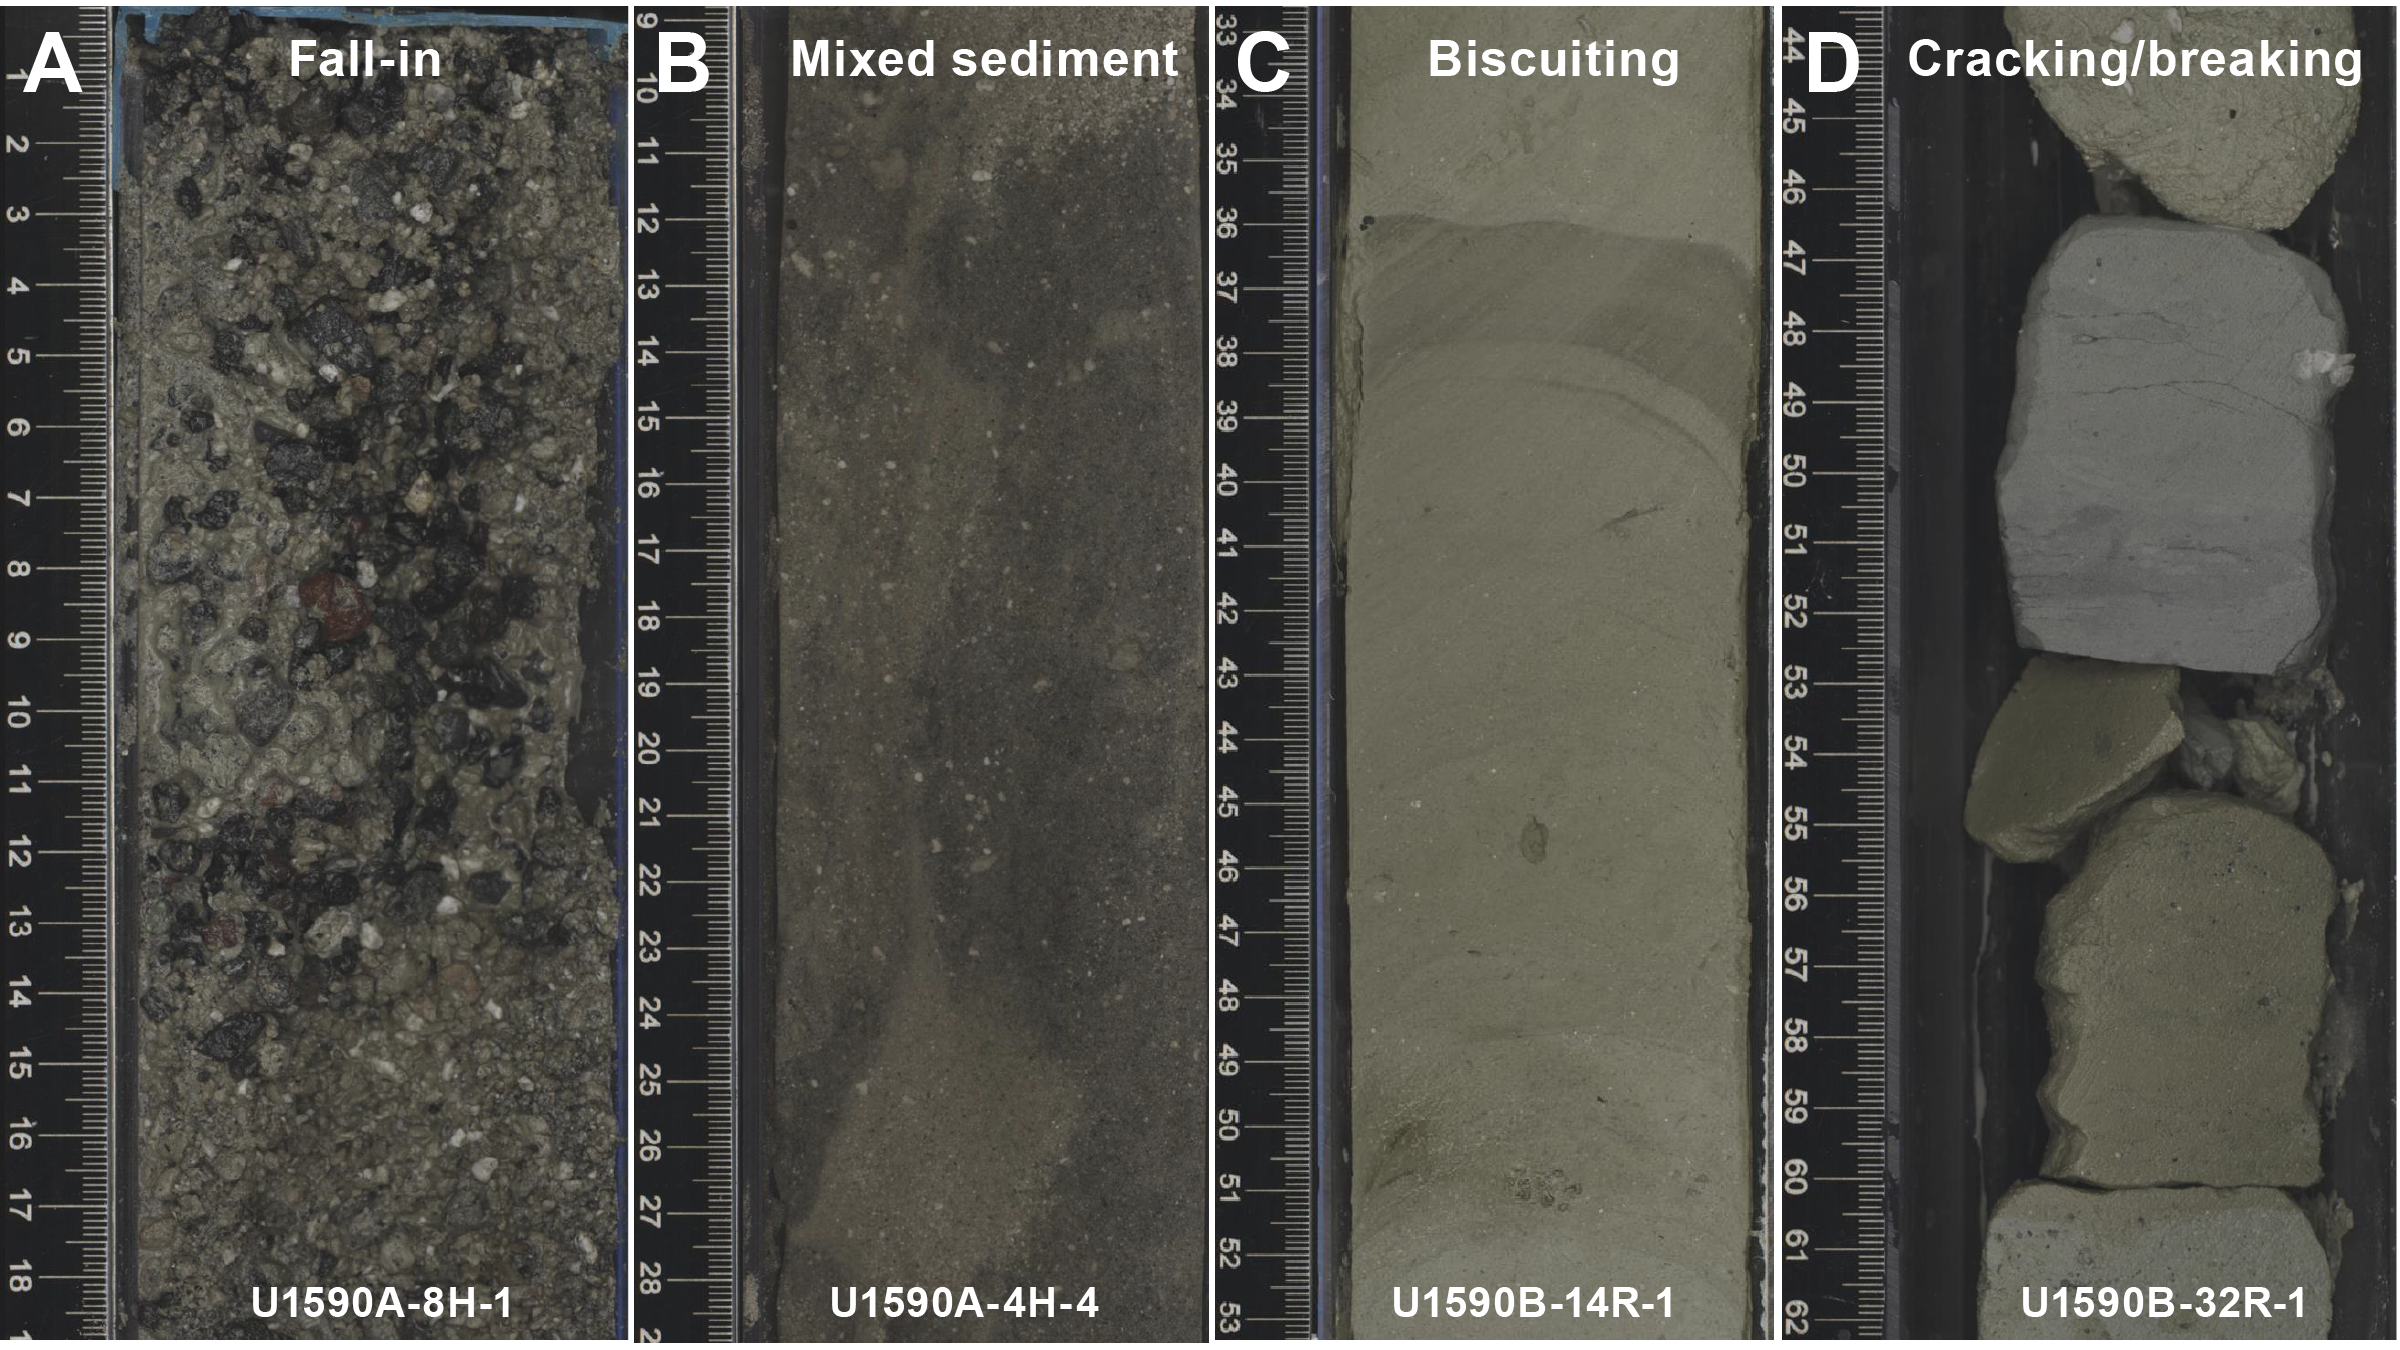
Figure F6. Core disturbances.
3.2. Description of units and subunits
The sediments recovered from Holes U1590A and U1590B are divided into two lithostratigraphic units (I and II). Unit I is divided into three subunits (Ia–Ic), and Unit II is divided into four subunits (IIa–IId) (Figures F3, F4, F5; Table T2). Figures F7 and F8 display core images of the main lithologies found in Units I and II, respectively.
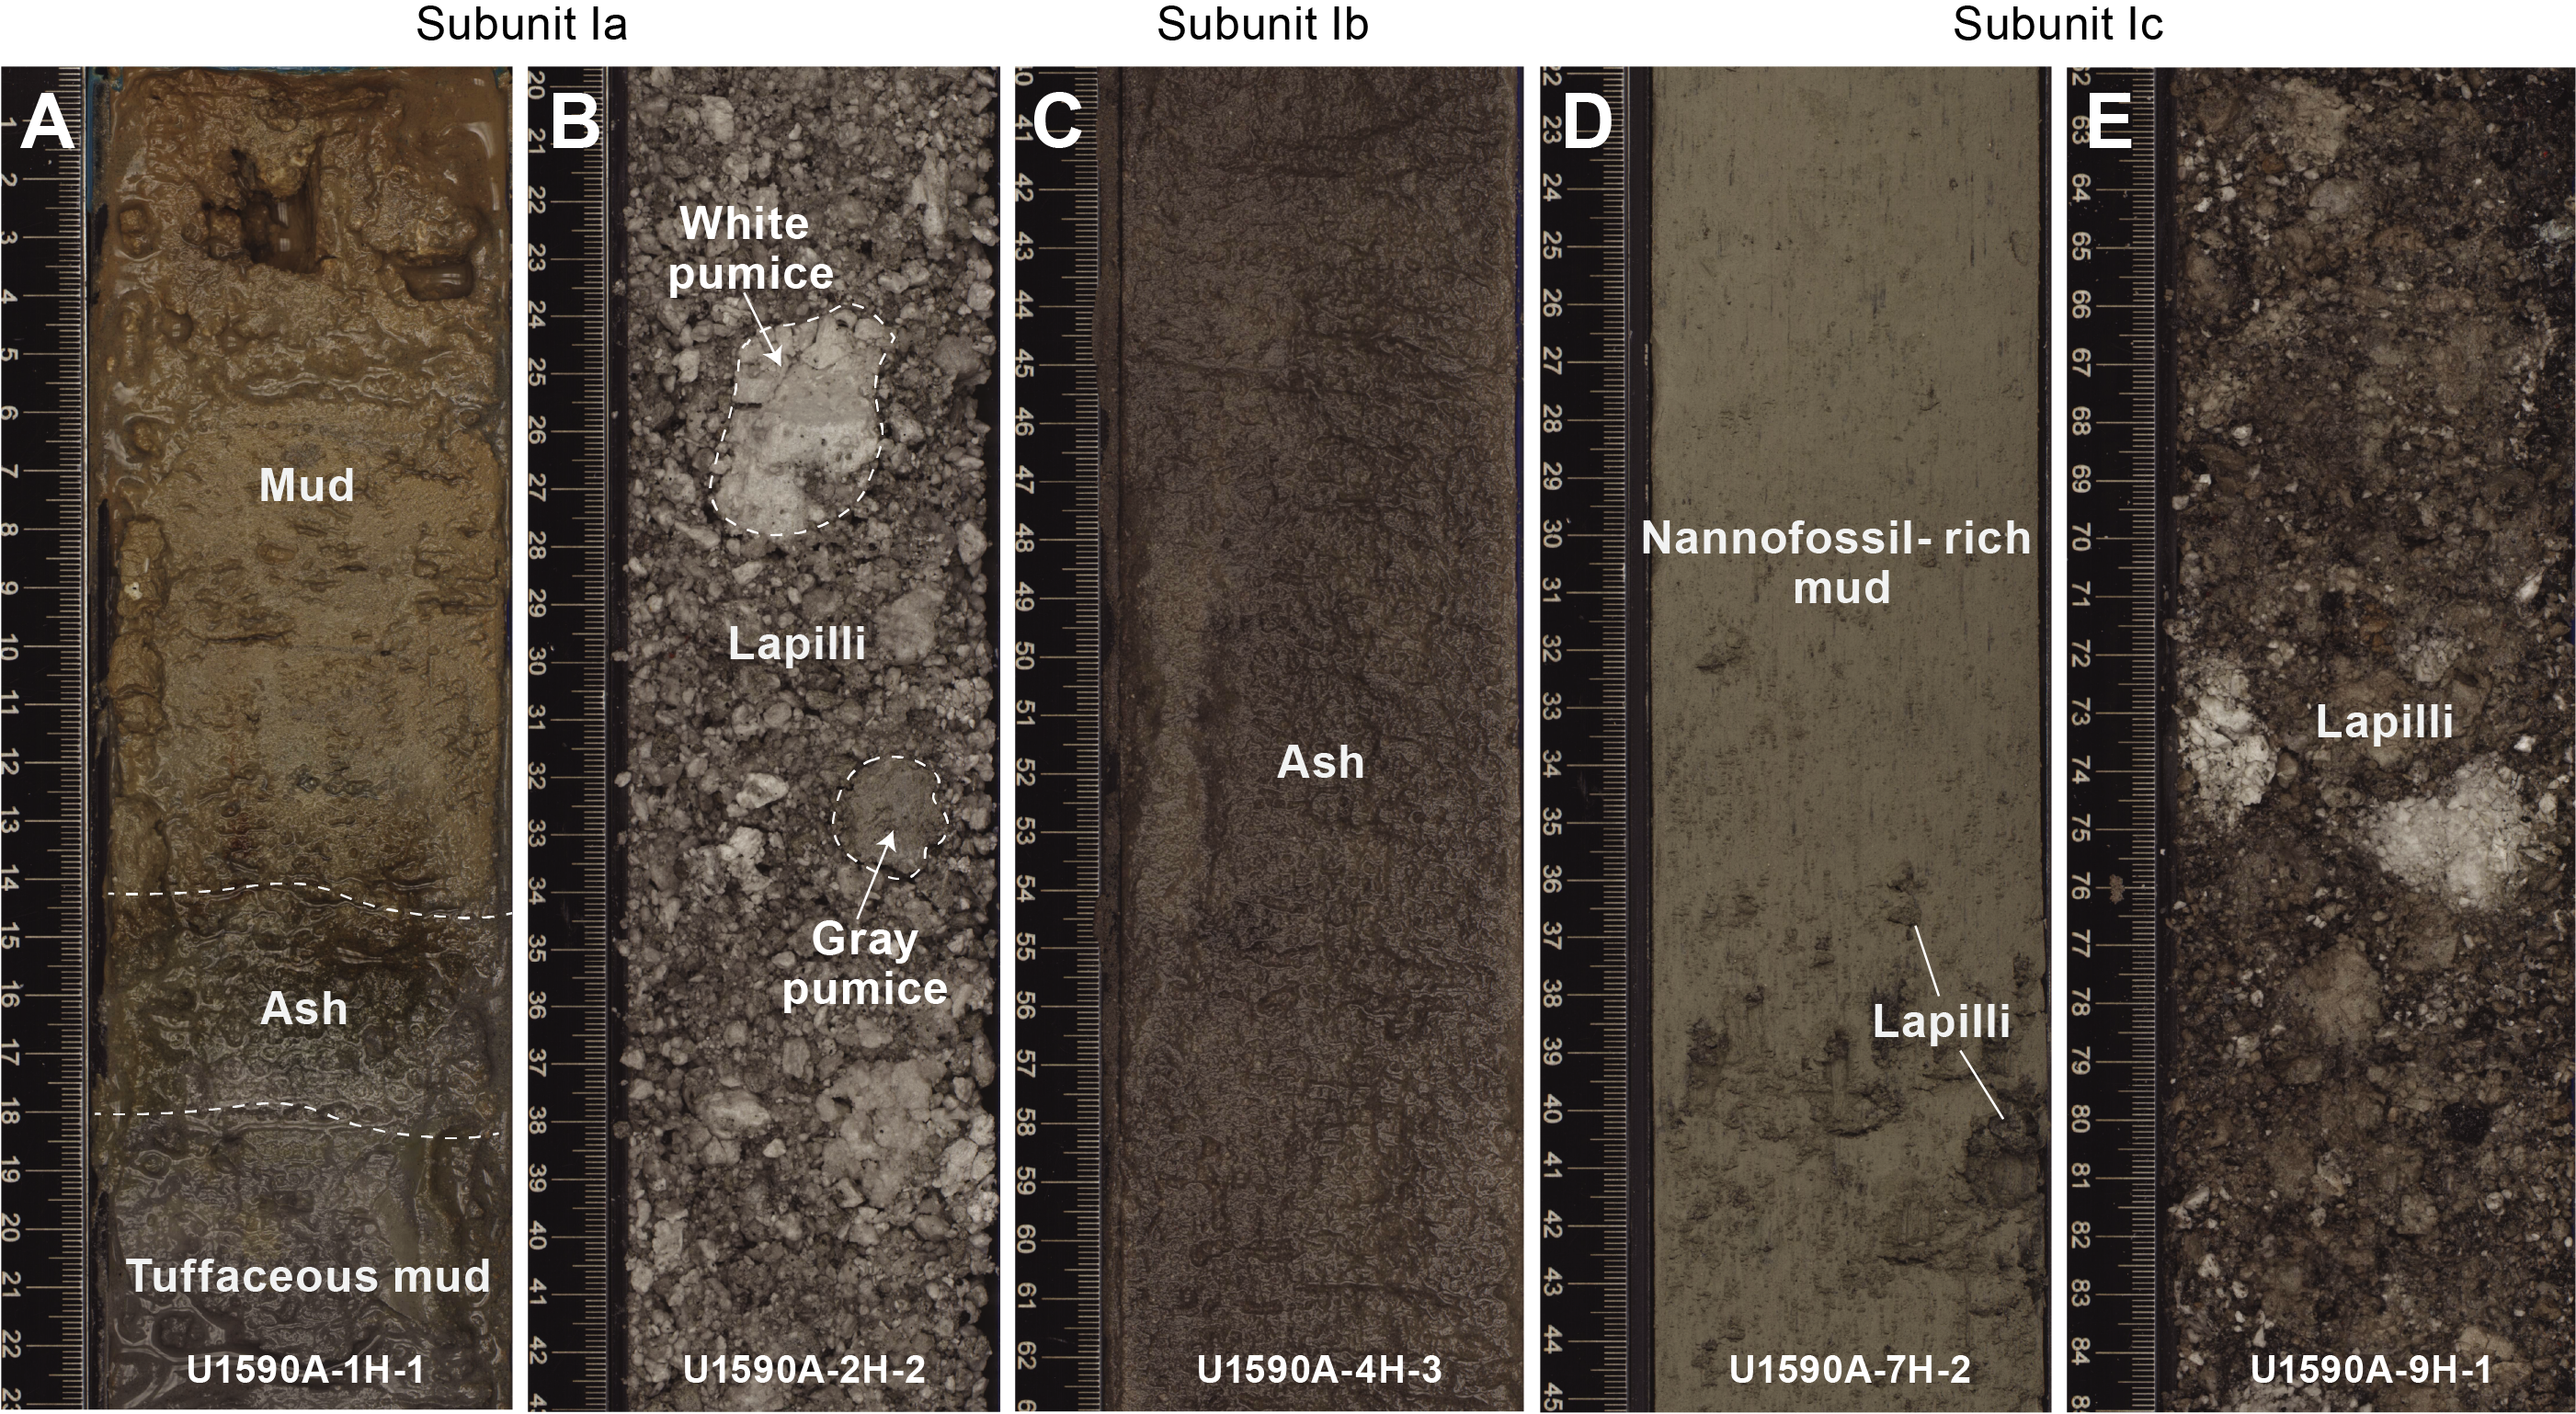
Figure F7. Representative lithologies, Unit I.
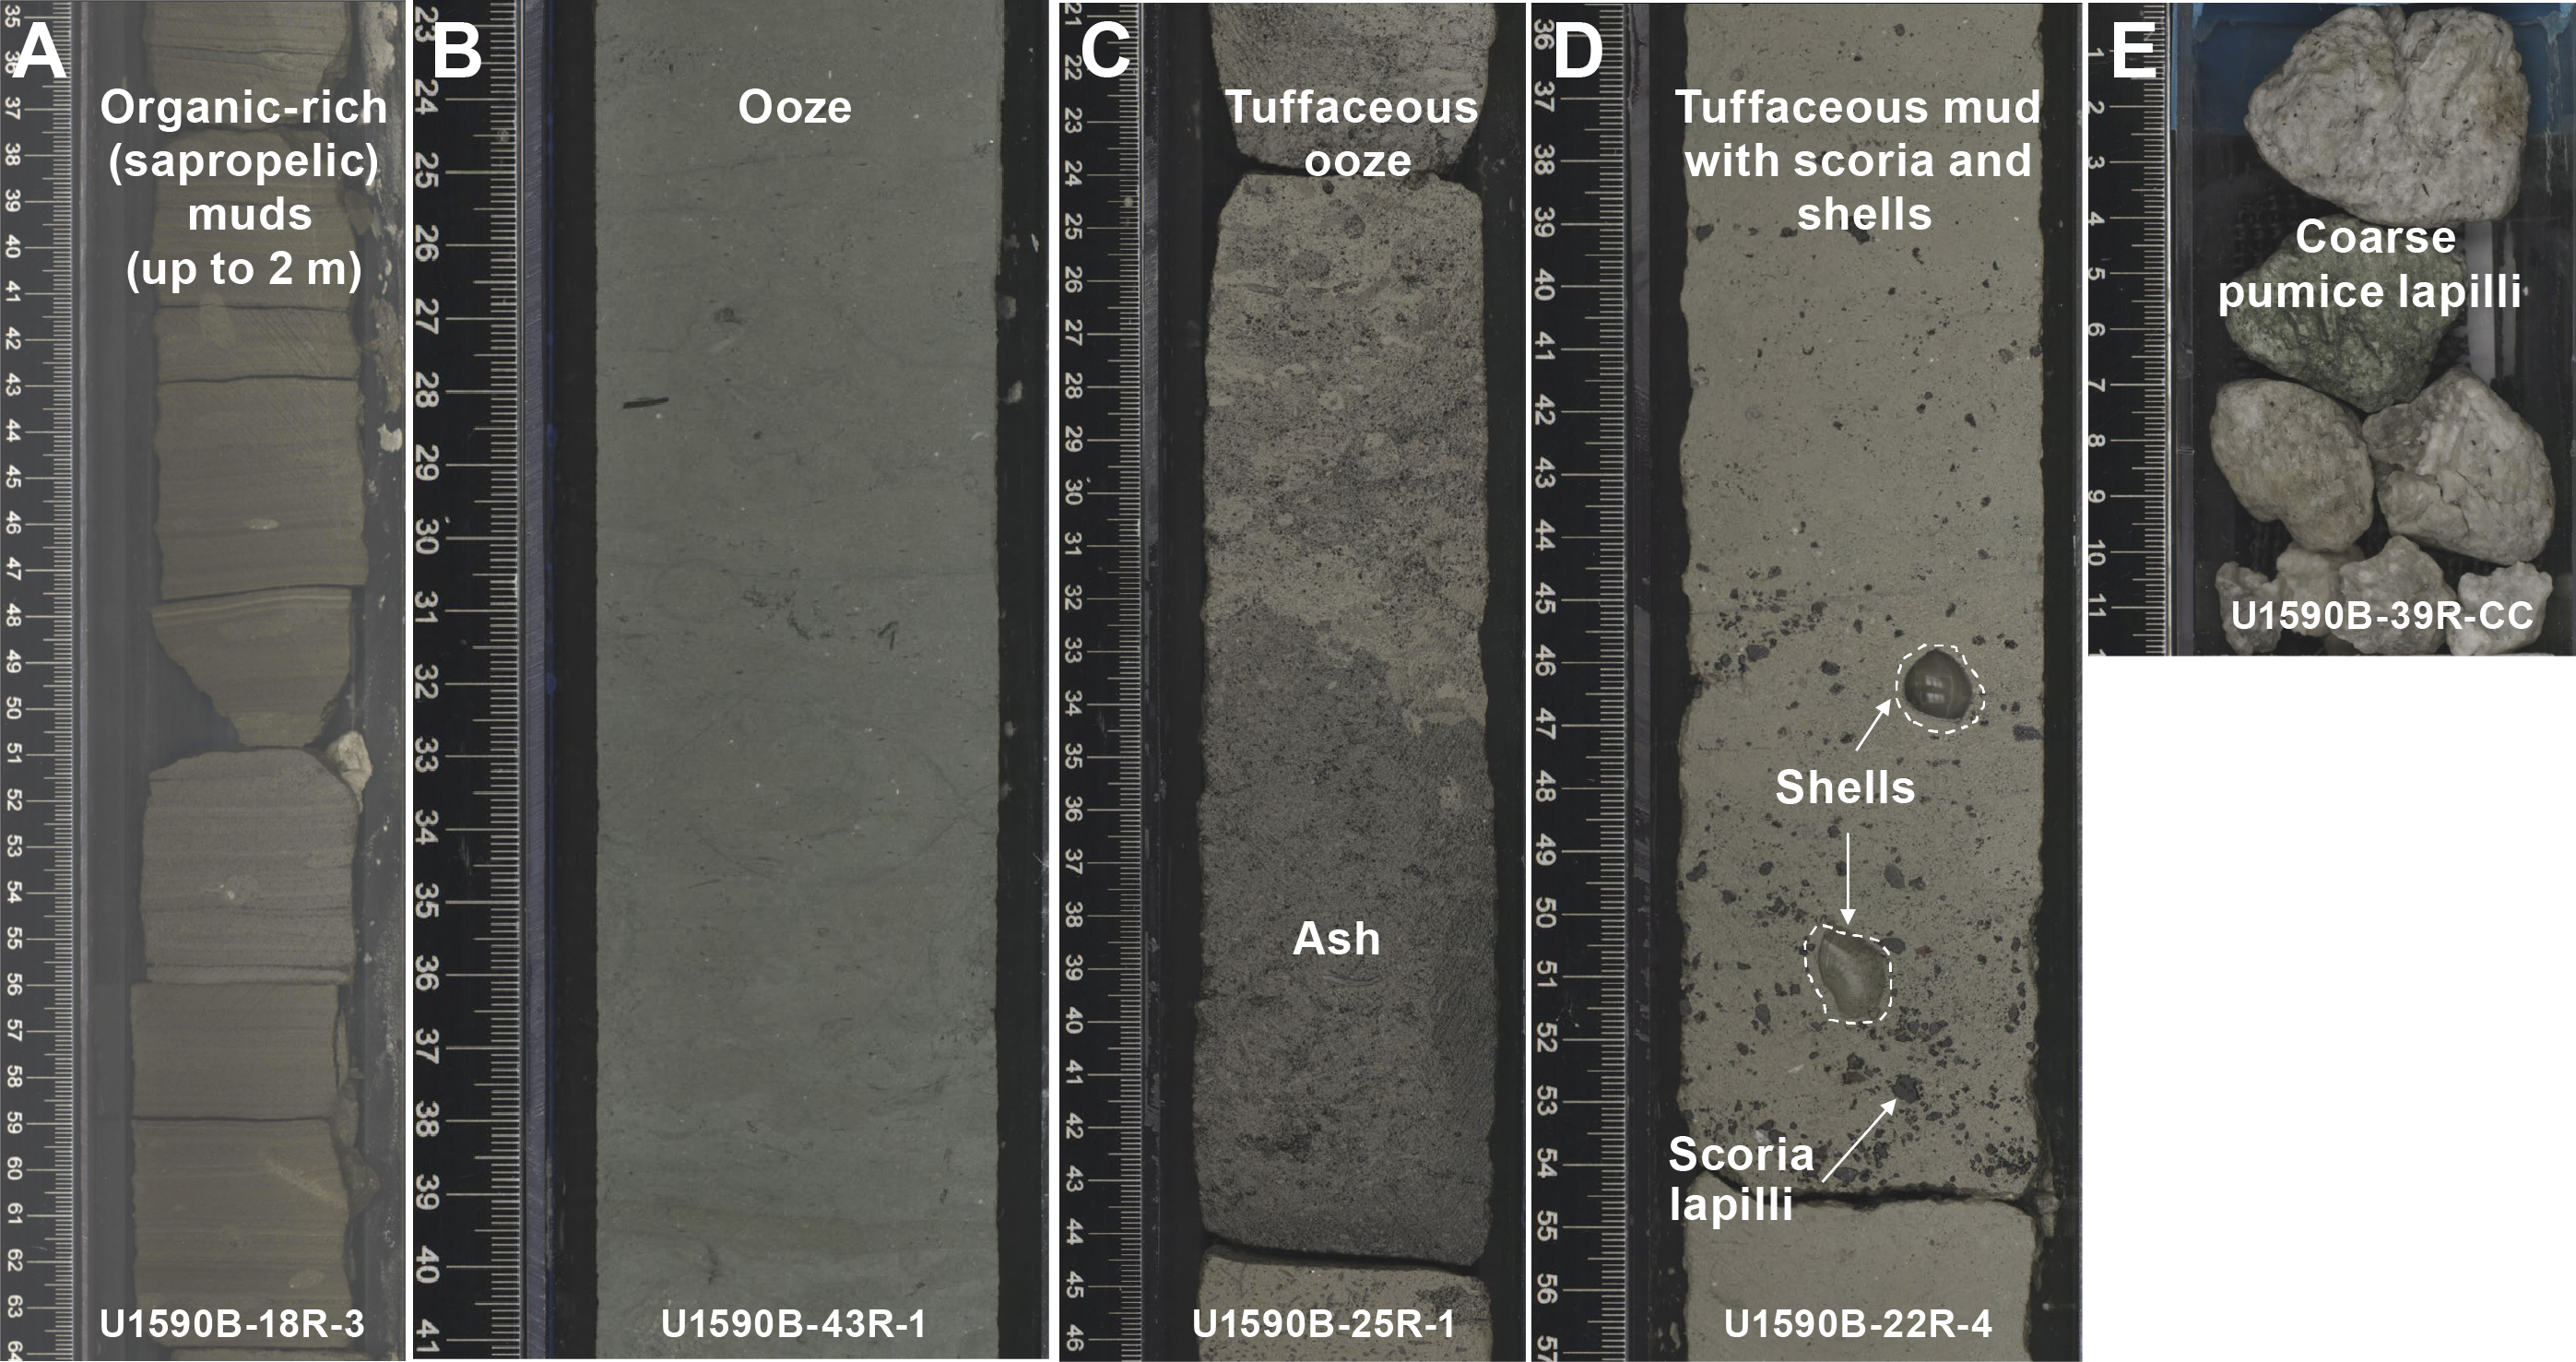
Figure F8. Representative lithologies, Unit II.
3.2.1. Unit I
- Interval: 398-U1590A-1H-1 to 11H-CC (bottom of the hole)
- Thickness: 91.45 m
- Depth: 0.00–91.45 mbsf
- Age: Holocene to Late Pleistocene
- Lithology: lapilli, ash, tuffaceous mud, and minor amounts of ooze and mud
Unit I extends from 0.00 to 91.45 mbsf (Table T2). The majority of this unit consists of volcanic sediments (>75% volcanic particles; glass shards, pumice, and crystals) with small amounts of tuffaceous (25%–75% volcanic particles) sediments and minor amounts of nonvolcanic (<25% volcanic particles) oozes/muds. Volcanic lithologies comprise ash, lapilli-ash, and lapilli. Description of ash, lapilli-ash, and lapilli in volcanic intervals was based on the relative abundance of ash-sized (<2 mm) and lapilli-sized (2–64 mm) particles, as described in Lithostratigraphy in the Expedition 398 methods chapter (Kutterolf et al., 2024), with ash and lapilli used when the proportion of one size was >75% and lapilli-ash used when both sizes were present but at <75% abundance (Fisher and Schmincke, 1984). The subunits were determined based on sharp changes in grain size:
- Subunit Ia (Sections 398-U1590A-1H-1 through 3H-CC): biotite-bearing white and gray pumice dominated with banded pumice.
- Subunit Ib (Sections 4H-1 through 6H-6): lapilli, ash, and tuffaceous mud with dark, coarse lithic-crystal-vitric ash. Dominated by a normally graded depositional sequence consisting of several volcanic-dominated layers with minor ooze and mud lithologies. The coarse ash and fine lapilli lithic components include clasts of blue and black metamorphic rock and brick red scoria. Large oxidized pumice clasts, notably without biotite, are also present.
- Subunit Ic (Sections 6H-6 through 11H-CC): lapilli with white biotite-bearing pumice and lithic lapilli that grade into tuffaceous to nannofossil-rich mud.
3.2.1.1. Subunit Ia
Subunit Ia (0.00–20.87 mbsf; Sections 398-U1590A-1H-1 through 3H-CC) is dominated by volcanic lithologies, particularly lapilli (Table T2). The uppermost 14 cm consists of brown mud with a greenish biogenic film that transitions downward into a thin (centimeter thick) ash layer and light gray tuffaceous mud with intervals containing lapilli (Figure F7A). This transitions to biotite-bearing lapilli-ash and then lapilli by 1.6 mbsf (Figure F7B). Dropstones of white and gray pumice in the tuffaceous mud (0.18–1.13 mbsf) are highly vesicular and reach sizes up to 4 cm. Between 1.7 and 20.4 mbsf, the subunit is dominated by moderately to poorly sorted lapilli characterized by gray, white, and banded pumice clasts; crystals (including biotite); dense vitric clasts; and scoria clasts. White pumice clasts are biotite bearing. The banded pumice is not common but is most abundant in Section 1H-5 and is also observed in minor proportions in Section 3H-CC. Pumice lapilli covered by a green coating are rare and are potentially caused by algae or secondary alteration.
3.2.1.2. Subunit Ib
Subunit Ib (23.3–49.87 mbsf; Sections 398-U1590A-4H-1 through 6H-6) begins with a transition from light gray to white coarse pumice lapilli and blocks at the base of Subunit Ia to a light brown calcareous tuffaceous mud and gray to dark gray fine ash, marking the beginning of Subunit Ib (Table T2). Subunit Ib consists primarily of lapilli, ash, and tuffaceous mud, with minor amounts of ooze with ash. The calcareous tuffaceous mud present in Subunit Ib is gray and is mostly present at the top of Sections 4H-1 and 4H-2. Section 4H-2 contains two ~15 cm thick intervals of ooze and calcareous tuffaceous mud that transition gradationally downward into lapilli-ash layers and terminate at a sharp contact above an overlying ash or lapilli-ash (Sections 4H-2, 30 cm, and 4H-2, 71 cm).
This subunit is dominated by a normally graded depositional sequence from Cores 398-U1590A-4H through 6H, with grain sizes of medium to coarse lapilli near the base (Sections 6H-4 through 6H-6) and fine lapilli to fine ash near the top (Sections 4H-2 through 4H-CC) (Figure F7C includes an image of the ash). Clasts are mainly poorly sorted gray to dark gray pumice with mafic volcanic and metamorphic lithics, giving the subunit an overall brownish gray color. Minor pink pumice clasts were observed in interval 6H-2, 141 cm, to 6H-5, 117 cm. Pumice in Subunit Ib is notably biotite poor in contrast to pumice recovered in Subunits Ia and Ic. The base of the depositional sequence terminates at an inclined contact with an underlying calcareous tuffaceous mud. The top of the unit grades into fine ash and ash with mud.
3.2.1.3. Subunit Ic
Subunit Ic (49.87–91.45 mbsf; Sections 398-U1590A-6H-6 through 11H-CC) begins with a transition from the basal coarse lapilli described in Subunit Ib to an intercalated mix of equal parts calcareous tuffaceous mud and lapilli, with each intercalation ranging 20–80 cm thick. The uppermost tuffaceous mud layers contain occasional pumice lapilli and volcanic lithics (Figure F7D) and small amounts of shell fragments, microfossils, and disseminated sulfides. Within the muds, irregular to gradational boundaries with lapilli intervals are observed. This intercalated upper section is underlain by several meters of lapilli and ash. The lower lapilli and ash-rich part of Subunit Ic can itself be divided into an upper and lower part. The upper part consists of well to moderately sorted lapilli and ash with abundant subrounded to subangular lithic and vitric clasts. Lithics include dark subrounded volcanics and small dark red oxidized fragments. Vitric clasts include white, gray, and pink pumice, with gray pumice dominant. The lower part of Subunit Ic is less lithic rich and consists of poorly to moderately sorted lapilli and lapilli-ash, some of which are normally graded (Figure F7D). The lapilli-ash is characterized by a high amount of gray, white, and pink lapilli-sized pumice, reaching a maximum size of coarse lapilli. Gray pumice is the most abundant, but white biotite-bearing pumice is also common.
3.2.2. Unit II
- Interval: 398-U1590B-2R-CC, 0 cm, to 57R-2, 130 cm (bottom of the hole)
- Thickness: 534.76 m
- Depth: 93–627.76 mbsf
- Age: Late Pleistocene to Early Pleistocene
- Lithology: ash, tuffaceous mud/ooze, calcareous mud/ooze, and organic-rich mud/ooze
The start of Unit II was defined to be the first interval sampled in Hole U1590B, given the poor recovery and inability to correlate between Holes U1590A and U1590B. This unit was sparsely sampled between 93 mbsf and the bottom of the hole at 627.76 mbsf (Figure F3; Table T2). The upper boundary with Unit I was not recovered, and the lower boundary is unconstrained, given the end of coring at 627.76 mbsf. The unit comprises tuffaceous sediments and minor ash and lapilli interspersed with oozes and calcareous muds (some of which are organic rich) (Figures F3, F4, F8). Oozes and muds are generally well sorted and variably contain shell fragments, including several large bivalves infilled with pyrite. Organic-rich (sapropelic) muds are common, some reaching thicknesses of 2 m (Figure F8A). By volume, tuffaceous sediments dominate the lithologies present in Unit II (Figures F4, F8C, F8D).
One unique feature of the materials recovered in Hole U1590B is the ubiquitous presence of both dispersed and concentrated intervals of scoria in the sediment (coarse ash– to medium lapilli–sized scoria), whether or not the hosting sediment is tuffaceous (Figure F8D). These scoria lapilli are found sporadically in Sections 18R-1 through 56R-1, but are especially prevalent and coarse in Sections 23R-7 through 29R-1.
Based on changes of recovered lithology of volcanic and nonvolcanic sediments, four subunits are defined in Unit II:
- Subunit IIa (Sections 398-U1590B-2R-CC, 0 cm, through 14R-CC, 18 cm; 93–209.94 mbsf): primarily tuffaceous mud, volcanic cobbles, ooze, and organic-rich ooze.
- Subunit IIb (Sections 18R-1, 0 cm, through 30R-6, 115 cm; 248.04–371.62 mbsf): primarily ooze, organic-rich ooze/mud, ooze with ash/scoria lapilli, calcareous sand, tuffaceous ooze/mud (± scoria lapilli, volcanic cobbles), and minor ash and lapilli. Recovery is the least poor in this subunit.
- Subunit IIc (Sections 31R-1, 0 cm, through 43R-2, 61 cm; 373.0–491.11 mbsf): primarily tuffaceous mud/ooze/sand, ash, lapilli, organic-rich ooze, and calcareous mud.
- Subunit IId (Sections 49R-1, 0 cm, through 57R-2, 130 cm; 547.4–627.76 mbsf): primarily ooze (± shells), mud (calcareous and noncalcareous), and calcareous sand.
3.2.2.1. Subunit IIa
Subunit IIa (93–209.94 mbsf; Sections 398-U1590B-2R-CC through 14R-CC) comprises volcanic lithologies (tuffaceous mud/ooze and volcanic cobbles), ooze, and organic-rich ooze (Table T2). The upper section consists of greenish gray to dark gray tuffaceous sediments; the middle section consists of gray volcanic cobbles; and the lower section consists of ooze, organic-rich ooze, and a small layer of tuffaceous ooze. The nonvolcanic sediments are dark gray to dark olive-gray with sharp boundaries between each interval. One interval of organic-rich ooze is thickly laminated (209.27–209.33 mbsf).
3.2.2.2. Subunit IIb
Subunit IIb (248.04–371.62 mbsf; Sections 398-U1590B-18R-1 through 30R-6) has the highest recovery in Unit II and consists of alternating intervals of tuffaceous and ooze-dominated lithologies (Table T2). Lithologies rich in volcanic clasts in this unit are mainly tuffaceous and occur in two large intervals (Cores 22R and 27R) and several smaller intervals (tens of centimeters in size) throughout. Several crystal ashes (mostly centimeters thick) are present at 299.17–302.06 mbsf. Ash, ash with lapilli, and lapilli layers are intermittently dispersed in the subunit. Nonvolcanic lithologies are dominantly calcareous mud and ooze and alternate with their organic-rich counterparts. Between 296.2 and 327.94 mbsf, the majority of the nonvolcanic lithologies (mainly ooze) contain ash or foraminifera at 1%–25% abundance. Lapilli-sized scoria are present intermittently in small abundance (25% or less) throughout different lithologies at 278.46–287.98 and 337.52–344.65 mbsf. Shells are observed within tuffaceous lithologies at 334.6–336.4 and 355.59–356.95 mbsf.
3.2.2.3. Subunit IIc
Subunit IIc (373–491.11 mbsf; Cores 398-U1590B-31R through 43R) is characterized by higher proportions of tuffaceous lithologies with minor volcanic lithologies (Table T2). Dark, rounded scoria are dispersed throughout this subunit as fine to medium lapilli or concentrated in intervals within tuffaceous ooze. Two large intervals of tuffaceous mud are observed at 373.35–392.36 mbsf (Cores 31R–32R) and 460.1–491.11 mbsf (Cores 40R–43R) (Figure F4). Both intervals of tuffaceous mud contain scoria and white and gray pumice lapilli as well as shell fragments (Figure F8D). Several pumice lapilli show mingled textures (e.g., interval 43R-2, 40–50 cm). Two thin dark-colored ash layers are present in Subunit IIc (intervals 33R, 16–18 cm, and 40R-1, 0–1 cm). Coarse pumice lapilli, 1–4 cm in diameter, were retrieved in only one section (39R-CC) (Figure F8E). Given the difficulty recovering pumice, it is likely that more of this coarse material is present in Hole U1590B. Minor intervals of organic-rich ooze occur in Subunit IIc, often with shell fragments (Cores 32R–33R).
3.2.2.4. Subunit IId
Subunit IId (547.4–627.76 mbsf; Sections 398-U1590B-49R-1 through 57R-2) encompasses the lowermost ~80 m of recovered materials, characterized by nonvolcanic lithologies (Table T2). The dominant lithology is greenish gray ooze (variably containing shells) interspersed with mud and sand. Volcanic and tuffaceous lithologies occur only in Core 50R, where mud is intercalated with calcareous tuffaceous mud and ash for ~1.5 m. The full extent of Subunit IId is unconstrained because drilling was terminated after Core 57R.
3.3. X-ray diffraction
XRD data were collected from four interstitial water (IW) squeeze cake sediment residues from Hole U1590A and seven IW squeeze cake sediment residues from Hole U1590B (Figure F9). Samples from Hole U1590A are from Lithostratigraphic Unit I and comprise volcanic lithologies (ash and lapilli), tuffaceous mud, and calcareous mud, and those from Hole U1590B are from Lithostratigraphic Unit II and include calcareous tuffaceous mud, calcareous mud, organic-rich calcareous mud, and ooze.
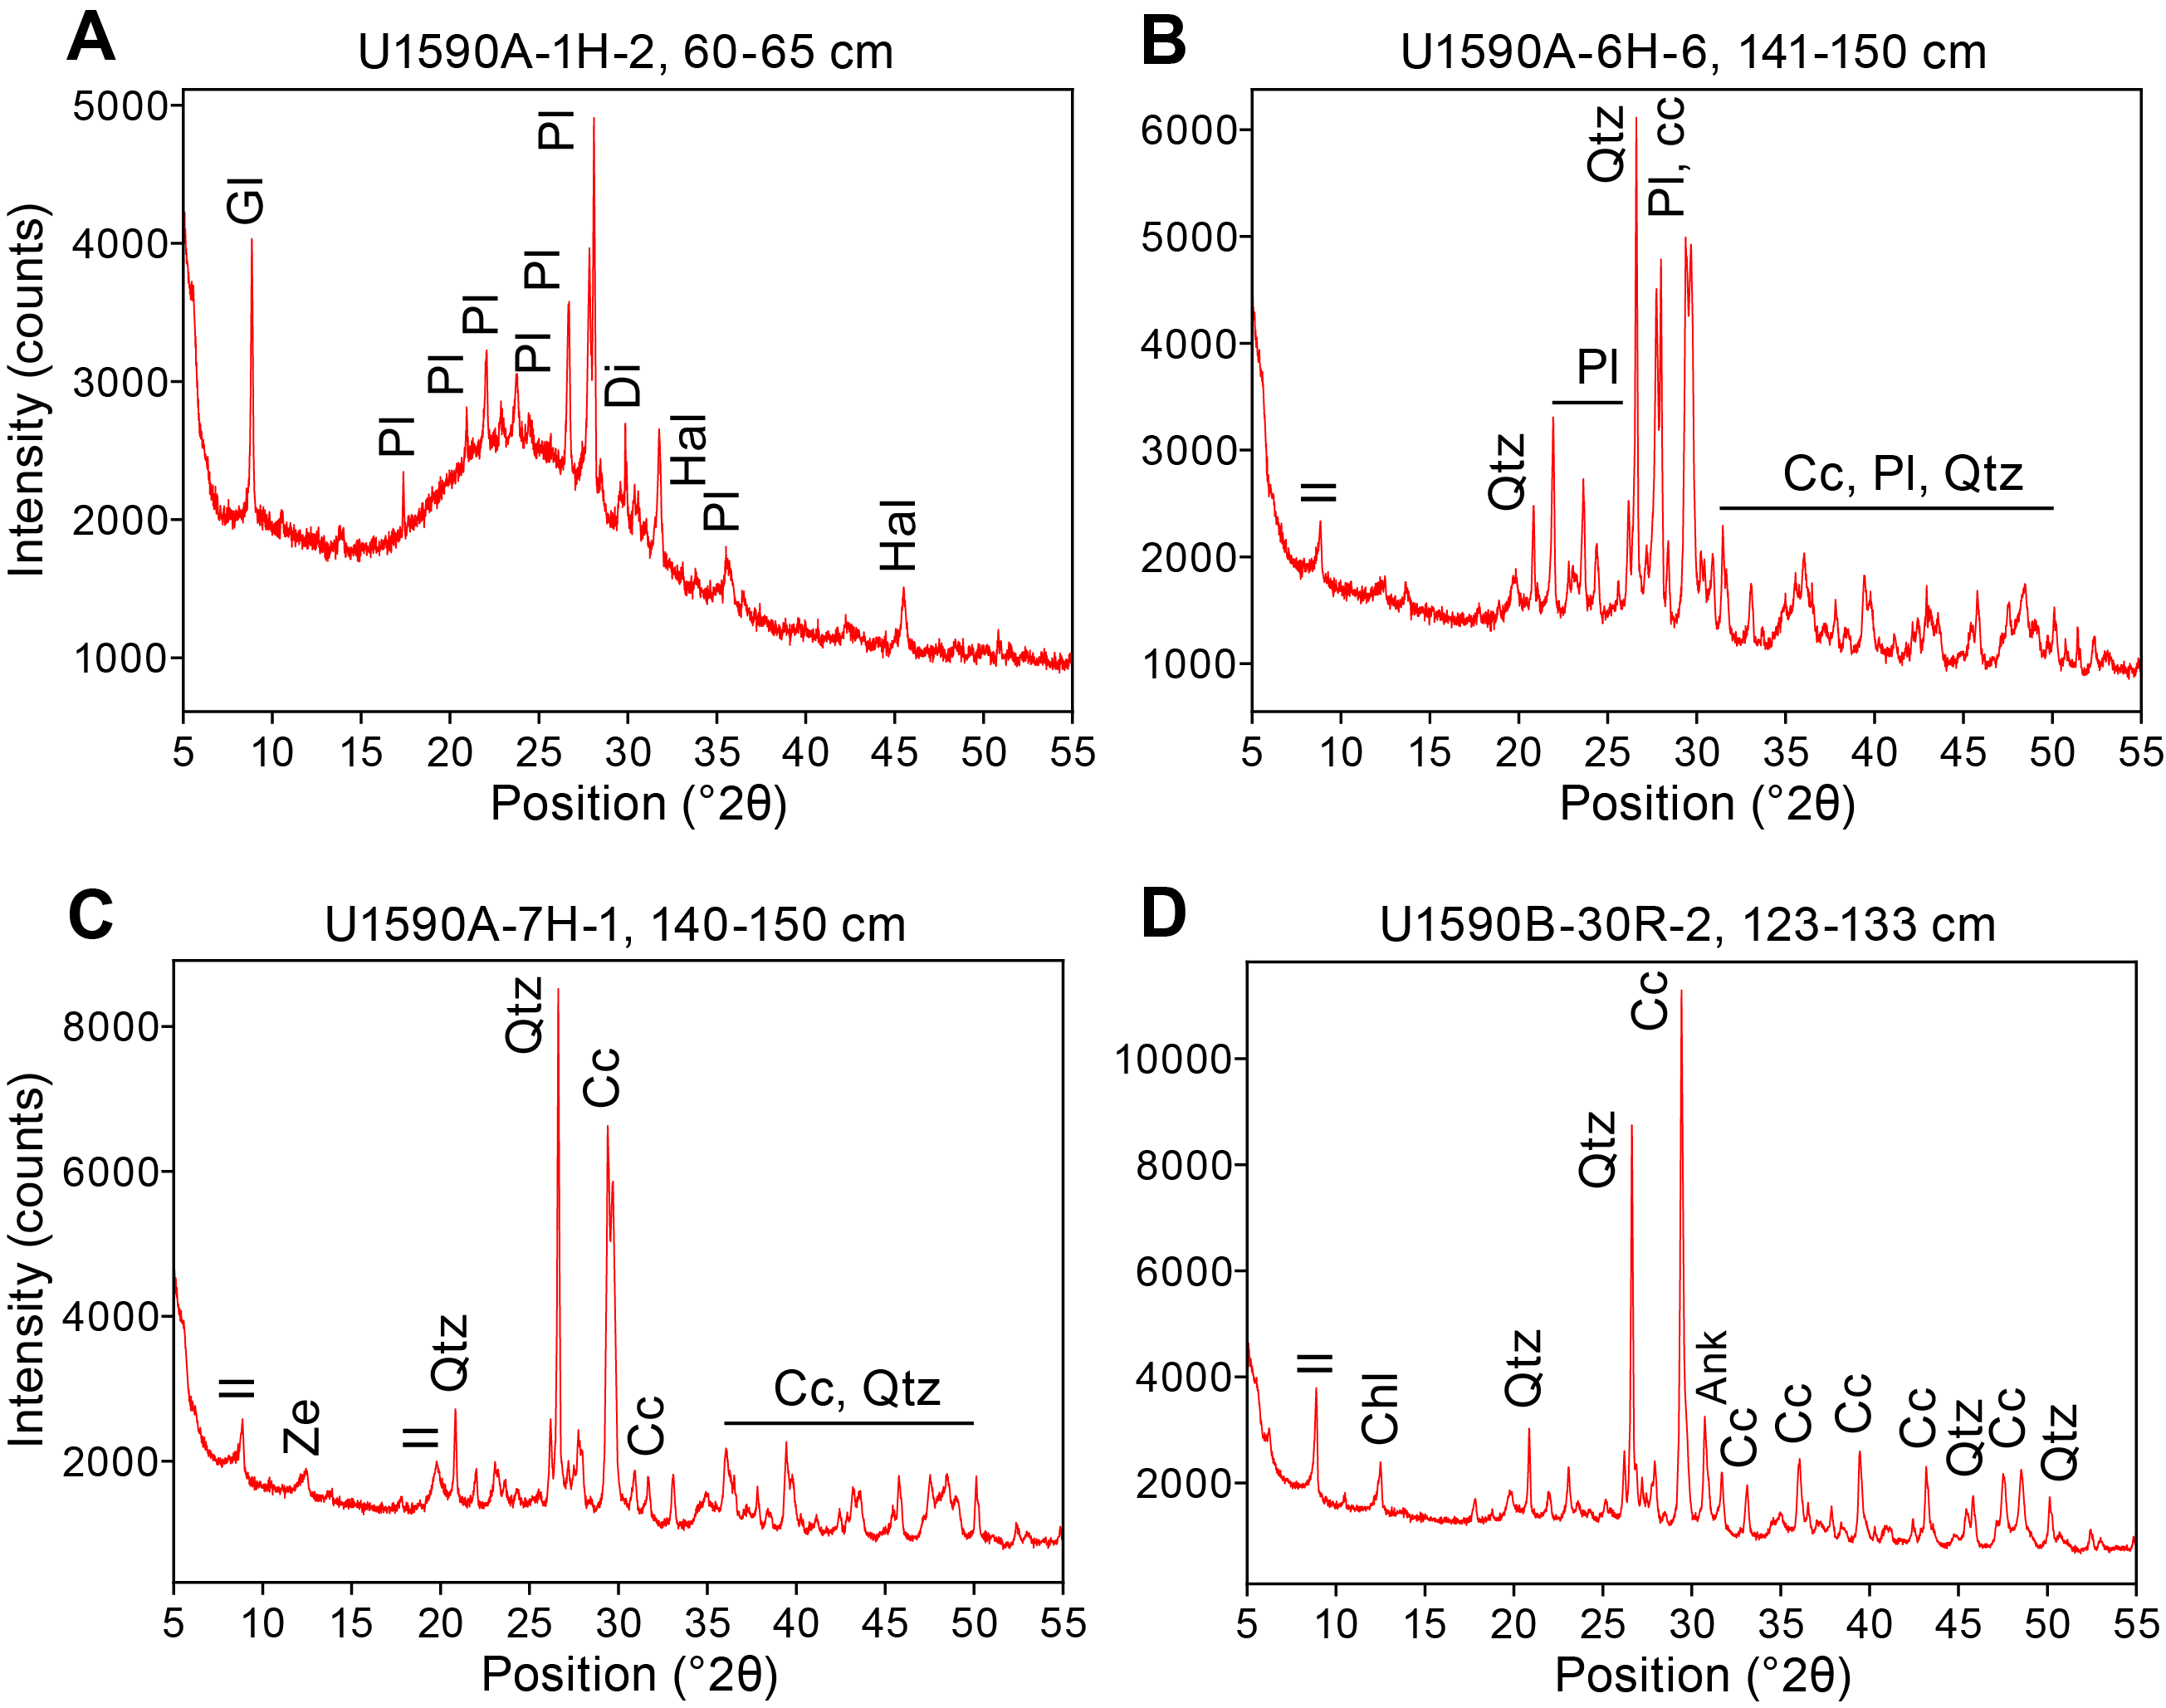
Figure F9. XRD spectra.
Representative XRD spectra are shown in Figure F9. Spectra of volcanic lithologies show a characteristic hump at low °2θ, indicating the presence of an amorphous (noncrystalline) phase (i.e., volcanic glass), and characteristic mineral peaks of Ca-rich plagioclase, augitic or diopsidic clinopyroxene, and other phases such as glauconite, quartz, and halite.
Identified mineral phases in tuffaceous lithologies include Ca-rich plagioclase and, depending on the proportion of volcanic to nonvolcanic material, a range of other phases such as quartz, calcium carbonate (calcite and aragonite), and clay minerals typical of the illite group.
Nonvolcanic lithologies are characterized by calcium carbonate (calcite and aragonite), quartz, and clay minerals typical of the illite group. Additionally, Na-rich plagioclase, muscovite, zeolite, chlorite, and ankerite were identified in some samples.
4. Stratigraphic correlation
Hole U1590A was drilled to 91.45 mbsf (CSF-A scale); Hole U1590B suffered from very low recovery in the first 17 cores, so the recovered interval began at 248 mbsf (continuing to 627.79 mbsf; CSF-A scale). Therefore, no stratigraphic correlation was possible. Consequently, our final splice consisted of both holes without any shifts applied. The result is shown in Figure F10, where we plot the magnetic susceptibility (MS), natural gamma radiation (NGR), and gamma ray attenuation (GRA) density measurements and the respective length of the cores from Holes U1590A and U1590B.
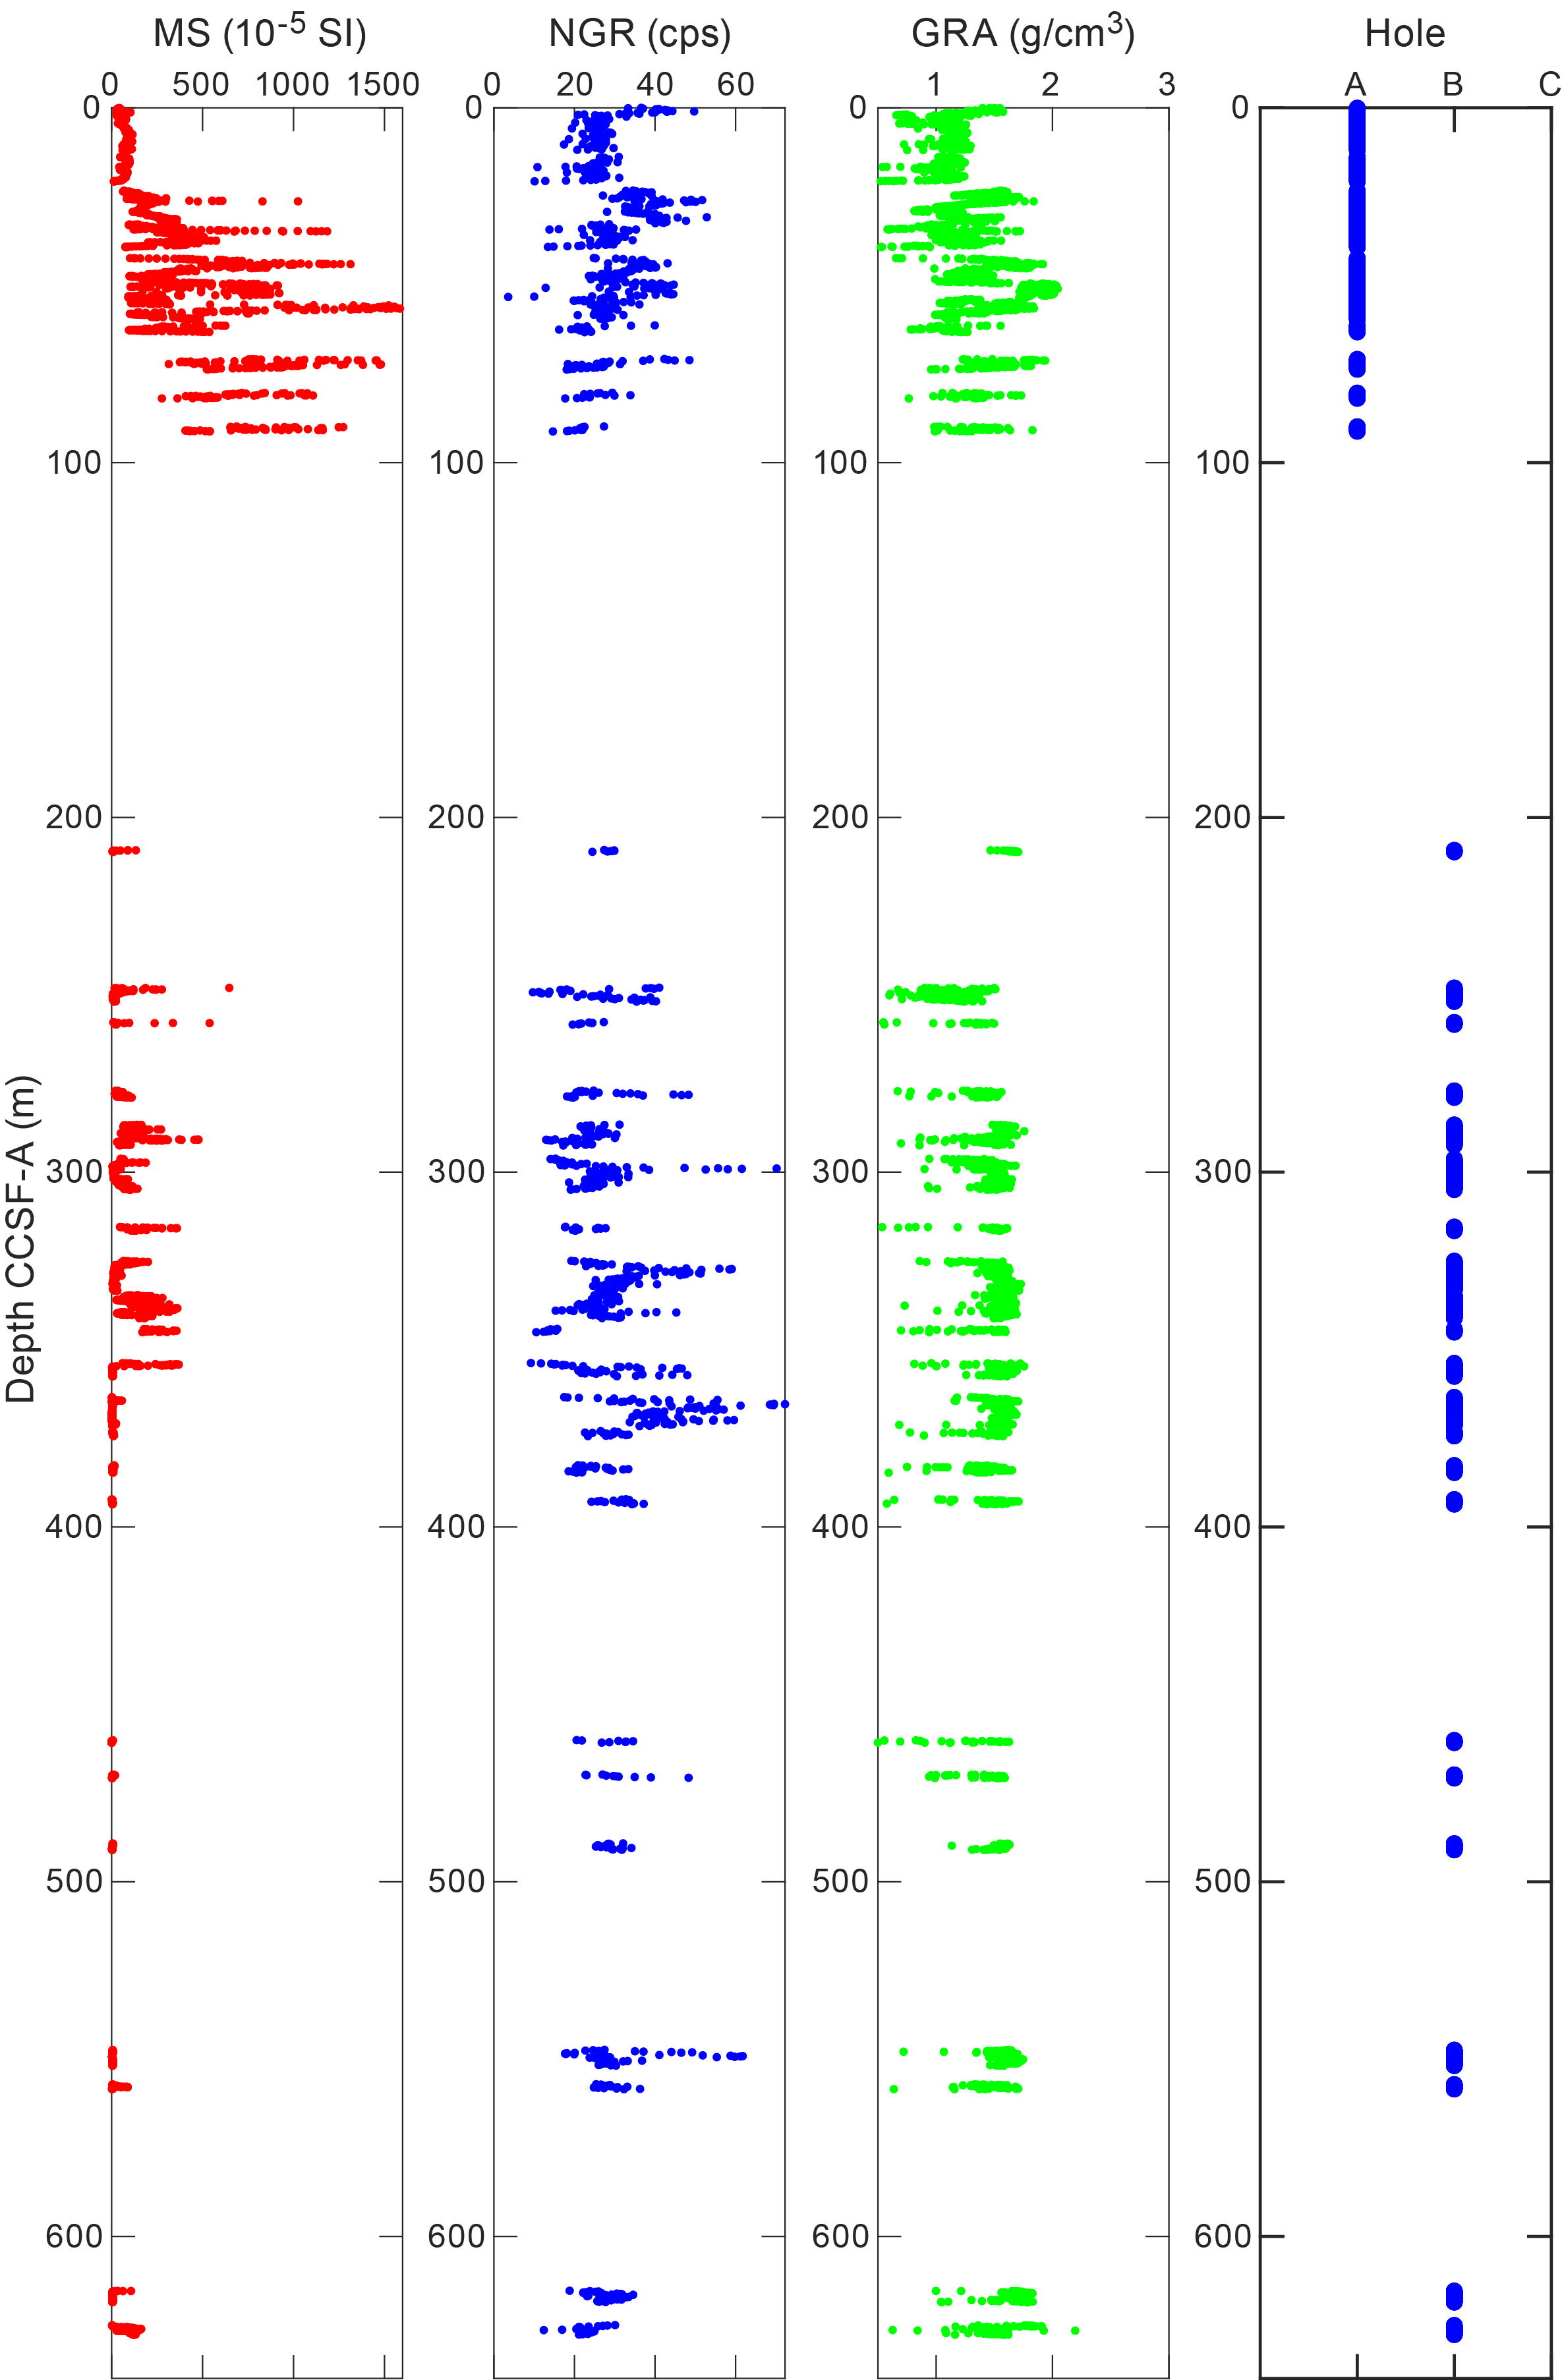
Figure F10. MS, NGR, and GRA density.
5. Structural geology
Structural geology analyses at Site U1590 included description of cores retrieved from Holes U1590A and U1590B. Structures observed and measured in the cores include bedding planes, faults, deformation bands, and foliations inside slumps. A total of 53 structures were measured from relatively consolidated intervals between 0 and 627.8 mbsf. The distributions and dip angles of bedding planes are shown in Figure F11. In general, bedding planes (n = 41) were horizontal throughout the boreholes with dips ranging 0°–7°. Minor-scale slumps characterized by oblique foliation of sand-mud mixed layers were identified at 460 and 470 mbsf in Hole U1590B.
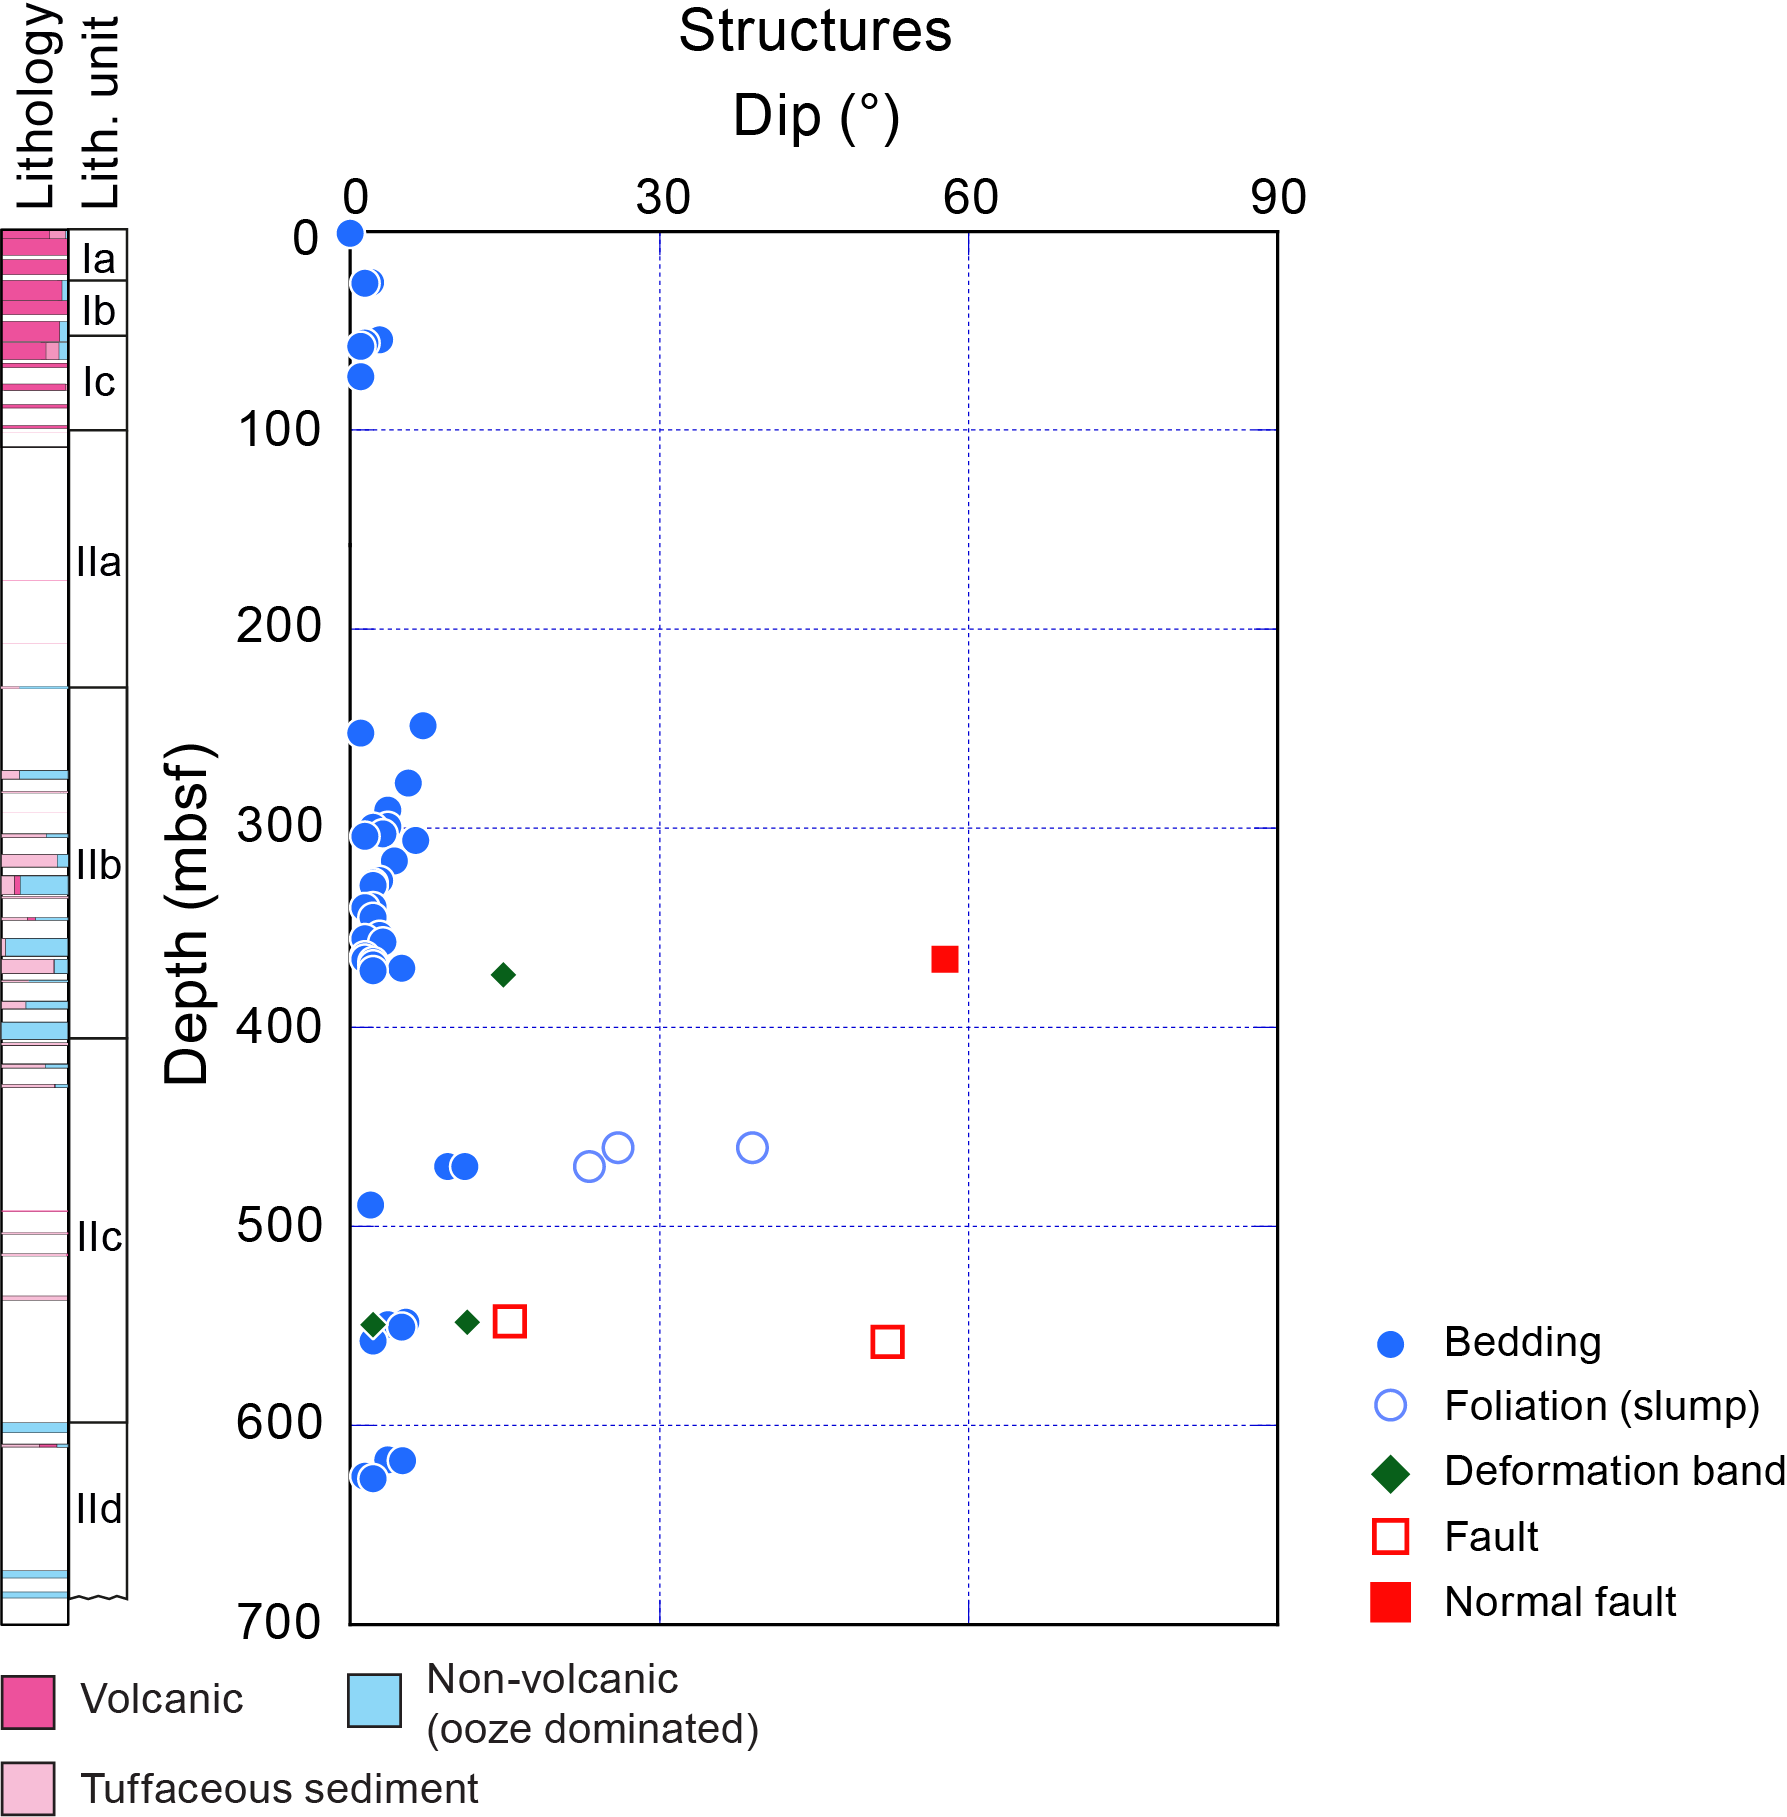
Figure F11. Dip data.
Some minor faults and deformation bands were apparent on split core surfaces and were developed below 350 mbsf. All the deformation represented cohesive (healed) fault planes with closed fault planes.
6. Biostratigraphy
Calcareous nannofossils and planktonic and benthic foraminifera were examined from core catcher samples and additional split core samples from Holes U1590A and U1590B to develop a shipboard biostratigraphic framework for Site U1590. Additionally, planktonic and benthic foraminifera provided data on paleowater depths, downslope reworking, and possible dissolution.
Site U1590 cored the flank of the Kolumbo submarine volcano sedimentary sequence and recovered a 627.79 m thick Holocene to Early Pleistocene sequence composed primarily of volcanogenic sediments and calcareous oozes. Calcareous nannofossils and planktonic foraminifera are typical of Holocene to Early Pleistocene sediments. Biostratigraphic datums recognized at Site U1590 are given in Tables T3 and T4, and an age-depth plot is shown in Figure F12.
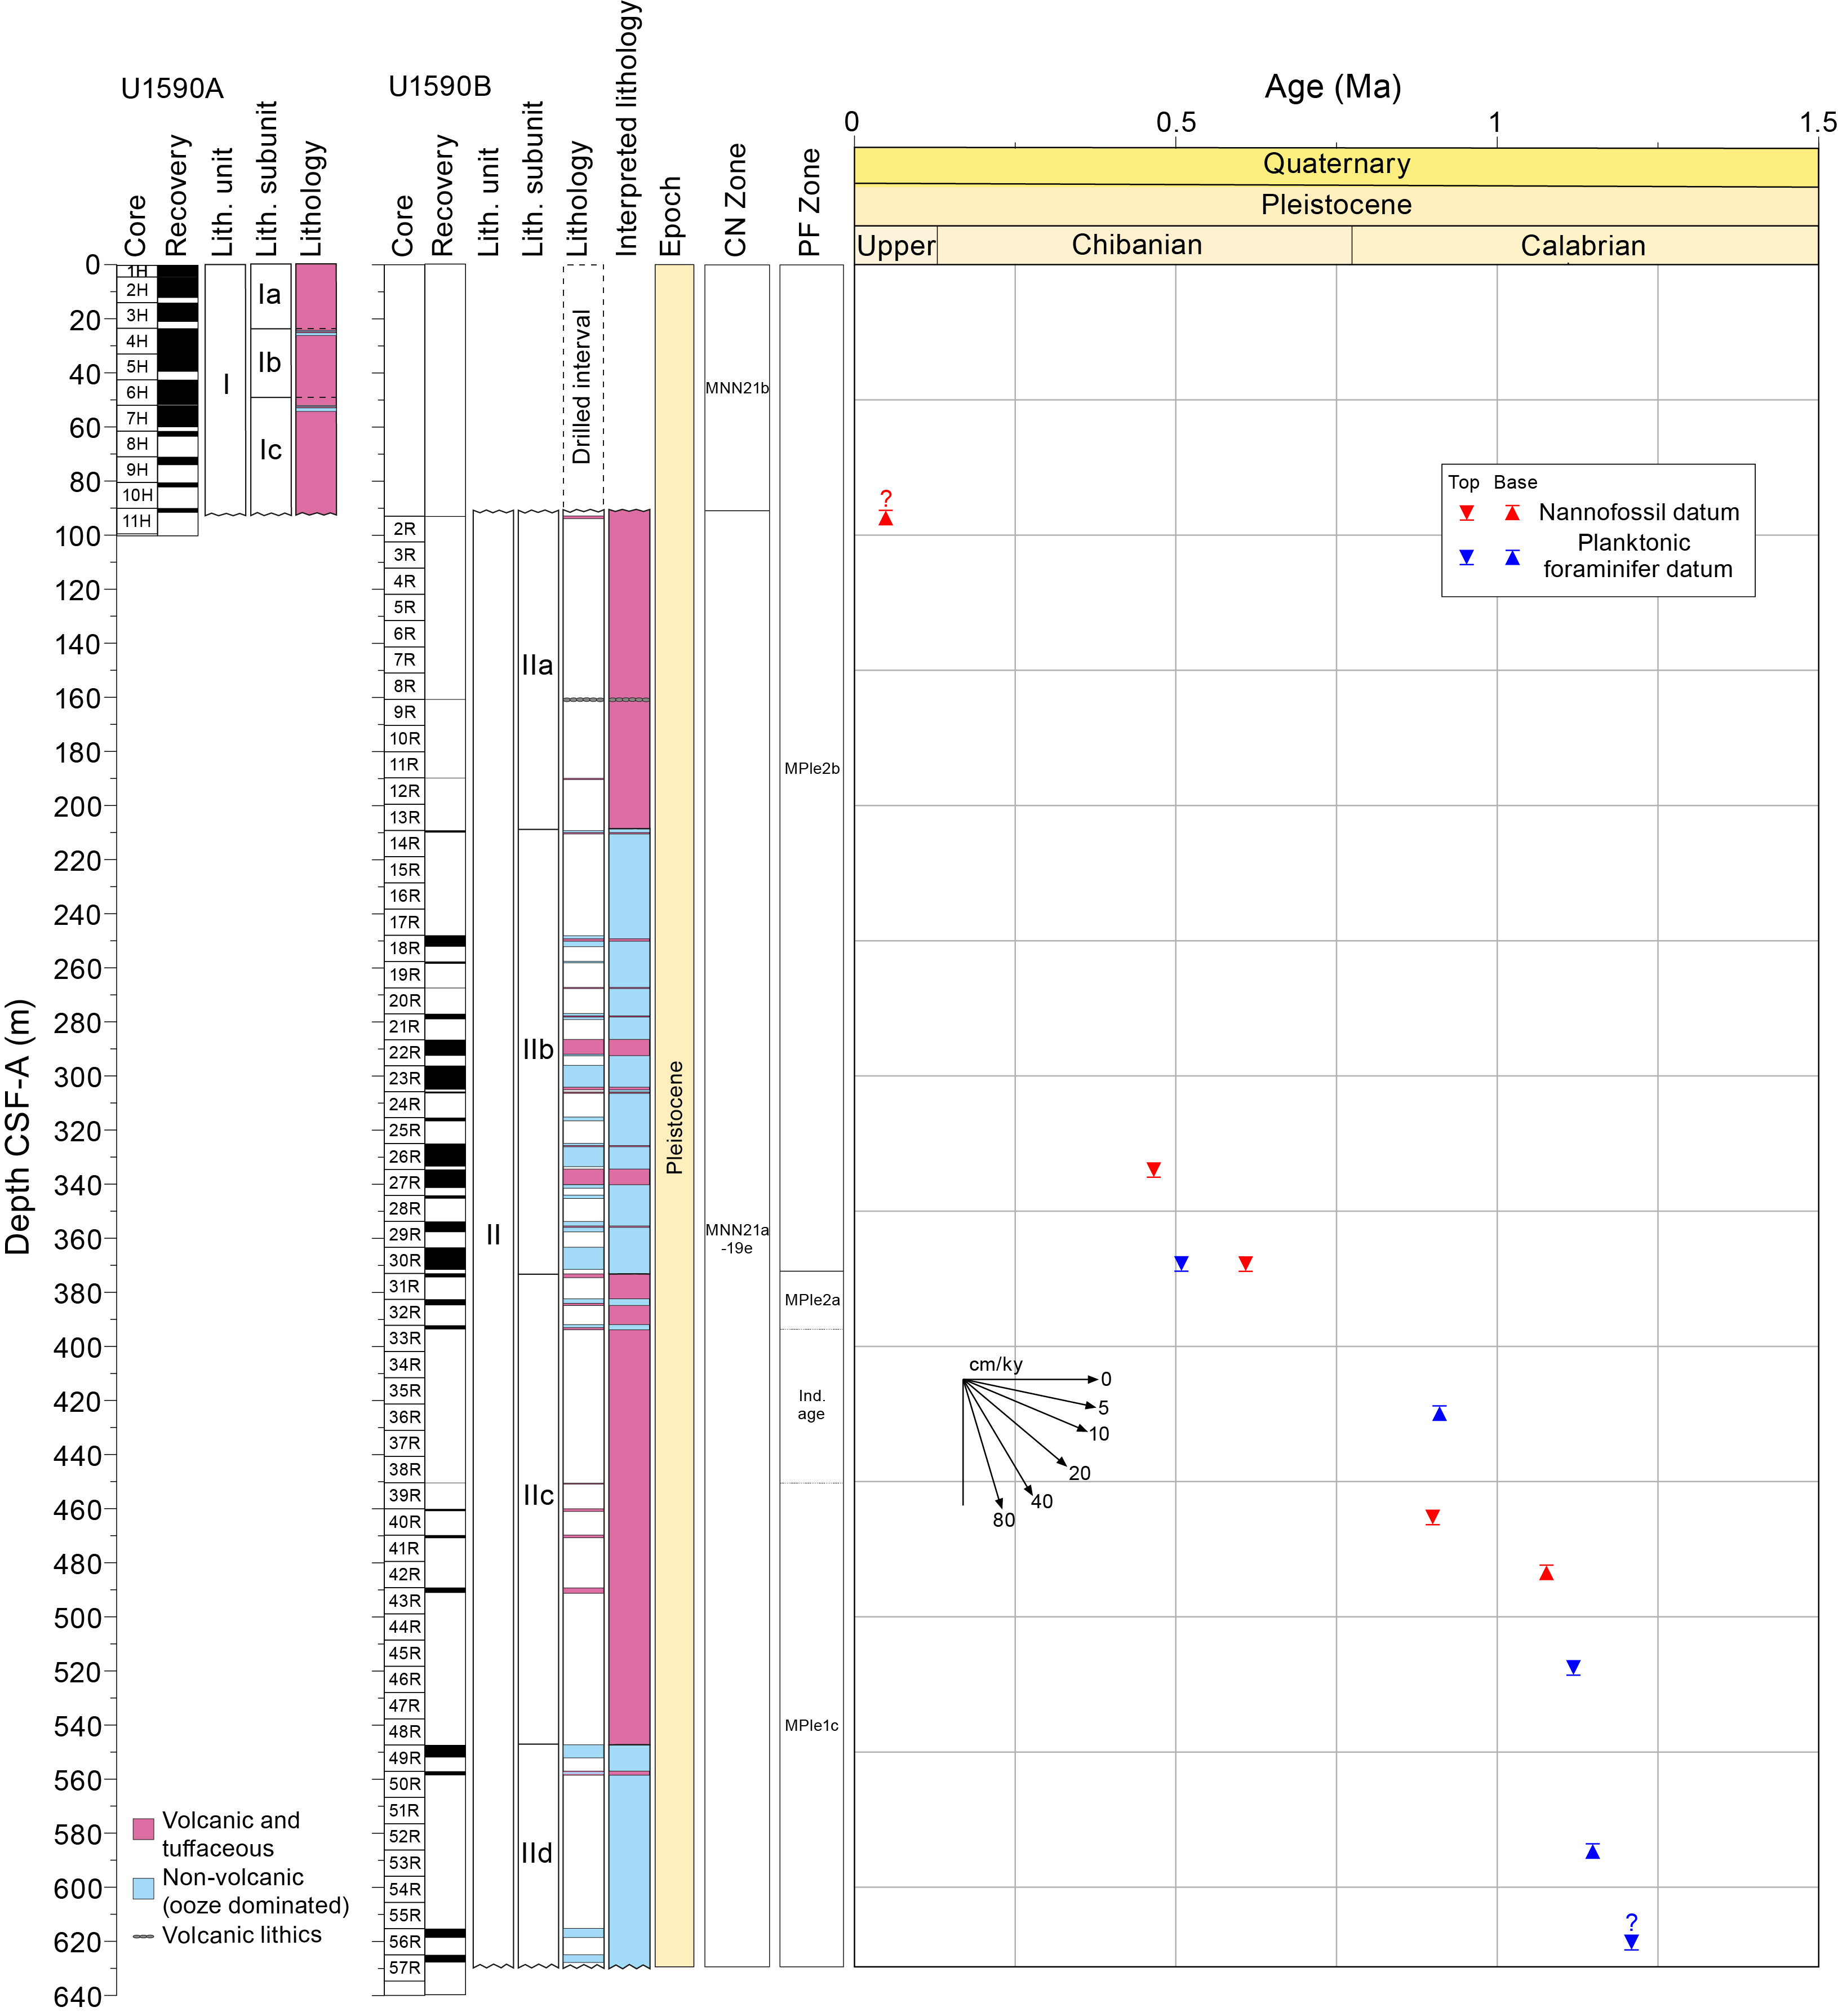
Figure F12. Age-depth plot.
Hole U1590A recovered Holocene to Late Pleistocene age sediments (<0.05 Ma) in interval 1H-1, 5–7 cm, through 11H-CC, 10–20 cm (0.07–91.43 mbsf). Hole U1590B recovered Late Pleistocene to Early Pleistocene age sediments (<0.51 to <1.21 Ma) in interval 2R-CC, 17–20 cm, through 57R-CC, 0–3 cm (93.2–627.79 mbsf).
6.1. Calcareous nannofossils
Calcareous nannofossil biostratigraphy at Site U1590 was established through analysis of core catcher samples and additional split core samples (Table T3). Nannofossils are rare to abundant in samples from the Holocene to Early Pleistocene sequence (Samples 398-U1590A-1H-1, 12 cm, to 11H-CC, 10–20 cm [0.12–90.86 mbsf], and 398-U1590B-2R-CC, 17–20 cm, to 57R-CC, 0–3 cm). Preservation is generally good to moderate with sporadically poor to very poor intervals throughout the sequence; however, there is significant reworking of older material in most of the Pleistocene samples. The assemblages are characterized by the occurrence of warm-water species such as Rhabdosphaera clavigera and Umbilicosphaera sibogae throughout the sequence at Site U1590.
The presence of Emiliania huxleyi in Samples 398-U1590A-1H-1, 5–7 cm, to 11H-1, 0–5 cm (0.12–90.86 mbsf), and Sample 398-U1590B-2R-CC, 17–20 cm, indicates a Holocene age (≤0.05 Ma) in Zones MNN21b (CNPL11, Backman et al., 2012; NN21, Martini, 1971; CN15, Okada and Bukry, 1980) of Rio et al. (1990) and Di Stefano and Sturiale (2010) (Figure F13). The sequence of Hole U1590A and Sample 398-U1590B-2R-CC, 17–20 cm, is interpreted to be above the acme base of E. huxleyi, which correlated the MNN21a/b boundary and Marine Isotope Stage 4–5a (0.05 Ma) by Rio et al. (1990), Castradori (1993), and Lourens et al. (2004) in the eastern Mediterranean. The top appearance datum of Pseudoemiliania lacunosa defines the MNN20/21a (MNN19f/MNN20, CNPL10/11, NN19/20, and CN14a/CN14b) boundary. The top consistent appearance of P. lacunosa in Hole U1590B occurs in Samples 26R-CC, 13–15 cm (333.46 mbsf), and 27R-CC, 13–15 cm (341.34 mbsf). Therefore, the interval from 26R-CC, 13–15 cm, through 27R-CC, 13–15 cm (337.4 mbsf), is assigned to the MNN20/21a boundary. The top occurrence of Gephyrocapsa sp. 3 (0.61 Ma), situated between the lower part of the Brunhes Chronozone in Zone MNN19f, is found between Samples 30R-CC, 99 cm, and 31R-CC, 0–2 cm (369.96–374.43 mbsf). The top occurrence of Reticulofenestra asanoi (0.901 Ma), situated at the top of the Jaramillo Subchronozone of the Matuyama Chronozone in Zone MNN19e, is recognized at the boundary between Samples 40R-CC, 0–2 cm, and 41R-CC, 0–2 cm (460.89–470.9 mbsf). The basal occurrence of R. asanoi (1.078 Ma), which lies just below the Jaramillo Subchronozone of the Matuyama Chronozone (MNN19e), is found between Samples 41R-CC, 0–2 cm, and 43R-CC, 0–2 cm (481.01 mbsf).
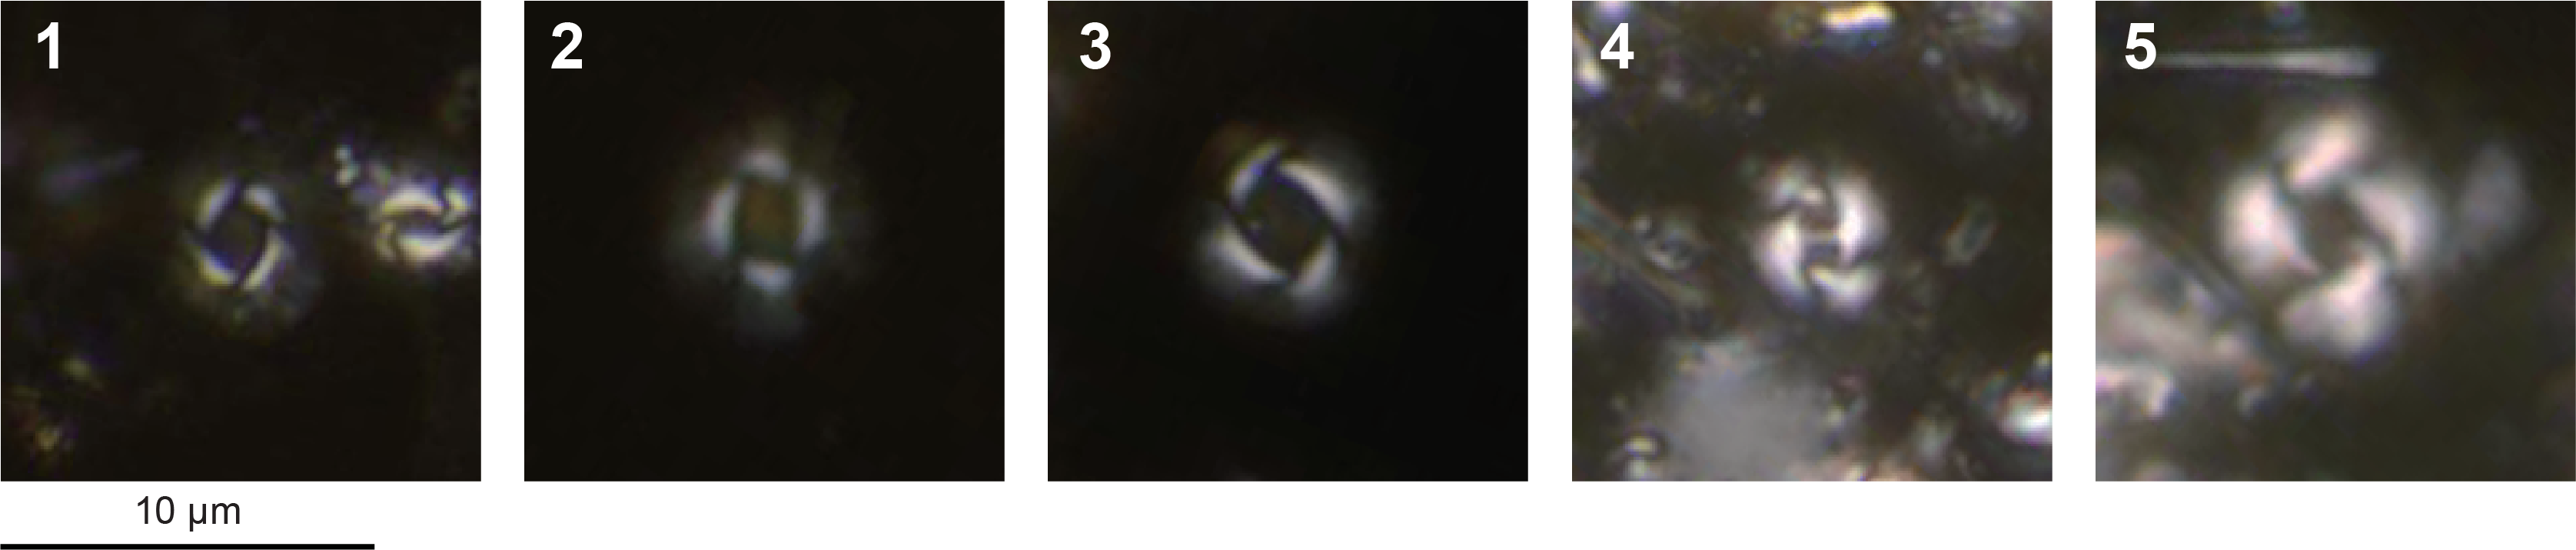
Figure F13. Calcareous nannofossils.
6.2. Foraminifera
Planktonic and benthic foraminifera were examined from core catcher samples and split core samples from Holes U1590A and U1590B (Tables T5, T6). Absolute ages assigned to biostratigraphic datums follow those listed in Table T6 in the Expedition 398 methods chapter (Kutterolf et al., 2024). Planktonic foraminifer datums for Site U1590 are given in Table T4. Planktonic foraminifer abundances and indications of oceanicity (e.g., Hayward et al., 1999) and benthic foraminifer paleowater depth estimations are shown in Figures F14 and F15.
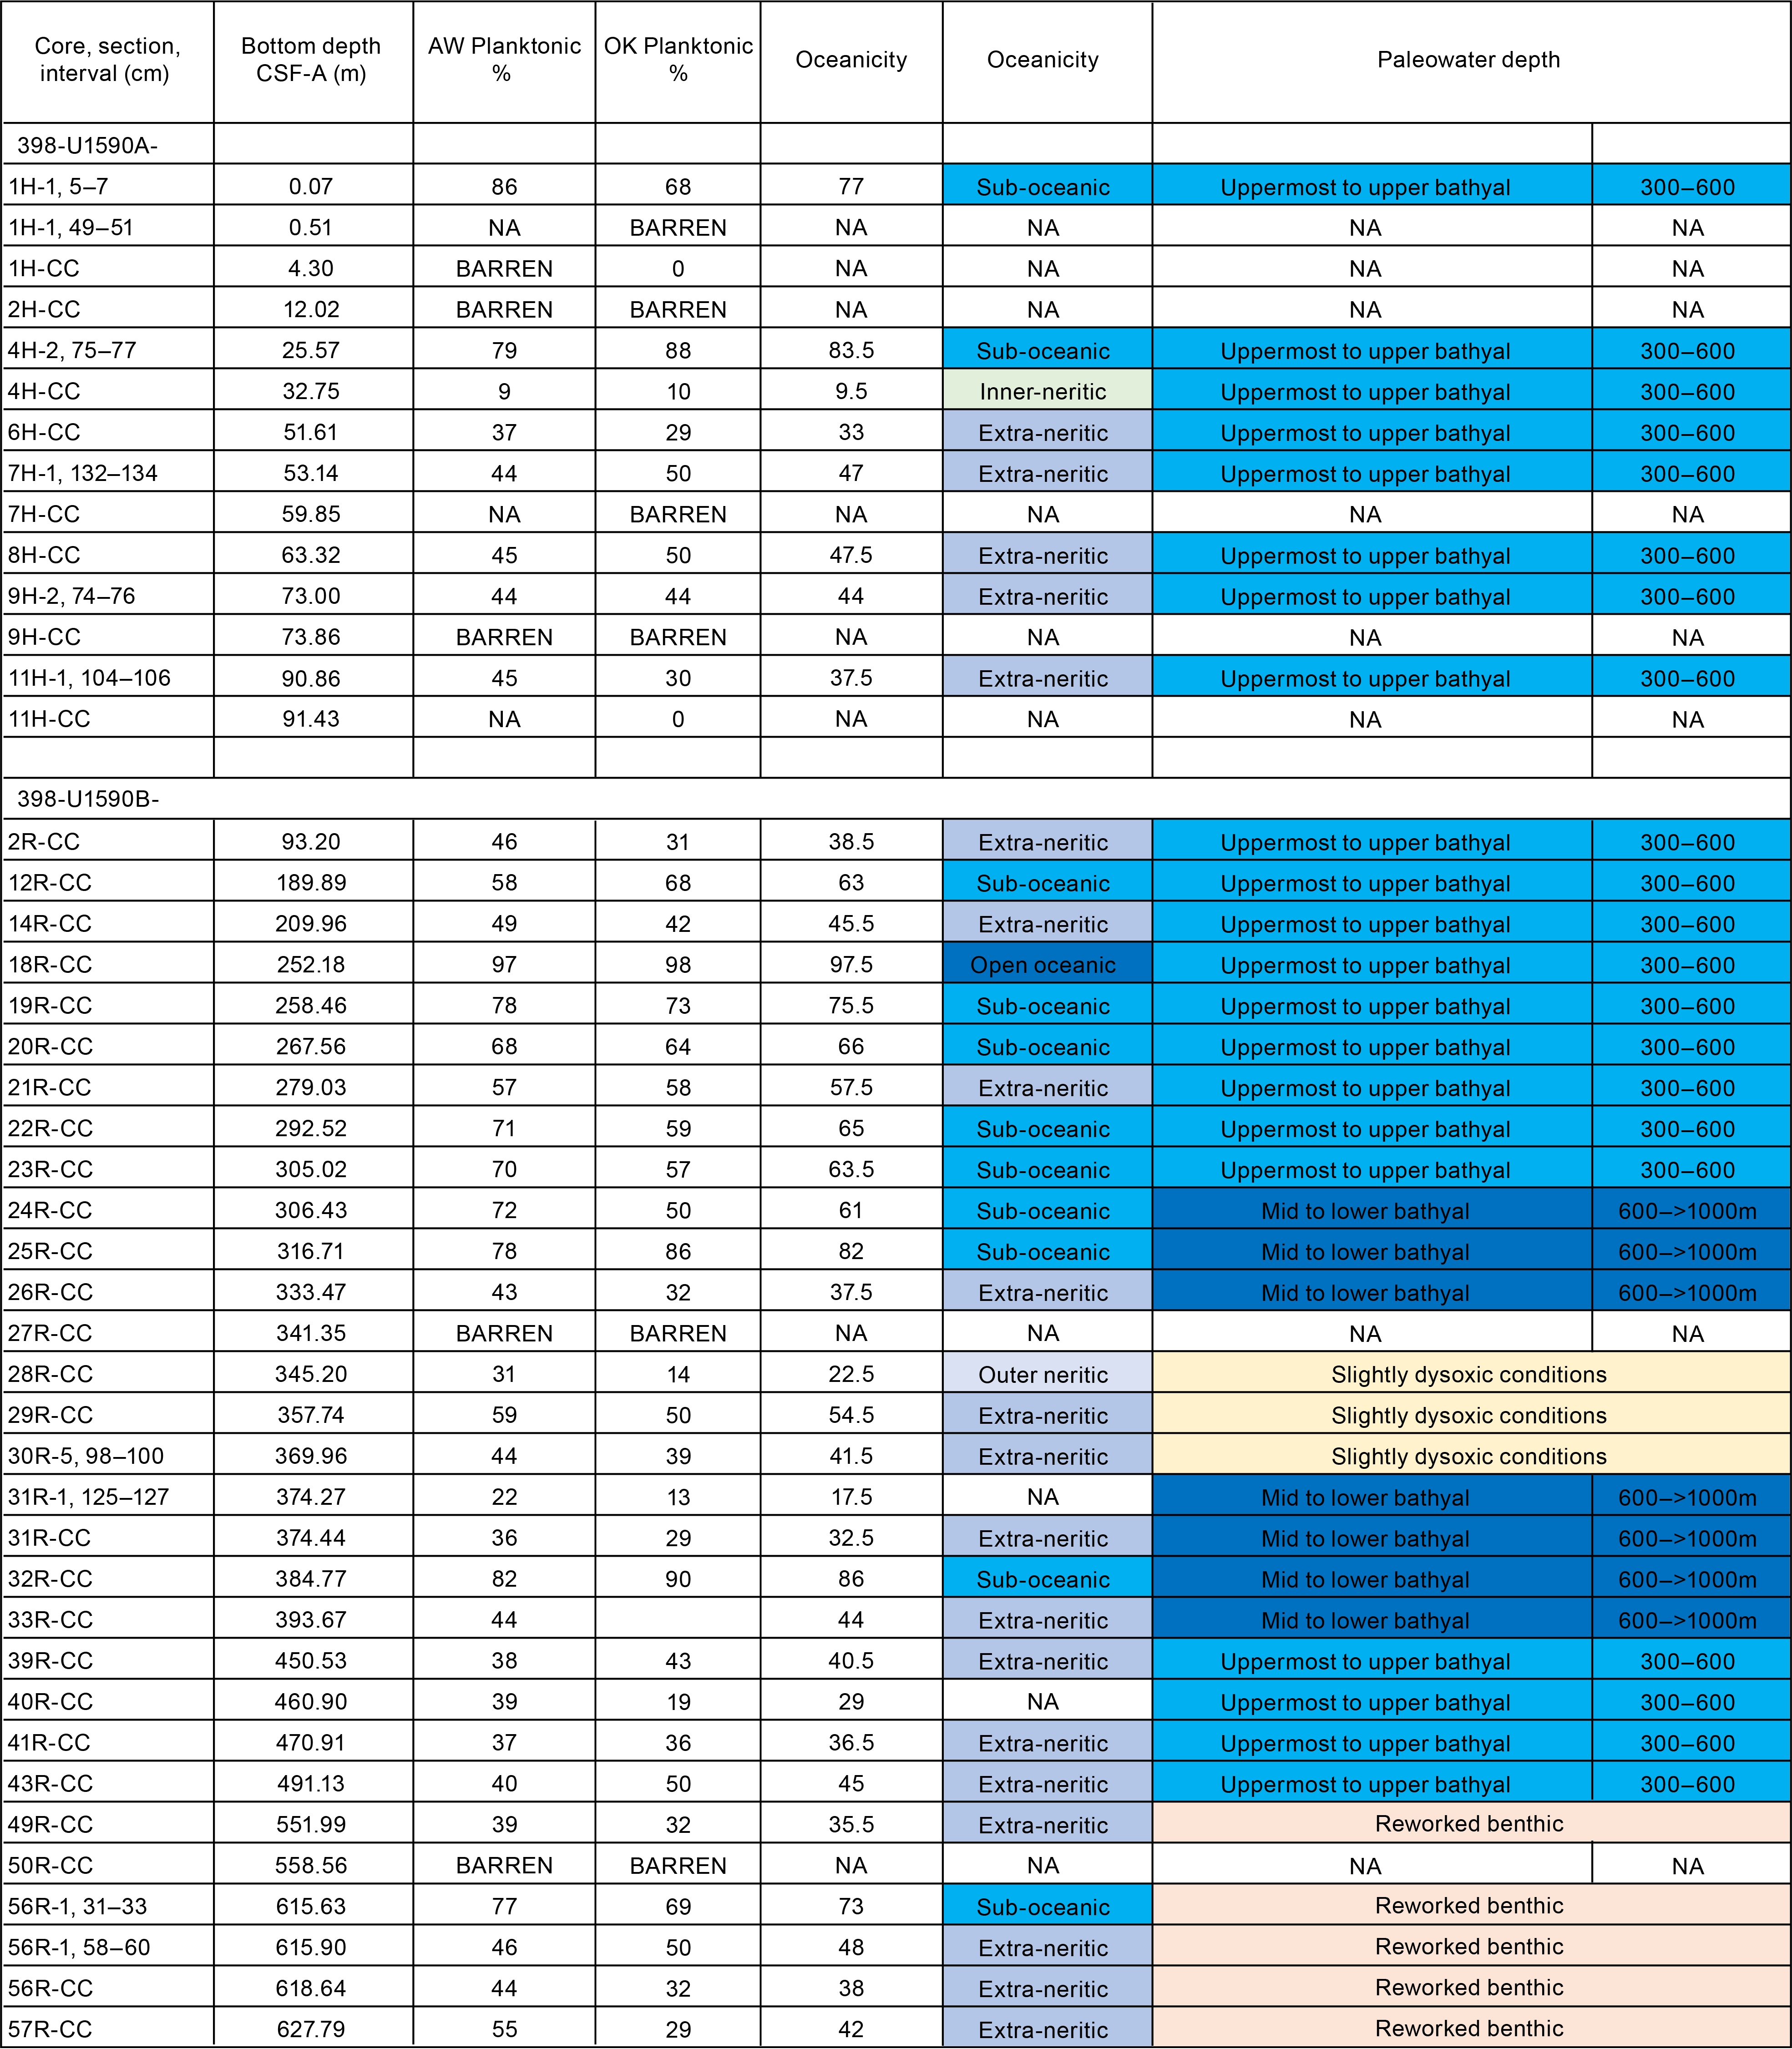
Figure F14. Foraminiferal oceanicity and paleowater depth estimates.
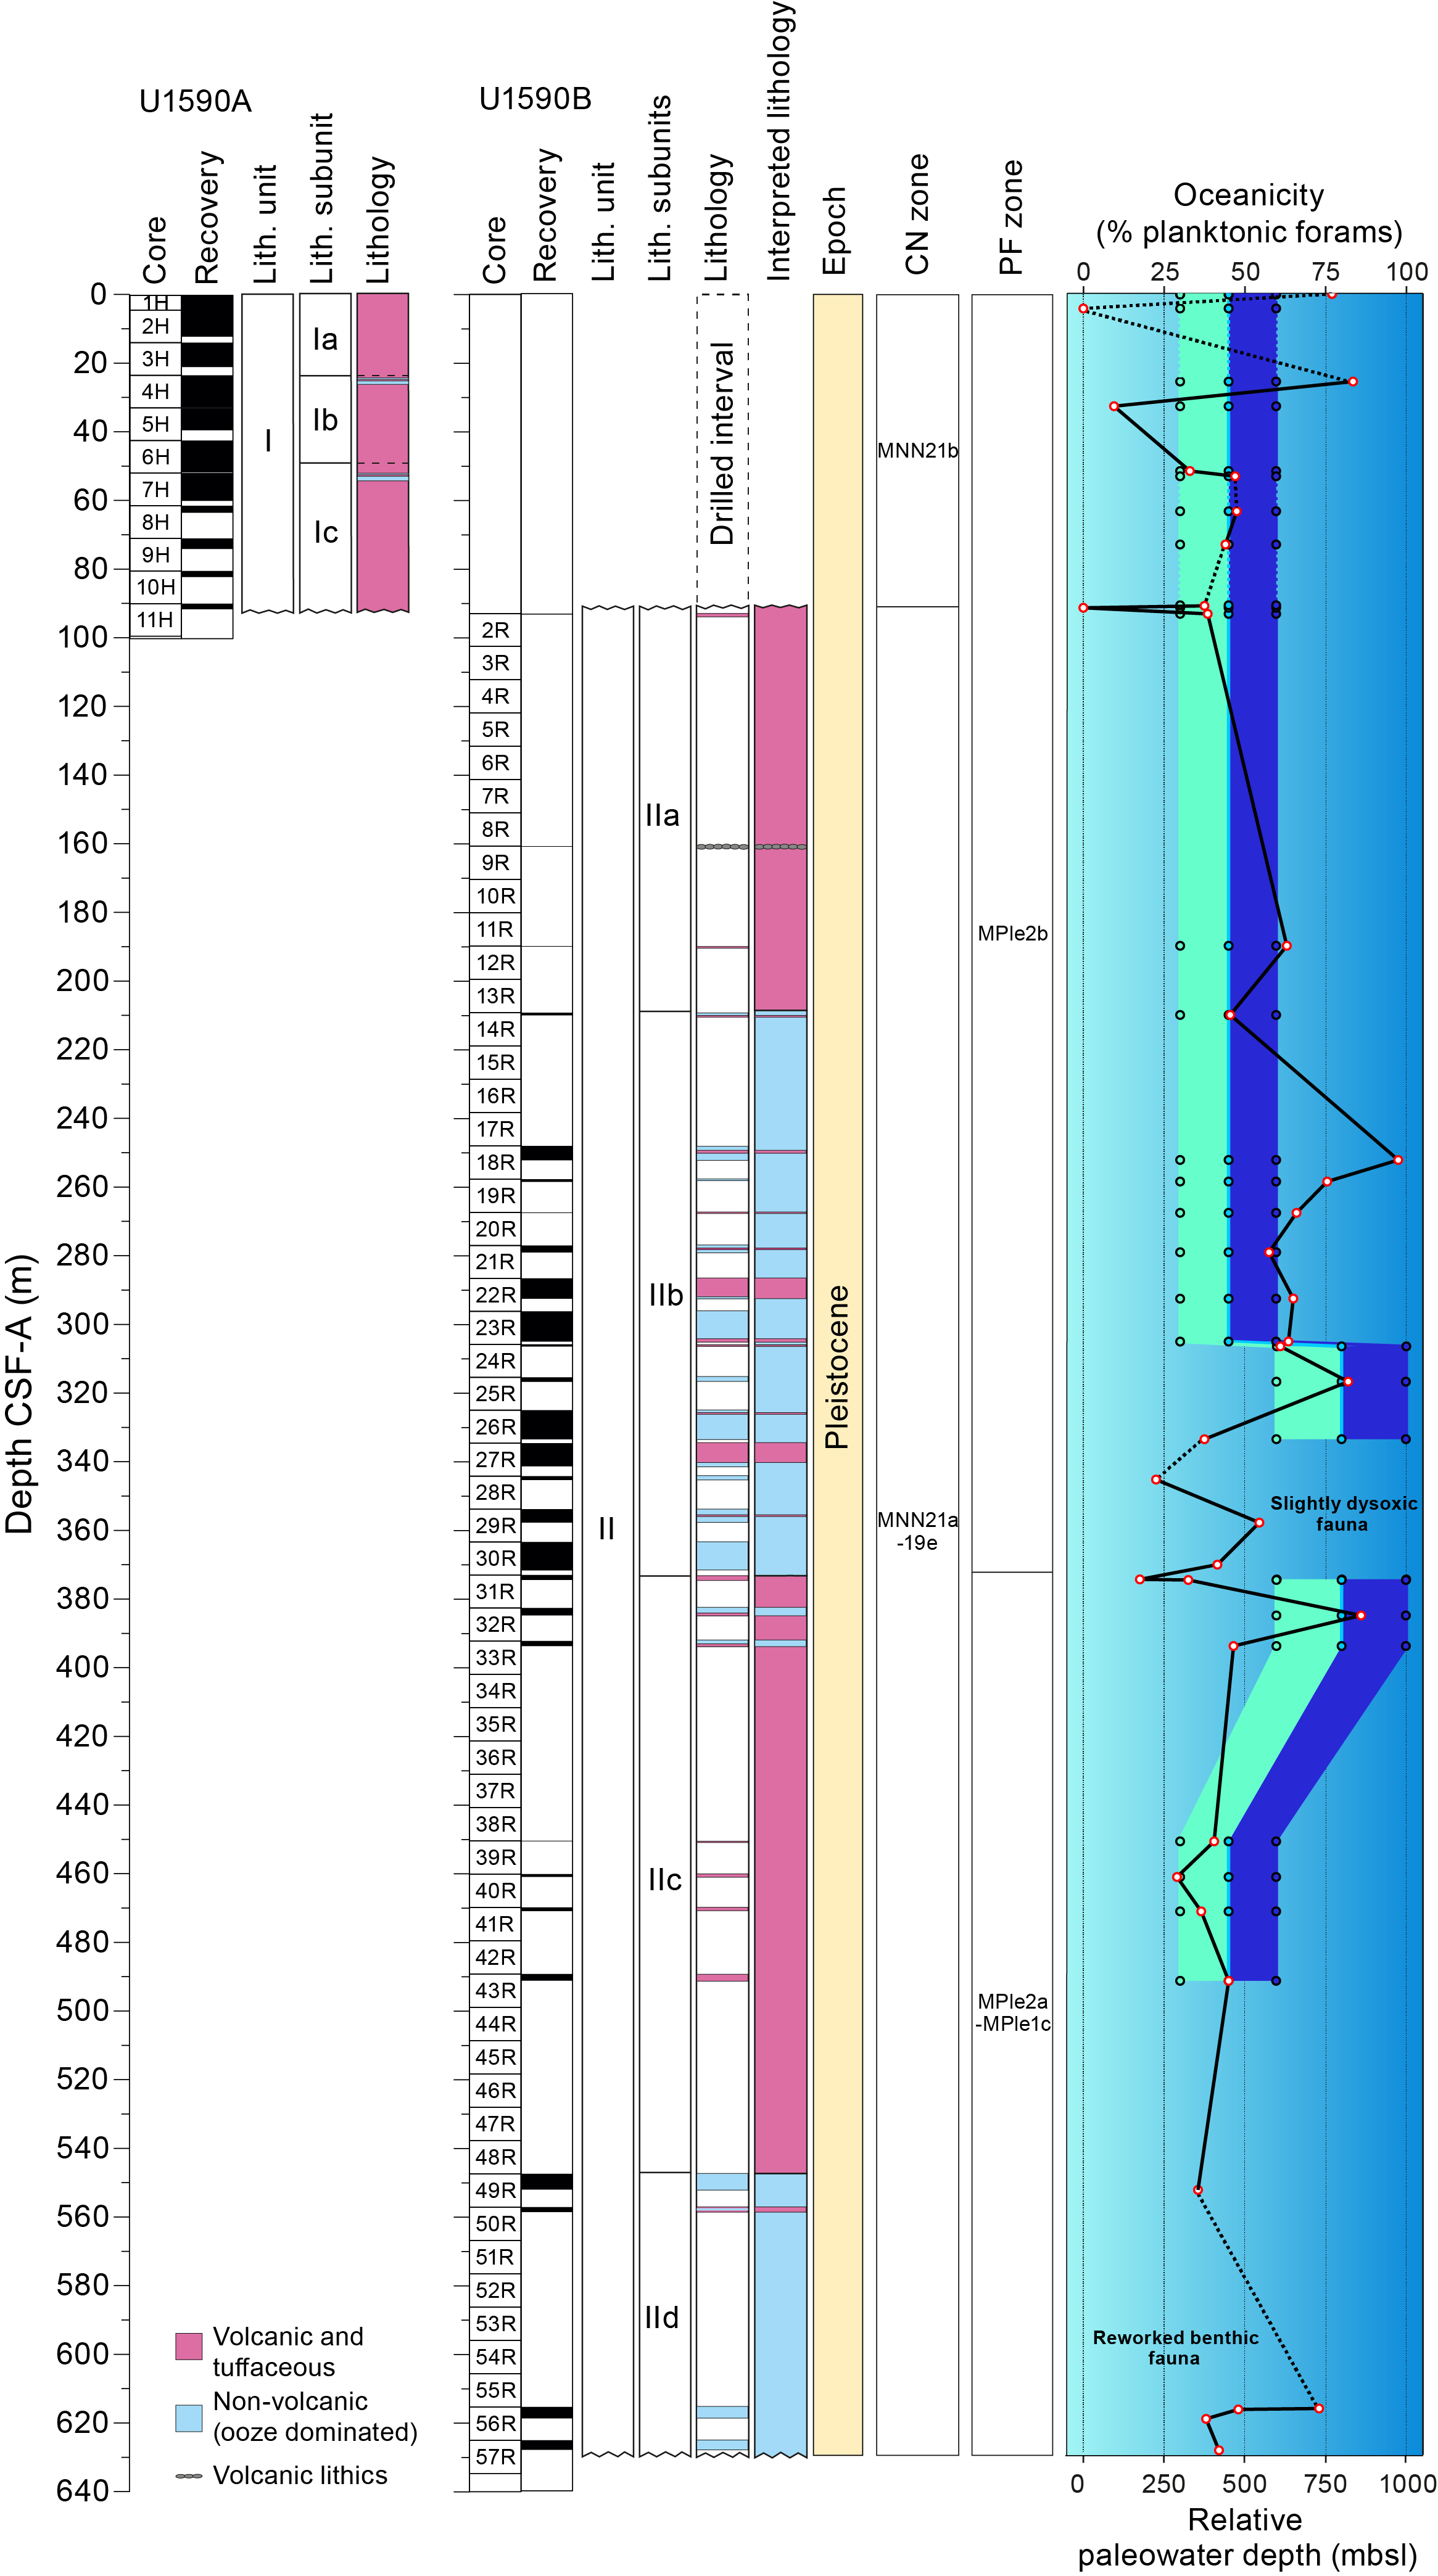
Figure F15. Biochronology and interpreted oceanicity and paleowater depths.
Because of the volcanogenic nature of the cored sedimentary sequence, residues (>125 µm) from washed samples were often significantly composed of volcaniclastic particles such as pumice, scoria, and ash that often diluted the microfossil component of residues. Foraminifera dominated the biogenic component of residues, however. In addition to volcanic material, clastic grains, minor pyrite, carbonaceous plant-derived matter, and other fossil material including shells and fragments (Bivalvia and Gastropoda), Pteropoda, Scaphopoda, Bryozoa, Arthropoda (Balanus), echinoid spines and plate fragments, radiolarians, ostracods, and otoliths were also present in variable amounts in most samples.
In the Holocene–Early Pleistocene section, foraminifera with very good to moderate preservation are present in siliciclastic and volcaniclastic sediments. Foraminifer abundances are variable, and foraminifera are notably rare in tuffaceous oozes, likely due to sedimentary dilution, whereas coarser volcaniclastic intervals are sometimes barren.
6.2.1. Holocene–Early Pleistocene biostratigraphy
As a result of explosive volcanic events and rapid deposition of the upper sedimentary section, the base of the Holocene is not possible to assign accurately. Planktonic foraminifer assemblages from the Holocene to Pleistocene section of Site U1590 are mostly well preserved, where specimens are rarely broken or exhibiting partially dissolved shell walls.
Holocene to Pleistocene foraminifer faunas suggest large fluctuations in relative paleowater depths and oceanicity with highly variable planktonic abundances that range 0%–98% when foraminifera were present (Figure F15). The fauna are typical of Pleistocene Mediterranean biostratigraphic zones, primarily composed of Neogloboquadrina incompta, Globigerina bulloides, Globigerina falconensis, Globigerina umbilicata, Globigerinella siphonifera, Globigerinita glutinata, Globigerinoides elongatus, Globigerinoides pyramidalis, Trilobatus trilobus group, Globigerinoides ruber var. white, G. ruber var. pink, Globoconella inflata, Hirsutella scitula, Neogloboquadrina pachyderma, Orbulina universa, Turborotalita quinqueloba, and Globigerinella calida (Figure F15). Rare reworked specimens of Globoturborotalita woodi are also often present.
Foraminiferal faunas are sufficiently common to biostratigraphically divide the Pleistocene sediments into three Mediterranean planktonic foraminiferal biostratigraphic zones (Lirer et al., 2019):
- Zone MPle2b (0.00–0.53 Ma): 0.07–369.97 mbsf.
- Zone MPle2a (0.53–0.91 Ma): 374.27–393.67 mbsf.
- Zone MPle1c (0.91–1.21 Ma): 450.53–627.79 mbsf.
The faunal criteria on which these age assignments are based are given below.
6.2.1.1. Zone MPle2b (0.00–0.53 Ma)
Samples 398-U1590A-1H-1, 5–7 cm, to 398-U1590B-30R-5, 98–100 cm (0.07–369.97 mbsf), are assigned to Zone MPle2b based on the occurrence of sinistrally coiled Neogloboquadrina spp. (<0.51 Ma) throughout the section. Notably, G. ruber var. pink (<0.33 Ma) was absent below Sample 398-U1590A-6H-CC, 14–19 cm (51.61 mbsf), which may be attributable to taphonomic processes.
6.2.1.2. Zone MPle2a (0.53–0.91 Ma)
Samples 398-U1590B-31R-1, 125–127 cm, to 33R-CC, 0–2 cm (374.27–393.67 mbsf), are assigned to Zone MPle2a based on the rare appearances of sinistrally coiled Neogloboquadrina spp. (0.51–0.91 Ma).
6.2.1.3. Zone MPle1c (0.91–1.21 Ma)
Samples 398-U1590B-39R-CC, 12–13 cm, to 57R-CC, 0–3 cm (450.53–627.79 mbsf), are assigned to Zone MPl31c based on the consistent occurrences of sinistrally coiled Neogloboquadrina spp. (0.91–1.21 Ma). Additionally, the influx of Truncorotalia crassaformis (1.12–1.15 Ma) was observed in Sample 49R-CC, 7–9 cm (551.99 mbsf).
6.2.2. Planktonic foraminiferal oceanicity
Planktonic foraminifer abundances are highly variable, ranging 0%–98% when foraminifera were present (Figure F14, F16). Because of the position of Site U1590 on the flank of the Kolumbo submarine volcano, many of the low and highly fluctuating planktonic foraminifer abundances are likely indicative of downslope reworking, environmental change, and sediment dilution associated with the rapid onset episodes of explosive volcaniclastic sedimentation. Oceanicity values are generally in agreement with benthic foraminiferal paleowater depth indicators (Figure F16), indicating extraneritic (100–200 mbsl) to suboceanic (200–1000 mbsl) conditions at Site U1590 throughout the majority of the cored interval, consistent with present-day water depths. However, in Samples 398-U1590B-18R-CC, 21–23 cm, to 32R-CC, 0–2 cm (252.18–384.77 mbsf), oceanicity calculations indicate potentially deeper waters with open-oceanic (>1000 mbsl) values on either side of an interval interpreted to contain downslope reworking from Samples 27R-CC, 13–15 cm, to 30R-5, 98–100 cm (431.35–369.96 mbsf) (Figure F16).
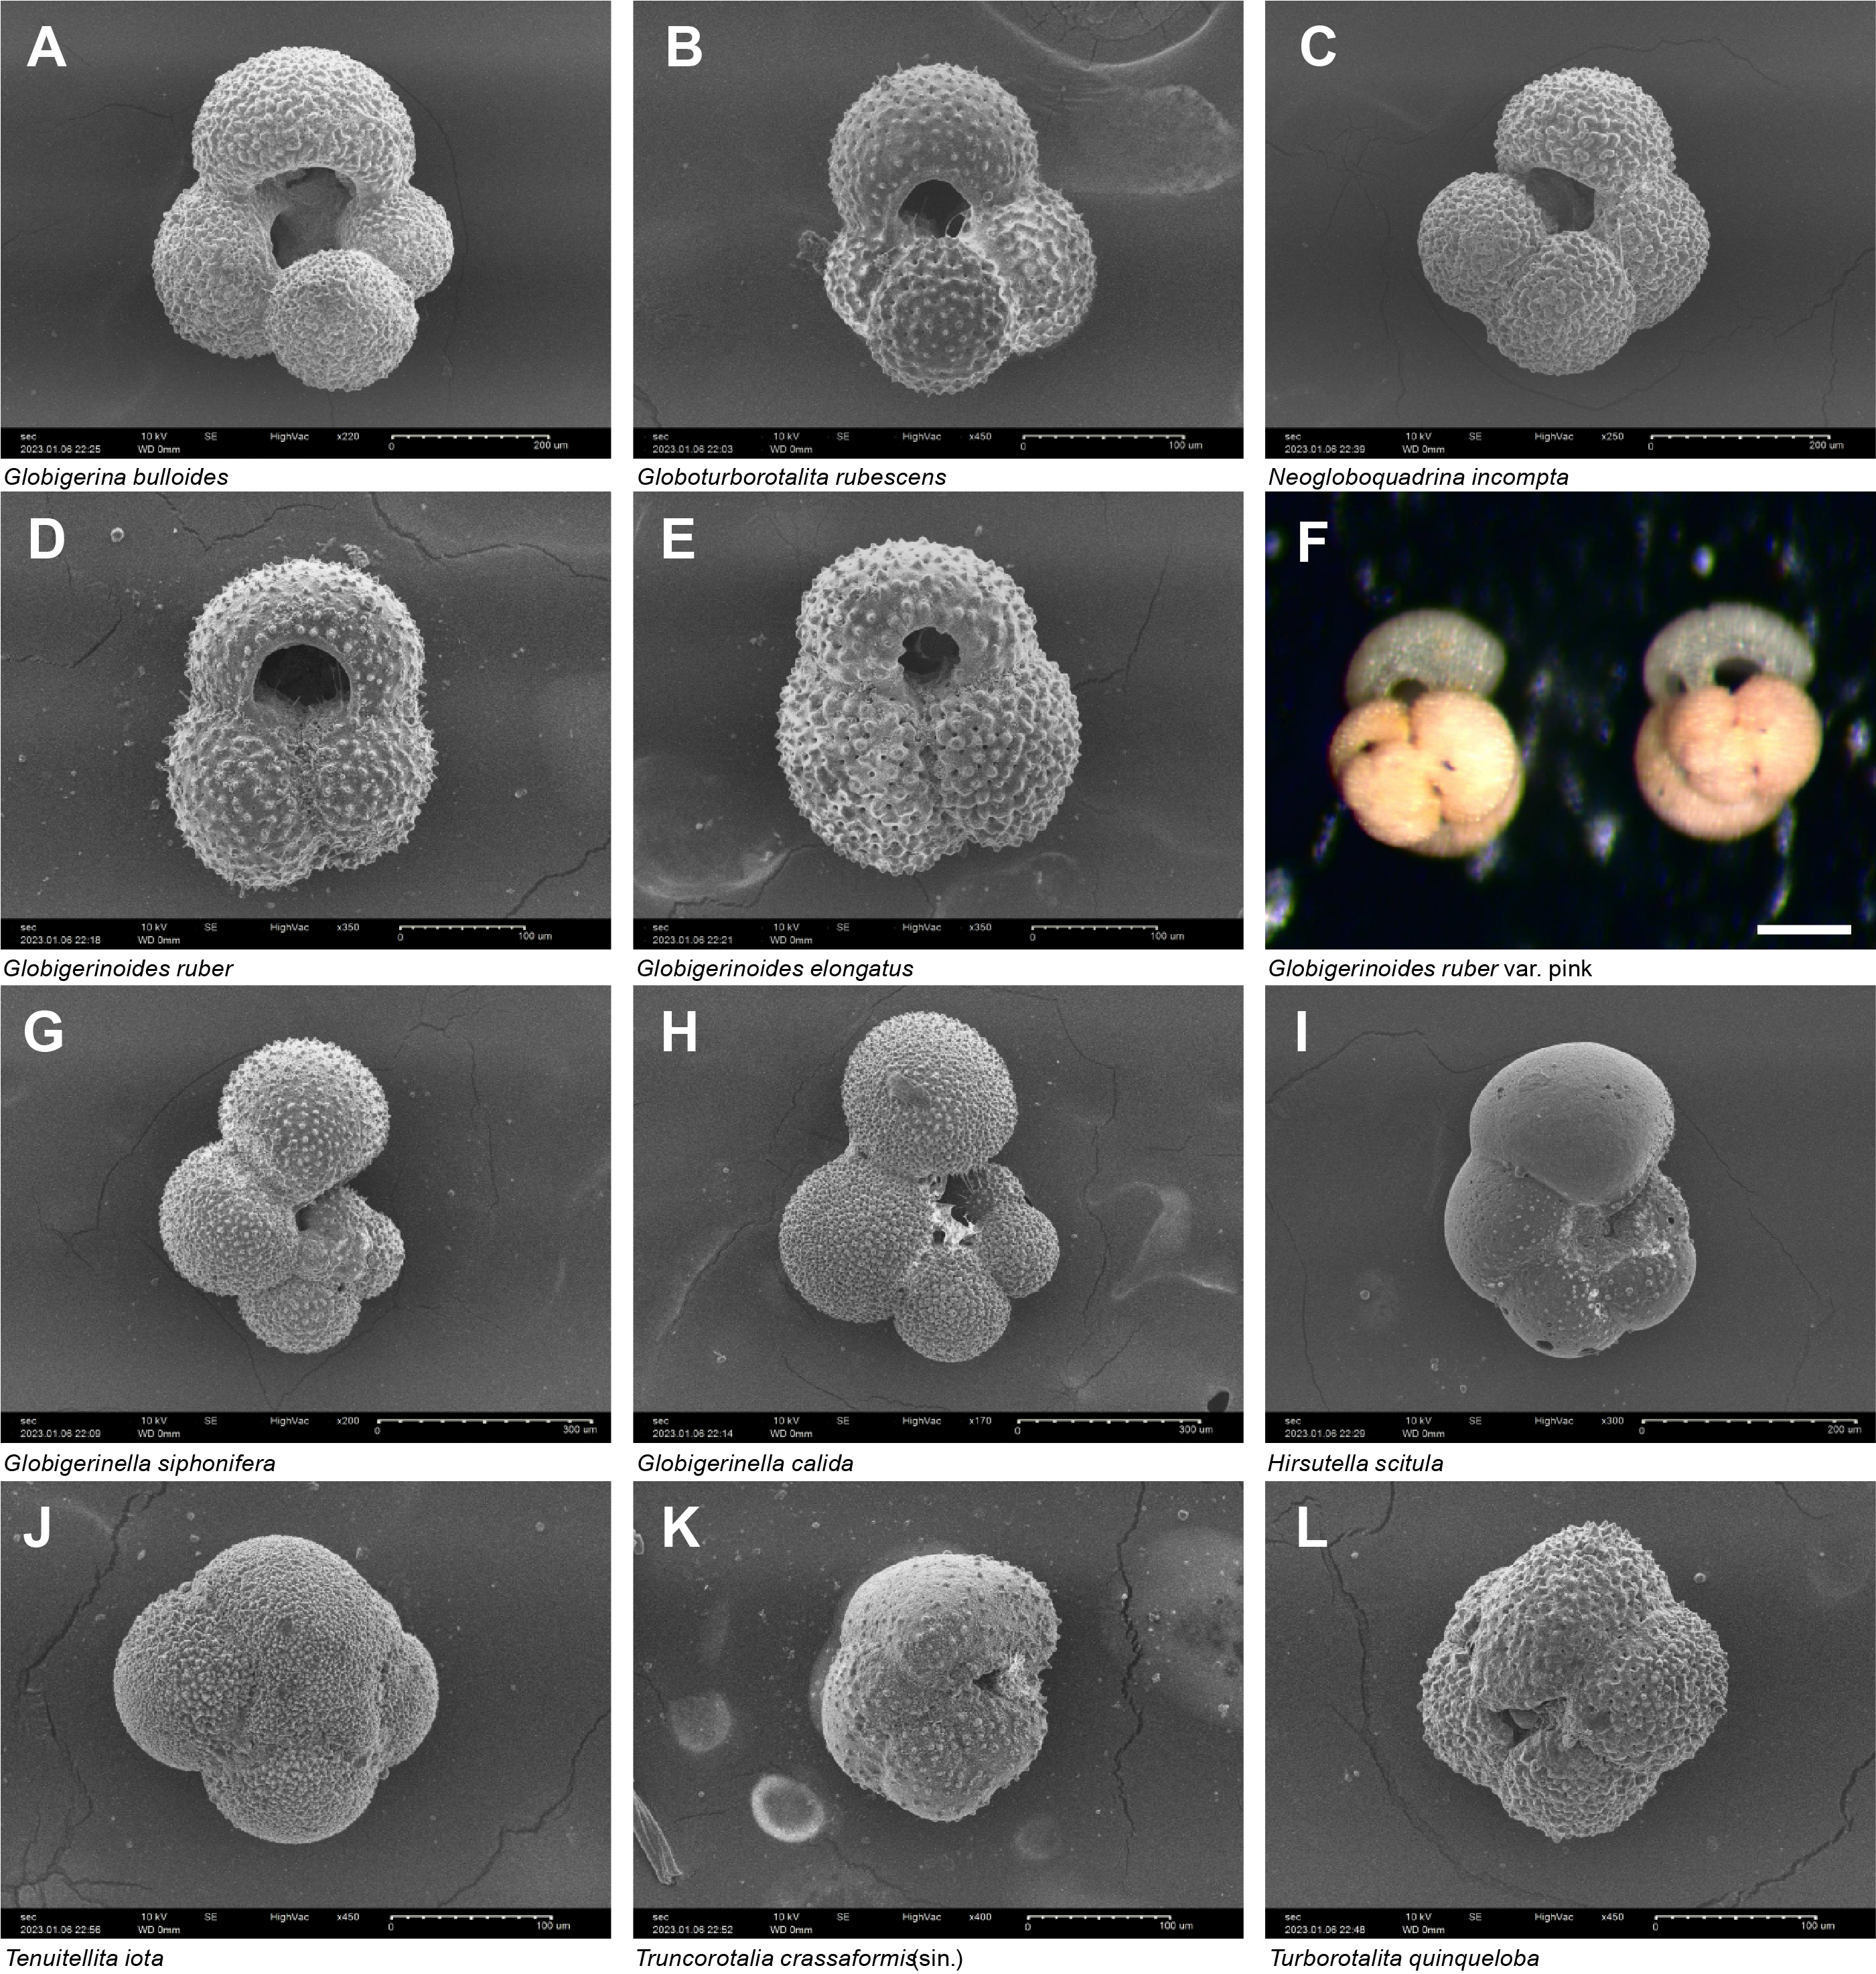
Figure F16. Planktonic foraminifer species.
6.2.3. Benthic foraminifera paleowater depths
Benthic foraminiferal assemblages are highly variable and interpreted as very abundant in situ faunas, primarily reworked/transported specimens, and totally barren samples. The low abundance or complete absence of benthic foraminiferal fauna in some samples (e.g., 398-U1590A-1H-1, 49–51 cm, to 2H-CC, 8–9 cm [0.51–12.02 mbsf], and 7H-CC, 15–19 cm, to 9H-CC, 7–10 cm [59.85–73.86 mbsf]) is possibly correlated with rapid emplacement of volcaniclastic sediments and/or inhospitable environmental conditions. The benthic foraminifer distributions in Hole U1590A (0.07–91.43 mbsf) and in Samples 398-U1590B-2R-CC, 17–20 cm, to 20R-CC, 0–2 cm (93.2–267.56 mbsf), indicate uppermost to upper bathyal (300–600 mbsl) paleowater depths (Figure F16), containing common and abundant benthic foraminifera of the upper bathyal species Cibicides pachyderma, Gyroidina spp., Bolivina dilatata, Amphicoryna scalaris, and Hyalinea balthica (Figure F17; Table T7). However, although species of lower bathyal markers including Cibicidoides wuellerstorfi and rare Articulina tubulosa are present in Samples 398-U1590A-6H-CC, 14–19 cm (51.61 mbsf), and 11H-1, 104–106 cm (90.86 mbsf), they were considered as transported, as were typical shelf species that were excluded from the interpretations. Samples 398-U1590B-21R-CC, 0–2 cm, to 31R-CC, 0–2 cm (279.03–374.44 mbsf), display mid- to lower bathyal paleowater depths (600 to >1000 mbsl), as indicated by the presence of C. wuellerstorfi and Cibicidoides mundulus along with Oridorsalis umbonatus, Trifarina spp., and Siphonina spp. Samples 39R-CC, 12–13 cm, to 49R-CC, 7–9 cm (450.53–551.99 mbsf), exhibit uppermost to upper bathyal paleowater depths (300–600 mbsl). Additionally, samples in various intervals exhibit rare broken and reworked foraminifer faunas and in some cases abundant specimens, such as in Samples 398-U1590A-8H-CC, 6–9 cm (63.32 mbsf), and 398-U1590B-56R-1, 58–60 cm, to 56R-CC, 0–5 cm (615.9–618.64 mbsf), likely representing downslope reworking and sediment transportation (Figure F16).
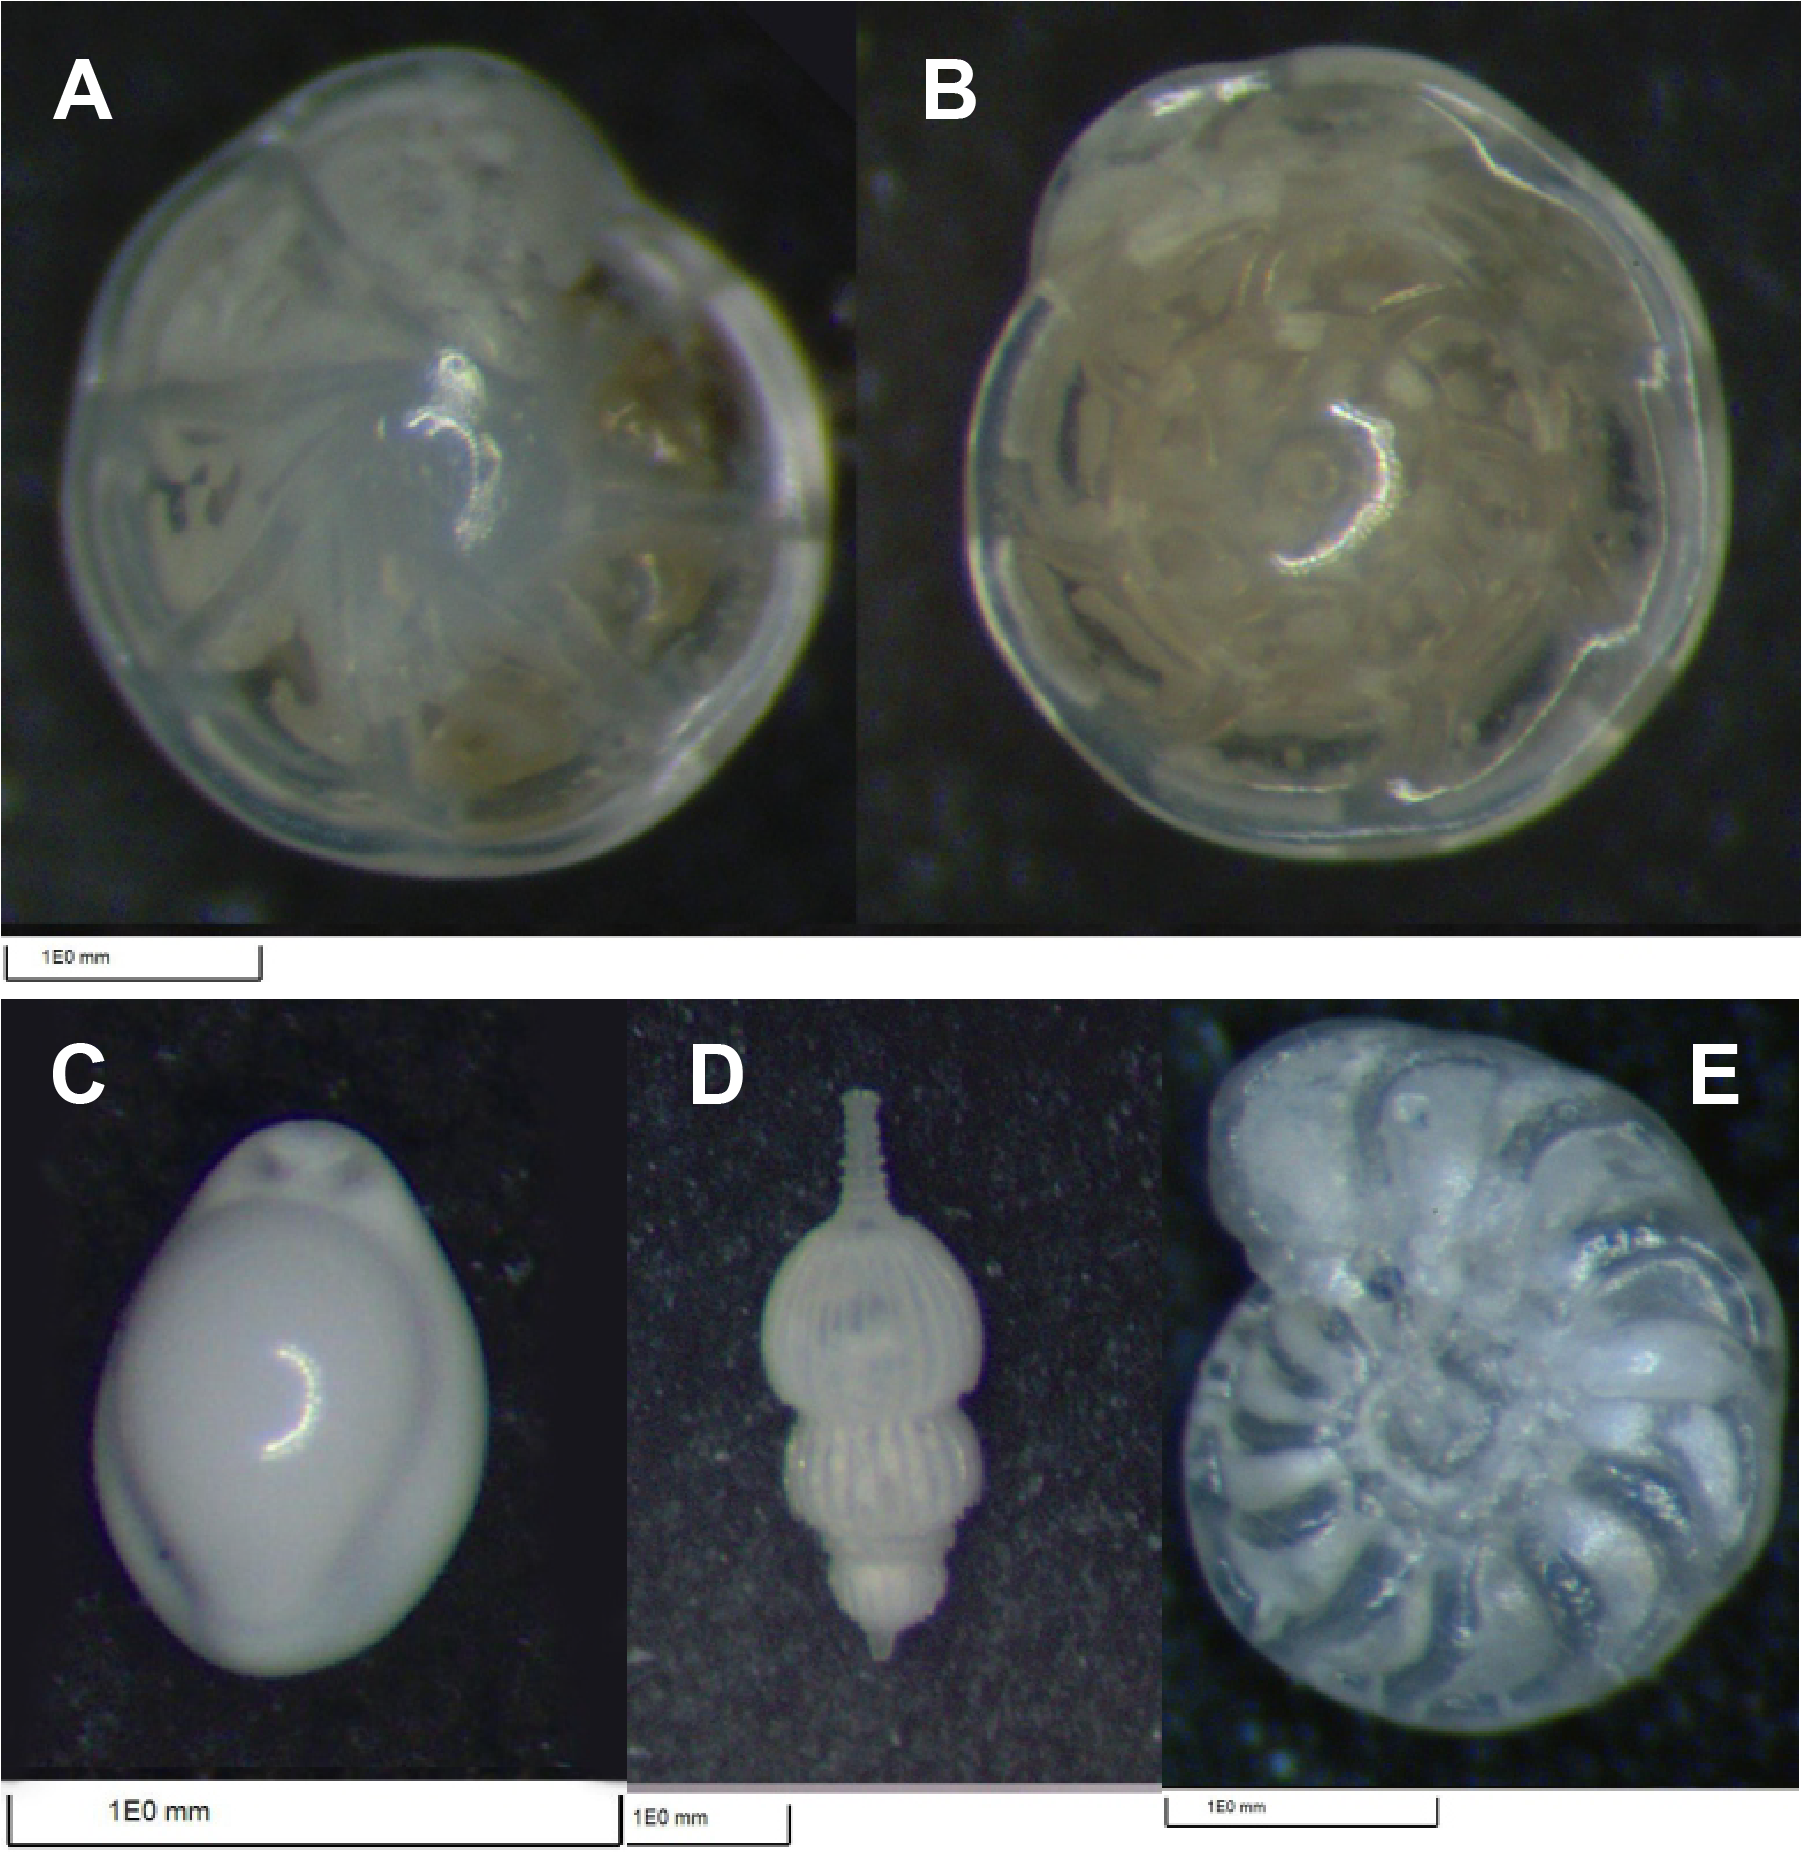
Figure F17. Benthic foraminifer species.
7. Paleomagnetism
Paleomagnetic analysis at Site U1590 focused on measurement and demagnetization of archive-half sections and 31 discrete samples to determine magnetostratigraphic age controls. The low overall recovery in Hole U1590B resulted in a restricted distribution of magnetic data downhole, and no reversal boundaries could be established. Nevertheless, by referring to biostratigraphic age constraints it was possible to make the following correlations with the geomagnetic polarity timescale (Gradstein et al., 2020): (1) interval 0–393 mbsf correlates with the Brunhes Chron (Chron C1n) and is therefore <0.773 Ma, (2) interval 470–491 mbsf corresponds to the Jaramillo Subchron (Chron C1r.1n) and was deposited within the period 1.008–1.076 Ma, and (3) interval 617–628 mbsf carries a reversed magnetization that was acquired during Chron C1r.2r (1.076–1.189 Ma).
7.1. Downhole variations in magnetic characteristics
Remanence measurements were made on archive-half section pieces recovered during Expedition 398 by APC and RCB coring in Holes U1590A and U1590B, respectively, using the 2G Enterprises Model 760R-4K superconducting rock magnetometer (SRM) system. Remanences were measured every 2 cm and were filtered to reject data from points within 8 cm of section ends. This produced a data set consisting of natural remanent magnetization and alternating field (AF) demagnetization data (after applied fields of 15, 20, and 25 mT) measured at 2577 intervals downhole. Point susceptibility data obtained from the archive-half sections were also filtered to preserve only data corresponding to the intervals where remanence measurements were made. In addition, 31 discrete samples were subject to AF demagnetization in maximum applied fields of up to 50–100 mT (in some cases up to 200 mT) to help constrain magnetic polarities. Some discrete samples were also thermal demagnetized at 85°C prior to AF demagnetization to partially remove any magnetic components carried by greigite (see Paleomagnetism in the Site U1589 chapter [Druitt et al., 2024]).
Downhole variations in magnetic properties are shown in Figure F18, and examples of demagnetization behavior of archive-half section and discrete samples are shown in Figure F19. The most significant change in bulk magnetic parameters occurs at ~350 mbsf, where there is a marked decrease in low-field MS, magnetization intensity, median destructive field, and the parameter Int25mT/k (Figure F18). This corresponds to a decrease in the proportion of volcanic and tuffaceous sediment in the hole below this depth (Figure F4).
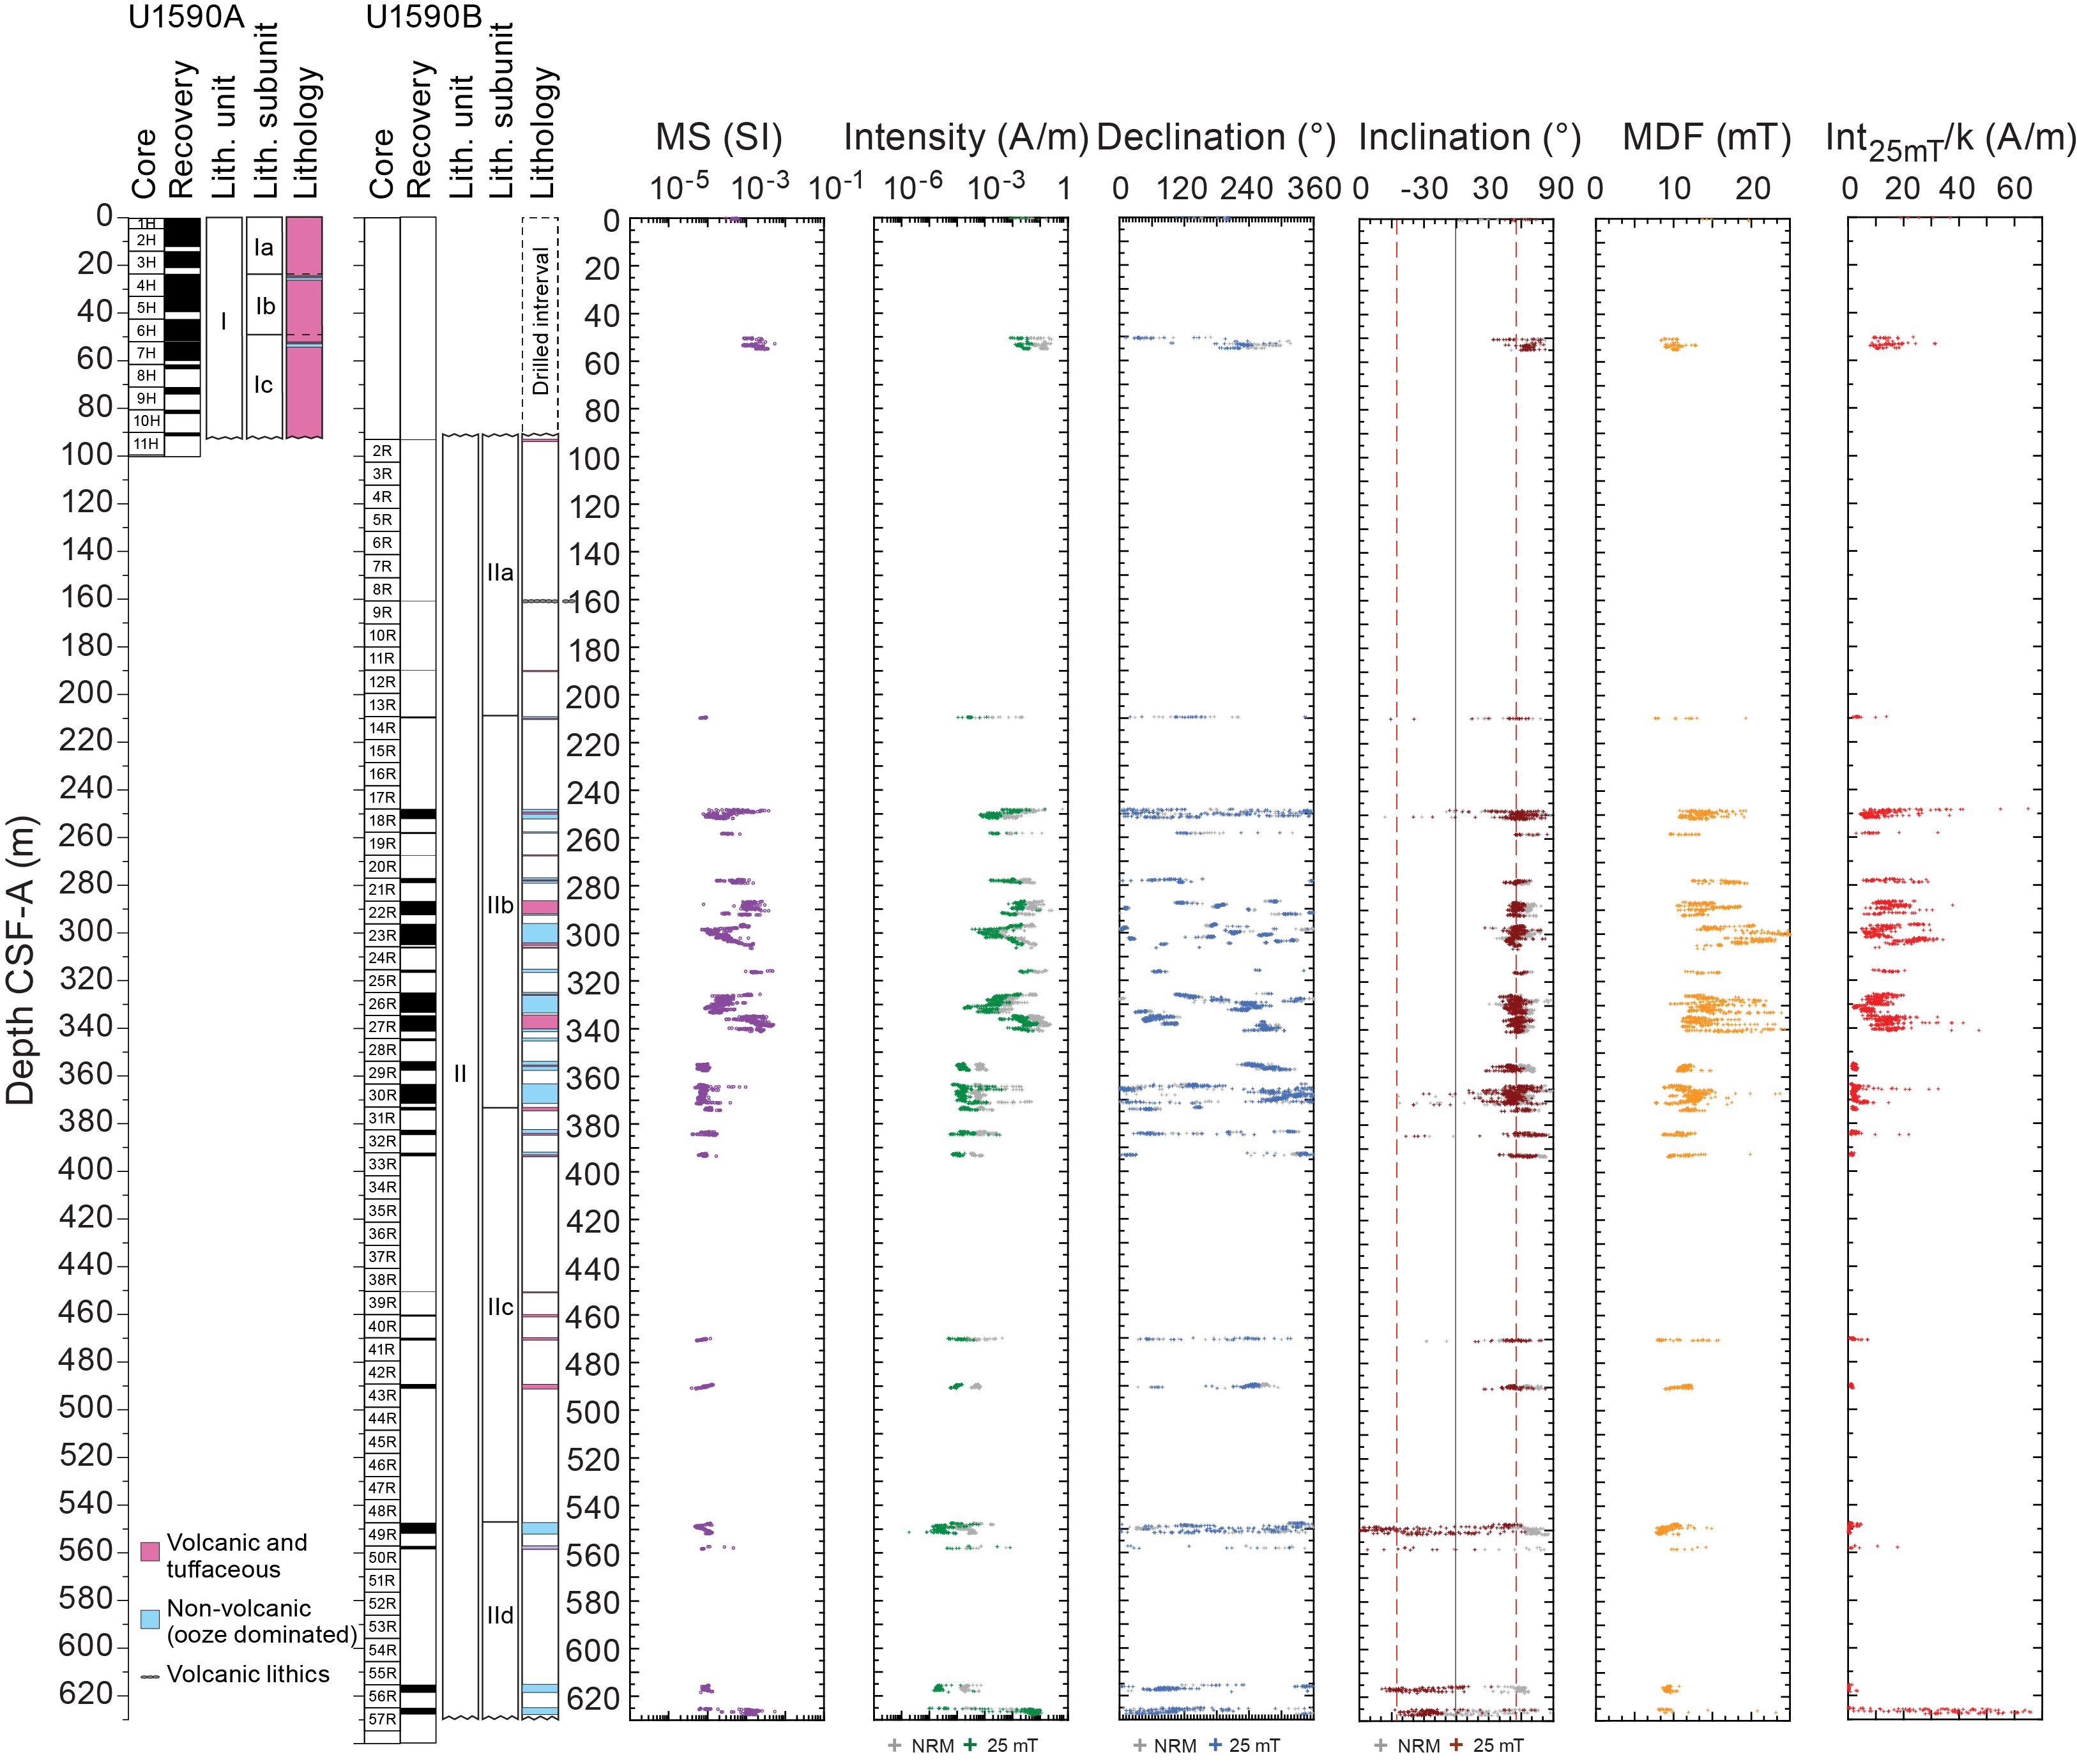
Figure F18. Magnetic data.
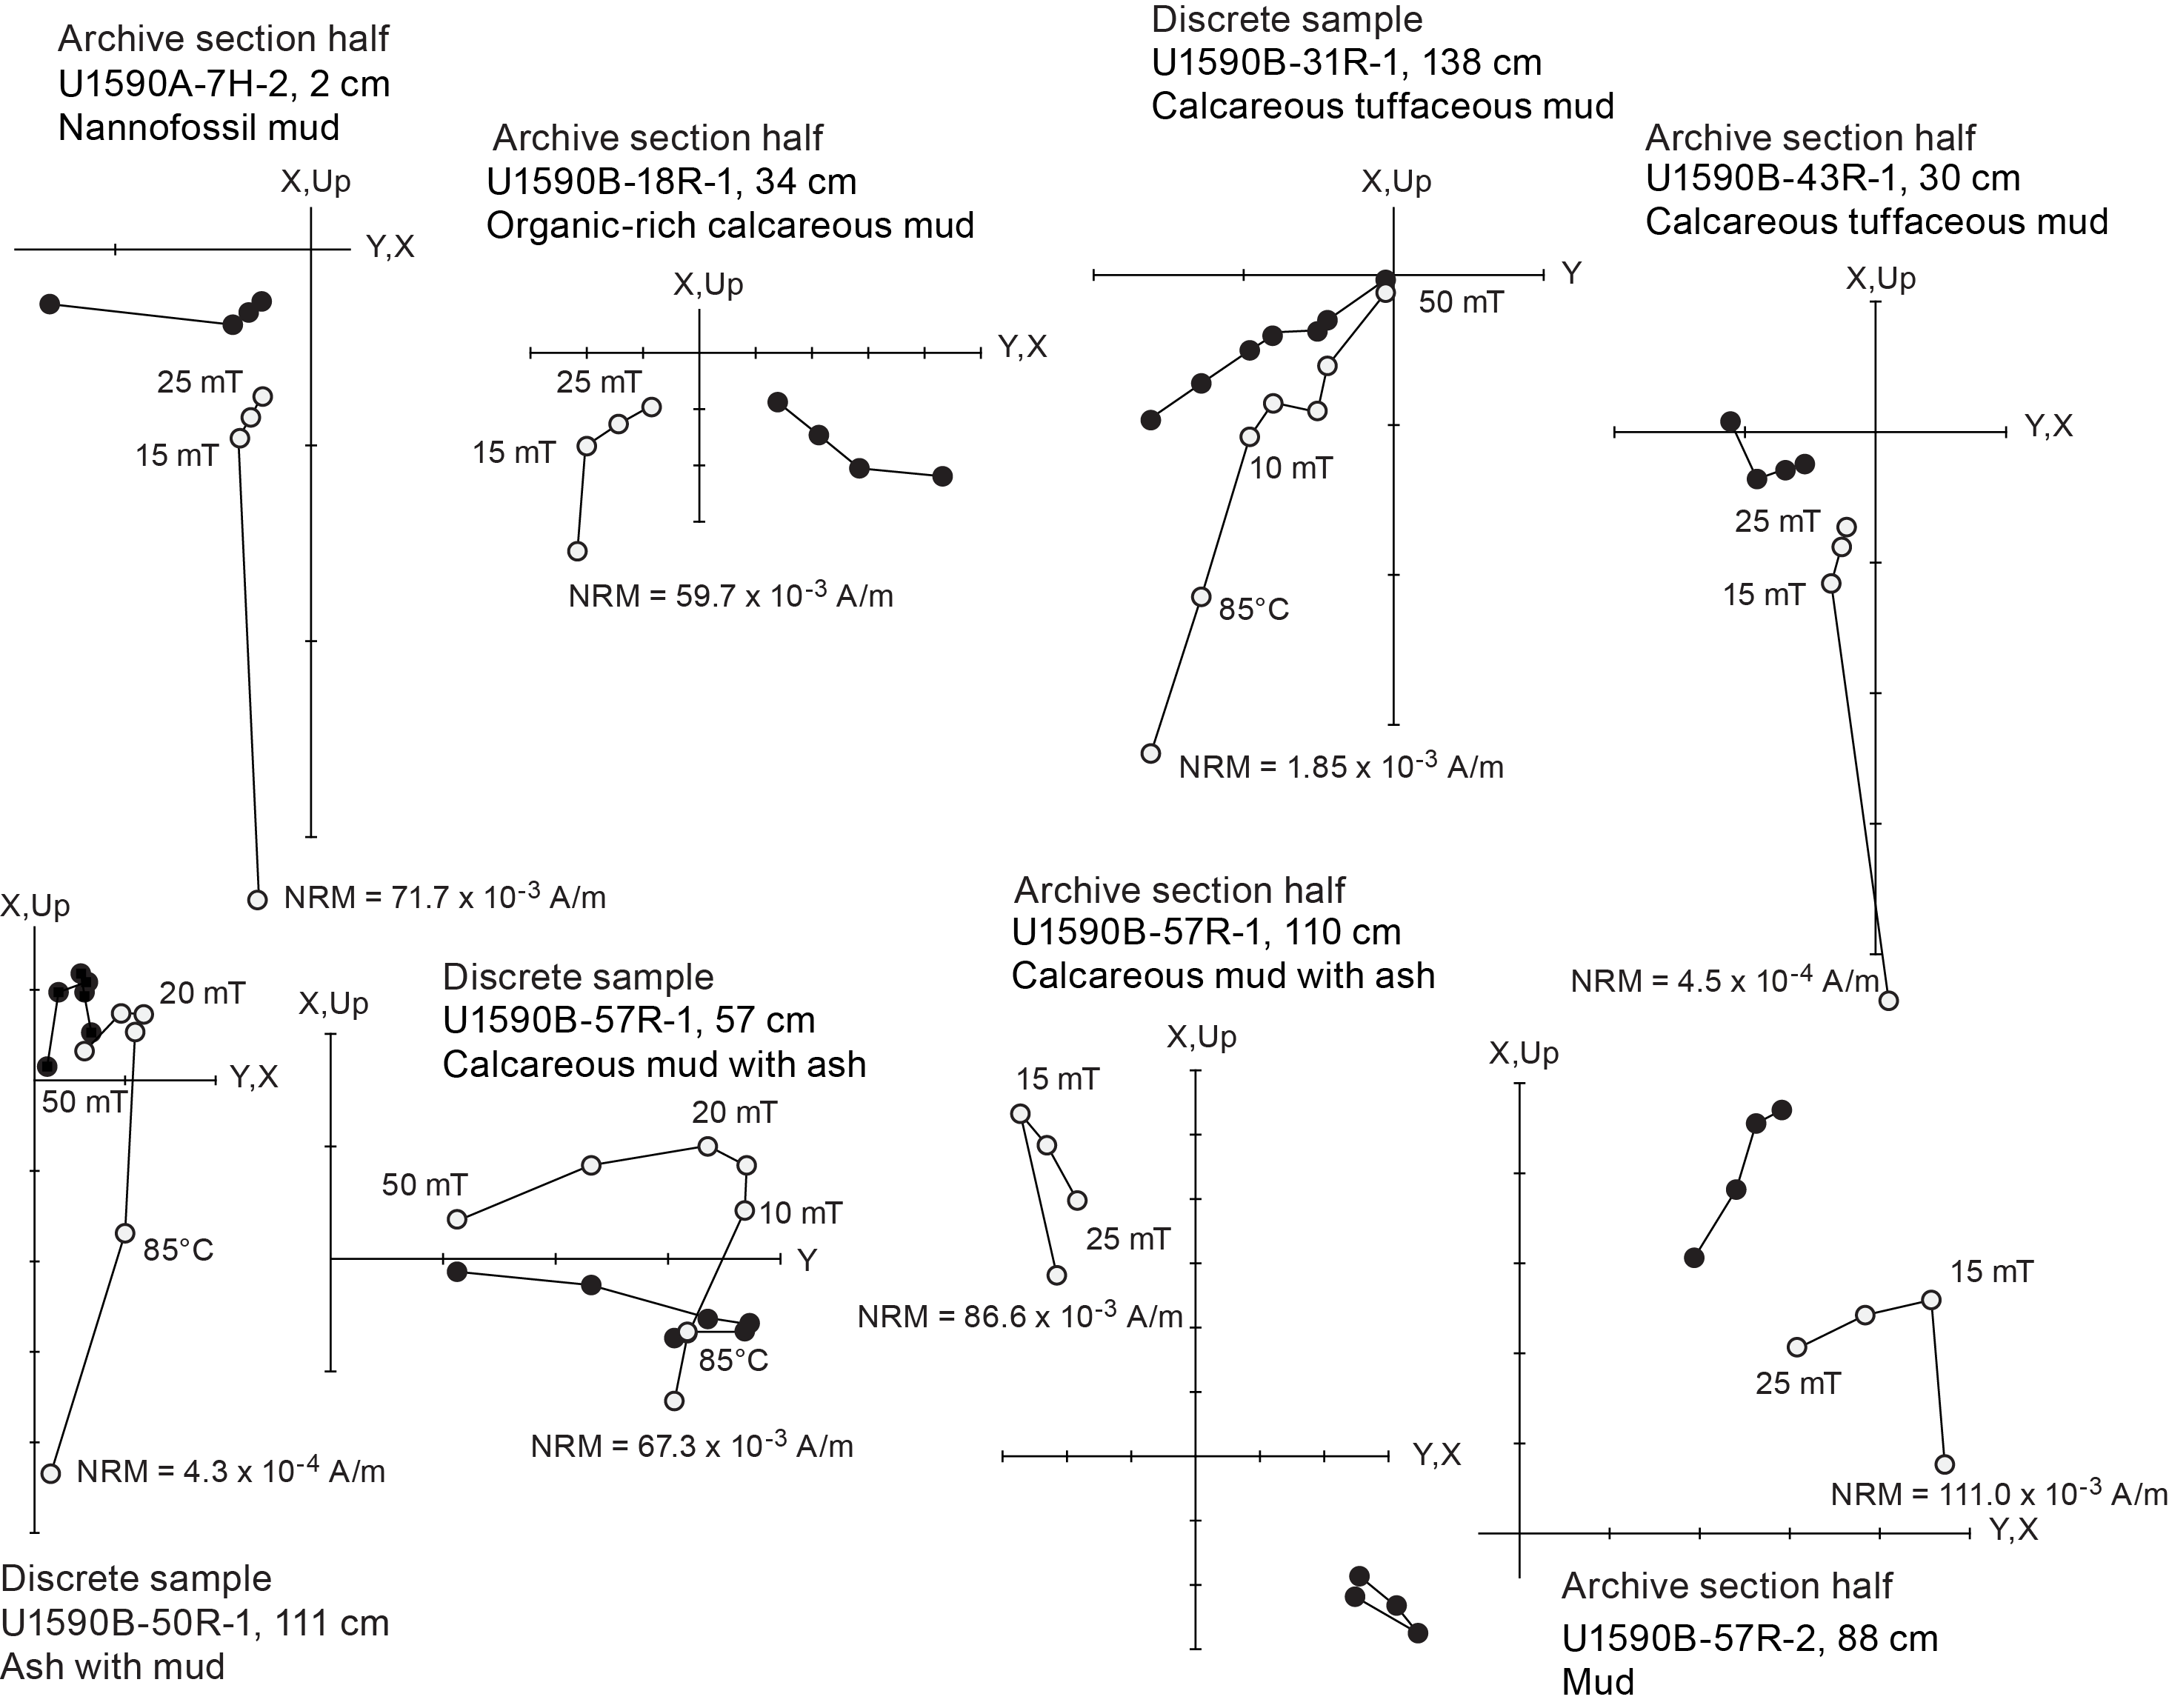
Figure F19. AF demagnetization.
7.2. Correlations with the geomagnetic polarity timescale
Downhole variations in inclination (following demagnetization at 25 mT) are shown in Figure F18. The mean inclination of interval 0–393 mbsf is 56.2° (k = 38.9; α95 = 1.2; n = 1973). This agrees perfectly with the geocentric axial dipole field inclination of 56° at Site U1590, confirming that this interval carries a normal polarity magnetization acquired in the Brunhes normal polarity period (Chron C1.n) and is consistent with a biostratigraphic marker for 0.61 Ma at 372 mbsf (see Biostratigraphy). The interval 470–491 mbsf also displays a normal polarity magnetization (mean inclination = 53.8°; k = 31.5; α95 = 2.2; n = 105) and lies between biostratigraphic markers for 0.901 Ma at 466 mbsf and 1.078 Ma at 481 mbsf (see Biostratigraphy). This interval may therefore be correlated with confidence to the Jaramillo Subchron (Chron C1r.1n; 1.008–1.076 Ma). In contrast to the rest of the record from this site, inclinations between 548 and 558 mbsf are widely scattered (Figure F18), suggesting that this interval may be affected by diagenetic alteration of the original magnetic assemblage. One discrete sample analyzed in this interval, however, has a clear reversed polarity (Sample 398-U1590B-50R-1, 111 cm; Figure F19). In addition, the last two cores sampled at this site (617–628 mbsf) display negative inclinations (mean = 33.7°; k = 11.8; α95 = 2.6; n = 222). These data are therefore consistent with the interval 548–628 mbsf acquiring magnetizations during the Matuyama Chron (Subchron C1r.2r; 1.076–1.189 Ma). This is consistent with biostratigraphic markers for 1.12 Ma at 521.5 mbsf and <1.21 Ma at 623.2 mbsf (see Biostratigraphy).
8. Physical properties
Volcaniclastic materials (ash, lapilli-ash, and lapilli) in the uppermost 90 m at Site U1590 exhibit large variations in MS. These subunits sometimes have low grain densities (<2.0 g/cm3). Lithostratigraphic Unit II muds and oozes between 300 and 370 mbsf show cyclic variations in NGR. Poor recovery in both Holes U1590A and U1590B limits the ability to document continuous variations in physical properties over more than several tens of meters.
8.1. Whole-round GRA density, MS, P-wave velocity, and NGR
Figures F20 and F21 summarize data collected on whole-round cores measured using the GRA densitometer, MS loop, and P-wave logger on the Whole-Round Multisensor Logger (WRMSL) and NGR. All cited depths are given using the CSF-A scale. Whole-round P-wave velocity was not measured for Hole U1590B because RCB cores do not fill the core liner. There are several sources of systematic error in these data that should be considered when interpreting values and trends.
- In Hole U1590A, water-rich cored materials are redistributed in the core liner producing, for example, downhole zigzag patterns of measured properties (e.g., GRA bulk density values at 3–10 mbsf).
- Recovered cores of unconsolidated materials can contain large amounts of extra water that lower the values of all physical property measurements made on whole-round cores.
- During RCB coring of Hole U1590B, the core liners were not full, and whole-round measurements of density, MS, and NGR will be systematically lower than true values in proportion to the fraction of the liner that was filled. This effect is quantified by a comparison of WRMSL and discrete measurements of density (Figure F21).
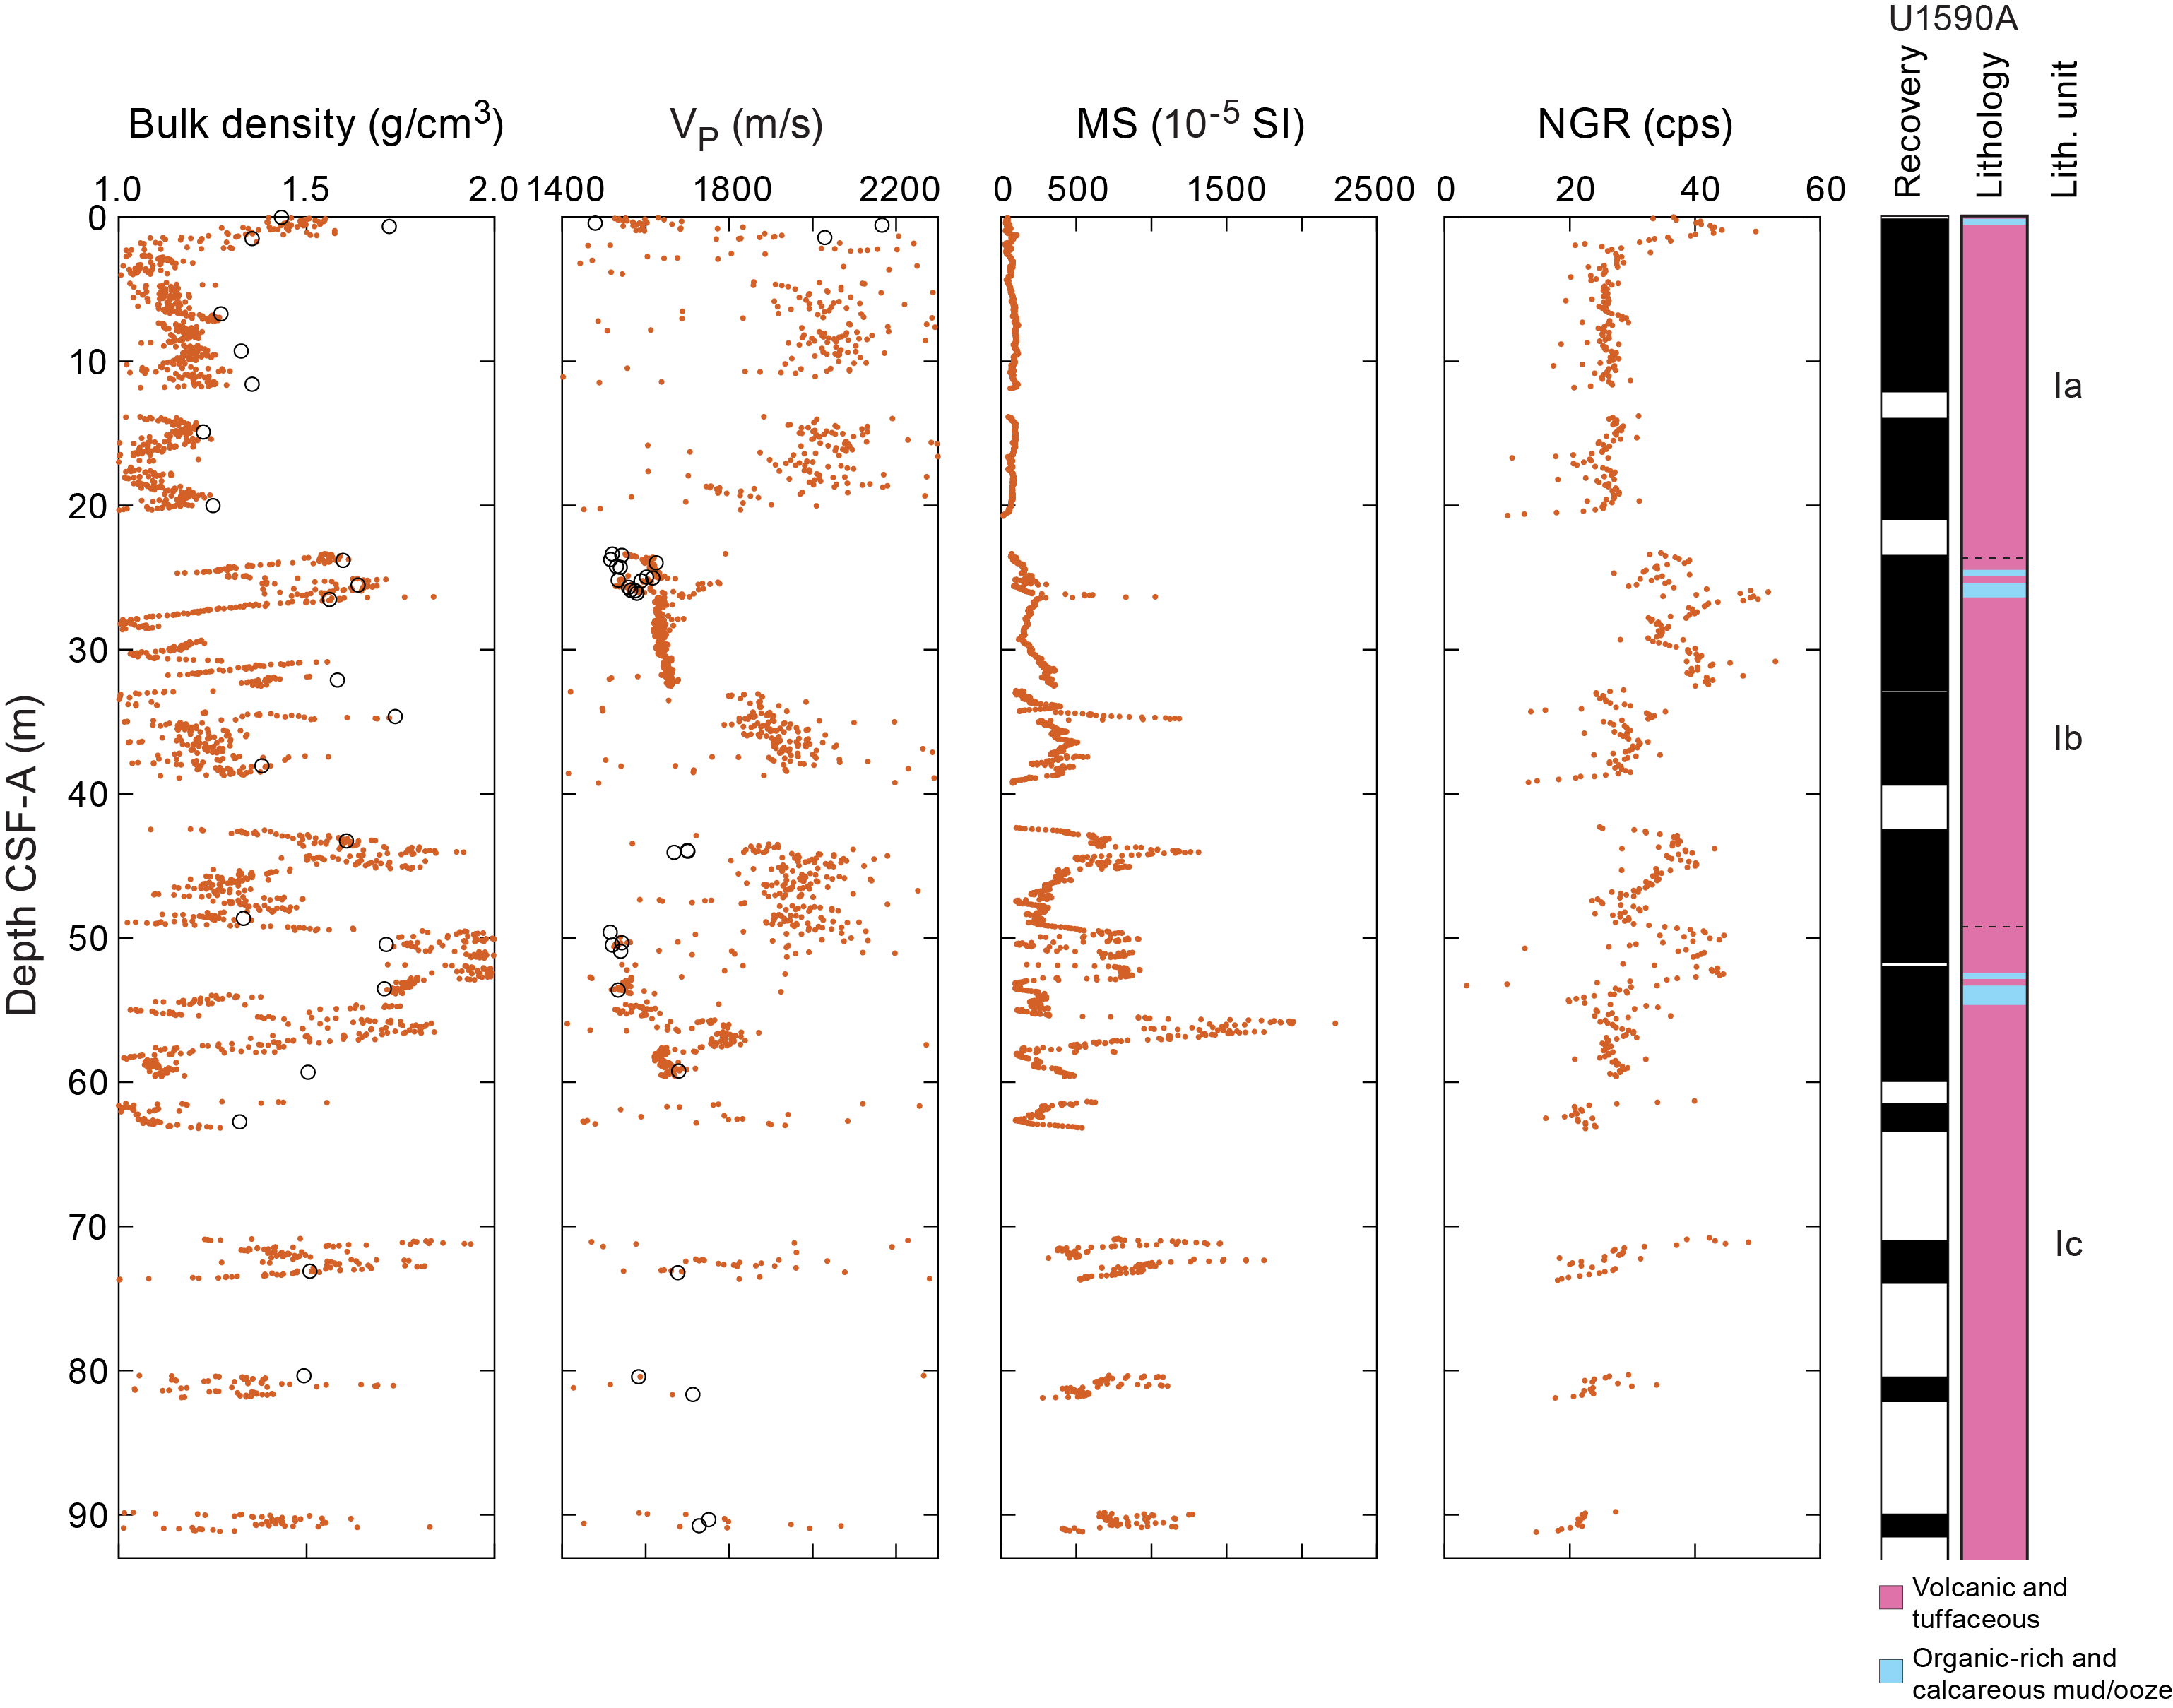
Figure F20. Physical properties, Hole U1590A.
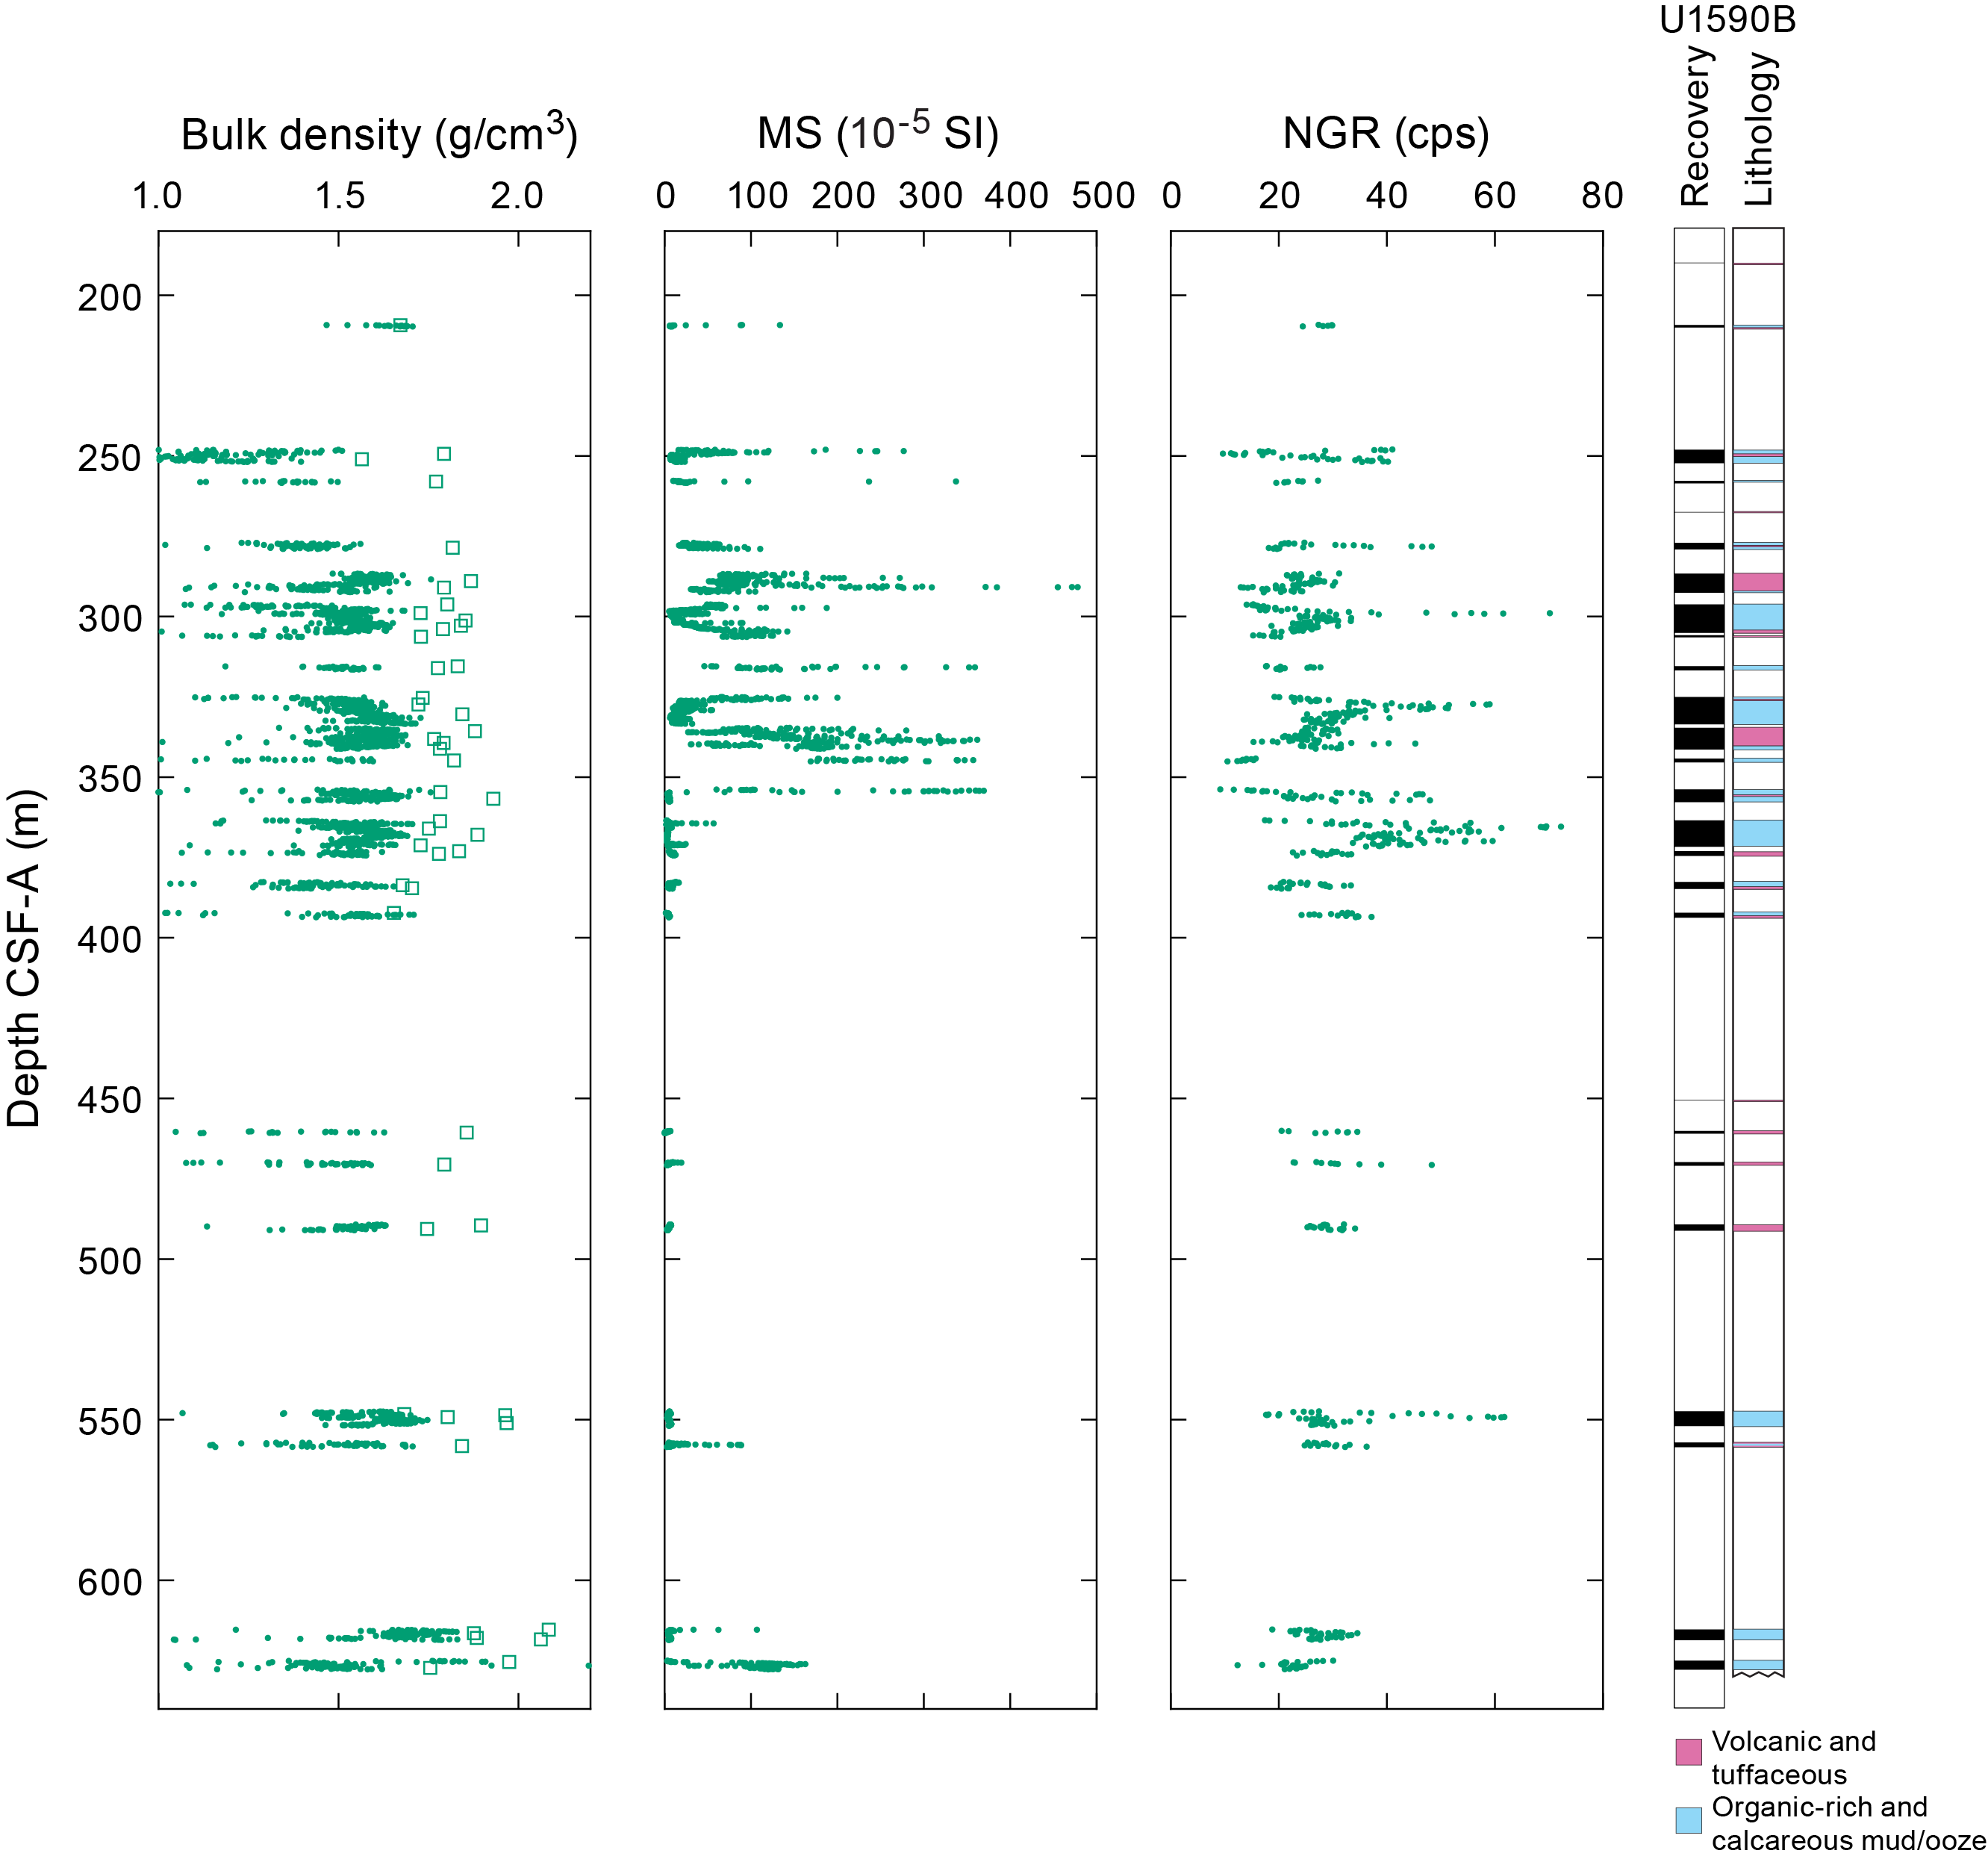
Figure F21. Physical properties, Hole U1590B.
MS is highly variable in the volcaniclastic deposits at this site. For example, volcaniclastic Lithostratigraphic Subunit Ia (see Lithostratigraphy) in the uppermost 21 m typically has MS values <100 × 10−5 SI, whereas Subunits Ib and Ic have values that can exceed 1000 × 10−5 SI at 26, 35, 44, 56, 72, 81, and 90 mbsf. These variations arise from differences in relative abundance of ferromagnetic minerals such as magnetite. No other whole-round measurement shows clear downhole trends over the cored interval. NGR measurements on whole-round cores with good recovery (Cores 398-U1590B-23R, 26R, 27R, and 30R) show, at least qualitatively, cyclic variations in Unit II muds and oozes between 300 and 370 mbsf.
8.2. Discrete measurements
8.2.1. Material strength
Sediment strength was measured with a pocket penetrometer (PP) on the catwalk immediately after section splitting. Automated vane shear (AVS) strength measurements were made on working-half sections (Table T8). The compressional strength measured using the PP is divided by 2 as an estimate of shear strength and converted to kilopascals from the force measurement (see Physical properties in the Expedition 398 methods chapter [Kutterolf et al., 2024]). Measurements were only made in fine-grained materials that remained intact in core liners upon recovery on the catwalk.
Figure F22 shows shear strength as a function of depth for Hole U1590A. No general trend is observed, possibly because of the sparse number of measurements, coarse grain size of recovered material, and shallow coring depths. In Hole U1590B, sediment was too stiff for successful AVS and PP measurements.
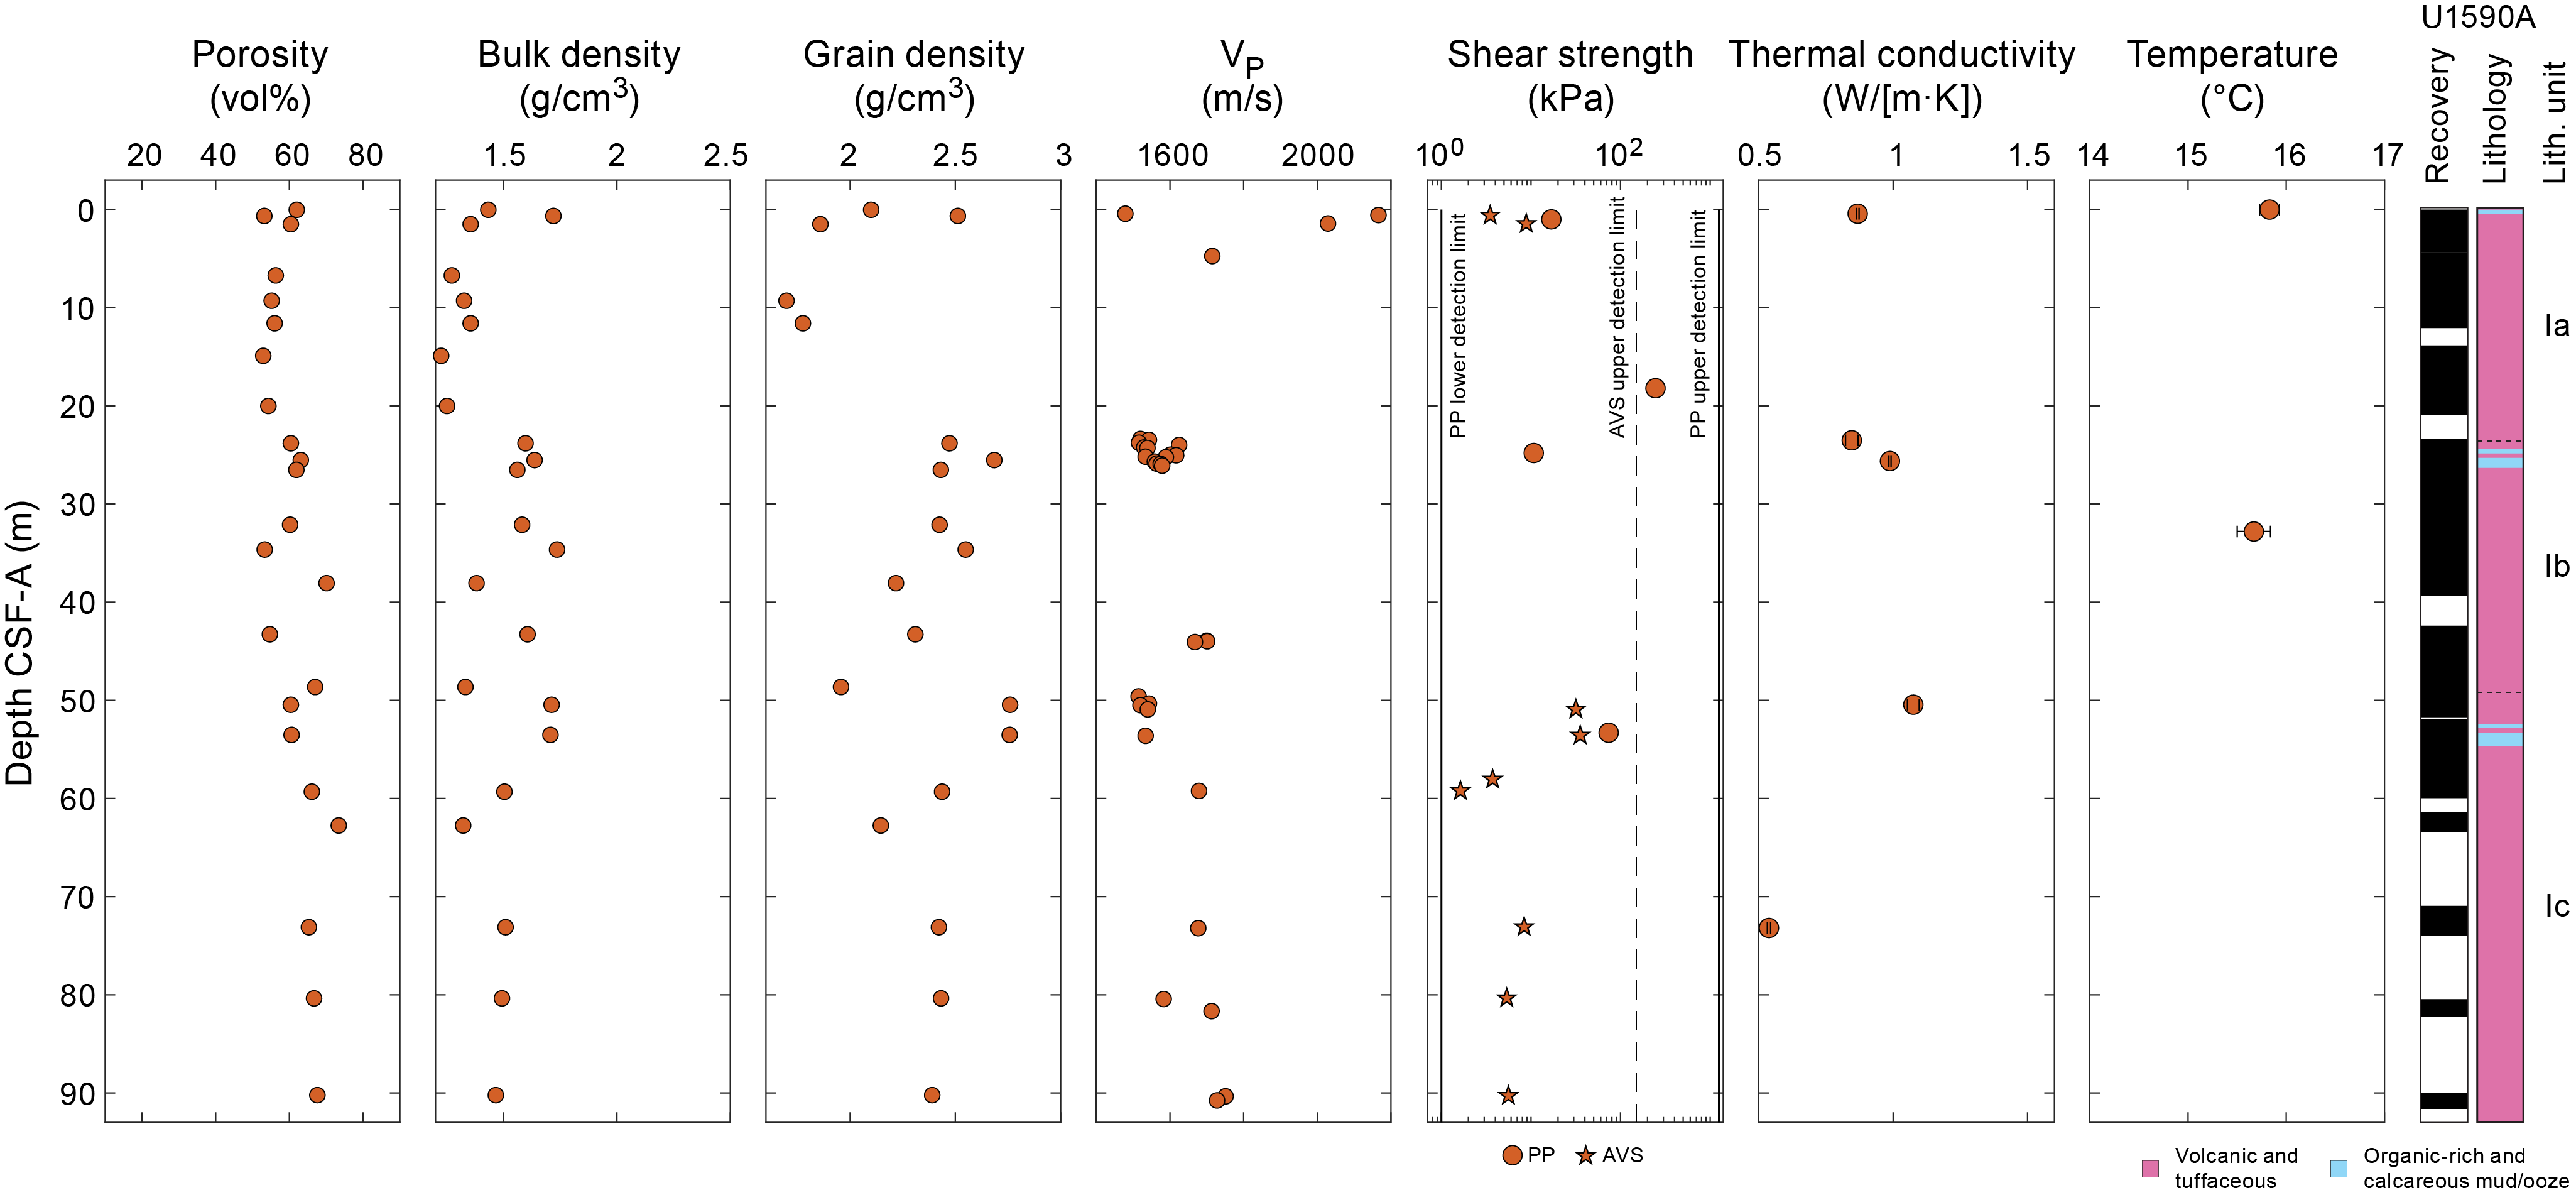
Figure F22. Discrete measurements, Hole U1590A.
8.2.2. P-wave velocity
Discrete measurements of P-wave velocity on working-half sections follow the trend observed in WRMSL measurements on whole-round cores of Hole U1590A (Figure F20). Discrete measurements are more reliable than WRMSL measurements because the calipers measure the P-wave velocity of cored materials by direct contact, whereas the WRMSL measures core liners that contain water pockets, fractures, and other gaps in the recovered materials.
Totals of 32 and 360 P-wave velocity measurements in the x-direction were made for Holes U1590A and U1590B, respectively (Figures F22, F23; Table T9). A best-fit to all measurements gives
where z is in kilometers and reported ± values are standard errors.
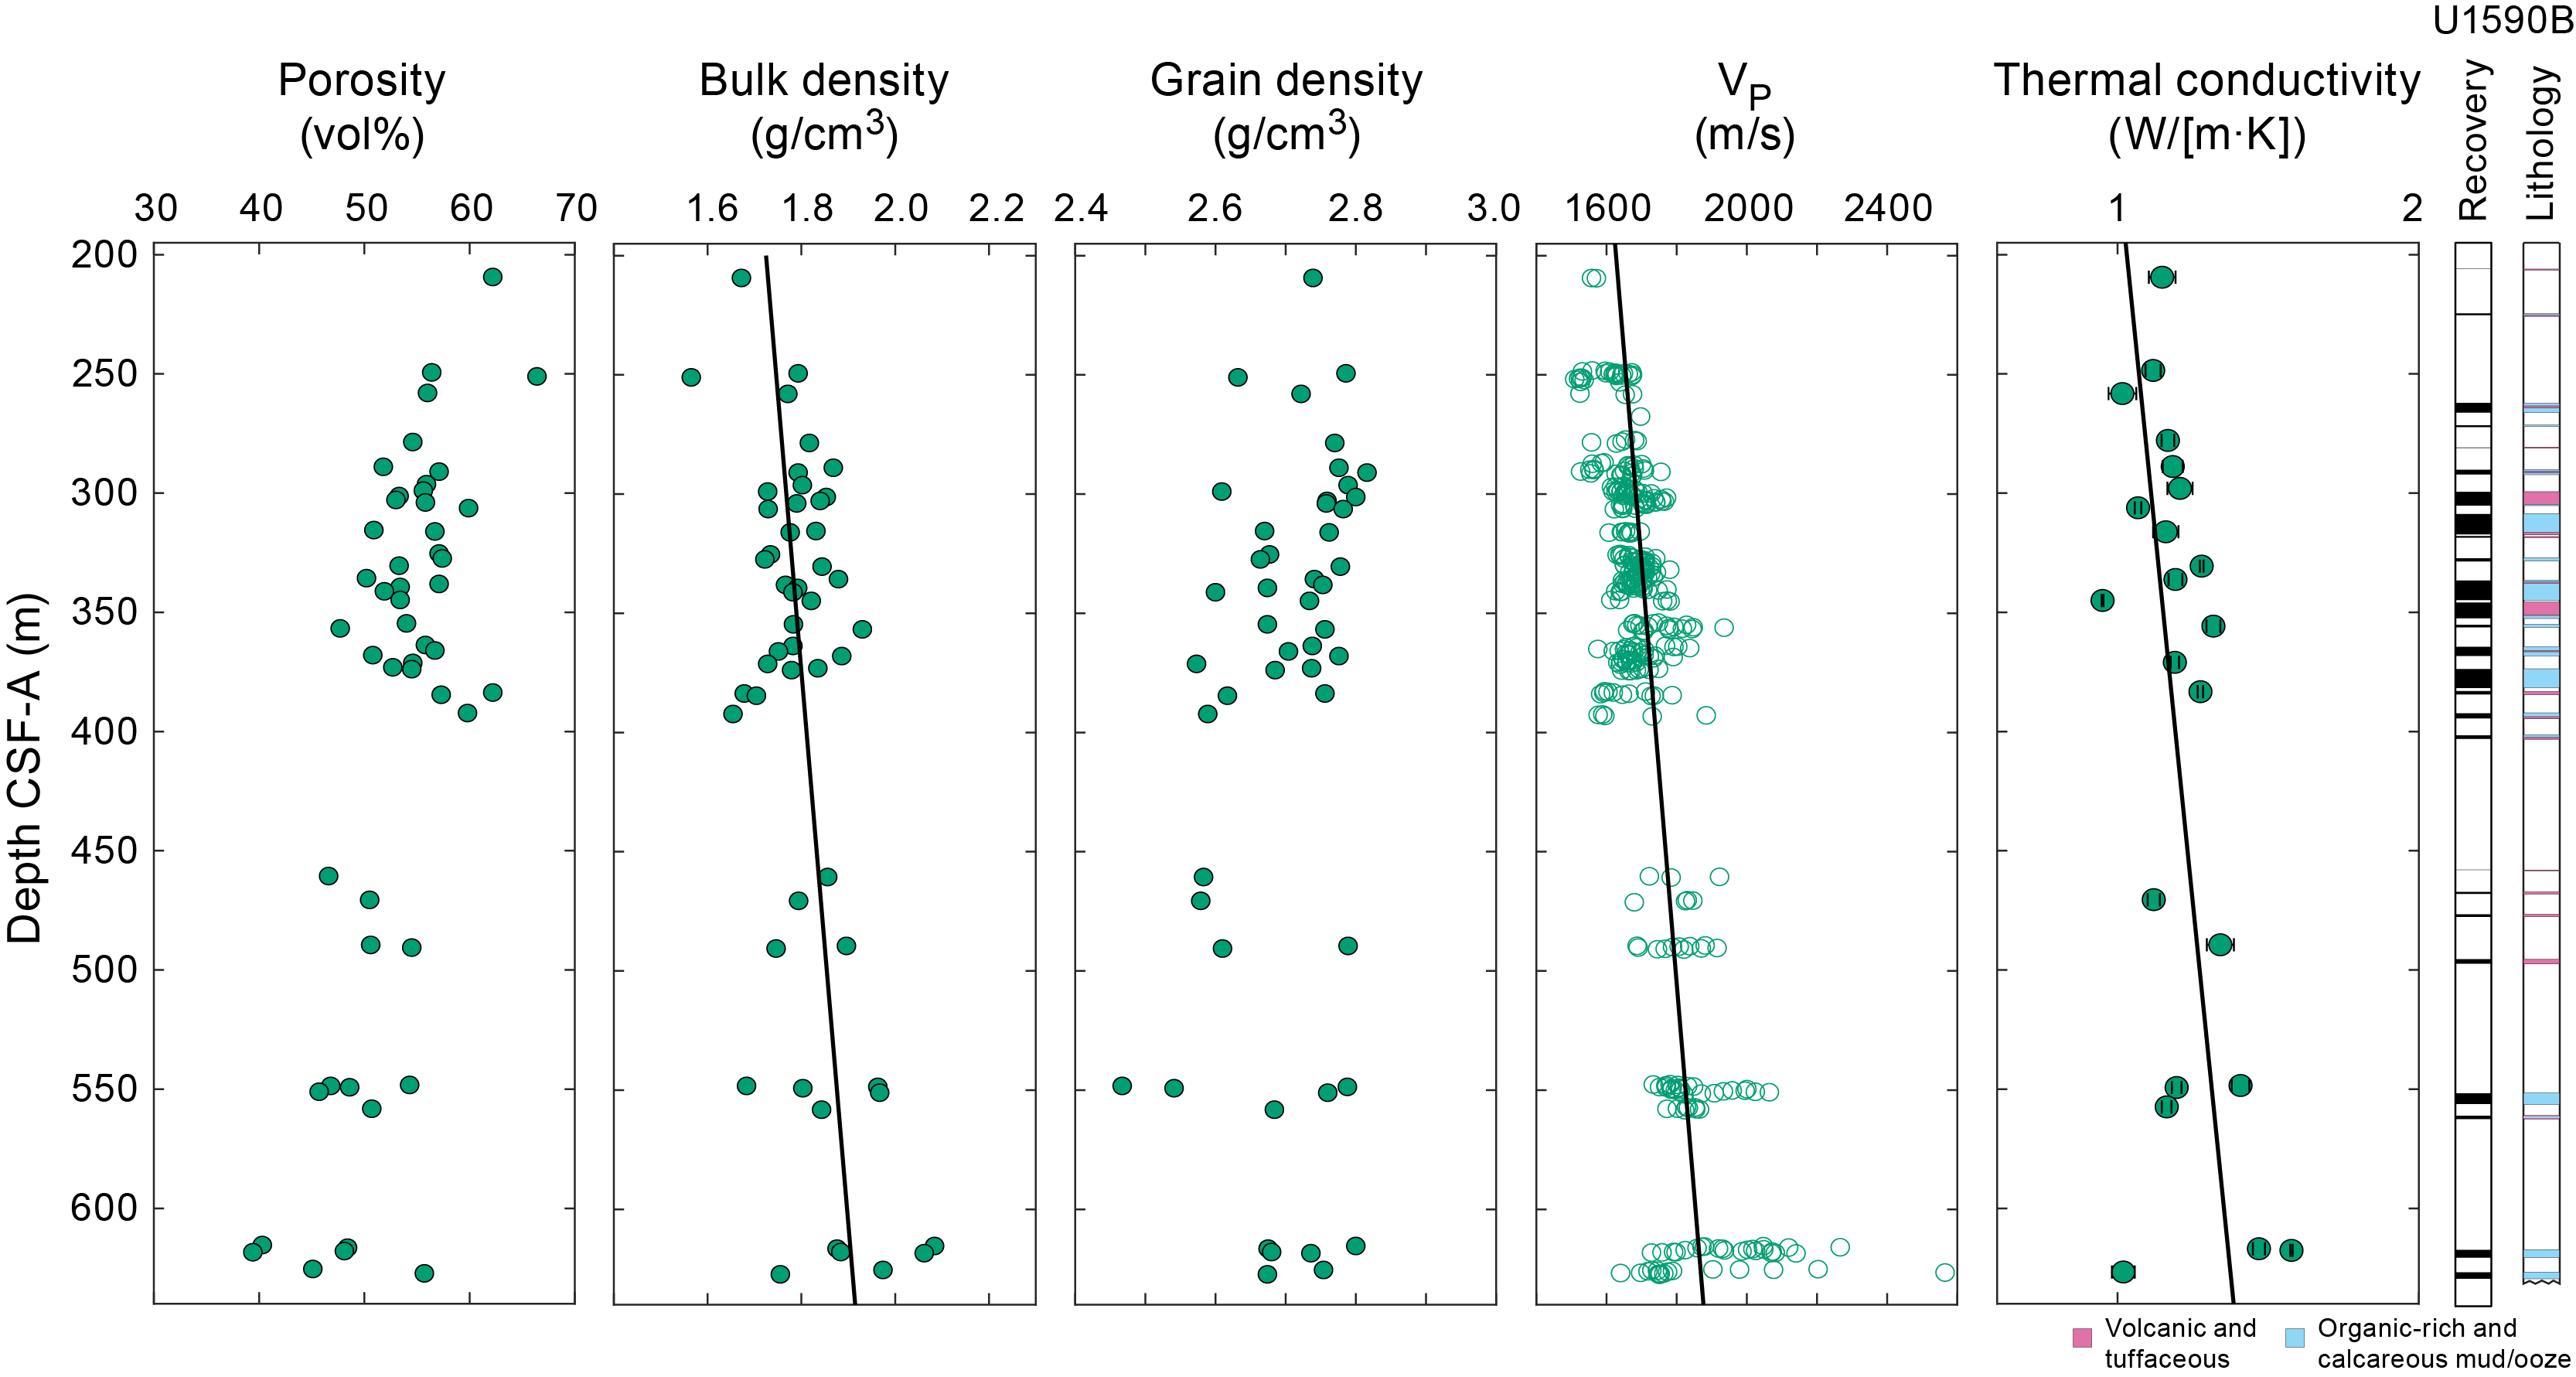
Figure F23. Discrete measurements, Hole U1590B.
8.2.3. Moisture and density
A total of 73 discrete samples were collected for moisture and density (MAD) measurements (Figures F22, F23; Table T10). Bulk density derived by MAD measurements on discrete samples are more reliable than GRA data from WRMSL measurements on whole-round cores.
Porosity ranges 39–73 vol%. Bulk density ranges 1.2–2.1 g/cm3. Bulk density is lowest in volcaniclastic materials. MAD measurements are systematically higher than values from RCB cores in Hole U1590B because cored materials do not fill the core liners (Figure F21).
Grain density ranges 1.4–2.8 g/cm3, with the low values (<2.2 g/cm3) from volcaniclastic subunits. Porosity decreases and bulk density increases with increasing depth, as expected from compaction. A least-squares fit of bulk density data from Hole U1590B is
where z is in kilometers and reported ± values are standard errors.
Eight pumice clasts were recovered in the core catcher from Core 398-U1590B-39R (450.5 mbsf). These clasts were left intact (i.e., not split into working and archive halves), saturated in seawater for 24 h to ensure that accessible pores were water-saturated, and then analyzed using standard MAD procedures. Mean bulk density is 1.51 g/cm3. Accessible porosity (i.e., porosity of the clasts that could be filled with water) has a mean of 46.4 vol% (range = 43–52 vol%). Grain density, which describes the mean density of the pumice solids (glass and minerals) but also any isolated vesicles, is 1.94 g/cm3 (range = 1.79–2.11 g/cm3).
8.2.4. Thermal conductivity
A total of 32 thermal conductivity measurements were made on selected working-half sections (Table T11). Thermal conductivity could not be measured on coarse volcaniclastic units that comprise a majority of the material in Hole U1590A Lithostratigraphic Unit I samples. Thus, an inherent sampling bias may affect mean values, variability, and trends. A least-squares linear fit to all thermal conductivity data is
where z is in kilometers and reported ± values are standard errors, with large scatter about the trend.
8.3. Downhole temperature measurement
Temperature was measured using the APCT-3 tool at the bottom of Hole U1590A (Core 4H; 32.8 mbsf). The temperature of ocean water at the seafloor was 15.83 ± 0.1°C based on mudline temperature measurements.
Temperature was modeled from time-series measurements using TP-Fit software (see Physical properties in the Expedition 398 methods chapter [Kutterolf et al., 2024]). In modeling, we used a thermal conductivity of k = 1.0 W/(m·K) based on our thermal conductivity measurement and a product of density and specific heat of ρC = 3.7 × 10⁶ J/(m3·K). Uncertainty in the calculated temperature assumes an uncertainty in k of ±0.15 W/(m·K) (based on our measurements) and in ρC of 0.3 × 10⁶ J/(m3·K). The best-fit temperature is 15.67 ± 0.17°C (Figure F22).
9. Geochemistry
9.1. Volcaniclastic bulk geochemistry
To determine the geochemistry of the volcanic and tuffaceous materials at Site U1590, 11 and 5 samples were handpicked from volcaniclastic layers in Holes U1590A and U1590B, respectively (Table T12; Figure F24). These volcaniclastic materials were cleaned, ground, fused, and dissolved. Shipboard analysis for major (Si, Al, Fe, Mg, and Ca), minor (Ti, Mn, Na, K, and P), and trace (Sc, V, Cr, Co, Ni, Cu, Zn, Rb, Sr, Y, Zr, Nb, Ba, Ce, and Nd) elements was completed using inductively coupled plasma–atomic emission spectroscopy (ICP-AES) (see Geochemistry in the Expedition 398 methods chapter [Kutterolf et al., 2024] for analytical technique).
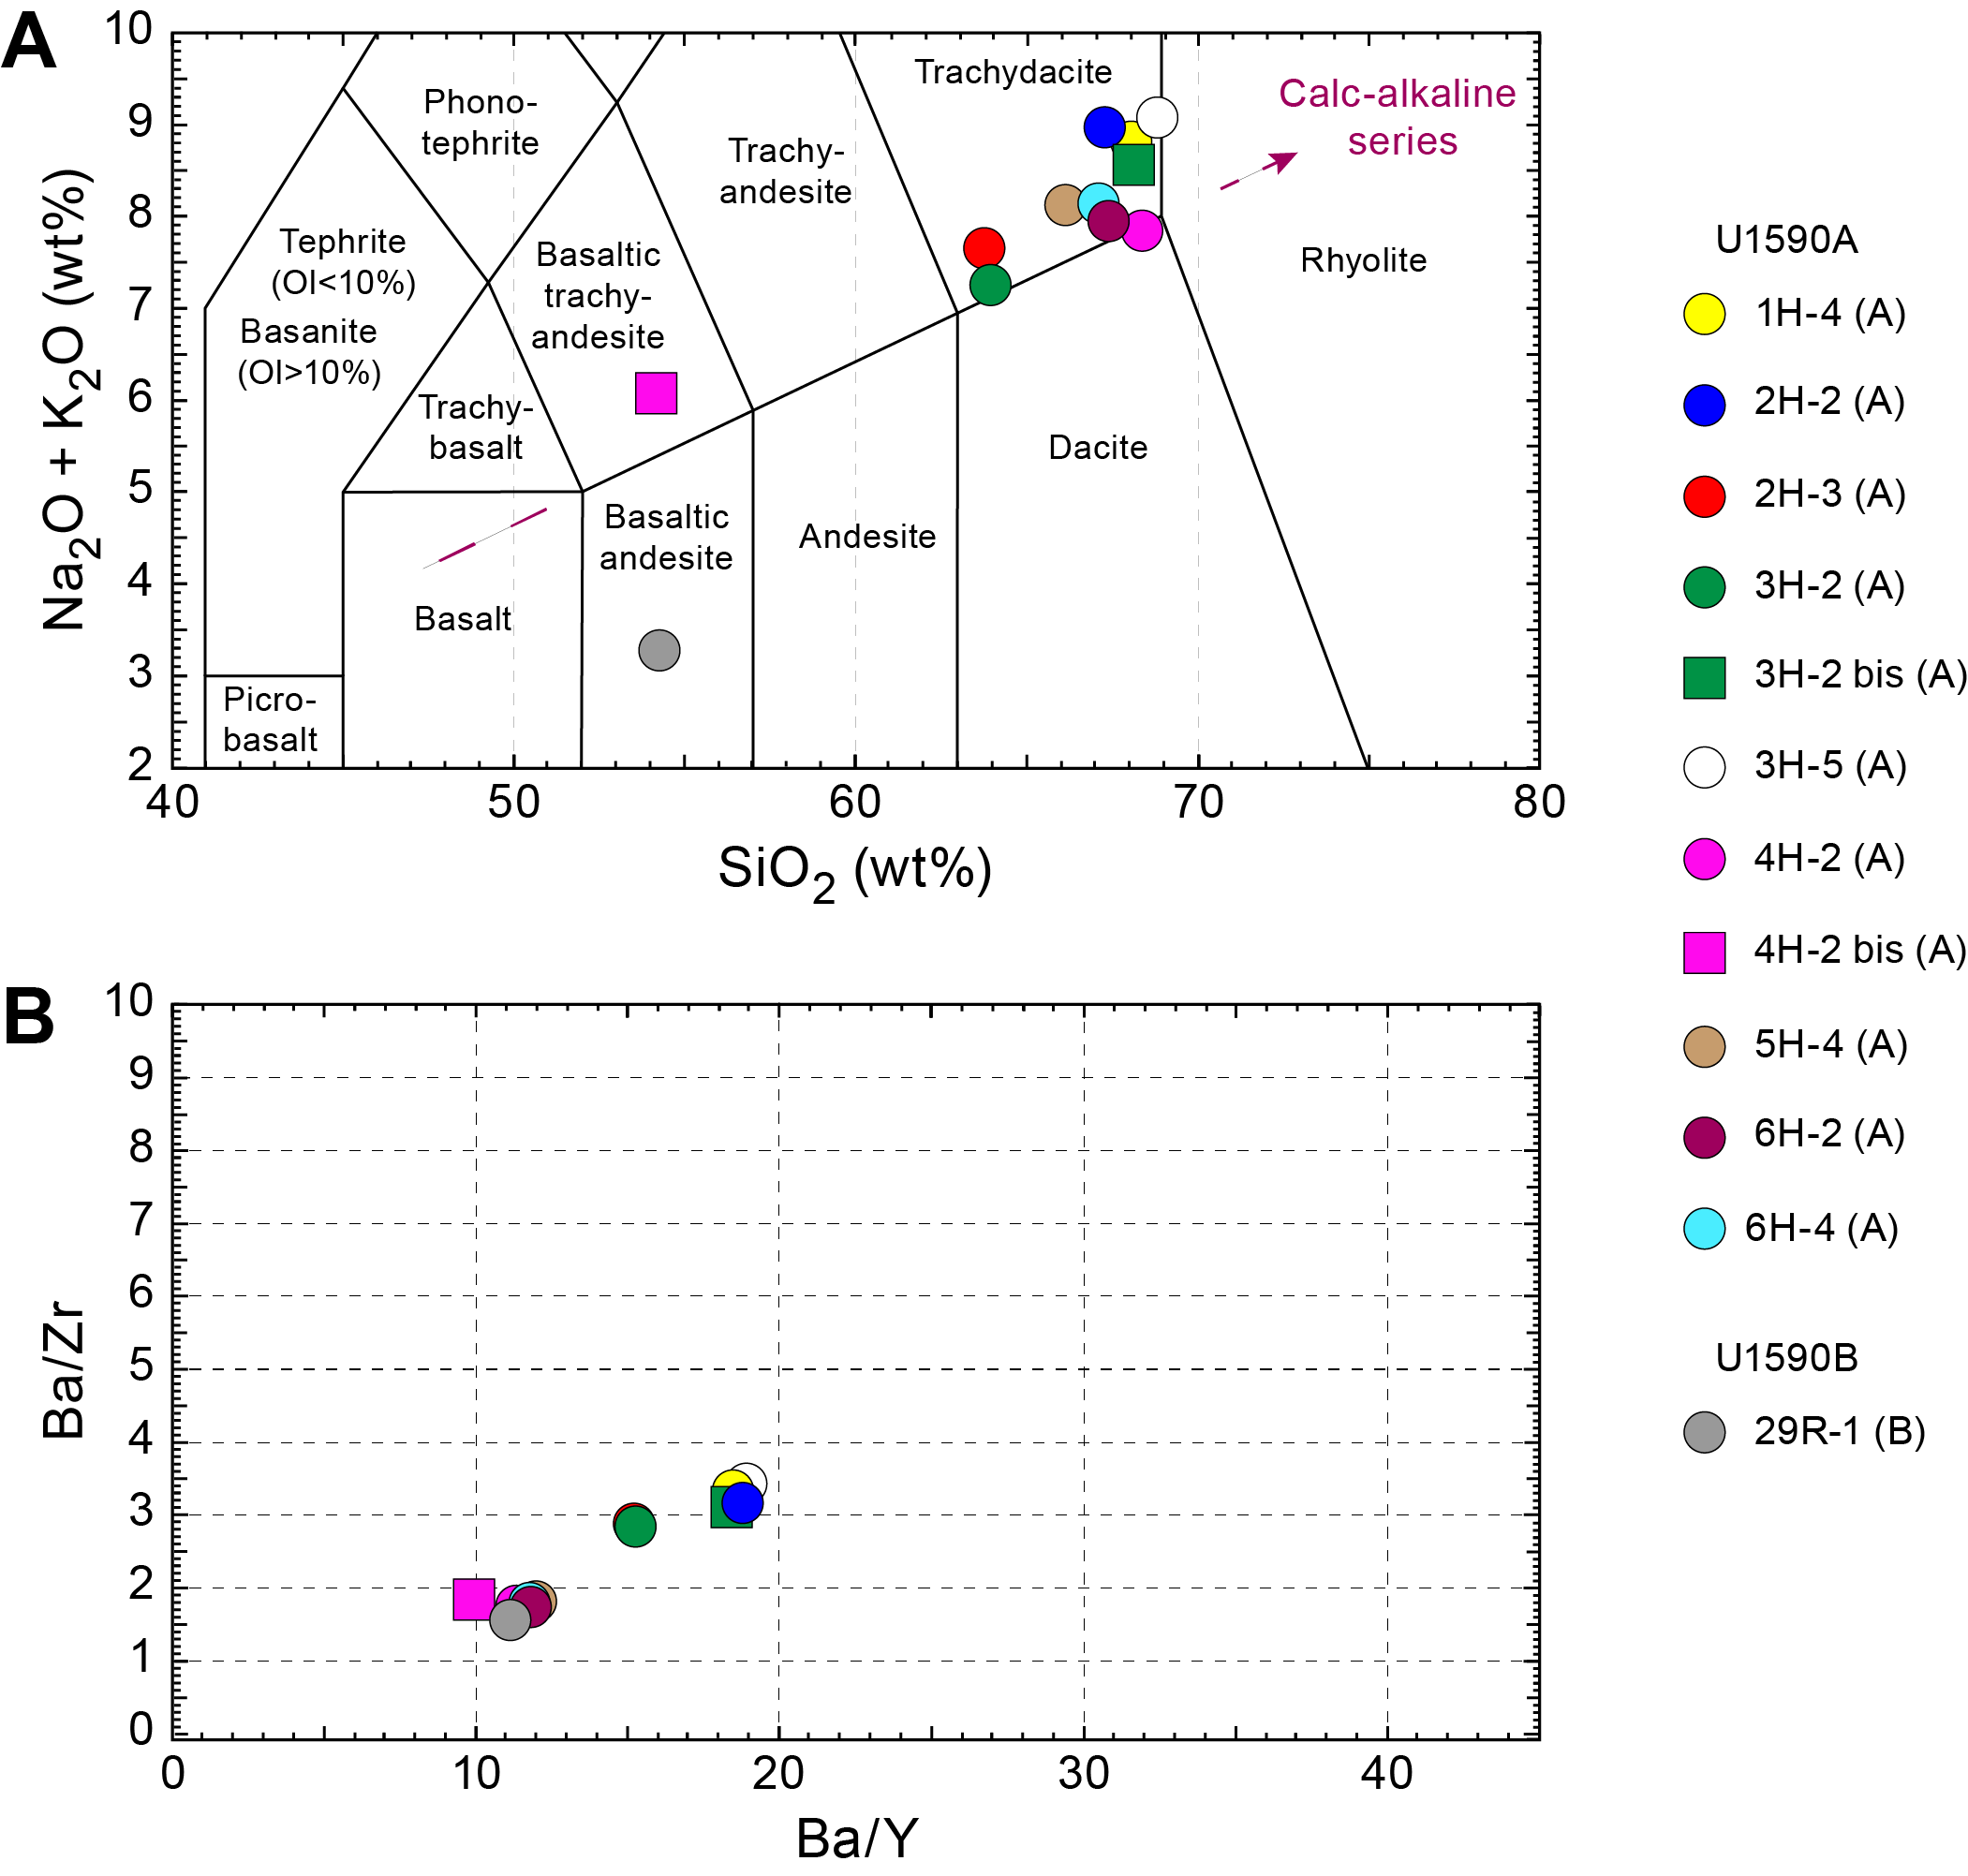
Figure F24. ICP-AES analyses.
9.1.1. ICP-AES: major, minor, and trace elements
Of the volcaniclastic units sampled, 2 were classified as basaltic andesites or basaltic trachyandesites and 10 as trachydacites (Table T12; Figure F24). As expected, bulk chemistry values are less evolved than glass chemistry reported in Kutterolf et al. (2021) due to bulk analyses, including both minerals and glass. Four samples (398-U1590B-39R-CC, 40R-CC, 41R-CC, and 43R-CC) were discarded for low totals that indicate they were not purely volcanic.
Concentrations are reported for all analyzed trace elements, but Ce, Cr, Cu, Nb, Ni, P, Rb, S, and V were below detection limits in the majority of samples and are not shown in Table T12. Trace element ratios were used to broadly discriminate between the volcanic centers of Kolumbo, Santorini, and Christiana.
9.2. Interstitial water geochemistry
To determine the inorganic constituents of IW, five water samples were taken (one mudline sample and four from whole-round squeezing of sediment intervals) from Hole U1590A and seven water samples were taken (all from whole-round squeezing of sediment intervals) from Hole U1590B, mainly from sections dominated by calcareous ooze but with volcanic input. Aliquots of IW were used for shipboard analyses, and the remaining water was retained for shore-based analysis, following protocols specified in Geochemistry in the Expedition 398 methods chapter (Kutterolf et al., 2024). The retrieved pore waters were analyzed for salinity, alkalinity, and pH. Shipboard analysis of major anions (Cl−, SO42−, and Br−), cations (Ca2+, Na+, Mg2+, and K+), and major (S, Ca, Mg, K, and Na) and minor (B, Ba, Fe, Li, Mn, P, Si, and Sr) elements was completed following the methods described in Geochemistry in the Expedition 398 methods chapter (Kutterolf et al., 2024).
9.2.1. Salinity, alkalinity, and pH
Salinity values in Hole U1590A are 40 in all samples, which is close to the current average Aegean salinity value of 39 (Table T13; Figure F25). Salinity values in Hole U1590B range 71–88.
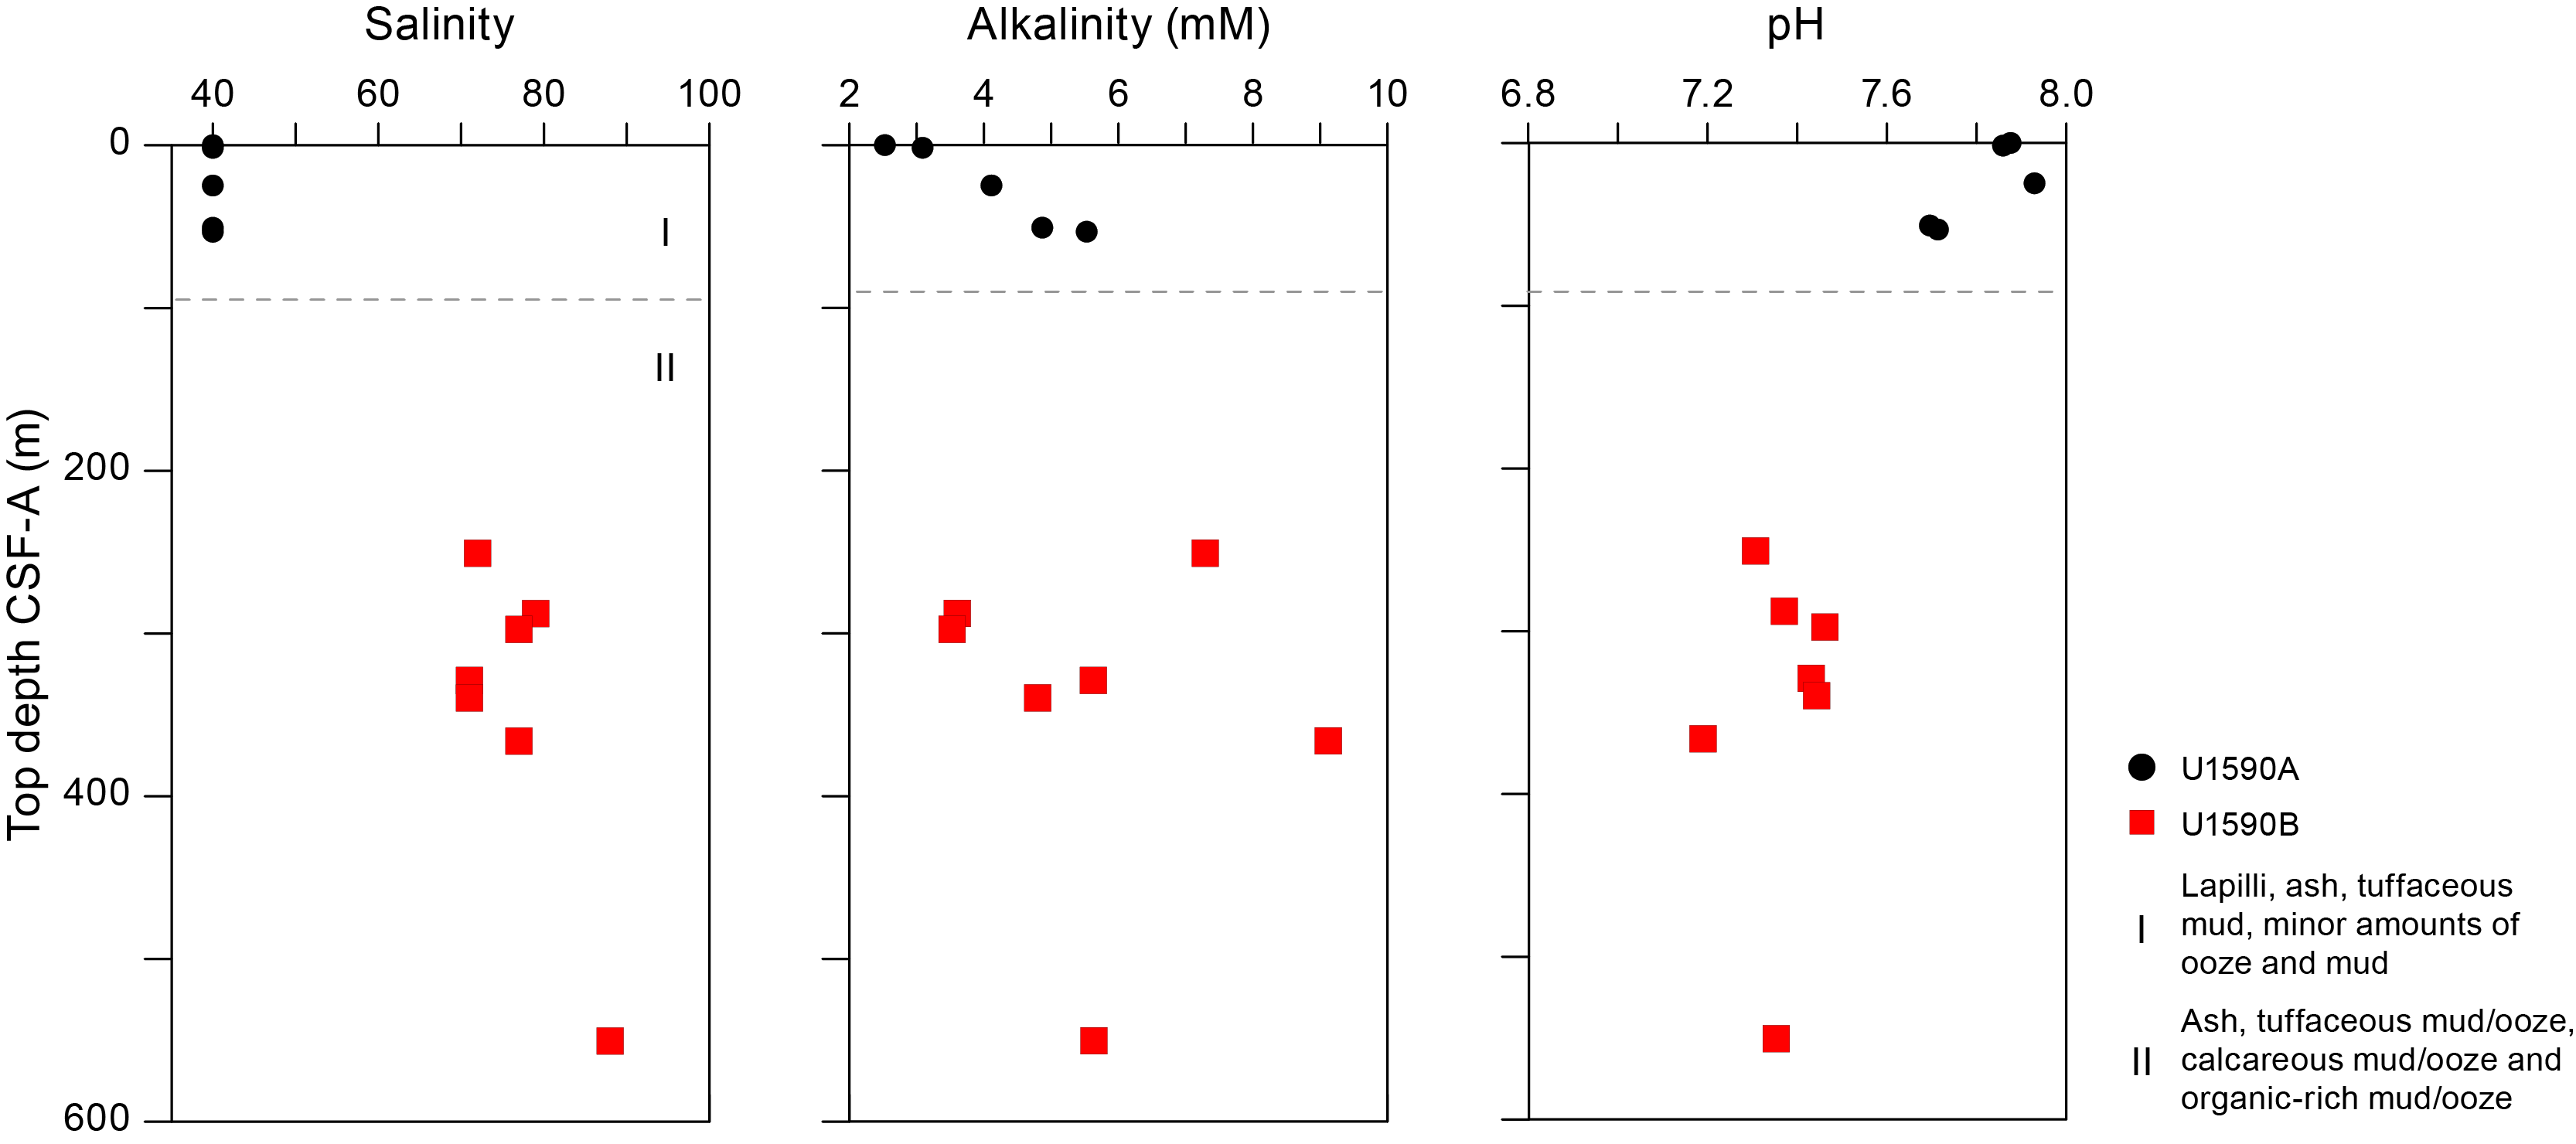
Figure F25. IW salinity, alkalinity, and pH.
Alkalinity in Hole U1590A increases from ~2.5 mM at the seafloor to a maximum of ~5.5 mM at 53.2 mbsf, whereas alkalinity in Hole U1590B ranges from a minimum of 3.5 mM at 297.5 mbsf to a maximum of 9.1 mM at 366 mbsf (Table T13; Figure F25). No correlation with depth was observed in Hole U1590B.
Values for pH show some variation within the sampled depths, ranging 7.7–7.9 (average = 7.8 ± 0.1) in Hole U1590A (Table T13; Figure F25). The highest value was measured at 24.8 mbsf in Hole U1590A. In Hole U1590B, pH values range 7.1–7.5 (average = 7.4 ± 0.1). The highest pH value was measured at 339.6 mbsf in Hole U1590B.
9.2.2. Bromide, chloride, sodium, boron, calcium, magnesium, potassium, and sulfate
Bromide, Cl−, Na+, B, Ca2+, Mg2+, and SO42− were measured using ion chromatography on extracted waters from Holes U1590A and U1590B, and values generally follow salinity with depth (Table T14; Figure F26). All follow similar trends, with lower values in the uppermost 53 m and increased concentrations at depth. There is a small peak in concentrations of Br−, Mg2+, K+, and Na+ at 288 mbsf. In the uppermost 53 m, K+ decreases strongly instead of staying relatively stable or slightly increasing. The maximum concentration in all is reached in the deepest sample, except for K+, which reaches its maximum at 288 mbsf.
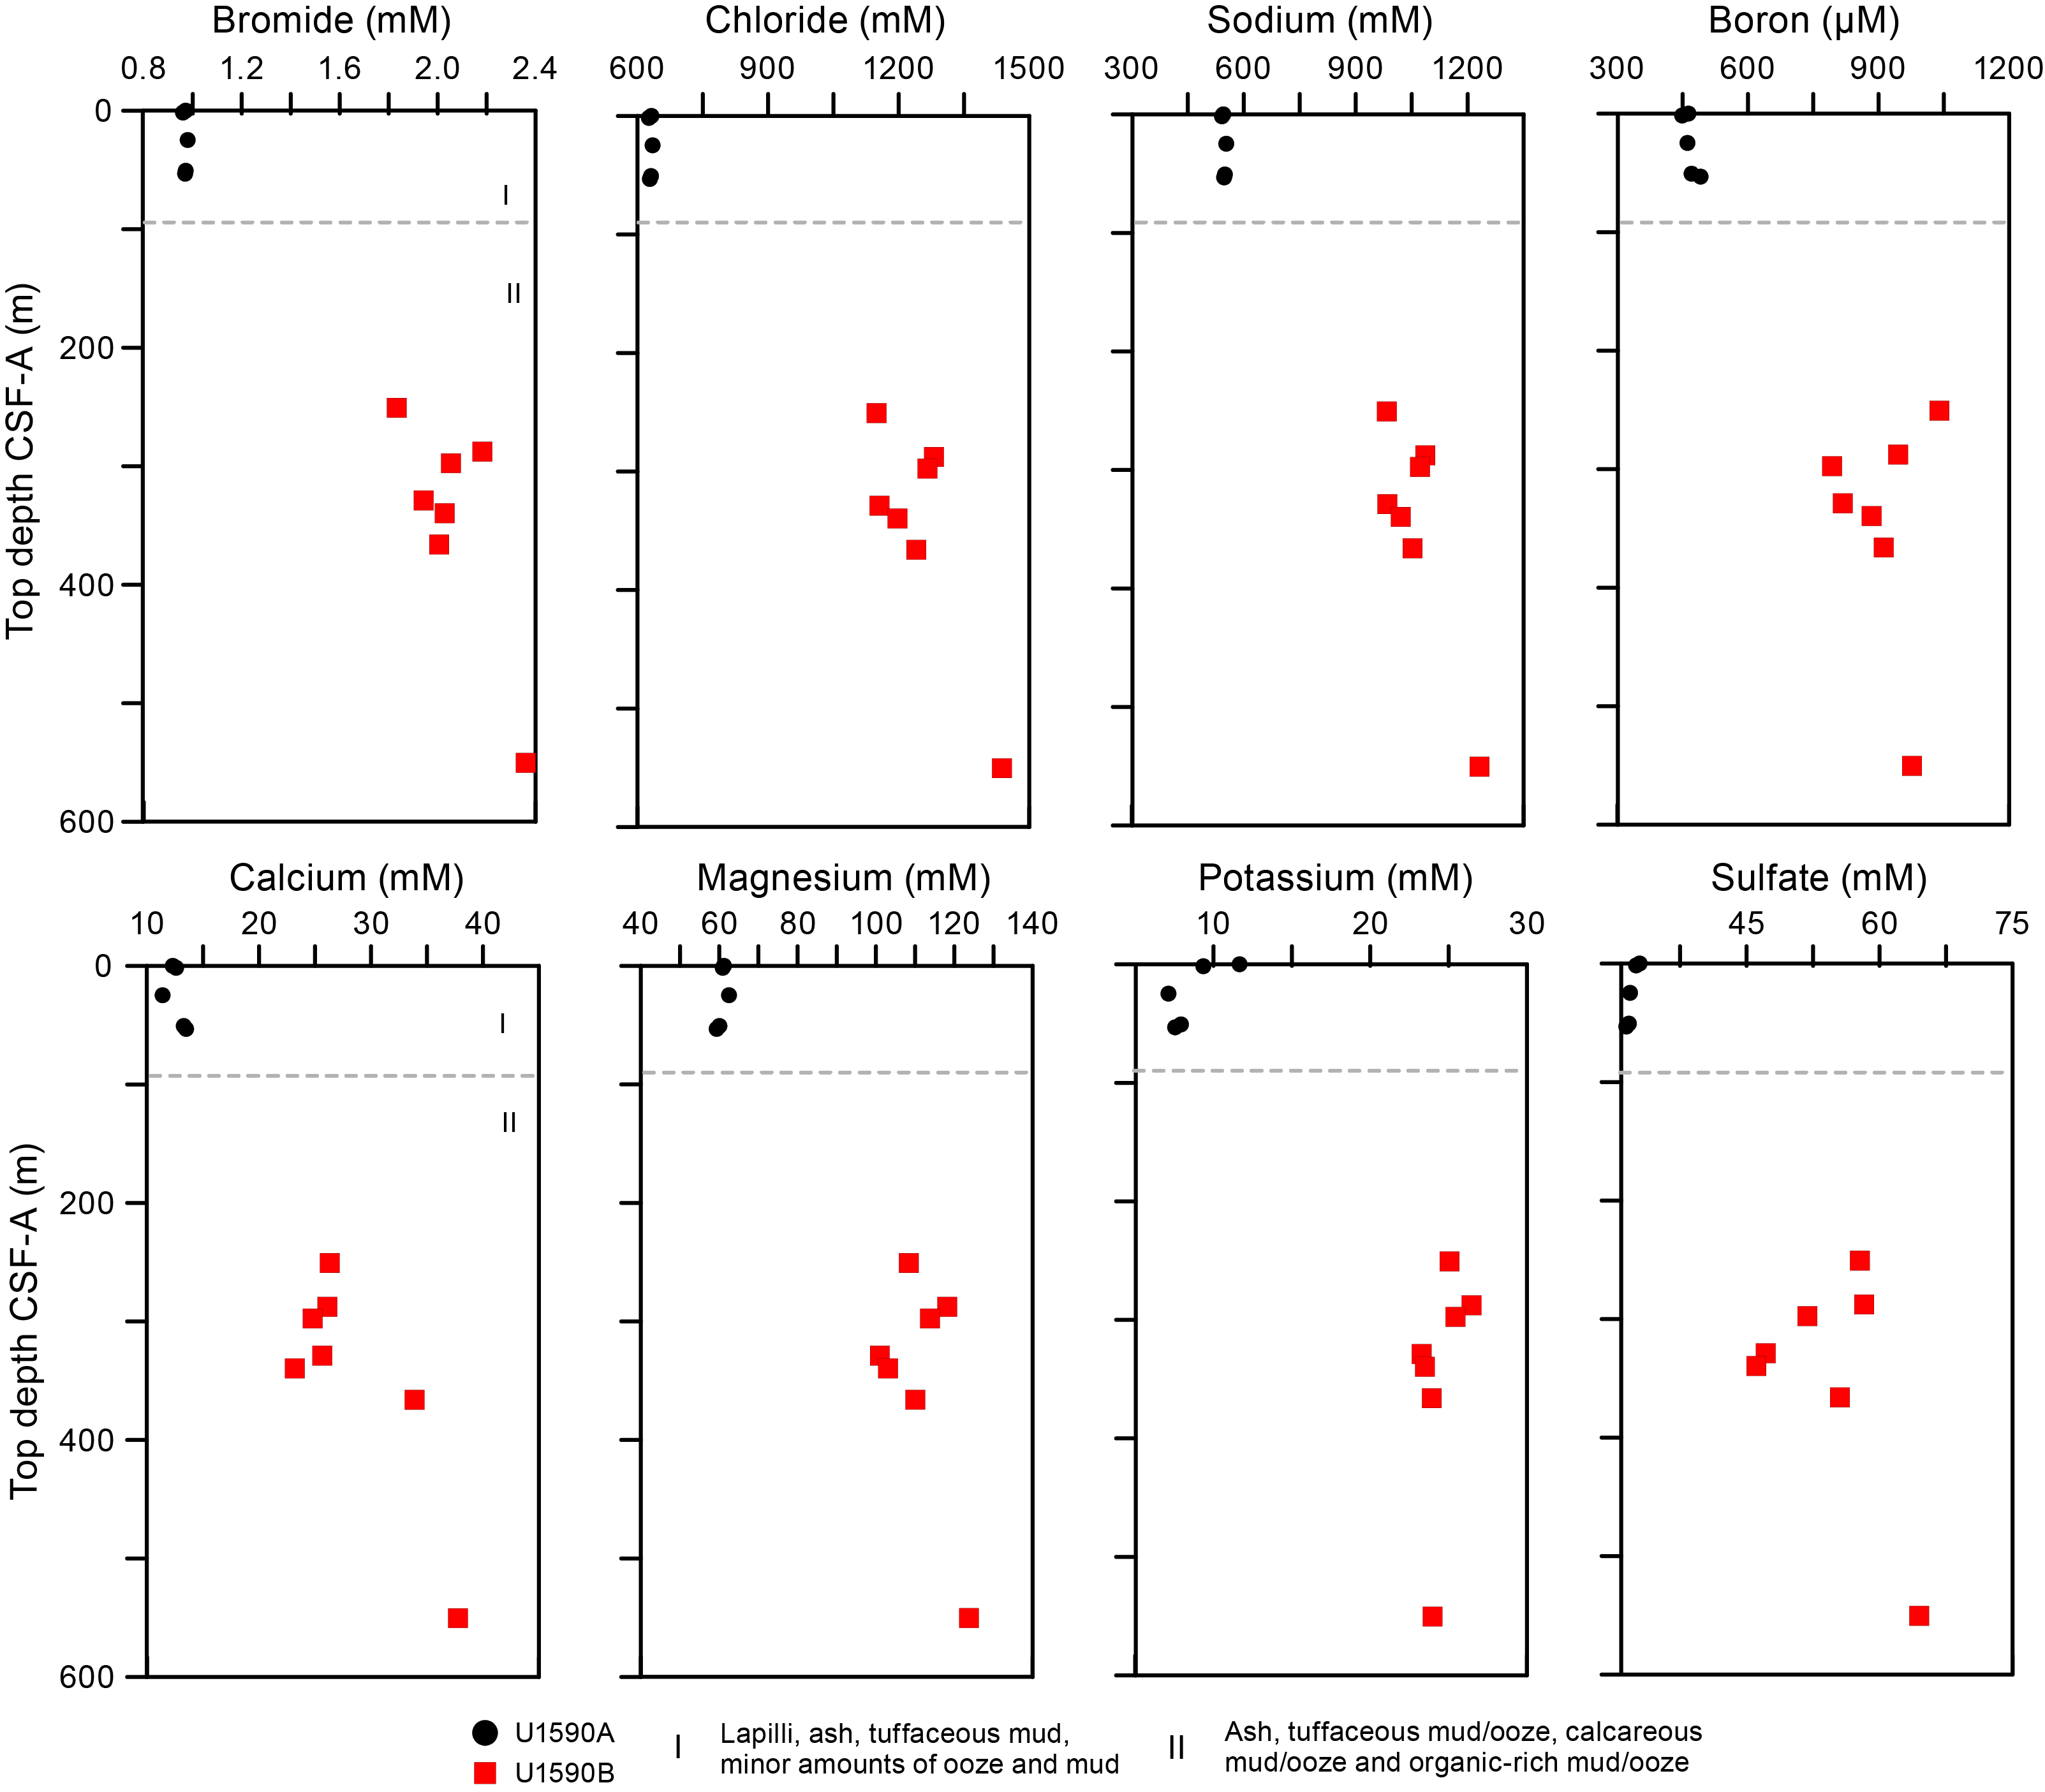
Figure F26. IW Br−, Cl−, Na+, B, Ca2+, Mg2+, K+, and SO42-.
9.2.3. Barium, lithium, manganese, strontium, silicon, iron, and phosphorus
Downhole concentrations for dissolved Ba, Li, Mn, Sr, and Si in Holes U1590A and U1590B do not correlate with salinity (Table T14; Figure F27). Barium is elevated in the uppermost samples and decreases to 1 µM in deeper samples, where it stays relatively constant. Lithium reaches its maximum in the deepest sample (442 µM at 550 mbsf), whereas Mn reaches its highest concentration of 38 µM at 25 mbsf before decreasing downhole. Trends for Sr and Si are similar. Both Sr and Si increase to peaks of 560 and 1061 µM at 340 and 366 mbsf, respectively. Iron and P are below the detection limit in a majority of samples and therefore are included in Table T14 but are not plotted.
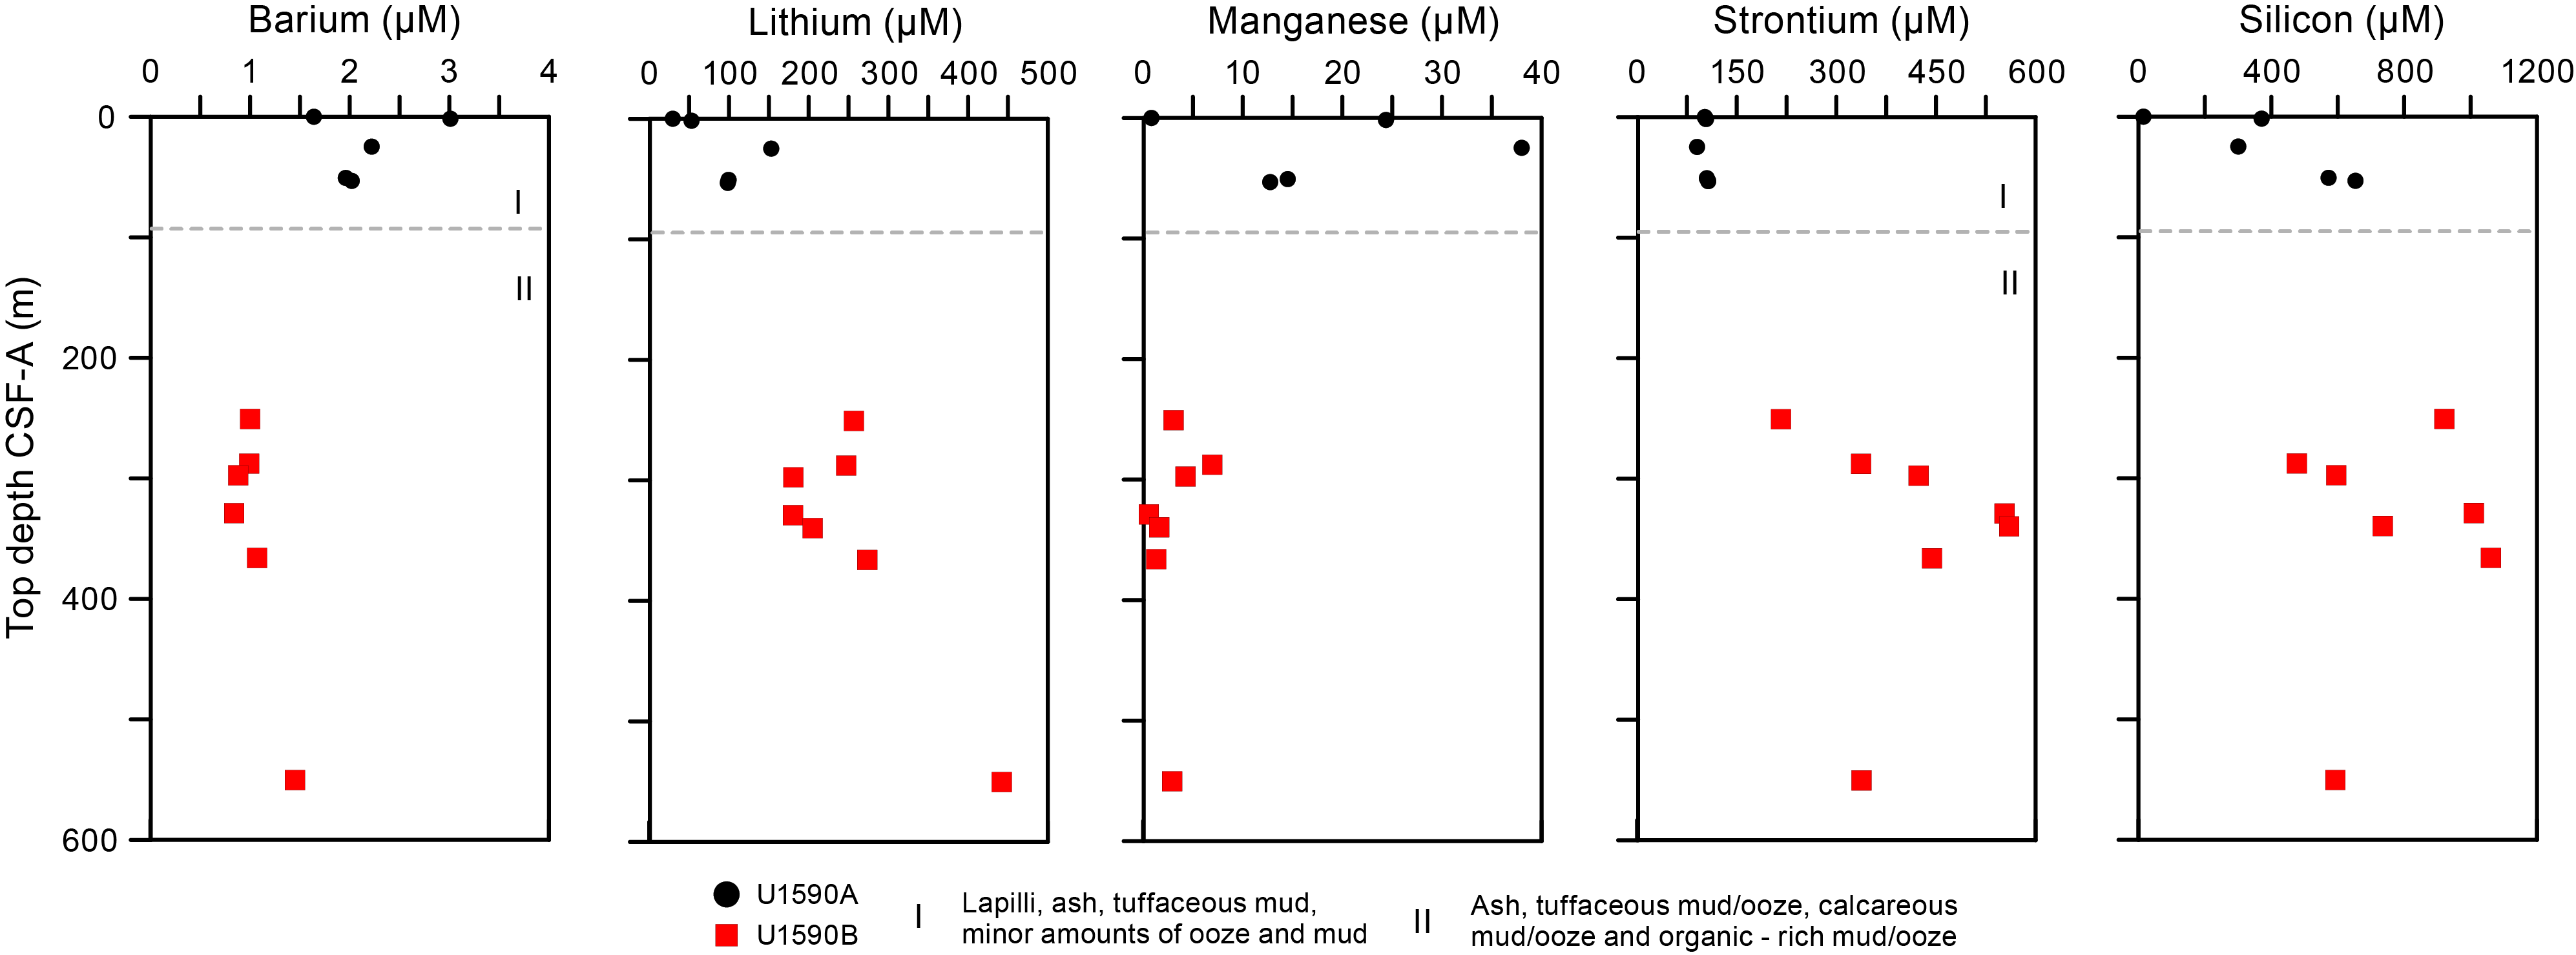
Figure F27. IW Ba, Li, Mn, Sr, and Si.
9.3. Sediment bulk geochemistry
A total of 13 sediment samples were taken for bulk geochemistry (Table T15; Figure F28) and analyzed as described in Geochemistry in the Expedition 398 methods chapter (Kutterolf et al., 2024). For total carbon, hydrogen, and nitrogen (CHN) analysis, duplicates were run for ~10% of the samples to determine analytical reproducibility.
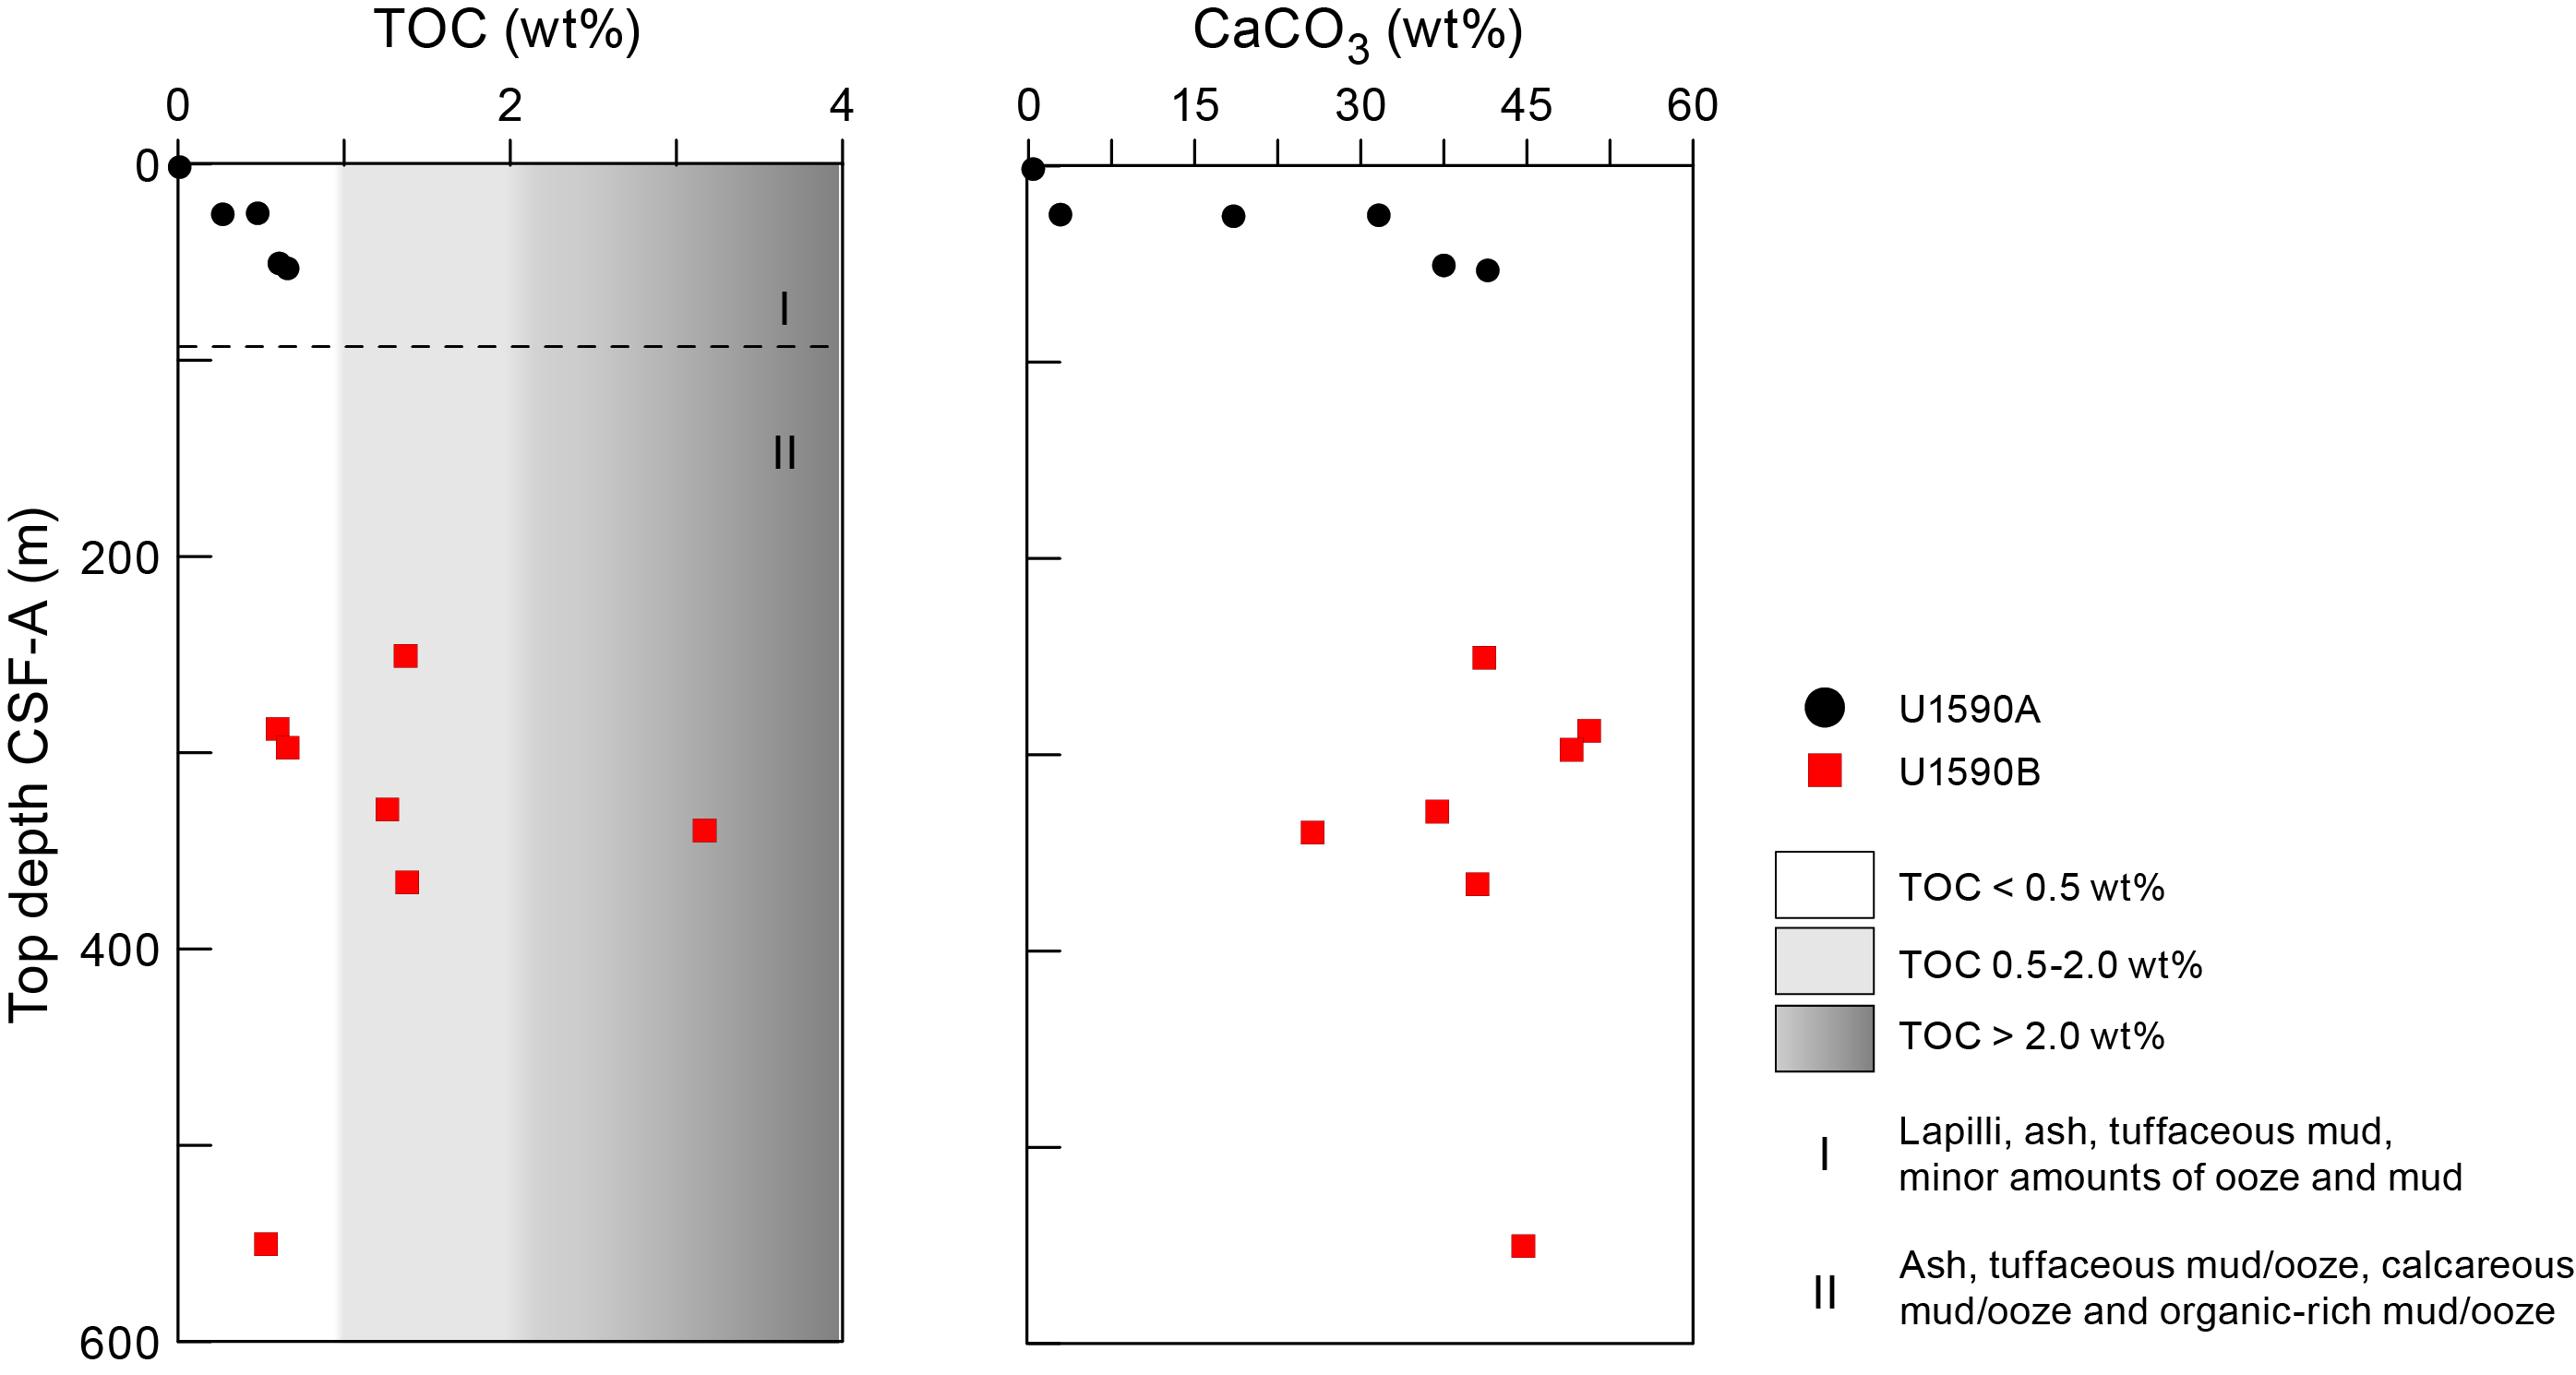
Figure F28. TOC and carbonate.
9.3.1. Sapropel identification
Two organic-rich units were sampled at 25.21 and 25.71 mbsf after core splitting and identification by the core describers. These samples yielded total organic carbon (TOC) values of 0.48 and 0.27 wt%, respectively (Table T15; Figure F28). Following convention set forth by Kidd et al. (1978), units with TOC > 2.0 wt% were identified as sapropels and units with TOC values of 0.5–2.0 wt% were identified as sapropelitic. Eight other samples obtained from IW squeeze cakes had TOC values in the sapropelitic range. One sample at 339 mbsf had a TOC value of 3.17 wt%, identifying it as a sapropel.
9.4. Headspace gas analysis
Headspace gas analyses were performed at a resolution of one sample per full-length core (9.5 m advance) throughout Holes U1590A and U1590B. The aim was to monitor the presence and abundance of C1–C3 hydrocarbons as part of the standard IODP safety protocol (Pimmel and Claypool, 2001). Totals of 11 and 26 headspace gas samples were analyzed in a gas chromatograph (GC) for Holes U1590A and U1590B, respectively (see Geochemistry in the Expedition 398 methods chapter [Kutterolf et al., 2024] for analytical technique).
Methane is the dominant hydrocarbon present in Hole U1590A. The data show low methane concentrations in Hole U1590A (0.71–2.25 ppmv) above 72.24 mbsf and values below detection limit to the base of the hole. Methane concentration was below detection limit throughout all depths in Hole U1590B. Ethane concentrations were below the detection limit for all samples measured for Holes U1590A and U1590B. Concentrations of other hydrocarbon species were too low to be detected using the flame ionization detector (FID) detector on the GC for either hole.
10. Microbiology
For Site U1590, only one whole-round core sample was collected from the mudline for microbial community composition analysis (Table T16).
References
Backman, J., Raffi, I., Rio, D., Fornaciari, E., and Pälike, H., 2012. Biozonation and biochronology of Miocene through Pleistocene calcareous nannofossils from low and middle latitudes. Newsletters on Stratigraphy, 45(3):221–244. https://doi.org/10.1127/0078-0421/2012/0022
Castradori, D., 1993. Calcareous nannofossil biostratigraphy and biochronology in eastern Mediterranean deep-sea cores. Rivista Italiana Di Paleontologia E Stratigrafia, 99(1):107–126.
Di Stefano, A., and Sturiale, G., 2010. Refinements of calcareous nannofossil biostratigraphy at the Miocene/Pliocene Boundary in the Mediterranean region. Geobios, 43(1):5–20. https://doi.org/10.1016/j.geobios.2009.06.007
Druitt, T.H., Kutterolf, S., Ronge, T.A., Beethe, S., Bernard, A., Berthod, C., Chen, H., Chiyonobu, S., Clark, A., DeBari, S., Fernandez Perez, T.I., Gertisser, R., Hübscher, C., Johnston, R.M., Jones, C., Joshi, K.B., Kletetschka, G., Koukousioura, O., Li, X., Manga, M., McCanta, M., McIntosh, I., Morris, A., Nomikou, P., Pank, K., Peccia, A., Polymenakou, P.N., Preine, J., Tominaga, M., Woodhouse, A., and Yamamoto, Y., 2024. Site U1589. In Druitt, T.H., Kutterolf, S., Ronge, T.A., and the Expedition 398 Scientists, Hellenic Arc Volcanic Field. Proceedings of the International Ocean Discovery Program, 398: College Station, TX (International Ocean Discovery Program). https://doi.org/10.14379/iodp.proc.398.103.2024
Fisher, R.V., and Schmincke, H.-U., 1984. Pyroclastic Rocks: Berlin (Springer). https://doi.org/10.1007/978-3-642-74864-6
Gradstein, F.M., Ogg, J.G., Schmitz, M.D., and Ogg, G.M. (Eds.), 2020. The Geologic Time Scale 2020: Amsterdam (Elsevier BV). https://doi.org/10.1016/C2020-1-02369-3
Hayward, B.W., Grenfell, H.R., Reid, C.M., and Hayward, K.A., 1999. Recent New Zealand shallow-water benthic foraminifera: taxonomy, ecologic distribution, biogeography, and use in paleoenvironmental assessment. In Institute of Geological & Nuclear Sciences Monograph, 21: Lower Hutt, NZ.
Hübscher, C., Ruhnau, M., and Nomikou, P., 2015. Volcano-tectonic evolution of the polygenetic Kolumbo submarine volcano/Santorini (Aegean Sea). Journal of Volcanology and Geothermal Research, 291:101–111. https://doi.org/10.1016/j.jvolgeores.2014.12.020
Jutzeler, M., White, J.D.L., Talling, P.J., McCanta, M., Morgan, S., Le Friant, A., and Ishizuka, O., 2014. Coring disturbances in IODP piston cores with implications for offshore record of volcanic events and the Missoula megafloods. Geochemistry, Geophysics, Geosystems, 15(9):3572–3590. https://doi.org/10.1002/2014GC005447
Kidd, R.B., Cita, M.B., and Ryan, W.B.F., 1978. Stratigraphy of eastern Mediterranean sapropel sequences recovered during DSDP Leg 42A and their paleoenvironmental significance. In Hsü, K., Montadert, L., et al., Initial Reports of the Deep Sea Drilling Project. 42(1): Washington, DC (US Government Printing Office), 421–443. https://doi.org/10.2973/dsdp.proc.42-1.113-1.1978
Kutterolf, S., Druitt, T.H., Ronge, T.A., Beethe, S., Bernard, A., Berthod, C., Chen, H., Chiyonobu, S., Clark, A., DeBari, S., Fernandez Perez, T.I., Gertisser, R., Hübscher, C., Johnston, R.M., Jones, C., Joshi, K.B., Kletetschka, G., Koukousioura, O., Li, X., Manga, M., McCanta, M., McIntosh, I., Morris, A., Nomikou, P., Pank, K., Peccia, A., Polymenakou, P.N., Preine, J., Tominaga, M., Woodhouse, A., and Yamamoto, Y., 2024. Expedition 398 methods. In Druitt, T.H., Kutterolf, S., Ronge, T.A., and the Expedition 398 Scientists, Hellenic Arc Volcanic Field. Proceedings of the International Ocean Discovery Program, 398: College Station, TX (International Ocean Discovery Program). https://doi.org/10.14379/iodp.proc.398.102.2024
Kutterolf, S., Freundt, A., Hansteen, T.H., Dettbarn, R., Hampel, F., Sievers, C., Wittig, C., Allen, S.R., Druitt, T.H., McPhie, J., Nomikou, P., Pank, K., Schindlbeck-Belo, J.C., Wang, K.-L., Lee, H.-Y., and Friedrichs, B., 2021. The medial offshore record of explosive volcanism along the central to eastern Aegean Volcanic Arc: 1. tephrostratigraphic correlations. Geochemistry, Geophysics, Geosystems, 22(12):e2021GC010010. https://doi.org/10.1029/2021GC010010
Le Maitre, R.W., Steckeisen, A., Zanettin, B., Le Bas, M.J., Bonin, B., and Bateman, P. (Eds.), 2002. Igneous Rocks: A Classification and Glossary of Terms (Second edition): Cambridge, UK (Cambridge University Press). https://doi.org/10.1017/CBO9780511535581
Lirer, F., Foresi, L.M., Iaccarino, S.M., Salvatorini, G., Turco, E., Cosentino, C., Sierro, F.J., and Caruso, A., 2019. Mediterranean Neogene planktonic foraminifer biozonation and biochronology. Earth-Science Reviews, 196:102869. https://doi.org/10.1016/j.earscirev.2019.05.013
Lourens, L., Hilgen, F., Shackleton, N.J., Laskar, J., and Wilson, D., 2004. The Neogene period. In Smith, A.G., Gradstein, F.M. and Ogg, J.G., A Geologic Time Scale 2004. Cambridge, UK (Cambridge University Press), 409–440. https://doi.org/10.1017/CBO9780511536045.022
Martini, E., 1971. Standard Tertiary and Quaternary calcareous nannoplankton zonation. Proceedings of the Second Planktonic Conference, Roma, 1970:739–785.
Okada, H., and Bukry, D., 1980. Supplementary modification and introduction of code numbers to the low-latitude coccolith biostratigraphic zonation (Bukry, 1973; 1975). Marine Micropaleontology, 5(3):321–325. https://doi.org/10.1016/0377-8398(80)90016-X
Pimmel, A., and Claypool, G., 2001. Introduction to shipboard organic geochemistry on the JOIDES Resolution. Ocean Drilling Program Technical Note, 30. https://doi.org/10.2973/odp.tn.30.2001
Preine, J., Karstens, J., Hübscher, C., Nomikou, P., Schmid, F., Crutchley, G.J., Druitt, T.H., and Papanikolaou, D., 2022. Spatio-temporal evolution of the Christiana-Santorini-Kolumbo volcanic field, Aegean Sea. Geology, 50(1):96–100. https://doi.org/10.1130/G49167.1
Rio, D., Raffi, I., and Villa, G., 1990. Pliocene-Pleistocene calcareous nannofossil distribution patterns in the western Mediterranean. In Kastens, K.A., Mascle, J., et al., Proceedings of the Ocean Drilling Program, Scientific Results. 107: College Station, TX (Ocean Drilling Program), 513–533. https://doi.org/10.2973/odp.proc.sr.107.164.1990