Druitt, T.H., Kutterolf, S., Ronge, T.A., and the Expedition 398 Scientists
Proceedings of the International Ocean Discovery Program Volume 398
publications.iodp.org
https://doi.org/10.14379/iodp.proc.398.105.2024
Site U15911
![]() T.H. Druitt,
T.H. Druitt,
![]() S. Kutterolf,
S. Kutterolf,
![]() T.A. Ronge,
T.A. Ronge,
![]() S. Beethe,
S. Beethe,
![]() A. Bernard,
A. Bernard,
![]() C. Berthod,
C. Berthod,
![]() H. Chen,
H. Chen,
![]() S. Chiyonobu,
S. Chiyonobu,
![]() A. Clark,
A. Clark,
![]() S. DeBari,
S. DeBari,
![]() T.I. Fernandez Perez,
T.I. Fernandez Perez,
![]() R. Gertisser,
R. Gertisser,
![]() C. Hübscher,
C. Hübscher,
![]() R.M. Johnston,
R.M. Johnston,
![]() C. Jones,
C. Jones,
![]() K.B. Joshi,
K.B. Joshi,
![]() G. Kletetschka,
G. Kletetschka,
![]() O. Koukousioura,
O. Koukousioura,
![]() X. Li,
X. Li,
![]() M. Manga,
M. Manga,
![]() M. McCanta,
M. McCanta,
![]() I. McIntosh,
I. McIntosh,
![]() A. Morris,
A. Morris,
![]() P. Nomikou,
P. Nomikou,
![]() K. Pank,
K. Pank,
![]() A. Peccia,
A. Peccia,
![]() P.N. Polymenakou,
P.N. Polymenakou,
![]() J. Preine,
J. Preine,
![]() M. Tominaga,
M. Tominaga,
![]() A. Woodhouse, and
A. Woodhouse, and
![]() Y. Yamamoto2
Y. Yamamoto2
1 Druitt, T.H., Kutterolf, S., Ronge, T.A., Beethe, S., Bernard, A., Berthod, C., Chen, H., Chiyonobu, S., Clark, A., DeBari, S., Fernandez Perez, T.I., Gertisser, R., Hübscher, C., Johnston, R.M., Jones, C., Joshi, K.B., Kletetschka, G., Koukousioura, O., Li, X., Manga, M., McCanta, M., McIntosh, I., Morris, A., Nomikou, P., Pank, K., Peccia, A., Polymenakou, P.N., Preine, J., Tominaga, M., Woodhouse, A., and Yamamoto, Y., 2024. Site U1591. In Druitt, T.H., Kutterolf, S., Ronge, T.A., and the Expedition 398 Scientists, Hellenic Arc Volcanic Field. Proceedings of the International Ocean Discovery Program, 398: College Station, TX (International Ocean Discovery Program). https://doi.org/10.14379/iodp.proc.398.105.2024
2 Expedition 398 Scientists’ affiliations.
1. Background and objectives
Prior to arrival on site, a decision was made to replace the original primary site (proposed Site CSK-13A) by an alternate site (proposed Site CSK-20A); hence, the latter became Site U1591. This was done to pass through a slightly more complete suite of reflectors in the 800–900 ms two-way traveltime (TWT) interval.
Site U1591 is located ~8 km northwest of Christiani Island and ~20 km southwest of Santorini (Figure F1) at 514 meters below sea level (mbsl). It was drilled in three holes (U1591A–U1591C) to a maximum recovery depth of 902.7 meters below seafloor (mbsf) (all depths below seafloor are given using the core depth below seafloor, Method A [CSF-A], scale, except in Operations where the drilling depth below seafloor [DSF] scale is used). Average core recovery was similar in all three holes (U1591A= 66%; U1591B= 43%; U1591C= 58%).
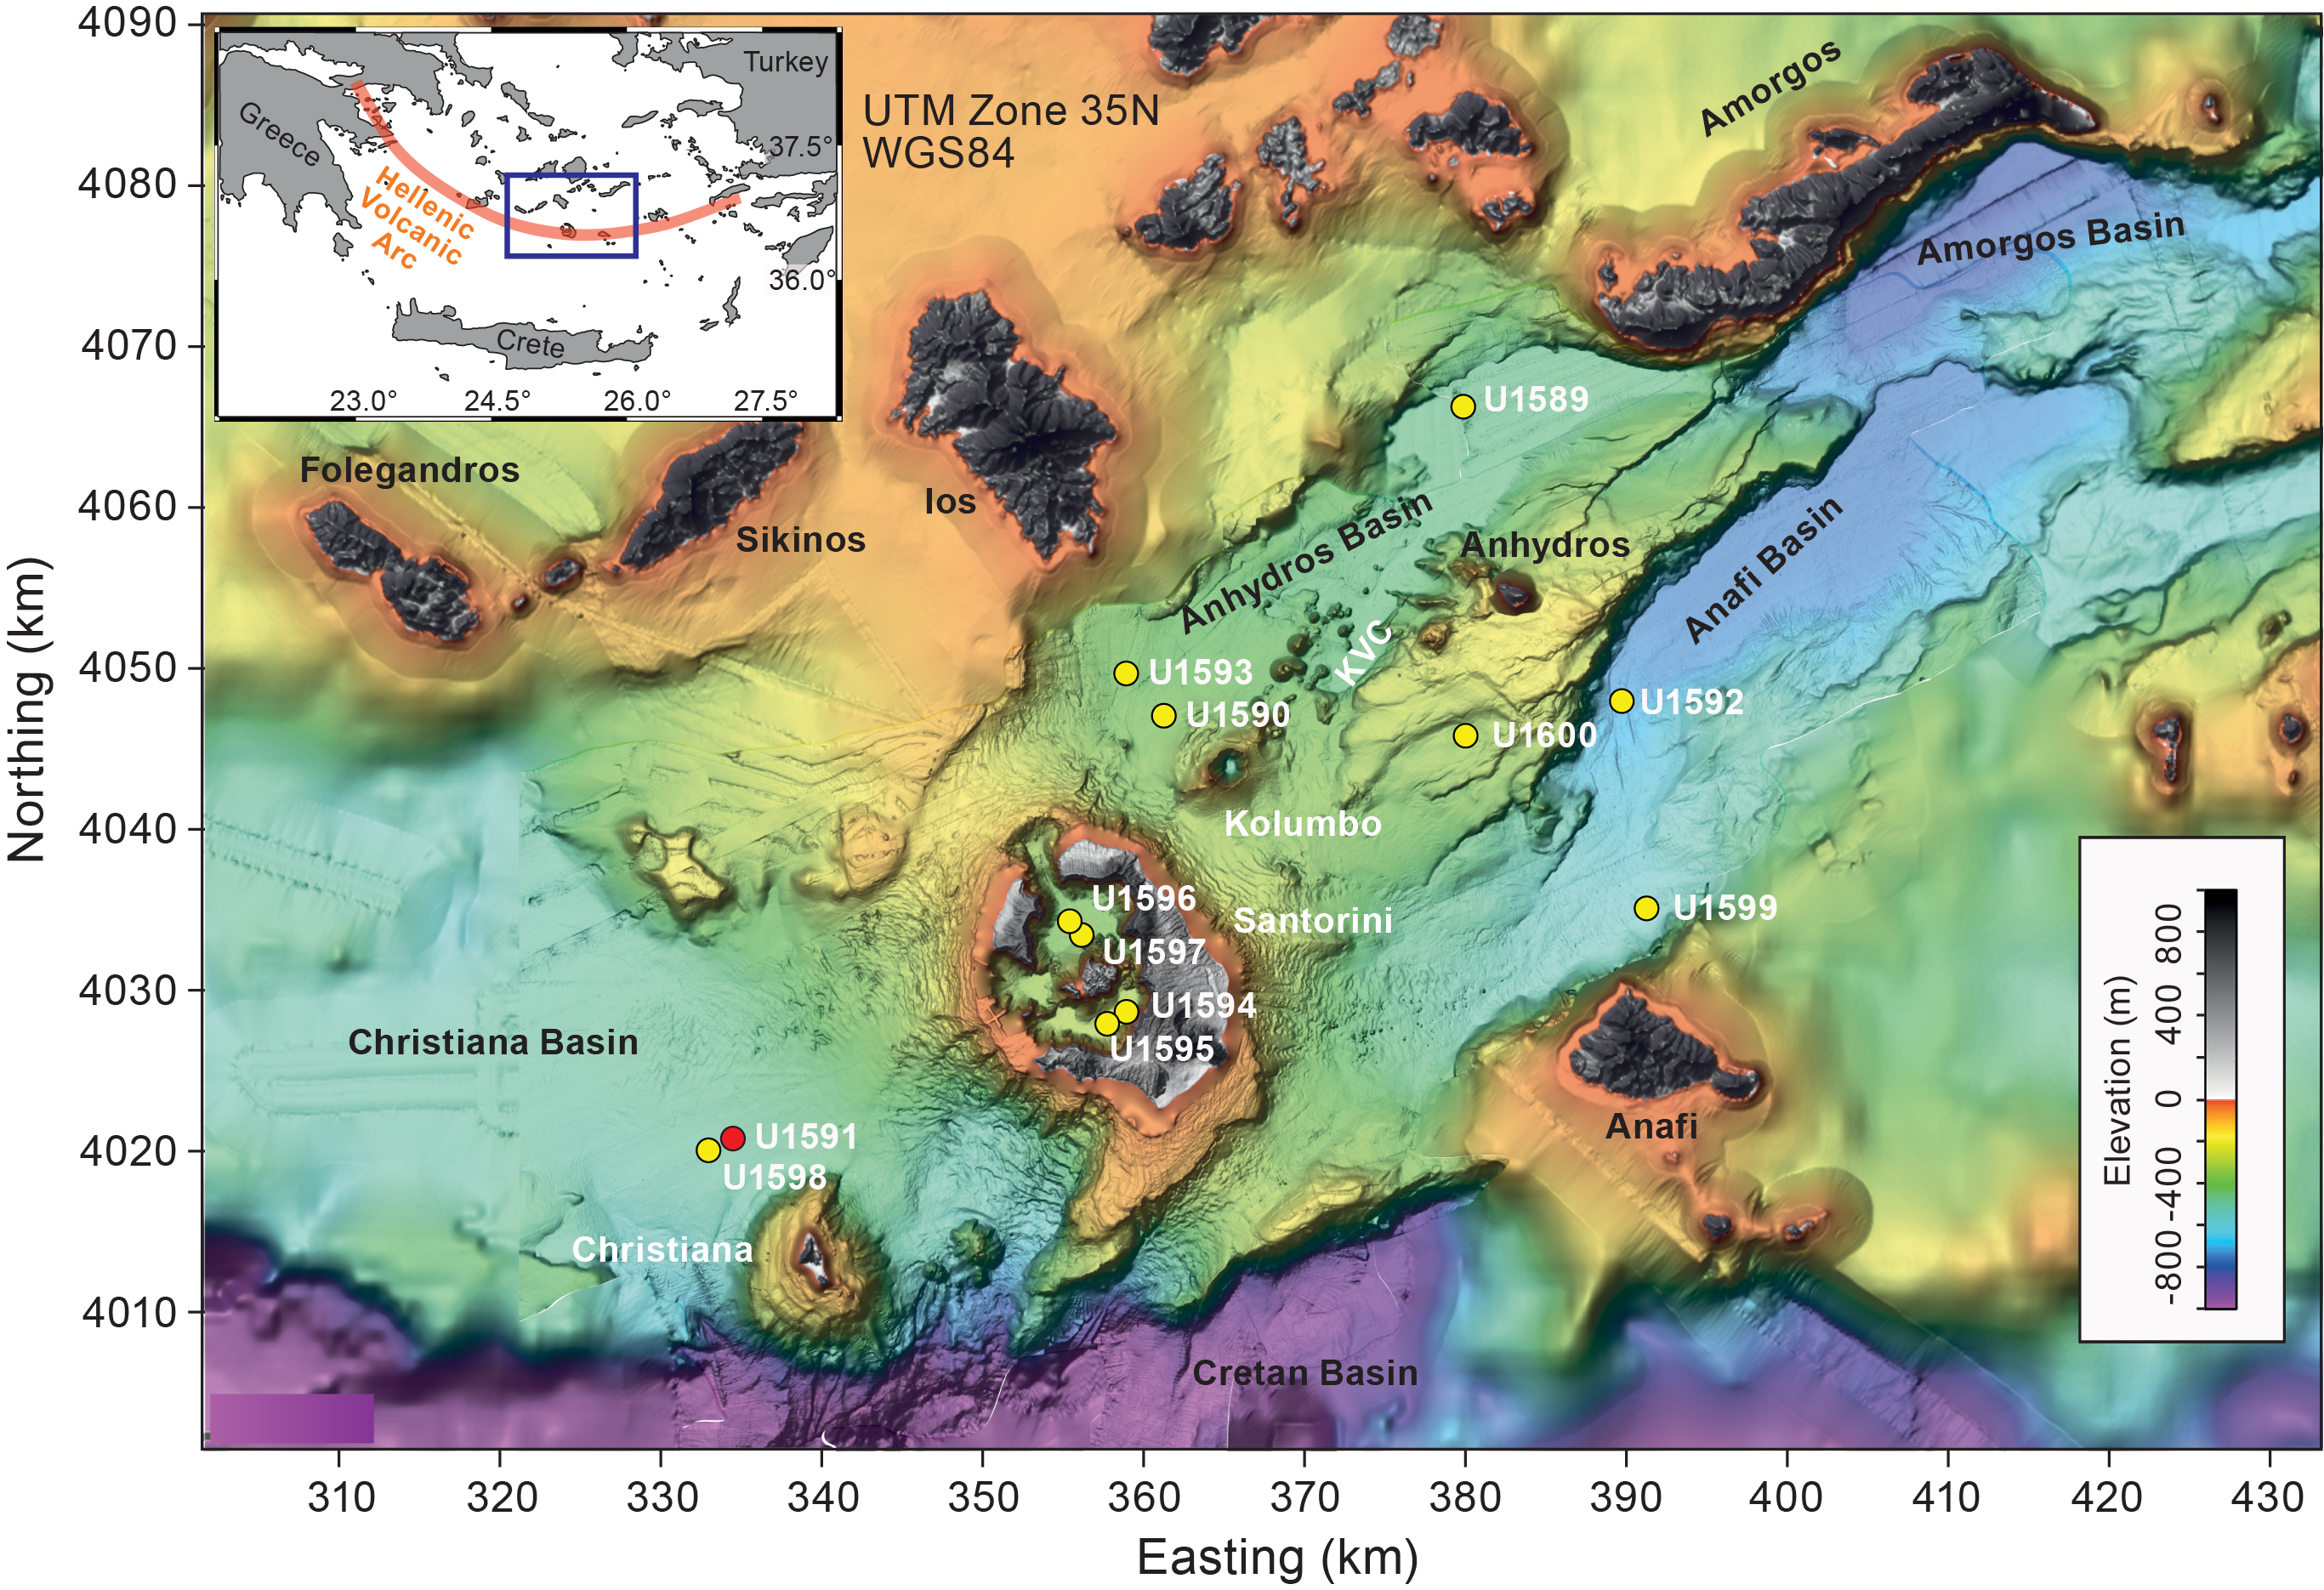
Figure F1. Site map.
The drill site targeted the volcano-sedimentary fill of the Christiana Basin. This basin was believed to have formed by subsidence along an ENE–WSW fault system before the changing tectonic regime activated the current northeast–southwest rift system in which the Christiana-Santorini-Kolumbo (CSK) volcanic field lies (Tsampouraki-Kraounaki and Sakellariou, 2018; Preine et al., 2022a, 2022b). Christiana Basin is deeper than the Anhydros and Anafi Basins; its volcano-sedimentary fill potentially recorded the earlier volcanic history of the CSK volcanic field (including the products of Christiana and early Santorini), as well as younger Santorini and possibly Milos Volcano to the west along the Hellenic volcanic arc. The now-extinct Christiana Volcano produced lavas and tuffs of unknown ages (Aarburg and Frechen, 1999). An ignimbrite found on Christiani Island (one of the two small islands of Christiana Volcano), Santorini, and the nonvolcanic island of Anaphi, called the Christiani Ignimbrite, was identified (Keller et al., 2010).
Six seismic units were previously recognized in the Christiana Basin (Preine et al., 2022a, 2022b; Figure F2). Site U1591 was chosen to pass through Seismic Units U1–U6, including volcaniclastics from Santorini and Christiana, and to target the top few meters of the prevolcanic basement below Unit U1. We received permission from the International Ocean Discovery Program (IODP) Environmental Protection and Safety Panel to drill to the Alpine basement at this site in an advanced piston corer/extended core barrel/rotary core barrel (APC/XCB/RCB) drilling strategy involving three holes.
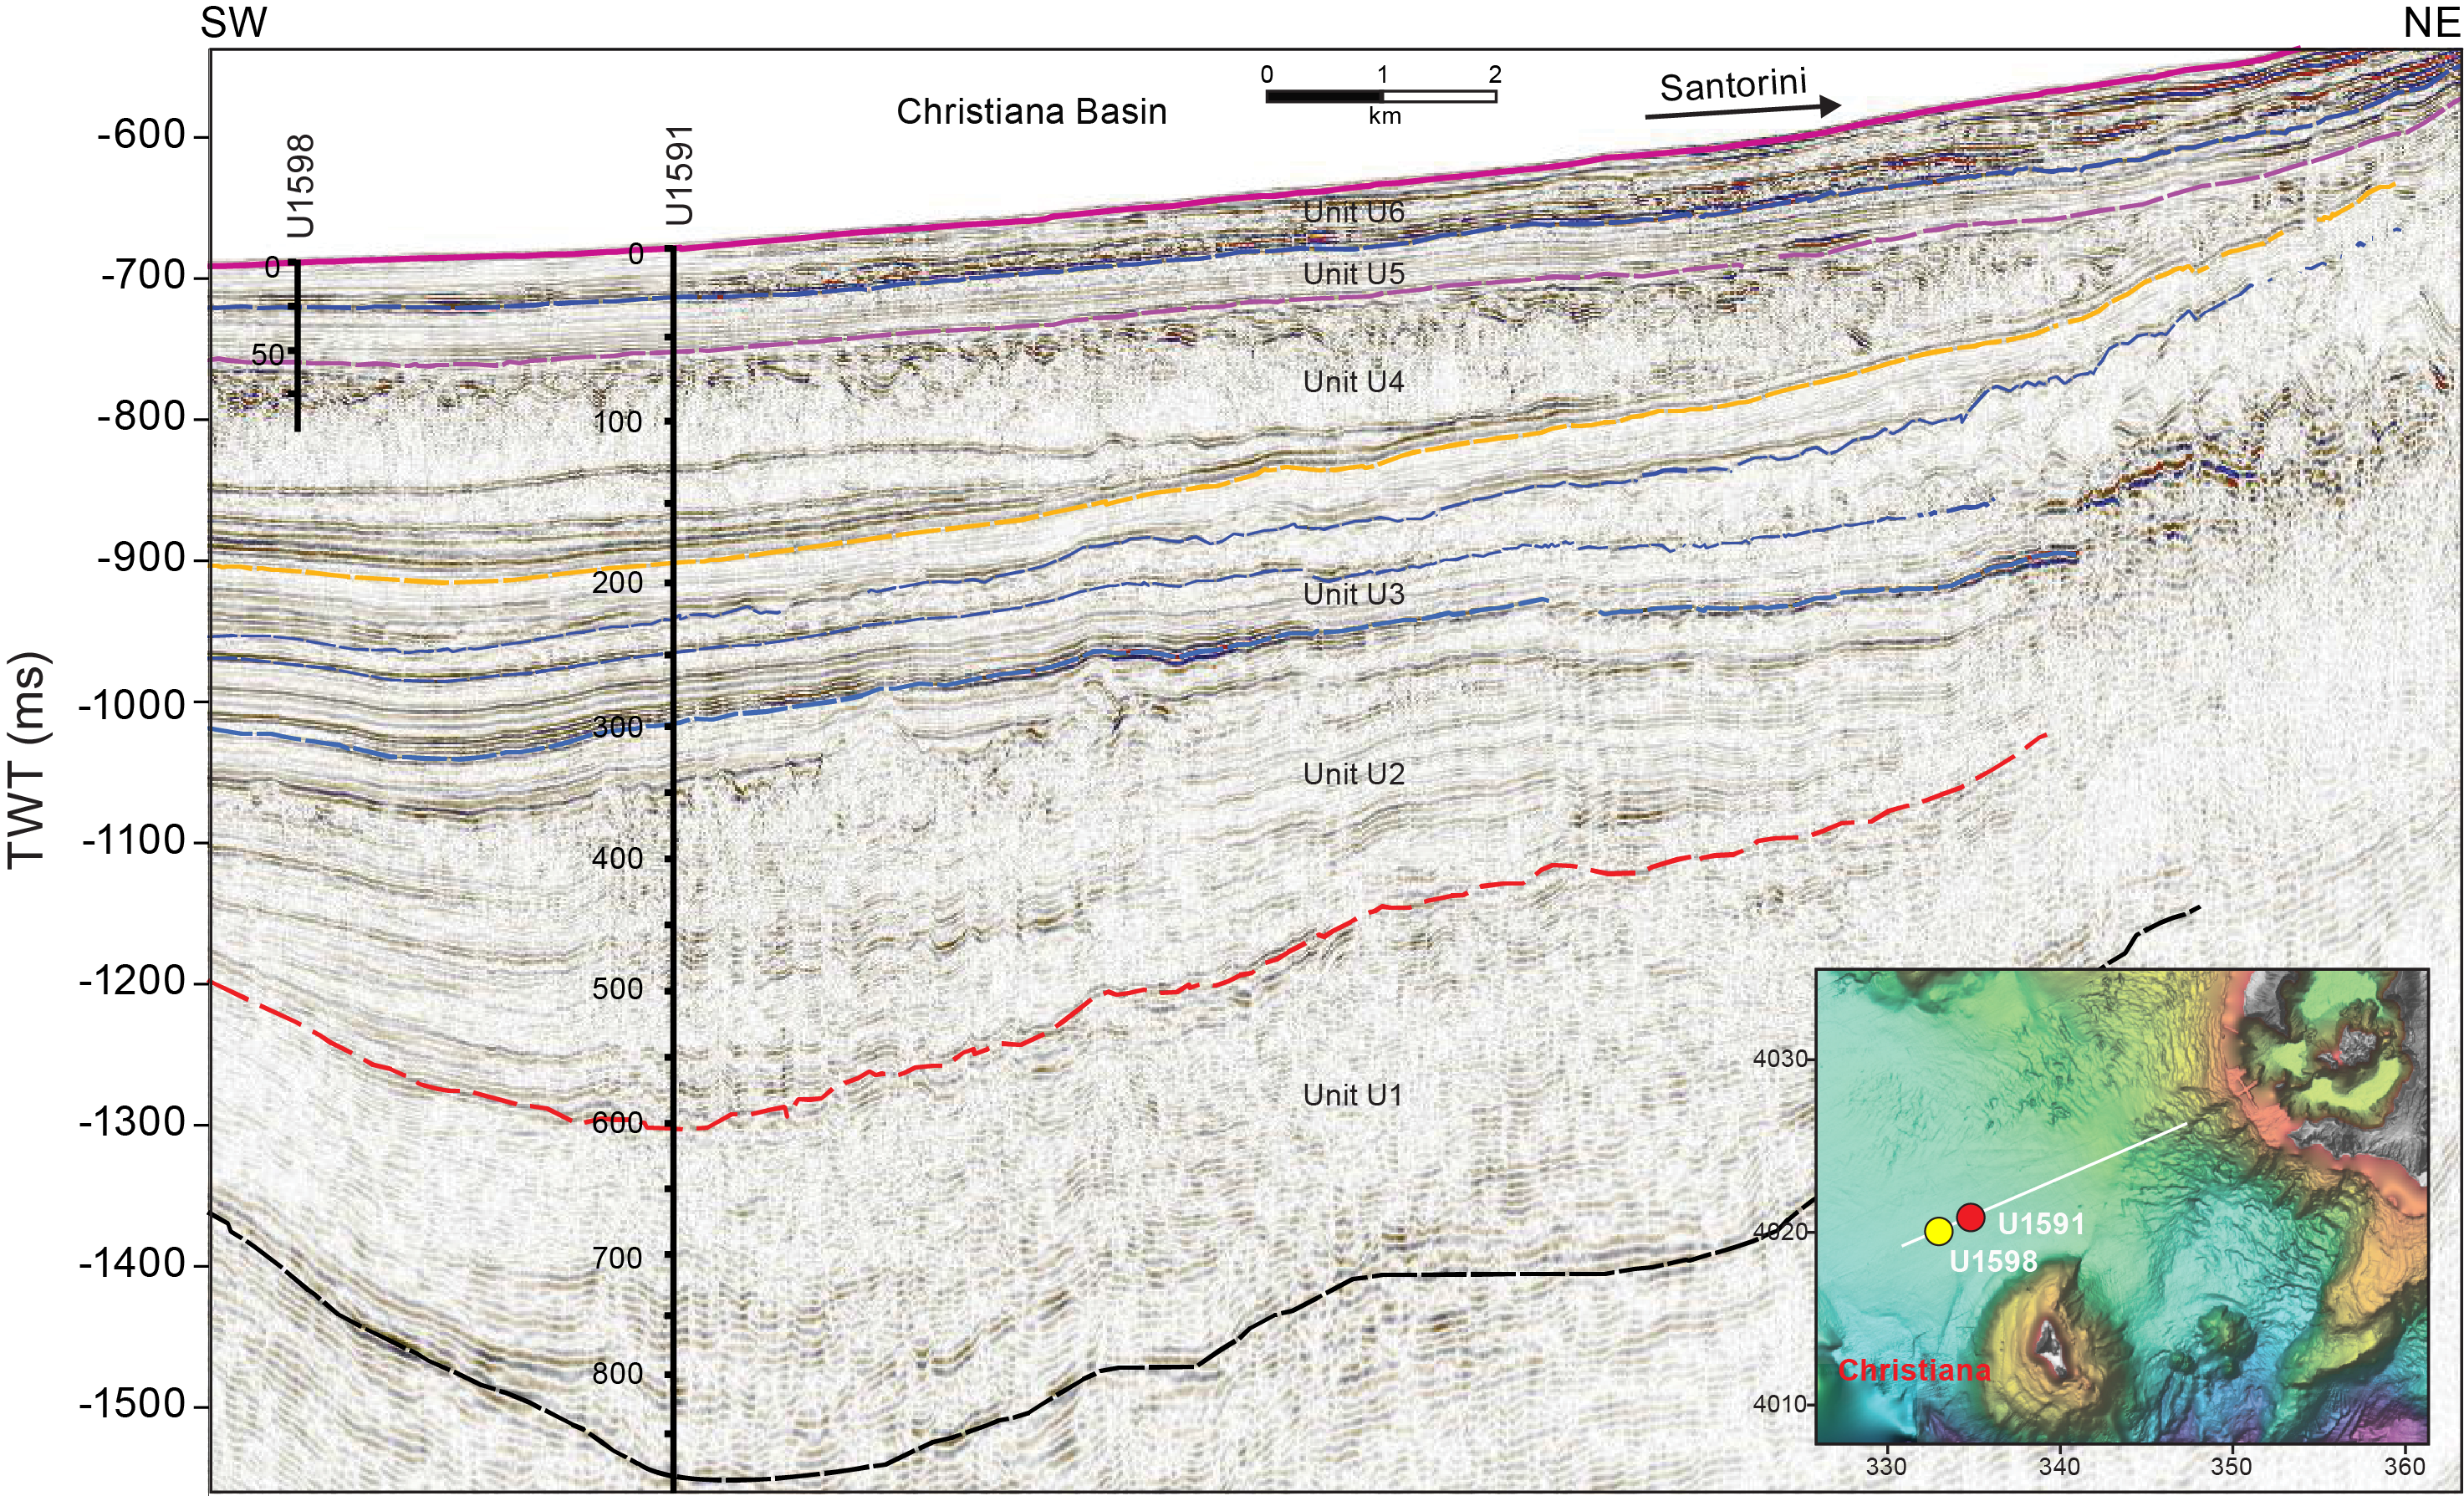
Figure F2. Seismic profile.
The aims of Site U1591 were (1) to better date the volcanic activity of Christiana using biostratigraphic and magnetostratigraphic means and determine whether the CSK volcanic field had Pliocene volcanism similar to the Milos Volcano farther west; (2) to relate the Christiana volcanism to subsidence along the ENE–WSW fault sets and to the activation of the northeast–southwest fault sets; and (3) to seek the submarine equivalent of the Christiani Ignimbrite. By using deeper coring (and seismic profiles) to reconstruct the volcanic, sedimentary, and tectonic histories of the Christiana Volcano, and possibly the Milos Volcano, we aimed to complement the Santorini and Kolumbo volcanic records of Sites U1589 and U1592 and therefore access a near-continuous time series of volcanism of the CSK volcanic field since rift inception. Site U1591 addressed scientific Objectives 1–4 and 6 of the Expedition 398 Scientific Prospectus (Druitt et al., 2022).
2. Operations
All thrusters were down and secured on 2 January 2023 at 0006 h. The vessel was switched to dynamic positioning auto control mode at 0014 h, marking the start of Site U1591. The transit from Site U1590 took only 2.3 h, covering 20.3 nmi at 8.8 kt.
Operations involved three holes, with heavier use of the XCB and RCB systems due to the seemingly poor hole conditions when piston coring. Hole U1591A was piston cored with the APC system until the hole became unstable at Core 10H and was ended after Core 11H. Hole U1591B was piston cored to just above the trouble area, drilled down, and then primarily XCB cored. Core 43X saw the XCB shoe sheared off, ending the hole. Hole U1591C was an RCB-only hole, drilled down to 149.3 mbsf and then cored to 902.9 mbsf. The hole was terminated for time.
2.1. Hole U1591A
At 0740 h on 2 January 2023, Hole U1591A was spudded at 36°18.7615′N, 025°09.0057′E with a recovery of 3.8 m for Core 1H and a calculated seafloor at 514.6 mbsf (Table T1). APC coring continued through Core 11H at 98.8 mbsf.
Tight hole conditions were seen, and the decision was made to pull the bottom-hole assembly (BHA) and remove the tapered drill collar (TDC) and the nonmagnetic drill collar (NMDC), both relatively expensive compared to the rest of the BHA and also in short supply on board.
The string was pulled out of the hole with the top drive to 508 meters below rig floor (mbrf), clearing the seafloor at 1512 h. The floor crew unloaded the Icefield MI-5 core orientation tool, and the top drive was racked back. The trip out continued to 136.6 mbrf. Meanwhile, the vessel was offset 20 m east of Hole U1591A. The bit cleared the rotary table at 1700 h, ending Hole U1591A.
2.2. Hole U1591B
Still on 2 January 2023, a reconfigured APC/XCB BHA was assembled with the same drill bit. The TDC and NMDC were removed and stored in the forward collar catwalk. The trip-in started at 1945 h. Hole U1591B was spudded at 2150 h on 2 January at 36°18.7621′N, 025°09.0190′E. The recovery of 3.8 m indicated seafloor at 513.8 mbsl. APC coring continued to 3 January and Core 8H from 64.6 mbsf.
At 0245 h on the morning of 3 January, the APC system was pulled and an XCB center bit was dropped. The intention was to drill through a previously identified pumice section. The driller established slow circulation rates and proceeded to drill from 74.1 to 98.8 mbsf. The driller worked tight hole conditions at 91.3 mbsf, and a mud sweep was pumped to help alleviate the trouble.
Following the drill-down interval, the half-length advanced piston corer (HLAPC) system was deployed from Core 10F at 98.8 mbsf through Core 13F at 112.9 mbsf. Several overpulls in the range of 40,000 lb were observed. More mud was pumped.
At 0930 h, coring switched to the XCB system with Core 14X at 117.6 mbsf through Core 16X at 146.7 mbsf. However, all three XCB cores were ~0 m recovery.
The switch was again made to the HLAPC system for Core 17F from 146.7 mbsf through Core 18F from 151.4 mbsf, but higher erratic torque in the hole paused coring for several minutes. Despite the poor recovery from rotary coring, the hole was behaving better with XCB coring. With the goal for the hole being the deep target, a final switch was made back to the XCB system.
XCB coring reinitiated with Core 19X from 156.1 mbsf through Core 35X to 321.0 mbsf. The Core 36X barrel did not land (standpipe pressure did not come up). The coring line was run to retrieve the barrel, striking it early at ~187 mbsf and shearing the overshot. The sinker bars were pulled up, and the overshot was replaced. A second attempt retrieved the barrel; however, there was no evidence for why the barrel hung.
On 5 January, XCB coring finished with Core 43X at 389.2 mbsf, the final depth for Hole U1591B, after the XCB cutting shoe sheared off in hole. The reason for the failure was not clear.
A mud sweep was pumped prior to tripping. The trip continued with the bit clearing the seafloor at 0800 h. The bit cleared the rig floor at 0950 h, ending Hole U1591B.
2.3. Hole U1591C
On 5 January 2023 at 1500 h, Hole U1591C was spudded at 36°18.7810′N, 025°08.9962′E, with an offset water depth of 524.9 mbrf. A drill-ahead section was completed to 149.3 mbsf. The center bit was retrieved at 1915 h, and RCB coring began with Cores 2R–5R at 187.4 mbsf by midnight on 5 January.
On 6 January, RCB coring continued from Core 6R at 187.4 mbsf through Core 13R at 265.0 mbsf. Switching to drilling mode, the driller advanced the interval from 265.0 to 350.0 mbsf. At 1200 h, the center bit was recovered, and RCB coring was reinstated with Core 15R. Coring continued, largely uneventfully, to 10 January and Core 71R at 902.9 mbsf, the final depth for Hole U1591C. The decision was made to terminate coring in favor of other objectives. The bit cleared the rotary table at 1550 h, and the drill floor was secured for the transit. Deckhands started raising the thrusters at 1636 h. All thrusters were up and secured at 1648 h, and the sea passage to Site U1590 began, ending Site U1591.
3. Lithostratigraphy
Cores from three consecutive holes at Site U1591 (U1591A–U1591C) recovered a partial stratigraphy from 0 to 902.67 mbsf (Figure F3). Hole U1591A consists of Cores 1H–11H (0–90.85 mbsf), Hole U1591B includes Cores 1H–43X (0–386.57 mbsf), and Hole U1591C includes Cores 1R–71R (158.71–902.67 mbsf). We observed very good correlation between Holes U1591A and U1591B. Recovery in Hole U1591C began at ~160 mbsf, with the goal of recovering volcanic intervals that were only poorly recovered at the bottom of Hole U1591B. In addition, Hole U1591C targets the lithology of the underlying basement.
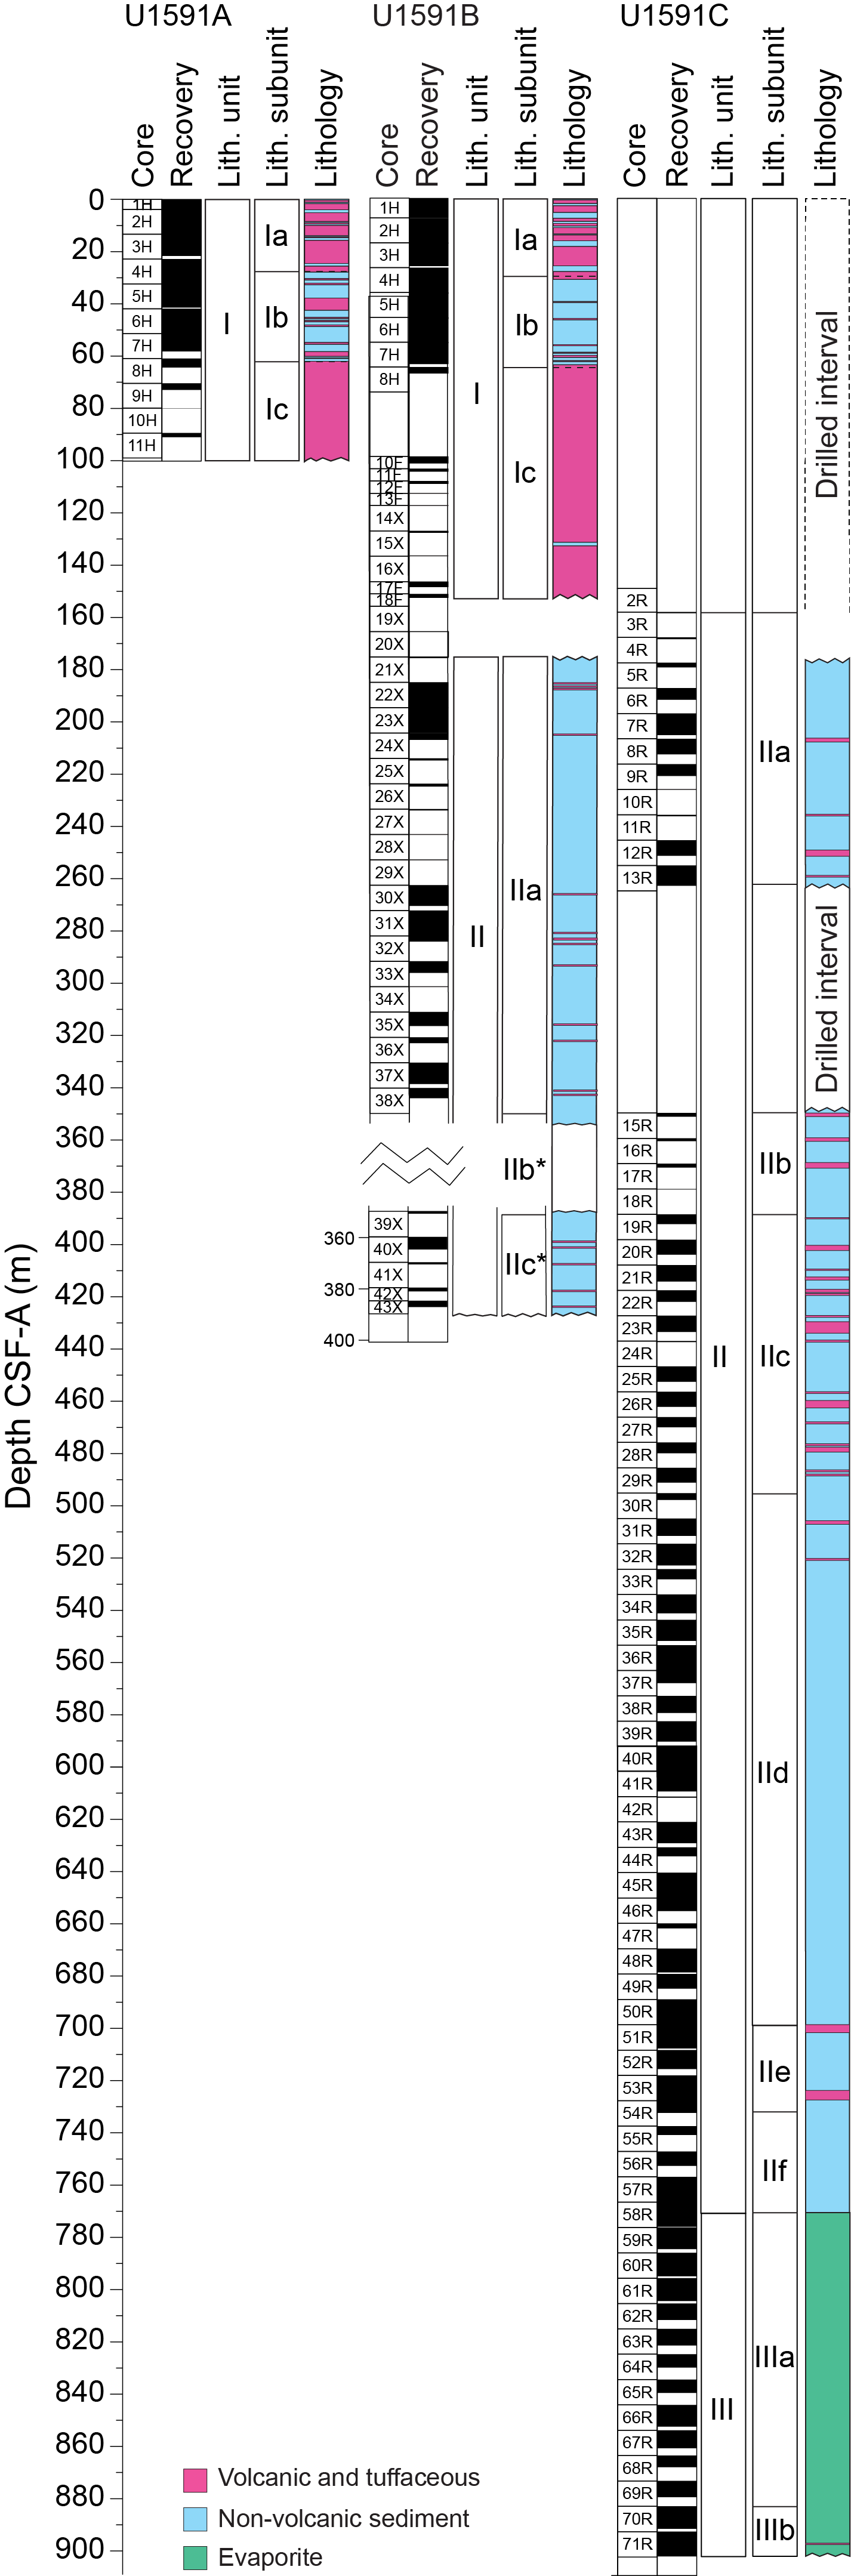
Figure F3. Lithostratigraphy.
The recovered material is sedimentary and unlithified throughout Holes U1591A and U1591B. A gradual transition to stiffer and more consolidated material toward the bottom of Hole U1591B continues in Hole U1591C. These visual observations are corroborated by increasing P-wave velocity and bulk density and decreasing porosity (see Physical properties). Sediment in Hole U1591C transitions gradually from consolidated sediment to sedimentary rock. In contrast to this gradual transition, the change in classification from sediment to sedimentary rock must occur at one specific interval. This boundary was made (see the Expedition 372B/375 methods chapter [Wallace et al., 2019]) where preparing smear slides became difficult and a concomitant increase in the slope of the P-wave velocity occurred (after Core 398-U1591C-23R). Subsequently, the lithology names changed from ash to tuff, ooze to marl, mud to mudstone, and so on.
The sedimentary succession in the uppermost 772 m is characterized by both volcanic lithologies (ash/tuff, lapilli-ash, lapilli, and tuffaceous mud/sand/mudstone/sandstone) and nonvolcanic calcareous mud/mudstone and ooze/marl. At 772 mbsf, there is a sharp transition from marls, calcareous mudstones, and micrites to nodular anhydrite-bearing lithologies (± algal mats).
Changes in relative abundances of volcanic lithologies and oozes/marls enables definition of the first two lithostratigraphic units at Site U1591. Unit I is dominated by extensive volcanic intervals with lesser overall amounts of nonvolcanic material, whereas Unit II is dominated by oozes/marls and calcareous muds/mudstones with lesser volcanic intervals (Figures F3, F4). Smear slides for microscopic analyses were prepared to confirm macroscopic descriptions of distinct lithology changes at the section level, such as identification of vitric ash particles in tuffaceous lithologies or crystals in ash layers. In Unit I, the succession of tuffaceous muds/oozes and volcanic layers defines three subunits (Ia–Ic). Unit II displays six subunits (IIa–IIf) typically defined based on relative proportions of volcanic material in the dominantly nonvolcanic unit.
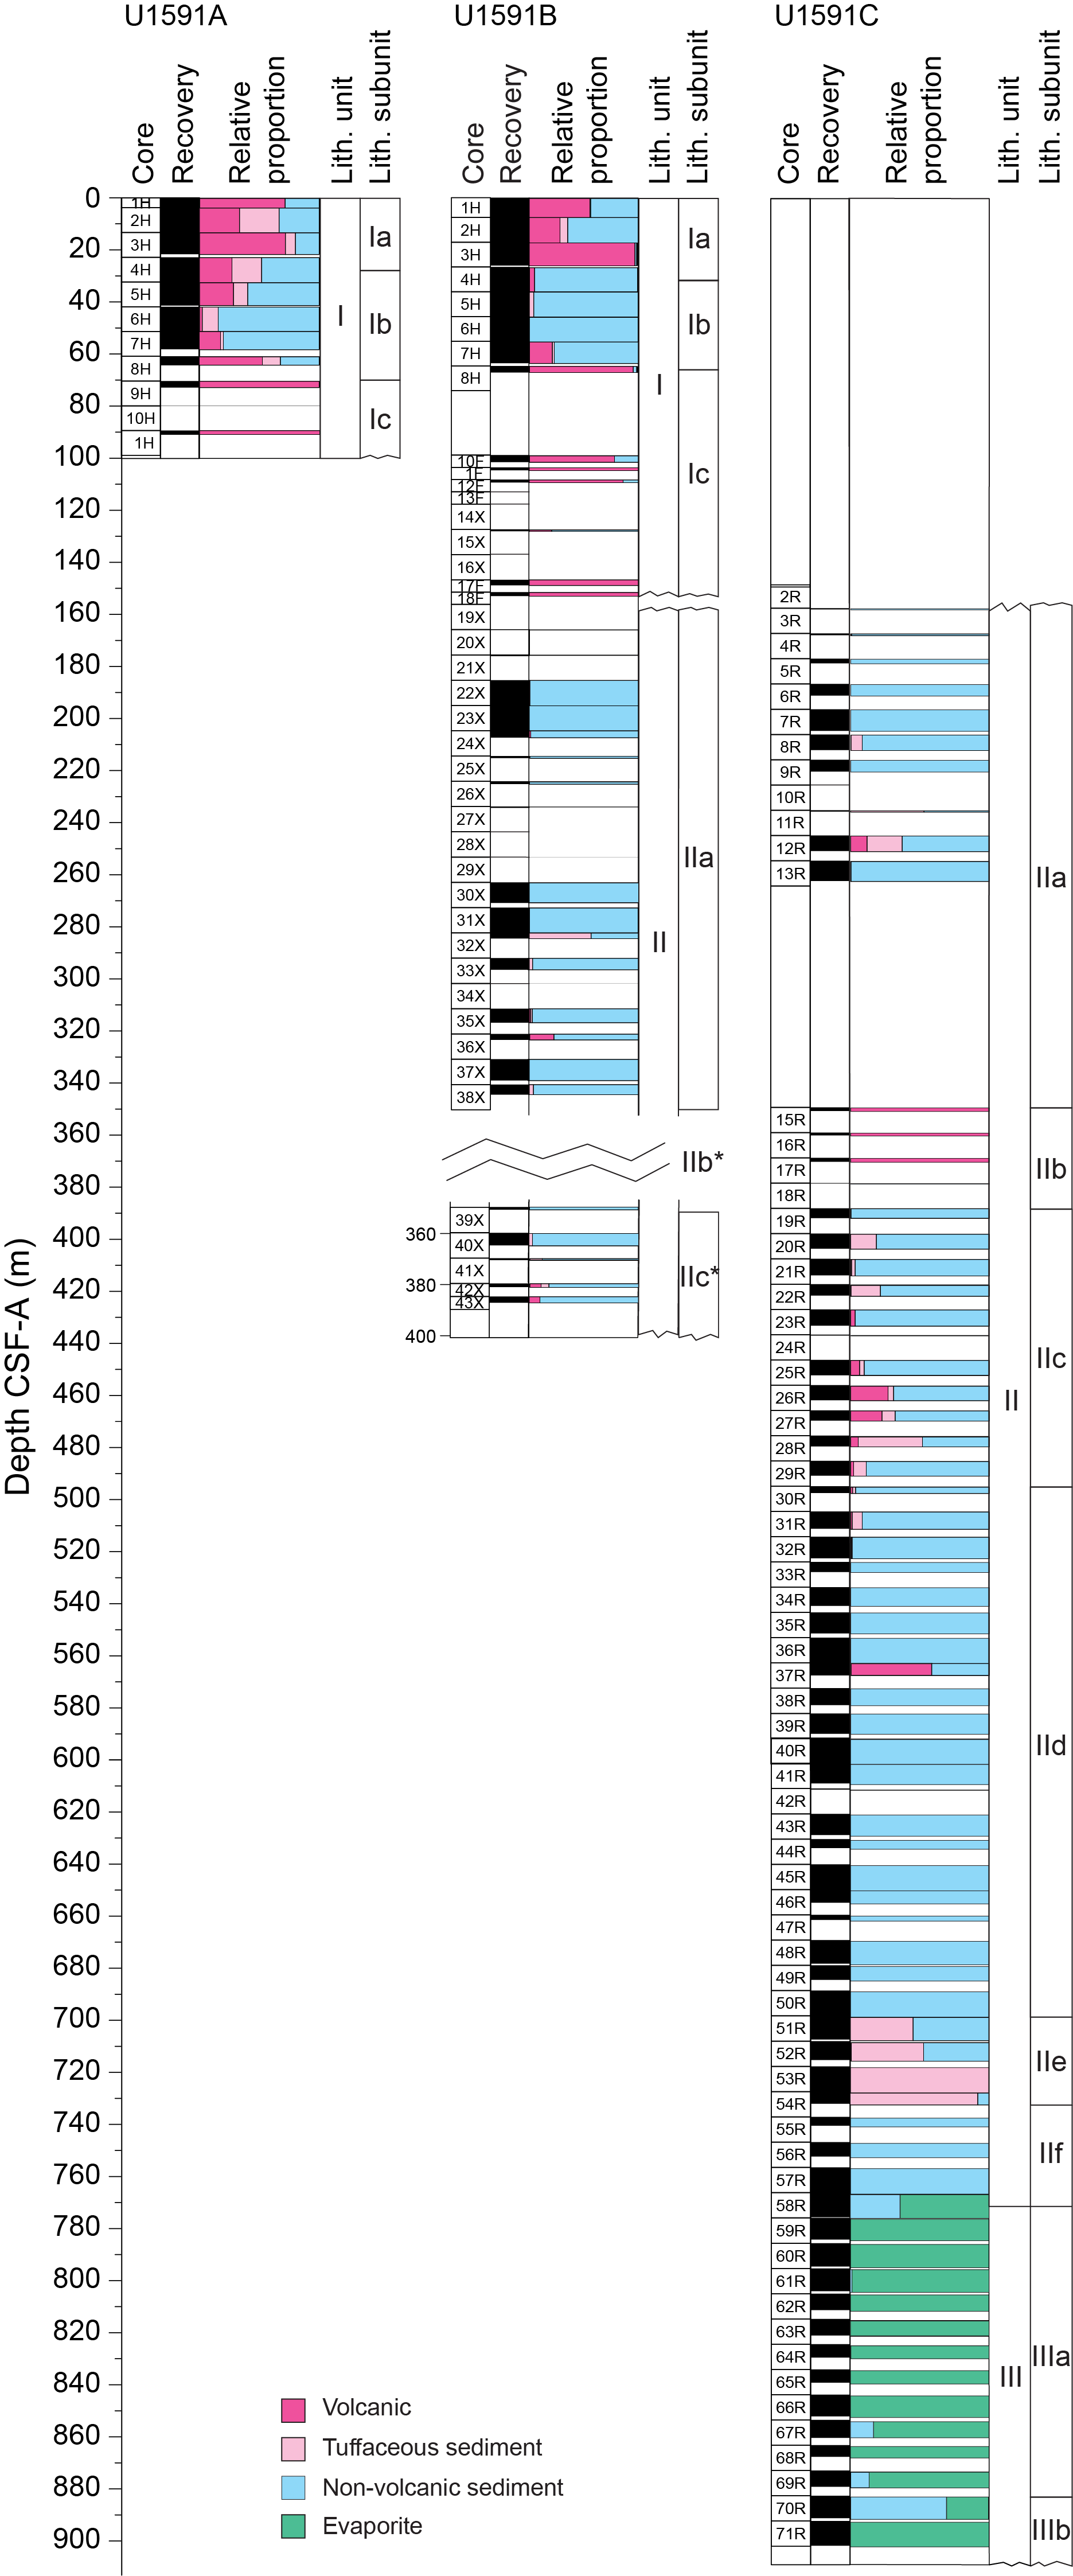
Figure F4. Volcanic, tuffaceous, and nonvolcanic lithologies.
The third lithostratigraphic unit (Unit III) is marked by the onset of lithologies containing anhydrite (evaporite sequence), clearly showing a distinct change in depositional environment from deep marine to shallow and terrestrial. A transition to ash- and lapilli-bearing mudstone and micrite containing anhydrite (Subunit IIIb) marks the bottom of Hole U1591C.
Figure F3 summarizes the lithostratigraphy of Site U1591, displaying core recovery and lithostratigraphic units and subunits in Holes U1591A–U1591C. Table T2 provides the upper and lower boundaries and biostratigraphic ages (see Biostratigraphy) of the lithostratigraphic units and the upper and lower boundaries of the subunits. Figure F4 graphically presents the relative proportions of volcanic, tuffaceous, and nonvolcanic lithologies within each hole in reference to lithostratigraphic units and subunits. Figure F5 shows the grain size distributions of the lithologies in Units I–III in more detail. Figure F6 displays different types of core disturbances observed in Site U1591.
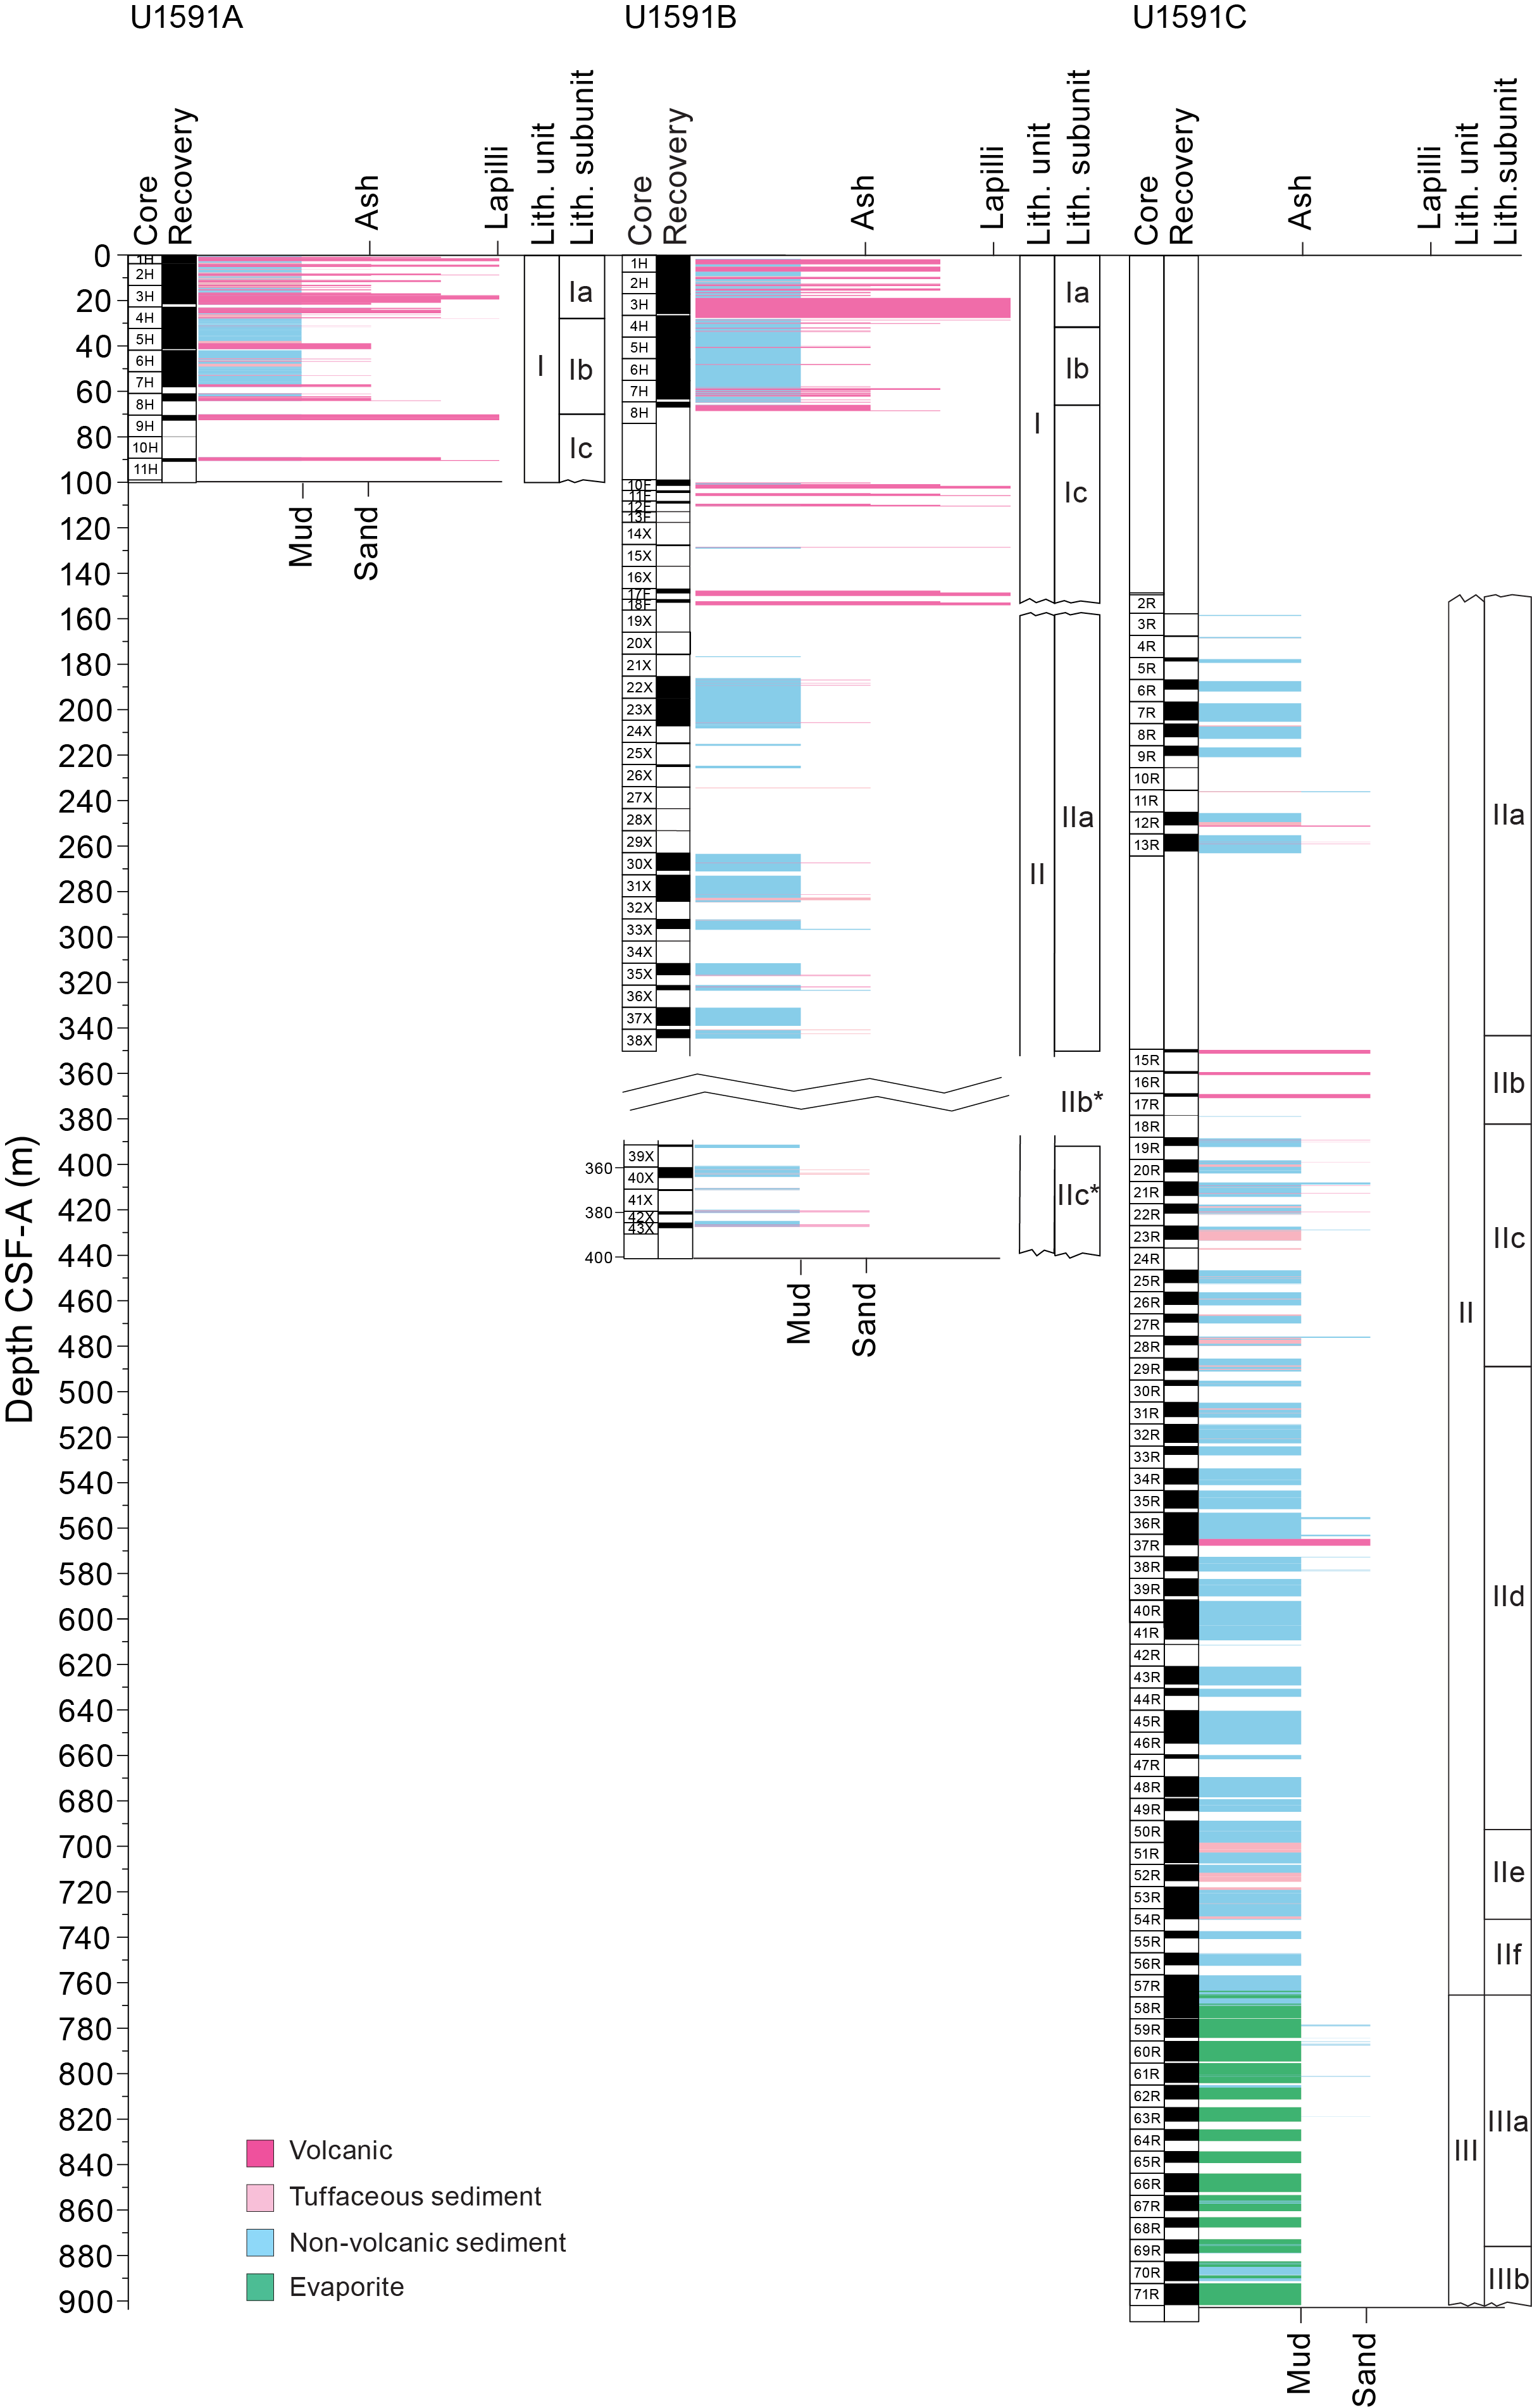
Figure F5. Average grain size distribution.
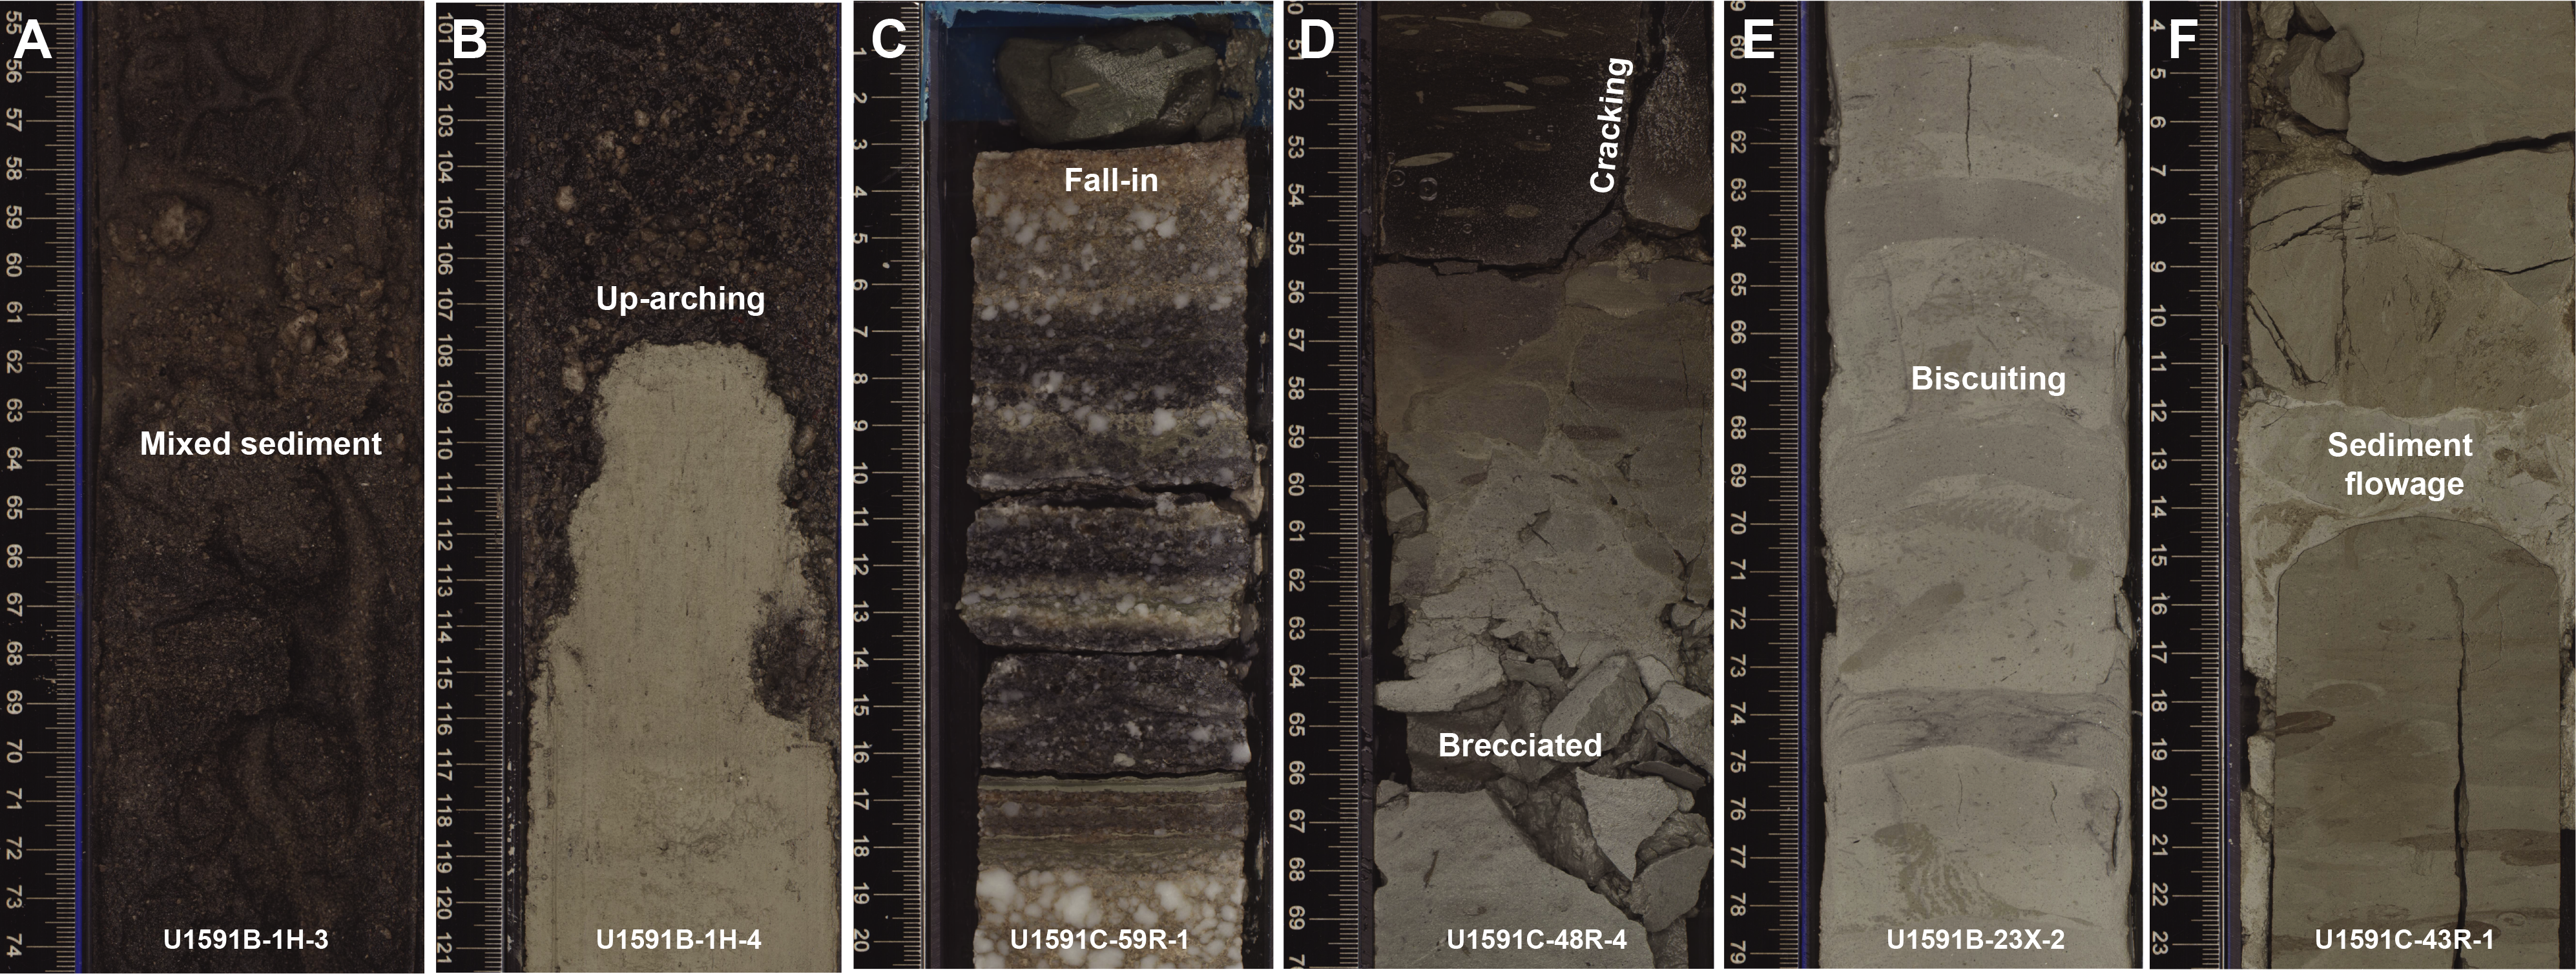
Figure F6. Core disturbances.
The following sections describe (1) the effects of core disturbance, (2) the three lithostratigraphic units and subunits, (3) correlations between Holes U1591A–U1591C, and (4) X-ray diffraction (XRD) results from Site U1591.
3.1. Core disturbance
Several types of core disturbance are observed in the sediments from Site U1591:
- Mixed sediment: grains and clasts that flow and mix in water-saturated, granular core sections, producing moderately to severely disturbed original sedimentary structures and stratigraphy (Figure F6A).
- Uparching: slight to moderate coring-induced shear between the sediment and core liner results in bedding uniformly dragged downward along the core margins (Figure F6B). In these intervals, the original lithofacies and sedimentary structures are usually slightly to severely disturbed but can still be recognized visually.
- Fall-in: coarse clast-supported intervals at the tops of many cores (Figure F6D). In these intervals, which may extend up to 39 cm in thickness, original lithofacies and sedimentary structures are usually destroyed.
- Brecciated: core extension disturbs the core until it becomes sheared, or, in the case of brittle failure, brecciated (Figure F6D). Slight brecciation produces cracks in the original lithologies, whereas moderate to severe brecciation disturbs original lithofacies and sedimentary structures more severely (Figure F6D), although they usually remain readily recognizable. In contrast, the contacts between intervals and stratifications in granular layers may be lost due to brecciation.
- Biscuiting: fractured disc-shaped pieces ranging from a few centimeters to more than 10 cm thick, often packed with sheared and remolded core material mixed with drill slurry, filling gaps between brittle biscuits (Figure F6E). The degree of biscuiting ranges from slight to severe, depending on the size of the biscuits and the proportion of biscuits to infill material.
3.2. Description of units and subunits
The sediments recovered from Holes U1591A–U1591C comprise three volcano-sedimentary lithostratigraphic units (I–III) (Figure F3). Unit I is divided into three subunits (Ia–Ic), Unit II is divided into six subunits (IIa–IIf), and Unit III is divided into two subunits (IIIa and IIIb) (Figures F4, F5; Table T2). The lithology of these units and subunits is described below.
3.2.1. Unit I
- Intervals: 398-U1591A-1H-1 to the bottom of the hole; 398-U1591B-1H-1 to 18F-CC, 25 cm
- Thickness: 152.88 m
- Depth: 0.00–152.88 mbsf
- Age: Holocene to Middle Pleistocene
- Lithology: volcanic and tuffaceous lithologies (ash, lapilli, lapilli-ash, and tuffaceous mud) and lesser ooze/organic-rich ooze and calcareous mud
Unit I extends from 0 to 152.88 mbsf (Table T2). Hole U1591A was terminated before reaching the bottom of the unit, but it was recovered in Hole U1598B. Unit I primarily consists of intercalated tuffaceous mud, ash, lapilli-ash, and lapilli punctuated by variable thickness intervals of calcareous mud and ooze (Figures F4, F5). Volcanic intervals commonly have sharp bottom contacts with tuffaceous or biogenic lithologies. Figure F7 highlights core section images of the most common lithologies collected from Unit I. Figure F8 shows representative smear slides from these lithologies.
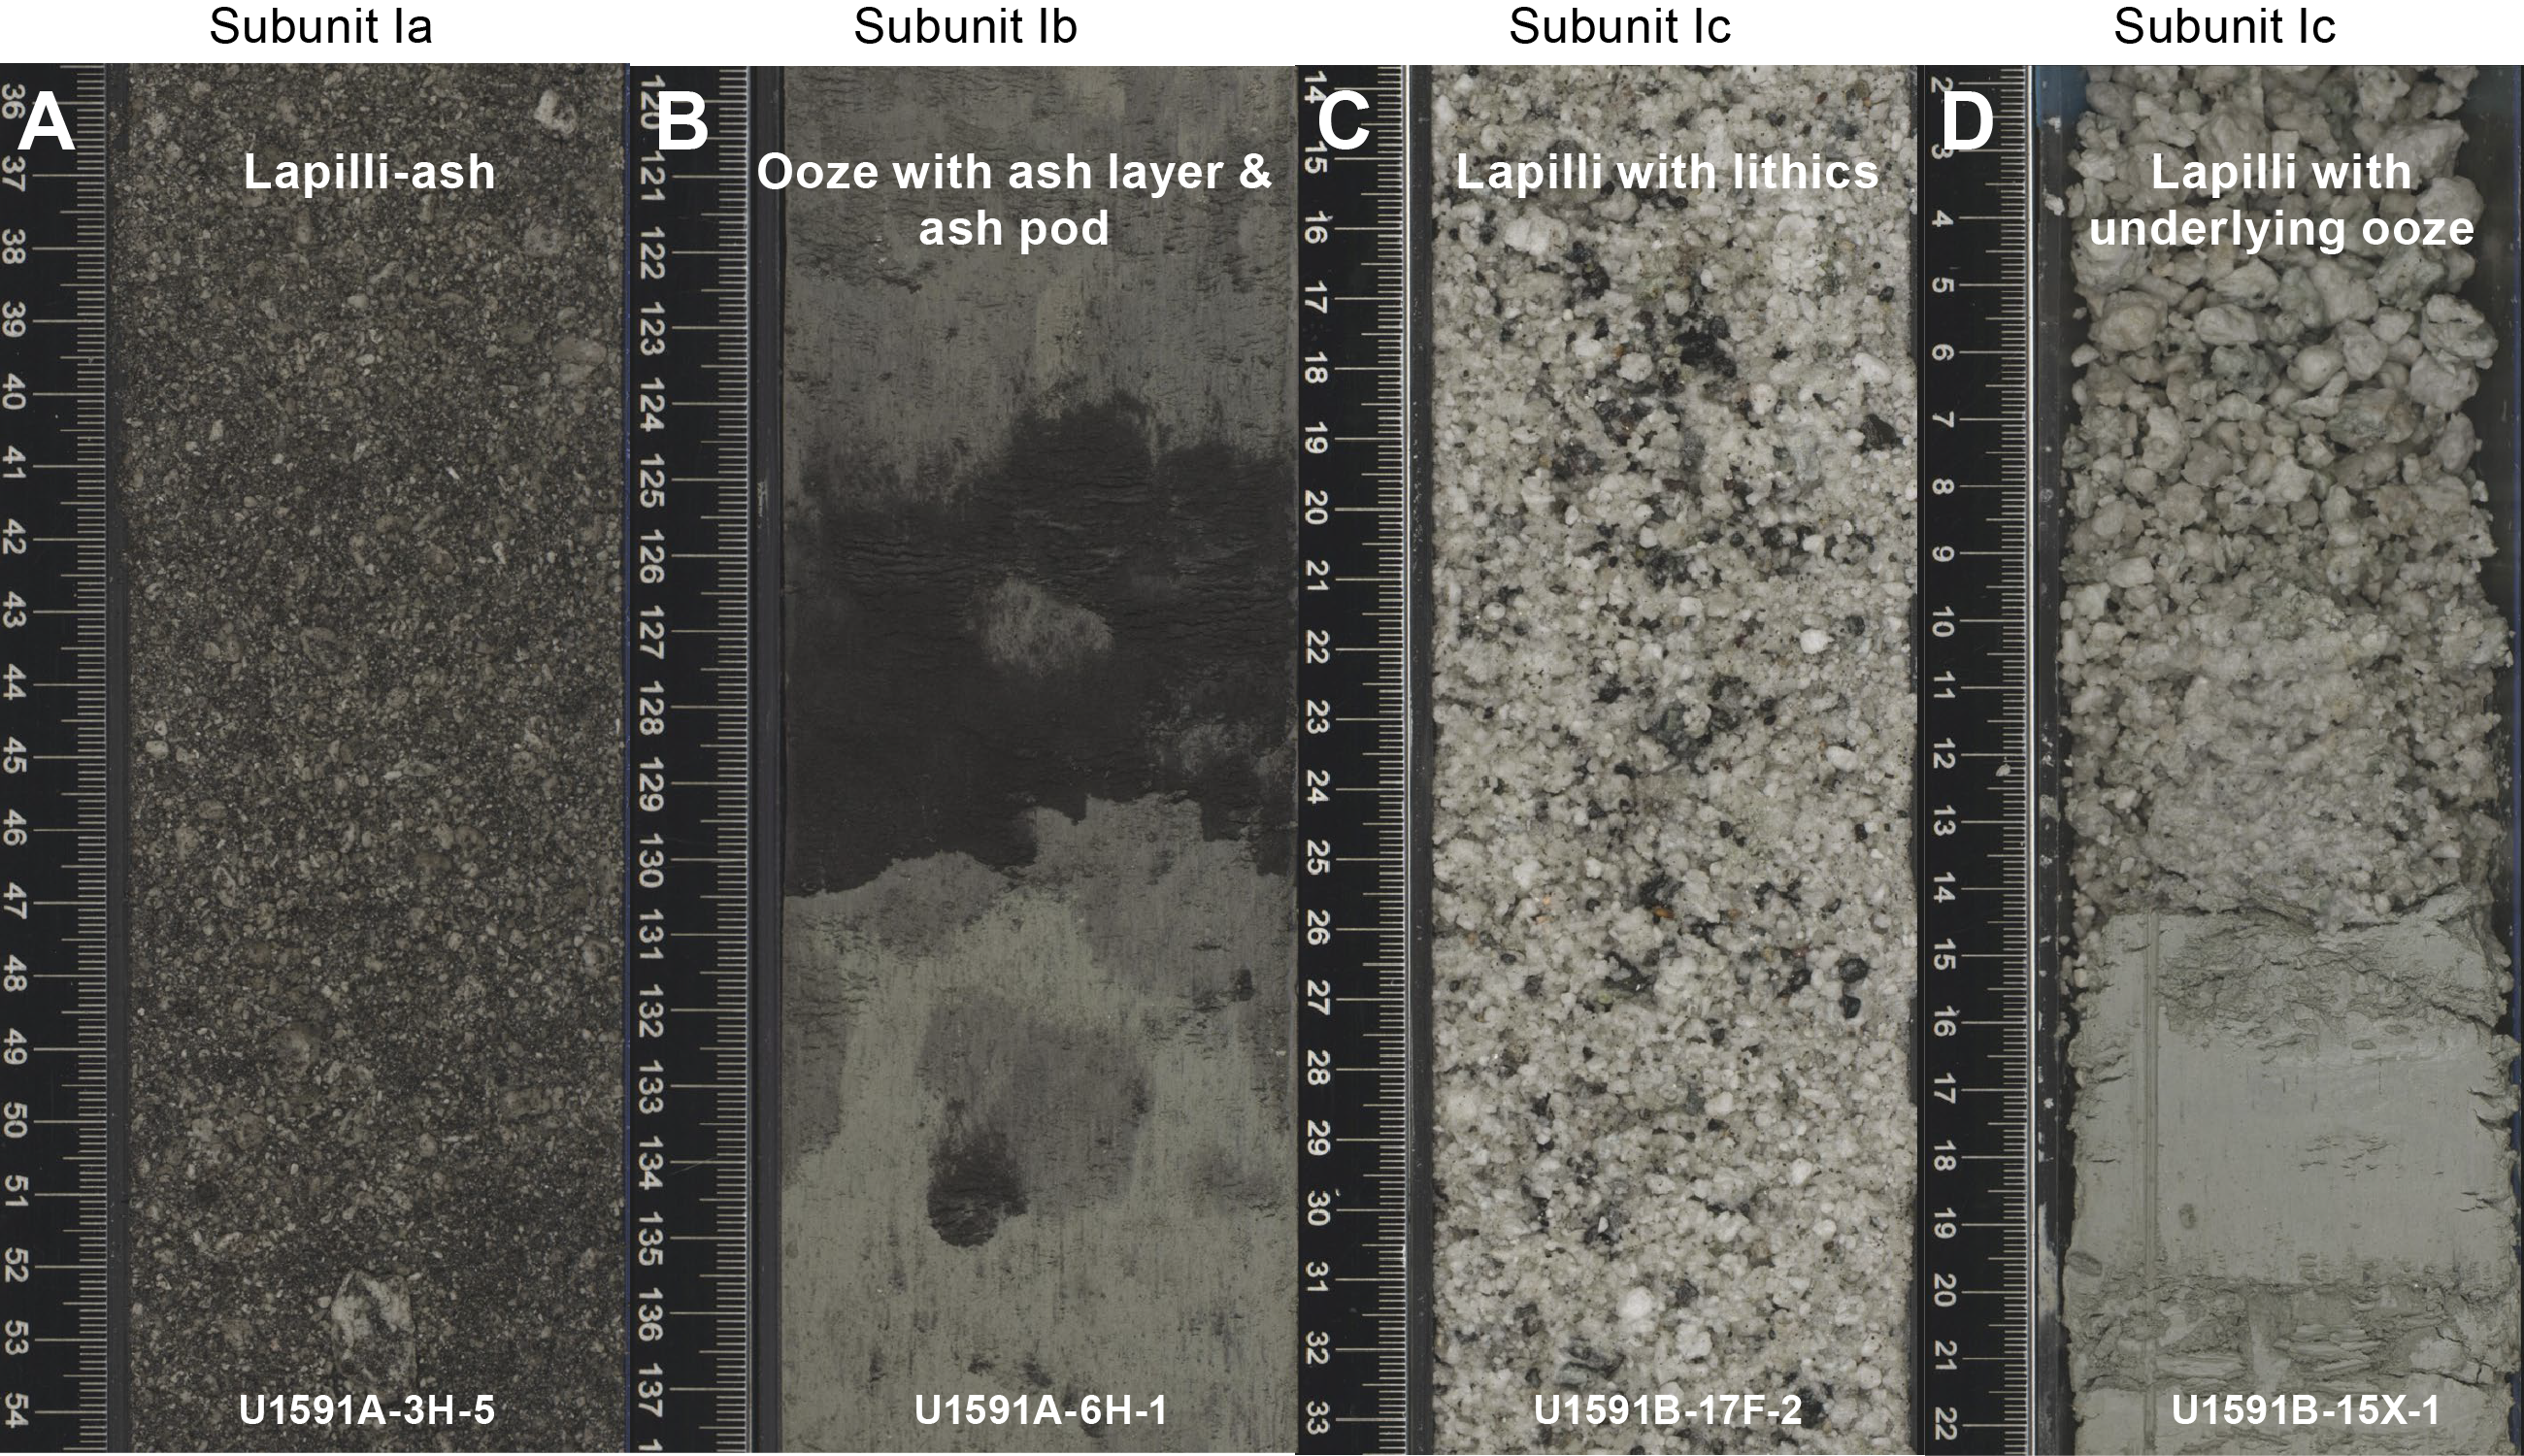
Figure F7. Volcanic lithologies.
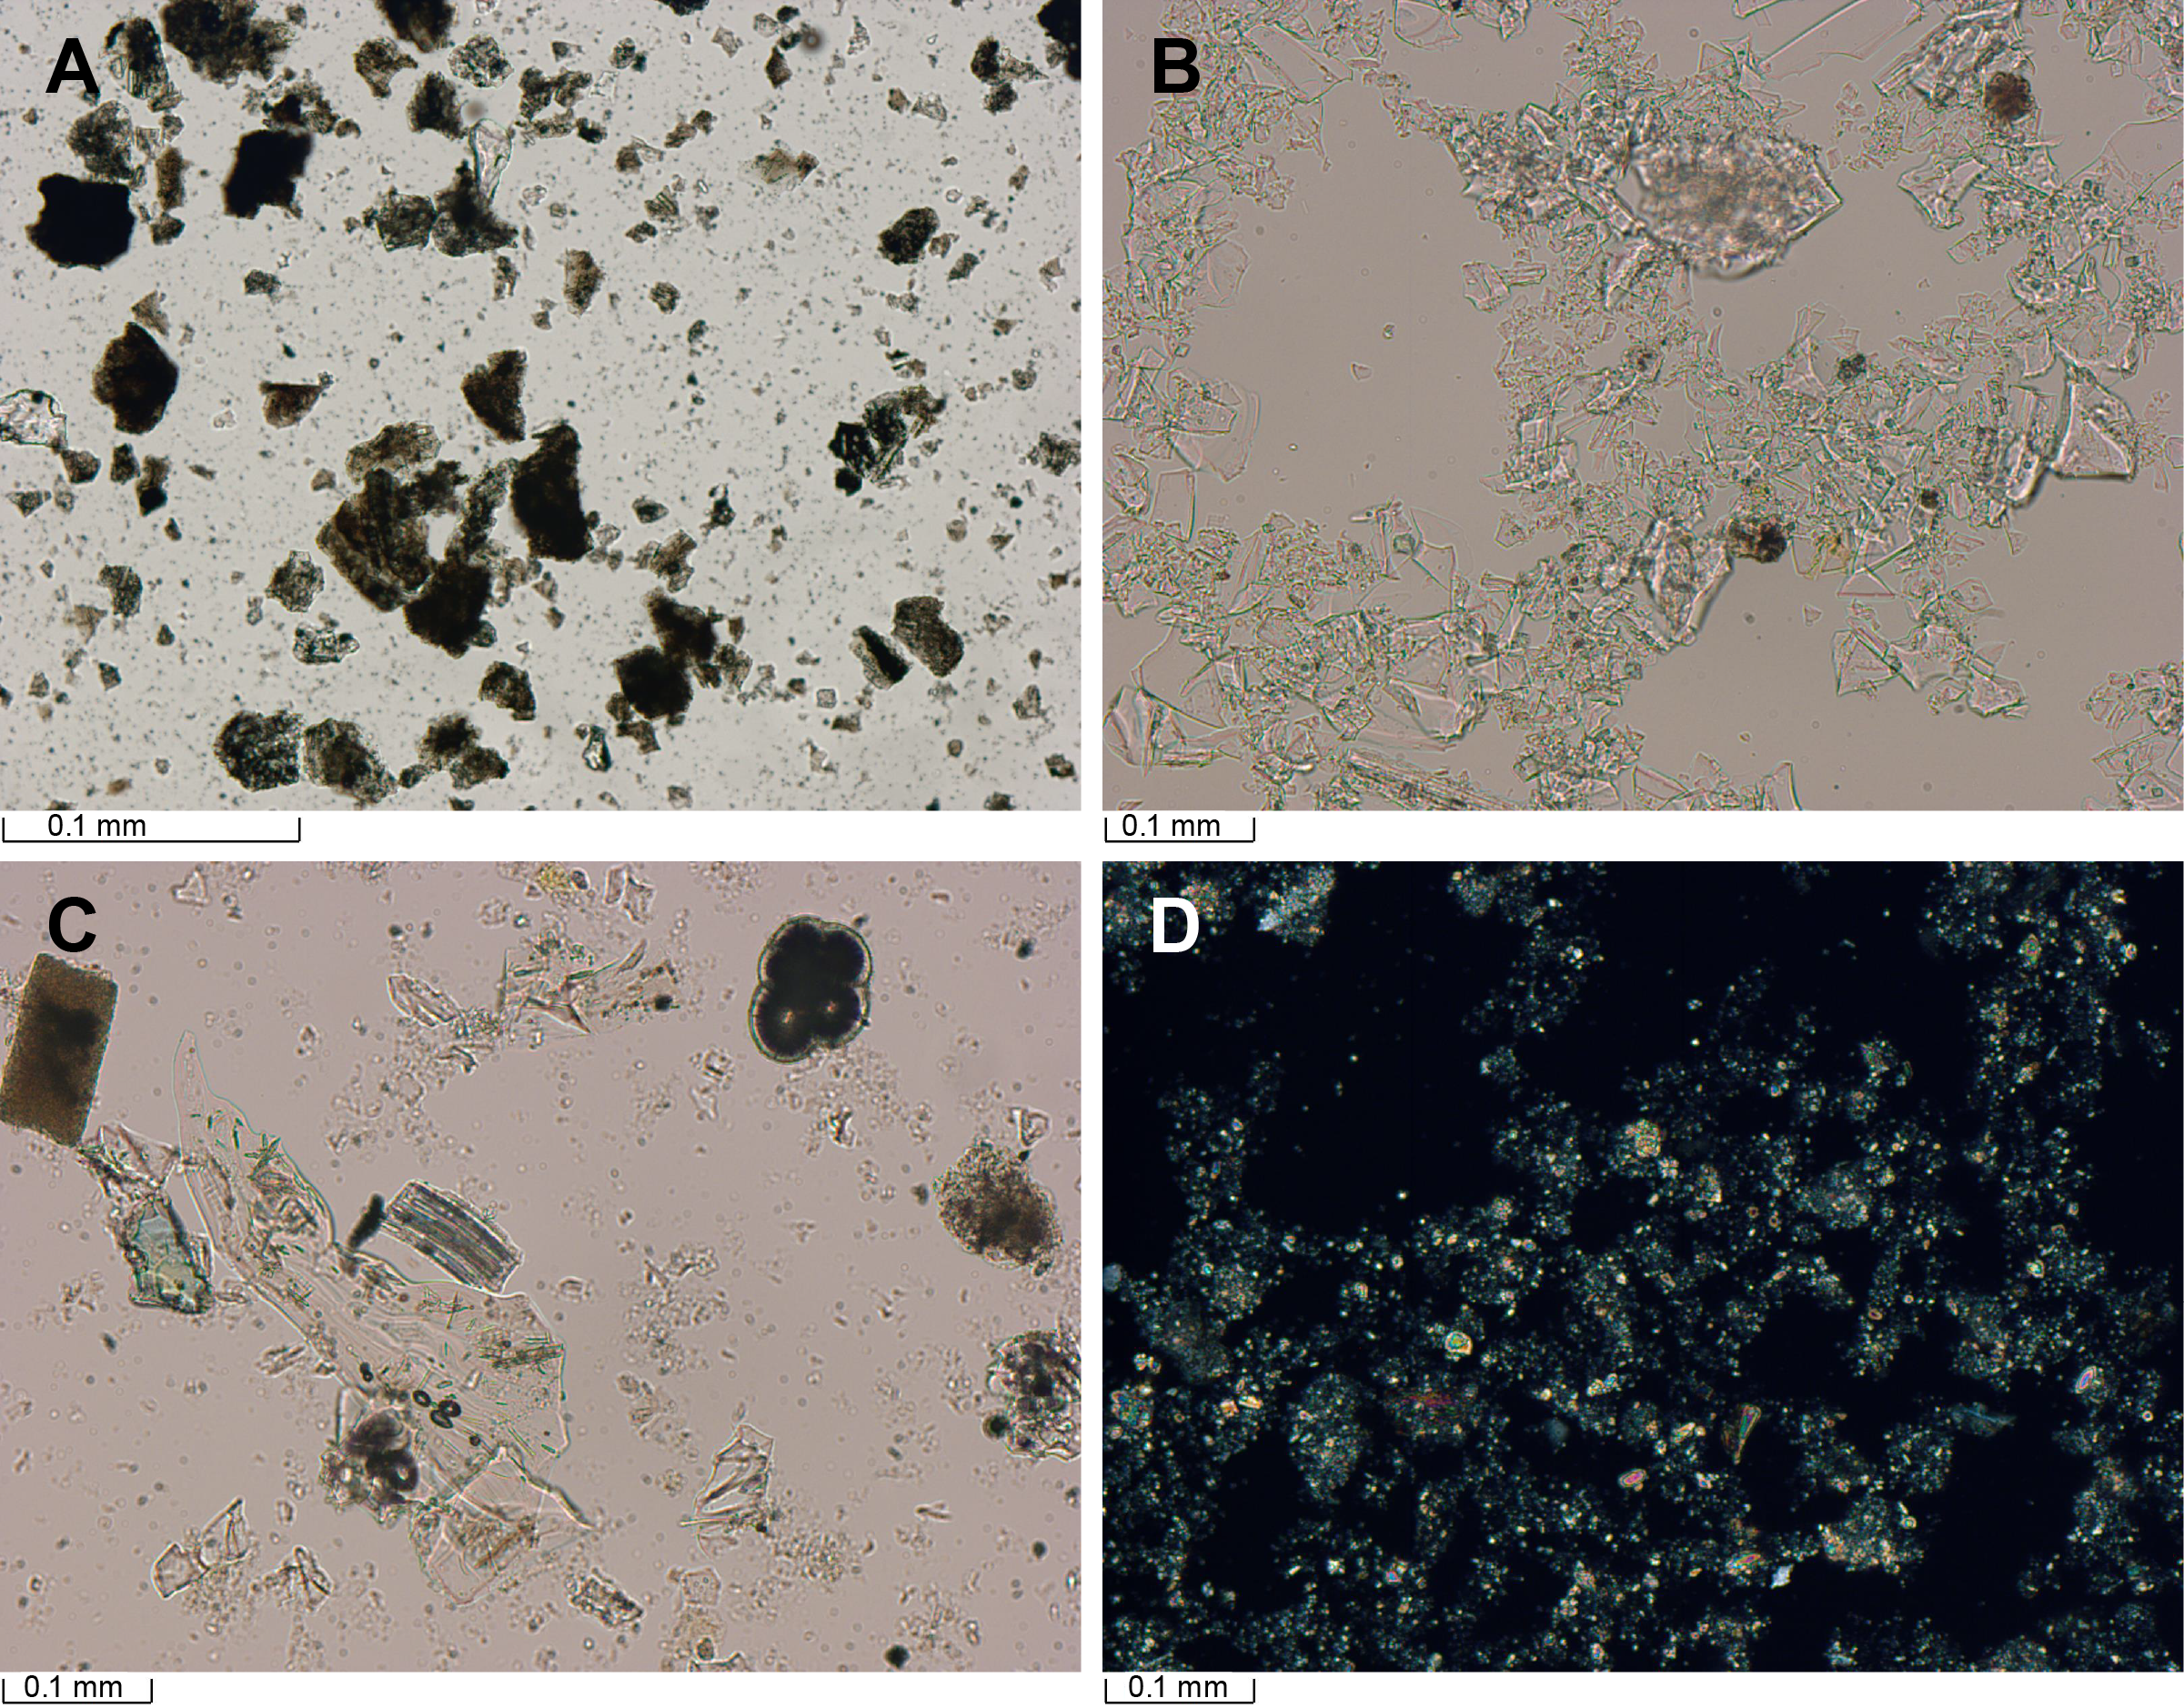
Figure F8. Lithologies, Unit I.
Volcanic lithologies (>75% volcanic particles; glass shards, pumice, crystals) comprise ash, lapilli-ash, and lapilli. Description of these lithologies in volcanic intervals was based on the relative abundance of ash-sized (<2 mm) and lapilli-sized (2–64 mm) particles, as described in Lithostratigraphy in the Expedition 398 methods chapter (Kutterolf et al., 2024), with ash and lapilli used when the proportion of one size was >75% and lapilli-ash used when both sizes were present but at <75% abundance (Fisher and Schmincke, 1984). Macroscopically, ash layers are typically white to dark gray, well sorted, range from fine ash to coarse ash, and variably admixed with mud at the top. Ash layers are typically nongraded or normally graded and are frequently characterized by a sharp base and a more diffuse and often bioturbated upper boundary that grades into tuffaceous mud. Microscopically, ash layers are characterized by colorless angular glass shards with or without crystals. Transparent pumiceous glass shards are also observed. An ash layer in the uppermost section of core (398-U1591B-8H-1, ~32 cm) contains a high abundance of pumiceous glass with tubular and rounded vesicles. A lower abundance of tubular vesicles in pumiceous glass was also observed in Sections 2H-2, 50 cm, and 8H-2, 64 cm. Some ash layers have distinct crystal/lithic-rich lags at their bases. Microscopic observations of smear slides were useful for identification of specific minerals (e.g., biotite, feldspar, and pyroxene) in ash. The coarser volcanic intervals in Unit I range from monomictic lapilli and lapilli-ash containing white to gray pumice lapilli with varying proportions of ash matrix to polymictic lithic-vitric lapilli and lapilli-ash (Figure F7). Less common are lithic-rich lapilli-ash layers. Where recovered, bottom contacts of these coarser units are sharp or bioturbated but commonly affected by uparching drilling disturbance.
Subunits in Unit I were defined by the relative proportion of volcanic/tuffaceous intervals and nonvolcanic intervals:
- Subunit Ia (Sections 398-U1591A-1H-1 through 4H-4, 34 cm [0–27.64 mbsf], and 398-U1591B-1H-1 through 4H-2, 65 cm [0–28.75 mbsf]): primarily ash, lapilli, and lapilli-ash. Other components include tuffaceous mud and ooze with intermittent inclusions of ash and lapilli.
- Subunit Ib (Sections 398-U1591A-4H-4, 34 cm, through 8H-1, 134 cm [27.64–62.14 mbsf], and 398-U1591B-4H-2, 65 cm, through 8H-1, 8 cm [28.75–64.68 mbsf]): primarily nonvolcanic material consisting of ooze, organic-rich ooze, and calcareous mud, punctuated by tuffaceous mud/ooze and ash, with one expansive ash layer in Hole U1591A at 37.67–41.29 mbsf (only present at 38.78–39.19 mbsf in Hole U1591B).
- Subunit Ic (Sections 398-U1591A-8H-2 [62.27 mbsf to the bottom of the hole] and 398-U1591B-8H-1, 10 cm, through 18F-CC, 25 cm [64.68–152.88 mbsf]): ash, lapilli, and a layer of tuffaceous mud.
3.2.1.1. Subunit Ia
Subunit Ia extends from 0 to ~27.6 mbsf (Sections 398-U1591A-1H-1 through 4H-4, 34 cm, and 398-U1591B-1H-1 through 4H-2, 65 cm) (Table T2) and is dominated by volcanic-rich lithologies with sparse intercalations of fine-grained muds or oozes. Thicknesses of the volcanic intervals vary from 0.2 to ~9 m. The uppermost 32 cm consists of well-sorted yellowish brown mud that overlies a thick package (2 m) of gray to dark gray lapilli-ash, ash, and lapilli in Hole U1591A (Figure F7A, F7B). Pumice encountered in the aforementioned sequence is subrounded, and echinoid spines were identified in the ash layer between 0.98 and 1.01 mbsf (Section 398-U1591A-1H-1). Below this volcanic package (2.24–2.95 mbsf), a light brownish gray to very dark gray ooze and organic-rich ooze contains subrounded pumice and ash (Figure F7C). The second volcanic package begins at 3 mbsf in both Holes U1591A and U1591B. Gray to black tuffaceous mud, dark gray to brown ash with lapilli, and dark gray to brown lapilli were encountered between 3.00 and 4.83 mbsf in Hole U1591A and between 3.38 and 5.67 mbsf in Hole U1591B. This dark volcanic material transitions sharply downward into gray to black ooze with ash, ash with nannofossils, and ooze. The lowermost volcanic-dominated package occurs between 7.26 and 27.64 mbsf; olive-gray to very dark grayish brown tuffaceous ooze, gray to black tuffaceous mud, gray to black ash, gray to black lapilli (both pumice and scoria; Core 398-U1591A-4H), and lapilli-ash layers dominate the lithology. Light gray to dark gray ooze (some with ash) are interbedded as minor constituents (Figure F7D).
3.2.1.2. Subunit Ib
Subunit Ib extends from 27.64 to 62.14 mbsf in Hole U1591A and 28.75 to 64.68 mbsf in Hole U1591B (Sections 398-U1591A-4H-4, 34 cm, through 8H-1, 134 cm, and 398-U1591B-4H-2, 65 cm, through 8H-1, 8 cm). It begins with the first thick package of ooze that occurs after the last lapilli unit in Subunit Ia. This subunit consists of a package of light greenish gray to olive-gray ooze intercalated with light brownish gray to very dark gray organic-rich (sapropelic) ooze, punctuated by several thin (<10 cm) ash layers overlain by associated tuffaceous oozes. Some of the oozes have ash pods and shell fragments. In the middle of Subunit Ib (37.67 mbsf in Hole U1591A) is one extensive 3.62 m thick tuffaceous and volcanic deposit (only 41 cm thick in Hole U1591B) of light brownish gray tuffaceous ooze and lithic-crystal ash with lapilli. The bottom of Subunit Ib is ooze rich but displays increasing frequency of tuffaceous ooze (some organic rich) and ash toward the bottom of the subunit.
3.2.1.3. Subunit Ic
Subunit Ic is a coarse volcanic subunit that begins beneath the last ooze interval in Subunit Ib. It extends in Hole U1591A from 62.27 mbsf to the bottom of the hole at 90.85 mbsf and in Hole U1591B from 64.68 to 152.88 mbsf. Recovery was poor, and coring in the uppermost part of Hole U1591C was unable to recover any of the volcanic material. This subunit begins with light gray ash (some with lapilli) and tuffaceous mud for 1.75 m, followed by a ~100 m thick package of light greenish gray lapilli-ash and lapilli. A thin section of the lapilli at 72.4 mbsf (interval 398-U1591A-9H-2, 70–73 cm) is highly vesicular and contains phenocrysts of plagioclase, clinopyroxene, and Fe-Ti oxides (Figure F9).
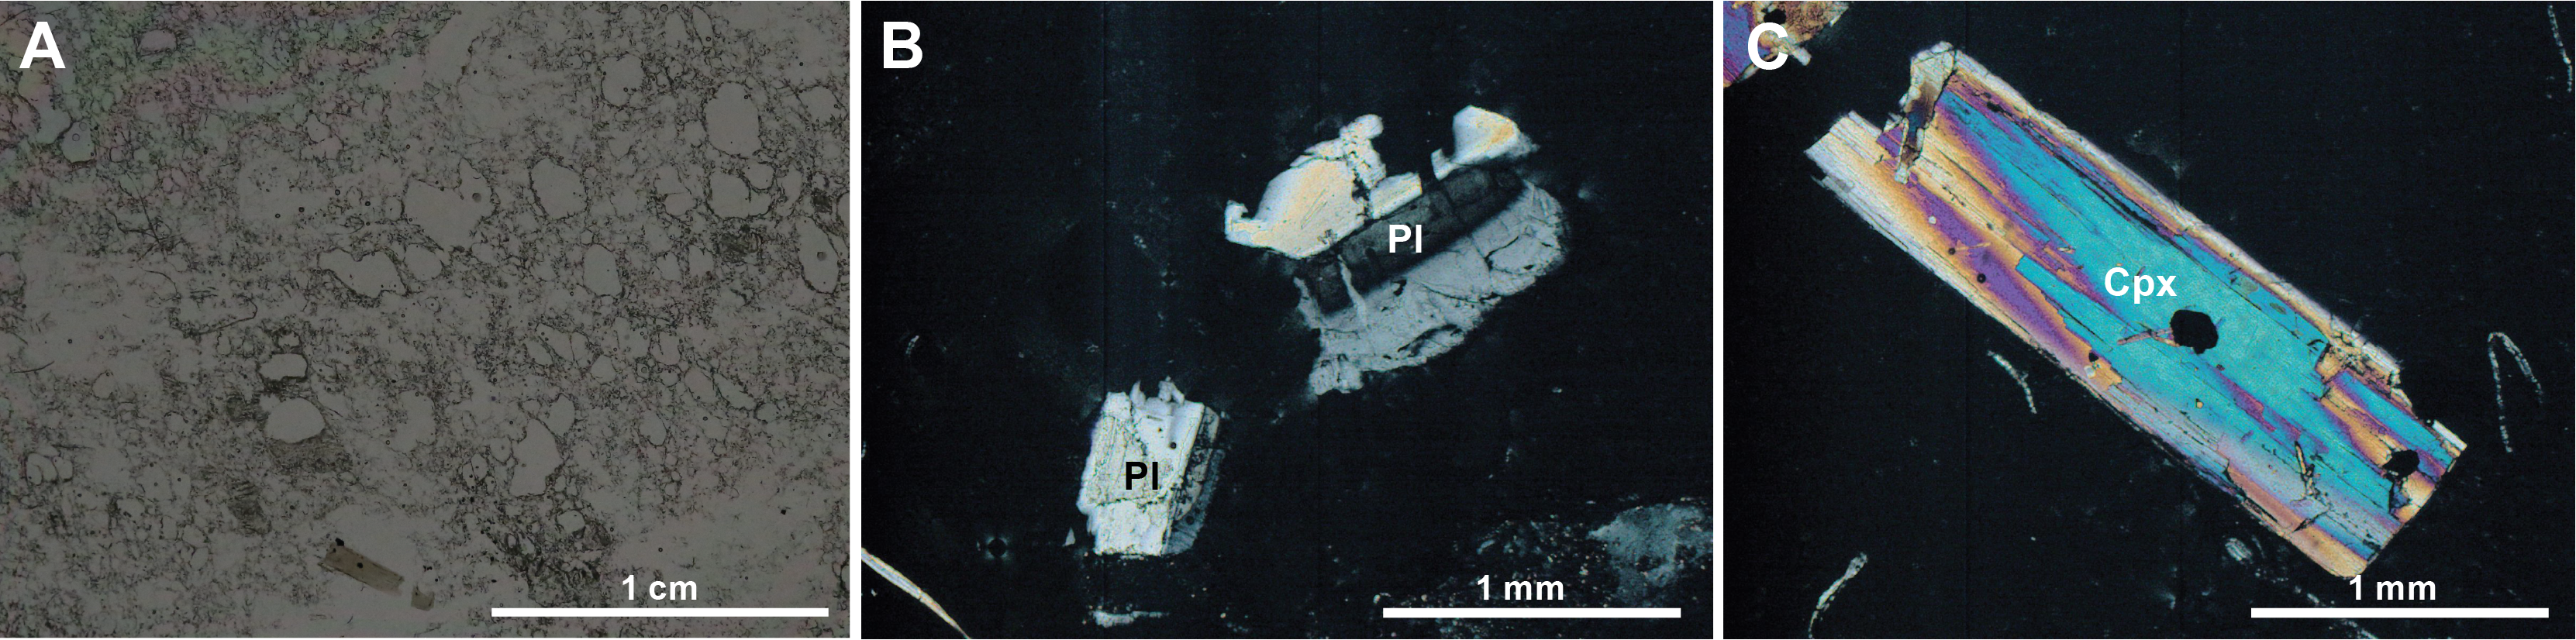
Figure F9. Pumice sample.
3.2.2. Unit II
- Intervals: 398-U1591B-21H-CC, 0 cm, to the bottom of the hole; 398-U1591C-3R-1, 0 cm, to 58R-4, 115 cm
- Thickness: 613.80 m
- Depths: Hole U1591B = 175.5–386.60 mbsf (bottom of the hole); Hole U1591C = 158.3–772.10 mbsf
- Age: Middle Pleistocene to Late Miocene (?) (see Biostratigraphy)
- Lithology: repeating packages of ooze/mud and organic-rich (sapropelic) ooze/mud with interspersed tuffaceous mud/sand, ash and lapilli-ash, and volcanic-dominated packages
Unit II (Figure F3; Table T2) was recovered in Holes U1591B and U1591C and is an extensive succession (613.8 m) of cyclic repetitions of ooze/mud and organic-rich (sapropelic) oozes and muds (Figure F10A) with minor ash and tuffaceous mud/sand. These successions are punctuated by thicker volcanic-dominated intervals. These thicker volcanic intervals, as well as the accompanying magnetic susceptibility (MS) and natural gamma radiation (NGR) data, are the basis for delineating subunits in Unit II (Table T2; see Physical properties). The top of Unit II does not begin at the same depth in Holes U1591B and U1591C because of poor recovery of the lowermost pumice-rich interval in Unit I. Hole U1591C began coring where recovery of the pumice was poorest in Hole U1591B but failed to recover it and instead retrieved material from Unit II. Thus, the actual top depth of Unit II is unconstrained.
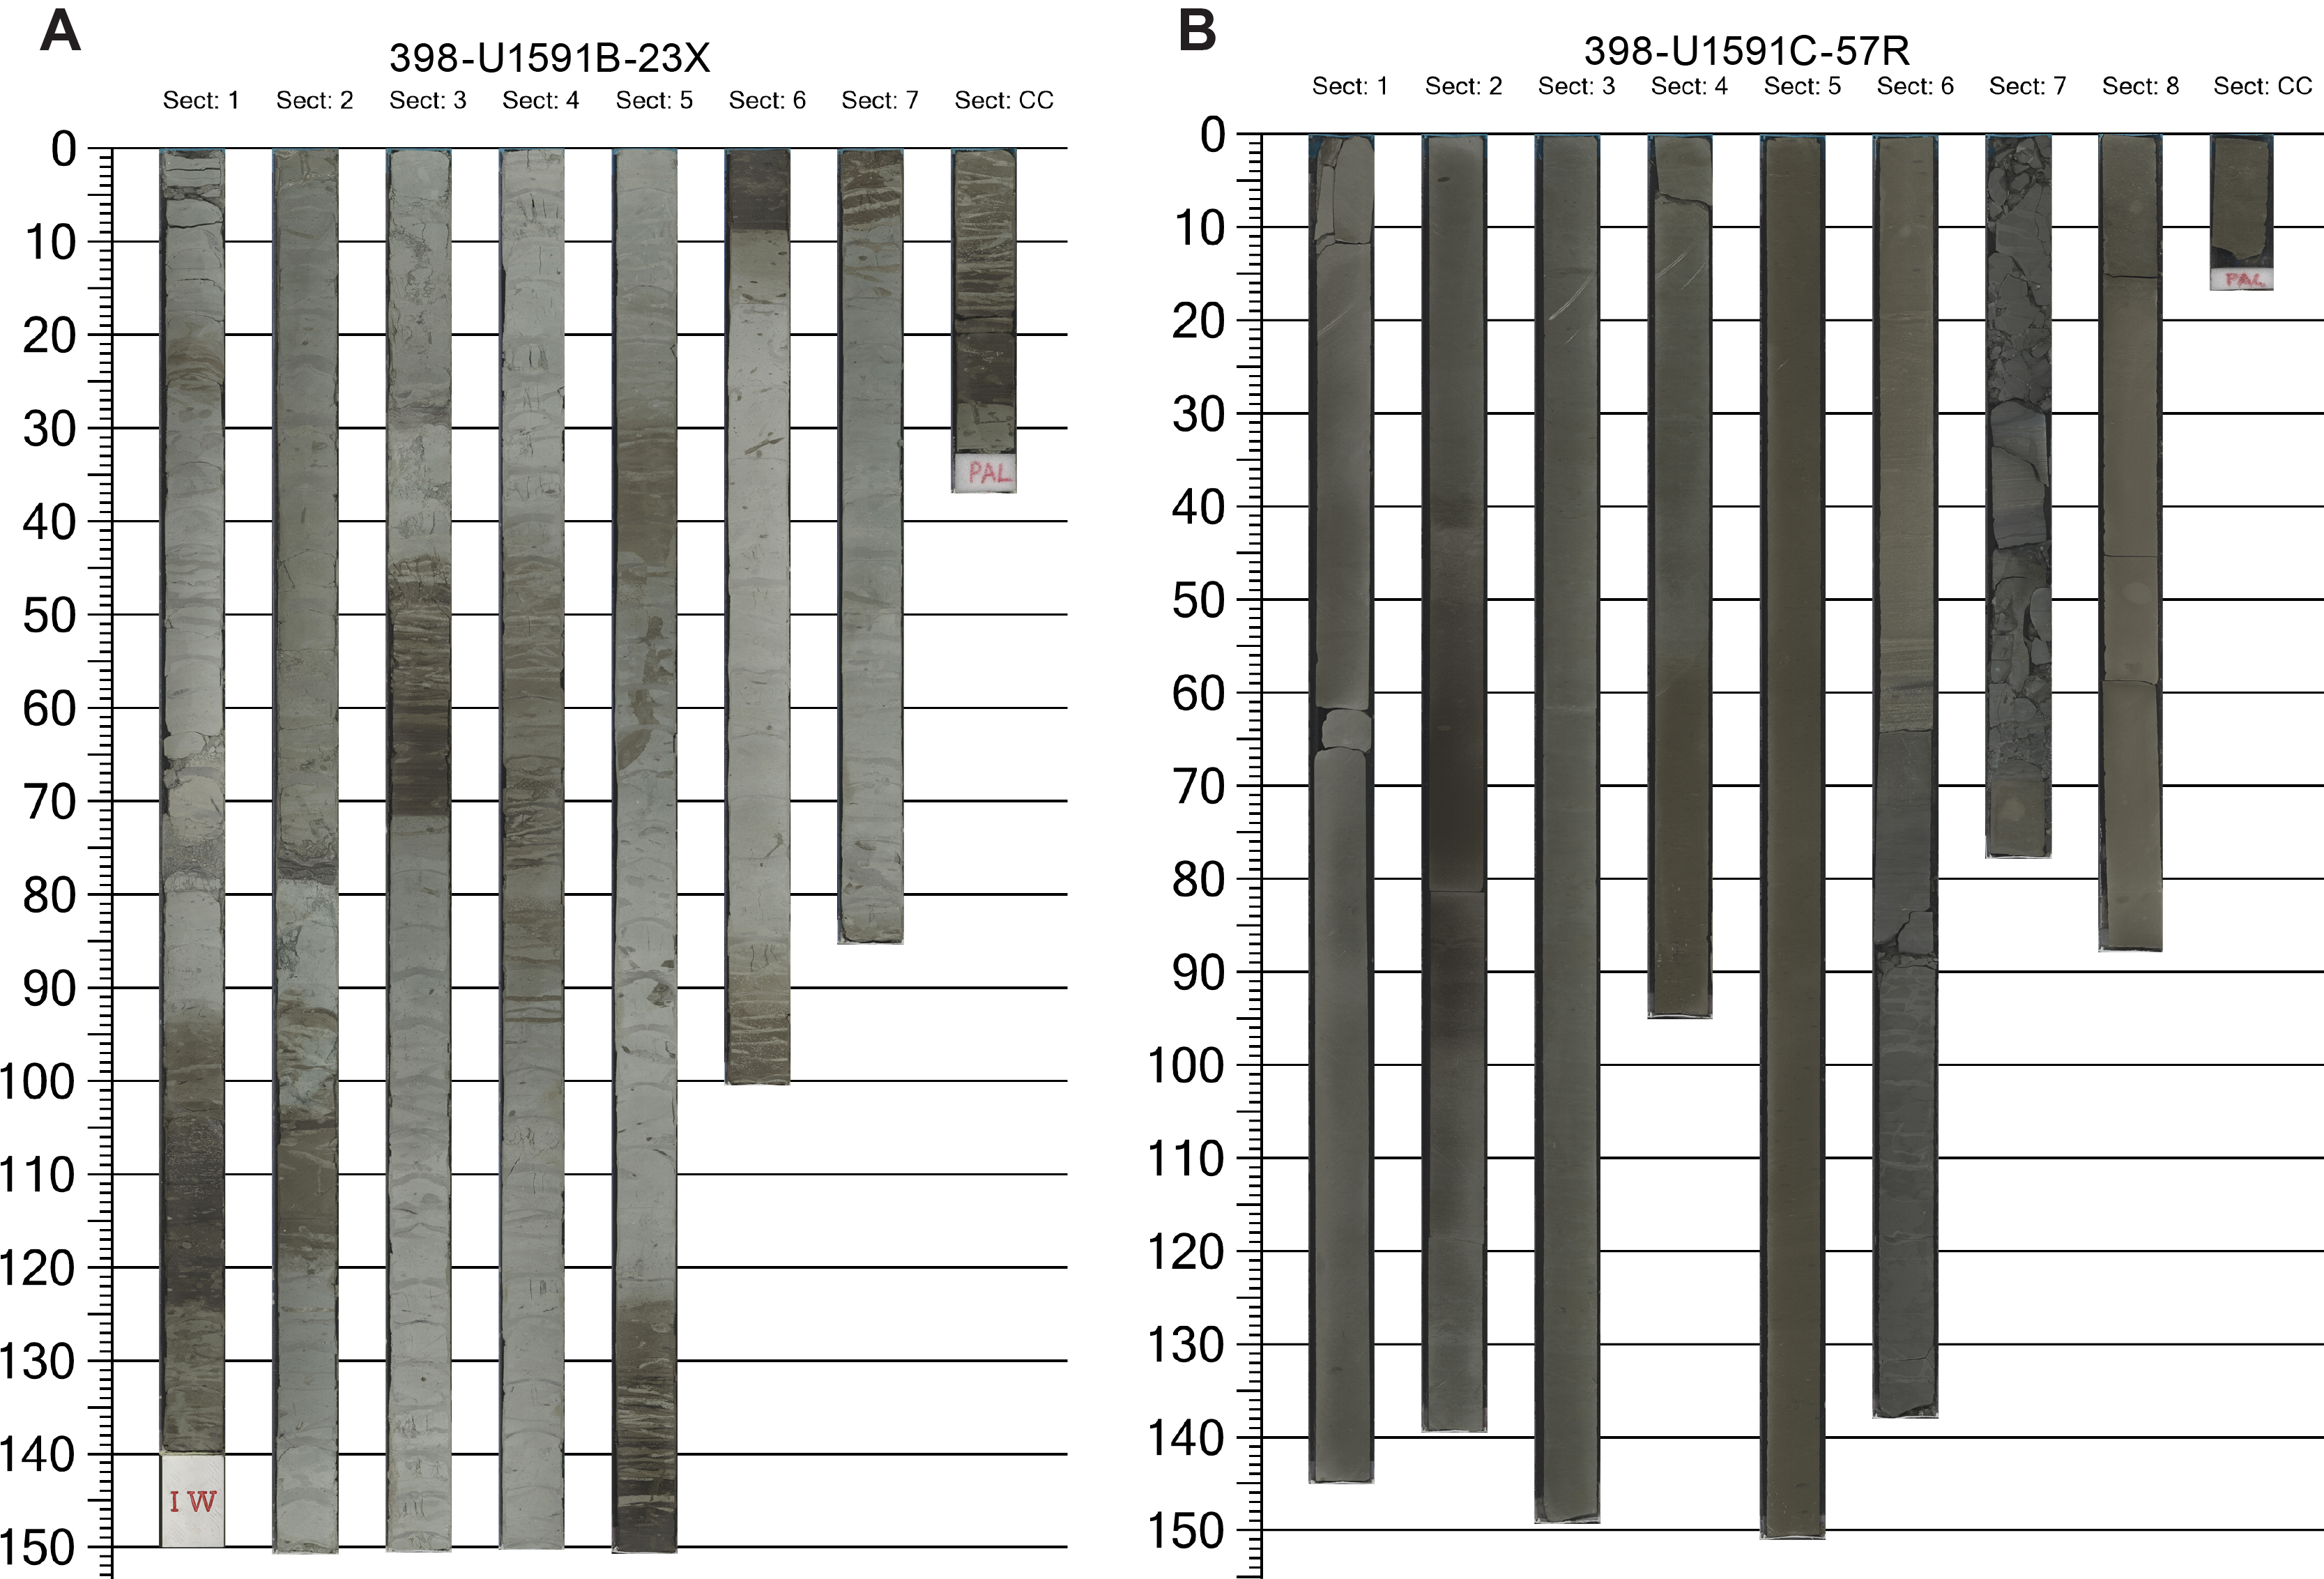
Figure F10. Core composites.
Organic-rich intervals are oozes and calcareous muds that are typically dark greenish brown to gray. They stand out in contrast to the light greenish gray oozes (Figure F10A). The repetitions of oozes and organic-rich oozes/muds show regular periodicity over the span of multiple cores, but the thickness of the organic-rich intervals gradually increases and decreases over the span of 10 or more cores (Figure F11). On average, organic-rich intervals are 2–30 cm thick and repeat every 80–120 cm with rare breaks of up to 7 m. Their bottom contacts with oozes are typically horizontal and sharp, but the top contact shows a gradual change in color upward from dark greenish gray to light greenish gray to the sharp bottom contact of the next organic-rich interval (Figure F10A). The upper contacts of the organic-rich intervals are typically diffuse and gradational and marked by high bioturbation, often as Chondrites traces (Figure F12A). Some organic-rich intervals show well-preserved Zoophycos traces (Figure F12A) and disseminated sulfides. The darkest colored organic-rich intervals are commonly thinly laminated. Within these ooze/mud intervals are intermittent volcanic (ash and lapilli-ash) and mixed sediments (tuffaceous mud/sand).
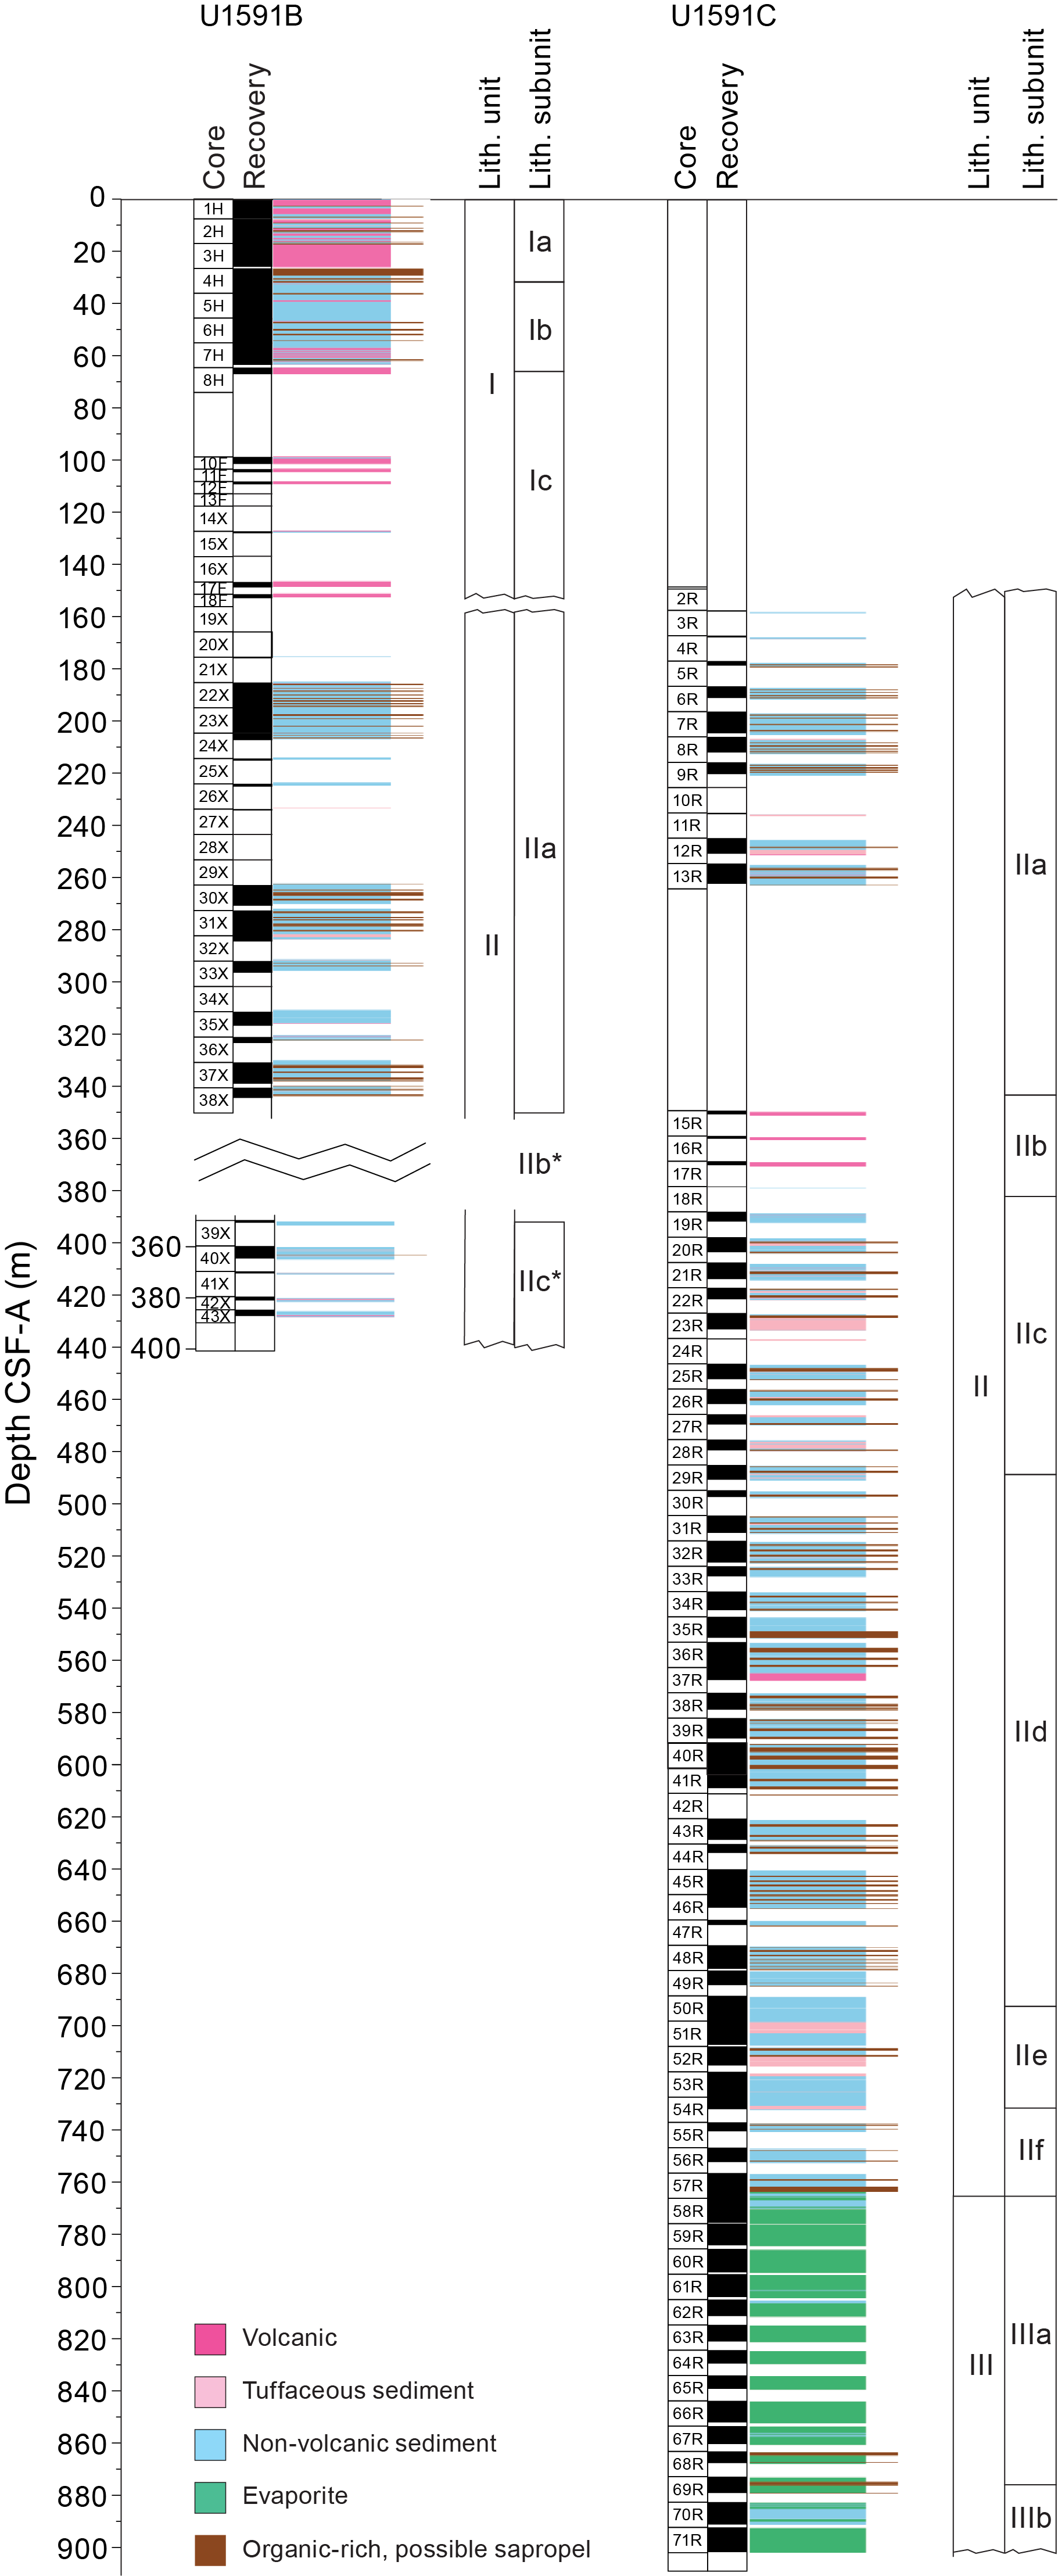
Figure F11. Organic-rich, sapropelic lithologies.
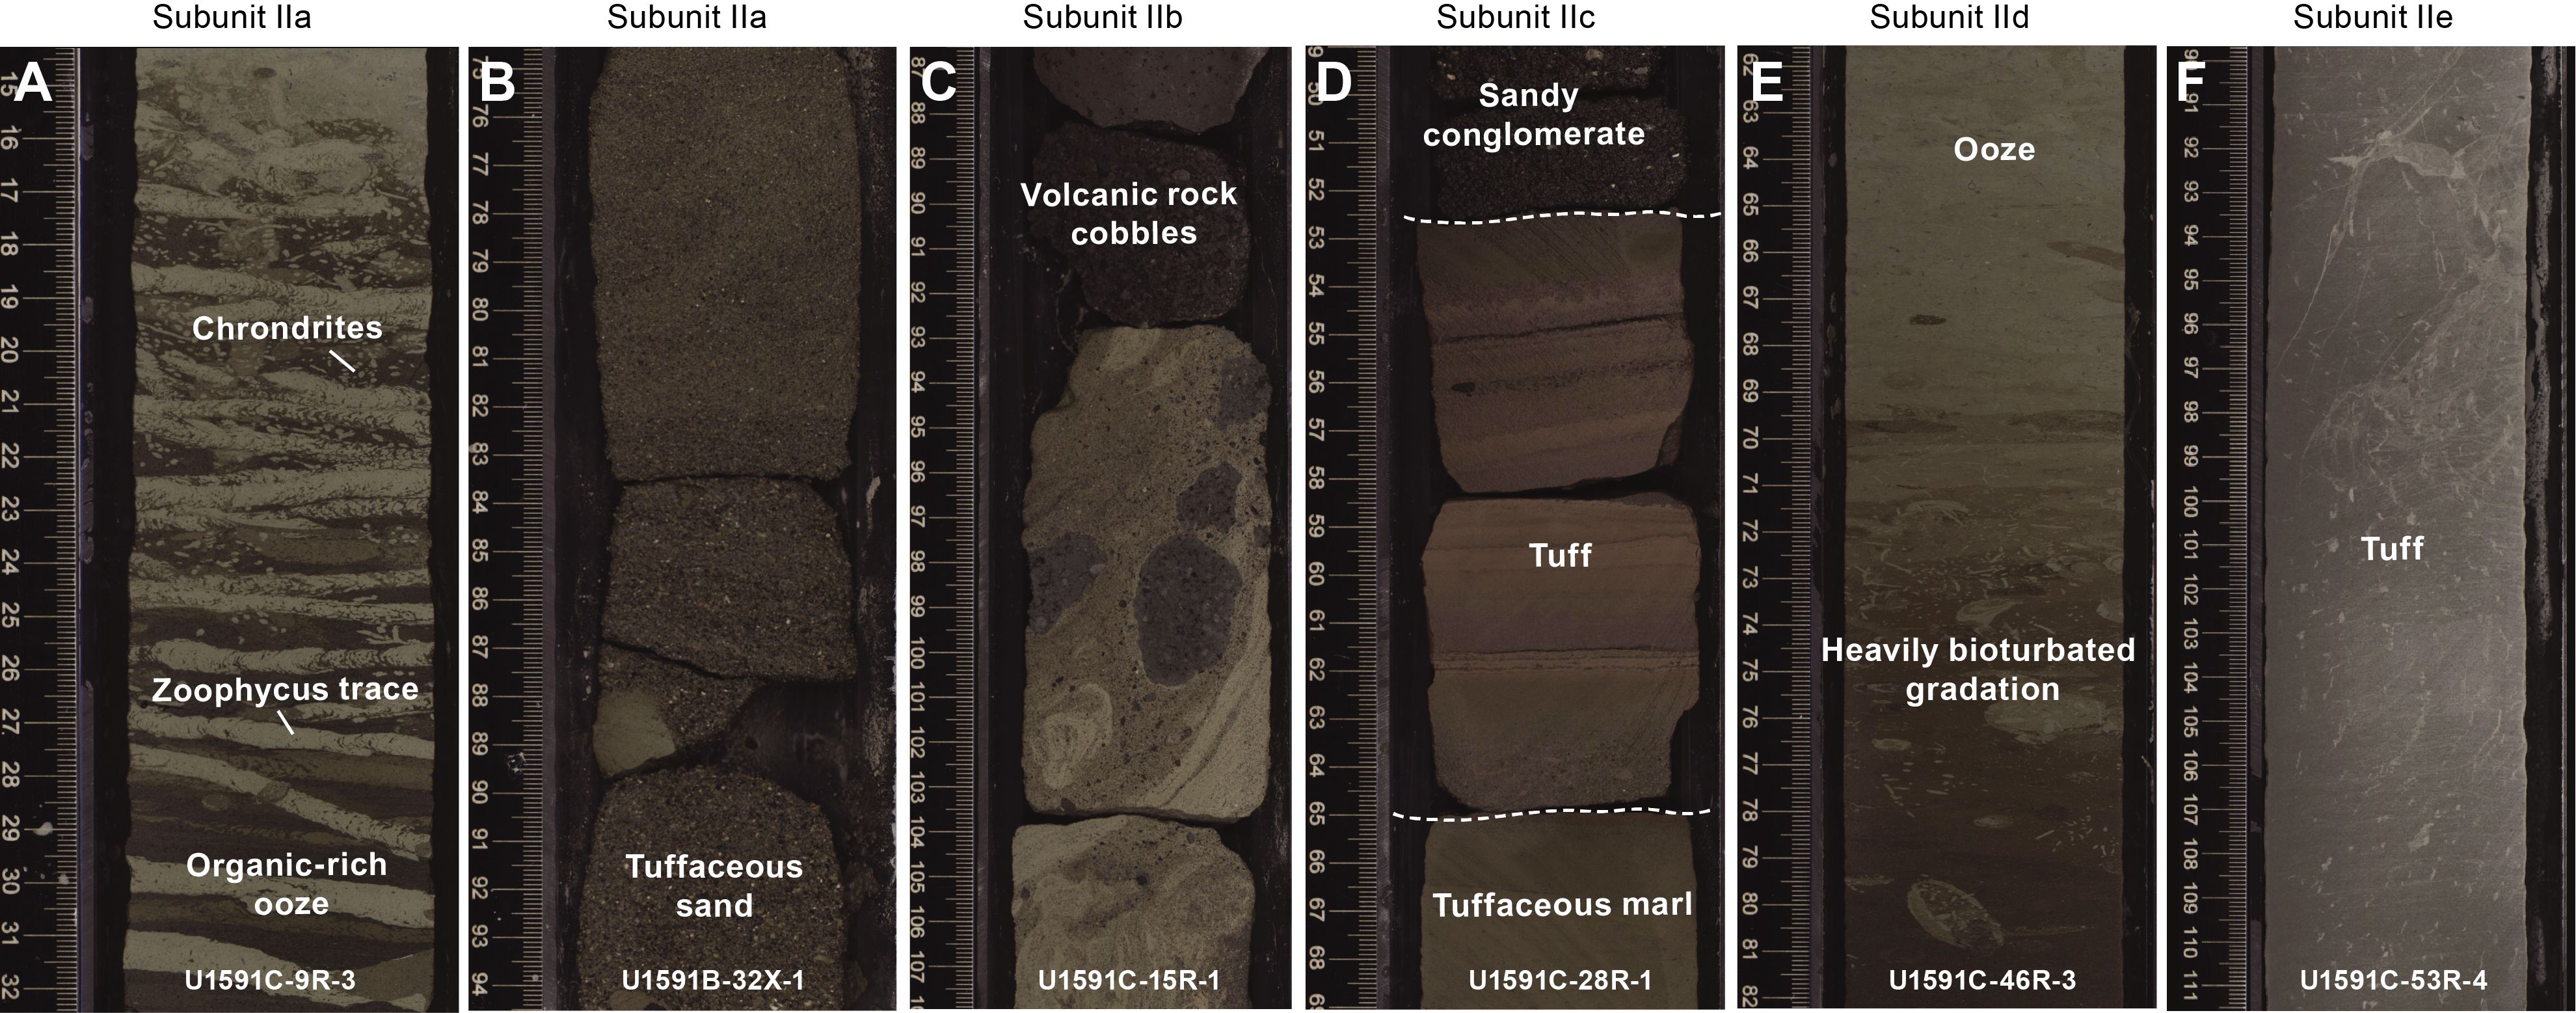
Figure F12. Lithologies, Unit II.
The two volcanic-dominated intervals that punctuate the ooze/mud-dominated intervals consist of a volcanic cobble unit and a tuffaceous mud (see Subunit IIb and Subunit IIe).
3.2.2.1. Subunit IIa
Subunit IIa was partially recovered in Holes U1591B and U1591C (Table T2) and is 104.72 m thick. The boundary between the bottom of Unit I and the top of Unit II (Subunit IIa) was not recovered. There is a gap in recovery in Hole U1591B from 152.8 to 175.5 mbsf (Cores 19X–21X), and Hole U1591C begins at 158.3 mbsf (Core 3R). The first core (3R) is assigned to this subunit instead of Unit I because of its lithology (nonvolcanic) and lower MS compared to the lower part of Unit I in Hole U1591B.
Subunit IIa consists dominantly of nonvolcanic material; slight to moderately bioturbated ooze/mud and their organic-rich equivalents; and sparse volcanic intervals of tuffaceous sand and mud, ash, and ash with lapilli. Very thin (centimeter scale) ash layers are present throughout.
Very little to no recovery occurred between Cores 398-U1591B-25X and 29X (214.9–262.8 mbsf). However, this section was partially recovered in Hole U1591C with a gap between 220.9 and 235.9 mbsf (Cores 10R and 11R). In Core 398-U1591B-27X (233.7 mbsf), 18 cm of gravelly tuffaceous sand was recovered (Figure F12B), and the same lithology was recovered in Core 398-U1591C-11R (236 mbsf). The poor recovery around this depth is likely caused by a coarse lithology that does not core well. Another large gap in recovery is present in Hole U1591C at 263.1–350 mbsf; however, this section was partially recovered in Hole U1591B (Figure F3).
The overall MS of this subunit is low, increasing in the intervals that contain volcanic material. The darkest colored organic-rich oozes and muds show higher NGR compared to the surrounding oozes and muds with lower organic content. Because of the cyclic nature of these lithologies, NGR fluctuates throughout the subunit (see Physical properties).
3.2.2.2. Subunit IIb
Subunit IIb is thin (38.94 m) and comprises mainly cobble-sized volcanic rocks with small intervals of lithic-crystal ash showing slump features (Figure F12C). This subunit was only sparsely sampled between 350 and 388.94 mbsf in Hole U1591C (Cores 15R–19R), but recovery was poorer in Hole U1591B, where only 24 cm of the subunit was sampled, part of which is fall-in (Section 39X-1; 350.10–350.35 mbsf). In Hole U1591C, the base of this subunit is defined at the base of cobble fall-in (Section 15R-1). Consequently, the top and base of this subunit are not well defined. The conflicting thickness of this subunit across Holes U1591B and U1591C, resulting in a depth offset across holes, can be attributed to a slump feature (see Stratigraphic correlation).
The cobbles in this subunit range from light gray to very dark grayish brown and are a mix of glassy, porphyritic, and red (oxidized) volcanic rocks. In general, several cobbles of the same type exist sequentially within core sections (i.e., four porphyritic cobbles are followed by two glassy cobbles, etc.). The matrix between cobbles is present only intermittently but is typically light gray lithic-crystal ash (Figure F12C). High MS is observed across this subunit in both holes.
A thin section of one of the volcanic cobbles from Core 398-U1591C-17X shows a highly porphyritic and glomeroporphyritic texture with phenocrysts of plagioclase, amphibole, clinopyroxene, and Fe-Ti oxides (Figure F13A–F13D).
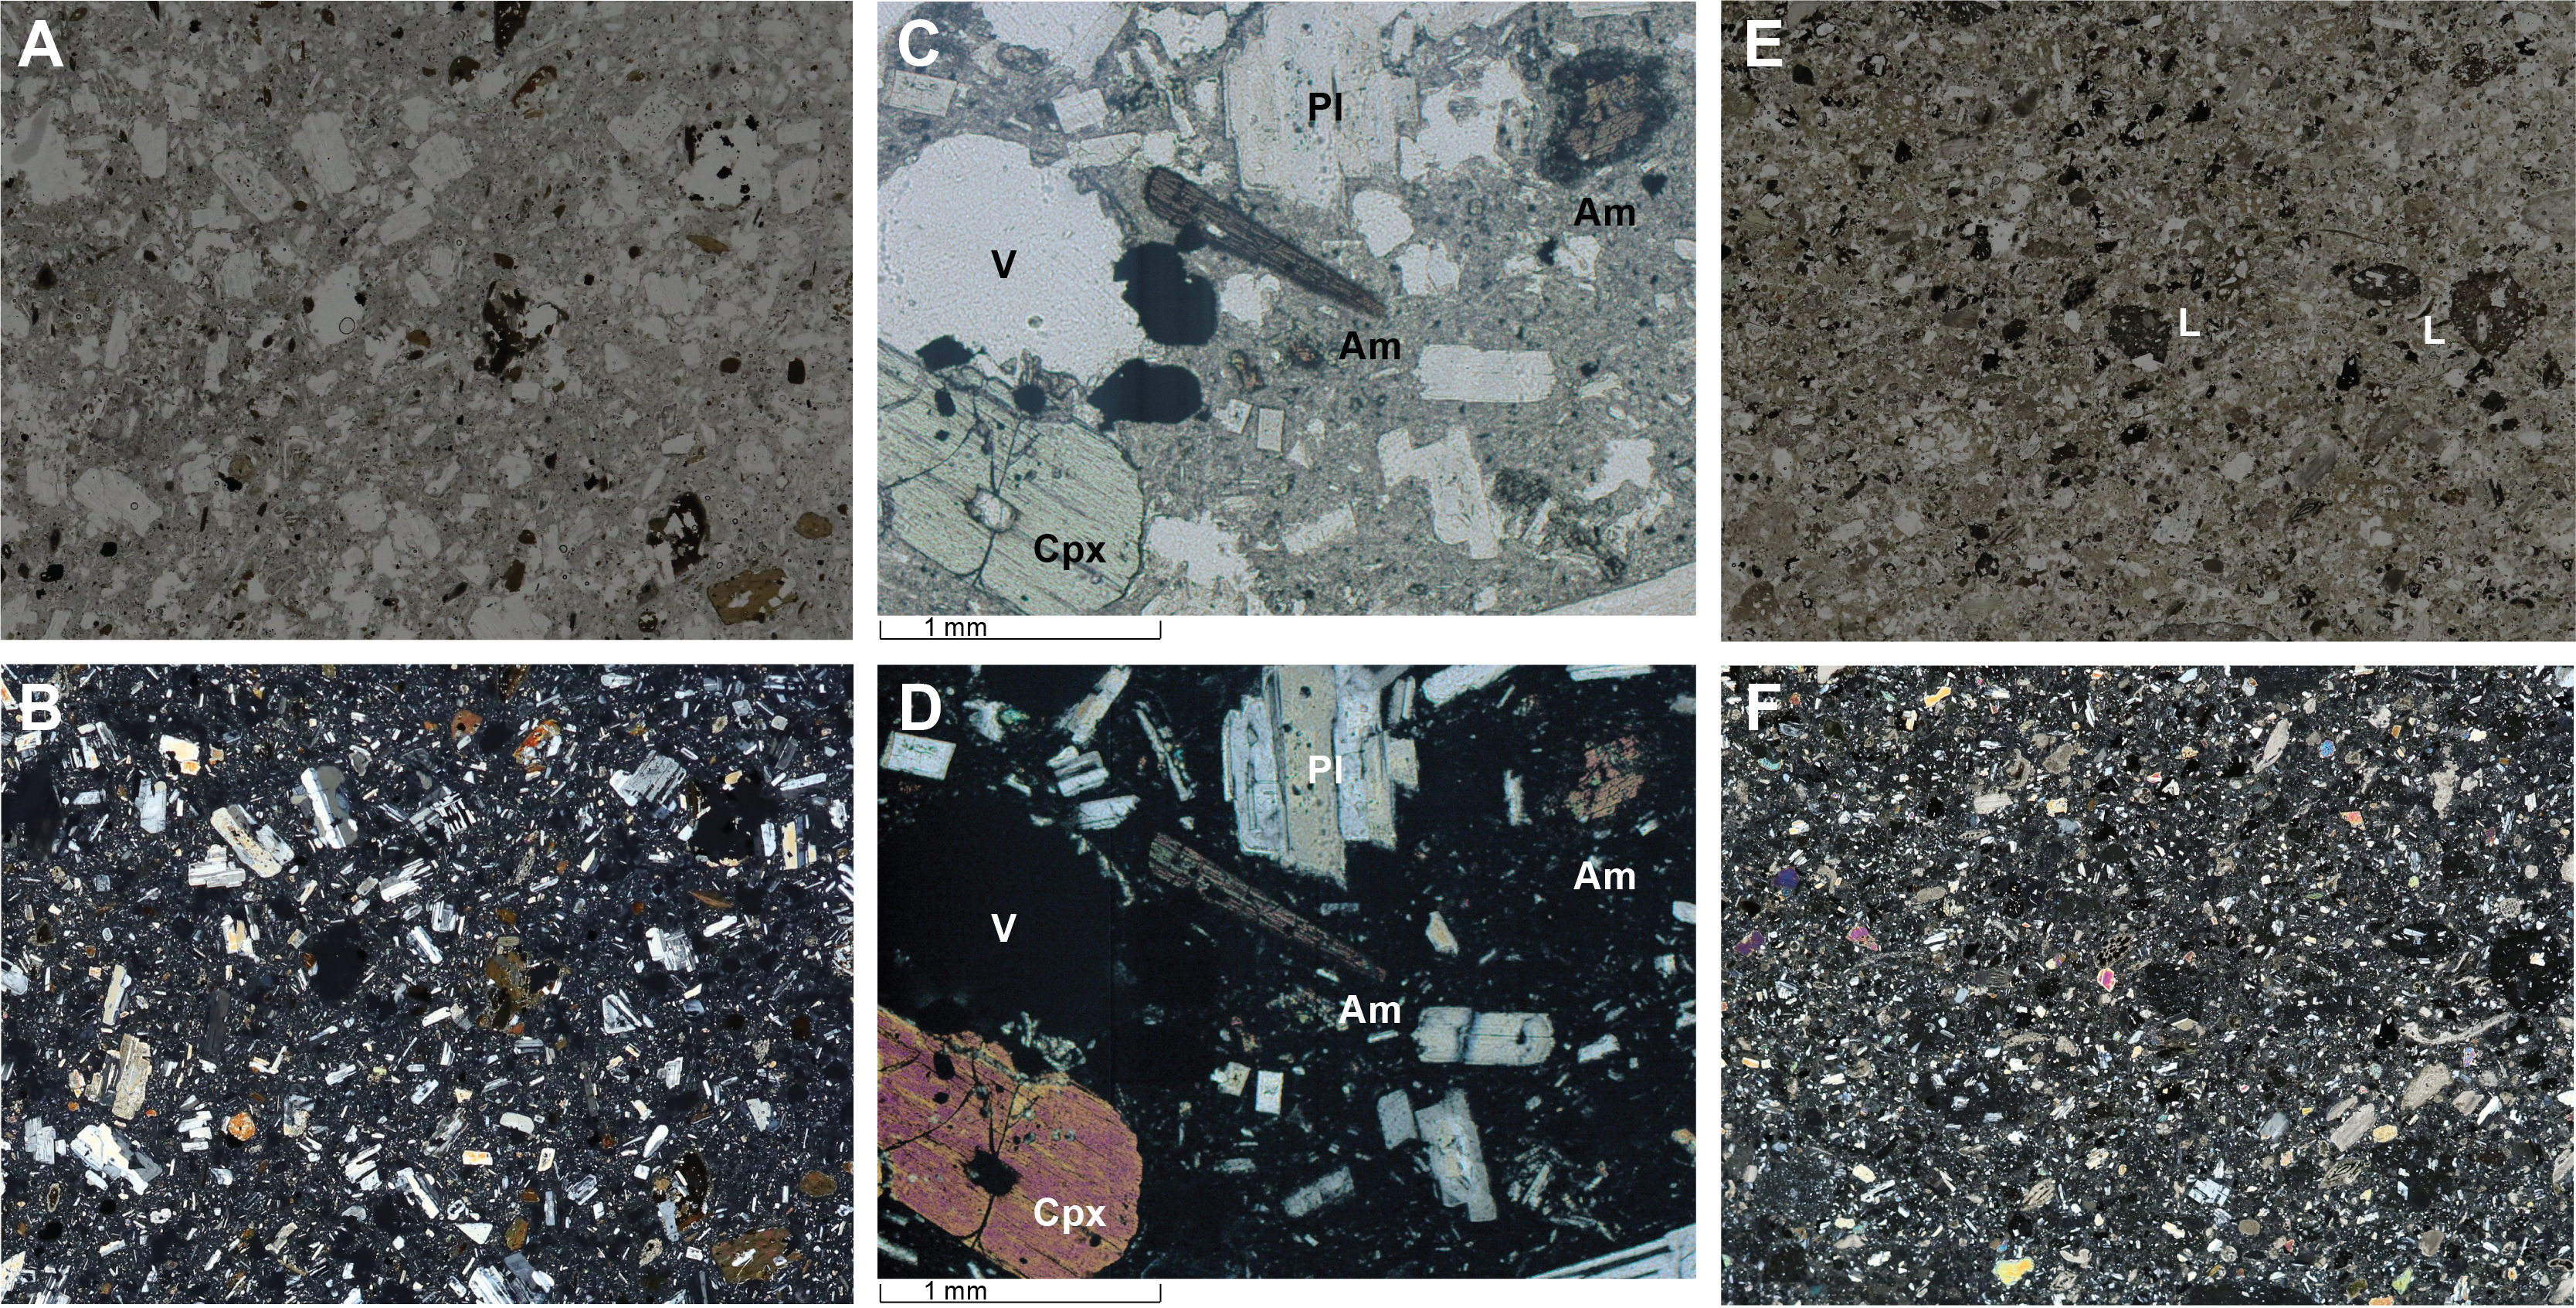
Figure F13. Cobbles and sandstone.
3.2.2.3. Subunit IIc
Subunit IIc was partially recovered in Hole U1591B (350.35 mbsf to the bottom of the hole) and fully recovered in Hole U1591C (388.94–491.44 mbsf). As discussed in Subunit IIb, the offset in depths between Holes U1591B and U1591C is caused by variable thickness of a slump deposit. The total thickness of this subunit is 102.5 m. The upper boundary is not well defined in Holes U1591B or U1591C. In Hole U1591B, it is irregular and moderately disturbed by biscuiting (~20 cm), and in Hole U1591C the contact between it and Subunit IIb above was not recovered (see Subunit IIb). Subunit IIc is characterized by a moderately high frequency of volcanic lithologies within an ooze-dominated background in comparison with Subunits IIa, IId, and IIf. Lithologies present in Subunit IIc include oozes and their lithified equivalent (marl), ash (variably lithified to tuff and sometimes lithic- or crystal-rich), tuffaceous, and organic-rich sediments.
Most volcanic lithologies in Subunit IIc occur as centimeter-thick dark gray to light greenish gray ash or tuff layers interbedded with slight to moderately bioturbated ooze/marls or tuffaceous sediments (Figure F12D). Pumice clasts were identified within several volcanic intervals and are commonly rounded to subrounded and white/gray. One instance of biotite-bearing tuff was identified via smear slide in interval 398-U1591C-28R-1, 54–65 cm. The highest abundance of volcanic-rich sediments occurs between Cores 25R and 27R. Volcanic lithologies identified in Subunit IIc show a moderate increase in MS, which is anticorrelated with NGR (see Physical properties).
A thin section of a gravelly sandstone from Core 398-U1591C-28R is characterized by abundant volcanic lithics, typically plagioclase- and pyroxene-bearing scoria, grains of plagioclase, benthic foraminifera, and other bioclasts.
3.2.2.4. Subunit IId
Subunit IId was observed only in Hole U1591C and extends from 495.5 to 699.31 mbsf (Sections 30R-1, 0 cm, through 50R-CC, 16 cm) (Table T2). The upper boundary with Subunit IIc was clearly identified based on a sharp decrease in MS (see Physical properties), signifying the observed decrease in ash-bearing lithologies. Subunit IId consists of highly bioturbated marl, mudstone, and calcareous mudstone intercalated with organic-rich marl, mudstone, and calcareous mudstone. Organic-rich intervals are commonly thinly laminated and show well-preserved Zoophycos and Chondrites traces (Figure F12E) and disseminated sulfides. Marl, mudstone, and calcareous mudstone have shell fragments, disseminated sulfides, and nodules of pyrite. A 2.08 m thick ash layer is observed between 566.06 and 568.14 mbsf (interval 37R-2, 135 cm, to 37R-CC, 11 cm). The middle part of the subunit (558.77–634.69 mbsf) is characterized by thicker organic-rich intervals (Sections 36R-6 through 44R-3). Marl layers in between also seem to be darker and more olive-colored than the marls above and below this interval. Below 568.14 mbsf, the organic-rich intervals become thinner (<50 cm) until they disappear; the two lowermost sections of the subunit, Cores 49R and 50R (679.8–699.36 mbsf), only contain two organic-rich calcareous mudstones <10 cm thick. Marl and mudstone between these thin organic-rich intervals are slightly bioturbated and contain plant and shell fragments and some nodules/veins of pyrite.
3.2.2.5. Subunit IIe
Subunit IIe is characterized by intermittent tuff, tuffaceous mudstone, and marl/mudstone. The recovered lithologies extend from 699.2 to 732.53 mbsf (Sections 398-U1591C-51R-1, 0 cm, through 54R-CC, 3 cm) (Table T2). The number of organic-rich intervals is very low in this subunit (Figure F10B). Only three layers of organic-rich marl (92.5, 18, and 10 cm thick) were identified between 709.25 and 712.27 mbsf (Sections 52R-1 through 52R-3). In the uppermost part of the subunit, marl is moderately sorted and contains shell fragments, organic-rich pods, and nodules of pyrite. The lower section, below 712 mbsf, consists mainly of well-sorted and fine-grained tuffaceous mudstone and tuff (Figure F12F). Some tuffaceous mudstones are thinly laminated (<0.3 cm). Unusually, the presence of volcanic material correlates with low MS (see Physical properties).
3.2.2.6. Subunit IIf
Subunit IIf extends from 732.53 to 772.1 mbsf (Sections 398-U1591C-54R-CC, 3 cm, through 58R-4, 115 cm) (Table T2). The uppermost part of the subunit consists of intercalated marl and organic-rich marl characterized by gradational boundaries. The thickness of the organic-rich intervals increases downcore from ~20 cm in the upper part of this subunit to ~1.5 m in the lower part. Some micrite with foraminifera, lapilli, or tuff were observed between 764.32 and 767.39 mbsf. These micritic intervals are moderately sorted and display normal grading. The lower part of the subunit consists of thinly laminated calcareous mudstone and sandstone. These intervals are moderately to poorly sorted and contain lithic clasts and carbonate.
3.2.3. Unit III
- Interval: 398-U1591C-58R-4, 115 cm, to 71R-CC, 30 cm (bottom of the hole)
- Thickness: 130.57 m
- Depth: 772.1–902.67 mbsf
- Age: probable Miocene
- Lithology: anhydrite; alternating micrites with sandstone, mudstone, and evaporites; chert; and micrite with lapilli
Unit III was recovered only in Hole U1591C (Figures F14, F15; Table T2) and begins with the appearance of evaporitic lithologies that extend to the bottom of the hole. The appearance of anhydrite in Section 58R-4, 115 cm, coincides with an increase in bulk density and was confirmed as anhydrite by XRD analysis (see Physical properties and X-ray diffraction) (Figure F14). The unit is dominated by white to dark gray nodular and laminated anhydrite deposits interbedded with micrite (Figure F14A). Minor sandstone and mudstone lithologies are present, often with a micritic or anhydritic component. Intervals of nodular anhydrite commonly occur as small growths between micrite intervals (~10 mm nodules; Figure F14A), with a few extensive intervals of almost pure anhydrite separated by thin veinlets of micrite (Figure F14B). The presence of micrite was confirmed with smear slides or an HCl test. Organic-rich lithologies also appear in Unit III, occurring in thinly laminated black to reddish black muds, mudstone, and micrite.
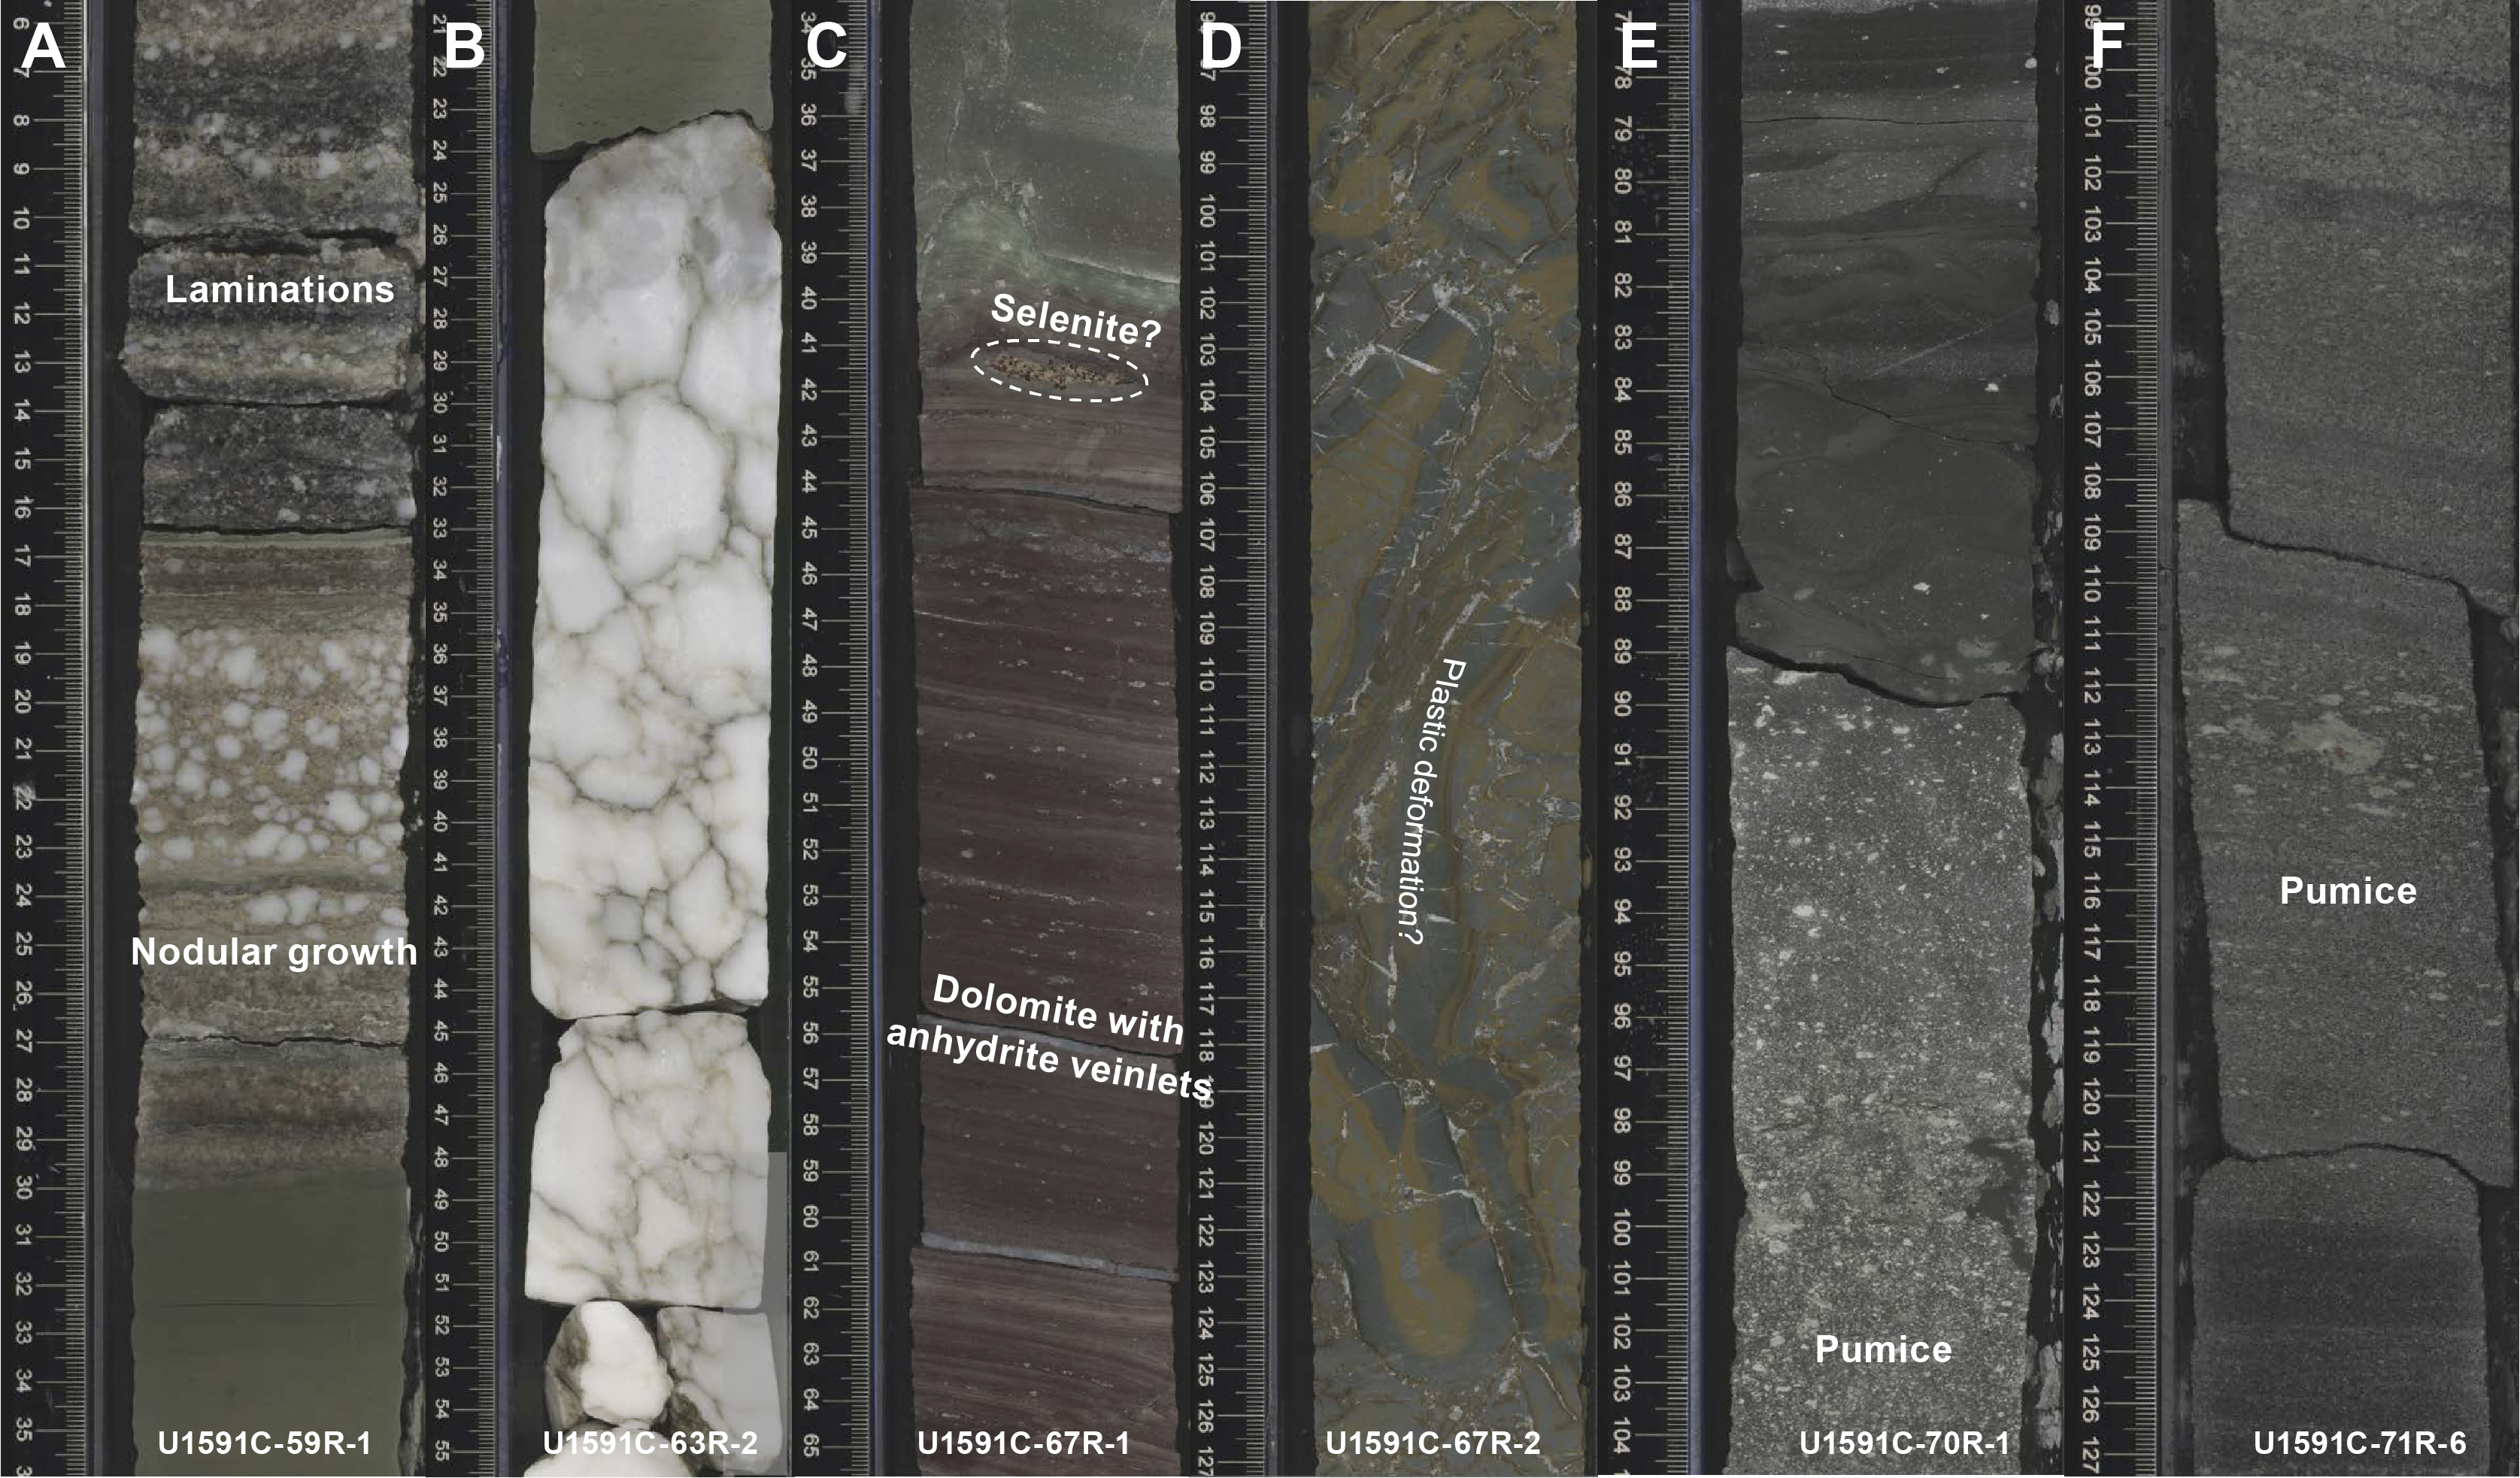
Figure F14. Lithologies, Unit III.
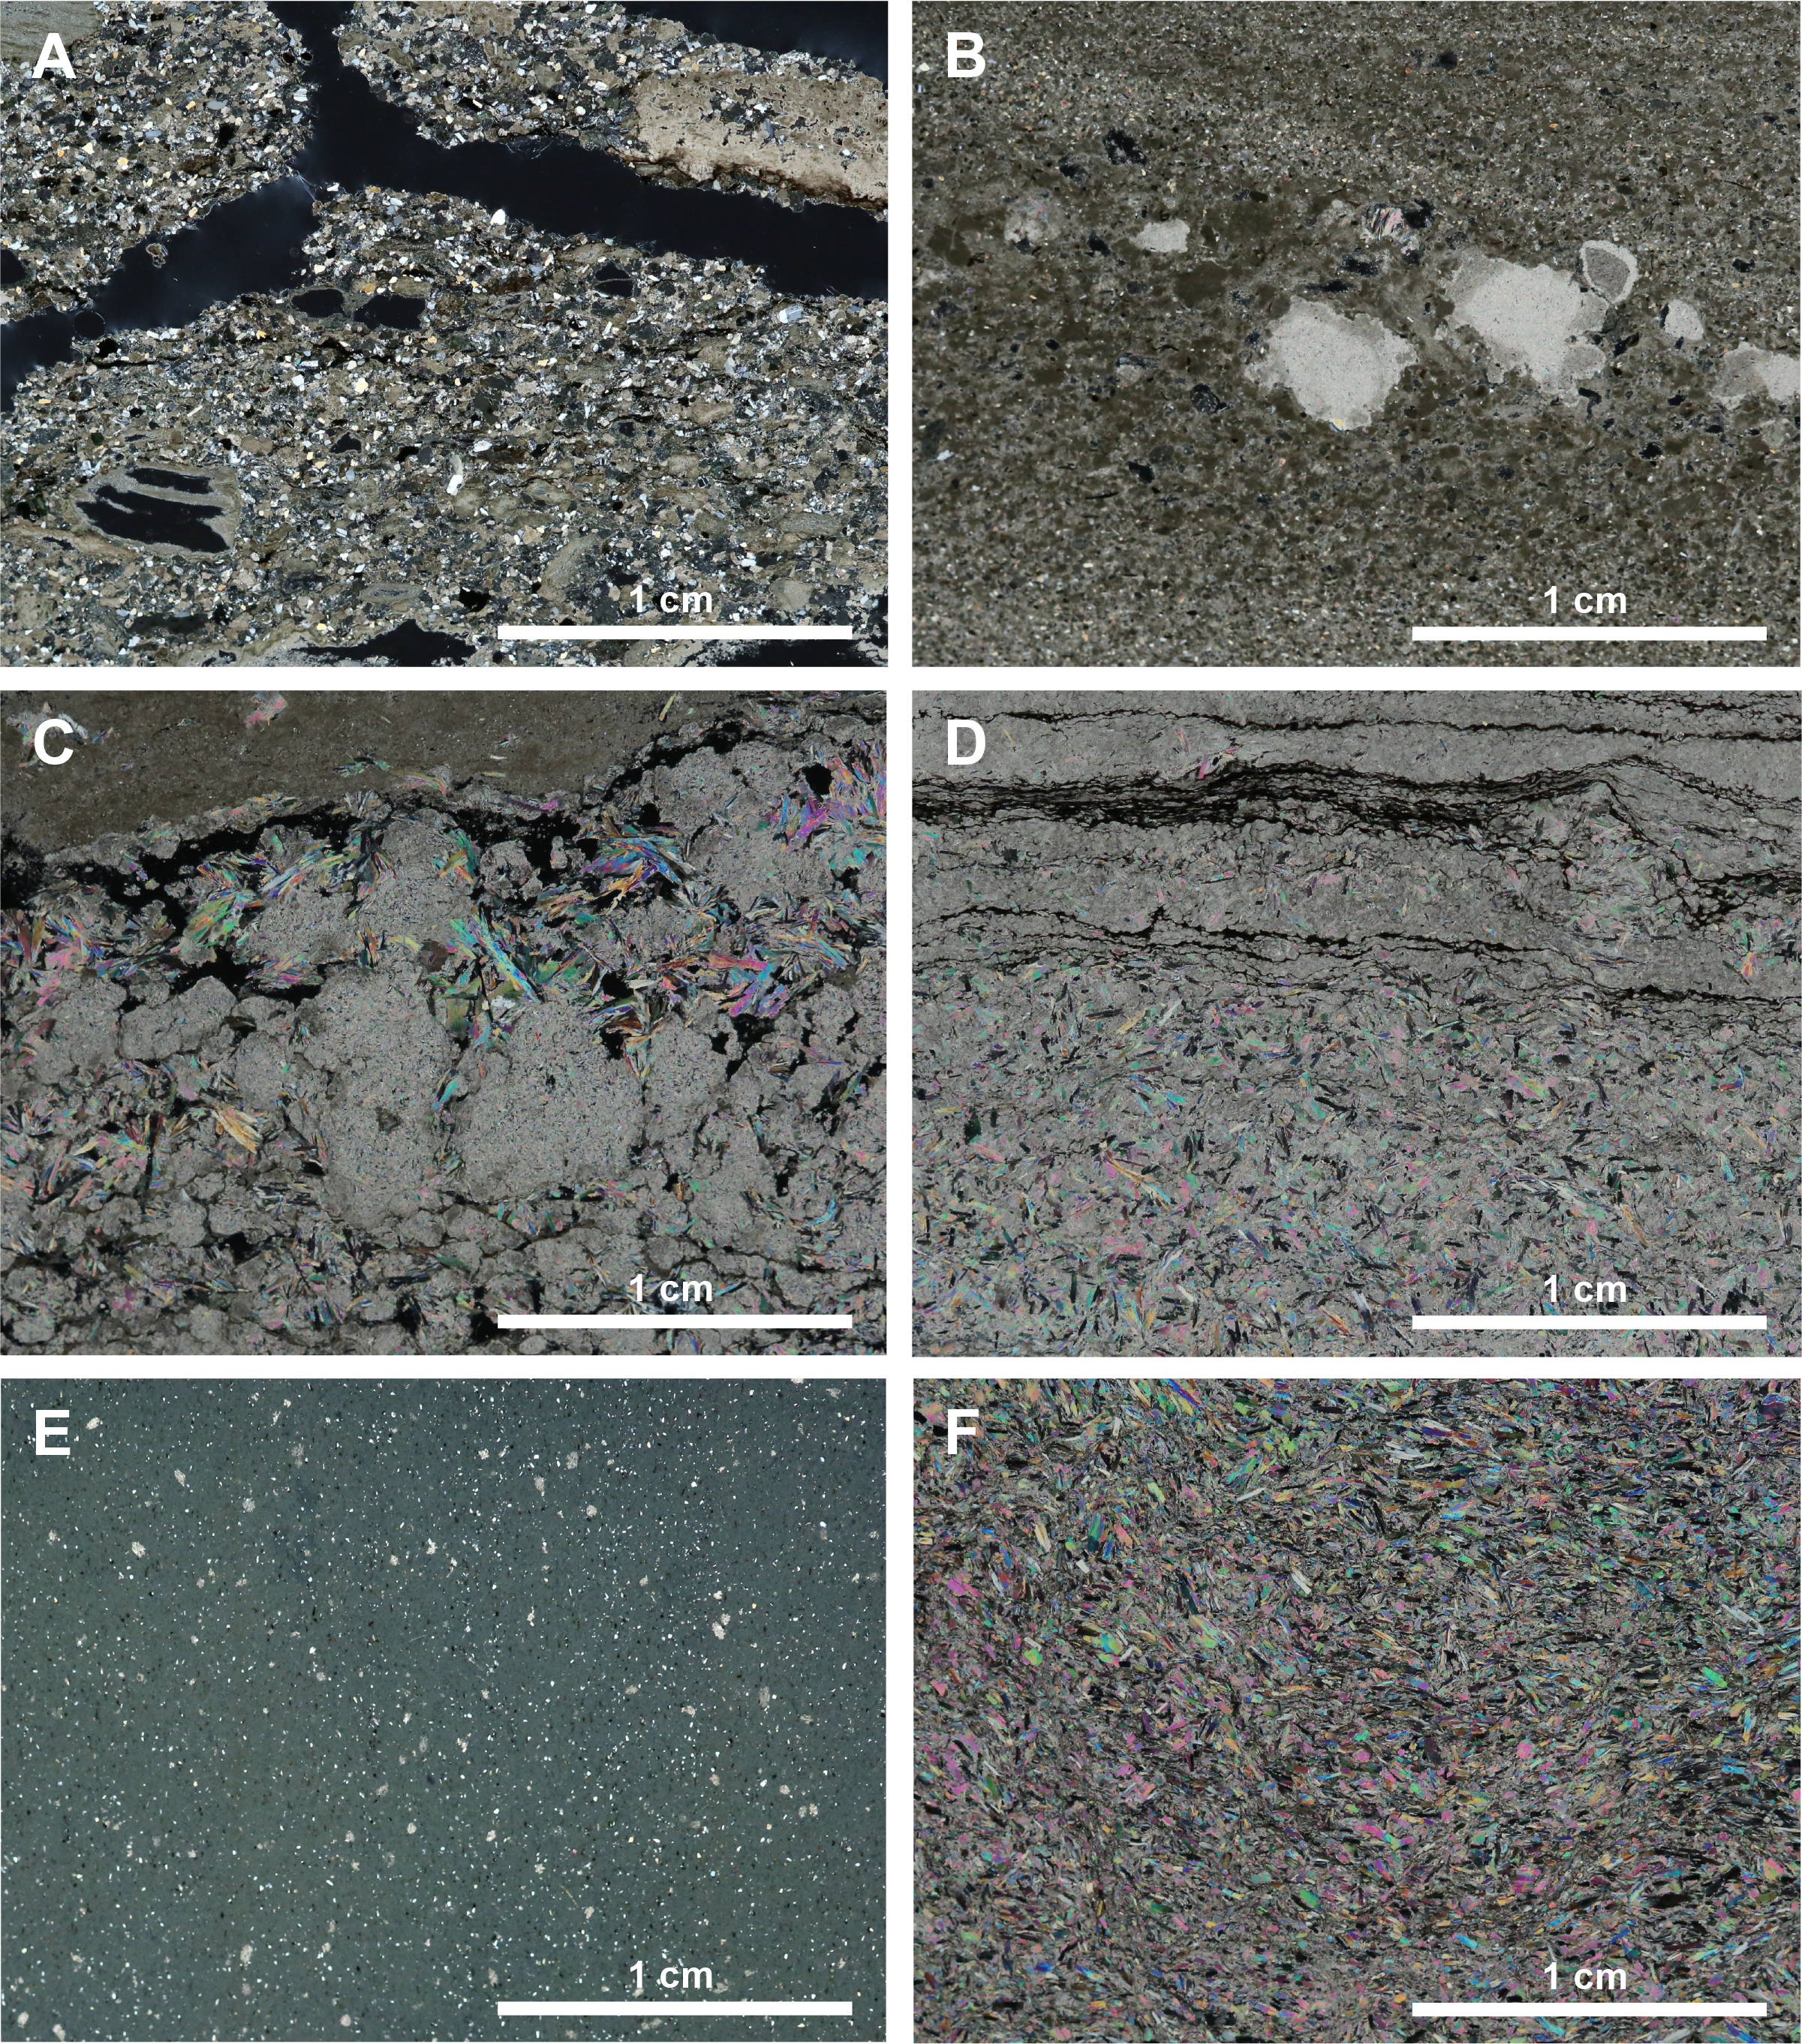
Figure F15. Evaporite lithologies.
Subunits in Unit III were designated based on the relative proportion of evaporitic deposits, as well as the appearance of lapilli near the bottom of Hole U1591C:
- Subunit IIIa (Sections 398-U1591C-58R-4, 115 cm, through 69R-CC, 21 cm; 772.1–879.99 mbsf): primarily evaporitic lithologies of alternating laminated to nodular anhydrite and micrite, with minor anhydritic mud/sandstones/breccias, organic-rich micrite, and organic-rich mud.
- Subunit IIIb (Sections 398-U1591C-70R-1, 0 cm, through 71R-CC, 30 cm; 883.5–902.67 mbsf): anhydritic mudstone, micrite, and anhydrite with variable presence of gypsum and lapilli clasts.
3.2.3.1. Subunit IIIa
Subunit IIIa consists almost entirely of evaporitic lithologies (e.g., nodular anhydrite) with minor micritic/anhydritic sediments. Volcanic deposits, including pumice clasts, were identified occasionally. This subunit is ~108 m thick, extending from the top of Unit III to ~883 mbsf. The top boundary marks the start of anhydrite-dominated lithologies, transitioning from a dark greenish gray micrite to a thickly laminated, dark gray anhydritic micrite (Section 398-U1591C-58R-4, 115 cm). The subunit consists majorly of alternating anhydrite (laminated or nodular; Figure F14A) and micrite or micritic sediments. Laminated anhydrite sequences alternate between white and dark gray with wavy bedding ranging 0.3–10 cm in thickness. These laminations often have a crinkly texture with small anhydrite nodules separated by thin layers of micrite or mud. Micrite, mud, and sandstone are predominantly greenish gray to olive; however, between ~802 and 812.2 mbsf (interval 61R-5, 27 cm, to 62R-5, 111 cm) and 845.48–855.93 mbsf (interval 66R-1, 78 cm, to 67R-2, 15 cm), the color of the predominantly evaporitic lithologies changes to brownish red with fewer anhydritic nodules and more anhydrite-filled veins (Figure F14C). Between 817.2 and 817.83 mbsf (Section 63R-2, 24 cm), the most continuous interval of massive anhydrite was recovered (Figure F14B). Intervals dominated by dolomite also occur (e.g., Core 67R), as identified by XRD (see X-ray diffraction). A few intervals show signs of plastic deformation and potential alteration (Figure F14D).
Thin sections of four samples from Subunit IIIa show crystal-rich, quartz-feldspar-biotite bearing sandstone with laminated algal mats (Figure F15A), feldspar-bearing sandstone with fine-grained anhydrite nodules (Figure F15B), laminated anhydrite alternating with micrite (Figure F15C), and another laminated anhydrite alternating with algal mats and micrite (Figure F15D).
3.2.3.2. Subunit IIIb
Subunit IIIb (~883–902 mbsf [bottom of the hole]; Table T2) consists of ~19 m thick anhydritic mudstone, mudstone, and micritic anhydrite with mica (<2 mm), lapilli-sized pumice, and gypsum. Core 398-U1591C-70R consists mostly of massive or unbedded (anhydritic) mudstone, whereas Core 71R consists of anhydritic mudstone and micritic anhydrite, resulting in bedding and laminations from Section 70R-3 downward (Figure F14F). Between ~884 and 886.4 mbsf the (anhydritic) mudstone is bluish gray, whereas the uppermost part of this subunit is dark gray or grayish green to dark gray. Pumice clasts are concentrated in Sections 70R-1 (0–29, 34–47, 65–77, and 90–114 cm), 70R-6 (11–101 cm), 71R-6 (0–140 cm), and 71R-7 (0–43 cm). Most are mica rich, probably biotite (Figure F14E, F14F). Gypsum nodules were macroscopically identified in Sections 71R-2 (79–106 cm), 71R-3 (0–143 cm), and 71R-4 (0–94 cm) based on their hardness (very easily scratchable) and color (light gray to white).
Two thin sections from Subunit IIIb show fine-grained anhydritic mudstone with grains of plagioclase, quartz, and biotite (Figure F15E, F15F) and coarse-grained anhydrite characterized by elongated anhydrite and gypsum crystals with interstitial micrite (Figure F15F).
3.3. Correlations between holes
The sediments recovered from Holes U1591A–U1591C partly allow for correlation of sediment-specific features such as volcanic layers (e.g., discrete ash or tuffaceous mud and ooze) or organic-rich (sapropelic) ooze and mud. Holes U1591A and U1591B largely overlap; however, Hole U1591A terminates at ~100 mbsf, whereas Hole U1591B continues to ~400 mbsf. The recovery of Hole U1591C was planned to largely overlap with Hole U1591B between ~160 and 260 mbsf to recover sediments that were lost in Hole U1591B; however, the recovery in Hole U1591C was not significantly better, resulting in many core recovery gaps and generally limiting correlations between both holes.
3.3.1. Notable correlated deposits
- Sections 398-U1591A-2H-5 (bottom depth = 11.35 mbsf) and 398-U1591B-2H-3 (11.85 mbsf) (Figure F16A). This ~39.5 cm thick interval of ash, tuffaceous ooze/mud, and lapilli-ash is generally volcanic rich with ~60 cm of thick lapilli-ash at the bottom, followed by a ~20–30 cm thick tuffaceous ooze, and a ~2 cm diffuse ash layer at the top. The tuffaceous ooze shows vertical, partly lens-shaped bioturbation.
- Sections 398-U1591A-4H-4 (bottom depth = 28.8 mbsf) and 398-U1591B-4H-2 (29.6 mbsf) (Figure F16B). This interval of calcareous tuffaceous mud, organic-rich ooze, and ooze with ash pods is characterized by its dark brown color, linked to the organic and tuffaceous material, and the gradational transition from organic-rich ooze to ooze. The ooze contains some ash pods.
- Sections 398-U1591A-8H-1 (bottom depth = 62.14 mbsf) and 398-U1591B-7H-5 (62.52 mbsf) (Figure F16C). The ash layer in this interval of ooze, ash, and ooze is discrete, although slightly disturbed by drilling, and roughly 4 cm thick. Toward the top, the ash grades into a tuffaceous ooze (~10–18 cm; slightly thicker in Hole U1591A).
- Sections 398-U1591B-23X-4 (bottom depth = 200.93 mbsf) and 398-U1591C-7R-2 (199.94 mbsf) (Figure F17A). The organic-rich ooze in this interval of ooze and organic-rich ooze is highly bioturbated (probably by Zoophycos) with tunnel-shaped, slightly inclined burrows.
- Sections 398-U1591B-27X-CC (bottom depth = 233.88 mbsf) and 398-U1591C-11R-1 (236.19 mbsf) (Figure F17B). This interval of gravelly tuffaceous sands and muds with ooze was only tentatively correlated between Holes U1591B and U1591C, due to strongly disturbed sediments in Hole U1591B. The gravel-sized clasts were identified as volcanic lithics and pumice.
- Sections 398-U1591B-30X-1 (bottom depth = 263.31 mbsf) and 398-U1591C-13R-CC (263.02 mbsf) (Figure F17C). The organic-rich ooze in this interval of ooze and organic-rich ooze shows a very sharp contact with the lower ooze and a slightly diffuse upper boundary. Sediments in both holes show signs of strong to severe drilling disturbance.
- Sections 398-U1591B-39X-1 (bottom depth = 350.94 mbsf) and 398-U1591C-15R-1 (351.2 mbsf) (Figure F17D). This interval of highly disturbed ash with cobble-sized lithics, especially in Hole U1591B, is highly disturbed by drilling. Nevertheless, based on the cobble-sized clasts, these two intervals are tentatively correlated. The main component of the light beige sediment is ash.
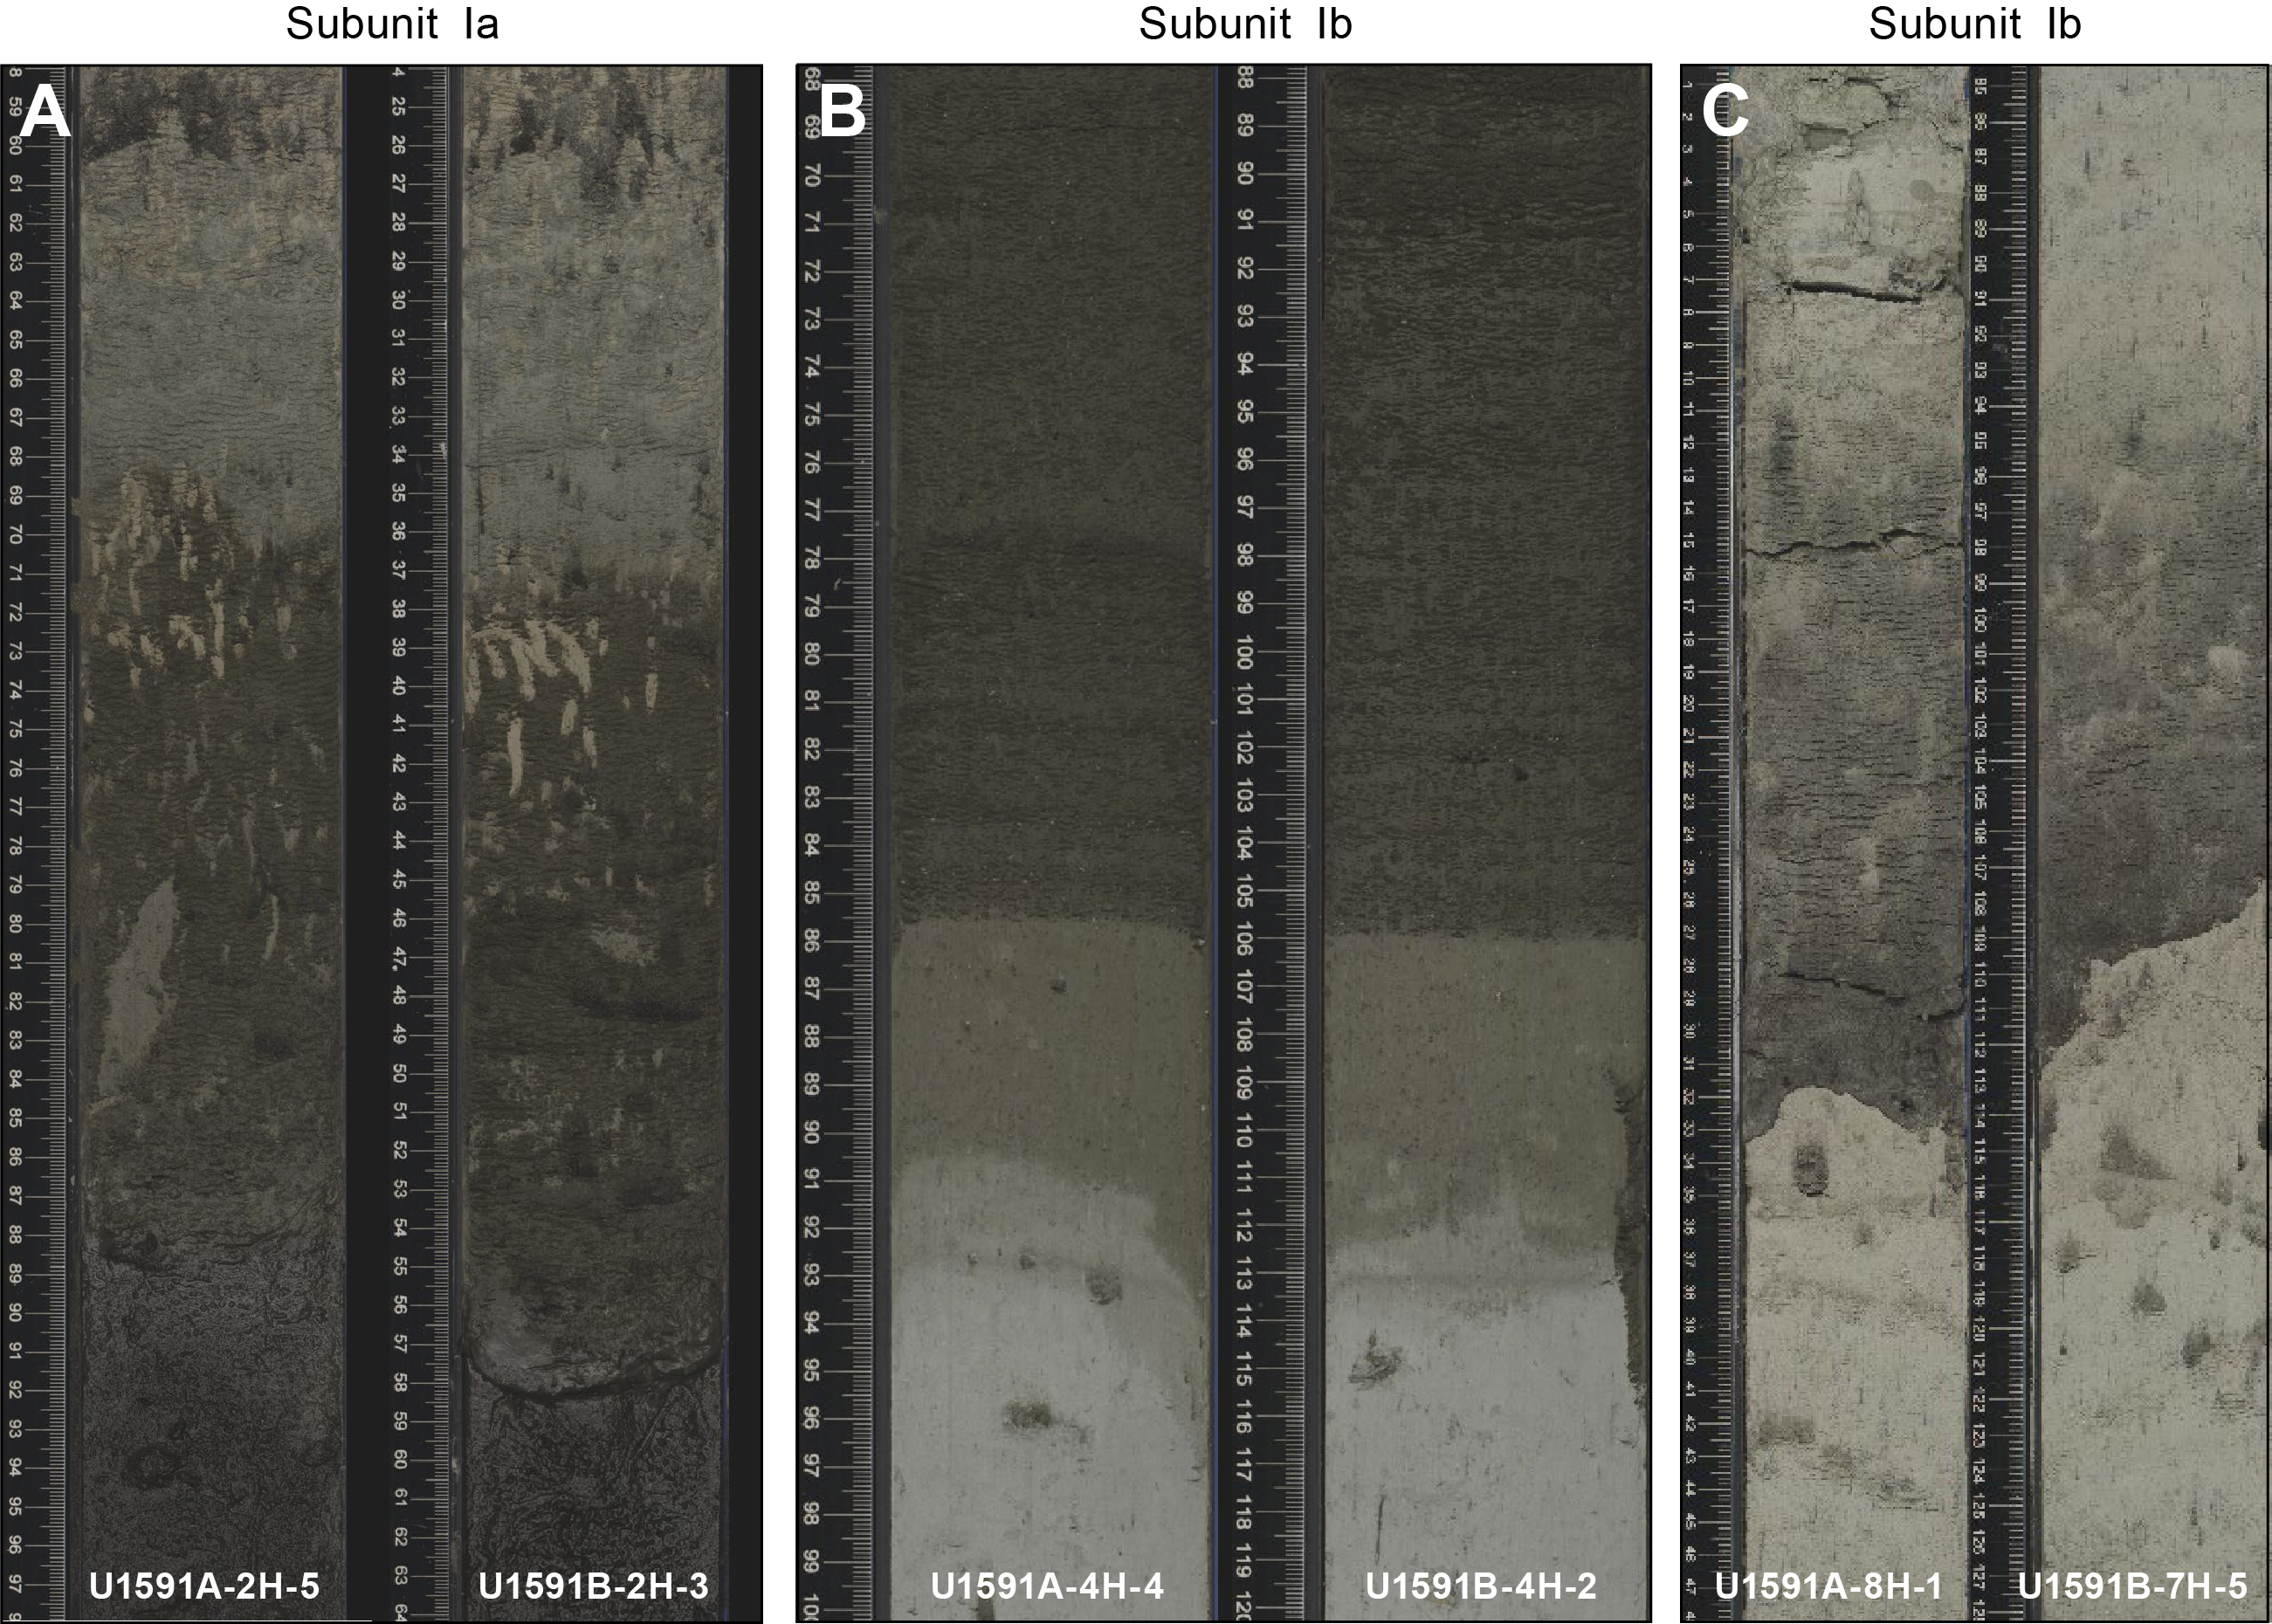
Figure F16. Correlations between Holes U1591A and U1591B.
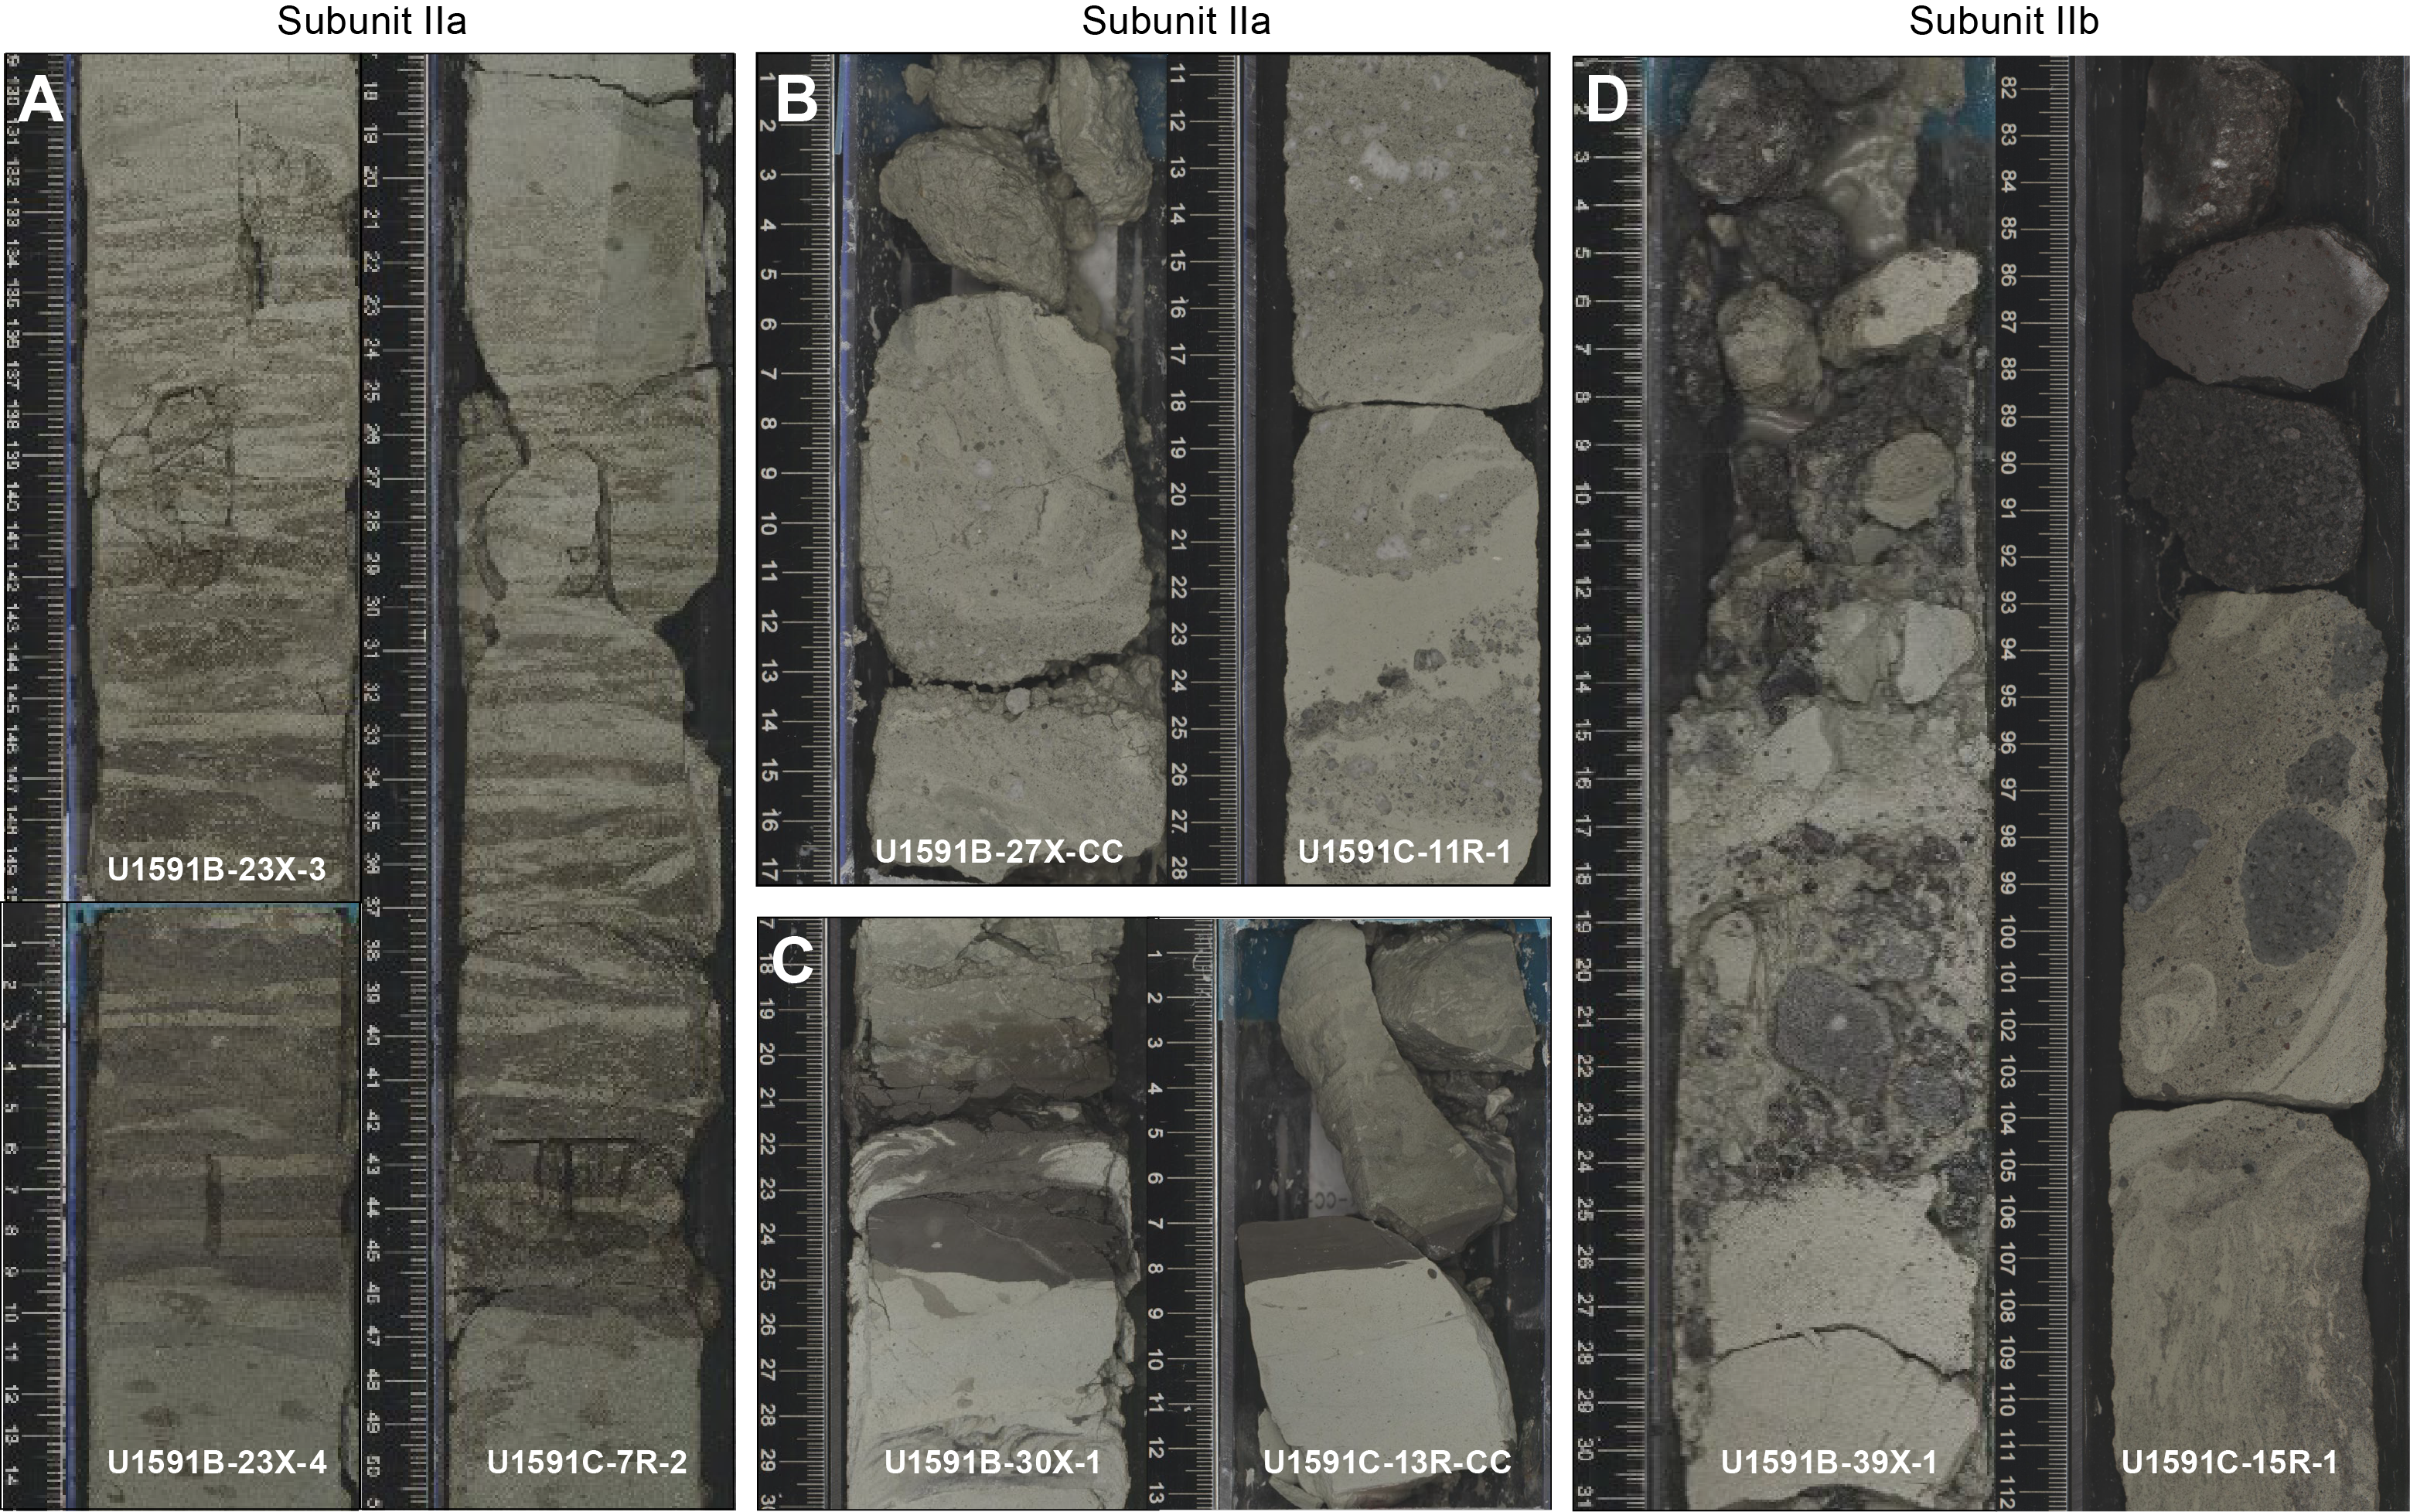
Figure F17. Correlations between Holes U1591B and U1591C.
3.4. X-ray diffraction
XRD data were collected from 8 interstitial water (IW) squeeze cake sediment residues from Hole U1591A, 11 from Hole U1591B, and 31 from Hole U1591C. The XRD spectra obtained on lithologies from Units I and II were similar to those from Sites U1589 and U1590, with the majority of analyses carried out on oozes and organic-rich oozes in addition to samples from tuffaceous sediments (oozes and muds) and volcanic lithologies. Oozes and organic-rich oozes and muds are characterized by calcite and quartz, and most samples also contain Ca-rich or Na-rich plagioclase and clay minerals of the illite group and, in some cases, the smectite group (montmorillonite). Other minerals identified in these lithologies include dolomite, ankerite, glauconite, and chlorite, among other minor phases. Tuffaceous sediments and ash show characteristic XRD patterns of glass-rich (volcanic) material with a characteristic hump at low °2θ, indicating the presence of an amorphous (noncrystalline) phase. Among the identified minerals in these lithologies were Ca-rich plagioclase, but the majority of phases identified were calcite, quartz, glauconite, and clay minerals of the illite and smectite groups (montmorillonite).
Discrete samples from Unit III were analyzed by XRD to characterize the evaporite sequences that define this lithostratigraphic unit, in particular Subunit IIIa. Selected XRD spectra are shown in Figure F18. Anhydrite has been identified as one of the major evaporite minerals, occurring as laminated and nodular varieties, and as veins and veinlets (Figure F18A, F18B). Other descriptive intervals in Subunit IIIa are dominated by dolomite with minor quartz or are characterized by a multimineral assemblage of dolomite and quartz with minor calcite and vermiculite (Figure F18C, F18D). The XRD spectra of two discrete samples analyzed from Subunit IIIb are characterized by Ca-rich plagioclase and muscovite (Sample 398-U1591C-71R-2, 34–35 cm) and Ca-rich plagioclase and illite, respectively.
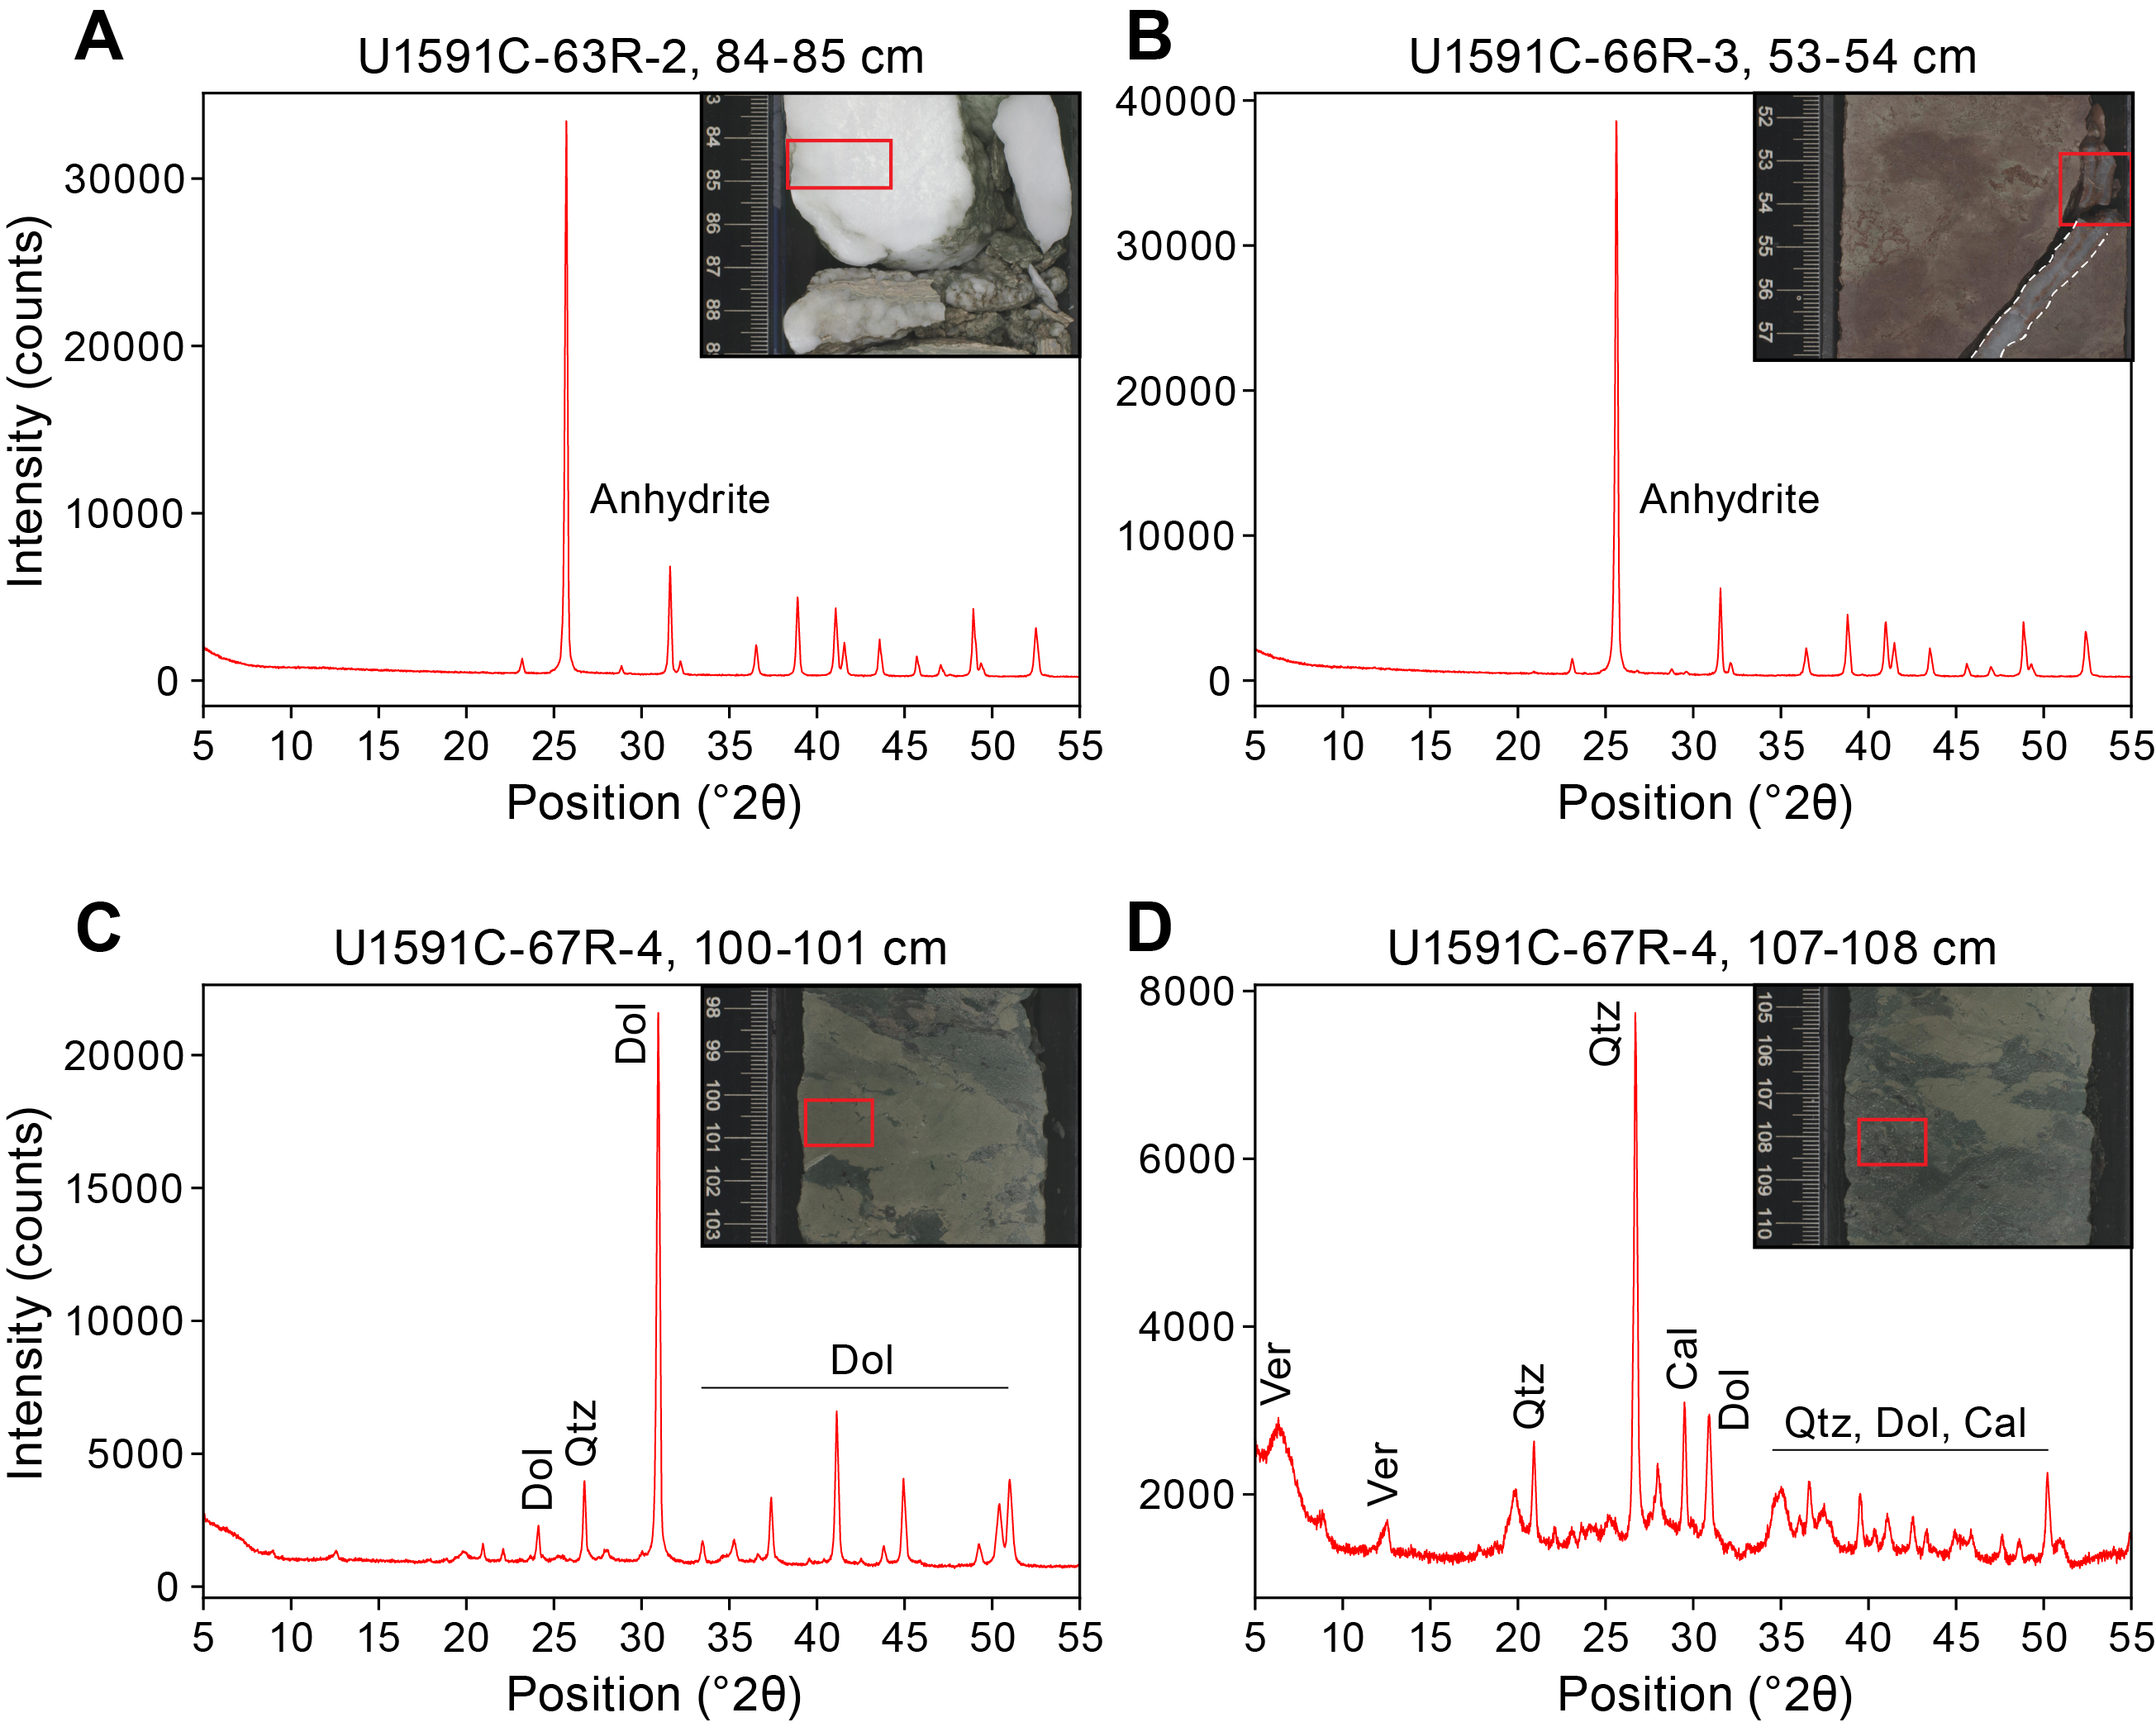
Figure F18. XRD spectra.
4. Stratigraphic correlation
Three holes were drilled at Site U1591. Hole U1591A was drilled to 90.85 mbsf (CSF-A scale) using only the APC system. Hole U1591B was drilled to 386.6 mbsf using the APC system (to 67.09 mbsf), the HLAPC system (98.8–112.9 and 146.7–152.88 mbsf), and the XCB system (117.6–137 and 156.1–386.6 mbsf). Between 74.1 and 98.8 mbsf, no cores were recovered intentionally to further advance through an interval that was difficult to drill in Hole U1591A. In Hole U1591C, the RCB system was used to drill to 902.67 mbsf, and the uppermost 149.3 m were intentionally not recovered.
4.1. Correlation during coring
Because Hole U1591A had proven to be very challenging for drilling, the priority for Hole U1591B was to advance without any delay. This implied that correlation during drilling was not required, and we did not use the Special Task Multisensor Logger (STMSL) for measurements of physical properties for fast correlations.
4.2. Correlation for establishing CCSF-A depth scale and construction of the splice
To establish the core composite depth below seafloor, Method A (CCSF-A), depth scale, we focused on the uppermost 67.09 m where piston coring was possible in Holes U1591A and U1591B and correlated the measured physical properties using the Whole-Round Multisensor Logger (WRMSL; for MS, gamma ray attenuation [GRA] density, and P-wave velocity), the Natural Gamma Radiation Logger (NGRL; for NGR intensity), and subsequently the Section-Half Multisensor Logger (SHMSL; for MS and color reflectance), as well as photos once the cores were split into working and archive halves (see Physical properties; also see Physical properties in the Expedition 398 methods chapter [Kutterolf et al., 2024]).
Both Holes U1591A and U1591B recovered the mudline. However, we used Core 398-U1591A-1H as the anchor because it recovered a few centimeters (3.6 cm) more of the mudline than Core 398-U1591B-1H. From there, we achieved a gapless correlation between Holes U1591A and U1591B to 68 m CCSF-A. Below this depth, however, no reliable correlations were possible due to the low recovery. All depth offsets are reported in Table T3.
Figure F19 shows MS for the uppermost 70 m for both holes on the shifted CCSF-A scale, as well as the splice (core composite depth below seafloor, Method D [CCSF-D], scale) generated by combining representative intervals from both holes. In general, we identified a very good correlation between the MS measurements for both holes that also resulted in a reliable correlation of the other physical properties and the core photos. The only interval where the correlation was more difficult was between Cores 398-U1591A-5H and 398-U1591B-5H (~42 m CCSF-A), where the ash layers in the lower part of Core 398-U1591A-5H are significantly thicker than those in Core 398-U1591B-5H.
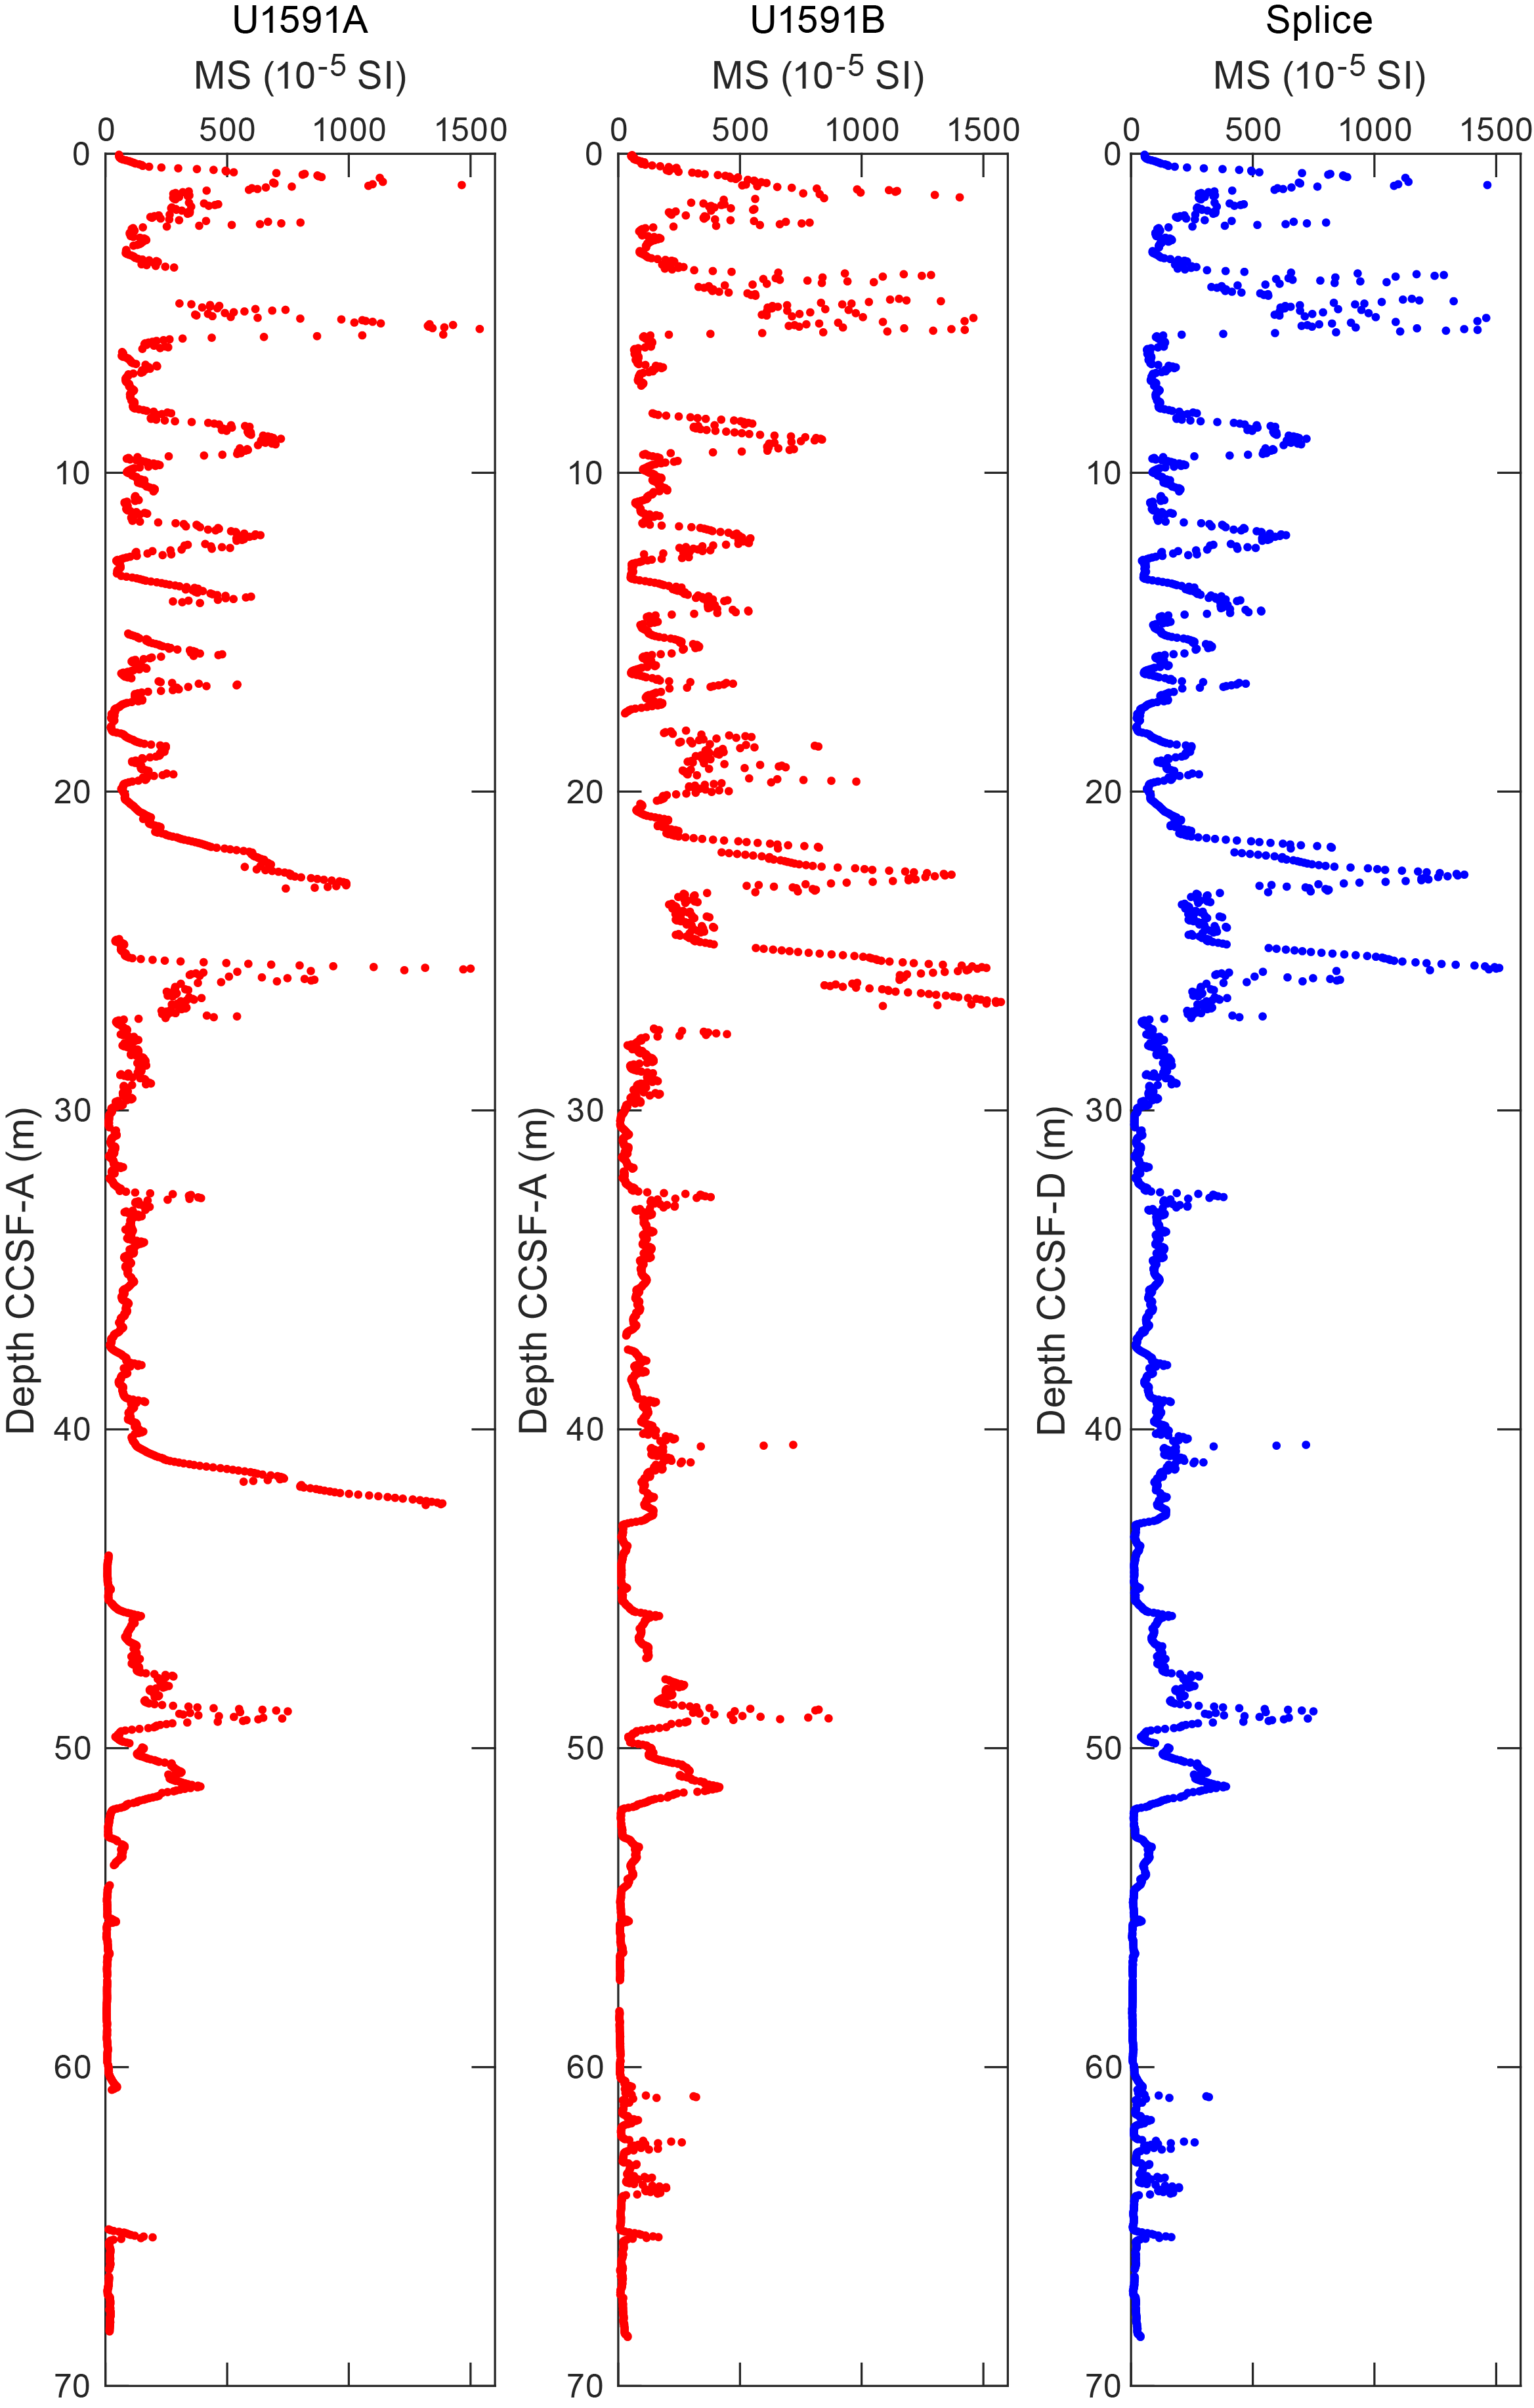
Figure F19. WRMSL-derived MS data.
For the deeper part of the stratigraphy below 68 mbsf, where no reliable correlations were possible, we did not apply any shifts to keep the CCSF-A scale as close to the CSF-A scale as possible. Figure F20 shows the resulting splice (CCSF-D scale) from Holes U1591A–U1591C (see Table T4 for splice ties). Hole U1591C successfully closed major gaps between ~225 and 264 mbsf and provides a surprisingly continuous record of the subsurface between 300 and 900 mbsf, when considering that Hole U1591C was drilled with the RCB system.
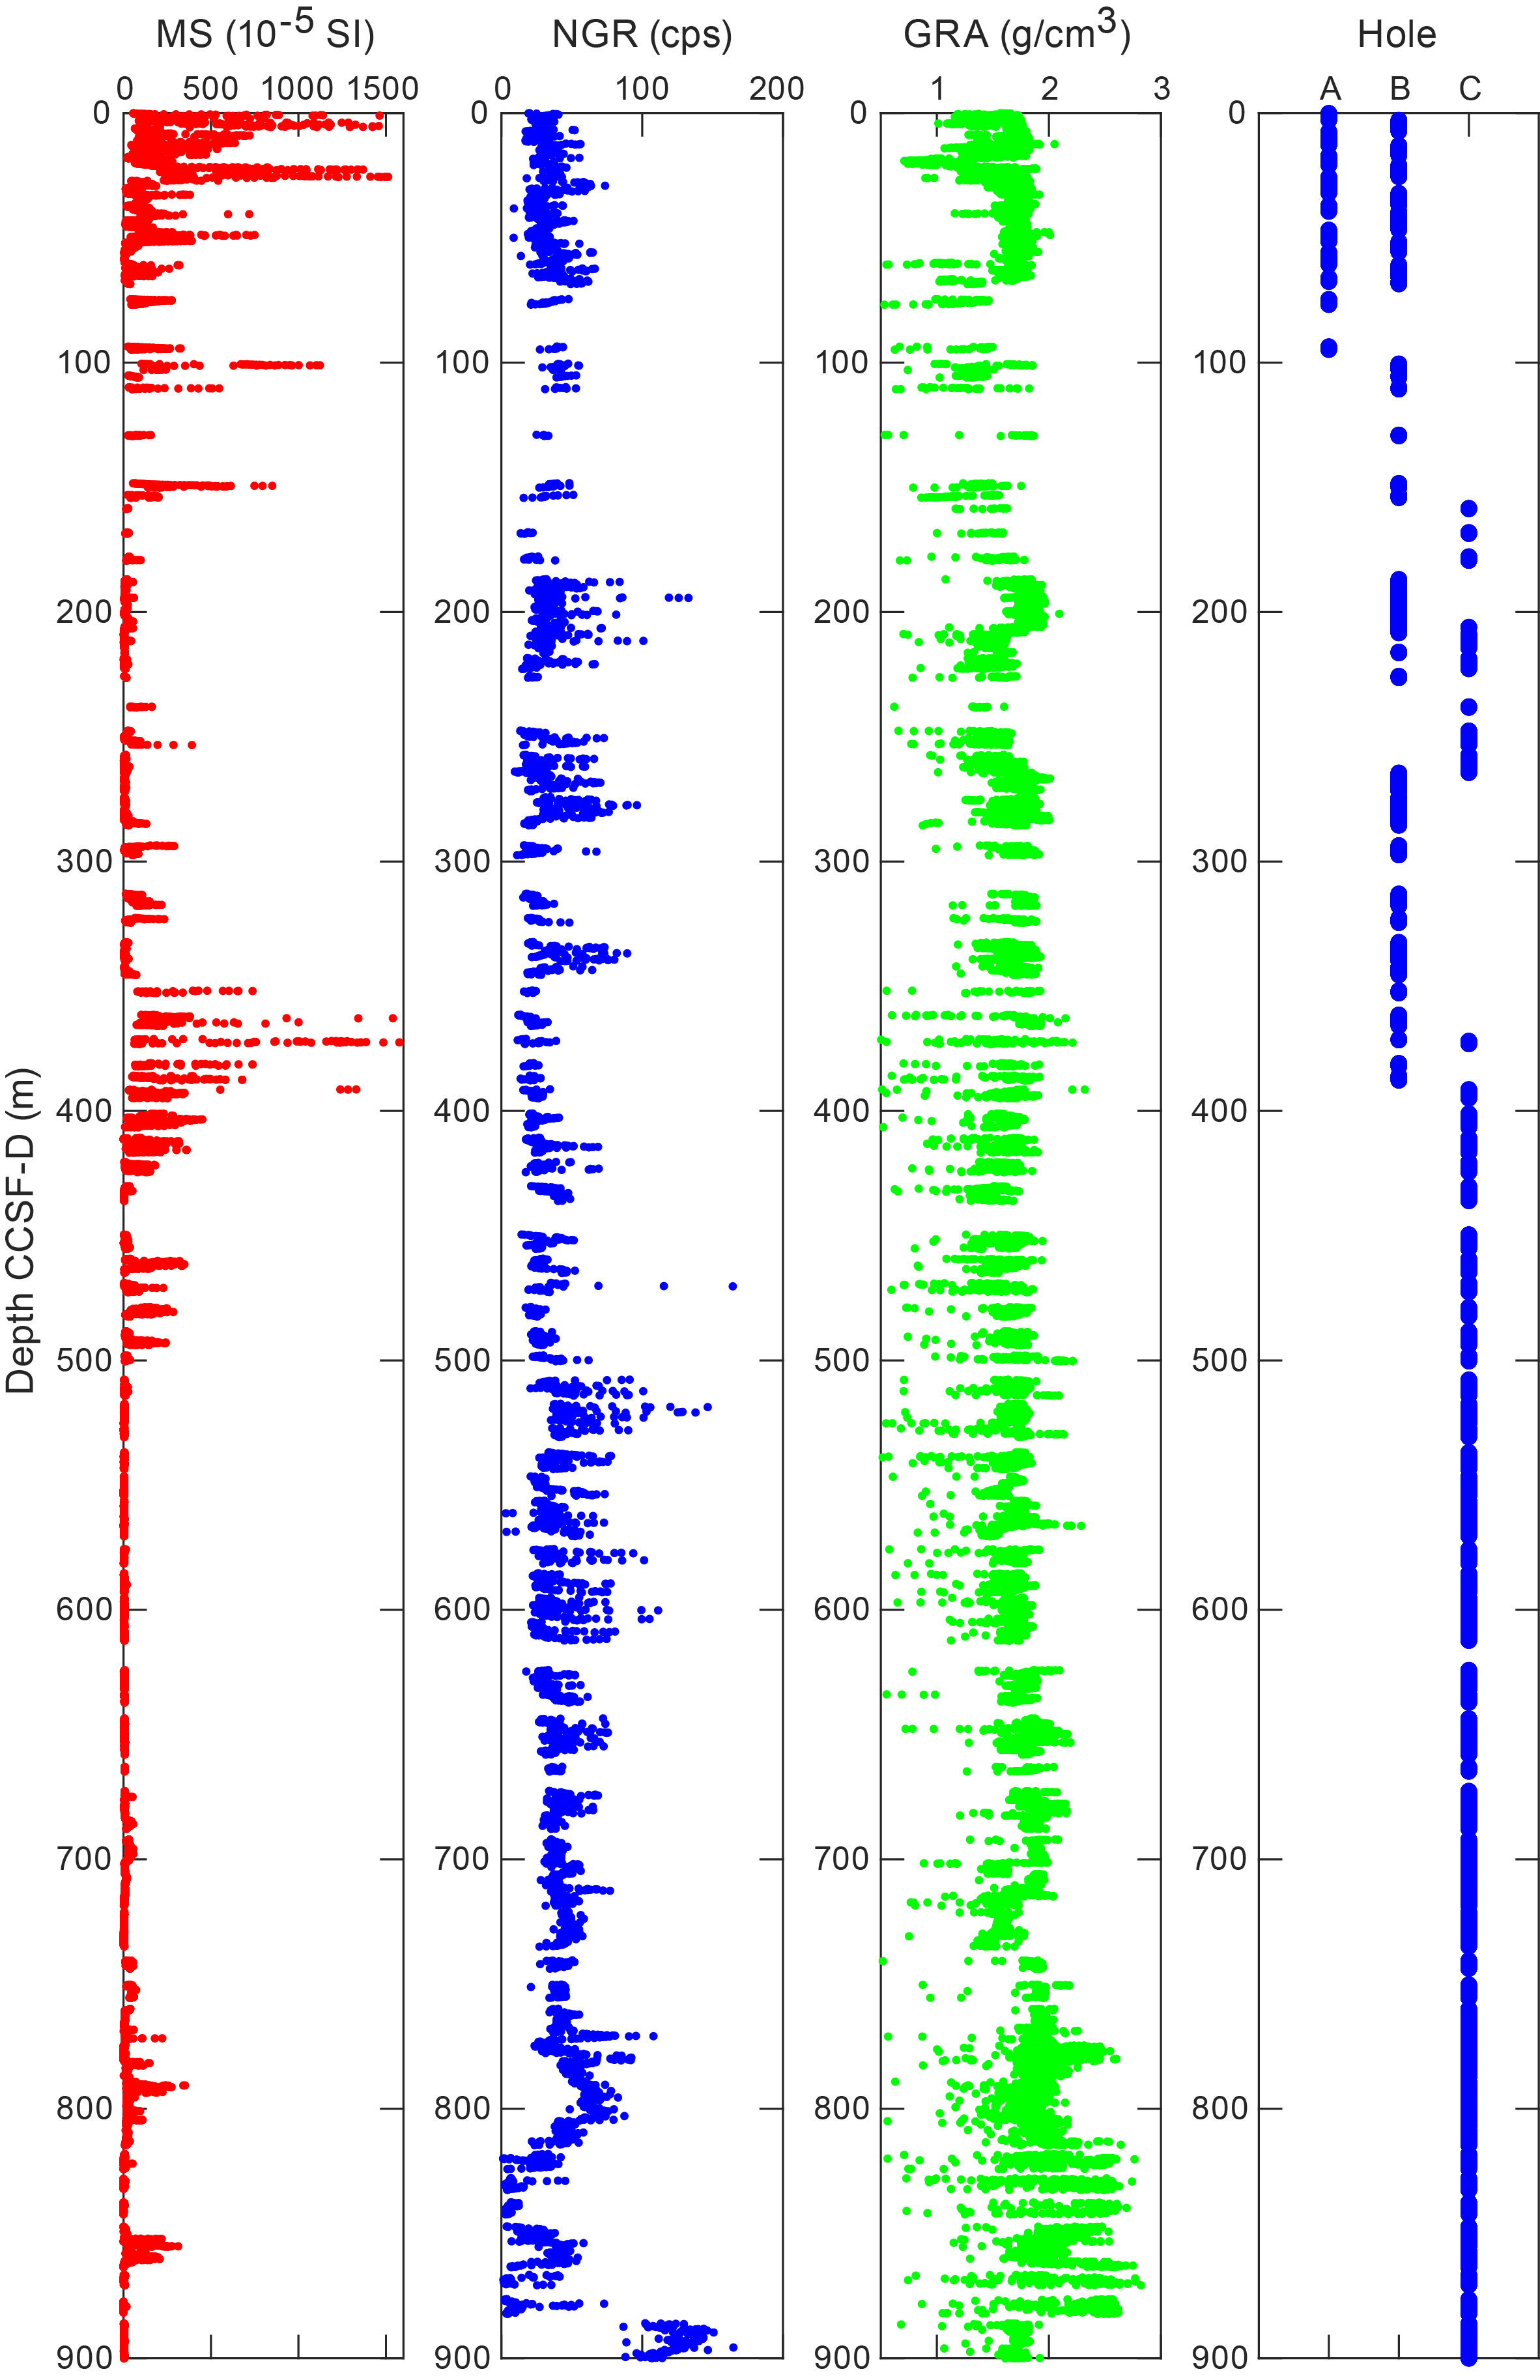
Figure F20. Splice.
In general, no significant core expansion was observed during curation and handling of the cores. Figure F21 shows a plot comparing the CSF-A and CCSF-A scales for Holes U1591A and U1591B and a linear regression curve calculated for both holes together for the uppermost 60 m. The deviation from the dotted line indicates an affine growth factor of approximately 3%.
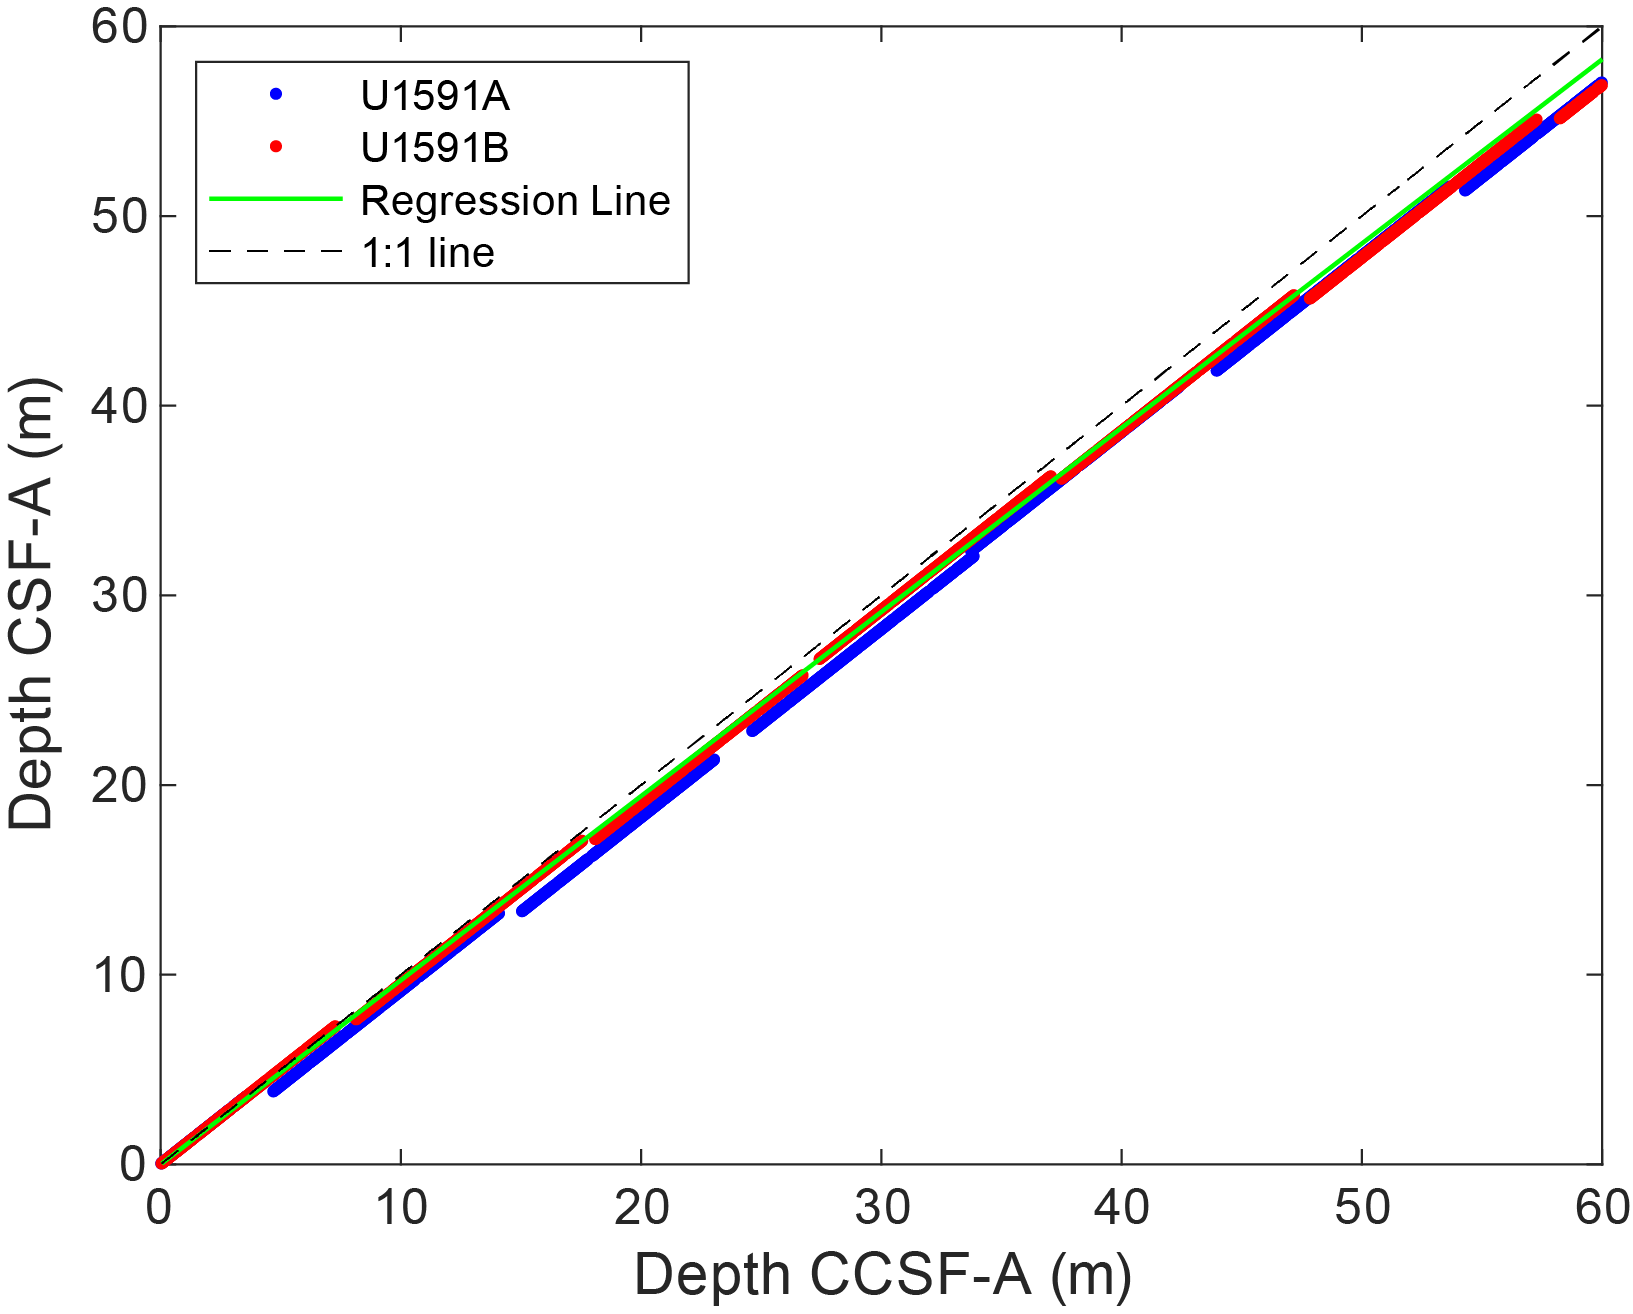
Figure F21. Core depths.
5. Structural geology
Structural geology analyses at Site U1591 included description of cores retrieved from Holes U1591A–U1591C. A total of 535 structures were measured, and most of those measurements derive from relatively consolidated intervals. Observed and measured structures on cores are bedding (79.1%), faults and deformation bands (12.7%), mineral veins (1.3%), and sediment veins (1.3%). The distributions and dip angles of planar structures are shown in Figure F22. The precision of shipboard orientation measurements is estimated to be ±2°. Deformation related to drilling and core recovery was noted but not recorded. Here, we describe and provide examples of each of the features that were recorded.
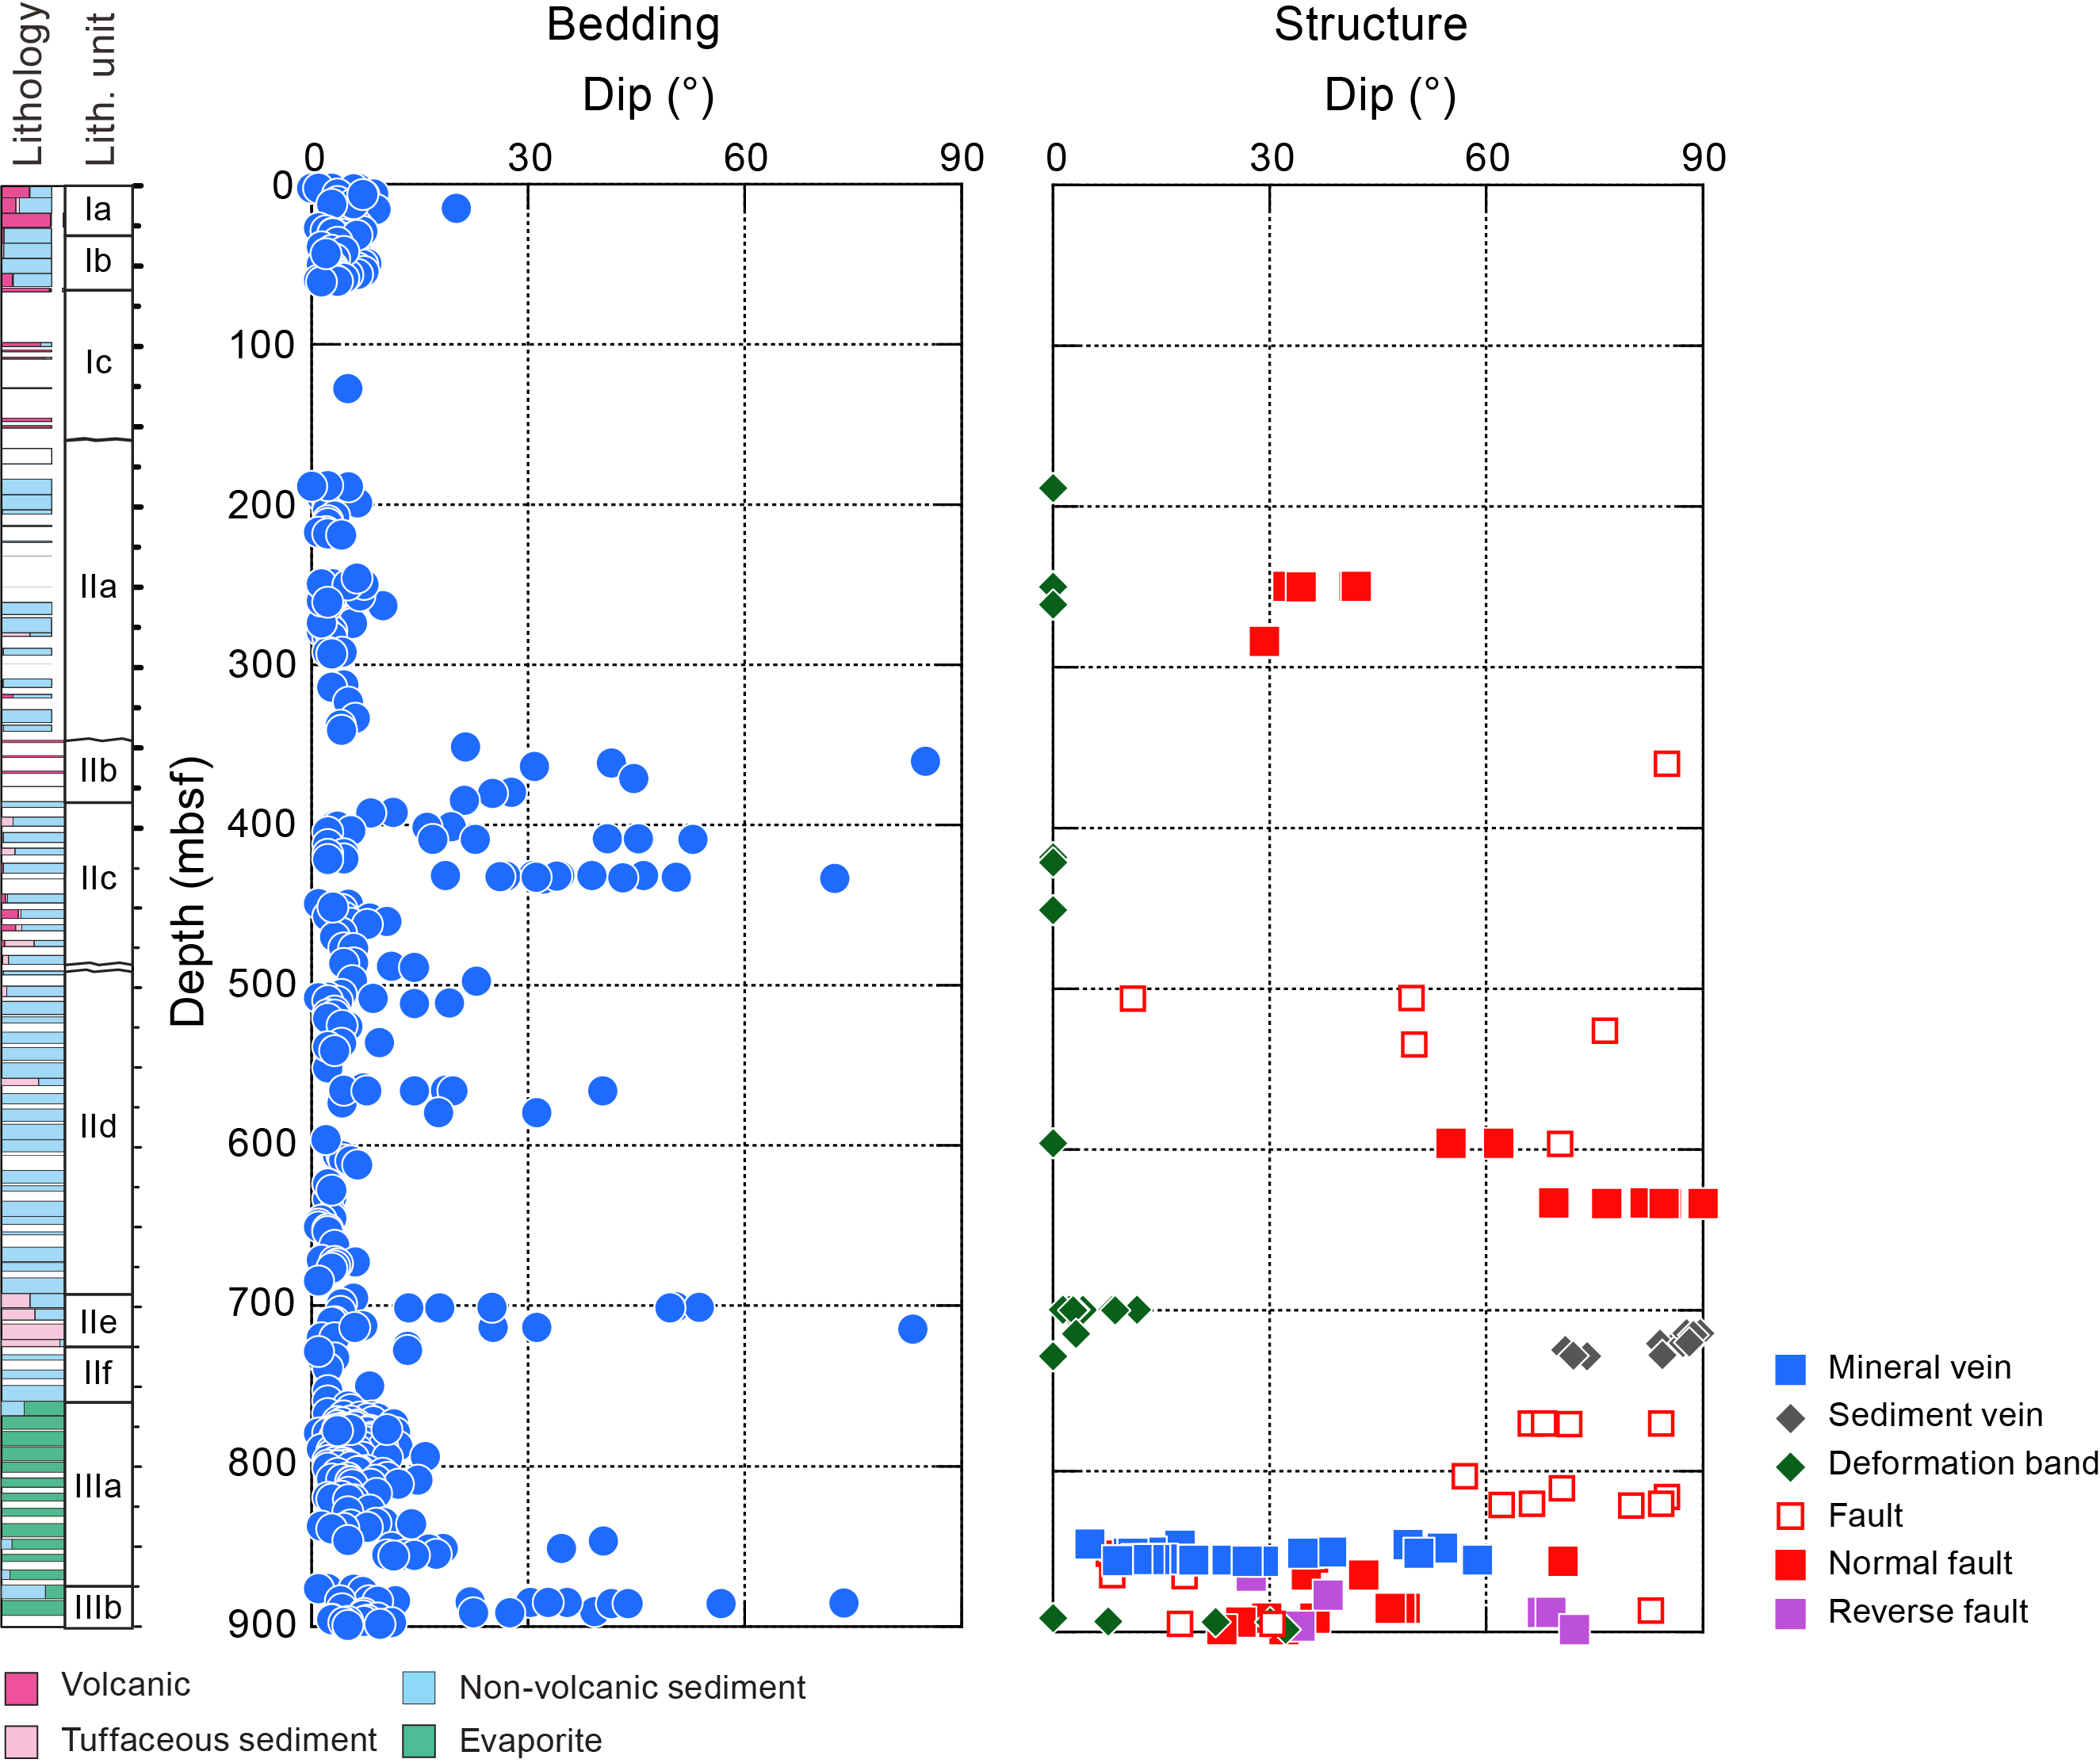
Figure F22. Dip data.
5.1. Bedding
Bedding planes (n = 423) were measured mainly on thin sand beds/laminae, sapropels, micrites, and anhydrite boundaries. They exhibit horizontal to subhorizontal dips above 350 mbsf (n = 133; mostly ≤10°; mean dip = 3.9°; median dip = 3.2°; standard deviation = 2.5°). However, steeper dips are observed below 350 mbsf, ranging 5°–85° (n = 290; mean dip = 11.4°; median dip = 5.6°; standard deviation = 14.1°) (Figure F22).
To evaluate the bedding dip variations in the ~900 m deep hole, we divided bedding measurements corresponding to the lithostratigraphic units/subunits defined by core description (see Lithostratigraphy) and used a box plot to indicate the distribution of bedding dips (Figure F23). Measurements were mostly concentrated in Lithostratigraphic Unit I and Subunits IIa–IIf, IIIa, and IIIb, but were limited by core recovery in Lithostratigraphic Subunit Ic (see Lithostratigraphy; Figure F22). Thus, a total of nine bedding measurement units were described that correspond respectively to the abovementioned lithostratigraphic units/subunits. In the box plot, each box indicates the data distribution range between the twenty-fifth and seventy-fifth percentiles, which is statistically meaningful. Median values (fiftieth percentile of all respective measurements in a unit) representative of the data distribution were used for evaluation of dip angles.
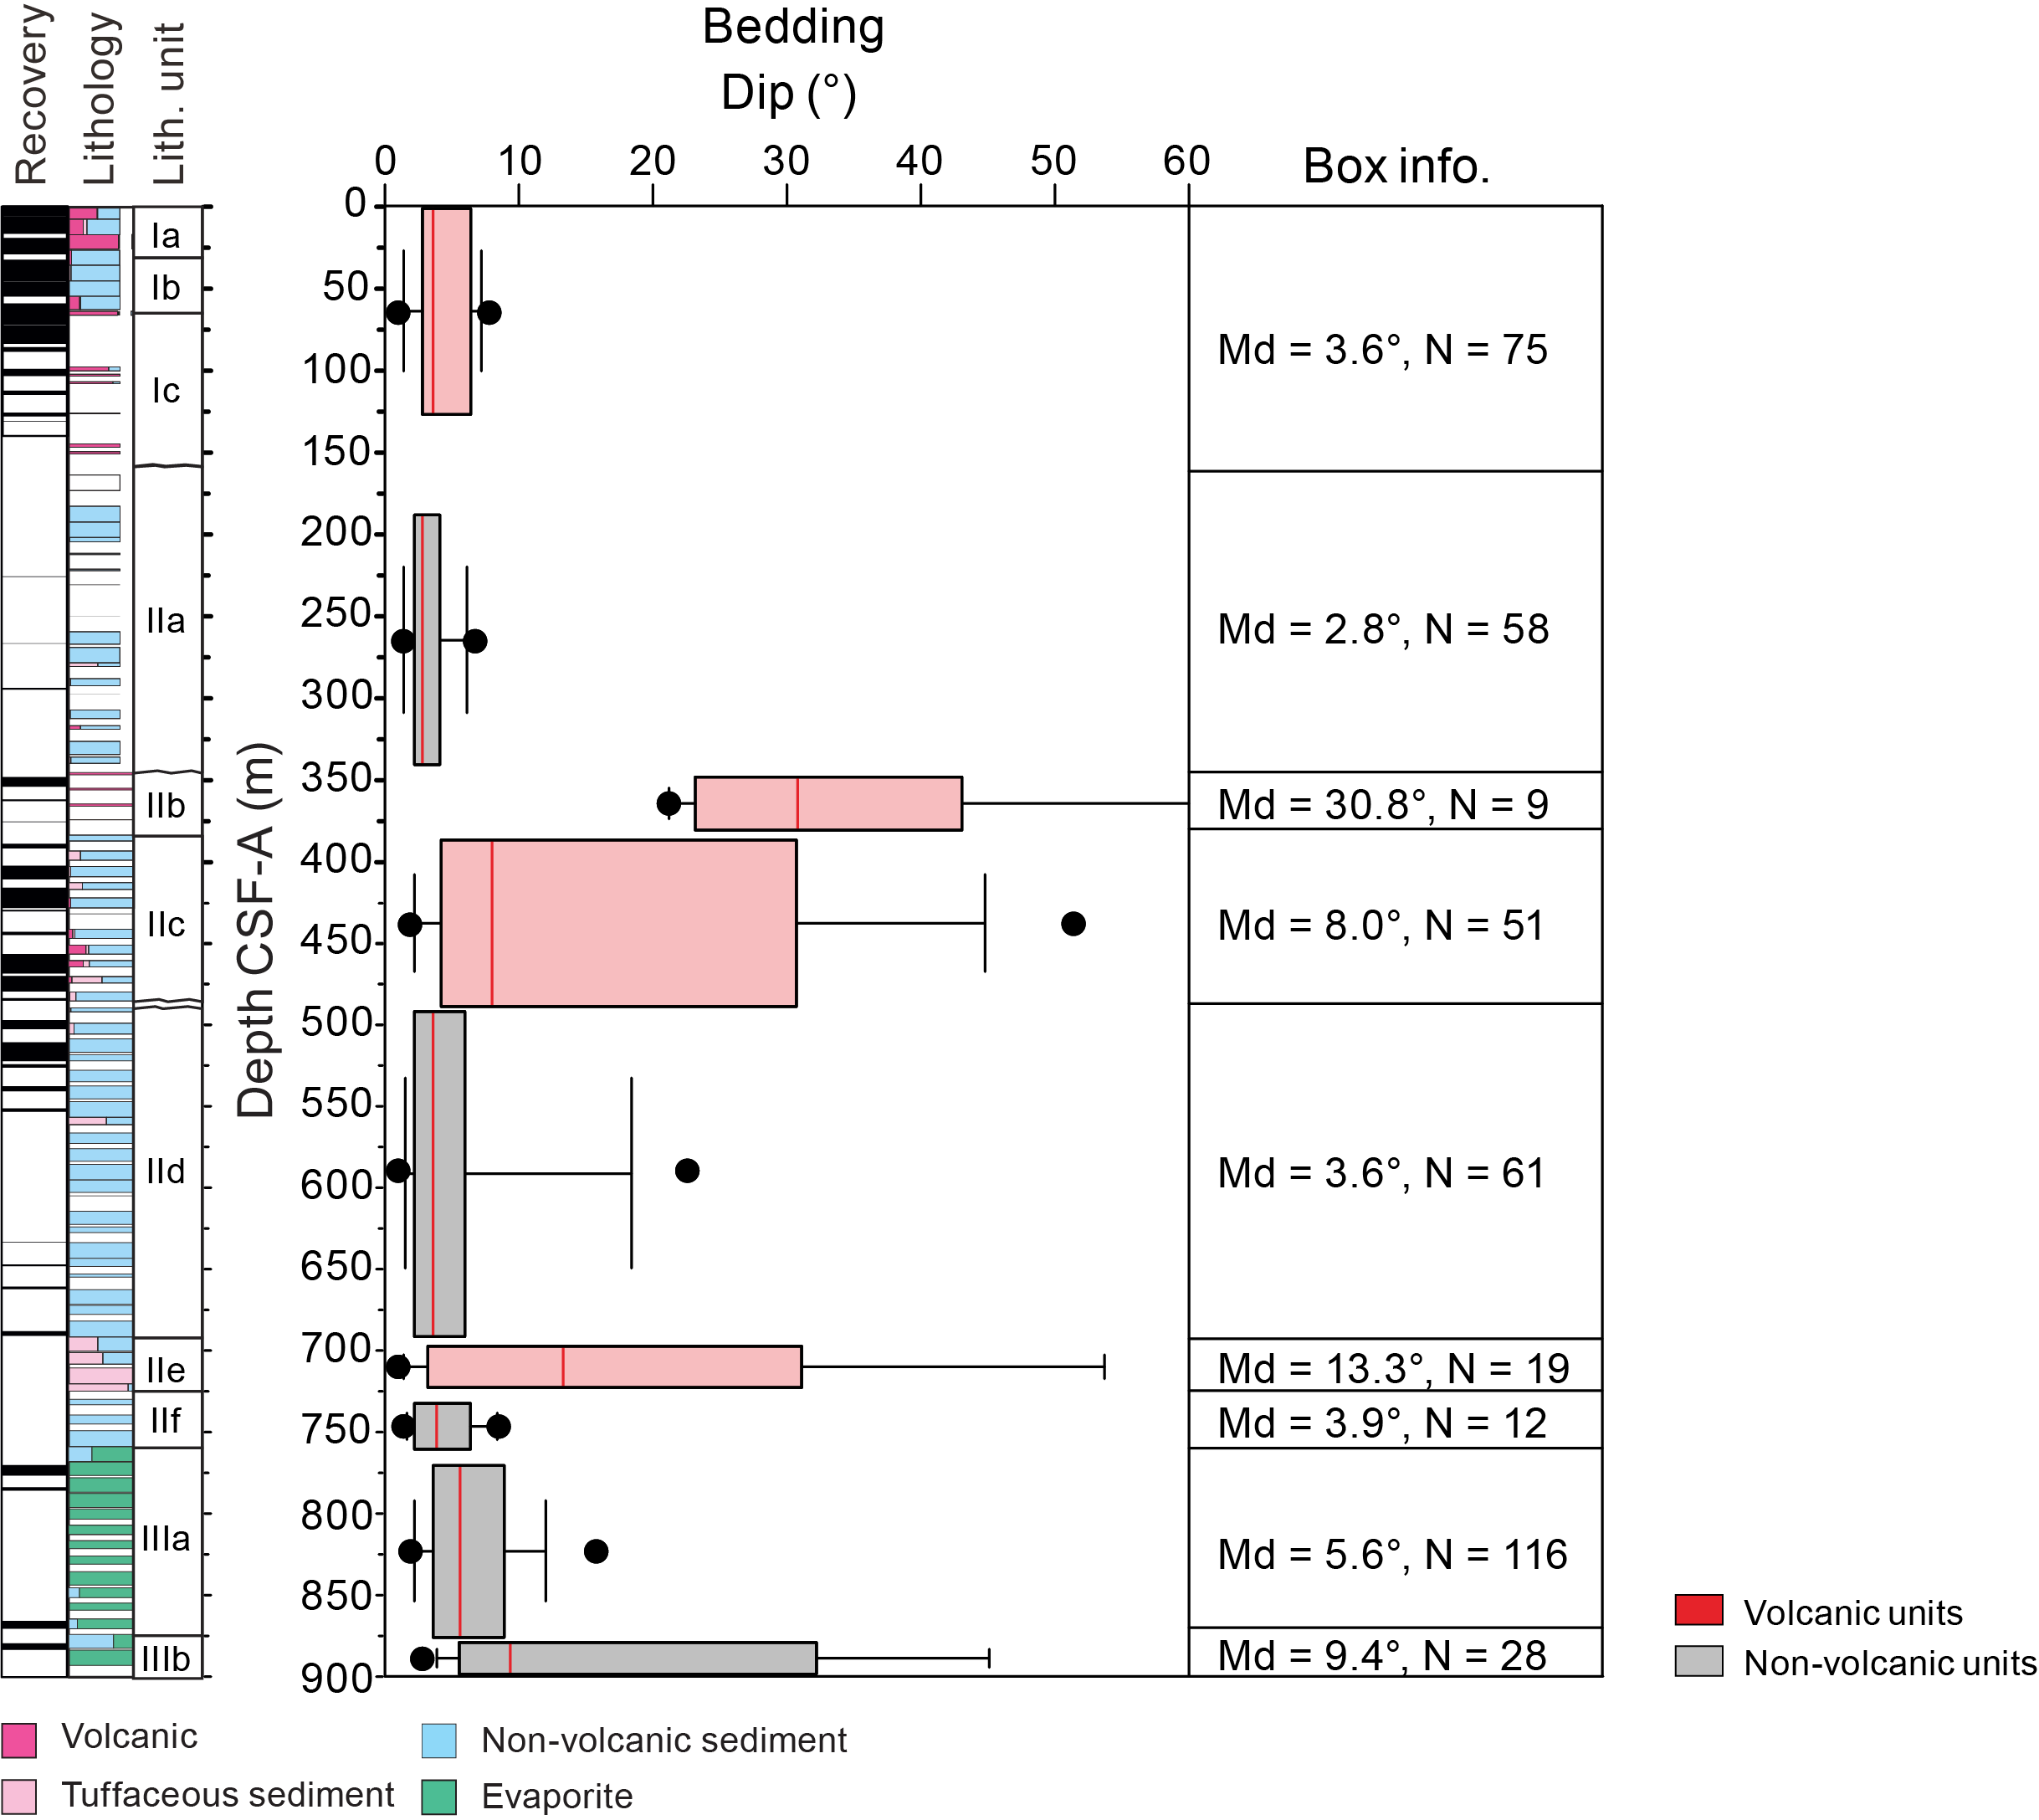
Figure F23. Bedding dip.
Major increases in bedding dip were identified at the bottom of Subunits IIe, IIc, and IIb. These occur in lithostratigraphic units/subunits where slump deposits were identified and consist of either volcanic- or tuffaceous-rich lithologies and ooze (see Lithostratigraphy; Figures F23, F24). In contrast, lithostratigraphic units/subunits without distinguishable volcanic records show decreasing median dips from the bottom to top also within the twenty-fifth to seventy-fifth percentile ranges, indicating that the tectonic tilting of Christiana Basin generally decreased upward. More specifically, for nonvolcanic units, the dip distributions are all positively skewed (indicating the median dip is closer to the lower quartile), with the median dip decreasing monotonically from 9.4° in Lithostratigraphic Subunit IIIb to 2.8° in Subunit IIa. Increases in median dip (from 3.9° to 13.3°) were identified between Subunits IIf and IIe. Similar major increases occurred between Subunits IId and IIc (from 3.6° to 8.0°) and between Subunit IIa and Unit I (from 2.8° to 3.6°) (Figure F23). All changes noted above occurred from nonvolcanic units to volcanic units, indicating either that earthquakes associated with volcanism triggered slumping or that the volcanism and slumping were both the consequence of rift pulses (Figure F24). From Subunit IIc to Subunit IIb, an obvious increase in the median dip (from 8.0° to 30.8°) was identified, indicating that a stronger disturbance occurred in Subunit IIb (Figure F23).
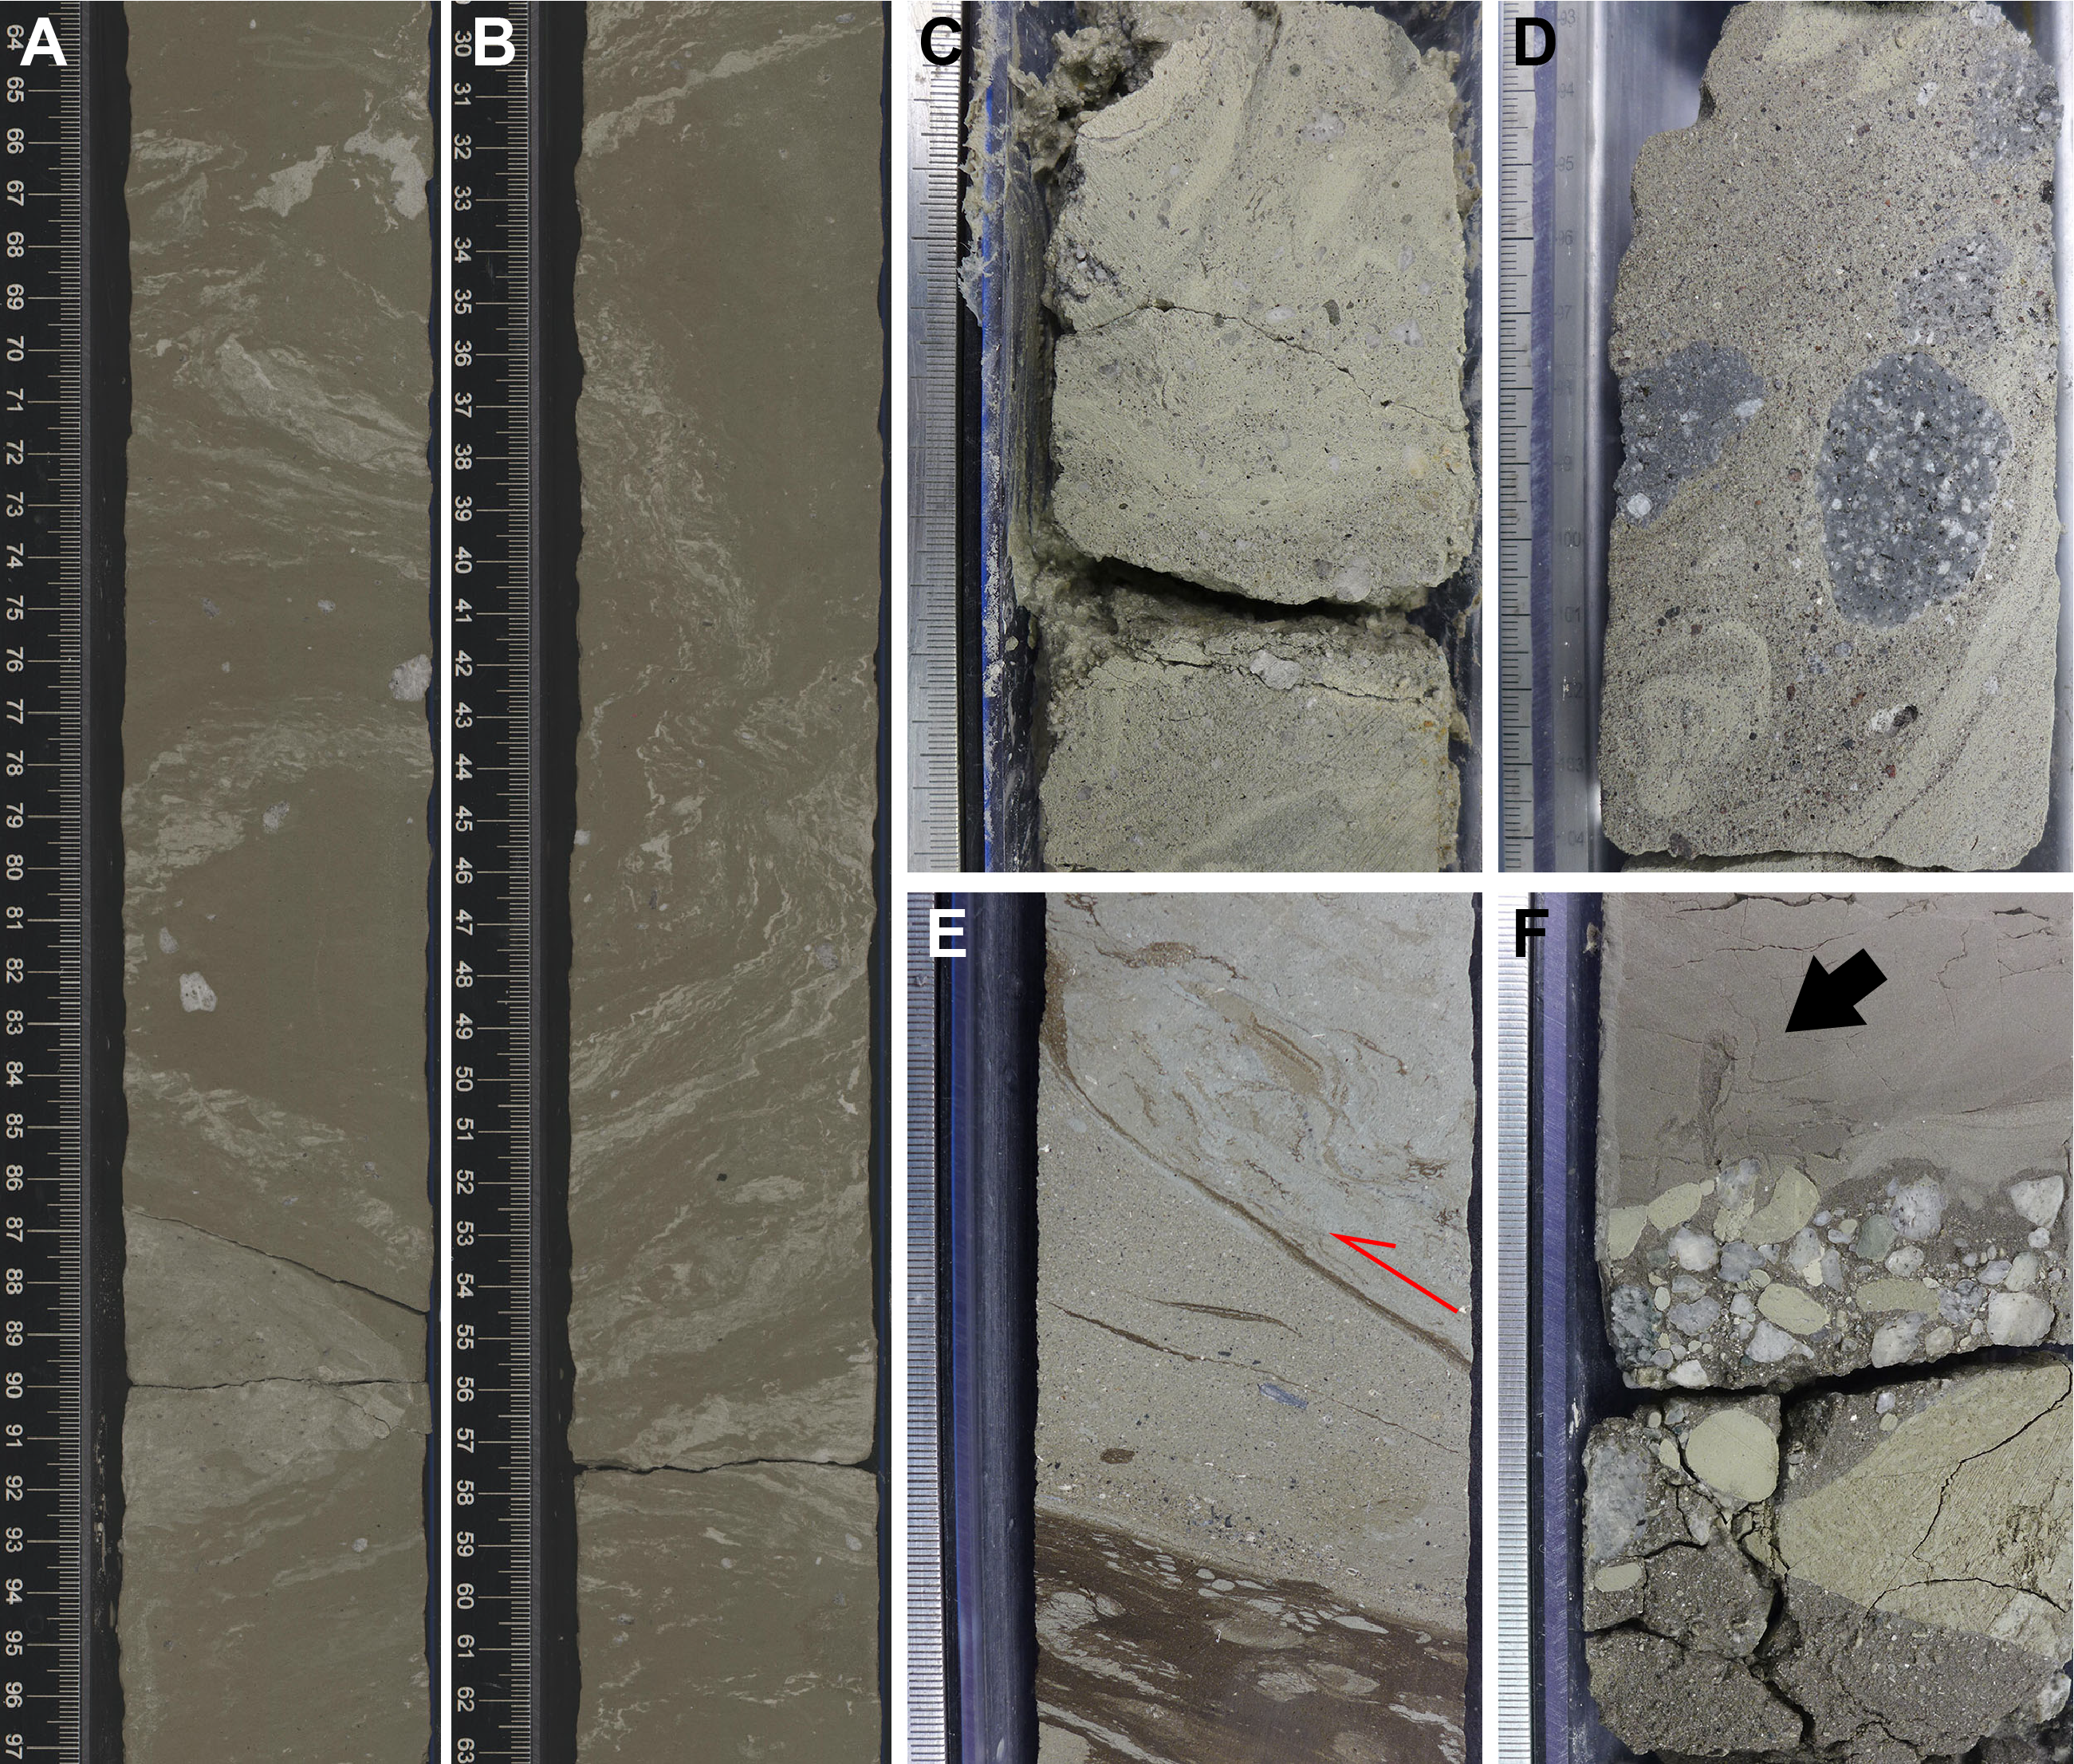
Figure F24. Slumps.
5.2. Slumps
At Site U1591, slump deposits were frequently identified as (1) block-in-matrix occurrences, (2) flow/disturbed mud, and (3) folding of sandy laminae/beds in muddy matrixes (Figure F24). The uppermost slump in the retrieved interval is from Sections 398-U1591C-9R-4 through 12R-1 (220–245 mbsf). The same slump interval is correlated to Section 398-U1591B-27X-CC (233 mbsf). Below 350 mbsf in Hole U1591C, a minor slump occurred at ~360 mbsf and slump-dominant intervals are identified at 420–477, 565–582, 699–708, and 885–890 mbsf (Figures F22, F24). These slump horizons also correspond to the intervals of drastic increase in sedimentation rate (see Biostratigraphy), indicative of thick accumulation/duplication of the same sedimentary intervals by slumping.
Most of the slump deposits at Site U1591 were classified as the third type listed above: folding of sandy laminae/beds in muddy matrixes (Figure F24A, F24B). Continuous sandy beds traced on a core-section scale (~1 m) rarely show disaggregation or flowage, but they present small-scale brittle deformation, each offset by a few millimeters filled with homogeneous muddy matrix. This type of slump lacks strong disturbance, and the mixture of materials apparently formed during slower migration (e.g., creep) in contrast to other types of slumps (Figure F24C–F24F). On the other hand, other examples in the cores show the first and second slump types (block-in-matrix and flow/disturbed-mud with highly mixed matrixes) (Figure F24C, F24D). The occurrence of polymictic clasts (Figure F24E, F24F) is also indicative of longer distances of transport compared with slump types associated with folding of sandy laminae/layers.
5.3. Faults
Small-scale faults are apparent on split core surfaces (Figure F25). They show displacement from a few millimeters to a centimeter. The sense and/or amount of displacement is defined where these faults cut bioturbation or sedimentary structures and by asymmetric fabrics within and around the faults. Faults at Site U1591 have normal and reverse senses of displacement and mostly represent cohesive (healed) fault planes with closed fault planes. Only in Lithostratigraphic Unit III do some of the normal faults have open fault planes with slickenlines, slickensteps, and mineral growth (Figure F26F). Although there is a population of reverse faults in Unit III, they are developed in the folded sandstone layers of a slump interval (Figure F24E).
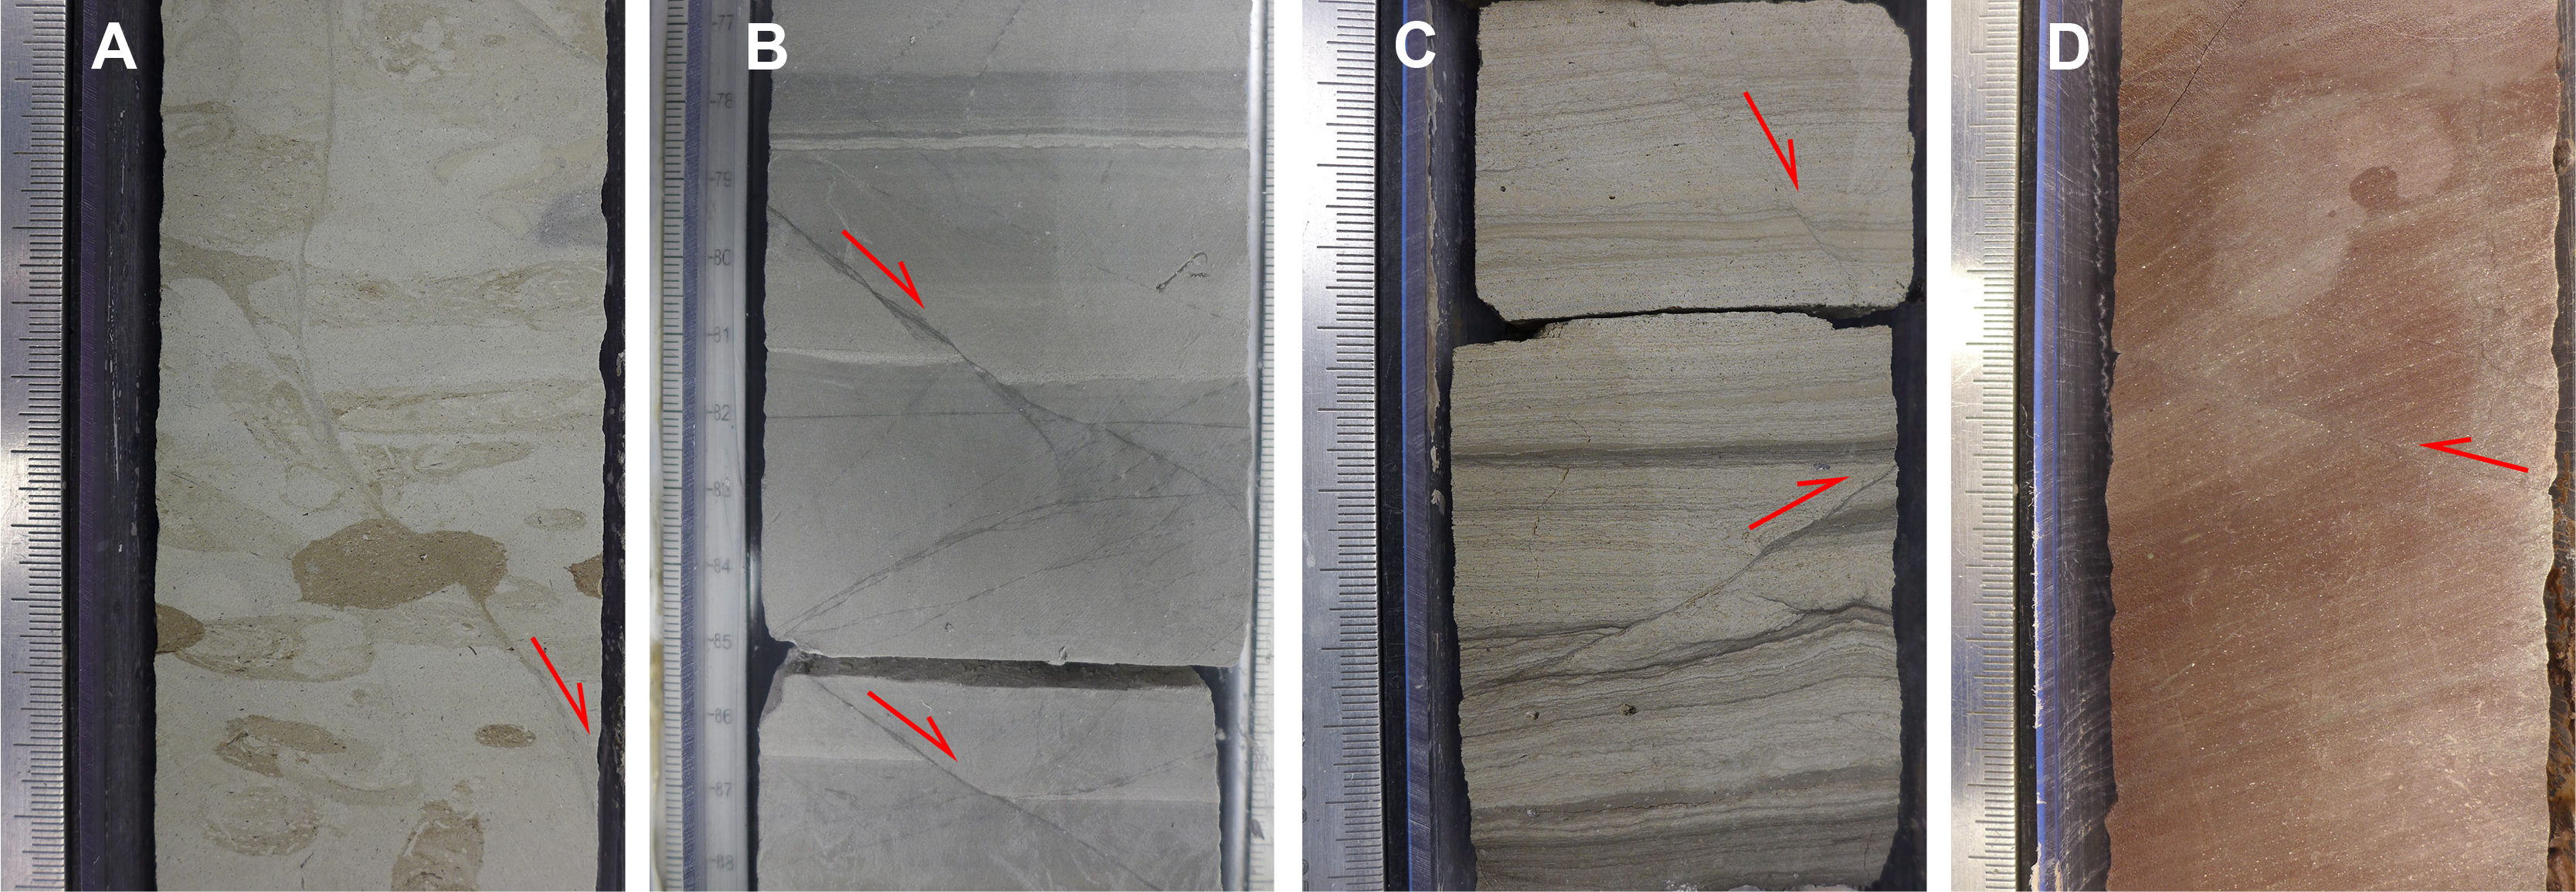
Figure F25. Faults.
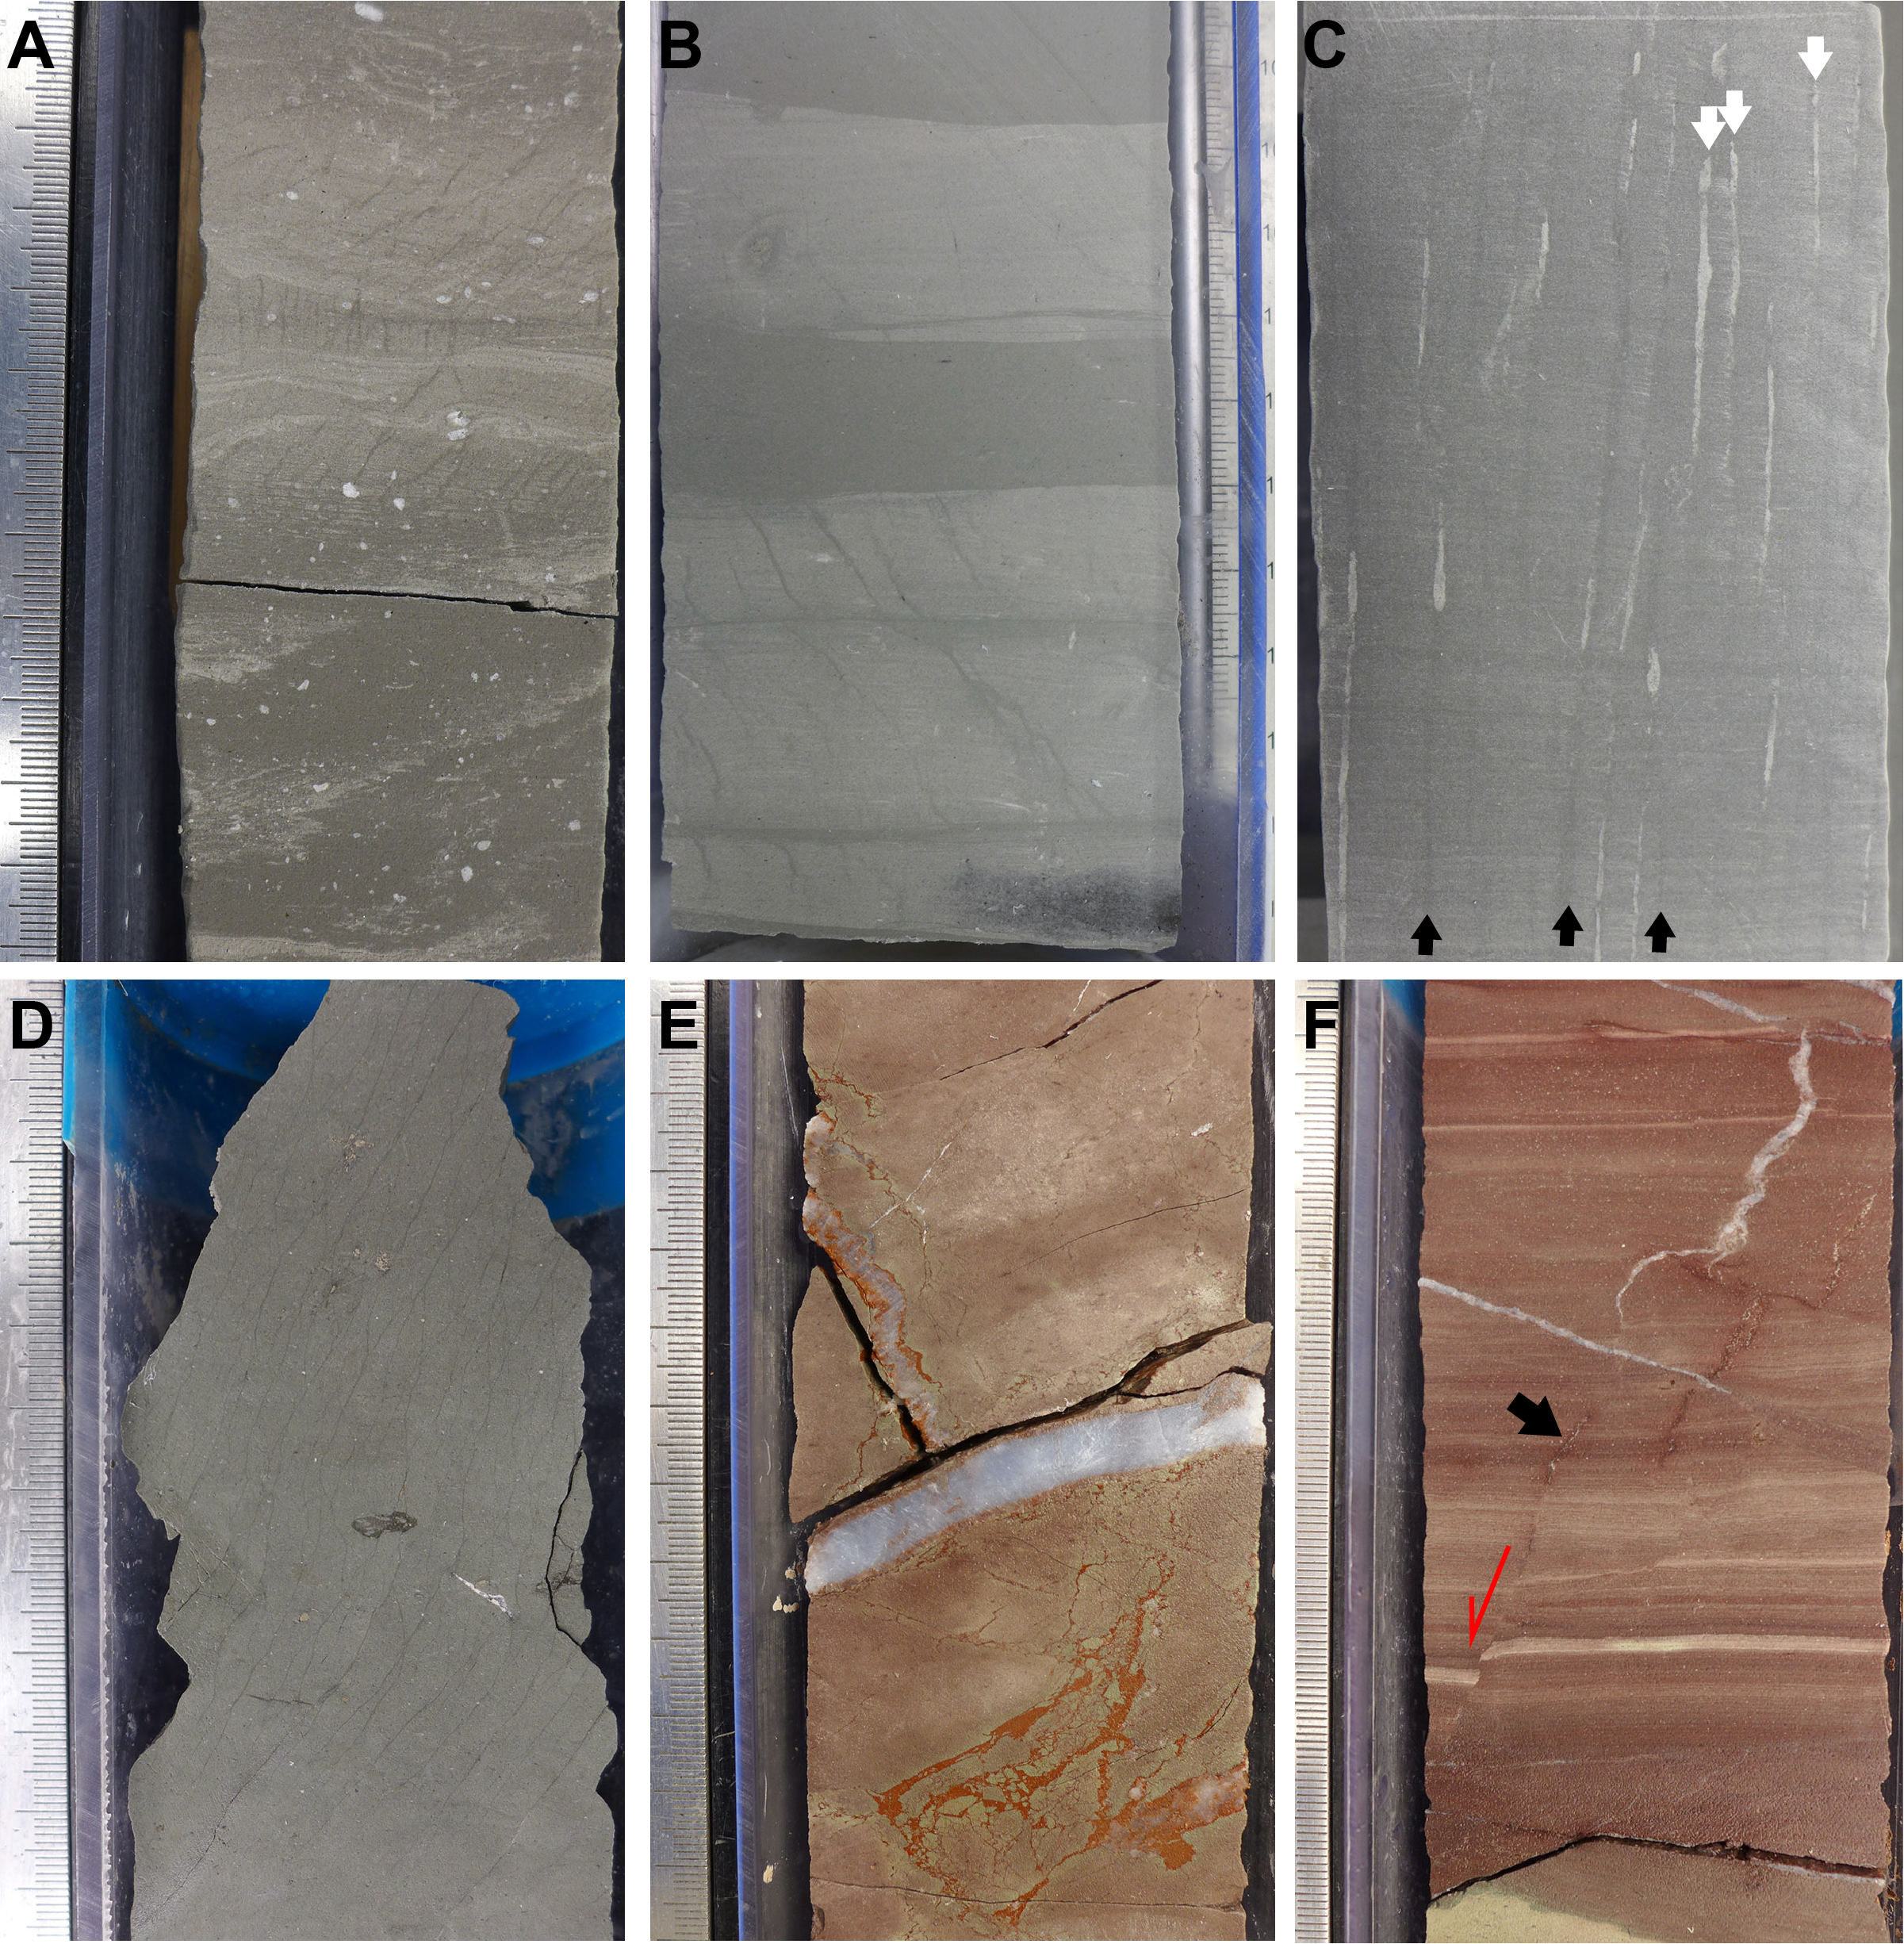
Figure F26. Sediment-filled veins.
A larger population of normal faults developed just below the slump intervals (Figure F22), possibly indicating that a sudden increase of overburden pressure was associated with slump initiation, leading to the formation of larger differential stress as well as excess fluid pressure and finally achieving failure. Generation of slumps and normal faults associated with rapid increase of overburden are consistent with the extensional stress field of the Christiana Basin.
Deformation bands parallel/subparallel to the bedding planes are characterized by a black seam developed throughout the core. Although it is difficult to identify the offset and sense of shear, these bands represent density reduction and small offset (e.g., Hanamura and Ogawa, 1993; Maltman et al., 1993). They apparently formed soon after sedimentation.
5.4. Sediment-filled veins and mineral veins
Sediment-filled veins and mineral veins were identified in specific intervals in the lower parts of Lithostratigraphic Units II and III, respectively (Figure F26). Sediment-filled veins are divided into two types: mud-filled and sand-filled veins. The former is recognized as parallel sets or arrays of sigmoidal or curviplanar seams generally <1 mm wide, as found from 714 to 721 mbsf (Cores 398-U1591C-52R and 53R) (Figures F22, F26A–F26D). The typical thickness of these vein arrays is 1–10 cm.
Mud-filled veins are called “vein structure” and are common in sediments at subduction zones (accretionary prism, slope, and forearc basins; Hanamura and Ogawa, 1993; Maltman et al., 1993). They were identified in cores retrieved by ocean drilling including at the Nankai, Costa Rica, and Oregon margins and also in shallowly buried accretionary prism/slope sediments exposed on land in the Miura/Boso Peninsulas, Japan, and the Monterey Formation (USA) (Hanamura and Ogawa, 1993; Maltman et al., 1993; Shipboard Scientific Party, 2001; Expedition 334 Scientists, 2012). Field and experimental studies have shown that these structures are caused by the shaking of sediments during earthquakes (Hanamura and Ogawa, 1993; Brothers et al., 1996).
On the other hand, sand-filled veins are recognized as parallel sets or curviplanar seams generally <1 mm wide and were found from 720 to 728 mbsf (Core 398-U1591C-53R) (Figures F22, F26C). The dip angle of each vein ranges 71˚–87˚, almost parallel to the mud-filled vein structures on the split core surface. However, they apparently cross in three dimensions. This crosscutting relationship has not been identified previously because of its faint appearance. The typical length of these vein arrays is 2–5 cm.
Mineral veins mostly filled with anhydrite were identified in Unit III (Figure F22). The veins are 1–5 mm thick and occur from 844 to 856 mbsf (Cores 398-U1591C-66R and 67R). Although their dip angles are distributed over a wide range, most are parallel to bedding planes. However, some cut the bedding planes at higher dip angles (Figure F26E, F26F).
6. Biostratigraphy
Planktonic and benthic foraminifera and calcareous nannofossils were examined from core catcher samples and additional split core samples from Holes U1591A–U1591C to develop a shipboard biostratigraphic framework for Site U1591. Additionally, planktonic and benthic foraminifera provided data on paleowater depths, downslope reworking, and possible dissolution.
Site U1591 cored the Christiana Basin sedimentary sequence and recovered a 902.59 m thick Holocene to Early Pliocene (Late Miocene?) sequence composed primarily of volcanogenic sediments, calcareous and tuffaceous oozes, and evaporitic and siliciclastic sediments. Calcareous nannofossils and planktonic foraminifera provided good resolution in the Holocene through Early Pliocene sediments. Ages provided by benthic foraminifera were also consistent with those of planktonic foraminifera and calcareous nannofossils. Biostratigraphic datums recognized at Site U1591 are given in Tables T5 and T6, and an age-depth plot is shown in Figure F27.
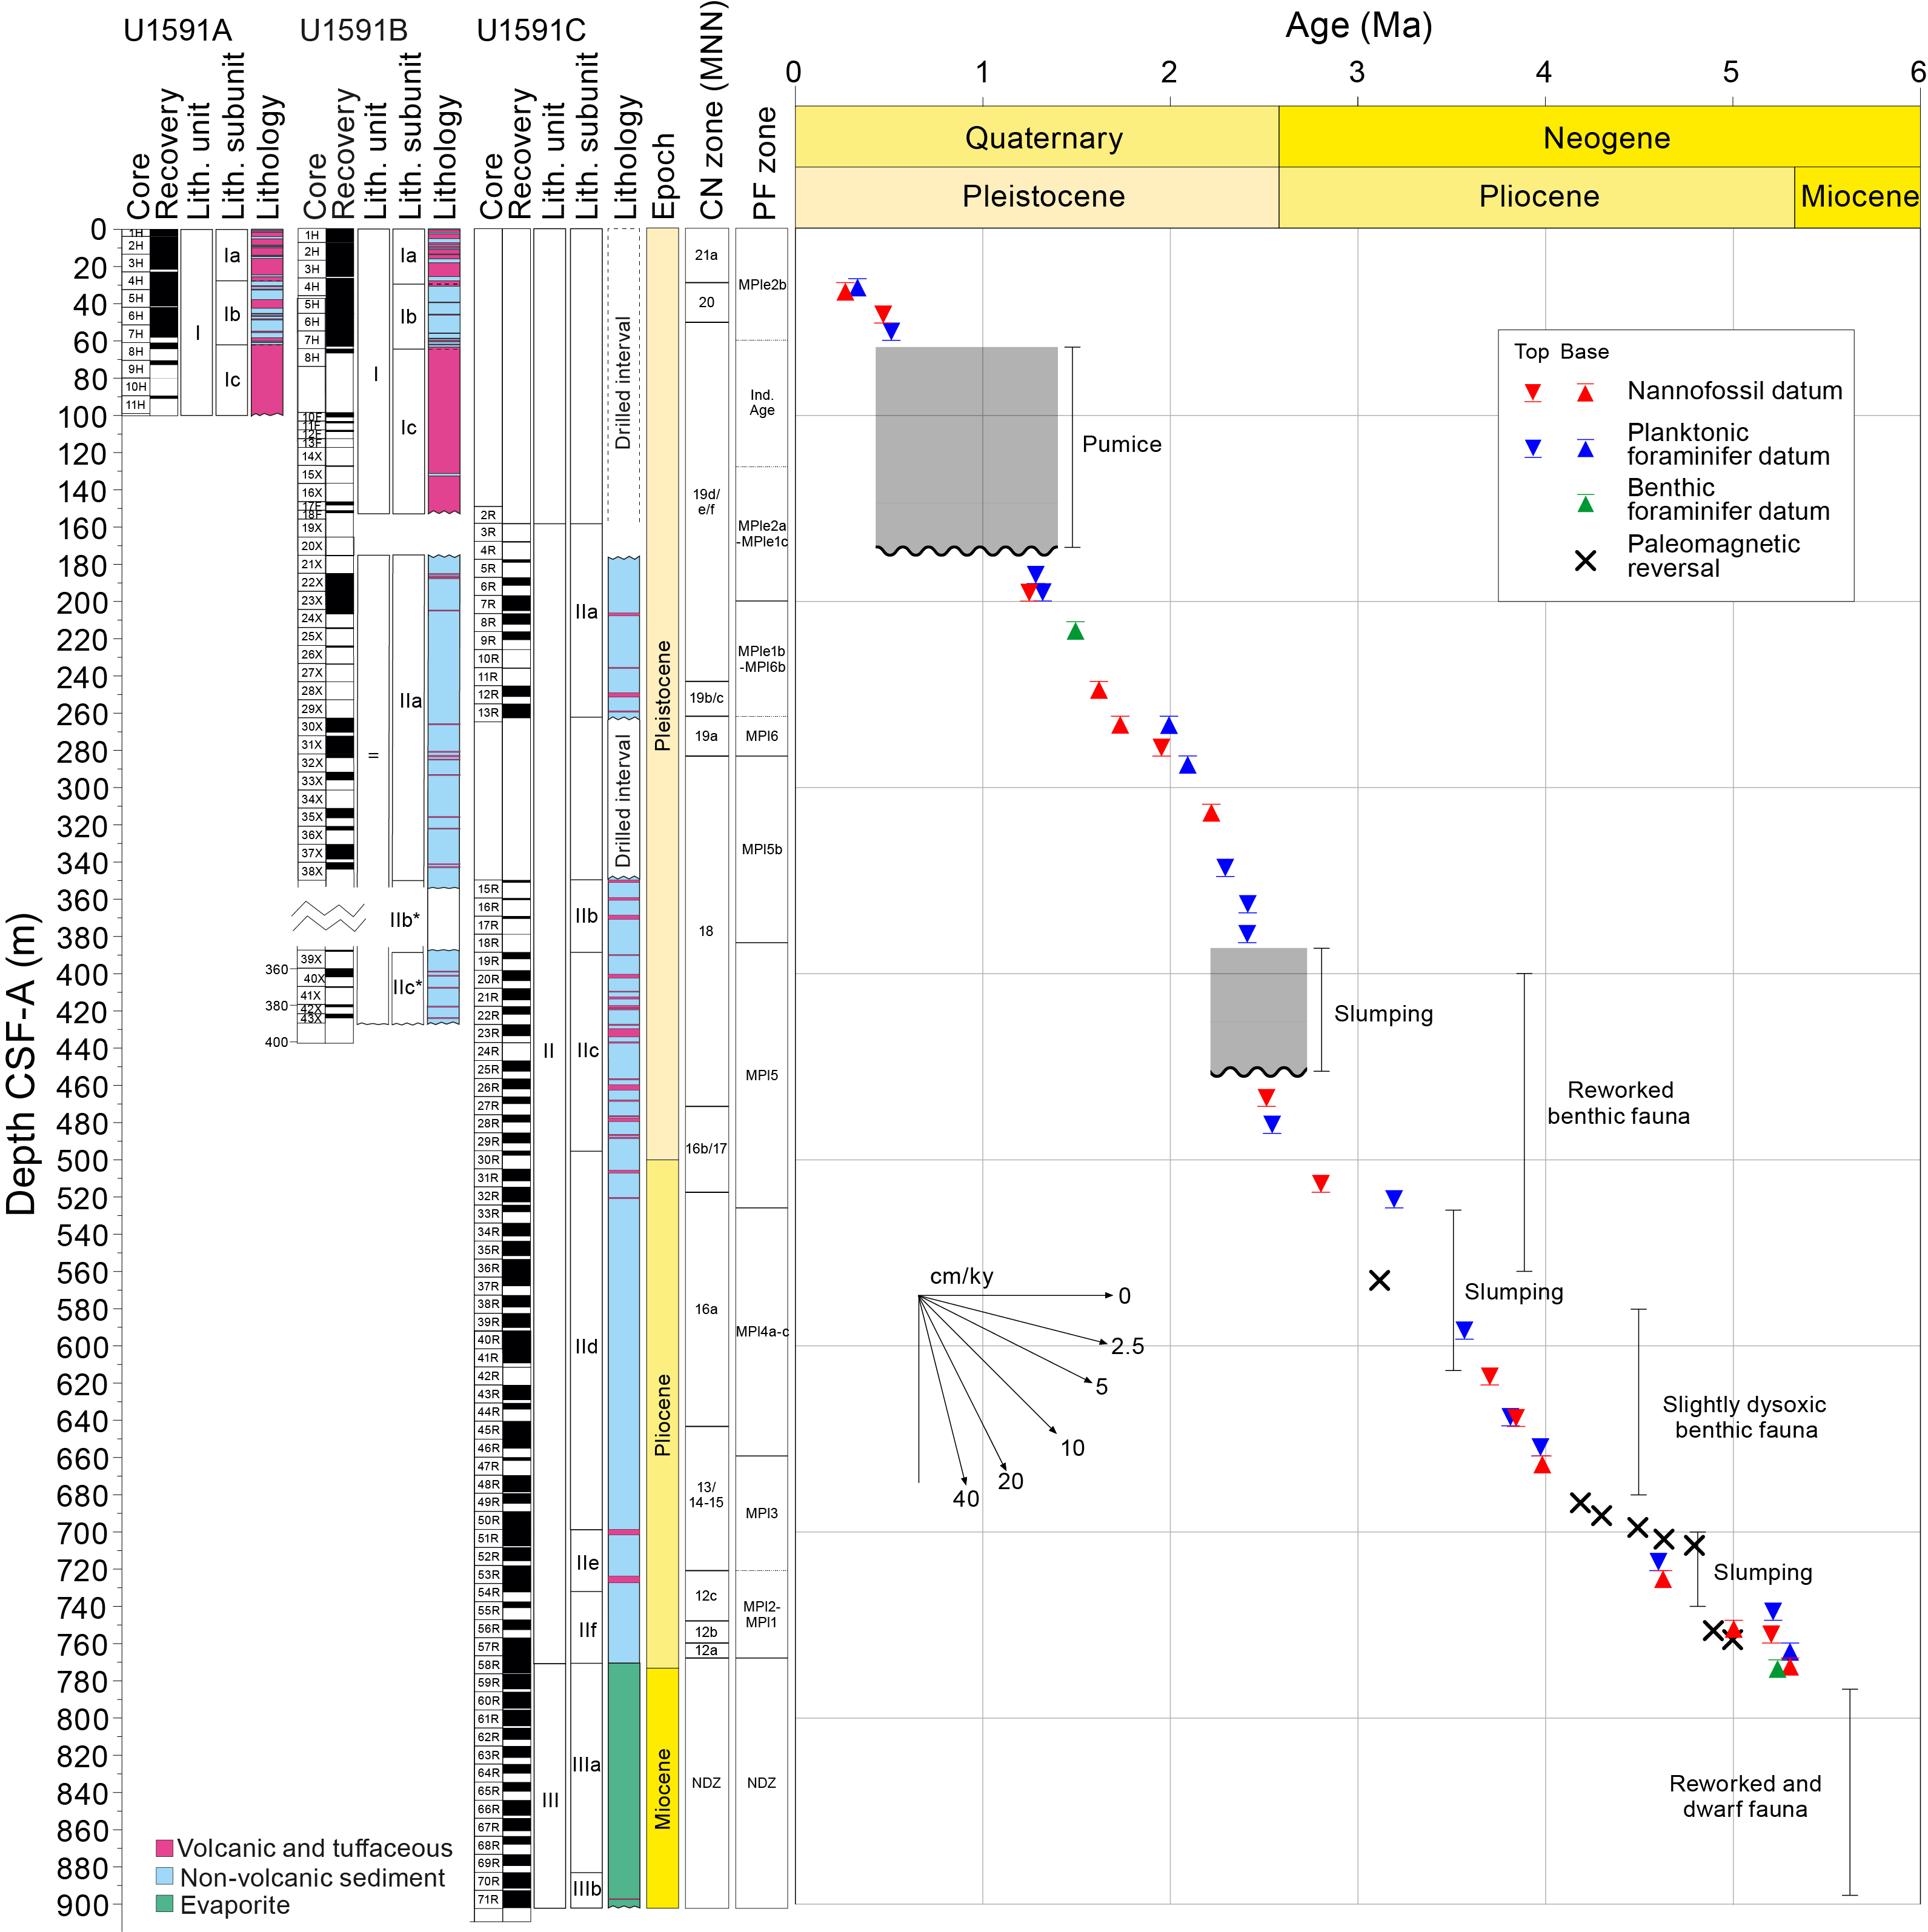
Figure F27. Age-depth plot.
In Hole U1591A, Holocene to Middle Pleistocene aged sediments (0–0.51 Ma) were recovered from Samples 1H-CC, 11–16 cm, to 10H-CC, 0–5 cm (3.79–79.85 mbsf). Hole U1591B recovered Holocene to Early Pleistocene aged sediments (0–2.41 Ma) from Samples 1H-CC, 20–23 cm, to 43X-CC, 39–41 cm (7.56–386.6 mbsf). Hole U1591C recovered Pleistocene to Early Pliocene aged sediments (~1.2–5.33 Ma) from Samples 3R-CC, 0–2 cm, to 58R-2, 13–15 cm (158.73–768.62 mbsf), and sediments of an indeterminate age from Samples 58R-2, 89–91 cm, to 70R-CC, 0 cm (769.38–902.59 mbsf).
6.1. Calcareous nannofossils
Calcareous nannofossil biostratigraphy in Holes U1591A–U1591C was established through analysis of core catcher samples, with additional split core samples taken to better constrain biostratigraphic events. Nannofossils are rare to abundant in samples from the Pleistocene–Pliocene sequence (Hole U1591A = 3.765–79.825 mbsf; Hole U1591B = 7.545–386.59 mbsf; Hole U1591C = 158.72–769.72 mbsf) and are rare to barren in Miocene samples (Hole U1591C = 776.47–892.1 mbsf). Preservation is moderate to poor throughout the sequence, and there is significant reworking of older material in most of the Pleistocene and Pliocene samples (Figure F28). Sixteen nannofossil biostratigraphic datums and two calcareous nannofossil zones are recognized at Site U1591, representing a discontinuous Pleistocene to Miocene sedimentary sequence. Distributions of calcareous nannofossil taxa are shown in Table T7, and biostratigraphic datums are given in Table T5 and in GEODESC.
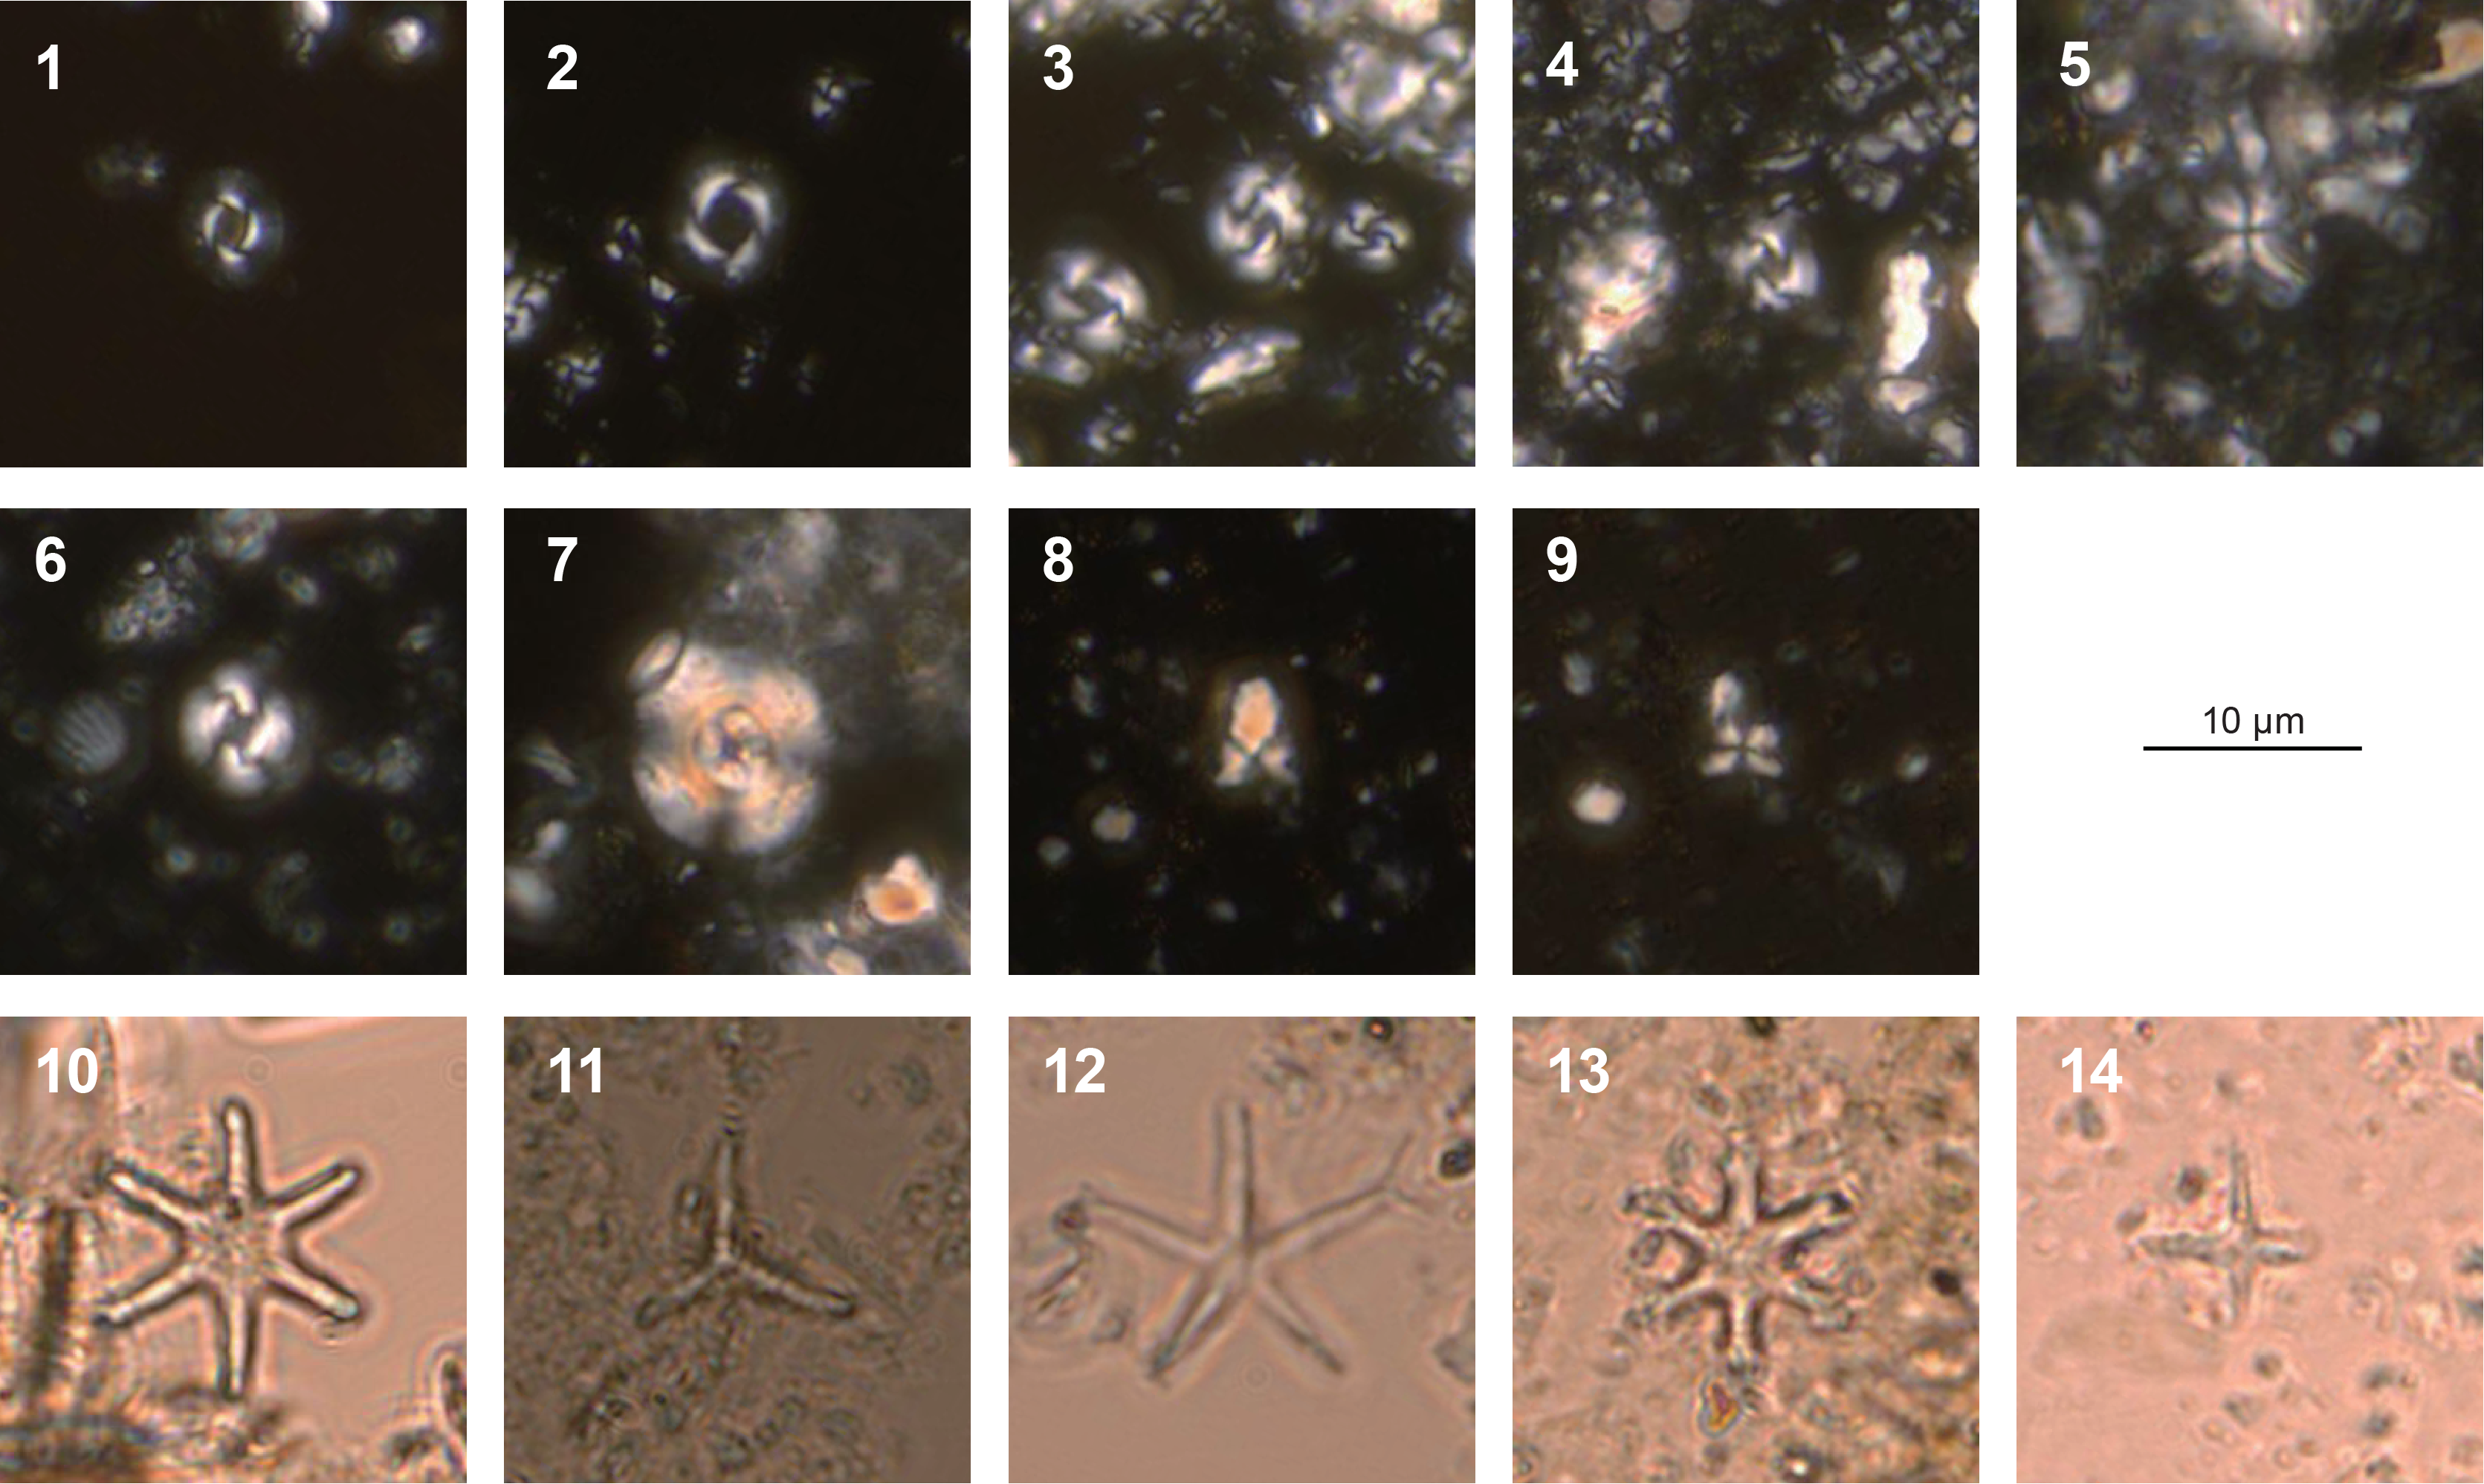
Figure F28. Calcareous nannofossils.
6.1.1. Pleistocene
The presence of Emiliania huxleyi in Samples 398-U1591A-1H-CC, 11–16 cm, to 3H-CC, 17–20 cm (3.765–21.575 mbsf), and 398-U1591B-1H-CC, 20–23 cm, to 3H-CC, 15–16 cm (7.545–25.995 mbsf), indicates a Holocene to Middle Pleistocene age (≤0.29 Ma) in Zones MNN21a and MNN21b (CNPL11, Backman et al., 2012; NN21, Martini, 1971; CN15, Okada and Bukry, 1980) of Rio et al. (1990) and Di Stefano and Sturiale (2010) (Figure F28). The top occurrence of Pseudoemiliania lacunosa defines the Zone MNN20/21a (CNPL10/11, NN19/20, and CN14a/CN14b) boundary. The last consistent appearance of P. lacunosa in Holes U1591A and U1591B occurs in Samples 398-U1591A-6H-CC, 20–23 cm (51.825 mbsf), and 398-U1591B-6H-CC, 25–28 cm (55.415 mbsf). The large form of Gephyrocapsa spp. (>5.5 µm) appears between 1.245 and 1.617 Ma (Zones MNN19d, CNPL8, NN19, and CN13b) and occurs between Samples 398-U1591B-23X-CC, 18–20 cm, and 27X-CC, 18–21 cm, and between Samples 398-U1591C-7R-CC, 0–2 cm, and 11R-CC, 0–2 cm. Samples 398-U1591B-29X-CC, 0–3 cm, and 398-U1591C-12R-CC, 11–14 cm, and 13R-CC, 14–16 cm, are characterized by the occurrence of Gephyrocapsa oceanica, Gephyrocapsa caribbeanica, and P. lacunosa and by the absence of the large form of Gephyrocapsa spp. This indicates that these intervals (U1591B = 253.1–270.65 mbsf; U1591C = 251.53–263.04 mbsf) are assigned to an age between 1.617 and 1.73 Ma. The Gelasian (Early Pleistocene) assemblages found at this site are characterized by the occurrence of discoasters that include marker species of Miocene–Pliocene successions. The last occurrence of Discoaster brouweri, which indicates the Zone MNN18/19a boundary (NN18/19 and CN12d/CN13a), occurs between Samples 398-U1591B-31X-CC, 35–38 cm, and 32X-CC, 37–40 cm (283.31 mbsf). The acme base of Discoaster triradiatus, which characterizes middle Zone MNN18 (2.216 Ma), appears between Samples 34X-CC, 0–2 cm (301.62 mbsf), and 35X-CC, 38–43 cm (316.59 mbsf).
6.1.2. Pliocene
In Hole U1591C, the top of Discoaster pentaradiatus (2.512 Ma) occurs at the boundary between Samples 398-U1591C-26R-CC, 0–3 cm, and 28R-CC, 22–24 cm (471.325 mbsf), and defines Zone MNN17/18 (NN/17/18, CN12c/d, and CNPL5/6). Discoaster tamalis disappears at 2.8 Ma in the upper part of the Gauss Chronozone. This specimen last occurs in Hole U1591C between Samples 31R-CC, 19–21 cm (511.84 mbsf), and 32R-CC, 21–23 cm (523.14 mbsf). Sphenolithus abies, with its last occurrence in the lower part of Zone MNN16a (3.7 Ma; NN16/CN12a/CNPL4), is found in and below Sample 43R-CC, 9–11 cm. The last occurrence of Reticulofenestra pseudoumbilicus, which shows the boundary of Zone MNN15/16 (3.839 Ma; NN15/16, CN11b/12a, and CNPL3/4), is recognized between Samples 44R-CC, 0–2 cm (634.71 mbsf), and 45R-CC, 20–25 cm (650.97 mbsf). The base common occurrence of D. tamalis in Zone MNN14-15 (3.97 Ma) is found at the boundary between Samples 46R-CC, 13–16 cm (655.71 mbsf), and 47R-CC, 0–2 cm (662.31 mbsf). The base common occurrence of Helicosphaera sellii, which indicates the boundary of Zone MNN12c/13 (4.62 Ma), occurs between Samples 51R-CC, 25–30 cm (708.25 mbsf), and 54R-CC, 39–42 cm (732.89 mbsf). R. pseudoumbilicus shows a paracme (absence interval) in the Lower Pliocene (Di Stefano and Sturiale, 2010). This specimen paracme top appears in Samples 55R-CC, 0–3 cm (741.38 mbsf), and 56R-CC, 8–10 cm (753.19 mbsf). Reticulofenestra zancleana, which characterizes the lowermost Pliocene (5.199–5.322 Ma; MNN12a) in the Mediterranean area (Di Stefano and Sturiale, 2010), occurs between Samples 57R-CC, 14–16 cm (767.39 mbsf), and 58R-1, 130 cm (768.4 mbsf).
6.1.3. Miocene
Sample 398-U1591C-60R-1, 4 cm (786.53 mbsf), yields Calcidiscus premacintyrei, Coccolithus miopelagicus, and Cyclicargolithus floridanus, which define Zone MNN6 (12.57–13.60 Ma; NN6/CN5a/CNM8). Sample 68R-4, 83–85 cm (868.085 mbsf), which includes C. premacintyrei, C. floridanus, and Sphenolithus macintyrei without Helicosphaera ampliaperta, defines Zone MNN5 (13.60–14.86 Ma; NN5/CN4/CNM7).
6.2. Foraminifera
Planktonic and benthic foraminifera were examined in core catcher samples and split core samples from Holes U1591A–U1591C (Tables T8, T9). Absolute ages assigned to biostratigraphic datums follow those listed in Table T6 in the Expedition 398 methods chapter (Kutterolf et al., 2024). Planktonic and benthic foraminifer datums for Site U1591 are given in Table T6. Planktonic foraminifer abundances and indications of oceanicity (e.g., Hayward et al., 1999) and benthic foraminifer paleowater depths estimations are shown in Figures F29 and F30.
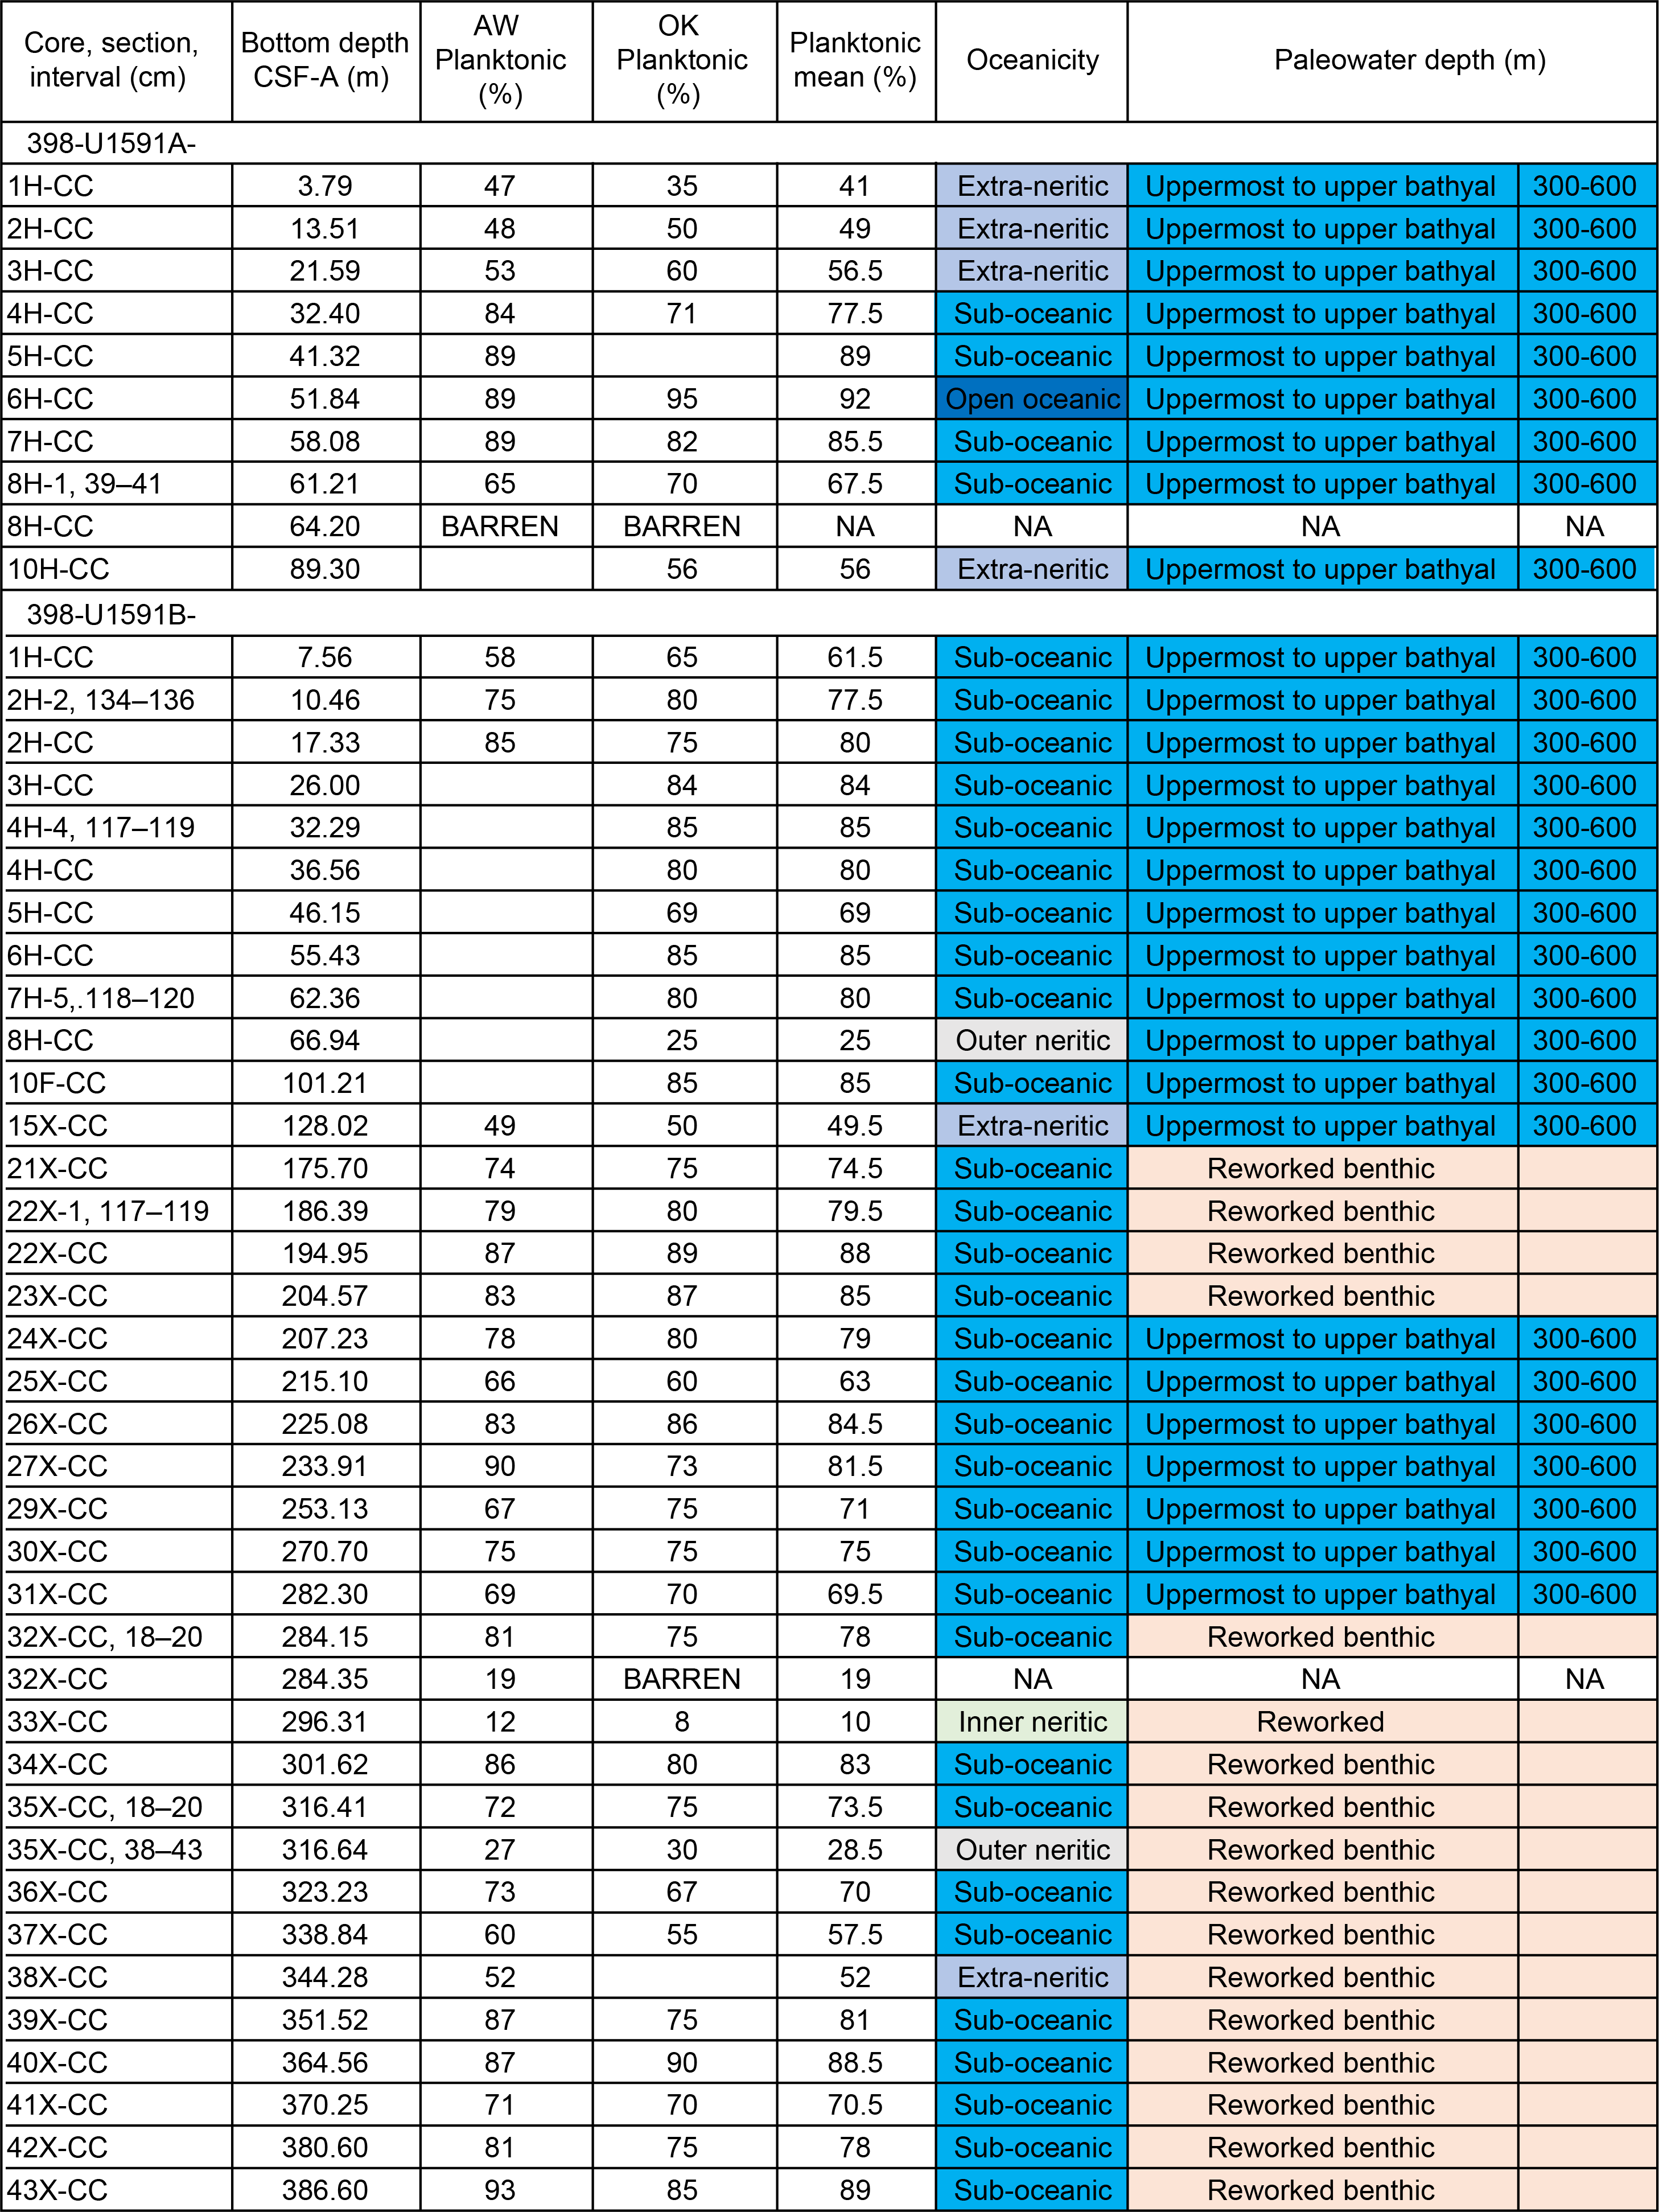
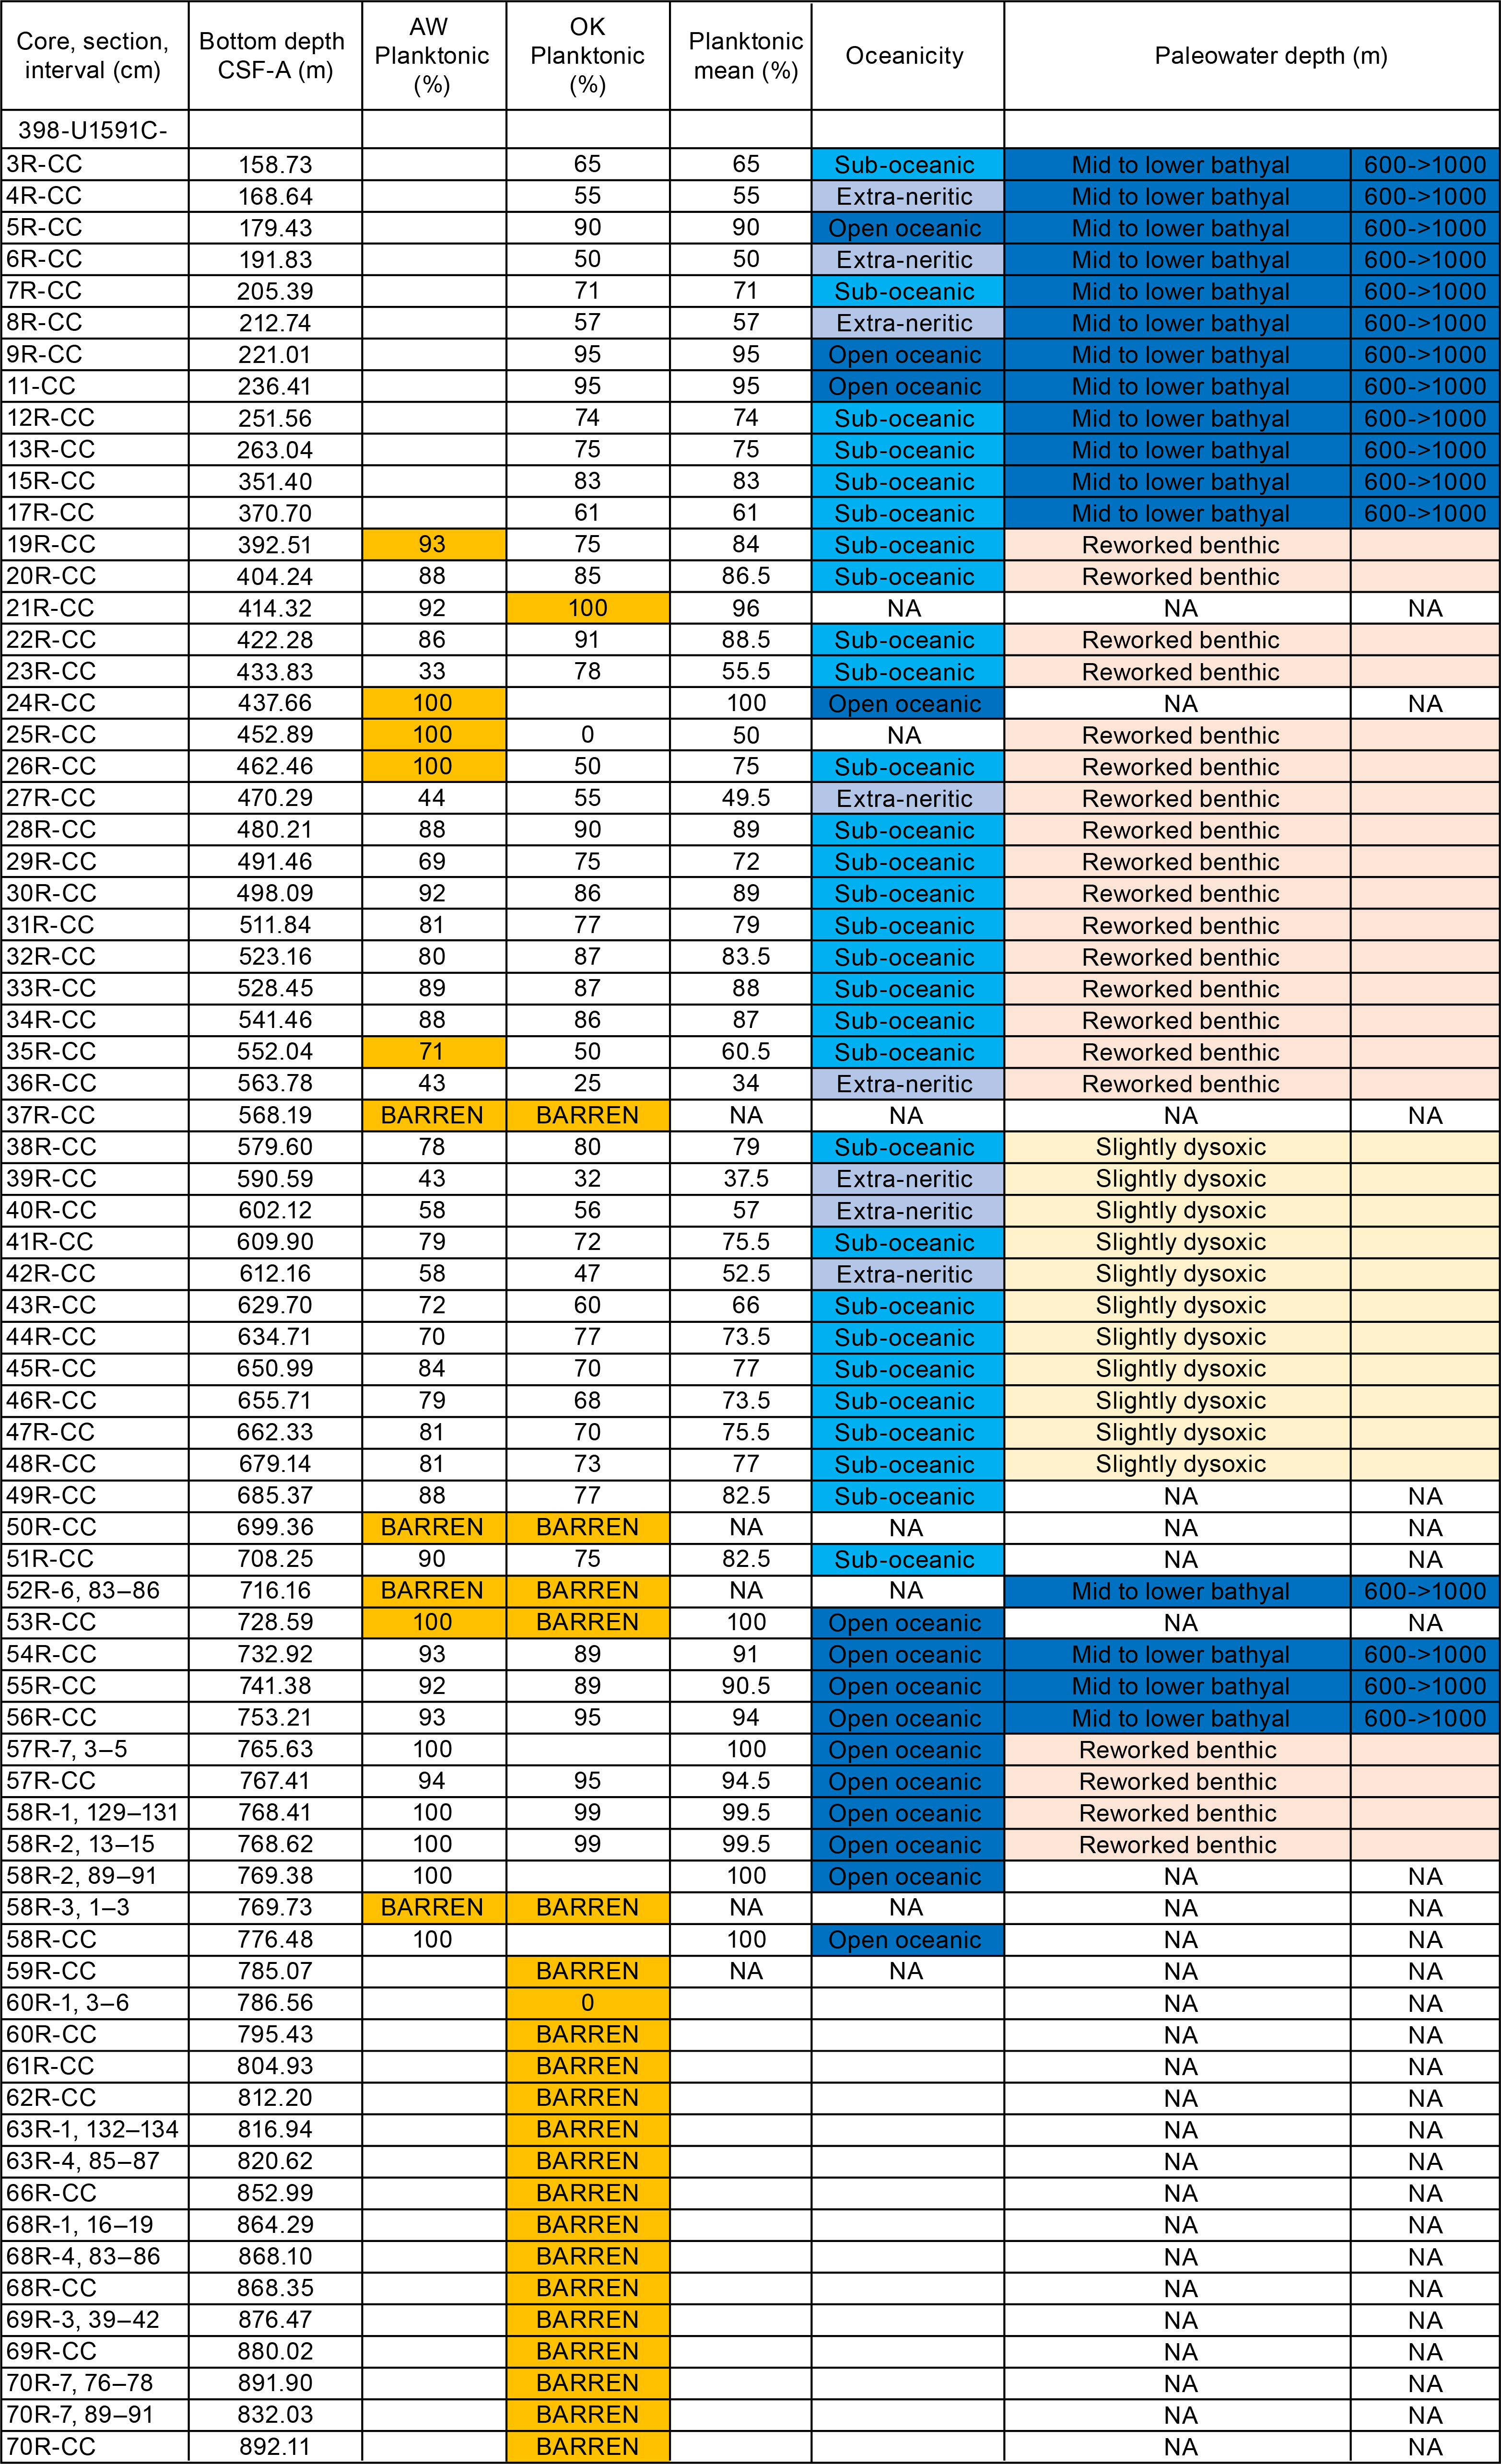
Figure F29. Foraminiferal oceanicity and paleowater depth estimates.
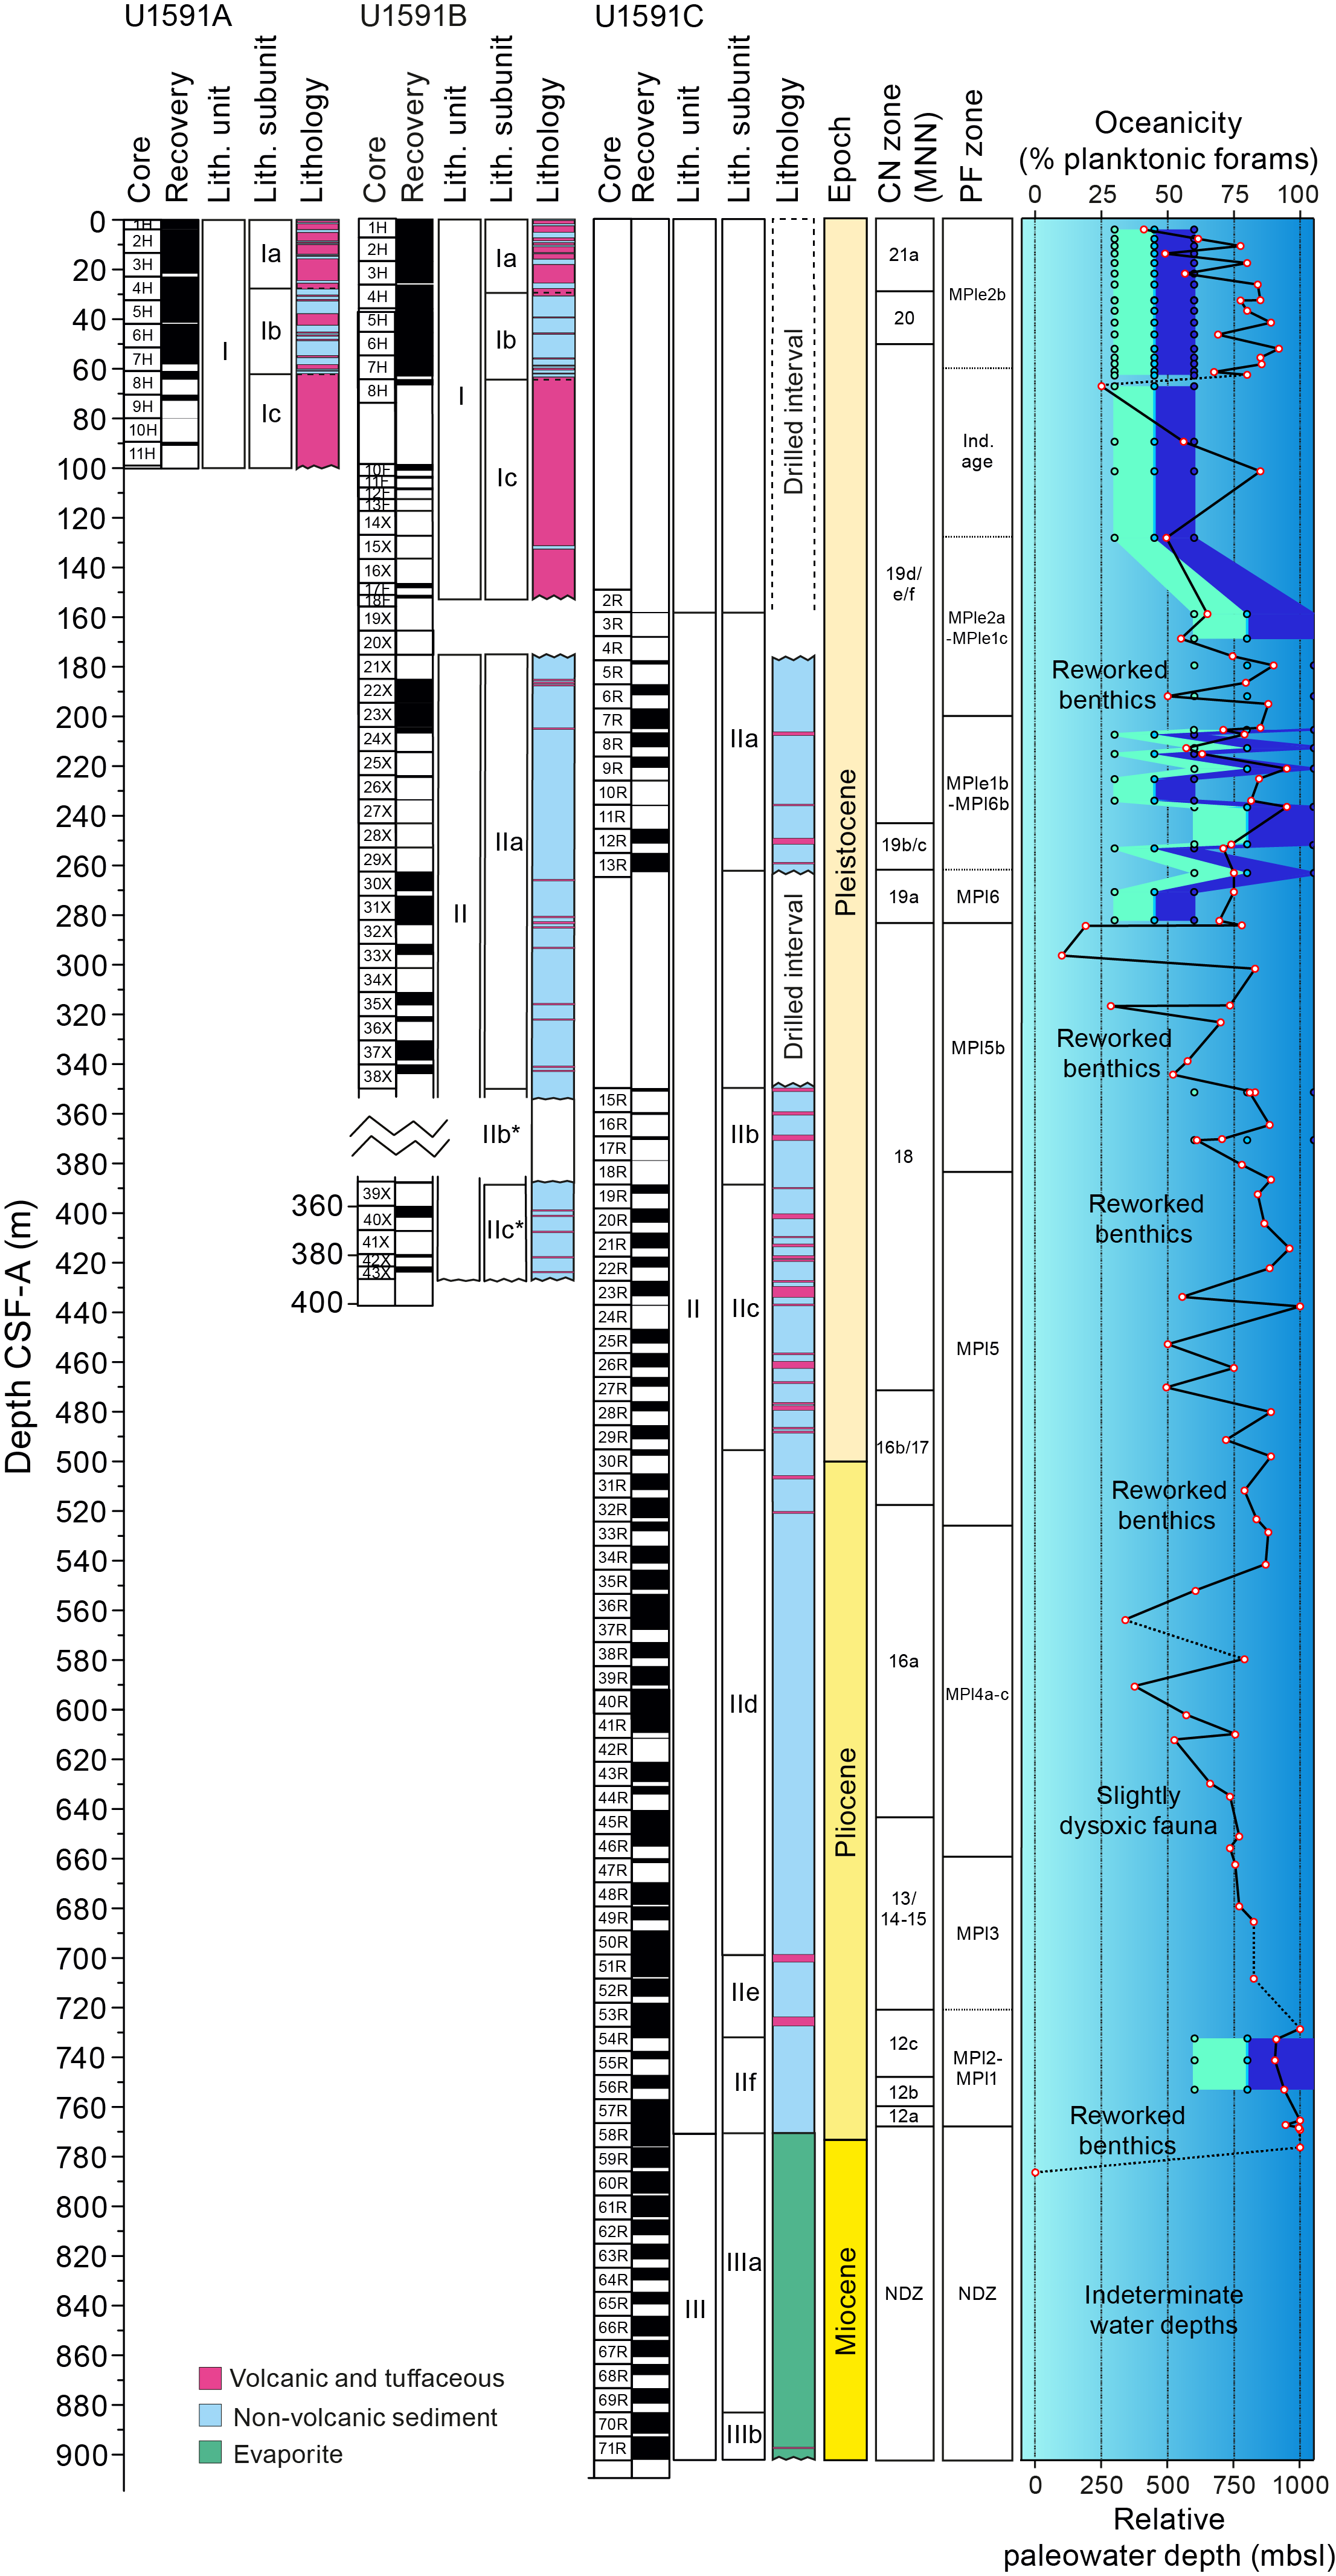
Figure F30. Biostratigraphic summary.
Because of the volcanogenic nature of the cored sedimentary sequence, residues (>125 µm) from washed samples were often significantly composed of volcaniclastic particles such as pumice, scoria, and ash that often diluted the microfossil component of residues. Foraminifera dominated the biogenic component of residues, however, and age markers were present in sufficient numbers to date most samples reliably. In addition to volcanic material, clastic grains, minor pyrite, carbonaceous plant-derived matter, and other fossil material including shells and fragments (Bivalvia and Gastropoda), Pteropoda, Scaphopoda, Bryozoa, Arthropoda (Balanus), echinoid spines and plate fragments, radiolarians, and ostracods, as well as fish teeth, are also present in variable amounts in most samples. In addition, reworked Pliocene foraminifera are often present.
Throughout the section, foraminifera with very good to poor preservation are present in siliciclastic and volcaniclastic sediments. However, where present, foraminifera found in evaporitic and siliciclastic sediments from Samples 398-U1591C-58R-2, 89–91 cm, to 70R-CC, 0–2 cm (769.38–892.11 mbsf), were very rare and exhibited very poor preservation. Foraminifer abundances are also highly variable, commonly making up the primary sedimentary component in nannofossil oozes and notably rare in tuffaceous oozes, likely due to sedimentary dilution, whereas coarser volcaniclastic intervals and evaporitic and siliciclastic intervals were sometimes barren altogether of biogenic material.
6.2.1. Holocene to Pleistocene foraminiferal biostratigraphy
As a result of explosive volcanic events and rapid deposition of the upper sedimentary section, the base of the Holocene is not possible to assign accurately. Planktonic foraminifer assemblages from the Holocene–Pleistocene section of Holes U1591A–U1591C are mostly well preserved, with specimens rarely broken or exhibiting partially dissolved shell walls.
Holocene–Pleistocene foraminifer faunas indicate large fluctuations in relative paleowater depth and oceanicity, with highly variable planktonic abundances that range 12%–100% when foraminifera were present (Figure F30). The fauna is typical of Mediterranean biostratigraphic Zones MPle2–MPl5, primarily composed of Neogloboquadrina incompta, Globigerina bulloides, Globigerina falconensis, Globigerina umbilicata, Globigerinella siphonifera, Globigerinita glutinata, Globigerinoides elongatus, Globigerinoides pyramidalis, Trilobatus trilobus group, Globigerinoides ruber var. white, G. ruber var. pink, Globoconella inflata, Hirsutella scitula, Truncorotalia truncatulinoides s.l. (sinistral and dextral coiling), Neogloboquadrina pachyderma, Orbulina universa, Turborotalita quinqueloba, and Globigerinella calida through the Middle Pleistocene–Holocene, and the addition of species such as Globoturborotalita woodi, Globorotalia bononiensis, Globigerinoides obliquus, Globigerinoides extremus, and Neogloboquadrina atlantica (sinistral) through the Lower Pleistocene (Figures F31, F32). Rare reworked Pliocene specimens are found throughout the Holocene–Pleistocene interval.
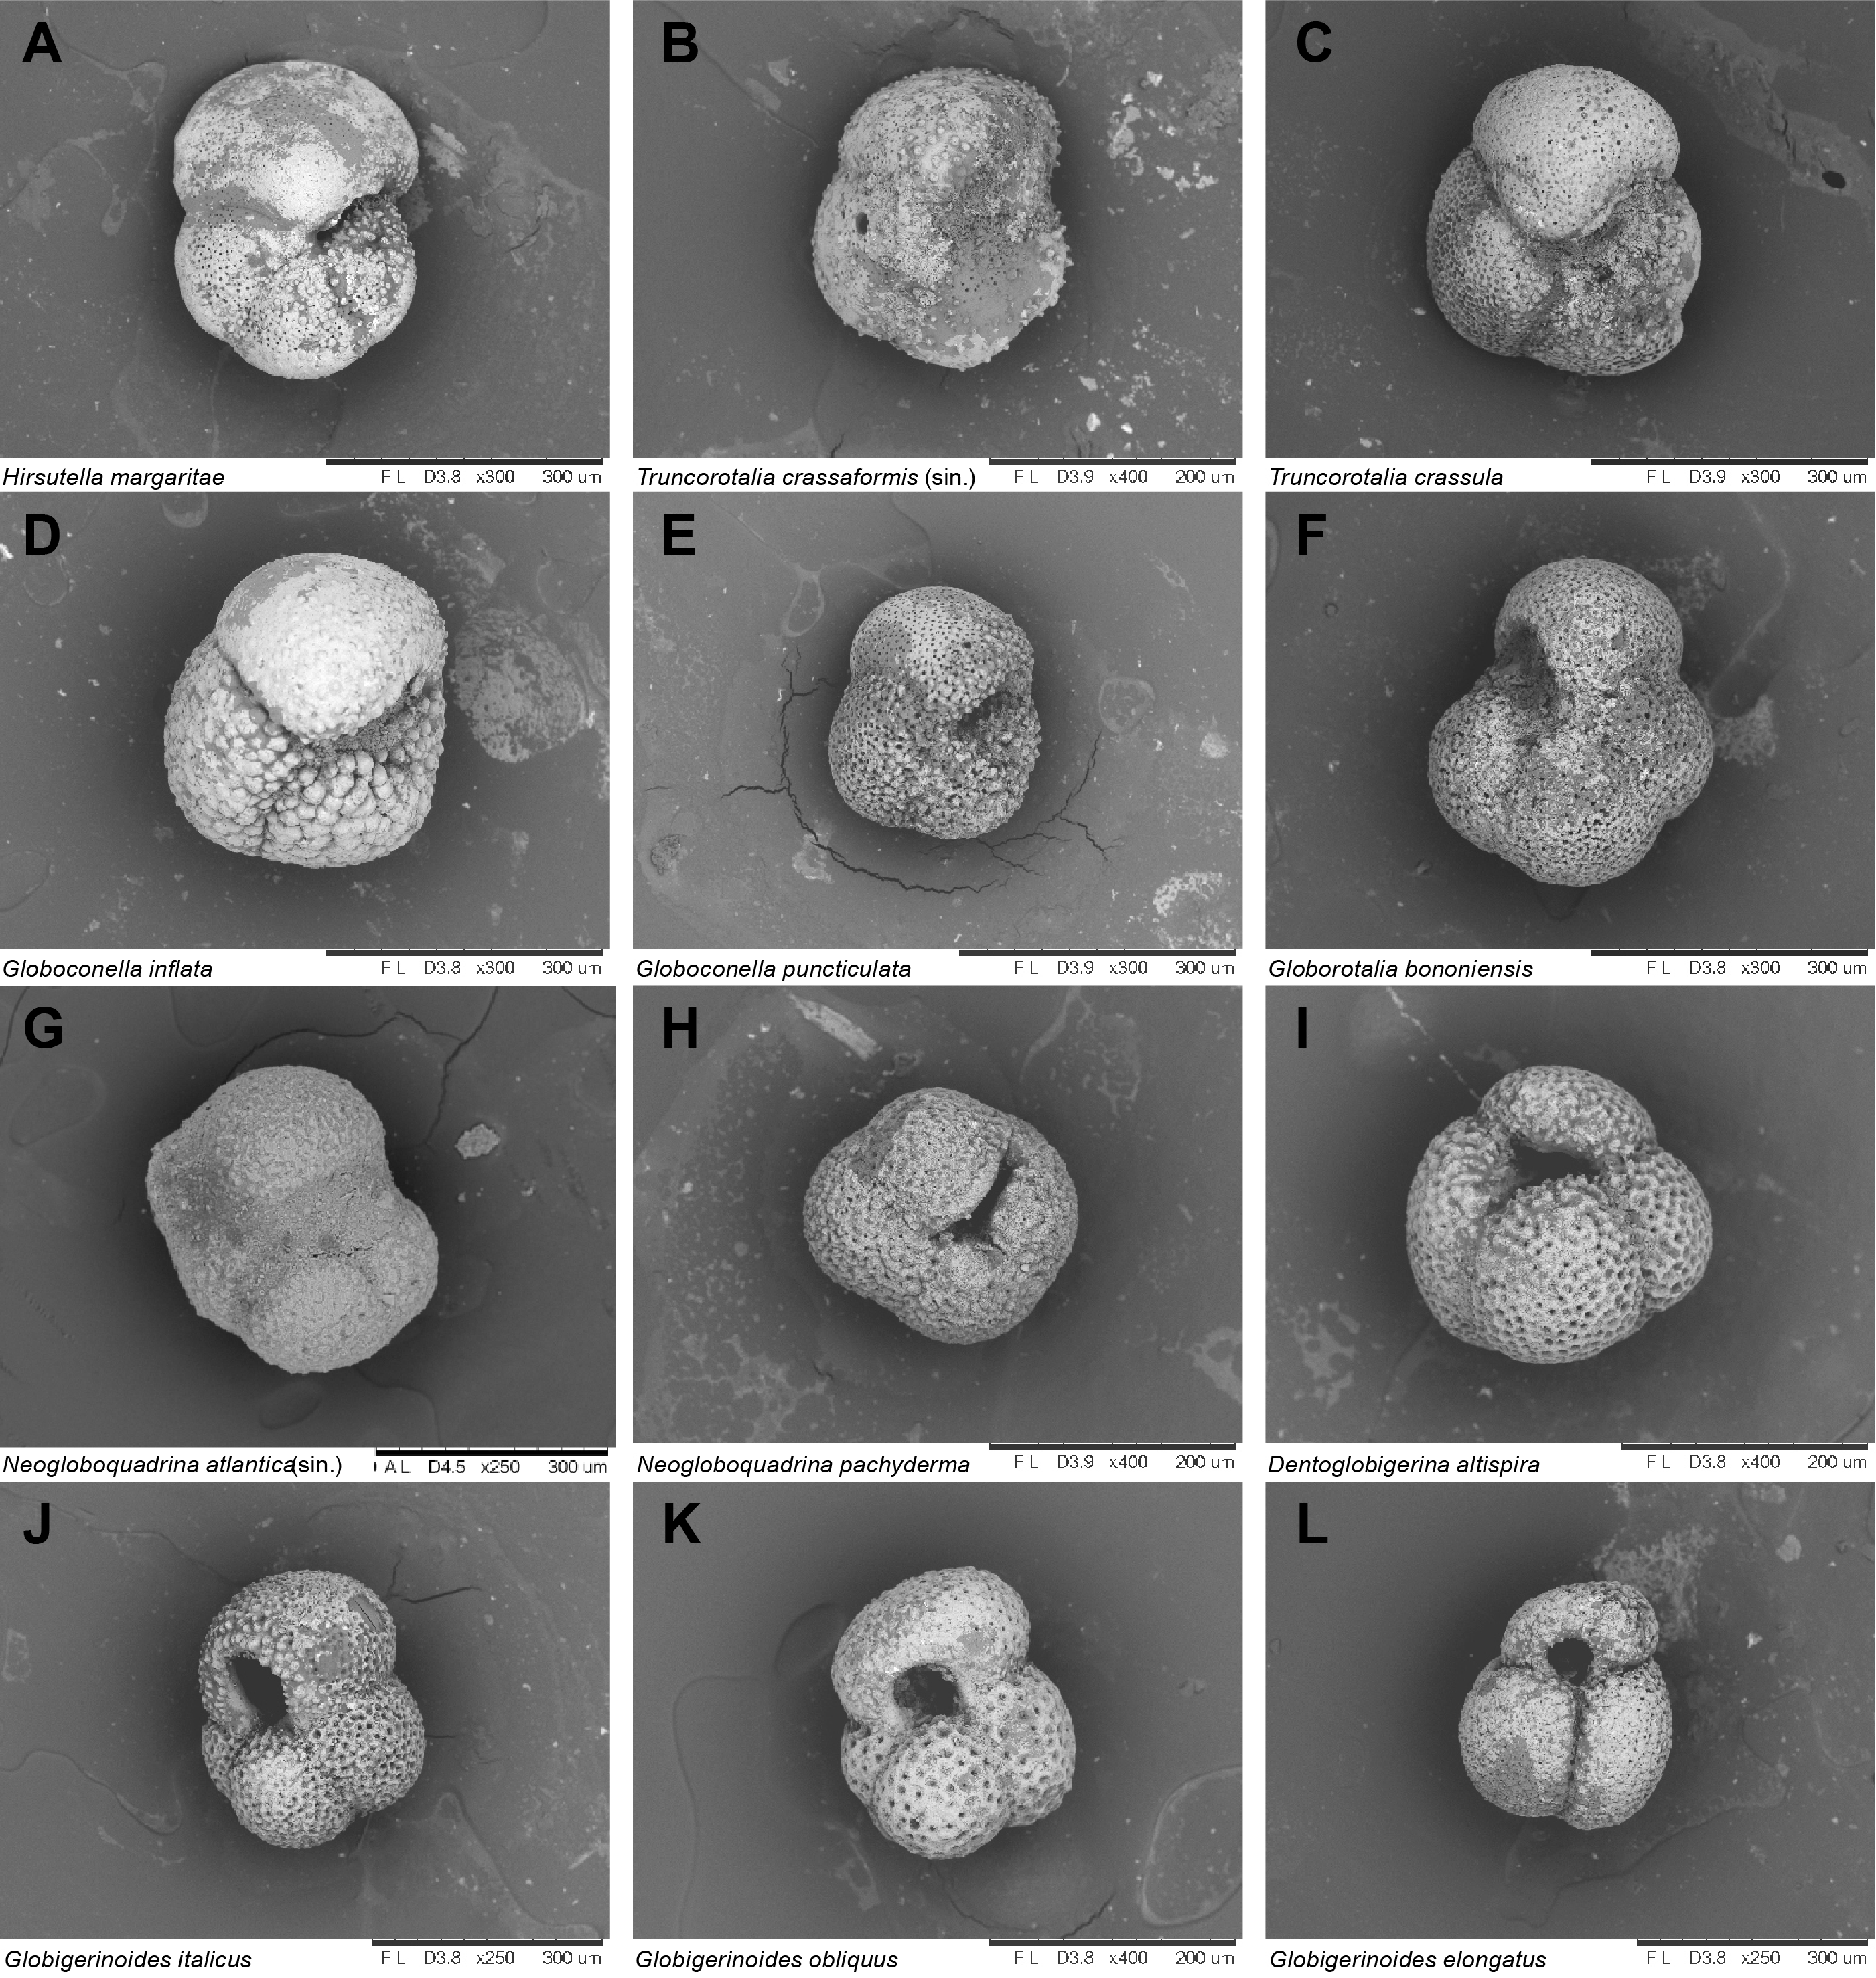
Figure F31. Planktonic foraminifera, Site U1591.
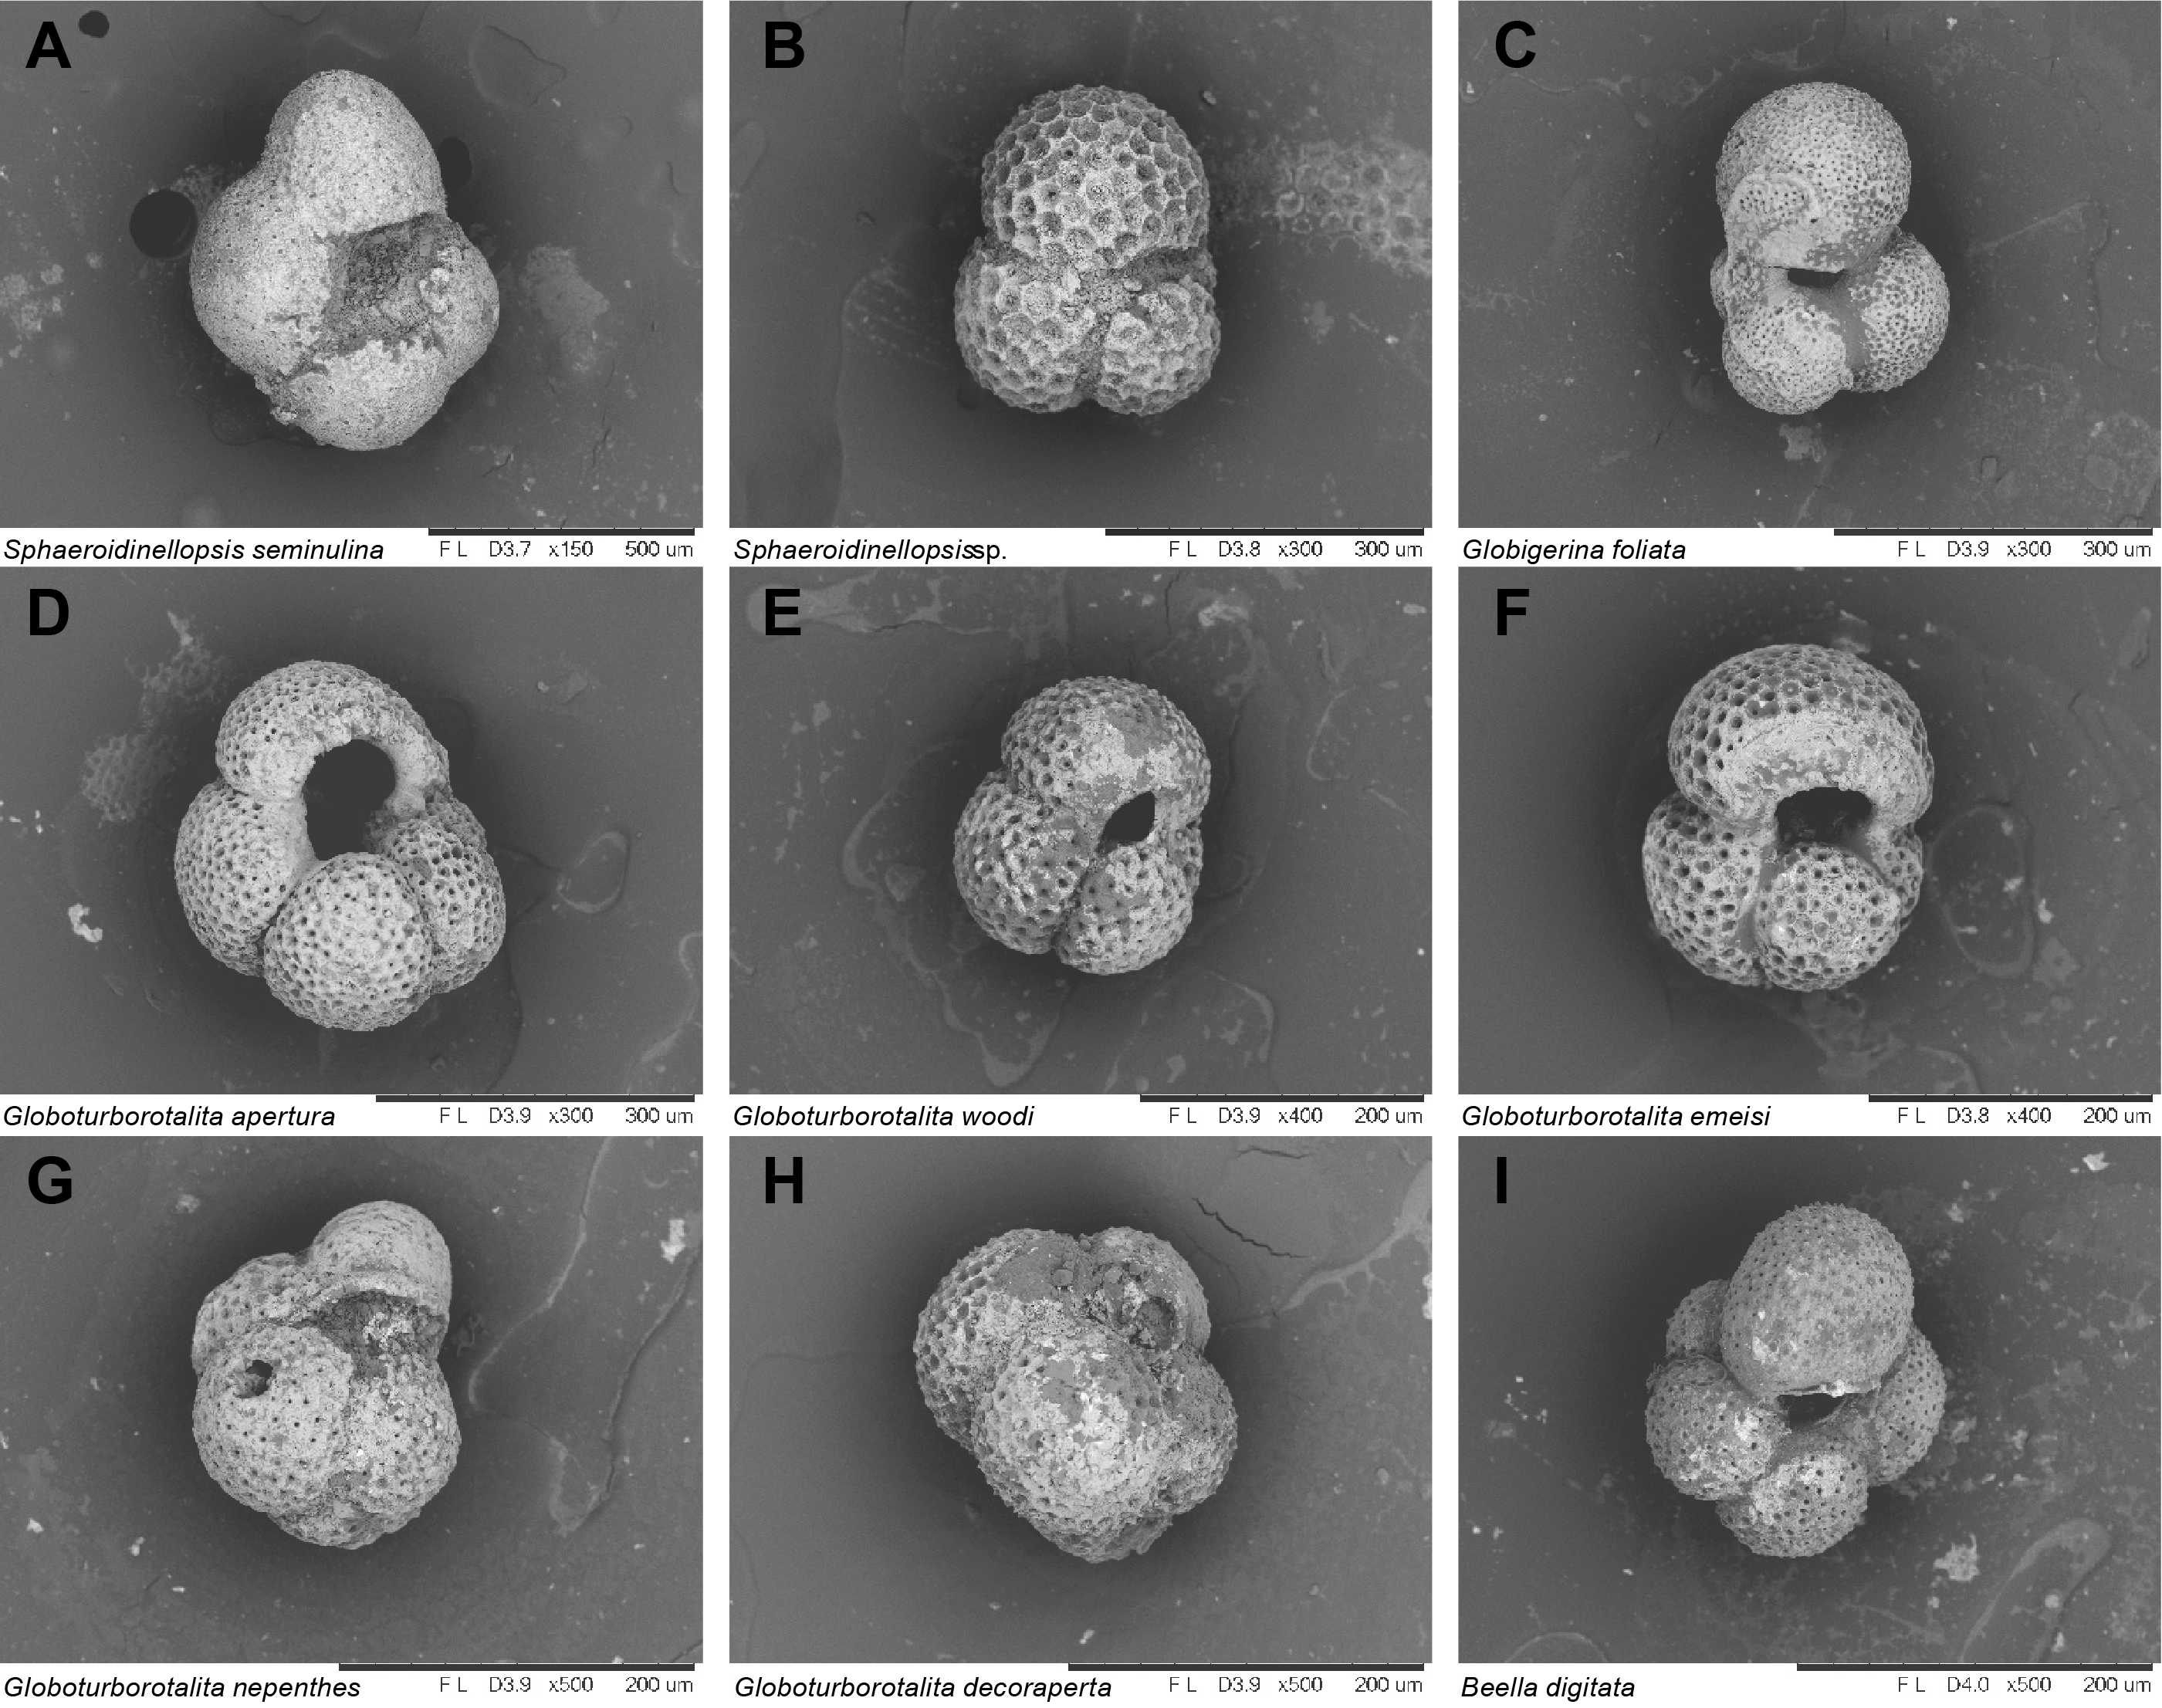
Figure F32. Planktonic foraminifera, Holes U1591A and U1591C.
Foraminiferal faunas are sufficiently common to biostratigraphically divide the Pleistocene into the majority of Mediterranean planktonic foraminiferal biostratigraphic zones determined via both primary and secondary marker species (Lirer et al., 2019), separated by several sedimentary hiatus:
- Zone MPle2b (0.00–0.53 Ma), Hole U1591A: 3.79–58.08 mbsf.
- Zones MPle1c–2a (0.53–1.21 Ma), Hole U1591B: 128.02–204.57 mbsf.
- Zones MPle1b–MPl6b (1.21–2.00 Ma), Hole U1591B: 207.23–253.13 mbsf.
- Zone MPl6 (2.00–2.09 Ma), Hole U1591B: 270.7–282.3 mbsf.
- Zone MPl5b (2.09–2.41 Ma), Hole U1591B: 284.15–364.56 mbsf.
The faunal criteria for age assignments are given below.
6.2.1.1. Zone MPle2b (0.00–0.53 Ma)
Samples 398-U1591A-1H-CC, 54–59 cm, to 7H-CC, 0–5 cm (3.79–58.08 mbsf), are assigned to Zone MPle2b based on the paracme top of sinistrally coiled Neogloboquadrina spp. (<0.51 Ma) in Sample 8H-1, 39–41 cm (61.21 mbsf), above which this species is common but sporadically present through sediments. Furthermore, the first occurrence of G. ruber var. pink (<0.33 Ma) occurs in Sample 33H-CC, 17–20 cm (21.59 mbsf).
6.2.1.2. Zone MPle2a–1c (0.53–1.21 Ma)
Samples 398-U1591B-15X-1, 117–119 cm, to 23X-CC, 34–38 cm (128.02–204.57 mbsf), are assigned to Zones MPle2a–1c based on the common occurrence of sinistrally coiled Neogloboquadrina spp. (0.91–1.21 Ma). Because of the consistent occurrence of sinistrally coiled Neogloboquadrina spp., the base of Zone MPle2a (0.91 Ma) could not be assigned and is likely missing because of the extensive and potentially erosive overlying pumice deposits of Lithostratigraphic Subunit Ic.
6.2.1.3. Zones MPle1b–MPl6b (1.21–2.00 Ma)
Samples 398-U1591B-24X-CC, 38–41 cm, to 29X-CC, 0–3 cm (207.23–253.13 mbsf), are assigned to Zones MPle1b–MPl6b based on the top occurrence of well-preserved and morphologically advanced specimens of G. obliquus (last occurrence = 1.28 Ma) alongside rare sinistrally coiled Neogloboquadrina spp. (1.21–1.37 Ma) throughout the top part of this interval. The base of this zone is assigned based on the first common occurrence of G. inflata (1.99 Ma) in Sample 29X-CC, 0–3 cm (253.13 mbsf), which was used in place of the primary biostratigraphic marker for this zone in the Mediterranean Sea (Lirer et al., 2019), the first occurrence of T. truncatulinoides (2.00 Ma), a species that is comparably rare in the Aegean Sea. Additionally, Sample 24X-CC (207.23 mbsf) marks the first common occurrence of the benthic foraminifer Hyalinea balthica (1.492 Ma; Lourens et al., 1998).
6.2.1.4. Zone MPl6 (2.00–2.09 Ma)
Samples 398-U1591B-30X-CC, 39–44 cm, to 31X-CC (270.7–282.3 mbsf) are assigned to Zone MPl6 because it represents the interval from the first occurrence of G. inflata (2.09 Ma) and the first common occurrence of G. inflata (2.00 Ma).
6.2.1.5. Zone MPl5b (2.09–2.41 Ma)
Samples 398-U1591B-32X-CC, 18–20 cm, to 40X-CC, 0–3 cm (284.15–364.56 mbsf) are assigned to Zone MPl5b based on the absence of G. inflata and the last occurrence of N. atlantica (sinistral) (2.41 Ma) in Sample 41X-CC, 18–22 cm (370.25 mbsf).
6.2.2. Pliocene foraminiferal biostratigraphy
Planktonic foraminifer assemblages from the Pliocene section of Hole U1591C are mostly well preserved; specimens are rarely broken or exhibit partially dissolved shell walls.
Pliocene foraminifer faunas indicate large fluctuations in relative paleowater depths and oceanicity with highly variable planktonic abundances that range 33%–100% where foraminifera are present (Figure F30). The fauna is typical of Mediterranean biostratigraphic Zones MPl5–NDZ, primarily composed of N. incompta, G. bulloides, G. falconensis, G. glutinata, G. elongatus, T. trilobus group, G. ruber var. white, N. pachyderma, O. universa, and more typical Pliocene species such as G. obliquus, G. extremus, Globoturborotalita decoraperta, Sphaeroidinellopsis s.l., Globoconella puncticulata, Hirsutella margaritae, and Truncorotalia crassula (Figures F31, F32).
Foraminiferal faunas are sufficiently common to biostratigraphically divide the Pliocene into the majority of Mediterranean planktonic foraminiferal biostratigraphic zones determined via both primary and secondary marker species (Lirer et al., 2019), which are separated by several sedimentary hiatus:
- Zone MPl5 (2.41–3.19 Ma), Hole U1591C: 392.51–523.16 mbsf.
- Zones MPl4a–4c (3.19–3.98 Ma), Hole U1591C: 528.45–655.71 mbsf.
- Zone MPl3 (3.98–4.52 Ma), Hole U1591C: 662.33–708.25 mbsf.
- Zones MPl2–MPl1 (4.52–5.33 Ma), Hole U1591C: 732.92–768.62 mbsf.
- Nondistinctive Zone (5.33–5.99 Ma), Hole U1591C: 769.38–892.11 mbsf.
The faunal criteria on which these age assignments are based are given in the sections below.
6.2.2.1. Zone MPl5 (2.41–3.19 Ma)
Samples 398-U1591C-19R-CC, 0–4 cm, to 32R-CC, 21–23 cm (392.51–523.16 mbsf), are assigned to Zone MPl5 based on the rare to common occurrences of G. bononiensis (last common occurrence = 2.41 Ma) and the absence of Sphaeroidinellopsis s.l. (last occurrence = 3.19 Ma). Additionally, the last common occurrence of G. obliquus (2.54 Ma) occurs in Sample 29R-CC, 0–2 cm (491.46 mbsf).
6.2.2.2. Zones MPl4c–4a (3.19–3.98 Ma)
Samples 398-U1591C-33R-CC, 14–17 cm, to 46R-CC, 13–16 cm (528.45–655.71 mbsf), are assigned to biostratigraphic Zones MPl4c–4a based on the last occurrence of Sphaeroidinellopsis s.l. (3.19 Ma) in Sample 33R-CC, 14–17 cm (528.45 mbsf), and the absence of common occurrence of H. margaritae (last common occurrence = 3.98 Ma). Additionally, typical specimens of G. ruber occur at the base of this interval; the last occurrence of H. margaritae (3.81 Ma) was found in Sample 45R-CC, 23–25 cm (650.99 mbsf); and the last occurrence of G. puncticulata (3.57 Ma) was found in Sample 40R-CC, 18–20 cm (602.12 mbsf). However, G. puncticulata is reported to occur consistently and abundantly through its range in the Mediterranean (Lirer et al., 2019) and is only sporadically present at the Aegean Expedition 398 sites; therefore, this datum can only tentatively be used to constrain the boundary between Zones MPl4 and MPl4b.
6.2.2.3. Zone MPl3 (3.98–4.52 Ma)
Samples 398-U1591C-47R-CC, 0–2 cm, to 51R-CC, 25–30 cm (662.33–708.25 mbsf), are assigned to Zone MPl3 based on the top common occurrence of H. margaritae (3.98 Ma) in Sample 47R-CC, 0–2 cm (662.33 mbsf); the absence of Globoturborotalita nepenthes (last occurrence ~4.6 Ma); and the presence of typical specimens of G. elongatus. Because of the presence of significant sediment remobilization from 700 to 715 mbsf, the base of this zone is difficult to accurately assign.
6.2.2.4. Zones MPl2–MPl1 (4.52–5.33 Ma)
Samples 398-U1591C-54R-CC, 39–42 cm, to 58R-2, 13–15 cm (732.92–768.62 mbsf), are assigned to Zones MPl2–MPl1 based on the last occurrence of G. nepenthes (~4.6 Ma) in Sample 54R-CC, 39-42 cm (732.92 mbsf), and the absence of normal marine planktonic foraminiferal assemblages in sediments deeper than Sample 58R-2, 89–91 cm (768.62 mbsf). The lower part of this sedimentary section also contains higher abundances of G. nepenthes and Globoturborotalita apertura; rare occurrences of the species Globoturborotalita emeisi; the acme of Sphaeroidinellopsis s.l. (5.21–5.3 Ma) in Sample 56R-CC, 8–10 cm (753.21 mbsf); and the first occurrence of Siphonina reticulata (5.234 Ma) (Lourens et al., 2004) in Sample 58R-1, 129–131 cm (768.41 mbsf). The boundary between Zones MPl2 and MPl1 could not be accurately assigned because the boundary marker species (first common occurrence of H. margaritae; 5.08 Ma) is only continuously present in pelagic successions (Lirer et al., 2019).
6.2.2.5. Nondistinctive Zone (5.33–5.99 Ma)
Samples 398-U1591C-58R-2, 89–91 cm, to 70R-CC, 0–2 cm (769.38–892.11 mbsf), are assigned to the Nondistinctive Zone due to absence of normal marine planktonic foraminiferal assemblages, and, where present, faunas are dwarfed and exhibit very poor preservation.
6.2.3. Planktonic foraminiferal oceanicity
Planktonic foraminifer abundances are highly variable, ranging 12%–100% when foraminifera were present. Oceanicity values are generally in agreement with benthic foraminiferal paleowater depth indicators in intervals where reworking is low or absent (Figure F30). In general, the oceanicity data for Site U1591 indicate that relatively consistent suboceanic conditions (200–1000 mbsl) prevailed from Samples 398-U1591A-1H-CC, 11–16 cm, to 398-U1591B-32X-CC, 18–20 cm (3.79–284.15 mbsf). Samples 32X-CC, 37–40 cm, to 38X-CC, 37–40 cm (284.35–344.28 mbsf), indicate large fluctuations in oceanicity from suboceanic (200–1000 mbsl) to inner neritic (0–50 mbsl) conditions, where Sample 33X-CC, 43–45 cm (296.31 mbsf), records the lowest oceanicity values (12% planktonic foraminifera) recorded downhole so far (Figure F30). Samples 39X-CC, 31–36 cm, to 398-U1591C-34R-CC, 19–24 cm (313.52–541.46 mbsf), then indicate generally suboceanic conditions (200–1000 mbsl) downhole, after which values once again fluctuate between extraneritic (100–200 mbsl) and suboceanic in Samples 35R-CC, 14–16 cm, to 42R-CC, 0–2 cm (552.04–612.16 mbsf). Downhole from Sample 42R-CC, 0–2 cm, planktonic foraminifera indicate increasing oceanicity, consistently indicating open oceanic conditions from Samples 53R-CC, 21–24 cm, to 58R-CC, 18–20 cm (728.59–776.48 mbsf), below which foraminifera are not present in abundances sufficient for oceanicity interpretations.
6.2.4. Benthic foraminifera paleowater depths
Benthic foraminiferal distributions are variable, indicating paleowater depths from uppermost bathyal (200–400 m) to lower bathyal (>1000 m) (Figure F30). The low abundances or complete absence of benthic foraminiferal faunas in some samples (e.g., 398-U1591B-32X-CC, 37–40 cm [284.35 mbsf], and 398-U1591C-19R-CC, 0–4 cm, to 36R-CC, 22–24 cm [392.51–563.78 mbsf]) are possibly correlated with rapid emplacement of volcaniclastic sediments and/or inhospitable environmental conditions. Samples from Hole U1591A (3.8–89.3 mbsf) and Samples 398-U1591B-1H-CC, 20–23 cm, to 15X-CC, 15–18 cm (7.56–128.02 mbsf), record an uppermost to upper bathyal depth (300–600 m), as indicated by the presence of species such as Cibicides pachyderma and Gyroidina spp., Cassidulina spp., and H. balthica. Samples 398-U1591C-3R-CC, 0–2 cm, to 17R-CC, 0–2 cm (158.73–370.7 mbsf), and 54R-CC, 39–42 cm, to 56R-CC, 8–10 cm (732.92–753.21 mbsf), exhibit mid- to lower bathyal paleowater depths, as indicated by the presence of Oridorsalis umbonatus, whereas lower bathyal markers including Cibicidoides wuellerstorfi and C. mundulus also occur (Figures F30, F33). Additionally, samples in various intervals present broken and reworked foraminifer faunas and in some cases abundant specimens, as in Samples 29R-CC, 0–2 cm (491.46 mbsf), and 36R-CC, 22–24 cm (563.78 mbsf), which likely represent downslope reworking and sediment transportation (Figure F30). For Samples 39R-CC, 0–2 cm, to 48R-CC, 0–4 cm (590.59–679.14 mbsf), no paleowater depth estimation was possible because of the dominance of dysoxic-tolerant species such as Bolivina dilatata and Bulimina costata (e.g., Abu-Zied et al., 2008), most possibly representing intervals with high organic matter content.
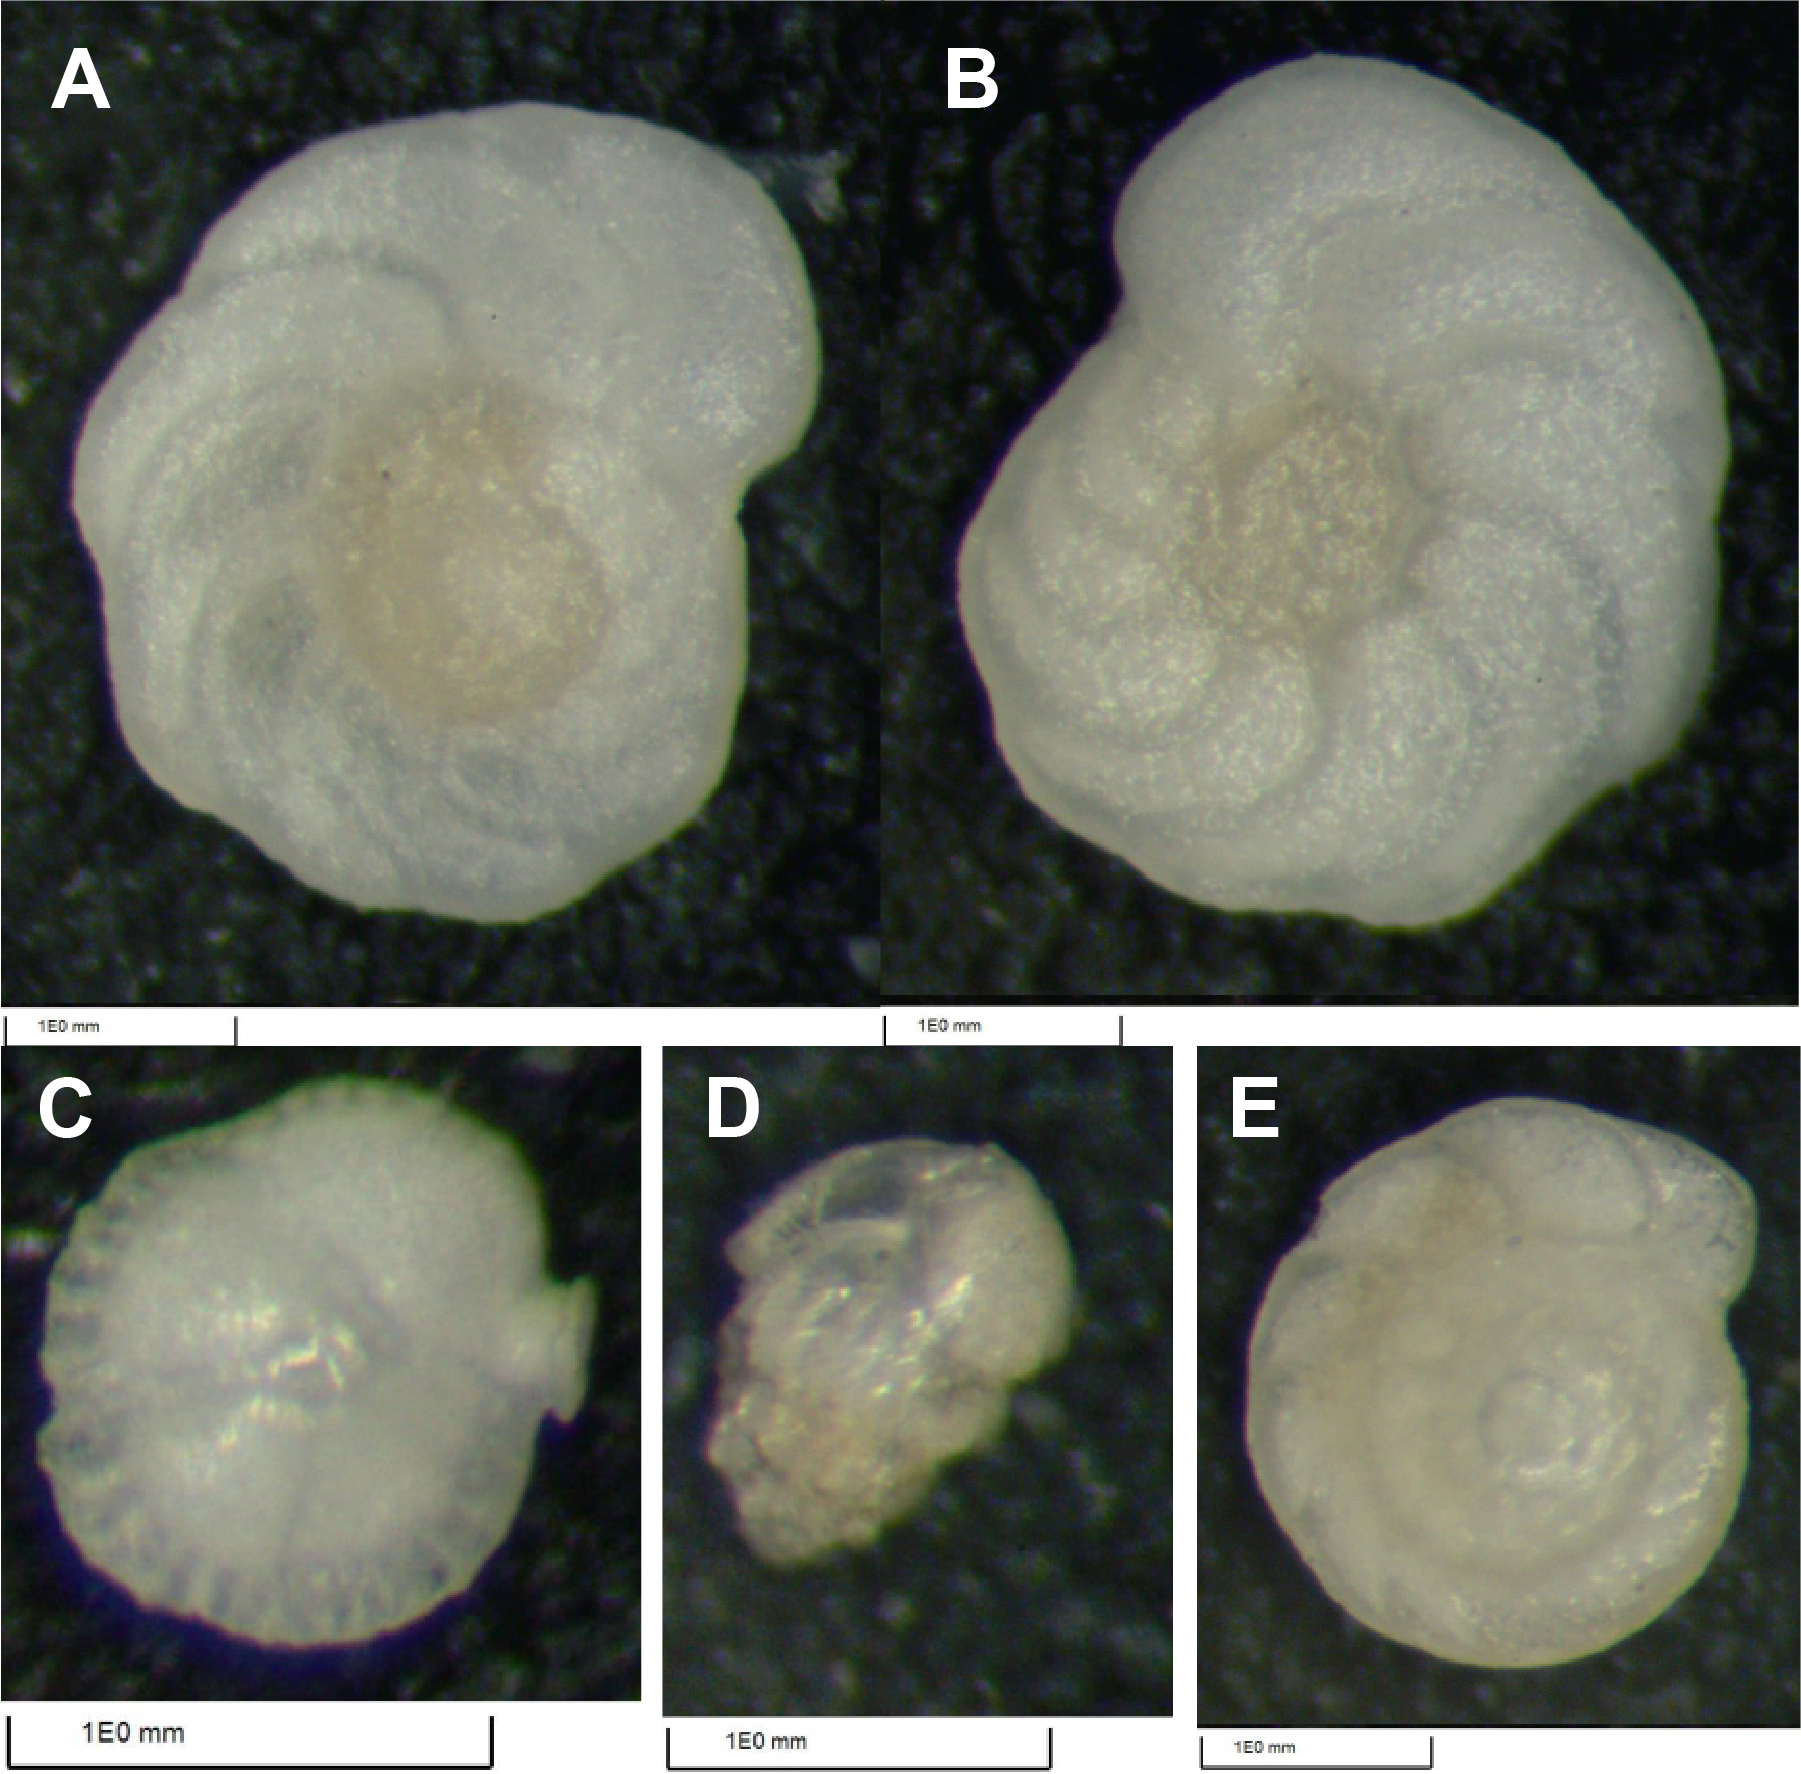
Figure F33. Benthic foraminifera.
7. Paleomagnetism
Paleomagnetic analyses at Site U1591 focused on measurement and demagnetization of archive-half sections to determine magnetostratigraphic age controls. The uppermost 63 m of the sequence sampled at this site carries normal polarity remanences acquired during the Brunhes Chron. Scattered inclinations then prevent magnetostratigraphic correlations from ~185 to 480 mbsf. From 480 to 770 mbsf, however, the quality of data improves and eight reversal boundaries can be tied precisely to the geomagnetic polarity timescale (within the Pliocene), with a further four tentative correlations also possible. Data in the Messinian evaporite sequence sampled deeper than 771 mbsf are less conclusive. Some intervals display reversed polarities consistent with formation during Chron C3r (5.235–6.023 Ma; Gradstein et al., 2020), but other intervals appear to be contaminated by a strong drilling-induced overprint with steep positive inclinations.
7.1. Bulk magnetic properties
The bulk magnetic parameters of intensities of magnetization and low-field MS typically have log-normal (geometric) distributions in natural samples (Tarling, 1983). Table T10 provides the geometric means and ranges of these parameters observed at the same measurement points in archive-half sections for all three holes cored at Site U1591, whereas the histograms of Figure F34 show their overall distributions for the entire site (plotted as log10 values). Both parameters show positive skew, reflecting dominance of measurements made in weakly magnetic sediments and sedimentary rocks.
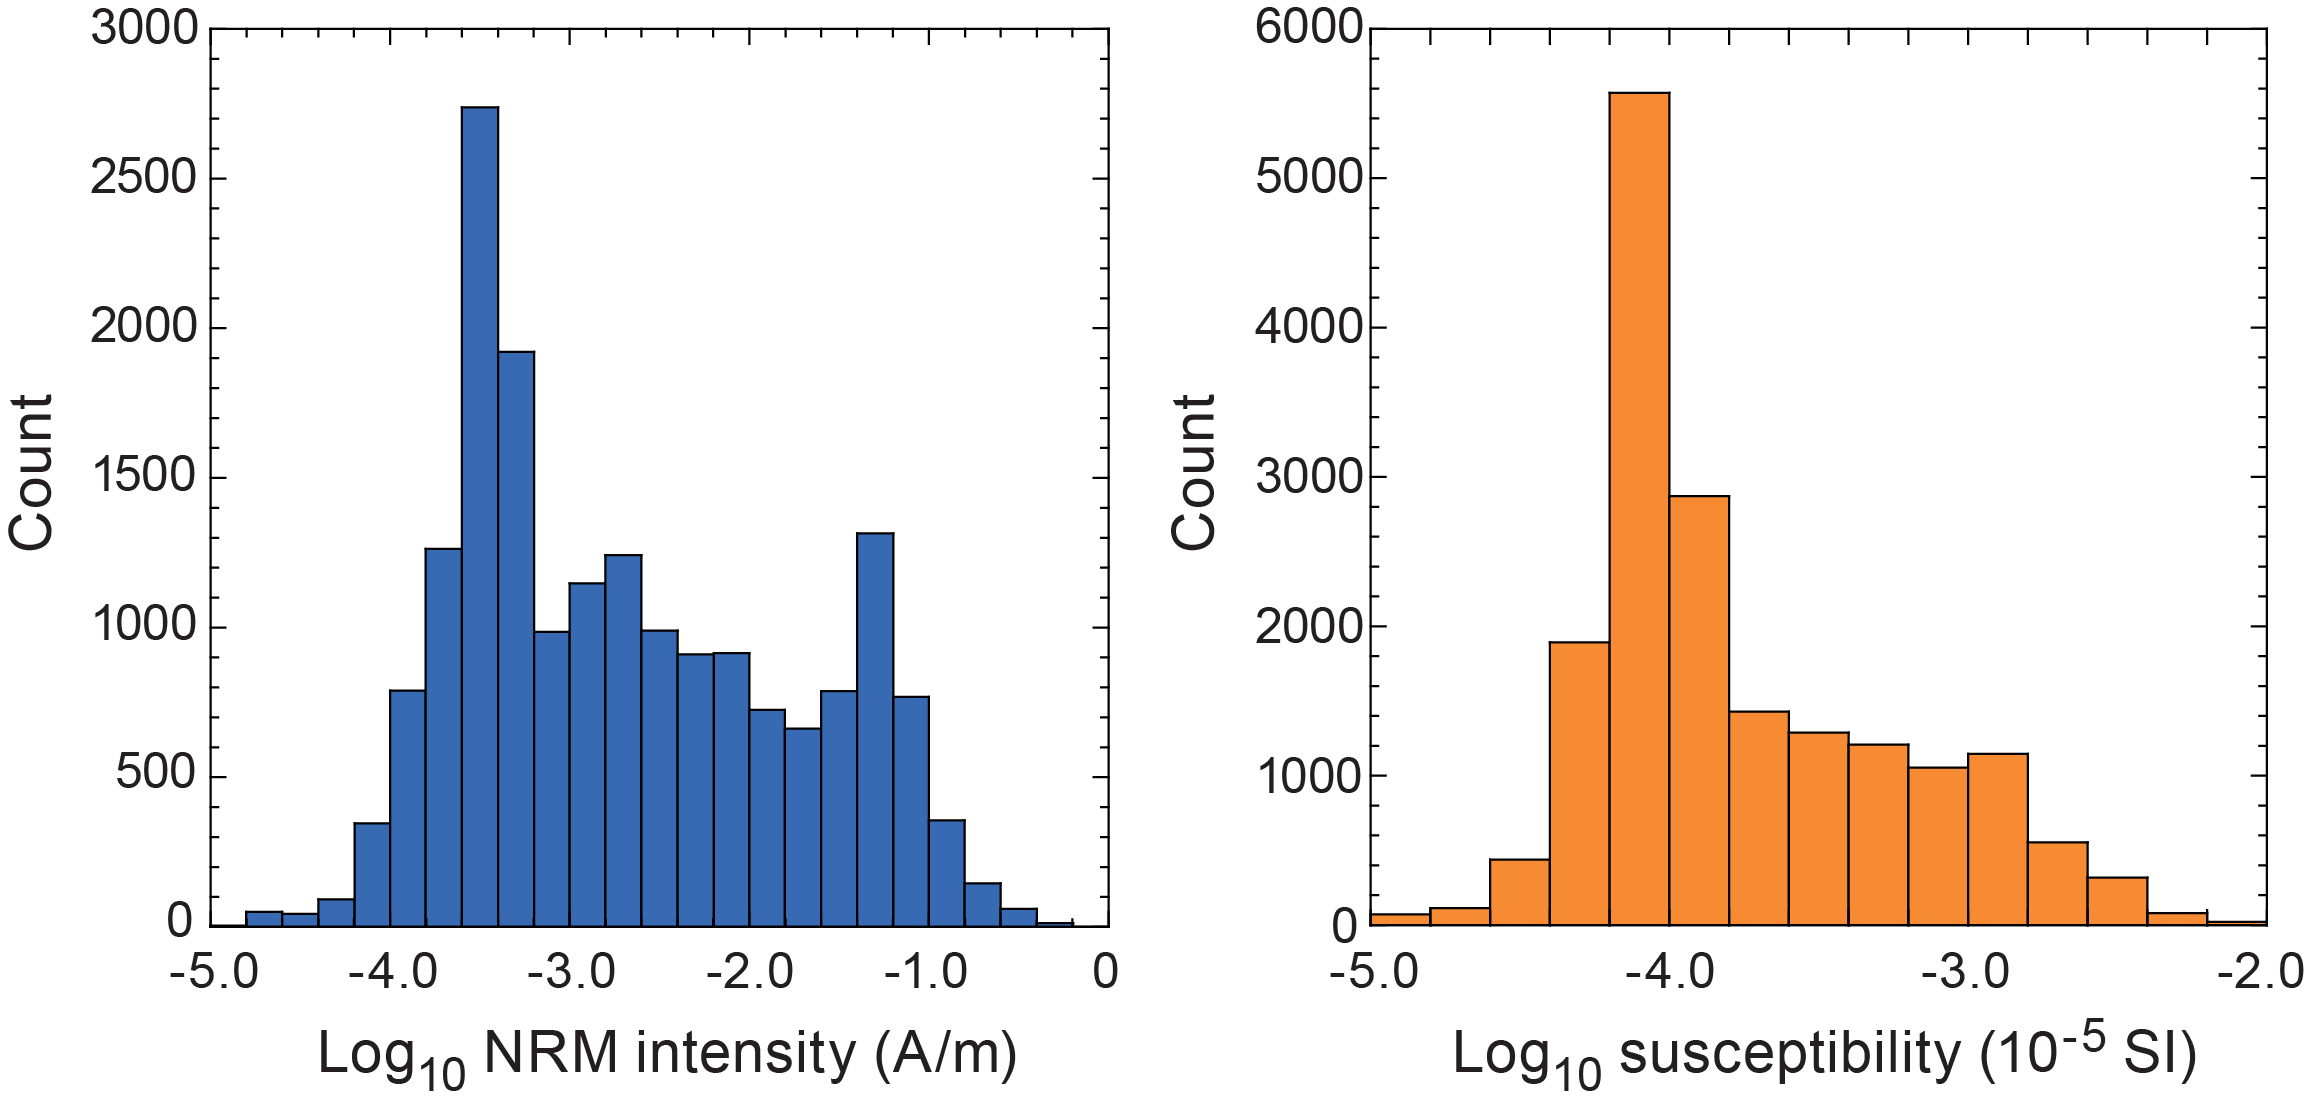
Figure F34. NRM intensity and low-field MS.
7.2. Downhole variations in magnetic characteristics
Remanence measurements were made on archive-half sections recovered during Expedition 398 by APC, XCB, and RCB coring in Holes U1591A–U1591C using the 2G Enterprises Model 760R-4K superconducting rock magnetometer (SRM) system. Remanences were measured every 2 cm and were filtered to reject data from points within 8 cm of section ends. This produced a dataset consisting of natural remanent magnetization (NRM) and alternating field (AF) demagnetization data (after applied field steps of 15, 20, and 25 mT) measured at 18,271 intervals downhole. Point MS data obtained from the archive-half sections were also filtered to preserve only data corresponding to the intervals where remanence measurements were made. In addition, 119 discrete samples were subject to AF demagnetization in maximum applied fields of up to 50–100 mT (in some cases up to 200 mT) to help constrain magnetic polarities.
Downhole variations in magnetic properties are shown in Figures F35, F36, and F37 for Holes U1591A, U1591B, and U1591C, respectively. Declinations of magnetizations are azimuthally unconstrained and show wide variations between cores, as expected. Inclinations are observed to become shallower than the NRM directions following demagnetization, reflecting removal of a ubiquitous drilling-induced remanent magnetization (DIRM). Variations in inclinations fall into three zones: (1) interval 0–63 mbsf, inclinations are consistently positive and close to the expected value of 56° for the site; (2) interval 185–480 mbsf, inclinations are widely scattered but with a bias toward steep values >56° (these variations may reflect a combination of residual DIRM components and/or the effects of diagenetic alteration); and (3) a zone below 480 mbsf that exhibits systematic variations between normal and reversed inclinations. The significance of these data for magnetostratigraphic dating is discussed below. Median destructive fields (MDFs) throughout the sampled sequence are typically 10–15 mT, indicating a dominance of low-coercivity magnetic minerals, but some intervals (e.g., 680–820 mbsf; Figure F37) display higher MDFs, suggesting presence of higher coercivity carriers. Samples in these intervals often display only minor directional and intensity variations after treatment at 15 mT, and analysis of discrete samples indicated that even demagnetization in applied fields of 50–200 mT results in limited changes in intensity. These characteristics suggest that magnetic remanence is carried by hematite (in addition to a magnetite signal overprinted by DIRMs) with high coercivities (Kletetschka and Wieczorek, 2017).
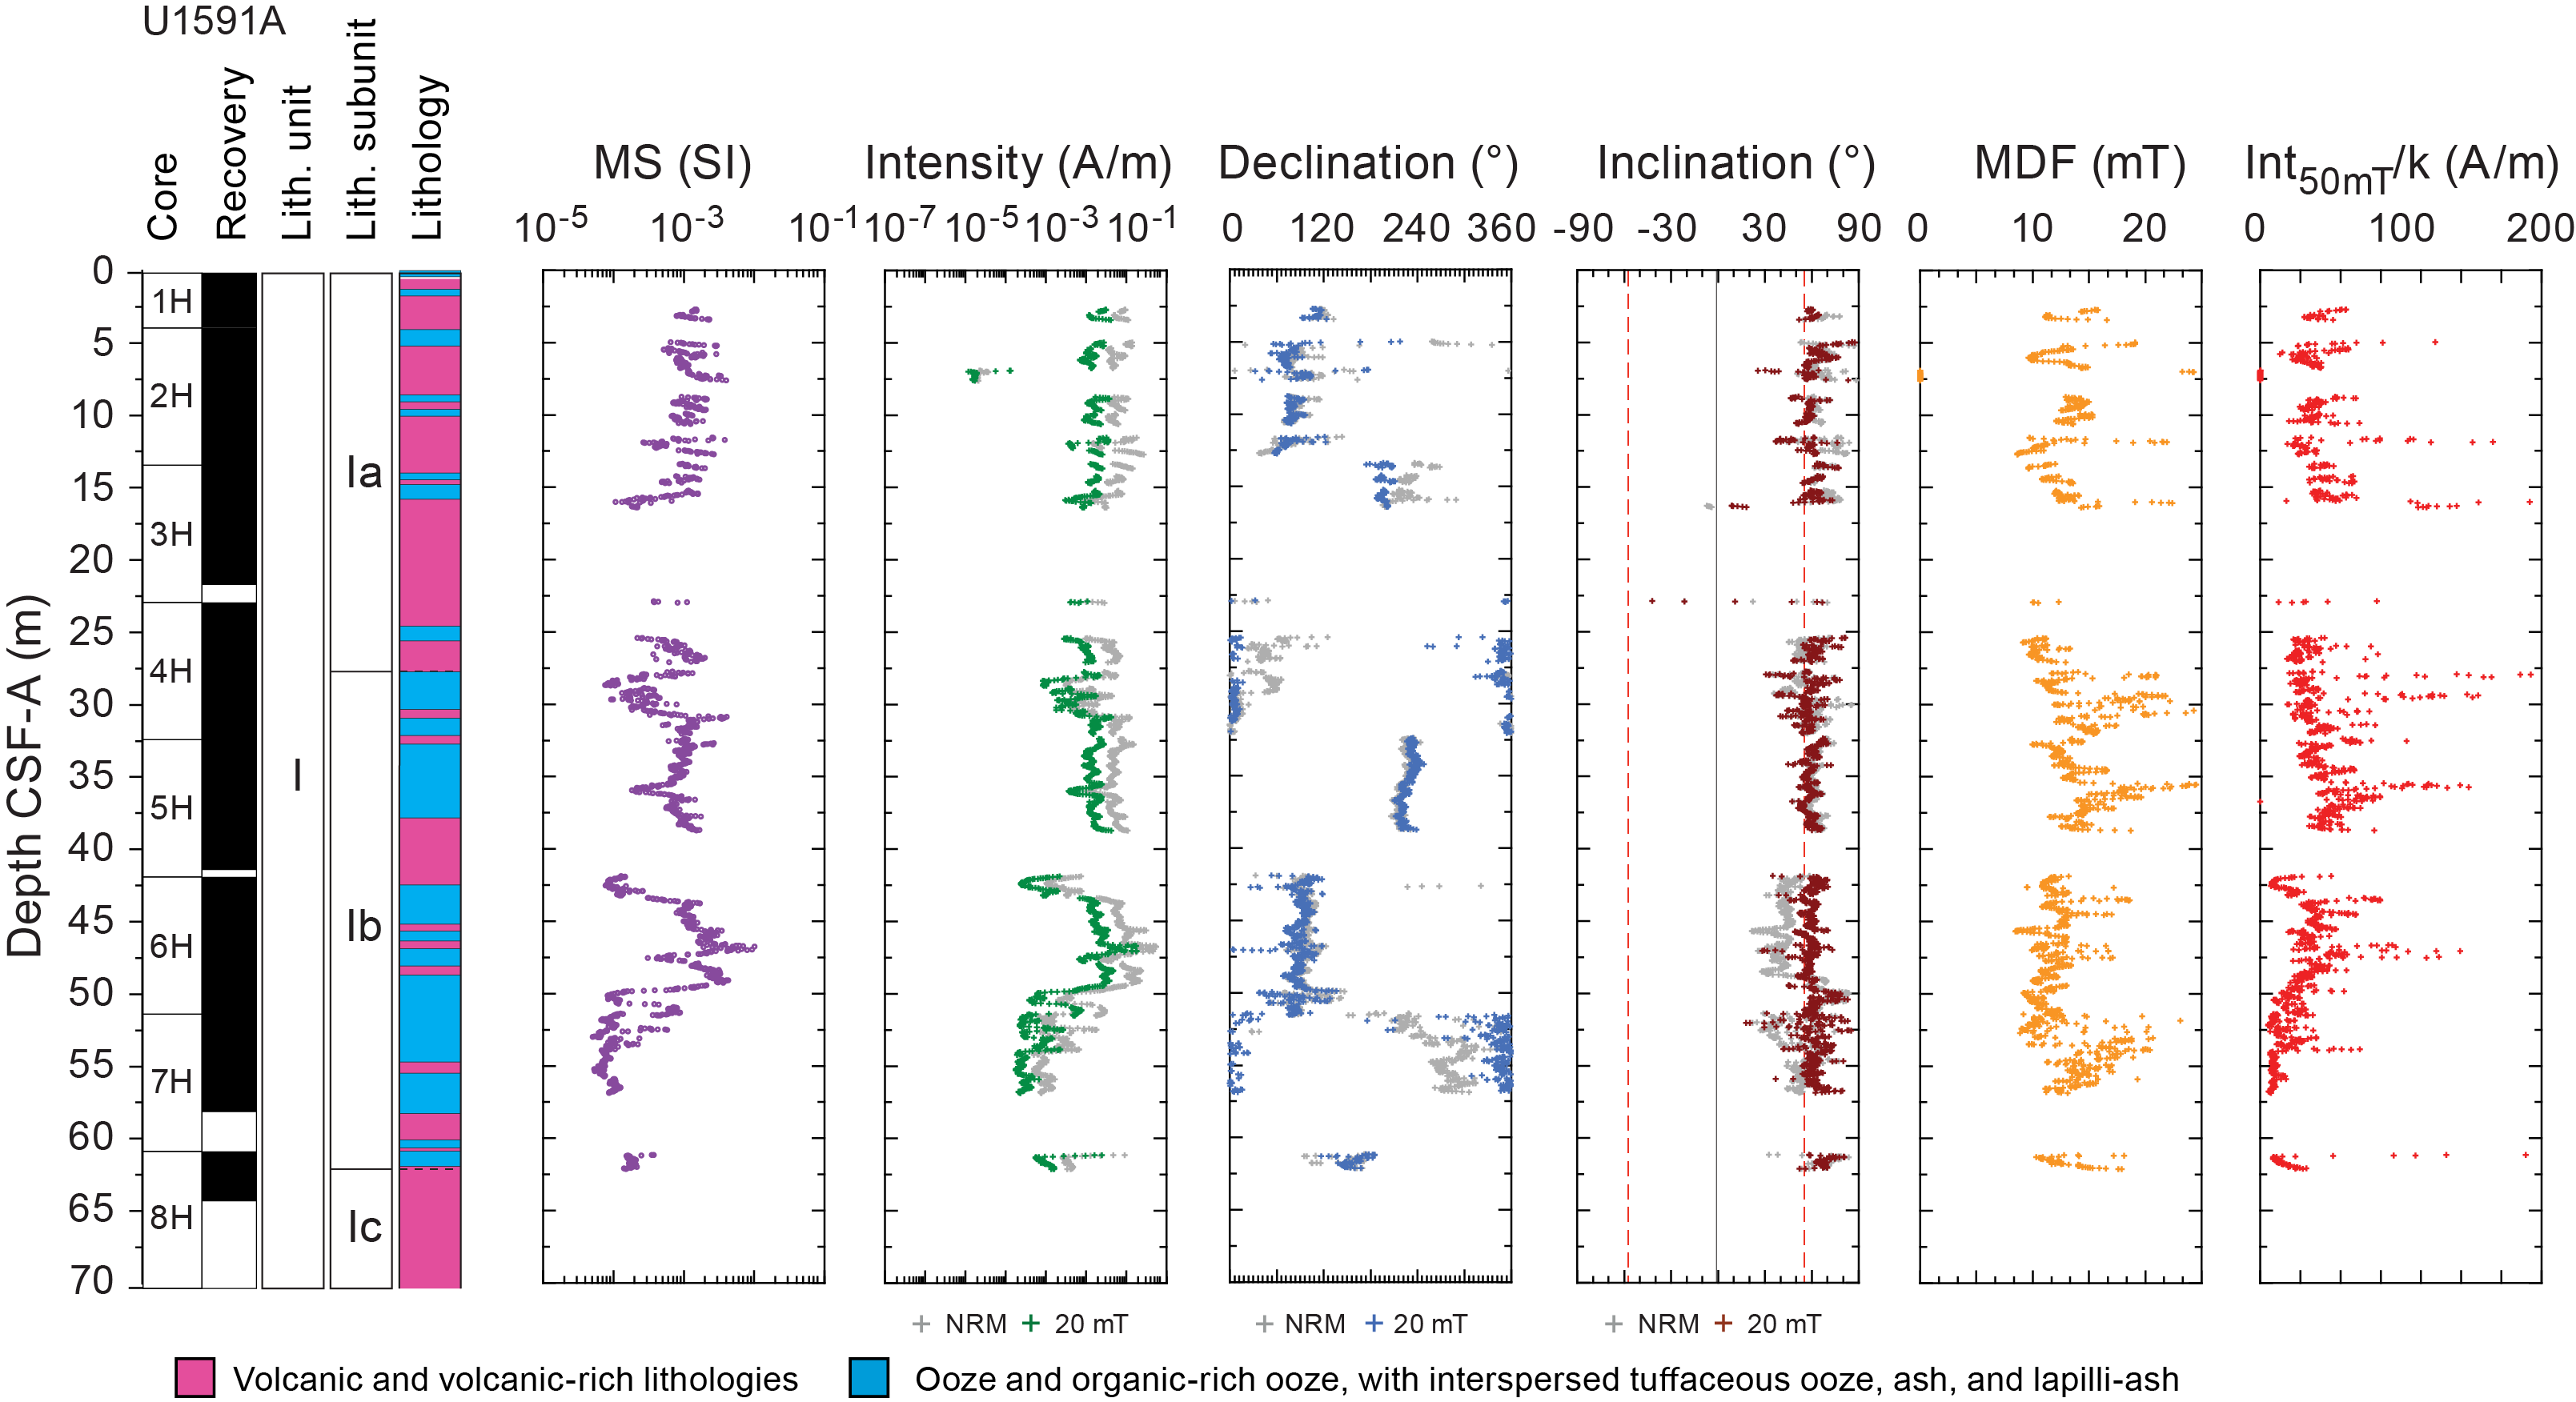
Figure F35. Magnetic data, Hole U1591A.
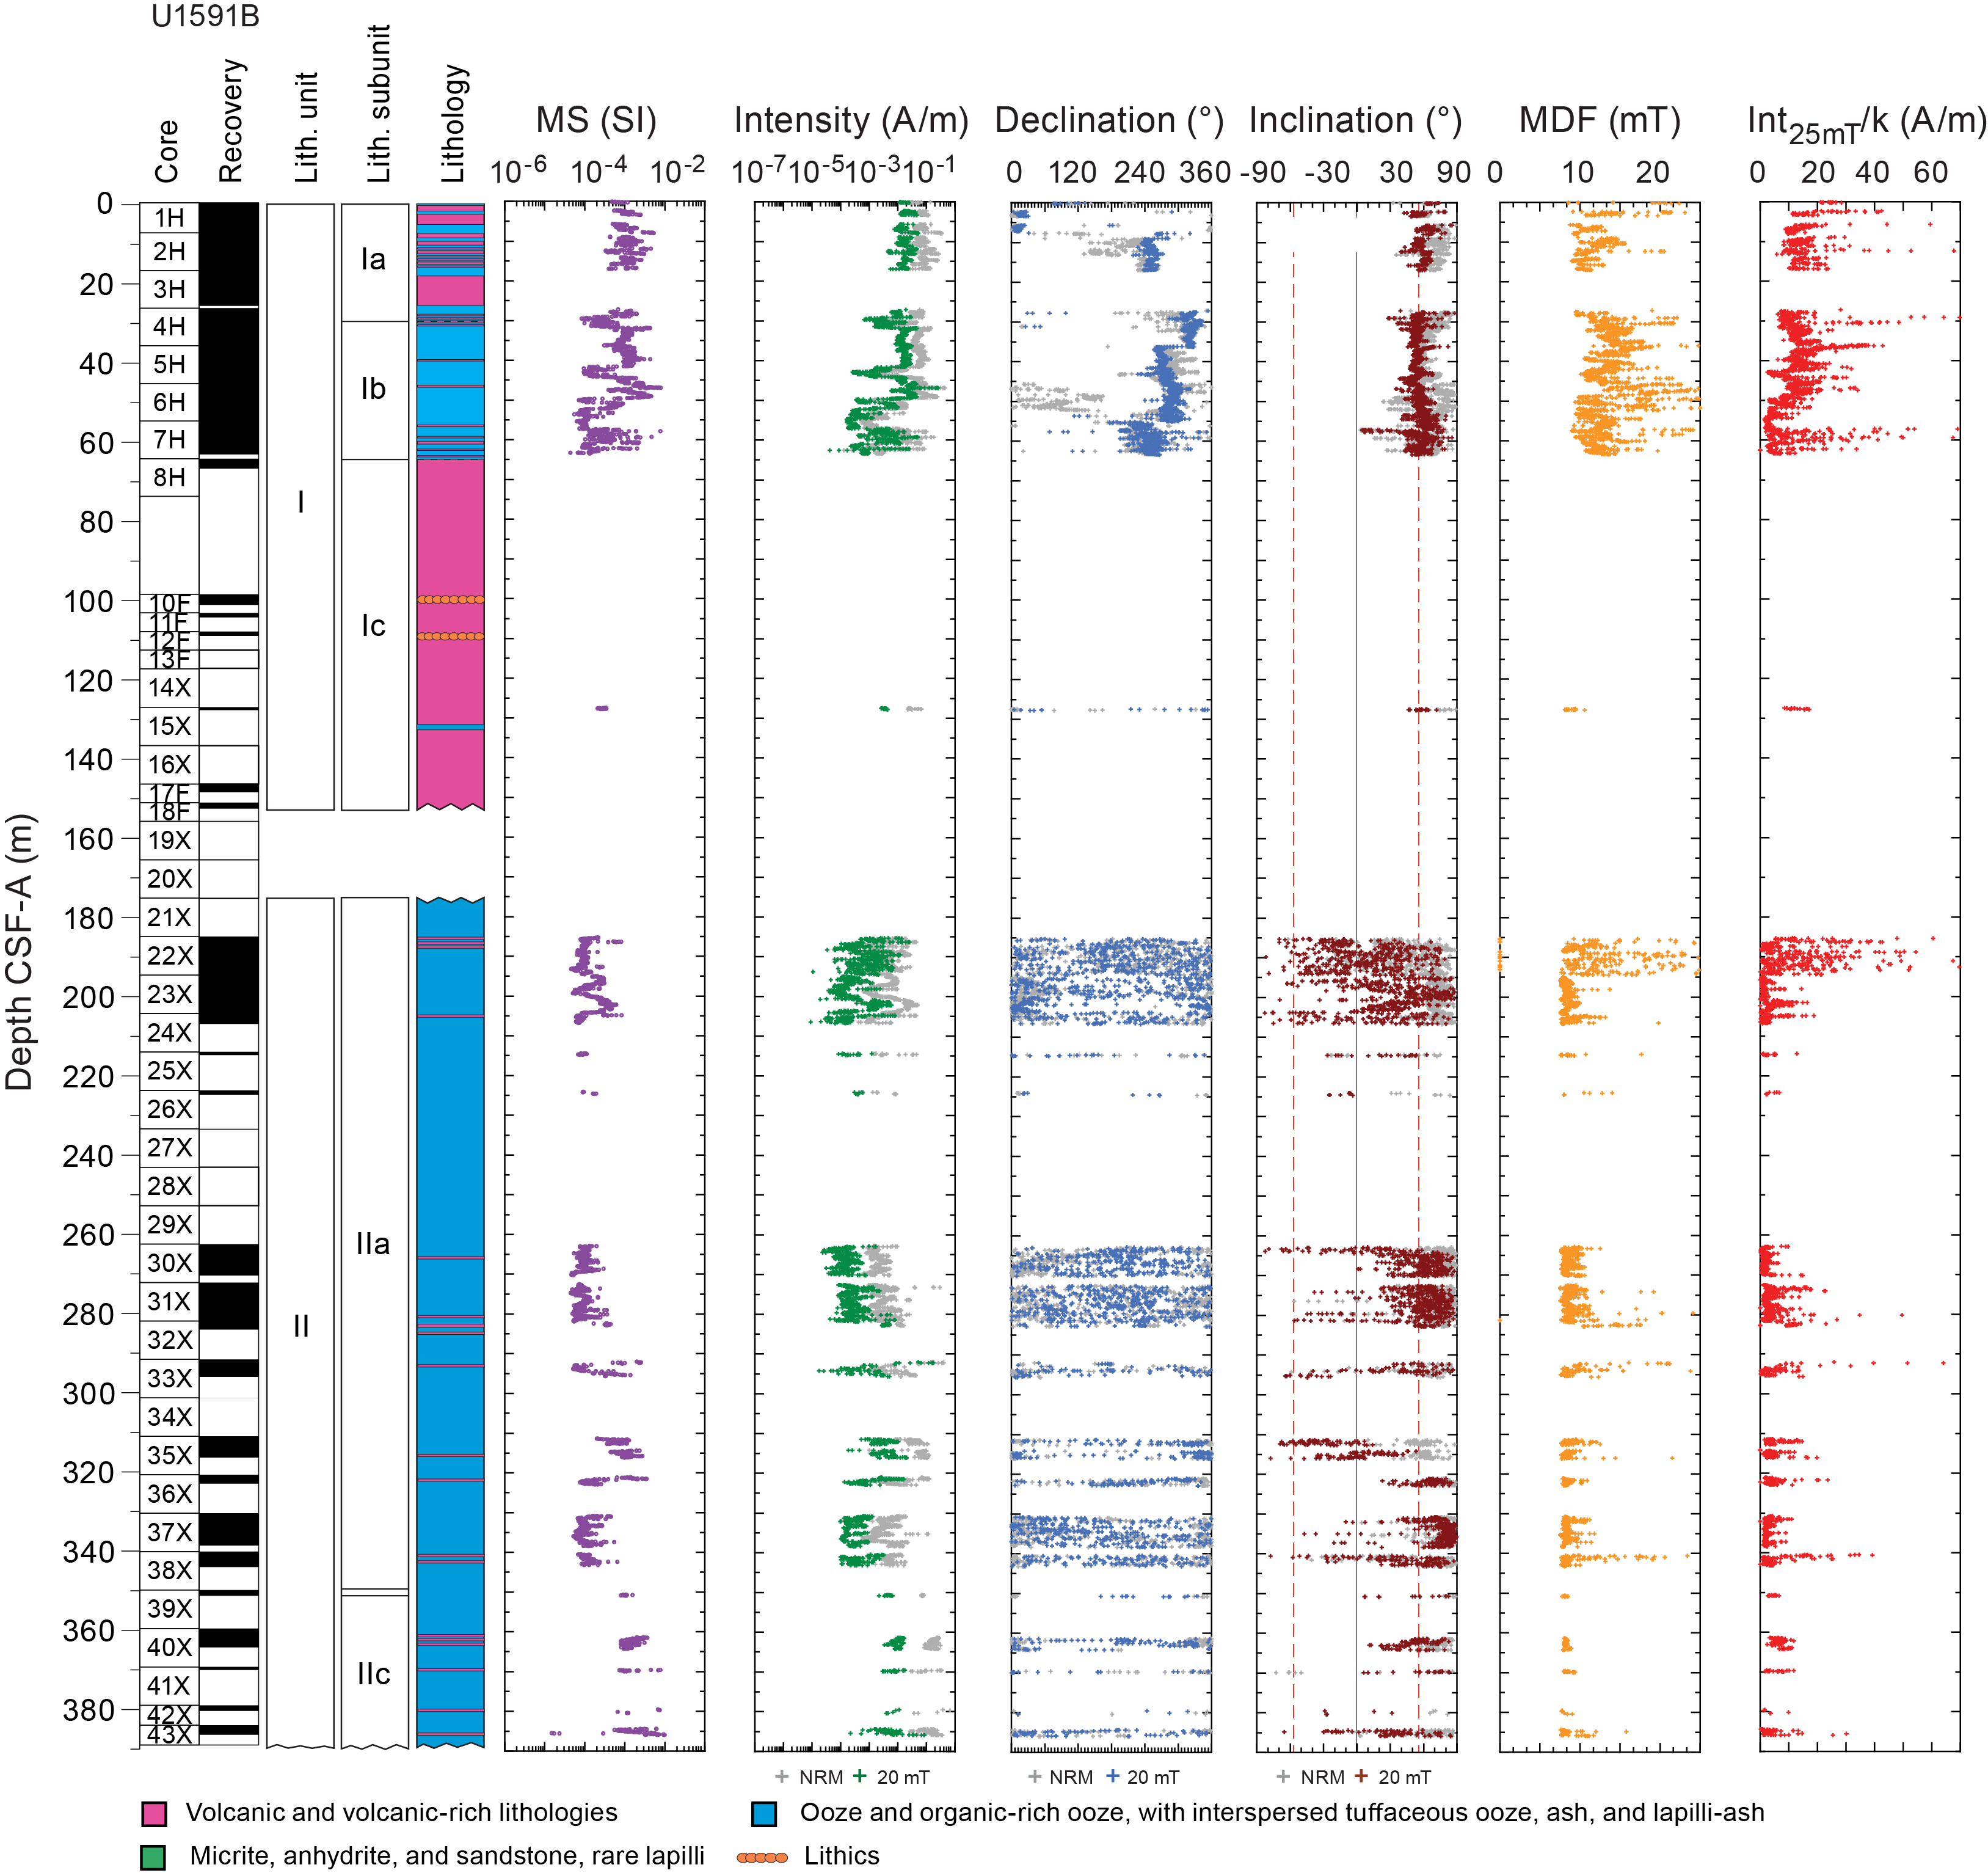
Figure F36. Magnetic data, Hole U1591B.
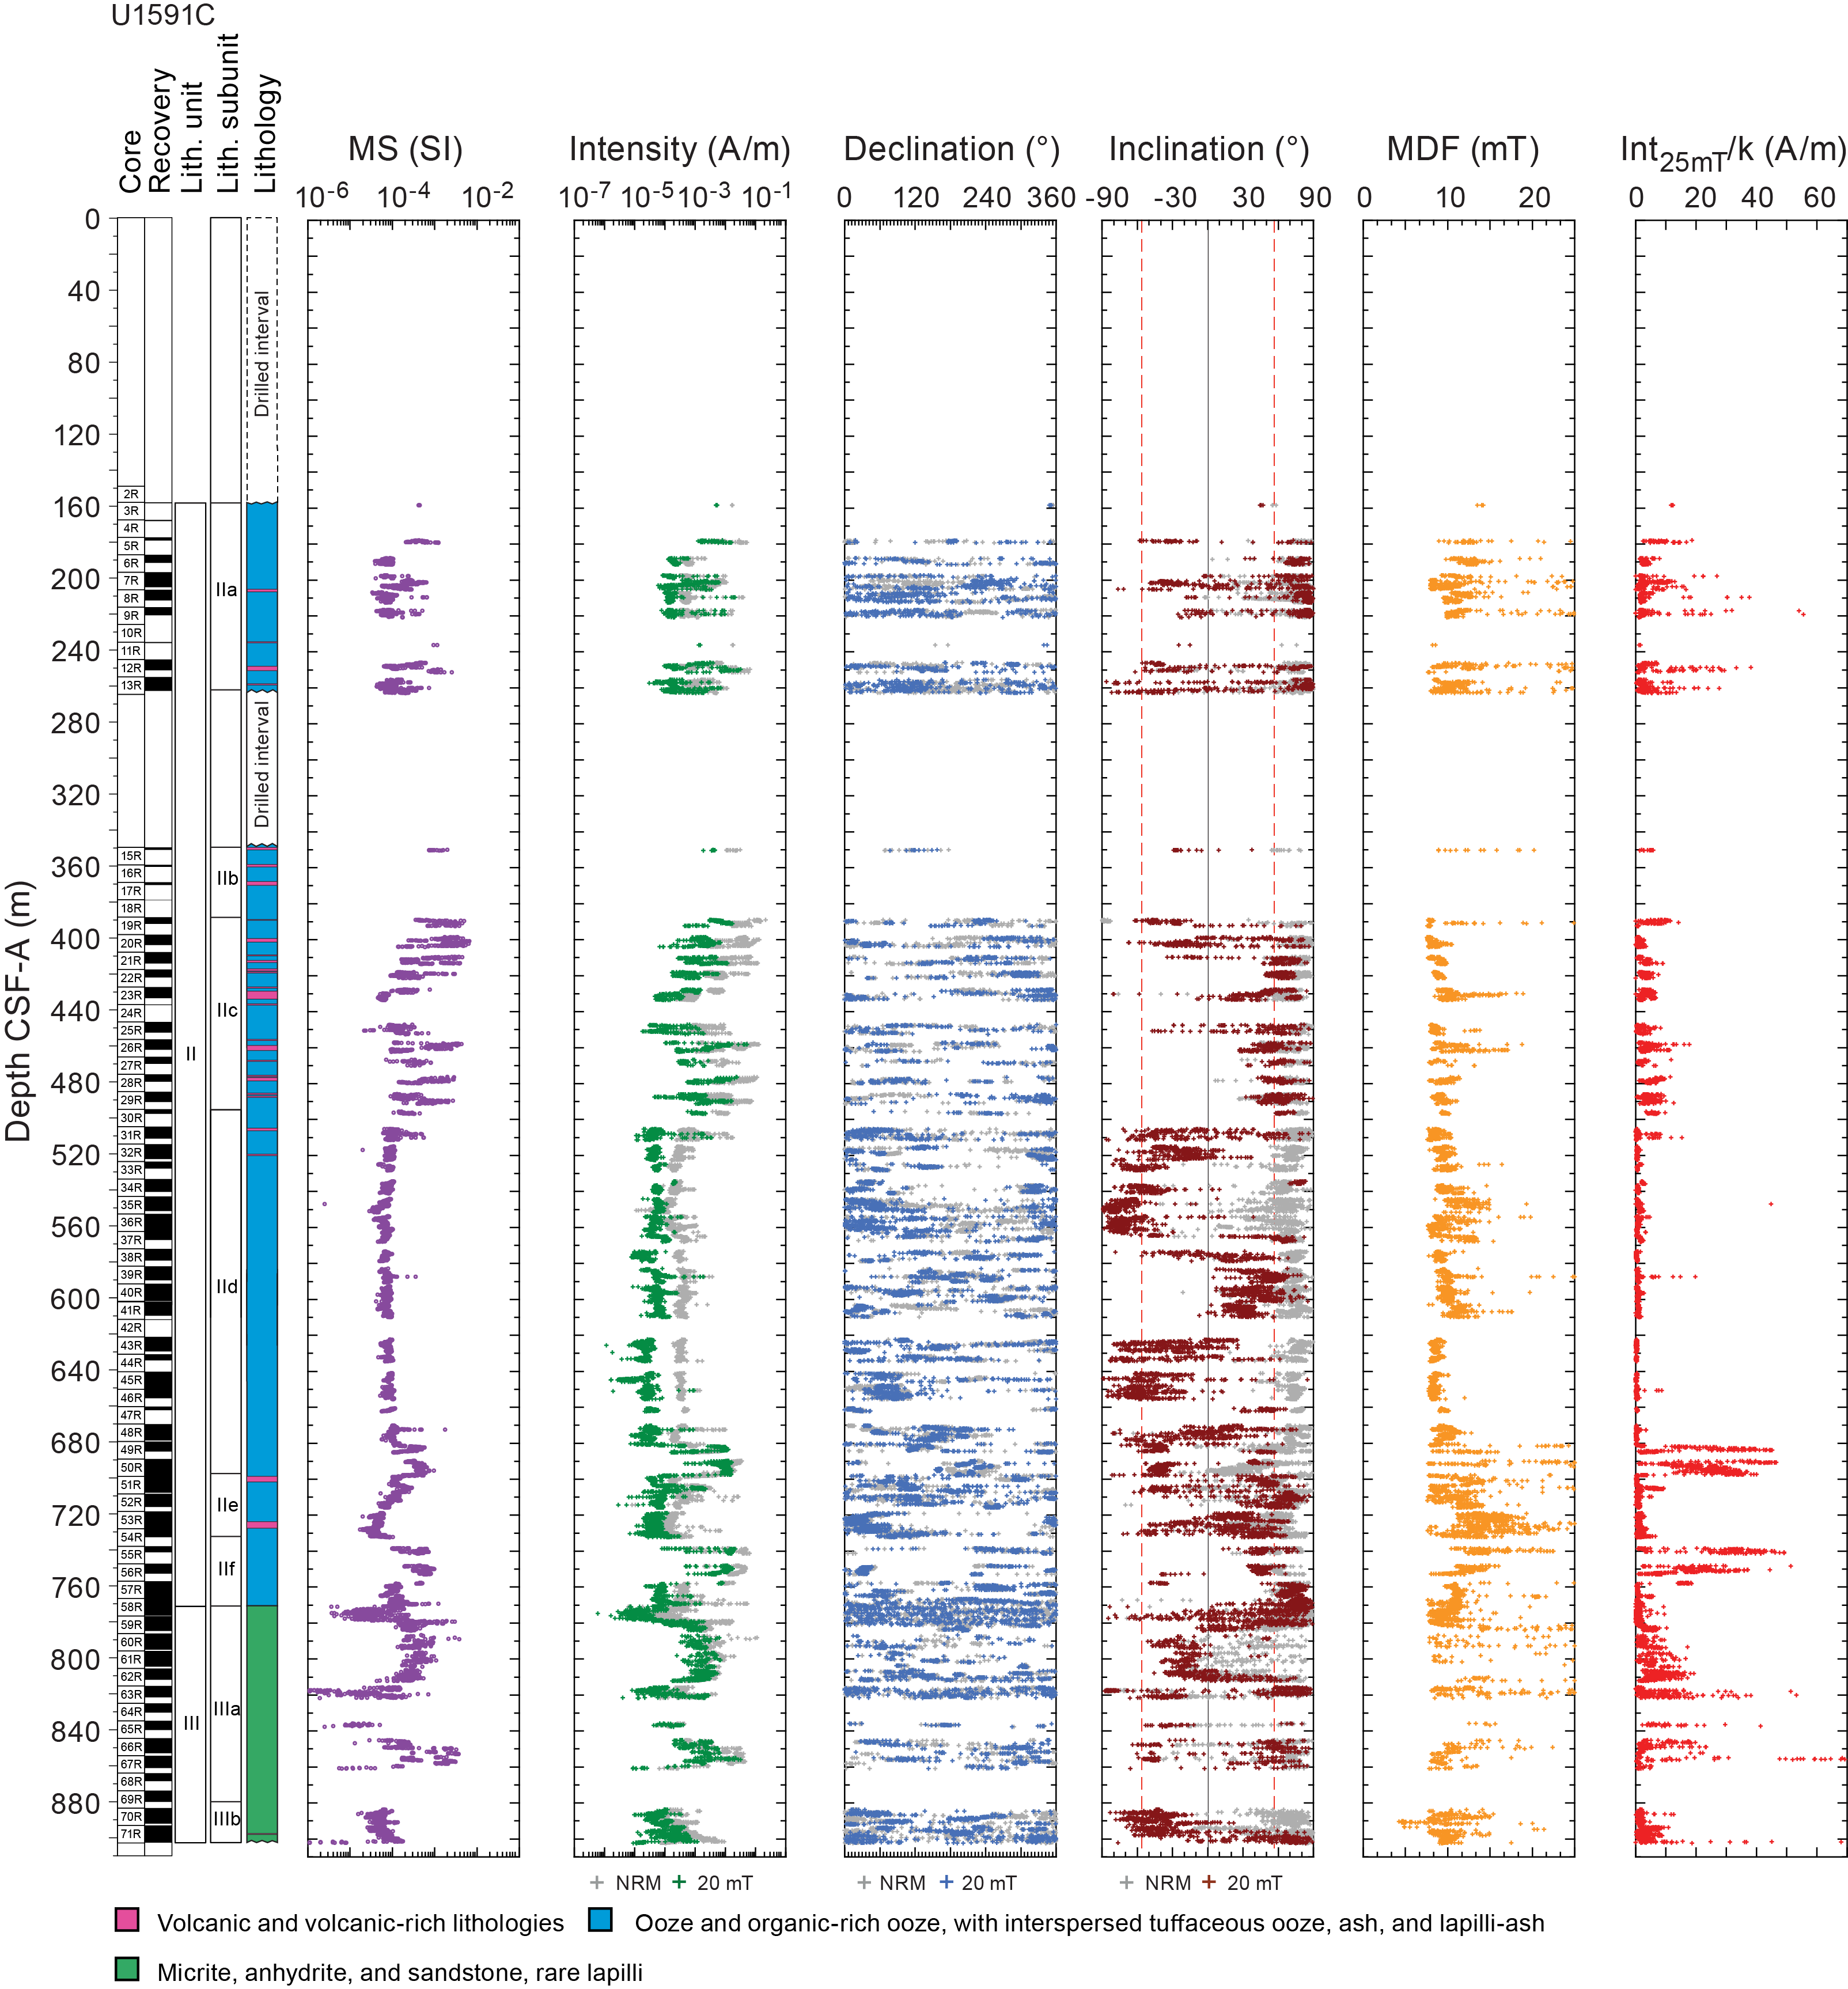
Figure F37. Magnetic data, Hole U1591C.
We employed an automated principal component analysis (PCA) approach to analyze archive-half section data acquired at higher AF demagnetization steps to identify samples displaying linear decay toward the origin during demagnetization (see Paleomagnetism in the Site U1589 chapter [Druitt et al., 2024]). This involved comparing free-fitting and anchored PCA directions through the 15, 10, and 25 mT step remanences calculated with PuffinPlot software and accepting only those free-fitting PCAs with maximum angular deviations <15° that differ by <15° from the corresponding anchored PCAs. The resulting PCA data set represents the highest quality inclination estimates obtained in each of the three holes sampled at Site U1591. We also observed a significant number of samples that displayed only minor decay in intensity after removal of the drilling-induced magnetization and only minor variation in magnetization directions at higher steps. These samples carry stable magnetizations that cannot be demagnetized using the SRM system but still provide valuable information about magnetic polarity. To extract inclination data from such samples, we also calculated the Fisher mean directions of the remanences measured at each interval downhole after demagnetization at 15, 20, and 25 mT. For samples where no valid PCA was found, we accepted those Fisher mean directions with precision parameters >15 and α95 cones of confidence <15°. Samples that yielded neither statistically acceptable PCAs or Fisher mean directions were represented in the final site database by their 25 mT step inclinations. The combination of these three different estimates of inclinations downhole was then used to define magnetozones.
7.3. Correlations with the geomagnetic polarity timescale
Variations in inclination with depth after combining data from all three holes into a single record (divided by quality) are shown in Figure F38. The highest quality PCA directions down to 63 mbsf have a mean inclination of 53.4° (k = 42.5; α95 = 1.0; n = 2908). This agrees well with the geocentric axial dipole field inclination of 56° at Site U1591, confirming that the interval 0–63 mbsf carries a normal polarity magnetization acquired in the Brunhes Chron.
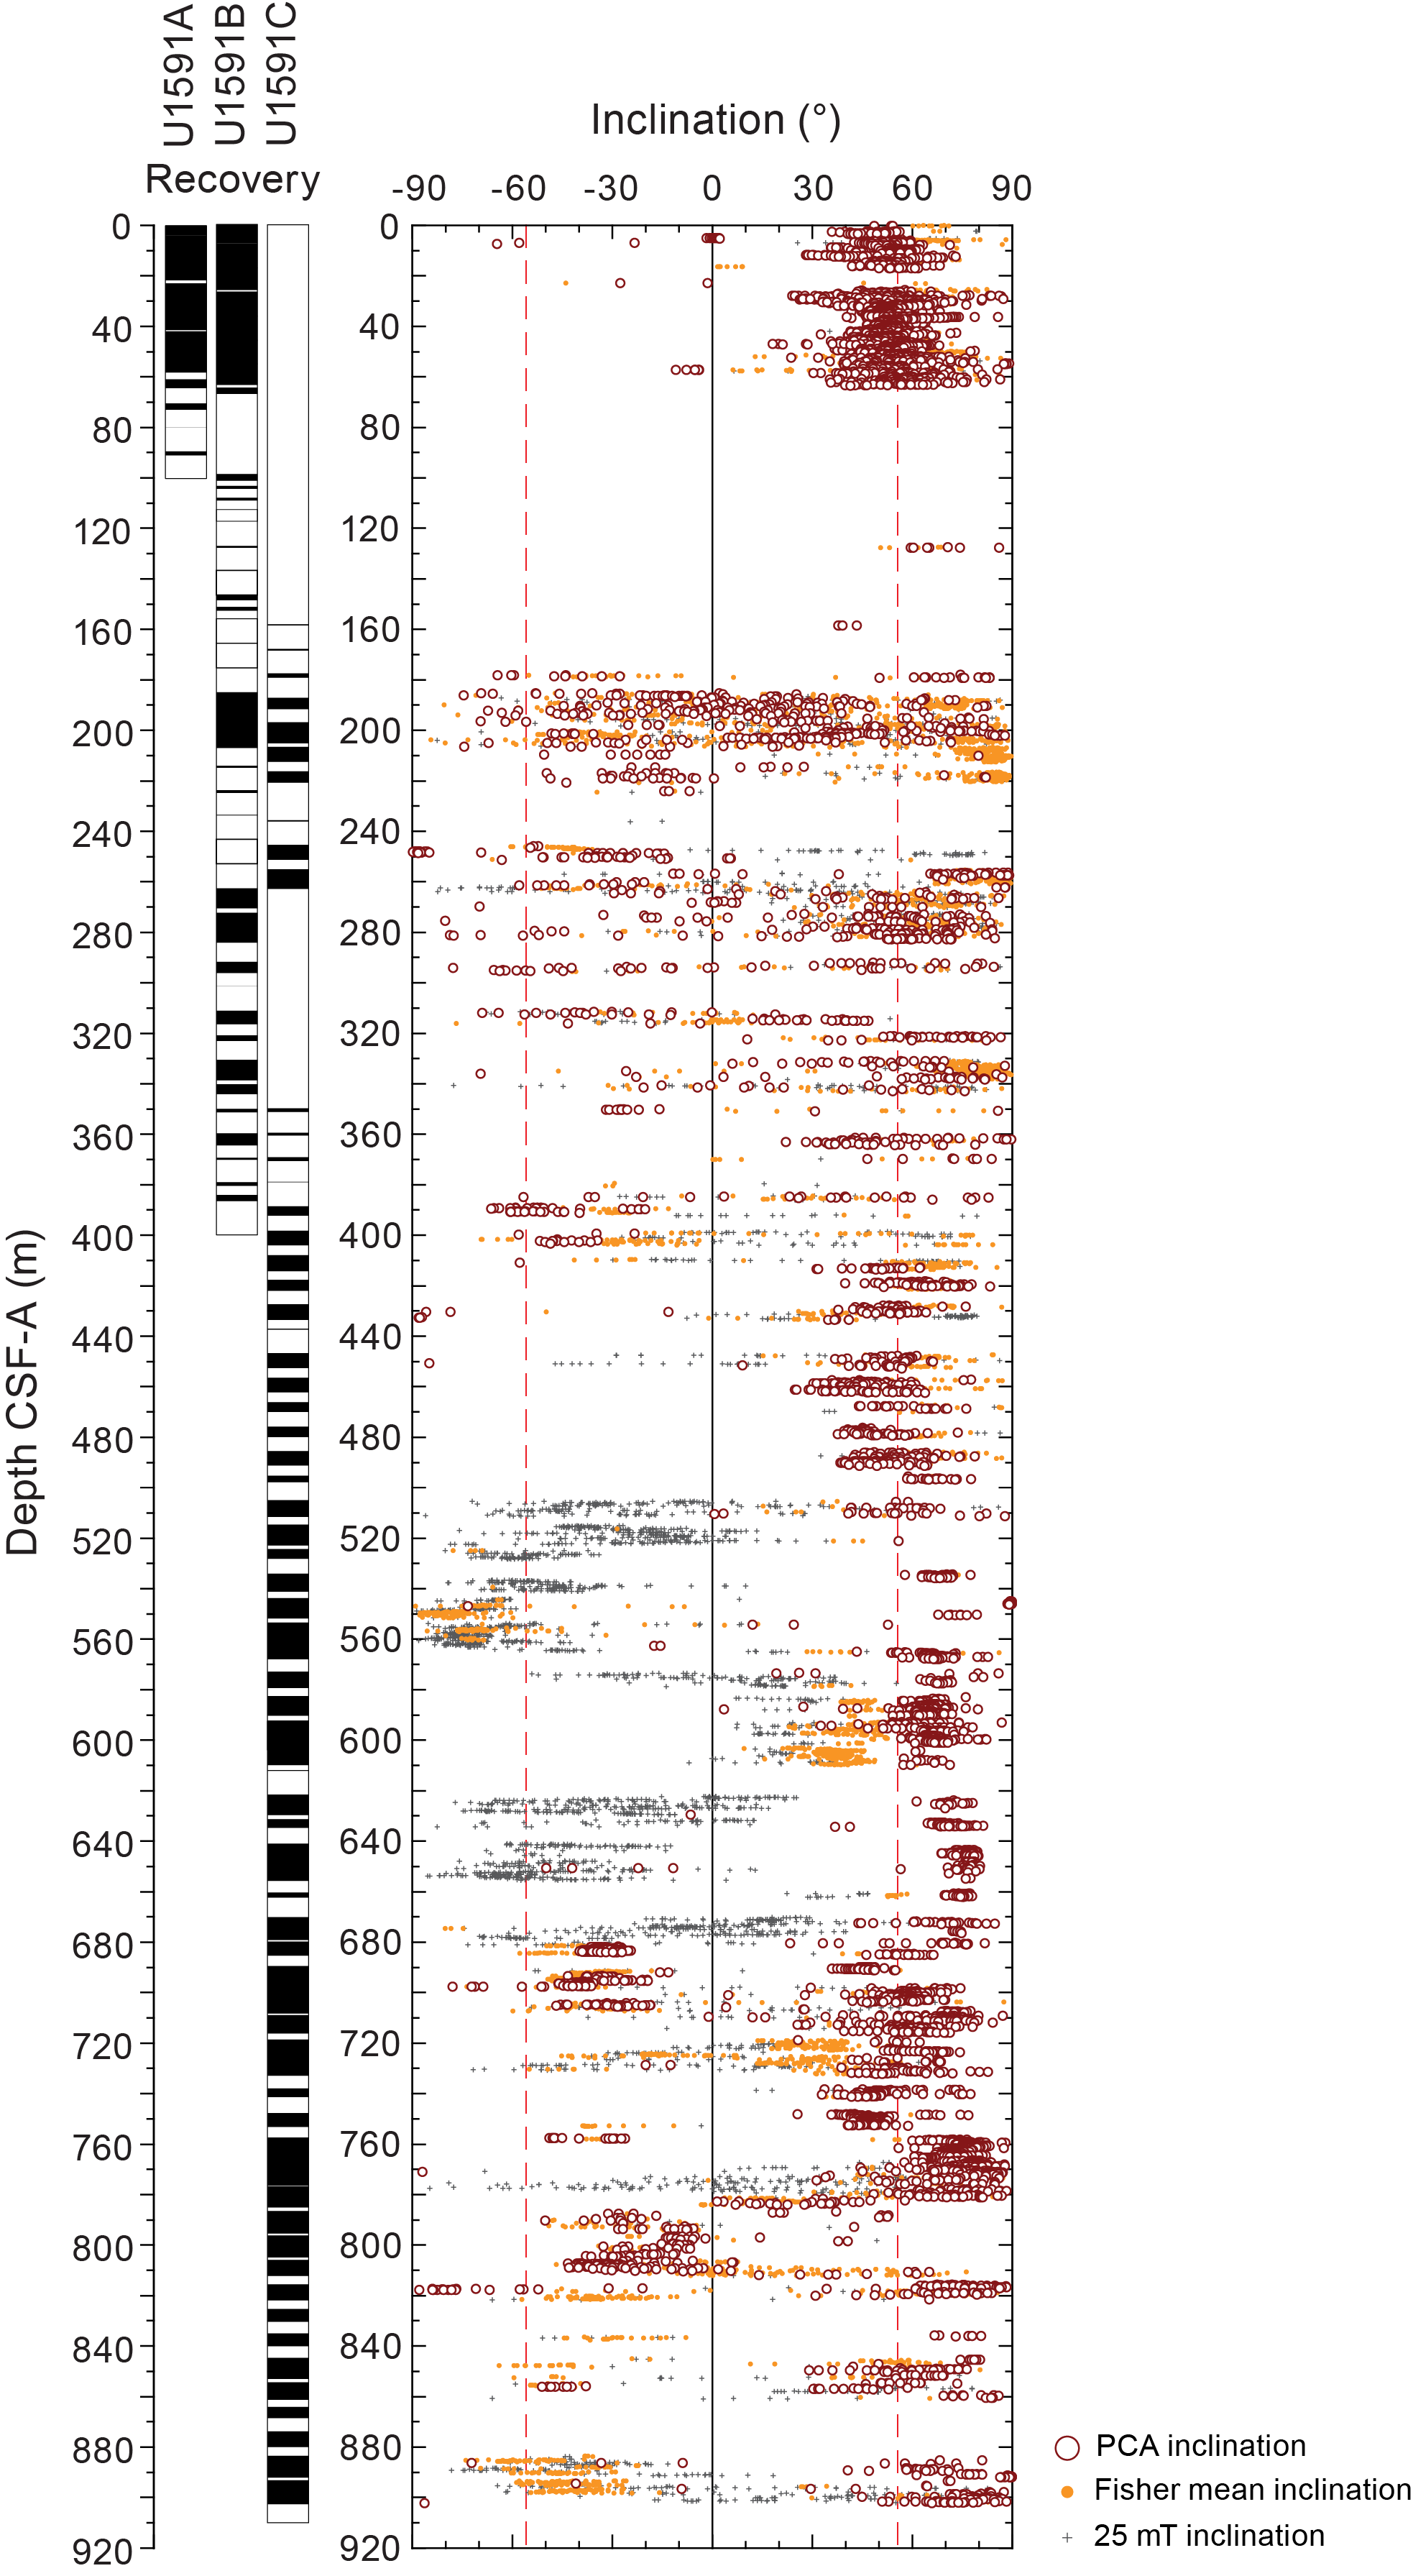
Figure F38. Magnetic inclinations.
Inclinations at 185–480 mbsf vary widely and are considered unreliable for magnetostratigraphic interpretation. This interval is biostratigraphically dated to 1.28–2.51 Ma (see Biostratigraphy), spanning Chrons C1r.3r–C2r.2r, where the geomagnetic field had a reversed polarity apart from two short normal subchrons at 1.775–1.934 Ma (C2n) and 2.120–2.155 Ma (C2r.1n) (Gradstein et al., 2020). The presence of samples with both normal and reversed polarity with no systematic distribution in this interval therefore suggests that the record is affected by variable diagenetic alteration and the growth of new magnetic mineral assemblages (see Paleomagnetism in the Site U1589 chapter [Druitt et al., 2024]).
Inclinations in the interval 480–770 mbsf show systematic variations with depth that define eight clear reversals that may be correlated with confidence to the geomagnetic polarity timescale (Gradstein et al., 2020) on the basis of both archive-half section and discrete sample data. Inclination data for this interval are shown in detail in Figures F39 and F40, and examples of both archive-half section and discrete sample demagnetization data across these reversal events are shown in Figure F41. A downhole change from reversed to normal polarity at 564.8 mbsf (Figure F39) lies between biostratigraphic markers for 2.80 and 3.19 Ma and must therefore represent the base of Chron C2An.1r at 3.116 Ma (see Biostratigraphy). The remaining seven clear reversals (Figure F40) occur below a biostratigraphic marker for 3.98 Ma and are tied to the bases of Chrons C2Ar–C3n.3r (see Biostratigraphy). The assignment of interval 707.2–753.0 mbsf (Cores 398-U1591C-52R to 55R) to Chron C3n.3n (Figure F40) implies a period of very rapid deposition (45.8 m in 97 ka). An additional four tentative correlations may also be made (flagged by question marks in Figures F39, F40) but should not be used in the age model for the site.
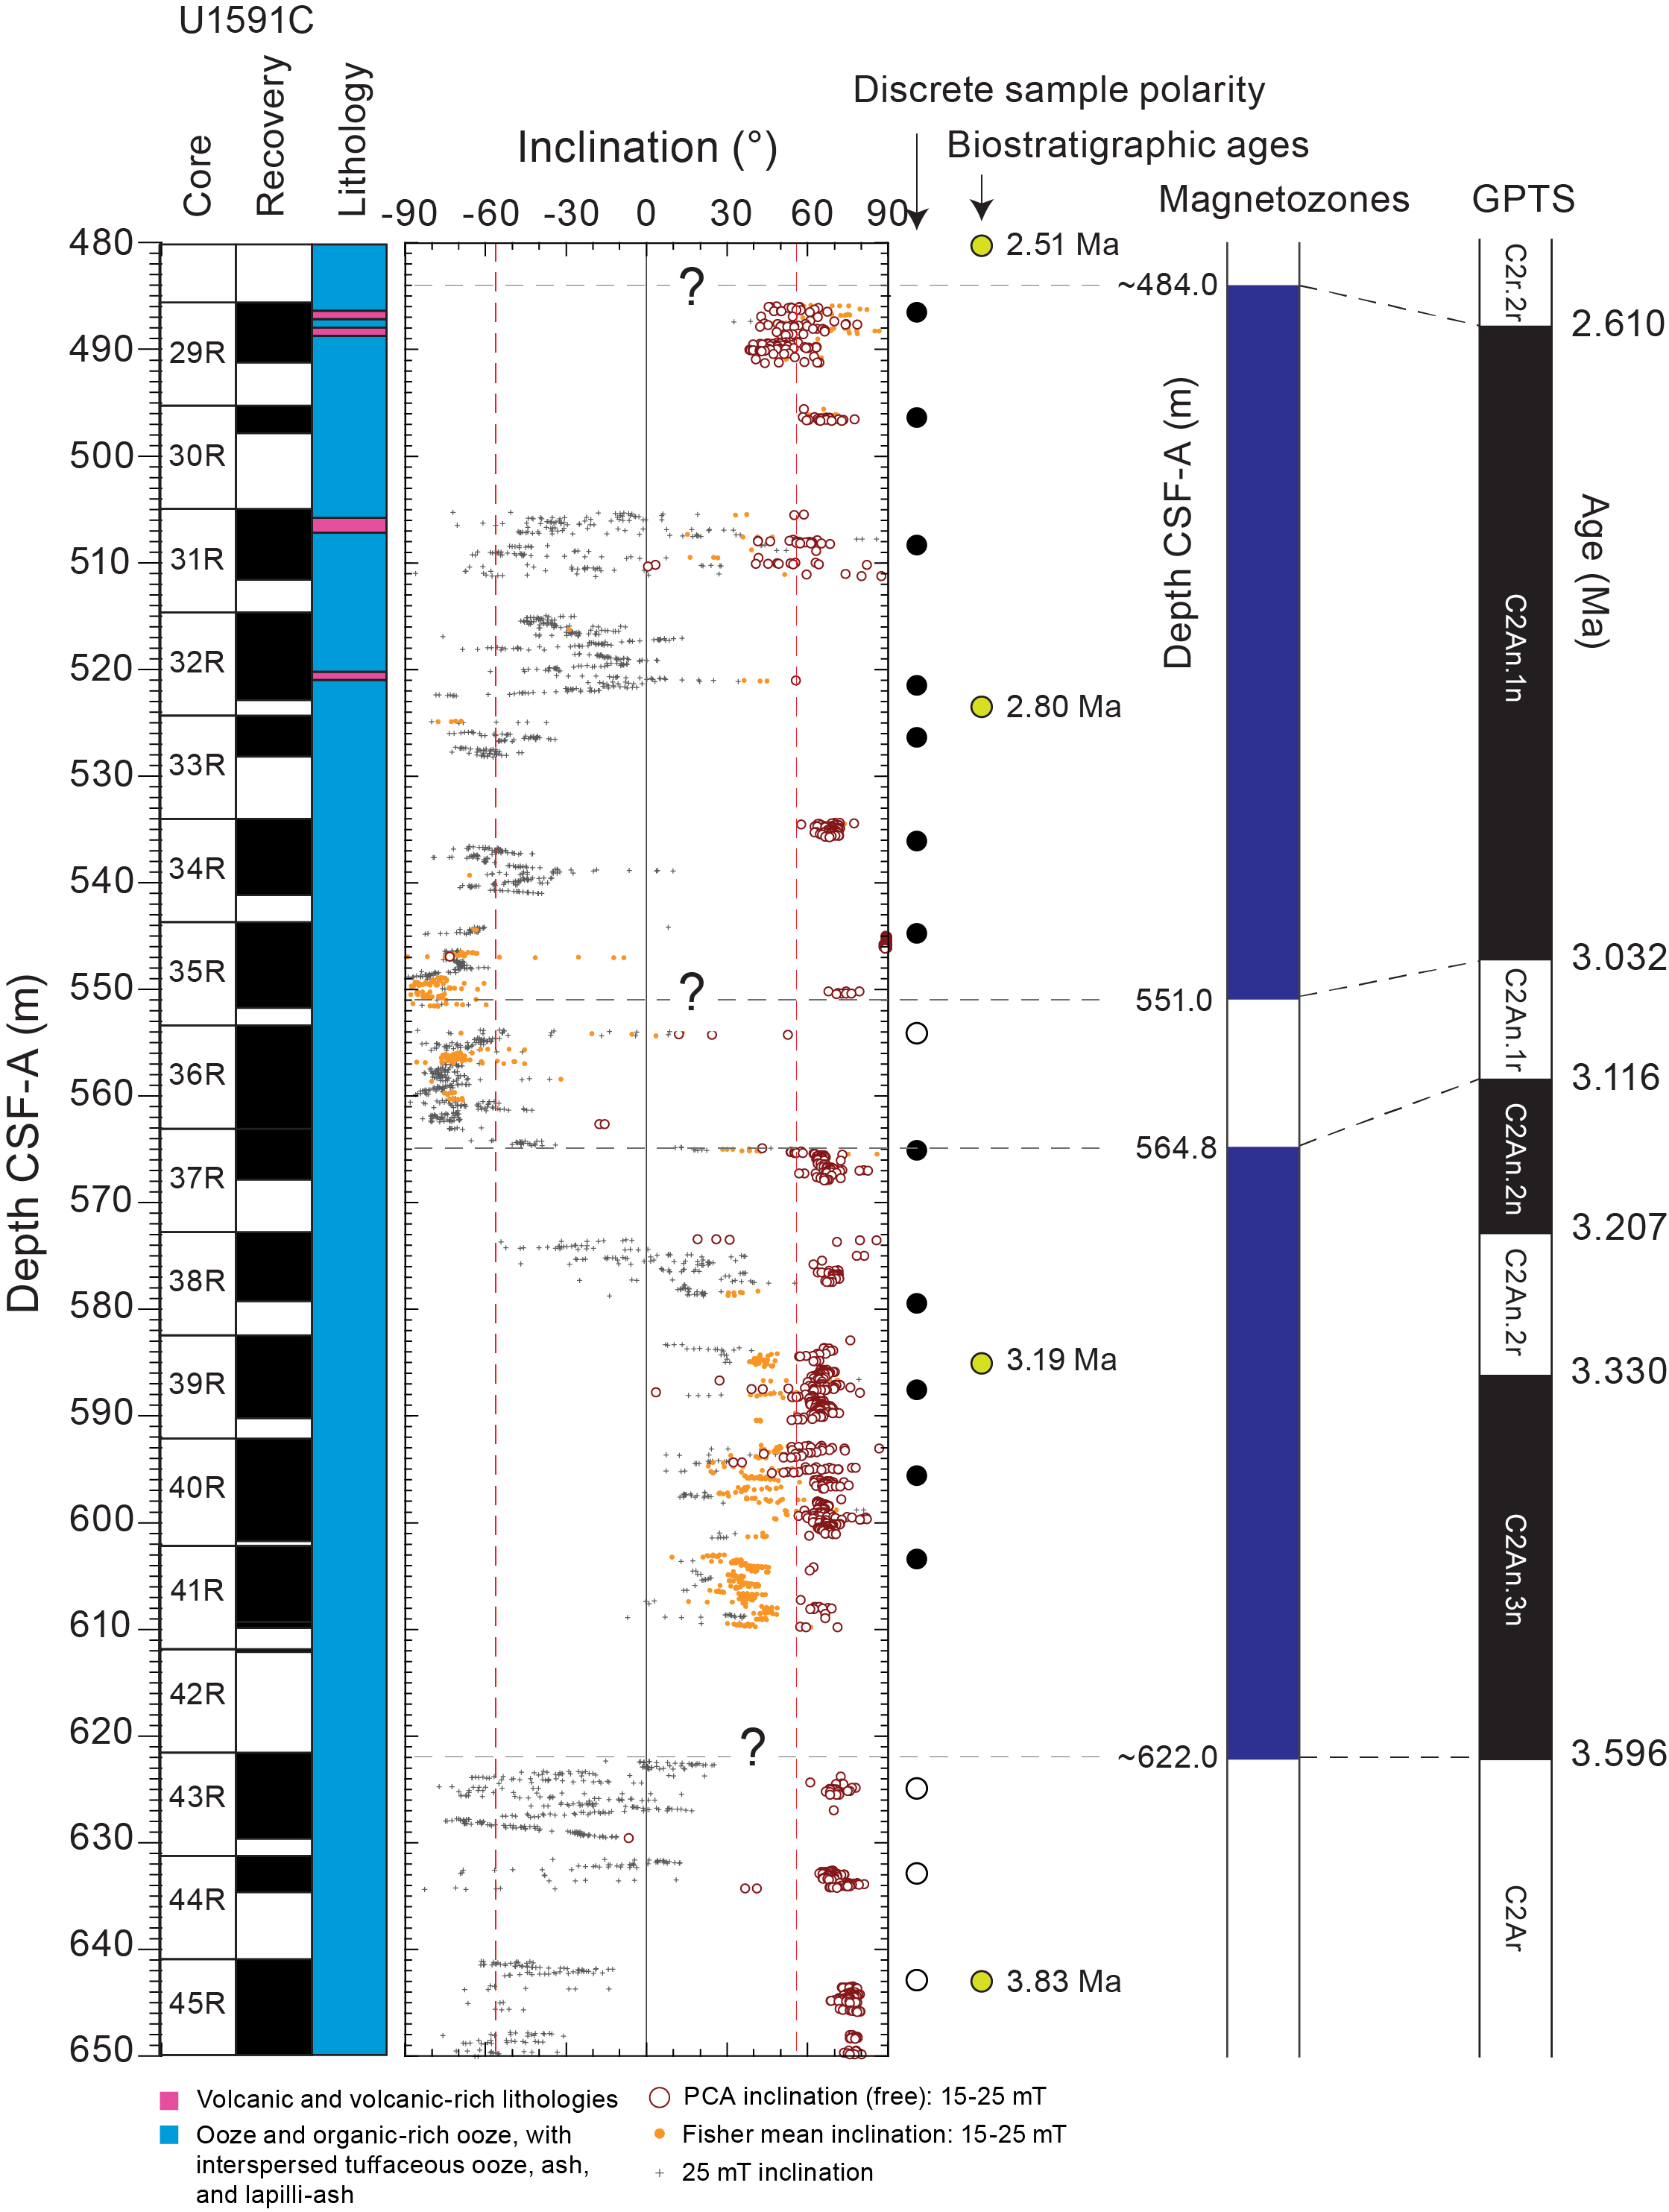
Figure F39. Magnetic inclinations, 480–650 mbsf.
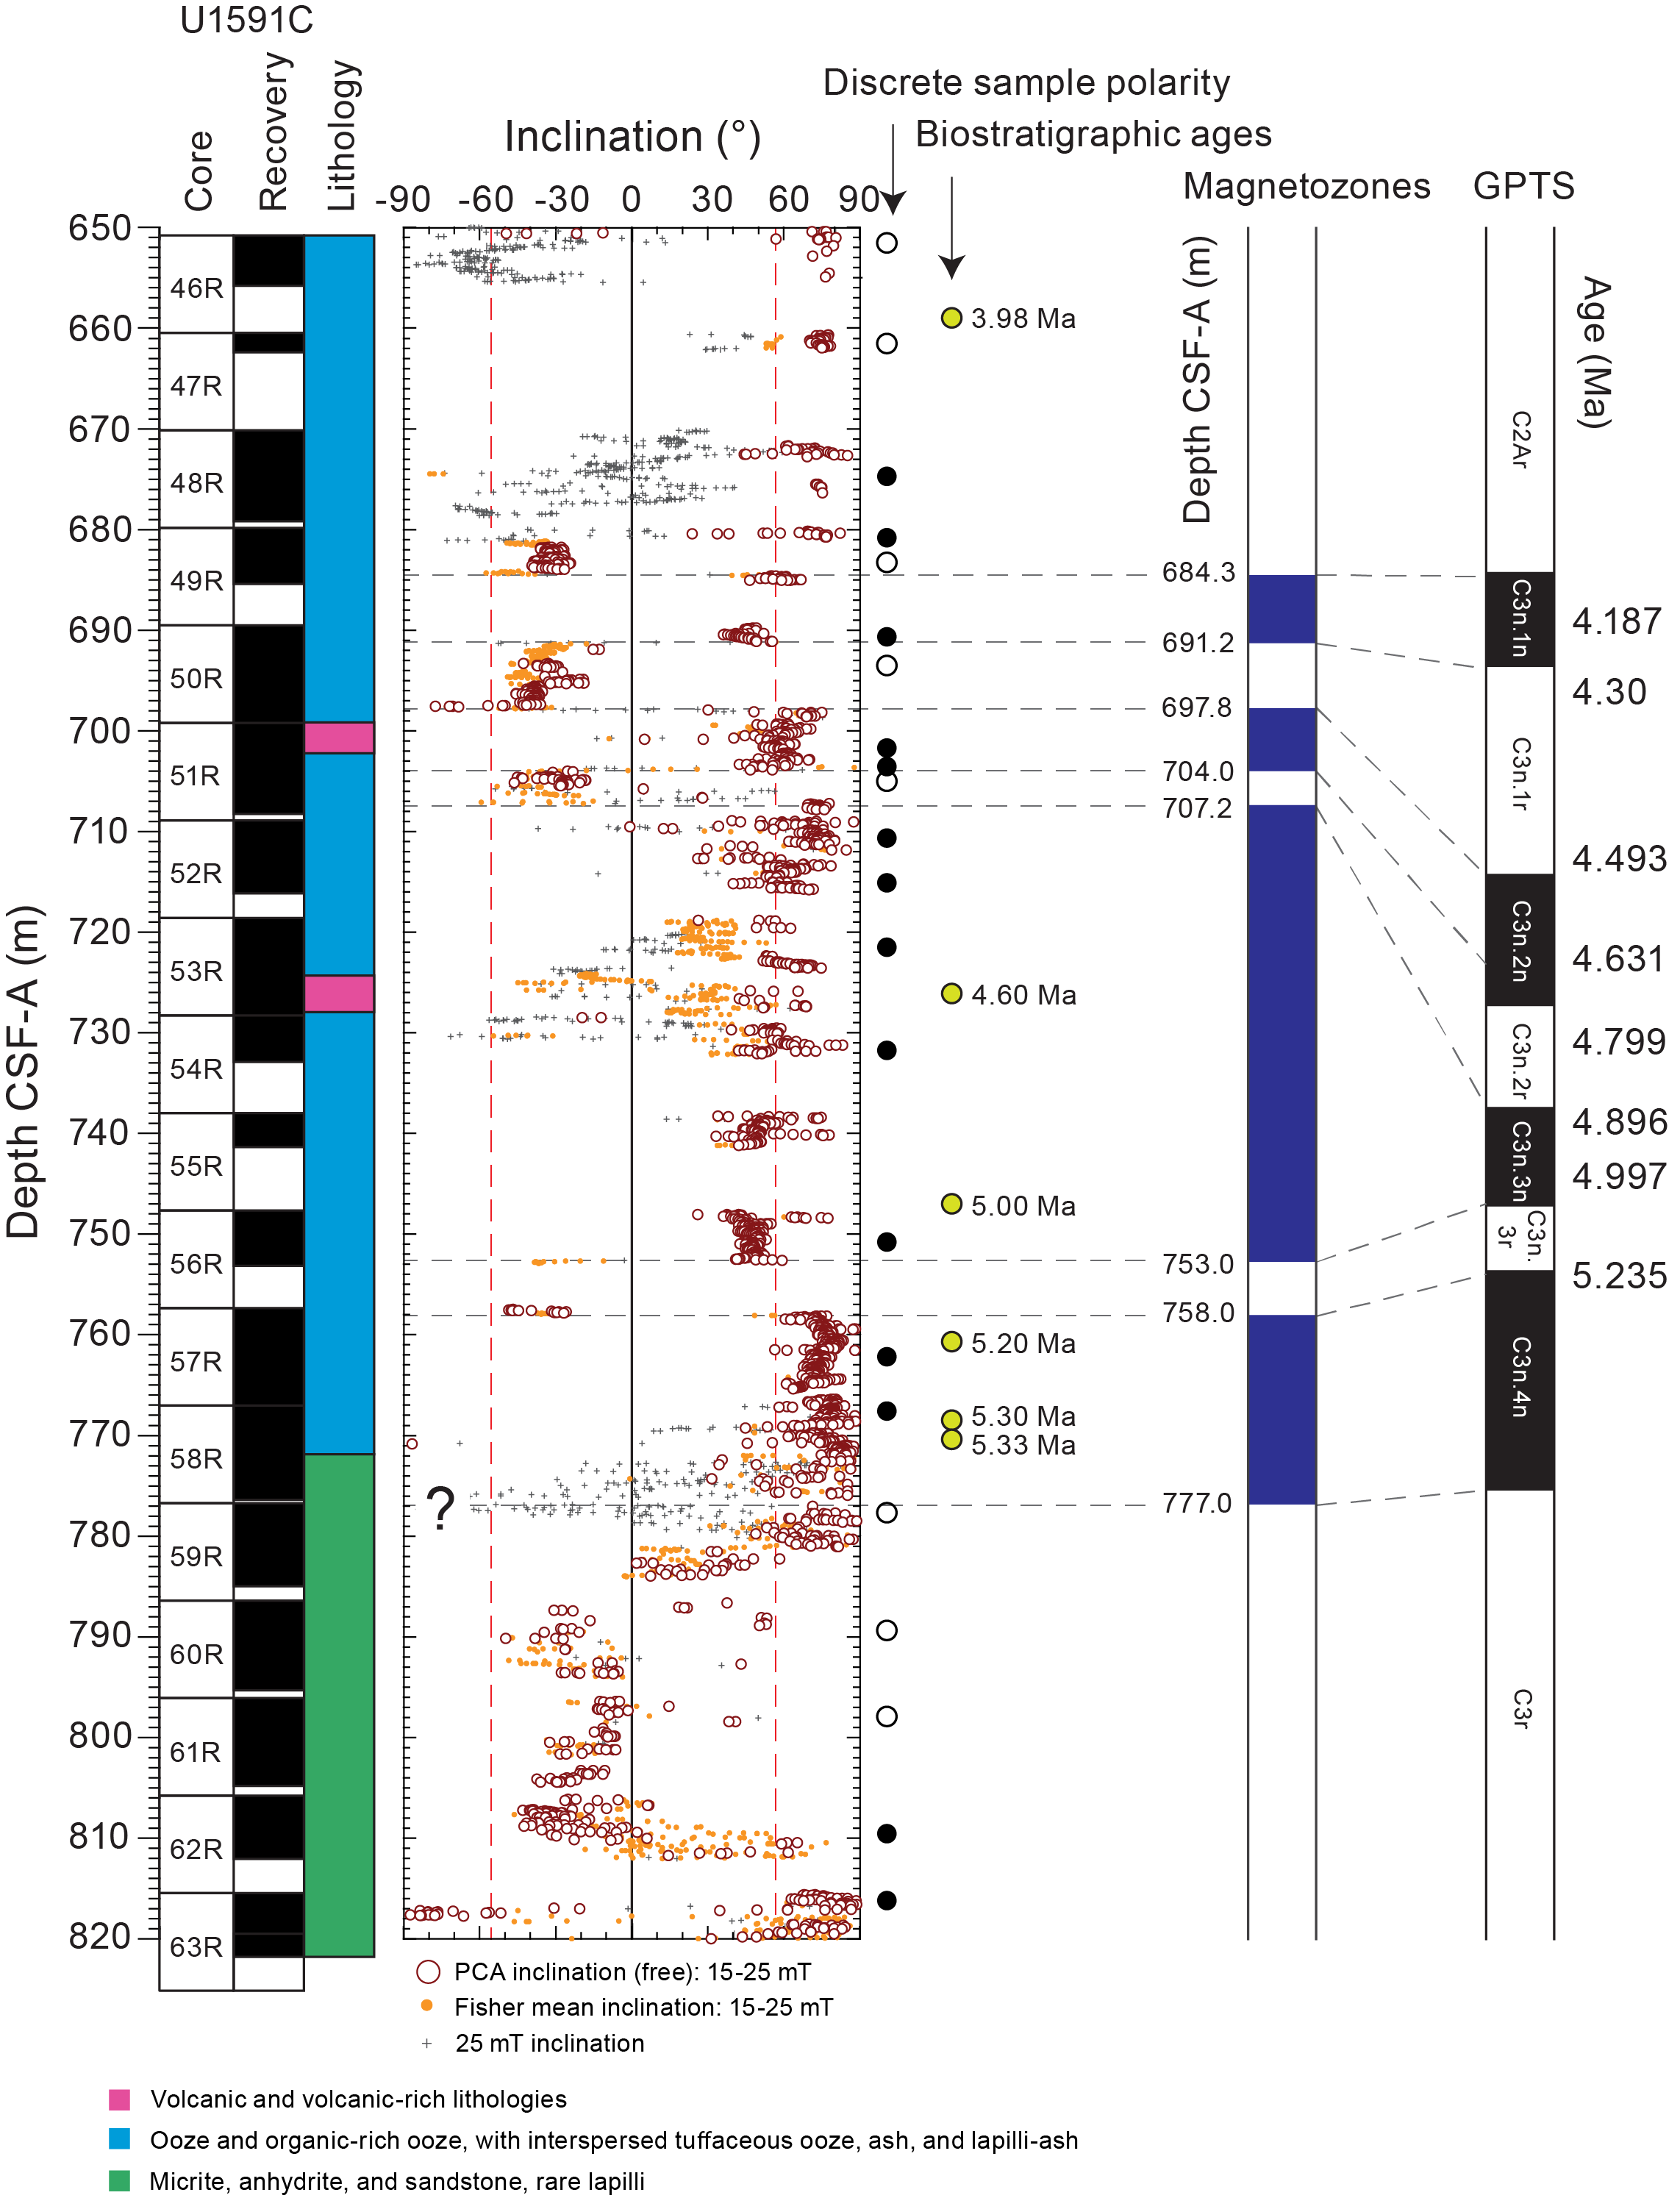
Figure F40. Magnetic inclinations, 650–820 mbsf.
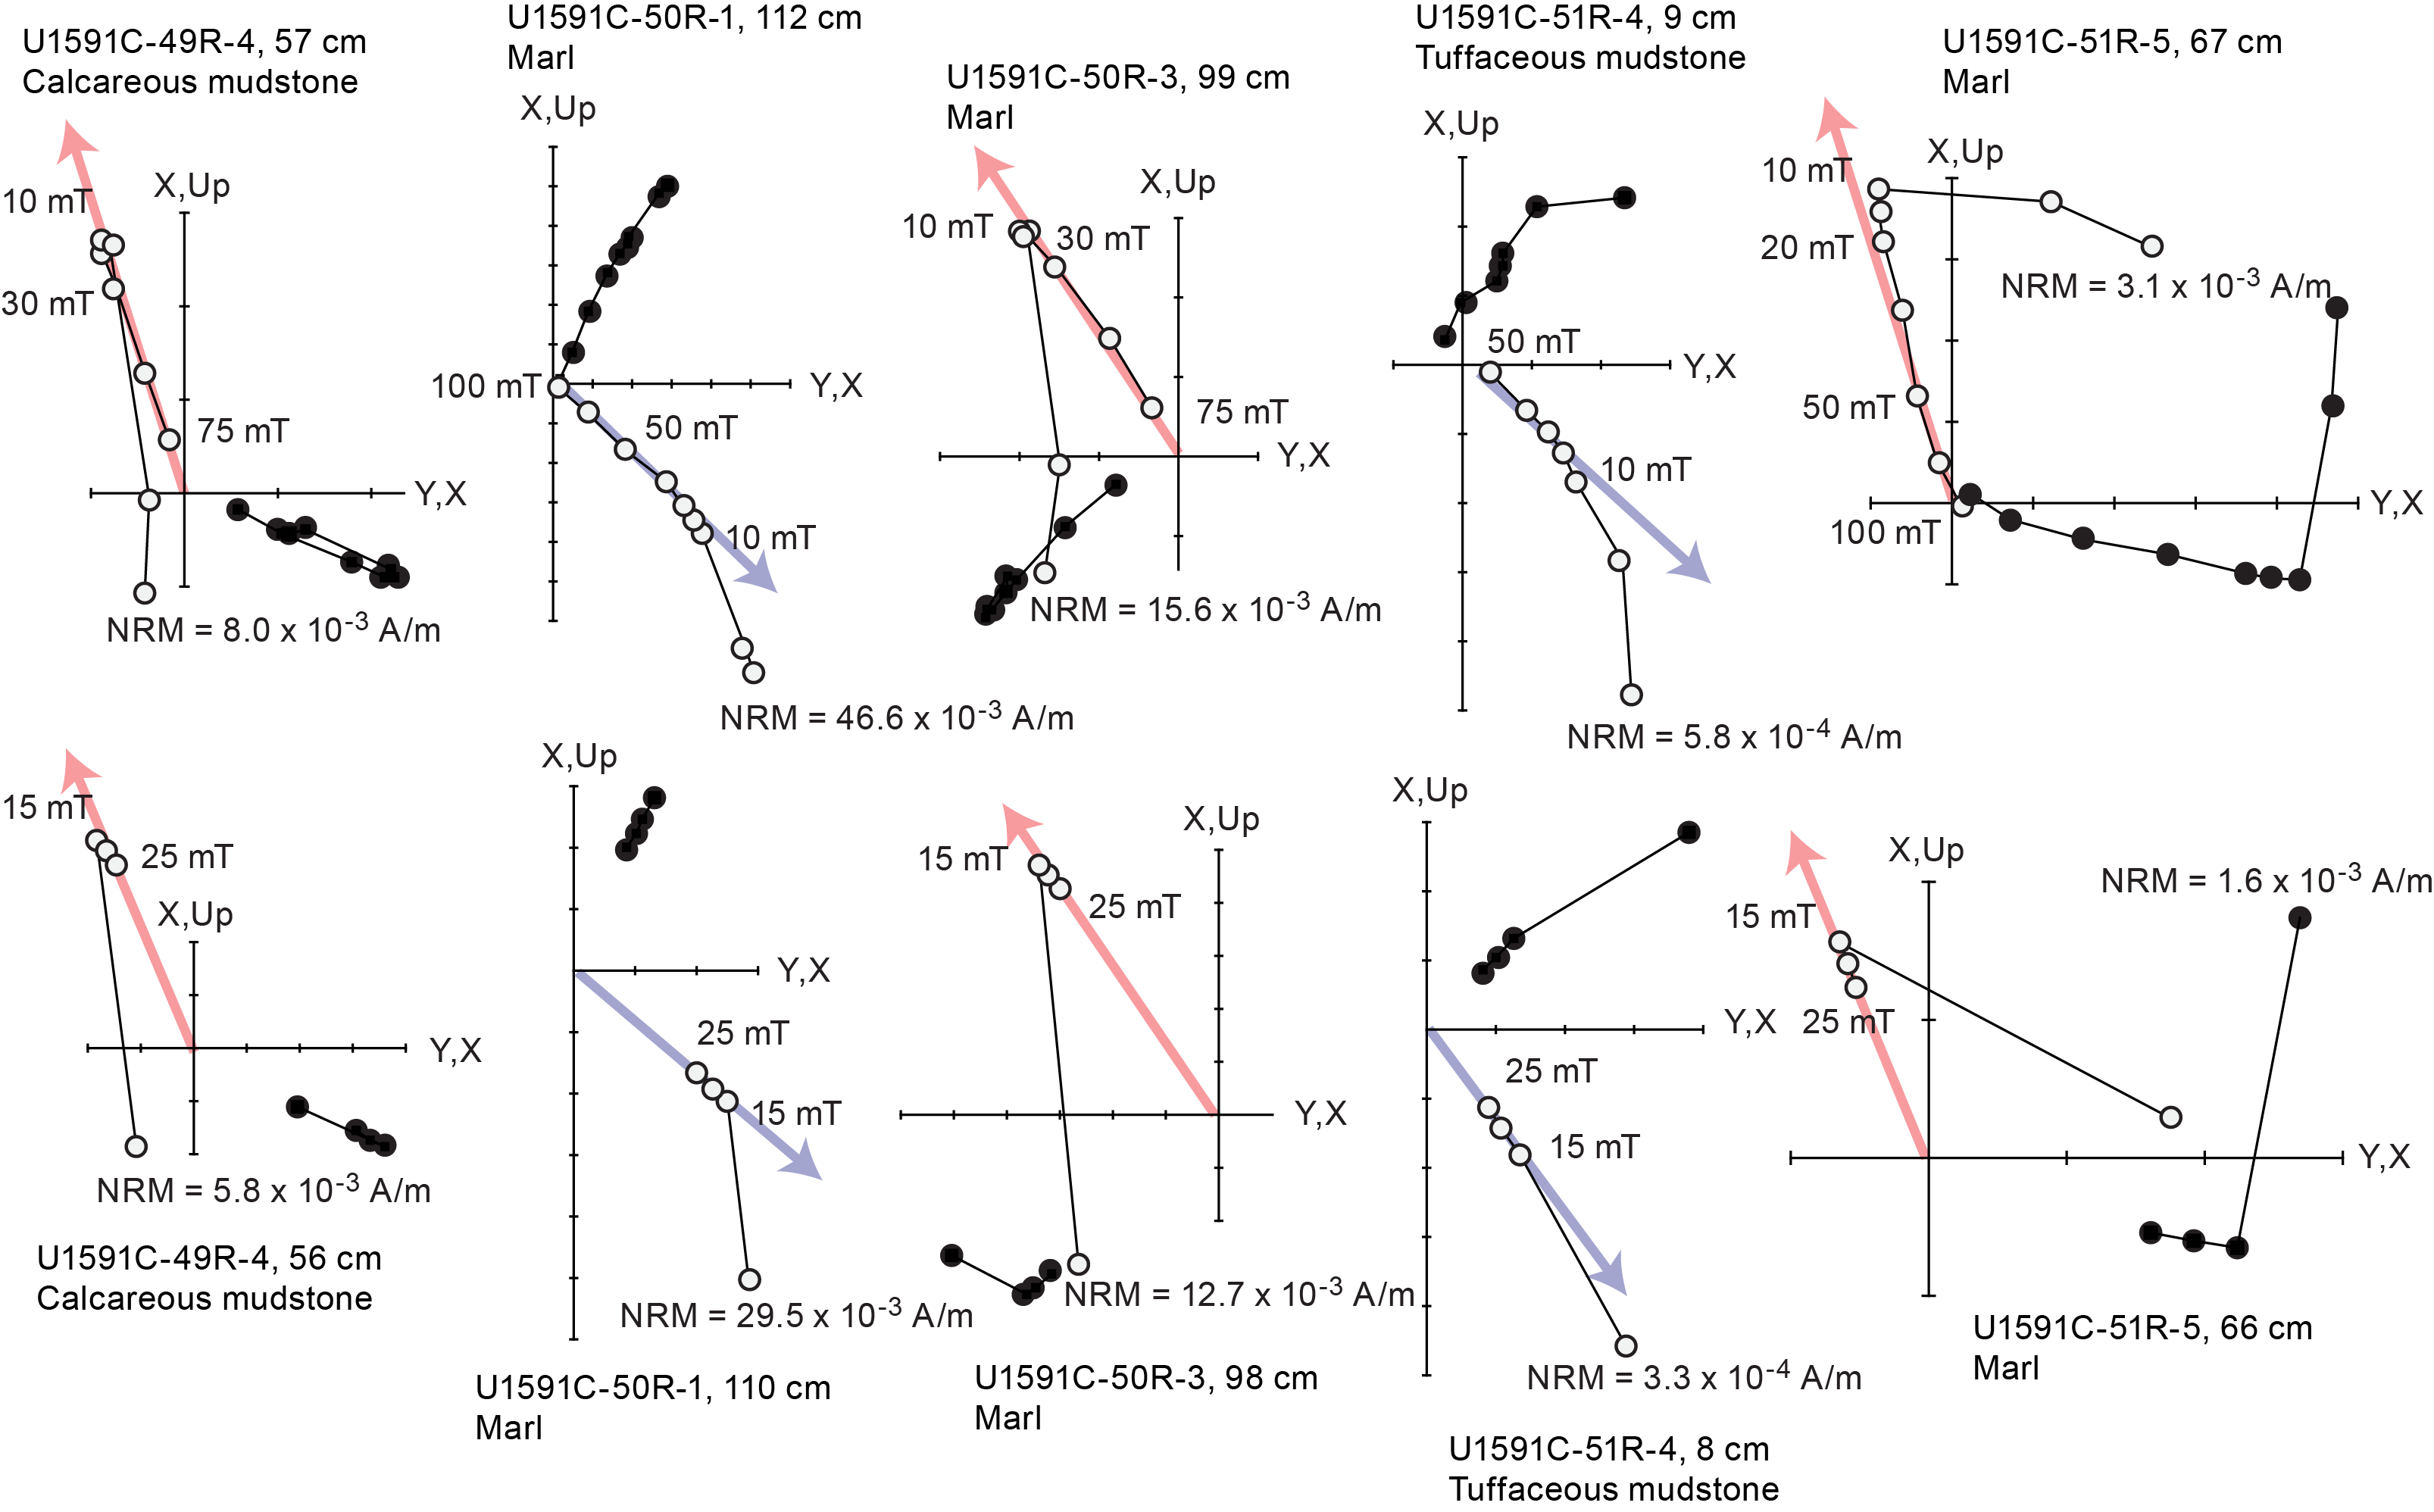
Figure F41. AF demagnetization.
The Messinian evaporite sequence sampled below 771 mbsf shows large variations in inclination estimates including several intervals with positive PCA inclinations that are steeper than the expected value at this site and some intervals with negative Fisher mean inclinations. These variations in apparent polarity are not considered reliable for magnetostratigraphic purposes, however, because the well-established age of the Messinian evaporites (5.96–5.33 Ma; Krijgsman et al., 2007) falls entirely within reversed Chron C3r (Gradstein et al., 2020).
7.4. Anisotropy of low-field magnetic susceptibility
Anisotropy of magnetic susceptibility was measured on 106 discrete samples from Site U1591 (Figure F42). The distribution of the majority of sample minimum principal susceptibility (kmin) axes is subvertical with subhorizontal girdle distributions of intermediate (kint) and maximum (kmax) axes. Corrected anisotropy degrees, PJ, reach maximum values of 1.14 (i.e., 14% anisotropy), but the majority of samples have moderate anisotropies of ~1.01–1.06. Shape parameters are mainly positive, indicating dominance of oblate anisotropy ellipsoids. These distributions are characteristic of primary depositional fabrics with kmin principal axes oriented normal to bedding.
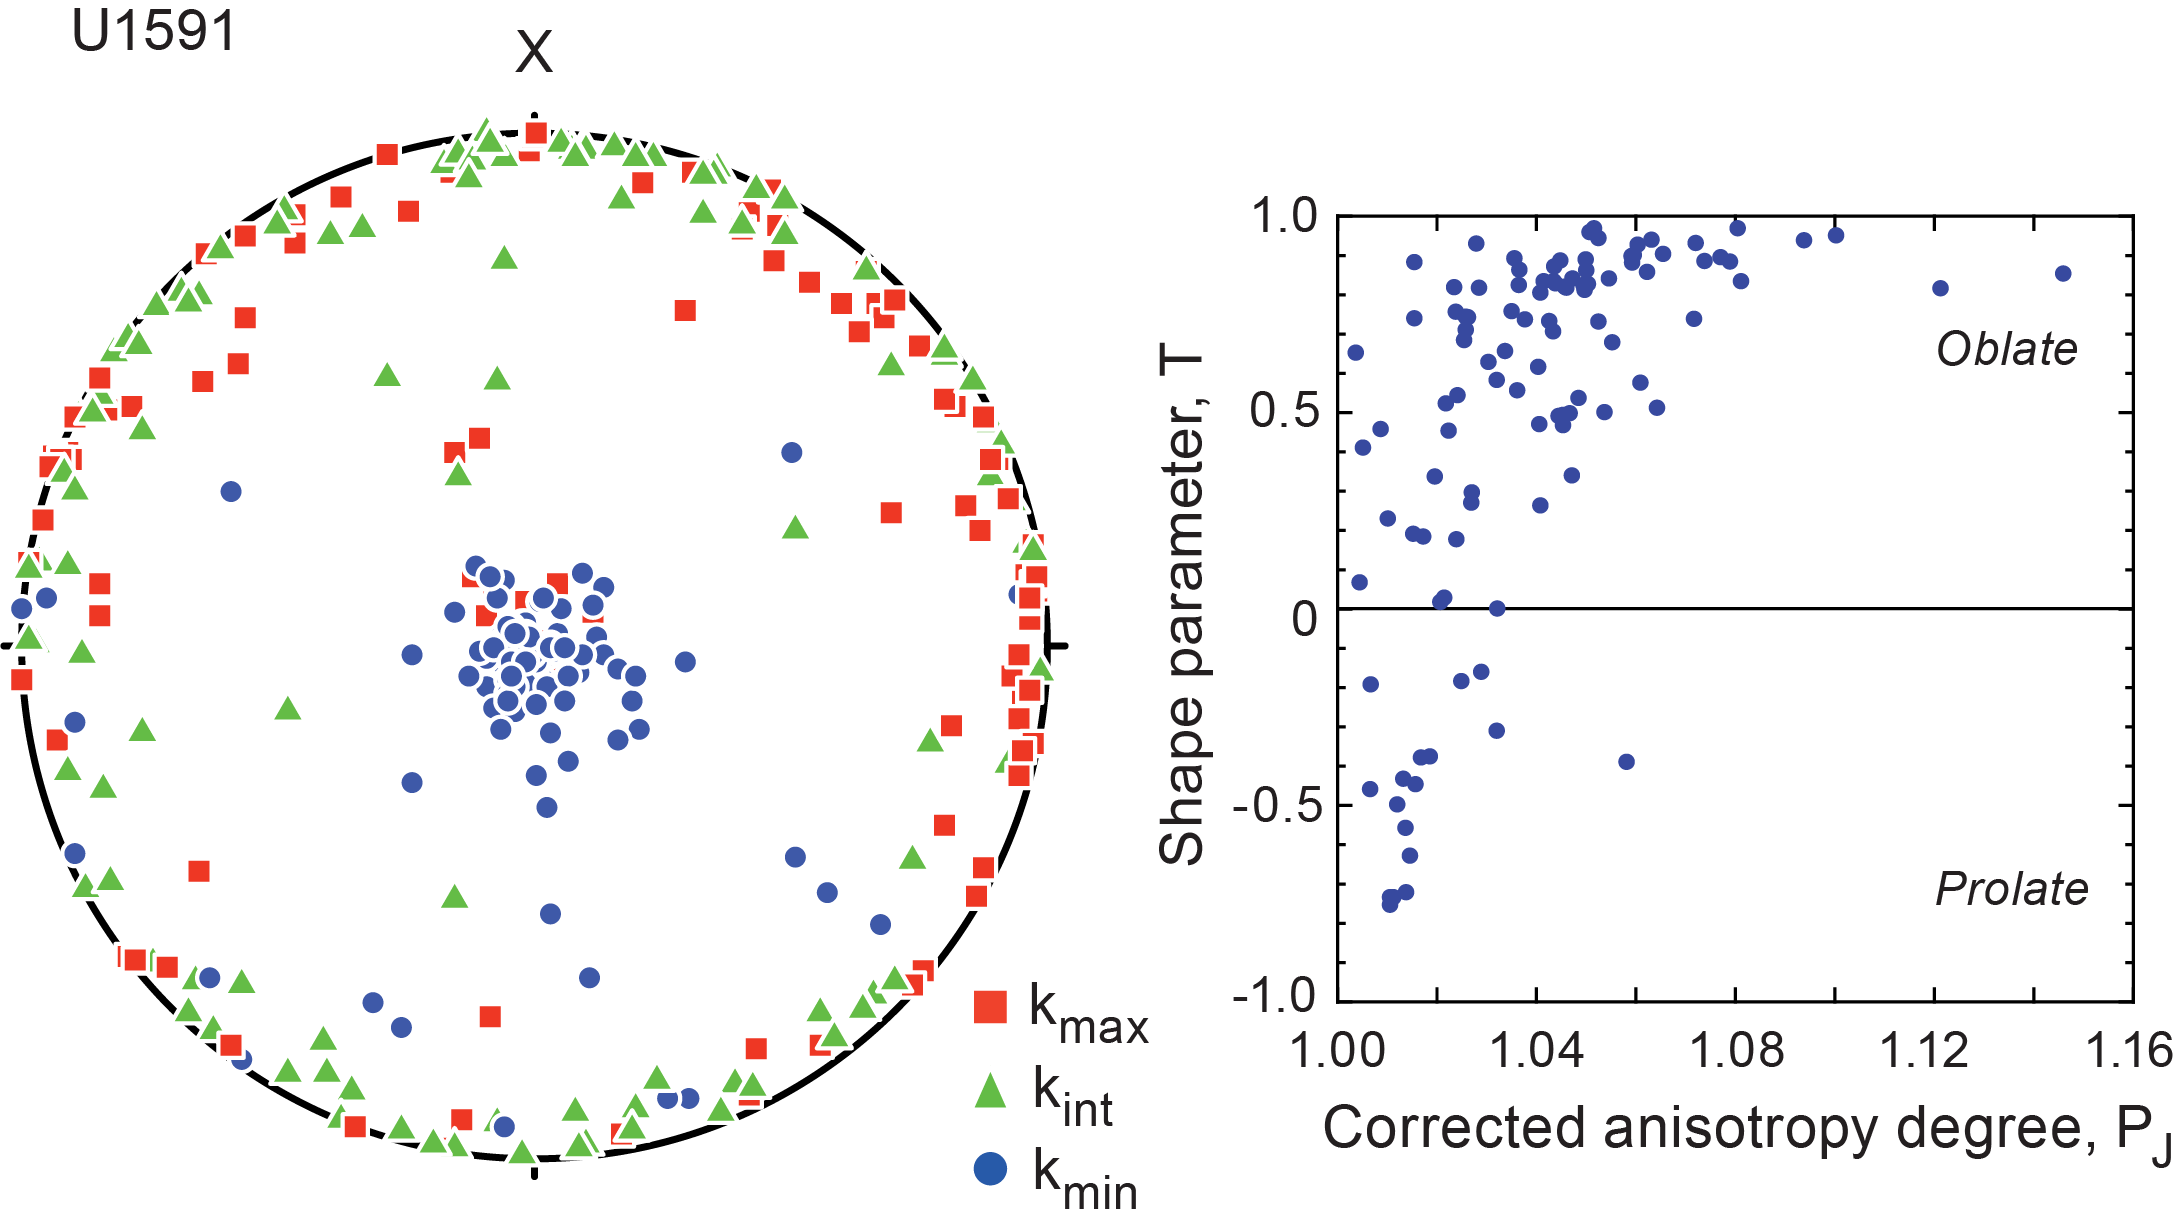
Figure F42. Discrete sample anisotropy.
8. Physical properties
Physical properties at Site U1591 correlate with lithology. Thick volcaniclastic layers in Lithostratigraphic Unit I (ash, lapilli-ash, and lapilli) sometimes have low grain densities (<2.0 g/cm3) in coarse, pumice-rich subunits. Volcaniclastic deposits also exhibit large variations in MS and often have high MS compared to other sediments at this site. High-MS anomalies are most abundant and largest in amplitude at depths shallower than 490 mbsf (downhole through Core 398-U1591C-29R). Unit II, which is dominated by nannofossil-rich oozes, often displays cyclic variations in NGR that correlate with organic-rich layers. The anhydrite layers of Unit III have much higher P-wave velocity, thermal conductivity, and bulk density and lower NGR than the surrounding sediments.
8.1. Whole-round GRA density, MS, P-wave velocity, and NGR
Figure F43 summarizes data collected on whole-round cores measured using the GRA densitometer, MS loop, and P-wave logger on the WRMSL and NGR. There are a few possible systematic sources of error in these data that should be considered when interpreting absolute values and trends.
- Redistribution of unconsolidated volcaniclastic materials in core liners during coring and on the core retrieving platform can lead to sorting by particle size and density and hence changes in physical properties.
- During XCB and RCB coring, recovered cores can contain cracks and void space around the cored materials that lower the values of all physical property measurements made on whole-round cores.
- Whole-round measurements in sections that match discrete measured values on split cores are thus most reliable. Note that whole-round P-wave velocity data were not collected for RCB cores because the cored materials do not fill the core liner.
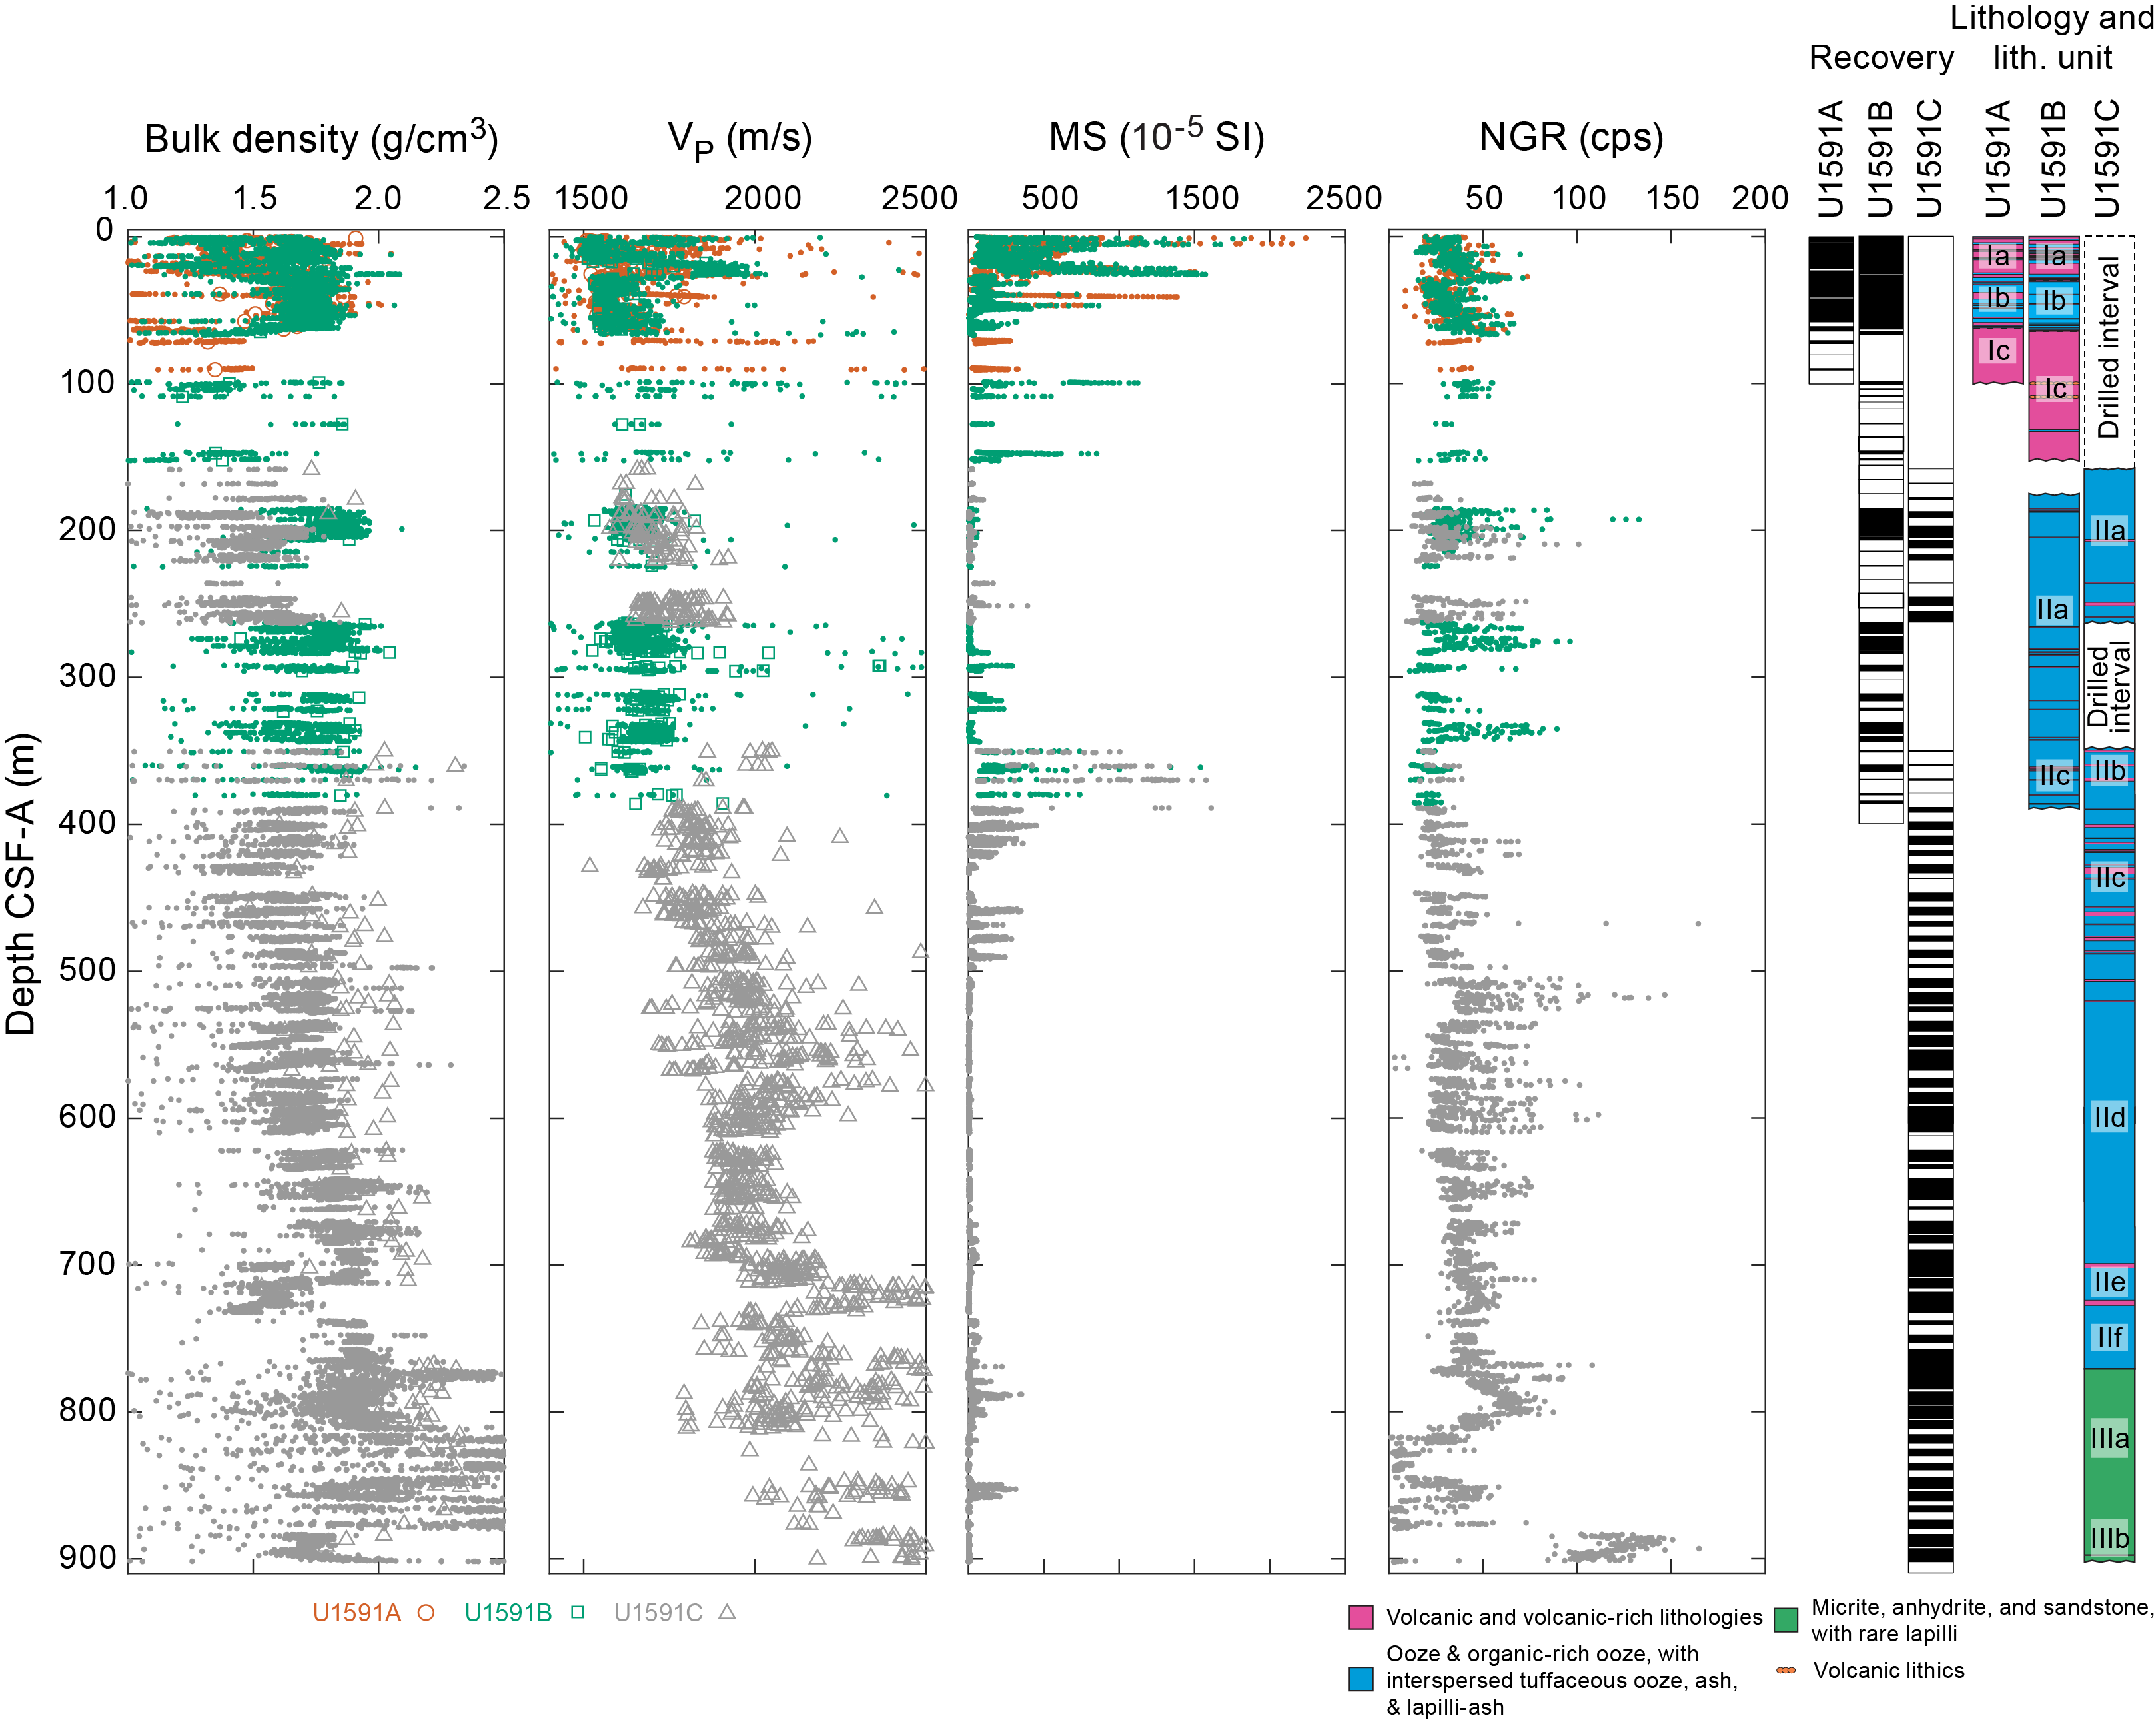
Figure F43. Physical properties.
MS variability is high in the volcaniclastic deposits at this site. These variations arise from differences in relative abundance of ferromagnetic minerals. For example, volcaniclastic Lithostratigraphic Subunit Ia (see Lithostratigraphy) in the uppermost 30 m has MS values as high as 1000 × 10−5 to 2000 × 10−5 SI and values of ~1500 × 10−5 SI in intervals that contain tuffaceous sand (360–364 mbsf in Hole U1591B) and lithic crystal ash with cobbles (volcanic slump deposit of Subunit IIb Cores 398-U1591C-16R and 17R; 360–370 mbsf). Figure F44 illustrates correlations between lithology and physical properties including MS in Cores 398-U1591B-2H and 3H. Overall, at this site, MS anomalies are most pronounced and occur most abundantly to 490 mbsf (Core 398-U1591C-29R). Large MS peaks occur again in Unit III below 770 mbsf, beginning in Core 58R (Figure F43).
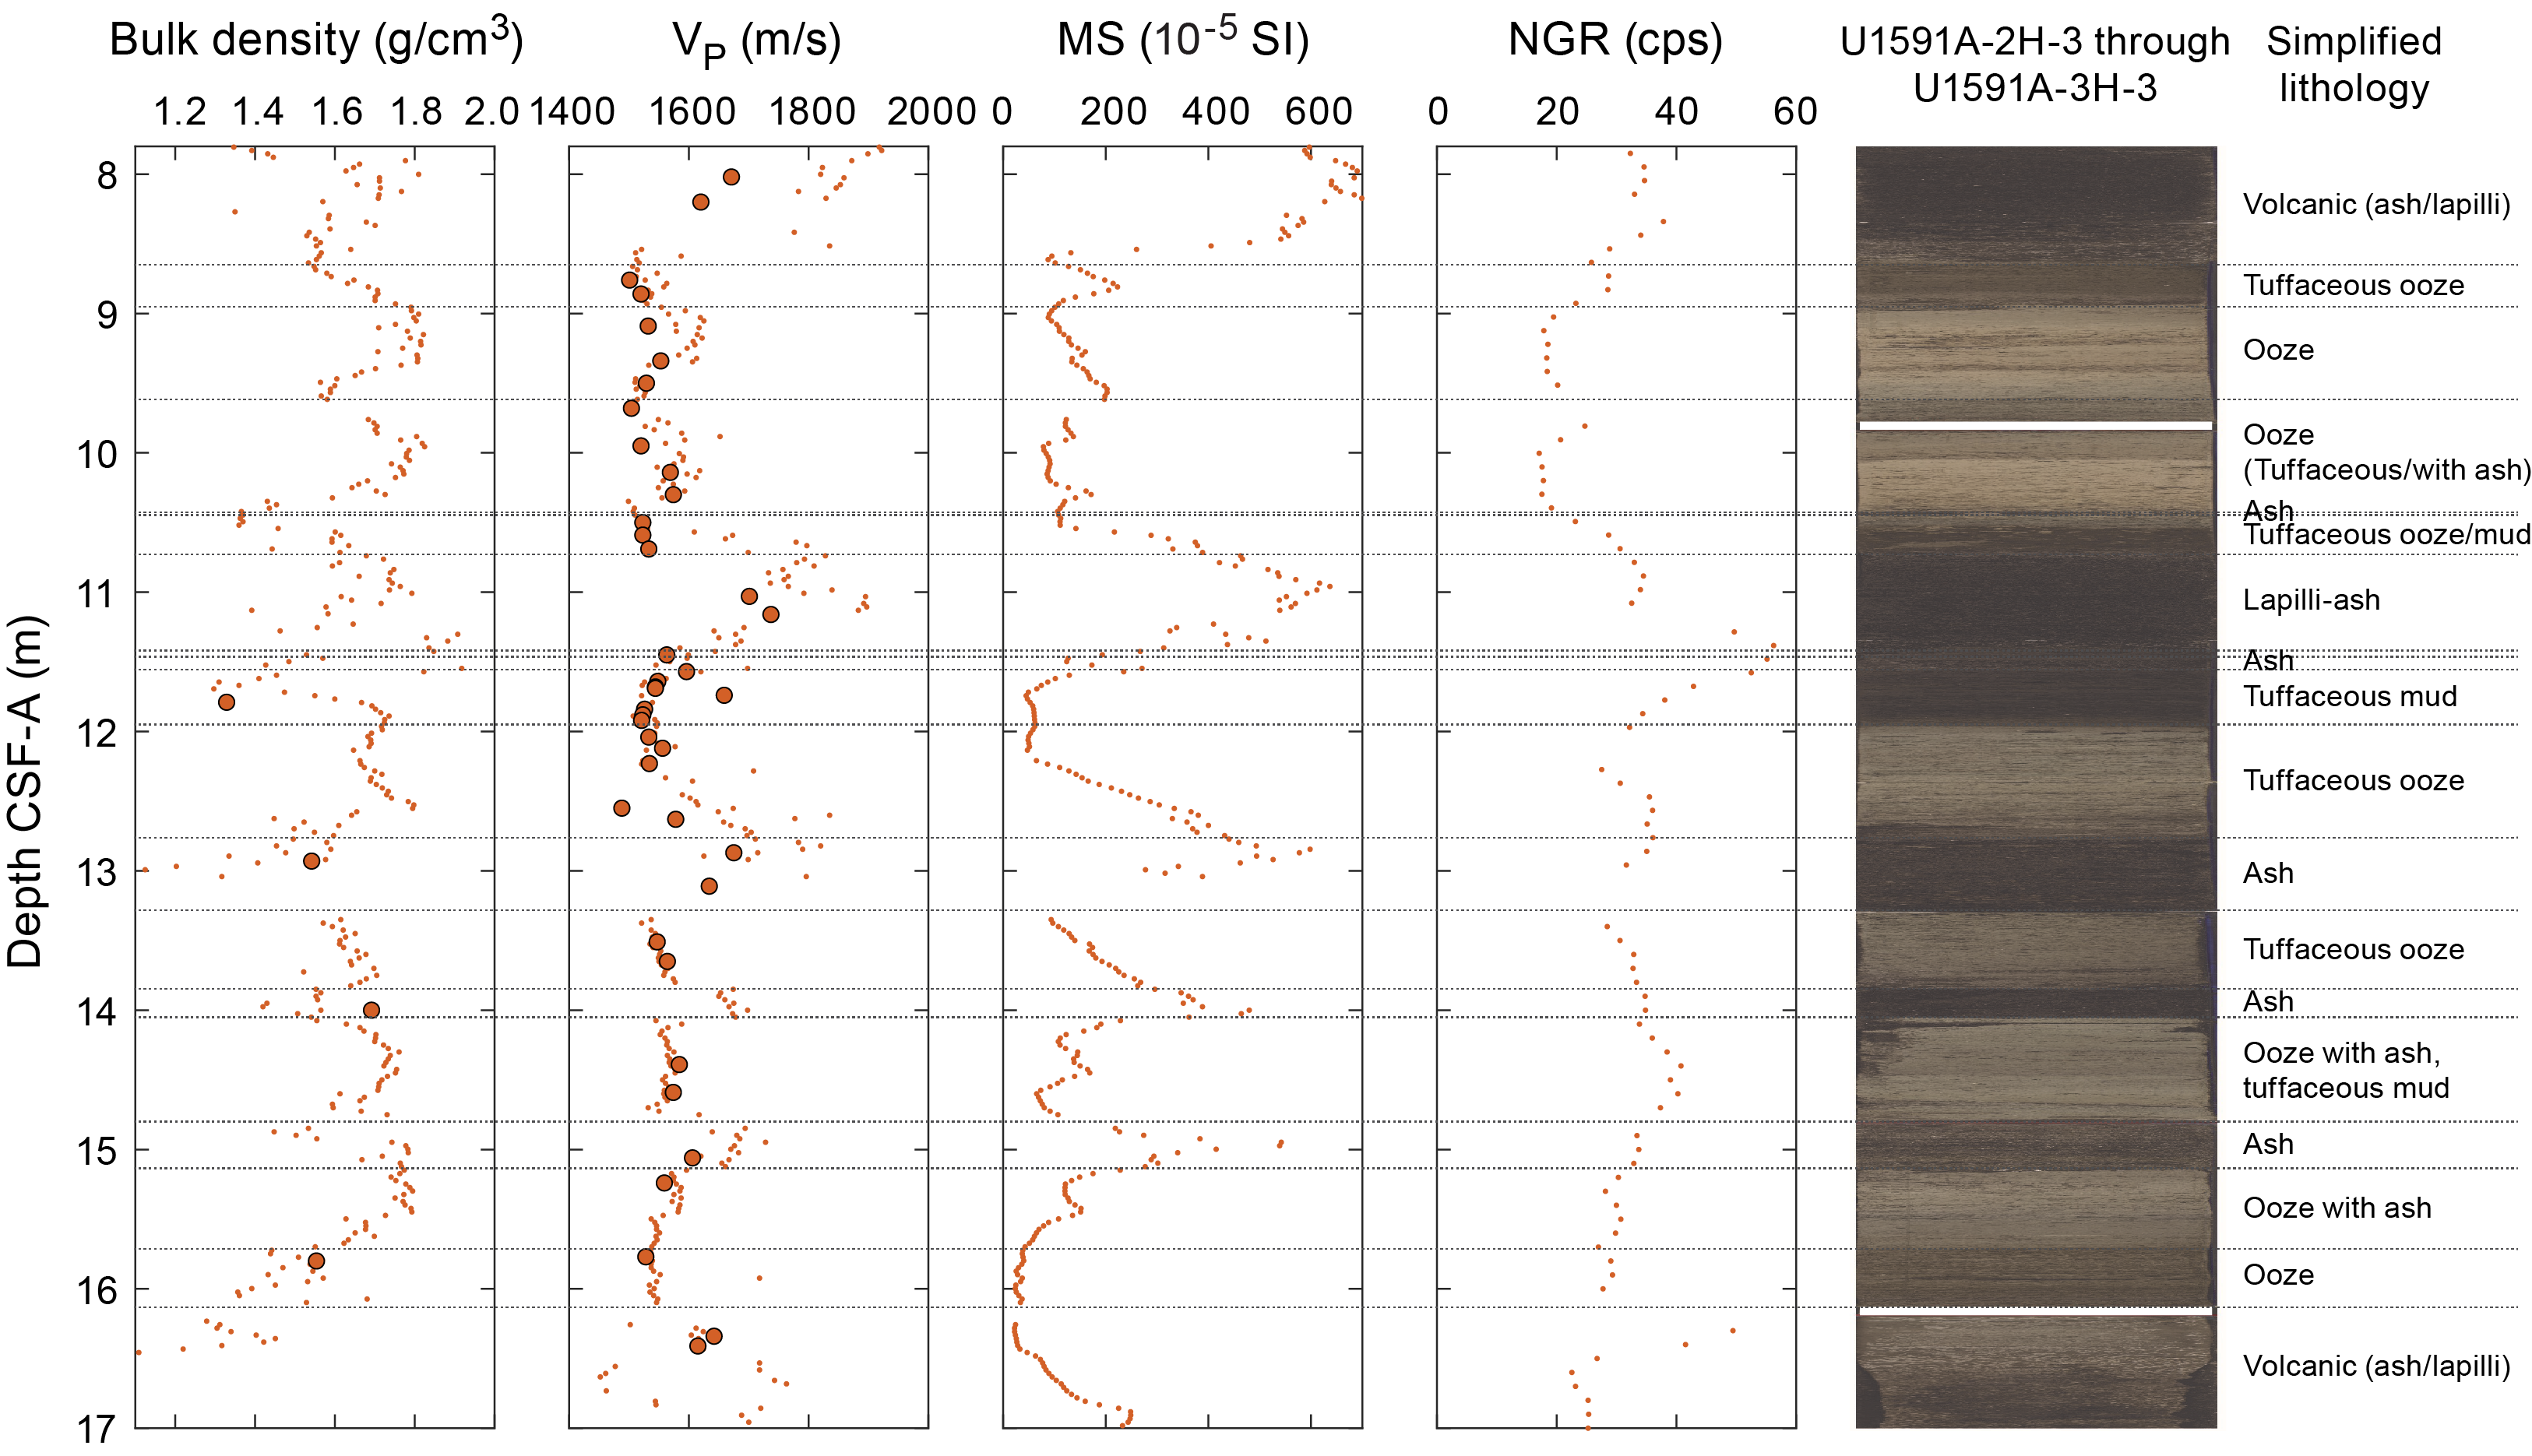
Figure F44. Lithology and physical properties measurements.
NGR measurements on whole-round core sections show (at least qualitatively) cyclic variations that are most clear in Unit II at 400–680 mbsf (Cores 398-U1591C-20R through 48R). Variations are often correlated with the presence of organic-rich lithologies, as shown in Figure F45 (see Lithostratigraphy). NGR measurements on whole-round core sections of Cores 70R and 71R (883–903 mbsf) show distinctive increases in total counts to >150 counts/s from values <40 counts/s at shallower depths (Figure F43).
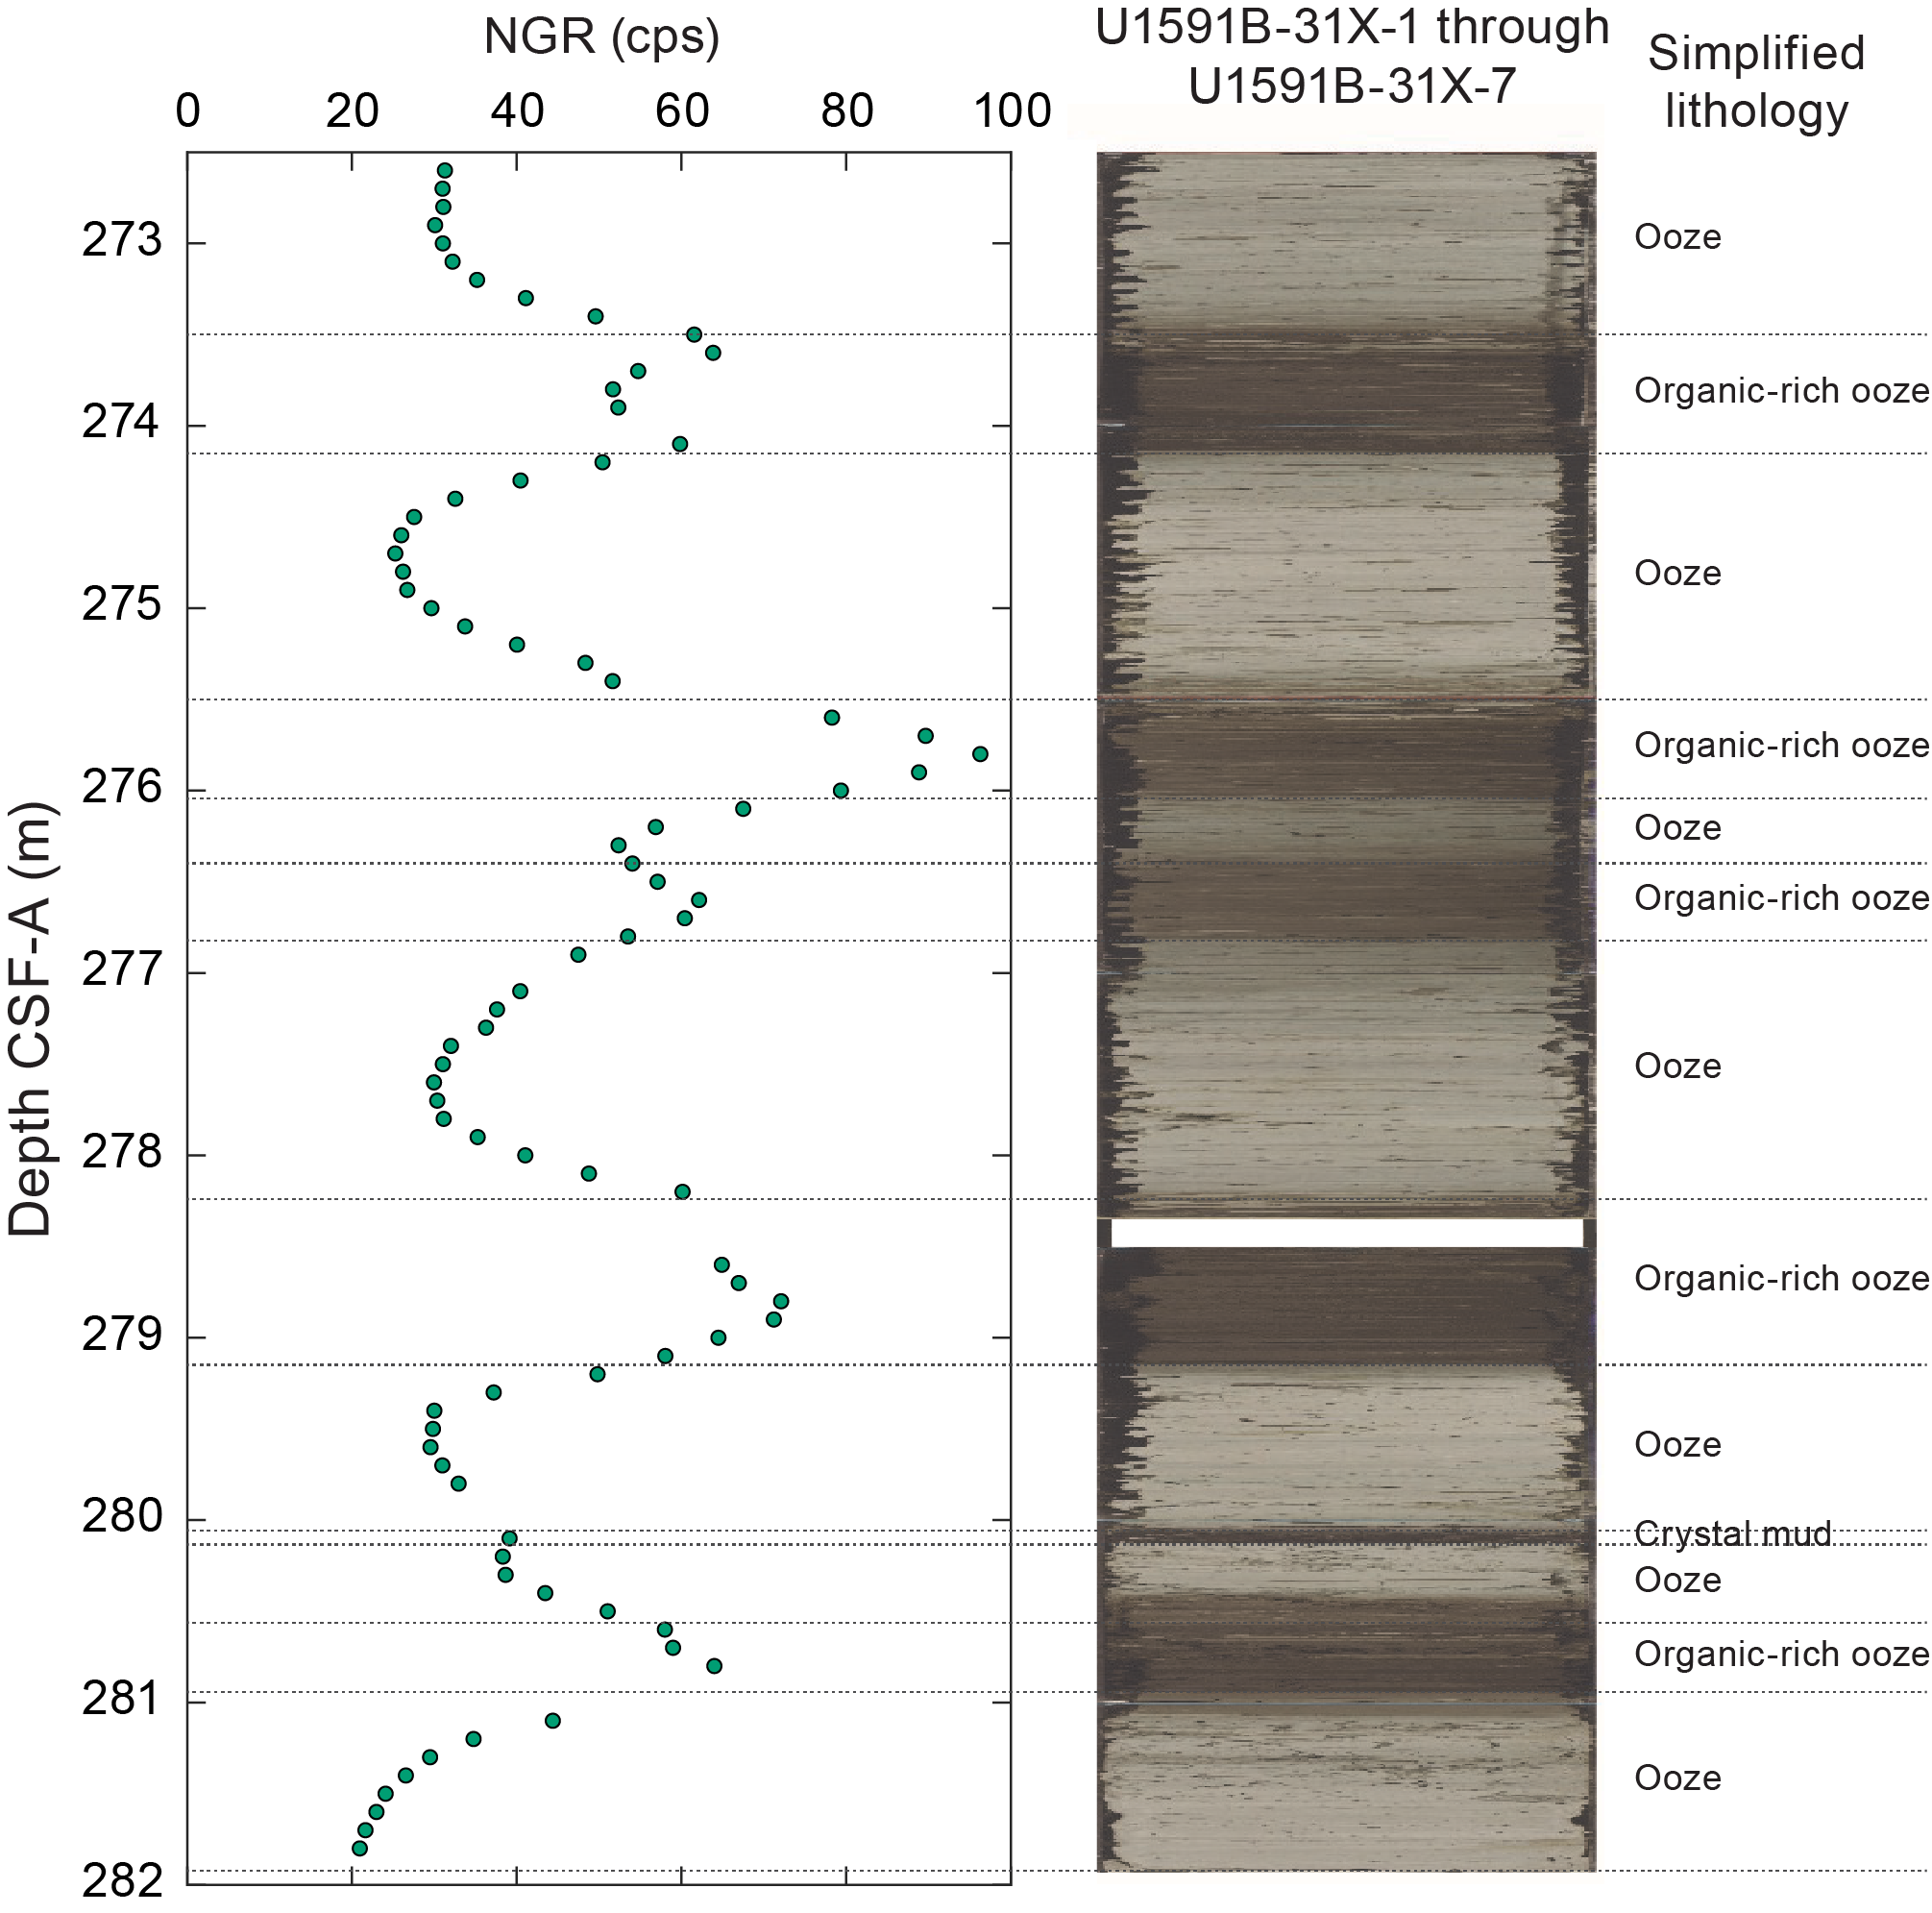
Figure F45. Lithology and NGR measurements.
8.2. Discrete measurements
8.2.1. Material strength
Sediment strength was measured with a pocket penetrometer (PP) on the catwalk immediately after section splitting. Automated vane shear (AVS) strength measurements were made on working-half sections. Totals of 14 and 33 AVS measurements were made on working-half sections from 5 to 61 mbsf in Hole U1591A and from 3 to 380 mbsf in Hole U1591B, respectively (Figure F46; Table T11). Samples in the uppermost 100 m with shear strengths too low to be measured might be a consequence of disturbance during recovery. A total of 21 PP measurements were made on fine-grained materials that remained intact in core liners upon recovery on the catwalk (Table T11). No measurements were made in Hole U1591C during RCB coring because the recovered material was too stiff or was already crumbling during splitting of core sections. Figure F46 shows that shear strength increases as a function of depth to 400 mbsf, and below this depth the fine-grained sediment became too stiff to be measured.
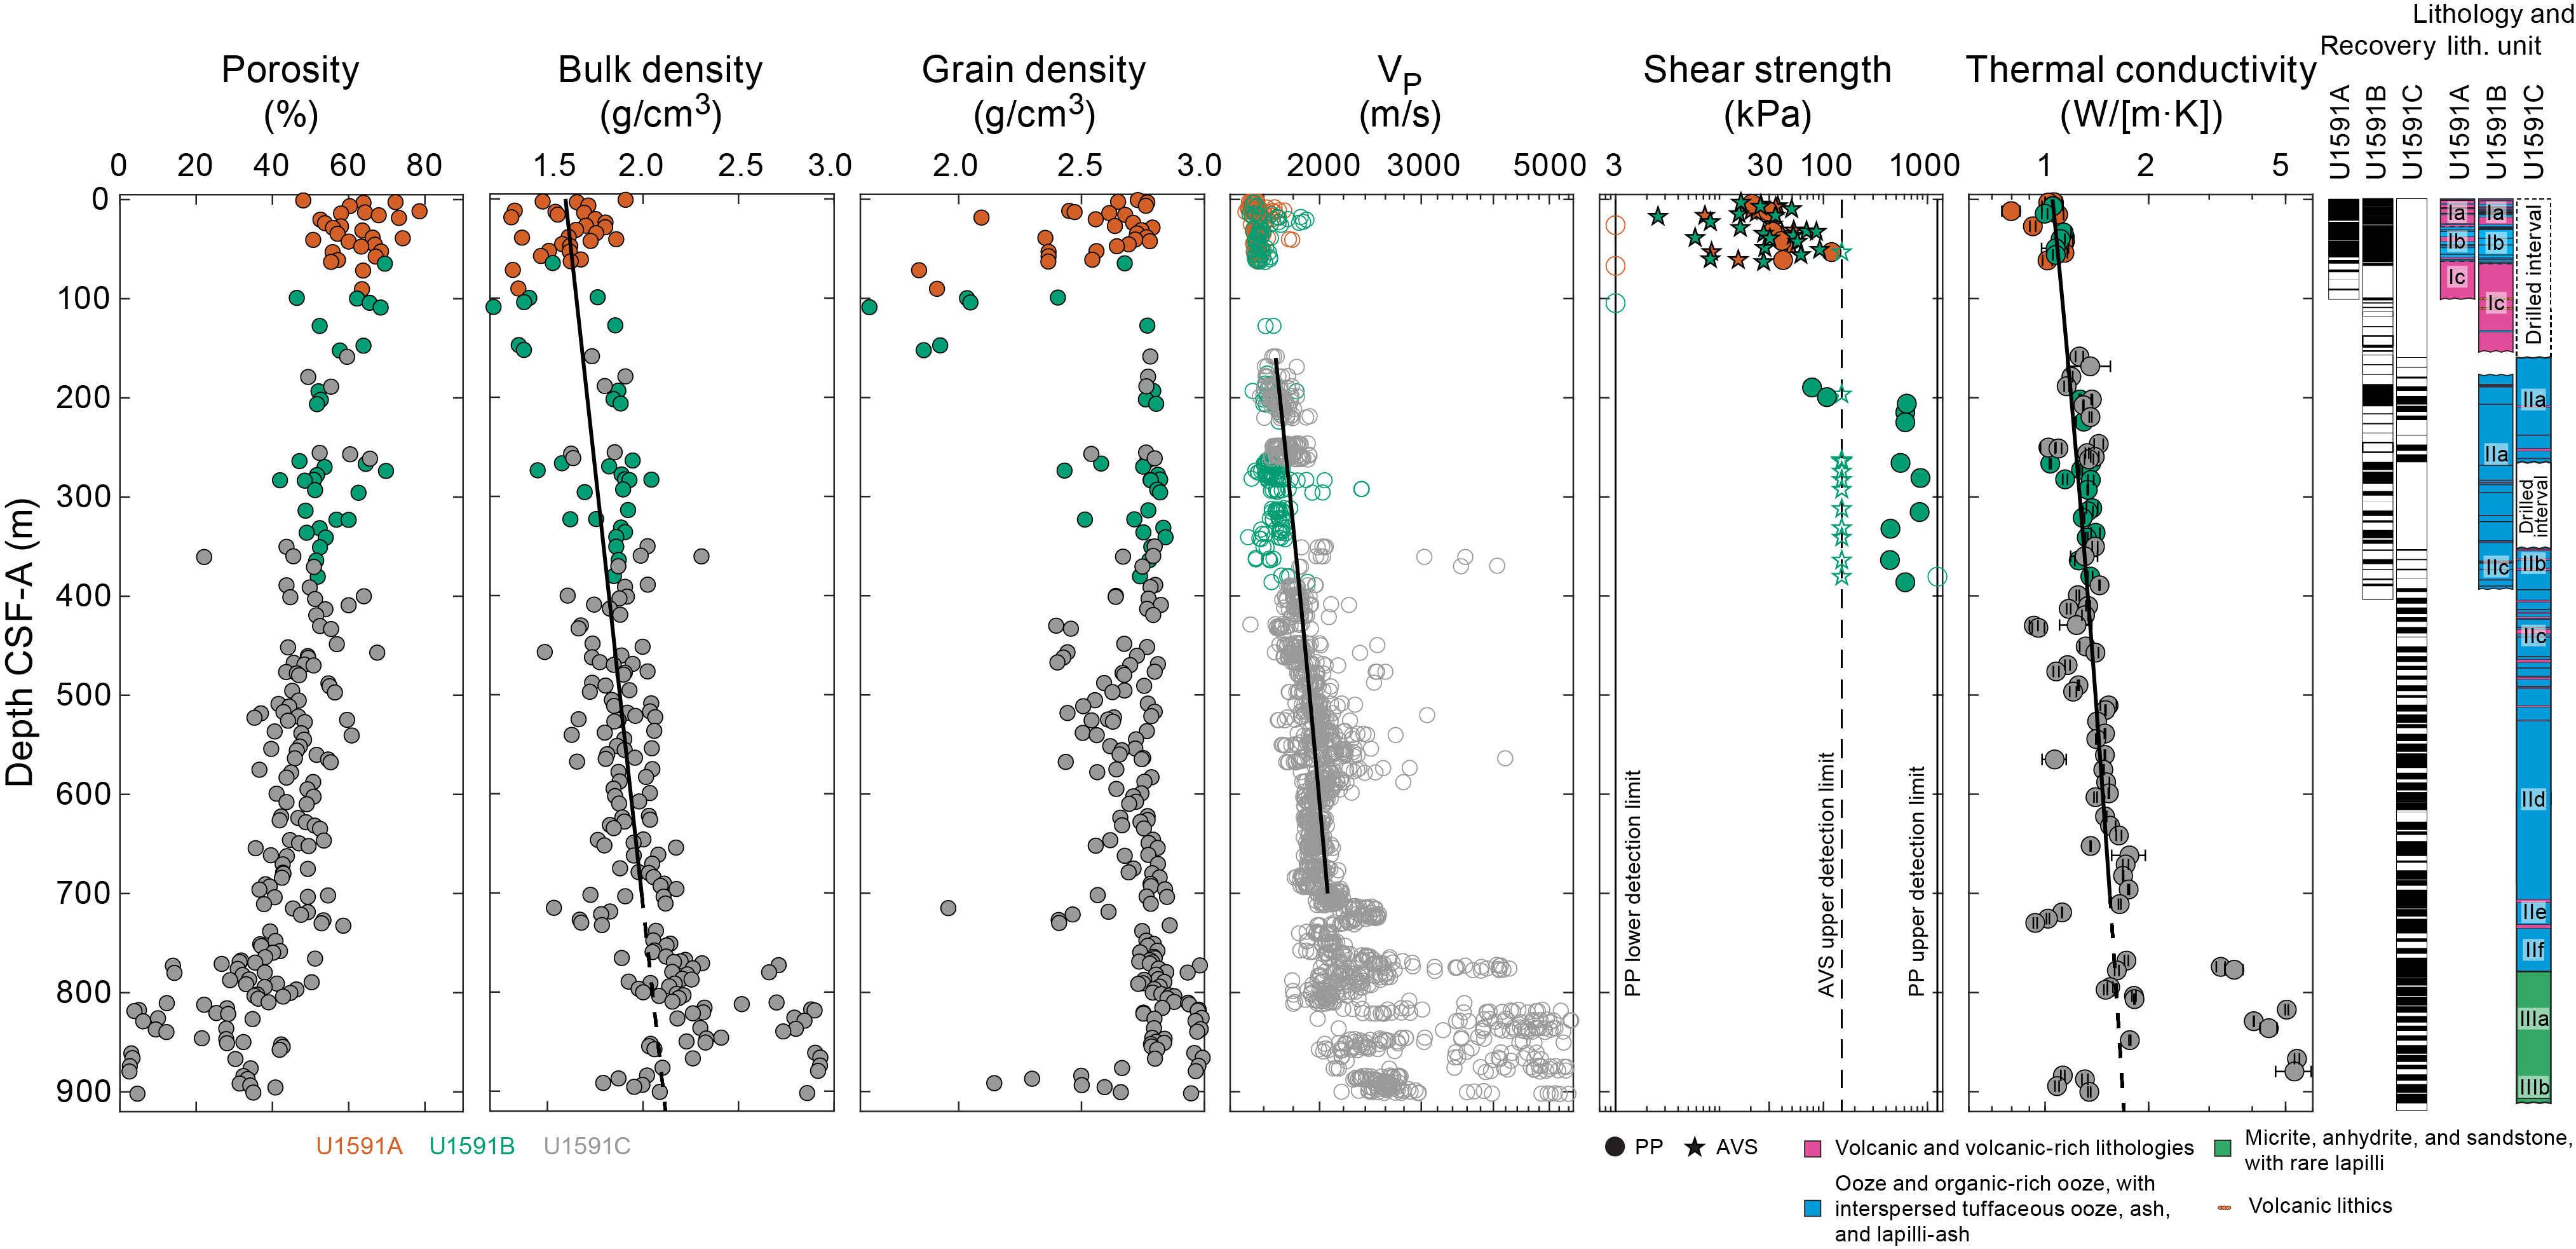
Figure F46. Discrete measurements.
8.2.2. P-wave velocity
Totals of 119, 209, and 1534 P-wave velocity measurements were conducted on Hole U1591A, U1591B, and U1591C working-half sections, respectively. The discrete measurements of P-wave velocity follow the trend observed in WRMSL measurements on whole-round cores (Figures F43, F46; Table T12); P-wave velocity increases with depth, which is expected as sediments compact. Discrete measurements are more reliable and have less scatter than WRMSL measurements because the calipers measure the P-wave velocity of cored materials in direct contact, whereas the WRMSL measures material within core liners that contain water pockets, fractures, and other gaps that are ubiquitous in the XCB and RCB cores that dominated drilling at this site. Note that discrete P-wave velocity measurements of cores with severe biscuiting drilling disturbance may be affected by soft material that likely originated from the drilling disturbance of the formation and is found between the coherent core pieces and the underlying core liner. Measurements were not made where biscuiting disturbance was clear.
Volcaniclastic materials in Lithostratigraphic Unit I have P-wave velocities of ~1.5–1.7 km/s. Typical P-wave velocity of the oozes in Unit II increases with depth from ~1.7 km/s at the top of Unit II to ~2.1 km/s at its base. A best-fit to measurements from Holes U1591B and U1591C for Unit II (160–700 mbsf; a total of 1070 discrete measurements) gives
where z is in kilometers and reported ± values are standard errors. Unit III has highly variable P-wave velocity (Figure F46) with evaporite velocities that can exceed 5.0 km/s, whereas the background sediments have values similar to those of the overlying deposits of Unit II (2.1–2.8 km/s).
8.2.3. Moisture and density
A total of 217 discrete samples were collected to conduct moisture and density (MAD) measurements (Figure F46; Table T13). Bulk density derived by MAD measurements on discrete samples should be more reliable than GRA data from WRMSL measurements on whole-round cores.
Porosity ranges 3–79 vol% (mean = 45 vol%; standard deviation = 15 vol%). Bulk density ranges 1.2–2.9 g/cm3 and is lowest in volcaniclastic materials with high porosity. Grain density ranges 1.6–3.0 g/cm3 (mean = 2.68 g/cm3; median = 2.76 g/cm3), with the low values primarily in volcaniclastic subunits in the uppermost 150 m. The evaporites of Lithostratigraphic Unit III have grain densities >2.9 g/cm3, consistent with anhydrite-dominated lithologies (anhydrite mineral density = 2.96 g/cm3). A few low grain densities (<2.4 g/cm3) are found in between anhydrite-dominated lithologies in Unit III. Excluding the evaporites of Unit III, bulk density increases with depth. A least-squares fit of bulk density data from Units I and II in the uppermost 700 m is
where z is in kilometers and reported ± values are standard errors.
8.2.4. Thermal conductivity
A total of 101 thermal conductivity measurements were made on selected working-half sections, typically 1–2 per core (Table T14). Overall, thermal conductivity increases with increasing depth (Figure F46), as expected from the compaction of the sediments. The anhydrite-dominated lithologies of Unit III have much higher thermal conductivities (4–5 W/[m·K]) than sediments at the same depths (1–2 W/[m·K]). A least-squares linear fit to the thermal conductivity data for the uppermost 700 m (hence omitting the high values from anhydrite in Unit III) is
where z is in kilometers and reported ± values are standard errors, with large scatter about the trend.
9. Geochemistry
9.1. Volcaniclastic bulk geochemistry
To determine the geochemistry of the volcanic and tuffaceous materials, 22 tephra samples were handpicked from various layers in Holes U1591A–U1591C. Following cleaning, grinding, fusion, and dissolution, the materials were analyzed shipboard for major (Si, Al, Fe, Mg, and Ca), minor (Ti, Mn, Na, K, and P), and trace (Sc, V, Cr, Co, Ni, Cu, Zn, Rb, Sr, Y, Zr, Nb, Ba, Ce, and Nd) elements using inductively coupled plasma–atomic emission spectroscopy (ICP-AES) (see Geochemistry in the Expedition 398 methods chapter [Kutterolf et al., 2024] for analytical technique). Several unknown samples were run multiple times to determine analytical reproducibility.
9.1.1. ICP-AES: major, minor, and trace elements
Of the volcaniclastic units sampled, 3 were classified as basaltic andesites or basaltic trachyandesites, 4 as andesites or trachyandesites, 13 as dacites or trachydacites, and 2 as rhyolites (Table T15; Figure F47). Bulk chemistry values are less evolved than glass chemistry reported in Kutterolf et al. (2021), as expected due to bulk analyses including both minerals and glass.
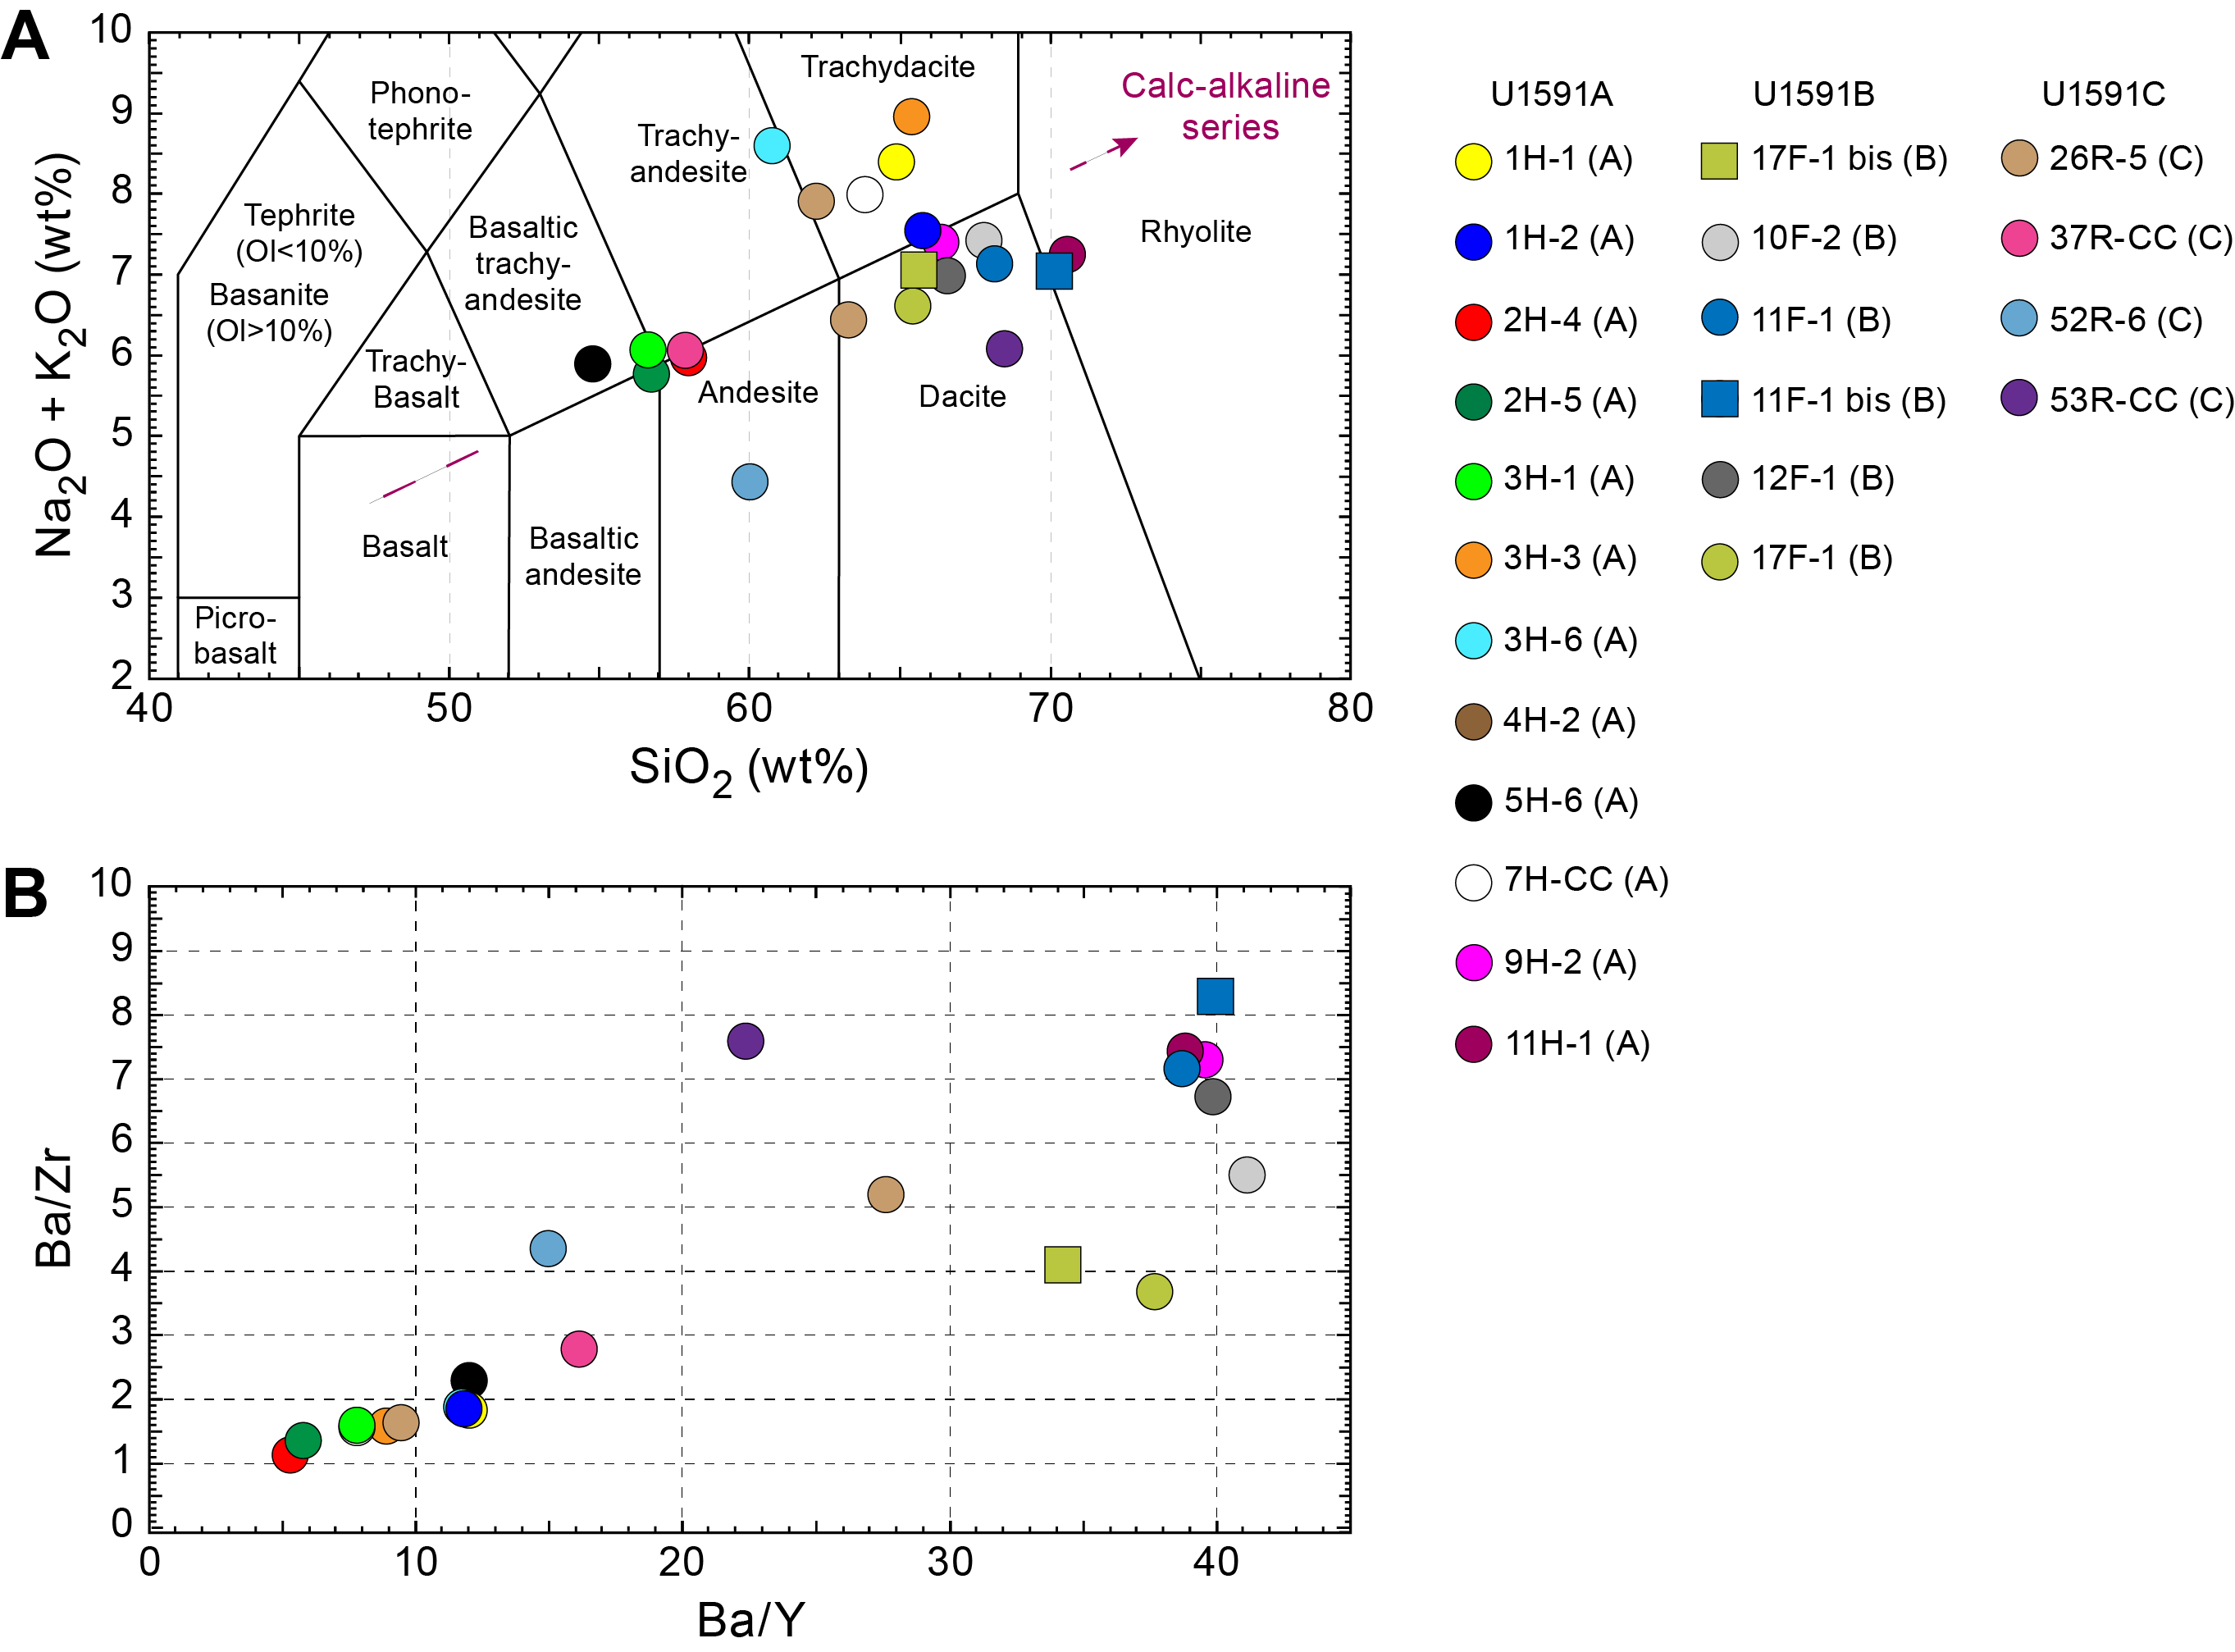
Figure F47. ICP-AES analyses.
Concentrations are reported for all analyzed trace elements, but Ce, Cr, Cu, Nb, Ni, P, Rb, S, and V were below detection limits in the majority of samples and are not shown for respective samples in Table T15; volcaniclastic analytical errors are ±1% for major elements and ±5%–10% for trace elements (see Geochemistry in the Expedition 398 methods chapter [Kutterolf et al., 2024]). Trace element ratios were used to broadly discriminate between the volcanic centers of Kolumbo, Santorini, and Christiana.
9.2. Interstitial water geochemistry
To determine the inorganic constituents of IW, a total of 55 water samples were taken from the mudline and whole-round squeezing of sediment intervals in Holes U1591A (10 samples), U1591B (12 samples), and U1591C (33 samples). Aliquots of IW were used for shipboard analyses, and the remaining water was taken for shore-based analysis following protocols specified by individual scientists. The retrieved pore waters were analyzed shipboard for salinity, alkalinity, pH, major anions (Cl−, SO42−, and Br−), major cations (Ca2+, Na+, Mg2+, and K+), and major (S, Ca, Mg, K, and Na) and minor (B, Ba, Fe, Li, Mn, P, Si, and Sr) elements using the methods described in Geochemistry in the Expedition 398 methods chapter (Kutterolf et al., 2024).
9.2.1. Salinity, alkalinity, and pH
Total IW salinities range 35–70 throughout the hole; most values are 35–60 (Table T16; Figure F48). The highest salinity values of 70, 56, 64, and 52, which caused four local maxima, were recorded in Sections 398-U1591A-6H-4, 398-U1591B-40X-3, 398-U1591C-12R-2, and 28R-1, respectively. Salinities <39 may be related to pore water freshening from dehydration of clays at depth or during the squeezing procedure.
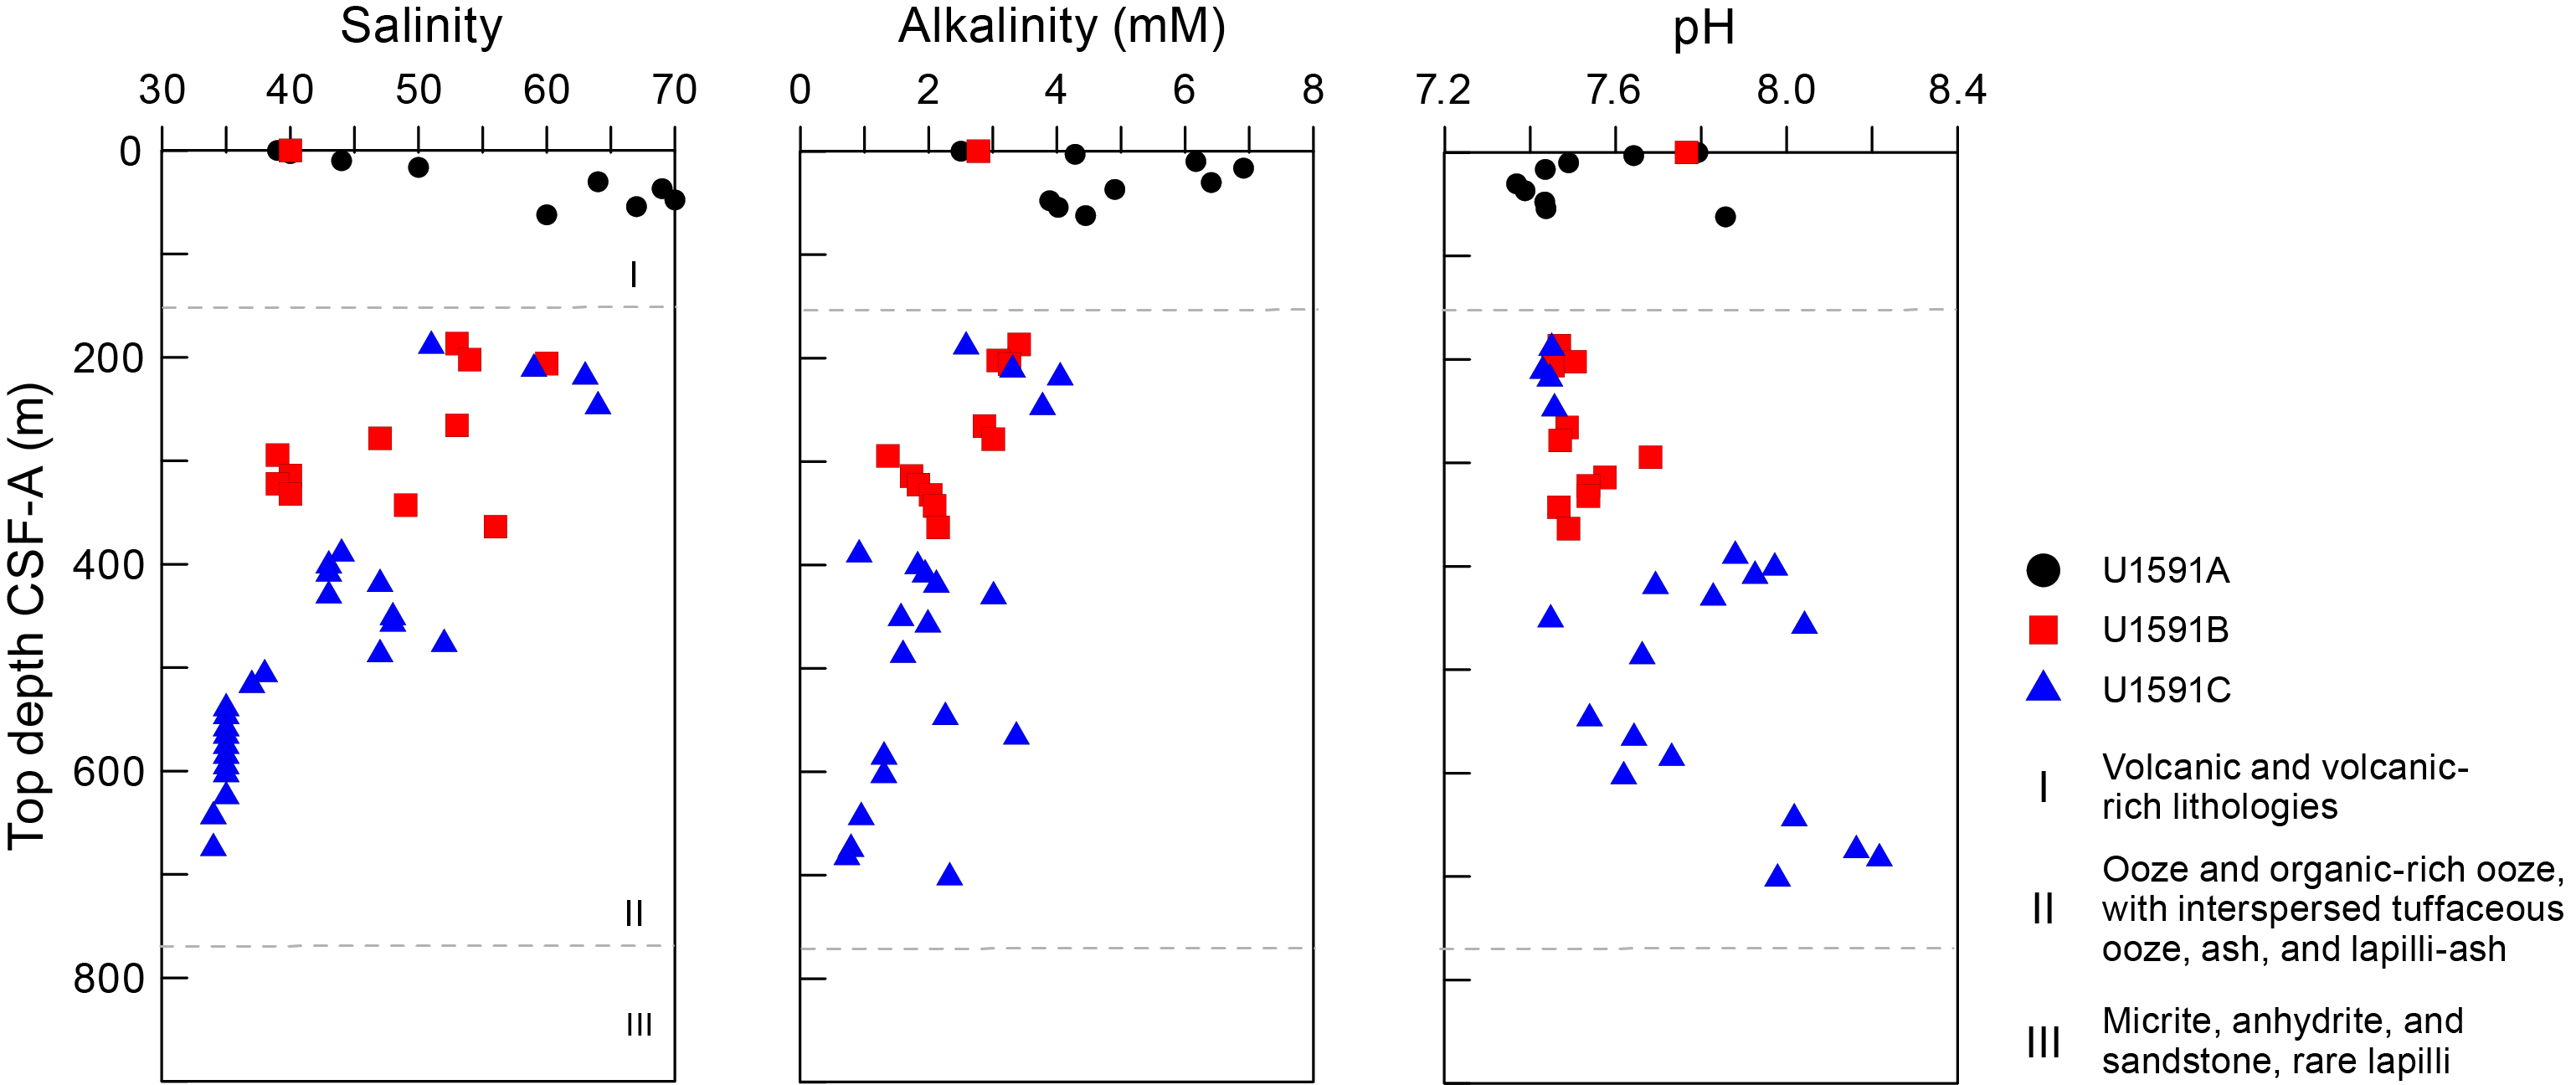
Figure F48. IW salinity, alkalinity, and pH.
Total alkalinity increases from 2.5 mM at the seafloor to a maximum of ~7 mM at 16 mbsf. In general, alkalinity decreases with depth below this maximum, aside from elevated values of 4.1, 3.0, and 3.4 mM at 219, 430, and 566 mbsf, respectively (Table T16; Figure F48).
Values for pH show some variation in the sampled depths, ranging 7.4–8.2 (average = 7.8 ± 0.1). Higher pH was recorded in deeper samples.
9.2.2. Bromide, chloride, boron, sodium, potassium, magnesium, calcium, and sulfate
Bromide, Cl−, B, Na+, K+, Mg2+, Ca2+, and SO42− all follow similar trends to salinity and reach maxima in the same samples as salinity (except B and Ca2+, which are slightly higher in the sample from the core above) (Table T17; Figure F49). These maxima occur mainly in lithologies dominated by calcareous ooze (see Lithostratigraphy); however, alteration of intercalated volcanic material may be supplying these elements to the pore fluids (Schacht et al., 2008). Between 500 and 650 mbsf, SO42− drastically decreases and has near-zero values before increasing again to the bottom of the hole. This trend is similar in the other elements, most prominently in K+ and Ca2+.
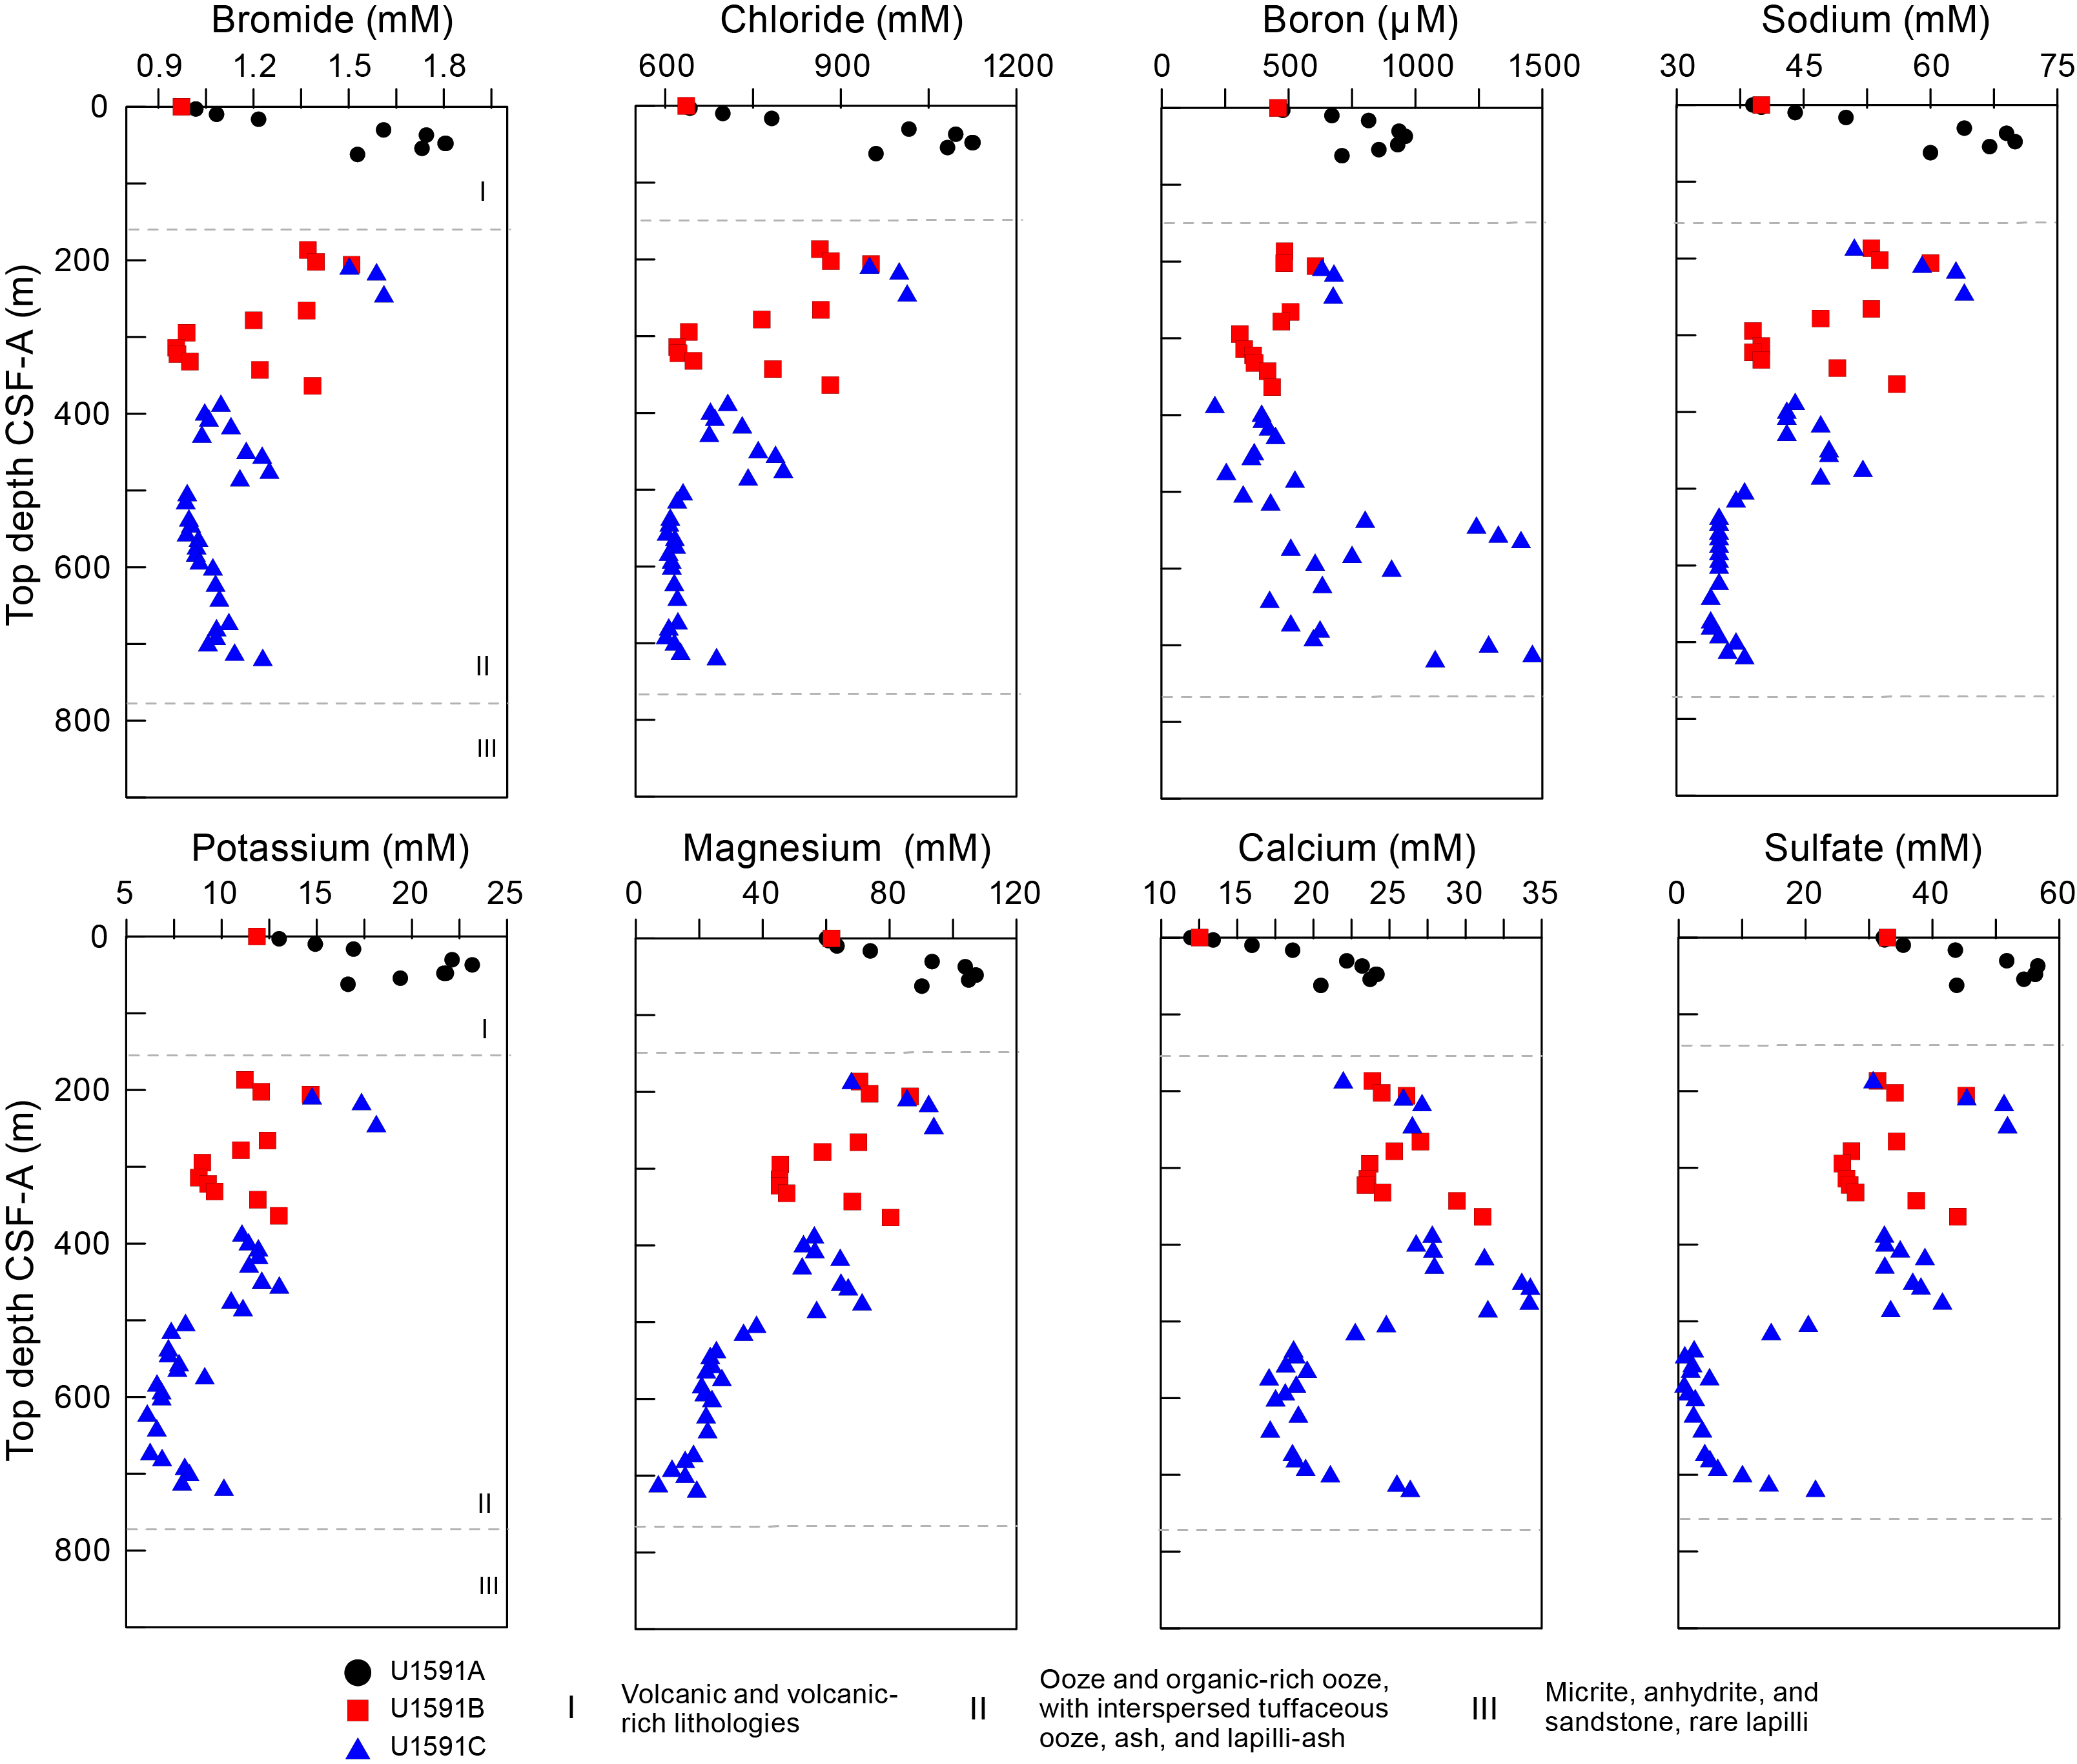
Figure F49. IW Br, Cl, Na, B, Ca, Mg, K, and SO42−.
9.2.3. Lithium, strontium, manganese, barium, and silicon
Trends for Li, Sr, Mn, Ba, and Si do not strongly correlate with lithologic units (Table T17; Figure F50). Lithium and Sr follow largely similar trends with depth: an initial increase with depth, a decrease to minima near 450 mbsf, and an increase to maxima at 625 and 585 mbsf, respectively. Pore water Mn concentration is highest at the surface and increases again beginning at 300 mbsf. Between 500 and 700 mbsf, pore water Mn is near zero, which corresponds to the peaks in Li, Sr, and Ba. Barium is near zero except for a peak of 48 µM between 500 and 700 mbsf, also corresponding to the lowest values for SO42−. Silicon values show no obvious trends. Iron and phosphorus are not plotted because most or all samples had concentrations below the detection limit. However, most samples with detectable Fe values are in the uppermost 63 m and reach concentrations as high as 66 µM.
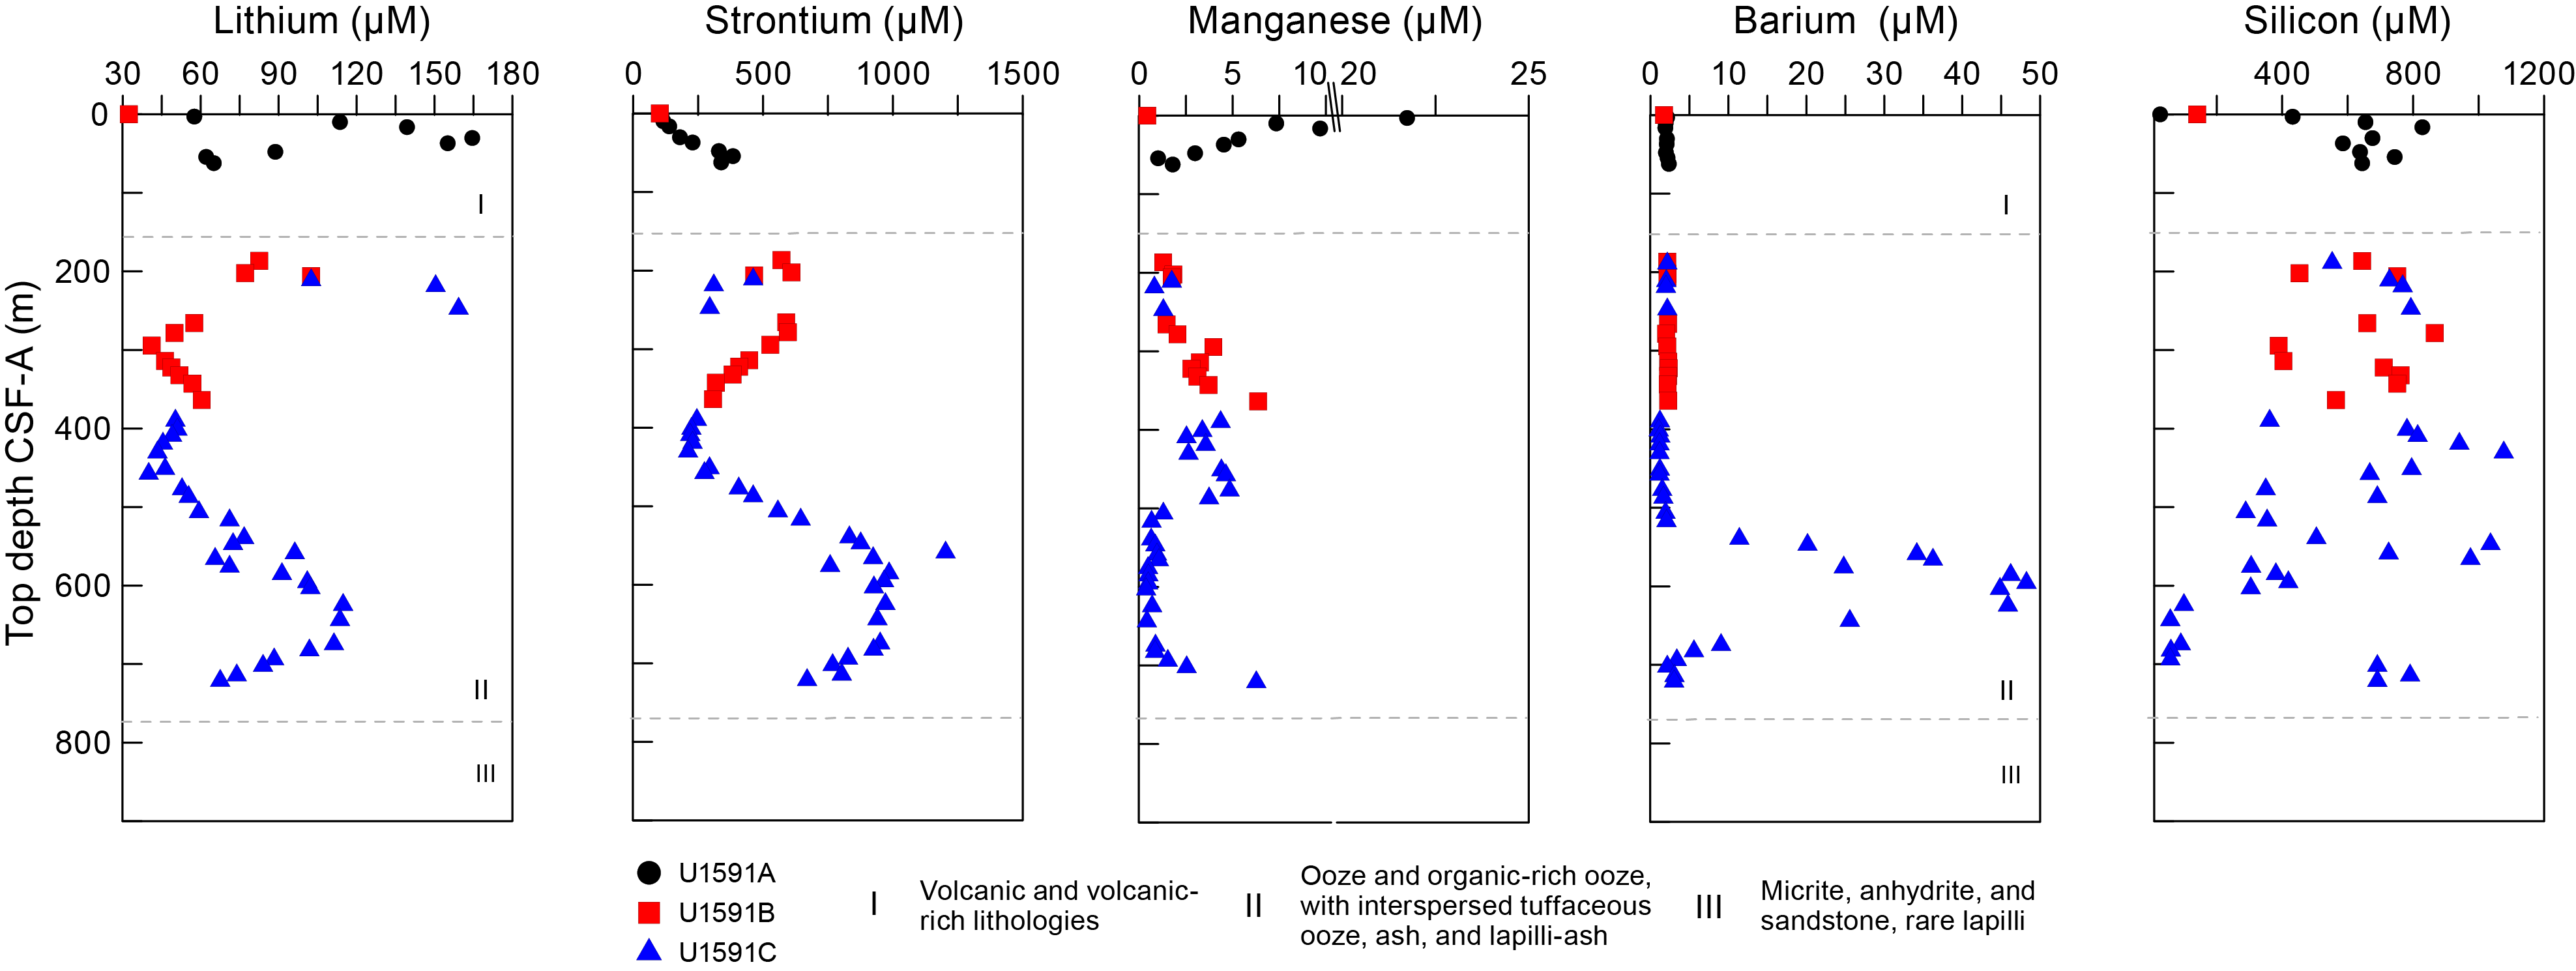
Figure F50. IW Li, Sr, Mn, Ba, and Si.
9.3. Sediment bulk geochemistry
A total of 101 sediment samples were analyzed for bulk geochemistry (Table T18). Of these, 100 were analyzed for total carbon, hydrogen, and nitrogen (CHN) and 100 were analyzed for inorganic carbon and carbonate content following the protocols explained in Geochemistry in the Expedition 398 methods chapter (Kutterolf et al., 2024). For the CHN analysis, duplicates were run on ~10% of the samples to determine analytical reproducibility. Highest carbonate values are noted in the interval 186–693 mbsf, reaching values of 71 wt%, corresponding to Lithostratigraphic Unit II, which is dominated by calcareous oozes (Figure F51). We note a slight decrease in carbonate content at ~400–500 mbsf, which corresponds to higher amounts of volcanic or tuffaceous lithologies in that unit. In Unit III, which is characterized by evaporites, three samples were collected to identify the total organic carbon (TOC) content of mud and possible interaction with the evaporites. The mud layer was sampled at 774.75 mbsf and has two adjacent evaporite units, one light and one dark, at 774.79 and 774.82 mbsf, respectively. The TOC value for the mud unit is 0.23 wt%, and both evaporite units have TOC values of 0.08 wt%.
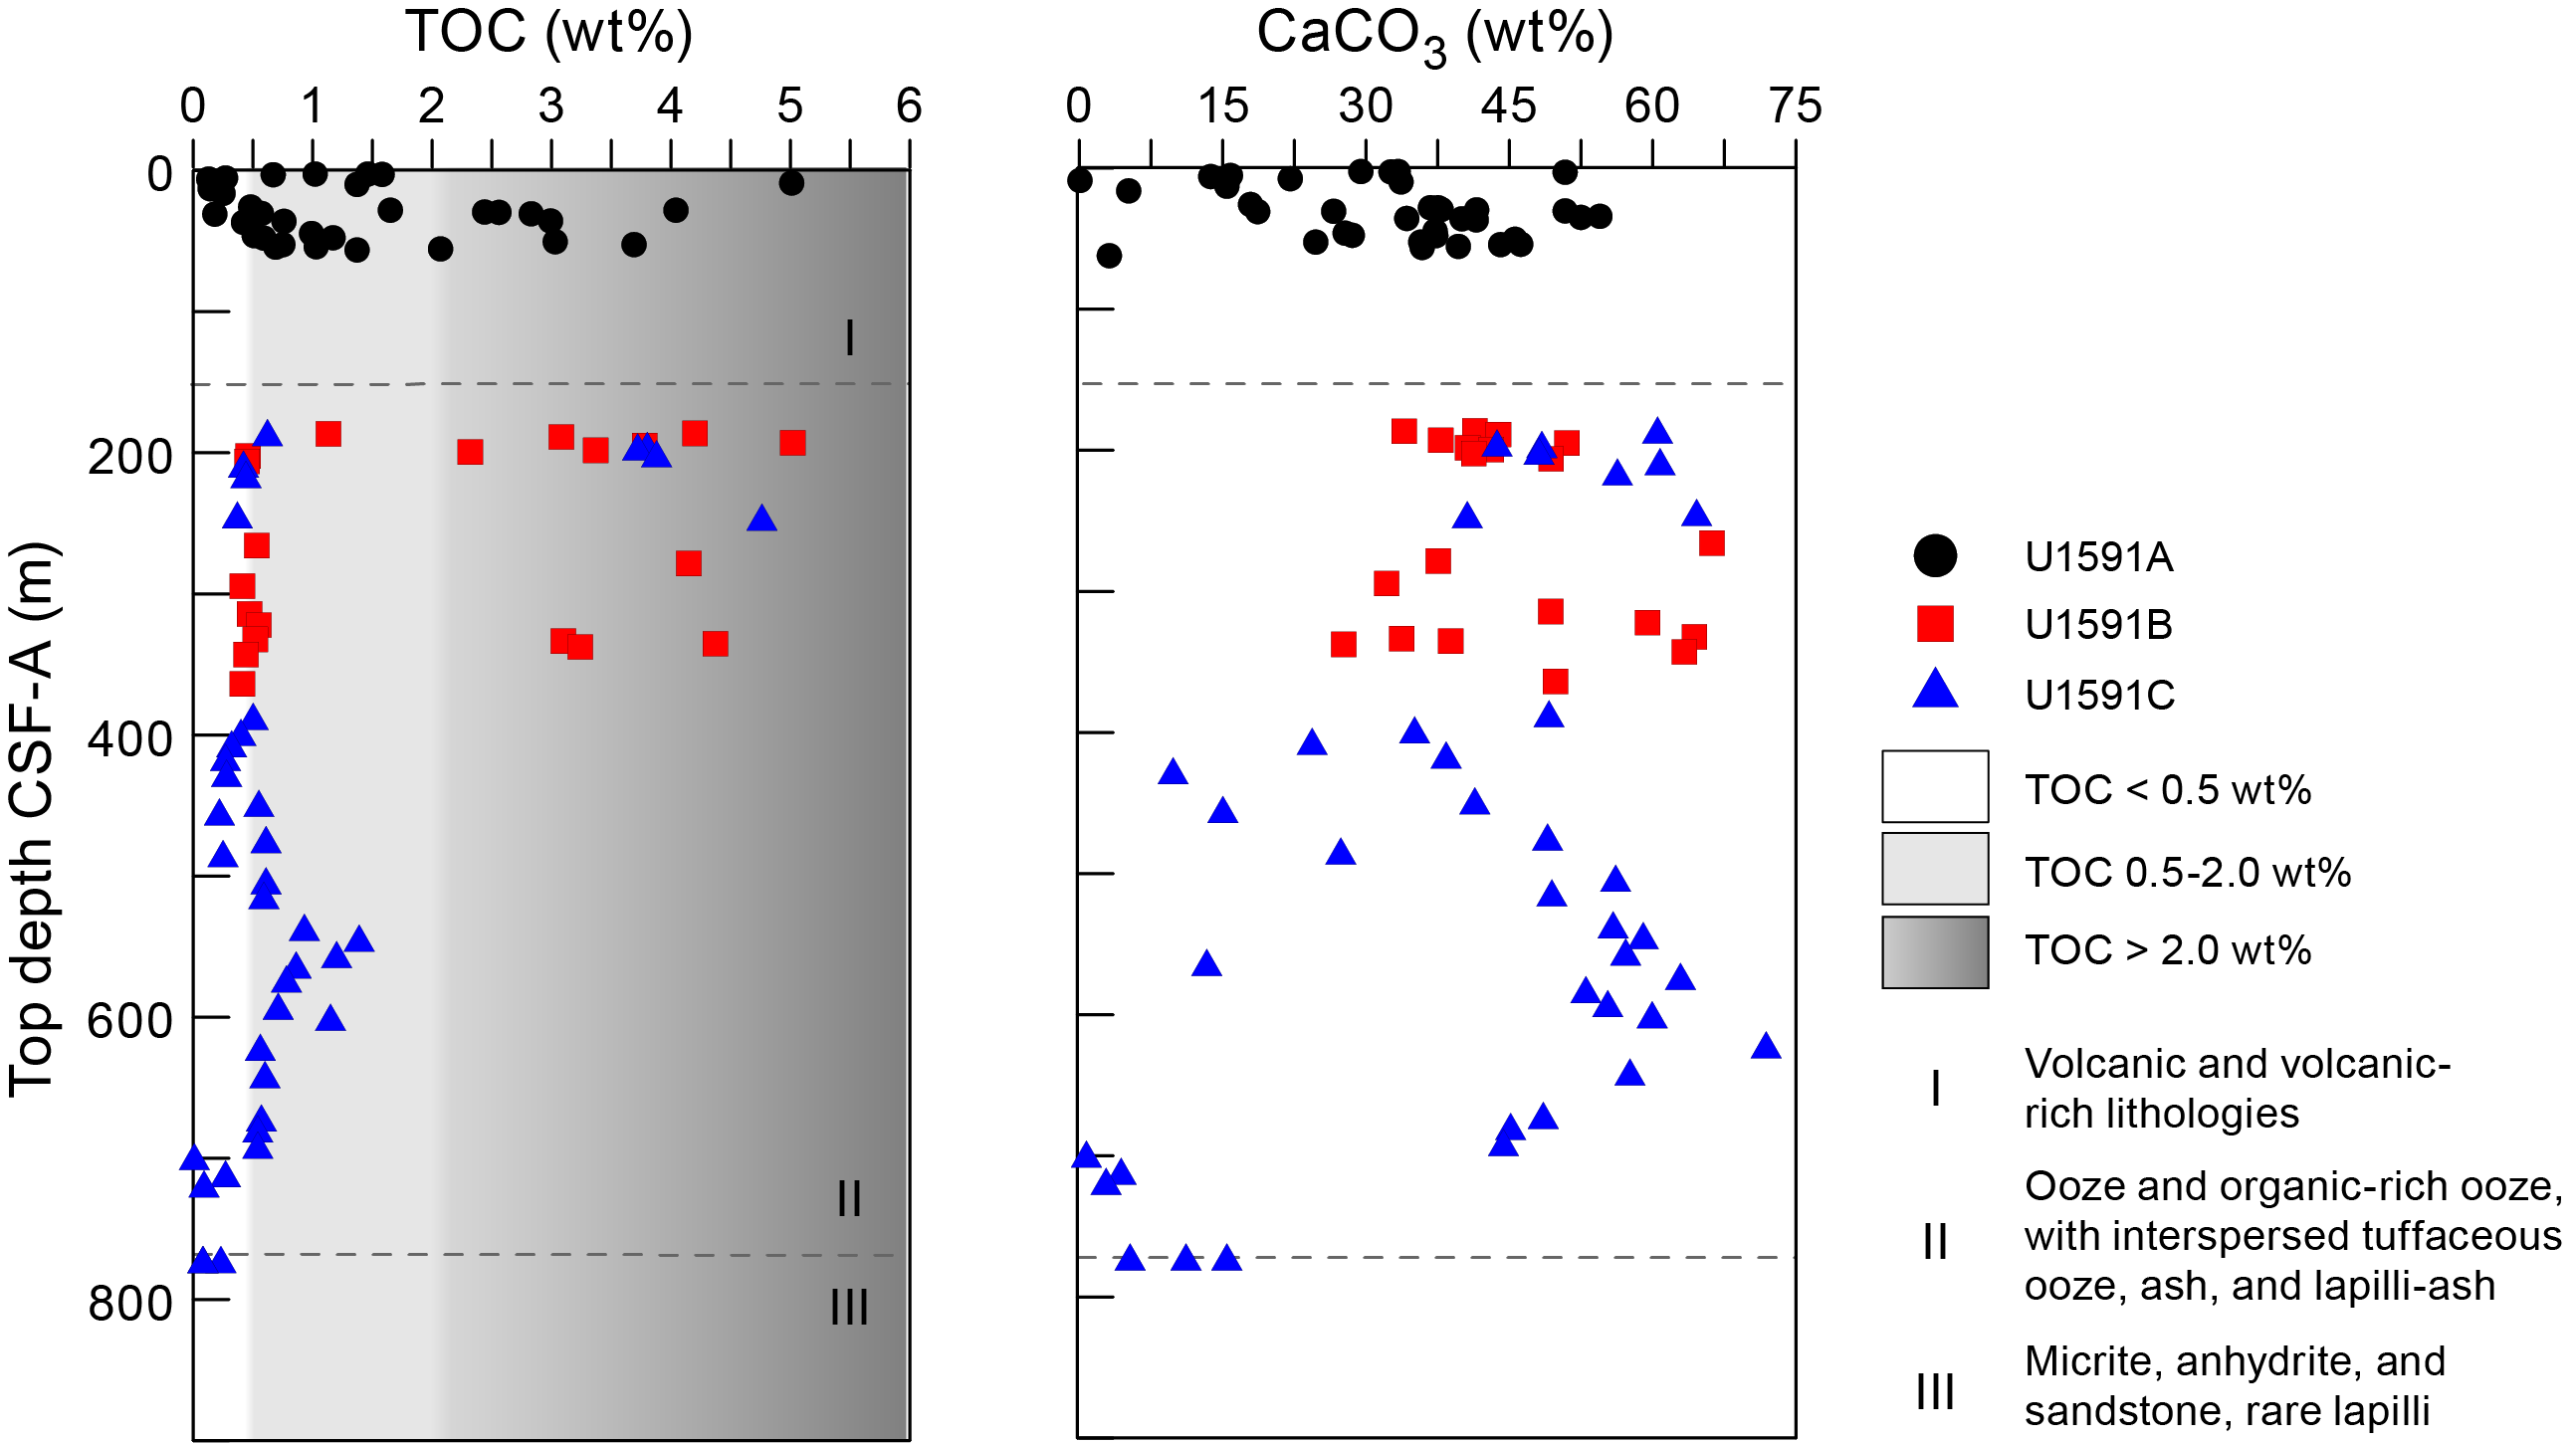
Figure F51. TOC and carbonate.
9.3.1. Sapropel identification
A total of 44 organic-rich units of interest were sampled after core splitting. Because of the lithified nature of cores deeper than ~400 mbsf, limited sampling was realized on board, although more organic-rich units were identified by the core describers (see Lithostratigraphy). TOC was calculated using total carbon and inorganic carbon values. Following the convention set forth by Kidd et al. (1978), units with TOC > 2.0 wt% were identified as sapropels and units with TOC values of 0.5–2.0 wt% were identified as sapropelitic. Using these values, 22 units were identified as sapropels and 37 units were identified as sapropelitic (Figure F51).
9.4. Headspace gas analysis
Headspace gas analyses were performed at a resolution of one sample per full-length core (9.5 m advance) or one sample every other core for half-length cores (4.7 m advance) throughout Hole U1591A. The aim was to monitor the presence and abundance of C1–C3 hydrocarbons as part of the standard IODP safety protocol (Pimmel and Claypool, 2001). A total of 10 headspace gas samples were analyzed using gas chromatography (GC) (see Geochemistry in the Expedition 398 methods chapter [Kutterolf et al., 2024]). Methane was the dominant hydrocarbon present at low concentrations or concentrations below the detection limit in Hole U1591A (Figure F52). Ethane, propane, butane, and other heavier hydrocarbons were either present in low concentrations or below the detection limit.
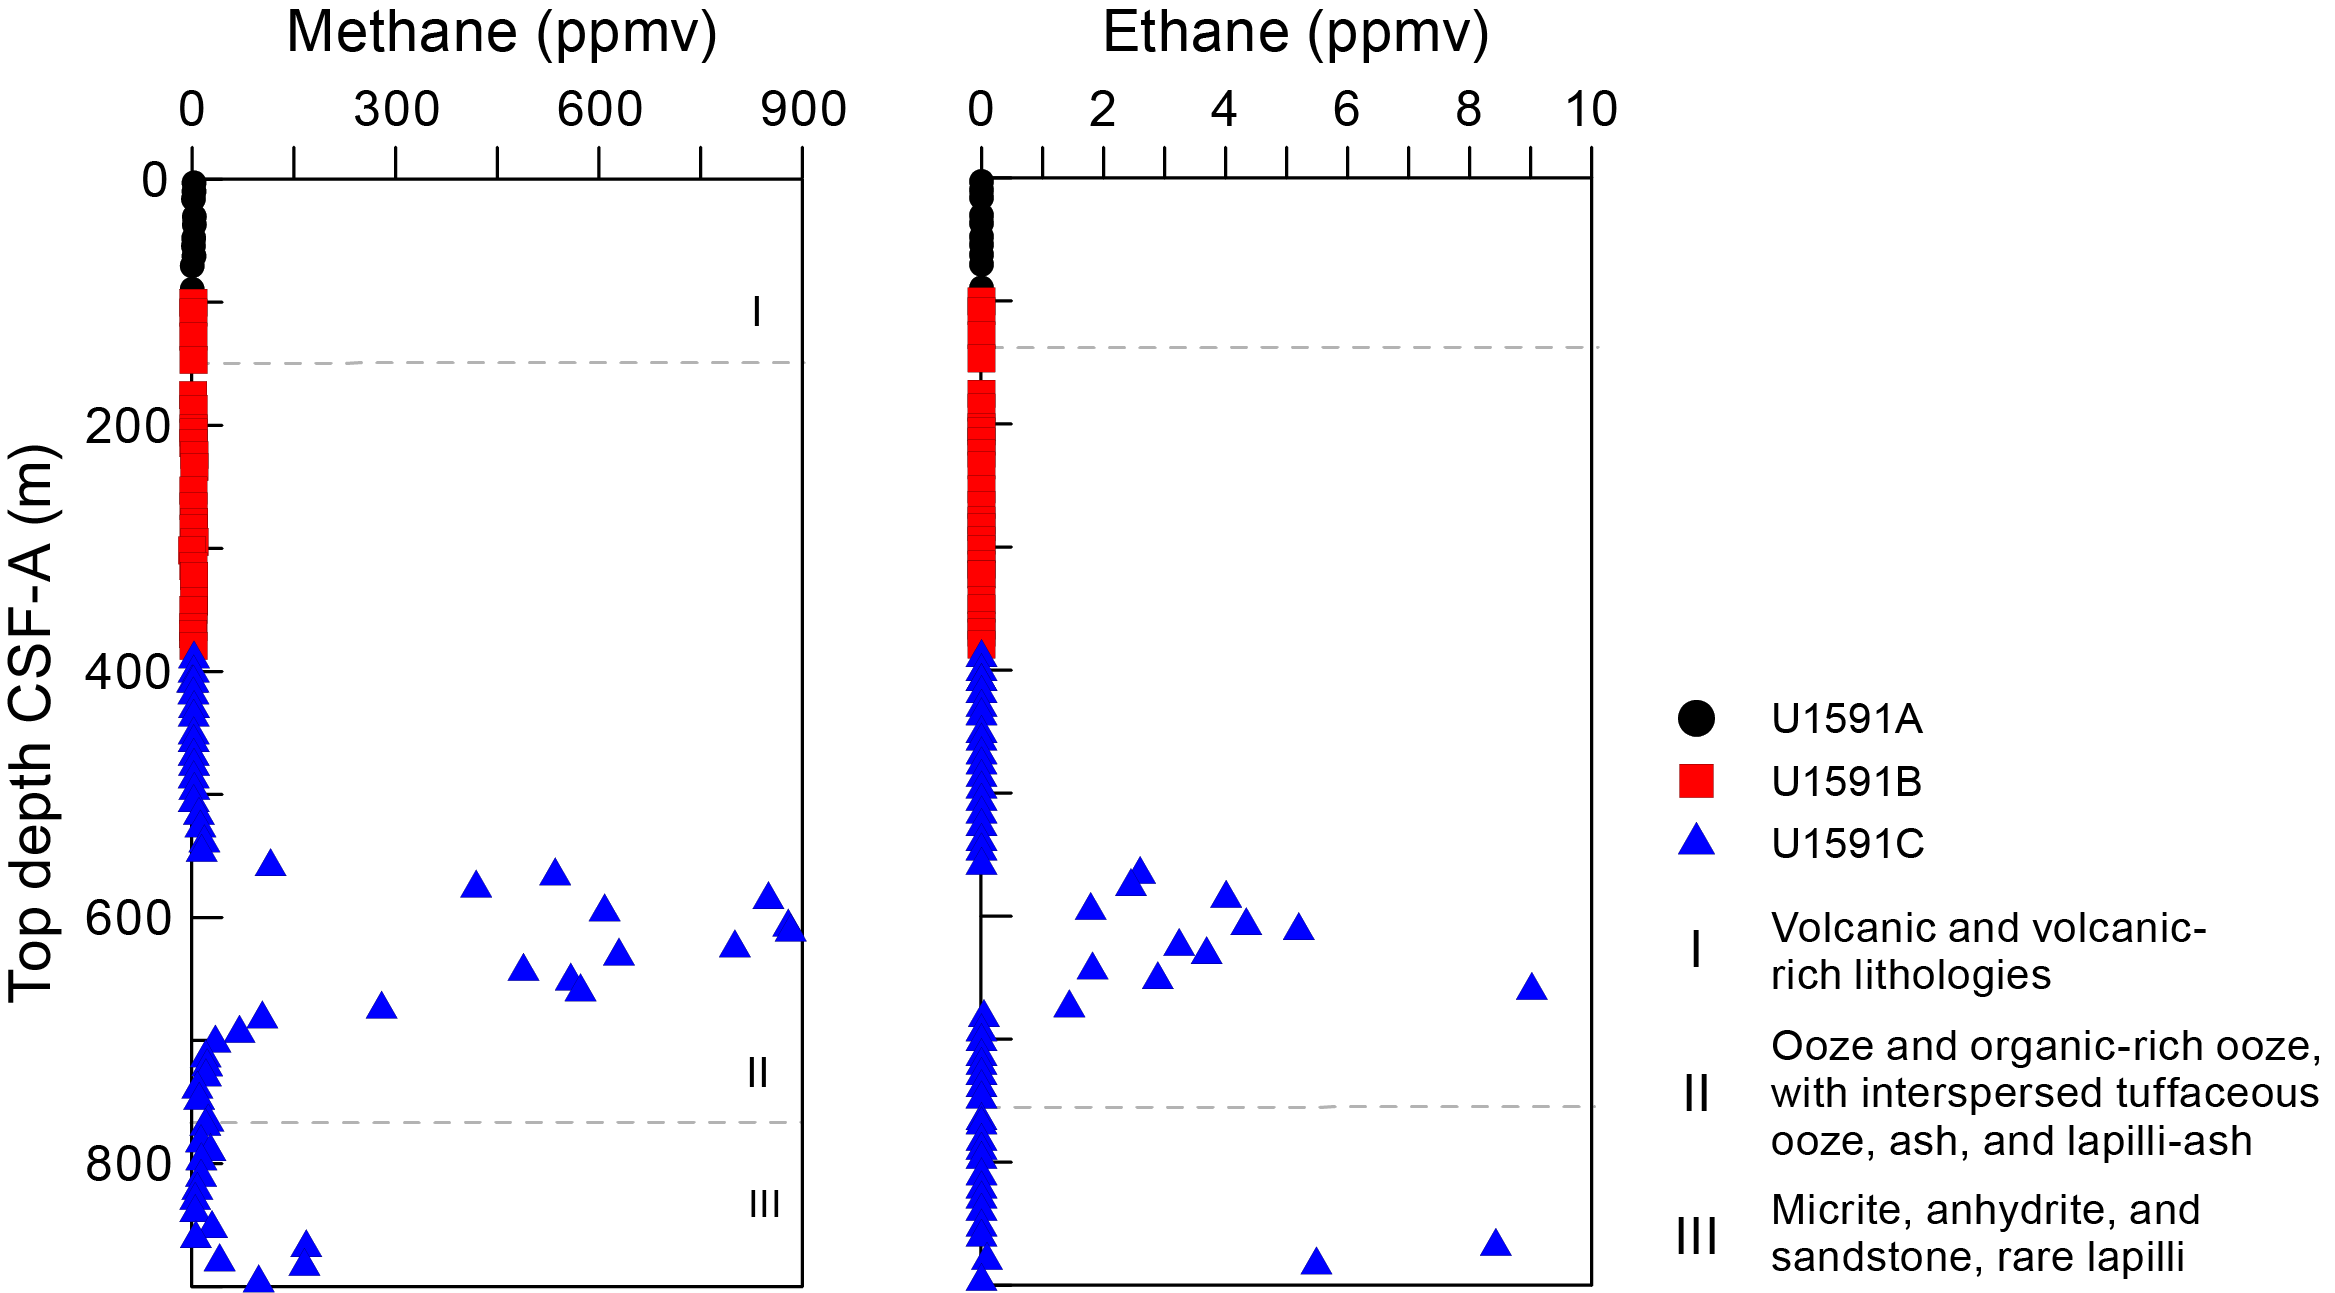
Figure F52. Headspace gas analyses of methane.
Headspace gas analyses were resumed on Hole U1591B when coring progressed deeper than Hole U1591A (100.3 mbsf). Below this depth, headspace gas analyses were performed at a resolution of one sample per core or one sample every other core for half-length cores to the base of the hole. A total of 26 headspace gas samples were analyzed using GC. No elevated methane concentrations were noted in the core except a concentration of 51.8 ppmv at 385.82 mbsf (Figure F52).
Headspace gas analyses were resumed on Hole U1591C when coring progressed deeper than Hole U1591B (389.9 mbsf). Below this depth, 53 headspace gas analyses were performed at a resolution of one sample per core to the base of the hole. Methane values were low to 559 mbsf and then gradually increased to 612 mbsf, where the maximum value of 883 ppmv was reached. Below this depth, methane values decreased to 868 mbsf, below which depth values again increased to 168 ppmv. Ethane concentrations are low or below the detection limit except in intervals with elevated methane concentrations. The highest ethane concentration observed was 9 ppmv at 660 mbsf (Figure F52).
10. Microbiology
For Site U1591, two whole-round core samples were collected for microbial community composition analysis (Table T19).
References
Aarburg, S., and Frechen, M., 1999. Die pyroklastischen Abfolgen der Christiana-lnseln (Süd-Ägäis, Griechenland). In Becker-Haumann, R., and Frechen, M. (Eds.) Terrestrische Quartargeologie. 260–276.
Abu-Zied, R.H., Rohling, E.J., Jorissen, F.J., Fontanier, C., Casford, J.S.L., and Cooke, S., 2008. Benthic foraminiferal response to changes in bottom-water oxygenation and organic carbon flux in the eastern Mediterranean during LGM to Recent times. Marine Micropaleontology, 67(1–2):46–68. https://doi.org/10.1016/j.marmicro.2007.08.006
Backman, J., Raffi, I., Rio, D., Fornaciari, E., and Pälike, H., 2012. Biozonation and biochronology of Miocene through Pleistocene calcareous nannofossils from low and middle latitudes. Newsletters on Stratigraphy, 45(3):221–244. https://doi.org/10.1127/0078-0421/2012/0022
Brothers, R.J., Kemp, A.E.S., and Maltman, A.J., 1996. Mechanical development of vein structures due to the passage of earthquake waves through poorly-consolidated sediments. Tectonophysics, 260(4):227–244. https://doi.org/10.1016/0040-1951(96)00088-1
Di Stefano, A., and Sturiale, G., 2010. Refinements of calcareous nannofossil biostratigraphy at the Miocene/Pliocene Boundary in the Mediterranean region. Geobios, 43(1):5–20. https://doi.org/10.1016/j.geobios.2009.06.007
Druitt, T., Kutterolf, S., and Höfig, T.W., 2022. Expedition 398 Scientific Prospectus: Hellenic Arc Volcanic Field. International Ocean Discovery Program. https://doi.org/10.14379/iodp.sp.398.2022
Druitt, T.H., Kutterolf, S., Ronge, T.A., Beethe, S., Bernard, A., Berthod, C., Chen, H., Chiyonobu, S., Clark, A., DeBari, S., Fernandez Perez, T.I., Gertisser, R., Hübscher, C., Johnston, R.M., Jones, C., Joshi, K.B., Kletetschka, G., Koukousioura, O., Li, X., Manga, M., McCanta, M., McIntosh, I., Morris, A., Nomikou, P., Pank, K., Peccia, A., Polymenakou, P.N., Preine, J., Tominaga, M., Woodhouse, A., and Yamamoto, Y., 2024. Site U1589. In Druitt, T.H., Kutterolf, S., Ronge, T.A., and the Expedition 398 Scientists, Hellenic Arc Volcanic Field. Proceedings of the International Ocean Discovery Program, 398: College Station, TX (International Ocean Discovery Program). https://doi.org/10.14379/iodp.proc.398.103.2024
Expedition 334 Scientists, 2012. Expedition 334 summary. In Vannucchi, P., Ujiie, K., Stroncik, N., and the Expedition 334 Scientists, Proceedings of the Integrated Ocean Drilling Program. 334: Tokyo (Integrated Ocean Drilling Program Management International, Inc.). https://doi.org/10.2204/iodp.proc.334.101.2012
Fisher, R.V., and Schmincke, H.-U., 1984. Pyroclastic Rocks: Berlin (Springer). https://doi.org/10.1007/978-3-642-74864-6
Gradstein, F.M., Ogg, J.G., Schmitz, M.D., and Ogg, G.M. (Eds.), 2020. The Geologic Time Scale 2020: Amsterdam (Elsevier BV). https://doi.org/10.1016/C2020-1-02369-3
Hanamura, Y., and Ogawa, Y., 1993. Layer-parallel faults, duplexes, imbricate thrusts and vein structures of the Miura Group: keys to understanding the Izu fore-arc sediment accretion to the Honshu fore arc. Island Arc, 2(3):126–141. https://doi.org/10.1111/j.1440-1738.1993.tb00081.x
Hayward, B.W., Grenfell, H.R., Reid, C.M., and Hayward, K.A., 1999. Recent New Zealand shallow-water benthic foraminifera: taxonomy, ecologic distribution, biogeography, and use in paleoenvironmental assessment. In Institute of Geological & Nuclear Sciences Monograph, 21: Lower Hutt, NZ.
Jelínek, V., and Kropáček, V., 1978. Statistical processing of anisotropy of magnetic susceptibility measured on groups of specimens. Studia Geophysica et Geodaetica, 22(1):50–62. https://doi.org/10.1007/BF01613632
Jutzeler, M., White, J.D.L., Talling, P.J., McCanta, M., Morgan, S., Le Friant, A., and Ishizuka, O., 2014. Coring disturbances in IODP piston cores with implications for offshore record of volcanic events and the Missoula megafloods. Geochemistry, Geophysics, Geosystems, 15(9):3572–3590. https://doi.org/10.1002/2014GC005447
Keller, J., Dietrich, V., Reusser, E., Gertisser, R., and Aarburg, S., 2010. Recognition of a major ignimbrite in the early evolution of the Santorini Group: the Christiani ignimbrite. Presented at the Cities on Volcanoes Conference, Tenerife, Spain, January 2010.
Kidd, R.B., Cita, M.B., and Ryan, W.B.F., 1978. Stratigraphy of eastern Mediterranean sapropel sequences recovered during DSDP Leg 42A and their paleoenvironmental significance. In Hsü, K., Montadert, L., et al., Initial Reports of the Deep Sea Drilling Project. 42(1): Washington, DC (US Government Printing Office), 421–443. https://doi.org/10.2973/dsdp.proc.42-1.113-1.1978
Kletetschka, G., and Wieczorek, M.A., 2017. Fundamental relations of mineral specific magnetic carriers for paleointensity determination. Physics of the Earth and Planetary Interiors, 272:44–49. https://doi.org/10.1016/j.pepi.2017.09.008
Krijgsman, W., Hilgen, F.J., Meijer, P.T. and Briand, F., 2007. Chronological constraints and consequences for the Messinian Salinity Crisis. In CIESM, The Messinian Salinity Crisis from Mega-deposits to Microbiology - a Consensus Report: Almeria, 7–10 November 2007. CIESM Workshop Monographs, 33.
Kutterolf, S., Druitt, T.H., Ronge, T.A., Beethe, S., Bernard, A., Berthod, C., Chen, H., Chiyonobu, S., Clark, A., DeBari, S., Fernandez Perez, T.I., Gertisser, R., Hübscher, C., Johnston, R.M., Jones, C., Joshi, K.B., Kletetschka, G., Koukousioura, O., Li, X., Manga, M., McCanta, M., McIntosh, I., Morris, A., Nomikou, P., Pank, K., Peccia, A., Polymenakou, P.N., Preine, J., Tominaga, M., Woodhouse, A., and Yamamoto, Y., 2024. Expedition 398 methods. In Druitt, T.H., Kutterolf, S., Ronge, T.A., and the Expedition 398 Scientists, Hellenic Arc Volcanic Field. Proceedings of the International Ocean Discovery Program, 398: College Station, TX (International Ocean Discovery Program). https://doi.org/10.14379/iodp.proc.398.102.2024
Kutterolf, S., Freundt, A., Hansteen, T.H., Dettbarn, R., Hampel, F., Sievers, C., Wittig, C., Allen, S.R., Druitt, T.H., McPhie, J., Nomikou, P., Pank, K., Schindlbeck-Belo, J.C., Wang, K.-L., Lee, H.-Y., and Friedrichs, B., 2021. The medial offshore record of explosive volcanism along the central to eastern Aegean Volcanic Arc: 1. tephrostratigraphic correlations. Geochemistry, Geophysics, Geosystems, 22(12):e2021GC010010. https://doi.org/10.1029/2021GC010010
Le Maitre, R.W., Steckeisen, A., Zanettin, B., Le Bas, M.J., Bonin, B., and Bateman, P. (Eds.), 2002. Igneous Rocks: A Classification and Glossary of Terms (Second edition): Cambridge, UK (Cambridge University Press). https://doi.org/10.1017/CBO9780511535581
Lirer, F., Foresi, L.M., Iaccarino, S.M., Salvatorini, G., Turco, E., Cosentino, C., Sierro, F.J., and Caruso, A., 2019. Mediterranean Neogene planktonic foraminifer biozonation and biochronology. Earth-Science Reviews, 196:102869. https://doi.org/10.1016/j.earscirev.2019.05.013
Lourens, L., Hilgen, F., Shackleton, N.J., Laskar, J., and Wilson, D., 2004. The Neogene period. In Smith, A.G., Gradstein, F.M. and Ogg, J.G., A Geologic Time Scale 2004. Cambridge, UK (Cambridge University Press), 409–440. https://doi.org/10.1017/CBO9780511536045.022
Lourens, L.J., Hilgen, F.J., and Raffi, I., 1998. Base of large Gephyrocapsa and astronomical calibration of early Pleistocene sapropels in Site 967 and Hole 969D: solving the chronology of the Vrica Section (Calabria, Italy). In Robertson, A.H.F., Emeis, K.-C., Richter, C., and Camerlenghi, A. (Eds.), Proceedings of the Ocean Drilling Program, Scientific Results. 160: College Station, TX (Ocean Drilling Program), 191. https://doi.org/10.2973/odp.proc.sr.160.017.1998
Maltman, A.J., Byrne, T., Karig, D.E., and Lallemant, S., 1993. Deformation at the toe of an active accretionary prism: synopsis of results from ODP Leg 131, Nankai, SW Japan. Journal of Structural Geology, 15(8):949–964. https://doi.org/10.1016/0191-8141(93)90169-B
Martini, E., 1971. Standard Tertiary and Quaternary calcareous nannoplankton zonation. Proceedings of the Second Planktonic Conference, Roma, 1970:739–785.
Okada, H., and Bukry, D., 1980. Supplementary modification and introduction of code numbers to the low-latitude coccolith biostratigraphic zonation (Bukry, 1973; 1975). Marine Micropaleontology, 5(3):321–325. https://doi.org/10.1016/0377-8398(80)90016-X
Pimmel, A., and Claypool, G., 2001. Introduction to shipboard organic geochemistry on the JOIDES Resolution. Ocean Drilling Program Technical Note, 30. https://doi.org/10.2973/odp.tn.30.2001
Preine, J., Karstens, J., Hübscher, C., Crutchley, G.J., Druitt, T.H., Schmid, F., and Nomikou, P., 2022a. The hidden giant: how a rift pulse triggered a cascade of sector collapses and voluminous secondary mass-transport events in the early evolution of Santorini. Basin Research, 34(4):1465–1485. https://doi.org/10.1111/bre.12667
Preine, J., Karstens, J., Hübscher, C., Nomikou, P., Schmid, F., Crutchley, G.J., Druitt, T.H., and Papanikolaou, D., 2022b. Spatio-temporal evolution of the Christiana-Santorini-Kolumbo volcanic field, Aegean Sea. Geology, 50(1):96–100. https://doi.org/10.1130/G49167.1
Rio, D., Raffi, I., and Villa, G., 1990. Pliocene-Pleistocene calcareous nannofossil distribution patterns in the western Mediterranean. In Kastens, K.A., Mascle, J., et al., Proceedings of the Ocean Drilling Program, Scientific Results. 107: College Station, TX (Ocean Drilling Program), 513–533. https://doi.org/10.2973/odp.proc.sr.107.164.1990
Schacht, U., Wallmann, K., Kutterolf, S., and Schmidt, M., 2008. Volcanogenic sediment–seawater interactions and the geochemistry of pore waters. Chemical Geology, 249(3):321–338.https://doi.org/10.1016/j.chemgeo.2008.01.026
Shipboard Scientific Party, 2001. Leg 190 summary. In Moore, G.F., Taira, A., Klaus, A., et al., Proceedings of the Ocean Drilling Program, Initial Reports, 190. College Station, TX (Ocean Drilling Program), 1–87. https://doi.org/10.2973/odp.proc.ir.190.101.2001
Tarling, D.H., 1983. Paleomagnetism: Principles and Applications in Geology, Geophysics and Archaeology: Dordrecht, Netherlands (Springer). https://doi.org/10.1007/978-94-009-5955-2
Tsampouraki-Kraounaki, K., and Sakellariou, D., 2018. Seismic stratigraphy and geodynamic evolution of Christiana Basin, South Aegean Arc. Marine Geology, 399:135–147. https://doi.org/10.1016/j.margeo.2018.02.012
Wallace, L.M., Saffer, D.M., Barnes, P.M., Pecher, I.A., Petronotis, K.E., LeVay, L.J., Bell, R.E., Crundwell, M.P., Engelmann de Oliveira, C.H., Fagereng, A., Fulton, P.M., Greve, A., Harris, R.N., Hashimoto, Y., Hüpers, A., Ikari, M.J., Ito, Y., Kitajima, H., Kutterolf, S., Lee, H., Li, X., Luo, M., Malie, P.R., Meneghini, F., Morgan, J.K., Noda, A., Rabinowitz, H.S., Savage, H.M., Shepherd, C.L., Shreedharan, S., Solomon, E.A., Underwood, M.B., Wang, M., Woodhouse, A.D., Bourlange, S.M., Brunet, M.M.Y., Cardona, S., Clennell, M.B., Cook, A.E., Dugan, B., Elger, J., Gamboa, D., Georgiopoulou, A., Han, S., Heeschen, K.U., Hu, G., Kim, G.Y., Koge, H., Machado, K.S., McNamara, D.D., Moore, G.F., Mountjoy, J.J., Nole, M.A., Owari, S., Paganoni, M., Rose, P.S., Screaton, E.J., Shankar, U., Torres, M.E., Wang, X., and Wu, H.-Y., 2019. Expedition 372B/375 methods. In Wallace, L.M., Saffer, D.M., Barnes, P.M., Pecher, I.A., Petronotis, K.E., LeVay, L.J., and the Expedition 372/375 Scientists, Hikurangi Subduction Margin Coring, Logging, and Observatories. Proceedings of the International Ocean Discovery Program, 372B/375: College Station, TX (International Ocean Discovery Program). https://doi.org/10.14379/iodp.proc.372B375.102.2019