Druitt, T.H., Kutterolf, S., Ronge, T.A., and the Expedition 398 Scientists
Proceedings of the International Ocean Discovery Program Volume 398
publications.iodp.org
https://doi.org/10.14379/iodp.proc.398.107.2024
Site U15931
![]() T.H. Druitt,
T.H. Druitt,
![]() S. Kutterolf,
S. Kutterolf,
![]() T.A. Ronge,
T.A. Ronge,
![]() S. Beethe,
S. Beethe,
![]() A. Bernard,
A. Bernard,
![]() C. Berthod,
C. Berthod,
![]() H. Chen,
H. Chen,
![]() S. Chiyonobu,
S. Chiyonobu,
![]() A. Clark,
A. Clark,
![]() S. DeBari,
S. DeBari,
![]() T.I. Fernandez Perez,
T.I. Fernandez Perez,
![]() R. Gertisser,
R. Gertisser,
![]() C. Hübscher,
C. Hübscher,
![]() R.M. Johnston,
R.M. Johnston,
![]() C. Jones,
C. Jones,
![]() K.B. Joshi,
K.B. Joshi,
![]() G. Kletetschka,
G. Kletetschka,
![]() O. Koukousioura,
O. Koukousioura,
![]() X. Li,
X. Li,
![]() M. Manga,
M. Manga,
![]() M. McCanta,
M. McCanta,
![]() I. McIntosh,
I. McIntosh,
![]() A. Morris,
A. Morris,
![]() P. Nomikou,
P. Nomikou,
![]() K. Pank,
K. Pank,
![]() A. Peccia,
A. Peccia,
![]() P.N. Polymenakou,
P.N. Polymenakou,
![]() J. Preine,
J. Preine,
![]() M. Tominaga,
M. Tominaga,
![]() A. Woodhouse, and
A. Woodhouse, and
![]() Y. Yamamoto2
Y. Yamamoto2
1 Druitt, T.H., Kutterolf, S., Ronge, T.A., Beethe, S., Bernard, A., Berthod, C., Chen, H., Chiyonobu, S., Clark, A., DeBari, S., Fernandez Perez, T.I., Gertisser, R., Hübscher, C., Johnston, R.M., Jones, C., Joshi, K.B., Kletetschka, G., Koukousioura, O., Li, X., Manga, M., McCanta, M., McIntosh, I., Morris, A., Nomikou, P., Pank, K., Peccia, A., Polymenakou, P.N., Preine, J., Tominaga, M., Woodhouse, A., and Yamamoto, Y., 2024. Site U1593. In Druitt, T.H., Kutterolf, S., Ronge, T.A., and the Expedition 398 Scientists, Hellenic Arc Volcanic Field. Proceedings of the International Ocean Discovery Program, 398: College Station, TX (International Ocean Discovery Program). https://doi.org/10.14379/iodp.proc.398.107.2024
2 Expedition 398 Scientists’ affiliations.
1. Background and objectives
Site U1593 (proposed Site CSK-04C) is located 8 km northwest of the submarine Kolumbo caldera on its flank in the Anhydros Basin at a water depth of 402 meters below sea level (mbsl) (Figure F1). It lies on Seismic Line HH06-44, offset 600 m northeast from Seismic Line HH06-22 (Figure F2). We drilled to a maximum recovery depth of 250.9 meters below seafloor (mbsf; all depths below seafloor are given using the core depth below seafloor, Method A [CSF-A], scale, except in Operations where the drilling depth below seafloor [DSF] scale is used) in three holes (U1593A–U1593C) with average core recoveries of 60%, 67%, and <1%, respectively.
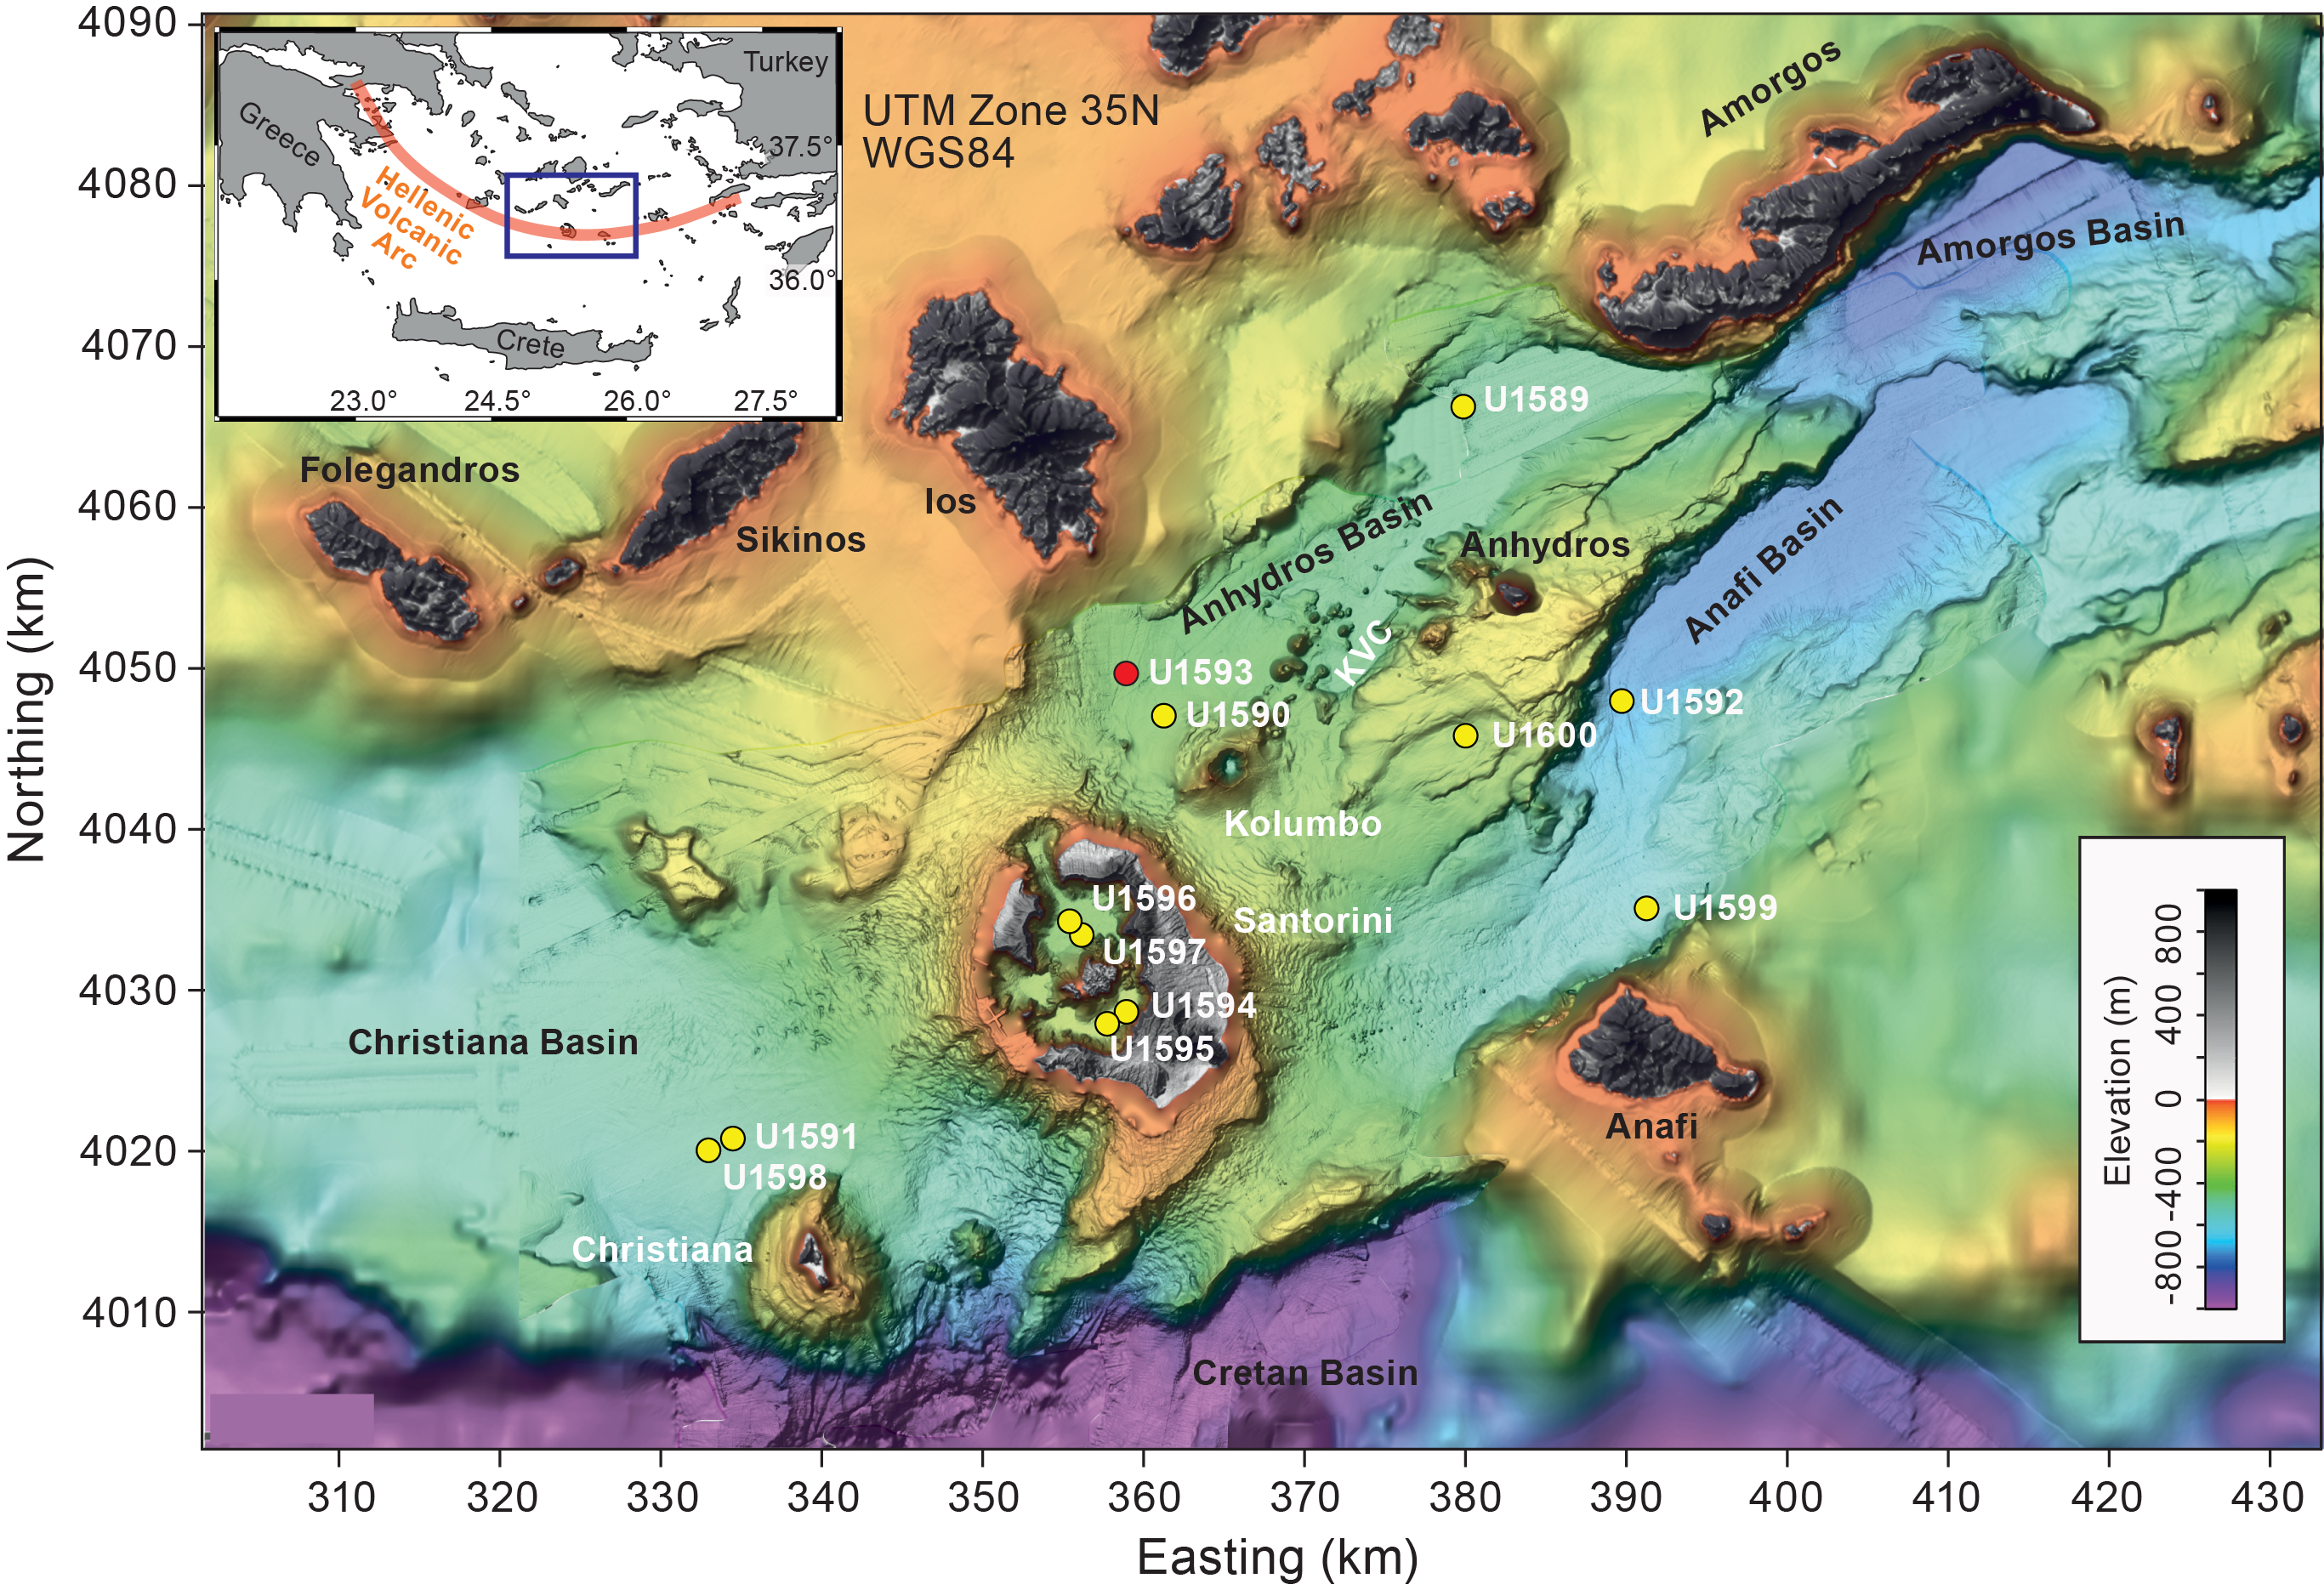
Figure F1. Site map.
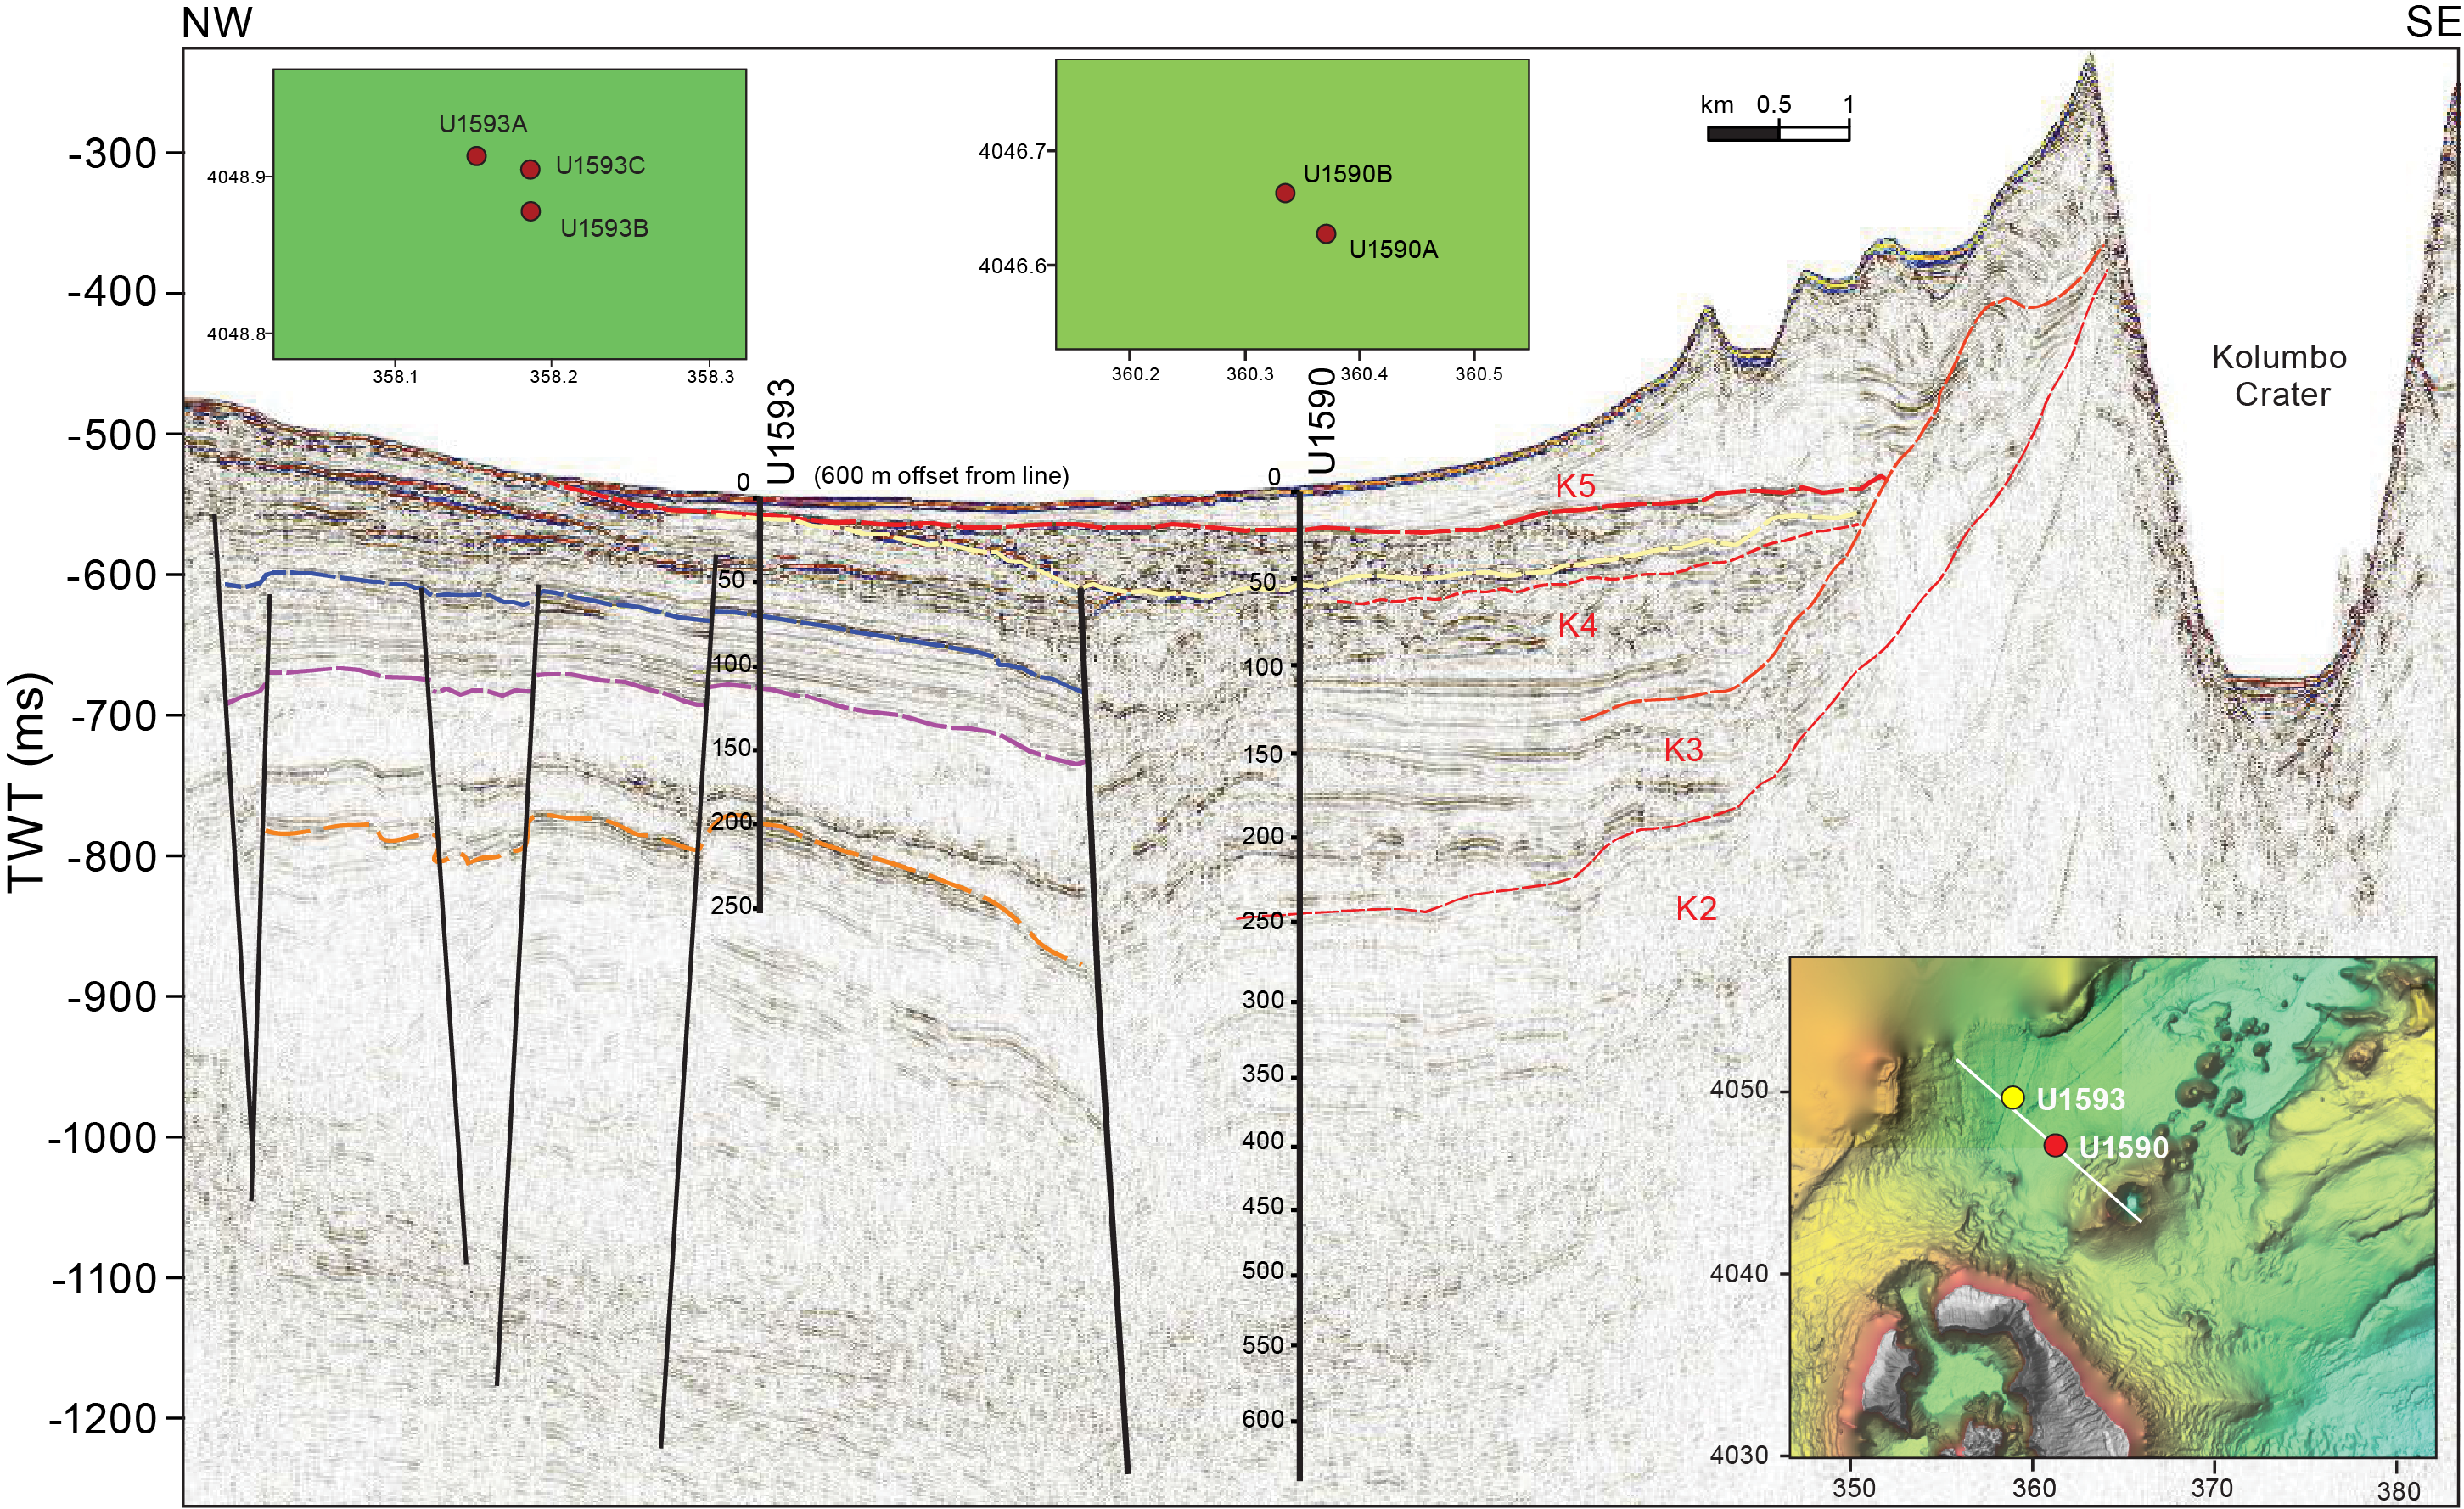
Figure F2. Seismic profile.
The seismic profiles across the Kolumbo edifice reveal five units interpreted as Kolumbo-derived volcaniclastics (K1 to K5 from the base up), with Seismic Unit K5 representing the 1650 Common Era (CE) eruption (Hübscher et al., 2015; Preine et al., 2022). The submarine cones northeast of Kolumbo postdate Unit K2 on seismic profiles, but their products were not expected to be prominent in our drill cores.
The aim of drilling on the flanks of Kolumbo was to penetrate the different seismically recognized volcanic eruption units from that volcano (K1–K3 and K5 or their thin, lateral equivalents) as well as many eruption units from Santorini and traces from the submarine cones northeast of Kolumbo. This enabled characterization of the products of the Kolumbo eruptions and construction of a coherent stratigraphy for Santorini and the submarine Kolumbo volcano chain together. The anticipated lithologies were volcaniclastics, muds, and turbidites.
Site U1593 lies at the foot of the Kolumbo edifice, 3 km northwest of Site U1590. Owing to poor recovery at the latter site, we decided to also drill at Site U1593, which lies on the other side (northwest) of the Kolumbo Fault from Site U1590. This had two advantages. First, we could measure the offset across the Kolumbo Fault by correlating key marker layers from one site to the other. Second, the sequence at Site U1593 was more condensed than at Site U1590, offering us older recovery and better hole stability.
Like Site U1590, Site U1593 allowed us to drill Seismic Units K1–K3 and K5, and therefore nearly the entire history of Kolumbo Volcano, within the proposed drilling target depth of 581 mbsf. Intercalated seismic units were believed to contain the products of Santorini eruptions, including potentially those of smaller magnitude than recorded at the more distal basin sites.
2. Operations
Operations at Site U1593 involved three holes, with an expected switch to the rotary core barrel (RCB) system for Hole U1593C. After arrival on 18 January 2023, all thrusters were down and secured at 2318 h. The vessel was switched to dynamic positioning control at 2324 h, and the rig floor was given the all clear.
2.1. Hole U1593A
An advanced piston corer/extended core barrel (APC/XCB) bottom hole assembly (BHA) with bit was assembled, and Hole U1593A (36°34.5103′N, 25°24.8765′E) was spudded on 19 January 2023 at 0245 h from 409.0 meters below rig floor (mbrf). Recovery for Core 1H was 4.7 m, giving a calculated seafloor of 402.5 mbsl (Table T1).
APC coring continued with Cores 2H–16H from 4.7 to 147.2 mbsf. Indications of partial strokes on three consecutive cores, plus a high overpull on Core 16H, led to a switch to half-length APC (HLAPC) coring. HLAPC coring commenced with Core 17F and continued on 20 January through Core 38F to 250.6 mbsf, the final depth for Hole U1593A. The drill string was tripped up with the top drive to 202.6 mbsf, the top drive was racked back, and the trip out continued to 404.9 mbrf. The bit cleared the seafloor at 0750 h, ending Hole U1593A.
2.2. Hole U1593B
The rig crew serviced the rig while the vessel was offset 50 m southeast. At 0940 h on 21 January 2023, Hole U1593B (36°34.4916′N, 25°24.9000′E) was spudded from 412.0 mbrf. The recovery of 6.20 m gave a calculated seafloor as 404.0 mbsl. APC coring continued with Cores 2H–11H. HLAPC coring began with Core 12F at 101.2 mbsf and continued on 21 January through Core 39F to 232.8 mbsf, the final depth for Hole U1593B. The bit cleared the rotary table at 1409 h, ending Hole U1593B.
2.3. Hole U1593C
At 1445 h, the vessel was offset 25 m north. Meanwhile, the crew started assembling the RCB BHA with a bit. Hole U1593C (36°34.5060′N, 25°24.8995′E) was spudded at 1752 h. Drill-ahead continued to 192.6 mbsf. At the 192 mbsf mark, the drill pipe started experiencing increasing torque. The hole was circulated and conditioned. The drill string was worked up from 189.3 to 173.1 mbsf, and the center bit was retrieved.
During the attempt to work the drill string back to bottom, excessive torque was still observed. The drill string was backreamed from 192.6 to 123 mbsf this time, resulting in overpull and a loss of rotation. Attempts to free the string with mud sweeps and circulation proved fruitless. Overpulls were increased to a final attempt at 150,000 lb, still with no success.
At 0830 h, the Schlumberger wireline was rigged up to sever the pipe. The drill string was severed at 37.0 mbsf at 1010 h and immediately regained rotation. The severing tool was retrieved and laid out, and the crew rigged down the wireline. The drill string was tripped up with the top drive, and the pipe cleared the rotary table at 1320 h.
The drill floor was secured, and the thrusters were raised starting at 1646 h. The vessel was switched to bridge control at 1648 h. All thrusters were up and secure, and the sea passage began at 1700 h, ending Site U1593.
3. Lithostratigraphy
Cores from Site U1593 recovered a coherent stratigraphy from 0 to 250.89 mbsf (Figure F3). Hole U1593A consists of Sections 1H-1 through 38F-CC (0–250.89 mbsf). Hole U1593B consists of Sections 1H-1 through 39F-CC (0–232.46 mbsf). The holes were drilled to overlap with each other so that missing stratigraphy (unrecovered material) in Hole U1593A could be recovered in Hole U1593B. This was partially achieved (Figure F3).
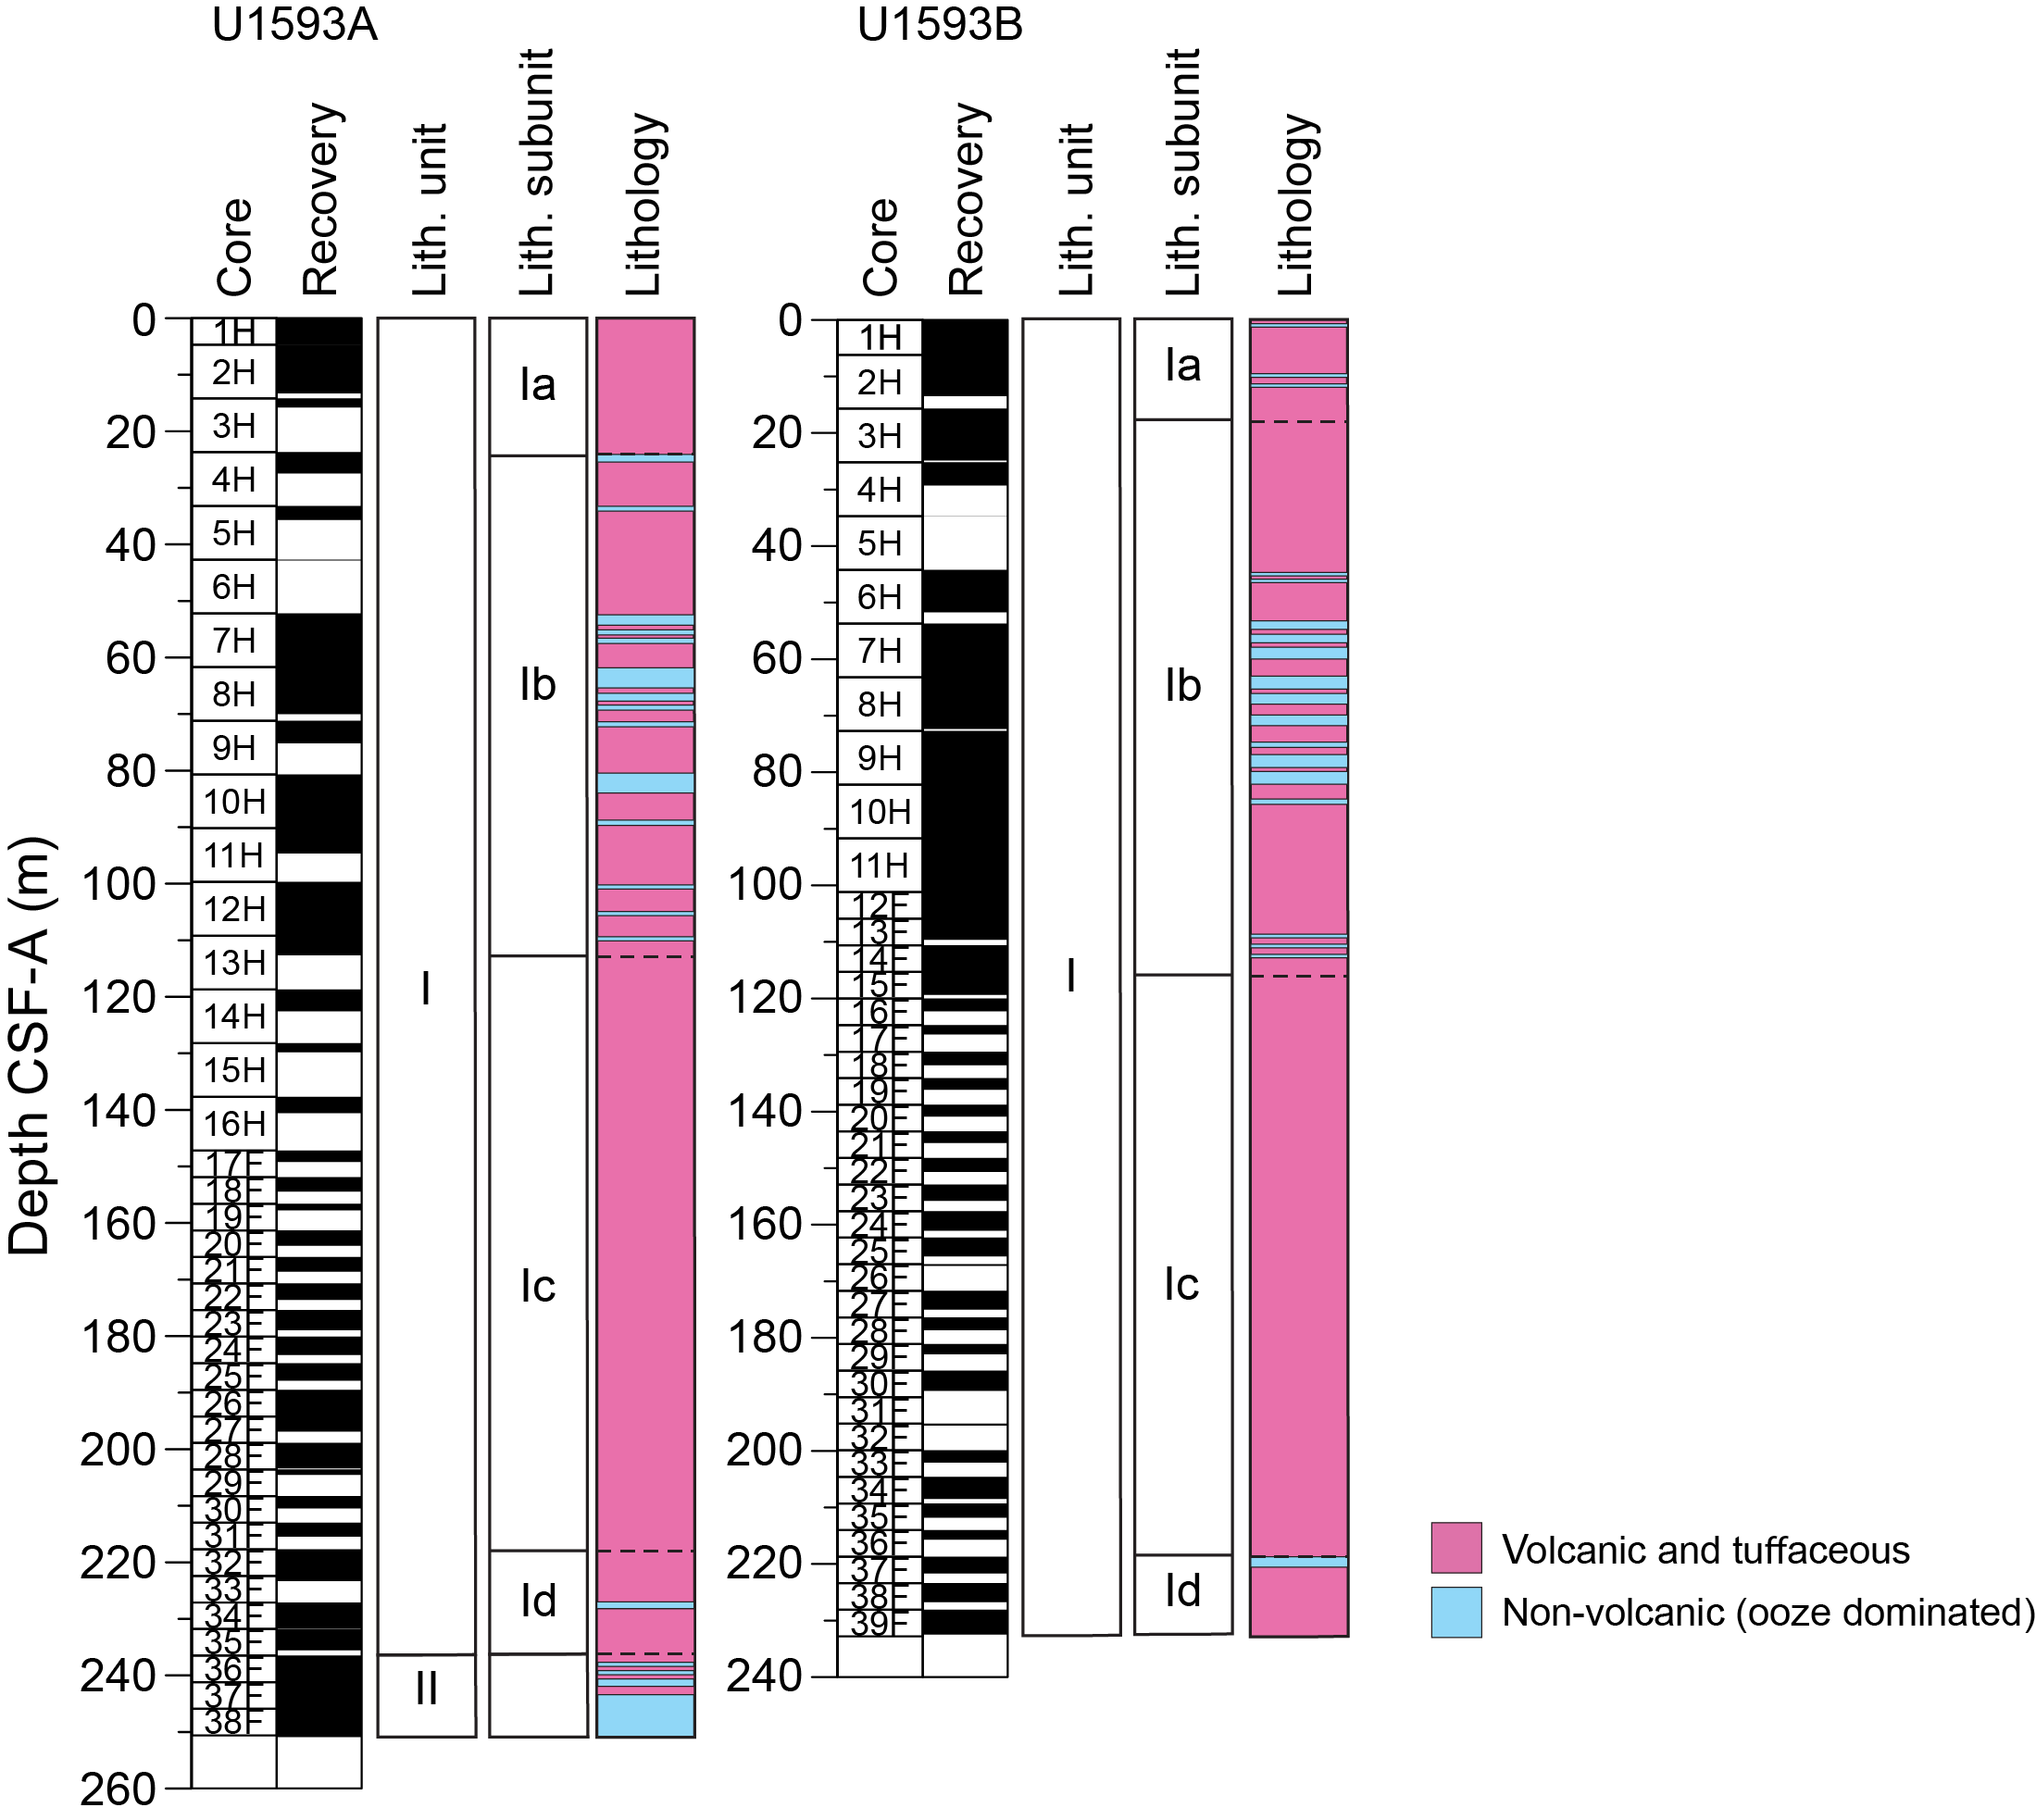
Figure F3. Lithostratigraphy.
The recovered material is unlithified sediment dominated by volcanic and tuffaceous material interspersed with minor amounts of nonvolcanic sediments in both holes. Site U1593 has two lithostratigraphic units (I and II). Unit I is composed of four subunits (Ia–Id), and Unit II, which is only present in Hole U1593A, has no subunits. Smear slides for microscopic analyses were prepared to confirm macroscopic descriptions of distinct lithology changes at the section level, such as identification of vitric ash particles in tuffaceous lithologies or crystals in ash layers.
Figure F3 summarizes the lithostratigraphy of Site U1593, displaying core recovery and lithostratigraphic units and subunits in Holes U1593A and U1593B. Table T2 provides the upper and lower boundaries, thicknesses, and lithologic summaries of the units and subunits. Figure F4 graphically presents the relative proportions of volcanic, tuffaceous, and nonvolcanic lithologies in each hole with lithostratigraphic units and subunits. Figure F5 schematically presents the grain sizes of the sediments in both units, in particular the changes in grain size in the volcanic- and tuffaceous-dominated units, to graphically show the distributions of ash, lapilli-ash, and lapilli. Figure F6 displays different types of core disturbance observed at Site U1593.
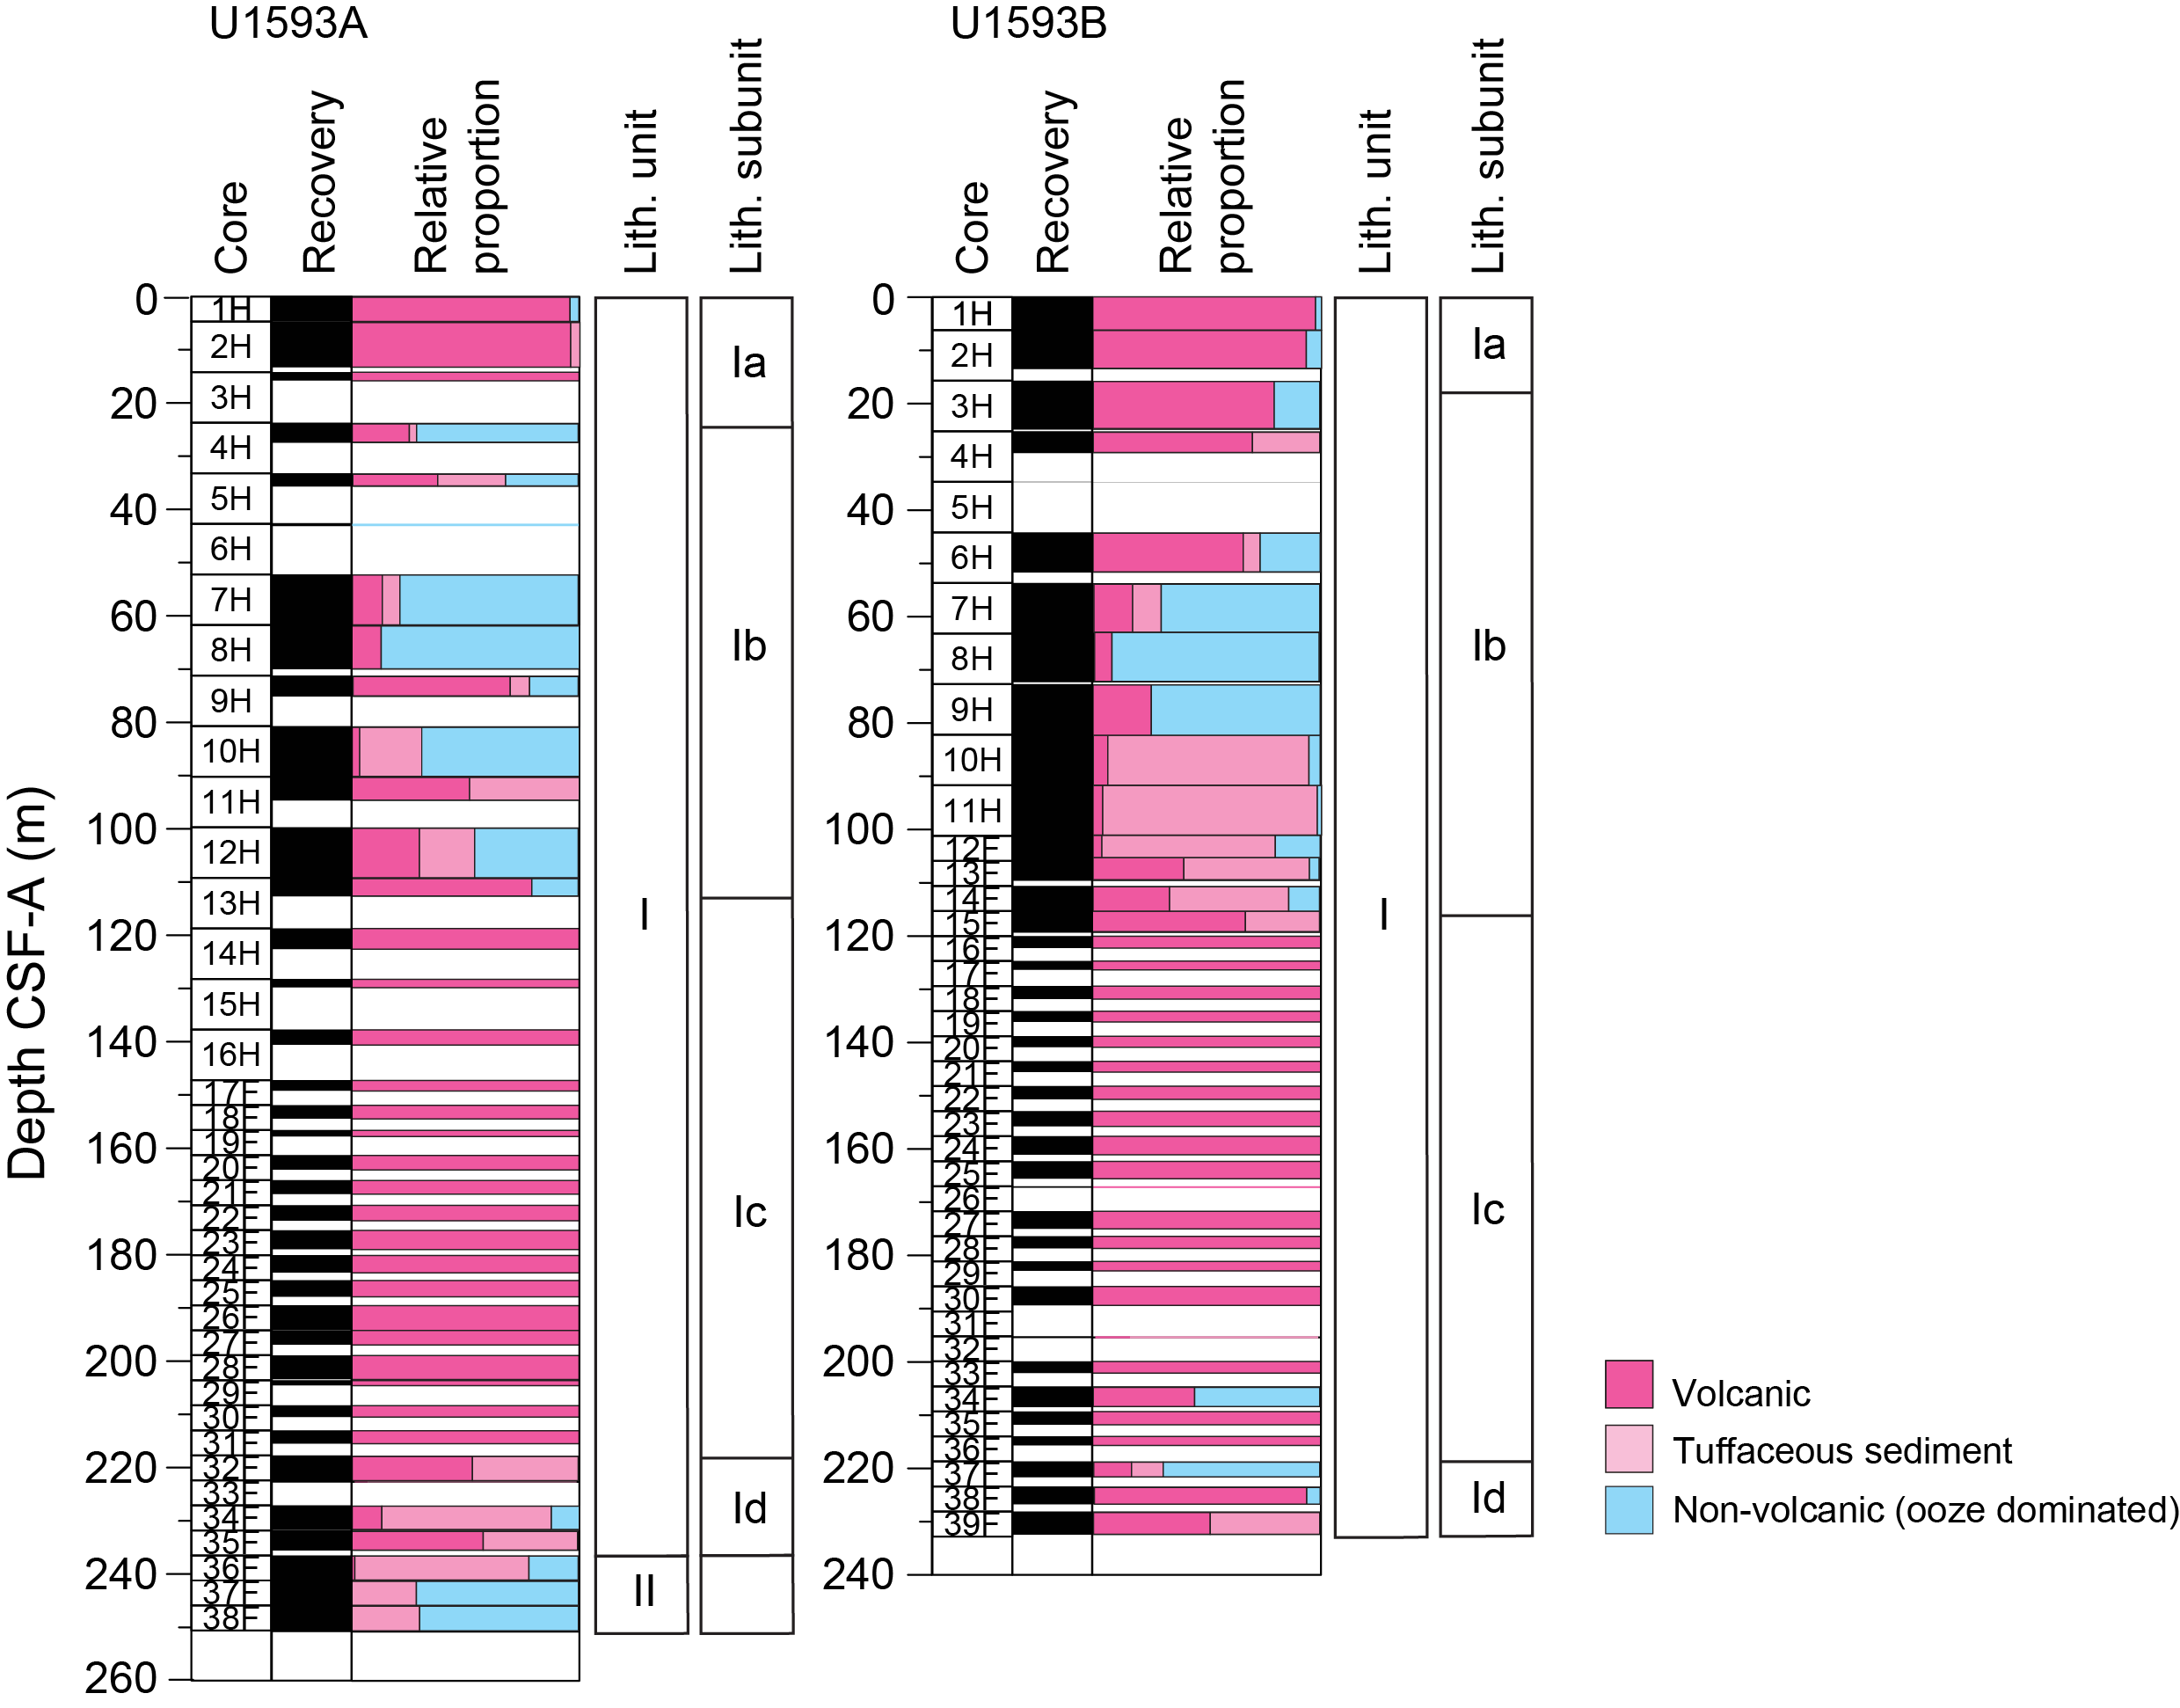
Figure F4. Volcanic, tuffaceous, and nonvolcanic lithologies.
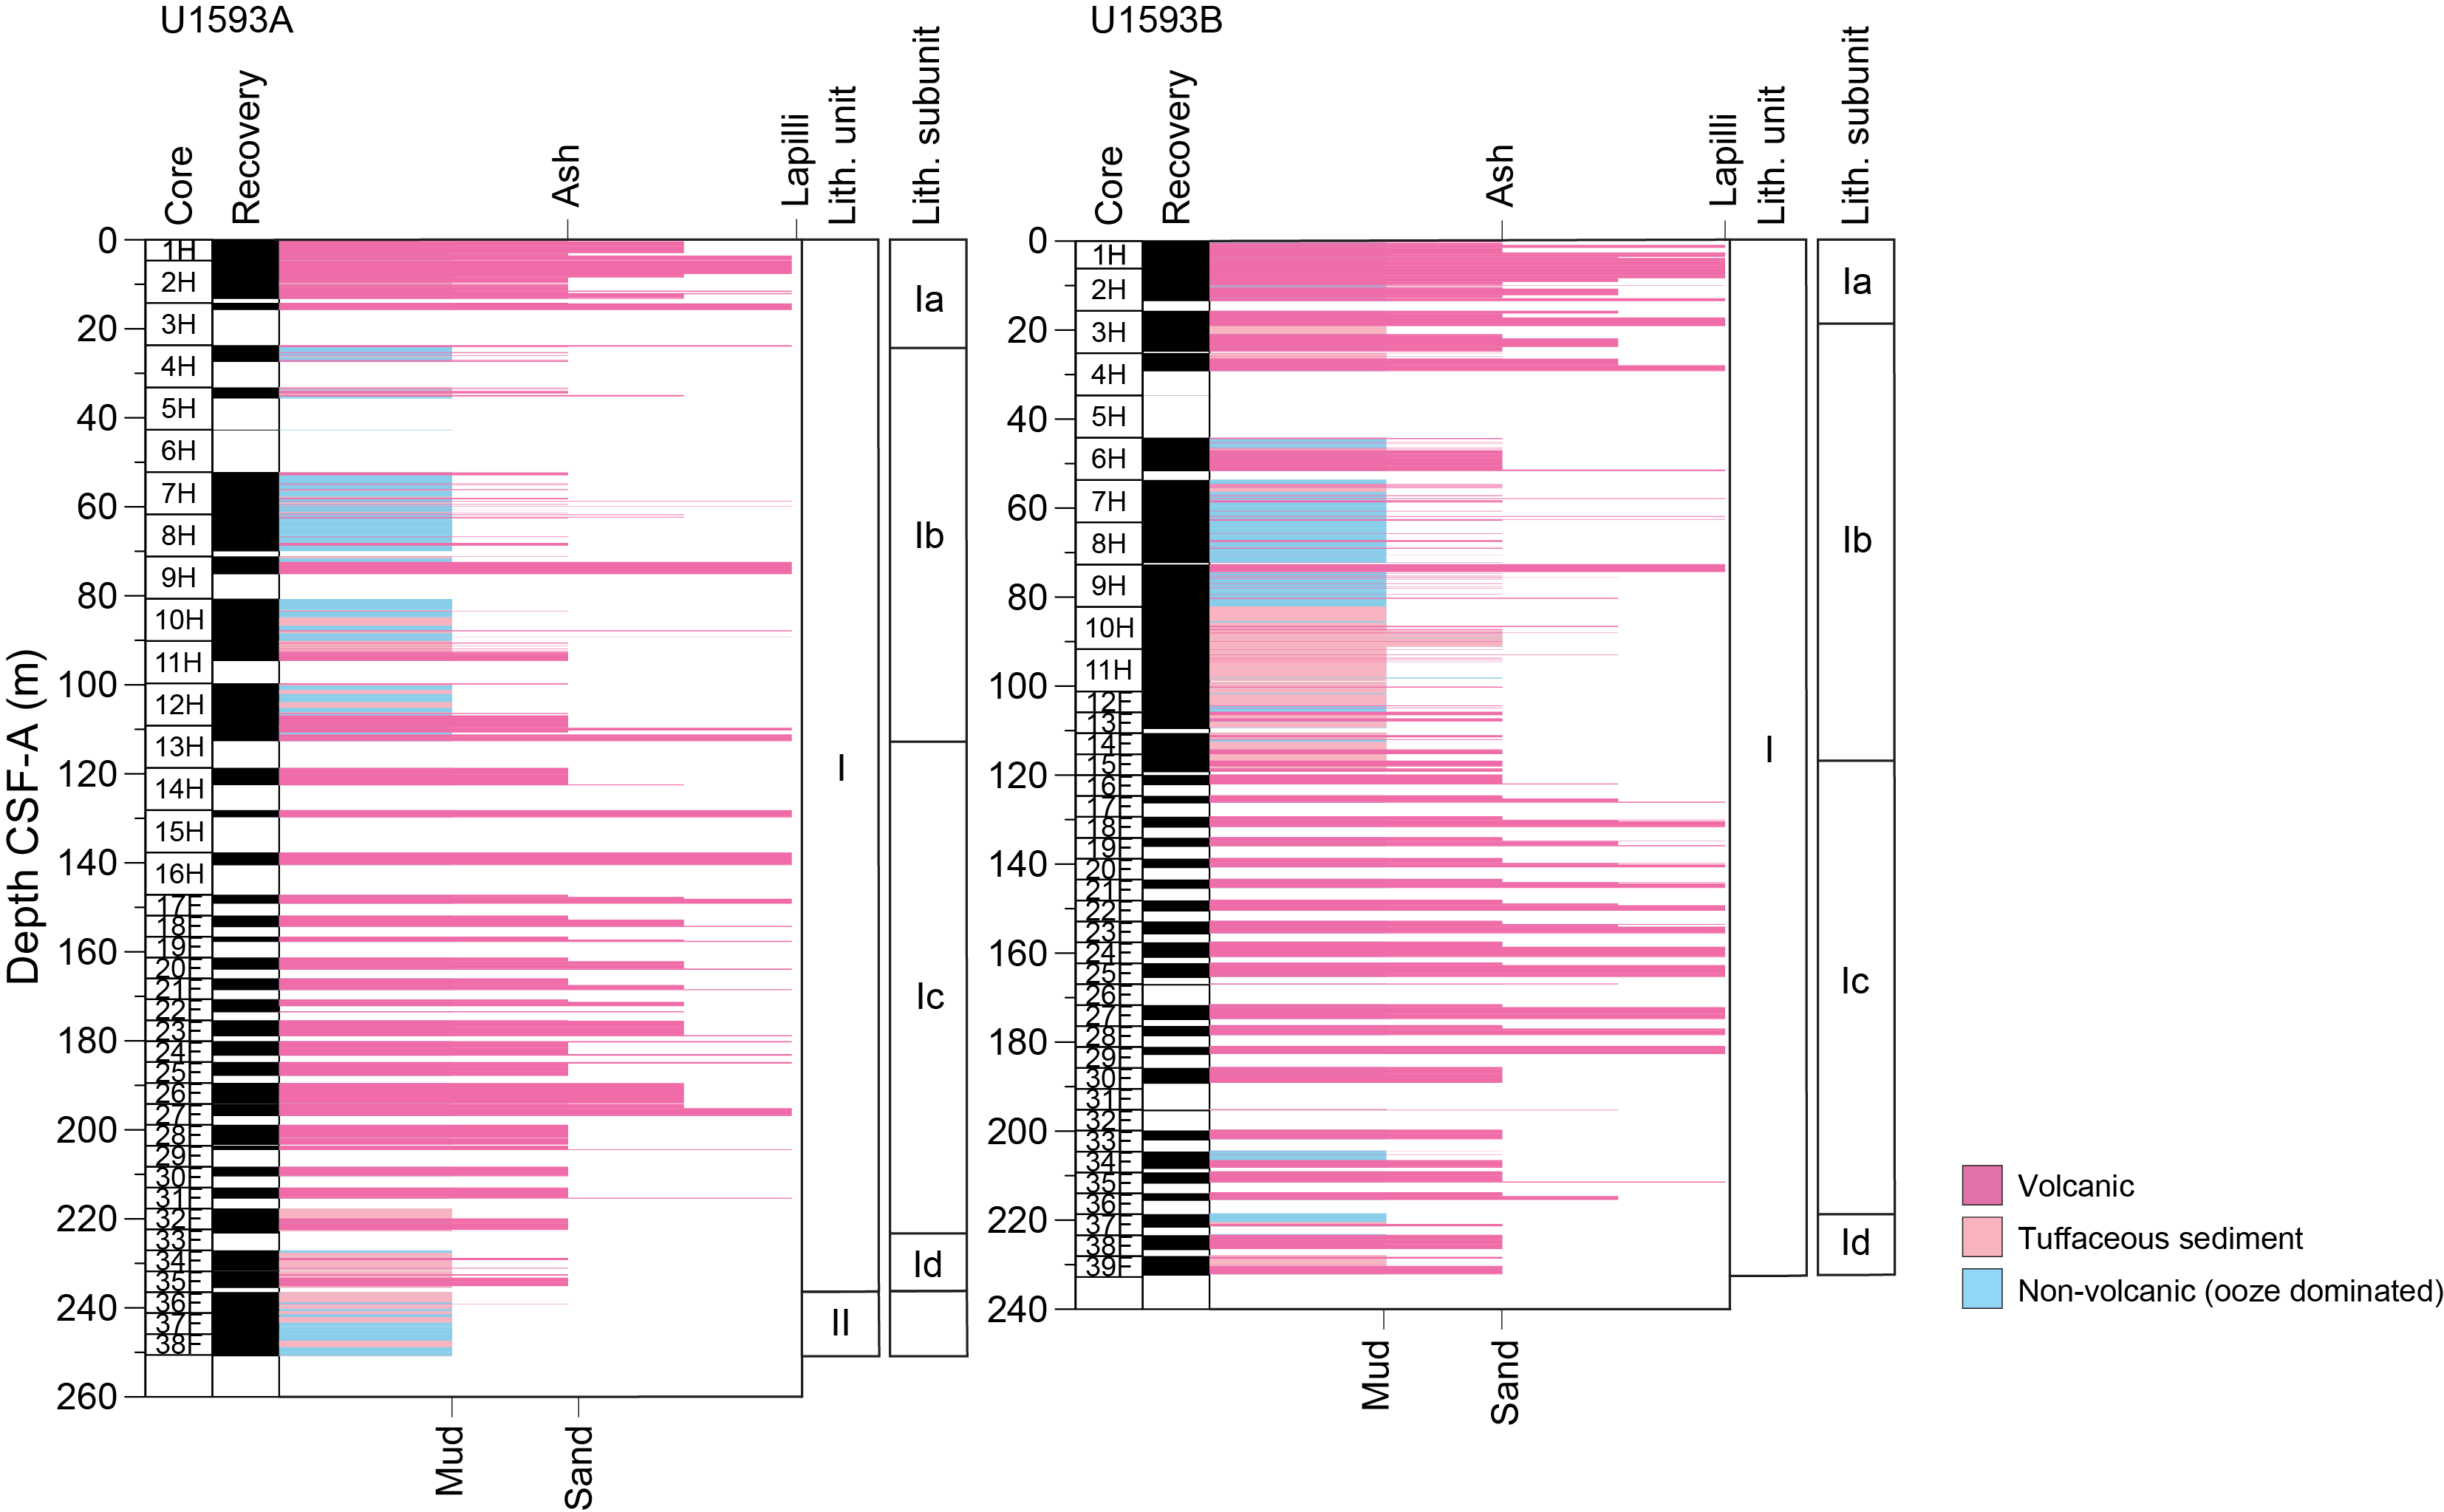
Figure F5. Grain size distribution.
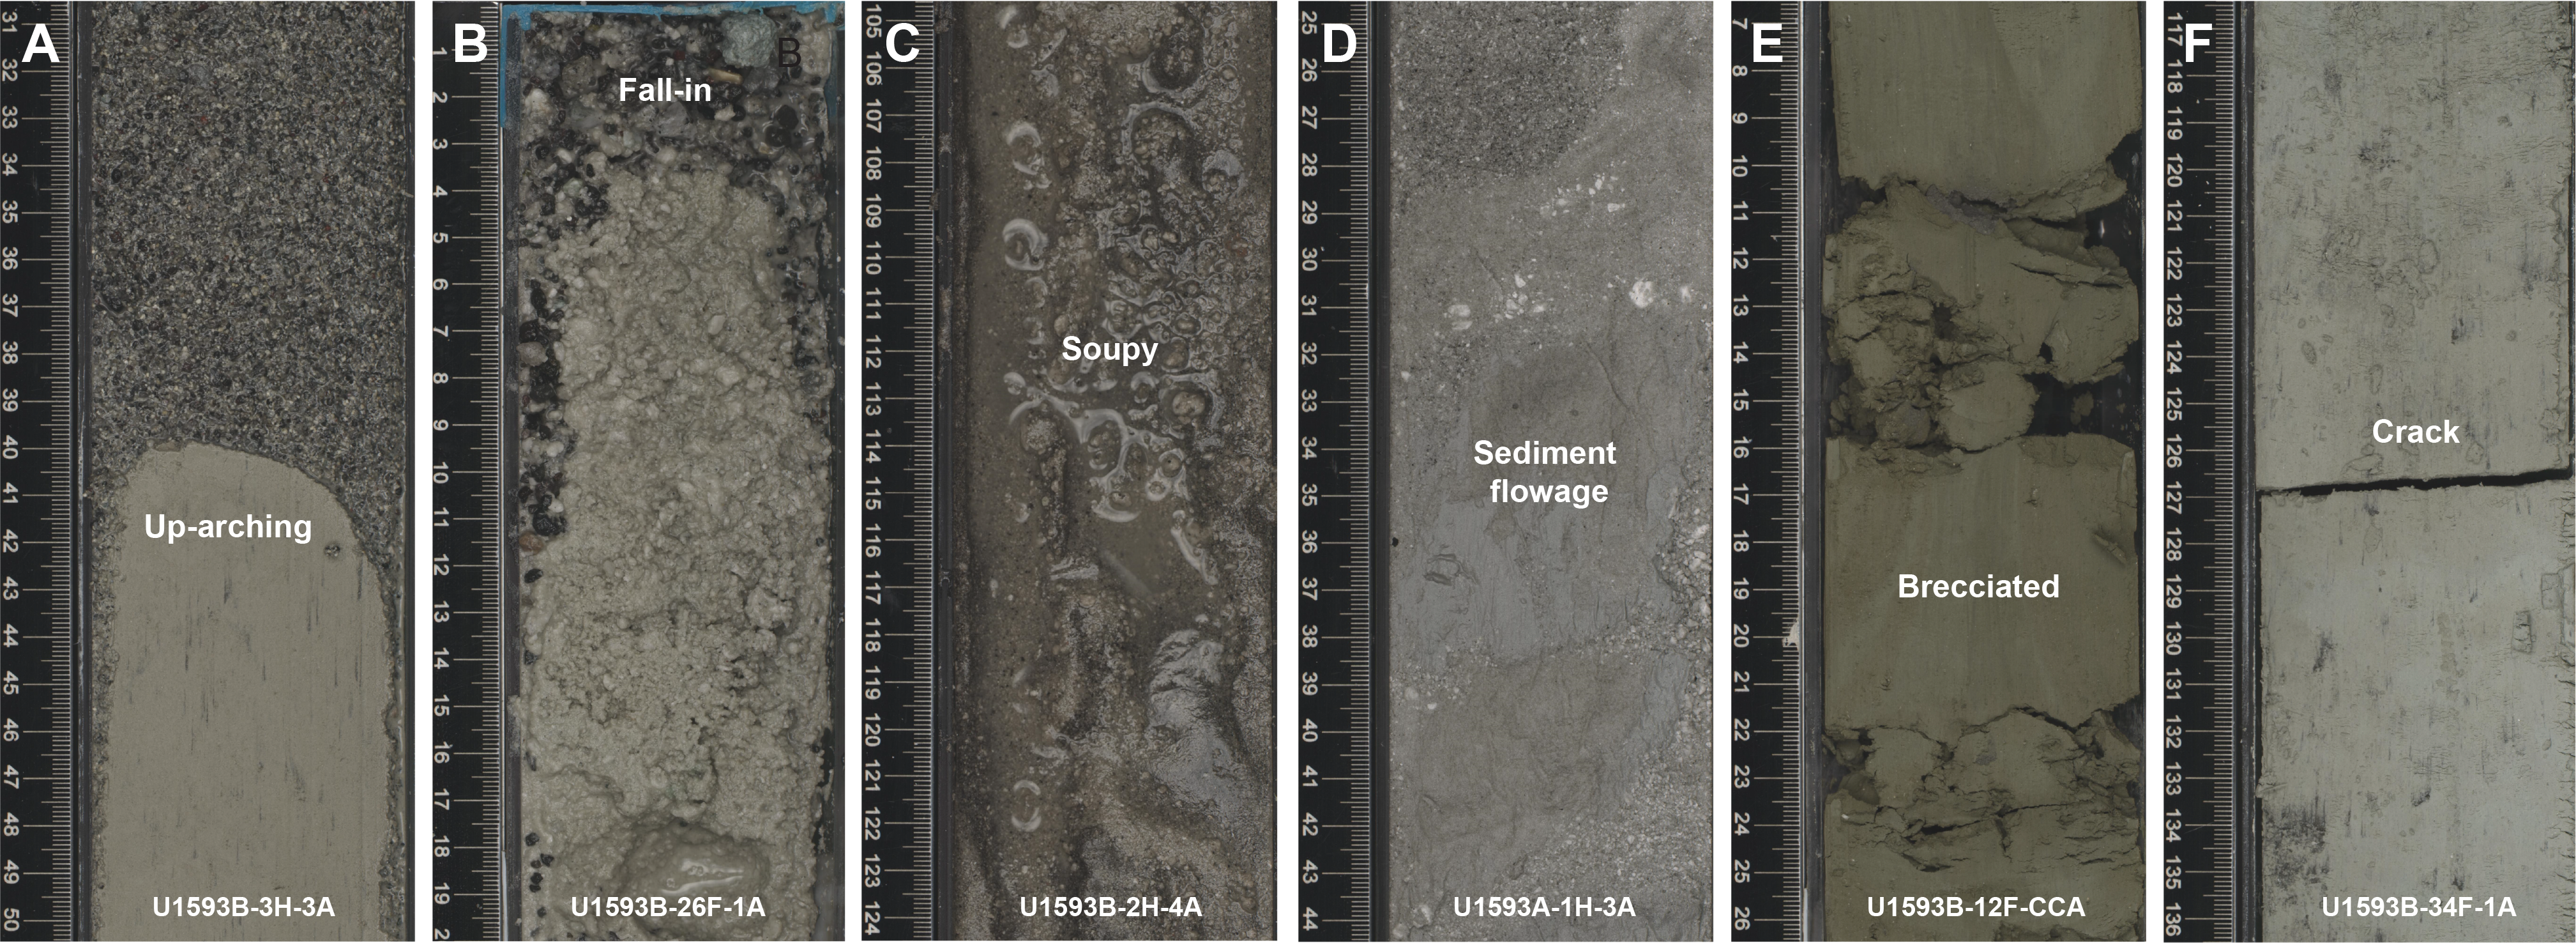
Figure F6. Core disturbances.
The following sections describe (1) the effects of core disturbance, (2) the lithostratigraphic units and subunits, (3) correlations between Holes U1593A and U1593B, and (4) X-ray diffraction (XRD) results from Site U1593.
3.1. Core disturbance
Several types of core disturbance disrupt the lithostratigraphy at Site U1593 (Figure F6):
- Uparching: slight to moderate coring-induced shear between the sediment and core liner results in bedding uniformly dragged downward along the core margins (Figure F6A). In these intervals, the original lithofacies and sedimentary structures are usually slightly to severely disturbed but can still be recognized visually.
- Fall-in: centimeter- to several tens of centimeters–thick coarse clast-supported intervals at the tops of some cores (Figure F6B). We exclude these intervals from lithostratigraphy interpretations.
- Soupy: typically restricted to water-saturated intervals of unconsolidated ash, overprinting original sedimentary or depositional structures (Figure F6C).
- Sediment flowage: softer or less cohesive units are plastically mixed with harder, more cohesive units either during shaking or biscuiting or due to underpressure of a partial stroke and flow along the core liner, sometimes subsequently deposited in cracks of more consolidated sediments. Relics of squeezed sediment are visible between the liner and the sediment (Figure F6D).
- Brecciated: core extension that disturbs the core until it becomes sheared, or, in the case of brittle failure, brecciated (Figure F6E). Slight brecciation produces cracks in the original lithologies (Figure F6F), whereas moderate to severe brecciation disturbs original lithofacies and sedimentary structures more severely, although they usually remain readily recognizable.
- Artificial size and density segregation: likely to occur during drilling or with postrecovery core handling processes on board (e.g., inclining, shaking, and plunging cores on the catwalk to compact sediments). Jutzeler et al. (2014) also described pseudohorizontal density grading that can occur while the core is lying flat on deck, resulting in vertical structures once the core is turned upright. Such core disturbance is observed most often in volcanic sediments because increased porosity allows sucking in of seawater during hydraulic piston coring. The resulting soupy texture allows material to flow within the core liner. Secondary normal or reverse grading, or density separation of clasts, may occur as a result of this disturbance and obscure primary sedimentary features.
3.2. Description of units and subunits
3.2.1. Unit I
- Intervals: 398-U1593A-1H-1, 0 cm, to 35F-3, 95 cm; 398-U1593B-1H-1, 0 cm, to the bottom of the hole
- Depths: Hole U1593A = 0.00–235.1 mbsf; Hole U1593B = 0.00–232.44 mbsf
- Thickness: Hole U1593A = 235.1 m; Hole U1593B = >232.44 m
- Age: Holocene to Early Pleistocene
- Lithology: volcanic and tuffaceous lithologies (ash, lapilli, and lapilli-ash and tuffaceous mud/ooze) and minor ooze, organic-rich ooze/mud, and ooze with ash/lapilli
Unit I extends from 0 to 235.10 mbsf in Hole U1593A and 0 to 232.44 mbsf in Hole U1593B (Table T2). It consists of mainly ash and pumice lapilli in the uppermost ~22 m (Subunit Ia), followed by a repetitive sequence of nonvolcanic and dark gray to black volcanic sediments for ~93 m (Subunit Ib). This is followed by a ~100 m thick white to gray ash and lapilli sequence (Subunit Ic), and a mixed sequence of tuffaceous oozes and black ashes for the final ~17 m (Figures F4, F5). Volcanic intervals commonly have sharp bottom contacts with tuffaceous or nonvolcanic lithologies. Figures F7, F8, F9, and F10 highlight exemplary core section images of the most common lithologies collected from Unit I. Figures F11 and F12 show representative smear slides from these lithologies.
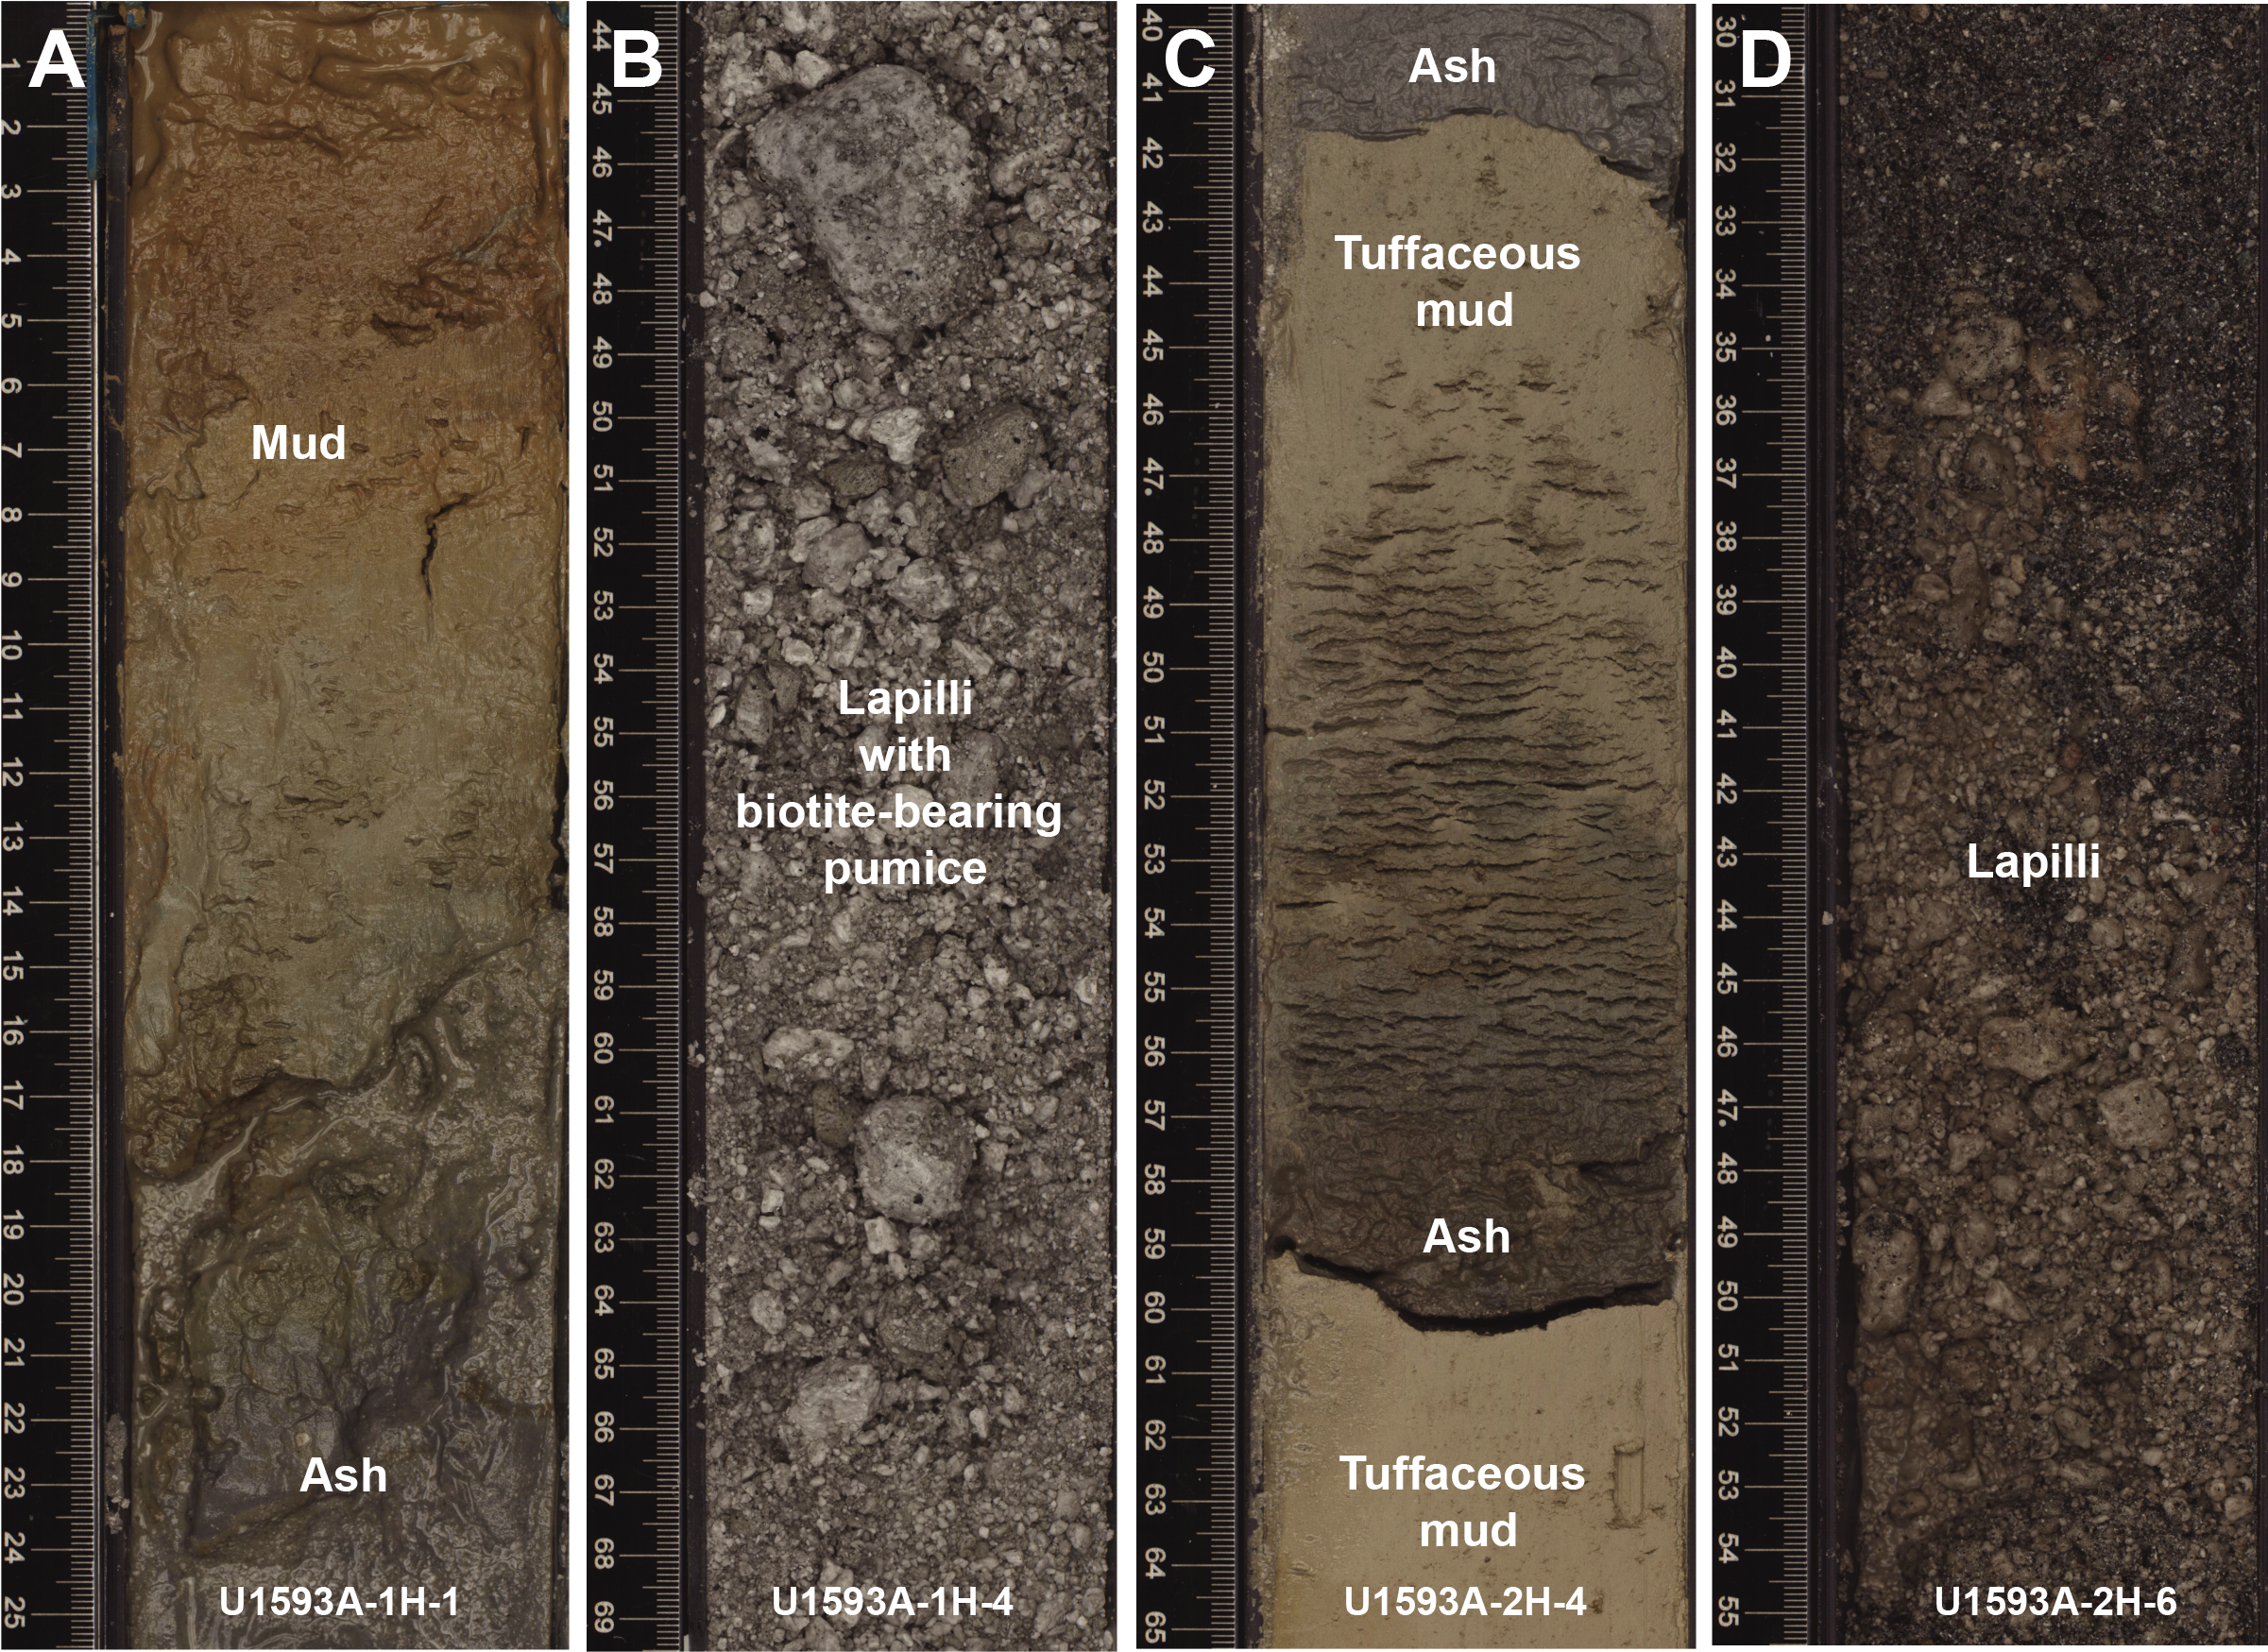
Figure F7. Subunit Ia lithologies.
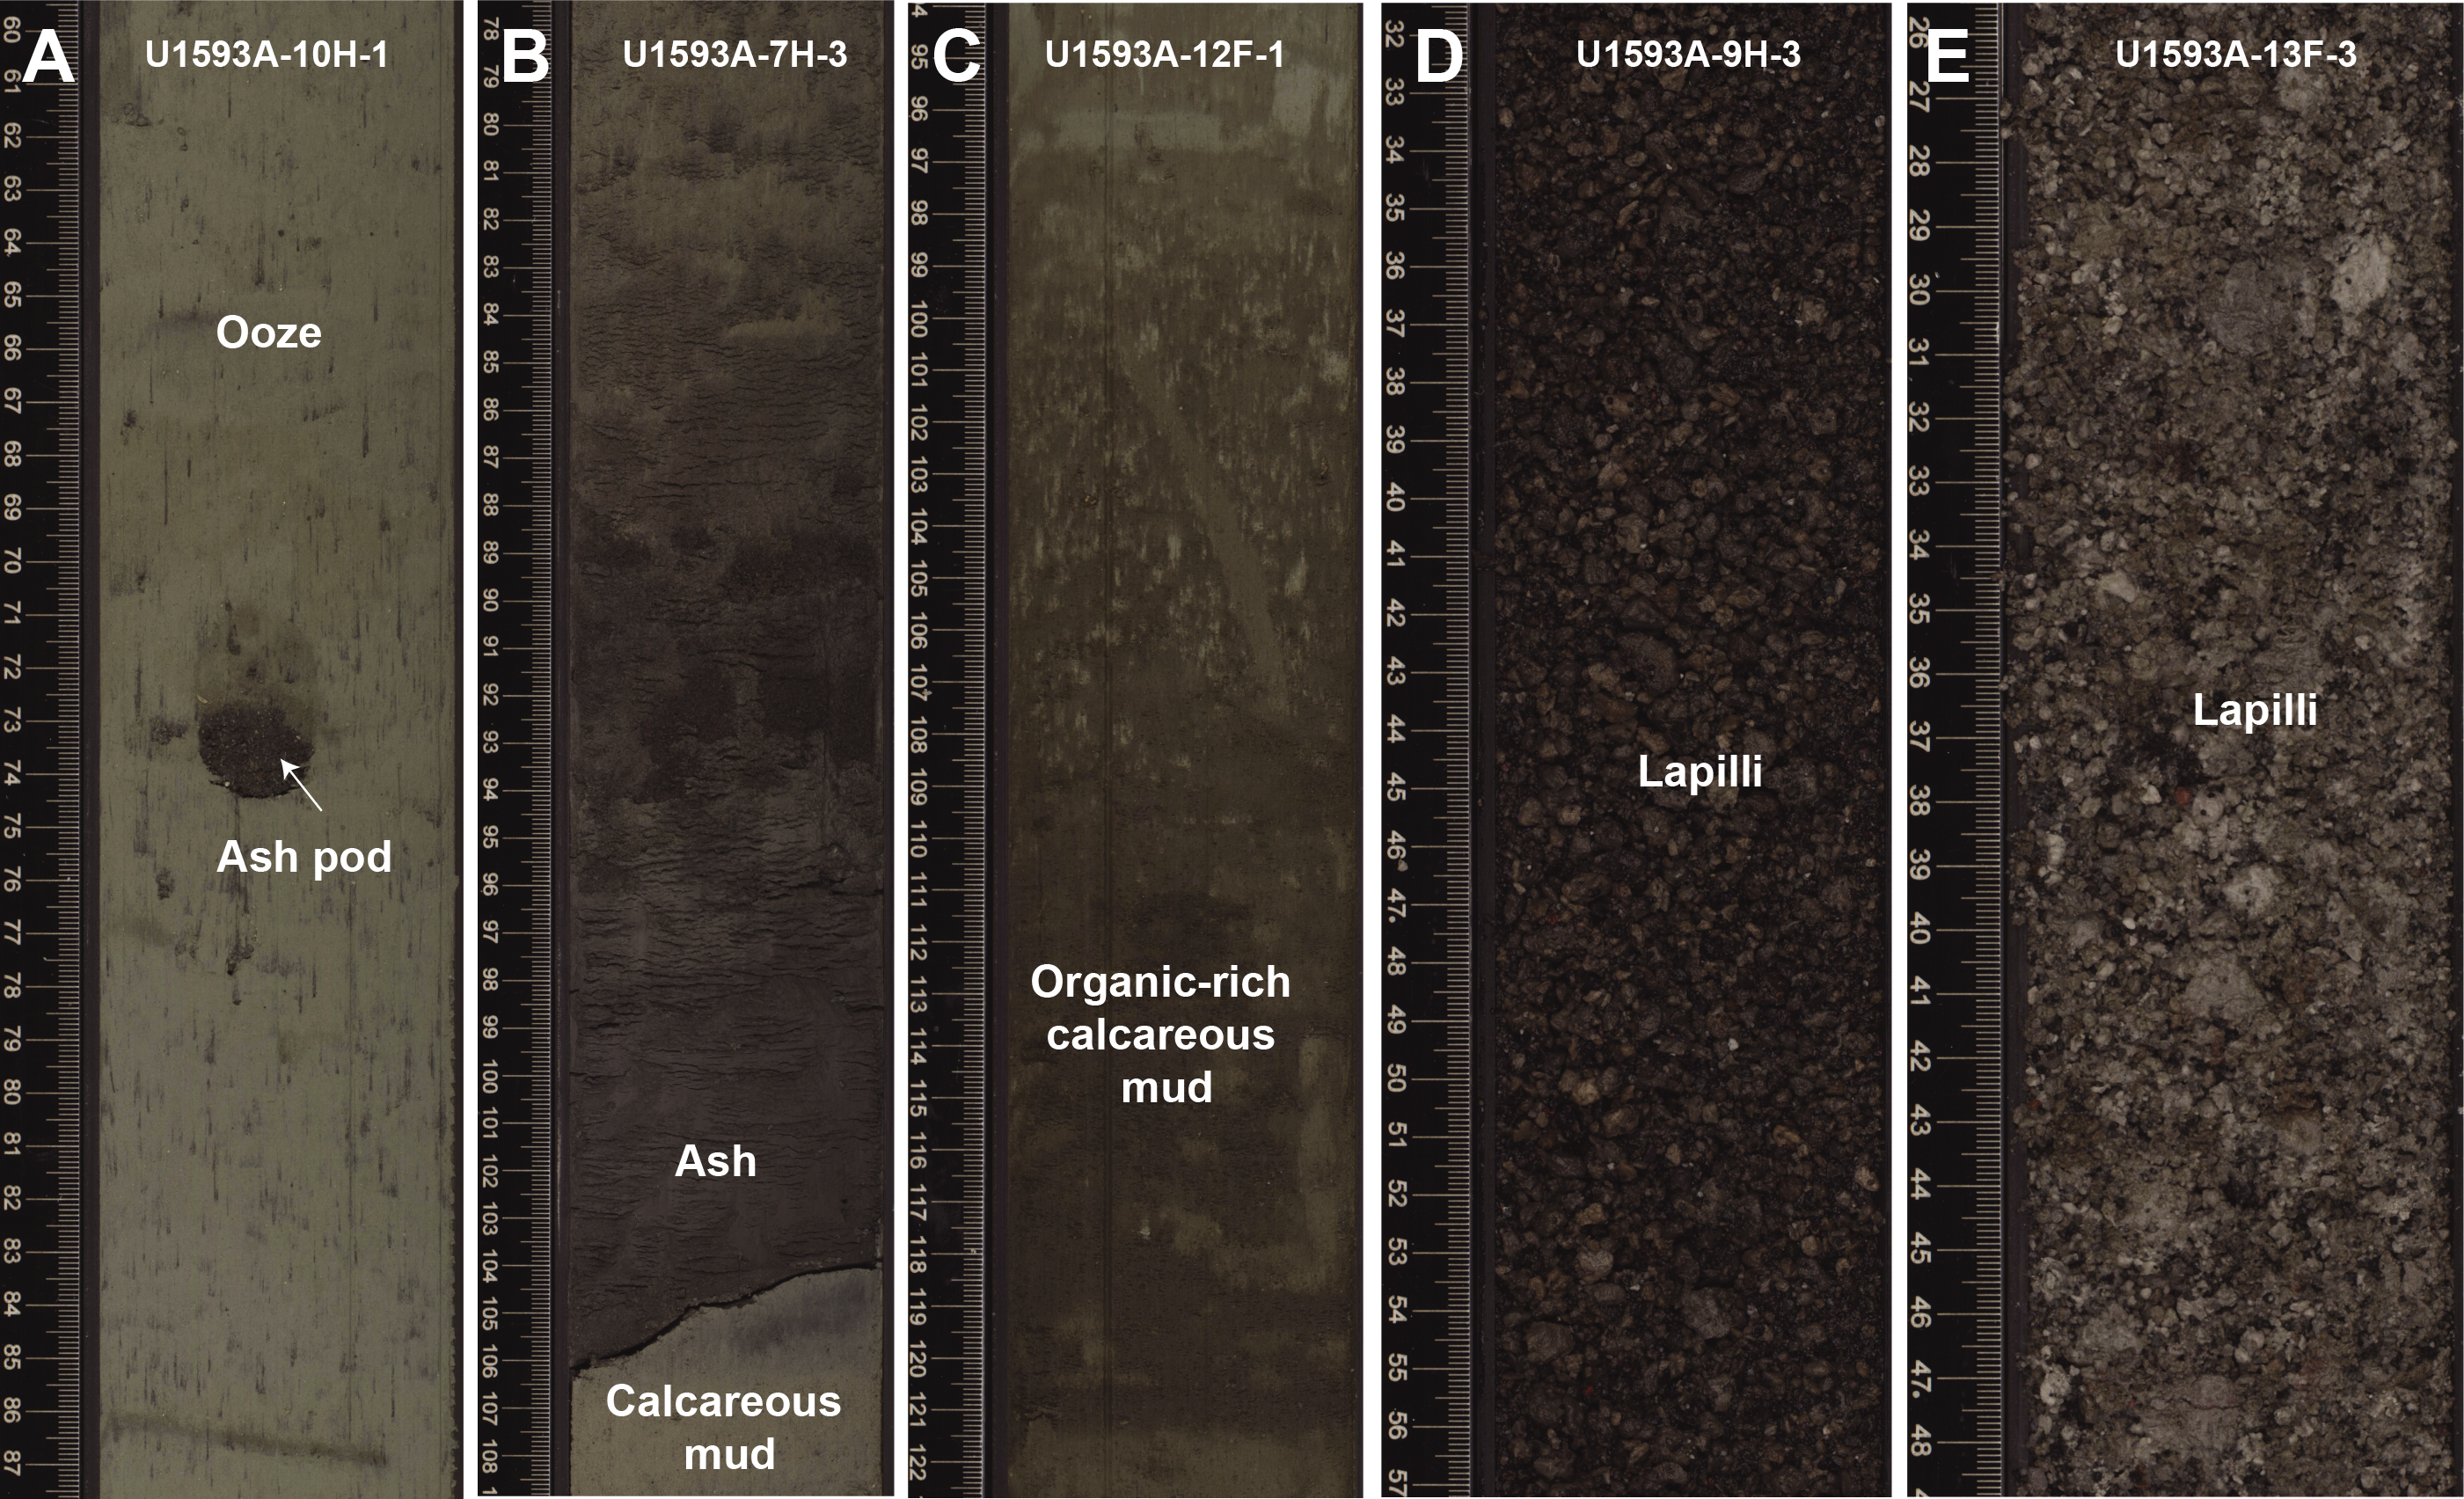
Figure F8. Subunit Ib lithologies.
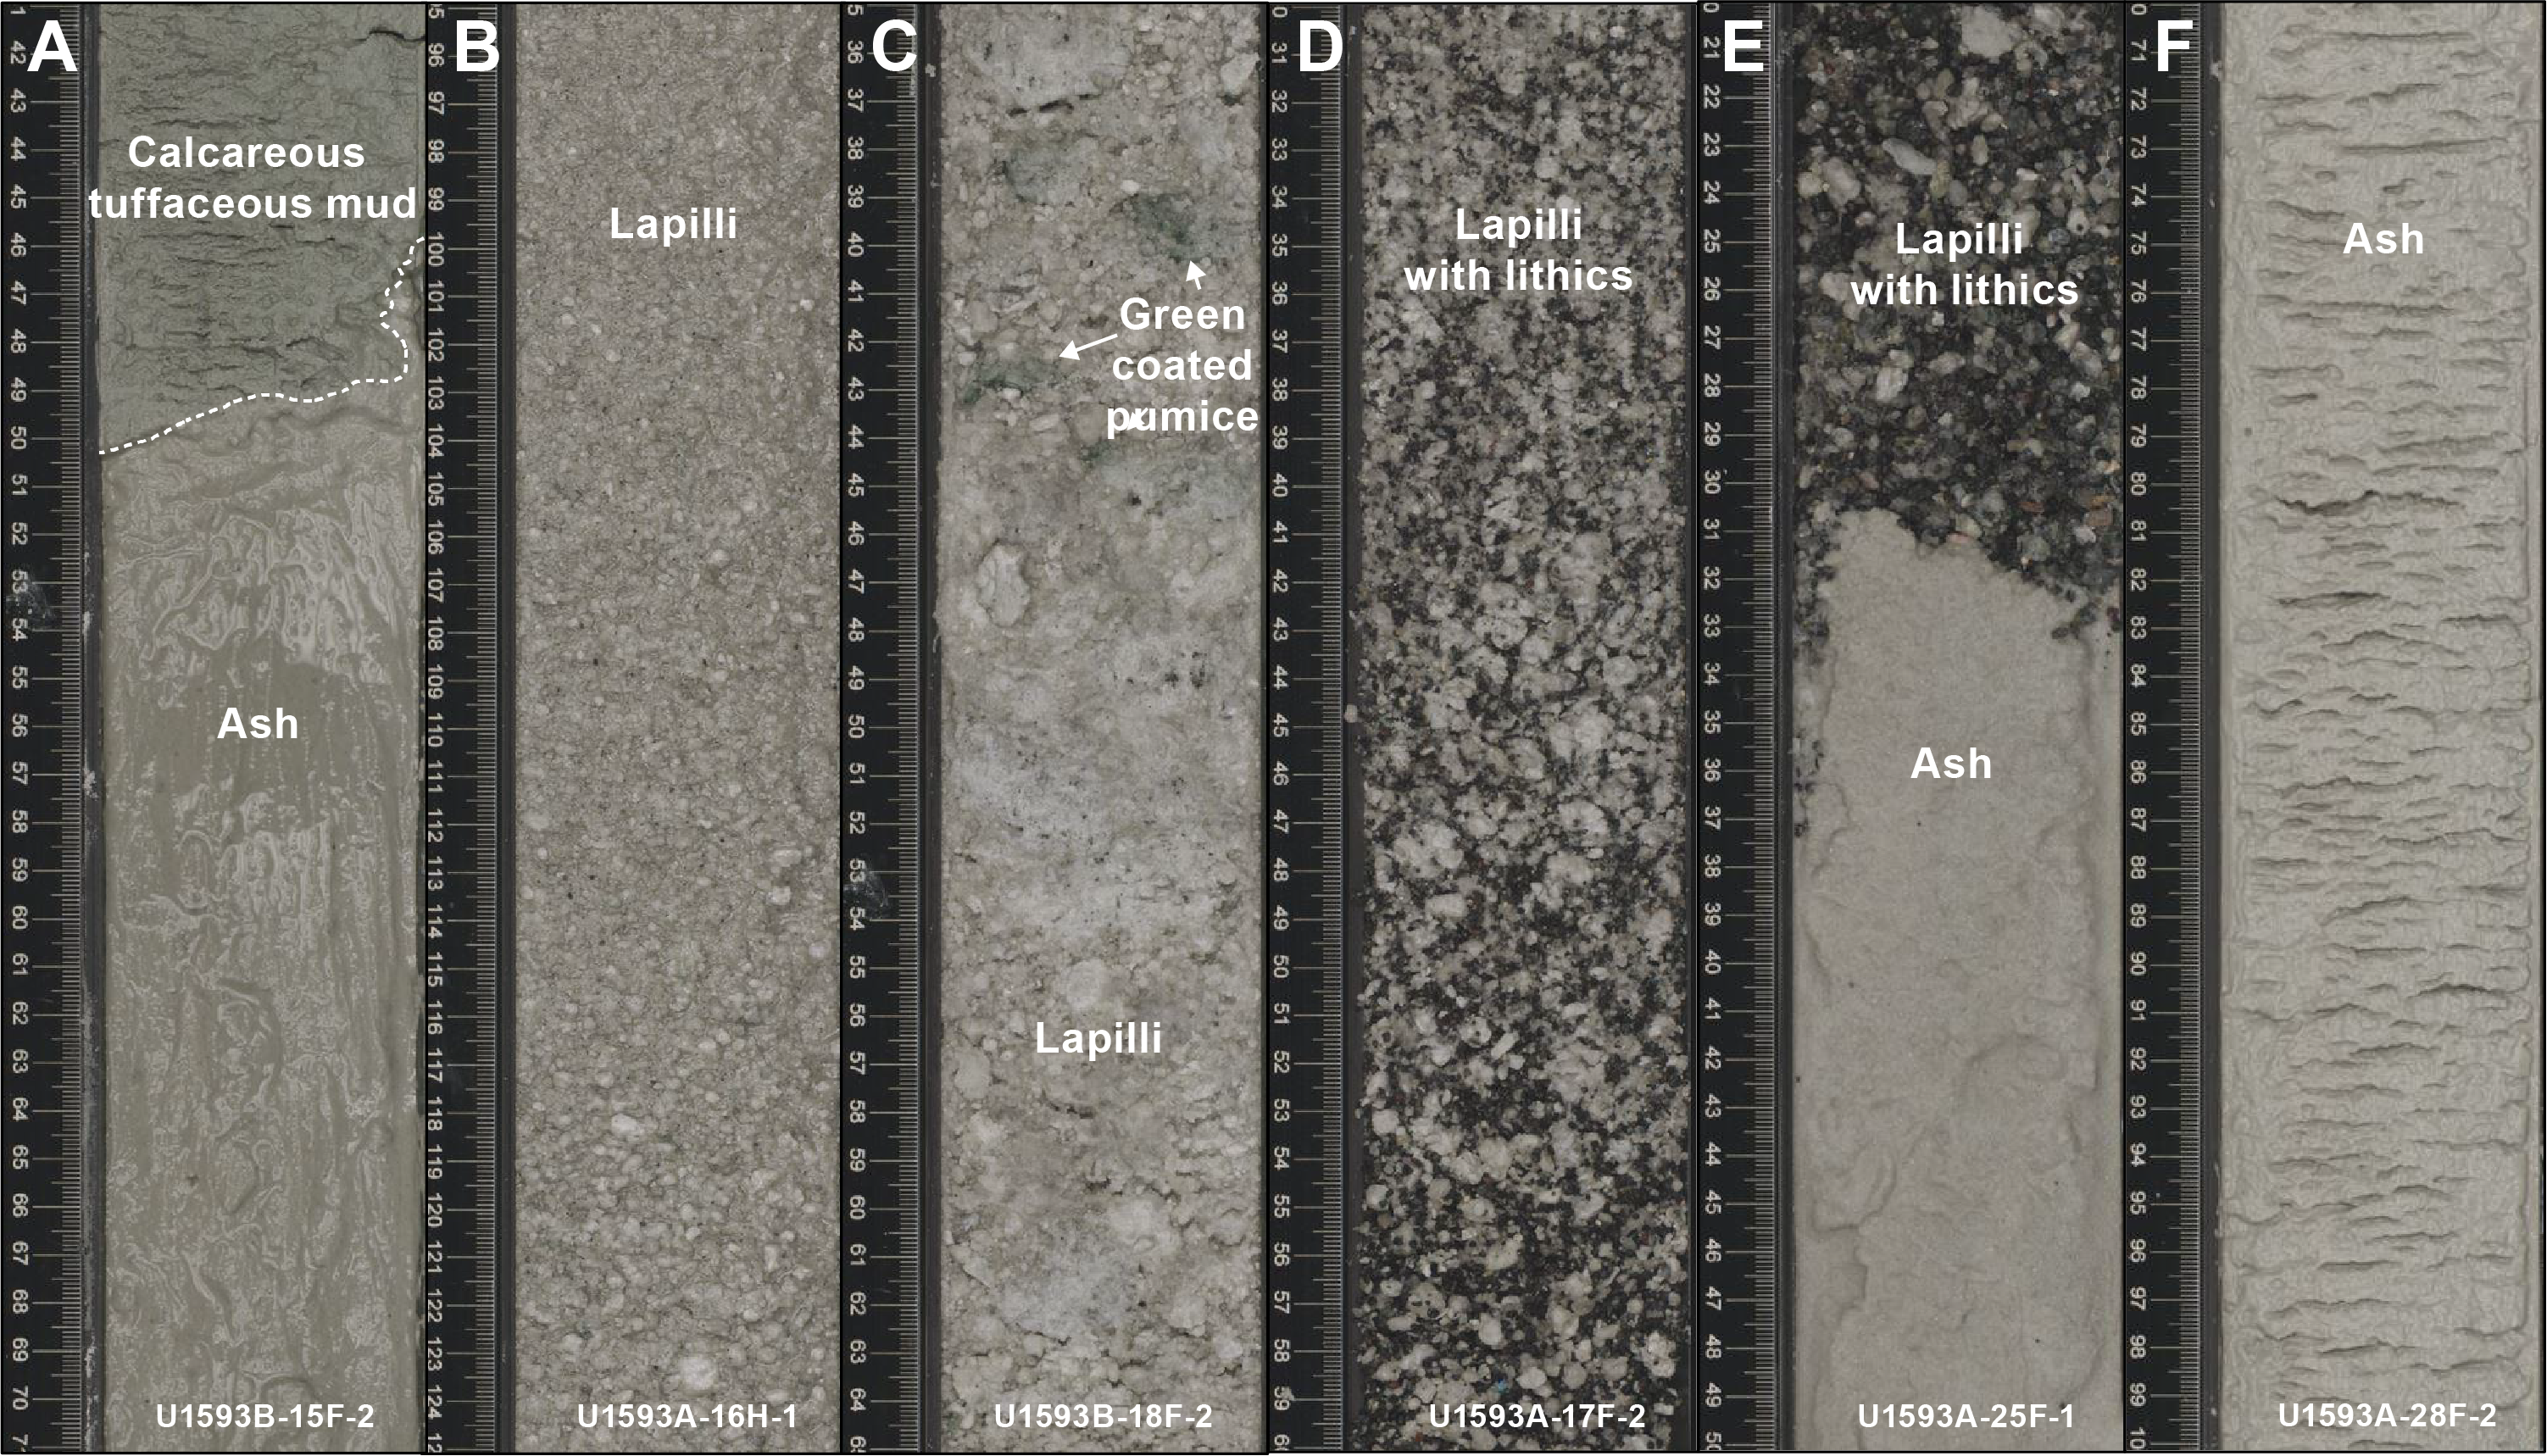
Figure F9. Subunit Ic lithologies.
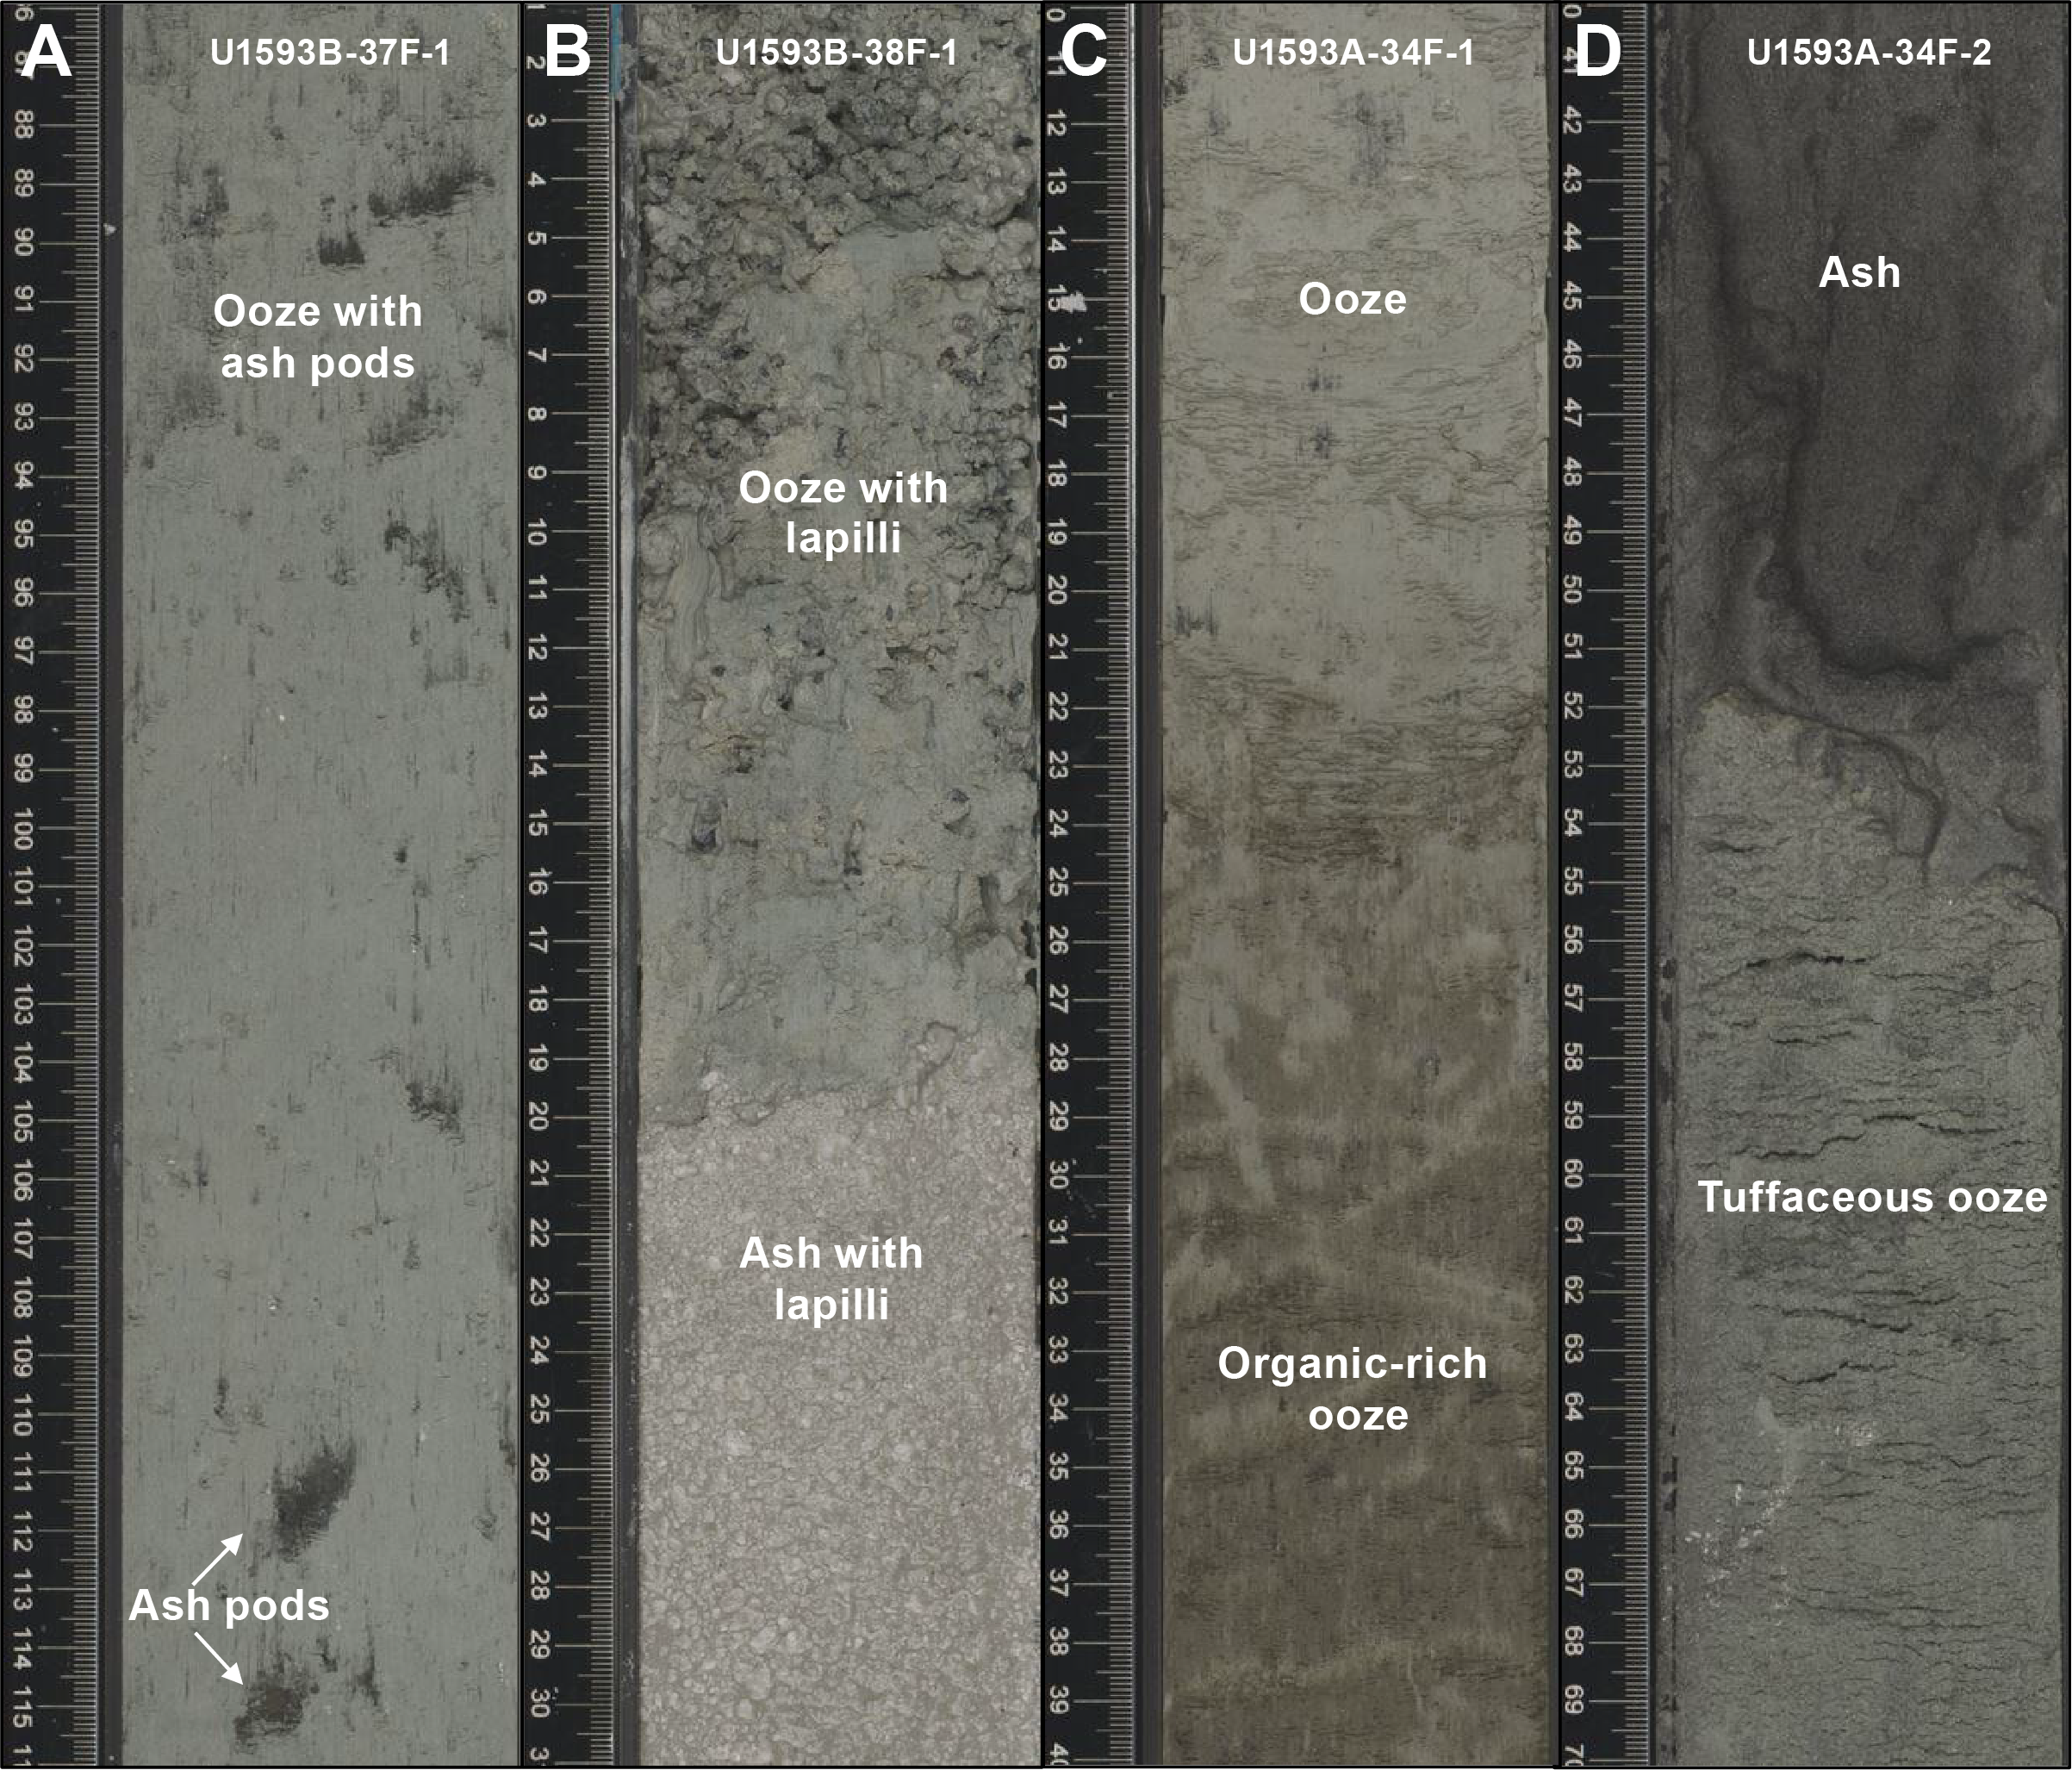
Figure F10. Subunit Id lithologies.
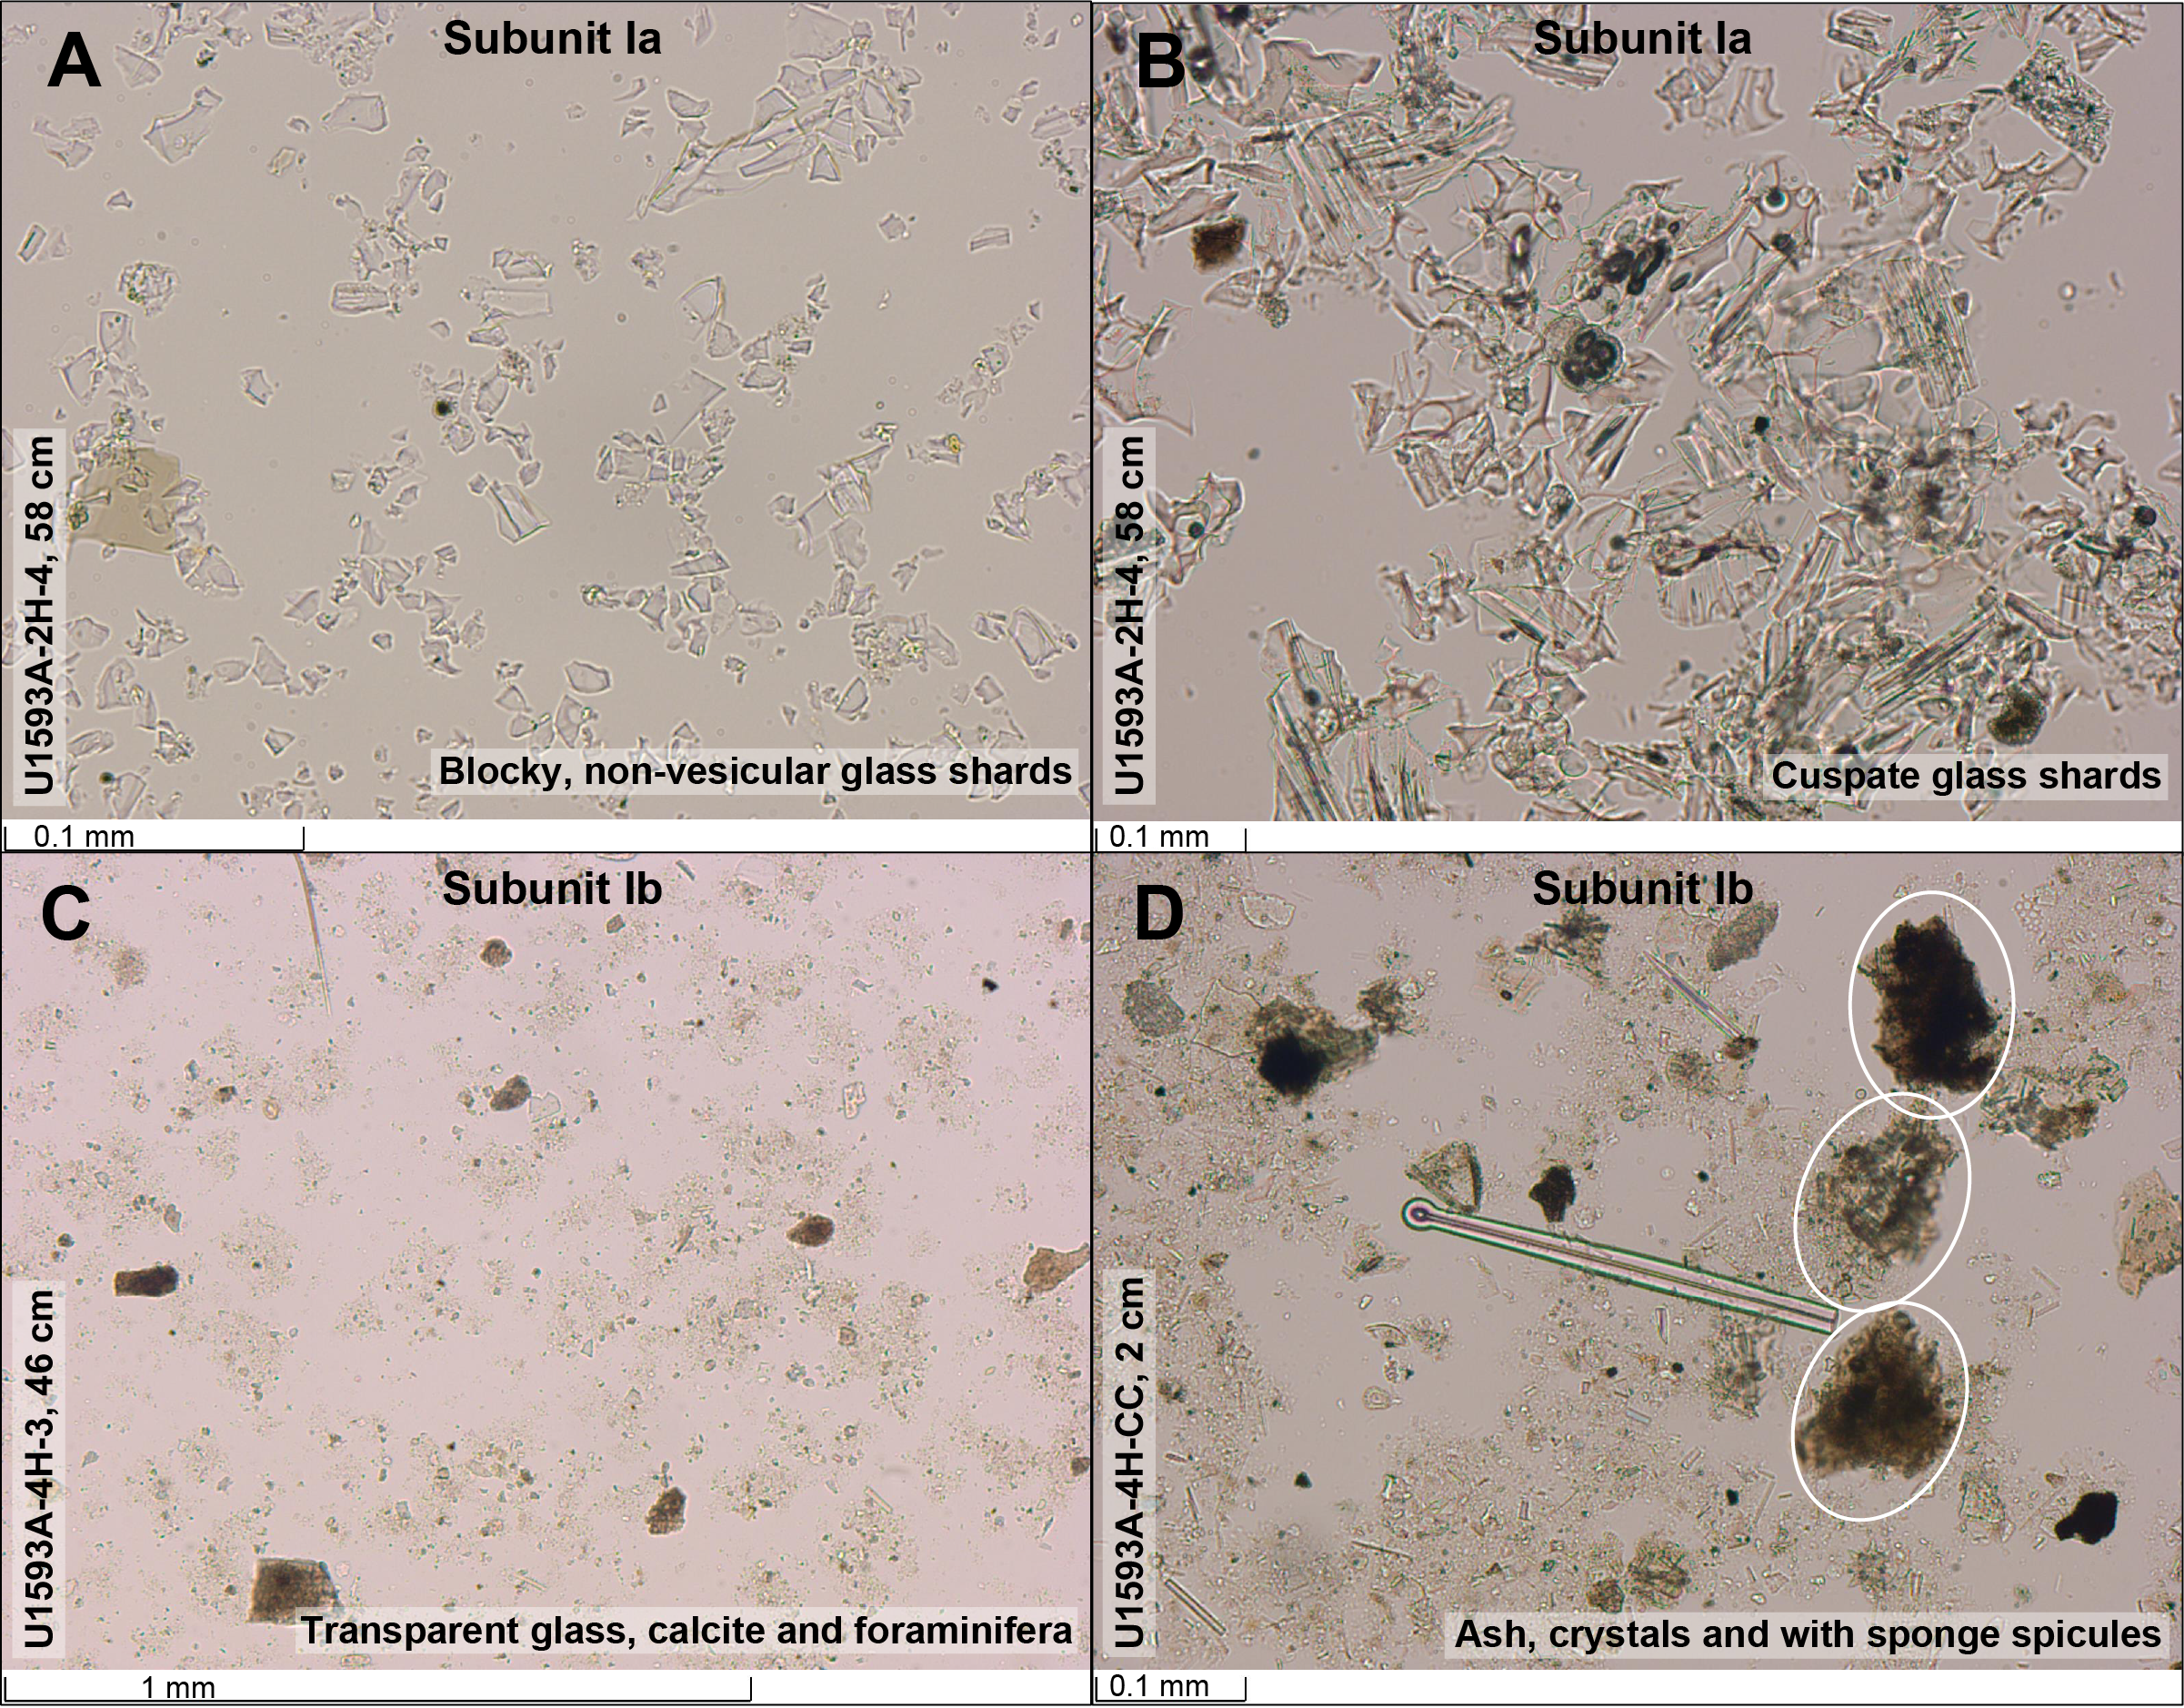
Figure F11. Subunit 1a and 1b lithologies.
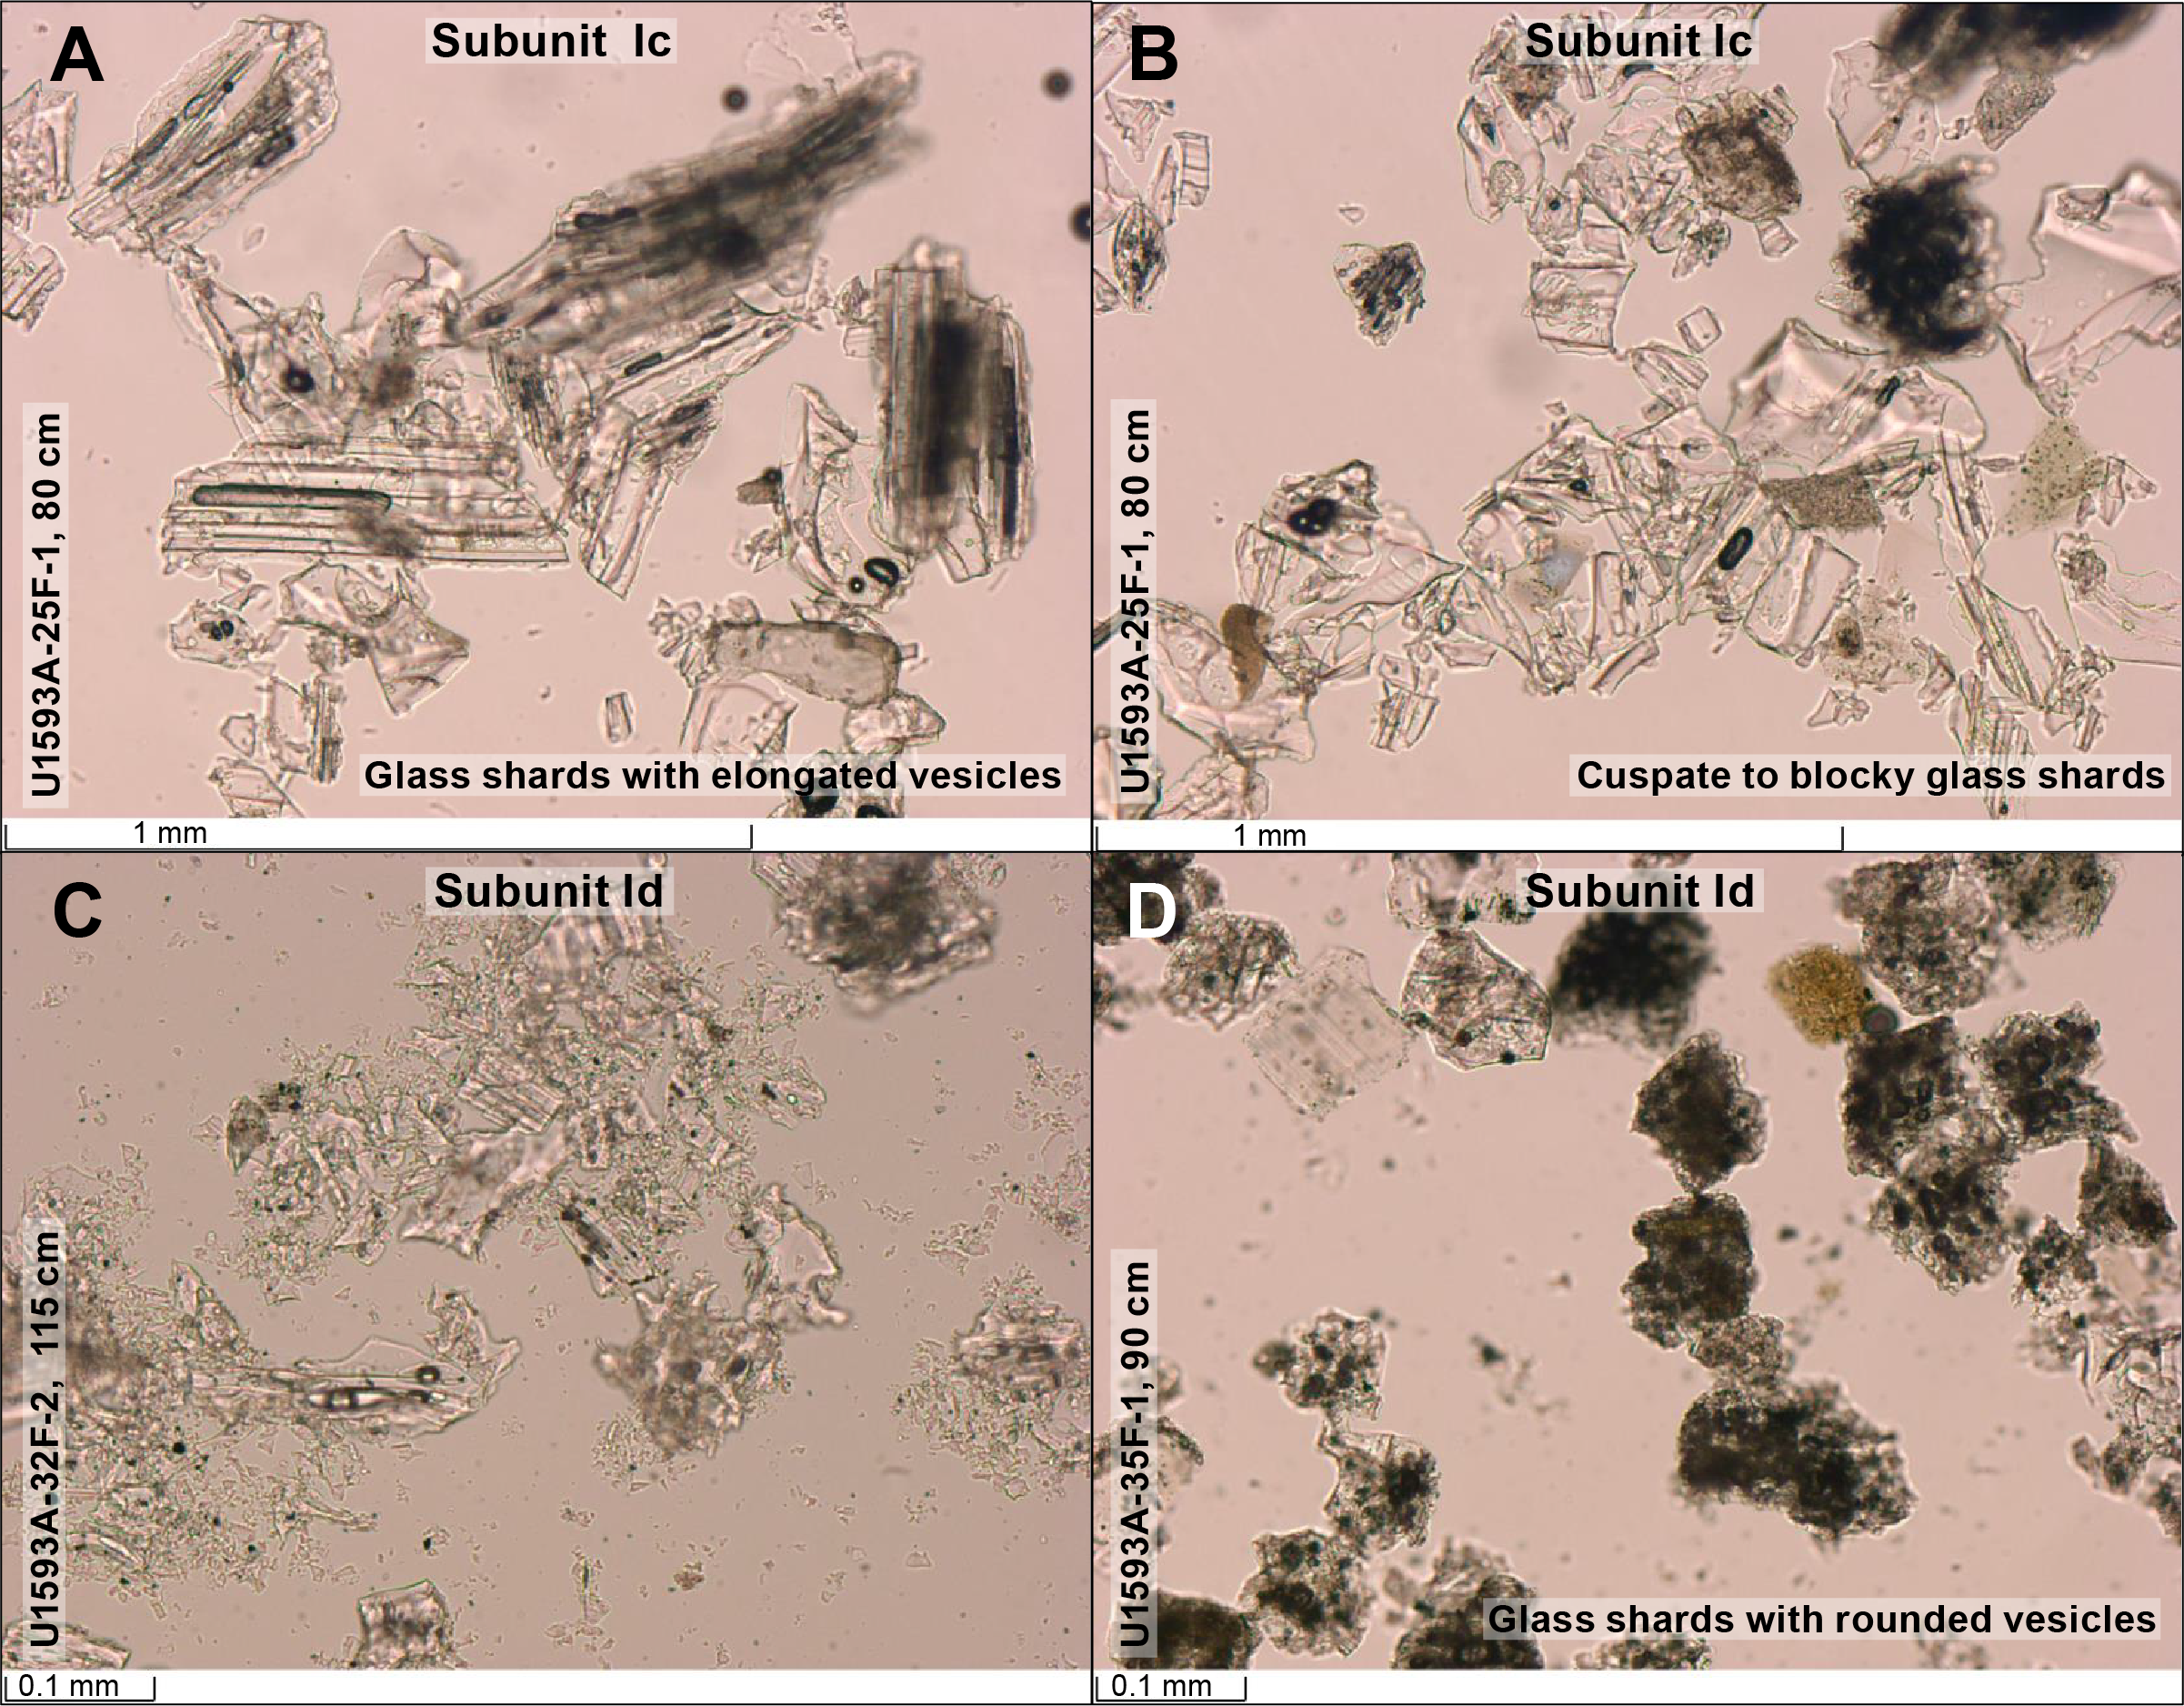
Figure F12. Subunit 1c and 1d lithologies.
Volcanic lithologies (>75% volcanic particles; glass shards, pumice, and crystals) comprise ash, lapilli-ash, and lapilli. Description of ash, lapilli-ash, and lapilli in volcanic intervals was based on the relative abundance of ash-sized (<2 mm) and lapilli-sized (2–64 mm) particles, as described in Lithostratigraphy in the Expedition 398 methods chapter (Kutterolf et al., 2024). Ash and lapilli were used when the proportion of one grain size was >75%, and lapilli-ash was used when both grain sizes were present but at <75% abundance (Fisher and Schmincke, 1984).
Macroscopically, ash layers in Unit I are variable in color from white to gray to dark grayish brown to black. The dark-colored ashes are more common in Subunits Ib and Id, whereas all ashes in Subunit Ic are white to gray. They are typically well sorted, have a grain size range from fine to coarse ash, sometimes occur with lapilli, and are variably mixed with nonvolcanic sediment at their upper contact. They are frequently characterized by a sharp base and a more diffuse and often bioturbated upper boundary that grades into tuffaceous mud or ooze (Figures F7C, F8B). Microscopic observations of smear slides were useful for identification of specific minerals, especially biotite in Subunit Ia and hornblende in Subunits Ic and Id.
Lapilli and lapilli-ash layers are also variable in color from white to gray to dark brownish gray (Figures F7, F8, F9) and range from a few centimeters to several meters thick. They are often truncated at their lower boundaries by loss of recovery, so recovered contacts with underlying material are rare. Where recovered, lower contacts of these coarser units are sharp or bioturbated but commonly affected by uparching drilling disturbance.
Subunits in Unit I were defined by the relative proportions of volcanic/tuffaceous intervals and nonvolcanic intervals, as well as by grain size:
- Subunit Ia (Sections 398-U1593A-1H-1, 0 cm, through 4H-1, 37 cm [0–24.07 mbsf] and 398-U1593B-1H-1, 0 cm, through 3H-3, 41 cm [0–19.11 mbsf]): primarily ash, lapilli, and lapilli-ash.
- Subunit Ib (Sections 398-U1593A-4H-1, 37 cm, through 13H-CC, 12 cm [24.07–112.66 mbsf] and 398-U1593B-3H-3, 41 cm, through 15F-2, 50 cm [19.11–116.92 mbsf]): interspersed tuffaceous, volcanic, and nonvolcanic sediment.
- Subunit Ic (Sections 398-U1593A-14H-1, 0 cm, to 32F-1, 5 cm [118.7–217.75 mbsf] and 398-U1593B-15F-2, 50 cm, through 37F-1, 17 cm [116.92–218.87 mbsf]): primarily ash and lapilli.
- Subunit Id (Sections 398-U1593A-32F-1, 5 cm, through 35F-3, 95 cm [217.75–235.1 mbsf] and 398-U1593B-37F-1, 17 cm, to the bottom of the hole in Section 39F-CC, 9 cm [218.87–232.44 mbsf]): interspersed ooze and ash.
3.2.1.1. Subunit Ia
Subunit Ia extends from 0 to 24.07 mbsf in Hole U1593A and from 0 to 19.11 mbsf in Hole U1593B (Sections 398-U1593A-1H-1, 0 cm, through 4H-1, 37 cm, and 398-U1593B-1H-1, 0 cm, through 3H-3, 41 cm) (Figure F3). This subunit consists of mainly volcanic and tuffaceous lithologies (ash, lapilli, and lapilli-ash and tuffaceous mud/ooze) with small amounts of mud and organic-rich tuffaceous mud. Subunit Ia starts with ~20 cm of brown mud (Figure F7A) followed by two large intervals of lapilli-ash separated by 20 cm thick brown mud or organic-rich tuffaceous ooze at ~10 mbsf. The first lapilli-ash interval mainly consists of centimeter-sized rounded white biotite-bearing pumice (Figure F7B). Smaller clasts are gray, white, or banded pumice, subrounded to subangular in shape. No biotite-bearing pumice are found in the second interval of lapilli-ash. In this second interval, coarse lapilli are subangular, whereas fine- to medium-sized lapilli are rounded. Some banded pumice lapilli are also observed. A higher abundance of lithics is observed in this second interval, ranging in size from fine ash to coarse lapilli. The lithics are of volcanic origin, and pyroxene and feldspar crystals are also observed.
Exemplary smear slides show representative lithologies (Figure F11A, F11B). Microscopically, ash layers are characterized by colorless blocky and nonvesicular glass shards with rare crystals (Figure F11A) and rare cuspate glass shards (Figure F11B).
3.2.1.2. Subunit Ib
Subunit Ib extends from 24.07 to 112.66 mbsf in Hole U1593A and from 19.11 to 116.92 mbsf in Hole U1593B (Sections 398-U1593A-4H-1, 37 cm, through 13H-CC, 12 cm, and 398-U1593B-3H-3, 41 cm, through 15F-2, 50 cm) (Figures F3, F4, F5). Subunit Ib is composed of both volcanic and nonvolcanic sediments interspersed throughout both holes, with volcanic lithologies slightly more abundant (Figure F8). In Hole U1593A, ash intervals are commonly several centimeters thick to occasionally tens of centimeters thick and range from greenish gray (when mixed with ooze) to gray to very dark gray or black (Figure F8B). Lower boundaries of pure ash layers are overall sharp, and upper boundaries are gradational into the overlying lithology. Lapilli-ash intervals are usually moderately to poorly sorted and gray-brown/black in color, and lapilli intervals range from poor to well sorted and are dark gray-black (Figure F8D, F8E). Nonvolcanic and tuffaceous sediments in Subunit Ib range from greenish gray to olive to gray, are well sorted, and show slight to moderate bioturbation (Figure F8C). Often, nonvolcanic lithologies contain some volcanic material (1%–25%; e.g., ooze with ash, ash pods, or lapilli) (Figure F8A). Normally graded volcanic intervals are observed in this subunit in Cores 398-U1593A-9H and 13H, and 398-U1593B-3H, 4H, and 6H.
The boundary between Subunits Ib and Ic is marked by a distinct change in color of the volcanic lithologies. Subunit Ib comprises gray-black volcanics, whereas Subunit Ic comprises white–light gray volcanics.
3.2.1.3. Subunit Ic
Subunit Ic extends from 118.7 to 217.75 mbsf in Hole U1593A and from 116.92 to 218.87 mbsf in Hole U1593B (Sections 398-U1593A-14H-1, 0 cm, through 32F-1, 5 cm, and 398-U1593B-15F-2, 50 cm, through 37F-1, 17 cm) (Figures F3, F4, F5). This subunit is composed almost entirely of volcanic lithologies, with minor ooze and tuffaceous ooze intervals occurring near the boundary with Subunit Id. The subunit begins in both holes with a fine light gray ash that grades into lapilli-ash to lapilli with dominantly white pumice clasts. White pumice lapilli and fine white ash dominate the lithology present in the rest of Subunit Ic, represented continuously for nearly 100 m (Hole U1593A: 122.44–215.45 mbsf; Hole U1593B: 120–202.06 mbsf) (Figure F8). They are notably biotite bearing and variably contain black volcanic lithics and minor red oxidized lithics. Smear slide observations record dominantly transparent glass with blocky, cuspate, and pumiceous shapes, along with the presence of feldspar, biotite, and minor pyroxene (Figure F12).
Section 398-U1593A-21F-2 contains cobble-sized lithic clasts of intermediate to felsic porphyritic volcanic rock and metamorphic rock (serpentinite). Vitric clasts are subrounded to subangular, with minor gray pumice (sometimes mingled) observed alongside white pumice clasts. Rare green vitric clasts appear to be white pumice with a thin green coating, perhaps due to biological or chemical alteration.
Normal grading is observed in some intervals, although it is unclear whether the feature is primary or an artifact of drilling and postrecovery core handling. Similarly, concentrated layers of volcanic lithic clasts are observed in Hole U1593B, whereas the correlated intervals in Hole U1593A have disseminated lithics (e.g., Section 17F-1, 100 cm, contains mixed lithic and pumice lapilli, and Section 398-U1593B-22F-1, 75 cm, contains a concentrated layer of lithics surrounded by white pumice lapilli). This indicates that the density separation observed in Hole U1593B may be due to coring disturbance rather than a primary depositional feature.
Minor intervals of calcareous tuffaceous mud, tuffaceous ooze, and ooze occur in Subunit Ic in both Holes U1593A and U1593B (Figure F8). These lithologies are observed more often in Hole U1593B, where the top of Subunit Ic contains a minor interval of calcareous tuffaceous mud (Sections 15F-3, 59 cm, through 15F-4, 25 cm) and several short intervals of greenish gray ooze are observed in Core 34F. In contrast, Subunit Ic in Hole U1593A contains only one interval of tuffaceous ooze at the terminal contact that marks the beginning of Subunit Id (interval 32F-1, 0–5 cm).
3.2.1.4. Subunit Id
Subunit Id was recovered in both holes and extends in Hole U1593A from 227.35 to 235.1 mbsf (Sections 32F-1, 5 cm, through 35F-3, 95 cm) and in Hole U1593B from 228.1 to 232.44 mbsf (Sections 31F-1, 17 cm, through 39F-CC, 9 cm) (Figure F3). The total thickness of this subunit is 17.35 m in Hole U1593A; the bottom of this subunit was not recovered in Hole U1593B. Subunit Id is characterized by an increased abundance of greenish gray and well-sorted nonvolcanic lithologies including ooze, organic-rich ooze, and crystal-rich tuffaceous ooze (Figure F10) with lesser ash. Numerous intervals of ooze contain ash pods (Figure F10A) and lapilli, the latter of which contain subangular pumice (Figure F10B). Ooze intervals also may contain shell fragments and disseminated sulfides. Intercalated volcanic layers are ash and lapilli (Figure F10B, F10D). The thickness of dark to very dark ash layers varies from 20 to 170 cm, and rip-up clasts of sediments occur. The ash layers consist of blocky to pumiceous glass shards with nonvesicular, rounded, and tubular vesicles (Figure F12C, F12D). Hornblende was identified microscopically and occurs as up to 1 mm–sized crystals. Only a few organic-rich ooze intervals are observed in Subunit Id, and they are characterized by moderate bioturbation and gradational upper (Figure F10C) and lower contacts.
3.2.2. Unit II
- Interval: 398-U1593A-35F-3, 95 cm, to 38F-CC, 16 cm (bottom of the hole)
- Thickness: (>15.79 m)
- Depth: 235.1–250.89 mbsf
- Age: Early Pleistocene
- Lithology: mainly nonvolcanic oozes or organic-rich oozes with intermittent intervals of tuffaceous ooze and ash
Unit II was recovered in Hole U1593A and extends from 235.1 mbsf to the bottom of the hole at 250.89 mbsf (Sections 35F-3, 95 cm, through 38F-CC, 16 cm) (Figure F3; Table T2). It is primarily composed of ooze-dominated lithologies interspersed with minor intervals of organic-rich ooze, calcareous mud, tuffaceous mud/ooze, and ash (Figure F13). Unit II is marked by a distinctive shift in lithology from volcanic to nonvolcanic and ooze-dominated, corroborated by a jump to higher grain density (see Physical properties). Coring in Hole U1593B did not reach Unit II.
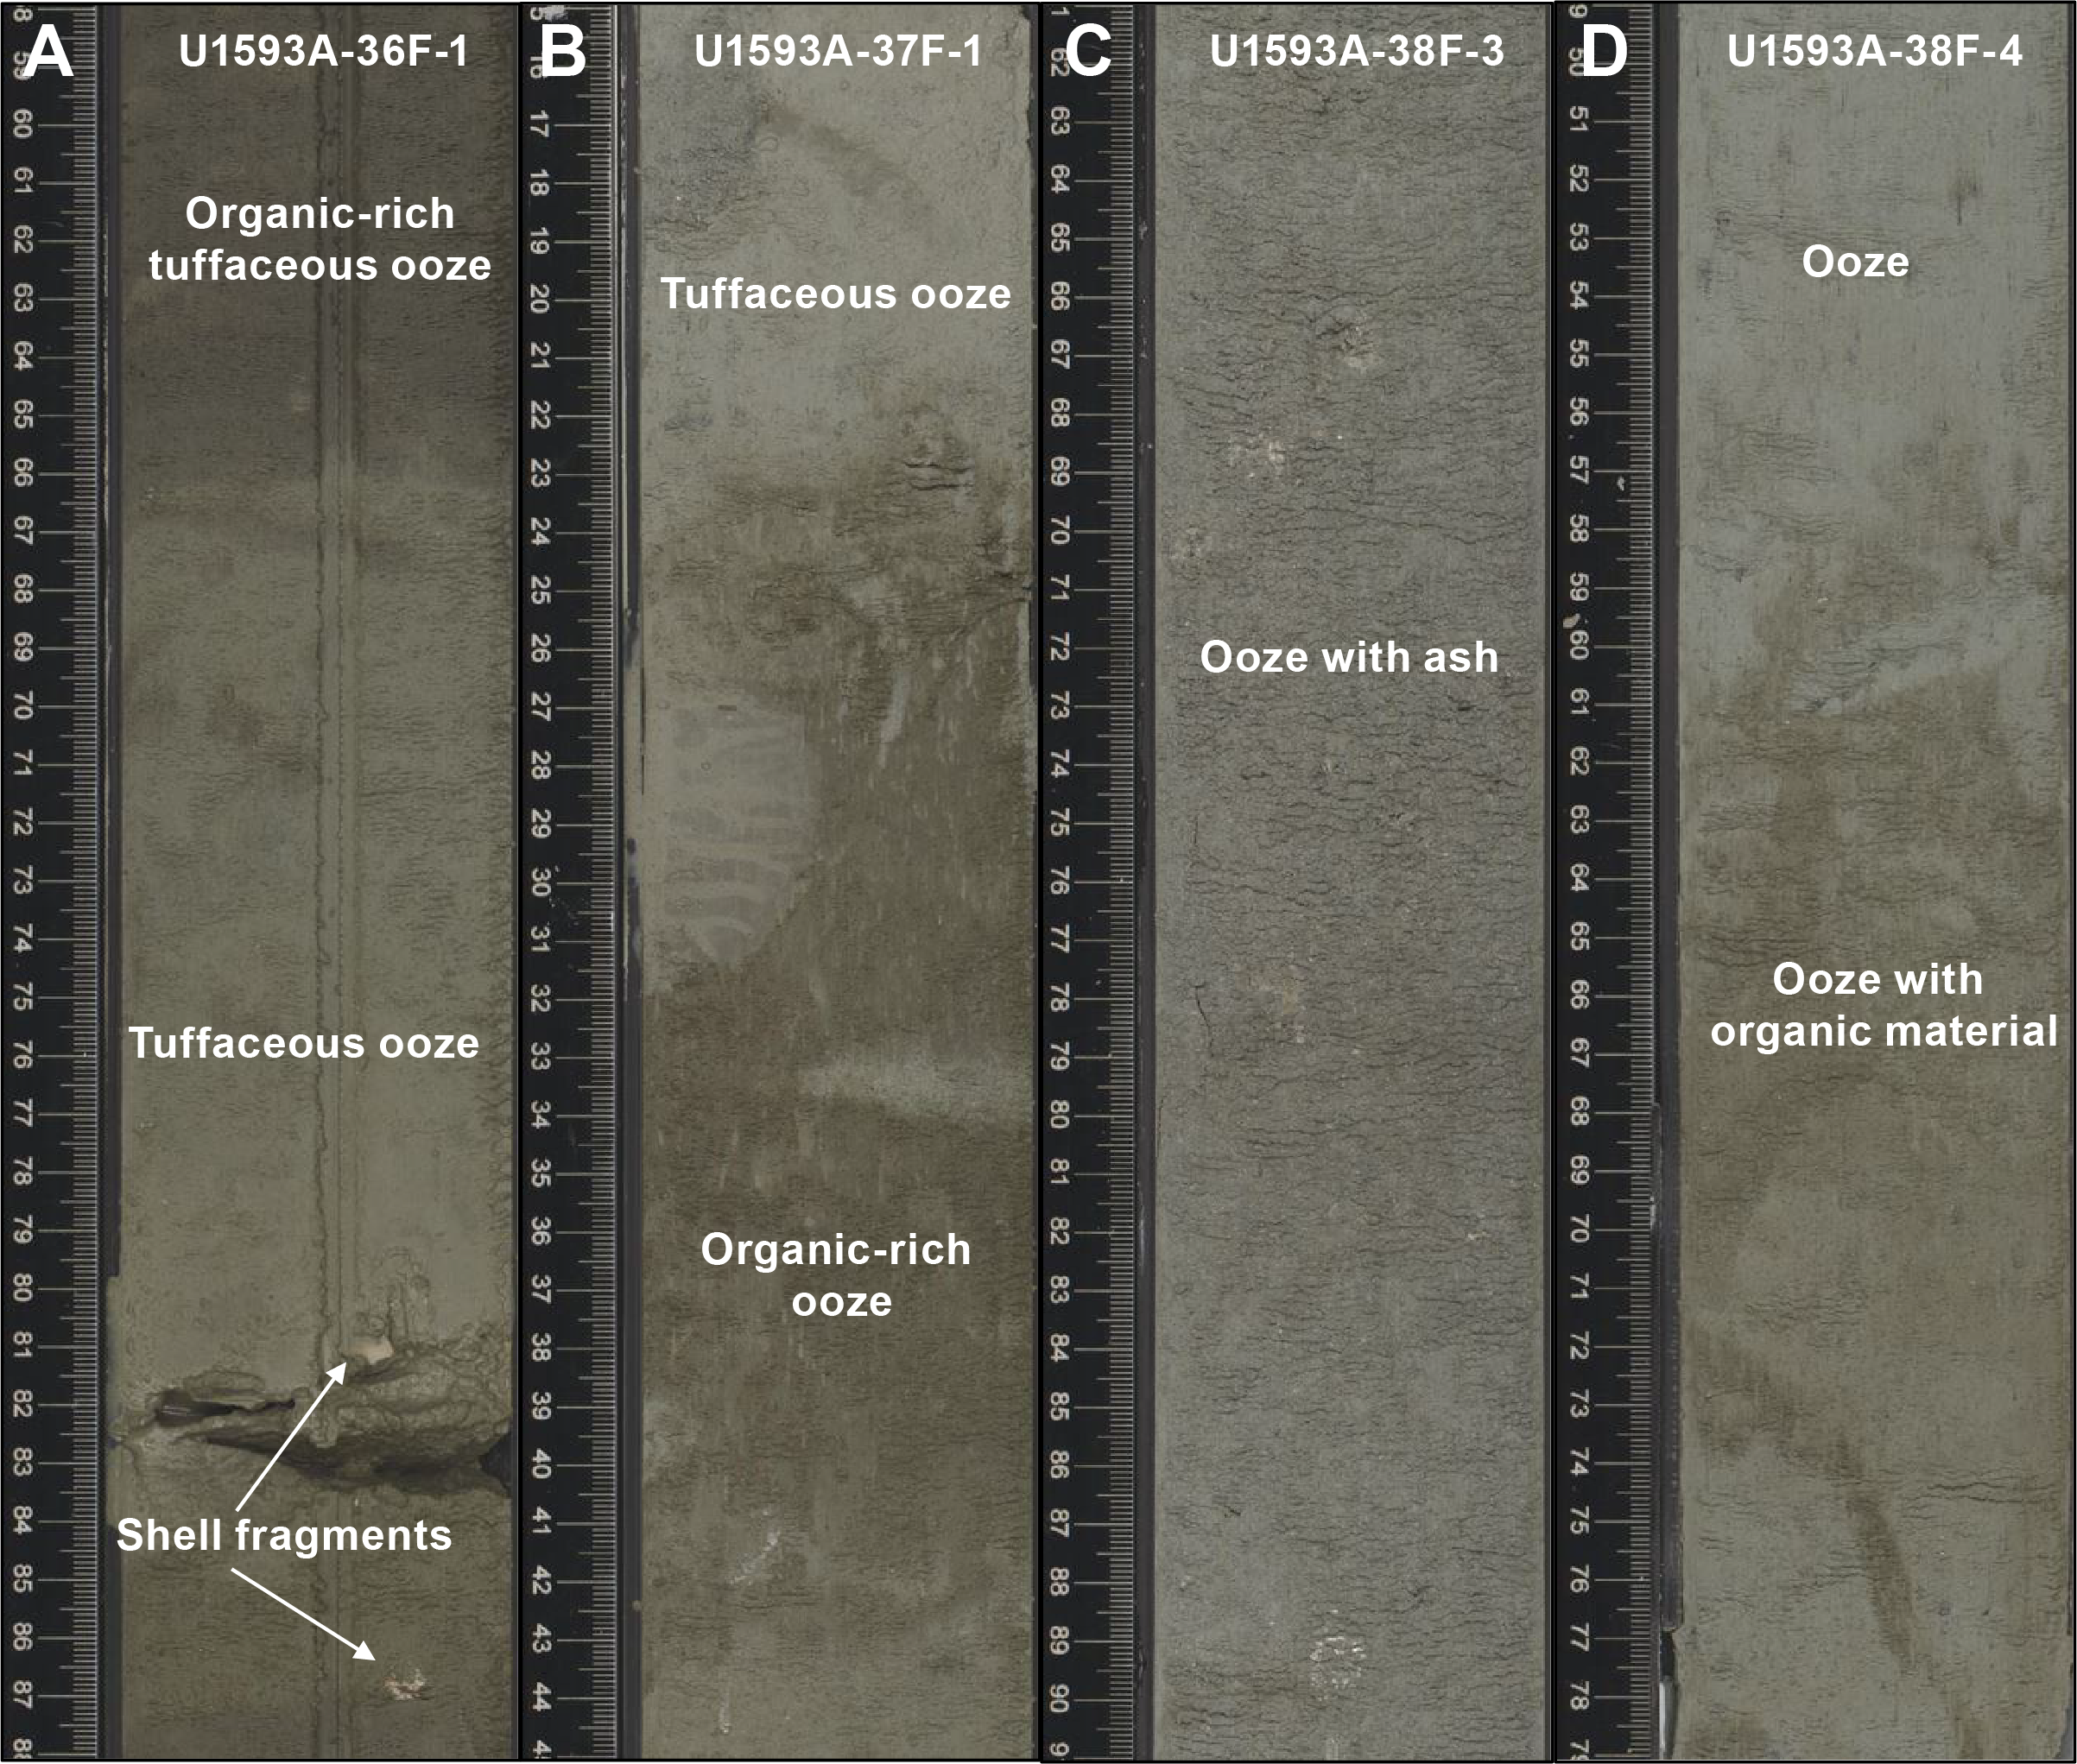
Figure F13. Unit II lithologies.
Oozes generally appear greenish gray to olive-gray to dark grayish brown and variably contain shell fragments, echinoderm spines, and foraminifera (Figure F13A). Intervals of organic-rich (sapropelic) ooze are common, often identified by a gradational change from greenish gray ooze to dark grayish brown ooze (Figure F13B, F13D). These organic-rich intervals are generally 1–60 cm thick and often display higher degrees of bioturbation. Intervals of ooze containing 1%–25% volcanic material (with lapilli, lithics, or ash pods; Figure F13C) occur near the bottom of Unit II (Cores 37F–38F).
Smear slides taken in Unit II display dominantly biogenic components (e.g., high proportion of nannofossils) and confirm the presence of tuffaceous intervals that could not be macroscopically determined. Sedimentary lithics, calcite, foraminifera, sponge spicules, pyrite, and feldspar were often observed in microscopic smear slides.
3.3. Correlations between holes
Hole U1593B was drilled to overlap with Hole U1593A so that the recovered stratigraphy could be correlated. Hole U1593A extends to 250.89 mbsf, and Hole U1593B extends to 232.44 mbsf. This extensive overlap allows for correlation of several sediment-specific features between the base of Hole U1593A and the beginning of Hole U1593B.
3.3.1. Notable correlated deposits
- Lower contact of a gray ash layer with an organic-rich tuffaceous ooze followed by a 10 cm thick ash layer characterized by a sharp curviplanar lower contact at 9.81 mbsf in Hole U1593A (interval 2H-4, 42–60 cm) and 9.87 mbsf in Hole U1593B (interval 2H-3, 73–93 cm) (Figure F14A).
- Ash layers separated by tuffaceous ooze/mud at 25–26 mbsf (intervals 398-U1593A-4H-3, 72–103 cm, and 398-U1593B-4H-1, 73–104 cm). This interval is characterized by two dark ash layers separated by mud/ooze. Figure F14B shows the transition from the lowermost ash to the overlying tuffaceous ooze.
- Organic-rich calcareous mud at 65–66 mbsf (intervals 398-U1593A-8H-4, 26–55 cm, and 398-U1593B-8H-2, 85–115 cm) (Figure F14C). This interval is highly bioturbated with tunnel shapes and slightly inclined burrows.
- Ooze with ash pods observed at 87–88 mbsf (intervals 398-U1593A-10H-6, 50–90 cm, and 398-U1593B-10H-4, 50–90 cm) (Figure F14D). This interval shows dark patches of fine ash dispersed throughout.
- Tuffaceous/ooze with lapilli and ash with lapilli at 222–223 mbsf (intervals 398-U1593A-33H-1, 10–33 cm, and 398-U1593B-38H-1, 0–23 cm) (Figure F14E). This interval is characterized by greenish gray and poorly sorted tuffaceous/ooze with lithics (volcanic rock) followed by a light gray ash with lapilli. The contact between these two lithologies is sharp and irregular.
- Tuffaceous ooze at 218 mbsf (intervals 398-U1593A-32H-1, 0–23 cm, and 398-U1593B-37H-1, 7–31 cm) (Figure F14F). The greenish gray tuffaceous ooze is underlain by light gray tuffaceous ooze.
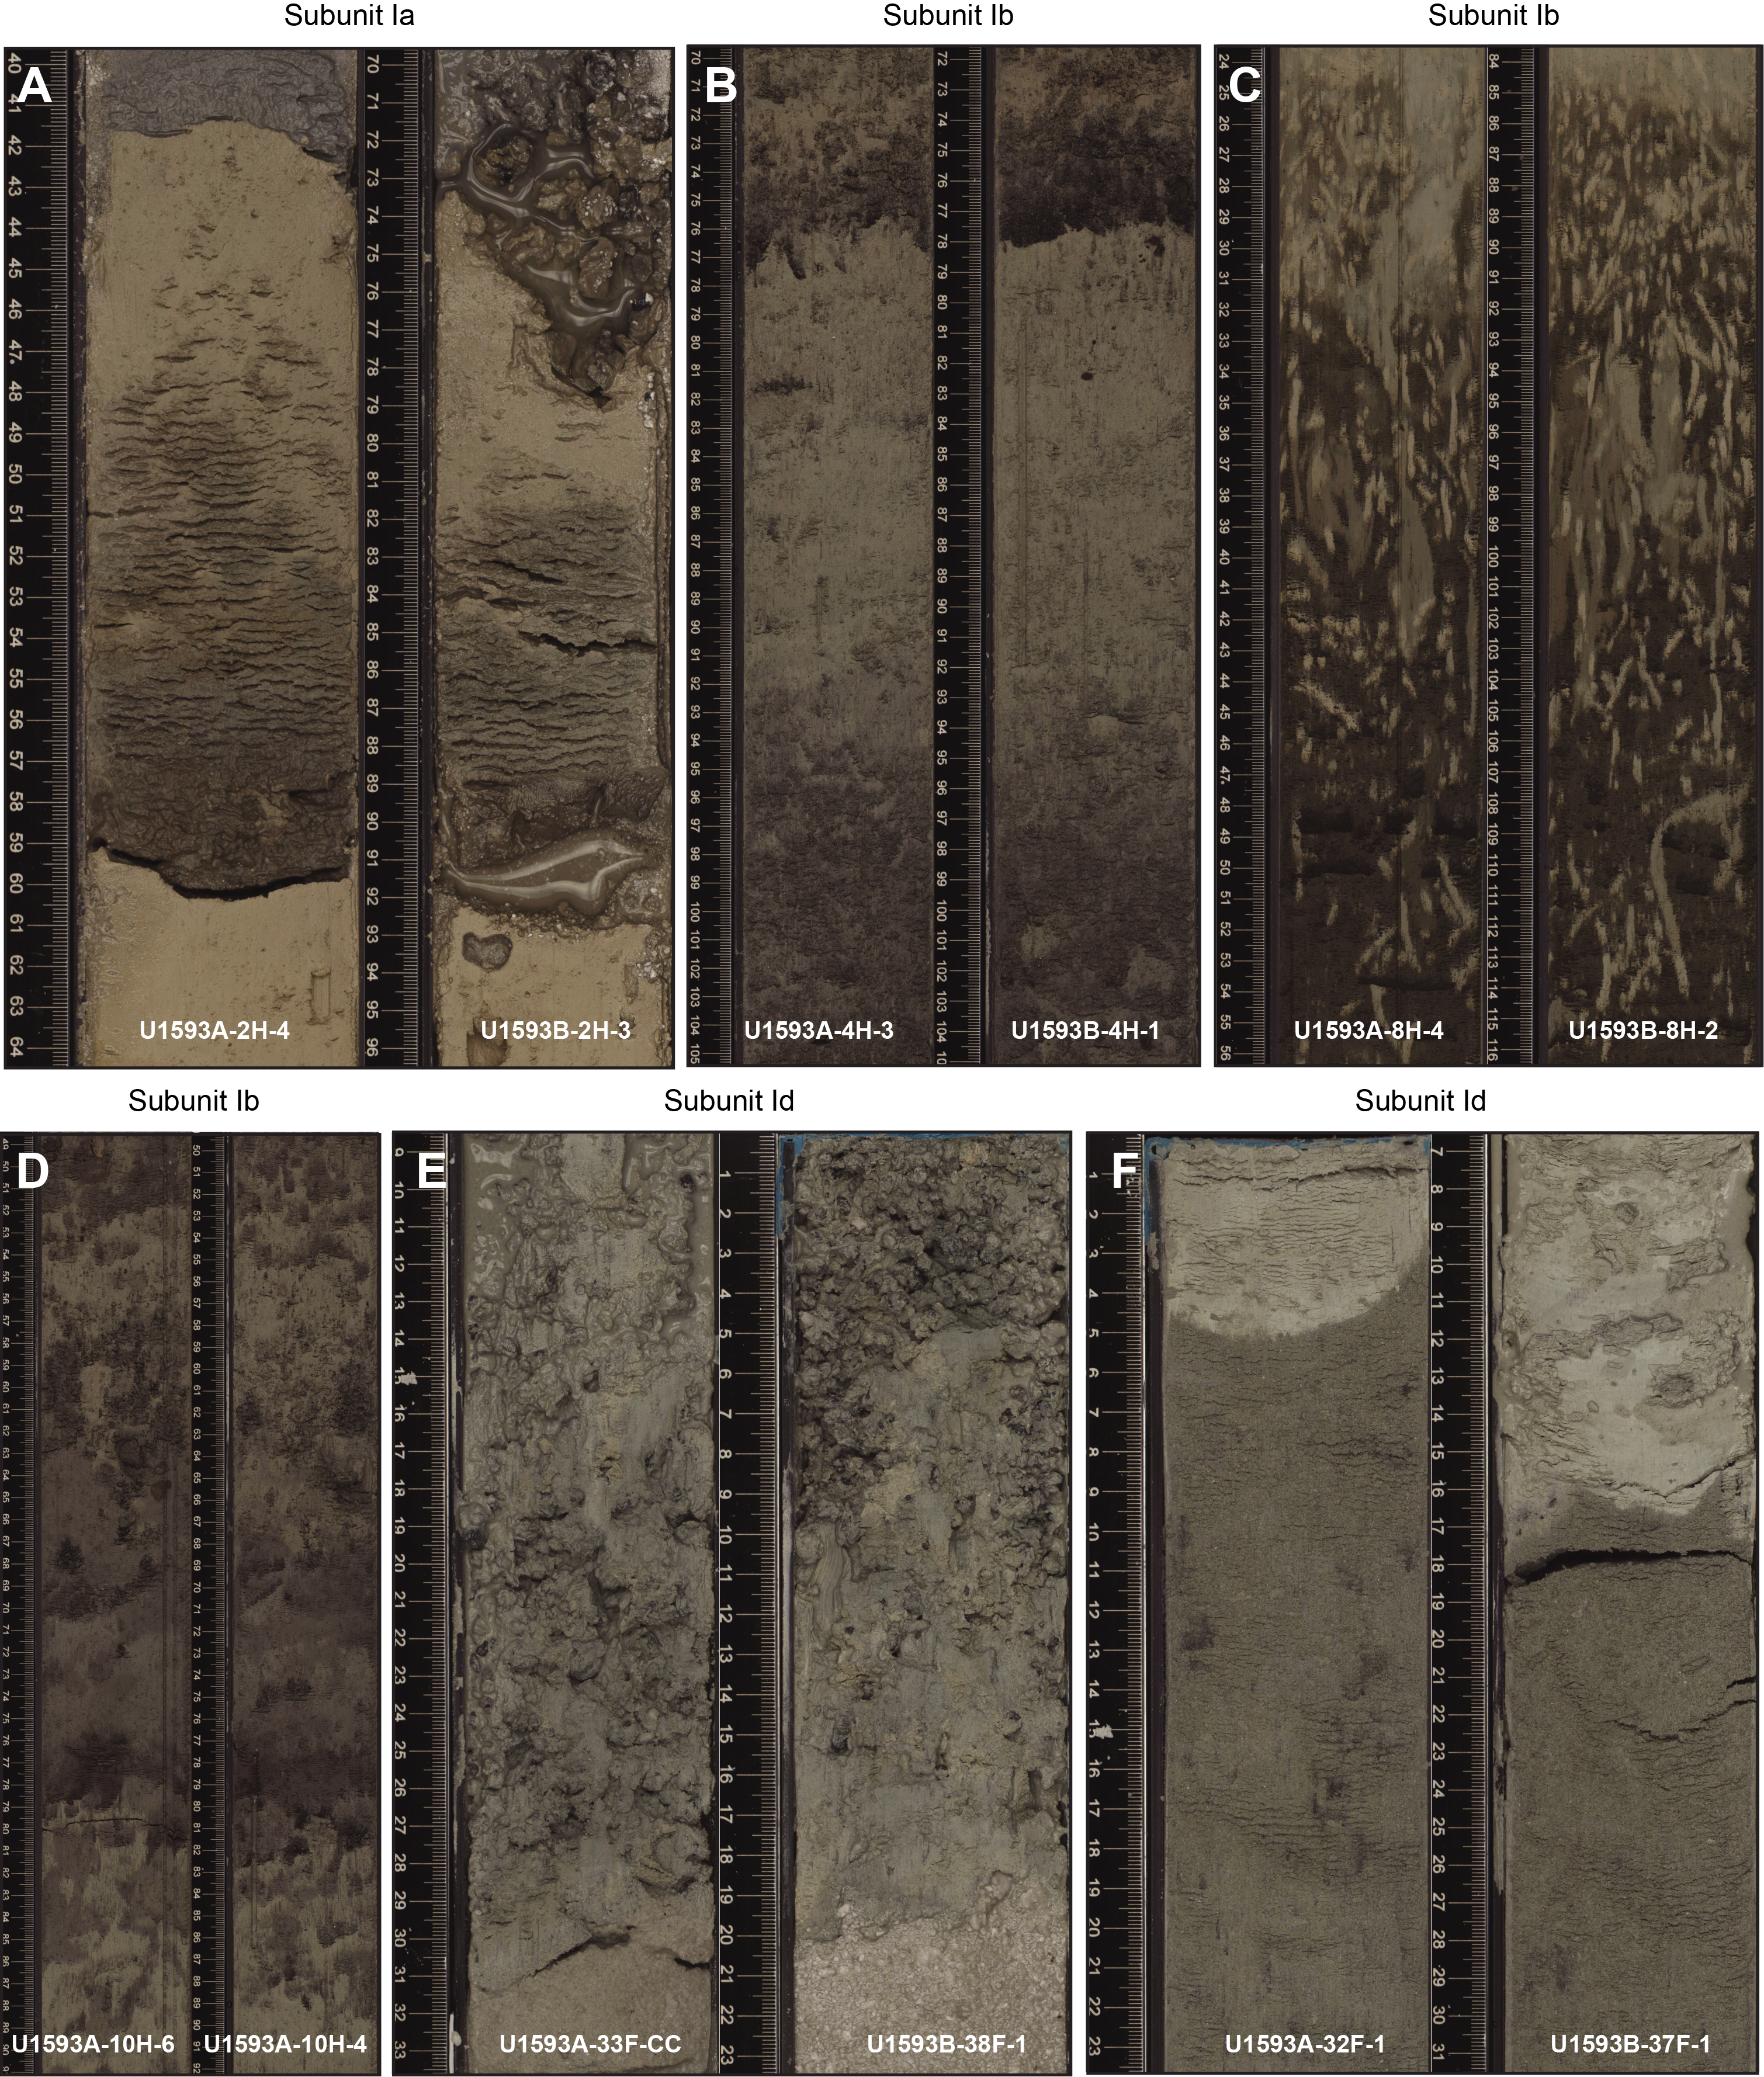
Figure F14. Stratigraphic correlations.
3.4. X-ray diffraction
XRD data were collected from one interstitial water (IW) squeeze cake sediment residues from Hole U1593A and six IW squeeze cake sediment residues from Hole U1593B. The analyzed samples comprise lithologies from Lithostratigraphic Units I and II.
XRD spectra of representative Unit I lithologies comprise ooze with ash (Figure F15A), ooze (Figure F15B), volcanic ash (Figure F15C), and tuffaceous mud (Figure F15D).
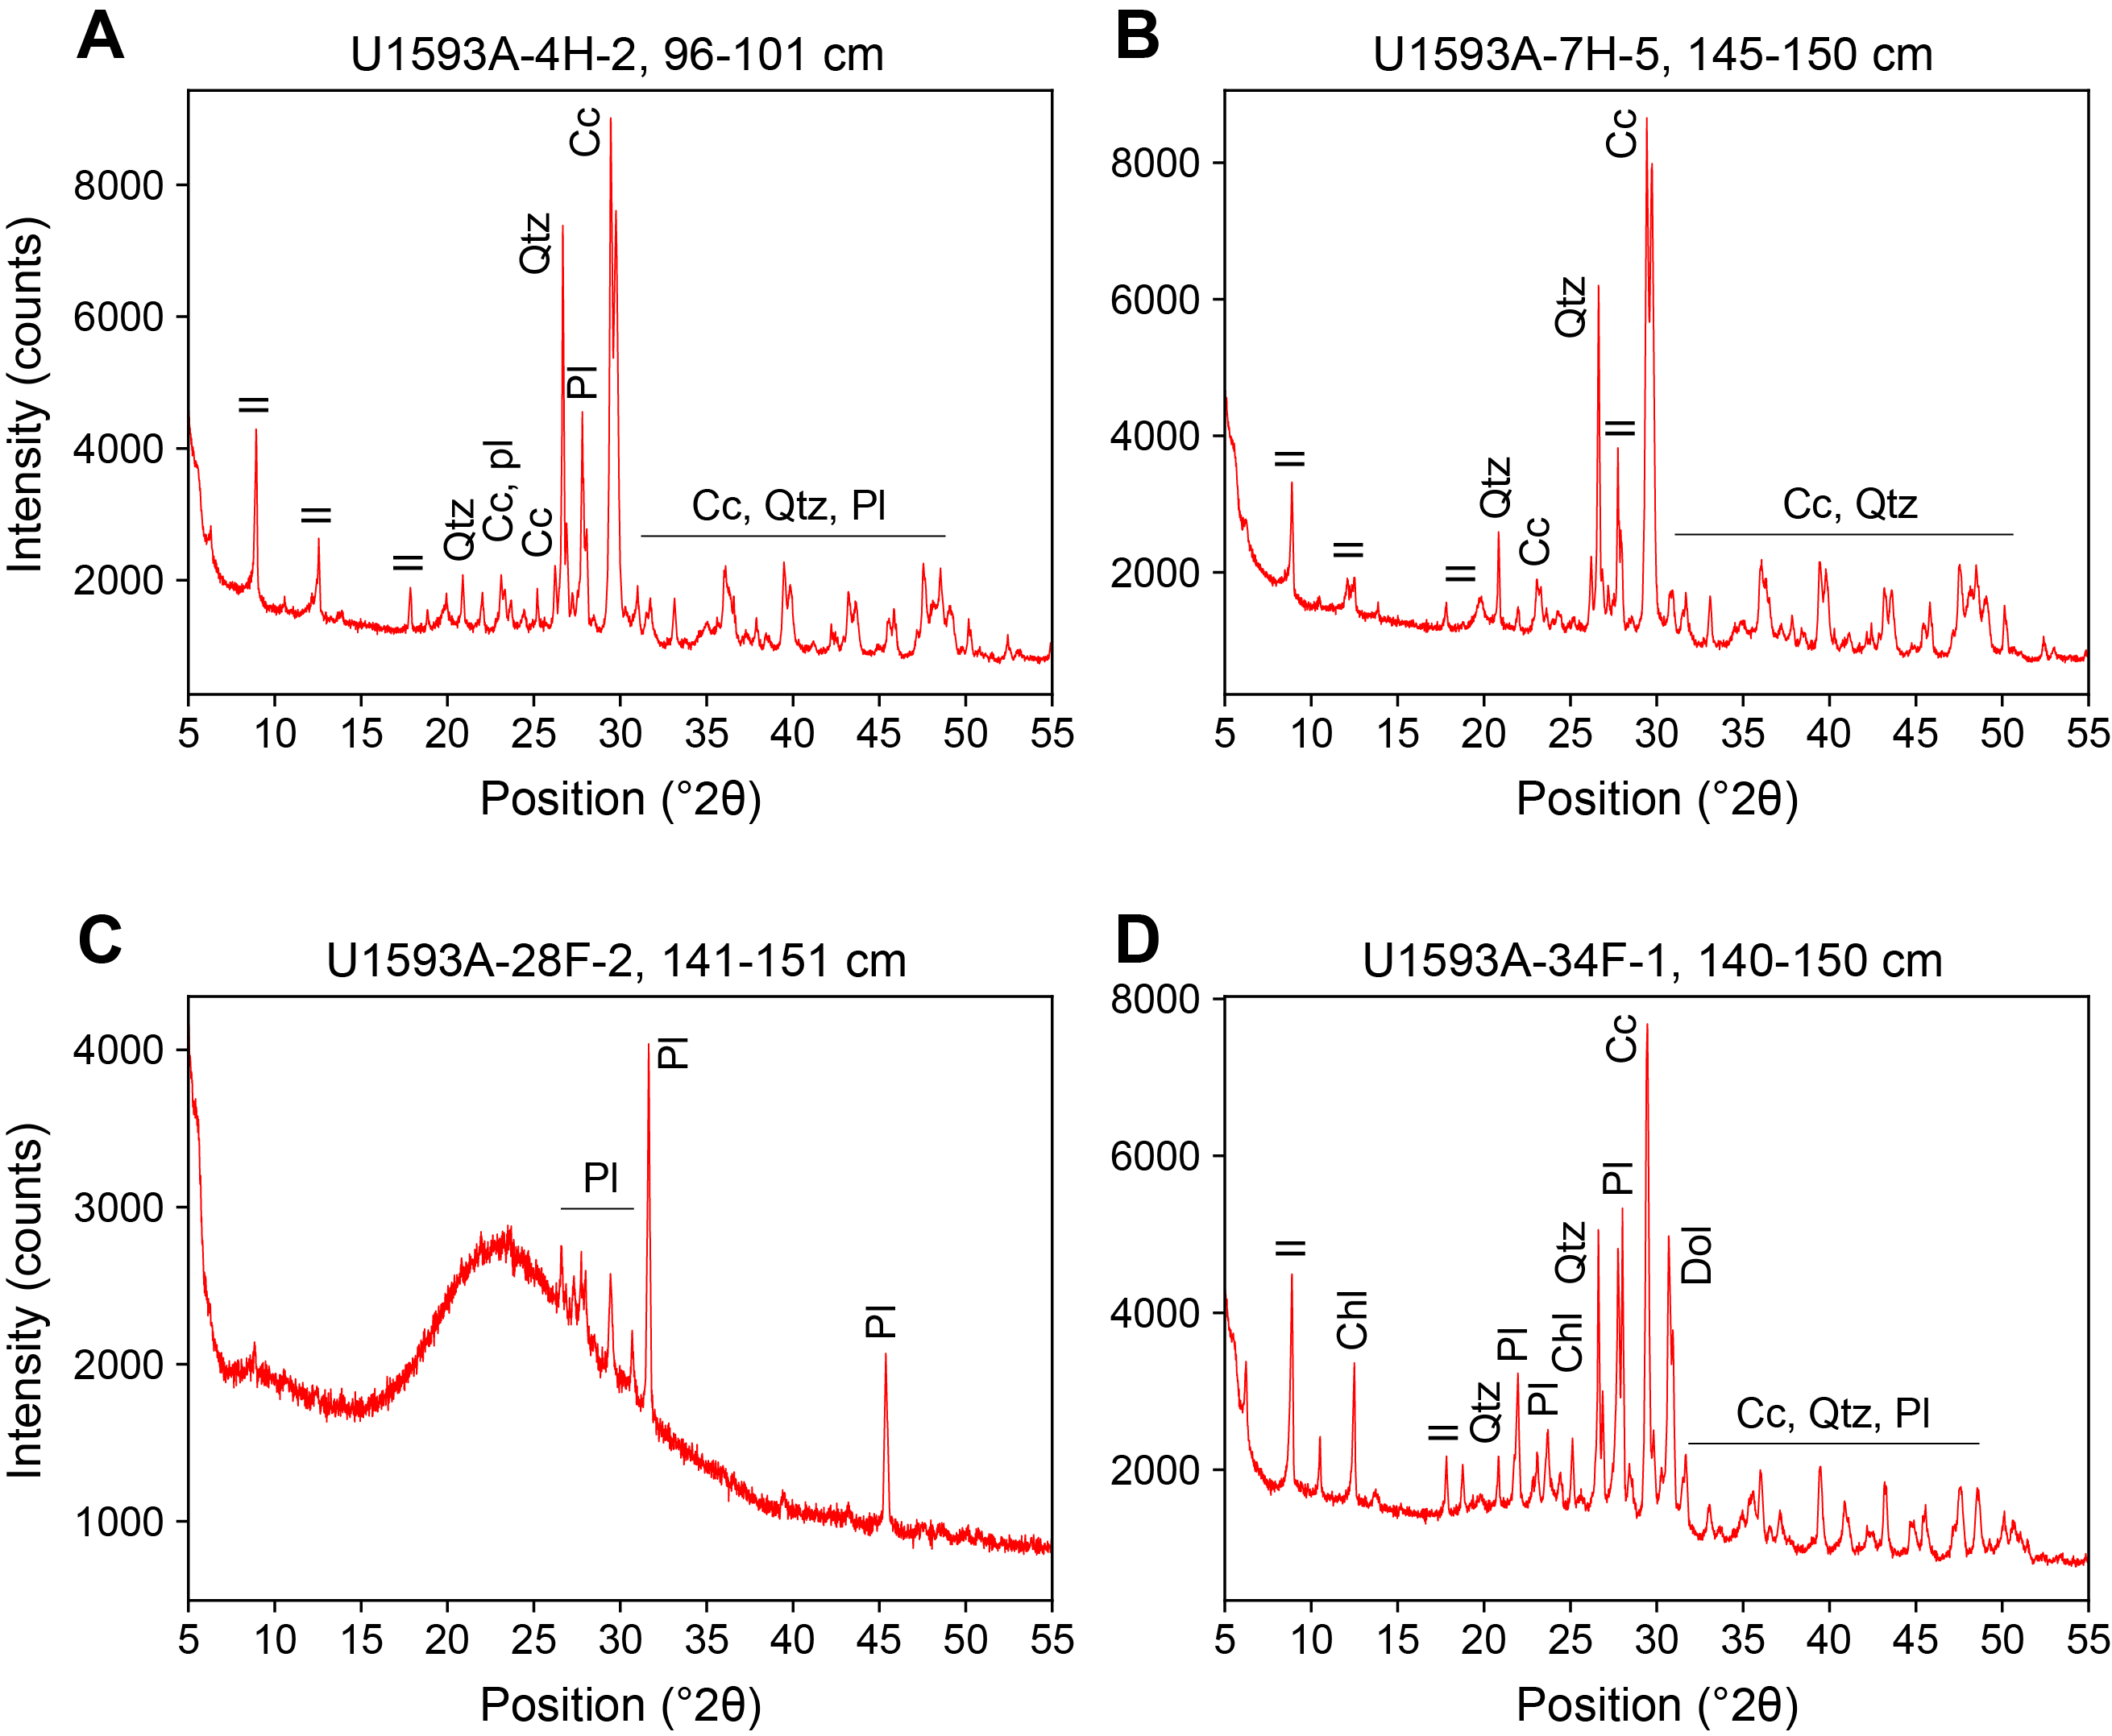
Figure F15. XRD spectra.
The volcanic ash sample (Figure F15C) shows a characteristic hump at low °2θ, indicating the presence of volcanic glass, which is less obvious in the tuffaceous mud sample. The only identified crystalline phase in the ash is Ca-rich plagioclase. Oozes (Figure F15B) are characterized by calcium carbonate (calcite and aragonite), quartz, and clay minerals typical of the illite group as the main constituents. Ooze with ash and tuffaceous mud (Figure F15A, F15D) also typically have a mineral content of calcium carbonate (calcite and aragonite), quartz, and clay minerals (typically illite), with additional dolomite, chlorite, and Ca- or Na-rich plagioclase, depending on the relative proportion of volcanic and nonvolcanic lithologies.
4. Stratigraphic correlation
Three holes were drilled at Site U1593. Hole U1593A was drilled to 250.89 mbsf using the APC and HLAPC systems (APC: 0–140.55 mbsf; HLAPC: 147.2–250.89 mbsf). Hole U1593B was drilled to 232.46 mbsf (APC: 0–101.72 mbsf; HLAPC: 101.2–232.46 mbsf). Hole U1593C caved in before any core could be retrieved; hence, correlations were only possible between Holes U1593A and U1593B.
4.1. Correlation for establishing CCSF-A depth scale and construction of the splice
Cores from Holes U1593A and U1593B had overlaps almost over the entire depth to 232.46 mbsf. For correlations, we used mainly the magnetic susceptibility (MS) derived from the Whole-Round Multisensor Logger (WRMSL) and half-core imagery (see Physical properties). In most cases, both criteria delivered consistent results. We used those correlations to determine affine ties between the two holes (Table T3) and applied minor shifts to the cores (<5.1 m). However, between Cores 398-U1593A-13H and 398-U1593B-13F and Cores 398-U1593A-34F and 398-U1593B-39F, neither the half-core images nor the physical properties revealed any distinctive characteristics, so no cores were shifted.
Figure F16 shows the MS measured in Holes U1593A and U1593B on the core composite depth below seafloor, Method A (CCSF-A), scale, as well as the splice plotted on the CCSF, Method D (CCSF-D), scale. The resulting splice is reported in Table T4 and Figure F17, in which MS, natural gamma radiation (NGR), and gamma ray attenuation (GRA) density measurements (see Physical properties) are plotted on the CCSF-D scale, as well as the coverage of respective depth intervals in Holes U1593A and U1593B. The maximum depth on the CCSF-D scale is 254.6 m, which means the total expansion amounts to 3.7 m (1.6%) (Figure F18).
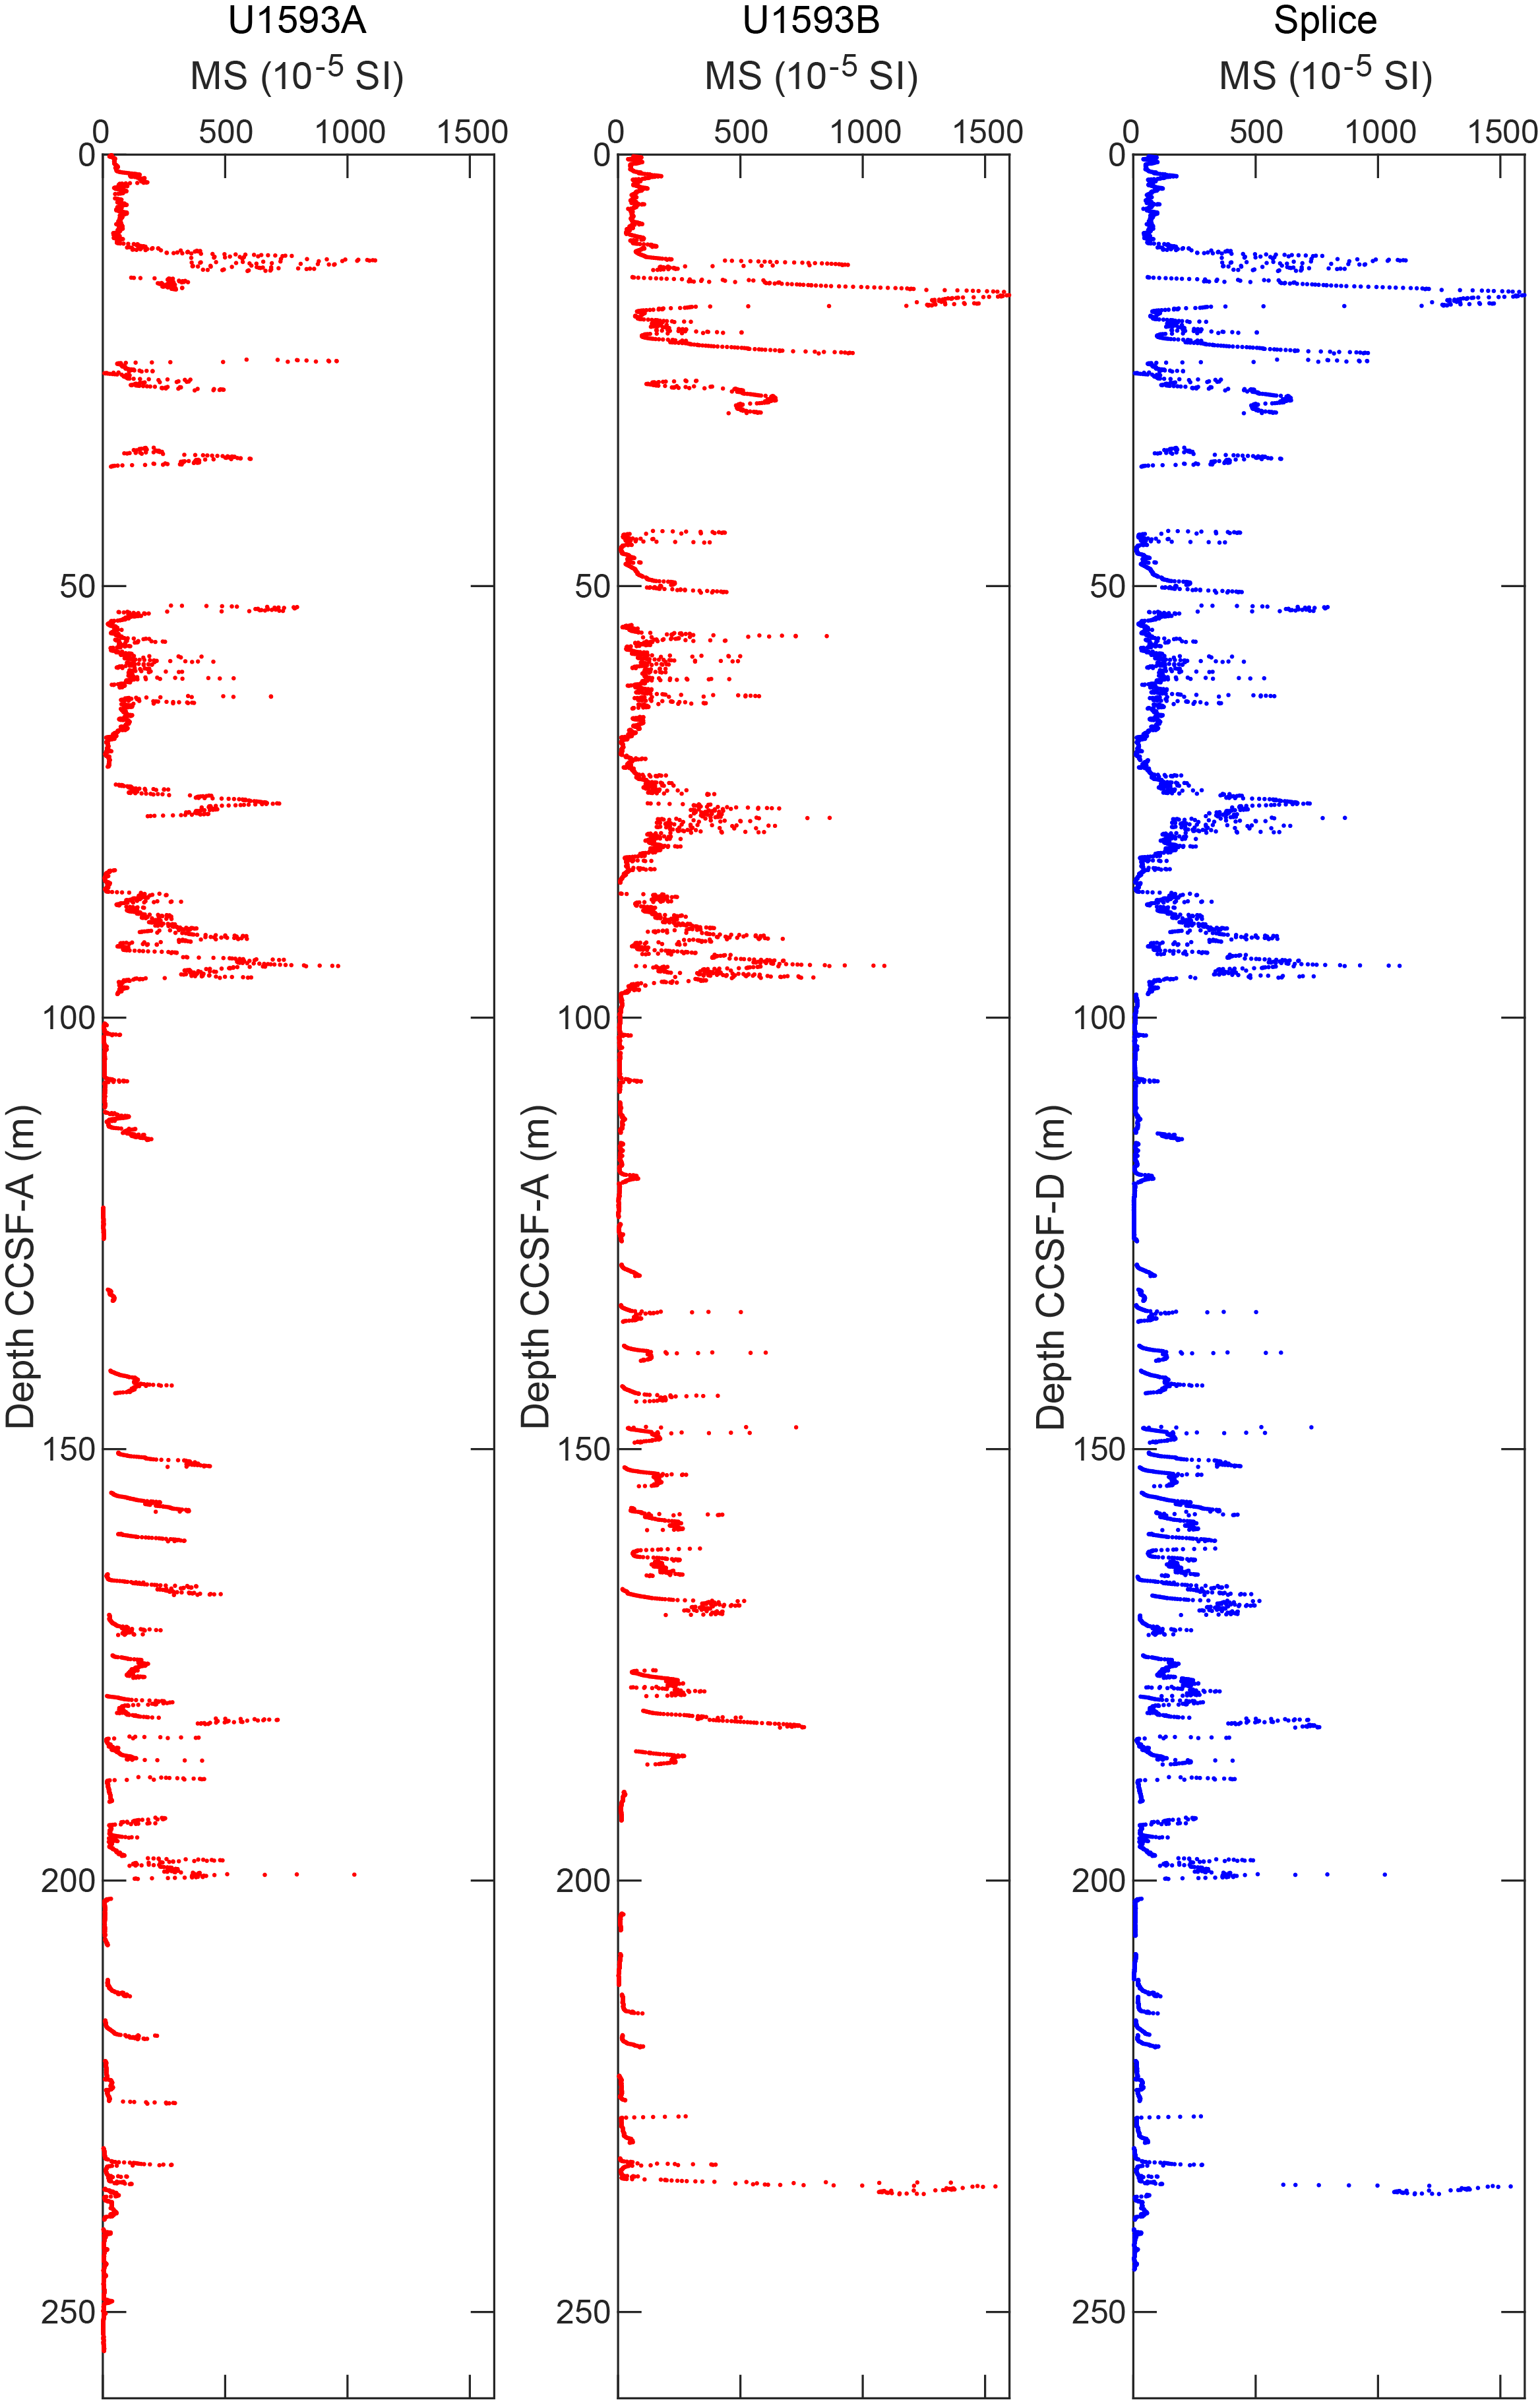
Figure F16. MS data.
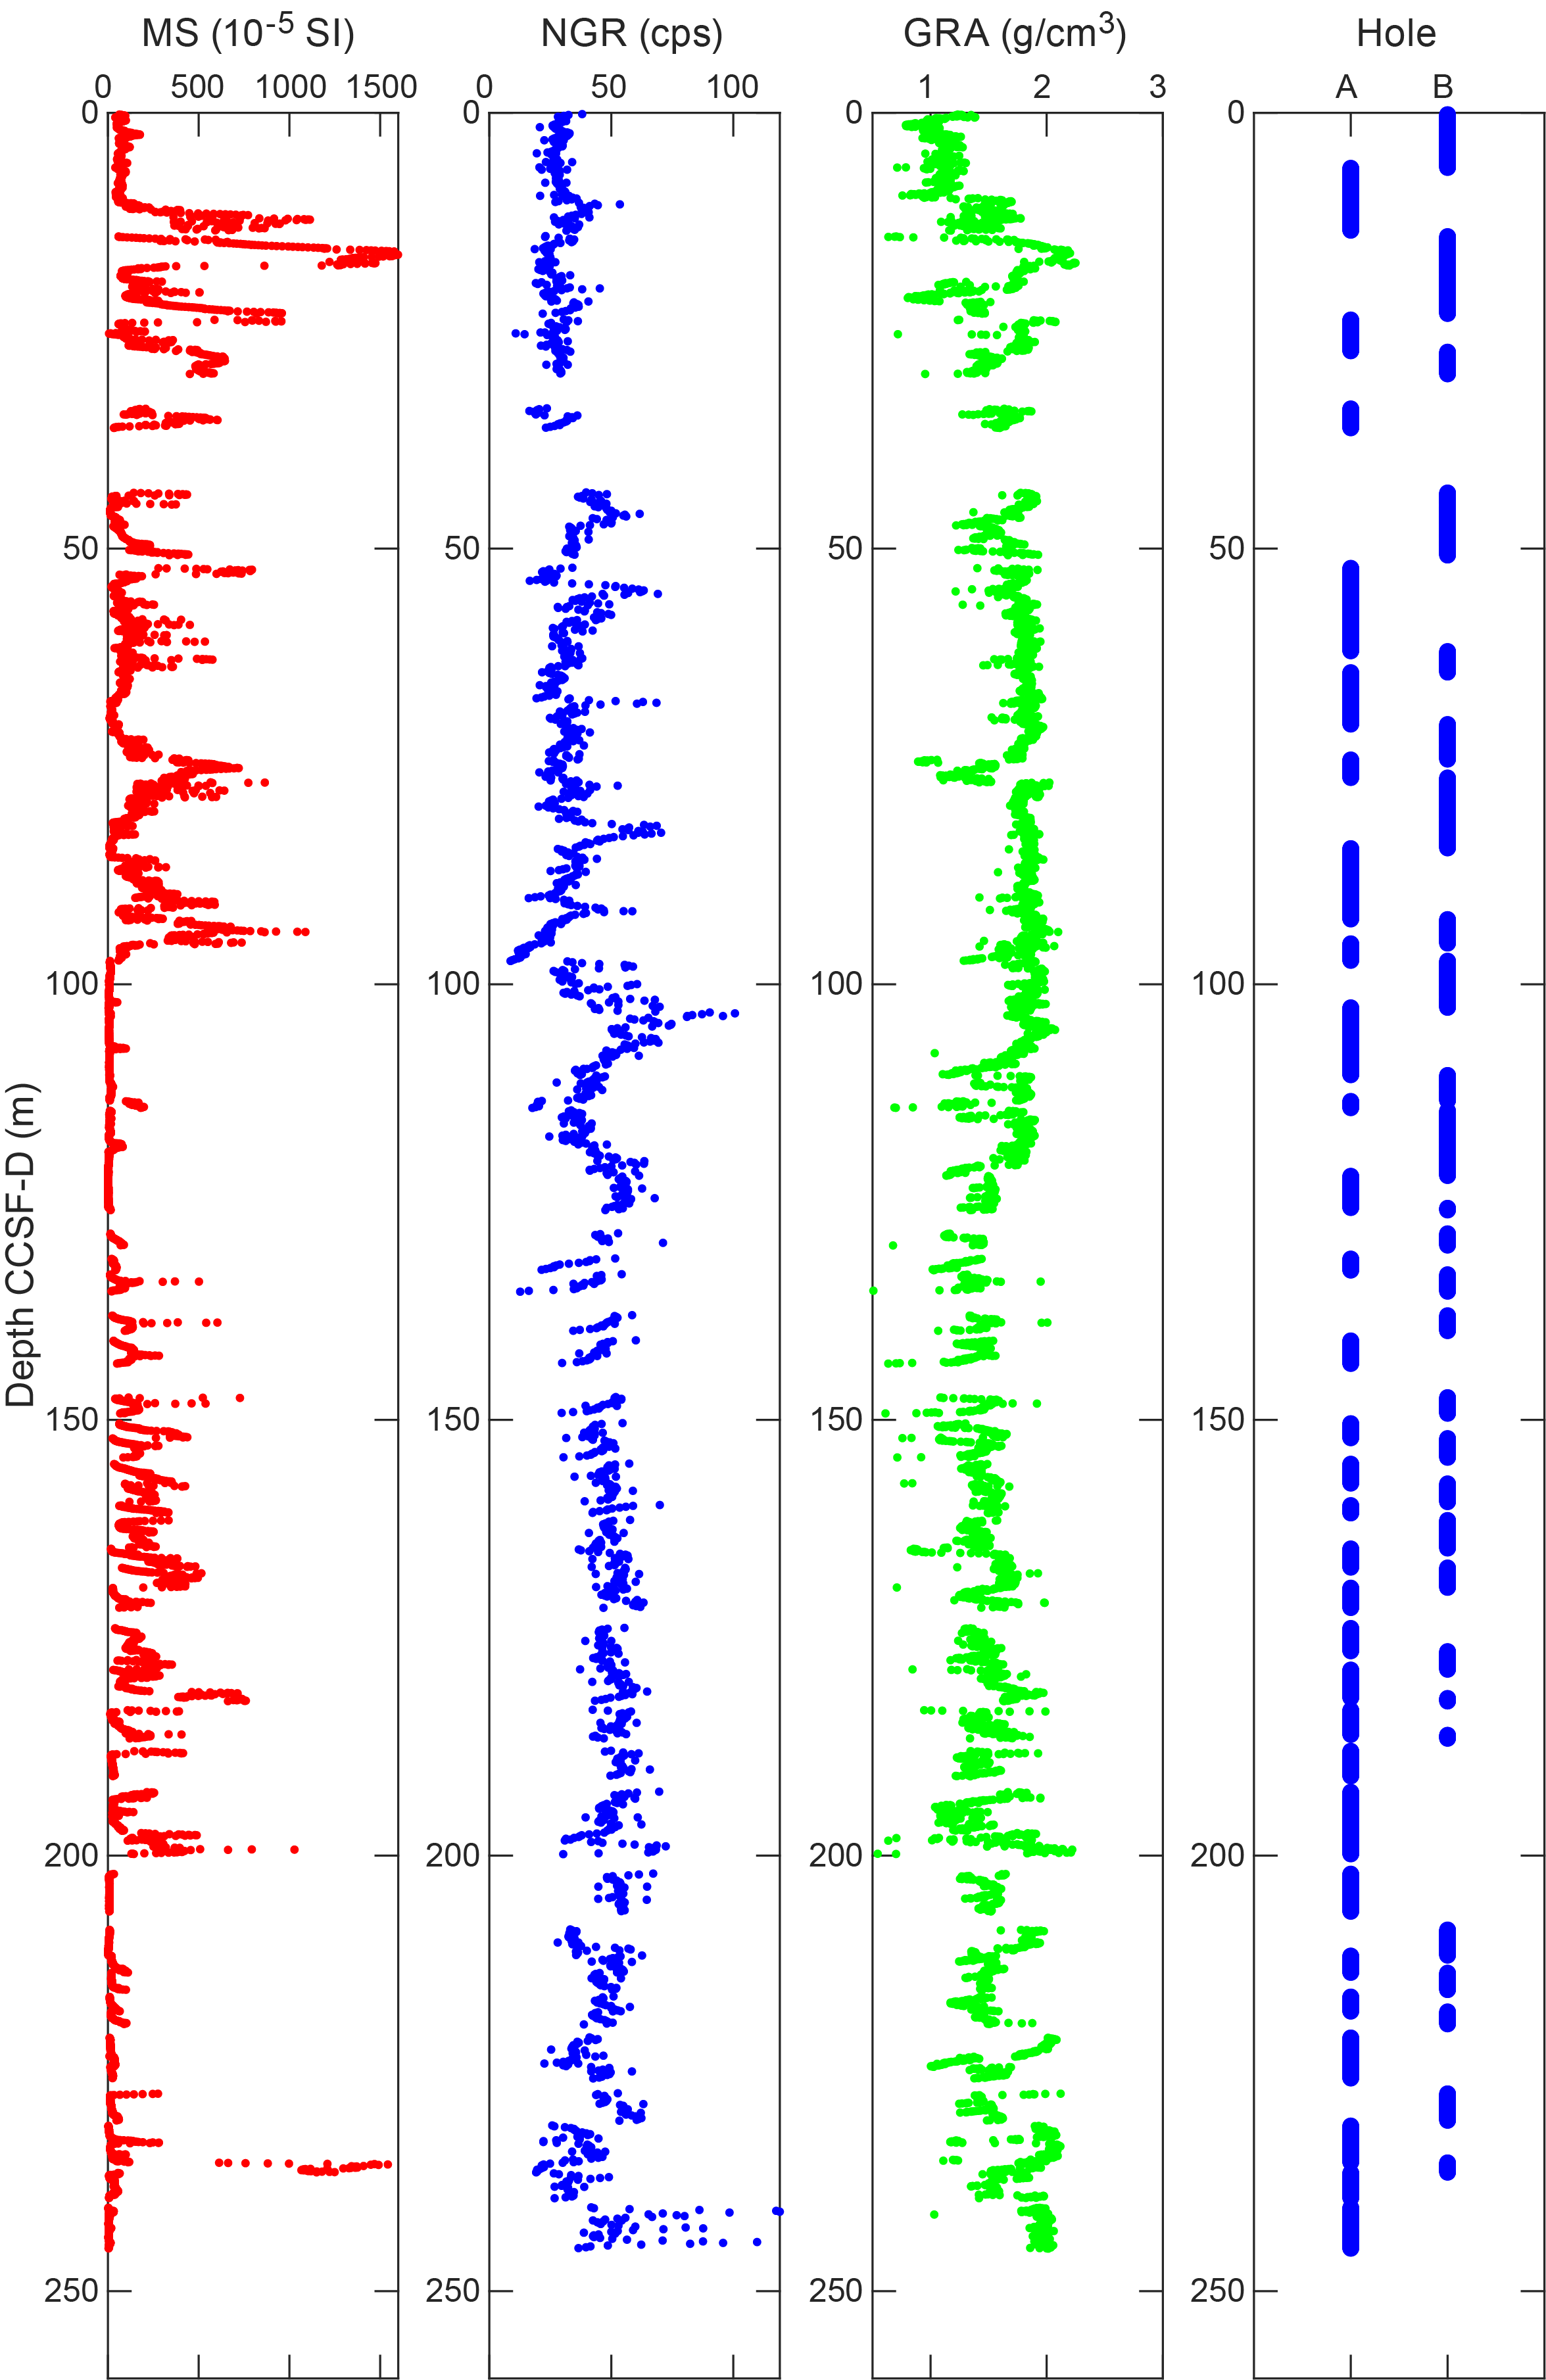
Figure F17. Splice.
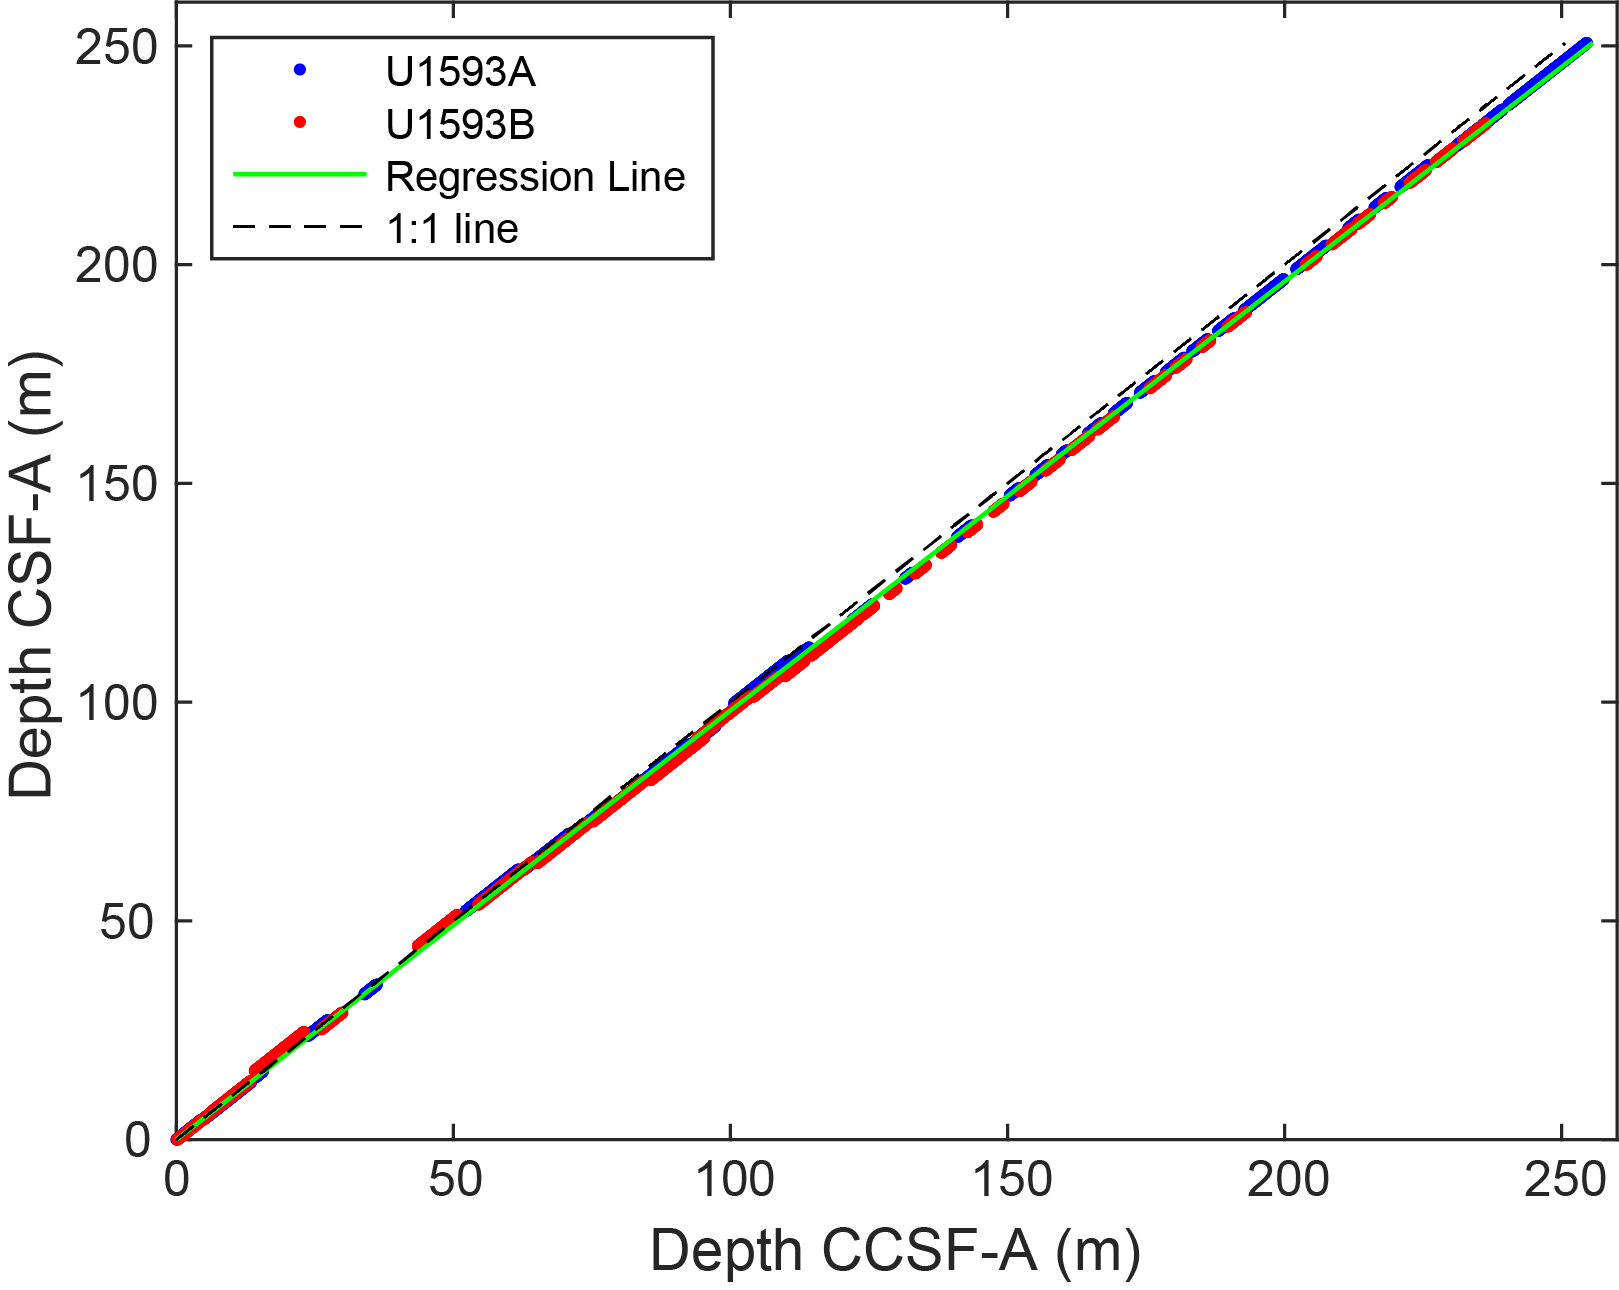
Figure F18. Core top depths.
5. Structural geology
Structural geology analyses at Site U1593 included description of cores retrieved from Holes U1593A and U1593B. A total of 66 structures were measured, and most of those measurements were derived from relatively consolidated intervals. Observed and measured structures on cores are all bedding. The distributions of dip angles of planar structures (measured to an estimated accuracy of ±2°) are shown in Figure F19. Deformation related to drilling and core recovery was noted but not recorded.
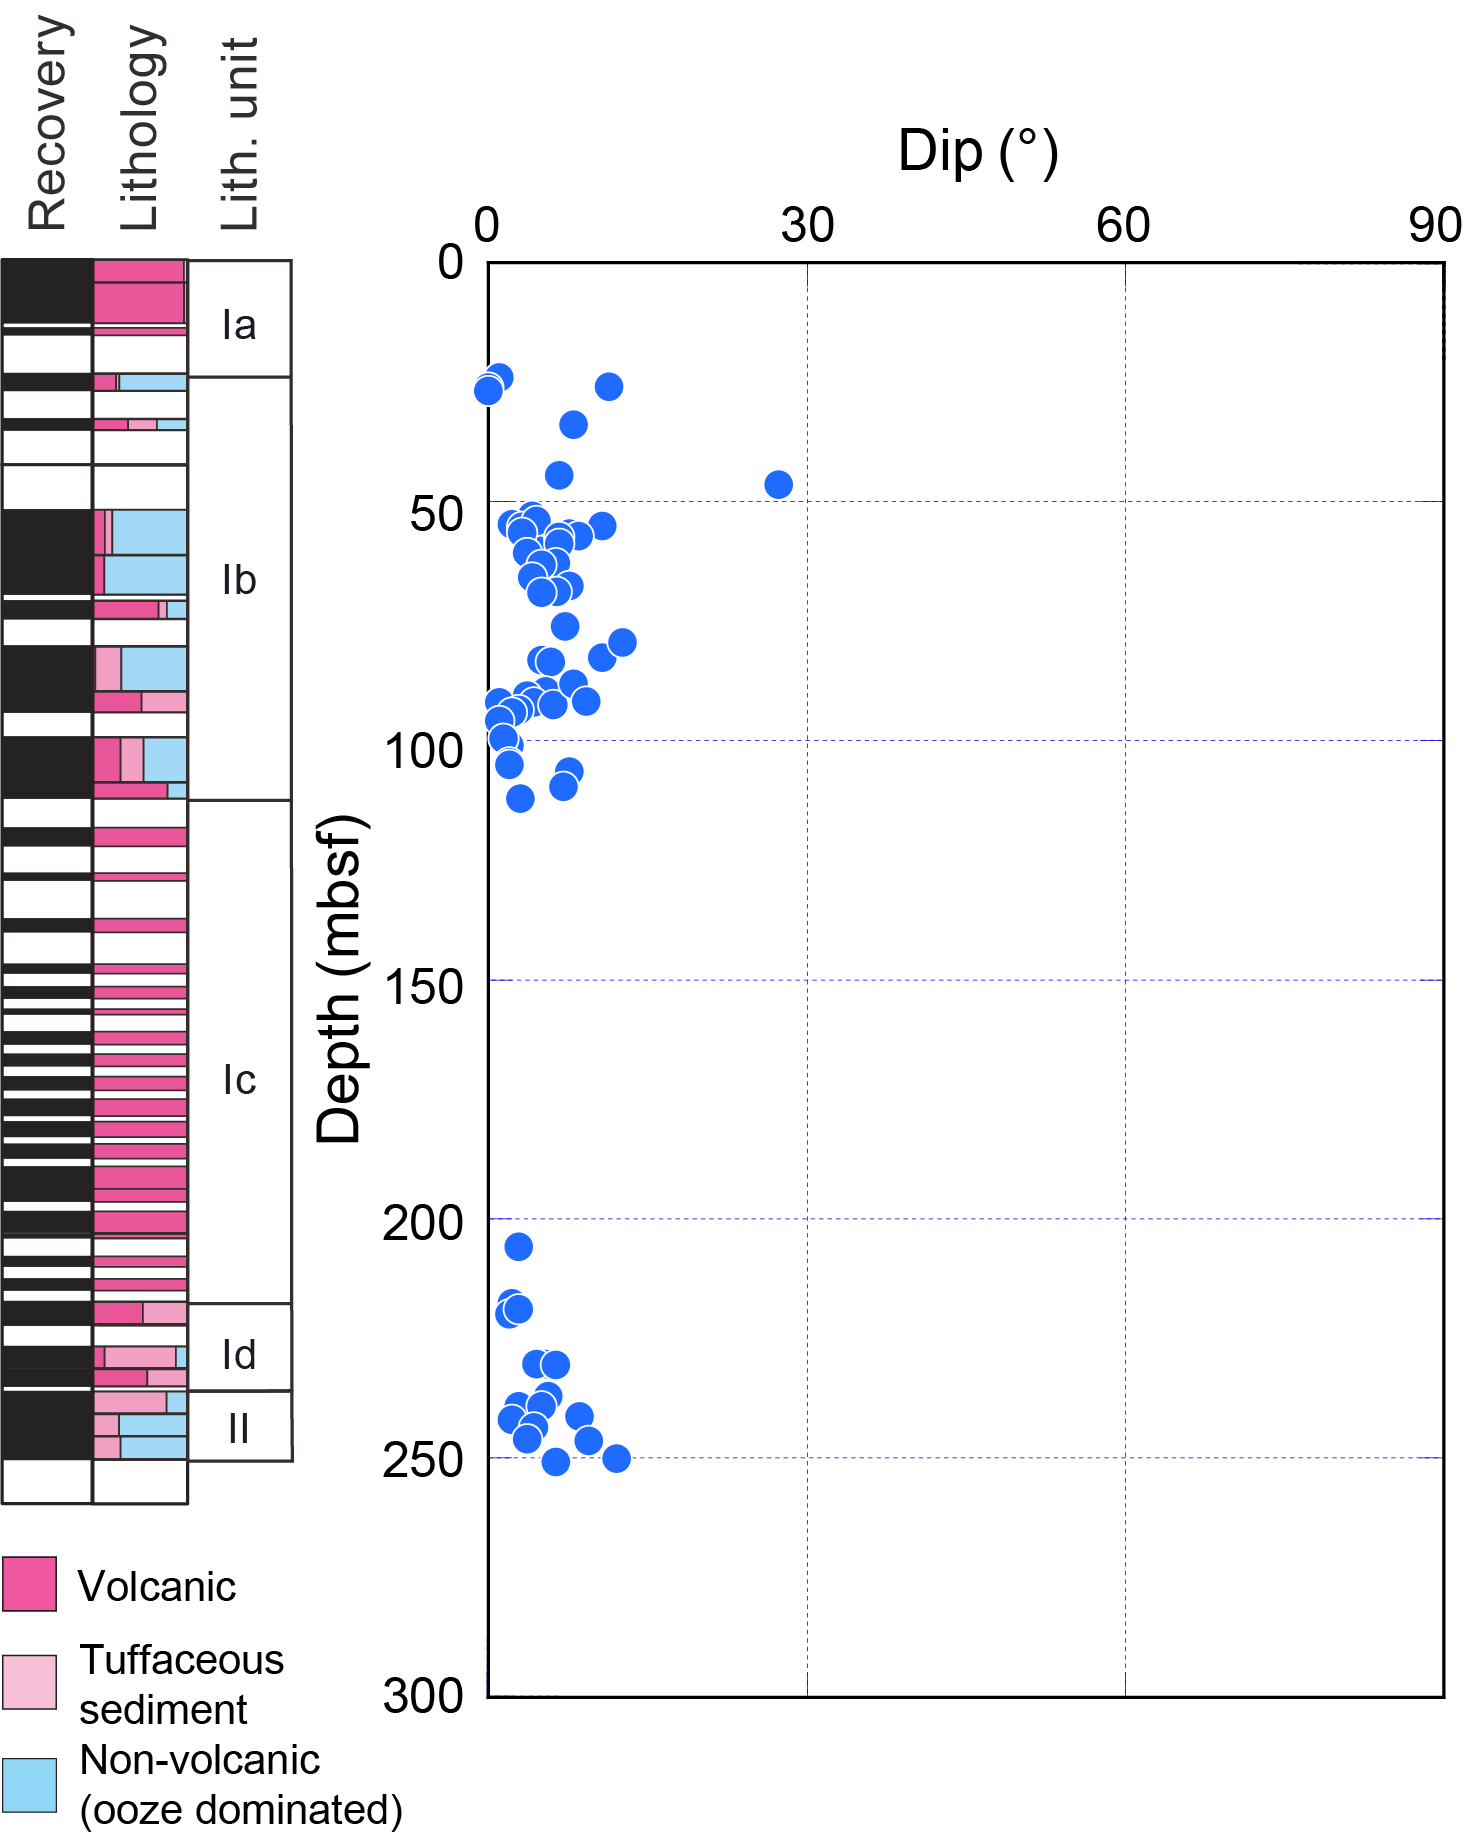
Figure F19. Dip data.
5.1. Bedding
Bedding planes (n = 66) were measured mainly on thin sand beds/laminae and mud boundaries, and they mostly exhibit horizontal to subhorizontal dips throughout the core (Figure F19). However, some steeper inclinations developed throughout the core.
The available bedding measurements were divided according to lithostratigraphic unit/subunit, as defined by core description (see Lithostratigraphy), and box plots were used to indicate the distribution of bedding dips (Figure F20). Measurements were mostly concentrated in Lithostratigraphic Subunits Ib and Id and Unit II (Figure F19), forming three groups for analysis. In the figure, each box indicates the data distribution range between the twenty-fifth and seventy-fifth percentiles, which is statistically meaningful. Median values (fiftieth percentile of all respective measurements in a unit), which are representative of the data distribution, were used for the evaluation of dip angles.
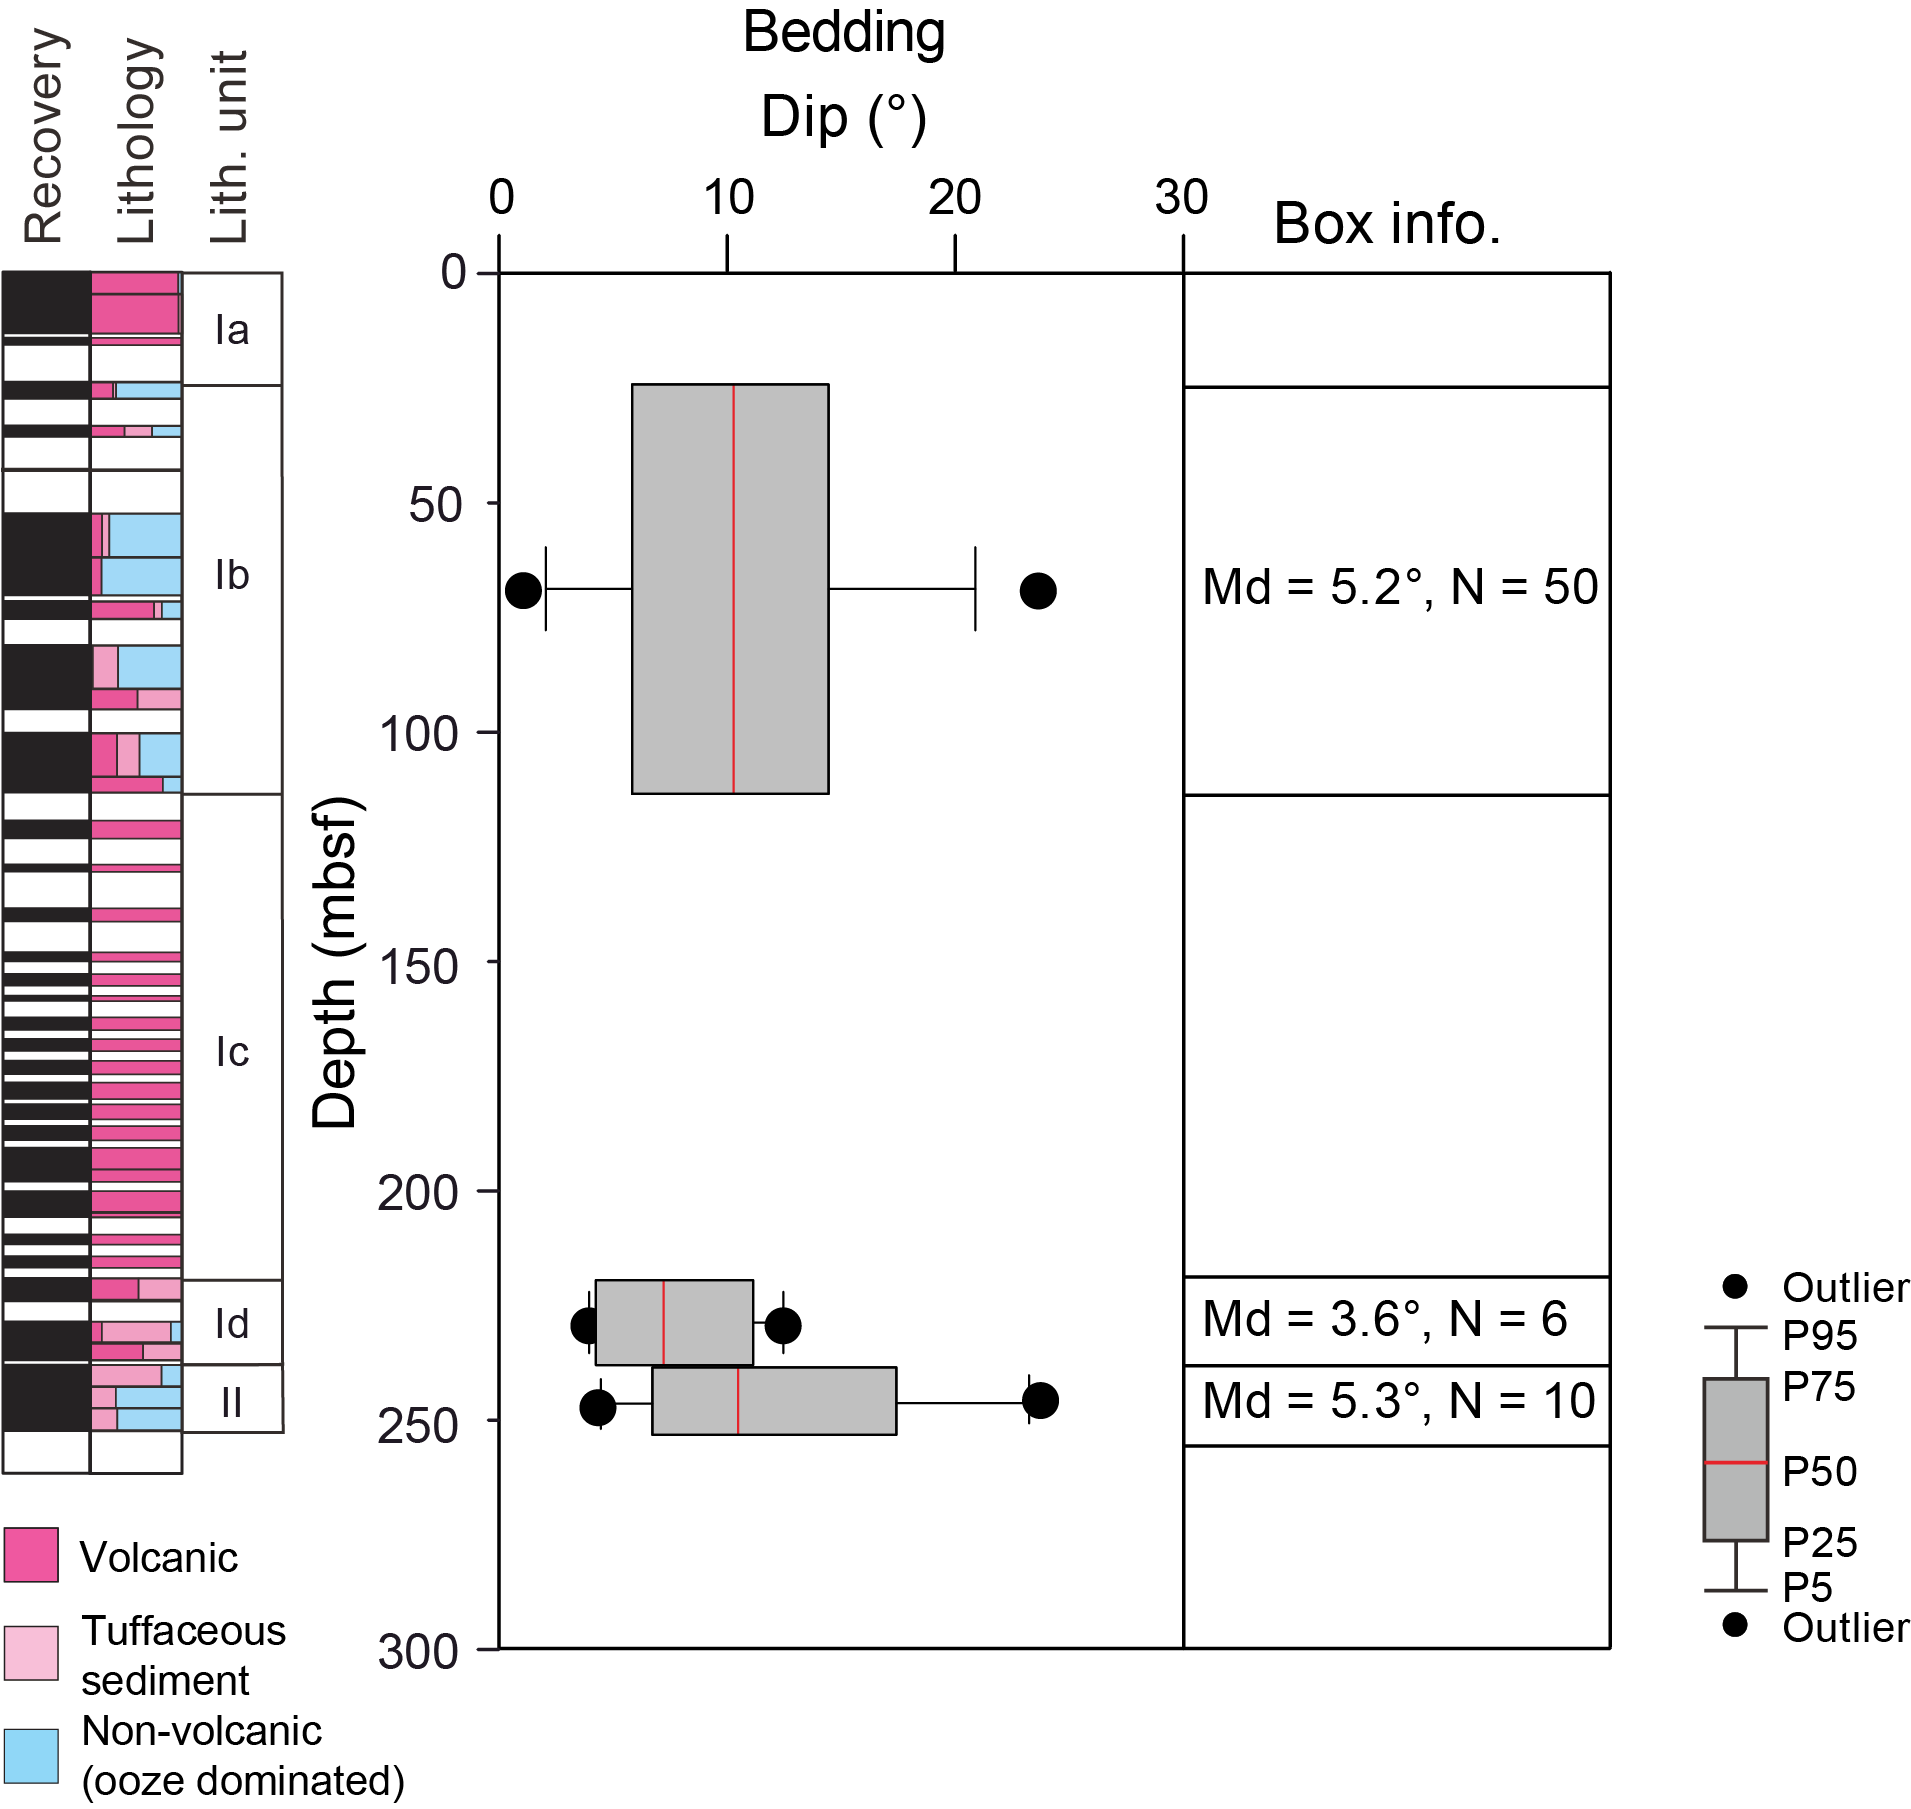
Figure F20. Bedding dip.
A slight decrease in the median bedding dip was identified between Unit II (median dip = 5.3°) and Subunit Id (median dip = 3.6°). A slight increase in median dip from 3.6° to 5.2° is seen between Subunits Id and Ib (Figure F20). Unit II was described as ooze-dominated deposits with thin layers of volcanic deposits, whereas Subunits Id and Ib consist of interbedded volcanic/tuffaceous and ooze deposits (see Lithostratigraphy). The occurrence of volcanism, or of seismic shaking, triggered slumps in Subunits Ib and Id and Unit II, thus increasing the median dip and the range within the twenty-fifth to seventy-fifth percentiles (Figure F20).
6. Biostratigraphy
Planktonic and benthic foraminifera and calcareous nannofossils were examined from core catcher samples and additional split core samples from Holes U1593A and U1593B to develop a shipboard biostratigraphic framework for Site U1593. Additionally, planktonic and benthic foraminifera provided data on paleowater depths, downslope reworking, and possible dissolution.
Site U1593 cored the basin floor sedimentary sequence northwest of Site U1590 and the Kolumbo submarine volcano and recovered a 250.89 m thick Late to Early Pleistocene sequence composed primarily of volcanogenic sediments and calcareous oozes. Calcareous nannofossils and planktonic foraminifera are typical of Late to Early Pleistocene sediments. Biostratigraphic datums recognized at Site U1593 are given in Tables T5 and T6, and an age-depth plot is shown in Figure F21.
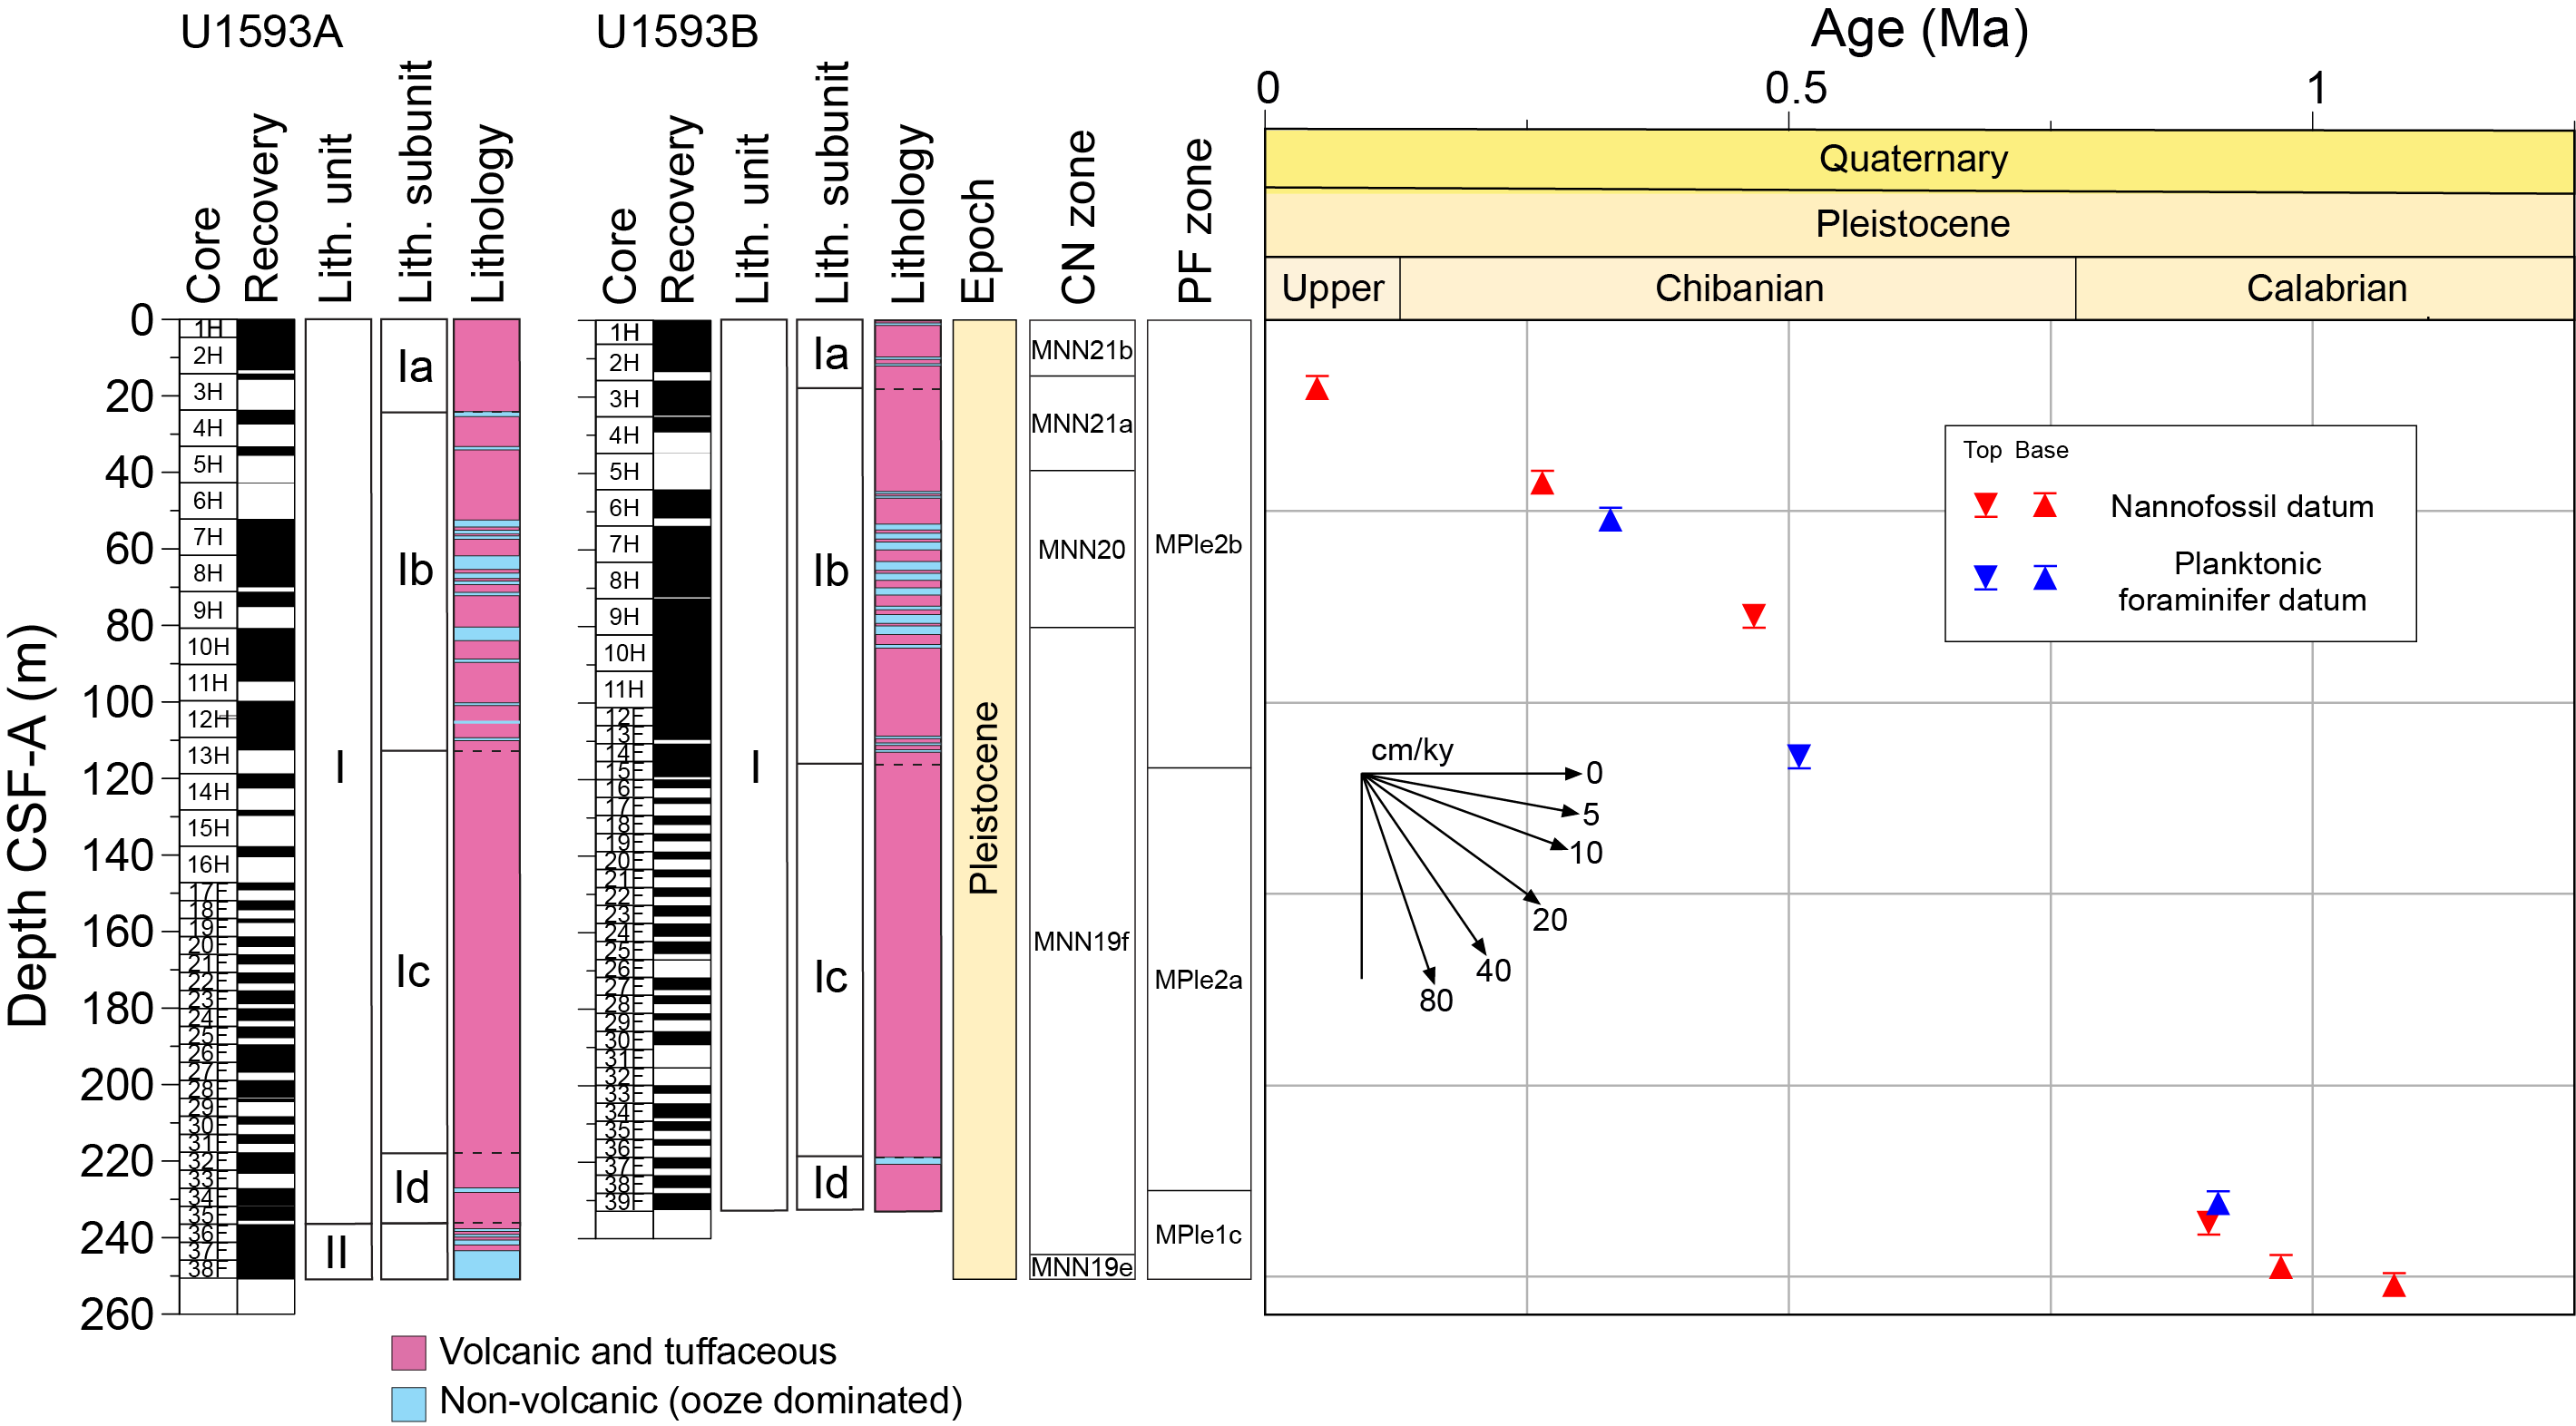
Figure F21. Age-depth plot.
Hole U1593A recovered Holocene to Early Pleistocene sediments (<1.078 Ma) from Samples 1H-1, 10–12 cm, to 38F-CC, 16–18 cm (4.73–250.89 mbsf). Hole U1593B recovered Late to Early Pleistocene sediments (>0.91 Ma) from Samples 1H-CC, 7–9 cm, to 39F-CC (6.28–232.46 mbsf).
6.1. Calcareous nannofossils
Calcareous nannofossil biostratigraphy in Holes U1593A and U1593B was established through analysis of core catcher samples and additional split core samples. Nannofossils are common to very rare in samples from the Pleistocene sequence (4.72–250.88 mbsf). Preservation is moderate to poor throughout the sequence, and there is significant reworking of older material in most of the Pleistocene samples. Six nannofossil biostratigraphic datums are recognized at Site U1593, representing a continuous Pleistocene sedimentary sequence (Figure F22). Biostratigraphic datums are given in Table T5, and the distribution of calcareous nannofossil taxa is shown in Table T7.
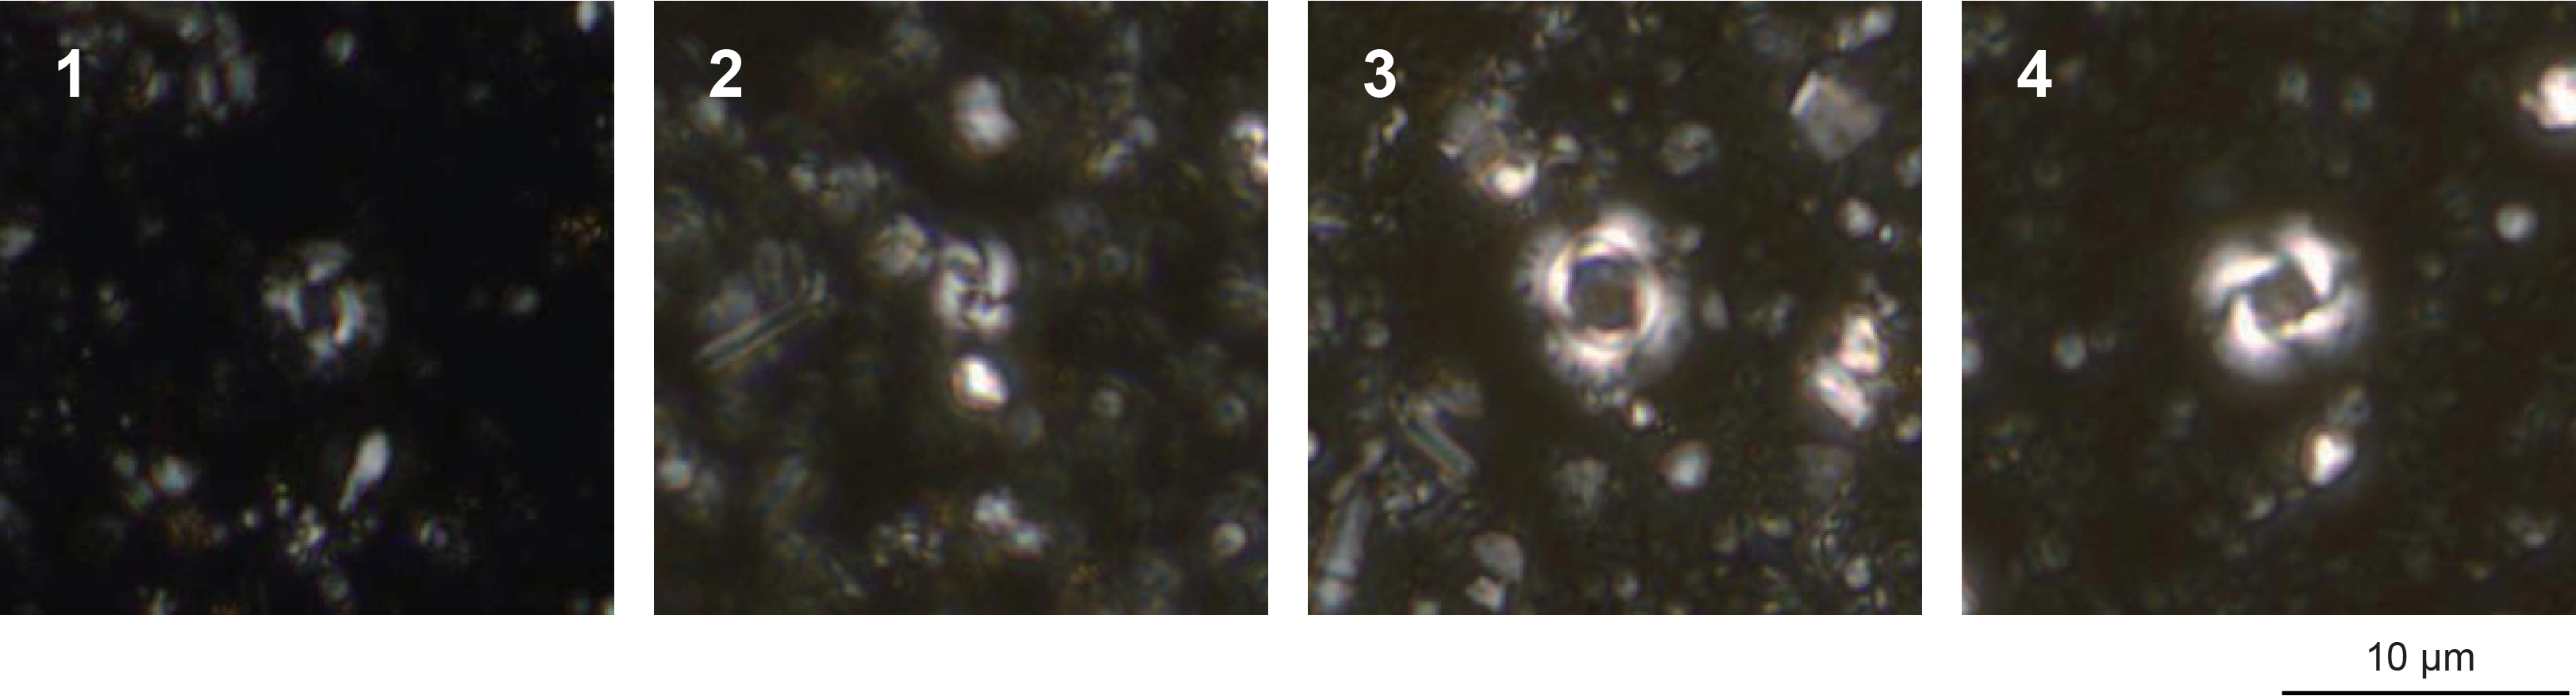
Figure F22. Calcareous nannofossils.
The presence of Emiliania huxleyi in Samples 398-U1593A-1H-CC, 10–12 cm, to 5H-CC, 15–17 cm (4.72–35.66 mbsf), indicates a Middle Pleistocene to Holocene age (≤0.29 Ma) in Zone NN21 of Martini (1971). The acme base of E. huxleyi, which correlates the Zone MNN21a/21b boundary and Marine Isotope Stages 4–5a (0.05 Ma) by Rio et al. (1990), Castradori (1993), and Lourens et al. (2004) in the eastern Mediterranean, is shown between Samples 2H-CC, 6–7 cm, and 3H-CC, 10–11 cm (13.3–15.78 mbsf). The last appearance datum of Pseudoemiliania lacunosa defines the Zone NN19/20 boundary. The last consistent appearance of P. lacunosa in Hole U1593A occurs in Sample 10H-CC, 0–2 cm (90.4 mbsf). The top occurrence of Reticulofenestra asanoi (0.901 Ma), situated at the top of the Jaramillo Subchronozone of the Matuyama Chronozone in Zone MNN19e, is recognized at the boundary between Samples 35F-CC, 0–5 cm, and 36F-CC, 0–5 cm (235.54–241.48 mbsf). The basal occurrence of Gephyrocapsa sp. 3 (0.97 Ma), situated at the top of the Jaramillo Subchronozone of the Matuyama Chronozone in Zone MNN19e, is found between Samples 36F-CC, 21–23 cm, and 37F-CC, 22–24 cm (241.5–246.17 mbsf). The basal occurrence of R. asanoi (1.078 Ma), which lies just below the Jaramillo Subchronozone of the Matuyama Chronozone (Zone MNN19e), is found between Samples 37F-CC, 22–24 cm, and 38F-CC, 16–18 cm (246.19–250.87 mbsf).
6.2. Foraminifera
Planktonic and benthic foraminifera were examined from core catcher samples and split core samples from Holes U1593A and U1593B (Figure F21). Absolute ages assigned to biostratigraphic datums follow those listed in Table T5 in the Expedition 398 methods chapter (Kutterolf et al., 2024). Planktonic foraminifer datums are given in Table T6. The distribution of important planktonic and benthic foraminifer taxa is given in Tables T8 and T9, and planktonic foraminifer abundances and indications of oceanicity (e.g., Hayward et al., 1999), paleowater depths, and downslope reworking are shown in Figures F23 and F24.
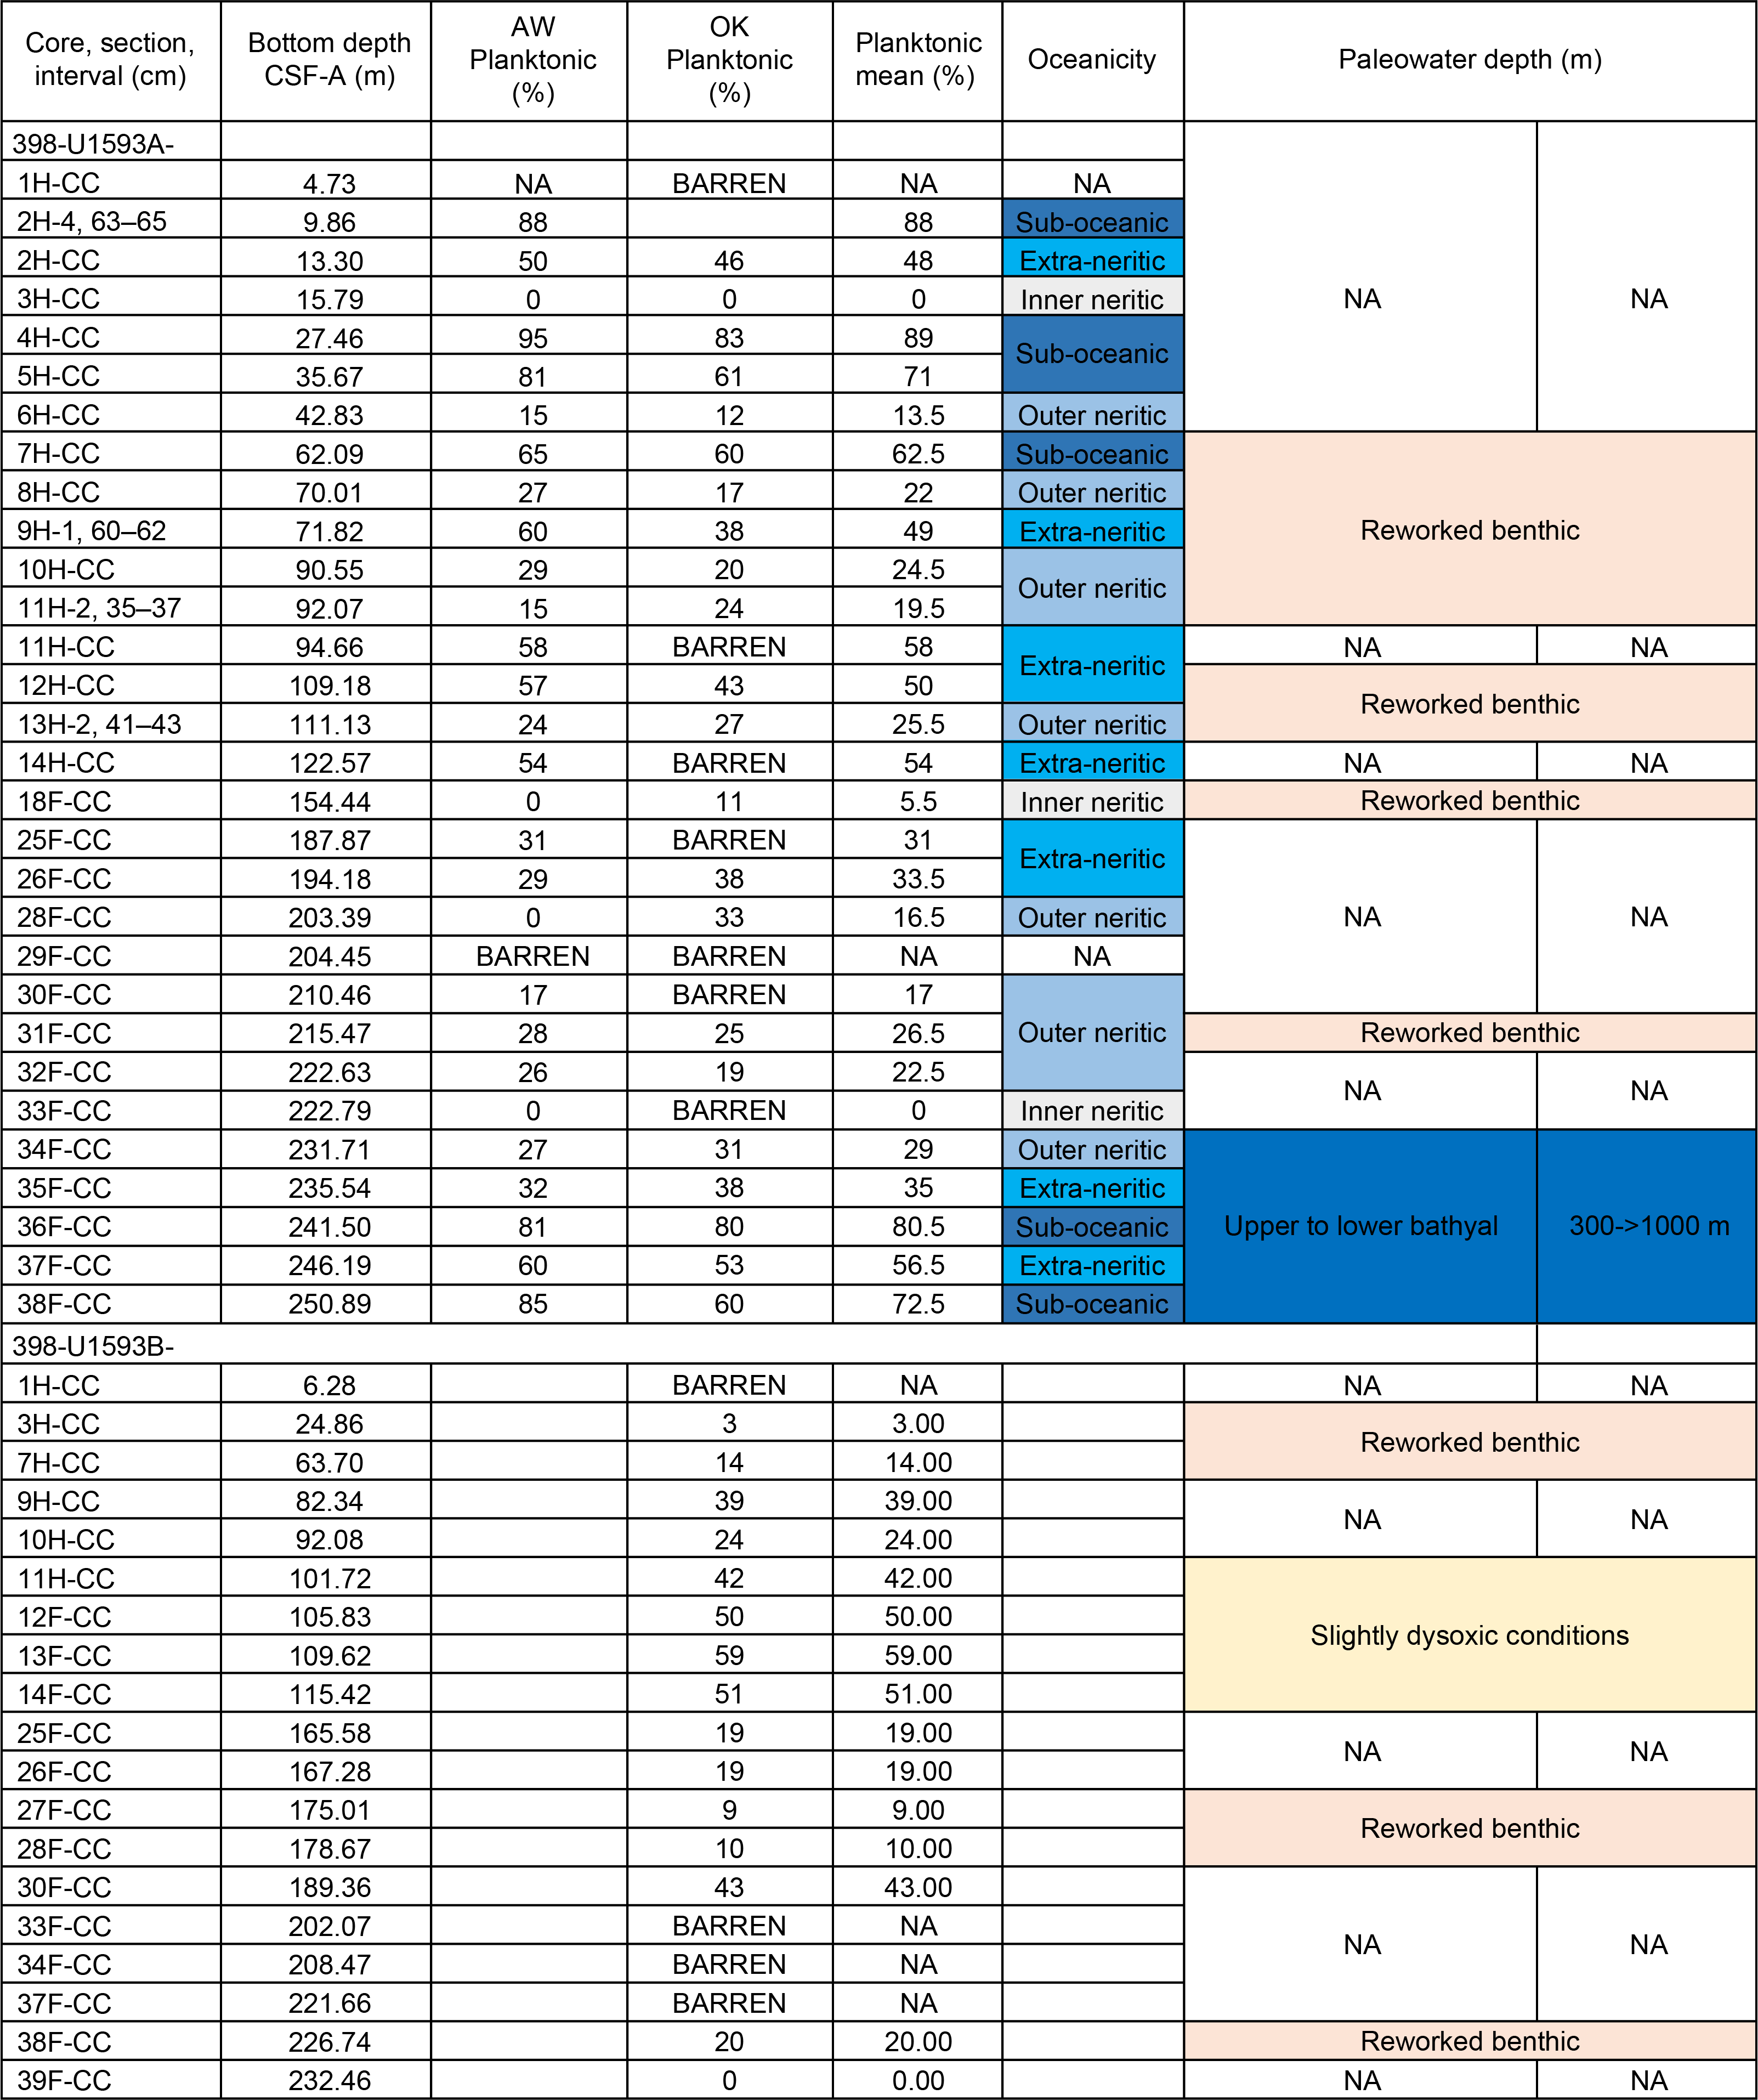
Figure F23. Foraminiferal oceanicity and paleowater depth estimates.
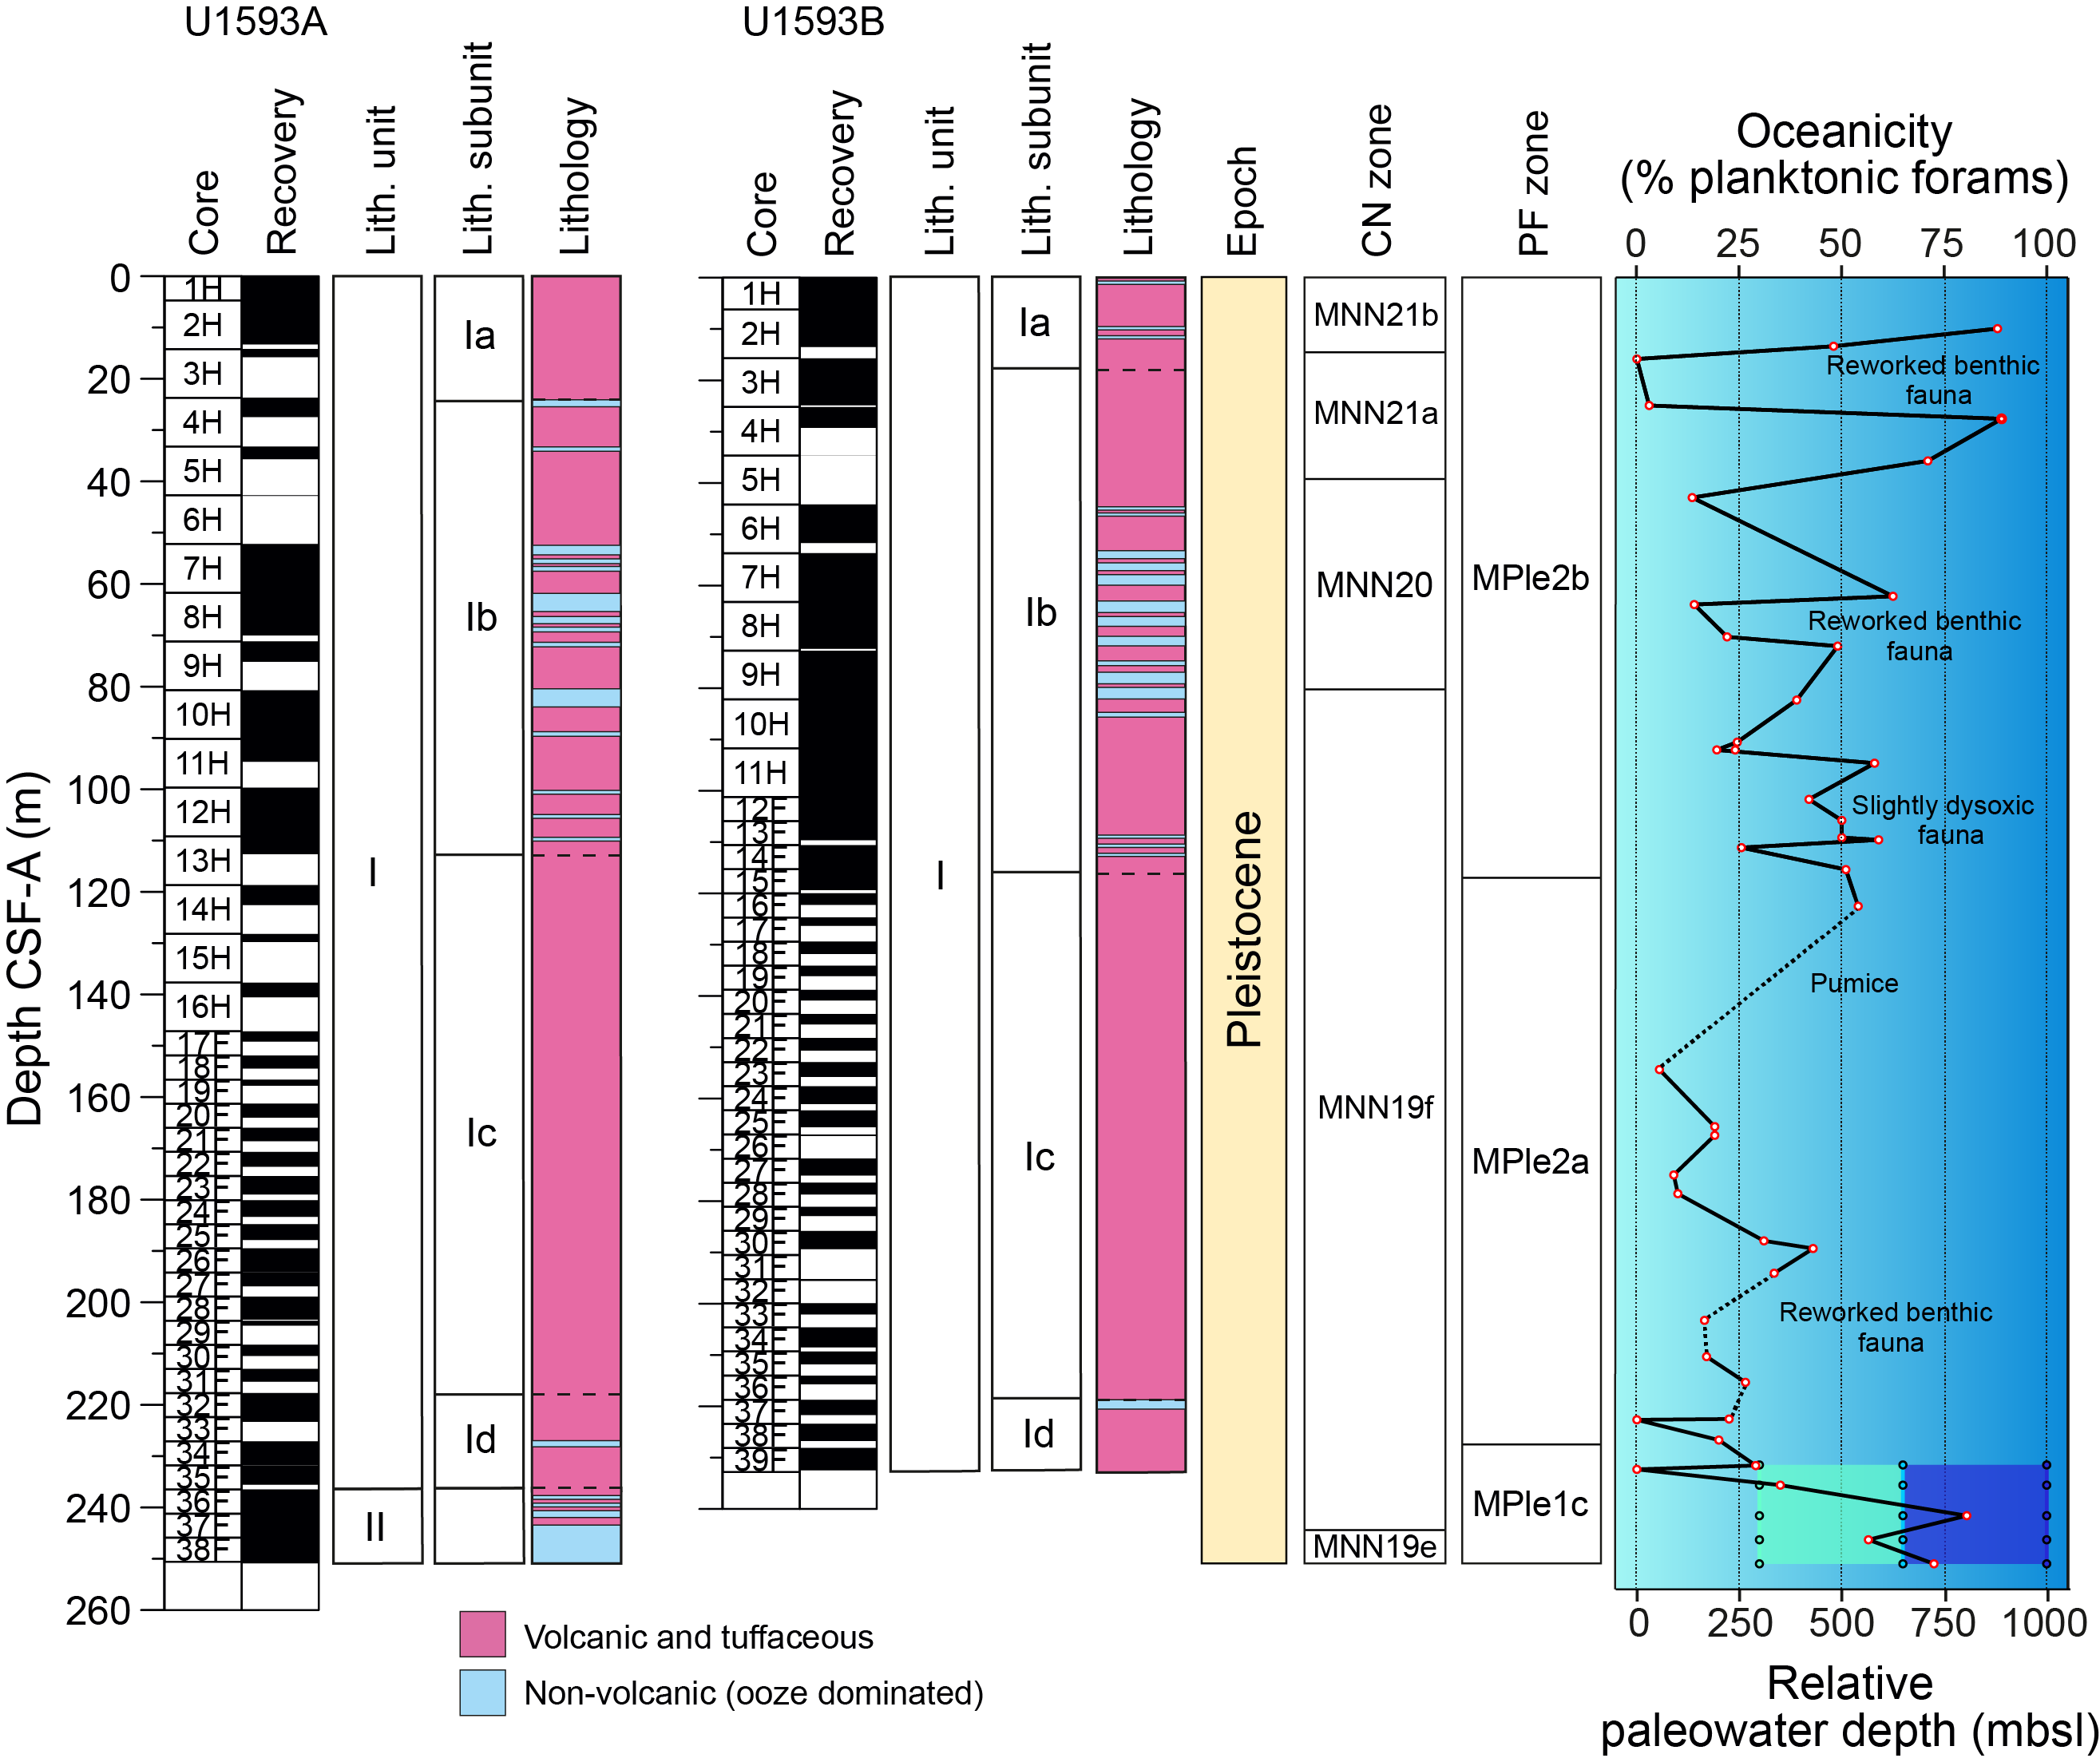
Figure F24. Biostratigraphic summary.
Because of the volcanogenic nature of the cored sedimentary sequence, residues (>125 µm) from washed samples were often significantly composed of volcaniclastic particles such as pumice, scoria, and ash that diluted the microfossil component. Foraminifera dominated the biogenic component of residues, however. Additionally, volcanic material, clastic grains, minor pyrite, carbonaceous plant-derived matter, and other fossil material including shells and fragments (Bivalvia and Gastropoda), Pteropoda, Scaphopoda, Bryozoa, Arthropoda (crab claws), echinoid spines and plate fragments, and radiolarians, as well as ostracods, were present in variable amounts in many samples.
In the Late to Early Pleistocene section, foraminifera with very good to poor preservation are present in siliciclastic and volcaniclastic sediments. Foraminifer abundances are also highly variable and are notably rare in tuffaceous oozes, likely due to sedimentary dilution, whereas coarser volcaniclastic intervals were sometimes barren.
6.2.1. Late to Early Pleistocene biostratigraphy
Because of explosive volcanic events and rapid deposition of the upper sedimentary section, the base of the Holocene is not possible to assign accurately. Planktonic foraminifer assemblages from the Late to Early Pleistocene section of Site U1593 are mostly well preserved where specimens are rarely broken or exhibiting partially dissolved shell walls.
Late to Early Pleistocene foraminifer faunas suggest large fluctuations in relative paleowater depth and oceanicity with highly variable planktonic abundances that range 0%–89% when foraminifera are present (Figures F23, F24). The faunas are typical of Pleistocene Mediterranean biostratigraphic zones, primarily composed of Neogloboquadrina incompta, Globigerina bulloides, Globigerina falconensis, Globigerina umbilicata, Globigerinella siphonifera, Globigerinita glutinata, Globigerinoides elongatus, Globigerinoides pyramidalis, Trilobatus trilobus group, Globigerinoides ruber var. white, G. ruber var. pink, Globoconella inflata, Hirsutella scitula, Truncorotalia truncatulinoides s.l., Neogloboquadrina pachyderma, Orbulina universa, Turborotalita quinqueloba, and Globigerinella calida (Figure F25). Rare reworked specimens of Globoturborotalita woodi are also often present.
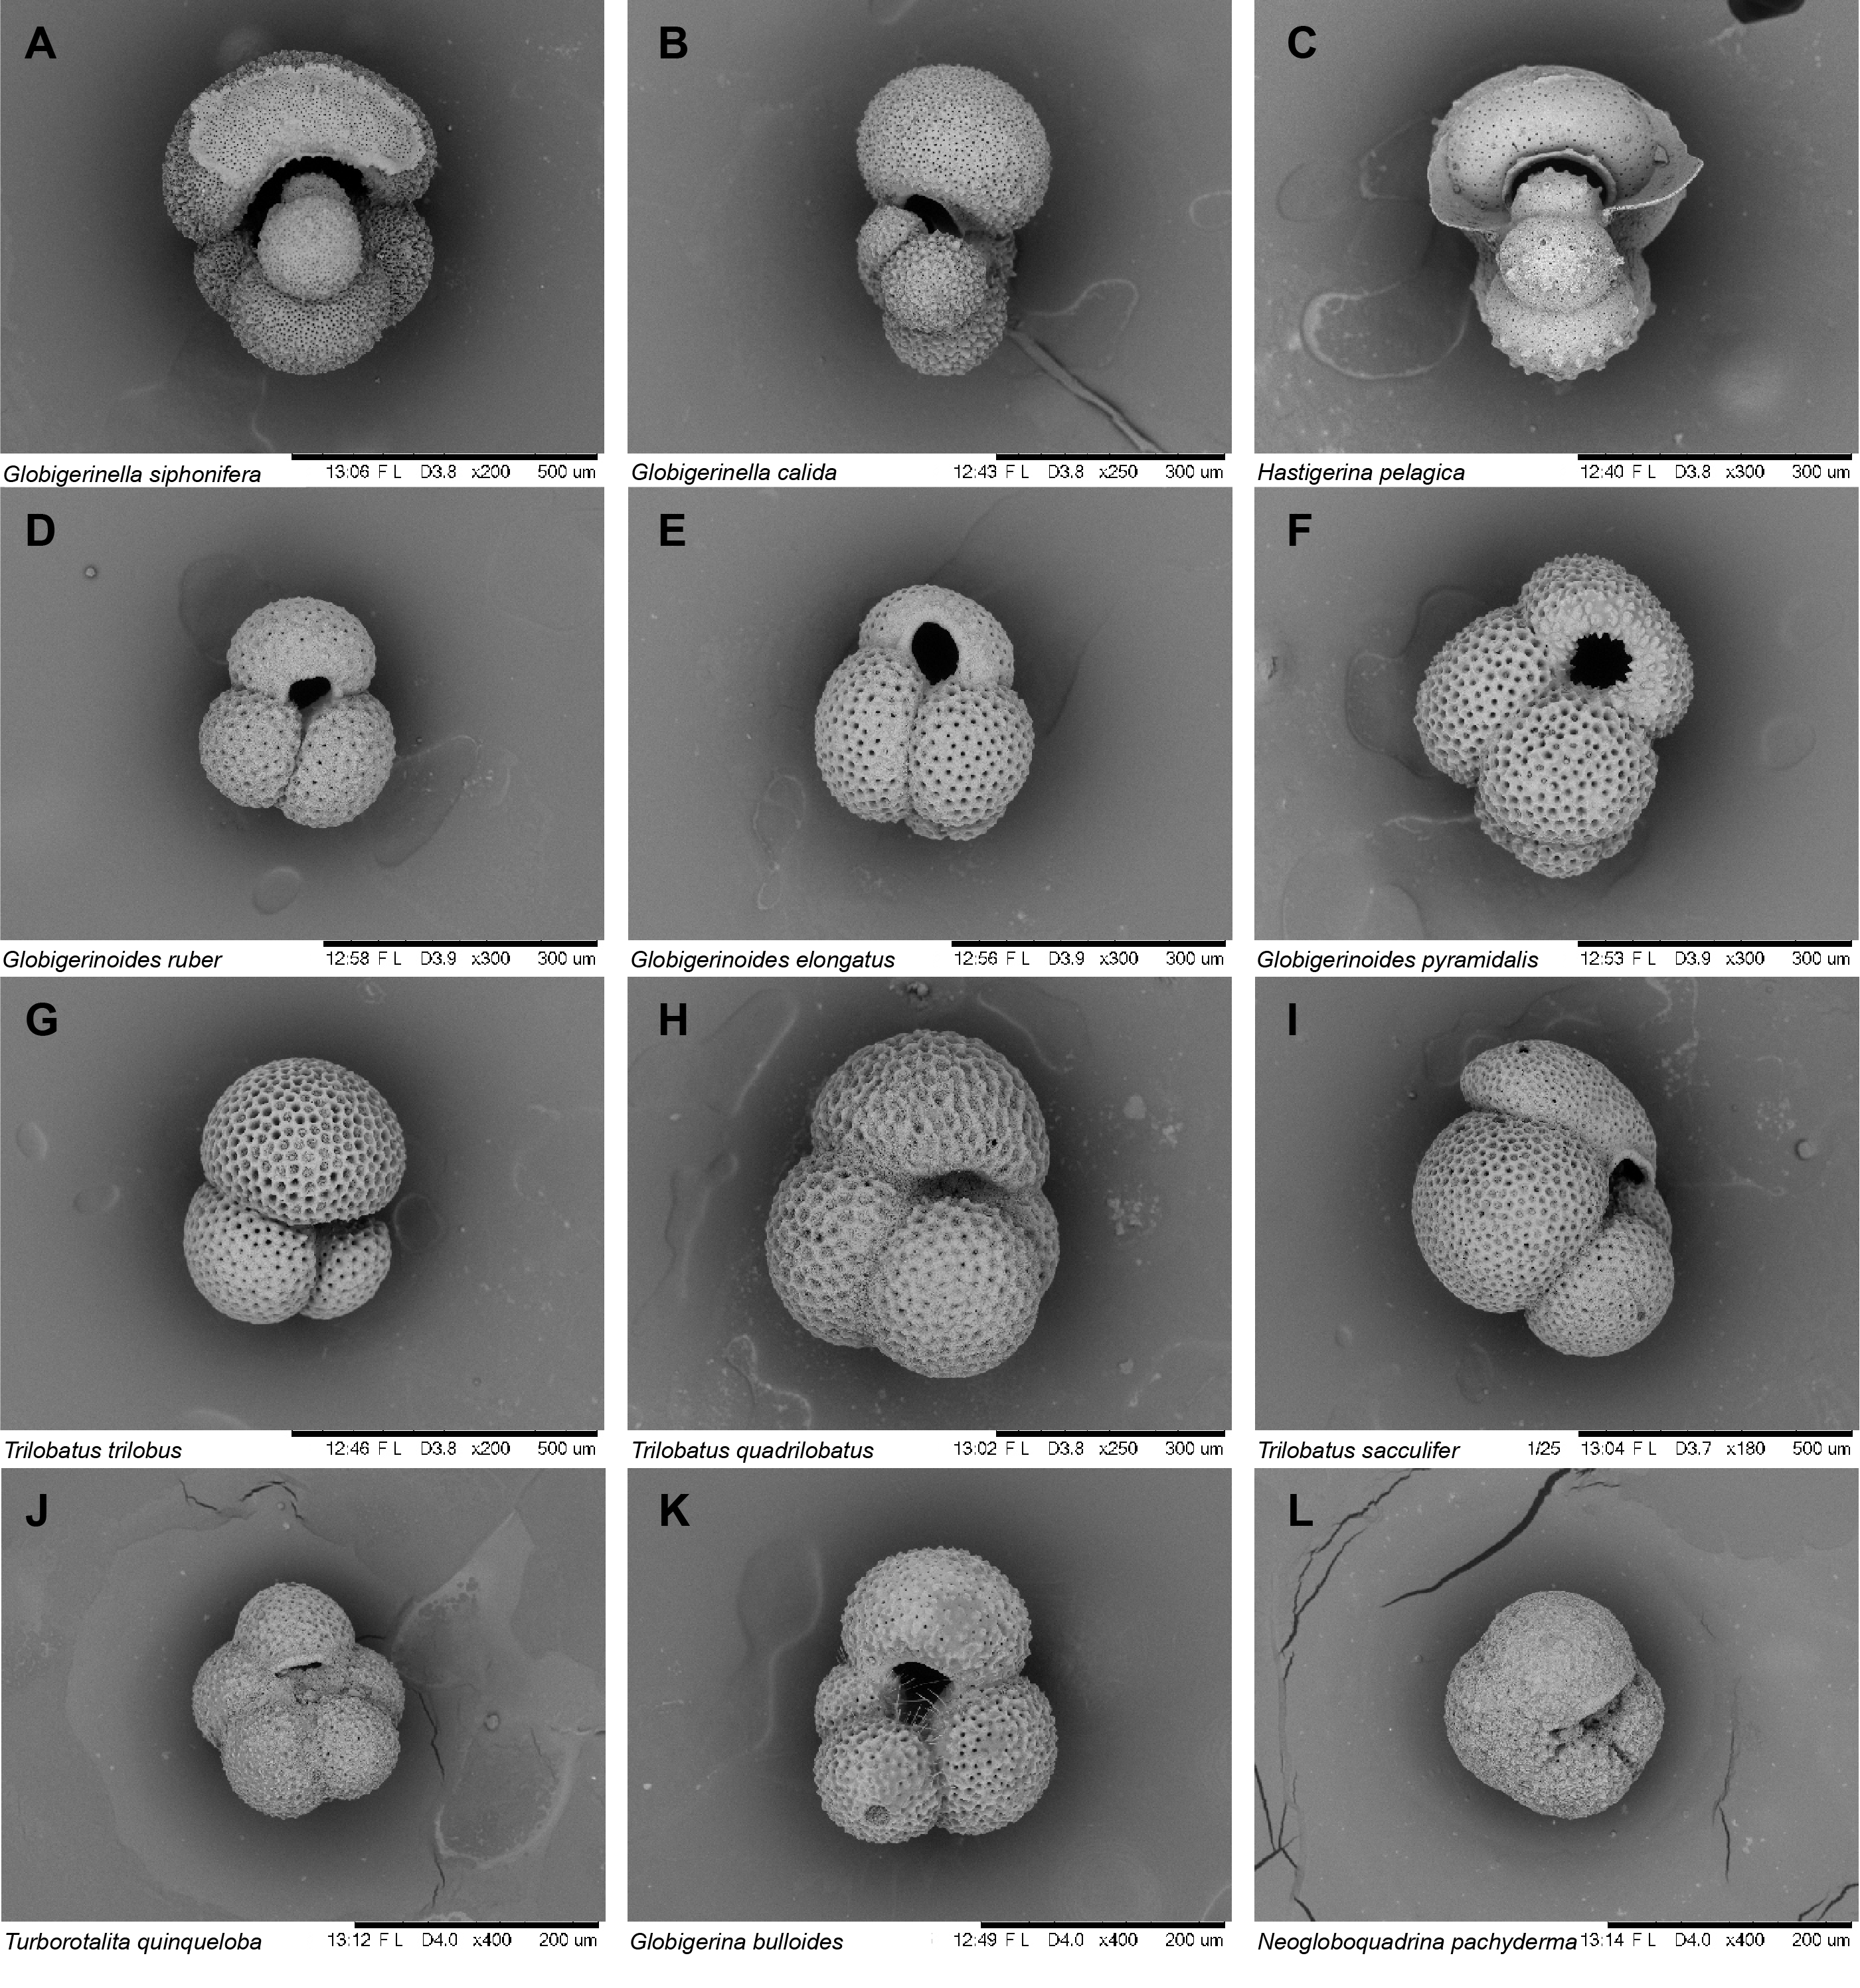
Figure F25. Planktonic foraminifera.
Foraminiferal faunas are sufficiently common to biostratigraphically divide the Pleistocene sediments into three Mediterranean planktonic foraminiferal biostratigraphic zones (Lirer et al., 2019):
- Zone MPle2b (0.00–0.53 Ma): 4.73–111.13 mbsf.
- Zone MPle2a (0.53–0.91 Ma): 122.57–222.63 mbsf.
- Zone MPle1c (0.91–1.21 Ma): 231.7–250.89 mbsf.
The faunal criteria on which these age assignments are based are given in the subsections below.
6.2.1.1. Zone MPle2b (0.00–0.53 Ma)
Samples 398-U1593A-1H-1, 10–12 cm, to 13H-2, 41–43 cm (4.73–111.13 mbsf), are assigned to Zone MPle2b based on the consistent occurrences of sinistrally coiled Neogloboquadrina spp. (<0.51 Ma) throughout the section. Additionally, there are variable occurrences of T. truncatulinoides (first common occurrence = 0.51 Ma) within this interval, and the first occurrence of G. ruber var. pink (<0.33 Ma) is found in Sample 5H-CC, 15–17 cm (35.67 mbsf).
6.2.1.2. Zone MPle2a (0.53–0.91 Ma)
Samples 398-U1593A-14H-CC, 0–5 cm, to 32F-CC, 17–19 cm (122.57–222.63 mbsf), are assigned to Zone MPle2a based on the rare appearances of sinistrally coiled Neogloboquadrina spp. (0.51–0.91 Ma) and the absence of T. truncatulinoides s.l. (0.53–0.934 Ma).
6.2.1.3. Zone MPle1c (0.91–1.21 Ma)
Samples 398-U1593A-34F-CC, 32–34 cm, to 38F-CC, 16–18 cm (231.7–250.89 mbsf), are assigned to Zone MPle1c based on the consistent common occurrences of sinistrally coiled Neogloboquadrina spp. (0.91–1.21 Ma).
6.2.2. Planktonic foraminiferal oceanicity
Planktonic foraminifer abundances are highly variable, ranging 0%–89% when foraminifera are present (Figures F23, F25). Because of the position of Site U1593 proximal to the Kolumbo submarine volcano, many of the low and highly fluctuating planktonic foraminifer abundances in the upper part of the sedimentary section (4.73–222.79 mbsf) are likely indicative of downslope reworking or environmental change and sediment dilution associated within the rapid onset episodes of explosive volcaniclastic sedimentation. Oceanicity values support benthic foraminiferal paleowater depth indicators in the deeper part of the section where paleowater depths are possible to interpret accurately (231.7–250.89 mbsf) (Figure F24), generally indicating suboceanic conditions (200–1000 mbsl).
6.2.3. Benthic foraminifera paleowater depths
Benthic foraminiferal assemblages are highly variable from abundant in situ faunas, abundant reworked/transported specimens, and totally barren samples. The low abundances or the complete absence of benthic foraminiferal faunas in most of the samples (e.g., 398-U1593A-1H-CC, 10–12 cm, to 6H-CC, 10–13 cm [4.73–42.83 mbsf]; 14H-CC, 0–5 cm, to 33H-CC, 0–4 cm [122.46–222.79 mbsf]; 398-U1593B-1H-CC, 7–9 cm, to 10H-CC, 7–12 cm [6.28–92.08 mbsf]; and 25F-CC, 17–19 cm, to 39F-CC, 9–11 cm [165.58–232.46 mbsf]) are possibly correlated with rapid emplacement of volcaniclastic sediments and/or inhospitable environmental conditions. Consequently, no paleowater depth estimates were possible for these intervals (Figure F24). The benthic foraminifer distributions indicate a gradual transition from upper to lower bathyal (300 to >1000 mbsl) paleowater depths (Figure F24) for Samples 398-U1593A-34F-CC, 32–34 cm, to 38F-CC, 16–18 cm (231.71–250.89 mbsf), with common and rare benthic foraminifera of the upper bathyal species Cassidulina spp., Globocassidulina subglobosa, Cibicidoides crebbsi, Amphicoryna scalaris, and Hyalinea balthica and lower bathyal markers including common and abundant Cibicidoides wuellerstorfi and Cibicidoides mundulus. For Samples 398-U1593B-11H-CC, 0–6 cm, to 14F-CC, 11–14 cm (101.72–115.42 mbsf), no paleowater depth estimation was possible due to the dominance of dysoxic-tolerant species such as Bolivina dilatata, Bolivina striatula, and Cassidulina carinata (e.g., Abu-Zied et al., 2008), most possibly representing intervals with high organic matter input and content (Figures F24, F26). Finally, samples in various intervals exhibit rare broken and mixed reworked foraminifer faunas, which in some cases are abundant, as in Samples 398-U1593A-7H-CC, 27–29 cm, to 11H-2, 35–37 cm (62.09–92.07 mbsf), which likely represent downslope reworking and sediment transportation (Figure F24).
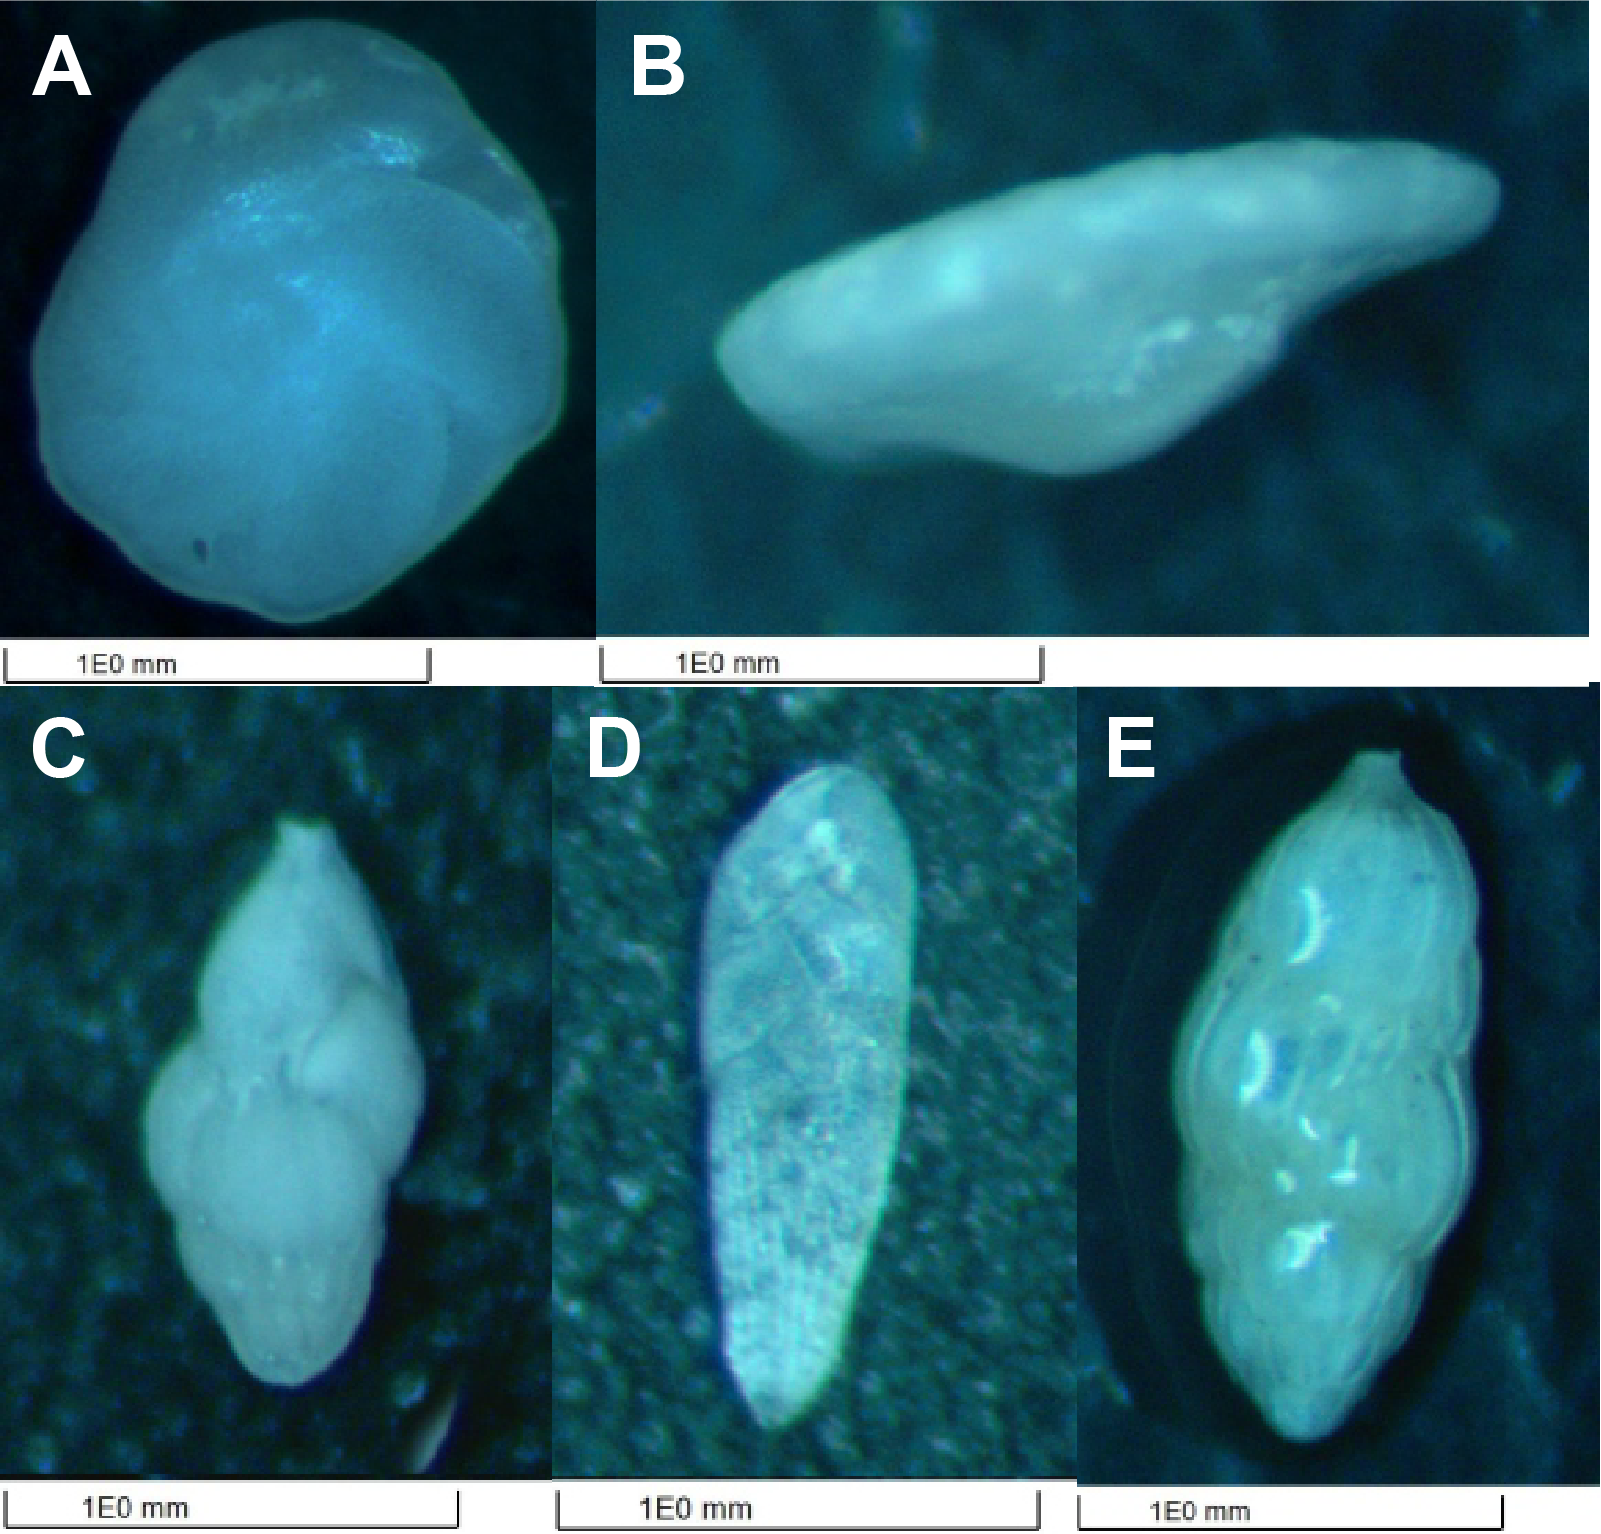
Figure F26. Benthic foraminifera.
7. Paleomagnetism
Paleomagnetic analysis at Site U1593 focused on measurement and demagnetization of archive-half sections to determine magnetostratigraphic age controls, together with demagnetization of 19 discrete samples.
The uppermost 117 m of the formation measured in Hole U1593A carries normal polarity remanences acquired during the Brunhes Chron (C1n) (Figure F27). No cores suitable for paleomagnetic analysis were recovered in the 88 m below this (117–205 mbsf), but a 2 m interval with normal polarity at ~206 mbsf is also assigned to the Brunhes Chron (Figure F27). The mean inclination of these intervals is 57.7° (k = 36.1; α95 = 1.3; n = 4170), in good agreement with the expected geocentric axial dipole inclination of 56° at this site.
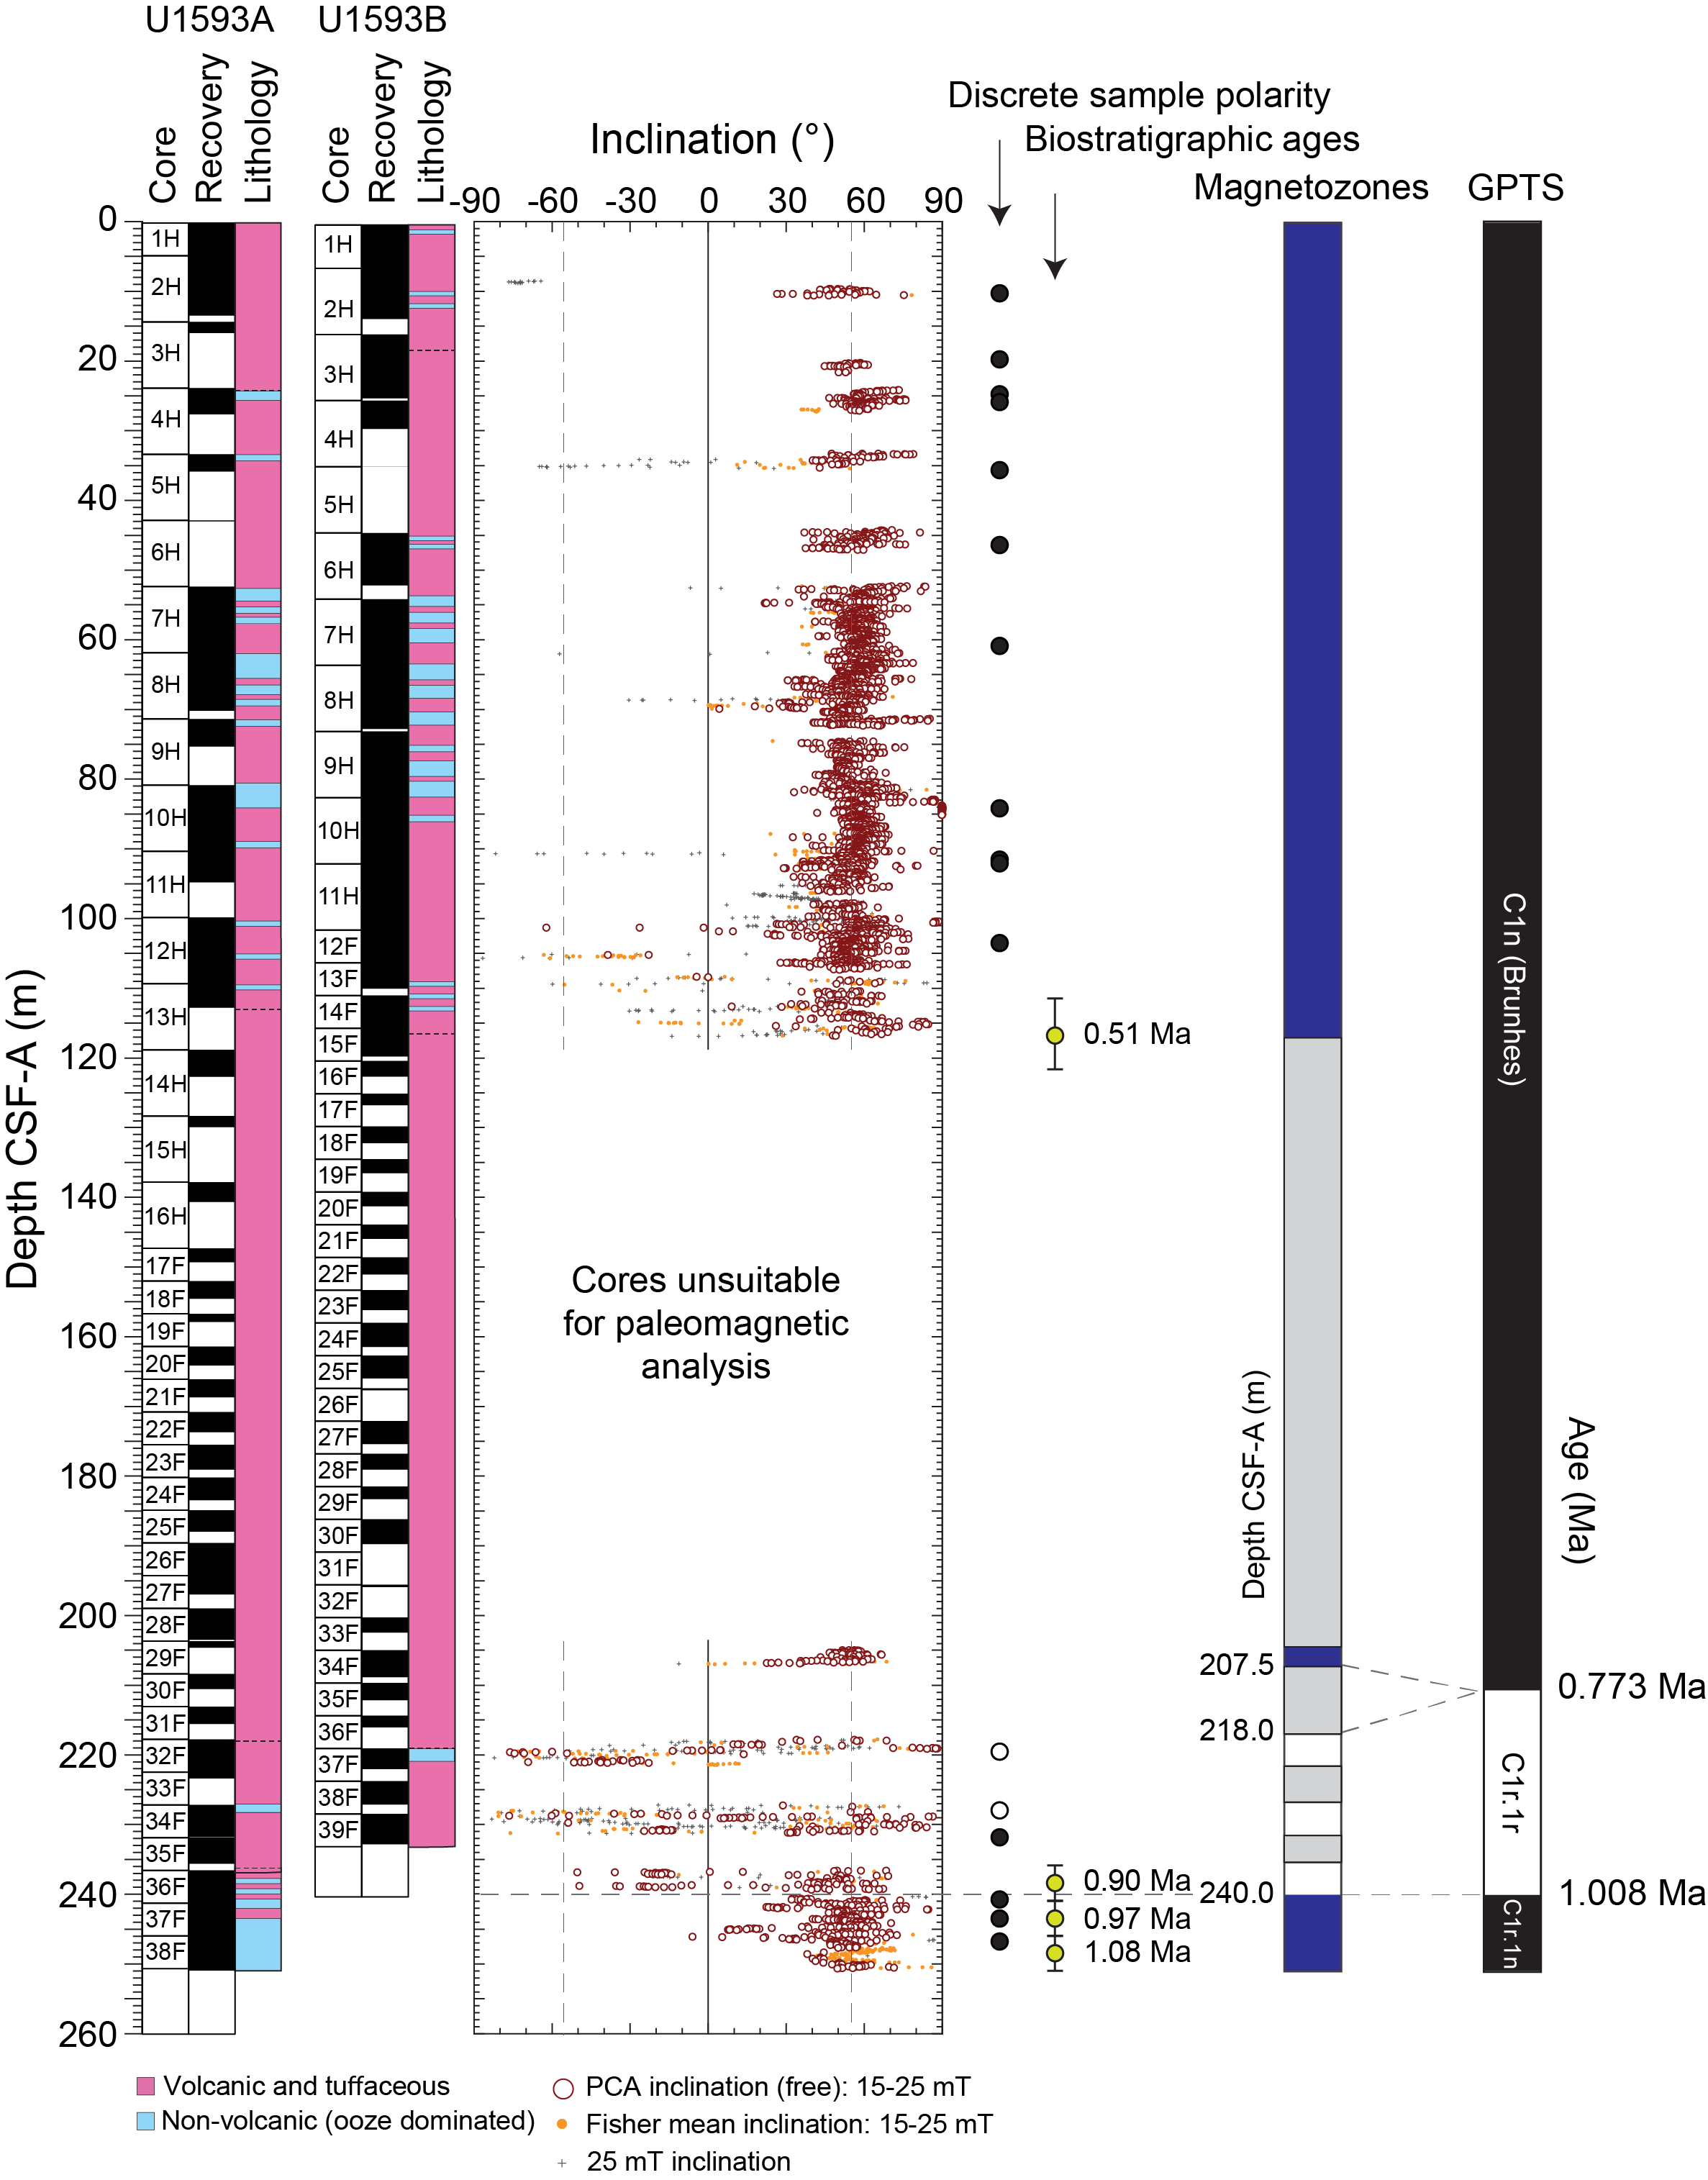
Figure F27. Magnetic inclinations.
The interval from 217 to 240 mbsf is marked by wide variations in inclinations, estimated by applying automated principal component analysis and calculation of Fisher mean directions of magnetization using the data from the 15, 20, and 25 mT demagnetization steps and inclinations of the 25 mT step (see Paleomagnetism in the Site U1591 chapter [Druitt et al., 2024b]). This can only be explained by variable partial to complete diagenetic overprinting of a reversed polarity depositional remanent magnetization acquired during the Matuyama Chron (Chron C1r.1r) by a chemical remanence acquired during the subsequent normal polarity Brunhes Chron (Chron C1n). On this basis, we assign the Brunhes/Matuyama boundary (0.773 Ma; Gradstein et al., 2020) to the interval 207.5–218.0 mbsf and the interval displaying variable inclinations to Chron C1r.1r (Figure F27). This is supported by reversed polarity magnetizations isolated by alternating field demagnetization of two archive-half sections (398-U1593A-32F-2 and 34F-1) and two discrete samples displaying clear reversed polarities in some intervals (Figure F28). We note that a discrete sample in Section 35F-1 displayed apparent normal polarity but appears to be affected by gyroremanent magnetization acquisition at higher demagnetizing fields (50 mT) and is considered unreliable.
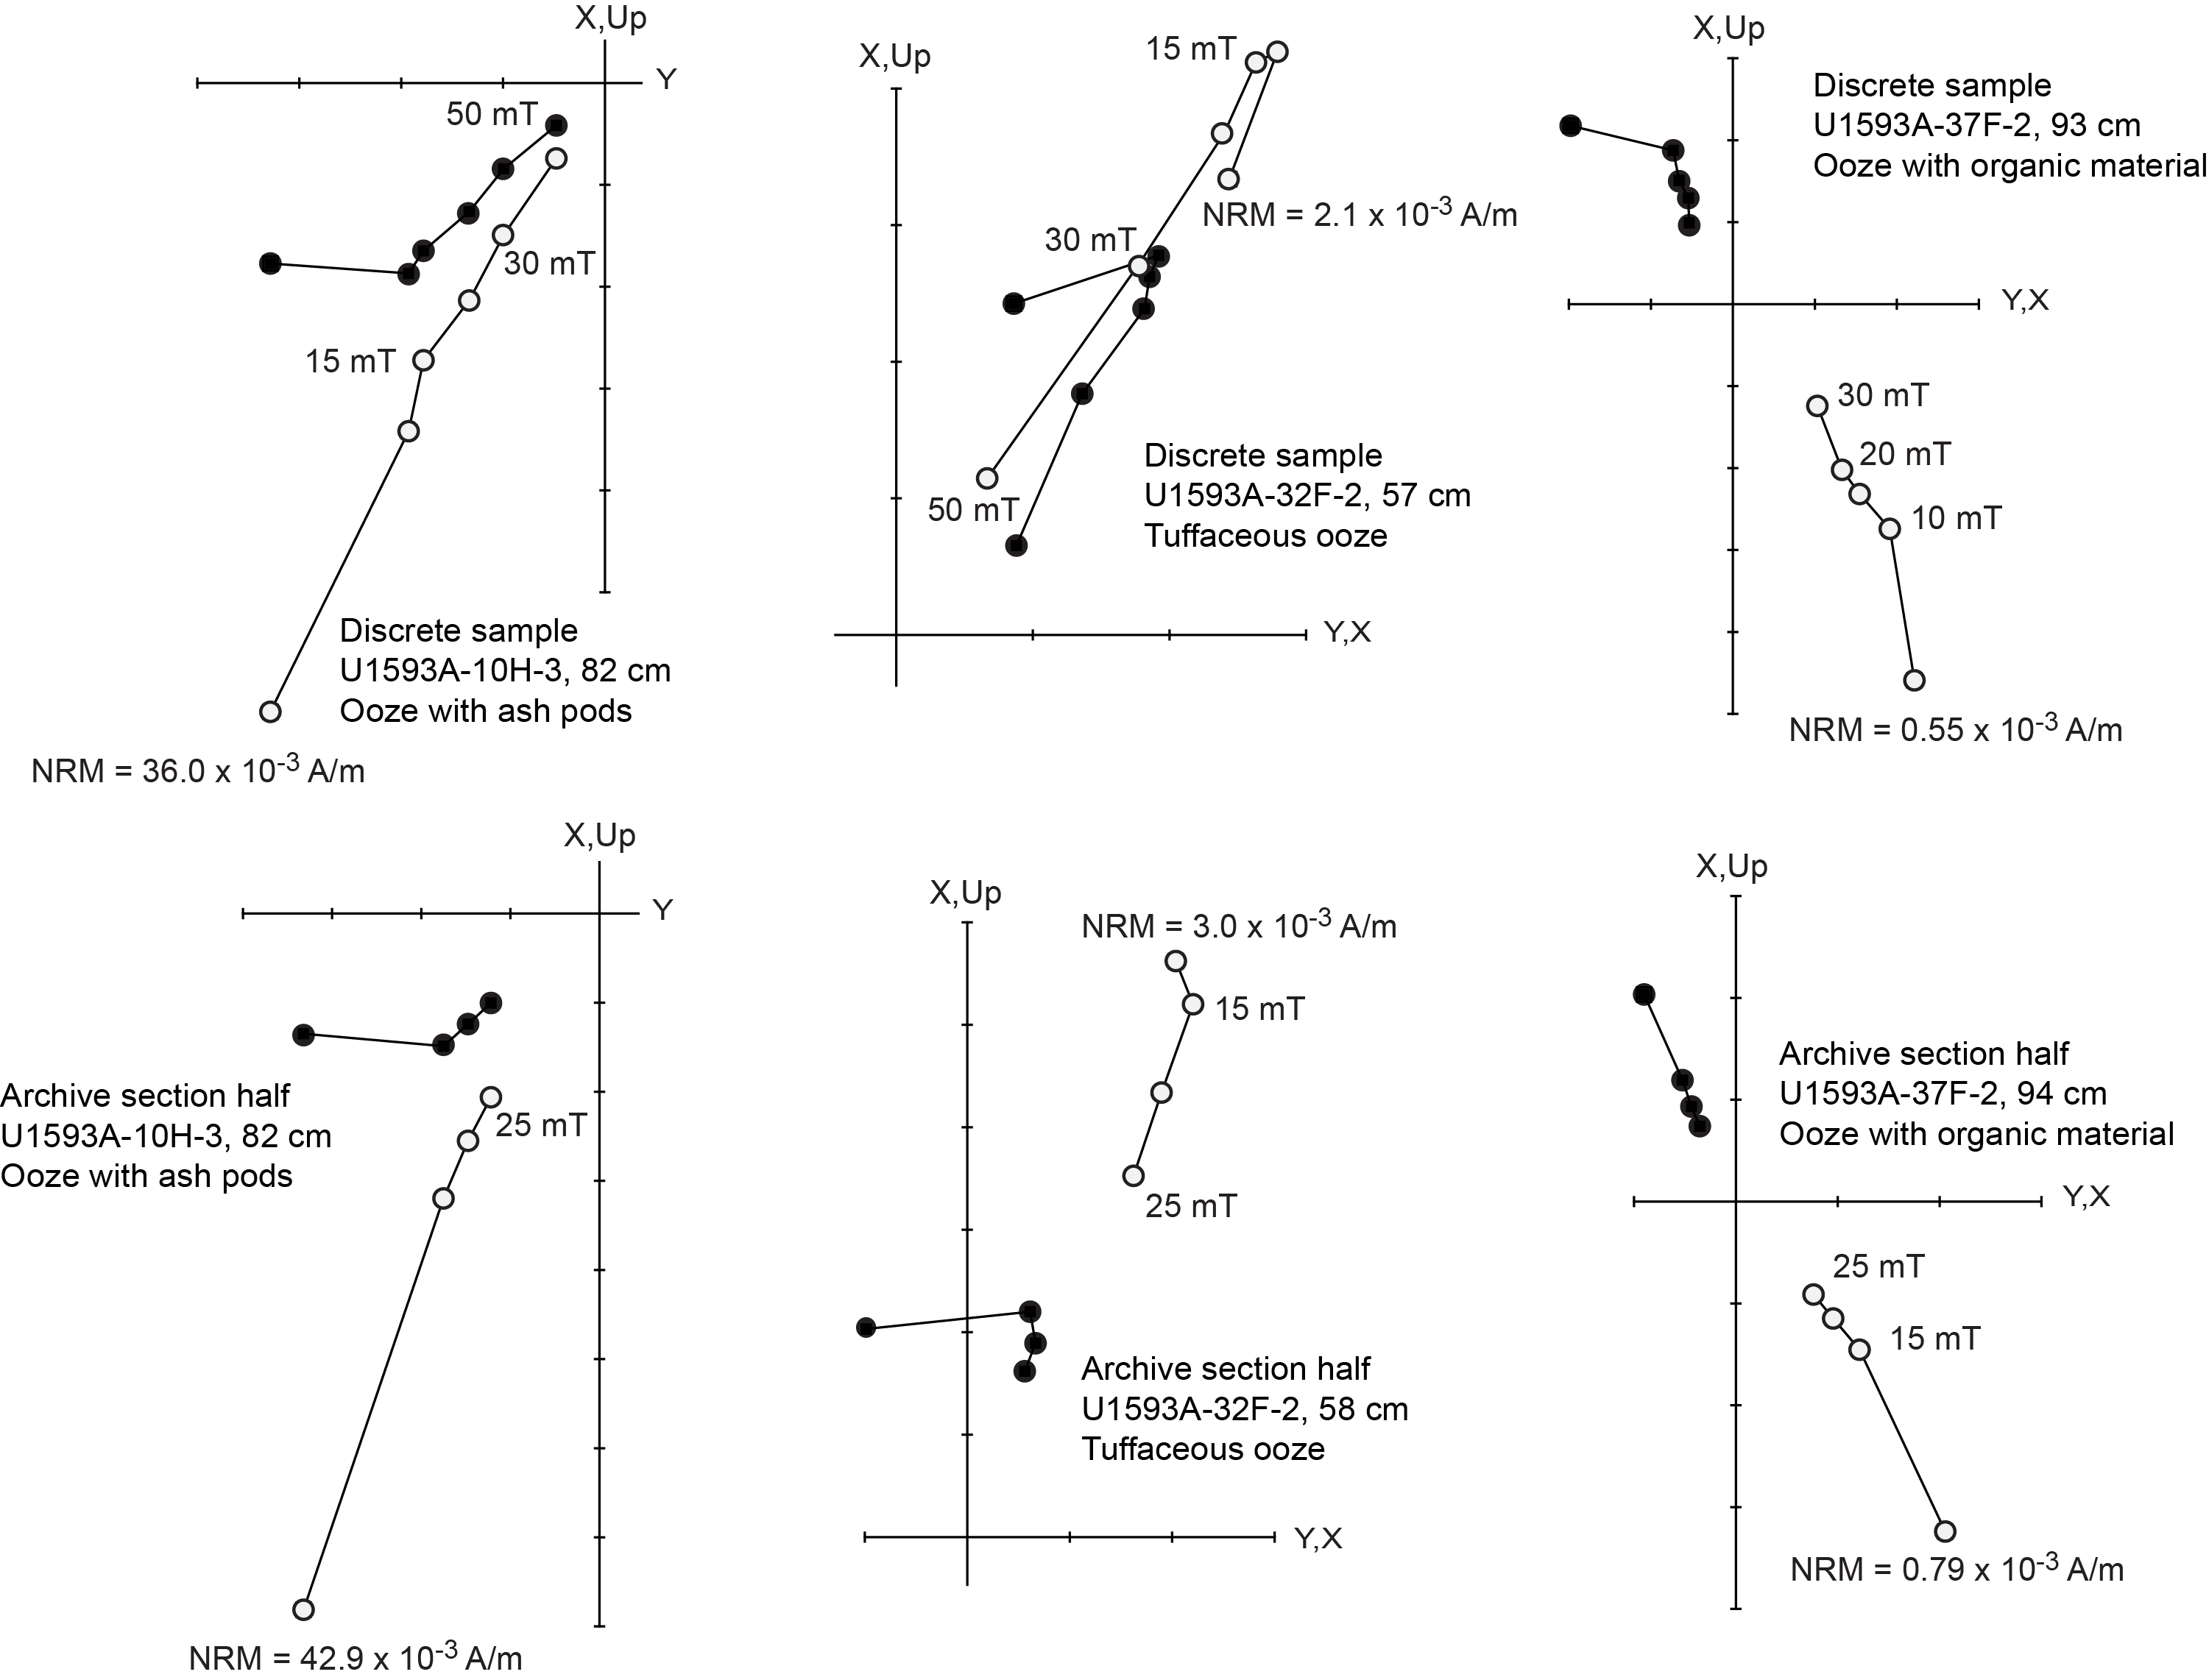
Figure F28. AF demagnetization.
Below 240 mbsf, inclinations return to consistent normal polarities clustered around the expected inclination (mean = 51.8°; k = 18.7; α95 = 2.4; n = 332). We therefore assign this interval to Chron C1r.1n (Jaramillo Chron) and place the top of this chron (1.008 Ma) at the change in character of the inclination signal at 240 mbsf.
8. Physical properties
Coarse volcaniclastic deposits at Site U1593 typically have low grain density and thermal conductivity compared to nonvolcanic sediments at this site. MS is highly variable in volcaniclastic layers and is sometimes very high. The typical increases in bulk density, P-wave velocity, and thermal conductivity with increasing depth are not clearly documented at this site.
8.1. Whole-round GRA density, MS, P-wave velocity, and NGR
Figure F29 summarizes data collected on whole-round cores using the GRA densitometer, MS loop, and P-wave logger on the WRMSL as well as NGR. All cited depths are on the CSF-A scale. There are a few possible systematic sources of error in these data that should be considered when interpreting absolute values and trends.
- Redistribution of unconsolidated volcaniclastic materials in core liners during coring and on the core retrieving platform can lead to sorting by particle size and density and hence changes in physical properties.
- Core liners often contained large amounts of water. Thus, whole-round measurements in sections that match discrete measured values on split cores are most reliable.
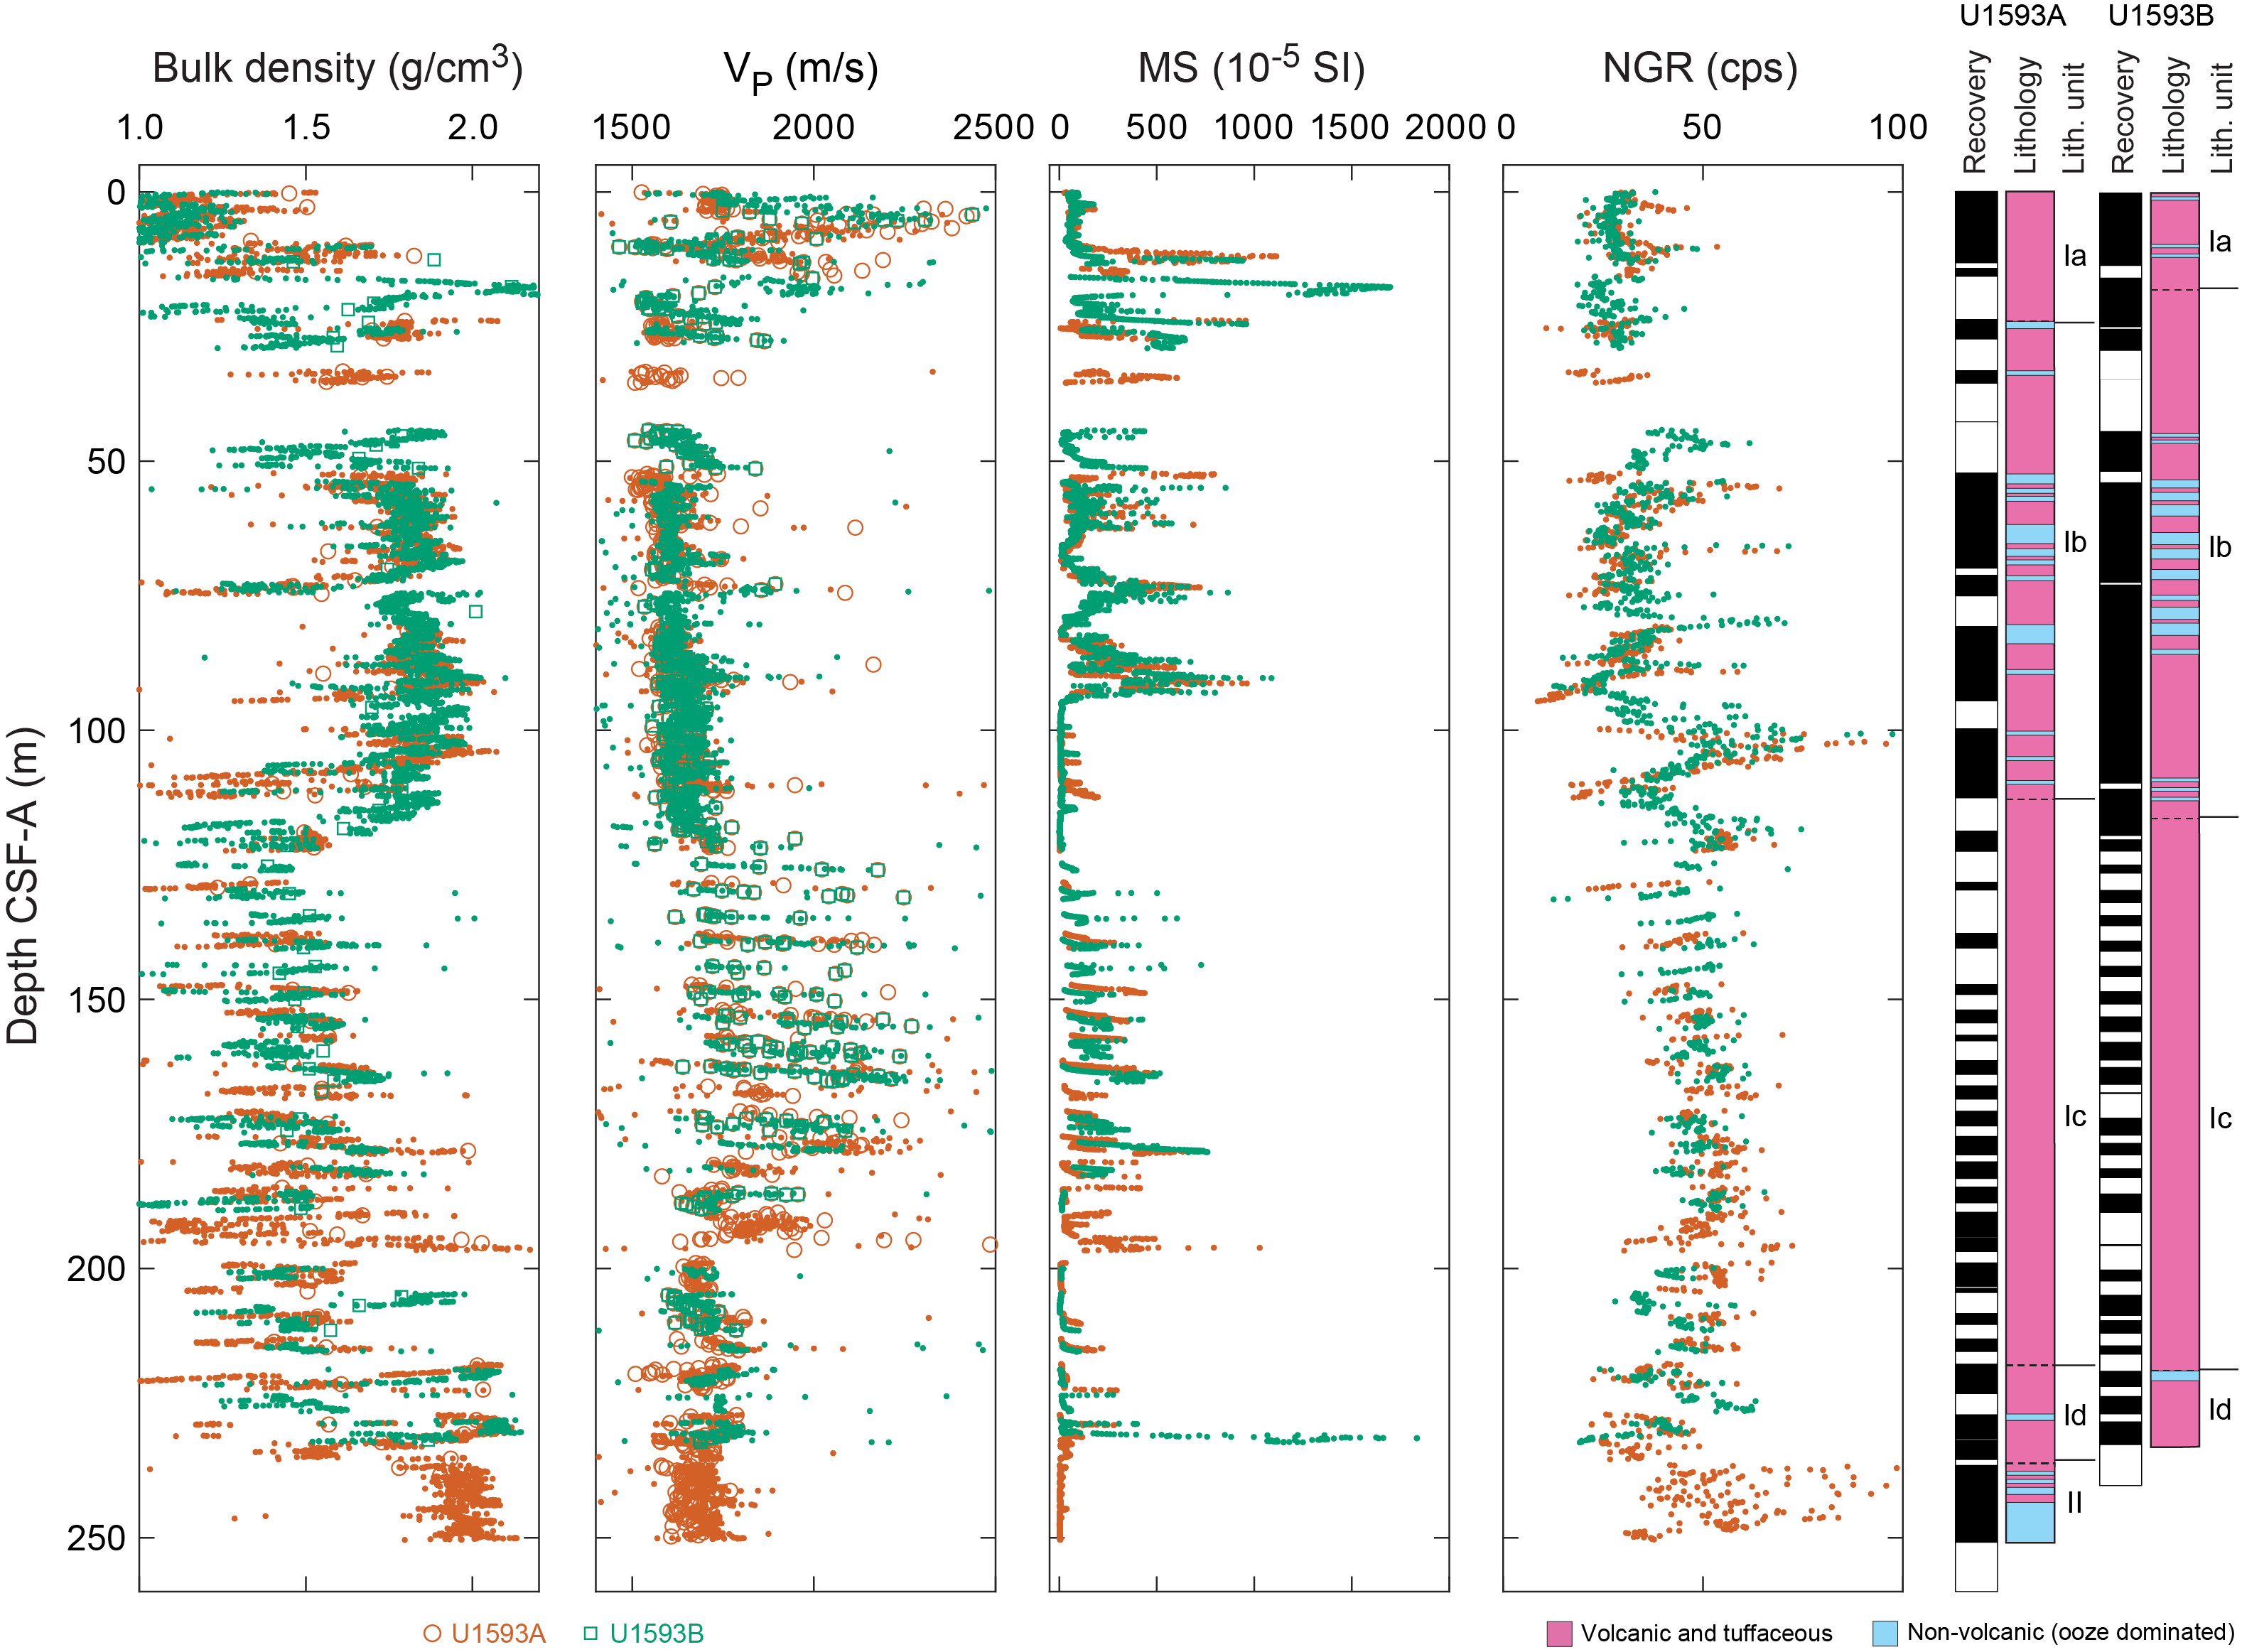
Figure F29. Physical properties.
MS is highly variable in the volcaniclastic deposits at this site. A lithic ash layer in Section 398-U1593A-39H-6 and an ash layer in Section 398-U1593B-39F-1 have the largest MS values (>1500 × 10−5 SI).
Overall, there is no clear systematic increase in bulk density and P-wave velocity with increasing depth. Whether the lack of signature of compaction is real, a consequence of the limited depth of the holes, or an artifact of drilling and recovery disturbances cannot be readily determined.
8.2. Discrete measurements
8.2.1. Material strength
Sediment strength was measured with a pocket penetrometer (PP) on the catwalk immediately after section splitting. Automated vane shear (AVS) strength measurements were made on working-half sections. A total of 56 AVS measurements were made on working-half sections from 13 to 162 mbsf in Hole U1593A (Figure F30; Table T10). A total of 27 PP measurements were made (Table T10) on fine-grained materials that remained intact in core liners upon recovery on the catwalk. The uppermost 110 m shows a general trend of increasing shear strength with increasing depth, and AVS measurements are similar to those of the PP. At greater depths, shear strength decreases; whether this is representative of in situ conditions or the measurements are dominated by disturbance during coring and recovery cannot be determined.
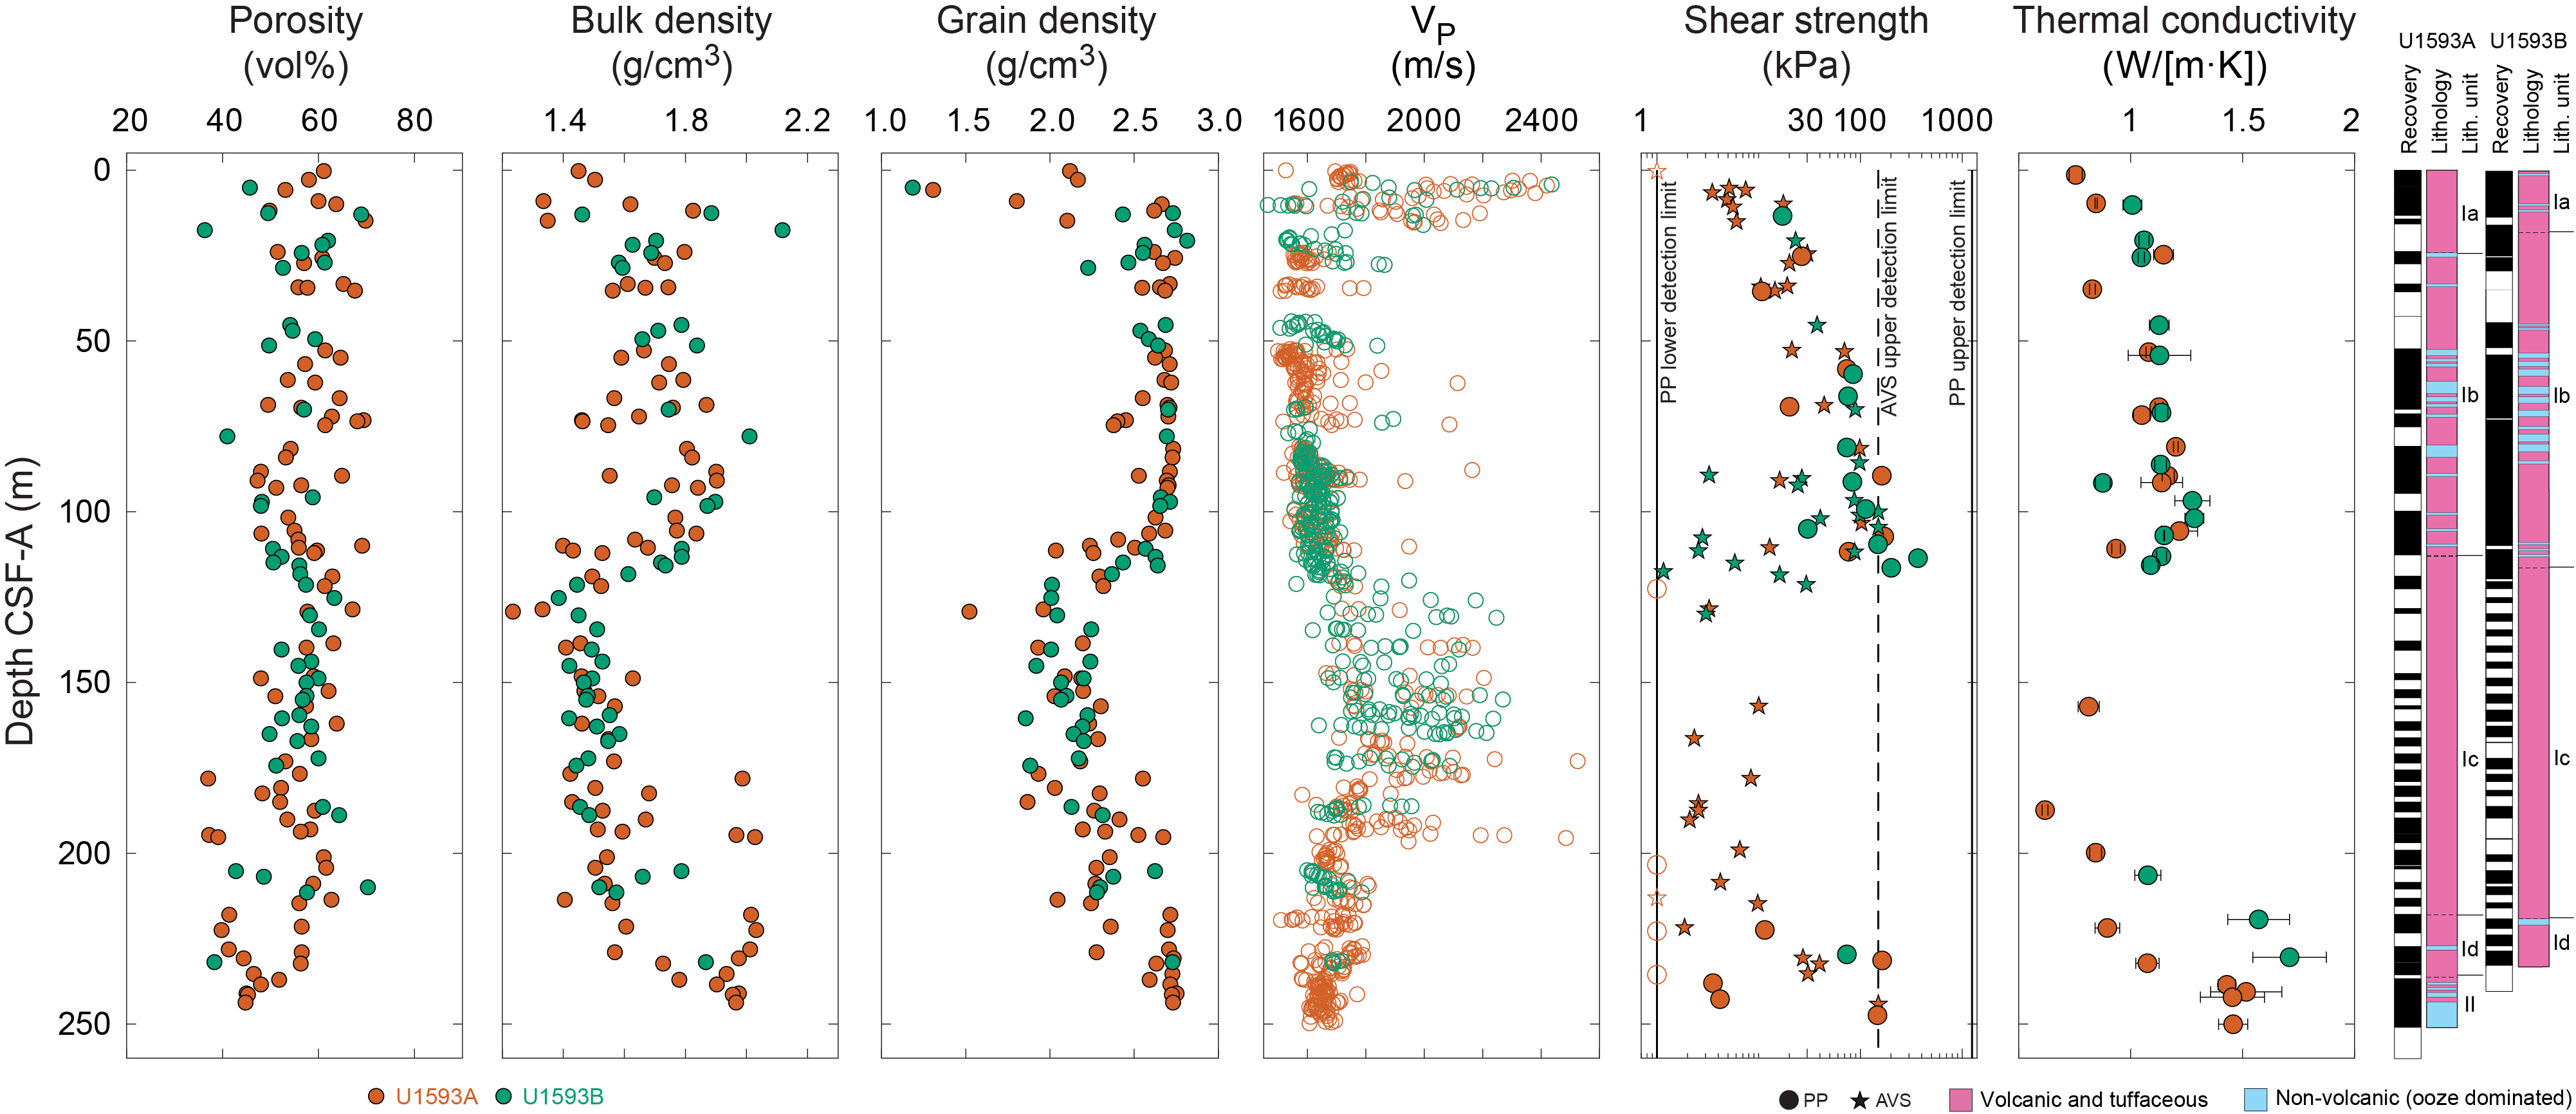
Figure F30. Discrete measurements.
8.2.2. P-wave velocity
Totals of 962 and 385 discrete P-wave velocity measurements were conducted on Hole U1593A and U1593B working-half sections, respectively (Figure F30; Table T11). Discrete measurements of P-wave velocity on working-half core sections are similar to those measured using the WRMSL on whole-round cores (Figure F29). There are no clear trends with increasing depth.
Discrete measurements were sometimes challenging to make in coarse, pumice-rich deposits because signals obtained were especially noisy, making it difficult for us to pick a clear first arrival of P-wave. Furthermore, the particle size was a substantial fraction of the distance between the two calipers used to make the measurements; hence, the measurements may not be representative of true bulk properties (i.e., sample size is not much larger than a representative elementary volume).
8.2.3. Moisture and density
Totals of 87 and 48 discrete samples from Holes U1593A and U1593B, respectively, were collected for moisture and density measurements (Figure F30; Table T12). Bulk density derived by moisture and density measurements on discrete samples should be more reliable than GRA density data from WRMSL measurements on whole-round cores, although in both cases coring and recovery disturbances may have impacted measured values.
Porosity ranges 36–70 vol% (mean = 55 vol%; standard deviation = 7 vol%). Bulk density ranges 1.1–2.1 g/cm3 (mean = 1.65 g/cm3) and is lower in volcaniclastic materials than ooze-dominated sediment. Bulk density does not obviously increase with depth.
Grain density ranges 1.1–2.8 g/cm3 (mean = 2.4 g/cm3; median = 2.5 g/cm3). The lowest values are in volcaniclastic subunits.
8.2.4. Thermal conductivity
A total of 37 thermal conductivity measurements were made on selected working-half sections (Table T13). Measurements could not be made on coarse, volcaniclastic materials; hence, the values we report are not representative of the full range of recovered lithologies. There is no apparent increase in thermal conductivity with increasing depth (Figure F30). Compared to typical sediments, in which thermal conductivity is >1 W/(m·K) deeper than 100 mbsf, thermal conductivity is low in volcaniclastic sediments at Site U1593.
9. Geochemistry
9.1. Volcaniclastic bulk geochemistry
To determine the geochemistry of the volcanic and tuffaceous materials, 13 tephra and ash samples were handpicked from various layers in Hole U1593A. Following cleaning, grinding, fusion, and dissolution, the materials were analyzed shipboard for major (Si, Al, Fe, Mg, and Ca), minor (Ti, Mn, Na, K, and P), and trace (Sc, V, Cr, Co, Ni, Cu, Zn, Rb, Sr, Y, Zr, Nb, Ba, Ce, and Nd) elements using inductively coupled plasma–atomic emission spectroscopy (ICP-AES) (see Geochemistry in the Expedition 398 methods chapter [Kutterolf et al., 2024] for analytical technique). Several unknown samples were run multiple times to determine analytical reproducibility.
9.1.1. ICP-AES: major, minor, and trace elements
Of the volcaniclastic units sampled, one was classified as a basalt, one as a basaltic andesite, three as andesites or trachyandesites, seven as dacites or trachydacites, and one as a rhyolite (Table T14; Figure F31). Bulk chemistry values are less evolved than glass chemistry reported in Kutterolf et al. (2021), as expected, due to bulk analyses including both minerals and glass.
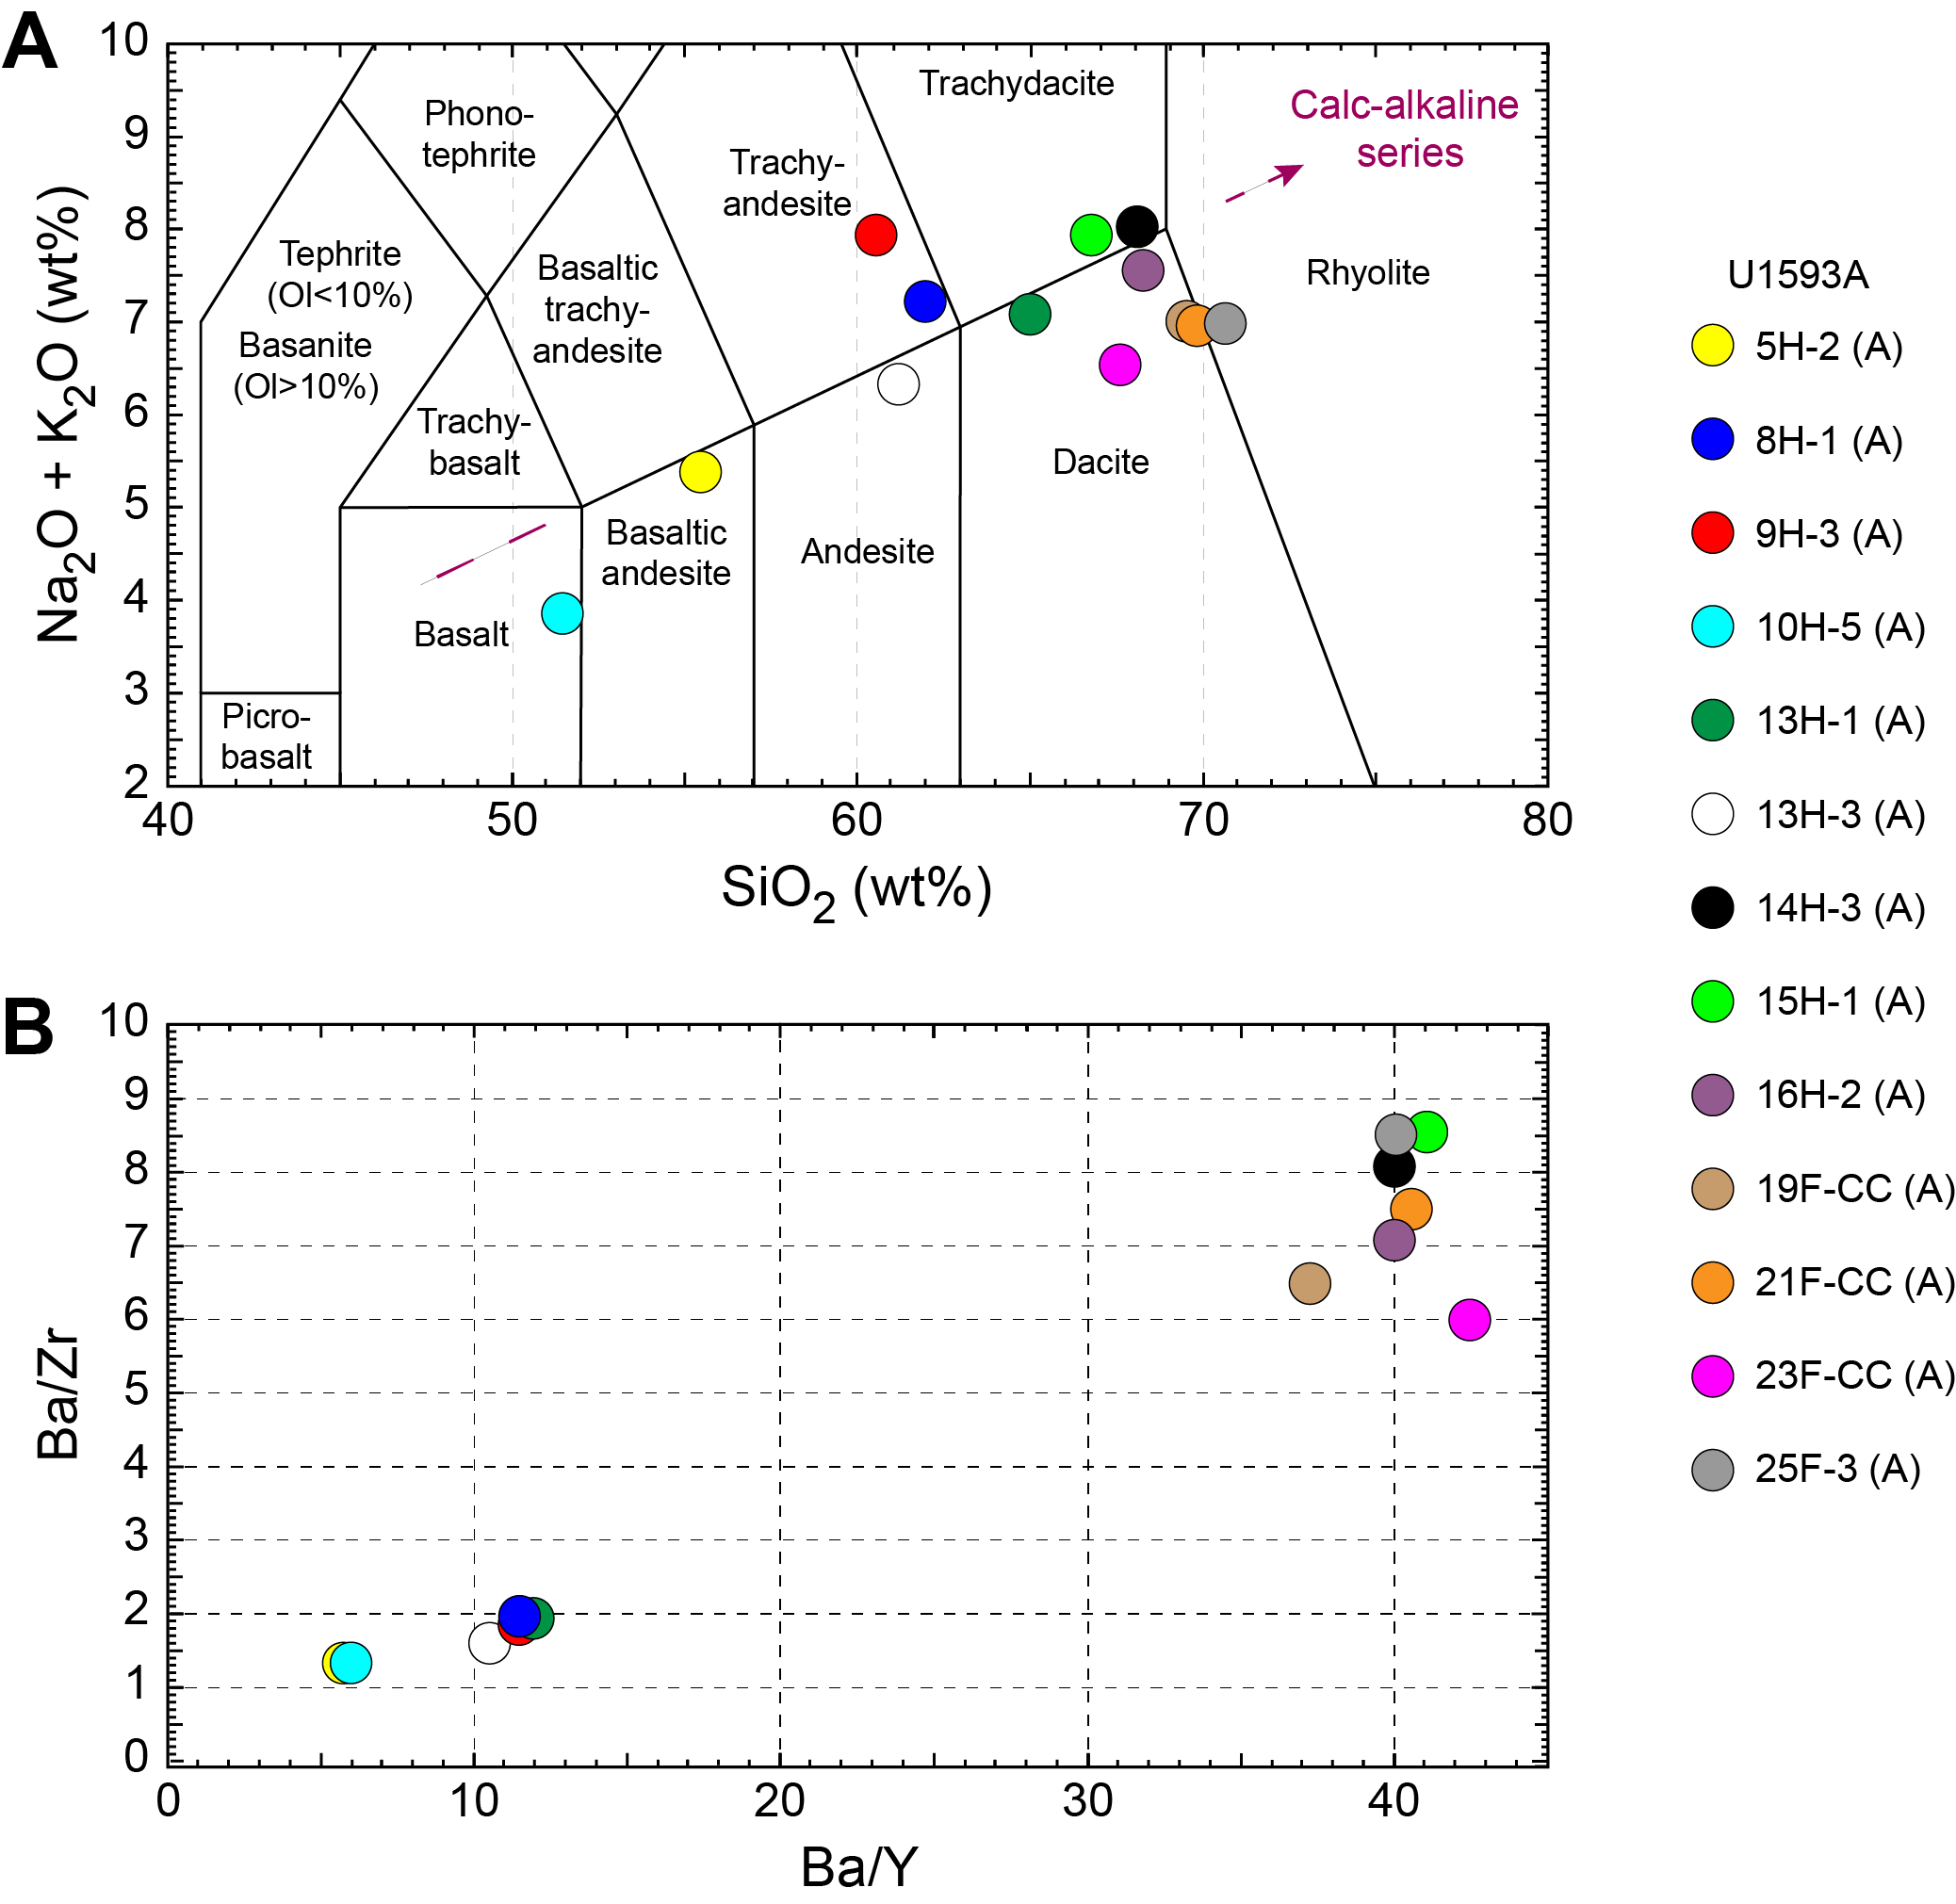
Figure F31. ICP-AES analyses.
Concentrations are reported for all analyzed trace elements, but Ce, Cr, Cu, Nb, Ni, P, Rb, S, and V were below detection limits in the majority of samples and are not shown for respective samples in Table T14; volcaniclastic analytical errors are ±1% for major elements and ±5%–10% for trace elements (see Geochemistry in the Expedition 398 methods chapter [Kutterolf et al., 2024]). Trace element ratios were used to broadly discriminate between the volcanic centers of Kolumbo, Santorini, and Christiana.
9.2. Interstitial water geochemistry
To determine the inorganic constituents of IW, a total of 17 water samples were taken from the mudline and whole-round squeezing of sediment intervals in Holes U1593A (11 samples) and U1593B (6 samples). No IW samples were collected between 108 and 202 mbsf. Aliquots of IW were used for shipboard analyses, and the remaining water was retained for shore-based analysis, following protocols specified by individual scientists. The retrieved pore waters were analyzed shipboard for salinity, alkalinity, pH, major anions (Cl−, SO42−, and Br−), major cations (Ca2+, Na+, Mg2+, and K+), and major (S, Ca, Mg, K, and Na) and minor (B, Ba, Fe, Li, Mn, P, Si, and Sr) elements using the methods described in Geochemistry in the Expedition 398 methods chapter (Kutterolf et al., 2024).
9.2.1. Salinity, alkalinity, and pH
Salinity ranges 40–73, with most values falling between 60 and 70 (Table T15; Figure F32). The highest salinity value of 73 was recorded at 202 mbsf (Section 398-U1593A-28F-2).
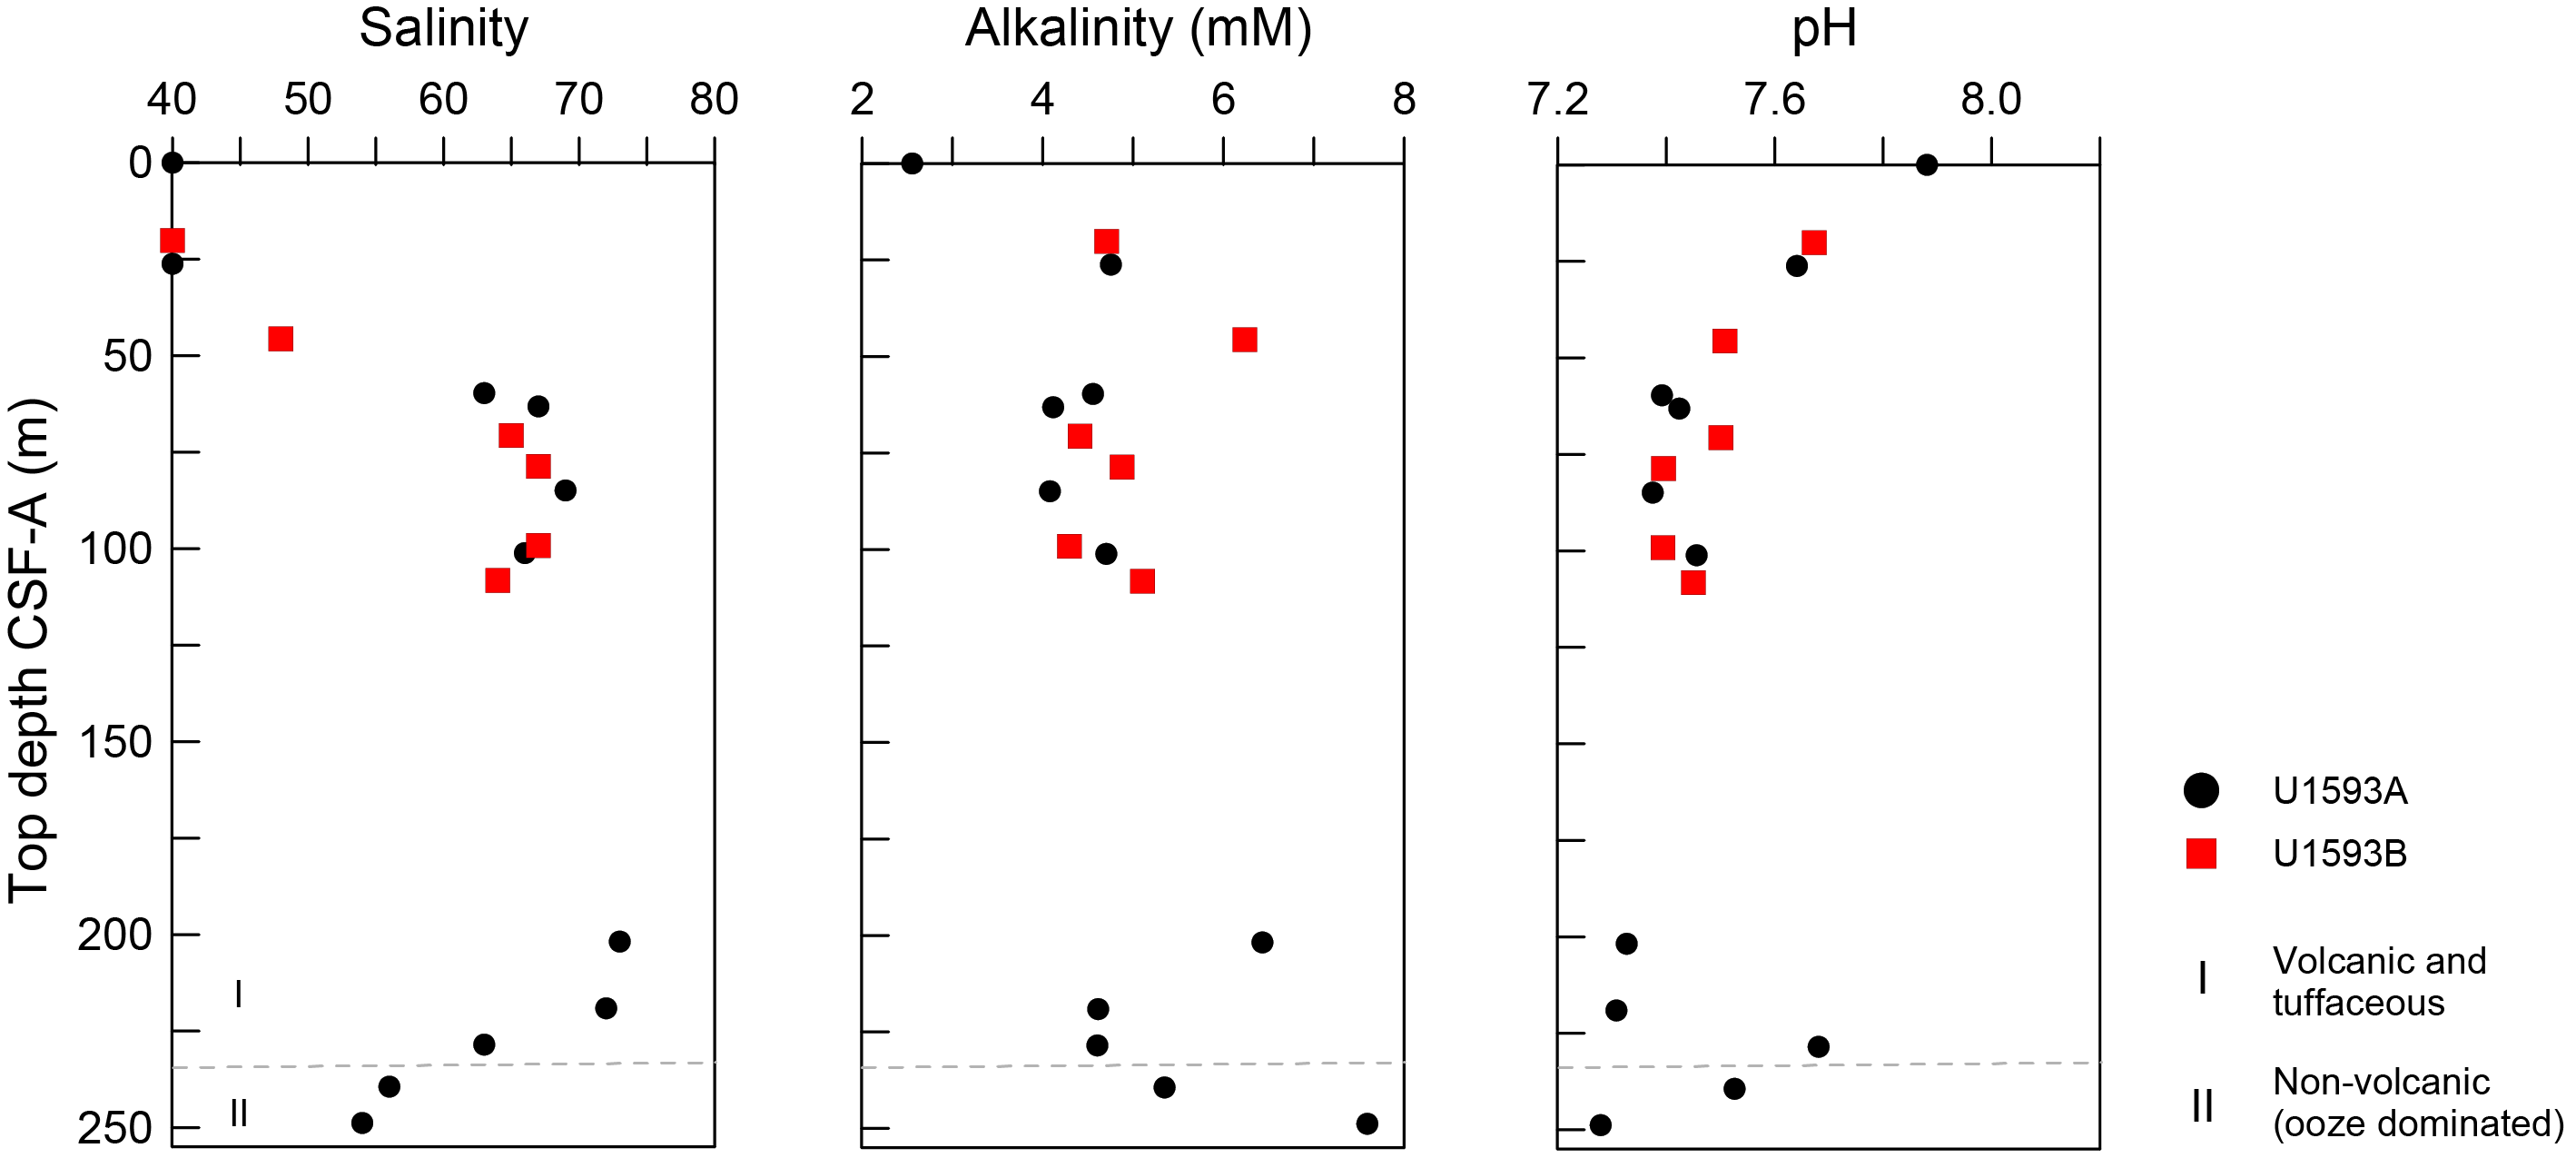
Figure F32. IW salinity, alkalinity, and pH.
Alkalinity ranges from 2.55 mM at the mudline to 7.6 mM at 249 mbsf at the base of Hole U1593A (Table T15; Figure F32). Most values for IW alkalinity are 4–5.5 mM, except for three samples with values of 6.2, 6.4, and 7.6 mM at 46, 202, and 249 mbsf, respectively.
Values for pH generally decrease within the sampled depths, ranging from 7.9 at the mudline to 7.3 at 249 mbsf, except for two elevated values of 7.7 and 7.5 at 229 and 239 mbsf, respectively (Table T15; Figure F32).
9.2.2. Bromide, chloride, boron, sodium, potassium, magnesium, calcium, and sulfate
Bromide, Cl−, B, Na+, K+, Mg2+, Ca2+, and SO42− all follow trends similar to salinity, although Ca2+ has a less rounded curve between 50 and 108 mbsf (Table T16; Figure F33). Values are fairly constant in the uppermost 25 m and increase through 63–101 mbsf before slightly decreasing to 108 mbsf. IW concentrations are elevated at 202–220 mbsf in all but K+, and values decrease to the bottom of Hole U1593A at 249 mbsf.
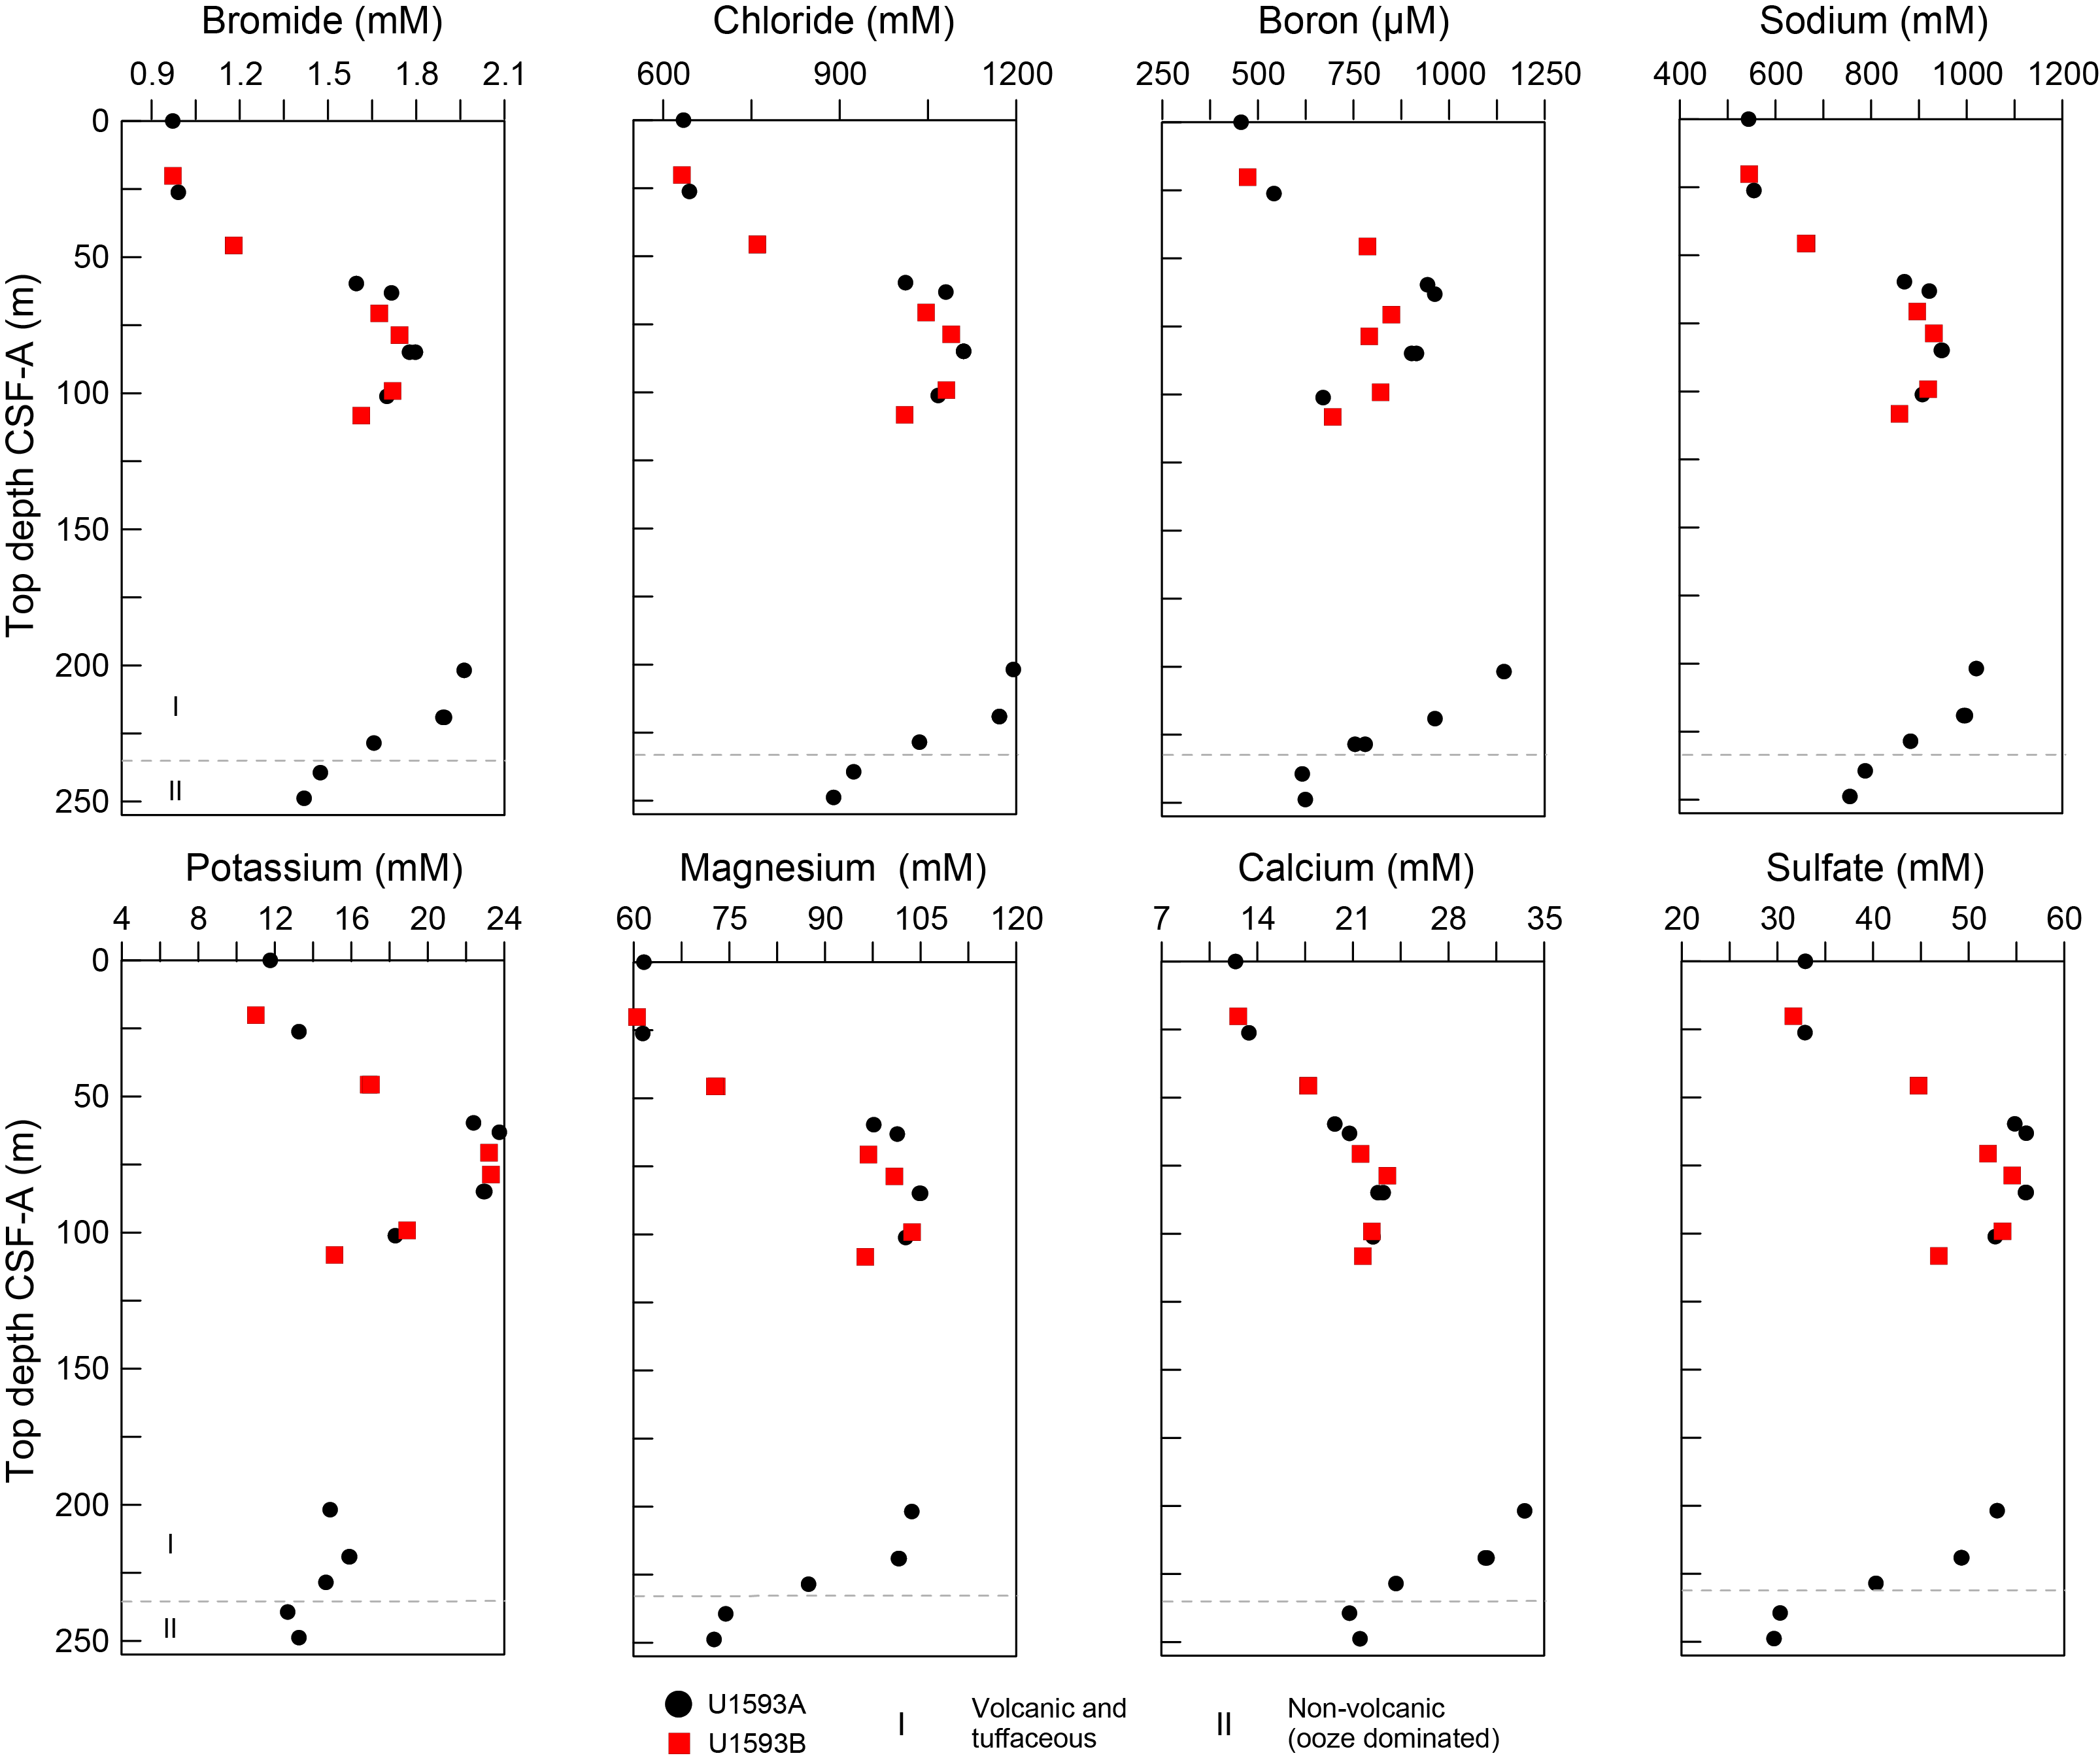
Figure F33. IW Br, Cl, B, Na, K, Mg, Ca, and SO42−.
9.2.3. Lithium, iron, manganese, barium, silicon, and strontium
Trends for Mn, Ba, Si, and Sr do not follow salinity as strongly as the major cations and anions, although Li generally does, unlike previous sites (Table T16; Figure F34). Strontium increases nearly linearly with depth to a maximum of 853 µM at 239 mbsf. IW Fe and Mn are elevated at 26–85 mbsf. Between 202 and 249 mbsf, Fe and Mn are low, except for one sample (398-U1593A-28F-2) with values of 52.2 and 3.7 µM at 202 mbsf. These high values correspond to the highest recorded salinity at Site U1593. Trends for Ba and Si are not as strong, although there is notable similarity in samples recovered in Hole U1593B. Both Ba and Si have elevated values between 202 and 249 mbsf and reach peaks of 3.8 µM at 229 mbsf and 1198 µM at 249 mbsf, respectively. Phosphorus is below the detection limit in all samples.
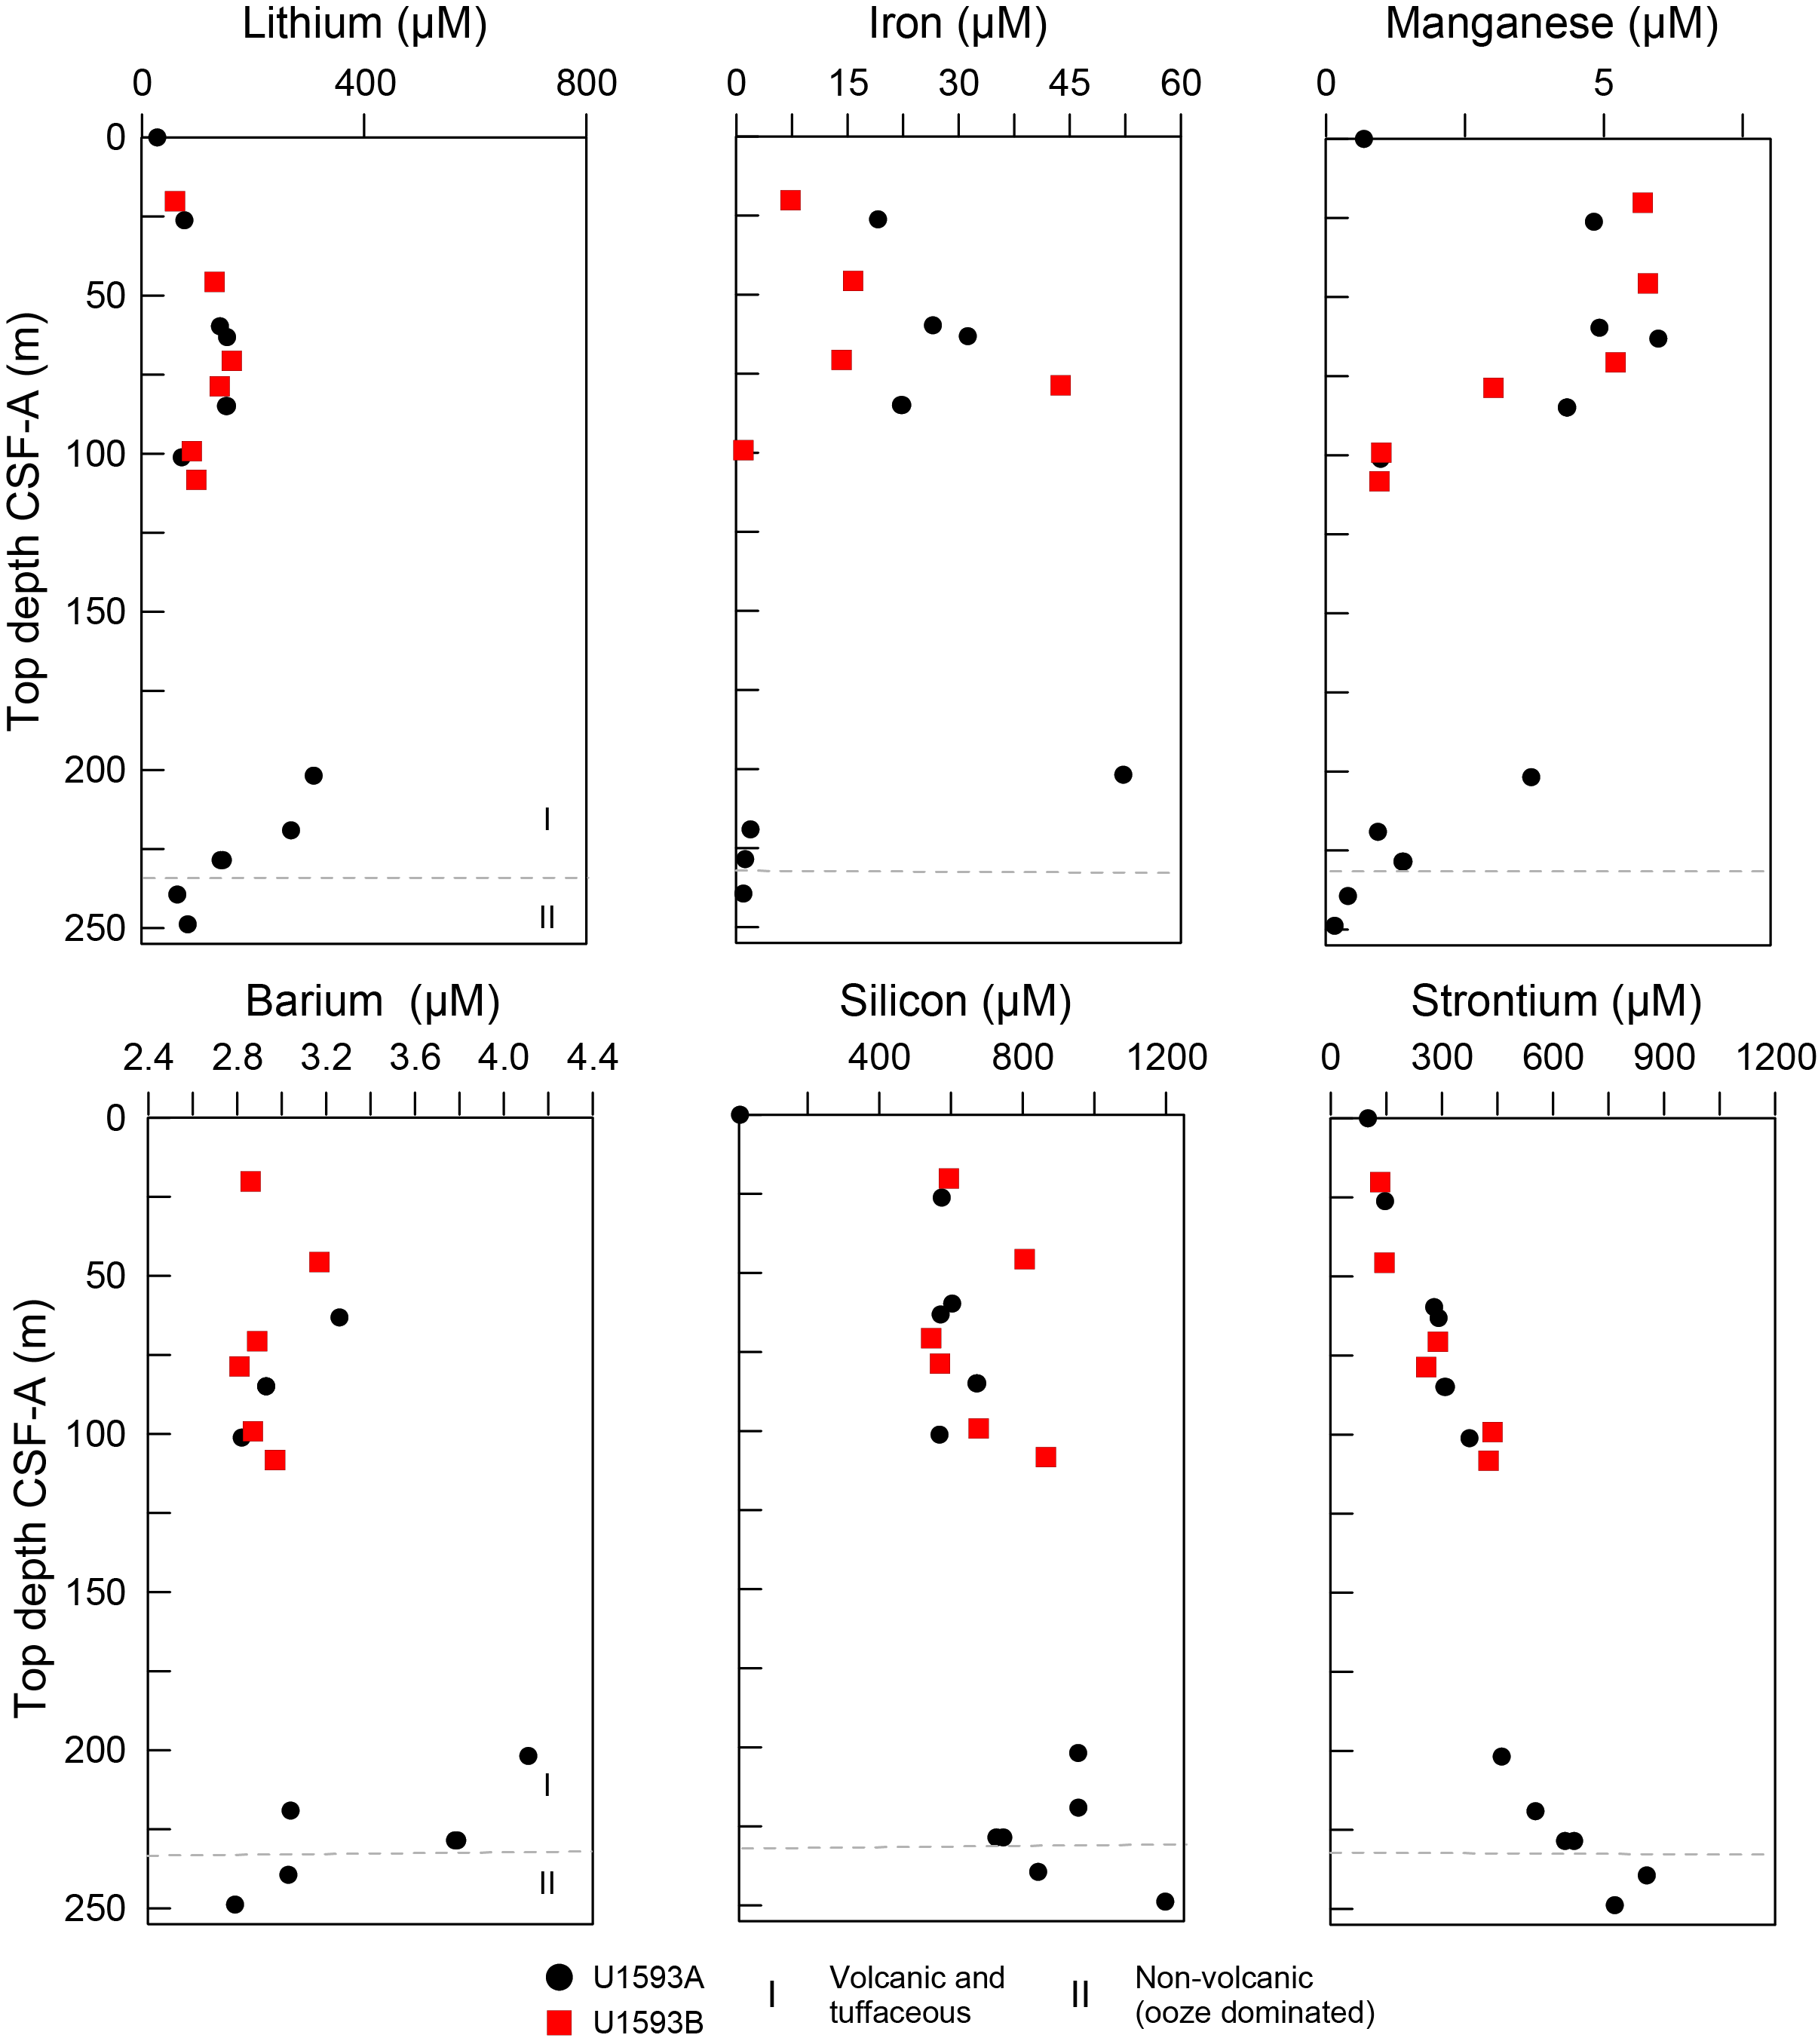
Figure F34. IW Li, Fe, Mn, Ba, Si, and Sr.
9.3. Sediment bulk geochemistry
A total of 16 sediment samples were analyzed for bulk geochemistry (Table T17). All were analyzed for total carbon, hydrogen, and nitrogen (CHN) and for inorganic carbon and carbonate content (see Geochemistry in the Expedition 398 methods chapter [Kutterolf et al., 2024]). For CHN analysis, duplicates were run for ~10% of the samples to determine analytical reproducibility. The highest carbonate value (65 wt%) is noted at 101 mbsf (Figure F35).
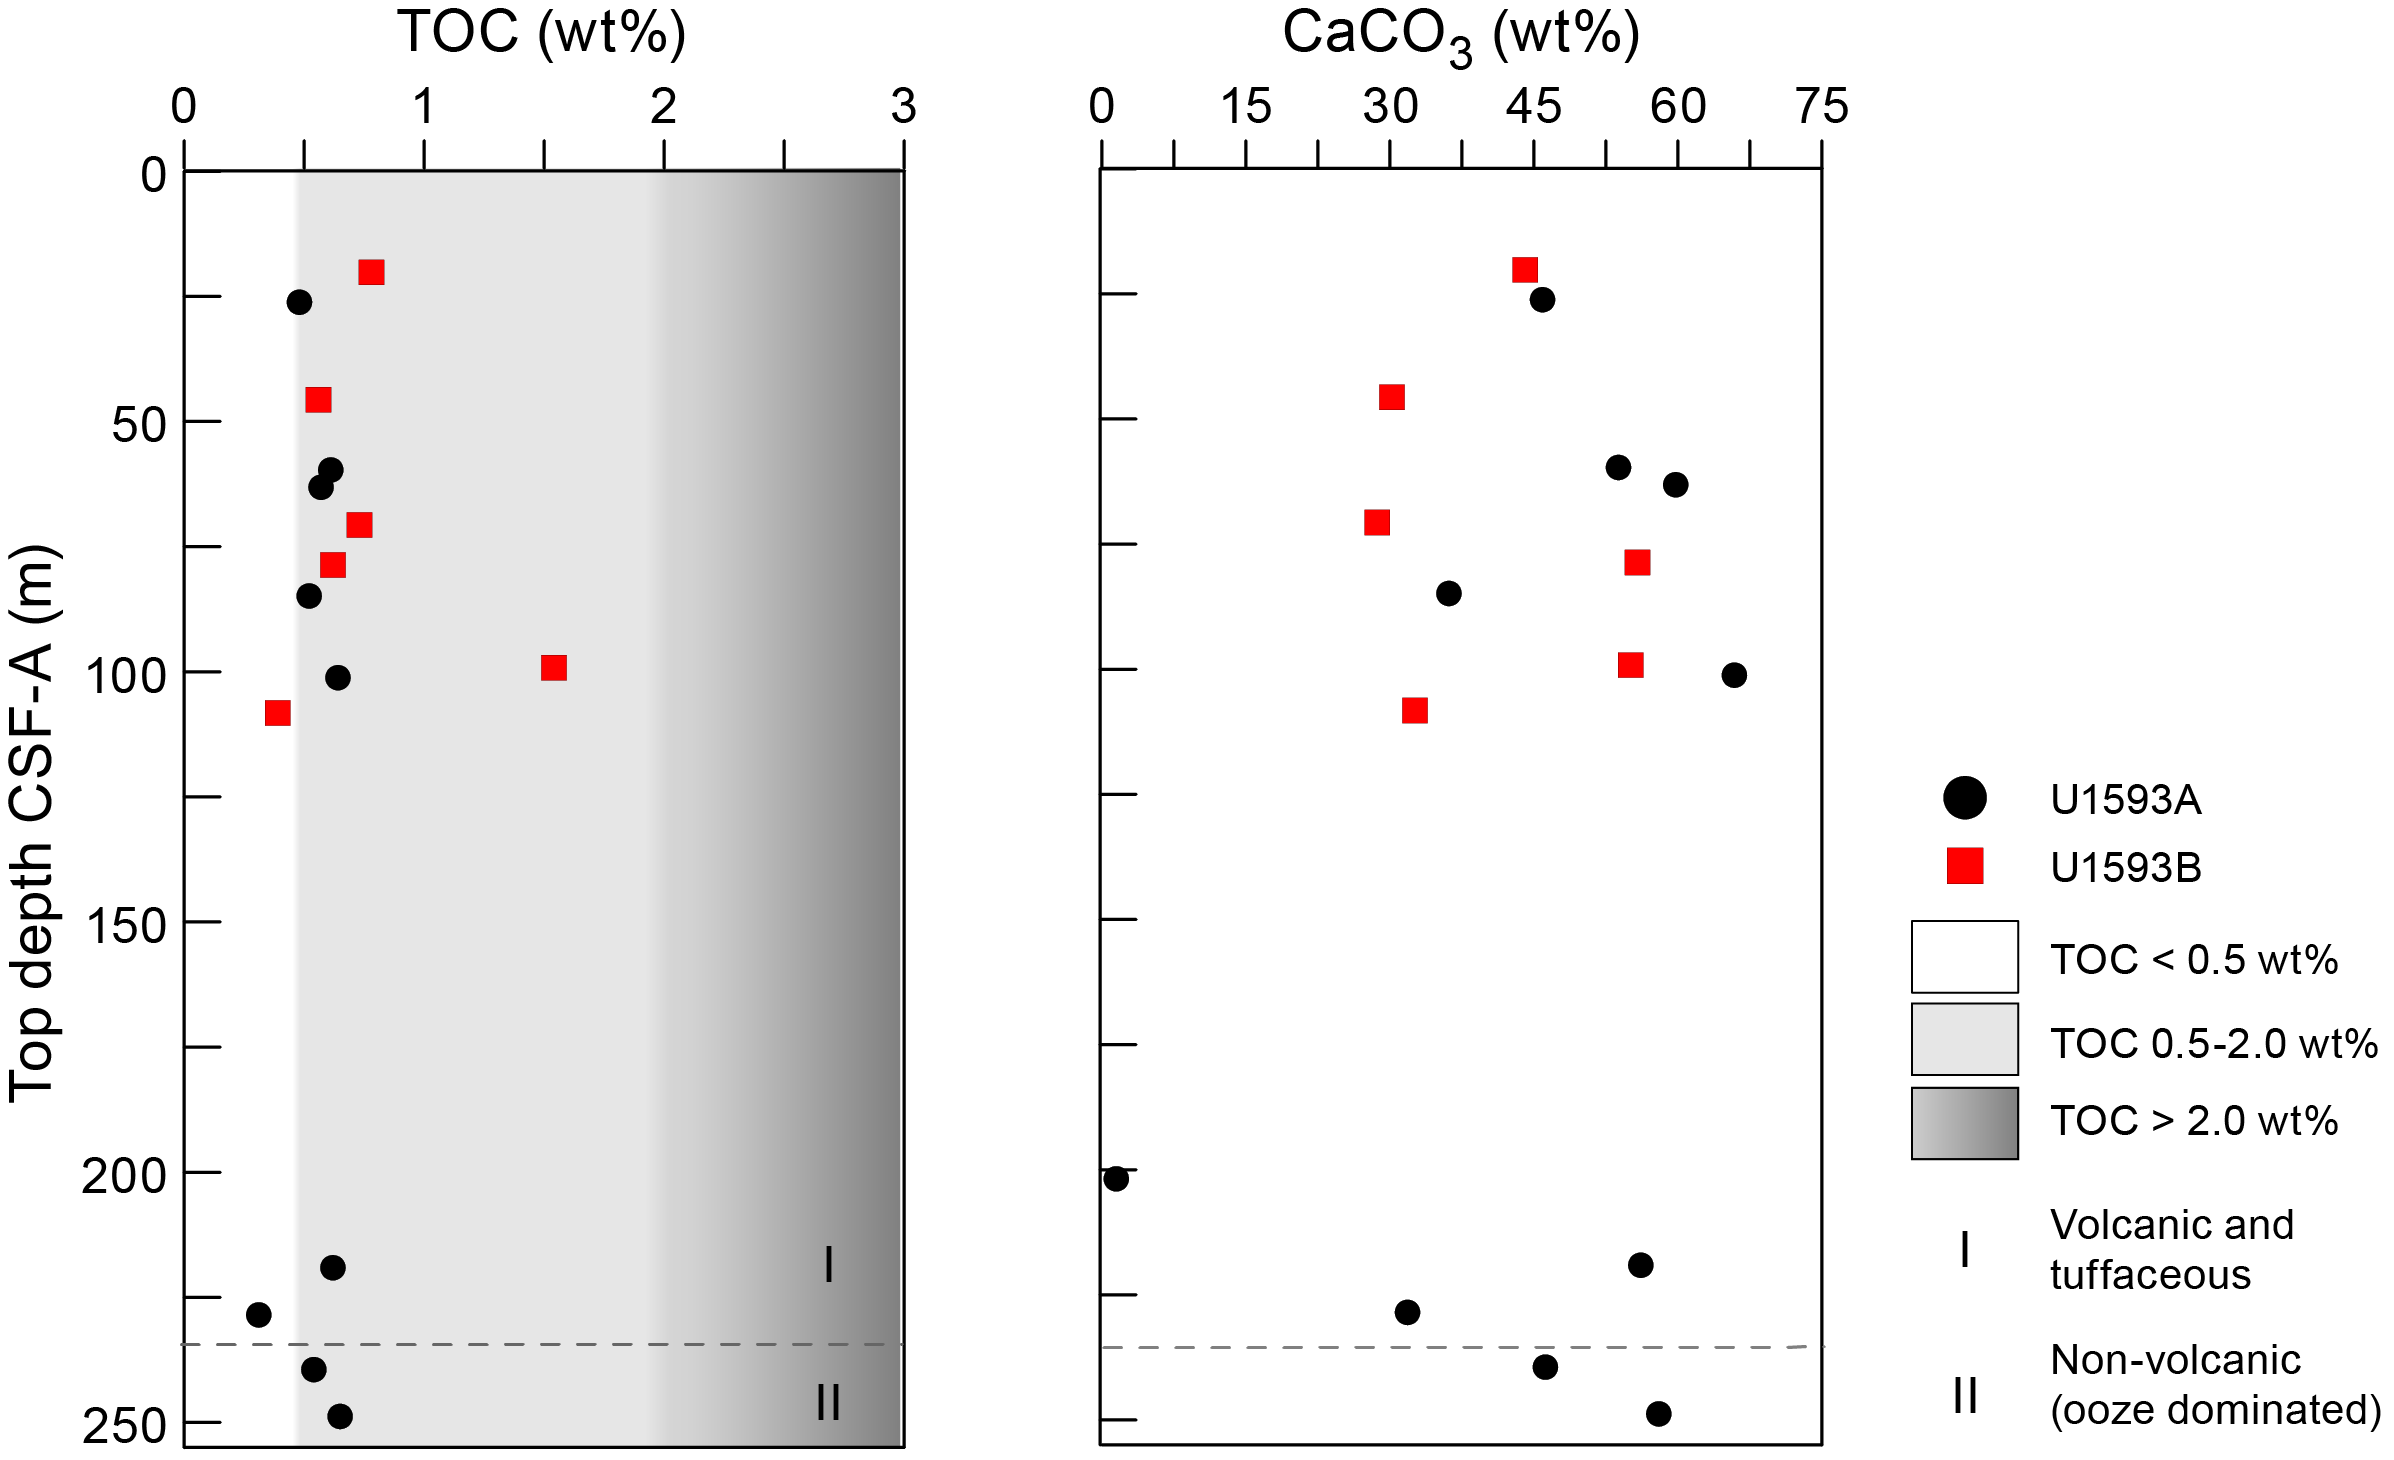
Figure F35. TOC and carbonate.
9.3.1. Sapropel identification
Total organic carbon (TOC) was calculated using total carbon and inorganic carbon values. Following the convention set forth by Kidd et al. (1978), units with TOC values >2.0 wt% were identified as sapropels and units with TOC values of 0.5–2.0 wt% were identified as sapropelitic. Using these values, 11 units were identified as sapropelitic (Table T17; Figure F35).
9.4. Headspace gas analysis
Headspace gas analyses were performed at a resolution of one sample per full-length core (9.5 m advance) or one sample every other core for half-length cores (4.7 m advance) throughout Hole U1593A. Analyses were resumed for Hole U1593B when depth of penetration exceeded recovery in Hole U1593A. The aim was to monitor the presence and abundance of C1–C3 hydrocarbons as part of the standard International Ocean Discovery Program safety protocol (Pimmel and Claypool, 2001). A total of 27 headspace gas samples from this site were analyzed using gas chromatography (see Geochemistry in the Expedition 398 methods chapter [Kutterolf et al., 2024]). Methane, ethane, and propane concentrations were below the detection limit in all measured samples.
References
Abu-Zied, R.H., Rohling, E.J., Jorissen, F.J., Fontanier, C., Casford, J.S.L., and Cooke, S., 2008. Benthic foraminiferal response to changes in bottom-water oxygenation and organic carbon flux in the eastern Mediterranean during LGM to Recent times. Marine Micropaleontology, 67(1–2):46–68. https://doi.org/10.1016/j.marmicro.2007.08.006
Castradori, D., 1993. Calcareous nannofossil biostratigraphy and biochronology in eastern Mediterranean deep-sea cores. Rivista Italiana Di Paleontologia E Stratigrafia, 99(1). https://doi.org/10.13130/2039-4942/8948
Druitt, T.H., Kutterolf, S., Ronge, T.A., Beethe, S., Bernard, A., Berthod, C., Chen, H., Chiyonobu, S., Clark, A., DeBari, S., Fernandez Perez, T.I., Gertisser, R., Hübscher, C., Johnston, R.M., Jones, C., Joshi, K.B., Kletetschka, G., Koukousioura, O., Li, X., Manga, M., McCanta, M., McIntosh, I., Morris, A., Nomikou, P., Pank, K., Peccia, A., Polymenakou, P.N., Preine, J., Tominaga, M., Woodhouse, A., and Yamamoto, Y., 2024a. Site U1589. In Druitt, T.H., Kutterolf, S., Ronge, T.A., and the Expedition 398 Scientists, Hellenic Arc Volcanic Field. Proceedings of the International Ocean Discovery Program, 398: College Station, TX (International Ocean Discovery Program). https://doi.org/10.14379/iodp.proc.398.103.2024
Druitt, T.H., Kutterolf, S., Ronge, T.A., Beethe, S., Bernard, A., Berthod, C., Chen, H., Chiyonobu, S., Clark, A., DeBari, S., Fernandez Perez, T.I., Gertisser, R., Hübscher, C., Johnston, R.M., Jones, C., Joshi, K.B., Kletetschka, G., Koukousioura, O., Li, X., Manga, M., McCanta, M., McIntosh, I., Morris, A., Nomikou, P., Pank, K., Peccia, A., Polymenakou, P.N., Preine, J., Tominaga, M., Woodhouse, A., and Yamamoto, Y., 2024b. Site U1591. In Druitt, T.H., Kutterolf, S., Ronge, T.A., and the Expedition 398 Scientists, Hellenic Arc Volcanic Field. Proceedings of the International Ocean Discovery Program, 398: College Station, TX (International Ocean Discovery Program). https://doi.org/10.14379/iodp.proc.398.105.2024
Fisher, R.V., and Schmincke, H.-U., 1984. Pyroclastic Rocks: Berlin (Springer). https://doi.org/10.1007/978-3-642-74864-6
Gradstein, F.M., Ogg, J.G., Schmitz, M.D., and Ogg, G.M. (Eds.), 2020. The Geologic Time Scale 2020: Amsterdam (Elsevier BV). https://doi.org/10.1016/C2020-1-02369-3
Hayward, B.W., Grenfell, H.R., Reid, C.M., and Hayward, K.A., 1999. Recent New Zealand shallow-water benthic foraminifera: taxonomy, ecologic distribution, biogeography, and use in paleoenvironmental assessment. In Institute of Geological & Nuclear Sciences Monograph, 21: Lower Hutt, NZ.
Hübscher, C., Ruhnau, M., and Nomikou, P., 2015. Volcano-tectonic evolution of the polygenetic Kolumbo submarine volcano/Santorini (Aegean Sea). Journal of Volcanology and Geothermal Research, 291:101–111. https://doi.org/10.1016/j.jvolgeores.2014.12.020
Jutzeler, M., White, J.D.L., Talling, P.J., McCanta, M., Morgan, S., Le Friant, A., and Ishizuka, O., 2014. Coring disturbances in IODP piston cores with implications for offshore record of volcanic events and the Missoula megafloods. Geochemistry, Geophysics, Geosystems, 15(9):3572–3590. https://doi.org/10.1002/2014GC005447
Kidd, R.B., Cita, M.B., and Ryan, W.B.F., 1978. Stratigraphy of eastern Mediterranean sapropel sequences recovered during DSDP Leg 42A and their paleoenvironmental significance. In Hsü, K., Montadert, L., et al., Initial Reports of the Deep Sea Drilling Project. 42(1): Washington, DC (US Government Printing Office), 421–443. https://doi.org/10.2973/dsdp.proc.42-1.113-1.1978
Kutterolf, S., Druitt, T.H., Ronge, T.A., Beethe, S., Bernard, A., Berthod, C., Chen, H., Chiyonobu, S., Clark, A., DeBari, S., Fernandez Perez, T.I., Gertisser, R., Hübscher, C., Johnston, R.M., Jones, C., Joshi, K.B., Kletetschka, G., Koukousioura, O., Li, X., Manga, M., McCanta, M., McIntosh, I., Morris, A., Nomikou, P., Pank, K., Peccia, A., Polymenakou, P.N., Preine, J., Tominaga, M., Woodhouse, A., and Yamamoto, Y., 2024. Expedition 398 methods. In Druitt, T.H., Kutterolf, S., Ronge, T.A., and the Expedition 398 Scientists, Hellenic Arc Volcanic Field. Proceedings of the International Ocean Discovery Program, 398: College Station, TX (International Ocean Discovery Program). https://doi.org/10.14379/iodp.proc.398.102.2024
Kutterolf, S., Freundt, A., Hansteen, T.H., Dettbarn, R., Hampel, F., Sievers, C., Wittig, C., Allen, S.R., Druitt, T.H., McPhie, J., Nomikou, P., Pank, K., Schindlbeck-Belo, J.C., Wang, K.-L., Lee, H.-Y., and Friedrichs, B., 2021. The medial offshore record of explosive volcanism along the central to eastern Aegean Volcanic Arc: 1. tephrostratigraphic correlations. Geochemistry, Geophysics, Geosystems, 22(12):e2021GC010010. https://doi.org/10.1029/2021GC010010
Le Maitre, R.W., Steckeisen, A., Zanettin, B., Le Bas, M.J., Bonin, B., and Bateman, P. (Eds.), 2002. Igneous Rocks: A Classification and Glossary of Terms (Second edition): Cambridge, UK (Cambridge University Press). https://doi.org/10.1017/CBO9780511535581
Lirer, F., Foresi, L.M., Iaccarino, S.M., Salvatorini, G., Turco, E., Cosentino, C., Sierro, F.J., and Caruso, A., 2019. Mediterranean Neogene planktonic foraminifer biozonation and biochronology. Earth-Science Reviews, 196:102869. https://doi.org/10.1016/j.earscirev.2019.05.013
Lourens, L., Hilgen, F., Shackleton, N.J., Laskar, J., and Wilson, D., 2004. The Neogene period. In Smith, A.G., Gradstein, F.M. and Ogg, J.G., A Geologic Time Scale 2004. Cambridge, UK (Cambridge University Press), 409–440. https://doi.org/10.1017/CBO9780511536045.022
Martini, E., 1971. Standard Tertiary and Quaternary calcareous nannoplankton zonation. Proceedings of the Second Planktonic Conference, Roma, 1970:739–785.
Pimmel, A., and Claypool, G., 2001. Introduction to shipboard organic geochemistry on the JOIDES Resolution. Ocean Drilling Program Technical Note, 30. https://doi.org/10.2973/odp.tn.30.2001
Preine, J., Karstens, J., Hübscher, C., Nomikou, P., Schmid, F., Crutchley, G.J., Druitt, T.H., and Papanikolaou, D., 2022. Spatio-temporal evolution of the Christiana-Santorini-Kolumbo volcanic field, Aegean Sea. Geology, 50(1):96–100. https://doi.org/10.1130/G49167.1
Rio, D., Raffi, I., and Villa, G., 1990. Pliocene-Pleistocene calcareous nannofossil distribution patterns in the western Mediterranean. In Kastens, K.A., Mascle, J., et al., Proceedings of the Ocean Drilling Program, Scientific Results. 107: College Station, TX (Ocean Drilling Program), 513–533. https://doi.org/10.2973/odp.proc.sr.107.164.1990