Druitt, T.H., Kutterolf, S., Ronge, T.A., and the Expedition 398 Scientists
Proceedings of the International Ocean Discovery Program Volume 398
publications.iodp.org
https://doi.org/10.14379/iodp.proc.398.109.2024
Site U15951
![]() T.H. Druitt,
T.H. Druitt,
![]() S. Kutterolf,
S. Kutterolf,
![]() T.A. Ronge,
T.A. Ronge,
![]() S. Beethe,
S. Beethe,
![]() A. Bernard,
A. Bernard,
![]() C. Berthod,
C. Berthod,
![]() H. Chen,
H. Chen,
![]() S. Chiyonobu,
S. Chiyonobu,
![]() A. Clark,
A. Clark,
![]() S. DeBari,
S. DeBari,
![]() T.I. Fernandez Perez,
T.I. Fernandez Perez,
![]() R. Gertisser,
R. Gertisser,
![]() C. Hübscher,
C. Hübscher,
![]() R.M. Johnston,
R.M. Johnston,
![]() C. Jones,
C. Jones,
![]() K.B. Joshi,
K.B. Joshi,
![]() G. Kletetschka,
G. Kletetschka,
![]() O. Koukousioura,
O. Koukousioura,
![]() X. Li,
X. Li,
![]() M. Manga,
M. Manga,
![]() M. McCanta,
M. McCanta,
![]() I. McIntosh,
I. McIntosh,
![]() A. Morris,
A. Morris,
![]() P. Nomikou,
P. Nomikou,
![]() K. Pank,
K. Pank,
![]() A. Peccia,
A. Peccia,
![]() P.N. Polymenakou,
P.N. Polymenakou,
![]() J. Preine,
J. Preine,
![]() M. Tominaga,
M. Tominaga,
![]() A. Woodhouse, and
A. Woodhouse, and
![]() Y. Yamamoto2
Y. Yamamoto2
1 Druitt, T.H., Kutterolf, S., Ronge, T.A., Beethe, S., Bernard, A., Berthod, C., Chen, H., Chiyonobu, S., Clark, A., DeBari, S., Fernandez Perez, T.I., Gertisser, R., Hübscher, C., Johnston, R.M., Jones, C., Joshi, K.B., Kletetschka, G., Koukousioura, O., Li, X., Manga, M., McCanta, M., McIntosh, I., Morris, A., Nomikou, P., Pank, K., Peccia, A., Polymenakou, P.N., Preine, J., Tominaga, M., Woodhouse, A., and Yamamoto, Y., 2024. Site U1595. In Druitt, T.H., Kutterolf, S., Ronge, T.A., and the Expedition 398 Scientists, Hellenic Arc Volcanic Field. Proceedings of the International Ocean Discovery Program, 398: College Station, TX (International Ocean Discovery Program). https://doi.org/10.14379/iodp.proc.398.109.2024
2 Expedition 398 Scientists’ affiliations.
1. Background and objectives
Site U1595 (proposed Site CSK-08B) is located in the southern basin of the Santorini caldera at 291 meters below sea level (mbsl) (Figure F1). It was drilled in three holes (U1595A–U1595C) to a maximum recovery depth of 127.0 meters below seafloor (mbsf) (all depths below seafloor are given using the core depth below seafloor, Method A [CSF-A], scale, except in Operations where the drilling depth below seafloor [DSF] scale is used). Average hole core recoveries range 46%–77%. Site U1594 addresses the same drilling objectives and lies northeast of Site U1595. Two additional sites (U1596 and U1597) lie in the northern caldera basin.
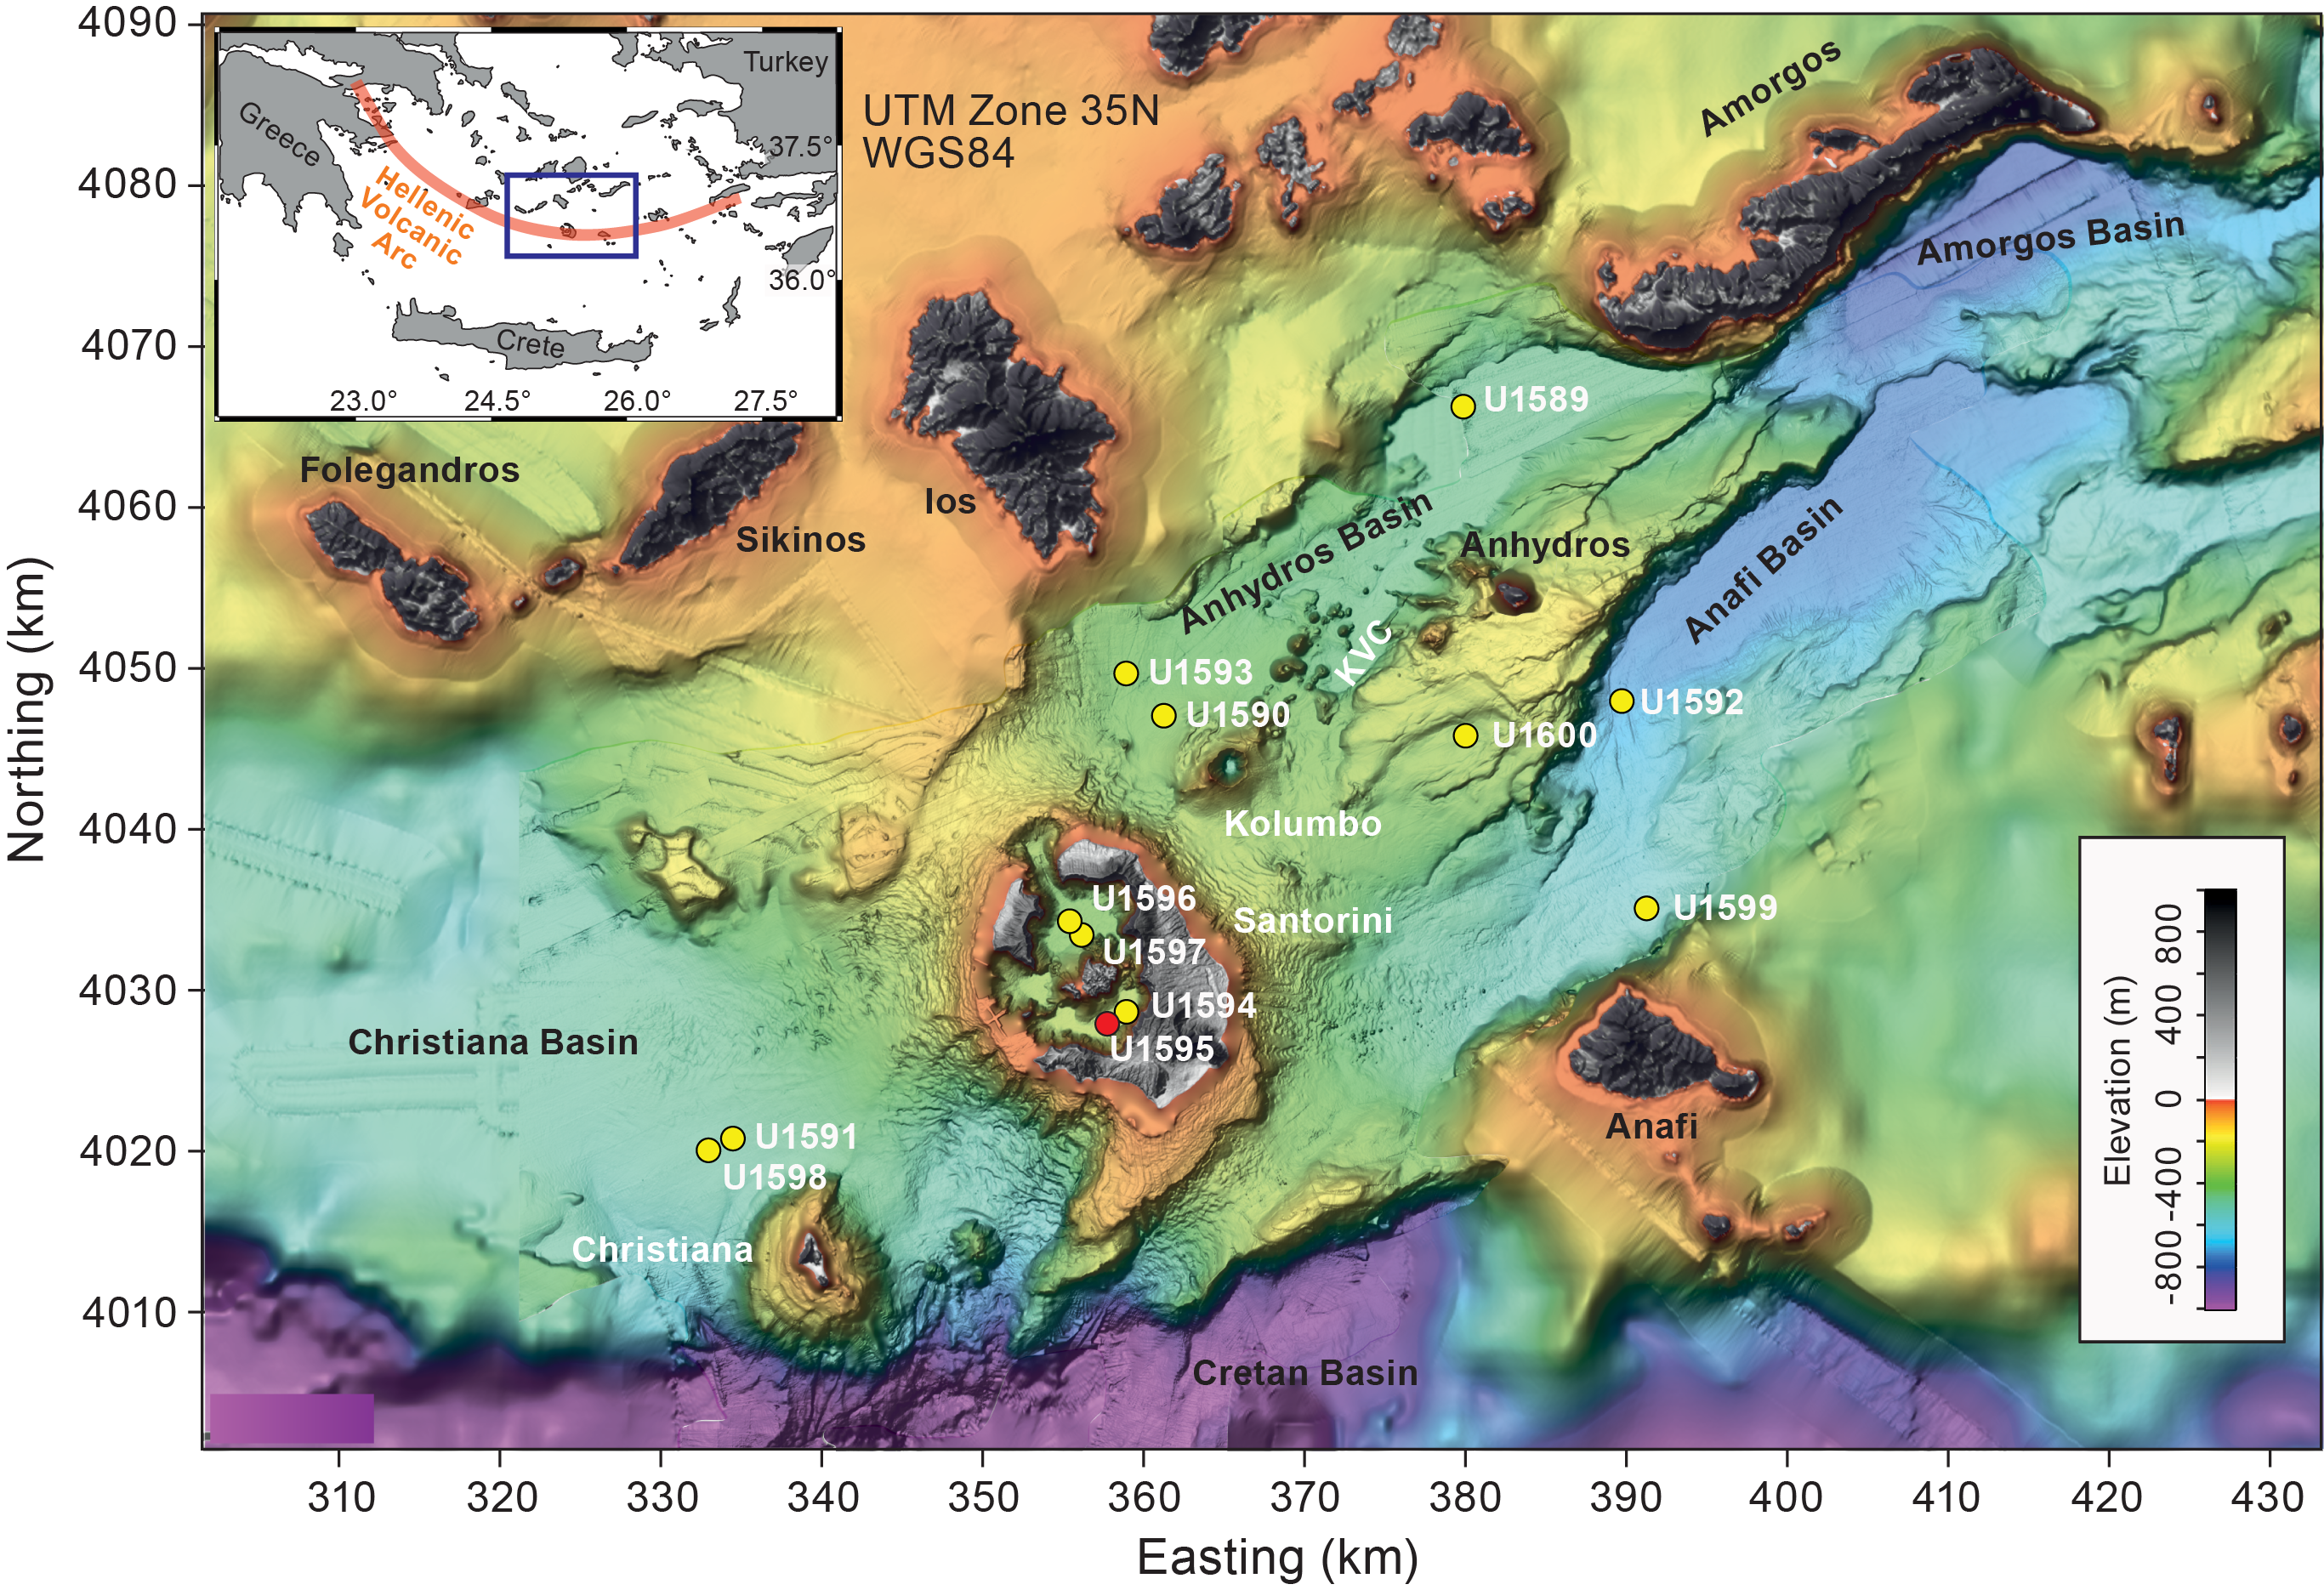
Figure F1. Site map.
Four seismic units (S1–S4) were previously recognized in the Santorini caldera (Johnston et al., 2015; Nomikou et al., 2016) (Figure F2). Seismic Units S1–S3 were thought to consist of muds and sands from cliff mass wasting (Unit S1); compacted (possibly lithified) sandy volcaniclastics from Kameni Volcano (Unit S2); and consolidated coarse blocky intracaldera tuffs, landslide debris, and/or flood gravels (Unit S3). Unit S4 was thought to be intracaldera tuff from the Late Bronze Age eruption. The four caldera sites were planned to sample Units S1–S3; test the published correlations between the two caldera basins; penetrate below Unit S3 into Unit S4; and address scientific Objectives 1, 4, 5, and 7 of the Expedition 398 Scientific Prospectus (Druitt et al., 2022). By drilling both caldera basins and exploiting our dense seismic reflection coverage, we gained access to the 3D architecture of the entire caldera fill. We also targeted the question of why the northern basin is 100 m deeper than the southern one. Finally, we tested whether Unit S3 consisted of flood debris from the caldera flooding event (Nomikou et al., 2016) or whether it was Late Bronze Age intracaldera tuff (Johnston et al., 2015). The intracaldera sites were used for microbiological work of Objective 7.
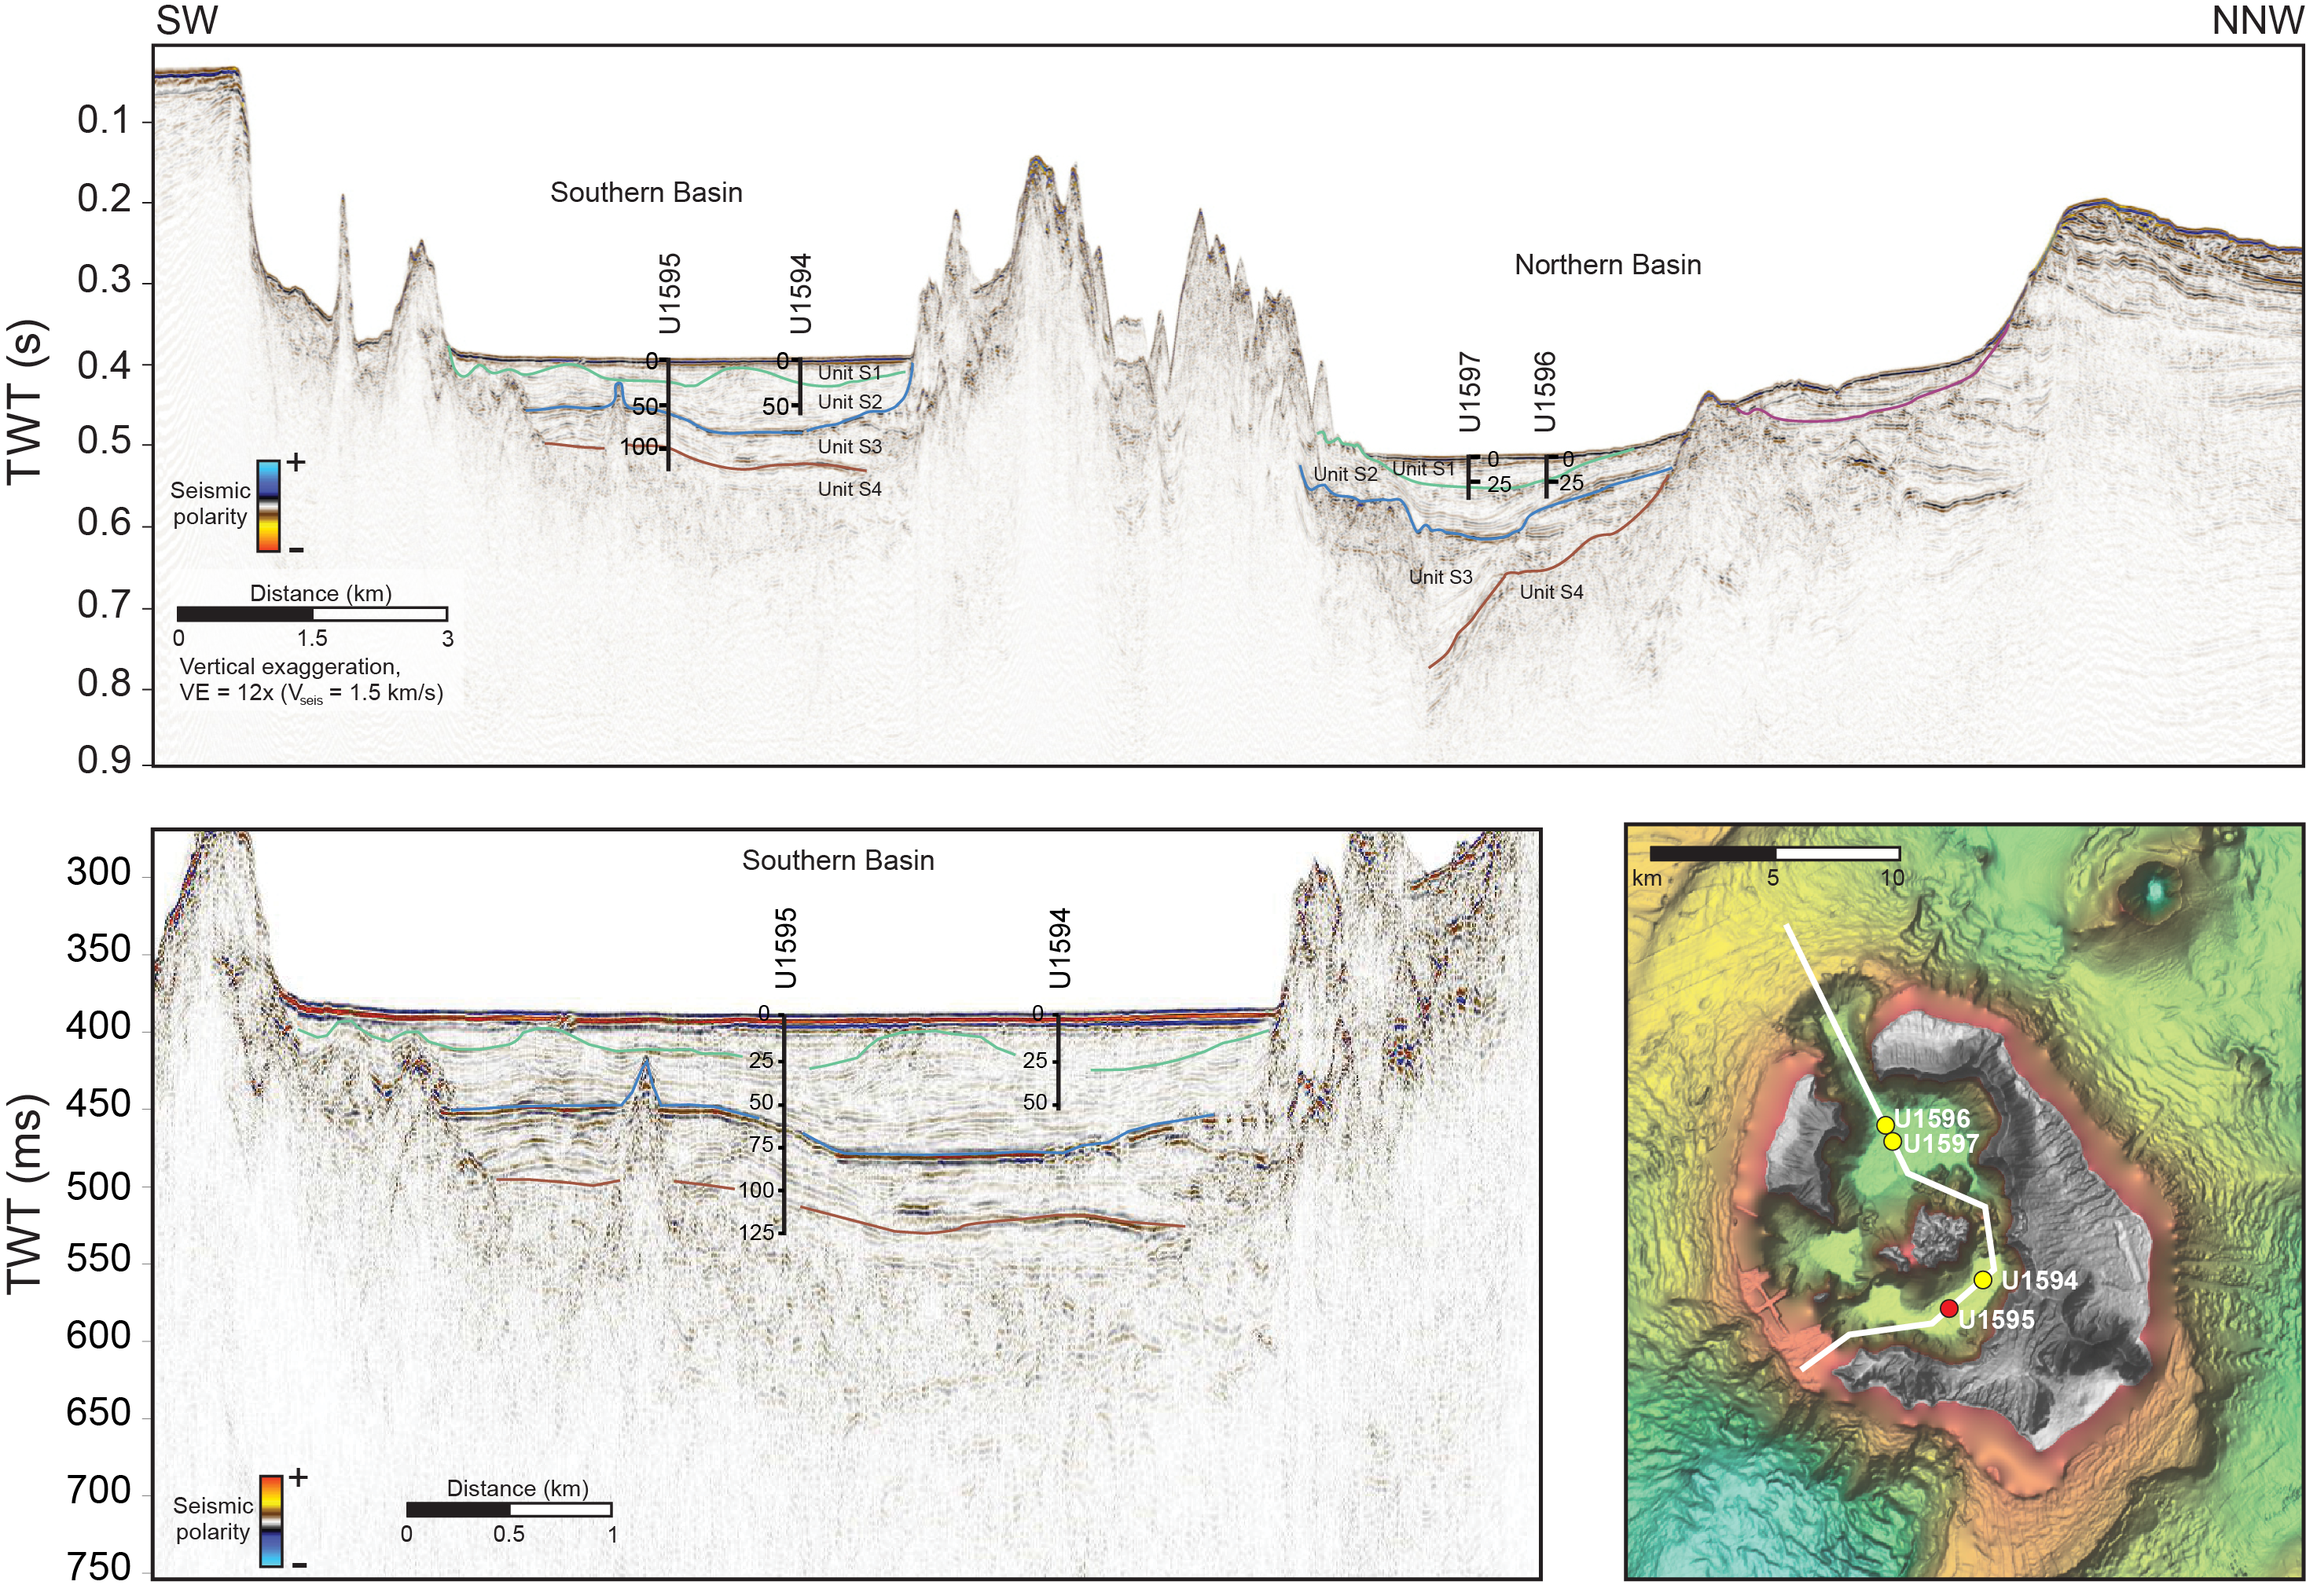
Figure F2. Seismic profile.
2. Operations
2.1. Hole U1595A
With the dynamic positioning (DP) move completed at 0530 h on 23 January 2023, Hole U1595A (36°22.8955′N, 25°24.3630′E) was spudded at 0635 h. With a shoot depth of 297.0 meters below rig floor (mbrf) and a recovery of 3.6 m, the calculated seafloor was 291.6 mbsl (Table T1).
Advanced piston corer (APC) coring continued through Core 11H at 98.6 mbsf, the final depth for Hole U1595A. At 1315 h, while preparing to shoot Core 11H, the hole packed off suddenly. The backpressure exceeded 3400 psi within 1–2 s, and the relief valves on Mud Pumps 1 and 2 ruptured. The pressure spike also sent the sinker bars up, and they slammed into the oil saver, knocking it off and up into the top drive. Seawater rained down on the drill floor for several seconds. The coring line separated from the rope socket and came spooling out. With no core barrel in the pipe because of a planned switch to the half-length APC (HLAPC), the sinker bars were lost in the hole.
The driller still had rotation with the pipe but no pressure. Lifting off the elevator showed the pipe to be vertically stuck as well. The mud pump relief valve discs were replaced, and the pumps were put back on line. The driller started applying pressure, but the hole still appeared to be packing off, with intermittent pressure spikes to 2800 psi.
An attempt to free the oil saver using the forward coring line sinker bars to drive it down was unsuccessful; however, the drill string was worked free. The drill string was pulled out of the hole with the top drive from 89.1 mbsf to 271.2 mbrf, and the bit cleared the seafloor at 1636 h. With the drill string out of the hole, the rig crew was able to remove the oil saver after ~2 h. The bit cleared the rotary table at 2131 h.
At 2300 h, the vessel began a DP move from Site U1595, ending the site, to Site U1596 in the northern portion of the Santorini caldera.
2.2. Hole U1595B
The ship returned to Site U1595 at 0415 h on 2 February 2023, 50 m from Hole U1595A. The vessel was under DP control at 0440 h. The rig crew began assembling the bottom hole assembly (BHA) with a used bit. From 0745 to 0915 h, the vessel was awaiting media and guests. The launch was alongside the R/V JOIDES Resolution at 0900 h, and eight guests boarded via the pilot’s ladder. The launch was away at 0915 h. Safety orientations were conducted, and film crews set up on the drill floor and catwalk and in the laboratory.
Core 1H was shot from 297.0 mbrf. Hole U1595B was spudded at 1010 h, with 3.7 m of recovery. The seafloor was calculated at 291.4 mbsl. APC coring continued with Cores 2H–13H. A 130,000 lb overpull was observed on Core 13H. The bit was advanced to 117.7 mbsf. The eight guests disembarked to the launch just after 1415 h, and the launch was away at 1425 h.
At 1900 h, the change was made to the HLAPC system with Cores 14F and 15F to 127.1 mbsf, the final depth for Hole U1595B. Maximum overpull and high amps on the bit advance provided the incentive to leave the hole. The drill string was tripped up, and the bit cleared the seafloor at 2320 h, ending Hole U1595B.
2.3. Hole U1595C
The vessel was again offset 50 m along the seismic line toward proposed Site CSK-18A. Hole U1595C (36°22.8674′N, 25°24.3062′E) was spudded at 0005 h on 3 February 2023, with Core 1H shot from 297.0 mbrf. The recovery of 3.8 m established the seafloor at 291.3 mbsl. A center bit was dropped for a 49.2 m drilled interval. With drill-down completed to 53.0 mbsf, coring was picked up again with the HLAPC system for Cores 3F–11F to 95.3 mbsf.
The launch arrived at 0910 h with 15 guests and media. After the visitors boarded via the ladder, the launch was away at 0920 h. Interviews and filming continued, primarily in the laboratories and on the bridge and the forward forecastle deck.
After Core 11F, the plan was to drill ahead to 104 mbsf and resume coring. However, high torque led to the drill string stalling. A 100,000 lb overpull was applied with no success. The drill pipe was worked, and after about 20–30 min it regained rotation. The decision was made to abandon the hole.
The string was pulled out of the hole with the top drive, clearing the seafloor at 1115 h. The bit cleared the rotary table at 1347 h. The rig floor was secured at 1415 h. Just after 1410 h, the 15 guests disembarked to the launch. The launch was away at 1430 h, and the DP move to Site U1596 in the northern caldera began.
3. Lithostratigraphy
Cores from Site U1595 recovered a coherent stratigraphy from 0 to 126.93 mbsf (Sections 398-U1595A-1H-1 through 10H-CC, 398-U1595B-1H-1 through 15F-CC, and 398-U1595C-1H-1 through 11F-CC) (Figure F3). Recovery in Hole U1595C is fragmentary.
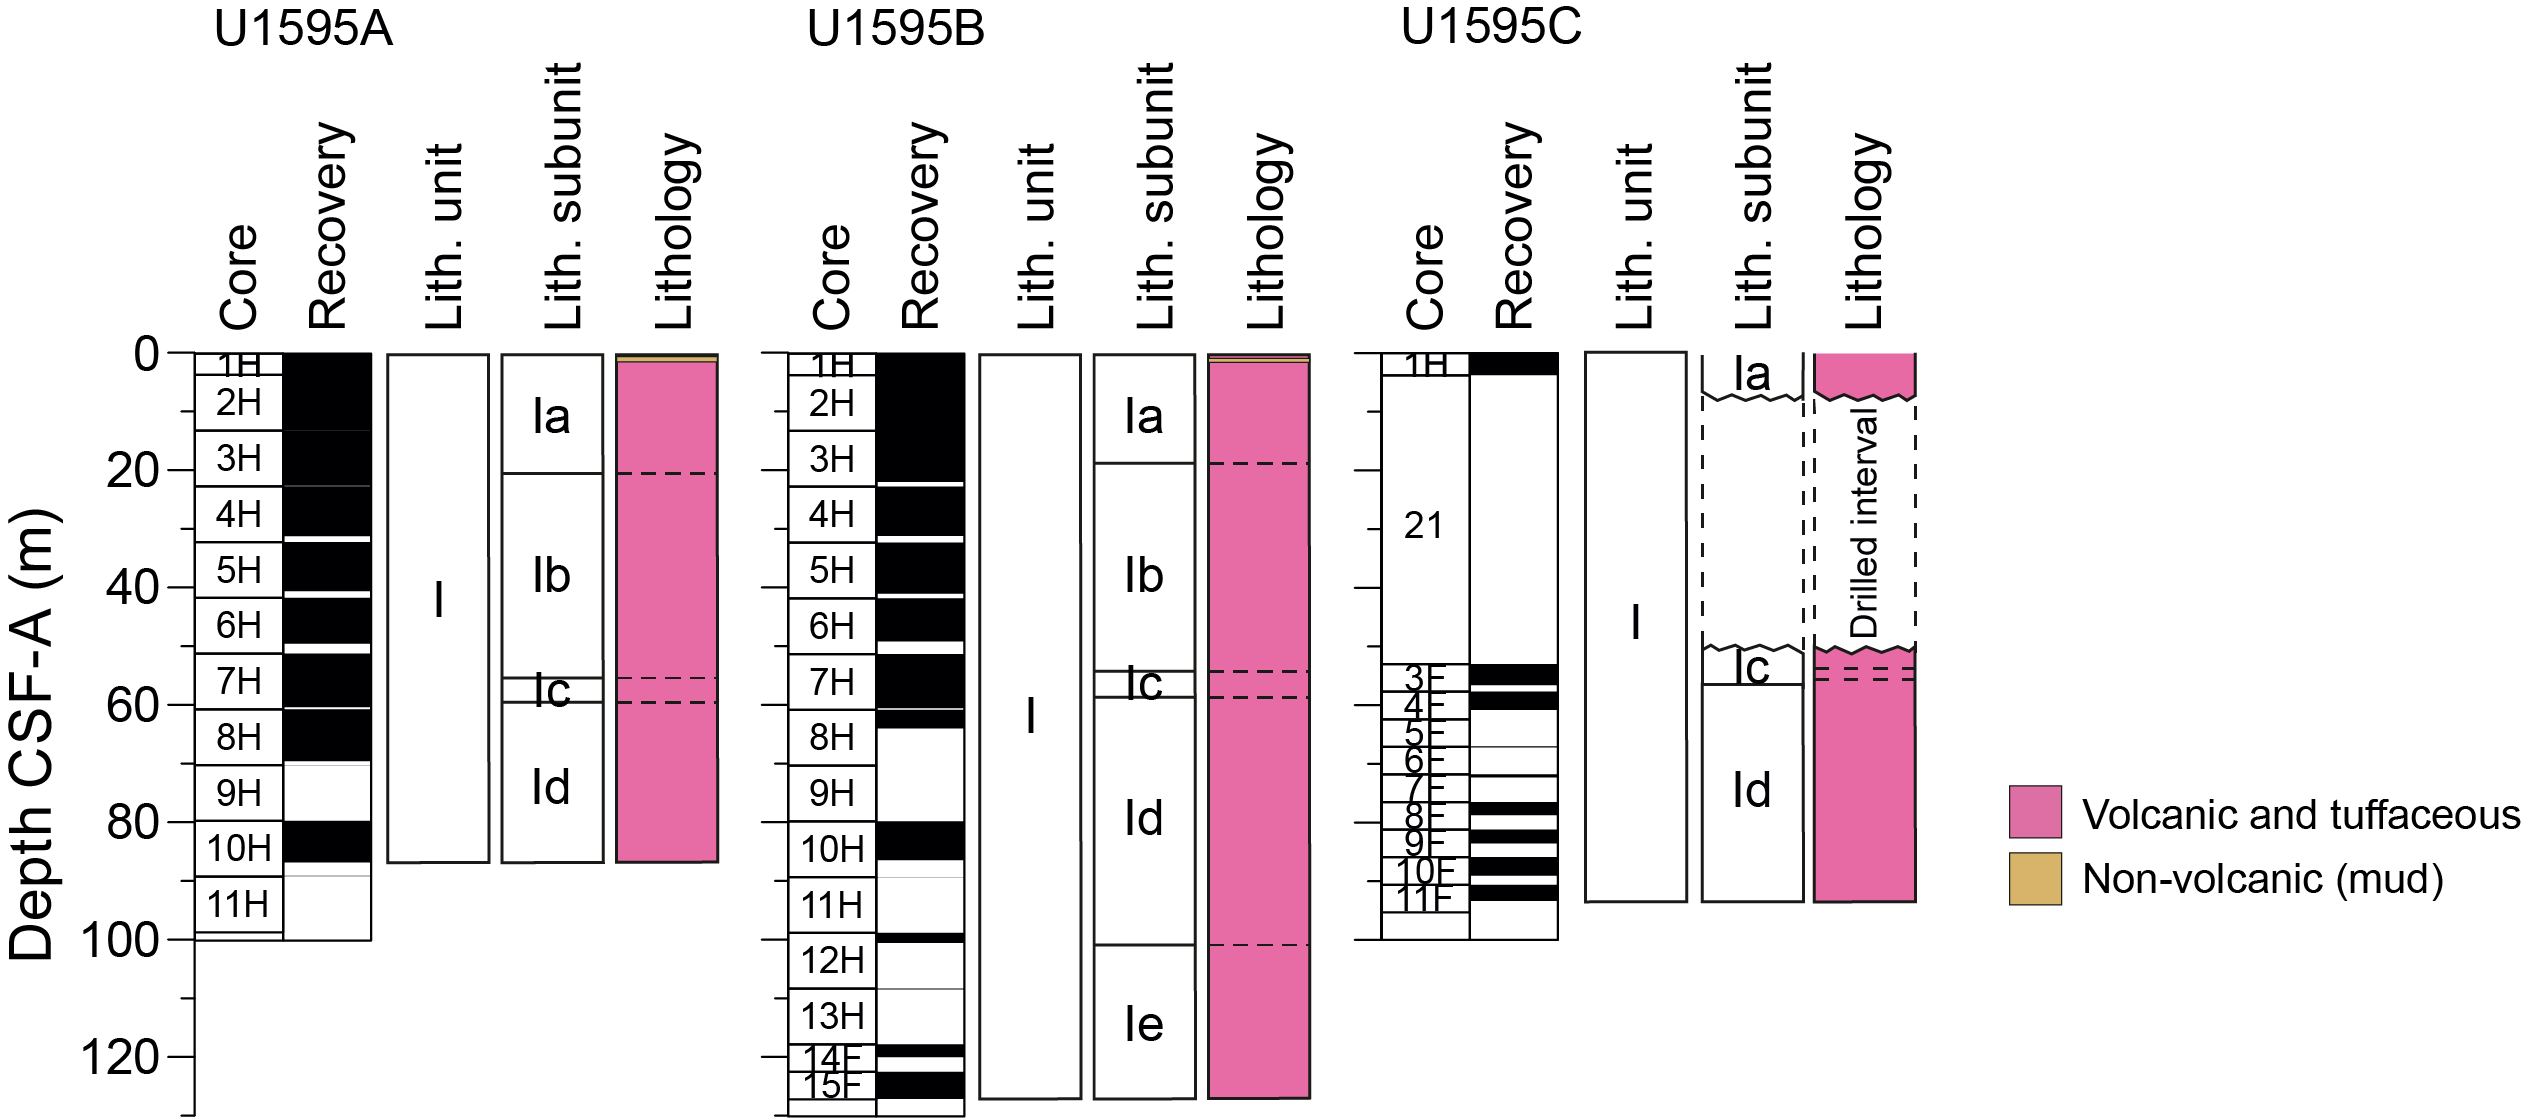
Figure F3. Lithostratigraphy.
The recovered material is unlithified sediment dominated by volcanic material with very minor amounts of mud and tuffaceous mud in the uppermost 1 m of Holes U1595A and U1595B. Smear slides for microscopic analyses were prepared to confirm macroscopic descriptions of distinct lithology changes at the section level, such as identification of vitric ash particles in tuffaceous lithologies or crystals in ash layers. X-ray diffraction (XRD) data were obtained from 12 interstitial water (IW) squeeze cake sediment residues from Holes U1595A–U1595C.
Figure F3 summarizes the lithostratigraphy of Site U1595, displaying core recovery and lithostratigraphic unit and subunits in each hole. Table T2 provides the upper and lower boundaries, thicknesses, and lithologic summaries of the unit and subunits. Figure F4 graphically presents the relative proportions of volcanic, tuffaceous, and nonvolcanic lithologies in Holes U1595A–U1595C, with lithostratigraphic unit and subunits labeled. Figure F5 presents the grain size distribution of the sediments, in particular the changes in grain size within the volcanic-dominated units, to graphically show the distribution of ash, lapilli-ash, and lapilli. Figure F6 displays different types of core disturbance observed at the site.
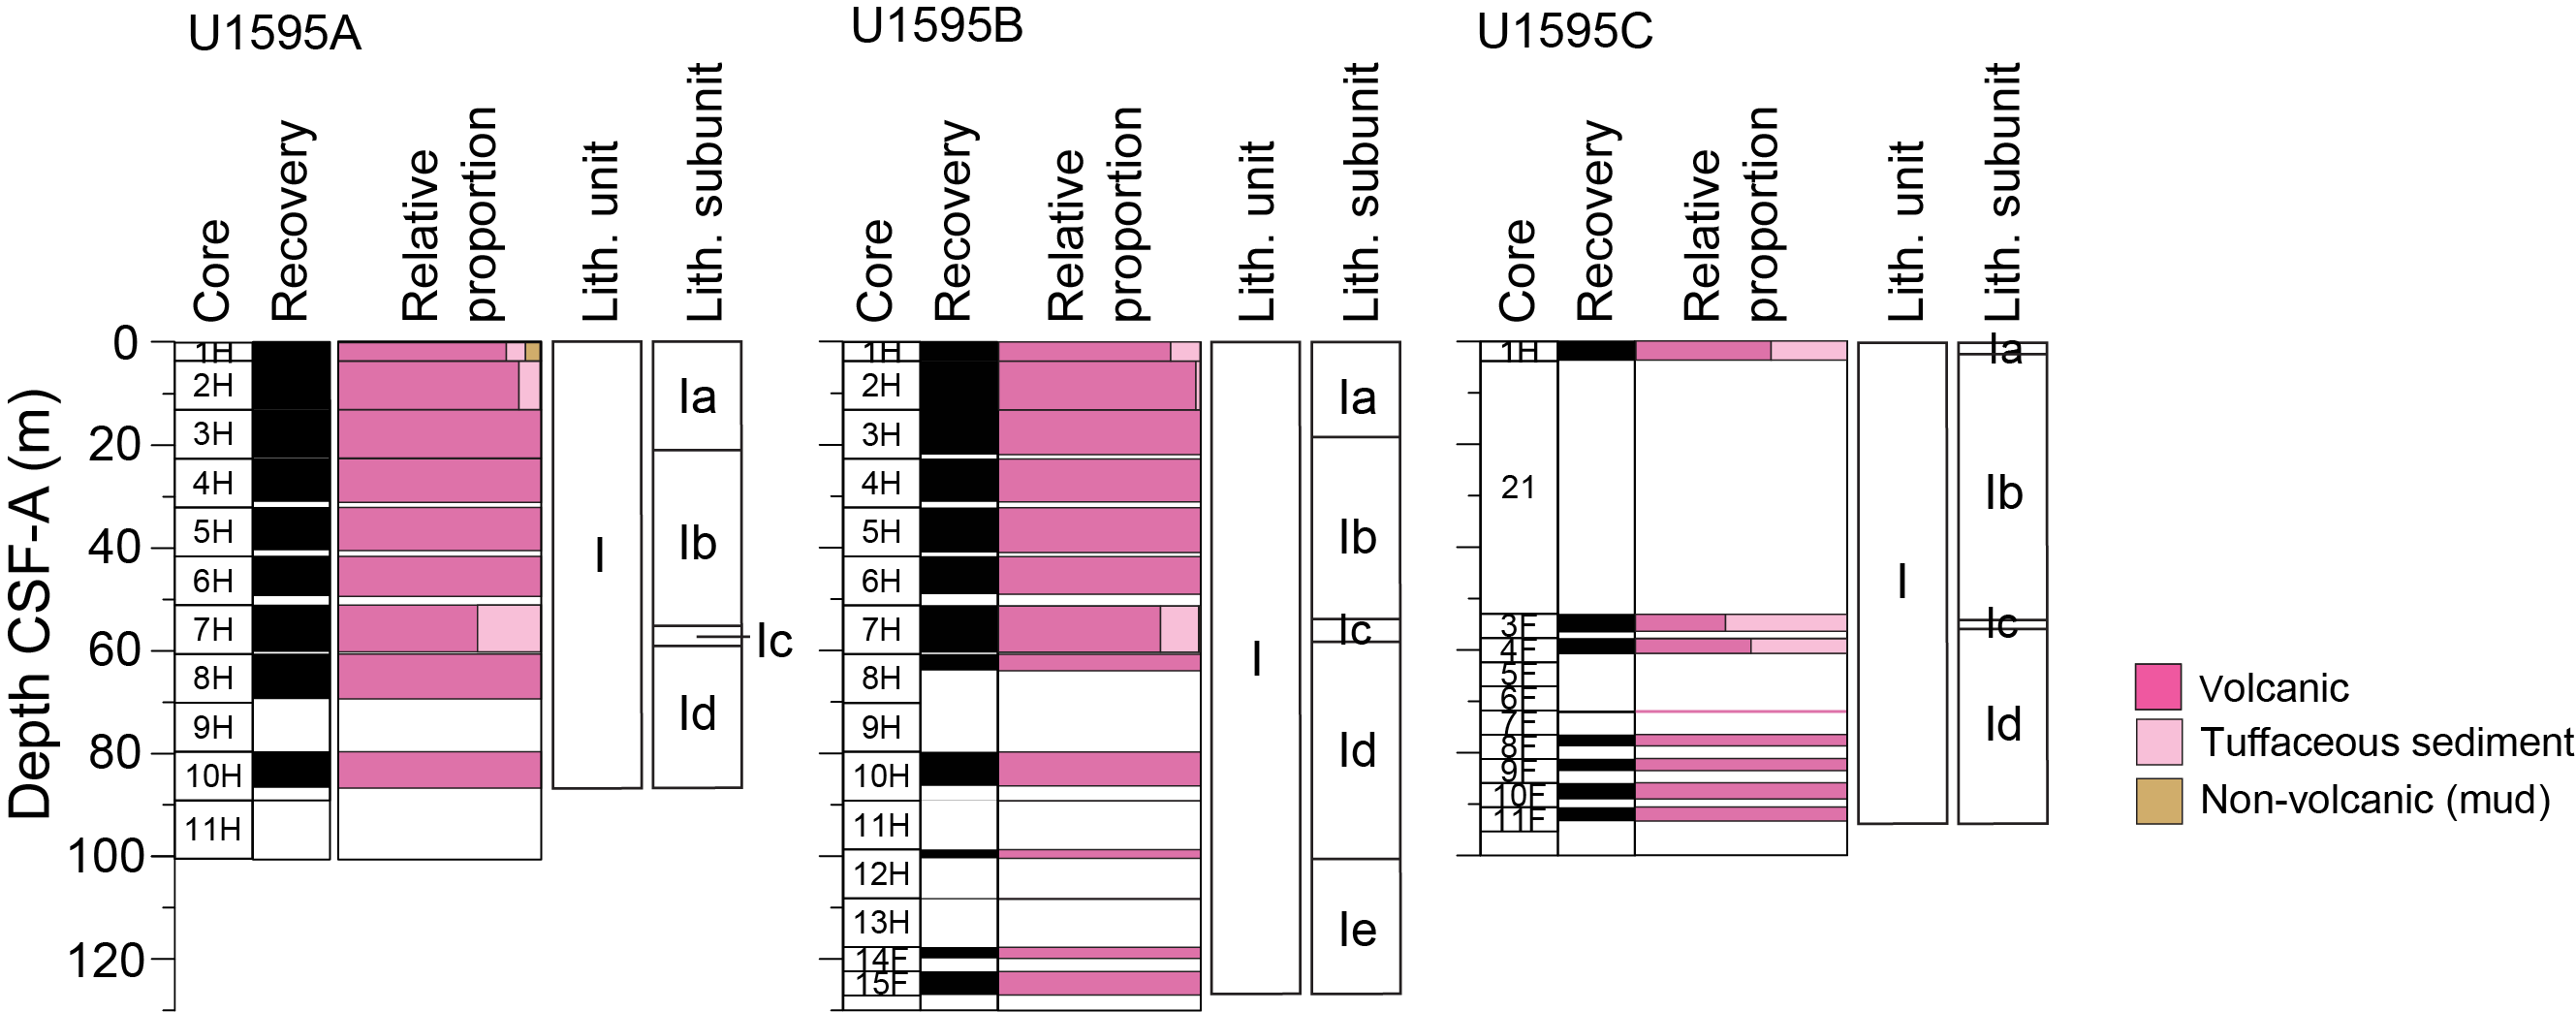
Figure F4. Volcanic, tuffaceous, and nonvolcanic lithologies.
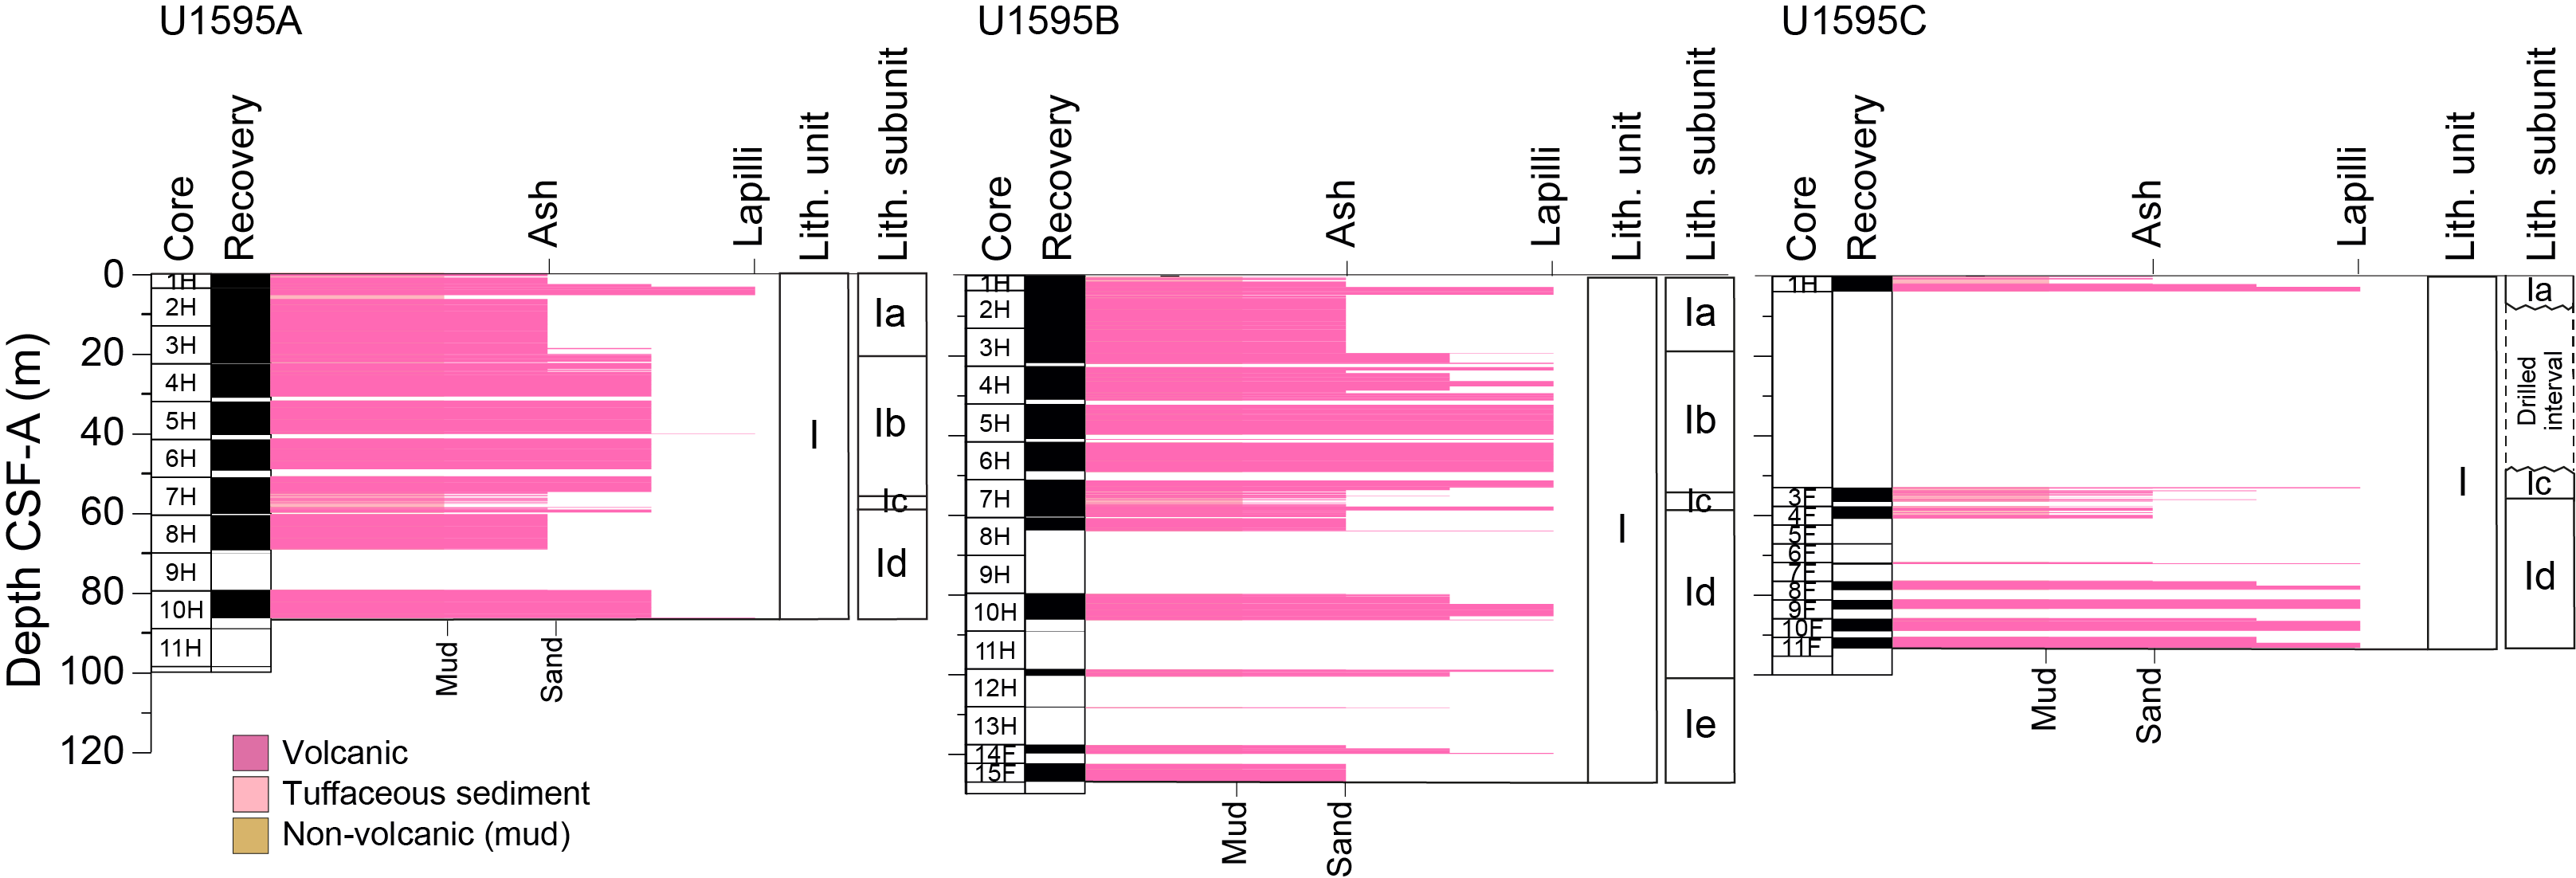
Figure F5. Grain size distribution.
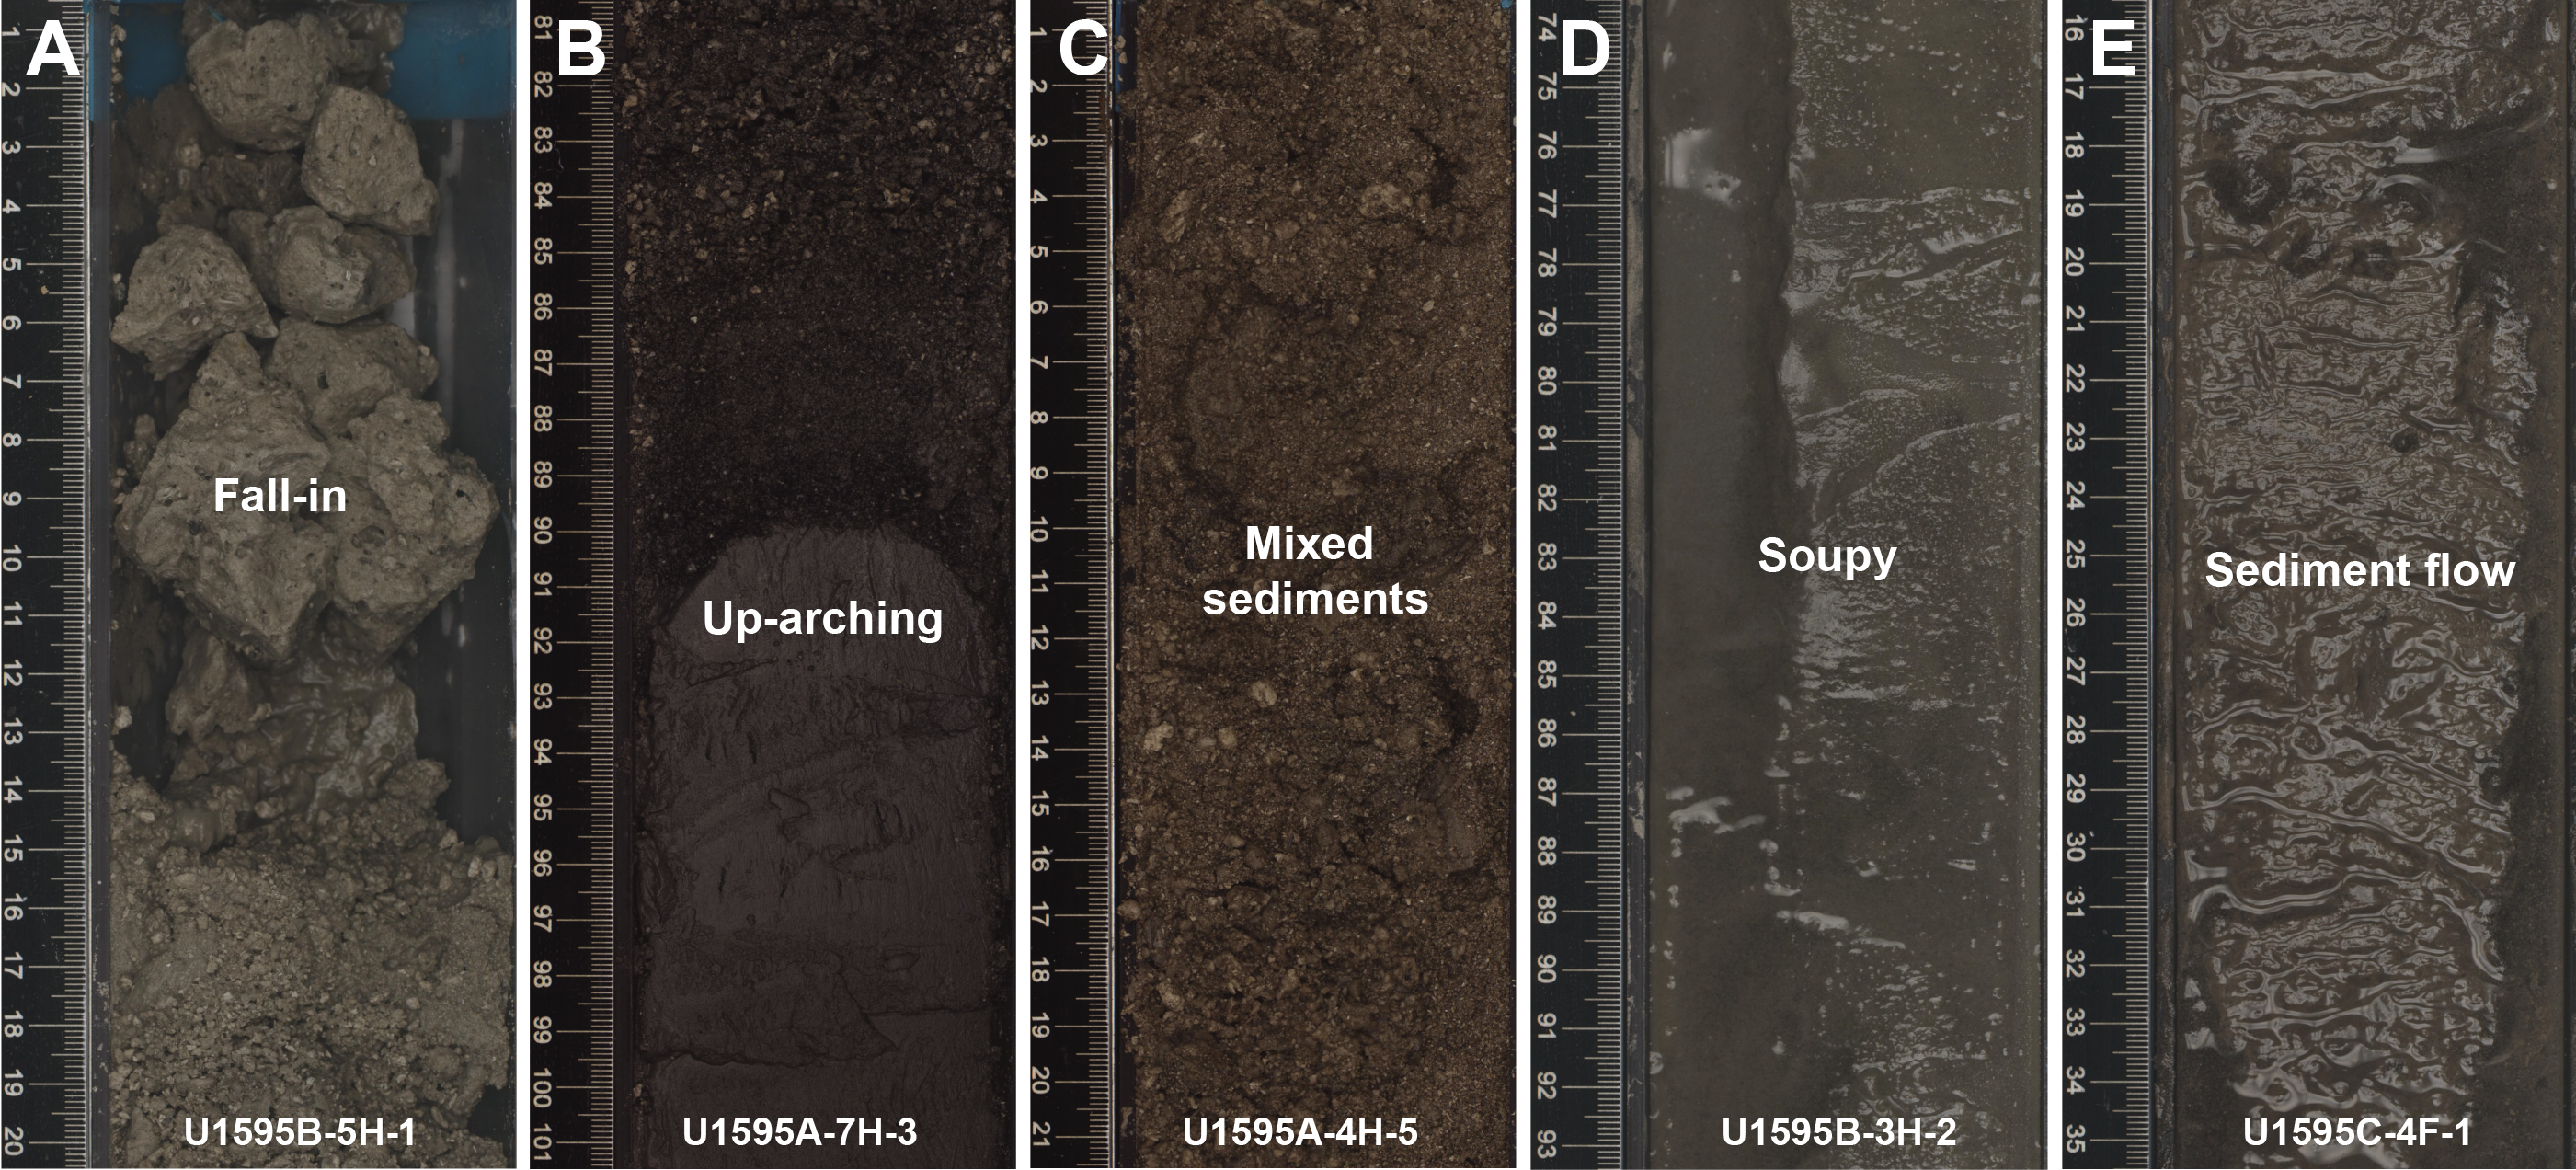
Figure F6. Core disturbances.
The following sections describe (1) the effects of core disturbance, (2) the lithostratigraphic unit and subunits, (3) correlations between holes, and (4) XRD results from Site U1595.
3.1. Core disturbance
Several types of core disturbance disrupt the lithostratigraphy at Site U1595 (Figure F6):
- Fall-in: coarse clast-supported or, in some cases, finer grained muddy intervals at the tops of many cores (Figure F6A). In these intervals, original lithofacies and sedimentary structures are usually slightly disturbed and not fully destroyed; however, fall-in can cause a severe grade of drilling disturbance because the primary stratigraphy of the sediments might be disturbed.
- Uparching: slight to moderate coring-induced shear between the sediment/ash and core liner results in bedding uniformly dragged downward along the core margins (Figure F6B). In these intervals, the original lithofacies and sedimentary structures are usually slightly to severely disturbed but can still be recognized visually.
- Mixed sediment or soupy: typically restricted to water-saturated intervals of unconsolidated ash and lapilli-ash that overprint original sedimentary or depositional structures (Figure F6C, F6D).
- Sediment flowage: high shearing rates between cored sediments and core liner leave a smear or thin trail of displaced sediment along the inside of the core liner (Figure F6E).
- Artificial size and density segregation: likely occurs during drilling or with postrecovery core handling processes (e.g., inclining, shaking, and plunging cores on the catwalk to compact sediments). Jutzeler et al. (2014) also described pseudohorizontal density grading that may occur while a core is lying flat on deck, resulting in vertical structures once the core is turned upright. Such core disturbances are observed most often in volcanic sediments because increased porosity allows sucking in of seawater during hydraulic piston coring. The resulting soupy texture allows material to flow within the core liner. Secondary normal or reverse grading, or density separation of clasts, may occur as a result of this disturbance and obscure primary sedimentary features.
3.2. Description of unit and subunits
3.2.1. Unit I
- Intervals: 398-U1595A-1H-1, 0 cm, to 10H-CC, 11 cm (bottom of the hole); 398-U1595B-1H-1, 0 cm, to 15F-CC, 13 cm (bottom of the hole); 398-U1595C-1H-1, 0 cm, to 11F-CC, 15 cm (bottom of the hole)
- Depth: 0.00–126.93 mbsf
- Thickness: >126.93 m
- Age: Holocene
- Lithology: volcanic (ash, lapilli-ash, and lapilli), minor tuffaceous sediment (tuffaceous mud), and nonvolcanic sediment (mud)
The sediment recovered from Holes U1595A–U1595C is summarized in one main lithostratigraphic unit (Unit I) and divided into five subunits (Ia–Ie) (Figures F3, F4, F5; Table T2). Figure F7 displays exemplary core section images of the main lithologies found in Unit I.
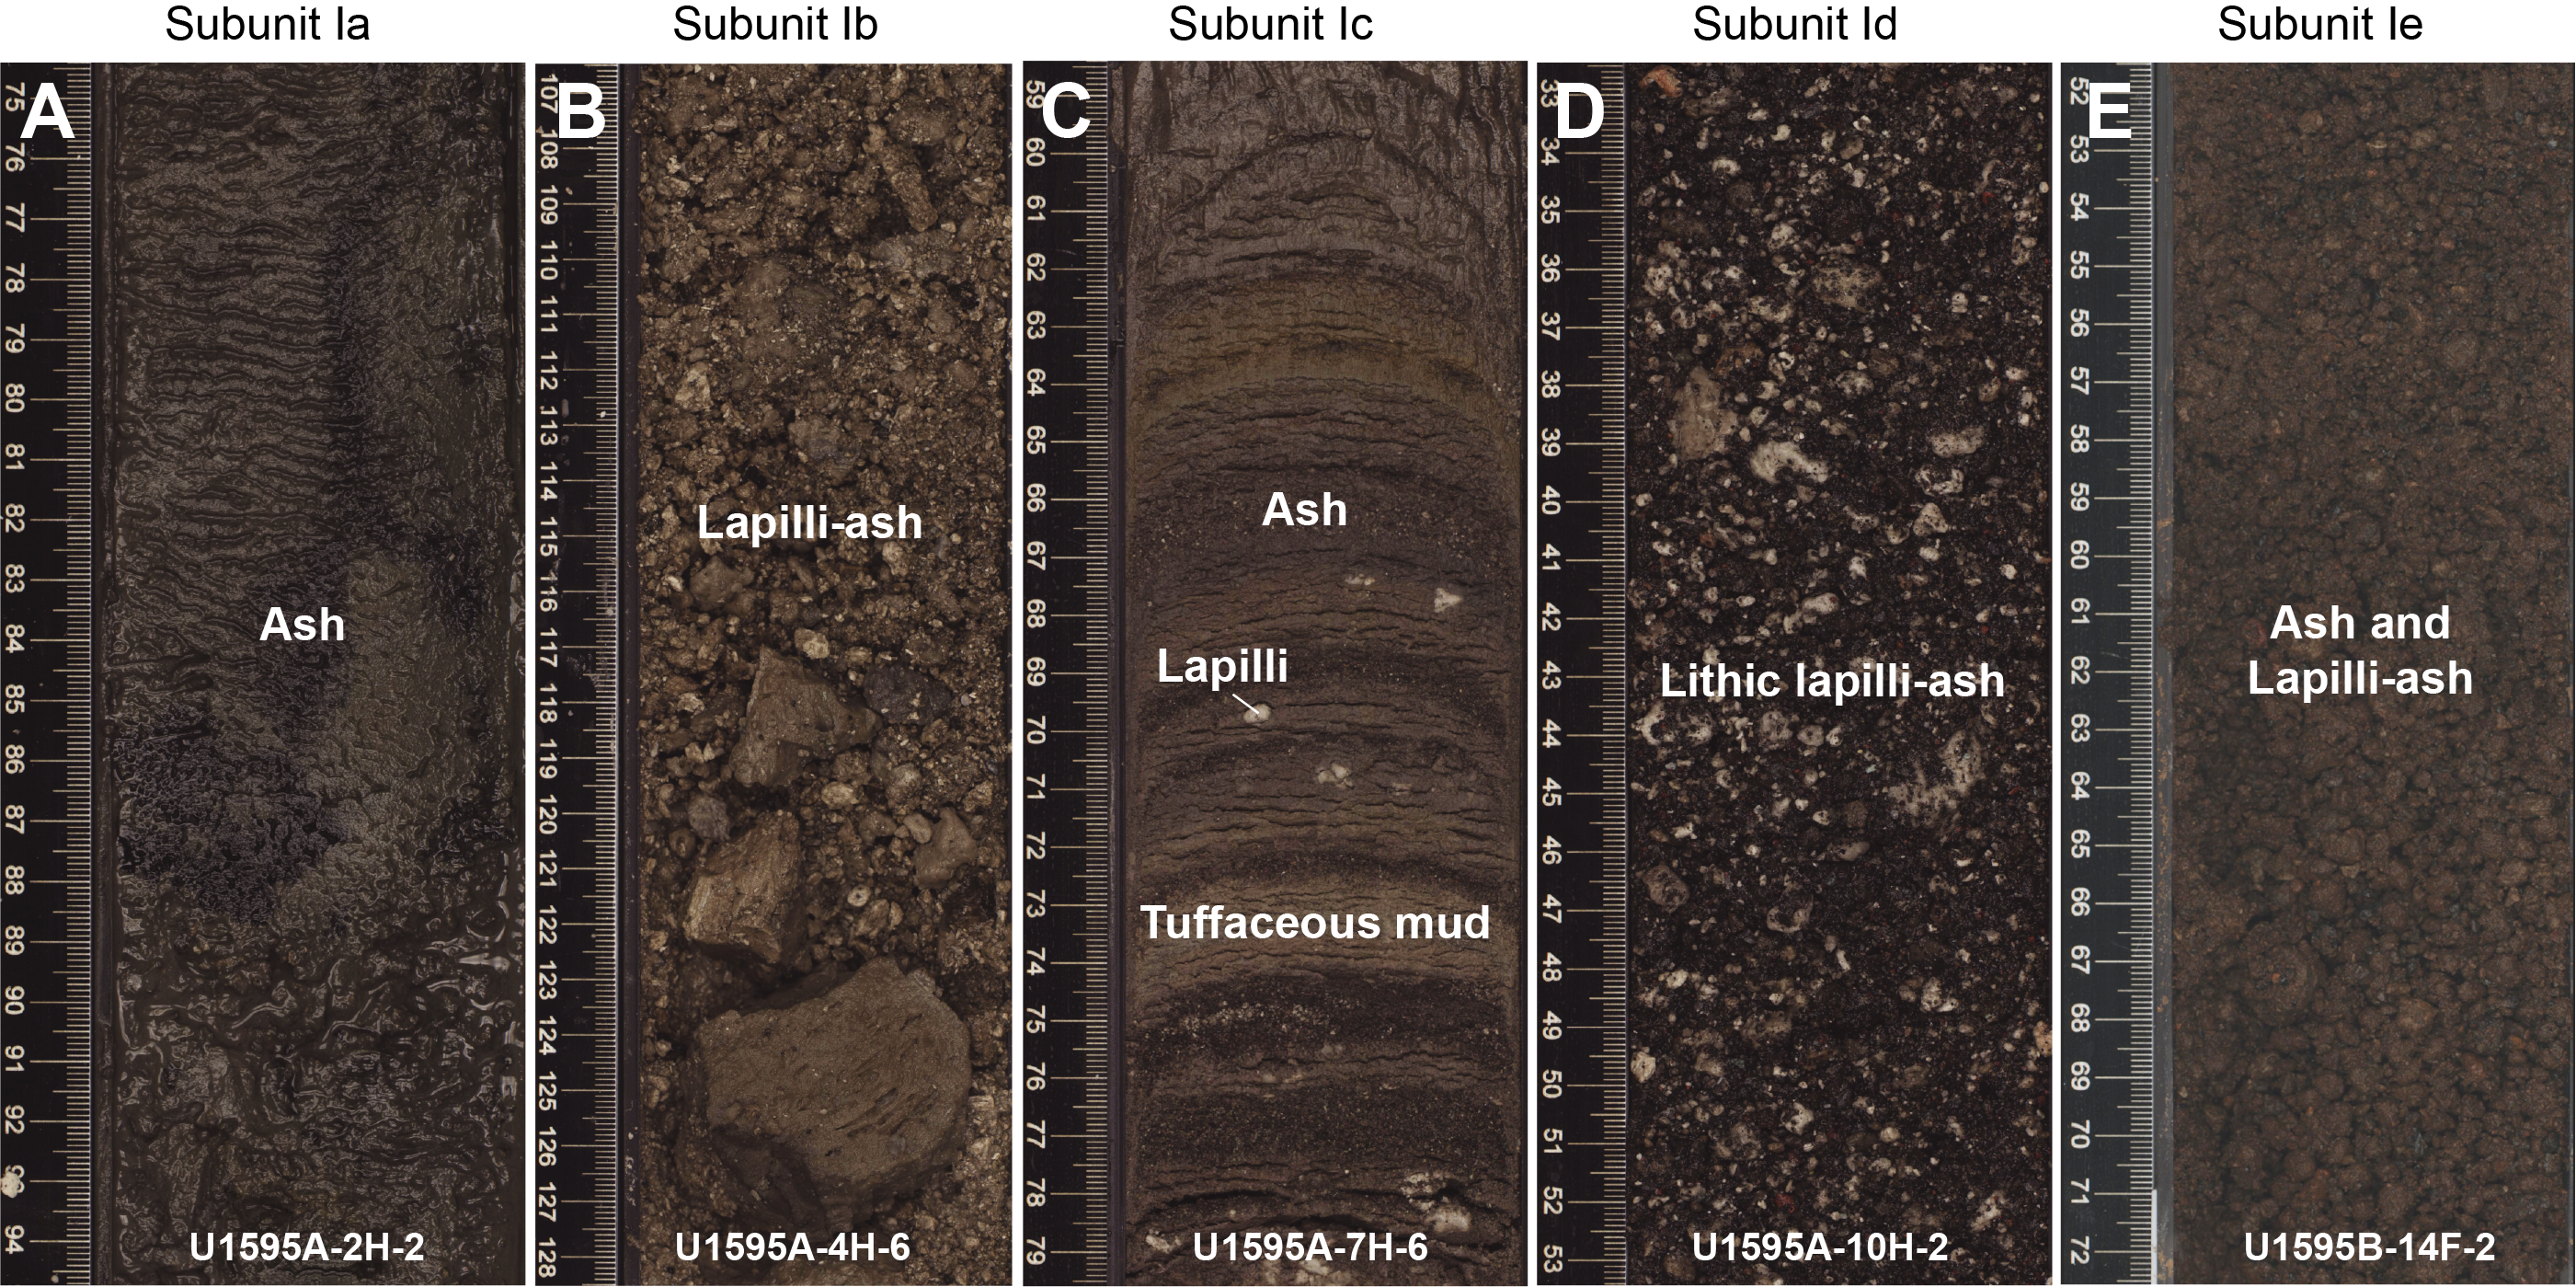
Figure F7. Subunit 1a–1c lithologies.
Unit I extends from 0 to 126.93 mbsf in Hole U1595B, the deepest drilled hole of the site (Table T2). It consists predominantly of volcanic lithologies (>75% volcanic particles; glass shards, pumice, scoria, and crystals) with small amounts of tuffaceous (25%–75% volcanic particles) and nonvolcanic sediments (<25% volcanic particles).
Volcanic lithologies (>75% volcanic particles; glass shards, pumice, and crystals) comprise ash, lapilli-ash, and lapilli. Description of these lithologies in volcanic intervals was based on the relative abundance of ash-sized (<2 mm) and lapilli-sized (2–64 mm) particles, as described in Lithostratigraphy in the Expedition 398 methods chapter (Kutterolf et al., 2024a). Ash and lapilli were used when the proportion of one grain size was >75%, and lapilli-ash described when both grain sizes were present but at <75% abundance (Fisher and Schmincke, 1984).
The subunits are described as follows:
- Subunit Ia (Sections 398-U1595A-1H-1, 0 cm, through 3H-6, 11 cm [0–20.76 mbsf]; 398-U1595B-1H-1, 0 cm, through 3H-4, 146 cm [0–19.17 mbsf]; and 398-U1595C-1H-1, 0 cm [lower contact to Subunit Ib was not cored in Hole U1595C]): ash-dominated succession of volcanic lithologies with a minor amount of mud.
- Subunit Ib (Sections 398-U1595A-3H-6, 11 cm, through 7H-3, 91 cm [20.76–55.01 mbsf], and 398-U1595B-3H-4, 146 cm, through 7H-2, 89 cm [19.17–53.6 mbsf]; Subunit Ib was not cored in Hole U1595C): lapilli-ash and lapilli-dominated succession with lesser ash.
- Subunit Ic (Sections 398-U1595A-7H-3, 91 cm, through 7H-6, 82 cm [55.01–59.46 mbsf]; 398-U1595B-7H-2, 89 cm, through 7H-5, 62 cm [53.6–57.75 mbsf]; and 398-U1595C-3F-1, 25 cm, through 3F-2, 149 cm [53.25–55.99 mbsf]): intercalated thin ash, ash lapilli, and tuffaceous mud (±lapilli).
- Subunit Id (Sections 398-U1595A-7H-6, 82 cm, through 10H-CC, 11 cm [59.46–86.7 mbsf]; 398-U1595B-7H-5, 62 cm, through 12H-CC, 33 cm [57.75–100.44 mbsf]; and 398-U1595C-3F-3, 0 cm, through 11F-CC, 15 cm [55.99–93.33 mbsf]): ash, lithic lapilli-ash, and lithic lapilli.
- Subunit Ie (Sections 398-U1595B-13H-CC, 0 cm, through 15F-CC, 13 cm [108.2–126.93 mbsf]; Subunit Ie was not cored in Holes U1595A and U1595C): red-hued ash and lapilli-ash.
3.2.1.1. Subunit Ia
Subunit Ia extends from 0 to 20.76 mbsf in Hole U1595A and from 0 to 19.17 mbsf in Hole U1595B (Figure F3; Table T2). The uppermost sediment successions of Subunit Ia were recovered in Hole U1595C; however, the lower contact of this subunit was not cored. This subunit consists predominantly of volcanic lithologies (ash, lapilli-ash, and lapilli) with minor amounts of tuffaceous sediment (tuffaceous mud) and nonvolcanic sediment (mud) in the uppermost section of Hole U1595A. In Hole U1595A, Subunit Ia starts with ~30 cm of dark (yellowish) brown (tuffaceous) mud with intercalated centimeter-scale black ash layers. In Holes U1595B and U1595C, this top interval consists of dark (yellowish) brown tuffaceous mud and very dark grayish ash with mud. The remainder of the subunit comprises intervals of ash, lapilli-ash, and lapilli, the majority of which are well sorted and olive-gray to very dark gray. Coarser grained volcanic intervals are composed of moderately to poorly sorted grayish brown to very dark gray lapilli-ash and lapilli with maximum grain sizes of medium–coarse lapilli. Pumice clasts are typically subangular and white, tan, dark brown, and dark gray. In Holes U1595A and U1595B, a 1 m thick tuffaceous mud/ash with mud interval is observed between ~5 and 6 mbsf. Directly below this is a ~9.5 m thick well-sorted, very dark gray fine ash (Figure F7A). Ash intervals below this are typically grayish brown and characterized by grain size ranging from fine to coarse ash. Within these ashes, minor amounts of dispersed light brown, subangular, medium–coarse pumice lapilli are observed. Microscopically, ash layers are characterized by transparent blocky, nonvesicular, and pumiceous glass shards with tubular vesicles (Figure F8A). Rare volcanic lithics, cuspate glass shards, and crystals are also observed.
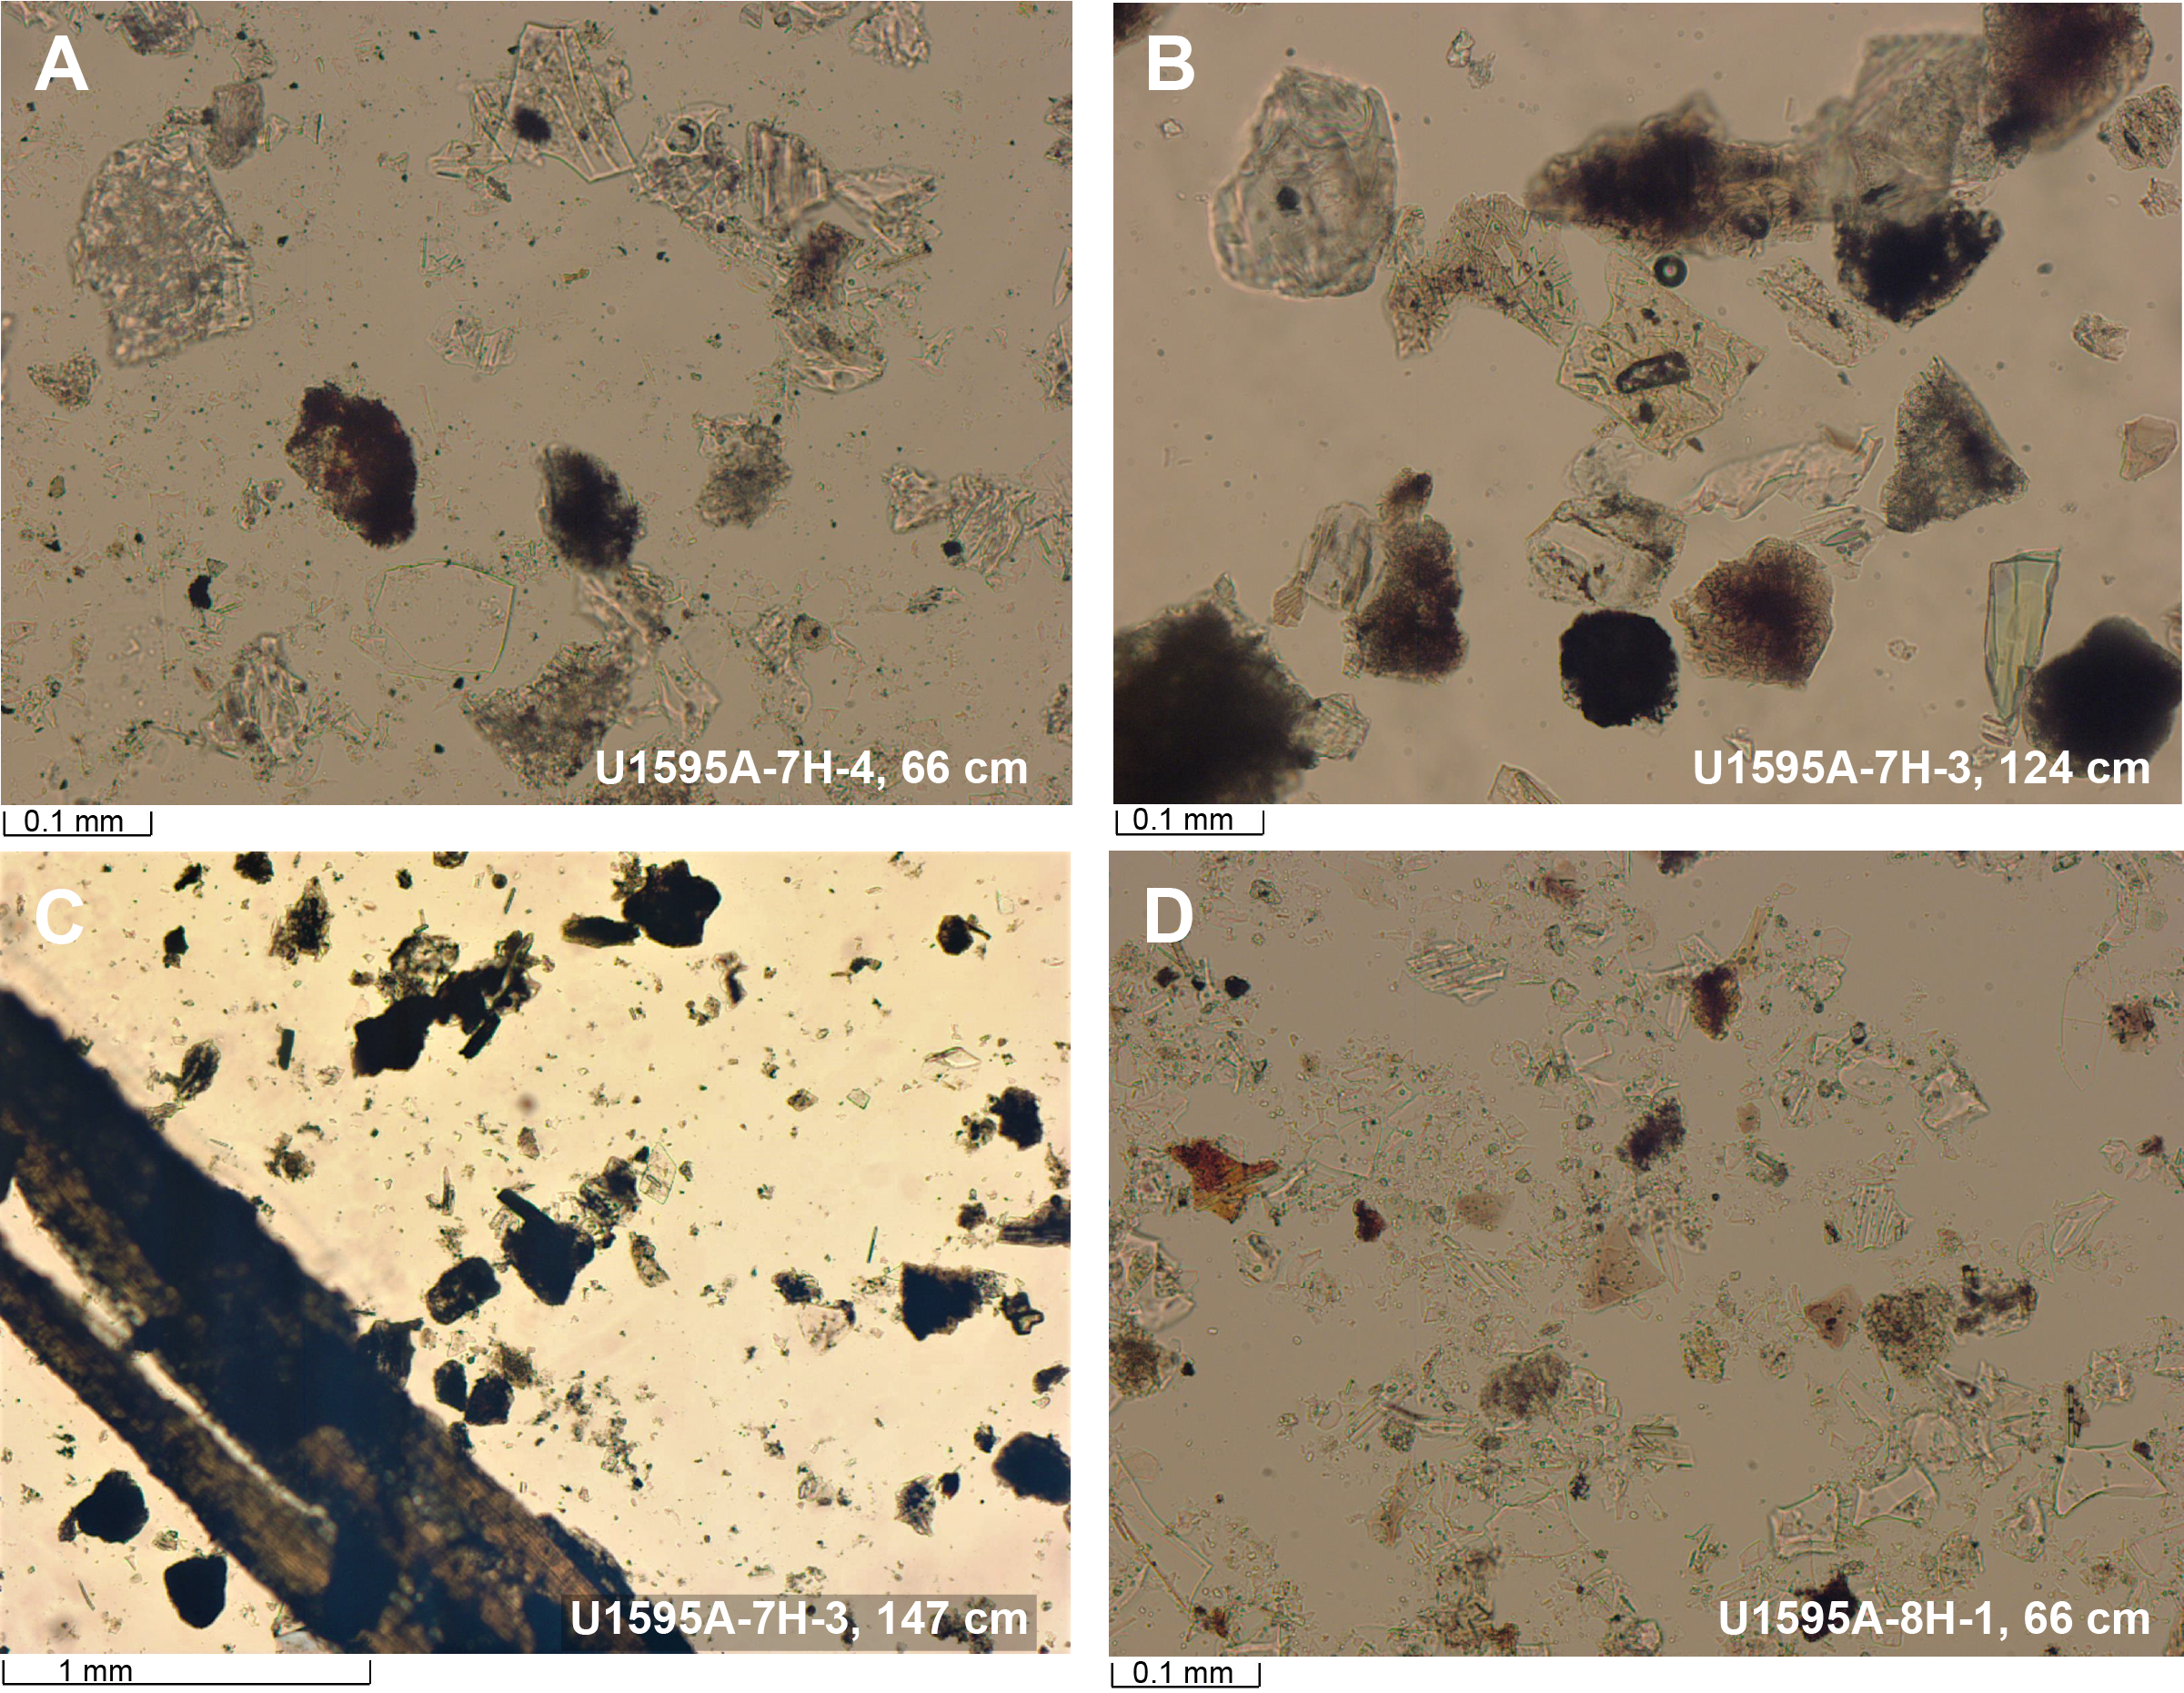
Figure F8. Subunit Ic and Id lithologies.
This subunit has lithologic similarities with Subunit Ia at Site U1594 (see Lithostratigraphy in the Site U1594 chapter [Kutterolf et al., 2024b]).
3.2.1.2. Subunit Ib
Subunit Ib extends from 20.76 to 55.01 mbsf in Hole U1595A and from 19.17 to 53.6 mbsf in Hole U1595B; it was not cored in Hole U1595C (Figure F3; Table T2). Subunit Ib consists entirely of volcanic lithologies including ash, lapilli-ash, and lapilli (Figure F7B). The boundary between the bottom of Subunit Ia and the top of Subunit Ib is recognized by the appearance of pumice lapilli and a color change from dark gray to brown to grayish brown. This subunit boundary is also marked by a distinct change in bulk density, P-wave velocity, and natural gamma radiation (NGR) (see Physical properties). Bulk density decreases significantly at the subunit boundary, whereas the decrease in NGR across the boundary is more gradual. P-wave velocities also display a sharp change at the subunit boundary, becoming strikingly more scattered but, on average, higher in Subunit Ib (see Physical properties).
The lapilli-ash of Subunit Ib is light grayish brown to dark gray and comprises poorly to moderately sorted, subrounded to subangular pumice lapilli. The pumice lapilli are typically brownish gray to dark gray and moderately to highly vesicular, with vesicle shapes ranging from elongated to tubular. Banded pumice lapilli and pumice with mafic enclaves are common throughout this subunit. The bands and enclaves are recognizable as dark-colored bands or dark, rounded, equant patches in generally lighter colored or brown pumice.
This subunit has lithologic similarities with Subunit Ib at Site U1594 (see Lithostratigraphy in the Site U1594 chapter [Kutterolf et al., 2024b]).
3.2.1.3. Subunit Ic
Subunit Ic extends from 55.01 to 59.46 mbsf in Hole U1595A, from 53.6 to 57.75 mbsf in Hole U1595B, and from 53.25 to 55.99 mbsf in Hole U1595C (Figure F3; Table T2). The subunit is ~3–4.5 m thick but comprises numerous individual intervals. The subunit begins with ~40 cm of fine-grained black ash or tuffaceous mud, and physical properties show marked changes (see Physical properties). Below this are intercalated volcanic layers with tuffaceous mud (±lapilli) (Figures F7C, F8A). The volcanic intervals are mainly dark-colored and well-sorted ashes with sharp lower boundaries and usually gradational upper boundaries, characterized by an average grain size of fine ash in Holes U1595A and U1595B and coarse ash in Hole U1595C. Some ash layers contain gray pumice, black volcanic lithics, red oxidized lithics, and plagioclase crystals. Some layers have a dark gray to black crystal-rich base (Figures F7C, F8B).
In the uppermost part of Subunit Ic, tuffaceous intervals are well sorted and characterized by a very dark gray color, sharp boundaries, and the presence of plant fragments and hydrothermally altered/oxidized sediment (Figure F8C). Organic material, probably marine plant residue, is observed in Section 398-U1595A-7H-3, 146 cm. In Hole U1595B, an interval of tuffaceous mud in this subunit is anomalously green and may be from green clay or bacterial interaction (interval 398-U1595B-7H-4, 28–32 cm). The lowermost part of the subunit consists of several intervals of dark gray to dark olive-gray tuffaceous mud ± lapilli/ash pods. In Hole U1595A, lapilli in these intervals are subrounded pumice clasts, and in Holes U1595B and U1595C, occasional well-rounded pumice lapilli occur.
3.2.1.4. Subunit Id
Subunit Id extends from 59.46 to 86.7 mbsf in Hole U1595A, from 57.75 to 100.44 mbsf in Hole U1595B, and from 55.99 to 93.33 mbsf in Hole U1595C (Figure F3; Table T2). The bottom of this subunit was not cored in Holes U1595A and U1595C. Subunit Id consists entirely of volcanic lithologies (i.e., ash, tuffaceous mud, lapilli-ash, and lapilli) (Figures F7D, F8D). The subunit begins with a dark-colored lithic lapilli-ash interval characterized by subrounded gray pumice, black lithics, red oxidized lithics, and plagioclase crystals. This is followed by a dark gray to dark grayish brown, well-sorted ash or intercalated ash with tuffaceous mud interval with an average grain size of fine ash and a maximum grain size of fine lapilli (Figure F5). The base of this interval contains pumice, red oxidized lithics, and plagioclase crystals. Subunit Id ends with a moderately sorted lithic lapilli-ash/lapilli interval dominated by dark-colored lithics and red oxidized lithics with white, gray, and tan pumice lapilli (Figure F7D).
3.2.1.5. Subunit Ie
Subunit Ie was only recovered in Hole U1595B, and it extends from 108.2 to 126.93 mbsf (Sections 13H-CC, 0 cm, through 15F-CC, 13 cm [bottom of the hole]) (Figure F3; Table T2). The bottom of this subunit was not recovered. Subunit Ie is distinguished from Subunit Id by a distinct change in lithology from coarser grained, lithic-rich volcanics above to a more red-hued, finer grained volcanic sequence below (Figure F5). The subunit begins with a lapilli-ash layer with subrounded pumice lapilli and a red cobble-sized volcanic lithic in the first few centimeters. This is followed by an interval of moderately to well-sorted, dusky red to reddish black ash and lapilli-ash with a maximum grain size of medium–coarse lapilli (Figure F7E). Lapilli clasts are typically subrounded brown pumice and oxidized scoria. Lithic clasts consist of black volcanics, oxidized lithics, and obsidian glass. Two normally graded volcanic intervals and one symmetrically graded interval (normal to reverse) are observed in Sections 14F-1 and 14F-2, respectively. The lowermost part of this subunit consists of a well-sorted, nongraded, dark gray ash layer characterized by grain size ranging from coarse ash to fine lapilli. Clasts in this interval are subrounded white and tan pumice lapilli and black volcanic lithics.
3.3. Correlations between holes
The recovered sediments from Holes U1595A–U1595C allow for correlation of sediment-specific features such as volcanic layers (e.g., discrete ash or lapilli layers) or organic-rich horizons. All holes largely overlap in an effort to fill gaps in recovery and obtain a complete record. Holes U1595A and U1595B extend to 86.68 and 126.93 mbsf, respectively. Hole U1595C recovery extends to 93.33 mbsf with a gap in coring between 3.73 and 53 mbsf. Here, we highlight notable lithologic correlations between Holes U1595A–U1595C.
3.3.1. Notable correlated deposits
- 17–55 mbsf: nearly 40 m of grayish brown ash, lapilli-ash, and lapilli were correlated between Holes U1595A and U1595B (Figure F9A). Components generally are subrounded pumice and scoria with abundant mafic enclaves. Volcanic lithics are variably present in coarser grained intervals.
- 57–57 mbsf: tuffaceous muds (variably organic rich) with closely intercalated ash layers appear in Holes U1595A–U1595C (Figure F9B). The tuffaceous muds in this region are distinct in color with yellowish red to very dark grayish green intervals. The ash layers are generally 1–2 cm thick with sharp lower boundaries and gradational upper boundaries.
- ~80–100 mbsf: a distinctive lithic lapilli layer appears across all three holes (Figure F9C). Lapilli clasts consist primarily of rounded black volcanic rock lithics with minor scoria, pumice, and red oxidized lithics.
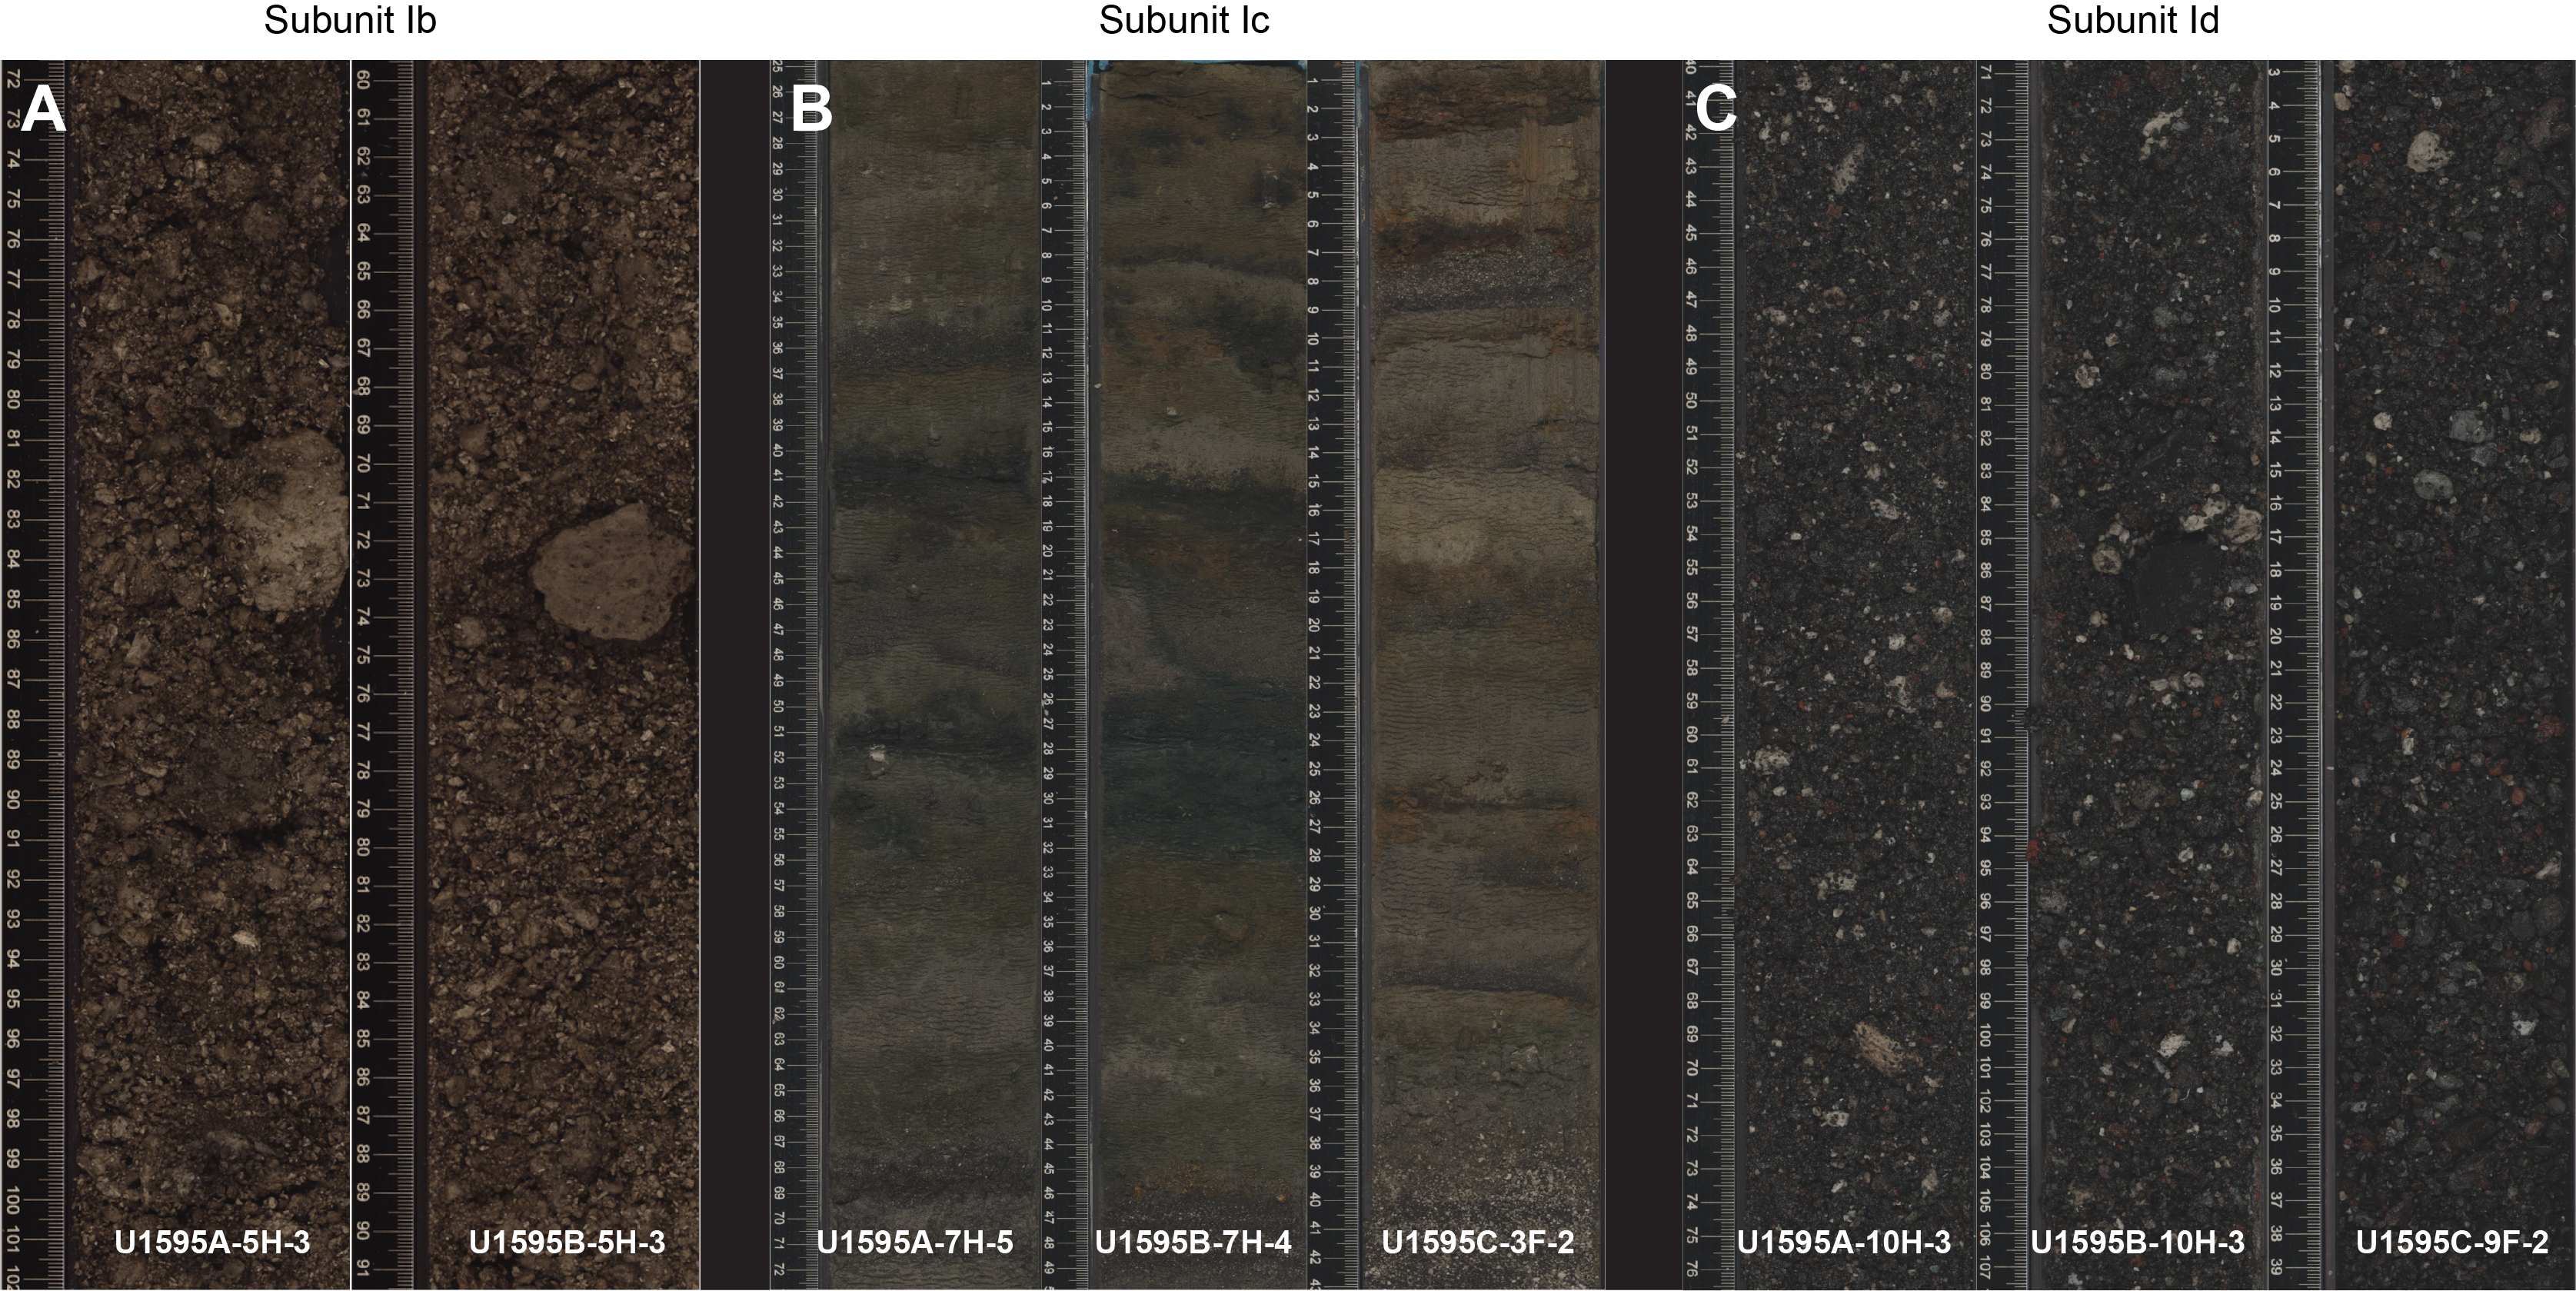
Figure F9. Correlation between lithologies.
3.4. X-ray diffraction
XRD data were collected from four IW squeeze cake sediment residues from Hole U1595A, six from Hole U1595B, and one from Hole U1595C. The analyzed samples comprise lithologies from Subunits Ia, Ib, and Ic.
Figure F10 shows XRD spectra of ash samples and a tuffaceous mud with lapilli. The ash samples show the typical hump at low °2θ that is characteristic of volcanic glass. The only identified primary crystalline phase in the ash is Ca-rich plagioclase, which was identified alongside clay minerals of the illite group. The tuffaceous mud shows characteristics similar to the ash samples but with a slightly less pronounced amorphous hump at low °2θ and the presence of Ca-rich plagioclase. In addition, a small amount of a silica phase (quartz) was identified.
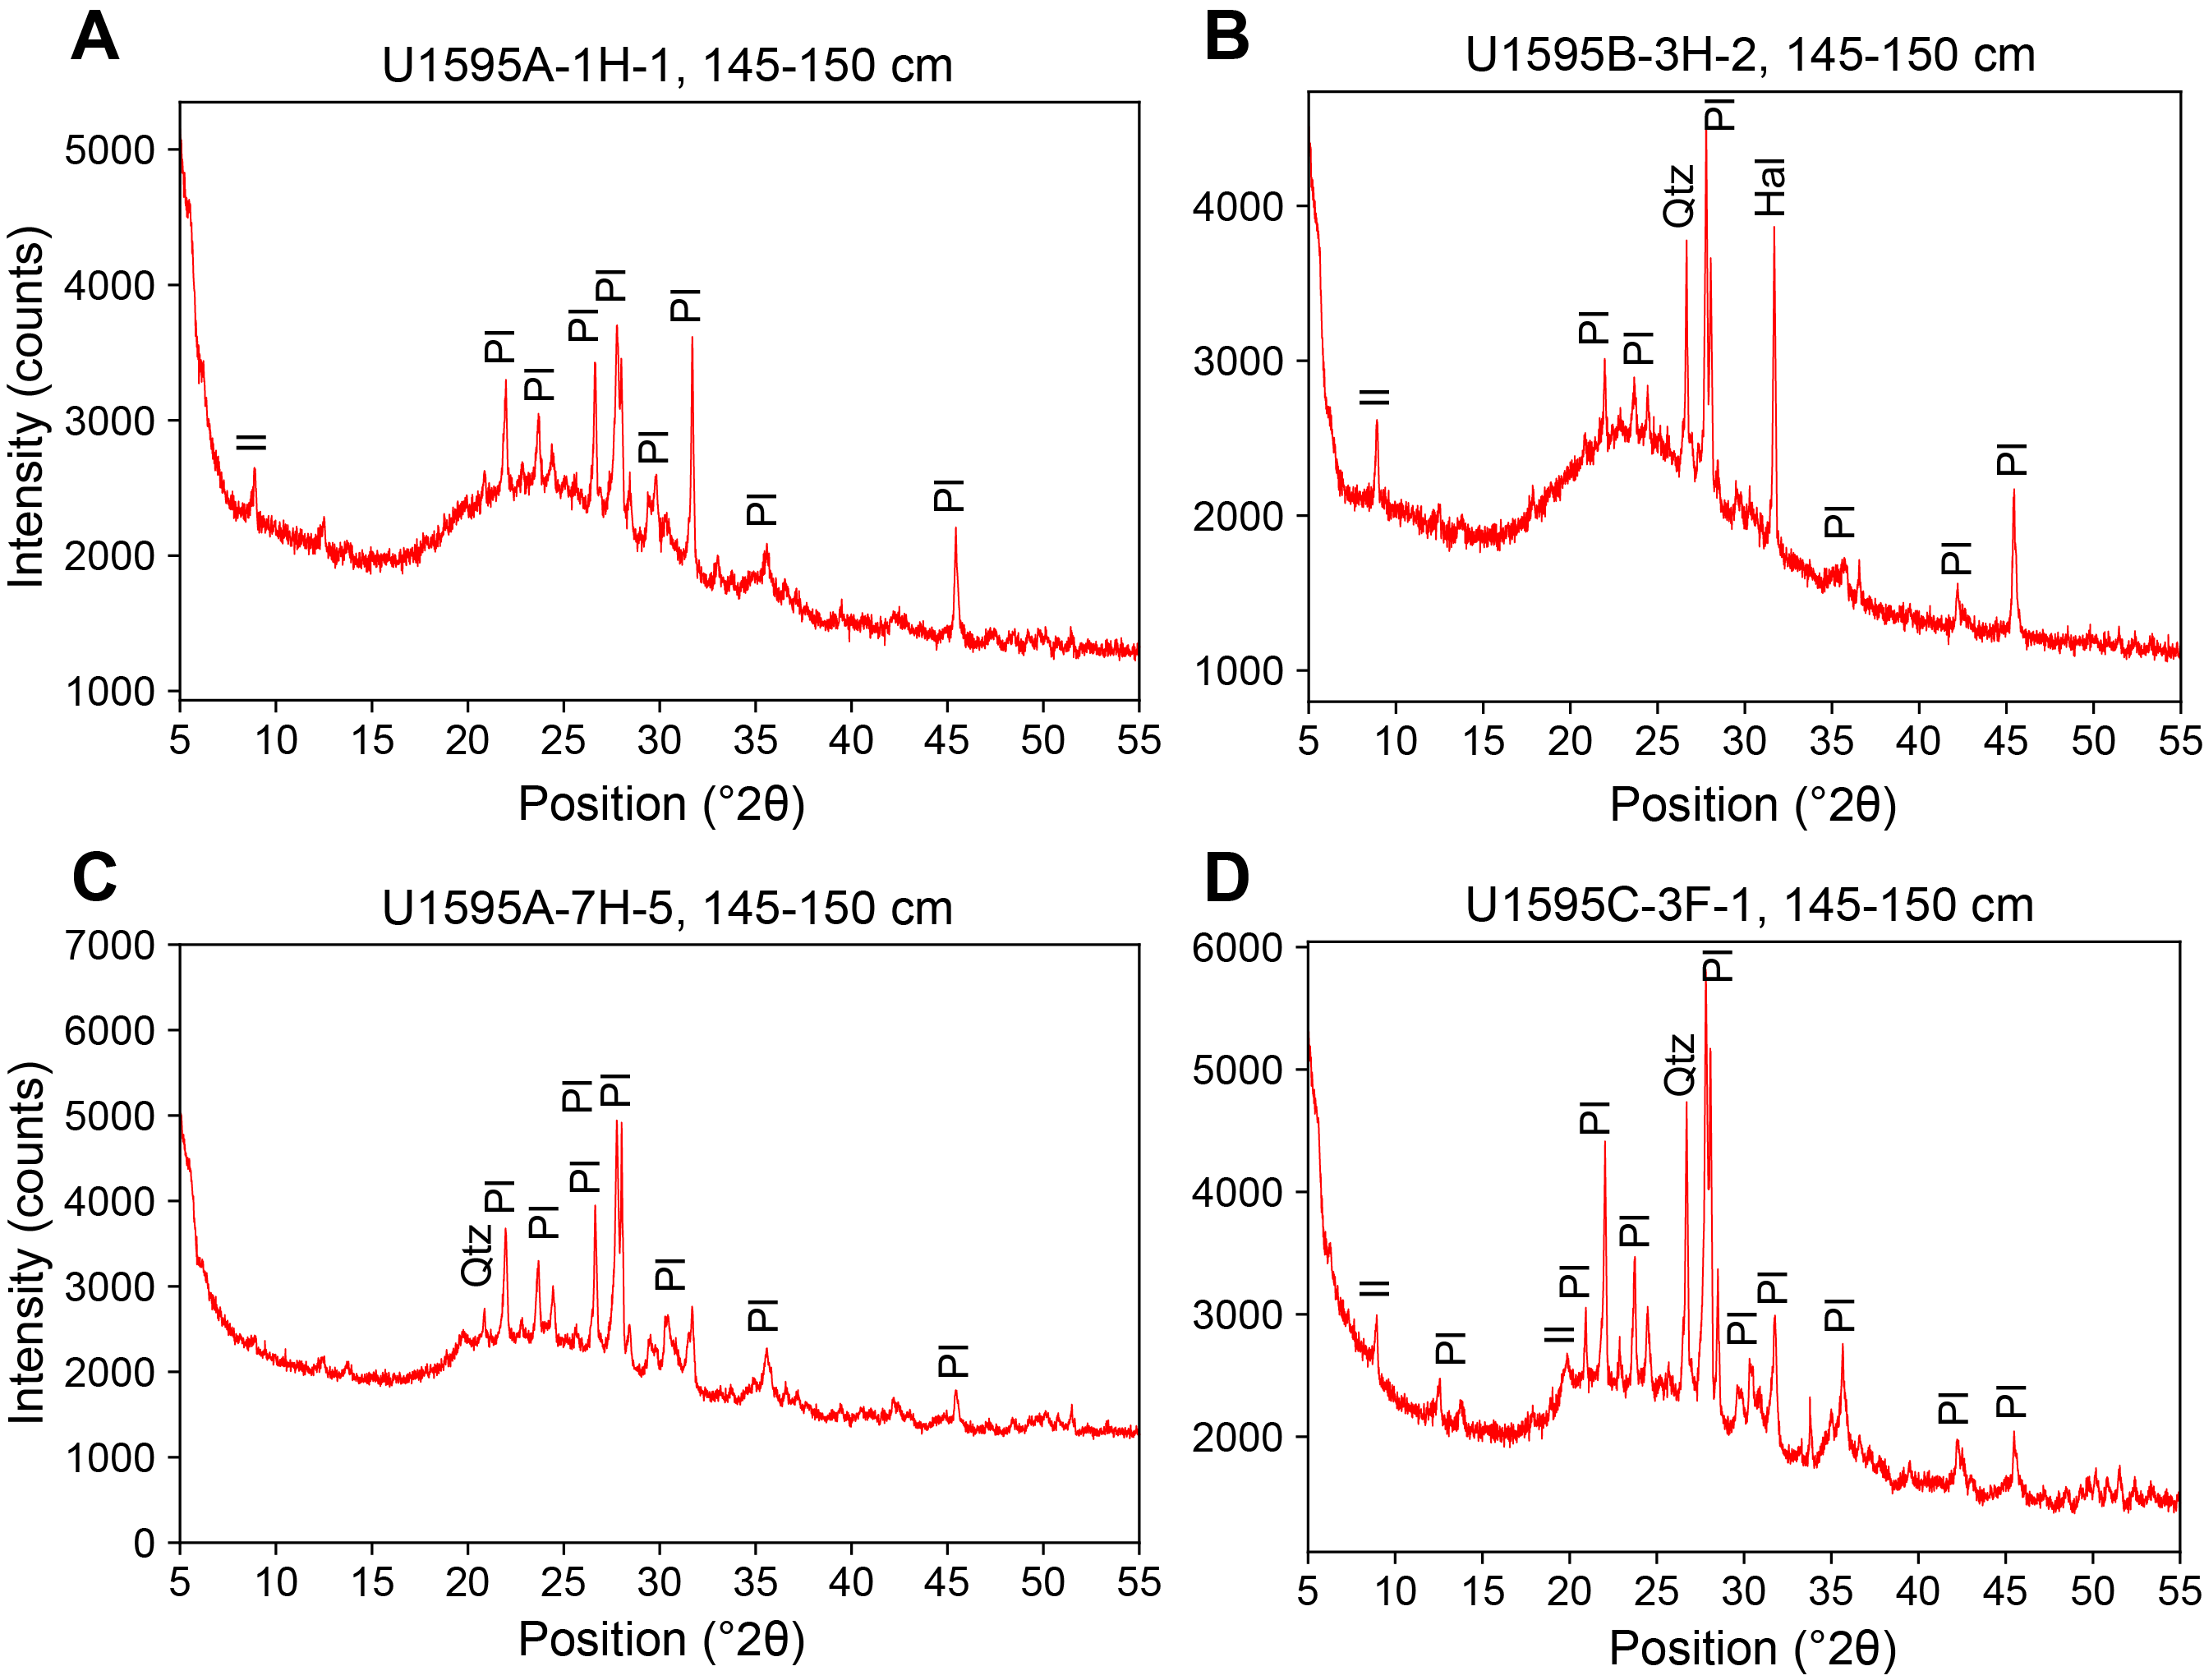
Figure F10. XRD spectra.
4. Stratigraphic correlation
Three holes were drilled at Site U1595. Holes U1595A and U1595B were drilled with the full APC system. Hole U1595A penetrated to 89.1 mbsf, and Hole U1595B penetrated to 126.98 mbsf. Hole U1595C cored the mudline with a full APC stroke and cored to 93.33 mbsf with the HLAPC system; the interval between 3.77 and 53.0 mbsf was drilled without recovery.
No correlation during coring was required because of the very challenging drilling conditions. Therefore, we did not use the Special Task Multisensor Logger (STMSL) for measurements of physical properties for fast correlations.
4.1. Correlation for establishing CCSF-A depth scale and construction of the splice
To establish the core composite depth below seafloor, Method A (CCSF-A), depth scale, we analyzed Holes U1595A–U1595C for their physical properties using the Whole-Round Multisensor Logger (WRMSL; for magnetic susceptibility [MS] and gamma ray attenuation [GRA] density) and the Natural Gamma Radiation Logger (NGRL; for NGR intensity), as well as photos once the cores were split into working and archive halves (see Physical properties; also see Physical properties in the Expedition 398 methods chapter [Kutterolf et al., 2024a]). In general, correlation was very challenging at this site. Only the MS data allowed several reliable correlations, whereas NGR and GRA density measurements were strongly overprinted by the irregular distribution of core material in cores with low recovery and a high water content.
All three holes recovered the mudline, and we used Core 398-U1595A-1H as the initial anchor for stratigraphic correlation. From there, we attempted to determine the relative depth offset of each core by establishing affine ties between the holes based on the maximum correlation of all measured physical properties. These depth offsets are reported in Table T3. Figure F11 shows the MS data for the three holes on the resulting CCSF-A scale, in which individual cores are shifted according to the identified correlations. This figure highlights the vertical alignment of characteristic events in the adjacent holes.
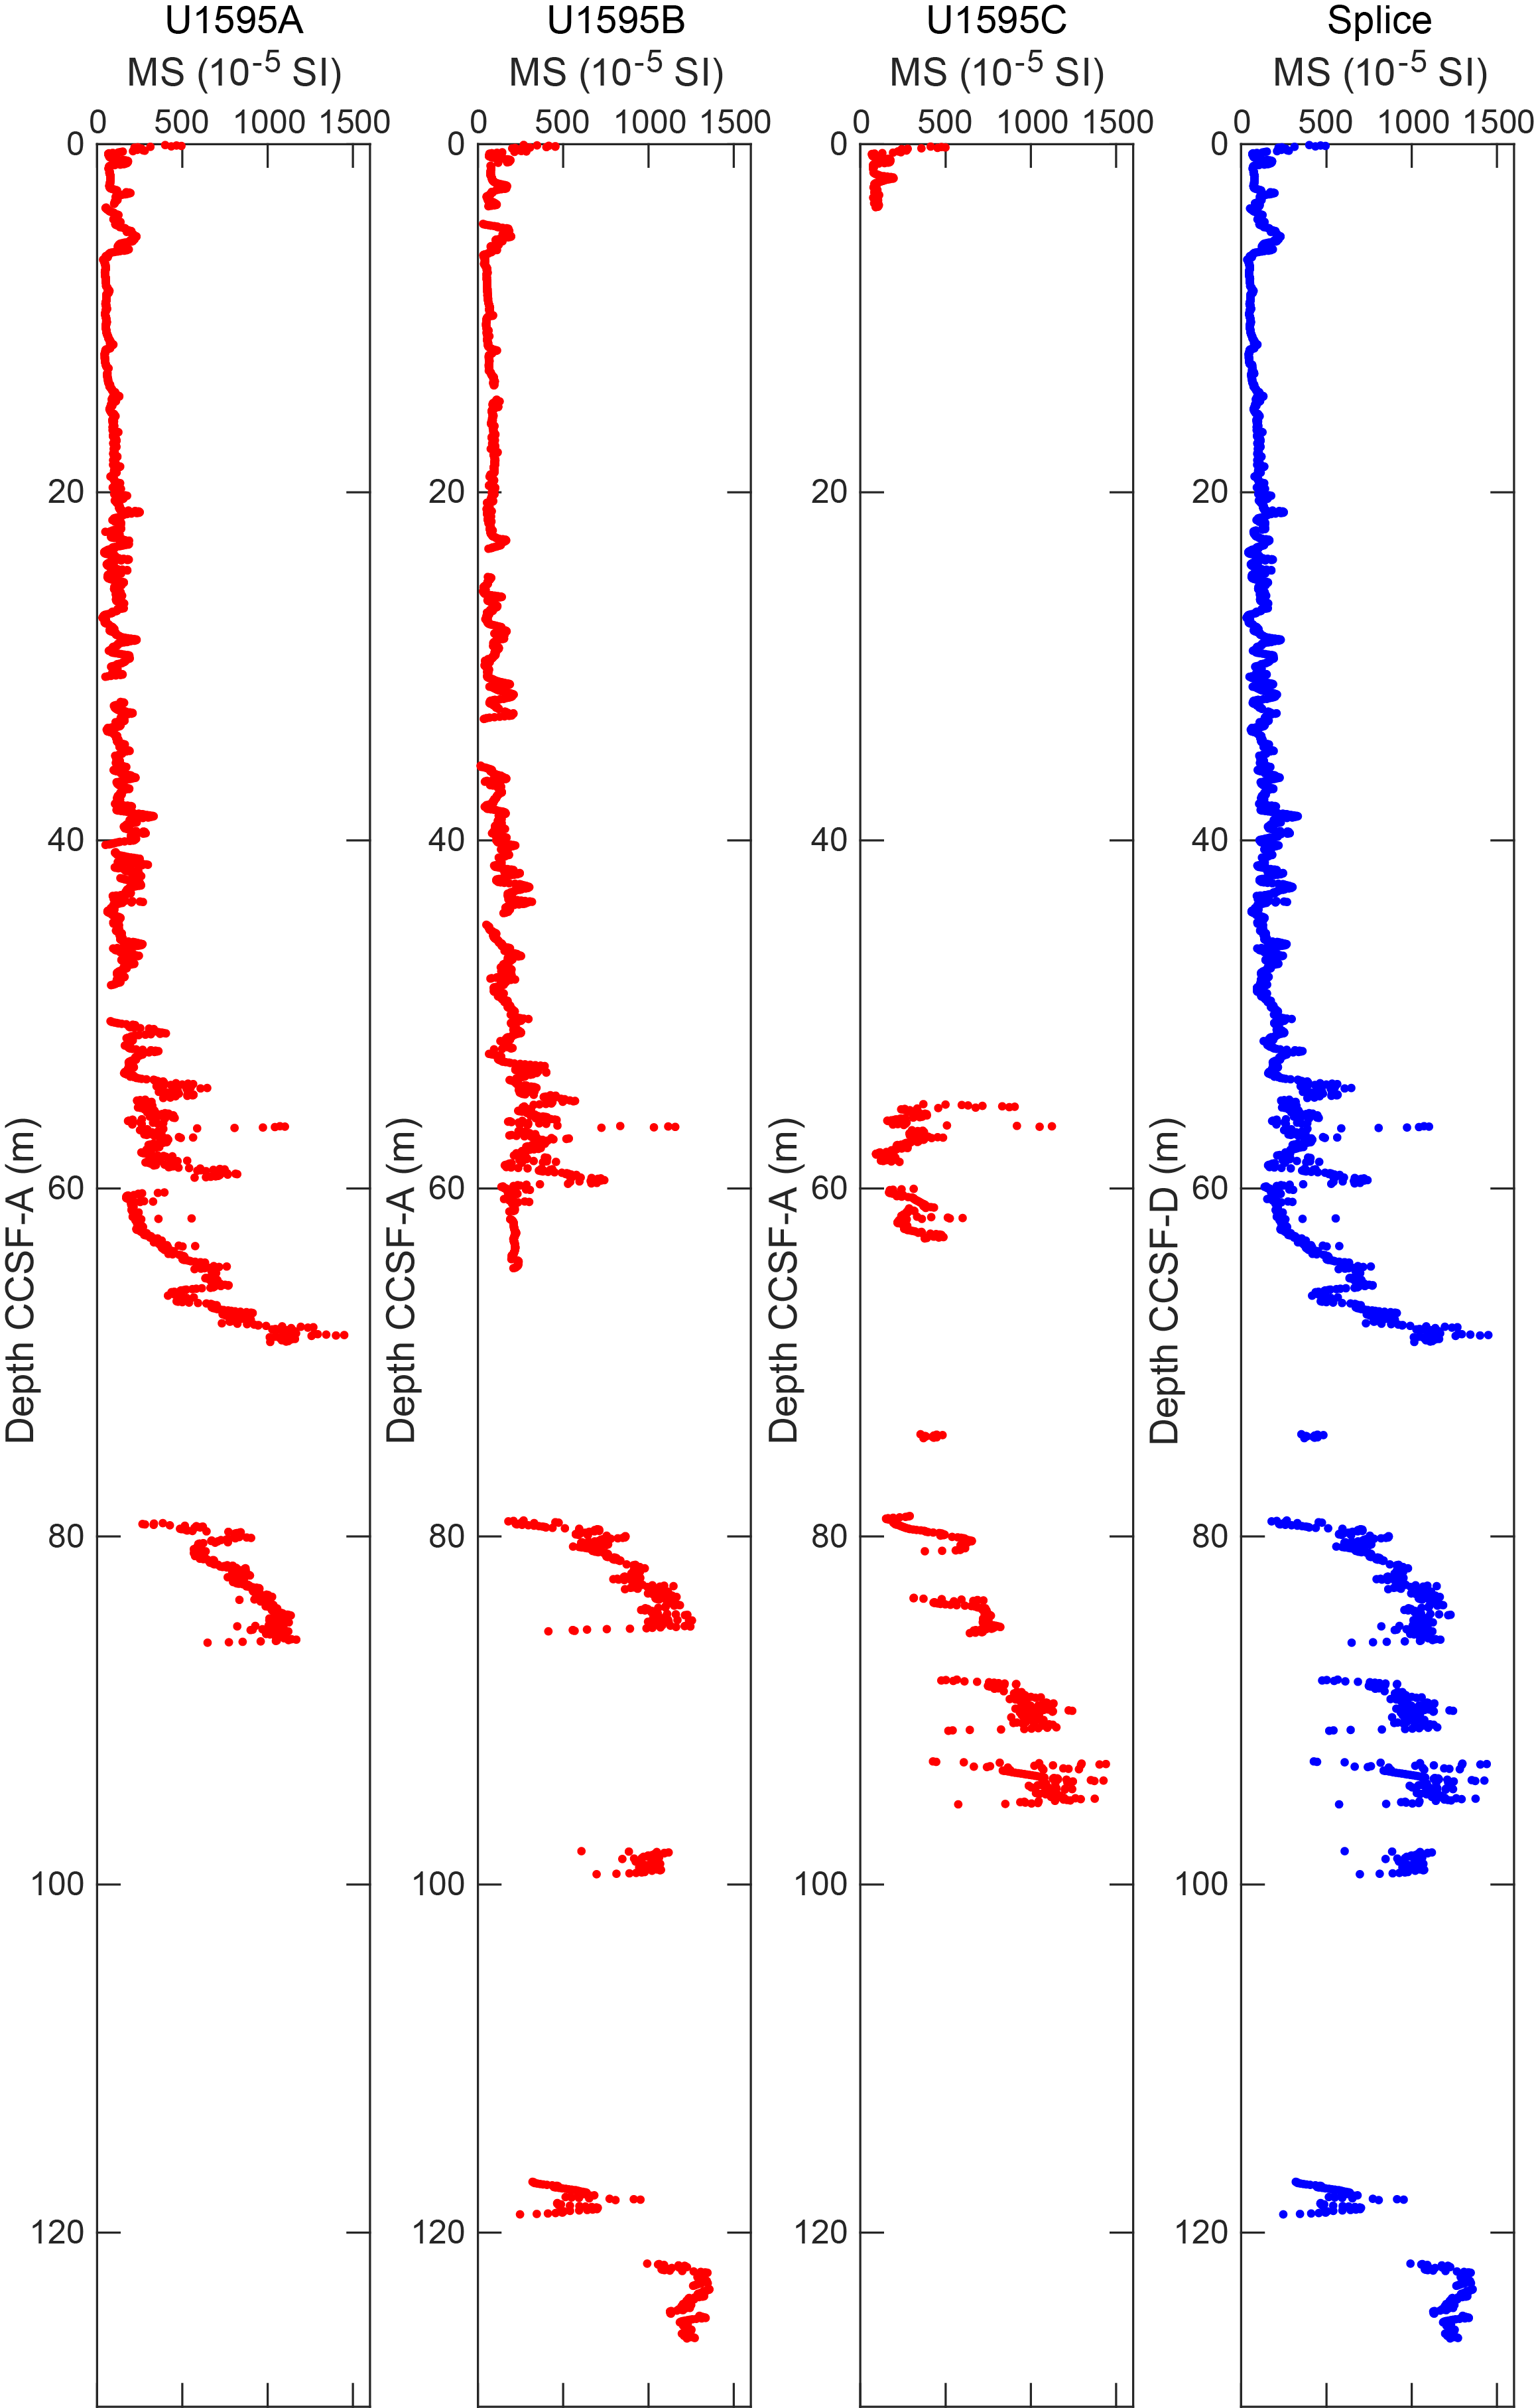
Figure F11. MS data.
Stratigraphic correlation was difficult at this site because of the high lateral variability of lithologies and the soupy nature of the recovered material, which led to the occurrence of interruptions in the stratigraphic correlation. For each of these interruptions, we used the relative offset between untied (uncorrelated) cores derived from the CSF-A scale to keep the composite depth scale as close to the original CSF-A scale as possible.
Once we established the composite (CCSF-A) depth scale, we spliced selected sequences from Holes U1595A–U1595C to create the most complete and representative section possible. The end product of this process is reported in Table T4 and Figures F11 and F12.
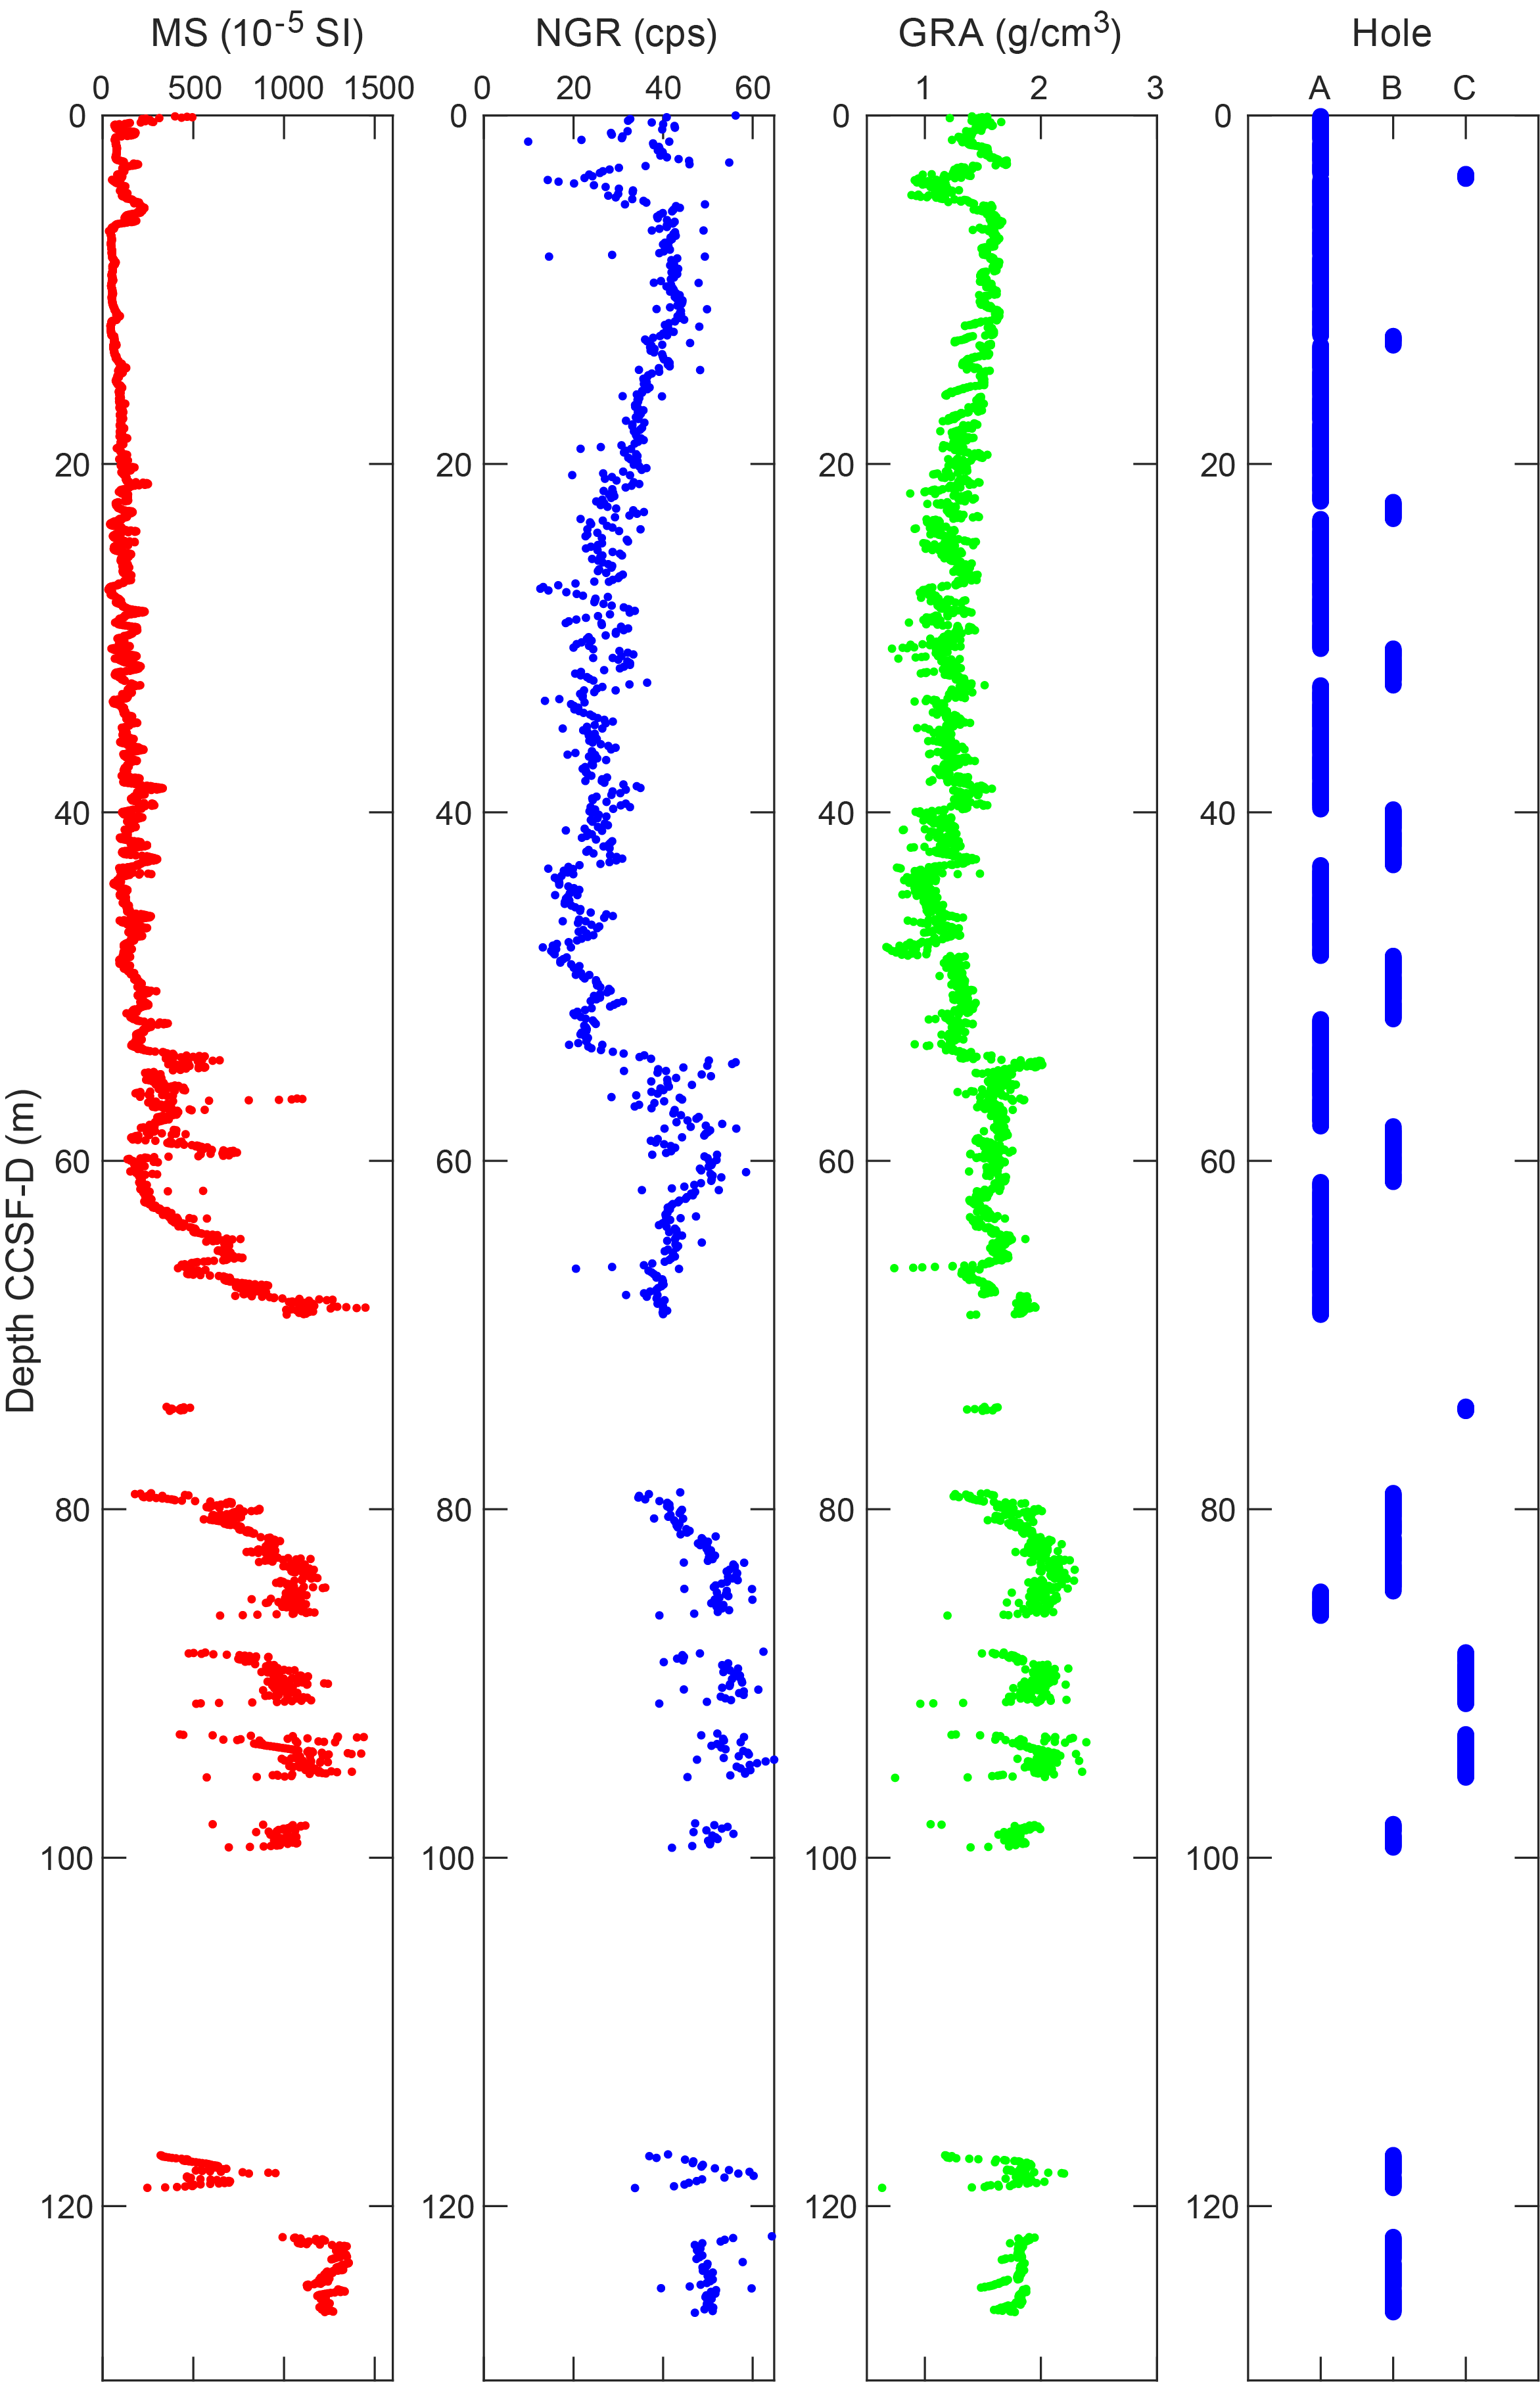
Figure F12. Splice.
From the mudline to ~69 mbsf, the splice is continuous. Recovery became sparse at ~69 mbsf, and the splice contains larger gaps below this depth.
No significant expansion was observed in the cores from Site U1595. Figure F13 shows a plot comparing the CSF-A and CCSF-A scales for Holes U1595A–U1595C and a linear regression curve calculated for the three holes together. The deviation from the dotted line indicates an affine growth factor of approximately 1%.
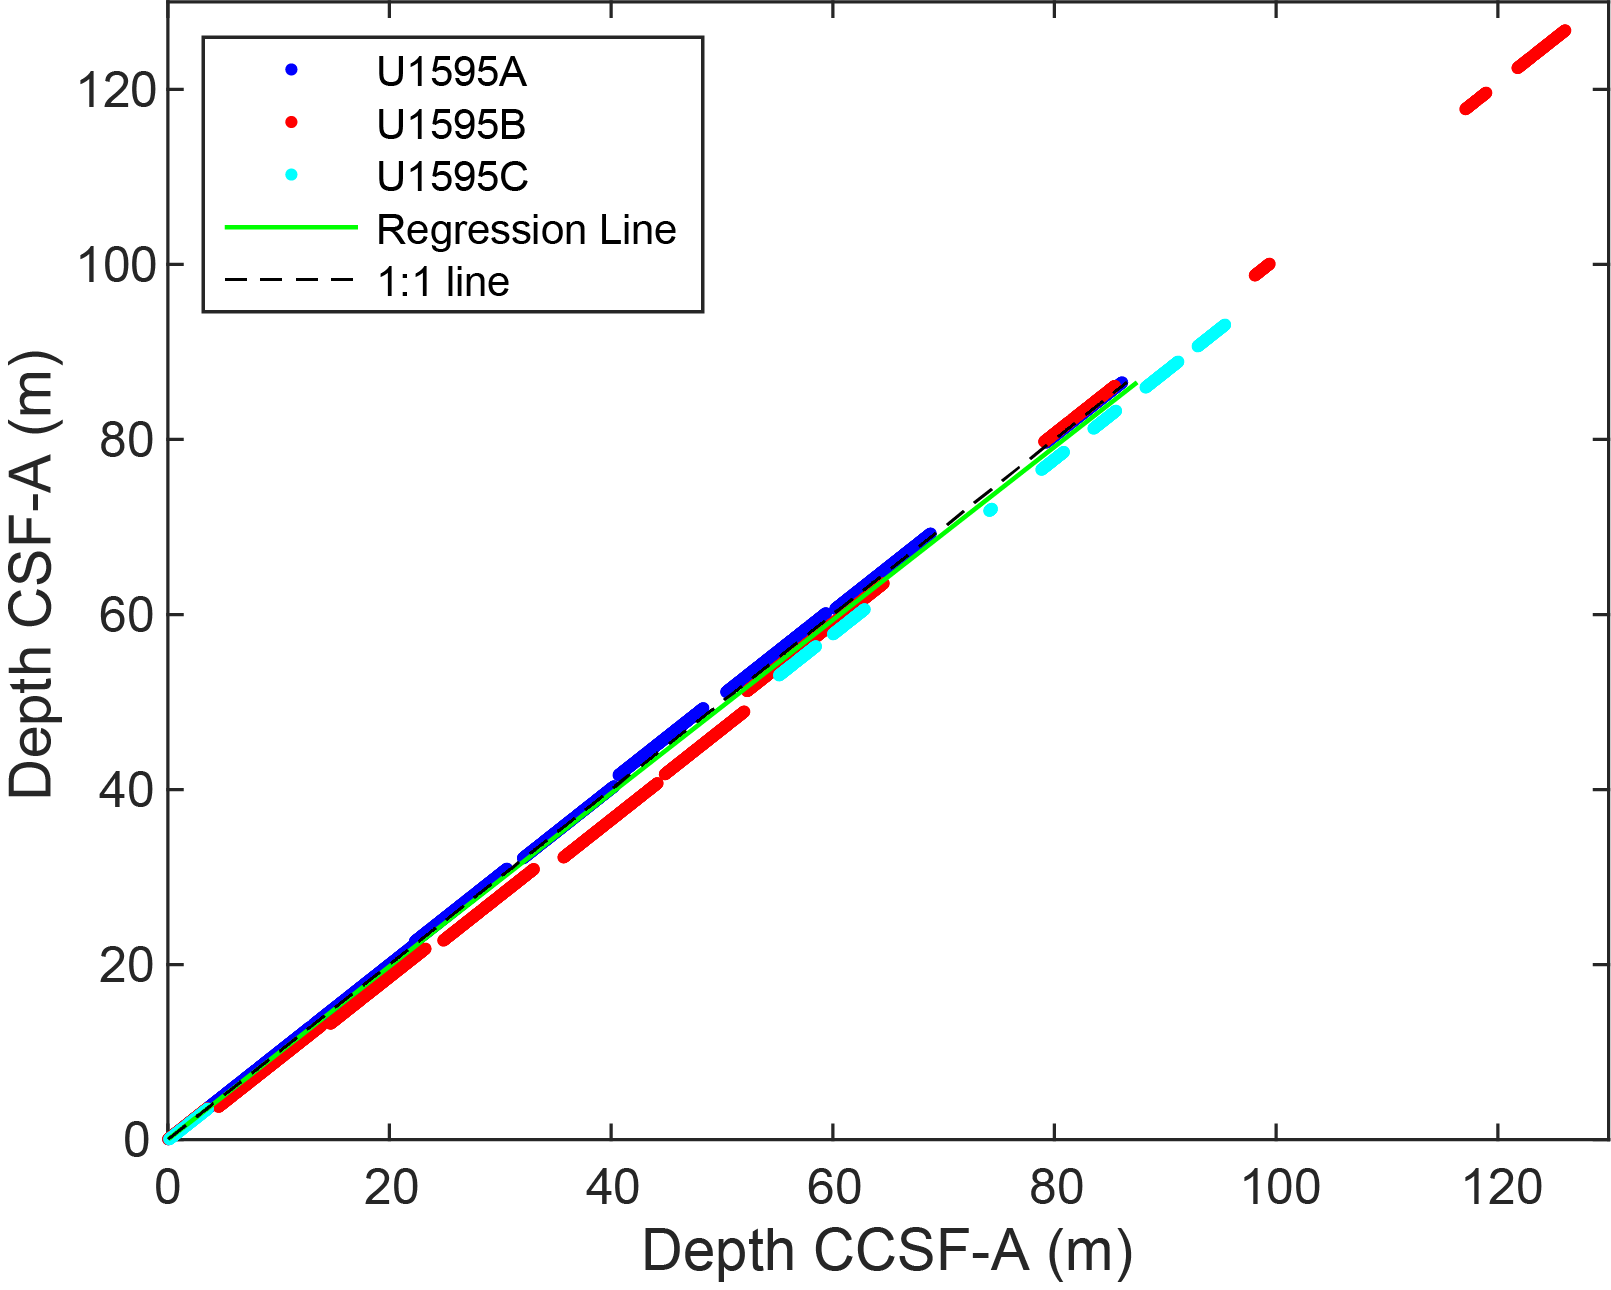
Figure F13. Core top depths.
5. Structural geology
Structural geology analyses at Site U1595 included description of cores retrieved from Holes U1595A–U1595C. A total of 23 measurements were made, mostly in relatively consolidated intervals. The distributions and dip angles of planar structures (measured to an estimated accuracy of ±2°) are shown in Figure F14. The data, measured primarily on thin sand beds/laminae and mud boundaries, exhibit mainly horizontal to subhorizontal dips ranging 1°–5° (average = ~3.0°). Three steeper bedding planes show inclined dips ranging 10°–19° (average = ~14.1°).
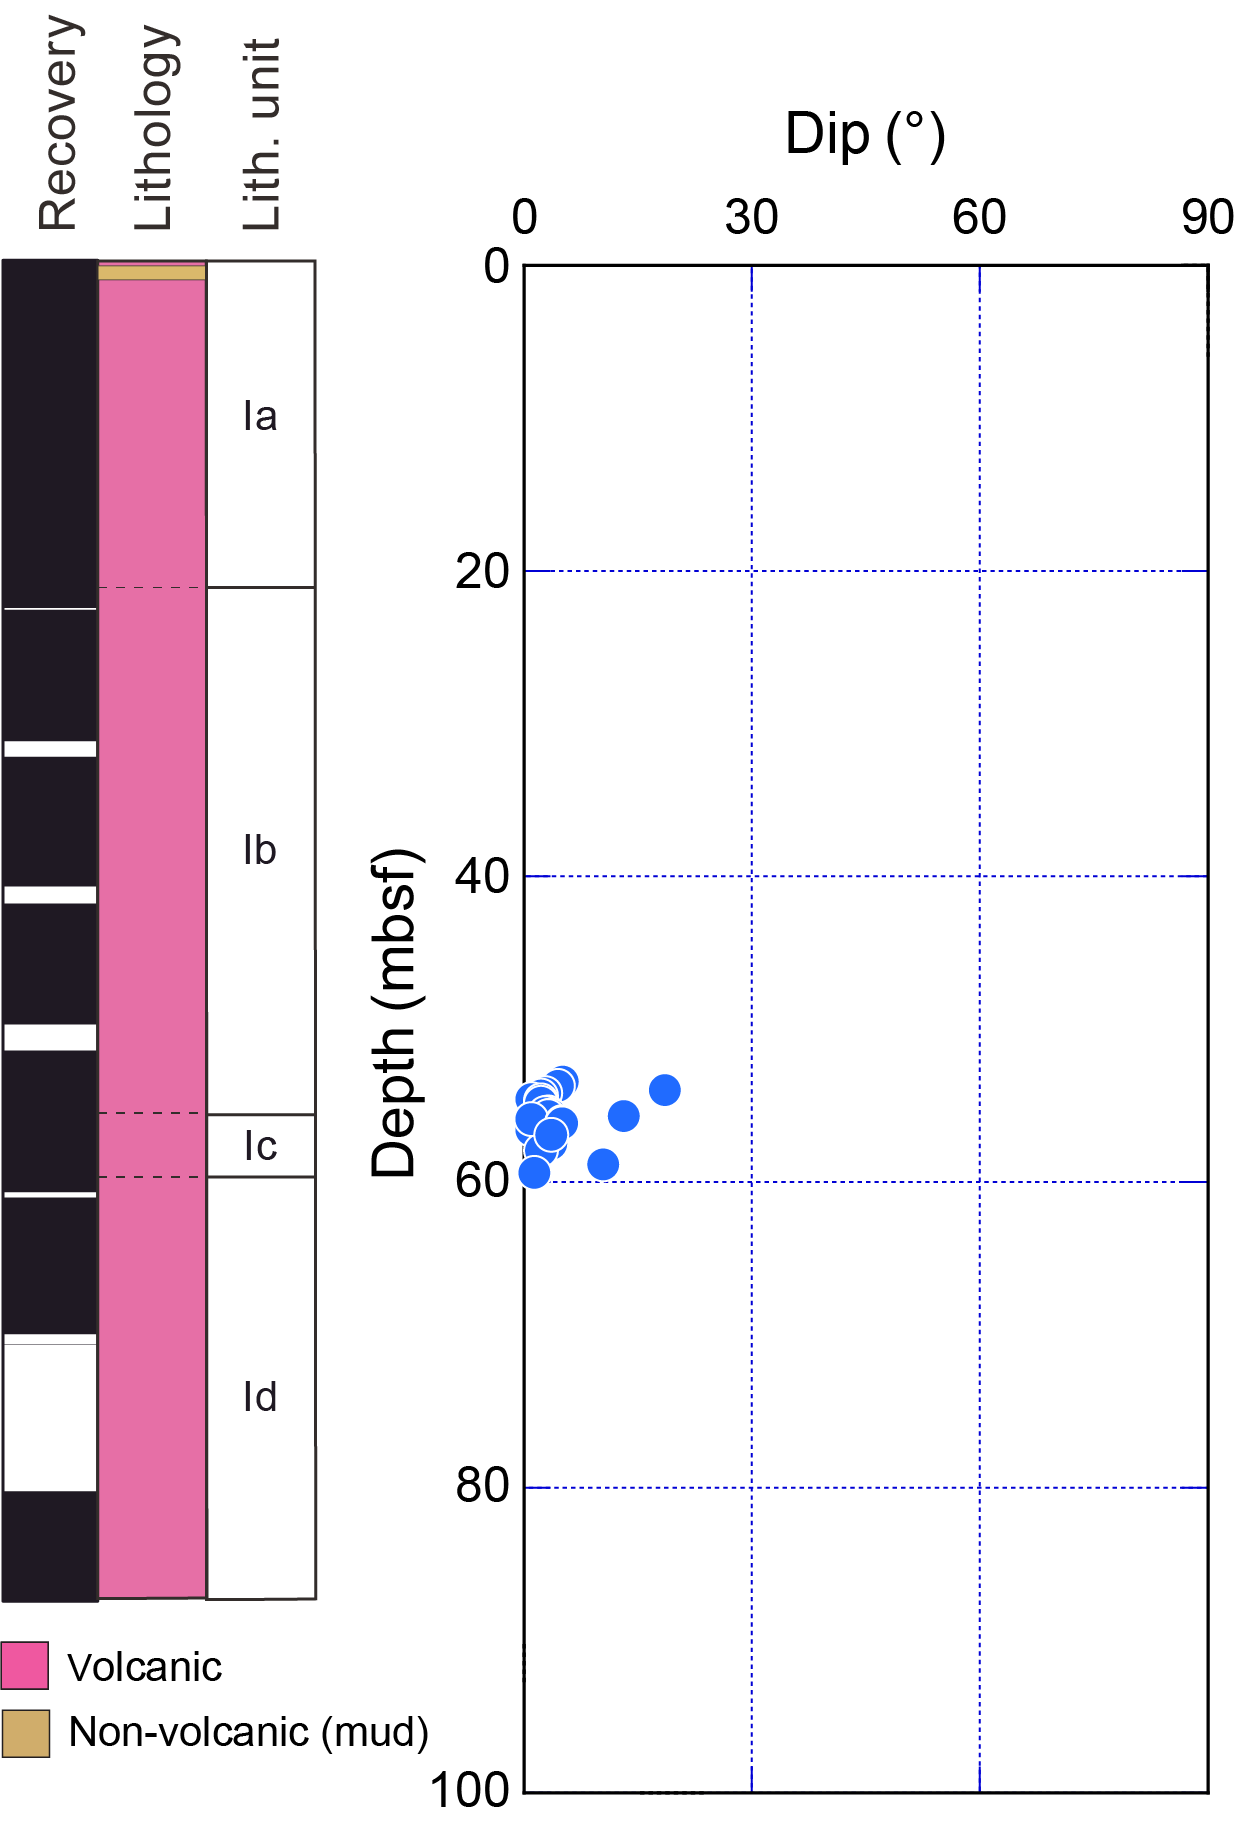
Figure F14. Dip data.
Deformation related to drilling and core recovery was noted but not recorded.
6. Biostratigraphy
Planktonic and benthic foraminifera and calcareous nannofossils were examined from core catcher samples from Holes U1595A–U1595C to assess the paleoenvironmental conditions of Site U1595.
Site U1595 cored the sedimentary sequence in the southeast portion of the Santorini caldera and recovered a 126.93 m thick sequence composed primarily of volcanogenic sediments. Very rare, well-preserved benthic and planktonic foraminifera and ostracods were found in Samples 398-U1595A-2H-CC, 17–19 cm, and 398-U1595C-1H-CC, 14–18 cm (Tables T5, T6; Figures F15, F16), although assemblage abundances were insufficient to permit paleoenvironmental analyses. Calcareous nannofossils were found in Samples 398-U1595B-1H-CC, 8–13 cm, and 398-U1595C-1H-CC, 14–18 cm (Table T7; Figure F17). Calcareous nannofossil assemblages were similar to living coccolithophores (Dimiza et al., 2008).
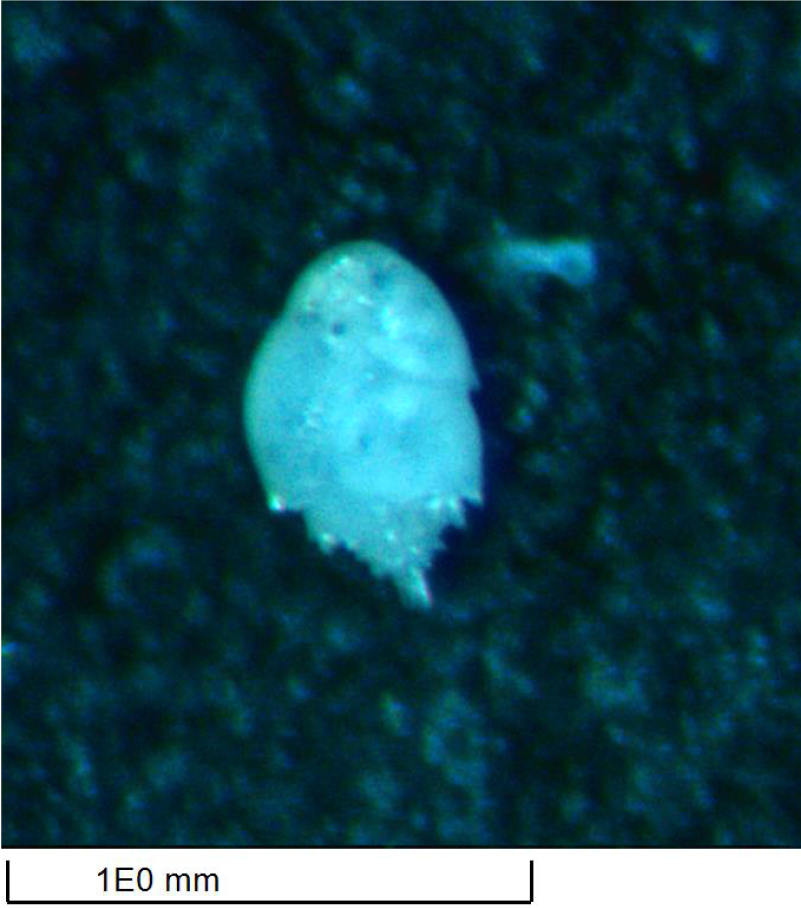
Figure F15. Bulimina aculeata.
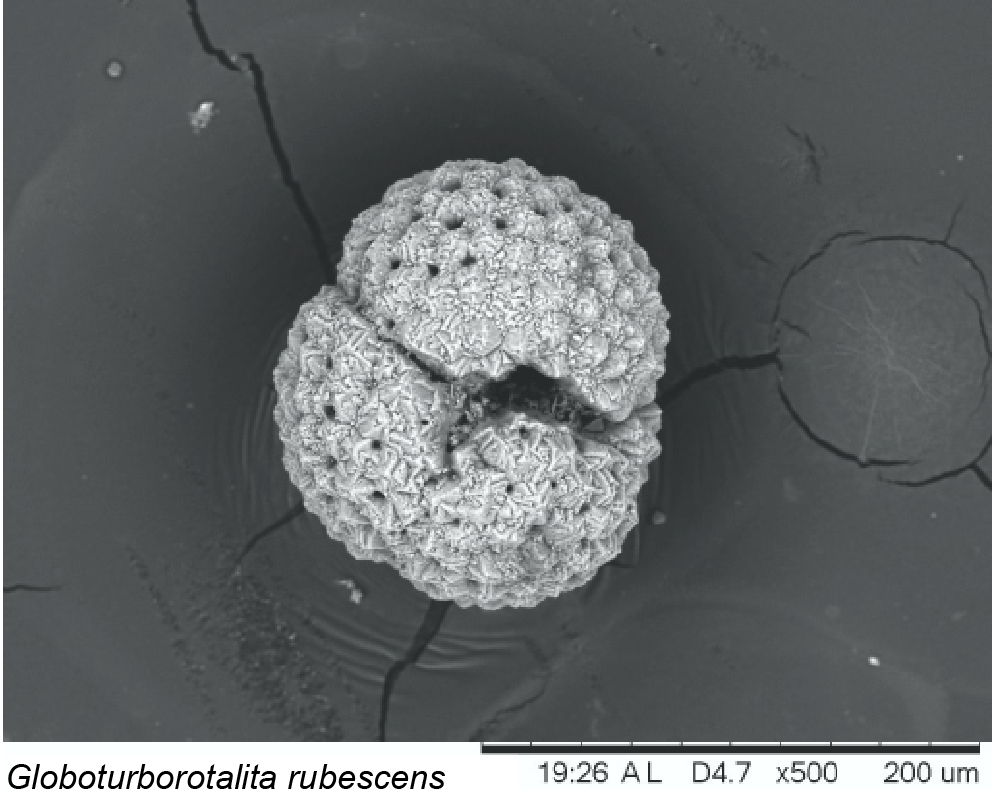
Figure F16. Globoturborotalita rubescens.
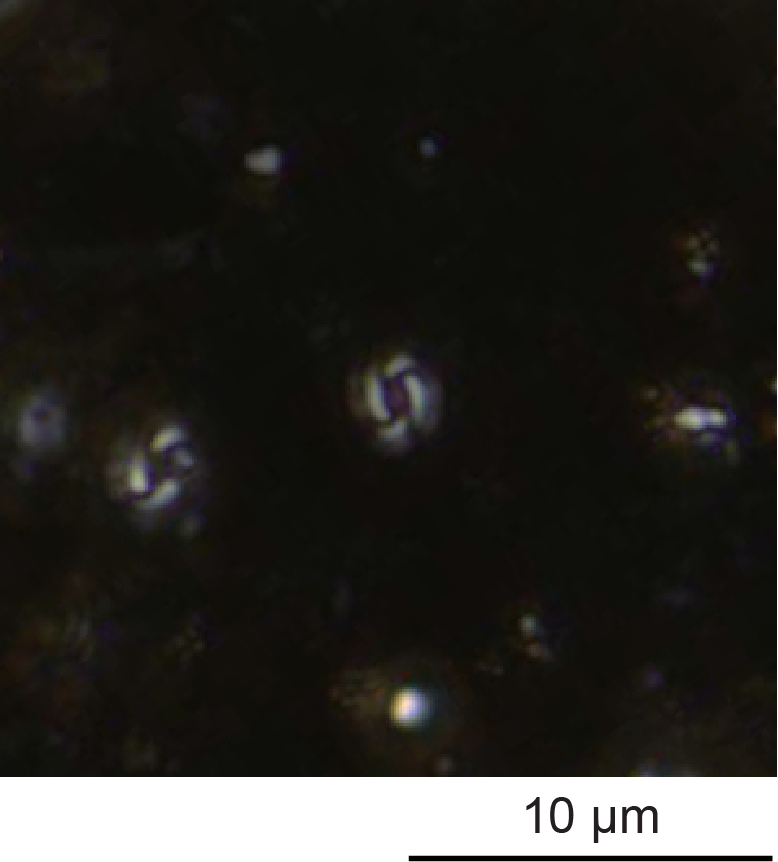
Figure F17. Calcareous nannofossils.
7. Paleomagnetism
Only five sections from two cores (398-U1595A-7H and 8H) recovered at Site U1595 were suitable for paleomagnetic analysis using the 2G Enterprises superconducting rock magnetometer (SRM) system. Alternating field demagnetization of these sections yielded data at 242 intervals between 54.96 and 62.02 mbsf. Magnetizations generally decayed linearly to the origin following removal of a drilling-induced component of magnetization after demagnetization at 15 mT (Figure F18). The mean inclination of principal component directions that passed the statistical filtering described at Site U1591 (see Paleomagnetism in the Site U1591 chapter [Druitt et al., 2024b]) is 56.9° (k = 44.8; α95 = 1.5; n = 165), in close agreement with the geocentric axial dipole field inclination of 56° at this site (Figure F18). The interval analyzed is therefore assigned to the Brunhes Chron (C1n, <0.773 Ma; Gradstein et al., 2020), consistent with the age of the Santorini caldera.
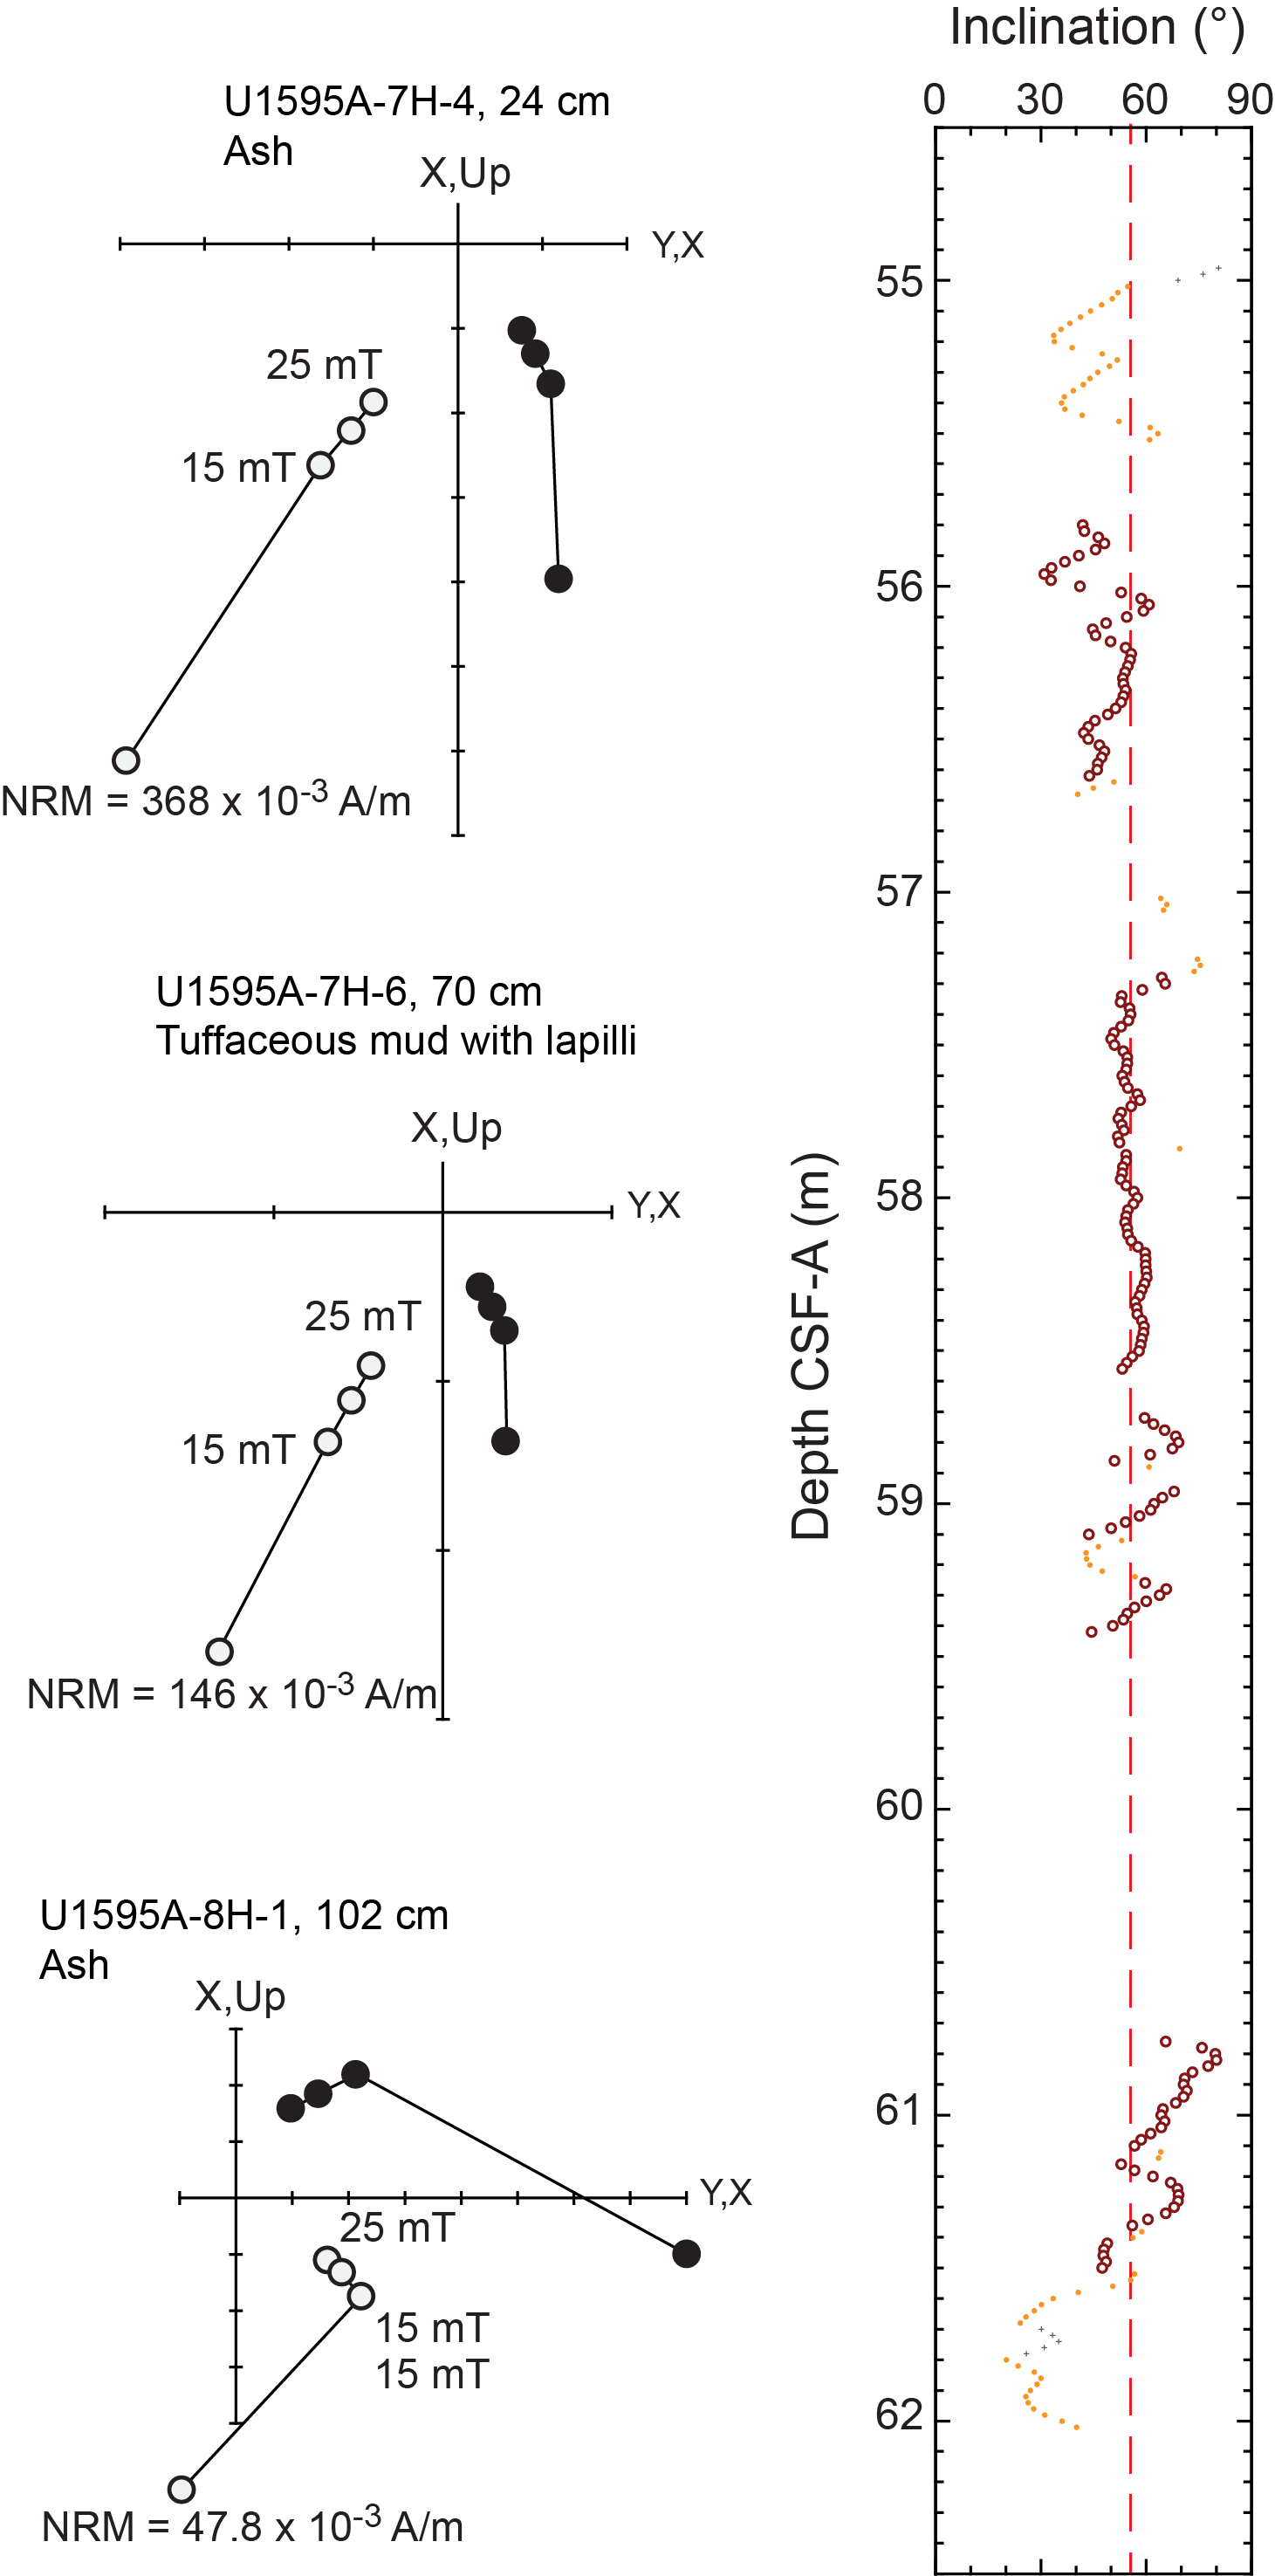
Figure F18. AF demagnetization and magnetic inclinations.
8. Physical properties
There is a general trend of increasing bulk density and MS with increasing depth at Site U1595. Grain densities are sometimes <2.0 g/cm3 in volcaniclastic layers. Thermal conductivity is lower than typical values for sediments at similar depths. The physical properties at Site U1595 resemble those at Site U1594 in the uppermost 50 m where the depth ranges overlap.
8.1. Whole-round GRA density, MS, P-wave velocity, and NGR
Figure F19 summarizes data collected on whole-round cores using the GRA densitometer, MS loop, and P-wave logger on the WRMSL and NGR. All cited depths are on the CSF-A scale. There are some systematic sources of error in these data that should be considered when interpreting absolute values and trends:
- Redistribution of unconsolidated volcaniclastic materials in core liners during coring and on the core retrieving platform can lead to sorting by particle size and density and, hence, changes in physical properties.
- Core liners sometimes contained large amounts of water. Thus, whole-round measurements in sections that match discrete measured values on split cores are most reliable.
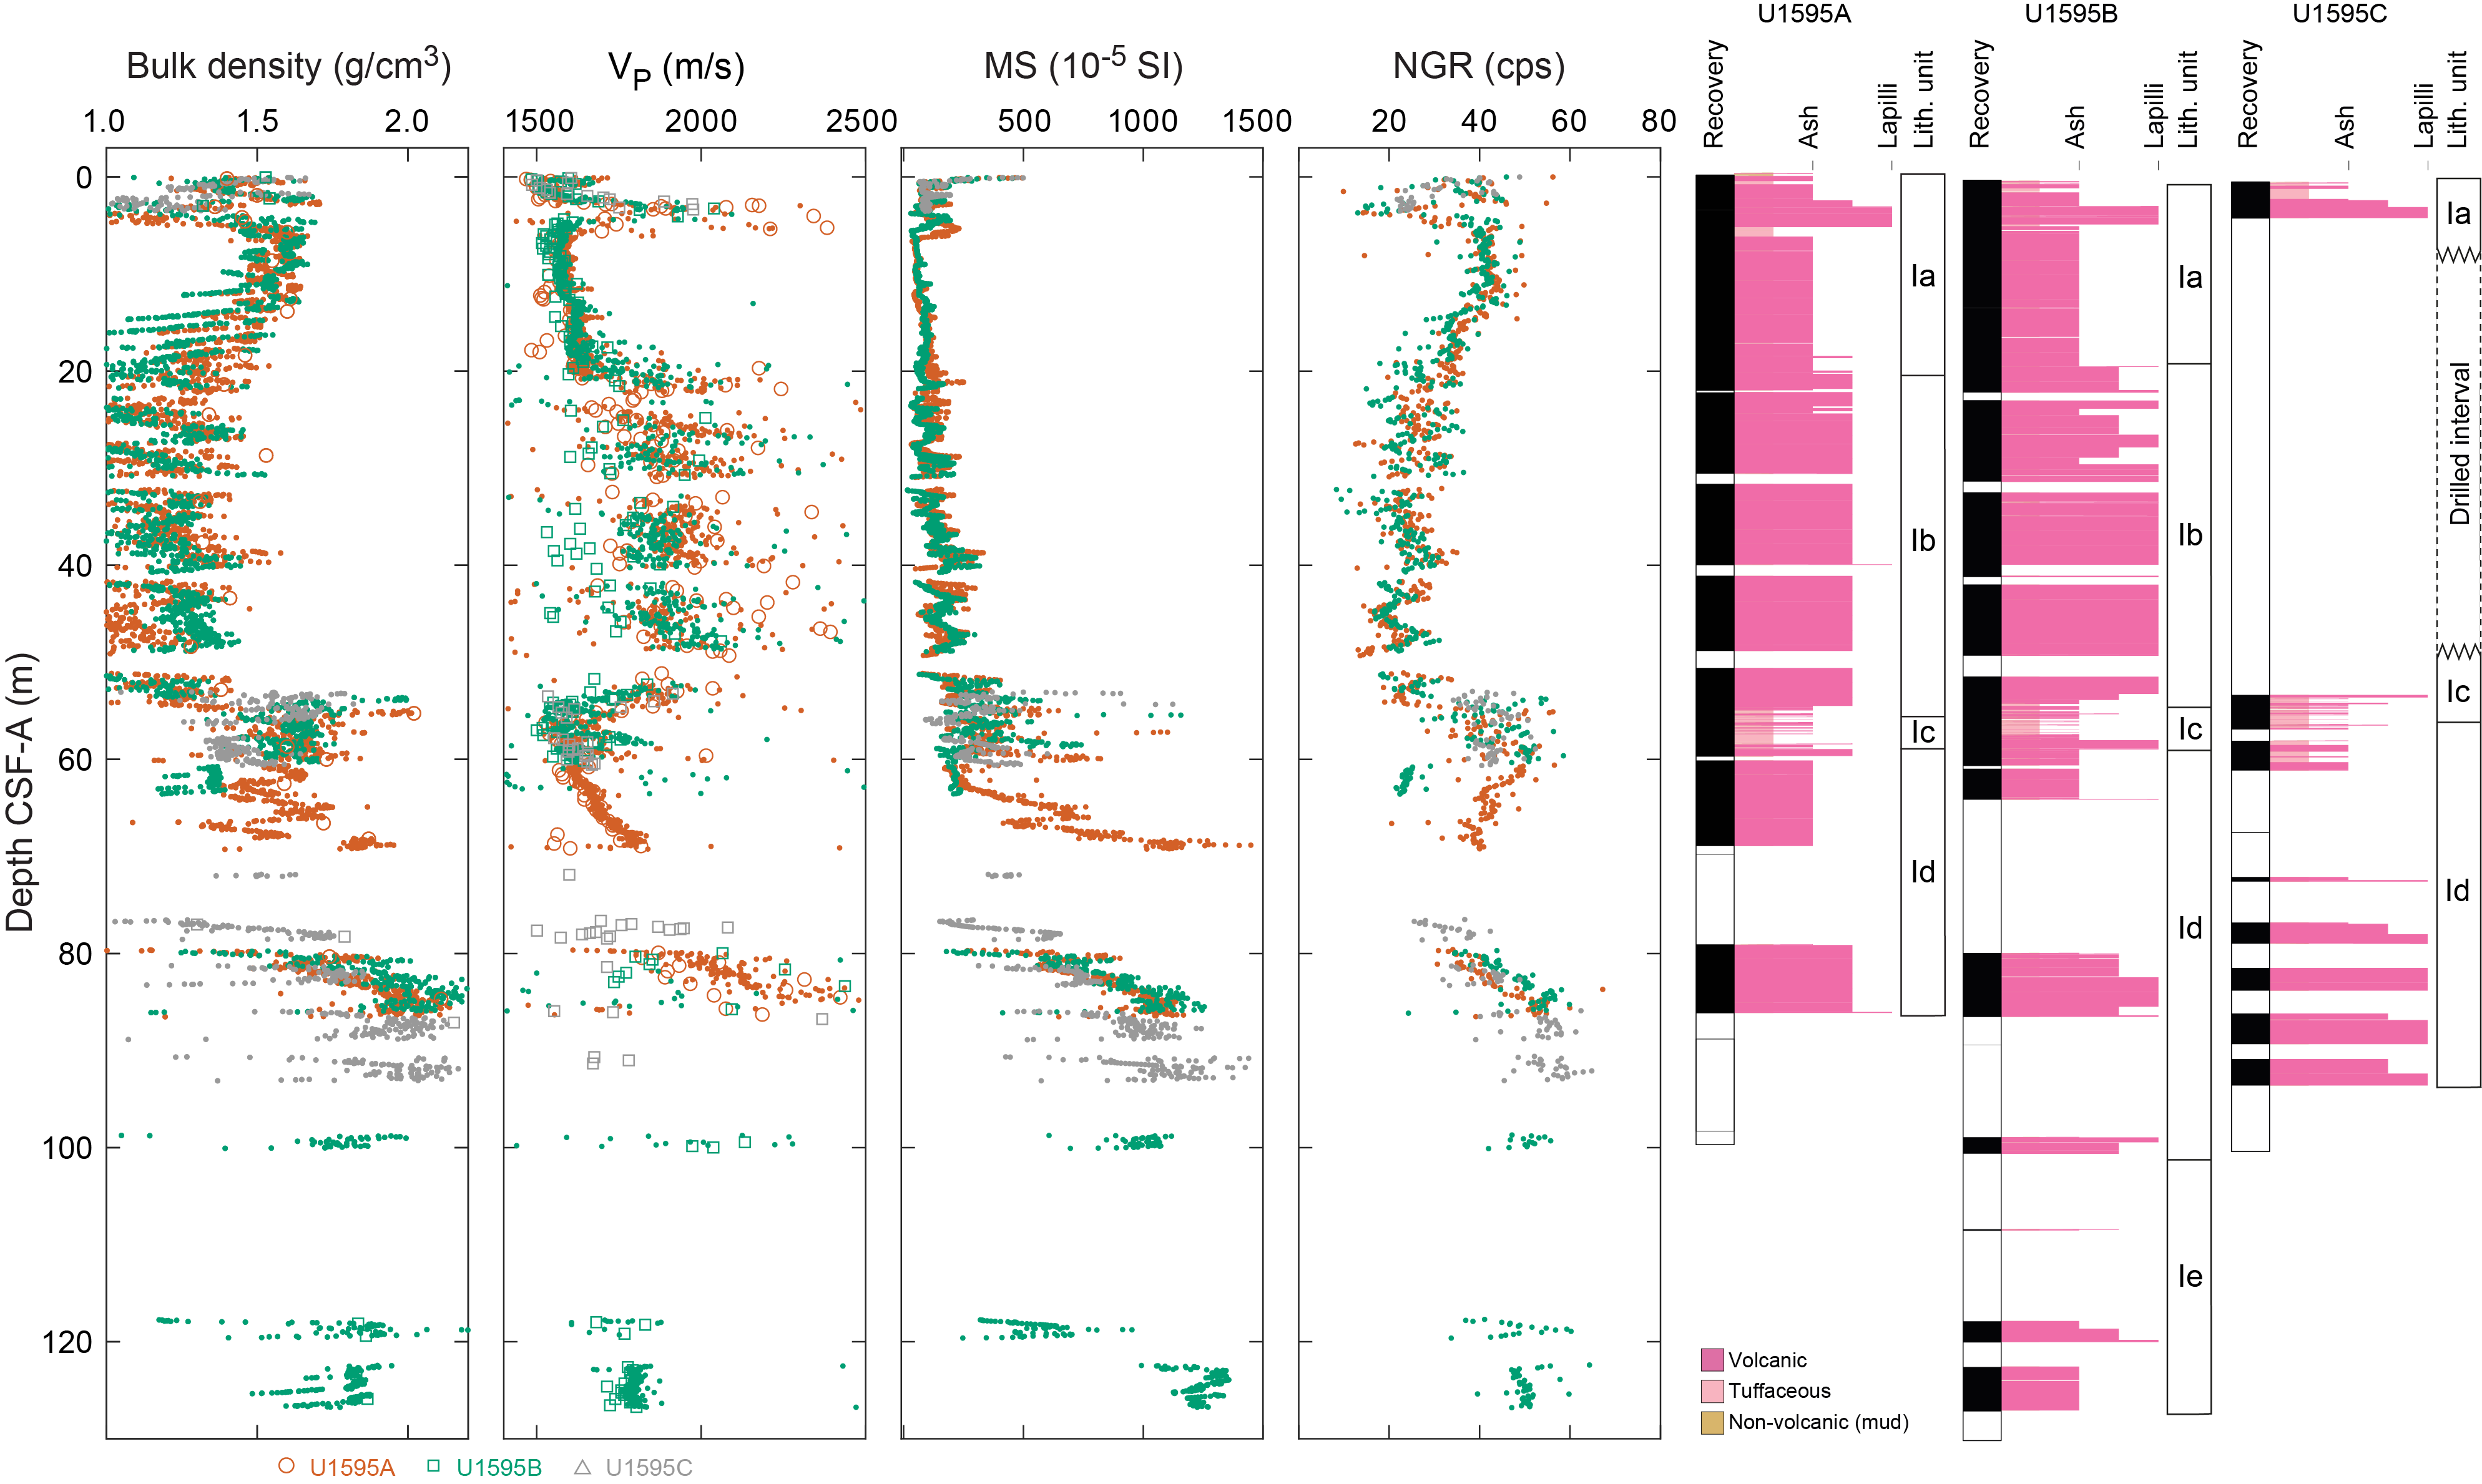
Figure F19. Physical properties.
Overall, there is a general trend of increasing bulk density and MS with increasing depth. NGR decreases with increasing depth in the uppermost 50 m and then increases over the next 40 m.
8.2. Discrete measurements
8.2.1. Material strength
Sediment strength was measured with a pocket penetrometer (PP) on the catwalk immediately after section splitting. Automated vane shear (AVS) strength measurements were made on working-half sections. Because volcaniclastic materials are not suitable for these measurements, few measurements could be made (14 AVS and 4 PP in nonvolcaniclastic layers) (Figure F20; Table T8).
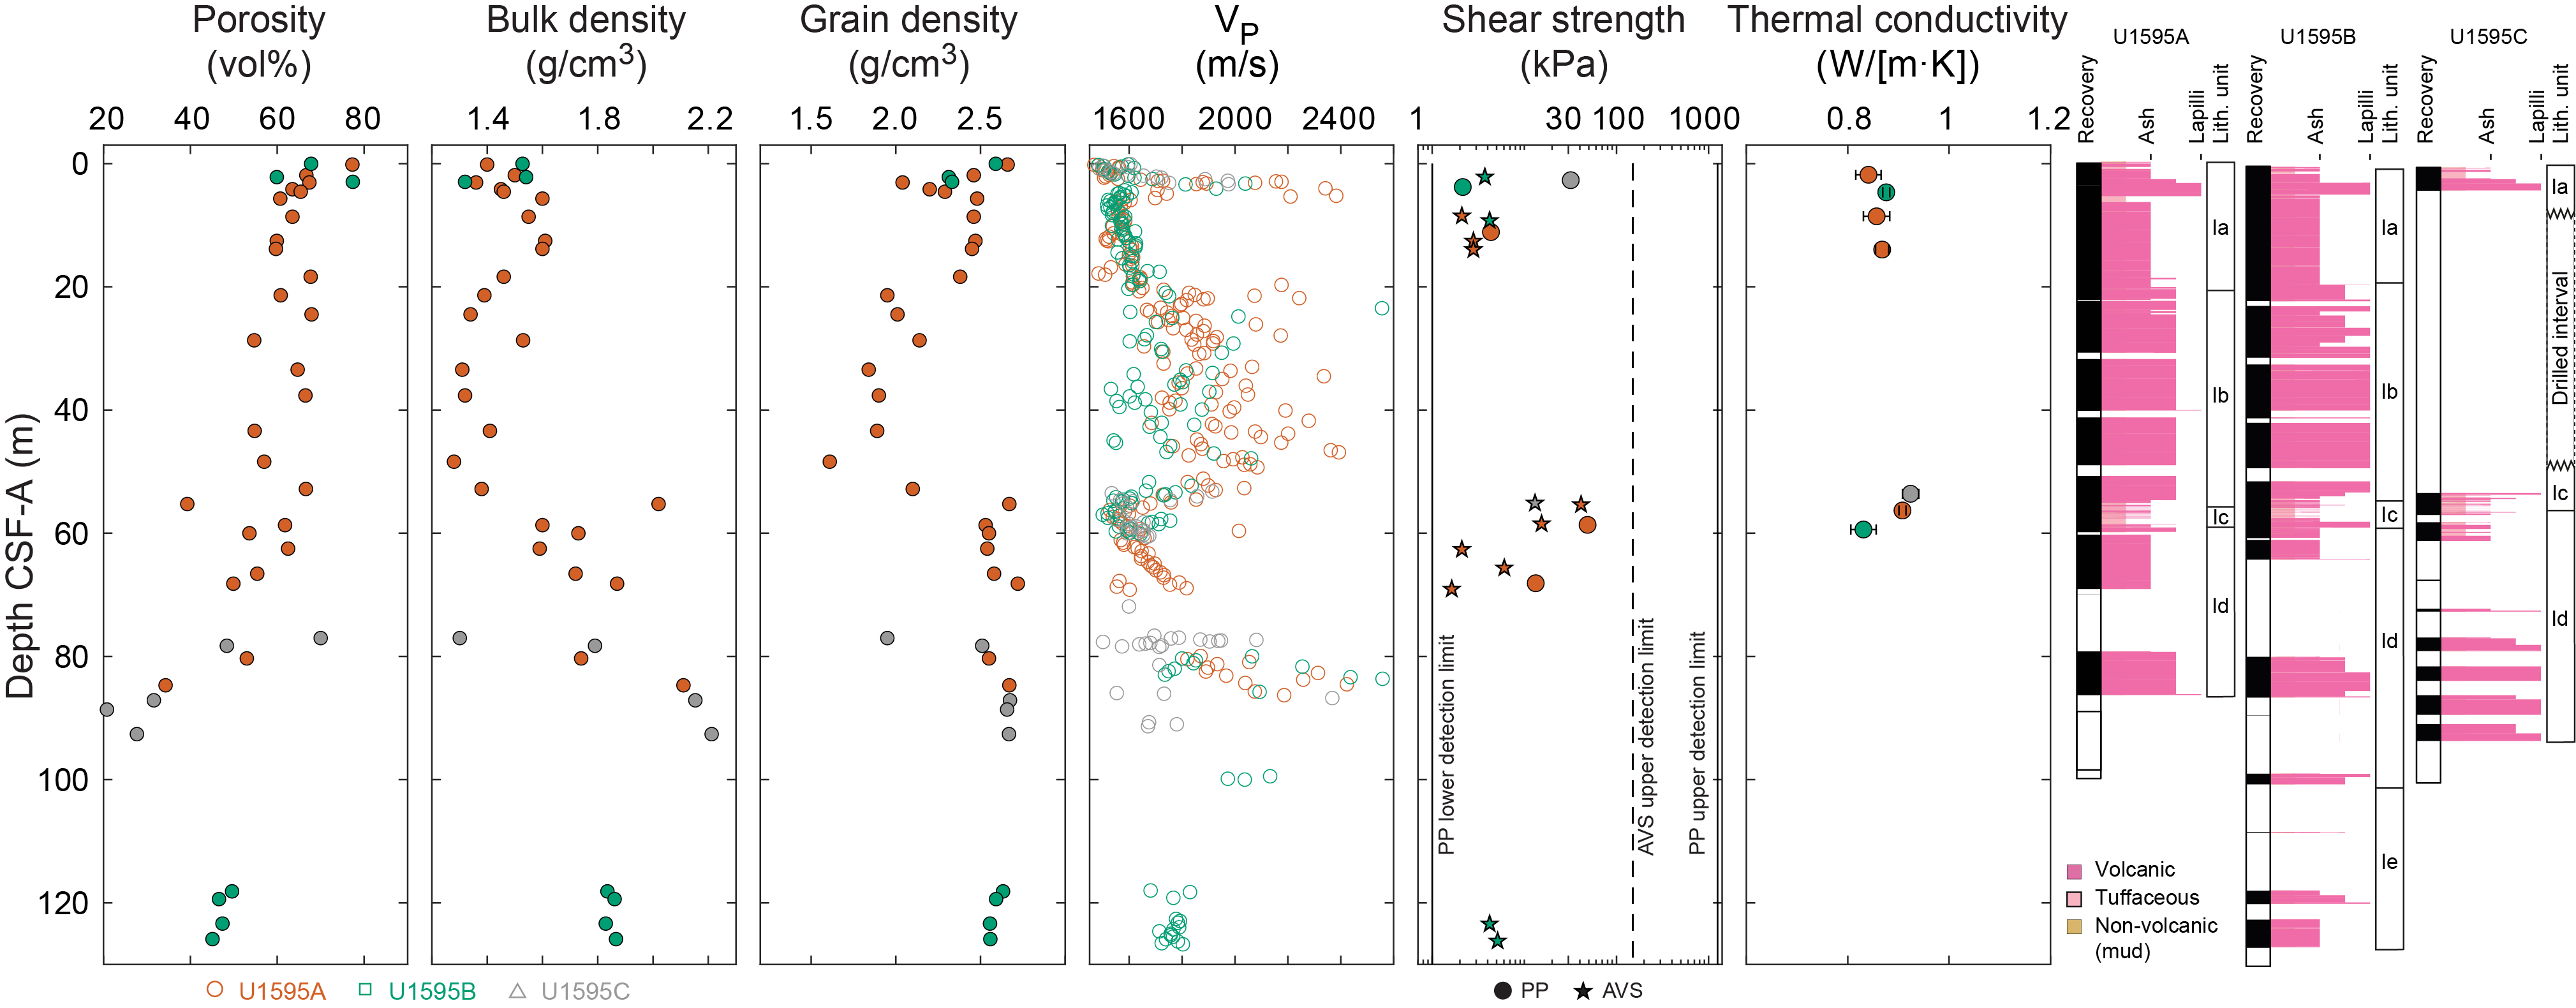
Figure F20. Discrete measurements.
8.2.2. P-wave velocity
Totals of 204, 173, and 61 P-wave velocity measurements were conducted on working-half sections from Holes U1595A, U1595B, and U1595C, respectively (Figure F20; Table T9). Discrete measurements of P-wave velocity on working-half core sections are similar to those measured using the WRMSL on whole-round cores (Figure F19). There is a high P-wave velocity layer between 3 and 5 mbsf. The large scatter in the interval 20–60 mbsf arises from a combination of measurements that capture bulk sediment properties (lower values) and measurements made across a small number of lapilli clasts (larger values). For lapilli and larger–sized clasts, the particle size was a substantial fraction of the distance between the two calipers used to make the measurements; hence, the measurements may not be representative of true bulk properties (i.e., sample size is not much larger than a representative elementary volume).
8.2.3. Moisture and density
A total of 38 discrete samples were collected for moisture and density (MAD) measurements (Figure F20; Table T10). Bulk density derived by MAD measurements on discrete samples should be more reliable than GRA data from WRMSL measurements on whole-round cores, although in both cases, coring and recovery disturbances may have impacted measured values.
Porosity ranges 21–77 vol% (mean = 60 vol%; standard deviation = 13 vol%). Bulk density ranges 1.28–2.32 g/cm3 (mean = 1.63 g/cm3). Overall, bulk density increases with increasing depth.
Grain density ranges 1.61–2.72 g/cm3 (mean = 2.37 g/cm3; median = 2.48 g/cm3). A total of 16% of discrete samples have grain densities <2.0 g/cm3.
8.2.4. Thermal conductivity
A total of seven thermal conductivity measurements were made on selected working-half sections (Table T11). Measurements could not be made on coarse volcaniclastic materials; hence, the values we report are not representative of the full range of recovered lithologies. Compared to typical sediments, in which thermal conductivity is close to 1 W/(m·K) at these depths below seafloor, the mean thermal conductivity of 0.87 W/(m·K) is low in volcaniclastic sediments at Site U1595.
9. Geochemistry
9.1. Volcaniclastic bulk geochemistry
To determine the geochemistry of the volcanic and tuffaceous materials, six tephra samples were handpicked from various layers in Holes U1595A–U1595C. Following cleaning, grinding, fusion, and dissolution, the materials were analyzed shipboard for major (Si, Al, Fe, Mg, and Ca), minor (Ti, Mn, Na, K, and P), and trace (Sc, V, Cr, Co, Ni, Cu, Zn, Rb, Sr, Y, Zr, Nb, Ba, Ce, and Nd) elements using inductively coupled plasma–atomic emission spectroscopy (ICP-AES) (see Geochemistry in the Expedition 398 methods chapter [Kutterolf et al., 2024a] for analytical technique). Several unknown samples were run multiple times to determine analytical reproducibility.
9.1.1. ICP-AES: major, minor, and trace elements
Of the volcaniclastic units sampled, two were classified as andesites or trachyandesites and four as dacites or trachydacites (Table T12; Figure F21). Bulk chemistry values are less evolved than glass chemistry reported in Kutterolf et al. (2021), as expected due to bulk analyses including both minerals and glass.
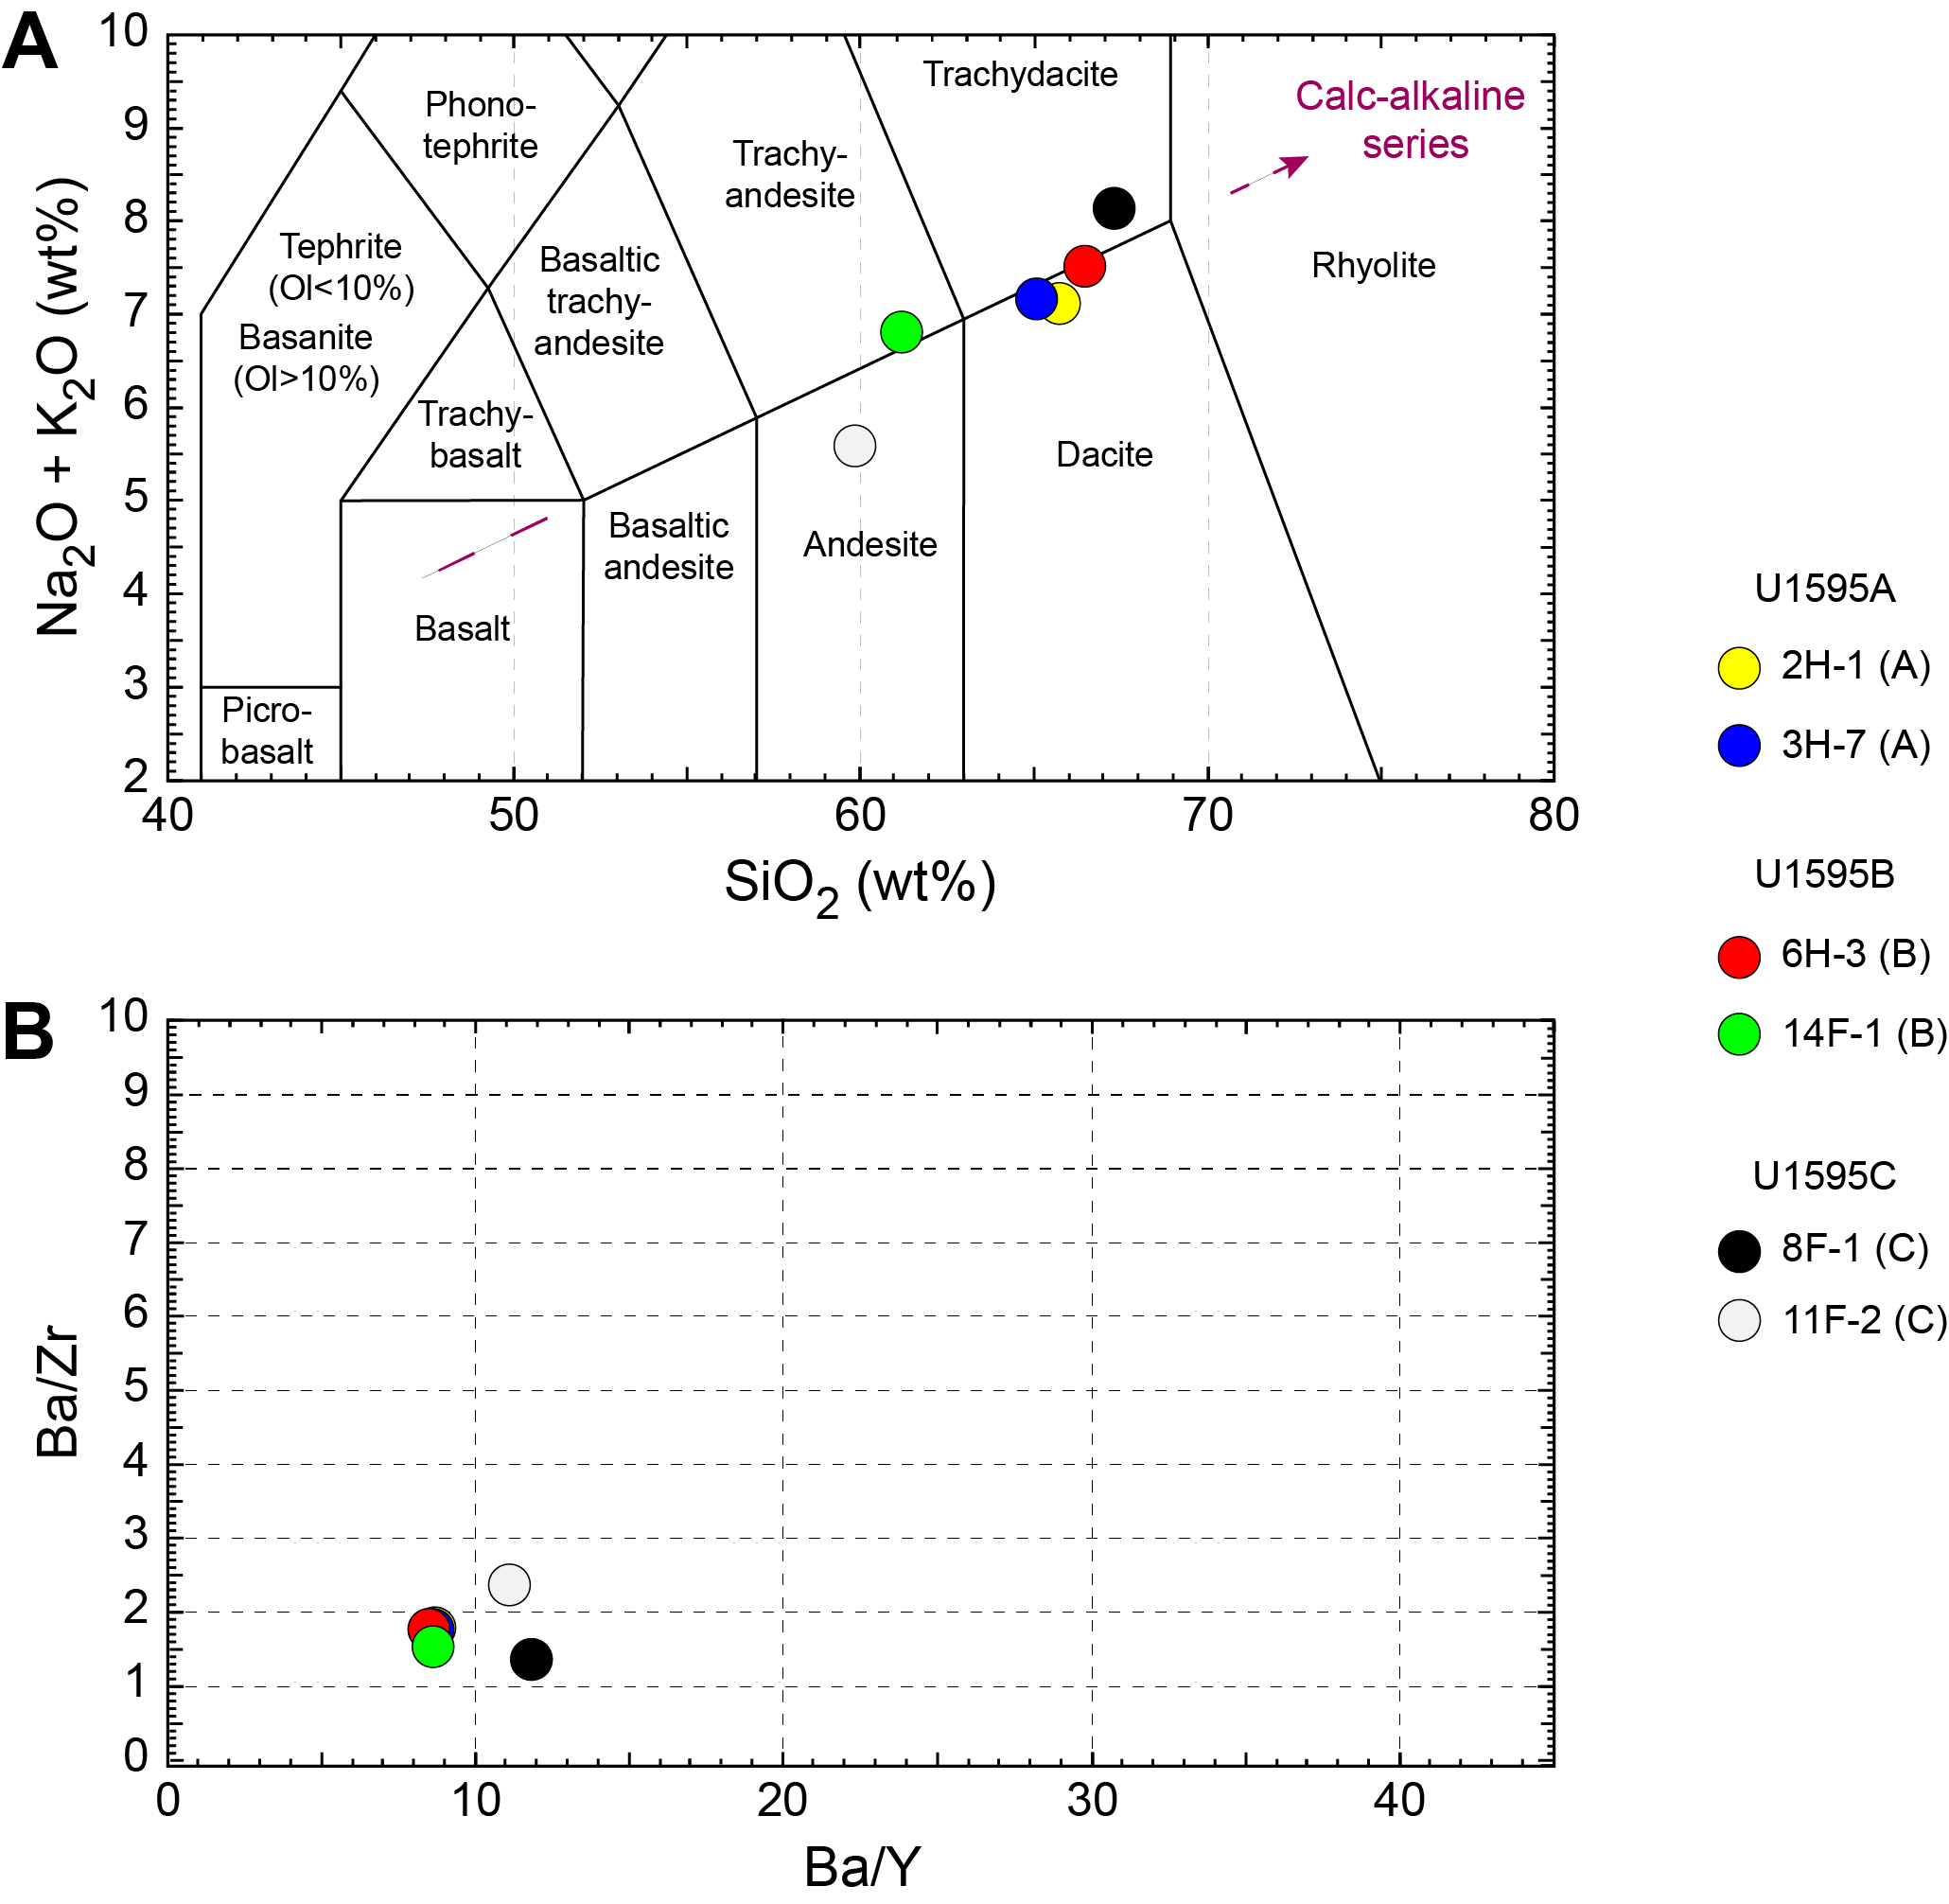
Figure F21. ICP-AES analyses.
Concentrations are reported for all analyzed trace elements, but Ce, Cr, Cu, Nb, Ni, P, Rb, S, and V were below detection limits in the majority of samples and are not shown for respective samples in Table T12; volcaniclastic analytical errors are ±1% for major elements and ±5%–10% for trace elements (see Geochemistry in the Expedition 398 methods chapter [Kutterolf et al., 2024a]). Trace element ratios were used to broadly discriminate between the volcanic centers of Kolumbo, Santorini, and Christiana.
9.2. Interstitial water geochemistry
To determine the inorganic constituents of IW, a total of 16 water samples were taken from the mudline and whole-round squeezing of sediment intervals at Site U1595. Aliquots of IW were used for shipboard analyses, and the remaining water was taken for shore-based analysis, following protocols specified by individual scientists. The retrieved pore waters were analyzed shipboard for salinity, alkalinity, pH, major anions (Cl−, SO42−, and Br−), major cations (Ca2+, Na+, Mg2+, and K+), and major (S, Ca, Mg, K, and Na) and minor (B, Ba, Fe, Li, Mn, P, Si, and Sr) elements using the methods described in Geochemistry in the Expedition 398 methods chapter (Kutterolf et al., 2024a).
9.2.1. Salinity, alkalinity, and pH
Salinity values are 40–41 throughout Site U1595 (Table T13; Figure F22). Minimal variation was recorded.
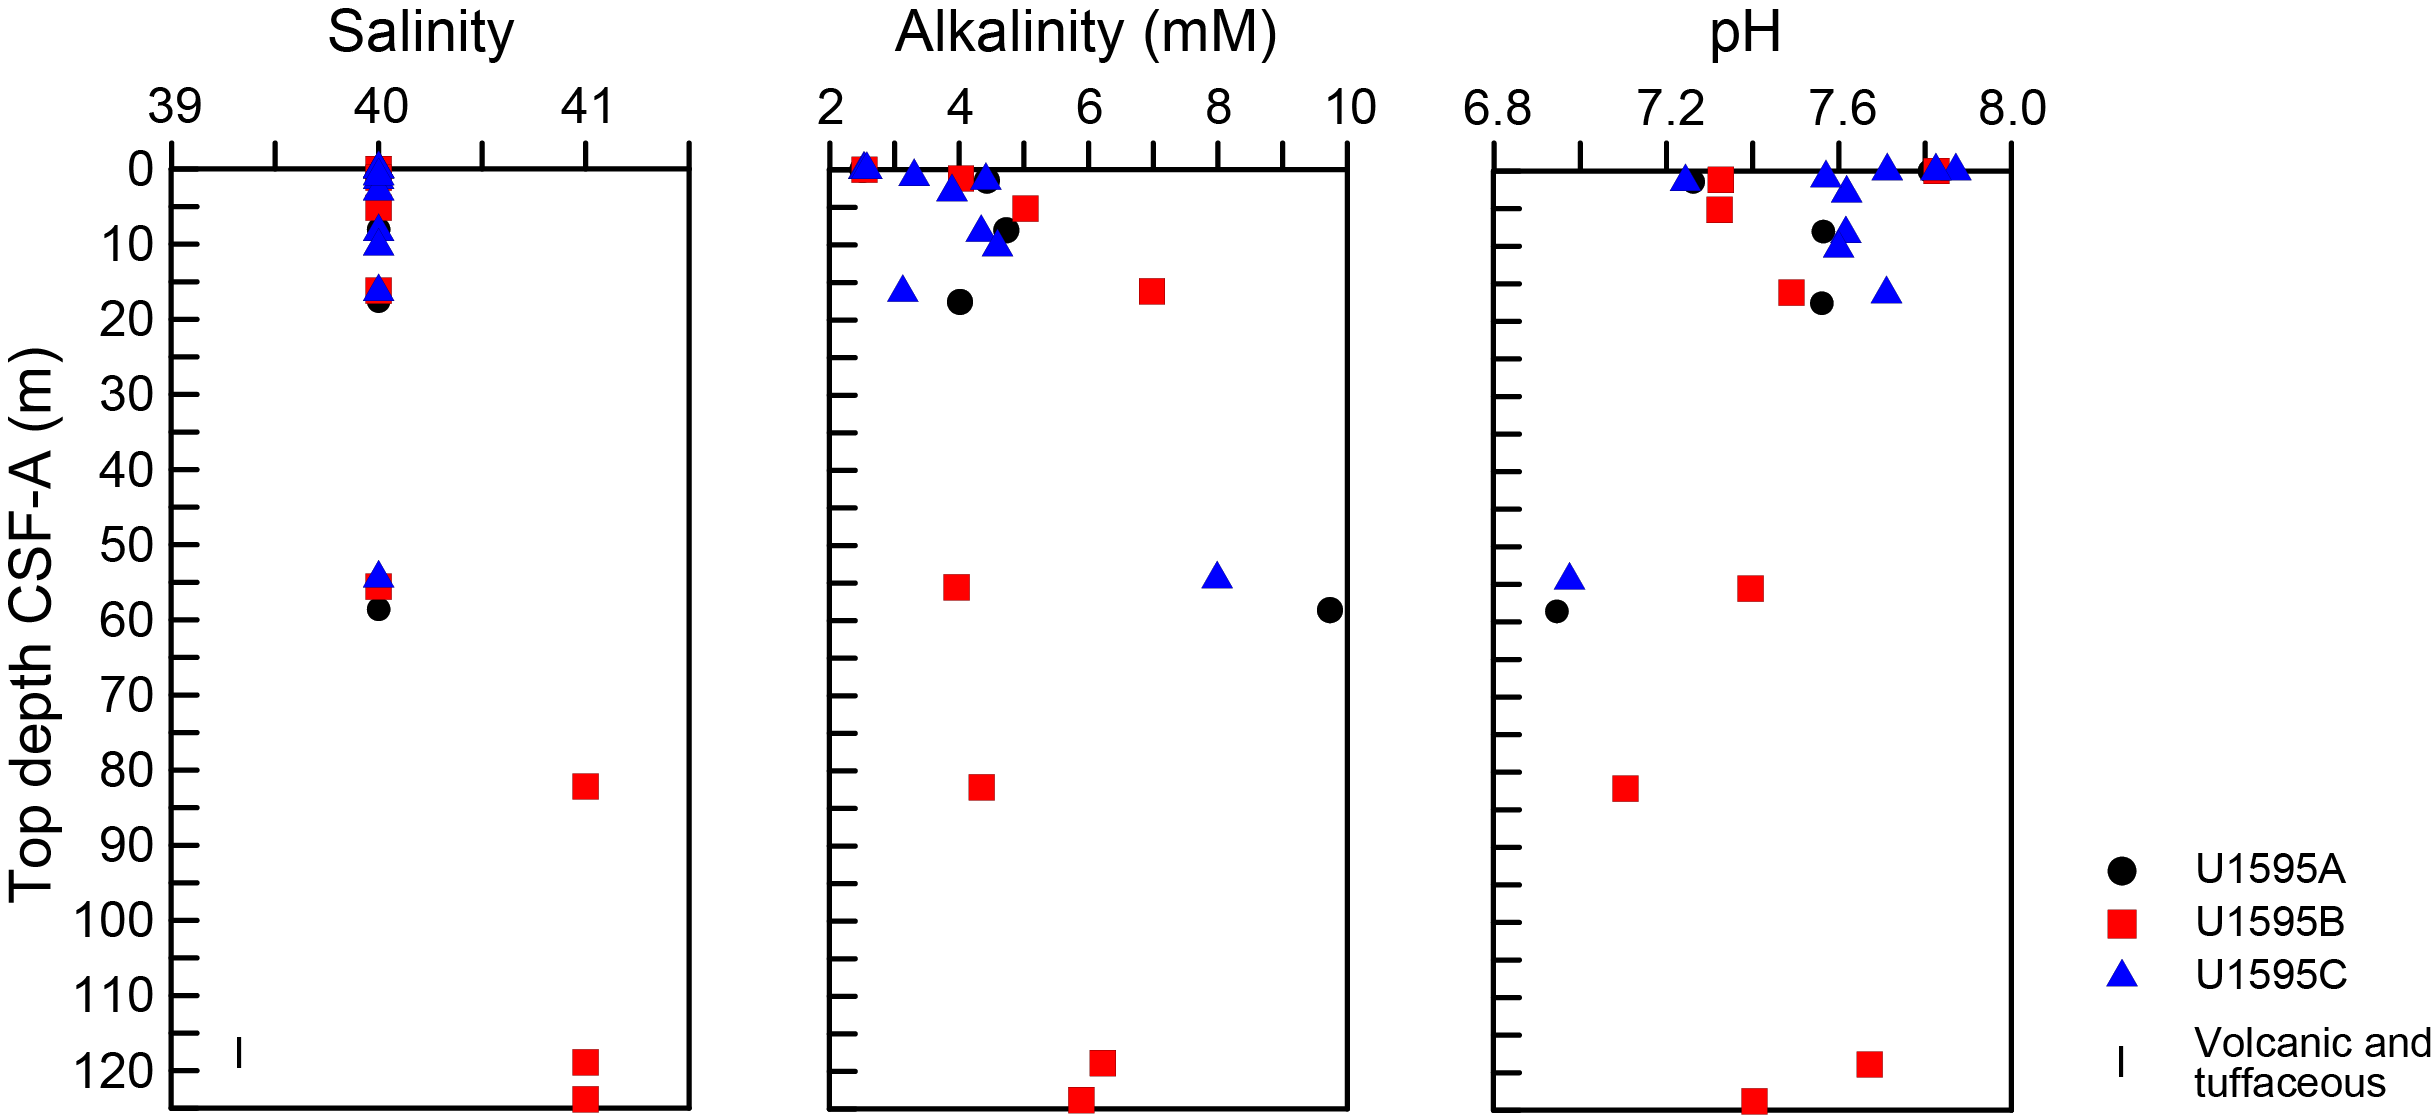
Figure F22. IW salinity, alkalinity, and pH.
Alkalinity is lowest at the mudline (2.5 mM) and increases gradually with depth. Two higher values of 7.0 and 9.7 mM are noted at 16.2 and 58.6 mbsf, respectively (Table T13; Figure F22).
Values for pH show variation within the sampled depths, ranging 7.0–8.0 (average = 7.4 ± 0.3) (Table T13; Figure F22).
9.2.2. Bromide, chloride, boron, sodium, potassium, magnesium, calcium, and sulfate
Major cations, anions, and B do not show any strong downhole trends (Table T14; Figure F23). Bromide, Cl−, Mg2+, Na+, and SO42− are scattered in the uppermost samples that were retrieved from all three holes, and all three generally increase with depth. Boron decreases with depth, whereas Ca2+ slightly increases with depth. Potassium decreases to 16.2 mbsf, increases to 82.2 mbsf, and decreases again to 123.8 mbsf.
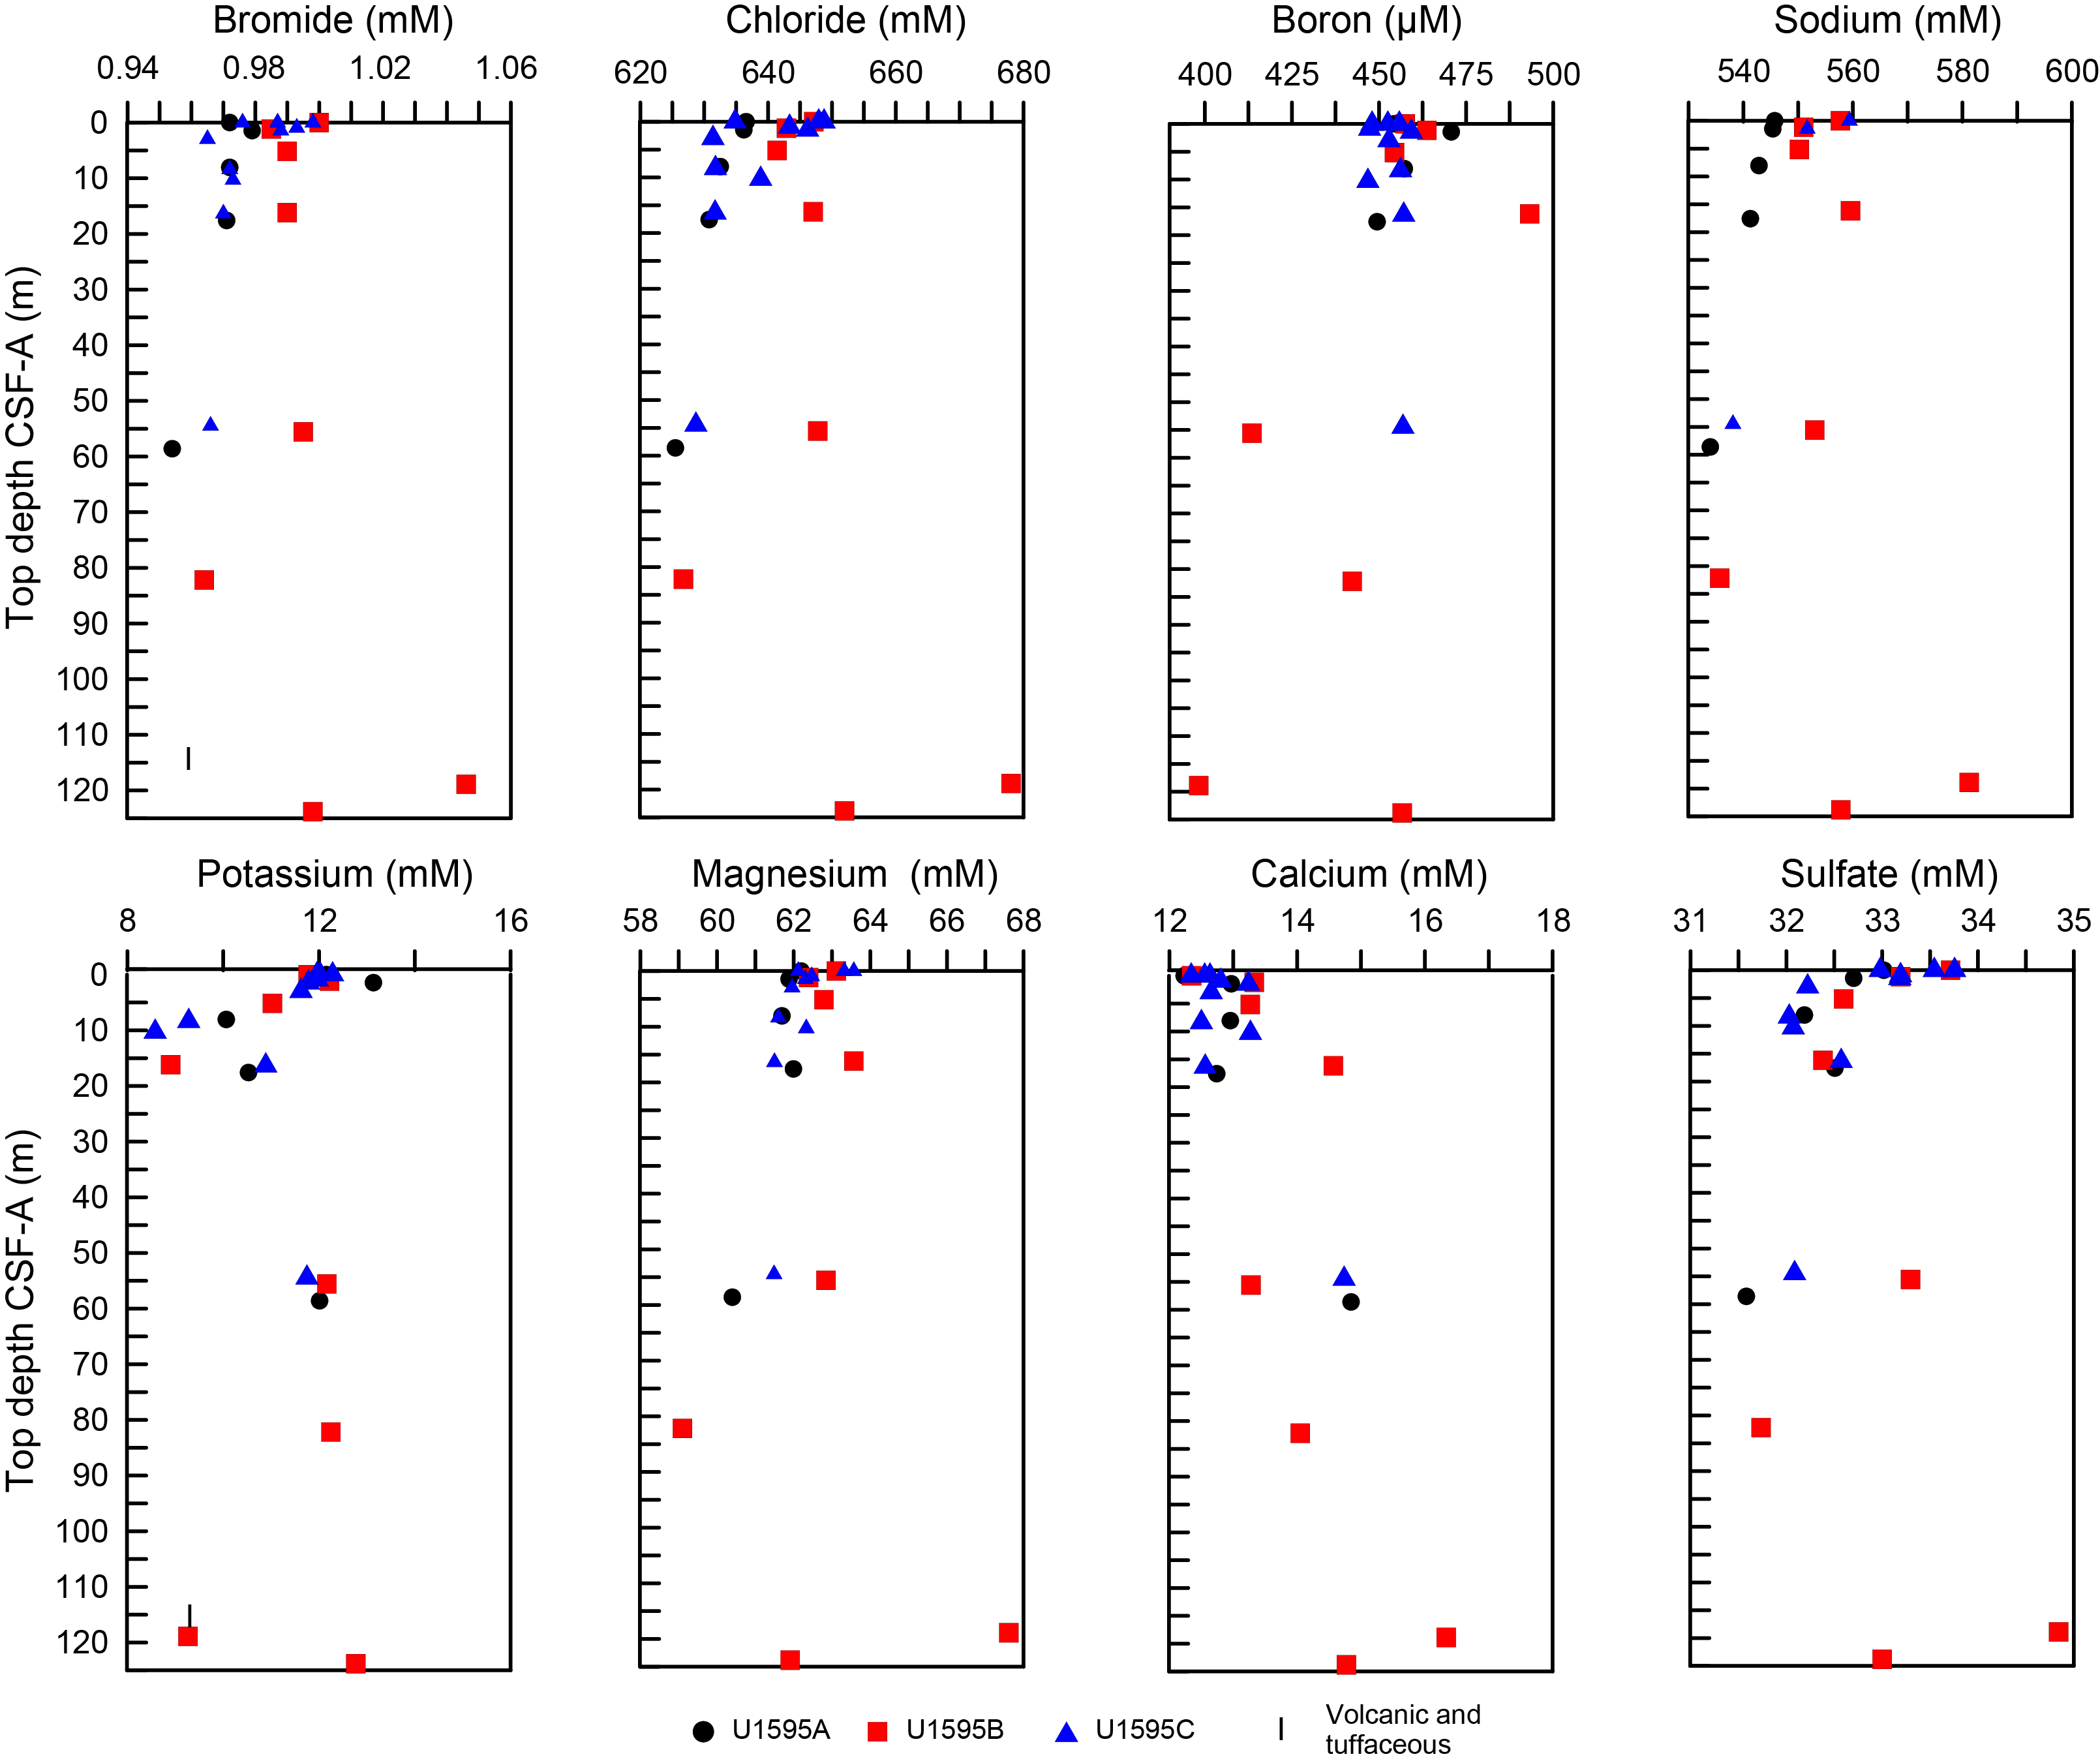
Figure F23. IW Br, Cl, B, Na, K, Mg, Ca, and SO42−.
9.2.3. Lithium, iron, manganese, barium, silicon, and strontium
IW concentrations and trends for Li, Fe, Mn, Ba, Si, and Sr are shown in Table T14 and Figure F24. Lithium and Si generally increase with depth with some scatter observed. Strontium is scattered, especially in the uppermost 20 m, although the two lowest concentrations are in the deepest samples recovered at 118.9 and 123.8 mbsf. Iron and Mn are elevated in the uppermost 20 m, although higher values of Fe are noted at 54.5 mbsf and Mn increases slightly below 82.2 m. Barium shows little variation with depth.
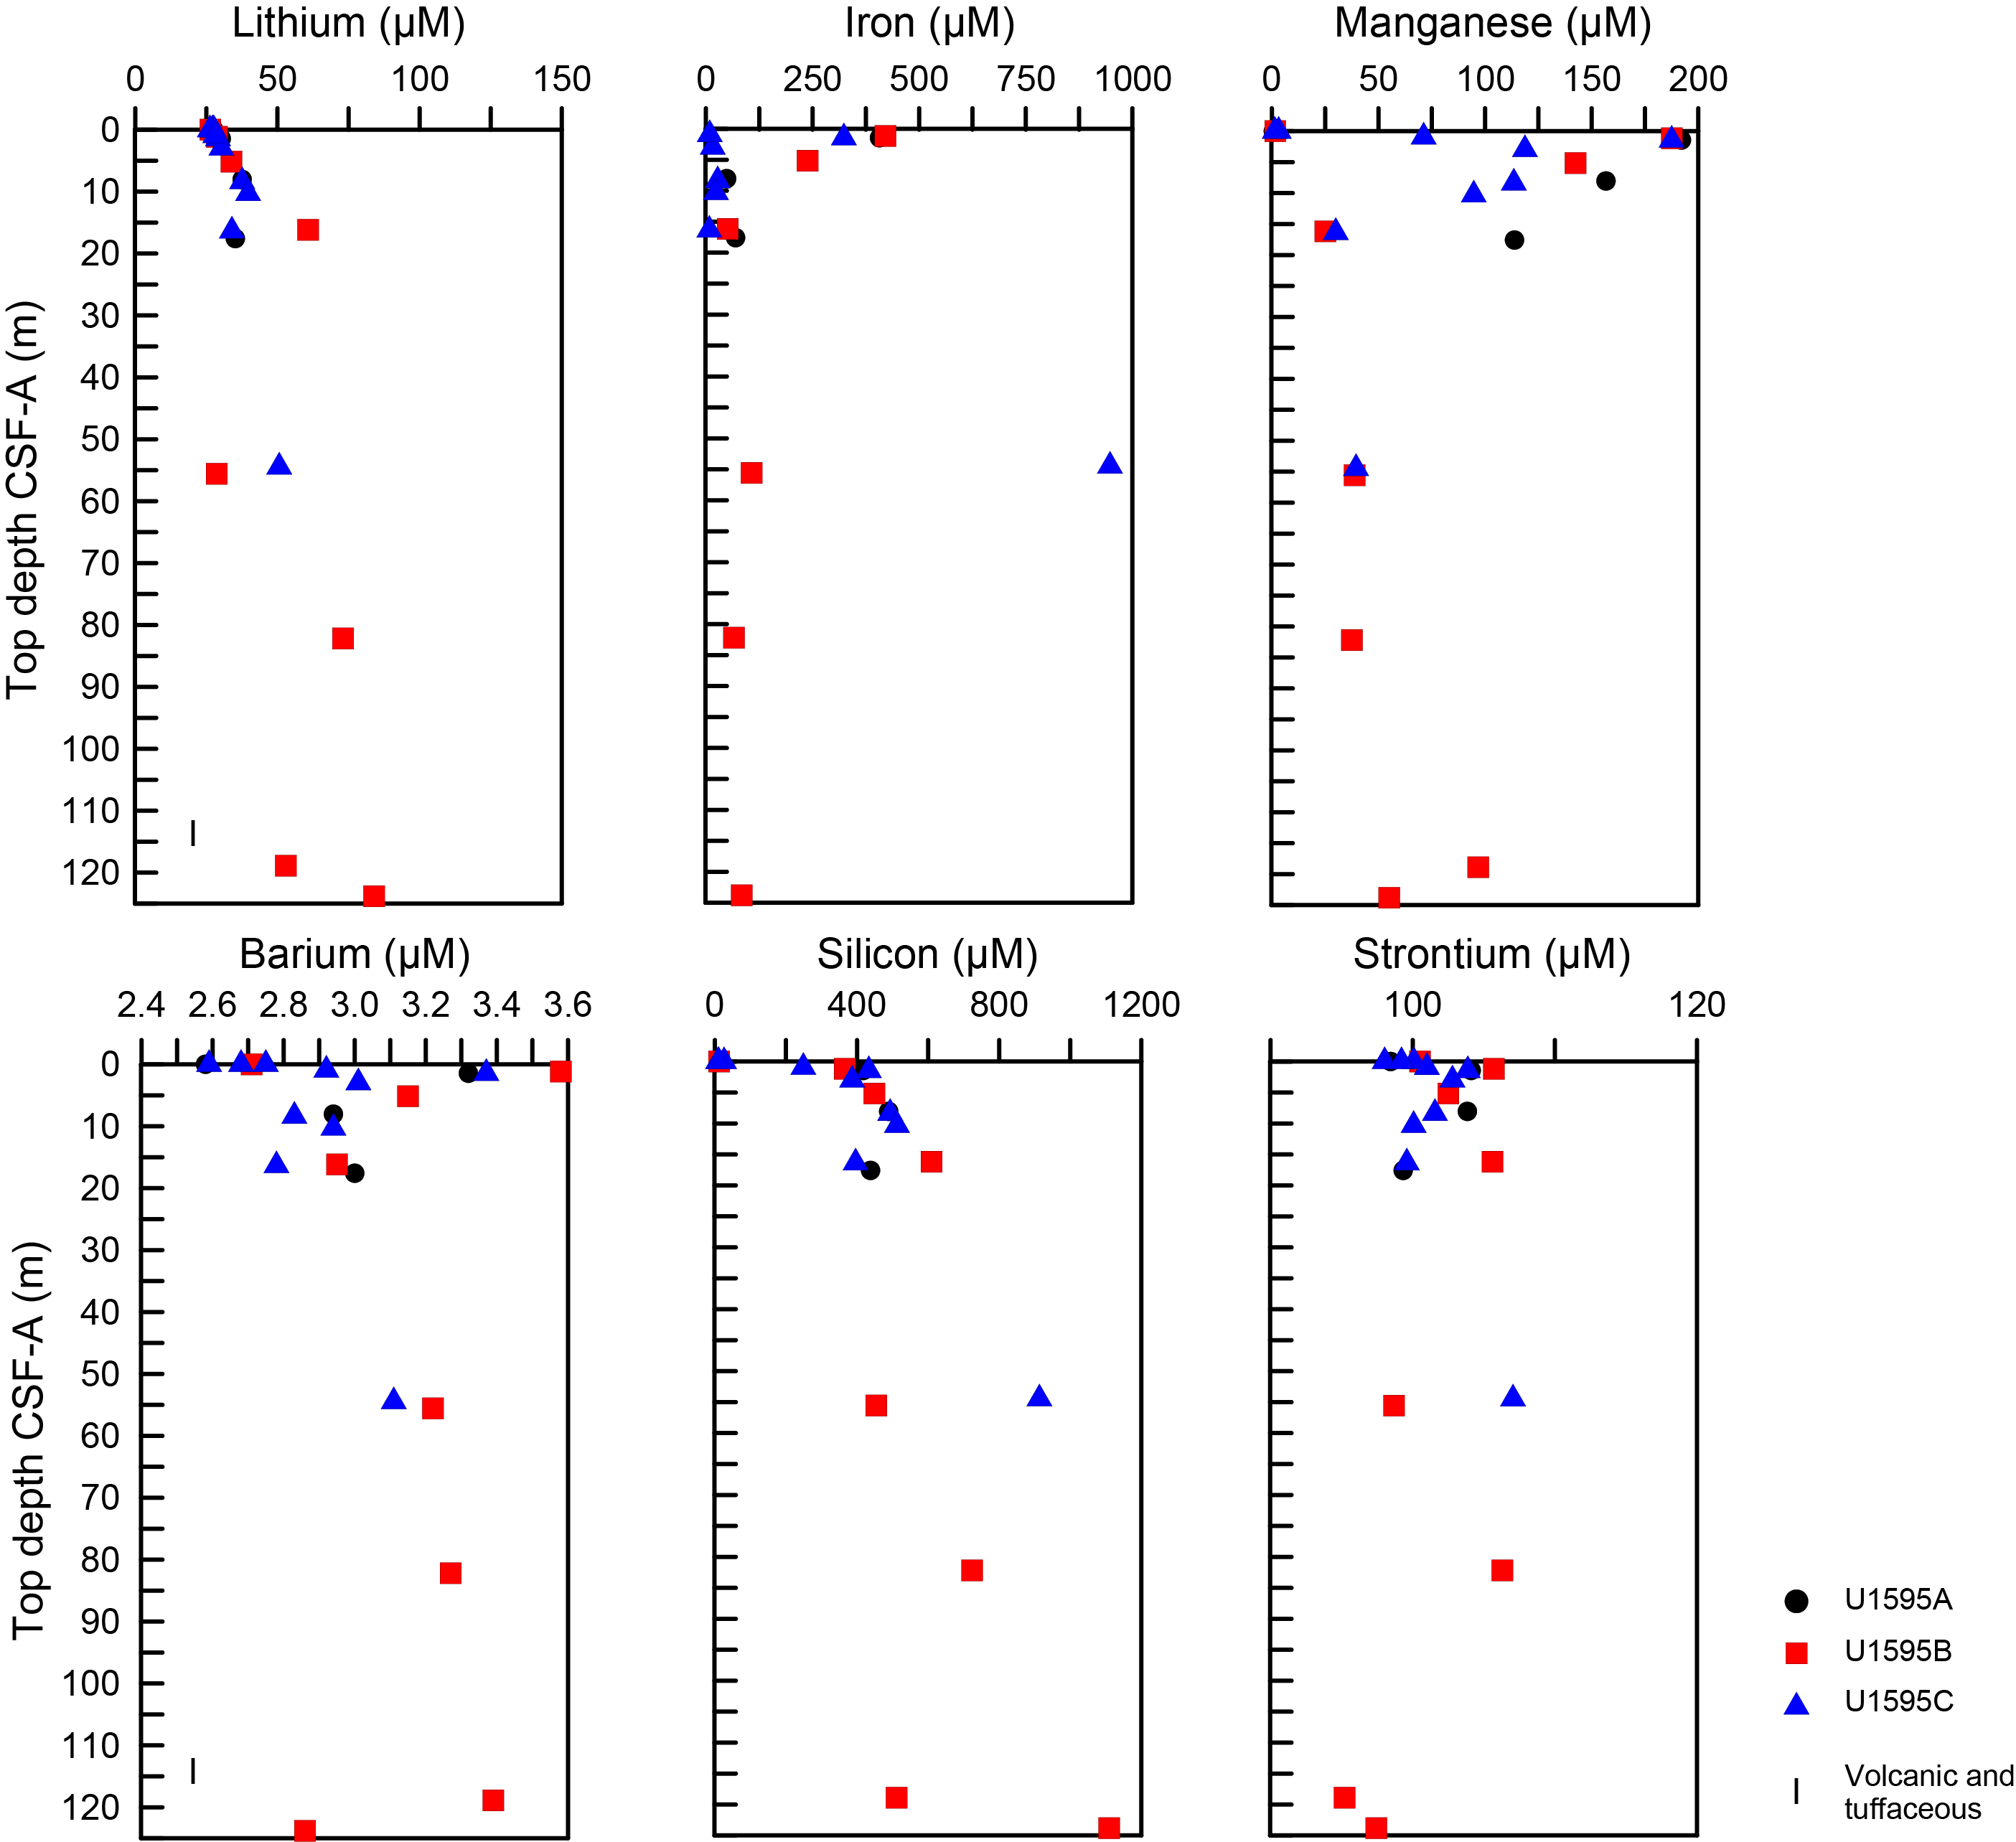
Figure F24. IW Li, Fe, Mn, Ba, Si, and Sr.
9.3. Sediment bulk geochemistry
A total of 13 sediment samples were analyzed for bulk geochemistry (Table T15). All were analyzed for total carbon, hydrogen, and nitrogen (CHN) and for inorganic carbon and carbonate content (see Geochemistry in the Expedition 398 methods chapter [Kutterolf et al., 2024a]). For CHN analysis, duplicates were run for ~10% of the samples to determine analytical reproducibility (standard deviation: N = 0.01; C = 0.04) (Table T15).
9.3.1. Sapropel identification
Total organic carbon (TOC) was calculated using total carbon and inorganic carbon values. Following the convention set forth by Kidd et al. (1978), units with TOC values >2.0 wt% were identified as sapropels and units with TOC values of 0.5–2.0 wt% were identified as sapropelitic. Using these values, one sample at 55 mbsf was identified as sapropelitic (Figure F25).
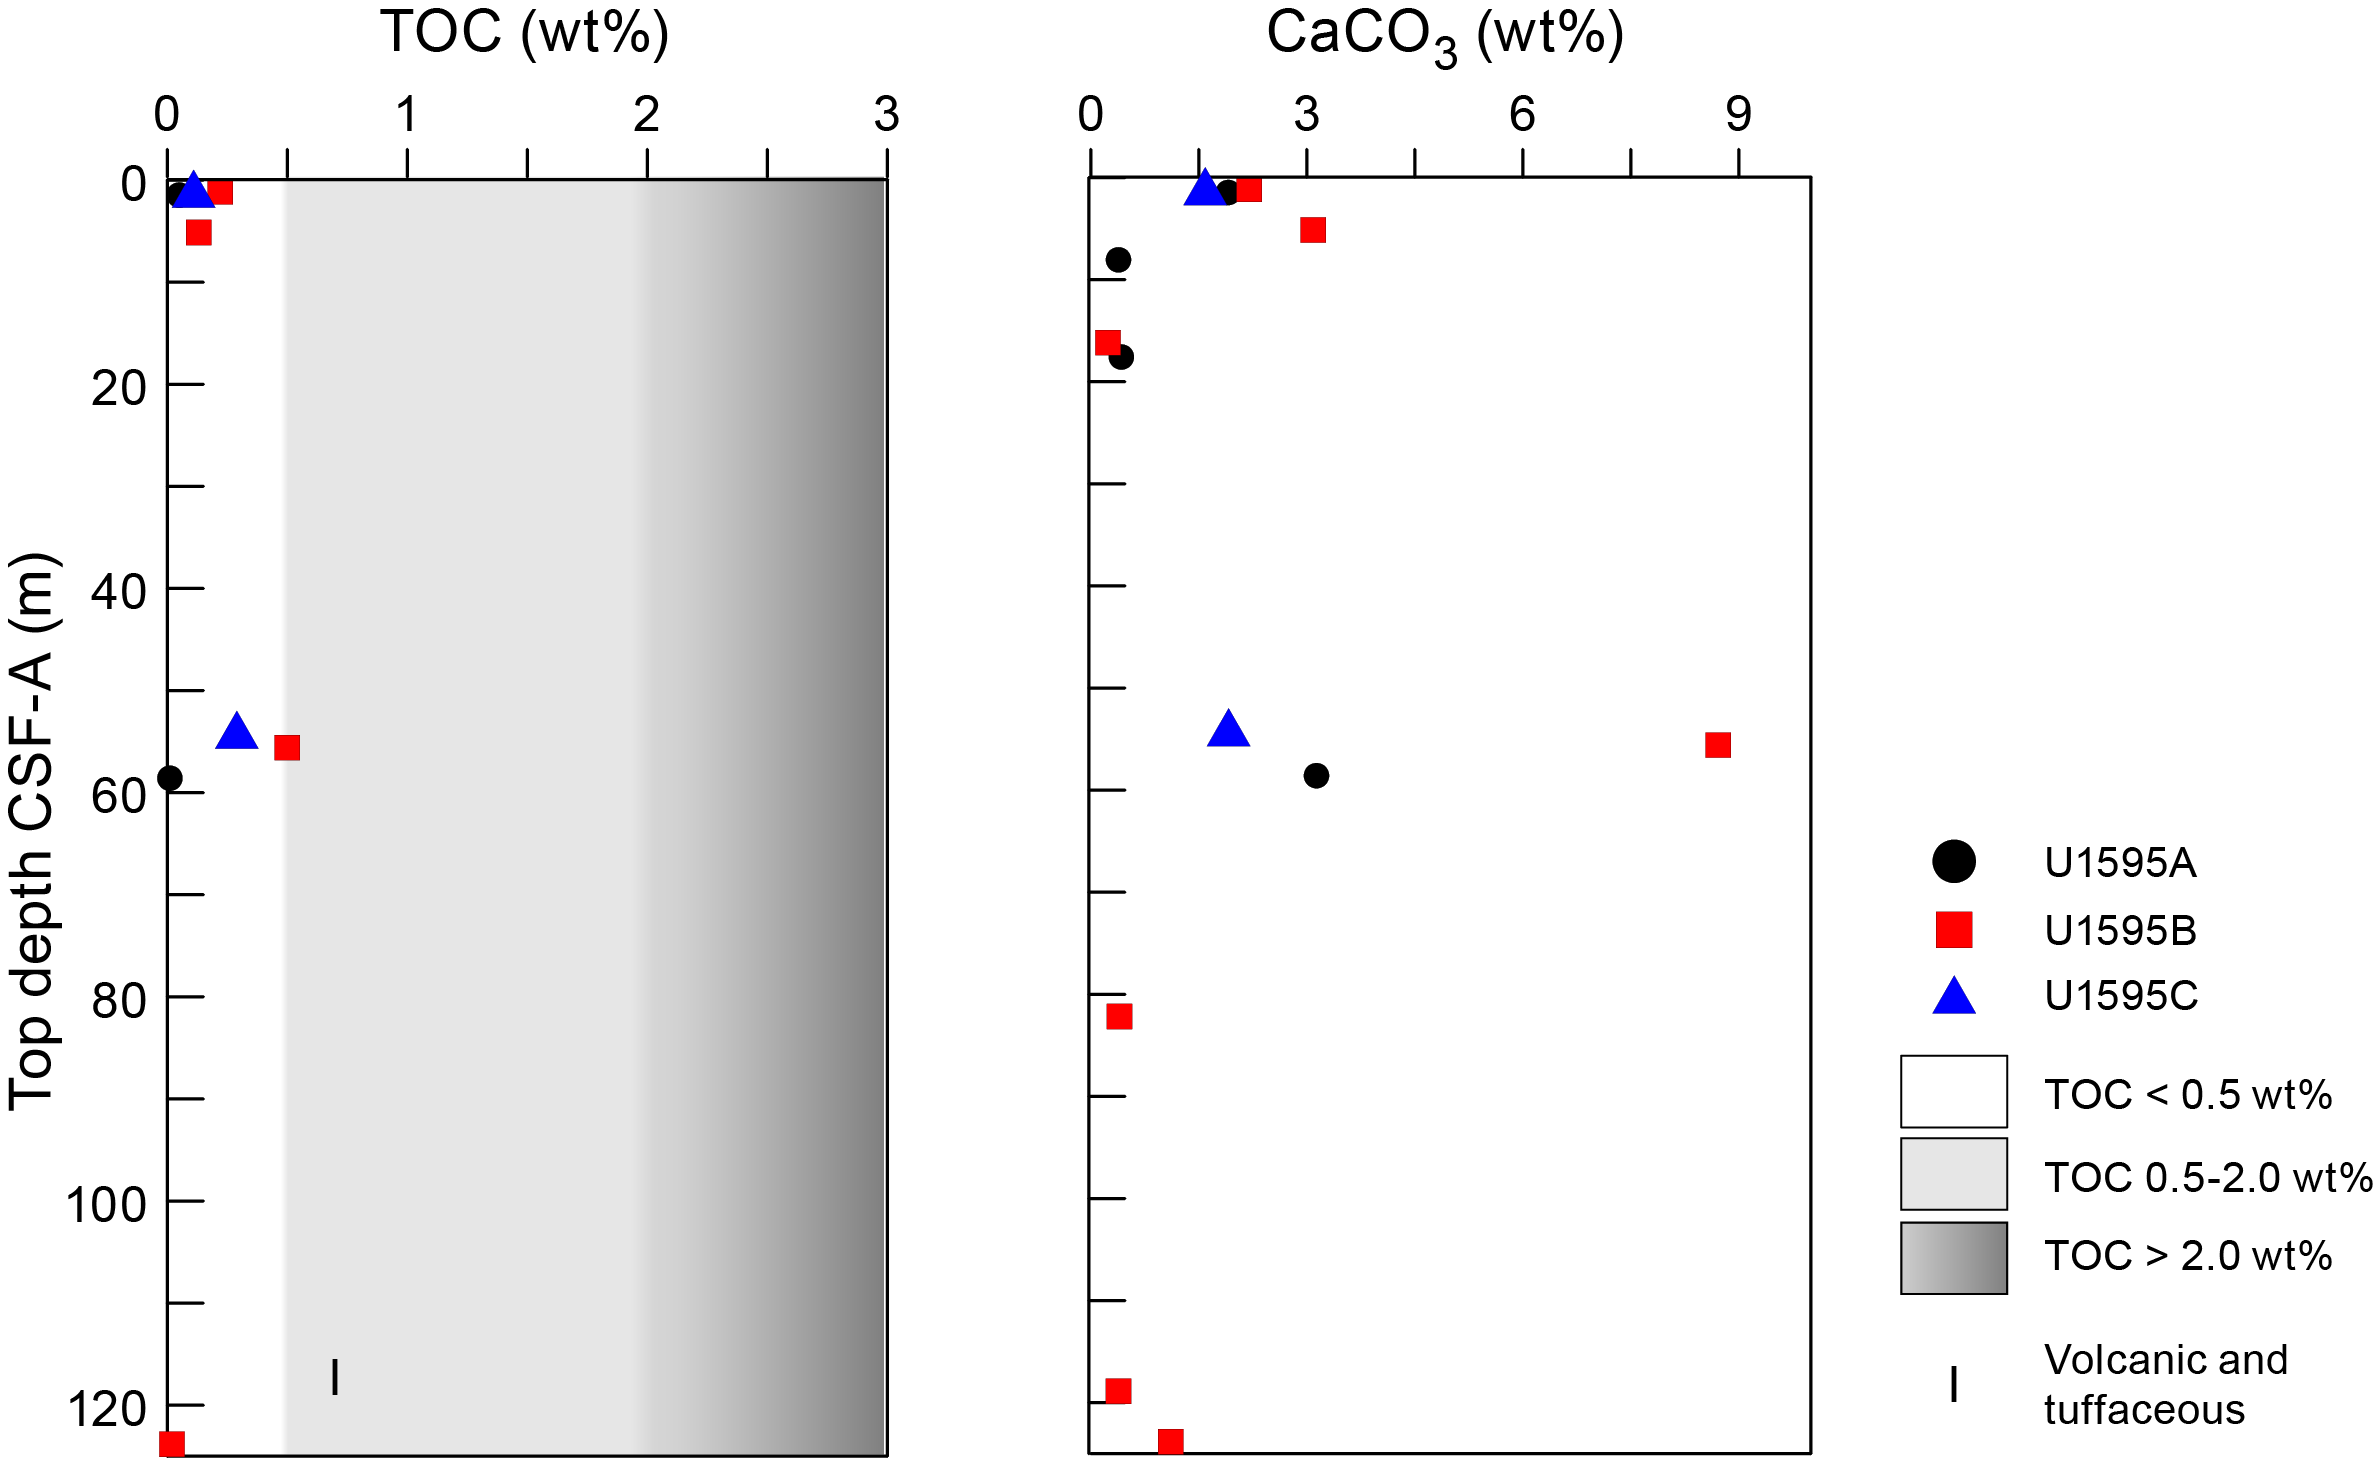
Figure F25. TOC and carbonate.
9.4. Headspace gas analysis
Headspace gas analyses were performed at a resolution of one sample per full-length core (9.5 m advance) throughout Hole U1595A. The aim was to monitor the presence and abundance of C1–C3 hydrocarbons as part of the standard International Ocean Discovery Program safety protocol (Pimmel and Claypool, 2001). A total of nine headspace gas samples from this hole were analyzed using gas chromatography (GC) (see Geochemistry in the Expedition 398 methods chapter [Kutterolf et al., 2024a]). Methane, ethane, and propane concentrations were below the detection limit throughout Hole U1595A. Concentrations of heavier hydrocarbons (iso-butane, n-butane, and n-pentane, etc.) were below the detection limit throughout Hole U1595A.
Headspace gas analyses resumed for Hole U1595B when a depth close to the deepest depth of Hole U1595A was reached (82 mbsf). Below this depth, headspace gas analyses were performed at a resolution of one sample per core to the base of the hole. A total of five headspace gas samples were analyzed using GC. No elevated methane concentrations were noted.
10. Microbiology
Fourteen whole-round core samples were collected for microbiological analyses at Site U1595 (Table T16). After the cores were transferred to the core retrieving platform, the whole-round samples were collected based on their color. To choose the appropriate incubation temperature, the core temperature was measured in the section above the sample.
The whole-round sample was transferred to the laboratory, and the following subsamples were collected:
- POLYmeta: 40 cm3 of material was placed in a 50 mL Falcon tube and stored at −80°C.
- POLYmicro: 12 cm3 of material was placed in a 15 mL Falcon tube and stored at −80°C.
- POLYanae: 12 cm3 of material was placed in a 15 mL Falcon tube and stored in the anaerobic chamber.
- POLYcell: 1.5 cm3 of material was placed in a 15 mL Falcon tube and fixed with 8.5 mL of sterile filtered seawater and 1.5 mL formalin 20% at 4°C (Formal-Fixx for fixation of pathology specimen contents).
- POLYFe: 1.5 cm3 of material was placed in a 15 mL Falcon tube and ~3–4 mL of 9K agar medium was added. Samples were stored at 16°C.
- POLYmicroscope: 1.5 cm3 of material was placed in a 2 mL vial and stored at 4°C.
- POLYFe-agar: using a sterile inoculating loop, material from the POLYFe subsample was spread on 9K agar plates and stored at 16°C.
In total, 97 subsamples were collected for microbiological analysis from the whole-round core samples, 12 samples were collected from the mudline Cores 398-U1595B-1H and 14F and 398-U1595C-1H for microbial community composition analysis, and 7 more samples were collected from Core 398-U1595B-7H for microbial isolation in 9K medium.
Table T17 lists all samples from this site.
References
Dimiza, M.D., Triantaphyllou, M.V., and Dermitzakis, M.D., 2008. Seasonality and ecology of living coccolithophores in Eastern Mediterranean coastal environment (Andros Island, Middle Aegean Sea). Micropaleontology, 54(2):159–175. http://www.jstor.org/stable/30130910
Druitt, T., Kutterolf, S., and Höfig, T.W., 2022. Expedition 398 Scientific Prospectus: Hellenic Arc Volcanic Field. International Ocean Discovery Program. https://doi.org/10.14379/iodp.sp.398.2022
Druitt, T.H., Kutterolf, S., Ronge, T.A., Beethe, S., Bernard, A., Berthod, C., Chen, H., Chiyonobu, S., Clark, A., DeBari, S., Fernandez Perez, T.I., Gertisser, R., Hübscher, C., Johnston, R.M., Jones, C., Joshi, K.B., Kletetschka, G., Koukousioura, O., Li, X., Manga, M., McCanta, M., McIntosh, I., Morris, A., Nomikou, P., Pank, K., Peccia, A., Polymenakou, P.N., Preine, J., Tominaga, M., Woodhouse, A., and Yamamoto, Y., 2024a. Site U1589. In Druitt, T.H., Kutterolf, S., Ronge, T.A., and the Expedition 398 Scientists, Hellenic Arc Volcanic Field. Proceedings of the International Ocean Discovery Program, 398: College Station, TX (International Ocean Discovery Program). https://doi.org/10.14379/iodp.proc.398.103.2024
Druitt, T.H., Kutterolf, S., Ronge, T.A., Beethe, S., Bernard, A., Berthod, C., Chen, H., Chiyonobu, S., Clark, A., DeBari, S., Fernandez Perez, T.I., Gertisser, R., Hübscher, C., Johnston, R.M., Jones, C., Joshi, K.B., Kletetschka, G., Koukousioura, O., Li, X., Manga, M., McCanta, M., McIntosh, I., Morris, A., Nomikou, P., Pank, K., Peccia, A., Polymenakou, P.N., Preine, J., Tominaga, M., Woodhouse, A., and Yamamoto, Y., 2024b. Site U1591. In Druitt, T.H., Kutterolf, S., Ronge, T.A., and the Expedition 398 Scientists, Hellenic Arc Volcanic Field. Proceedings of the International Ocean Discovery Program, 398: College Station, TX (International Ocean Discovery Program). https://doi.org/10.14379/iodp.proc.398.105.2024
Fisher, R.V., and Schmincke, H.-U., 1984. Pyroclastic Rocks: Berlin (Springer). https://doi.org/10.1007/978-3-642-74864-6
Gradstein, F.M., Ogg, J.G., Schmitz, M.D., and Ogg, G.M. (Eds.), 2020. The Geologic Time Scale 2020: Amsterdam (Elsevier BV). https://doi.org/10.1016/C2020-1-02369-3
Johnston, E.N., Sparks, R.S.J., Nomikou, P., Livanos, I., Carey, S., Phillips, J.C., and Sigurdsson, H., 2015. Stratigraphic relations of Santorini’s intracaldera fill and implications for the rate of post-caldera volcanism. Journal of the Geological Society (London, UK), 172(3):323–335. https://doi.org/10.1144/jgs2013-114
Jutzeler, M., White, J.D.L., Talling, P.J., McCanta, M., Morgan, S., Le Friant, A., and Ishizuka, O., 2014. Coring disturbances in IODP piston cores with implications for offshore record of volcanic events and the Missoula megafloods. Geochemistry, Geophysics, Geosystems, 15(9):3572–3590. https://doi.org/10.1002/2014GC005447
Kidd, R.B., Cita, M.B., and Ryan, W.B.F., 1978. Stratigraphy of eastern Mediterranean sapropel sequences recovered during DSDP Leg 42A and their paleoenvironmental significance. In Hsü, K., Montadert, L., et al., Initial Reports of the Deep Sea Drilling Project. 42(1): Washington, DC (US Government Printing Office), 421–443. https://doi.org/10.2973/dsdp.proc.42-1.113-1.1978
Kutterolf, S., Druitt, T.H., Ronge, T.A., Beethe, S., Bernard, A., Berthod, C., Chen, H., Chiyonobu, S., Clark, A., DeBari, S., Fernandez Perez, T.I., Gertisser, R., Hübscher, C., Johnston, R.M., Jones, C., Joshi, K.B., Kletetschka, G., Koukousioura, O., Li, X., Manga, M., McCanta, M., McIntosh, I., Morris, A., Nomikou, P., Pank, K., Peccia, A., Polymenakou, P.N., Preine, J., Tominaga, M., Woodhouse, A., and Yamamoto, Y., 2024a. Expedition 398 methods. In Druitt, T.H., Kutterolf, S., Ronge, T.A., and the Expedition 398 Scientists, Hellenic Arc Volcanic Field. Proceedings of the International Ocean Discovery Program, 398: College Station, TX (International Ocean Discovery Program). https://doi.org/10.14379/iodp.proc.398.102.2024
Kutterolf, S., Druitt, T.H., Ronge, T.A., Beethe, S., Bernard, A., Berthod, C., Chen, H., Chiyonobu, S., Clark, A., DeBari, S., Fernandez Perez, T.I., Gertisser, R., Hübscher, C., Johnston, R.M., Jones, C., Joshi, K.B., Kletetschka, G., Koukousioura, O., Li, X., Manga, M., McCanta, M., McIntosh, I., Morris, A., Nomikou, P., Pank, K., Peccia, A., Polymenakou, P.N., Preine, J., Tominaga, M., Woodhouse, A., and Yamamoto, Y., 2024b. Site U1594. In Druitt, T.H., Kutterolf, S., Ronge, T.A., and the Expedition 398 Scientists, Hellenic Arc Volcanic Field. Proceedings of the International Ocean Discovery Program, 398: College Station, TX (International Ocean Discovery Program). https://doi.org/10.14379/iodp.proc.398.108.2024
Kutterolf, S., Freundt, A., Hansteen, T.H., Dettbarn, R., Hampel, F., Sievers, C., Wittig, C., Allen, S.R., Druitt, T.H., McPhie, J., Nomikou, P., Pank, K., Schindlbeck-Belo, J.C., Wang, K.-L., Lee, H.-Y., and Friedrichs, B., 2021. The medial offshore record of explosive volcanism along the central to eastern Aegean Volcanic Arc: 1. tephrostratigraphic correlations. Geochemistry, Geophysics, Geosystems, 22(12):e2021GC010010. https://doi.org/10.1029/2021GC010010
Le Maitre, R.W., Steckeisen, A., Zanettin, B., Le Bas, M.J., Bonin, B., and Bateman, P. (Eds.), 2002. Igneous Rocks: A Classification and Glossary of Terms (Second edition): Cambridge, UK (Cambridge University Press). https://doi.org/10.1017/CBO9780511535581
Nomikou, P., Druitt, T.H., Hübscher, C., Mather, T.A., Paulatto, M., Kalnins, L.M., Kelfoun, K., Papanikolaou, D., Bejelou, K., Lampridou, D., Pyle, D.M., Carey, S., Watts, A.B., Weiß, B., and Parks, M.M., 2016. Post-eruptive flooding of Santorini caldera and implications for tsunami generation. Nature Communications, 7(1):13332. https://doi.org/10.1038/ncomms13332
Pimmel, A., and Claypool, G., 2001. Introduction to shipboard organic geochemistry on the JOIDES Resolution. Ocean Drilling Program Technical Note, 30. https://doi.org/10.2973/odp.tn.30.2001