Druitt, T.H., Kutterolf, S., Ronge, T.A., and the Expedition 398 Scientists
Proceedings of the International Ocean Discovery Program Volume 398
publications.iodp.org
https://doi.org/10.14379/iodp.proc.398.113.2024
Site U15991
![]() T.H. Druitt,
T.H. Druitt,
![]() S. Kutterolf,
S. Kutterolf,
![]() T.A. Ronge,
T.A. Ronge,
![]() S. Beethe,
S. Beethe,
![]() A. Bernard,
A. Bernard,
![]() C. Berthod,
C. Berthod,
![]() H. Chen,
H. Chen,
![]() S. Chiyonobu,
S. Chiyonobu,
![]() A. Clark,
A. Clark,
![]() S. DeBari,
S. DeBari,
![]() T.I. Fernandez Perez,
T.I. Fernandez Perez,
![]() R. Gertisser,
R. Gertisser,
![]() C. Hübscher,
C. Hübscher,
![]() R.M. Johnston,
R.M. Johnston,
![]() C. Jones,
C. Jones,
![]() K.B. Joshi,
K.B. Joshi,
![]() G. Kletetschka,
G. Kletetschka,
![]() O. Koukousioura,
O. Koukousioura,
![]() X. Li,
X. Li,
![]() M. Manga,
M. Manga,
![]() M. McCanta,
M. McCanta,
![]() I. McIntosh,
I. McIntosh,
![]() A. Morris,
A. Morris,
![]() P. Nomikou,
P. Nomikou,
![]() K. Pank,
K. Pank,
![]() A. Peccia,
A. Peccia,
![]() P.N. Polymenakou,
P.N. Polymenakou,
![]() J. Preine,
J. Preine,
![]() M. Tominaga,
M. Tominaga,
![]() A. Woodhouse, and
A. Woodhouse, and
![]() Y. Yamamoto2
Y. Yamamoto2
1 Druitt, T.H., Kutterolf, S., Ronge, T.A., Beethe, S., Bernard, A., Berthod, C., Chen, H., Chiyonobu, S., Clark, A., DeBari, S., Fernandez Perez, T.I., Gertisser, R., Hübscher, C., Johnston, R.M., Jones, C., Joshi, K.B., Kletetschka, G., Koukousioura, O., Li, X., Manga, M., McCanta, M., McIntosh, I., Morris, A., Nomikou, P., Pank, K., Peccia, A., Polymenakou, P.N., Preine, J., Tominaga, M., Woodhouse, A., and Yamamoto, Y., 2024. Site U1599. In Druitt, T.H., Kutterolf, S., Ronge, T.A., and the Expedition 398 Scientists, Hellenic Arc Volcanic Field. Proceedings of the International Ocean Discovery Program, 398: College Station, TX (International Ocean Discovery Program). https://doi.org/10.14379/iodp.proc.398.113.2024
2 Expedition 398 Scientists’ affiliations.
1. Background and objectives
Site U1599 is located ~6 km north of Anafi Island within the upper reaches of the Anafi Basin at a water depth of 592 meters below sea level (mbsl) (Figure F1). Permission to drill in this location was granted by the International Ocean Discovery Program (IODP) Environmental Protection and Safety Panel during the expedition (proposed Site CSK-22A). Three holes (U1599A–U1599C) were drilled to a maximum recovery depth of 698.1 meters below seafloor (mbsf) (all depths below seafloor are given using the core depth below seafloor, Method A [CSF-A] scale, except in Operations, where the drilling depth below seafloor [DSF] scale is used), with average hole core recoveries ranging 51%–83% (Figure F2).
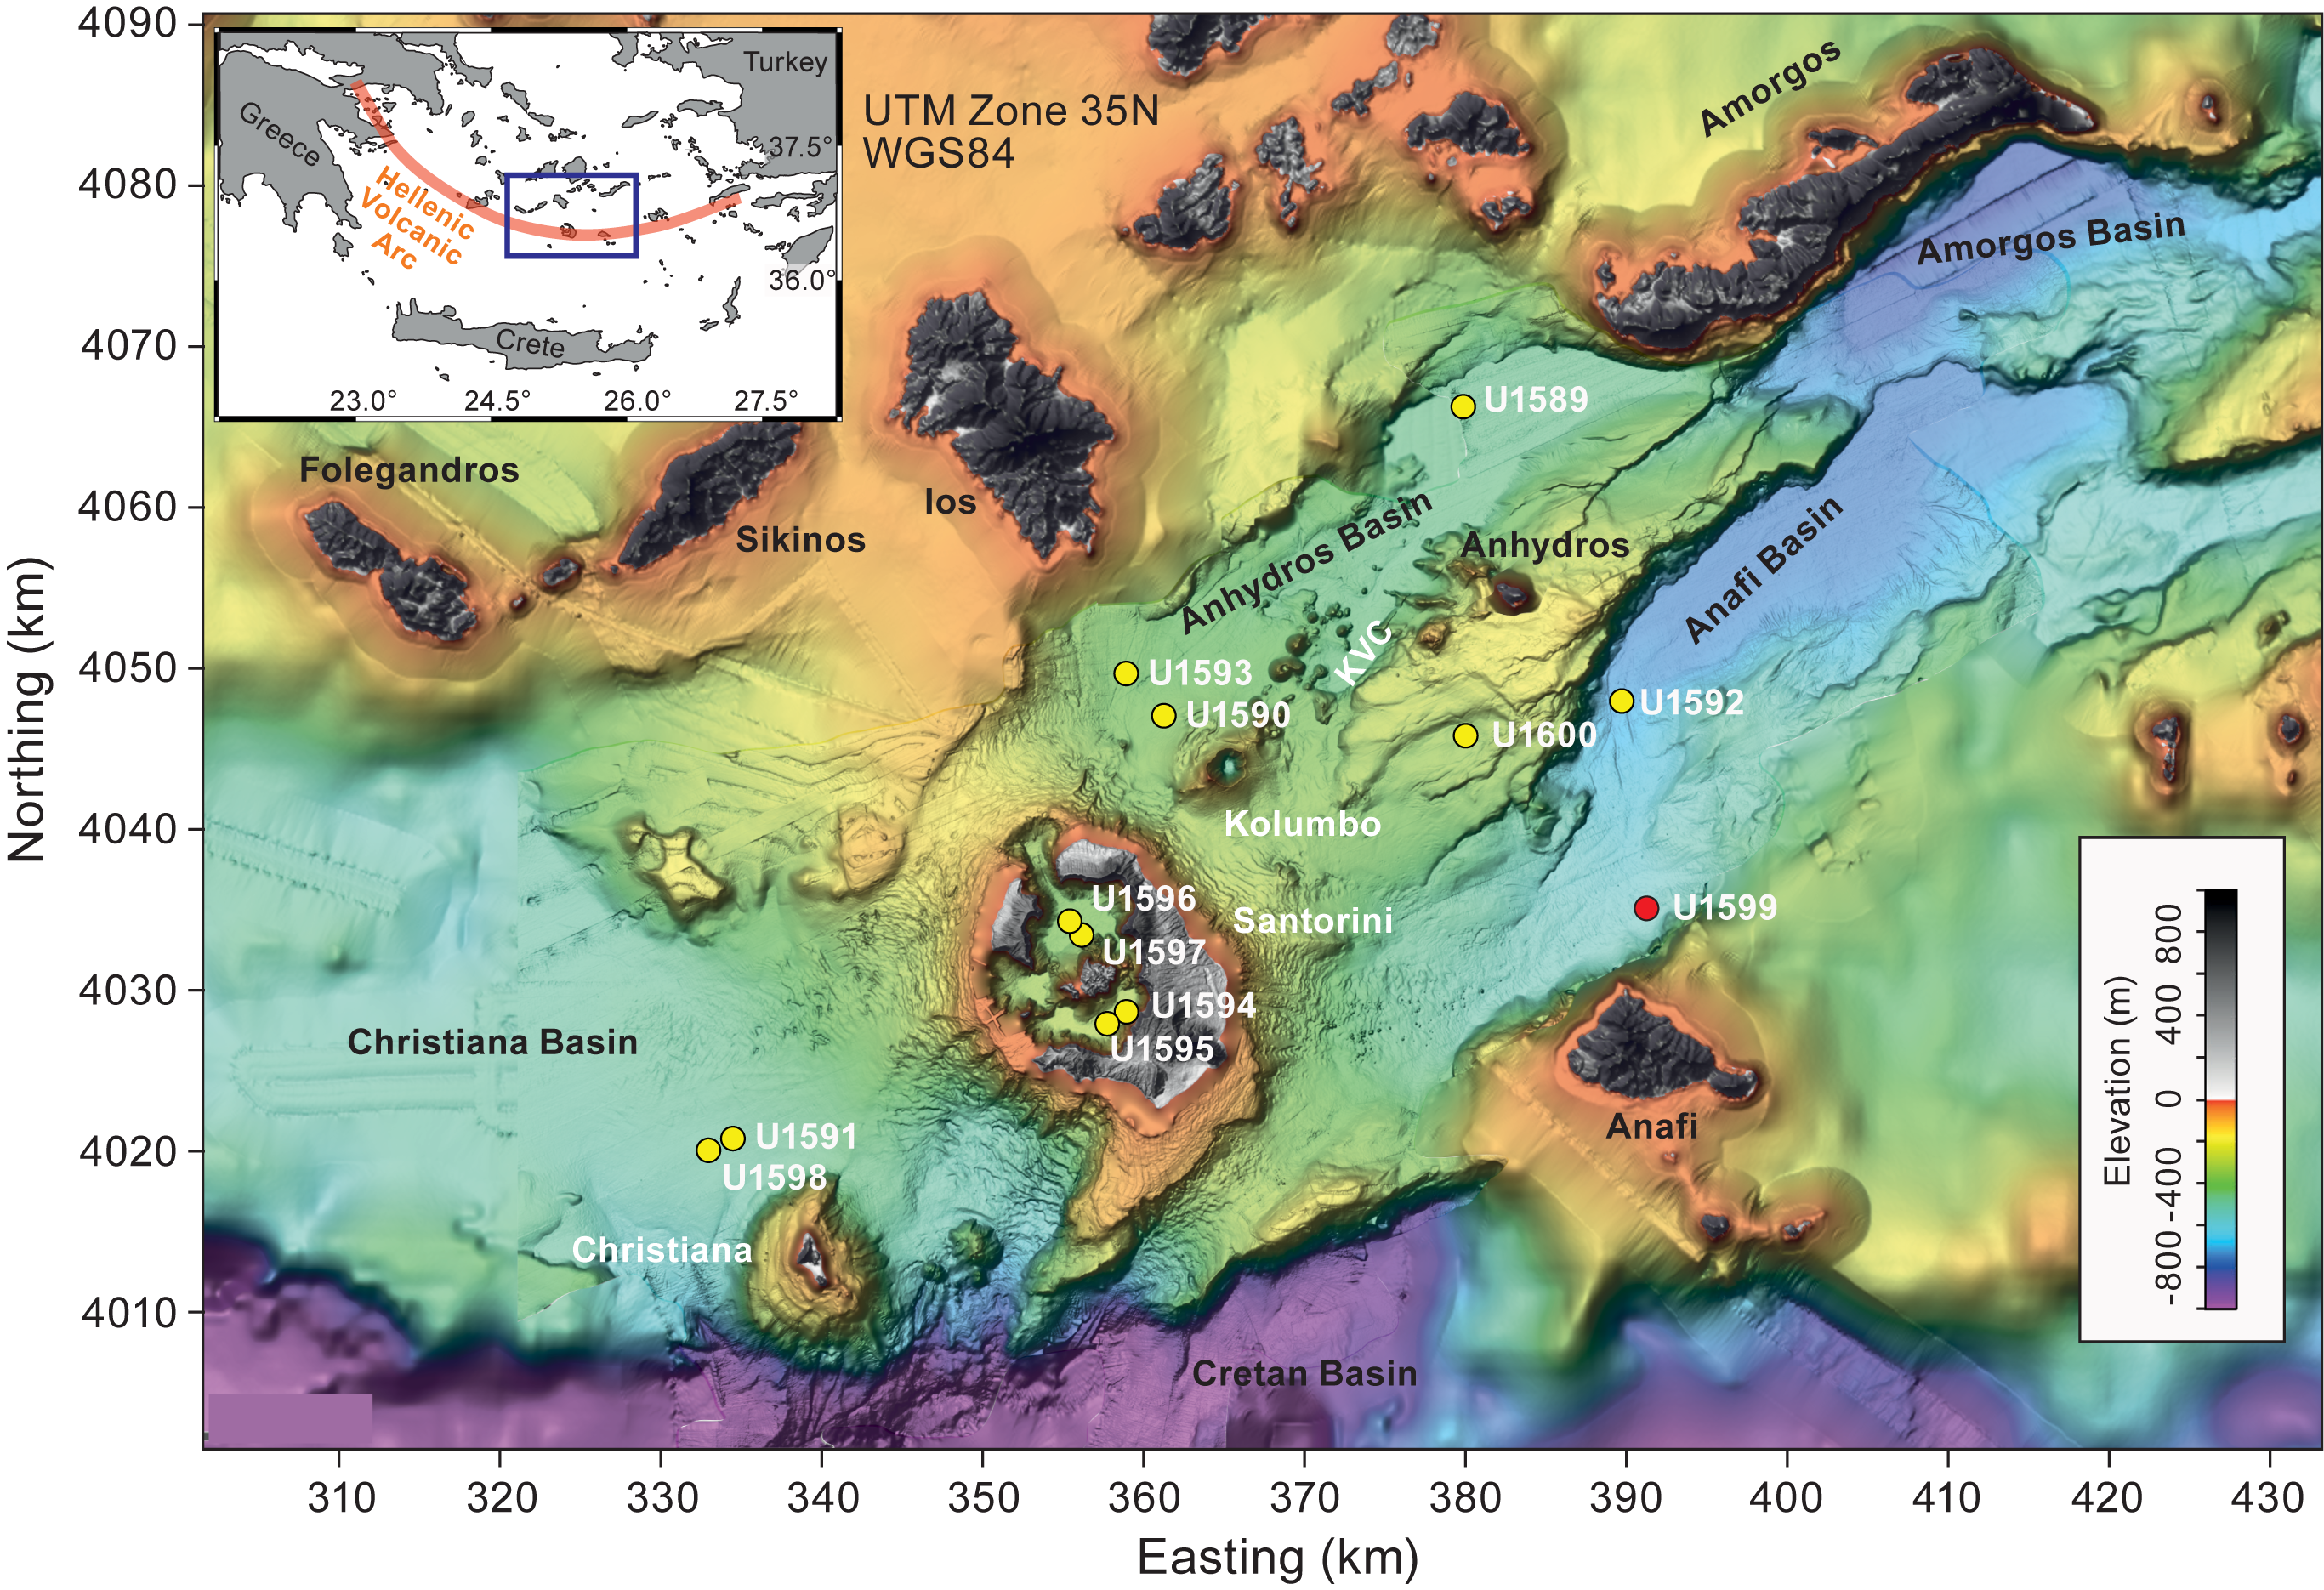
Figure F1. Site map.
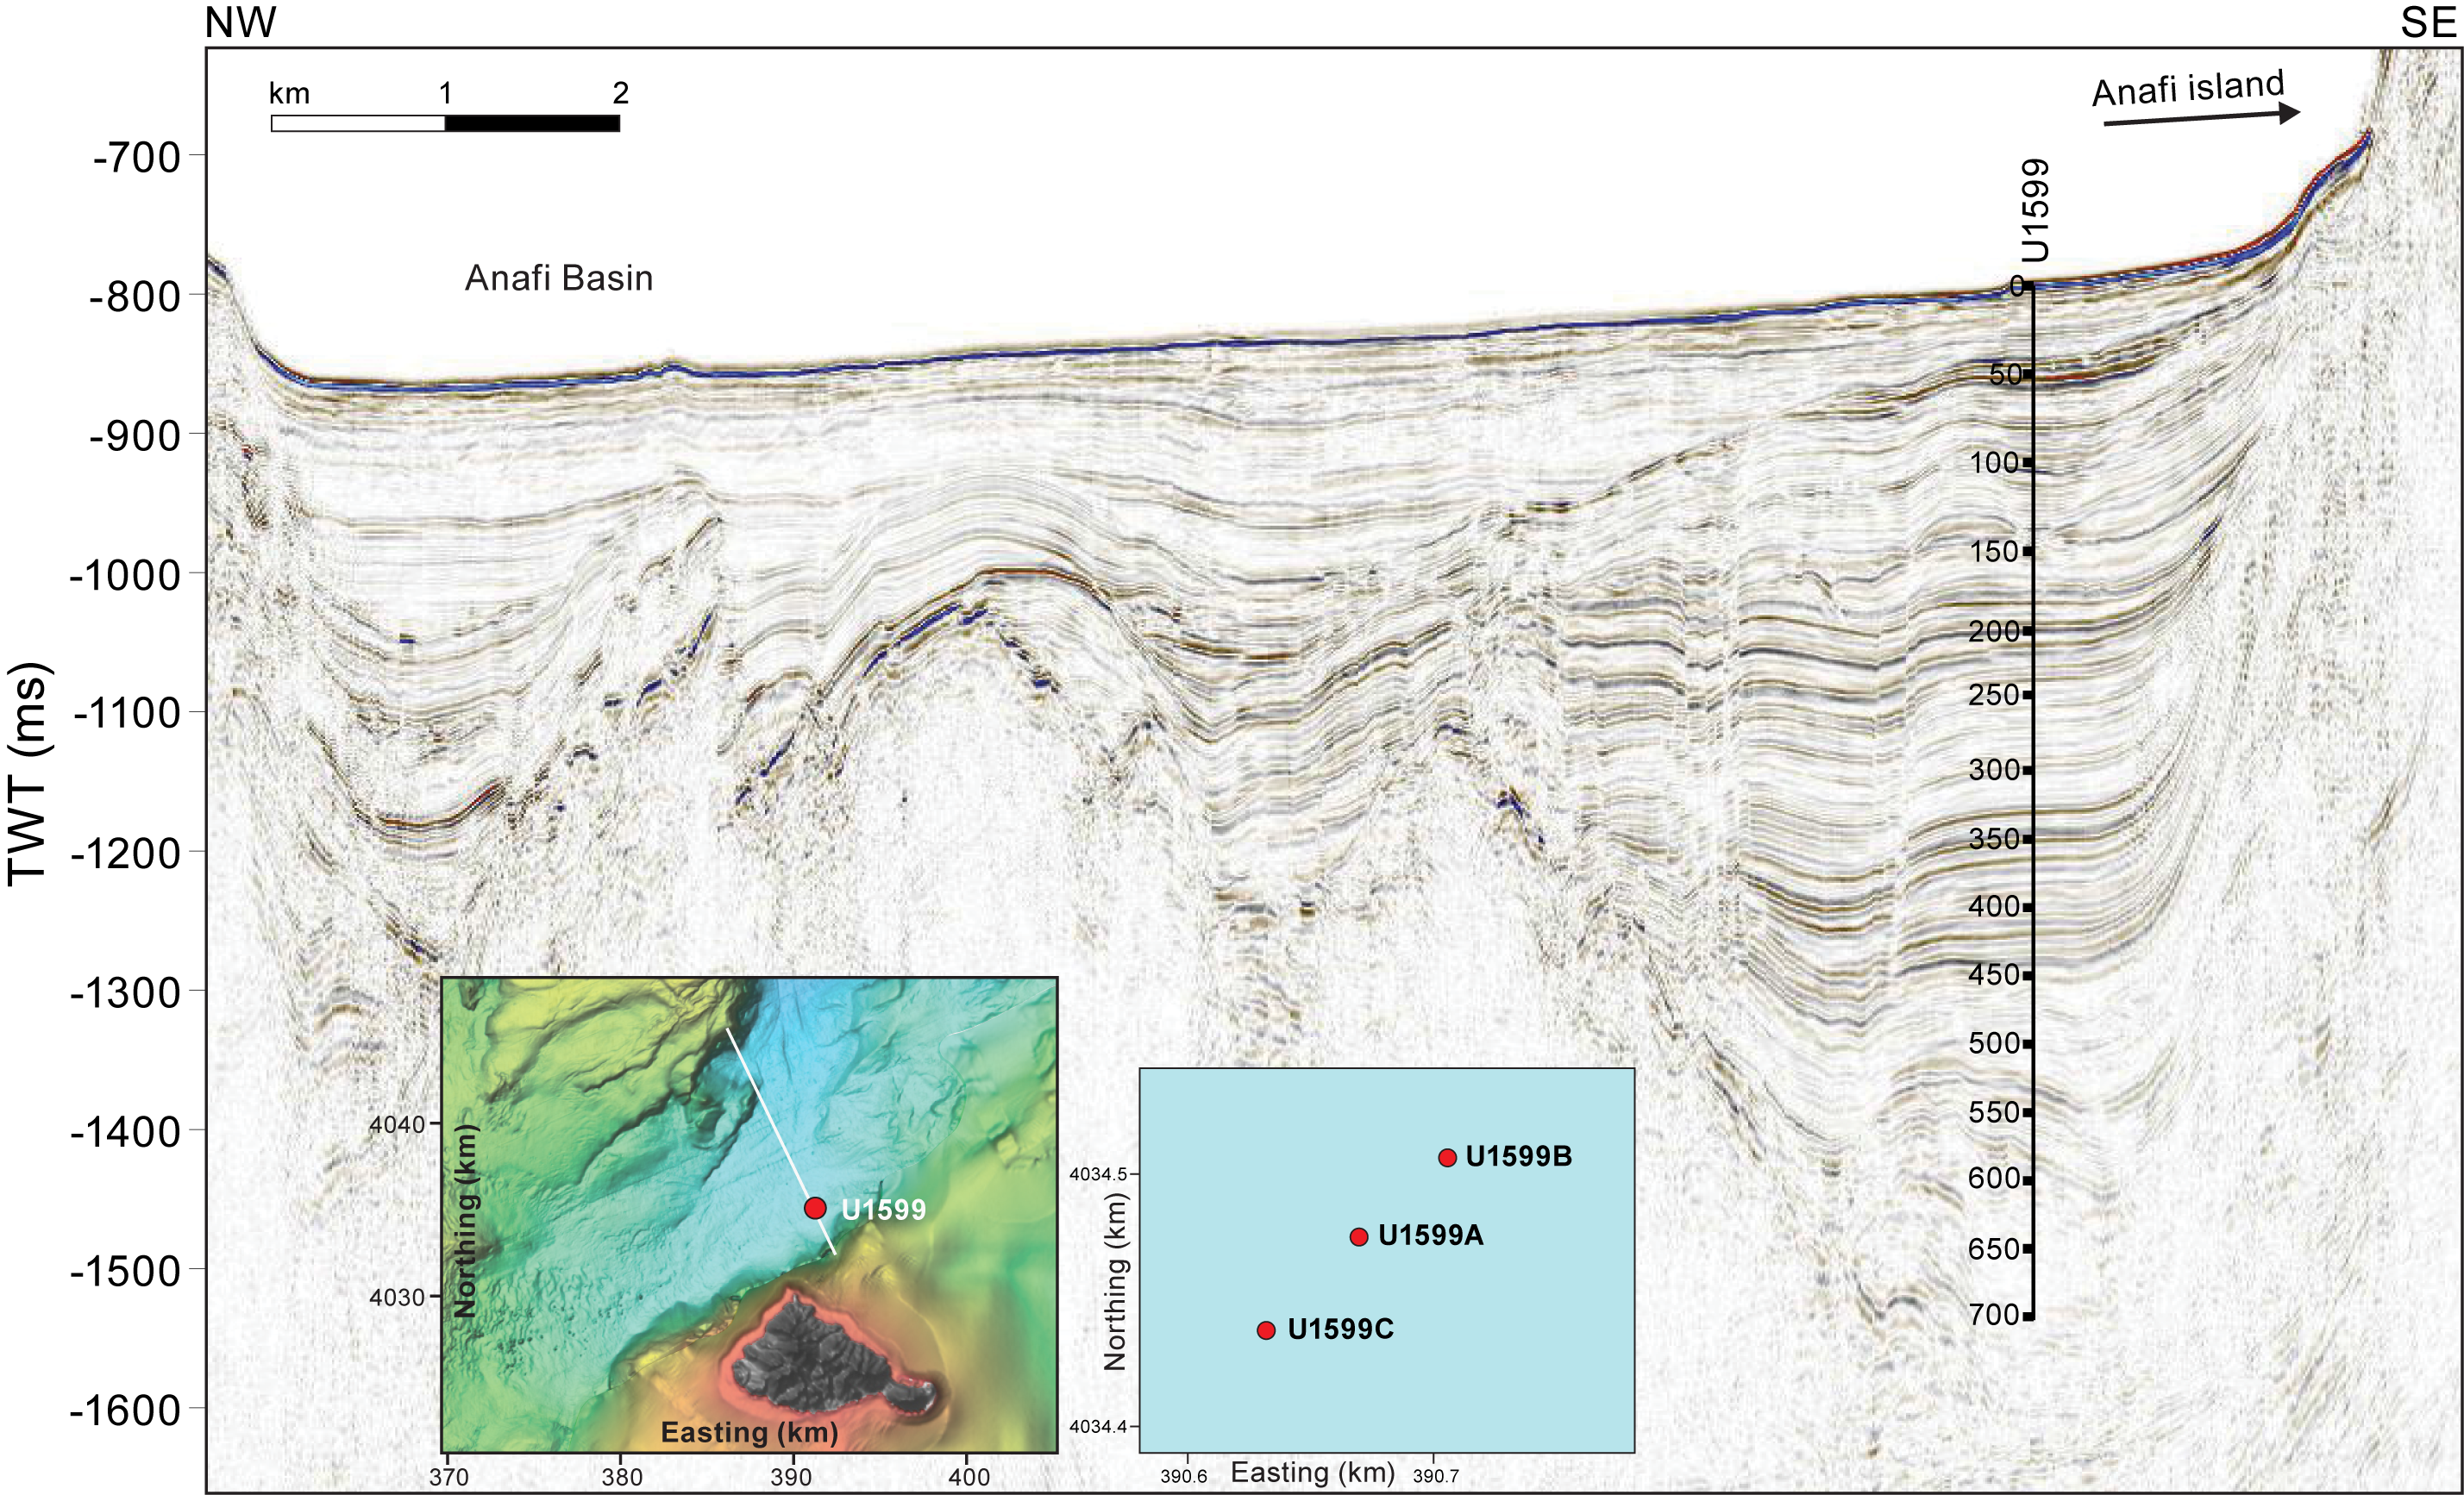
Figure F2. Seismic profile.
Whereas Site U1592 is situated on the axis of the Anafi Basin and penetrated a thick basin fill including mass-transported material, Site U1599 is located on the southeast margin of the basin. It was chosen to offer a condensed sequence of tephra without quantities of mass-wasting debris. As such, it provided a complete stratigraphy of volcanic tephra from Santorini and Kolumbo. The same six seismic units (U1–U6, from the bottom up; Preine et al., 2022a, 2022b) present at Site U1592 are present at Site U1599. Site U1599 is located within the area of the 2015 PROTEUS seismic tomography experiment, during which subbottom profiling, gravity, and magnetic data were also recorded (Hooft et al., 2017).
Drilling at Site U1599 enabled us to reconstruct a near-complete volcanic stratigraphy consistent with both onshore and offshore constraints and pinned by chronological markers from biostratigraphy, magnetostratigraphy, and sapropel records. Benthic foraminifera from fine-grained sediments provided estimates of paleowater depths and, via integration with seismic profiles and chronologic data, of time-integrated basin subsidence rates. Drilling in the Anafi Basin addressed scientific Objectives 1–4 and 6 of the Expedition 398 Scientific Prospectus (Druitt et al., 2022). It was complemented by Site U1589 in the Anhydros Basin because each basin tapped a different sediment distributary branch of the Christiana-Santorini-Kolumbo volcanic system.
2. Operations
The vessel arrived at Site U1599 on 25 January 2023 at 2115 h, ending the transit and marking the start of Site U1599.
2.1. Hole U1599A
The crew made up the advanced piston corer/extended core barrel (APC/XCB) bottom hole assembly (BHA) with a bit. The BHA was run in to 585.7 meters below rig floor (mbrf). On 26 January 2023, following 12.75 h awaiting approval for the site, the go-ahead was given at 1315 h. The APC barrel was fired for Core 1H from 599.0 mbrf. Once retrieved, it was discovered the core barrel had parted at the midconnection. The pipe tally and the precision depth recorder were verified. A second attempt was made with the APC system; unfortunately, the result was the same—a parted core barrel.
An XCB barrel was dropped. Hole U1599A (36°26.9592′N, 25°46.8005′E) was spudded at 1535 h with a solid tag at 602.5 mbrf. After retrieval, the barrel had zero recovery, but it was obvious the coring system had been in the ground.
Given continuing uncertainty of the stiffness of the formation, the coring approach was switched to half-length APC (HLAPC) for Core 2F from 9.7 mbsf. The 97% recovery showed the material was suitable for piston coring. It was assumed there was some tightly compacted layer at the mudline.
Coring was then switched to the APC system with Cores 3H–9H at 71.4 mbsf (Table T1). The formation stiffened up quickly, forcing the change to HLAPC coring for Core 10F and all the way through Core 44F to 245.4 mbsf, the final depth for Hole U1599A. There was an unsuccessful overpull of 60,000 lb on Core 44F. An attempt was made to drill over the barrel for ~30 min. The driller aired down the compensator and applied 100,000 lb overpull, which freed the barrel. The decision was made to terminate the hole.
The string was pulled up with the top drive from 240.7 to 185.4 mbsf, and the bit cleared the seafloor at 2145 h, ending Hole U1599A.
2.2. Hole U1599B
The vessel was offset 50 m northeast of Hole U1599A, and the seafloor was tagged at 604.0 mbsf. Hole U1599B (36°26.9764′N, 25°46.8237′E) was spudded at 2330 h on 27 January 2023 with Core 1X to 9.7 mbsf. Coring was switched to the APC system for Cores 2H–11H at 95.2 mbsf. Overpulls of 35,000 and 30,000 lb were seen on Cores 10H and 11H, respectively. Coring was again switched, this time to the HLAPC system, for Core 12F from 104.7 mbsf through Core 40F at 241.0 mbsf, the final depth for Hole U1599B.
The drill string was tripped up with the top drive, and the bit cleared the seafloor at 0100 h and the rotary table at 0255 h. The drill floor was secured, and the thrusters were raised starting at 0324 h. All thrusters were up and secure, the vessel was under bridge control, and the sea passage started at 0336 h.
2.3. Hole U1599C
Hole U1599C (36°26.9389′N, 25°46.7762′E) was spudded on 30 January 2023 at 1925 h. A seafloor depth of 604.0 mbrf was used by offset. Drill-ahead without recovery progressed to 223.0 mbsf at 0445 h. RCB coring commenced with Core 2R on 30 January and proceeded through 1 February and Core 25R to 455.5 mbsf. The drill string was tripped from 455.5 to 404.9 mbsf. The top drive was racked back, and the pipe trip up continued to 55.6 mbsf.
Next, the rig crew pulled the upper guide horn (UGH) in preparation for launching a free-fall funnel (FFF). The FFF was assembled and welded in the moonpool. The FFF was launched at 2005 h and immediately chased with the vibration isolated television (VIT) camera at 2015 h.
At the seafloor, the VIT camera verified the FFF had landed successfully. The pipe was tripped up and out of the hole from 55.6 mbsf to 516.7 mbrf with the camera observing. The bit cleared the seafloor at 2117 h and seemed to leave the FFF undisturbed.
The VIT was back on deck at 2209 h. The rig crew then reinstalled the UGH and reassembled the rig floor. The pipe trip continued to 145.0 mbrf. The bit cleared the rotary table at 0025 h, and the rig floor was secured. The vessel was switched to bridge control at 0130 h on 2 February. All thrusters were up and secure, with the start of the sea passage to Site U1595 at 0142 h, ending Site U1599 for the time being.
After arrival on 5 February, the crew made up the RCB BHA with the bit used previously. Winds were forecast to rise above 40 kt with gusts over 50 kt, exceeding shallow operations limits. The vessel began waiting on weather with the pipe down, beginning at 0915 h on 6 February. The ship was offset 5.5 nm west in dynamic positioning (DP) mode to deeper water, away from Anafi Island, which was on the leeward side.
At 1840 h on 6 February, in anticipation of the weather coming down, the ship started the DP move back over Hole U1599C. The move was completed at 0100 h on 7 February, and the vessel went back to work following 39.75 h of waiting on weather.
The VIT was deployed. While the camera system was being lowered, the vessel was maneuvered for reentry for about 30 min, reentering Hole U1599C at 0230 h. The VIT was retrieved and back on deck at 0345 h.
The pipe was tripped in to 56.6 mbsf, and the top drive was assembled. A wash barrel was dropped. The trip in with the top drive progressed to 410.0 mbsf, where an obstruction was found. The wash barrel was recovered, a center bit was dropped, and the hole was reamed down to 455.5 mbsf.
At 1300 h on 7 January, RCB coring commenced with Core 26R from 455.5 mbsf and continued to 9 January through Core 50R at 697.8 mbsf, the final depth for Hole U1599C.
The drill string was tripped with the top drive, and the bit cleared the rotary table at 2030 h. The rig floor was secured, with all equipment put away, at 2130 h.
The thrusters were raised and the vessel brought under bridge control at 2134 h. All thrusters were up and secure, and the start of the sea passage to Heraklion at 2142 h marked the end of Site U1599.
All total, Hole U1599C took 4.6 days.
3. Lithostratigraphy
Cores from Site U1599 recovered a relatively coherent stratigraphy from 0 to 698.01 mbsf in three holes (Figure F3); however, there was no core recovery in the first cores of Holes U1599A and U1599B. Hole U1599A consists of Sections 2F-1 through 44F-CC (9.7–245.69 mbsf), Hole U1599B consists of Sections 2H-1 through 40F-CC (9.7–241.22 mbsf), and Hole U1599C consists of Sections 2R-1 through 50R-CC (223–697.8 mbsf). Recovery in Hole U1599C began at 223 mbsf using RCB coring with the goal of overlapping the bottoms of Holes U1599A and U1599B to get better recovery.
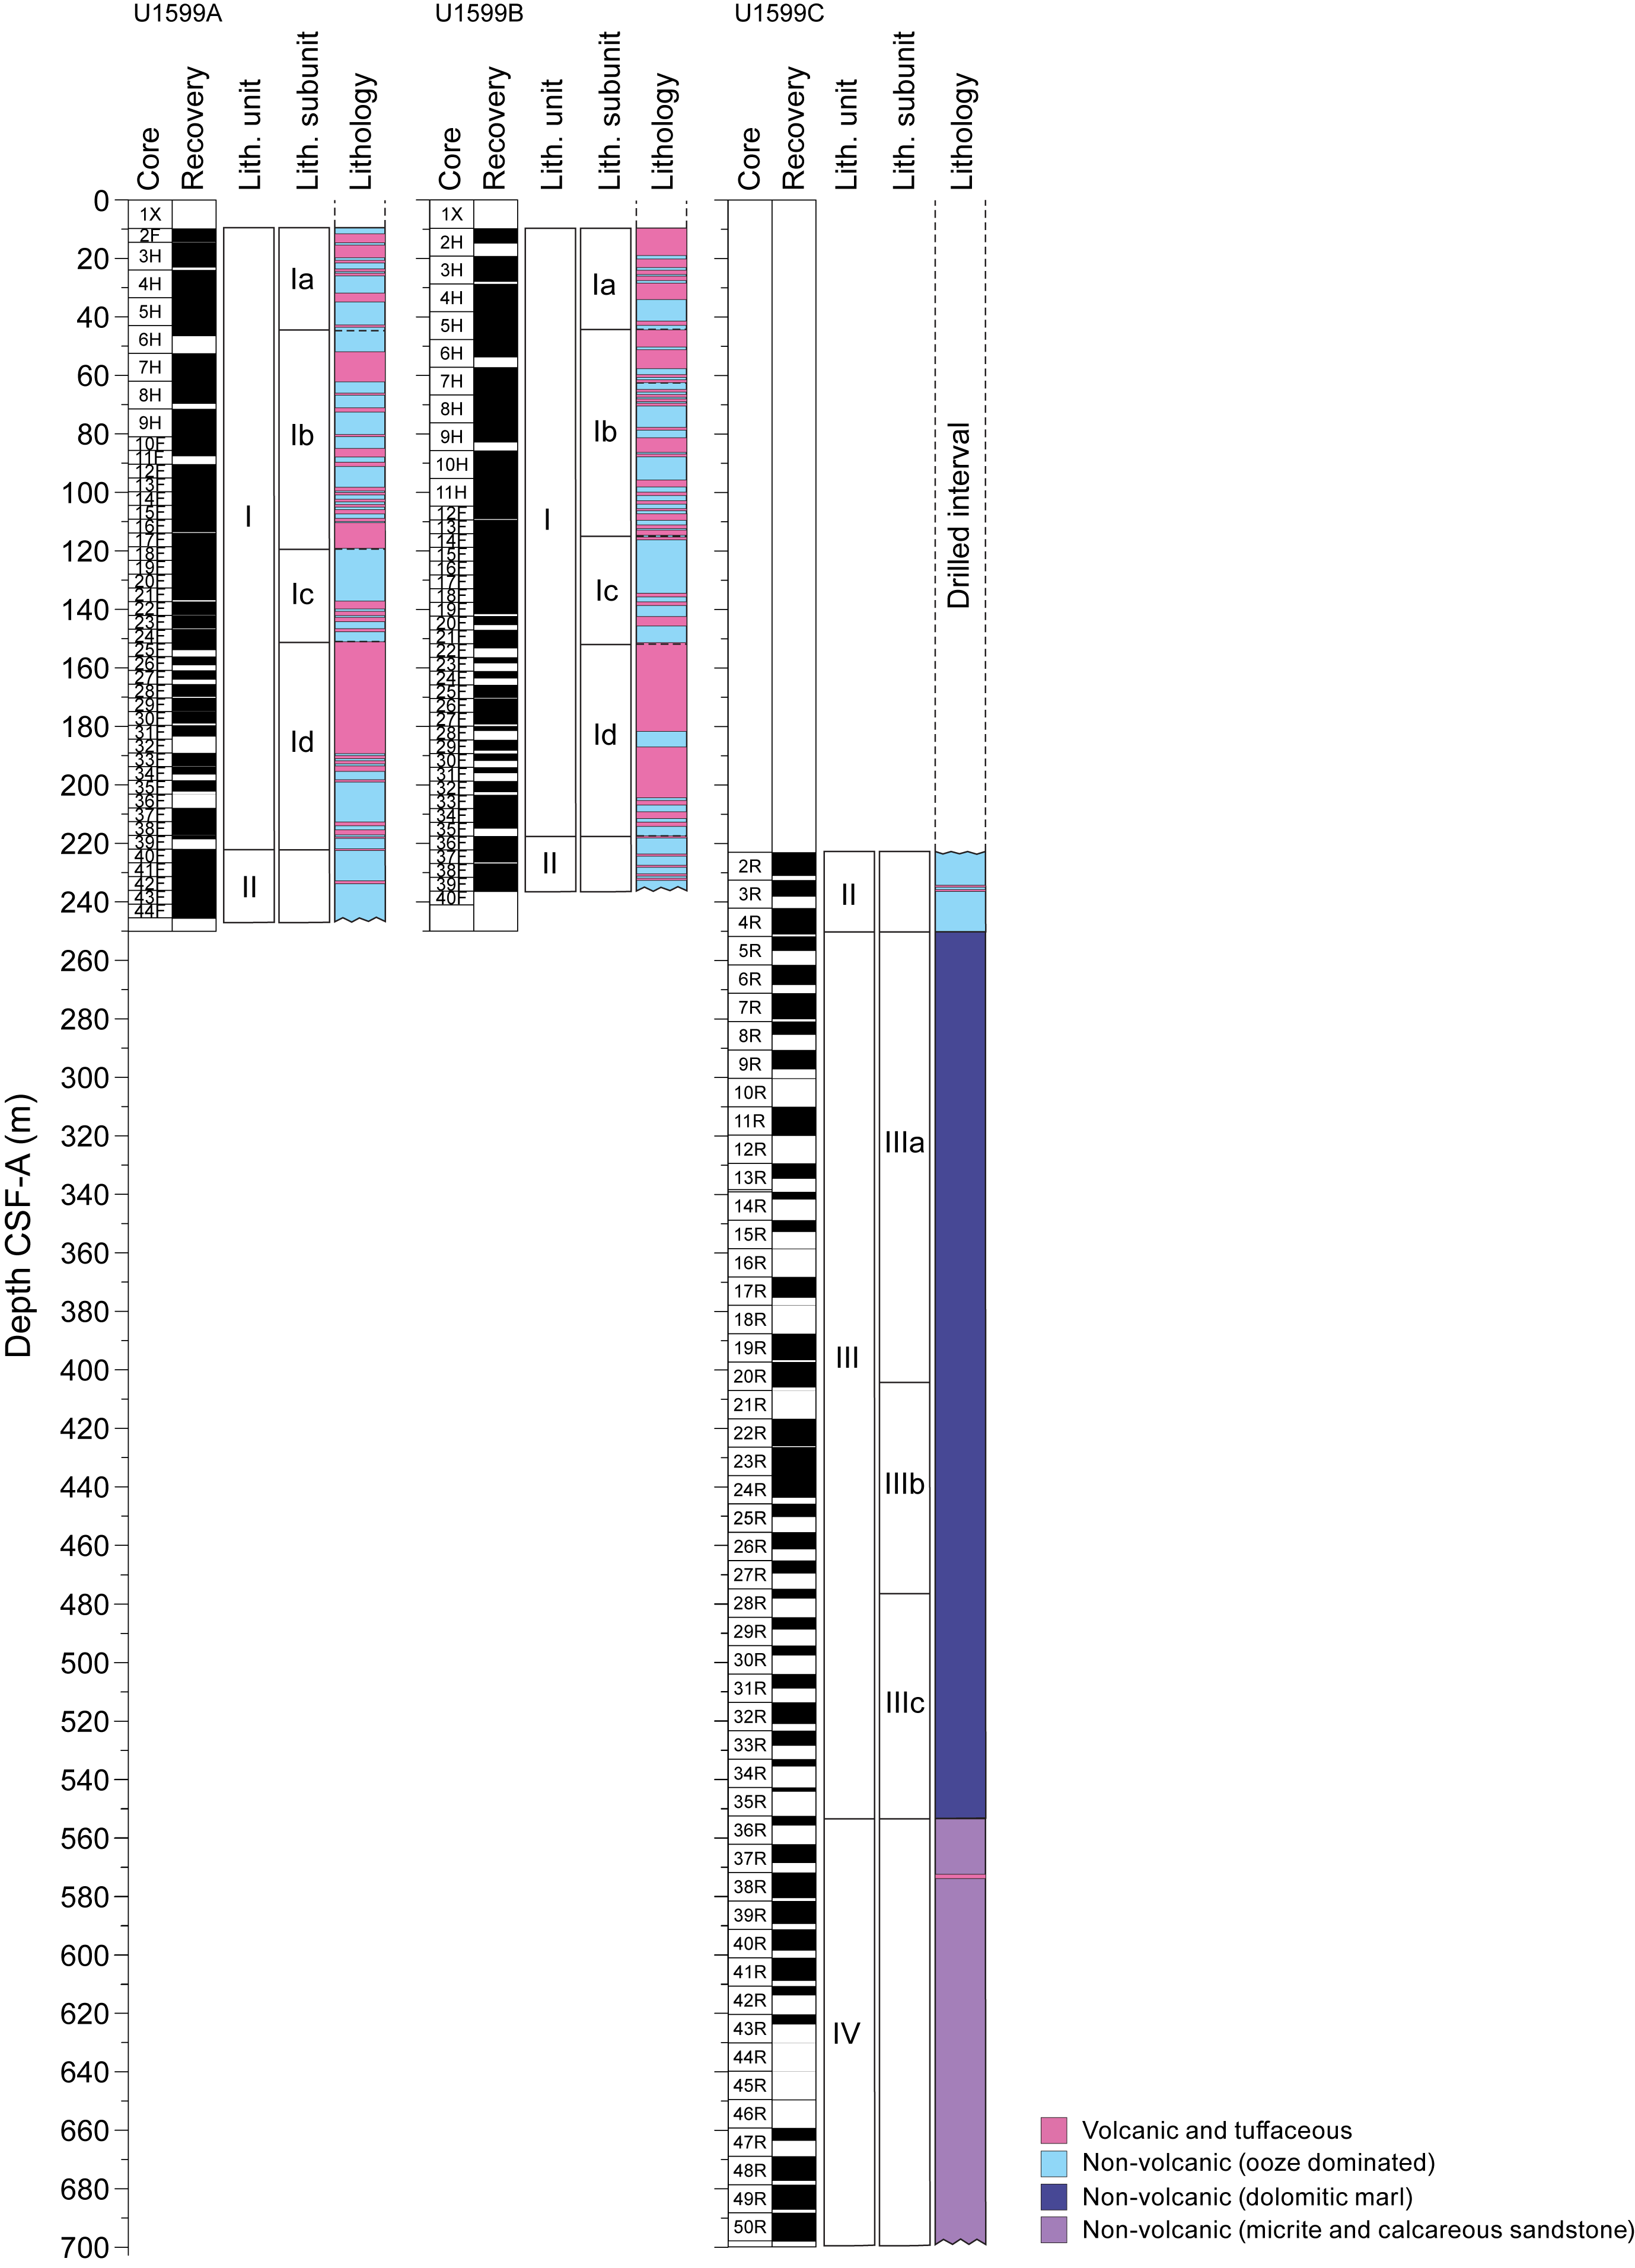
Figure F3. Lithostratigraphy.
The recovered material is unlithified sediment in Holes U1599A and U1599B, with mixed volcanic, tuffaceous, and nonvolcanic material in the uppermost ~220 m (Lithostratigraphic Unit I), which transitions to dominantly ooze interspersed with minor volcanic and tuffaceous sediments for the following ~25 m (Unit II). Unit III consists of ~300 m of dolomitic marl with organic-rich–dominated intervals, followed by ~144 m of micrites and calcareous sandstones (Unit IV).
Smear slides for microscopic analyses were prepared to confirm macroscopic descriptions of distinct lithology changes at the section level, such as identification of vitric ash particles in tuffaceous lithologies or crystals in ash layers.
The succession of volcanic layers and tuffaceous or nonvolcanic layers defines four subunits in Unit I (Ia–Id). These subunit distinctions are corroborated by physical property data (i.e., magnetic susceptibility [MS] and natural gamma radiation [NGR]) (see Physical properties). Units II and IV do not exhibit sufficient variation to warrant subunits; however, in Unit III a multicore organic-rich lithology allows for designation of Subunits IIIa–IIIc.
X-ray diffraction (XRD) data were obtained from 21 interstitial water (IW) squeeze cake sediment residues from Hole U1599A, 2 from Hole U1599B, and 16 from Hole U1599C. Additionally, two further samples from Hole U1599C were analyzed using XRD.
Figure F3 summarizes the lithostratigraphy of Site U1599, displaying core recovery and lithostratigraphic units and subunits in Holes U1599A–U1599C. Table T2 provides the upper and lower boundaries, thicknesses, biostratigraphic ages (see Biostratigraphy), and lithologic summaries of the units and subunits. Figure F4 graphically presents the relative proportions of volcanic, tuffaceous, and nonvolcanic lithologies with lithostratigraphic units and subunits. Figure F5 presents grain size distributions of the sediments in all units, in particular the changes in grain size within the volcanic- and tuffaceous-dominated units to graphically show the distribution of ash, lapilli-ash, and lapilli in those units. Figure F6 displays different types of core disturbance observed at Site U1599.
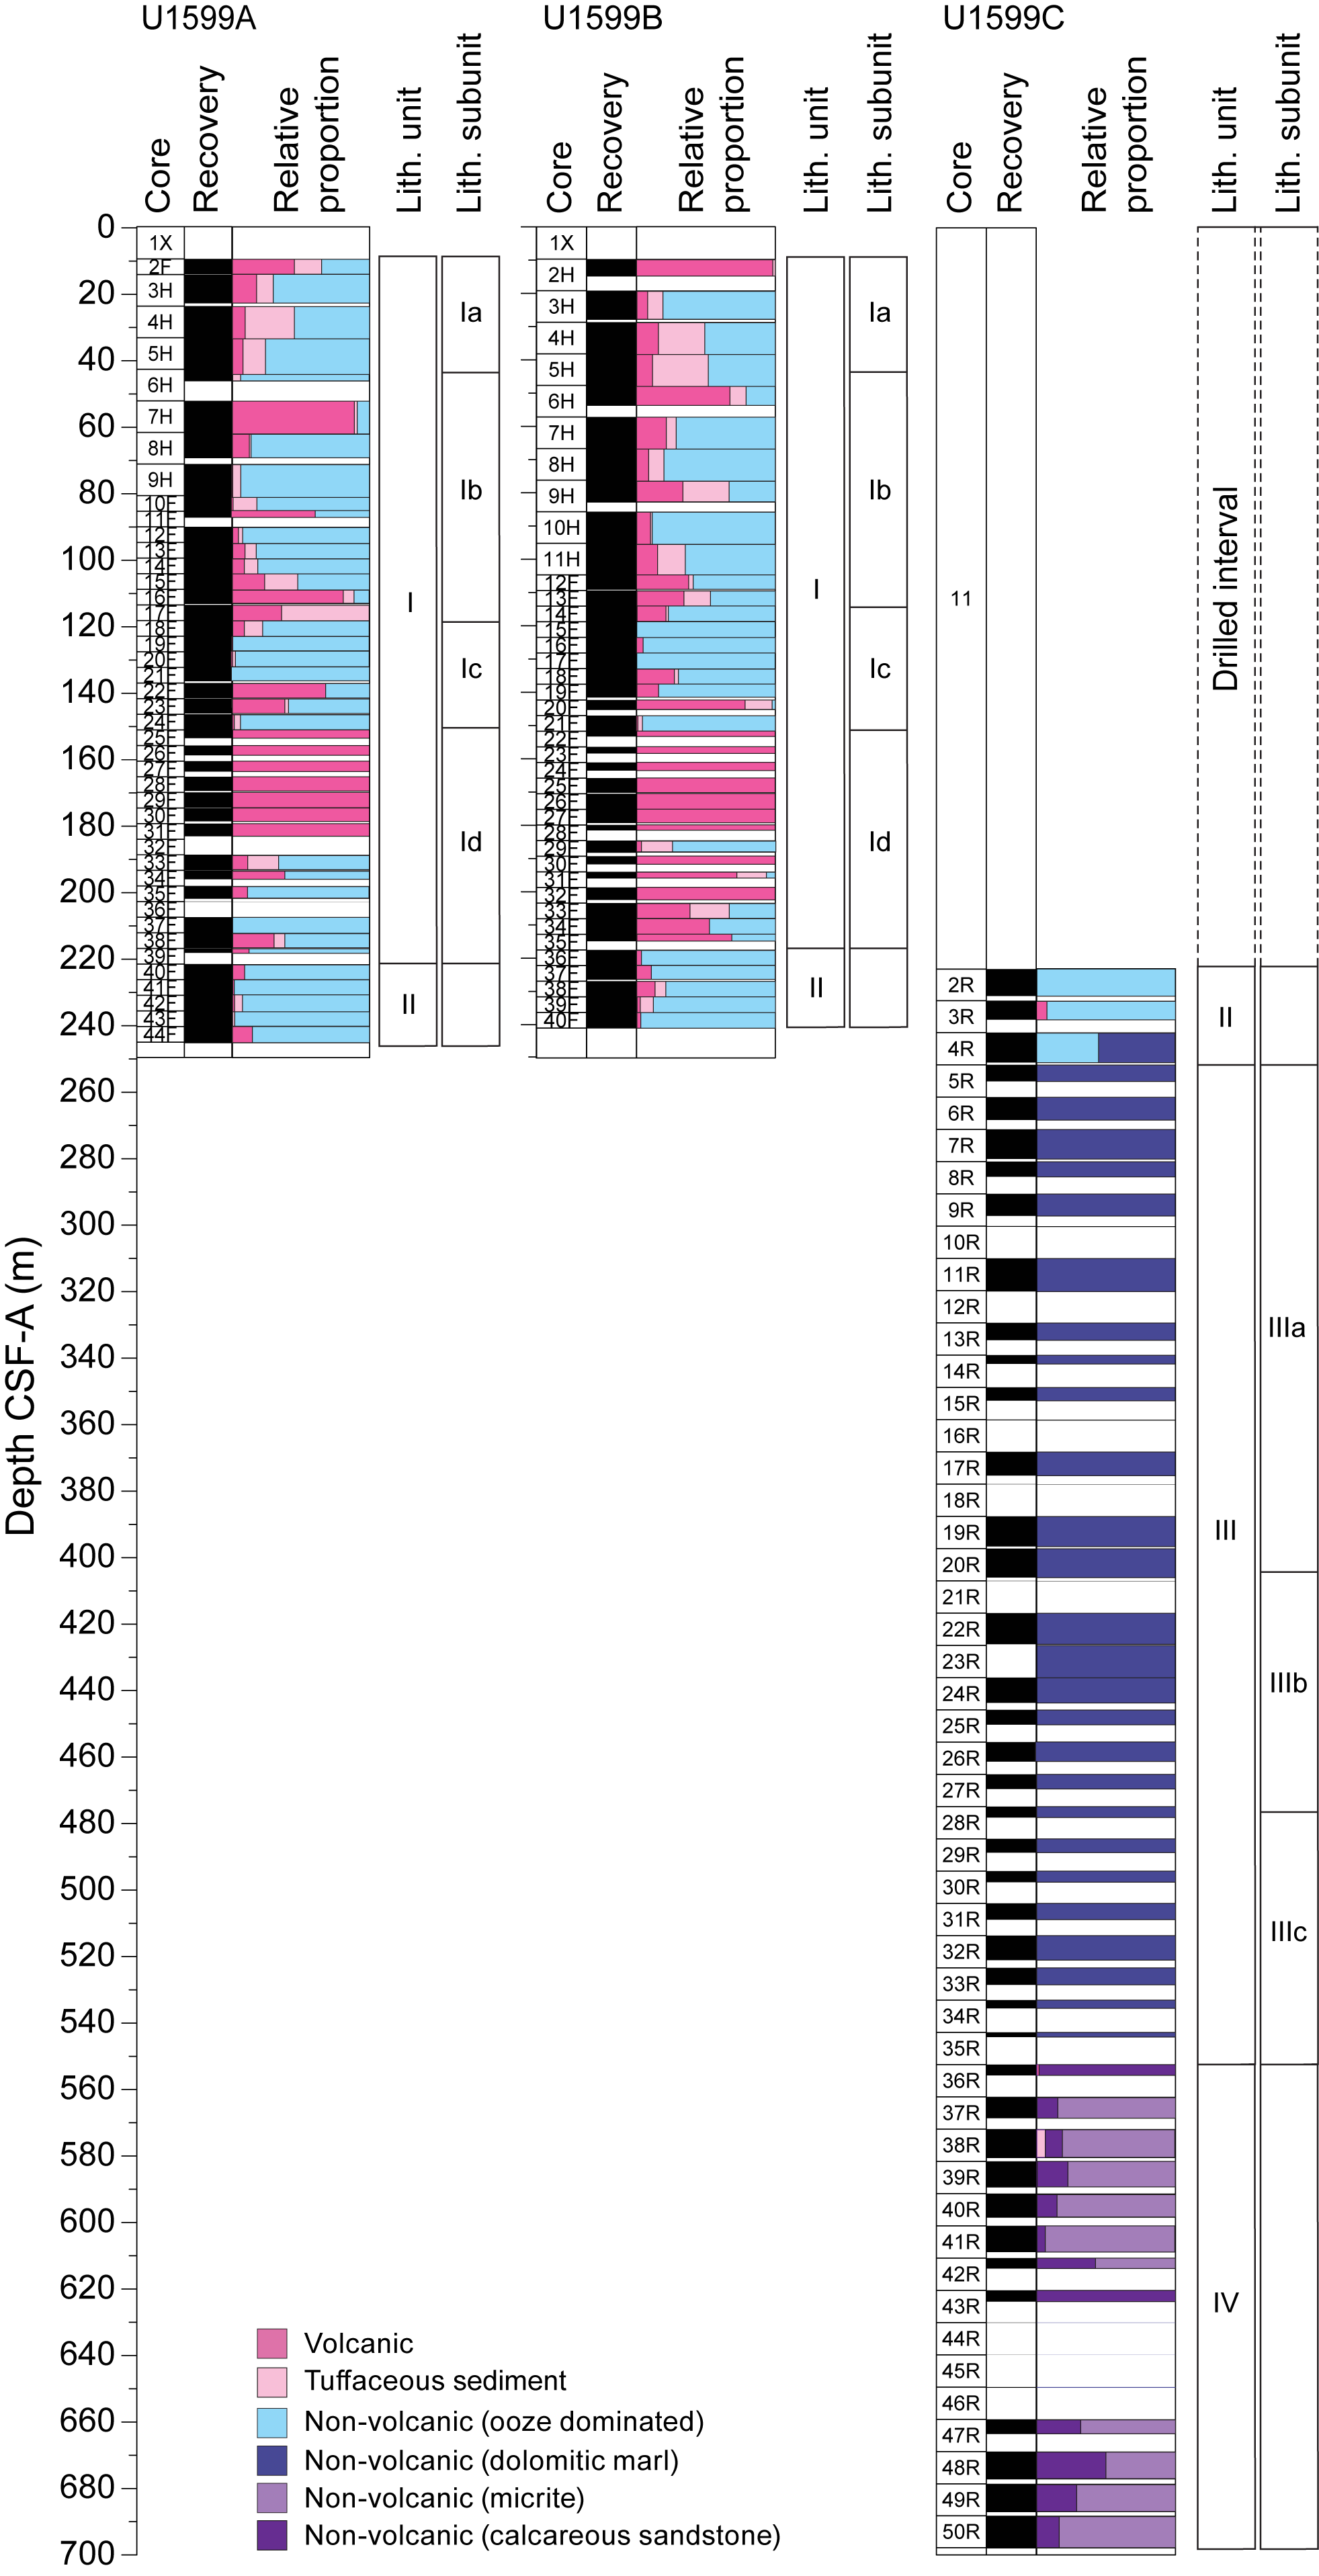
Figure F4. Volcanic, tuffaceous, and nonvolcanic lithologies.
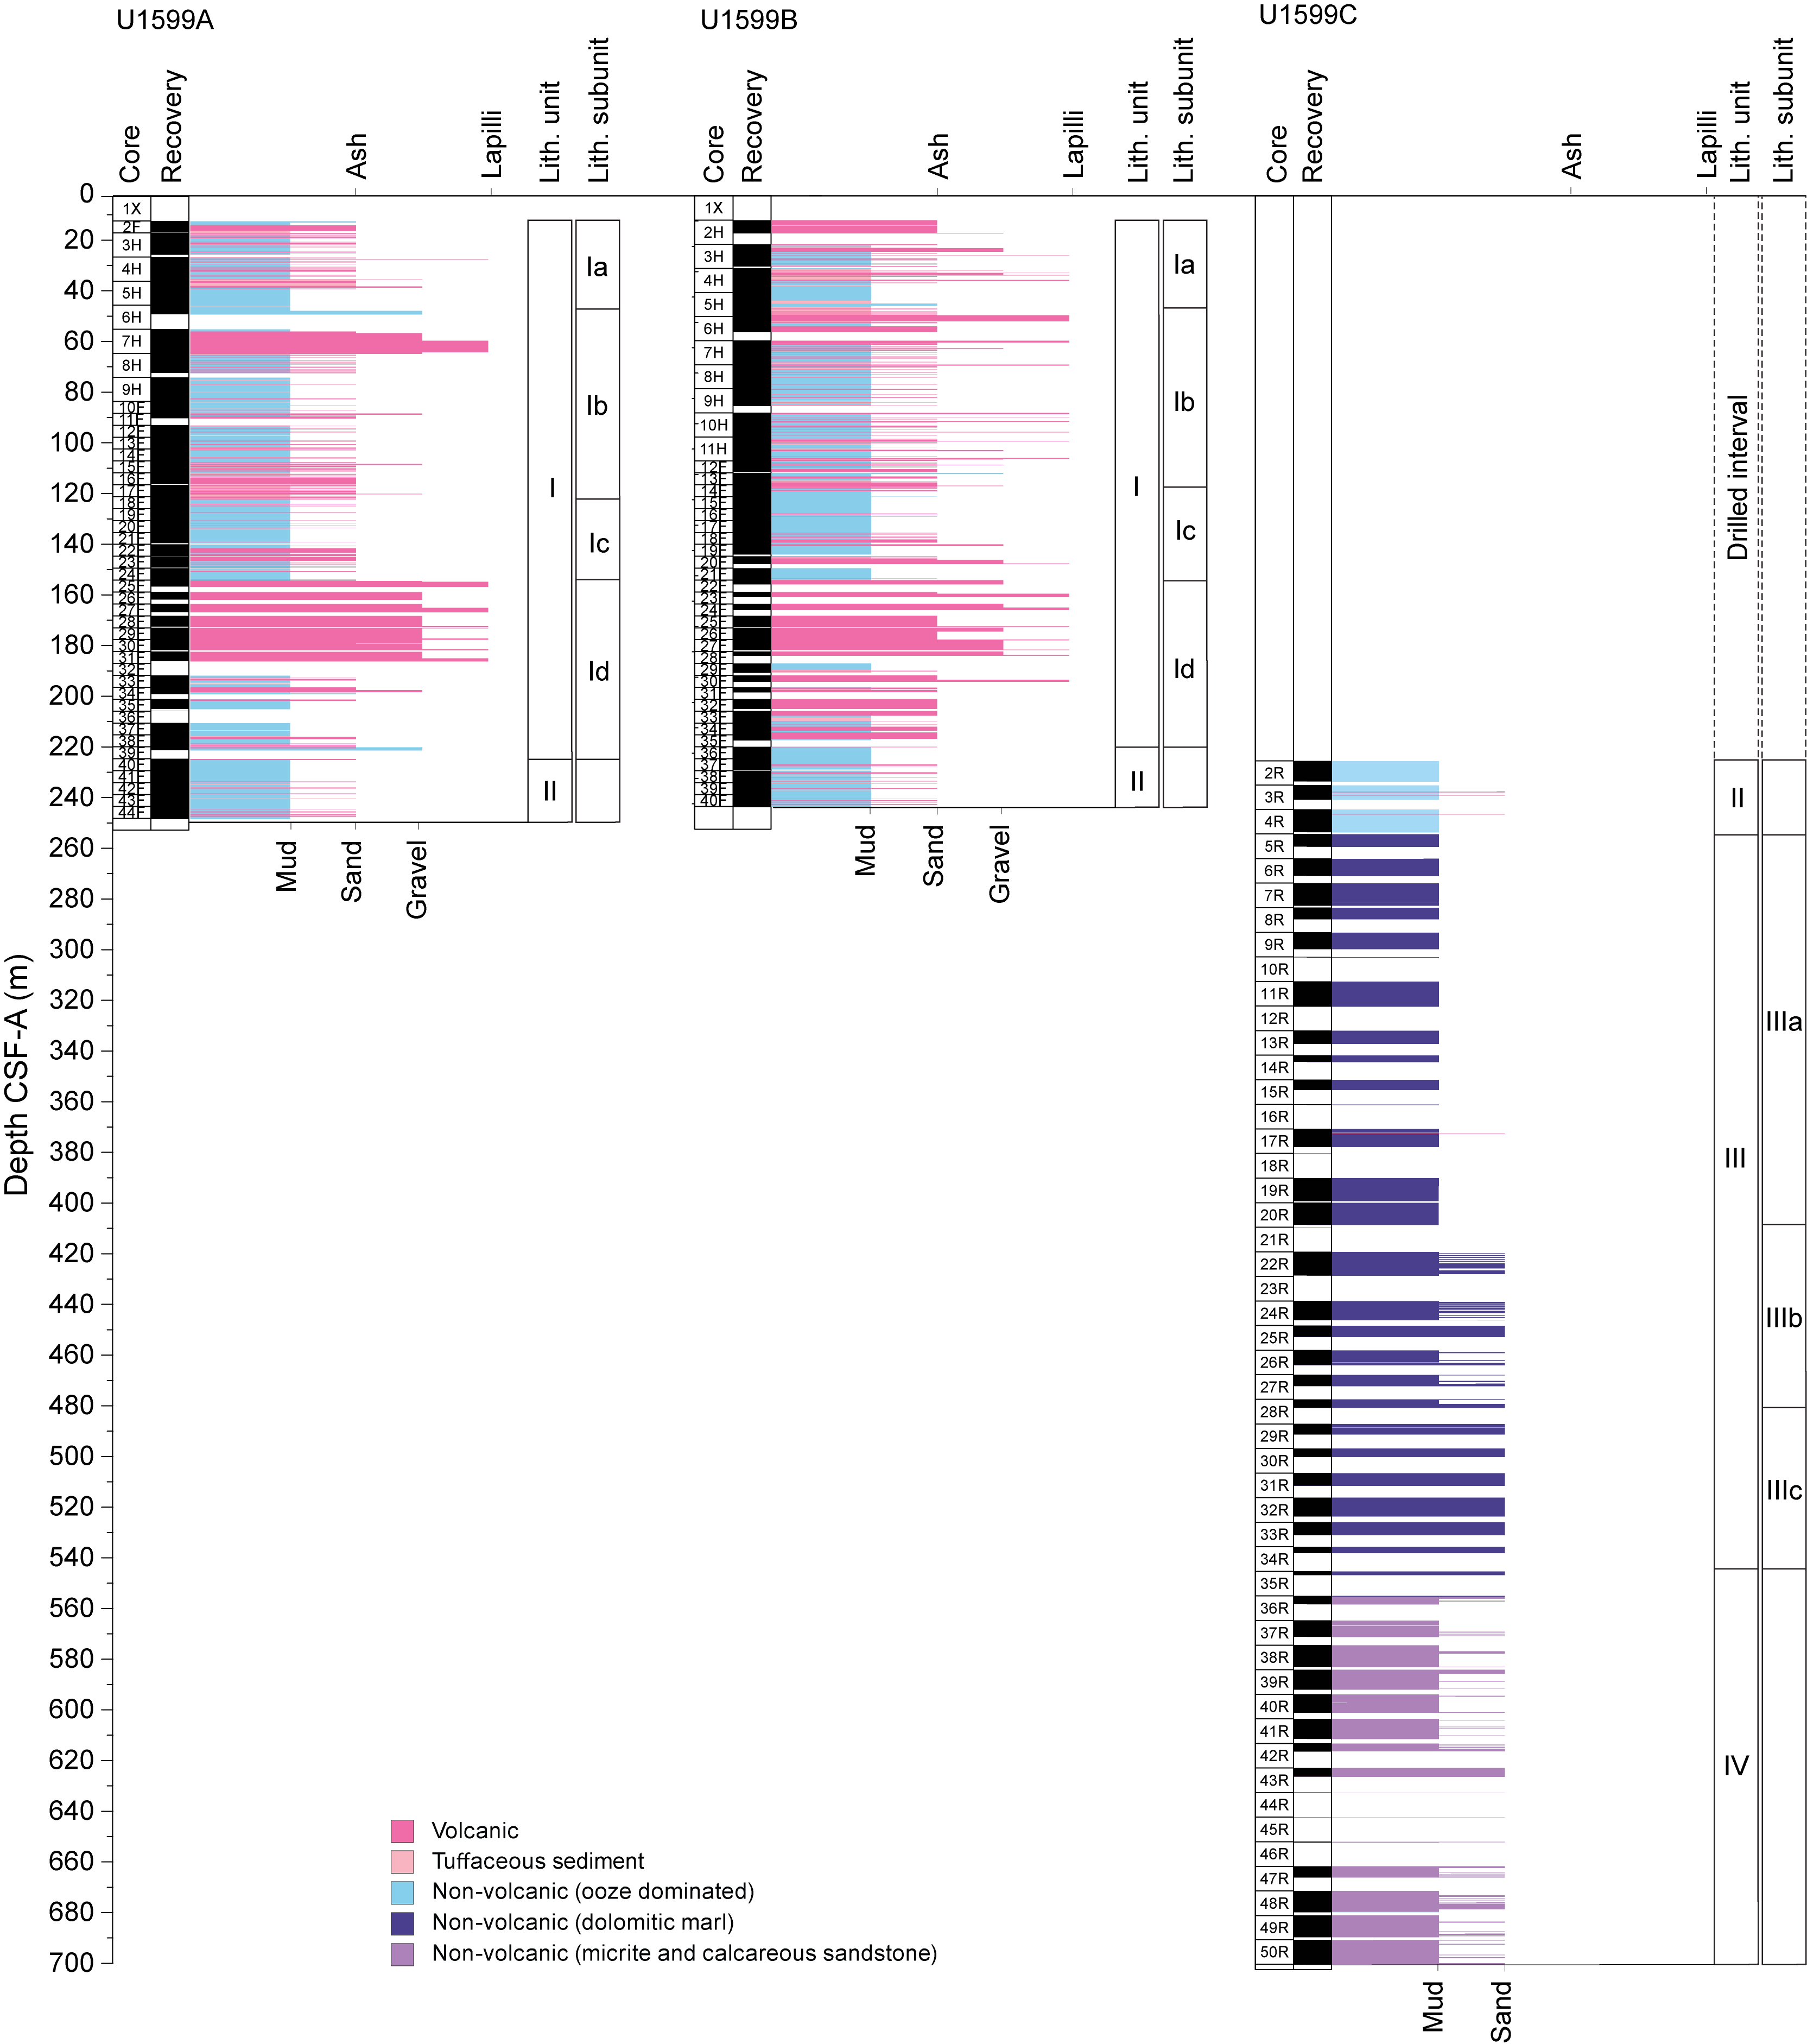
Figure F5. Grain size distribution.
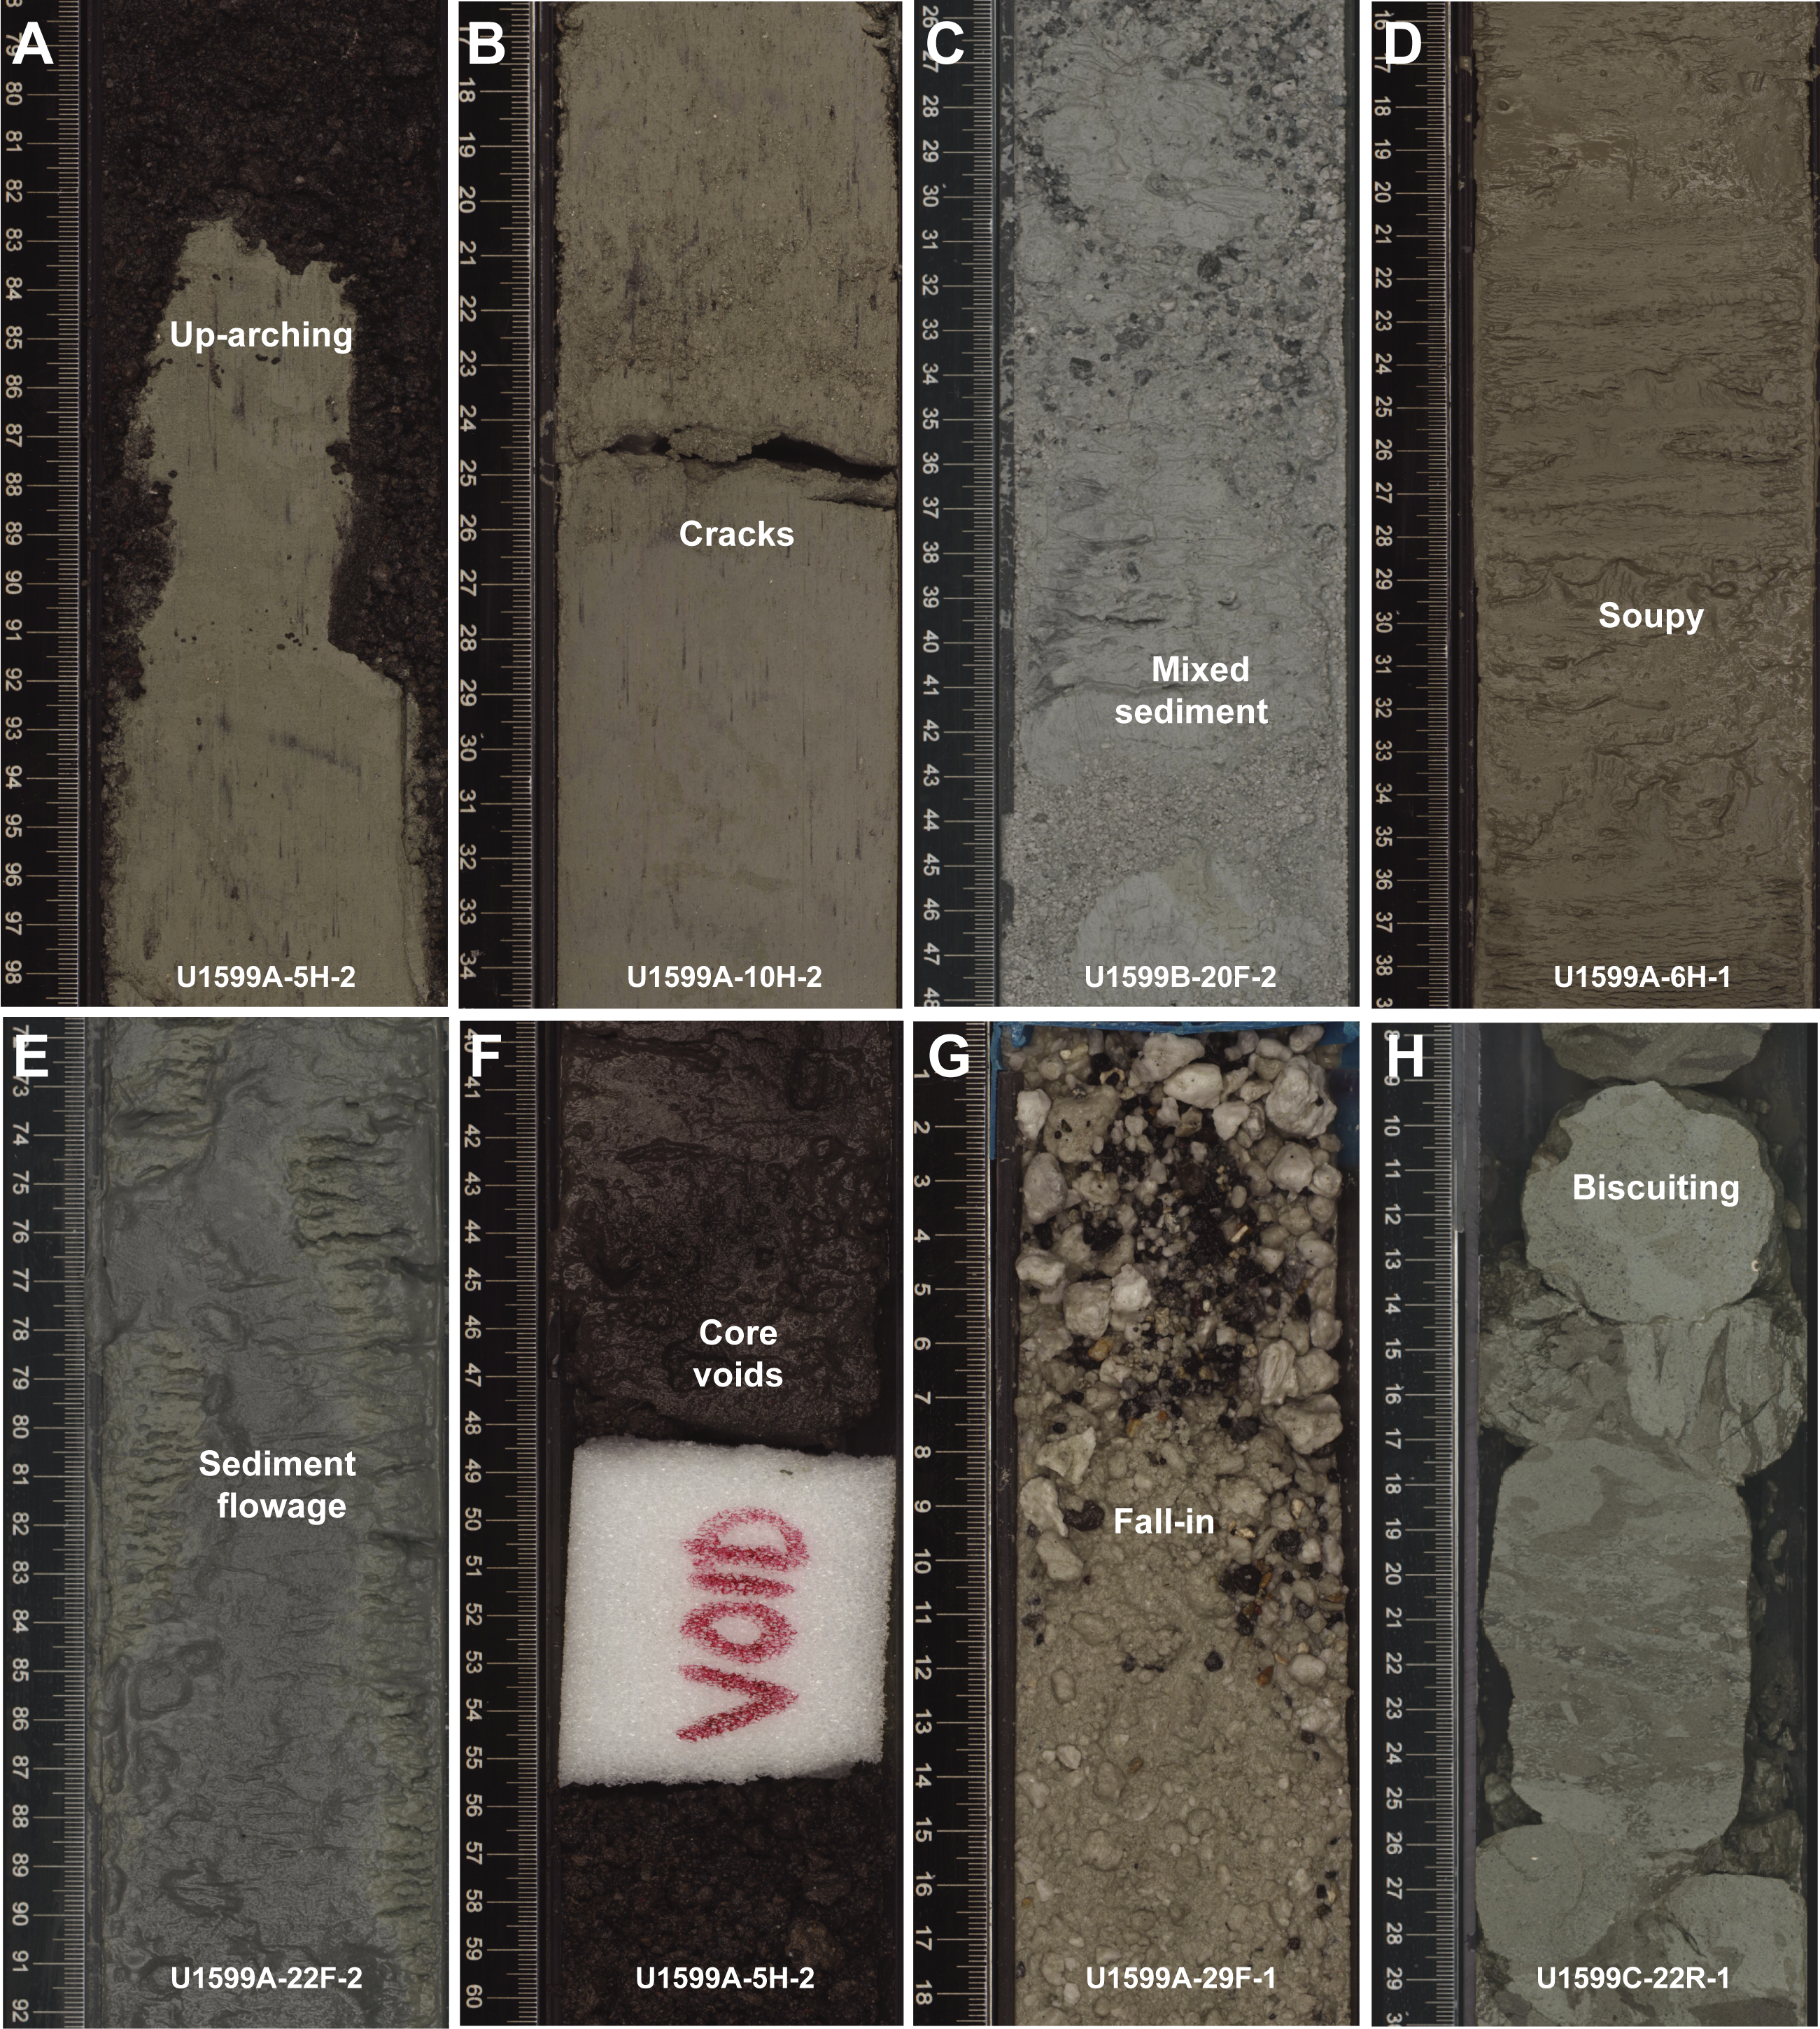
Figure F6. Core disturbances.
The following sections describe (1) the effects of core disturbance; (2) the four lithostratigraphic units and subunits; (3) correlations between Holes U1599A, U1599B, and U1599C; and (4) XRD results from Site U1599.
3.1. Core disturbance
Several types of core disturbance disrupt the lithostratigraphy at Site U1599 (Figure F6):
- Uparching: slight to moderate coring-induced shear between the sediment and core liner resulting in bedding uniformly dragged downward along the core margins (Figure F6A). In these intervals, original lithofacies and sedimentary structures are usually slightly to severely disturbed but can still be recognized visually.
- Cracks: slight brecciation in the original lithologies, typically a result of drilling-related brittle rock failure (Figure F6B).
- Mixed sediment: occurs in water-saturated, granular core sections where grains and clasts flow and mix, producing moderately to severely disturbed, partially overprinted, sedimentary structures and stratigraphy (Figure F6C).
- Soupy: typically restricted to water-saturated intervals of unconsolidated ash, overprinting original sedimentary or depositional structures (Figure F6D).
- Sediment flowage: produced by high shearing rates between cored sediments and the core liner that typically leave a smear or thin trail of displaced sediment along the outside rim of the core (Figure F6E).
- Core voids: up to ~5 cm voids in the original lithologies were observed in a few instances (Figure F6F), for example in cores that experienced basal flow-in (Jutzeler et al., 2014), core extension, or low recovery. Original lithofacies and sedimentary structures are fully destroyed in these intervals.
- Fall-in: at the top of cores, granular material from the top of the hole may fall in and accumulate at the bottom until the next core is recovered (Figure F6G). In these intervals, original lithofacies and sedimentary structures are usually destroyed.
- Biscuiting: fractured disc-shaped pieces ranging in size from a few to more than 10 cm thick, often packed with sheared and remolded core material mixed with drill slurry, filling gaps between brittle biscuits (Figure F6H). The degree of biscuiting ranges from slight to severe, depending on the size of the biscuits and the proportion of biscuits to infill material.
- Artificial size and density segregation: likely to occur during drilling or with postrecovery core handling processes on board (e.g., inclining, shaking, and plunging cores on the core receiving platform to compact sediments), or while the core is lying flat on deck (Jutzeler et al., 2014). Such core disturbance is observed most often in volcanic sediments because increased porosity allows sucking in of seawater during hydraulic piston coring. The resulting soupy texture allows material to flow within the core liner. Secondary normal or reverse grading, or density separation of clasts, may occur as a result of this disturbance and obscure primary sedimentary features.
3.2. Description of units and subunits
The sediments recovered from Holes U1599A–U1599C comprise four lithostratigraphic units (I–IV) (Figure F3). Unit I is divided into four subunits (Ia–Id), and Unit III is divided into three subunits (IIIa–IIIc) (Figures F3, F4, F5; Table T2). The lithologies of these units and subunits are described below.
3.2.1. Unit I
- Intervals: 398-U1599A-2F-1, 0 cm, to 40F-1, 41 cm; 398-U1599B-2H-1, 0 cm, to 36F-1, 17 cm
- Thicknesses: Hole U1599A = 212.61 m; Hole U1599B = 207.97 m
- Depths: Hole U1599A = 9.71–222.31 mbsf; Hole U1599B = 9.7–217.67 mbsf
- Age: Holocene to Middle Pleistocene
- Lithology: volcanic (ash, lapilli-ash, and lapilli) and tuffaceous sediments with ooze and organic-rich ooze
Unit I extends from 9.7 to 222.31 mbsf in Hole U1599A and 9.7 to 217.67 mbsf in Hole U1599B (Table T2). There was no recovery in the first core of either of these holes. Unit I consists of ooze and organic-rich ooze intercalated with volcanic sediments in the uppermost 45 m (Subunit Ia) followed by a lapilli-dominated sequence that transitions to mixed intervals of ash, ooze, organic-rich ooze, and ooze with dispersed ash pods in the next 74 m (Subunit Ib); 33 m of organic-rich ooze with lesser volcanic and tuffaceous intervals (Subunit Ic); and finally a volcanic-dominated succession of white lapilli, lapilli-ash, and ash intervals with lesser ooze intervals for the final ~70 m (Subunit Id) (Figures F3, F4, F5). Volcanic intervals commonly have sharp bottom contacts with tuffaceous or nonvolcanic lithologies. Figure F7 highlights core images of the most common lithologies collected from each of the subunits from Unit I. Figure F8 shows representative smear slides from these lithologies.
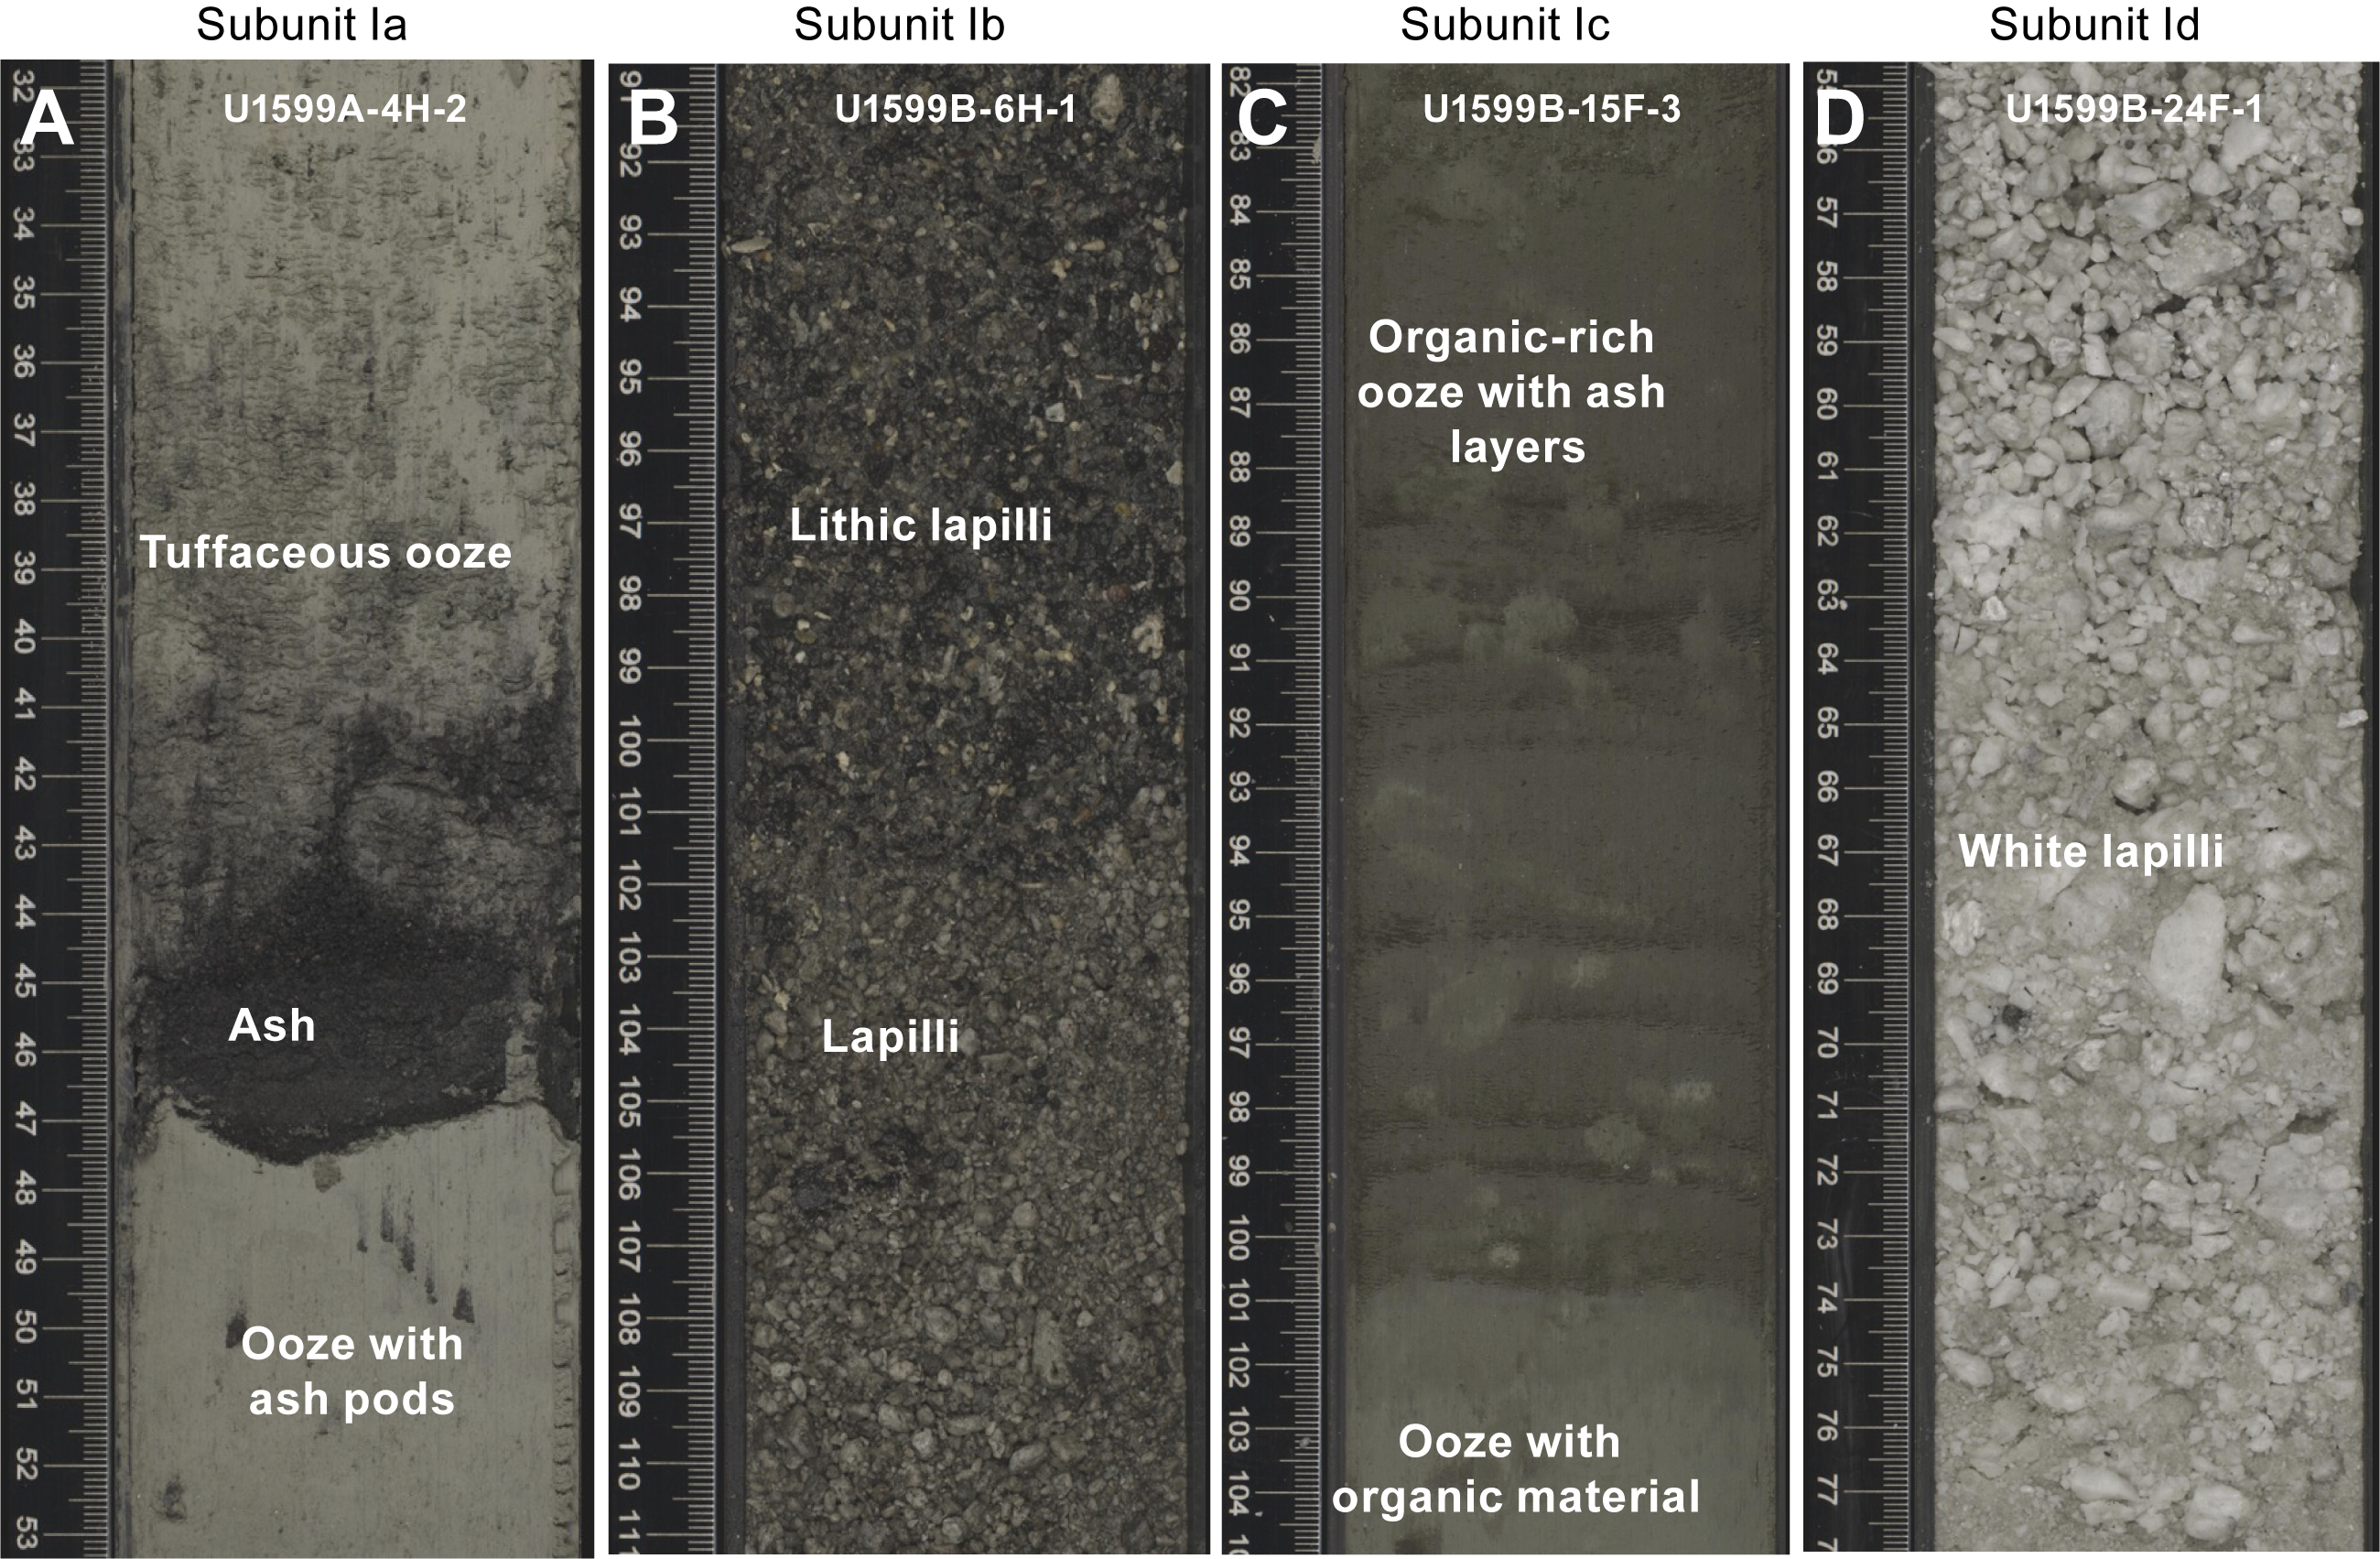
Figure F7. Unit I lithology.
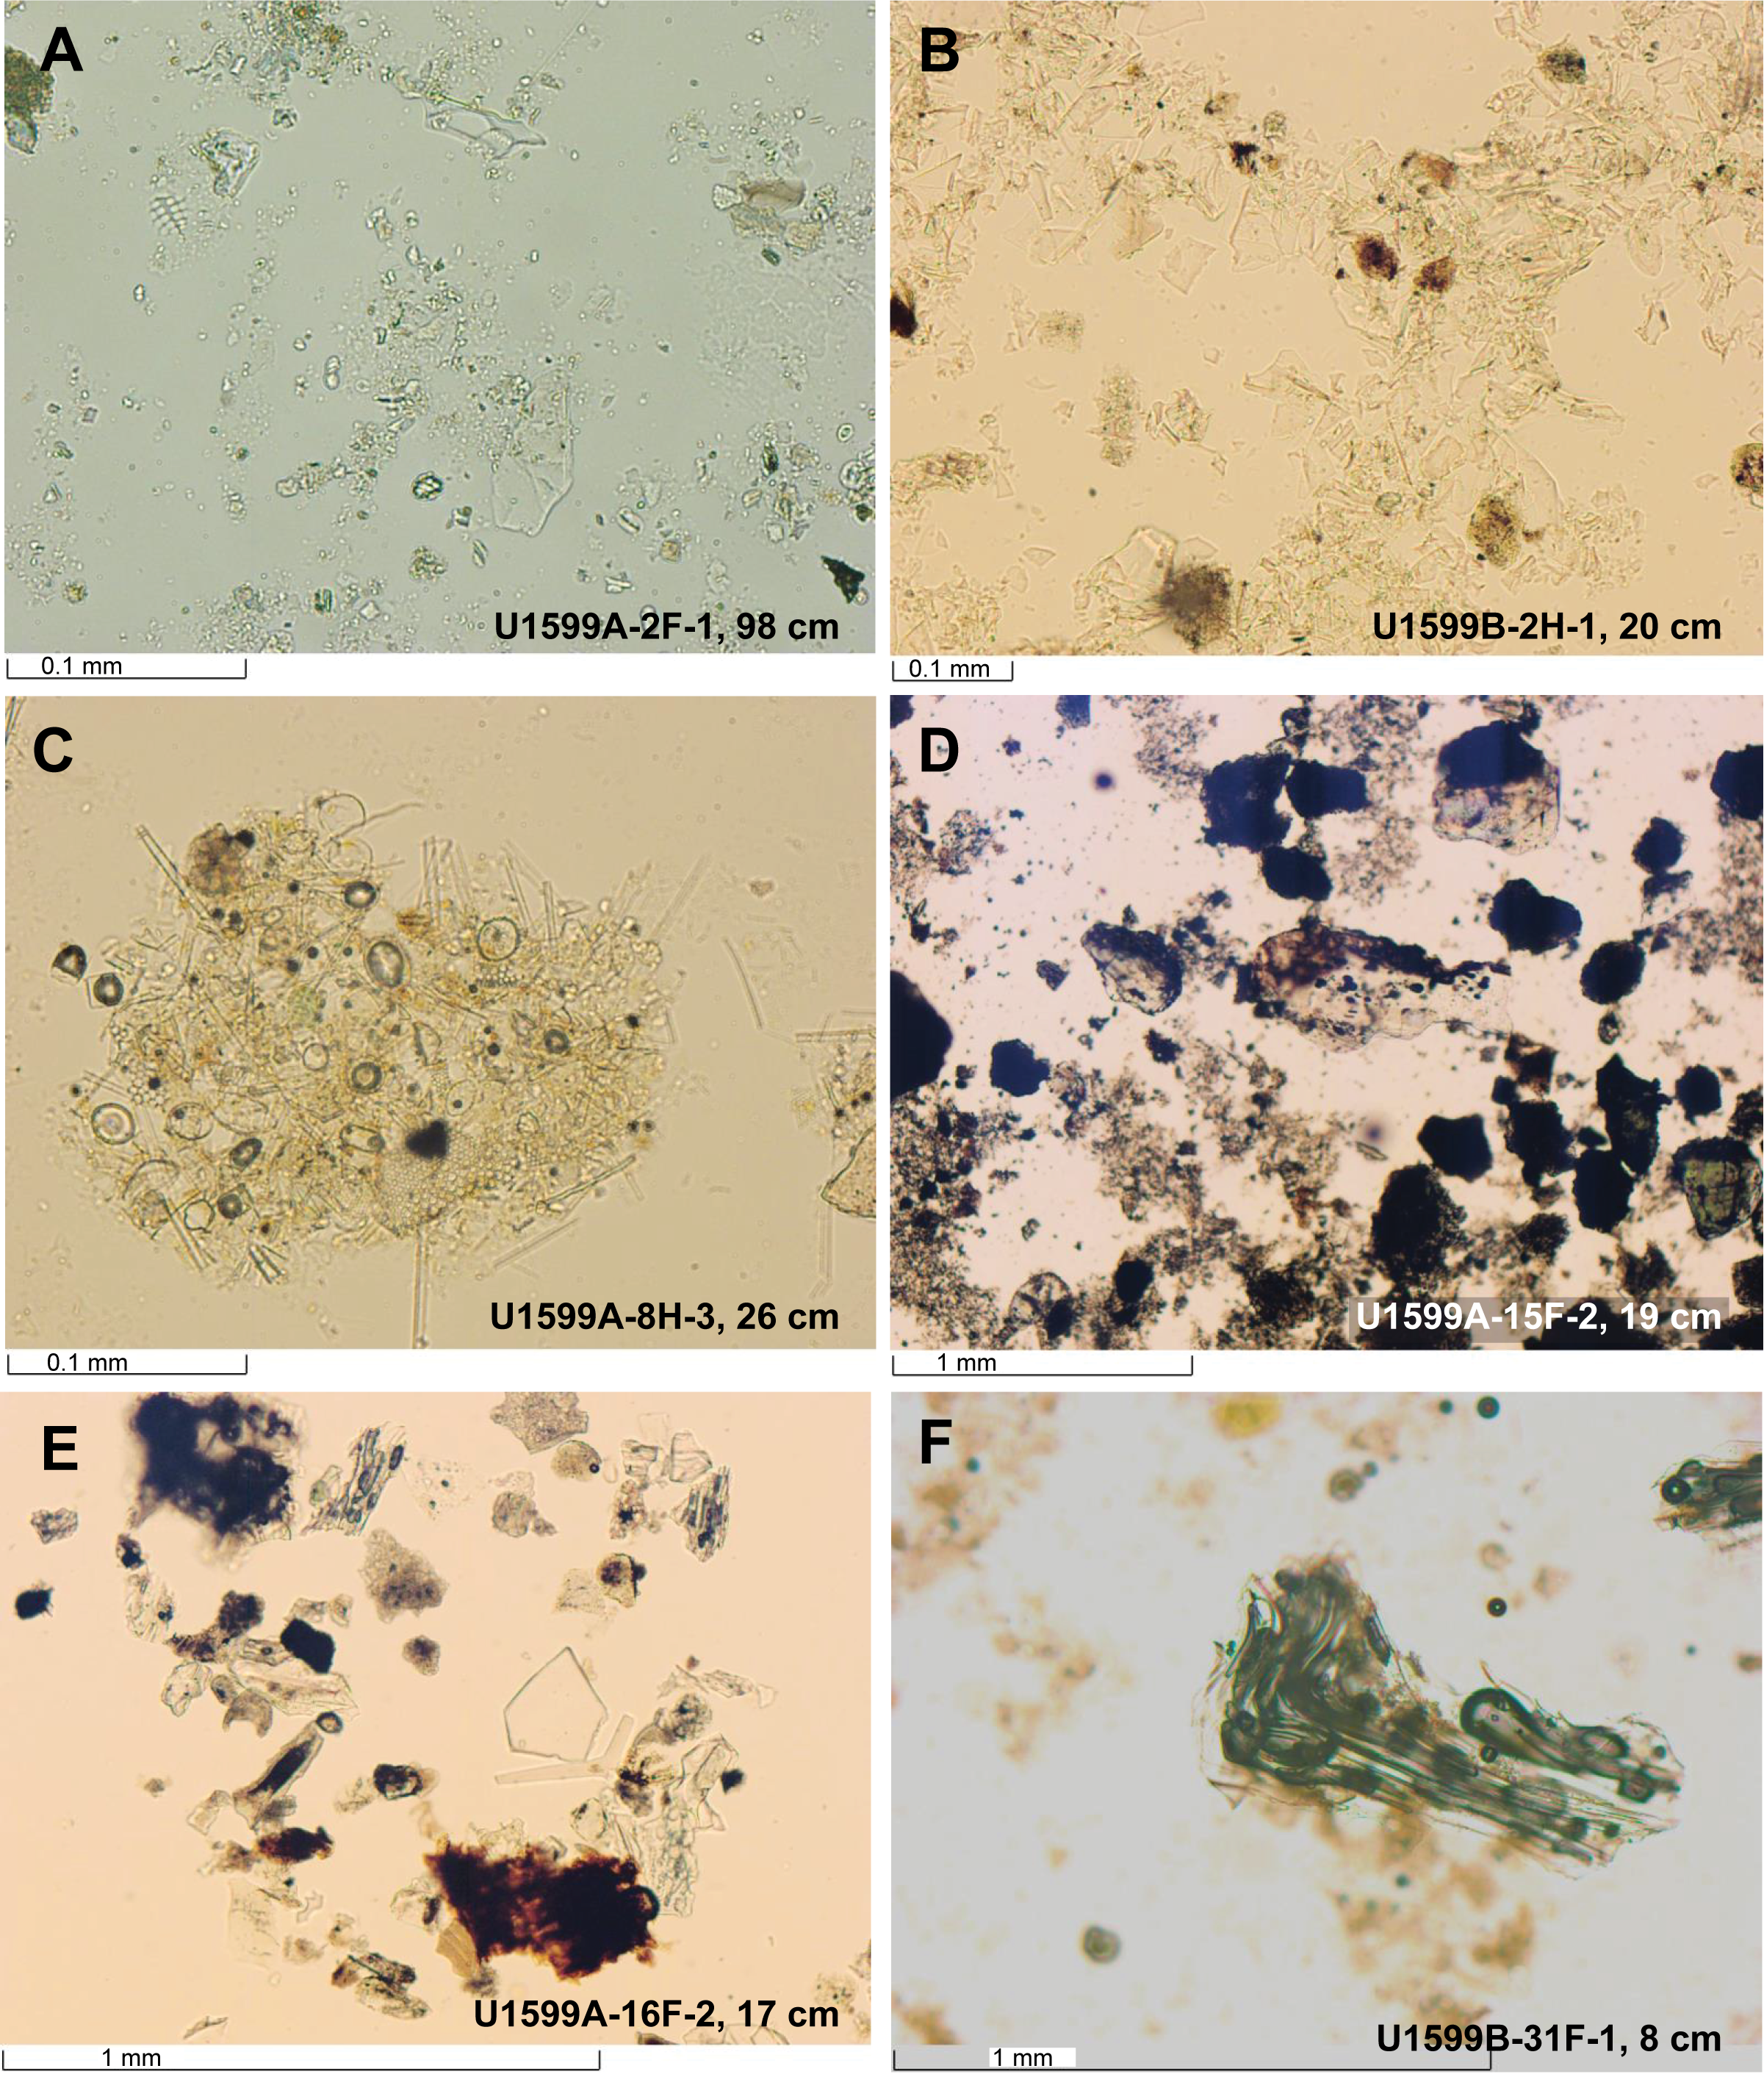
Figure F8. Subunit Ia, Ib, and Id lithology.
Volcanic lithologies (>75% volcanic particles; glass shards, pumice, and crystals) comprise ash, lapilli-ash, and lapilli, based on the relative abundance of ash-sized (<2 mm) and lapilli-sized (2–64 mm) particles, as described in Lithostratigraphy in the Expedition 398 methods chapter (Kutterolf et al., 2024a), with ash and lapilli used when the proportion of one size was >75% abundance and lapilli-ash used when both sizes were present but at <75% abundance (Fisher and Schmincke, 1984).
Macroscopically, ash layers in Unit I are typically gray and well sorted, range in grain size from fine to coarse ash, and are variably admixed with nonvolcanic sediment at the upper contact. Thicknesses of volcanic intervals in Unit I are highly variable, from centimeter scale to meter scale (e.g., a 12 cm thick ash layer in Section 398-U1599A-13F-1 as compared to an 870 cm thick lapilli-ash/lapilli interval in Subunit Ib). They are frequently characterized by a sharp base and a more diffuse and often bioturbated upper boundary that grades into tuffaceous sediments or ooze. Microscopic observations of smear slides were useful for identification of vitric ash particles in tuffaceous sediments and for specific minerals, especially biotite.
Lapilli and lapilli-ash layers are typically dark gray to dark brownish gray or white and range from a few centimeters to several meters thick. They are often truncated at the lower boundary by loss of recovery, so recovered contacts with underlying material are rare. Where recovered, bottom contacts of these coarser units are sharp or bioturbated and commonly affected by uparching drilling disturbance.
Subunits were defined by the relative proportion of volcanic/tuffaceous intervals and nonvolcanic intervals, as well as by grain size:
- Subunit Ia (Sections 398-U1599A-2F-1, 0 cm, through 6H-2, 73 cm [9.7–45.13 mbsf], and 398-U1599B-2H-1, 0 cm, through 5H-3, 140 cm [9.7–42.61 mbsf]): ooze and organic-rich ooze dominated with intermixed ash, lapilli-ash, and tuffaceous ooze.
- Subunit Ib (Sections 398-U1599A-6H-3, 0 cm, through 18F-1, 102 cm [45.13–119.52 mbsf], and 398-U1599B-5H-3, 140 cm, through 14F-2, 116 cm [42.61–116.63 mbsf]): mixed intervals of ash, ooze, organic-rich ooze, and ooze with dispersed ash pods, with one large lapilli and lapilli-ash sequence. Ash intervals are typically dark colored.
- Subunit Ic (Sections 398-U1599A-18F-1, 102 cm, through 24F-CC, 17 cm [119.52–151.58 mbsf], and 398-U1599B-14F-2, 116 cm, through 21F-4, 75 cm [116.63–151.68 mbsf]): ooze and organic-rich ooze dominated with lesser volcanic and tuffaceous intervals. (Note: The depth in meters below seafloor for the bottom of Subunit Ic is deeper than the top of Subunit Id because of core expansion.)
- Subunit Id (Sections 398-U1599A-24F-CC, 17 cm, through 40F-1, 41 cm [151.4–222.31 mbsf], and 398-U1599B-22F-1, 0 cm, through 36F-1, 17 cm [151.7–217.67 mbsf]): volcanic dominated with abundant white lapilli, lapilli-ash, and ash intervals. Intercalated oozes become more abundant downhole.
3.2.1.1. Subunit Ia
Subunit Ia is 35.43 m thick in Hole U1599A and 32.91 m thick in Hole U1599B. It extends from 9.7 to 45.13 mbsf in Hole U1599A (Sections 2F-1, 0 cm, through 6H-2, 73 cm) and from 9.7 to 42.61 mbsf in Hole U1599B (Sections 2H-1, 0 cm, through 5H-3, 140 cm) (Figures F3, F4, F5; Table T2). The subunit is dominated by ooze and organic-rich ooze intermixed with ash, lapilli-ash, and tuffaceous ooze. Subunit Ia starts with gray bioclastic gravelly muddy sand that has a slightly uparching but sharp bottom contact to an underlying ooze. Ooze intervals display slight bioturbation and are light greenish gray to greenish gray to gray. This lithology contains ash pods and shell fragments, gastropods, and coral fragments (Figure F7A). Intercalated volcanic intervals are mainly well-sorted, dark-colored ash layers with sharp lower contacts and gradational upper contacts (Figure F7A). The few lapilli and lapilli-ash layers observed contain pumice and scoria. Only one organic-rich ooze is present in Subunit Ia in Sections 398-U1599A-4H-5 and 4H-6 and 398-U1599B-3H-7. This interval is very dark olive-gray and is characterized by planar thin laminations (<0.3 cm), ash pods, and moderate bioturbation. Tuffaceous lithologies include tuffaceous mud, tuffaceous sand, and tuffaceous ooze with grain size varying from mud to pebble. They contain ash pods, pumice lapilli, and lithics; are well sorted; and show a large range in color from greenish gray, dark gray, light olive-gray, gray, grayish brown, and light brownish gray. Subunit Ia ends with a 9.13 m thick interval of well-sorted greenish gray ooze and tuffaceous ooze. This last ooze interval is characterized by low MS and high NGR compared to the beginning of the next subunit (see Physical properties).
Selected smear slides of representative lithologies of Subunit Ia are shown in Figure F8. A sample of ooze with ash (Figure F8A) is characterized by calcareous nannofossils, a variety of microfossils, authigenic calcite, and glass. An ash sample (Figure F8B) is dominated by colorless blocky to pumiceous glass shards and minor other components, including sedimentary lithics, crystals (e.g., feldspar), and microfossils.
3.2.1.2. Subunit Ib
Subunit Ib is 74.39 m thick in Hole U1599A and 74.02 m thick in Hole U1599B. It extends from 45.13 to 119.52 mbsf in Hole U1599A (Sections 6H-3, 0 cm, through 18F-1, 102 cm) and from 42.61 to 116.63 mbsf in Hole U1599B (Sections 5H-3, 140 cm, through 14F-2, 116 cm) (Figures F3, F4, F5; Table T2). This subunit consists of mixed intervals of dark-colored ash, ooze, organic-rich ooze, and ooze with dispersed ash pods.
The subunit begins with a transition from ooze to a gravelly sand with shells in both holes. This interval contains volcanic, metamorphic, sedimentary, and biogenic lithics and is followed by 8.73 m of moderately sorted lapilli and lapilli-ash with grain size ranging from coarse ash to lapilli (Figure F7B).
Between 53.26 and 61.99 mbsf, Core 398-U1599A-7H comprises a normal-graded succession from lapilli to lapilli-ash to ash from Sections 7H-1 (top) to 7H-7 (bottom), with nonvolcanic ooze and tuffaceous ooze intervals at the top (Section 7H-1) and bottom (Section 7H-CC) (Figure F9). Clasts consist of subrounded gray, white, and banded pumice; black volcanic lithics; and red oxidized volcanic lithics. This normally graded succession of volcanic deposits is not present in Hole U1599B.
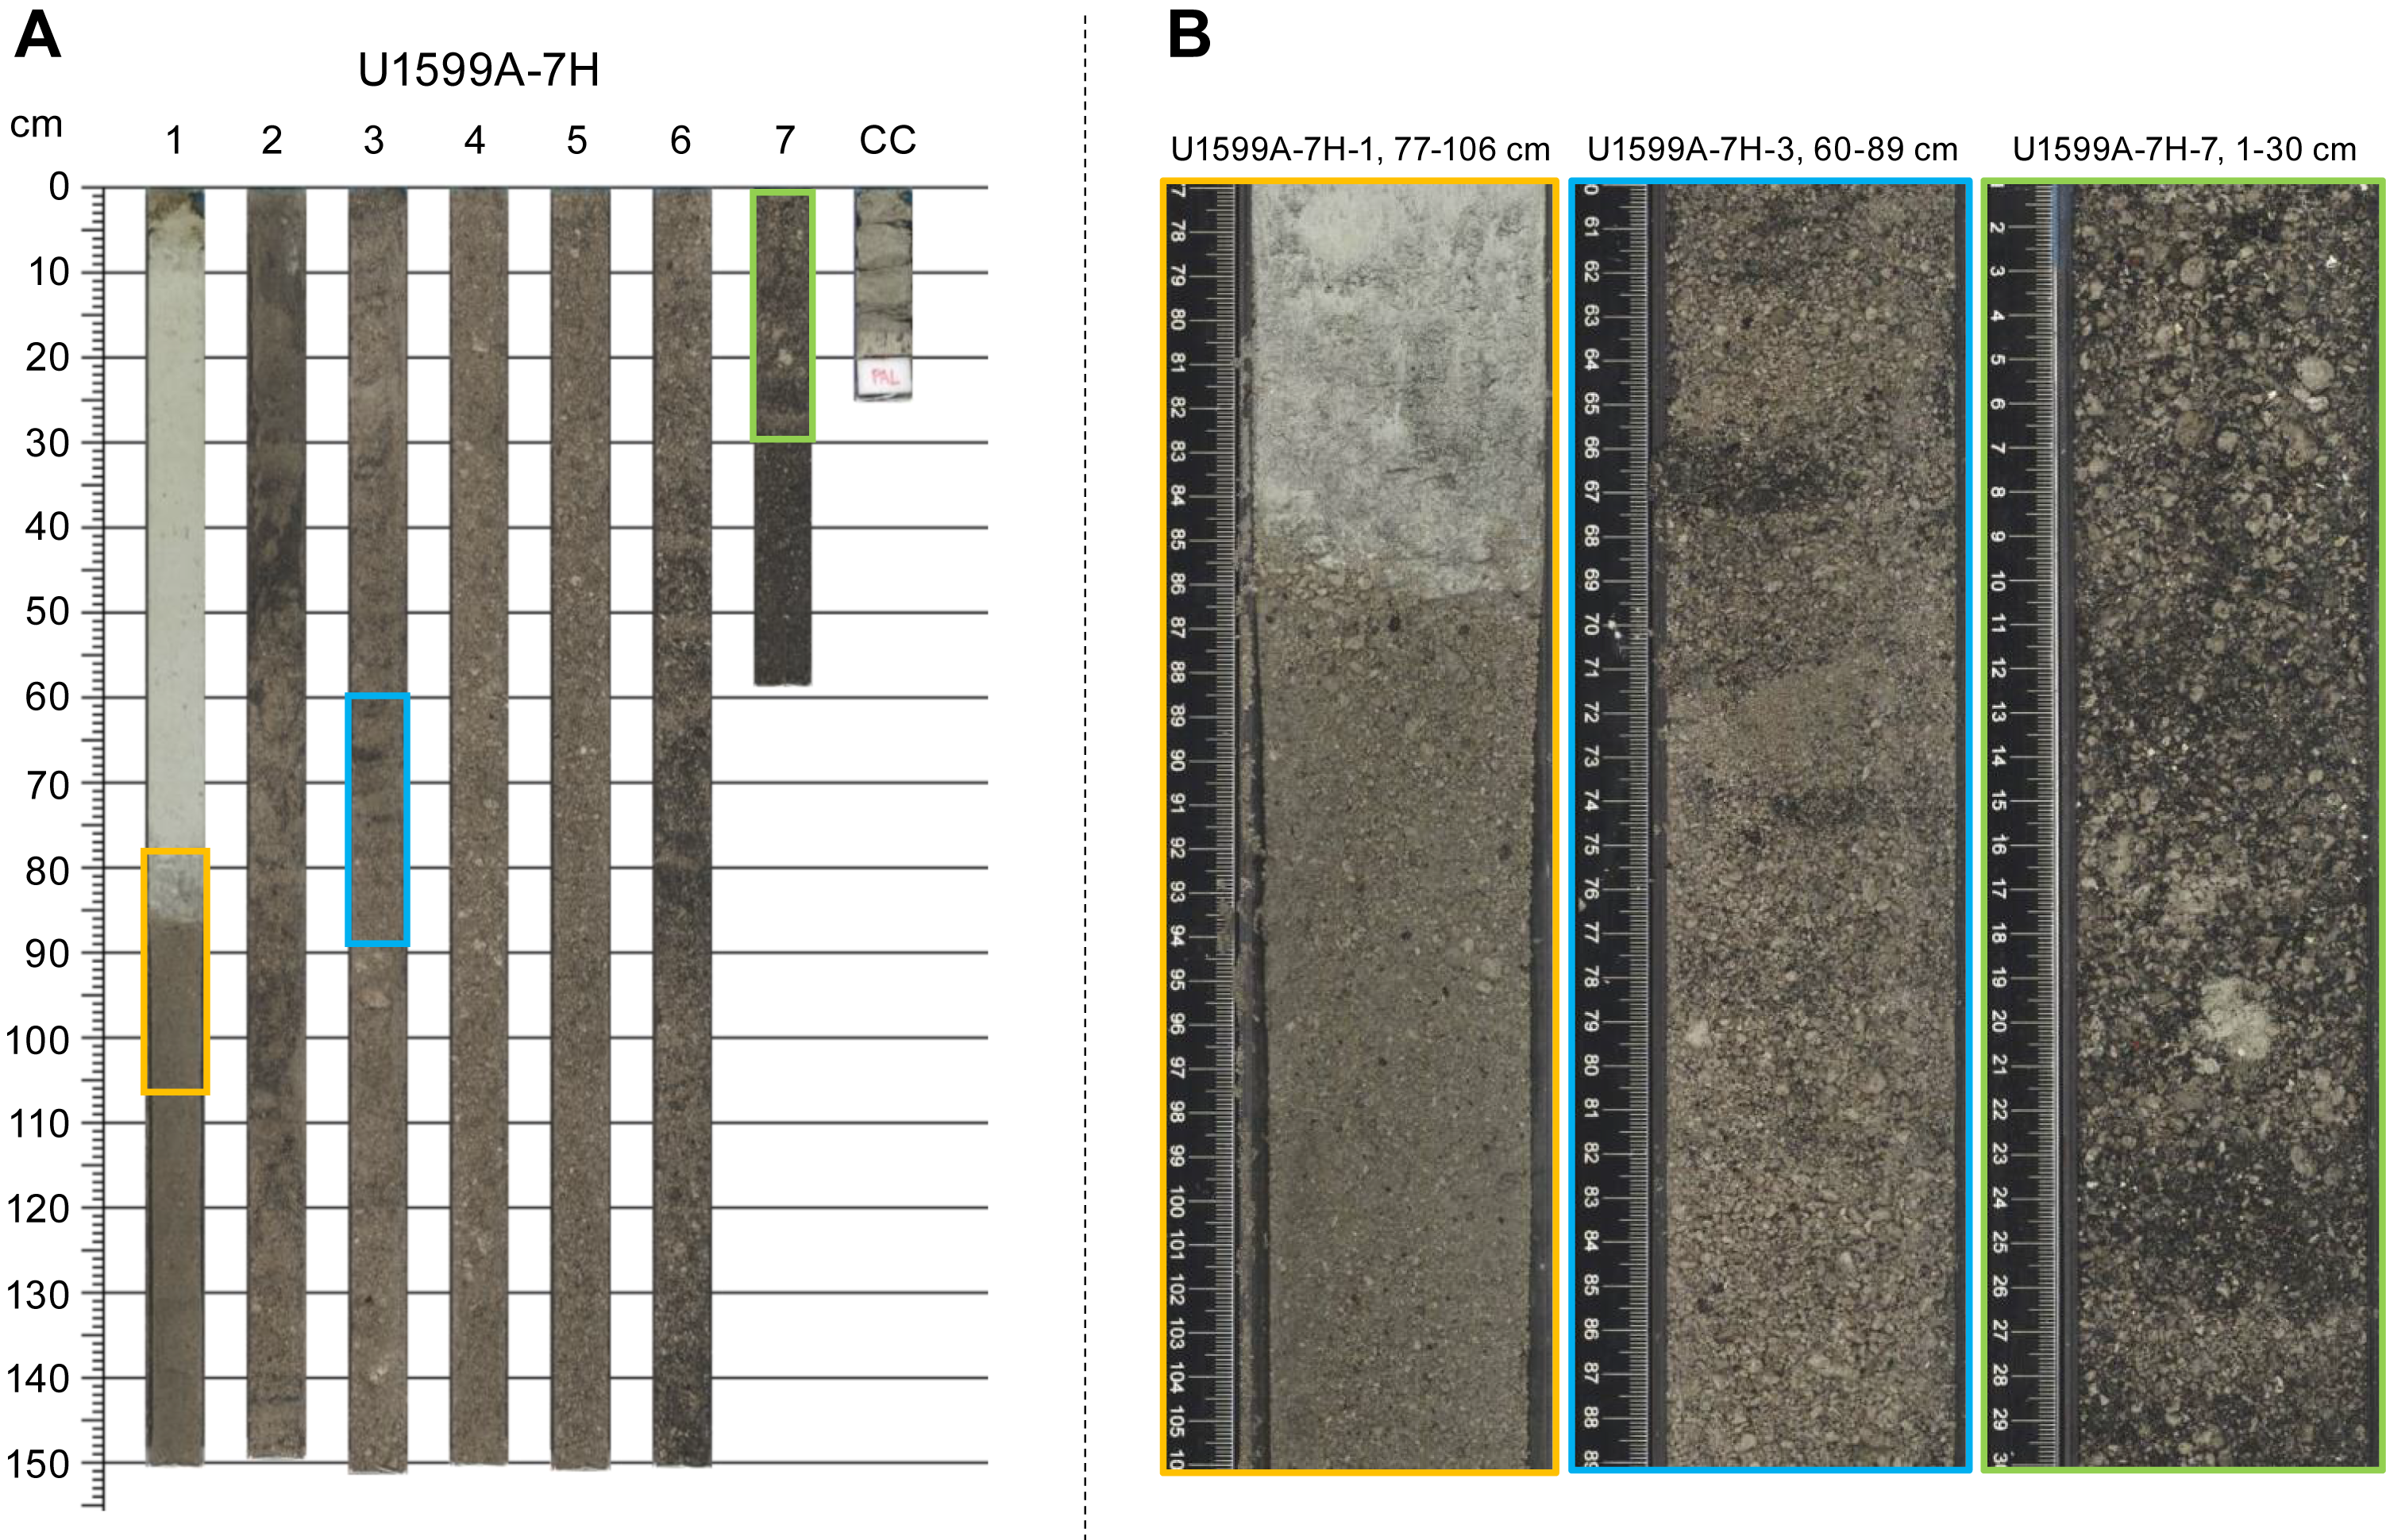
Figure F9. Lapilli to lapilli-ash to ash succession.
Some intraclasts of ooze and shell fragments are also observed within this subunit. The end of this subunit correlates to a sharp decrease in MS (see Physical properties).
Selected smear slides of representative lithologies of Subunit Ib are shown in Figure F8. A sample of organic-rich ooze (Figure F8C) is characterized by its almost entirely biogenic composition and, in this case, predominantly siliceous organisms (e.g., diatoms and radiolarians). This particular sample is a notable exception to the calcareous (nannofossil) oozes generally observed at Site U1599. A crystal ash sample (Figure F8D) is dominated by crystals (e.g., feldspar and pyroxene) and volcanic lithics. Some crystals contain melt inclusions. Another crystal ash sample from Subunit Ib (Figure F8E) contains a higher proportion of blocky to pumiceous transparent glass as well as a minor amount of biotite and biogenic material.
3.2.1.3. Subunit Ic
Subunit Ic is 32.06 m thick in Hole U1599A and 35.05 m thick in Hole U1599B. It extends from 119.52 to 151.58 mbsf in Hole U1599A (Sections 18F-1, 102 cm, through 24F-CC, 17 cm) and from 116.63 to 151.68 mbsf in Hole U1599B (Sections 14F-2, 116 cm, through 21F-4, 75 cm) (Figures F3, F4, F5; Table T2). Subunit Ic is marked by a distinctive change in lithology to nonvolcanic and ooze-dominated sediments compared to the previous subunit, corroborated by a sharp decrease in MS and an increase in thermal conductivity (see Physical properties). The subunit consists of a package of light greenish gray to olive-gray ooze intercalated with light brownish gray to very dark gray organic-rich (sapropelic) ooze (Figure F7C) punctuated by several ash layers. Organic-rich ooze intervals display moderate bioturbation and traces of Zoophycos. Thin, dark ash layers are well sorted and are characterized by grain size ranging from fine to coarse ash, sharp lower contacts, and gradational upper contacts. Three ~1 m thick gray soupy volcanic intervals are observed at the bottom of this subunit. In Hole U1599A, these volcanic intervals consist of drilling-disturbed soupy ash (no internal sedimentary structures visible), whereas in Hole U1599B distinct volcanic intervals consist of both ash and lapilli-ash containing subangular white and gray pumice, red oxidized pumice, plagioclase crystals, and shell fragments.
3.2.1.4. Subunit Id
Subunit Id is 70.91 m thick in Hole U1599A and 65.97 m thick in Hole U1599B. It extends from 151.4 to 222.31 mbsf in Hole U1599A (Sections 24F-CC, 17 cm, through 40F-1) and 151.7 to 217.67 mbsf in Hole U1599B (Sections 22F-1, 0 cm, through 36F-1, 17 cm) (Figures F3, F4, F5; Table T2). It consists of white to gray subangular to subrounded ash, lapilli-ash, and lapilli for the first 30–40 m (Figure F7D). These intervals are moderately to poorly sorted and are sometimes normally graded. The remainder of the subunit consists of volcanic intervals (ash, tuffaceous ooze, and lapilli-ash) intermixed with nonvolcanic intervals (ooze and sand). These are generally light gray ashes interlayered with gray to greenish-gray tuffaceous ooze or ooze with ash.
In Hole U1599A, a gravelly interval composed of volcanic and sedimentary lithics and shell fragments is observed at 217.25–218.42 mbsf, and in Hole U1599B, a similar deposit is observed at 191.1–191.67 mbsf.
An exemplary smear slide of ooze with ash is shown in Figure F8F. The ooze contains abundant nannofossils with a minor amount of sand-sized blocky and pumiceous volcanic glasses.
3.2.2. Unit II
- Intervals: 398-U1599A-40F-1, 41 cm, to 44F-CC, 22 cm (bottom of the hole); 398-U1599B-36F-1, 17 cm, to 40F-CC, 17 cm (bottom of the hole); and 398-U1599C-2R-1, 0 cm, to 4R-4, 140 cm
- Thicknesses: Hole U1599A = 23.35 m; Hole U1599B = 23.52 m; Hole U1599C = 28.04 m
- Depths: Hole U1599A = 222.31–245.66 mbsf; Hole U1599B = 217.67–241.19 mbsf; Hole U1599C = 223–251.04 mbsf
- Age: Middle Pleistocene to Early Pleistocene
- Lithology: ooze and organic-rich ooze with lesser thin ash and tuffaceous intervals; organic-rich oozes become more abundant downhole
Unit II was recovered in all three holes and is the thinnest unit at Site U1599 (ranging 23–28 m). It is composed dominantly of ooze and organic-rich ooze with intermittent ash layers throughout. The subunit begins in Holes U1599A and U1599B below the last thick volcanic interval of Unit I and represents the first appearance of multiple cores of ooze and organic-rich ooze with a few thin ash layers (Figure F10). The top of Unit II was not recovered in Hole U1599C; however, one notable correlation of an ooze interval was established at ~244 mbsf between Holes U1599A, U1599B, and U1599C (see Correlations between holes). Oozes generally appear gray to greenish gray and have slight bioturbation; the majority contain ash pods or foraminifera (Figure F10A). Volcanic intervals are less abundant in Unit II, but where they do occur, they vary in thickness from a few centimeters up to ~45 cm. They are light gray to dark gray or black and range from fine to coarse ash. Their bottom boundaries are usually sharp, whereas their top boundaries are irregular or gradational (Figure F10B). Intervals of organic-rich (sapropelic) ooze occur throughout Unit II, often identified by a gradational change from greenish gray ooze to olive-gray ooze with moderate bioturbation (Figure F10C). These organic-rich intervals are generally 20–30 cm thick.
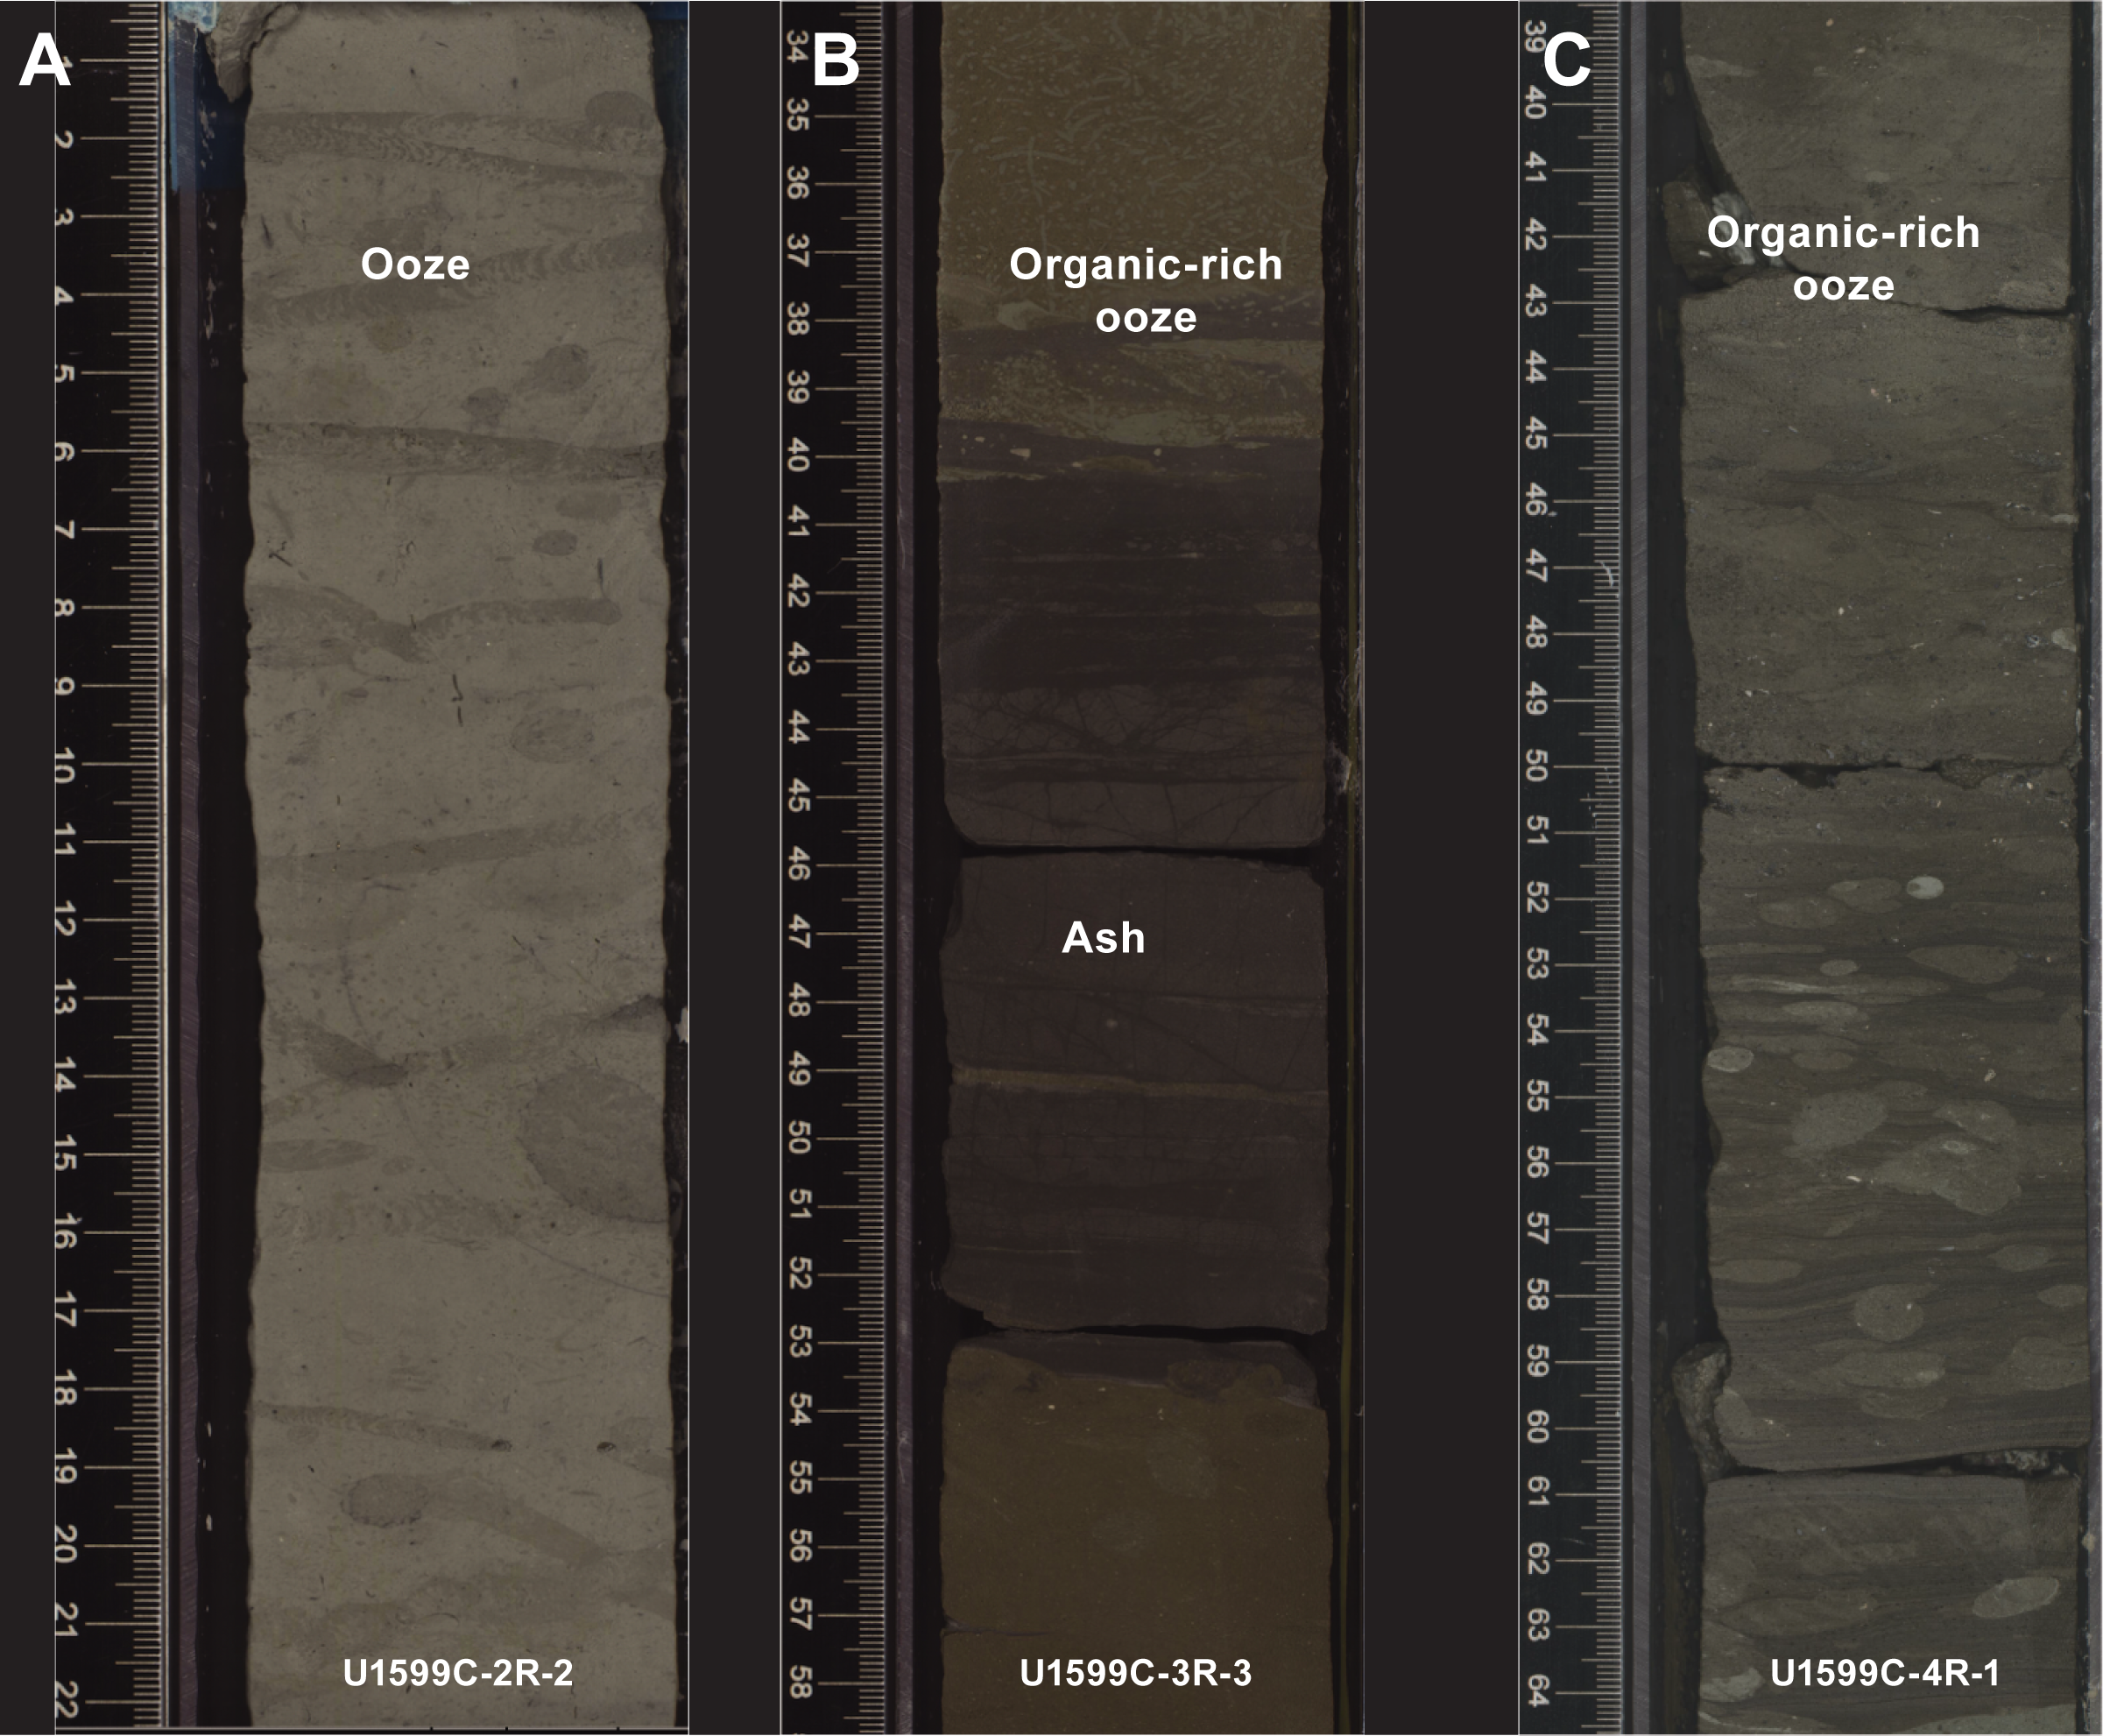
Figure F10. Unit II lithology, Hole U1599C.
Selected smear slides of representative lithologies of Unit II are shown in Figure F11. An ash layer collected in Section 398-U1599A-42F-4, 26 cm, consists of blocky and nonvesicular glass fragments, calcite, pyroxene, feldspar, and opaques (Figure F11A). Calcareous tuffaceous sand contains abundant calcite and trace foraminifera, diatoms, radiolaria, pyroxene, and feldspar (Figure F11B). A few blocky and nonvesicular glass fragments are also observed.
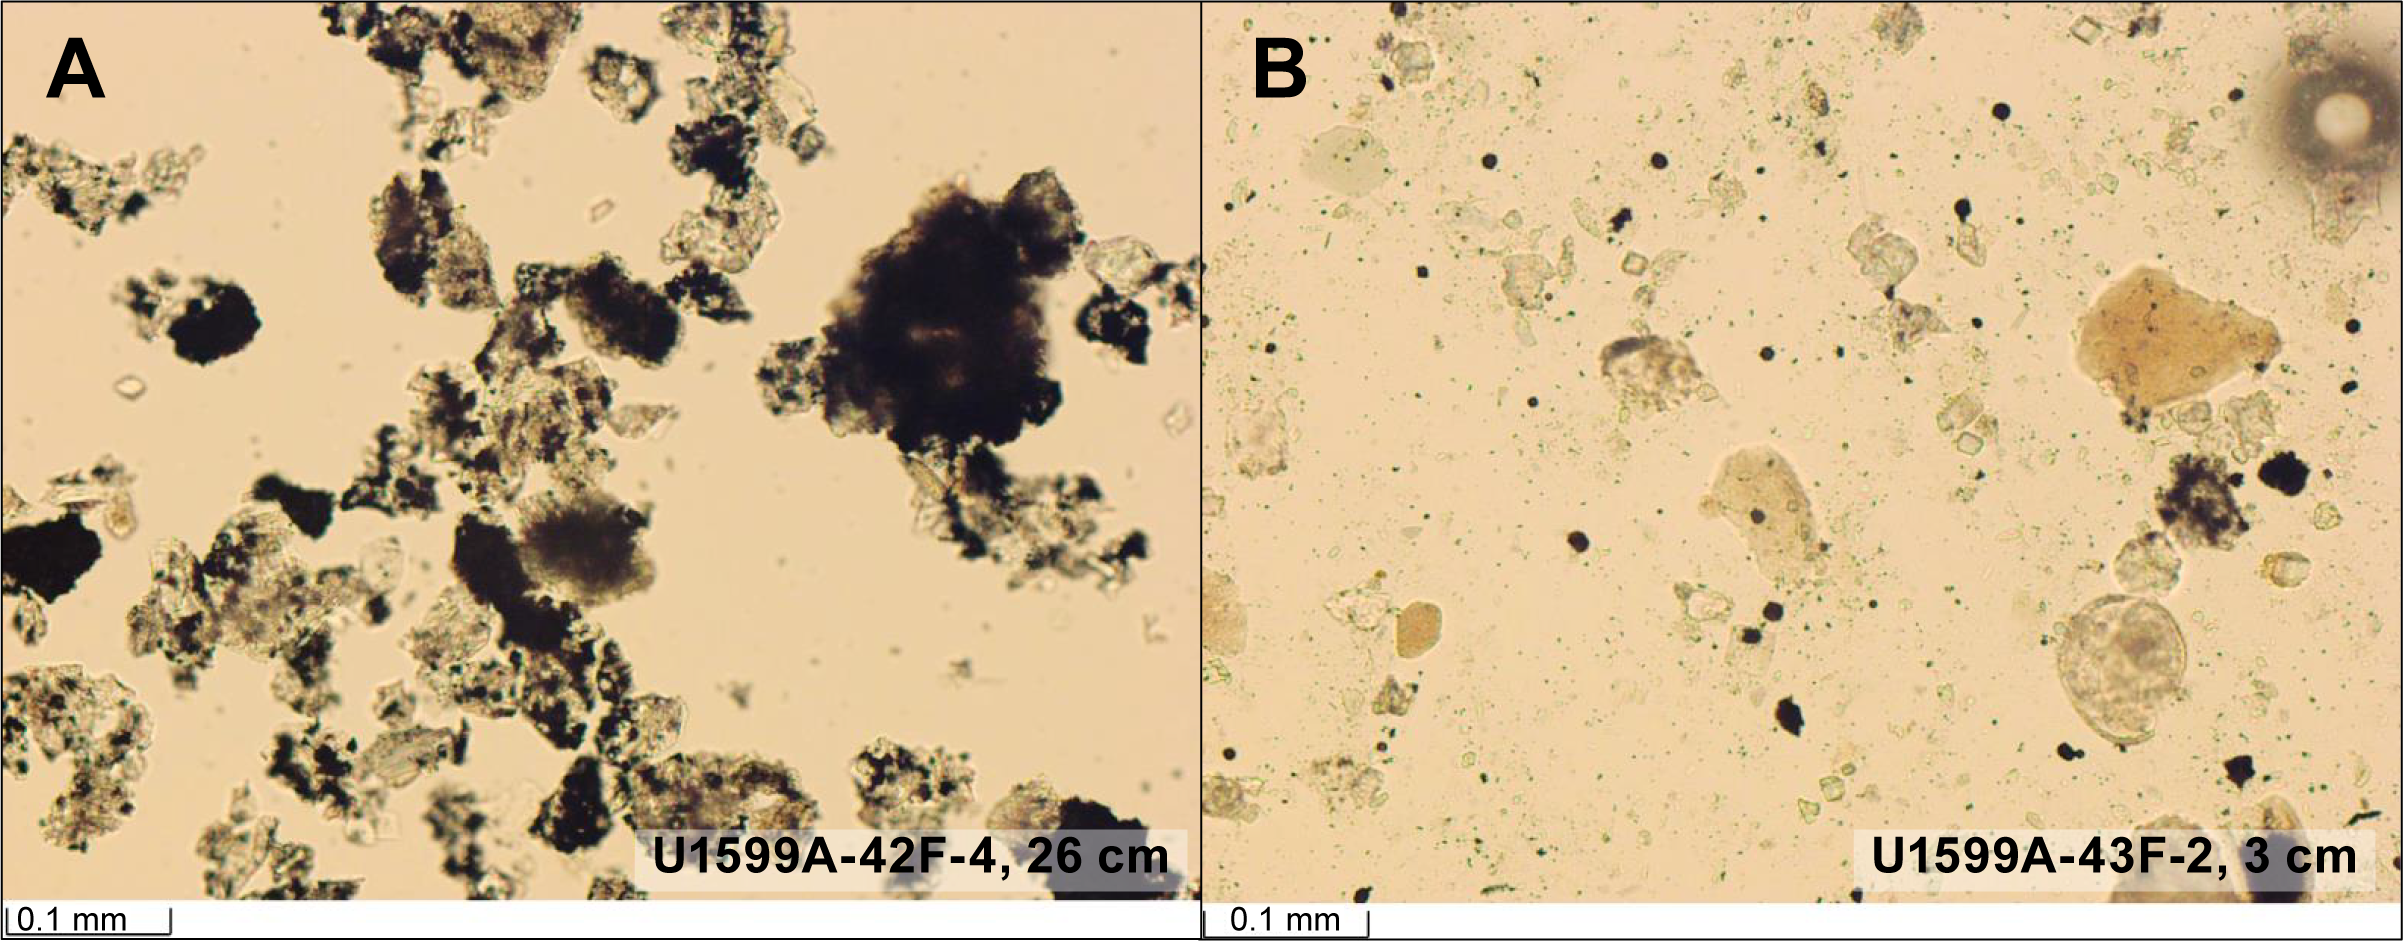
Figure F11. Unit II lithology, Hole U1599A.
3.2.3. Unit III
- Interval: 398-U1599C-4R-5, 0 cm, to 36R-1, 32 cm
- Thickness: 305.12 m
- Depth: 247.7–552.82 mbsf
- Age: Early Pleistocene to Pliocene
- Lithology: dolomitic marl and organic-rich dolomitic marl
Unit III extends from 247.7 to 552.82 mbsf in Hole U1599C (Sections 4R-5, 0 cm, through 36R-1, 32 cm) (Figures F3, F4, F5; Table T2). The total thickness of this unit is 305.12 m.
The upper boundary of Unit III is defined by the appearance of dolomitic marl, a consolidated sediment in comparison to the previously unlithified sediments. Dolomitic marl was macro- and microscopically identified in Core 398-U1599C-5R, but XRD results show that it also occurs in Core 4R, thus defining the boundary between Units II and III. Unit III consists of gray to light greenish gray dolomitic marl with periodic intervals of organic-rich dolomitic marl and mudstone. Dolomite was defined macroscopically by its gritty texture and use of 20% HCl, which reacted strongly with the rock compared to 10% HCl. The presence of dolomite throughout this unit was confirmed by XRD (see X-ray diffraction). Disseminated sulfides are present throughout the unit.
Subunits were defined by the relative proportion of organic-rich intervals:
- Subunit IIIa (Sections 398-U1599C-4R-5, 0 cm, through 20R-6, 48 cm; 247.7–403.31 mbsf): greenish gray to dark greenish gray/dark olive-gray dolomitic marl and organic-rich dolomitic marl.
- Subunit IIIb (Sections 398-U1599C-20R-6, 48 cm, through 28R-2, 55 cm; 403.31–476.65 mbsf): organic-rich dolomitic marl.
- Subunit IIIc (Sections 398-U1599C-28R-2, 55 cm, through 36R-1, 32 cm; 476.65–552.82 mbsf): gray to dark gray dolomitic marl and organic-rich dolomitic marl.
3.2.3.1. Subunit IIIa
Subunit IIIa extends from 247.7 to 403.31 mbsf in Hole U1599C (Sections 4R-5, 0 cm, through 20R-6, 48 cm) (Figures F3, F4, F5; Table T2). The subunit consists of greenish gray to light greenish gray dolomitic marl with periodic intervals of organic-rich dolomitic marl and mudstone (Figure F12A). Dolomitic sand intervals are slightly bioturbated, whereas organic-rich intervals are moderately to highly bioturbated and display numerous well-preserved traces of Chondrites and Zoophycos (Figure F12C). The organic-rich intervals are commonly thinly laminated (<0.3 cm thick) and display a gradational upper contact and a horizontal sharp lower contact. In the lower part of the subunit (below 329.4 mbsf), the fine-grained and well-sorted lithologies are characterized by the presence of shell fragments.
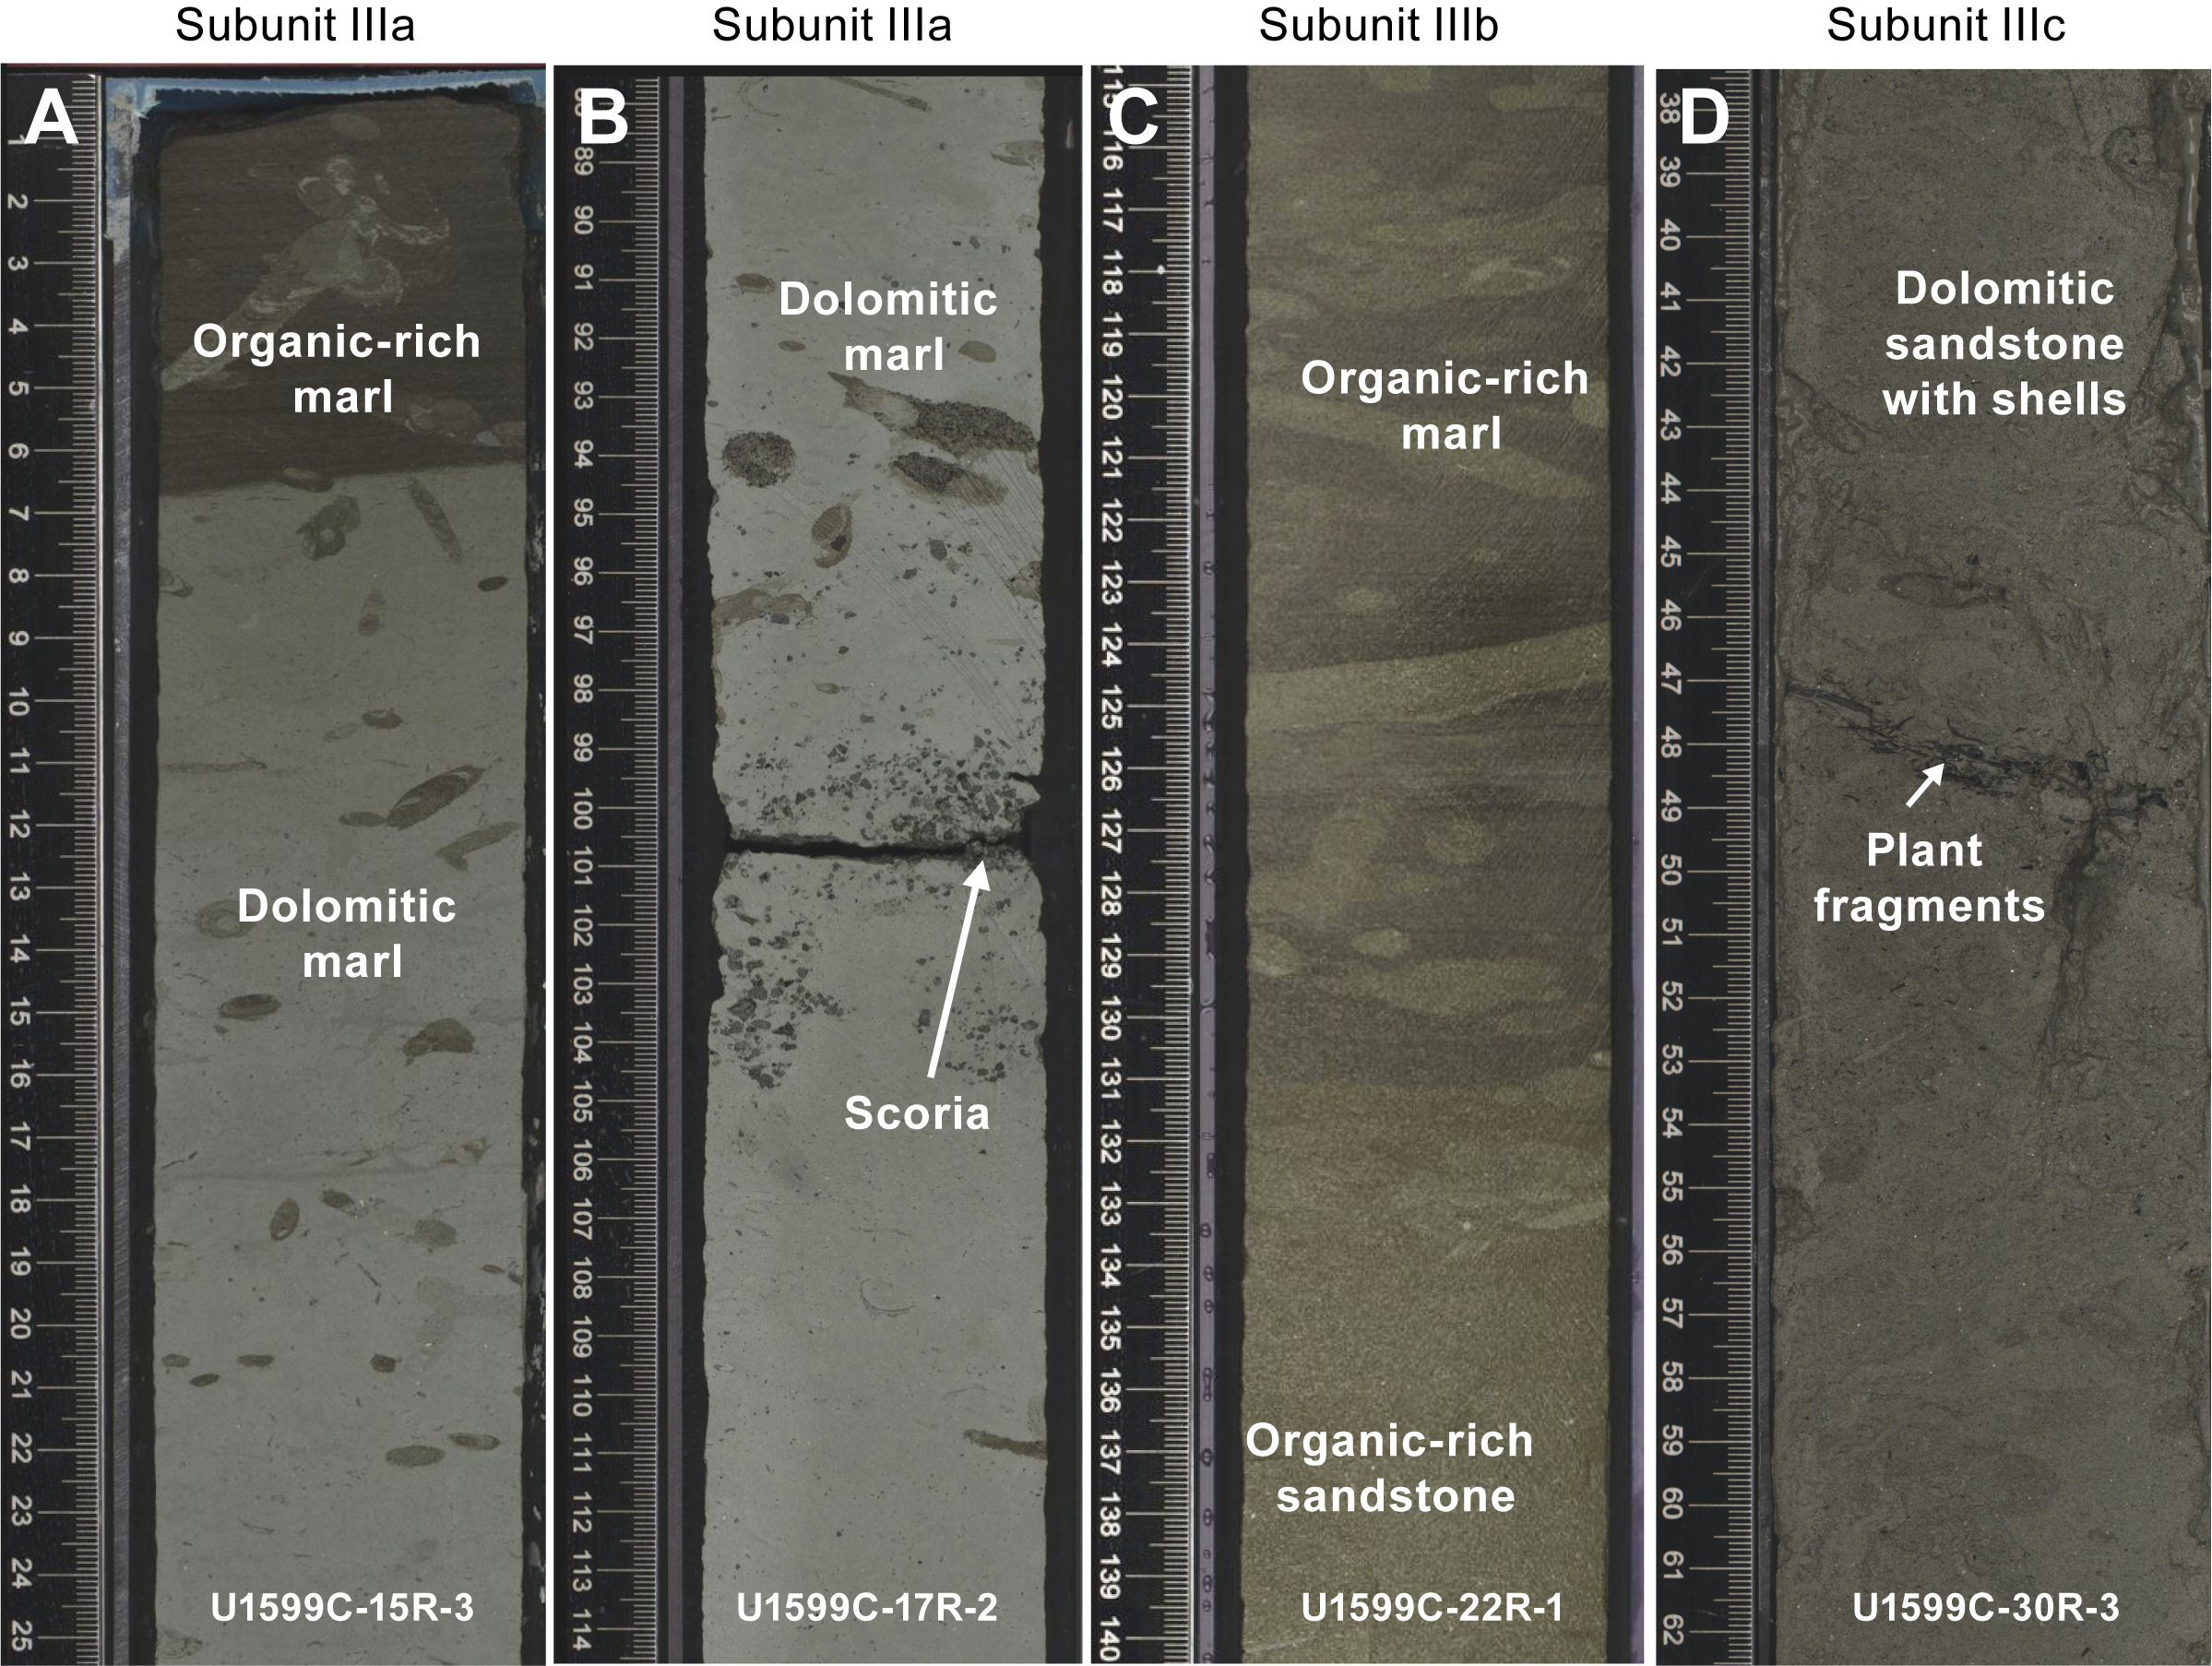
Figure F12. Unit III lithology, Hole U1599C.
Three intervals, 333.22–333.37, 341.63–341.69, and 370.70–371.91 mbsf (Sections 398-U1599C-13R-3, 14R-CC, 17R-2, and 17R-3) (Figure F12B), contain ash and lapilli. Clasts are angular scoria lapilli, subangular and subrounded pumice, plagioclase, pyroxene, and biotite. In the first two intervals, white pumice with crystals is dominant and gray and banded pumice are present but rare.
An exemplary smear slide of a dolomitic marl of Subunit IIIa is shown in Figure F13A. Sample 398-U1599C-5R-4, 83 cm, consists of dolomite, abundant calcareous nannofossils, glaucophane, and sedimentary lithics.
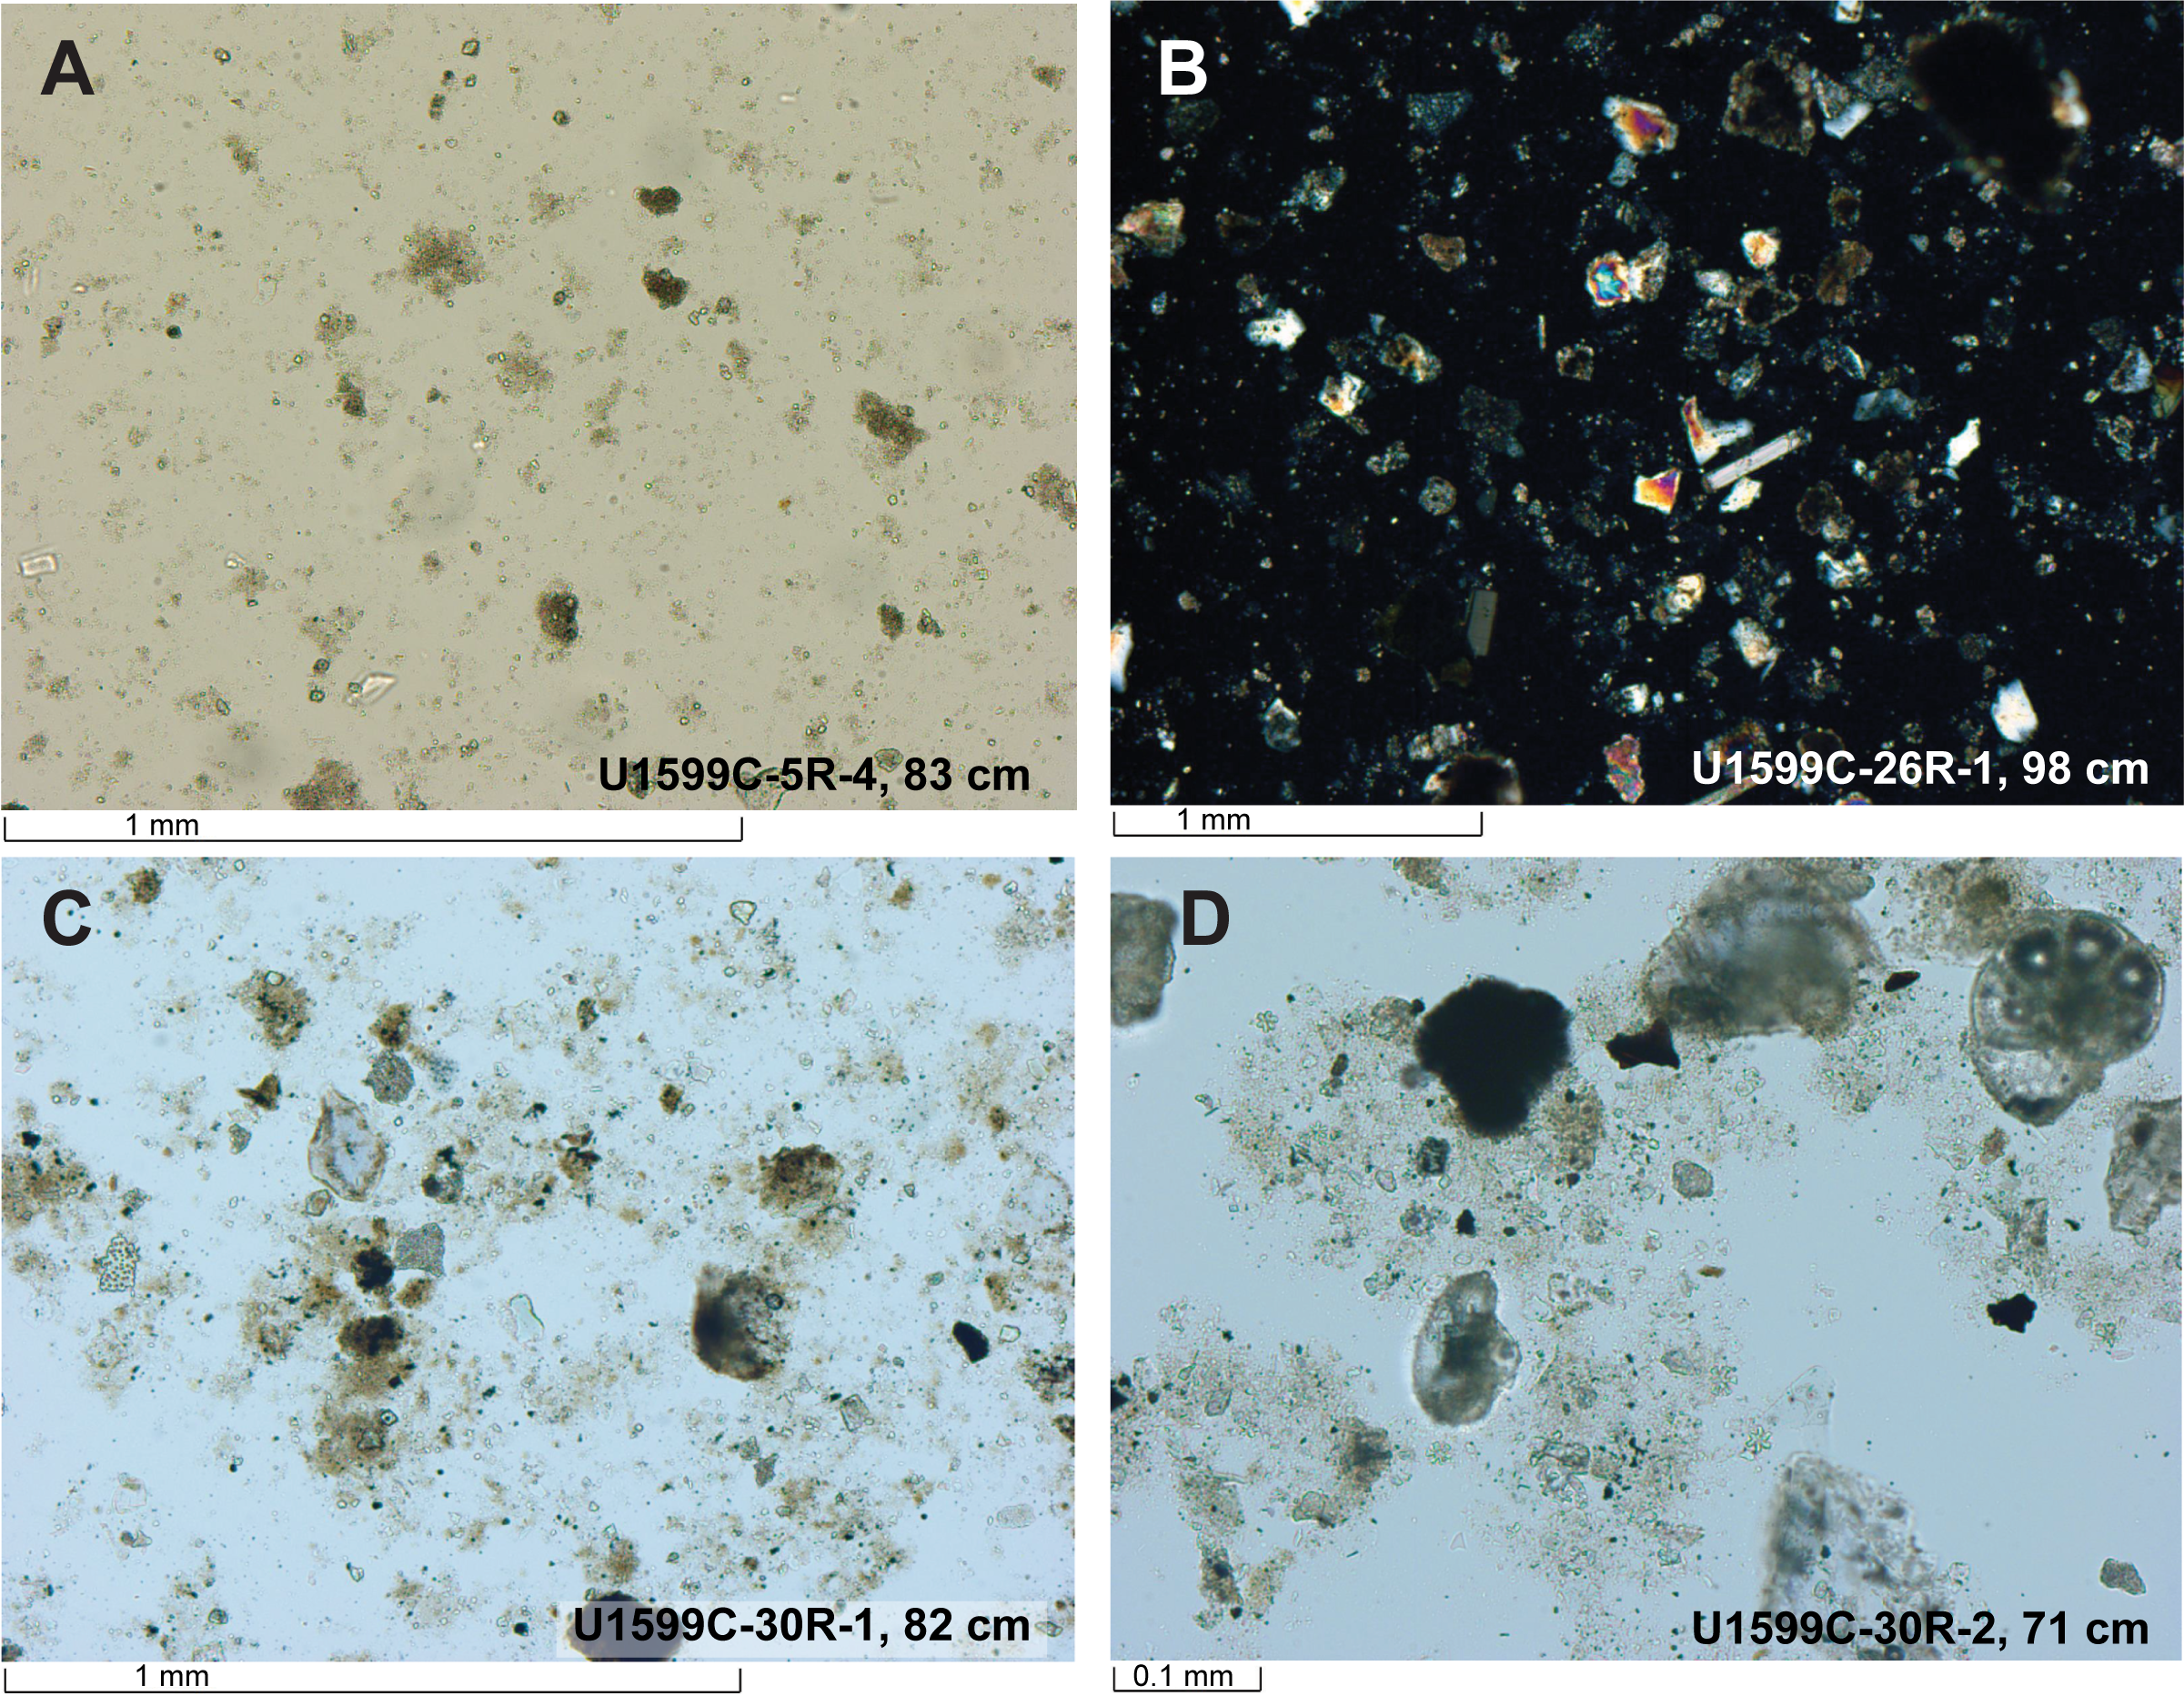
Figure F13. Subunit IIIa-IIIc lithology, Hole U1599C.
3.2.3.2. Subunit IIIb
Subunit IIIb extends from 403.31 to 476.65 mbsf in Hole U1599C (Sections 20R-6, 48 cm, through 28R-2, 55 cm) (Figures F3, F4, F5; Table T2). It mainly consists of dark gray organic-rich dolomitic marl and mudstone/sandstone with shells intercalated with thin intervals of gray dolomitic marl with organic material (Figure F12C). Subunit IIIb is darker colored than Subunits IIIa and IIIc because of its high organic content. Bioturbation is slight to moderate across the entire subunit with numerous well-preserved traces of Chondrites and Zoophycos (Figure F12C). Organic-rich intervals are commonly thinly laminated (<0.3 cm thick) and display a gradational upper contact and a horizontal sharp lower contact. A few intervals with ash and ash pods are also observed between 456.29 and 475.09 mbsf. Dolomitic marls and their organic-rich equivalents are coarser grained (dolomitic sandstone) in Section 22R-1 (~417 mbsf), and most sections of Core 22R consist of well-sorted dolomitic sands with biogenic clasts, including shell fragments.
An exemplary smear slide of a dolomitic marl with ash of Subunit IIIb is shown in Figure F13B. Sample 398-U1599C-26R-1, 98 cm, consists of dolomite, abundant calcareous nannofossils, foraminifera, and brown and altered volcanic glass, as well as pyroxene, mica, and quartz.
3.2.3.3. Subunit IIIc
Subunit IIIc extends from 476.65 to 552.82 mbsf in Hole U1599C (Sections 28R-2, 55 cm, through 36R-1, 32 cm) (Figures F3, F4, F5; Table T2) and is dominated by dolomitic sandstone with shells and organic-rich dolomitic sandstone with shells. Lithologies are typically greenish gray or gray to dark gray, well sorted, and range in grain size from fine sand to pebble. Clasts are mostly made of volcanic rock, sedimentary rock, red oxidized lithics, crystals (quartz and micas), and plant fragments. Quartz and micas are present throughout Subunit IIIc. Slight bioturbation is observed throughout the subunit and consists of burrows infilled by coarser material. The subunit ends in a dolomitic sandy conglomerate with clasts of volcanic rock, sedimentary rock, sandstone, mudstone, quartz, micas, and red oxidized lithics. This interval is moderately to poorly sorted, with grain sizes ranging from coarse sand to pebble.
Selected smear slides of representative lithologies of Subunit IIIc are shown in Figures F11C and F13D. An organic-rich sand collected in Section 398-U1599C-30R-1, 82 cm, consists of dolomite; rare calcite; abundant calcareous nannofossils; foraminifera; organic material; rare altered glass; sedimentary lithics; and mineral grains of pyroxene, feldspar, and quartz, with minor amounts of opaques and zircon (Figure F13C). A dolomitic sand collected in Section 30R-2, 71 cm, is characterized by dolomite; calcite; minor amounts of authigenic pyrite; calcareous nannofossils; foraminifera; and mineral grains of pyroxene, opaques, feldspar, quartz, and sedimentary lithics (Figure F13D).
3.2.4. Unit IV
- Interval: 398-U1599C-36R-1, 32 cm, to 50R-CC, 10 cm (bottom of the hole)
- Thickness: 145.19 m
- Depth: 552.8–698.01 mbsf
- Age: Early to Middle Miocene
- Lithology: calcareous mudstone/sandstone, tuff, micrite, and tuffaceous sandstone
Unit IV was only recovered in Hole U1599C and is 144.98 m thick because the hole was terminated before the lower boundary was recovered. The unit begins with calcareous mudstone with interbedded layers of sandstone and a few tuff layers (Figure F14A). The unit transitions downward into a micrite-dominated succession with interbedded calcareous sandstone. Some sandstone intervals contain ash and are described as tuffaceous (25%–75% volcanic glass and crystals) or ash-bearing (<25% volcanic glass and crystals). The volcanic glass in these intervals is variably altered and clear.
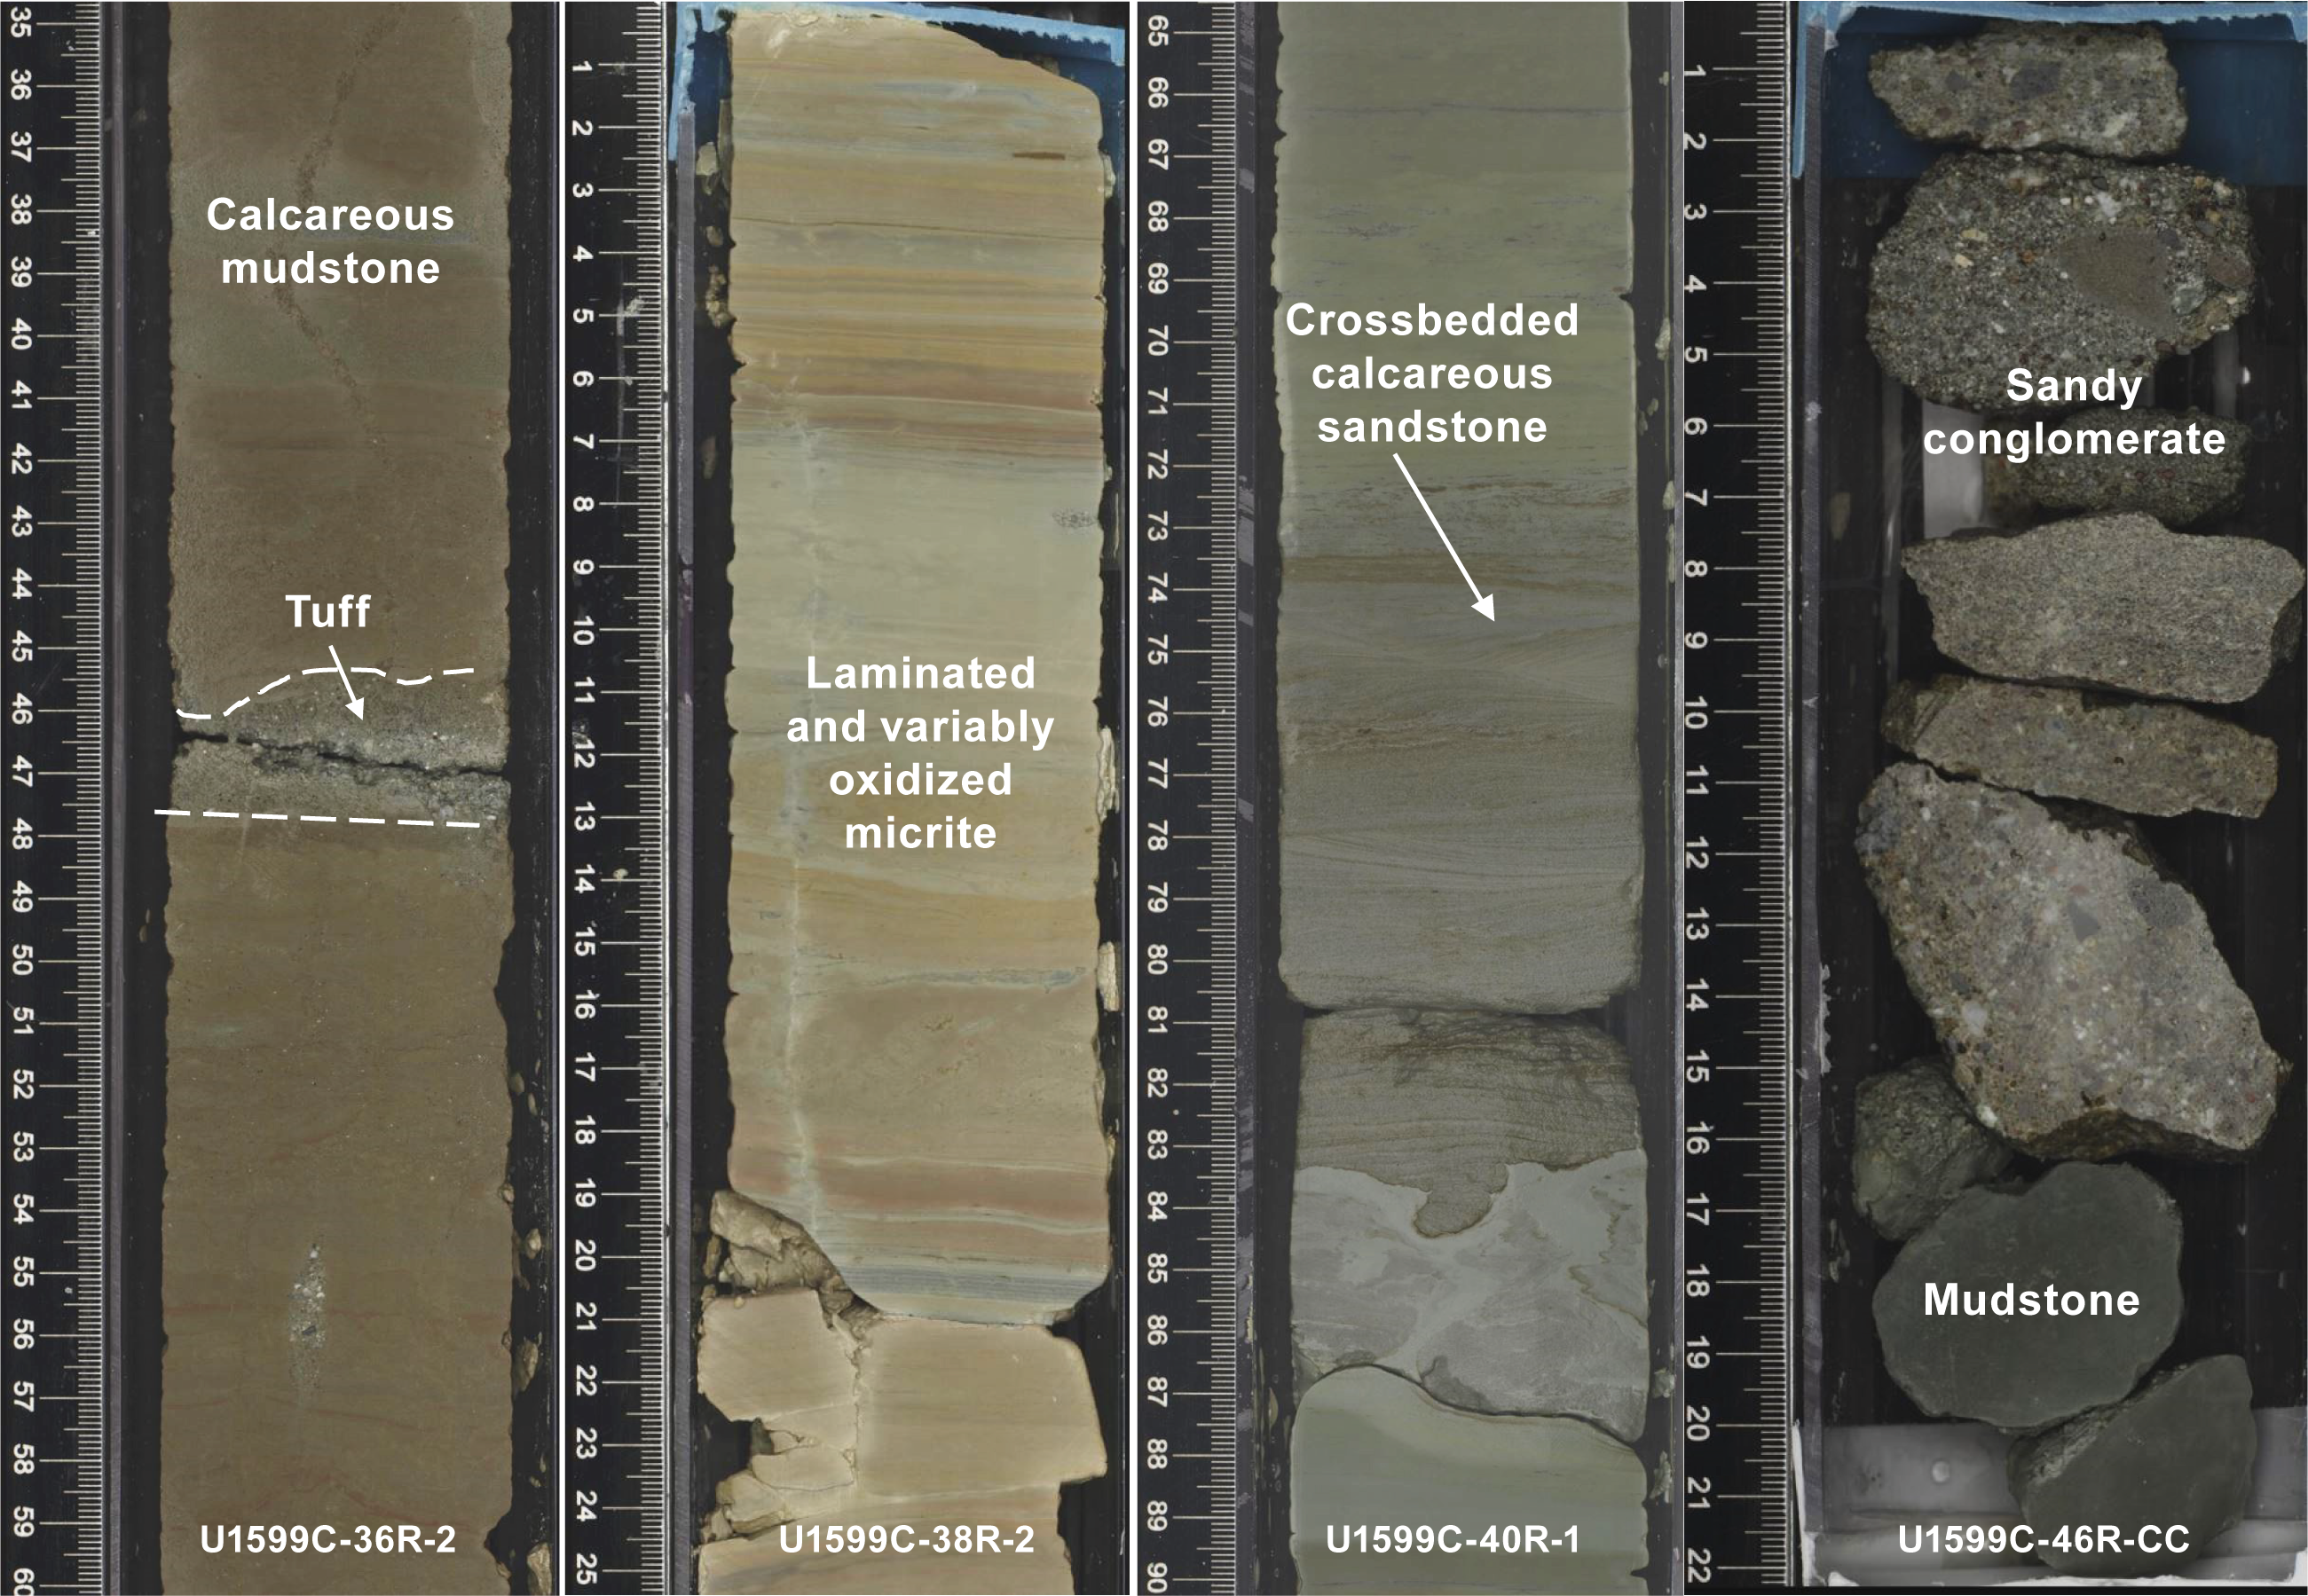
Figure F14. Common lithologies from Unit IV, Hole U1599C.
The calcareous mudstone is dark grayish brown, usually slightly bioturbated, well sorted, and effervesces with 10% HCl. This transitions downward into micrite that alternates from greenish gray to light yellowish brown to light brownish gray and is variably oxidized (Figure F14B). The micrite is usually thinly laminated to thinly bedded and is well sorted with limited to no bioturbation. Interbedded calcareous sandstones are observed regularly within the micrite in Cores 398-U1599C-37R through 48R and are cross-bedded in Core 40R (Figure F14C). In Core 48R, coarser sedimentary intervals become common, such as calcareous gravelly sandstone and matrix-supported sandy conglomerate (Figure F14D). The sandstones are well sorted and sometimes normally graded or bedded. Gravelly sandstone and matrix-supported sandy conglomerate are polymictic poorly sorted greenish gray to very dark greenish gray lithologies with sedimentary, volcanic, and carbonate clasts (>2 mm) and crystals.
The sedimentary rocks become chaotically bedded in Core 398-U1599C-49R, consisting of an irregular and microfaulted mixture of variably colored micrite, dolostone, calcareous sandstone, and sandy conglomerate (sometimes normally graded). Dolostone is nodular and irregular in color, varying between light brown and pinkish gray, and has significantly higher P-wave velocity (see Physical properties). By the next and final core (50R), however, lithologies return to the more typical micrite with occasional interbedded calcareous sandstone.
An exemplary smear slide of an ash within Unit IV is shown in Figure F15. The sample, collected in Section 398-U1599C-36R-3, 36 cm, consists mostly of altered volcanic glass and volcanic minerals including pyroxene, amphibole, feldspar, and biotite, alongside calcite.
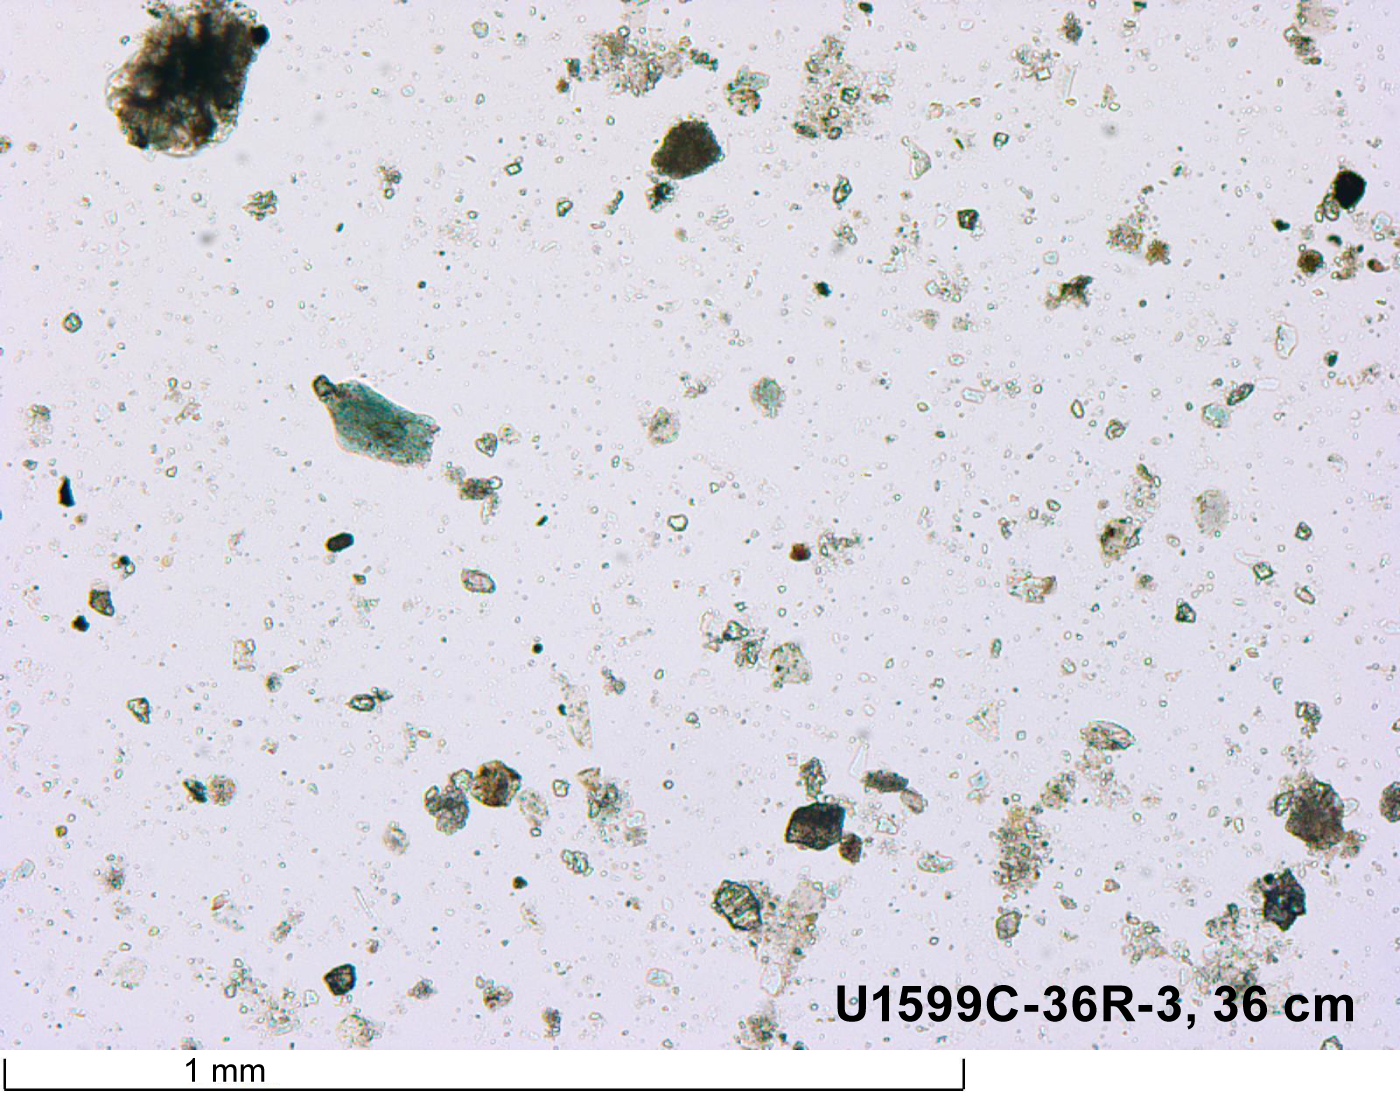
Figure F15. Unit IV ash.
3.3. Correlations between holes
The recovered sediments from Holes U1599A–U1599C allow for correlation of sediment-specific features such as volcanic layers (e.g., discrete ash or lapilli layers) or organic-rich (sapropelic) horizons. Holes U1599A and U1599B largely overlap in an effort to fill gaps in recovery. Holes U1599A and U1599B extend to 245.66 mbsf and 241.19 mbsf, respectively, and Hole U1599C recovery begins at 223 mbsf; thus, ~22.69 m of overlap was recovered. In the following section, we highlight notable lithologic correlations between cores in Unit I (Figure F16) and Unit II (Figure F17).
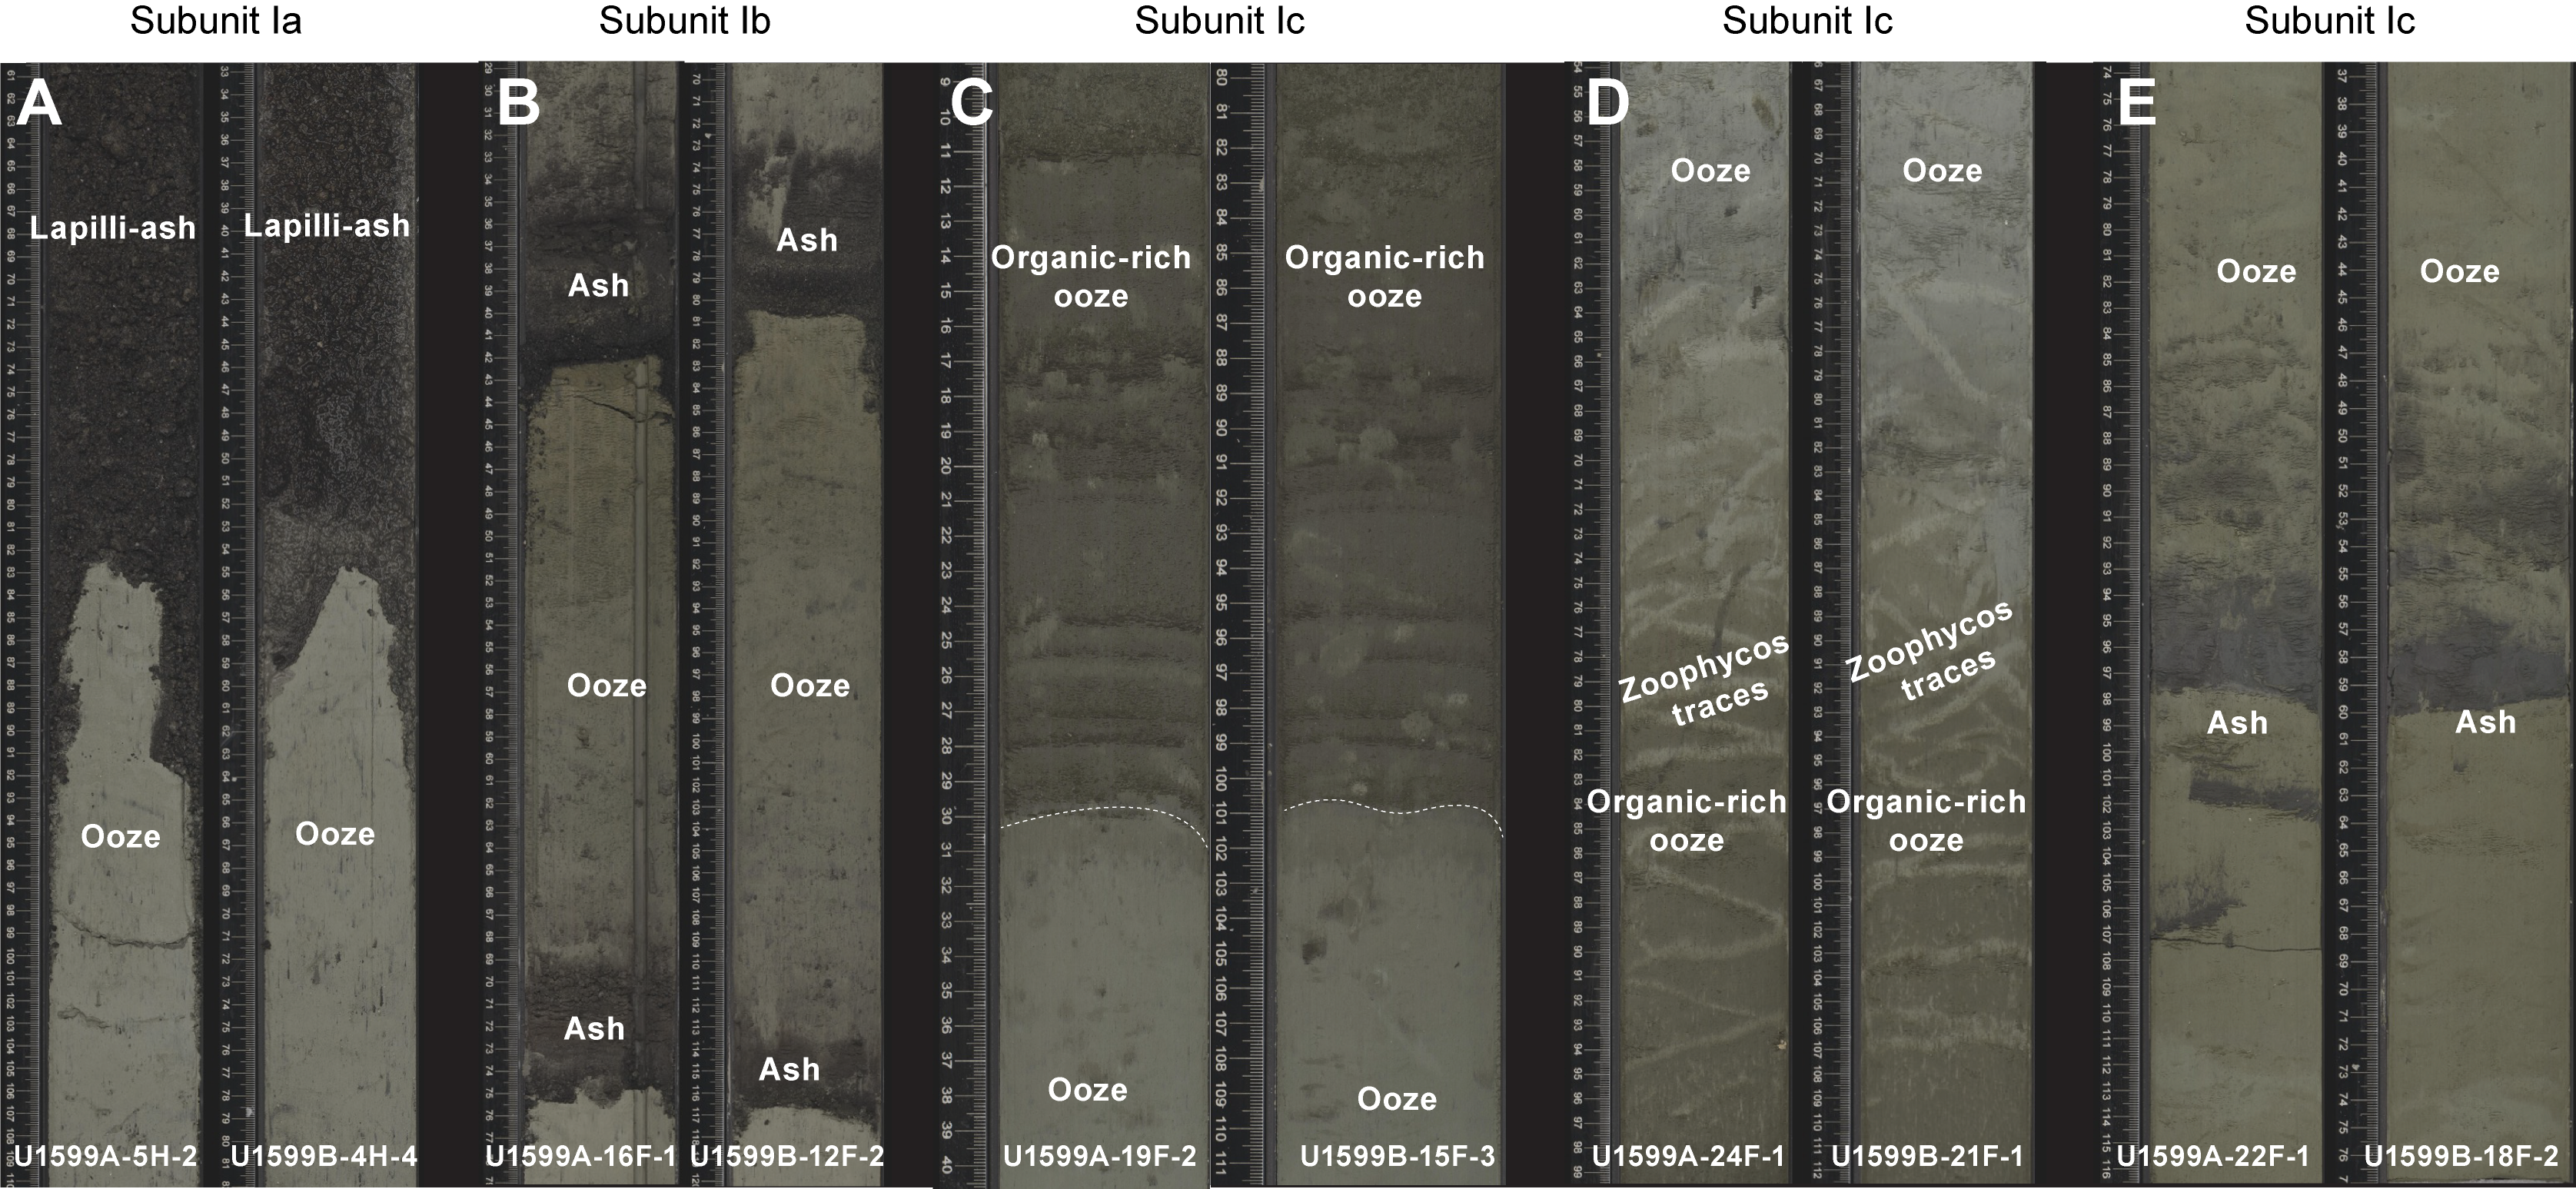
Figure F16. Stratigraphic correlations, Unit I.
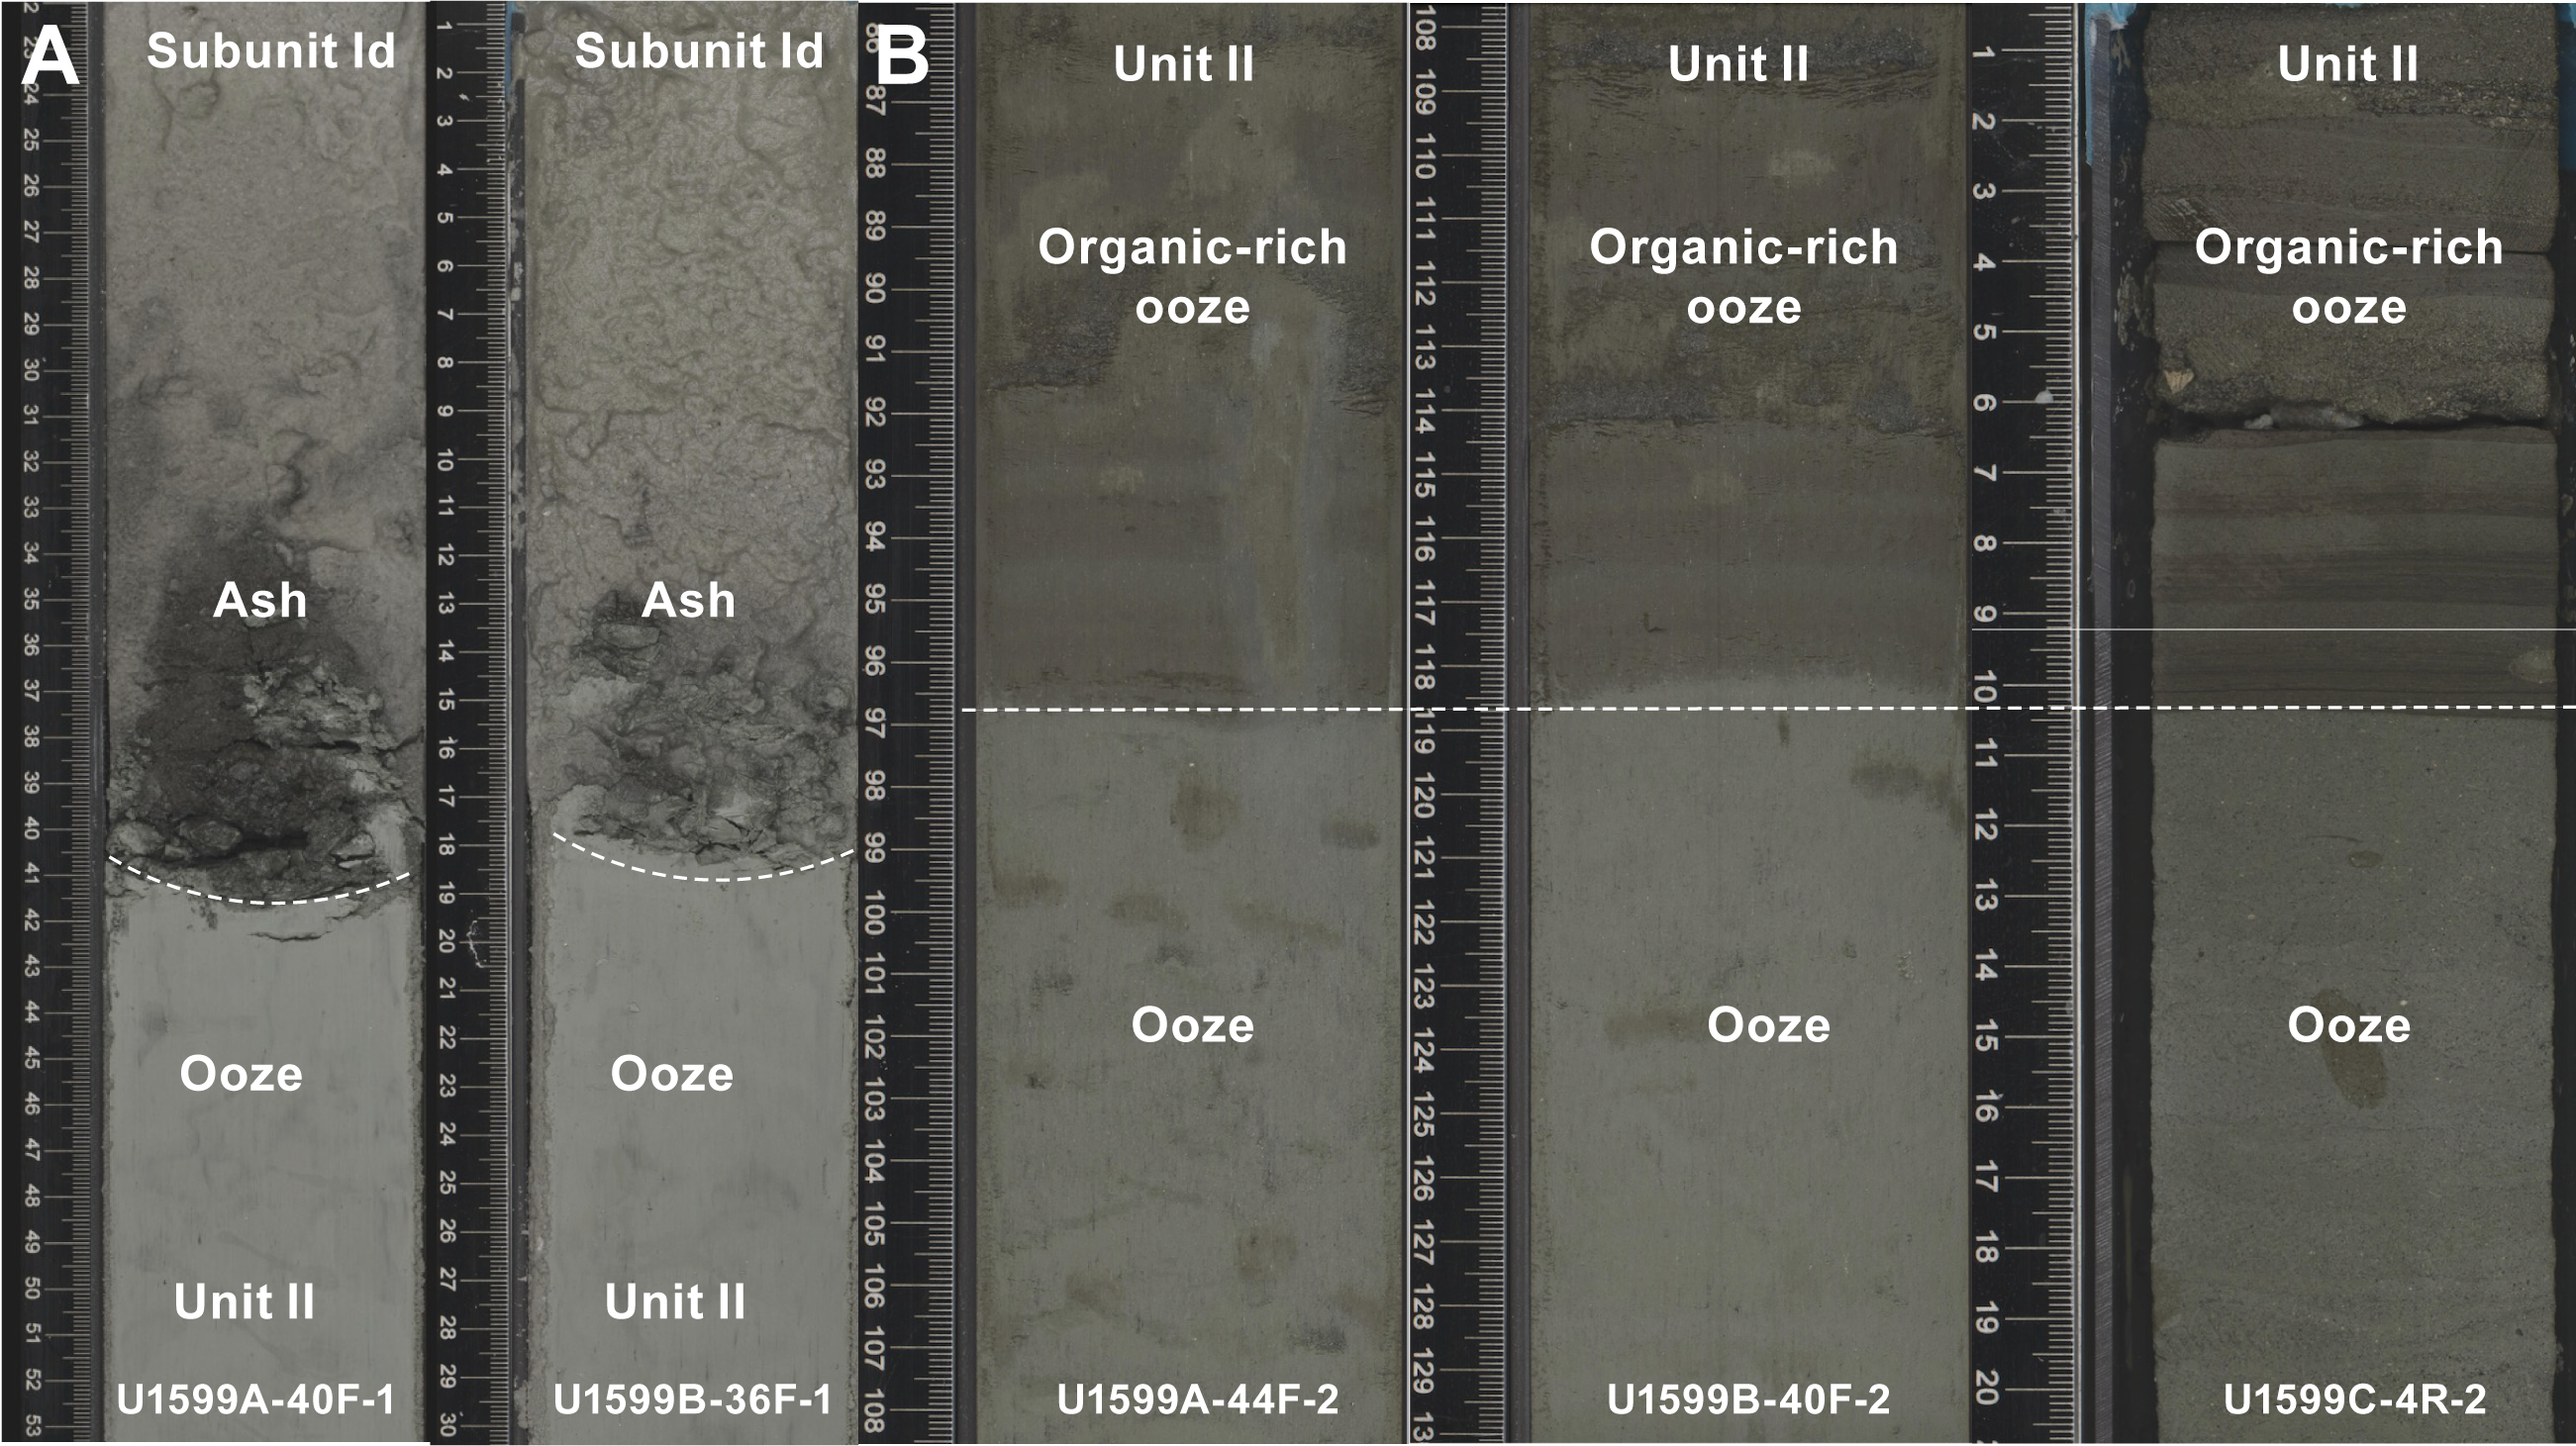
Figure F17. Stratigraphic correlations, Unit II.
3.3.1. Notable correlated deposits
- Lapilli-ash layer with dark gray pumice and scoria, red oxidized lithics, and a sharp lower contact to underlying ooze (Sections 398-U1599A-5H-2, 92 cm [35.82 mbsf], and 398-U1599B-4H-4, 55 cm [33.59 mbsf]) (Figure F16A). The uparching observed in the ooze is core disturbance resulting from slight to moderate coring-induced shear between the sediment and core liner.
- Two ash layers intercalated with ooze (Sections 398-U1599A-16F-1, 42–75 cm [~109.6 mbsf], and 398-U1599B-12F-2, 80–117 cm [~107 mbsf]) (Figure F16B). In both holes, the first 6 cm thick ash layer displays a sharp lower contact with the uparching disturbance and a gradational upper contact. There is also a color change from dark gray to gray from the bottom to the top. Below this ash layer is a 25 cm thick greenish gray ooze and a 3 cm thick dark gray ash layer.
- Thinly laminated organic-rich ooze interval with a sharp lower boundary. This slightly bioturbated interval is followed by greenish gray ooze (Sections 398-U1599A-19F-2, 30 cm [125 mbsf], and 398-U1599B-15F-3, 101 cm [~122 mbsf]) (Figure F16C).
- ~10 cm thick fine ash layer (Sections 398-U1599A-22F-1, 98 cm [138 mbsf], and 398-U1599B-18F-2, 60 cm [135 mbsf]) (Figure F16E). This ash has a relatively sharp lower boundary and a diffuse and gradational upper boundary.
- Ooze and organic-rich ooze interval with a gradation boundary between the two lithologies (Sections 398-U1599A-24F-1, 63–114 cm [~147 mbsf], and 398-U1599B-21F-1, 89–142 cm [~148 mbsf]) (Figure F16D). The organic-rich ooze in both holes is highly bioturbated by Zoophycos with tunnel-shaped, slightly inclined burrows.
- Dark gray–gray coarse ash observed directly above a greenish gray ooze, marking the boundary between Subunit Id and Unit II (Sections 398-U1599A-40F-1, 41 cm [222 mbsf], and 398-U1599B-36F-1, 17 cm [217 mbsf]) (Figure F17A).
- The only correlation across all three holes is an olive-gray organic-rich ooze with a sharp, planar contact to greenish gray ooze in Unit II at 243 mbsf in Hole U1599A, 239 mbsf in Hole U1599B, and 244 mbsf in Hole U1599C (Figure F17B).
3.4. X-ray diffraction
XRD data were obtained from 21 IW squeeze cake sediment residues from Hole U1599A, 2 from Hole U1599B, and 15 from Hole U1599C. Additionally, 4 further samples from Hole U1599C were analyzed using XRD.
XRD spectra of representative lithologies from Lithostratigraphic Units I–III are shown in Figure F18. These comprise ooze (Figure F18A: Section 398-U1599A-4H-6; Subunit Ia), tuffaceous ooze (Figure F18B: Section 398-U1599A-22F-1; Subunit Ic), calcareous tuffaceous mud (Figure F18C: Section 398-U1599C-2R-5; Unit II), and dolomitic marl (Figure F18D: Section 398-U1599C-5R-3; Unit III). Identified minerals in these lithologies include predominantly calcium carbonate (calcite and aragonite) and quartz in addition to clay minerals of the illite and/or smectite groups and occasional glauconite and chlorite. Plagioclase has been identified in some of the lithologies also. Sediments of Unit III (Figure F18D) are dolomitic and contain between 9.2% and 32.8% dolomite, based on Rietveld analyses.
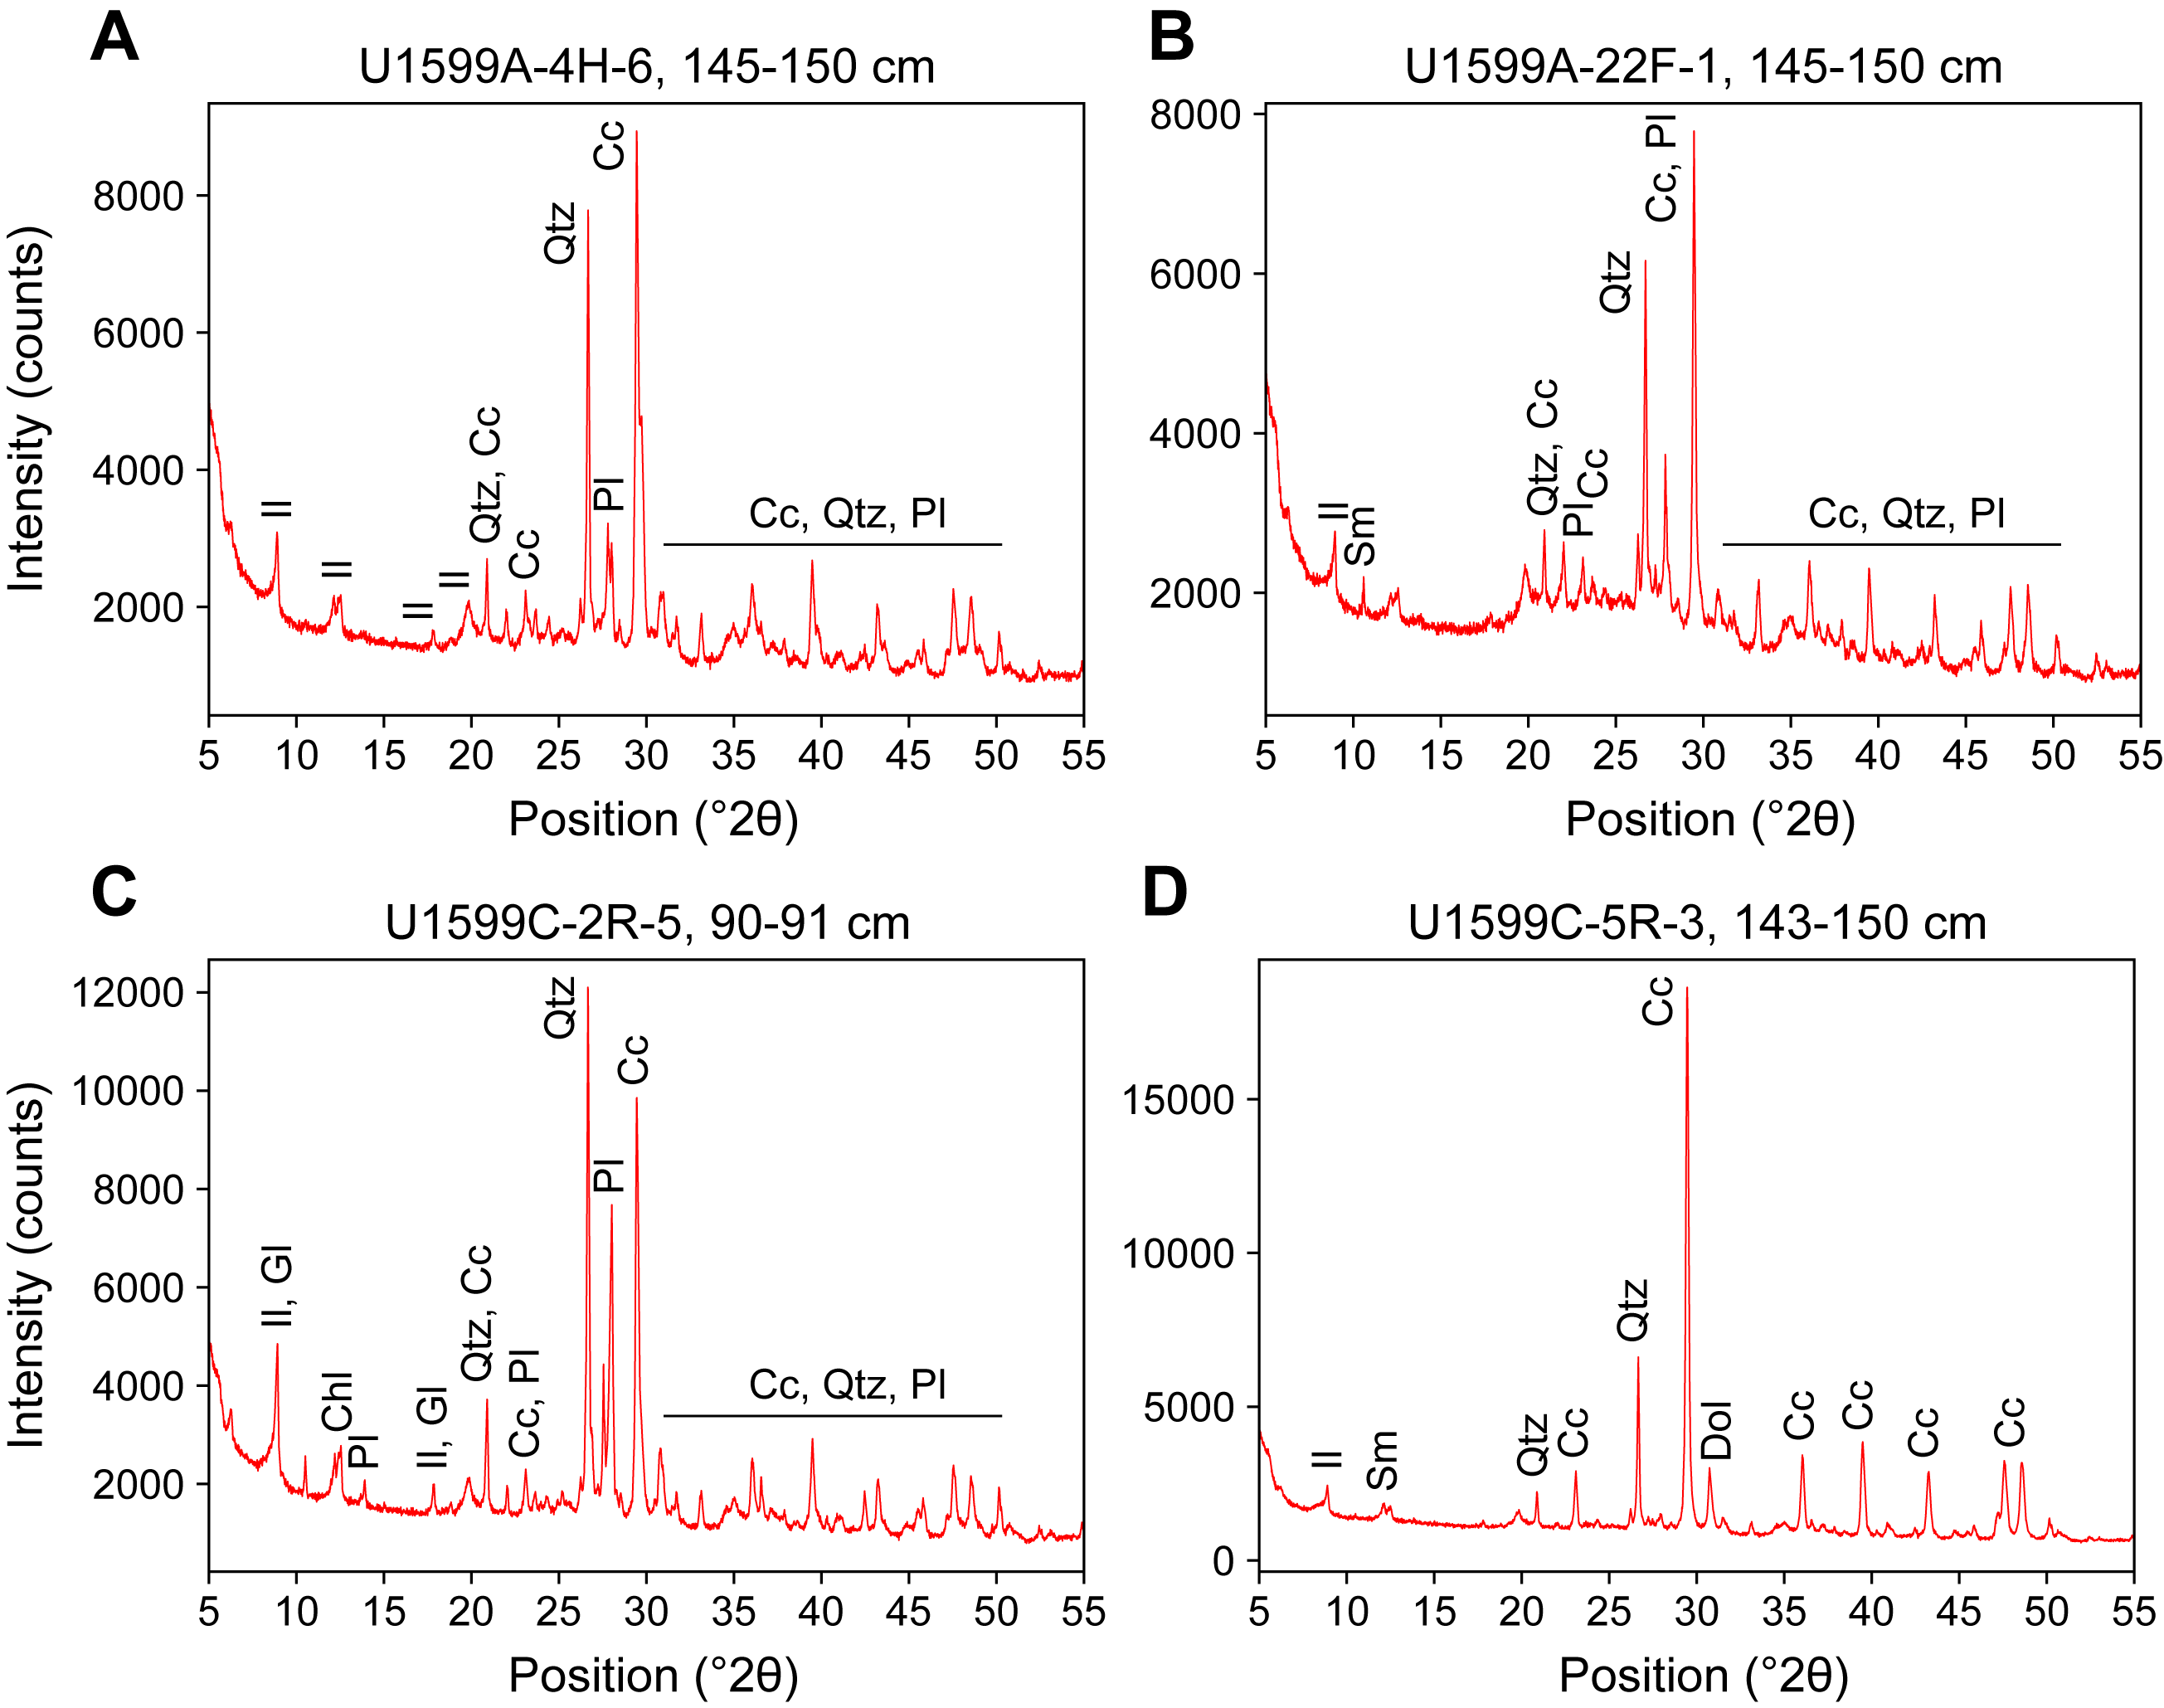
Figure F18. XRD spectra.
4. Stratigraphic correlation
Three holes were drilled at Site U1599. Hole U1599A cored to 245.69 mbsf using the APC (9.7–81.35 mbsf) and HLAPC systems (80.9–245.69 mbsf). Hole U1599B was drilled to 241.22 mbsf using the APC (9.7–105.2 mbsf) and HLAPC systems (104.7–241.22 mbsf). Hole U1599C was drilled without recovery to 223.0 mbsf, and rotary core barrel (RCB) coring was performed from 223.0 to 698.01 mbsf.
No correlation during coring was required due to the prevailing challenging drilling condition.
4.1. Correlation for establishing CCSF-A depth scale and construction of the splice
To establish the core composite depth below seafloor, Method A (CCSF-A), scale, we analyzed cores from Holes U1599A–U1599C for their physical properties using the Whole-Round Multisensor Logger (WRMSL) for MS and gamma ray attenuation (GRA) density; the Natural Gamma Radiation Logger (NGRL) for NGR intensity; and photos after the cores were split into working and archive halves (see Physical properties; also see Physical properties in the Expedition 398 methods chapter [Kutterolf et al., 2024a]). The MS data were the most reliable physical parameter for correlations, whereas NGR and GRA density measurements were often overprinted by the irregular distribution of core material in cores with low recovery and high water content.
Because no mudline was preserved, we used Core 398-U1599A-2F as the anchor for stratigraphic correlation. Using this anchor core, we attempted to determine the relative depth offset of each core by establishing affine ties between the holes based on the maximum correlation of all measured physical properties. These depth offsets are reported in Table T3. Figure F19 shows the MS of the three holes on the resulting CCSF-A scale, in which individual cores are shifted according to the identified correlations. This figure highlights the vertical alignment of characteristic events in the adjacent holes.
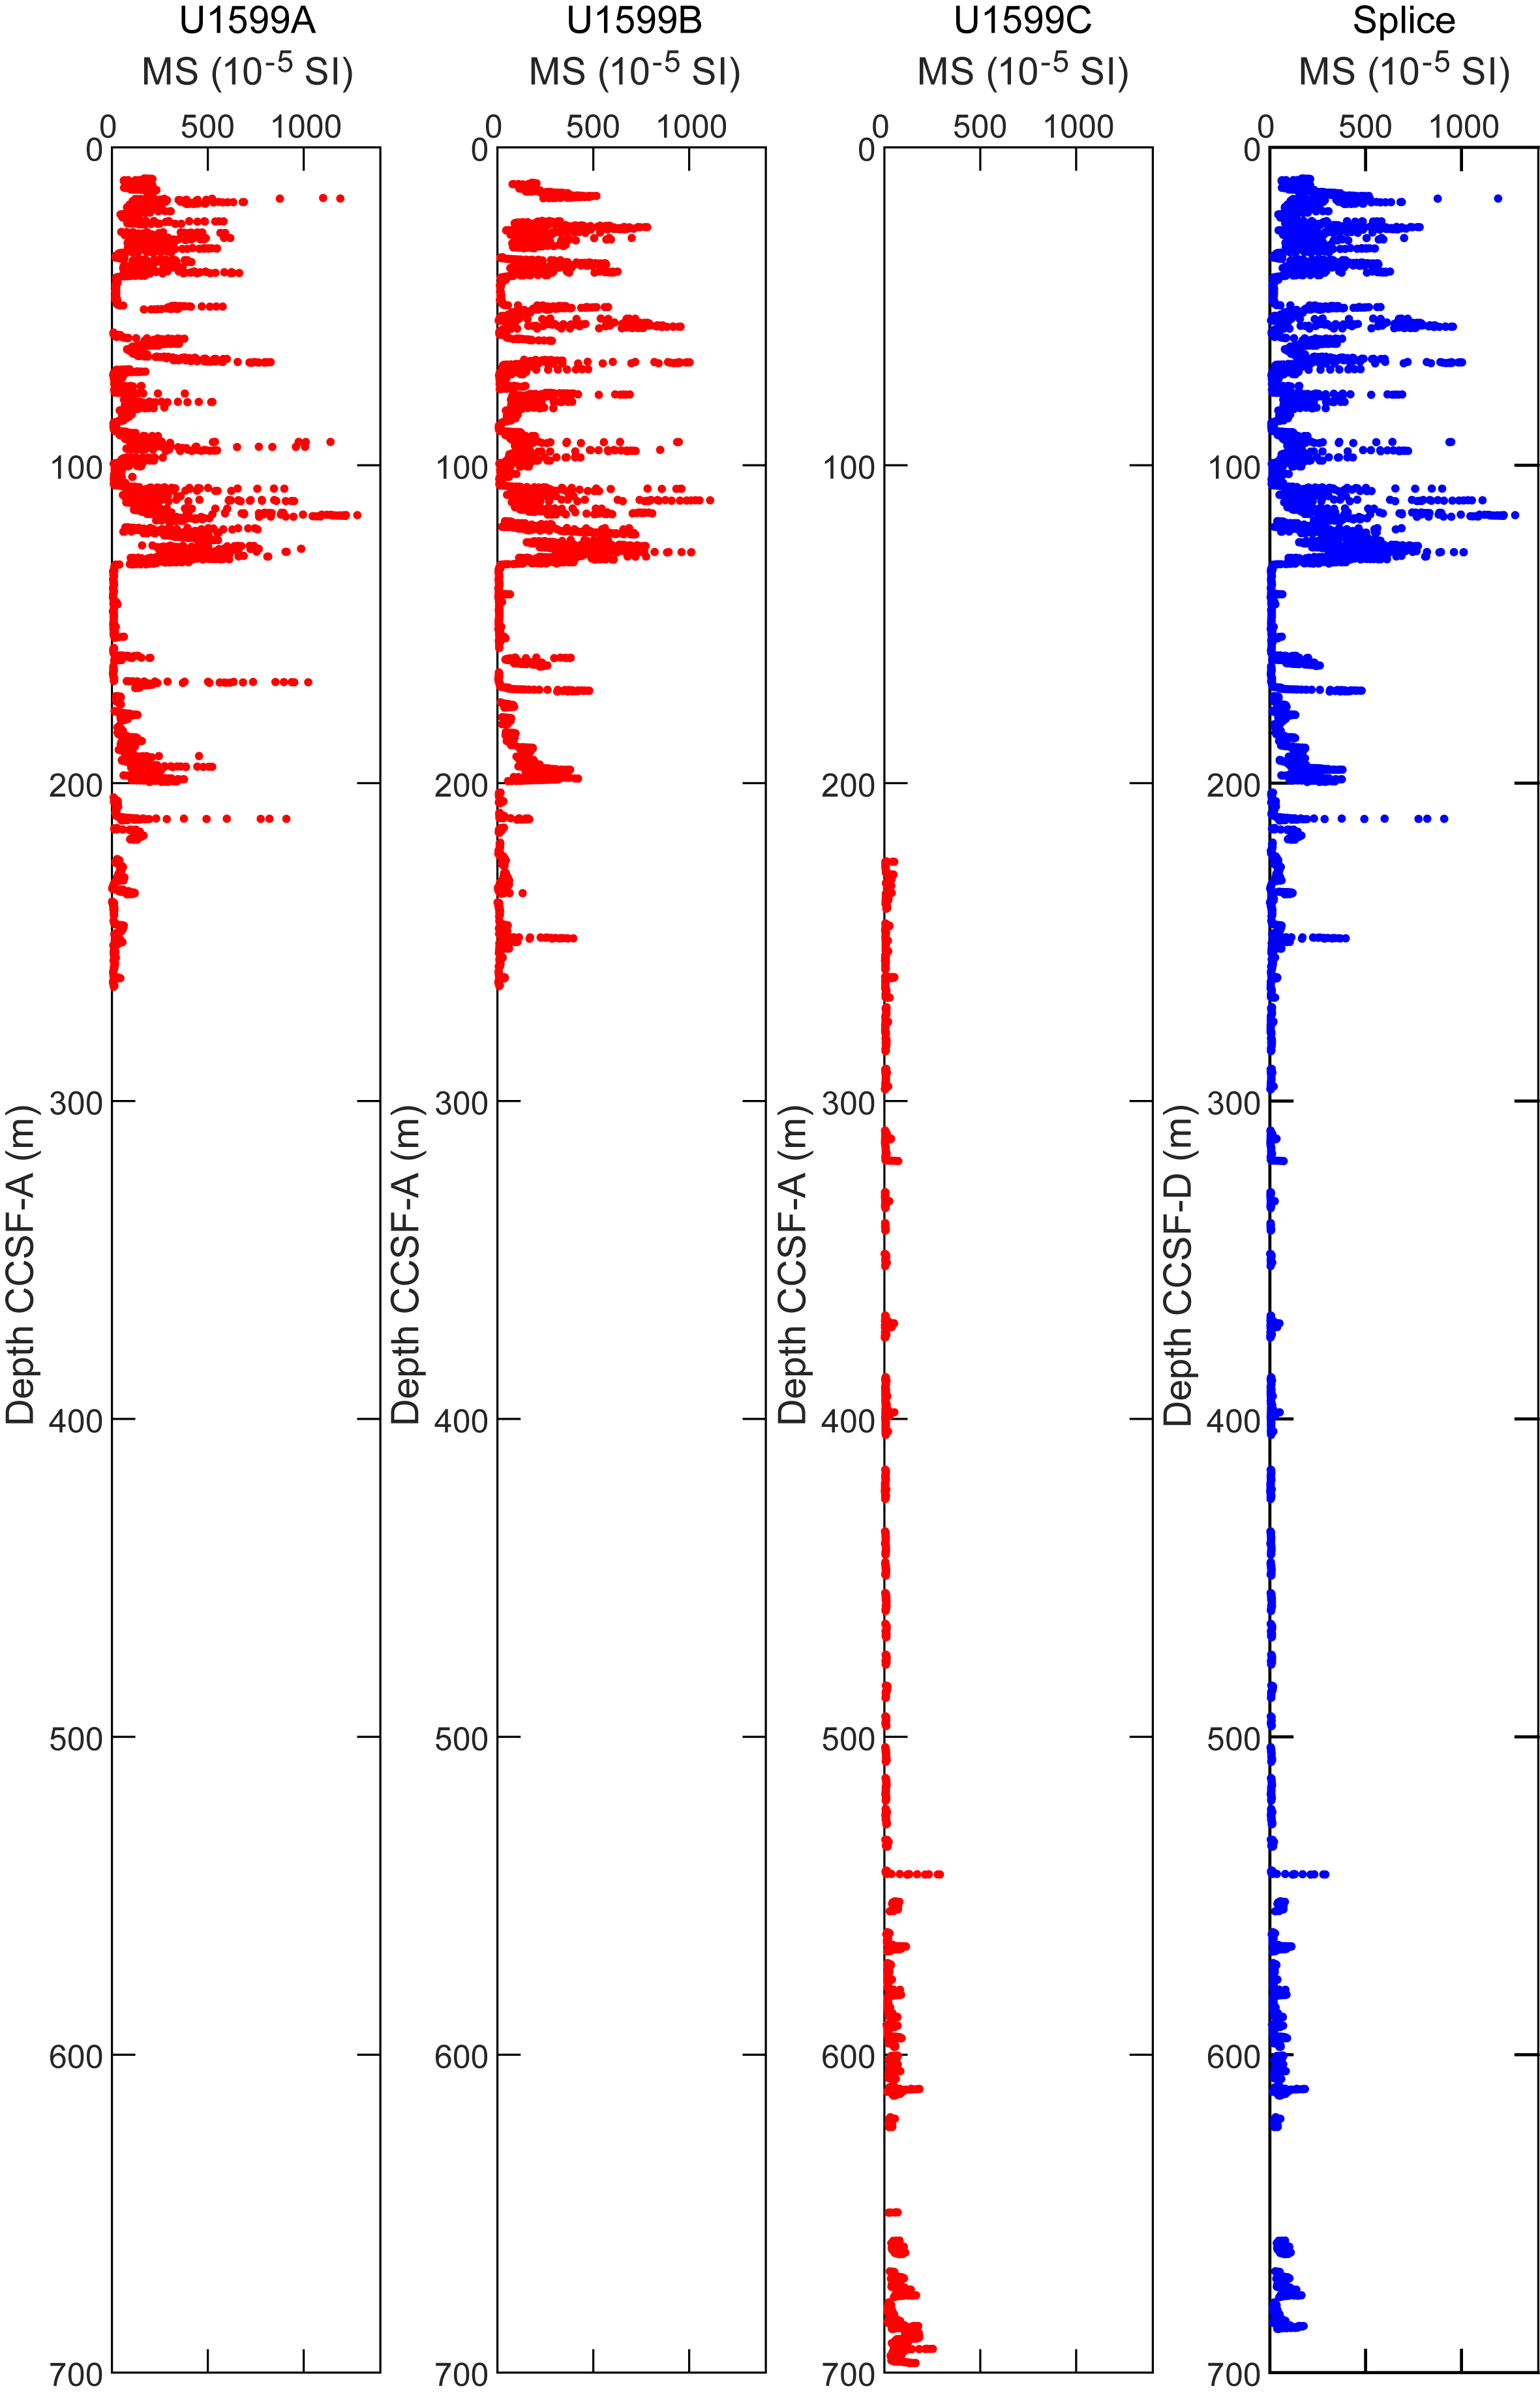
Figure F19. MS data.
In general, we were able to identify reliable correlations between most cores of Holes U1599A and U1599B to ~160 mbsf (CCSF-A scale). From there, low recovery, as well as strong lithologic variations and the soupy nature of the recovered material, led to the occurrence of interruptions in the stratigraphic correlation. For each of these interruptions, we used the relative offset between untied (uncorrelated) cores derived from the CSF-A scale to keep the composite depth scale as close to the original CSF-A scale as possible.
Once we had established the composite depth scale, we spliced selected sequences from Holes U1599A and U1599B and added the additional but sparser parts of Hole U1599C to create the most complete and representative section possible. The end product of this process is reported in Table T4 and illustrated in Figure F20. Until about 211 mbsf (CCSF, Method D [CCSF-D], scale), the splice contains gaps that are smaller than 3 m. From there, larger gaps occur.
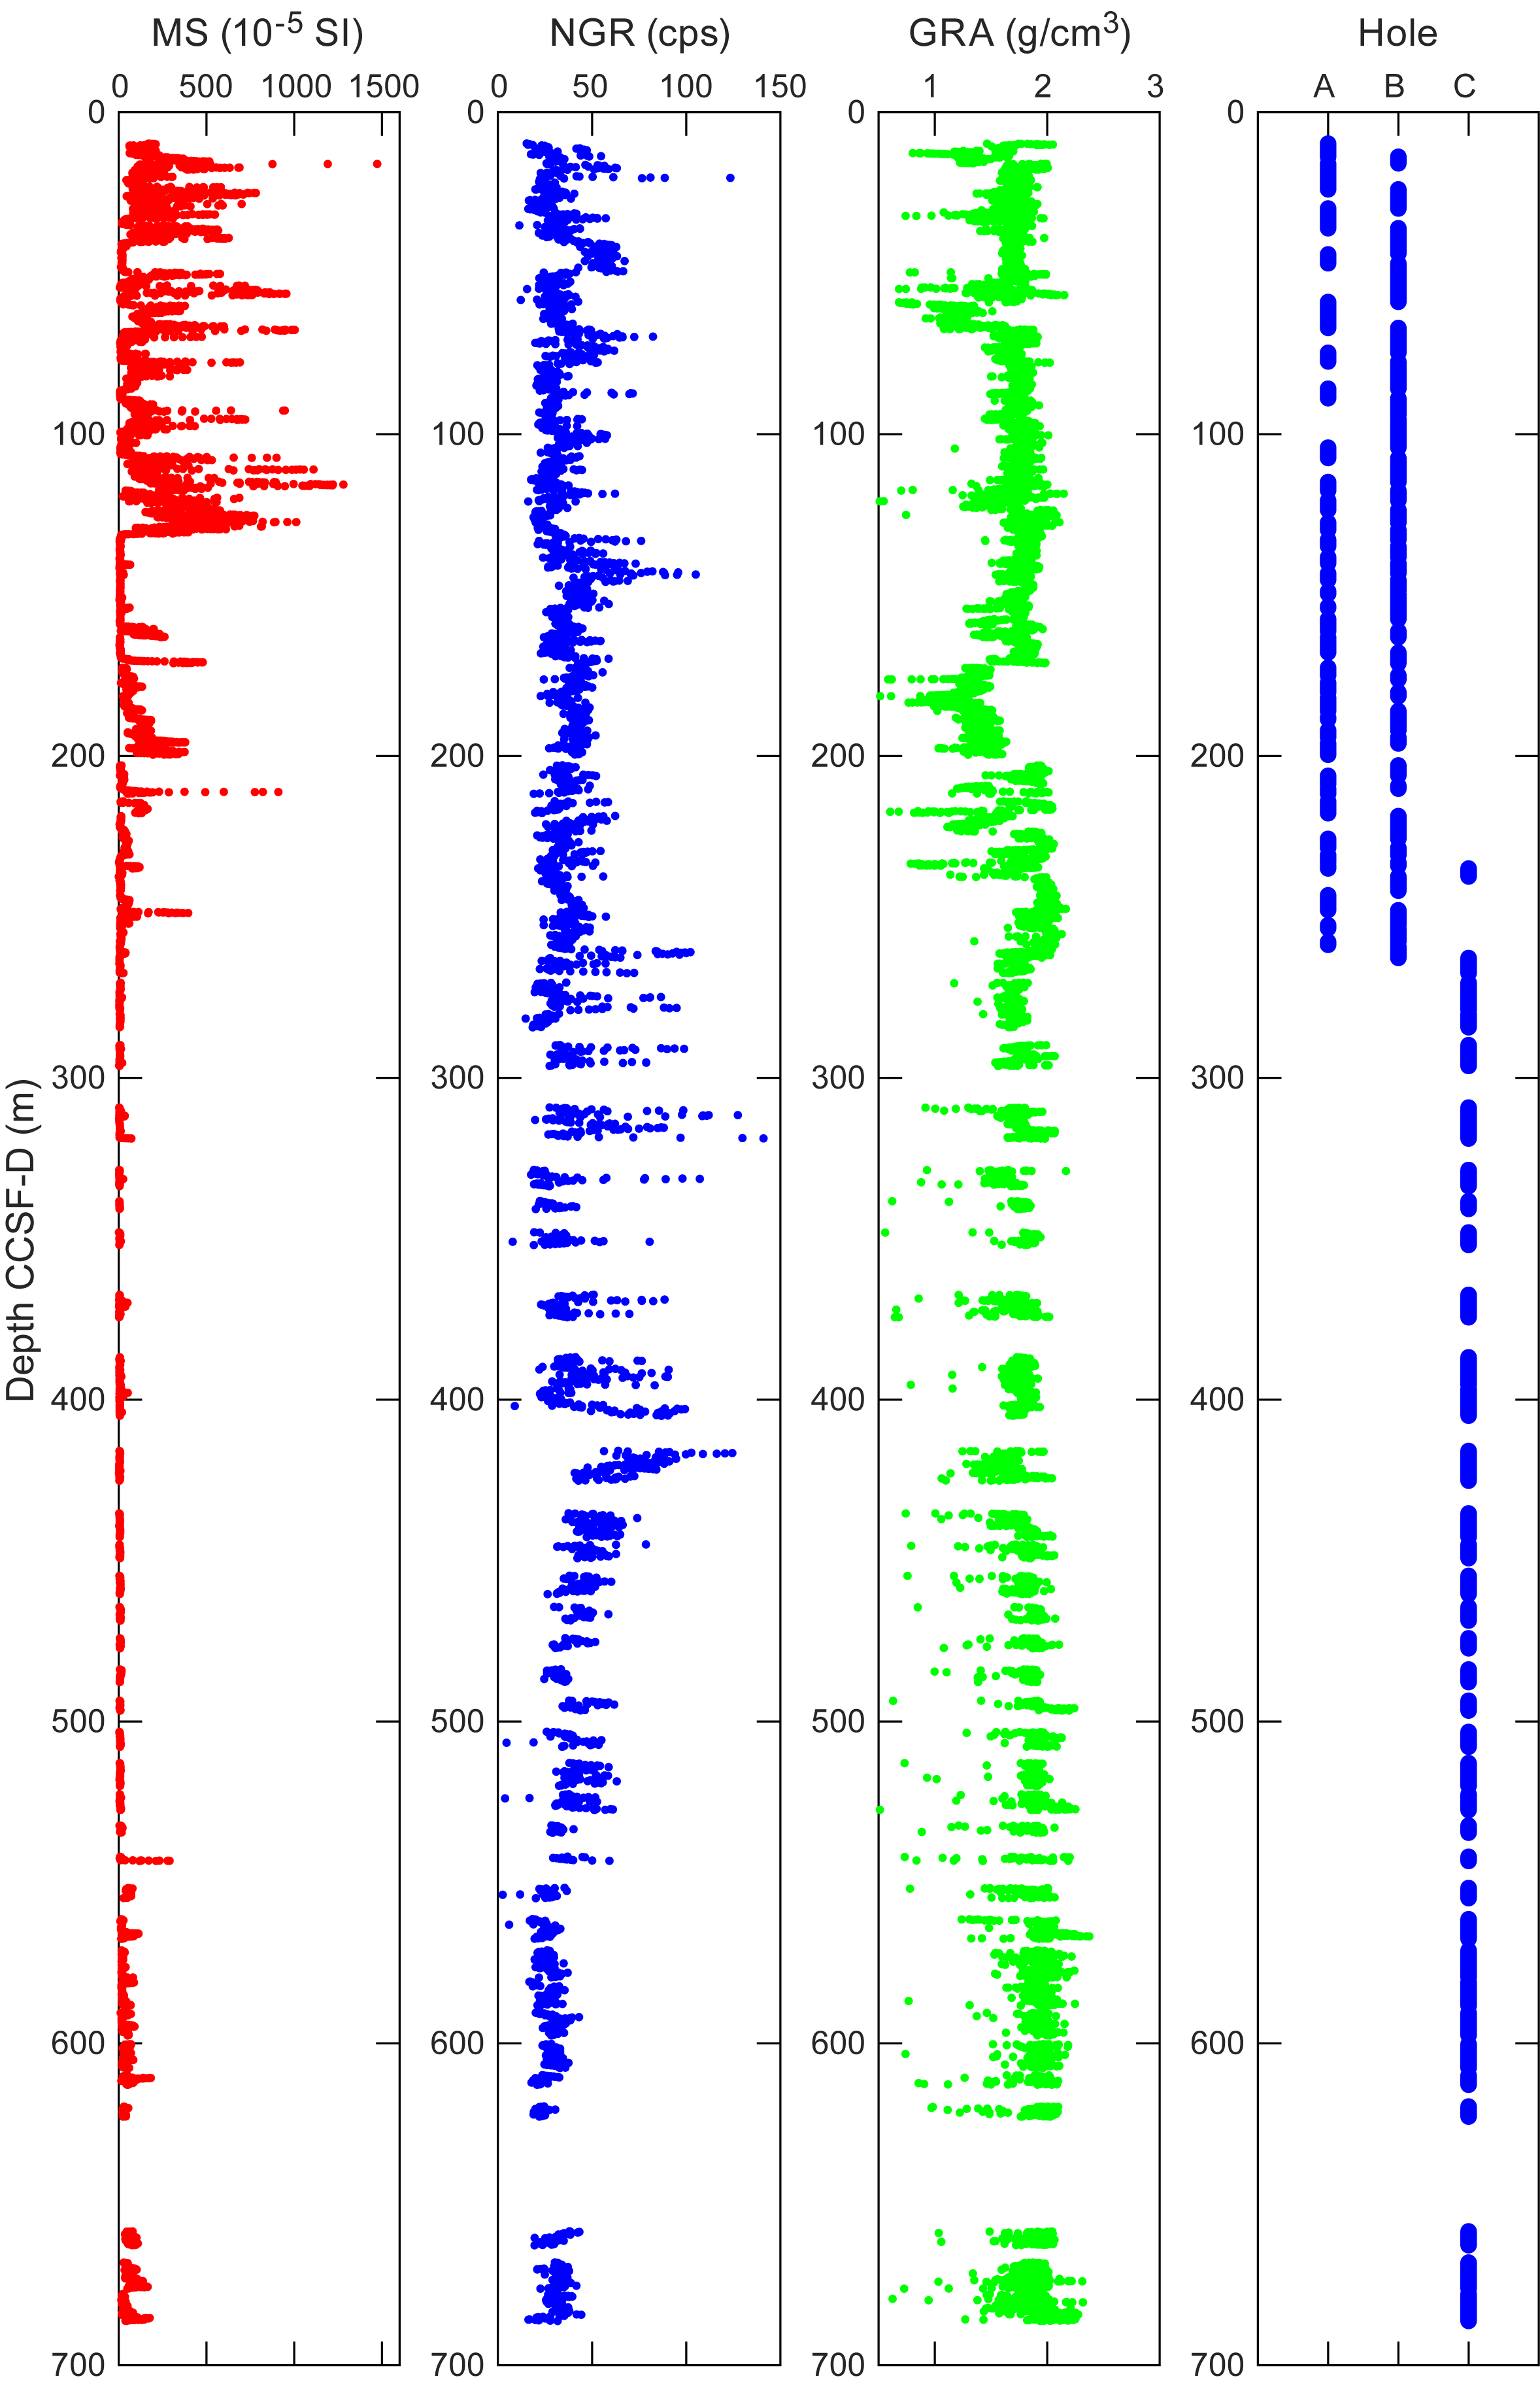
Figure F20. Splice.
Compared to the previous sites, cores from Site U1599 showed more significant expansion. Figure F21 plots the CSF-A and CCSF-A scales for Holes U1599A and U1599B and shows a linear regression curve calculated for both holes together. The deviation from the dotted line indicates an affine growth factor of approximately 9%. Because Hole U1599C had only a small overlap interval with the other holes and was largely appended, we excluded it for this calculation.
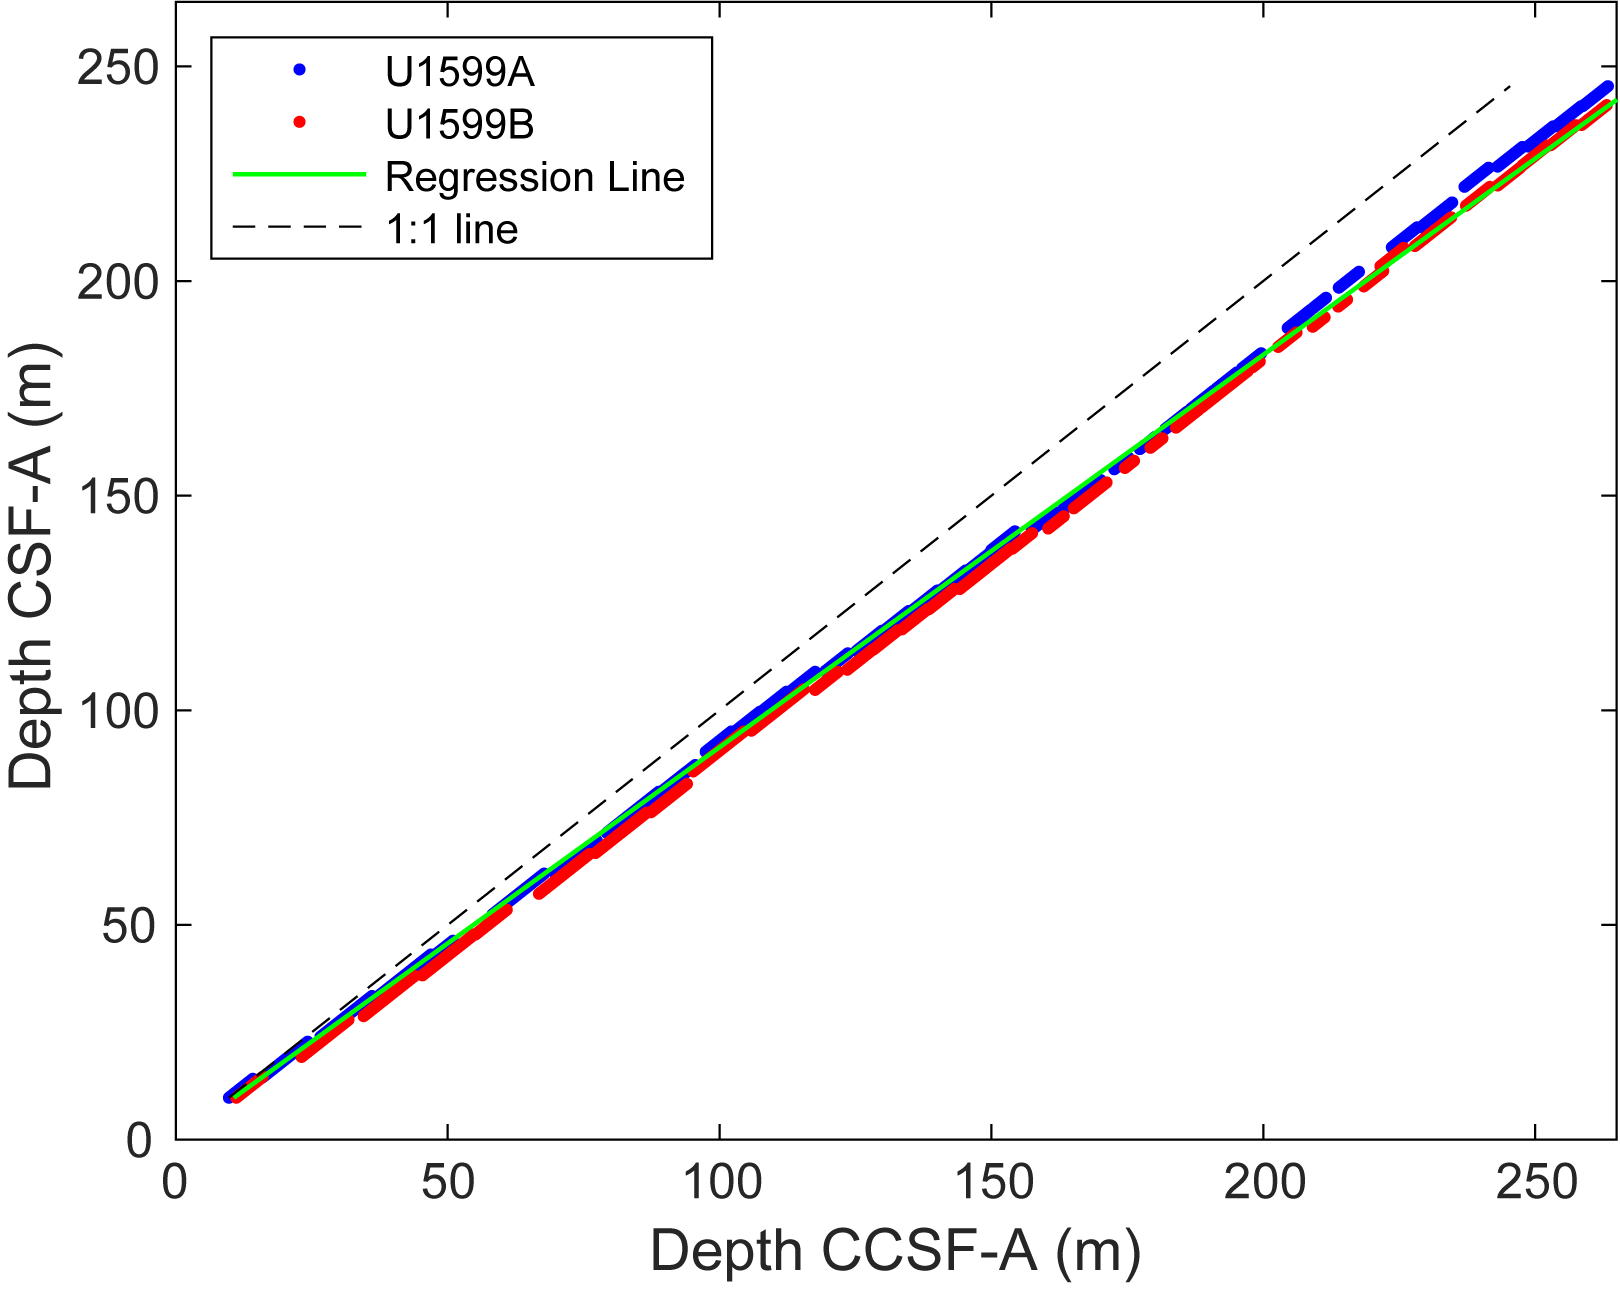
Figure F21. Core top depths.
5. Structural geology
Structural geology analyses at Site U1599 included description of cores retrieved from Holes U1599A–U1599C. A total of 625 structures were measured, mostly in relatively consolidated intervals. Observed and measured structures in cores include bedding (73%), faults and deformation bands (20%), mineral veins (1%), and sand dikes (injection; 6%). The distributions and dip angles of planar structures (measured to an estimated accuracy of ±2°) are shown in Figure F22. Deformation related to drilling and core recovery was noted but not recorded. Here, we describe and provide examples of each of the features that were recorded.
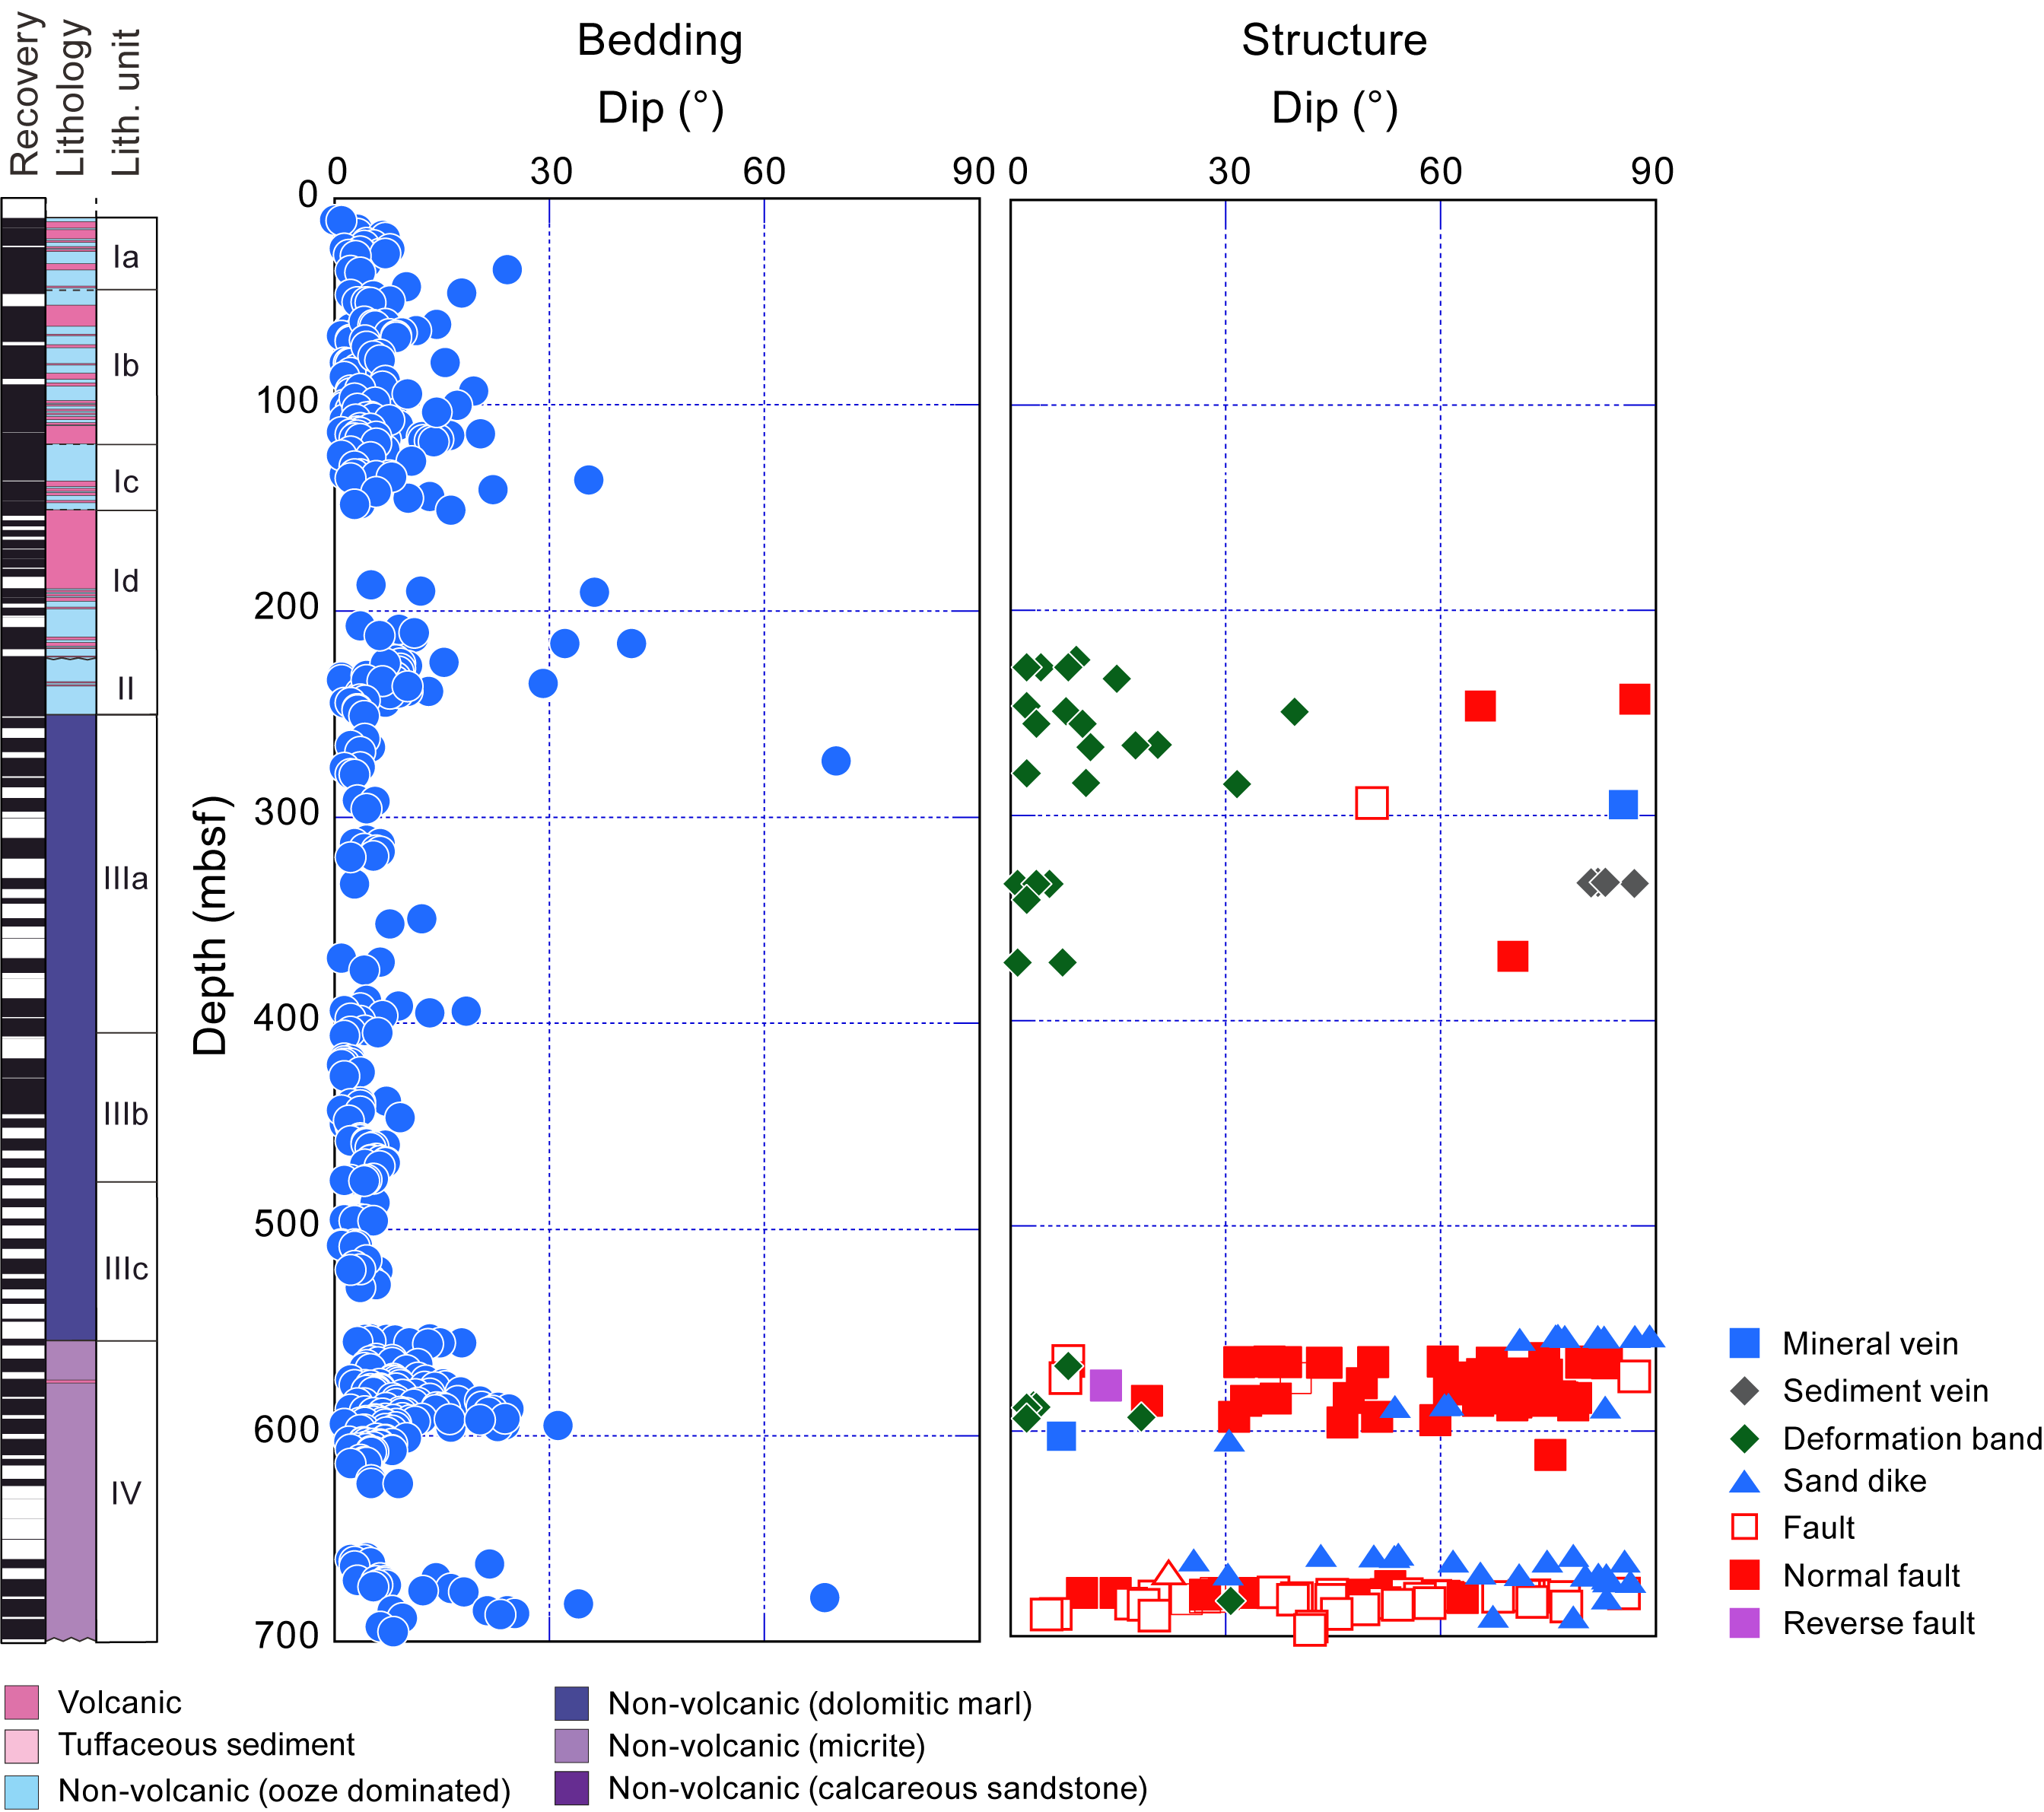
Figure F22. Dip data.
5.1. Bedding
Bedding planes (n = 455) were measured mainly on thin sand beds/laminae, sapropels, micrites, and dolomite boundaries. They exhibit horizontal to subhorizontal dips (mean dip = 7.4°; median dip = 5.0°; standard deviation = 7.3°) (Figure F22A).
To evaluate the bedding dip variations in the ~700 m deep hole, we divided bedding measurements corresponding to the lithostratigraphic units/subunits defined by core description (see Lithostratigraphy) and used a box plot to indicate the distribution of bedding dips (Figure F23). Thus, a total of nine bedding measurement units were defined that correspond to the abovementioned lithostratigraphic units/subunits. In the box plot, each box indicates the data distribution range between the twenty-fifth and seventy-fifth percentiles, which is statistically meaningful. Median values (fiftieth percentile of all respective measurements in a unit), which are representative of the data distribution, were used for the evaluation of dip angles. This shows consistent low bedding dips across most units, with slightly steeper dips of ~7° and 11° seen only in Unit IV and Subunit 1d, respectively (Figure F23).
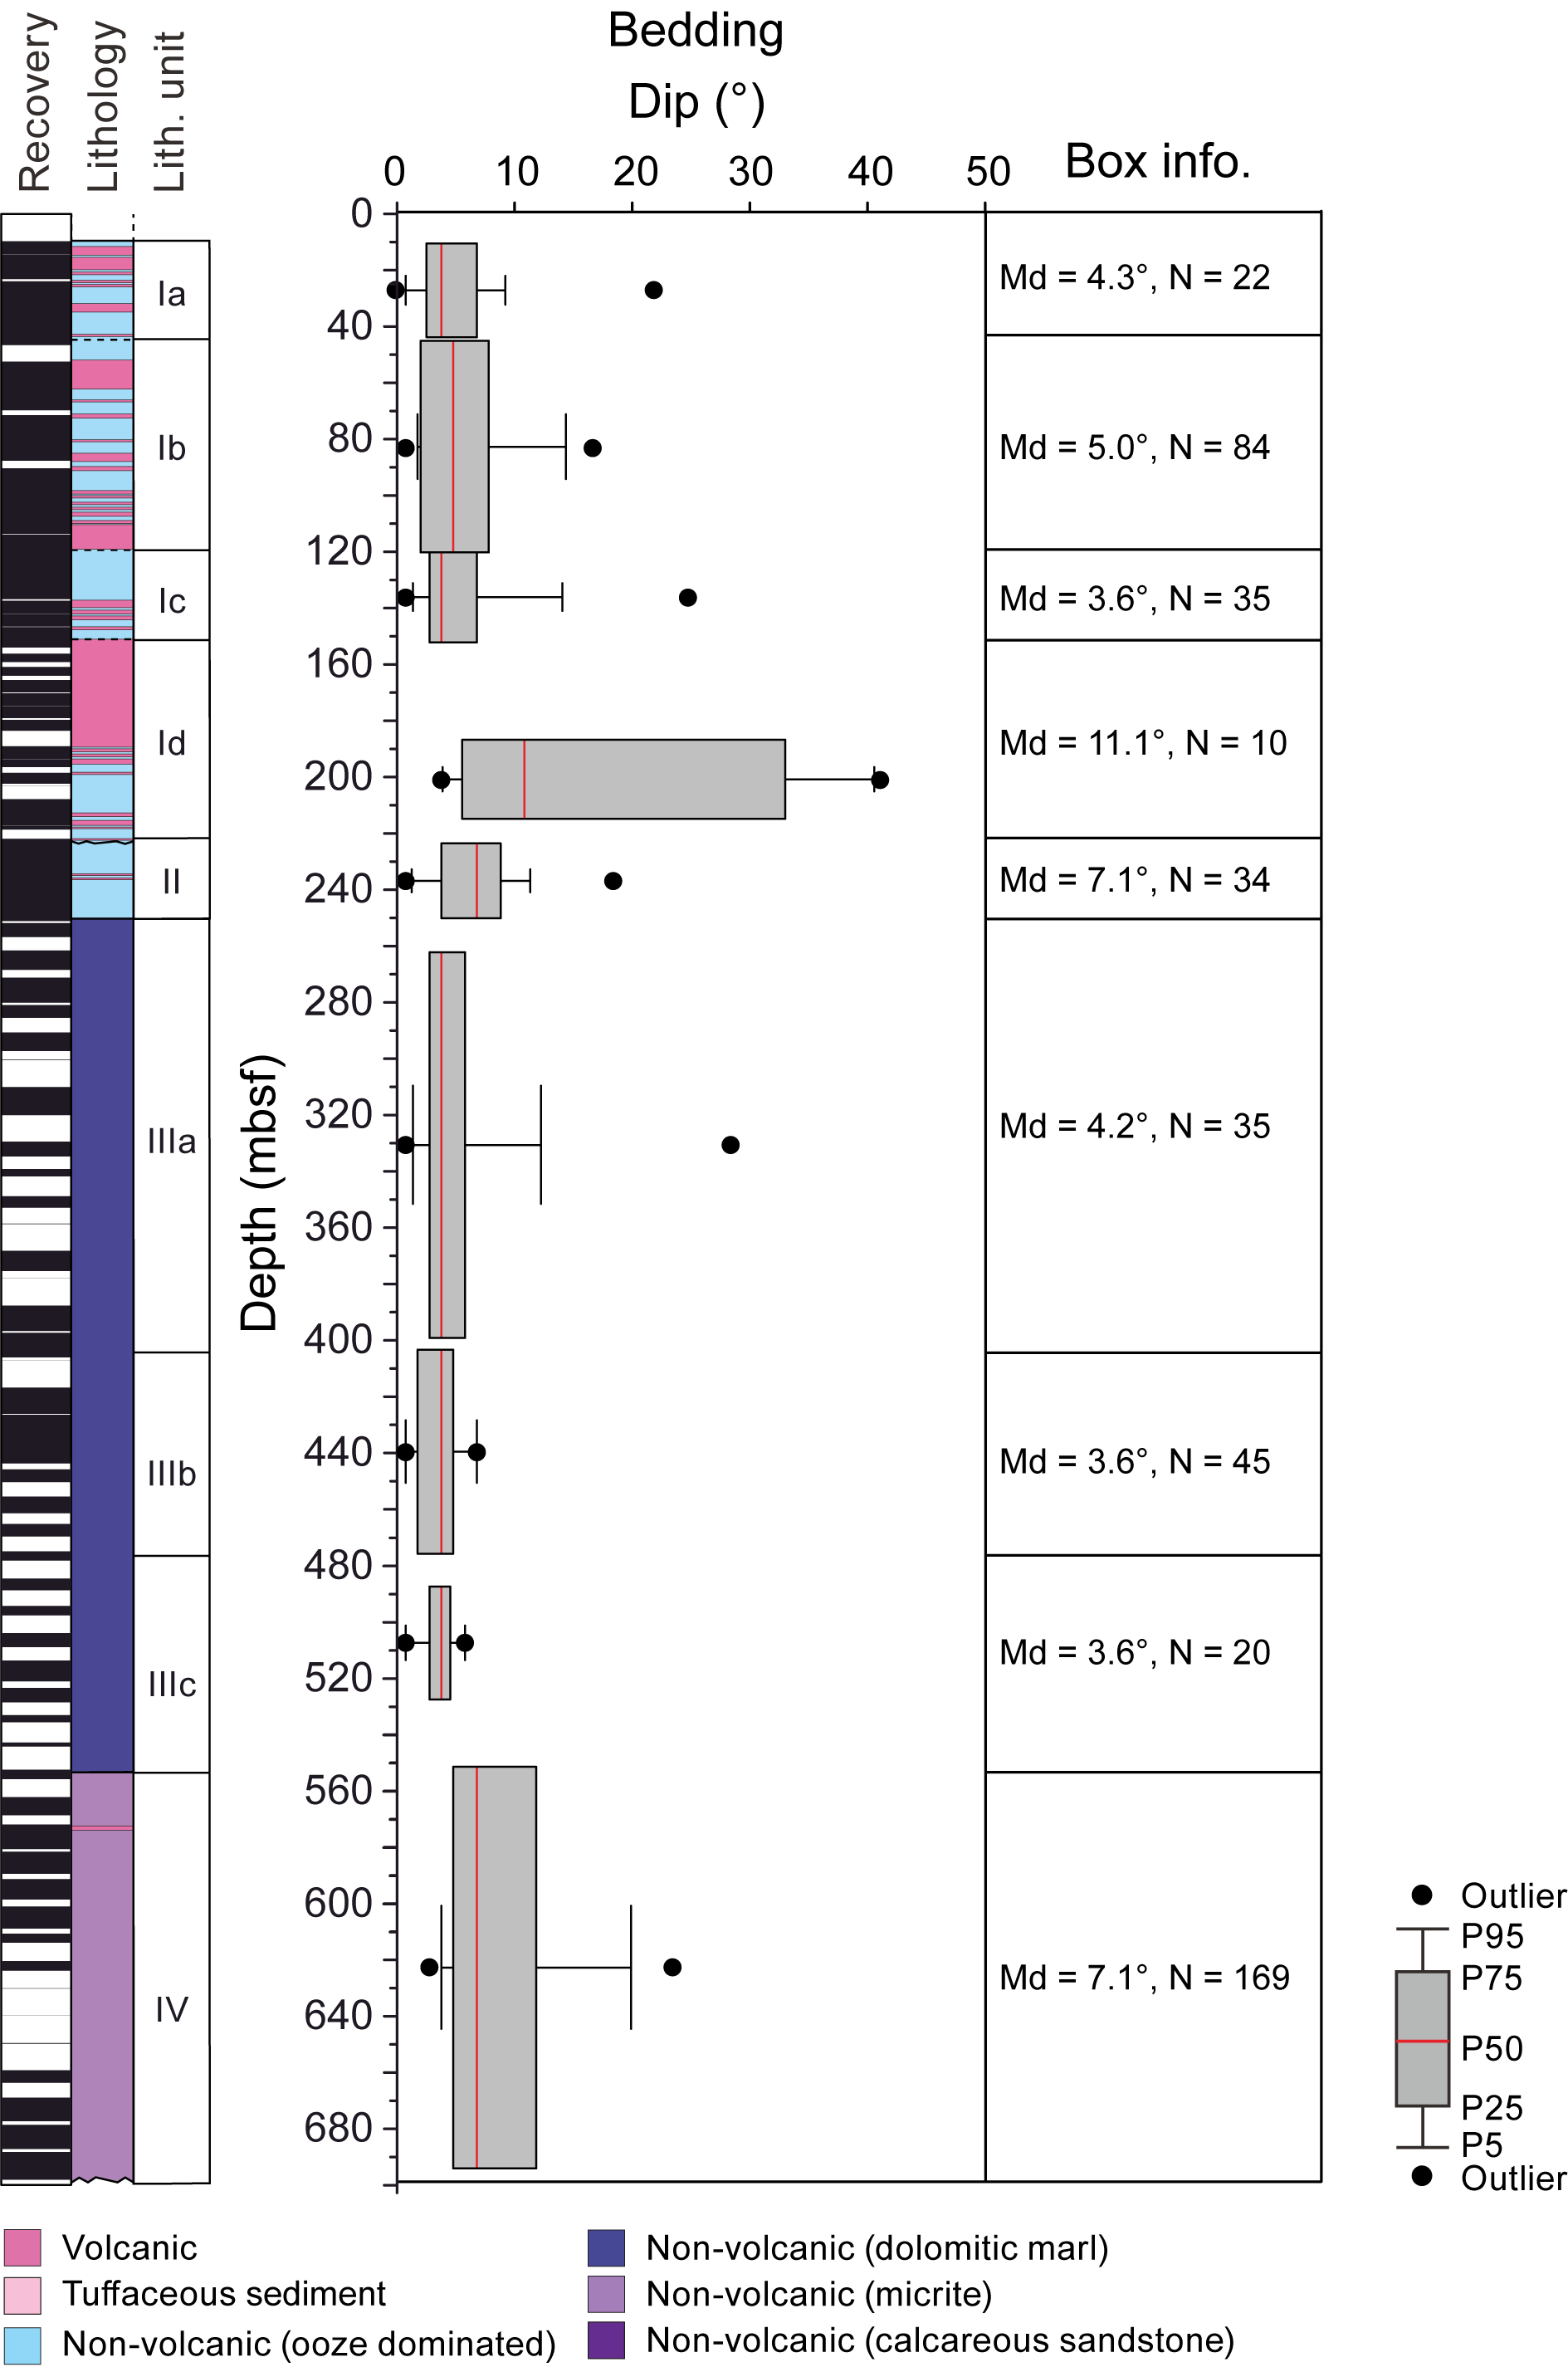
Figure F23. Bedding dip.
5.2. Faults and sand dikes
Small-scale faults and sand dikes are apparent on split core surfaces (Figures F24, F25). They show apparent displacements from a few millimeters to a centimeter. The sense and/or amount of displacement is defined where they cut bioturbation or sedimentary structures and by asymmetric fabrics within and around the faults. Most faults at Site U1599 have a normal sense of displacement and mostly represent cohesive (healed) fault planes with closed fault planes.
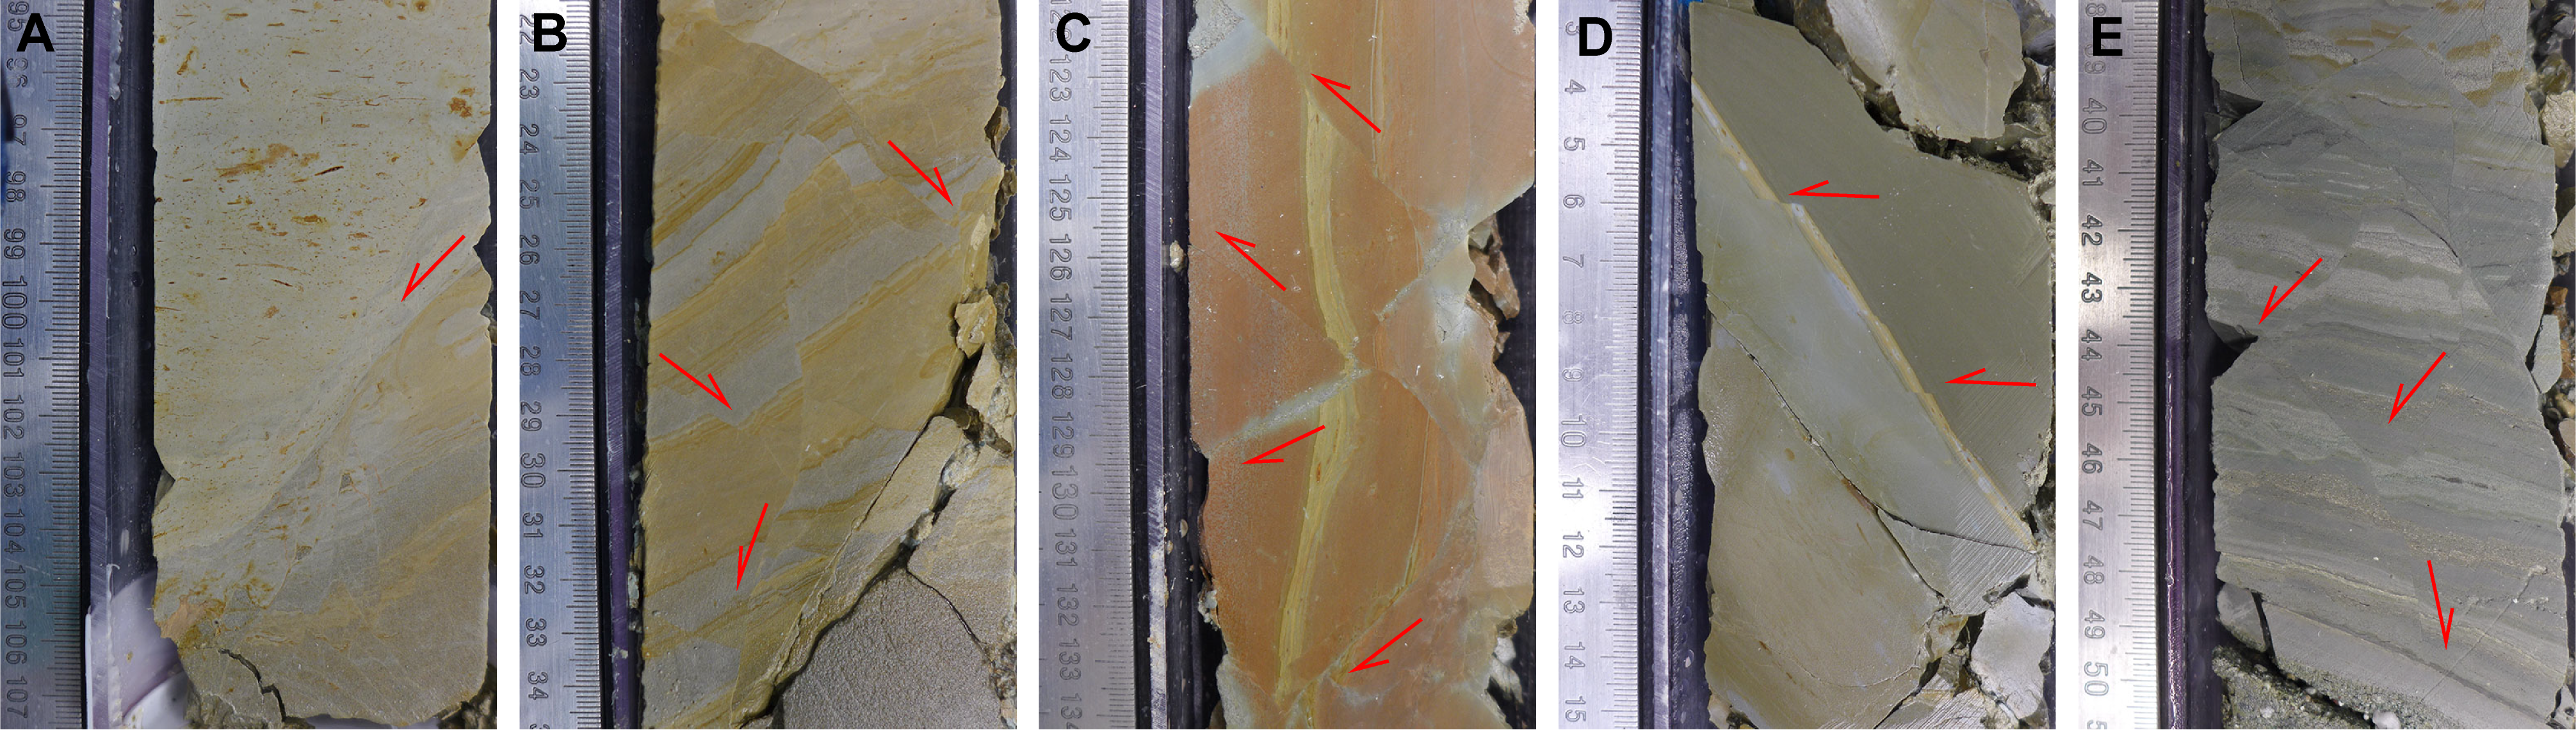
Figure F24. Faults.
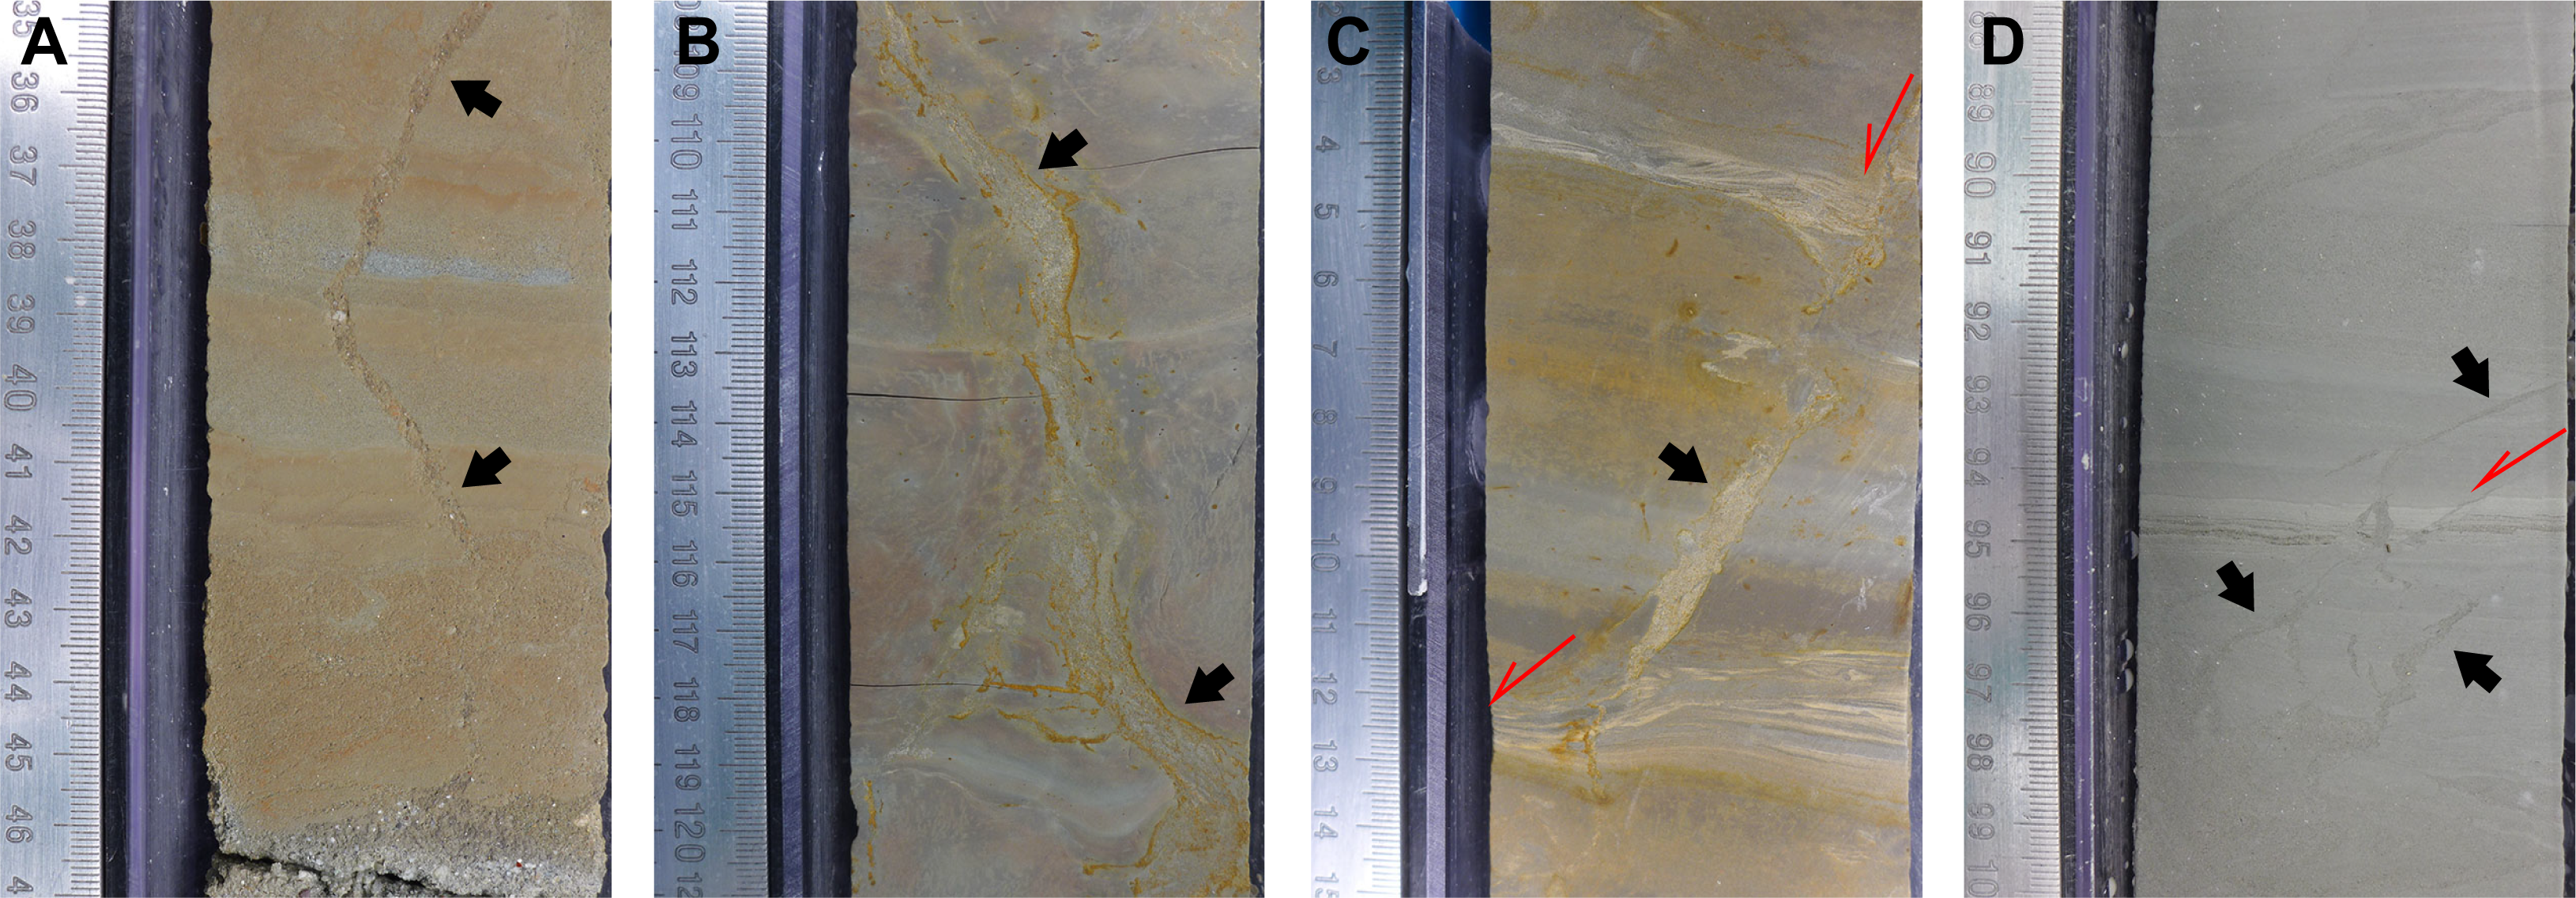
Figure F25. Sand dikes.
Sand dikes are abundantly developed below Core 398-U1599C-36R. Inside, the dikes are composed of medium–coarse sand grains, and the width of each dike ranges 0.5–10 mm. Dikes are divided into two types: (1) those representing pure tensile fractures (Figure F25A, F25B) and (2) those displaying a hybrid-failure mode with shear and extension along them (Figure F25C, F25D). Tensile fracture dikes have no significant preferred orientation; they commonly wind through the rocks with orientations varying within 2–10 cm intervals. Therefore, their orientation was apparently random. In contrast, the hybrid-failure dikes show relatively sharper straight planes with a few centimeters offset and a normal sense of displacement.
Almost randomly oriented sand dikes that represent pure tensile-fracture mode form by hydrofracturing, apparently associated with earthquake-induced liquefaction. Generally, hydrofracturing occurred under small differential stress Δσ (= σ1 − σ3) < 4T (Sibson, 1981), where T denotes tensile strength of rocks. However, given their random orientation, these formed under much smaller differential stress. On the other hand, the dikes that represent hybrid-failure mode formed under the stress state 4T < Δσ < 5.5T (Sibson, 1981).
A dense population of faults was identified in the interval between Sections 398-U1599C-37R-4 and 40R-4 (566–595 mbsf) and below 49R-1 (678 mbsf). These intervals correspond to the core depth where sand dikes are abundantly developed between Sections 36R-2 (554 mbsf) and 41R-3 (554–605 mbsf) and below Section 47R-2 (660 mbsf). This implies that the decrease in effective stress associated with the sand liquefaction may have led to the formation of a large number of normal faults.
5.3. Sediment-filled veins and mineral veins
Sediment-filled veins were identified in specific intervals in the middle part of Lithostratigraphic Subunit IIIa. They are recognized as parallel sets or arrays of sigmoidal or curviplanar seams generally <1 mm wide from 332.8 to 333.5 mbsf (Section 398-U1599C-13R-3) (Figures F22, F26). The typical thickness of these vein arrays ranges 5–10 cm.
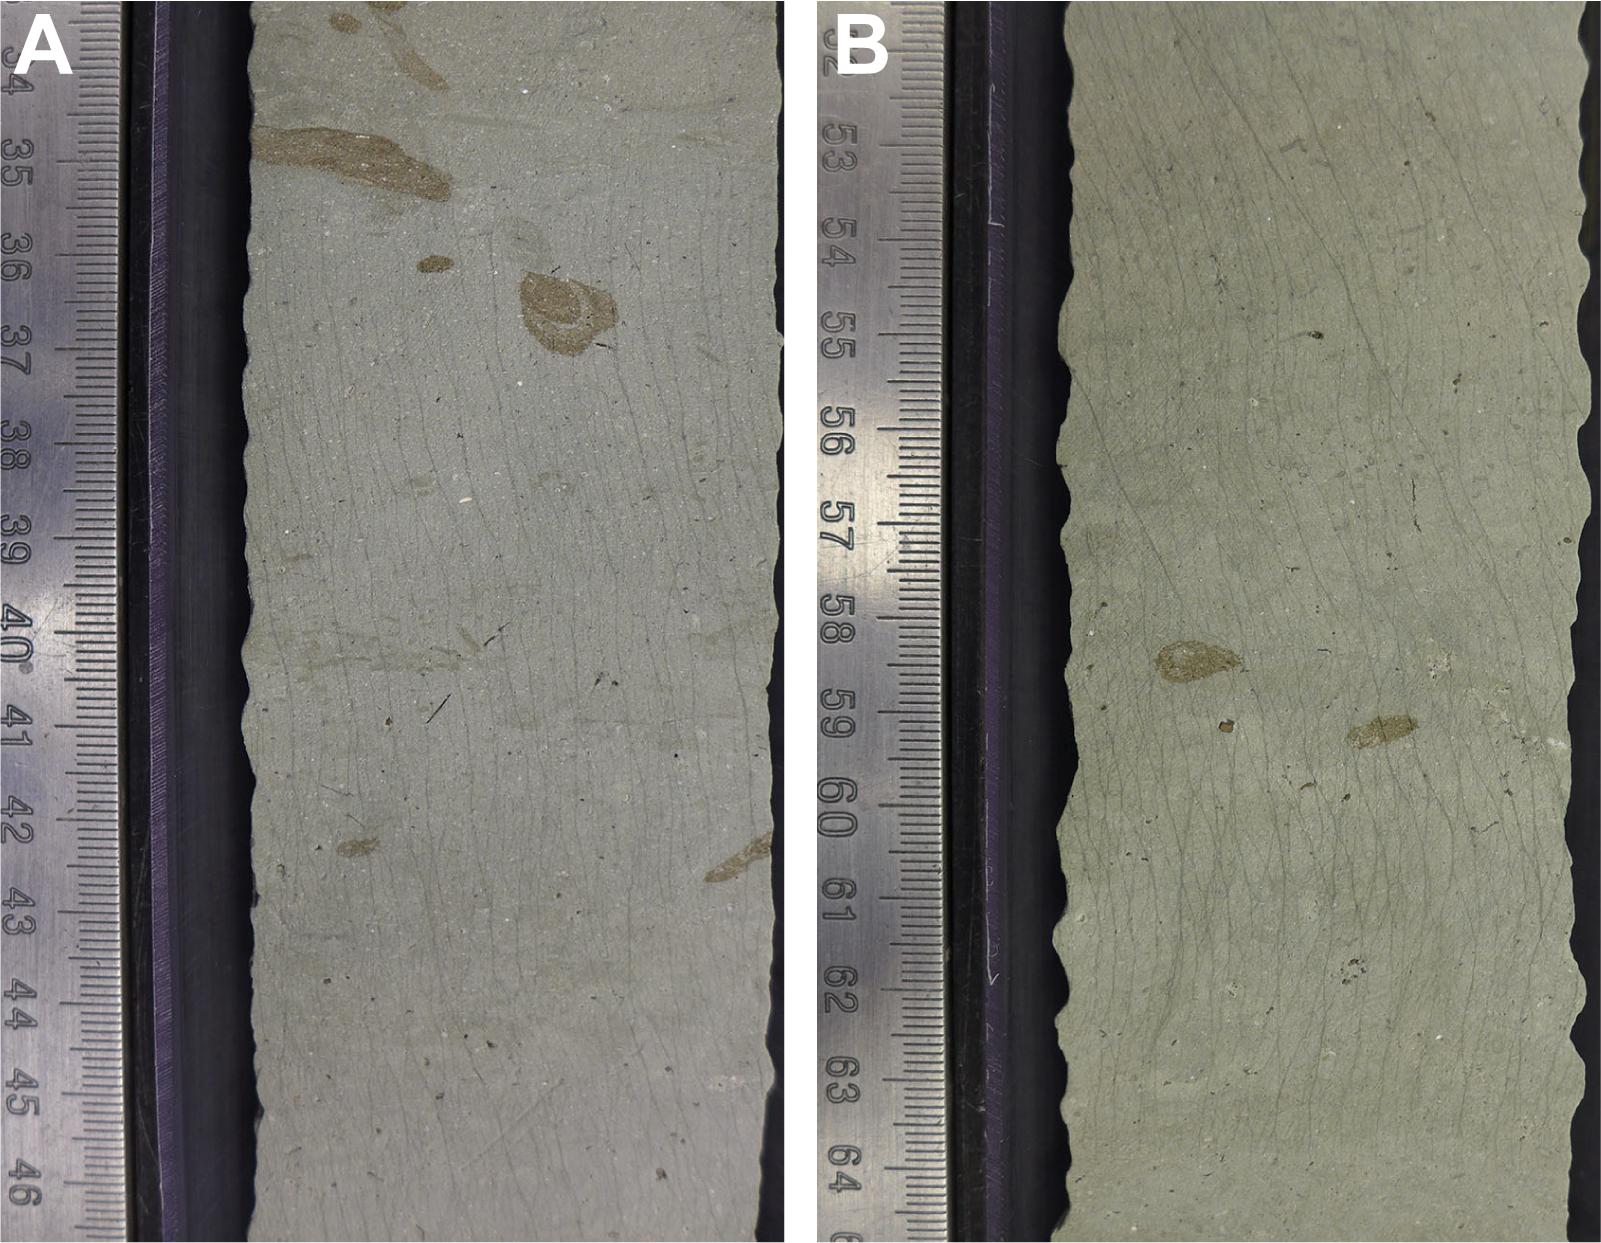
Figure F26. Sediment-filled veins.
Mud-filled veins are classified as vein structures and are common in sediments at subduction zones (accretionary prism, slope, and forearc basins; Hanamura and Ogawa, 1993; Maltman et al., 1993). They were also identified in cores retrieved by ocean drilling including Nankai, Costa Rica, and Oregon and also in shallowly buried accretionary prism/slope sediments exposed on land in the Miura/Boso Peninsulas, Japan, and the Monterey Formation (USA) (Hanamura and Ogawa, 1993; Maltman et al., 1993; Shipboard Scientific Party, 2001; Expedition 334 Scientists, 2012). Field and experimental studies have shown that these structures are caused by shaking of sediments during earthquakes (Hanamura and Ogawa, 1993; Brothers et al., 1996).
6. Biostratigraphy
Planktonic and benthic foraminifera and calcareous nannofossils were examined from core catcher samples and additional split core samples from Holes U1599A–U1599C to develop a shipboard biostratigraphic framework for Site U1599. Additionally, planktonic and benthic foraminifera provided data on paleowater depths, downslope reworking, and possible dissolution.
Site U1599 cored the southeastern Anafi Basin sedimentary sequence and recovered a 697.8 m thick Holocene to Miocene sequence composed of volcanogenic sediments, calcareous and tuffaceous oozes, dolomitic marls, and micritic and calcareous sandstones. Calcareous nannofossils and planktonic foraminifera provided good resolution in the Holocene through Upper Pliocene sediments; however, significant reworking within the lower section facilitated the use of first occurrence datums for primary age control. Ages provided by benthic foraminifera were consistent with those of planktonic foraminifera and calcareous nannofossils. Biostratigraphic datums recognized at Site U1599 are given in Tables T5 and T6, and an age-depth plot is shown in Figure F27.
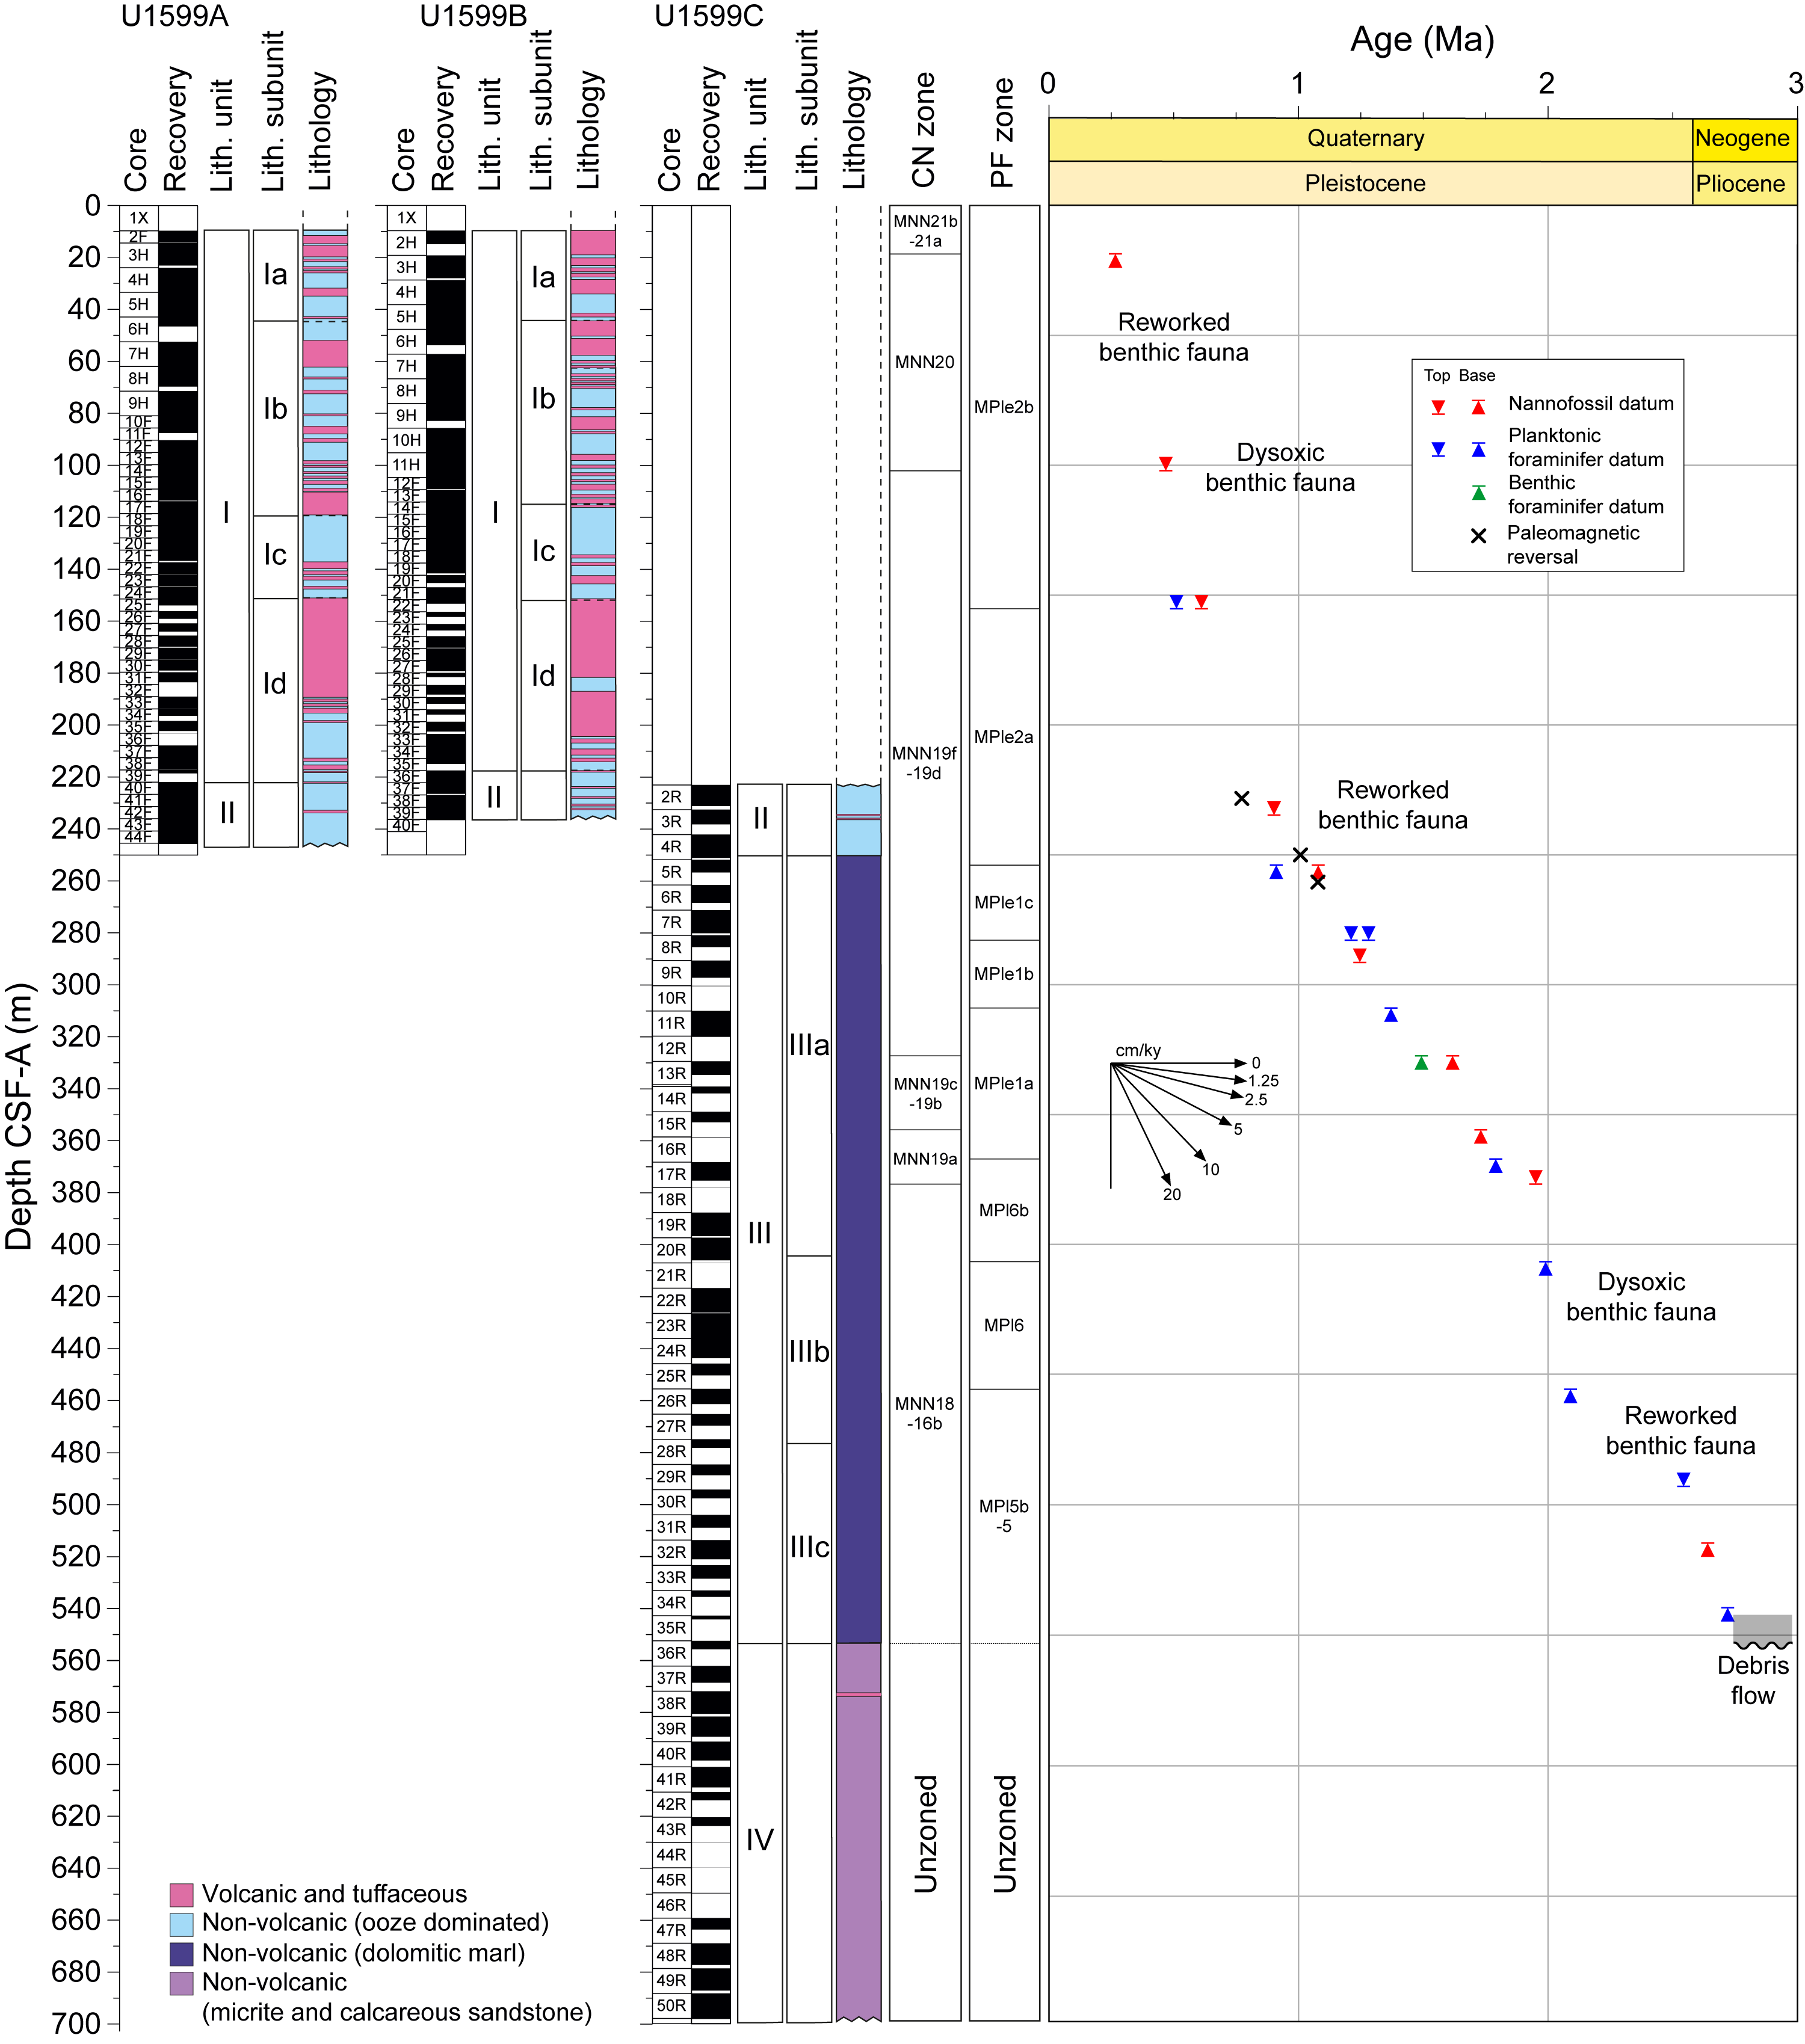
Figure F27. Age-depth plot.
Holocene to Middle Pleistocene–aged sediments (0–0.901 Ma) were recovered in Hole U1599A in Samples 2F-CC, 0–5 cm, to 43F-CC, 24–29 cm (14.25–241.06 mbsf). In Hole U1599B, Holocene to Middle Pleistocene–aged sediments (0–0.901 Ma) were recovered in Samples 1H-CC, 20–23 cm, to 43X-CC, 39–41 cm (7.56–386.6 mbsf). Hole U1599C recovered Middle Pleistocene to Early Miocene–aged sediments (~0.901 to ~18.5 Ma) from Samples 2R-CC, 16–19 cm, to 44R-CC, 1–4 cm (231.08–630.14 mbsf).
6.1. Calcareous nannofossils
Calcareous nannofossil biostratigraphy in Holes U1599A–U1599C was established through analysis of core catcher samples, with additional split core samples taken to better constrain biostratigraphic events. Nannofossils are rare to abundant in samples from the Pleistocene–Pliocene sequence (Hole U1599A: 14.2–245.69 mbsf; Hole U1599B: 38.39–241.22 mbsf; Hole U1599C: 231.23–630.125 mbsf) and are rare to common in Miocene samples (Hole U1599C: 580.585–630.125 mbsf). Nannofossils are well to poorly preserved throughout the sequence, and there is significant reworking of older material in most of the Pleistocene samples. Ten nannofossil biostratigraphic datum planes and two calcareous nannofossil zones are recognized at Site U1599, representing a discontinuous Pleistocene to Miocene sedimentary sequence (Figure F28). Distributions of calcareous nannofossil taxa are shown in Table T7, and biostratigraphic datums are given in Table T5 and the GEODESC data in the Laboratory Information Management System (LIMS) database.
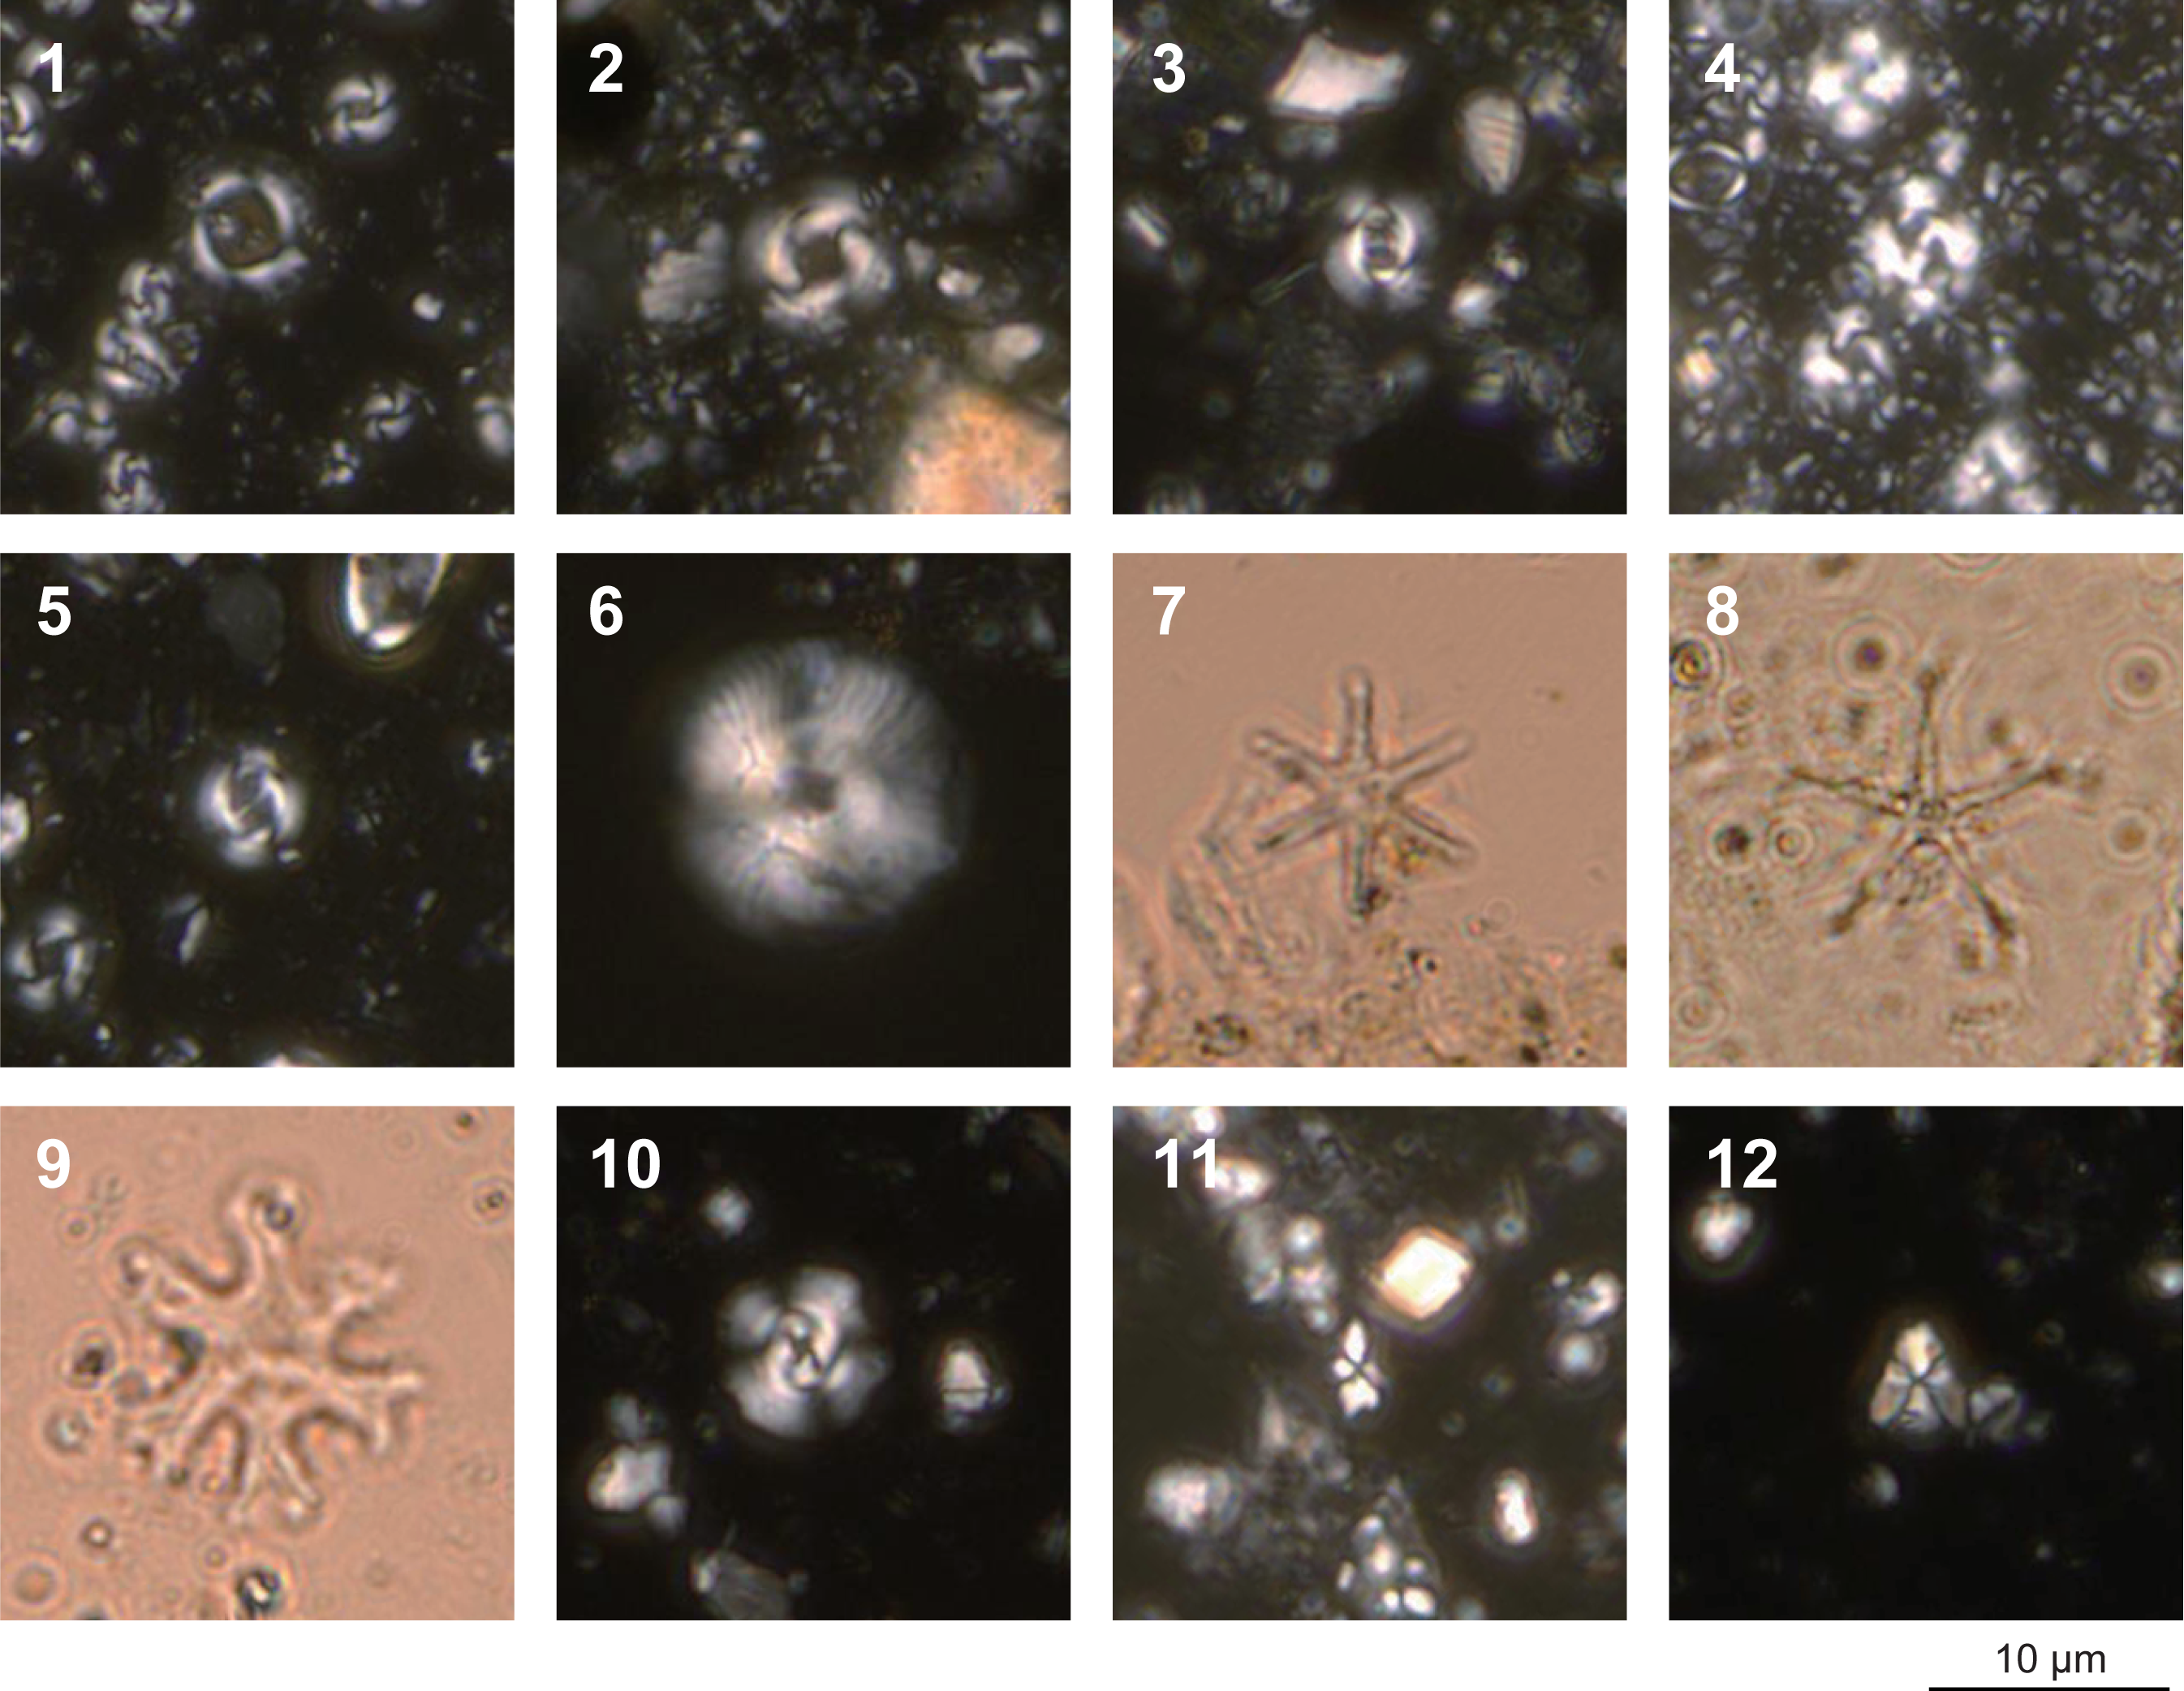
Figure F28. Calcareous nannofossils.
6.1.1. Pleistocene
The presence of Emiliania huxleyi in Sample 398-U1599A-2F-CC, 0–5 cm (14.225 mbsf), indicates a Holocene to Middle Pleistocene age (≤0.265 Ma) within Zones MNN21a and 21b (CNPL11: Backman et al., 2012; NN21: Martini, 1971; CN15: Okada and Bukry, 1980) of Rio et al. (1990) and Di Stefano and Sturiale (2010). The top occurrence of Pseudoemiliania lacunosa (0.467 Ma) defines the Zone MNN20/21a (CNPL10/11, NN19/20, and CN14a/CN14b) boundary. The last consistent appearance of P. lacunosa in Holes U1599A and U1599B occurs in Samples 398-U1599A-13F-CC, 0–5 cm, to 14F-CC, 8–10 cm (99.725–104.46 mbsf); 398-U1599B-10H-CC, 22–24 cm; and 11H-CC, 23–25 cm (95.32–105.19 mbsf). The top occurrence of Gephyrocapsa sp. 3 (0.61 Ma), situated between the lower part of the Brunhes Chron in Zone MNN19f, is found between Samples 398-U1599A-24F-CC, 15–17 cm, and 26F-CC, 0–2 cm (151.59–158.87 mbsf), and between Samples 398-U1599B-21F-CC, 0–2 cm, and 25F-CC, 0–1 cm (151.69–169.99 mbsf). The top occurrence of Reticulofenestra asanoi (0.901 Ma), situated at the top of the Jaramillo Subchron of the Matuyama Chron in Zone MNN19e, is recognized at the boundary between Samples 398-U1599A-42F-CC, 11–21 cm, and 43F-CC, 24–29 cm (236.26–241.035 mbsf); in Sample 398-U1599B-38F-CC, 11–14 cm (231.765–236.535 mbsf); and in Samples 398-U1599C-2R-CC, 16–19 cm, and 3R-CC, 13–15 cm (231.225–238.29 mbsf). The basal occurrence of R. asanoi (1.078 Ma), which lies just below the Jaramillo Subchron of the Matuyama Chron (Zone MNN19e), is found between Samples 4R-CC, 22–24 cm, and 5R-CC, 16–18 cm (251.14–256.7 mbsf).
Large-form Gephyrocapsa spp. (>5.5 µm) that appear between 1.245 and 1.617 Ma (Zones MNN19d, CNPL8, NN19, and CN13b) are present between Samples 389-U1599C-9R-CC, 0–3 cm (297.185 mbsf); 10R-CC, 0–5 cm (300.445 mbsf); and 11R-6, 32 cm (317.24 mbsf). Samples 13R-CC, 4–10 cm; 14R-CC, 10–12 cm; and 15R-CC, 0–2 cm (334.58–352.79 mbsf), are characterized by the occurrence of Gephyrocapsa oceanica, Gephyrocapsa caribbeanica, and P. lacunosa and by the absence of large-form Gephyrocapsa spp. This assemblage indicates that the interval between 334.58 and 352.79 mbsf can be assigned to an age between 1.617 and 1.73 Ma. The Gelasian (Early Pleistocene) assemblages found at this site are characterized by the occurrence of discoasters, including marker species of Miocene to Pliocene successions. The last occurrence of Discoaster brouweri, which indicates the boundary of Zones MNN18/19a (NN18/19 and CN12d/CN13a), occurs at the boundary of Samples 17R-CC, 0–2 cm, and 18R-CC, 0–2 cm (375.28–377.91 mbsf). The acme base of Discoaster pentaradiatus, which characterizes the middle of Zone MNN16b (2.64 Ma), appears between Samples 31R-CC, 20–22 cm (508.91 mbsf), and 32R-CC, 16–18 cm (521.06 mbsf).
6.1.2. Miocene
There is a remarkable change in species composition of calcareous nannofossils between Samples 398-U1599C-35R-CC, 0–3 cm (544.2 mbsf), and 37R-CC, 20–22 cm (568.59 mbsf). In contrast to the previous samples, sediments below Sample 37R-CC, 20–22 cm, contain Sphenolithus heteromorphus and Sphenolithus belemnos, Cyclicargolithus floridanus, Discoaster deflandrei, and Sphenolithus dissimilis. These assemblages suggest that the interval between Samples 37R-CC, 20–22 cm (568.59 mbsf), and 44R-CC, 1–4 cm (630.125 mbsf), can be assigned to the Early Miocene.
6.2. Foraminifera
Planktonic and benthic foraminifera were examined in core catcher samples and split core samples from Holes U1599A–U1599C (Tables T8, T9). Absolute ages assigned to biostratigraphic datums follow those listed in Table T6 in the Expedition 398 methods chapter (Kutterolf et al., 2024a). Planktonic and benthic foraminifer datums for Site U1599 are given in Table T6. Planktonic foraminifer abundances and indications of oceanicity (e.g., Hayward et al., 1999) and benthic foraminifer paleowater depth estimations are given in Figures F29 and F30.
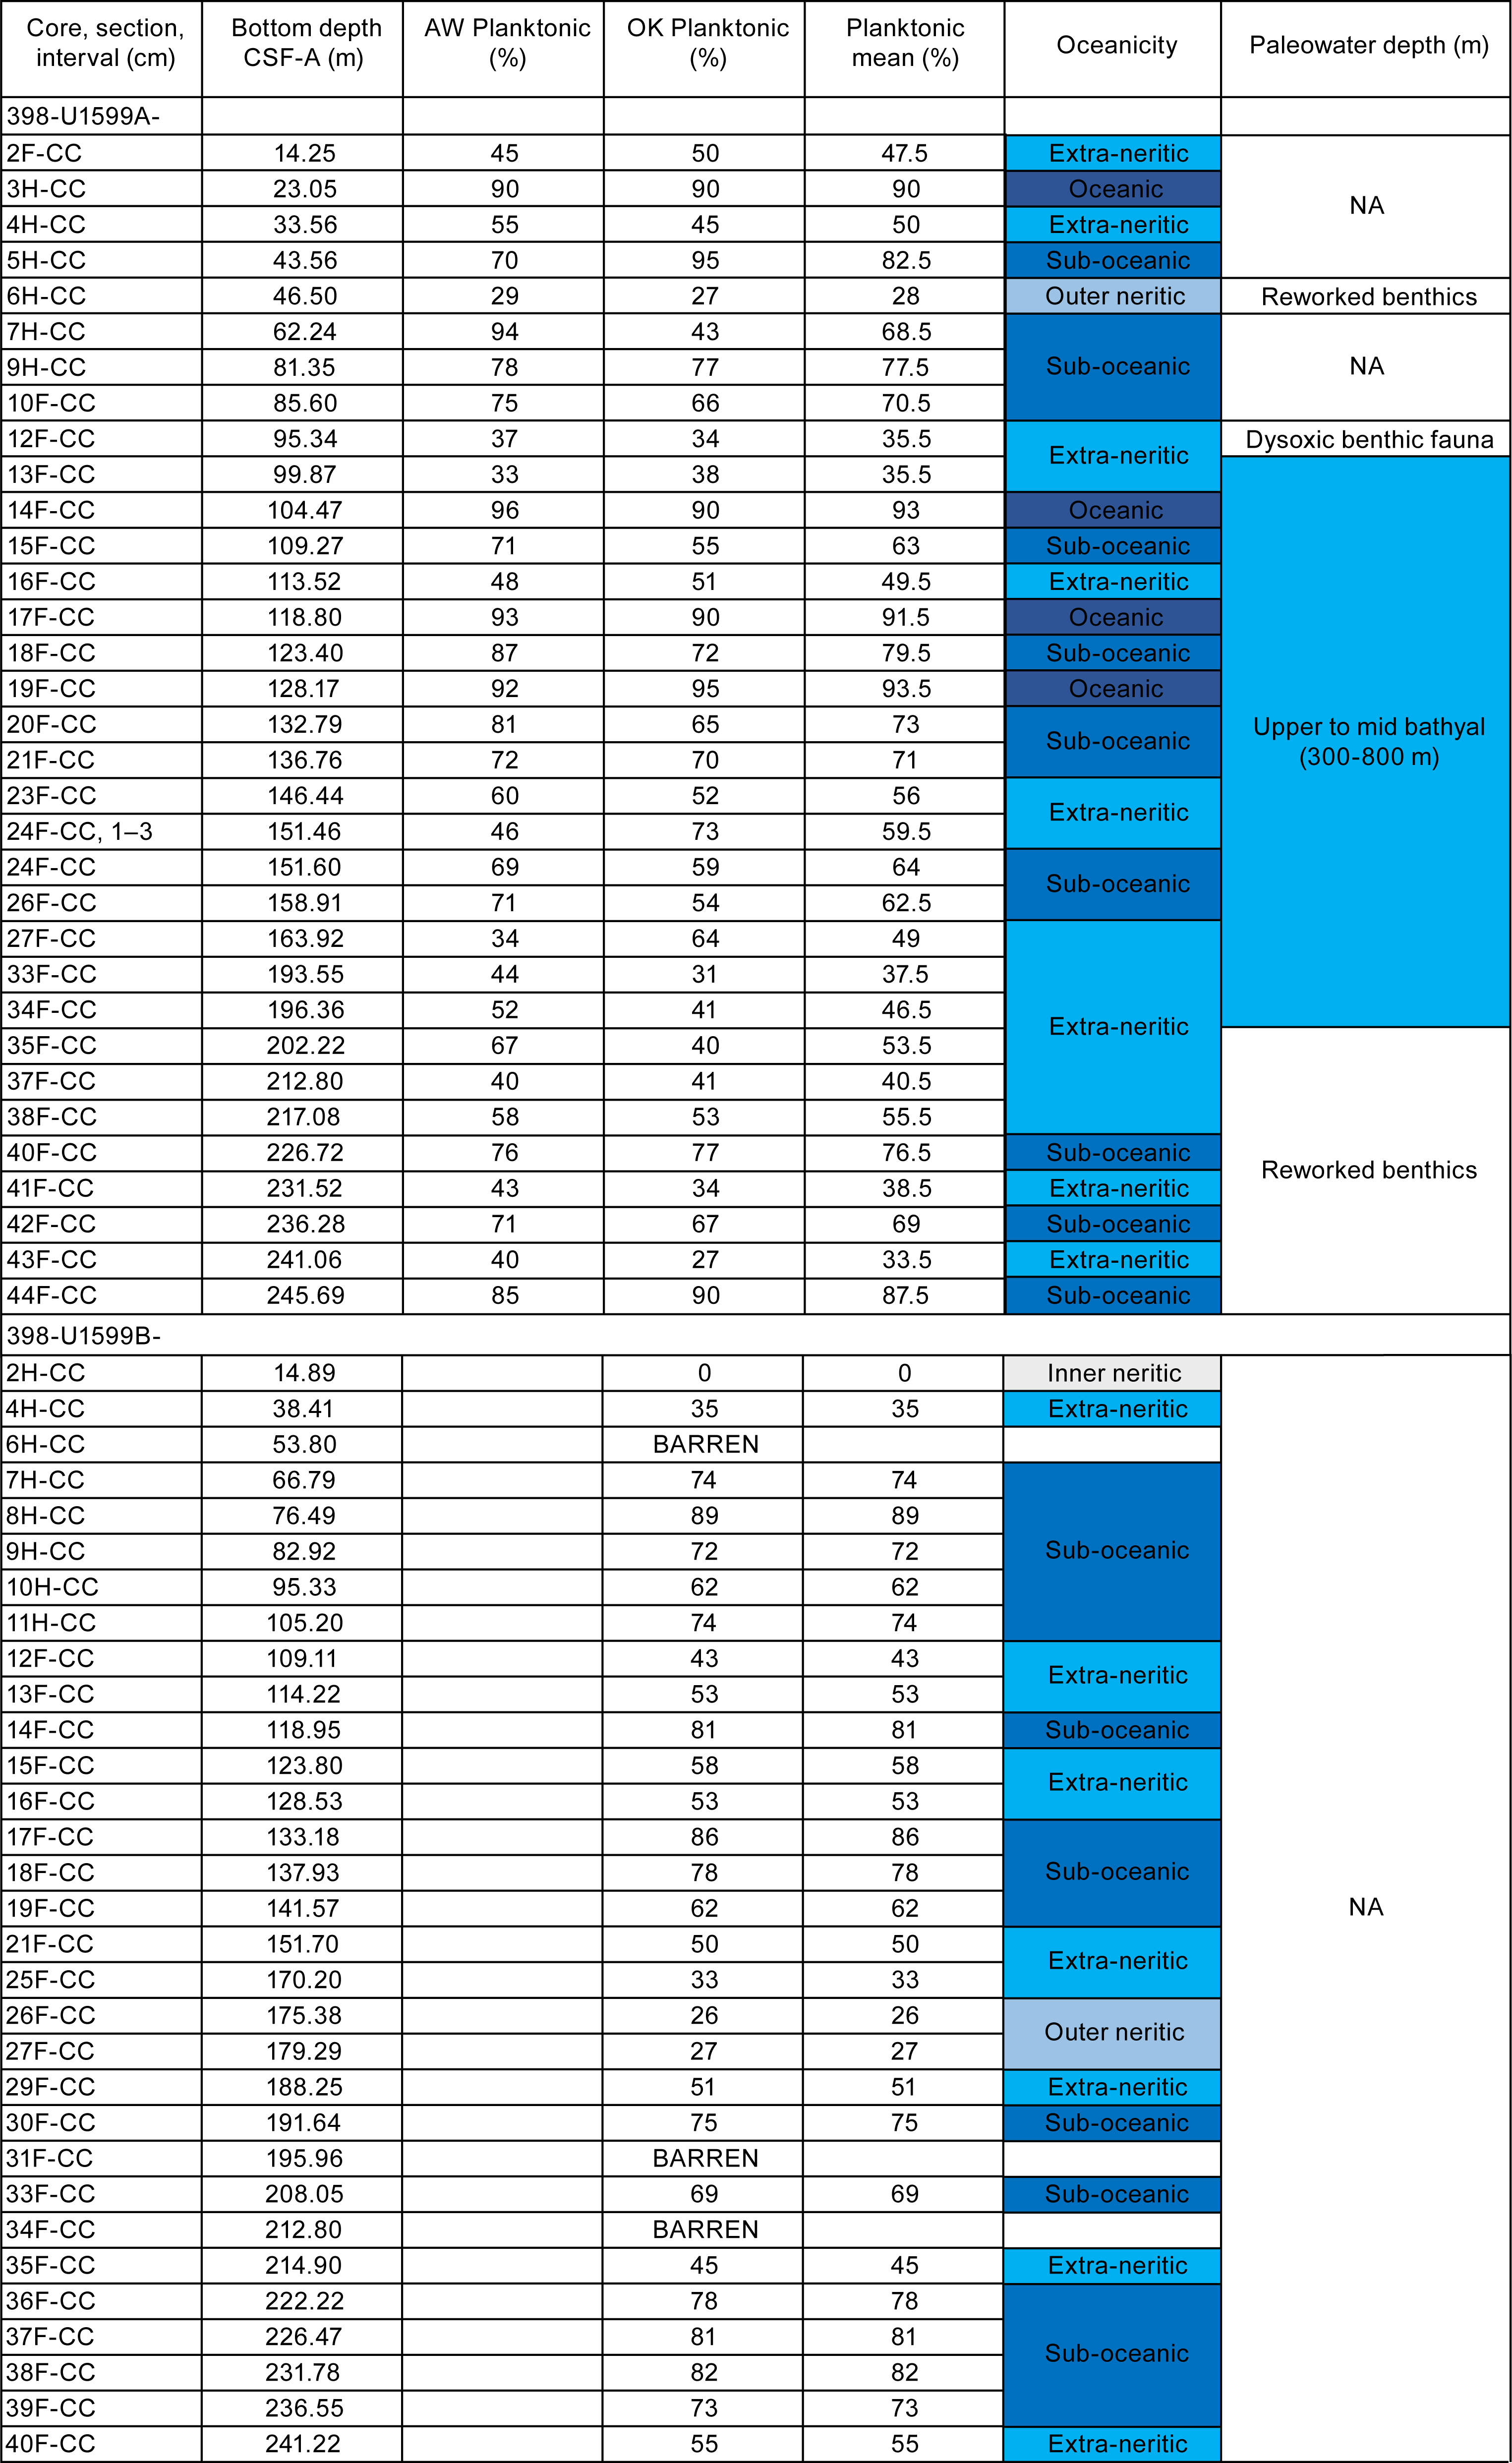
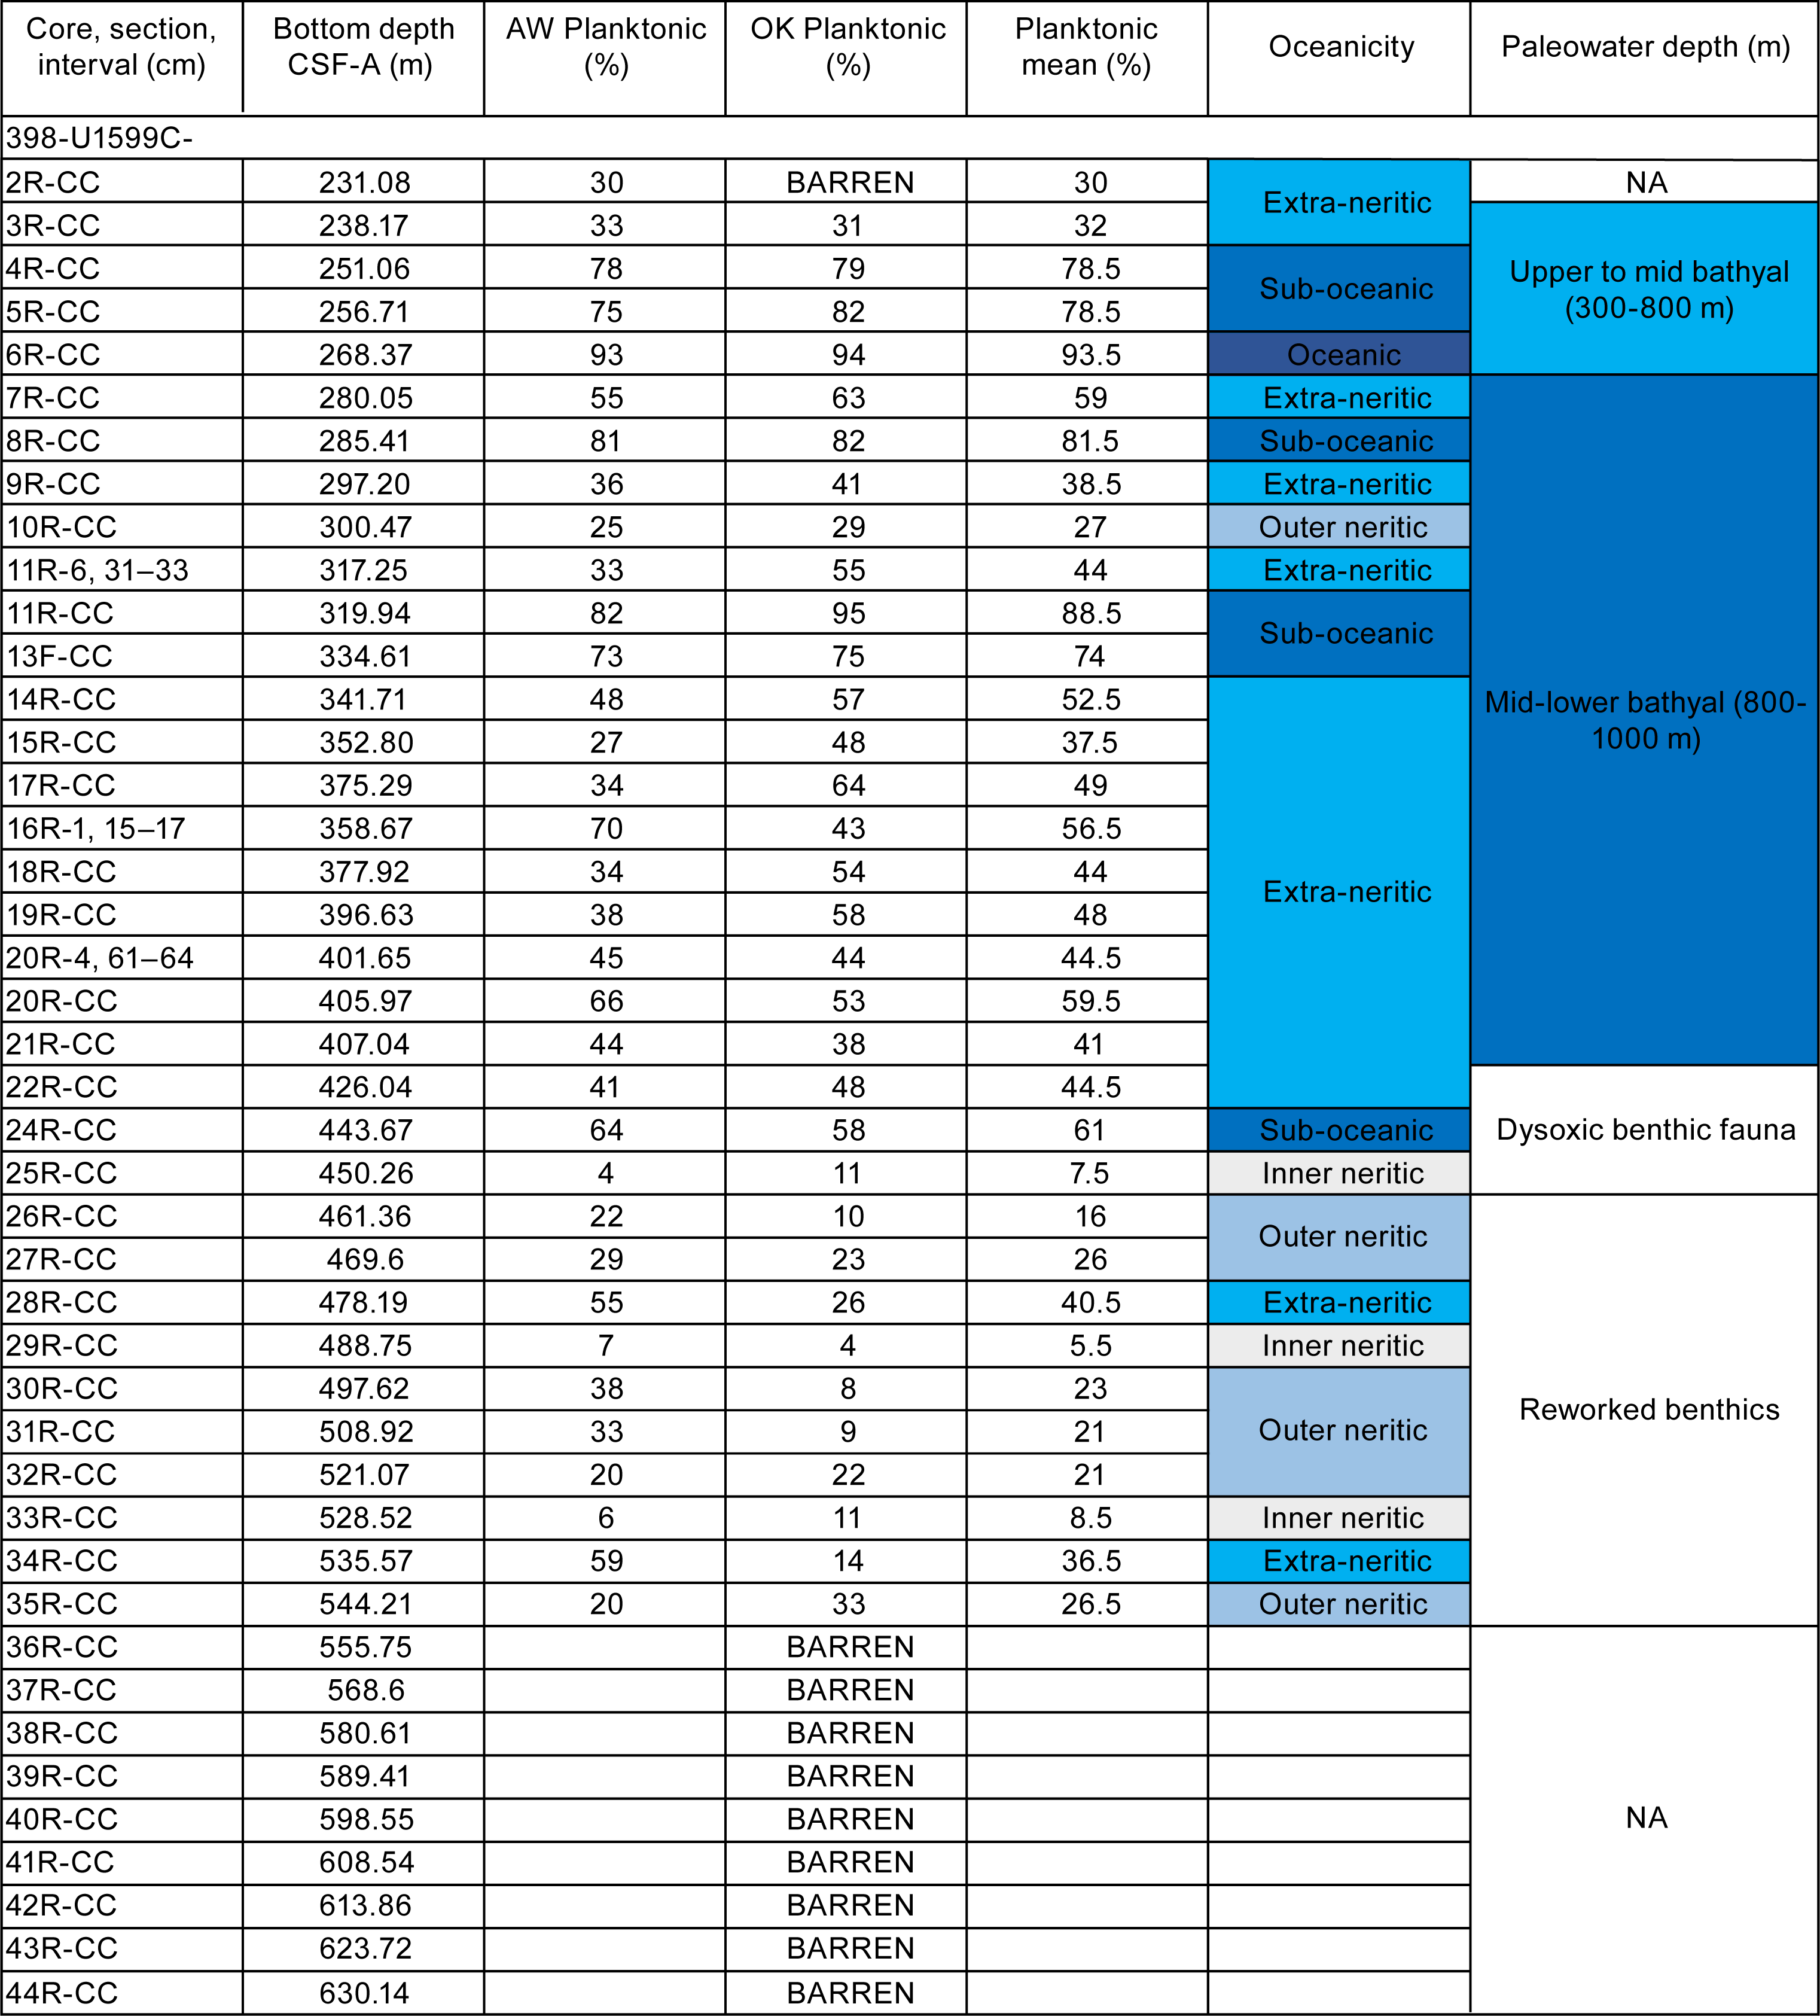
Figure F29. Foraminiferal oceanicity and paleowater depth estimates.
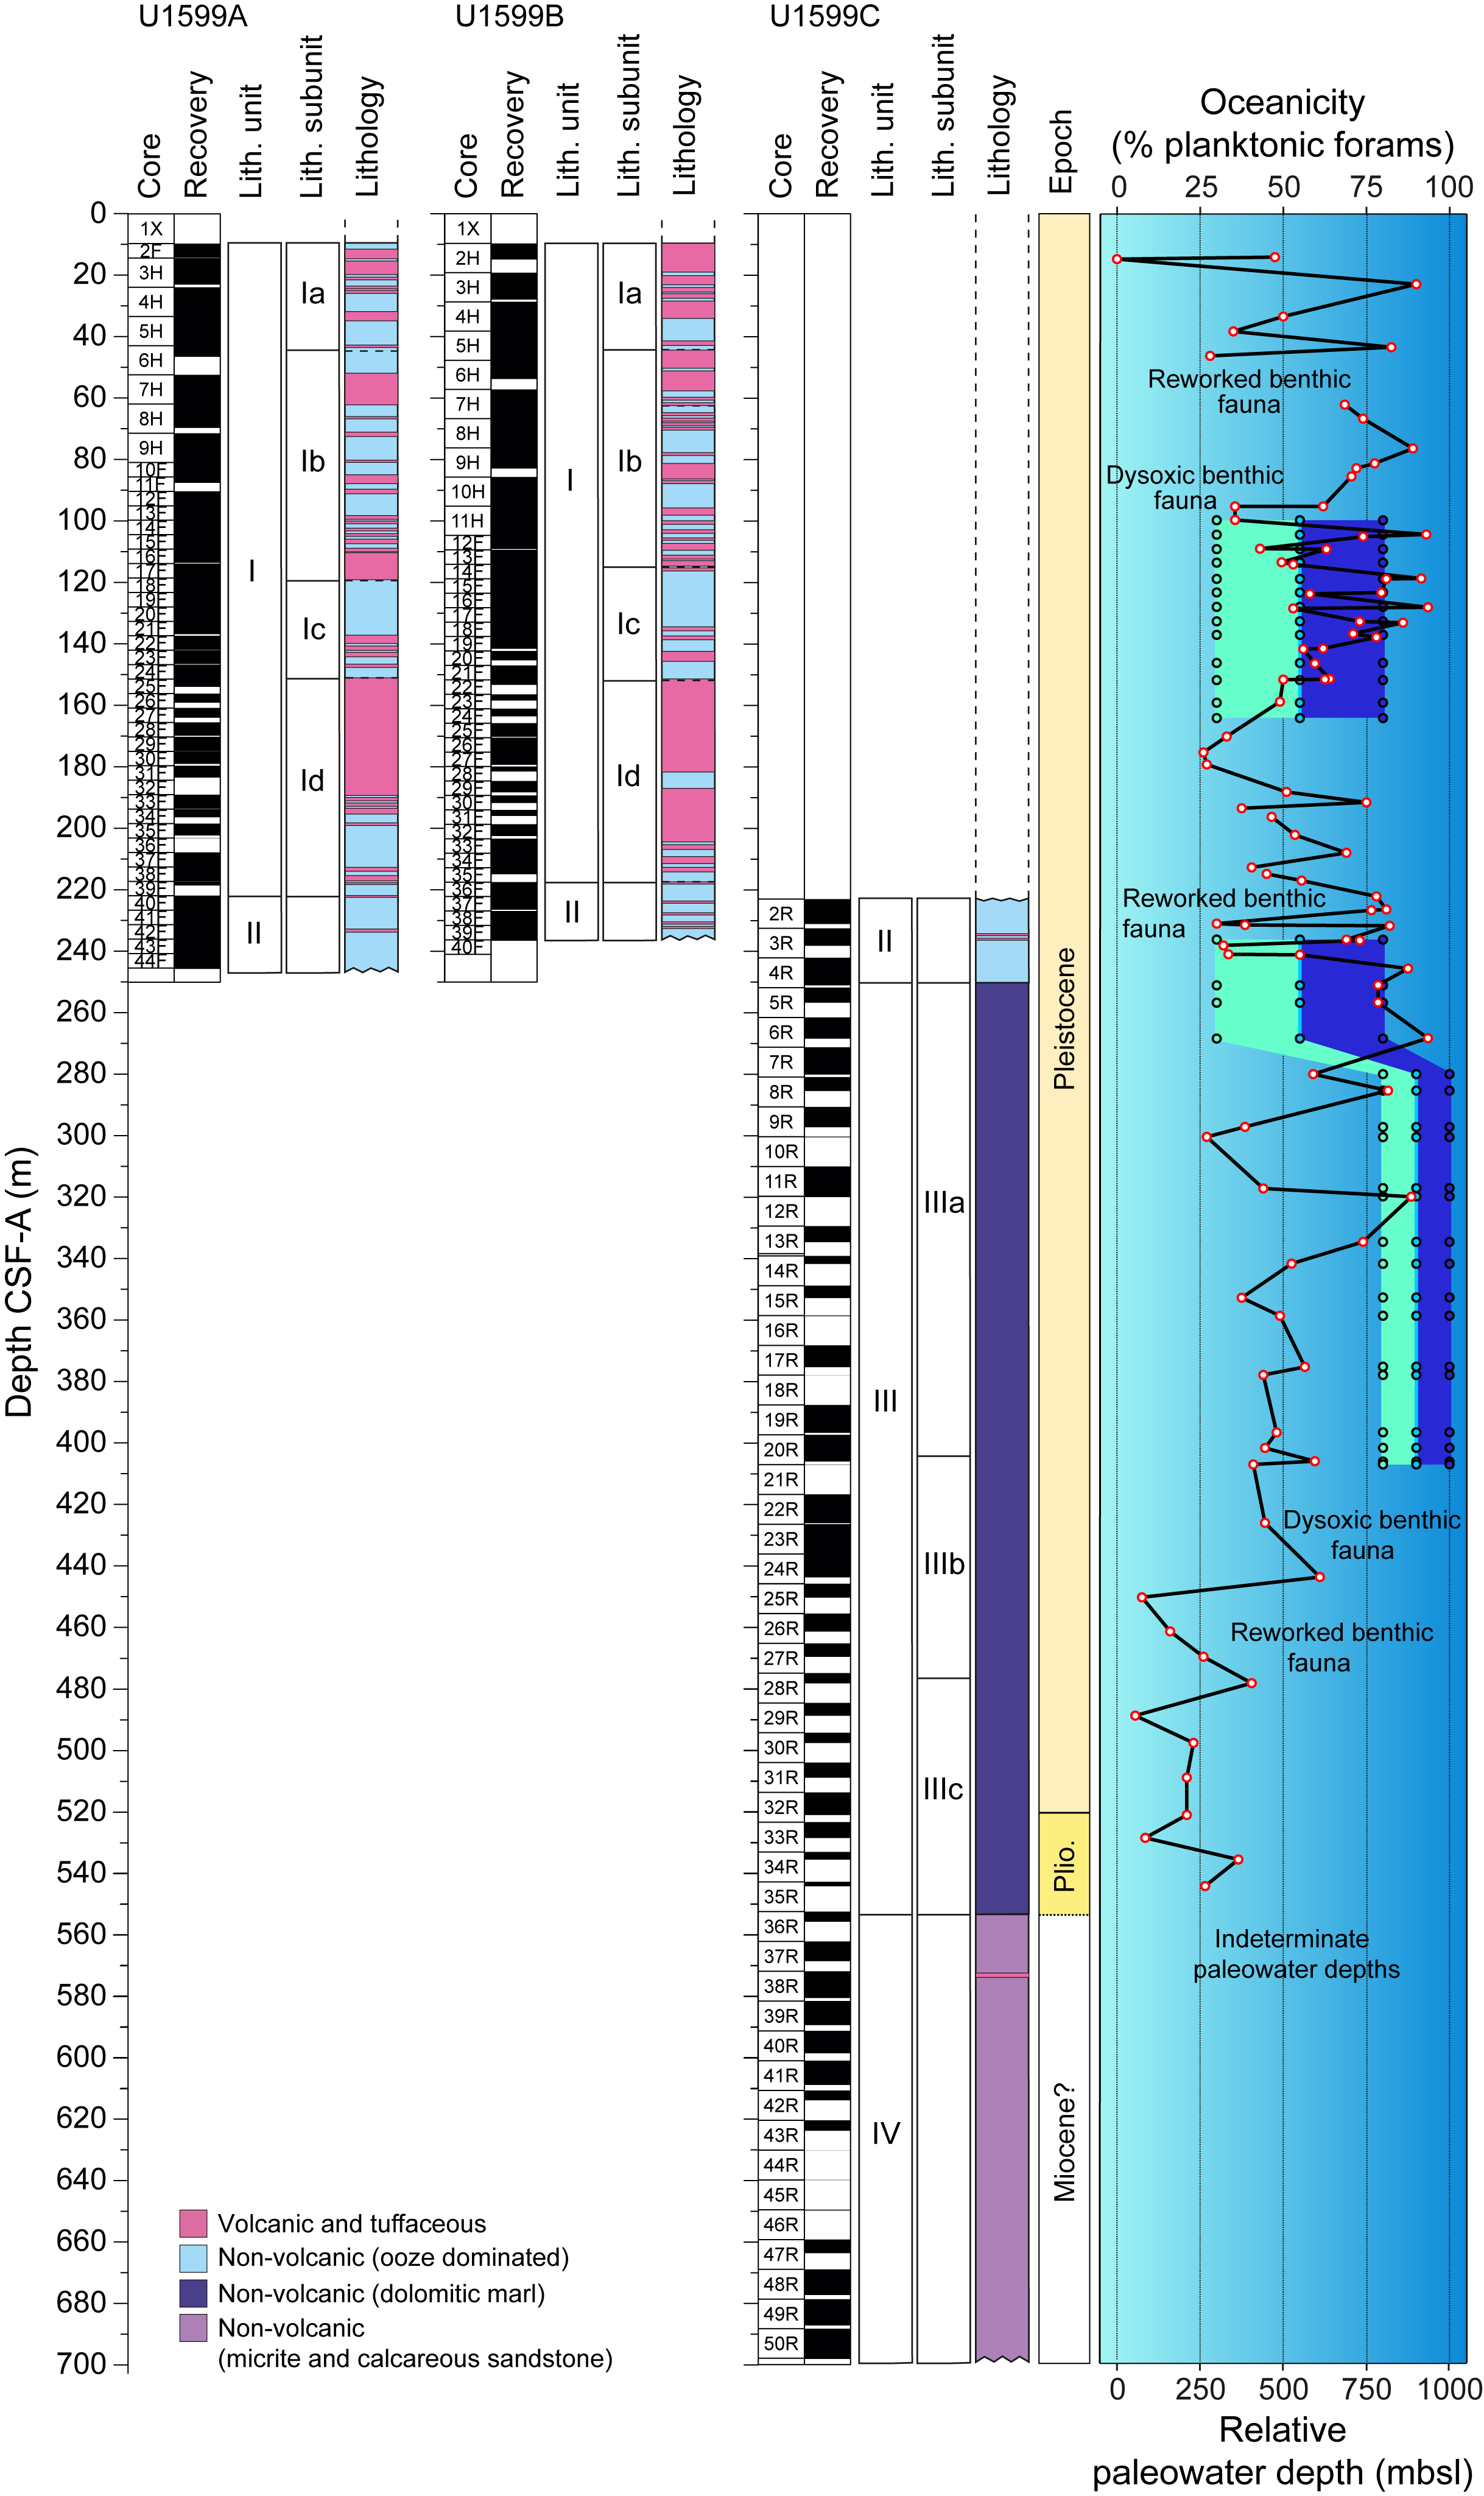
Figure F30. Biostratigraphy.
Because of the volcanogenic nature of the cored sedimentary sequence, residues (>125 µm) from washed samples were often significantly composed of volcaniclastic particles such as pumice, scoria, and ash that diluted the microfossil component of residues. Foraminifera dominate the biogenic component of residues, however, and age markers are present in sufficient numbers to date most samples reliably. Significant reworking made first occurrence datums most reliable. Additionally, volcanic material, clastic grains, minor pyrite, carbonaceous plant-derived matter, and other fossil material, including shells and fragments (Bivalvia and Gastropoda), Pteropoda, Scaphopoda, Bryozoa, Arthropoda (Balanus), echinoid spines and plate fragments, radiolarians, and ostracods, as well as fish teeth, are also present in variable amounts in most samples. In addition, reworked Pliocene foraminifera are often present.
Throughout the section, foraminifera with very good to very poor preservation are present in siliciclastic, volcaniclastic, and dolomitic sediments. Foraminifer abundances are also variable, and they are notably rare in tuffaceous oozes, likely due to sedimentary dilution, whereas coarser volcaniclastic intervals are sometimes barren. Notably, foraminifera are very rare or absent from the lowermost micritic and calcareous sandstones.
6.2.1. Holocene to Upper Pliocene foraminiferal biostratigraphy
Because of explosive volcanic events and rapid deposition of the upper sedimentary section, the base of the Holocene is not possible to assign accurately. Planktonic foraminifer assemblages from the Holocene–Pleistocene section of Holes U1599A–U1599C are mostly well preserved, where specimens are rarely broken or exhibiting partially dissolved shell walls.
Holocene–Upper Pliocene foraminifer faunas indicate large fluctuations in relative paleowater depth and oceanicity with highly variable planktonic abundances that range 0%–93.5% where foraminifera are present (Figure F30). The fauna are typical of Pliocene–Pleistocene Mediterranean biostratigraphic zones, primarily composed of Neogloboquadrina incompta, Globigerina bulloides, Globigerina falconensis, Globigerinita glutinata, Globigerinoides elongatus, Globigerinoides pyramidalis, Trilobatus trilobus group, Globigerinoides ruber var. white, Globoconella inflata, Hirsutella scitula, Truncorotalia truncatulinoides s.l. (sinistral and dextral coiling), Neogloboquadrina pachyderma, Orbulina universa, Turborotalita quinqueloba, and Globigerinella calida through the Holocene to Middle Pleistocene, with the addition of species such as Globoturborotalita woodi, Globigerinoides obliquus, Globigerinoides extremus, Neogloboquadrina atlantica (sinistral and dextral), and Globoturborotalita decoraperta through the Lower Pleistocene to Upper Pliocene (Figure F31). Common reworked specimens are found throughout the studied interval.
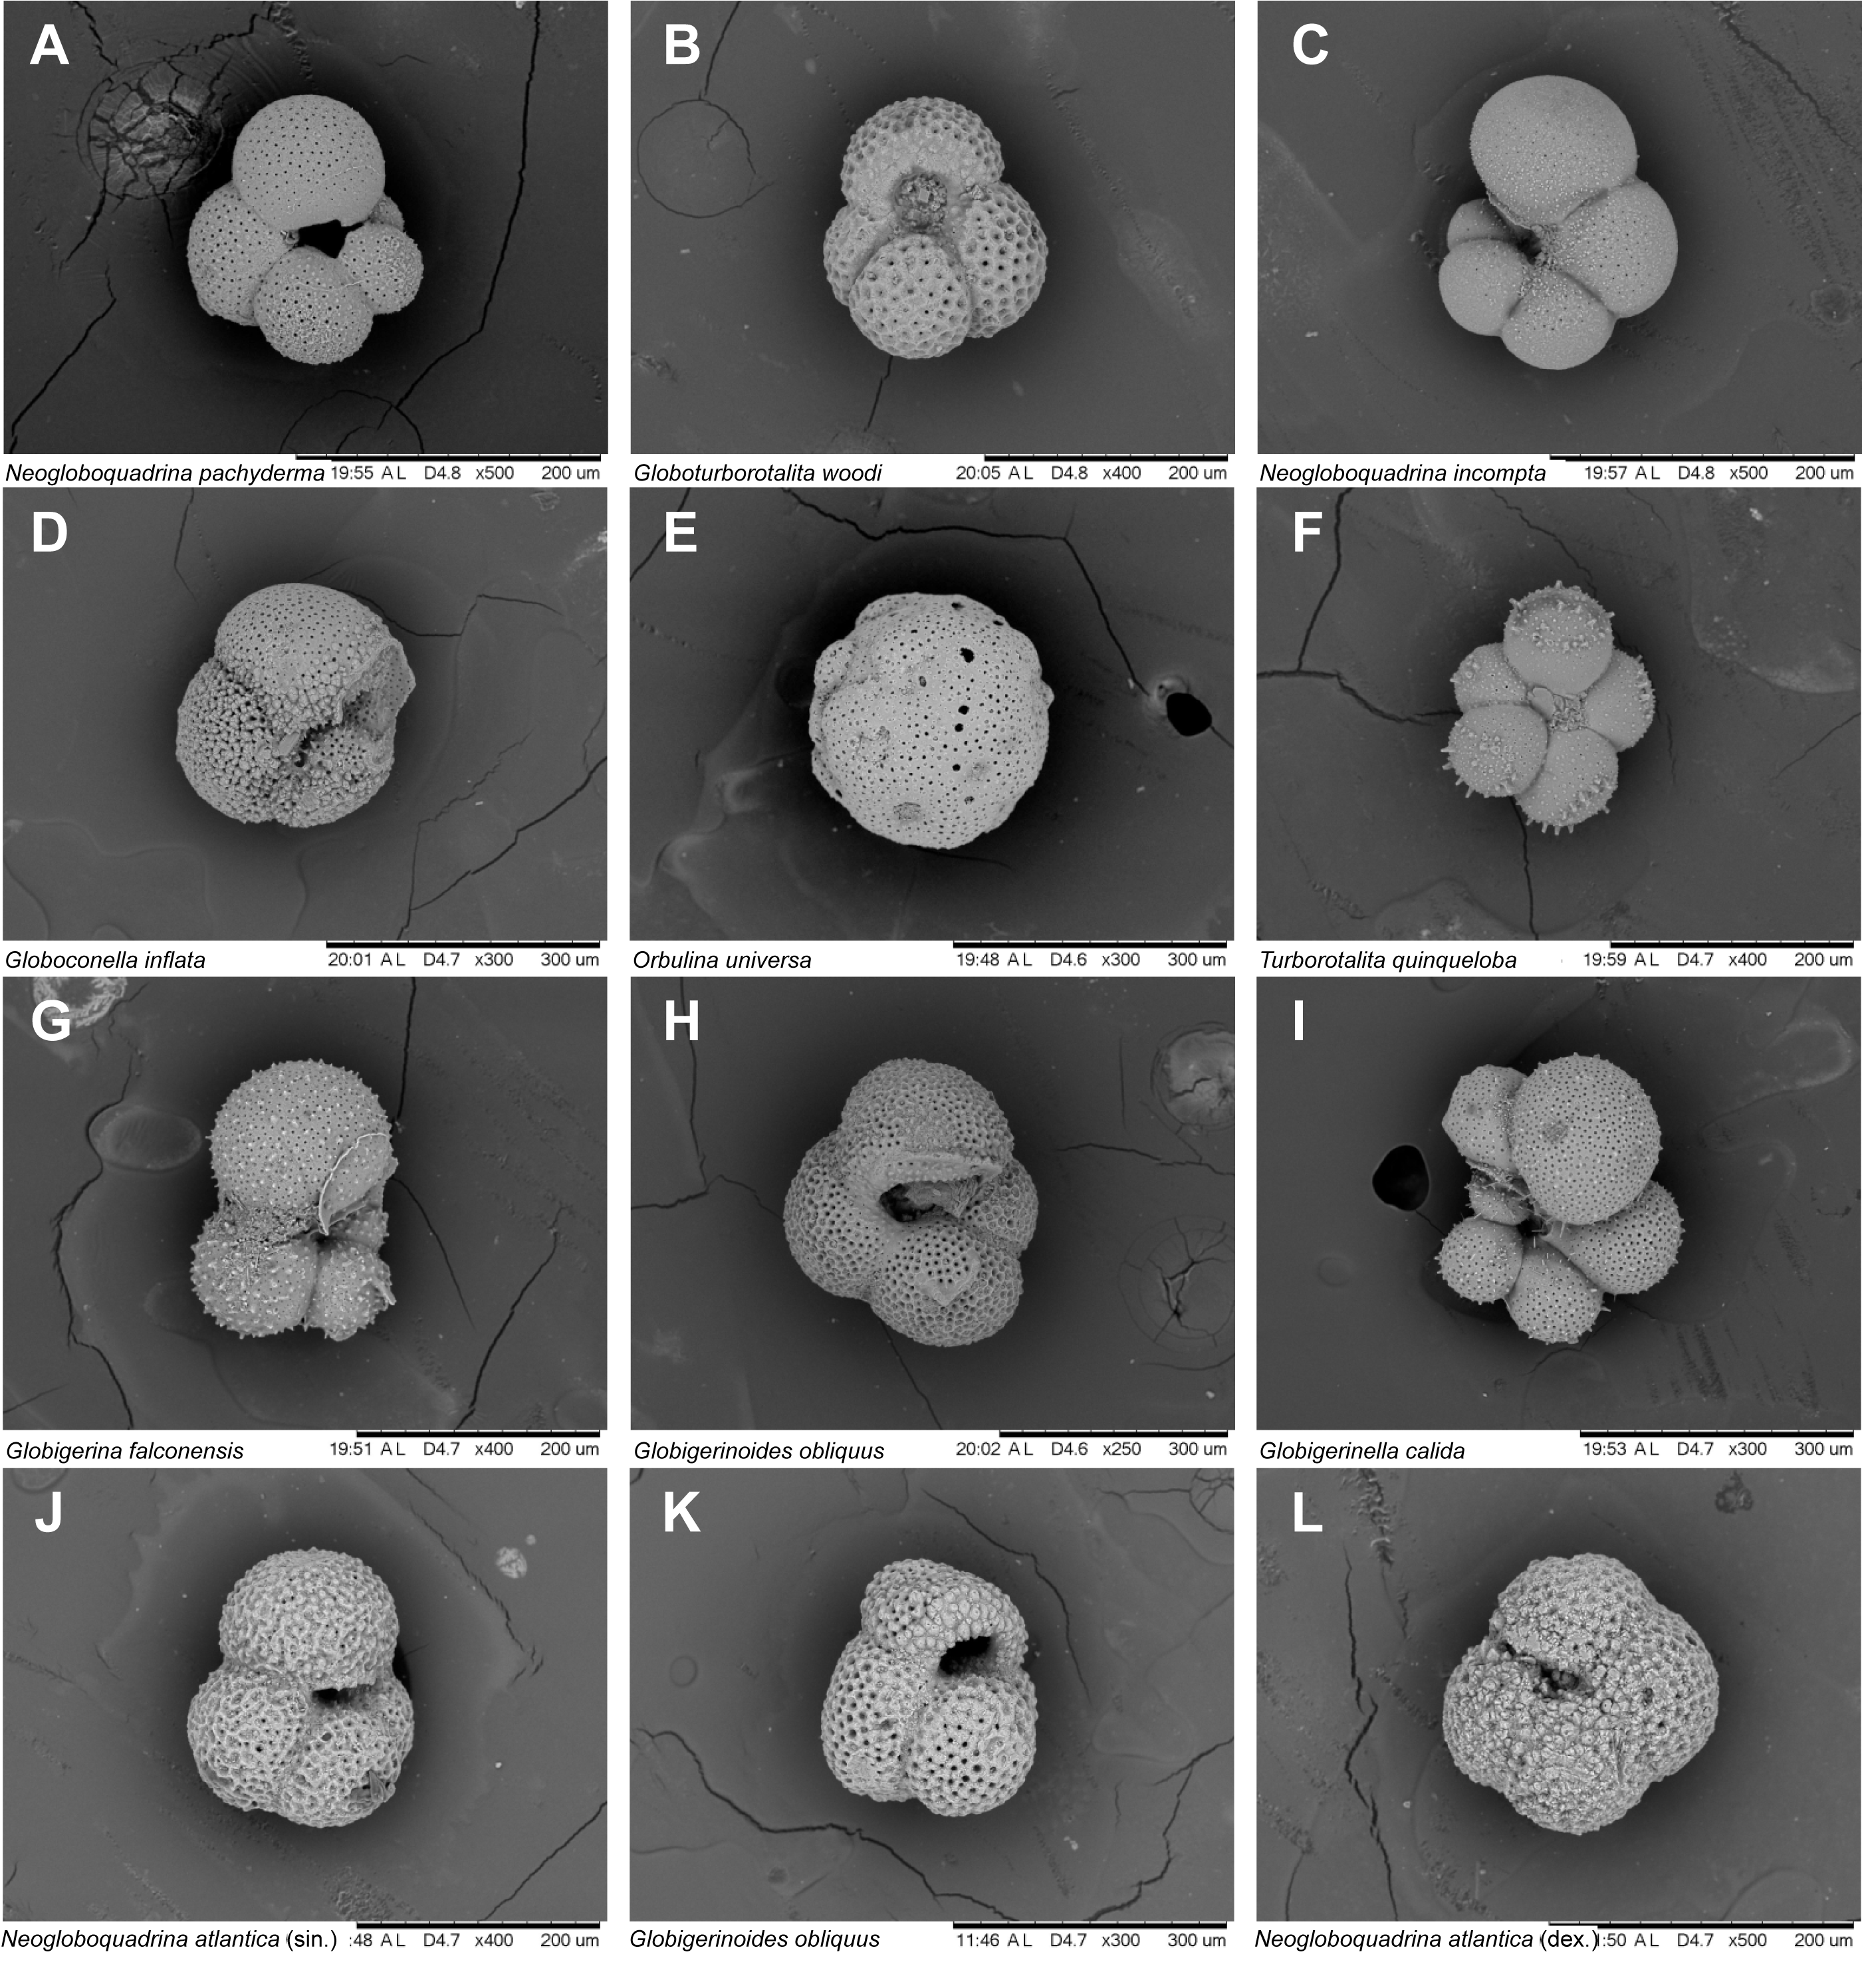
Figure F31. Planktonic foraminifera.
Foraminiferal faunas are sufficiently common to biostratigraphically divide the Pleistocene into the majority of Pleistocene to Upper Pliocene Mediterranean planktonic foraminiferal biostratigraphic zones determined via both primary and secondary marker species (Lirer et al., 2019):
- Zone MPle2b (0.00–0.53 Ma), Hole U1599A: 14.25–151.46 mbsf.
- Zone MPle2a (0.53–0.94 Ma), Holes U1599A, U1599C: 151.6–251.06 mbsf.
- Zone MPle1c (0.94–1.21 Ma), Hole U1599C: 256.71–280.05 mbsf.
- Zone MPle1b (1.21–1.37 Ma), Hole U1599C: 285.41–300.47 mbsf.
- Zone MPle1a (1.37–1.79 Ma), Hole U1599C: 317.25–358.67 mbsf.
- Zone MPl6b (1.79–2.00 Ma), Hole U1599C: 375.29–405.97 mbsf.
- Zone MPl6 (2.00–2.09 Ma), Hole U1599C: 407.04–450.26 mbsf.
- Zones MPl5b-5 (2.09–3.19 Ma), Hole U1599C: 451.36–535.57 mbsf.
The faunal criteria on which these age assignments are based are given in the sections below.
6.2.1.1. Zone MPle2b (0.00–0.53 Ma)
Samples 398-U1599A-2F-CC, 0–5 cm, to 24F-CC, 1–3 cm (14.25–151.46 mbsf), are assigned to Zone MPle2b based on the paracme top of sinistrally coiled Neogloboquadrina spp. (<0.51 Ma) occurring between Samples 24F-CC, 1–3 cm, and 24F-CC, 15–17 cm (151.46–151.6 mbsf), above which this species is more common. Additionally, T. truncatulinoides s.l. (first common occurrence = 0.53) occurs sporadically throughout this interval.
6.2.1.2. Zone MPle2a (0.53–0.94 Ma)
Samples 398-U1599C-24F-CC, 15–17 cm, to 4R-CC, 9–11 cm (151.6–251.06 mbsf), are assigned to Zone MPle2a based on the absence of T. truncatulinoides s.l. (0.53–0.934 Ma) and the sporadic occurrences of sinistrally coiled Neogloboquadrina spp. (0.51–0.91 Ma) throughout this interval.
6.2.1.3. Zone MPle1c (0.94–1.21 Ma)
Samples 398-U1599C-5R-CC, 0–2 cm, to 7R-CC, 16–19 cm (256.71–300.47 mbsf), are assigned to Zone MPle1c based on the high abundances of sinistrally coiled Neogloboquadrina spp. (0.91–1.21 Ma) throughout this interval.
6.2.1.4. Zone MPle1b (1.21–1.37 Ma)
Samples 398-U1599C-8R-CC, 24–27 cm, to 10R-CC (285.41–300.47 mbsf) are assigned to Zone MPle1b based on the absence or rare occurrence of sinistrally coiled Neogloboquadrina spp. (1.21–1.37 Ma). Moreover, the last occurrence of G. obliquus s.s. (last occurrence = 1.28 Ma) is observed in Sample 8R-CC, 24–27 cm (285.41 mbsf).
6.2.1.5. Zone MPle1a (1.37–1.79 Ma)
Samples 398-U1599C-11R-6, 31–33 cm, to 16R-1, 15–17 cm (317.25–358.67 mbsf), are assigned to Zone MPle1a based on the first common occurrence of sinistrally coiled Neogloboquadrina spp. (1.79 Ma) in Sample 16R-1, 15–17 cm (358.67 mbsf). Additionally, Sample 11R-CC (319.94 mbsf) marks the first common occurrence of the benthic foraminifer Hyalinea balthica (1.492 Ma; Lourens et al., 1998).
6.2.1.6. Zone MPl6b (1.79–2.00 Ma)
Samples 398-U1599C-17R-CC, 0–2 cm, to 20R-CC, 8–11 cm (375.29–405.97 mbsf), are assigned to Zone MPl6b based on the absence or rare occurrence of sinistrally coiled Neogloboquadrina spp (>1.79 Ma) and the first common occurrence of G. inflata (1.99 Ma) in Sample 20R-CC, 8–11 cm (405.97 mbsf).
6.2.1.7. Zone MPl6 (2.00–2.09 Ma)
Samples 398-U1599C-21R-CC, 0–4 cm, to 25R-CC, 10–15 cm (407.04–450.26 mbsf), are assigned to Zone MPl6 because it represents the interval between the first occurrence of G. inflata (2.09 Ma) and the first common occurrence of G. inflata (2.00 Ma).
6.2.1.8. Zones MPl5b–5 (2.09–3.19 Ma)
Samples 398-U1599C-26R-CC, 9–12 cm, to 34R-CC, 12–15 cm (451.36–535.57 mbsf), are assigned to Zones MPl5b–5 based on the absence of G. inflata; the last common occurrence of G. obliquus s.s. in Sample 30R-CC, 15–17 cm (497.62 mbsf); and the lowest occurrence of N. atlantica (sinistral) in Sample 34R-CC, 12–15 cm (535.57 mbsf). The base of these zones is likely missing due to the presence of a debris flow below this interval. Additionally, there is significant reworking throughout this interval in the form of Hirsutella margaritae, Sphaeroidinellopsis sp., and Dentoglobigerina altispira.
6.2.1.9. Nondistinctive Zone (5.33–? Ma)
Downcore of the debris flow underlying Zones MPl5b–5, Samples 398-U1599C-35R-CC, 0–2 cm, to 44R-CC, 1–4 cm (544.21–630.14 mbsf), are assigned to the Nondistinctive Zone or older due to the absence of normal marine planktonic foraminiferal assemblages, and, where present, faunas are dwarfed and exhibit very poor preservation. The microfossil component within this section is primarily composed of rare, moderately preserved Ostracoda. Furthermore, a significant quantity of carbonaceous plant matter and charcoal is present within this interval.
6.2.2. Planktonic foraminiferal oceanicity
Planktonic foraminifer abundances are highly variable, ranging 0%–93.5% when foraminifera are present (Figure F30). Oceanicity values are generally in agreement with benthic foraminiferal paleowater depth indicators in intervals where reworking is low or absent. In such intervals, the oceanicity data for Site U1599 indicate that relatively consistent extraneritic to suboceanic conditions (100–1000 mbsl) prevailed within Samples 398-U1599A-2F-CC, 0–5 cm, to 398-U1599C-6R-CC, 0–2 cm (14.25–268.37 mbsf). Below this depth, oceanicity values are mostly in disagreement with paleowater depth reconstructions from Samples 398-U1599C-7R-CC, 16–19 cm, to 21R-CC, 0–4 cm (280.05–407.04 mbsf), where oceanicity values continue to indicate shallower conditions. Downcore from this interval, oceanicity values decrease significantly, indicating shallowing conditions approaching Sample 398-U1599C-35R-CC, 0–2 cm (544.21 mbsf), below which oceanicity values are indeterminate.
6.2.3. Benthic foraminifera paleowater depths
Benthic foraminiferal distributions are variable, indicating paleowater depths from uppermost bathyal (200–400 m) to lower bathyal (>1000 m) (Figure F30). The low abundance or complete absence of benthic foraminiferal faunas in some samples (e.g., 398-U1599A-2F-CC, 0–5 cm, to 10F-CC, 0-3 cm [14.25–85.60 mbsf]; 24F-CC, 15–17 cm, to 26F-CC, 0–5 cm [151.60–158.91 mbsf]; and 398-U1599B-17F-CC, 20–22 cm, to 39F-CC, 18–21 cm [133.18–236.55 mbsf]) are possibly correlated with rapid emplacement of volcaniclastic sediments and/or inhospitable environmental conditions. Samples 398-U1599A-13F-CC, 17 cm, to 34F-CC, 21–23 cm (99.87–196.36 mbsf), record an upper to midbathyal depth (300–800 m), as indicated by the presence of species such as Cibicides pachyderma and Gyroidina spp., Cassidulina spp., H. balthica, and Ioanella tumidula. Samples 398-U1599C-7R-CC, 16–19 cm, to 21R-CC, 0–4 cm (280.05–407.04 mbsf), exhibit mid- to lower bathyal paleowater depth markers, as indicated by the presence of Oridorsalis umbonatus, whereas lower bathyal markers including Cibicidoides wuellerstorfi and Cibicidoides mundulus also commonly occur. Additionally, samples in various intervals present broken and reworked foraminifer faunas, which in some cases are abundant, as in Sample 398-U1599A-6H-CC, 0–1 cm (46.37 mbsf), and likely represent downslope reworking and sediment transportation. Furthermore, Samples 398-U1599C-26R-CC, 9–12 cm, to 35R-CC, 0–2 cm (461.36–544.21 mbsf), exhibit a lot of reworked specimens and also typical shelf species, potentially suggesting gradual shallowing of the environment. For Sample 398-U1599A-12F-CC, 18–23 cm (95.34 mbsf), and Samples 398-U1599C-22R-CC, 0–3 cm, to 25R-CC, 10–15 cm (426.04–450.26 mbsf), no paleowater depth estimation was possible because of the dominance of dysoxia-tolerant species such as Bolivina dilatata and Bulimina costata (e.g., Abu-Zied et al., 2008), most possibly representing intervals with high organic matter content.
7. Paleomagnetism
Paleomagnetic analysis at Site U1599 focused on measurement and demagnetization of archive-half sections to determine magnetostratigraphic age controls. Three reversal boundaries could be tied with confidence to the geomagnetic polarity timescale (GPTS; Gradstein et al., 2020): (1) the Brunhes/Matuyama transition (0.773 Ma) occurs at 228.3 mbsf (CCSF); (2) the top of the Jaramillo Subchron (C1r.1n; 1.008 Ma) is observed at 250.0 mbsf; and (3) the base of the Jaramillo Subchron (1.076 Ma) occurs at 260.5 mbsf. No magnetostratigraphic correlations were possible deeper than 260.5 mbsf (CCFS) due to a combination of degradation of the record by diagenetic alteration and lack of available independent biostratigraphic markers to aid correlation.
7.1. Downhole variations in magnetic characteristics
Remanence measurements were made using the 2G Enterprises Model 760R-4K superconducting rock magnetometer (SRM) system on archive-half section pieces recovered using APC coring in Holes U1599A and U1599B and RCB coring in Hole U1599C. Remanences were measured every 2 cm and were filtered to reject data from points within 8 cm of section ends. This produced a combined site-level data set consisting of natural remanent magnetization (NRM) and alternating field (AF) demagnetization data (after applied fields of 15, 20, and 25 mT) measured at 19,428 intervals downhole. Point MS data obtained from the archive-half sections were also filtered to preserve only data corresponding to the intervals where remanence measurements were made. In addition, 59 discrete samples were subject to AF demagnetization in maximum applied fields of up to 50–100 mT to further constrain magnetic polarities.
Downhole variations in magnetic properties for Holes U1599A, U1599B, and U1599C are shown in Figures F32, F33, and F34, respectively. Declinations of magnetizations are azimuthally unconstrained and show wide variations between cores, as expected. Inclinations are observed to become shallower than the NRM directions following demagnetization, reflecting removal of a ubiquitous drilling-induced remanent magnetization. Variations in inclinations after demagnetization at 25 mT fall into three zones: (1) from 0 to 190 mbsf in Holes U1599A and U1599B, inclinations are consistently positive and close to the expected geocentric axial dipole (GAD) value of 56° for the site (Figures F32, F33); (2) below 190 mbsf in Holes U1599A and U1599B and throughout Hole U1599C, inclinations are widely scattered but dominantly positive; and (3) below 550 mbsf, inclinations are dominantly negative (Figure F34). The significance of these data for magnetostratigraphic dating is discussed further below. Median destructive fields throughout the sampled sequence are typically 10–25 mT, indicating dominance of low-coercivity magnetic minerals.
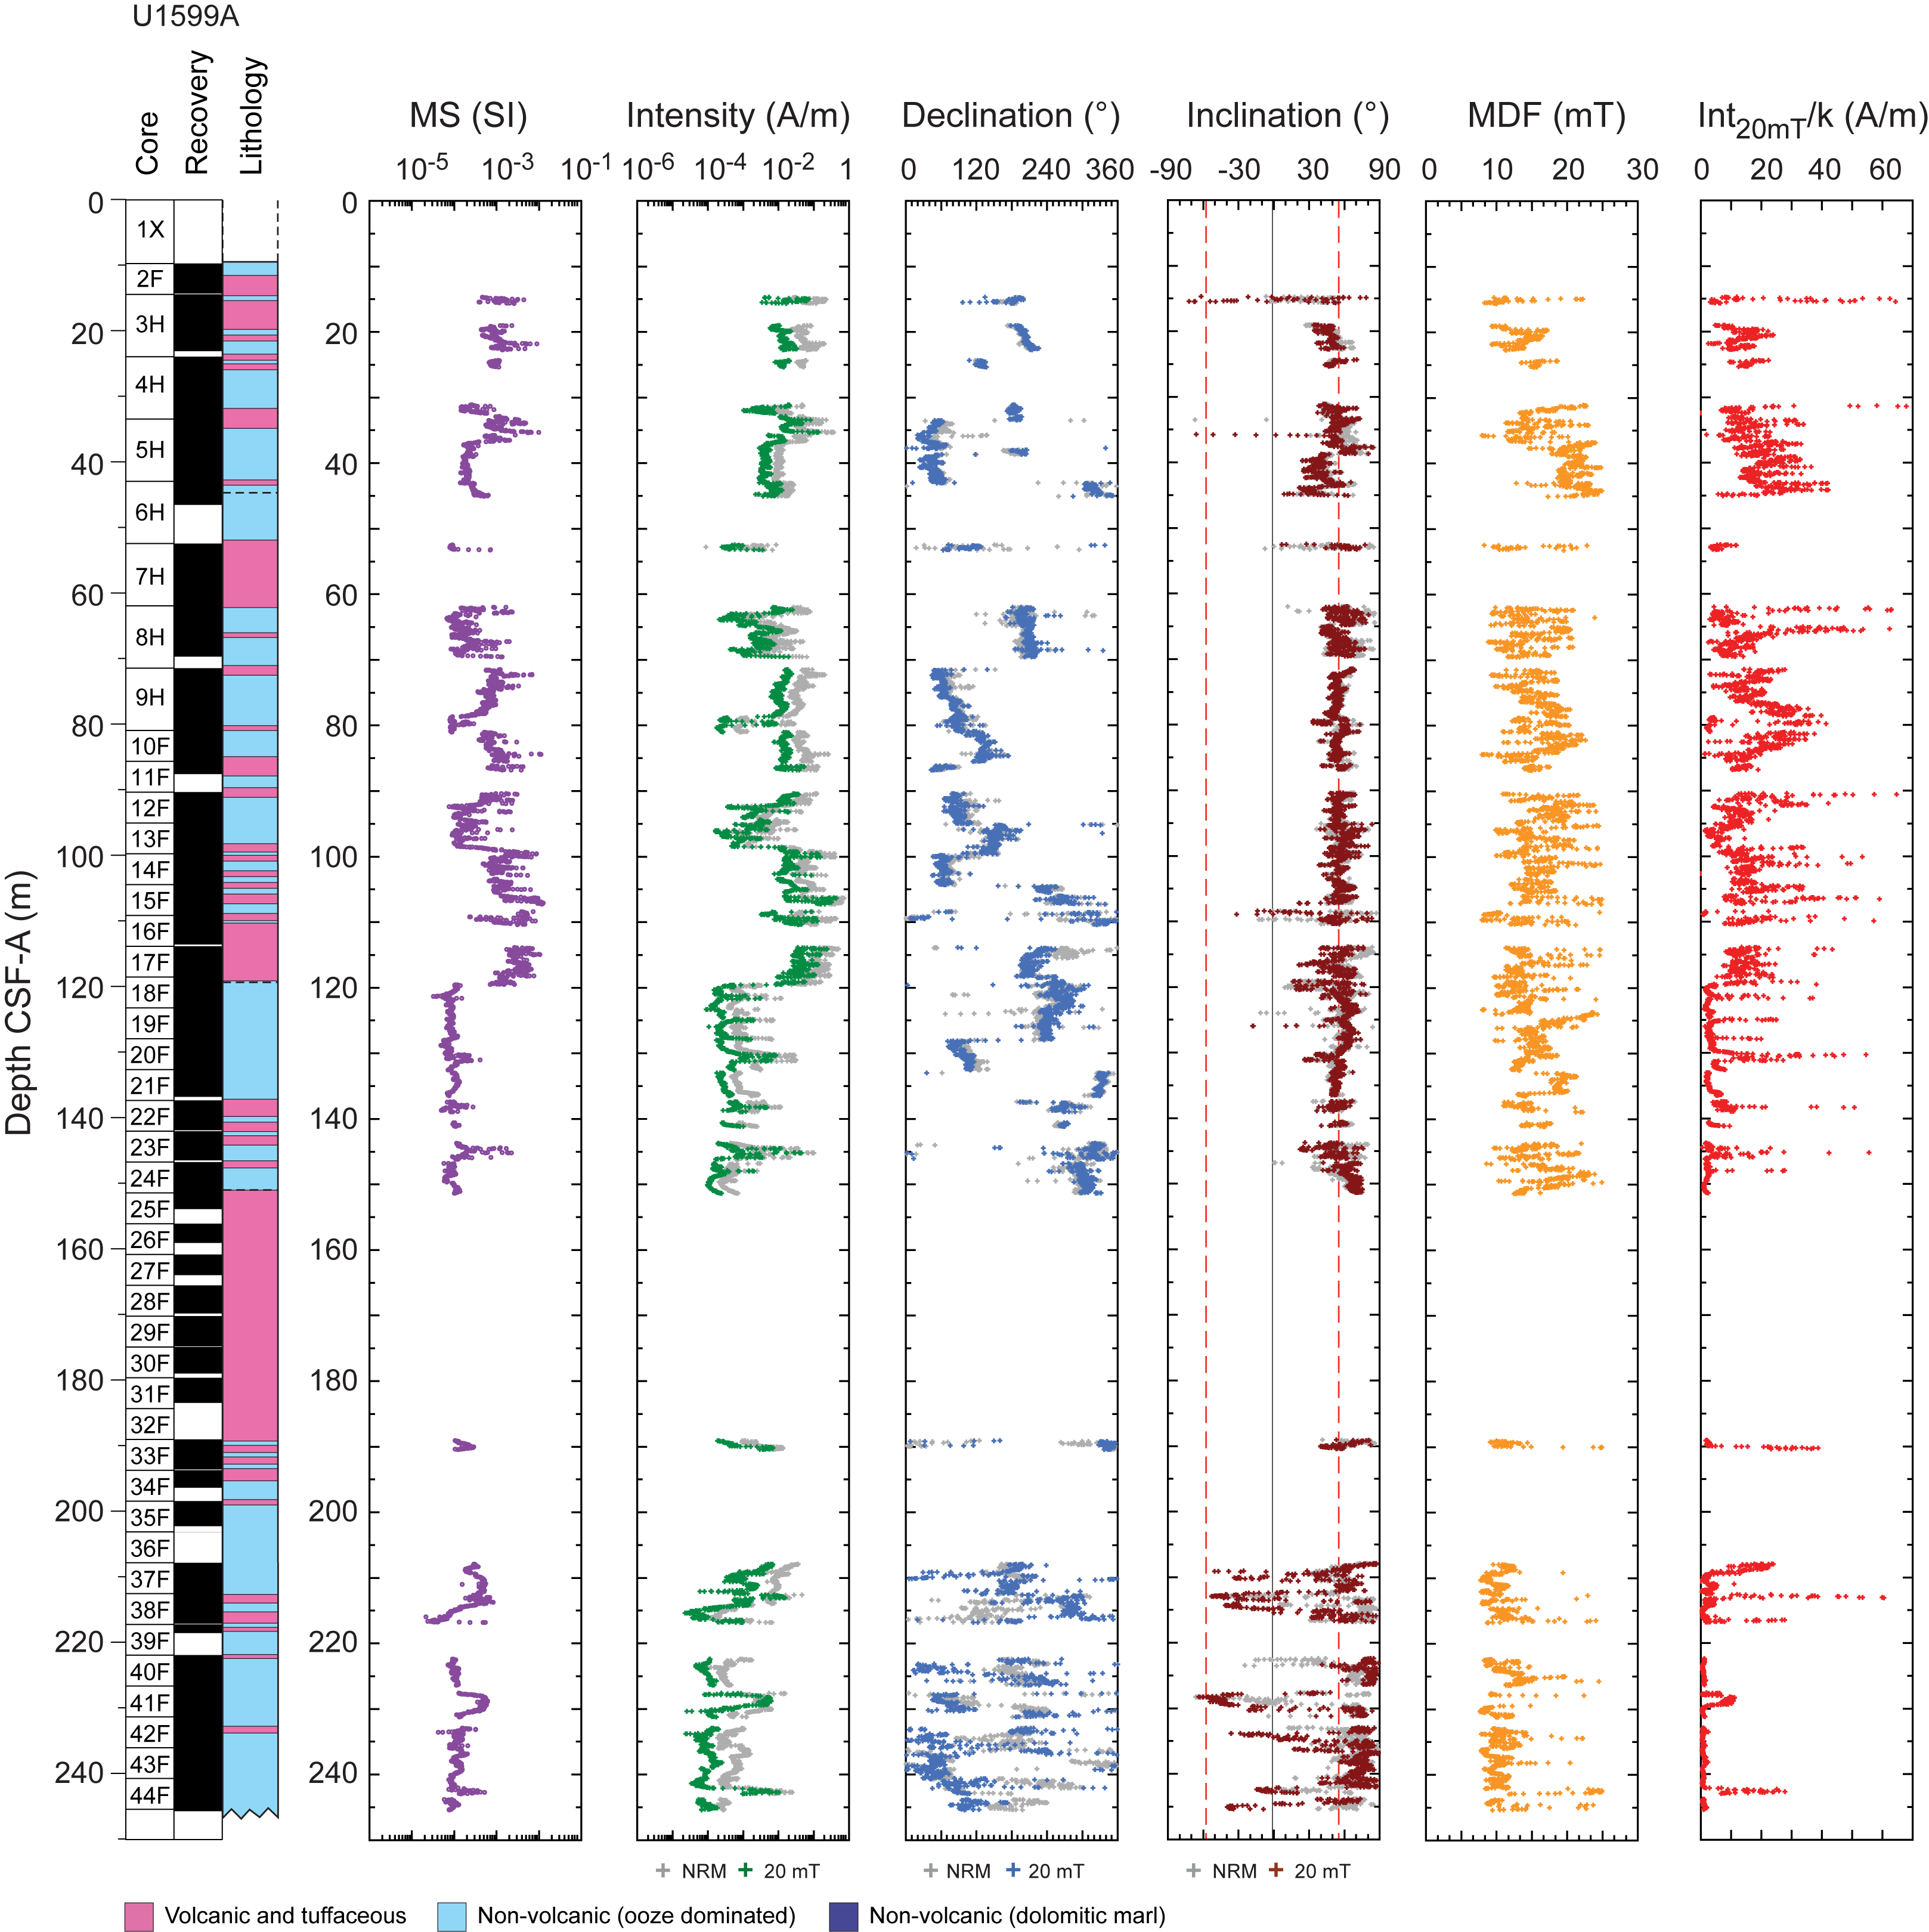
Figure F32. Magnetic data, Hole U1599A.
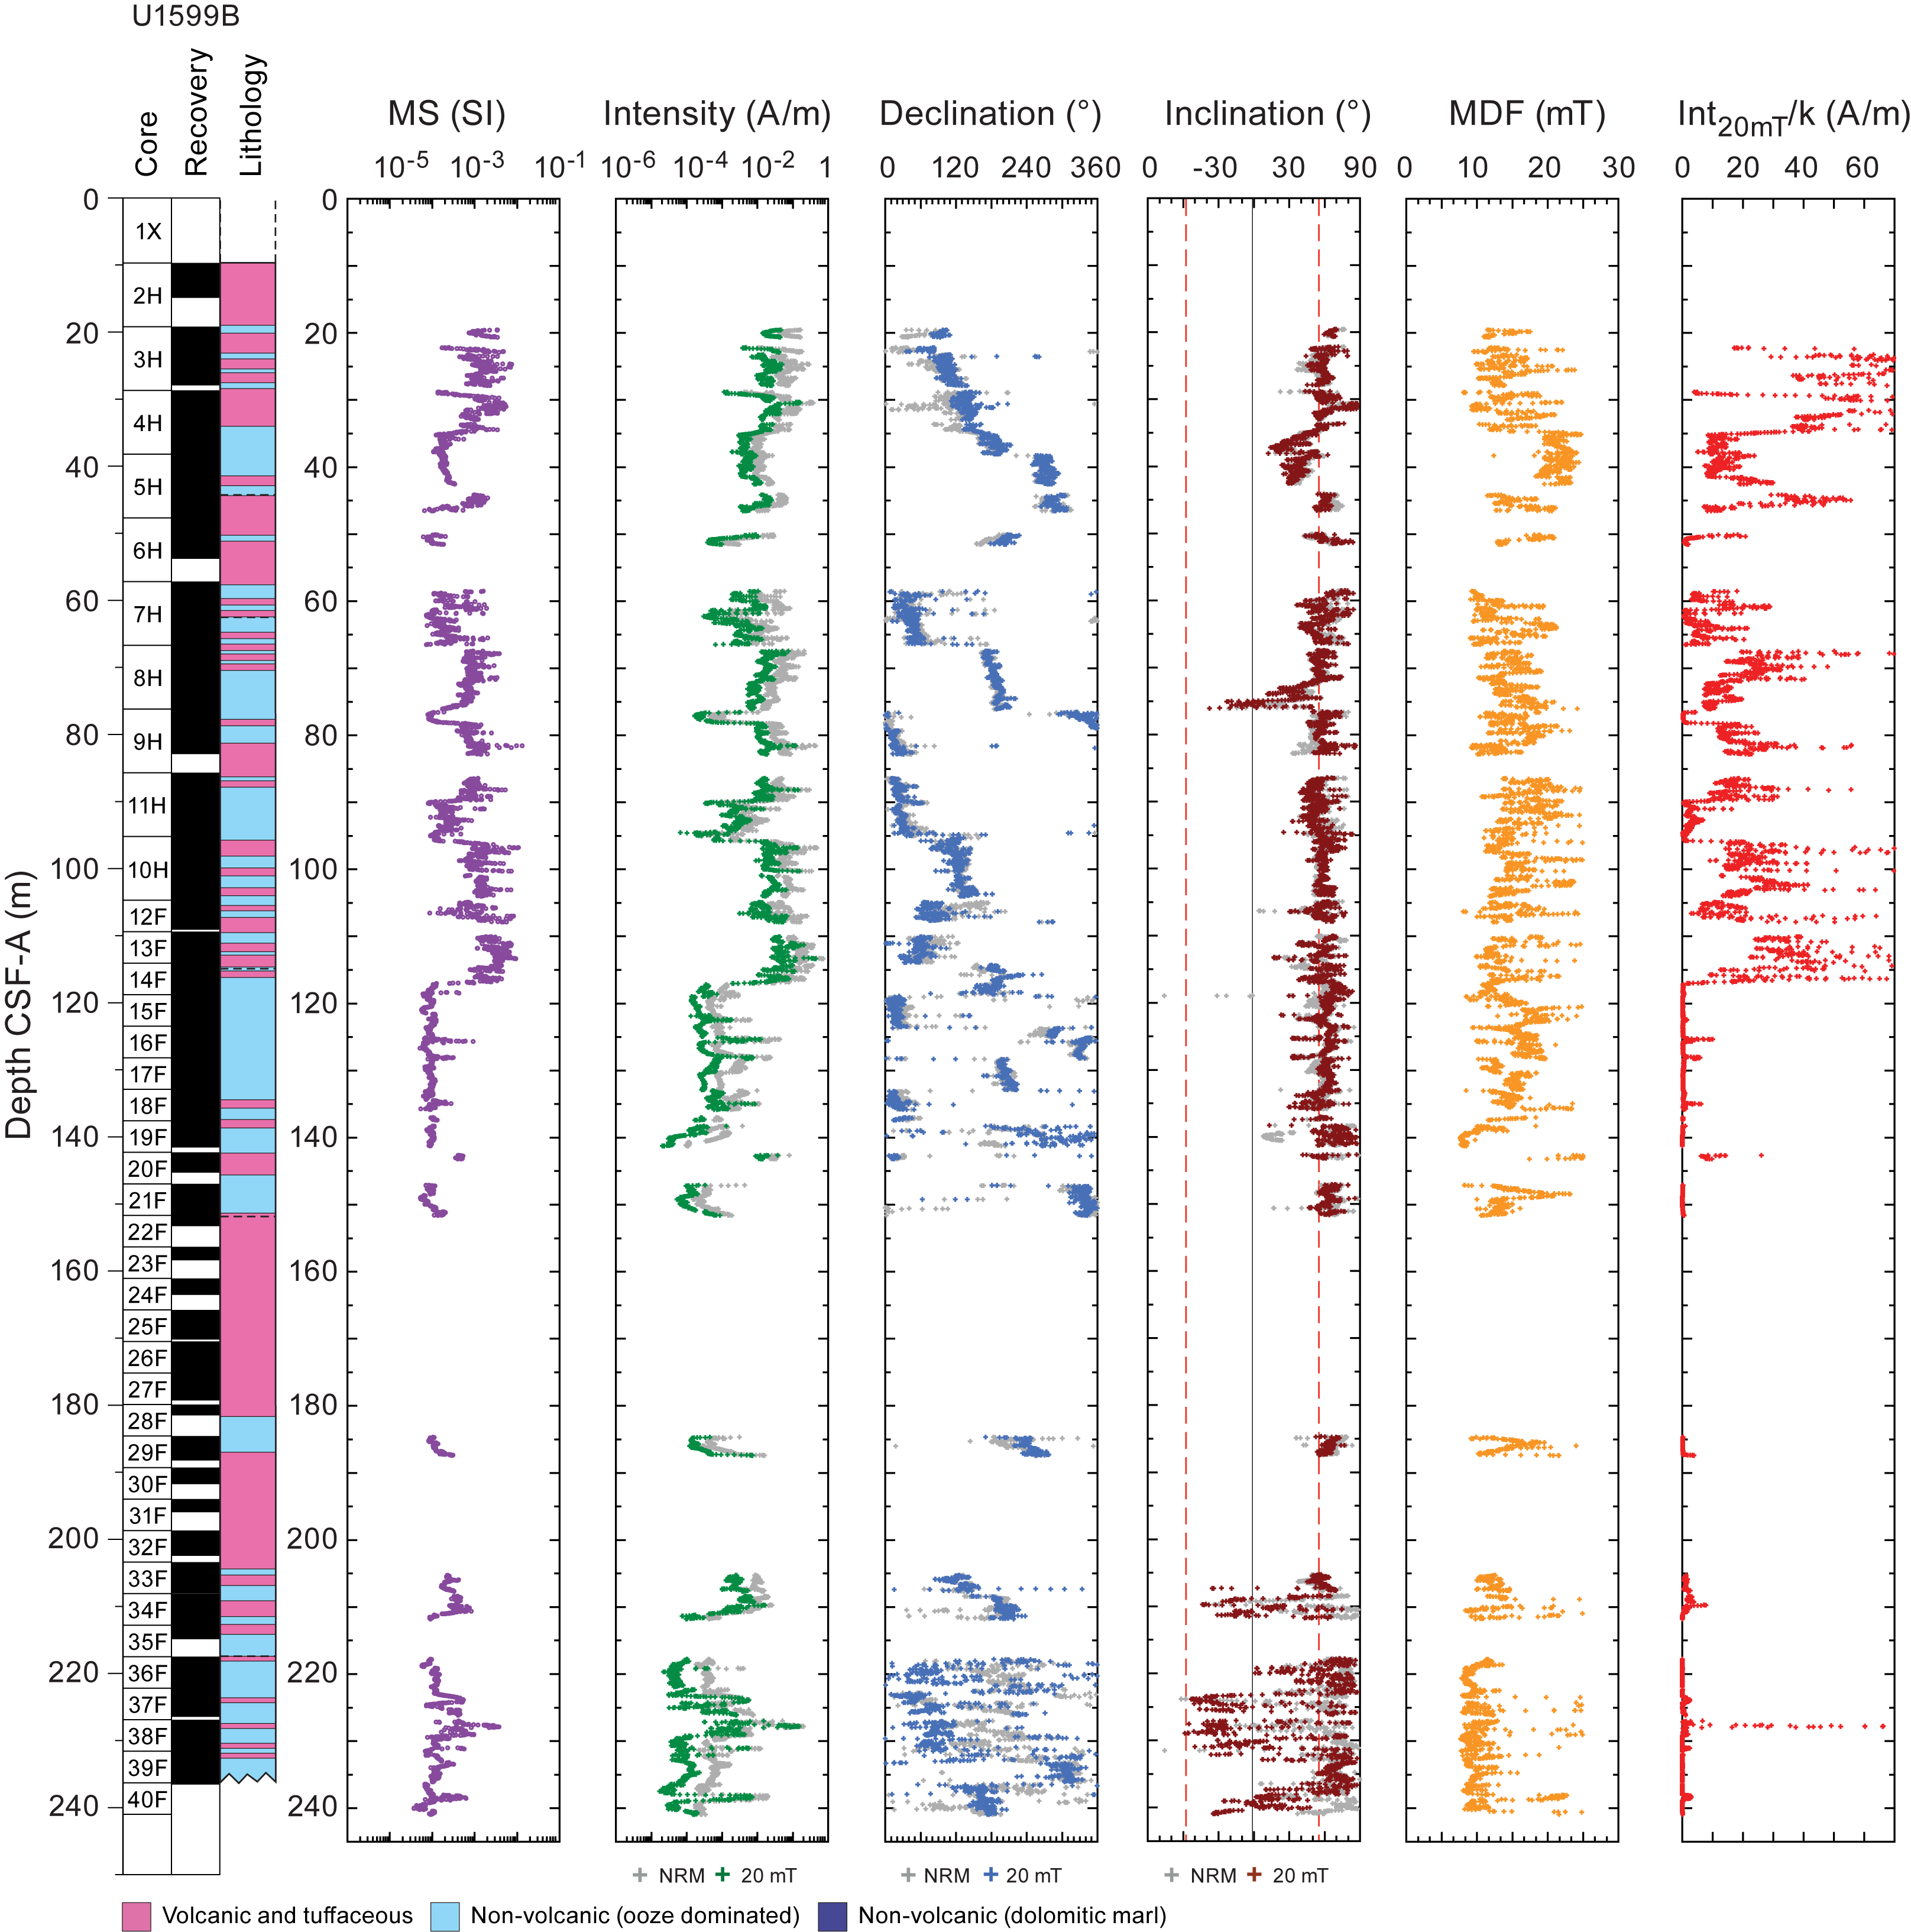
Figure F33. Magnetic data, Hole U1599B.
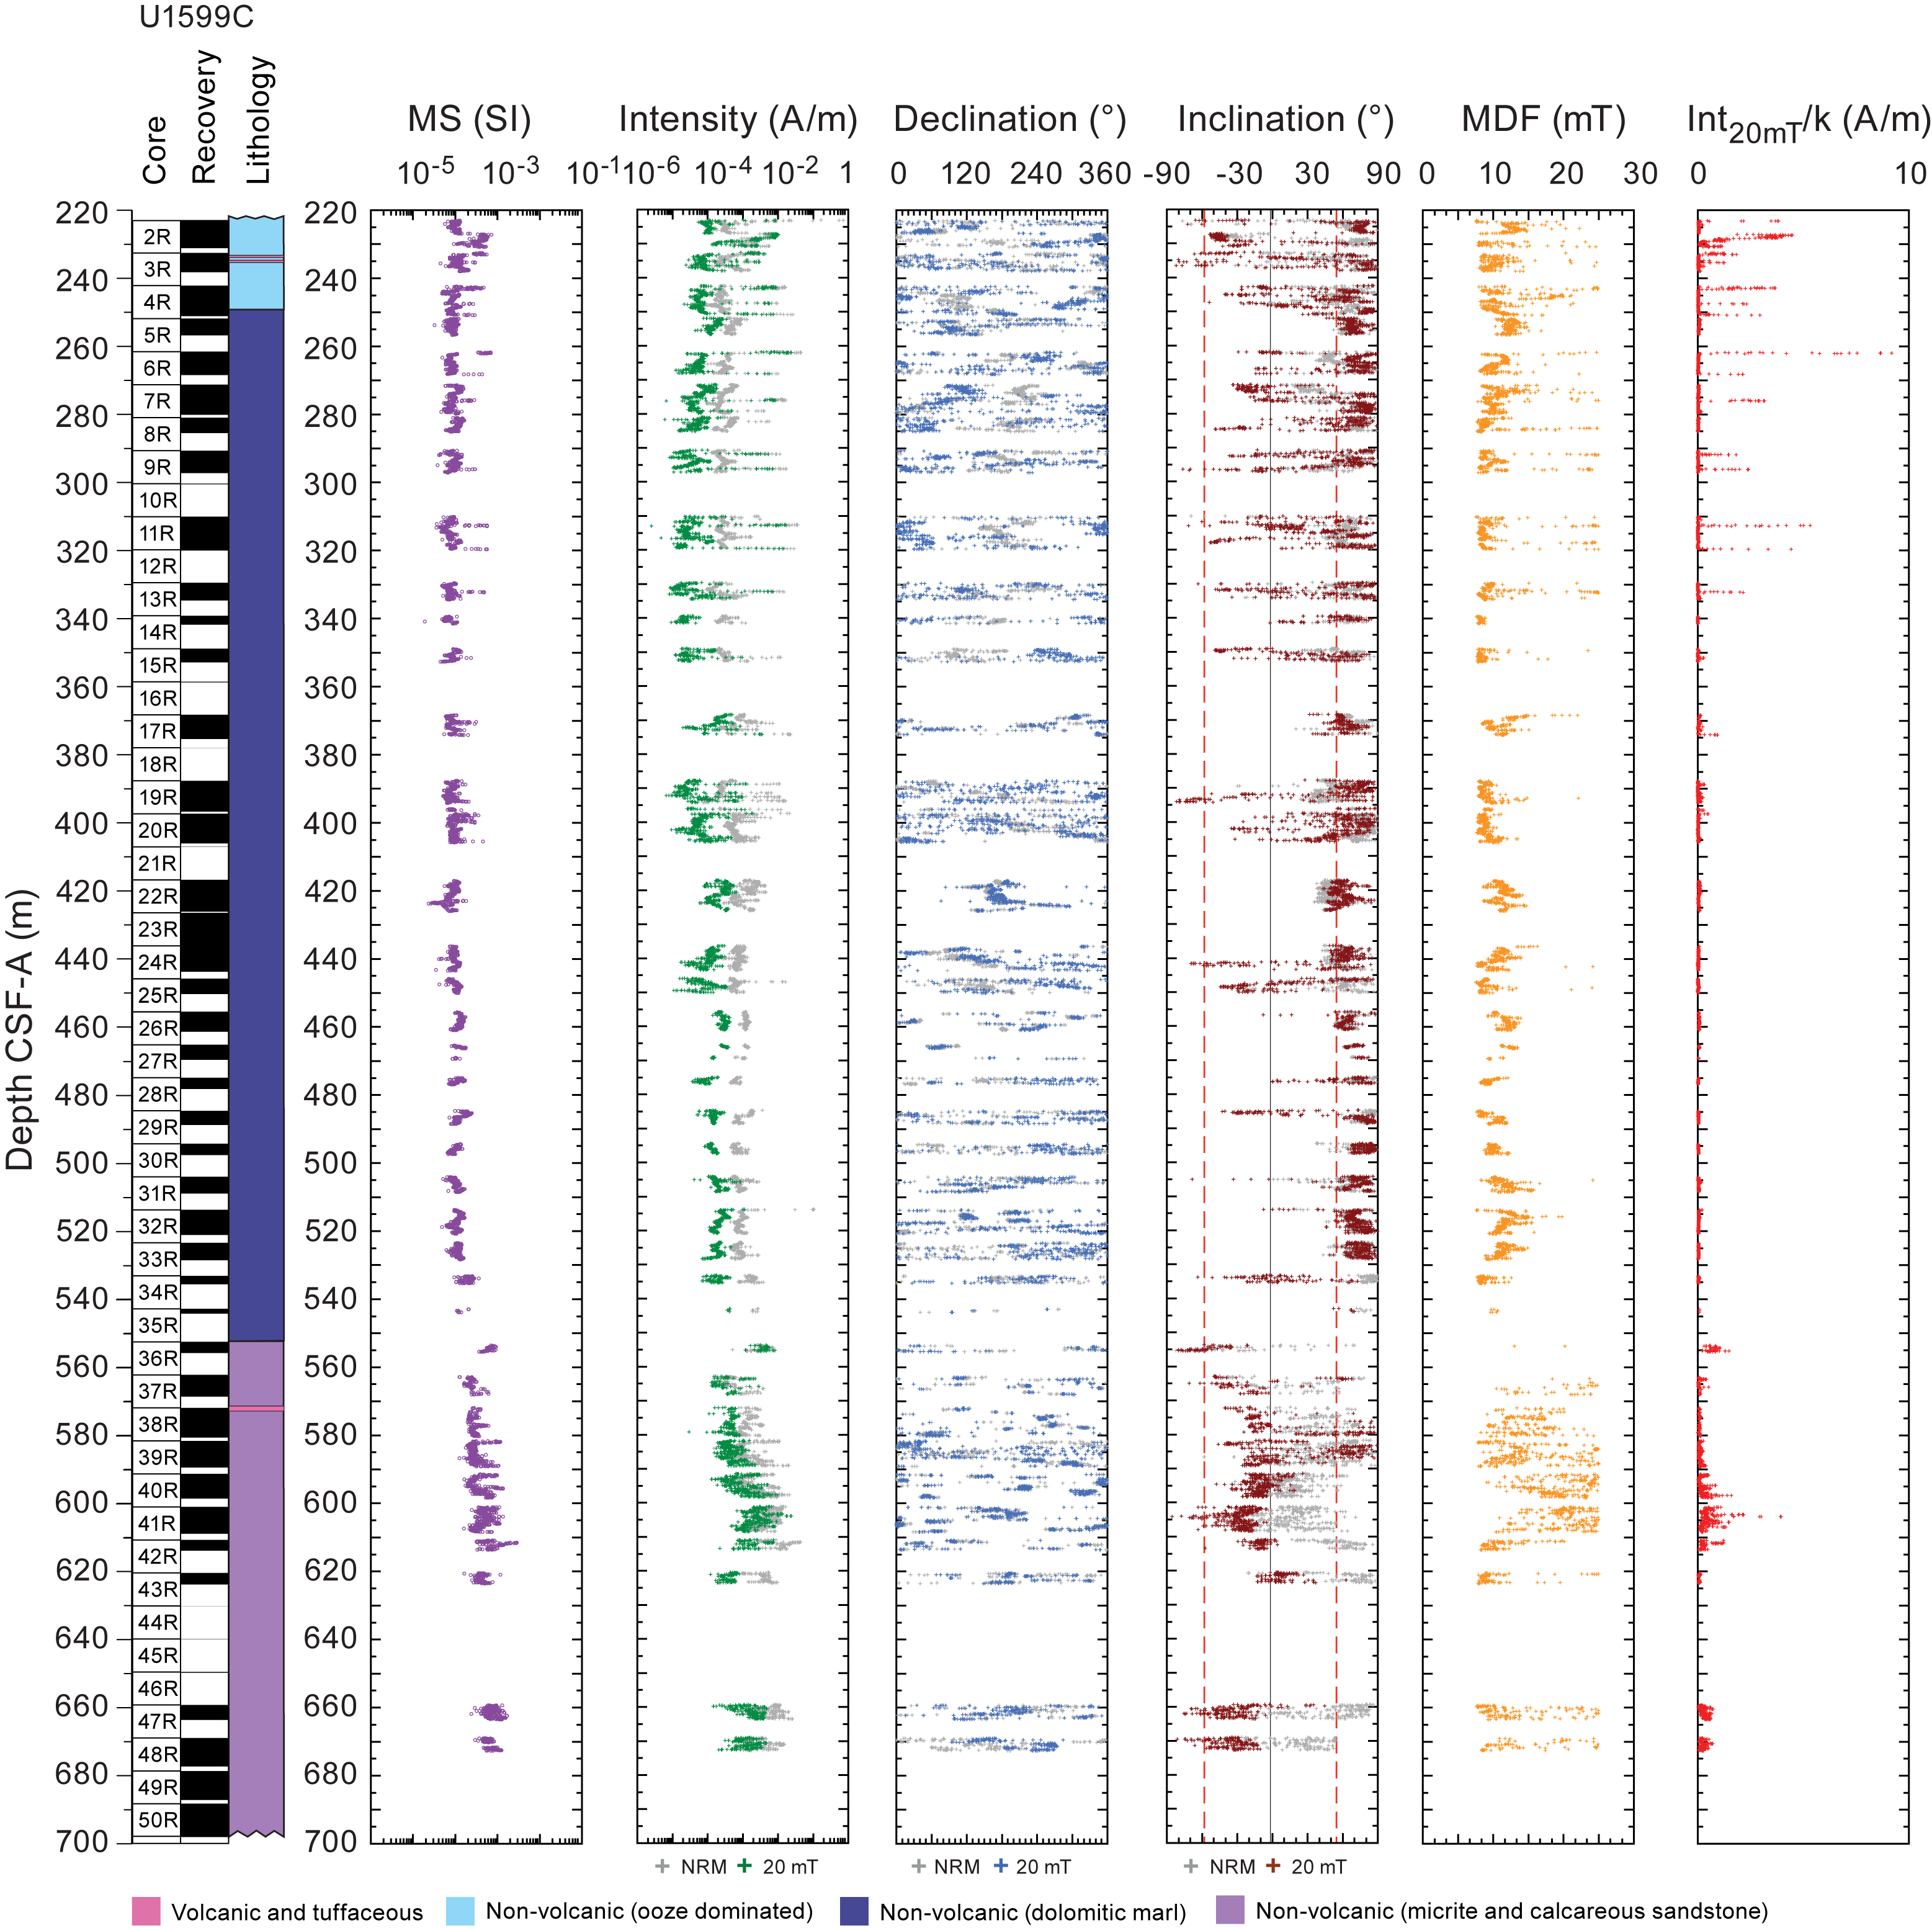
Figure F34. Magnetic data, Hole U1599C.
We applied an automated principal component analysis (PCA) approach to analyze archive-half section data acquired at higher AF demagnetization steps to identify samples displaying linear decay toward the origin during demagnetization (see Paleomagnetism in the Site U1591 chapter [Druitt et al., 2024b]). This involved comparing free-fitting and anchored PCA directions through the 15, 10, and 25 mT step remanences calculated with PuffinPlot software and accepting only those free-fitting PCAs with maximum angular deviations <15° that differ by <15° from the corresponding anchored PCAs. The resulting PCA data set represents the highest quality inclination estimates obtained in each of the holes sampled at Site U1599. We also calculated the Fisher mean directions of the remanences measured at each interval downhole after demagnetization at 15, 20, and 25 mT. For samples where no valid PCA was found, we accepted those Fisher mean directions with precision parameters >15 and α95 cones of confidence <15°. Samples that yielded neither statistically acceptable PCAs nor Fisher mean directions were represented in the final site database by their 25 mT step inclinations. The combination of these three different estimates of inclinations downhole was then used to attempt correlation to the GPTS after converting from the CSF-A to the CCSF depth scale to allow results from all three holes to be placed on a common depth scale.
7.2. Correlations with the geomagnetic polarity timescale
The uppermost 228 m (CCSF) of the sampled sequence carries normal polarity remanences acquired during the Brunhes Chron (C1n; 0–0.773 Ma; Gradstein et al., 2020) (Figure F35). The Brunhes/Matuyama transition is placed at 228 mbsf (Figure F36), with the reversely magnetized interval 228–250 mbsf assigned to Chron C1r.1r (0.773–1.008 Ma; Gradstein et al., 2020). The Jaramillo Subchron (1.008–1.076 Ma; Gradstein et al., 2020) is present at 250–260.5 mbsf (Figure F36). Beneath this, the interval 260.5 to ~360 mbsf (Figures F36, F37) shows scattered positive and negative inclinations that cannot be tied to the GPTS, probably reflecting disruption of the primary magnetic signal by diagenetic alteration. Inclinations in interval ~360–530 mbsf are of normal polarity and cluster around the expected GAD field inclination of +56° (Figure F37). However, biostratigraphic markers suggest that this depth interval should correlate with reversed polarity Chrons C1r.3r, C2r.1r, and C2r.2r, again suggesting remagnetization during diagenesis. Finally, consistently negative inclinations observed in interval 550–674 mbsf (Figure F37) indicate that this interval carries reversed magnetization, but the lack of a reliable magnetostratigraphy above this zone and absence of biostratigraphic markers below 543 mbsf make correlation of this reversed interval with the GPTS impossible.
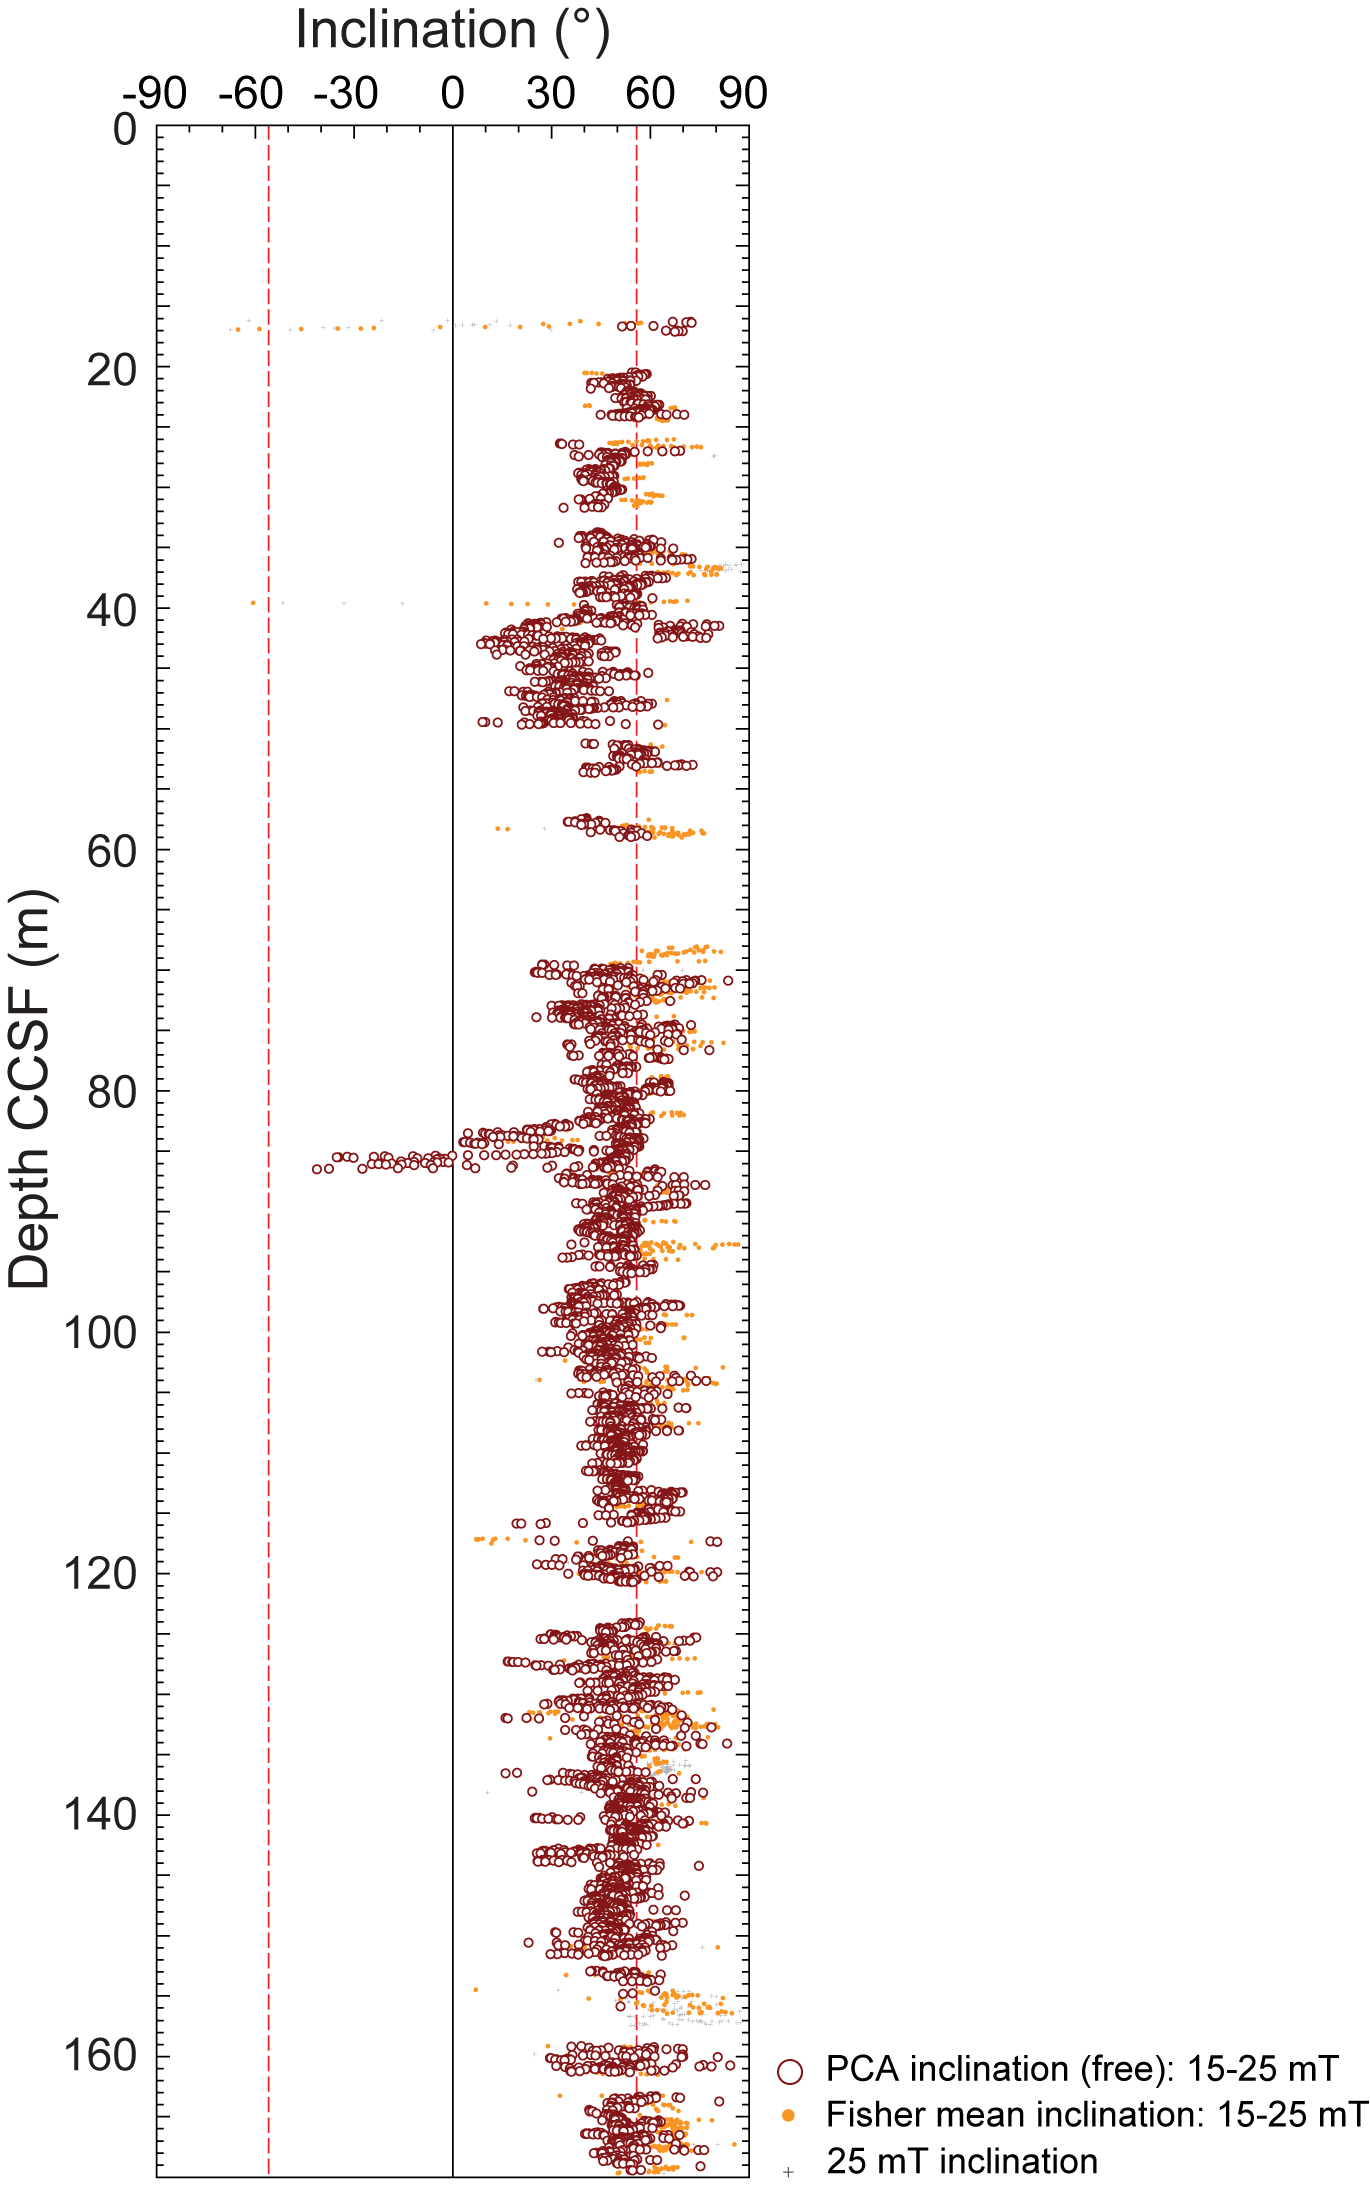
Figure F35. Magnetic inclinations.
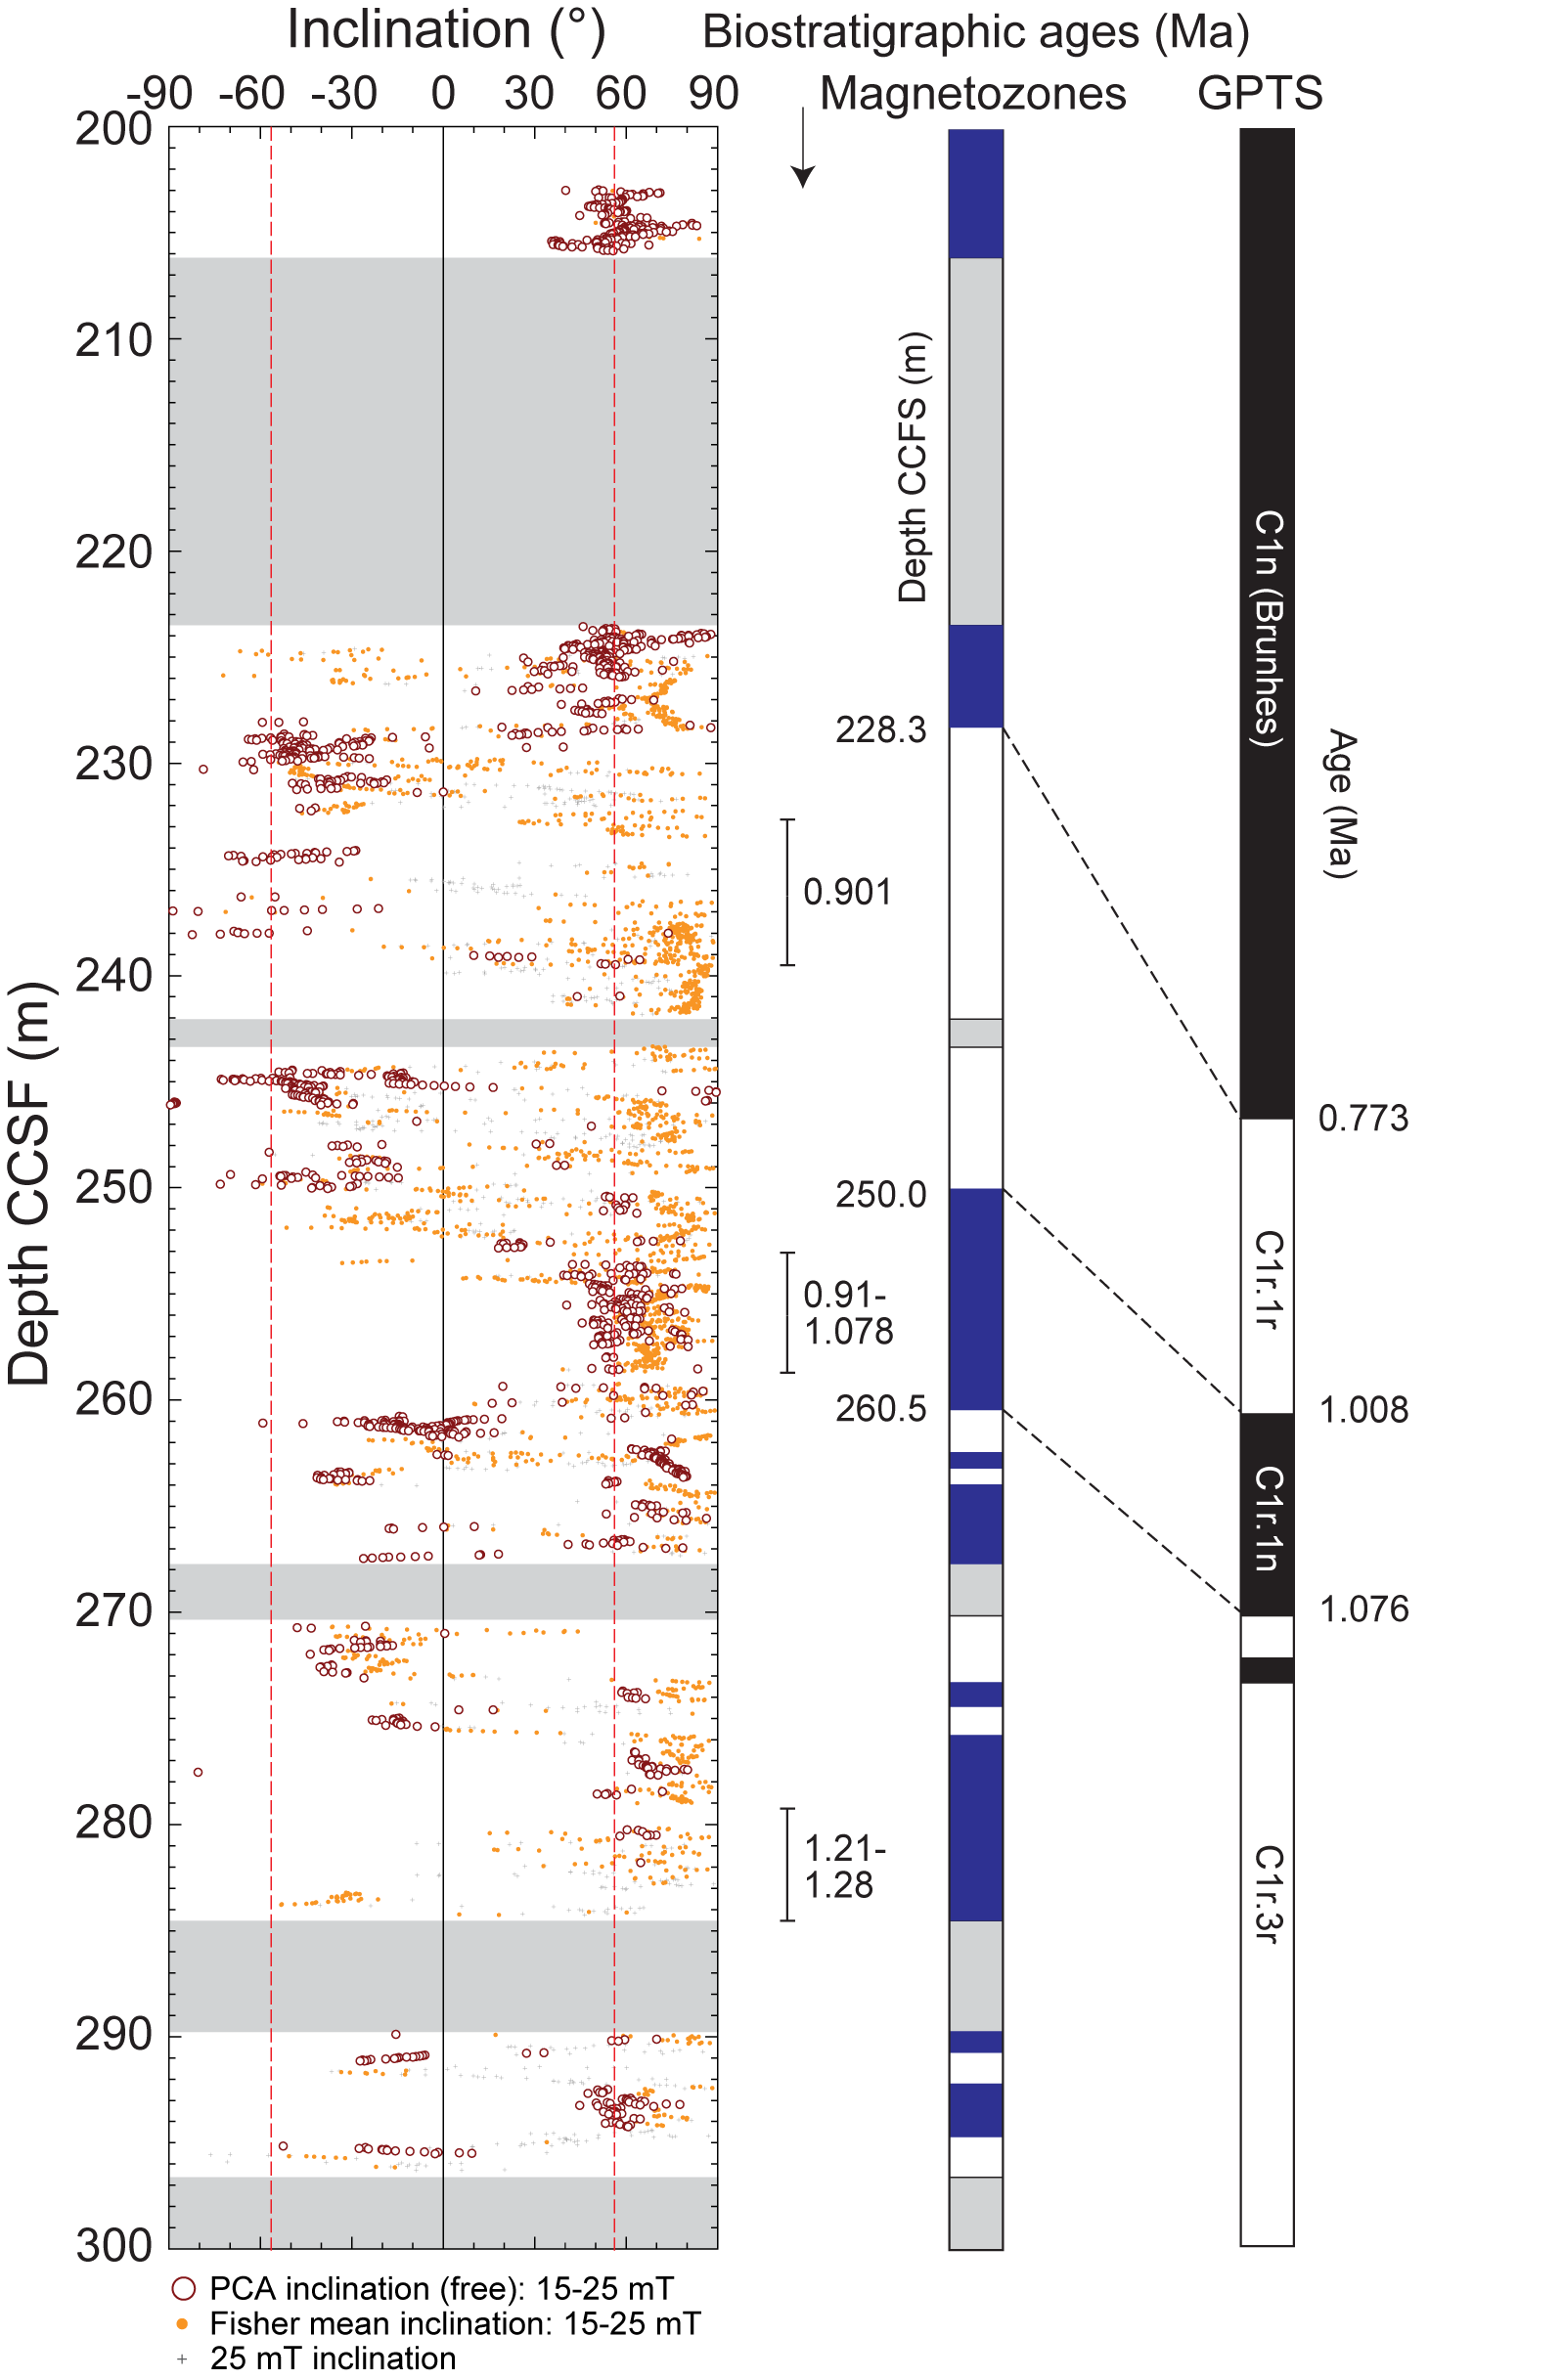
Figure F36. Magnetic inclinations, 200-300 mbsf.
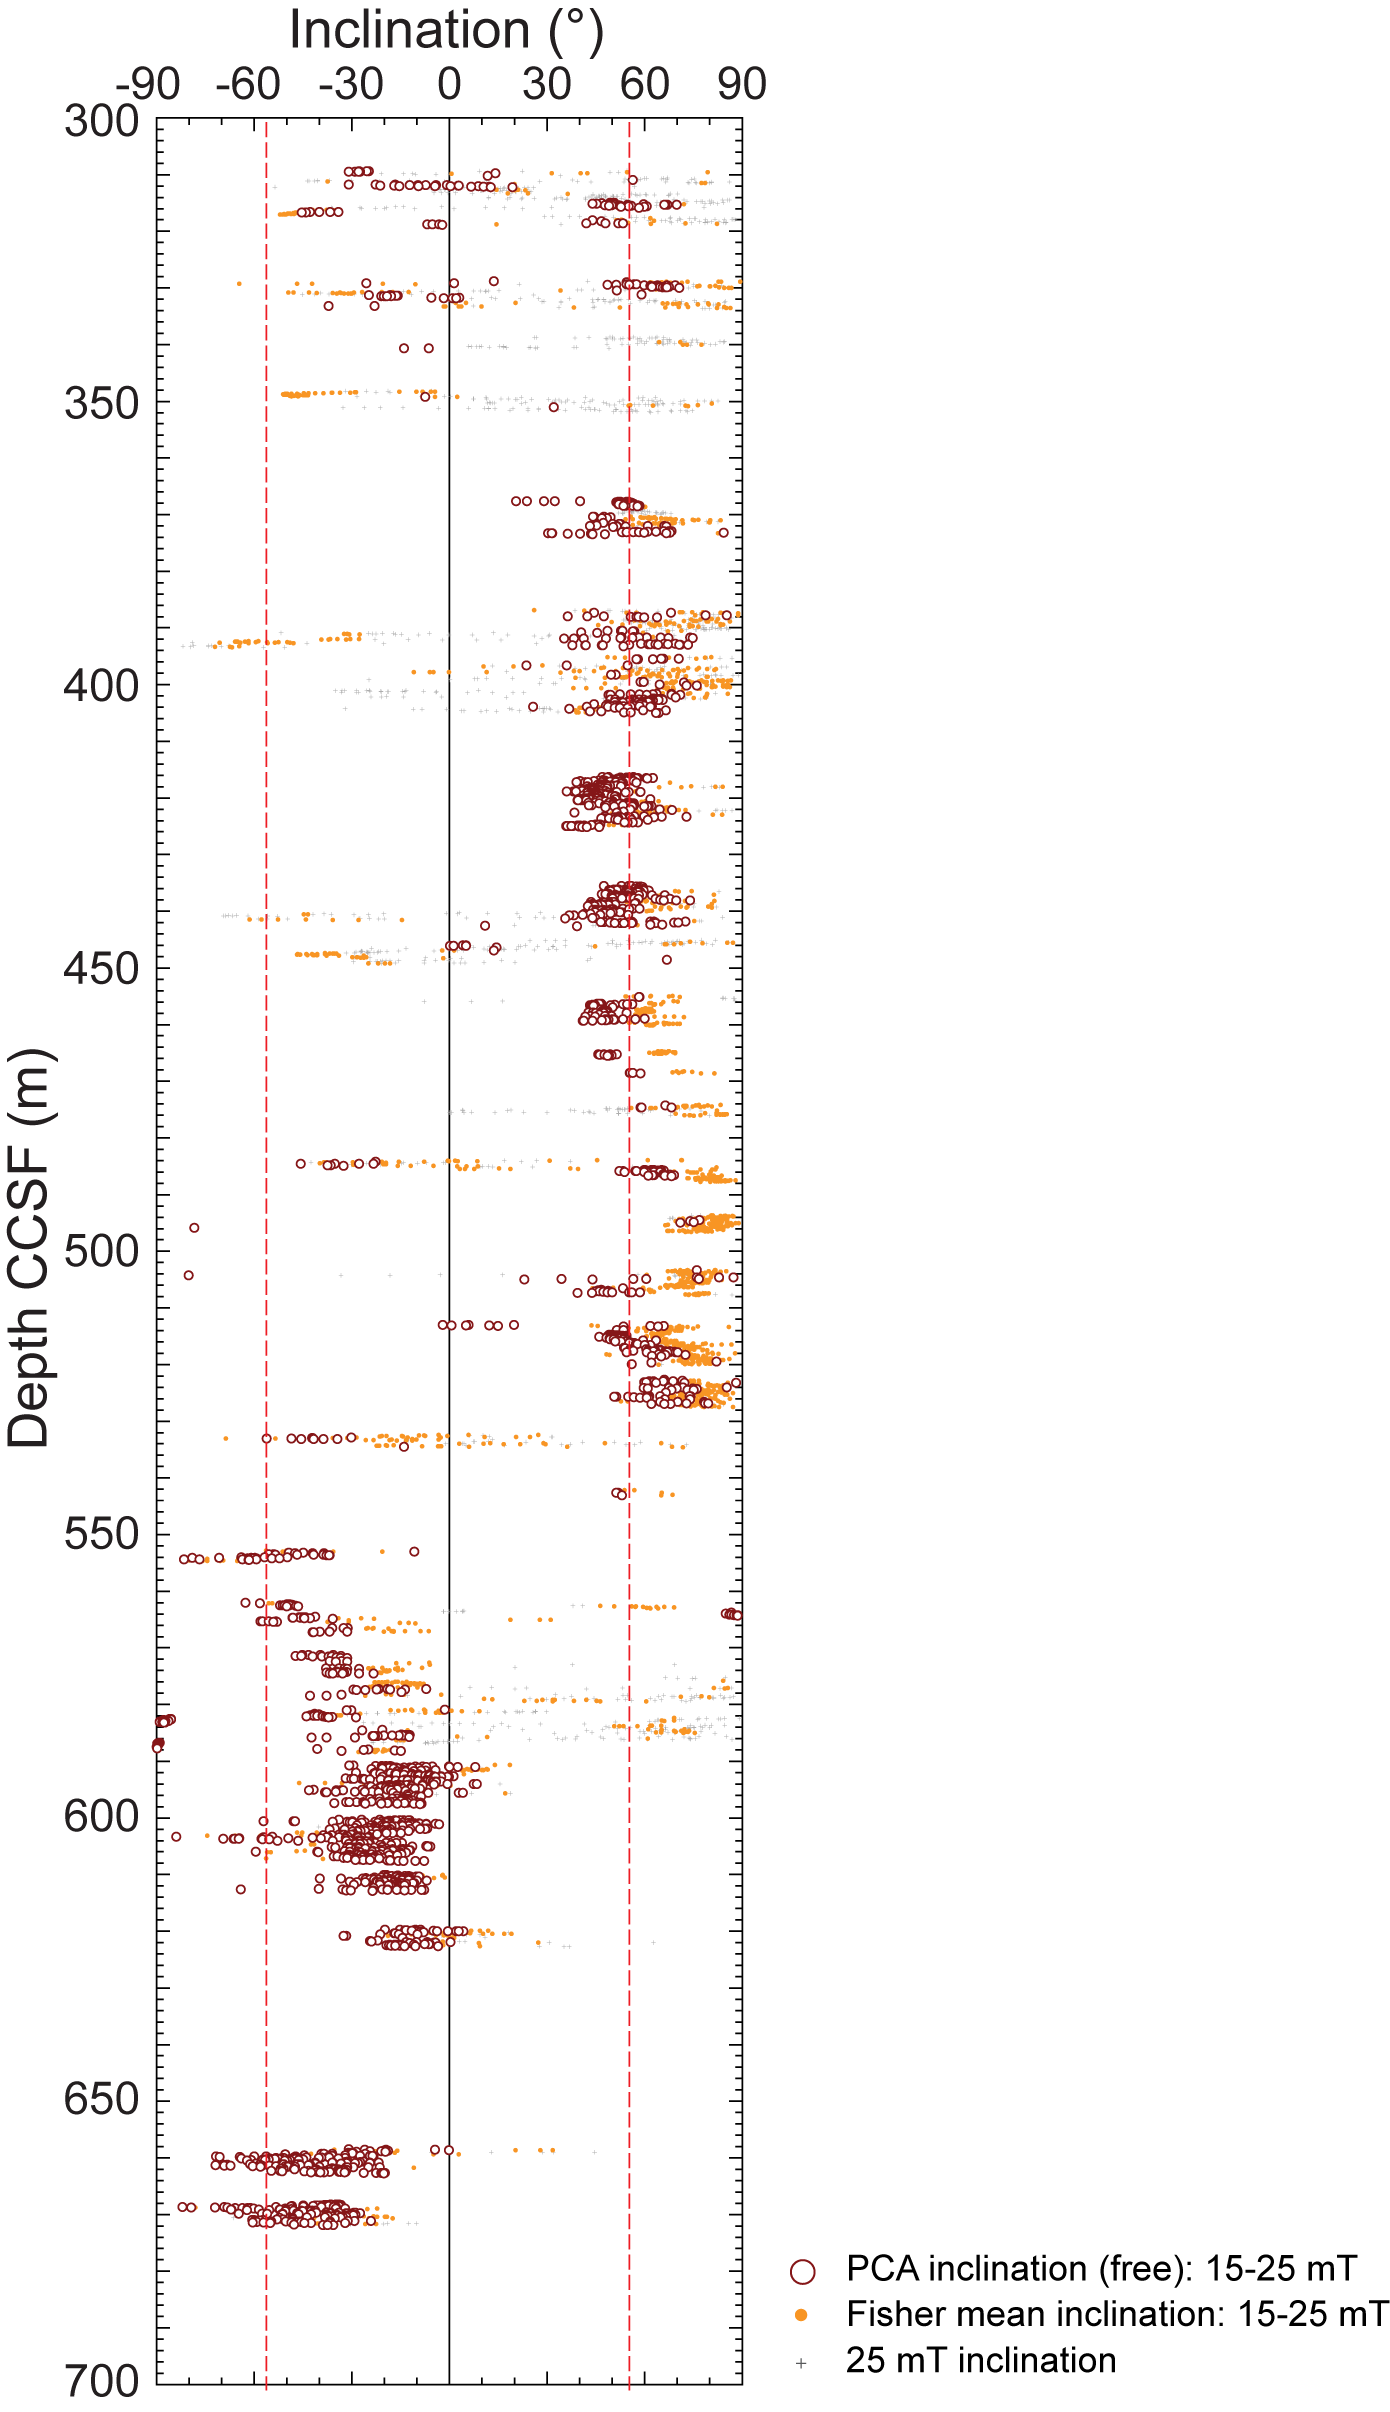
Figure F37. Magnetic inclinations, 300-700 mbsf.
8. Physical properties
There is a general trend of increasing P-wave velocity, bulk density, and thermal conductivity with increasing depth at Site U1599. MS is highly variable in volcaniclastic layers of Lithostratigraphic Units I and II, and it is sometimes very high. Grain densities in volcanic lapilli layers of Unit I are sometimes <2.0 g/cm3. The dolomitic marls of Unit III have low MS, and P-wave velocity increases systematically with increasing depth except for a sandy interval where P-wave velocity decreases slightly before increasing more gradually with increasing depth. In the micrites of Unit IV, MS is higher than in Unit III and P-wave velocity increases with increasing depth.
8.1. Whole-round GRA density, MS, P-wave velocity, and NGR
Figure F38 summarizes data collected on whole-round cores measured on the GRA densitometer, MS loop, and P-wave logger on the WRMSL, as well as NGR. All cited depths are on the CSF-A scale. A few possible systematic sources of error in these data should be considered when interpreting absolute values and trends.
- Redistribution of unconsolidated volcaniclastic materials in core liners during APC coring and on the core receiving platform can lead to sorting by particle size and density.
- APC cores often contained large amounts of water. As a result, WRMSL measurements of bulk density are systematically lower than discrete measurements at this site.
- Whole-round measurements in sections that match discrete measurement values on split cores are thus most reliable.
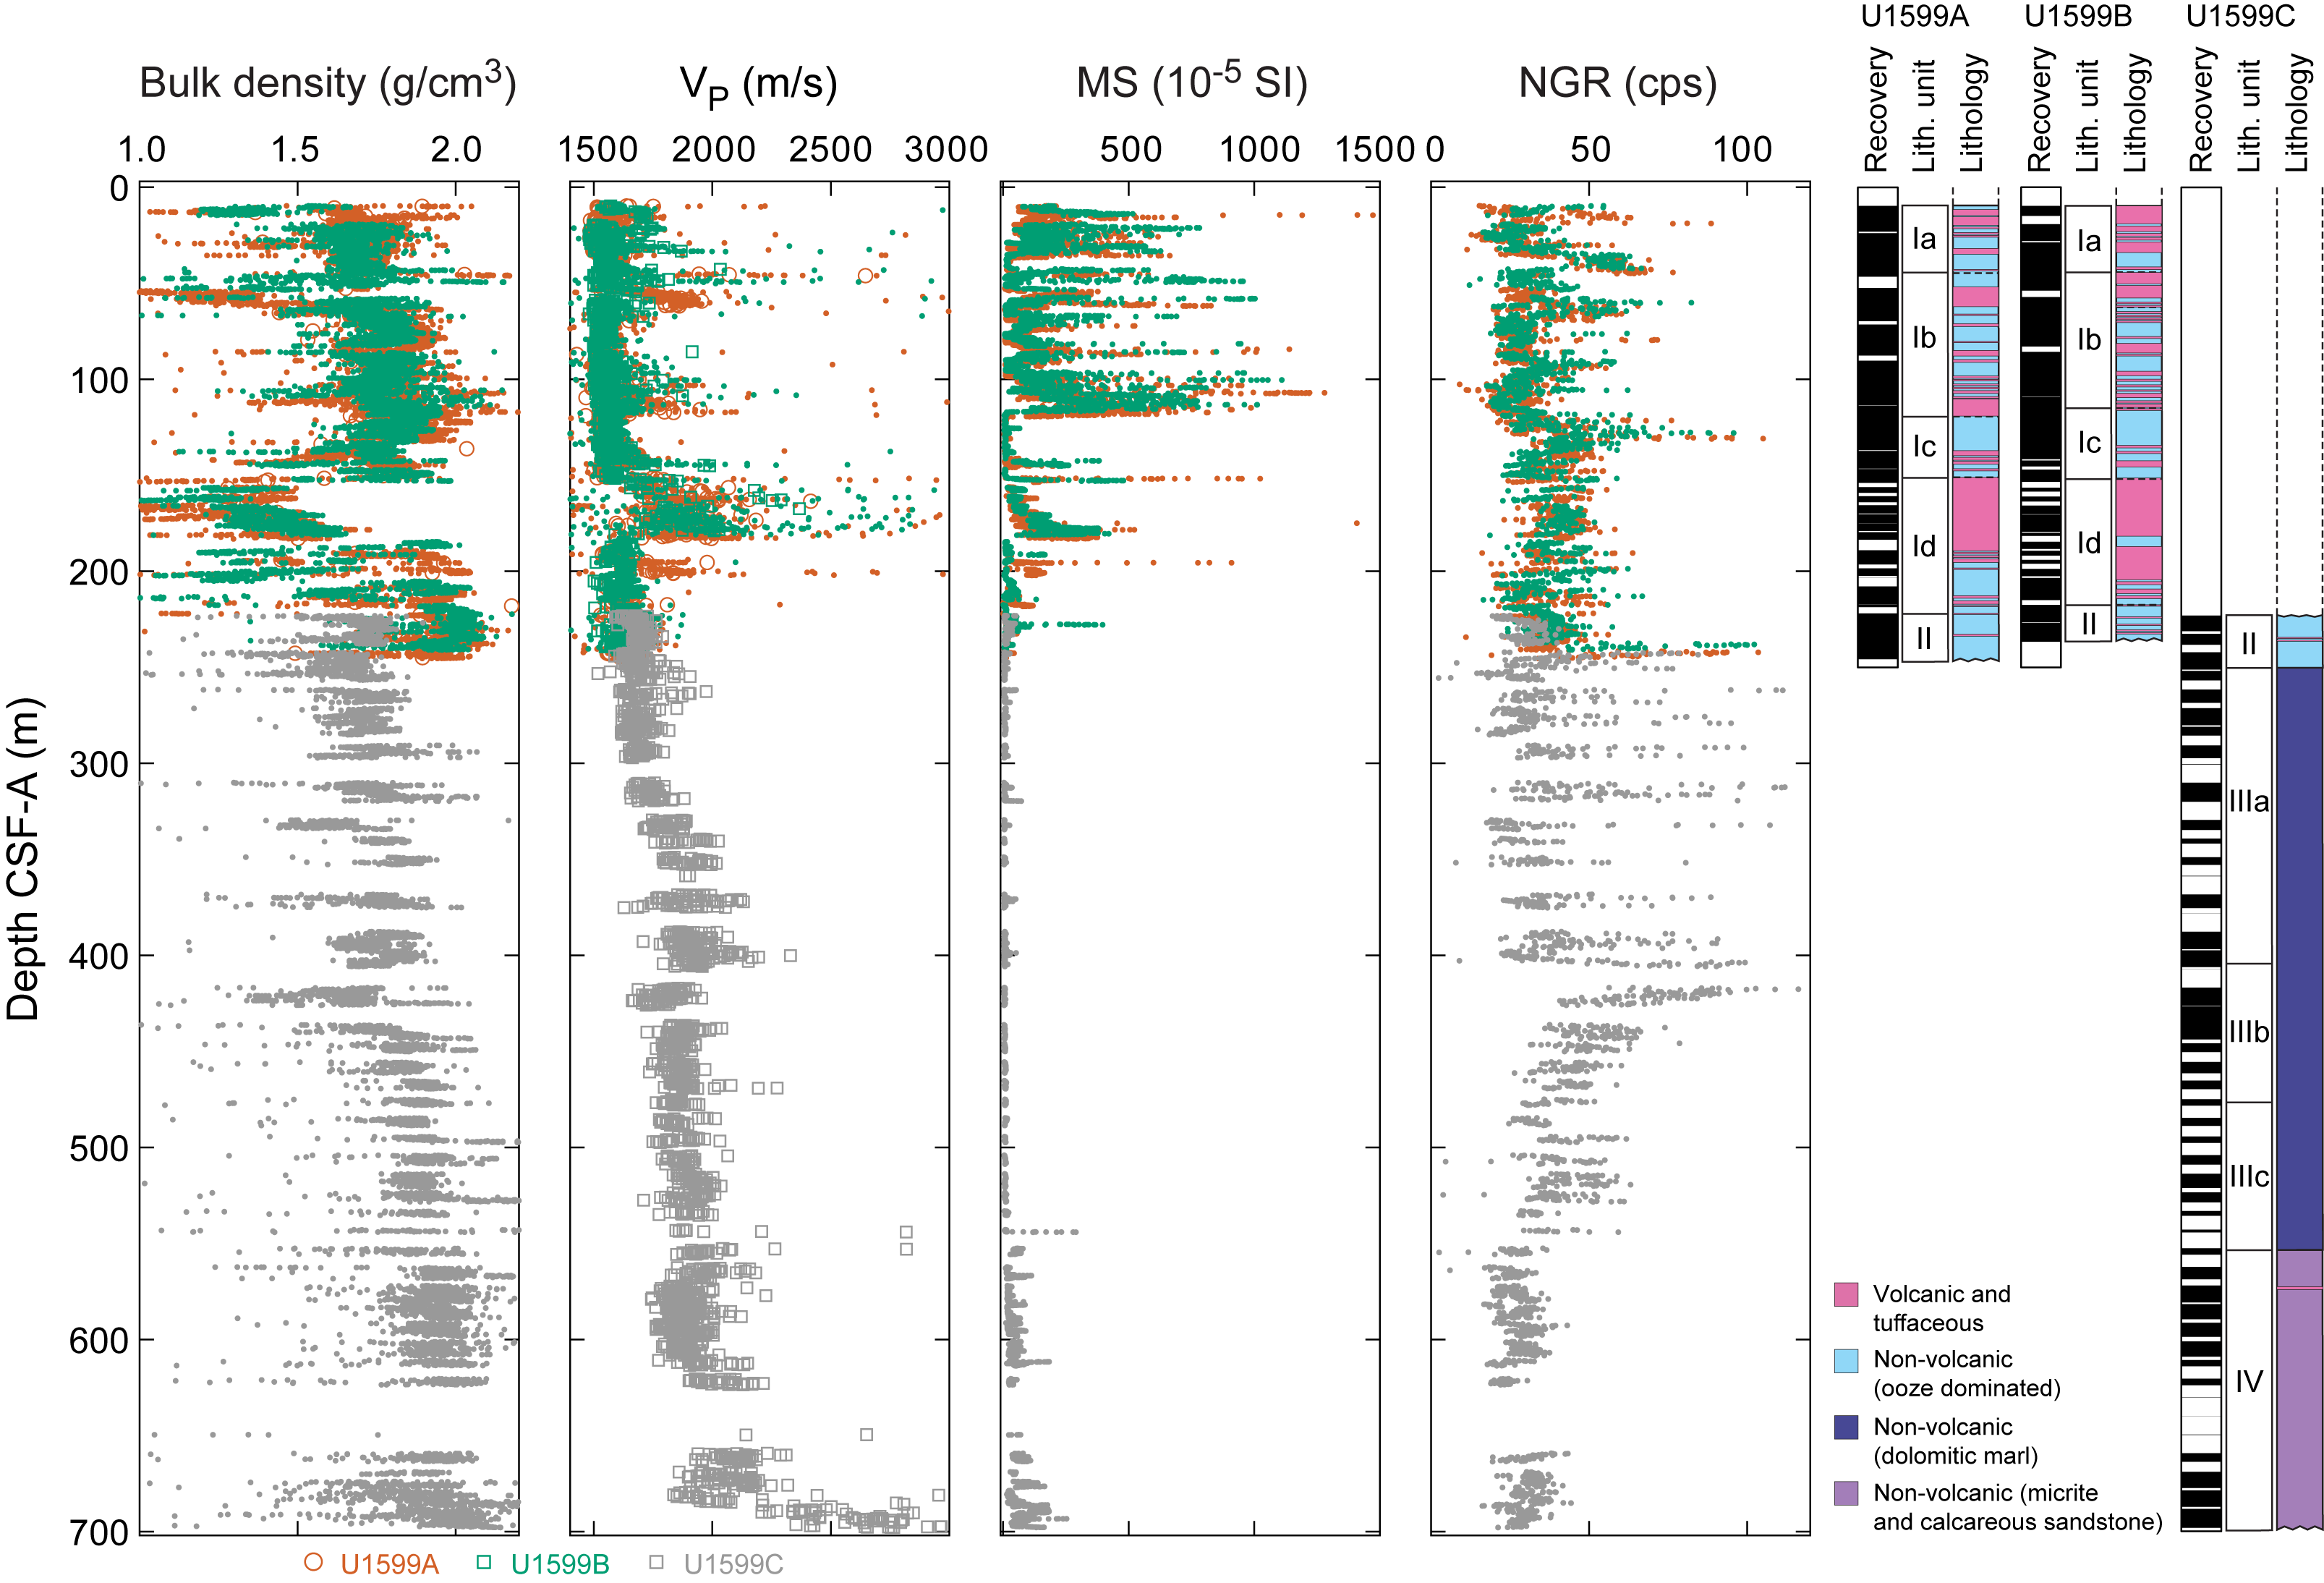
Figure F38. Physical properties.
To assess the role of possible disturbance to sediment properties while the core is waiting to be measured, an experiment was undertaken on a typical section containing pumice lapilli. The chosen section does not show the obvious sign of redistribution in the form of an along-section gradient in density (i.e., the pattern in bulk density seen in Figure F40 in the Site U1592 chapter [Kutterolf et al., 2024b]). Section 398-U1599B-27F-2 was passed through the WRMSL 10 min after the core was divided into sections on the catwalk. The section was then twice passed through the WRMSL 14 h later, with the two repeat measurements separated by 9 min. WRMSL GRA bulk density and MS are shown in Figure F39. During the 14 h interval, the section was stored horizontally and subjected only to the motion of the ship. After the 14 h of repose, one interval of low bulk density had increased in density, and overall there is slightly less variability in density along the section. There is no change in MS, suggesting that the source of MS is mainly minerals contained within pumice lapilli that were too large to be easily redistributed laterally. However, fine-grained ash (glass) with lower MS and higher bulk density than lapilli were able to be redistributed laterally through the framework of larger clasts as the whole core section was repeatedly tilted or handled during transport between instruments and the storage rack. The along-section variation in bulk density was therefore altered without affecting the variation in MS. This experiment highlights that in addition to typical drilling disturbance, physical properties of unconsolidated volcaniclastic material can also potentially be altered by motion of the ship and core handling prior to measurement.
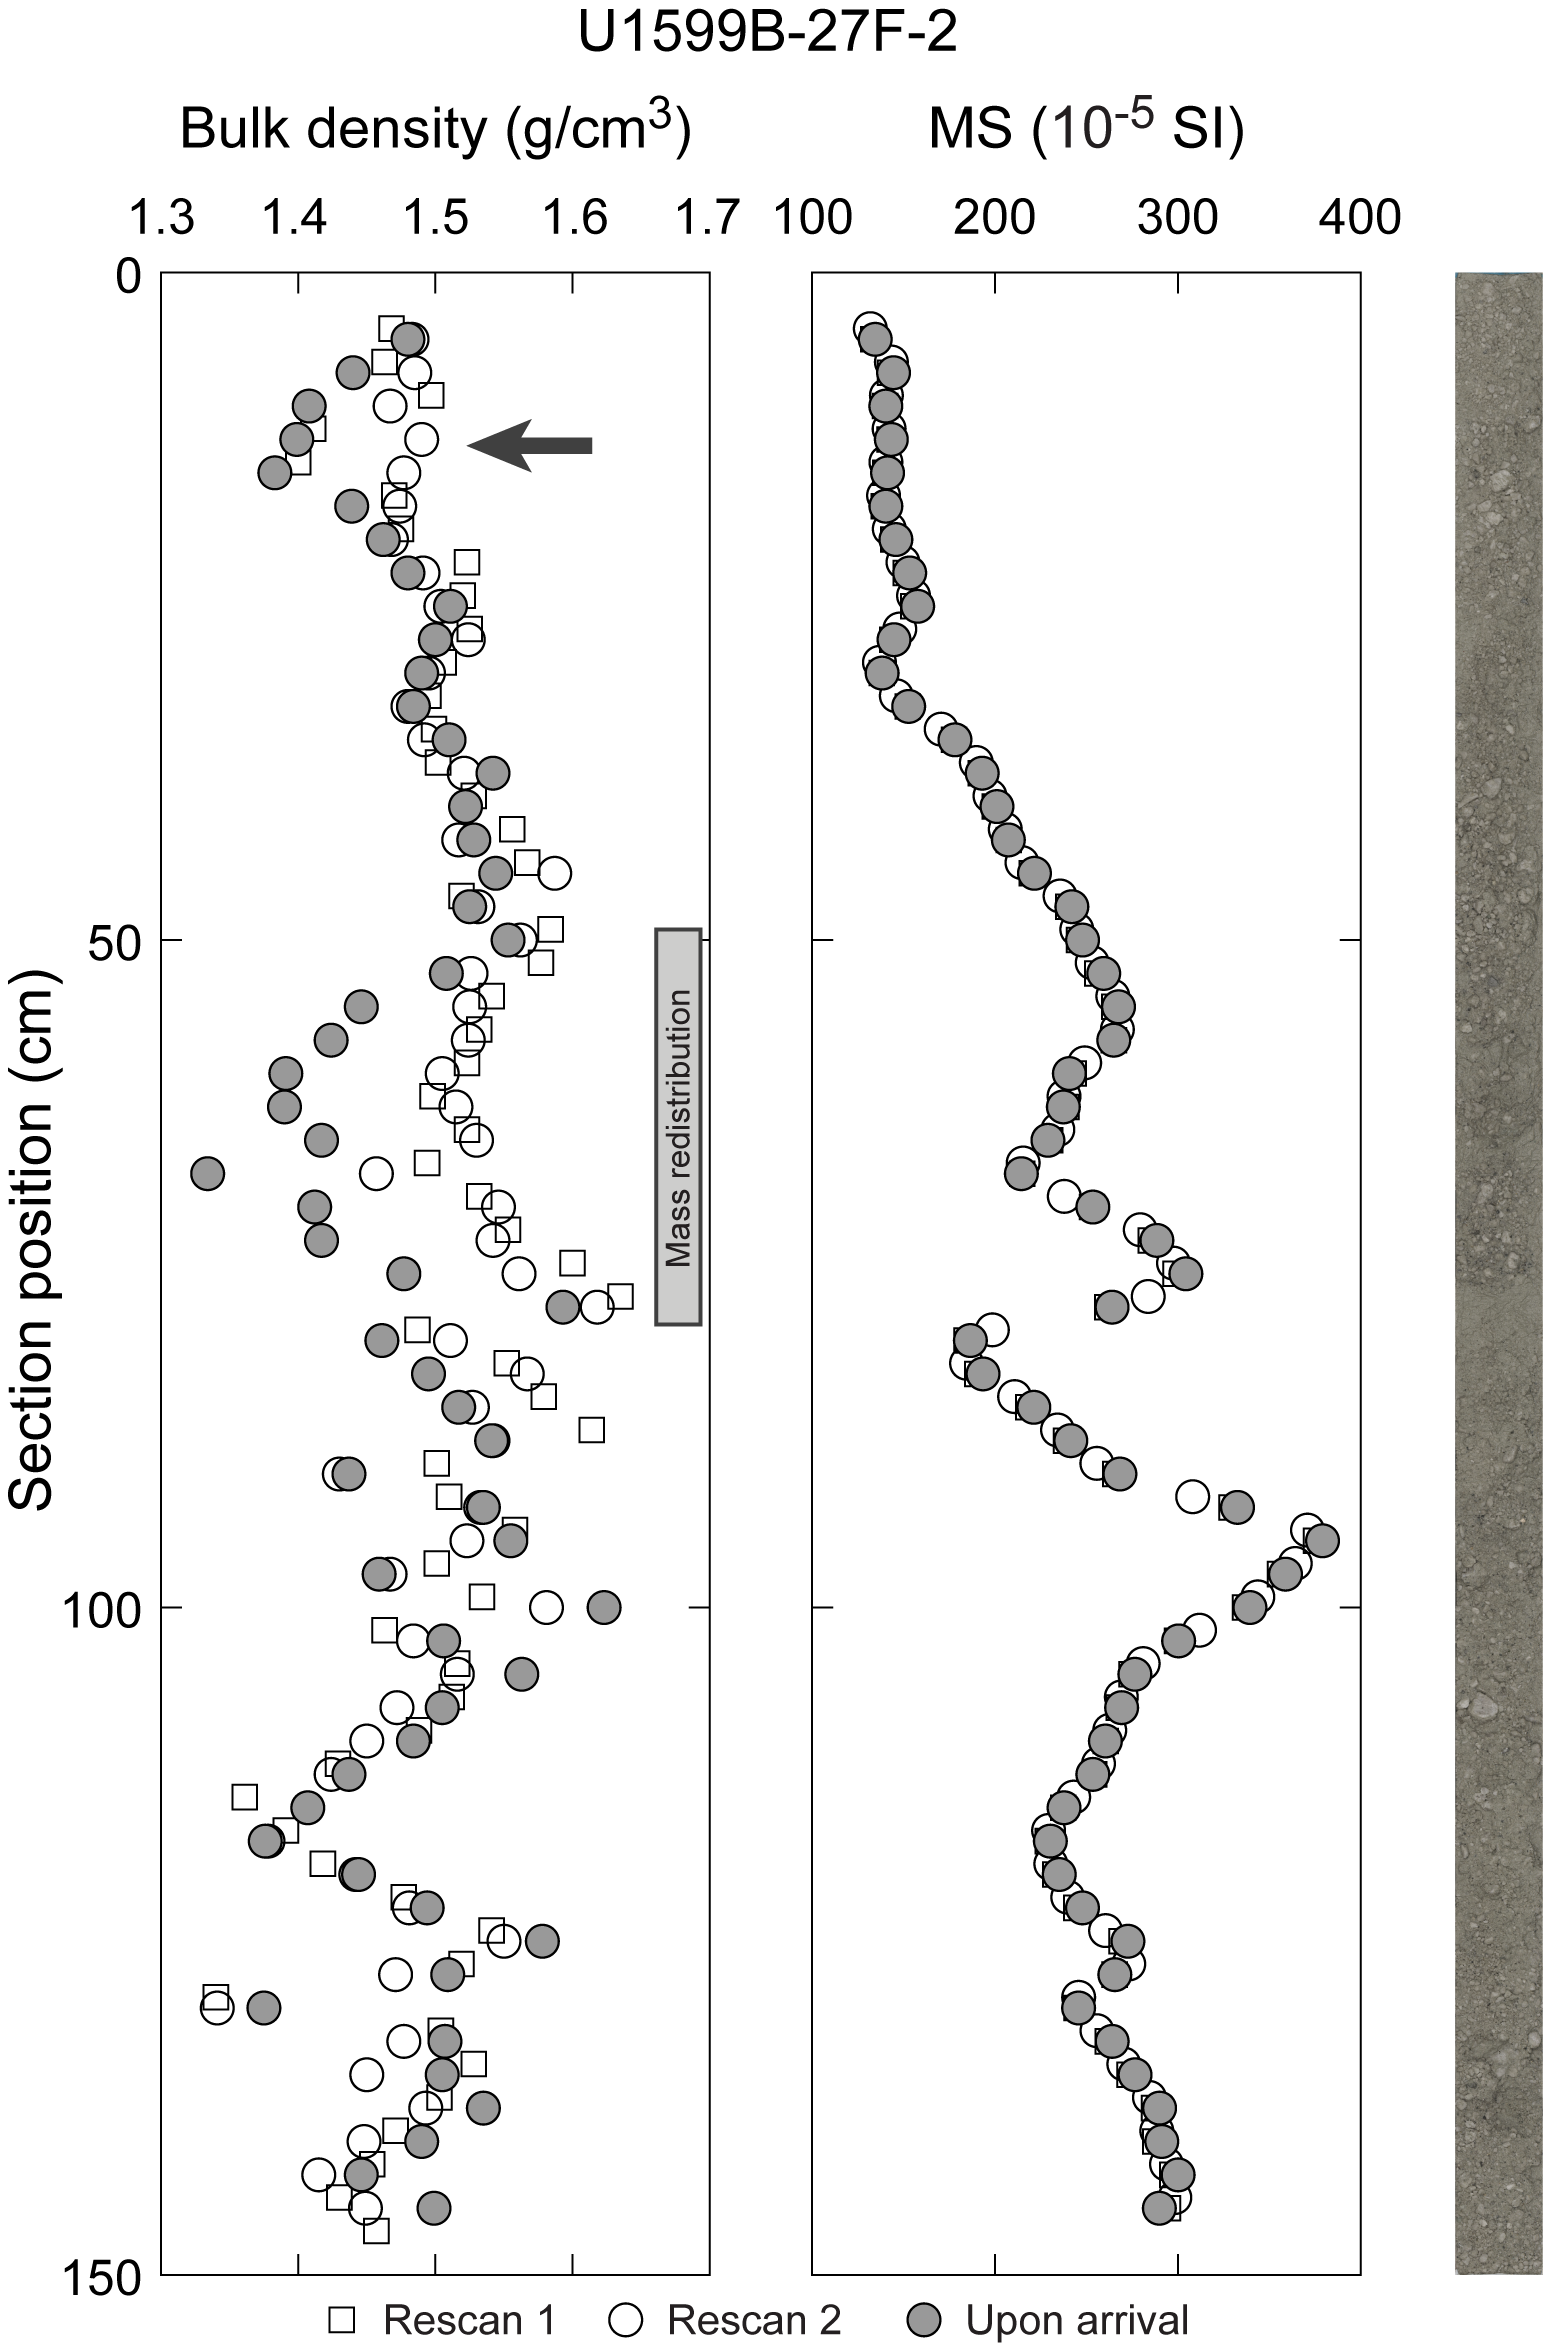
Figure F39. Bulk density and MS, Section 398-U1599B-27F-2.
MS is highly variable within the volcaniclastic deposits in Lithostratigraphic Unit I and can be very high (>2500 × 10−5 SI; Figure F38). High values of MS correspond to volcaniclastic layers. The MS of Unit III is much lower than that of Units I and II and lower than that of Unit IV. NGR is more variable in Unit III than in volcaniclastic-dominated Units I and II and micrites of Unit IV.
Overall, there is no clear systematic increase in bulk density and P-wave velocity with increasing depth in Unit I, but there is a monotonic increase in nonsandy marls of Unit III and micrites of Unit IV. Whether the lack of signature of compaction in Unit I is real, a consequence of the limited depth of the holes, or an artifact of drilling and recovery disturbances cannot be readily determined. Lapilli-ash layers that are more than several meters thick (~50 and ~160–180 mbsf) have high P-wave velocities.
8.1.1. Discrete measurements
8.1.1.1. Material strength
Sediment strength was measured with a pocket penetrometer (PP) on the catwalk immediately after section splitting. Automated vane shear (AVS) strength measurements were made on working-half sections. Totals of 22 and 7 AVS measurements were made on working-half sections in Holes U1599A and U1599B, respectively (Figure F40; Table T10). Totals of 22 and 25 PP measurements were made (Table T10) on fine-grained materials that remained intact in core liners upon recovery on the catwalk in Holes U1599A and U1599B, respectively. There is a general trend of increasing shear strength with increasing depth, and the magnitudes of the AVS and PP measurements are similar in the uppermost 150 mbsf.
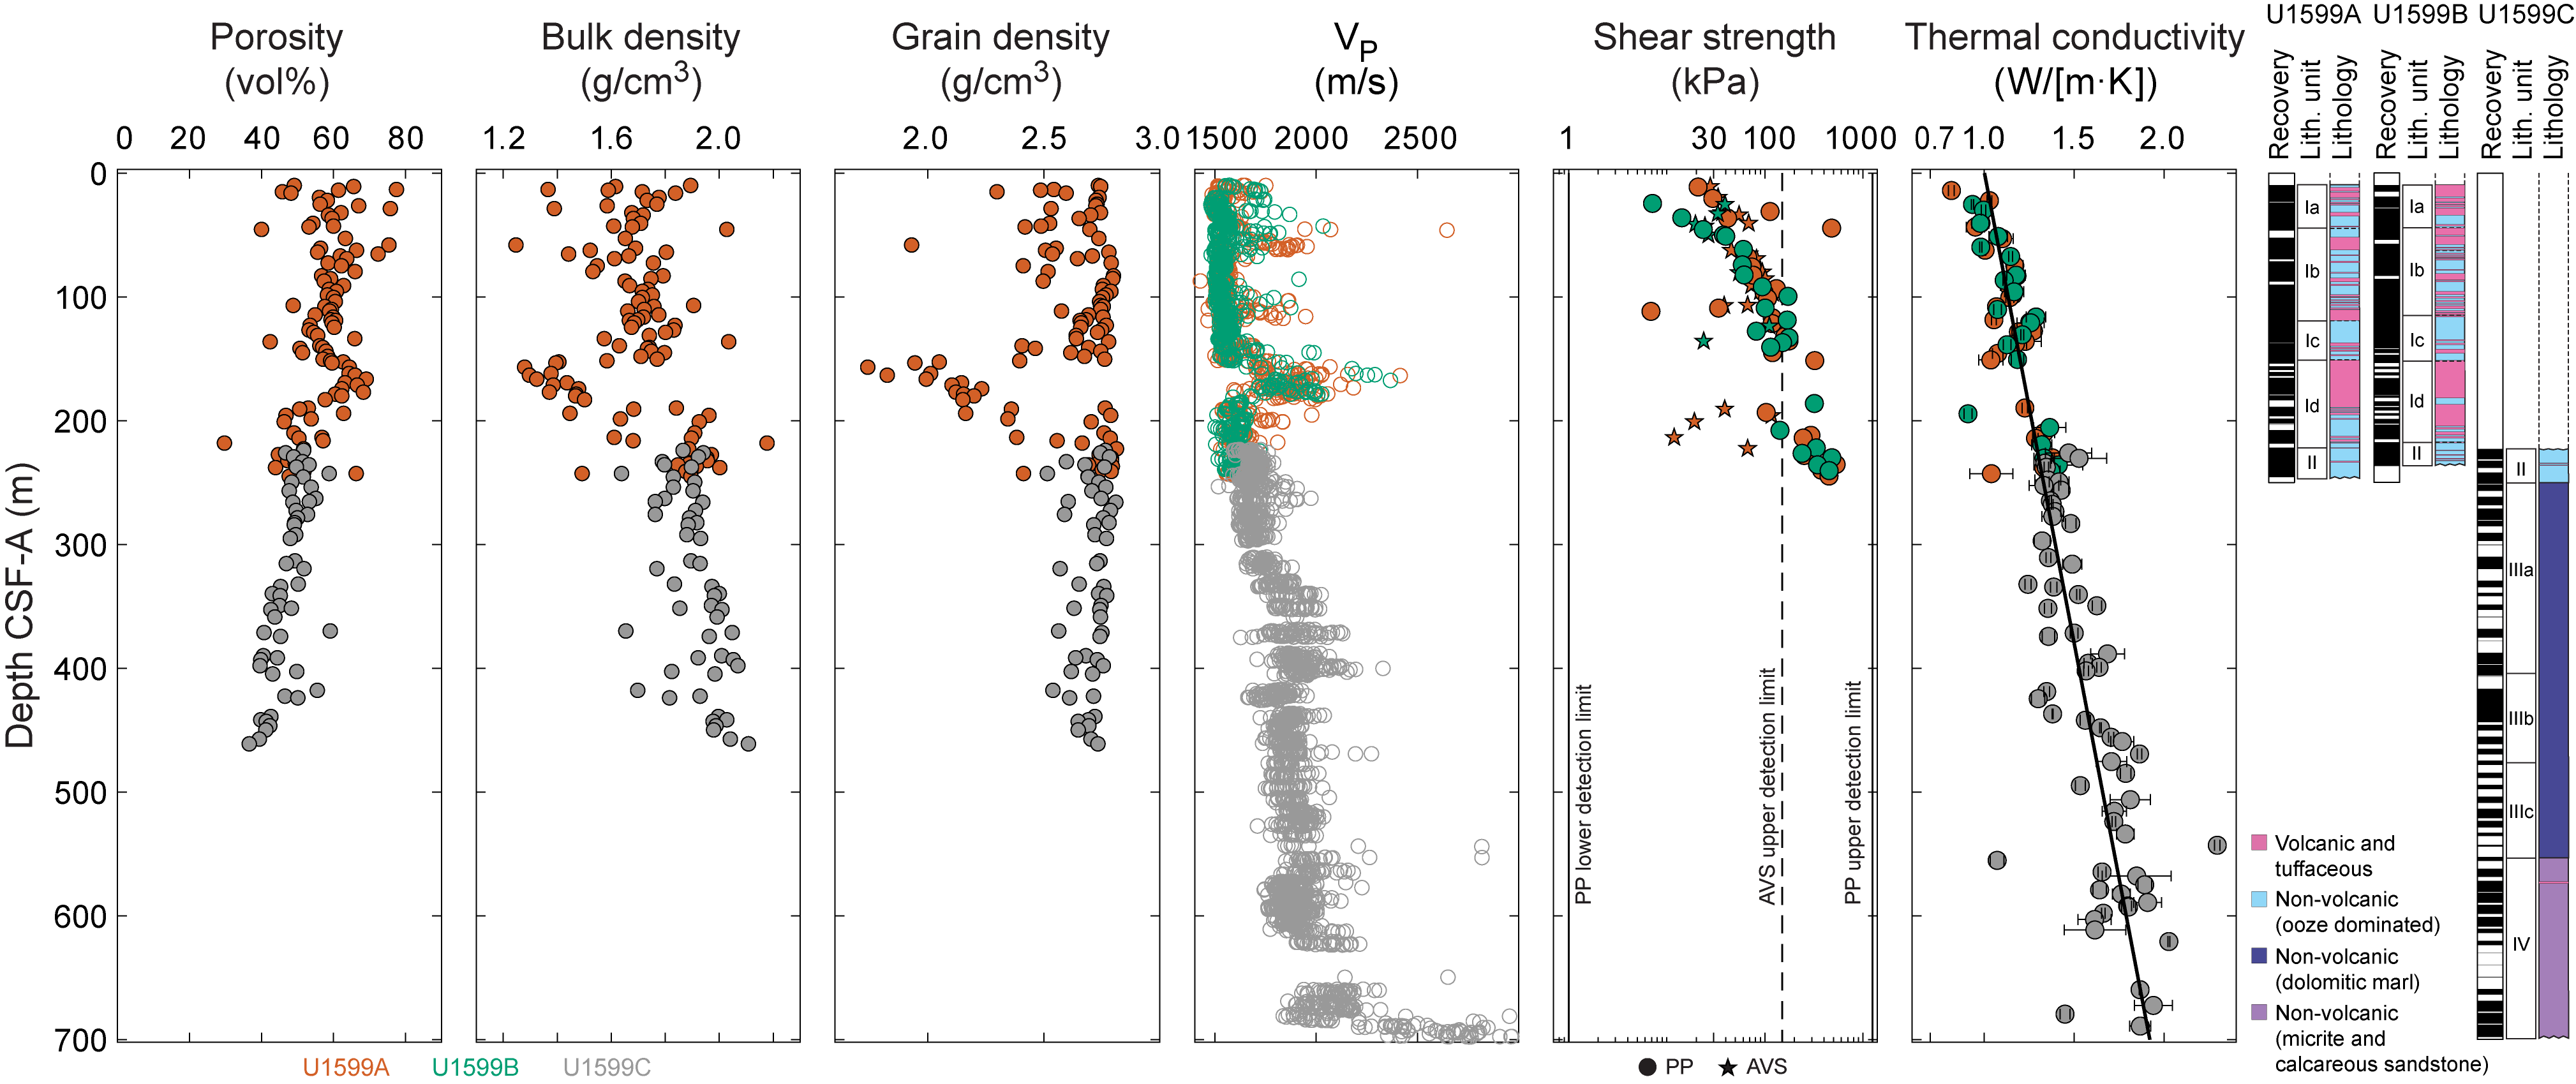
Figure F40. Discrete measurements.
8.1.1.2. P-wave velocity
Totals of 651, 616, and 1852 discrete P-wave velocity measurements were conducted on Hole U1599A, U1599B, and U1599C working-half sections, respectively (Figure F40; Table T11). P-wave velocity ranges 1.43–4.03 km/s (mean = 1.78 km/s). Discrete measurements of P-wave velocity on working-half core sections from Holes U1599A and U1599B are similar to those measured using the WRMSL on whole-round cores (Figure F38).
In the uppermost 250 m, there is no clear increase of P-wave velocity with increasing depth. In Lithostratigraphic Unit III, in contrast, P-wave velocity increases systematically through the non-sandy marls at 250–400 mbsf. P-wave velocity increases with increasing depth in Unit IV.
Discrete measurements were sometimes challenging to make in coarse, pumice-rich deposits because signals were especially noisy. Furthermore, particle size was a substantial fraction of the distance between the two calipers used to make the measurements; hence, the measurements may not be representative of true bulk properties (i.e., sample size is not much larger than a representative elementary volume).
8.1.1.3. Moisture and density
Totals of 98 and 51 discrete samples were collected from Holes U1599A and U1599C, respectively, to conduct moisture and density (MAD) measurements (Figure F40; Table T12). Bulk density derived using MAD measurements on discrete samples should be more reliable than GRA density data from WRMSL measurements on whole-round cores, although in both cases, coring and recovery disturbances may have impacted measured values.
Porosity ranges 30–78 vol% (mean = 54 vol%; standard deviation = 8 vol%). Bulk density ranges 1.25–2.18 g/cm3 (mean = 1.78 g/cm3). Bulk density is lower in volcaniclastic materials than other lithologies.
Grain density ranges 1.74–2.81 g/cm3 (mean = 2.61 g/cm3; median = 2.70 g/cm3). The lowest values occur in volcaniclastic subunits, mostly in lapilli layers at 120–230 mbsf.
Overall, there is a general trend of decreasing porosity and increasing bulk density with increasing depth. The largest deviation from this general trend occurs in the coarse lapilli between ~160 and 180 mbsf in Subunit Id, where the grain density is also low.
8.1.1.4. Thermal conductivity
A total of 107 thermal conductivity measurements were made on selected working-half sections (Table T13; Figure F40). Measurements could not be made on coarse volcaniclastic materials; hence, the values we report are not representative of the full range of recovered lithologies. A linear fit to the thermal conductivity data is
where z is in kilometers and reported ± values are standard errors.
9. Geochemistry
9.1. Volcaniclastic bulk geochemistry
To determine the geochemistry of the volcanic and tuffaceous materials, nine tephra samples were handpicked from various layers within Hole U1599A. Following cleaning, grinding, fusion, and dissolution, the materials were analyzed shipboard for major (Si, Al, Fe, Mg, and Ca), minor (Ti, Mn, Na, K, and P), and trace (Sc, V, Cr, Co, Ni, Cu, Zn, Rb, Sr, Y, Zr, Nb, Ba, Ce, and Nd) elements using inductively coupled plasma–atomic emission spectroscopy (ICP-AES) (see Geochemistry in the Expedition 398 methods chapter [Kutterolf et al., 2024a]). Several unknown samples were run multiple times to determine analytical reproducibility.
9.1.1. ICP-AES: major, minor, and trace elements
Of the volcaniclastic units sampled, one was classified as a basalt and eight as dacites (Table T14; Figure F41). Bulk chemistry values are less evolved than glass chemistry reported in Kutterolf et al. (2021), as expected due to bulk analyses including both minerals and glass.
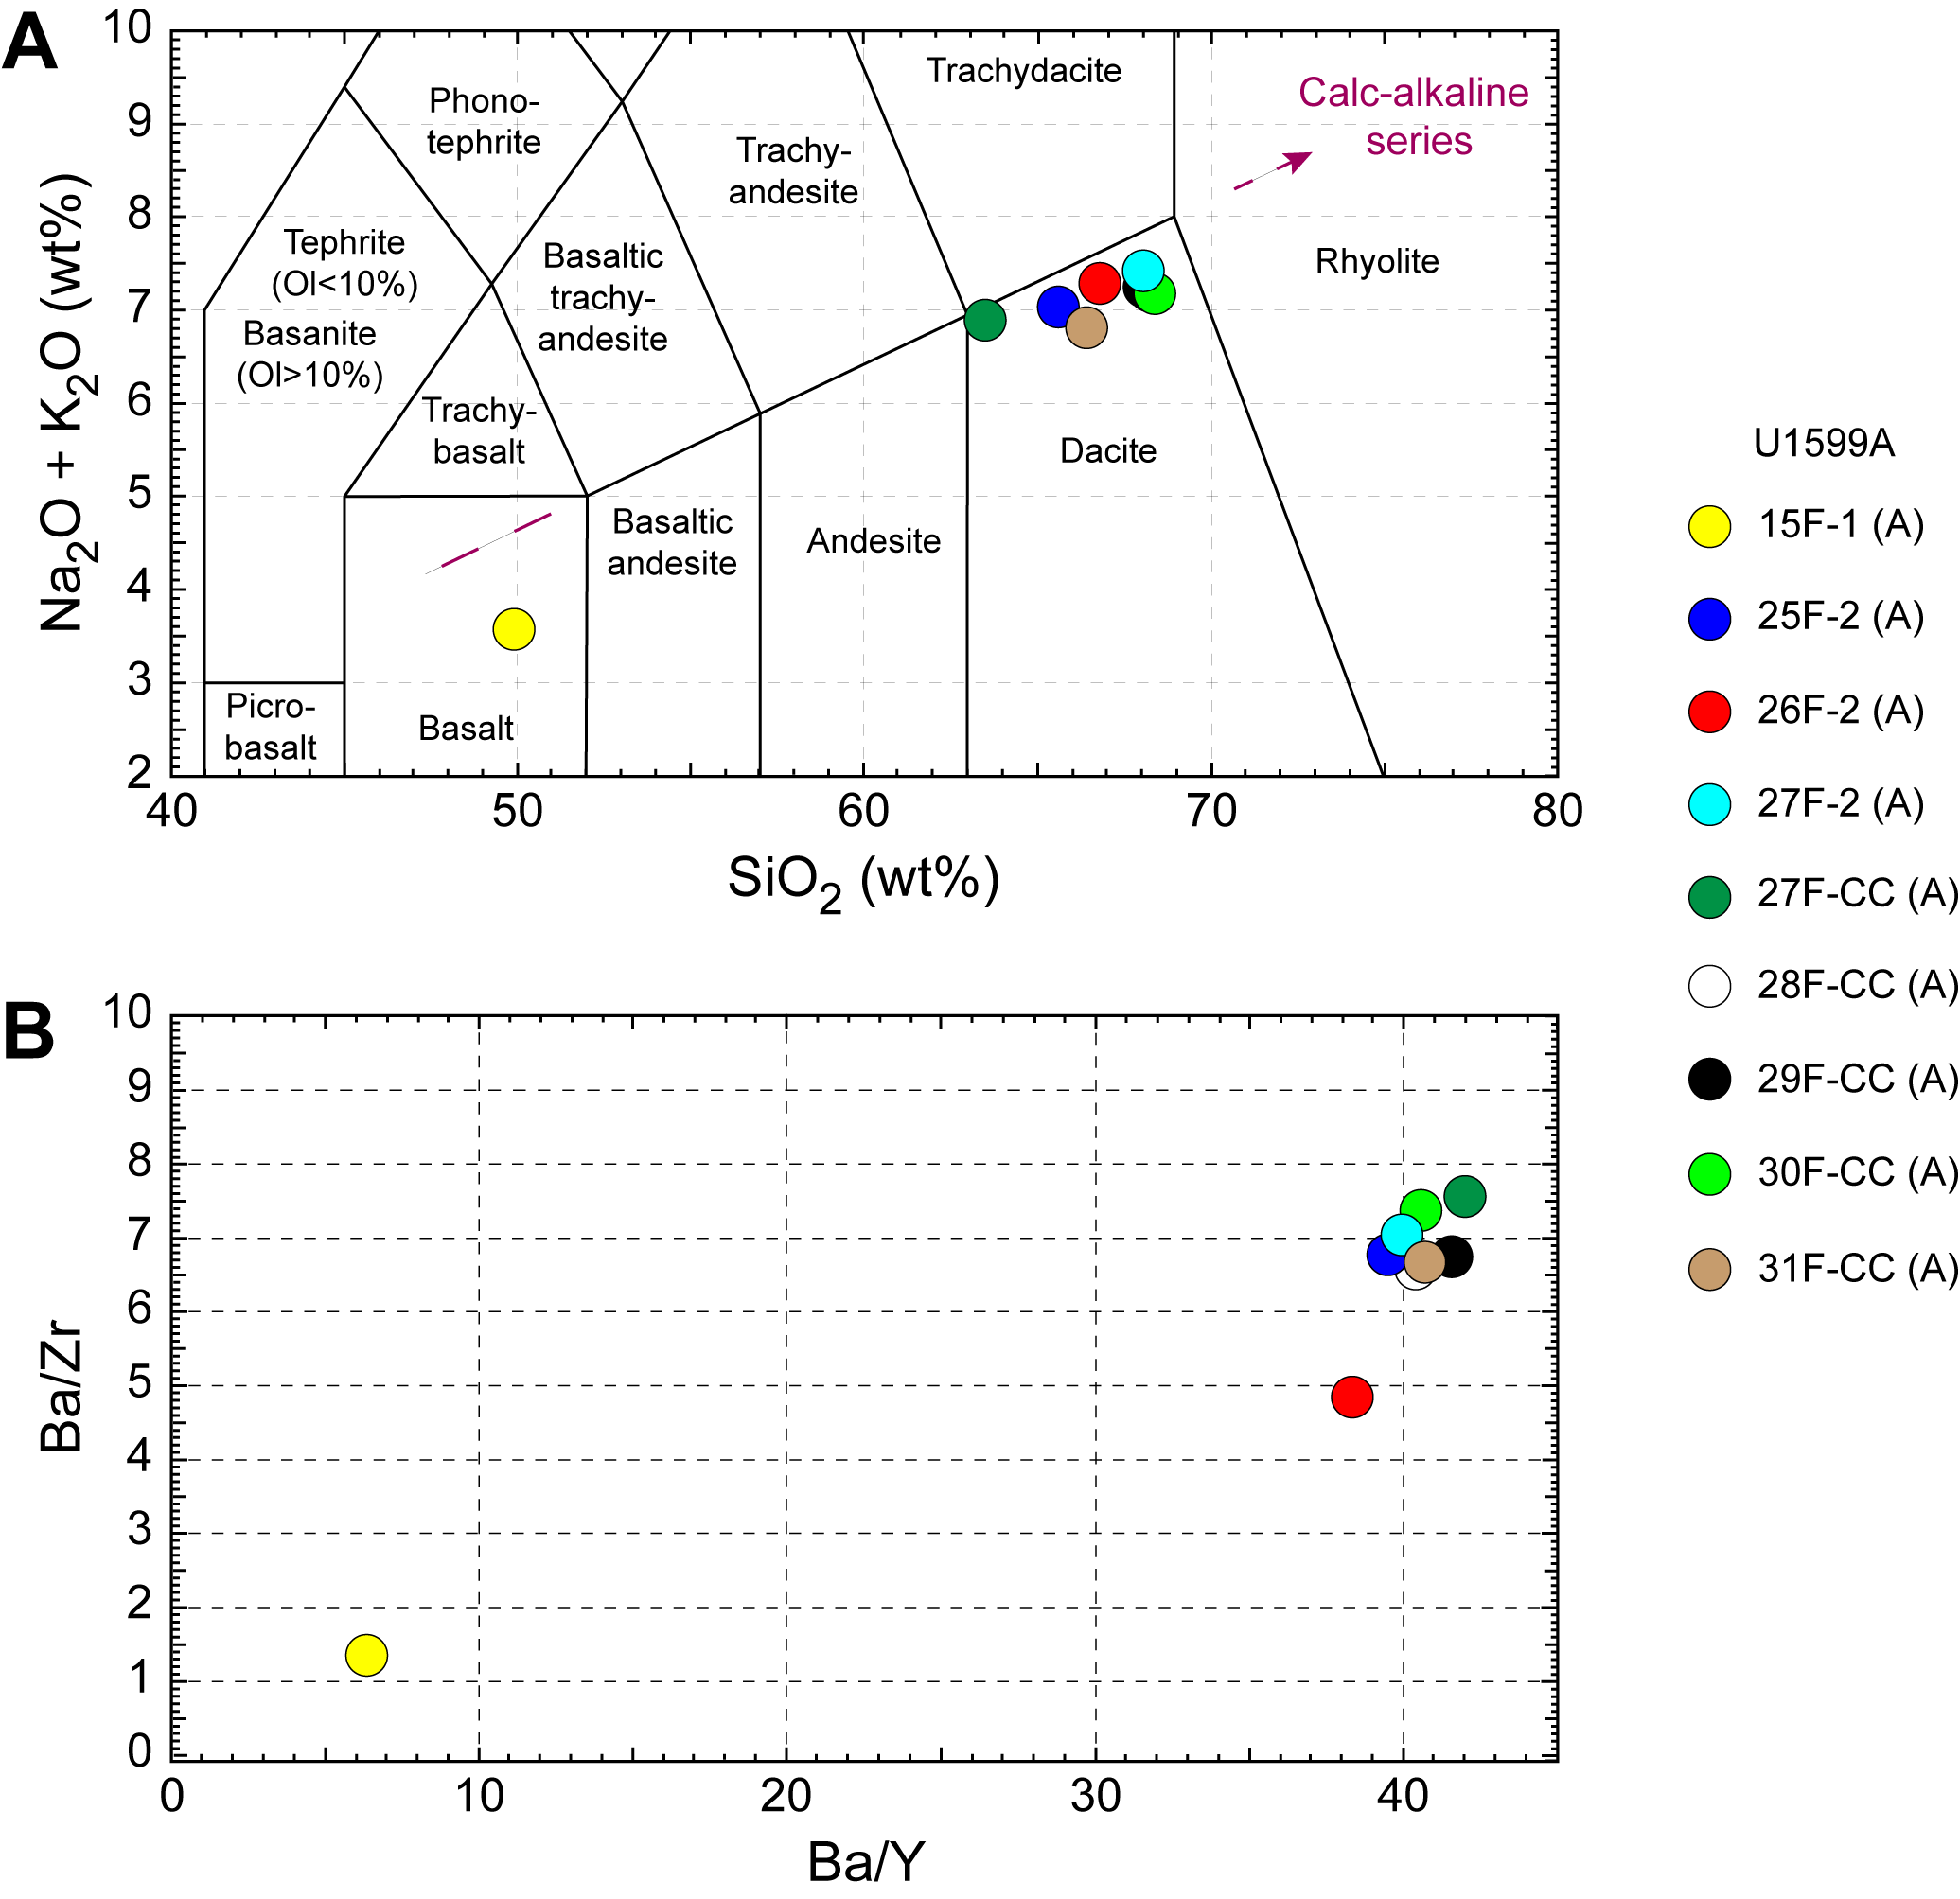
Figure F41. ICP-AES analyses.
Concentrations are reported for all analyzed trace elements, but Ce, Cr, Cu, Nb, Ni, P, Rb, S, and V were below detection limits in the majority of samples and are not shown for respective samples in Table T14; volcaniclastic analytical errors are ±1% for major elements and ±5%–10% for trace elements (see Geochemistry in the Expedition 398 methods chapter [Kutterolf et al., 2024a]). Trace element ratios were used to broadly discriminate between the volcanic centers of Kolumbo, Santorini, and Christiana.
9.2. Interstitial water geochemistry
To determine the inorganic constituents of IW, a total of 38 water samples were taken from the mudline and whole-round squeezing of sediment intervals from Holes U1599A (21 samples), U1599B (2 samples), and U1599C (15 samples). Aliquots of IW were used for shipboard analyses, and the remaining water was taken for shore-based analysis following protocols specified by individual scientists. An additional six samples were processed for shore-based analysis only. The retrieved pore waters were analyzed shipboard for salinity, alkalinity, pH, major anions (Cl−, SO42−, and Br−), major cations (Ca2+, Na+, Mg2+, and K+), and major (S, Ca, Mg, K, and Na) and minor (B, Ba, Fe, Li, Mn, P, Si, and Sr) elements using the methods described in Geochemistry in the Expedition 398 methods chapter (Kutterolf et al., 2024a).
9.2.1. Salinity, alkalinity, and pH
Salinity values range 34–46 throughout Site U1599 (Table T15; Figure F42). The highest salinity value of 46 was recorded at 61.6 mbsf (Section 398-U1599B-7H-3). There are local salinity maxima at 61.6, 199.9, 332.4, and 448.7 mbsf.
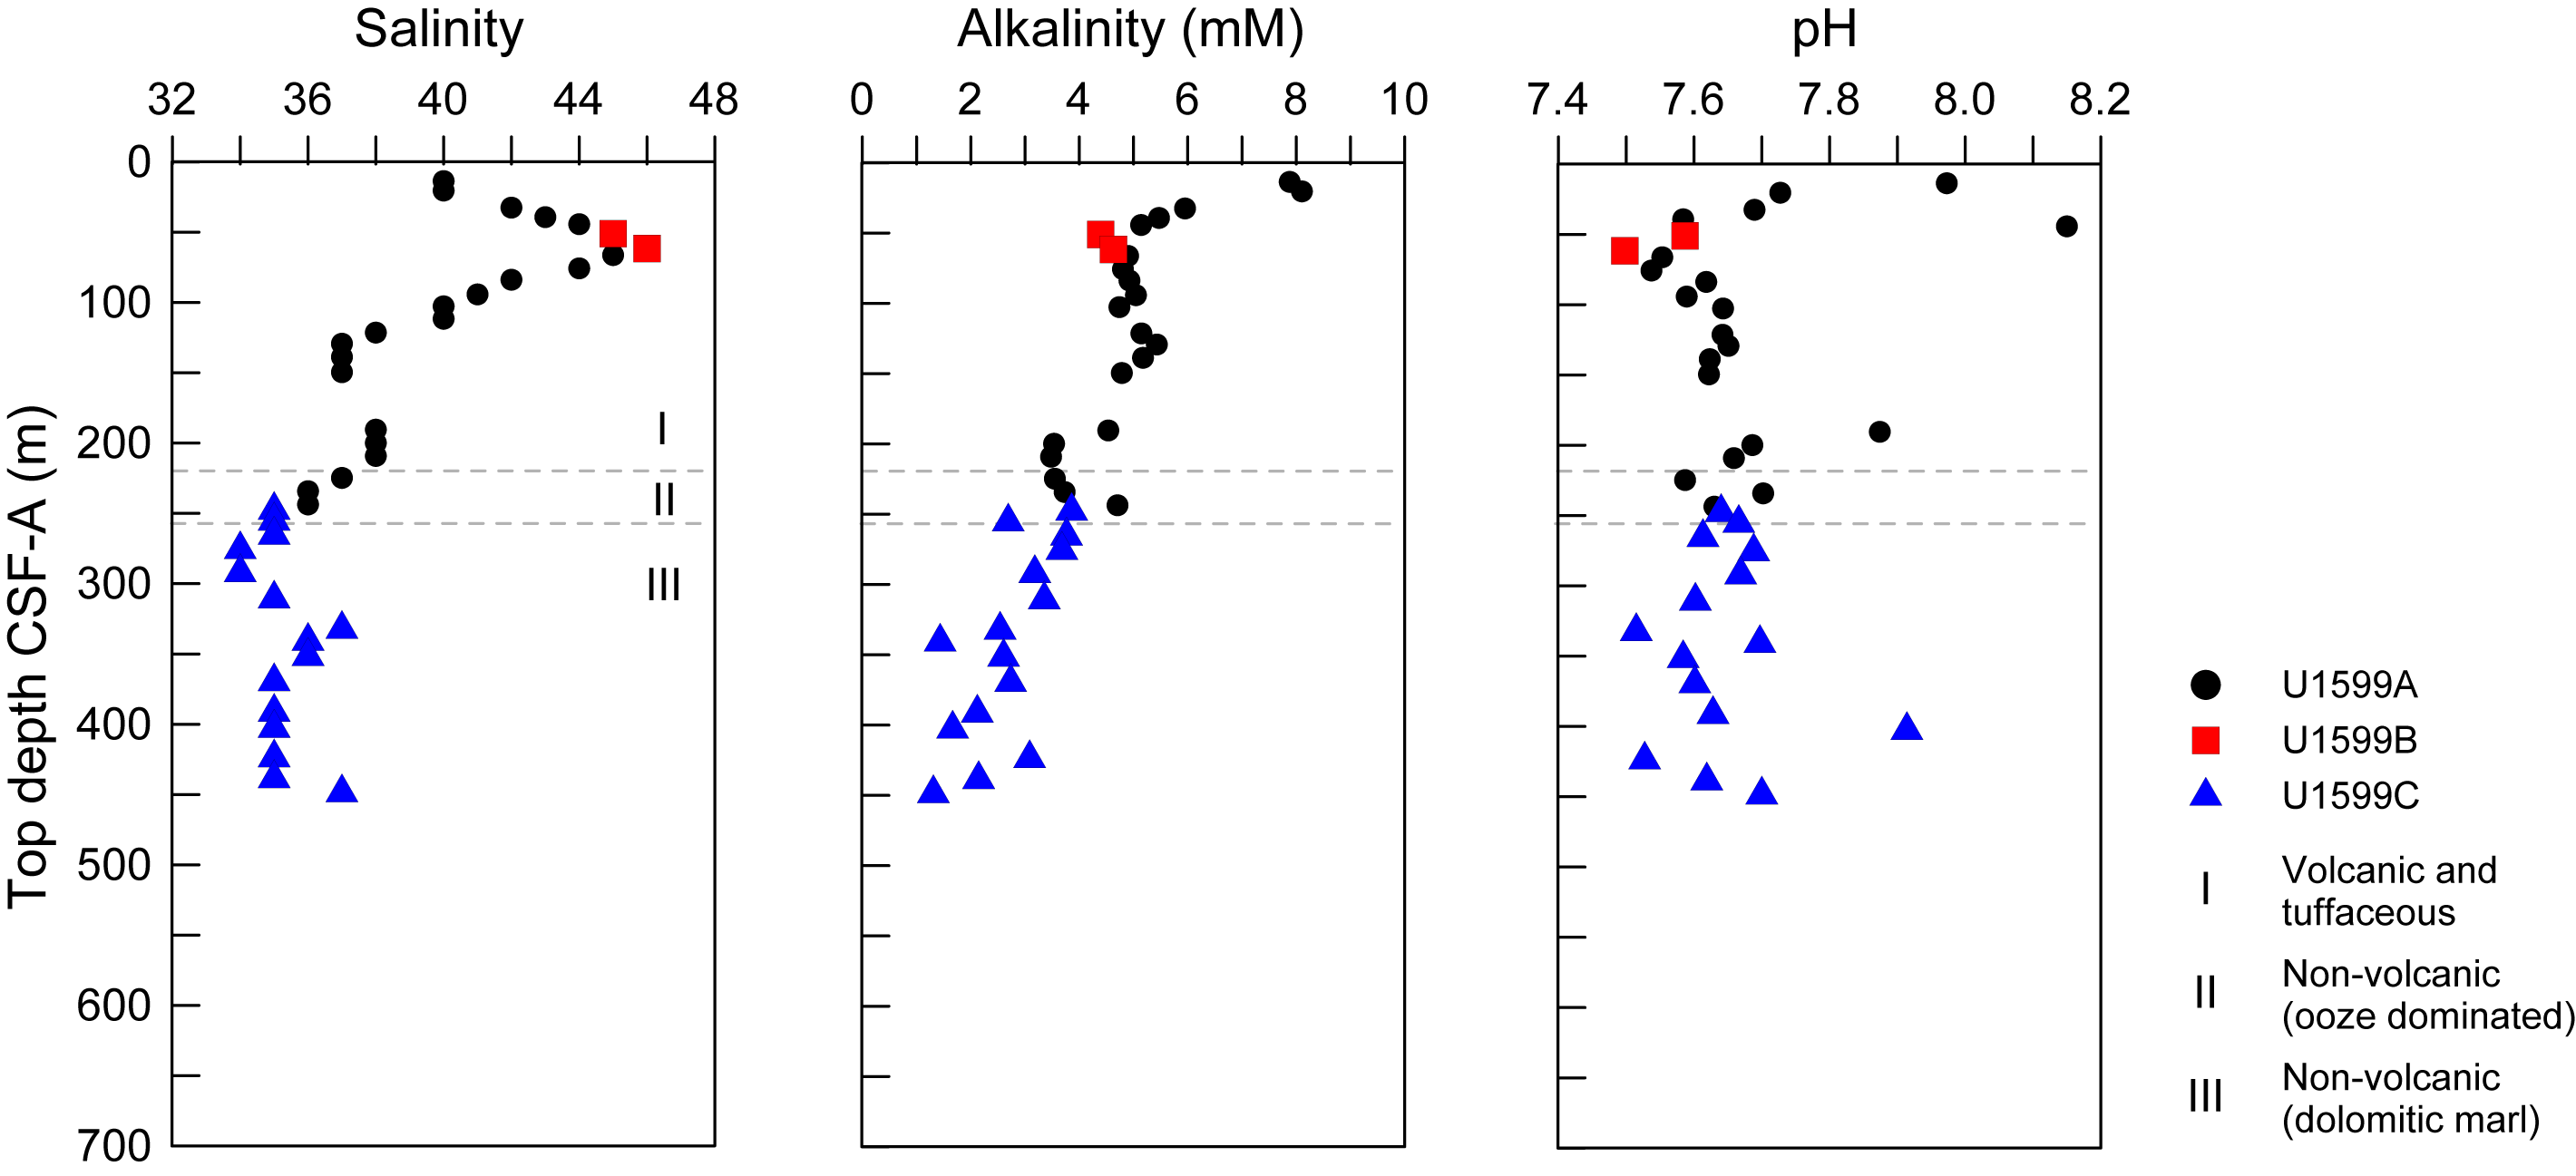
Figure F42. IW salinity, alkalinity, and pH.
Alkalinity decreases downhole with some variation. There is a decrease in total alkalinity (7.9–3.7 mM) with depth to just above the base of Hole U1599A at 234.27 mbsf, followed by an increase in the lowermost sample (Table T15; Figure F42). Hole U1599B exhibits nearly constant alkalinity in the two sampled cores. Hole U1599C shows overall lower alkalinity values than the other two holes, with an overall decrease to a site alkalinity minimum of 1.3 mM at the base of the hole (448.7 mbsf).
Values for pH vary at the sampled depths, ranging 7.5–8.2 (average = 7.7 ± 0.1) (Table T15; Figure F42).
9.2.2. Bromide, chloride, boron, sodium, potassium, magnesium, calcium, and sulfate
Calcium, Mg, K, and SO42− follow similar trends and have similar local maxima as salinity, but Br−, Cl−, B, and Na do not (Table T16; Figure F43). Magnesium, K, and SO42− have the most similar profile shapes. Bromide, Cl−, B, and Na initially increase with depth to 66.3 mbsf, similar to salinity; below this depth, they do not have similar local maxima as salinity, Ca, Mg, K, and SO42− but instead show less variation with depth.
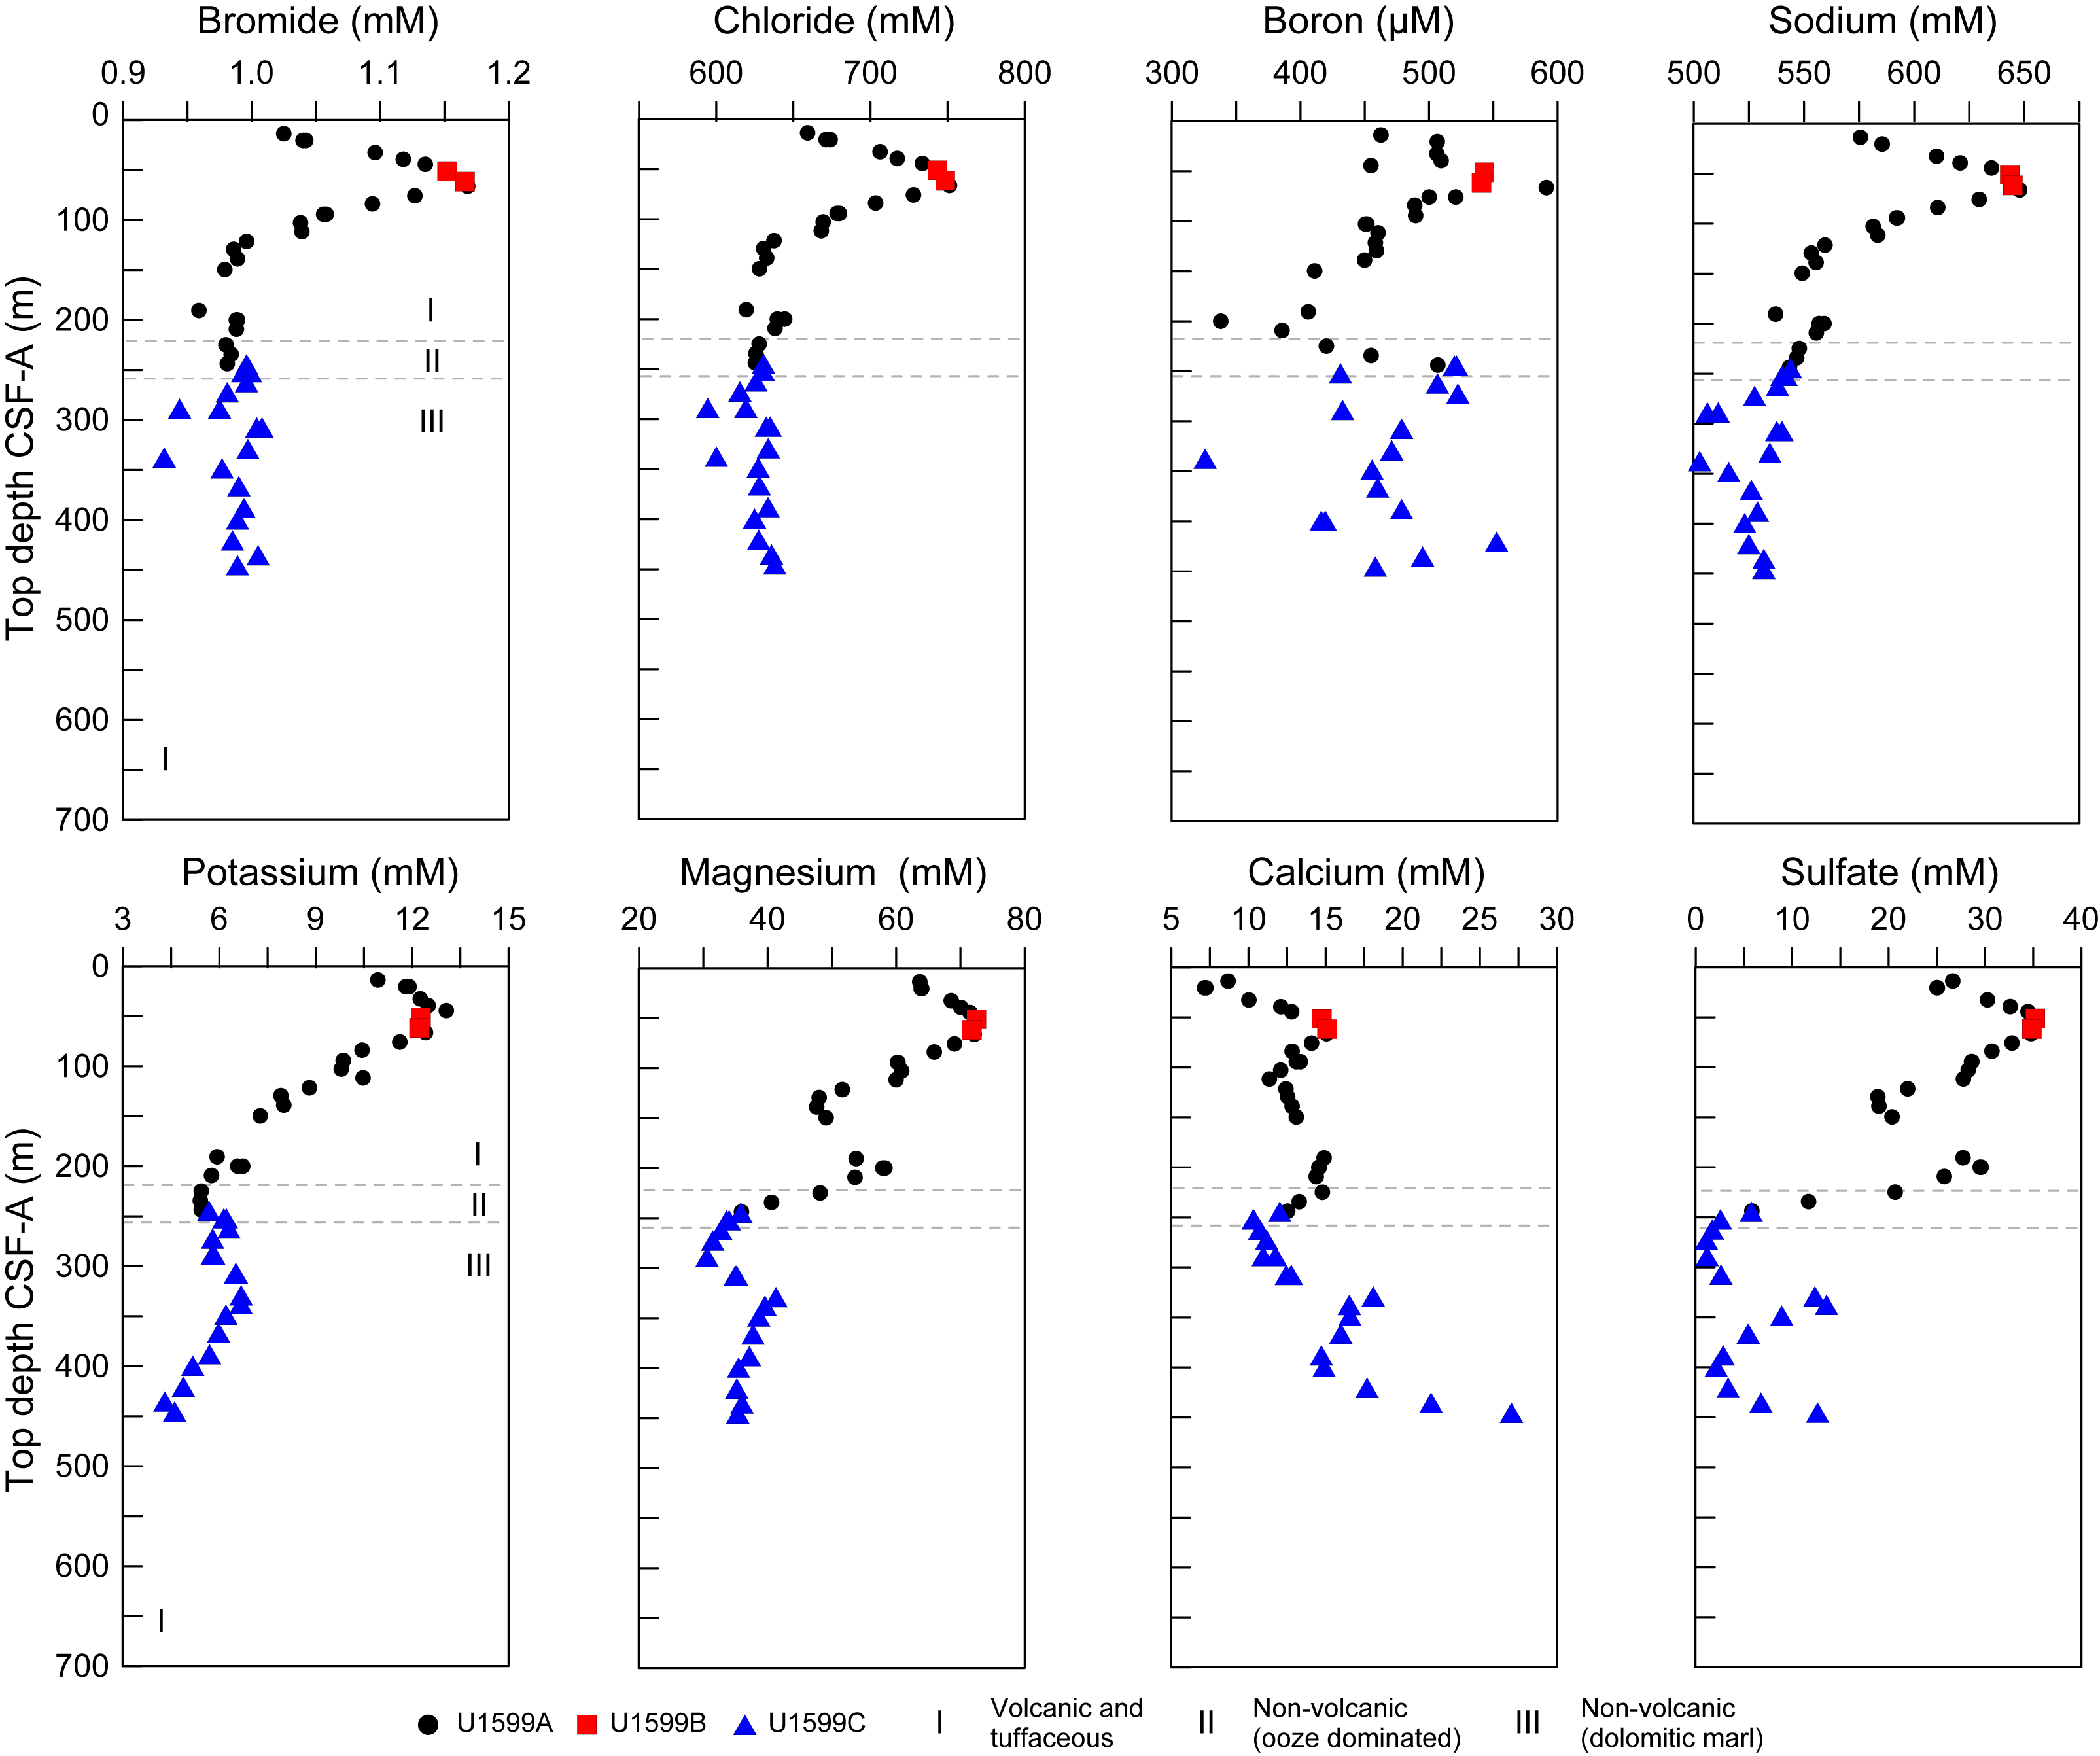
Figure F43. IW Br, Cl, B, Na, K, Mg, Ca, and SO42−.
9.2.3. Lithium, strontium, iron, manganese, barium, and silicon
Trends for Sr, Mn, Ba, and Si do not follow salinity, although Li does (Table T16; Figure F44). Lithium has four maxima at 44.4, 224.9, 351.7, and 448.7 mbsf, all of which are near maxima in Mg, K, SO42−, and salinity. Strontium increases with depth to a maximum of 711.6 µM at 292 mbsf before decreasing downhole. Manganese is elevated in the uppermost 150 m and has lower values with slight variations at depth. Iron was only detectable in nine samples that occurred in regions with elevated Mn concentrations. Barium is near zero in all samples except at 250–325 mbsf and again at 375–425 mbsf, corresponding to minima in SO42−. There are no clear trends for IW Si concentrations, and P is below detection limit in all but one sample.
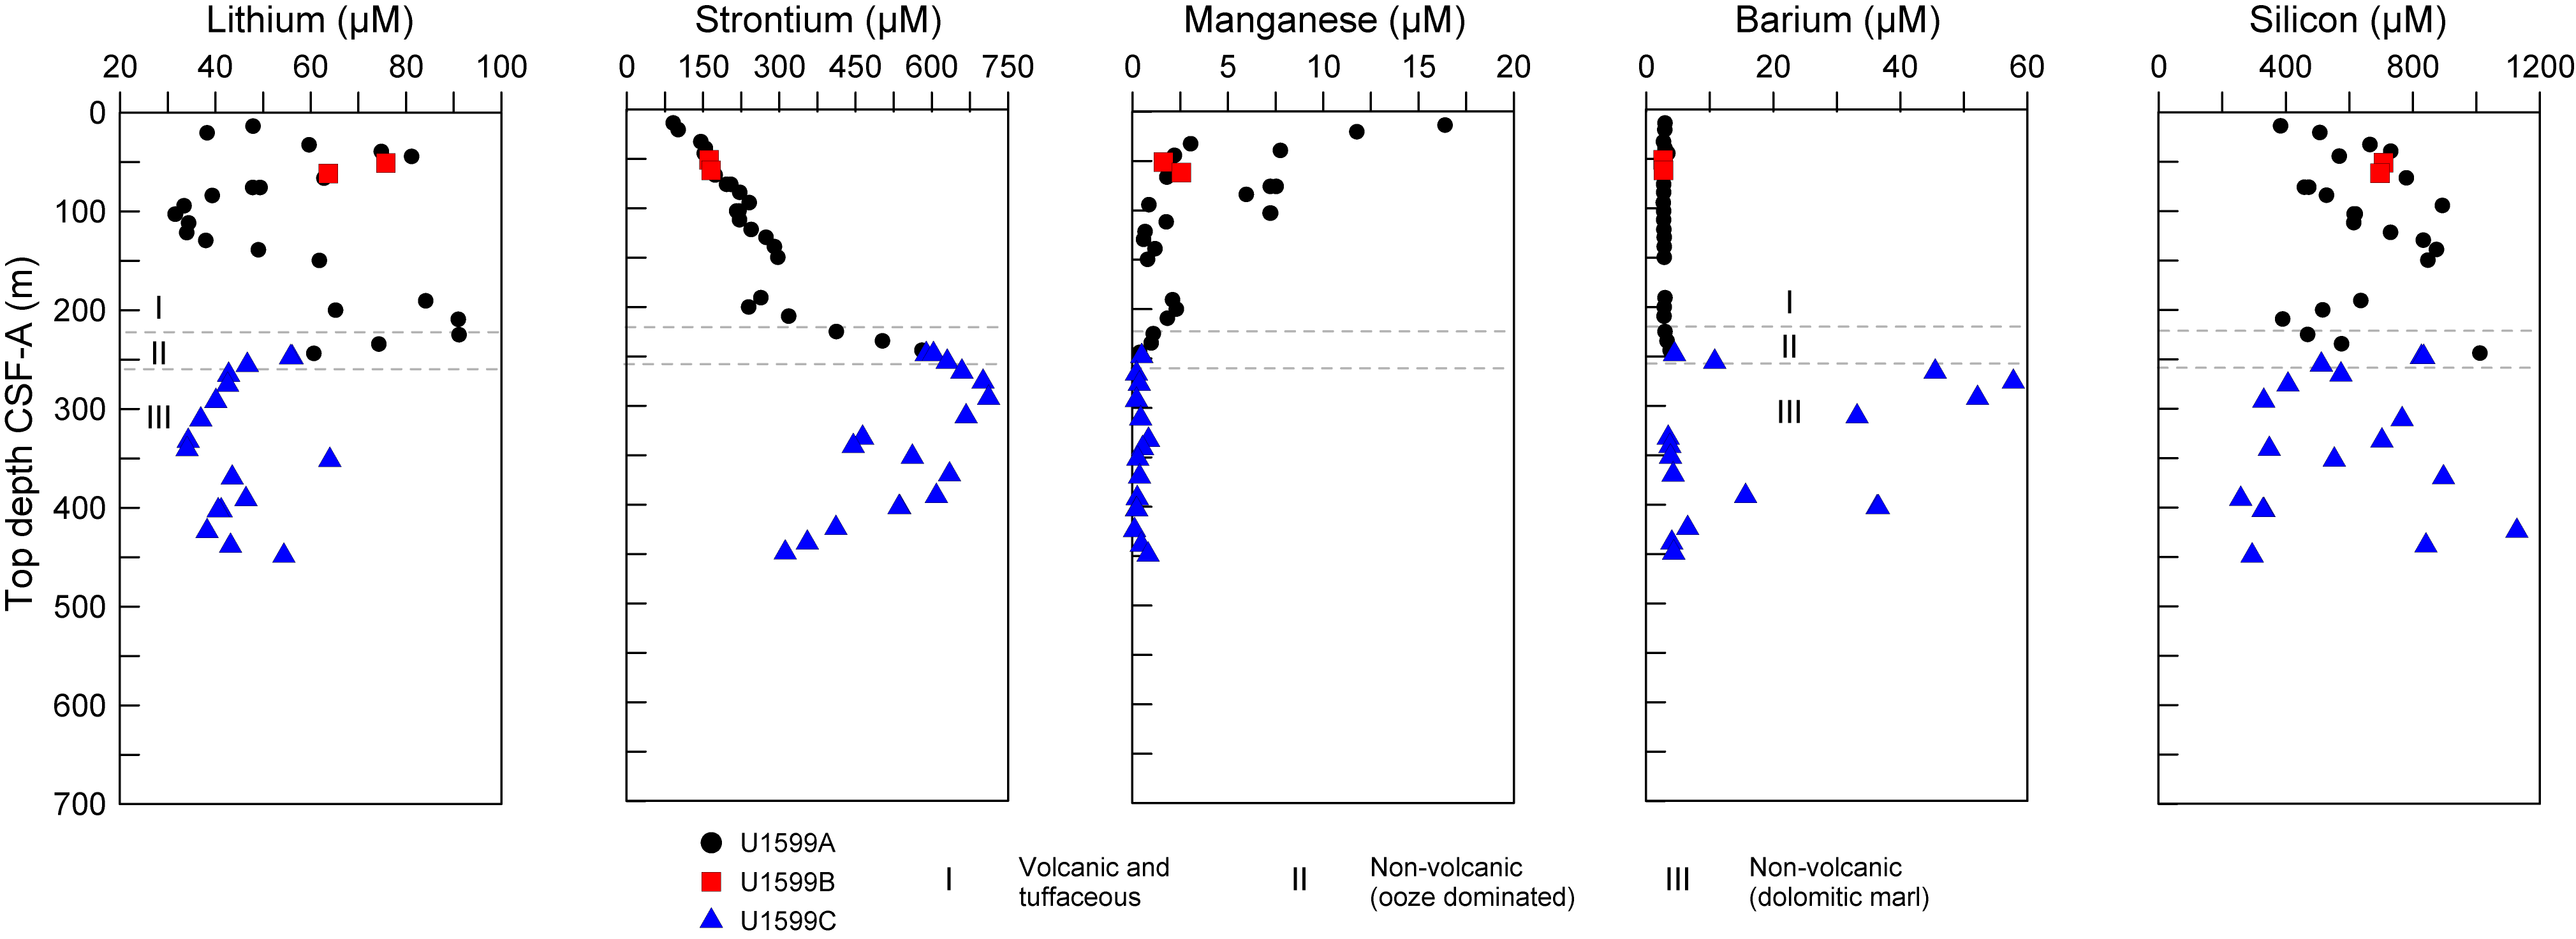
Figure F44. IW Li, Sr, Mn, Ba, and Si.
9.3. Sediment bulk geochemistry
A total of 39 sediment samples were analyzed for bulk geochemistry (Table T17). All were analyzed for total carbon, hydrogen, and nitrogen (CHN) and for inorganic carbon and carbonate content following the protocols explained in Geochemistry in the Expedition 398 methods chapter (Kutterolf et al., 2024a). For CHN analysis, duplicates were run for ~10% of the samples to determine analytical reproducibility (standard deviations: N = 0.01; C = 0.04) (Figure F45).

Figure F45. TOC and carbonate.
9.3.1. Sapropel identification
Total organic carbon (TOC) was calculated using total carbon and inorganic carbon values. Following the convention set forth by Kidd et al. (1978), units with TOC values >2.0 wt% were identified as sapropels, and units with TOC of 0.5–2.0 wt% were identified as sapropelitic. Using these values, 19 units were identified as sapropelitic and 11 units were identified as sapropels (Figure F45).
9.4. Headspace gas analysis
Headspace gas analyses were performed at a resolution of one sample per full-length core (9.5 m advance) throughout Hole U1599A. The aim was to monitor the presence and abundance of C1–C3 hydrocarbons as part of the standard IODP safety protocol (Pimmel and Claypool, 2001). A total of 26 headspace gas samples from this hole were analyzed using gas chromatography (GC) (see Geochemistry in the Expedition 398 methods chapter [Kutterolf et al., 2024a]). Methane, ethane, and propane concentrations were below the detection limit throughout Hole U1599A.
Headspace gas analyses were resumed on Hole U1599C when a depth was reached that exceeded that of Hole U1599A (247.7 mbsf). Below this depth, headspace gas analyses were performed at a resolution of one sample per core to the base of the hole. A total of 45 headspace gas samples were analyzed using GC. Methane concentrations in Hole U1599C increased between 266 and 311 mbsf, reaching a maximum of 816.3 ppmv at 275.7 mbsf before returning to below detection limit to the base of the hole. Methane, ethane, and propane concentrations were below the detection limit in all other samples.
10. Microbiology
A total of 35 whole-round core samples were collected for microbiological analyses (Table T18). After the cores were transferred to the core receiving platform, the whole-round samples were collected based on the sediment color. Reddish to orange coloration was used as an indicator for iron-rich layers that often host the microbial communities we sought. To choose the appropriate incubation temperature, the core temperature was measured in the section above the sample.
The whole rounds were transferred to the microbiology laboratory, and the following subsamples were collected for microbial community composition analysis, metagenomics, cell counting, microscope, and microbial cultivation: POLYmeta, POLYmicro, POLYanae, POLYcell, POLYFe, POLYmicroscope, and POLYFe-agar.
In total, 246 subsamples were collected for microbiological analysis from the whole-round core samples.
References
Abu-Zied, R.H., Rohling, E.J., Jorissen, F.J., Fontanier, C., Casford, J.S.L., and Cooke, S., 2008. Benthic foraminiferal response to changes in bottom-water oxygenation and organic carbon flux in the eastern Mediterranean during LGM to Recent times. Marine Micropaleontology, 67(1–2):46–68. https://doi.org/10.1016/j.marmicro.2007.08.006
Backman, J., Raffi, I., Rio, D., Fornaciari, E., and Pälike, H., 2012. Biozonation and biochronology of Miocene through Pleistocene calcareous nannofossils from low and middle latitudes. Newsletters on Stratigraphy, 45(3):221–244. https://doi.org/10.1127/0078-0421/2012/0022
Brothers, R.J., Kemp, A.E.S., and Maltman, A.J., 1996. Mechanical development of vein structures due to the passage of earthquake waves through poorly-consolidated sediments. Tectonophysics, 260(4):227–244. https://doi.org/10.1016/0040-1951(96)00088-1
Di Stefano, A., and Sturiale, G., 2010. Refinements of calcareous nannofossil biostratigraphy at the Miocene/Pliocene Boundary in the Mediterranean region. Geobios, 43(1):5–20. https://doi.org/10.1016/j.geobios.2009.06.007
Druitt, T., Kutterolf, S., and Höfig, T.W., 2022. Expedition 398 Scientific Prospectus: Hellenic Arc Volcanic Field. International Ocean Discovery Program. https://doi.org/10.14379/iodp.sp.398.2022
Druitt, T.H., Kutterolf, S., Ronge, T.A., Beethe, S., Bernard, A., Berthod, C., Chen, H., Chiyonobu, S., Clark, A., DeBari, S., Fernandez Perez, T.I., Gertisser, R., Hübscher, C., Johnston, R.M., Jones, C., Joshi, K.B., Kletetschka, G., Koukousioura, O., Li, X., Manga, M., McCanta, M., McIntosh, I., Morris, A., Nomikou, P., Pank, K., Peccia, A., Polymenakou, P.N., Preine, J., Tominaga, M., Woodhouse, A., and Yamamoto, Y., 2024a. Site U1589. In Druitt, T.H., Kutterolf, S., Ronge, T.A., and the Expedition 398 Scientists, Hellenic Arc Volcanic Field. Proceedings of the International Ocean Discovery Program, 398: College Station, TX (International Ocean Discovery Program). https://doi.org/10.14379/iodp.proc.398.103.2024
Druitt, T.H., Kutterolf, S., Ronge, T.A., Beethe, S., Bernard, A., Berthod, C., Chen, H., Chiyonobu, S., Clark, A., DeBari, S., Fernandez Perez, T.I., Gertisser, R., Hübscher, C., Johnston, R.M., Jones, C., Joshi, K.B., Kletetschka, G., Koukousioura, O., Li, X., Manga, M., McCanta, M., McIntosh, I., Morris, A., Nomikou, P., Pank, K., Peccia, A., Polymenakou, P.N., Preine, J., Tominaga, M., Woodhouse, A., and Yamamoto, Y., 2024b. Site U1591. In Druitt, T.H., Kutterolf, S., Ronge, T.A., and the Expedition 398 Scientists, Hellenic Arc Volcanic Field. Proceedings of the International Ocean Discovery Program, 398: College Station, TX (International Ocean Discovery Program). https://doi.org/10.14379/iodp.proc.398.105.2024
Expedition 334 Scientists, 2012. Expedition 334 summary. In Vannucchi, P., Ujiie, K., Stroncik, N., and the Expedition 334 Scientists, Proceedings of the Integrated Ocean Drilling Program. 334: Tokyo (Integrated Ocean Drilling Program Management International, Inc.). https://doi.org/10.2204/iodp.proc.334.101.2012
Fisher, R.V., and Schmincke, H.-U., 1984. Pyroclastic Rocks: Berlin (Springer). https://doi.org/10.1007/978-3-642-74864-6
Gradstein, F.M., Ogg, J.G., Schmitz, M.D., and Ogg, G.M. (Eds.), 2020. The Geologic Time Scale 2020: Amsterdam (Elsevier BV). https://doi.org/10.1016/C2020-1-02369-3
Hanamura, Y., and Ogawa, Y., 1993. Layer-parallel faults, duplexes, imbricate thrusts and vein structures of the Miura Group: keys to understanding the Izu fore-arc sediment accretion to the Honshu fore arc. Island Arc, 2(3):126–141. https://doi.org/10.1111/j.1440-1738.1993.tb00081.x
Hayward, B.W., Grenfell, H.R., Reid, C.M., and Hayward, K.A., 1999. Recent New Zealand shallow-water benthic foraminifera: taxonomy, ecologic distribution, biogeography, and use in paleoenvironmental assessment. In Institute of Geological & Nuclear Sciences Monograph, 21: Lower Hutt, NZ.
Hooft, E.E.E., Nomikou, P., Toomey, D.R., Lampridou, D., Getz, C., Christopoulou, M.-E., O’Hara, D., Arnoux, G.M., Bodmer, M., Gray, M., Heath, B.A., and VanderBeek, B.P., 2017. Backarc tectonism, volcanism, and mass wasting shape seafloor morphology in the Santorini-Christiana-Amorgos region of the Hellenic Volcanic Arc. Tectonophysics, 712–713:396–414. https://doi.org/10.1016/j.tecto.2017.06.005
Jutzeler, M., White, J.D.L., Talling, P.J., McCanta, M., Morgan, S., Le Friant, A., and Ishizuka, O., 2014. Coring disturbances in IODP piston cores with implications for offshore record of volcanic events and the Missoula megafloods. Geochemistry, Geophysics, Geosystems, 15(9):3572–3590. https://doi.org/10.1002/2014GC005447
Kidd, R.B., Cita, M.B., and Ryan, W.B.F., 1978. Stratigraphy of eastern Mediterranean sapropel sequences recovered during DSDP Leg 42A and their paleoenvironmental significance. In Hsü, K., Montadert, L., et al., Initial Reports of the Deep Sea Drilling Project. 42(1): Washington, DC (US Government Printing Office), 421–443. https://doi.org/10.2973/dsdp.proc.42-1.113-1.1978
Kutterolf, S., Druitt, T.H., Ronge, T.A., Beethe, S., Bernard, A., Berthod, C., Chen, H., Chiyonobu, S., Clark, A., DeBari, S., Fernandez Perez, T.I., Gertisser, R., Hübscher, C., Johnston, R.M., Jones, C., Joshi, K.B., Kletetschka, G., Koukousioura, O., Li, X., Manga, M., McCanta, M., McIntosh, I., Morris, A., Nomikou, P., Pank, K., Peccia, A., Polymenakou, P.N., Preine, J., Tominaga, M., Woodhouse, A., and Yamamoto, Y., 2024a. Expedition 398 methods. In Druitt, T.H., Kutterolf, S., Ronge, T.A., and the Expedition 398 Scientists, Hellenic Arc Volcanic Field. Proceedings of the International Ocean Discovery Program, 398: College Station, TX (International Ocean Discovery Program). https://doi.org/10.14379/iodp.proc.398.102.2024
Kutterolf, S., Druitt, T.H., Ronge, T.A., Beethe, S., Bernard, A., Berthod, C., Chen, H., Chiyonobu, S., Clark, A., DeBari, S., Fernandez Perez, T.I., Gertisser, R., Hübscher, C., Johnston, R.M., Jones, C., Joshi, K.B., Kletetschka, G., Koukousioura, O., Li, X., Manga, M., McCanta, M., McIntosh, I., Morris, A., Nomikou, P., Pank, K., Peccia, A., Polymenakou, P.N., Preine, J., Tominaga, M., Woodhouse, A., and Yamamoto, Y., 2024b. Site U1592. In Druitt, T.H., Kutterolf, S., Ronge, T.A., and the Expedition 398 Scientists, Hellenic Arc Volcanic Field. Proceedings of the International Ocean Discovery Program, 398: College Station, TX (International Ocean Discovery Program). https://doi.org/10.14379/iodp.proc.398.106.2024
Kutterolf, S., Freundt, A., Hansteen, T.H., Dettbarn, R., Hampel, F., Sievers, C., Wittig, C., Allen, S.R., Druitt, T.H., McPhie, J., Nomikou, P., Pank, K., Schindlbeck-Belo, J.C., Wang, K.-L., Lee, H.-Y., and Friedrichs, B., 2021. The medial offshore record of explosive volcanism along the central to eastern Aegean Volcanic Arc: 1. tephrostratigraphic correlations. Geochemistry, Geophysics, Geosystems, 22(12):e2021GC010010. https://doi.org/10.1029/2021GC010010
Le Maitre, R.W., Steckeisen, A., Zanettin, B., Le Bas, M.J., Bonin, B., and Bateman, P. (Eds.), 2002. Igneous Rocks: A Classification and Glossary of Terms (Second edition): Cambridge, UK (Cambridge University Press). https://doi.org/10.1017/CBO9780511535581
Lirer, F., Foresi, L.M., Iaccarino, S.M., Salvatorini, G., Turco, E., Cosentino, C., Sierro, F.J., and Caruso, A., 2019. Mediterranean Neogene planktonic foraminifer biozonation and biochronology. Earth-Science Reviews, 196:102869. https://doi.org/10.1016/j.earscirev.2019.05.013
Lourens, L.J., Hilgen, F.J., and Raffi, I., 1998. Base of large Gephyrocapsa and astronomical calibration of early Pleistocene sapropels in Site 967 and Hole 969D: solving the chronology of the Vrica Section (Calabria, Italy). In Robertson, A.H.F., Emeis, K.-C., Richter, C., and Camerlenghi, A. (Eds.), Proceedings of the Ocean Drilling Program, Scientific Results. 160: College Station, TX (Ocean Drilling Program), 191. https://doi.org/10.2973/odp.proc.sr.160.017.1998
Maltman, A.J., Byrne, T., Karig, D.E., and Lallemant, S., 1993. Deformation at the toe of an active accretionary prism: synopsis of results from ODP Leg 131, Nankai, SW Japan. Journal of Structural Geology, 15(8):949–964. https://doi.org/10.1016/0191-8141(93)90169-B
Martini, E., 1971. Standard Tertiary and Quaternary calcareous nannoplankton zonation. Proceedings of the Second Planktonic Conference, Roma, 1970:739–785.
Okada, H., and Bukry, D., 1980. Supplementary modification and introduction of code numbers to the low-latitude coccolith biostratigraphic zonation (Bukry, 1973; 1975). Marine Micropaleontology, 5(3):321–325. https://doi.org/10.1016/0377-8398(80)90016-X
Pimmel, A., and Claypool, G., 2001. Introduction to shipboard organic geochemistry on the JOIDES Resolution. Ocean Drilling Program Technical Note, 30. https://doi.org/10.2973/odp.tn.30.2001
Preine, J., Hübscher, C., Karstens, J., and Nomikou, P., 2022a. Volcano-tectonic evolution of the Christiana-Santorini-Kolumbo rift zone. Tectonics, 41(11):e2022TC007524. https://doi.org/10.1029/2022TC007524
Preine, J., Karstens, J., Hübscher, C., Nomikou, P., Schmid, F., Crutchley, G.J., Druitt, T.H., and Papanikolaou, D., 2022b. Spatio-temporal evolution of the Christiana-Santorini-Kolumbo volcanic field, Aegean Sea. Geology, 50(1):96–100. https://doi.org/10.1130/G49167.1
Rio, D., Raffi, I., and Villa, G., 1990. Pliocene-Pleistocene calcareous nannofossil distribution patterns in the western Mediterranean. In Kastens, K.A., Mascle, J., et al., Proceedings of the Ocean Drilling Program, Scientific Results. 107: College Station, TX (Ocean Drilling Program), 513–533. https://doi.org/10.2973/odp.proc.sr.107.164.1990
Shipboard Scientific Party, 2001. Leg 190 summary. In Moore, G.F., Taira, A., Klaus, A., et al., Proceedings of the Ocean Drilling Program, Initial Reports, 190. College Station, TX (Ocean Drilling Program), 1–87. https://doi.org/10.2973/odp.proc.ir.190.101.2001
Sibson, R.H., 1981. Controls on low-stress hydro-fracture dilatancy in thrust, wrench and normal fault terrains. Nature, 289(5799):665–667. https://doi.org/10.1038/289665a0