Druitt, T.H., Kutterolf, S., Ronge, T.A., and the Expedition 398 Scientists
Proceedings of the International Ocean Discovery Program Volume 398
publications.iodp.org
https://doi.org/10.14379/iodp.proc.398.114.2024
Site U16001
![]() S. Kutterolf,
S. Kutterolf,
![]() T.H. Druitt,
T.H. Druitt,
![]() T.A. Ronge,
T.A. Ronge,
![]() S. Beethe,
S. Beethe,
![]() A. Bernard,
A. Bernard,
![]() C. Berthod,
C. Berthod,
![]() H. Chen,
H. Chen,
![]() S. Chiyonobu,
S. Chiyonobu,
![]() A. Clark,
A. Clark,
![]() S. DeBari,
S. DeBari,
![]() T.I. Fernandez Perez,
T.I. Fernandez Perez,
![]() R. Gertisser,
R. Gertisser,
![]() C. Hübscher,
C. Hübscher,
![]() R.M. Johnston,
R.M. Johnston,
![]() C. Jones,
C. Jones,
![]() K.B. Joshi,
K.B. Joshi,
![]() G. Kletetschka,
G. Kletetschka,
![]() O. Koukousioura,
O. Koukousioura,
![]() X. Li,
X. Li,
![]() M. Manga,
M. Manga,
![]() M. McCanta,
M. McCanta,
![]() I. McIntosh,
I. McIntosh,
![]() A. Morris,
A. Morris,
![]() P. Nomikou,
P. Nomikou,
![]() K. Pank,
K. Pank,
![]() A. Peccia,
A. Peccia,
![]() P.N. Polymenakou,
P.N. Polymenakou,
![]() J. Preine,
J. Preine,
![]() M. Tominaga,
M. Tominaga,
![]() A. Woodhouse, and
A. Woodhouse, and
![]() Y. Yamamoto2
Y. Yamamoto2
1 Kutterolf, S., Druitt, T.H., Ronge, T.A., Beethe, S., Bernard, A., Berthod, C., Chen, H., Chiyonobu, S., Clark, A., DeBari, S., Fernandez Perez, T.I., Gertisser, R., Hübscher, C., Johnston, R.M., Jones, C., Joshi, K.B., Kletetschka, G., Koukousioura, O., Li, X., Manga, M., McCanta, M., McIntosh, I., Morris, A., Nomikou, P., Pank, K., Peccia, A., Polymenakou, P.N., Preine, J., Tominaga, M., Woodhouse, A., and Yamamoto, Y., 2024. Site U1600. In Druitt, T.H., Kutterolf, S., Ronge, T.A., and the Expedition 398 Scientists, Hellenic Arc Volcanic Field. Proceedings of the International Ocean Discovery Program, 398: College Station, TX (International Ocean Discovery Program). https://doi.org/10.14379/iodp.proc.398.114.2024
2 Expedition 398 Scientists’ affiliations.
1. Background and objectives
Site U1600 is located 10 km south of Anhydros Island within a small graben atop the Anhydros Horst (Figure F1). The Anhydros Horst separates the Anhydros Basin to the west from the Anafi Basin to the east (Preine et al., 2022a, 2022b). The water depth is 326 meters below sea level (mbsl). Permission to drill in this location was requested as Site CSK-24A and granted by the International Ocean Discovery Program (IODP) Environmental Protection and Safety Panel during the expedition. Three holes (U1600A–U1600C) were drilled for a total recovery depth of 184.2 meters below seafloor (mbsf) (all depths below seafloor are given using the core depth below seafloor, Method A [CSF-A] scale, except in Operations, where the drilling depth below seafloor [DSF] scale is used), with average recoveries ranging 32%–75%.
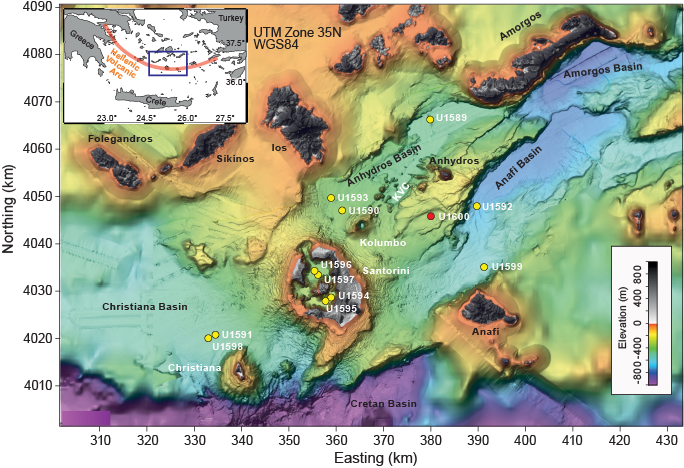
Figure F1. Site map.
The site was chosen because of its situation on the Anhydros Horst immediately east of the Kolumbo chain of volcanoes and for the well-stratified nature of the graben fill on seismic profiles (Figure F2). It seemed to be a likely site at which to drill a condensed sequence of muds and tephra for chronology, sheltered from the large-scale mass wasting of the main basins. Site U1600 is located within the area of the 2015 PROTEUS seismic tomography experiment, during which subbottom profiling, gravity, and magnetic data were also recorded (Hooft et al., 2017).
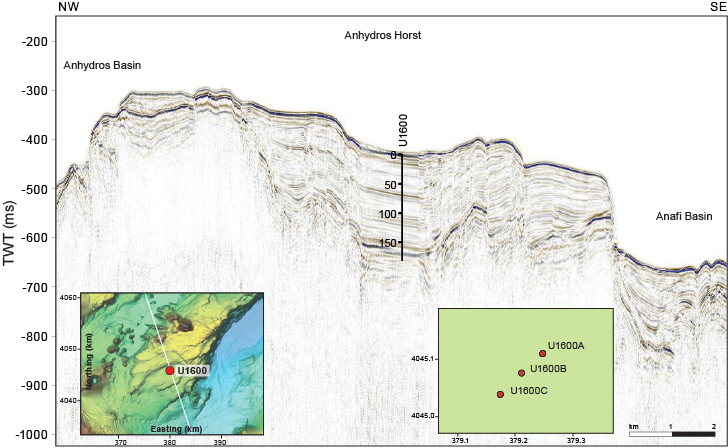
Figure F2. Seismic profile.
Drilling at Site U1600 provided the possibility of reconstructing a near-complete volcanic stratigraphy consistent with both onshore and offshore constraints and pinned by chronological markers from biostratigraphy, magnetostratigraphy, and sapropel records. Benthic foraminifera from fine-grained sediments provided estimates of paleowater depths and, via integration with seismic profiles and chronologic data, of time-integrated basin subsidence rates. Drilling on the Anhydros Horst addressed scientific Objectives 1–4 and 6 of the Expedition 398 Scientific Prospectus (Druitt et al., 2022).
2. Operations
The vessel arrived on location at Site U1600 on 29 January 2023 at 0430 h. The vessel was switched to full dynamic positioning mode and was on auto control at 0450 h, beginning Site U1600.
2.1. Hole U1600A
With the all clear given, the rig crew started assembling the advanced piston corer/extended core barrel (APC/XCB) bottom hole assembly (BHA) with the same bit used previously. Hole U1600A (36°32.6277′N, 25°39.0553′E) was spudded with Core 1H on 29 January 2023 at 0710 h. The recovery of 4.0 m gave a calculated seafloor of 326.2 mbsl (Table T1). APC coring continued with Cores 2H–4H. Prior to Core 4H, two misfires (pins did not shear) were experienced with the APC system, and an XCB barrel was run as a deplugger. Core 4H was fired on the third attempt with good recovery but with 45,000 lb overpull and a completely fractured liner.
The switch was made to the half-length APC (HLAPC) system with Cores 5F–10F at 56 mbsf. Core 10F required overpull of 50,000 lb. Coring continued with Cores 11X–13X to 84.4 mbsf, the final depth for Hole U1600A. The recovery for the XCB coring was extremely poor, and the decision was made to repeat the piston section in a new hole. The drill string was pulled up with the top drive, clearing the seafloor at 1905 h and ending Hole U1600A.
2.2. Hole U1600B
The ship was positioned 50 m southwest of Hole U1600A. Hole U1600B (36°32.6092′N, 25°39.0311′E) was spudded with Core 1H on 29 January 2023 at 2005 h. Recovery of 6.8 m established the water depth at 326.3 mbsl. Coring was switched to the HLAPC system from Core 2F and continued on 30 January through Core 19F at 91.4 mbsf, the final depth for Hole U1600B.
The drill string was tripped up with the top drive, clearing the seafloor at 0735 h. The bit cleared the rotary table at 0900 h, and the drill floor was secured for transit.
The crew started raising the thrusters at 0954 h, and the vessel was under bridge control at 0956 h. All thrusters were up and secured, and the sea passage started at 1000 h, ending Hole U1600B.
2.3. Hole U1600C
The vessel returned to Site U1600 on 4 February 2023. Once on site, the rig crew assembled the rotary core barrel (RCB) BHA with a used bit. Hole U1600C (36°32.5890′N, 25°39.0067′E) was spudded at 0655 h. A drill-ahead was done to 75.0 mbsf. RCB coring was initiated with Core 2R from 75.0 mbsf through Core 14R at 188.5 mbsf on 5 February, the final depth for Hole U1600C. After confirming that the basement was reached, the string was tripped up with the top drive, and the bit cleared the seafloor at 0410 h and the rig floor at 0525 h. The drill floor was secured at 0548 h, the vessel was switched to bridge control, and the thrusters were raised starting at 0550 h. All thrusters were up and secure, starting the sea passage at 0600 h and ending Site U1600.
Hole U1600C took 26.00 h (1.1 days).
3. Lithostratigraphy
Cores from Site U1600 recovered a relatively coherent sedimentary stratigraphy from 0 to 184.24 mbsf (Sections 398-U1600A-1H-1 through 13X-CC [0–74.73 mbsf]; 398-U1600B-1H-1 through 19F-CC [0–91.65 mbsf]; and 398-U1600C-3R-CC through 14R-1) (Figure F3).
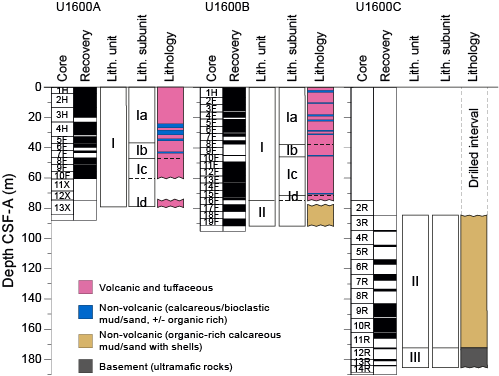
Figure F3. Lithostratigraphy.
The recovered material is sedimentary and unlithified in Holes U1600A and U1600B, with a gradual transition to stiffer and more consolidated material toward the bottom of Hole U1600B. Hole U1600C consists of more consolidated sediments, but paradoxically this is not supported by higher P-wave velocity (see Physical properties). However, a change from sediment to sedimentary rock was clearly identified at ~166 mbsf; hence, the lithology name changes from sediment (e.g., sand) to sedimentary rock (e.g., sandstone).
X-ray diffraction (XRD) data were obtained from three interstitial water (IW) squeeze cake sediment residues from Hole U1600A and five each from Holes U1600B and U1600C.
The sedimentary succession in the uppermost 92 m is dominated by volcanic and tuffaceous lithologies with minor intermittent intervals of nonvolcanic muds and sands (Lithostratigraphic Unit I). All cores in Unit I are rich in bioclasts (shells and shell fragments), even the volcanic intervals. In cases where ash or lapilli intervals have >25% bioclasts, they are denoted by the name bioclastic ash, and where bioclasts are present in abundances <25% that name becomes “with shells.” There are few ooze intervals in Unit I; most tuffaceous and nonvolcanic sediments are muds and sands, and the criteria for the “bioclastic” prefix and the “with shells” suffix is the same as described above. Smear slides for microscopic analyses were prepared to confirm macroscopic descriptions of distinct lithology changes at the section level, such as identification of vitric ash particles in tuffaceous lithologies or crystals in ash layers.
Unit II (77.30–172 mbsf), observed in the lowermost 14 m of Hole U1600B and in the uppermost ~87 m of Hole U1600C, is a continuation of the calcareous muds and sands present in Unit I but with three important distinctions: (1) these sediments are devoid of any volcanic and tuffaceous intervals, whereas Unit I in Holes U1600A and U1600B contains abundant volcanic and tuffaceous intervals; (2) the sediments in Unit II are almost entirely organic rich; and (3) XRD data show significant dolomite (see X-ray diffraction) that was not observable macroscopically. Given these differences, all of Hole U1600C is designated as Unit II down to a sharp discontinuity with ultramafic basement rock at 172.1 mbsf. These basement rocks are designated as Unit III.
Figure F3 summarizes the lithostratigraphy of Site U1600, displaying core recovery and lithostratigraphic units and subunits in Holes U1600A–U1600C. Table T2 provides the upper and lower boundaries, thicknesses, biostratigraphic ages (see Biostratigraphy), and lithologic summary of the units and subunits. Figure F4 graphically presents the relative proportions of volcanic, tuffaceous, and nonvolcanic lithologies with lithostratigraphic units and subunits. Figure F5 presents the grain size distribution of the sediments in all units and subunits, in particular those within the volcanic- and tuffaceous-dominated subunits of Unit I, to graphically show the distribution of ash, lapilli-ash, and lapilli and the variation between mud and sand in the lowermost part of Unit I and in Unit II. Figure F6 displays different types of core disturbance observed at Site U1600.
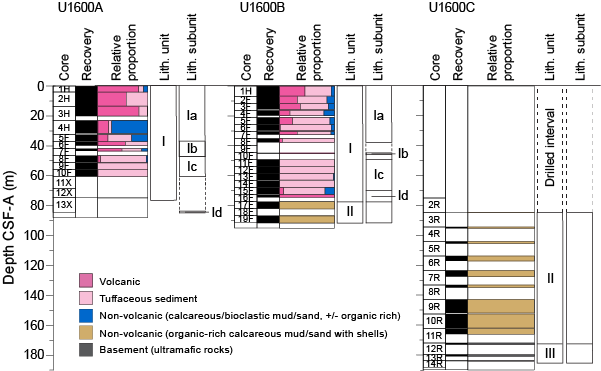
Figure F4. Volcanic, tuffaceous, and nonvolcanic lithologies.
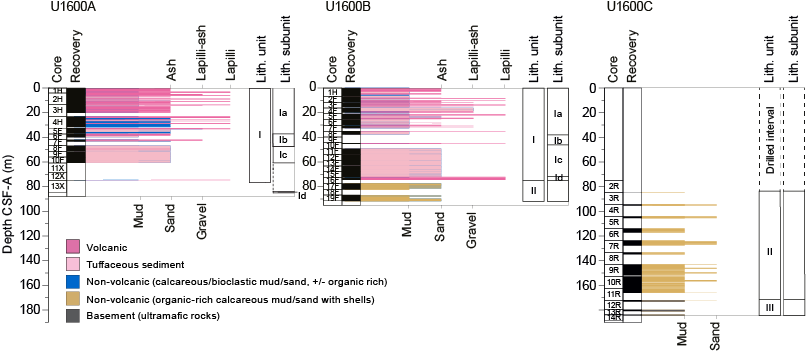
Figure F5. Grain size distribution.
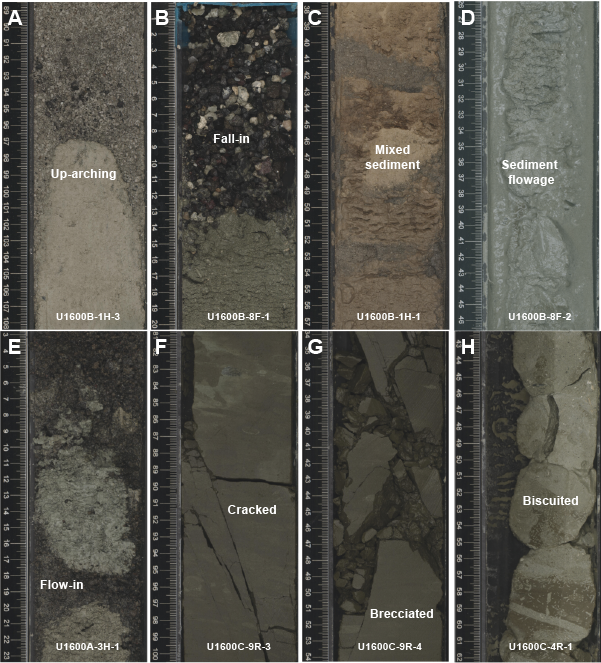
Figure F6. Core disturbances.
The following sections describe (1) the effects of core disturbance; (2) the lithostratigraphic units and subunits; (3) the correlations between Holes U1600A, U1600B, and U1600C; and (4) XRD results from Site U1600.
3.1. Core disturbance
Several types of core disturbance disrupt the lithostratigraphy at Site U1600 (Figure F6):
- Uparching: slight to moderate coring-induced shear between the sediment and core liner results in bedding uniformly dragged downward along the core margins (Figure F6A). In these intervals, original lithofacies and sedimentary structures are usually slightly to severely disturbed but can still be recognized visually.
- Fall-in: granular material from the top of the hole may fall in and accumulate at the bottom until the next core is recovered (Figure F6B). We exclude these intervals from lithostratigraphy interpretations.
- Mixed sediment: in water-saturated, granular core sections, grains and clasts flow and mix, producing moderately to severely disturbed, partly overprinted, sedimentary structures and stratigraphy (Figure F6C).
- Sediment flowage: high shearing rates between cored sediments and the core liner leave a smear or thin trail of displaced sediment along the inside of the core liner (Figure F6D).
- Special variety of midcore flow-in: deformation (shearing and truncation) of mud caused by underpressure stress during retrieval of the core from the host sediments is aggravated by midcore flow-in of allochthonous, dark sandy sediment injected between the segmented mud units (Figure F6E; Jutzeler et al., 2014).
- Cracks: slight drilling-related brecciation produces cracks in the original lithologies (Figure F6F).
- Brecciated: more intense drilling-related brittle rock failure disturbs the original lithofacies and sedimentary structures more severely, although they usually remain recognizable (Figure F6G).
- Biscuiting: fractured disc-shaped pieces, ranging in size from a few to more than 10 cm, often packed with sheared and remolded core material mixed with drill slurry, filling gaps between brittle biscuits (Figure F6H). The degree of biscuiting ranges from slight to severe, depending on the size of the biscuits and the proportion of biscuits to infill material.
- Artificial size and density segregation: likely to occur during drilling, with postrecovery core handling processes on board (e.g., inclining, shaking, and plunging cores on the catwalk to compact sediments), or while the core is lying flat on deck (Jutzeler et al., 2014). Such core disturbance is observed most often in volcanic sediments because increased porosity allows sucking in of seawater during hydraulic piston coring. The resulting soupy texture allows material to flow within the core liner. Secondary normal or reverse grading or density separation of clasts may occur as a result of this disturbance and obscure primary sedimentary features.
3.2. Description of units and subunits
3.2.1. Unit I
- Intervals: 398-U1600A-1H-1, 0 cm, to 13X-CC (bottom of the hole); 398-U1600B-1H-1, 0 cm, to 16F-CC
- Depths: Hole U1600A = 0–74.73 mbsf; Hole U1600B = 0–74.46 mbsf
- Thicknesses: Hole U1600A = 74.73 m; Hole U1600B = 74.46 m
- Age: Holocene to Early Pleistocene
- Lithology: volcanic sediment (ash, lapilli-ash, and lapilli) and tuffaceous sediment (calcareous tuffaceous mud and sand) with lesser nonvolcanic sediment (calcareous mud, bioclastic sand, and gravel), with organic-rich varieties
The sediment recovered from Hole U1600A and most of Hole U1600B is summarized in one main volcanic- and tuffaceous-dominated unit (Unit I) divided into four subunits (Ia–Id) (Figures F3, F4, F5; Table T2). Figure F7 displays images of the main lithologies of Unit I.
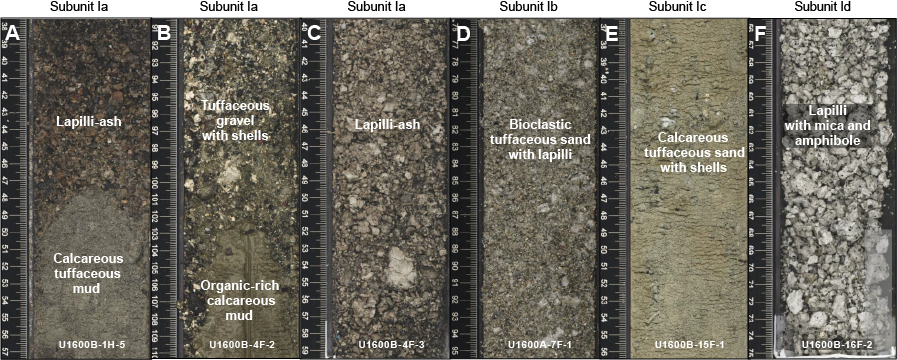
Figure F7. Unit I lithology.
Unit I extends from 0 to 74.73 mbsf in Hole U1600A and from 0 to 74.46 mbsf in Hole U1600B (Table T2). Unit I consists predominantly of calcareous tuffaceous sediment (tuffaceous oozes, muds, and sands) and volcanic lithologies (ash, lapilli-ash, and lapilli) with lesser amounts of nonvolcanic sediments (ooze, calcareous mud and sand, and bioclastic sand and their organic-rich counterparts). Grain sizes in Hole U1600B transition from mud in the uppermost 33 m to sand in the remainder of the hole, but this trend is not apparent in sediments from Hole U1600A.
Volcanic lithologies (>75% volcanic particles; glass shards, pumice, lithics, and crystals) comprise ash, lapilli-ash, and lapilli. Description of ash, lapilli-ash, and lapilli in volcanic intervals was based on the relative abundance of ash-sized (<2 mm) and lapilli-sized (2–64 mm) particles, as described in Lithostratigraphy in the Expedition 398 methods chapter (Kutterolf et al., 2024), with ash and lapilli used when the proportion of one size was >75% and lapilli-ash described when both sizes were present at <75% abundance (Fisher and Schmincke, 1984).
Nonvolcanic sediment intervals are less abundant but occur throughout both holes. They include calcareous/bioclastic mud and sand and their organic-rich counterparts.
Shells and shell fragments are abundant in Unit I, even appearing in abundances >25% in ash and lapilli intervals. Naming protocols thus allowed for unusual lithology names such as bioclastic ash or bioclastic lapilli-ash as well as bioclastic tuffaceous sand with lapilli.
The subunits are described as follows:
- Subunit Ia (Sections 398-U1600A-1H-1, 0 cm, through 5F-CC, 8 cm [0–37 mbsf], and 398-U1600B-1H-1, 0 cm, through 8F-2, 117 cm [0–37.67 mbsf]): volcanic-dominated succession of ash, lapilli-ash, and lapilli with tuffaceous ooze/mud intercalated with a minor amount of calcareous mud.
- Subunit Ib (Sections 398-U1600A-6F-1, 0 cm, through 8F-1, 14 cm [37.2–46.74 mbsf], and 398-U1600B-10F-1, 0 cm, through 10F-CC, 18 cm [44.7–45.28 mbsf]): bioclastic ash and lapilli.
- Subunit Ic (Sections 398-U1600A-8F-1, 14 cm, through 10F-CC, 10 cm [46.74–60.61 mbsf], and 398-U1600B-11F-1, 0 cm, through 15F-3, 113 cm [49.1–72.03 mbsf]): calcareous tuffaceous sand with shells.
- Subunit Id (Sections 398-U1600A-13X-CC, 0 cm, through 13X-CC, 3 cm [74.7–74.73 mbsf], and 398-U1600B-15F-3, 113 cm, through 16F-CC, 9 cm [72.03–74.46 mbsf]: lapilli.
3.2.1.1. Subunit Ia
Subunit Ia extends from 0 to 37 mbsf in Hole U1600A and from 0 to 37.67 mbsf in Hole U1600B (Figure F3; Table T2). This subunit is distinguished by the predominance of volcanic lithologies (ash, lapilli-ash, and lapilli) intercalated with tuffaceous sediment (calcareous tuffaceous mud) and a small amount of nonvolcanic sediments (calcareous mud and organic-rich calcareous mud). Subunit Ia begins in both holes with ~60 cm of brown organic-rich tuffaceous mud and gray tuffaceous mud with an intercalated centimetric gray ash layer. This thin ash layer is well sorted and contains biotite-bearing, subrounded white pumice. It is followed by several distinct intervals of dark-colored ash with lapilli and lapilli-ash. The first interval consists of poorly sorted ash and lapilli-ash with multiple normal grading, subrounded white and gray pumice, and plagioclase and pyroxene crystals (intervals 398-U1600A-1H-1, 56 cm, through 1H-CC, 13 cm, and 398-U1600B-1H-1, 63 cm, through 1H-3, 97 cm). Another notable interval, only observed in Hole U1600B (1H-4, 5 cm, through 1H-5, 48 cm), consists of dark grayish brown ash and lapilli-ash with subrounded pink, white, and tan pumice clasts that contain plagioclase and pyroxene crystals. Shorter intervals (1–25 cm) of ash, lapilli-ash, and lapilli within calcareous tuffaceous mud are observed throughout Subunit Ia, often occurring in repetitive packages within the same core or core section (Figure F7A–F7C). Microscopic smear slide observations confirmed the presence of ash and volcanic crystals within tuffaceous lithologies and dominantly pumiceous and blocky glass in ash (Figure F8A, F8B). Calcareous tuffaceous mud and sand observed in Subunit Ia are commonly greenish gray to light grayish brown and often contain lithics, pumice/scoria, and shell fragments (Figure F7A, F7B). Observed biogenic clasts include shells, brachiopods, gastropods, bivalves, corals, and scaphopods. The bottom boundary of Subunit Ia is marked by the cessation of frequent intercalated dark volcanic lithologies and the appearance of bioclastic sands, ashes, and lapilli. Correlation between Subunit Ia in Holes U1600A and U1600B is generally good, although the volcanic lithologies observed in Hole U1600B tend to be finer grained and less extensive than their equivalent units in Hole U1600A, potentially due to variable recovery in each hole.
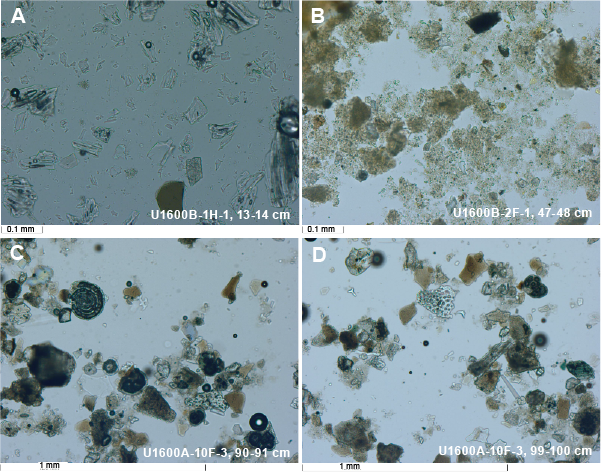
Figure F8. Subunit Ia and Ic lithology.
3.2.1.2. Subunit Ib
Subunit Ib extends from 37.2 to 46.74 mbsf in Hole U1600A and from 44.7 to 45.28 mbsf in Hole U1600B (Sections 398-U1600A-6F-1, 0 cm, through 8F-1, 14 cm, and 398-U1600B-10F-1, 0 cm, through 10F-CC, 18 cm) (Figure F3; Table T2). Subunit Ib consists of bioclastic volcanic lithologies, including ash, lapilli-ash, and lapilli (Figure F7D) intercalated with bioclastic tuffaceous sand with lapilli, bioclastic sand with lapilli, and gravel with lapilli. The boundary between the bottom of Subunit Ia and the top of Subunit Ib is characterized by a distinct color change from dark gray and olive to light gray and greenish gray. Bioclastic volcanic lithologies are typically light greenish gray and characterized by grain size ranging from fine ash to coarse lapilli. The interval is moderately to poorly sorted and contains subangular fibrous white pumice and shell fragments. Some normal grading is observed. Smear slides taken in Subunit Ib show sedimentary lithics, foraminifera, biotite, and feldspar. Clay minerals, calcite, and nannofossils are also observed (Figure F8C, F8D).
3.2.1.3. Subunit Ic
Subunit Ic extends from 46.74 to 60.61 mbsf in Hole U1600A (Sections 8F-1, 14 cm, through 10F-CC, 10 cm) and from 49.1 to 72.03 mbsf in Hole U1600B (Sections 11F-1, 0 cm, through 15F-3, 113 cm) (Figure F3; Table T2). The maximum thickness of this subunit (22.93 m) is observed in Hole U1600B. The subunit is dominated by tuffaceous lithologies including bioclastic tuffaceous sand, calcareous tuffaceous sand with shells, gravel (granule), and organic-rich calcareous mud (Figure F7E). Intervals are mainly greenish to light greenish gray in color and well sorted with a maximum grain size of coarse sand. Clasts are lithics, biogenic, and crystals and consist of volcanic rocks, shells, biotite, pyroxene, and plagioclase. Some intervals contain organic material with moderate bioturbation and are more brownish in color. Shell fragments are scaphopoda (Sections 398-U1600A-9F-2 and 398-U1600B-14F-CC) and echinoderm spines (Sections 398-U1600A-8F-2, 85F-3, and 8F-CC). Subunit Ic ends with a calcareous tuffaceous sand with lapilli containing hornblende- and biotite-bearing pumice.
3.2.1.4. Subunit Id
Subunit Id extends from 74.7 to 74.73 mbsf in Hole U1600A (Sections 13X-CC, 0 cm, through 13X-CC, 3 cm [bottom of the hole]), and from 72.03 to 74.46 mbsf in Hole U1600B (Sections 15F-3, 113 cm, through 16F-CC, 9 cm) (Figure F3; Table T2). The total thickness of this subunit is 2.43 m in Hole U1600B; only 3 cm of this subunit was recovered in Hole U1600A. Subunit Id consists entirely of light gray to white lapilli (Figure F7F). The subunit is characterized by moderately to well-sorted pumice clasts that are rich in biotite and hornblende. This lapilli layer has a grain size range of fine lapilli to coarse lapilli (2–64 mm). The whole of Core 398-U1600B-16F shows normal grading from the bottom (core catcher) to the top (Section 16F-1). Each section in that core is also itself normally graded.
3.2.2. Unit II
- Intervals: 398-U1600B-17F-1, 0 cm, to 19F-CC, 16 cm (bottom of the hole); and 398-U1600C-3R-CC, 0 cm, to 12R-1, 10 cm
- Depths: Hole U1600B = 77.3–91.63 mbsf; Hole U1600C = 84.70–172.1 mbsf
- Thickness: 92.1 m (calculating from the top of Unit II in Hole U1600B to the bottom of Unit II in Hole U1600C)
- Age: Early Pleistocene to Pliocene
- Lithology: primarily organic-rich calcareous mud/sand with shells with lesser calcareous mud/sand, sandstone, and rare ash pods
Unit II begins with the first calcareous sand with shells beneath a lapilli interval in Hole U1600B. It continues in Hole U1600C and is dominated by interbedded organic-rich calcareous mud and sand with shells (Figures F3, F9A; Table T2). The unit starts at 77.3 mbsf in Hole U1600B with cyclical variations between calcareous sands with shells and organic-rich calcareous muds through 91.63 m (bottom of the hole). The unit continues with these cyclic variations in Hole U1600C from 84.7 to 105.39 mbsf, at which point all sand and mud intervals become organic rich until 166.01 mbsf, where there is an unrecovered transition to sandstone.
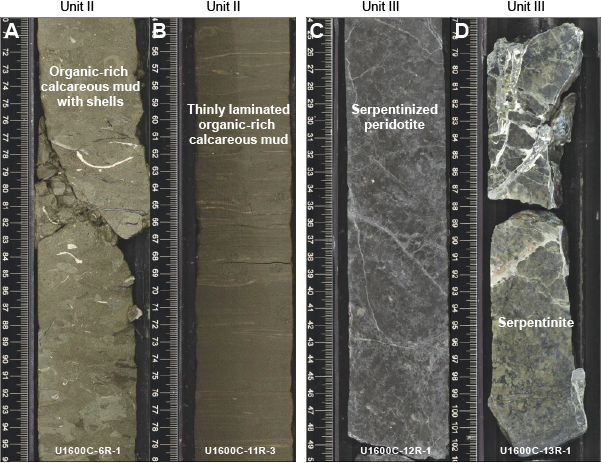
Figure F9. Unit II and III lithology.
A brachiopod was recovered in the upper part of this unit (interval 398-U1600B-19F-3, 21–25 cm) (Figure F10).
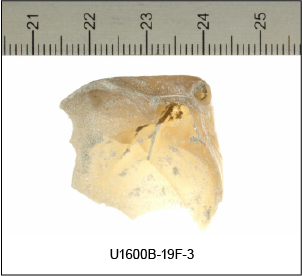
Figure F10. Subunit Ie brachiopod.
Organic-rich calcareous muds are olive-gray to dark olive-gray with or without thin (<0.3 cm) laminations (Figure F9A, F9B). Some intervals of mud are normally graded from fine sand at the base to mud. They are typically highly bioturbated with Zoophycos and Chondrites traces and contain burrows infilled with ash. Grain size ranges from mud to medium sand. Calcareous sand and organic-rich calcareous sand are well sorted, with colors ranging from greenish gray in the nonorganic-rich intervals to olive-gray in the organic-rich intervals.
The sands and muds are interbedded on scales of 25–50 cm, but with depth, mud intervals become thicker such that by 150.15 mbsf organic-rich calcareous mud is the only lithology until the bottom of the unit.
3.2.3. Unit III
- Interval: 398-U1600C-12R-1, 10 cm, to 14R-1, 54 cm (bottom of the hole)
- Depth: 172.1–184.24 mbsf
- Thickness: >12.14 m
- Age: Uncertain
- Lithology: ultramafic rocks
The rocks recovered from the base of Hole U1600C are summarized in one unit (Unit III) (Figures F3, F9C, F9D; Table T2). Unit III extends from 172.1 to 184.24 mbsf in Hole U1600C and consists of serpentinized ultramafic rocks (peridotite) (Table T2). Figure F9C and F9D displays core images of the main lithology found in Unit III.
Macroscopically, two distinct types of peridotite were observed. Dark gray serpentinized peridotite in Section 398-U1600C-12R-1 (Figure F9C) grades into grayish green, heavily serpentinized peridotite (serpentinite) in Sections 13R-1 and 14R-1 (Figure F9D). The dark gray variety is characterized by olivine replaced by serpentine, coarse orthopyroxene, and white crosscutting talc veins. The grayish green variety is partly brecciated, mesh-textured, completely serpentinized, and also contains white crosscutting talc veins. These rocks represent in situ basement rocks that underlie the sediments of Unit II.
Thin sections of two samples from Unit III are displayed in Figure F11. The dark gray peridotite from Section 398-U1600C-12R-1 (Figure F11A–F11C) shows orthopyroxene porphyroblasts often partly or almost completely altered to opaques (magnetite), chlorite, and replacement of olivine by serpentine, with only small relics of olivine preserved. Crosscutting veins are characterized by serpentine minerals, calcite, talc, and quartz. The grayish green serpentinite from Sections 13R-1 and 14R-1 (Figure F11D–F11F) is characterized by serpentine minerals, chlorite, spinel, and opaques (magnetite). Olivine is completely replaced by serpentine, producing a mesh texture of pseudomorphic serpentine after olivine. Brecciation is indicated by the presence of a coarse-grained part of the thin section with interlocking carbonate crystals. Crosscutting veins consist of serpentine minerals, talc, and quartz, among others.
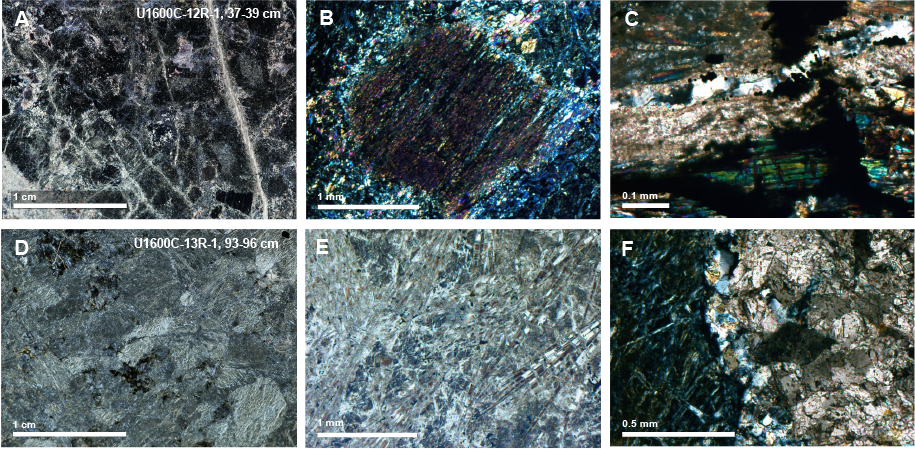
Figure F11. Unit III ultramafic rocks.
3.3. Correlations between holes
Holes U1600A and U1600B were drilled to overlap so that recovered stratigraphy could be correlated. Hole U1600A extends to 74.73 mbsf, and Hole U1600B extends to 91.65 mbsf. The overlap in the uppermost 75 m allows correlation of sediment-specific features. In both holes, recovery was poor between 40 and 46 mbsf. Although the base of Hole U1600B overlaps ~7 m with the top of Hole U1600C, the limited recovery within these core sections does not allow correlation between these two holes.
3.3.1. Notable correlated deposits
- Mud with lapilli overlying a light gray ash layer in the uppermost 17 cm of Holes U1600A and U1600B (Figure F12A).
- Lithic lapilli overlying calcareous tuffaceous mud in Subunit Ia (9.27 mbsf in Hole U1600A and 8.79 mbsf in Hole U1600B) (Figure F12B).
- Double ash layer at 26.11 mbsf in Hole U1600A and 25.19 mbsf in Hole U1600B showing a finer grained, gray ash layer at the bottom and a coarser grained, black ash layer at the top (Figure F12C).
- Rarely observed organic-rich interval in tuffaceous ooze (59.47 mbsf in Hole U1600A; 63.86 mbsf in Hole U1600B) (Figure F12D).
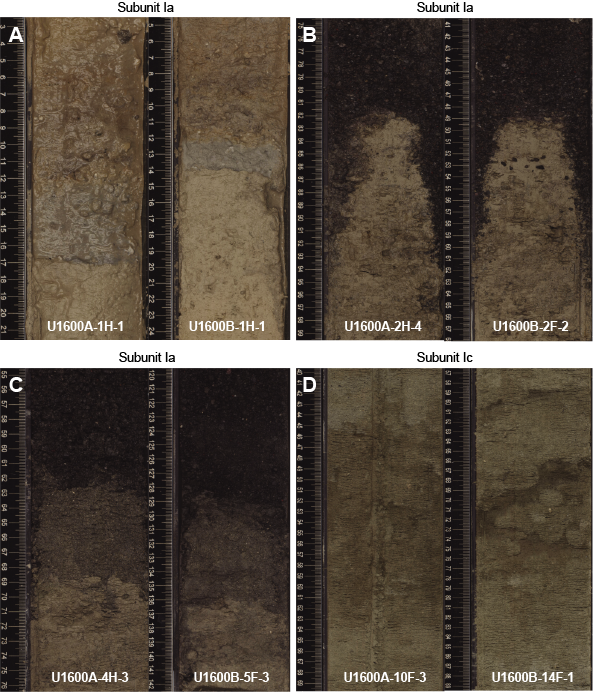
Figure F12. Stratigraphic correlation.
3.4. X-ray diffraction
XRD data were collected from three IW squeeze cake sediment residues from Hole U1600A and five squeeze cake sediment residues each from Holes U1600B and U1600C. The analyzed samples comprise lithologies ranging from organic-rich tuffaceous ooze to bioclastic tuffaceous sand with organic material, calcareous tuffaceous sand with shells, and calcareous mud and sand with shells. Muds and sands in Hole U1600C are calcareous, with some also containing significant amounts of dolomite. Spectra of representative lithologies from Subunits Ia, Ic, and Ie and Unit II are shown in Figure F13. Major mineral phases identified in these lithologies include calcium carbonate (calcite and/or aragonite), quartz, and clay minerals of the illite group. In addition, Ca-rich or Na-rich plagioclase and clinopyroxene (diopside) are identified in tuffaceous lithologies, which may also show the characteristic amorphous hump at low °2θ, if larger amounts of volcanic glass are present. Samples of mud or mud with shells analyzed in Hole U1600C are often dolomitic, with abundances ranging 6.6%–43.2%, as identified using the Rietveld method.
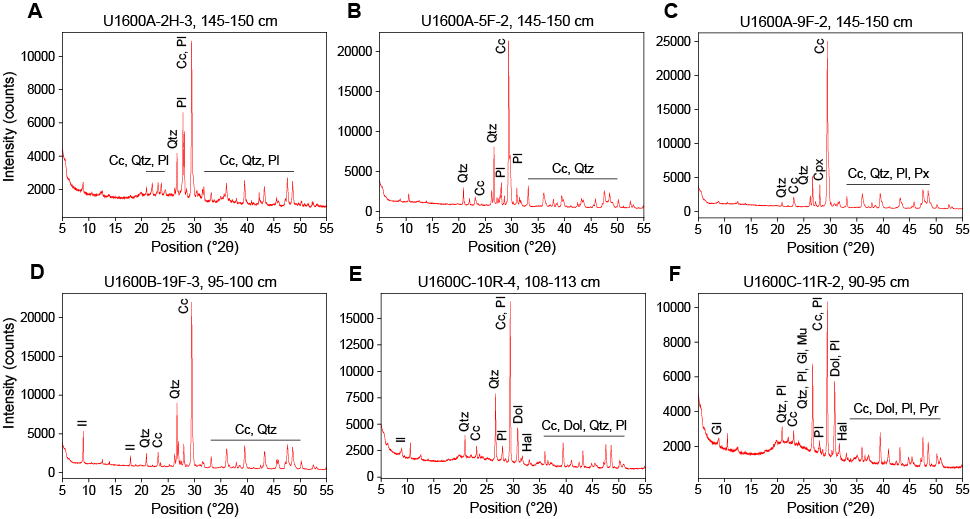
Figure F13. XRD spectra.
4. Stratigraphic correlation
Three holes were drilled at Site U1600. Hole U1600A was cored to 74.76 mbsf (CSF-A scale) using the APC (0–31.74 mbsf), HLAPC (32.5–60.66 mbsf), and XCB (60.7–74.76 mbsf) systems. Hole U1600B was cored to 91.65 mbsf using the APC (0–6.83 mbsf) and HLAPC (6.8–91.65 mbsf) systems. Hole U1600C was drilled using the RCB system to 184.24 mbsf; the uppermost interval from 0 to 75 mbsf was drilled without coring.
No correlation during coring was required due to the prevailing challenging drilling condition recognized in Hole U1600A.
4.1. Correlation for establishing CCSF-A depth scale and construction of the splice
To establish the core composite depth below seafloor, Method A (CCSF-A), depth scale, we analyzed cores from Holes U1600A and U1600B for their physical properties using the Whole-Round Multisensor Logger (WRMSL) for magnetic susceptibility (MS) and gamma ray attenuation (GRA) density; the Natural Gamma Radiation Logger (NGRL) for NGR intensity; and photos after the cores were split into working and archive halves (see Physical properties; also see Physical properties in the Expedition 398 methods chapter [Kutterolf et al., 2024]). The MS data proved to be the most reliable physical parameter for correlations. Because Hole U1600C had no overlap with Holes U1600A and U1600B, no correlation was possible.
Both Holes U1600A and U1600B preserved the mudline; we used Core 398-U1600A-1H as the anchor for stratigraphic correlation. Using this anchor core, we attempted to determine the relative depth offset of each core by establishing affine ties between the holes based on the maximum correlation of all measured physical properties. These depth offsets are reported in Table T3. Figure F14 shows the MS of the three holes on the resulting CCSF-A scale, in which individual cores are shifted according to the identified correlations. This figure highlights the vertical alignment of characteristic events in the adjacent holes.
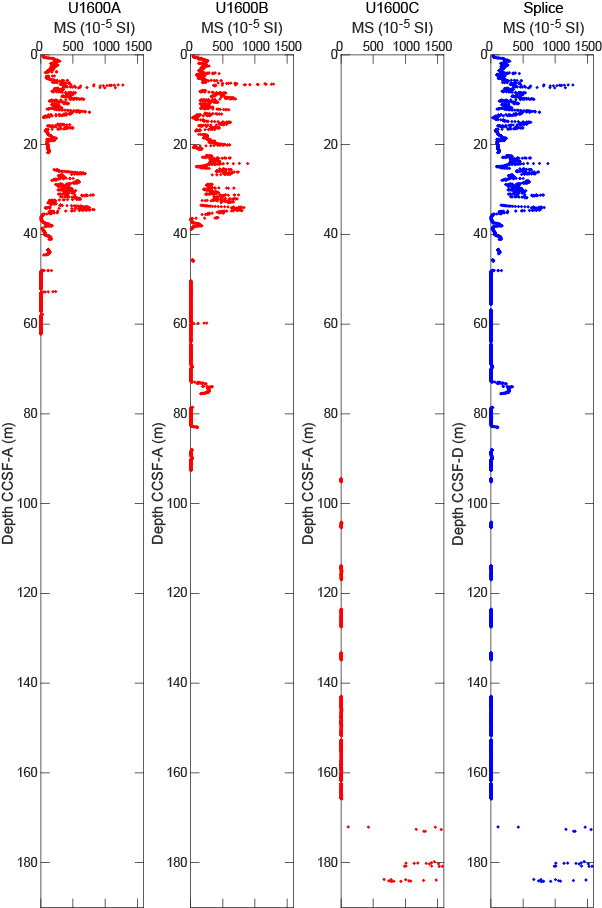
Figure F14. MS data.
In general, we were able to identify reliable correlations between most cores of Holes U1600A and U1600B. Interruptions in the correlation chain occurred in ashy and tuffaceous segments, where no reliable correlations were possible. For each of these interruptions, we used the relative offset between untied (uncorrelated) cores derived from the CSF-A scale in order to keep the composite depth scale as close to the original CSF-A scale as possible.
After we established the composite depth scale, we spliced selected sequences from Holes U1600A and U1600B and appended Hole U1600C to create the most complete and representative section possible. The end product of this process is shown in Table T4 and Figure F15. To ~70 mbsf (CCSF, Method D [CCSF-D], scale), the splice contains only small gaps less than 2 m. Farther below, larger gaps occur, which are the result of the generally lower recovery.
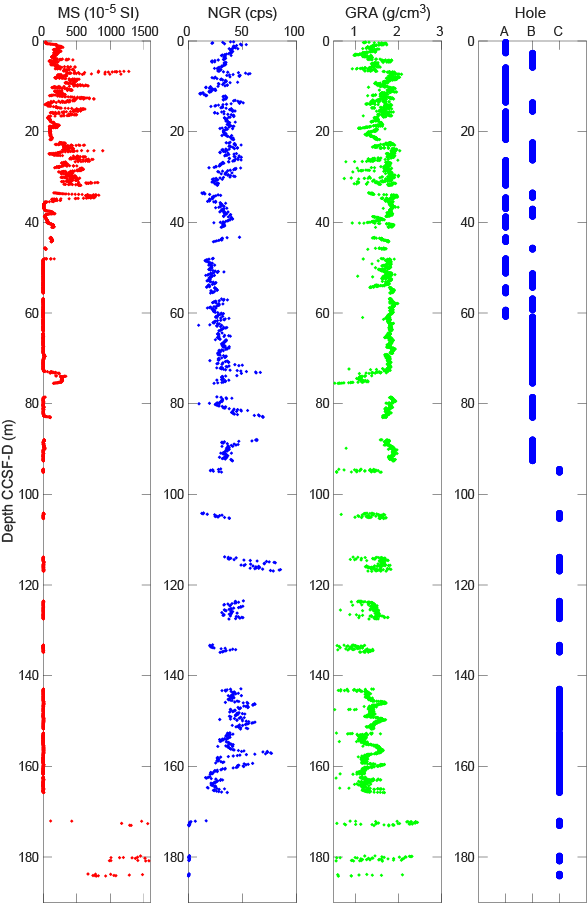
Figure F15. Splice.
Site U1600 cores showed no significant expansion. Figure F16 plots the CSF-A and CCSF-A scales for Holes U1600A–U1600C and shows a a linear regression curve calculated for all holes together. The deviation from the dotted line indicates an affine growth factor of approximately 2%.
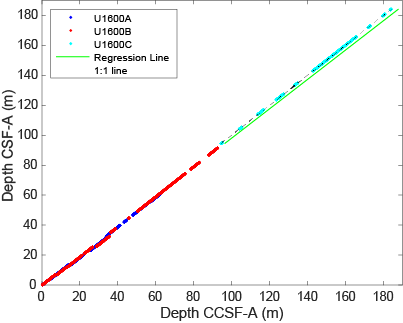
Figure F16. Core top depths.
5. Structural geology
Structural geology analyses at Site U1600 included description of cores retrieved from Holes U1600A–U1600C. A total of 70 structures were measured, and most of those measurements derived from relatively consolidated intervals. Observed and measured structures in cores are bedding, which includes lamination, faults, deformation bands, breccias, and mineral veins. The distributions and dip angles of planar structures (measured to an estimated accuracy of ±2°) are shown in Figure F17.
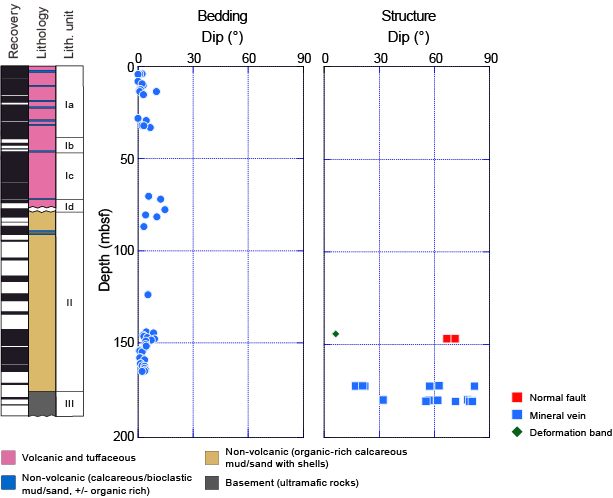
Figure F17. Dip data.
Deformation related to drilling and core recovery was noted but not recorded. Here, we describe and provide examples of the features that were recorded.
5.1. Bedding
Bedding planes (n = 48), measured mainly on thin sand beds/laminae, organic-rich mud, and ooze boundaries, mostly exhibit horizontal to subhorizontal dips ranging from 1° to 15° (mean dip = 4°) (Figure F17). However, steeper inclinations develop at 72–82 mbsf within Lithostratigraphic Subunit Id where dips range 4°–15° (mean = 11°) (Figure F18).
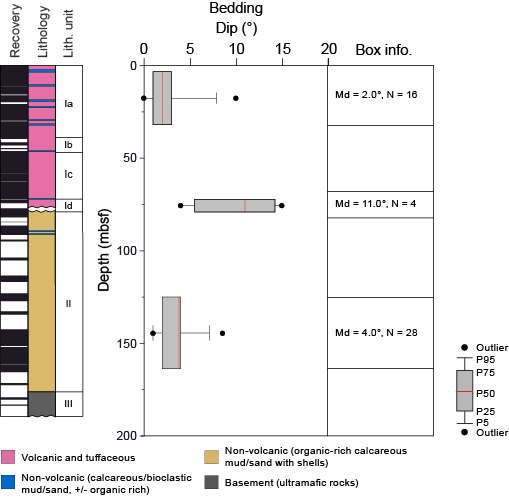
Figure F18. Bedding dip.
To evaluate the bedding dip variations in the ~190 m deep hole, we divided bedding measurements to correspond to the lithostratigraphic units/subunits defined by core description (see Lithostratigraphy) and used a box plot to indicate the distribution of bedding dips (Figure F18). Measurements were mostly concentrated in Subunits Ia and Id and Unit II (Figure F17). Thus, a total of three bedding measurement units were described. In the box plot, each box indicates the data distribution range between the twenty-fifth and seventy-fifth percentiles, which is statistically meaningful. Median values (fiftieth percentile of all respective measurements in a unit), which are representative of the data distribution, were used for the evaluation of dip angles. Major increases in bedding dips were identified from Unit II through Subunit Id, where median dips increase from 4° to 11°. In contrast, in Subunits Id–Ia, median dip decreases from 11° to 2° (Figure F18).
5.2. Mineral veins
Mineral veins are abundant in the interval below 172 mbsf in Hole U1600C (Figure F17), which corresponds to Lithostratigraphic Unit III (see Lithostratigraphy), which is composed of serpentinized peridotite. Crystal growth of quartz was identified in the gap along fractures. Sometimes it represented brecciated textures composed of angular-shaped host rock clasts (Figure F19). A thin talc film developed along the contact between the host rock and breccia and along brecciated clasts. Also, in situ brecciation of talc was frequently identified along the thick mineral veins. These textures apparently indicate that the talc was formed from the reaction between serpentine and SiO2-saturated fluid during brecciation.
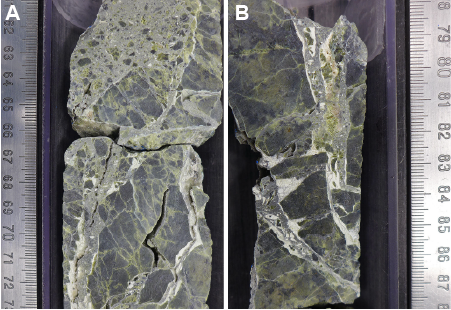
Figure F19. Mineral veins and breccia.
6. Biostratigraphy
Planktonic and benthic foraminifera and calcareous nannofossils were examined from core catcher samples and additional split core samples from Holes U1600A–U1600C to develop a shipboard biostratigraphic framework for Site U1600. Additionally, planktonic and benthic foraminifera provided data on paleowater depths, downslope reworking, and possible dissolution.
Site U1600 drilled the sedimentary sequence atop the tectonic horst situated between the Anafi and Anhydros Basins and recovered a 184.24 m thick Holocene to Upper Pliocene sequence comprising volcanogenic sediments, calcareous and tuffaceous sands, and ultramafic basement. Calcareous nannofossils and planktonic foraminifera provided good resolution in the Holocene through Upper Pliocene sediments. Ages provided by benthic foraminifera were also consistent with those of planktonic foraminifera and calcareous nannofossils. Biostratigraphic datums recognized at Site U1600 are given in Tables T5 and T6, and an age-depth plot is shown in Figure F20.
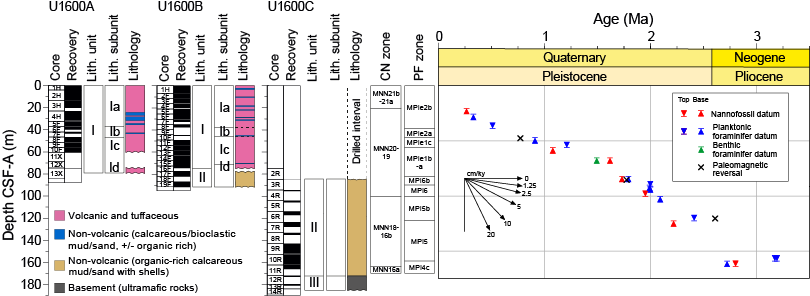
Figure F20. Age-depth plot.
Hole U1600A recovered Holocene to Early Pleistocene–aged sediments (0.00–0.91 Ma) from Samples 1H-CC, 30–31 cm, to 6F-CC, 0–3 cm (4.08–39.79 mbsf). Hole U1600B recovered Holocene to Early Pleistocene–aged sediments (0.00–1.99 Ma) from Samples 1H-CC, 8–11 cm, to 19F-CC, 16–18 cm (6.83–91.65 mbsf). Hole U1600C recovered Early Pleistocene to Late Pliocene–aged sediments (1.95–3.19 Ma) from Samples 3R-CC, 14–17 cm, to 11R-CC, 0–5 cm (84.87–165.89 mbsf).
6.1. Calcareous nannofossils
Calcareous nannofossil biostratigraphy in Holes U1600A–U1600C was established through analysis of core catcher samples and additional split core samples. Nannofossils are rare to abundant in samples from the Pleistocene to Upper Pliocene sequence (Hole U1600A: 4.08–74.76 mbsf; Hole U1600B: 6.83–91.65 mbsf; Hole U1600C: 84.855–165.865 mbsf). Preservation is generally good to moderate with sporadically poor intervals throughout the sequence (Figure F20); however, there is significant reworking of older material in most of the Pleistocene samples. The assemblages are characterized by the occurrence of warm-water species such as Rhabdosphaera clavigera and Umbilicosphaera sibogae throughout the sequence in Holes U1600A and U1600B.
Seven nannofossil biostratigraphic datums are recognized at Site U1600, representing a continuous Late Pliocene to Late Pleistocene sedimentary sequence (Figure F21). The distribution of calcareous nannofossil taxa is shown in Table T7, and biostratigraphic datums are given in Table T5.
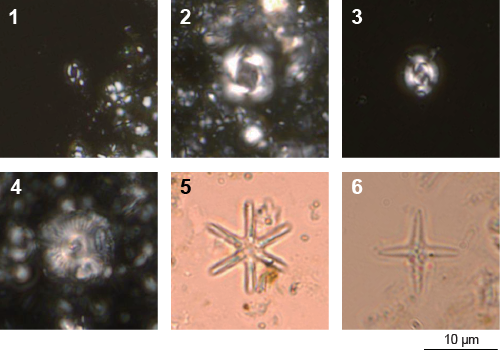
Figure F21. Calcareous nannofossils.
The presence of Emiliania huxleyi in Samples 398-U1600A-1H-CC, 30–31 cm, to 2H-6, 97–100 cm (4.08–12.46 mbsf), and 398-U1600B-1H-CC, 8–11 cm, to 3F-CC, 0–4 cm (6.83–15.6 mbsf), indicates a Holocene to Middle Pleistocene age (≤0.265 Ma) within Zones MNN21a and 21b (CNPL11: Backman et al., 2012; NN21: Martini, 1971; CN15: Okada and Bukry, 1980) of Rio et al. (1990) and Di Stefano and Sturiale (2010). The basal occurrence of Reticulofenestra asanoi (1.078 Ma), which lies just below the Jaramillo Subchron of the Matuyama Chron in Zone MNN19e, is found between Samples 11F-CC, 13–15 cm, and 12F-CC, 13–15 cm (53.94–58.5 mbsf). The large form of Gephyrocapsa spp. (>5.5 µm) that appears between 1.245 and 1.617 Ma (Zones MNN19d, CNPL8, NN19, and CN13b) occurs in Samples 12F-CC, 13–15 cm, and 13F-CC, 12–14 cm (58.5–62.94 mbsf). The basal occurrence of medium-form Gephyrocapsa spp. (>4.0 µm), which is situated just above Olduvai Subchron of the Matuyama Chron within Zone MNN19b (CNPL8, NN19, and CN13a), is recognized between Samples 17F-CC, 16–18 cm, and 18F-CC, 14–16 cm. The assemblages in Samples 18R-CC, 14–16 cm, and 19F-CC, 16–18 cm (82.14–91.64 mbsf), are characterized by occurrences of Calcidiscus macintyrei, Gephyrocapsa spp. (small form), Pseudoemiliania lacunosa, and Reticulofenestra spp. without Discoasteraceae. Thus, Samples 18F-CC, 14–16 cm, and 19F-CC, 16–18 cm, are tentatively placed in Zone MNN19a (CNPL7, NN19, and CN13a; 1.73–1.95 Ma). The Gelasian (Early Pleistocene) assemblages found at this site are characterized by the occurrence of discoasters, which include marker species of Miocene to Pliocene successions. The last occurrence of Discoaster brouweri, which indicates the boundary of Zones MNN18/19a (NN18/19 and CN12d/CN13a), occurs between Samples 398-U1600C-4R-CC, 8–12 cm, and 5R-CC, 11–14 cm (100.4 mbsf). The acme base of Discoaster triradiatus, which characterizes the middle MNN18 Zone (2.216 Ma), appears between Samples 6R-CC, 13–18 cm, and 7R-CC, 13–18 cm (122.4 mbsf). The Discoaster tamalis disappearance at 2.8 Ma occurs in the upper part of the Gauss Chron, and this specimen last occurs between Samples 10R-CC, 13–15 cm (161.96 mbsf), and 11R-CC, 0–5 cm (165.865 mbsf).
6.2. Foraminifera
Planktonic and benthic foraminifera were examined from core catcher samples and split core samples from Holes U1600A–U1600C (Tables T8, T9). Absolute ages assigned to biostratigraphic datums follow those listed in Table T6 in the Expedition 398 methods chapter (Kutterolf et al., 2024). Planktonic and benthic foraminifer datums for Site U1600 are given in Table T6. Planktonic foraminifer abundances and indications of oceanicity (e.g., Hayward et al., 1999) and benthic foraminifer paleowater depth estimations are given in Figures F22 and F23.
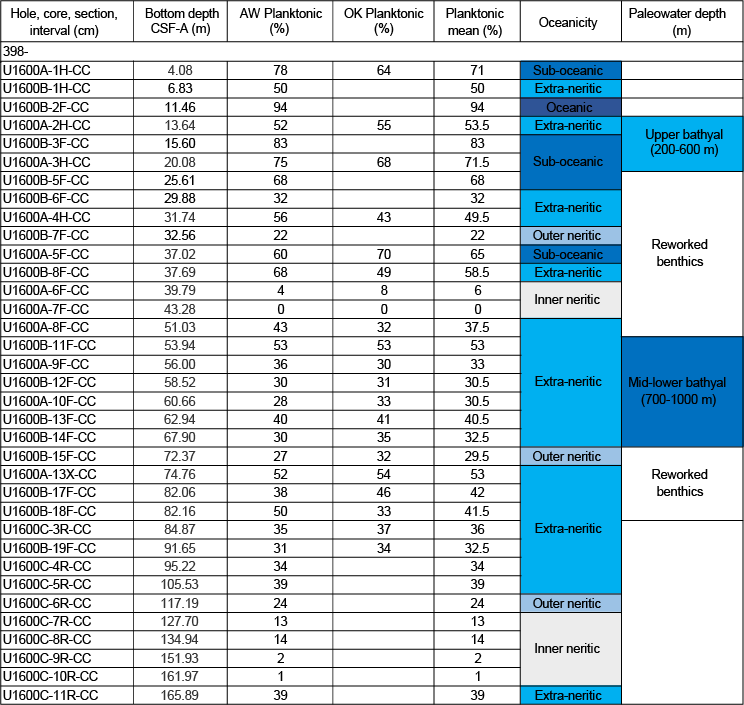
Figure F22. Foraminiferal oceanicity and paleowater depth estimates.
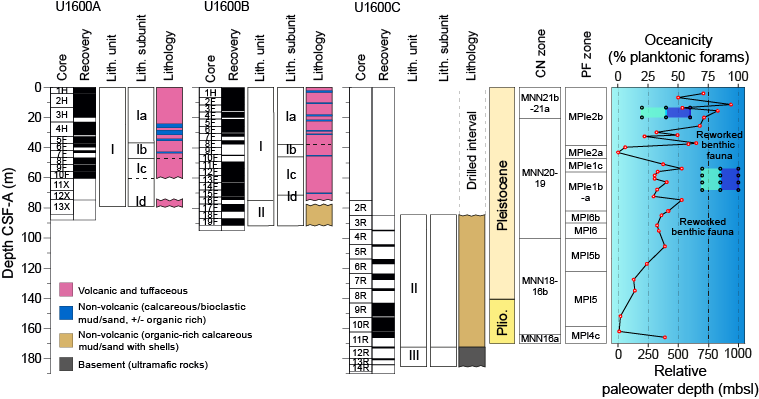
Figure F23. Biostratigraphy.
Because of the volcanogenic and siliciclastic nature of sections of the cored sedimentary sequence, residues (>125 µm) from washed samples were often commonly composed of volcaniclastic particles such as pumice, scoria, and ash and siliciclastic grains that often diluted the microfossil component of residues. Foraminifera often dominate the biogenic component of residues where age markers are present in sufficient numbers to date most samples reliably; however, a significant component of other fossil material are present, including shells and fragments (Bivalvia and Gastropoda), Pteropoda, Scaphopoda, Bryozoa, Cnidaria (coral), echinoid spines and plate fragments, radiolarians, and ostracods, as well as fish teeth. In addition, reworked Lower Pleistocene and Pliocene foraminifera are often present.
Throughout the section, foraminifera with very good to poor preservation are present in sediments. Foraminifer abundances are also variable and are notably rare in tuffaceous oozes, likely due to sedimentary dilution, whereas coarser bioclastic intervals are sometimes barren of planktonic foraminifera.
6.2.1. Holocene to Pleistocene foraminiferal biostratigraphy
Because of explosive volcanic events and rapid deposition of the upper sedimentary section, the base of the Holocene is not possible to assign accurately. Planktonic foraminifer assemblages from the Holocene–Pleistocene section of Holes U1600A–U1600C are mostly well preserved, where specimens are rarely broken or exhibiting partially dissolved shell walls.
Holocene–Pleistocene foraminifer faunas indicate large fluctuations in relative paleowater depth and oceanicity, with highly variable planktonic abundances that range 0%–94% where foraminifera are present (Figure F23). The fauna are typical of Pleistocene Mediterranean biostratigraphic zones, primarily composed of Neogloboquadrina incompta, Globigerina bulloides, Globigerina falconensis, Globigerina umbilicata, Globigerinella siphonifera, Globigerinita glutinata, Globigerinoides elongatus, Globigerinoides pyramidalis, Trilobatus trilobus group, Globigerinoides ruber var. white, Globigerinoides ruber var. pink, Globoconella inflata, Hirsutella scitula, Neogloboquadrina pachyderma, Orbulina universa, Turborotalita quinqueloba, and Globigerinella calida through the Middle Pleistocene–Holocene, and the addition of species such as Globoturborotalita woodi, Globorotalia bononiensis, Globigerinoides obliquus, Globigerinoides extremus, and Neogloboquadrina atlantica (sinistral) through the Lower Pleistocene (Figure F24). Reworked specimens are common throughout the section.
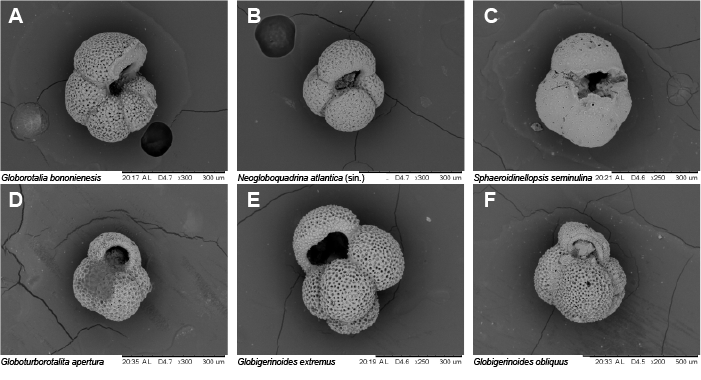
Figure F24. Planktonic foraminifera.
Foraminiferal faunas are sufficiently common to biostratigraphically divide the Pleistocene into the majority of Pleistocene Mediterranean planktonic foraminiferal biostratigraphic zones determined via both primary and secondary marker species (Lirer et al., 2019):
- Zone MPle2b (0.00–0.53 Ma), Hole U1600A: 4.08–37.02 mbsf.
- Zone MPle2a (0.53–0.94 Ma), Hole U1600A: 39.79–43.28 mbsf.
- Zone MPle1c (0.94–1.21 Ma), Hole U1600B: 53.94 mbsf.
- Zones MPle1b–1a (1.21–1.79 Ma), Hole U1600B: 58.52–82.06 mbsf.
- Zone MPl6b (1.79–2.00 Ma), Holes U1600B and U1600C: 82.16–84.87 mbsf.
- Zone MPl6 (2.00–2.09 Ma), Holes U1600B and U1600C: 91.65–95.22 mbsf.
- Zone MPl5b (2.09–2.41 Ma), Hole U1600C: 105.53–117.19 mbsf.
The faunal criteria on which these age assignments are based are given in the sections below.
6.2.1.1. Zone MPle2b (0.00–0.53 Ma)
Samples 398-U1600A-1H-CC, 30–31 cm, to 5F-CC, 8–10 cm (4.08–37.02 mbsf), are assigned to Zone MPle2b based on the paracme top of sinistrally coiled Neogloboquadrina spp. (<0.51 Ma) occurring between Samples 5F-CC, 8–10 cm, and 6F-CC, 0–3 cm (37.02–39.79 mbsf), above which this species is more common.
6.2.1.2. Zone MPle2a (0.53–0.94 Ma)
Samples 398-U1600A-6F-CC, 0–3 cm, to 7F-CC, 0–3 cm (39.79–43.28 mbsf), are assigned to Zone MPle2a based on the absence of sinistrally coiled Neogloboquadrina spp. (0.51–0.91 Ma) throughout this interval.
6.2.1.3. Zone MPle1c (0.94–1.21 Ma)
Sample 398-U1600B-11F-CC, 13–15 cm (53.94 mbsf), is assigned to Zone MPle1c based on the high abundances of sinistrally coiled Neogloboquadrina spp. (0.91–1.21 Ma) throughout this interval.
6.2.1.4. Zones MPle1b–1a (1.21–1.79 Ma)
Samples 398-U1600B-12F-CC, 13–15 cm, to 17F-CC, 16–18 cm (58.52–82.06 mbsf), are assigned to Zones MPle1b–1a based on the first common occurrence of sinistrally coiled Neogloboquadrina spp. (1.79 Ma) in Sample 17F-CC, 16–18 cm (82.06 mbsf). Additionally, Sample 13F-CC, 12–14 cm (62.94 mbsf), marks the first common occurrence of the benthic foraminifer Hyalinea balthica (1.492 Ma; Lourens et al. 1998).
6.2.1.5. Zone MPl6b (1.79–2.00 Ma)
Samples 398-U1600B-18F-CC, 14–16 cm, to 398-U1600C-3R-CC, 14–17 cm (82.16–84.87 mbsf), are assigned to Zone MPl6b based on the absence or rare occurrences of sinistrally coiled Neogloboquadrina spp. (>1.79 Ma) and the first common occurrence of Globorotalia inflata (1.99 Ma) in Sample 3R-CC, 14–17 cm (84.87 mbsf).
6.2.1.6. Zone MPl6 (2.00–2.09 Ma)
Samples 398-U1600B-19F-CC, 16–18 cm, to 4R-CC, 8–12 cm (91.65–95.33 mbsf), are assigned to Zone MPl6 because it represents the interval between the first occurrence of G. inflata (2.09 Ma) and the first common occurrence of G. inflata (2.00 Ma).
6.2.1.7. Zone MPl5b (2.09–2.41 Ma)
Samples 398-U1600C-5R-CC, 11–14 cm, to 6R-CC, 13–18 cm (105.53–117.19 mbsf), are assigned to Zone MPl5b based on the absence of G. inflata and the last common occurrence of G. bononiensis (2.41 Ma) between Samples 6R-CC, 13–18 cm, and 7R-CC, 13–18 cm (117.19–127.7 mbsf).
6.2.2. Pliocene foraminiferal biostratigraphy
Planktonic foraminifer assemblages from the Pliocene section of Hole U1600C are mostly well preserved, where specimens are rarely broken or exhibiting partially dissolved shell walls.
Pliocene planktonic foraminifer faunas indicate relatively shallow paleowater depths and oceanicity values that range 1%–39% when foraminifera are present (Figure F23). The fauna is typical of Mediterranean biostratigraphic Zones MPl5–MPl4c, primarily composed of N. incompta, G. bulloides, G. glutinata, G. elongatus, T. trilobus group, G. ruber var. white, O. universa, and more typical Upper Pliocene species such as G. bononiensis, N. atlantica (sinistral), G. obliquus, Globoturborotalita decoraperta, G. woodi, Globoturborotalita apertura, Sphaeroidinellopsis s.l., and Dentoglobigerina altispira (Figure F24).
Foraminiferal faunas are sufficiently common to biostratigraphically divide the Pliocene into two Upper Pliocene Mediterranean planktonic foraminiferal biostratigraphic zones determined via both primary and secondary marker species (Lirer et al., 2019):
- Zone MPl5 (2.41–3.19 Ma), Hole U1600C: 127.7–161.97 mbsf.
- Zone MPl4c (3.19–3.31 Ma), Hole U1600C: 165.89 mbsf.
The faunal criteria on which these age assignments are based are given in the sections below.
6.2.2.1. Zone MPl5 (2.41–3.19 Ma)
Samples 398-U1600C-7R-CC, 13–18 cm, to 10R-CC, 13–15 cm (127.7–161.97 mbsf), are assigned to Zone MPl5 based on the consistent common occurrences of G. bononiensis (last common occurrence = 2.41 Ma), the first occurrence of N. atlantica (sinistral) (first occurrence = 2.72 Ma), and the absence of Sphaeroidinellopsis s.l. (last occurrence = 3.19 Ma).
6.2.2.2. Zone MPl4c (3.19–3.31 Ma)
Sample 398-U1600C-11R-CC, 0–5 cm (165.89 mbsf), has been assigned to biostratigraphic Zone MPl4c based on the last occurrences of D. altispira (3.17 Ma) and Sphaeroidinellopsis s.l. (3.19 Ma) in this sample.
6.2.3. Planktonic foraminiferal oceanicity
Planktonic foraminifer abundances are highly variable, ranging 0%–94% when foraminifera are present (Figures F22, F23). Oceanicity values are rarely in good agreement with benthic foraminiferal paleowater depth indicators (Figure F24), indicating an overall general decrease in oceanicity from suboceanic (200–1000 mbsl) to inner neritic (0–50 mbsl) conditions downcore. Despite this trend, there is a notable interval of reduced oceanicity from Sample 398-U1600A-6F-CC, 0–3 cm, to 7F-CC, 0–3 cm (39.79–43.28 mbsf), where foraminifer faunas indicate inner neritic (0–50 mbsl) oceanicity values (Figure F23).
6.2.4. Benthic foraminifera paleowater depths
Benthic foraminiferal distributions are highly variable, indicating paleowater depths from uppermost bathyal (200 m) to lower bathyal (>1000 m) (Figure F23). The low abundances of benthic foraminiferal faunas in some samples (e.g., 398-U1600B-2F-CC, 20–22 cm, to 8F-CC, 0–2 cm [11.46–37.69 mbsf]) are possibly correlated with rapid emplacement of volcaniclastic sediments and/or inhospitable environmental conditions. Samples 398-U1600A-2H-CC, 24–27 cm, to 3H-CC, 11–14 cm (13.64–20.08 mbsf), record an uppermost to upper bathyal (200–600 m) paleowater depth, as indicated by the presence of species such as Cassidulina spp., Bolivina spp., Bulimina spp., and Cibicides pachyderma. Samples 398-U1600B-11F-CC, 13–15 cm, to 14F-CC, 11–13 cm (53.94–67.9 mbsf), indicate mid- to lower bathyal (700 to >1000 m) paleowater depths due to the presence of lower bathyal markers such as Cibicidoides wuellerstorfi, signifying deposition in paleowater depths >1000 mbsl (Figure F23). Commonly reworked benthic foraminifera in Samples 398-U1600A-4H-CC, 83–85 cm, to 6F-CC, 0–3 cm (31.74–39.79 mbsf); 398-U1600B-5F-CC, 23–27 cm, to 8F-CC, 0–2 cm (25.61–37.69 mbsf); and 15F-CC, 18–19 cm, to 18F-CC, 14–16 cm (72.37–82.16 mbsf), likely represent downslope reworking.
7. Paleomagnetism
Paleomagnetic analysis at Site U1600 focused on measurement and demagnetization of archive-half sections to determine magnetostratigraphic age controls, together with demagnetization of 17 discrete samples. Results are discussed below using depths on the CCSF scale to allow data from all three holes at this site to be combined on a common depth scale.
The uppermost 40 m of the sequence sampled at this site carries normal polarity remanences acquired during the Brunhes Chron (C1n) (Figures F25, F26), with a mean inclination of statistically acceptable principal component directions of +51.2° (k = 62.0; α95 = 1.2; n = 163), in good agreement with the expected geocentric axial dipole inclination of +56° at this site.
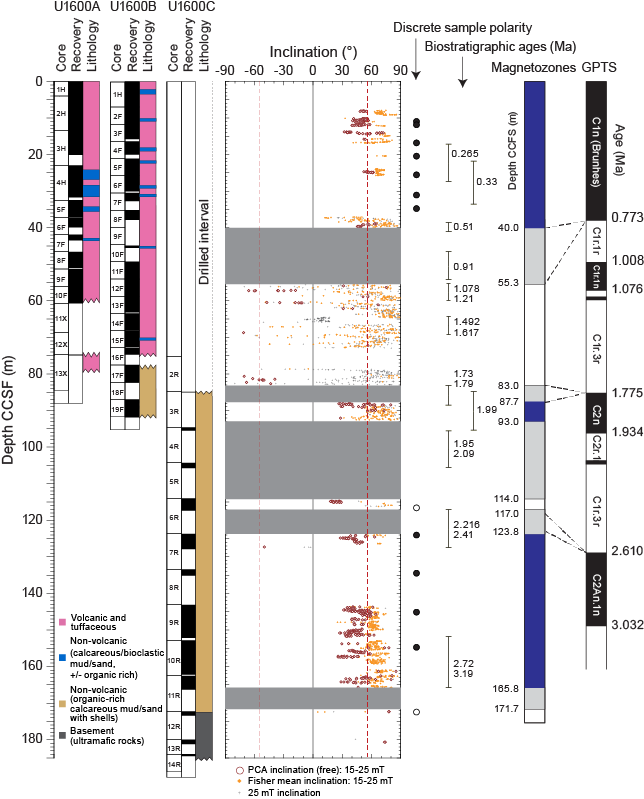
Figure F25. Magnetic inclinations.
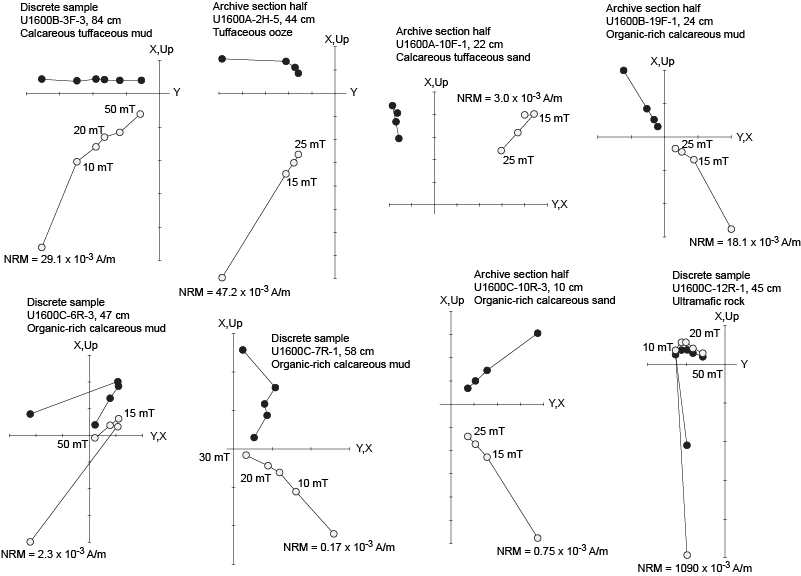
Figure F26. AF demagnetization.
The interval 55.3–83.0 mbsf is marked by wide variations in inclinations estimated using automated principal component analysis; calculation of Fisher mean directions of magnetization using the data from the 15, 20, and 25 mT demagnetization steps; and inclinations of the 25 mT step (see Paleomagnetism in the Site U1591 chapter [Druitt et al., 2024b]). This can only be explained by variable partial to complete diagenetic overprinting of a reversed polarity depositional remanent magnetization acquired during the Matuyama Chron by a chemical remanence acquired during a subsequent normal polarity chron. Some samples in this interval do show clear reversed polarity, however (Figure F26). Biostratigraphic constraints indicate that the top of this interval postdates the end of the Jaramillo Subchron (C1r.1n), so we assign it to reversed Chron C1r.3r (Gradstein et al., 2020). On this basis, we assign the Brunhes/Matuyama boundary (0.773 Ma; Gradstein et al., 2020) to the interval between 40.0 and 55.3 mbsf, where no data are available (Figure F25), and this interval must also span Chrons C1r.1r and C1r.1n.
There is a clear change in magnetic polarity on either side of the interval 83.0–87.7 mbsf, with reversed and normal polarity principal component directions clustering around the expected values of ±56° (Figures F25, F26). Biostratigraphic markers for interval 1.73–1.79 Ma indicate this reversal must correspond to the boundary between Chrons C1r.3r and C2n (Olduvai Subchron) at 1.775 Ma (Gradstein et al., 2020). The base of Chron C2n is undefined.
Discrete samples on either side of the interval 117.0–123.8 mbsf (where no data are available) indicate another change in polarity (Figure F25), with normal polarity inclinations seen in both archive-half section and discrete sample data from 123.8 to 165.8 mbsf (Figures F25, F26). Biostratigraphic markers indicate that this normal polarity interval corresponds to Chron C2An.1n. This places the top of this chron (2.610 Ma; Gradstein et al., 2020) in the interval 117.0–123.8 mbsf.
Very limited data are available below 165.8 mbsf. One discrete sample showing clear reversed polarity (Figure F25, F26) was collected from the ultramafic rocks of the basement, but this has no magnetostratigraphic significance because the age of this unit significantly predates the tectonic development of the volcanic rift zone.
8. Physical properties
The typical increases of bulk density and P-wave velocity with increasing depth are not clearly documented at Site U1600. MS can be high and highly variable in volcaniclastic layers, is low in the tuffaceous and ooze-dominated layers, and is very high in the basement rocks. Grain density in volcanic and tuffaceous layers is occasionally <2.0 g/cm3.
8.1. Whole-round GRA, MS, P-wave velocity, and NGR
Figure F27 summarizes data collected on whole-round cores measured on the GRA densitometer, MS loop, and P-wave logger on the WRMSL, as well as natural gamma radiation (NGR). All cited depths are on the CSF-A scale. A few possible systematic sources of error in these data should be considered when interpreting absolute values and trends.
- Redistribution of unconsolidated volcaniclastic materials in core liners during coring and in the core receiving facility can lead to sorting by particle size and density.
- APC cores often contained large amounts of water. As a result, WRMSL measurements of bulk density are systematically lower than discrete measurements at this site.
- Whole-round measurements in sections that match discrete measurement values on split cores are thus most reliable.
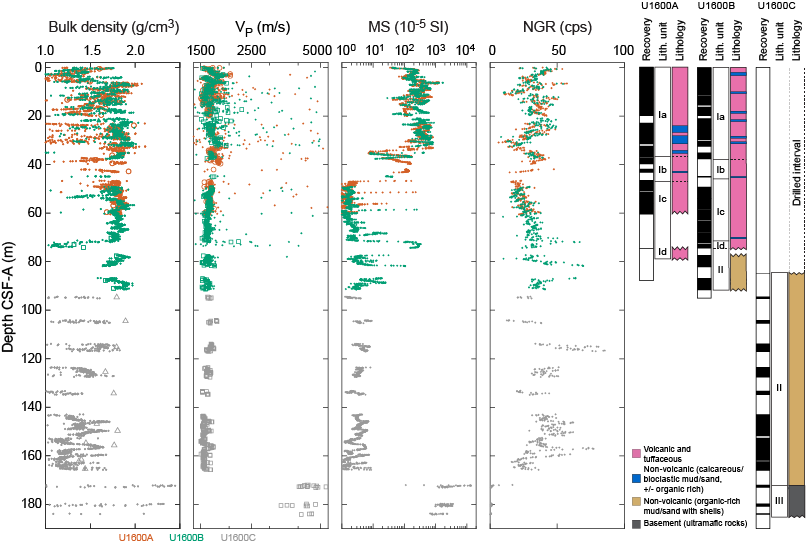
Figure F27. Physical properties.
MS is high and highly variable in the volcaniclastic deposits in Sections 398-U1600A-1H-1 through 5H-1 (0–34 mbsf) and 398-U1600B-1H-1 through 7F-1 (0–32 mbsf). MS is exceptionally high in the basement below 165 mbsf (>10,000 × 10−5 SI). Two high P-wave velocity layers at ~17 and ~71 mbsf correspond to lapilli-ash layers.
Overall, above the basement there is no clear systematic increase in bulk density and P-wave velocity with increasing depth. Whether the lack of a signature of compaction is real, a consequence of the limited depth of the holes, or an artifact of drilling and recovery disturbances cannot be readily determined.
8.2. Discrete measurements
8.2.1. Material strength
Sediment strength was measured with a pocket penetrometer (PP) on the catwalk immediately after section splitting. Automated vane shear (AVS) strength measurements were made on working-half sections. Totals of 4 and 11 AVS measurements were made on working-half sections from Holes U1600A and U1600B, respectively (Figure F28; Table T10). Totals of 7 and 13 PP measurements were made (Table T10) on fine-grained materials that remained intact in core liners upon recovery on the catwalk in Holes U1600A and U1600B, respectively. There is no strong trend in shear strength with increasing depth except for slight decreases in shear strengths above and below intervals of no recovery at 40–47 and 38–49 mbsf in Holes U1600A and U1600B, respectively.
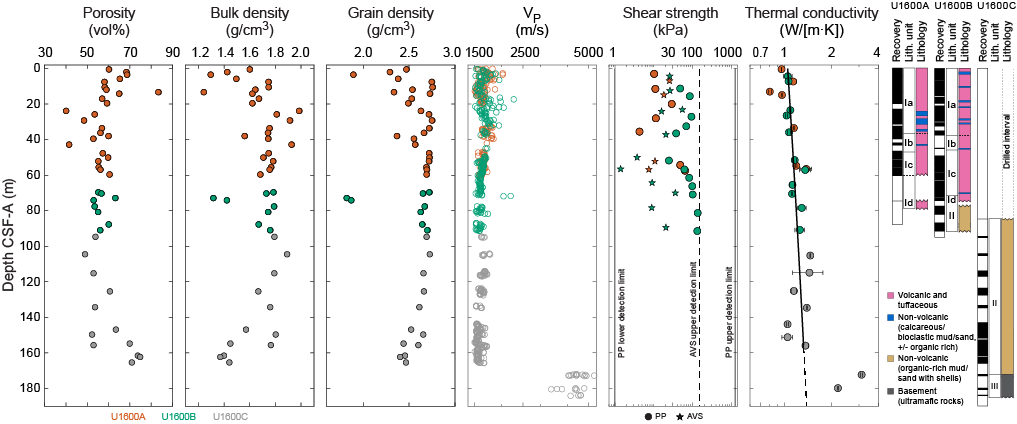
Figure F28. Discrete measurements.
8.2.2. P-wave velocity
Totals of 149, 221, and 223 discrete P-wave velocity measurements were conducted on Hole U1600A, U1600B, and U1600C working-half sections, respectively (Figure F28; Table T11). Above the basement in the uppermost 166 m, P-wave velocity ranges 1.51–2.27 km/s (mean = 1.63 km/s). Discrete measurements of P-wave velocity on working-half core sections show similar downhole variations as those measured using the WRMSL on whole-round cores (Figure F27). There is no clear trend of increasing velocity with increasing depth. Rather, the highest velocities, and largest variability, are found in the volcaniclastic materials at ~3, 17, and 72 mbsf.
Discrete measurements were sometimes challenging to make in coarse, pumice-rich deposits because signals were especially noisy. Furthermore, particle size was a substantial fraction of the distance between the two calipers used to make the measurements; hence, the measurements may not be representative of true bulk properties (i.e., sample size is not much larger than a representative elementary volume).
In basement rocks below 166 mbsf, P-wave velocity ranges 3.37–5.29 km/s (mean = 4.27 km/s).
8.2.3. Moisture and density
Totals of 25, 8, and 13 discrete samples were collected from Holes U1600A, U1600B, and U1600C, respectively, to conduct moisture and density (MAD) measurements (Figure F28; Table T12). Bulk density derived using MAD measurements on discrete samples should be more reliable than GRA bulk density data from WRMSL measurements on whole-round cores, although in both cases, coring and recovery disturbances may have impacted measured values.
Above the basement in the uppermost 166 m, porosity ranges 40–83 vol% (mean = 59 vol%; standard deviation = 8 vol%). Bulk density ranges 1.24–2.00 g/cm3 (mean = 1.67 g/cm3). Bulk density is lower in volcaniclastic materials than ooze-dominated sediment at the same depth; nonvolcanic muds and sands in the lower part of Lithostratigraphic Unit II also have low bulk density values. Grain density ranges 1.82–2.77 g/cm3 (mean = 2.56 g/cm3; median = 2.65 g/cm3). The lowest values in volcaniclastic subunits average 2.56 g/cm3 (median = 2.65 g/cm3). The lowest grain densities are found in lapilli layers at 3.4 mbsf in Hole U1600A and 72.6–74.4 mbsf in Hole U1600B. In Unit II, organic-rich calcareous muds have lower grain densities than organic-rich calcareous sands. The usual trends of decreasing porosity and increasing bulk density with increasing depth are not seen in Units I and II at Site U1600.
One sample from basement Unit III was collected from Hole U1600C to conduct MAD measurements (not shown on Figure F28). Porosity is 7%, which is significantly lower than the sediments of Units I and II. Bulk density is 2.66 g/cm3, and grain density is 2.79 g/cm3.
8.2.4. Thermal conductivity
A total of 27 thermal conductivity measurements were made on selected working-half sections (Table T13; Figure F28). Measurements could not be made on coarse volcaniclastic materials; hence, the values we report are not representative of the full range of recovered lithologies. In the uppermost 166 m above basement rocks, mean thermal conductivity is 1.16 W/(m·K), and a linear fit to these data is
where z is in kilometers and reported ± values are standard errors. The two basement samples from Unit III have thermal conductivities markedly higher, at 3.1 and 2.2 W/(m·K).
9. Geochemistry
9.1. Volcaniclastic bulk geochemistry
To determine the geochemistry of the volcanic and tuffaceous materials, seven tephra samples were handpicked from various layers within Hole U1600A. Following cleaning, grinding, fusion, and dissolution, the materials were analyzed shipboard for major (Si, Al, Fe, Mg, and Ca), minor (Ti, Mn, Na, K, and P), and trace (Sc, V, Cr, Co, Ni, Cu, Zn, Rb, Sr, Y, Zr, Nb, Ba, Ce, and Nd) elements using inductively coupled plasma–atomic emission spectroscopy (ICP-AES) (see Geochemistry in the Expedition 398 methods chapter [Kutterolf et al., 2024]). Several unknown samples were run multiple times to determine analytical reproducibility.
9.1.1. ICP-AES: major, minor, and trace elements
Of the volcaniclastic units sampled, one was classified as a basalt, one as a basaltic andesite, two as trachyandesites, and two as dacites or trachydacites (Table T14; Figure F29). Bulk chemistry values are less evolved than glass chemistry reported in Kutterolf et al. (2021), as expected due to bulk analyses including both minerals and glass.
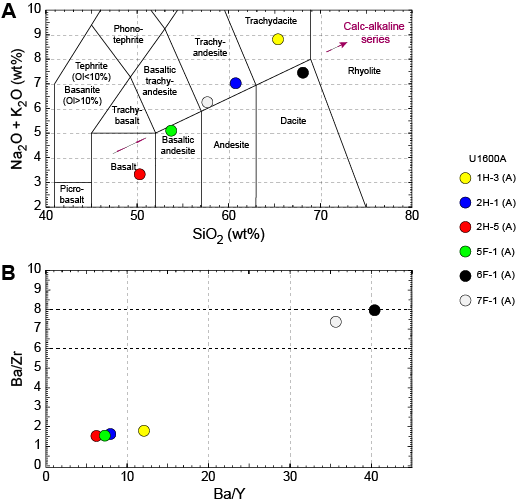
Figure F29. ICP-AES analyses.
Concentrations are reported for all analyzed trace elements, but Ce, Cr, Cu, Nb, Ni, P, Rb, S, and V were below detection limits in the majority of samples and are not shown for respective samples in Table T14; volcaniclastic analytical errors are ±1% for major elements and ±5%–10% for trace elements (see Geochemistry in the Expedition 398 methods chapter [Kutterolf et al., 2024]). Trace element ratios were used to broadly discriminate between the volcanic centers of Kolumbo, Santorini, and Christiana.
9.2. Interstitial water geochemistry
To determine the inorganic constituents of IW, a total of 14 water samples were taken from the mudline and whole-round squeezing of sediment intervals from Holes U1600A (4 samples), U1600B (5 samples), and U1600C (5 samples). Aliquots of IW were used for shipboard analyses, and the remaining water was taken for shore-based analysis following protocols specified by individual scientists. The retrieved pore waters were analyzed shipboard for salinity, alkalinity, pH, major anions (Cl−, SO42−, and Br−), major cations (Ca2+, Na+, Mg2+, and K+), and major (S, Ca, Mg, K, and Na) and minor (B, Ba, Fe, Li, Mn, P, Si, and Sr) elements using the methods described in Geochemistry in the Expedition 398 methods chapter (Kutterolf et al., 2024).
9.2.1. Salinity, alkalinity, and pH
Salinity ranges 38–40 (Table T15; Figure F30). The highest salinity value of 40 was recorded at the mudline (Section 398-U1600A-1H-1) and at 61.5 mbsf (Section 398-U1600B-13F-2).
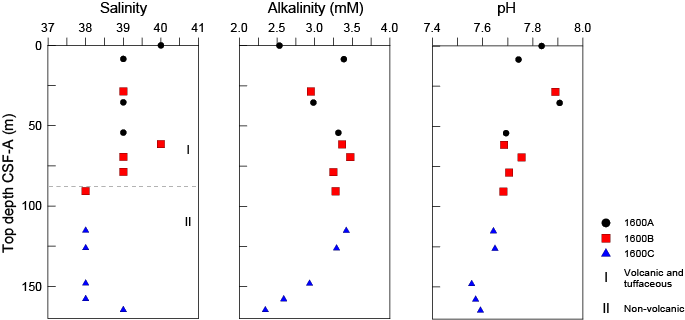
Figure F30. IW salinity, alkalinity, and pH.
Alkalinity ranges from 2.5 mM at the mudline to 3.3 mM at 54 mbsf at the base of Hole U1600A (Table T15; Figure F30). An alkalinity high of 3.5 mM was measured at 69 mbsf in Hole U1600B. Below 115.3 mbsf, alkalinity decreases with depth.
Values for pH exhibit a narrow range, 7.5–7.9, and generally decrease downhole (Table T15; Figure F30).
9.2.2. Bromide, chloride, boron, sodium, potassium, magnesium, calcium, and sulfate
IW concentrations of Br−, Cl−, B, Na+, K+, Mg2+, Ca2+, and SO42− are provided in Table T16 and plotted in Figure F31. Bromide, Cl−, and Na+ show similar trends and generally decrease with depth with some scatter. Calcium concentrations increase with depth (11–16 mM). Potassium ranges 11–13 mM. Boron increases with depth but with some variation, including minima at 35.5 and 148.1 mbsf and maxima at 90.5 and 164.6 mbsf. Concentrations of Mg2+ and SO42− decrease from their highest values at 8.4 mbsf to a minimum at 35.5 mbsf before increasing slightly to 61.5 mbsf. Below 61.5 mbsf, both Mg2+ and SO42− decrease to minimum values observed at 115.3 mbsf before increasing again downhole.
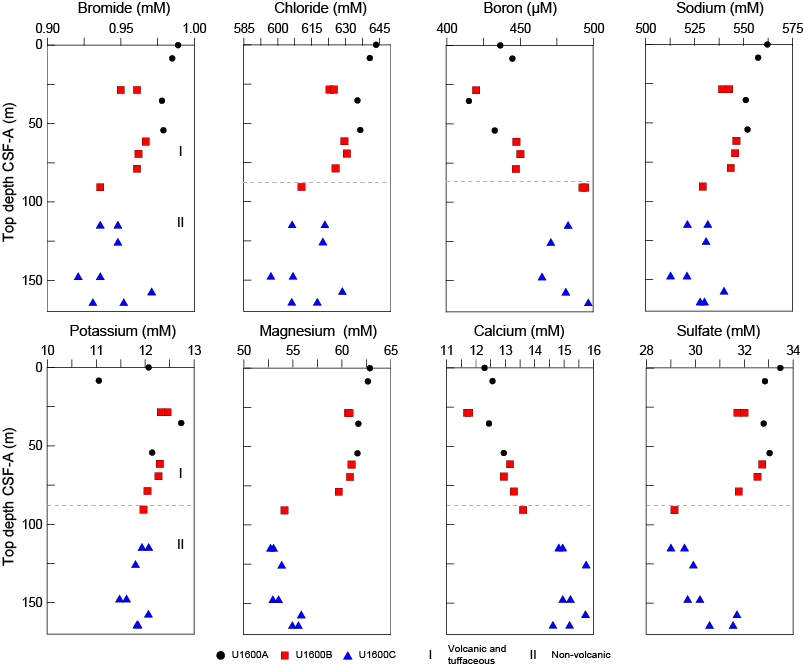
Figure F31. IW Br, Cl, B, Na, K, Mg, Ca, and SO42−.
9.2.3. Lithium, strontium, manganese, barium, silicon, iron, and phosphorus
IW concentrations of Li, Sr, Mn, Ba, and Si are provided in Table T16 and Figure F32. Lithium shows little variation with depth aside from one elevated value at 8.4 mbsf that corresponds to the maximum Mn value. Strontium increases initially with depth to a maximum of 284.7 µM at 90.7 mbsf and decreases below this depth. Barium and Si both remain relatively constant until they increase in concentration below 115.3 mbsf. Iron and P are both below the detection limit in a majority of samples and are not plotted.
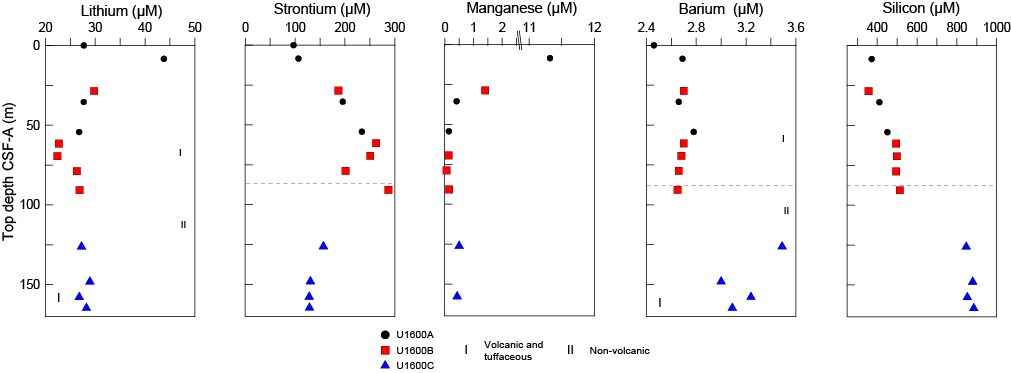
Figure F32. IW Li, Sr, Mn, Ba, and Si.
9.3. Sediment bulk geochemistry
A total of 13 sediment samples were analyzed for bulk geochemistry (Table T17). All were analyzed for total carbon, hydrogen, and nitrogen (CHN) and for inorganic carbon and carbonate content following the protocols explained in Geochemistry in the Expedition 398 methods chapter (Kutterolf et al., 2024). For CHN analysis, duplicates were run for ~10% of the samples to determine analytical reproducibility (standard deviations: N = 0.01; C = 0.03). Carbonate values are highest in Lithostratigraphic Unit I (see Lithostratigraphy), peaking at 82 wt% at 54 mbsf, which is characterized by volcanic and tuffaceous material but contains some calcareous ooze lithologies (Figure F33). Notably, carbonate values decrease and total organic carbon (TOC) increases in Lithostratigraphic Unit II, which is characterized by organic-rich calcareous mud/sand.
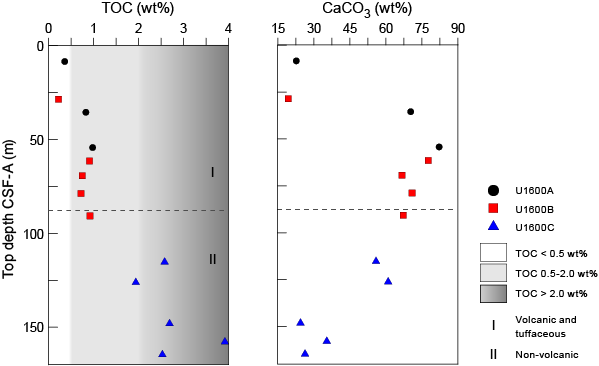
Figure F33. TOC and carbonate.
9.3.1. Sapropel identification
TOC was calculated using total carbon and inorganic carbon values. Following the convention set forth by Kidd et al. (1978), units with TOC >2.0 wt% were identified as sapropels, and units with TOC of 0.5–2.0 wt% were identified as sapropelitic. Using these values, four units were identified as sapropels and seven units were identified as sapropelitic (Figure F33).
9.4. Headspace gas analysis
Headspace gas analyses were performed at a resolution of one sample per full-length core (9.5 m advance) or one sample every other core for half-length cores (4.7 m advance) throughout Hole U1600A. Analyses were resumed on Hole U1600B when depth of penetration exceeded recovery in Hole U1600A. Analyses were resumed on Hole U1600C when depth of penetration exceeded recovery in Hole U1600B. The aim was to monitor the presence and abundance of C1–C3 hydrocarbons as part of the standard IODP safety protocol (Pimmel and Claypool, 2001). A total of 19 headspace gas samples were analyzed using gas chromatography (GC) (see Geochemistry in the Expedition 398 methods chapter [Kutterolf et al., 2024]). Methane, ethane, and propane concentrations were below the detection limit in all measured samples.
10. Microbiology
At Site U1600, three whole-round core samples were collected. After the cores were transferred to the core receiving platform, whole-round samples were collected based on sediment color. Reddish to orange coloration was used as an indicator for iron-rich layers that often host the microbial communities we sought. To choose the appropriate incubation temperature, the core temperature was measured in the section above the sample.
The whole-round samples were transferred to the laboratory, and the following subsamples for different analyses were collected: POLYmeta, POLYmicro, POLYanae, POLYcell, POLYFe, POLYmicroscope, and POLYFe-agar. In total, 21 subsamples were collected for microbiological analysis from the whole-round core samples.
A list of all samples, including duplicates, from this site is shown in Table T18.
References
Backman, J., Raffi, I., Rio, D., Fornaciari, E., and Pälike, H., 2012. Biozonation and biochronology of Miocene through Pleistocene calcareous nannofossils from low and middle latitudes. Newsletters on Stratigraphy, 45(3):221–244. https://doi.org/10.1127/0078-0421/2012/0022
Di Stefano, A., and Sturiale, G., 2010. Refinements of calcareous nannofossil biostratigraphy at the Miocene/Pliocene Boundary in the Mediterranean region. Geobios, 43(1):5–20. https://doi.org/10.1016/j.geobios.2009.06.007
Druitt, T., Kutterolf, S., and Höfig, T.W., 2022. Expedition 398 Scientific Prospectus: Hellenic Arc Volcanic Field. International Ocean Discovery Program. https://doi.org/10.14379/iodp.sp.398.2022
Druitt, T.H., Kutterolf, S., Ronge, T.A., Beethe, S., Bernard, A., Berthod, C., Chen, H., Chiyonobu, S., Clark, A., DeBari, S., Fernandez Perez, T.I., Gertisser, R., Hübscher, C., Johnston, R.M., Jones, C., Joshi, K.B., Kletetschka, G., Koukousioura, O., Li, X., Manga, M., McCanta, M., McIntosh, I., Morris, A., Nomikou, P., Pank, K., Peccia, A., Polymenakou, P.N., Preine, J., Tominaga, M., Woodhouse, A., and Yamamoto, Y., 2024a. Site U1589. In Druitt, T.H., Kutterolf, S., Ronge, T.A., and the Expedition 398 Scientists, Hellenic Arc Volcanic Field. Proceedings of the International Ocean Discovery Program, 398: College Station, TX (International Ocean Discovery Program). https://doi.org/10.14379/iodp.proc.398.103.2024
Druitt, T.H., Kutterolf, S., Ronge, T.A., Beethe, S., Bernard, A., Berthod, C., Chen, H., Chiyonobu, S., Clark, A., DeBari, S., Fernandez Perez, T.I., Gertisser, R., Hübscher, C., Johnston, R.M., Jones, C., Joshi, K.B., Kletetschka, G., Koukousioura, O., Li, X., Manga, M., McCanta, M., McIntosh, I., Morris, A., Nomikou, P., Pank, K., Peccia, A., Polymenakou, P.N., Preine, J., Tominaga, M., Woodhouse, A., and Yamamoto, Y., 2024b. Site U1591. In Druitt, T.H., Kutterolf, S., Ronge, T.A., and the Expedition 398 Scientists, Hellenic Arc Volcanic Field. Proceedings of the International Ocean Discovery Program, 398: College Station, TX (International Ocean Discovery Program). https://doi.org/10.14379/iodp.proc.398.105.2024
Fisher, R.V., and Schmincke, H.-U., 1984. Pyroclastic Rocks: Berlin (Springer). https://doi.org/10.1007/978-3-642-74864-6
Gradstein, F.M., Ogg, J.G., Schmitz, M.D., and Ogg, G.M. (Eds.), 2020. The Geologic Time Scale 2020: Amsterdam (Elsevier BV). https://doi.org/10.1016/C2020-1-02369-3
Hayward, B.W., Grenfell, H.R., Reid, C.M., and Hayward, K.A., 1999. Recent New Zealand shallow-water benthic foraminifera: taxonomy, ecologic distribution, biogeography, and use in paleoenvironmental assessment. In Institute of Geological & Nuclear Sciences Monograph, 21: Lower Hutt, NZ.
Hooft, E.E.E., Nomikou, P., Toomey, D.R., Lampridou, D., Getz, C., Christopoulou, M.-E., O’Hara, D., Arnoux, G.M., Bodmer, M., Gray, M., Heath, B.A., and VanderBeek, B.P., 2017. Backarc tectonism, volcanism, and mass wasting shape seafloor morphology in the Santorini-Christiana-Amorgos region of the Hellenic Volcanic Arc. Tectonophysics, 712–713:396–414. https://doi.org/10.1016/j.tecto.2017.06.005
Jutzeler, M., White, J.D.L., Talling, P.J., McCanta, M., Morgan, S., Le Friant, A., and Ishizuka, O., 2014. Coring disturbances in IODP piston cores with implications for offshore record of volcanic events and the Missoula megafloods. Geochemistry, Geophysics, Geosystems, 15(9):3572–3590. https://doi.org/10.1002/2014GC005447
Kidd, R.B., Cita, M.B., and Ryan, W.B.F., 1978. Stratigraphy of eastern Mediterranean sapropel sequences recovered during DSDP Leg 42A and their paleoenvironmental significance. In Hsü, K., Montadert, L., et al., Initial Reports of the Deep Sea Drilling Project. 42(1): Washington, DC (US Government Printing Office), 421–443. https://doi.org/10.2973/dsdp.proc.42-1.113-1.1978
Kutterolf, S., Druitt, T.H., Ronge, T.A., Beethe, S., Bernard, A., Berthod, C., Chen, H., Chiyonobu, S., Clark, A., DeBari, S., Fernandez Perez, T.I., Gertisser, R., Hübscher, C., Johnston, R.M., Jones, C., Joshi, K.B., Kletetschka, G., Koukousioura, O., Li, X., Manga, M., McCanta, M., McIntosh, I., Morris, A., Nomikou, P., Pank, K., Peccia, A., Polymenakou, P.N., Preine, J., Tominaga, M., Woodhouse, A., and Yamamoto, Y., 2024. Expedition 398 methods. In Druitt, T.H., Kutterolf, S., Ronge, T.A., and the Expedition 398 Scientists, Hellenic Arc Volcanic Field. Proceedings of the International Ocean Discovery Program, 398: College Station, TX (International Ocean Discovery Program). https://doi.org/10.14379/iodp.proc.398.102.2024
Kutterolf, S., Freundt, A., Hansteen, T.H., Dettbarn, R., Hampel, F., Sievers, C., Wittig, C., Allen, S.R., Druitt, T.H., McPhie, J., Nomikou, P., Pank, K., Schindlbeck-Belo, J.C., Wang, K.-L., Lee, H.-Y., and Friedrichs, B., 2021. The medial offshore record of explosive volcanism along the central to eastern Aegean Volcanic Arc: 1. tephrostratigraphic correlations. Geochemistry, Geophysics, Geosystems, 22(12):e2021GC010010. https://doi.org/10.1029/2021GC010010
Le Maitre, R.W., Steckeisen, A., Zanettin, B., Le Bas, M.J., Bonin, B., and Bateman, P. (Eds.), 2002. Igneous Rocks: A Classification and Glossary of Terms (Second edition): Cambridge, UK (Cambridge University Press). https://doi.org/10.1017/CBO9780511535581
Lirer, F., Foresi, L.M., Iaccarino, S.M., Salvatorini, G., Turco, E., Cosentino, C., Sierro, F.J., and Caruso, A., 2019. Mediterranean Neogene planktonic foraminifer biozonation and biochronology. Earth-Science Reviews, 196:102869. https://doi.org/10.1016/j.earscirev.2019.05.013
Lourens, L.J., Hilgen, F.J., and Raffi, I., 1998. Base of large Gephyrocapsa and astronomical calibration of early Pleistocene sapropels in Site 967 and Hole 969D: solving the chronology of the Vrica Section (Calabria, Italy). In Robertson, A.H.F., Emeis, K.-C., Richter, C., and Camerlenghi, A. (Eds.), Proceedings of the Ocean Drilling Program, Scientific Results. 160: College Station, TX (Ocean Drilling Program), 191. https://doi.org/10.2973/odp.proc.sr.160.017.1998
Martini, E., 1971. Standard Tertiary and Quaternary calcareous nannoplankton zonation. Proceedings of the Second Planktonic Conference, Roma, 1970:739–785.
Okada, H., and Bukry, D., 1980. Supplementary modification and introduction of code numbers to the low-latitude coccolith biostratigraphic zonation (Bukry, 1973; 1975). Marine Micropaleontology, 5(3):321–325. https://doi.org/10.1016/0377-8398(80)90016-X
Pimmel, A., and Claypool, G., 2001. Introduction to shipboard organic geochemistry on the JOIDES Resolution. Ocean Drilling Program Technical Note, 30. https://doi.org/10.2973/odp.tn.30.2001
Preine, J., Hübscher, C., Karstens, J., and Nomikou, P., 2022a. Volcano-tectonic evolution of the Christiana-Santorini-Kolumbo rift zone. Tectonics, 41(11):e2022TC007524. https://doi.org/10.1029/2022TC007524
Preine, J., Karstens, J., Hübscher, C., Nomikou, P., Schmid, F., Crutchley, G.J., Druitt, T.H., and Papanikolaou, D., 2022b. Spatio-temporal evolution of the Christiana-Santorini-Kolumbo volcanic field, Aegean Sea. Geology, 50(1):96–100. https://doi.org/10.1130/G49167.1
Rio, D., Raffi, I., and Villa, G., 1990. Pliocene-Pleistocene calcareous nannofossil distribution patterns in the western Mediterranean. In Kastens, K.A., Mascle, J., et al., Proceedings of the Ocean Drilling Program, Scientific Results. 107: College Station, TX (Ocean Drilling Program), 513–533. https://doi.org/10.2973/odp.proc.sr.107.164.1990