Knutz, P.C., Jennings, A.E., Childress, L.B., and the Expedition 400 Scientists
Proceedings of the International Ocean Discovery Program Volume 400
publications.iodp.org
https://doi.org/10.14379/iodp.proc.400.106.2025
Site U16061
![]() P.C. Knutz,
P.C. Knutz,
![]() A.E. Jennings,
A.E. Jennings,
![]() L.B. Childress,
L.B. Childress,
![]() R. Bryant,
R. Bryant,
![]() S.K. Cargill,
S.K. Cargill,
![]() H.K. Coxall,
H.K. Coxall,
![]() T.D. Frank,
T.D. Frank,
![]() G.R. Grant,
G.R. Grant,
![]() R.E. Gray,
R.E. Gray,
![]() L. Ives,
L. Ives,
![]() V. Kumar,
V. Kumar,
![]() S. Le Houedec,
S. Le Houedec,
![]() J. Martens,
J. Martens,
![]() F. Naim,
F. Naim,
![]() M. Nelissen,
M. Nelissen,
![]() V. Özen,
V. Özen,
![]() S. Passchier,
S. Passchier,
![]() L.F. Pérez,
L.F. Pérez,
![]() J. Ren,
J. Ren,
![]() B.W. Romans,
B.W. Romans,
![]() O. Seki,
O. Seki,
![]() P. Staudigel,
P. Staudigel,
![]() L. Tauxe,
L. Tauxe,
![]() E.J. Tibbett,
E.J. Tibbett,
![]() Y. Yokoyama,
Y. Yokoyama,
![]() Y. Zhang, and
Y. Zhang, and
![]() H. Zimmermann2
H. Zimmermann2
1 Knutz, P.C., Jennings, A.E., Childress, L.B., Bryant, R., Cargill, S.K., Coxall, H.K., Frank, T.D., Grant, G.R., Gray, R.E., Ives, L., Kumar, V., Le Houedec, S., Martens, J., Naim, F., Nelissen, M., Özen, V., Passchier, S., Pérez, L.F., Ren, J., Romans, B.W., Seki, O., Staudigel, P., Tauxe, L., Tibbett, E.J., Yokoyama, Y., Zhang, Y., and Zimmermann, H., 2025. Site U1606. In Knutz, P.C., Jennings, A.E., Childress, L.B., and the Expedition 400 Scientists, NW Greenland Glaciated Margin. Proceedings of the International Ocean Discovery Program, 400: College Station, TX (International Ocean Discovery Program). https://doi.org/10.14379/iodp.proc.400.106.2025
2 Expedition 400 Scientists' affiliations.
1. Background and objectives
Site U1606 (proposed Site MB-17A) was cored at 74°13.9380′N, 61°2.2426′W at 653 meters below sea level (mbsl) on the middle section of the northwest Greenland shelf (Figure F1). The site targets the transition from preglacial contourite drift sediments into glacigenic deposits of the earliest trough mouth fan progradation (Seismic Unit 1), marking the first advance of the northern Greenland ice sheet onto the continental margin (Figure F2). The drilling target was at 411 m core depth below seafloor, Method A (CSF-A), near the base of Megaunit B above Horizon c1 (Figure F3), coring a succession that is complementary to Site U1608. The uppermost 180 m at Site U1606 targets a geographically restricted depositional unit, possibly an erosional remnant, aimed at capturing a stratigraphic record of the preglacial to glacial transition that hypothetically corresponds to the Pleistocene/Pliocene boundary (Knutz et al., 2019). Below 150–180 m CSF-A, Site U1606 targets a 200 m thick sedimentary unit characterized internally by a uniform bundle of tilting strata that converges updip against a fault defining an erosional scarp above Horizon c1 (Figure F3). The seismic geometries imply accumulation of sedimentary drift deposits of Megaunit B over a significantly truncated section of Megaunit C (Knutz et al., 2015). The lower sedimentary unit of Site U1606 has a corresponding section at the base of Site U1608 (Figures F2, F3).
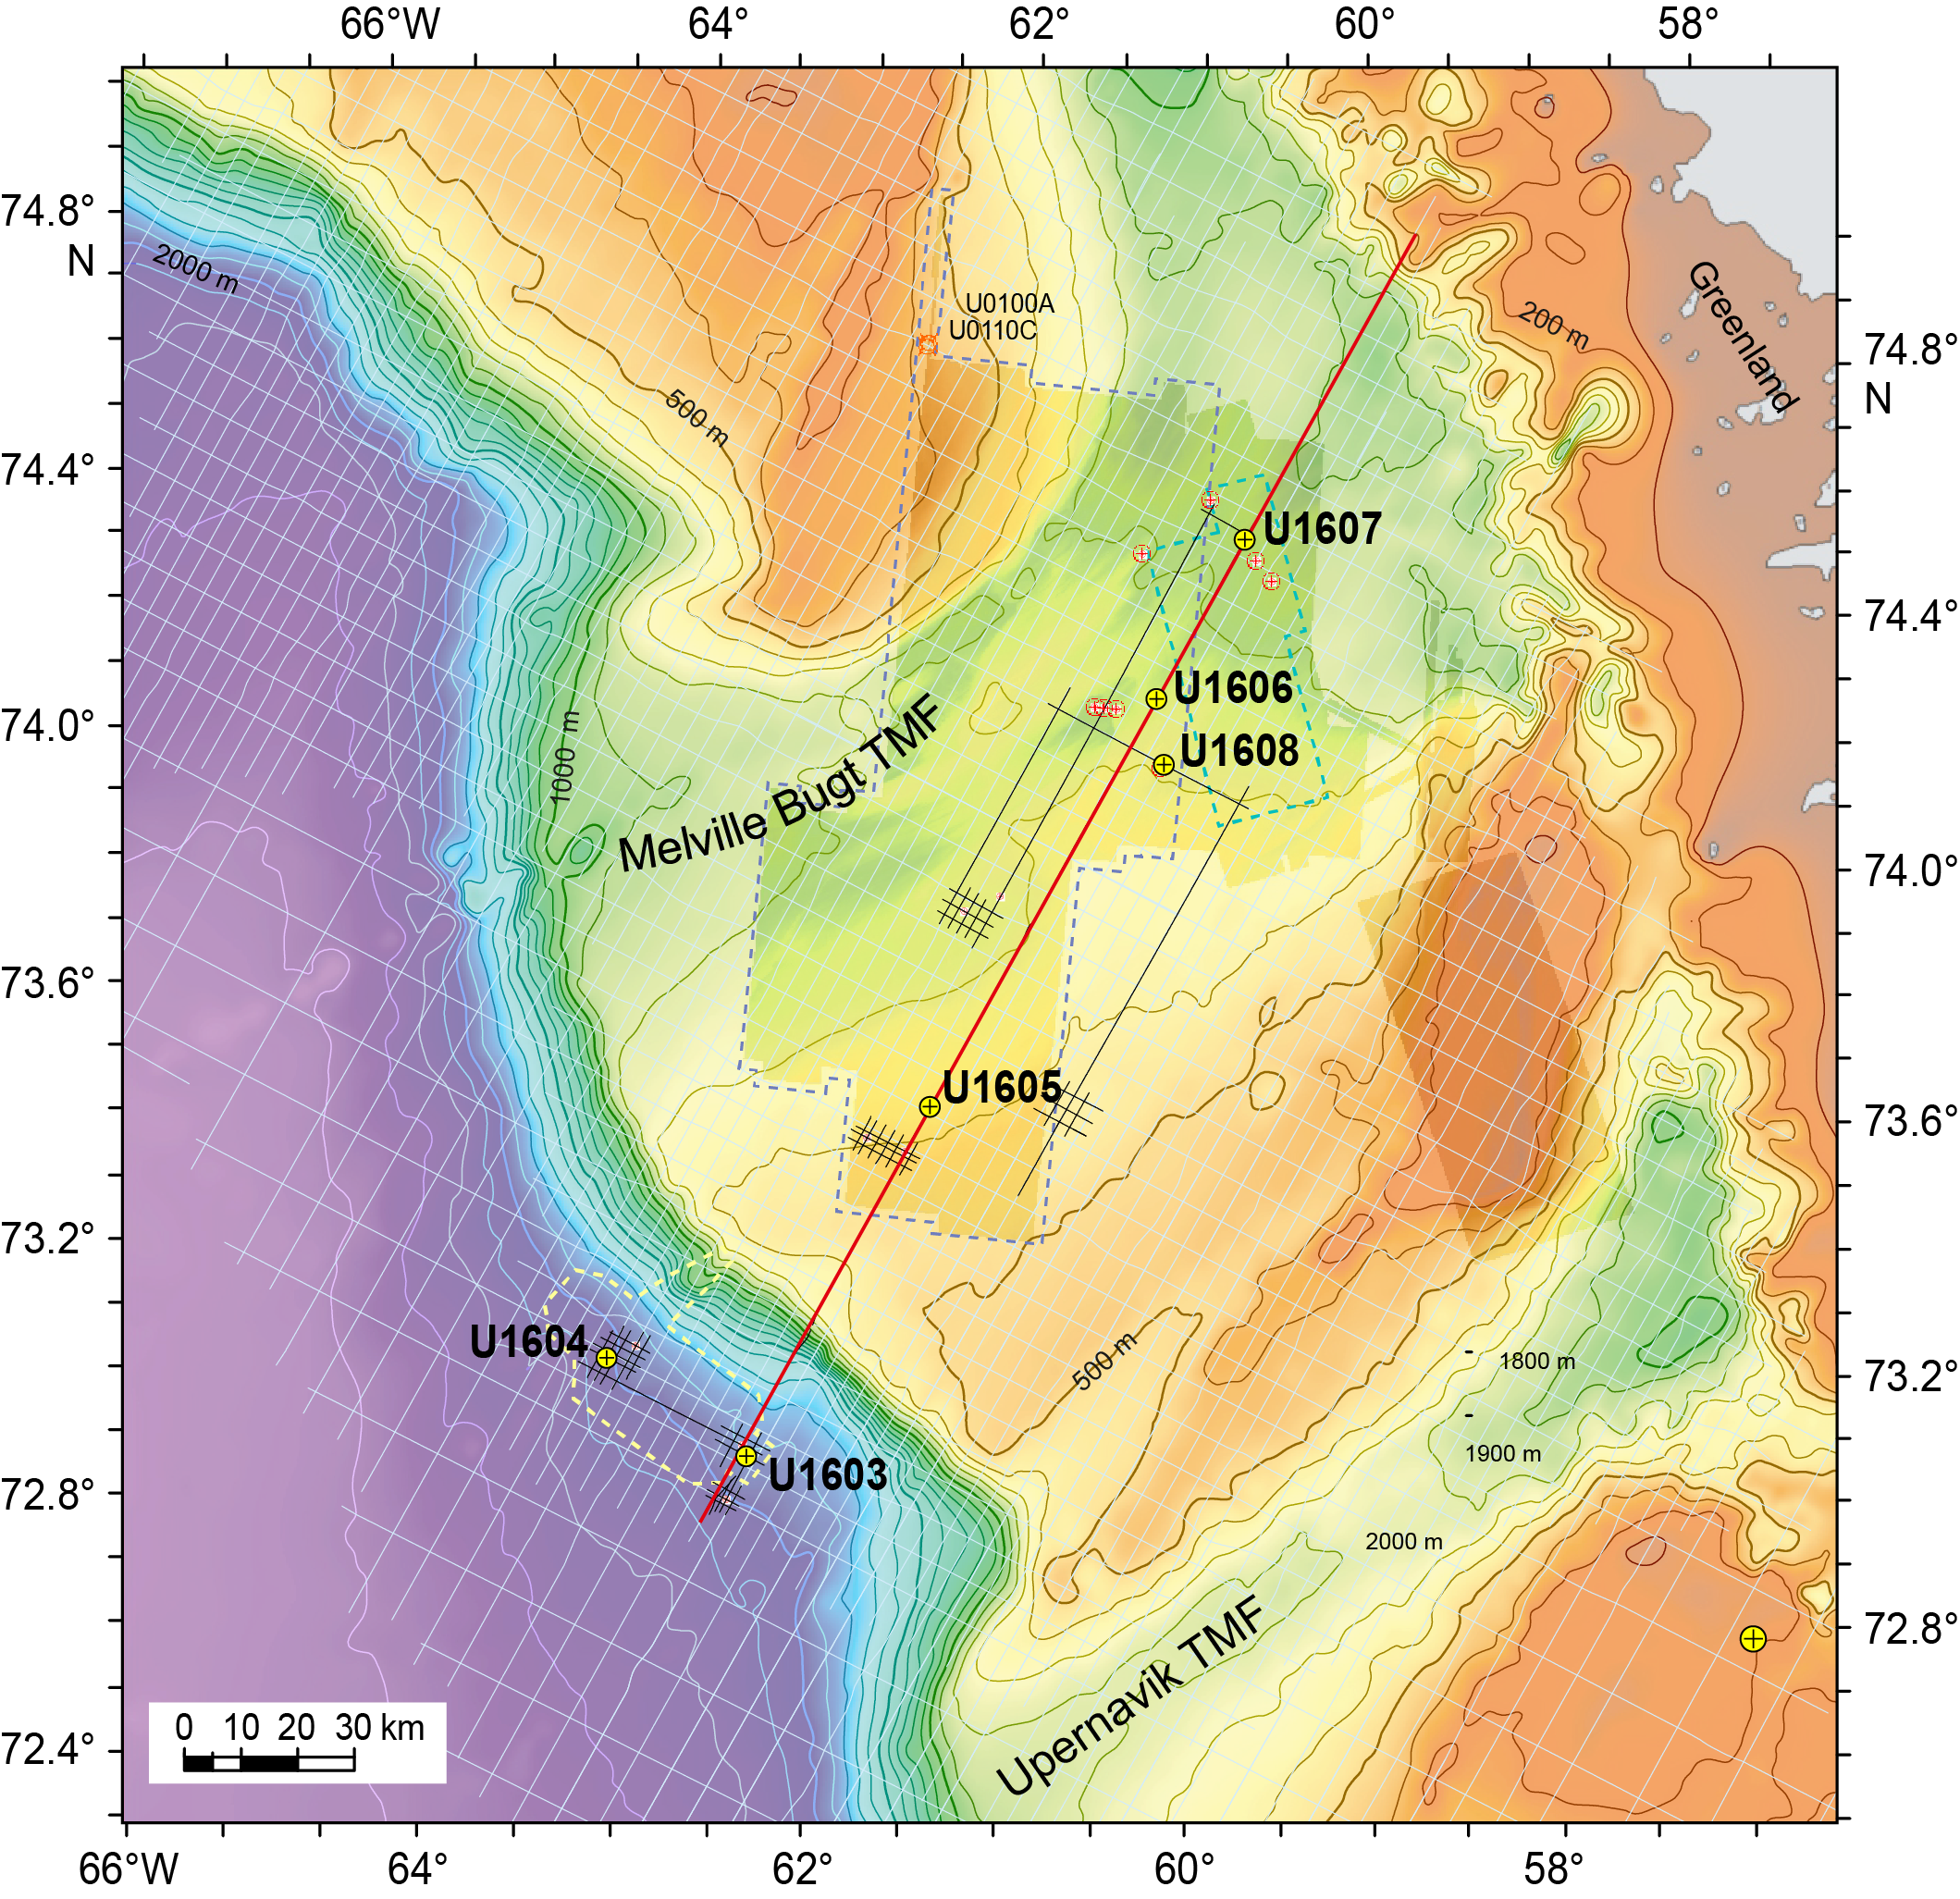
Figure F1. Bathymetry map.

Figure F2. Seismic profile and close-up bathymetry map.
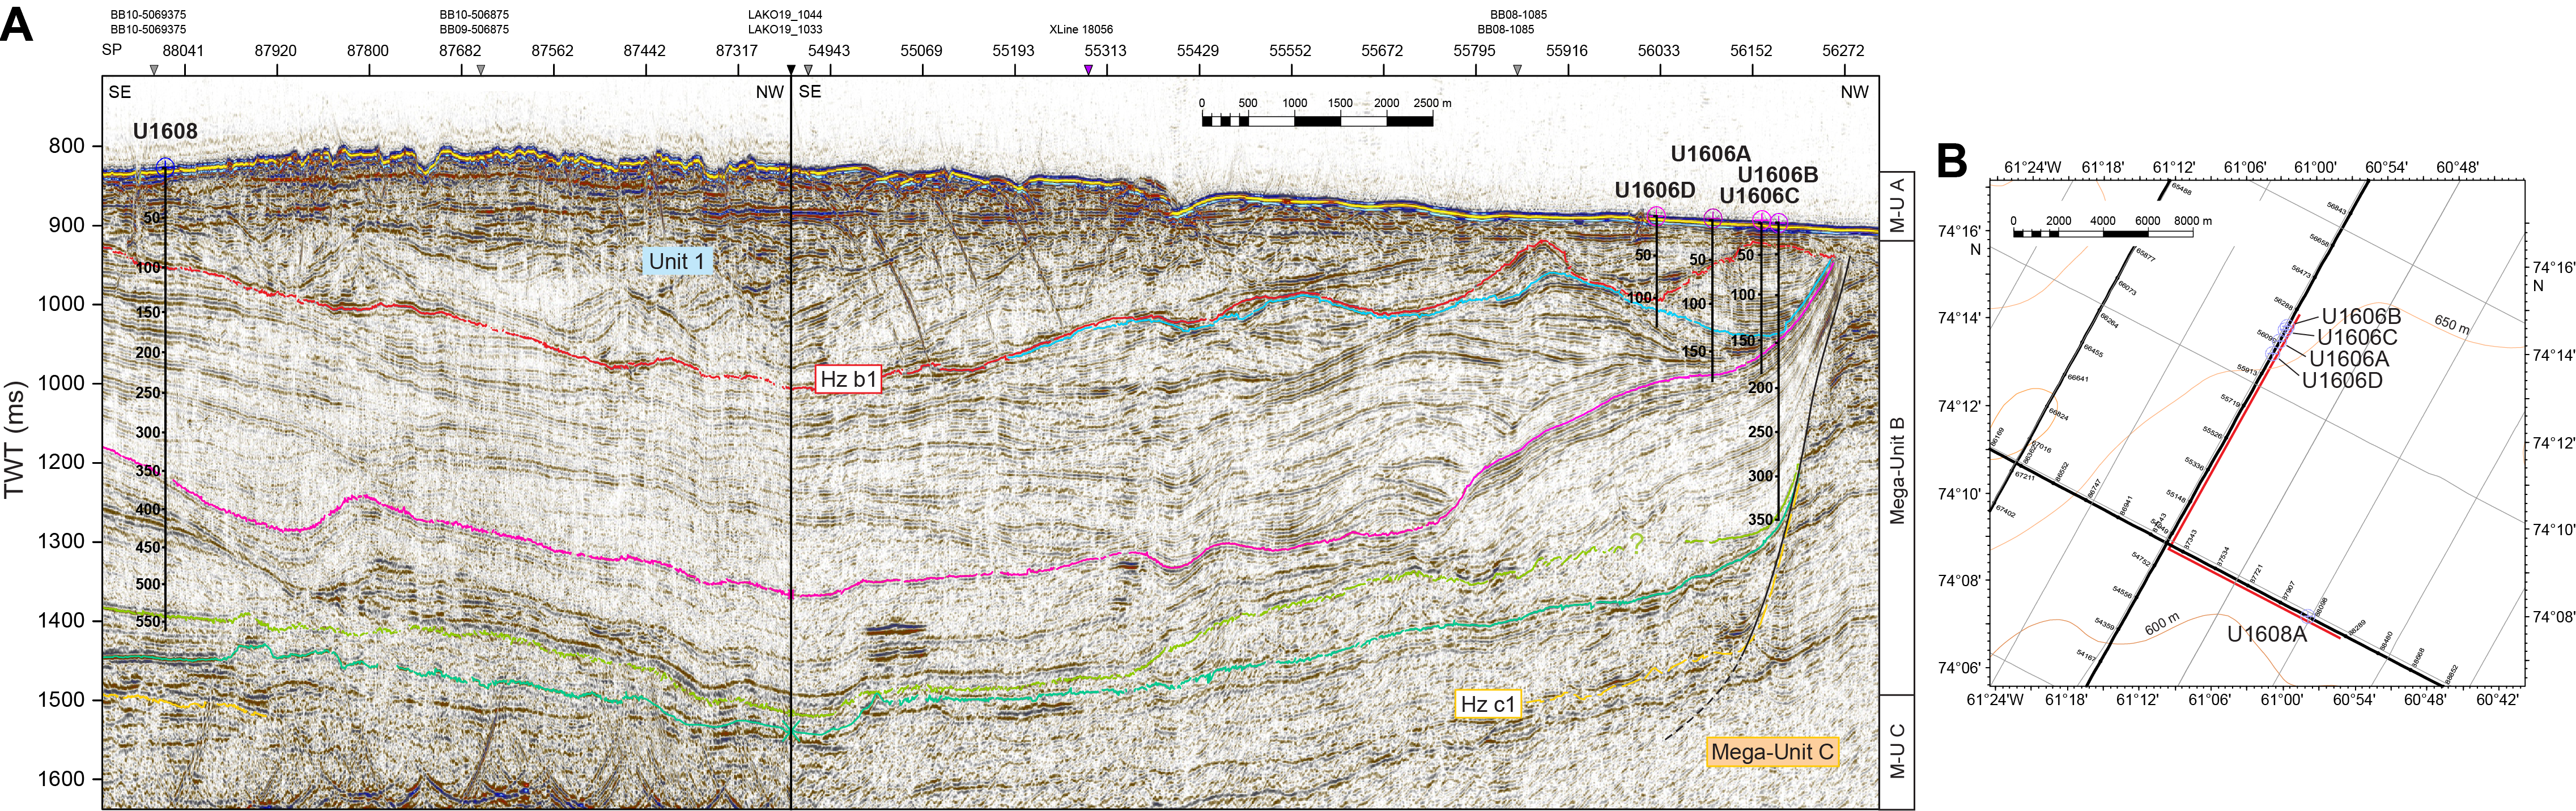
Figure F3. Composite seismic profile and close-up bathymetry map, Sites U1606 and U1608.
Today, Site U1606 is influenced by the northward-flowing West Greenland Current, which delivers relatively warm and saline Atlantic waters (3°–5°C) originating in the Irminger Current, overlain by a colder, fresher surface layer sourced from glacier meltwater and Arctic surface water derived both from the East Greenland Current and the Arctic island channels at the northern end of Baffin Bay (Tang et al., 2004). The path of the West Greenland Current is marked by lower sea ice concentrations (Tang et al., 2004).
The expected lithologies are gravel-sand, diamicton, and pebbly mud in the uppermost 40 m and mudstone with silty-sandy intervals in the succession below. The seismic characteristics suggest a gradual transition from a deep marine (outer shelf) to a more near-shore environment, eventually replaced by a proglacial setting (Figure F4).
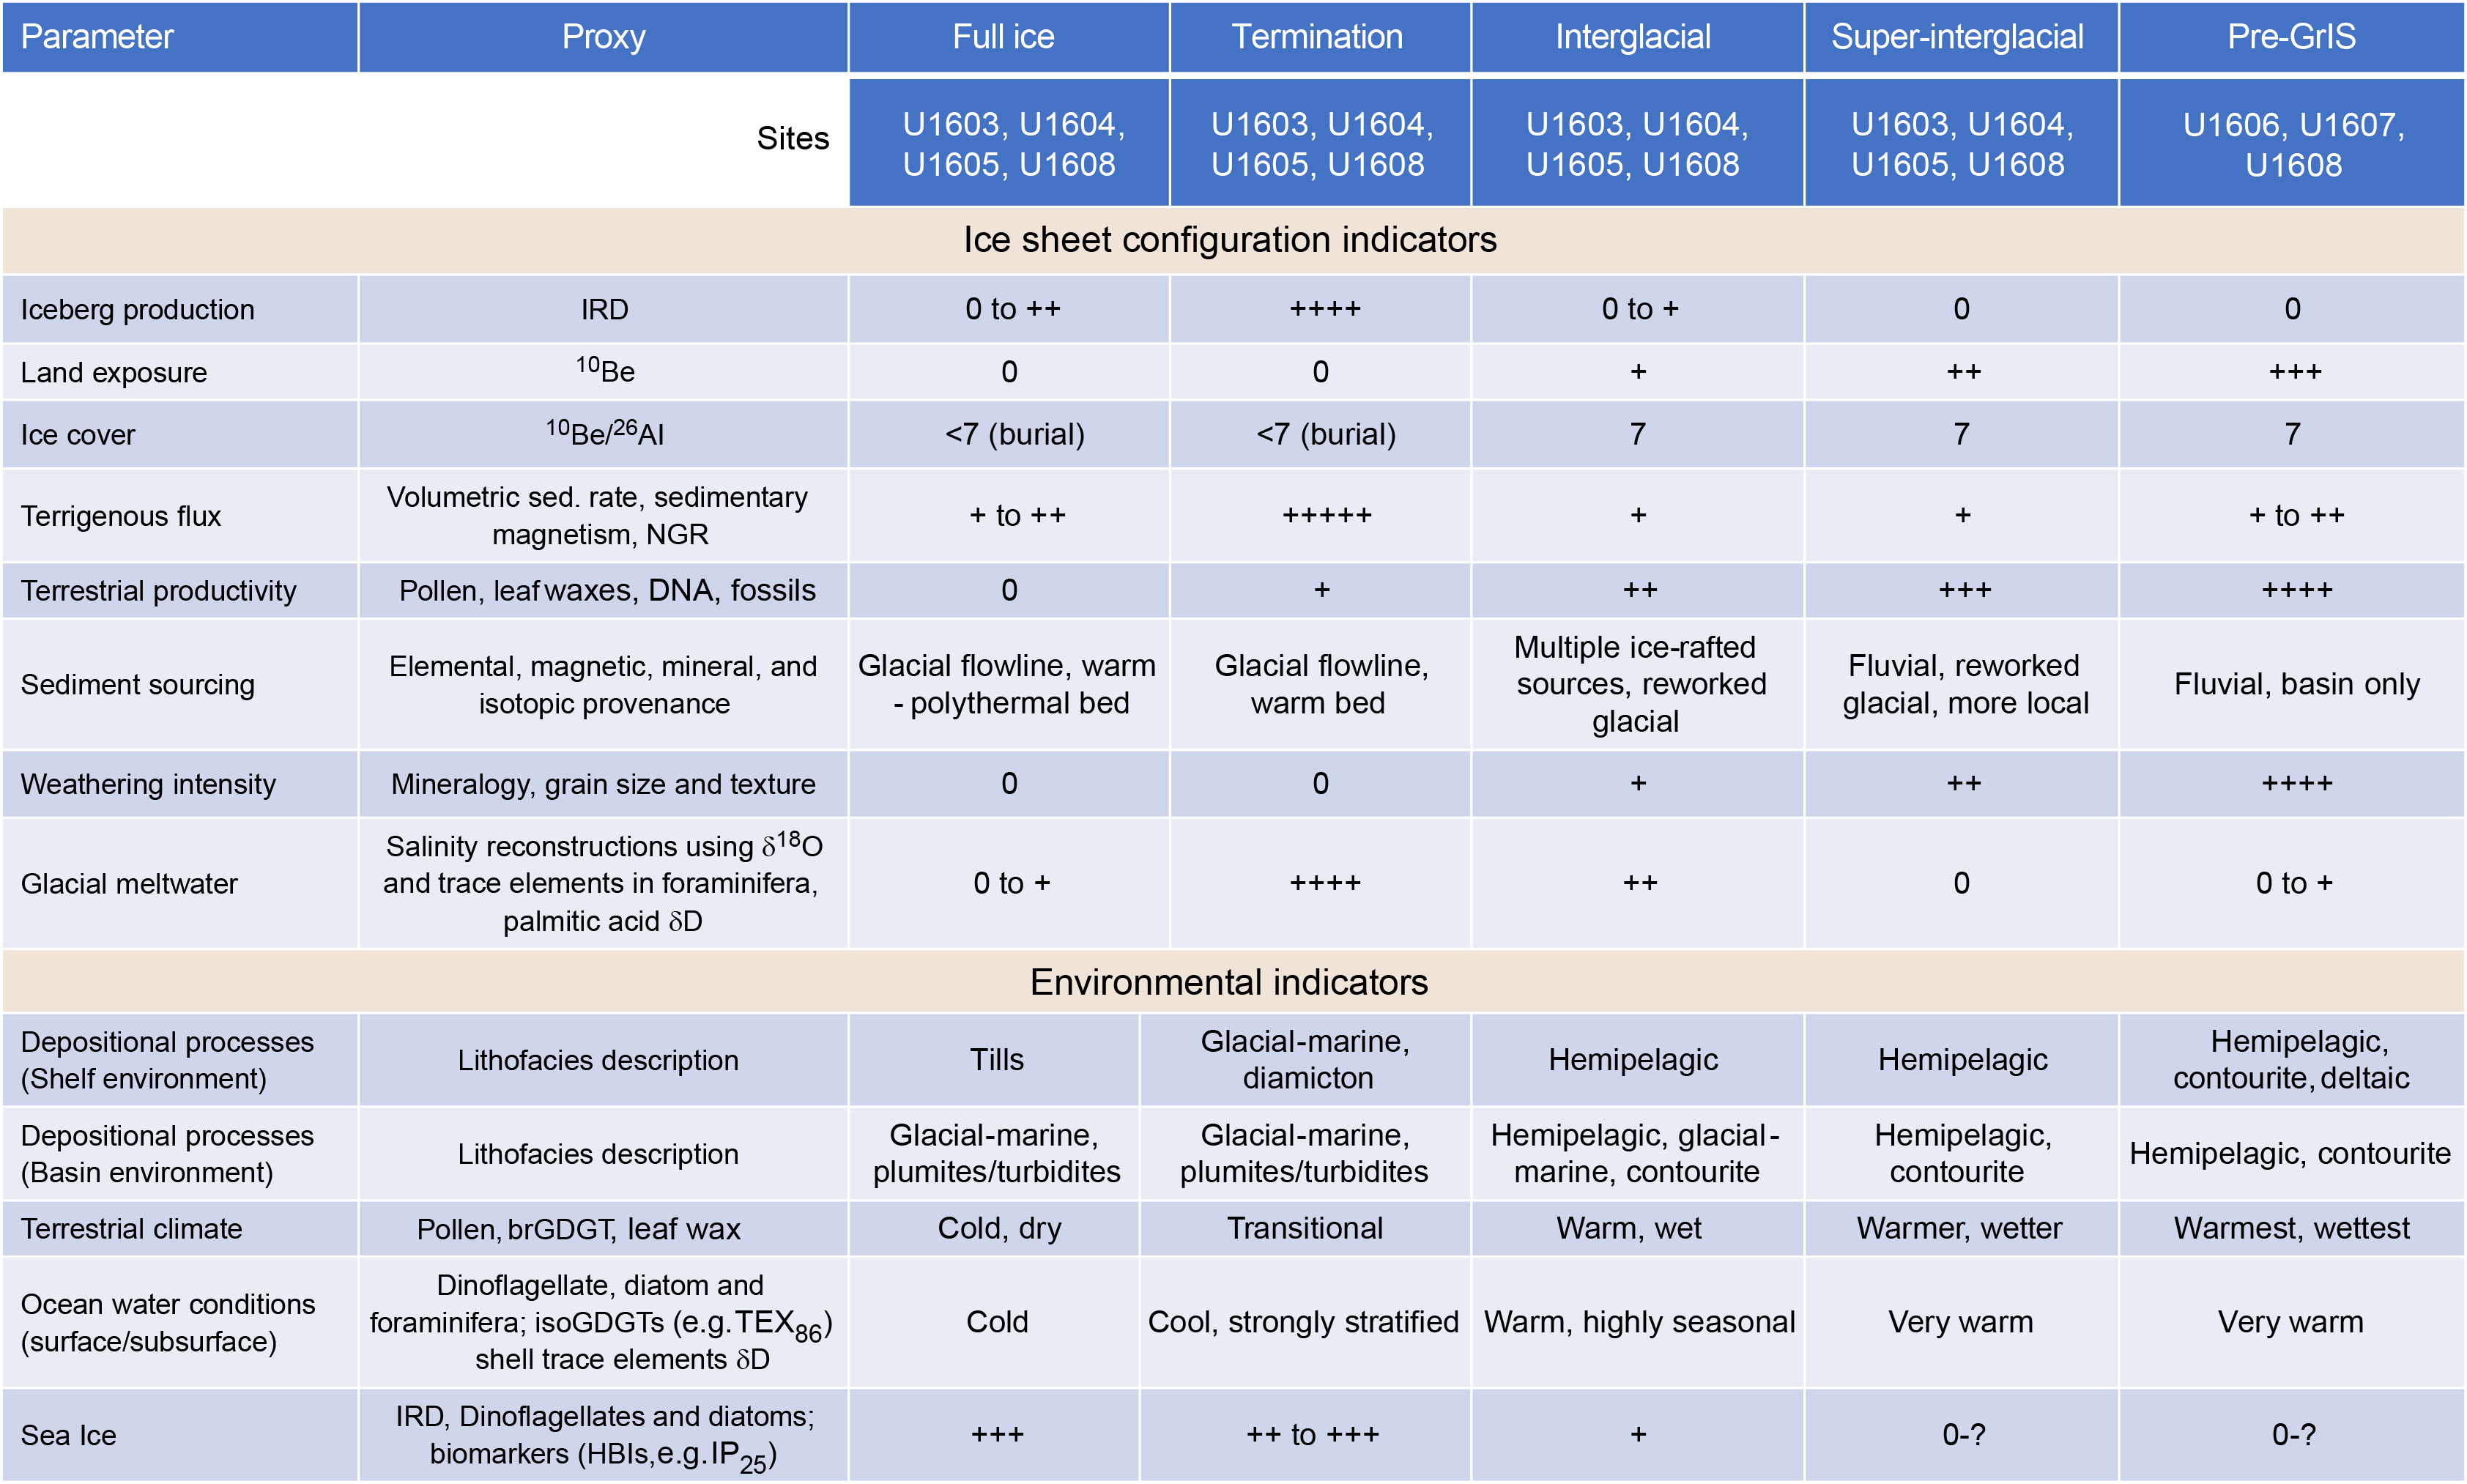
Figure F4. Diagnostic template for ice sheet evolution.
There are two principal goals for this site: (1) capture deposits corresponding to the earliest shelf-based glaciations in northwest Greenland (earliest glacial clinoforms of Megaunit A) and (2) recover Neogene sediments of likely Pliocene age in Megaunit B that can elucidate paleoceanographic conditions prior to the major expansion of the Greenland ice sheet (Knutz et al., 2015). Hypothetically, the contourite drift may provide a marine analog to terrestrial outcrops (e.g., Beaufort and Kap København formations), depicting warm climate conditions in the High Arctic during late Pliocene to Early Pleistocene (Gosse et al., 2017).
Planned drilling at Site U1606 included using the rotary core barrel (RCB) system from the seafloor to 411 m CSF-A in the first hole. If intervals of special interest (e.g., marine mud) were encountered, a second hole would be attempted by wash-down drilling followed by coring using the advanced piston corer (APC) system. Downhole logging planned for the first hole included the triple combo tool string, Formation MicroScanner (FMS), and Versatile Seismic Imager (VSI) check shots.
2. Operations
Site U1606 hole locations, water depths, and number of cores recovered are listed in Table T1. All times are local ship time (UTC − 3 h) unless otherwise noted.
2.1. Hole U1606A
The vessel transited 44 nmi from Site U1605 to Site U1606. The thrusters were lowered and secured, and the ship was fully in dynamic positioning (DP) mode at 2200 h on 13 September 2023. Ice monitoring began, and the vessel made the final approach to the site slowly as ice vacated the area. The rig crew made up an RCB bottom-hole assembly (BHA) in preparation for Hole U1606A, and the drill string was partially lowered while we waited on ice to clear the site. By 0230 h on 14 September, we positioned the vessel over the site, and Hole U1606A was spudded at 0415 h. Cores 1R–20R advanced from 0 to 182.4 m CSF-A and recovered 30.14 m (16%). At 1030 h on 15 September, ice moved within 3 nmi of the vessel, and we raised the drill string to 24.6 m CSF-A by 1215 h. The ice was slow moving (nearly stationary) and was expected to linger over the site for more than a day while moving closer to the vessel. The decision was made to pull out of Hole U1606A and move to Site U1607. The drill string was tripped up with the bit at the surface at 1424 h. The drill floor was secured for transit, and the thrusters were raised and secured for transit at 1500 h.
A total of 20 cores were taken in Hole U1606A over a 182.4 m interval with 16.5% recovery. Total time on Hole U1606A was 41.04 h (1.71 days). In total, 1.5 h were spent waiting on ice, and an additional 4.5 h of operational time was spent out of Hole U1606A to wait on ice.
2.2. Hole U1606B
The vessel transited the 6.6 nmi from Site U1608 back to Site U1606 on 30 September 2023, arriving at 1715 h. The thrusters were lowered and secured, and the ship was fully in DP mode at 1738 h. The vessel was positioned 710 m northeast of Hole U1606A along the seismic line. The rig crew made up an RCB BHA, and the drill string was tripped to near the seafloor. Hole U1606B was spudded at 2125 h, tagging the seafloor at 656.4 mbsl. Cores 1R–39R advanced from 0.0 to 350.0 m CSF-A and recovered 164.44 m (47%). We tripped the pipe out of the hole, clearing the seafloor at 0110 h on 3 October and ending Hole U1606B.
A total of 39 cores were taken in Hole U1606B over a 350 m interval with 46.9% recovery. Total time on Hole U1606B was 55.44 h (2.31 days).
2.3. Hole U1606C
The vessel was offset 181 m southwest of Hole U1606B along the seismic line, and Hole U1606C was spudded at 0245 h on 3 October 2023. The hole was drilled ahead to 25 m CSF-A before removing the center bit and dropping an RCB core barrel. Cores 2R–18R advanced from 25.0 to 186.7 m CSF-A and recovered 45.31 m (28%). We tripped the pipe out of the hole, clearing the seafloor at 0355 h on 4 October and ending Hole U1606C.
A total of 17 cores were taken in Hole U1606C over a 161.7 m interval with 28% recovery. Total time on Hole U1606C was 26.64 h (1.11 days).
2.4. Hole U1606D
The vessel was offset 598 m southwest of Hole U1606A along the seismic line, and Hole U1606D was spudded at 0625 h on 4 October 2023. The hole was drilled ahead to 13.6 m CSF-A before we removed the center bit and dropped an RCB core barrel. Cores 2R–14R advanced from 13.6 to 132.1 m CSF-A and recovered 7.83 m (6.6%). We then tripped the pipe out of Hole U1606D, clearing the rig floor at 0815 h on 5 October. The drill floor was secured for transit, and the thrusters were raised and secured for transit at 1206 h, ending Hole U1606D and Site U1606.
A total of 13 cores were taken in Hole U1606D over a 118.5 m interval with 6.6% recovery. Total time on Hole U1606D was 31.92 h (1.33 days).
The vessel then began the 1799 nmi transit to Hafnarfjörður, Iceland, at 1206 h on 5 October. Expedition 400 officially ended with the first line ashore at 1954 h on 13 October local time (UTC − 0 h).
3. Lithostratigraphy
Site U1606 consists of four holes (U1606A–U1606D) that were cored with the RCB coring system; therefore, detailed correlation between sites was not attempted (see Stratigraphic correlation). Holes U1606A and U1606B were cored to ~180 and ~350 m CSF-A with 16% and 47% recovery, respectively. Holes U1606C and U1606D were washed down and cored over a 162 and 118 m interval to a total depth of 187 and 132 m CSF-A, respectively, with 28% and 7% recovery. Site U1606 is on the middle continental shelf at a modern water depth of ~650 m with discrete seismic stratigraphic packages of variable thicknesses underlying an inferred gravel lag at the seafloor. The seismic stratigraphy shows strata generally dipping southwestward that are bounded by a fault to the northeast. Because of low recovery in the upper parts of each hole, reporting the lithostratigraphy and depositional history of these intervals is limited at Site U1606. The recovered sediment is tentatively interpreted as Miocene–Pleistocene based on limited chronological information (see Biostratigraphy).
Site U1606 was drilled along a ~1.3 km long southwest–northeast transect and targeted seismic stratigraphic packages with varying thicknesses at each hole (Figure F39; see Stratigraphic correlation). The lithostratigraphic units are therefore not laterally continuous and, at some sites, are not present as a result of stratal pinch-out (Figure F39). The stratigraphy of Site U1606 is divided into four lithostratigraphic units (I–IV; Figure F5; Table T2), with each hole summarized individually (Figures F6, F7, F8, F9). Named sedimentary lithofacies include (1) laminated or bioturbated mud with or without dispersed sand; (2) calcareous mud and sand; (3) stratified or bioturbated sandy mud with and without dispersed clasts; (4) stratified or bioturbated muddy sand and sand with and without dispersed clasts; (5) interlaminated to interbedded sand and mud; and (6) muddy coarse sand, diamicton, and intraclast conglomerate.
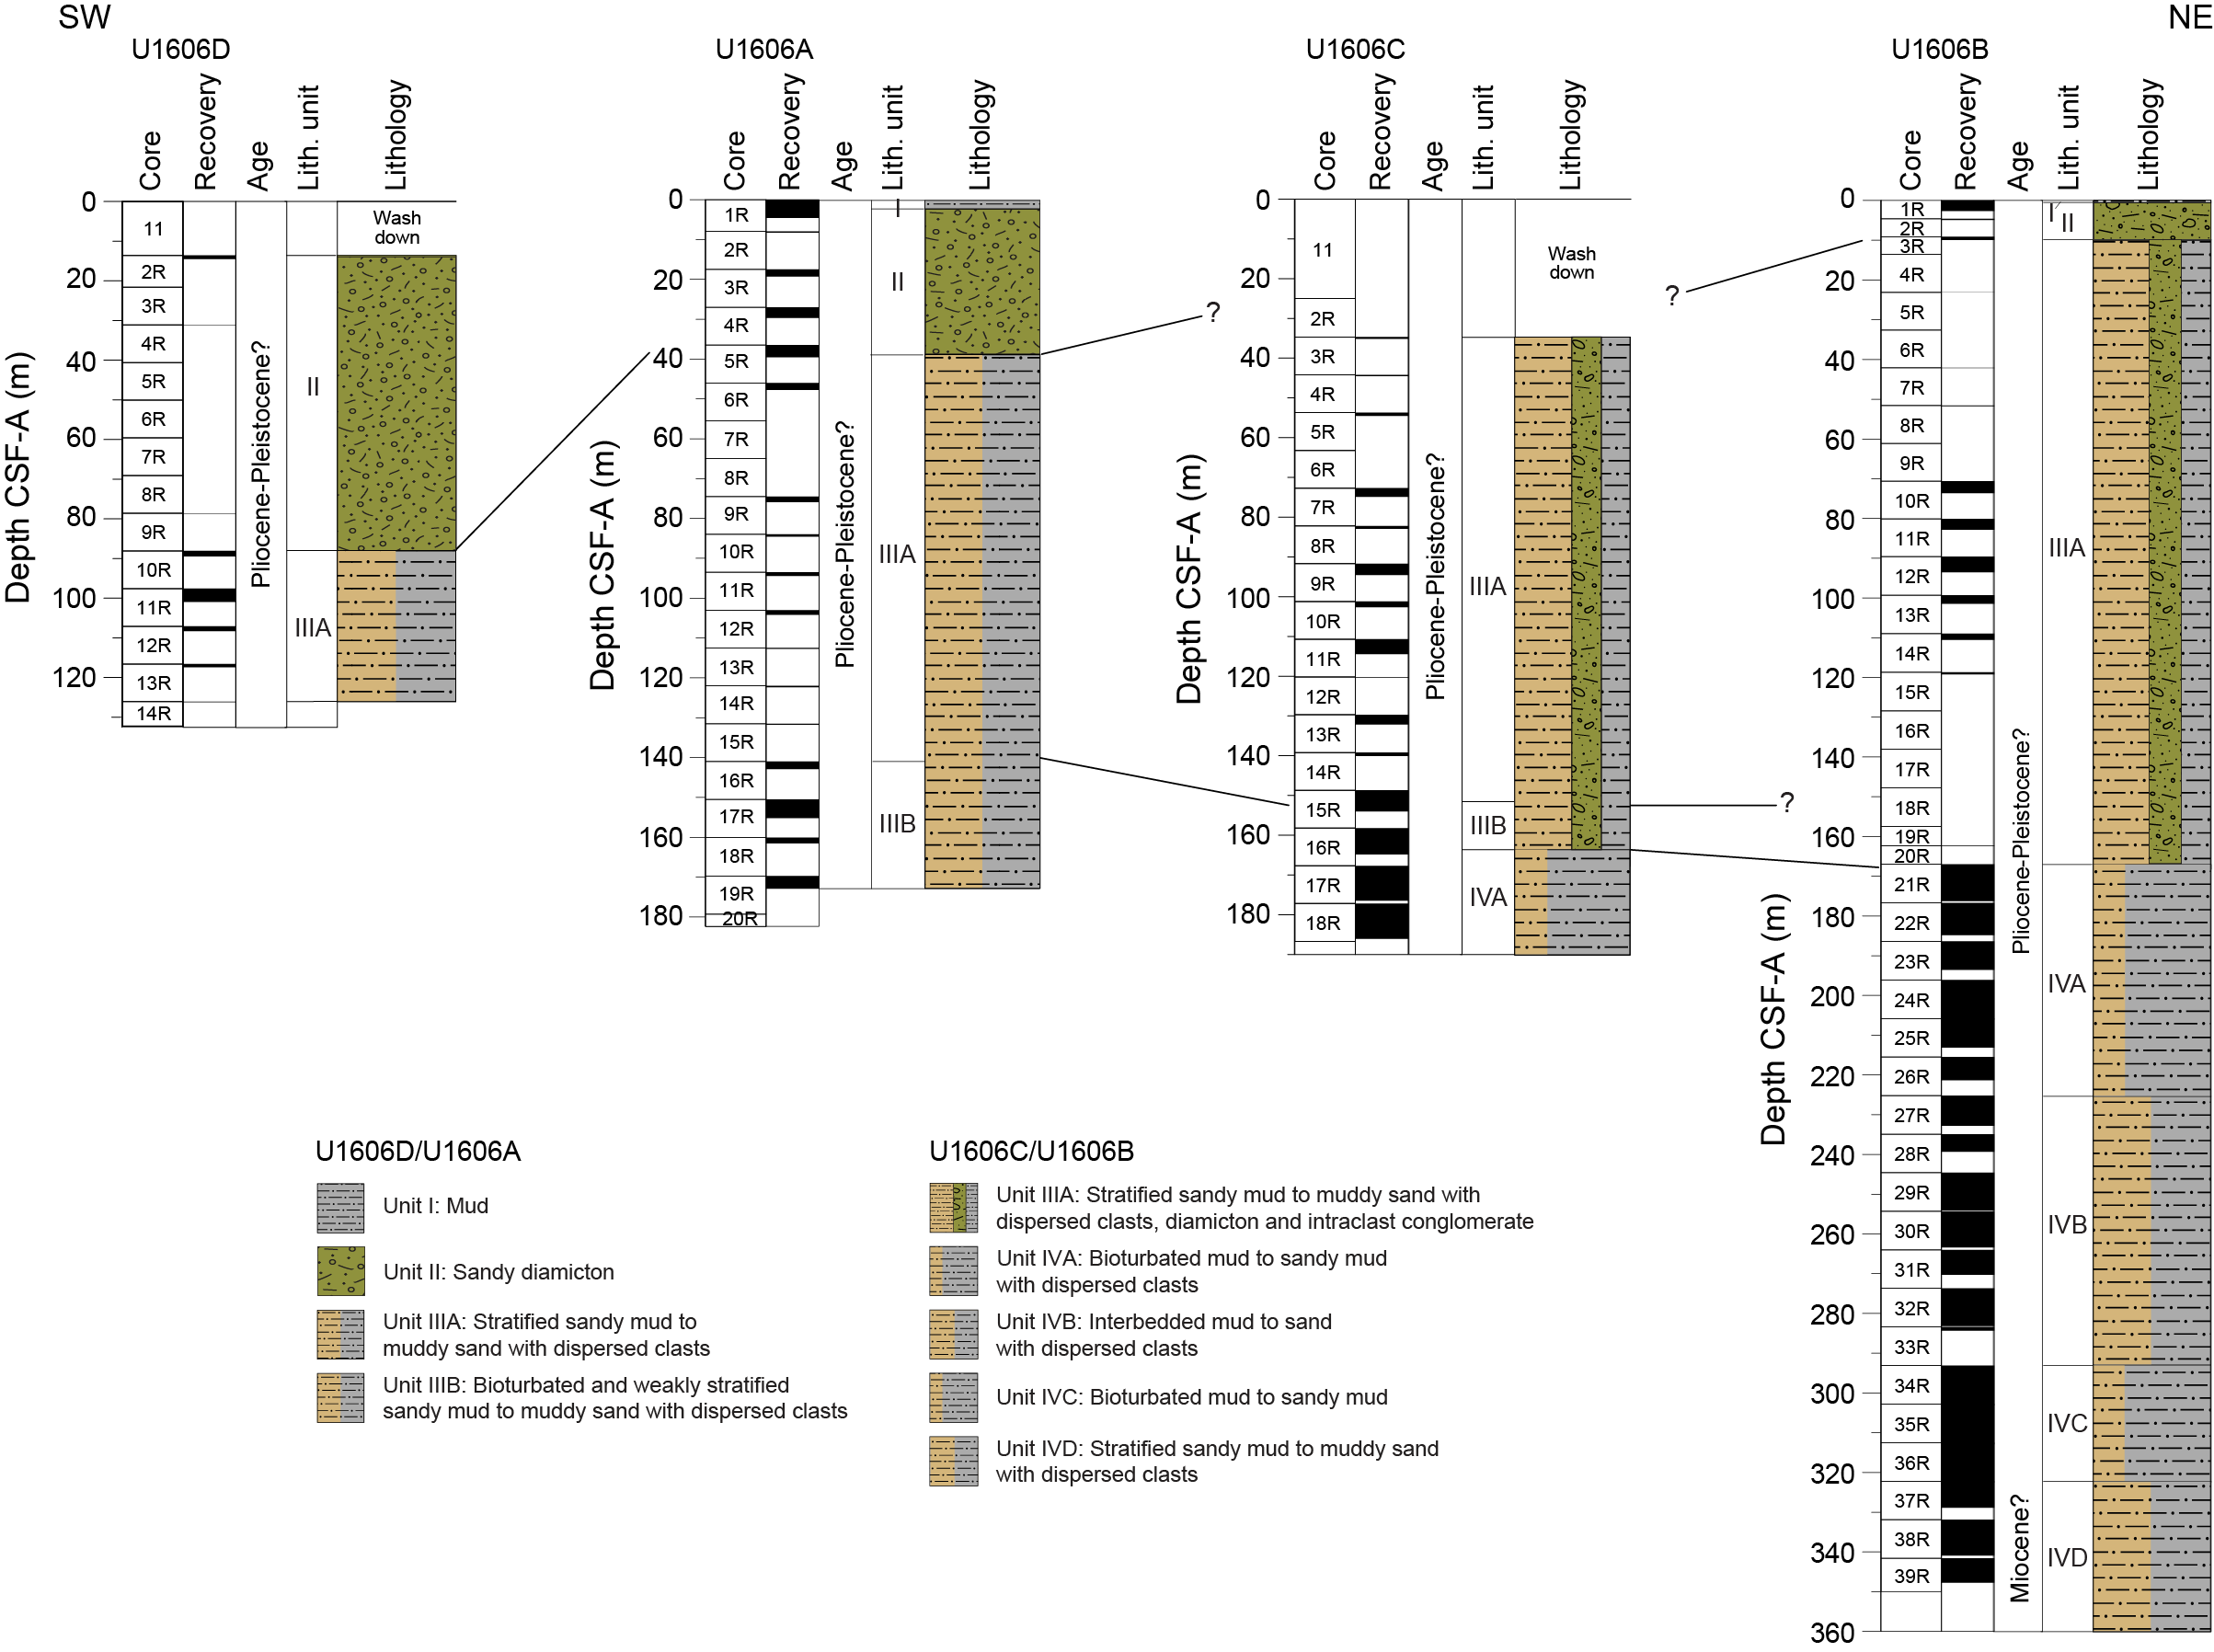
Figure F5. Lithostratigraphic summary and hole correlation.
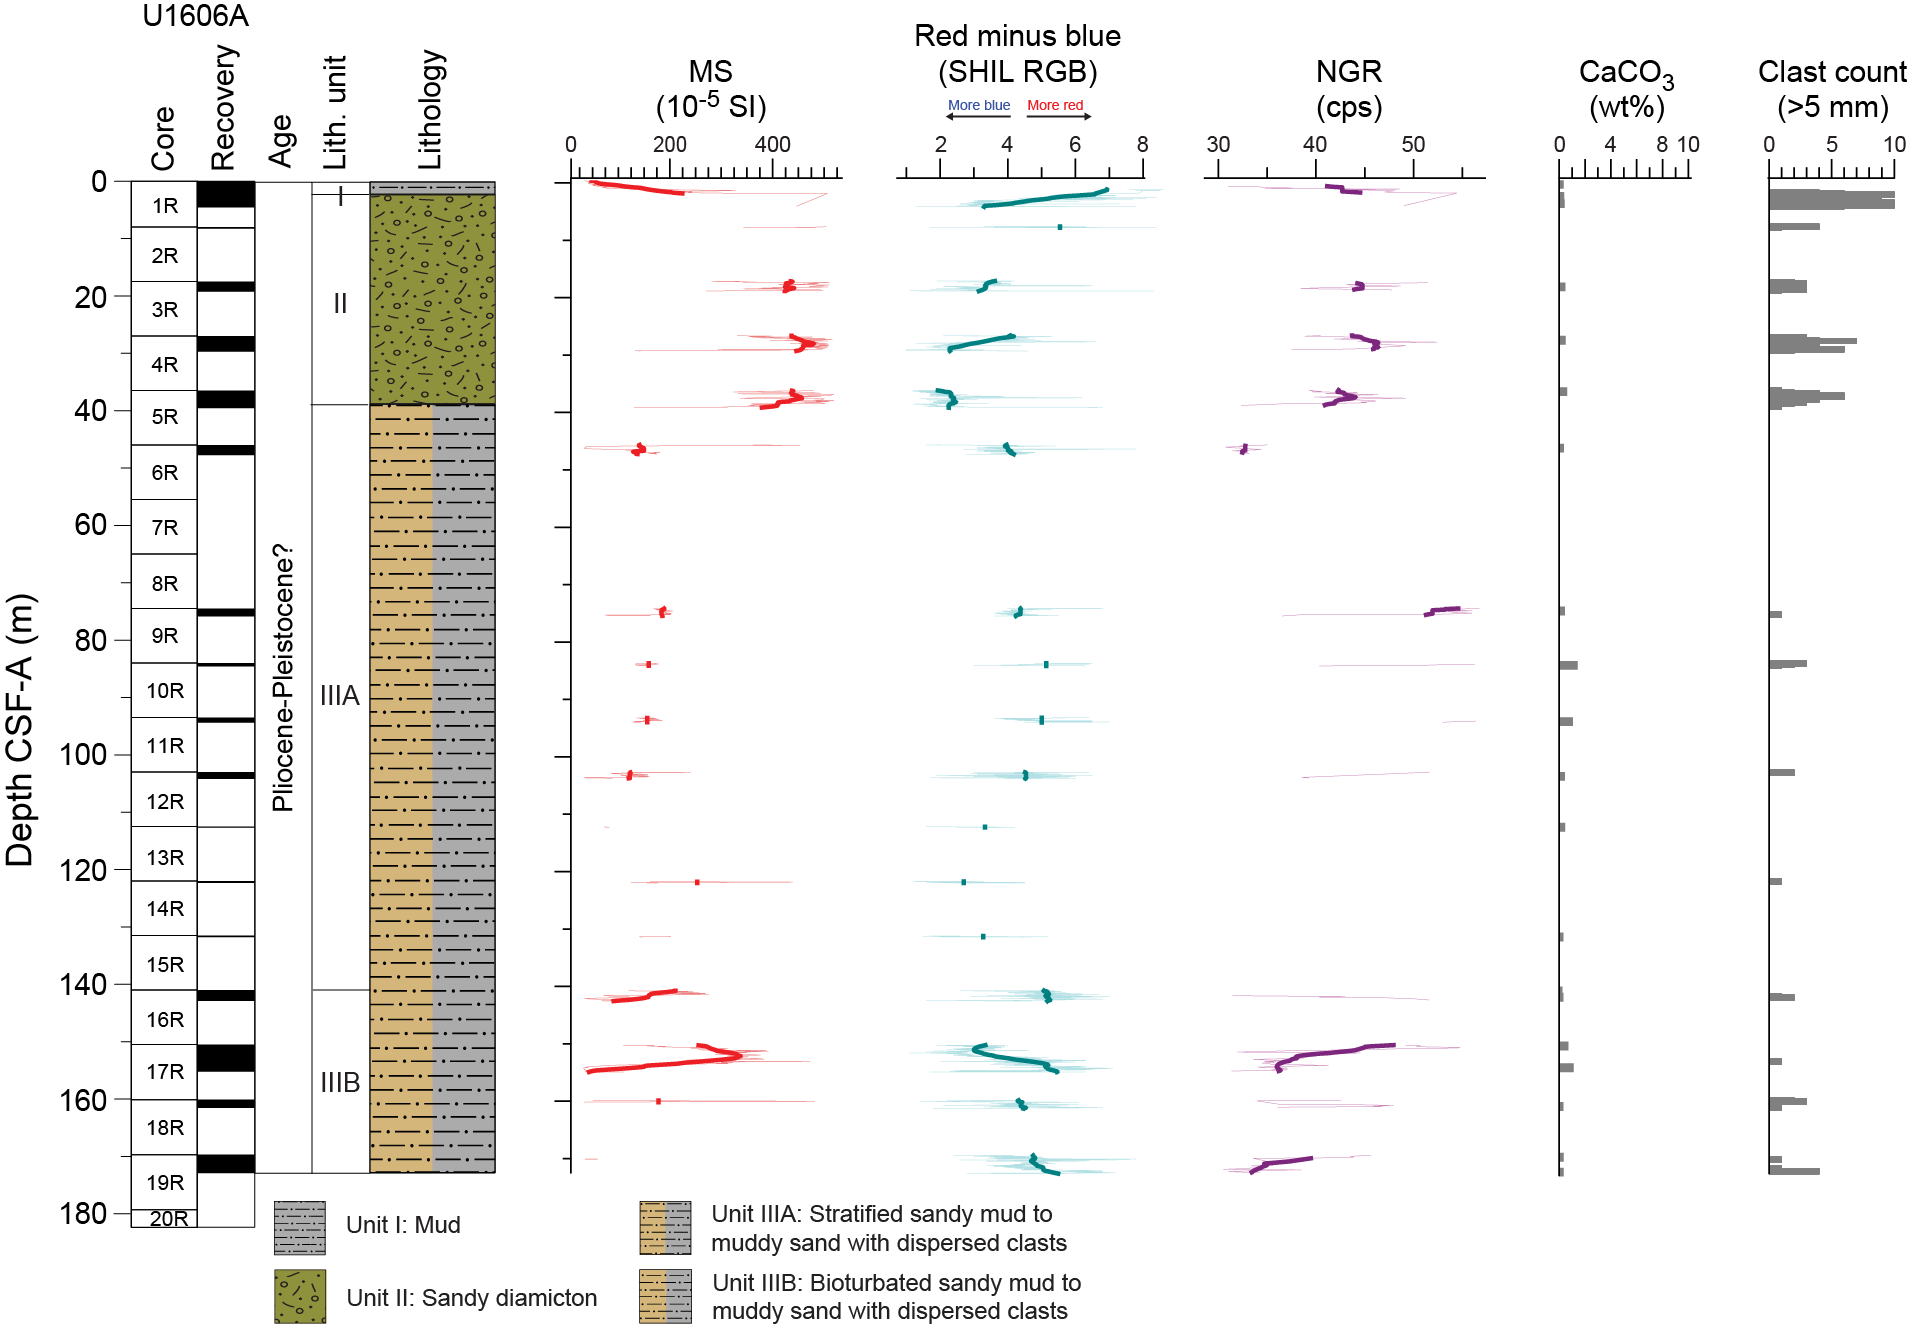
Figure F6. Lithostratigraphic summary, Hole U1606A.

Figure F7. Lithostratigraphic summary, Hole U1606B.
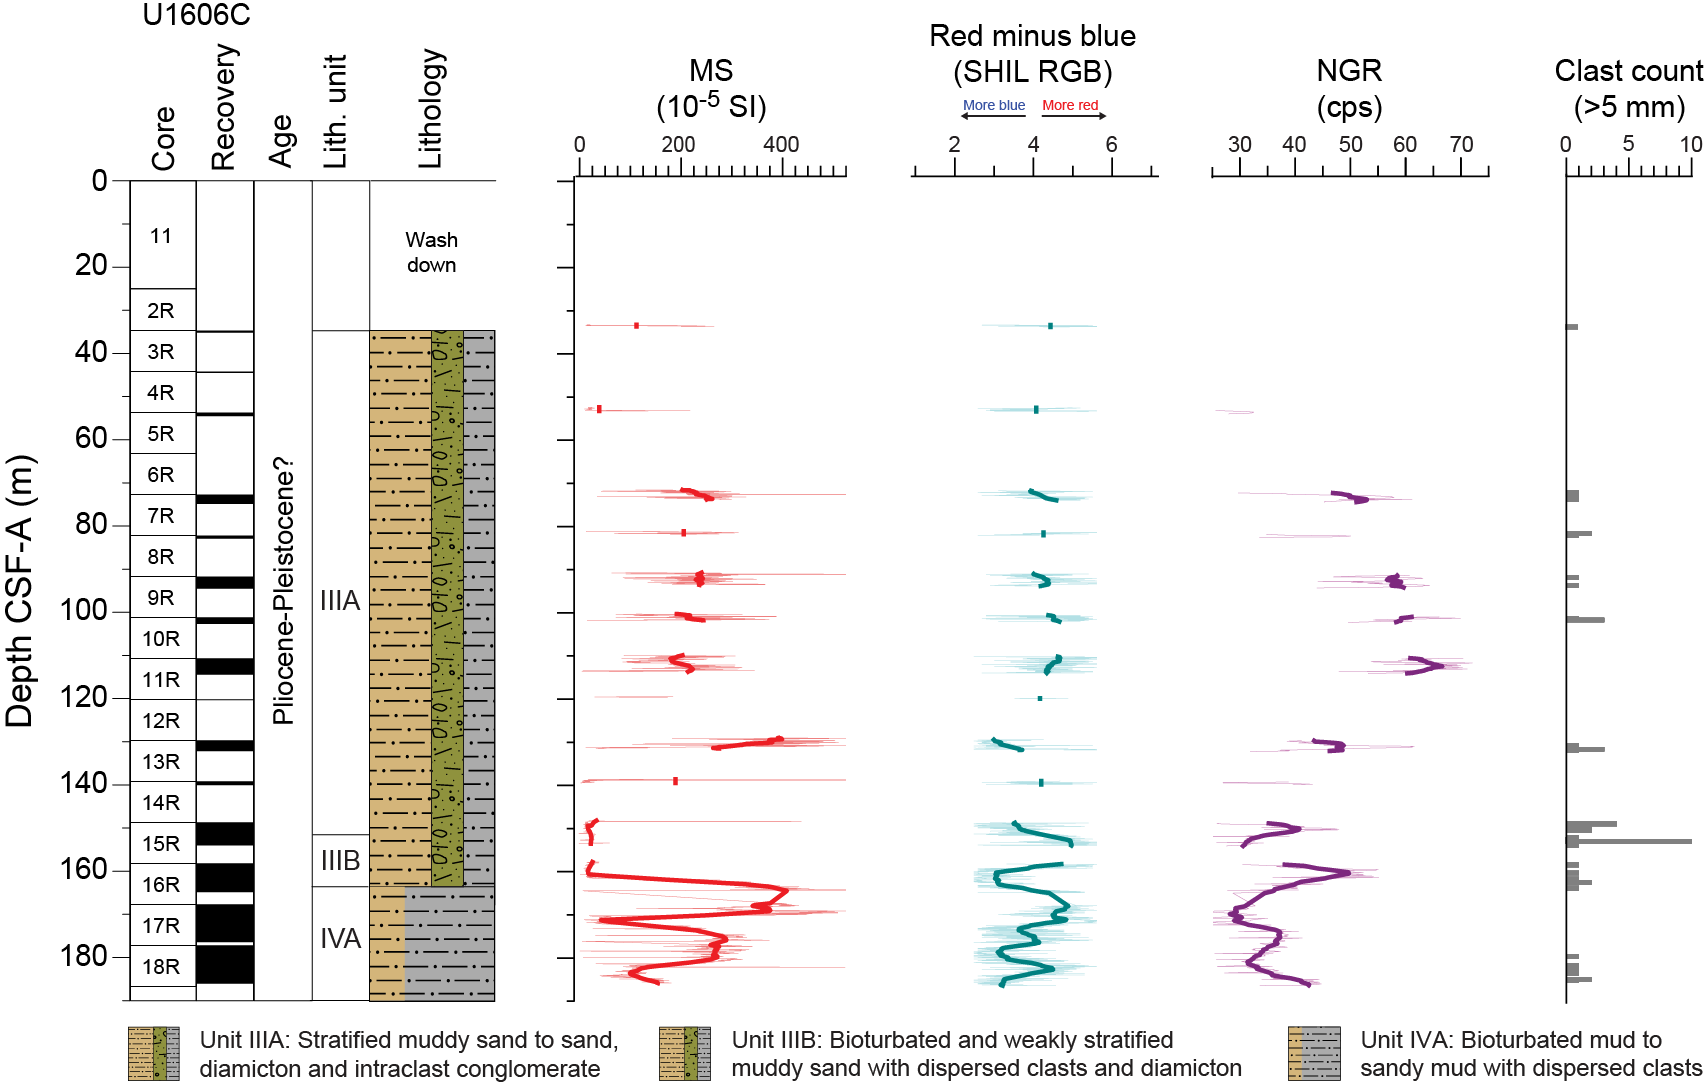
Figure F8. Lithostratigraphic summary, Hole U1606C.

Figure F9. Lithostratigraphic summary, Hole U1606D.
Lithostratigraphic Unit I was recovered in Holes U1606A and U1606B and contains unlithified brown mud to sandy mud. Unit II comprises sandy diamicton ranging from clast-poor to clast-rich, also recovered only in Holes U1606A and U1606B. Unit III is formed of sandy mud and muddy sand with dispersed clasts and has two subunits (IIIA and IIIB) distinguished by the degree of bioturbation and stratification. Subunit IIIA was recovered in all holes at Site U1606 and contains weakly to strongly stratified sandy mud and muddy sand with dispersed clasts. Subunit IIIB is identified only in Holes U1606A and U1606C and is characterized as moderately bioturbated stratified sandy mud to muddy sand with dispersed clasts. Unit IV is defined by alternating bioturbated mud and sandy mud (Subunits IVA and IVC) with interbedded mud and sand (Subunits IVB and IVD). Subunit IVA is present in Holes U1606B and U1606C, whereas Subunits IVB–IVD are only present in Hole U1606B.
Overall, the sedimentary succession collected at Site U1606 is consistent with a shelf setting with periods of hemipelagic deposition punctuated by periods of glacially influenced processes and variable periods of potential bottom current reworking.
3.1. Unit descriptions
Site U1606 is divided into four lithostratigraphic units (I–IV; youngest to oldest) (Figures F5, F6, F7, F8, F9; Table T2). Significant downhole changes in lithology were determined using a combination of visual core description, microscopic characterization (using smear slides, grain mounts, and thin sections), reflectance spectroscopy and colorimetry, and bulk and clay mineralogical analyses using X-ray diffraction (XRD) (see Lithostratigraphy in the Expedition 400 methods chapter [Knutz et al., 2025a]).
3.1.1. Unit I
- Intervals: 400-U1606A-1R-1, 0 cm, to 1R-2, 78 cm; 400-U1606B-1R-1, 0 cm, to 1R-1, 24 cm
- Depths: Hole U1606A = 0–2.28 m CSF-A; Hole U1606B = 0–0.24 m CSF-A
- Thicknesses: Hole U1606A = 2.28 m; Hole U1606B = 0.24 m
- Age: Holocene
- Lithology: mud and sandy mud
Lithostratigraphic Unit I is characterized by brown biosilica-bearing mud and sandy mud at the top of Holes U1606A and U1606B and is interpreted as Holocene in age.
3.1.2. Unit II
- Intervals: 400-U1606A-1R-2, 78 cm, to 5R-2, 94 cm; 400-U1606B-1R-1, 24 cm, to 3R-1, 80 cm; 400-U1606D-2R-1, 0 cm, to 10R-1, 0 cm
- Depths: Hole U1606A = 2.28–38.83 m CSF-A; Hole U1606B = 0.24–9.90 m CSF-A; Hole U1606D = 13.6–88.1 m CSF-A
- Thicknesses: Hole U1606A = 36.55 m; Hole U1606B = 9.66 m; Hole U1606D = 74.5 m
- Age: Pliocene–Pleistocene?
- Lithology: clast-poor to clast-rich sandy diamicton
Lithostratigraphic Unit II is characterized by medium to dark grayish brown clast-rich to clast-poor sandy diamicton, generally massive, with some weakly stratified occurrences (e.g., Section 400-U1606A-5R-1A, 74 cm). Rare to few shell fragments and large (>0.5 mm) foraminifera are present. Clasts are 1–3 cm crystalline granular plutonic and/or high-grade metamorphic in origin. Bioturbation is absent.
3.1.3. Unit III
3.1.3.1. Subunit IIIA
- Intervals: 400-U1606A-5R-2, 94 cm, to 16R-1, 0 cm; 400-U1606B-3R-1, 80 cm, to 21R-1, 0 cm; 400-U1606C-3R-1, 0 cm, to 15R-2, 127 cm; 400-U1606D-10R-1, 0 cm, to 13R-1, 83 cm* (asterisk denotes recovered extent in that hole; see Table T2)
- Depths: Hole U1606A = 38.83–141.00 m CSF-A; Hole U1606B = 9.9–167.00 m CSF-A; Hole U1606C = 34.7–151.44 m CSF-A; Hole U1606D = 88.10–126.24 m CSF-A
- Thicknesses: Hole U1606A = 102.17 m; Hole U1606B = 157.1 m; Hole U1606C = 116.74 m; Hole U1606D = 38.14 m
- Age: Pliocene–Pleistocene?
- Lithology: sandy mud, muddy sand with dispersed clasts, diamicton, and conglomerate
Lithostratigraphic Subunit IIIA is characterized by intervals of dark green to dark brown or grayish yellow sandy mud and muddy sand with dispersed clasts. In Hole U1606A, Subunit IIIA occurs as meter-scale grayish yellow stratified muddy sand with dispersed clasts, laminated mud, and sandy mud. In Holes U1606B and U1606C, Subunit IIIA is described as grayish brown stratified coarse muddy sand to sand with dispersed clasts, laminated mud with dispersed clasts, and interbedded laminated mud with diamicton. Notably, Subunit IIIA contains diamicton and mud-intraclast sandy conglomerates at the base of Holes U1606B and U1606C. In Hole U1606D, Subunit IIIA is predominantly dark gray interlaminated sand and mud, mud, and sandy mud with fewer dispersed clasts than are present in correlative Subunit IIIA in Holes U1606A–U1606C. Dispersed clasts are commonly angular fine granules of quartz, with rare subangular pebbles of felsic plutonic and/or metamorphic rock type. Rare shell fragments, mollusks (bivalves and gastropods), and organic material (wood), along with concretions, are present in this subunit. Soft-sediment deformation occurs in Holes U1606B and U1606C, especially in association with the lower diamicton and conglomerate. Bioturbation is absent to sparse.
3.1.3.2. Subunit IIIB
- Intervals: 400-U1606A-16R-1, 0 cm, to 19R-CC, 10 cm* (asterisk denotes recovered extent in that hole; see Table T2); 400-U1606C-15R-2, 127 cm, to 16R-3, 139 cm
- Depths: Hole U1606A = 141.00–172.87 m CSF-A; Hole U1606C = 151.44–162.56 m CSF-A
- Thicknesses: Hole U1606A = 31.87 m; Hole U1606C = 11.12 m
- Age: Pliocene–Pleistocene?
- Lithology: sandy mud and muddy sand
Lithostratigraphic Subunit IIIB was recovered in Holes U1606A and U1606C and is characterized by intervals of dark gray to dark greenish gray muddy sand and sandy mud with dispersed clasts. Notably, bioturbated intervals are common. In Hole U1606A, Subunit IIIB contains laminated sands interbedded with muddy sand and becomes weakly stratified downcore with increasing bioturbation. In Hole U1606C, Subunit IIIB also contains weakly stratified to sparsely laminated muddy sands with increasing bioturbation downcore. A clast-poor diamicton occurs in Hole U1606C at the base of the unit. Dispersed clasts are commonly angular fine granules of quartz, with rare subangular pebbles of felsic plutonic and/or metamorphic rock type. Rare shell fragments of small bivalves, along with concretions, were present. This subunit is not observed in Hole U1606B because of stratal pinch-out (Figure F39).
3.1.4. Unit IV
3.1.4.1. Subunit IVA
- Intervals: 400-U1606B-21R-1, 0 cm, to 27R-1, 0 cm; 400-U1606C-16R-3, 139 cm, to 18R-6, 142 cm* (asterisk denotes recovered extent in that hole; see Table T2)
- Depths: Hole U1606B = 167.00–225.2 m CSF-A; Hole U1606C = 162.56–186.07 m CSF-A
- Thicknesses: Hole U1606B = 58.2 m; Hole U1606C = 23.51 m
- Age: Pliocene–Pleistocene?
- Lithology: mud, mud with sand, mud with dispersed clasts, sandy mud, calcareous mud
Lithostratigraphic Subunit IVA is dominated by dark greenish gray bioturbated to weakly stratified mud. In Hole U1606B, the lithology subtly increases in grain size from mud with dispersed clasts to mud with sand and sandy mud, with a thin occurrence of muddy sand before fining downcore to the base of the unit. In Hole U1606C, the sequence coarsens downcore to the bottom of the hole, suggesting that the base of the subunit is not recovered. Mud generally occurs with sand or dispersed clasts that rarely exceed 5 mm. When clasts are observed, they are 1–2 cm igneous rocks, including dark-colored and fine-grained rocks. In this subunit, the bioturbation is moderate to common with millimeter- to centimeter-scale black-lined burrows. The sand component is not dominant in this subunit and is generally fine to very fine. Rare shell fragments are present toward the base of the subunit, along with concretions and pseudomorphs after ikaite. Although calcareous mud is only present as bioturbated patches in Hole U1606B, it is present as distinctive centimeter-scale beds in Core 400-U1606C-18R.
3.1.4.2. Subunit IVB
- Interval: 400-U1606B-27R-1, 0 cm, to 34R-1, 0 cm
- Depth: 225.20–293.10 m CSF-A
- Thickness: 67.90 m
- Age: Pliocene–Pleistocene?
- Lithology: calcareous mud, sandy mud, muddy sand, muddy sand with dispersed clasts, and interbedded sand and mud
Lithostratigraphic Subunit IVB is almost exclusively dark yellowish gray to dark brown sand-based lithologies and is dominated by interbedded sand and mud. Bioturbation is absent to common but generally at lower levels than the bounding subunits. The interbedded sand and mud is thinly bedded on a centimeter scale, consisting of massive mud coarsening up into sands that contain parallel laminations. In intervals where dispersed clasts are observed, they are granules less than 5 mm, and where they occur in association with the interbedded lithology, they are generally within the sand laminae. A single stratified calcareous mud bed is observed in this subunit, and there are a few carbonate-cemented intervals. Shell fragments are present in approximately half the sediment thickness as rare to few occurrences, and muddy sand contains shell fragments more often than not. Bedding was observed to be inclined over several meters at 5°–8° from horizontal.
3.1.4.3. Subunit IVC
- Interval: 400-U1606B-34R-1, 0 cm, to 37R-1, 0 cm
- Depth: 293.1–322.20 m CSF-A
- Thickness: 29.10 m
- Age: Pliocene–Pleistocene?
- Lithology: mud, mud with sand, sandy mud
Lithostratigraphic Subunit IVC consists of dark gray to dark greenish gray mud, sandy mud, and mud with sand, with moderate to abundant bioturbation. Sand is very fine with occasional blebs of fine to medium sand, which are likely burrow fills. Typically, burrow fills are thin millimeter-scale, oriented subhorizontal, and dark gray in color. Calcareous blebs up to 2 cm wide are also considered burrow fill. This subunit has no observed clasts and very rare shell fragments and other unidentified fossil material. Subunit IVC shares many characteristics with Subunit IVA.
3.1.4.4. Subunit IVD
- Interval: 400-U1606B-37R-1, 0 cm, to 39R-CC, 12 cm (bottom of the hole)
- Depth: 322.2–347.66 m CSF-A (bottom of the hole)
- Thickness: 25.46 m
- Age: Miocene?–Pliocene?
- Lithology: sandy mud and muddy sand with and without dispersed clasts
Lithostratigraphic Subunit IVD contains brown to greenish gray sandy mud and muddy sand with and without dispersed clasts. Bioturbation is absent to common. Stratification is observed through one interval as sand laminae disturbed by bioturbation and beds of 1–2 cm thick dispersed coarse-grained sands. Clasts occur as rare singular subrounded pebbles of felsic coarse-crystalline granular or mafic fine-grained crystalline source. Subunit IVD shares many characteristics with Subunit IVB.
3.2. Lithofacies descriptions
At Site U1606, six main lithofacies are identified based on lithology, sedimentary structures, and texture, with additional characteristics such as fossil content, deformation, and diagenesis noted.
3.2.1. Lithofacies 1: laminated or bioturbated mud with or without dispersed sand
Lithofacies 1 consists of mud with or without dispersed sand and that is either laminated or bioturbated (Figure F10). The color of this lithofacies ranges from medium to dark brown to medium to dark greenish gray. Intervals of this lithofacies occur at the decimeter scale and up to >9 m thick. In the occurrences that include sparse dispersed sand, the sand varies between very fine to medium grained. Outsized clasts include rare occurrences of up to granule-sized grains. Mud with dispersed sand is also commonly observed with gradational contacts with overlying or underlying sandy mud/muddy sand (Lithofacies 3 and 4).

Figure F10. Lithofacies 1.
In the occurrences of this lithofacies that are bioturbated, the intensity ranges from a bioturbation index of 3 (distinct traces, some bedding intact) to 6 (total homogenization of sediment, no original bedding visible). The bioturbation in this lithofacies is dominated by millimeter-scale, oval to circular traces filled with dark gray material (mud) (Figure F10D–F10F) or, less commonly, calcareous light brown mud. The high degree of bioturbation in this lithofacies generally obscures primary depositional structures and bedding relationships. The distribution of sand-sized material appears to be strongly influenced by bioturbation, with sand often concentrated in pockets or burrow linings in more intensely bioturbated intervals.
Smear slide analysis of Lithofacies 1 indicates highly variable mixtures of clay- and silt-sized material, with lower proportions of sand. The composition of silt and sand grains includes quartz (common to abundant), feldspar (rare to common), mica (rare to abundant), and rare to trace amounts of other lithic grains and accessory minerals. A biosiliceous component of diatom fragments, diatom frustules, radiolaria, and sponge spicules is also observed in some smear slides. The biosiliceous component is of variable abundance, and the sampling scarcity of smear slides did not allow for characterization of the stratigraphic continuity of biosiliceous material. Therefore, a biosiliceous-bearing mud was not designated in this lithofacies.
Lithofacies 1 is interpreted to represent sedimentation in a low- to moderate-energy marine shelf setting characterized by dominantly suspension settling (e.g., hemipelagic or plume deposition) combined with episodes of ice rafting and/or bottom current reworking. The bioturbated fabric leads to a high degree of uncertainty regarding a specific depositional environment interpretation.
3.2.2. Lithofacies 2: calcareous mud and sand
Lithofacies 2 consists of isolated 5–15 cm thick beds of light gray to yellowish brown variably bioturbated calcareous mud that occur in association with mud and muddy sand (Lithofacies 3 and 4) in Lithostratigraphic Subunits IVA–IVC in Holes U1606A and U1606B. Beds are typically bioturbated. Upper and lower contacts with enclosing sediments can be diffuse (Figure F11A, F11B) or sharp (Figure F11C). Analysis of smear slides shows that this lithofacies is dominated by carbonate mud and contains common silt-sized grains of quartz and feldspar. Calcareous mud is rare at Site U1606 relative to other sites examined during this expedition, perhaps due to poor recovery or position on the shelf. As at other sites, the beds are interpreted as depositional rather than diagenetic and may represent a specific provenance and/or transport process.
Figure F11. Lithofacies 2.
3.2.3. Lithofacies 3: stratified or bioturbated sandy mud with and without dispersed clasts
Lithofacies 3 consists of decimeter- to meter-scale beds of sand-sized terrigenous material mixed with mud varying from greenish gray to grayish brown to brown in color. It is weakly stratified with rare laminae, bioturbated, and with or without dispersed clasts (Figure F12). The dispersed clast components of this facies (>2 mm) are generally granules (2–4 mm) with some occurrences of pebble grains. The relatively small sizes of the outsized grains in this lithofacies means that they are not included in clast counts (clasts >5 mm) (see Lithostratigraphy in the Expedition 400 methods chapter [Knutz et al., 2025a]). Of the pebble-sized outsized clasts, igneous lithologies appear to be the most frequently occurring type throughout this lithofacies. This lithofacies can contain weak stratification and rare sand laminae, both of which are disrupted by sparse to moderate bioturbation. Shell fragments are more common in this lithofacies than in other facies at this site and occur as disarticulated valves.
Figure F12. Lithofacies 3.
The presence of weak stratification, rare sand laminae, and dispersed clasts in this lithofacies is interpreted as deposition in a continental shelf to slope environment with bottom currents of variable energy and sediment delivery by iceberg and/or sea ice rafting.
3.2.4. Lithofacies 4: stratified or bioturbated muddy sand and sand with and without dispersed clasts
Lithofacies 4 is similar to Lithofacies 3 (sandy mud) but contains relatively coarser grained material, typically coarse sand. This lithofacies also consists of decimeter- to meter-scale beds of sand-sized terrigenous material mixed with mud varying from greenish gray to grayish brown to brown in color. The dispersed clast components of this facies are generally granules (2–4 mm) with fewer occurrences of larger clasts that are associated with the sandy mud. This lithofacies can occur with faint stratification when bioturbated to weakly stratified with coarse sand laminae and centimeter-scale bedding (Figure F13). Shell fragments are also relatively common within this lithofacies and occur as disarticulated valves.
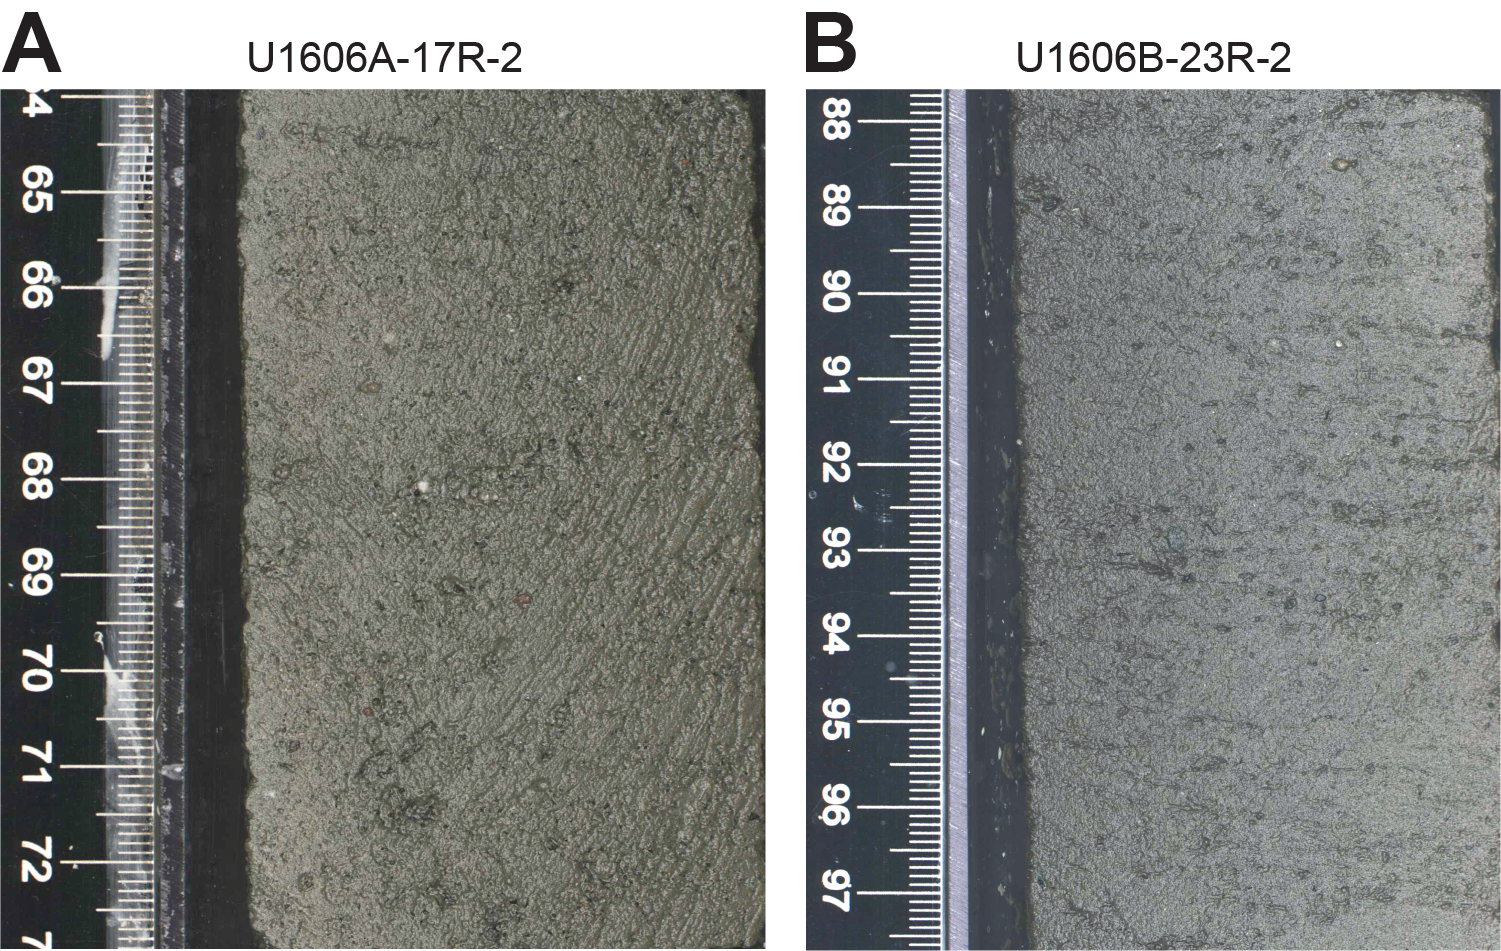
Figure F13. Lithofacies 4.
In general, this lithofacies represents a higher energy environment than the sandy mud, but it is still interpreted as deposition in a continental shelf-to-slope environment with bottom currents of high energy and sediment delivery by iceberg and/or sea ice rafting.
3.2.5. Lithofacies 5: interlaminated to interbedded sand and mud
Lithofacies 5 consists of gray, thinly interlaminated to thinly interbedded mud to very fine sand with dispersed clasts (Figure F14). This facies occurs over intervals approximately 1–2 m thick (Figure F14A). Laminae are planar with either diffuse or sharp boundaries; inclined bedding, soft-sediment deformation, or synsedimentary microfaulting is common. Individual laminae may be massive, normally graded, or inversely graded. Bioturbation is sparse and, where present, cross sections of isolated centimeter-scale burrows with a black lining are observed on the core surface, and/or as millimeter-scale oblique traces in X-ray images. Shell fragments are rare. Brown-green color banding is present in thinly interbedded intervals of mud and very fine sand.
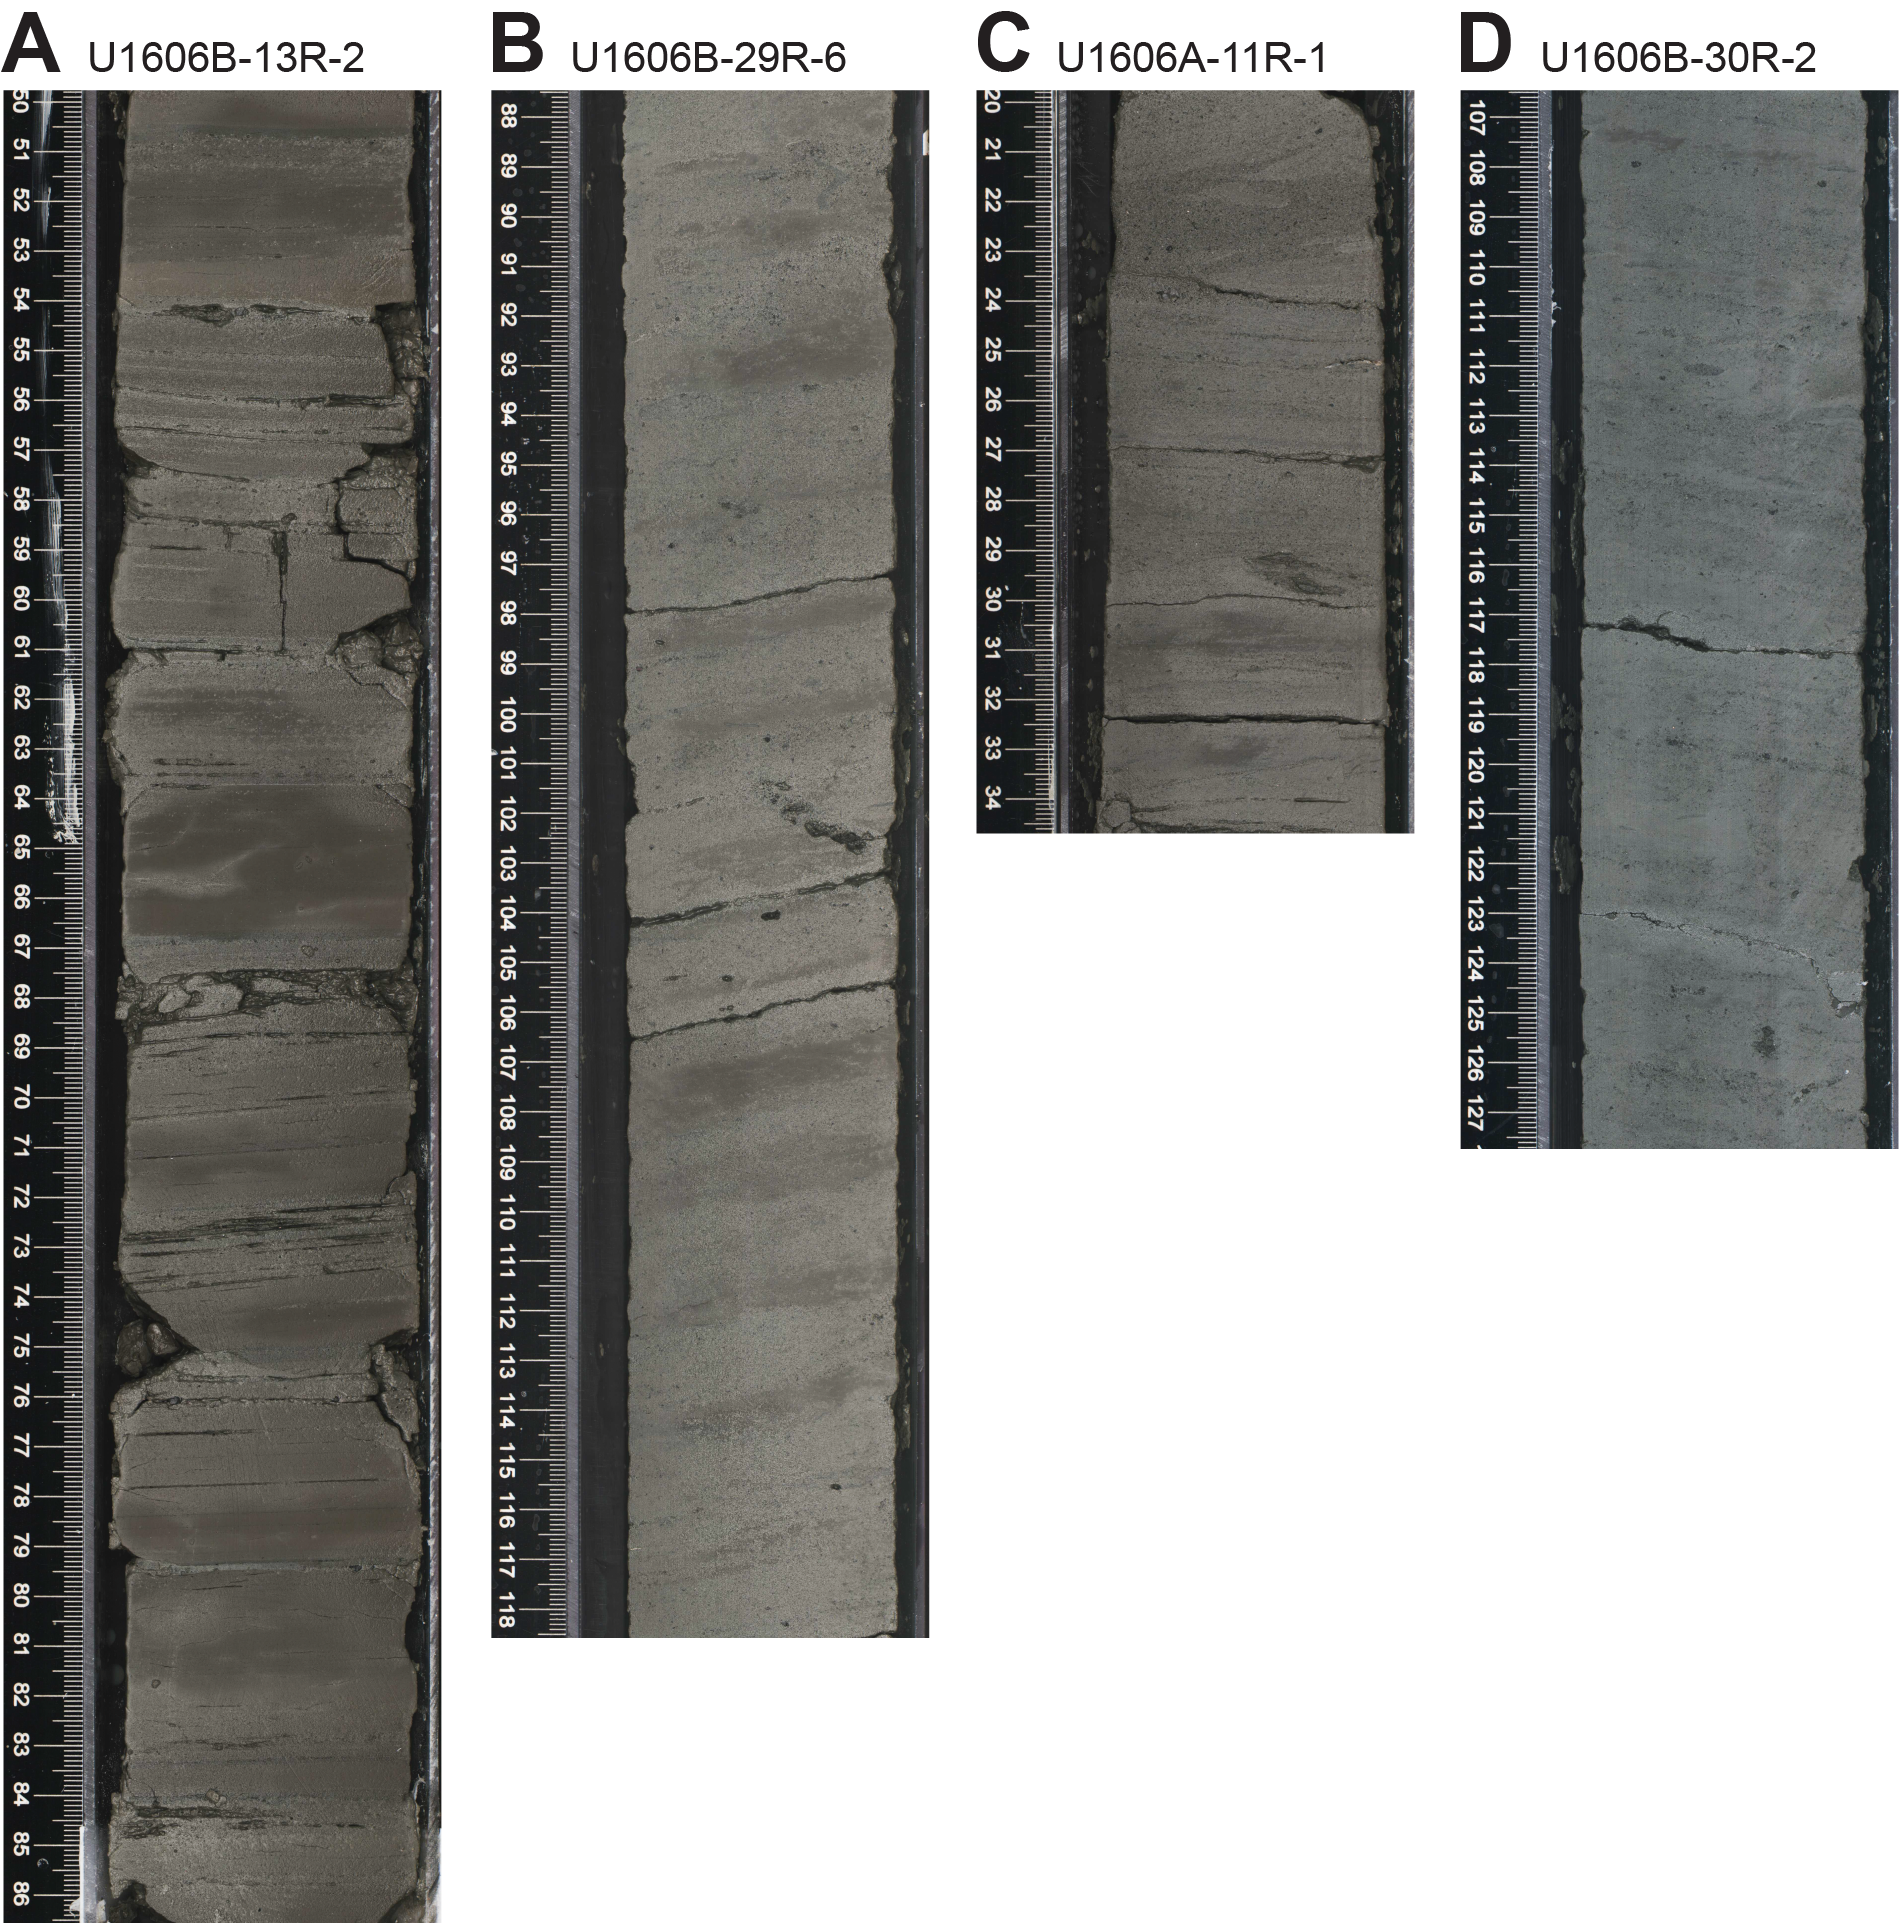
Figure F14. Lithofacies 5.
Lithofacies 5 represents deposition of mud and very fine sand from suspension plumes and weak currents in a glaciomarine depositional environment with deposition of outsized clasts from floating ice. Synsedimentary deformation is likely related to the gravitational instability of rapidly accumulating fine-grained sediments with high pore water pressures.
3.2.6. Lithofacies 6: muddy coarse sand, diamicton, and intraclast conglomerate
Lithofacies 6 consists of gray coarse muddy sand with decimeter-scale laminated mud interbeds, intraclast conglomerate, and sandy diamicton (Figure F15), which sometimes show synsedimentary deformation features. Bed thickness is typically less than 1 m. Shell fragments are present in the sandy matrix of this facies. Bioturbation is not typically observed in this lithofacies. Massive to crudely stratified muddy sand beds are poorly sorted with a sand fraction ranging in grain size from fine to coarse and a >2 mm clast percentage below 1%. Intervals with a clast percentage higher than 5% are classified as sandy diamicton. Grayish brown mud interbeds are thinly laminated and show convolute bedding over a decimeter to meter scale (Figure F15A). The sandy intraclast conglomerates consist of coarse muddy sands with isolated floating clasts of grayish brown laminated mudstone.
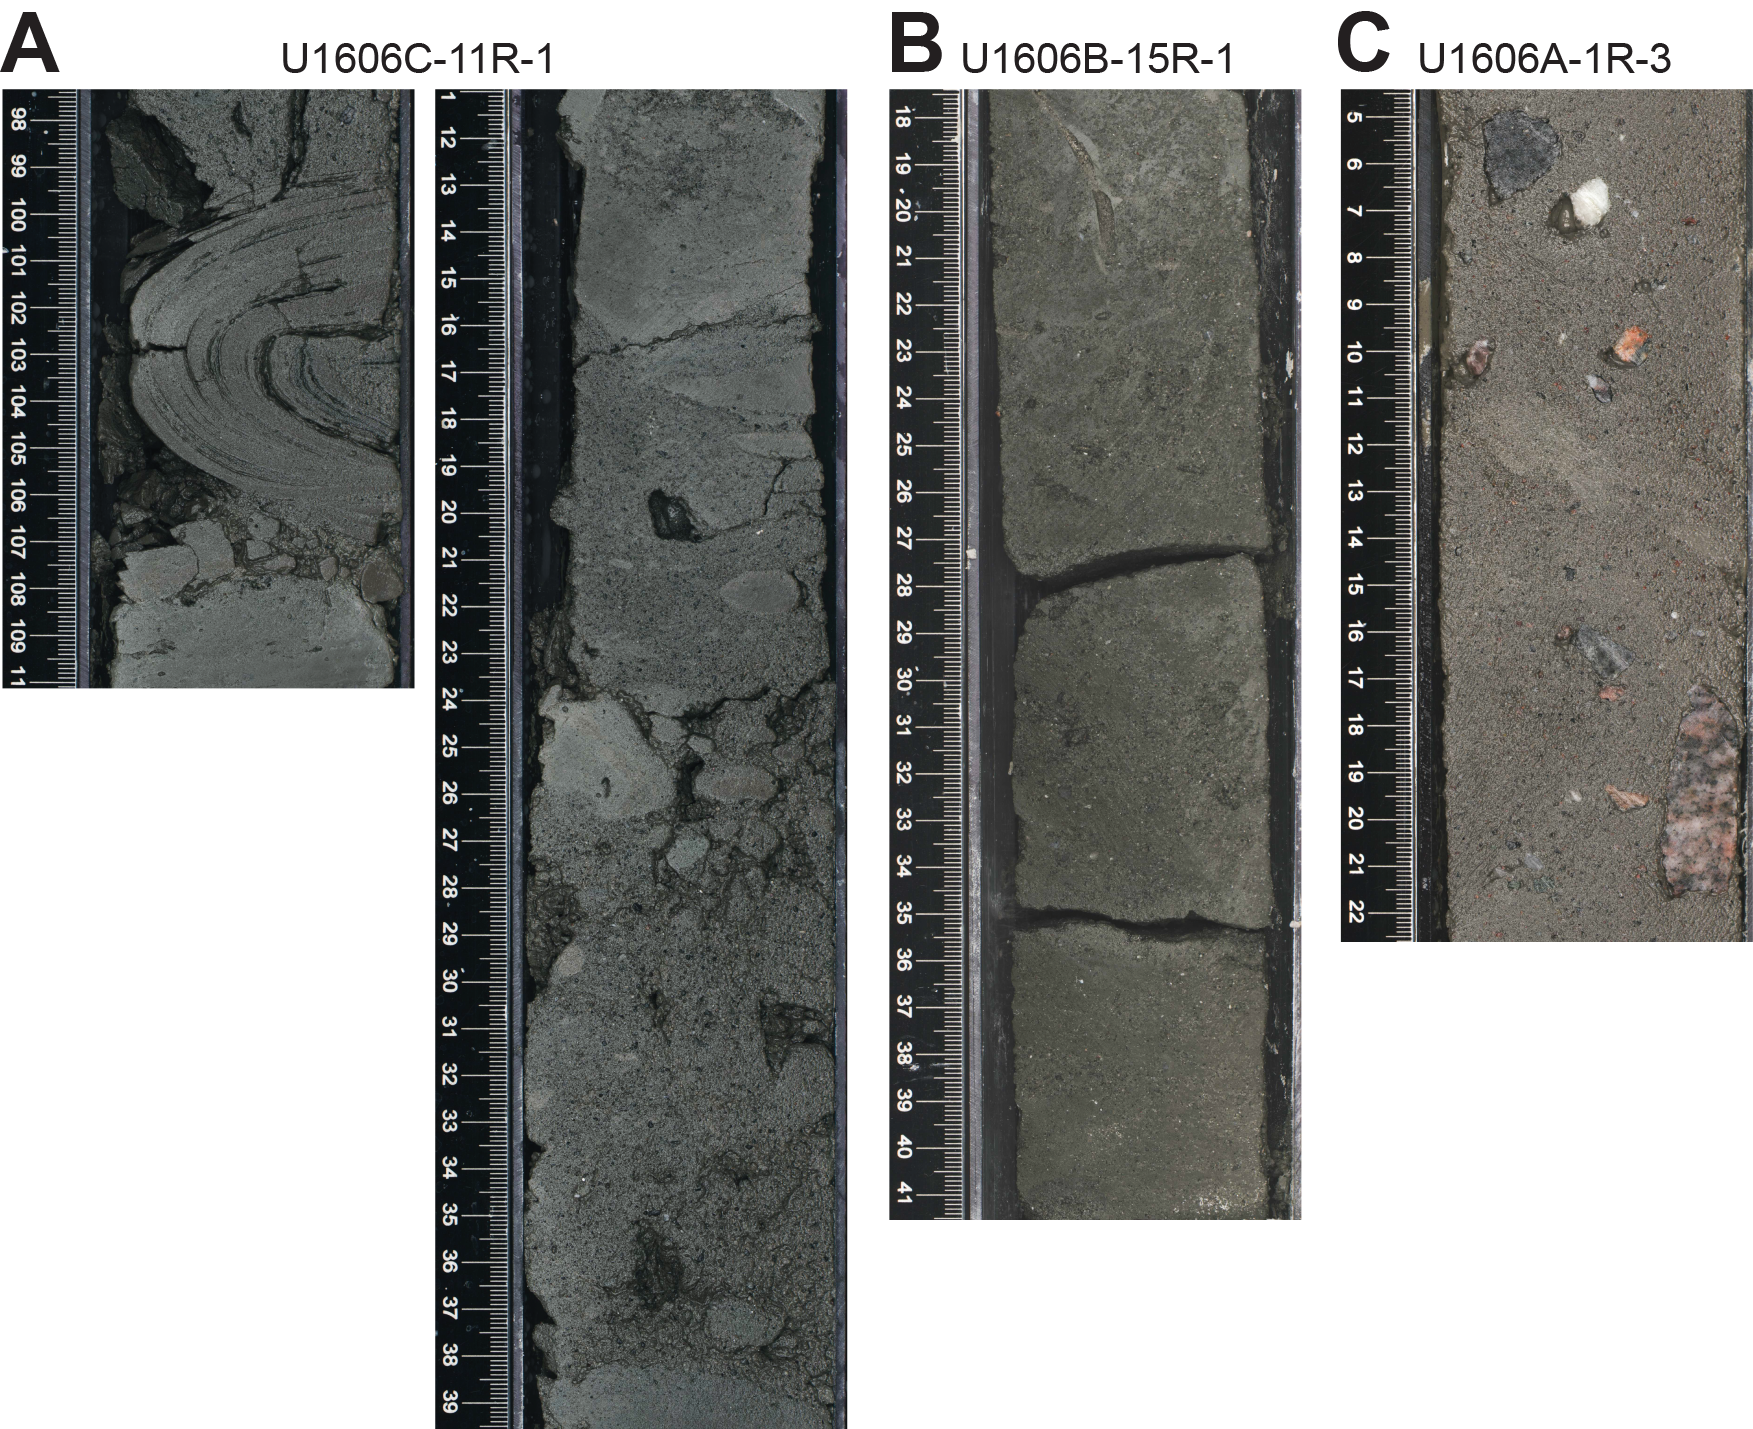
Figure F15. Lithofacies 6.
Lithofacies 6 represents deposition in an ice-proximal glaciomarine environment. Poorly sorted coarse-grained muddy sand and diamictons can be indicative of melt out from ice at the grounding line. The interbedding between laminated mud and poorly sorted coarse muddy sands is indicative of abrupt changes in the sediment transport capacity of meltwater conduits. Convolute bedding results from slope instability and gravity flow of rapidly accumulating sediment.
3.3. Diagenesis
Diagenetic features at Site U1606 include carbonate concretions and cemented intervals, along with pseudomorphs after ikaite. Relative to other sites, carbonate concretions are rare, with only five occurrences noted, spanning Lithostratigraphic Unit II through Subunit IVA. Many occur as cemented clasts in sections dominated by drilling disturbance, making interpretation difficult. Where intact, the boundaries of the concretions are diffuse or gradational over a centimeter. Carbonate-cemented intervals (~2–20 cm thick) are present in intervals of sandy mud and muddy sand in Units III and IV. These are fully lithified due to calcium carbonate cement infilling primary intergranular pore space. The lateral extents of these features span beyond the core width. As such, they could either be large concretions or cemented horizons that are laterally extensive. Pseudomorphs after ikaite (CaCO3 · 6H2O), known as glendonites, occur in Holes U1606B and U1606C between 173 and 332 m CSF-A. The pseudomorphs occur as poorly indurated, diamond- to blade-shaped voids 2–3 cm in length and contain coarse (1–2 mm) orange crystals of calcium carbonate.
3.4. Smear slide and thin section analysis
A total of 34 smear slides were taken during core description to ascertain the characteristics and composition of the fine sediment fraction in different lithologies and lithostratigraphic units of Site U1606. The fine fraction is composed primarily of terrigenous components that include clay minerals (clay fraction) and quartz, mica, and feldspar (abundant to dominant in the silt and sand fractions). Chlorite is present in rare to common amounts, with the highest concentrations occurring in green and greenish gray lithologies. Biogenic components are more prominent in the fine fraction than at other sites, consistently making up ~40% of the fine fraction in Lithostratigraphic Unit I and 2%–10% of the fine fraction in Units II–IV. The biogenic material is biosiliceous and consists mainly of diatoms with rare sponge spicules and trace amounts of radiolaria. Three thin sections (TS23–TS25) were cut from semilithified and cemented sand intervals in Hole U1606A to examine the composition of framework grains. In all cases, framework grains are dominated by angular clasts of quartz and feldspar. Some difficulties were encountered in the making of TS23 (Sample 17R-4, 37–41 cm), which led to the removal of most of the matrix. TS24 (Sample 14R-1, 21–25 cm) and TS25 (Sample 19R-1, 74–78 cm) are heavily calcite cemented, with equant calcite cement filling intergranular pore space. TS24 contains disarticulated bivalve shells. TS51 (Sample 400-U1606B-10R-1, 0–6 cm) was cut from an outsized clast interpreted as a dropstone. It consists of coarse, interlocking grains of quartz and feldspar minerals. The rock is cut by thin fractures that have been filled with a fine-grained mineral with a bright birefringence.
3.5. Clay and bulk mineralogy results
Bulk (6 samples) and clay (10 samples) XRD analyses were performed on samples from Hole U1606A to determine the mineral compositions in Lithostratigraphic Unit II and Subunits IIIA and IIIB. A qualitative and ratio-based summary of XRD results is given in Table T3 for bulk mineralogical composition and in Table T4 for clay compositions.
The bulk mineralogical composition of Hole U1606A is dominated by quartz, feldspar, and plagioclase. Dolomite, pyrite, illite, and kaolinite are also present throughout Units I–III in abundances characterized as rare to few. The chlorite/illite ratio shows higher values and increases through the lower part of Unit II into the upper part of Subunit IIIA compared to remaining intervals of Hole U1606A, signaling a relative increase in the abundance of chlorite at the Unit II to Subunit IIIA transition.
3.6. Preliminary depositional interpretation
Site U1606 recovered a sequence of (tentatively) Pleistocene, Pliocene, and Miocene (?) (see Biostratigraphy) sediments from the shelf offshore northwest Greenland. The thin muddy succession recovered at the top of Holes U1606A and U1606B (Lithostratigraphic Unit I) records Holocene deposition. Although poorly recovered, Unit II suggests deposition of very coarse-grained (cobble and larger) glacigenic sediment. Unit III consists of deposits not recovered at other sites during this expedition. The combination of laminated mud, sandy diamicton, intraclast conglomerate, and soft-sediment deformation alternating at a decimeter scale suggests a glaciomarine environment, potentially in a proximal position relative to the grounding line. The oldest unit (IV), which makes up the lower half of Hole U1606B, contains alternating packages of bioturbated mud with dispersed sand, sandy mud, and muddy sand with dispersed clasts, indicating a mixed-energy shelf setting with periods of hemipelagic deposition punctuated by glacially influenced processes (e.g., ice rafting) and bottom current reworking.
4. Biostratigraphy
4.1. Biostratigraphy and paleoenvironment
Site U1606 is situated on the middle part of the northwest Greenland shelf in ~655 m of water. The aim was to core through the inferred Pleistocene glacial sedimentary cover, which was predicted to correspond to the earliest shelf-based glaciations in northwest Greenland, into probable Pliocene-age contourite sediments (Seismic Megaunit B). This site complements Site U1608, which has a thinner Pleistocene cover, and captures similar sequences within the underlying contourite drift. The records will be used to (1) test the primary hypotheses that glacial expansion in northern Greenland is linked with intensification of Northern Hemisphere glaciation (3.3–2.8 Ma) and (2) constrain Pliocene climate variability and test whether high Arctic warmth of the early mid-Pliocene is associated with enhanced ocean heat transport.
Four holes were cored at Site U1606. Holes U1606B–U1606D were drilled more than 2 weeks after Hole U1606A, which was aborted prematurely because of an approaching iceberg. Holes U1606A and U1606B were examined for microfossils. Holes U1606C and U1606D were considered copies of Holes U1606A and U1606B and thus were not sampled routinely shipboard for biostratigraphic purposes, except for two test samples for diatom analysis. Subsequent examination of cores from the different holes shows them to have considerable lithostratigraphic differences that might warrant full paleontological study in the future. Core catcher samples and additional split core samples from 15 of the 19 cores of Hole U1606A and 25 of the 39 cores from Hole U1606B were examined for foraminifera, diatoms, dinoflagellate cysts (dinocysts) and other palynomorphs, and marine sedimentary ancient DNA (sedaDNA). Samples from working section halves were taken in the uppermost 1.5 m of soft, soupy mud in Core 400-U1606A-1R to provide Holocene reference assemblages. Mudline samples from Hole U1606A were also examined. Observations of foraminifera from palynomorph and diatom slide preparations were integrated in the overall foraminifera evaluations.
The sandy muds and muddy sands with variable clast contributions that are typical of Hole U1606A contain sparse but reasonably well preserved calcareous microfossils (Figure F16). Where foraminifera appear, only benthic species occur, and these remain as trace to rare occurrences, except in Sample 400-U1606A-11R-CC where they are rare to common in the >63 µm residue. The benthic foraminifera–containing interval from Cores 10R–13R (84.51–112.65 m CSF-A) is consistent with an age older than >700 ka. Diatoms were observed in ~52% of all samples examined, with poor to moderate preservation. The diatom assemblages observed are consistent with Pliocene age and signify Atlantic water influence at Site U1606. The dinocyst assemblages downhole to Sample 10R-CC (84.56 m CSF-A) are indicative of a Pleistocene or younger age. In Holes U1606A and U1606B, reworked late Pliocene dinocysts are present. The assemblages of Hole U1606B are consistent with a Pleistocene to Pliocene age. Palynomorph preparations revealed varying abundances of in situ dinocysts and reworked terrestrial palynomorphs. The observed microfossil assemblages are typical of Arctic environments with subarctic to boreal elements. Other fossil components observed include bivalve mollusk shell fragments, pieces of terrestrial wood and plant, and fragments of an encrusting bryozoan, implying abundant marine life on the Greenland shelf. Figure F17 shows the range of fossil material found at Site U1606.
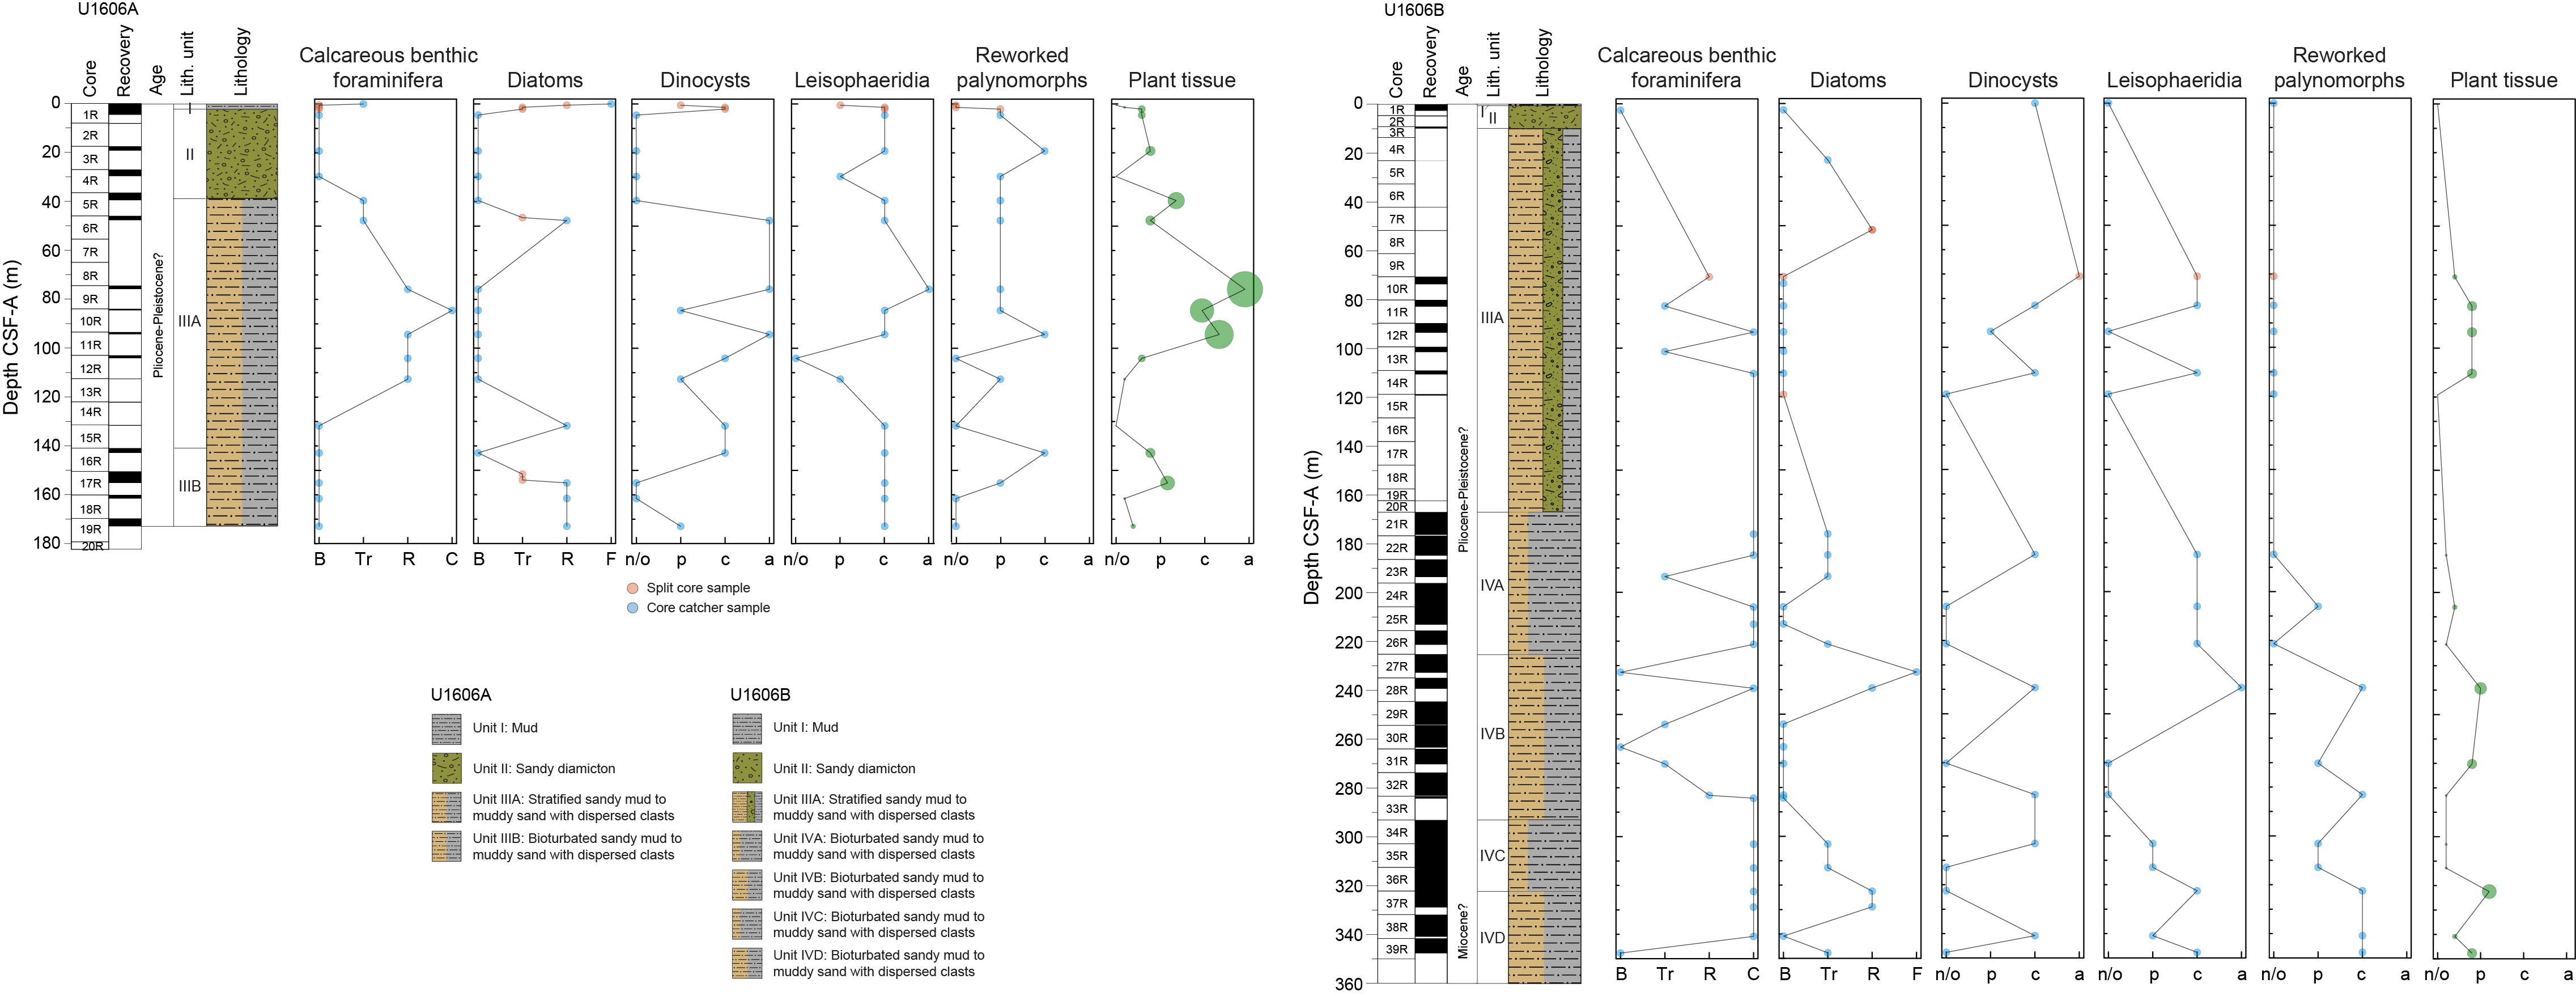
Figure F16. Trends across fossil groups.
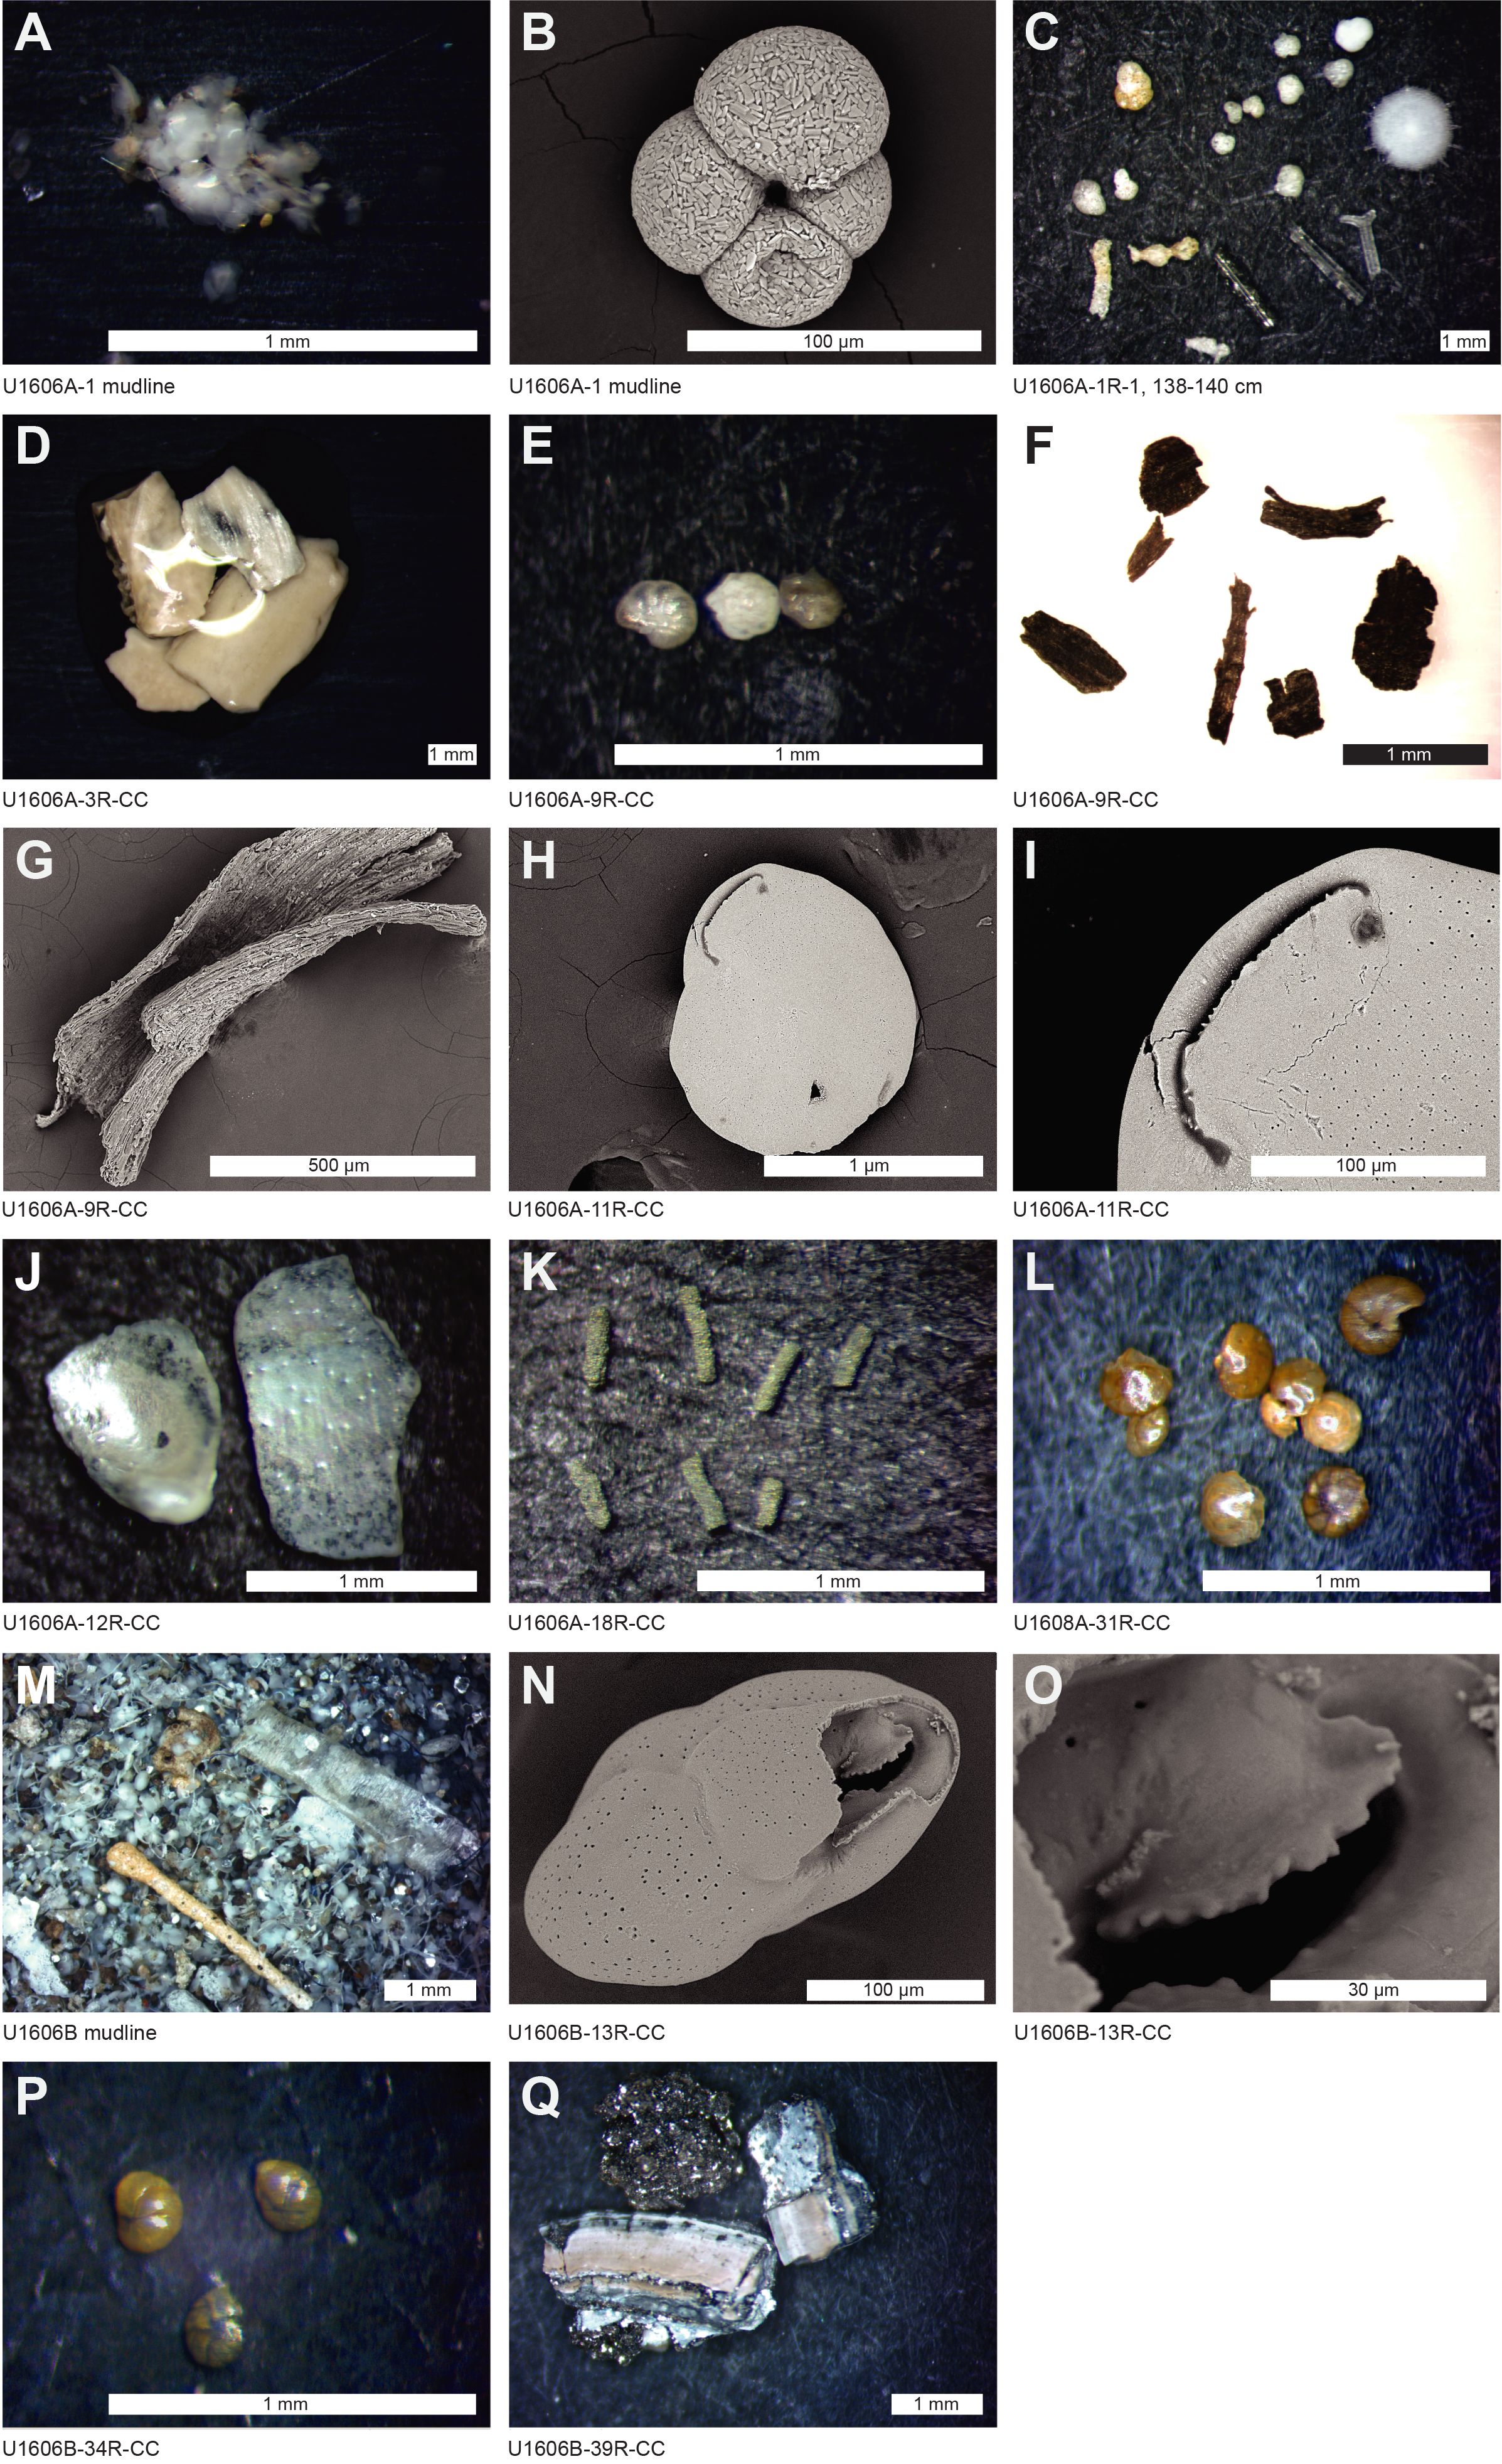
Figure F17. Microfossil material from foraminiferal sand samples.
4.1.1. Foraminifera
The mudline sample of Hole U1606A contains one specimen of Nonionellina labradorica, rare agglutinated foraminifera, and centric diatoms, diatom setae, radiolaria, arthropod mandibles, and plant debris, consistent with the modern, productive interglacial environment (Figure F17A, F17B). Of the processed foraminifera samples, 8 of the 15 core catcher samples from Hole U1606A are devoid of foraminifera, 6 have rare to trace foraminifera, and 1 has a relatively rich assemblage of calcareous benthic foraminifera (Table T5). The >125 µm and 63–125 µm sieved fractions were examined separately, but because of the typically low numbers of foraminifera, observations are combined.
Samples from Hole U1606A contain only benthic foraminifera (Table T5). Samples 1R-1, 51–53 cm, 1R-1, 138–140 cm, and 1R-2, 59–61 cm, from the mud of Lithostratigraphic Unit I (see Lithostratigraphy) contain small agglutinated benthic foraminifera as well as sponge spicules, which are often pyritized, and radiolaria (Figure F17C). Sample 1R-CC falls within the sandy diamicton of Unit II. Only Cores 1R, 4R, 3R, 6R, and 9R provided core catcher samples in the uppermost ~75 m of the hole; other cores contained only washed gravel or had zero recovery. This interval is barren of foraminifera, apart from one large pyritized specimen of Elphidium sp. in Sample 5R-CC and two poorly preserved unidentifiable calcareous forms in Sample 6R-CC. Benthic foraminifera are present again in Samples 9R-CC to 13R-CC from Subunit IIIA. Here, they are calcareous and relatively well preserved, with white to transparent tests and rare to common abundance (Figure F17E). The most commonly observed benthic species are Cassidulina cf. reniforme, Elphidium clavatum, Elphidium spp., and sporadic Buccella sp. Samples 15R-CC to 19R-CC are all barren.
Scanning electron microscope (SEM) work confirmed the presence of Cassidulina teretis by the presence of teeth of its apertural plate, distinguishing it from the younger relative Cassidulina neoteretis in Sample 400-U1606A-10R-CC (84.510 m CSF-A), which implies an age of 700 ka or older (Seidenkrantz, 1995). The presence of a finely serrated apertural plate and large pores in an imaged specimen from Sample 11R-CC (94.34 m CSF-A) confirmed the identity of Cassidulina laevigata, a species with boreal affinities at these depths, (Figure F17H, F17I). In addition to foraminifera, small amounts of highly corroded bivalve mollusk fragments were observed in core catcher samples from Hole U1606A (Cores 3R–13R), sometimes with the original mother of pearl nacre intact (Figure F17D, F17J). Organic debris is common and notable in the additional samples from Core 1R and the core catcher samples of Cores 5R–19R, where large pieces of plant debris occur (Figure F17F). SEM imaging of a piece of plant material reveals the fibrous texture, presumably of some wood stem or grass (Figure F17G). Pyritized worm burrow infills are significant contributors to Sample 18R-CC from Subunit IIB, which is defined by significant bioturbation (Figure F17K).
The foraminifera sand fractions provide an opportunity to observe variability in lithic and diagenetic grains throughout the cored section. Figure F18 presents examples of the lithic and mineral components of core catcher samples. The >63 µm fraction from Sample 400-U1606A-1R-2, 59–61 cm, from the mud of Lithostratigraphic Unit I contains some larger clasts (>500 µm) including quartz, pyrite, and glauconite (Figure F18A). Pyrite is also present in the mudline sample and is common to abundant in Cores 3R–6R. In Subunit IIIA, the mineral sand component is consistently gray in color and reasonably well sorted (Figure F18B), although variable amounts of larger clasts occur (Figure F17C). Grain shapes of the larger clasts (>500 µm) include a large proportion of rounded to subrounded grains (with low sphericity), suggesting some element of fluvial transport or transport via land-fast sea ice. Grain sizes are only periodically greater than 500 µm in the core catcher samples. The fine fraction (125–63 µm) tends to be dominated by fine angular quartz, and this fraction often dominates the bulk sieved (>63 µm) processed samples. High abundances of glauconite and pyrite correlate with samples that are foraminifera barren.
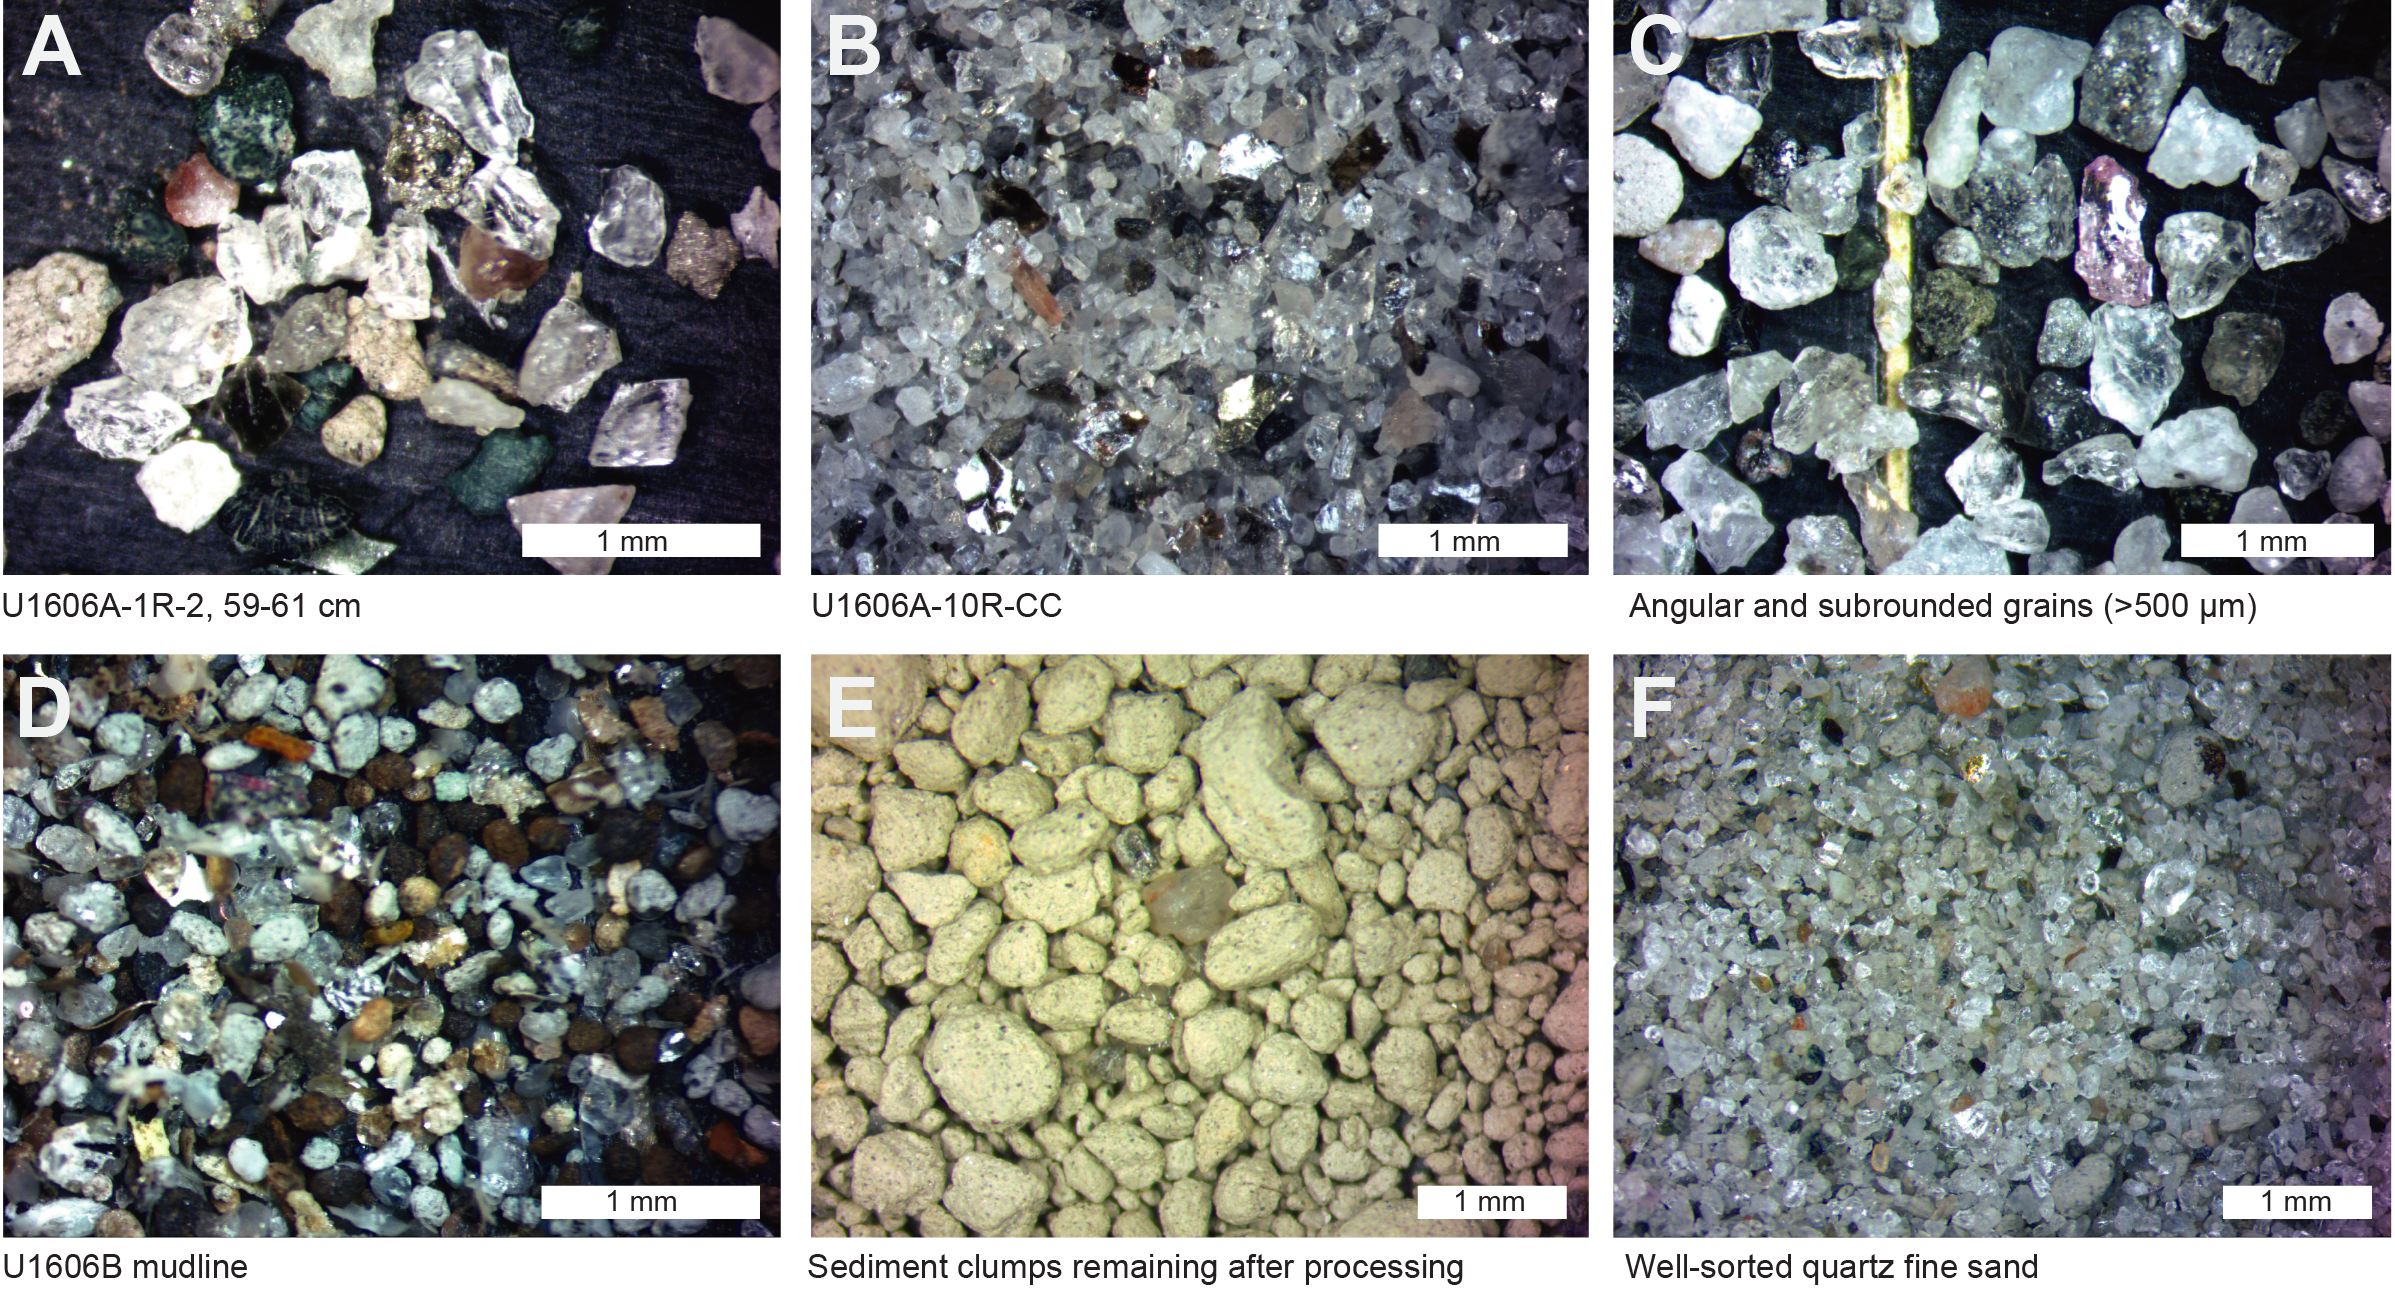
Figure F18. Lithic and mineral components of foraminifera core catcher samples.
Hole U1606B, which was cored 700 m away from Hole U1606A along the site-defining seismic line, had somewhat better recovery than Hole U1606A, providing an opportunity to better characterize the sediments and microfossil assemblages of Site U1606. The mudline of Hole U1606B is similar to Hole U1606A in that it contains abundant diatoms and agglutinated benthic foraminifera, including an intact specimen of the agglutinated genus Hyperammina (Figure F17M). Of the processed foraminifera samples, 4 of the 27 samples from Hole U1606B (25 core catcher samples plus 2 split core samples where no core catcher samples were available) are devoid of foraminifera, 10 have rare to trace foraminifera, and 11 have relatively rich assemblages of calcareous benthic foraminifera (Table T5). Planktonic foraminifera are absent. No samples were obtained from Lithostratigraphic Unit I at Hole U1606B, and the first core catcher sample (1R-CC) falls in the sandy diamicton of Unit II (Figure F16), which is barren of foraminifera. As in Hole U1606A, recovery of Unit II and the uppermost ~60 m of Subunit IIIA (stratified sandy mud to muddy sand with dispersed clasts, diamicton, and intraclast conglomerate) was extremely poor, and most cores were empty. Sample 400-U1606B-5R-CC contains a small amount of muddy sediment that contains poorly preserved and yellow-stained specimens of C. cf. reniforme, Cibicides, and a milliolid (Table T5). Progressing down through Subunit IIIA, the muds and sands feature trace to rare foraminifera (Figure F16) with intervals of relatively higher foraminifera abundance. Notably, foraminifera are common in Sample 12R-CC (Table T5). The benthic species most frequently observed in Subunit IIIA are C. cf. reniforme and Elphidium spp., with some occurrences of C. teretis, C. laevigata, Epistominella spp., and Melonis sp. In Sample 11R-CC, scarce, tiny Epistominella vitrea and Islandiella norcrossi were observed (Table T5). SEM analysis revealed that a co-occurring Cassidulina morphotype, C. cf. reniforme, which has a more lenticular morphology than classic C. reniforme, also has a toothed apertural plate (Figure F17N, F17O).
Within the variably bioturbated sands and muds of Lithostratigraphic Unit IV and its subunits, foraminifera are trace to common, except in Samples 400-U1606B-27R-CC, 30R-CC, and 39R-CC, where they are barren (Table T5). The most frequently observed benthic species are Bucella tenerrima, C. cf. reniforme, C. teretis, E. vitrea, and Islandiella cf. islandica with less frequent occurrences of Cibicides sp., Epistominella spp., and Stainforthia feylingi (Table T5; Figure F17O, F17P). Melonis barleeanus is infrequent below Sample 29R-CC (254.04 m CSF-A), and Bucella sp. becomes more common. This might signify an environmental change, although in general, these assemblages of calcareous benthic foraminifera conform well with previously identified Neogene Arctic shelf assemblages (Feyling-Hanssen, 1976). A single specimen of an important age indicator, Cibicides grossus, was tentatively identified in Sample 22R-CC (184.75 m CSF-A). This species, which is the marker for a late Pliocene biozone defined in the Canadian Arctic Clyde Foreland Formation (Feyling-Hanssen, 1976), had its last occurrence calibrated to 1.8 Ma (Refsnider et al., 2013), although others have suggested an older age of 2.3–2.5 Ma for this event (Eidvin and Nagy, 1999). We use this as an upper age constraint to support a late Pliocene or early Pleistocene age for this horizon within Subunit IVA.
An interesting observation is that from Sample 400-U1606B-21R-CC to the base of the hole, foraminifera are often stained yellow (Figure F17L, F17P). This transition coincides with the transition from Lithostratigraphic Subunit IIIB to Subunit IVA. Preservation is variable amongst the yellow-stained assemblages, which exhibit poor to excellent preservation, have variable amounts of pyrite infilling that tends to accentuate sutures, and are sometimes fragmented. This phenomenon was not seen in Hole U1606A; however, a similar pattern occurs at Site U1608. Slightly yellow foraminifera started appearing in Samples 400-U1608A-23R-CC to 32R-CC (Unit II at Site U1608), with stronger yellow staining seen from Sample 33R-CC to the base of Hole U1608, coincident with Unit III at Site U1608. The source of the yellow color has yet to be determined. Shell and wood fragments are also regular features of Hole U1606B samples, and other biological material appear sporadically in the form of mollusk shell fragments, wood and plant debris, ostracods, and bryozoan fragments (Table T5). Furthermore, the geochemistry profiles show increases of Fe and other chemical species within the yellow foraminifera intervals (see Geochemistry). The sediments are clearly reactive, as shown also by mollusk shells, which are pyritized in places (Figure F17Q).
4.1.2. Diatoms
At Site U1606, 54 samples from core catcher and section halves were processed and investigated for diatoms. Among them, 28 samples contain diatoms (~52% of all samples; 12 from Hole U1606A, 15 from Hole U1606B, and 1 from Hole U1606D) with poor to moderate preservation (Tables T6, T7; Figure F16). Generally, the diatom abundances range from trace to rare, except mudline Sample 400-U1606A-1R-1, 0 cm, which contains few diatoms.
Samples 400-U1606A-1R-1, 0 cm (mudline), and 1R-1, 52 cm, contain diatoms with preservation ranging from poor to moderate. The assemblage is dominantly composed of Actinocyclus curvatulus, Asteromphalus robustus, Chaetoceros spp. resting spore, Coscinodiscus oculus-iridis, Rhizosolenia hebetata f. hebetata, Rhizosolenia hebetata f. semispina, Shionodiscus trifultus, Thalassiosira antarctica var. borealis resting spores, and Thalassiothrix longissima (Table T6). This diatom assemblage closely resembles those found in the mudline samples from Sites U1603 and U1604, pointing to a characteristic Pleistocene Arctic environment. Diatoms are nearly barren in Samples 1R-1, 139 cm, to 5R-CC, except trace amounts of A. curvatulus in Samples 1R-1, 139 cm, and 1R-2, 60 cm (Table T6). Trace to rare amounts of radiolarians, silicoflagellates, and sponge spicules were observed in the samples containing diatoms (Table T6).
The diatom assemblages observed in Samples 400-U1606A-6R-1, 56 cm, to 19R-CC differ from those in the uppermost samples from Hole U1606A (Table T6). These assemblages mainly consist of trace to common amounts of Actinoptychus senarius, Chaetoceros spp. resting spore, Fossulaphycus arcticus, Fragilariopsis cylindrus, Fragilariopsis oceanica, Fragilariopsis reginae-jahniae, Paralia sulcata, Porosira glacialis, Stephanopyxis turris, Thalassionema nitzschioides, and T. antarctica var. borealis resting spores. The presence of F. arcticus, F. cylindrus, F. oceanica, F. reginae-jahniae, P. glacialis, and T. antarctica var. borealis resting spores are recognized as indicators of contemporary Arctic sea ice environments (e.g., Koç Karpuz and Schrader, 1990; Oksman et al. 2019). T. nitzschioides were observed with few to common amounts in Samples 6R-CC, 15R-CC, 17R-CC, 18R-CC, and 19R-CC. This species indicates temperate Atlantic water in the modern North Atlantic Ocean (e.g., Koç Karpuz and Schrader, 1990; Oksman et al., 2019). Overall, this diatom assemblage may imply a warmer water environment under the influence of Atlantic water with seasonal sea ice. In addition, trace to common amounts of the neritic diatom species Melosira sol and P. sulcata, seen in Samples 18R-CC and 19R-CC, suggest a shallow shelf environment.
In Holes U1606B and U1606D, diatoms were observed in 16 of 32 samples (400-U1606B-5R-CC to 39R-CC and 400-U1606D-13R-1, 15 cm) (Table T7). The diatom assemblage is akin to the one noted in the lower portion of Hole U1606A (131.73–172.87 m CSF-A) but displays a greater diversity of genera and species. The assemblage is also characterized by trace to common amounts of sea ice diatoms, neritic species, and the Atlantic water indicator T. nitzschioides. The possible freshwater diatoms Aulacoseira spp., Cyclotella spp., and Eunotia spp. also occur in this assemblage and suggest a shallow and neritic environment influenced by seasonal sea ice and Atlantic water. Trace amounts of biostratigraphic marker Proboscia barboi were observed in Samples 400-U1606A-17R-CC (155.13 m CSF-A), 19R-CC (172.87 m CSF-A), and 400-U1606B-5R-CC (23.1 m CSF-A). Based on the diatom biostratigraphy established at Ocean Drilling Program (ODP) Site 907 in the Icelandic Plateau, this species has an age range from late Miocene to early Pliocene (Koç and Scherer, 1996). It suggests that the intervals above 172. 87 m CSF-A in Hole U1606A are no older than 3.31–3.33 Ma and those below 23.1 m CSF-A in Hole U1606B are constrained in the late Miocene to early Pliocene. Another possible biostratigraphic marker, Thalassiosira nidulus, was sporadically observed in Samples 400-U1606A-6R-CC (47.69 m CSF-A) to 18R-CC (161.525 m CSF-A) and Samples 400-U1606B-8R-1, 5 cm (51.65 m CSF-A), to 37R-CC (328.82 m CSF-A). Considering the diatom biostratigraphy established in the North Atlantic (ODP Leg 151 Site 947; Koç and Scherer, 1996), the first occurrence (FO) of T. nidulus is dated at 4.58 Ma (updated to the geomagnetic polarity timescale of Ogg [2020]) and implies that the corresponding intervals do not predate 4.58 Ma. Trace amounts of Thalassiosira grunowii were observed in Sample 400-U1606A-15R-CC (Figure F19). This species is dated to the middle to late Miocene in the North Atlantic (Koç and Scherer, 1996). However, it is noteworthy that T. grunowii was also observed in a sample with a possible Pliocene age at Site 646B (ODP Leg 105) in the Labrador Sea, off the southwestern coast of Greenland (Monjanel and Baldauf, 1989). This hints at a potential alternative age assignment, potentially influenced by geographic differences between the North Atlantic and the Labrador Sea. The age discrepancy underscores the need for further investigation into the stratigraphic range of T. grunowii in the North Atlantic.
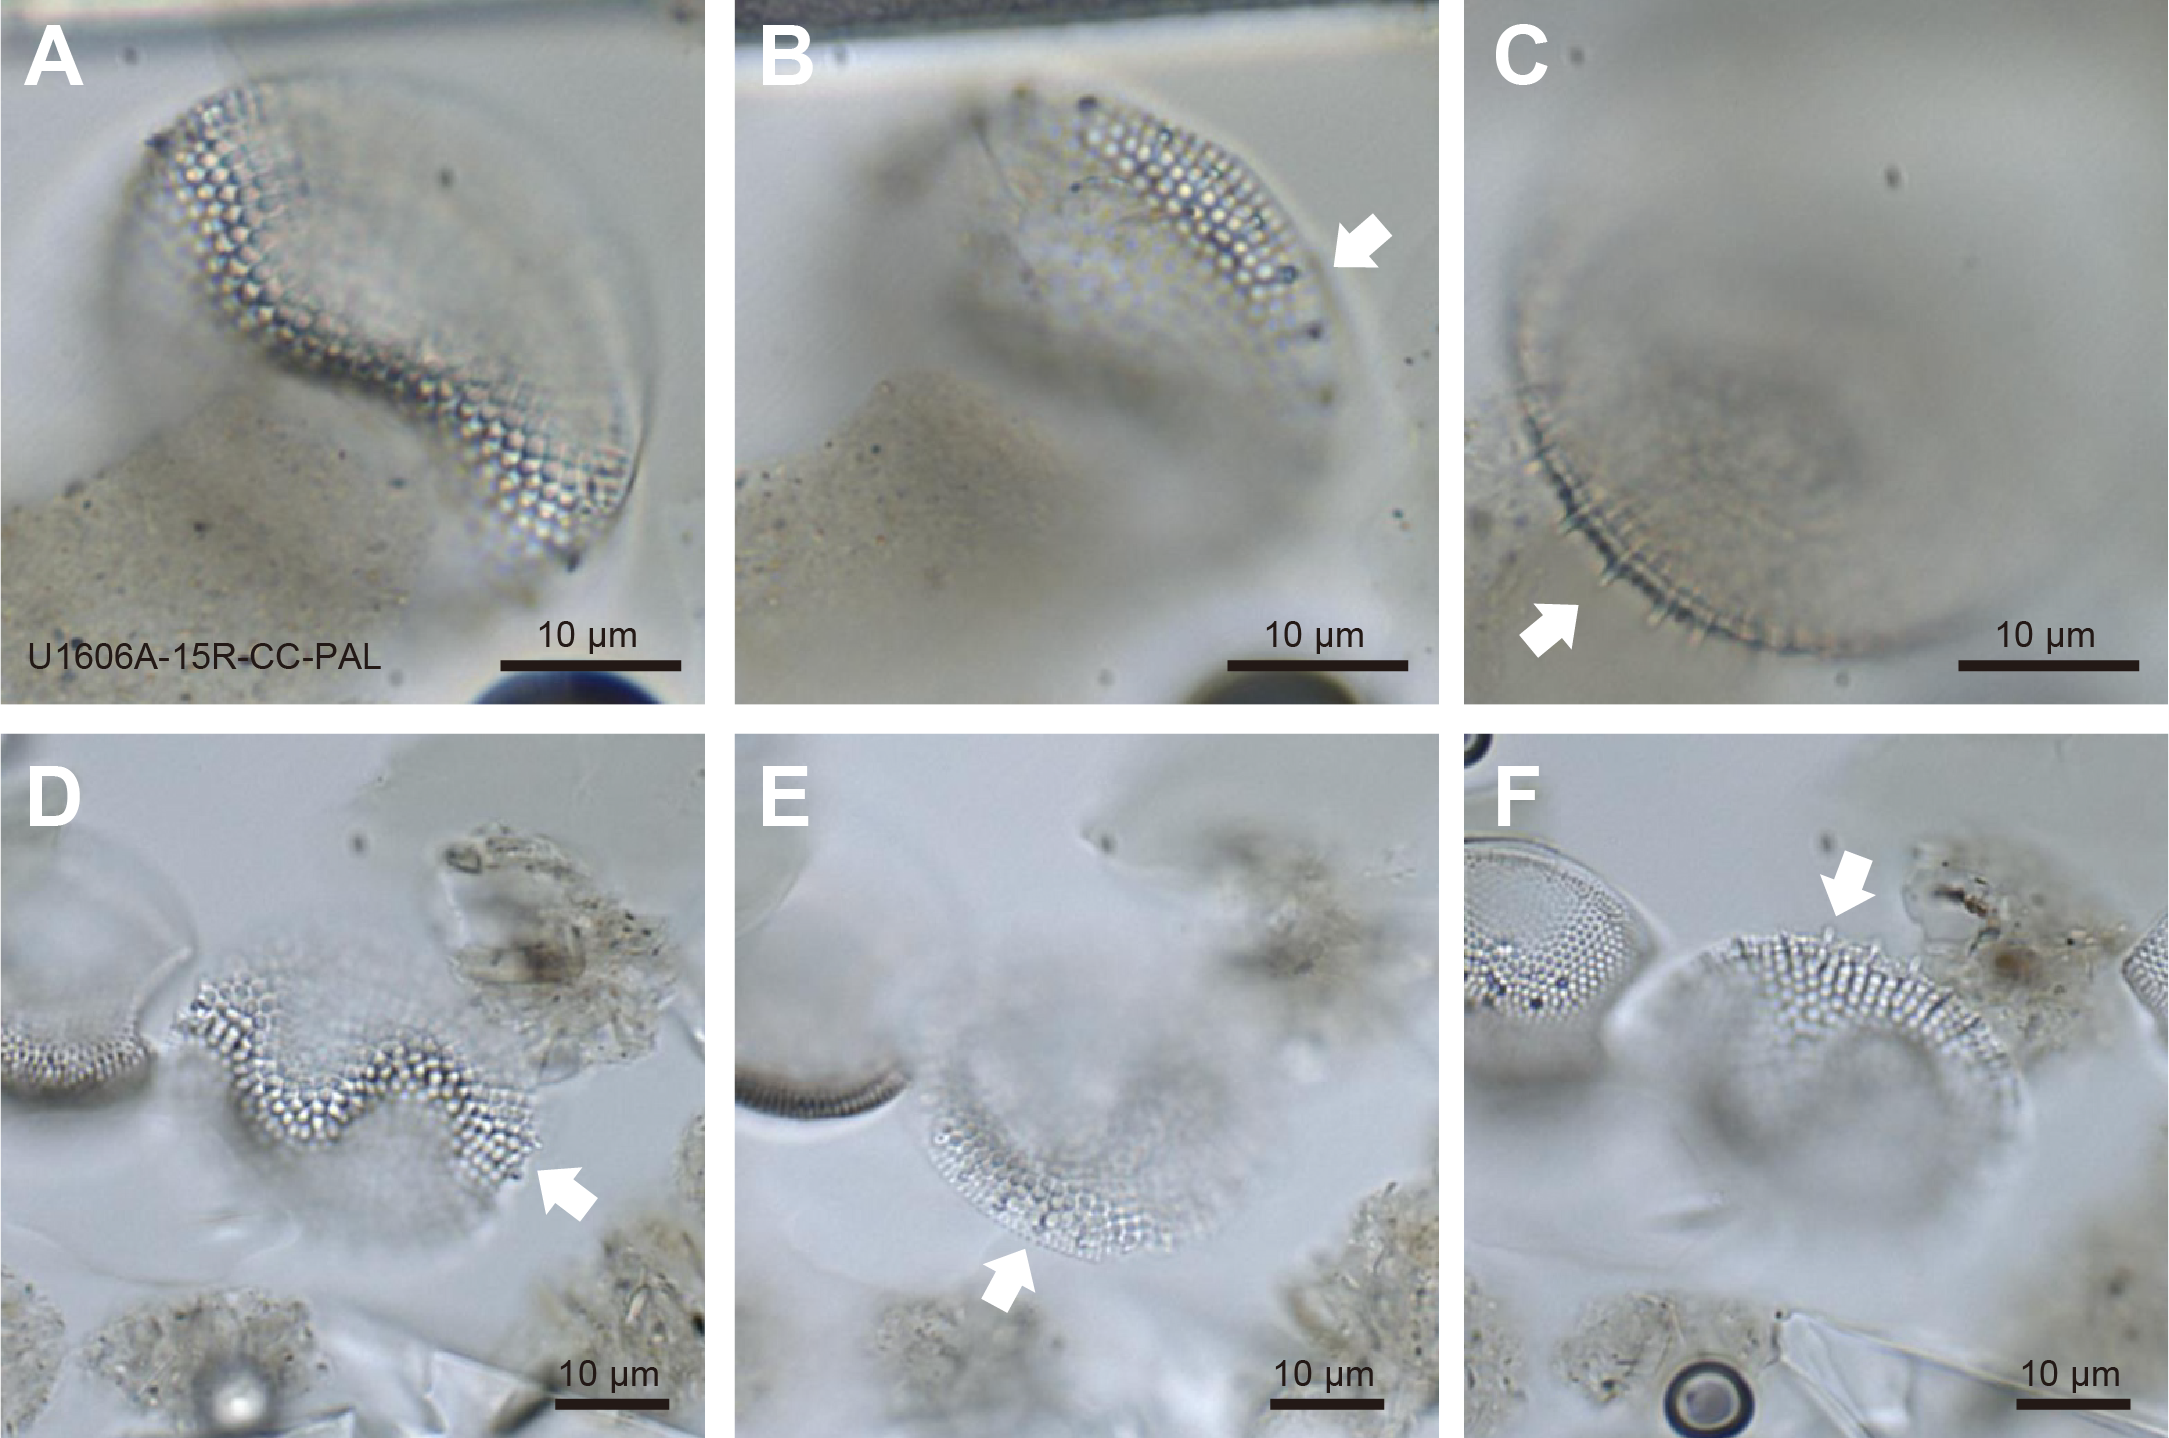
Figure F19. Thalassiosira grunowii.
4.1.3. Palynology
In total, 15 core catcher samples and 3 additional samples from Hole U1606A and 16 core catcher samples from Hole U1606B from targeted intervals were processed following the procedure described in Biostratigraphy in the Expedition 400 methods chapter (Knutz et al., 2025a).
Overall, palynomorphs and notably dinocysts are commonly present. Occurrences of palynofacies categories and palynomorphs for all samples from Site U1606 are summarized in Tables T8 and T9 and Figure F16.
All dinocyst species observed in the analyzed material are consistent with a Pleistocene to Pliocene age. Preservation of in situ dinocysts is good. In the two discrete samples taken from muddy Section 400-U1606A-1R-1, various dinocysts are present that likely represent Holocene assemblages. A poorly preserved Spiniferites spp. (Figure F20A) is present in Sample 1R-2, 59–60 cm. In Sample 1R-1, 138–139 cm, part of a transparent dinocyst is present (Figure F20B). These most likely autotrophic transparent cysts are typical of open ocean, warmer conditions that represent an interglacial period, like the modern environment. In Holocene and Pleistocene sediments from Sites U1603 and U1604, these transparent cysts were not recorded. The bad preservation of these cysts at Site U1606 may indicate that their absence at Sites U1603 and U1604 is a result of selective preservation (e.g., Zonneveld et al., 2008). Furthermore, common Islandinidium spp. (Figure F20C) are recorded in Sample 400-U1606A-1R-2, 59–60 cm. Because of high abundances of diatoms within these samples, the palynomorphs were diluted. Shore-based preparation of these samples, using hydrofluoric acid, will provide useful insight into the dinocyst assemblages in the Holocene muds of Site U1606. Overall in Hole U1606A, dinocyst species belonging to the genus Brigantedinium spp. are present in 10 out of 18 samples throughout the studied interval. This taxon is most abundant in Sample 9R-CC. Other species of dinocyst include Echinidinium delicatum (Figure F20D) and Echinidinium granulatum (Figure F20E) in Sample 10R-CC. These dinocysts were recorded in Hole U1606A in samples downhole to Sample 10R-CC (84.56 m CSF-A) and in Hole U1606B in samples downhole to Sample 14R-CC (110.44 m CSF-A). Other dinocysts recorded in the samples from Hole U1606A include Lejeunecysta spp. (Figure F20F) in Samples 3R-CC, 6R-CC, and 11R-CC. Lejeunecysta spp. is also present in Sample 400-U1606B-22R-CC. Furthermore, the dinocyst Selenopemphix dionaeacysta (Figure F20G) is present in samples in both Holes U1606A and U1606B. In Hole U1606A, this cyst was recorded in Samples 10R-CC and 12R-CC. In Hole U1606B, which reached a greater depth than Hole U1606A, this species was recorded in Samples 400-U1606B-10R-1, 25–26 cm, and 11R-CC, and it is common in both samples. In the eastern North Atlantic, S. dionaeacysta ranges 3.42–2.69 Ma (De Schepper and Head, 2009).

Figure F20. Palynomorphs.
Other observations from the palynomorph preparations include high abundances of terrestrial material in Holes U1606A and U1606B. In Hole U1606A, terrestrial reworking is present in most samples but is especially abundant between 75.87 and 94.39 m CSF-A (Samples 9R-CC to 11R-CC). In Hole U1606B, two intervals with terrestrial reworking are present (Samples 28R-CC and 36R-CC). In Hole U1606A at 47.74 m CSF-A, an algae-like unidentified palynomorph with typical dots is common (Figure F20H). This type of palynomorph is also common at Site U1608.
Pollen and spores (Figure F20I) are part of the assemblage throughout the entire studied interval in varying abundances. Because it is hard to distinguish reworked and in situ pollen and spores, additional analyses are required to further constrain their origin. Additionally, fungal remains (Figure F20J) are present in Hole U1606A (Sample 13R-CC) and Hole U1606B (Sample 11R-CC). Unidentified, fungal-like palynomorphs (Figure F20K, F20L) are common in Hole U1606B in Sample 12R-CC.
4.1.4. Marine sedimentary ancient DNA
Aside from the mudline sample (~10 g), one sample was taken on the catwalk (400-U1606B-11R-1; 81.45–81.5 m CSF-A) and processed following the whole-round core interval sampling procedure (see Biostratigraphy in the Expedition 400 methods chapter [Knutz et al., 2025a]). The perfluorodecalin (PFD) tracer was confirmed in the scraped-off surface of the sediment of this sample (trace amount), and the interstitial water (IW) sample from 81.5–81.6 m CSF-A (0.803 ppb) was taken adjacently, whereas PFD was absent from the inner part of the sample, suggesting no drilling fluid intrusion during rotary coring.
4.1.5. Biochronology
Using an integrated micropaleontological approach, we can provide broad biostratigraphic constraints to explore the age progression at Site U1606 (Table T10; Figure F21). The focus is on Hole U1606B, which is the deepest hole cored at this site, with some constraints from Hole U1606A from diatoms. The occurrence of C. teretis in Sample 400-U1606B-10R-CC implies that this sample and the section below are older than 0.7 Ma (Seidenkrantz, 1995). Another important age indicator is C. grossus. Its tentative occurrence in Sample 22R-CC (184.75 m CSF-A) provides an upper age constraint, suggesting this sample is older than 1.8 Ma, thus late Pliocene or early Pleistocene (Refsnider et al., 2013). The occurrence of P. barboi (marine diatom) in Samples 400-U1606A-17R-CC, 19R-CC, and 400-U1606B-5R-CC suggests a potential age range spanning 3.31–3.33 to 8.59–9.57 Ma (Table T10; Figure F21) (Koç and Scherer, 1996). Additionally, the sporadic occurrence of T. nidulus (marine diatom) in the lowermost samples from Holes U1606A and U1606B implies that the entire site is no older than 4.58 Ma, based on the North Atlantic calibration of T. nidulus FO (Table T10; Figure F21) (Koç and Scherer, 1996).
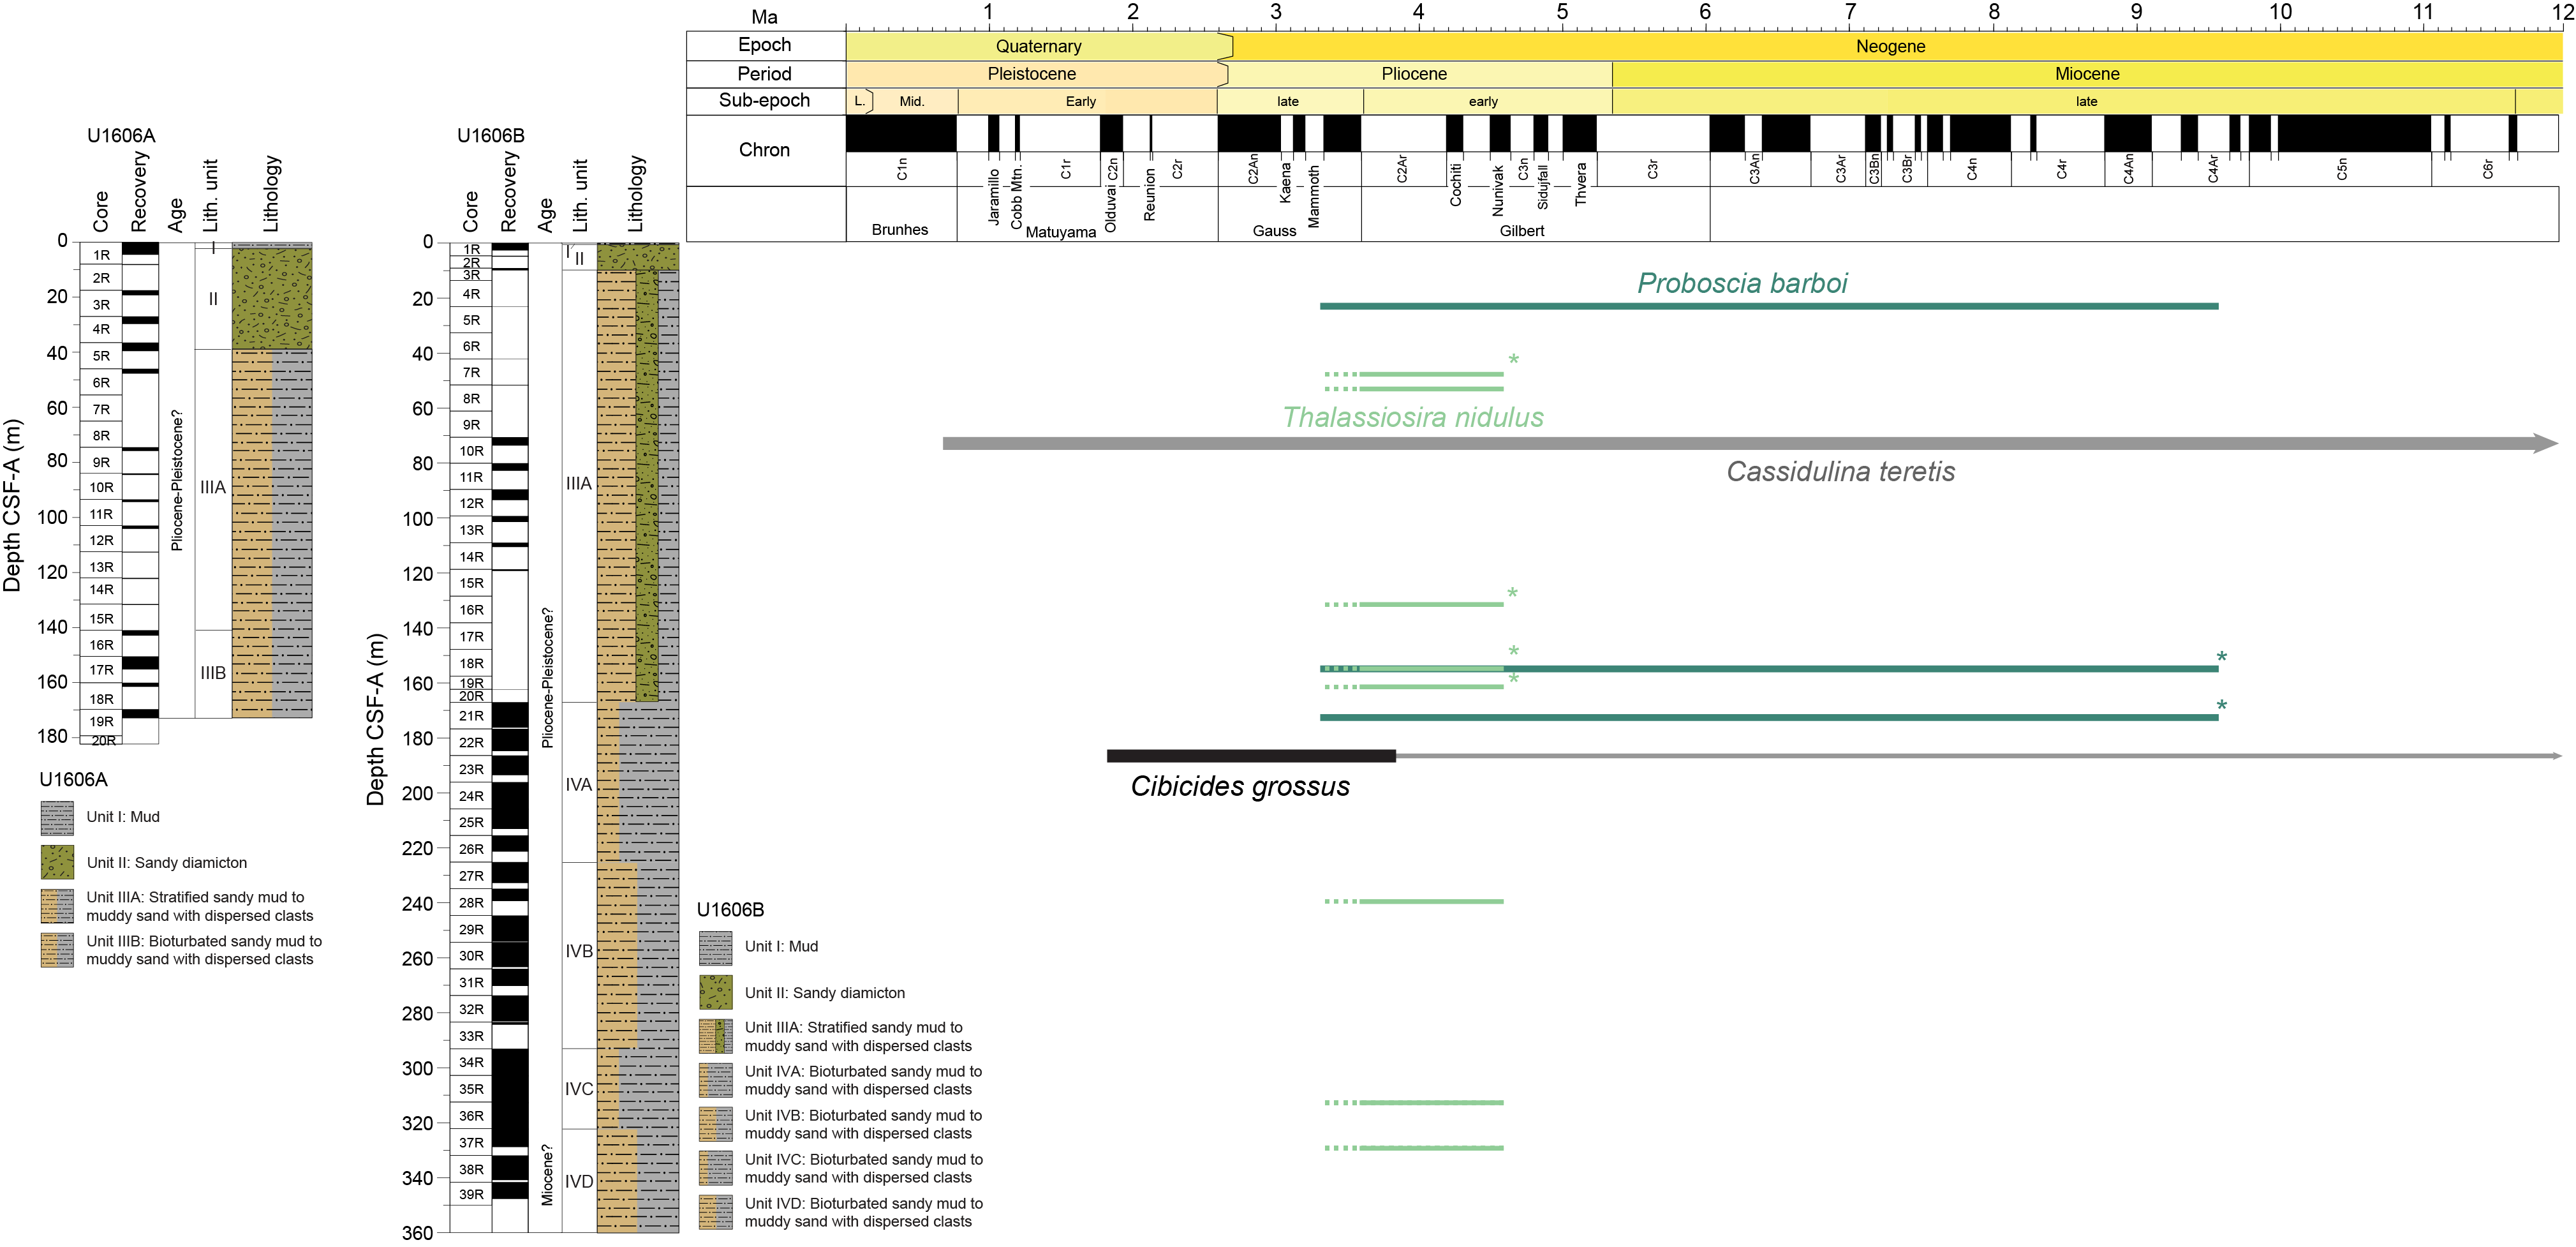
Figure F21. Chronostratigraphic constraints.
5. Paleomagnetism
Pass-through paleomagnetic measurements from Site U1606 were performed using the superconducting rock magnetometer (SRM) to investigate the remanent magnetization on a total of 182 archive section halves. Measurements were not made on core catcher sections or those that were heavily disturbed. All measurements on archive section halves were made at 2 cm intervals up to a peak alternating field (AF) demagnetization of 20 mT.
A total of 144 discrete cube samples were taken from working section halves. Generally, we collected one sample per core section, avoiding visually disturbed intervals. Samples were collected using the parallel saw. We measured 123 specimens on the SRM, following stepwise demagnetization up to 40 mT. The remaining specimens were preserved for further study.
5.1. Discrete sample measurements
A total of 144 discrete cube samples were collected from working section halves from Site U1606: 20 from Hole U1606A, 103 from Hole U1606B, and 21 from Hole U1606C. No discrete samples were collected from Hole U1606D. Of the specimens, 123 were measured stepwise up to a peak AF demagnetization of 40 mT. Demagnetization behavior is shown in Zijderveld diagrams (Zijderveld, 1967) in Figure F22.
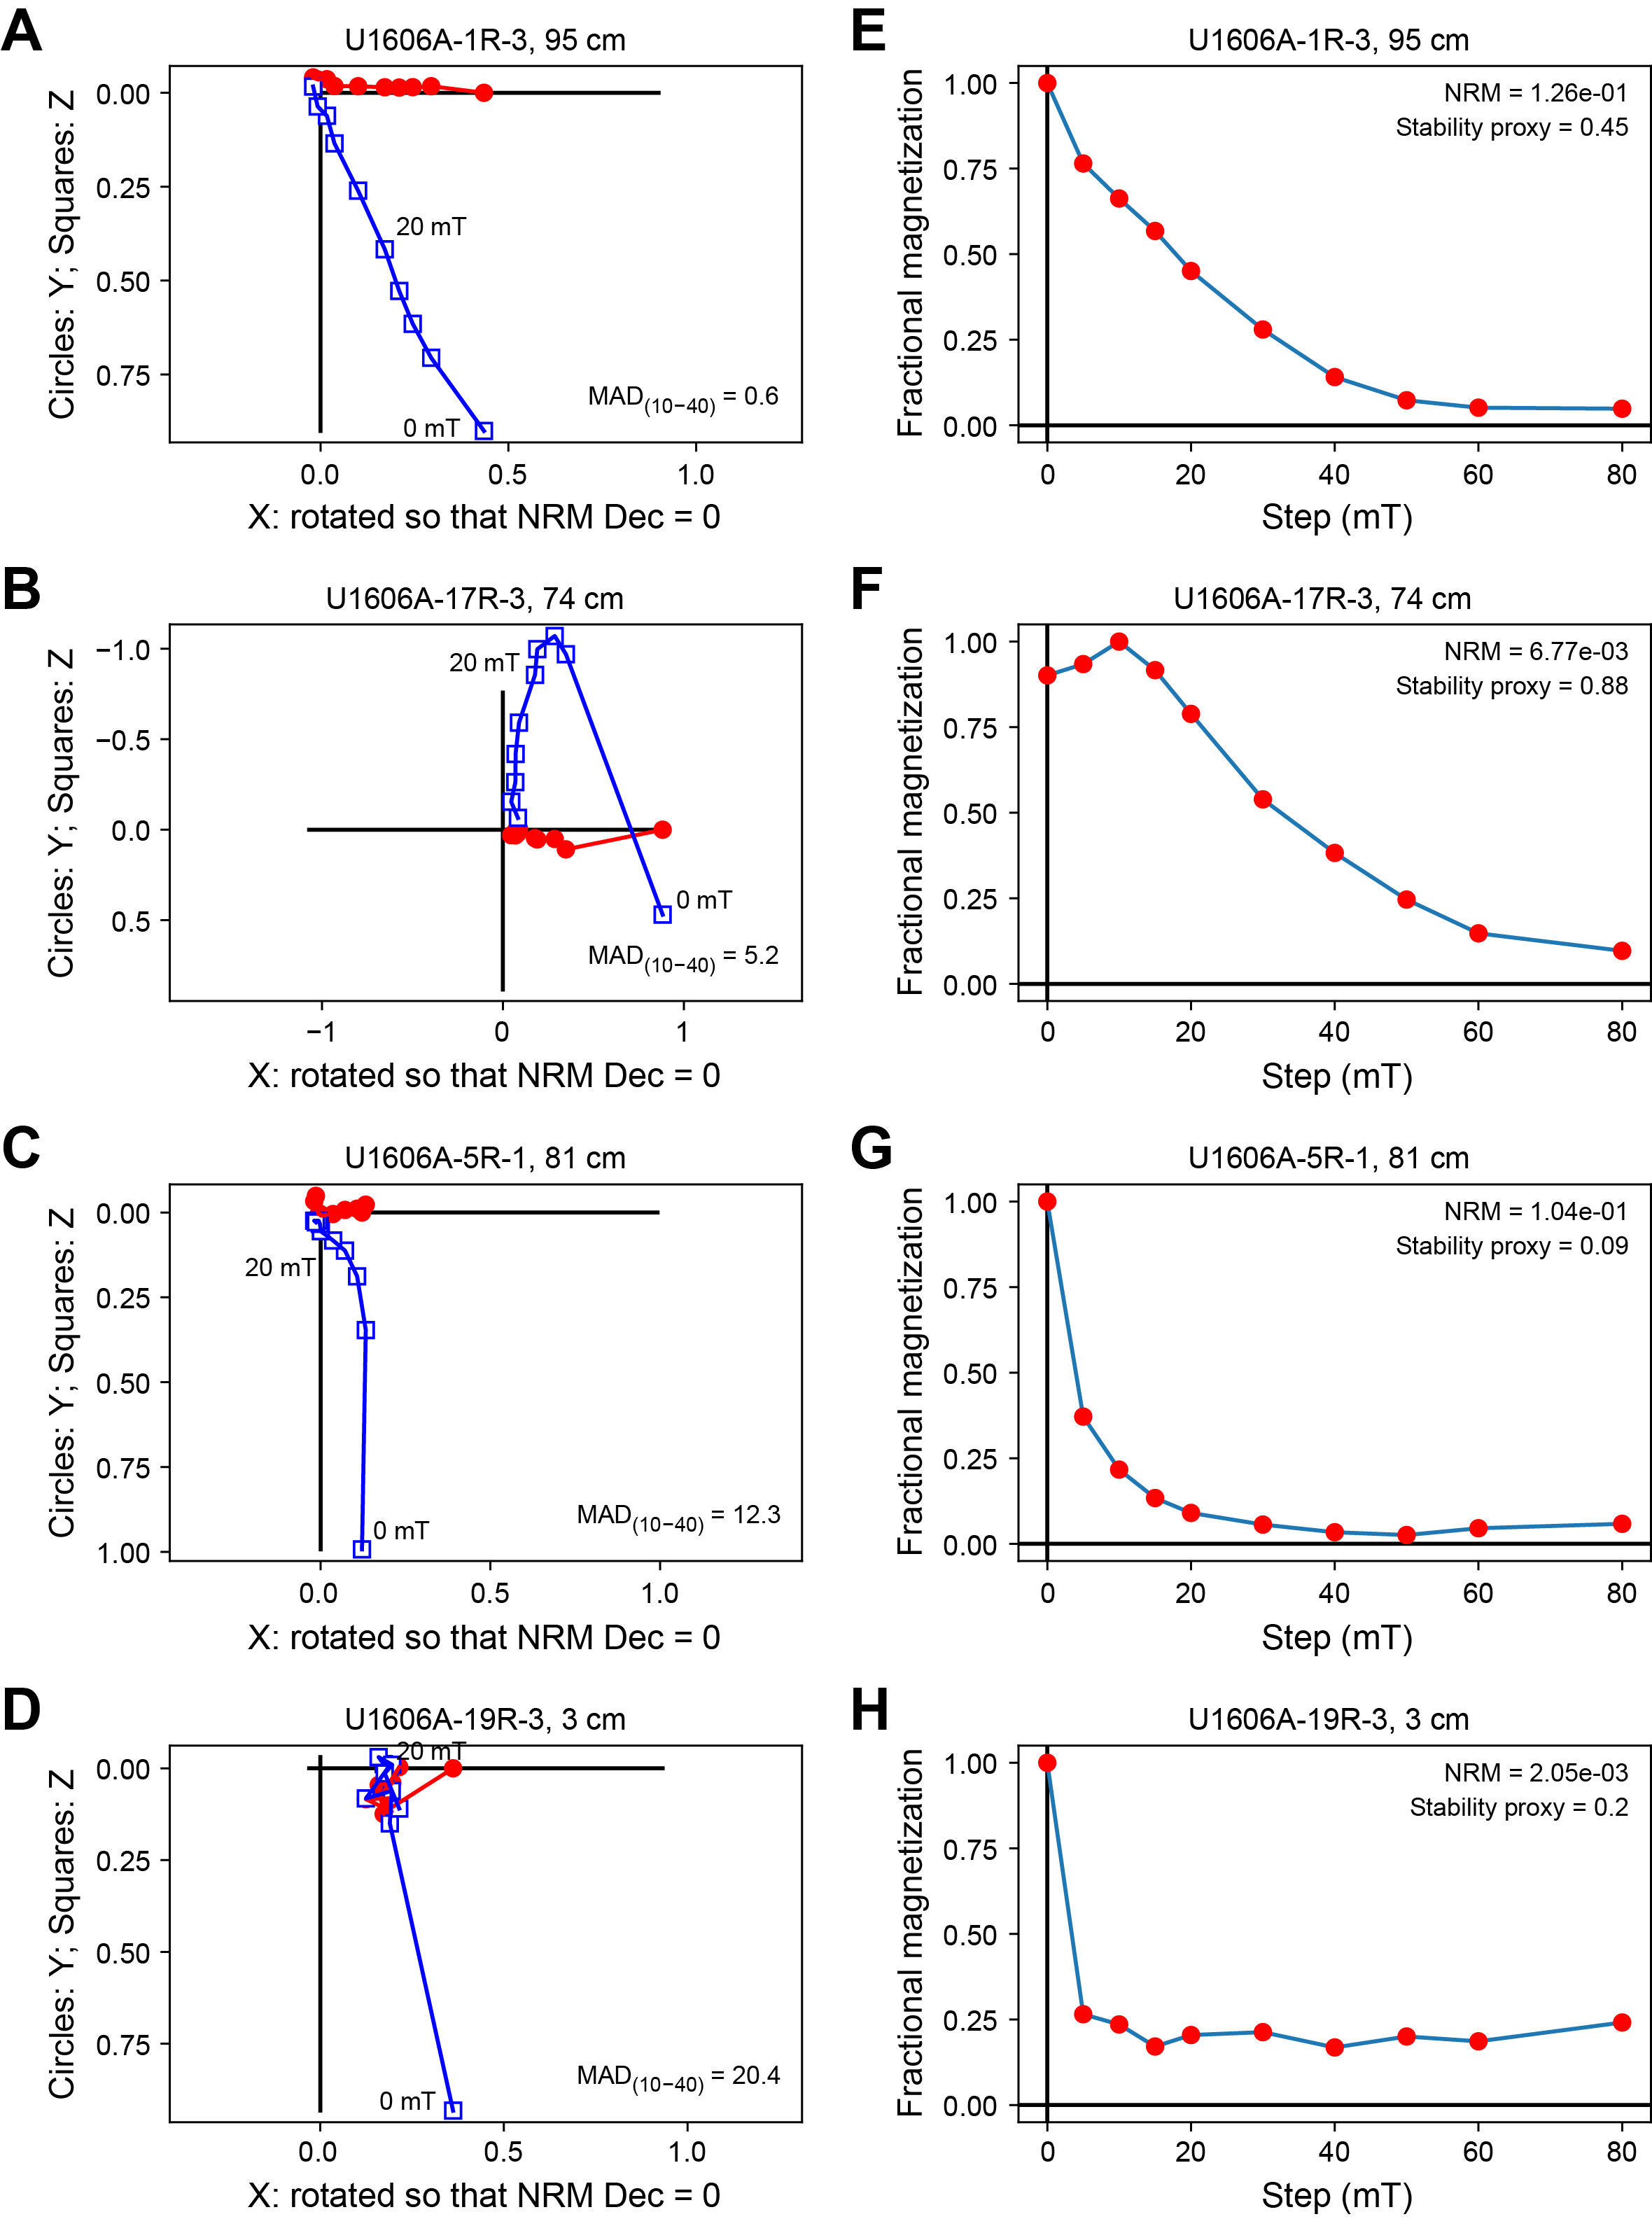
Figure F22. AF demagnetization behavior.
We used two parameters to separate data with straightforward polarity interpretations from those whose polarity is difficult to determine or trust. The first is the maximum angular deviation (Kirschvink, 1980), which uses principal component analysis through the characteristic component of the magnetization vector to calculate scatter in the directional data. We calculated the maximum angular deviation value for the vector between 10 and 40 mT and considered maximum angular deviation values above 20° to be unreliable. The second parameter considers the magnetization remaining after AF demagnetization to 20 mT. The magnetization remaining is expressed as a fraction of the initial remanence (fractional magnetization), which can be used as a proxy for magnetic stability. We considered specimens with a fractional magnetization of less than 20% after the 20 mT AF demagnetization step to be unreliable. We also used this parameter to filter the archive section half measurements.
5.2. Archive-half measurements
The natural remanent magnetization of sections from Site U1606 was measured, followed by AF demagnetization steps of 10 and 20 mT to remove the drill string overprint. Of the 182 section halves measured, 24 were from Hole U1606A, 119 from Hole U1606B, 33 from Hole U1606C, and 6 from Hole U1606D. To filter out data from sections that were deemed unreliable, the remanence data were filtered as follows:
- All measurements within 10 cm of section ends were deleted to remove the edge effects associated with pass-through measurements and disturbance from cutting of the core sections.
- Intervals with drilling disturbances as defined by the disturbance intensity code of "moderately disturbed" or greater (see Lithostratigraphy in the Expedition 400 methods chapter [Knutz et al., 2025a]) were removed.
- Intervals with less than 20% of the magnetic remanence remaining after demagnetization to 20 mT were removed.
The data from the 20 mT demagnetization step are shown in Figures F23, F24, F25, and F26 for Holes U1606A–U1606D. Both unfiltered (gray dots) and filtered (black dots) archive section half data are plotted, along with discrete specimen data. Discrete specimens are shown as red stars when deemed reliable and as blue Xs when unreliable. The inclinations from the filtered 20 mT step archive section half data are shown as kernel density estimates (Figure F27) and are generally bimodal, with a much larger fraction of reversed polarity measurements.
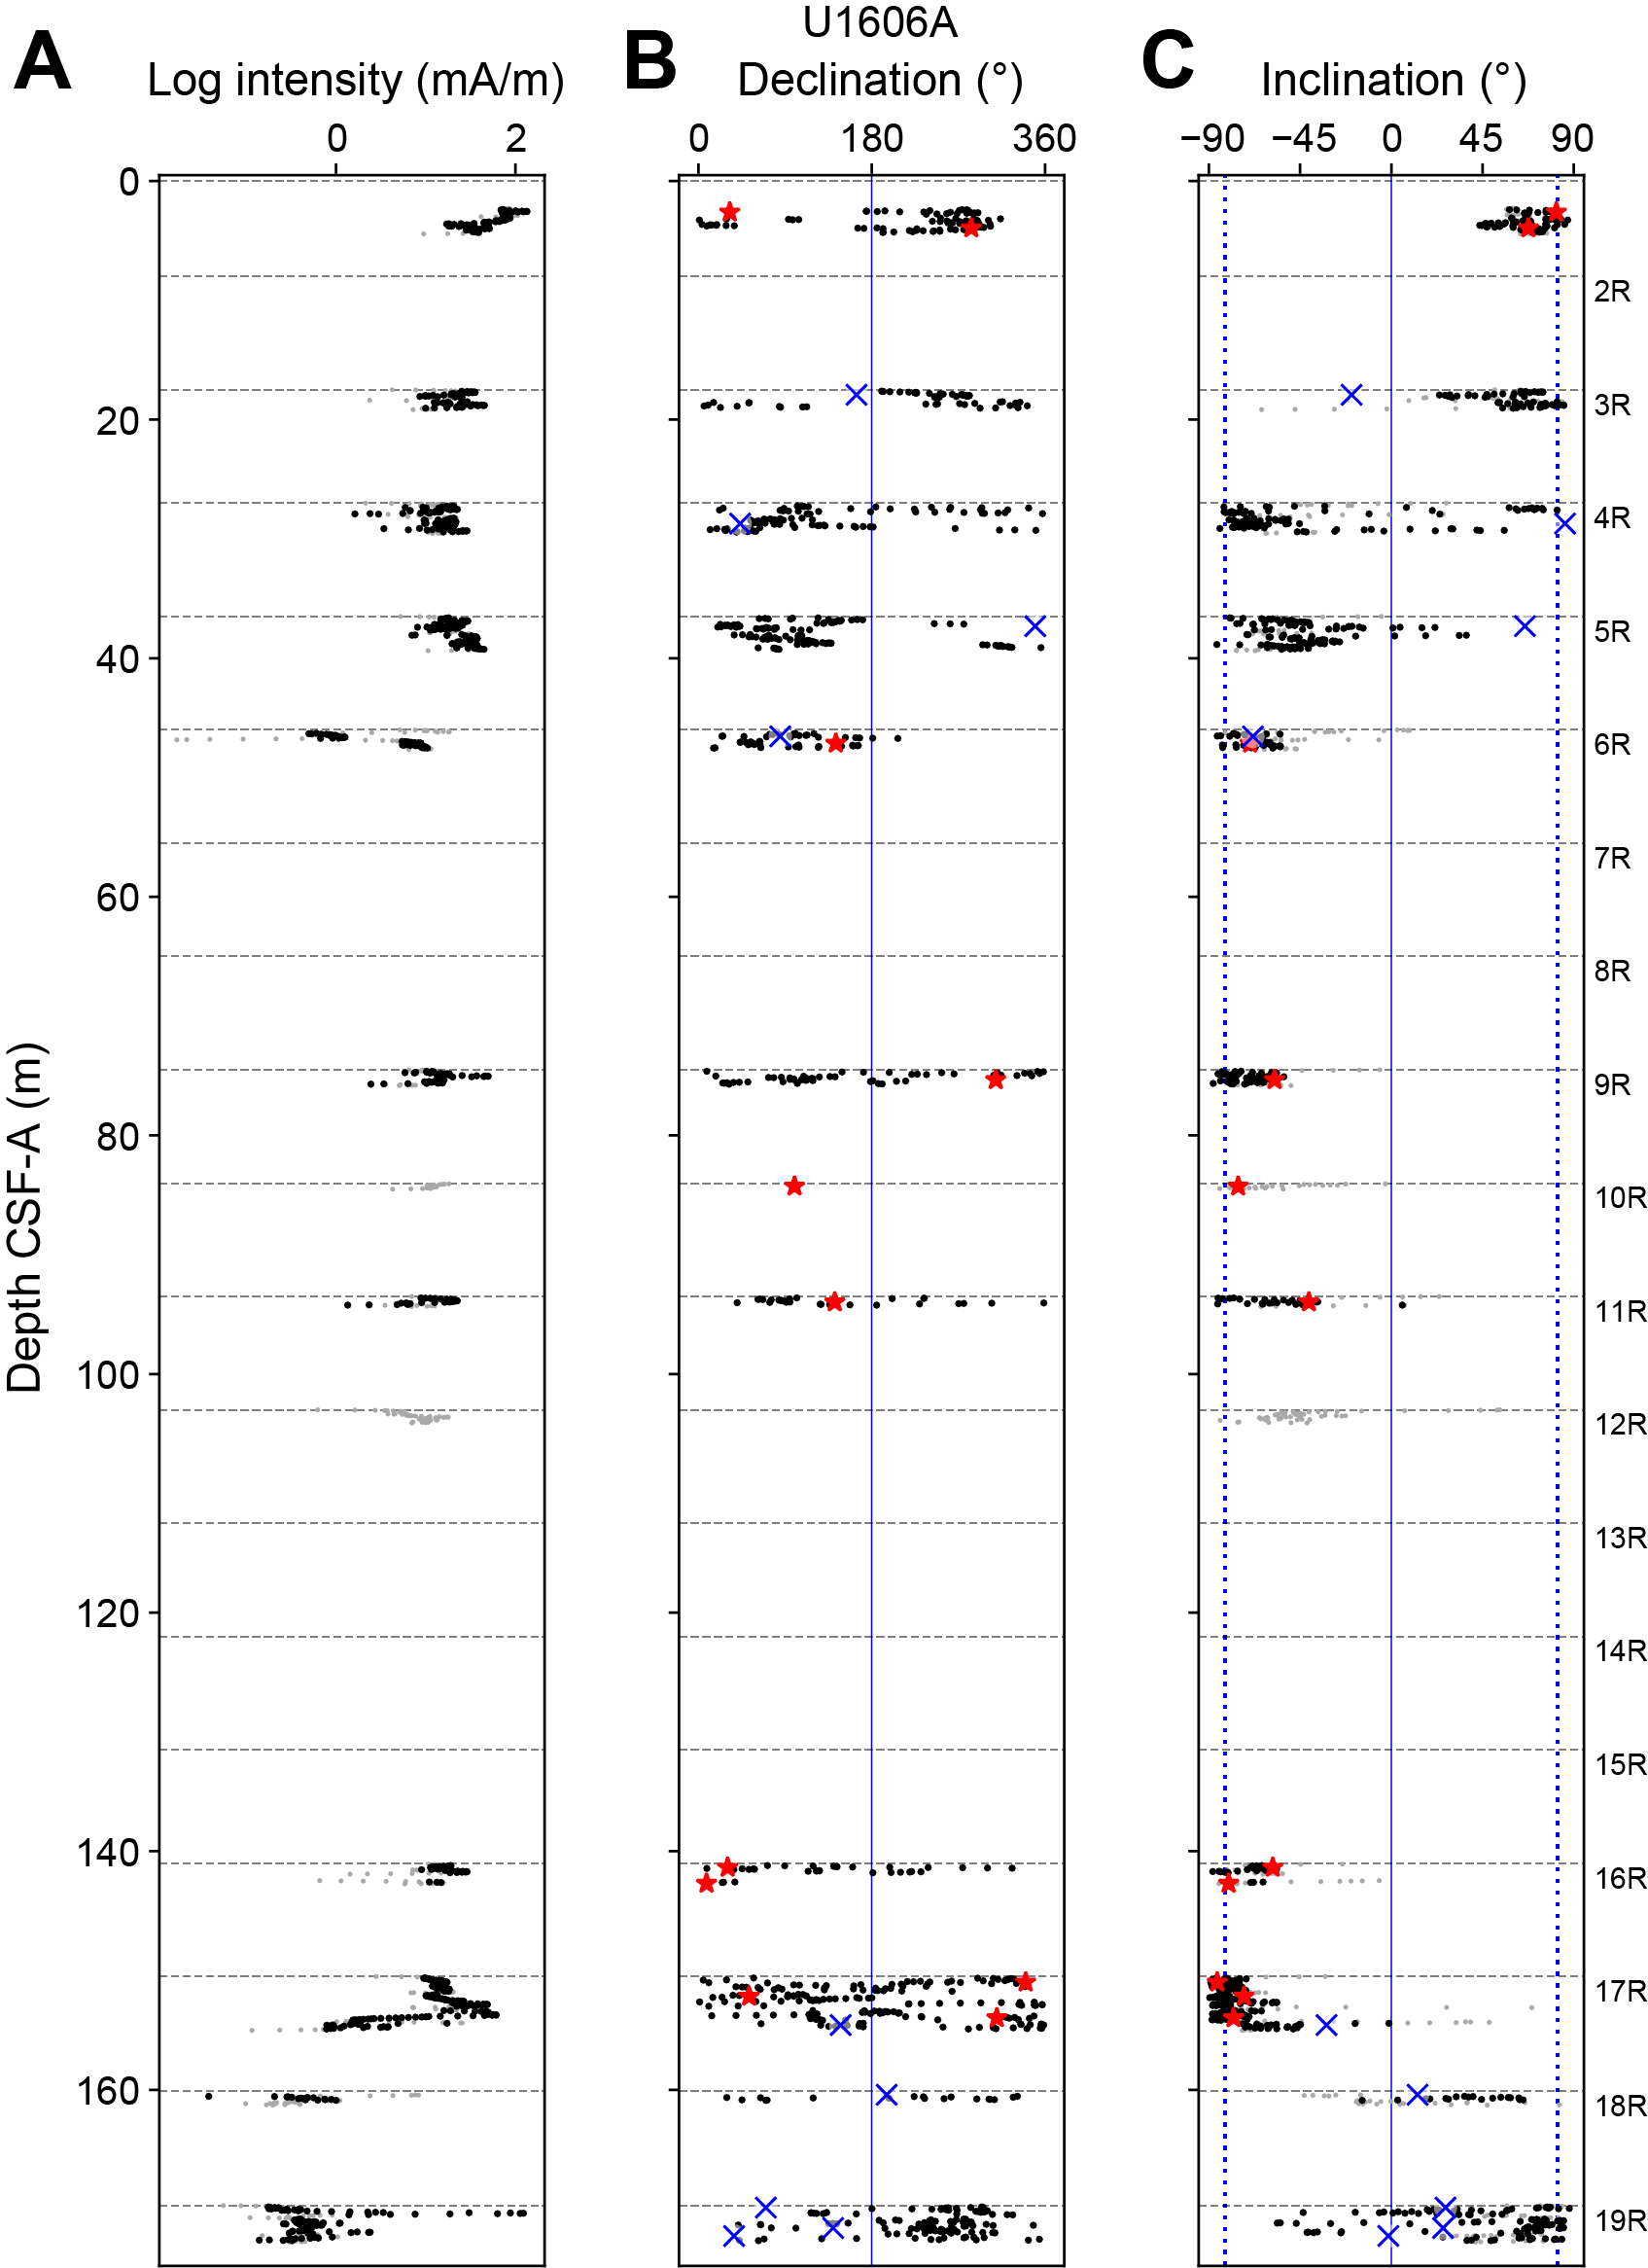
Figure F23. Intensity, declination, and inclination, Hole U1606A.
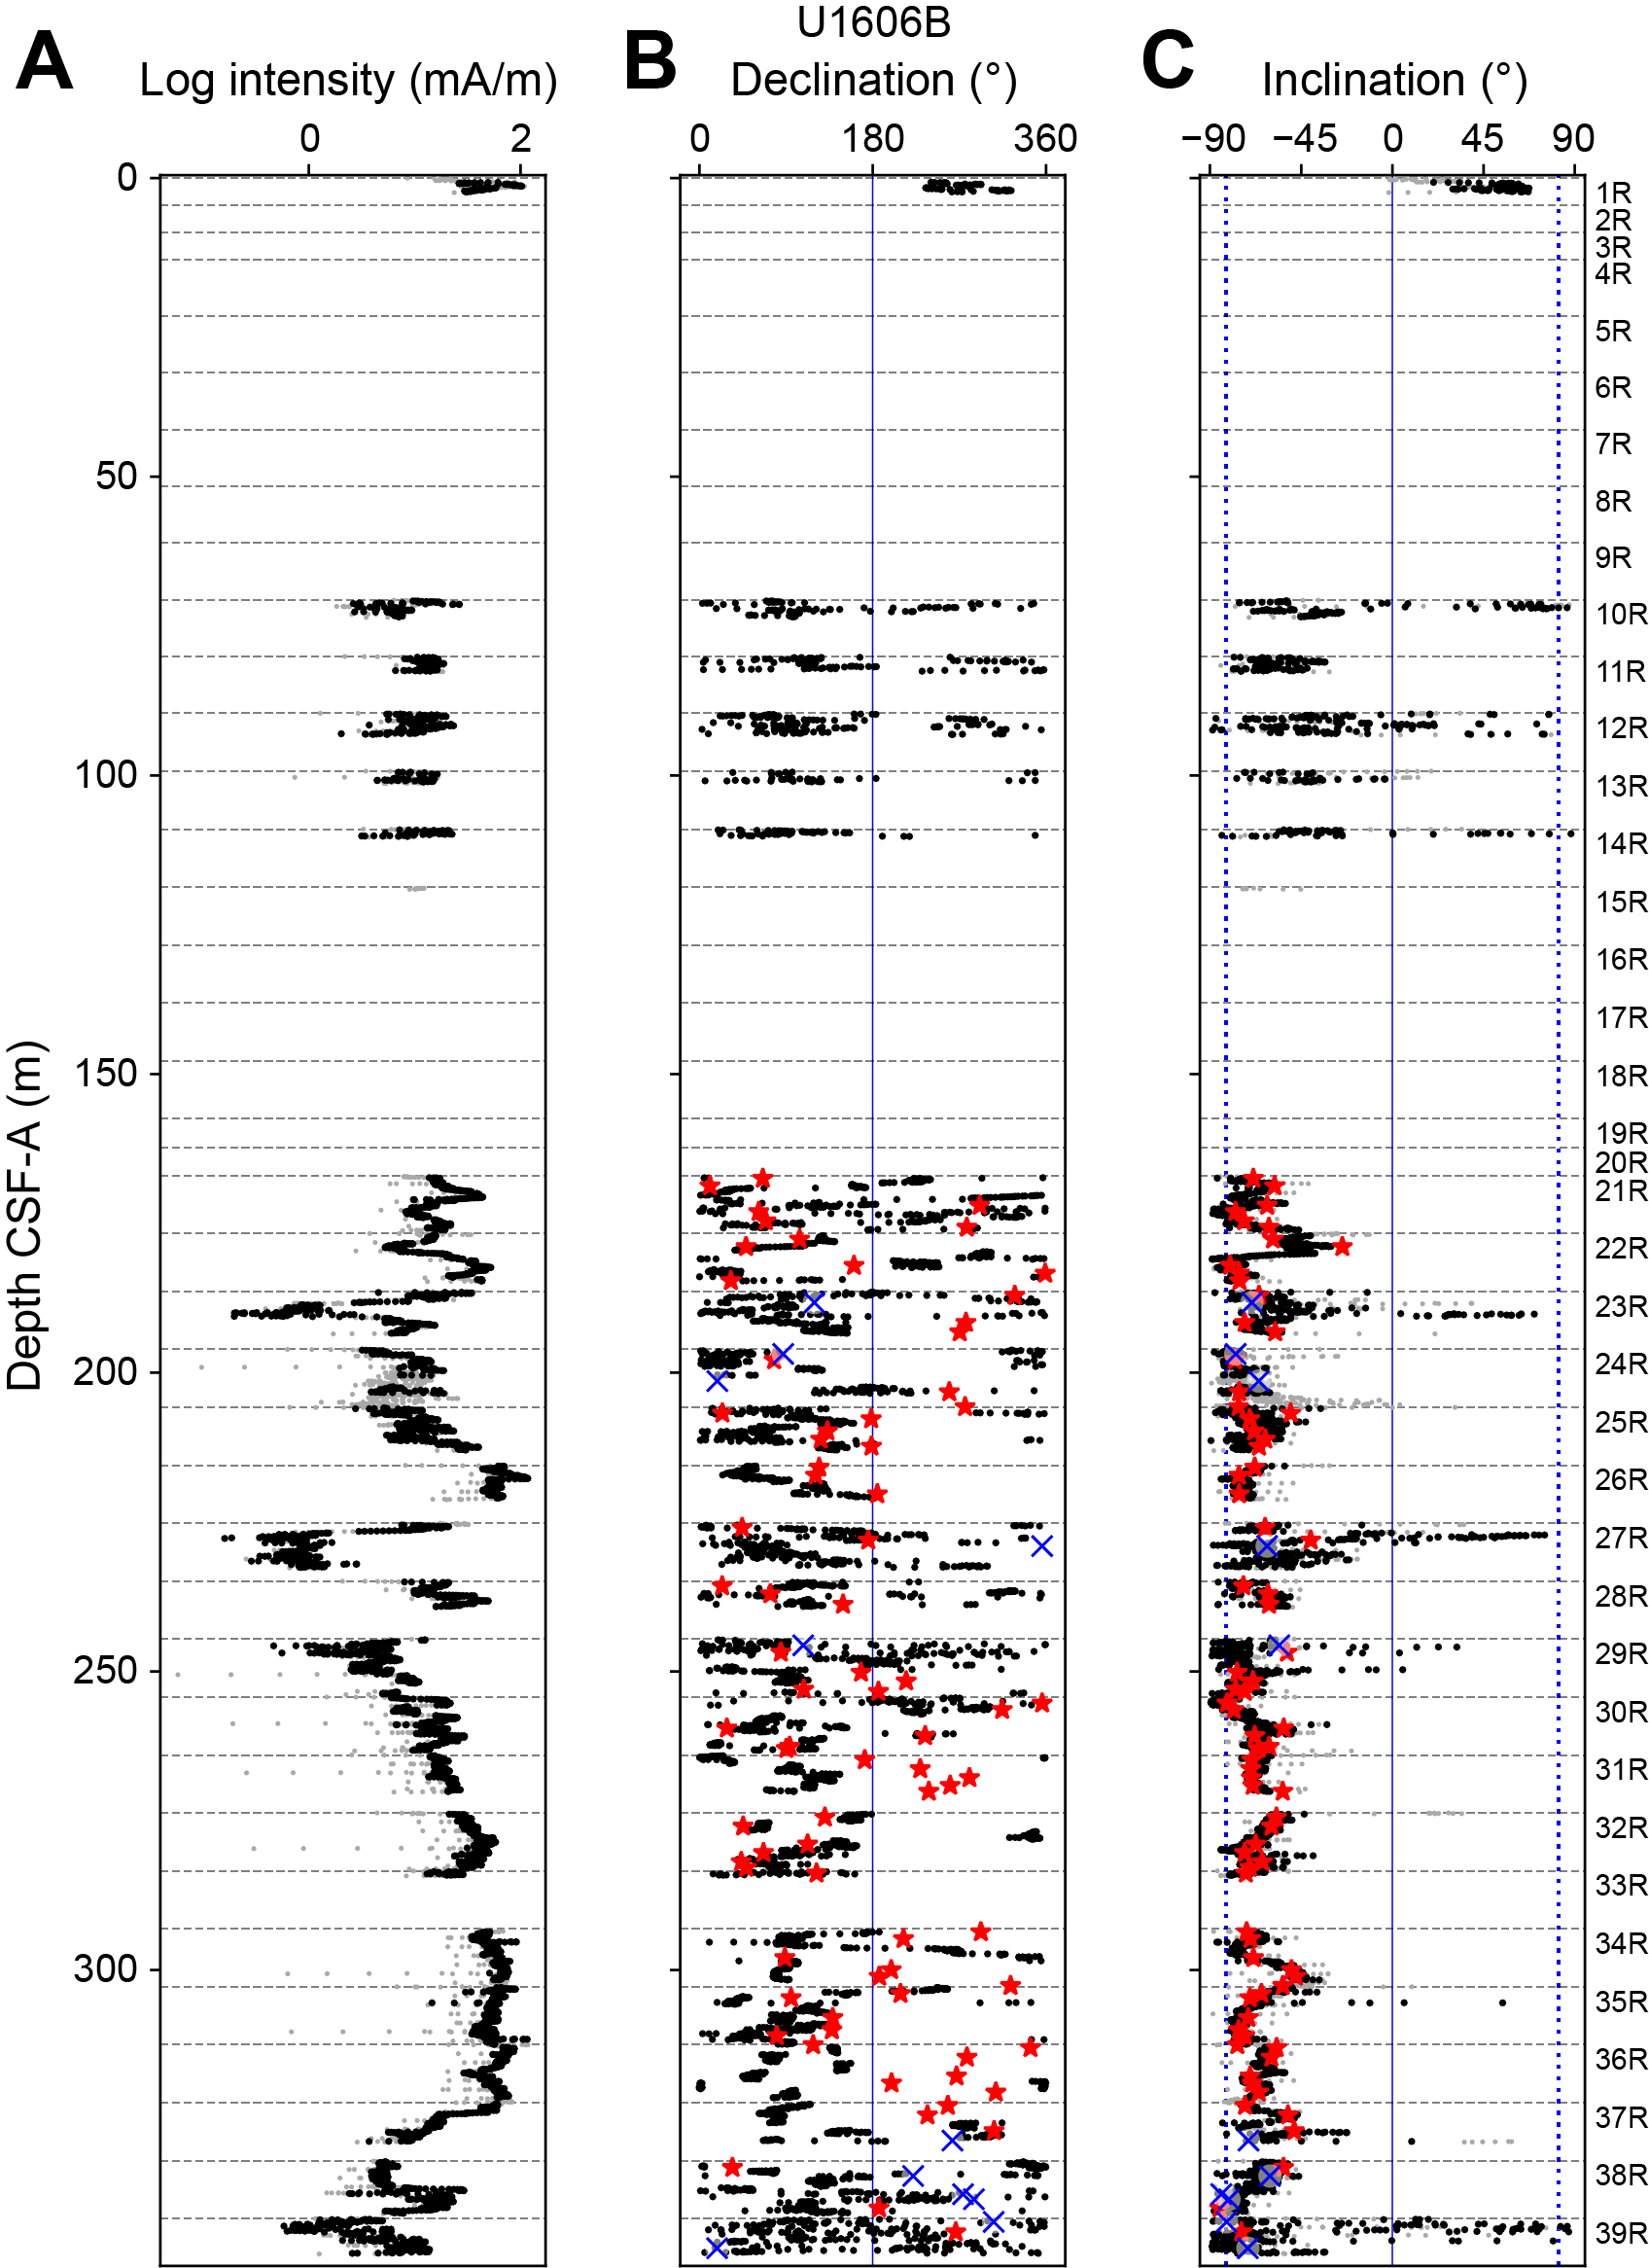
Figure F24. Intensity, declination, and inclination, Hole U1606B.
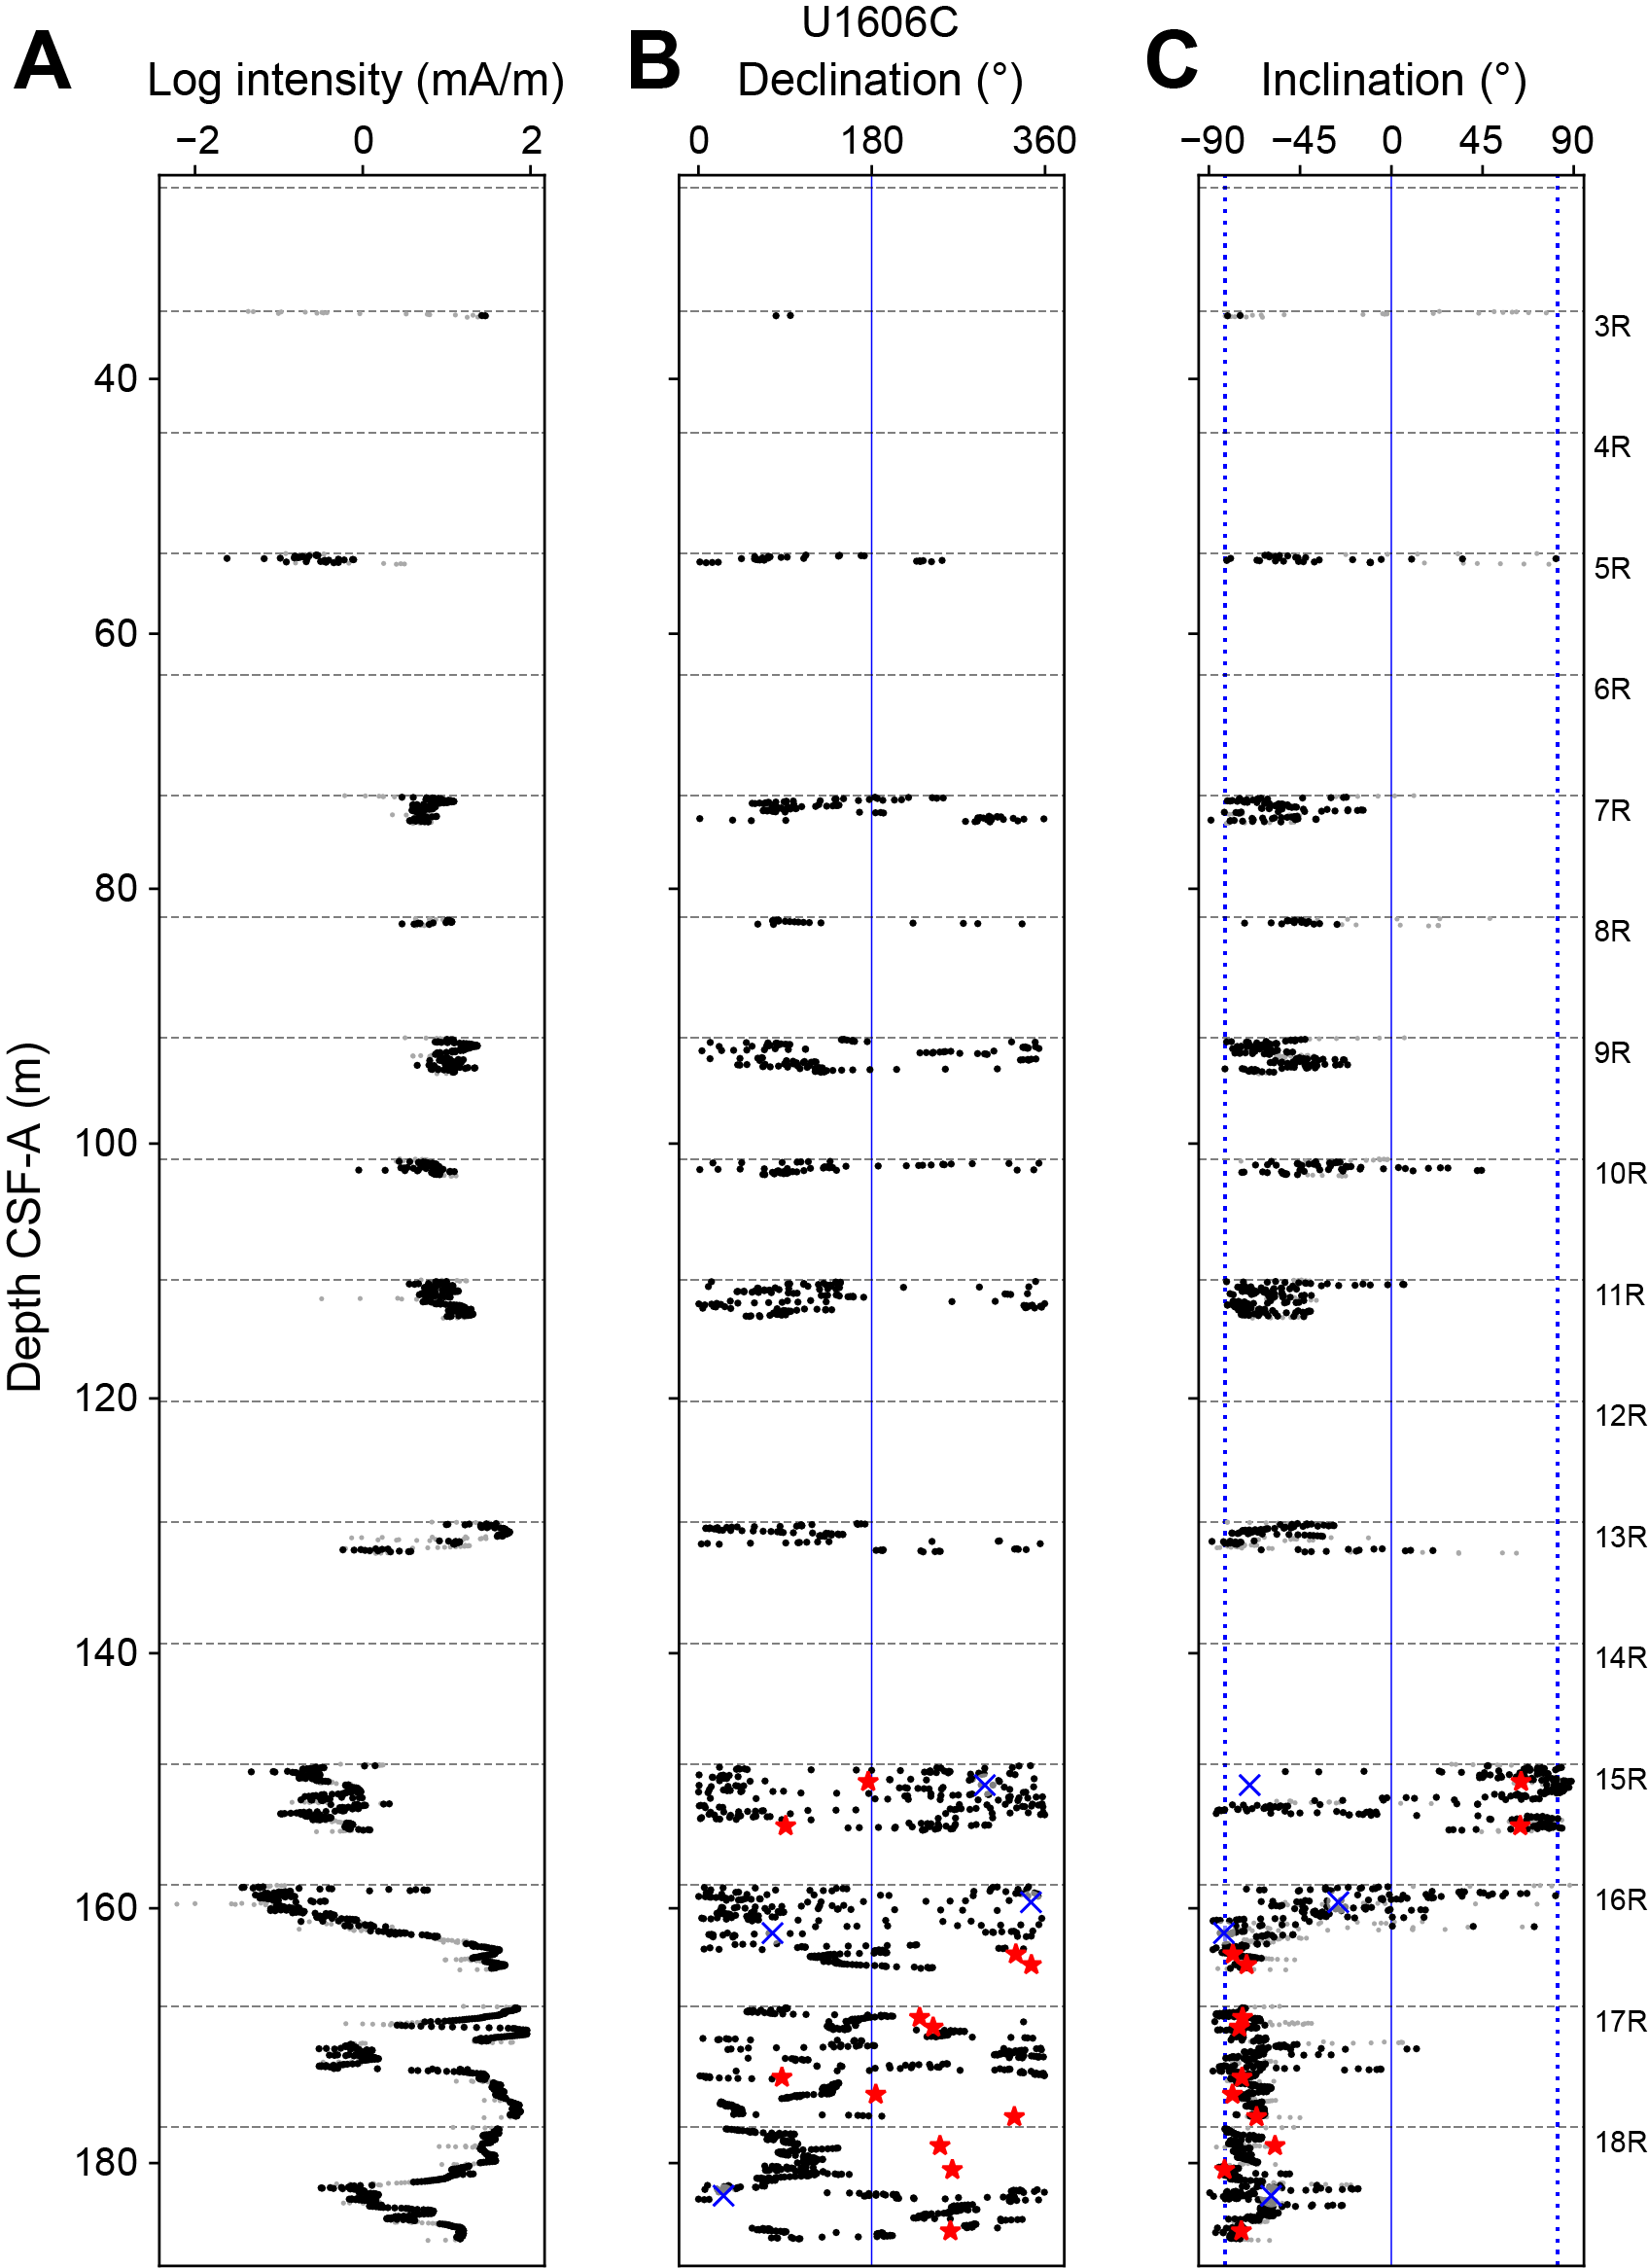
Figure F25. Intensity, declination, and inclination, Hole U1606C.
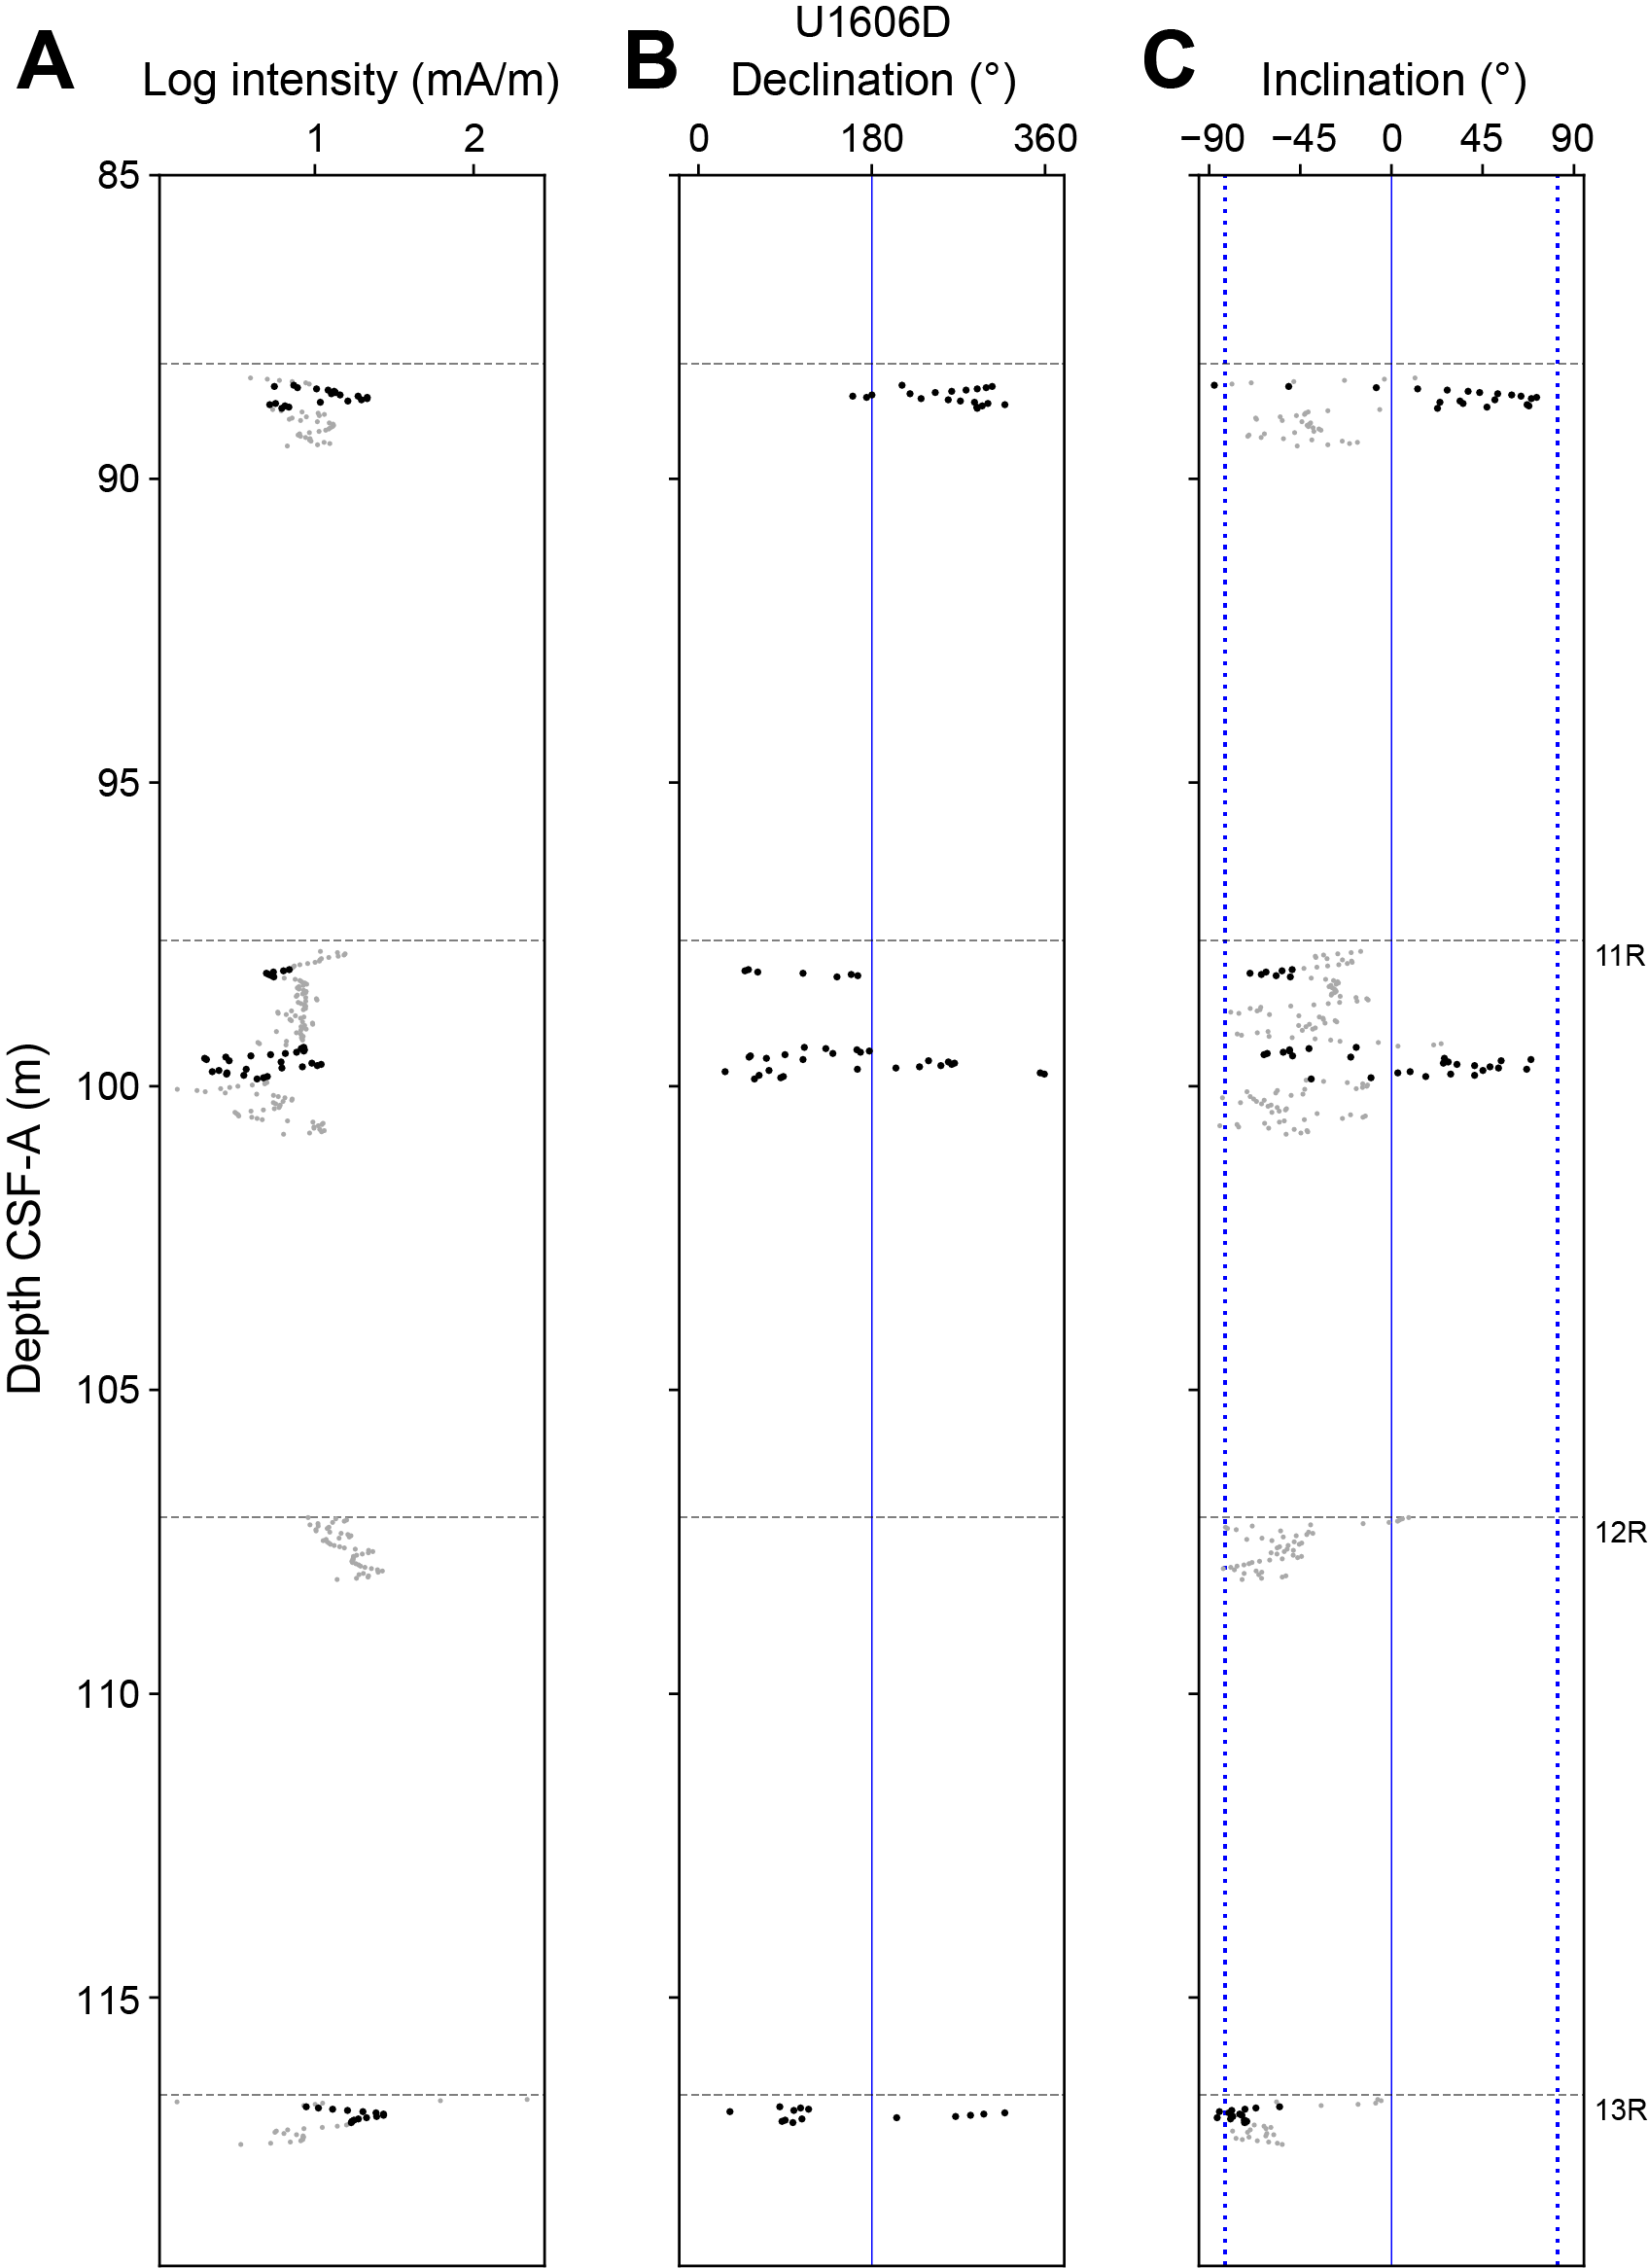
Figure F26. Intensity, declination, and inclination, Hole U1606D.

Figure F27. Inclination.
5.3. Magnetostratigraphy
Magnetostratigraphy at Site U1606 is highly uncertain. Polarity zones were defined for Holes U1606A (Table T11), U1606B (Table T12), and U1606C (Table T13). We summarize the data from Site U1606 and compare it to Site U1608 in Figure F28. Correlation between holes is complicated by prominent lateral changes in the sedimentary units depicted by the seismic stratigraphy (Figure F2). This is notably seen as a pinch-out of a stratified wedge below 140 m CSF-A that expands to the southwest. At Site U1608, the equivalent stratigraphic package is represented by almost 300 m. The lower bounding reflector of the wedge, referred to as the pink horizon, is located in Holes U1606A–U1606C and U1608A, but it is poorly recovered. The pink horizon displays a dipping trend across Holes U1606B, U1606C, and U1606A (Figure F2) and is considered a discontinuity that impacts the magnetostratigraphic interpretation. It appears in Polarity Zone R4 of Hole U1608A, which lies between Polarity Zones N4 and N5 and is interpreted as either the Sidufjall/Thvera Subchrons (C3n.3n/C3n.4n) in the "old age model" for Hole U1608A or combined together as C2An.3n (lower Gauss Chron) in the "young age model" (see Age model in the Site U1608 chapter [Knutz et al., 2025b]). The pink reflector in Hole U1606C falls below Polarity Zones N1 and N2 (Figure F28E, F28F), which are likely the same as Polarity Zones N4 and N5 in Hole U1608A. This implies that the horizon is diachronous and cannot be used as a temporal marker.
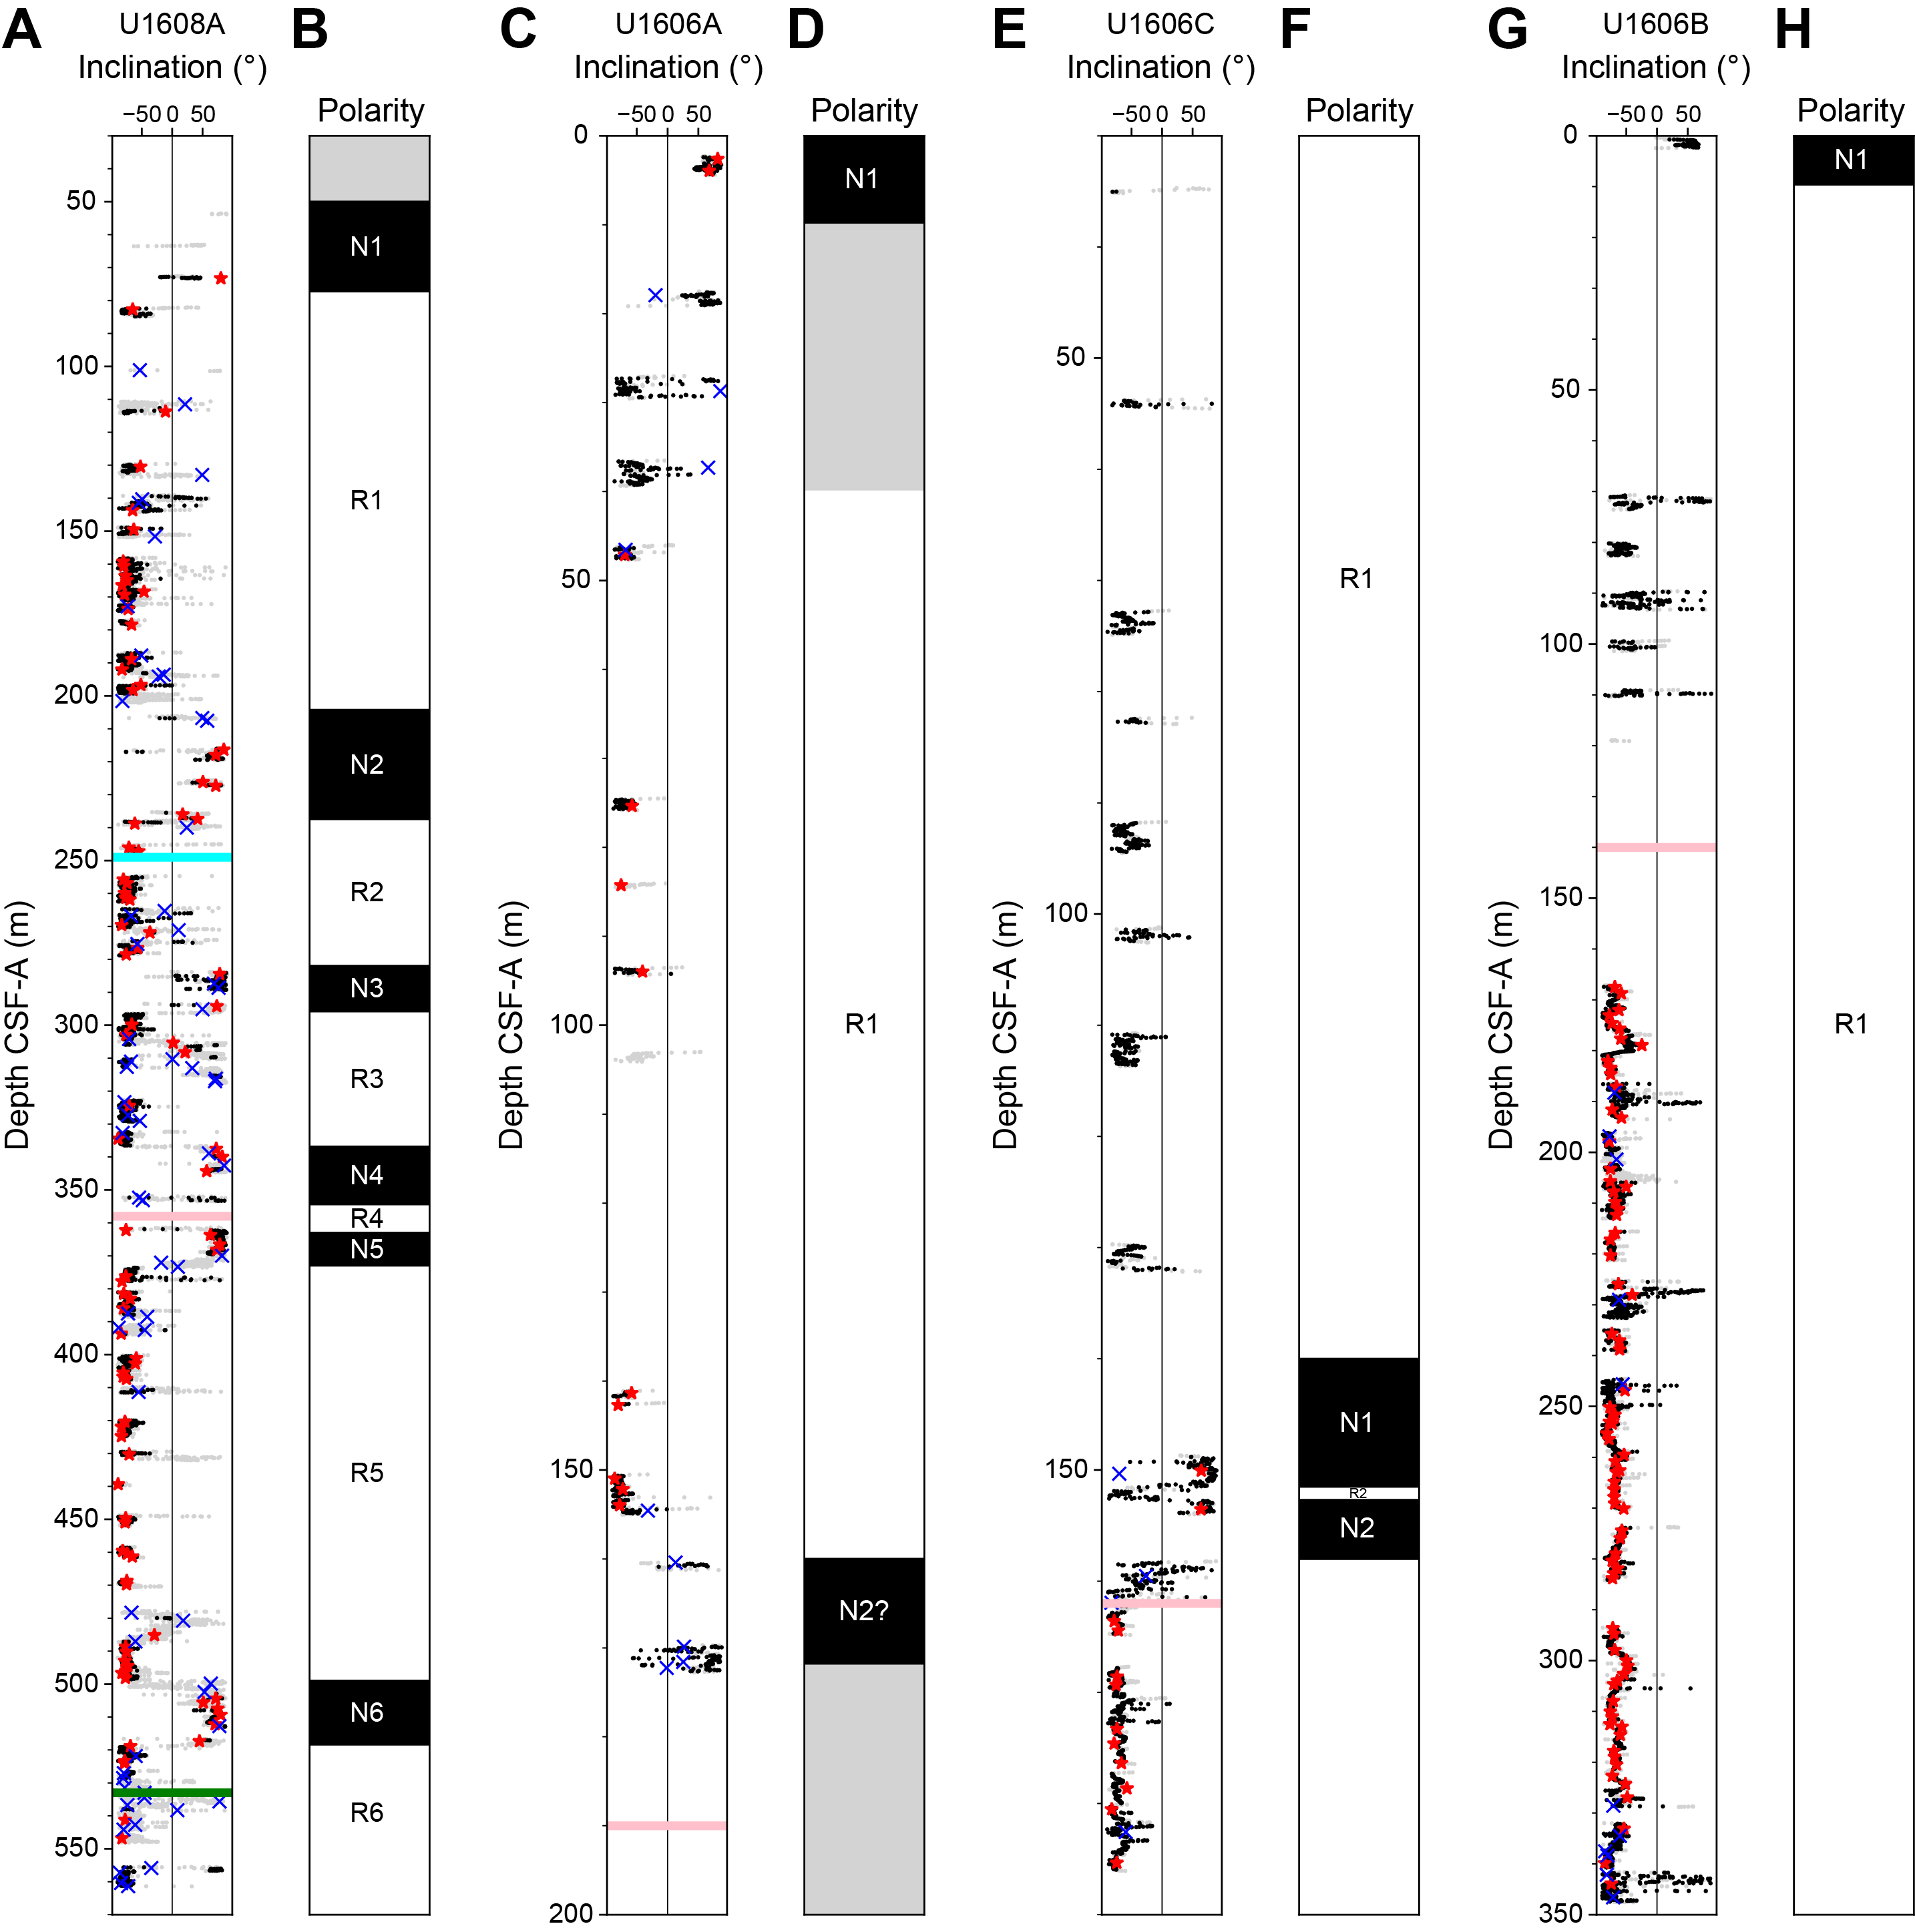
Figure F28. Magnetostratigraphy.
6. Physical properties
Physical property data were acquired on all cores from Holes U1606A–U1606D using the Whole-Round Multisensor Logger (WRMSL) for wet bulk density from gamma ray attenuation (GRA), magnetic susceptibility (MS), and P-wave velocity (using the P-wave logger [PWL]). We also measured natural gamma radiation (NGR) on the Natural Gamma Radiation Logger (NGRL) in all sections longer than 50 cm. NGR measurements were taken upon arrival in the laboratory, and WRMSL logging was performed after equilibration to room temperature (~20°C).
The cores were split into halves after NGRL and WRMSL logging. X-ray images were acquired on the archive halves of every core. The Section Half Multisensor Logger (SHMSL) was used to measure point MS (MSP) and color reflectance using the L*a*b* color system, and the red-green-blue color space (RGB) of the sediments was captured with the Section Half Imaging Logger (SHIL). Thermal conductivity was measured in one working section half per core. In addition, we determined P-wave velocities at discrete points on the working section halves for all cores from Site U1606. In general, P-wave velocity measurements were taken at variable intervals to accommodate lithologic variations and, on average, three measurements per core were obtained. Samples for moisture and density (MAD) were taken in sedimentary intervals at an average of two samples per core. Thus, discrete wet bulk density, dry bulk density, grain density, and porosity were obtained for the sedimentary intervals of Site U1606.
The sensors worked correctly, and the data are of good quality. Prominent variations in physical property values occur at similar depths in NGR and MS signals and are associated with major lithologic changes in the cores. However, the abundant low-recovery intervals of this site produce a highly fragmented record of physical properties. All analyses described in this section are reported in meters CSF-A, unless otherwise stated.
6.1. Physical property measurements and measurement intervals
High-resolution physical property measurements were made on all cores from Holes U1606A–U1606D to provide basic information on sediment composition and variability. The WRMSL measured bulk density by GRA, MS, and compressional P-wave velocity on the PWL at 2 cm intervals. WRMSL measurements were obtained upon equilibration to room temperature. The RCB system has a slightly smaller core diameter and does not fill the liner entirely, and PWL readings lack close contact between the caliper and the sediment, leading to large standard deviations in the measurements. Thus, PWL measurements are not consistent and should be considered only together with the discrete P-wave measurements from the P-wave caliper (PWC). NGR was measured with a counting period of 300 s at 10 cm intervals (see Physical properties in the Expedition 400 methods chapter [Knutz et al., 2025a]) on all cores from Site U1606.
After the cores were split, the archive section halves were X-ray imaged. Thermal conductivity was measured using the TK04 (Teka Bolin) system with a puck probe on the working section halves. PWC velocity was acquired in three working section halves per core for Hole U1606A. MSP and color reflectance were measured at 2 cm intervals using the SHMSL, and section-half images were collected with the SHIL on all archive section halves. Additionally, discrete samples from all cores from Holes U1606A and U1606B were taken for MAD measurements as two samples per core, ideally representing different lithologies. The samples were processed on board to determine water content, wet bulk density, dry bulk density, porosity, and grain density.
Low recovery across some intervals limits the quality of the measured physical properties. However, core disturbances such as upbowing of layers did not prevent meaningful core-seismic integration.
6.1.1. Whole-Round Multisensor Logger measurements
Results from NGRL and WRMSL measurements for Holes U1606A–U1606D are compiled in Figure F29. The logs described in this chapter have undergone preliminary processing including clipping, despiking, and smoothing. A positive correlation is found between NGR counts and MS at Site U1606 (Figures F29, F30). The correlation between these physical properties distinguishes six physical properties (PP) units (I–VI) at Site U1606; their main characteristics are summarized in Table T14. The descriptions below are mainly focused on the lower five units (II–VI) because only scattered values related to low recovery were obtained in Unit I.
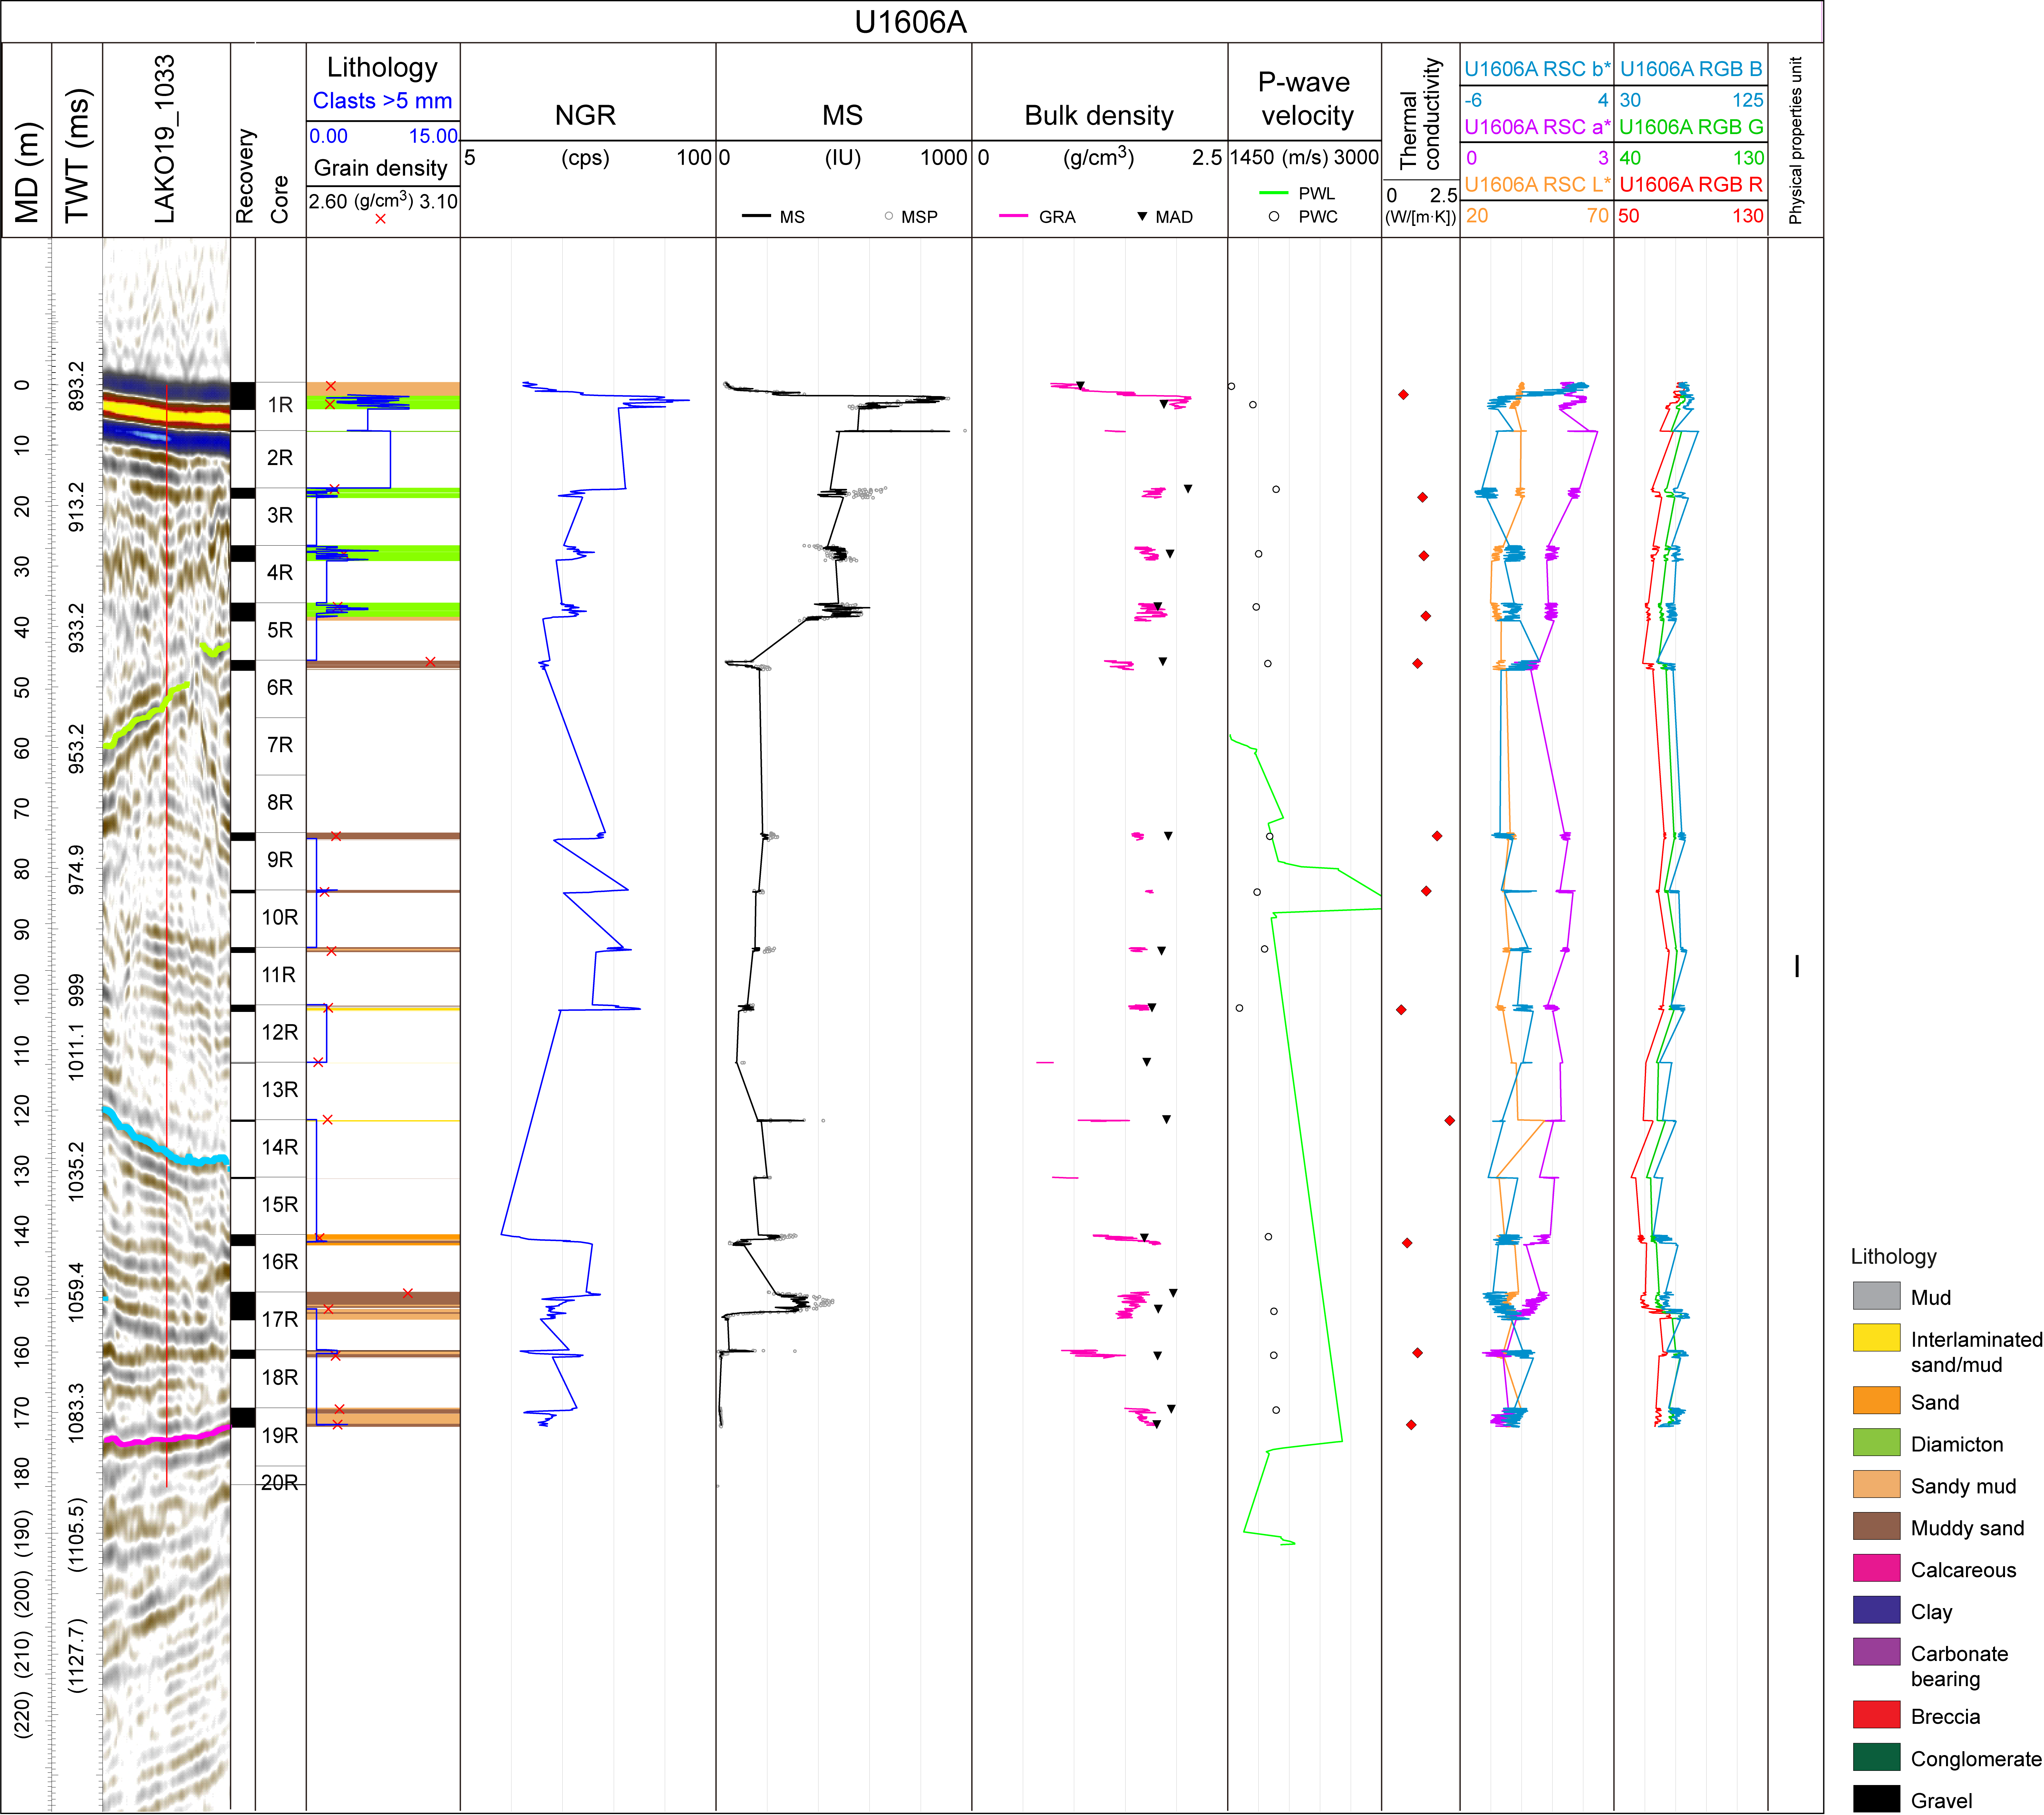
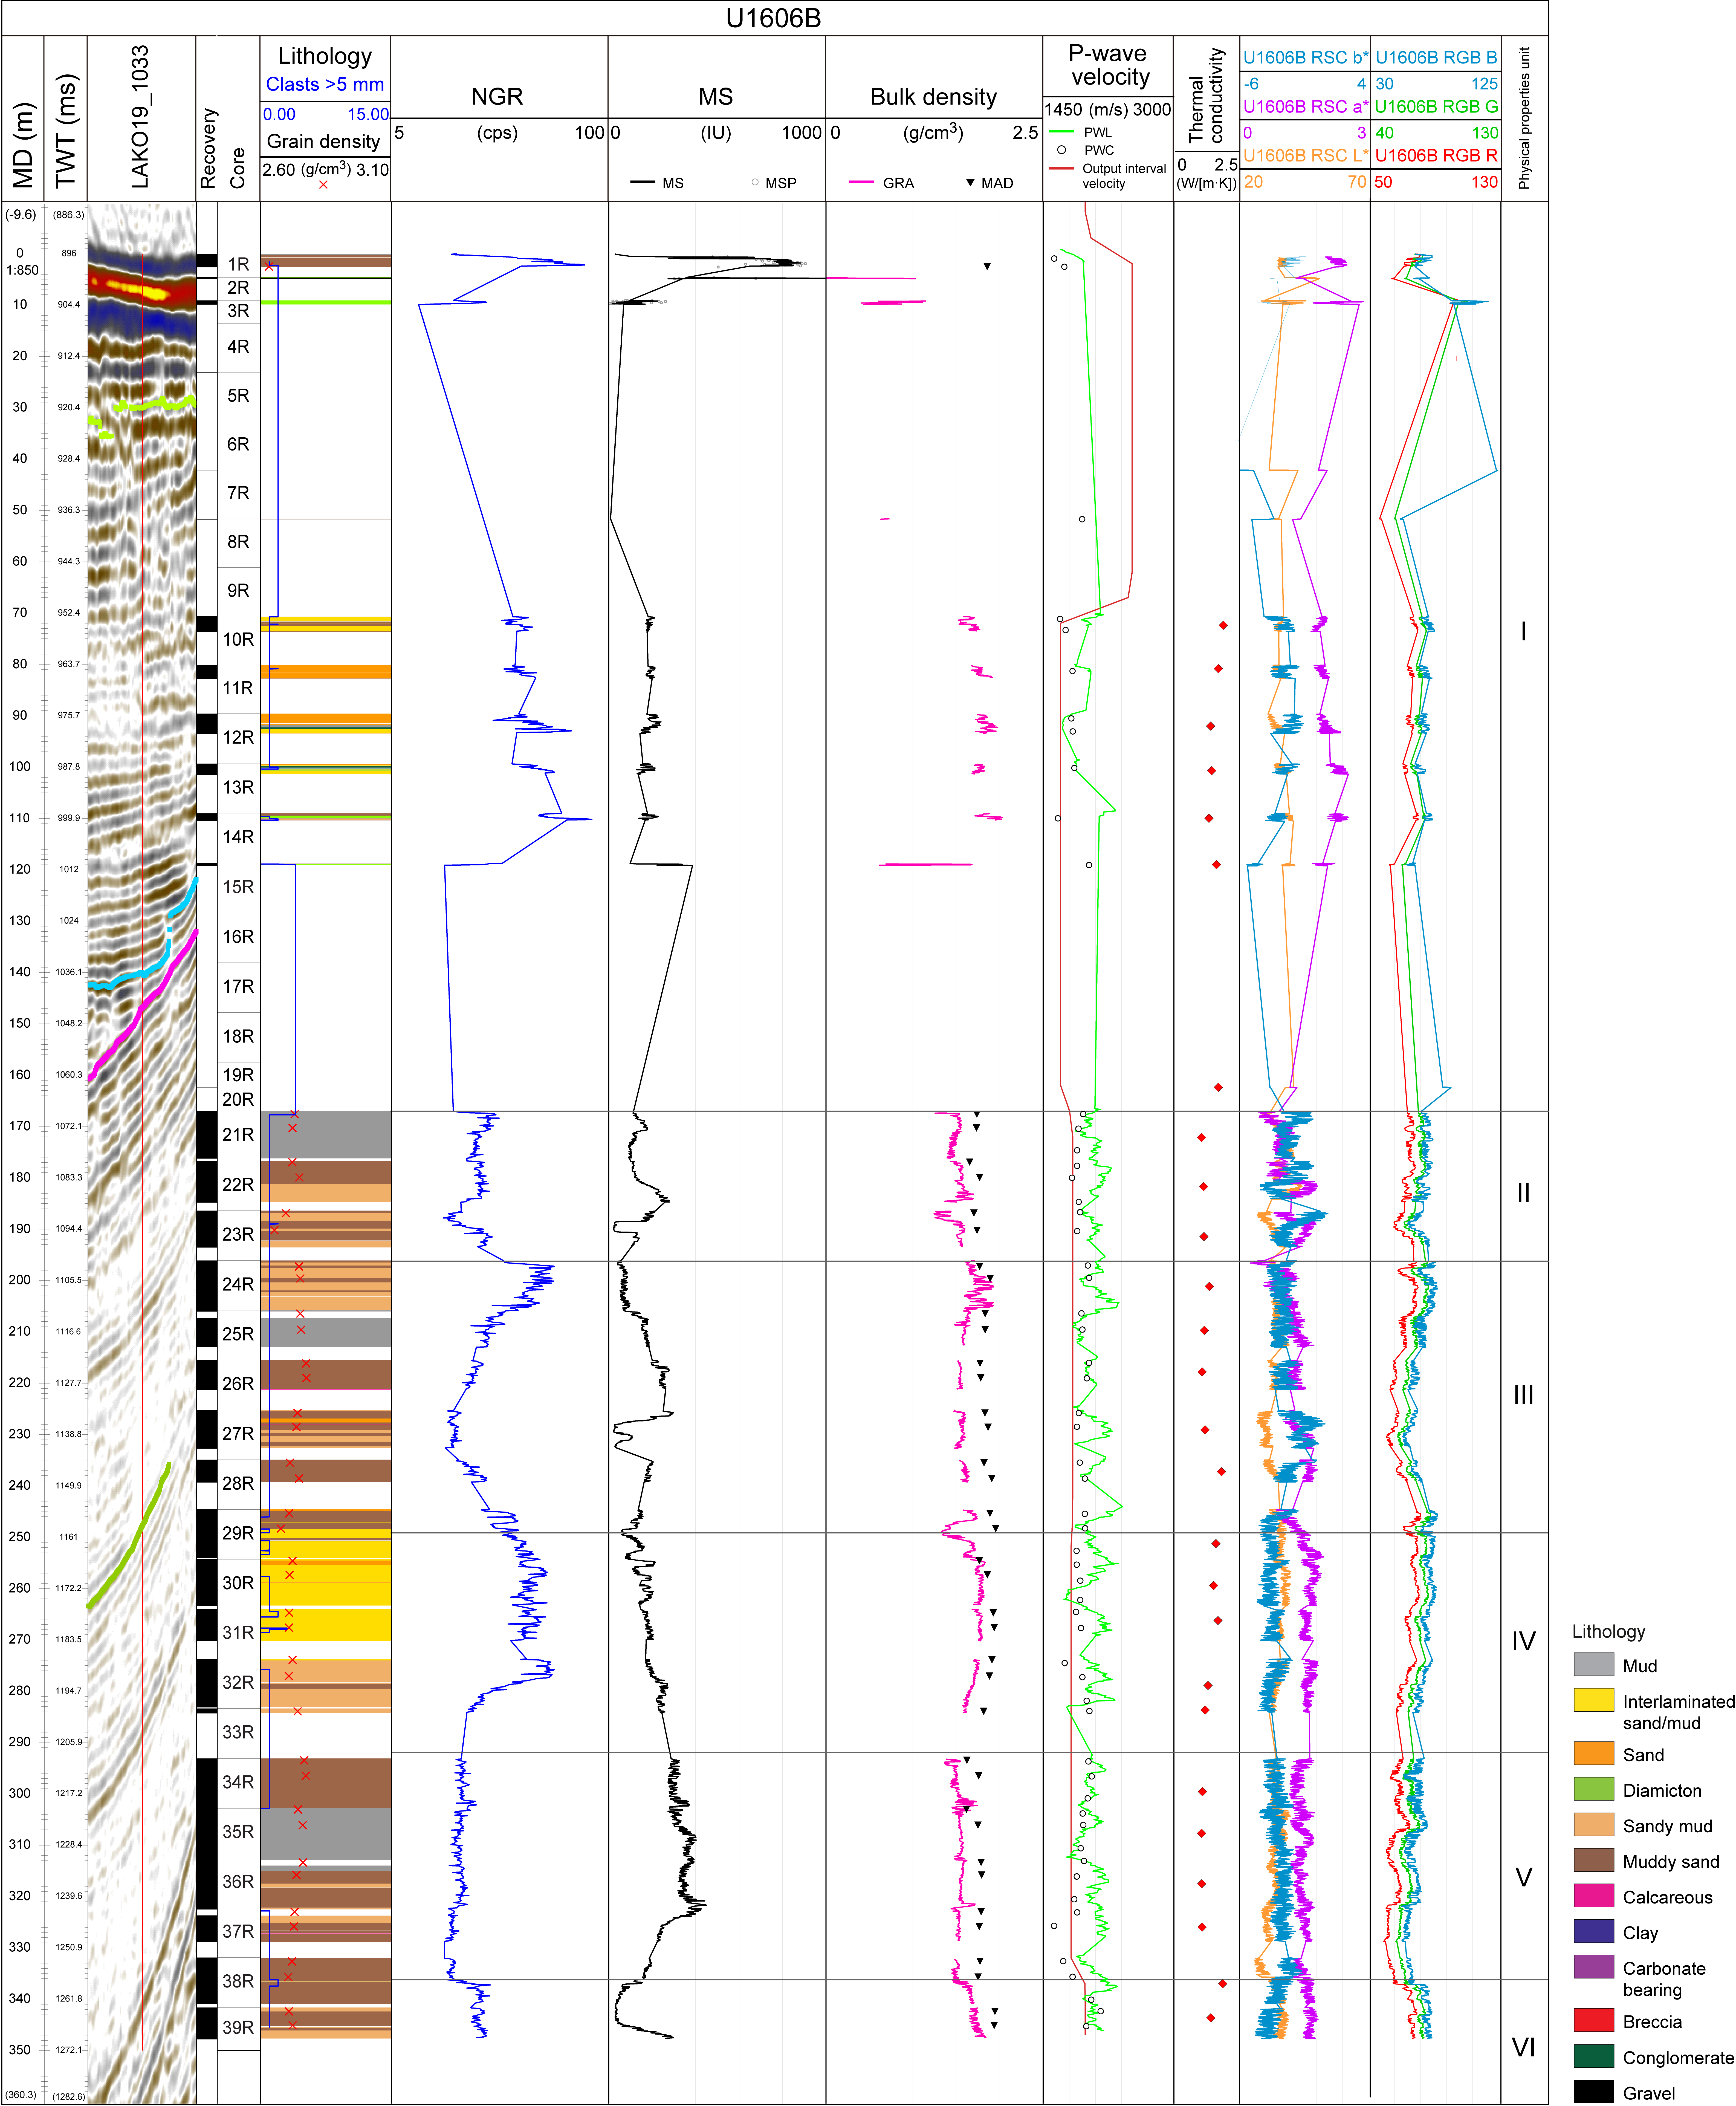


Figure F29. Physical properties.
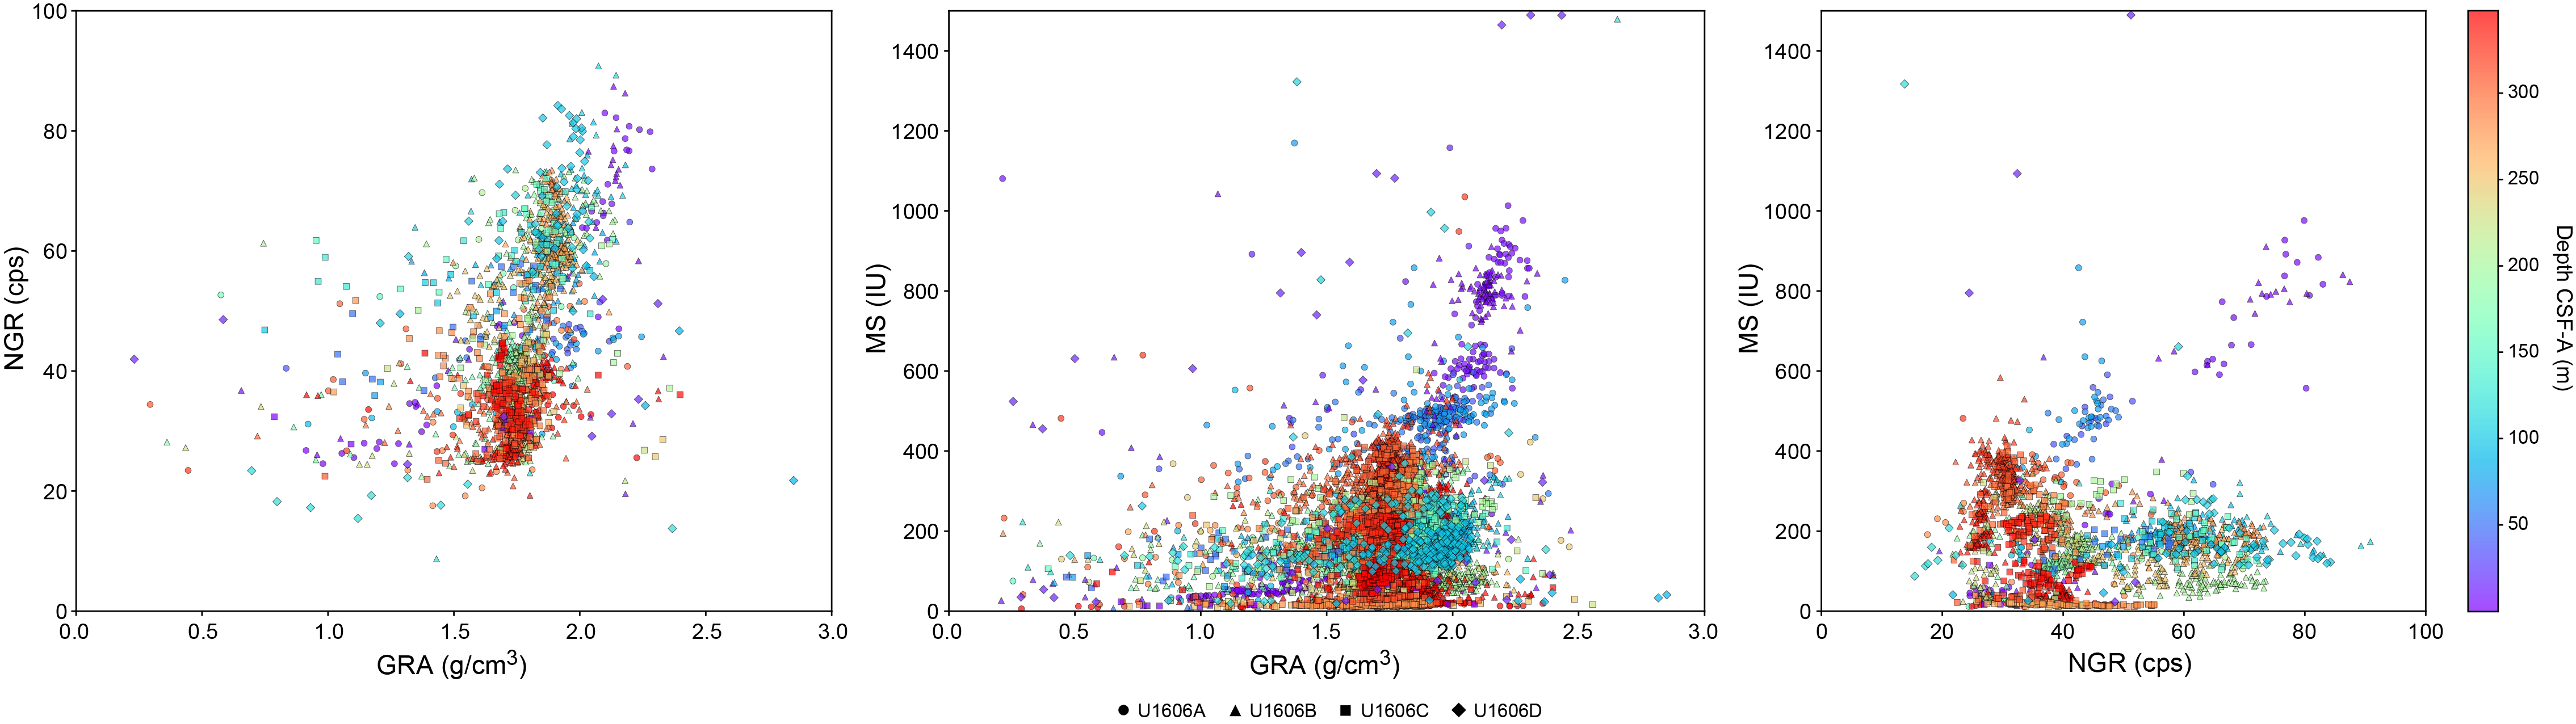
Figure F30. NGR, GRA bulk density, and MS.
6.1.1.1. Gamma ray attenuation bulk density
Wet bulk densities range 0.4–2.2 g/cm3 with a mean value of 1.8 g/cm3. The overall trend of GRA values is relatively constant downhole with a slight downhole decrease through Core 400-U1606B-38R (~335 m CSF-A). GRA density values show lower amplitude variability than the rest of the physical property measurements. Downhole increases in GRA density occur in PP Units I, II, and VI, whereas density decreases downhole throughout Unit IV. GRA density values have very low-amplitude variability in Units III and V. A sharp decrease in density from 1.8 to 1.6 g/cm3 is observed in Cores 23R (~186 m CSF-A) and 29R (~250 m CSF-A). GRA bulk density values are systematically lower than densities calculated from the MAD samples by 0.2 g/cm3 (Figure F29).
6.1.1.2. Magnetic susceptibility
Changes in MS throughout Site U1606 track with the lithologic changes. MS usually appears as sharp peaks of high-amplitude variability, responding to the concentration and type of magnetic minerals deposited in the sediments. Values at Site U1606 range 9 × 10⁻⁵ to 1050 × 10−5 SI with an average of 193 × 10−5 SI (Figures F29, F30). MS shows a sharp high value peak near the seafloor in all Site U1606 holes except Hole U1606C. Those are the highest MS values, reaching over 800 × 10−5 SI. High-amplitude variability of MS values is observed in PP Units II and III, whereas Units IV–VI show an overall trend of downward increase in MS values with very low values (35 × 10−5 SI) between Units V and VI in Core 400-U1606B-39R (~343 m CSF-A).
6.1.1.3. P-wave velocity using the P-wave logger
P-wave velocities measured with the PWL are unreliable because all sections have cracks and poor contact between the sediment and the liner. The measurements show picks of unrealistically high velocities, and the lowest values are less than average seawater standards (1450 m/s). Thus, the PWL absolute values should not be considered, and the trend should be interpreted taking into account lithology and other physical property measurements collected at Site U1606 (Figure F29).
6.1.2. Natural gamma radiation
NGR values at Site U1606 oscillate between 11 and 91 counts/s with a mean of 44 counts/s. They show high-amplitude variability through Core 400-U1606B-33R (~285 m CSF-A). Although PP Units III and IV show a downward decrease, the trend of NGR values in Units II, V, and VI is constant (Figure F29). Maximum NGR values (>60 counts/s) are present in Cores 400-U1606A-12R (~100 m CSF-A), 400-U1606B-14R (~120 m CSF-A), 24R (~197 m CSF-A), 32R (~275 m CSF-A), 400-U1606C-11R (~112 m CSF-A), and 400-U1606D-11R (~100 m CSF-A).
6.1.3. Thermal conductivity
Thermal conductivity at Site U1606 varies between 1.0 W/(m·K) in Core 400-U1606A-12R (105 m CSF-A) and 4.2 W/(m·K) in Core 400-U1606D-2R (~15 m CSF-A) (Figure F29). The mean value of thermal conductivity is 1.8 W/(m·K). There is a general decreasing trend in values with depth through Core 400-U1606B-37R (~332 m CSF-A). The observed thermal conductivity does not present a clear dependence on sediment facies.
6.1.4. Point magnetic susceptibility
MSP measurements are generally higher than values obtained from the WRMSL (Figure F29). In addition, MSP data show higher variability due to the smaller integration volume of the sensor (~1 cm; 1σ) compared to the loop (~18 cm; 1σ) used for the WRMSL (Weber et al., 1997). The general trends of MS and MSP are, however, comparable at Site U1606.
6.1.5. Color reflectance
L* and b* values are relatively constant at Site U1606. However, they show an out of phase trend in the lowermost 180 m of Hole U1606B (Figure F29), with the lowest L* values matching intervals of high b* values between 170 and 350 m CSF-A. The highest a* values are within PP Unit I, followed by an overall decreasing trend to the bottom of the site.
6.1.6. Gantry
Results of section-half gantry measurements for Holes U1606A and U1606B are compiled in Figure F31. Correlation between GRA and MAD density and PWL and PWC values is shown in Figure F29.
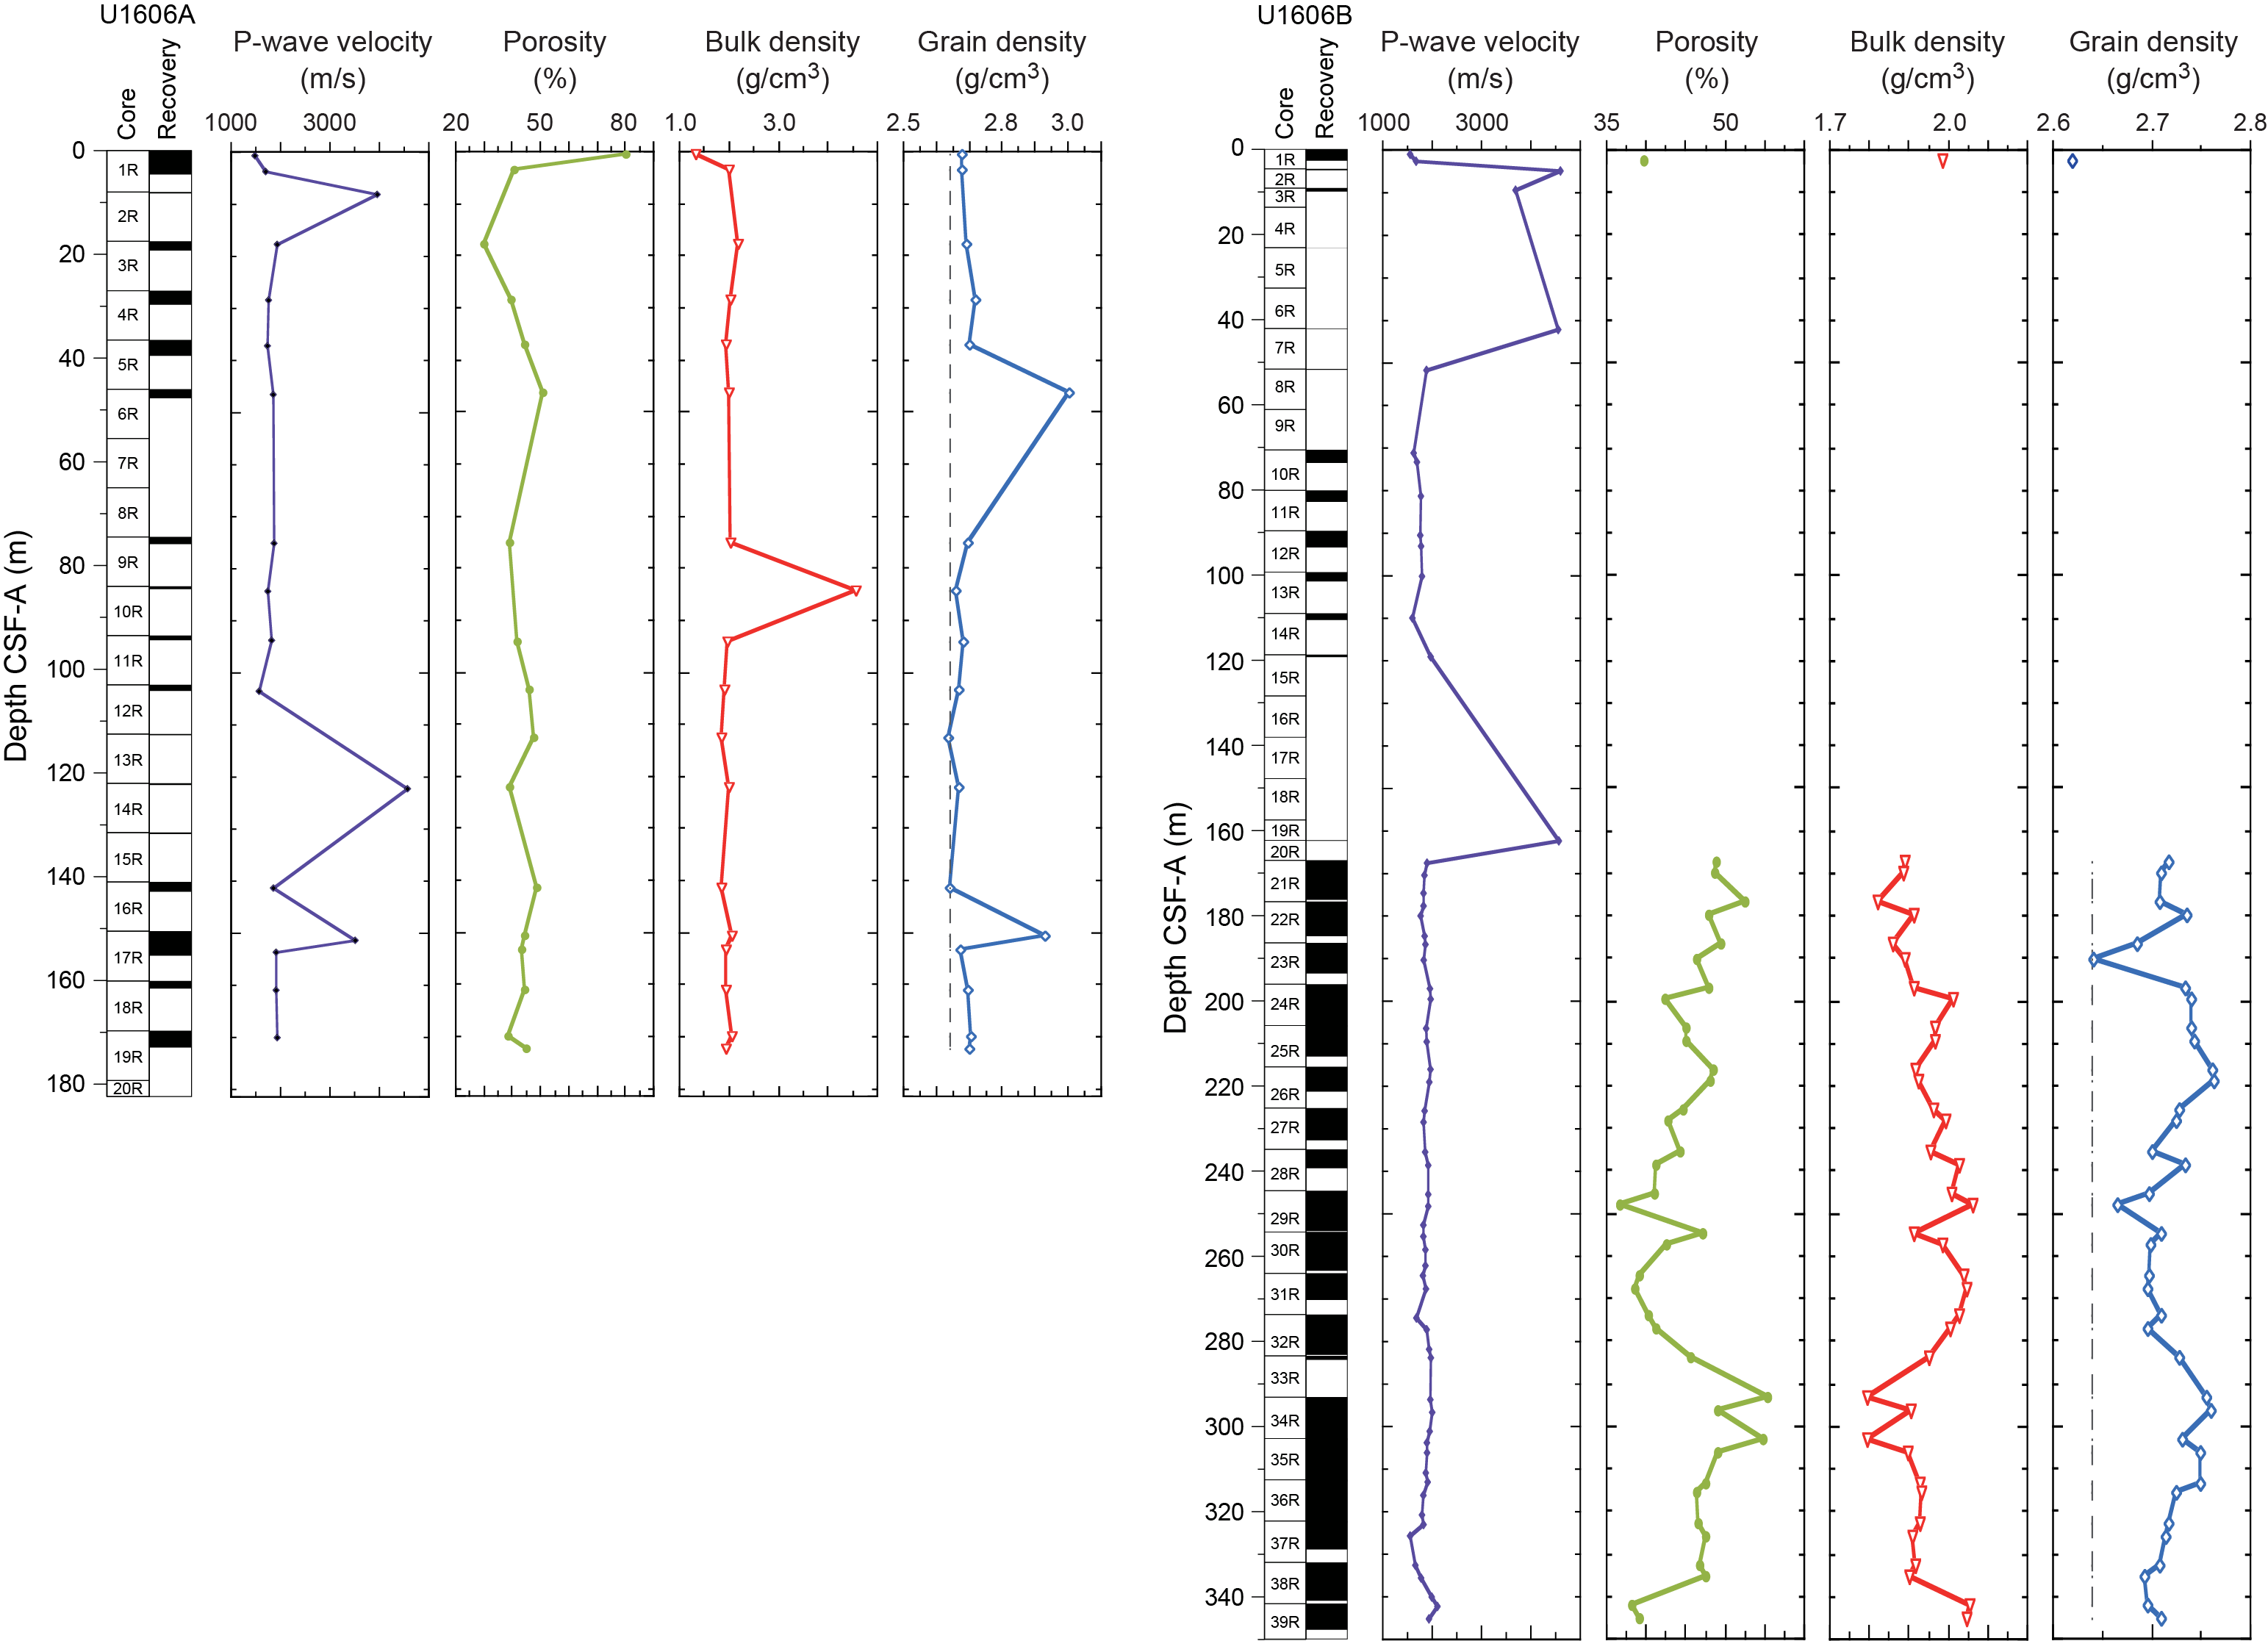
Figure F31. Gantry and MAD analyses.
6.1.6.1. P-wave velocity using the P-wave caliper
Discrete P-wave measurements were carried out using the PWC (see Physical properties in the Expedition 400 methods chapter [Knutz et al., 2025a]) on every core with recovery from Site U1606. Measurement resolution within each core varied depending on lithology, recovery, and quality, with at least one measurement per core. PWC values range 1555–4600 m/s, and the very high values correspond to measurements on igneous rocks in sections of washed gravel, which are not representative of the average PWC value of the formation. The average PWC values of the sedimentary intervals are 1750 m/s for Hole U1606A, 1873 m/s for Hole U1606B, 1855 m/s for Hole U1606C, and 1781 m/s for Hole U1606D. PWC values present a relatively constant trend downhole at Site U1606 (Figures F29, F31).
6.1.6.2. Moisture and density
Sediment samples were taken from the working halves of split cores for measuring MAD for Holes U1606A and U1606B. Sample resolution varied depending on lithology, recovery, and core quality but was about two samples per core. Bulk density values were calculated from moisture and volume measurements (see Physical properties in the Expedition 400 methods chapter [Knutz et al., 2025a]). MAD samples were taken adjacent to the PWC measurement when possible so that a correlation between P-wave velocity and bulk density can be made. A total of 56 samples were taken for MAD measurements for Site U1606: 18 from Hole U1606A and 38 from Hole U1606B.
The density trend observed from MAD density values generally correlates with the trend of GRA bulk density measured on the WRMSL (Figure F29). However, absolute values of MAD density are about 0.2 g/cm3 higher than GRA density values. Bulk density values for Site U1606 range 1.3–4.6 g/cm3 with a mean of 2.0 g/cm3. MAD density likely reflects the grain density of the major lithologic components at this site: quartz (2.65 g/cm3), biotite (~3 g/cm3), common clays, and feldspars (~2.56 g/cm3).
Porosity represents the percent of pore space of wet sediment volume and generally decreases downhole as the sediments compact (Figure F31). Discrete porosity values at Site U1606 range ~30%–80% with an average porosity of 45%. Porosity at Site U1606 is constant in the uppermost 170 m, conditioned by the low core recovery obtained in this interval. However, the variability in porosity is greater from ~170 m CSF-A to the bottom of the site, with minimum values in Core 400-U1606B-29R (~250 m CSF-A) and maximum porosity in Core 34R (~295 m CSF-A).
6.2. Core-log-seismic correlation
The seismic facies of the units defined by physical properties are described in Table T14. General changes in seismic facies in the seismic profile correspond to changes in the physical properties. Correlation of the seismic signal in two-way traveltime with depth in meters was achieved through the construction of distinct velocity models. At Site U1606, velocity models were generated considering the average P-wave velocity used in the proposal (1950 m/s) and the P-wave velocities measured in the laboratory (mainly PWC). Site U1606 was not logged and thus lacks a robust velocity model provided by downhole methods such as the Dipole Sonic Imager (DSI; sonic) or VSI experiment (see Downhole measurements in the Expedition 400 methods chapter [Knutz et al., 2025a]). The laboratory PWL data are unreliable, as discussed above, and do not provide a velocity profile that could be used for time-depth correlations. The PWC values are systematically lower than expected for this type of recovered lithologies, but they show a regular trend downhole that provides clues for the time-depth correlations.
To achieve a working time-depth relationship for Site U1606, we used GRA density values measured for Hole U1606B to generate a synthetic seismogram. The input velocity was based on a theoretical function, and the wavelength was taken from the seismic profile LAKO19_1033 (Knutz et al., 2022) (Figure F29). Five tie points were established between the seismic profile and the synthetic seismogram. Minor shifts were prioritized against major shifts, and lithologic constraints were taken into consideration. A final coherence of 63% was achieved on the tie (Figure F32). The interval velocities of the final model respond to the general trend observed for PWC values (Figure F29). These interval velocities were applied to Holes U1606A, U1606C, and U1606D, with local variations based on lithologic changes (Table T15). The resulting time-depth relationships have been applied in the figures of this chapter.
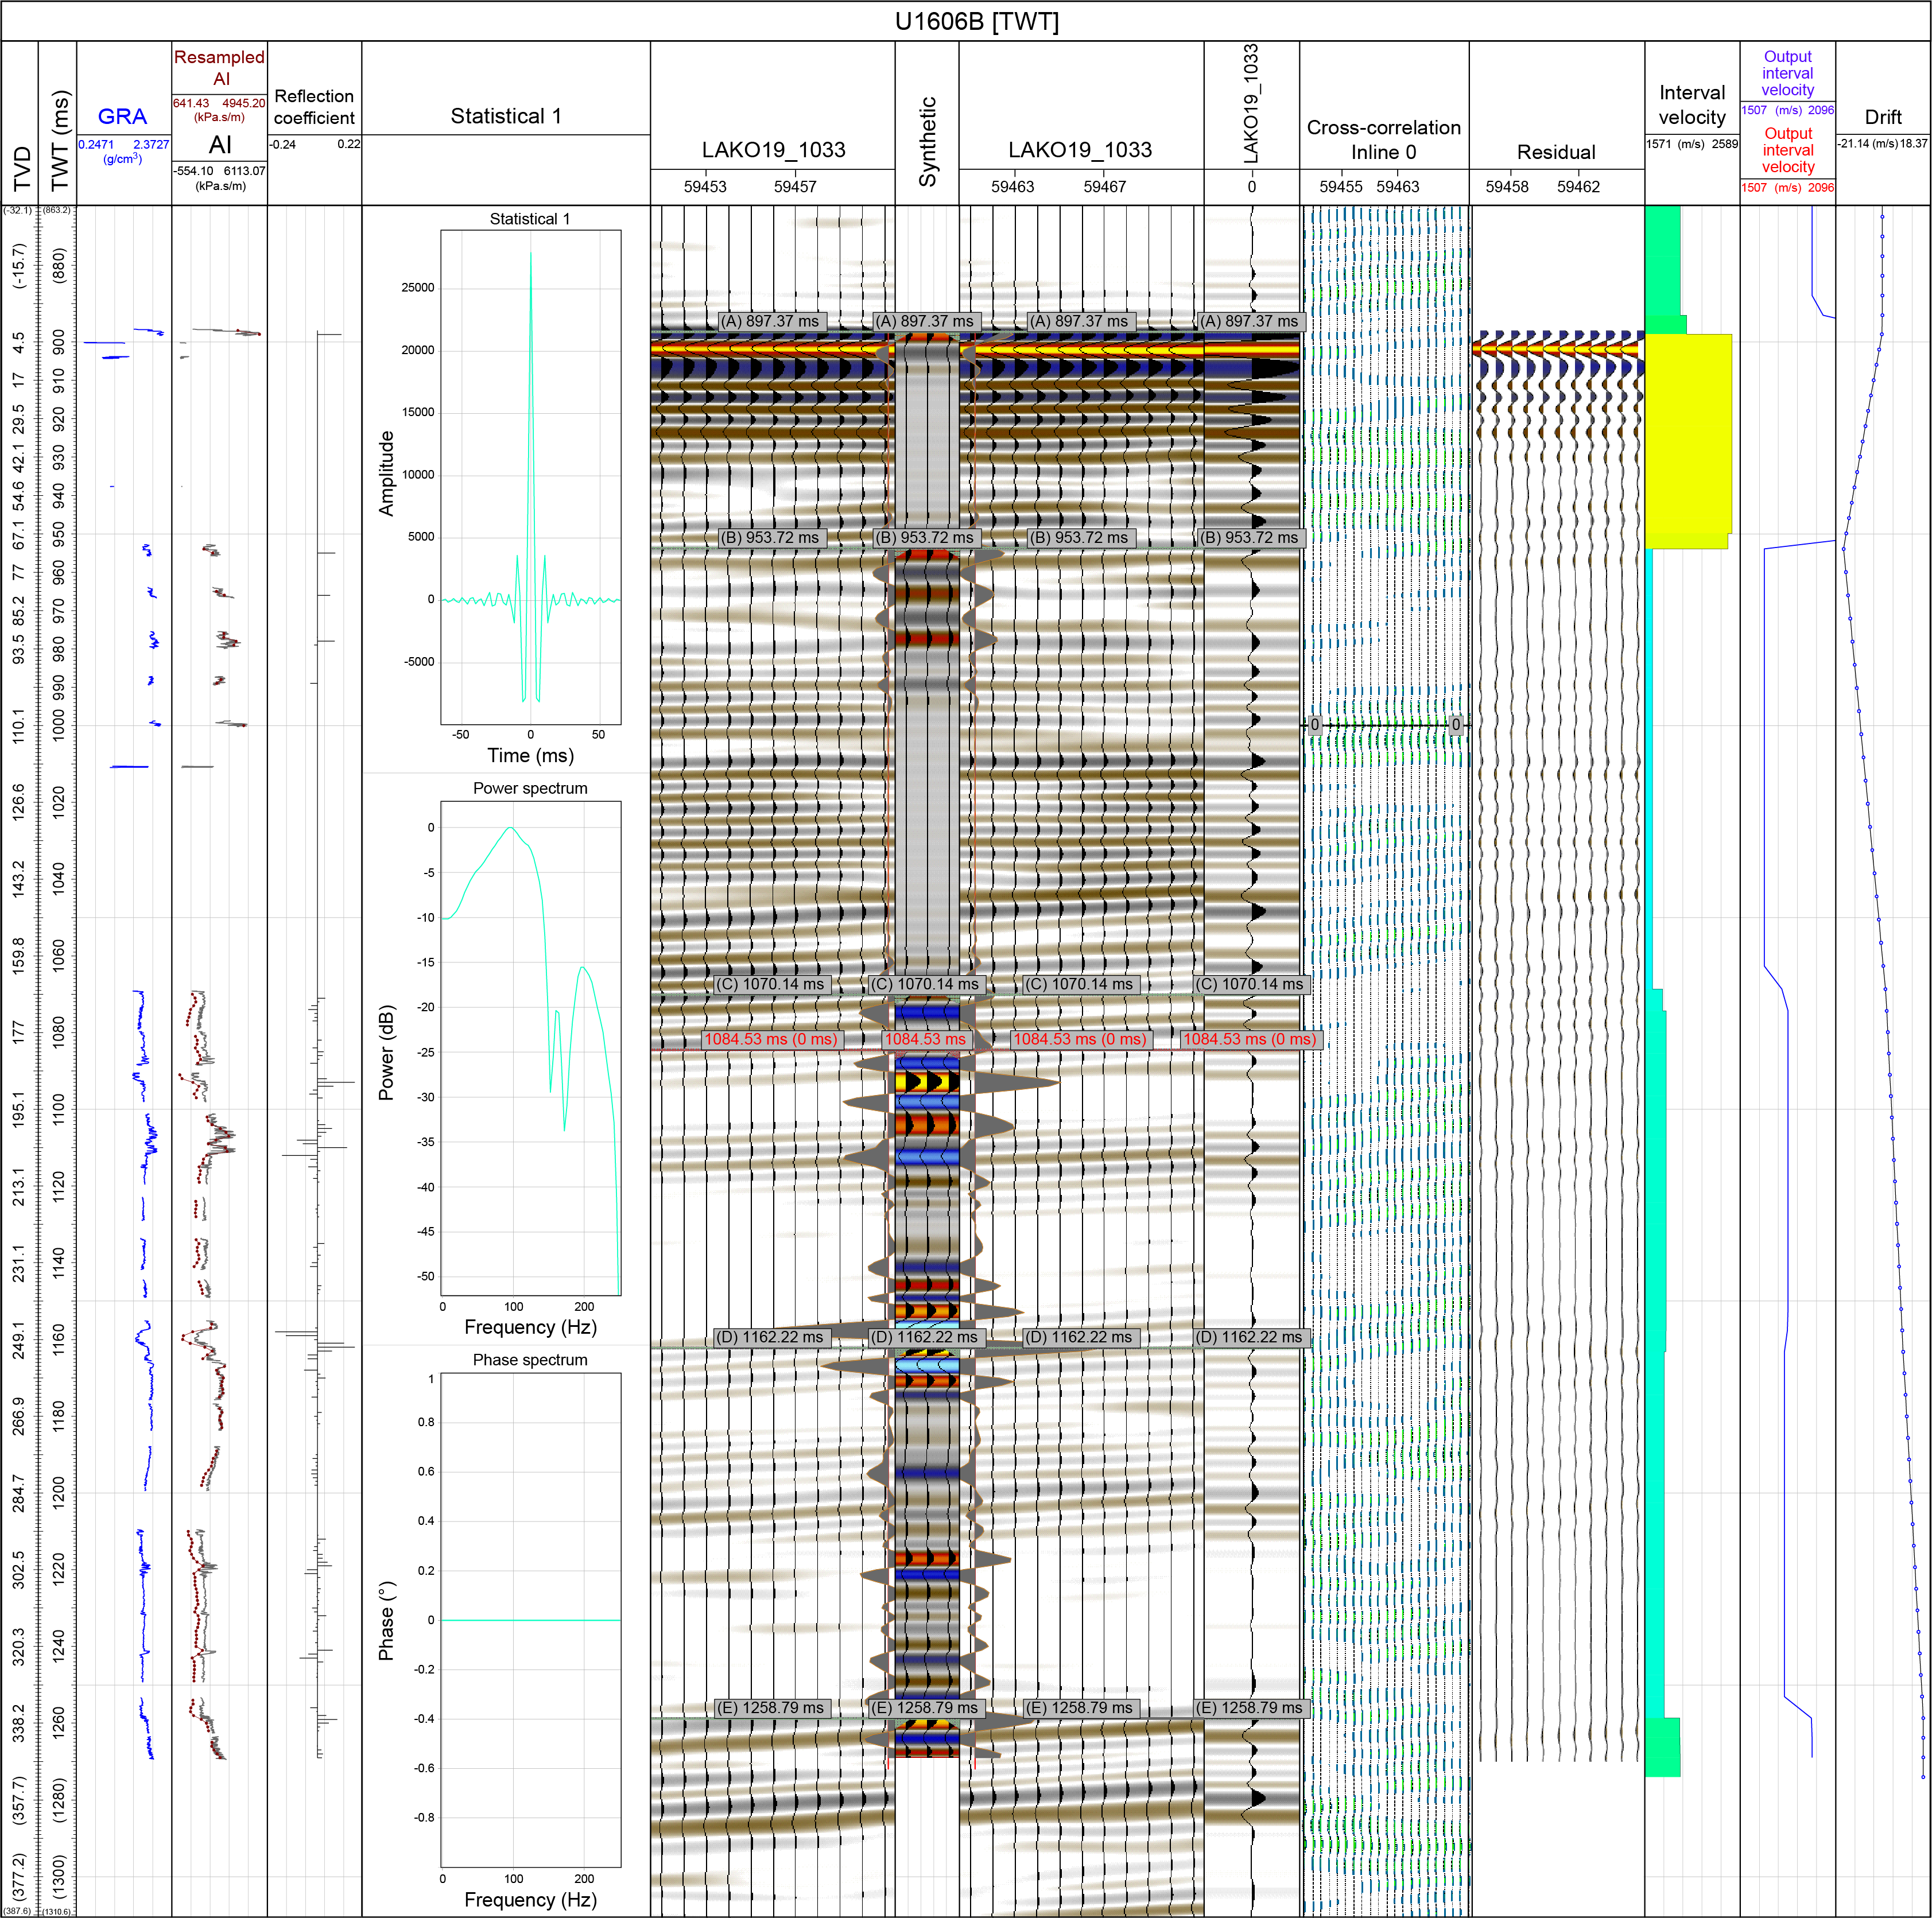
Figure F32. Synthetic seismogram from GRA density data.
7. Geochemistry
Samples for headspace gas, IW chemistry, and bulk sediment geochemistry were analyzed at Site U1606. Headspace hydrocarbon gas measurements showed low concentrations in the uppermost 10 m of Holes U1606A and U1606B, and below this depth, high concentrations of methane were present to the bottom of Holes U1606A, U1606B, and U1606D (up to 87,400 ppmv). The main findings from IW analysis include low salinity measurements (as low as 12) in the upper part of the site, between approximately 20 and 140 m CSF-A. Gradual downhole increases in salinity, sodium, chloride, and bromide occur below approximately 150 m CSF-A. Elemental analysis of solid material revealed average concentrations of 0.36 wt% organic carbon and 0.05 wt% nitrogen throughout Holes U1606A and U1606B.
7.1. Volatile hydrocarbons
As part of routine environmental protection and safety monitoring, headspace hydrocarbons were analyzed at Holes U1606A, U1606B, and U1606D (Figure F33). A total of 69 headspace samples were collected across the three holes. Methane (CH4) concentrations were below 25 ppmv within the uppermost 10 m (Holes U1606A and U1606B) and then increased to average concentrations of 10,100 ppmv in Hole U1606A, 32,700 ppmv in Hole U1606B, and 8,000 ppmv in Hole U1606D across depths below 10 m CSF-A (89–117 m CSF-A in Hole U1606D). Of the heavier hydrocarbon gases, only ethane (C2H6) was detected at low concentrations, with values mostly below 20 ppmv. The resulting C1/C2 ratios were between 1,800 and 17,800.
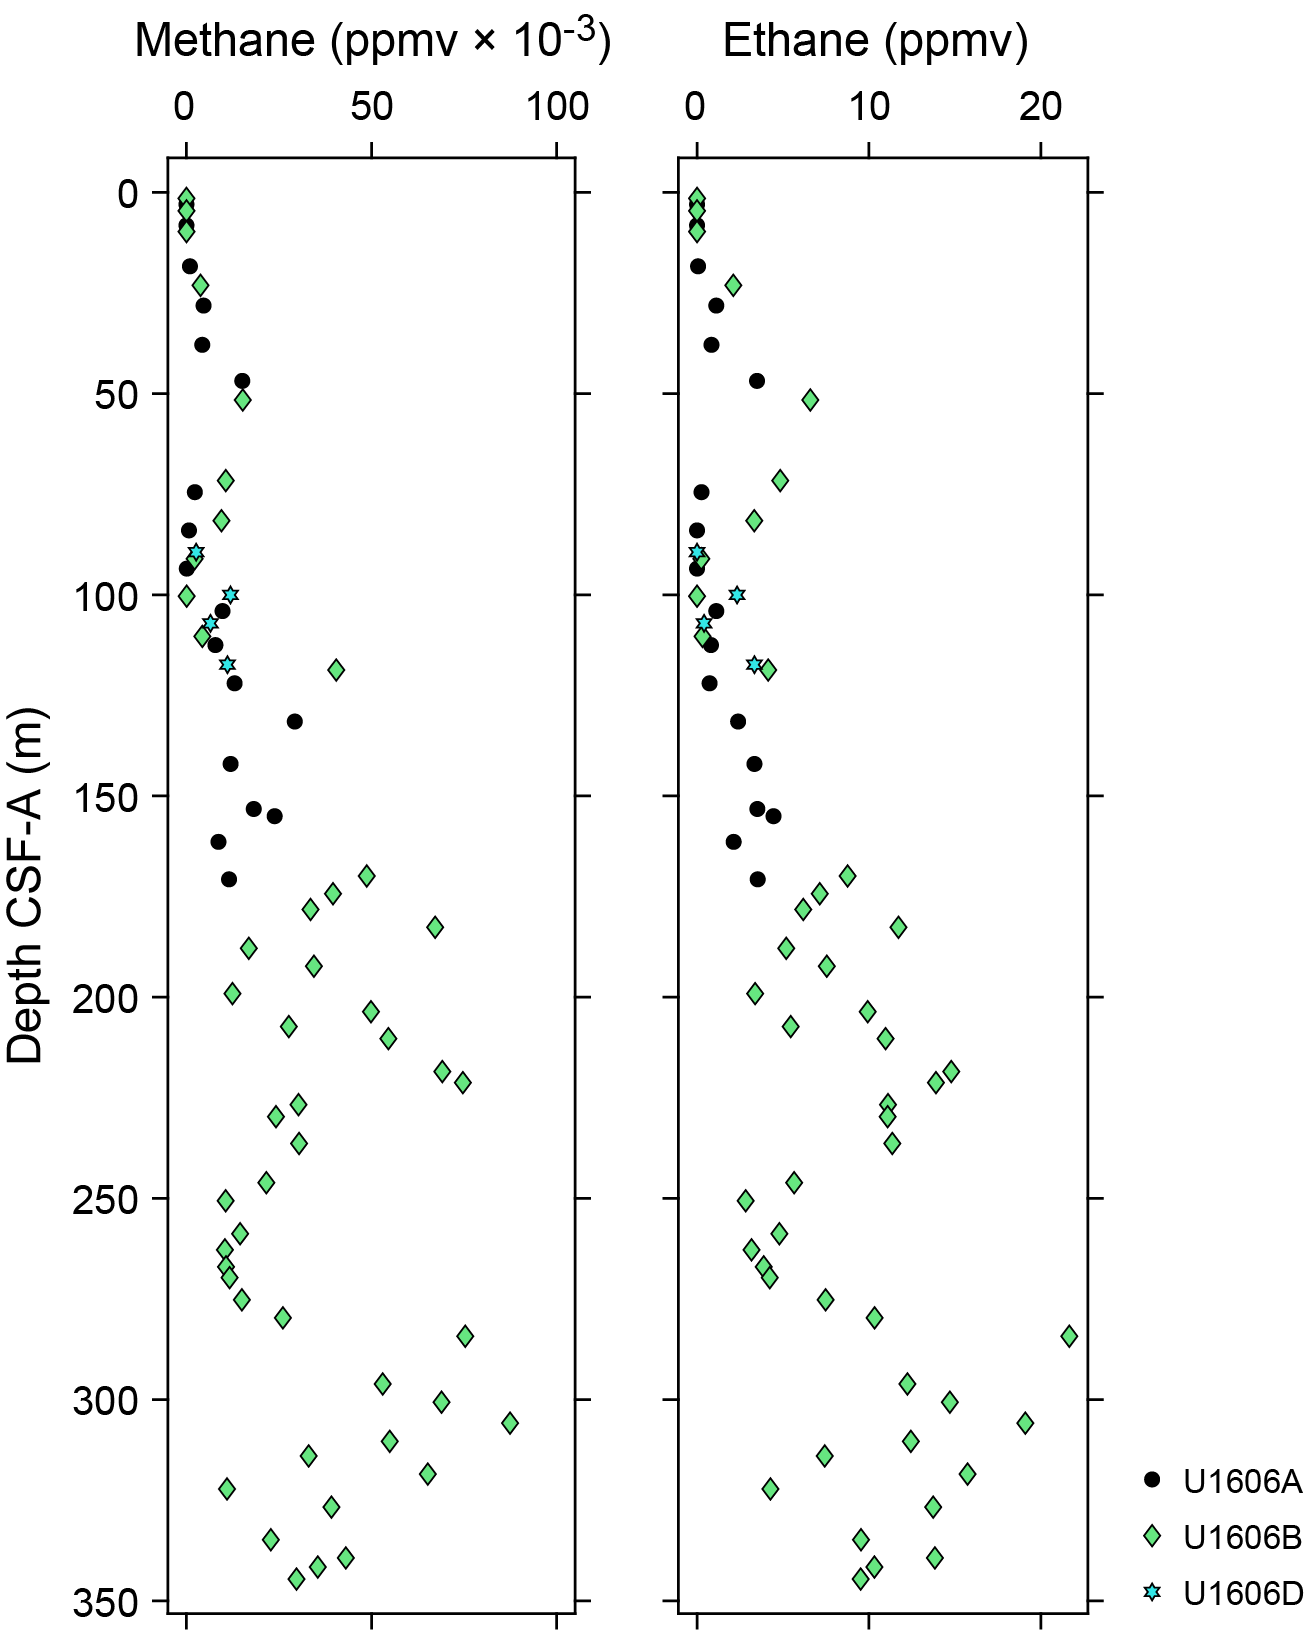
Figure F33. Hydrocarbon gas concentrations.
7.2. Interstitial water chemistry
A total of 35 IW samples were squeezed from 5 or 10 cm whole-round samples. Typical samples yielded 15–30 cm3 of water for subsequent analysis. Additionally, 8 Rhizon samples were taken from the uppermost 5 m of Holes U1606A and U1606B, and mudline samples were taken from Holes U1606A and U1606B. The majority of the IW data are from Holes U1606A and U1606B, with some overlap between the sampled depths. Where there was overlap, measured geochemical properties of these waters often differed substantially, particularly in the interval 50–100 m CSF-A. This difference may be attributed to differences in the host sediment because these holes were cored/drilled ~700 m apart, with seismic reflectors differing as much as 50 m in depth between the holes.
7.2.1. pH and alkalinity
The results for pH and alkalinity measurements are shown in Figure F34. The measured pH values range 7.50–8.30, increasing abruptly in the uppermost 30 m to a maximum of 8.30 at 28.04 m CSF-A. Below this depth, pH decreases roughly linearly downhole to ~7.6 at the bottom of the site. Alkalinity values increase from a minimum of 2.4 mM at the mudline to 8.1 mM at 18.28 m CSF-A. Below this depth, there is some variability, even between holes, with four Hole U1606B samples being noticeably higher in alkalinity than corresponding samples from Hole U1606A between 75 and 100 m CSF-A. Below this depth, alkalinity generally decreases consistently.
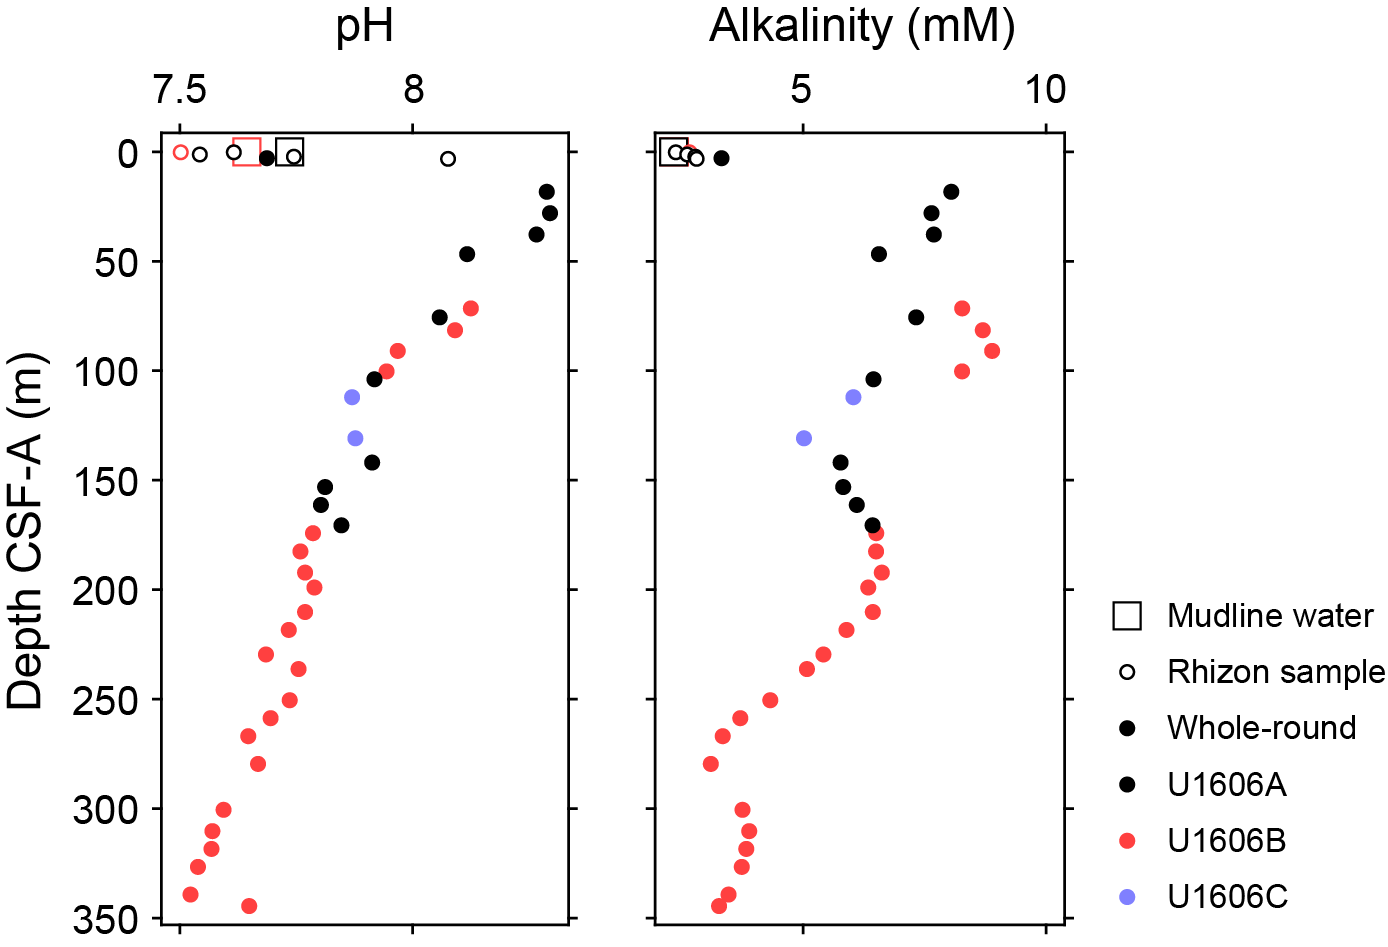
Figure F34. IW pH and alkalinity.
7.2.2. Salinity, sodium, chloride, lithium, potassium, and bromide
Salinity and dissolved sodium, chloride, lithium, potassium, and bromide concentrations are shown in Figure F35. Salinity decreases sharply from mudline values of 34 to a minimum of 12 at 28.04 m CSF-A. Salinity values range 12–17 between 8.28 and 141.94 m CSF-A. Salinity increases with depth below 141.94 m CSF-A, with a value of 31 at the bottom of Hole U1606B. Sodium and chloride show trends similar to salinity, with sharp decreases in the uppermost ~30 m and gradual increases with depth. There appears to be an offset in sodium and chloride trends between Holes U1606A and U1606B. Hole U1606B shows higher chloride and sodium values than Hole U1606A at the same depths. Sodium concentrations (as measured by ion chromatography) decrease from a maximum of 488.3 mM at the mudline to a minimum of 196.3 mM at 28.04 m CSF-A. Below this depth, sodium values consistently increase to around 350 mM at the bottom of Hole U1606B. Chloride decreases from a maximum value of 552.5 mM at the mudline to a minimum of 216.7 at 28.04 m CSF-A. Below this depth, the value generally increases to around 550 mM at the bottom of Hole U1606B.

Figure F35. IW salinity, Na, Cl, Li, K, and Br.
Lithium decreases from a mudline value of 25.7 µM to a minimum of 3.1 µM at 28.04 m CSF-A and then increases steadily downhole to 174.19 m CSF-A. From 174.19 to 310.27 m CSF-A, lithium concentrations are consistently between 20 and 23 µM. Below 310.27 m CSF-A, lithium values increase downhole, reaching a maximum of 27.0 µM.
Potassium (as measured by inductively coupled plasma–atomic emission spectroscopy [ICP-AES]) decreases from a maximum value of 11 mM at 1.25 m CSF-A to a minimum of 1.3 mM at 28.04 m CSF-A. Below 18.28 m CSF-A, potassium values generally range 1–3 mM, with a local maximum around 170–200 m CSF-A.
Bromide decreases from a mudline value of 0.8 mM to a minimum of 0.3 mM at 28.04 m CSF-A and then increases to the bottom of the site, reaching a maximum of 1.4 mM at 339.24 m CSF-A.
7.2.3. Ammonium, manganese, iron, sulfate, phosphate, and boron
Ammonium, manganese, iron, sulfate, phosphate, and boron concentrations are shown in Figure F36. IW ammonium concentrations increase downhole in Holes U1606A and U1606B. Concentrations increase from a mudline value of 25 µM to a maximum of 6391 µM in the deepest sample collected from Hole U1606A at 170.61 m CSF-A and to a maximum of 5542 µM at 229.59 m CSF-A in Hole U1606B, below which ammonium decreases slightly in concentration. In the interval where both Holes U1606A and U1606B were sampled (75–175 m CSF-A), the two holes have very different profiles, indicating that the differences in host rock may have played a significant role in governing ammonium concentrations.
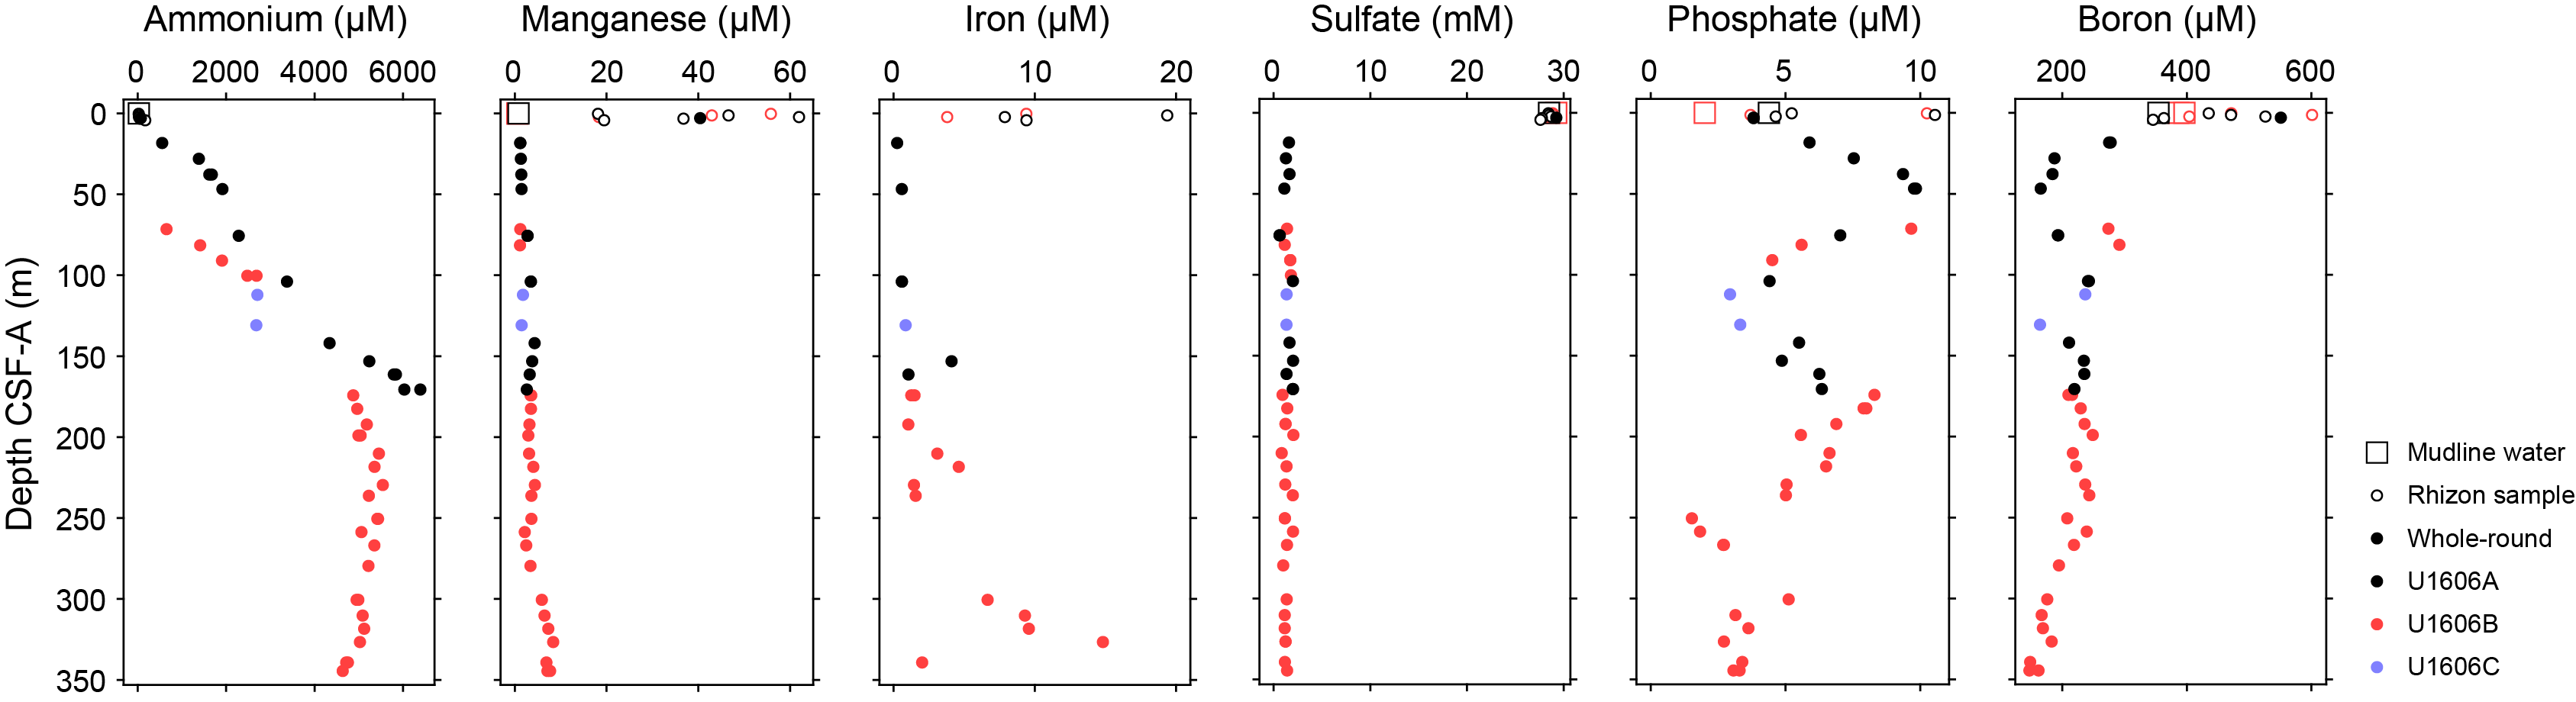
Figure F36. IW ammonium, Mn, Fe, sulfate, phosphate, and B.
Dissolved manganese increases to a maximum of 62 µM within the uppermost 5 m and then decreases to ~1 µM by 18.28 m CSF-A. Manganese concentrations are between 1 and 10 µM from 18.28 m CSF-A to the bottom of the site. Iron concentrations range from below the ICP-AES detection limit to a maximum of 19 µM at 1.25 m CSF-A and show a similar increase and decrease to that of manganese within the uppermost 5 m. Iron concentrations also increase below ~300 m CSF-A. Sulfate concentrations are around ~28 mM within the uppermost 5 m and mostly range 0–2 mM from 18.28 m CSF-A to the bottom of the site.
Phosphate concentrations range ~2–11 µM downhole. The mudline samples at Holes U1606A and U1606B differ by ~2 µM, although all holes record a seemingly congruent trend with one another downhole, showing multiple maxima and minima while remaining consistently low.
Boron shows an overall decrease downhole. Concentrations increase from mudline values of ~380 µM to a maximum concentration of 601 µM at 1.25 m CSF-A in Hole U1606A. Below this depth, values decrease monotonically to a concentration of 147 µM at 344.49 m CSF-A at the bottom of Hole U1606B.
7.2.4. Calcium, magnesium, strontium, silicon, and barium
Calcium, magnesium, strontium, silicon, and barium concentrations are shown in Figure F37. Calcium concentrations (measured by ICP-AES) decrease from 9.7 mM at 0.25 m CSF-A to 2.0 mM at 18.28 m CSF-A. Below this depth, values remain low (<5 mM) to around 100 m CSF-A, below which calcium values increase monotonically to 25.4 mM at the bottom of Hole U1606B.
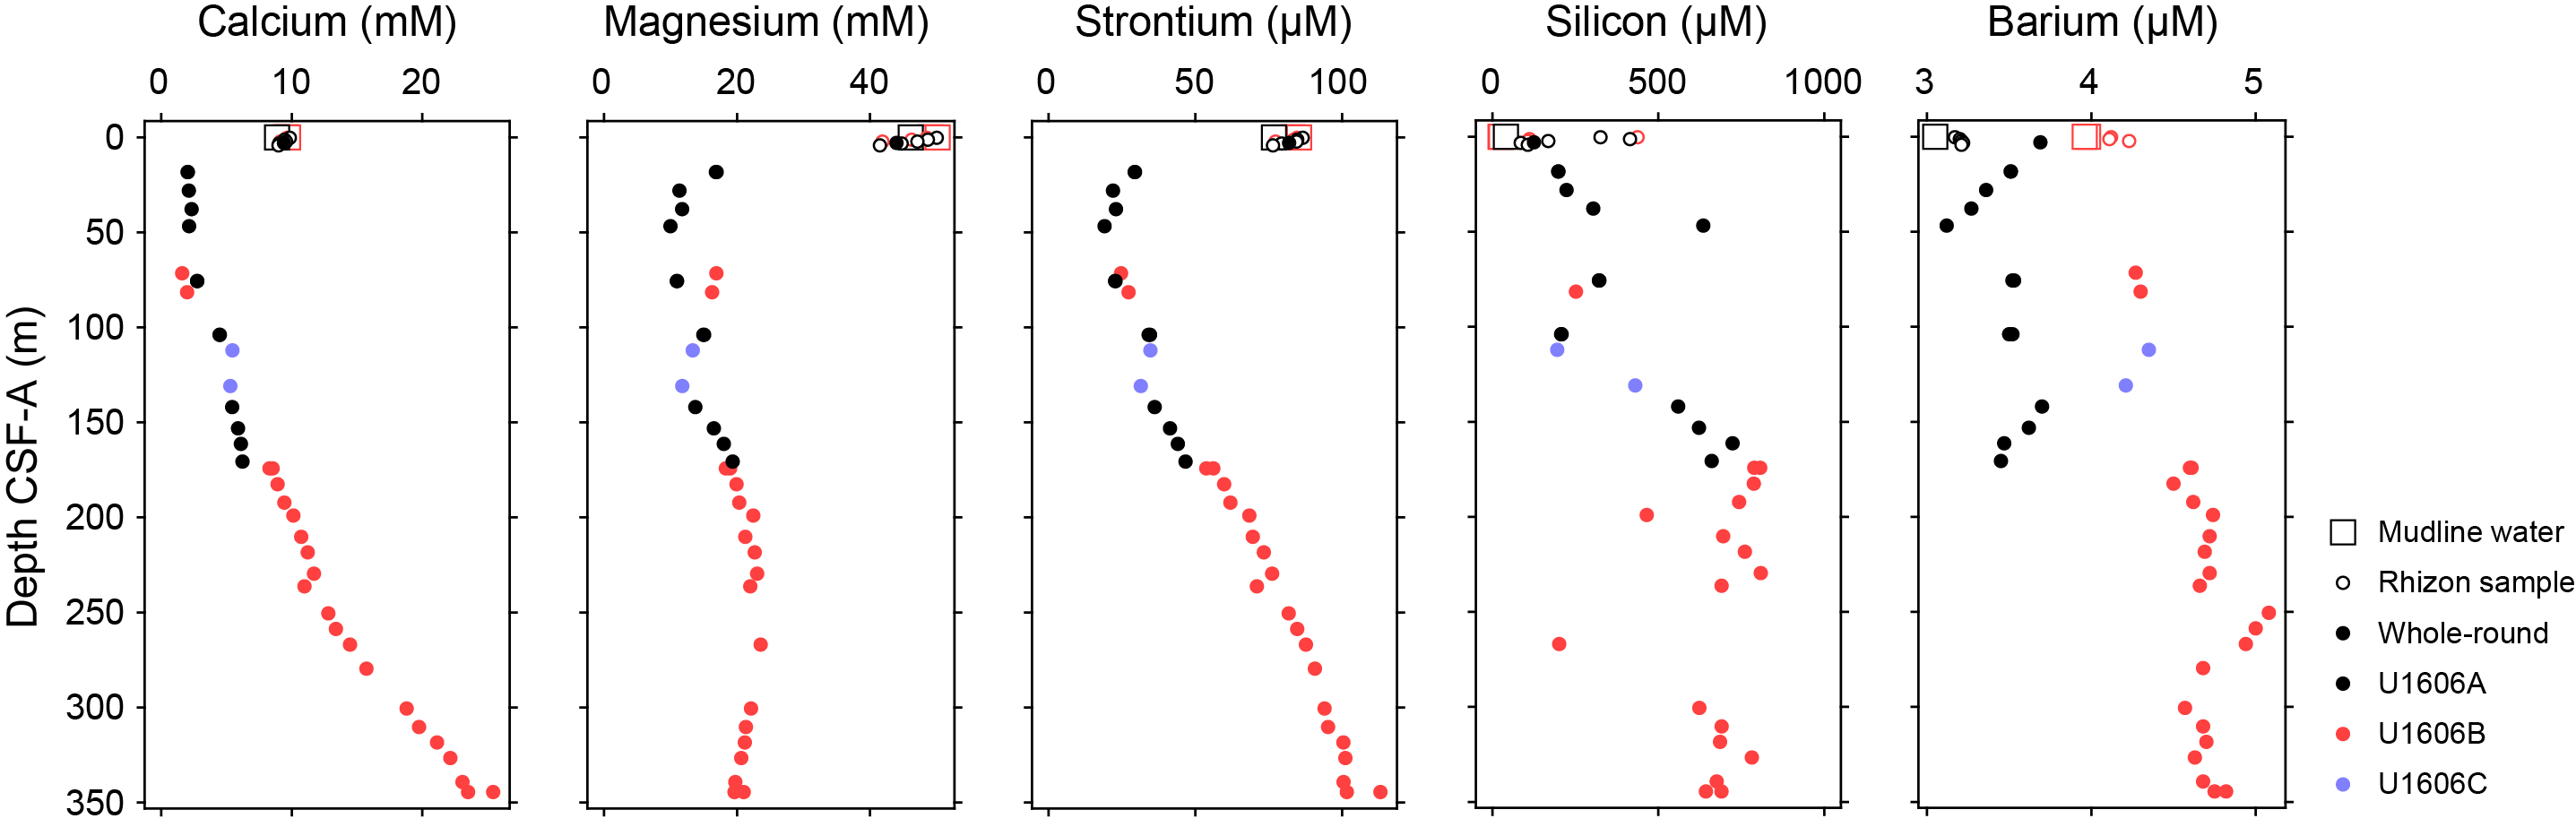
Figure F37. IW Ca, Mg, Sr, Si, and Ba.
Magnesium concentrations (as measured by ICP-AES) decrease from a maximum of 50.2 mM at the mudline to a minimum of 10.0 mM at 46.75 m CSF-A, below which concentrations remain largely unchanged downhole, although with a broad maximum of ~21 mM between 225 and 300 m CSF-A.
Dissolved strontium decreases in concentration from a maximum of 85.3 µM at the mudline to a minimum of 19.1 µM at 46.75 m CSF-A. Below this depth, strontium concentrations increase consistently to a concentration of 113.1 µM at the bottom of Hole U1606B.
Dissolved silicon was highly variable but consistently elevated in pore waters compared to the mudline concentration of 24.6 µM. Values generally increase downhole, reaching a broad maximum of 600–800 µM below 180 m CSF-A.
Dissolved barium concentrations generally increase downhole from a minimum of 3.1 µM at the mudline to a broad maximum between 4.5 and 5.1 µM below 174.19 m CSF-A in Hole U1606B. Barium concentrations are consistently ~1 µM higher in Holes U1606B and U1606C compared to Hole U1606A at all depths, including mudline water samples. This offset in barium concentrations may be attributed to instrumental drift, especially because barium values are relatively low.
7.3. Bulk sediment geochemistry
7.3.1. Carbon, nitrogen, and carbonate
The shipboard solid phase analysis at Site U1606 from all major lithostratigraphic units identified consisted of measurements of CaCO3, total carbon (TC), and total nitrogen (TN) using shipboard sampling. A total of 44 samples were collected and analyzed across Holes U1606A (0–173 m CSF-A) and U1606B (168–344 m CSF-A). Total organic carbon (TOC) was calculated from measurements of CaCO3 and TC. The combined record of CaCO3, TOC, and TN contents (weight percent) at Site U1606 is shown in Figure F38. The CaCO3 content shows an overall increasing trend with depth, with an average of 0.55 wt% in the uppermost 230 m and overall higher values below 230 m CSF-A with an average CaCO3 content of 1.18 wt%. Although this contrast is also seen in the TC content (0.07 versus 0.14 wt%), we observed that the concentrations of TC, TOC, and TN are more consistent throughout the combined Site U1606 record, with average concentrations of 0.45, 0.36, and 0.05 wt%, respectively.
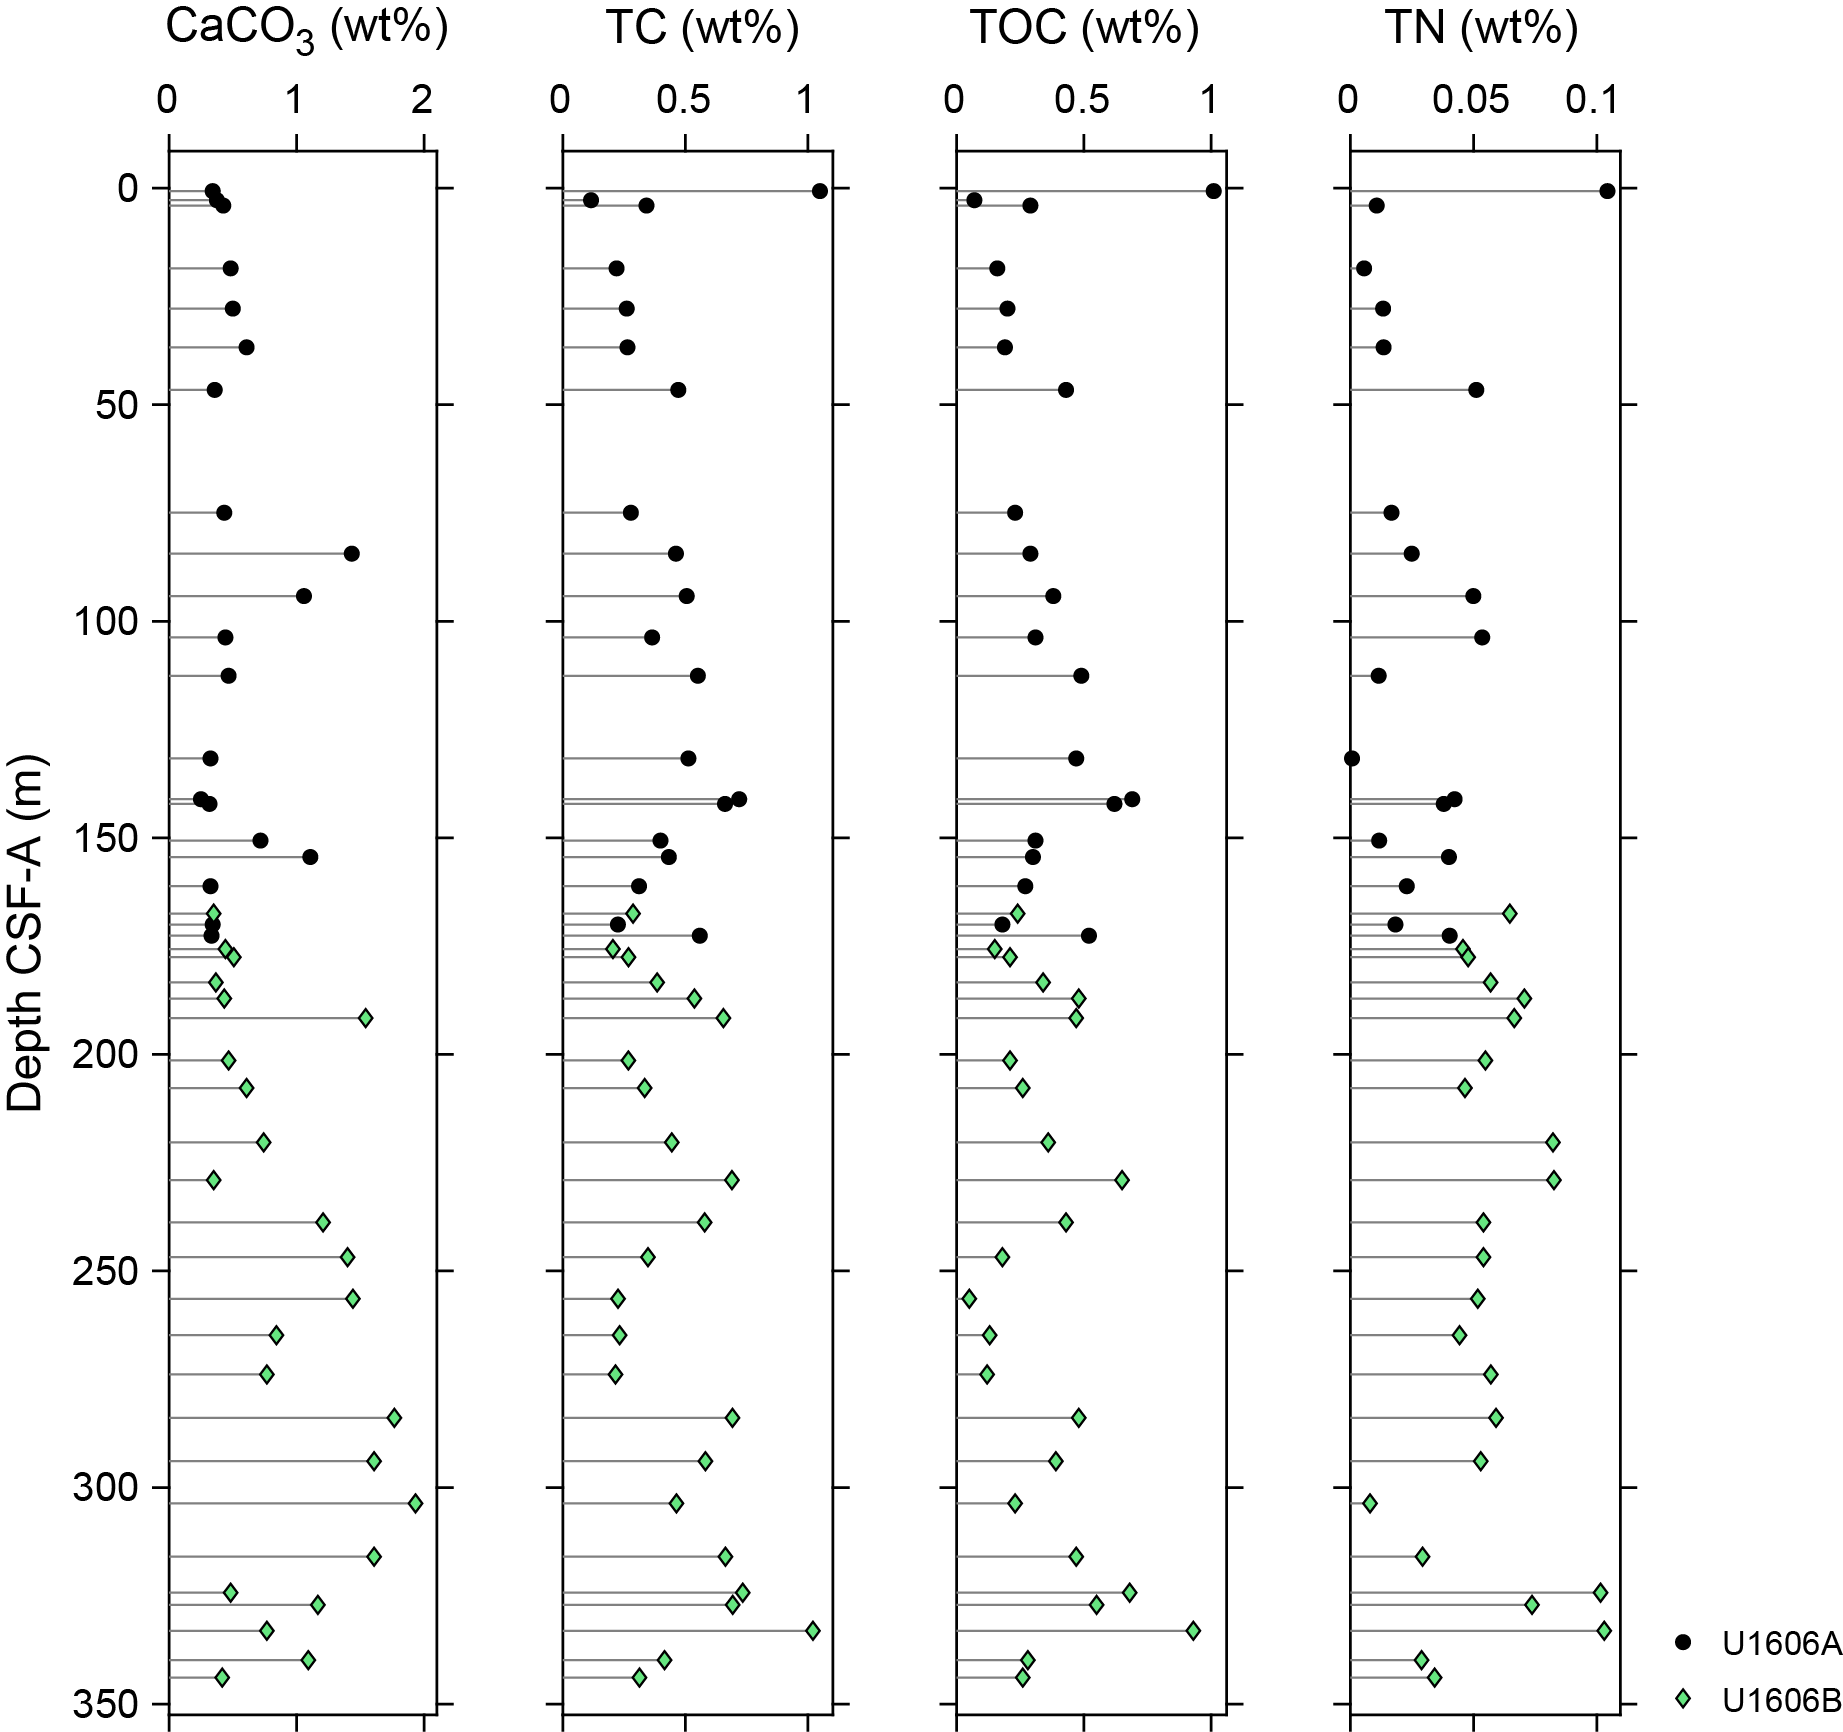
Figure F38. CaCO3, TC, TOC, and TN.
8. Stratigraphic correlation
Site U1606 includes four holes that are located far apart from each other, and their recovery is generally low (see Operations). All holes were drilled on the same seismic line (Figure F39). Considering the low recovery and the large distance between the holes at Site U1606 (181 to 598 m), the standard procedure for stratigraphic correlation could not be implemented (see Stratigraphic correlation in the Expedition 400 methods chapter [Knutz et al., 2025a]).
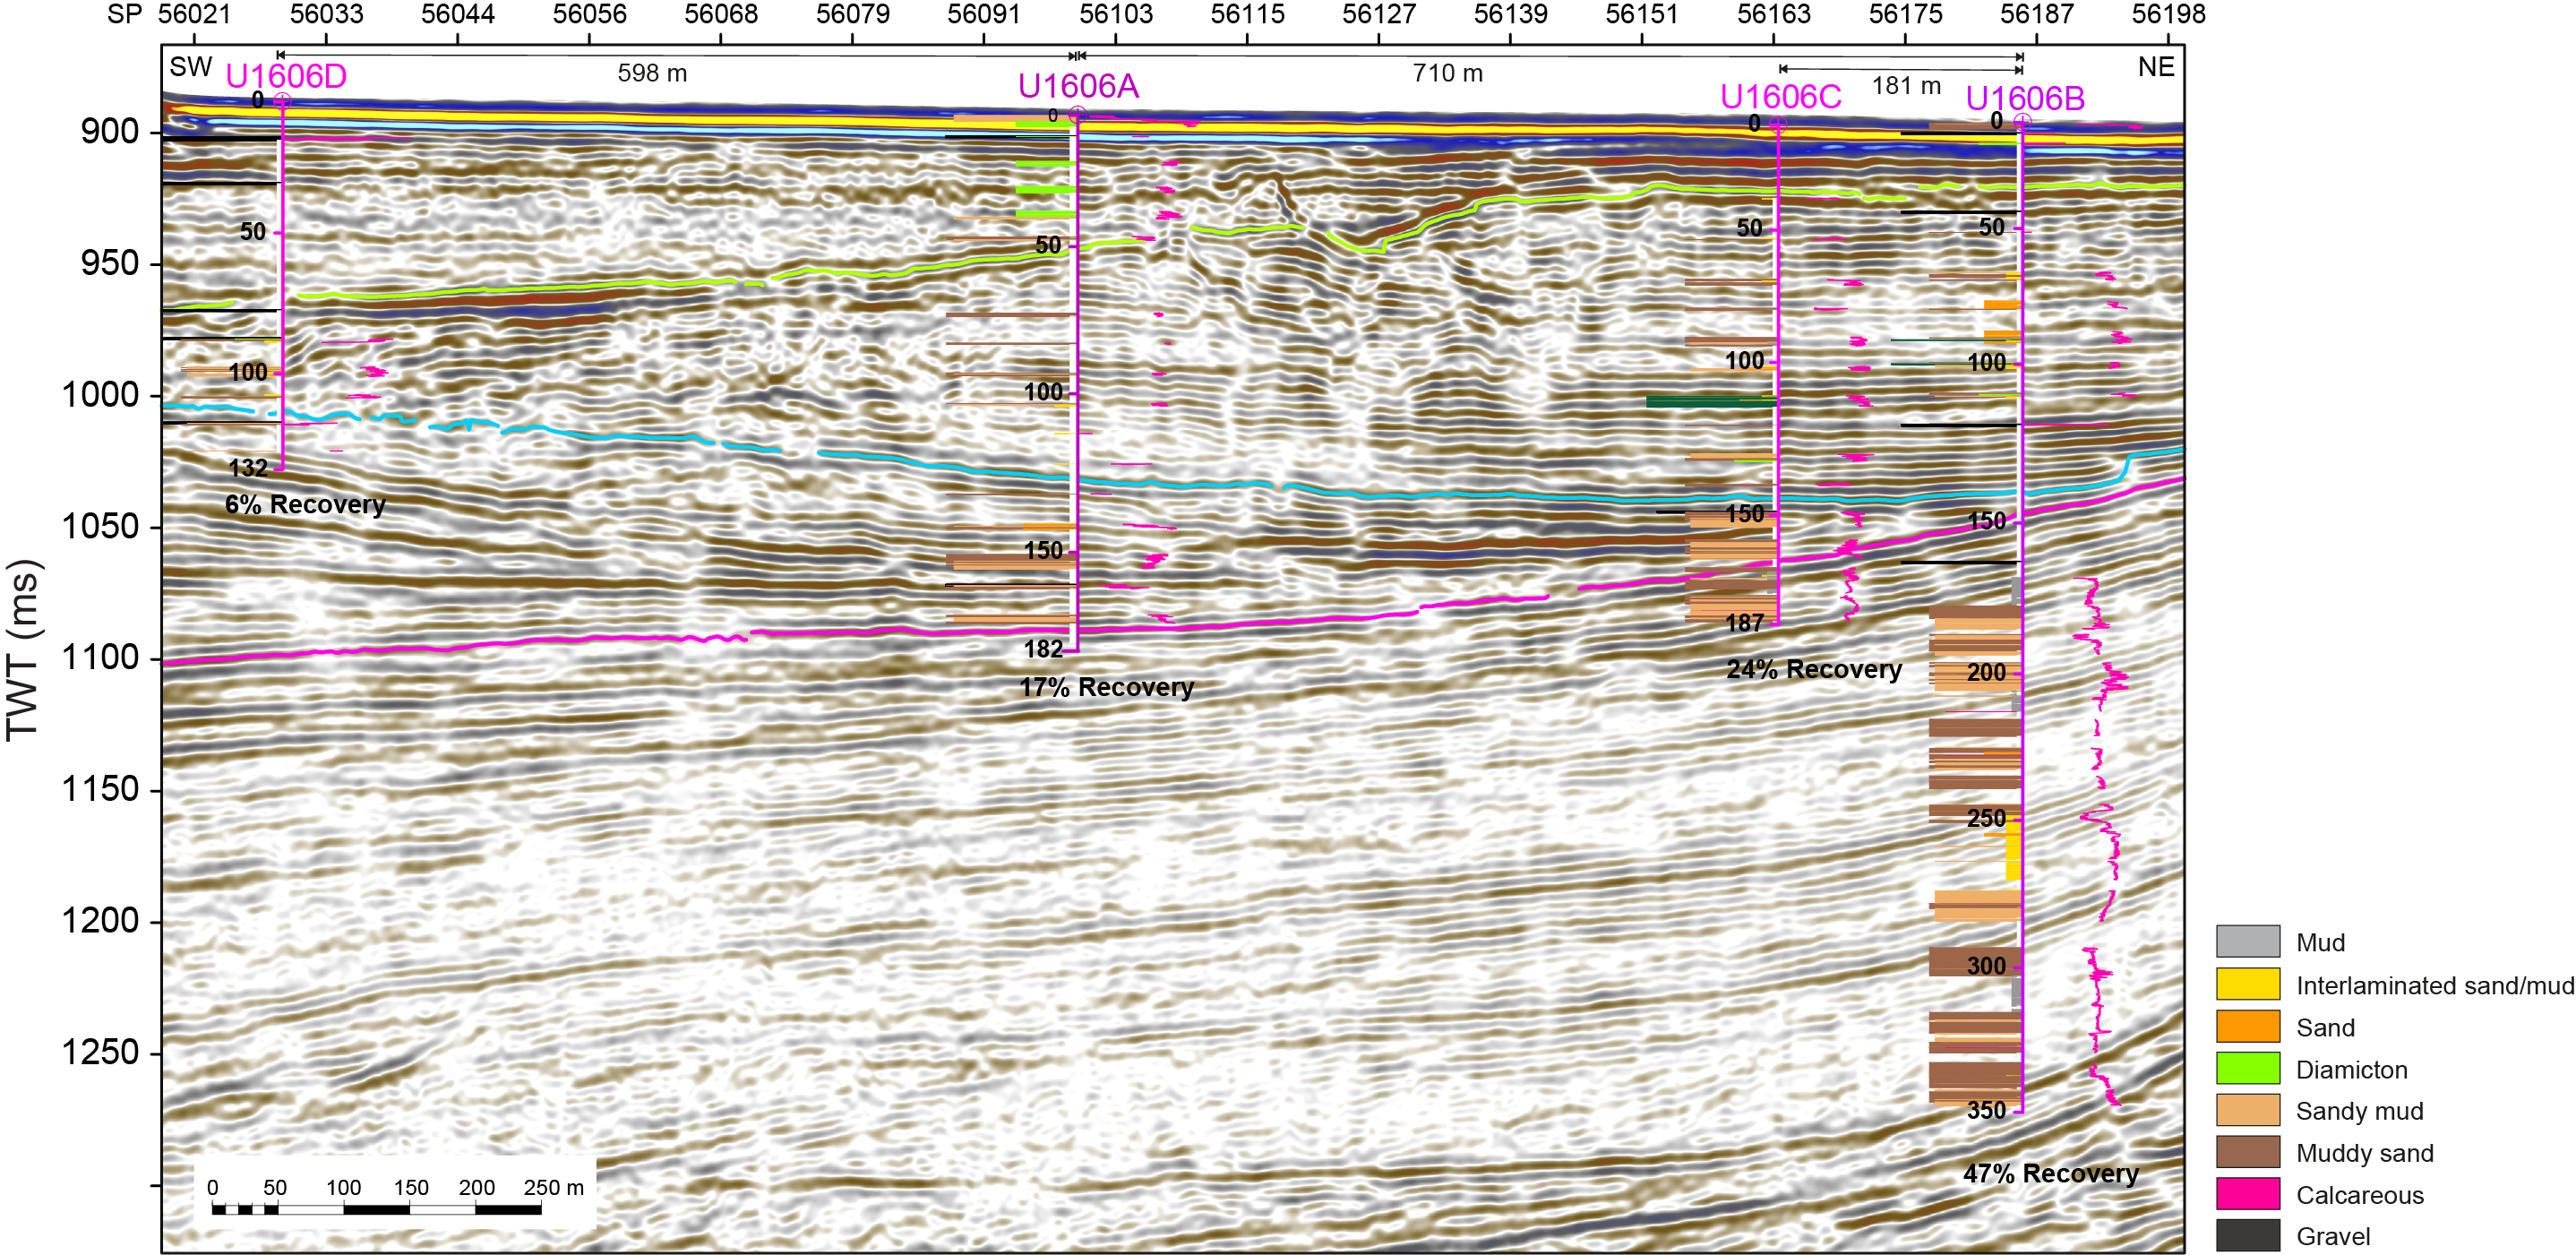
Figure F39. Seismic profile LAKO19_1033 and Holes U1606A–U1606D.
Physical property data, including NGR and MS, from all holes at Site U1606 were imported and examined in Correlator (v. 4). All cores from Site U1606 were cored with the RCB system; thus, gaps and missing intervals were expected. Core disturbances, shattered core liners, and other issues impacting core quality mean that the stratigraphic coherence of the recovered sequence is variable. Recovery gaps commonly overlap between all holes at Site U1606 in the uppermost 180 m of the record, and only Hole U1606B significantly penetrates below this depth (Table T16).
Further efforts were made to correlate the record of each hole with the seismic stratigraphy of the area (Figure F39). Physical properties and paleomagnetism, together with biostratigraphic and lithologic constraints, were taken into consideration for correlation between the holes at Site U1606. A time-depth correlation was developed (see Core-log-seismic correlation). Despite the uncertainties on the absolute depths, this model provides a means for further investigation of the Site U1606 record across all holes (Figure F39; Table T16).
References
Cox, D.R., Huuse, M., Newton, A.M.W., Sarkar, A.D., and Knutz, P.C., 2021. Shallow gas and gas hydrate occurrences on the northwest Greenland shelf margin. Marine Geology, 432:106382. https://doi.org/10.1016/j.margeo.2020.106382
De Schepper, S., Beck, K.M., and Mangerud, G., 2017. Late Neogene dinoflagellate cyst and acritarch biostratigraphy for Ocean Drilling Program Hole 642B, Norwegian Sea. Review of Palaeobotany and Palynology, 236:12–32. https://doi.org/10.1016/j.revpalbo.2016.08.005
De Schepper, S., and Head, M.J., 2009. Pliocene and Pleistocene dinoflagellate cyst and acritarch zonation of DSDP Hole 610A, eastern North Atlantic. Palynology, 33(1):179–218. https://doi.org/10.2113/gspalynol.33.1.179
de Vernal, A., and Mudie, P.J., 1989. Pliocene and Pleistocene palynostratigraphy at ODP Sites 646 and 647, eastern and southern Labrador Sea. In Srivastava, S.P., Arthur, M., Clement, B., et al., Proceedings of the Ocean Drilling Program, Scientific Results, 105: College Station, TX (Ocean Drilling Program), 401–422. https://doi.org/10.2973/odp.proc.sr.105.134.1989
Duque-Herrera, A.-F., Helenes, J., Pardo-Trujillo, A., Flores-Villarejo, J.-A., and Sierro-Sánchez, F.-J., 2018. Miocene biostratigraphy and paleoecology from dinoflagellates, benthic foraminifera and calcareous nannofossils on the Colombian Pacific coast. Marine Micropaleontology, 141:42–54. https://doi.org/10.1016/j.marmicro.2018.05.002
Eidvin, T., and Nagy, J., 1999. Foraminiferal biostratigraphy of Pliocene deposits at Site 986, Svalbard margin. In Raymo, M.E., Jansen, E., Blum, P., and Herbert, T.D. (Eds.), Proceedings of the Ocean Drilling Program, Scientific Results. 162: College Station, TX (Ocean Drilling Program). https://doi.org/10.2973/odp.proc.sr.162.009.1999
Feyling-Hansen, R.W., 1976. The stratigraphy of the Quaternary Clyde Foreland Formation, Baffin Island, illustrated by the distribution of benthic foraminifera. Boreas, 5(2):77–94. https://doi.org/10.1111/j.1502-3885.1976.tb00333.x
Gosse, J.C., Ballantyne, A.P., Barker, J.D., Csank, A.Z., Fletcher, T.L., Grant, G.W., Greenwood, D.R., MacPhee, R.D.E., and Rybczynski, N., 2017. PoLAR-FIT: Pliocene landscapes and Arctic remains—frozen in time. Geoscience Canada, 44(1):47–54. https://doi.org/10.12789/geocanj.2017.44.116
Jakobsson, M., Mayer, L., Coakley, B., Dowdeswell, J.A., Forbes, S., Fridman, B., Hodnesdal, H., Noormets, R., Pedersen, R., Rebesco, M., Schenke, H.W., Zarayskaya, Y., Accettella, D., Armstrong, A., Anderson, R.M., Bienhoff, P., Camerlenghi, A., Church, I., Edwards, M., Gardner, J.V., Hall, J.K., Hell, B., Hestvik, O., Kristofferson, Y., Marcussen, C., Mohammad, R., Mosher, D., Nghiem, S.V., Pedrosa, M.T., Travaglini, P.G., and Weatherall, P., 2012. The International Bathymetric Chart of the Arctic Ocean (IBCAO) Version 3.0. Geophysical Research Letters, 39(12):L12609. https://doi.org/10.1029/2012GL052219
Jansen, E., Sjøholm, J., Bleil, U., and Erichsen, J.A., 1990. Neogene and Pleistocene glaciations in the Northern Hemisphere and Late Miocene — Pliocene global ice volume fluctuations: evidence from the Norwegian Sea. In Bleil, U., and Thiede, J. (Eds.), Geological History of the Polar Oceans: Arctic versus Antarctic. NATO ASI Series, 308: 677–705. https://doi.org/10.1007/978-94-009-2029-3_35
Kirschvink, J.L., 1980. The least-squares line and plane and the analysis of palaeomagnetic data. Geophysical Journal International, 62(3):699–718. https://doi.org/10.1111/j.1365-246X.1980.tb02601.x
Knutz, P., Jennings, A., and Childress, L.B., 2022. Expedition 400 Scientific Prospectus: NW Greenland Glaciated Margin. International Ocean Discovery Program. https://doi.org/10.14379/iodp.sp.400.2022
Knutz, P.C., Hopper, J.R., Gregersen, U., Nielsen, T., and Japsen, P., 2015. A contourite drift system on the Baffin Bay–West Greenland margin linking Pliocene Arctic warming to poleward ocean circulation. Geology, 43(10):907–910. https://doi.org/10.1130/G36927.1
Knutz, P.C., Jennings, A.E., Childress, L.B., Bryant, R., Cargill, S.K., Coxall, H.K., Frank, T.D., Grant, G.R., Gray, R.E., Ives, L., Kumar, V., Le Houedec, S., Martens, J., Naim, F., Nelissen, M., Özen, V., Passchier, S., Pérez, L.F., Ren, J., Romans, B.W., Seki, O., Staudigel, P., Tauxe, L., Tibbett, E.J., Yokoyama, Y., Zhang, Y., and Zimmermann, H., 2025a. Expedition 400 methods. In Knutz, P.C., Jennings, A.E., Childress, L.B., and the Expedition 400 Scientists, NW Greenland Glaciated Margin. Proceedings of the International Ocean Discovery Program, 400: College Station, TX (International Ocean Discovery Program). https://doi.org/10.14379/iodp.proc.400.102.2025
Knutz, P.C., Jennings, A.E., Childress, L.B., Bryant, R., Cargill, S.K., Coxall, H.K., Frank, T.D., Grant, G.R., Gray, R.E., Ives, L., Kumar, V., Le Houedec, S., Martens, J., Naim, F., Nelissen, M., Özen, V., Passchier, S., Pérez, L.F., Ren, J., Romans, B.W., Seki, O., Staudigel, P., Tauxe, L., Tibbett, E.J., Yokoyama, Y., Zhang, Y., and Zimmermann, H., 2025b. Site U1608. In Knutz, P.C., Jennings, A.E., Childress, L.B., and the Expedition 400 Scientists, NW Greenland Glaciated Margin. Proceedings of the International Ocean Discovery Program, 400: College Station, TX (International Ocean Discovery Program). https://doi.org/10.14379/iodp.proc.400.108.2025
Knutz, P.C., Newton, A.M.W., Hopper, J.R., Huuse, M., Gregersen, U., Sheldon, E., and Dybkjær, K., 2019. Eleven phases of Greenland Ice Sheet shelf-edge advance over the past 2.7 million years. Nature Geoscience, 12(5):361–368. https://doi.org/10.1038/s41561-019-0340-8
Koç Karpuz, N., and Schrader, H., 1990. Surface sediment diatom distribution and Holocene paleotemperature variations in the Greenland, Iceland and Norwegian Sea. Paleoceanography, 5(4):557–580. https://doi.org/10.1029/PA005i004p00557
Koç, N., and Scherer, R.P., 1996. Neogene diatom biostratigraphy of the Iceland Sea Site 907. In Thiede, J., Myhre, A.M., Firth, J.V., Johnson, G.L., and Ruddiman, W.F. (Eds.), Proceedings of the Ocean Drilling Program, Scientific Results. 151: College Station, TX (Ocean Drilling Program), 61–74. https://doi.org/10.2973/odp.proc.sr.151.108.1996
Monjanel, A.-L., and Baldauf, J.G., 1989. Miocene to Holocene diatom biostratigraphy from Baffin Bay and Labrador Sea, Ocean Drilling Program Sites 645 and 646. In Srivastava, S.P., Arthur, M.A., Clement, B., et al., Proceedings of the Ocean Drilling Program, Scientific Results. 105: College Station, TX (Ocean Drilling Program), 305–322. https://doi.org/10.2973/odp.proc.sr.105.127.1989
Newton, A.M.W., Knutz, P.C., Huuse, M., Gannon, P., Brocklehurst, S.H., Clausen, O.R., and Gong, Y., 2017. Ice stream reorganization and glacial retreat on the northwest Greenland shelf. Geophysical Research Letters, 44(15):7826–7835. https://doi.org/10.1002/2017GL073690
Ogg, J.G., 2020. Geomagnetic Polarity Time Scale. In Gradstein, F.M., Ogg, J.G., Schmitz, M., and Ogg, G. (Eds.), Geologic Time Scale 2020. Amsterdam (Elsevier), 159–192. https://doi.org/10.1016/B978-0-12-824360-2.00005-X
Oksman, M., Juggins, S., Miettinen, A., Witkowski, A., and Weckström, K., 2019. The biogeography and ecology of common diatom species in the northern North Atlantic, and their implications for paleoceanographic reconstructions. Marine Micropaleontology, 148:1–28. https://doi.org/10.1016/j.marmicro.2019.02.002
Osterman, L.E., and Qvale, G., 1989. Benthic foraminifers from the Voring Plateau (ODP Leg 104). In Eldholm, O., Thiede, J., Taylor, E., et al., Proceedings of the Ocean Drilling Program, Scientific Results. 104: College Station, TX (Ocean Drilling Program), 745–768. http://doi.org/10.2973/odp.proc.sr.104.159.1989
Refsnider, K.A., Miller, G.H., Fréchette, B., and Rood, D.H., 2013. A chronological framework for the Clyde Foreland Formation, eastern Canadian Arctic, derived from amino acid racemization and cosmogenic radionuclides. Quaternary Geochronology, 16:21–34. https://doi.org/10.1016/j.quageo.2012.05.009
Seidenkrantz, M.S., 1995. Cassidulina teretis Tappan and Cassidulina neoteretis new species (Foraminifera): stratigraphic markers for deep sea and outer shelf areas. Journal of Micropalaeontology, 14(2):145–157. https://doi.org/10.1144/jm.14.2.145
Soliman, A., Ćorić, S., Head, M.J., Piller, W.E., and El Beialy, S.Y., 2012. Lower and Middle Miocene biostratigraphy, Gulf of Suez, Egypt based on dinoflagellate cysts and calcareous nannofossils. Palynology, 36(1):38–79. https://doi.org/10.1080/01916122.2011.633632
Tang, C.C.L., Ross, C.K., Yao, T., Petrie, B., DeTracey, B.M., and Dunlap, E., 2004. The circulation, water masses and sea-ice of Baffin Bay. Progress in Oceanography, 63(4):183–228. https://doi.org/10.1016/j.pocean.2004.09.005
Weber, M.E., Niessen, F., Kuhn, G., and Wiedicke, M., 1997. Calibration and application of marine sedimentary physical properties using a multi-sensor core logger. Marine Geology, 136(3–4):151–172. https://doi.org/10.1016/S0025-3227(96)00071-0
Zegarra, M., and Helenes, J., 2011. Changes in Miocene through Pleistocene dinoflagellates from the eastern equatorial Pacific (ODP Site 1039), in relation to primary productivity. Marine Micropaleontology, 81(3):107–121. https://doi.org/10.1016/j.marmicro.2011.09.005
Zijderveld, J.D.A., 1967. AC demagnetization of rocks: analysis of results. In Runcorn, S.K.C., Creer, K.M., and Collinson, D.W. (Eds.), Methods in Palaeomagnetism. Developments in Solid Earth Geophysics. J.R. Balsley (Series Ed.), 3: 254–286. https://doi.org/10.1016/B978-1-4832-2894-5.50049-5
Zonneveld, K.A.F., Versteegh, G., and Kodrans-Nsiah, M., 2008. Preservation and organic chemistry of late Cenozoic organic-walled dinoflagellate cysts: a review. Marine Micropaleontology, 68(1):179–197. https://doi.org/10.1016/j.marmicro.2008.01.015