Knutz, P.C., Jennings, A.E., Childress, L.B., and the Expedition 400 Scientists
Proceedings of the International Ocean Discovery Program Volume 400
publications.iodp.org
https://doi.org/10.14379/iodp.proc.400.108.2025
Site U16081
![]() P.C. Knutz,
P.C. Knutz, ![]() A.E. Jennings,
A.E. Jennings, ![]() L.B. Childress,
L.B. Childress, ![]() R. Bryant,
R. Bryant, ![]() S.K. Cargill,
S.K. Cargill, ![]() H.K. Coxall,
H.K. Coxall, ![]() T.D. Frank,
T.D. Frank, ![]() G.R. Grant,
G.R. Grant, ![]() R.E. Gray,
R.E. Gray, ![]() L. Ives,
L. Ives, ![]() V. Kumar,
V. Kumar, ![]() S. Le Houedec,
S. Le Houedec, ![]() J. Martens,
J. Martens, ![]() F. Naim,
F. Naim, ![]() M. Nelissen,
M. Nelissen, ![]() V. Özen,
V. Özen, ![]() S. Passchier,
S. Passchier, ![]() L.F. Pérez,
L.F. Pérez, ![]() J. Ren,
J. Ren, ![]() B.W. Romans,
B.W. Romans, ![]() O. Seki,
O. Seki, ![]() P. Staudigel,
P. Staudigel, ![]() L. Tauxe,
L. Tauxe, ![]() E.J. Tibbett,
E.J. Tibbett, ![]() Y. Yokoyama,
Y. Yokoyama, ![]() Y. Zhang, and
Y. Zhang, and ![]() H. Zimmerman2
H. Zimmerman2
1 Knutz, P.C., Jennings, A.E., Childress, L.B., Bryant, R., Cargill, S.K., Coxall, H.K., Frank, T.D., Grant, G.R., Gray, R.E., Ives, L., Kumar, V., Le Houedec, S., Martens, J., Naim, F., Nelissen, M., Özen, V., Passchier, S., Pérez, L.F., Ren, J., Romans, B.W., Seki, O., Staudigel, P., Tauxe, L., Tibbett, E.J., Yokoyama, Y., Zhang, Y., and Zimmermann, H., 2025. Site U1608. In Knutz, P.C., Jennings, A.E., Childress, L.B., and the Expedition 400 Scientists, NW Greenland Glaciated Margin. Proceedings of the International Ocean Discovery Program, 400: College Station, TX (International Ocean Discovery Program).
https://doi.org/10.14379/iodp.proc.400.108.2025
2 Expedition 400 Scientists’ affiliations.
1. Background and objectives
Site U1608 (proposed Site MB-06D) was cored at 74°7.6818′N, 60°58.3172′W at 607 meters below sea level (mbsl) on the middle section of the northwest Greenland shelf, west of the Melville Bay Ridge and graben structures formed during Cretaceous rifting (Figure F1; see Figure F4 in the Expedition 400 summary chapter [Knutz et al., 2025b]). The main coring targets are mounded contourite drift deposits of expected Pliocene age associated with Megaunit B (Knutz et al., 2015, 2019; Aubrey et al., 2021) and overlying sediments of Megaunit A, recording the transition into glacigenic deposits of earliest trough mouth fan (TMF) progradation (Figure F2). The expanded interval of Megaunit B, captured at Sites U1606 and U1608, reflects deposition below a major incised escarpment that is at least 500 m tall and extends into disturbed sediment packages interpreted as mass transport deposits (Figure F3). The base of the contourite drift accumulation is defined by Horizon c1 of probable Late Miocene age (Knutz et al., 2015). Site U1608 ends ~100 m above Horizon c1, which at this location is characterized by an erosional unconformity related to the slope instability that is strongly expressed in the seismic record (Figure F3). In the context of the full development of the Melville Bugt TMF, Site U1608 targeted TMF Seismic Unit 1, which records the first advance of the northwestern Greenland ice sheet (GrIS) onto the continental shelf, which is hypothesized to correspond to the Pleistocene/Pliocene boundary (Knutz et al., 2019) (Figures F2, F3). Combined, the cores from middle shelf Sites U1606 and U1608 access archives of ocean and climate conditions presumably much warmer than today that were buried by glacial deposits representing global cooling and expansion of northern hemisphere glaciers. These sites use the dynamic drift morphology to capture different parts of Megaunit B strata to capture high-resolution records of the Pliocene ocean-climate system at high Arctic latitudes.
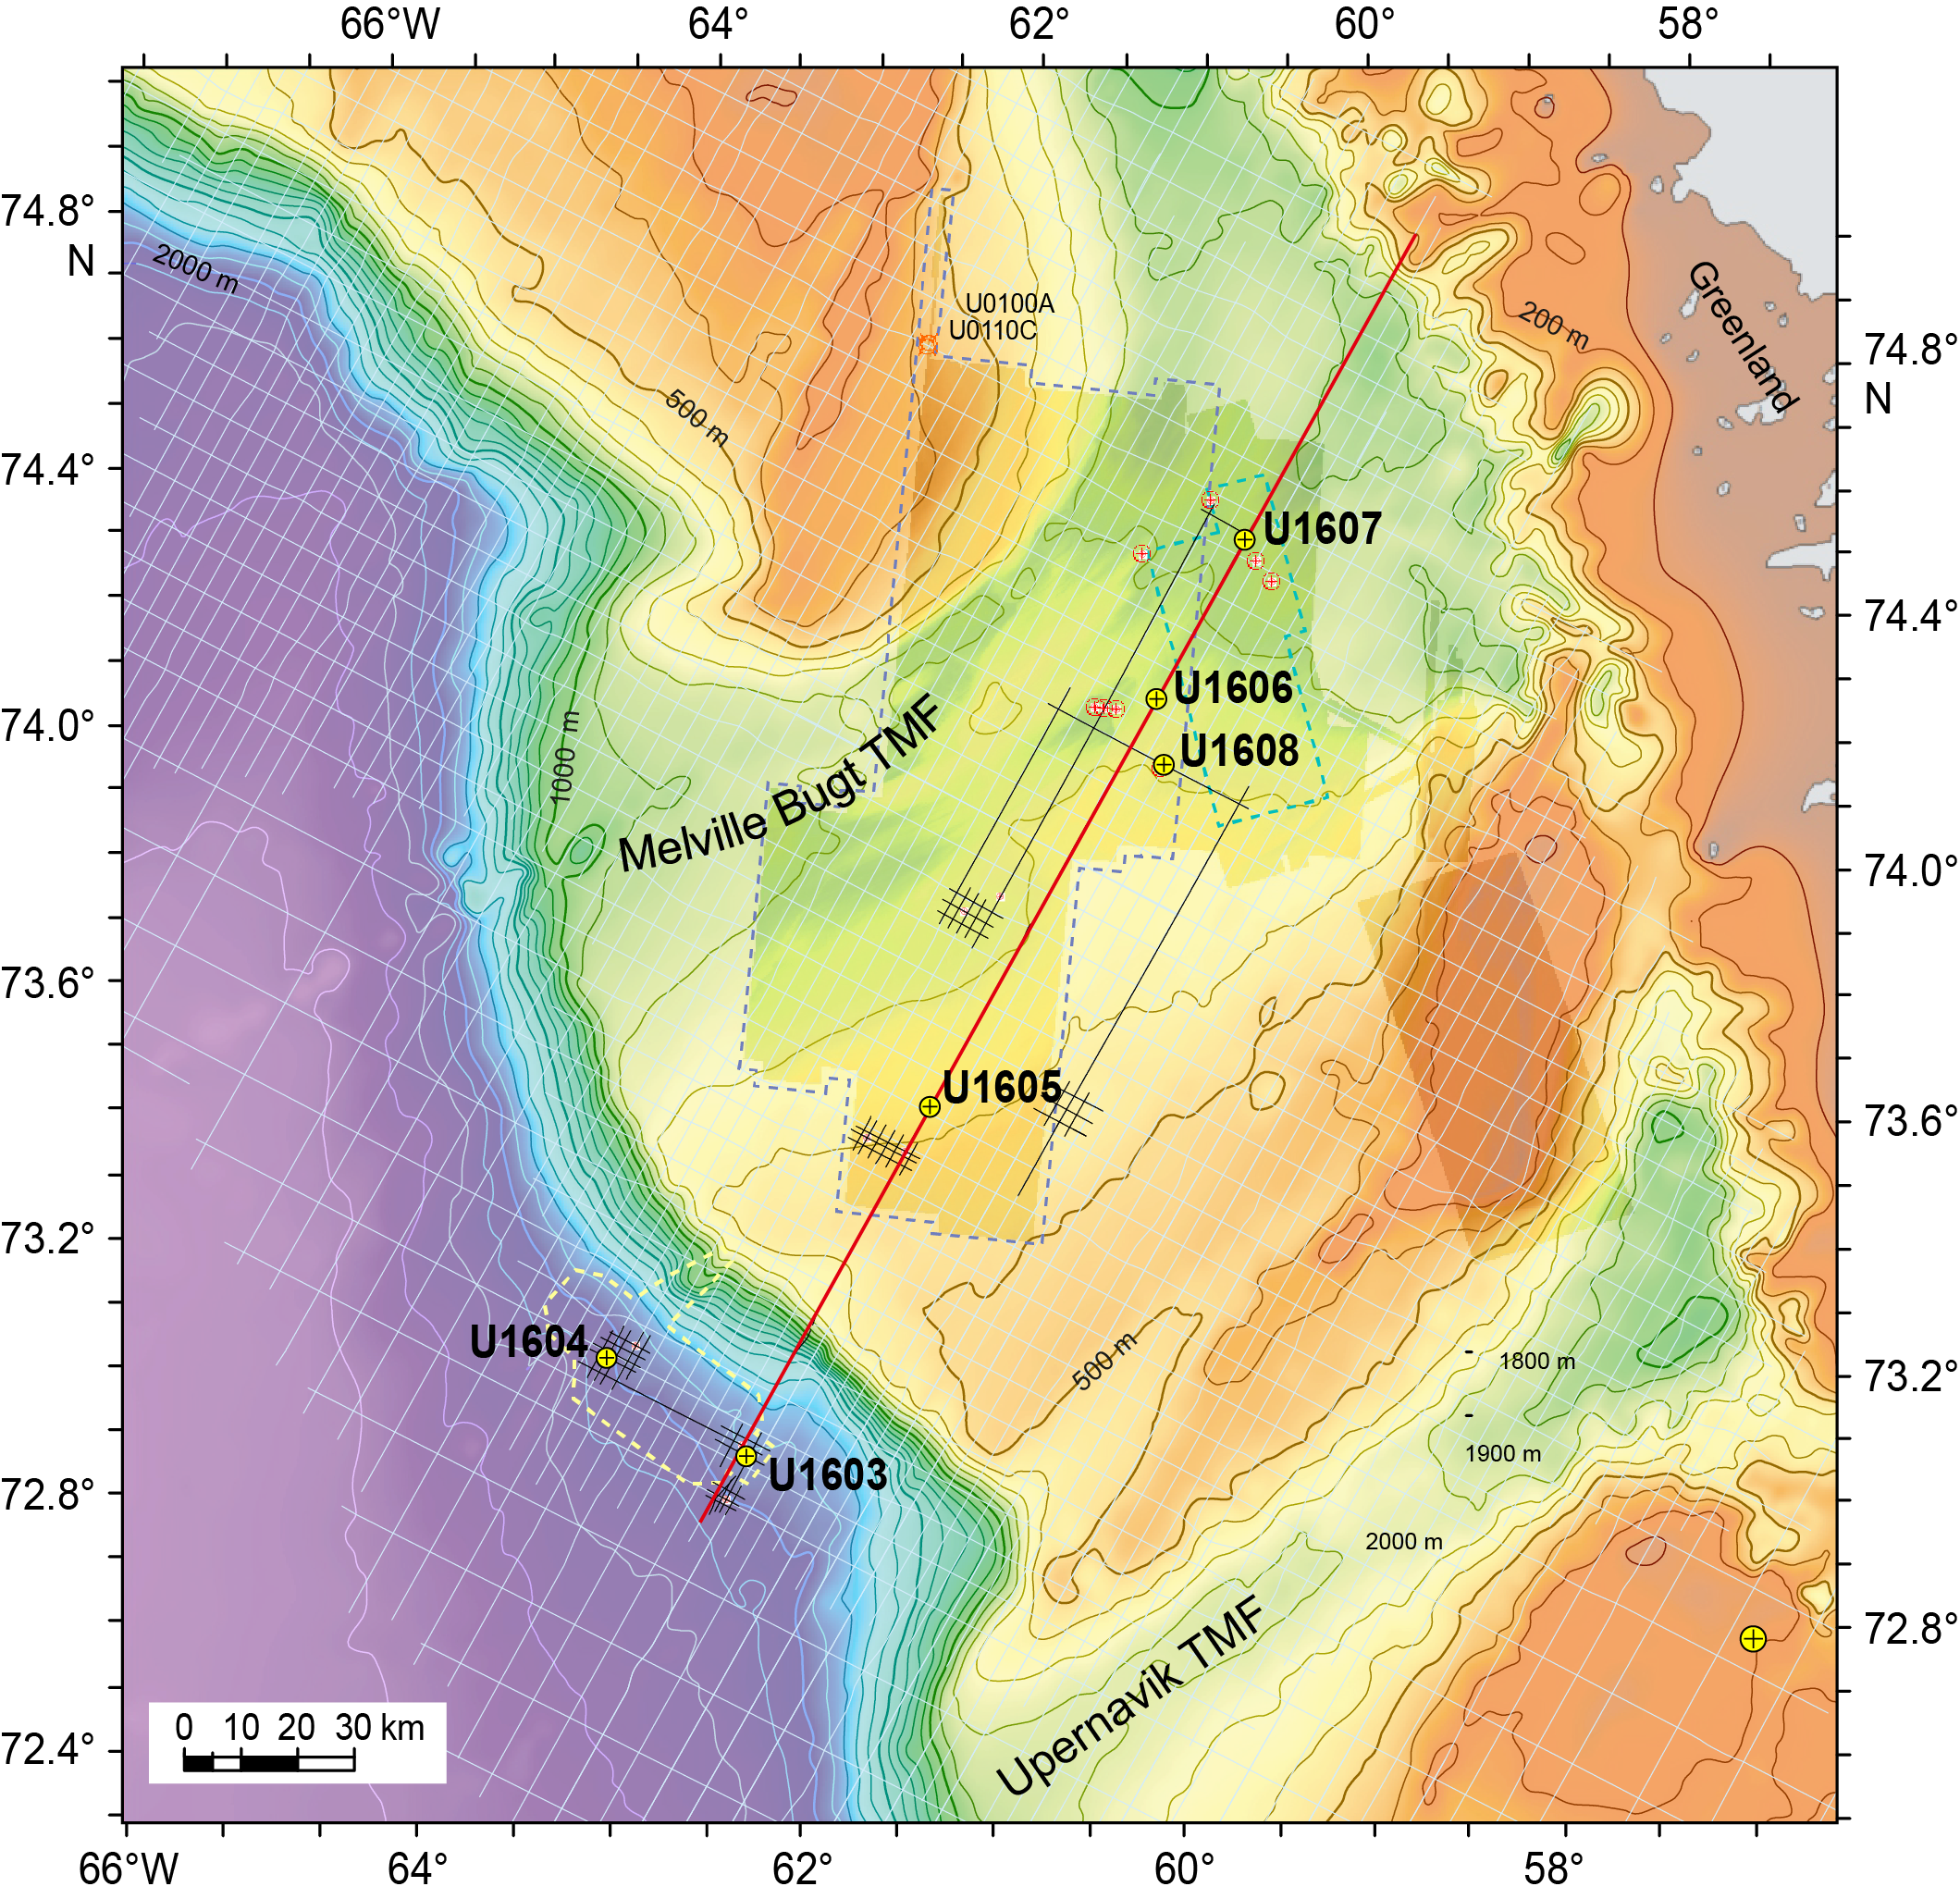
Figure F1. Bathymetry map.
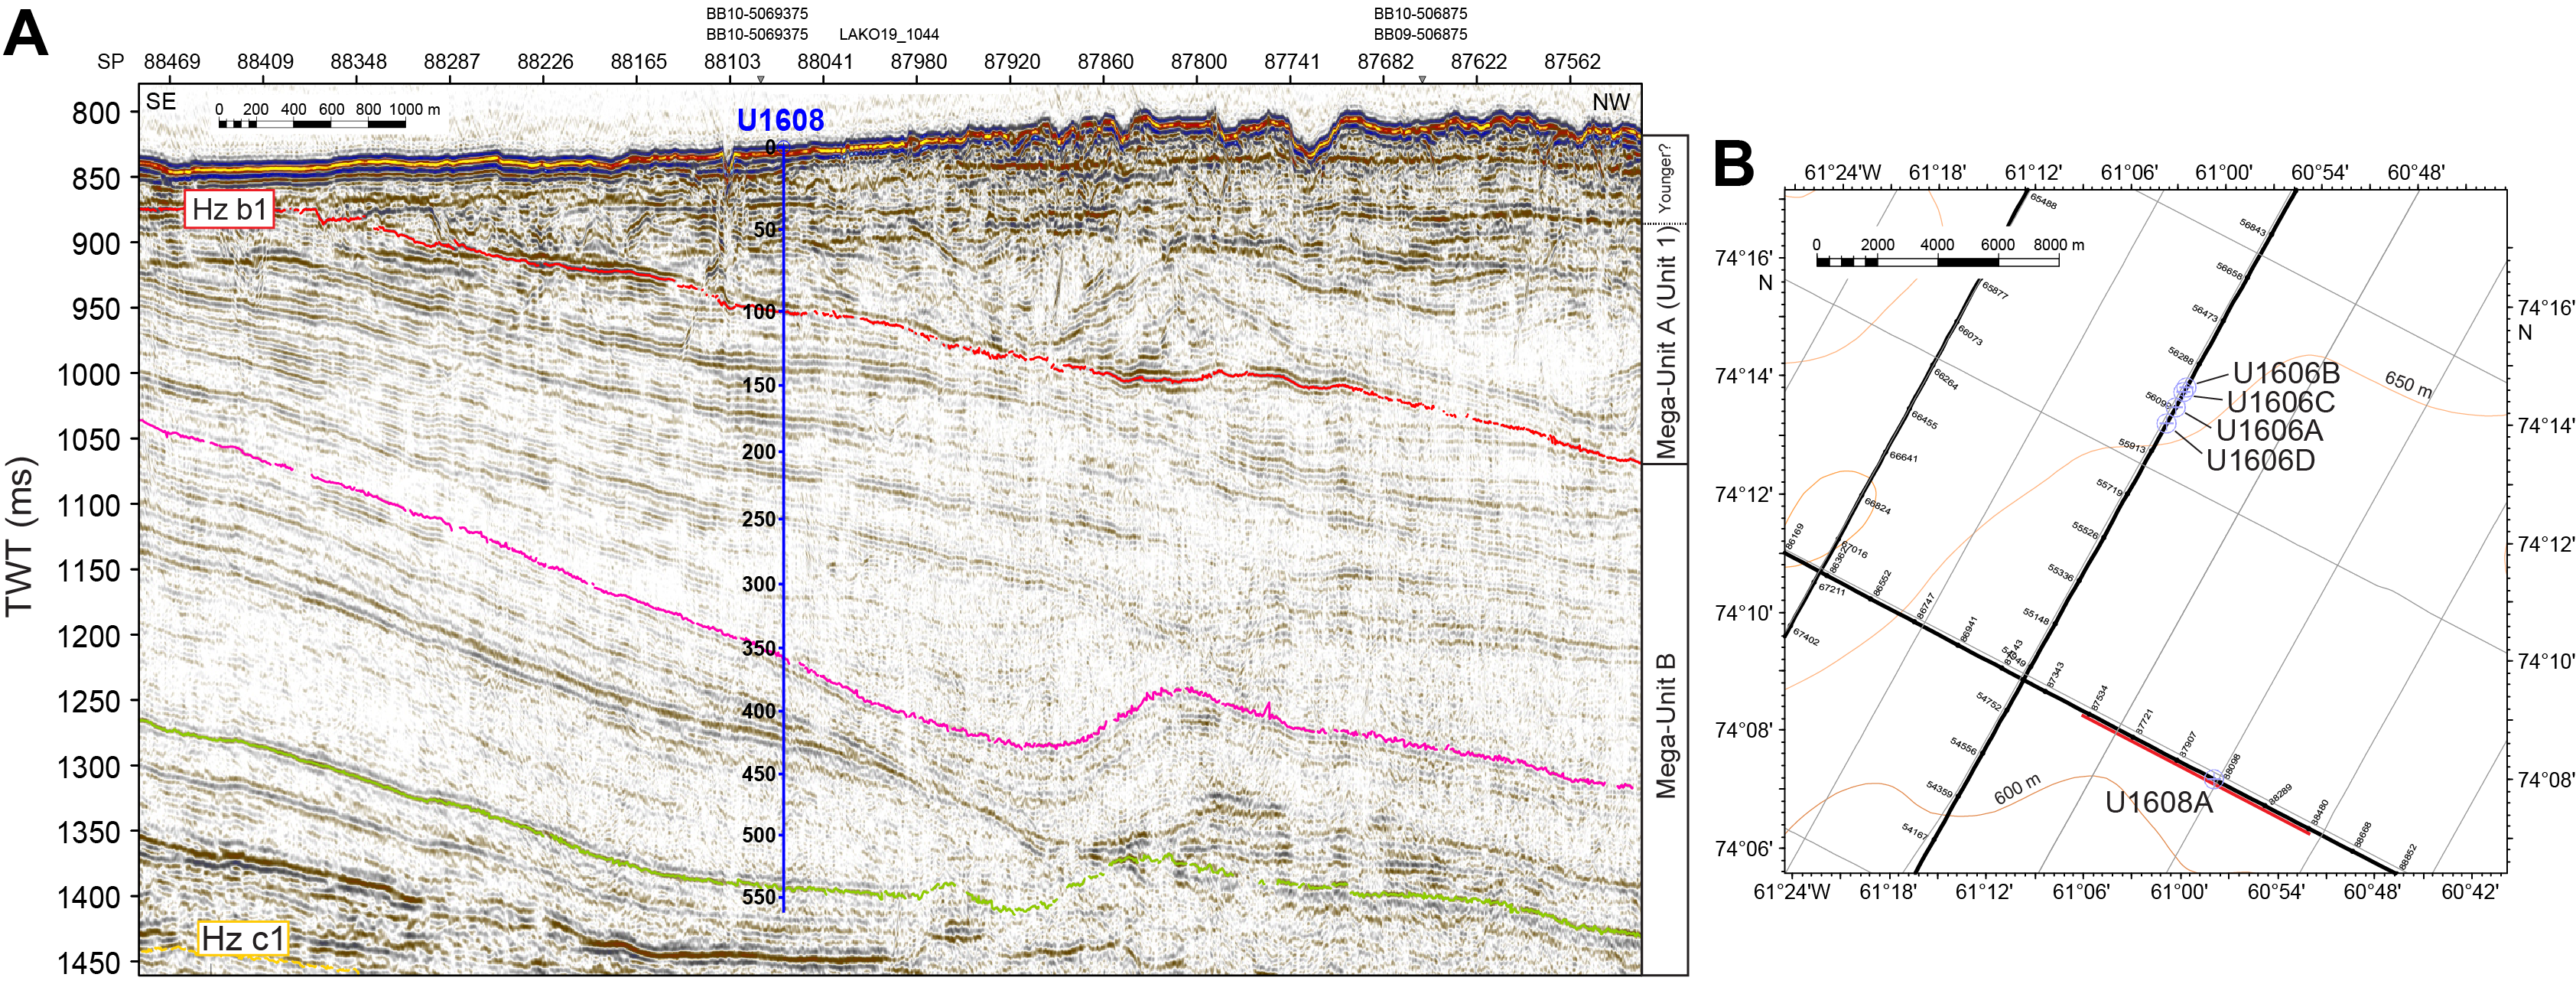
Figure F2. Seismic profile and close-up bathymetry map.
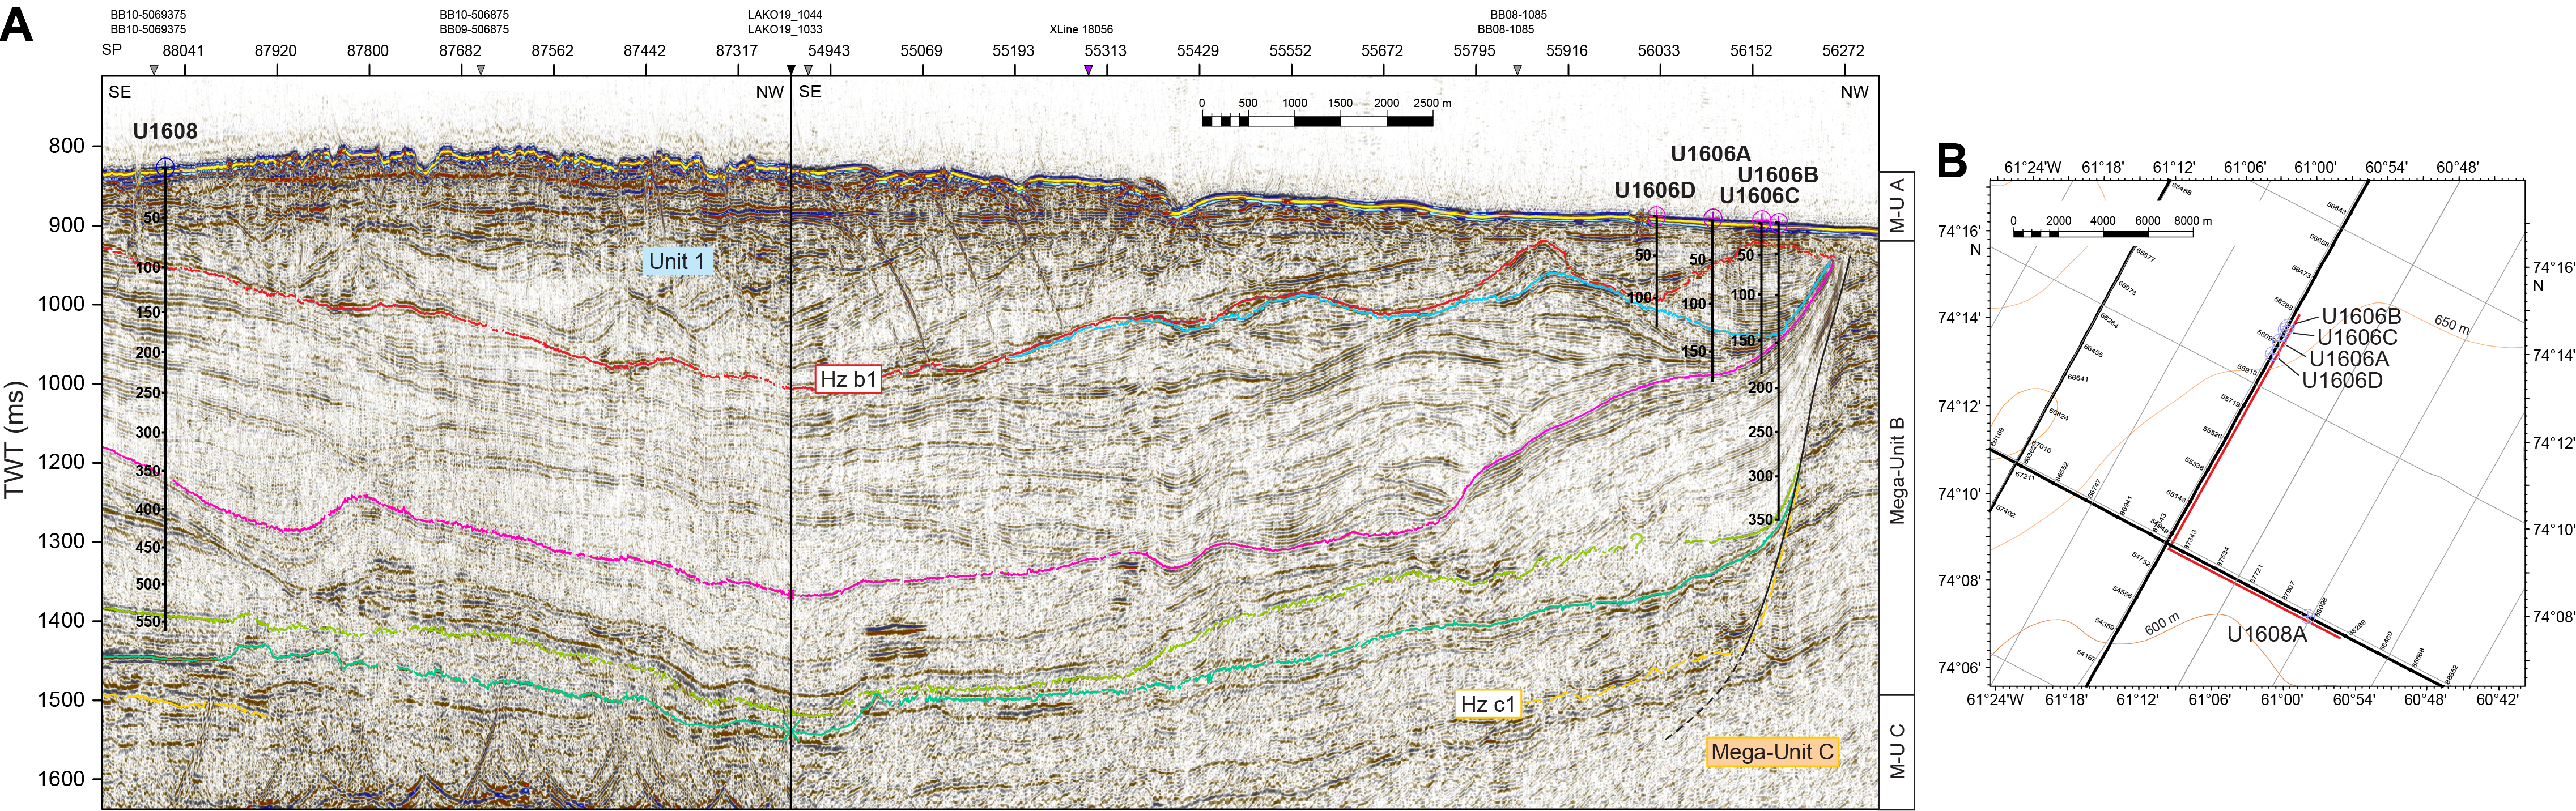
Figure F3. Composite seismic profile and close-up bathymetry map, Sites U1606 and U1608.
Today, Site U1608 is influenced by the northward-flowing West Greenland Current, which delivers relatively warm and saline Atlantic waters (3°–5°C) originating in the Irminger Current, overlain by a colder, fresher surface layer sourced from glacier meltwater and Arctic surface water derived both from the East Greenland Current and via the Arctic island channels at the northern end of Baffin Bay (Tang et al., 2004). The path of the West Greenland Current is marked by lower sea ice concentrations (Tang et al., 2004).
The expected lithologies are gravel-sand, diamicton, and pebbly mud, potentially with more muddy intervals, in the uppermost 100 m and mudstone with silty-sandy intervals in the succession below. The seismic characteristics suggest a gradual transition from a deep marine (outer shelf) to a more near-shore environment, eventually replaced by a proglacial to subglacial setting (Figure F4). The two principal goals for this site are (1) to capture deposits corresponding to the earliest shelf-based glaciations in northwest Greenland (earliest glacial clinoforms of Megaunit A) and (2) to recover Neogene sediments of likely Pliocene age in Megaunit B that can elucidate paleoceanographic conditions prior to the major expansion of the GrIS (Knutz et al., 2015). Hypothetically, the contourite drift may provide a marine analog to terrestrial outcrops (e.g., Beaufort Formation [Ellesmere Island] and Kap København Formation [north Greenland]) depicting warm climate conditions in the High Arctic during late Pliocene to Early Pleistocene (Funder et al., 2001; Gosse et al., 2017).
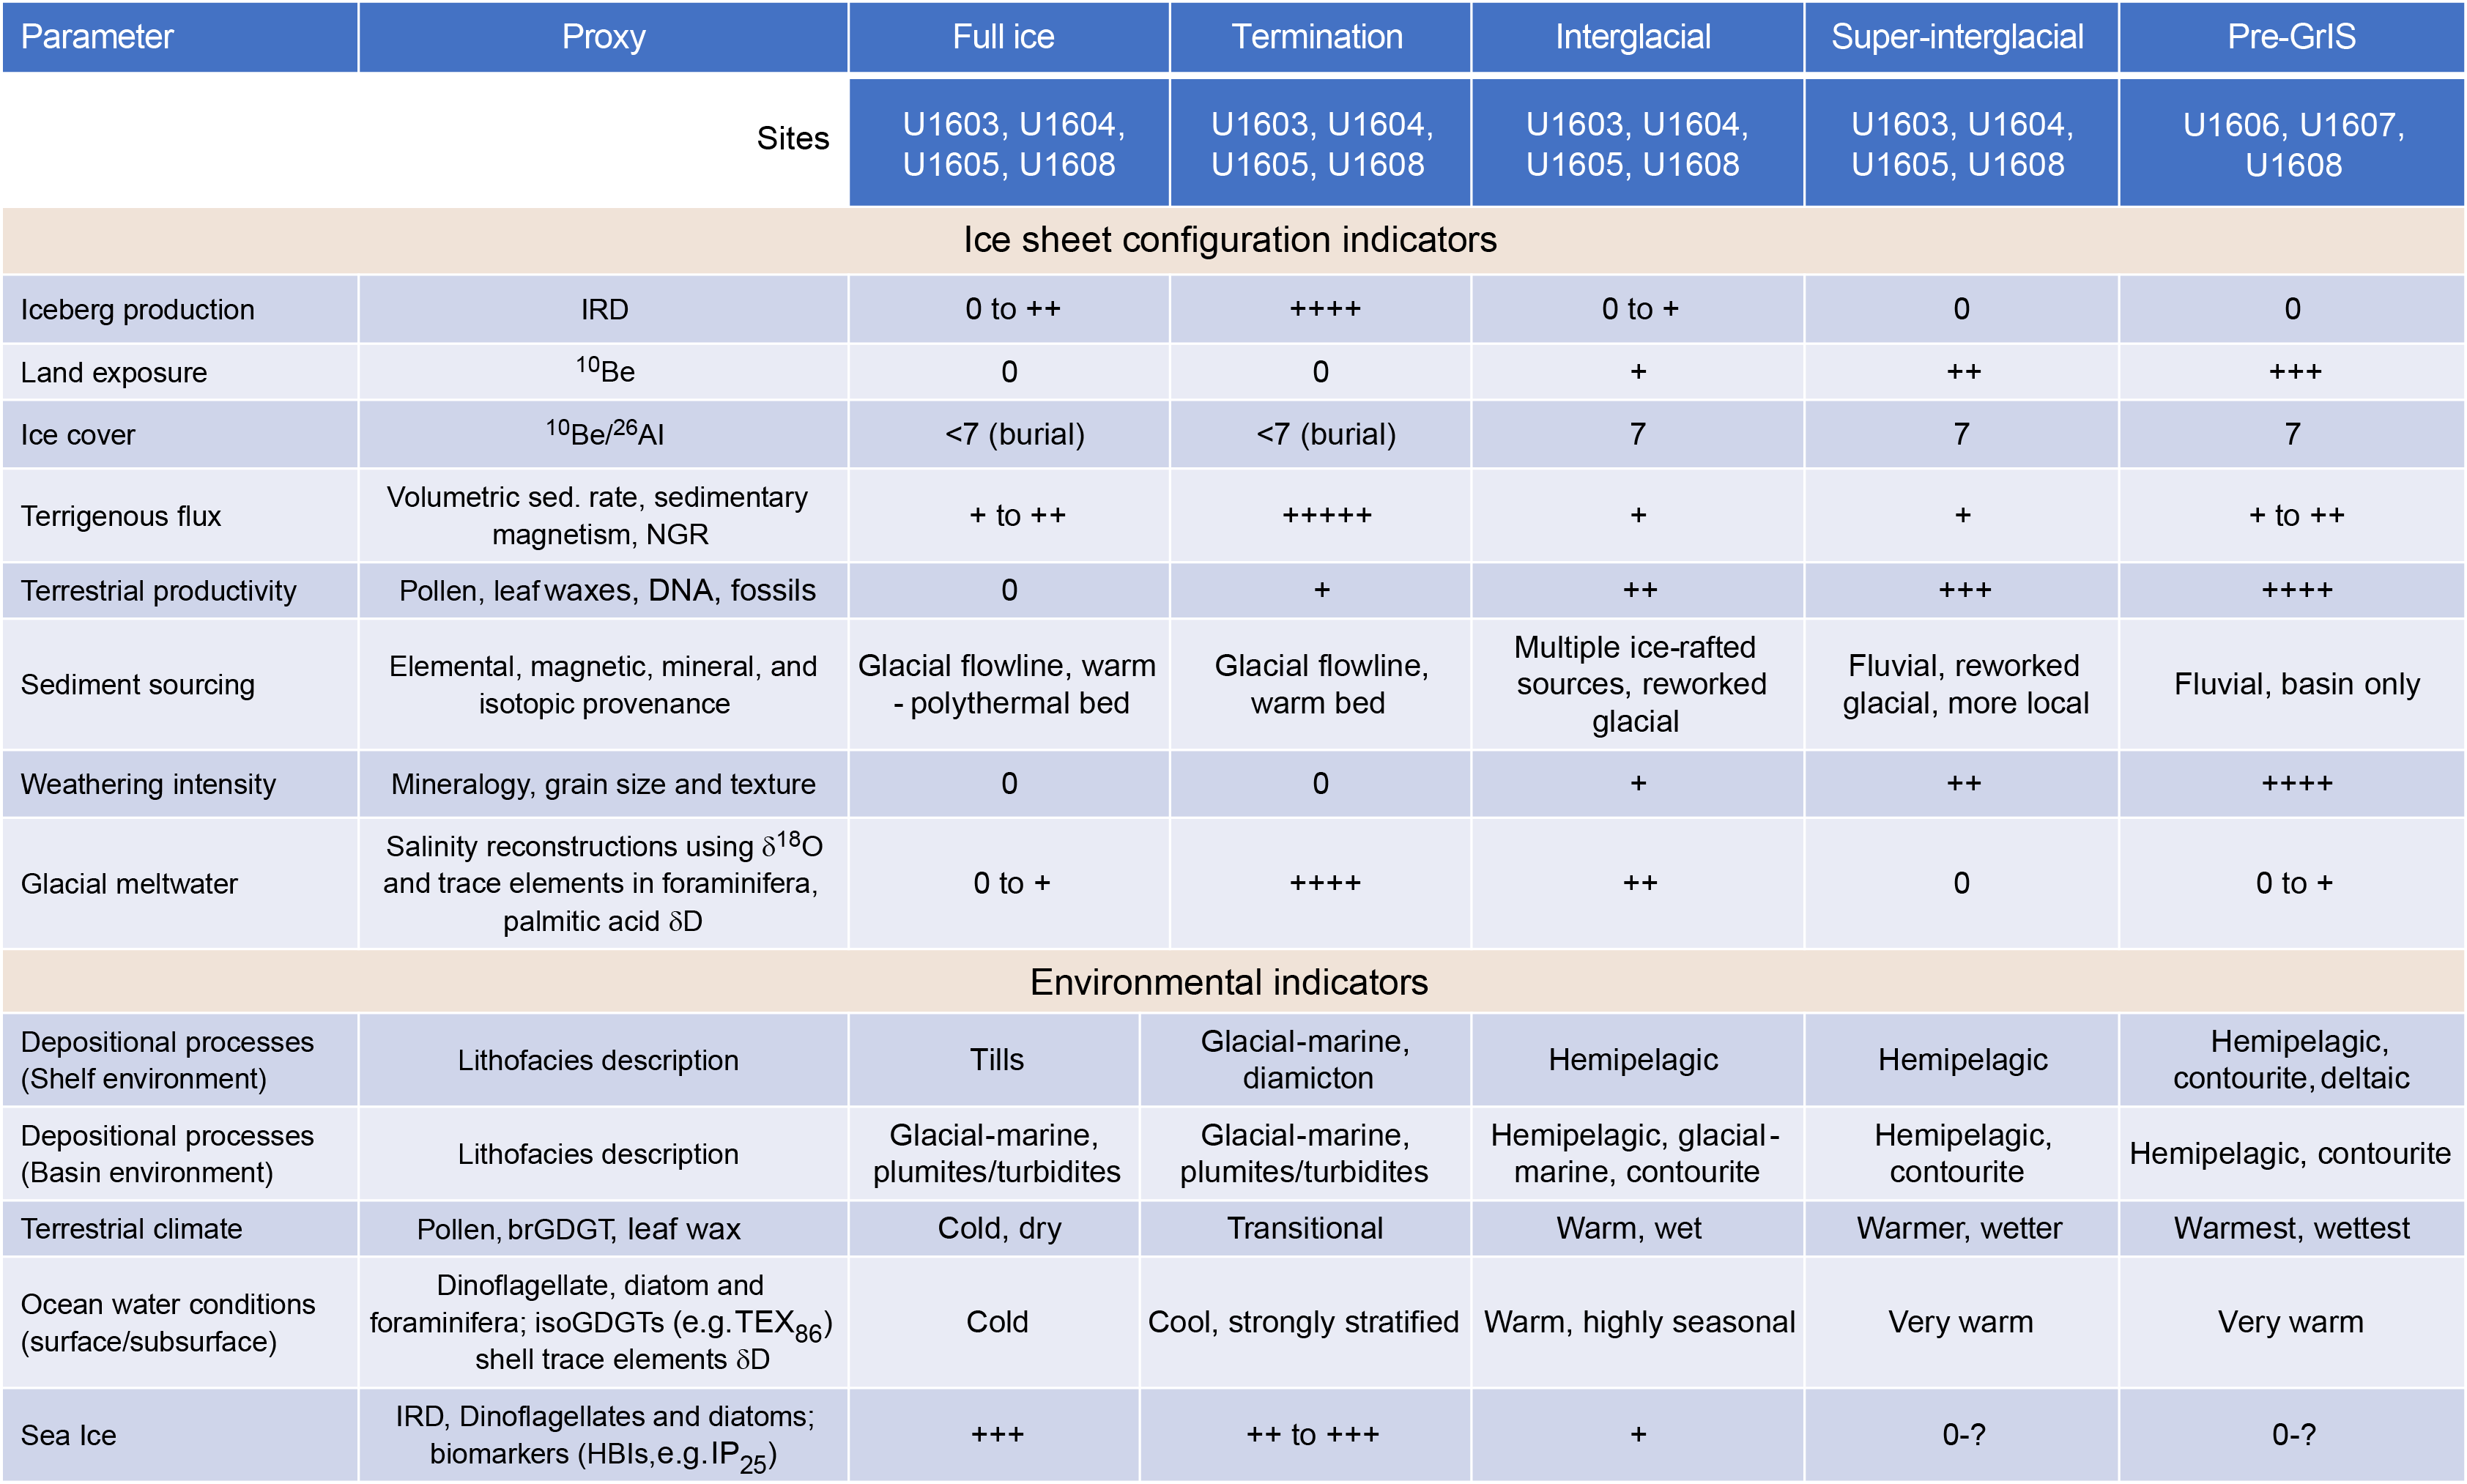
Figure F4. Diagnostic template for ice sheet evolution.
Planned drilling at Site U1608 included coring with the rotary core barrel (RCB) system to 561 m core depth below seafloor, Method A (CSF-A), in the first hole. Downhole logging was planned for the first hole, including the triple combo tool string, Formation MicroScanner (FMS), and Versatile Seismic Imager (VSI) check shots. Time permitting, a second hole to 400 m CSF-A was also planned.
2. Operations
The Site U1608 hole location, water depth, and number of cores recovered are listed in Table T1. All times are local ship time (UTC − 3 h) unless otherwise noted.
2.1. Hole U1608A
The vessel transited 23 nmi from Site U1607 to Site U1608. The thrusters were lowered and secured, and the ship was fully in dynamic positioning mode at 0051 h on 26 September 2023. The rig crew made up an RCB bottom-hole assembly (BHA), and the drill string was tripped to near the seafloor. Hole U1608A was spudded at 0435 h, tagging the seafloor at 606.9 mbsl. Cores 1R–60R advanced from 0 to 561.0 m CSF-A and recovered 267.35 m (47.7%).
Sepiolite (drilling mud) was swept in the hole, and the bit was released in the hole at 1555 h on 29 September to prepare for logging Hole U1608A. The hole was displaced with heavy mud (barite), and the pipe was tripped up with the end of the pipe ultimately placed at 103.9 m CSF-A due to concerns about the condition and stability of the hole. A modified triple combo (quad combo) tool string was deployed to the base of Hole U1608A and tagged the bottom at 558.6 m CSF-A. Following a complete pass of the hole, the quad combo tool string was pulled to the rig floor and broken down. The FMS (without sonic) tool string was then assembled and deployed at 0235 h on 30 September. After two successful logs, the FMS tool was brought back on board and broken down. The VSI was rigged up and deployed, and the protected species watch began at 0730 h. Stations were measured uphole every 20 m, and the VSI was back on board by 1300 h. With logging completed, we tripped the pipe out of Hole U1608A, clearing the rig floor at 1555 h. The drill floor was secured for transit, and the thrusters were raised and secured for transit at 1630 h, ending Hole U1608A and Site U1608.
A total of 60 cores were taken in Hole U1608A over a 561 m interval with 47.7% recovery. Total time on Hole U1608A was 111.84 h (4.66 days).
3. Lithostratigraphy
Site U1608 consists of one hole (U1608A) cored to a total depth of 561 m CSF-A with 47.66% recovery. The stratigraphy of Site U1608 is divided into four lithostratigraphic units (I–IV; Figure F5; Table T2). The lithofacies include (1) bioturbated mud with dispersed sand, (2) calcareous mud, (3) sandy mud/muddy sand with or without dispersed clasts, and (4) clast-poor sandy diamicton. Lithofacies 1 and 3 are present in all lithostratigraphic units, whereas Lithofacies 2 and 4 occur only in Units II and IV.
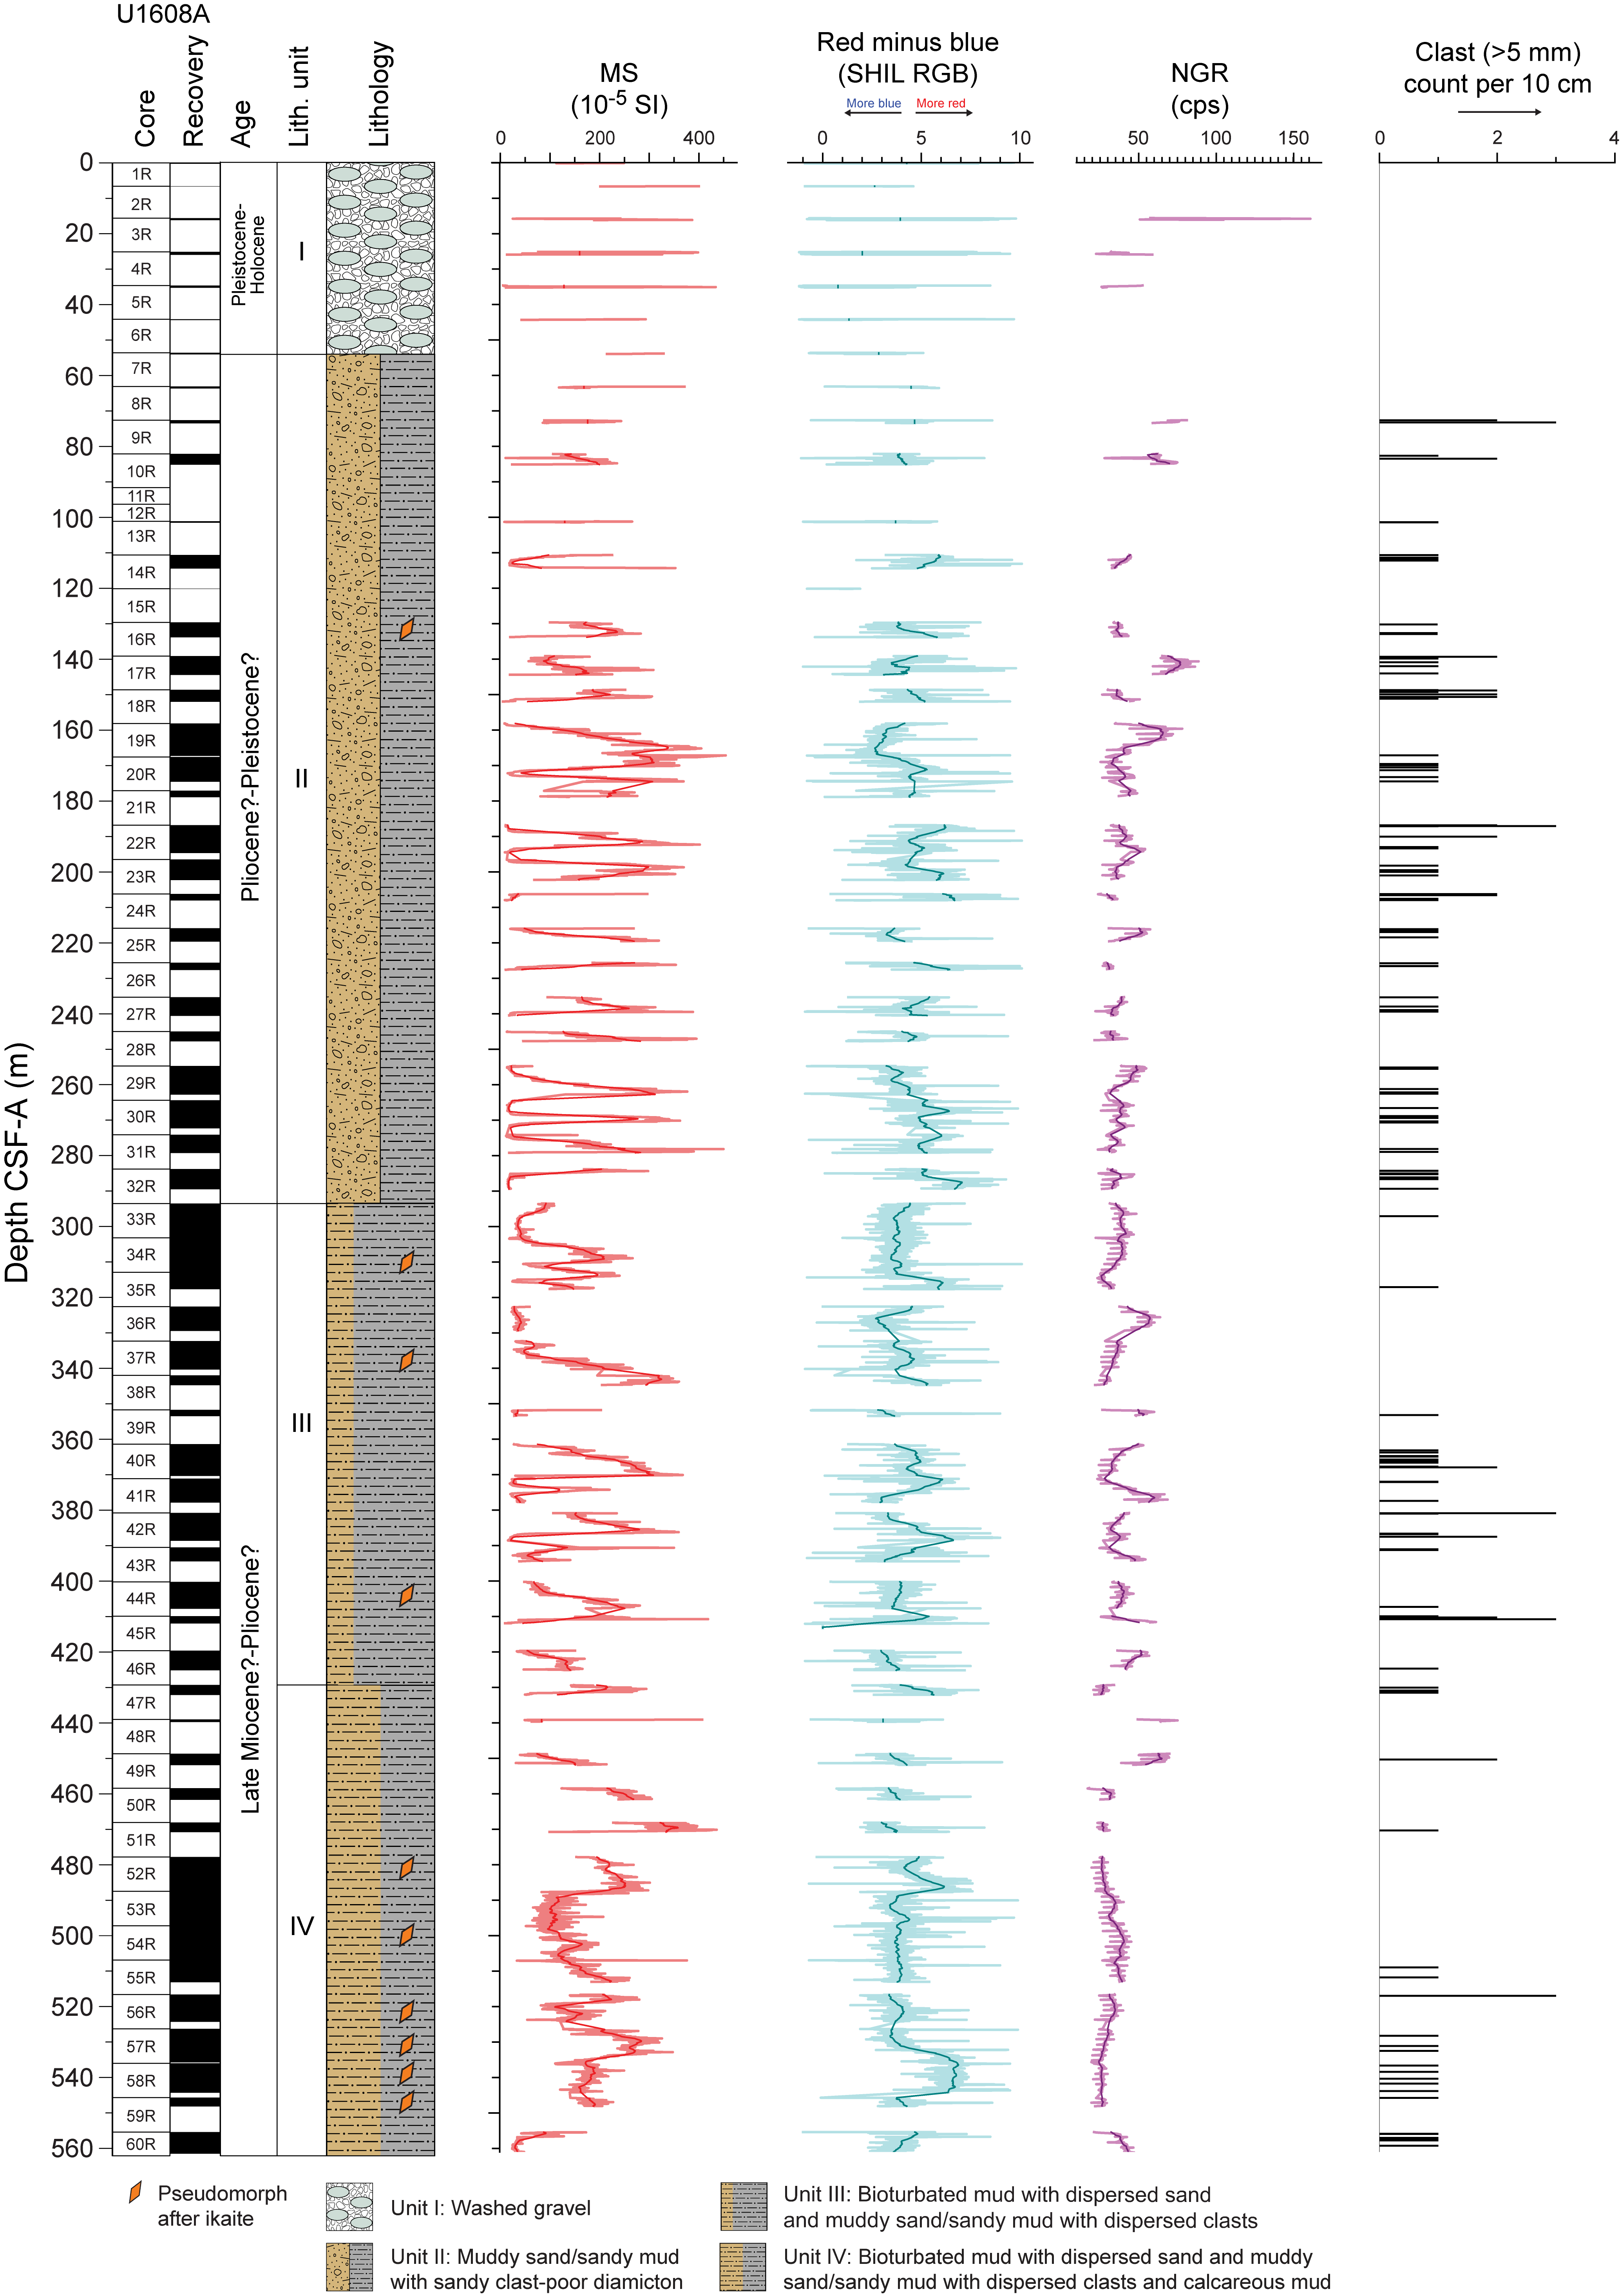
Figure F5. Lithostratigraphic summary.
Lithostratigraphic Unit I contains the uppermost 53.6 m of this site and consists of washed gravel (a product of drilling disturbance) (see Lithostratigraphy in the Expedition 400 methods chapter [Knutz et al., 2025a]) with diverse igneous, plutonic, and metamorphic clasts. Unit II (53.6–293.5 m CSF-A) contains bioturbated sandy mud/muddy sand with or without dispersed clasts, calcareous mud, and occurrences of clast-poor sandy diamicton. Unit III (293.5–429.3 m CSF-A) contains meter- to decimeter-scale intervals of bioturbated mud with sand and sandy mud to muddy sand with or without dispersed clasts. Overall, Unit III is distinguished from Unit II by a decrease in the abundance of sand, a significant reduction in the occurrence of the calcareous mud lithofacies, and an increase in the abundance of bioturbated mud with dispersed sand.
Unit IV is 135.8 m thick (429.3–561.46 m CSF-A) and consists of alternating meter- to decimeter-scale intervals of bioturbated mud with dispersed sand and decimeter-scale intervals of sandy mud/muddy sand. This unit marks a downhole increase in the sand proportion and an increase in the occurrence of yellowish calcareous mud. In this unit, the calcareous mud commonly occurs as centimeter-scale bioturbated patches.
Overall, the sedimentary succession recovered at Site U1608 is consistent with deposition in a marine shelf setting with sedimentary contributions from glacigenic and minor hemipelagic biosiliceous sources (see Biostratigraphy for detailed marine microfossil information).
3.1. Unit descriptions
Site U1608 is divided into four lithostratigraphic units (Units I–IV; youngest to oldest). Significant downhole changes in lithology were determined using a combination of visual core description, microscopic characterization (using smear slides and thin sections), reflectance spectroscopy and colorimetry, magnetic susceptibility (MS), and bulk and clay mineralogical data determined using X-ray diffraction (XRD) (see Lithostratigraphy in the Expedition 400 methods chapter [Knutz et al., 2025a]).
3.1.1. Unit I
- Interval: 400-U1608A-1R-1, 0 cm, to 7R-1, 0 cm
- Depth: 0–53.6 m CSF-A
- Thickness: 53.6 m
- Age: Pleistocene–Holocene
- Lithology: washed gravel
Lithostratigraphic Unit I was poorly recovered and is characterized by pebble- to cobble-sized clasts of predominantly igneous and metamorphic lithologies, including weakly banded granitic gneisses, amphibolite, garnet-bearing lithologies, strongly foliated metamorphic rocks, and felsic and mafic plutonic igneous lithologies. The washed gravel is lithologically consistent with clasts in diamicton at this site and Site U1605. Although the surfaces of a few pebbles and cobbles were covered in muddy sediment, they were generally cleaned or washed during the drilling and curation process.
3.1.2. Unit II
- Interval: 400-U1608A-7R-1, 0 cm, to 33R-1, 0 cm
- Depth: 53.6–293.5 m CSF-A
- Thickness: 239.9 m
- Age: Pliocene?–Pleistocene?
- Lithology: muddy sand/sandy mud with clast-poor sandy diamicton and intervals of calcareous mud
Lithostratigraphic Unit II is dominated by dark greenish gray muddy sand and sandy mud with and without dispersed clasts. Bioturbation is commonly expressed as dark gray to gray millimeter- to centimeter-scale burrows. Unit II is also characterized by the presence of greenish gray to brownish gray clast-poor sandy diamicton. Downcore transitions between intervals of sandy mud/muddy sand and clast-poor sandy diamicton are gradational both in dominant grain size and color over 5 to 30 cm. Intervals of light brown calcareous mud are typically 4–10 cm thick and can be observed with thin (<0.3 cm) parallel lamination in Unit II. Shell fragments up to ~2 cm long occur throughout this unit.
3.1.3. Unit III
- Interval: 400-U1608A-33R-1, 0 cm, to 47R-1, 0 cm
- Depth: 293.5–429.3 m CSF-A
- Thickness: 135.8 m
- Age: Late Miocene?–Pliocene?
- Lithology: bioturbated mud with dispersed sand and muddy sand/sandy mud with dispersed clasts
The top of Lithostratigraphic Unit III is defined based on the first downhole occurrence of greenish gray bioturbated mud with sand. The interval is dominated by poorly sorted mud with dispersed sand lithofacies or sandy mud with a coarse sand fraction that occasionally exceeds sand size and was therefore described as mud to sandy mud with dispersed clasts. Those clasts that exceed sand size are <5 mm in diameter (and thus were not included in the clast count). Subangular to subrounded, light-colored coarse crystalline and black fine-grained pebble-sized clasts are common. Occasional weakly stratified muddy sand occurs. Bioturbation is described as millimeter- to centimeter-scale dark-colored burrows. Contacts between lithologies are gradational over 10 to 20 cm. The absence of clast-poor sandy diamicton lithofacies in Unit III and calcareous mud observed as burrow fill or bioturbated blebs and not as discrete beds characterize this lithostratigraphic unit. A peak of ~30% biosiliceous material, identified in smear slide, occurs in the muddy sand with dispersed clasts lithofacies of Core 400-U1608A-35R-2. Because of the variability in the biosiliceous component and the sampling scarcity of smear slides, it was not possible to confirm continuity of biosiliceous material.
3.1.4. Unit IV
- Interval: 400-U1608A-47R-1, 0 cm, to 60R-CC, 5 cm
- Depth: 429.3–561.46 m CSF-A
- Thickness: 132.16 m
- Age: Late Miocene?–Pliocene?
- Lithology: bioturbated mud with dispersed sand, muddy sand/sandy mud with dispersed clasts and calcareous mud
Lithostratigraphic Unit IV is dominated by bioturbated mud with dispersed sand similar to Unit III but with a change in color toward grayish green to grayish brown. This unit is also associated with a greater prevalence of sand interbeds with decimeter-thick intervals of grayish green to brownish muddy sand/sandy mud. Bioturbation is present as millimeter- to centimeter-scale burrows filled with dark material, as in Unit III. However, in Unit IV, the occurrence of calcareous mud increases relative to Unit III and is also observed within centimeter-scale bioturbated patches. Pseudomorphs after ikaite are a prominent feature of the lower part of this unit (Cores 400-U1608A-57R through 59R).
3.2. Lithofacies descriptions
3.2.1. Lithofacies 1: bioturbated mud with dispersed sand
Lithofacies 1 consists of mud with sand with moderate to abundant bioturbation (Figure F6). The color of this lithofacies ranges from medium to dark greenish gray, and intervals of this facies can range up to several meters in thickness. The proportion of sand in this lithofacies varies, and gradational transitions into and out of sandy mud/muddy sand (Lithofacies 3) occur coincident with an increase of the sand component.

Figure F6. Lithofacies 1.
The bioturbation associated with this lithofacies is a defining characteristic, with the intensity ranging from a bioturbation index of 3 (distinct traces, some bedding intact) to 6 (total homogenization of sediment, no original bedding visible). The bioturbation features are dominated by millimeter-scale oval to circular traces filled either with dark to gray material (mud) or with calcareous light brown mud.
The high degree of bioturbation in this lithofacies generally obscures primary depositional structures and bedding relationships. The distribution of sand-sized material appears to be strongly influenced by bioturbation, with sand often concentrated in pockets or burrow linings in more intensely bioturbated intervals (Figure F6). Smear slide analysis of Lithofacies 1 indicates highly variable mixtures of clay- and silt-sized material, with lower proportions of sand. The composition of silt and sand grains includes quartz (common to abundant), feldspar (rare to common), mica (rare to abundant), and rare to trace amounts of other lithic grains and accessory minerals. A biosiliceous component composed of diatom fragments, diatom frustules, radiolaria, and sponge spicules is also observed in smear slides. The variable abundance of biosiliceous grains and the sampling scarcity of smear slides did not allow assessment of the continuity of biosiliceous material. Therefore, a biosiliceous-bearing mud was not designated in this lithofacies.
Lithofacies 1 is interpreted to represent sedimentation in a low- to moderate-energy marine shelf setting characterized by dominantly hemipelagic settling combined with episodes of bottom current reworking and/or ice rafting. The bioturbated fabric leads to a high degree of uncertainty regarding a specific depositional environment interpretation.
3.2.2. Lithofacies 2: calcareous mud
Lithofacies 2 consists of isolated 5–10 cm thick beds of light gray to yellowish brown variably bioturbated calcareous mud, which occurs throughout the succession. Beds are lithified to varying degrees; have bioturbated lower contacts; and, in rare cases, present well-developed, thin, parallel laminations (Figure F7A–F7C). In Lithostratigraphic Unit IV, the calcareous mud occurs in bioturbated patches rather than distinct beds (Figure F7D). Thin sections and smear slides show that this lithofacies is dominated by carbonate micrite grains. Other components include dispersed silt- and sand-sized grains of quartz, feldspar, and other accessory minerals.
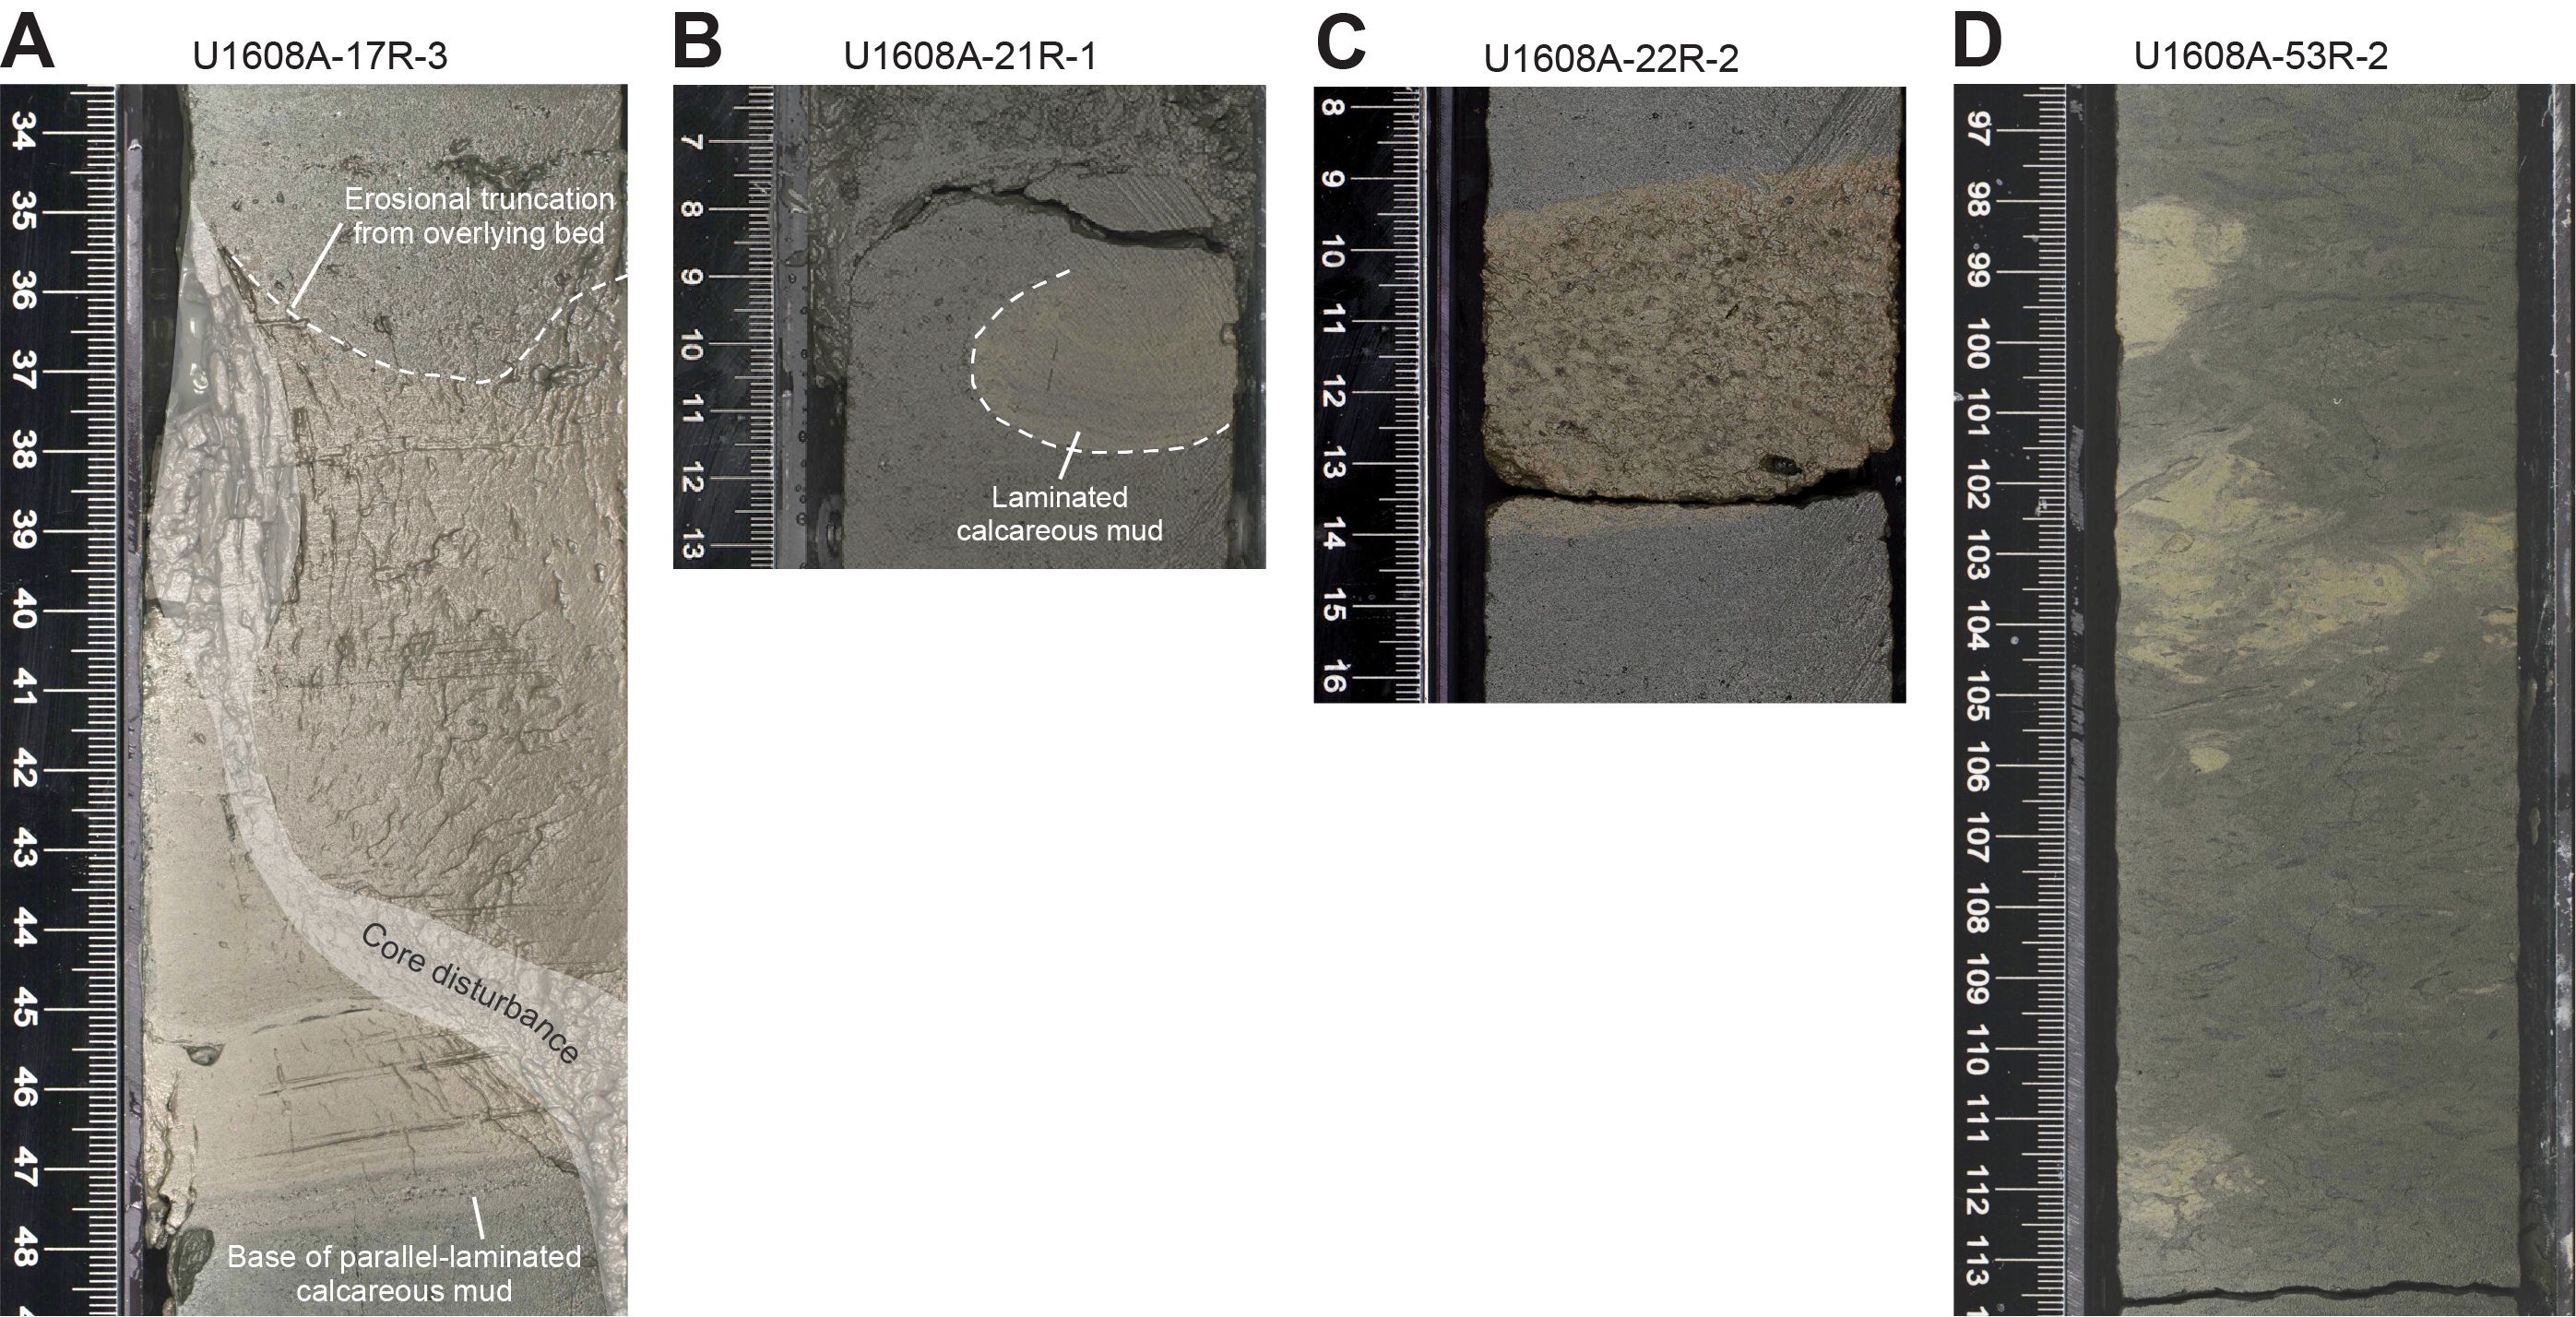
Figure F7. Lithofacies 2.
Lithofacies 2 is most likely the result of the deposition of carbonate mud. This lithofacies is more likely to be depositional than diagenetic because of the silt-sized nature of the matrix grains; diagenetic grains of this size would be difficult to precipitate in the limited intragranular pore space present in the mud-rich lithologies at this site. In addition, the occurrence of calcareous mud within isolated burrows suggests that it was present when burrowing organisms were active. The fine-grained nature of the deposit is most consistent with deposition out of suspension. The particles may have been either carried to the marine shelf from elsewhere via plumes or wind or generated locally during bursts of surface productivity by calcifiers.
3.2.3. Lithofacies 3: sandy mud/muddy sand with or without dispersed clasts
Lithofacies 3 consists of decimeter- to meter-scale beds of sand-sized terrigenous material mixed with mud varying from grayish green to greenish gray in color (Figure F8). The dispersed clast components of this facies (>2 mm) are generally granules (2–4 mm). Their relatively small sizes mean that they are not always associated with clast counts (clasts >5 mm) (see Lithostratigraphy in the Expedition 400 methods chapter [Knutz et al., 2025a]). Of the pebble-sized outsized clasts, rounded, mafic, aphanitic igneous lithologies are the most frequently occurring type throughout this site (see TS49). Lithofacies 3 may occur with rare sand laminae often disrupted by sparse to moderate bioturbation. Shell fragments are commonly found in this lithofacies and occur as disarticulated valves.
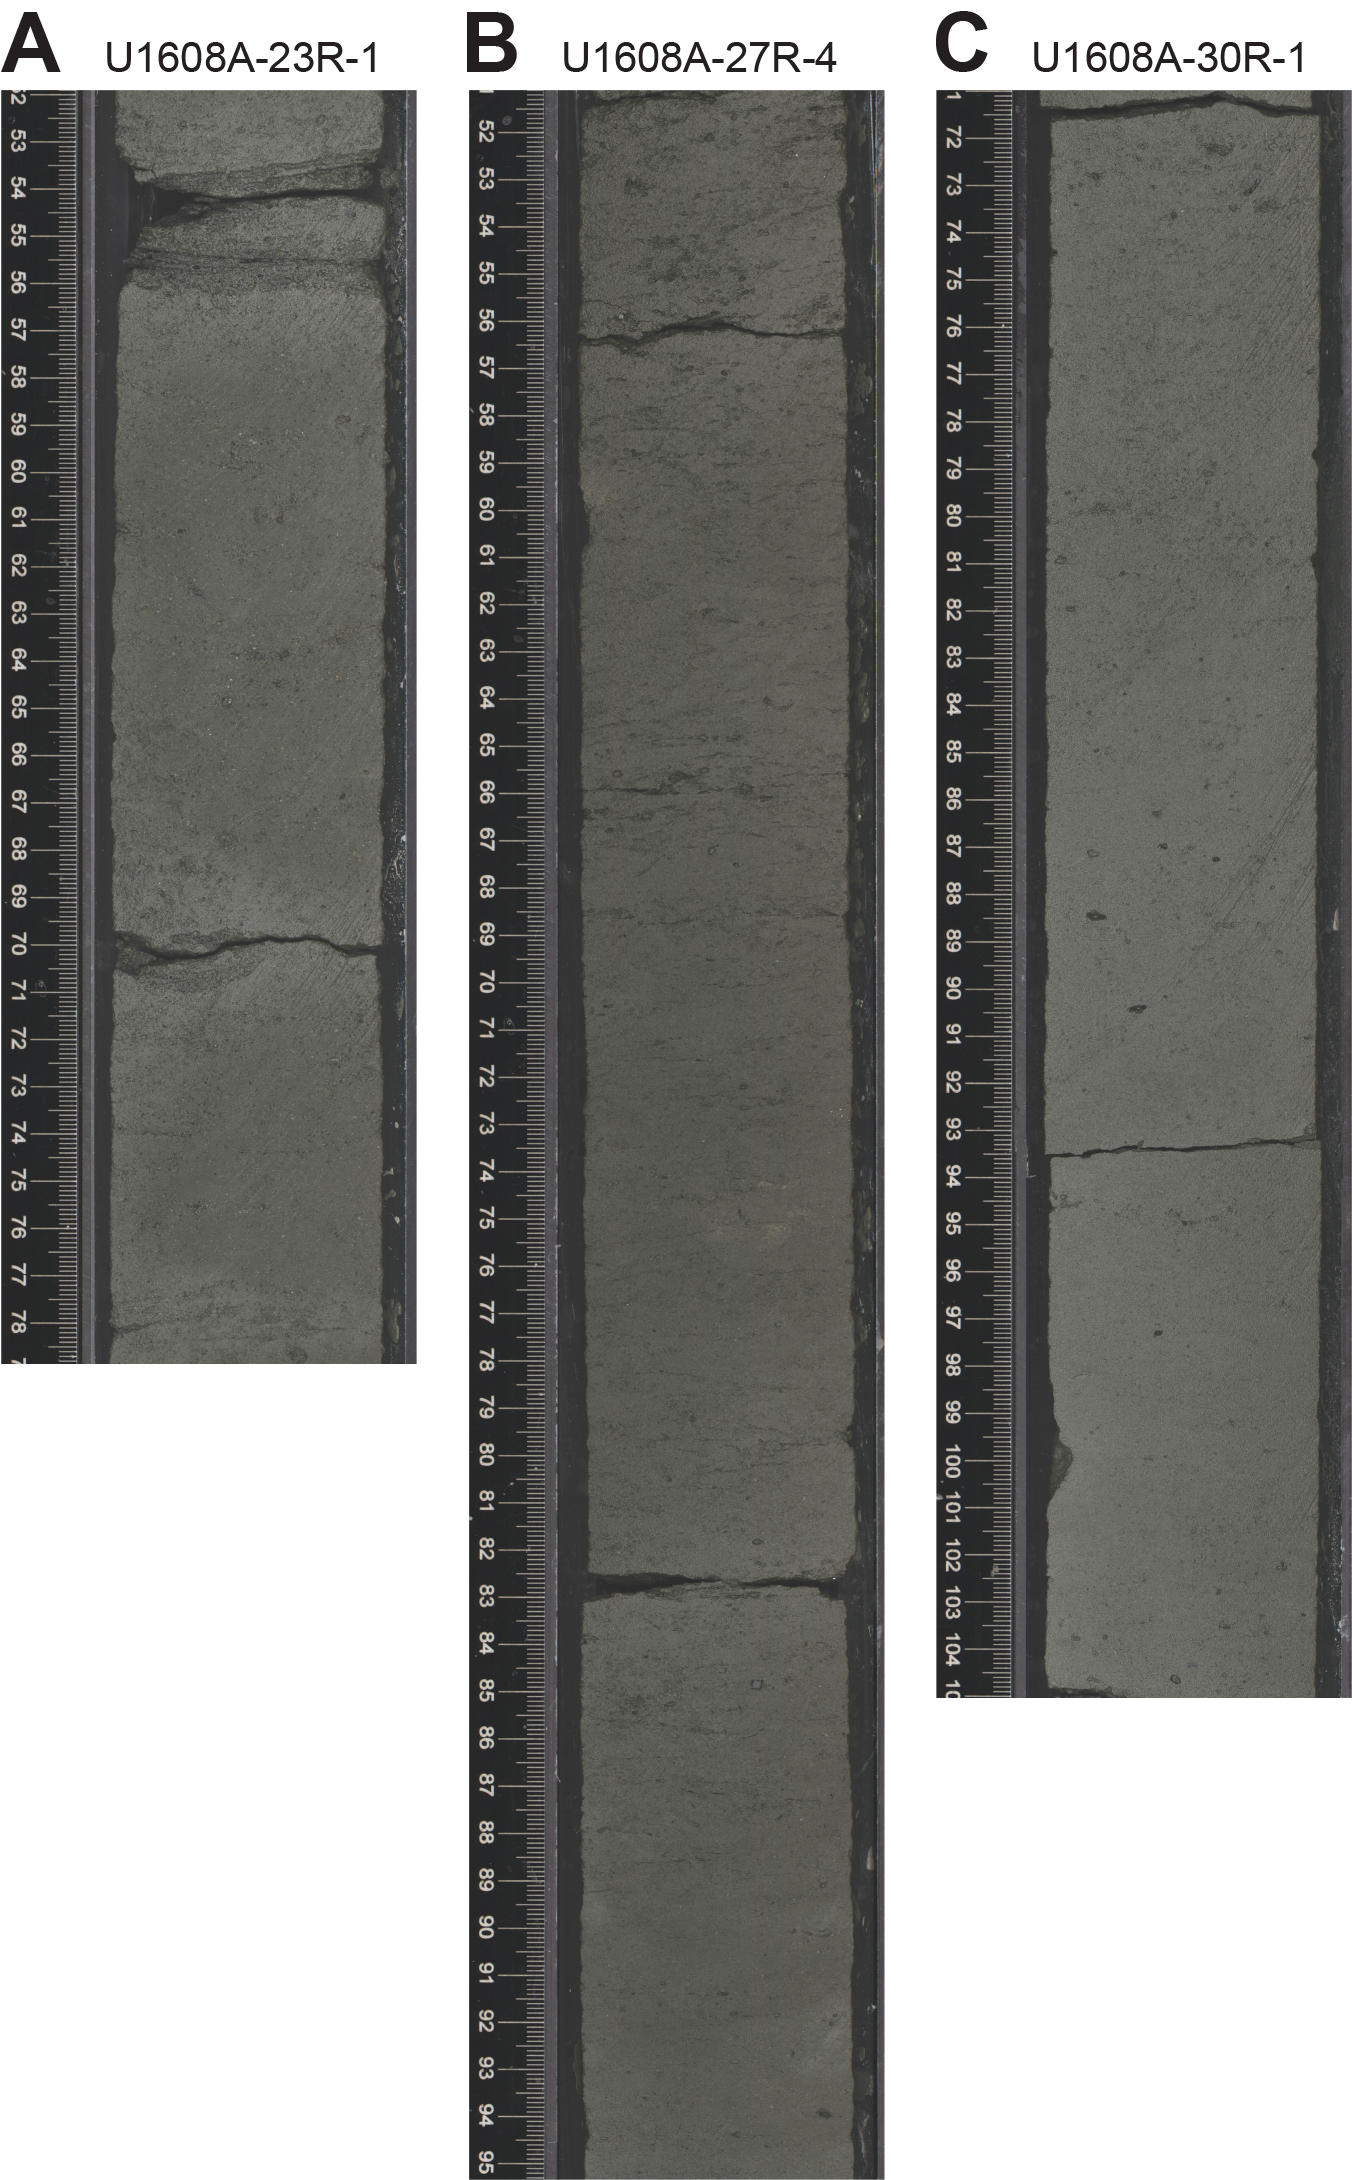
Figure F8. Lithofacies 3.
The presence of rare sand laminae and dispersed clasts is interpreted as deposition in a continental shelf environment with weak currents and sediment delivery by iceberg and/or sea ice rafting.
3.2.4. Lithofacies 4: clast-poor sandy diamicton
Lithofacies 4 consists of grayish brown to brown or greenish gray, weakly stratified, poorly sorted sediments with a matrix of mixed sand and mud and a clast abundance of 5%–10% (Figure F9). Bioturbation is absent to sparse in this lithofacies, suggesting that its weakly stratified characteristic is a depositional feature that has not been destroyed by bioturbation. This lithofacies does not exceed 1 m in thickness at this site. In almost all instances, both the upper and lower boundaries between Lithofacies 3 and 4 are gradational. The clasts are mainly small pebbles (<5 mm to 1 cm) and are composed of igneous lithologies.
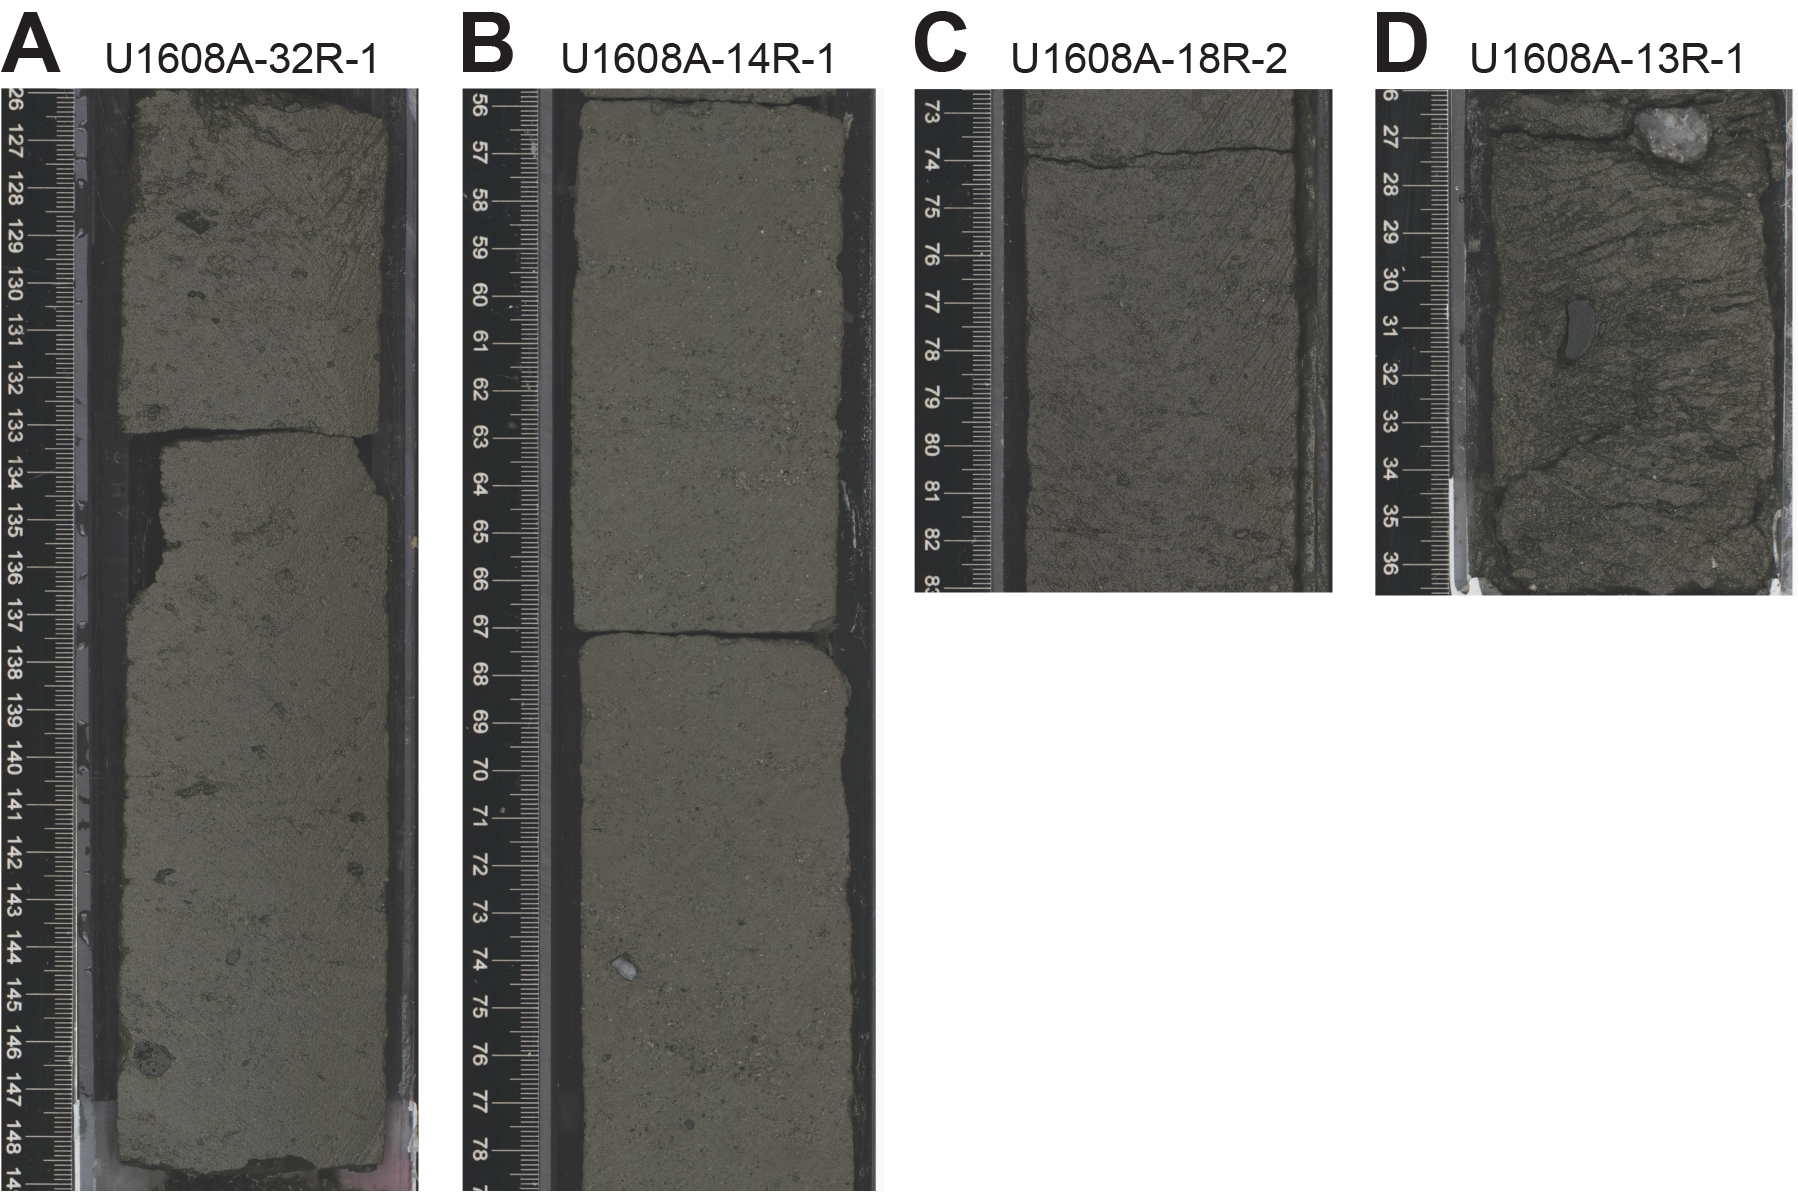
Figure F9. Lithofacies 4.
Lithofacies 4 represents deposition in a continental shelf environment with weak currents and sediment delivery by floating glacial ice and/or sea ice rafting.
3.3. Bioturbation and biological components
Bioturbation is a prominent characteristic of the sedimentary succession at Site U1608. The intensity of bioturbation varies, but it is present in all lithostratigraphic units and occurs in all lithofacies (to different degrees). A systematic characterization and identification of named traces, ichnofauna, and ichnofacies was not conducted at Site U1608 during shipboard description and analysis. However, the observed bioturbation fabrics indicate a large range of trace types and associated burrowing behaviors dependent on factors such as the nature of the substrate, food supply, bottom water oxygenation, sedimentation rates, and chemistry of shallow subsurface pore waters.
Fossils of many types are observed at Site U1608. Mollusk shells are common in Lithostratigraphic Unit II as articulated specimens, single valves, or shell fragments, most commonly in association with Lithofacies 1 (Figure F10C). A colony of in-place bryozoans was also found in Section 400-U1608A-19R-CC (Figure F10A). Organic debris including wood fragments as thick as 2 cm are also observed in Units II and III at Site U1608 (Figure F10B).
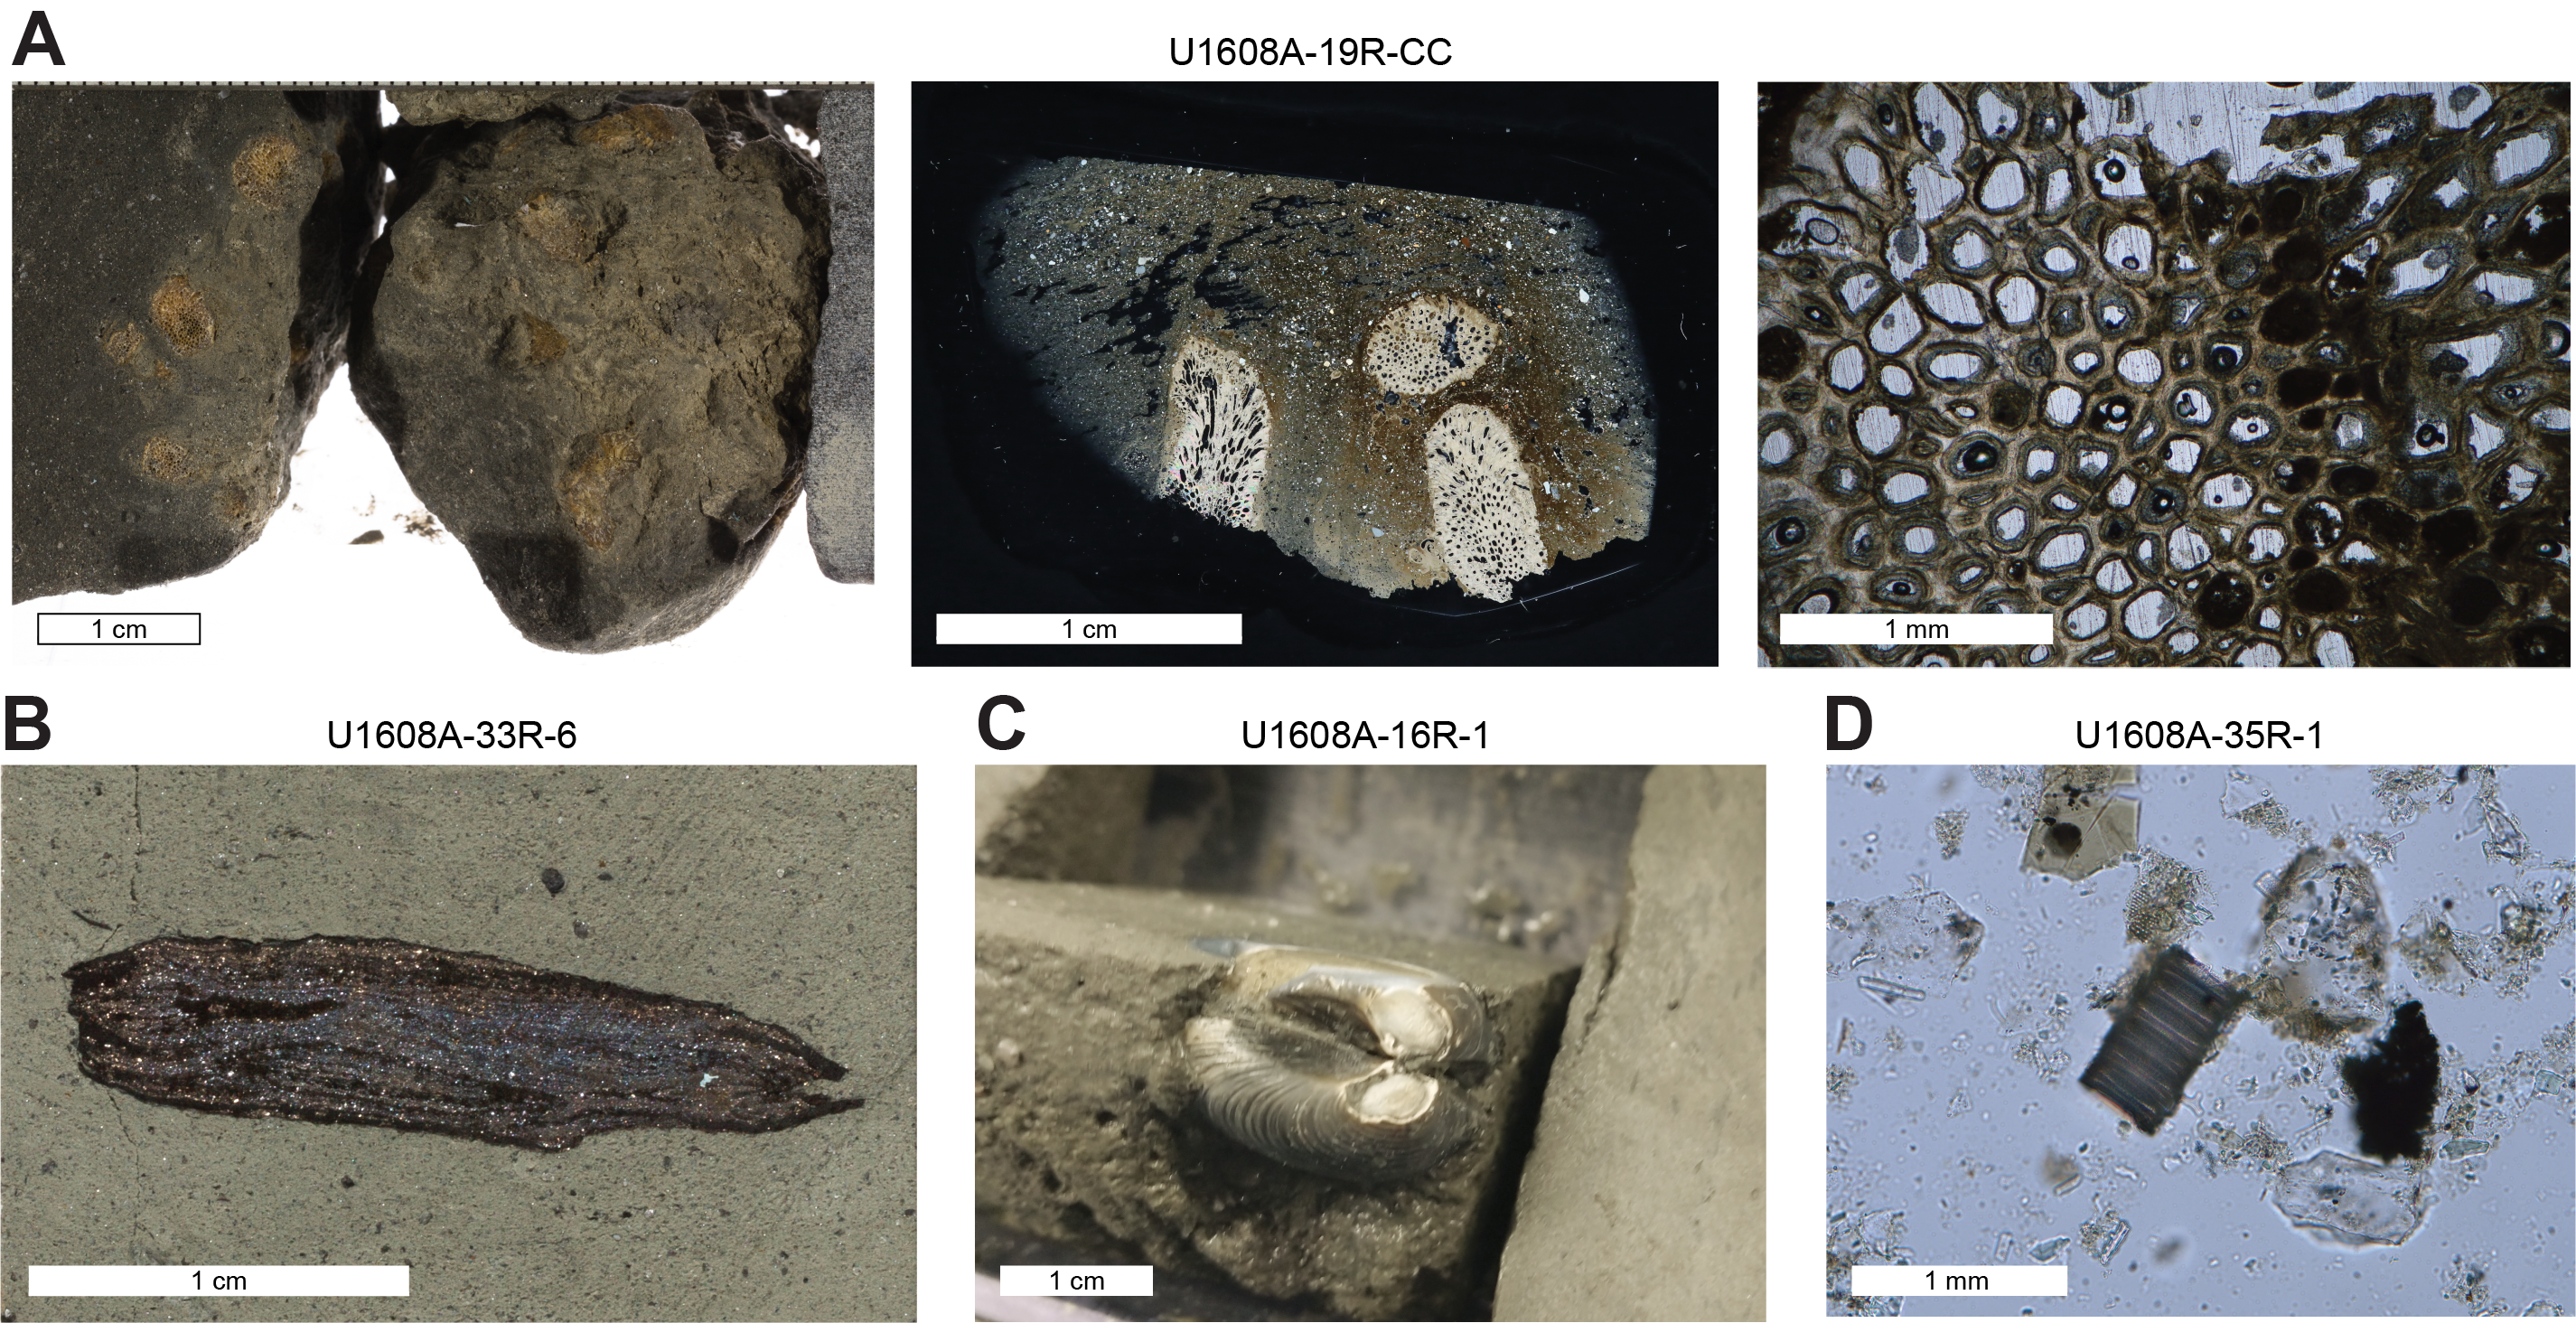
Figure F10. Bioturbation and trace fossils.
Smear slide observations indicate the presence of biosiliceous component such as spicules, radiolarian fragments, and diatoms found either as fragments, single individuals, or colonies (Figure F10D). Although the biosiliceous content is mainly associated with the bioturbated mud with sand lithofacies, it also occurs in the sandy mud/muddy sand lithofacies.
3.4. Diagenesis
Diagenetic features at Site U1608 mainly include carbonate concretions and pseudomorphs after ikaite (Figure F11). Carbonate concretions are present as spherical concretions ranging 1–3 cm in diameter and are sparse at Site U1608.
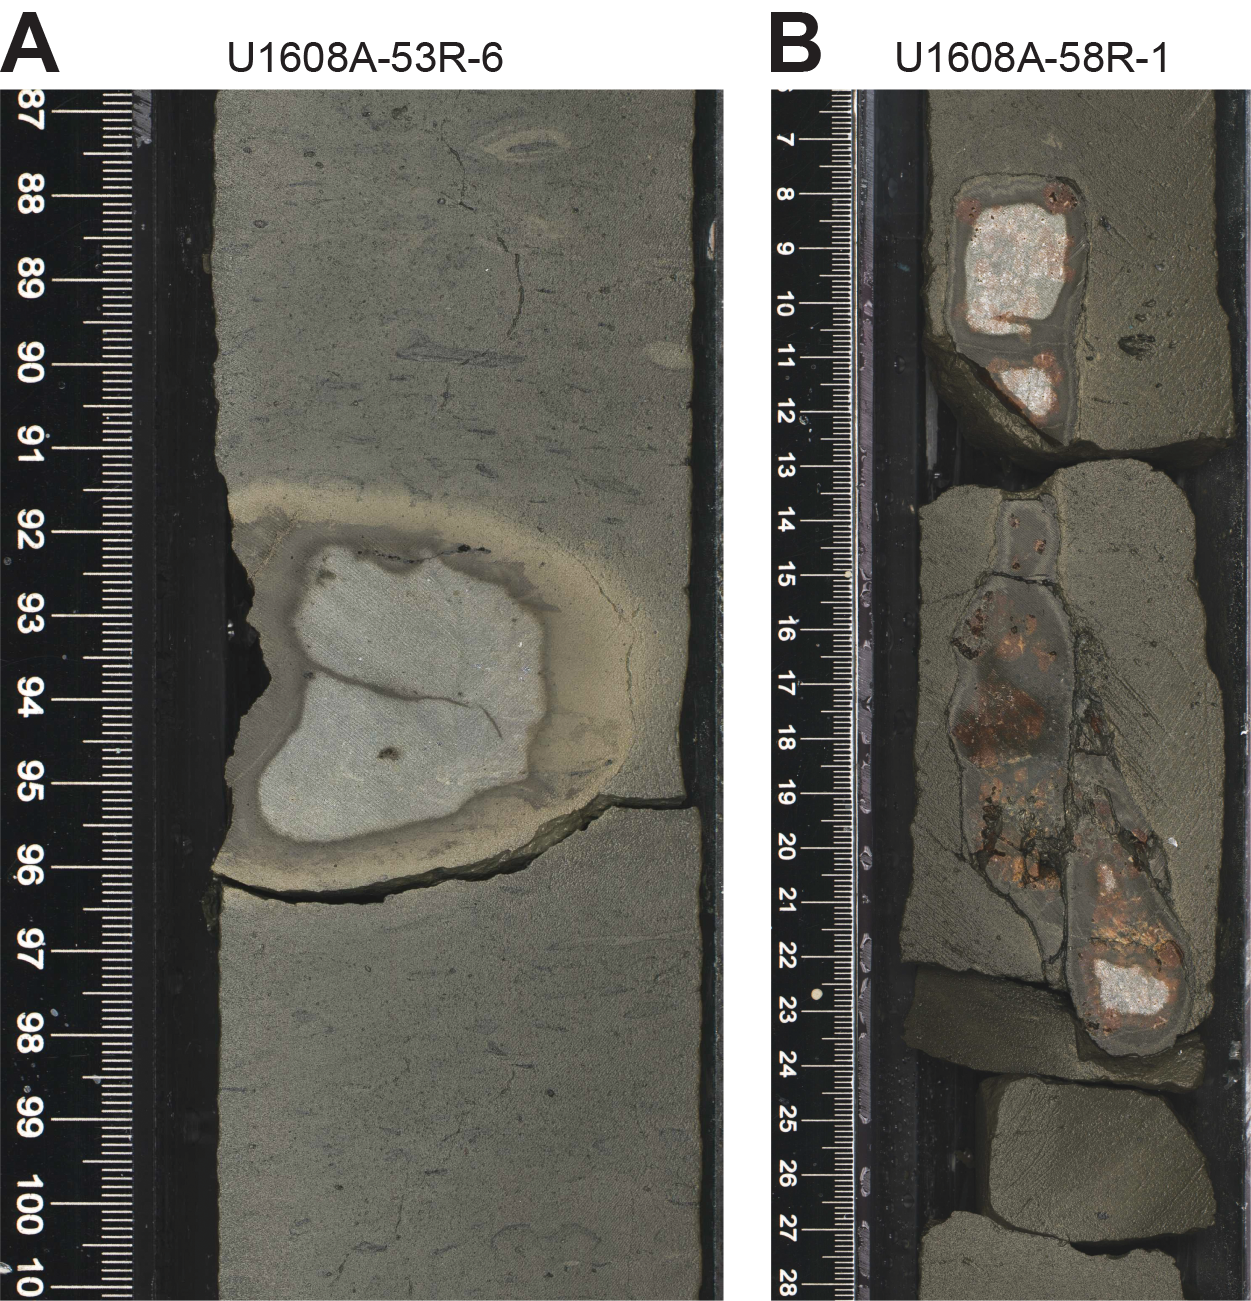
Figure F11. Diagenetic features.
Glendonite, known as a pseudomorph after ikaite (CaCO3 · 6H2O), appears within intervals of Lithofacies 1. Glendonite is sporadically recorded in Lithostratigraphic Units II and III and with a greater occurrence at the bottom in Unit IV. It occurs as blades or stellate forms typically 1–2 cm in diameter, ranging in color from maroon to orange and containing coarse carbonate crystals. The volume change associated with this transformation leads to the production of secondary porosity between calcite crystals. Because ikaite is known to form in marine settings only at frigid temperatures, the presence of its pseudomorphs provides broad constraints for paleoclimate conditions at the time enclosing sediments were deposited.
3.5. Smear slide and thin section analysis
A series of smear slides was taken during core description to ascertain the characteristics and composition of finer sediments, namely mud and very fine sand. Clay was too fine grained for mineralogical identification using petrographic methods. Silt- and sand-sized grains are of terrigenous origin, dominated by clay minerals, quartz, and feldspar, with rare to common opaque minerals. Lesser amounts of mica, chlorite, amphibole, pyrite, organics, and other accessory minerals were identified. Smear slide samples collected at Site U1608 are notable for the relative abundance of siliceous biogenic material compared to other sites from this expedition. Whole and fragmented diatoms, fragmented and whole radiolarians, and sponge spicules occur in trace to rare abundances in all slides downhole from Section 400-U1608A-20R-2, 130 cm (170.3 m CSF-A).
Four thin sections were prepared to characterize key features at Site U1608. One thin section (TS47) was cut from a piece of distinctive and recurring washed gravel lithology to determine the composition of accessory minerals that might be key to provenance identification. Thin section analysis revealed the composition to be garnet-bearing granitic gneiss. TS49 was prepared from a fine-grained black rock, a recurring lithology characteristic of dispersed clasts at Site U1608. Composed mainly of plagioclase, pyroxene, and opaque minerals, these rocks have a mafic volcanic origin. Additional thin sections were cut to confirm the identifications of a foraminifera-encrusted cheilostome bryozoan colony (TS45) encrusting a muddy cobble in Section 400-U1608A-19R-CC (Figure F10A) and an amber-colored pseudomorph after ikaite (TS50).
3.6. Clay and bulk mineralogy results
Samples were collected from Hole U1608A for bulk mineralogical (49 samples) and clay mineral (16 samples) analysis using XRD. The overall bulk mineralogical composition of sediment from Site U1608 is dominated by quartz, feldspar, and plagioclase (Table T3) with the presence of trace chlorite. Smectite is recorded in rare abundance from the lower part of Lithostratigraphic Unit III and throughout Unit IV. Although rare in abundance, augite, dolomite, and pyrite are commonly recorded throughout Hole U1608A.
The chlorite/illite ratio varies greatly, ranging 0.16–0.67, which is largely due to changes in the relative abundance of illite (Table T4). The variability observed in the ratio does not seem to be linked to lithostratigraphic units.
3.7. Preliminary depositional interpretation
Site U1608 recovered a succession of Pleistocene (?), Pliocene, and Miocene (?) sediments from the shelf offshore northwest Greenland. Although poorly recovered, Lithostratigraphic Unit I suggests a depositional environment with abundant very coarse grained (cobble and larger) material usually associated with subglacial to proglacial settings. The prevalence of the sandy mud/muddy sand with dispersed clasts and sandy diamicton lithofacies, especially in Unit II, suggests a glacigenic origin of the sediments and may record ice sheet and floating ice processes that occurred on the shelf. The dominantly fine-grained (mud with dispersed very fine– to fine-grained sand) lithofacies in Unit III indicates a relatively low-energy shelf setting but with episodes of bottom current reworking and possible glacier influence (which also occur in Unit IV). The multiple calcareous mud intervals in an otherwise siliciclastic-dominated succession may suggest episodes of variable sediment provenance in the depositional evolution and/or hemipelagic activity. The occurrence of biosiliceous material such as diatoms and radiolarians in the sediment also indicates a hemipelagic component at Site U1608.
4. Biostratigraphy
4.1. Biostratigraphy and paleoenvironment
Site U1608 (74°07.6818′N, 060°58.3172′W) was drilled on the middle shelf fringing the Melville Bugt trough at 606.9 mbsl. The aim was to recover Neogene contourite drift sediments, providing sedimentary archives of paleoceanographic conditions prior to the major basinward expansion of the GrIS. As indicated by seismic stratigraphy, an inferred late Neogene sediment sequence lies below a relatively thin covering (~70 m) of inferred Pleistocene glaciomarine, proglacial, and subglacial deposits. Core catcher samples from Hole U1608A were examined for foraminifera, diatoms, dinoflagellate cysts (dinocysts), and other palynomorphs. Samples were also taken for ancient sedimentary DNA (sedaDNA) analysis. The mudline was not recovered at Site U1608. The uppermost three cores (400-U1608A-1R through 3R) contained washed gravel and failed to recover fine-grained sediment suitable for microfossil analysis.
All microfossil groups are present in Site U1608 cores and occur throughout much of the recovered sequence (Figure F12). Benthic foraminifera occur in 88% of samples, whereas planktonic foraminifera are found in only three samples, represented in each case by a single specimen. Diatoms were observed in 70% of samples, and dinocysts were observed in 84% of the samples.
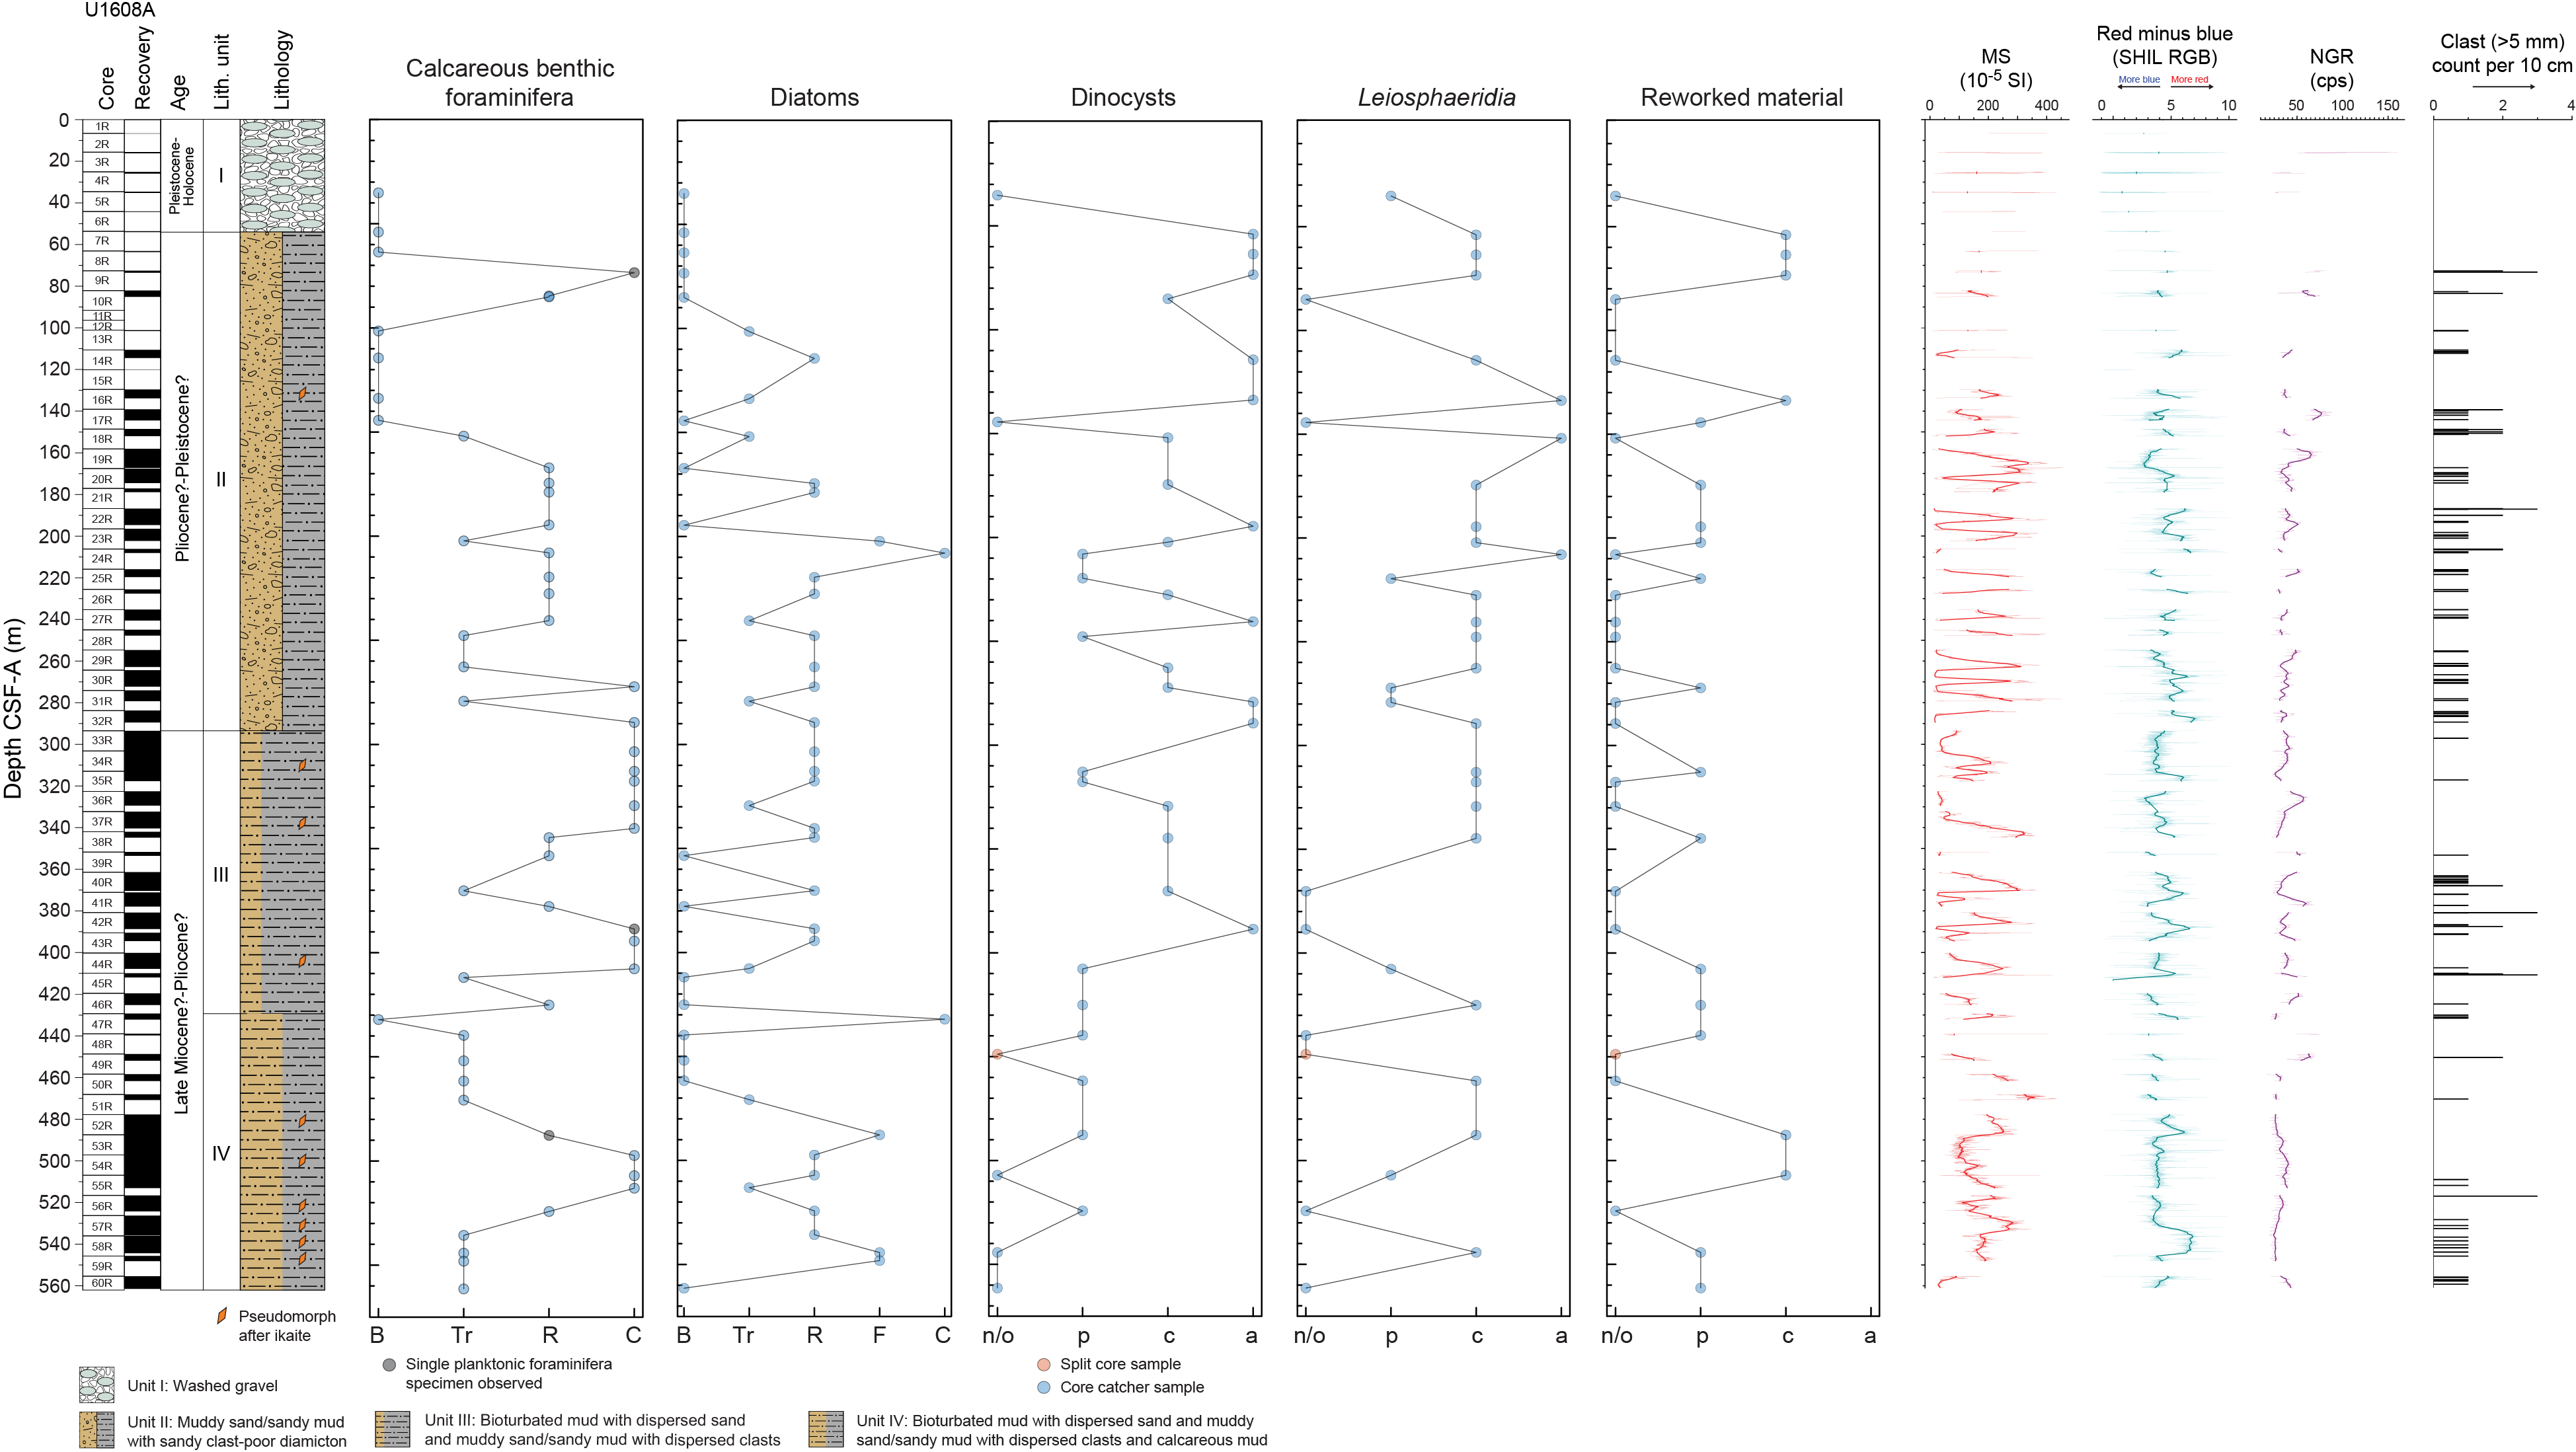
Figure F12. Trends across fossil groups.
Foraminifera are absent through Sample 400-U1608A-8R-CC. Below this depth, they become rare to intermittently common to the base of the hole and consist of typical Arctic Neogene shelf-slope benthic species (Feyling-Hansen, 1976) with intervals of warmer ocean conditions. The long-ranging benthic species recorded offer little age control, although the presence of Cassidulina teretis, which we have confirmed using scanning electron microscope (SEM) analysis (after Cage et al., 2021), implies that the foraminifera-bearing sediments between and including Samples 9R-CC (73.44 m CSF-A) and 56R-CC (524.24 m CSF-A) are older than 700 ka (middle Pleistocene) but no older than Middle Miocene (Seidenkrantz, 1995). Diatoms are barren through Core 12R, below which they are present in most core catcher samples. The diatom assemblages are at times diverse and well preserved, providing both age and paleoenvironmental constraints. Palynomorphs occur in every sample in varying abundances, including the uppermost 100 m, where other microfossils are absent. The dinocyst assemblages, which consist mostly of species associated with neritic, food-rich environments, are at times diverse, providing additional chronostratigraphic and paleoenvironmental insights. Pulses of terrestrial-derived organic material are a distinct feature of Site U1608. This is evidenced by occurrences of micro/macrofossil wood and plant fragments in sieved foraminifera samples, as well as by smaller plant/wood fragments, pollen, spores, and fungal material in palynomorph preparations. These pulses of terrestrial material in the sieved (>63 µm) foraminifera samples occur intermittently and at times intensely in Samples 10R-CC to 52R-CC (84.68–487.69 m CSF-A). Pulses of terrestrial material in the sieved (15–250 µm) palynology samples occur in samples from core catcher Sections 16R-CC, 24R-CC, 28R-CC, and 35R-CC. Often, the terrestrial pulses in the foraminifera samples do not correspond to terrestrial pulses in the palynology samples. Pulses of larger (>250 µm) and smaller (>63 µm) terrestrial material alternate, implying different transport mechanisms (e.g., fluvial versus glacial).
4.1.1. Foraminifera
Recovery was poor in the uppermost ~130 m of Site U1608, and only 8 of the 16 cores recovered over this interval yielded core catcher samples. Of the processed foraminifera samples from Hole U1608A, 45 of the 53 core catcher samples contain foraminifera (Figure F12). The vast majority of observed specimens are calcareous benthic species that appear as trace, rare, to common in abundance (Table T5; Figure F13). No agglutinated foraminifera were observed in the washed residues, and only trace and sporadic occurrences of planktonic foraminifera occur in Samples 400-U1608A-9R-CC, 42R-CC, and 52R-CC. The >125 and 63–125 µm sieved fractions were examined separately, but because of the typically low numbers of foraminifera, the observations are presented together. Most core catcher samples from Site U1608 consist of indurated sandy mud and muddy sand, which were consistently challenging to disaggregate. Samples had to first be manually broken into fragments and then subjected to multiple cycles of soaking, shaking, drying, and washing. Despite this procedure, the resulting residues were still left with many aggregates of unwashed mud in all size fractions. The foraminifera obtained were sometimes mechanically broken. General test preservation varied from good to poor, and specimens commonly exhibited yellow discoloration.
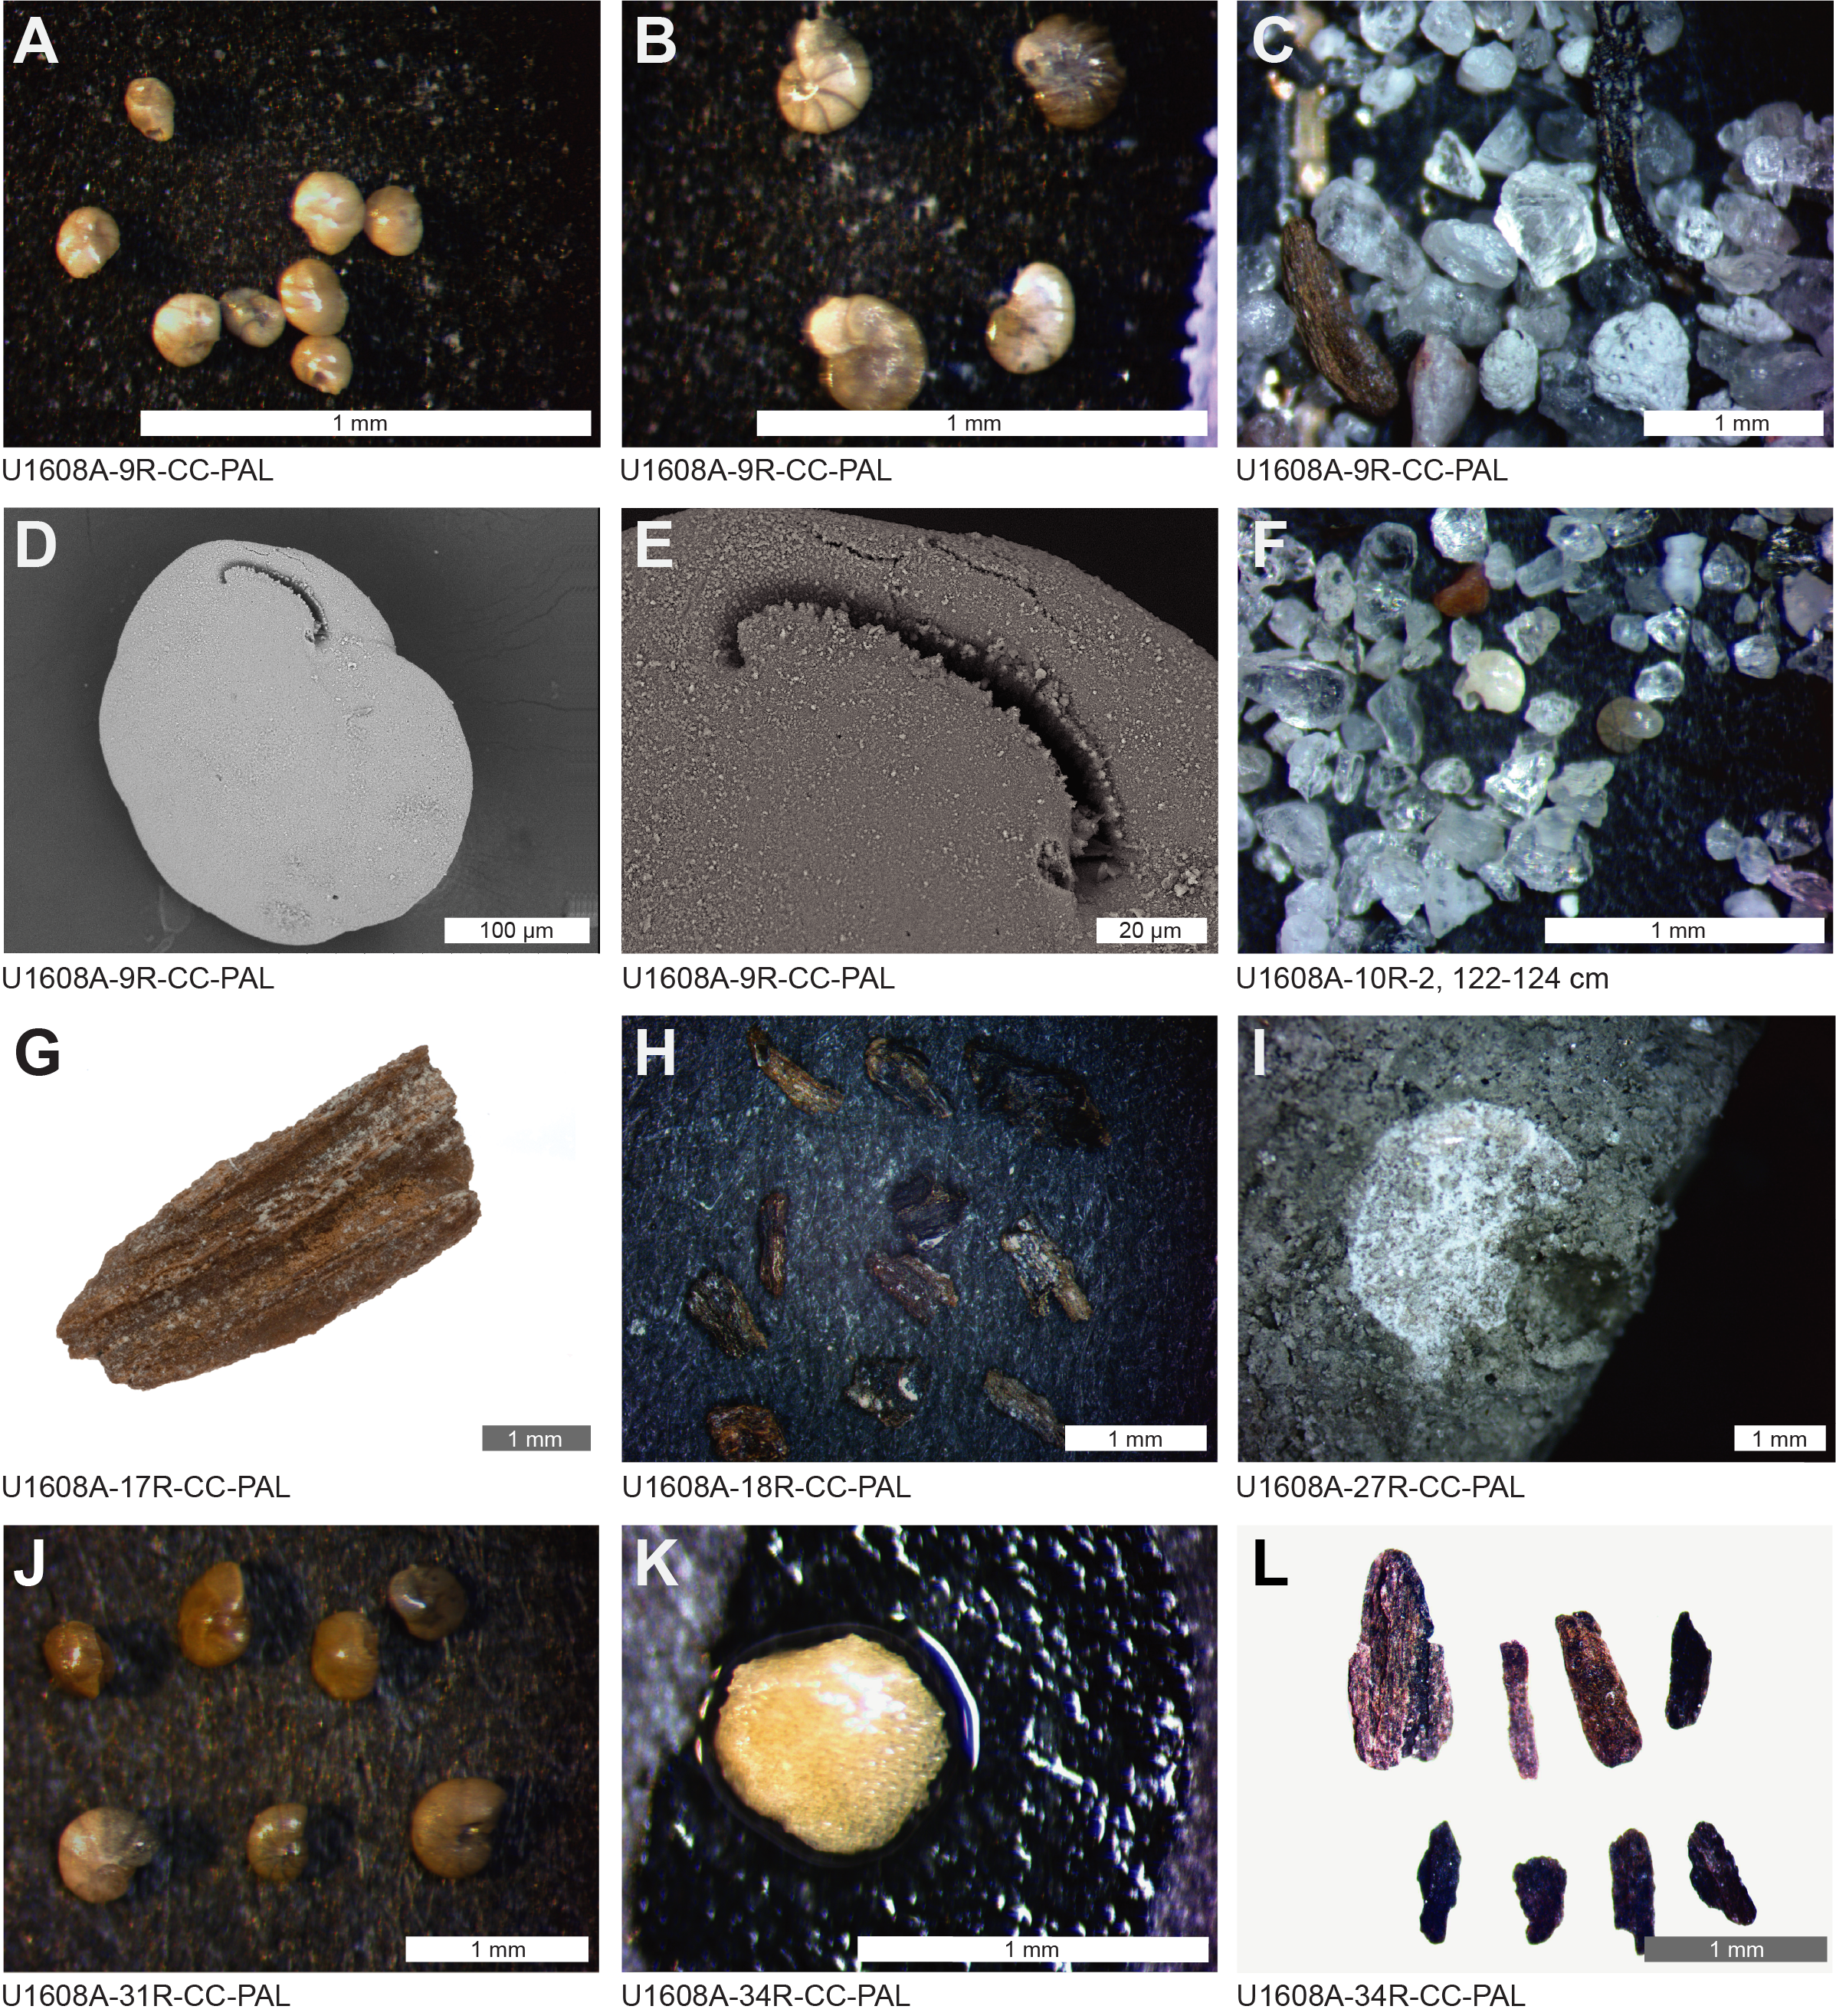
Figure F13. Benthic and planktonic foraminifera.
Within the washed gravel of Lithostratigraphic Unit I (see Lithostratigraphy), soft sediment appropriate for micropaleontological analysis was first recovered in Sample 400-U1608A-5R-CC (35.13 m CSF-A). This sample and Samples 7R-CC and 8R-CC are barren of foraminifera. Foraminifera first appear in the muddy sand/sandy mud (Unit II) of Sample 9R-CC at a relatively common abundance level (Figure F13A, F13B). The assemblage contains Cassidulina cf. reniforme, C. teretis, and Melonis (likely Melonis barleeanus, which is considered by some to be a junior synonym of Melonis affinis [Hayward et al., 2010]), with occasional Trifarina sp. and Cibicides sp. Foraminifera specimens show various degrees of yellow-brown staining (Figure F13A, F13B, F13F, F13J). The identification of C. teretis was confirmed by SEM analysis, which revealed the diagnostic toothed apertural plate characteristic of the species (Seidenkrantz, 1995; Cage et al., 2021) (Figure F13D, F13E). Following Cage et al. (2021), the occurrence of C. teretis implies the interval below and including Sample 9R-CC is older than 700 ka. One specimen of the planktonic foraminifera Neogloboquadrina pachyderma sinistral was also found in this sample. The two subsequent samples (10R-2, 122–124 cm, and 10R-CC) contain similar assemblages, although specimens are less common. Minor contributors to the benthic assemblages include Epistominella sp. and Elphidium sp. and/or Haynesina orbiculare. Unit II Samples 10R-CC to 17R-CC are barren of foraminifera.
In Sample 400-U1608A-18R-CC and below, benthic foraminifera reappear and remain fairly persistent in core catcher samples throughout Lithostratigraphic Units II–IV. Abundance levels vary from trace to common (although Sample 47R-CC is barren), with the richest assemblages occurring in Samples 30R-CC to 44R-CC (272.25–407.72 m CSF-A). In Sample 57R-CC (535.175 m CSF-A) and below, benthic foraminifera have only trace occurrences.
Similar to the foraminifera-bearing samples in the uppermost 100 m, the key faunal components of the cores below that depth are C. cf. reniforme, C. teretis, and M. barleeanus. These species occur fairly consistently downhole (Table T5). Cassidulina laevigata is recorded in several samples between and including Samples 400-U1608A-19R-CC to 43R-CC. Less common are Cibicides sp., Epistominella sp., Buccella sp., and occasional Fissurina sp., Elphidium, Brizalina, Cornuspira, and Stainforthia feylingi. Although agglutinated benthic foraminifera are not found in any of the Site U1608 core catcher samples, in Sample 27R-CC, we observed the pale, sandy, ghostlike trace of what appears to be the agglutinated benthic species Cyclammina cancellata (Figure F13I).
The typical assemblages containing C. cf. reniforme, C. teretis, and M. barleeanus overlap in terms of species content with those found in the early Pleistocene slope sequence of Ocean Drilling Program (ODP) Site 645 (Kaminski et al., 1989). There are also parallels to recent Arctic assemblages from similar water depths (350–900 mbsl) in the Canadian sector of the central Arctic Ocean where Atlantic water has a significant influence (Lagoe, 1979), although the diversity is lower at Site U1608. Moreover, the form recorded as C. teretis by Lagoe (1979) would now be considered Cassidulina neoteretis (Cage et al., 2021). There are also parallels between the Arctic upper slope fauna that feature common occurrences of C. teretis and C. cf. reniforme in the Clyde Foreland Formation on the northeast coast of Baffin Island (Feyling-Hansen, 1976), which subsequent chronological studies confirm to be of Early Pleistocene to latest Pliocene age (Refsnider et al., 2013). M. barleeanus is especially common in Hole U1608A (Table T5). This species, which is found in neritic and bathyal settings, occurs from the Oligocene to recent and becomes common in the North Atlantic region, like many of the modern benthic species, from the middle to upper Miocene (Katz and Miller, 1993; Holbourn et al., 2013). This environmentally flexible species can dominate calcareous assemblages in muddy shelf sediments around and within Baffin Bay (Kaminski et al., 1989). It is considered intolerant of reduced salinities, is infaunal, and is thought to thrive on altered buried organic matter (Caralp, 1989; Polyak et al., 2002; Bernhard and Panieri, 2018). C. reniforme is commonly associated with cold Arctic waters under marine influence in regions of seasonal sea ice cover and is tolerant of dysoxic or periodic anoxic conditions and cold seeps (Sejrup and Guilbault, 1980; Husum and Hald, 2004; Wollenburg and Mackensen, 2009). However, postexpedition work is required to determine whether the species most common in Megaunit B sediments from Sites U1608 and U1606 is Cassidulina subacuta, as recorded in the Clyde Foreland Formation, or is in fact C. reniforme. C. teretis had its first occurrence (FO) in the Norwegian Sea and the North Sea during the warm climate of the middle to upper Miocene (Jansen et al., 1990; Seidenkrantz, 1995). It has been linked to somewhat warmer waters circulating around the Arctic, including conditions where chilled Atlantic water is overlain by fresher Arctic surface layers (Jennings et al., 2004; Cage et al., 2021). The finding of C. laevigata in several samples is also significant. Today, this species is associated with warmer Atlantic-influenced surface waters at boreal latitudes, including off southwest Iceland in the path of the north-flowing Irminger Current (Jennings et al., 2004). In the Clyde Foreland Formation, situated on Baffin Island on the western Baffin Bay margin (Feyling-Hansen, 1976), C. laevigata is limited to the Pliocene. Its occurrence at Site U1608 implies a Pliocene or older age for Sample 400-U1608A-19R-CC and below, as well as relatively warmer water conditions. The presence of C. teretis to the base of the hole implies the cored sequence is no older than middle Miocene (Seidenkrantz, 1995).
The Site U1608 foraminifera preparations provide additional geological perspectives in the form of other microfossils and clast characteristics in the >63 µm washed residues. Important is the occurrence of terrestrial wood and plant fragments in multiple samples. These fragments often show indications of parallel venation reminiscent of grass or wood fiber (Figure F13C, F13G, F13H, F13L). The plant remains begin as rare shows in core catcher samples from and including Samples 400-U1608A-8R-CC to 53R-CC, varying from rare to abundant in Samples 28R-CC and 35R-CC (247.72 and 317.63 m CSF-A, respectively). Some fragments are black/brown colored, whereas others are fully or semipyritized. The occurrence of wood implies times of significant terrestrial vegetation being removed and transported to Site U1608 from land masses bordering Melville Bay, likely Greenland (Bennike, 1998) or farther afield, in the past. Other notable finds are fragments of encrusting bryozoa, indicating benthic life (Figure F13K). The mineral sand grain assemblages are fairly similar throughout Site U1608 cores (Figure F14). Where sediment was recovered in the washed gravel interval (Lithostratigraphic Unit I), the sand fraction consists of poorly sorted quartz sand and other mineral grains and lithics (Figure F14A). The sand components become generally better sorted in the muddy sand/sandy mud with sandy clast-poor diamicton of Unit II (Figure F14B), with variable amounts of larger grain sizes (>500 µm) appearing periodically (Figure F14C, F14D). Notable larger grains making appearances include very well rounded quartz grains (Figure F14C), as seen at other Expedition 400 sites, and other exotic-looking lithic grains, including red sandstone and foliated schist clasts (Figure F14D).

Figure F14. Bulk sediment and disaggregated grains.
4.1.2. Diatoms
At Site U1608, 52 samples were processed and observed for diatoms. Among them, 36 samples possess diatoms (~70% of all samples) with poor to moderate preservation (Table T6; Figure F12).
Diatoms are generally barren in Samples 400-U1608A-5R-1, 53–55 cm, to 10R-CC, whereas the majority of core catcher samples from Sections 13R-CC through 60R-CC contain trace to common amounts of diatoms (Table T6). The Hole U1608A diatom assemblages observed have high genera and species diversity. The dominant taxa include Chaetoceros spp. resting spore, Coscinodiscus marginatus, Fragilariopsis cylindrus, Fragilariopsis oceanica, Fragilariopsis reginae-jahniae, Melosira sol, Navicula spp., Rhaphoneis spp., Rhizosolenia hebetata f. hebetata, Rhizosolenia spp., Stephanopyxis turris, Thalassionema nitzschioides, and Thalassiosira nidulus throughout the diatom-bearing intervals (Table T6; Figure F15A–F15G). In samples containing diatoms, trace amounts of radiolarians, silicoflagellates, and sponge spicules are also observed.
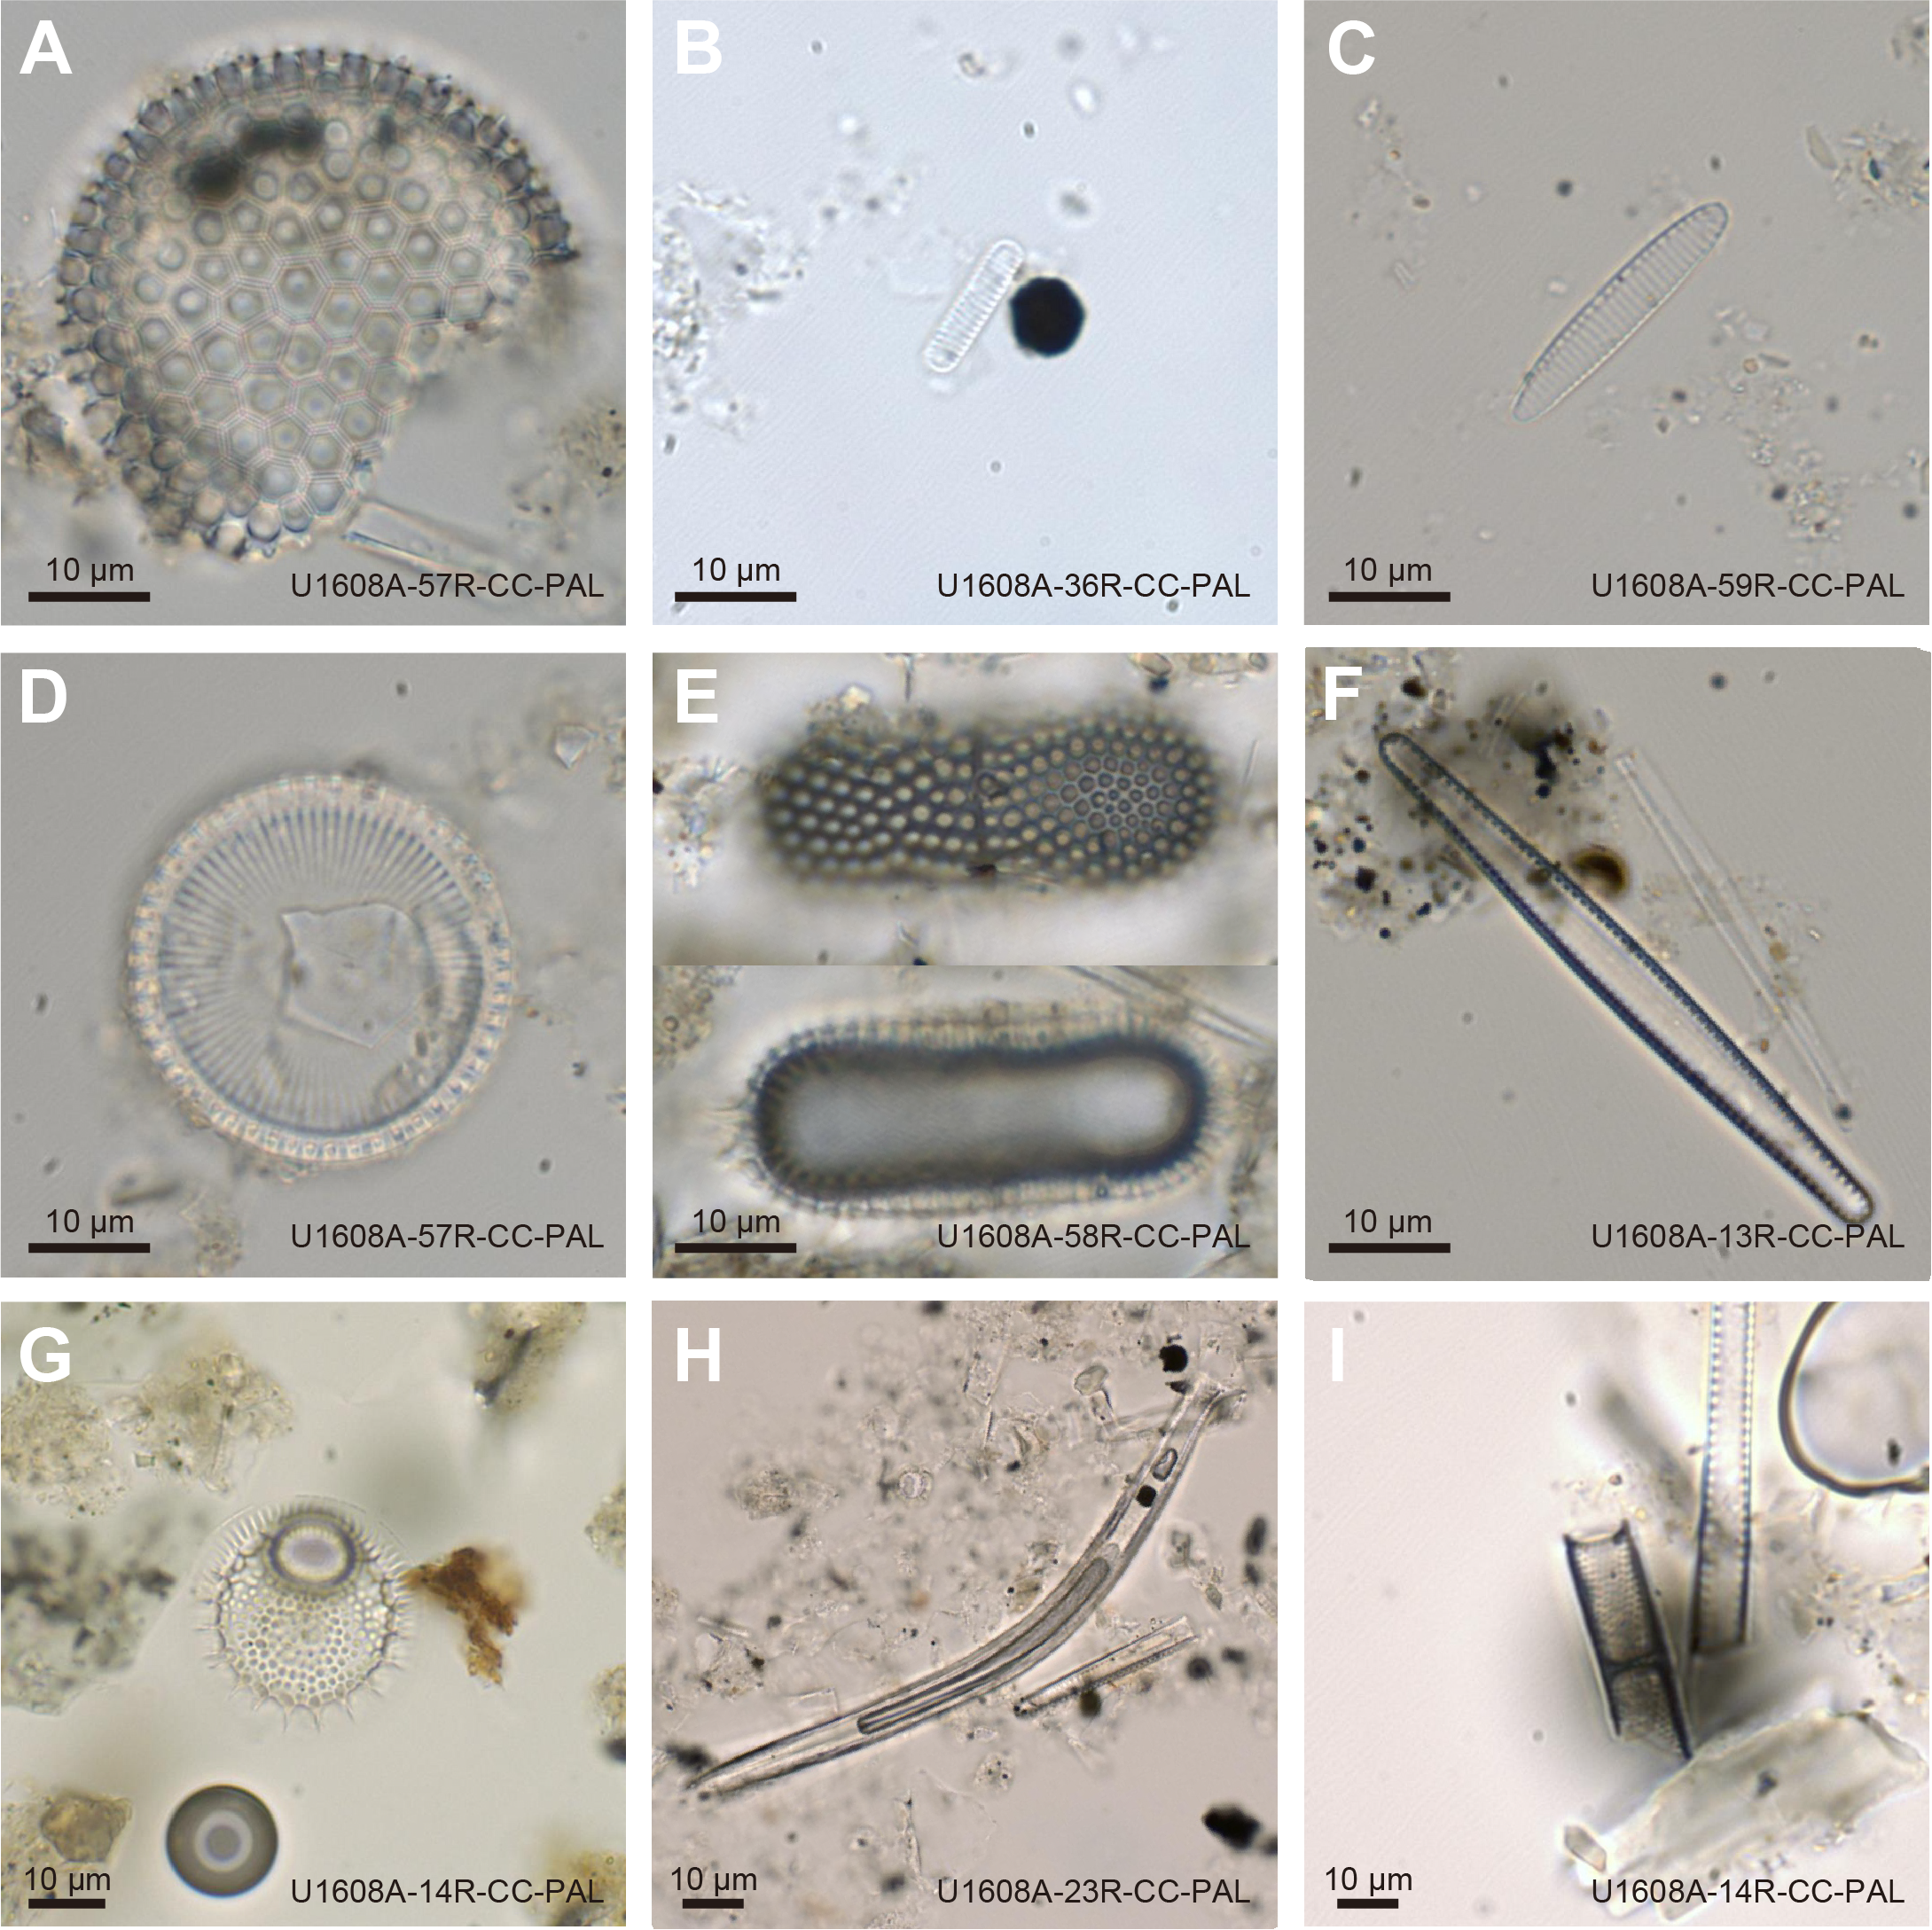
Figure F15. Diatoms.
A potential biostratigraphic marker, Proboscia barboi, is observed in the following core catcher samples: 400-U1608A-14R-CC, 21R-CC, 23R-CC, 24R-CC, 26R-CC, 29R-CC, 34R-CC, 52R-CC, and 54R-CC (Table T6; Figure F15H). Based on the North Atlantic diatom biostratigraphy of this species, an age range of late Miocene–late Pliocene can be assigned to core catchers from Cores 14R–54R (Koç and Scherer, 1996). However, another potential biostratigraphic marker, T. nidulus, occurs in trace to few amounts intermittently within and between Samples 14R-CC to 59R-CC (114.39–548.11 m CSF-A) (Table T6; Figure F15G). The FO of T. nidulus is dated to 4.57 Ma by a previous study at ODP Site 907 on the Icelandic Plateau in the North Atlantic (Koç and Scherer, 1996). Overall, this might suggest that the age of Core 59R and the overlying units are no older than the early Pliocene. Furthermore, the absence of Fragilariopsis doliolus and Proboscia curvirostris, whose FOs in the North Atlantic have been documented at 1.89 and 1.5 Ma, respectively (Baldauf, 1984; Koç et al., 1999), could serve as an age control for the uppermost portion of the diatom-bearing interval, beginning from Sample 13R-CC. This observation implies an age constraint no younger than the early Quaternary for the top of the diatomaceous interval (Sections 13R-CC through 59R-CC) at Site U1608. It is worth noting that the opacities stemming from the geographical component of the biostratigraphic chronology may hinder the coherent alignment of these tie points, which are based in the North Atlantic, with the diatom chronology of Site U1608 in Baffin Bay.
In Samples 400-U1608A-13R-CC to 59R-CC, trace to rare amounts of sea ice–related diatoms, including F. cylindrus, F. oceanica, F. reginae-jahniae, and Porosira glacialis, are sporadically observed (Table T6; Figures F15B, F15C, F16). These species are typically associated with sea ice conditions in the modern North Atlantic Ocean and Baffin Bay (e.g., Koç Karpuz and Schrader, 1990; Oksman et al., 2019). Furthermore, the species T. nitzschioides, which could indicate the presence of temperate Atlantic water influence (Koç Karpuz and Schrader, 1990), is found in most of the core catcher samples from Sections 13R-CC through 59R-CC, mostly few to common in relative abundance (Table T6; Figures F15F, F16). Taken together, the observed diatom assemblages may signify a temperate environment that is influenced by Atlantic waters and the occurrence of seasonal sea ice at Site U1608.

Figure F16. Abundances of select diatom species.
In Samples 400-U1608A-13R-CC to 59R-CC (Table T6), we note the presence of neritic species, including M. sol and Rhaphoneis spp., ranging from trace to common in relative abundance. Additionally, sporadic occurrences of potential freshwater diatoms, specifically aulacoseira spp., Cyclotella spp., and Eunotia spp., are also observed (Figure F15I). These observations imply a near-shore depositional environment for Site U1608.
4.1.3. Palynology
In total, 36 core catcher samples and 2 additional samples from targeted intervals were processed following the procedure described in Biostratigraphy in the Expedition 400 methods chapter (Knutz et al., 2025a). Because of time limitations, in some intervals only the even-numbered core catcher samples were analyzed on board.
Overall, dinocysts and other palynomorphs are present in all samples at varying abundance levels. Occurrences of palynofacies categories and palynomorphs for all samples from Site U1608 are detailed in Table T7 and Figure F12. Some intervals are characterized by a very high input of terrestrial material (Figure F17A) or clay clasts (Figure F17B). For intervals with high amounts of clay, processing using hydrofluoric acid (HF) is necessary to determine dinocyst abundances. The presence of diatoms in most samples further diluted the palynomorphs, and processing using HF will also benefit these samples.
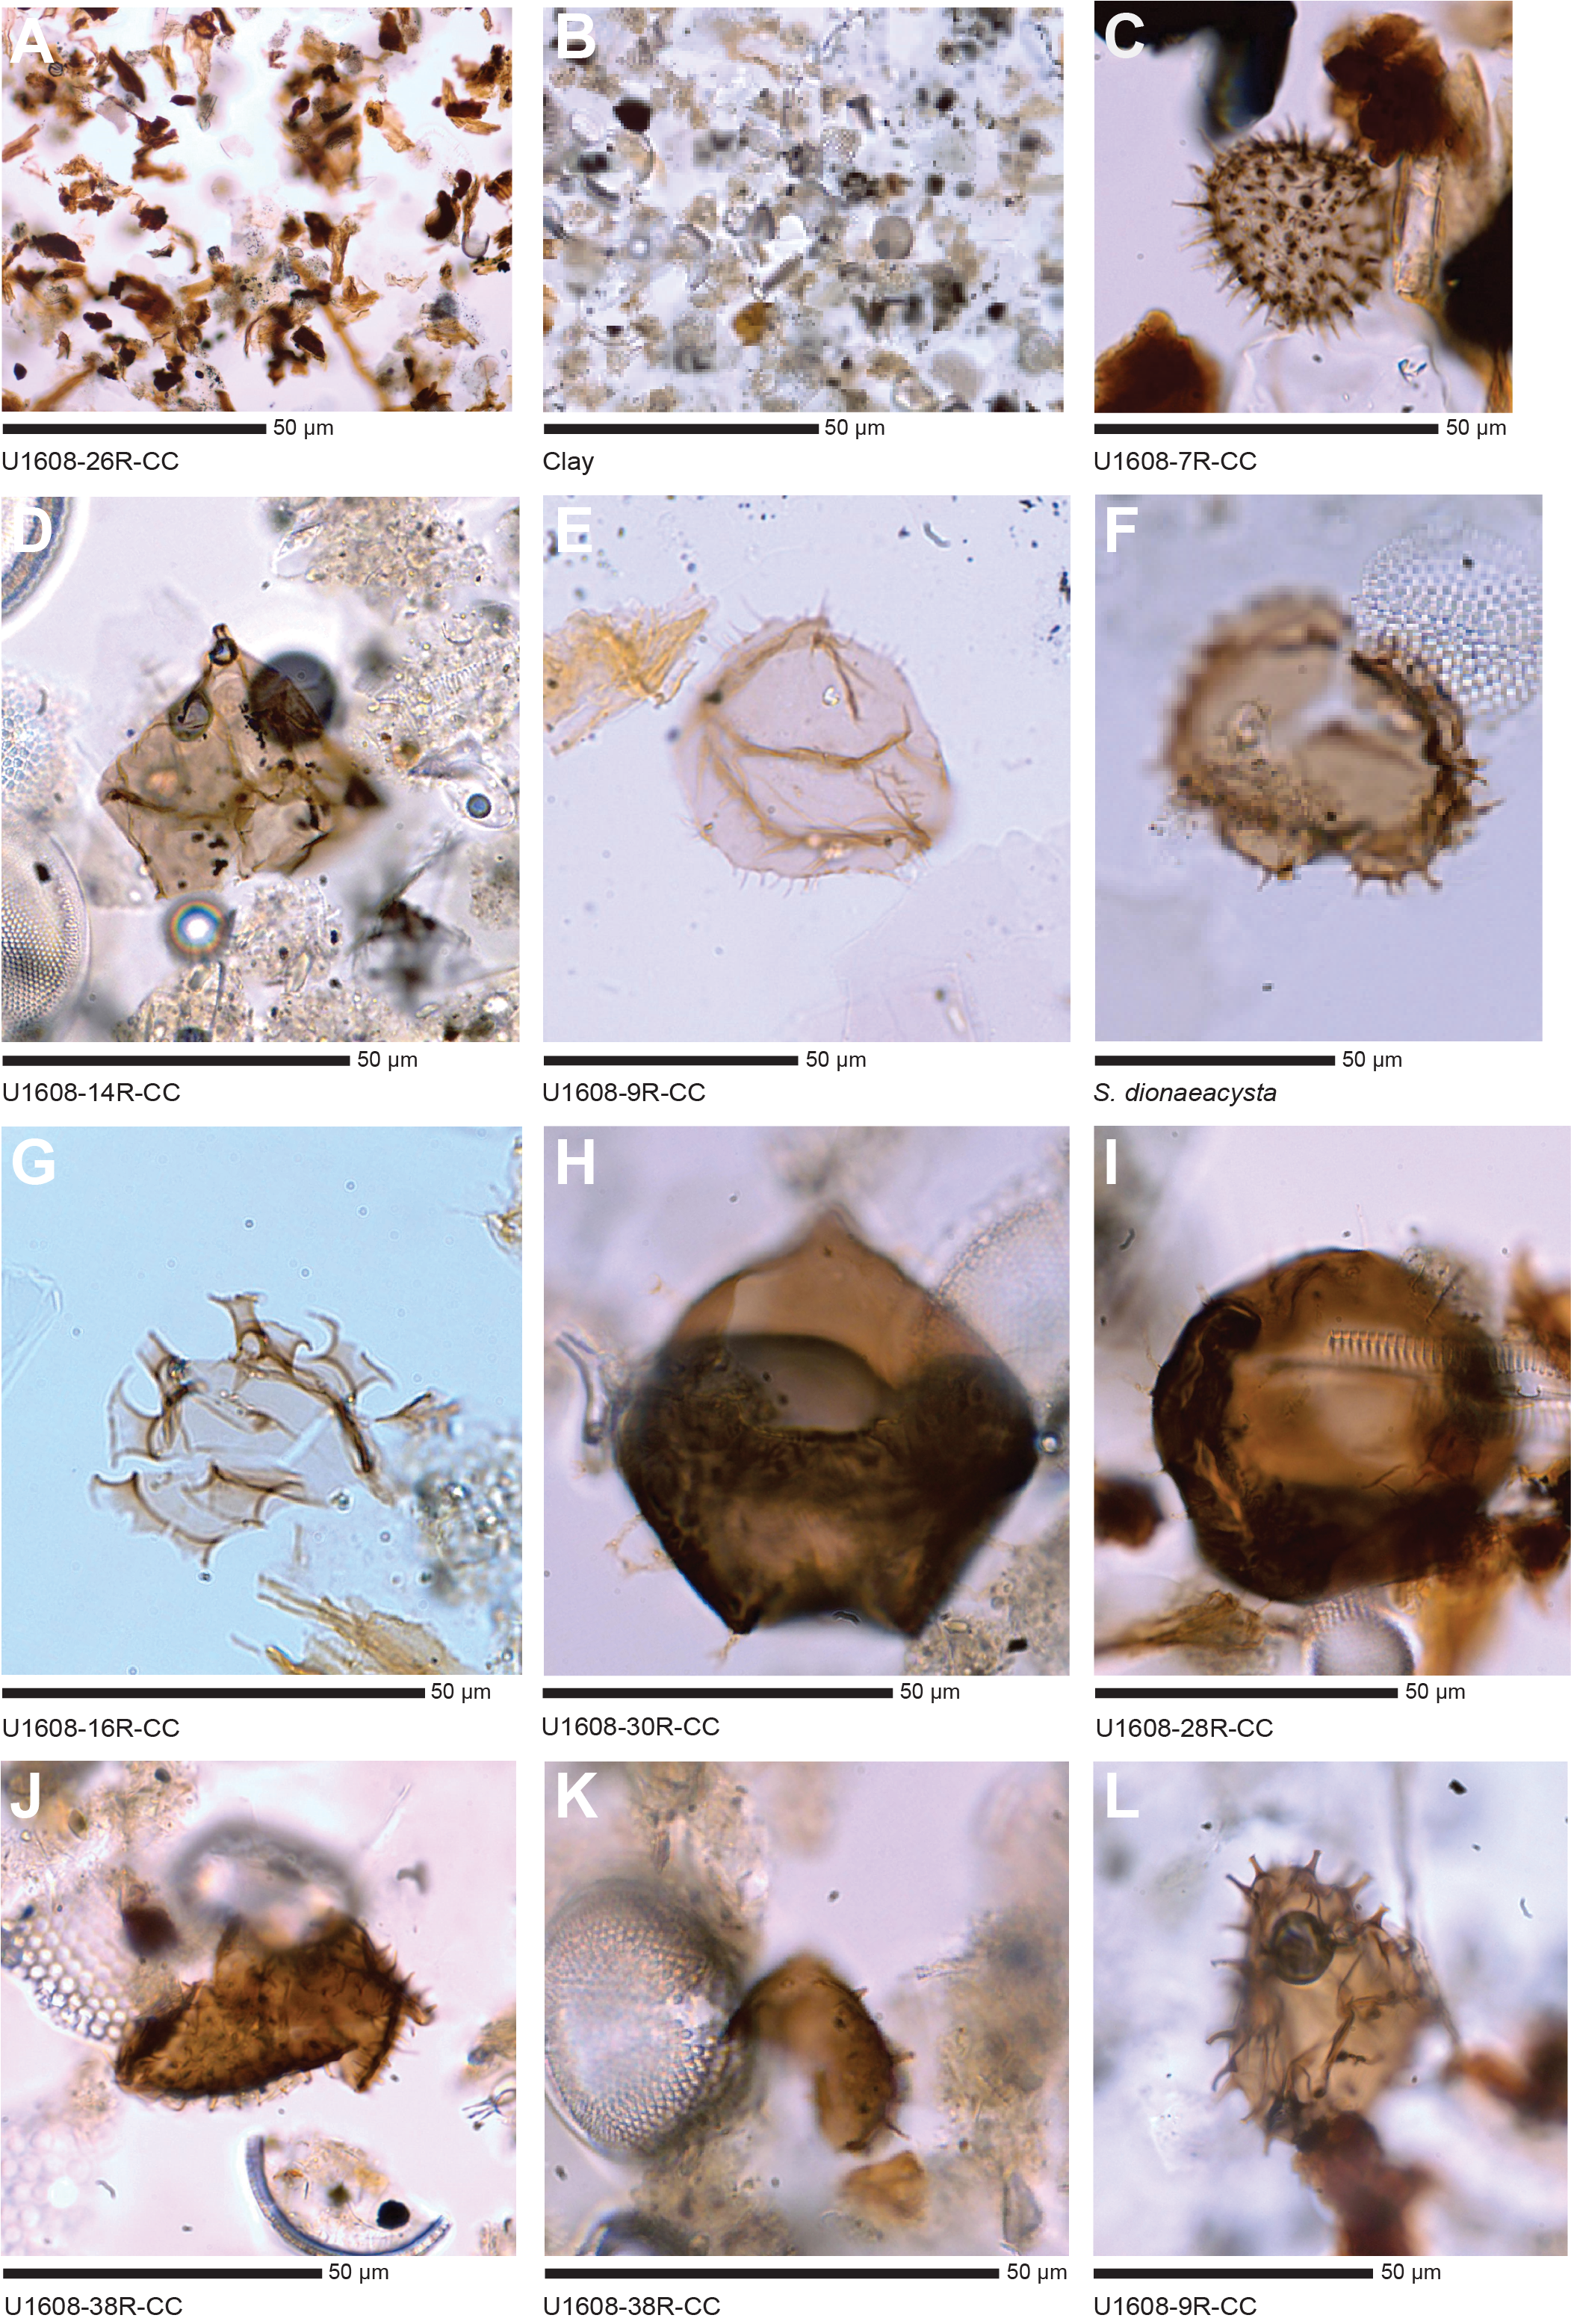
Figure F17. Palynomorphs.
Dinocyst species observed in the analyzed material are consistent with an age ranging from Holocene to early Pliocene. Preservation of in situ dinocysts is good where they are present. Dinocyst species belonging to the genus Brigantedinium spp. are present in 29 of 38 samples from throughout Hole U1608A, with highest abundances in the uppermost 85 m and Samples 22R-CC and 27R-CC. The presence of the dinocyst Islandinium cezare in Sample 7R-CC implies a Pleistocene to recent age (Figure F17C). In core catcher samples from Cores 7R–48R, dinocysts representing older than Pleistocene ages are present in varying abundances. These include the dinocyst Lejeunecysta fallax in Samples 14R-CC and 16R-CC (Figure F17D). At ODP Site 646 (Labrador Sea), this species has a last occurrence (LO) date of 2.53 Ma (de Vernal and Mudie, 1989). With an exception of three intervals from core catcher Samples 7R-CC to 48R-CC, dinocysts of early Pliocene age are continuously present. These include Selenopemphix brevispinosa (Figure F17E) and Selenopemphix dionaeacysta (Figure F17F). S. brevispinosa is tied to Biozone 2 of ODP Site 645 (Baffin Bay; Head et al., 1989) and has an LO date of 4.58 Ma at ODP Hole 642B (De Schepper et al., 2017). In the eastern north Atlantic, S. dionaeacysta ranges 3.42–2.69 Ma (De Schepper and Head, 2009). Additionally, a single specimen of Selenopemphix armageddonensis (Figure F17G) was recorded in Sample 16R-CC. The LO of this dinocyst was 5.47 Ma in ODP Hole 642B (Norwegian Sea; De Schepper et al., 2017). The dinocyst Barssidinium pliocenicum (Figure F17H, F17I) is present in Samples 40R-CC, 38R-CC, 28R-CC to 30R-CC, and 8R-CC. In the Norwegian Sea (ODP Hole 642B), the eastern North Atlantic (ODP Hole 610A), and the western North Atlantic (ODP Hole 603C), the LO of this species is in the Piacenzian (De Schepper et al., 2017). The end of the continuous occurrence of this species in Sample 28R-CC (247.77 CSF-A) implies a Piacenzian age. The occurrence of this species in Sample 8R-CC can be attributed to reworking. In Sample 36R-CC, a dinocyst resembling Operculodinium tegillatum is present (Figure F17J); however, this individual is folded, which makes identification challenging. In the Norwegian Sea (ODP Hole 642B), the eastern North Atlantic (ODP Hole 610A), and the western North Atlantic (ODP Hole 603C), the LO of this species is in the Zanclean (De Schepper et al., 2017). Other dinocysts recorded are Pentapharsodinium dalei in Sample 38R-CC (Figure F17K) and Xandarodinium cf. variabile in Sample 9R-CC (Figure F17L). In summary, based on the presence of these dinocysts, the results imply that core catcher samples from Cores 40R–48R (370.26–439.68 m CSF-A) are of early Pliocene age. Furthermore, the first continuous downhole occurrence of B. pliocenicum in Sample 28R-CC (247.745 m CSF-A) implies a late Pliocene (Piacenzian) age. The presence of dinocysts of early Pliocene age above this interval is most likely a result of reworking. Nevertheless, because this region is influenced by glacial processes and reworking, it cannot be ruled out that sediments in lower sections of Hole U1608A are also affected by reworking of older material, which complicates biostratigraphic interpretations. Further analyses using HF and comparing other proxies is required to further constrain the age of the studied material.
In addition to in situ palynomorphs, varying abundances of reworked palynomorphs were recorded in 20 samples. The reworked terrestrial material includes bisaccate pollen, other gymnosperm pollen, and fern spores.
Other palynological observations from Site U1608 include the presence of fungal remains, including fungal hyphae (Figure F18A–F18C) in some intervals, particularly in core catcher samples from Cores 400-U1608A-7R through 9R. Furthermore, fungal remains are present in Sample 29R-CC. High terrestrial material abundances (>10% coverage on slide) were recorded in slides from Samples 16R-CC, 24R-CC, 28R-CC, and 35R-CC. Within these samples, many different pollen and spores are present, although it is complicated to identify which are in situ and which are reworked. These assemblages include spores (Polydiisporites?) (Figure F18D), other fern spores (Figure F18E), and Betulacaea pollen (Figure F18F). Other palynomorphs include an unidentified palynomorph resembling epiphyllous fungi in Sample 10R-CC (Figure F18G), a mandible from Sample 38R-CC (Figure F18H), and a palynomorph that was particularly abundant in Sample 14R-CC (Figure F18I). Preservation of palynomorphs is very good, and even complete leaf cuticles are preserved (Figure F18J). The good preservation of palynomorphs and the rich assemblage shows the great potential of these materials for reconstructing the terrestrial environment and other biomarker-related work. An additional notable feature is the presence of a coccosphere belonging to an unknown species of coccolithophore in Sample 9R-CC (Figure F18K, F18L).
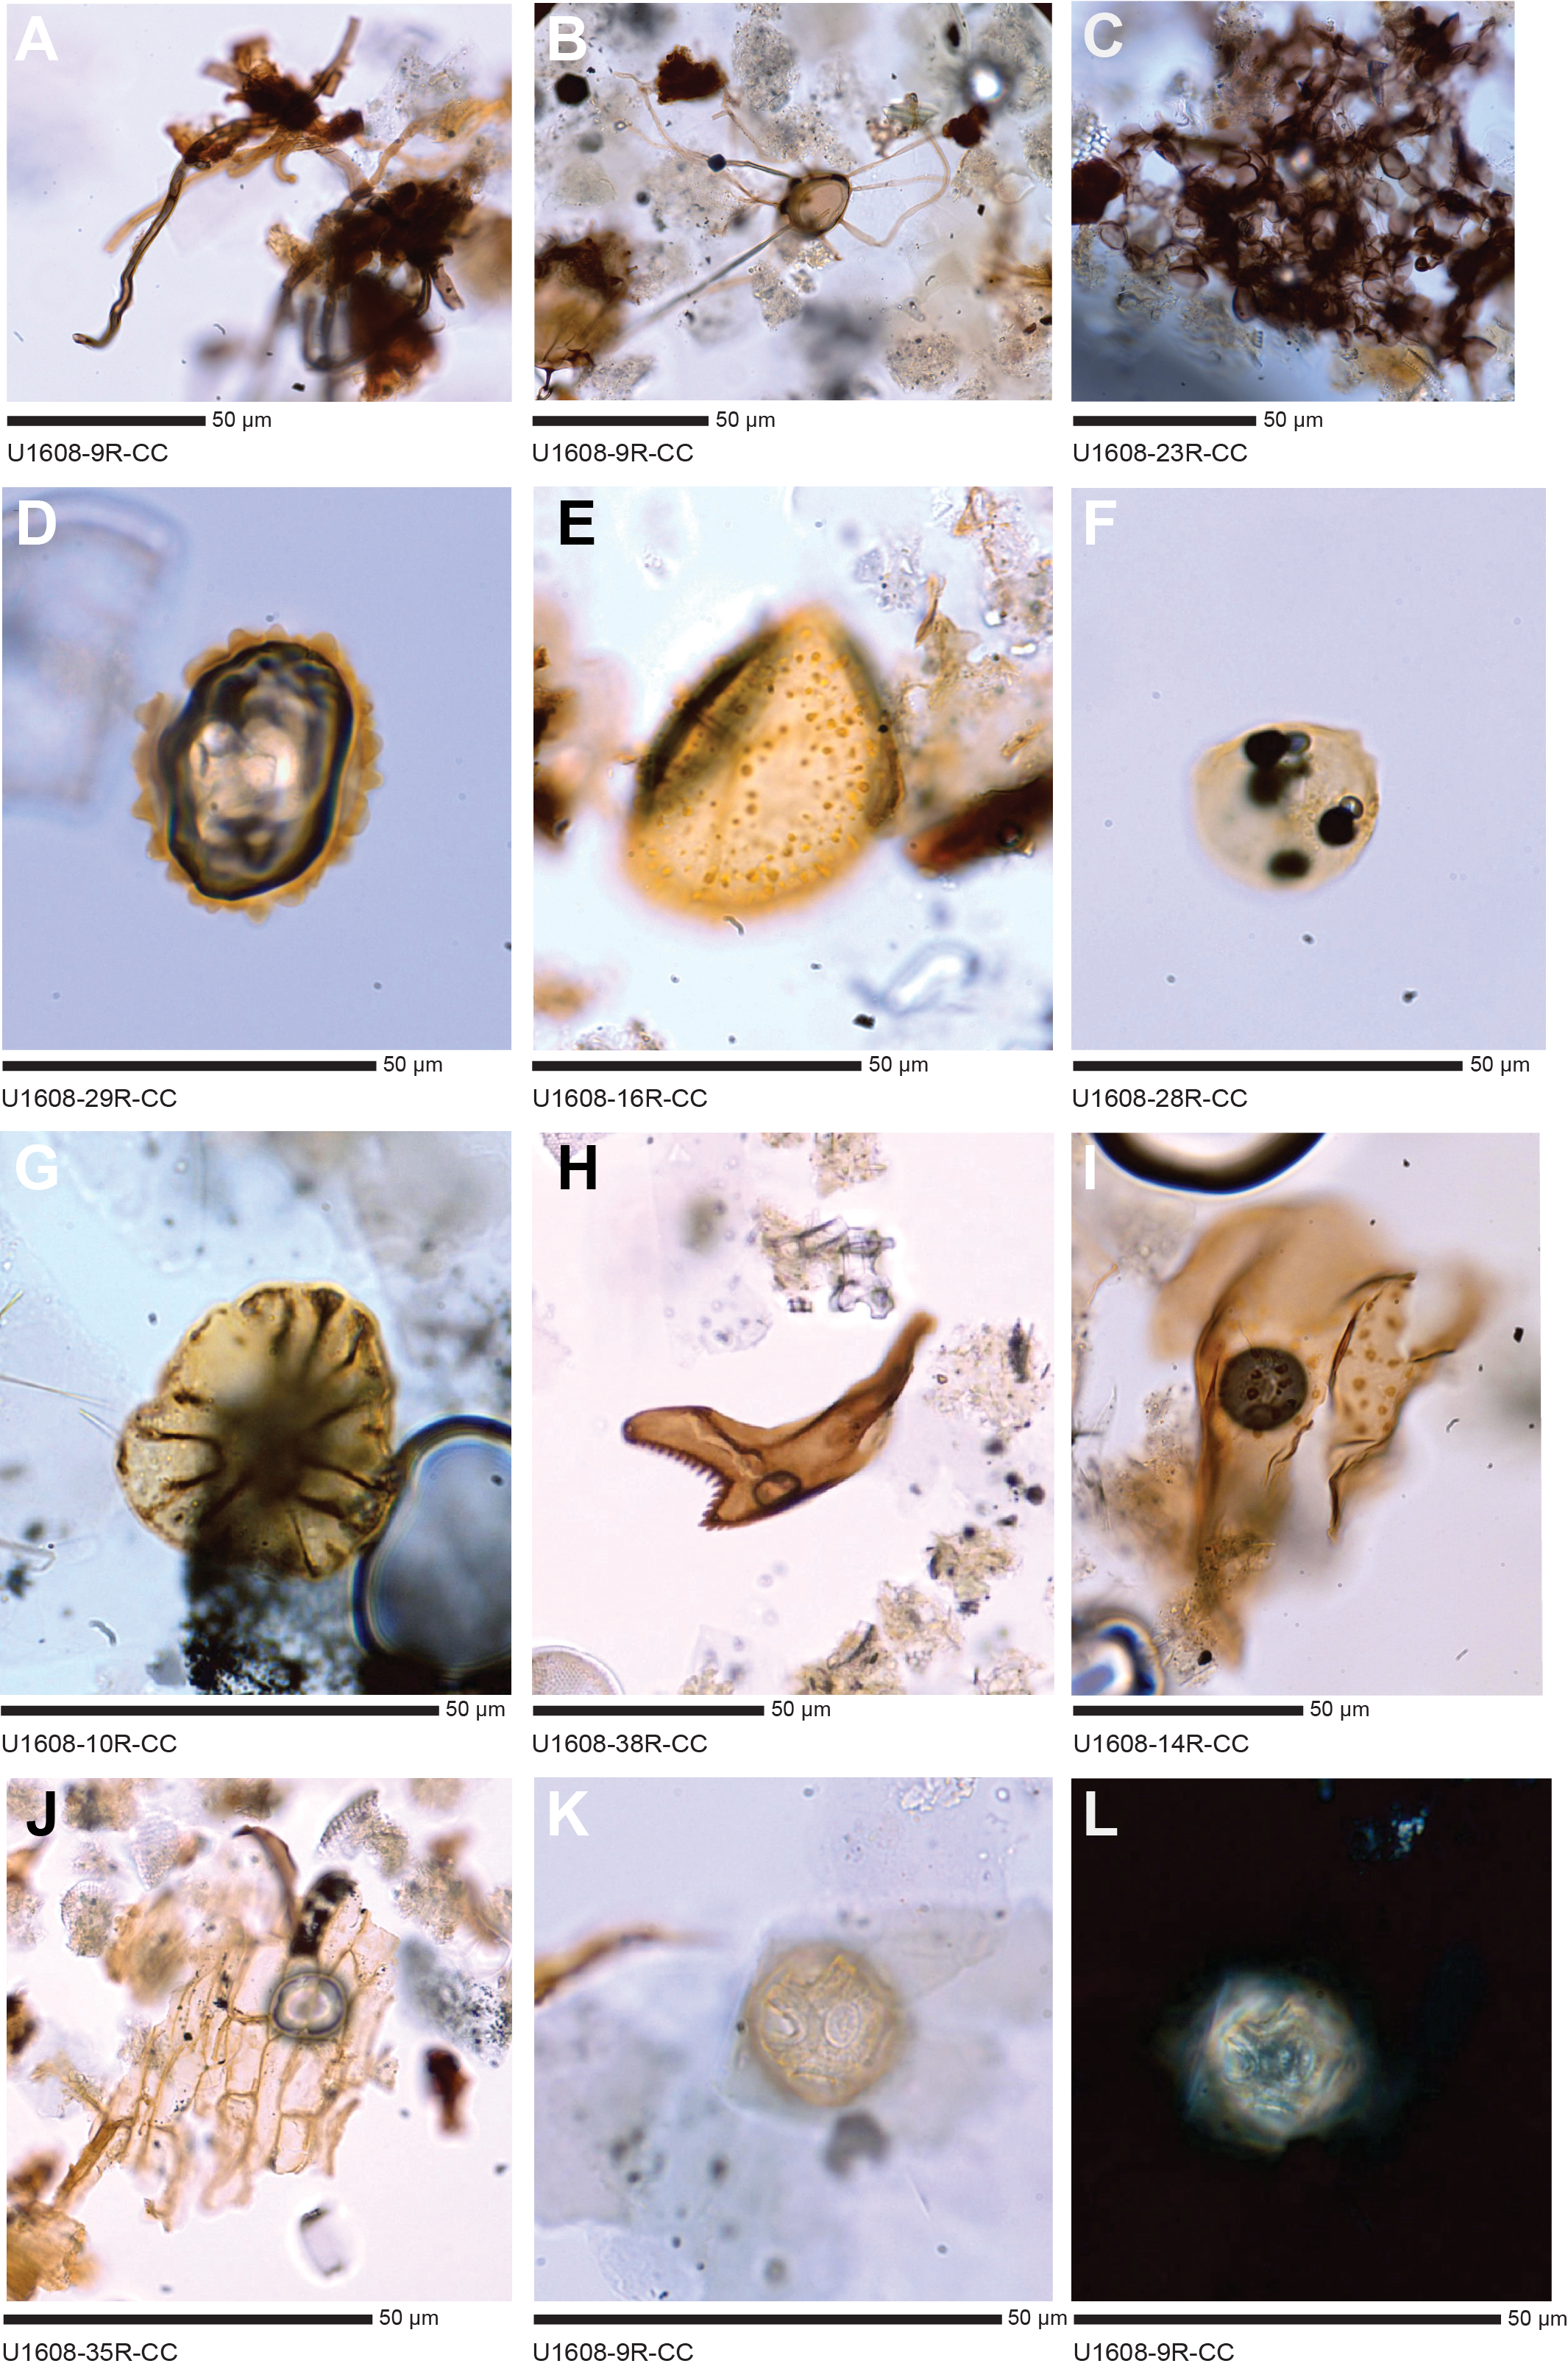
Figure F18. Palynomorphs and other microfossils.
4.1.4. Biochronology
Integration of the microfossil distributions allows a broad exploration of the age depth progression at Site U1608 (Figure F19; Table T8). The intermittent occurrence of P. barboi (marine diatom) in samples from throughout Hole U1608A (Samples 14R-CC to 54R-CC) suggests an age range from 3.31–3.33 to 8.59–9.57 Ma (Koç and Scherer, 1996) (Figure F19). Additionally, the occurrence of T. nidulus (marine diatom) in nearly half of the diatom-bearing layers, particularly at the bottom of Hole U1608A, constrains the entire site to no older than 4.58 Ma (Koç and Scherer, 1996) (Figure F19). In terms of foraminifera, the range of the benthic foraminifera C. teretis implies the interval below and including Sample 9R-CC is older than 700 ka, and the presence of this species to the base of the hole implies the cored sequence is no older than middle Miocene (Seidenkrantz, 1995). Although only a single specimen of N. pachyderma was found (Sample 9R-CC), we assume this coincides with a time at or after the species became common in the northern latitudes (i.e., the N. pachyderma common occurrence datum of 1.8 Ma [Flower, 1999]). That M. barleeanus is still present in Sample 58R-CC (544.24 m CSF-A) implies that this sample is no older than middle Miocene (Katz and Miller, 1993; Holbourn et al., 2013). Based on the presence of the dinocyst S. dionaeacysta, which has an FO at 3.42 Ma in the eastern North Atlantic (De Schepper and Head, 2009), in Sample 32R-CC at 289.445 m CSF-A and samples above this interval, a late Pliocene age (<3.42 Ma) can be assigned to 289.445 m CSF-A. The common occurrence of the dinocyst B. pliocenicum from Samples 28R-CC to 40R-CC indicates a late Pliocene age for this interval to 247.77 m CSF-A. In the Norwegian Sea (ODP Hole 642B), the eastern North Atlantic (ODP Hole 610A), and the western North Atlantic (ODP Hole 603C), the LO of this species is in the Piacenzian (De Schepper et al., 2017).
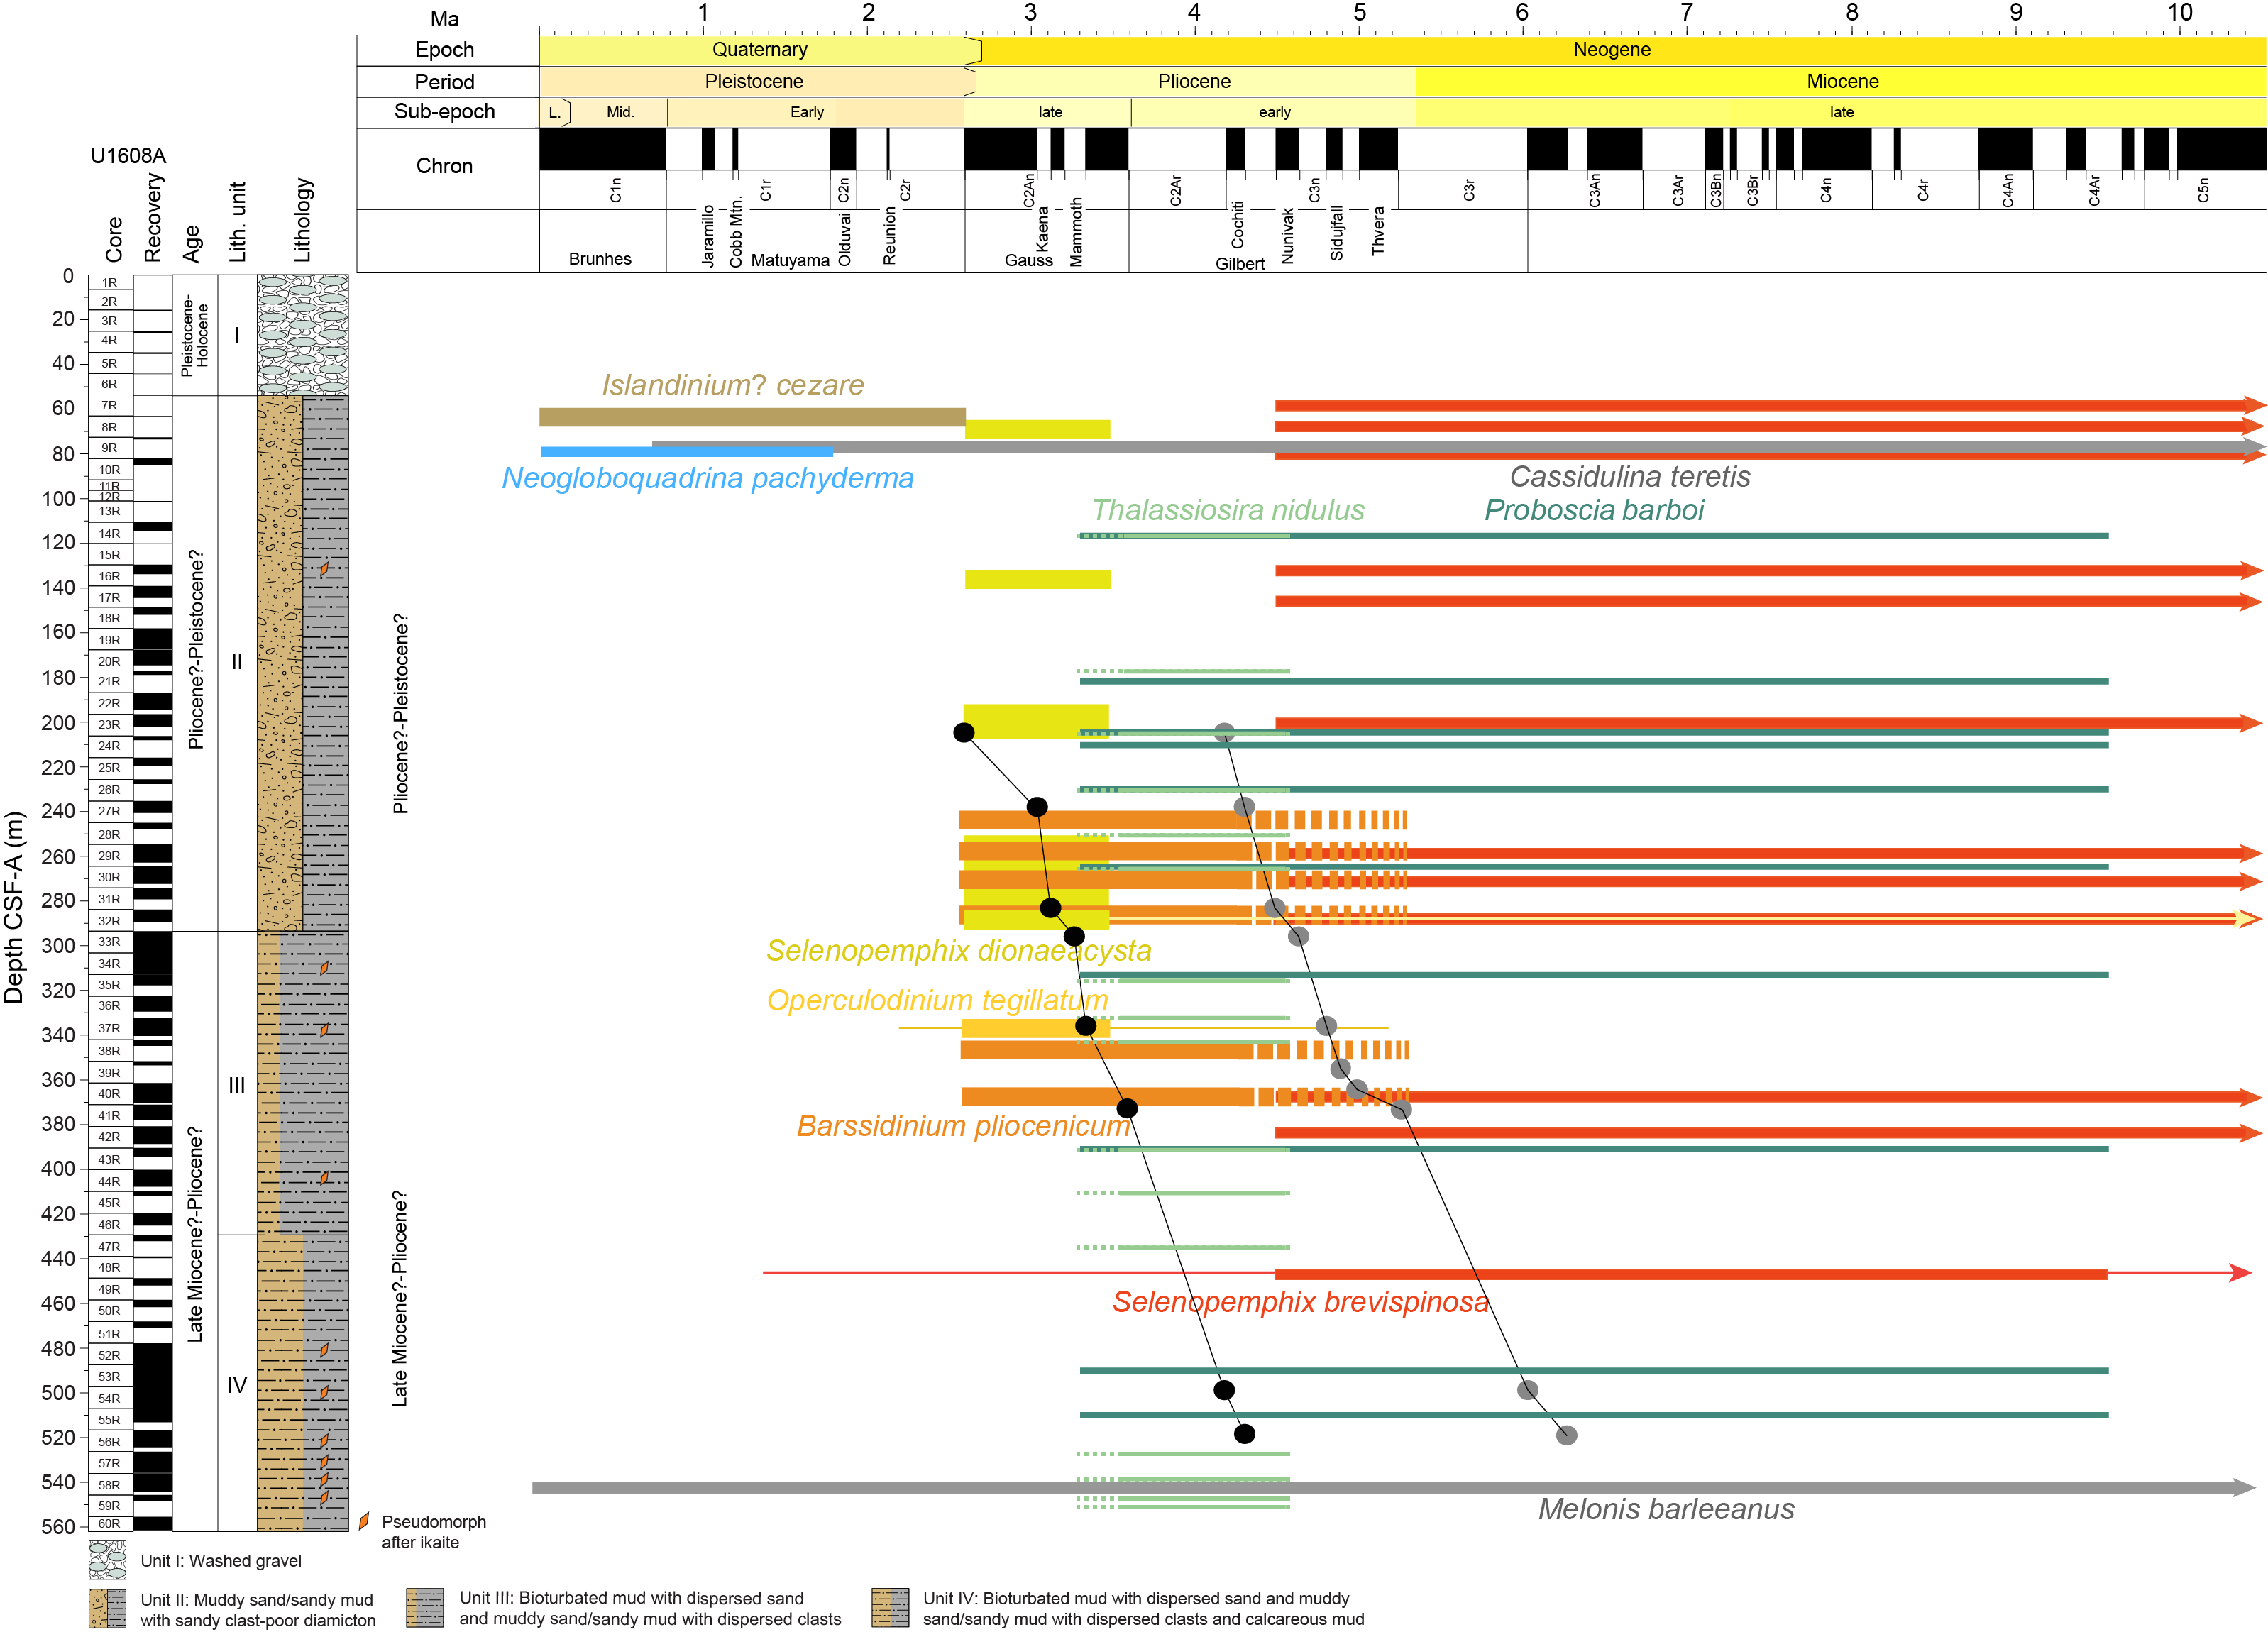
Figure F19. Chronostratigraphic constraints.
4.1.5. Marine sedimentary ancient DNA
At Site U1608, the goal was to extend the sedaDNA record to samples of putative Early Pleistocene and Late Pliocene age and test the temporal limits of sedaDNA preservation in the Arctic. Four whole-round intervals of RCB sediments were collected on the catwalk (Table T9; Figure F20) following the whole-round core interval sampling procedure (see Biostratigraphy in the Expedition 400 methods chapter [Knutz et al., 2025a]). The samples are composed of sandy mud (with or without dispersed clasts). Visual inspection and X-ray images above and below the sampled intervals suggest abundant bioturbation in the sample collected from interval 400-U1608A-14R-1, 140–145 cm (112 m CSF-A), whereas bioturbation is low or absent in the other samples. Perfluorodecalin (PFD) tracer was confirmed in sediment scrapes from the outer surface of the intact whole-round pieces; however, the interior of all samples was free of tracer, suggesting that no drill fluids (ambient seawater) infiltrated and contaminated the interior of the sample (Table T10).
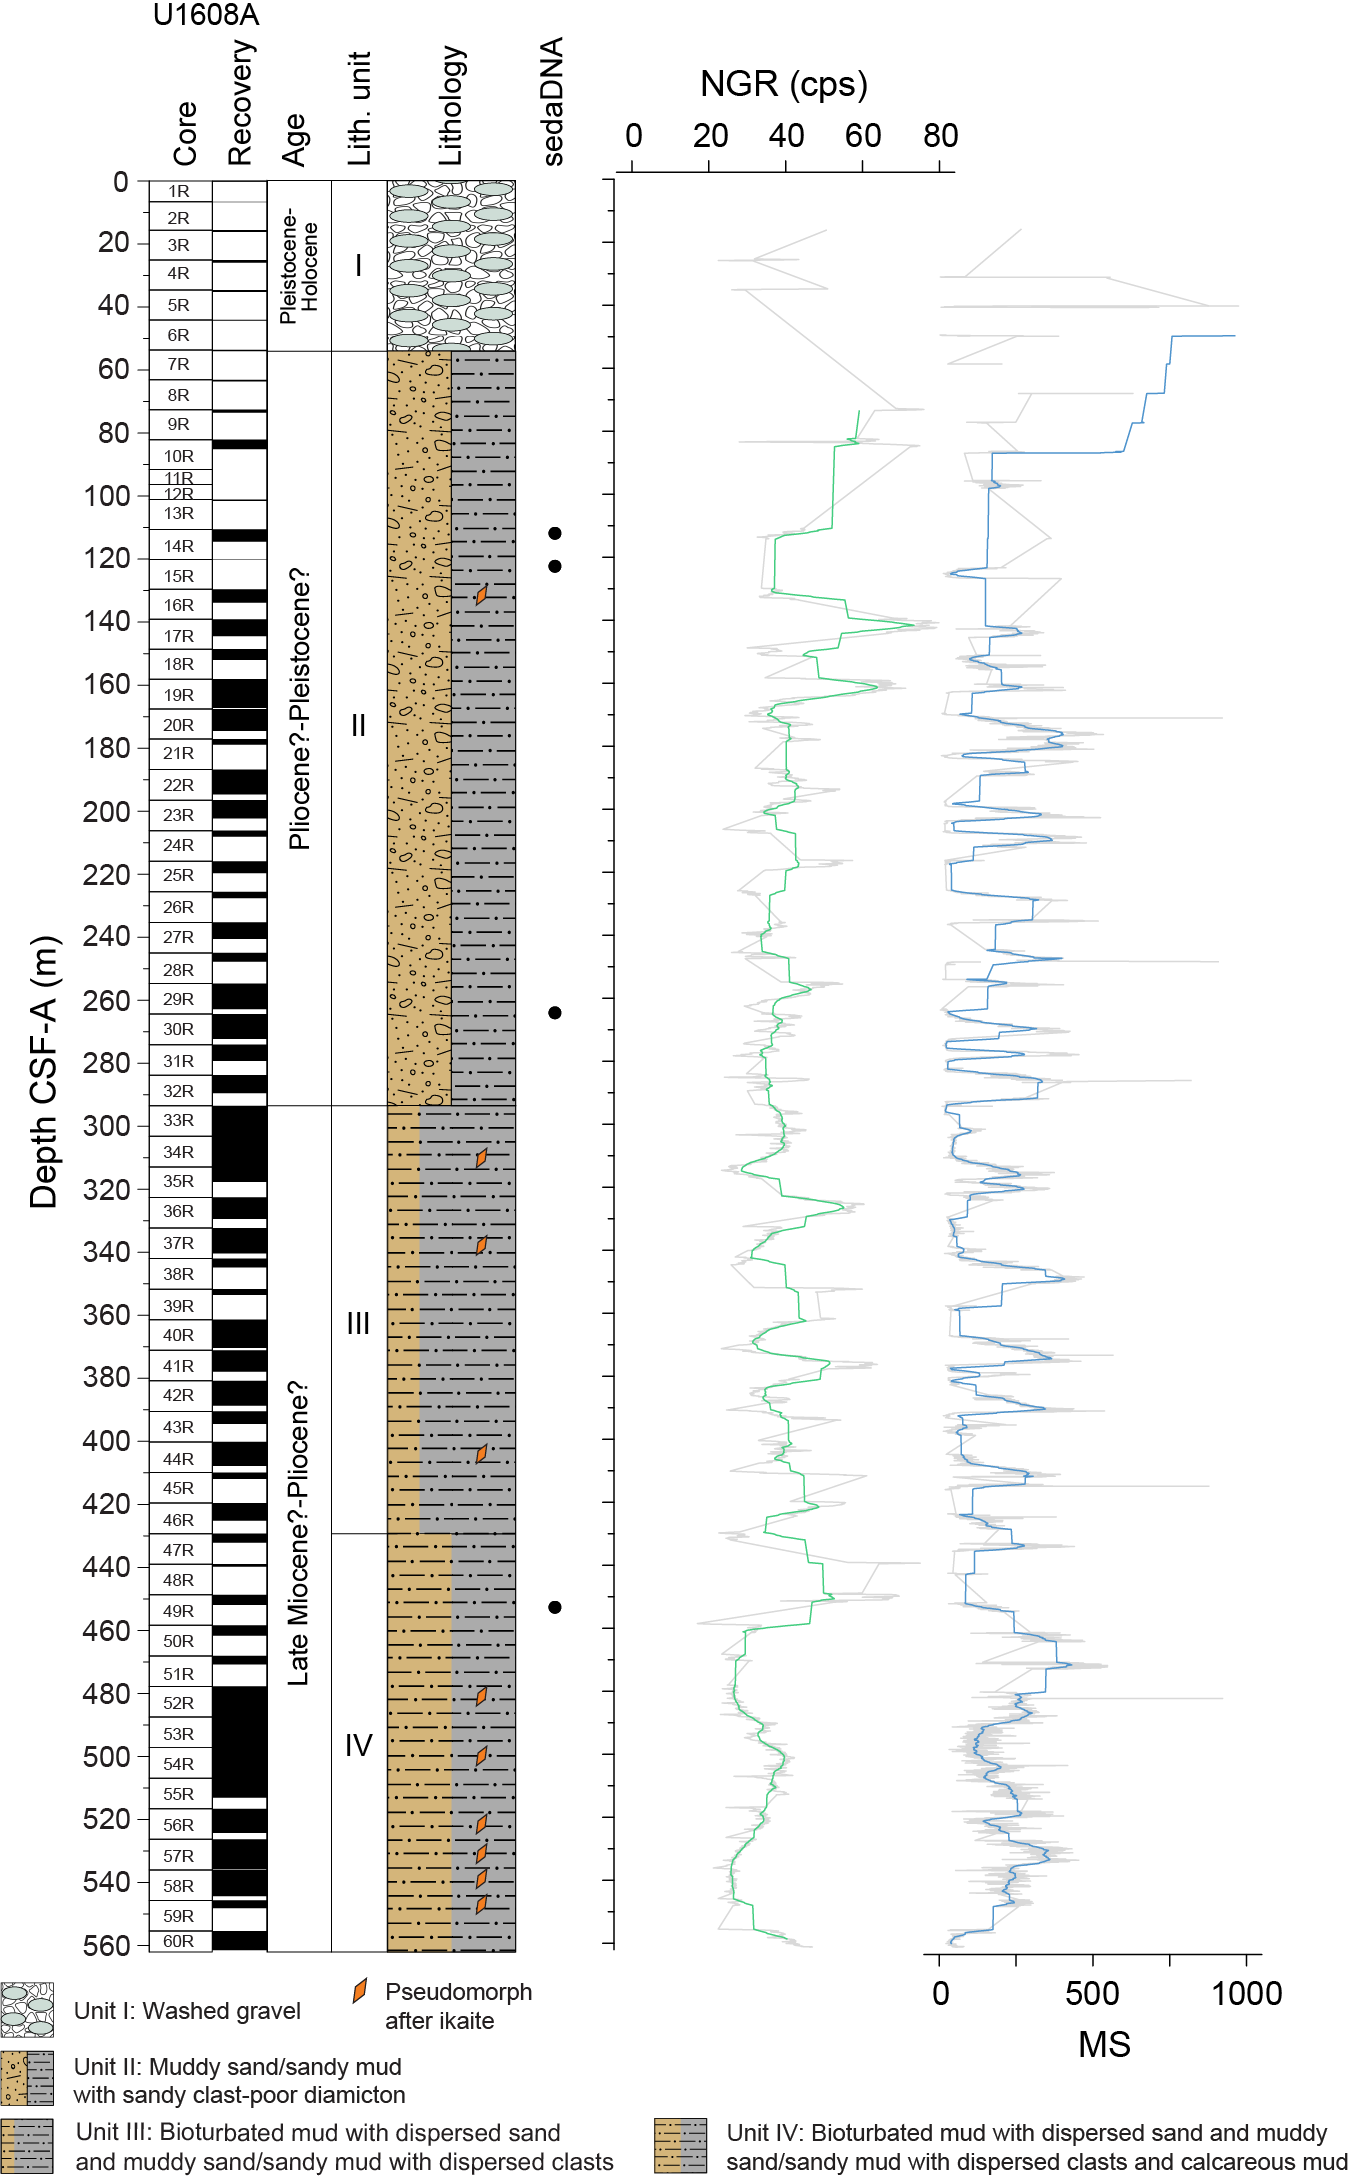
Figure F20. sedaDNA samples.
5. Paleomagnetism
Pass-through paleomagnetic measurements from Site U1608 were performed using the superconducting rock magnetometer (SRM) to investigate the natural remanent magnetization (NRM) of a total of 201 archive section halves. Measurements were not made on core catcher sections. All measurements on section halves were made at 2 cm intervals up to a peak alternating field (AF) demagnetization of 20 mT.
A total of 192 discrete cube samples were collected from the working section halves. Generally, we collected one sample per core section, avoiding visually disturbed intervals. Note that in paleomagnetic practice, samples are the objects that are taken (sampled) and specimens are the objects that are measured. In this case, the two objects are the same. Discrete specimens from Cores 400-U1608A-9R through 40R were measured on the SRM up to a peak AF demagnetization of 50 mT. Specimens from Cores 41R–60R were only demagnetized to a peak field of 40 mT.
5.1. Discrete sample measurements
A total of 192 discrete cube samples were collected from working section halves from Hole U1608A. A total of 89 specimens were measured after stepwise AF demagnetization up to a peak field of 50 mT on the SRM, and 70 specimens were measured after stepwise demagnetization to a peak field of 40 mT. Demagnetization behavior of representative specimens is shown in Figure F21. Zijderveld diagrams (Zijderveld, 1967) and plots showing the remaining magnetization after stepwise AF demagnetization are shown for typical normally magnetized (Figure F21A, F21E) and reversely magnetized (Figure F21B, F21F) specimens. Demagnetization behaviors of representative low stability specimens are also shown (Figure F21C, F21D, F21G, F21H); these specimens were largely demagnetized at low coercivities, putting the reliability of their polarity in doubt.
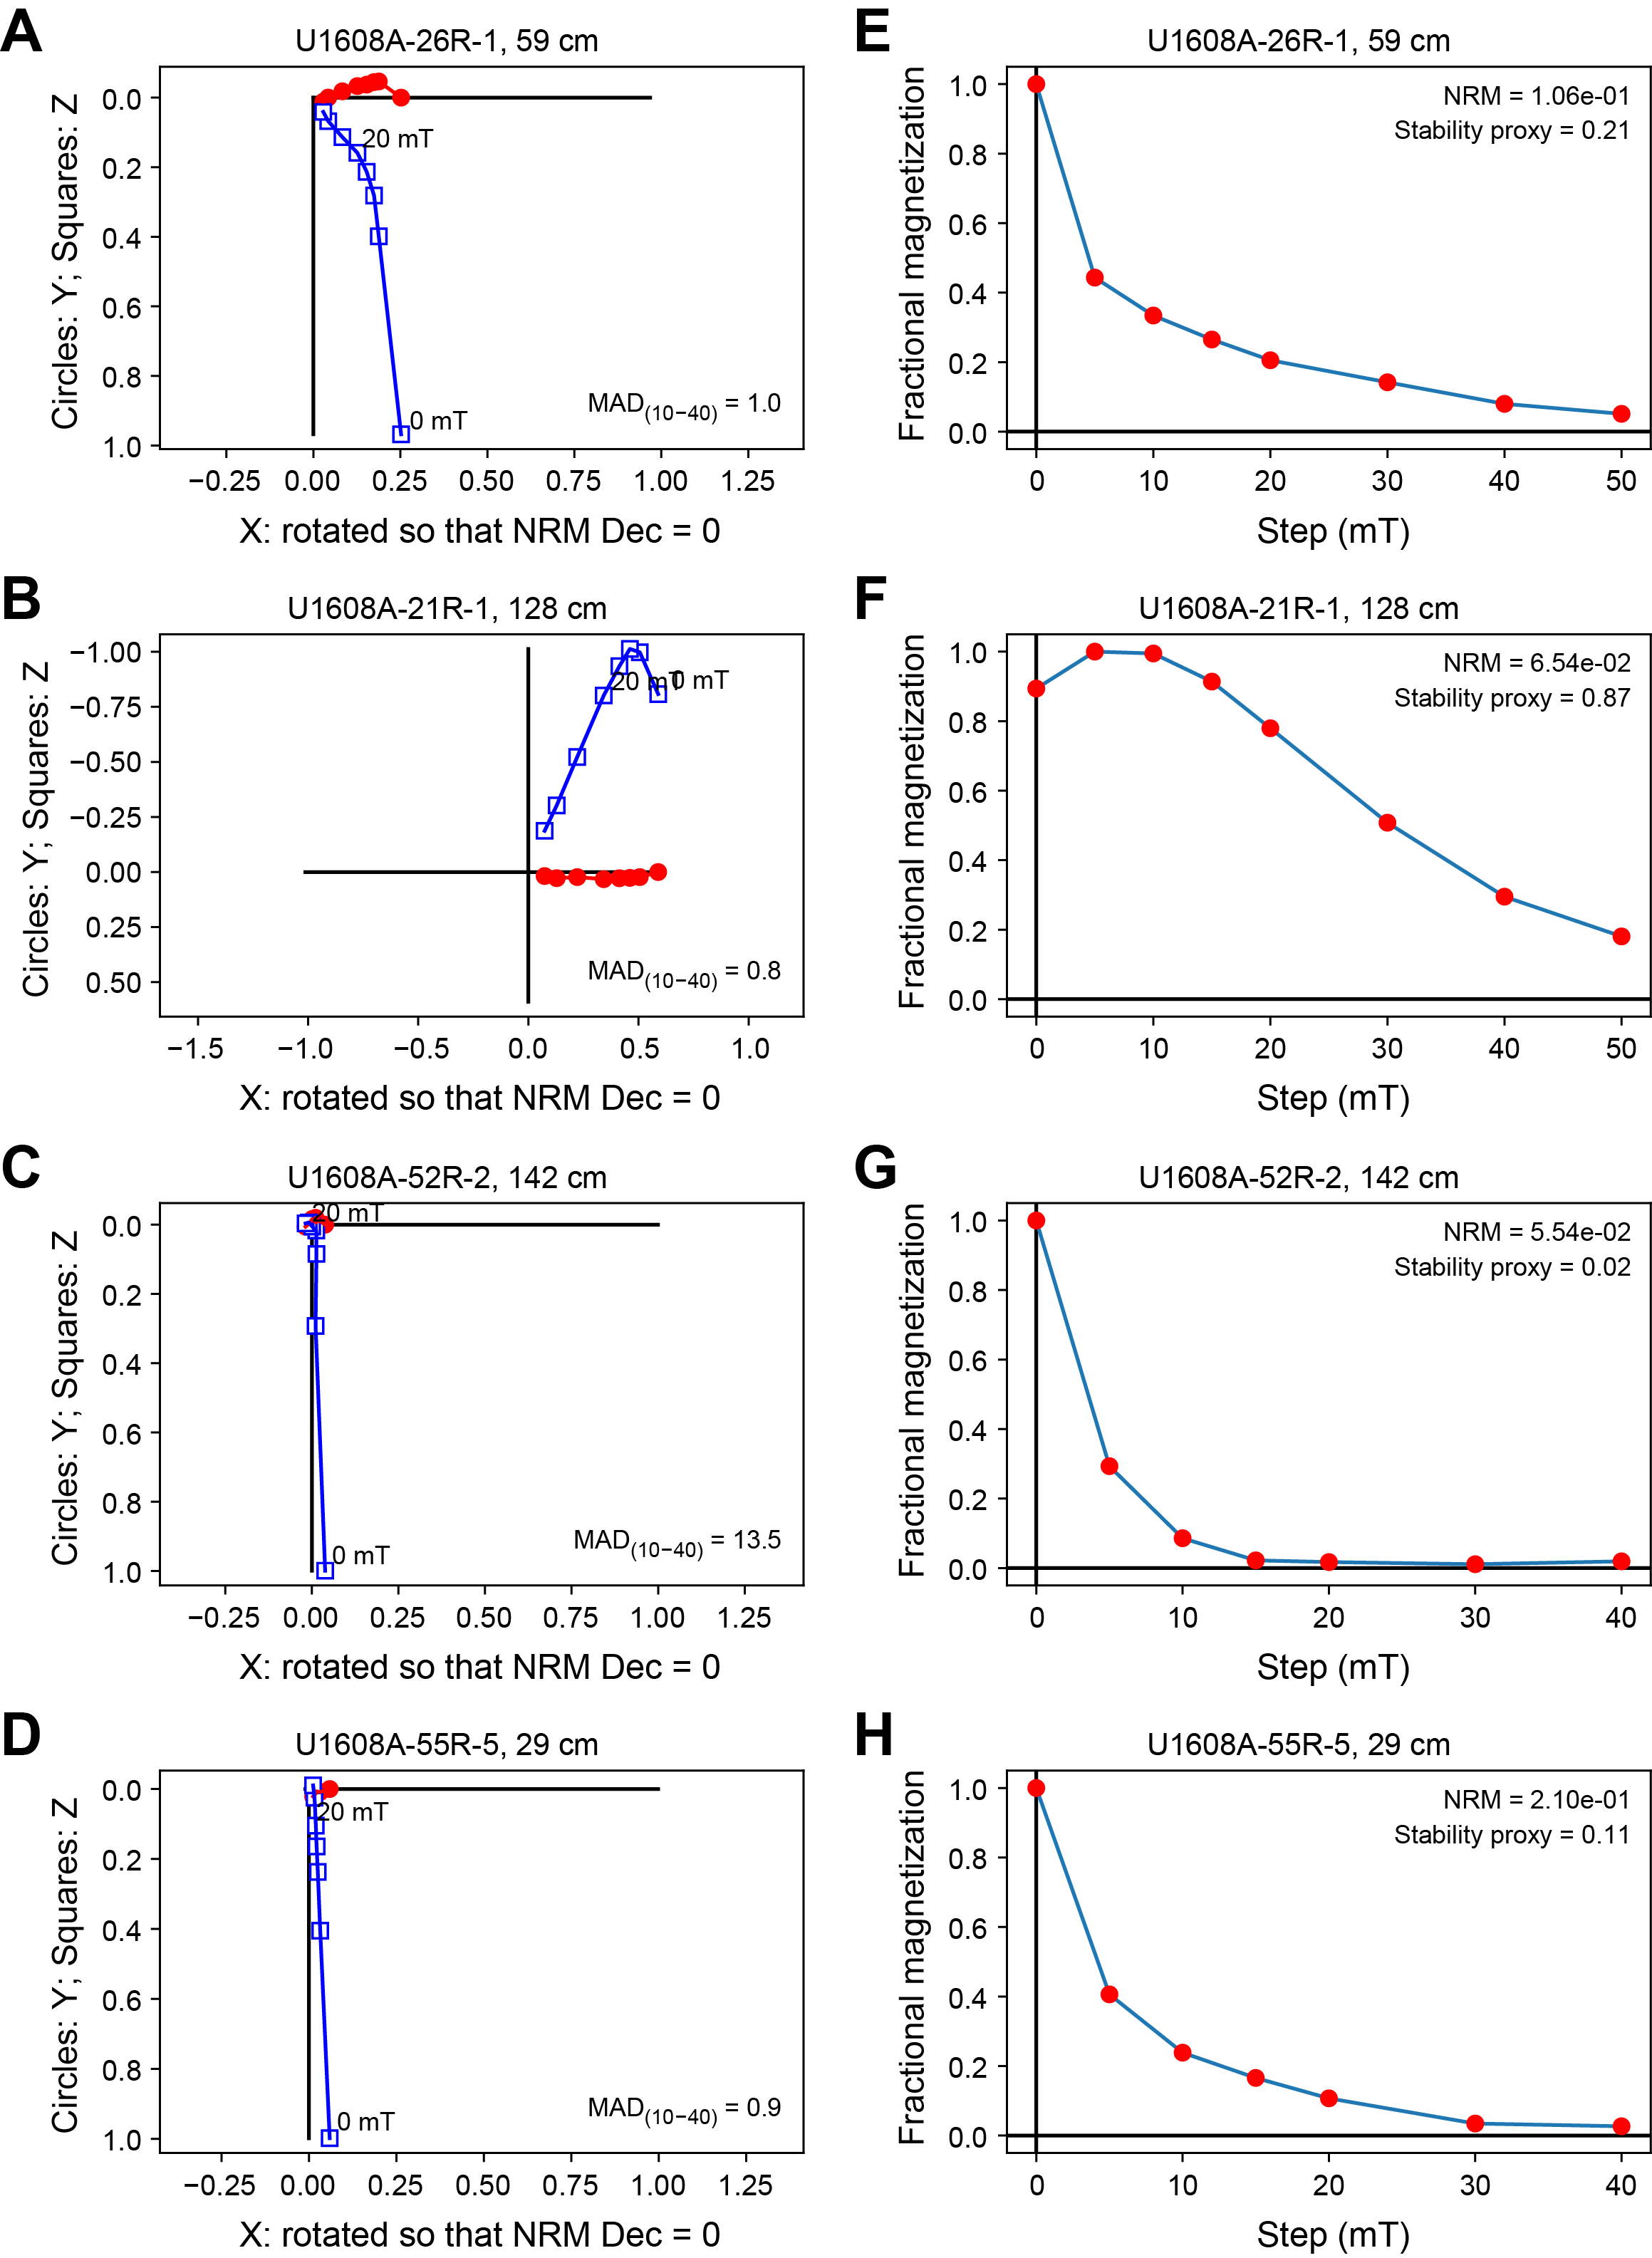
Figure F21. AF demagnetization behavior.
We used two parameters to separate data with straightforward polarity interpretations from those whose polarity is difficult to determine or trust. The first is the maximum angular deviation (Kirschvink, 1980), which uses principal component analysis through the characteristic component of the magnetization vector to calculate scatter in the directional data. We calculated the maximum angular deviation value for the vector between 10 and 40 mT and considered values above 20° to be unreliable. The second parameter considers the magnetization remaining after AF demagnetization to 20 mT. The magnetization remaining is expressed as a fraction of the initial remanence (fractional magnetization), which can be used as a proxy for magnetic stability. We considered specimens with a fractional magnetization of less than 20% after the 20 mT AF demagnetization step to be unreliable. We also used this parameter to filter the archive section half measurements.
5.2. Archive-half measurements
Site U1608 archive section halves were stepwise demagnetized to 20 mT to remove the drill string overprint. For each section, we measured the NRM and the magnetization after 10 and 20 mT peak AF demagnetization steps. Data were filtered as follows:
- All measurements within 10 cm of section ends were deleted to remove the edge effects associated with pass-through measurements.
- Intervals with drilling disturbances as defined by the disturbance intensity code of “moderately disturbed” or greater (see Lithostratigraphy in the Expedition 400 methods chapter [Knutz et al., 2025a]) were removed.
- Intervals with less than 20% of the magnetic remanence remaining after the 20 mT AF demagnetization step were removed.
The filtered and unfiltered data from the 20 mT demagnetization step of the archive section halves and the discrete specimens are shown in Figure F22. The inclinations from the filtered 20 mT demagnetization step archive section half data are also shown as kernel density estimates (Figure F23) and are generally bimodal at the estimates of inclinations for normal and reversed polarities at this latitude calculated from the geocentric axial dipole. The bimodal inclination distribution suggests that intervals of both normal and reversed polarity were recovered at Site U1608.

Figure F22. Intensity, declination, and inclination, Hole U1608A.
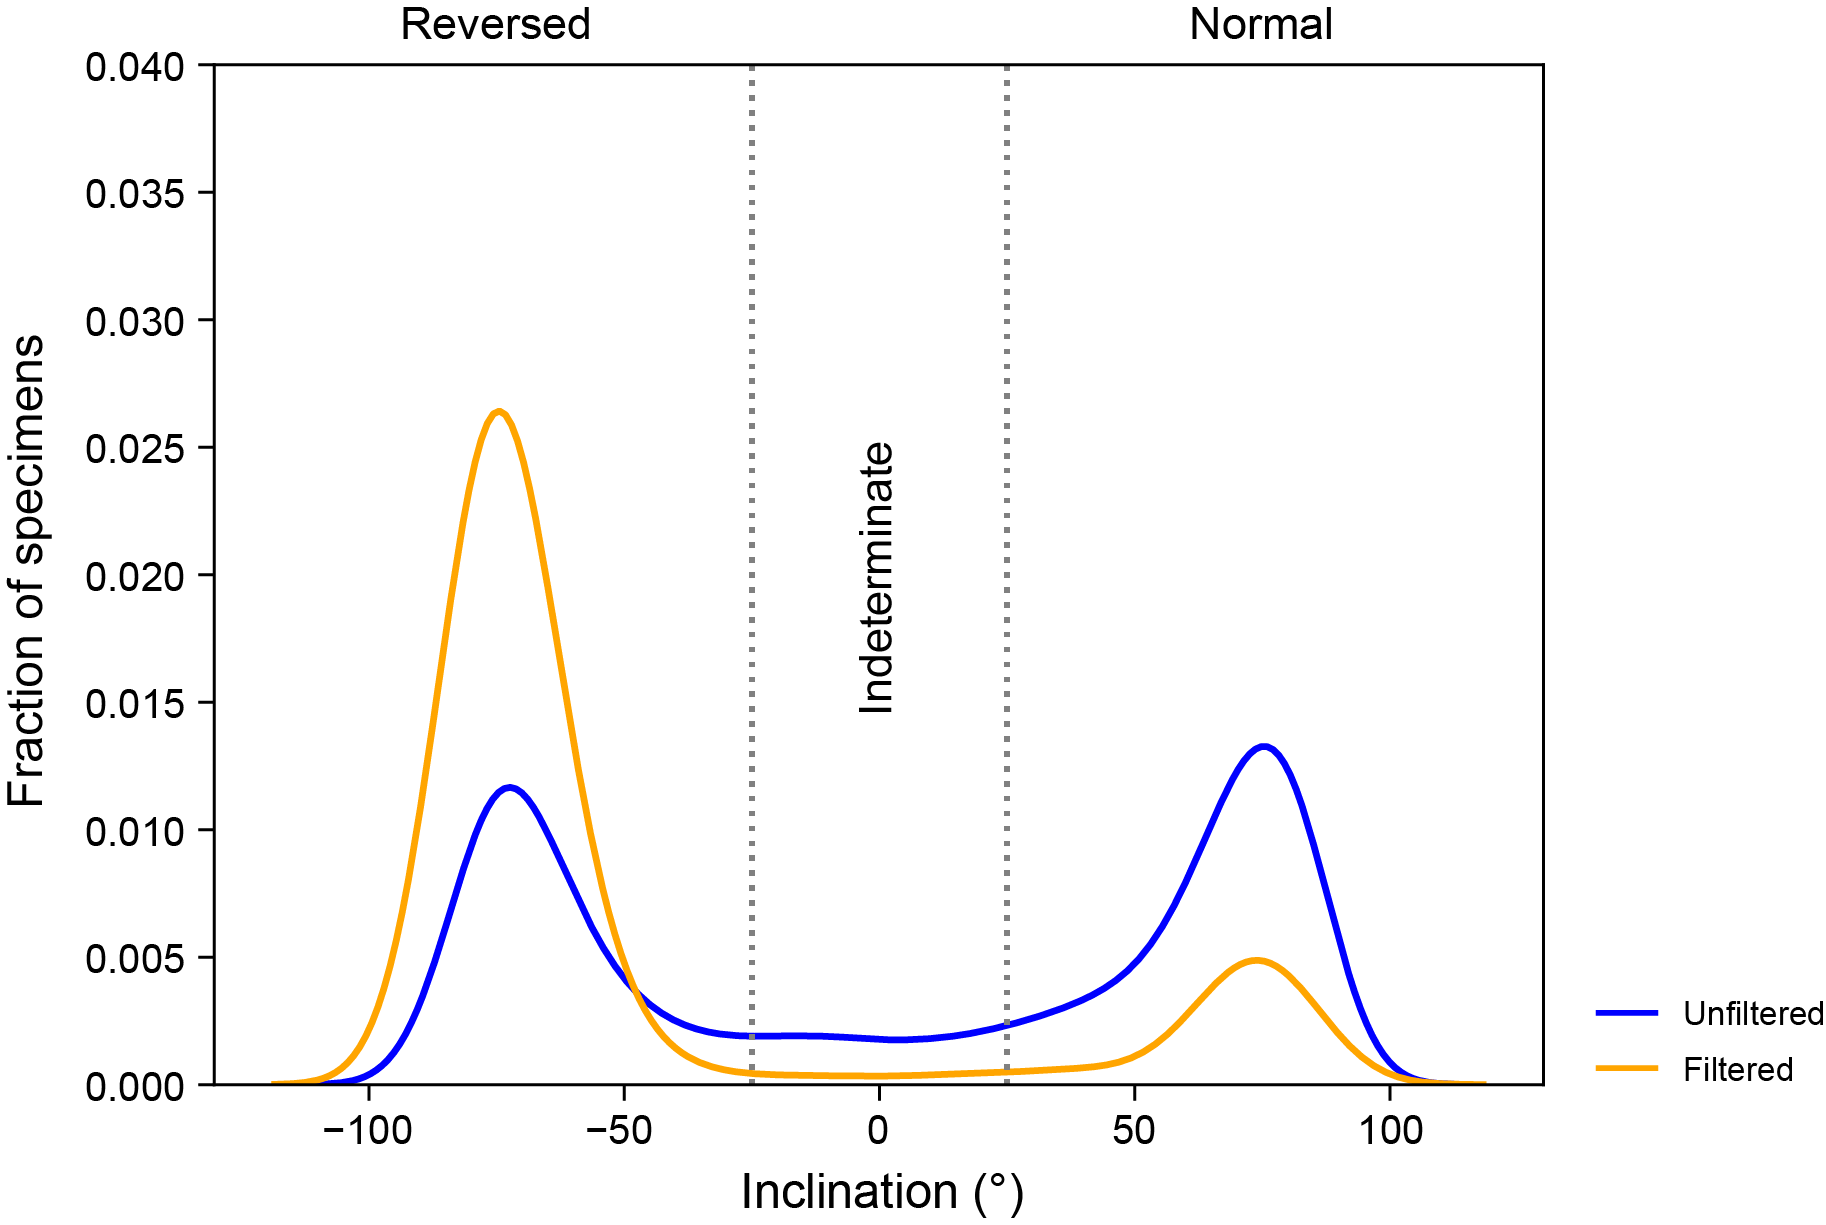
Figure F23. Inclination data.
5.2.1. Magnetostratigraphy
Magnetostratigraphic interpretations are based on inclinations calculated from archive section half and discrete specimen measurements made after the 20 mT AF demagnetization step, with downward-directed vectors being normal and upward-directed vectors being reversed. In Figure F24, we show the process whereby inclinations are interpreted as preliminary polarity zones. The depths of polarity zone boundaries are listed in Table T11. Possible hiatuses were identified in the seismic data at 96 and 535 m CSF-A (Figures F2, F24). For further correlation to chrons, see Age model.
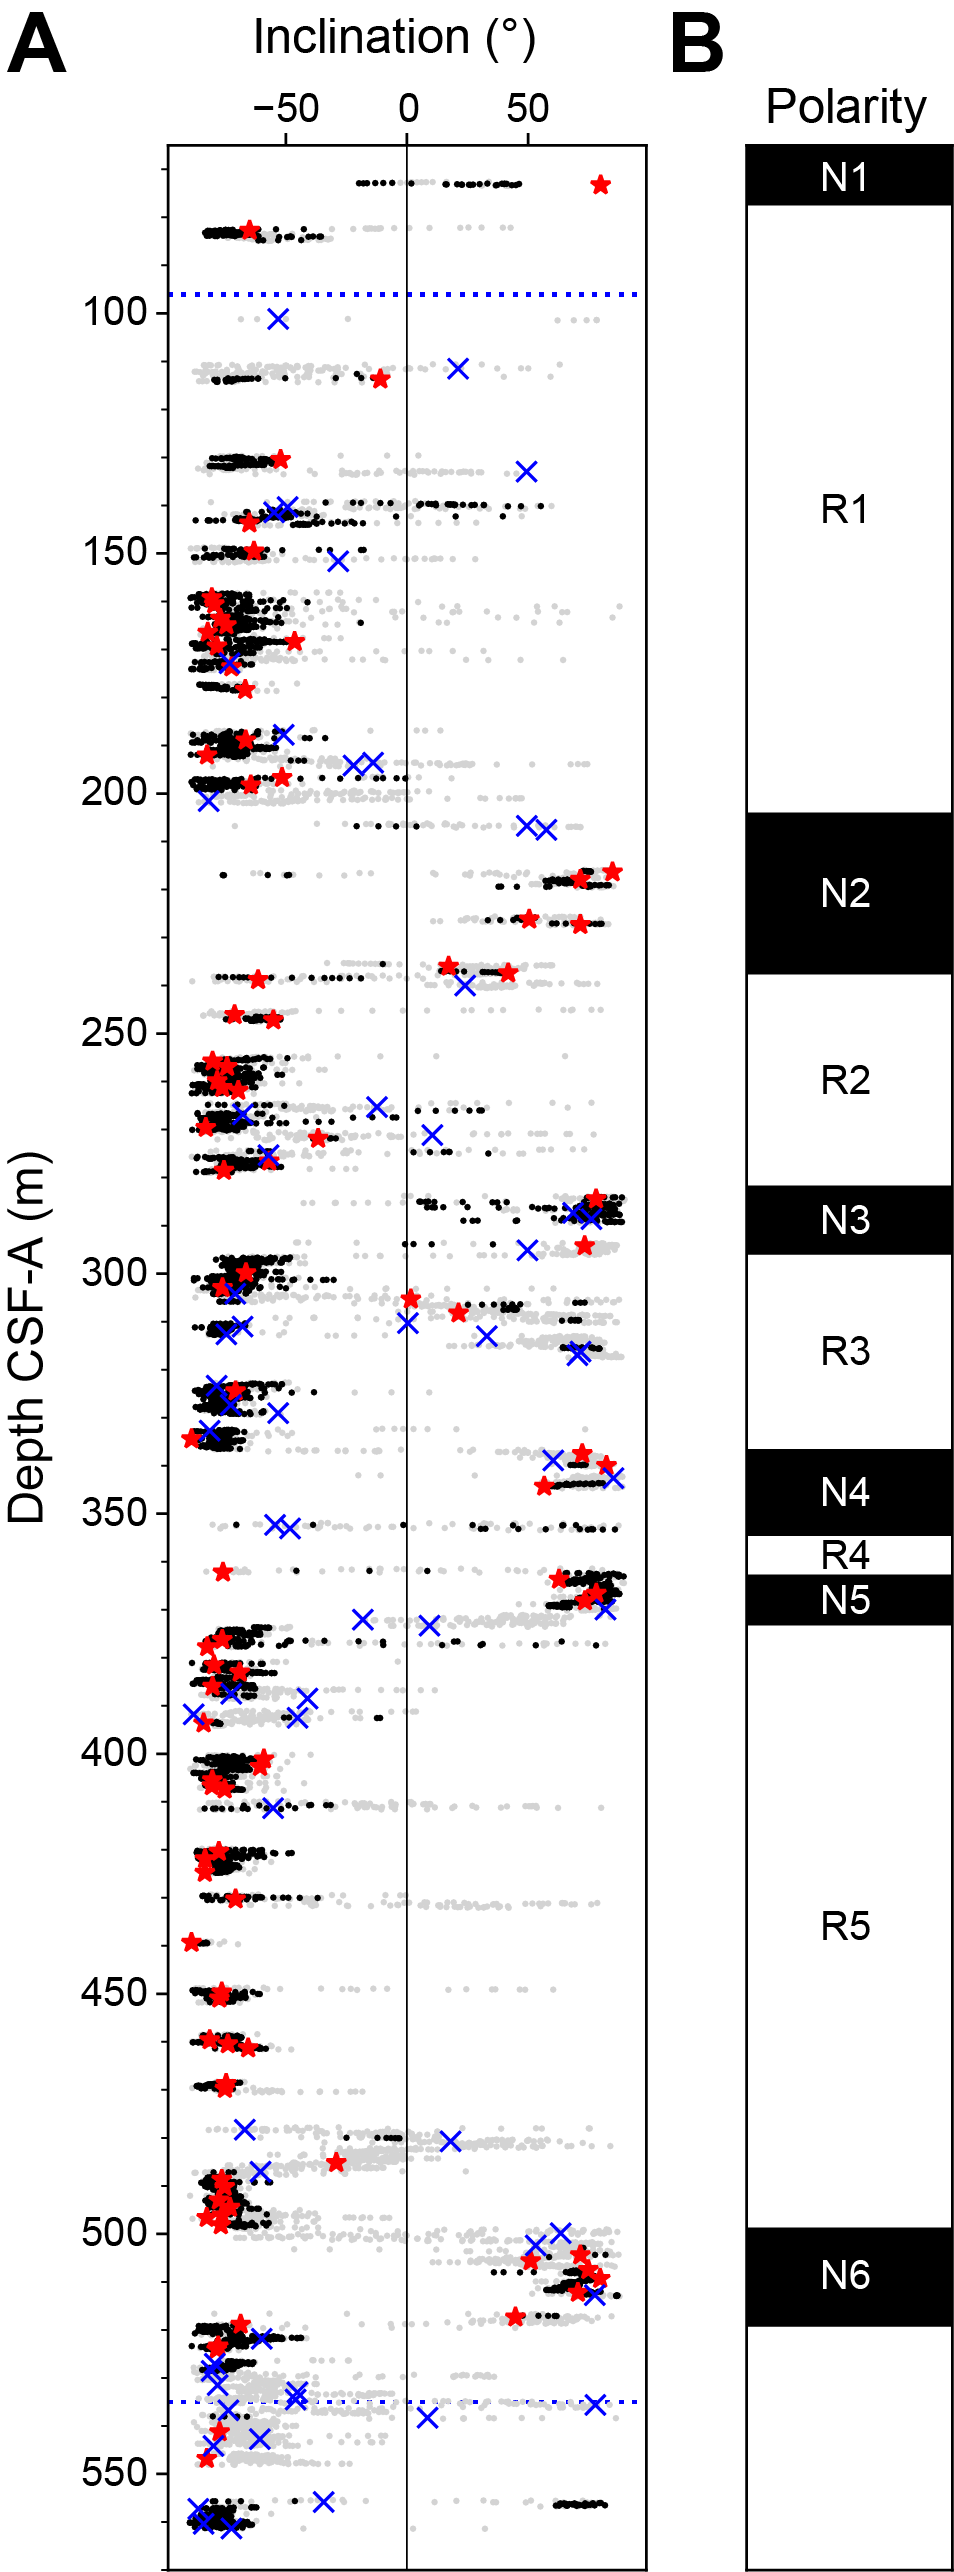
Figure F24. Magnetostratigraphy.
6. Physical properties
Physical property data were acquired on all cores from Hole U1608A. Natural gamma radiation (NGR) was acquired using the Natural Gamma Radiation Logger (NGRL) in all sections longer than 50 cm upon arrival to the laboratory. Further logging on the Whole-Round Multisensor Logger (WRMSL) was performed 4 h after core arrival to the laboratory for thermal equilibration (~20°C). The WRMSL provided wet bulk density from gamma ray attenuation (GRA), MS, and P-wave velocity (using the P-wave logger [PWL]) at 2 cm resolution.
After the whole rounds were split, we acquired X-ray imaging on every archive section half. Thermal conductivity was measured on one working section half per core. The Section Half Multisensor Logger (SHMSL) was used to measure point MS (MSP) and color reflectance using the L*a*b* color system, and the red-green-blue color space (RGB) of the sediments was captured with the Section Half Imaging Logger (SHIL). In addition, we determined P-wave velocities at three discrete points per core on the working section halves for all cores at Site U1608. Measurements were taken at variable intervals to accommodate lithologic variations. Two moisture and density (MAD) samples per core were taken and processed to obtain discrete wet bulk density, dry bulk density, grain density, and porosity measurements.
The sensors worked correctly, and the data are of good quality. Accordingly, the physical properties obtained from Hole U1608A provide valid and reproducible information on sediment composition and its variability for all cores. Prominent variations in physical property values occur at similar depths in NGR and density and are associated with major lithologic changes in the cores. Uniform lithologies reflect low variability in the physical property signals. All analyses described in this section are reported in meters core depth below seafloor, Method A (CSF-A), unless otherwise stated.
6.1. Physical property measurements and measurement intervals
High-resolution physical property measurements were made on all cores from Hole U1608A to provide basic information on sediment composition and variability. The WRMSL measured bulk density by GRA, MS, and compressional P-wave velocity on the PWL at 2 cm intervals. WRMSL measurements were obtained upon equilibration to room temperature. The RCB system has a slightly smaller core diameter and does not fill the liner entirely. Thus, PWL readings lack close contact between the caliper and the sediment, leading to large standard deviations in the measurements. However, the PWL trend is consistent with that of the discrete P-wave caliper (PWC) measurements. NGR was measured with a counting period of 300 s at 10 cm intervals (see Physical properties in the Expedition 400 methods chapter [Knutz et al., 2025a]) on all Site U1608 cores.
After the cores were split, the archive section halves were X-rayed. Thermal conductivity was measured using the TK04 (Teka Bolin) system in the working section halves, obtained with a puck probe. PWC velocity was acquired in three working section halves per core for Hole U1608A. MSP and color reflectance were measured at 2 cm intervals using the SHMSL, and section-half images were collected with the SHIL for all archive section halves. Additionally, discrete samples from all cores from Hole U1608A were taken for MAD measurements as two samples per core, ideally representing different lithologies. The samples were processed on board to determine water content, wet bulk density, dry bulk density, porosity, and grain density.
Core disturbances, such as upbowing of layers, did not diminish the quality of the physical property data in a way that prevents meaningful core-seismic integration.
6.1.1. Whole-Round Multisensor Logger measurements
Results from NGRL and WRMSL measurements for Hole U1608A are compiled in Figure F25. The logs described in this chapter (Figure F25; Table T12) have undergone preliminary processing including clipping, despiking, and smoothing. A positive correlation is found between density and NGR counts (Figures F25, F26), governing all measurements collected for Site U1608. The correlation between these physical properties distinguishes five physical properties (PP) units (I–V) at Site U1608; the main signatures of those units are summarized in Table T12.
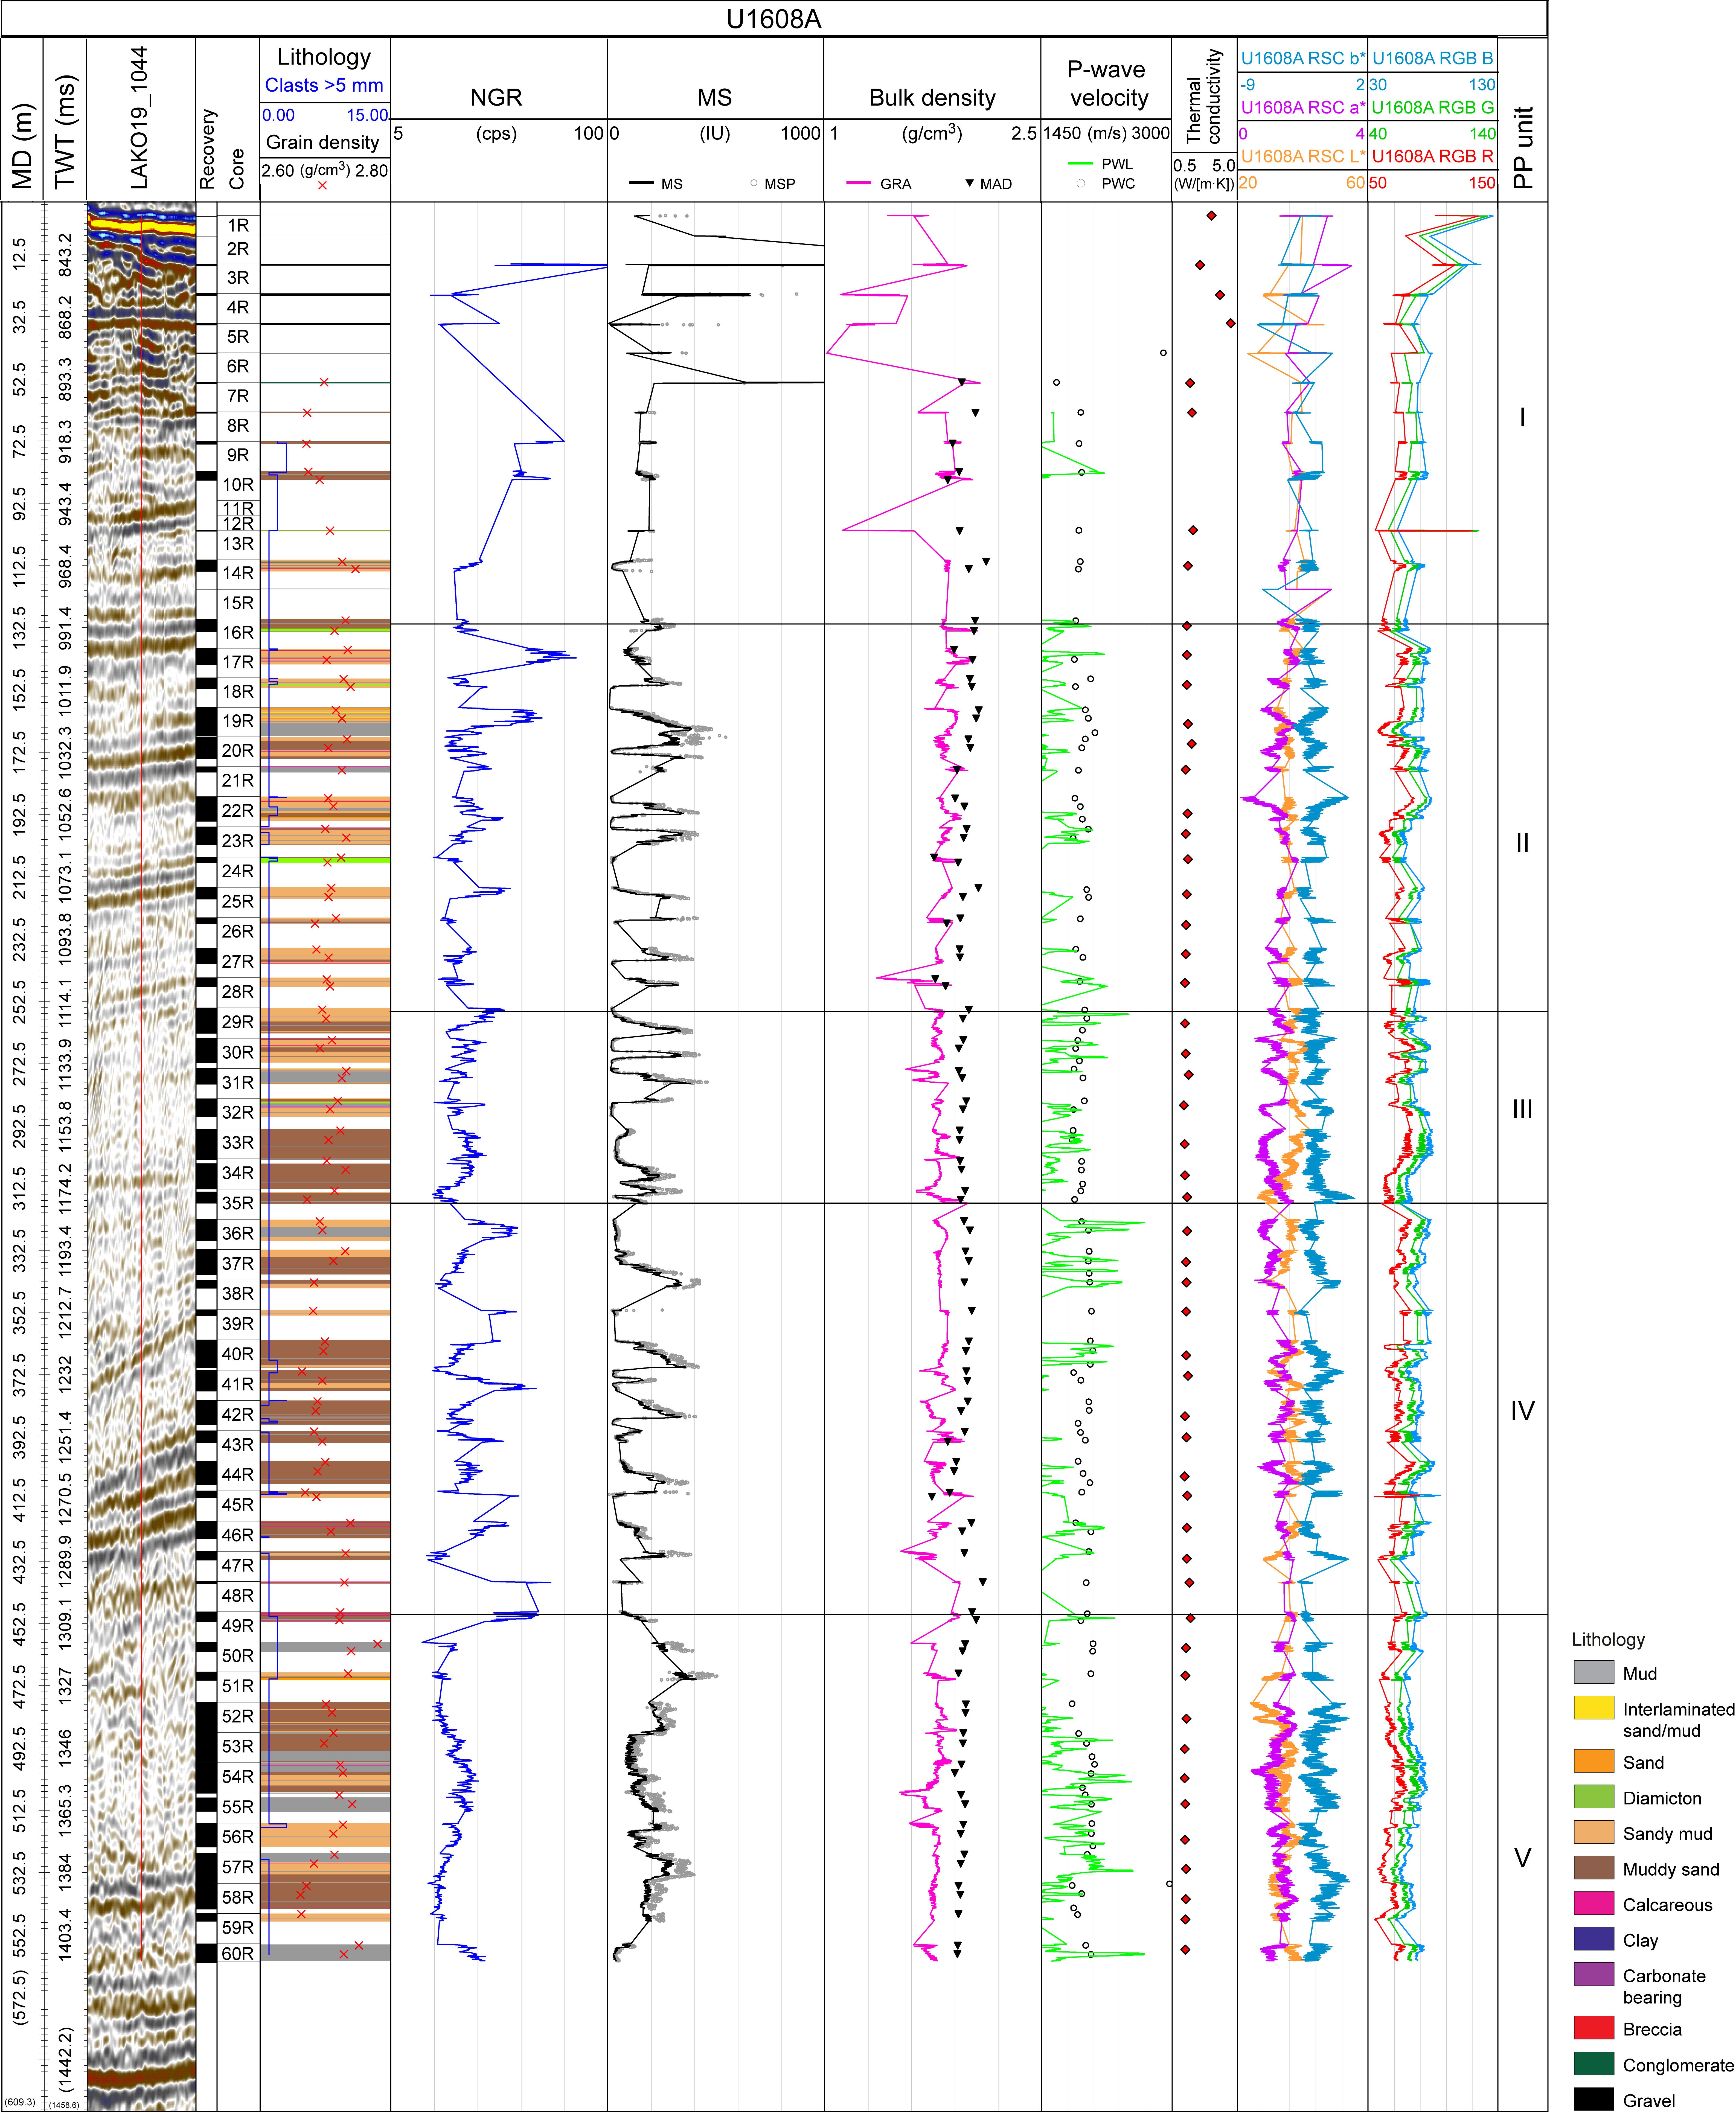
Figure F25. Physical properties.
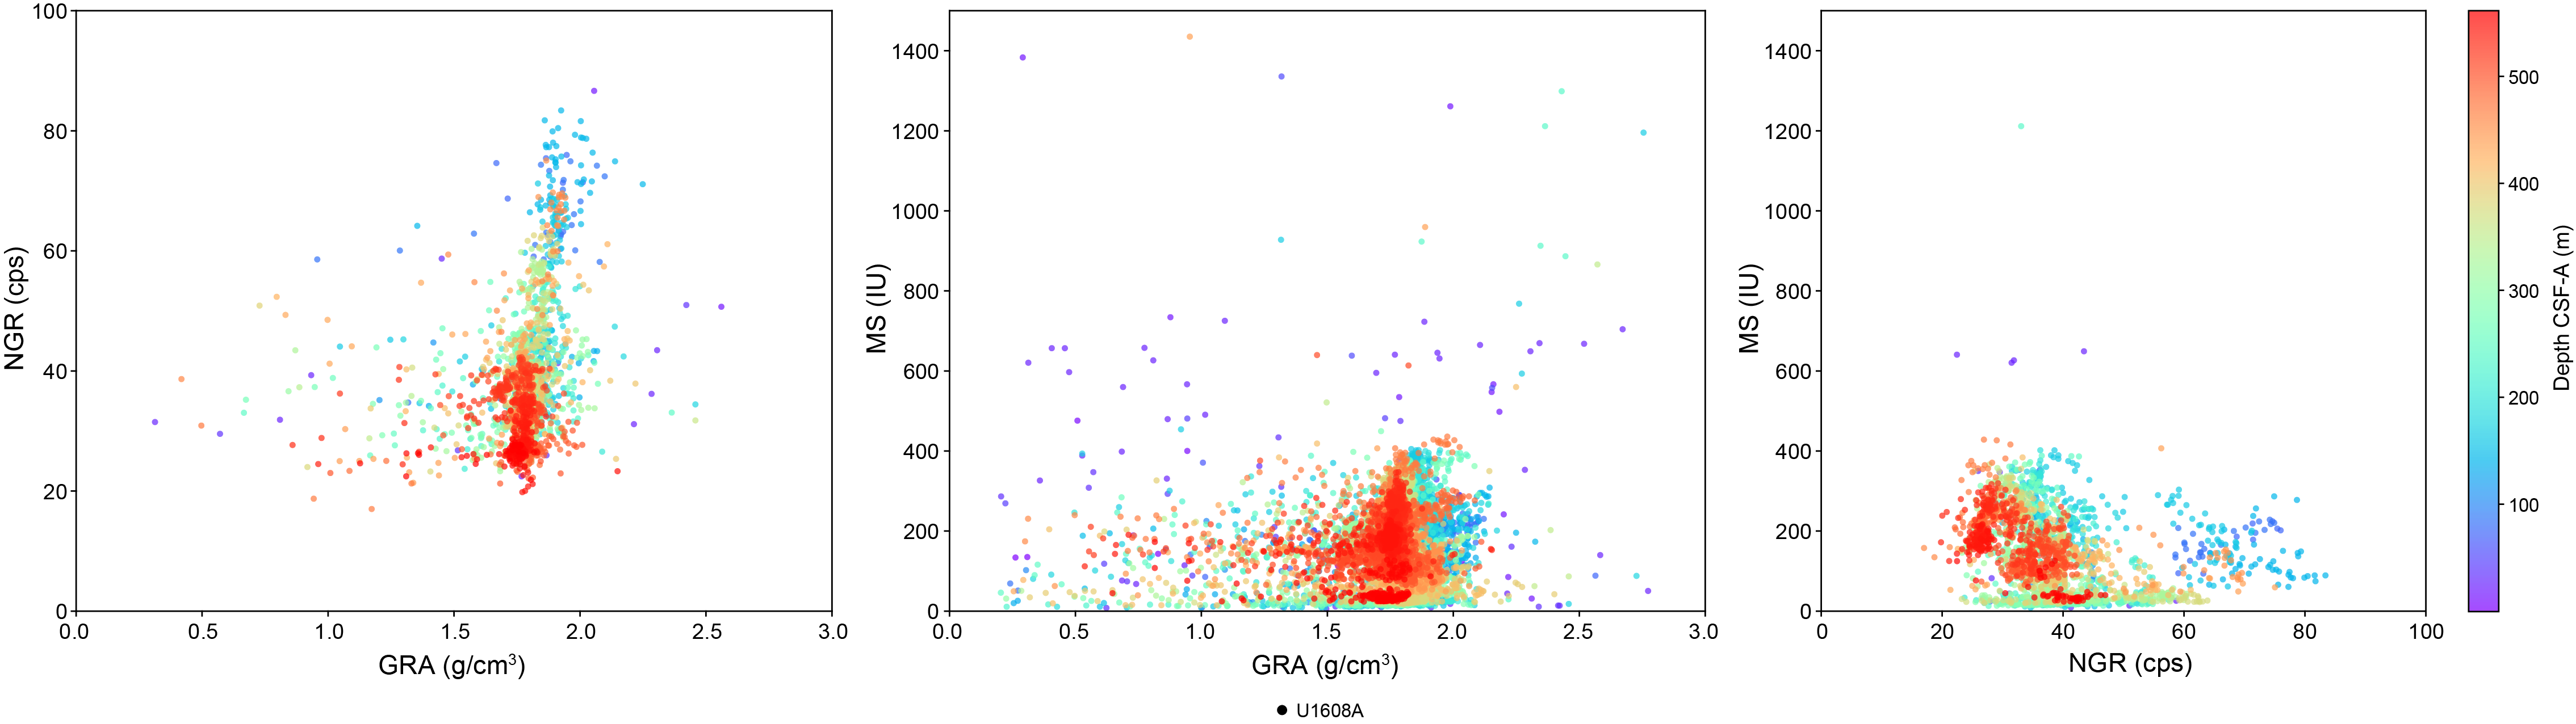
Figure F26. NGR, GRA bulk density, and MS.
6.1.1.1. Gamma ray attenuation bulk density
Wet bulk densities range 1.0–2.1 g/cm3 with a mean value of 1.8 g/cm3. GRA values are irregular from the mudline to Core 400-U1608A-16R (~130 m CSF-A) in correlation with the low recovery and washed gravel of PP Unit I (Table T12). Below this depth, the baseline of the GRA values is relatively constant at 1.8 g/cm3 for Hole U1608A (Figure F25). However, major variability is observed between Cores 23R and 31R (~200–280 m CSF-A) and between Cores 42R and 52R (~380–480 m CSF-A) in Units II and IV, respectively (Figure F25). Density from GRA is generally lower than measurements of MAD samples, particularly in intervals of high-amplitude variability.
6.1.1.2. Magnetic susceptibility
MS is sensitive to the concentration and type of magnetic minerals in the sediments. It usually appears as sharp peaks of high-amplitude variability, but MS also tracks the lithologic changes. Values at Site U1608 range 6 × 10⁻⁵ to 3604 × 10−5 SI. However, these extreme values of MS are present only in PP Unit I, which includes low recovery and is composed primarily of washed gravel (above Core 400-U1608A-15R; ~130 m CSF-A). Average MS is 144 × 10−5 SI (Figures F25, F26). MS values show high-amplitude variability following a cyclical pattern in the central Units II–IV identified at Site U1608. In the lowermost part of the hole (Unit V), MS shows low-amplitude variability with a downward decreasing trend to ~38 × 10−5 SI (Figure F25).
6.1.1.3. P-wave velocity using the P-wave logger
PWL measurements for Site U1608 are unreliable when made on sections with cracks or poor contact between the sediment and the liner. PWL values are generally very low, with minimum values around 1013 m/s, which shows the poor quality of the data (Figure F25).
6.1.2. Natural gamma radiation
NGR values range 18–161 counts/s; however, the average values are around 39 counts/s. NGR values display high-amplitude variability in PP Units II and IV and low values in Units III and V at Site U1608 (Figure F25). The high-amplitude variability in Units II and IV may be associated with lithologic intervals of high sand content.
6.1.3. Thermal conductivity
Thermal conductivity values vary between 1.3 and 4.5 W/(m·K) at Site U1608 (Figure F25). Values are constant below Core 400-U1608A-16R (~132 m CSF-A) around 1.5 W/(m·K). The maximum thermal conductivity value of 4.5 W/(m·K) was measured in Core 5R (~35 m CSF-A) (Figure F25).
6.1.4. Point magnetic susceptibility
The trend of MSP measurements shows a good match with the trend observed for MS values obtained from the WRMSL (Figure F25). However, higher variability is observed with this instrument due to the smaller volume integration of the sensor (~1 cm; 1σ) compared to the loop (~18 cm; 1σ) used for the WRMSL (Weber et al., 1997). MSP values are overall higher than the equivalent MS at Site U1608 (Figure F25).
6.1.5. Color reflectance
L*a*b* color reflectance values show low-amplitude variability downhole for Site U1608. The L* minimum values are observed between Cores 400-U1608A-33R and 35R (~296–322 m CSF-A) and between Cores 51R and 52R (~470–485 m CSF-A), where the b* component shows average higher values (Figure F25). The a* component shows a slight increasing trend downhole from 1.4 near the surface to 1.7 at the bottom of Hole U1608A.
6.1.6. Gantry
Results from section-half gantry and MAD measurements for Hole U1608A are compiled in Figure F27. Correlation between GRA and MAD density and PWC and PWL values confirms the high quality of the data (Figure F25).
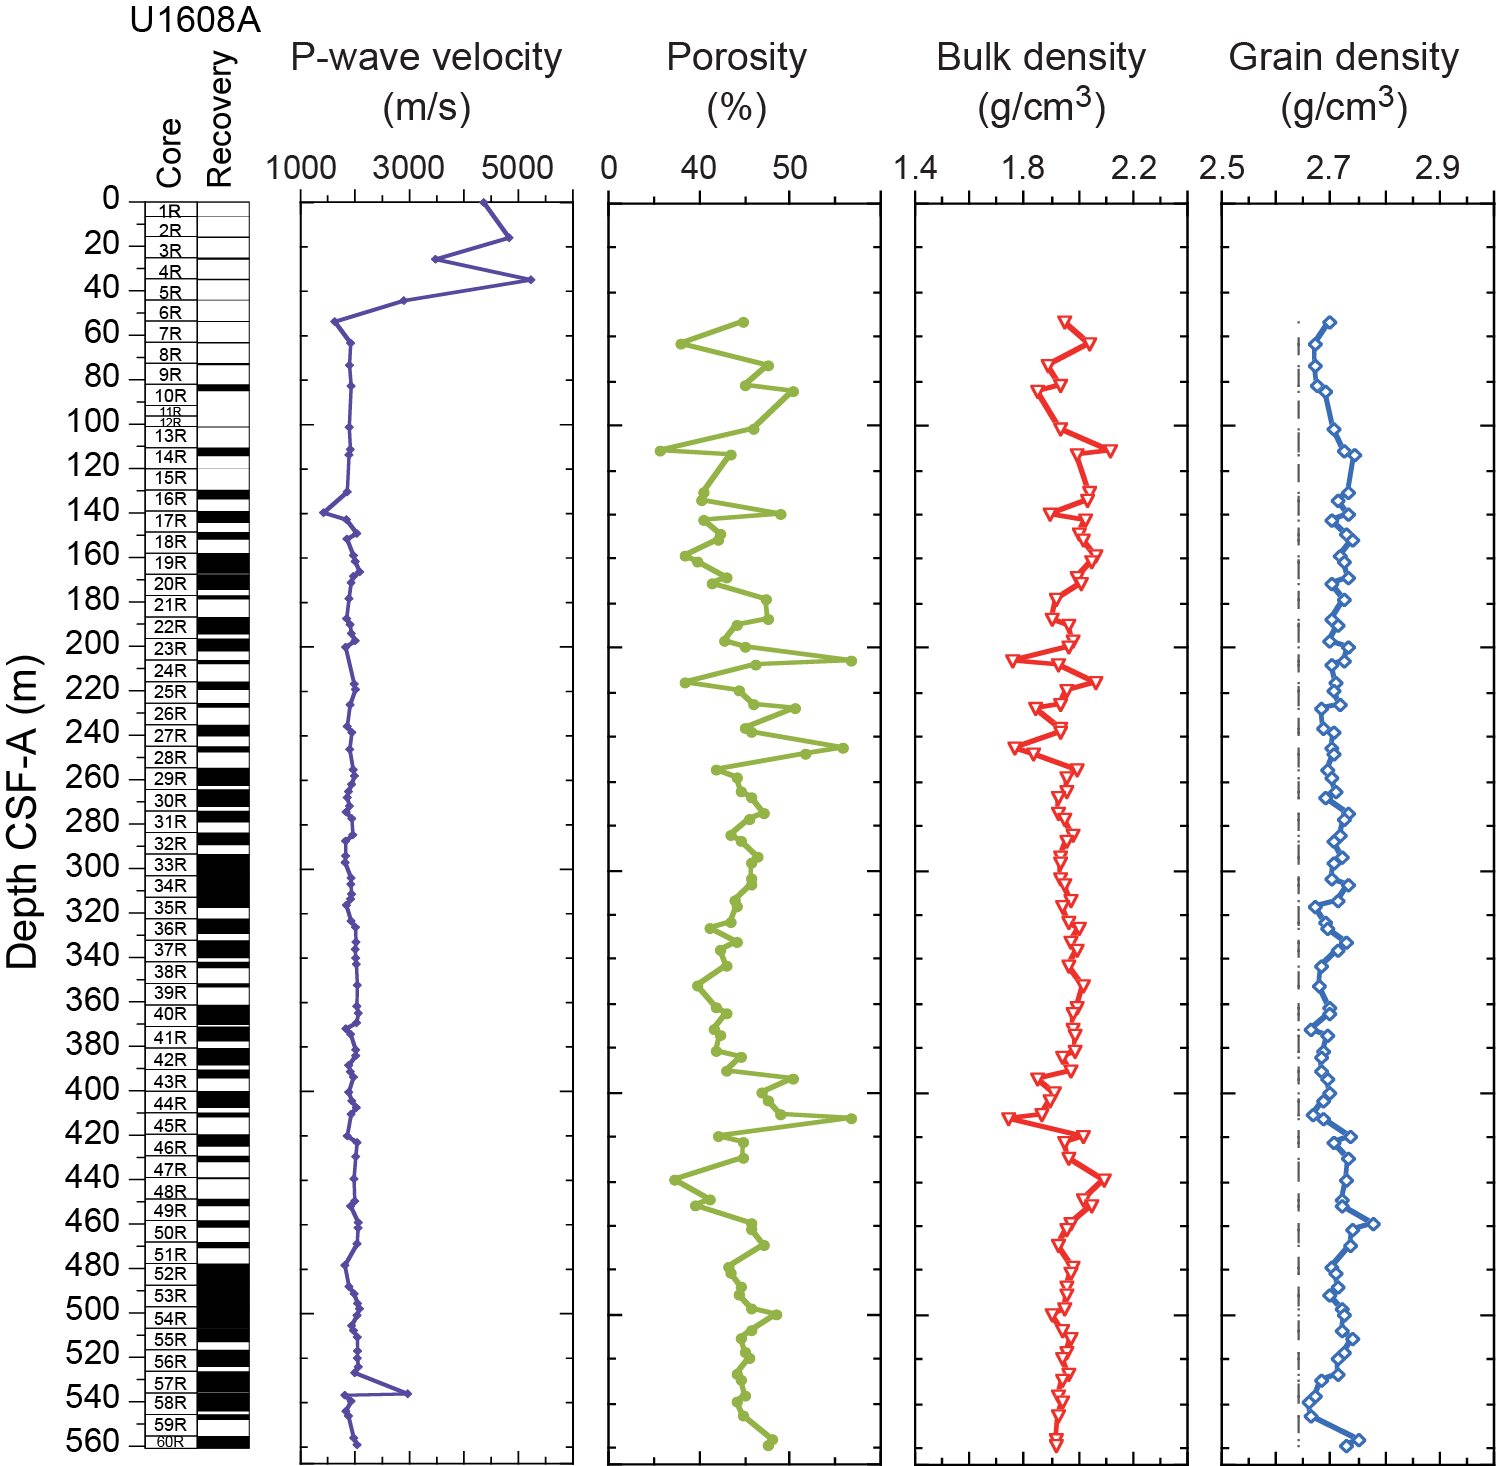
Figure F27. Gantry and MAD analyses.
6.1.6.1. P-wave velocity using the P-wave caliper
PWC values range 1423–5231 m/s, with an overall constant trend downhole. The average PWC value is 2059 m/s (Figures F25, F27).
6.1.6.2. Moisture and density
Sediment samples were taken from the working halves on all cores from Hole U1608A for MAD analyses (see Physical properties in the Expedition 400 methods chapter [Knutz et al., 2025a]). Sample resolution varied depending on lithology, recovery, and quality, but at least two samples per core were obtained. A total of 92 samples were taken for MAD estimates.
MAD density values are generally greater than GRA bulk density measured on the WRMSL (Figure F25). MAD bulk density values for Site U1608 range 1.7–2.1 g/cm3 with a mean of 2.0 g/cm3. Grain density shows high-amplitude variability at Site U1608 (Figures F25, F27), tentatively related to variability in the quantity of lithologic components at this site: quartz (2.65 g/cm3), biotite (~3 g/cm3), common clays, and feldspars (~2.56 g/cm3).
Porosity represents the percent of pore space of wet sediment volume and generally decreases downhole as the sediments compact (Figure F27). Average porosity in Hole U1608A is 45% and has no discernible trend downhole. Intervals of very high porosity are identified in the uppermost 260 m and between 380 and 420 m CSF-A. Maximum discrete porosity values in these depth intervals reach 57% for Cores 400-U1608A-24R, 25R, 43R, and 45R. Minimum porosity values (under 36%) are observed for Cores 14R and 48R at ~111 and ~442 m CSF-A, respectively.
6.2. Core-log-seismic correlation
The seismic facies of the units defined by physical properties are described in Table T12. General changes of seismic facies in the seismic profile correspond to changes in the physical properties. Correlation of the seismic signal in two-way traveltime with depth in meters has been achieved through the construction of distinct velocity models. At Site U1608, velocity models were generated considering P-wave velocities measured in the laboratory (i.e., PWC and PWL), P-wave velocity from the Dipole Sonic Imager (DSI; sonic), and time-depth relations from the VSI experiment (see Downhole logging). The laboratory P-wave values (PWC and PWL) are very low, resulting in an overexaggerated time-depth correlation. The low velocity values are probably related to core expansion upon resting in the laboratory (working section halves) or poor contact between the sediment and core liner in RCB cores (whole-round PWL measurements). The DSI sonic and the VSI check shots result in a very similar time-depth correlation. VSI check shots were evenly distributed along the borehole and provide the most robust time-depth constraints. Thus, the core-log-seismic correlation for Site U1608 was based on the resulting time-depth correlations from the VSI experiment (see Downhole logging) obtained from Hole U1608A. The resulting time-depth relationship has been applied to the figures in this chapter.
7. Geochemistry
Samples for headspace gas, interstitial water (IW) chemistry, and bulk sediment geochemistry were analyzed at Site U1608. Headspace hydrocarbon gas measurements showed low concentrations in the uppermost 50 m and high concentrations of methane (average = 33,800 ppm) from 50 m CSF-A to the bottom of Hole U1608A. IW samples were not taken in the uppermost part of the hole due to low recovery. The main findings from IW analysis include downhole increases in alkalinity, potassium, magnesium, and phosphate to around 250 m CSF-A and steadily decreasing values for these components below 300 m CSF-A. Elemental analysis of sediment material revealed average concentrations of 0.5 wt% organic carbon and 0.06 wt% nitrogen throughout Hole U1608A.
7.1. Volatile hydrocarbons
As part of routine environmental protection and safety monitoring, headspace hydrocarbons were analyzed for Hole U1608A (Figure F28). A total of 80 headspace samples were collected across the 60 cores retrieved from Hole U1608A. Among those collected, methane (CH4) concentration was very low (3 ppm) at 35 m CSF-A and then increased to concentrations of 20,000–80,000 ppm below 100 m CSF-A. Ethane (C2H6) was low in the uppermost 100 m and increased to concentrations of 10–40 ppm. Propane was also detected in most samples below 162 m depth CSF-A, with concentrations up to 15 ppm. Furthermore, low concentrations of iso-butane and n-butane were found sporadically, mostly below 360 m CSF-A, with maximum concentrations of 17 ppm. The resulting C1/C2 ratios were between 700 and 44,700.
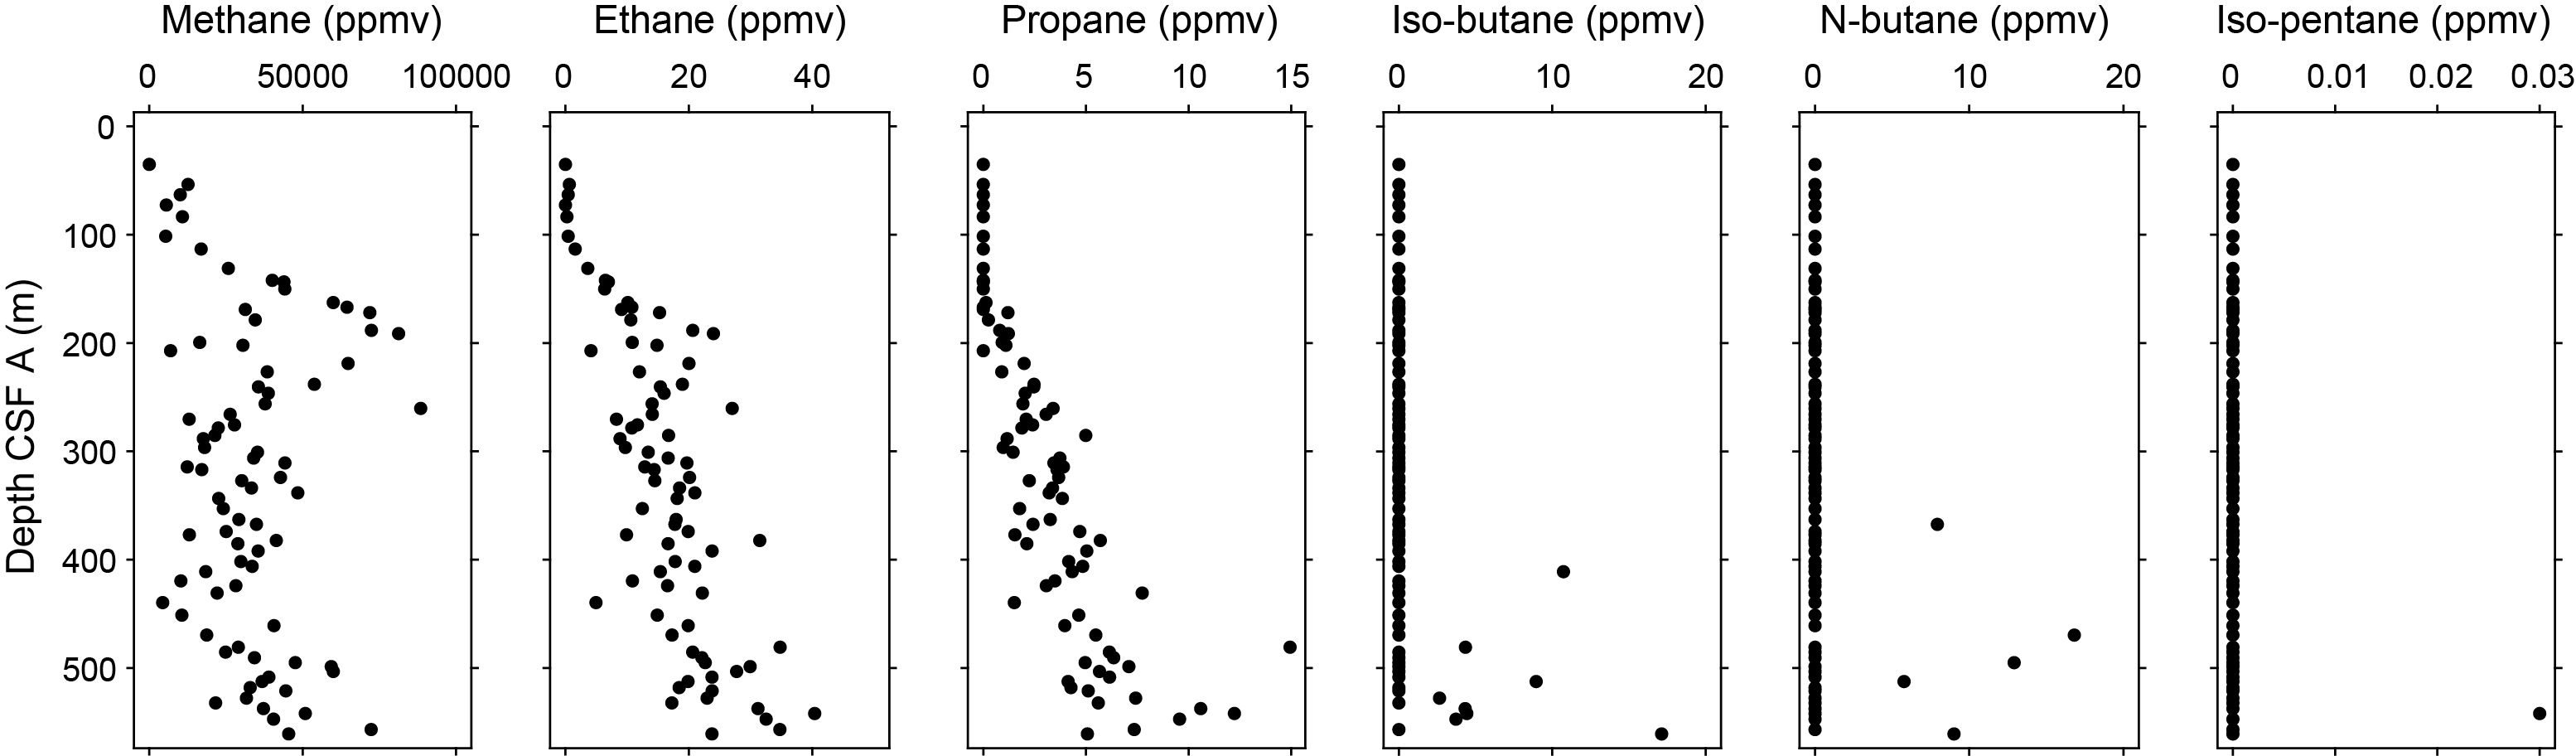
Figure F28. Hydrocarbon gas concentrations.
7.2. Interstitial water chemistry
A total of 44 IW samples were squeezed from 10 cm whole-round samples. Typical samples yielded 15–30 cm3 of water for subsequent analysis. Because of low recovery (<10%) of primarily washed gravel, no IW samples were taken from 0 to 83.22 m CSF-A. No mudline or Rhizon samples were collected at this site.
7.2.1. pH and alkalinity
The results for pH and alkalinity measurements are shown in Figure F29. The measured pH values range 7.56–8.01 with pH generally decreasing with depth. Alkalinity values increase from 7.3 mM at the uppermost measured point (83.22 m CSF-A) to a maximum of 23.8 mM at 270.22 m CSF-A. Alkalinity reaches a general plateau between 226.51 and 316.77 m CSF-A, with values between ~22 and 24 mM, and then decreases to the bottom of the hole, reaching a minimum of 4.6 mM at 556.62 m CSF-A.
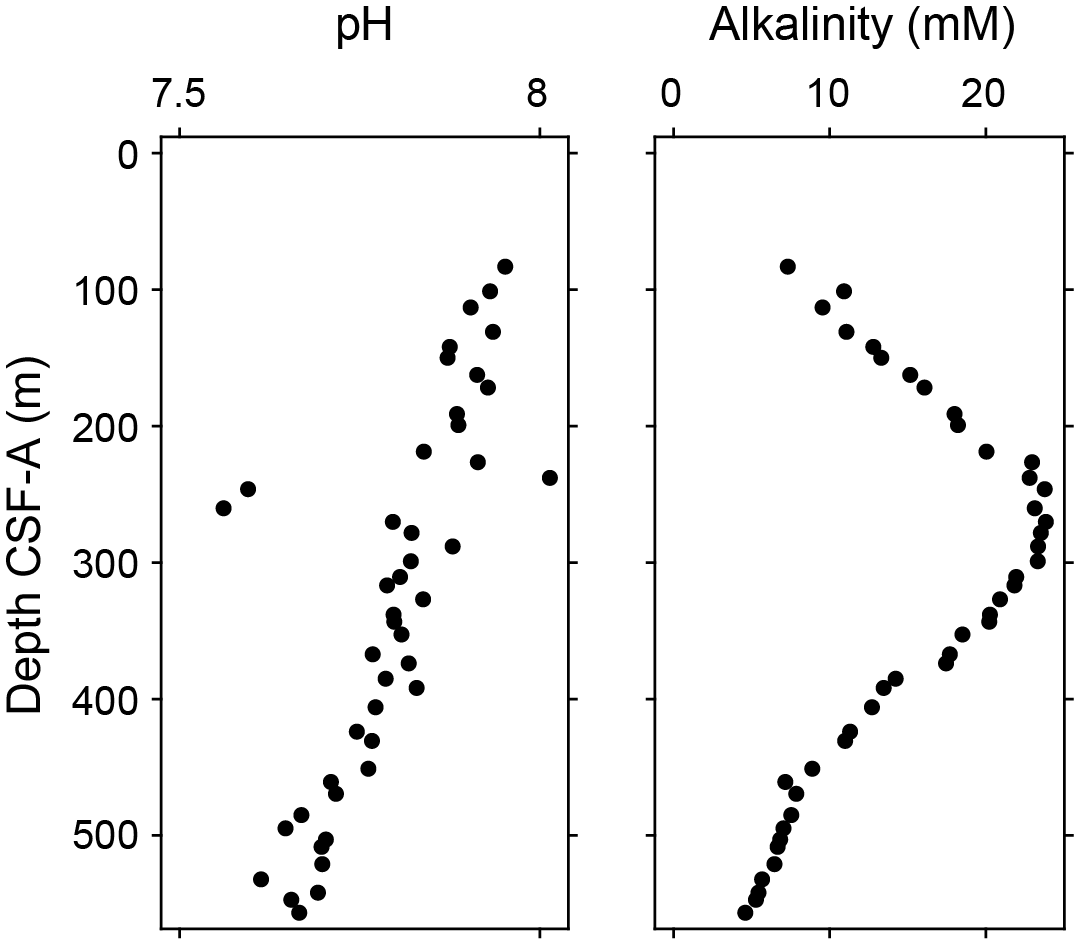
Figure F29. IW pH and alkalinity.
7.2.2. Salinity, sodium, chloride, lithium, potassium, and bromide
Salinity and dissolved sodium, chloride, lithium, potassium, and bromide concentrations are shown in Figure F30. Salinity generally increases downhole from a minimum of 21 in the uppermost measured sample (83.22 m CSF-A) to consistent values of 32 from 460.79 m CSF-A to the bottom of Hole U1608A. Sodium concentration (as measured using ion chromatography) increases from 331.1 mM at 83.22 m CSF-A to 472.7 mM at 352.74 m CSF-A. Below this depth, sodium values are consistently 470–478 mM to the bottom of the hole. Chloride also increases with depth from 317.8 mM at 83.22 m CSF-A to 552.4 mM at the bottom of the hole.
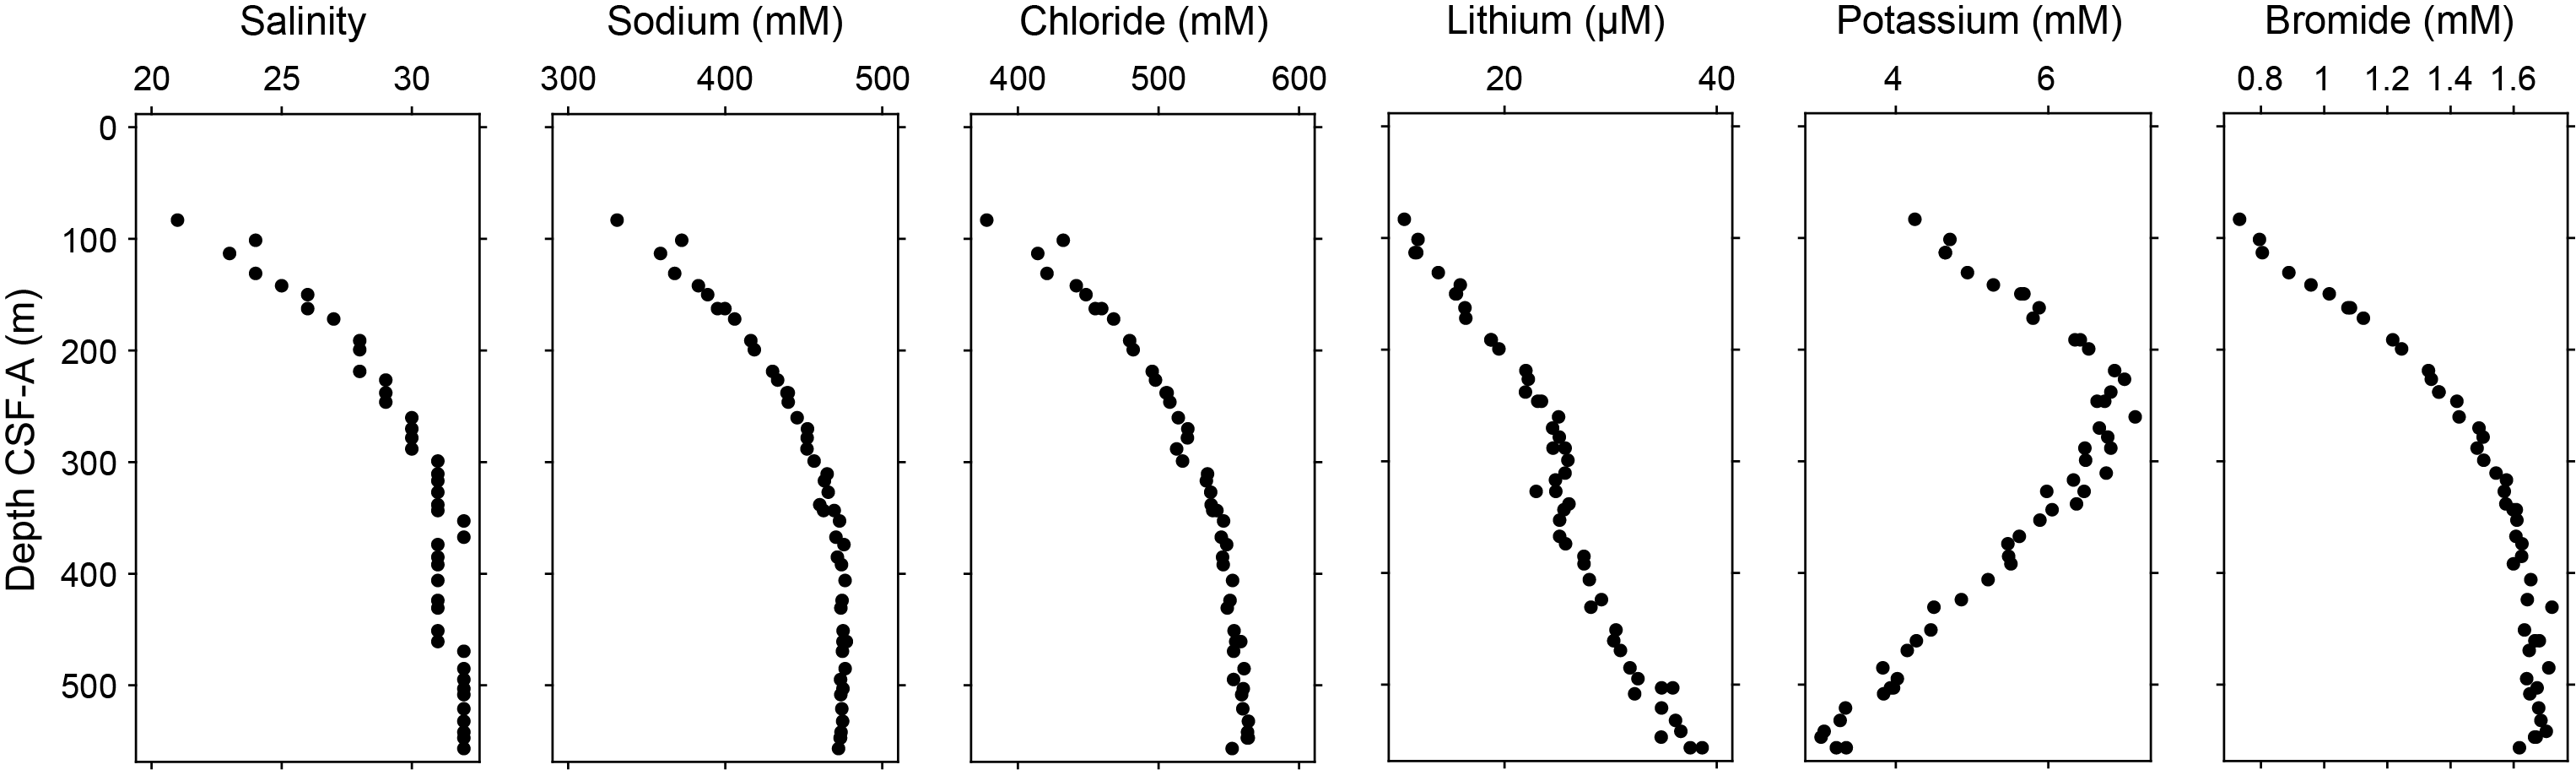
Figure F30. IW salinity, Na, Cl, Li, K, and Br.
Lithium increases downhole from a minimum of 10.6 µM in the uppermost sample (83.22 m CSF-A) to 38.6 µM at the bottom of the hole. Potassium (as measured using inductively coupled plasma–atomic emission spectroscopy [ICP-AES]) increases from 4.3 mM at 83.22 m CSF-A to a maximum of 7.1 mM at 260.26 m CSF-A and then decreases to the bottom of the hole, with a value of 3.4 mM at 556.62 m CSF-A. Bromide increases consistently from 0.7 mM at 83.22 m CSF-A to 1.6 mM at 343.4 m CSF-A and then increases with a more gradual trend to the bottom of the hole, with values generally between ~1.6 and 1.7 mM.
7.2.3. Ammonium, manganese, iron, sulfate, phosphate, and boron
Ammonium, manganese, iron, sulfate, phosphate, and boron concentrations are shown in Figure F31. Ammonium increases from 3,818 µM at 83.22 m CSF-A to a maximum of 10,871 µM at 326.98 m CSF-A. Ammonium concentrations are greater than 10,000 µM from 273.37 to 430.71 m CSF-A and then decrease to the bottom of Hole U1608A. Dissolved manganese shows an overall increase with depth, with a minimum value of 1 µM at 83.22 m CSF-A and a maximum of 6 µM at 541.90 m CSF-A. Iron concentrations range from below the ICP-AES detection limit to a maximum of 4 µM and show no obvious trend with depth. Sulfate concentrations are between 0.7 mM and 2.4 mM and show a general increase downhole. Phosphate concentrations are between ~30 and 40 µM from 83.22 to 171.83 m CSF-A. Phosphate concentrations are high (>40 µM) between 191.20 and 237.99 m CSF-A and then decrease downhole to values of approximately 5 µM below 521.00 m CSF-A. Boron shows an overall increase downhole, with a concentration of 218 µM at 83.22 m CSF-A and a maximum value of 361 µM at 508.33 m CSF-A. Boron decreases slightly in the deepest part of Hole U1608A, with a concentration of 291 µM at the bottom of the hole.
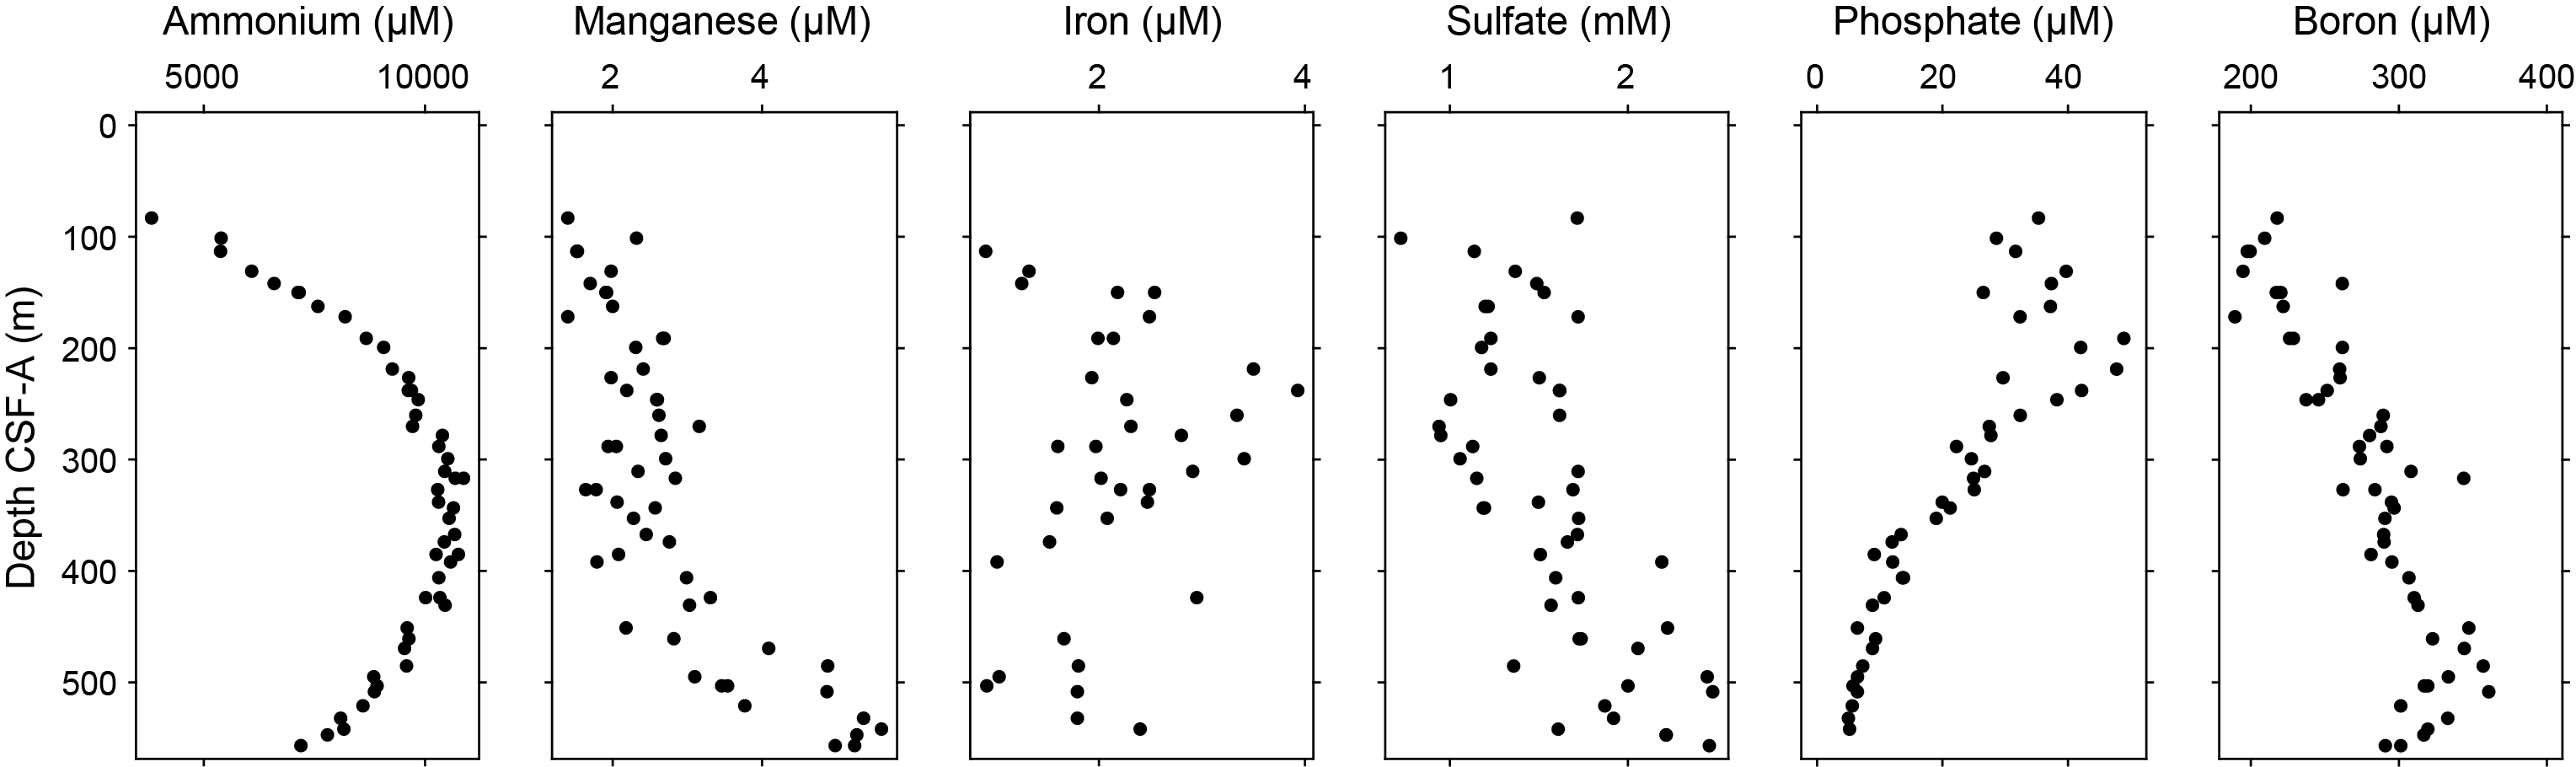
Figure F31. IW ammonium, Mn, Fe, sulfate, phosphate, and B.
7.2.4. Calcium, magnesium, strontium, silicon, and barium
Calcium, magnesium, strontium, silicon, and barium concentrations are shown in Figure F32. Calcium concentrations (measured by ICP-AES) increase from 2.4 mM at 83.22 m CSF-A to 15.6 mM at the bottom of Hole U1608A. In general, calcium values increase more gradually downhole to ~450 m CSF-A and more steeply below that depth. Magnesium concentrations (as measured using ICP-AES) increase from a minimum of 22.0 mM at 83.22 m CSF-A to a maximum of 29.4 mM at 391.9 m CSF-A and then decrease to 25.0 mM at the bottom of the hole. Strontium values increase monotonically downhole from 31 µM at 83.22 m CSF-A to 94 µM at 556.72 m CSF-A.
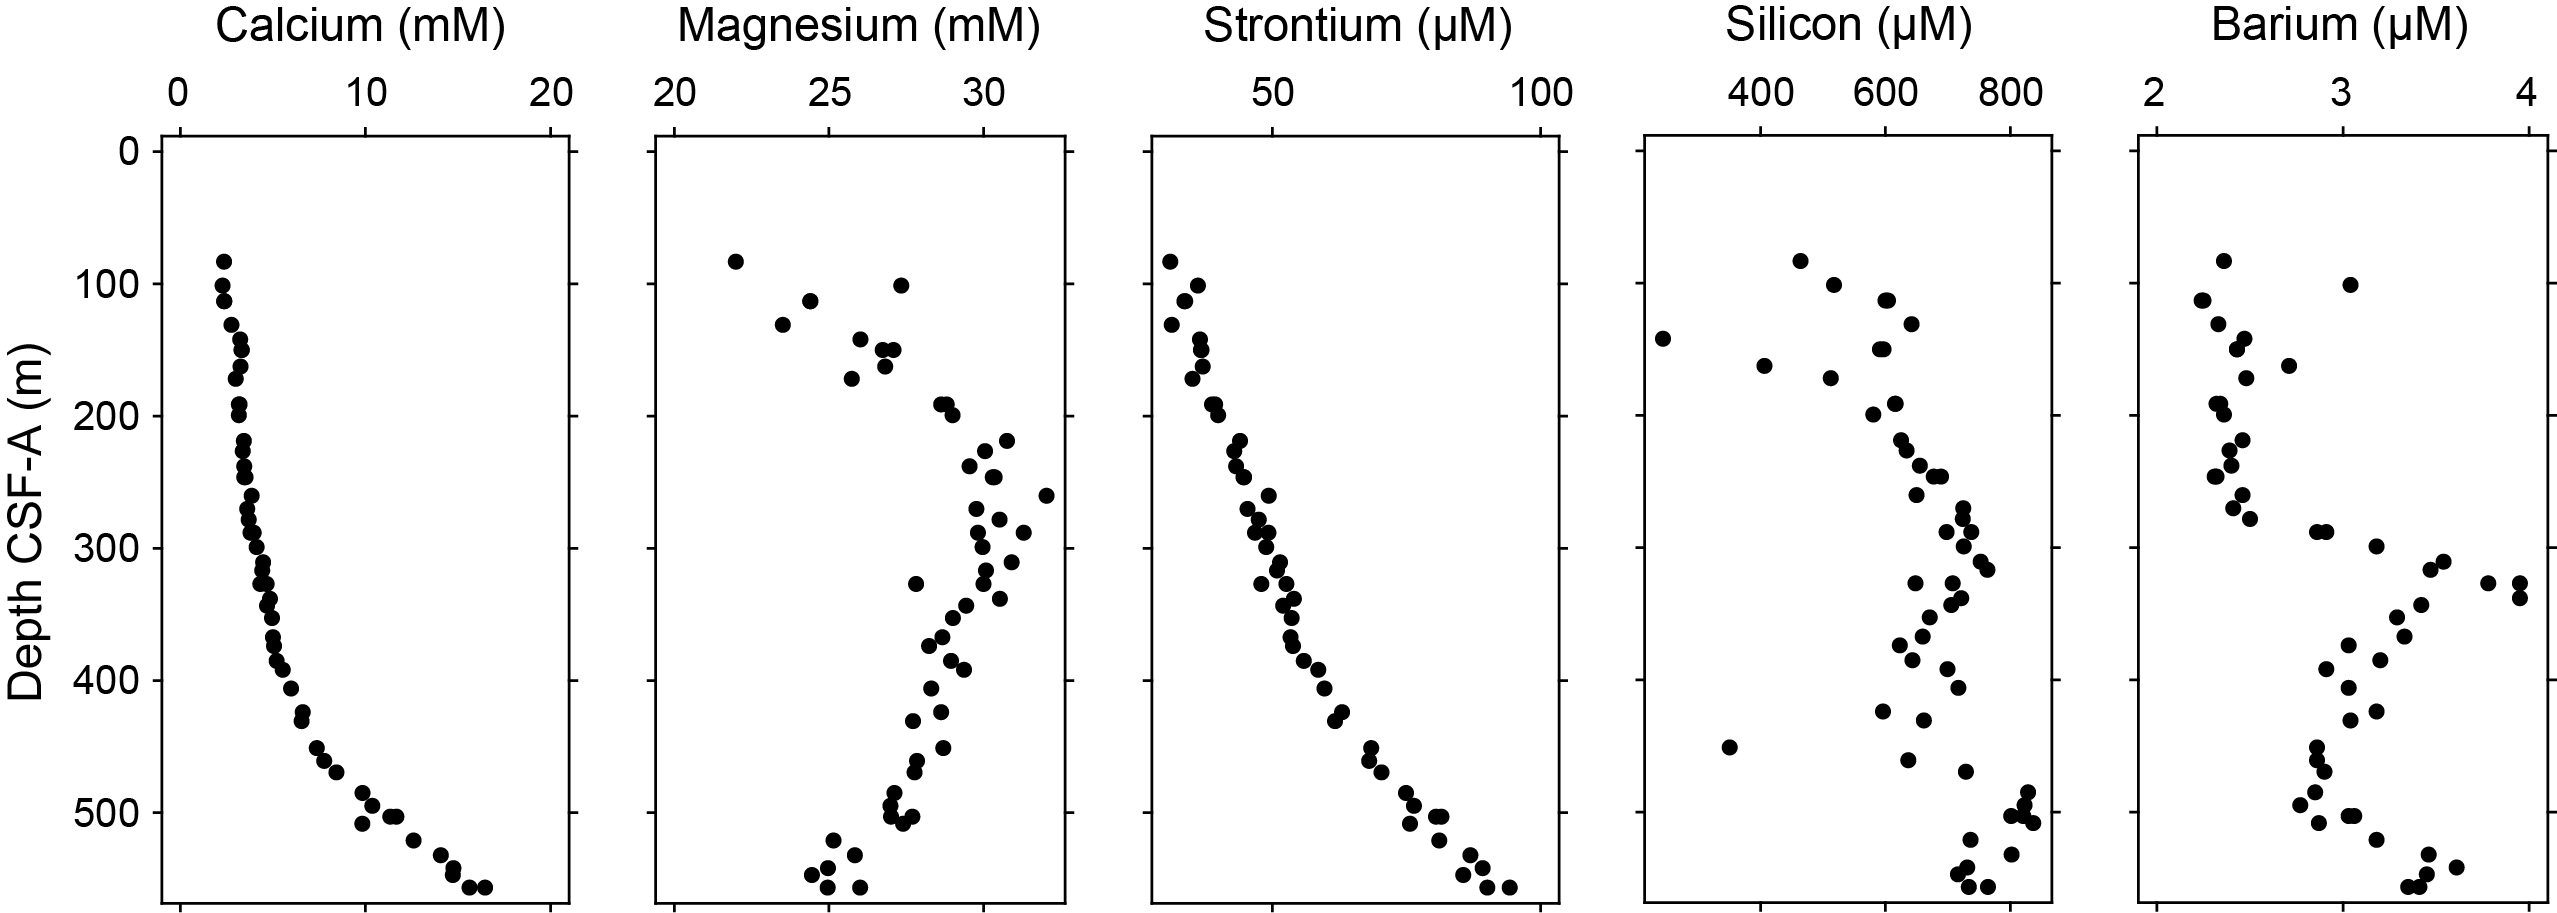
Figure F32. IW Ca, Mg, Sr, Si, and Ba.
Dissolved silicon concentration is elevated throughout this site compared to the mudline values at previous sites. Values at Site U1608 range 210 to ~850 µM compared to typical seawater concentrations of ~100 µM. Concentrations generally increase downhole but have local maxima at 310 and 500 m CSF-A. Dissolved barium concentrations generally increase downhole from a broad minimum of 2.4 µM in the uppermost 150 m of recovered core to a maximum of 4.0 µM at 338.22 m CSF-A and then decrease to 2.8 µM at 494.77 m CSF-A. Below this depth, barium concentrations generally increase to the bottom of the hole.
7.3. Bulk sediment geochemistry
7.3.1. Carbon, nitrogen, and carbonate
The shipboard solid phase analysis at Site U1608 from all major lithostratigraphic units identified consisted of measurements of CaCO3, total carbon (TC), and total nitrogen (TN) using shipboard sampling. A total of 71 samples were collected and analyzed. Total organic carbon (TOC) was calculated from measurements of CaCO3 and TC. Downhole profiles of CaCO3, TC, TOC, and TN contents (weight percent) at Site U1608 are shown in Figure F33. The CaCO3 content varies largely across Hole U1608A, with overall low average concentrations (0.8 wt%) above 300 m CSF-A and nearly three times higher (2.3 wt%) CaCO3 contents below this depth. The TC content varies accordingly, with 0.10 wt% in the uppermost 300 m and 0.28 wt% at depth. Concentrations of TOC and TN are on average 0.52 and 0.06 wt%, respectively.
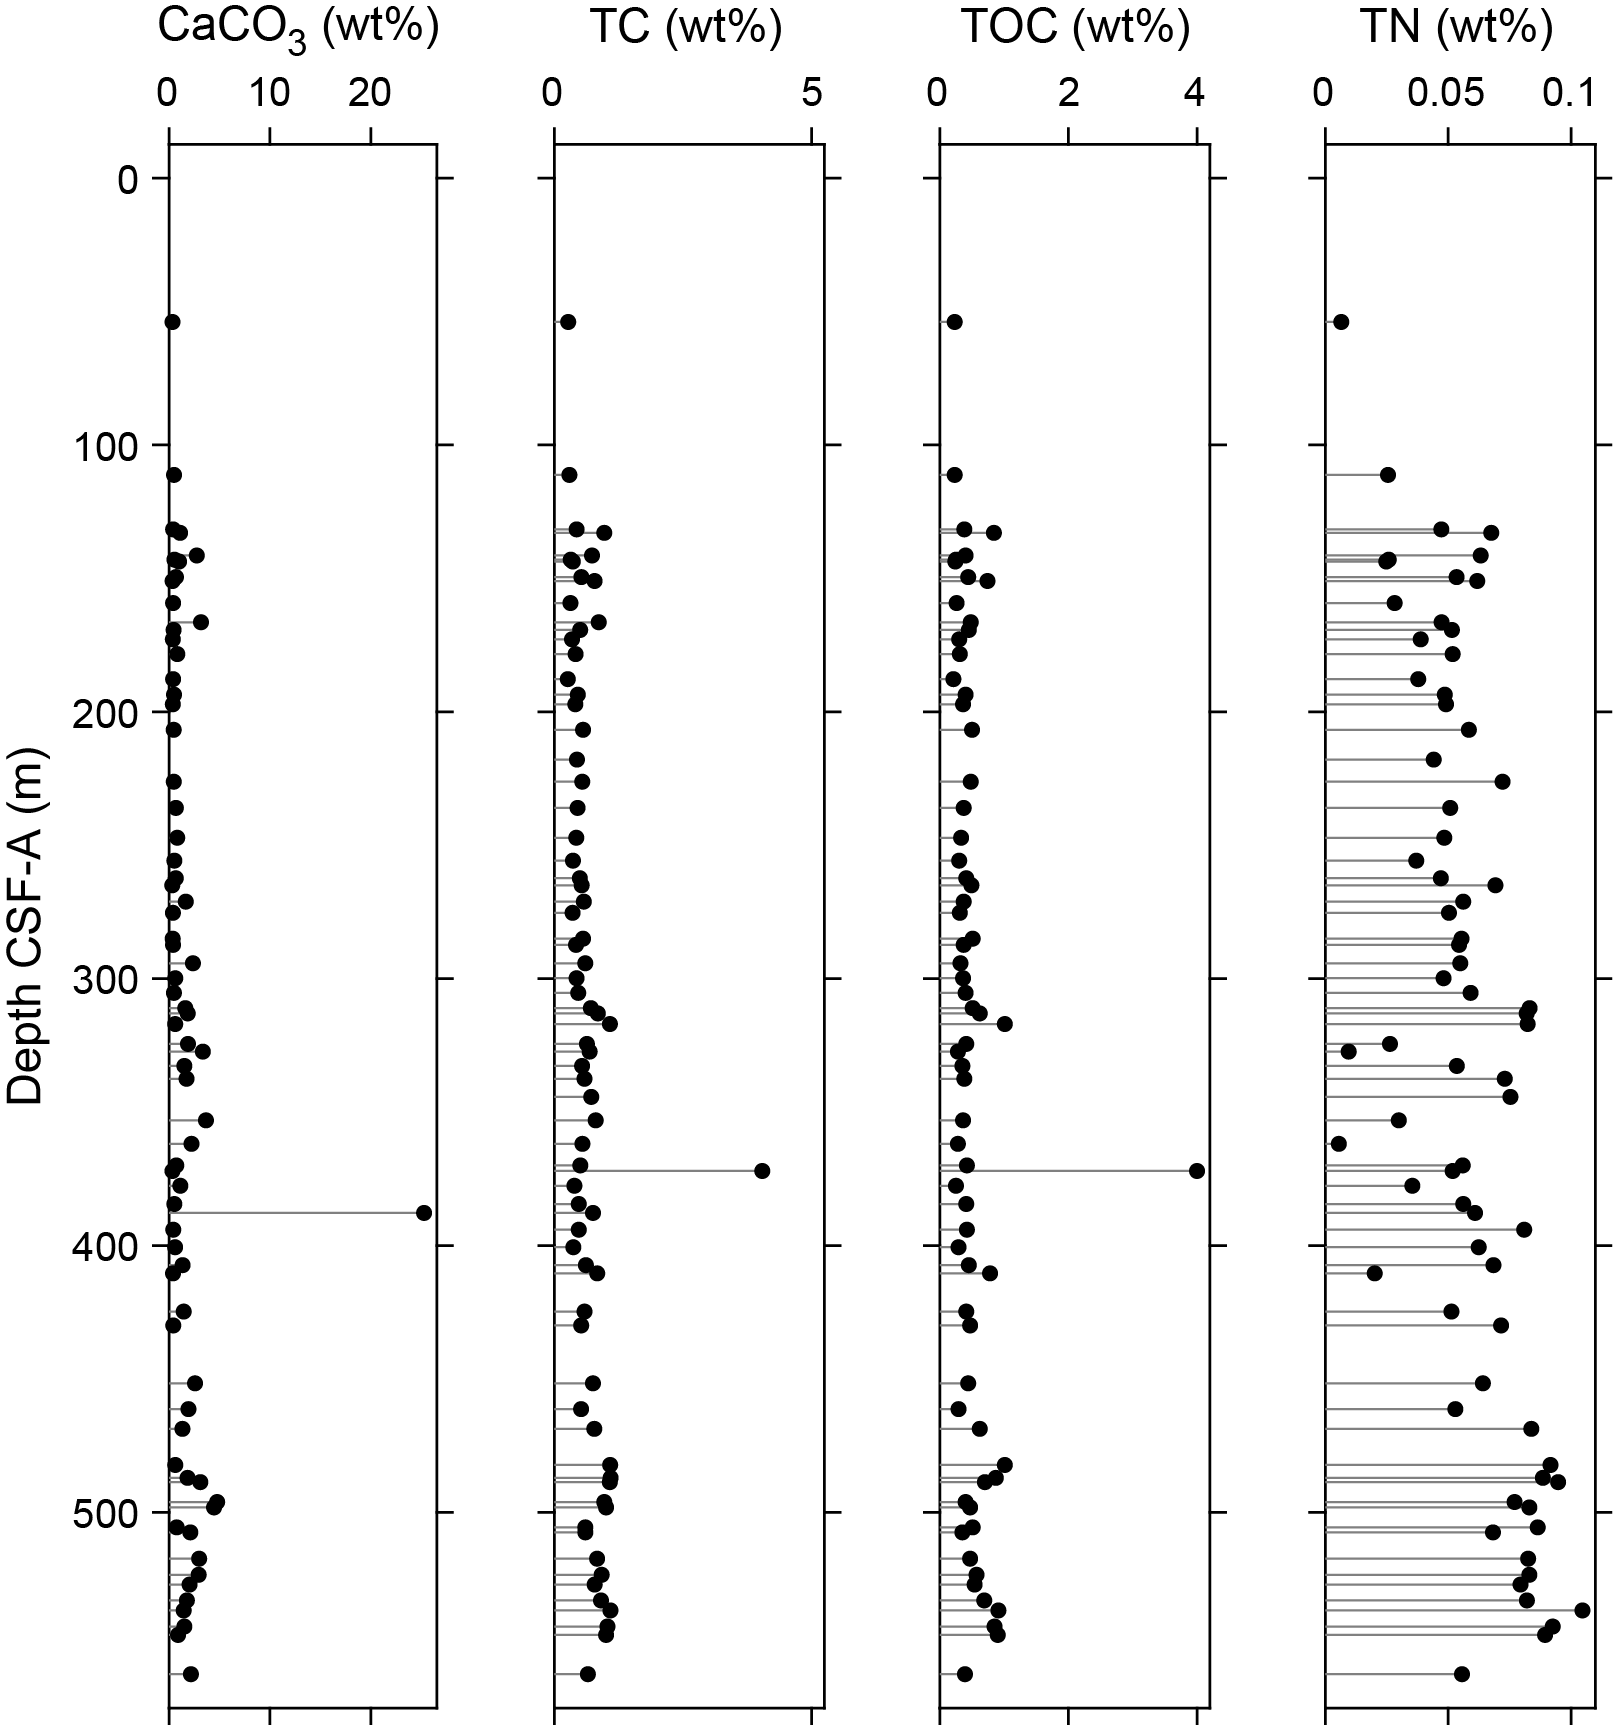
Figure F33. CaCO3, TC, TOC, and TN.
8. Stratigraphic correlation
A single hole was cored at Site U1608 to 561 m CSF-A. Downhole logging was implemented in Hole U1608A upon completion of the coring activities, aiming to establish connections to seismic data and provide additional data from cored (but possibly not recovered) intervals (see Downhole logging). The quality of the hole was generally good. Thus, the log provides a continuous record that may allow better interpretation of the lithologies encountered.
The recovery in Hole U1608A was 48%; thus, several formation intervals contained coring gaps. In addition, this site was drilled with the RCB system, and drilling deformation, core disturbances, shattered core liners, and other issues impacting core quality mean that the stratigraphic coherence of the sedimentary sequence recovered is variable. To analyze the extent of the core gaps and further improve the depth assessment of the recovered material, we correlated the physical properties measured on the cores to the downhole logs obtained from the borehole.
Whole-round MS and NGR measured on the cores were imported into Correlator (v. 4) following the standard procedure (see Stratigraphic correlation in the Expedition 400 methods chapter [Knutz et al., 2025a]). Downhole MS and natural gamma ray data were also imported into the software as a single core table. Ties between downhole data and core data were assessed based on visual and statistical matches of the properties. This procedure has some significant uncertainties due to the presence of large-scale features in the downhole logging data that do not resemble the record measured on cores in the laboratory. However, the overall cyclicity is well matched between the downhole logs and the cores, and the relative depth offset of each core provides information that can be used to confidently improve the depth constraints of the cores (Table T13).
The comparison of core and downhole logging data improves our understanding of the positions of the cores in the formation, particularly on those intervals of scattered recovery (Figure F25). The resulting depth scale is referred to as core composite depth below seafloor, Method A (CCSF-A), even though it is not a scale resulting from the alignment of two or more holes. The difference between CSF-A and CCSF-A depths varies downhole from a few centimeters to 10 m (Figure F34). The depth constraints provided by the downhole logging data allow an improved interpretation of the formation lithology, age, and physical properties.
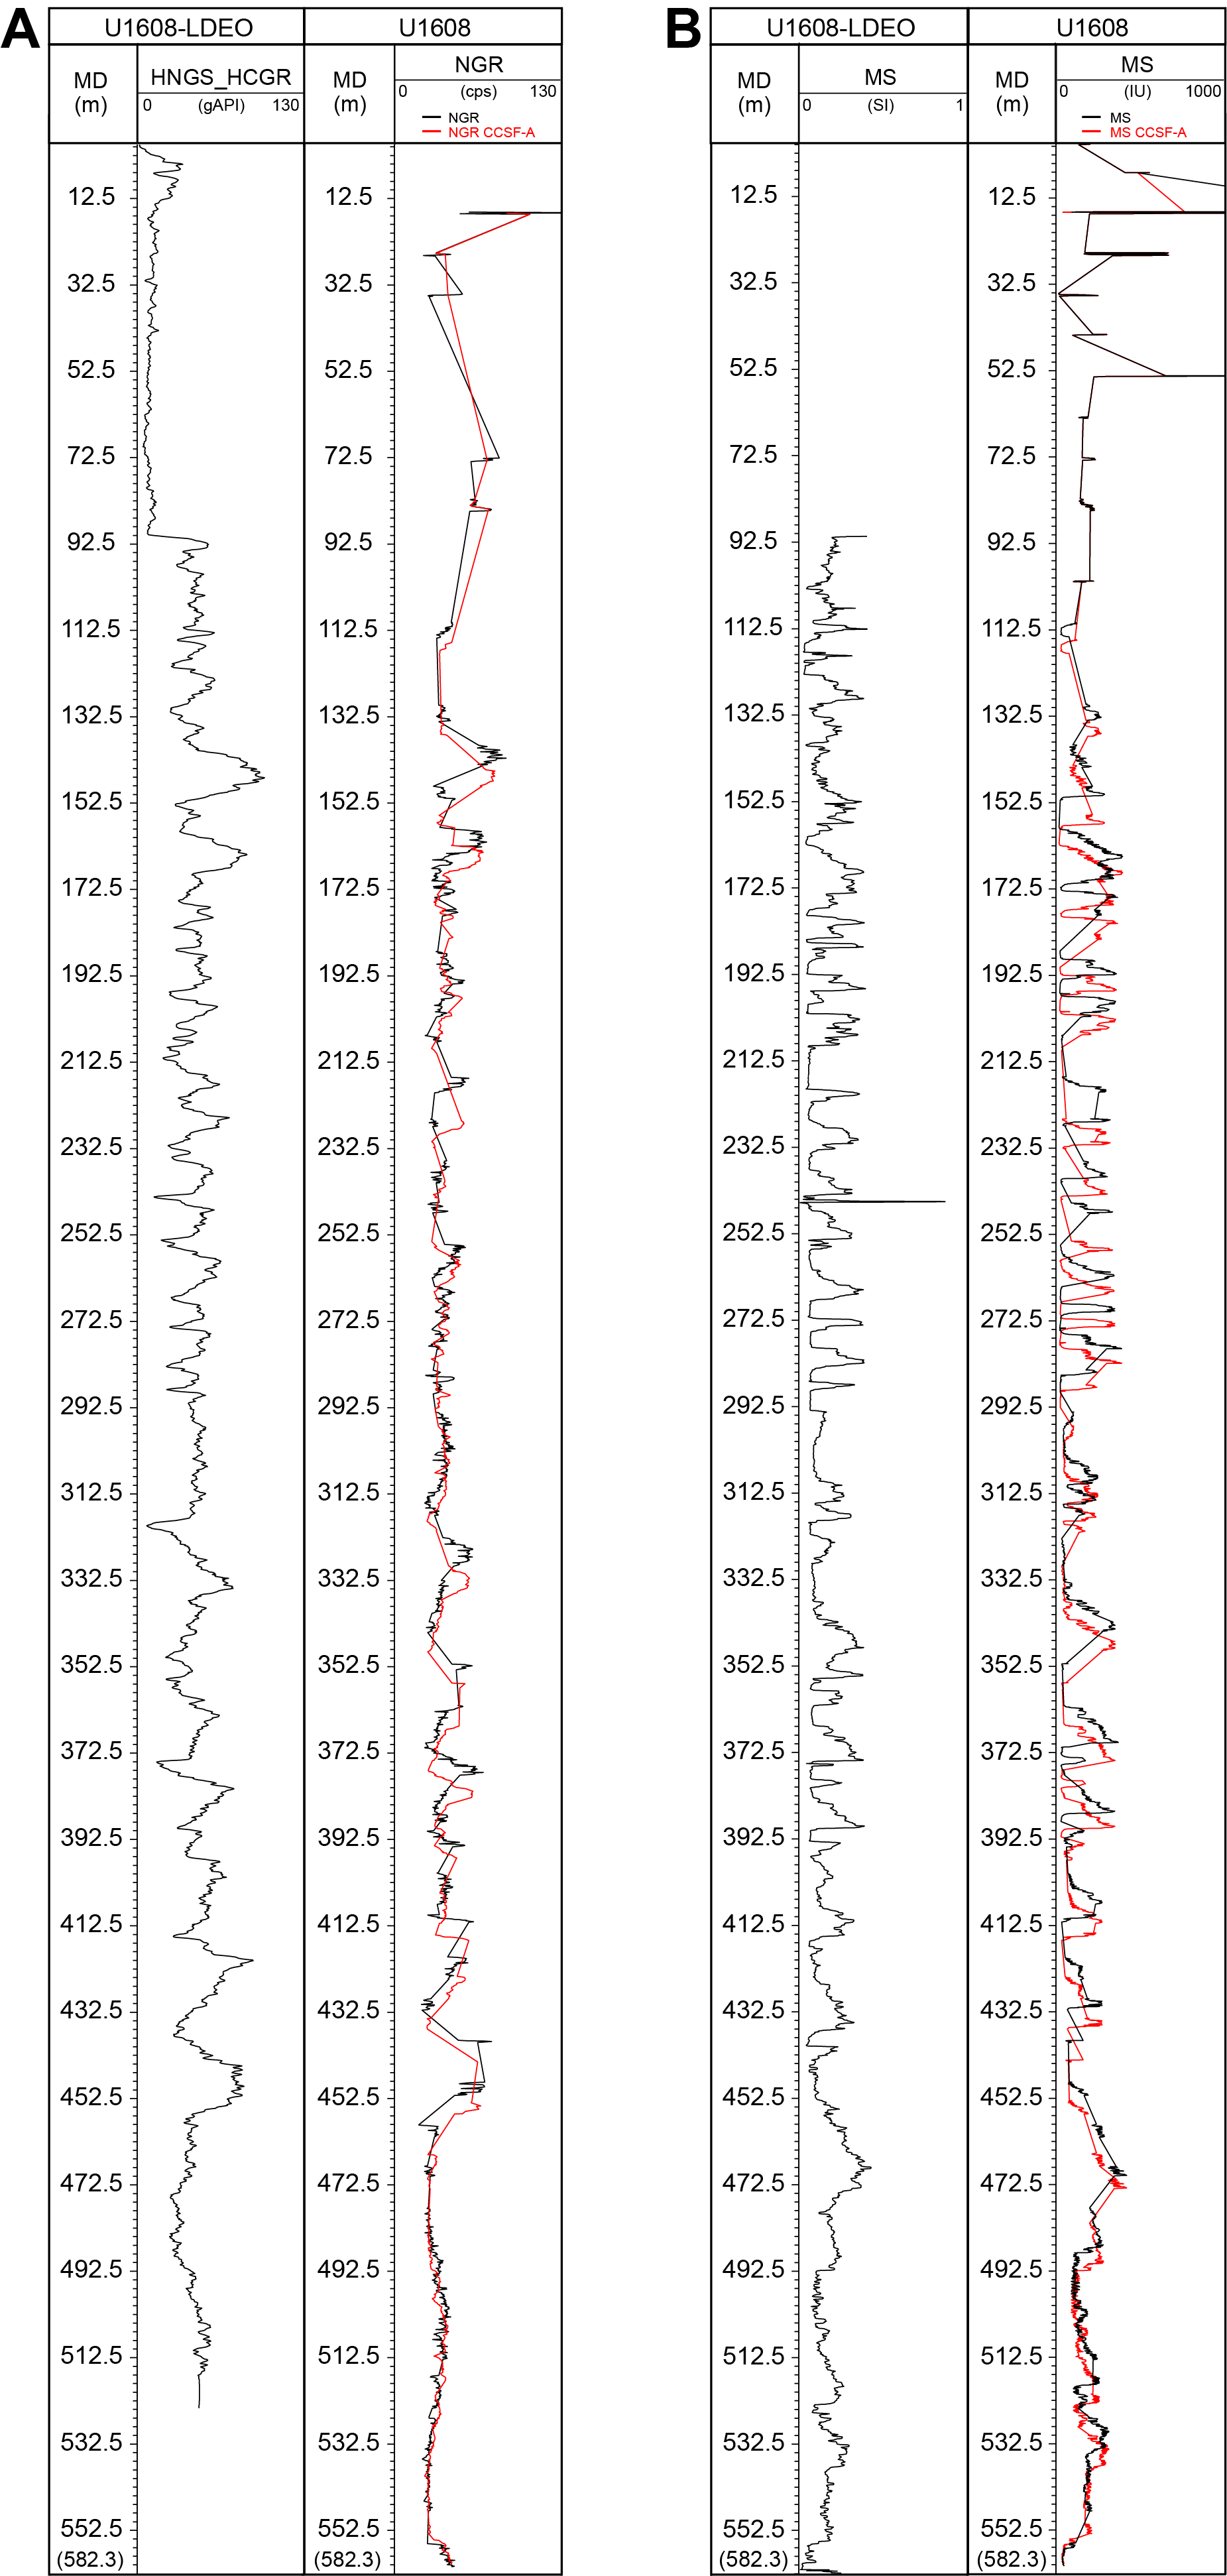
Figure F34. GR and MS data from downhole and core logging.
9. Age model
The initial age constraints for Site U1608 are based on magnetostratigraphic interpretations of inclination with additional biostratigraphic considerations (Figure F19). The diatom P. barboi was identified at 180–507 m CSF-A and has an age range of 3.31–9.49 Ma (Koç and Scherer, 1996). Another possible constraint is from the occurrence of the diatom T. nidulus throughout the site, whose FO is at 4.57 Ma (Koç and Scherer, 1996) on the Icelandic Plateau. With these considerations, we developed two possible age models (young and old) (Table T14; Figure F35). Possible hiatuses were also identified in the seismic data at 96 m CSF-A (Seismic Horizon b1) and 535 m CSF-A (Figure F2); the former eliminates the highest normal polarity zone as a possible constraint.

Figure F35. Magnetostratigraphic correlation.
The age models are shown in Figure F35. The young age model (Figure F35B, F35C) is inconsistent with the occurrence of P. barboi above 238 m CSF-A. In this model, Polarity Zone N2 is correlated to Chron C2An.1n (Table T14). The reversed Polarity Zone R5, between Polarity Zones N6 and N5, is correlated to Chron C2Ar. The possible hiatus at 535 m CSF-A inferred from the seismic data (Figure F2) suggests that the sediments below this depth are of uncertain relation to those above, and the fact that Chron C3An.2n is missing is perhaps not a surprise. The age-depth plot for the young age model is shown in Figure F36A. The average sediment accumulation rate for this age model is 18.5 cm/ky.
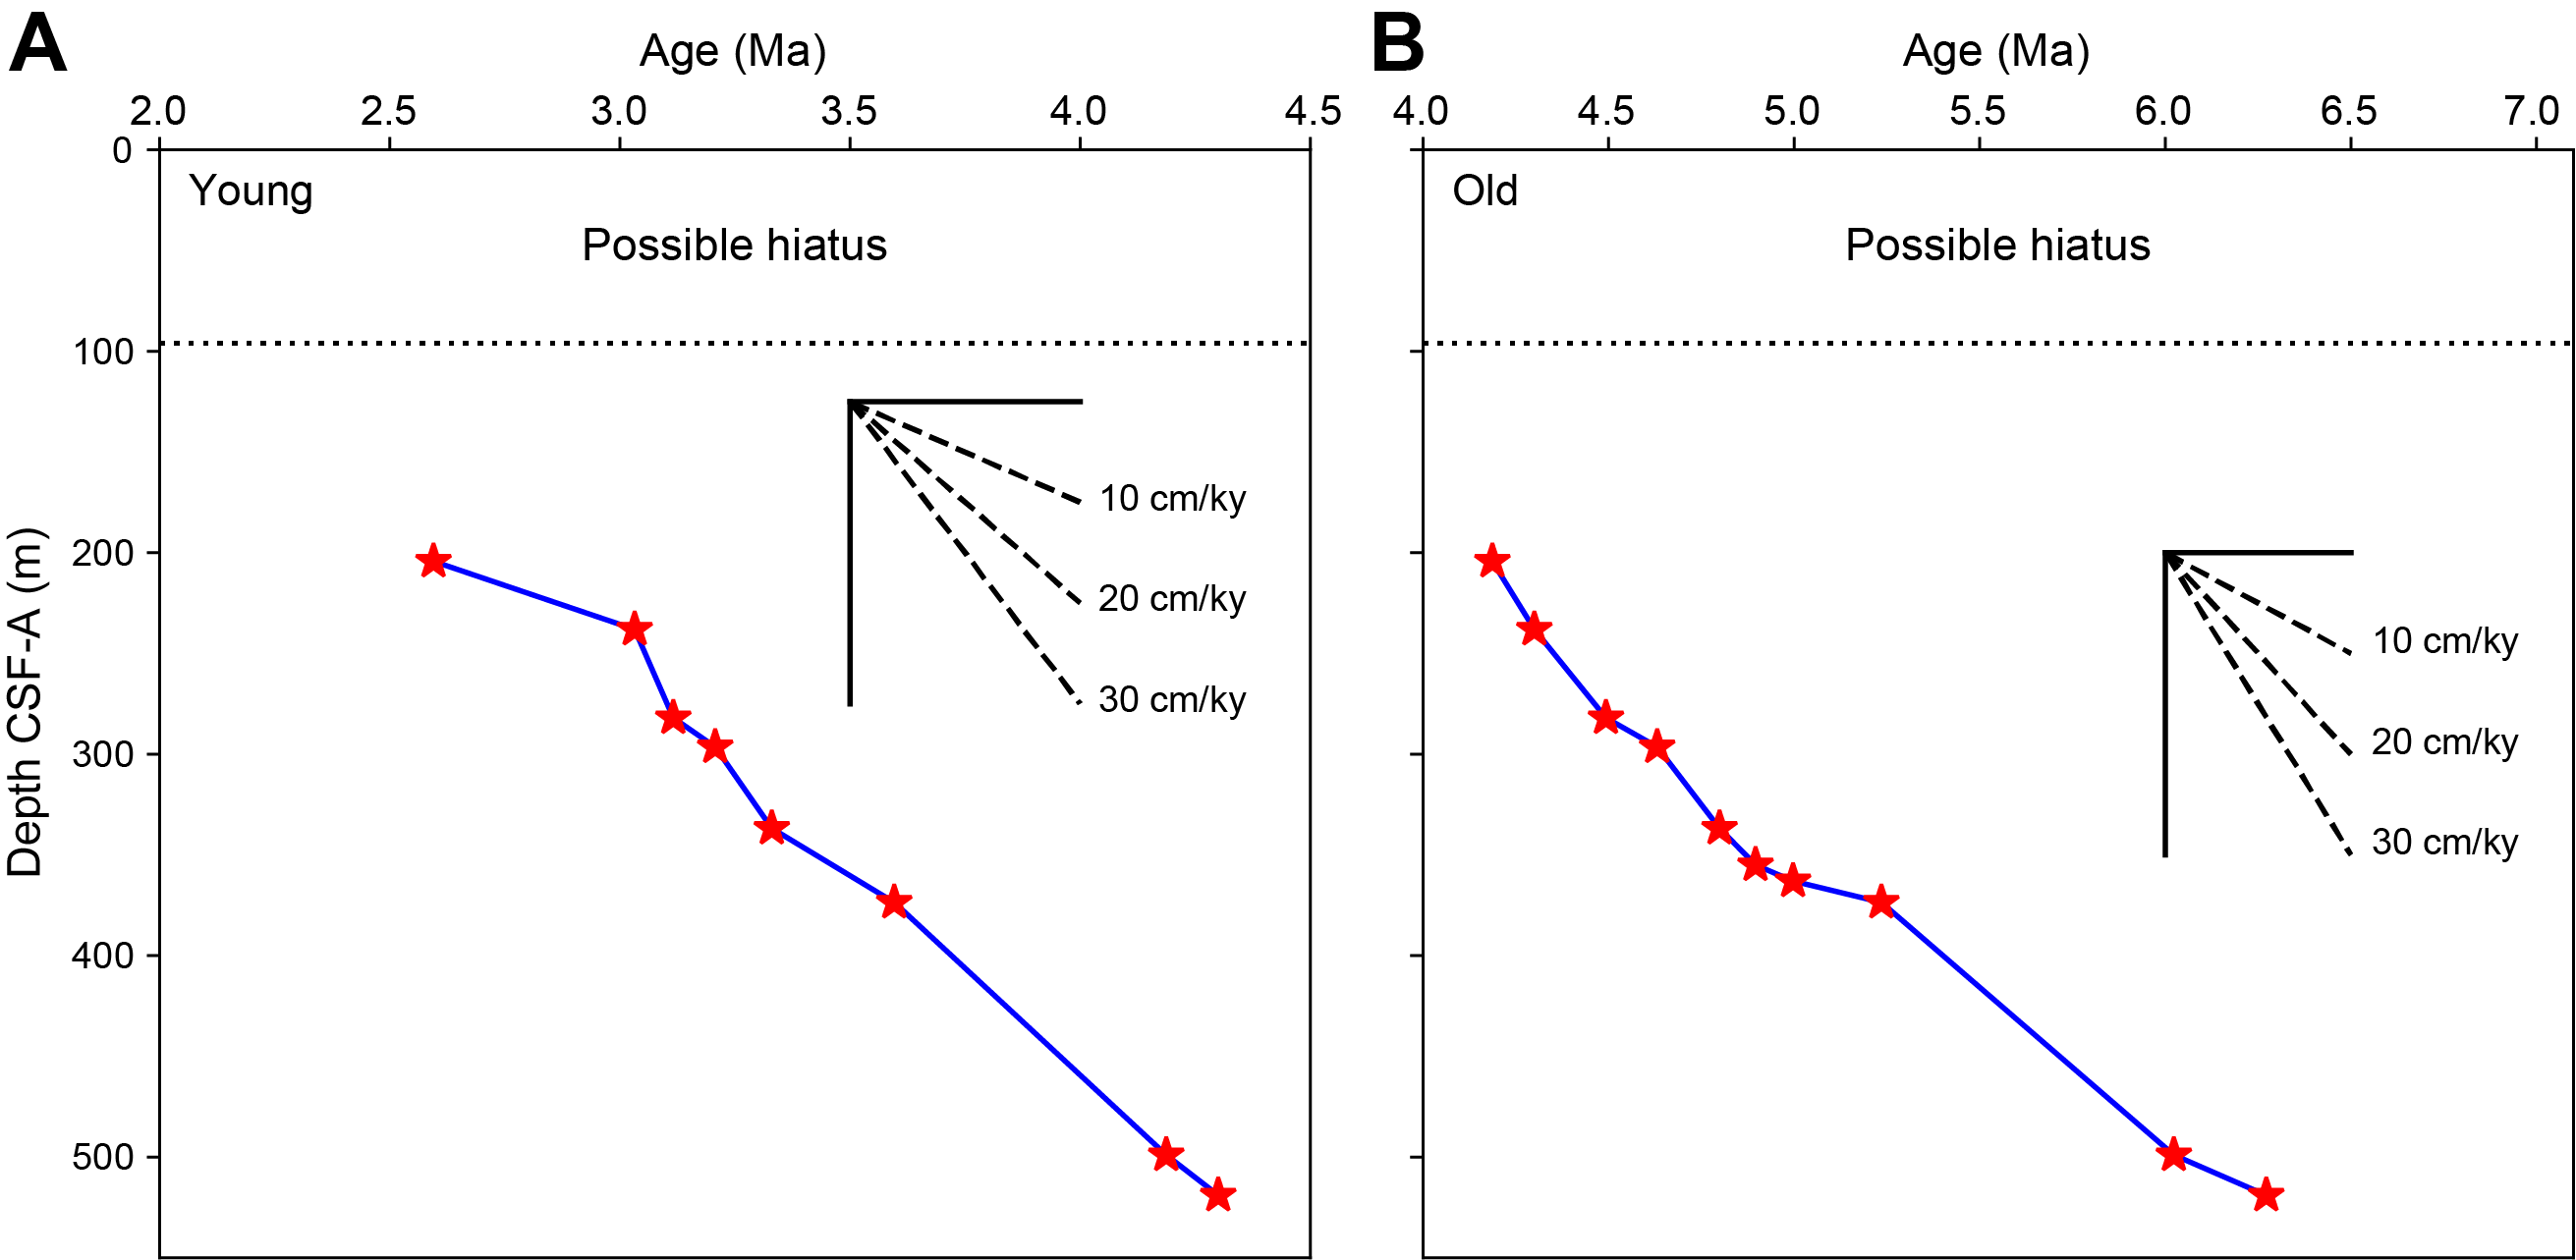
Figure F36. Age-depth plots.
In the old age model (Figure F35D, F35E), the transition between normal (Polarity Zone N2) and reversed (Polarity Zone R1) polarity is correlated to the end of Chron C3n.1n (Table T14), and the Polarity Zone N6/R5 reversal is correlated to the end of Chron C3An.1n. This age model is inconsistent with the occurrence of T. nidulus with an FO of 4.57 Ma on the Icelandic Plateau (Koç and Scherer, 1996). Again, the hiatus at 535 m suggests that the missing Chron C3An.2n was not recovered at Site U1608. The age-depth plot for the old age model is shown in Figure F36B, and the average sediment accumulation rate for this age model is 15.1 cm/ky.
Based on the presence of the dinocyst S. dionaeacysta, which ranges 3.53–2.68 Ma in the eastern North Atlantic (De Schepper and Head, 2009), in Sample 400-U1608A-42R-CC at 388.58 m CSF-A and samples above this interval, a late Pliocene age (<3.53 Ma) can be assigned to 388.58 m CSF-A. The common occurrence of the dinocyst B. pliocenicum from core catchers from Cores 28R–40R indicates a late Pliocene age for this interval up to 247.77 m CSF-A. In the Norwegian Sea (ODP Hole 642B), the eastern North Atlantic (ODP Hole 610A), and western North Atlantic (ODP Hole 603C), the LO of this species is in the Piacenzian (De Schepper et al., 2017). The young age model is better supported by biostratigraphic data than the older age model (Figure F19), suggesting that Site U1608 likely contains sediments mainly of Pliocene age.
10. Downhole logging
Downhole logging was carried out in Hole U1608A upon completion of coring operations. A quad combo tool string recorded MS, natural gamma ray, electrical laterolog resistivity, acoustic velocity, and density data. Four runs (two down passes plus two up passes) were carried out with the sensors recording on the way down and up. Two of the runs (initial down and final up) covered the full length of the hole to 2 m above the bottom, and two calibration runs (one up and one down) logged the deepest 100 m of the hole. The caliper showed a stable hole, and the instruments yielded reliable measurements. However, large washouts occur to 1020 meters below rig floor (mbrf), whereas the lowermost 157 m of the hole were homogeneous.
Upon completion of the downhole logging with the quad combo tool string, the FMS was lowered downhole. Three runs (a down pass plus two up passes) were completed. On the down passes, only the gamma ray was measured because the caliper of the FMS was closed.
Vertical seismic profiling was implemented with the VSI after the FMS run. The goal was to obtain an accurate time-depth relationship to tie the logging and coring results to the seismic data. The seismic source was lowered 5 m into the water and fired with increasing intensity according to the guidelines for a soft start. The VSI was lowered to the bottom of Hole U1608A. The geophones recorded the seismic signal at 24 stations with an average spacing of 20 m. A total of 20 of the 24 planned stations were successful, with three good shots recorded. However, stations between 1030 and 970 mbrf needed further processing. A protected species watch was in place before and during use of the seismic source.
Logging measurements were crucial for covering recovery gaps during RCB coring. Core logging and downhole logging results differ in absolute values, but the relative trends of the logs are comparable. Hence, logging data could be used for covering the formation recovery gaps with confidence.
10.1. Logging operations
The last core from Hole U1608A arrived on deck at 1530 h (all times provided in local ship time, UTC – 3 h, unless otherwise noted) on 29 September 2023. Hole preparation for the logging program started at 1600 h and included a high-viscosity mud sweep followed by releasing the RCB drill bit to the bottom of the hole and displacing the open hole with 10.5 lb/gal heavy mud (barite) to help with hole stability. The end of the pipe was raised to 89.1 mbsf and maintained at this depth throughout the entire logging operation, leaving ~472 m of open hole. The logging runs were implemented down to 1177 mbrf (approximately 2 m above the bottom of the hole). The wireline heave compensator (WHC) was used to reduce the effect of vertical ship motion on the wireline depth. Rigup for downhole logging started at 2053 h under good weather and ice conditions.
The quad combo tool string was assembled for the first run and consisted of the following tools from bottom to top (see Downhole measurements in the Expedition 400 methods chapter [Knutz et al., 2025a]): Magnetic Susceptibility Sonde (MSS), DSI, High-Resolution Laterolog Array (HRLA), Hostile Environment Litho-Density Sonde (HLDS; with source), Hostile Environment Natural Gamma Ray Sonde (HNGS), and Enhanced Digital Telemetry Cartridge (EDTC). The quad combo tool string was lowered into Hole U1608A at 2143 h on 29 September. All tools were run on the downlog except the density tool, which was run together with the caliper (borehole diameter) measurement tool on the uplog. The downlog started at 600 mbrf. No seafloor gamma peak was identified, but the increase in gamma radiation from 614 to 615 mbrf marked the seafloor. Further data processing by the Lamont-Doherty Earth Observatory (LDEO) pegged the seafloor at 614.5 mbrf based on the HNGS profile in Run 2. The log penetrated to 1177 mbrf. No problems were encountered getting down through the pipe or the open hole. Total penetration was 559 mbsf (i.e., 2 m above the total depth of the hole). After reaching total depth, the caliper arms were opened, and the density tool was enabled. The hole was logged up for a 100 m calibration pass. The tool was lowered back to 1177 mbrf, and the main uplog was collected. Downhole logging with the quad combo tool string was completed, and the tool string was rigged down by 0238 h on 30 September.
The second logging run consisted of the FMS tool string (see Downhole measurements in the Expedition 400 methods chapter [Knutz et al., 2025a]), with the HNGS and EDTC included for calibration purposes. DSI results from the quad combo run were excellent, and it was not included in this run. The FMS tool string was lowered into Hole U1608A and reached the base of the hole at 1177 mbrf. Two completed uplogs were recorded to 742 and 724 mbrf, respectively. The FMS resulted in a high-quality resistivity image of Hole U1608A. The tool string was returned to the rig floor at 0612 h on 30 September.
The third logging run included the VSI with the EDTC (see Downhole measurements in the Expedition 400 methods chapter). Observation for protected species began at 0730 h. The seismic source consisted of two 250 inch3 Sercel G guns in parallel array lowered 5 m into the water at 0500 h (Figure F37). The VSI was lowered to just above the end of the pipe at 0644 h while waiting for daylight before being lowered to 1175 mbrf in Hole U1608A. A total of 24 stations at 20 m spacing were occupied to obtain the best correlation with the seismic data (Table T15).
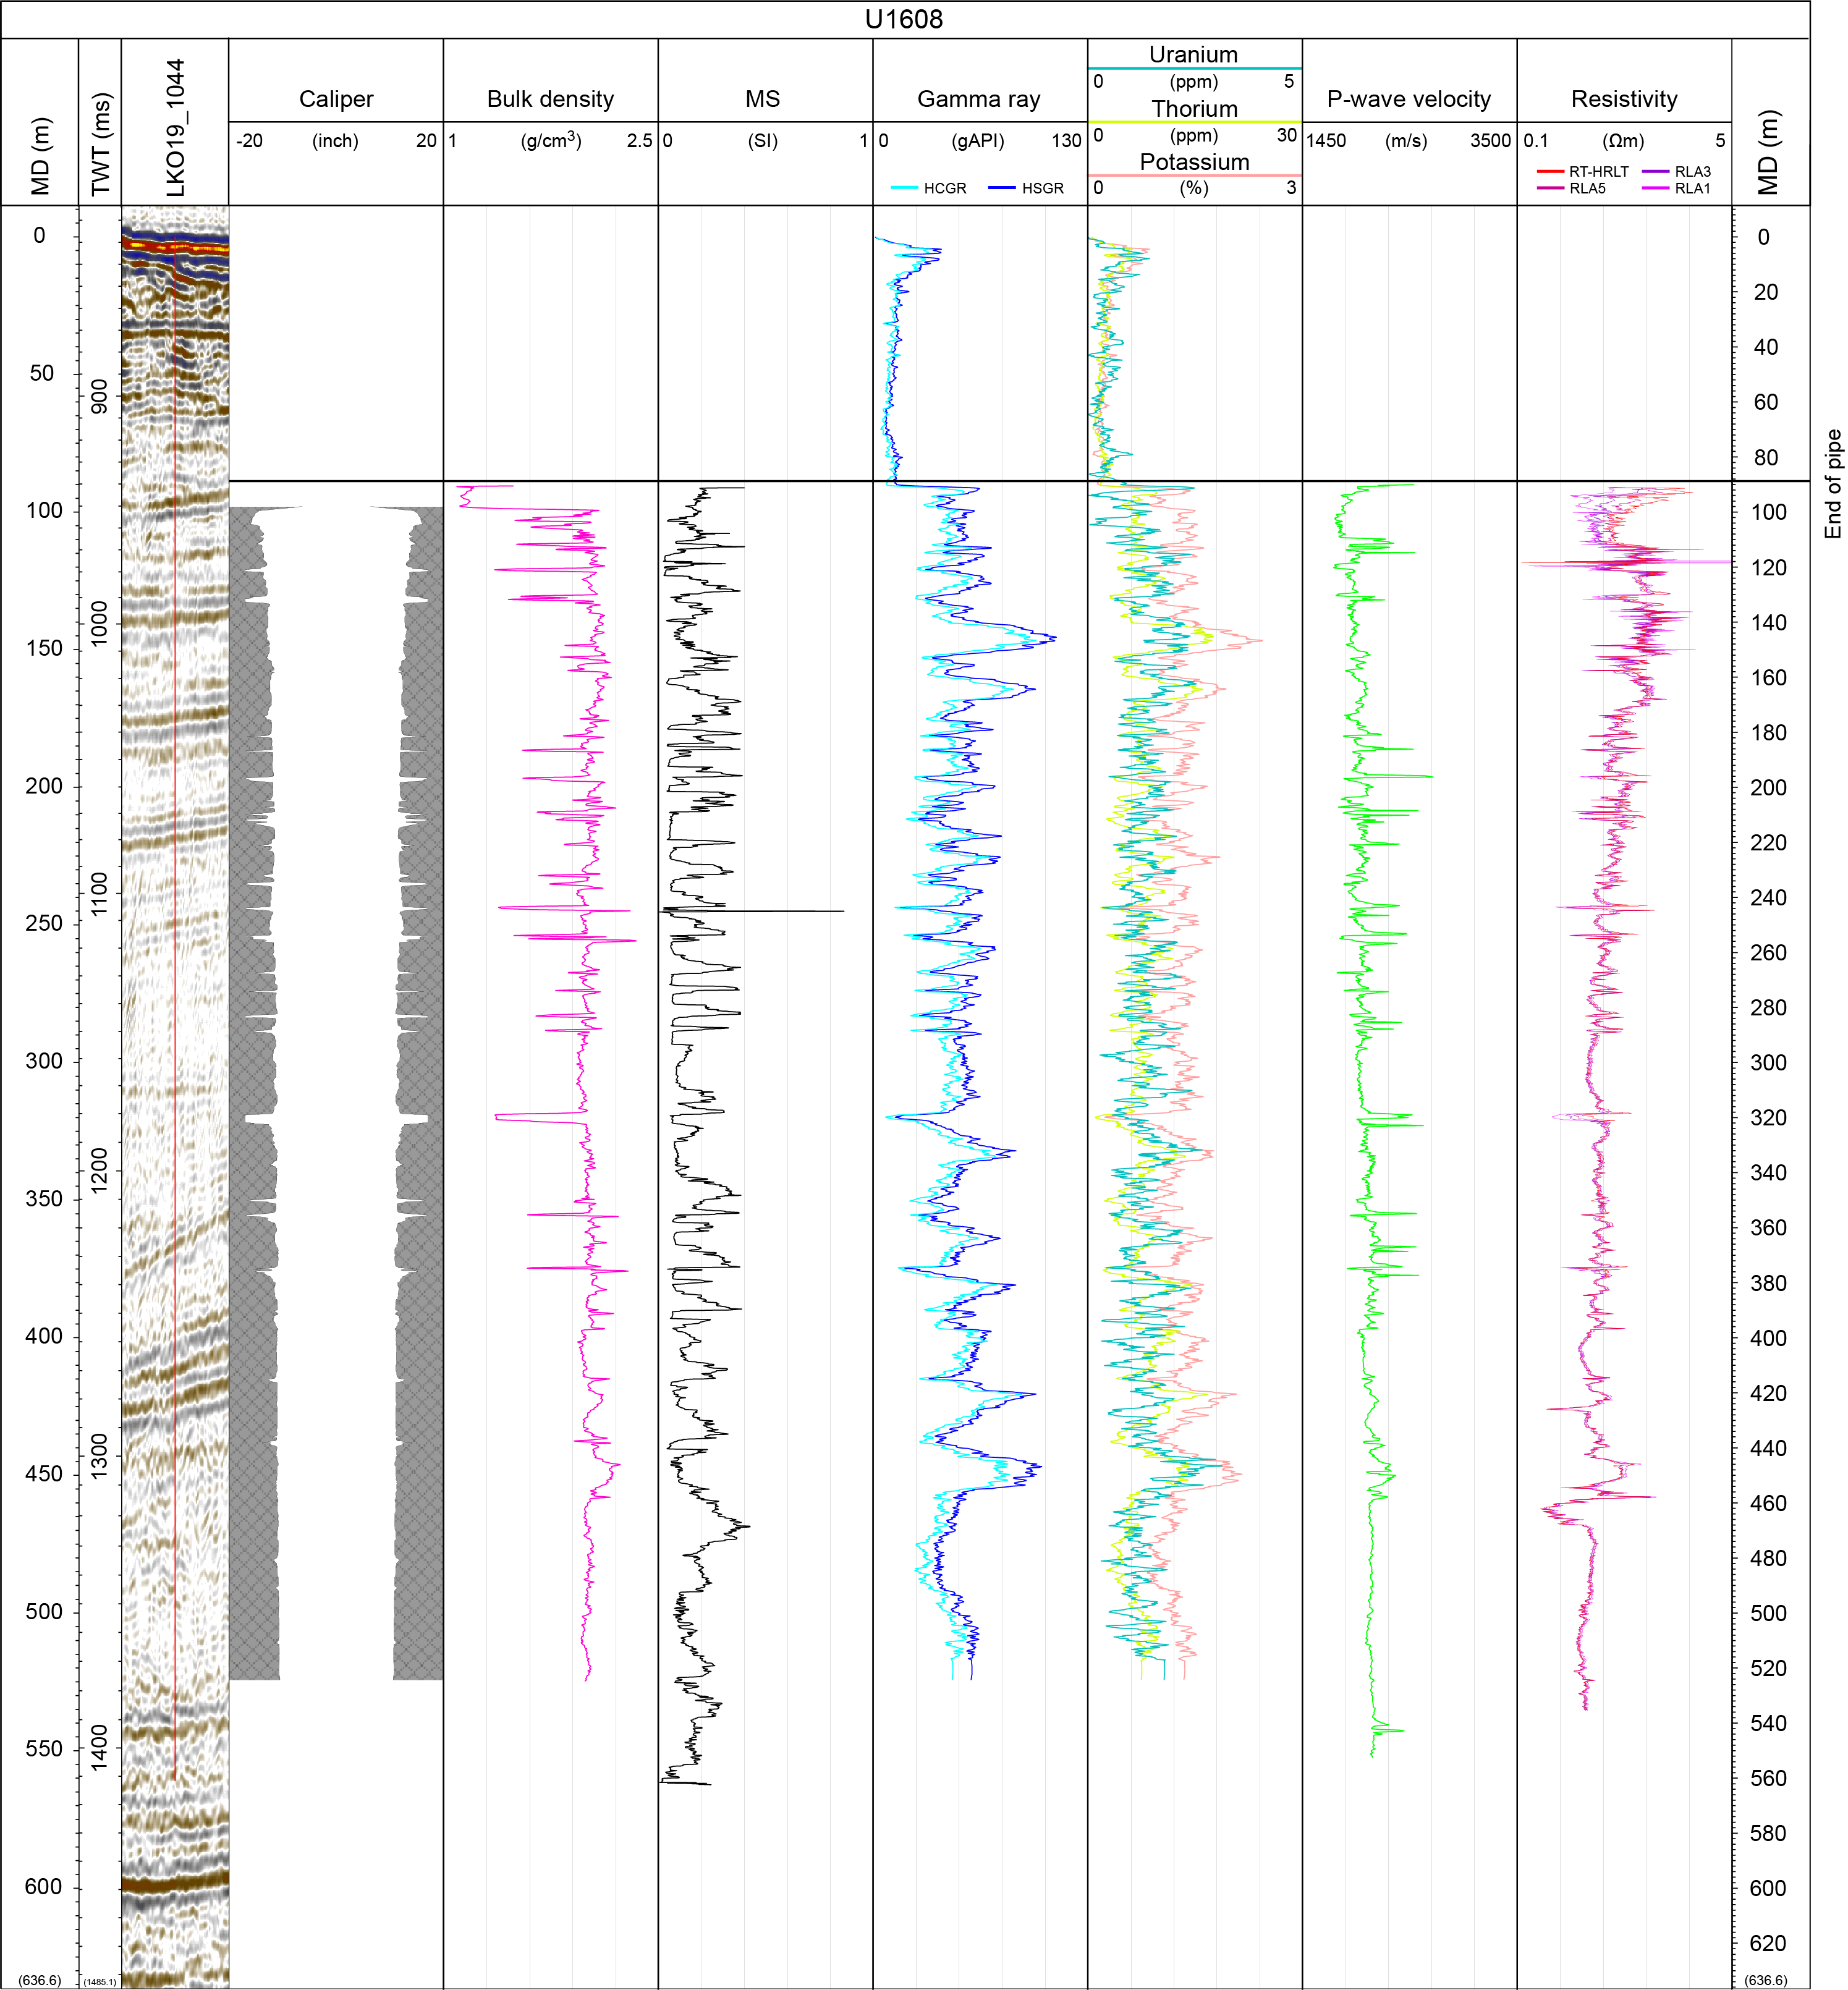
Figure F37. Downhole logs.
Stations between 1030 and 970 mbrf needed further processing. A total of 20 of the planned stations were successfully recorded after obtaining three successful shots. The VSI experiment finished at 1249 h, and the tool string returned to the surface at 1306 h.
10.1.1. Log data quality
The main control on log data quality is the diameter of the borehole measured by the caliper on the HLDS logging tool (Figure F37). The borehole had an average diameter of 12 inches, with frequent washout down to 1020 mbrf, and was relatively homogeneous at 11 inches over the lower 157 m. The standard deviation on the borehole diameter is over 1.3 inches. The quality of the logs is robust except for local deviations on the measurements that require good contact with the borehole wall, such as the density log (Figure F37). Log data were transmitted to LDEO for depth matching and data processing. The end of the drill string was placed at 89.1 mbsf; thus, the upper section of the formation is not described in the following text. Density ranges 1.7–2.2 g/cm3, with a baseline slightly increasing downward. Deep resistivity presents high variability, with an overall trend of decreasing downward. Resistivity values range 0.6–3.2 Ωm. Average gamma ray values are 49 American Petroleum Institute gamma ray units (gAPI) and progressively increase downhole. MS shows high-amplitude variability oscillating between 0.019 and 0.088 SI with mean values of 0.025 SI. P-wave velocity averages 2044 m/s, within a range of 1773–2282 m/s and a general trend of downward increase.
The downlog and uplog data of each measurement do not always perfectly match. In the case of gamma radiation, differences occur in absolute values because the uplog is corrected for borehole diameter as measured by the caliper and the presence of barite-weighted mud whereas the downlog is not corrected because the caliper is closed when the tool is lowered downhole. DSI passes were run at standard (high) frequency except the calibration up and down passes, during which medium frequency was tested. Sonic velocity values are consistently higher and more variable in downhole measurements compared to the values measured on cores (PWC) because downhole measurements are made under in situ conditions of pressure and temperature. Ultimately, the applied time-depth relationship is the one obtained from the VSI (see Core-log-seismic correlation).
The physical properties measured downhole are interpreted in a similar way to those measured on the cores in the laboratory (see Physical properties). Intervals of high-amplitude variability in the downhole NGR, MS, and density logs match those intervals of high-amplitude variability in the equivalent properties measured on the cores from Site U1608 (Figure F38). Small offsets and differences on the absolute values are expected and related to the assignment of core depths and formation effects. However, the PP units defined only by the values from the laboratory core measurements (Figure F25) also match the downhole logs (Figure F37).
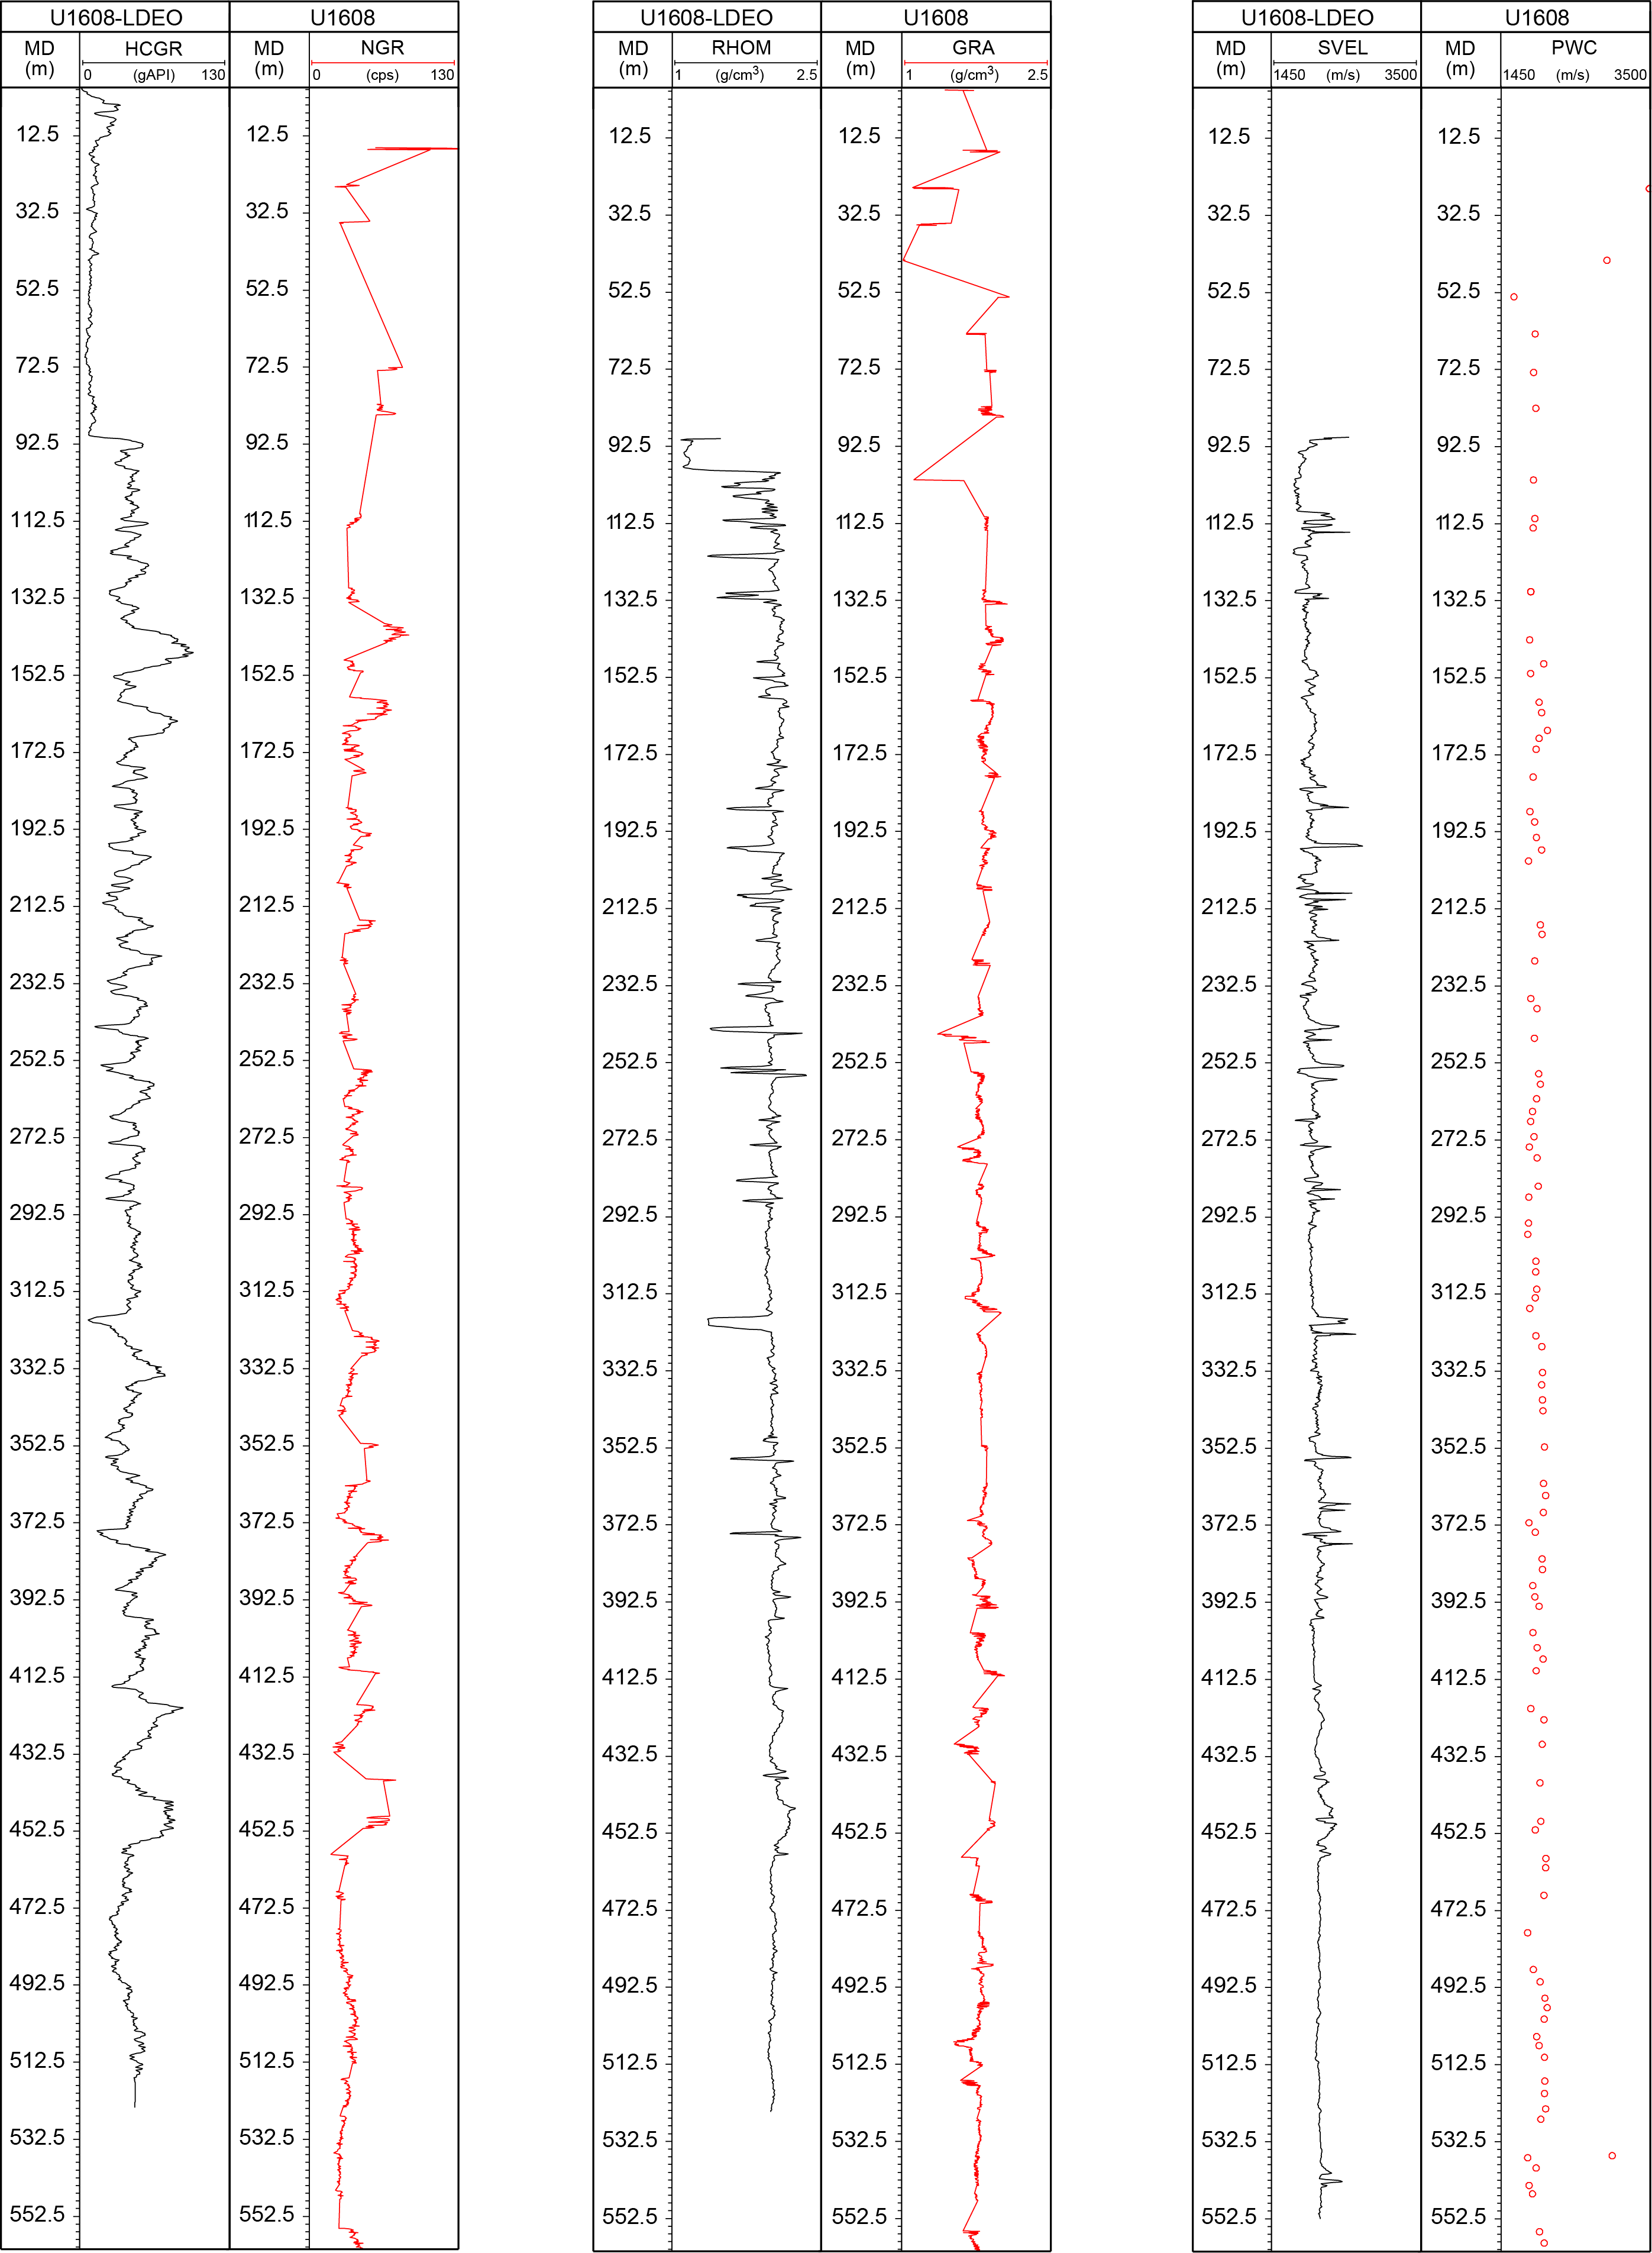
Figure F38. Gamma radiation, density, and velocity.
References
Aubry, A.M.R., de Vernal, A., and Knutz, P.C., 2021. Baffin Bay late Neogene palynostratigraphy at Ocean Drilling Program Site 645. Canadian Journal of Earth Sciences, 58(1):67–83. https://doi.org/10.1139/cjes-2019-0227
Baldauf, J.G., 1984. Cenozoic diatom biostratigraphy and paleoceanography of the Rockall Plateau region, North Atlantic, Deep Sea Drilling Project Leg 81. In Roberts, D.G., Schnitker, D., et al., Initial Reports of the Deep Sea Drilling Project. 81: Washington, DC (US Government Printing Office), 439–478. https://doi.org/10.2973/dsdp.proc.81.107.1984
Bennike, O., 1998. Late Cenozoic wood from Washington Land, North Greenland. Geology of Greenland Survey Bulletin, 180:155–158. https://doi.org/10.34194/ggub.v180.5100
Bernhard, J.M., and Panieri, G., 2018. Keystone Arctic paleoceanographic proxy association with putative methanotrophic bacteria. Scientific Reports, 8(1):10610. https://doi.org/10.1038/s41598-018-28871-3
Cage, A.G., Pieńkowski, A.J., Jennings, A., Knudsen, K.L., and Seidenkrantz, M.S., 2021. Comparative analysis of six common foraminiferal species of the genera Cassidulina, Paracassidulina, and Islandiella from the Arctic–North Atlantic domain. Journal of Micropalaeontology, 40(1):37–60. https://doi.org/10.5194/jm-40-37-2021
Caralp, M.H., 1989. Size and morphology of the benthic foraminifer Melonis barleeanum; relationships with marine organic matter. Journal of Foraminiferal Research, 19(3):235–245. https://doi.org/10.2113/gsjfr.19.3.235
Cox, D.R., Huuse, M., Newton, A.M.W., Sarkar, A.D., and Knutz, P.C., 2021. Shallow gas and gas hydrate occurrences on the northwest Greenland shelf margin. Marine Geology, 432:106382. https://doi.org/10.1016/j.margeo.2020.106382
De Schepper, S., Beck, K.M., and Mangerud, G., 2017. Late Neogene dinoflagellate cyst and acritarch biostratigraphy for Ocean Drilling Program Hole 642B, Norwegian Sea. Review of Palaeobotany and Palynology, 236:12–32. https://doi.org/10.1016/j.revpalbo.2016.08.005
De Schepper, S., and Head, M.J., 2009. Pliocene and Pleistocene dinoflagellate cyst and acritarch zonation of DSDP Hole 610A, eastern North Atlantic. Palynology, 33(1):179–218. https://doi.org/10.2113/gspalynol.33.1.179
de Vernal, A., and Mudie, P.J., 1989. Pliocene and Pleistocene palynostratigraphy at ODP Sites 646 and 647, eastern and southern Labrador Sea. In Srivastava, S.P., Arthur, M., Clement, B., et al., Proceedings of the Ocean Drilling Program, Scientific Results. 105: College Station, TX (Ocean Drilling Program), 401–422. https://doi.org/10.2973/odp.proc.sr.105.134.1989
Duque-Herrera, A.-F., Helenes, J., Pardo-Trujillo, A., Flores-Villarejo, J.-A., and Sierro-Sánchez, F.-J., 2018. Miocene biostratigraphy and paleoecology from dinoflagellates, benthic foraminifera and calcareous nannofossils on the Colombian Pacific coast. Marine Micropaleontology, 141:42–54. https://doi.org/10.1016/j.marmicro.2018.05.002
Dybkjær, K., and Piasecki, S., 2010. Neogene dinocyst zonation for the eastern North Sea Basin, Denmark. Review of Palaeobotany and Palynology, 161(1):1–29. https://doi.org/10.1016/j.revpalbo.2010.02.005
Feyling-Hansen, R.W., 1976. The stratigraphy of the Quaternary Clyde Foreland Formation, Baffin Island, illustrated by the distribution of benthic foraminifera. Boreas, 5(2):77–94. https://doi.org/10.1111/j.1502-3885.1976.tb00333.x
Flower, B.P., 1999. Data report: planktonic foraminifers from the subpolar North Atlantic and Nordic Seas: Sites 980–987 and 907. In Raymo, M.E., Jansen, E., Blum, P., and Herbert, T.D. (Eds.), Proceedings of the Ocean Drilling Program, Scientific Results. 162: College Station, TX (Ocean Drilling Program). https://doi.org/10.2973/odp.proc.sr.162.038.1999
Funder, S., Bennike, O., Böcher, J., Israelson, C., Petersen, K.S., and Símonarson, L.A., 2001. Late Pliocene Greenland – the Kap København Formation in North Greenland. Bulletin of the Geological Society of Denmark, 48:117–134. https://doi.org/10.37570/bgsd-2001-48-06
Gosse, J.C., Ballantyne, A.P., Barker, J.D., Csank, A.Z., Fletcher, T.L., Grant, G.W., Greenwood, D.R., MacPhee, R.D.E., and Rybczynski, N., 2017. PoLAR-FIT: Pliocene landscapes and Arctic remains—frozen in time. Geoscience Canada, 44(1):47–54. https://doi.org/10.12789/geocanj.2017.44.116
Hayward, B.W., Grenfell, H.R., Sabaa, A., Neil, H.L., and Buzas, M.A., 2010. Recent New Zealand deep-water benthic foraminifera: taxonomy, ecologic distribution, biogeography, and use in paleoenvironmental assessment. GNS Science Monograph, 26.
Head, M.J., Norris, G., and Mudie, P.J., 1989. Palynology and dinocyst stratigraphy of the Miocene in ODP Leg 105, Hole 645E, Baffin Bay. In Srivastava, S.P., Arthur, M., Clement, B., et al., Proceedings of the Ocean Drilling Program, Scientific Results. 105: College Station, TX (Ocean Drilling Program), 467–514. https://doi.org/10.2973/odp.proc.sr.105.137.1989
Holbourn, A., Henderson, A.S., and MacLeod, N., 2013. Atlas of Benthic Foraminifera: United Kingdom (John Wiley & Sons, Ltd.). https://doi.org/10.1002/9781118452493
Husum, K., and Hald, M., 2004. A continuous marine record 8000–1600 cal. yr BP from the Malangenfjord, north Norway: foraminiferal and isotopic evidence. The Holocene, 14(6):877–887. https://doi.org/10.1191/0959683604hl752rp
Jakobsson, M., Mayer, L., Coakley, B., Dowdeswell, J.A., Forbes, S., Fridman, B., Hodnesdal, H., Noormets, R., Pedersen, R., Rebesco, M., Schenke, H.W., Zarayskaya, Y., Accettella, D., Armstrong, A., Anderson, R.M., Bienhoff, P., Camerlenghi, A., Church, I., Edwards, M., Gardner, J.V., Hall, J.K., Hell, B., Hestvik, O., Kristofferson, Y., Marcussen, C., Mohammad, R., Mosher, D., Nghiem, S.V., Pedrosa, M.T., Travaglini, P.G., and Weatherall, P., 2012. The International Bathymetric Chart of the Arctic Ocean (IBCAO) Version 3.0. Geophysical Research Letters, 39(12):L12609. https://doi.org/10.1029/2012GL052219
Jansen, E., Sjøholm, J., Bleil, U., and Erichsen, J.A., 1990. Neogene and Pleistocene glaciations in the Northern Hemisphere and Late Miocene — Pliocene global ice volume fluctuations: evidence from the Norwegian Sea. In Bleil, U., and Thiede, J. (Eds.), Geological History of the Polar Oceans: Arctic versus Antarctic. NATO ASI Series, 308: 677–705. https://doi.org/10.1007/978-94-009-2029-3_35
Jennings, A.E., Weiner, N.J., Helgadottir, G., and Andrews, J.T., 2004. Modern foraminiferal faunas of the southwestern to northern Iceland Shelf: oceanographic and environmental controls. Journal of Foraminiferal Research, 34(3):180–207. https://doi.org/10.2113/34.3.180
Kaminski, M.A., Gradstein, F.M., Scott, D.B., and MacKinnon, K.D., 1989. Neogene benthic foraminifer biostratigraphy and deep-water history of Sites 645, 646, and 647, Baffin Bay and Labrador Sea. In Srivastava, S.P., Arthur, M., Clement, B., et al., Proceedings of the Ocean Drilling Program, Scientific Results. 105: College Station, TX (Ocean Drilling Program), 731–756. https://doi.org/10.2973/odp.proc.sr.105.123.1989
Katz, M.E., and Miller, K.G., 1993. Latest Oligocene to Earliest Pliocene benthic foraminiferal biofacies of the northeastern Gulf of Mexico. Micropaleontology, 39(4):367–403. https://www.jstor.org/stable/pdf/1485856.pdf
Kirschvink, J.L., 1980. The least-squares line and plane and the analysis of palaeomagnetic data. Geophysical Journal International, 62(3):699–718. https://doi.org/10.1111/j.1365-246X.1980.tb02601.x
Knutz, P.C., Hopper, J.R., Gregersen, U., Nielsen, T., and Japsen, P., 2015. A contourite drift system on the Baffin Bay–West Greenland margin linking Pliocene Arctic warming to poleward ocean circulation. Geology, 43(10):907–910. https://doi.org/10.1130/G36927.1
Knutz, P.C., Jennings, A.E., Childress, L.B., Bryant, R., Cargill, S.K., Coxall, H.K., Frank, T.D., Grant, G.R., Gray, R.E., Ives, L., Kumar, V., Le Houedec, S., Martens, J., Naim, F., Nelissen, M., Özen, V., Passchier, S., Pérez, L.F., Ren, J., Romans, B.W., Seki, O., Staudigel, P., Tauxe, L., Tibbett, E.J., Yokoyama, Y., Zhang, Y., and Zimmermann, H., 2025a. Expedition 400 methods. In Knutz, P.C., Jennings, A.E., Childress, L.B., and the Expedition 400 Scientists, NW Greenland Glaciated Margin. Proceedings of the International Ocean Discovery Program, 400: College Station, TX (International Ocean Discovery Program). https://doi.org/10.14379/iodp.proc.400.102.2025
Knutz, P.C., Jennings, A.E., Childress, L.B., Bryant, R., Cargill, S.K., Coxall, H.K., Frank, T.D., Grant, G.R., Gray, R.E., Ives, L., Kumar, V., Le Houedec, S., Martens, J., Naim, F., Nelissen, M., Özen, V., Passchier, S., Pérez, L.F., Ren, J., Romans, B.W., Seki, O., Staudigel, P., Tauxe, L., Tibbett, E.J., Yokoyama, Y., Zhang, Y., and Zimmermann, H., 2025b. Expedition 400 summary. In Knutz, P.C., Jennings, A.E., Childress, L.B., and the Expedition 400 Scientists, NW Greenland Glaciated Margin. Proceedings of the International Ocean Discovery Program, 400: College Station, TX (International Ocean Discovery Program). https://doi.org/10.14379/iodp.proc.400.101.2025
Knutz, P.C., Newton, A.M.W., Hopper, J.R., Huuse, M., Gregersen, U., Sheldon, E., and Dybkjær, K., 2019. Eleven phases of Greenland Ice Sheet shelf-edge advance over the past 2.7 million years. Nature Geoscience, 12(5):361–368. https://doi.org/10.1038/s41561-019-0340-8
Koç, N., Hodell, D.A., Kleiven, H.F., and Labeyrie, L., 1999. High-resolution Pleistocene diatom biostratigraphy of Site 983 and correlations with isotope stratigraphy. In Raymo, M.E., Jansen, E., Blum, P., and Herbert, T.D. (Eds.), Proceedings of the Ocean Drilling Program, Scientific Results. 162: College Station, TX (Ocean Drilling Program). https://doi.org/10.2973/odp.proc.sr.162.035.1999
Koç, N., and Scherer, R.P., 1996. Neogene diatom biostratigraphy of the Iceland Sea Site 907. In Thiede, J., Myhre, A.M., Firth, J.V., Johnson, G.L., and Ruddiman, W.F. (Eds.), Proceedings of the Ocean Drilling Program, Scientific Results. 151: College Station, TX (Ocean Drilling Program), 61–74. https://doi.org/10.2973/odp.proc.sr.151.108.1996
Koç Karpuz, N., and Schrader, H., 1990. Surface sediment diatom distribution and Holocene paleotemperature variations in the Greenland, Iceland and Norwegian Sea. Paleoceanography, 5(4):557–580. https://doi.org/10.1029/PA005i004p00557
Lagoe, M.B., 1979. Recent benthonic foraminiferal biofacies in the Arctic Ocean. Micropaleontology, 25(2):214–224. https://doi.org/10.2307/1485268
Newton, A.M.W., Knutz, P.C., Huuse, M., Gannon, P., Brocklehurst, S.H., Clausen, O.R., and Gong, Y., 2017. Ice stream reorganization and glacial retreat on the northwest Greenland shelf. Geophysical Research Letters, 44(15):7826–7835. https://doi.org/10.1002/2017GL073690
Ogg, J.G., 2020. Geomagnetic Polarity Time Scale. In Gradstein, F.M., Ogg, J.G., Schmitz, M., and Ogg, G. (Eds.), Geologic Time Scale 2020. Amsterdam (Elsevier), 159–192. https://doi.org/10.1016/B978-0-12-824360-2.00005-X
Oksman, M., Juggins, S., Miettinen, A., Witkowski, A., and Weckström, K., 2019. The biogeography and ecology of common diatom species in the northern North Atlantic, and their implications for paleoceanographic reconstructions. Marine Micropaleontology, 148:1–28. https://doi.org/10.1016/j.marmicro.2019.02.002
Polyak, L., Korsun, S., Febo, L.A., Stanovoy, V., Khusid, T., Hald, M., Paulsen, B.E., and Lubinski, D.J., 2002. Benthic foraminiferal assemblages from the southern Kara Sea, a river-influenced Arctic marine environment. Journal of Foraminiferal Research, 32(3):252–273. https://doi.org/10.2113/32.3.252
Refsnider, K.A., Miller, G.H., Fréchette, B., and Rood, D.H., 2013. A chronological framework for the Clyde Foreland Formation, eastern Canadian Arctic, derived from amino acid racemization and cosmogenic radionuclides. Quaternary Geochronology, 16:21–34. https://doi.org/10.1016/j.quageo.2012.05.009
Schreck, M., Matthiessen, J., and Head, M.J., 2012. A magnetostratigraphic calibration of Middle Miocene through Pliocene dinoflagellate cyst and acritarch events in the Iceland Sea (Ocean Drilling Program Hole 907A). Review of Palaeobotany and Palynology, 187:66–94. https://doi.org/10.1016/j.revpalbo.2012.08.006
Seidenkrantz, M.S., 1995. Cassidulina teretis Tappan and Cassidulina neoteretis new species (Foraminifera): stratigraphic markers for deep sea and outer shelf areas. Journal of Micropalaeontology, 14(2):145–157. https://doi.org/10.1144/jm.14.2.145
Sejrup, H.-P., and Guilbault, J.-P., 1980. Cassidulina reniforme and C. obtusa (Foraminifera), taxonomy, distribution, and ecology. Sarsia, 65(2):79–85. https://doi.org/10.1080/00364827.1980.10431476
Soliman, A., Ćorić, S., Head, M.J., Piller, W.E., and El Beialy, S.Y., 2012. Lower and Middle Miocene biostratigraphy, Gulf of Suez, Egypt based on dinoflagellate cysts and calcareous nannofossils. Palynology, 36(1):38–79. https://doi.org/10.1080/01916122.2011.633632
Tang, C.C.L., Ross, C.K., Yao, T., Petrie, B., DeTracey, B.M., and Dunlap, E., 2004. The circulation, water masses and sea-ice of Baffin Bay. Progress in Oceanography, 63(4):183–228. https://doi.org/10.1016/j.pocean.2004.09.005
Weaver, P.P.E., and Clement, B.M., 1986. Synchroneity of Pliocene planktonic foraminiferal datums in the North Atlantic. Marine Micropaleontology, 10(4):295–307. https://doi.org/10.1016/0377-8398(86)90033-2
Weber, M.E., Niessen, F., Kuhn, G., and Wiedicke, M., 1997. Calibration and application of marine sedimentary physical properties using a multi-sensor core logger. Marine Geology, 136(3–4):151–172. https://doi.org/10.1016/S0025-3227(96)00071-0
Wollenburg, J.E., and Mackensen, A., 2009. The ecology and distribution of benthic foraminifera at the Håkon Mosby mud volcano (SW Barents Sea slope). Deep Sea Research Part I: Oceanographic Research Papers, 56(8):1336–1370. https://doi.org/10.1016/j.dsr.2009.02.004
Zegarra, M., and Helenes, J., 2011. Changes in Miocene through Pleistocene dinoflagellates from the eastern equatorial Pacific (ODP Site 1039), in relation to primary productivity. Marine Micropaleontology, 81(3):107–121. https://doi.org/10.1016/j.marmicro.2011.09.005
Zijderveld, J.D.A., 1967. AC demagnetization of rocks: analysis of results. In Runcorn, S.K.C., Creer, K.M., and Collinson, D.W. (Eds.), Methods in Palaeomagnetism. Developments in Solid Earth Geophysics. J.R. Balsley (Series Ed.), 3: 254–286. https://doi.org/10.1016/B978-1-4832-2894-5.50049-5
Zonneveld, K.A.F., and Pospelova, V., 2015. A determination key for modern dinoflagellate cysts. Palynology, 39(3):387–409. https://doi.org/10.1080/01916122.2014.990115