Knutz, P.C., Jennings, A.E., Childress, L.B., and the Expedition 400 Scientists
Proceedings of the International Ocean Discovery Program Volume 400
publications.iodp.org
https://doi.org/10.14379/iodp.proc.400.101.2025
Expedition 400 summary1
![]() P.C. Knutz,
P.C. Knutz,
![]() A.E. Jennings,
A.E. Jennings,
![]() L.B. Childress,
L.B. Childress,
![]() R. Bryant,
R. Bryant,
![]() S.K. Cargill,
S.K. Cargill,
![]() H.K. Coxall,
H.K. Coxall,
![]() T.D. Frank,
T.D. Frank,
![]() G.R. Grant,
G.R. Grant,
![]() R.E. Gray,
R.E. Gray,
![]() L. Ives,
L. Ives,
![]() V. Kumar,
V. Kumar,
![]() S. Le Houedec,
S. Le Houedec,
![]() J. Martens,
J. Martens,
![]() F. Naim,
F. Naim,
![]() M. Nelissen,
M. Nelissen,
![]() V. Özen,
V. Özen,
![]() S. Passchier,
S. Passchier,
![]() L.F. Pérez,
L.F. Pérez,
![]() J. Ren,
J. Ren,
![]() B.W. Romans,
B.W. Romans,
![]() O. Seki,
O. Seki,
![]() P. Staudigel,
P. Staudigel,
![]() L. Tauxe,
L. Tauxe,
![]() E.J. Tibbett,
E.J. Tibbett,
![]() Y. Yokoyama,
Y. Yokoyama,
![]() Y. Zhang, and
Y. Zhang, and
![]() H. Zimmermann2
H. Zimmermann2
1 Knutz, P.C., Jennings, A.E., Childress, L.B., Bryant, R., Cargill, S.K., Coxall, H.K., Frank, T.D., Grant, G.R., Gray, R.E., Ives, L., Kumar, V., Le Houedec, S., Martens, J., Naim, F., Nelissen, M., Özen, V., Passchier, S., Pérez, L.F., Ren, J., Romans, B.W., Seki, O., Staudigel, P., Tauxe, L., Tibbett, E.J., Yokoyama, Y., Zhang, Y., and Zimmermann, H., 2025. Expedition 400 summary. In Knutz, P.C., Jennings, A.E., Childress, L.B., and the Expedition 400 Scientists, NW Greenland Glaciated Margin. Proceedings of the International Ocean Discovery Program, 400: College Station, TX (International Ocean Discovery Program). https://doi.org/10.14379/iodp.proc.400.101.2025
2 Expedition 400 Scientists’ affiliations.
Abstract
Elucidating the geologic history of the Greenland ice sheet (GrIS) is essential for understanding glacial instability thresholds, identified as major climate system tipping points, and how the cryosphere will respond to anthropogenic greenhouse gas emissions. To address current knowledge gaps in the evolution and variability of the GrIS and its role in Earth’s climate system, International Ocean Discovery Program (IODP) Expedition 400 obtained sedimentary records from Sites U1603–U1608 across the northwest Greenland margin into Baffin Bay where thick Cenozoic sedimentary successions can be directly linked to the evolution of the northern GrIS (NGrIS). The strategy of drilling along this transect was to retrieve a composite stratigraphic succession representing the late Cenozoic era from the Oligocene/early Miocene to the Holocene.
The proposed sites targeted high–accumulation rate deposits associated with contourite drifts and potential interglacial deposits within a trough mouth fan system densely covered by seismic data. The principal objectives were to (1) test if the NGrIS underwent near-complete deglaciations in the Pleistocene and assess the ice sheet’s response to changes in orbital cyclicities through the mid-Pleistocene transition, (2) ascertain the timing of the NGrIS expansion and examine a hypothesized linkage between marine heat transport through Baffin Bay and high Arctic warmth during the Pliocene, and (3) provide new understandings of climate-ecosystem conditions in Greenland during the geologic periods with increased atmospheric CO2 compared to preindustrial values, encompassing the last 30 My. The deep time objective was attained by coring at Site U1607 on the inner shelf to 978 meters below seafloor, capturing a succession of mainly Miocene and Oligocene age. The six sites drilled during Expedition 400 resulted in 2299 m of recovered core material, and wireline downhole logging was completed at Sites U1603, U1604, U1607, and U1608. This unique archive will provide the basis for understanding the full range of forcings and feedbacks—oceanic, atmospheric, orbital, and tectonic—that influence the GrIS over a range of timescales, as well as conditions prevailing at the time of glacial inception and deglacial to interglacial periods. We anticipate that the shipboard data and further analytical work on Expedition 400 material can constrain predictive models addressing the GrIS response to global warming and its impending effects on global sea levels.
Plain language summary
Sea level consequences of anthropogenic climate forcing hinge on how the polar ice sheets respond to global warming. If fully melted, the Greenland ice sheet has the potential to raise sea level by >7 meters, yet we know very little about its long-term responses to past climate warming or its role in Earth’s climate system. Expedition 400 seeks to address current knowledge gaps in the evolution and variability of the northern Greenland ice sheet by recovering sedimentary archives of warm and cold periods going millions of years back in time. This includes periods when the greenhouse gas content of the atmosphere was higher than it is today. By drilling at six sites to 978 meters below seafloor along a transect crossing the northwest Greenland margin into Baffin Bay, we obtained a total of 2299 meters of sediment. This extensive and unique sediment archive will be valuable for understanding the geologic history of the Greenland ice sheet and its response to past warming going back 30 million years before present. The sediment cores record climate conditions before Greenland became glaciated and indicate when the Greenland ice sheet first began to expand into the marine environment. We also see glacial and interglacial cycles when the ice sheet grew to its maximum position at the shelf edge and retreated toward land, possibly melting farther back than what is known from previous records.
1. Introduction
The Greenland ice sheet (GrIS) holds a large amount of freshwater, equivalent to ~7.4 m of global sea level (Bamber et al., 2013). Recent studies have highlighted the sensitivity of the GrIS to climate warming and the potential impact its meltwaters would have on sea level rise and the Atlantic Meridional Ocean Circulation (Alley et al., 2010; Khan et al., 2010; Hansen et al., 2016). With the prospect of irreversible ice sheet retreat as one of the major tipping points, documenting the full range of forcings and feedbacks—oceanic, atmospheric, orbital, and tectonic—that influence the GrIS over a range of timescales is crucial for making robust predictions of future climate and sea level change (Intergovernmental Panel on Climate Change [IPCC] Sixth Assessment Report; https: //www.ipcc.ch/assessment-report/ar6). To this end, high-resolution sedimentary archives proximal to Greenland that capture glacial discharges of meltwater and sediments under different ice sheet configurations as well as biogenic components reflecting marine and terrestrial climate conditions are needed. The objectives of Expedition 400 directly address the critical questions posed in the Climate and Ocean Change theme of the International Ocean Discovery Program (IODP) science plan: “How do ice sheets and sea level respond to a warming climate?” and “How does Earth’s climate system respond to elevated levels of atmospheric CO2?”
The response of the GrIS to extreme interglacial warmth is a highly relevant and debated topic although it is poorly constrained by data. During the last interglacial period, Marine Isotope Stage (MIS) 5e, global sea level was likely 6–9 m higher than present (Dutton and Lambeck, 2012), of which the GrIS may have contributed between 10% and 40% (Neem Community Members, 2013; Dutton et al., 2015). During MIS 11c, described as a super-interglacial (Loutre, 2003; Melles et al., 2012), global sea levels 6–13 m higher than today have been estimated (Dutton et al., 2015). Several studies associate MIS 11c with a significant or near-complete loss of the GrIS (Willerslev et al., 2007; de Vernal and Hillaire-Marcel, 2008; Reyes et al., 2014; Christ et al., 2023). The MIS 11c ice sheet loss apparently occurred despite more moderate summer temperatures compared to MIS 5e (Cluett and Thomas, 2021). A compelling result by Schaefer et al. (2016), based on cosmogenic nuclides in subice bedrock, suggests that central Greenland became deglaciated during one or more periods over the last 2.5 My. This concept raises critical questions: (1) What forcings drove near-complete melting of the northern GrIS (NGrIS) during the Pleistocene? and (2) How did the ice sheet reconfigure to a state of “normal” glacial–interglacial conditions? To answer these questions and test the temporal scenarios for ice sheet instabilities and extended deglaciation through the Pleistocene requires access to semicontinuous records from the continental margins around Greenland (Bierman et al., 2016).
The mid-Pleistocene transition (MPT) signifies a profound shift in glacial–interglacial cycles from 41 to 100 ky periodicities (Hodell and Channell, 2016). Although the 41 ky cycles are strongly linked to orbital forcing, the insolation changes associated with 100 ky cycles are weak and require a persistent amplification mechanism (Yin and Berger, 2010). Explanations for the MPT have focused on various aspects of CO2 reservoir exchanges between ice, ocean, and atmosphere (Raymo et al., 1996; Paillard, 1998; Ruddiman, 2006; Yin and Berger, 2010; Rial et al., 2013; Lear et al., 2016) and changes in ice sheet dynamics controlled by bedrock/regolith cover of Northern Hemisphere terrains (Clark and Pollard, 1998; Clark et al., 2006; Abe-Ouchi et al., 2013; Willeit et al., 2019). All hypotheses implicate the GrIS, directly or indirectly, but its dynamic behavior across the MPT is scarcely known. A potential linkage between global climate cycles and GrIS dynamics is highlighted by a recent study denoting a major change in northwest GrIS configuration through the MPT (Knutz et al., 2019).
The current understanding of the Cenozoic evolution of the GrIS has been developed largely from North Atlantic deep-sea records. In northeast Greenland, marine-based glaciers appear to have been active since the Miocene (~18 Ma) (Thiede et al., 2011), but smaller outlets may have existed as early as the late Eocene (Eldrett et al., 2007; St. John, 2008; Tripati et al., 2008). Deep drilling and seismic evidence indicate that glacially influenced sedimentation on the central–southern East Greenland margin began during the late Miocene (~7 Ma) (Larsen et al., 1994; Bierman et al., 2016; Pérez et al., 2018). Full-scale glaciation of Greenland is generally considered to be timed with intensification of the Northern Hemisphere glaciations interpreted from elevated ice rafting in the North Atlantic during the late Pliocene (3.3–2.8 Ma) (Shackleton et al., 1984; Jansen et al., 2000; St. John and Krissek, 2002). This ice sheet growth phase is possibly linked with a westward expansion of the GrIS into Baffin Bay during the Pliocene (Nielsen and Kuijpers, 2013; Knutz et al., 2019; Aubry et al., 2021). However, the chronology is poorly constrained and lacks core stratigraphic information from the West Greenland margin.
A better knowledge of the inception of the GrIS and its sectorized expansion during the late Cenozoic is needed to support sensitivity studies and climate models (DeConto et al., 2008). In particular, there is a pressing need for understanding the GrIS behavior during the warm climates with elevated CO2 of the Paleogene and Neogene. The Pliocene (5.3–2.6 Ma) is the most recent period when atmospheric CO2 concentrations were similar to the modern levels of ~400 ppm. This geologic time period thus functions as a past analog interval for the ongoing and future response of the ice sheet under warming conditions. Notably, the mid-Pliocene warm period (3.3–3.0 Ma) has been a focal point for paleoclimate reconstruction and modeling (Haywood et al., 2010; Dowsett et al., 2013). To study analogs for future global warming scenarios (e.g., pCO2 projections >600 ppm beyond 2050), it is necessary to access records going further back in time. Key stratigraphic intervals for gaining knowledge on elevated pCO2 climate regimes include the middle Miocene (16–15 Ma) and most of the Oligocene (34–27 Ma) (Zhang et al., 2013; O’Brien et al., 2020; Guillermic et al., 2022). These pre-Quaternary intervals likely have been recorded below the northwest Greenland margin (Knutz et al., 2015) but have yet to be explored by deep drilling.
The vulnerability of the GrIS to global climate change is a major concern, but it also highlights a knowledge gap that limits our ability to confidently project future cryospheric responses, including contributions to sea level rise (Dahl-Jensen et al., 2009; Briner et al., 2017). Cenozoic climate experienced significant changes in atmospheric greenhouse gas concentrations, notably linked to pCO2 (Pearson and Palmer, 2000; Zachos et al., 2008; Pagani, 2014). Model studies suggest that even the modest atmospheric CO2 changes (280–400 ppm) observed during the late Cenozoic exert a primary control on GrIS growth across the Pliocene–Pleistocene transition (Lunt et al., 2008; Tan et al., 2018). Other factors controlling ice sheet dynamics include changes in ocean currents (Nielsen et al., 2011; Knutz et al., 2015; Otto-Bliesner et al., 2017), tectonic base-level changes (Solgaard et al., 2013), and variations in geothermal heat flux (Fahnestock et al., 2001; Rogozhina et al., 2016), but these boundary conditions are poorly constrained by data and are not easily addressed by climate models. For the Oligocene and Miocene time periods, the linkage between global ice volume, surface temperatures, and atmospheric pCO2 is enigmatic. The expansion and dynamic variability of ice sheets in Antarctica during periods of global warming and moderate pCO2 levels imply a strong nonlinear behavior to climate forcing, with implications for ice sheet tipping points (Foster et al., 2012; Golledge et al., 2017; O’Brien et al., 2020; DeConto et al., 2021). The complex linkages or possible decoupling between pCO2 and global ice volume (Raymo et al., 1996; Tripati et al., 2009) underscore the importance of evaluating potential forcings in the earth system. Greenland is surrounded by narrow gateways that over millions of years may have changed configuration, potentially modulating ocean heat fluxes between the Arctic and North Atlantic regions (Thiede and Myhre, 1996). Unraveling the GrIS response to past global warming events will require consideration of regional effects such as those related to ocean gateways, topography, and ecosystems (Otto-Bliesner et al., 2017; Hodson et al., 2010).
With a clear goal of addressing the multiple questions and hypotheses that concern the long-term evolution and stability of the NGrIS, Expedition 400 was designed to obtain a composite sedimentary archive covering the last 25–30 My. The strategy was to drill seven sites along a transect across the northwest Greenland margin from the deep basin of Baffin Bay to the inner continental shelf (Figures F1, F2, F3). The transect is positioned between two major trough mouth fan (TMF) systems, the Melville Bugt and the Upernavik TMFs, which are the product of erosion and transport of sediments to the shelf edge by paleo–ice streams. The proposed sites primarily core high–accumulation rate deposits that include contourite, hemipelagic, and glacial-marine sediments of Quaternary, Pliocene, and Miocene–Oligocene age (Figure F4). With data extracted from composite archives obtained in close vicinity to major glacial outlets, we aim to determine maximum and minimum NGrIS configurations throughout the middle to late Cenozoic, from shelf edge glaciation to hypothesized complete ice loss, such as during Pleistocene super-interglacials.
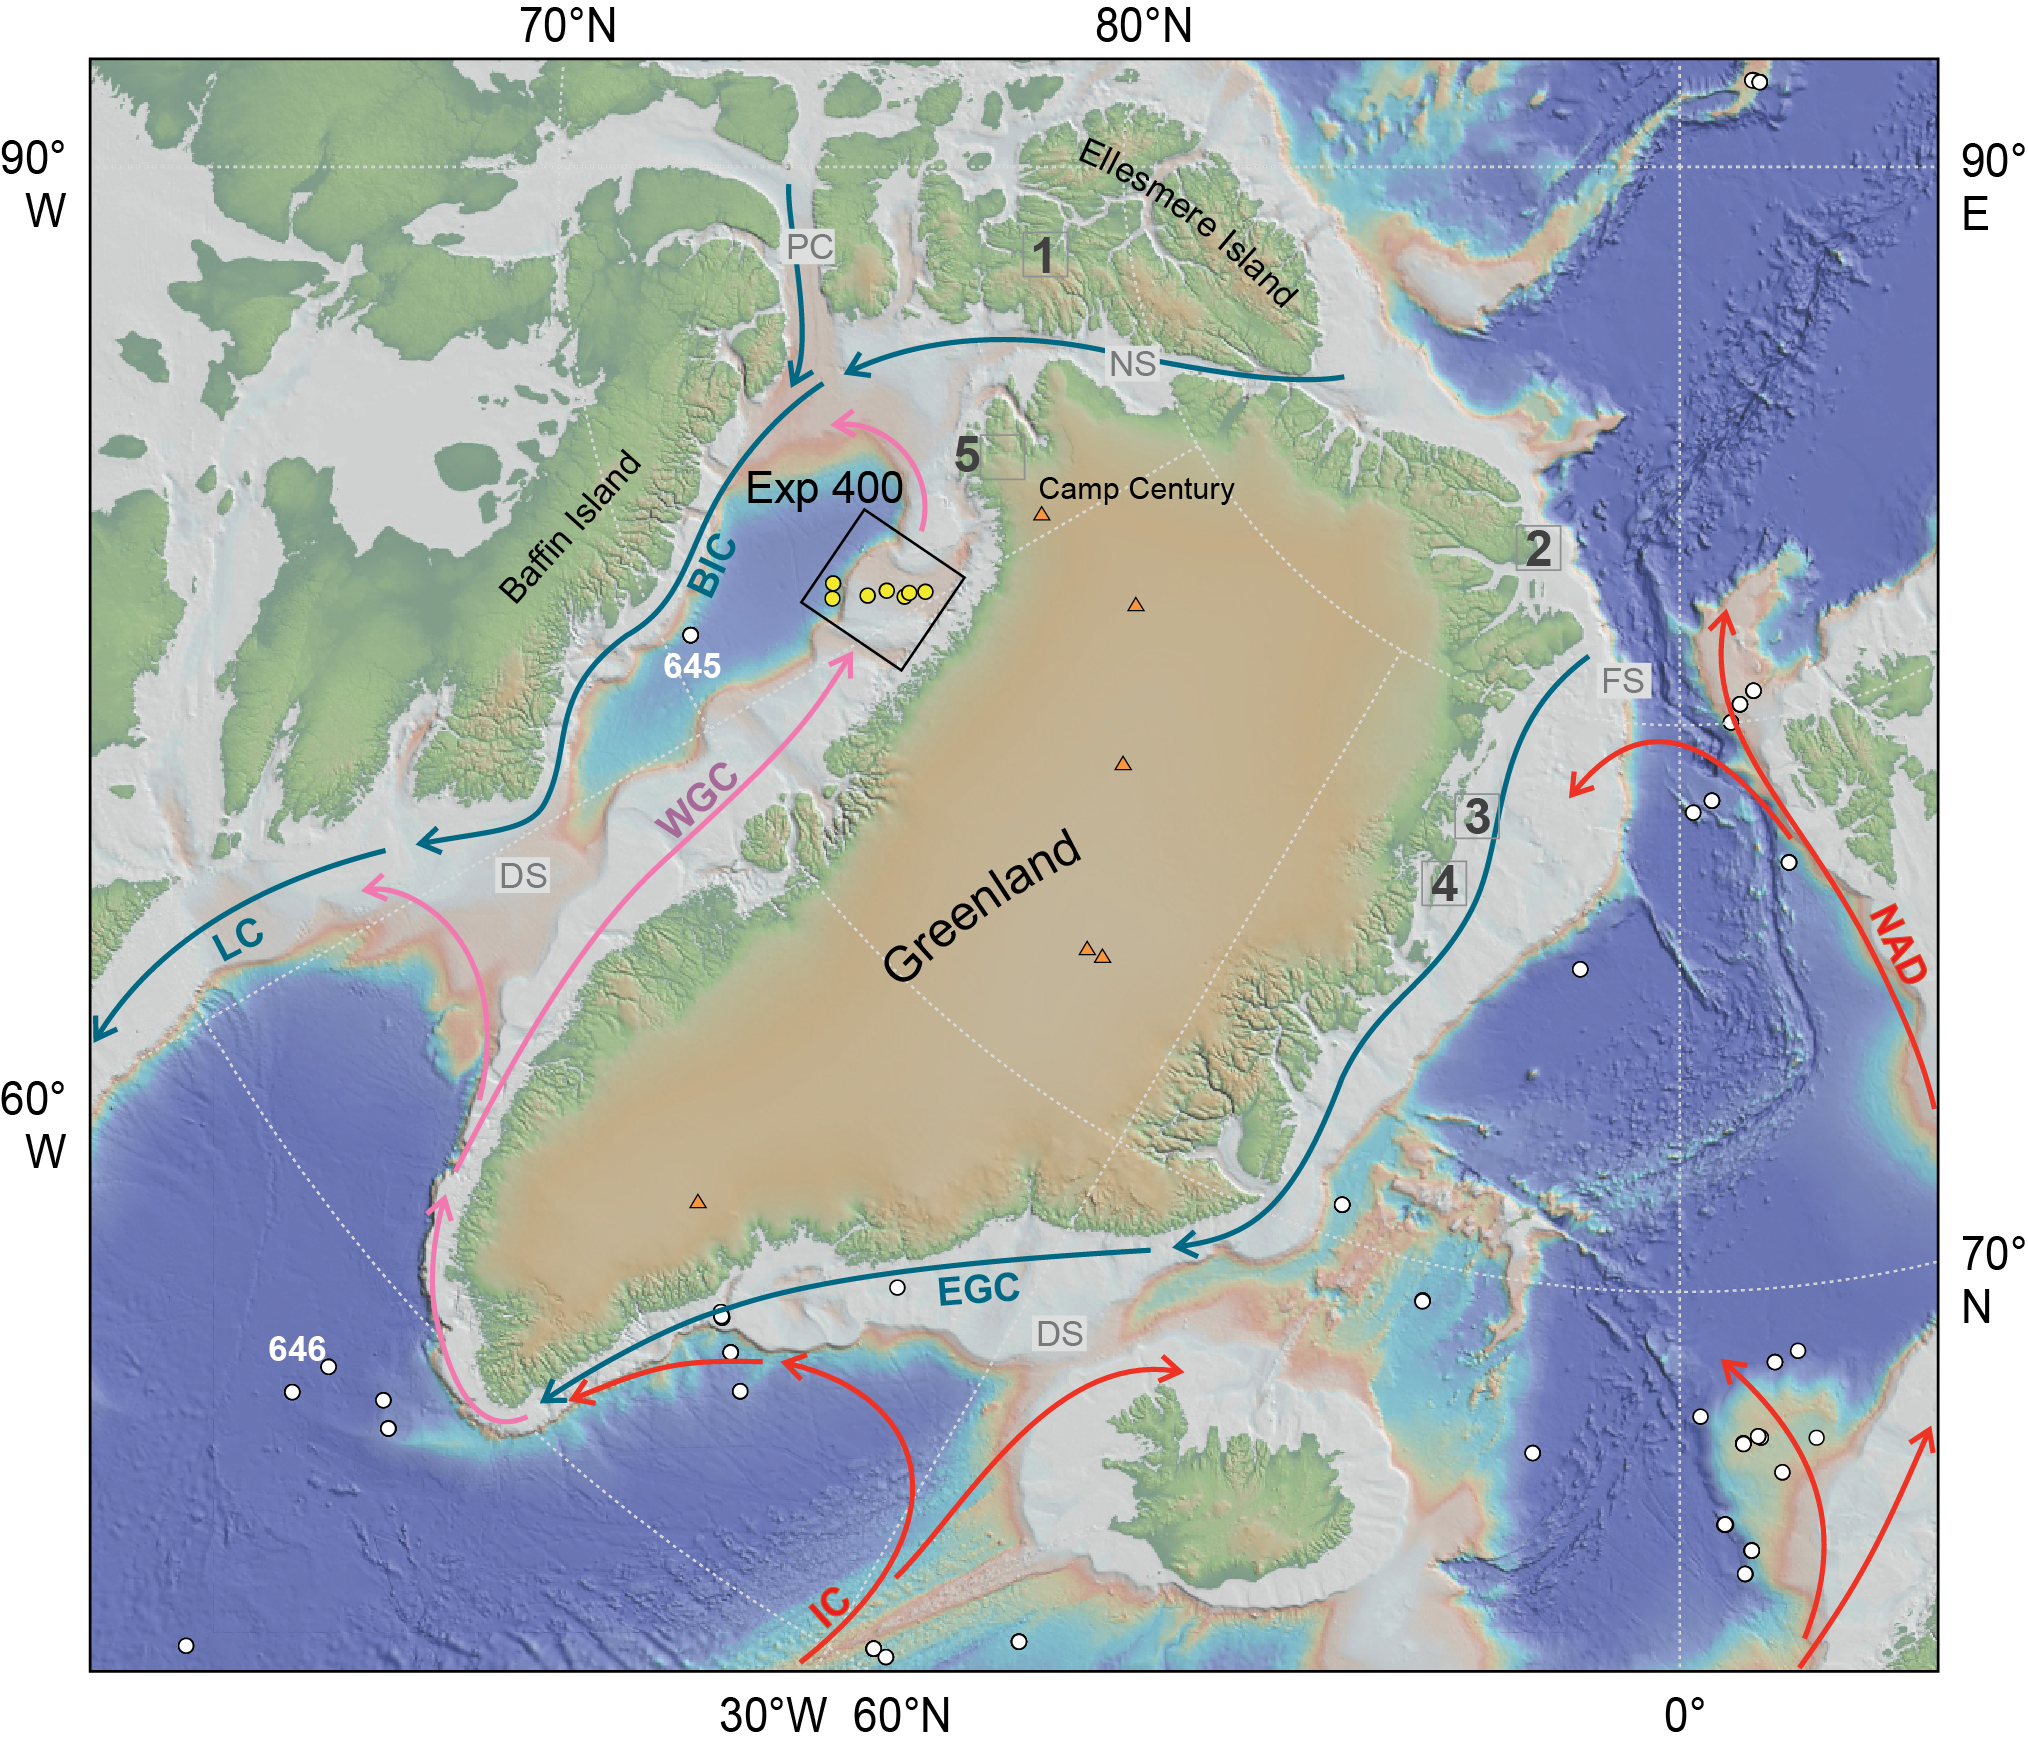
Figure F1. Topographic/bathymetric map.

Figure F2. Tectonic elements map.
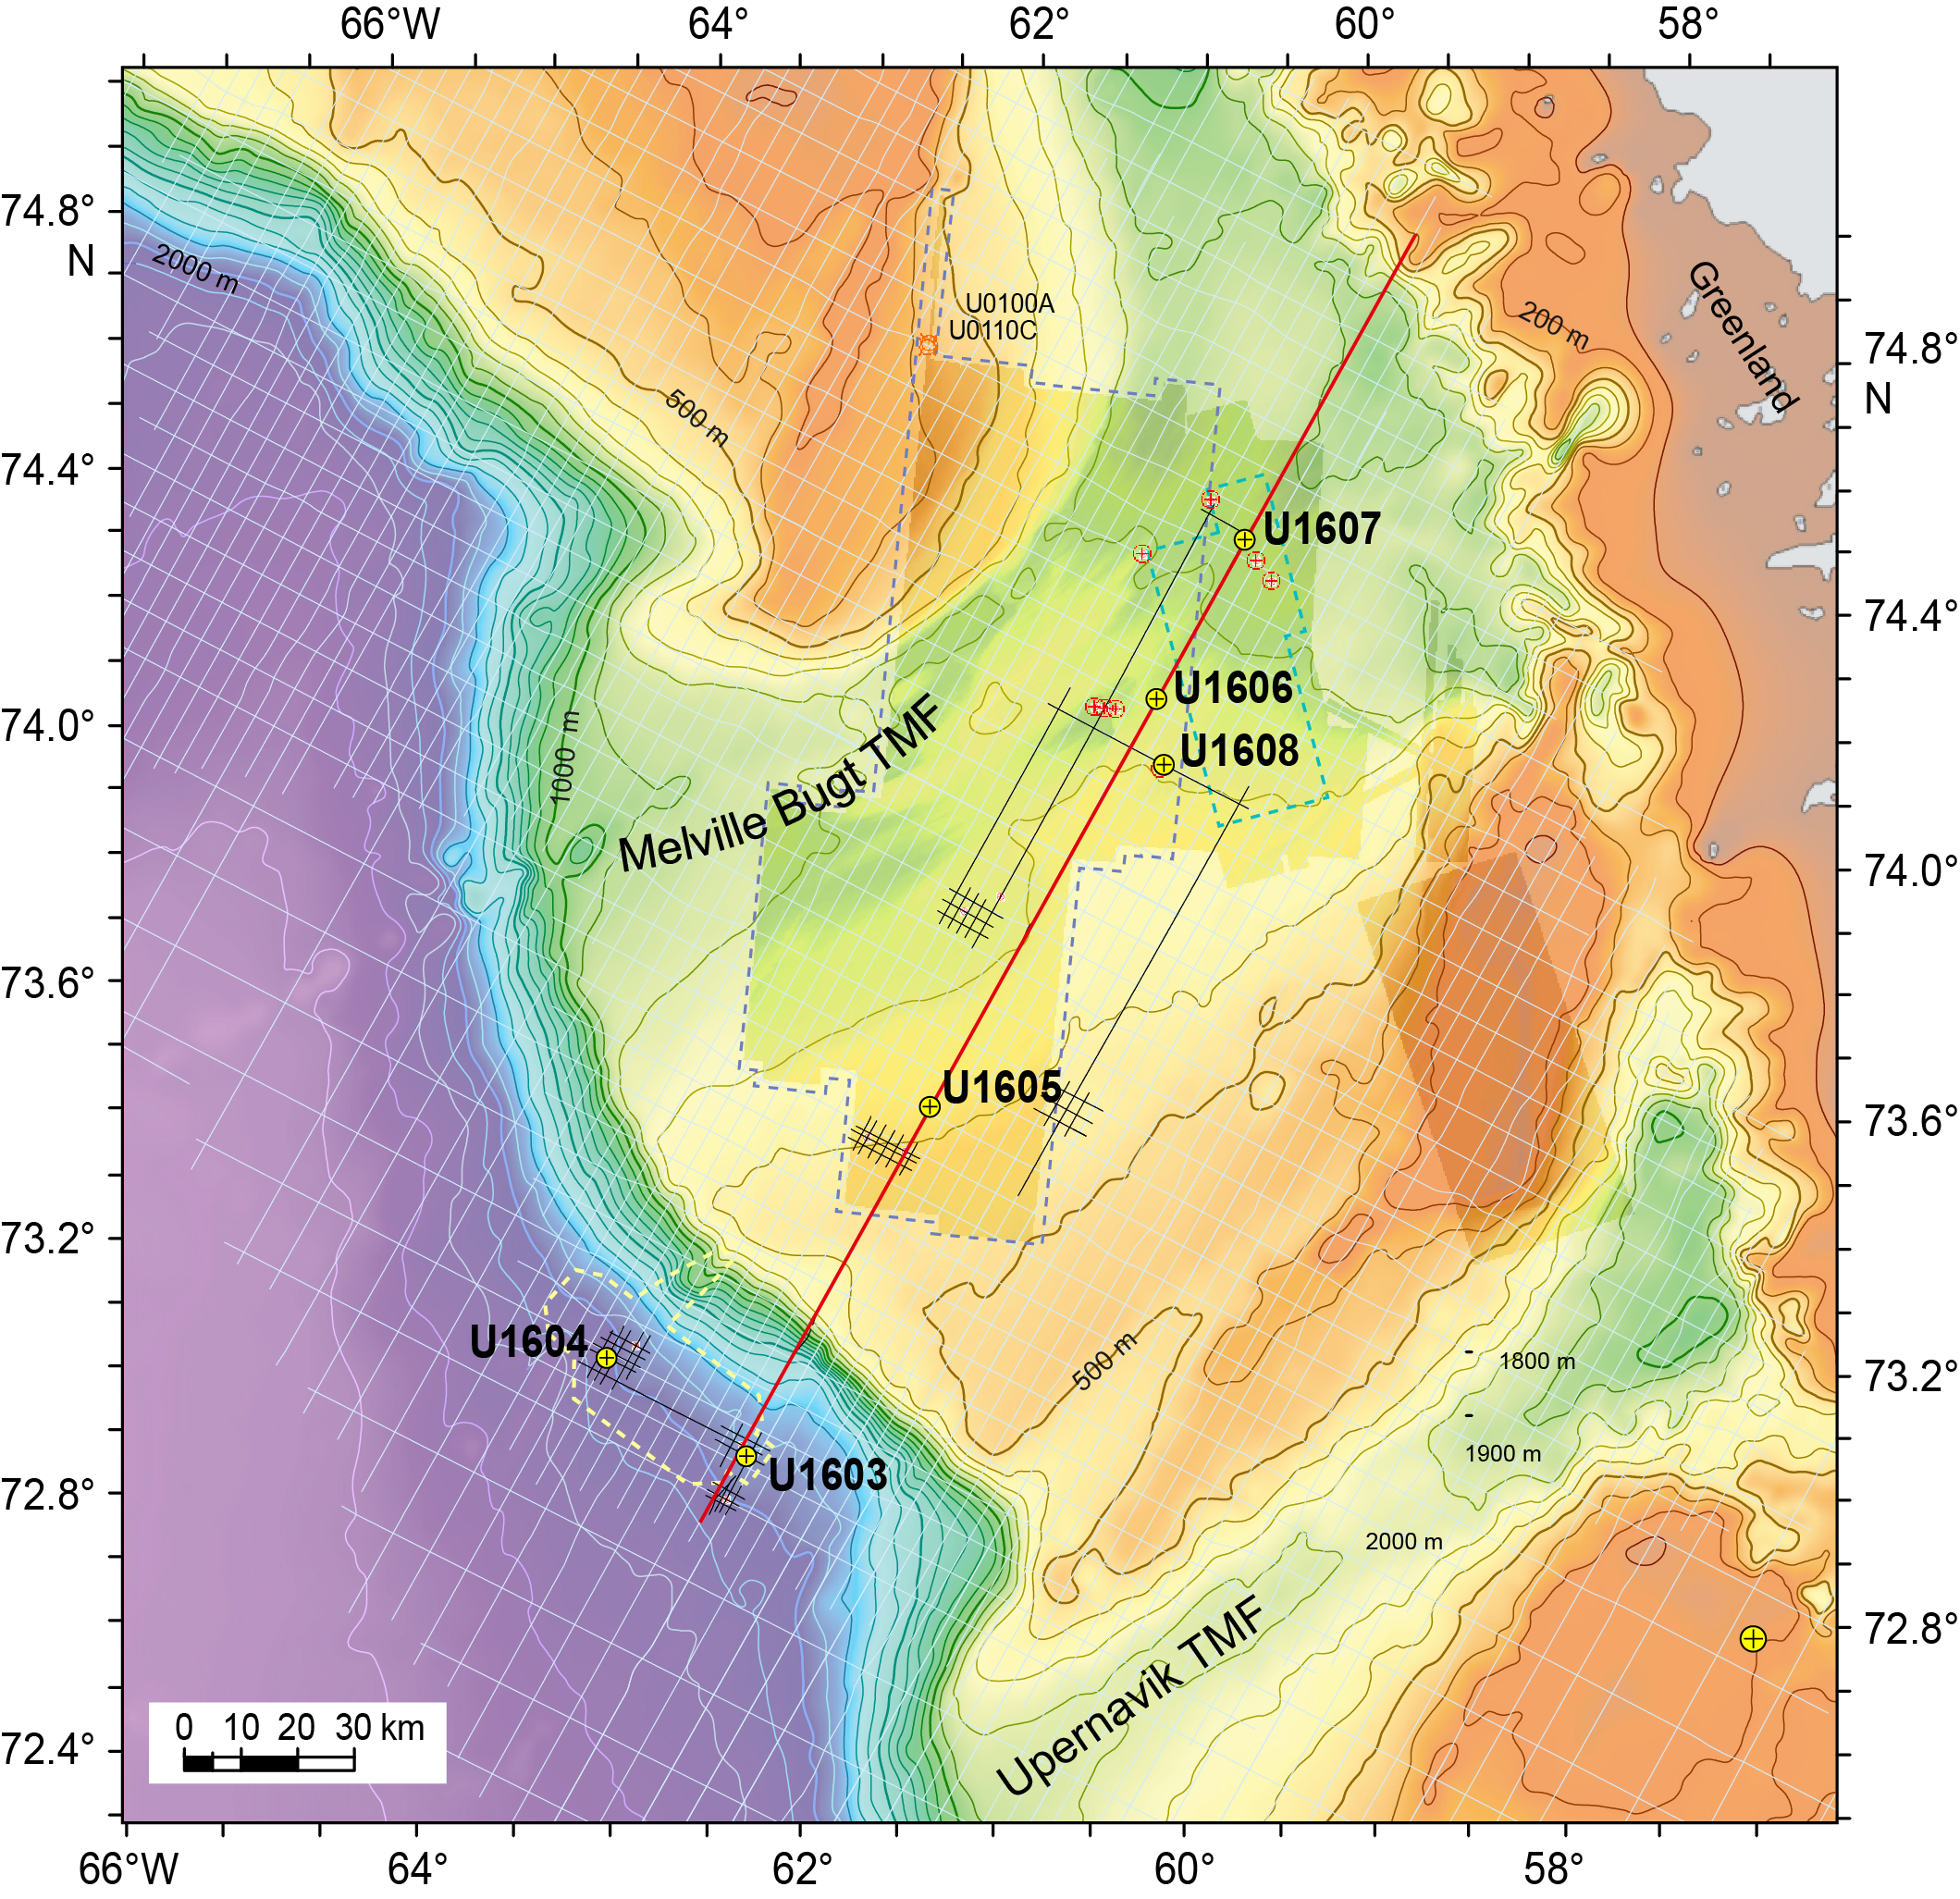
Figure F3. Site map.
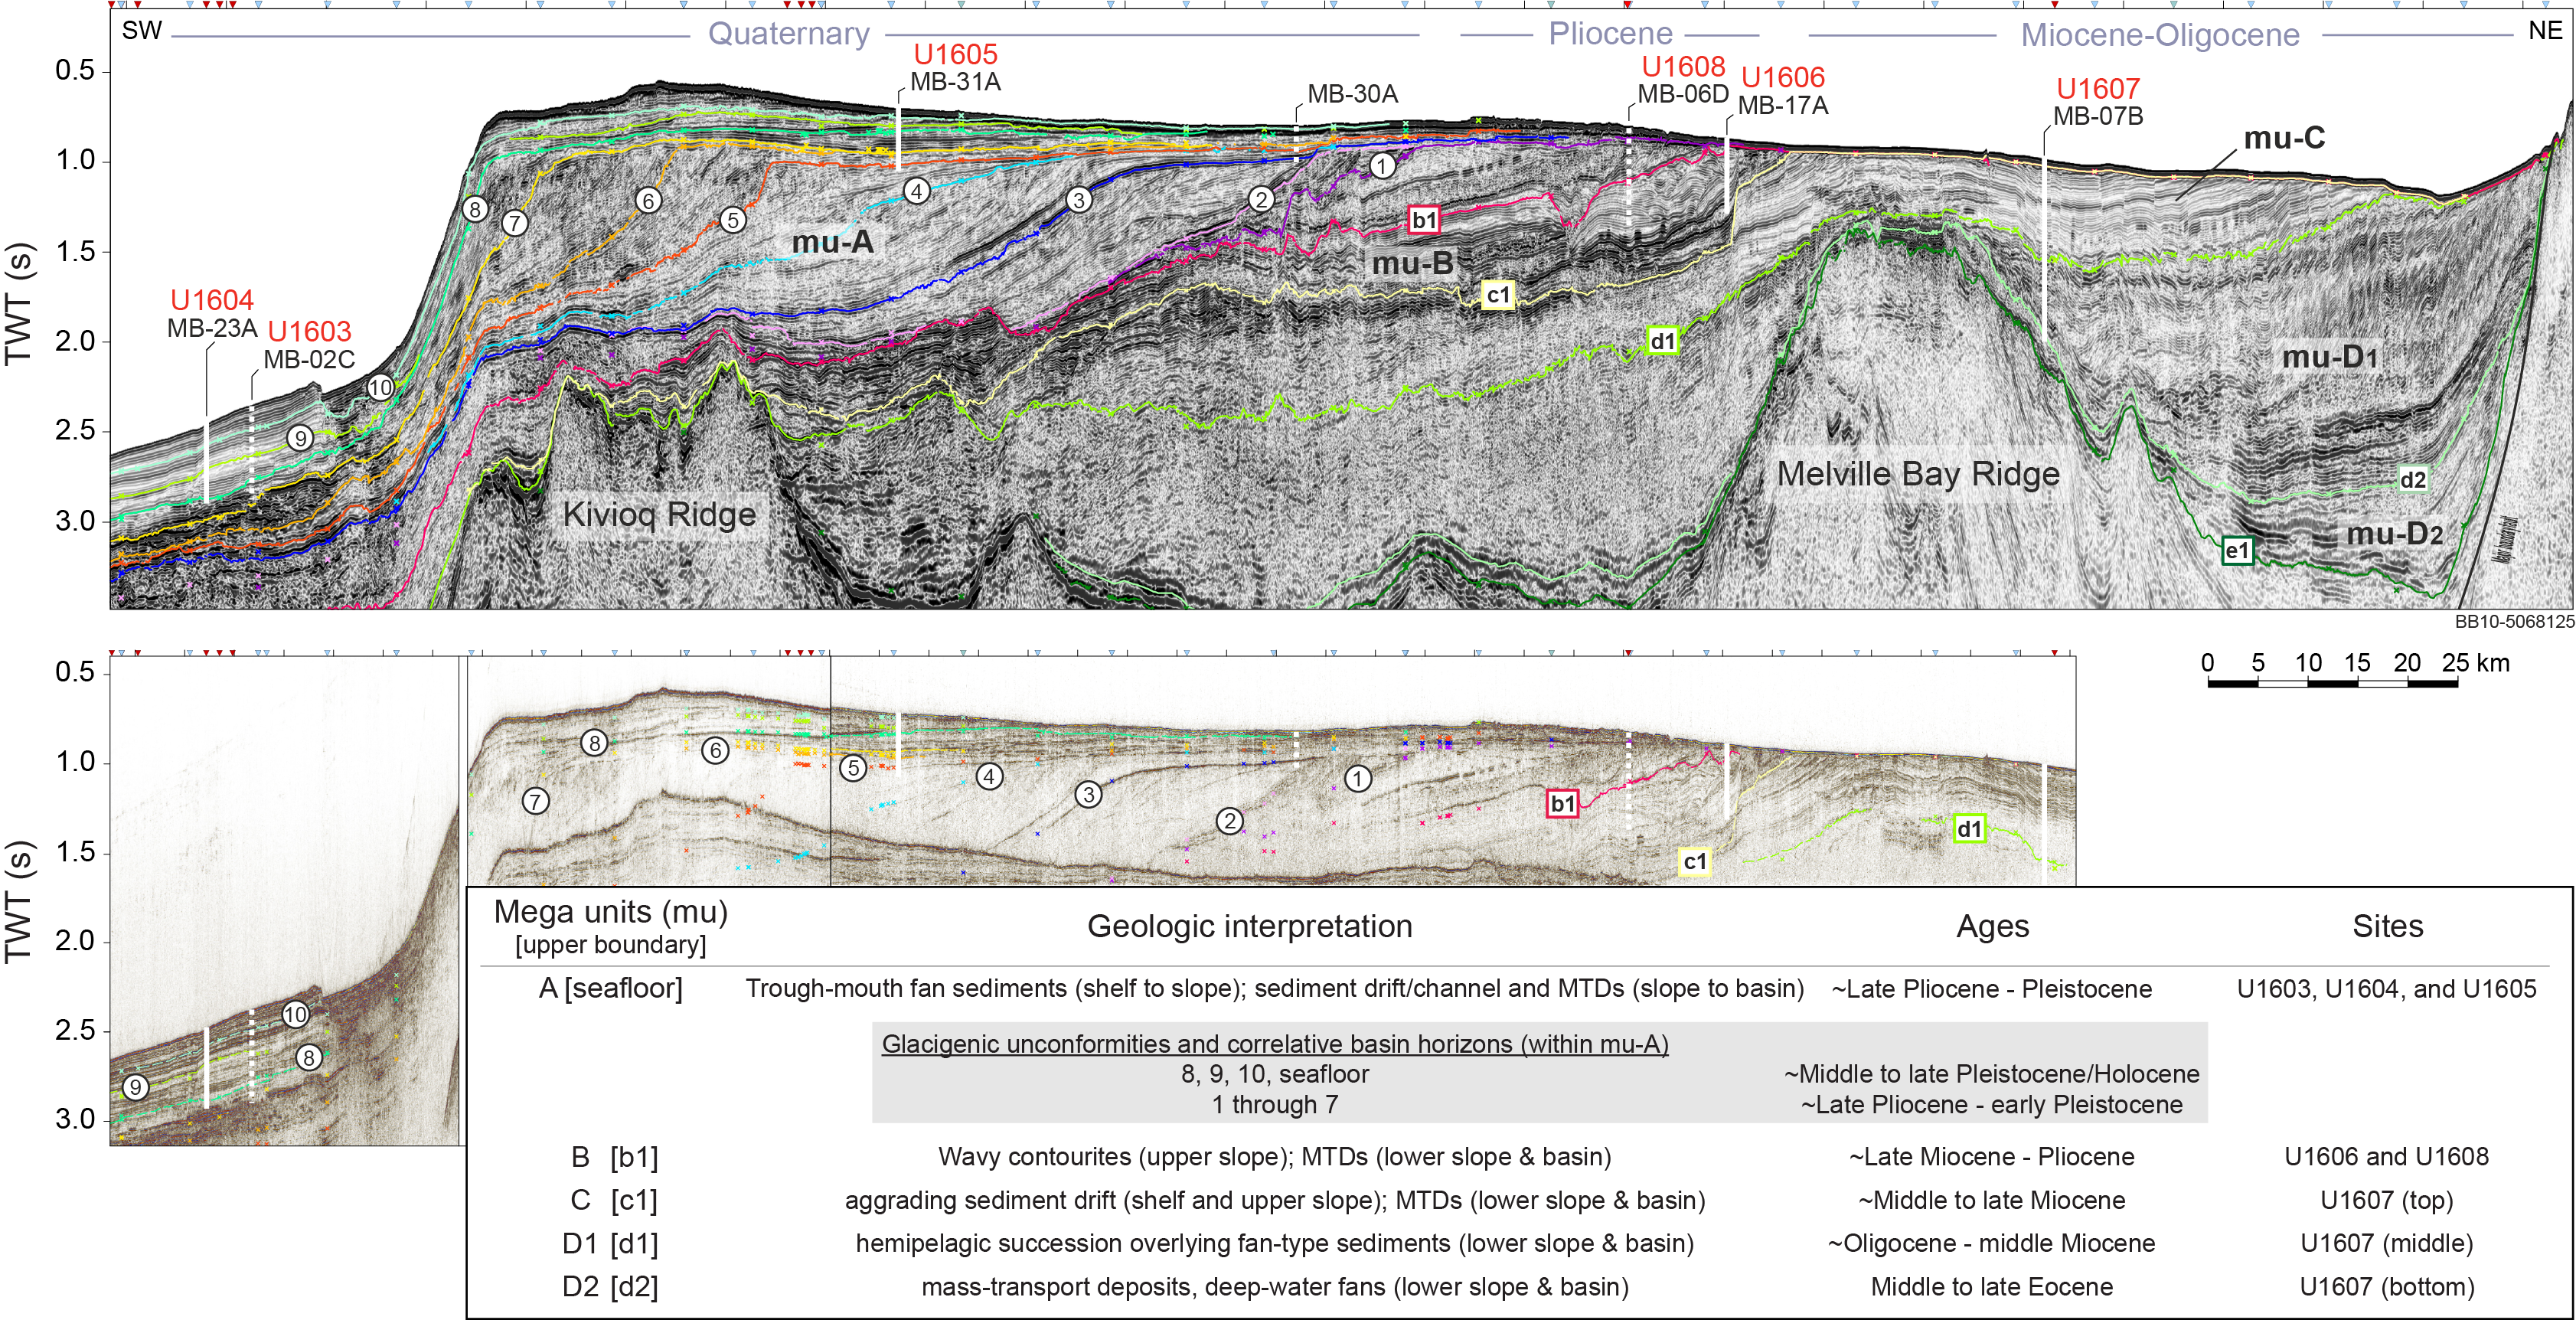
Figure F4. Key seismic transect.
2. Background
2.1. Baffin Bay hydrology
Baffin Bay is a semienclosed basin with predominantly cyclonic ocean circulation and a pronounced east–west hydrographic gradient (Figures F1, F2). The Baffin Island Current transports cold, low-salinity Arctic waters along the Canadian margin and exits through western Davis Strait. In contrast, the West Greenland Current carries warmer (3°–5°C) waters derived from both the North Atlantic Irminger Current and the East Greenland Current. The West Greenland Current travels northward over the West Greenland shelf regions at 100–500 meters below sea level (mbsl) (Bourke et al., 1989; Hamilton and Wu, 2013). Observations of the deep to intermediate circulation of Baffin Bay and hydrographic modeling indicate a southward counter current along the West Greenland slope from 68° to 72°N at 1000–1500 mbsl (Tang et al., 2004). Deepwater formation is possibly taking place in northern Baffin Bay, associated with brine formation during sea ice formation in the North Water Polynya, south of the Nares Strait (Yao and Tang, 2003). The rates and processes of water mass conversion in this area are not well understood (Bourke et al., 1989), but there is growing understanding of the role of the North Water Polynya and its influence on the interactions of northern and southern sourced water masses in the deepwater formation in Baffin Bay (Bâcle et al., 2002; Rysgaard et al., 2020).
2.2. Greenland ice sheet dynamics
The northwest Greenland shelf region was glaciated on multiple occasions, resulting in prominent TMFs that are the sedimentary expression of former glacial outlets of the NGrIS (Figure F3). Geophysical data and shallow core studies demonstrate the presence of fast-flowing ice streams that reached the outer shelf during the late Pleistocene (Ó Cofaigh et al., 2013; Dowdeswell et al., 2014; Slabon et al., 2016; Newton et al., 2017). The last glacial retreat from outer shelf grounding positions to fjord outlets in northwest Greenland probably occurred in discrete steps controlled by reverse bed gradients associated with shelf overdeepening (Patton et al., 2016; Newton et al., 2017) and enhanced marine ablation linked to the West Greenland Current (Jennings et al., 2017). Confluent Laurentide, Innuitian, and Greenland ice sheets blocked the Arctic–Atlantic gateways such as Parry Channel and Nares Strait during the Last Glacial Maximum, eliminating the inflow of Arctic waters into northern Baffin Bay and resulting in a circulation and sea ice regime much different from the modern one (Jennings et al., 2019; Jackson et al., 2021). Arctic–Atlantic gateway closures likely occurred during other glacial periods.
Ice sheet response to major climate transitions, such as the Pleistocene terminations, is poorly known. A recent study invokes a slow interglacial response to climate forcing, suggesting that the GrIS is in disequilibrium with global warming (Yang et al., 2022). Conversely, during glacial maxima ice shelves may have developed over Baffin Bay, buttressing the ice flow and possibly stabilizing the central ice domes in Greenland (Hulbe et al., 2004; Jennings et al., 2018; Couette et al., 2022). Thinning and breakup of stabilizing ice shelves can be triggered by ocean forcing at the grounding line amplified by drainage of surface meltwater to the bed (Holland et al., 2008; Straneo et al., 2012; Scambos et al., 2017; Catania et al., 2020; Jennings et al., 2022). Depending on physiographic factors such as bathymetry and lateral constraints, ice retreat can be catastrophic or episodic (Alley et al., 2007, 2015; Pollard et al., 2015; Scambos et al., 2017; Hogan et al., 2020). It is important to understand the complex forcings and conditions that initiate retreat and govern the rate of retreat of a previously stable marine-terminating ice sheet to better understand the impacts of ice sheet retreat on sea level, ocean circulation, nutrients, and ecosystems (Catania et al., 2020). Reconstructions of paleo–ice sheet behavior and mass balance change broaden the scope of our understanding of the potential outcomes of continued climate warming on the GrIS.
A better understanding of the boundary conditions and forcings determining long-term ice sheet evolution requires information only attainable by offshore drilling. However, long sedimentary records specifically illuminating NGrIS history are lacking. Previous drilled sites in the North Atlantic recovered sediment shed from elevated terrains in east Greenland (Thiede et al., 2011; Reyes et al., 2014) influenced by semipermanent alpine glaciers since the late Miocene (Bierman et al., 2016). The only deeply cored site in Baffin Bay (Site 645) was drilled during the early phase of the Ocean Drilling Program (ODP), and its contribution to understanding GrIS history is limited because of its location on the Canadian margin, poor recovery, and age uncertainties (Baldauf et al., 1989). In 2012, shallow coring was carried out in northeast Baffin Bay targeting Mesozoic rift deposits in exhumed sedimentary basins north of the Melville Bugt trough (Integrated Ocean Drilling Program Expedition 344S; Acton and the Expedition 344S Scientists, 2012). However, two sites, U0100 and U0110, penetrated a 124 m thick interval of overcompacted, muddy diamicton. Cosmogenic nuclides and other proxy data extracted from these proximal glacigenic sediments suggest that by the early Pleistocene, a persistent yet dynamic ice sheet existed in northwest Greenland (Christ et al., 2023).
The sensitivity of the GrIS to ocean warming (Holland et al., 2008; Yin et al., 2011) emphasizes the need for high-resolution records near the major glacial outlets of eastern Baffin Bay. Important advances in drilling techniques, dating methodologies, and proxy approaches make new drilling key for advancing understanding of past GrIS dynamics and ice-ocean-climate interactions, which so far have only been addressed by seabed mapping, shallow cores (Jennings et al., 2017, 2018), and seismic stratigraphy correlated to exploration wells (Hofmann et al., 2016).
2.3. Tectonostratigraphic development
The continental margin of northwest Greenland has a complex geologic and tectonic history that involves Cretaceous rift phases, extrusive volcanism, and tectonic inversion as seafloor spreading commenced in Baffin Bay. Rifting of the continental margins occurred during the Early and Late Cretaceous, forming numerous sedimentary basins and elongate grabens that fringe the Baffin Bay margins (Whittaker et al., 1997; Gregersen et al., 2013; Nøhr-Hansen et al., 2021) (Figure F2). Opening of Baffin Bay ensued from the late Paleocene through the Eocene, likely in tandem with the opening of the Labrador Sea (Chalmers et al., 1993) (Figure F1). The separation of Greenland relative to the North American continent ceased during the early Oligocene (Chron C13) as seafloor spreading commenced along the Aegir Ridge system of the Icelandic plate boundary (Oakey and Chalmers, 2012; Gregersen et al., 2022). The geologic architecture and stratigraphic knowledge of this region is mainly based on seismic and borehole data collected between 2007 and 2012 (Gregersen et al., 2013, 2016, 2022; Knutz et al., 2015, 2019, 2022). Eight seismic megaunits have been described, of which Megaunits A–E are attributed to the Cenozoic interval deposited after continental rifting ceased. The drilling targets of Expedition 400 identified along the key seismic transect cover Megaunits A–D (Figure F4).
Oblique plate motions between Greenland and North America resulted in a transpressional tectonic regime (strike-slip) on the West Greenland margin, which gave rise to major basin infilling packages and deepwater fan systems guided by structural lineaments along inverted rift basins (Megaunit E). From the middle late Oligocene through the middle Miocene, a more passive sedimentation regime ensued with infilling of the remnant rift-basin topography by Megaunits D1 and D2 (Figures F2, F4). In the Melville Bay Graben east of Melville Bay Ridge, Megaunit D2 forms a several kilometer thick succession of continuously stratified deposits that are intensely faulted, primarily as a result of marine clay compaction (Berndt et al., 2003). The mid-Miocene Unconformity (d1) separates Megaunits D1 and C. It demonstrates erosion over structural highs but is conformable within basin settings (e.g., Melville Bay Graben) (Figure F4). Megaunit C forms an asymmetric sediment prism covering wide parts of the inner shelf in northwest Greenland, with thicknesses up to 1200 m, that is variably modified by glacial erosion. The prism is interpreted to be a shelf-bound sediment drift that locally grades into clinoform features associated with prodeltaic environments (Knutz et al., 2015). The boundary between Megaunits C and B is an incised horizon (c1) that is correlated to extensive mass transport deposits on the lower slope and in the Baffin Bay basin, suggesting widespread submarine slope instability. The regional character of this erosion points to a phase of tectonic adjustment affecting the shelf margin, presumably during the late Miocene (Knutz et al., 2015). Megaunit B is characterized by distinct lenticular sediment bodies featuring asymmetric sediment waves that have accumulated into expanded sections over the Horizon c1 erosion scarp (Figure F4). The slope component of Megaunit B is interpreted to be a contourite drift with seismic ties to nearby drilled sections suggesting a Pliocene age (Knutz et al., 2015, 2019; Aubry et al., 2021).
2.4. Melville Bugt–Upernavik Trough Mouth Fan system
A prograded shelf package (Megaunit A) overlying the Neogene sediment drifts reflects deposition under the influence of major ice streams originating from the northwest GrIS sector (Figures F3, F4). Eleven prograding sedimentary units have been identified, each corresponding to bundles of glacial advance cycles within a major TMF system (Knutz et al., 2019; Newton et al., 2021). The TMF units are numbered according to their top bounding horizons, except Unit 11, which is capped by the seabed. The units are separated by glacial unconformities defining paleotrajectories of shelf break grounding zones that prograded seaward with sediment supplied by successive advances of the NGrIS onto the outer shelf and slope. Between the two modern cross-shelf troughs (Melville Bugt and Upernavik TMFs), topset strata of prograding units and associated shelf breaks are extremely well preserved because of high sediment input from paleo–ice streams and basin subsidence over older rift structures. The Expedition 400 drilling transect was designed to extract paleoclimate information from this intertrough aggrading sediment wedge (Figure F4). Within the topset package, seismic reflections phase reversed from seabed onlap the glacial erosion surfaces or infill intrashelf depressions. These reflections, which have stratal thicknesses of >20–30 m, may represent marine muddy sediments deposited during periods of grounding line retreat and rising sea level, interrupting the glacial advance megacycles. An age model for the depositional evolution of the TMF was reconstructed by correlating the seismic horizons to nearby wells/boreholes (Knutz et al., 2019). It is hypothesized that the stratal onlaps, succeeding major shifts in ice stream configuration, may have formed during periods of extreme warmth, such as super-interglacials (Knutz et al., 2019).
Beyond the shelf break, the horizons of Megaunit A can be traced along clinoformal reflections to the basin strata, resulting in a complete pseudo-3D mapping of the depositional units (Figure F4). The youngest depositional sequence, comprising Units 8–11, which are likely middle to late Pleistocene in age, form a series of contourites intersected by channel deposits on the lower slope. Thus, drilling these contourites will allow high-resolution paleoceanographic reconstructions back to, and potentially through, the MPT.
In summary, there are several reasons for choosing northeast Baffin Bay for documenting the Cenozoic evolution of the NGrIS:
- The area covers a large TMF system primarily constructed by glacial drainage over millions of years.
- It contains a succession of gently dipping strata where a composite sequence of Oligocene–Quaternary deposits may be drilled at relatively shallow depths.
- It has extensive coverage of high-quality 2D and 3D seismic data with outstanding imaging of glacigenic sediment progradation, marine deposits formed by along-slope currents, and hemipelagic basin-infilling sediments.
- A detailed seismic stratigraphy tied to well/borehole information illuminates the sediment transport dynamics from the NGrIS (Knutz et al., 2019).
- The western Greenland margin is accessible due to amenable ocean temperatures and reduced sea ice associated with the northbound West Greenland Current (Tang et al., 2004; Holland et al., 2008).
- Expedition 344S demonstrated in 2012 that the R/V JOIDES Resolution can successfully operate in northeast Baffin Bay, a region that is crossed by icebergs but lacks pack ice (Acton and the Expedition 344S Scientists, 2012).
2.5. Geophysical data
The supporting site survey data for Expedition 400 are archived at the IODP Site Survey Data Bank (https://ssdb.iodp.org/SSDBquery/SSDBquery.php; select P909 for proposal number).
Development of the coring plan for Expedition 400 was facilitated by an extensive seismic database. The core sites initially submitted for IODP drilling Proposal 909-Full1 were located using 2D seismic data, including four regional seismic surveys collected by TGS in 2007–2010. The final placement of sites (IODP drilling Proposals 909-Full2 and 909-Add) was accomplished based on (1) two 3D data volumes, Cairn-PITU-3D-2011 and Shell-ANU-3D-2012, and (2) a dedicated high-resolution seismic survey completed in 2019 as a collaboration between Geological Survey of Denmark and Greenland (GEUS) and Geoscience-Aarhus University using the Danish R/V Lauge Koch (LAKO) (Pearce and Knutz, 2019). Both 3D surveys were utilized in a compilation of seabed geomorphology (Newton et al., 2017, 2021) and geohazard assessments for further refining drill site locations (Cox et al., 2020, 2021).
The LAKO 2019 survey data provide high-resolution coverage (vertical resolution = ~4–6 m) of all primary sites and several alternate sites. The multichannel reflection seismic acquisition (15–300 Hz) was optimized to gain enhanced resolution in the uppermost 500 m of the sedimentary section, complementary to the existing industry data. A 90 cubic inch generator-injector (GI) gun was used as a seismic source configured with a 45 inch3 main chamber and a 45 inch3 injection chamber. Shot time was 4.0 s for most of the data, and record length varied between 2.0 and 3.5 s. Shots were recorded on a Geometrics GeoEel streamer, which included five 25 m active sections of 8 channels each (40 channels total) with a group spacing of 3.125 m. A total of 861 line km was collected. Initial processing producing a migrated data version was performed on the ship. Final processing on shore included confirmation of static and delay correction, deconvolution to zero-phase data, and f-k filtering. The overall data quality was excellent, except some of the shelf sections marked by significant short wavelength variations due to a rough seabed (e.g., boulders, glacial scouring, and iceberg plough marks).
For converting seismic drilling targets into metric depths, the proposed sites were bundled into four groups based on similarities in the depositional setting, geologic context, and general target depths. To obtain the most realistic time-depth conversion, all available data from the region were reviewed. Velocity information was extracted from existing industry boreholes south of the transect (e.g., Gamma-1), data gained from Expedition 344S sites north of the transect, and an interval velocity cube derived from the Cairn-PITU-3D-2011 seismic volume. The average vertical profile velocities applied for each setting were 1800 m/s for the deepwater sites (U1603 and U1604; proposed Sites MB-23A and MB-02C), 2200 m/s for the glacigenic topset strata on the shelf (Site U1605; proposed Site MB-31A and not drilled Site MB-30A), 1900 m/s for the Pliocene contourite sediments (Sites U1608 and U1606; proposed Sites MB-06D and MB-17A), and 2050 m/s for the Miocene succession (Site U1607; proposed Site MB-07B).
3. Scientific objectives
The overall objective of Expedition 400 is to provide new insights into the long-term evolution of the NGrIS (Figure F5). To this end, seismic imaging from the deep basin to inner shelf has guided the selection of coring sites and stratigraphic correlation. A multiproxy diagnostic template has been developed, which in concert with a transect-drilling strategy can constrain different phases of ice extent and regional climate regimes (Figure F6). This template provides a methodological basis to test hypotheses that are crucial for understanding GrIS history, how the glacial margins will respond to continued warming in the near future, and how this may affect other components of the Earth system.
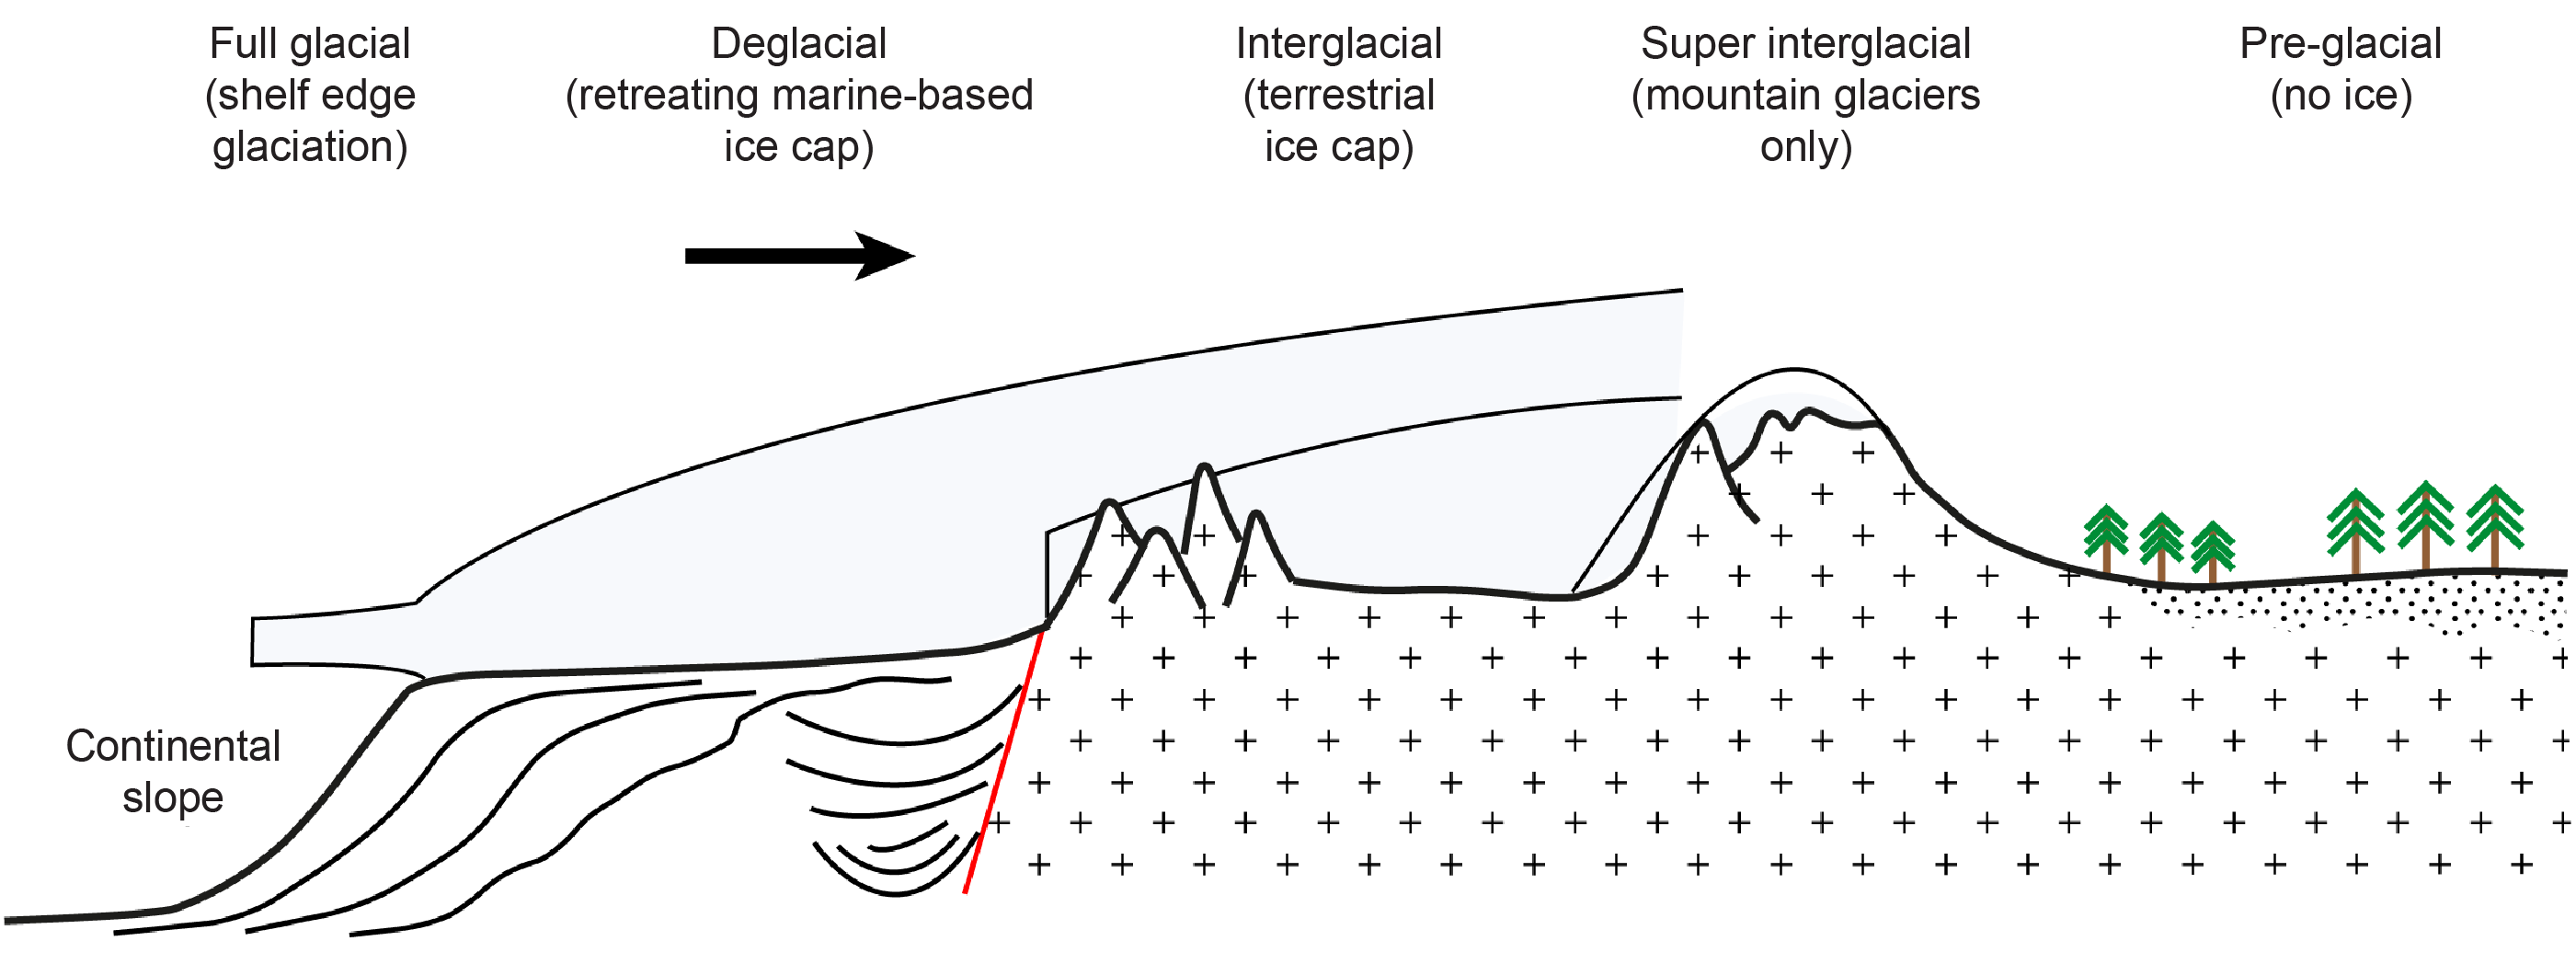
Figure F5. Conceptual stages of GrIS configurations.
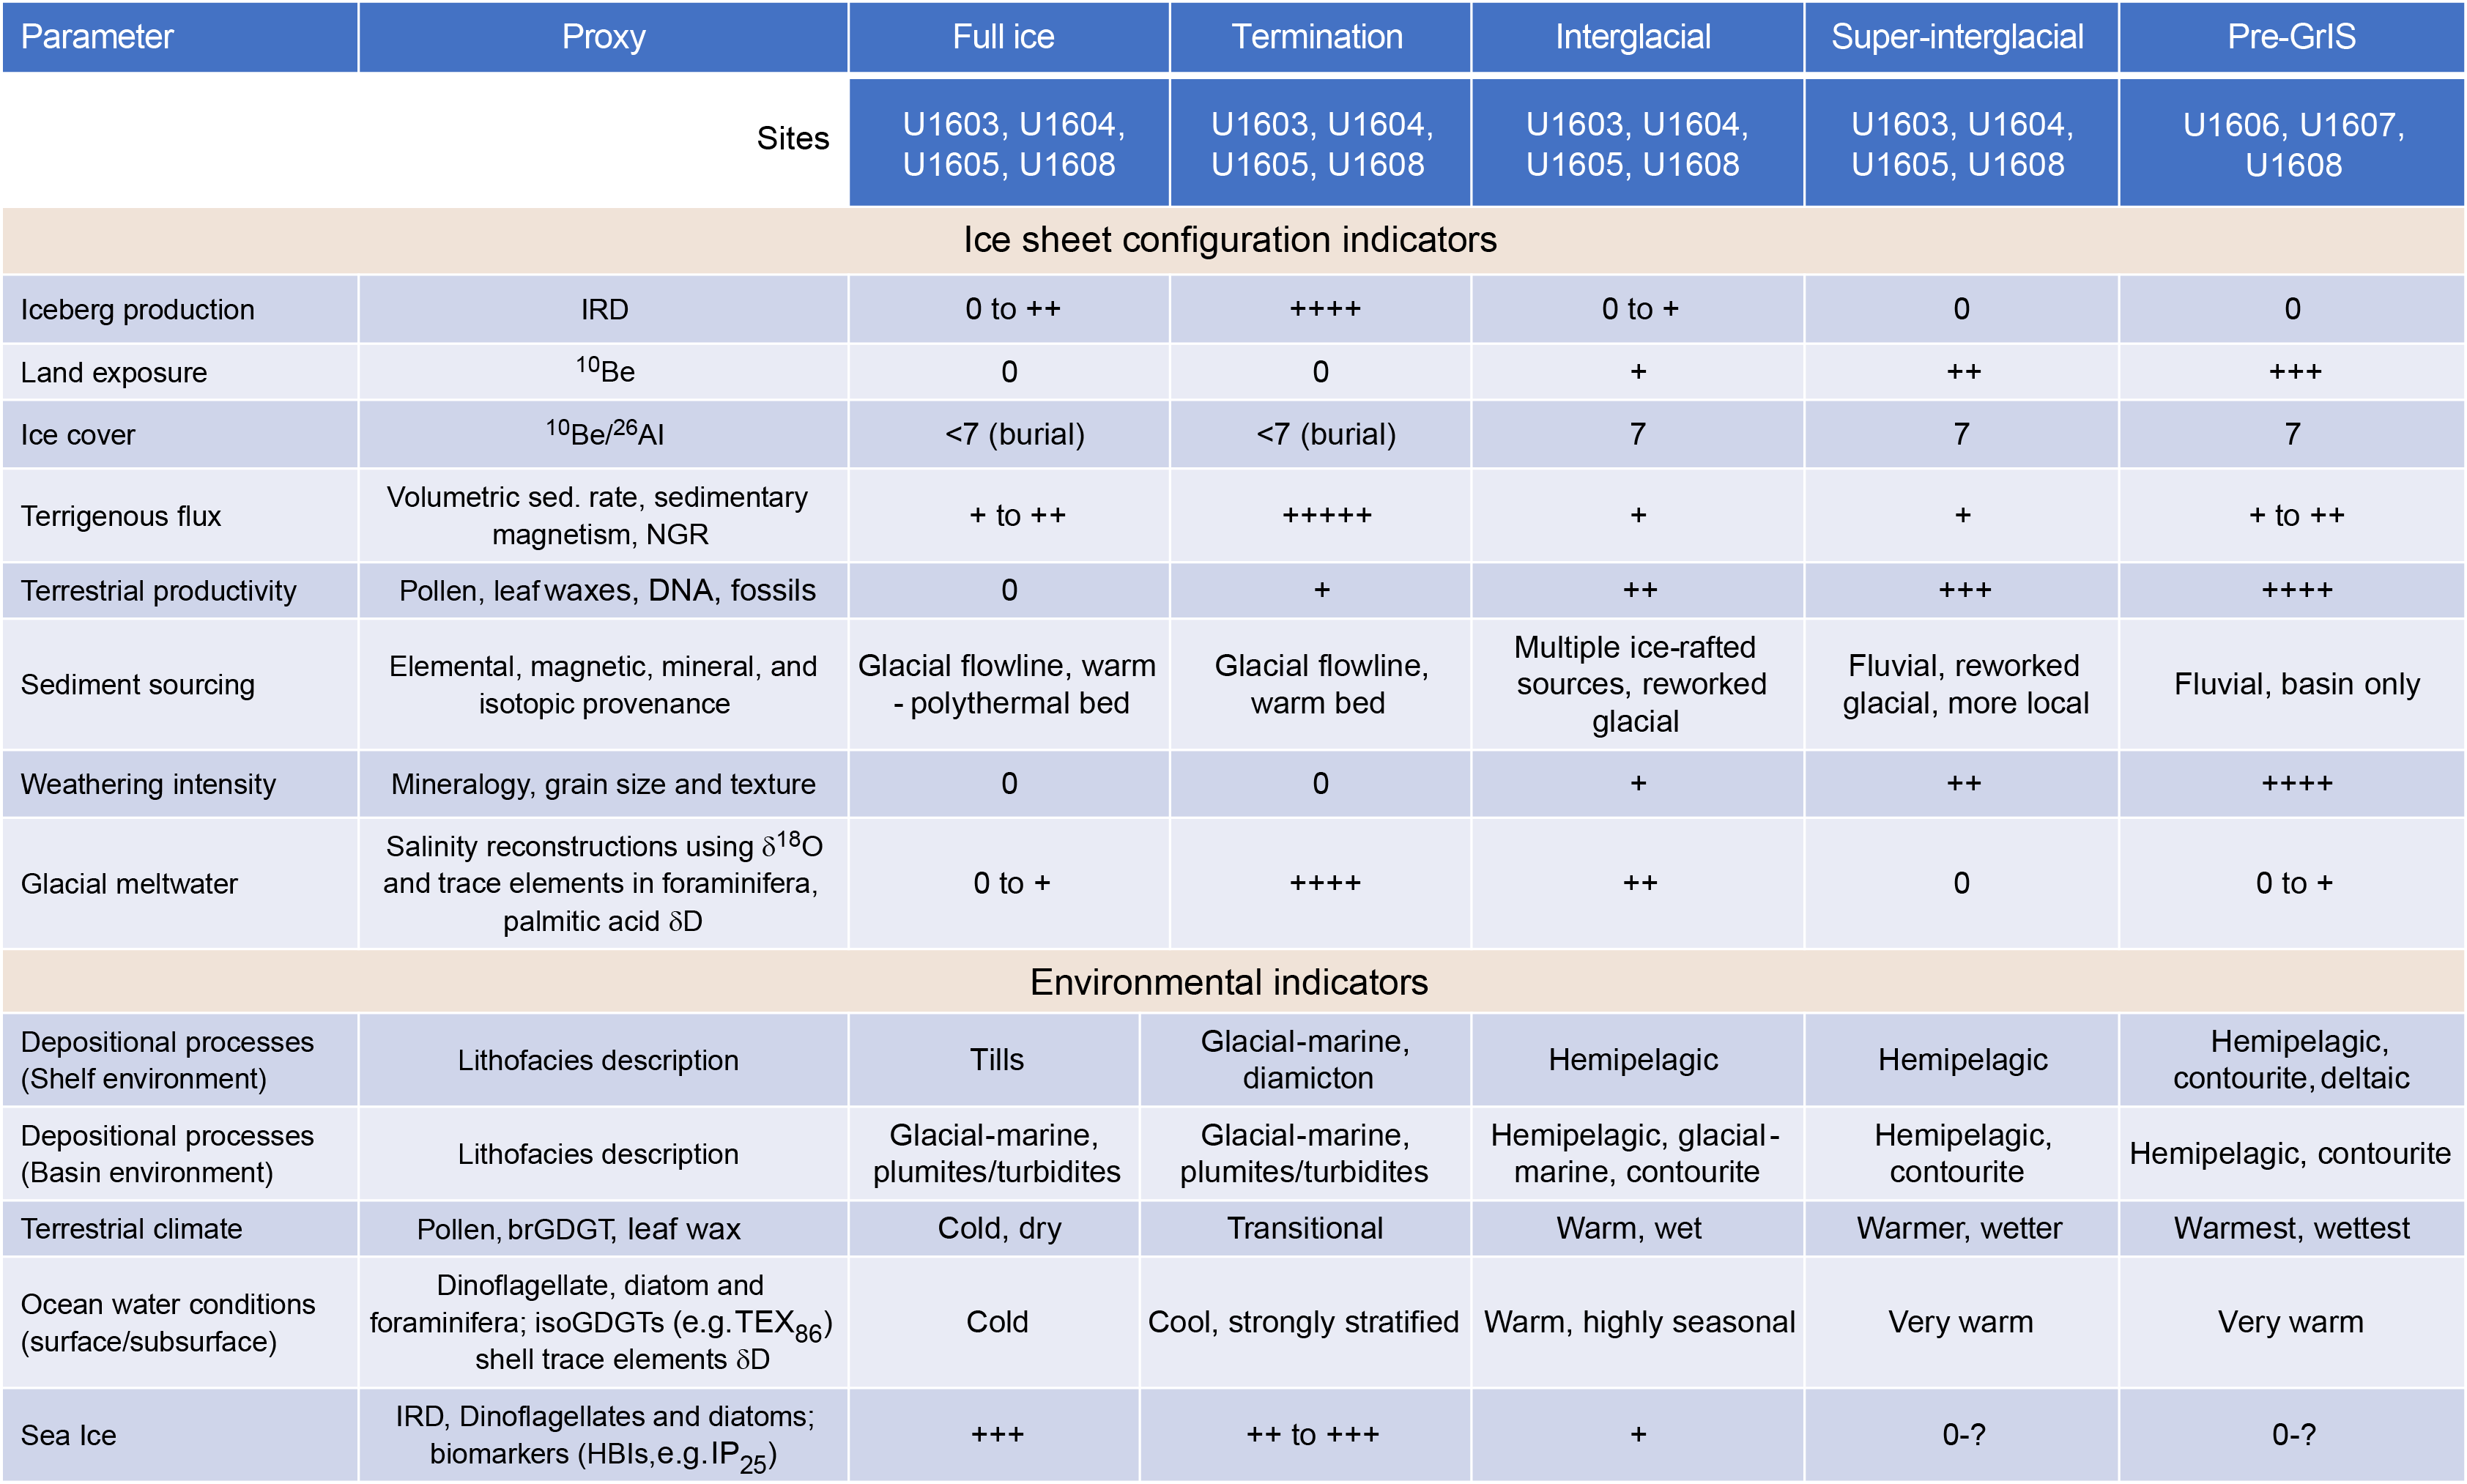
Figure F6. Diagnostic template for proxy interpretation.
Expedition 400 objectives focus on answering three key questions.
3.1. How did the NGrIS respond to extreme interglacial warmth?
Cosmogenic nuclides in subice bedrock show that central Greenland was almost completely deglaciated during one or more intervals over the last 2.5 My (Schaefer et al., 2016). This study cannot determine a unique ice cover history, but three scenarios are proposed varying from ice-free interglacials to a single 280 ky deglacial event during the early Pleistocene, followed by ~1.1 Ma of uninterrupted ice sheet coverage. Cosmogenic exposure age dating of the basal sediments and sediment-rich ice at the base of the Camp Century ice core indicate that the northwest GrIS retreated significantly during MIS 11 (~400 ky before present [BP]) (Christ et al., 2023). The long-term depositional record on the margin of northeast Baffin Bay contains the glaciation history needed to infer when such extreme mass loss occurred. By drilling high-accumulation sites in the basin (Sites U1603 and U1604) and on the shelf margin (Site U1605) targeting potential interglacial deposits, we intend to test the hypothesis that the NGrIS underwent substantial deglaciation on one or more occasions during the Pleistocene. Parameters for identifying warm interglacial periods will be derived from multiple qualitative and quantitative proxies that constrain ice sheet response and environmental conditions in both marine and terrestrial/atmospheric areas.
3.2. When did glacial inception occur in northwest Greenland, and how did the NGrIS dynamics evolve through Cenozoic climate transitions?
The relationship between long-term pCO2 trends, temperature records, and global ice volume is poorly understood. A northwest Greenland perspective of this knowledge gap will be gained by retrieving a composite Oligocene, Miocene, and Pliocene interval covered by primary Sites U1606–U1608. These archives will provide information on timing, sedimentary processes, and changes in denudation rates of Greenland through periods of large atmospheric CO2 variations. Organic components carried by these sediments in allochthonous or autochthonous fractions will provide insights into terrestrial and marine ecosystems and information on background climate states. We hypothesize that the decrease in pCO2 from the early middle Oligocene (>600 ppm) to early Miocene (<300 ppm) coincides with cold and possibly glacial environments in northwest Greenland. This will be tested by recovering a 980 m long climate record from Oligocene–Miocene strata at Site U1607.
A complicating factor, disrupting or modulating a linear response between pCO2 forcing and ice sheet growth/decay, may involve tectonic base-level adjustments causing snow line lowering (Foster et al., 2010) or changes in heat flux through oceanic gateways (Otto-Bliesner et al., 2017). Extensive submarine landslides into Baffin Bay associated with a late Miocene Unconformity (c1) along the northwest Greenland margin may reflect a regional tectonic adjustment apparently predating the first shelf edge advances (Knutz et al., 2015). This erosion event may be linked to hinterland uplift (Japsen et al., 2006), but a more concise understanding of its origin requires recovery of Neogene sediments. Following a full-scale glaciation, physical weathering would redistribute mass from the Greenland craton to the continental slope and consequently accelerate hinterland uplift by isostatic compensation (Berger et al., 2008; Medvedev et al., 2013), prompting the question: did active tectonics play a role in the development of the GrIS (Solgaard et al., 2013), or are the late Neogene basin adjustments along the West Greenland margin a response to mass redistribution caused by glacial erosion (Ruddiman and Kutzbach, 1989; Molnar and England, 1990; Eyles, 1996)?
The timing of the advance of marine-based glaciers onto the northwest Greenland margin is presently ambiguous. Drilling through the initial clinoforms of the first prograding unit and farther into marine contourite sediments of probable Pliocene age (Sites U1608 and U1606) will test the hypothesis that glacial expansion of the NGrIS is linked with intensification of Northern Hemisphere glaciation (3.3–2.8 Ma).
Understanding the evolution of the NGrIS may hold the key to the origin of Northern Hemisphere glaciation, including the mechanisms of gradual amplification of glacial cycles since the late Pliocene and the shift from 40 to 100 ky cycles across the MPT (Raymo and Huybers, 2008). A major reorganization in the ice flow that drains the NGrIS apparently occurred across the MPT (Knutz et al., 2019). Hence, both local and regional evidence suggests that major changes in the size, erosivity, and responsiveness of the GrIS occurred throughout the Pleistocene (Bierman et al., 2016; Schaefer et al., 2016). By drilling Seismic Units 7–9 at the deepwater sites (U1603 and U1604) and on the shelf (Site U1605), we will examine changes in NGrIS dynamics through the MPT pertaining to recent models, in particular the regolith hypothesis (Clark and Pollard, 1998).
3.3. What is the paleoceanographic and cryospheric significance of Pliocene contourite drifts in northeast Baffin Bay?
The early mid-Pliocene was characterized by relatively warm and humid forest tundra conditions in the high Arctic of Canada (Matthews and Ovenden, 1990; Fyles et al., 1994; Csank et al., 2011; Rybczynski et al., 2013) and Greenland (Bennike et al., 2002). A similar environment was inferred from early Pleistocene interglacial deposits in northern Greenland (Funder et al., 2001), which is when southern Greenland appears to have been forested (de Vernal and Mudie, 1989). These warm Arctic conditions occurred under modest pCO2 levels (~400 ppm), implying a high sensitivity of the Pliocene Arctic climate to pCO2 or the influence of other forcing factors (Haywood et al., 2016, 2020; Feng et al., 2022). Pliocene glacial ice was likely limited to high-elevation terrains in eastern and southern Greenland, although climate models are limited by a dearth of proxy archives close to Greenland (Koenig et al., 2015). In the late Neogene, presumably the latest Miocene and Pliocene, the West Greenland/Baffin Bay margin was influenced by contour currents that deposited extensive sedimentary drifts (Knutz et al., 2015). The establishment of persistent oceanic gradients strong enough to maintain a geostrophic boundary current over millions of years is intriguing and may be linked with enhanced Pliocene Atlantic Meridional Ocean Circulation. Past configurations of Arctic gateways (e.g., Davis Strait, Nares Strait, Fram Strait, and Bering Strait) could have played a key role for poleward heat exchange during the Pliocene (Hu et al., 2015; Keisling et al., 2017); however, the tectonic history of these topographic thresholds is poorly known (Eyles, 1996; Knies et al., 2014). The contourite deposits of Megaunit B, presently exposed at shallow depths below the glacial trough, can illuminate the environmental conditions of this paleocurrent system that appear to have existed prior to the expansion of the NGrIS.
Sites U1608 and U1606 provide a composite succession that can constrain Pliocene climate variability and paleotemperatures and test whether or not the high Arctic warmth of the early mid-Pliocene is associated with enhanced heat advection through Baffin Bay.
3.4. Scientific objectives
The Expedition 400 scientific objectives are as follows:
- Test the hypothesis that the NGrIS underwent significant deglaciation at intervals within the frequency range of orbital eccentricity (~100–400 ky). Pleistocene sites on the slope (Sites U1603 and U1604) and the outer shelf (Site U1605) are the key sites for attaining this objective.
- Test the hypothesis that the general decrease in pCO2 from the early middle Oligocene to the early Miocene resulted in cold and possibly glacially dominated environments in northwest Greenland. Site U1607 on the middle shelf addresses this objective.
- Provide information on the timing, sedimentary processes, sediment sources, and Greenland exposure history in the context of late Neogene tectonic adjustments inferred from the seismic record. Pliocene drill sites on the middle shelf (Sites U1606 and U1608) and Oligocene to Miocene Site U1607 on the middle shelf address this objective.
- Test the hypothesis that major glacial expansion of the NGrIS is linked with widespread intensification of Northern Hemisphere glaciation (3.3–2.8 Ma). Pliocene drill sites on the middle shelf (Sites U1606 and U1608) address this objective.
- Assess recent models for the change in orbital cycles through the MPT by analyzing sediment maturity and regolith history. Pleistocene sites on the slope (Sites U1603 and U1604) and the outer shelf (Site U1605) are the key sites for attaining this objective.
- Investigate whether high Arctic warmth of the early mid-Pliocene is related to heat advection through the western North Atlantic Ocean and Baffin Bay. Pliocene drill sites on the middle shelf (Sites U1606 and U1608) address this objective.
3.5. Connections to the 2050 Science Framework
The scientific objectives of IODP Expedition 400 are relevant to Strategic Objectives 3 (Earth’s Climate System), 4 (Feedbacks in the Earth System), and 5 (Tipping Points in Earth’s History) of the 2050 Scientific Framework. Strategic Objective 3 Earth’s Climate System recognizes the importance of understanding ice sheet history as a driver of sea level changes and ocean-atmosphere interactions, including understanding how the polar ice sheets will respond to increasing atmospheric CO2 concentrations. During Expedition 400, a transect of sites were drilled that capture an extensive history of glaciation in northern Greenland over the last 25 My. This timescale includes past warm periods when atmospheric CO2 was higher than today and interglacial periods when sea level exceeded today’s, indicating significant ice sheet melting. The GrIS has been resilient in the face of modern warming but is showing signs of enhanced mass loss. The unique geologic archive recovered during Expedition 400 spans pre–Northern Hemisphere glaciation, early ephemeral glaciation on northern Greenland, and the expansion of Northern Hemisphere glaciation as recorded by the building of the Melville Bugt TMF. The information gained from Expedition 400 is societally relevant because it will contribute important data to future projection ice sheet models that aim to predict rates and magnitudes of sea level rise from melting ice sheets. By sampling the natural range of sedimentary processes and responses to climate forcings involved in the change from Arctic warmth to extreme cooling and notably the onset of Northern Hemisphere glaciation, the Expedition 400 archive addresses Strategic Objectives 4 Feedbacks in the Earth System and 5 Tipping Points in Earth’s History. A potential tipping point can result from GrIS meltwater entering the North Atlantic subpolar gyre, impacting areas of deepwater formation and leading to destabilization of the overturning circulation. Expedition 400 data provide high-resolution geologic records for evaluating such tipping points over multiple cycles in the past, which may help to predict how GrIS melt will influence, and be influenced by, today’s changing climate.
4. Site summaries
4.1. Site U1603
4.1.1. Background and objectives
Site U1603 (proposed Site MB-23A) is located at 72°59.0386′N, 62°58.8333′W at 1801 mbsl below a prominent crescent-shaped protrusion of the Melville Bugt TMF on the northwest Greenland shelf margin (Figures F1, F2) (see Background and objectives in the Site U1603 chapter [Knutz et al., 2025a]). The site was aimed at retrieving a continuous high-resolution record of ice-ocean processes spanning the early Pleistocene to present. The depth target was the base of an expanded drift-channel succession situated on the lower slope between the Melville Bugt and Upernavik TMFs that are the modern expression of major paleo–ice streams draining the NGrIS (Knutz et al., 2019; Newton et al., 2017, 2020, 2021). The sedimentary succession is covered by regional 2D and high-resolution multichannel seismic data, providing a detailed seismic stratigraphy to guide the drilling objectives. The strategy at Site U1603 was to core through the youngest Seismic Units 9–11 and reach through a stratified interval within Seismic Unit 8, which appears to predate the channel formation. Site U1603 is paired with Site U1604, located ~35 km northwest where a complementary stratigraphic coverage can be achieved by targeting an expanded section of Unit 8 and then continue drilling to just below Horizon 7 (Figure F7).
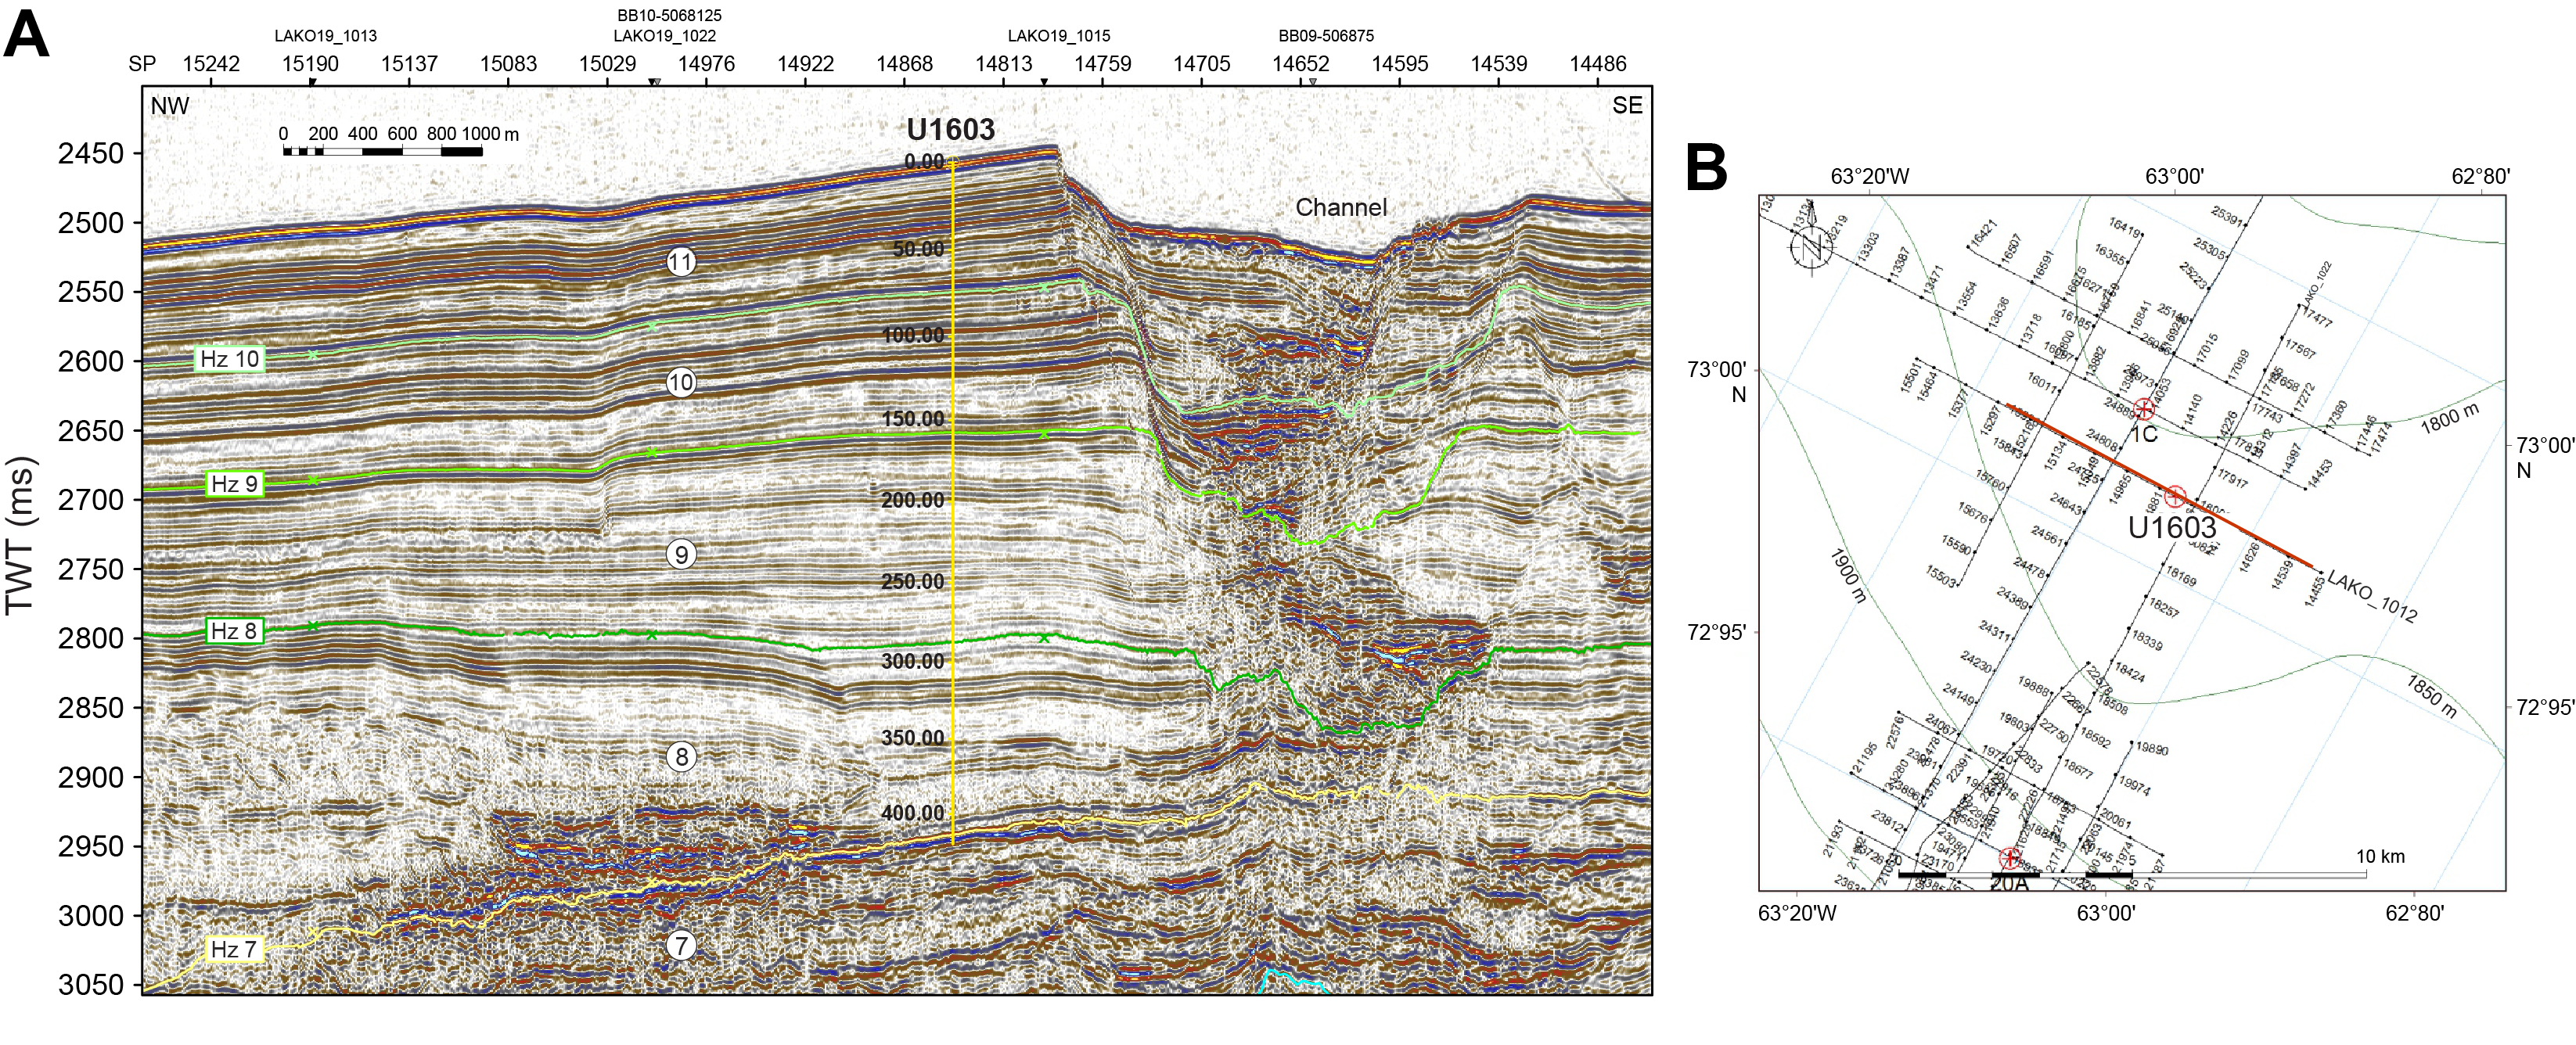
Figure F7. Seismic profile and close-up bathymetry map, Site U1603.
The drift-channel system cored at Site U1603 is influenced by the circulation of deepwater masses in Baffin Bay, which is poorly constrained by synoptic data (Tang et al., 2004). Gyre pulses of the West Greenland Current overflow the site at intermediate depths around 300 mbsl (Münchow et al., 2015). The succession is considered to be a product of Pleistocene ice-ocean interactions that were particularly active during periods when ice was grounded on the outer shelf and phases of ice sheet retreat. The scientific objectives for drilling Sites U1603 and U1604 are to (1) test the hypothesis that the NGrIS underwent significant deglaciation at intervals within the frequency range of orbital eccentricity (~100–400 ky) (Schaefer et al., 2016; Knutz et al., 2019) potentially related to exceptionally strong super-interglacials (Melles et al., 2012) and (2) achieve a long-term understanding (last 0.5 My or older) of marine-based ice sheet dynamics and phasing relations between ice streams draining different sectors of the North American and Greenland ice sheets. In particular, we hope that the records can provide insights to ocean conditions through glacial terminations and ice-ocean dynamics associated with the different stages of ice sheet configurations (Simon et al., 2014), which may implicate far-field effects such as the opening/closing of the Canadian Arctic straits (Lofverstrom et al., 2022). Finally, the multiproxy data collected at deepwater Sites U1603 and U1604 will contribute to the objective of assessing the regolith hypothesis for the change in orbital insolation frequency across the MPT (Clark and Pollard, 1998; Willeit et al., 2019).
Coring was planned in three holes with a target depth of 250 m core depth below seafloor, Method A (CSF-A), using the advanced piston corer (APC) coring system in the first two holes and 422 m CSF-A in the third hole using the APC/extended core barrel (XCB) coring system. Downhole logging with the triple combo tool string, Versatile Seismic Imager (VSI), and Formation MicroScanner (FMS) was planned for the third hole.
4.1.2. Operations
Expedition 400 began in Reykjavík, Iceland, at Skarfabakki Harbor at 0815 h on 12 August 2023. The IODP Expedition 395 science party departed the vessel on 12 August, and on 13 August the crew, staff, and science party of Expedition 400 boarded the vessel, with the oncoming JOIDES Resolution Science Operator (JRSO) technical staff arriving at 0900 h and the science party arriving at 1445 h. Immigration checks for those sailing were conducted dockside during the afternoon and completed by 1600 h. The science party began expedition preparation and received orientations including life at sea and safety training along with introductions to the laboratories during the rest of the port call. The two ice navigators were set up with Internet access, and the ice analysis and reporting routine was initiated. Freight was completed throughout the port call and included off-going shipments of core and refrigerated and frozen samples as well as the loading of sepiolite (drilling mud), drilling equipment, and fresh and frozen foods. On 16 August, fuel was bunkered and a boat drill was conducted.
The vessel was readied for departure, and the pilot came on board at 0745 h on 17 August. The tugs were secured shortly after, and the last line was released at 0806 h, marking the official start of the transit. By 0822 h, the tugboats were released; the pilot departed, and sea passage to Site U1603 began at 0824 h. The vessel remained underway until arriving at Site U1603 at 1355 h on 23 August. The thrusters were lowered and secured at 1412 h, and the vessel was fully in dynamic positioning (DP) mode at 1420 h, ending the transit. The journey covered 1721 nmi at an average speed of 11.3 kt (including pilotage).
The first attempt to spud Hole U1603A was an APC barrel shot from 1802.0 meters below rig floor (mbrf), resulting in a water core. The pipe was lowered 5 m, and a core barrel was shot from 1807 mbrf. Hole U1603A was spudded at 0425 h on 24 August with 4.65 m recovered. The seafloor was calculated at 1800.8 mbsl (1811.9 mbrf). Meters below rig floor depth is 11.1 m greater than meters below sea level. APC coring continued through Core 400-U1603A-13H at 118.6 m CSF-A. The advanced piston corer temperature (APCT-3) tool was run on Cores 4H, 7H, 10H, and 13H. The core liner shattered on Core 13H and had to be pumped out of the liner.
At 1515 h on 24 August, the bridge notified the drill floor that an iceberg had entered the Red Zone (i.e., would be within 3 nmi of the vessel in less than twice the time it will take to trip up to 50 m CSF-A). The drill string was tripped up with the top drive from 109.1 to 43.21 m CSF-A at 1600 h. From 1600 to 1715 h, the vessel tracked two icebergs. At 1715 h, with one of the icebergs entering the Termination Zone (within 1 nmi of the vessel), the order was given to pull the pipe clear of the seafloor. The drill string was again pulled up with the top drive, this time to 1778.3 mbrf, clearing the seafloor at 1742 h and ending Hole U1603A. The vessel was moved 500 m south in DP mode. The closest iceberg passed within ~0.6 nmi of the vessel. Once it was safe to do so, the vessel was moved back over location and offset 10 m northwest from Hole U1603A, coming into position at 2000 h on 24 August.
Hole U1603B was spudded at 2035 h on 24 August. It was washed down to 109.1 m CSF-A by 0100 h on 25 August. Coring began with Core 2H from 109.1 m CSF-A and continued through Core 5H at 147.1 m CSF-A. After an overpull and drillover of Core 5H, we switched to the half-length APC (HLAPC) system. HLAPC coring started with Core 6F and continued through Core 27F, shot from 243.9 m CSF-A at 0230 h on 26 August. The barrel pulled free from the formation with no overpull; however, the coring line could not pull the barrel up. The drill string was tripped back up to the vessel with the bit clearing the rig floor at 1157 h, ending Hole U1603B. Once the bottom-hole assembly (BHA) was on board, the core barrel was recovered with 0.08 m of material, likely from the push down trying to free the barrel. The final depth for Hole U1603B was 244.0 m CSF-A.
The vessel was offset 10 m northwest, and Hole U1603C was spudded at 0105 h on 27 August. The hole was drilled down over the next 7.75 h. Cores 2R–9R advanced from 211.5 to 285.0 m CSF-A and recovered 22.78 m (31%). At 1945 h on 27 August, ice moved within 3 nmi of the vessel and we raised the drill string to 22.3 m CSF-A and began waiting on ice. At 0000 h on 28 August, ice entered the 1 nmi exclusion zone. We raised the drill string, clearing the seafloor at 0009 h and ending Hole U1603C, and continued waiting on ice. The vessel was moved 1200 m east-northeast and then 700 m east-southeast in DP mode to maintain a safe distance from the ice. By 0330 h, the ice had cleared the site and the vessel was positioned 10 m northwest from Hole U1603C.
Hole U1603D was spudded at 0455 h on 28 August and was drilled ahead with a wash barrel to 102.0 m CSF-A. Because ice once again neared the site, we decided to install a free-fall funnel (FFF) to allow us to reenter Hole U1603D. The FFF was deployed at 0950 h, and by 1030 h we resumed drilling ahead in Hole U1603D to 189.0 m CSF-A. At 1400 h, ice moved within 3 nmi of the vessel, and we raised the drill string to 22.3 m CSF-A by 1515 h and began waiting on ice for the remainder of the day.
By 0015 h on 29 August, the ice had cleared the site. The drill string was lowered to 169.6 m CSF-A, and we washed back to 189.0 m CSF-A before drilling ahead to 269.4 m CSF-A. Cores 400-U1603D-2R through 8R advanced from 269.4 to 333.2 m CSF-A and recovered 14.62 m (24%). At 1400 h, ice moved within 3 nmi of the vessel, and we raised the drill string to 22.3 m CSF-A by 1545 h and began waiting on ice. Once again ice entered the 1 nmi exclusion zone, and we raised the drill string, clearing the seafloor at 1930 h. The vessel was moved 1000 m north in DP mode to maintain a safe distance from the ice. By 2157 h, we began to move back toward the site, and the vessel was in position over Hole U1603D by 2348 h on 29 August.
At 0100 h on 30 August, we began preparing the subsea camera system to assist with reentering Hole U1603D. At 0320 h, we successfully reentered the hole and recovered the subsea camera system. The drill string was lowered to 294.4 m CSF-A, and we washed back to 318.5 m CSF-A before encountering material that had fallen into the bottom of the hole. A center bit was dropped, and we washed to 333.2 m CSF-A by 0800 h. Cores 9R–18R advanced from 333.2 to 422.0 m CSF-A and recovered 28.69 m (32%). Sepiolite (drilling mud) was swept in the hole, and the bit was released at 2315 h to prepare for logging. We then tripped the drill string up with the bit positioned at 50.8 m CSF-A in preparation for logging.
The modified triple combo (quad combo) tool string was rigged up and, following a repair to the logging winch, was deployed to the base of Hole U1603D (419.5 m CSF-A). The quad combo measures natural gamma ray, density, acoustic velocity, resistivity, magnetic susceptibility (MS), and density. Following a complete pass of the hole, the quad combo was pulled to the rig floor and broken down. The VSI was rigged up, and the protected species watch began at 1600 h on 31 August. The VSI was deployed but almost immediately experienced a communication issue. The tool was brought back on board and repaired. At 1800 h, the VSI was deployed to 413.1 m CSF-A, and stations were measured uphole until 2120 h, when fog impacted visibility and the ability to monitor for protected species. After the VSI tool was brought back on board and broken down, the FMS-sonic tool string was assembled and deployed. The FMS-sonic tool string was run, and the tools were back on deck by 0345 h on 1 September. With logging completed, we tripped the pipe out of Hole U1603D, clearing the rig floor at 0900 h and ending Hole U1603D.
An APC/XCB BHA was made up, and we began tripping the drill pipe back to the seafloor at 1200 h. The vessel was offset 10 m northwest in DP mode, and the pipe was pumped with a cleanout tool while the tracer pumps were running. Hole U1603E was spudded at 1745 h on 1 September, and Core 1H recovered 6.94 m. Core 2H advanced to 16.4 m and recovered 9.75 m (103%). Cores 3H–6H each advanced 9.5 m but recovered almost no material (less than 20 cm each). The deplugger was run in the pipe. Core 7F advanced from 54.4 to 59.1 m CSF-A and recovered 0.31 m (7%). Following Core 7F, we decided to abandon Hole U1603E because of lack of recovery, and the drill string was tripped out, clearing the seafloor at 0140 h on 2 September.
The vessel was offset 10 m southeast of Hole U1603A to hopefully improve recovery and allow for better correlation with other holes. Hole U1603F was spudded at 0235 h on 2 September. Cores 1H–5H advanced from 0 to 44.0 m CSF-A and recovered 45.49 m (103%). Core 6F (44.0–48.80 m CSF-A; 4.73 m recovered) was cored with the HLAPC system to help adjust core spacing to cover gaps in Hole U1603A. Cores 7H–15H advanced from 48.8 to 134.3 m CSF-A and recovered 66.71 m (78%). The APCT-3 tool was run on Cores 4H and 10H. We then began pulling the drill string out of the hole, clearing the seafloor at 1935 h. The drill string was tripped up, with the bit at the surface at 0030 h. The drill floor was secured for transit, and the thrusters were raised and secured for transit at 0145 h, ending Hole U1603F and Site U1603.
4.1.3. Principal results
4.1.3.1. Lithostratigraphy
Site U1603 consists of six overlapping holes (U1603A–U1603F) cored to a total depth of 422 m CSF-A. Based on 243.6 m of recovered sediment, the 422 m thick section is divided into four lithostratigraphic units. Named lithofacies are sedimentary; are present in all four units with variable predominance; and include mud, calcareous mud, interlaminated to interbedded mud and sand, sandy mud with common clasts, and diamicton (Figure F8).
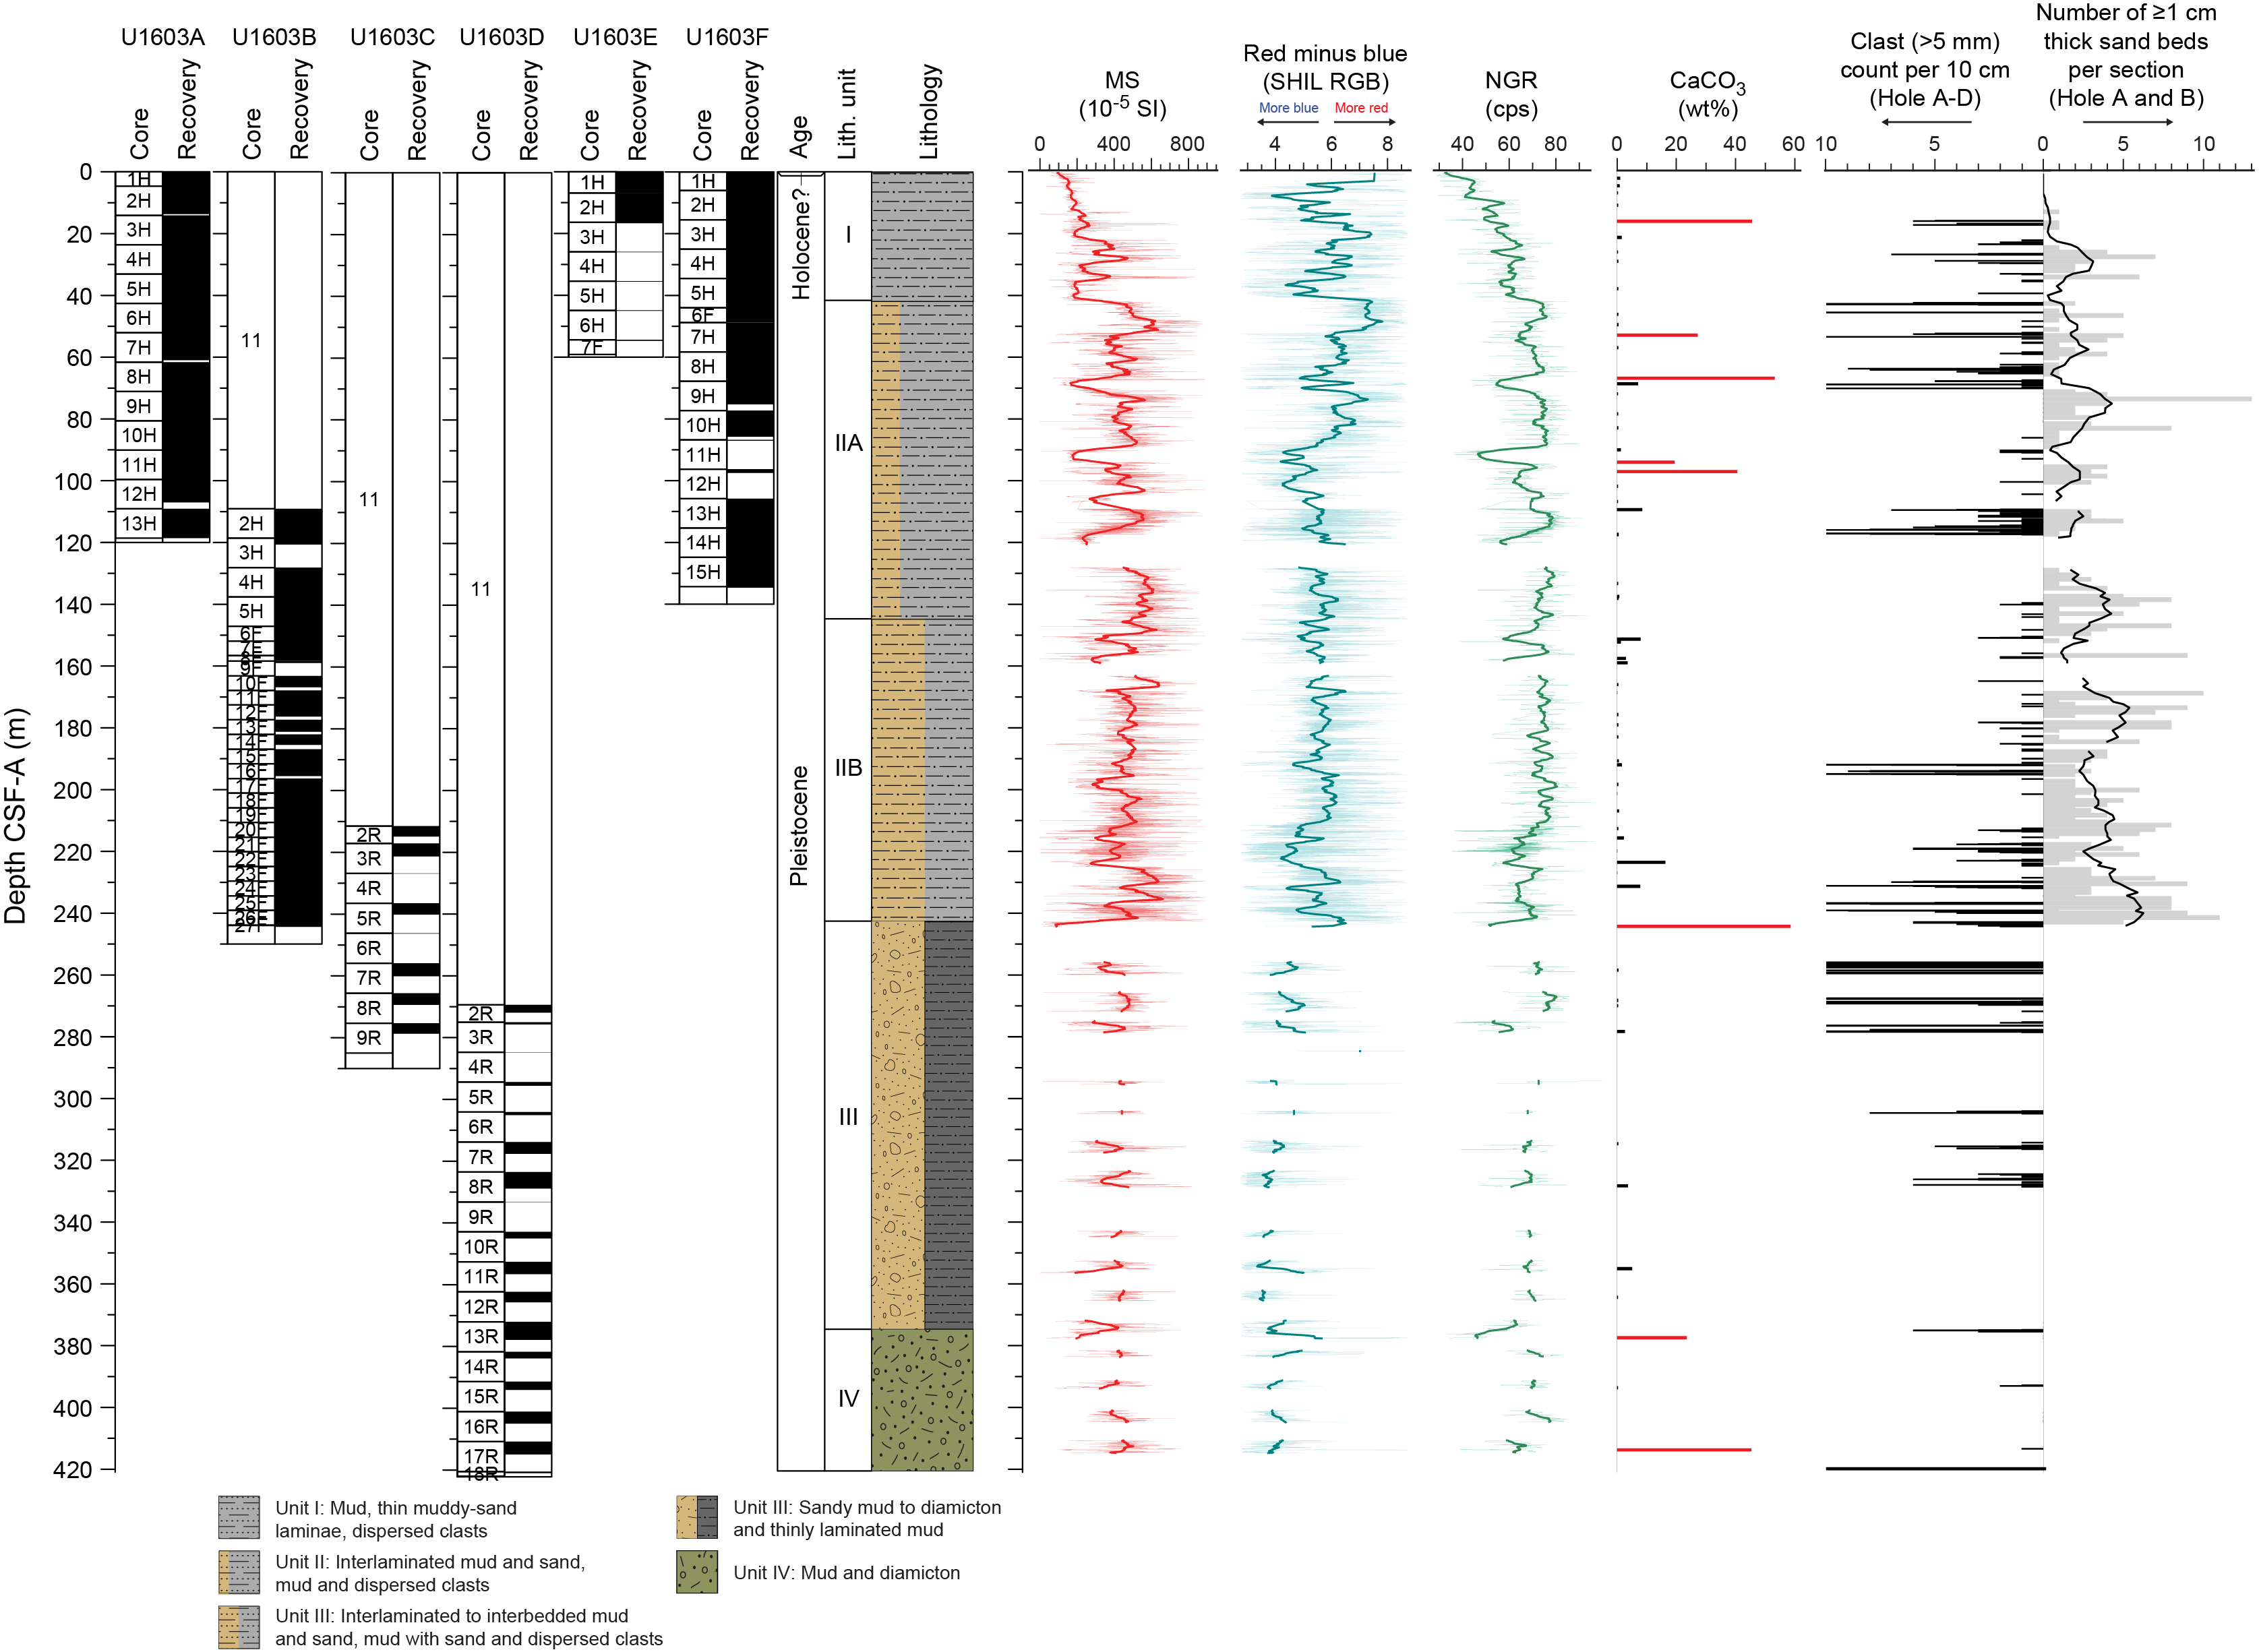
Figure F8. Lithostratigraphic summary, Site U1603.
Sediments recovered are consistent with the site location at the base of the continental slope proximal to a glaciated margin and deposited during the Early to Late Pleistocene. The deposits from 0 to ~243 m CSF-A (Lithostratigraphic Units I and II) are consistent with downslope and along-slope sedimentation on a channel levee system with high sedimentation rates (~28 cm/ky). The uppermost ~42 m (Unit I) consists of mud with irregular sand laminae and dispersed clasts. A thick sequence of interlaminated to interbedded mud and sand is predominant between ~42 and 243 m CSF-A (Unit II) and is divided into two subunits distinguished by laminae/bed thickness, proportion of mud versus sand, and clast occurrence. Subunit IIA (42–145 m CSF-A) consists of finer laminae, thinner sand beds, and a lower proportion of sand, whereas Subunit IIB (~145–243 m CSF-A) has thicker laminae and beds, a higher proportion of sand, and a relatively higher clast abundance. From 243 to 374 m CSF-A (Unit III), weakly stratified mud lithologies are dominant, sand lithofacies are rare, and clast occurrence increases significantly. In the lowermost ~46 m of Hole U1603D (Unit IV; 374–422 m CSF-A), weakly stratified muds similar in character to Unit III are present, but this unit also contains an interval of calcareous mud and various types of soft-sediment deformation that are absent in Unit III.
4.1.3.2. Micropaleontology
Core catcher samples from Holes U1603A–U1603D, together with additional samples from split sections, were examined for foraminifera, diatoms, dinocysts, and other palynomorphs. The additional samples examined for all microfossil groups were taken within cores where variations in lithology were observed. Sampling targets included intervals of massive muds, bioturbation, and muds with dispersed clasts that coincided with low natural gamma radiation (NGR) values, as well as carbonate-rich intervals. Mudline samples from Holes U1603A and U1603F were also examined. Cores from Holes U1603E and U1603F, which include a second copy of the uppermost ~130 m of the cored section, were not examined. Observations of foraminifera from palynomorph and diatom slide preparations were integrated in the overall foraminifera evaluations. Calcareous nannofossils were observed in smear slides by the sedimentology team in one core catcher sample and two diatom slides. A cursory examination of these was attempted but requires further study by a nannofossil specialist.
The muds and interlaminated sands and muds typical of Site U1603 are generally barren of diatoms and foraminifera. Where foraminifera appear, including planktonic and benthic species, they remain as trace to rare occurrences, except for two distinct intervals in Cores 400-U1603A-8H and 400-U1603D-13R where the planktonic foraminifera species Neogloboquadrina pachyderma is common to abundant. Diatoms were found in about 6% of all samples examined, with trace to rare amounts of specimens and species. Palynomorph preparations revealed persistent contributions of phytoclasts and reworked terrestrial pollen and spores. The observed microfossil specimens and assemblages for all groups are typical of cold-water polar environments, and in situ dinocyst species are typical of coastal or neritic environments. Observed specimens and assemblages are broadly consistent with a Pleistocene and younger age. The observed planktonic and benthic foraminifera species have long stratigraphic ranges and provide limited age control; however, the observed dinocysts are of Pleistocene and younger age. More detailed analysis of calcareous nannofossils may provide future constraints and a test of the paleomagnetic reversal interpretations and provisional age model.
One Hole U1603A mudline sample was collected for sedimentary ancient DNA (sedaDNA) analysis. A total of 60 additional samples for sedaDNA analysis were collected: 9 samples from Hole U1603E and 51 samples from Hole U1603F. Catwalk samples were generally taken at the bottom of Sections 1, 3, and 5 (if the section was available and the section bottom was undisturbed). Additional samples were collected from the working half of split sections, targeting massive mud layers characterized by low values of NGR and MS. All samples were immediately stored at −86°C. To assess the potential for contamination during coring and the sectioning of cores on the catwalk, a perfluorocarbon tracer was added to the drilling fluid. The majority of samples have a contamination level close to or below detection limit.
4.1.3.3. Paleomagnetism
Pass-through paleomagnetic measurements from Site U1603 were performed to investigate the natural remanent magnetization (NRM) in a total of 313 archive section halves. Measurements were not made on 16 archive section halves that had highly disturbed sediments, and no pass-through measurements were made on core catcher samples. All measurements on section halves were made at 2 cm intervals; we measured the initial magnetization and the magnetization following stepwise peak alternating field (AF) demagnetizations at 5, 10, 15, and 20 mT. Inclinations from filtered data imply that periods of both normal and reversed polarity were recovered at Site U1603. Most inclination magnitudes fall under expected values for the latitude of Site U1603 during normal (positive inclinations) and reversed (negative inclinations) polarities.
A total of 188 discrete cube samples were taken from the working section halves from Holes U1603A–U1603D. Generally, we collected one sample per section, avoiding visually disturbed intervals. We measured 54 samples on the AGICO JR-6A spinner magnetometer and 146 samples on the superconducting rock magnetometer (SRM). Some samples were measured on both instruments to ensure cross-calibration. Anhysteretic remanent magnetization (ARM) was also measured on a subset of 45 discrete samples from Holes U1603A and U1603B. These measurements were compared with bulk MS. The relationship between ARM and MS is quasilinear, which suggests that the concentration of magnetic minerals is the primary control on both measurements and supports the use of normalized remanence for estimating relative paleointensity (RPI).
4.1.3.4. Physical properties
Physical property data were acquired on all cores from Holes U1603A–U1603D using the Whole-Round Multisensor Logger (WRMSL) for wet bulk density from gamma ray attenuation (GRA), MS, and P-wave velocity (P-wave logger [PWL]). We also measured NGR in all sections longer than 50 cm. Thermal conductivity was measured in one whole-round section per core when possible. However, it was measured on one working section half per core if the sediment was too hard or the whole-round measurement readings were unreliable. For Holes U1603E and U1603F, only NGR and low-resolution (5 cm) MS were logged for stratigraphic correlation purposes. They were also sampled for sedaDNA; thus, the GRA source was kept inactive during WRMSL logging to avoid possible effects on the DNA.
After the whole rounds were split into halves, we acquired X-ray imaging on the archive halves of every core. The Section Half Multisensor Logger (SHMSL) was used to measure point MS and color reflectance using the L*a*b* color system as well as the red-green-blue (RGB) color space of the sediments with digital color imaging. In addition, we determined P-wave velocities at discrete points on the working section halves of almost all cores from Site U1603. In general, we measured discrete P-wave velocity in three sections per core for APC cores and two sections per core for HLAPC and rotary core barrel (RCB) cores. However, P-wave caliper (PWC) measurements of velocity were made in all sections from Holes U1603E and U1603F to compensate for the lack of PWL measurements. The measurement interval within each section was changed to accommodate lithologic variations. Two moisture and density (MAD) samples per core were taken and processed for Holes U1603A–U1603D to obtain discrete wet bulk density, dry bulk density, grain density, and porosity.
Prominent variations in physical property values occur at similar depths in NGR, density, and MS and are associated with major lithologic changes in the cores. More uniform lithologies are reflected by more monotonous physical property signals. The correlation between these physical properties distinguishes four physical properties (PP) units (I–IV) at Site U1603. In PP Unit I (0–20 m CSF-A), NGR, density, and MS all increase gradually downhole through the unit, which simultaneously transitions from mud to interlaminated mud with thin sandy beds. PP Unit II (20–160 m CSF-A) is characterized by high-amplitude variability in NGR, density, and MS. The lithology of PP Unit II is widely variable; mud intervals correspond to low values of NGR, density, and MS, whereas intervals of interbedded mud with abundant sand layers have high NGR, density, and MS values. In PP Unit III (160–215 m CSF-A), NGR is relatively constant whereas MS and density decrease slightly downhole in the unit. The low variability of these physical properties in PP Unit III occurs in a sand-dominated lithology, and minimum MS values in the unit correlate to interbedded thin layers of mud. PP Unit IV (215–422 m CSF-A) is placed within a transition from primarily diamicton to primarily mud and sandy mud with small intervals of diamicton. High-amplitude variability of NGR, density, and MS is likely related to this lithologic transition.
4.1.3.5. Geochemistry
Samples for headspace gas, interstitial water (IW) chemistry, and bulk sediment geochemistry were analyzed for Site U1603. Headspace hydrocarbon gas measurements show low concentrations in the uppermost 150 m and higher concentrations of methane, with a low yet consistent presence of ethane, in sediments below 150 m CSF-A. A key observation from IW analysis is a decrease in lithium and potassium with depth, possibly suggesting clay formation. A monotonic decrease in sulfate with depth to a minimum at around 150 m CSF-A may provide evidence for a sulfate–methane transition zone (SMTZ). IW iron, manganese, and phosphate show elevated concentrations near the seafloor and sharp decreases to low concentrations with depth. Increases in IW calcium and alkalinity in the shallower depths may indicate dissolution of calcium carbonate (CaCO3) minerals. Elemental analysis of solid material revealed overall low concentrations of carbon and nitrogen across most intervals, although individual layers were rich in CaCO3 with contents of up to 60%.
4.1.3.6. Stratigraphic correlation
The physical property records for Site U1603 were compared and correlated where possible to establish a common depth scale. To minimize coring gap alignment, sequences from Holes U1603A–U1603D were examined using whole-round MS (2 cm resolution; WRMSL) and NGR (10 cm resolution; all holes) data. In addition, NGR and MS (5 cm resolution) data were measured on sections from Holes U1603E and U1603F and examined in near–real time to ensure adequate coring depths to fill the gaps in Hole U1603A. Because triple APC offset coring was abandoned in favor of reaching the total depth at Site U1603, the splice could only provide partial stratigraphic coverage. The difficulty was further magnified by low recovery rates below 105 m CSF-A. Thus, Holes U1603A–U1603D were correlated to each other, but they were mostly aligned by the seafloor. Although it is still not possible to build a complete core composite depth below seafloor, Method D (CCSF-D), depth scale for Site U1603, the high recovery and core alignment between Holes U1603A, U1603E, and U1603F allow for the construction of a pseudo-splice to 98.9 m CCSF-D.
4.1.3.7. Age model
The age model for Site U1603 is largely based on magnetostratigraphic interpretations from Holes U1603A–U1603D. From the seafloor to ~194 m CSF-A, sediment is characterized by normal polarity (Zone N1) and is interpreted to be the Brunhes Chron (C1n; 0–0.773 Ma; Ogg, 2020). At ~194 m CSF-A, a transition to reversed polarity likely represents the Brunhes/Matuyama boundary. We also observe a shallowing in inclinations in the lower part of Core 400-U1603A-1H that likely represents the Laschamp excursion. Between the Laschamp excursion and the bottom of the Brunhes Chron, we estimate an average sediment accumulation rate of ~25 cm/ky. The normal polarity interval below ~327 m CSF-A in Hole U1603D is not well constrained because of gaps in recovery and drilling disturbance; however, it may be interpreted as the Jaramillo Subcron (C1r.1n; 0.99 Ma; Ogg, 2020). The coarse biostratigraphic constraints provided by dinocysts and sporadic foraminifera and diatom occurrences are consistent with this interpretation of the magnetostratigraphy.
4.1.3.8. Downhole measurements
Downhole logging was carried out in Hole U1603D. The quad combo tool string was deployed with the Magnetic Susceptibility Sonde (MSS), natural gamma ray, electrical laterolog resistivity, acoustic velocity, and density tools. Upon completion of the downhole logging with the quad combo tool string, vertical seismic profiling was attempted with the VSI. The goal was to obtain an accurate time-depth relationship to tie the logging and coring results to the seismic data. A total of 15 stations were planned for the geophones to record seismic images of the hole; however, a decrease in visibility due to fog resulted in terminating the VSI experiment after 10 stations were attempted. The coupling between the geophone and the hole failed at three of the stations. The FMS was run with the Dipole Sonic Imager (DSI) to obtain formation resistivity and velocity data for calibration/comparison with the velocities obtained using the quad combo tool string. Velocity data from the processed sonic obtained with the quad combo were used in the core-log-seismic correlation of this site. Logging measurements were crucial for covering recovery gaps during RCB coring. The downhole natural gamma ray and density logs have features in common with the equivalent laboratory data from Site U1603 with small offsets between log and core data because of the assignment of core depths when core recovery was not 100% and other effects. Additionally, the APCT-3 was deployed four times in Hole U1603A and two times in Hole U1603F, and formation measurements were used to derive a local geothermal gradient and heat flux.
4.2. Site U1604
4.2.1. Background and objectives
Site U1604 (proposed Site MB-02C) is located 16 km northwest of Site U1603 on the lower slope below the Melville Bugt TMF at 1943.6 mbsl at 73°06.9077′N, 63°47.3996′W (Figure F9) (see Background and objectives in the Site U1604 chapter [Knutz et al., 2025b]). The site targeted a high-resolution sediment drift sequence hypothesized to represent interactions between bottom contour currents and sediments supplied by NGrIS fluctuations from the early Pleistocene (up to 1 Ma) to present. The targeted sequence includes Seismic Units 8–11, especially focusing on an expanded interval of Seismic Unit 8, compared to Site U1603. Seismic Units 8–11 represent the most recent stages in the developmental history of the TMF. This site overlaps stratigraphically with the strata drilled at Site U1603. Accordingly, the two deepwater sites share similar objectives. With a deeper stratigraphic target, Site U1604 is particularly relevant for testing the hypothesis that the NGrIS underwent significant deglaciation at intervals within the frequency range of orbital eccentricity (~100–400 ky) and assessing recent models for the change in orbital cycles through the MPT.
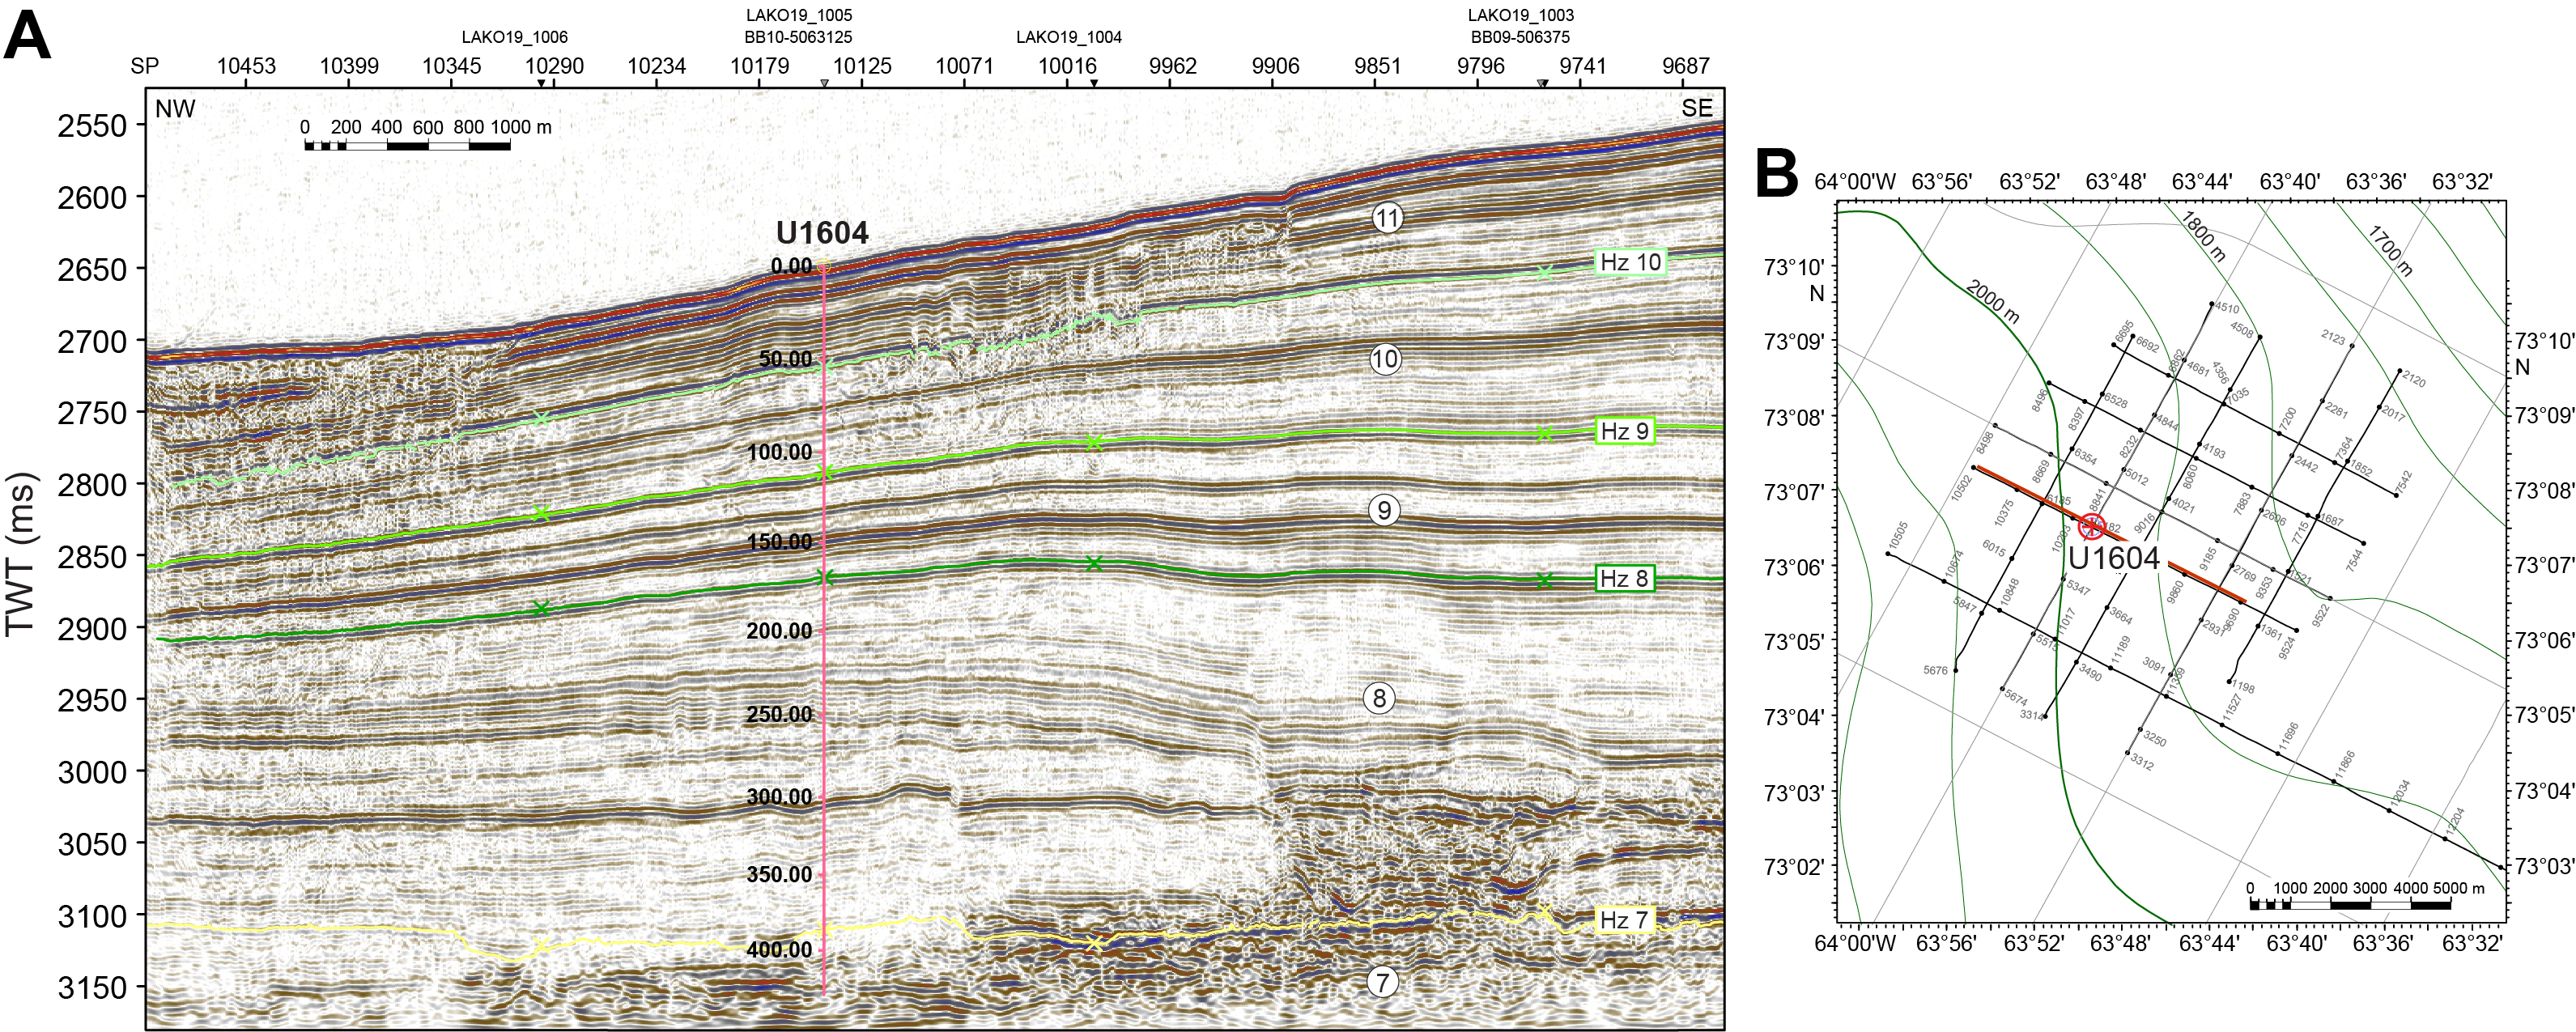
Figure F9. Seismic profile and close-up bathymetry map, Site U1604.
Coring was planned in two holes with a target depth to 432 m CSF-A in both holes using the APC/HLAPC and XCB coring systems. Downhole logging with the triple combo tool string, VSI, and FMS was planned for the second hole.
4.2.2. Operations
The vessel transited 16 nmi from Site U1603 to Site U1604, arriving on location at 0306 h on 3 September 2023. The thrusters were lowered and secured at 0324 h, and the ship was fully in DP mode at 0337 h. The rig crew made up an APC/XCB BHA and began tripping the drill pipe. Hole U1604A was spudded at 1020 h, and Core 1H recovered 2.04 m. The seafloor was calculated as 1942.2 mbsl. Cores 1H–26H advanced from 0 to 206.8 m CSF-A and recovered 195.34 m (96%). Temperature measurements were made on Cores 4H, 7H, 10H, and 13H.
We switched to the HLAPC coring system; however, Core 400-U1604A-27F only recovered 2.81 m after a partial stroke. We then switched to the XCB coring system, and Cores 28X–30X advanced from 209.6 to 233.0 m CSF-A and recovered 23.71 m (103%). At 1930 h on 4 September, ice moved within 3 nmi of the vessel, and we raised the drill string to 16.2 m CSF-A by 2045 h and began waiting on ice. By 2300 h, the ice had moved a sufficient distance away from the vessel and we began to lower the drill string back into Hole U1604A.
The drill string was lowered into Hole U1604A and washed back to 233.0 m CSF-A by 0100 on 5 September. Cores 31X and 32X advanced from 233.0 to 250.6 m CSF-A and recovered 11.05 m (63%). At 0430 h, ice moved within 3 nmi of the vessel, and we raised the drill string to 16.7 m CSF-A by 0545 h and began waiting on ice. Ice then entered the 1 nmi exclusion zone, and we raised the drill string, clearing the seafloor at 0715 h and ending Hole U1604A. The vessel was moved 700 m north and then 700 m west to maintain a safe distance from the ice.
By 1600 h on 5 September, we began to move back toward the site, and the vessel was in position over Hole U1604B (20 m northeast of Hole U1604A) by 1630 h. Hole U1604B was spudded at 1755 h, and the seafloor was established as 1943.6 mbsl. Cores 1H–14H advanced from 0 to 105.3 m CSF-A and recovered 98.14 m (93%). However, Core 14H only recovered 0.16 m of material. An XCB core barrel was dropped, and Core 15X advanced from 105.3 to 105.5 m CSF-A and recovered 0.22 m of hard material. We then switched back to APC coring, and Cores 16H–22H advanced from 105.5 to 163.1 m CSF-A and recovered 59.68 m (103%). Cores 21H and 22H were only partial strokes, so we switched to the HLAPC system for Core 23F, which advanced from 163.1 to 167.9 m CSF-A and recovered 4.78 m (100%). We switched back to APC coring, and Cores 24H–30H advanced from 167.9 to 216.8 m CSF-A and recovered 49.87 m (102%). We then switched to the HLAPC coring system, and Cores 31F–35F advanced from 216.8 to 237.6 m CSF-A and recovered 16.89 m (83%). With ice still in the general area, we decided to install a FFF to allow us to complete coring and logging of the site in Hole U1604B. The FFF was deployed at 1530 h on 7 September, and by 1630 h we resumed coring Hole U1604B. Cores 36X–55X advanced from 237.6 to 429.6 m CSF-A and recovered 88.25 m (46%).
Sepiolite (drilling mud) was swept in the hole, and heavy barite mud was added in preparation for logging Hole U1604B. The drill string was tripped up, and the end of pipe was set at 58.7 m CSF-A. The quad combo tool string was rigged up by 0100 h on 9 September and deployed to the base of Hole U1604B. Following a complete pass of the hole, the quad combo was pulled to the rig floor and broken down. The FMS was then assembled and deployed at 0640 h. The FMS was run, and the tools were back on deck by 1200 h. With logging completed, we tripped the pipe out of Hole U1604B, clearing the rig floor at 1720 h. The drill floor was secured for transit, and the thrusters were raised and secured for transit at 1824 h, ending Hole U1604B and Site U1604.
4.2.3. Principal results
4.2.3.1. Lithostratigraphy
The sediments recovered at Site U1604 are divided into three lithostratigraphic units with named sedimentary lithofacies including massive mud, weakly stratified mud, calcareous mud, thinly laminated mud, interlaminated sand and mud, and gravel-bearing sediment (Figure F10). Lithostratigraphic Unit I comprises the uppermost ~210 m of this site, and all lithofacies are present in various proportions. Lithostratigraphic Unit I is divided into Subunits IA and IB. Subunit IA is ~110 m thick and contains massive mud, weakly stratified mud, and laminated mud lithofacies with interbeds of calcareous mud and gravel-bearing sediment. Subunit IB has a larger proportion of interlaminated sand and mud and has relatively fewer outsized clasts (>2 mm diameter). Unit II is dominated by laminated mud and diamicton, often occurring as decimeter-scale interbeds. The laminated mud lithofacies continues to be characteristic downhole into Unit III, which is characterized by a significant reduction in sand laminae and gravel-bearing sediment compared to Unit II. Overall, the sedimentary succession recovered at Site U1604 is consistent with a glaciated continental slope environment with inputs from a combination of hemipelagic, contour current, and rare downslope processes and likely ice rafting (providing granule- to boulder-sized clasts) and plumites.
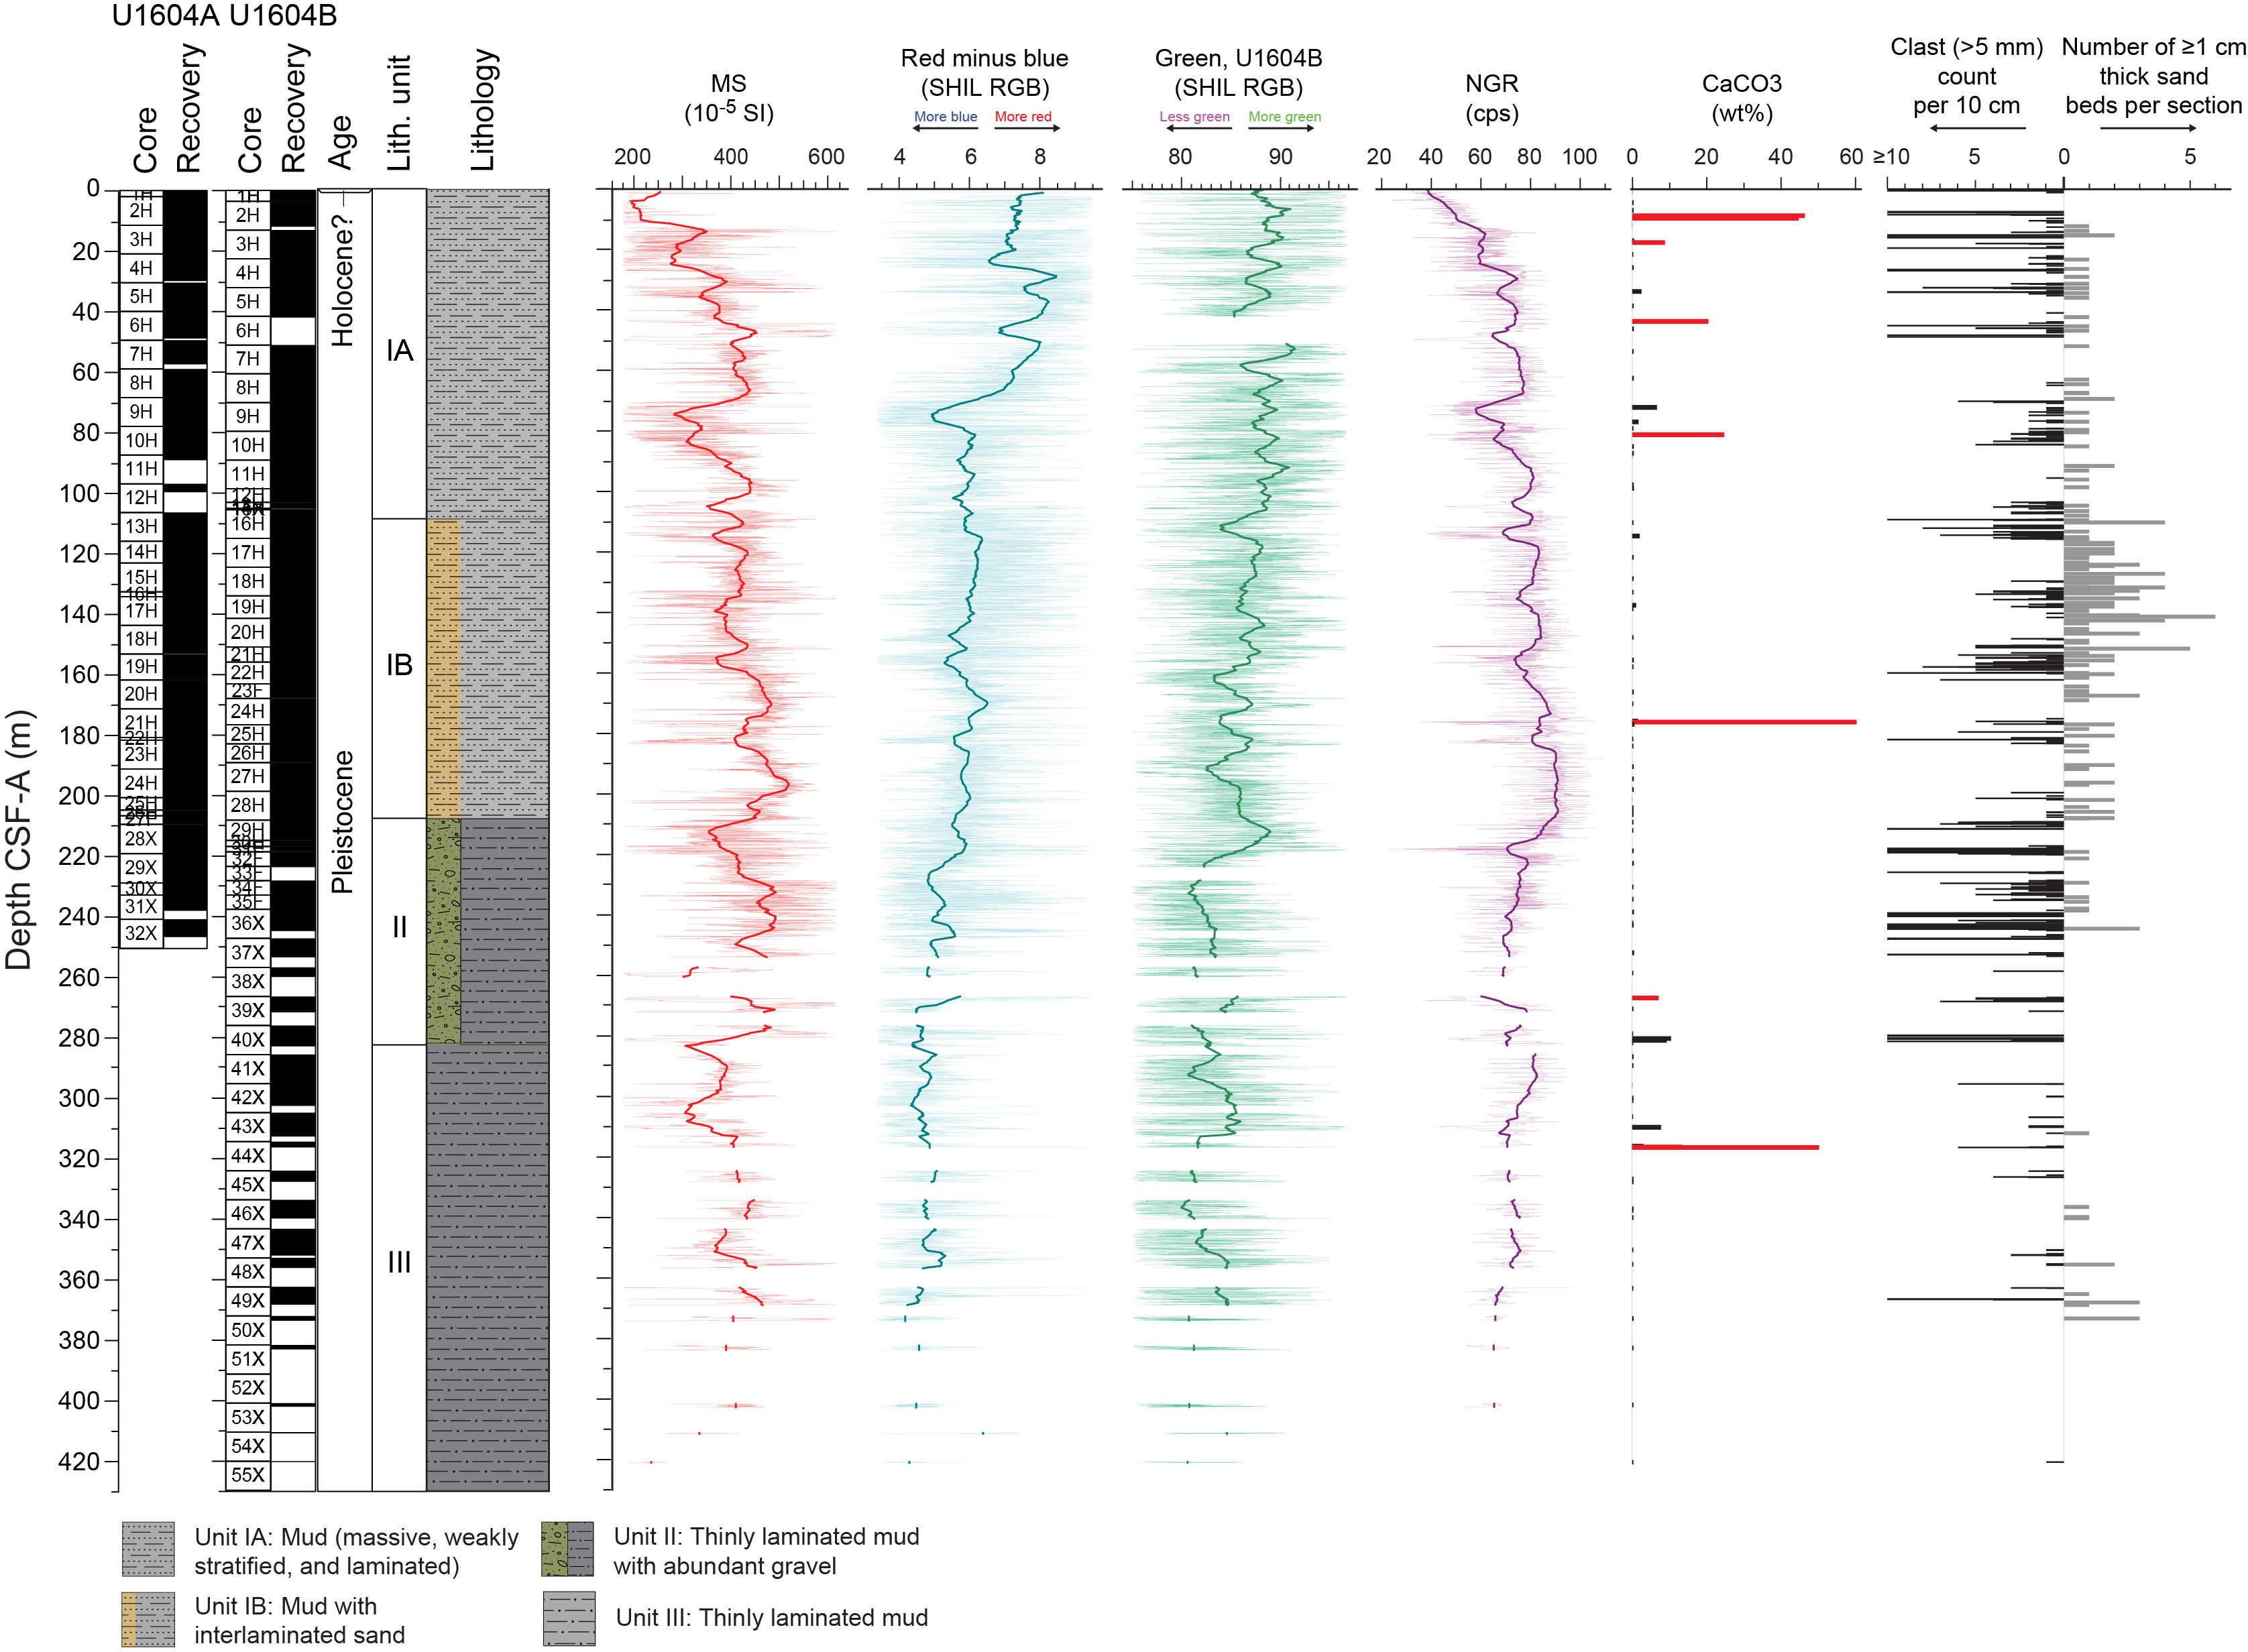
Figure F10. Lithostratigraphic summary, Site U1604.
4.2.3.2. Micropaleontology
Core catcher samples and additional split core samples from the 32 cores from Hole U1604A and 21 of the cores from Hole U1604B were examined for foraminifera, diatoms, dinocysts, and other palynomorphs. A special sampling scheme involving catwalk samples from section ends and freshly split cores was adopted to provide uncontaminated samples for sedaDNA from the APC/HLAPC cores from Hole U1604B (through Core 35F). Core catcher samples were not collected from the upper 35 cores from Hole U1604B because they represent a copy of the uppermost ~240 m of material cored in Hole U1604A. The additional samples were taken within intervals of muds and muds with dispersed clasts, avoiding interlaminated mud and sand lithologies. Mudline samples from Hole U1604A were also examined for microfossils. Observations of foraminifera from palynomorph and diatom slide preparations were integrated in the overall foraminifera evaluations. The muds and interlaminated sands and muds typical of Site U1604 are generally barren of microfossils, apart from dinocysts, which are present but scarce throughout the site, and occasional horizons where rare to few microfossils are found among the clast-rich lithologies. Where foraminifera appear, they remain as trace to rare occurrences, except in a few discrete intervals where they are rare to common in >63 µm residues. Juvenile foraminifera were observed in diatom 10 µm sieved preparations. Diatoms were found in ~5% of all samples examined, with specimens presenting as fragments or few individuals. Palynomorph preparations revealed generally low abundances of in situ dinocysts and varying abundances of reworked terrestrial and marine palynomorphs. The observed microfossil specimens and assemblages for all groups are broadly consistent with a Pleistocene age. The observed taxa have long stratigraphic ranges and thus provide limited age control. Specimens and assemblages of all groups are typical of cold-water polar environments.
4.2.3.3. Paleomagnetism
Pass-through paleomagnetic measurements for Site U1604 were performed using the SRM to investigate the NRM on a total of 389 archive section halves (157 sections from Hole U1604A and 91 from Hole U1604B). Measurements were not made on archive section halves that had highly disturbed sediments or on core catcher sections. All measurements on section halves were made at 2 cm intervals up to a peak AF demagnetization of 20 mT. A total of 248 discrete cube samples were taken from the working section halves. Discrete samples were measured on the SRM or the JR-6A spinner magnetometer. Generally, one sample per core section was collected, avoiding visually disturbed intervals and filling in gaps where the other hole did not have recovery. ARM was measured on a subset of 29 discrete samples from Hole U1604A. This subset of samples was demagnetized to 100 mT on all three axes prior to measuring the remanence. An ARM was imparted with a peak 100 mT AF and 50 µT direct current (DC) field, and the remanence was measured. Comparison of the ARM with volume-normalized bulk MS shows a quasilinear relationship between ARM and MS, suggesting that the concentration of magnetic minerals is the primary control on both measurements and supporting the use of normalized remanence for estimating RPI.
4.2.3.4. Physical properties
Physical property data were acquired on all cores from Holes U1604A and U1604B using the WRMSL for wet bulk density from GRA, MS, and P-wave velocity (PWL). We also measured NGR in all sections longer than 50 cm. Thermal conductivity was measured in one whole-round section per core when possible from Hole U1604A and below 250 m CSF-A in Hole U1604B. Thermal conductivity was measured on the working section halves if the sediment was too hard or the whole-round measurement readings were unreliable. In the uppermost 250 m of Hole U1604B, only NGR and low-resolution MS were logged. Cores 1H–35F constitute a replica of Hole U1604A, so equilibration to room temperature and GRA measurements were avoided in the interest of stratigraphic correlation and sedaDNA sampling. Thus, PWL measurements were not made and the GRA source was kept inactive during WRMSL logging.
Prominent variations in physical property values occur at similar depths in NGR, density, and MS and are associated with major lithologic changes in the cores. More uniform lithologies are reflected by more monotonous physical property signals. The correlation between these physical properties distinguishes the four PP units (I–IV) at Site U1604. PP Unit I (0–13 m CSF-A) is distinguished by increases in NGR, density, and MS that may be related to a decrease in water content below the mudline. Below, in PP Unit II (13–90 m CSF-A), high-amplitude variability in NGR, density, and MS reflects broad variability in the lithology. Low values of NGR, density, and MS correlate with mud intervals, whereas intervals of interbedded mud and sand have higher NGR, density, and MS values. In PP Unit III (90–210 m CSF-A), NGR, MS, and density increase slightly downhole within the unit. The low variability of these physical properties in PP Unit III is within a sand-dominated lithology, and minimum MS and NGR values in the unit correlate to intervals of mud. PP Unit IV (210–420 m CSF-A) is defined by low-amplitude variability of NGR, MS, and density, which all slightly decrease downhole within the unit, corresponding to a lithologic transition from mud to sand layers interbedded with diamicton.
4.2.3.5. Geochemistry
Samples for headspace gas, IW chemistry, and bulk sediment geochemistry were analyzed for Site U1604. Headspace hydrocarbon gas concentrations are low in the uppermost 200 m, and higher concentrations of methane, with a low yet consistent presence of ethane, are present in sediment below 200 m CSF-A. The main findings from IW analysis include decreases in lithium and potassium with depth. A monotonic decrease in sulfate with depth to a minimum at ~200 m CSF-A provides evidence for a SMTZ. IW iron, manganese, and phosphate concentrations are elevated near the seafloor and sharply decrease to low concentrations with depth (below ~20 m CSF-A). Increases in IW calcium and alkalinity in the uppermost ~25 m may indicate dissolution of CaCO3 minerals. Elemental analysis of solid material revealed overall low concentrations of carbon and nitrogen across most intervals, although individual layers were rich in CaCO3 with contents of up to 60%.
4.2.3.6. Stratigraphic correlation
Sequences from Hole U1604A were examined using NGR data measured at 10 cm intervals and whole-round MS measured at a 2 cm resolution with the WRMSL. In addition, 10 cm interval NGR data and 5 cm resolution MS data were measured on sections from Hole U1604B and examined in near–real time to ensure adequate coring depths to fill the gaps in Hole U1604A. Because triple APC offset coring was not planned at Site U1604, a splice for this site was not completed. Recovery gaps commonly overlap between Holes U1604A and U1604B. The difficulty was further magnified by deformation related to XCB coring. Thus, Holes U1604A and U1604B were correlated to the extent possible, but they were mostly aligned based on the mudline.
The top of Hole U1604A (which preserved a mudline) served as the anchor (zero depth point) for the generation of the CCSF, Method A (CCSF-A), depth scale at this site. From this reference, the relative core depths were determined by establishing depth offsets, or affine ties, between cores from the two holes based on optimized correlation of WRMSL-derived MS and NGR data. The upper part of the sequence is tied through Cores 400-U1604A-1H through 400-U1604B-2H, Cores 400-U1604A-3H through 400-U1604A-6H, and Cores 400-U1604A-7H through 400-U1604B-10H. The cores below are placed on a relative depth to each other. Core disturbances, shattered core liners, and other issues impacting core quality mean that the stratigraphic coherence of the recovered sequence is variable. Below 223 m CSF-A in Hole U1604A, NGR and MS are less coherent, which makes the stratigraphic correlation of the lowermost overlapping section dubious. In summary, it is not possible to build a complete CCSF-A depth scale for Site U1604. The high recovery and core alignment between Holes U1604A and U1604B allow for the construction of a preliminary CCSF-A depth scale, but the gaps between cores are unknown. Downhole logging data were used to improve the depth accuracy of these cores.
4.2.3.7. Age model
The age model for Site U1604 is based on magnetostratigraphic interpretations of Holes U1604A and U1604B. The uppermost ~138 m of sediment is characterized by normal polarity (Zone N1) and is interpreted to be the Brunhes Chron (C1n; 0–0.773 Ma; Ogg, 2020). From this identification, we estimate an average sediment accumulation rate of ~17 cm/ky during the Brunhes Chron. In addition, within the Brunhes Chron there are a number of decreases in relative paleointensity (DIPs). DIPs are calculated from the normalized remanence (NRM20mT) divided by MS. Seven well-defined DIPs in the Site U1604 RPI record correlate well with the Paleomagnetic Dipole Moment for the last 2 My (PADM2M) constructed by Ziegler et al. (2011). Using the PADM2M tie points, it is possible to predict where the MISs of the LR04 stack of Lisiecki and Raymo (2005) are at Site U1604.
The age model below ~138 m CSF-A is based on the inclinations. The normal polarity zone below 247.5 m CSF-A in Hole U1604B (Zone N2) is not well constrained because of gaps in recovery and drilling disturbance. However, the best supported identification of this reversal is with the Jaramillo Subchron (C1r.1n; 0.99 Ma; Ogg, 2020). If this scenario is correct, the average sediment accumulation rate from the base of the Brunhes/Matuyama boundary to the top of the Jaramillo is 34 cm/ky. From the paleomagnetic constraints described above, a preliminary age-depth model is constructed where the sediment accumulation rates are 17 cm/ky for the Brunhes Chron interval and 34 cm/ky below. The coarse biostratigraphic constraints provided by dinocysts and sporadic foraminifera and diatom occurrences in Holes U1604A and U1604B are consistent with this interpretation of the magnetostratigraphy.
4.2.3.8. Downhole measurements
Downhole logging was carried out in Hole U1604B upon completion of the coring operations. A quad combo tool string was deployed with the MSS, natural gamma ray, electrical laterolog resistivity, acoustic velocity, and density tools. Three runs (down pass, repeat pass, and main pass) were carried out, covering almost the full length of the open hole below the pipe (to 427.6 mbsf; 2 m above the bottom of the hole). The repeat (or calibration run) logged the deepest 100 m of the hole. The caliper showed a relatively stable hole with frequent washouts, and the instruments yielded reliable measurements that were used in the core-log-seismic correlation for this site.
Upon completion of downhole logging with the quad combo tool string, the FMS (without sonic) was lowered downhole. Three runs (a down pass and two up passes) were completed. On the down passes, only the gamma ray was measured because the caliper of the FMS was closed. The FMS resulted in a high-quality resistivity image of Hole U1604B.
Logging measurements were crucial for covering recovery gaps. Core logging and downhole logging results differ in absolute values, but the relative trends of the logs are comparable. Hence, logging data could be used for correlation purposes and for covering the formation recovery gaps with confidence. Velocity data from the sonic obtained with the quad combo were used in the core-log-seismic correlation for this site. Additionally, the APCT-3 tool was deployed four times in Hole U1604A.
4.3. Site U1605
4.3.1. Background and objectives
Site U1605 (proposed Site MB-31A) is located at 73°33.6421′N, 62°09.0687′W at 529 mbsl on the outer shelf of the northwest Greenland shelf margin (Figure F11) (see Background and objectives in the Site U1605 chapter [Knutz et al., 2025c]). Constrained by high-quality seismic data, the objective was to recover potential marine intervals within packages of horizontal, semicontinuous reflections that aggrade over glacial unconformities within the topset strata of the Melville Bugt TMF (Knutz et al., 2019). Site U1605 captures Seismic Units 7–10 with a target depth just below Seismic Horizon 6, corresponding to 282 m CSF-A (based on average P-wave velocity of 2200 m/s) (Figure F11). The sequence, considered to be mainly of early middle Pleistocene age, overlaps stratigraphically with deepwater Sites U1603 and U1604. The primary lithology was assumed to be compacted diamicton with intervals of sand and pebbly mud, representing marine to glaciomarine deposits, intersected by at least four glacial unconformities. The scientific objectives for drilling Site U1605 are complementary to deepwater Sites U1603 and U1604 but with an emphasis on testing the hypothesis that the NGrIS underwent significant deglaciation potentially related to exceptionally warm or prolonged super-interglacials (Schaefer et al., 2016; Christ et al., 2023). Additionally, multiproxy data from Site U1605 can be used to assess the regolith hypothesis for the change in orbital insolation frequency across the MPT (Clark and Pollard, 1998).
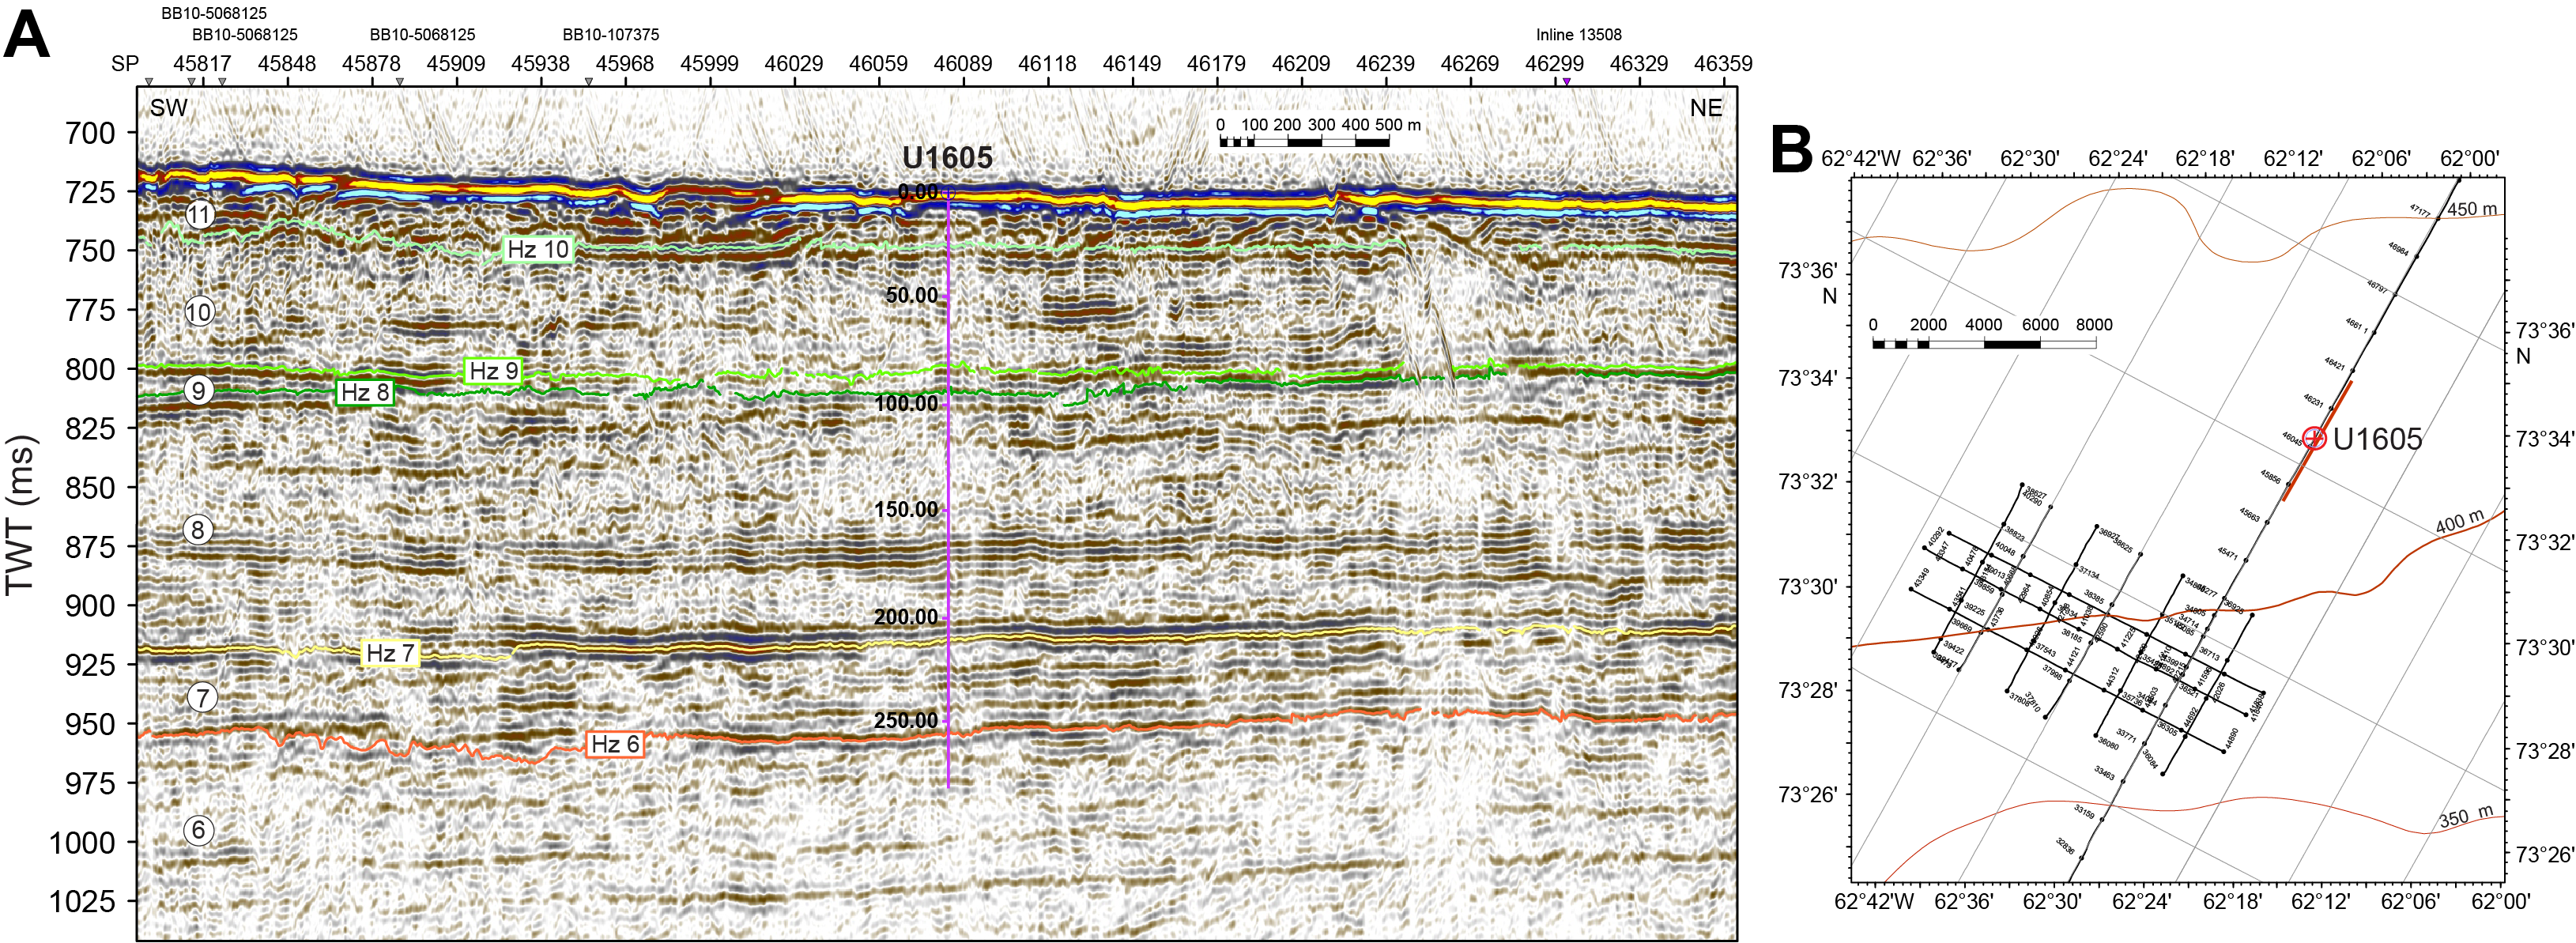
Figure F11. Seismic profile and close-up bathymetry map, Site U1605.
Coring was planned in two holes with a target depth of 282 m CSF-A. The first hole would be cored with the RCB system and then logged with the triple combo and FMS-sonic. The plan for the second hole was to drill ahead to 70 m CSF-A followed by APC/HLAPC/XCB coring to 282 m CSF-A.
4.3.2. Operations
The vessel transited 39 nmi from Site U1604 to Site U1605, arriving on location at 2200 h on 9 September 2023. After we observed that ice was a sufficient distance away from the vessel, the thrusters were lowered and secured at 2224 h and the ship was fully in DP mode at 2229 h. An RCB BHA was made up and tripped down. We initially attempted to spud Hole U1605A based on a water depth of 524.1 mbsl. Following a 3 m advance, the core barrel returned empty. The pipe was lowered, and Hole U1605A was spudded at 0340 h on 10 September and recovered 3.2 m from an 8.0 m advance. The seafloor was established as 528.66 mbsl. Cores 1R–47R advanced from 0 to 28.0 m CSF-A and recovered 38.45 m (13.6%). We then began pulling the drill string out of the hole, clearing the seafloor at 1535 h on 13 September. The drill string was tripped up with the bit at the surface at 1720 h. The drill floor was secured for transit, and the thrusters were raised and secured for transit at 1748 h, ending Hole U1605A and Site U1605. The rate of penetration at Site U1605 was highly variable (0.16–28.8 m/h) and averaged 4.56 m/h.
4.3.3. Principal results
4.3.3.1. Lithostratigraphy
Because of low recovery, reporting of lithostratigraphy and depositional history is limited at Site U1605. Magnetostratigraphy and biostratigraphy were restricted by discontinuous sampling and require further interpretation. The recovered sediment is tentatively interpreted to be Pleistocene based on seismic stratigraphic constraints.
The stratigraphy of Site U1605 is summarized as one lithostratigraphic unit comprising two subunits (IA and IB; younger to older) (Figure F12). Named sedimentary lithofacies include massive diamicton and stratified diamicton. A significant proportion of core recovered contains washed gravel (a form of core disturbance) with lithologies consistent with clasts present in the diamicton. Of the ~13% recovered, ~8% (~23 m cumulative) is diamicton, and the remaining ~5% is made up of washed gravel. Subunit IA contains the uppermost ~83 m and is composed of massive diamicton and gravel clasts (washed gravel) that are retained in the core barrel when finer unconsolidated sediment washed out during drilling. Subunit IB extends from 83 to 275.1 m CSF-A (deepest recovery) and consists of massive diamicton, stratified diamicton, and washed gravel.
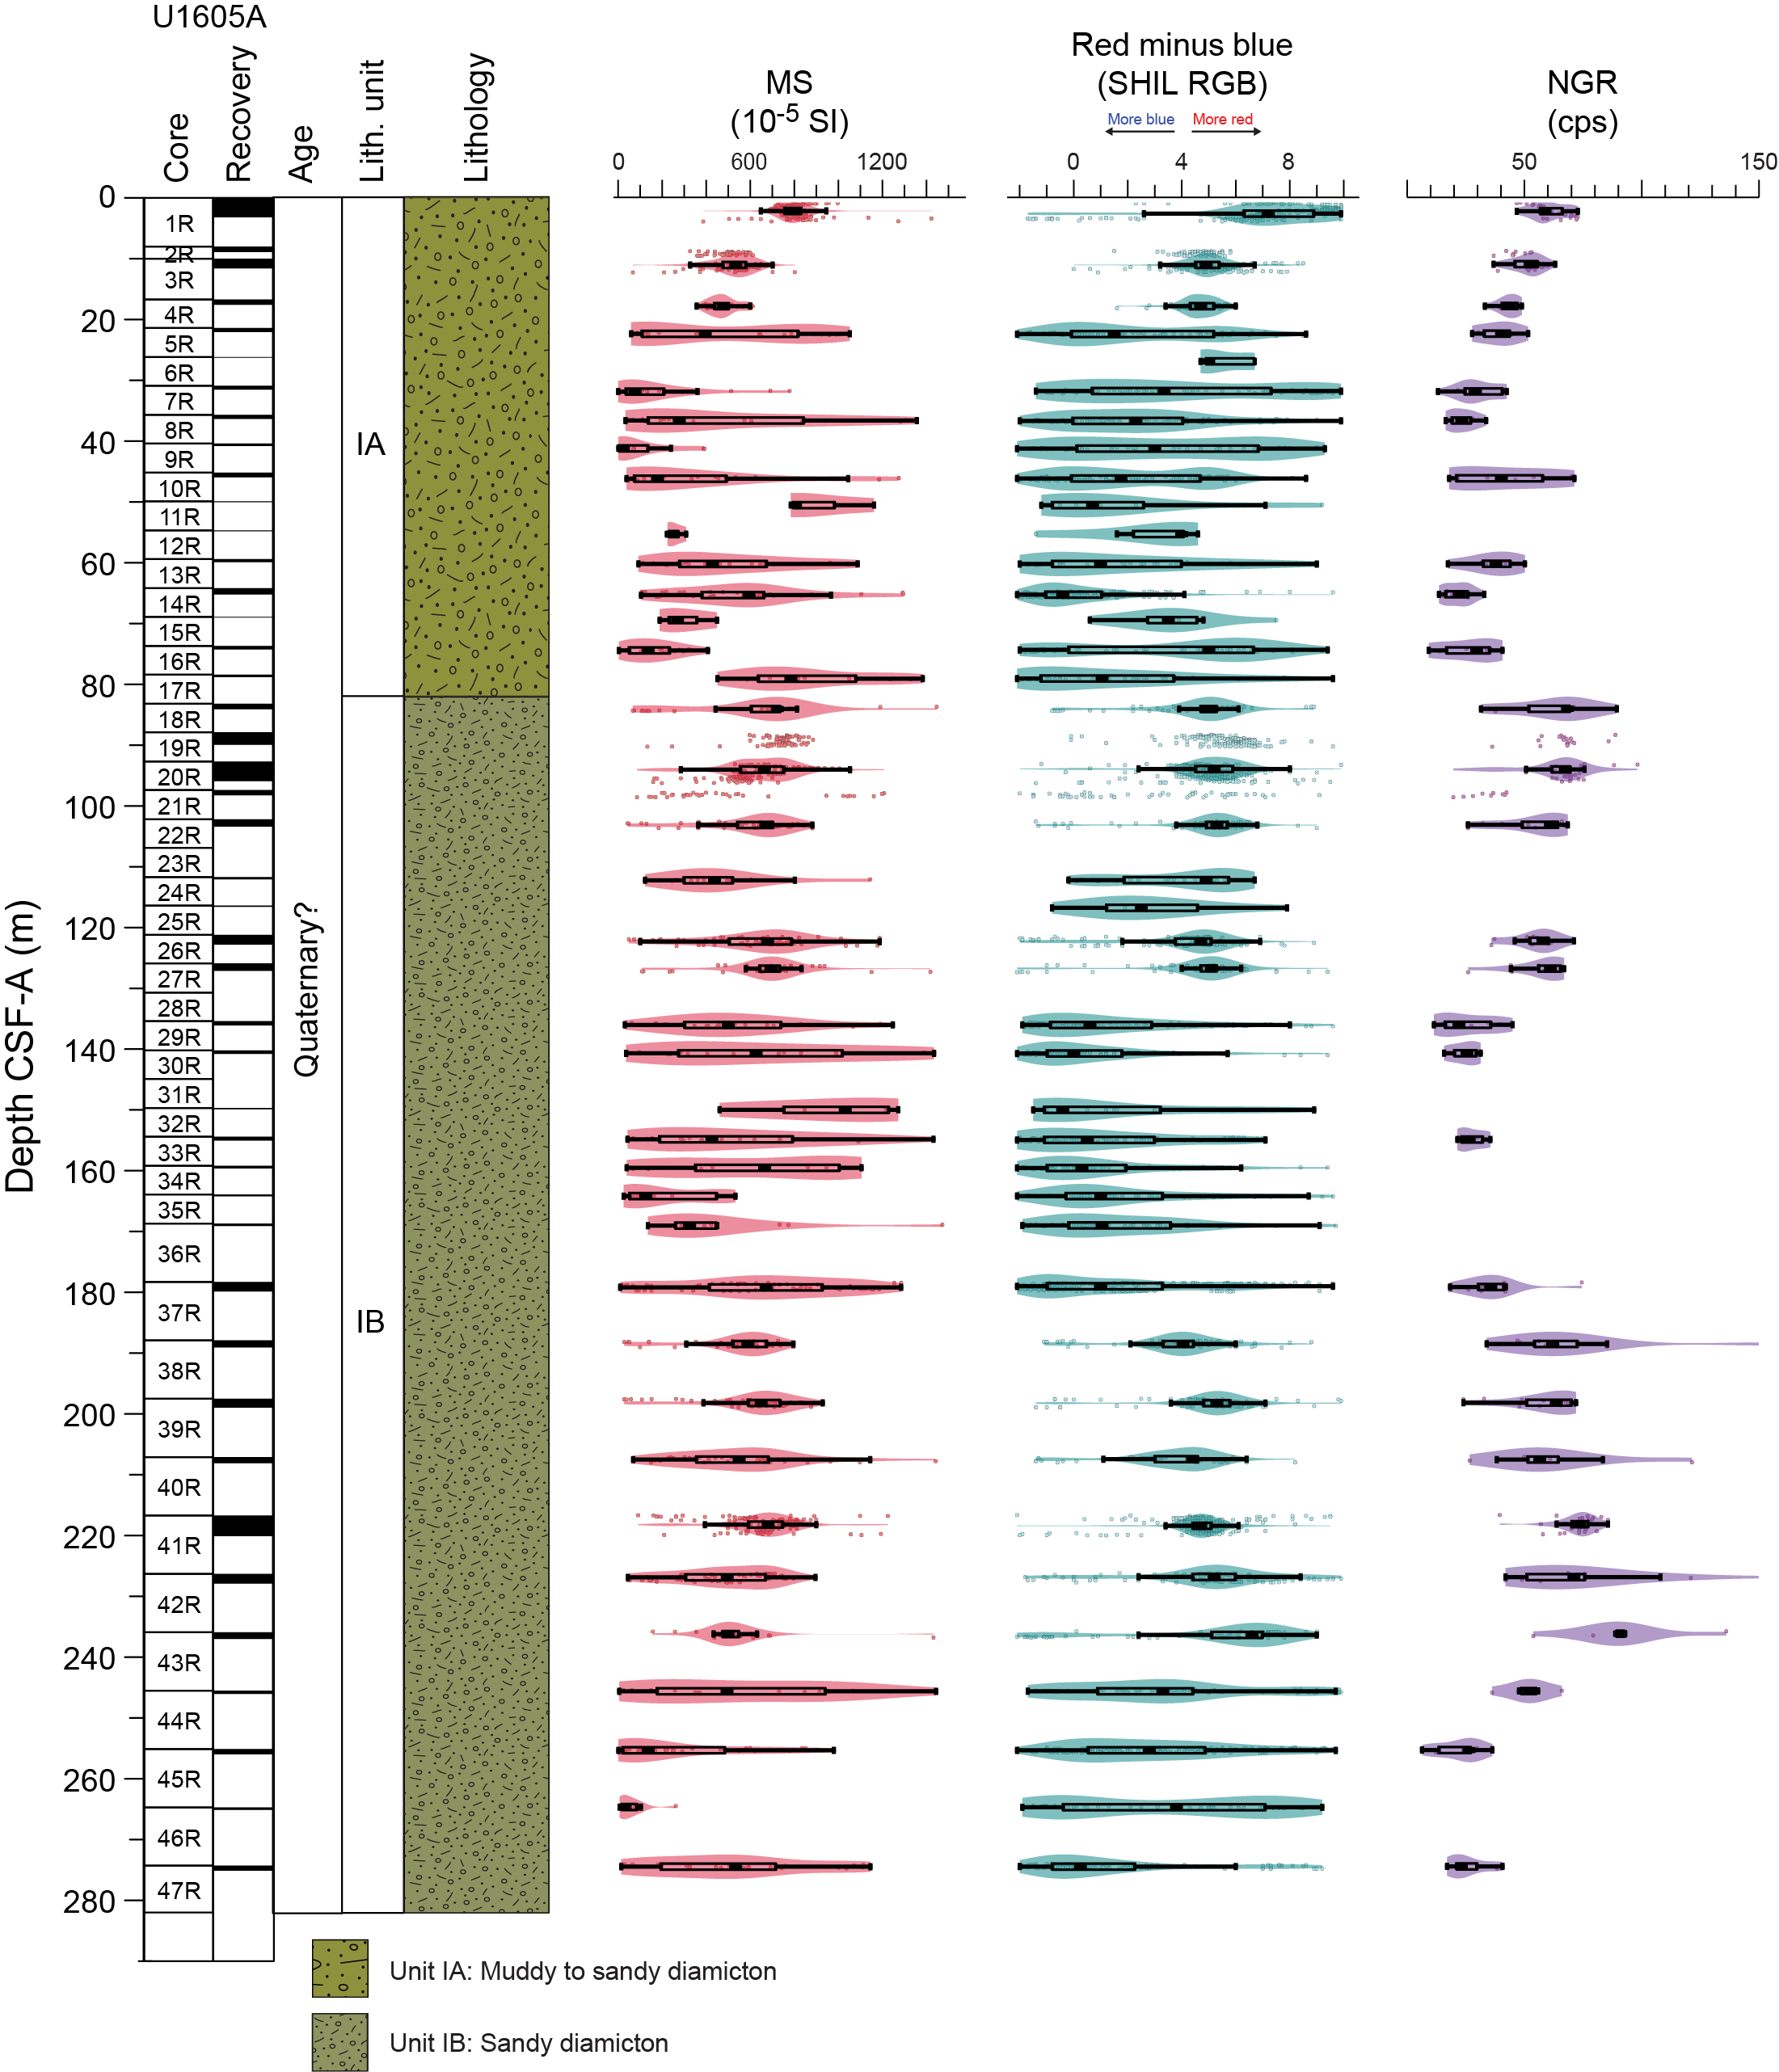
Figure F12. Lithostratigraphic summary, Site U1605.
4.3.3.2. Micropaleontology
Recovery was consistently poor, and many cores did not produce core catcher sediment samples. Where sediment was recovered, core catcher samples were composed of diamicton. Despite the indurated nature of the diamicton, the material disaggregated relatively easily. A total of 12 core catcher samples from the 47 cores from Hole U1605A and 1 mudline sample were prepared and examined for foraminifera, diatoms, dinocysts, and other palynomorphs. The samples were largely barren of foraminifera and diatoms. Diatoms were visually absent in the majority of samples, except in the mudline sample, which contains rare, poorly preserved diatoms typical of modern Arctic marine environments. Dinocysts and other palynomorphs, including Leisopheres (a group of acritarchs), were observed in multiple samples. A mudline sample (~10 g) was collected as a modern DNA reference in Hole U1605A. No samples were collected for sedaDNA analysis.
4.3.3.3. Paleomagnetism
Recovery from Site U1605 was poor, containing many barrels of washed gravel. However, where cohesive diamicton was present, paleomagnetic measurements were made on the archive halves with the SRM and on discrete samples from the working halves, either cut using a parallel saw or collected using the “Japanese” Natsuhara-Giken cubes (J-cubes). The 11 discrete samples were measured after stepwise demagnetization up to 80 mT peak AF demagnetization. Magnetic fabric assessed by anisotropy of MS (AMS) indicated some potential disturbance of the sedimentary fabric. NRM and the remanence after 10 and 20 mT peak AF demagnetization were measured on 16 archive section halves where diamicton was continuous for at least 40 cm. Careful filtering of the data for section end effects and/or other disturbances revealed an inclination change from steeply downward directions consistent with normal polarity at 217 m CSF-A to steeply upward directed below 217 m CSF-A, consistent with reversed polarity.
4.3.3.4. Physical properties
Standard physical property measurements were made on cores from Site U1605 using the WRMSL, SHMSL, and Natural Gamma Radiation Logger (NGRL) track instruments. Discrete measurements were also made for MAD analysis, thermal conductivity, and PWC P-wave velocity. Because of the low recovery and highly disturbed cored material, PWL measurements were unreliable. PWC was limited to diamictic intervals because values of isolated clasts are not representative of the formation.
Prominent variations in physical property values occur at similar depths in NGR, density, and MS and are associated with major lithologic changes in the cores; however, the low recovery at this site prevents much interpretation of physical properties. Four PP units (I–IV) are identified at Site U1605. In PP Unit I (0–80 m CSF-A), NGR, density, and MS all decrease gradually downhole through the unit, which may be related to a transition from the mudline to clast-rich diamicton and gravel. PP Unit II (80–125 m CSF-A) is identified by a sharp increase in density values, combined with a more gradual increase in NGR and MS indicative of the intervals of diamict and gravel lithologies of the unit. Below, in PP Unit III (125–175 m CSF-A) NGR, MS, and density values are relatively low but have higher amplitude variability, likely due to the gravel present within this unit. PP Unit IV (175–282 m CSF-A) is composed of diamicton with some gravel and has relatively higher NGR, MS, and density values than PP Unit III. Core-log-seismic correlation was based on the average PWC obtained on the diamictic recovered intervals and weighted with gravel intervals based on the recovered lithologies.
4.3.3.5. Geochemistry
Whole-round core samples were processed for IW and headspace void gas samples were measured for Site U1605; however, the frequency of these samples was limited by the availability of sediment. Headspace measurements showed low concentrations of hydrocarbons in the uppermost 130 and increasing concentrations at depth with a low yet consistent presence of ethane below 180 m CSF-A. Although low recovery and sporadic sampling led to a discontinuous pore water record, the main findings from IW analysis include decreases in lithium and potassium with depth. A monotonic decrease in sulfate with depth to a minimum around 190 m CSF-A provides evidence for a SMTZ. IW iron, manganese, and phosphate show elevated concentrations near the seafloor and sharp decreases to low concentrations with depth. Increases in calcium and alkalinity in the uppermost ~100 m are also observed. Elemental analysis of solid material revealed very low concentrations of carbon and nitrogen throughout the hole.
4.4. Site U1606
4.4.1. Background and objectives
Site U1606 (proposed Site MB-17A) is located at 74°13.9380′N, 61°2.2426′W at 653 mbsl on the middle section of the northwest Greenland shelf (Figure F3) (see Background and objectives in the Site U1606 chapter [Knutz et al., 2025d]). The site targets the transition from preglacial contourite drift sediments into glacigenic deposits of earliest TMF progradation (Seismic Unit 1), marking the first advance of the NGrIS onto the continental margin. The drilling target was 411 m CSF-A near the base of Megaunit B above Horizon c1 (Figure F13), coring a succession that is complementary to Site U1608. The uppermost 180 m at Site U1606 aimed to capture a stratigraphic record of the preglacial to glacial transition that hypothetically corresponds to the Pleistocene/Pliocene boundary (Knutz et al., 2019). Below 150–180 m CSF-A, Site U1606 targeted a 200 m thick sedimentary unit characterized internally by a uniform bundle of tilting strata that converges updip against an erosional scarp defined by Horizon c1 (Figure F13). The seismic geometries imply accumulation of sedimentary drift deposits over a significantly truncated section of Megaunit C (Knutz et al., 2015).
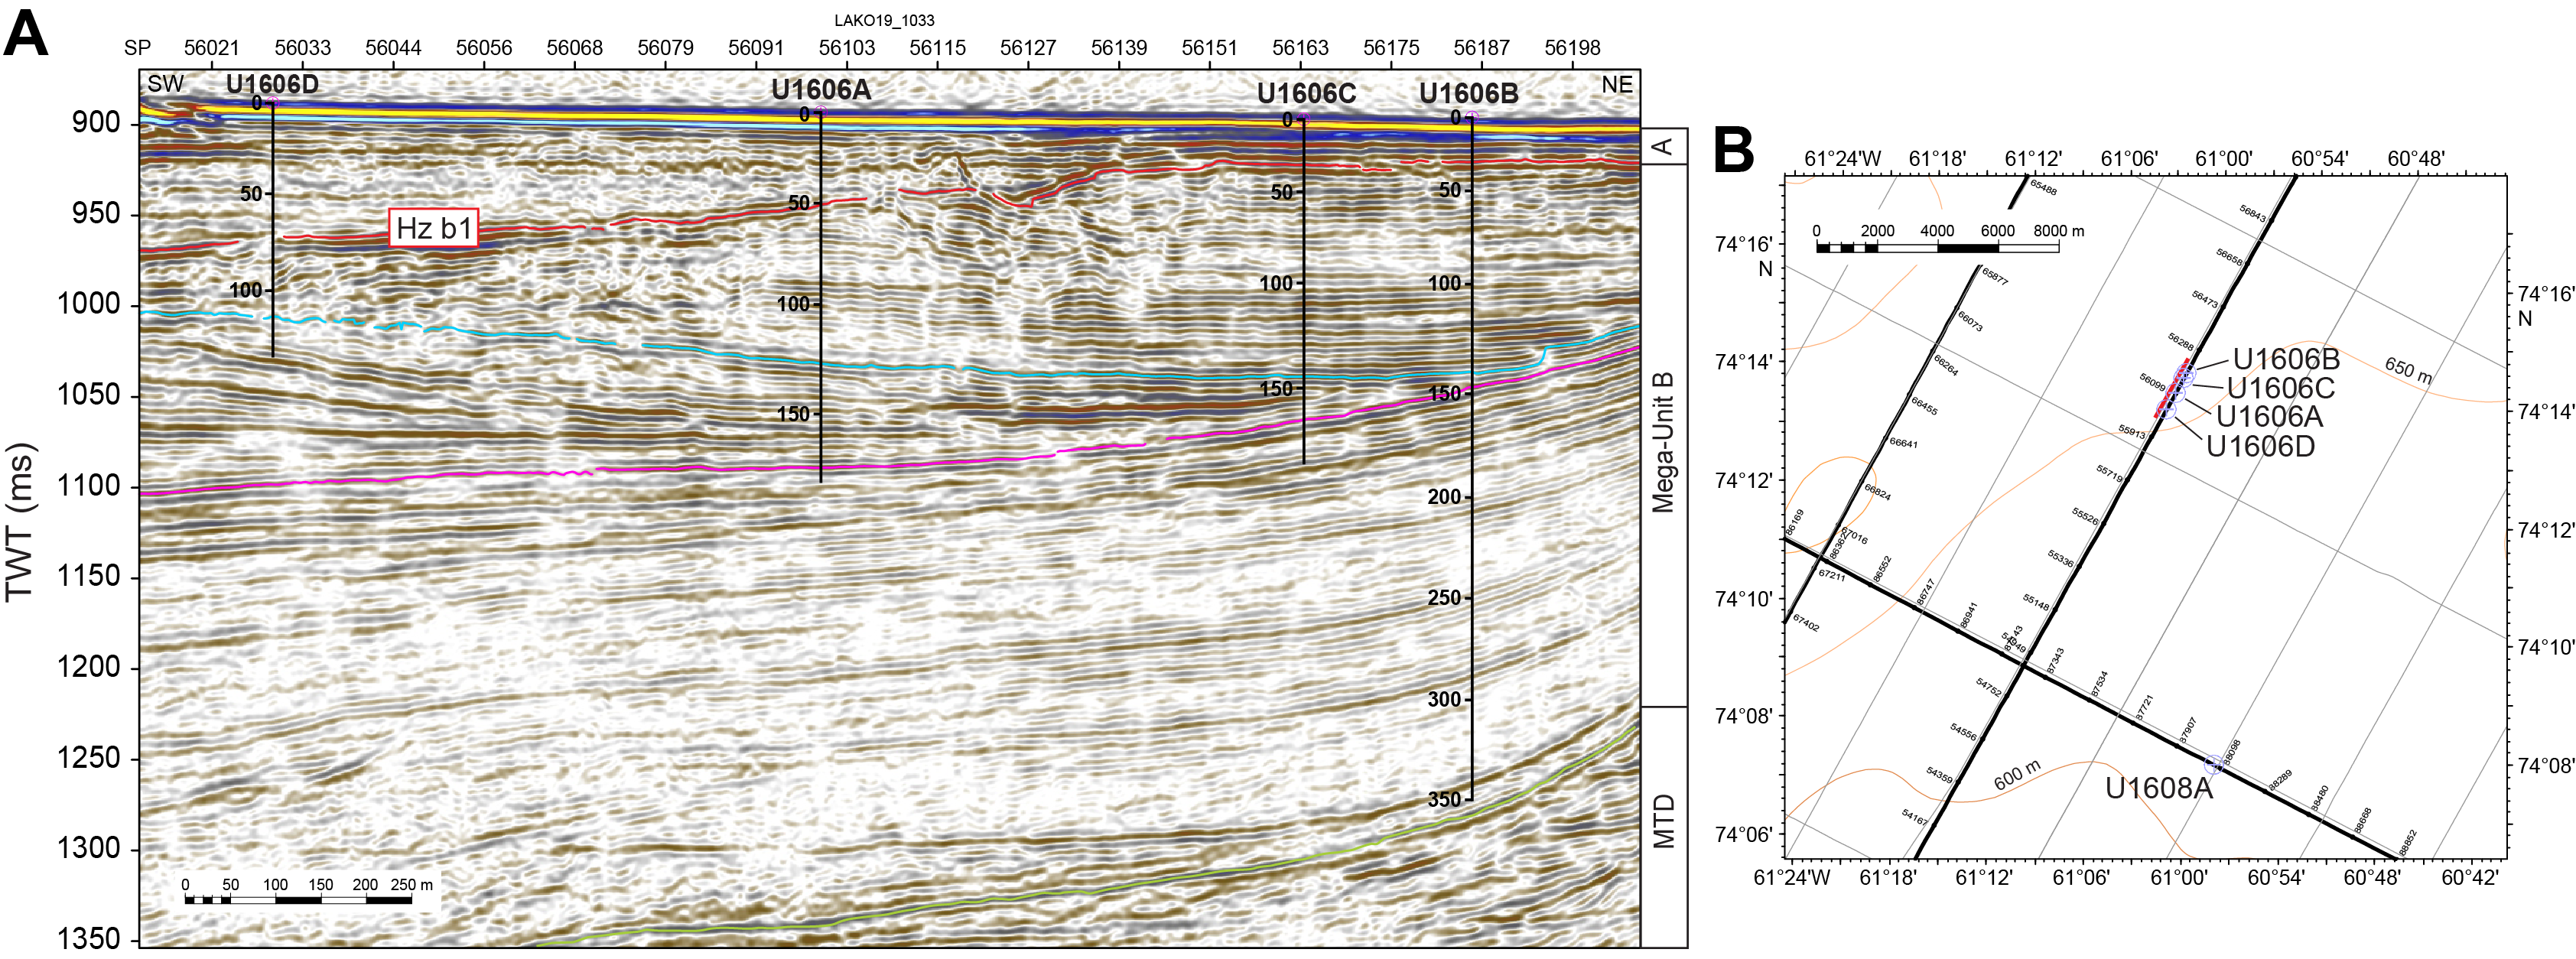
Figure F13. Seismic profile and close-up bathymetry map, Site U1606.
The expected lithologies are gravel-sand, diamicton, and pebbly mud in the uppermost 40 m and mudstone with silty-sandy intervals in the succession below. The seismic characteristics suggest a gradual transition from a deep marine (outer shelf) to a more nearshore environment, eventually replaced by a proglacial setting.
There are two principal goals for this site: (1) capture deposits corresponding to the earliest shelf-based glaciations in northwest Greenland (earliest glacial clinoforms of Megaunit A) and (2) recover Neogene sediments of likely Pliocene age in Megaunit B that can elucidate paleoceanographic conditions prior to the major expansion of the GrIS (Knutz et al., 2015). Hypothetically, the contourite drift may provide a marine analog to terrestrial outcrops (e.g., Beaufort and Kap København formations), depicting warm climate conditions in the High Arctic during the late Pliocene to early Pleistocene (Gosse et al., 2017).
Planned drilling at Site U1606 included coring with the RCB system from the seafloor to 411 m CSF-A in the first hole. If intervals of special interest (e.g., marine mud) were encountered, a second hole would be attempted by washing down followed by coring using the APC system. Downhole logging was planned for the first hole, including the triple combo tool string, FMS, and VSI check shots.
4.4.2. Operations
The vessel transited 44 nmi from Site U1605 to Site U1606. The thrusters were lowered and secured, and the ship was fully in DP mode at 2200 h on 13 September 2023. Ice monitoring began, and the vessel made the final approach to the site slowly as ice vacated the area. The rig crew made up an RCB BHA in preparation for Hole U1606A, and the drill string was partially lowered while we waited on ice to clear the site. By 0230 h on 14 September, we positioned the vessel over the site, and Hole U1606A was spudded at 0415 h. Cores 1R–20R advanced from 0 to 182.4 m CSF-A and recovered 30.14 m (16%). At 1030 h on 15 September, ice moved within 3 nmi of the vessel, and we raised the drill string to 24.6 m CSF-A by 1215 h. The ice was slow moving (nearly stationary) and was expected to linger over the site for more than 1 day while moving closer to the vessel. The decision was made to pull out of Hole U1606A and move to Site U1607. The drill string was tripped up with the bit at the surface at 1424 h. The drill floor was secured for transit, and the thrusters were raised and secured for transit at 1500 h.
The vessel transited the 6.6 nmi from Site U1608 back to Site U1606 on 30 September and arrived at 1715 h. The thrusters were lowered and secured, and the ship was fully in DP mode at 1738 h. The rig crew made up an RCB BHA, and the drill string was tripped to near the seafloor. Hole U1606B was spudded at 2125 h, tagging the seafloor at 656.4 mbsl. Cores 1R–39R advanced from 0.0 to 350.0 m CSF-A and recovered 164.44 m (47%). We tripped the pipe out of the hole, clearing the seafloor at 0110 h on 3 October and ending Hole U1606B.
The vessel was offset south-southwest of Hole U1606B, and Hole U1606C was spudded at 0245 h on 3 October. The hole was drilled ahead to 25 m CSF-A before removing the center bit and dropping an RCB core barrel. Cores 2R–18R advanced from 25.0 to 186.7 m CSF-A and recovered 45.31 m (28%). We tripped the pipe out of the hole, clearing the seafloor at 0355 h on 4 October and ending Hole U1606C.
The vessel was offset south-southwest of Hole U1606A, and Hole U1606D was spudded at 0625 h on 4 October. The hole was drilled ahead to 13.6 m CSF-A before removing the center bit and dropping an RCB core barrel. Cores 2R–14R advanced from 13.6 to 132.1 m CSF-A and recovered 7.83 m (7%). We then tripped the pipe out of Hole U1606D, clearing the rig floor at 0815 h on 5 October. The drill floor was secured for transit, and the thrusters were raised and secured for transit at 1206 h, ending Hole U1606D and Site U1606.
4.4.3. Principal results
4.4.3.1. Lithostratigraphy
The stratigraphy of Site U1606 is divided into four lithostratigraphic units (Figure F14). Site U1606 was drilled along a 1.3 km long southwest–northeast transect and targeted seismic stratigraphic packages with varying thicknesses in each hole; therefore, the lithostratigraphic units are not laterally continuous and at some sites are not present as a result of stratal pinch-out (Figure F13). Named sedimentary lithofacies include (1) laminated or bioturbated mud with or without dispersed sand; (2) calcareous mud and sand; (3) stratified or bioturbated sandy mud with and without dispersed clasts; (4) stratified or bioturbated muddy sand and sand, with and without dispersed clasts; (5) interlaminated to interbedded sand and mud; and (6) muddy coarse sand, diamicton, and intraclast conglomerate.
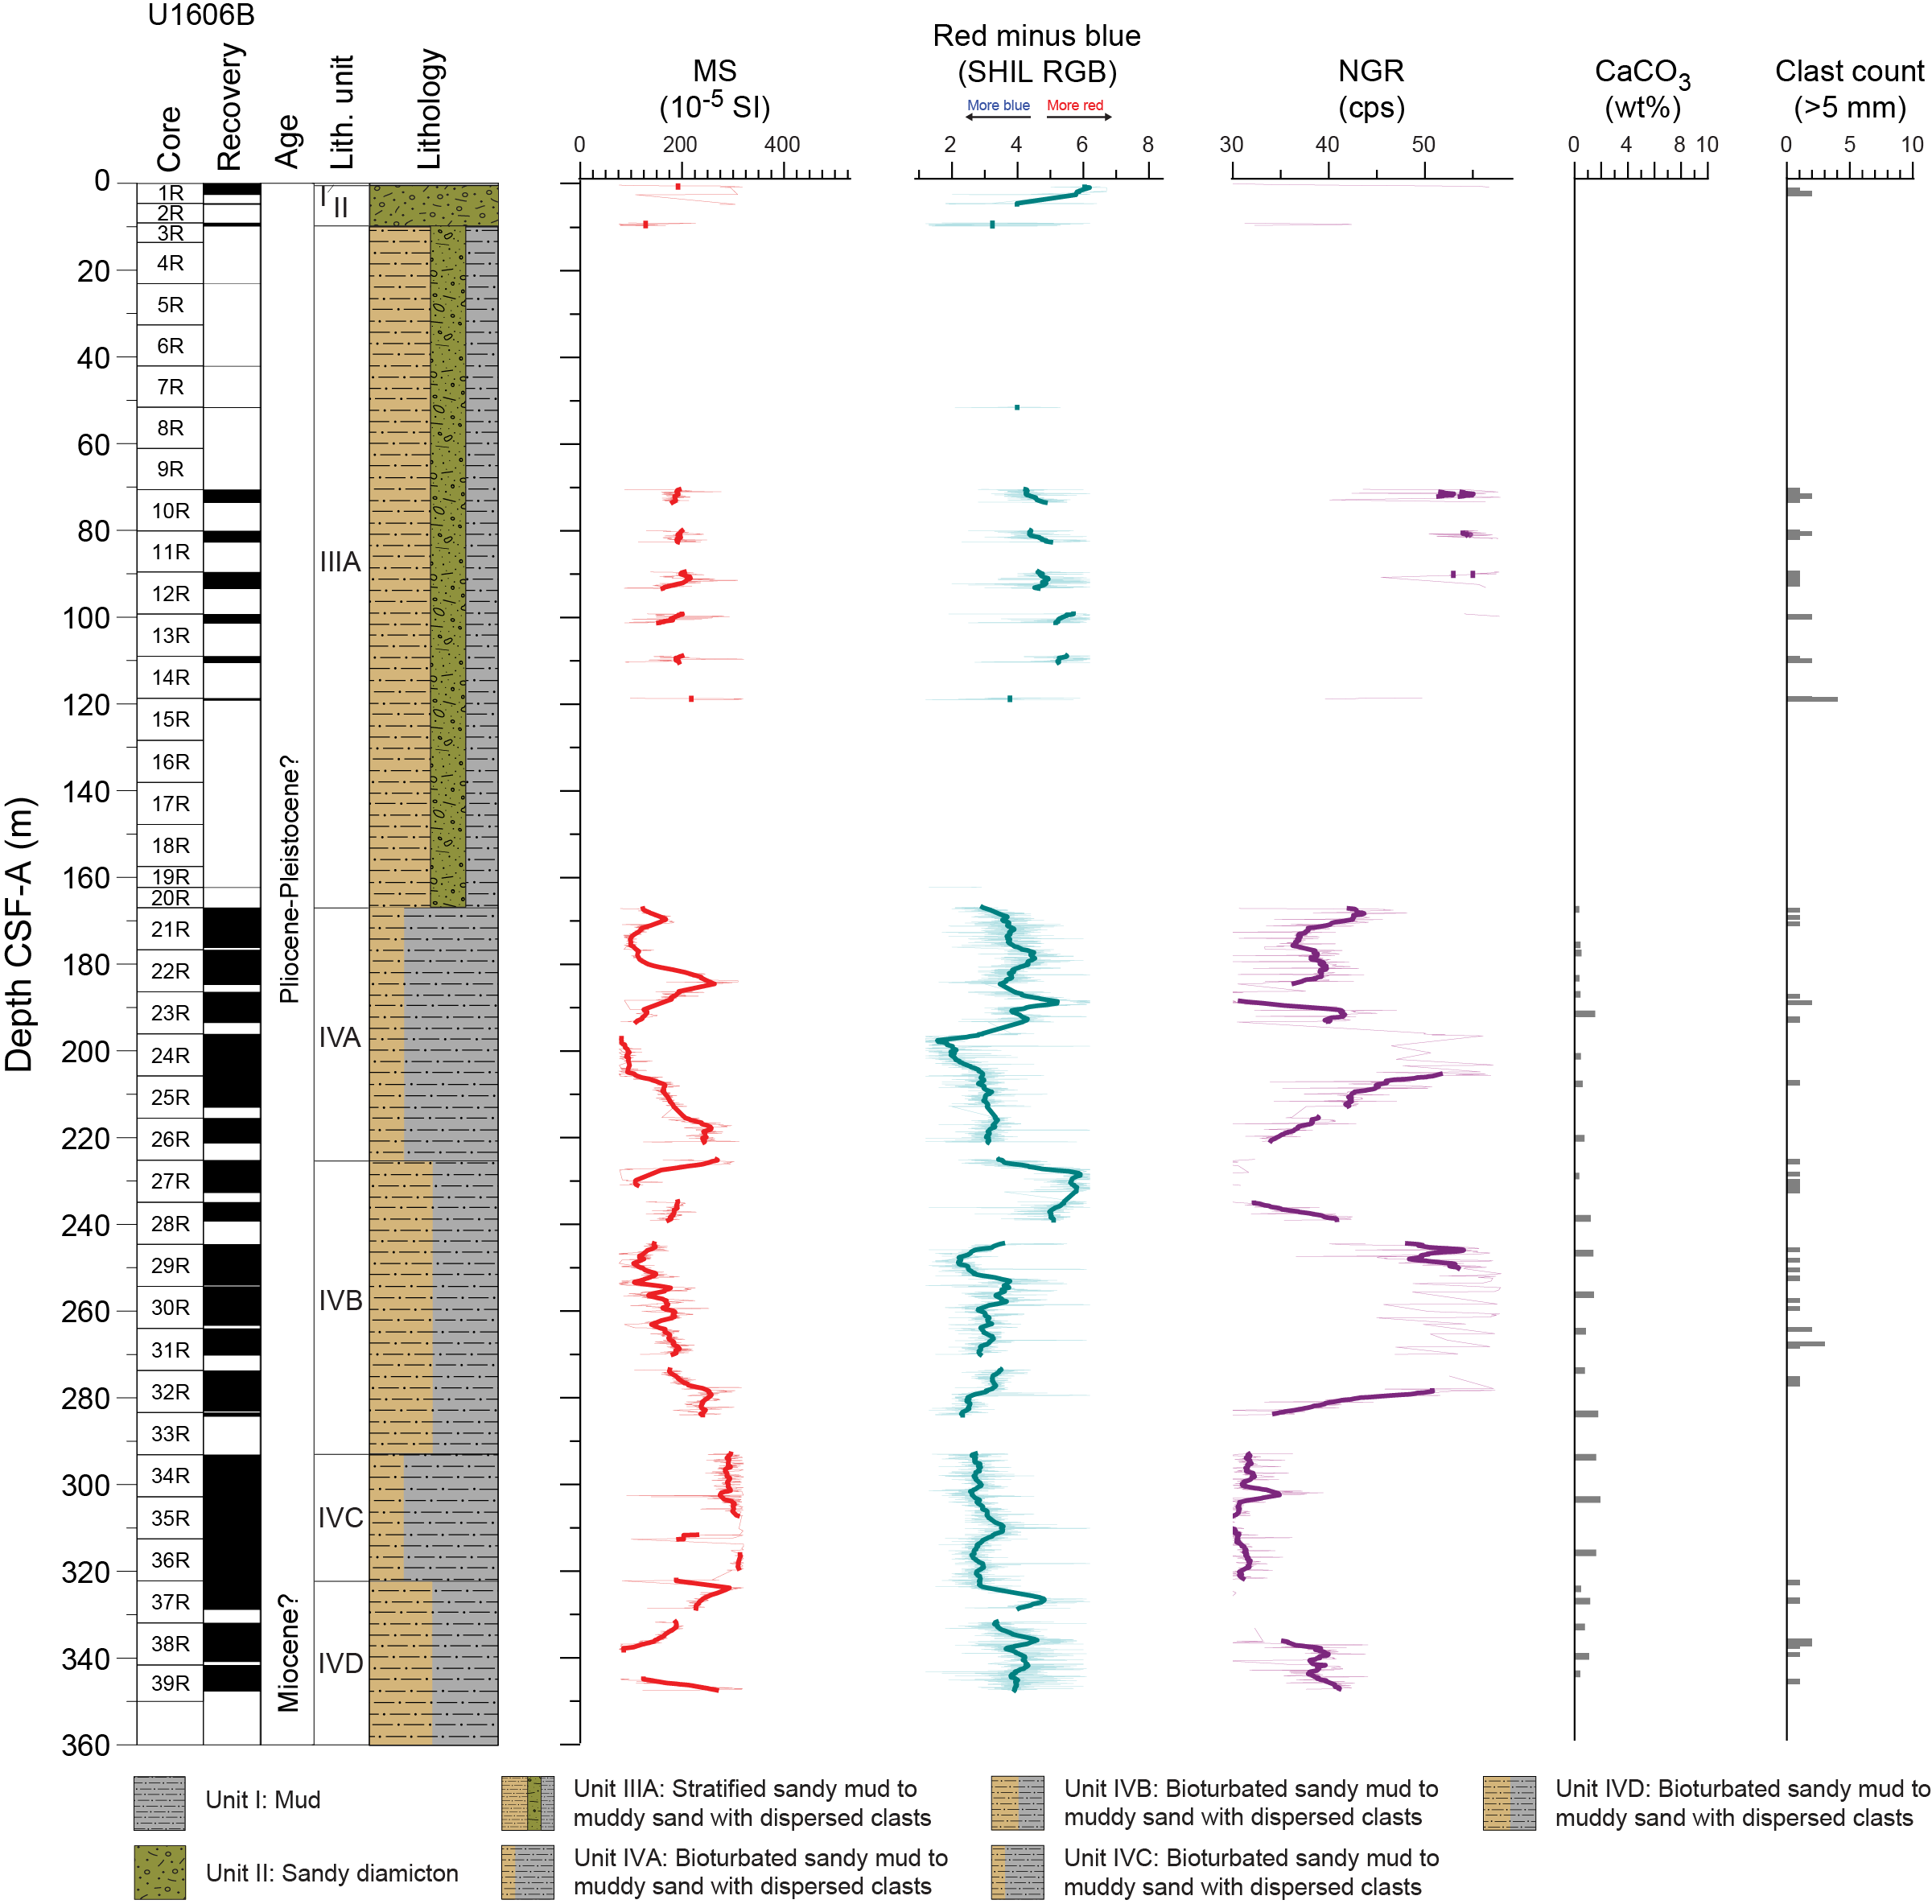
Figure F14. Lithostratigraphic summary, Site U1606.
Lithostratigraphic Unit I was recovered in Holes U1606A and U1606B and contains unlithified brown mud to sandy mud. Unit II comprises sandy diamicton ranging from clast poor to clast rich, also recovered only in Holes U1606A and U1606B. Unit III is formed of sandy mud and muddy sand with dispersed clasts and has two subunits distinguished by the degree of bioturbation and stratification. Subunit IIIA was recovered in all holes at Site U1606 and contains weakly to strongly stratified sandy mud and muddy sand with dispersed clasts. Subunit IIIB is identified only in Holes U1606A and U1606C and is characterized as moderately bioturbated stratified sandy mud to muddy sand with dispersed clasts. Unit IV is defined by alternating bioturbated mud and sandy mud (Subunits IVA and IVC) with interbedded mud and sand (Subunits IVB and IVD). Subunit IVA is present in both Holes U1606B and U1606C, whereas Subunits IVB–IVD are only present in Hole U1606B. Overall, the sedimentary succession collected at Site U1606 is consistent with an ice-proximal, subglacial, or proglacial glaciomarine depositional environment with highly variable periods of potential bottom-current reworking.
4.4.3.2. Micropaleontology
Core catcher samples and additional split core samples from Holes U1606A and U1606B were examined for foraminifera, diatoms, dinocysts, and other palynomorphs. Holes U1606C and U1606D had low recovery and were considered duplicates of Holes U1606A and U1606B. Thus, they were not sampled routinely shipboard for biostratigraphic purposes, apart from two test samples for diatom analysis. Subsequent examination of cores from all holes suggests considerable lithostratigraphic differences that might warrant full paleontological study in the future. The additional samples from working section halves were taken in the uppermost 1.5 m of soft, soupy muds in Core 400-U1606A-1R to provide Holocene reference assemblages. Mudline samples from Hole U1606A were also examined. Samples for sedaDNA were collected from Hole U1606B.
The sandy muds and muddy sands, with variable clast contributions, typical of Hole U1606A contain sparse but reasonably well preserved calcareous microfossils. Where foraminifera appear, only benthic species occur, and these remain as trace to rare occurrences, except in Sample 400-U1606A-11R-CC (~94 m CSF-A) where benthic species are rare to common in the >63 µm residue. The benthic foraminifera–containing interval from Cores 10R–13R (84.51–112.65 m CSF-A) is consistent with an age older than 700 ka. Diatoms with poor to moderate preservation were observed in ~52% of all samples examined. The diatom assemblages observed are consistent with Pliocene age and signify Atlantic water influence at Site U1606. The dinocyst assemblages downhole to ~84 m CSF-A are indicative of a Pleistocene or younger age. In Holes U1606A and U1606B, reworked late Pliocene dinocysts are present. The assemblages of Hole U1606B are consistent with a Pleistocene to Pliocene age. Palynomorph preparations revealed varying abundances of in situ dinocysts and reworked terrestrial palynomorphs. The observed microfossil assemblages are typical of cold-water Arctic environments with intervals containing microfossils indicative of warmer conditions. Other fossil components observed include bivalve mollusk shell fragments, pieces of terrestrial wood and plants, and fragments of an encrusting bryozoan, implying abundant marine life on the Greenland shelf.
4.4.3.3. Paleomagnetism
Pass-through paleomagnetic measurements from Site U1606 were performed using the SRM to investigate the remanent magnetization on a total of 182 archive section halves. Measurements were not made on core catcher sections or those that were heavily disturbed. All measurements on archive section halves were made at 2 cm intervals up to a peak AF demagnetization of 20 mT. A total of 144 discrete cube samples were taken from working section halves. Generally, we collected one sample per core section, avoiding visually disturbed intervals, using the parallel saw. Of the discrete samples, 123 were measured on the SRM and stepwise demagnetized up to 40 mT. The inclinations from the filtered 20 mT step archive-half data are generally bimodal, with a much larger fraction of reversed polarity measurements. Magnetostratigraphy at Site U1606 is highly uncertain, and correlation between holes is complicated by prominent lateral changes in the sedimentary units reflected in the seismic stratigraphy.
4.4.3.4. Physical properties
Standard physical property measurements were made on cores from Site U1606 using the WRMSL, SHMSL, and NGRL track instruments. Discrete measurements were also made for MAD analysis, thermal conductivity, and P-wave velocity on the PWC system. Because of the low recovery and highly disturbed cored material, PWL measurements were unreliable. PWC was limited to diamictic intervals because values of isolated clasts are not representative of the formation.
Prominent variations in physical property values occur at similar depths in NGR and MS and are associated with major lithologic changes in the cores; however, the abundant low-recovery intervals of this site produce a highly fragmented record of physical properties. A positive correlation is found between NGR counts and MS at Site U1606, and the correlation between these physical properties distinguishes six PP units (I–VI). In PP Unit I (0–170 m CSF-A), only scattered values related to low recovery were obtained and no trends are discernible. In PP Unit II (170–197 m CSF-A), NGR increases downhole and MS values decrease, corresponding to the transition from mud to muddy sand within the unit. Density values remain relatively constant across PP Unit II. PP Unit III (197–250 m CSF-A) is characterized by a decrease in NGR downhole, an increase in MS values, and relatively constant density values. The upper half of PP Unit IV (250–290 m CSF-A) is dominated by interlaminated sand and mud that transitions to sandy mud in the lower half of the unit. NGR increases downhole in the upper part of PP Unit IV before a sharp decrease to minimum values in the lower part of the unit. Changes in MS and density in PP Unit IV are less pronounced, with MS gradually increasing and density gradually decreasing downhole within the unit. PP Unit V (290–335 m CSF-A) is defined by an increase in MS downhole throughout the unit, which is composed of mud and sandy mud. NGR and density remain relatively constant throughout the unit. PP Unit VI (335–350 m CSF-A) is composed primarily of muddy sand, with the percentage of sand increasing downhole within the unit. The top of PP Unit VI is marked by a sharp increase in NGR and density and a decrease in MS. Core-log-seismic correlation at Site U1606 was achieved through implementation of a synthetic seismogram from the WRMSL density values obtained for Hole U1606B. The obtained interval velocities were later applied to Holes U1606A, U1606C, and U1606D, with local variations based on lithologic changes.
4.4.3.5. Geochemistry
Samples for headspace gas, IW chemistry, and bulk sediment geochemistry were analyzed for Site U1606, primarily for Holes U1606A and U1606B. Headspace hydrocarbon gas measurements showed low concentrations in the uppermost 10 m of Holes U1606A and U1606B, and below this depth, high concentrations of methane are present to the bottom of Holes U1606A, U1606B, and U1606D (up to 87,400 ppmv). The main findings from IW analysis include low salinity measurements (as low as 12) between approximately 20 and 140 m CSF-A. Gradual downhole increases in salinity, sodium, chloride, and bromide occur below approximately 150 m CSF-A. Elemental analysis of solid material revealed average concentrations of 0.36% organic carbon and 0.05% nitrogen throughout Holes U1606A and U1606B.
4.4.3.6. Stratigraphic correlation
Because of low recovery and the large distance between the holes at Site U1606, the standard procedure for stratigraphic correlation could not be implemented. Physical property data, including NGR and MS, from all holes at Site U1606 were imported and examined in Correlator (v. 4). All cores from Site U1606 were cored with the RCB system; thus, gaps and missing intervals were expected. Core disturbances, cores pumped from the liners, and other issues impacting core quality mean that the stratigraphic coherence of the recovered sequence is variable. Recovery gaps commonly overlap between all holes at Site U1606 in the uppermost 180 m of the record, and only Hole U1606B significantly penetrates below this depth.
Further efforts were made to correlate the record of each hole with the seismic stratigraphy of the area. Physical properties and paleomagnetism, together with biostratigraphic and lithologic constraints, were taken into consideration, and a core-log-seismic correlation was constructed. Despite the uncertainties on the absolute depths, this model provides a means for the further investigation of the Site U1606 record across all holes.
4.5. Site U1607
4.5.1. Background and objectives
Site U1607 (proposed Site MB-07B), the easternmost site in the Expedition 400 site transect, is located at 74°29.5499′N, 60°34.9900′W at 739 mbsl on the middle shelf landward of the Melville Bay Ridge (Figure F15) (see Background and objectives in the Site U1607 chapter [Knutz et al., 2025e]). Extensive seismic and limited borehole data indicate that this site captures Megaunits C, D1, and D2, interpreted to be a late–middle Miocene sediment drift that overlies a succession of mainly hemipelagic strata, possibly of early Miocene to Oligocene age (Knutz et al., 2022) (Figure F15). Accordingly, Site U1607 may capture the time period from 6 to 30 Ma.
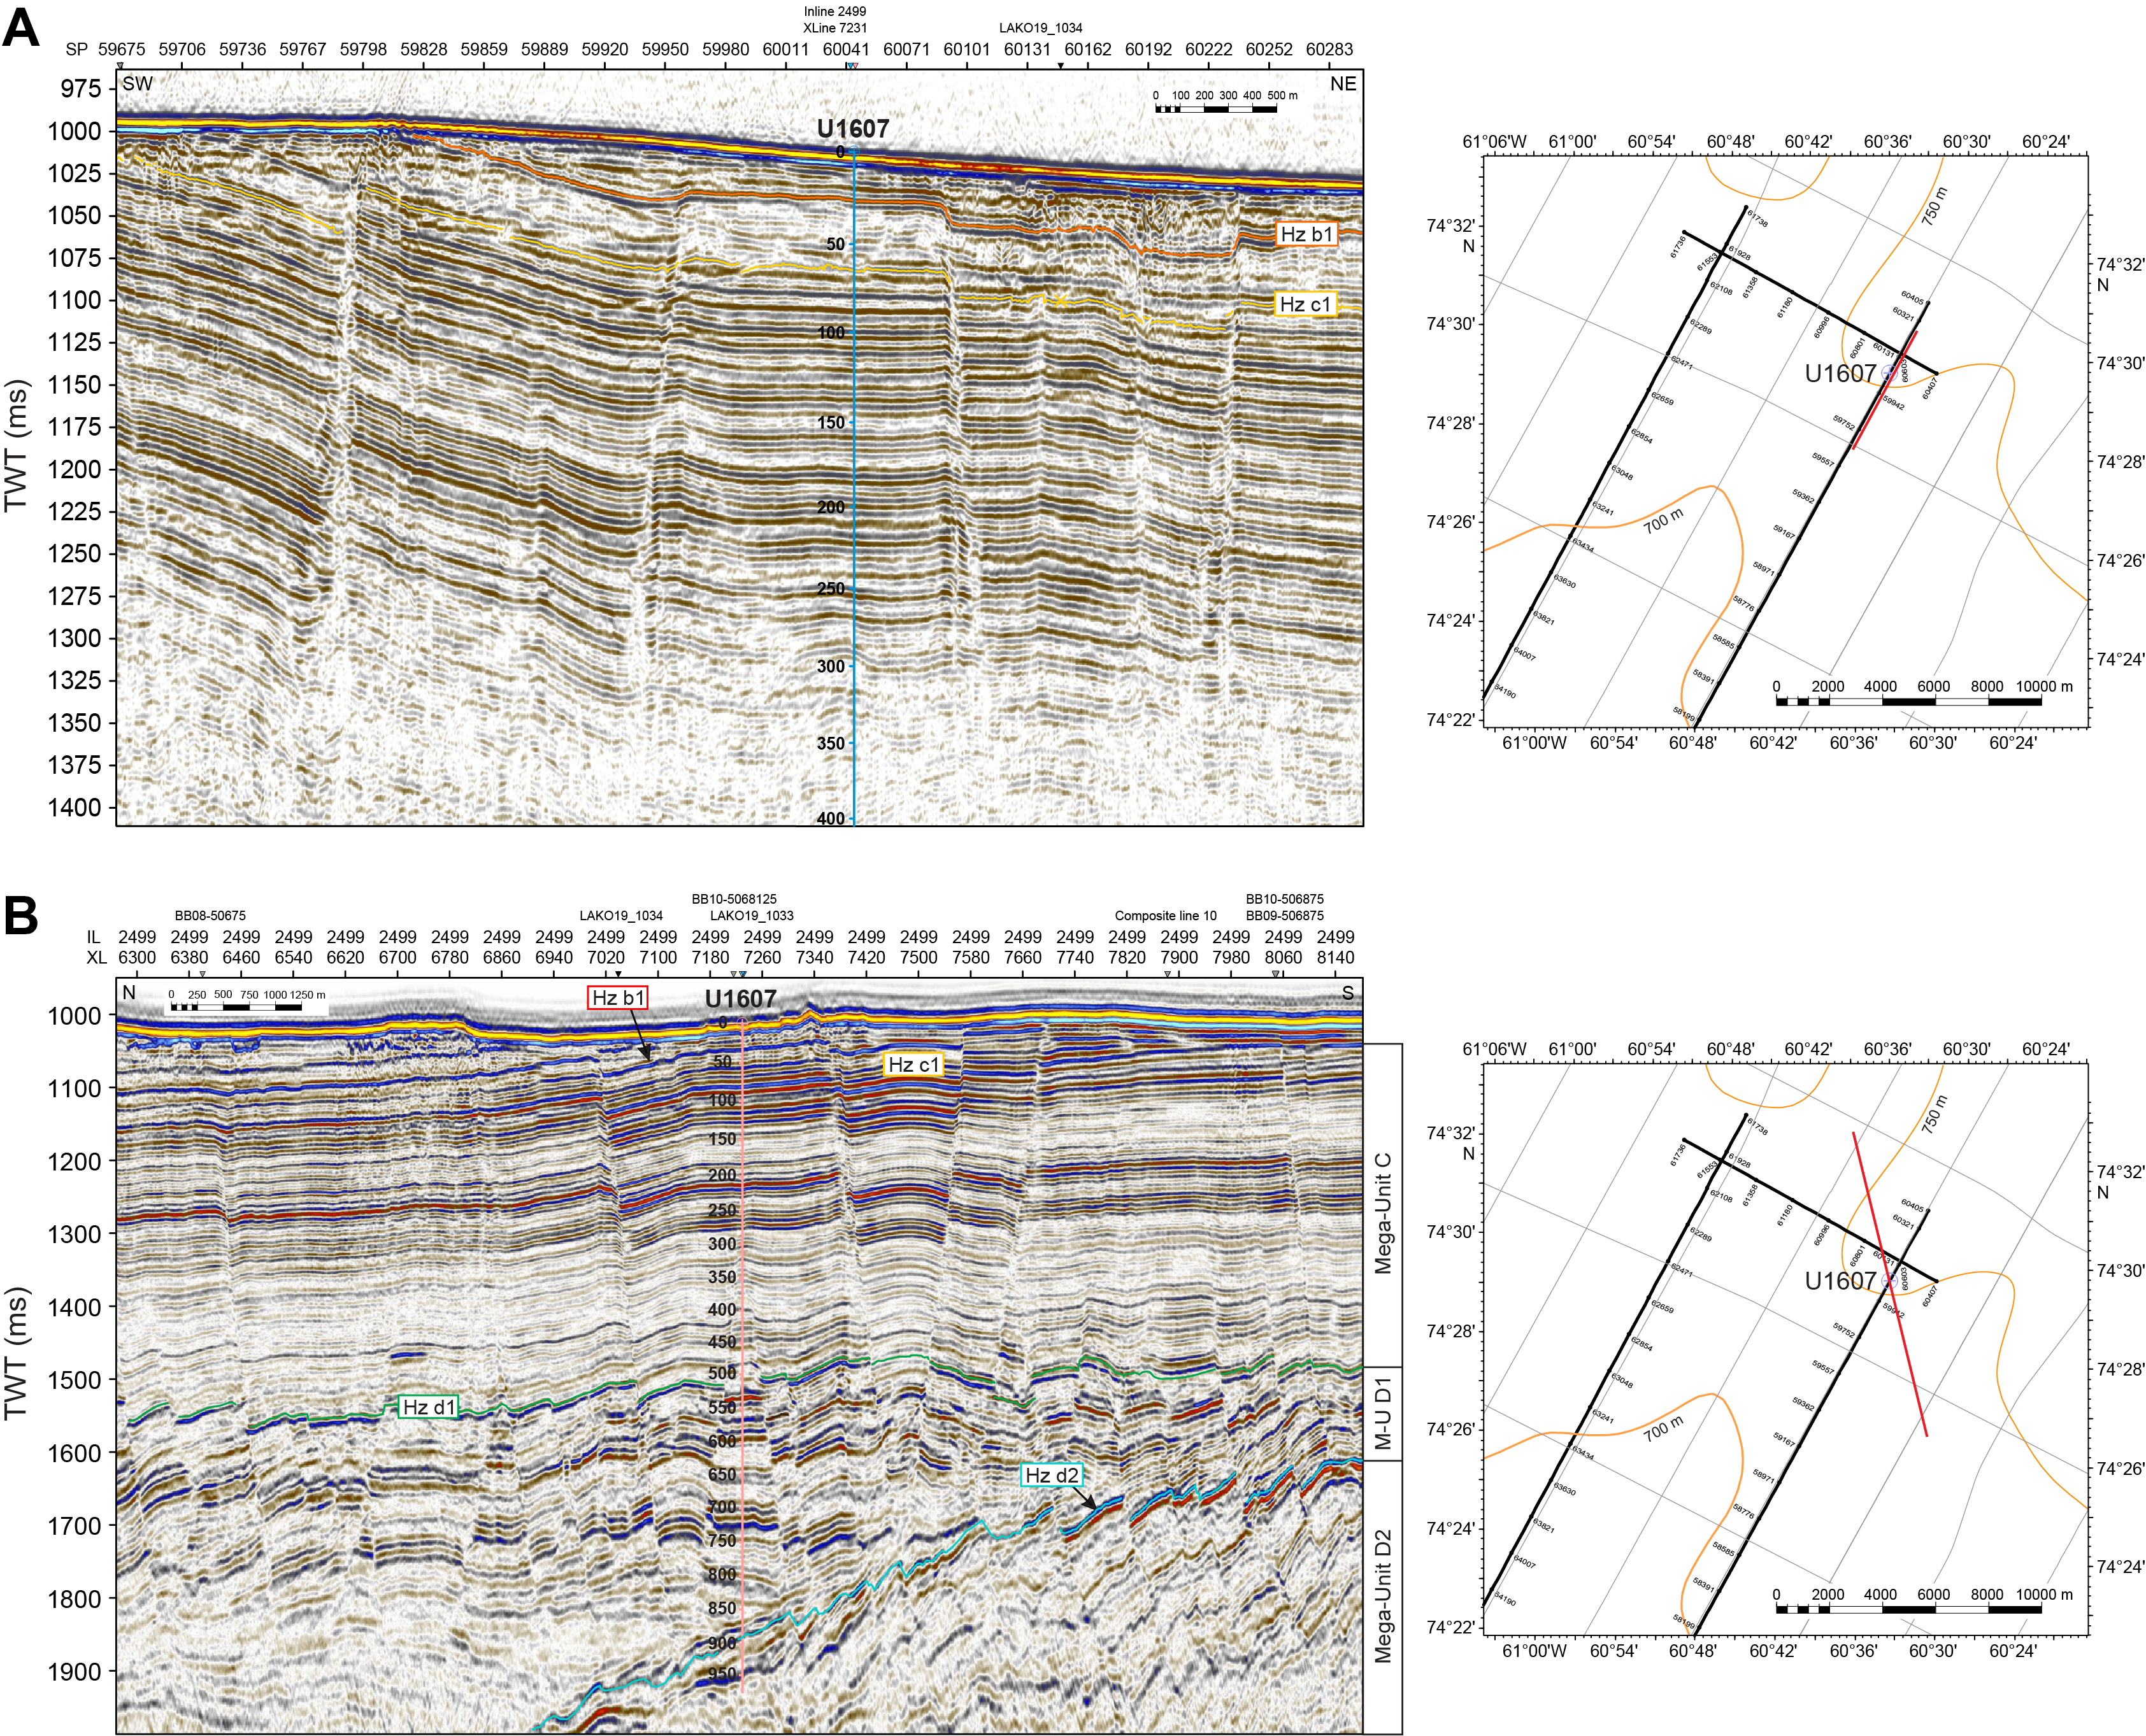
Figure F15. Seismic profiles and close-up bathymetry maps, Site U1607.
The sediment sequence comprising seismic Megaunits D1 and D2 represents gradual infilling of the remnant rift basin topography comprising the Melville Bay Graben (MBG) and adjacent ridge complex. The MBG was formed during an Early Cretaceous phase of continental rifting and ended during the early Paleocene as active seafloor spreading commenced in Baffin Bay (e.g., Gregersen et al., 2022). The overlying seismic Megaunit C is interpreted to be a shelf-based sediment drift receiving fine clastic input from nearby prodeltaic environments (Knutz et al., 2015). The boundary between Megaunits D2 and C is described as the mid-Miocene Unconformity (Horizon d1). It occurs within a conformable sequence in the basin but is shown as an erosional feature on the adjacent structural highs. Two seismic unconformities, corresponding to regional horizons (c1 and b1), are seen near the top of the sequence. By correlating the seismic profile farther south, it becomes evident that part of Megaunit C has been removed by erosion (Knutz et al., 2015). Thus, apart from the seabed itself, some degree of hiatus development may be assigned to Horizon c1 or d1. Based on the reflection strength, Horizon b1 appears more prominently as an erosional unconformity.
The goal at Site U1607 is to reconstruct past ocean and terrestrial climates in northeastern Baffin Bay and on Greenland, including testing the hypothesis that decreasing atmospheric CO2 from the middle Oligocene to early Miocene is linked to the onset of ephemeral glaciation in northwest Greenland (Scientific Objective 2). Additionally, the site may provide core data that can investigate the influence of Neogene tectonic adjustments on the sediment record (Scientific Objective 3). The expected lithology is claystone with silty to sandy intervals and siliceous ooze, consistent with predicted hemipelagic marine environments.
4.5.2. Operations
The vessel transited 17 nmi from Site U1606 to Site U1607. The thrusters were lowered and secured, and the ship was fully in DP mode at 1707 h on 15 September 2023. The rig crew made up an RCB BHA, and the drill string was tripped to near the seafloor. Hole U1607A was spudded at 2225 h, tagging the seafloor at 738.6 mbsl.
Cores 400-U1607A-1R through 60R advanced from 0 to 566.3 m CSF-A and recovered 470.47 m (83%). On 20 September, we began a bit change (70 h on bit). The pipe was raised to 53.4 m CSF-A, and a FFF was deployed at 1542 h. The subsea camera system was then deployed at 1652 h to observe that the FFF had landed in position and ensure a clean exit from Hole U1607A. The bit cleared the seafloor at 1753 h, and the subsea camera system was back on board by 1834 h. The drill string was then tripped up with the bit at the surface at 2037 h. An RCB BHA was made up with a new C-4 bit, and the drill string was tripped back to the seafloor. The subsea camera system was deployed at 2245 h, and Hole U1607A was reentered at 0042 h on 21 September. The subsea camera was back on board at 0130 h. The drill string was lowered to 516.7 m CSF-A, and we washed back down to 566.3 m CSF-A. Cores 61R–103R advanced from 566.3 to 978.0 m CSF-A and recovered 282.38 m (68%).
Sepiolite (drilling mud) was swept in the hole, and the bit was released at 1940 h on 24 September to prepare for logging. The hole was displaced with heavy mud (barite), and the end of pipe was raised to 59.6 m CSF-A. The quad combo tool string was deployed to the base of Hole U1607A, and at 938 m CSF-A (40 m from the bottom of the hole) a hard contact was encountered. The drill pipe was raised to 42.1 m CSF-A for the main pass. Following a complete pass of the hole, the quad combo was pulled up to the rig floor and broken down. The VSI was rigged up, and the protected species watch began at 0930 h on 25 September. The VSI was deployed to 930 m CSF-A, and stations were measured every 30 m uphole until 1715 h, at which time the protected species watch also concluded. The VSI was brought back on board, and with logging completed we tripped the pipe out of Hole U1607A, clearing the rig floor at 2111 h. The drill floor was secured for transit, and the thrusters were raised and secured for transit at 2124 h, ending Hole U1607A and Site U1607.
4.5.3. Principal results
4.5.3.1. Lithostratigraphy
The stratigraphy of Site U1607 is divided into five lithostratigraphic units with subunits (Figure F16). Some of the named sedimentary lithofacies are present in all units with variable prominence, whereas others are characteristic of a particular unit. The lithofacies include (1) mud, sandy mud, and muddy sand with dispersed clasts; (2) calcareous mud; (3) bioturbated sandy mud and muddy sand; and (4) glauconite-rich sandy mud, muddy sand, and sandy granule conglomerate.
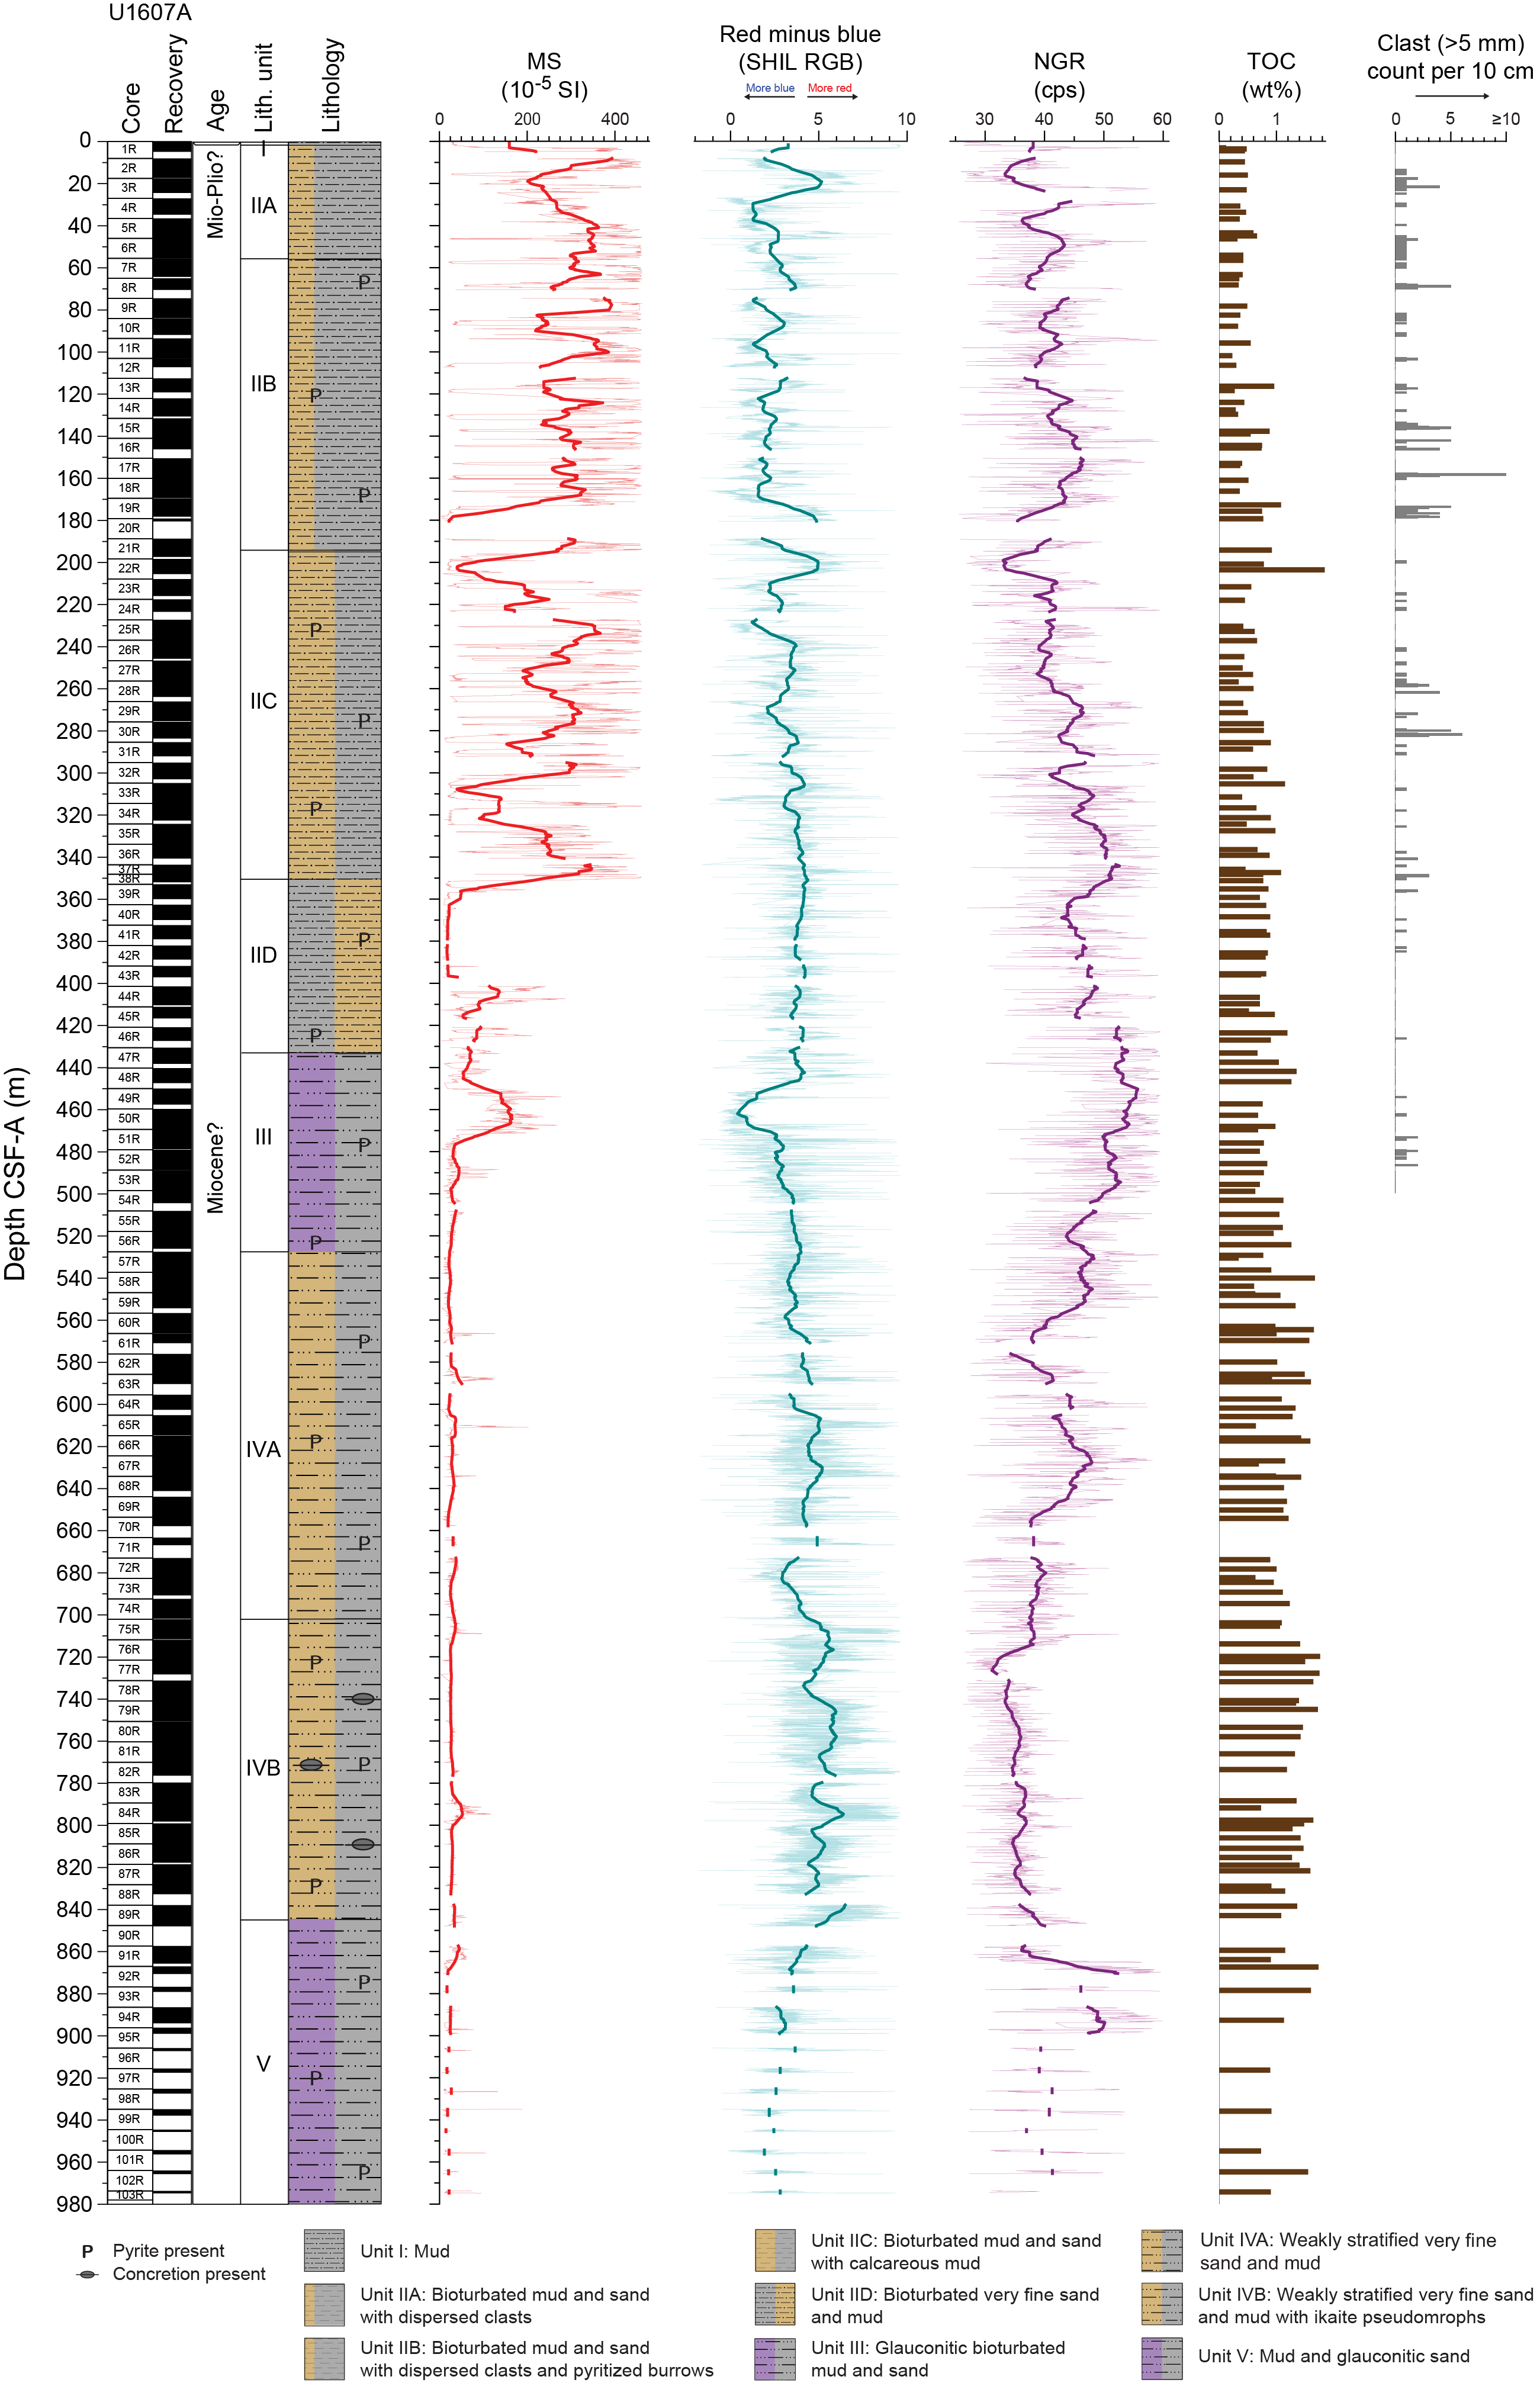
Figure F16. Lithostratigraphic summary, Site U1607.
Lithostratigraphic Unit I contains the uppermost 3.58 m of the site and consists of unlithified, soupy mud that likely represents Holocene deposition. Unit II (3.58–434.72 m CSF-A) contains bioturbated mud, sandy mud, muddy sand, calcareous mud, and dispersed clasts. This unit is divided into four subunits (IIA–IID), broadly following a downcore coarsening of sediment (mud to sand) and a decrease in dispersed clasts. Subunit IIA is 53.49 m thick and contains meter-scale beds of bioturbated mud, sandy mud, and muddy sand with dispersed clasts and a few beds of cemented calcareous mud. Subunit IIB is 136.68 m thick, and it is lithologically similar to Subunit IIA, distinguished by a color change from greenish gray to grayish brown, the first appearance downhole of iron sulfide–filled burrows, and common beds of cemented calcareous mud. Alternating mud and sandy mud to muddy sand lithologies on a decimeter scale are associated with Subunit IIC, which is 157.55 m thick, and represent an increase in the abundance of sand. Calcareous mud remains common, but a significant reduction in the occurrence of dark fine-grained iron sulfide–filled burrows and a decrease in dispersed clasts occurs within Subunit IIC. Subunit IID (83.42 m thick) is distinguished from Subunit IIC by an increasing dominance of sand lithologies, a decrease in calcareous mud and carbonate-cemented intervals, and rare occurrence of dispersed clasts. Unit III (434.72–530.47 m CSF-A) consists of bioturbated sand, muddy sand, and sandy mud. A distinguishing characteristic of Unit III is that it consists of glauconite-rich bioturbated sand, muddy sand, and sandy mud. Unit IV is 315.08 m thick, shows a significant decrease in detrital glauconite, and is divided into two subunits. Subunit IVA is 171.63 m thick and has weakly stratified muddy sand and sandy mud as the dominant lithology. Although yellowish brown beds of calcareous mud occur in overlying units, they become more prominent in Subunit IVA, with beds ranging 3–77 cm thick. Subunit IVB is 143.45 m thick and has a similar lithology to Subunit IVA. Marked differences include an increase in the dominance of sand over mud, the appearance of common pseudomorphs after ikaite and spherical calcareous concretions, and a decrease in calcareous mud. Unit V, which is 132.45 m thick, continues to the bottom of Hole U1607A. This unit is distinguished by the abrupt reappearance of abundant glauconite as sand- to granule-grade intraclasts in sharp-based, graded, and stratified sandy lithologies that is interbedded with and ultimately transitions downhole to brown and gray, sparsely bioturbated mud. Overall, the sedimentary succession recovered at Site U1607 is consistent with marine deposition within a subbasin situated inland of the Melville Bay Ridge.
4.5.3.2. Micropaleontology
Core catcher samples and additional split core samples from the 103 cores from Hole U1607A were examined for foraminifera, diatoms, dinocysts, and other palynomorphs. The split core samples targeted thin (typically centimeter scale) calcareous mud horizons and/or intervals close to mollusk shells, where carbonate/foraminifera preservation may have been enhanced, and intervals adjacent to where diatoms had been found in core catcher samples. Mudline samples were also examined for each group and collected for sedaDNA.
Microfossils generally occur only sporadically and discontinuously in the muddy sands, sandy muds, and muds typical of Site U1607, apart from palynomorphs, which have more continuous occurrences. A combination of paleoenvironmental restrictions (i.e., shelf/neritic environments unfavorable to pelagic species) and diagenetic influences on pore water chemistry and preservation potential is likely responsible for the paucity of biomineralized skeletal remains in many intervals. Biostratigraphic results are therefore limited but provide some degrees of age control in different parts of Hole U1607A.
Foraminifera are mostly limited to benthic species, and agglutinated species are the most common. Four samples from the weakly stratified very fine sands and muds of Lithostratigraphic Units IV and V (634–918 m CSF-A) contain scarce planktonic foraminifera specimens. Diatoms are observed in 12% of the samples examined. Dinocysts are present in the uppermost three core catcher samples and two additional samples that were taken from Core 400-U1607A-2R. No dinocysts were observed in core catcher samples from Cores 19R–74R, which is likely a result of dilution by terrigenous sediment input and a low concentration of dinocysts. Dinocyst abundances increase downhole from the core catcher sample of Core 74R. Postcruise palynological processing using hydrofluoric acid will provide more constraints on dinocyst abundances throughout this interval. Mollusk shells and their fragments are regular features of Site U1607 cores. Foraminifera shells, as well as mineralized burrow fills, are often pyritized.
The observed assemblages of all microfossil groups are generally composed of species with long geologic ranges. In terms of age control, all groups are consistent with Miocene ages, whereas downhole some taxa are suggestive of Oligocene ages. The meager planktonic foraminifera assemblages are of low diversity and consist of few (5–20 specimens) small-sized individuals. The deepest occurrence of planktonic foraminifera, observed in the core catcher sample of Core 400-U1607A-88R, is consistent with an early Miocene to late Oligocene age. The diatom species observed suggest Miocene ages, and downcore the dinocyst taxa reflect middle to late Miocene and older ages. In general, the microfossils from the uppermost 500 m of Hole U1607A are characteristic of coastal or neritic environments with ample food/nutrient availability, and below ~500 m CSF-A, assemblages reflect more open marine environments that are at times favorable to planktonic foraminifera. The prominence of agglutinated benthic foraminifera, which are more environmentally tolerant than calcareous species, is also consistent with a food-rich inner shelf environment corrosive to small calcitic tests. All microfossil assemblages have environmental and climatic affinities comparable to assemblages observed in the Miocene of western Baffin Bay and the Labrador Sea (ODP Leg 105) and the North Sea (Kaminski et al., 1989; King, 1989).
4.5.3.3. Paleomagnetism
Pass-through paleomagnetic measurements from Site U1607 were performed using the SRM to investigate the remanent magnetization on a total of 491 archive section halves. Measurements were not made on core catcher sections. All measurements on archive section halves were made at 2 cm intervals up to a peak AF demagnetization of 20 mT.
A total of 525 discrete cube samples were taken from working halves. Generally, we collected one sample per core section, avoiding visually disturbed intervals. Of the 525 samples, 512 were taken using the parallel saw and the rest were sampled by inserting J-cubes into the working half. Of the discrete samples, 476 samples were measured on the SRM and stepwise demagnetized up to 50 mT. The remaining specimens were preserved for further study.
At Site U1607, we used a filtering method that assesses the magnetic stability of archive half and discrete sample data. Above ~375 m CSF-A, we defined 13 magnetic polarity zones. Below ~375 m CSF-A, magnetic data were unreliable because of a diagenetic loss of remanence-carrying material, and it was not possible to define polarity intervals. Further constraint awaits other chronological information, including confirmation of possible unconformities or hiatuses.
4.5.3.4. Physical properties
Standard physical property measurements were made on cores from Hole U1607A using the WRMSL, SHMSL, and NGRL. Discrete measurements were also made for MAD analysis, thermal conductivity, and P-wave velocity on the PWC system. Prominent variations in physical property values occur at similar depths in NGR and density and are associated with major lithologic changes in the cores. A positive correlation is found between density and NGR counts for Site U1607. The correlation between these physical properties distinguishes five PP units (I–V) at Site U1607. PP Unit I (0–180 m CSF-A) is distinguished by a sharp increase downhole in NGR, MS, and density in the uppermost 50 m of material, followed by relatively constant values to 180 m CSF-A. In PP Unit II (180–350 m CSF-A), high-amplitude variability of NGR and MS reflects the broad variations in the lithology, which transitions from more frequent intervals of mud to muddy sand and sandy mud moving downhole through the unit. PP Unit III (350–720 m CSF-A) is characterized by a decrease in NGR and density values compared to Unit II, which might reflect the transition from intervals of mud and sand to predominantly muddy sand toward the bottom of this unit. Muddy sand is also the primary lithology of PP Unit IV (720–825 m CSF-A), where NGR, MS, and density remain constant relative to values observed in the lowermost interval of PP Unit III. PP Unit V (825–978 m CSF-A) is defined by a decrease in NGR and density to the bottom of the hole within a predominantly mud lithology.
4.5.3.5. Geochemistry
Samples for headspace gas, IW chemistry, and bulk sediment geochemistry were analyzed for Site U1607. Headspace hydrocarbon gas measurements revealed high concentrations below 5 m CSF-A with methane concentrations up to 113,700 ppm. Ethane was found at lower concentrations of up to 725 ppm, and longer chain hydrocarbon gases (propane, butane, and pentane) were detected at low yet consistent levels below 500 m CSF-A. The main findings from IW analysis include low salinity values in the uppermost 200 m of the site. IW iron, manganese, sulfate, and phosphate show elevated concentrations near the seafloor and sharp decreases to low concentrations with depth. Lithium and barium both increase significantly with depth. Elemental analysis of solid material reveal CaCO3 contents of largely <1%, and some intervals contain greater amounts (up to 59%). The contents of total organic carbon and total nitrogen increase notably with increasing depth.
4.5.3.6. Stratigraphic correlation
To analyze the extent of the core gaps and further improve the depth assessment of the recovered material, we correlated the physical properties measured on the cores to the downhole logs obtained from the borehole. Whole-round MS and NGR measured on the cores were imported into Correlator (v. 4), as well as downhole MS and natural gamma ray, which were imported into the software as a single core table. Ties between downhole data and core data were assessed based on visual and statistical matches of the properties. This procedure has some significant uncertainties because of the presence of large-scale features in the downhole logging data that do not resemble the record measured on cores in the laboratory. However, the overall cyclicity of the records is well matched between the downhole logs and the cores, and the relative depth offset of each core provides information that can be used to confidently improve the depth constraints of the cores. The resulting depth scale is referred to as CCSF-A even though it is not a scale resulting from the alignment of two or more holes. The difference between the CSF-A and CCSF-A depths varies downhole from a few centimeters to 3 m. The depth constraints provided by the downhole logging data allow an improved interpretation of the formation lithology, age, and physical properties.
4.5.3.7. Age model
The initial age constraints of Site U1607 are based on magnetostratigraphic interpretations of inclination with two additional biostratigraphic considerations. The diatom Proboscia barboi is present at 198.7 m CSF-A and has an age range of 3.31–9.49 Ma in the North Atlantic (Koç and Scherer, 1996). The second possible constraint is from the co-occurrence of two diatoms (Goniothecium rogersii and Goniothecium decoratum) at 199.54 m CSF-A whose age ranges overlap between 16 and 23 Ma (Suto et al., 2008). These two observations are mutually inconsistent and lead to two possible age models. There are also unconformities recorded in the seismic profile reflecting potential hiatuses at about 26 and 73 m CSF-A, the latter of which may eliminate the highest normal polarity zone as a possible constraint.
The first age model is based on the occurrence of P. barboi at 198.7 m CSF-A. In this model, the transition from normal to reversed for the highest normal zone is correlated to Chron C4r.1r and the lowest reversed to normal transition is correlated to Chron C4Ar.2n. The average sediment accumulation rate for this age model is 19 cm/ky. The second age model is based on the co-occurrence of the G. rogersii and G. decoratum species. In this model, the transition from normal to reversed for the highest normal zone is correlated to Chron C5Cn.2r and the lowest reversed to normal transition is correlated to Chron C6n. The average sediment accumulation rate for this age model is 13 cm/ky. Further refinement of the age model for Site U1607 must await shore-based studies.
4.5.3.8. Downhole measurements
Downhole logging was carried out in Hole U1607A upon completion of coring operations. A quad tool string was deployed with the MSS, natural gamma ray, electrical laterolog resistivity, acoustic velocity, and density tools. Four runs (two down passes and two up passes) were carried out with the sensors recording on the way down and up. Two of the runs (initial down pass and final up pass) covered the full length of the hole to 40 m above the bottom. Two calibration runs (one up pass and one down pass) were logged on the deepest 100 m of the hole. The caliper showed a homogeneous and stable hole with minimum washouts to 938 m CSF-A.
Upon completion of the downhole logging with the quad combo, vertical seismic profiling was implemented with the VSI to obtain an accurate time-depth relationship to tie the logging and coring results to the seismic data. The geophones recorded the seismic signal at 33 stations located at an average spacing of 30 m, and 3 good shots were recorded at most of the stations. Thus, VSI results were used in the core-log-seismic correlations at Site U1607. A protected species watch was in place before and during the use of the seismic source. Logging measurements were crucial for covering recovery gaps in RCB coring, especially near the bottom of Hole U1607A. Core logging and downhole logging results differ on absolute values, but the relative trends of the logs are comparable. Hence, logging data could be used to cover the formation recovery gaps with confidence.
4.6. Site U1608
4.6.1. Background and objectives
Site U1608 (proposed Site MB-06D) is located at 74°7.6818′N, 60°58.3172′W at 607 mbsl on the middle section of the northwest Greenland shelf west of the Melville Bay Ridge and graben structures formed during Cretaceous rifting (Figure F17) (see Background and objectives in the Site U1608 chapter [Knutz et al., 2025f]). The main coring targets are mounded contourite drift deposits of expected Pliocene age associated with Megaunit B (Knutz et al., 2015, 2019; Aubry, 2021) and the overlying sediments of Megaunit A, recording the transition into glacigenic deposits of earliest TMF progradation. The expanded interval of Megaunit B, captured at Site U1608 reflects deposition below a major incised escarpment that is at least 500 m tall and extends into disturbed sediment packages interpreted to be mass transport deposits. The base of the contourite drift accumulation is defined by Horizon c1 of probable late Miocene age (Knutz et al., 2015). Site U1608 ends ~100 m above Horizon c1, which at this location is characterized by an erosional unconformity. In overlying Megaunit A, 10 horizons are mapped using high-resolution seismic data; including the seabed, they define 11 seismic units that each record progradation of the TMF system under the influence of grounded glacier ice (Knutz et al., 2019) (Figure F4). TMF Seismic Unit 1 targeted at Site U1608 records the first advance of the northwest GrIS onto the continental shelf, hypothesized to correspond to the Pleistocene/Pliocene boundary (Knutz et al., 2019) (Figure F17).

Figure F17. Seismic profile and close-up bathymetry map, Site U1608.
The expected lithologies are gravel-sand, diamicton, and pebbly mud in the uppermost 40 m and mudstone with silty-sandy intervals in the succession below. The seismic characteristics suggest a gradual transition from a deep marine (outer shelf) to a more nearshore environment, eventually replaced by a proglacial setting. The expected lithologies are diamicton and mudstone with silty-sandy intervals such as would be expected in proglacial settings and from nearshore to deep marine environments. Drilling at Site U1608 includes RCB coring to 561 m drilling depth below seafloor (DSF) and logging.
There are two principal goals for this site: (1) capture deposits corresponding to the earliest shelf-based glaciations in northwest Greenland (earliest glacial clinoforms of Megaunit A) and (2) recover Neogene sediments of likely Pliocene age in Megaunit B that can elucidate paleoceanographic conditions prior to the major expansion of the GrIS (Knutz et al., 2015). Hypothetically, the contourite drift may provide a marine analog to terrestrial outcrops (e.g., Beaufort and Kap København Formations), depicting warm climate conditions in the High Arctic during late Pliocene to early Pleistocene (Gosse et al., 2017).
Planned drilling at Site U1608 included coring with the RCB system from the seafloor to 561 m CSF-A in a single hole. Planned downhole logging included the triple combo tool string, FMS, and VSI.
4.6.2. Operations
The vessel transited 23 nmi from Site U1607 to Site U1608. The thrusters were lowered and secured, and the ship was fully in DP mode at 0051 h on 26 September 2023. The rig crew made up an RCB BHA, and the drill string was tripped to near the seafloor. Hole U1608A was spudded at 0435 h, tagging the seafloor at 606.9 mbsl. Cores 1R–60R advanced from 0 to 561.0 m CSF-A and recovered 267.35 m (47%).
Sepiolite (drilling mud) was swept in the hole, and the bit was released in the hole at 1555 h on 29 September to prepare for logging Hole U1608A. The hole was displaced with heavy mud (barite), and the pipe was tripped up with the end of the pipe ultimately placed at 103.9 m CSF-A because of concerns about the condition and stability of the hole. The quad combo tool string was deployed to the base of Hole U1608A and tagged the bottom at 558.6 m CSF-A. Following a complete pass of the hole, the quad combo was pulled to the rig floor and broken down. The FMS (without sonic) tool string was then assembled and deployed at 0235 h on 30 September. After two successful logs, the FMS tool was brought back on board and broken down. The VSI was rigged up and deployed, and the protected species watch began at 0730 h. Stations were measured uphole every 20 m, and the VSI was back on board by 1300 h. With logging completed, we tripped the pipe out of Hole U1608A, clearing the rig floor at 1555 h. The drill floor was secured for transit, and the thrusters were raised and secured for transit at 1630 h, ending Hole U1608A and Site U1608.
4.6.3. Principal results
4.6.3.1. Lithostratigraphy
The stratigraphy of Site U1608 is divided into four lithostratigraphic units (Figure F18). The lithofacies include (1) bioturbated mud with dispersed sand, (2) calcareous mud, (3) sandy mud/muddy sand with or without dispersed clasts, and (4) clast-poor sandy diamicton. Lithofacies 1 and 3 are present in all lithostratigraphic units, and Lithofacies 2 and 4 occur only in Units II and IV.
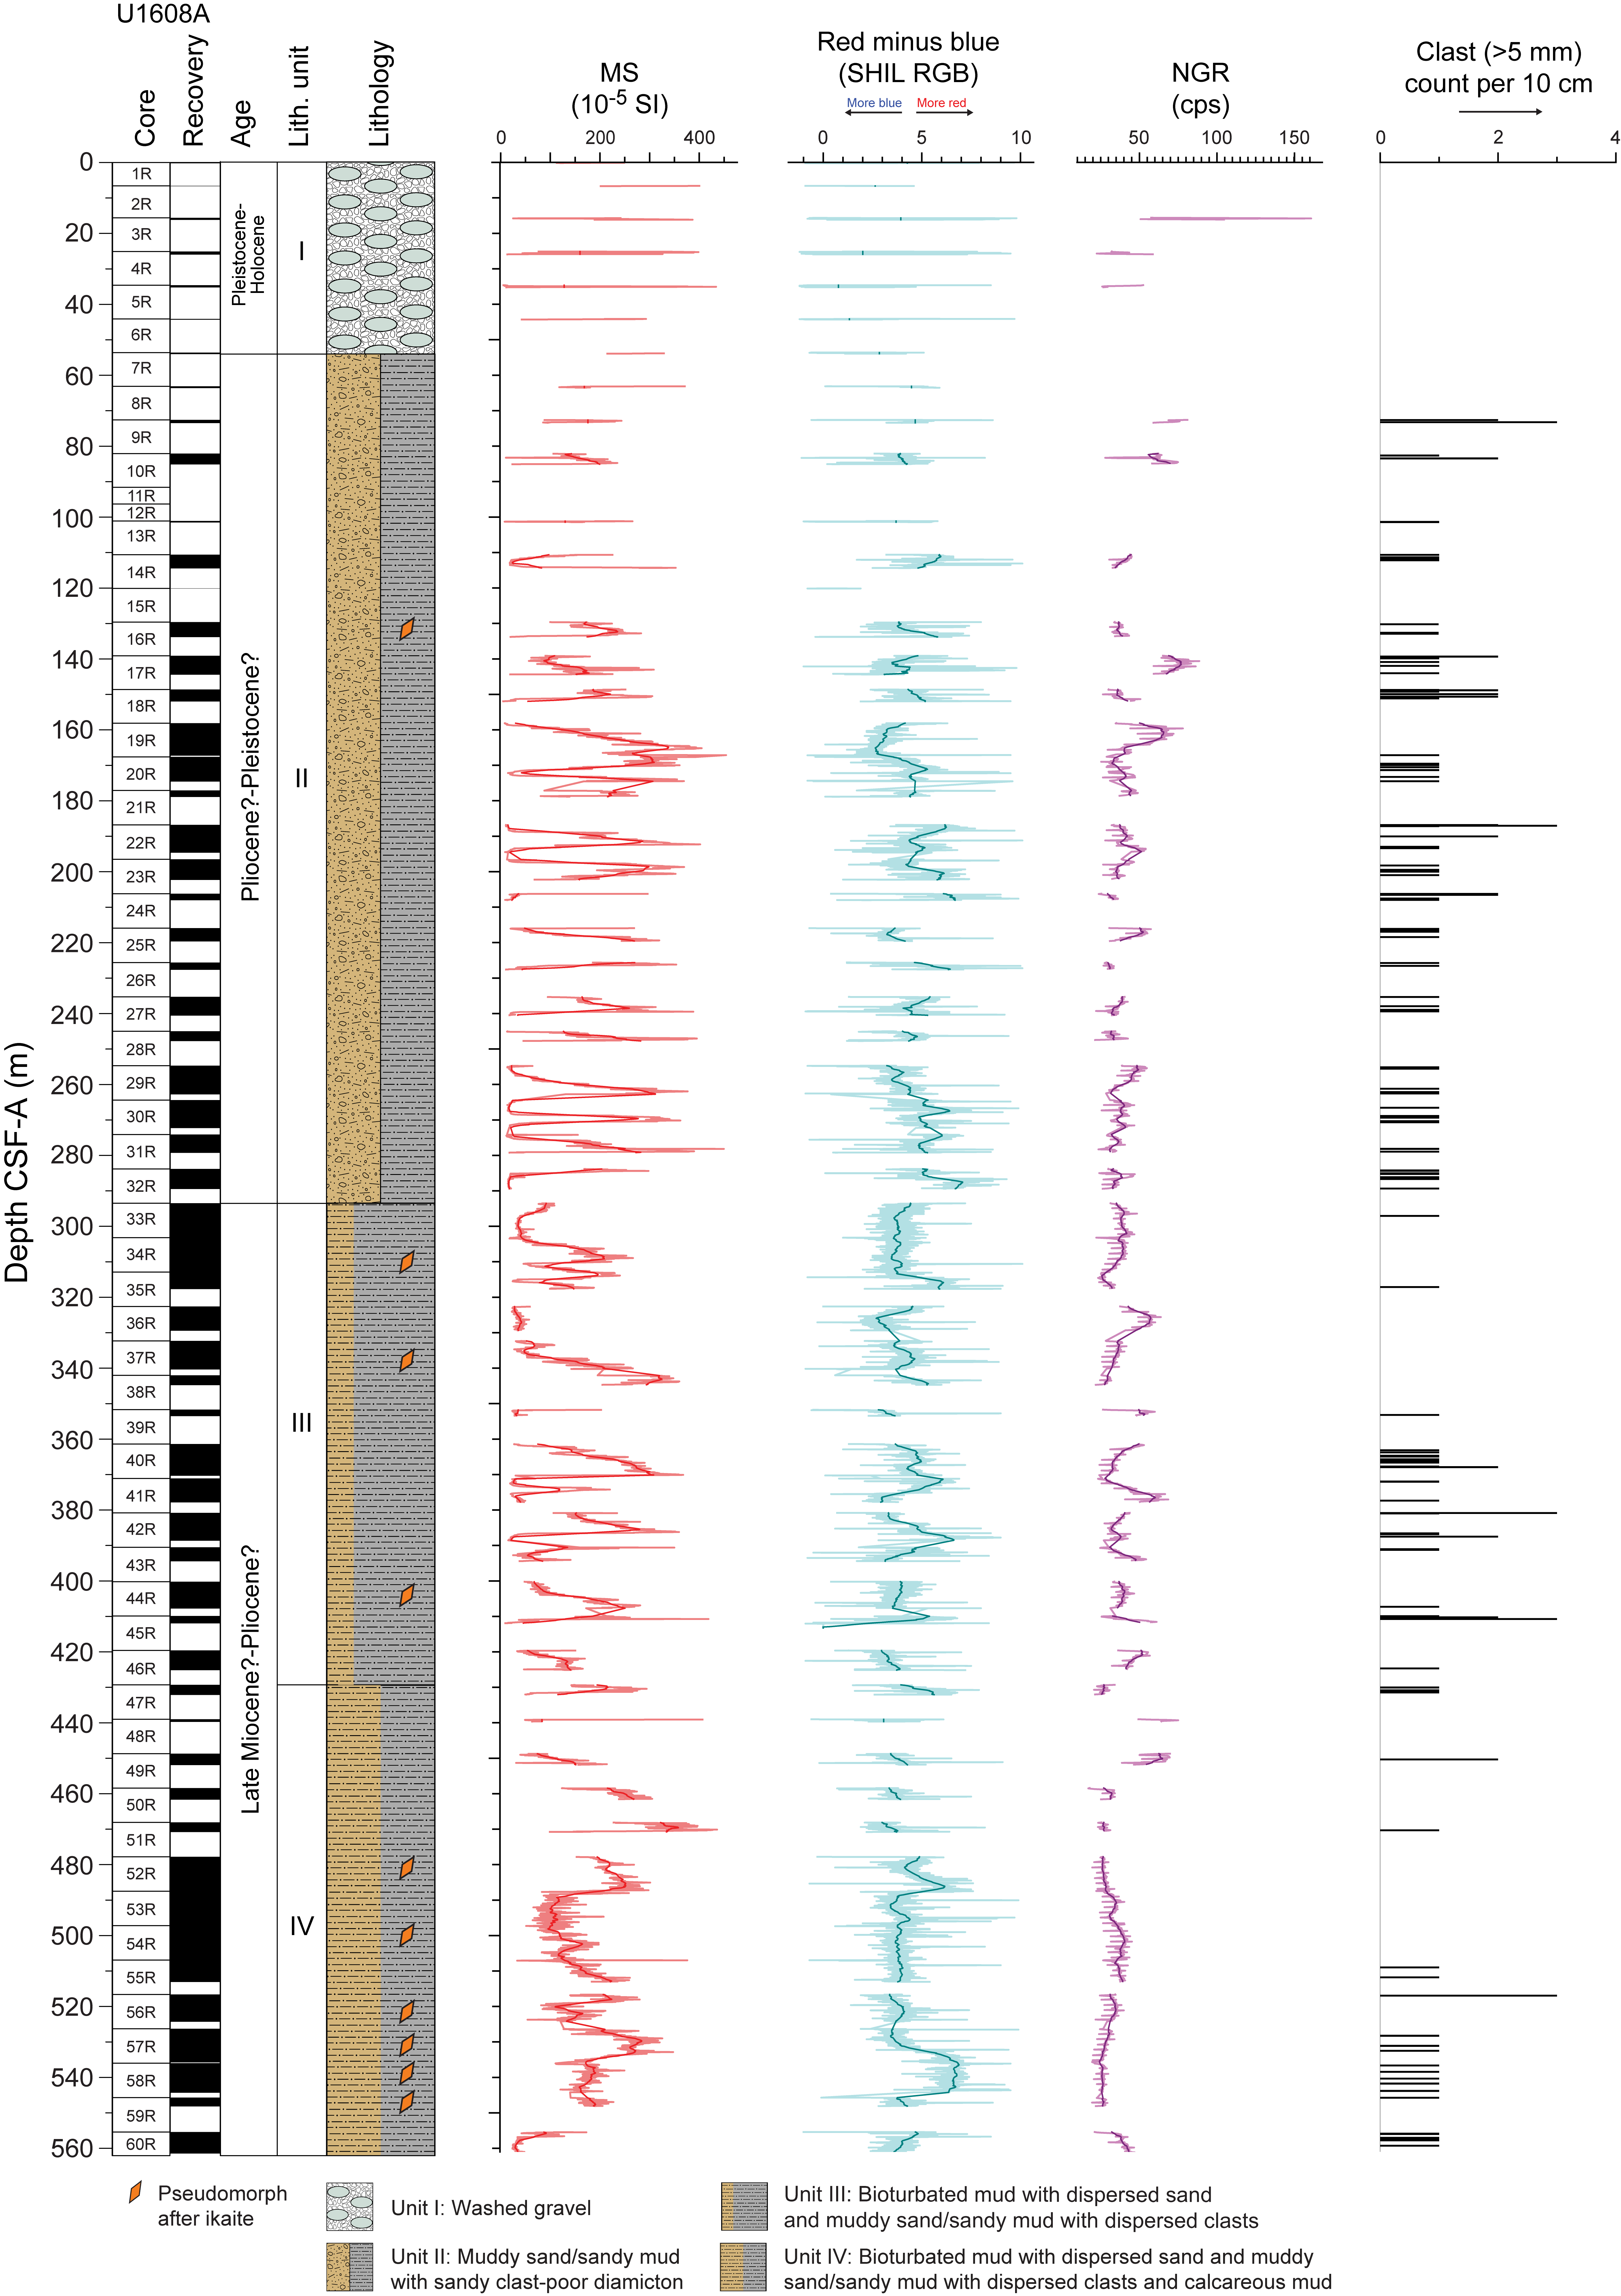
Figure F18. Lithostratigraphic summary, Site U1608.
Lithostratigraphic Unit I contains the uppermost 53.6 m of the site and consists of washed gravel (a product of drilling disturbance) with diverse igneous, plutonic, and metamorphic clasts. Unit II (53.6–293.5 m CSF-A) contains bioturbated sandy mud/muddy sand with or without dispersed clasts, calcareous mud, and occurrences of clast-poor sandy diamicton. Unit III (293.5–429.3 m CSF-A) contains meter- to decimeter-scale intervals of bioturbated mud with sand and sandy mud to muddy sand with or without dispersed clasts. Overall, Unit III is distinguished from Unit II by a decrease in the abundance of sand, a significant reduction in the occurrence of the calcareous mud lithofacies, and an increase in the abundance of bioturbated mud with dispersed sand. The 135.8 m thick Unit IV (429.3–561.46 m CSF-A) consists of alternating meter- to decimeter-scale intervals of bioturbated mud with dispersed sand and decimeter-scale intervals of sandy mud/muddy sand. This unit marks a downhole increase in the sand proportion and an increase in the occurrence of yellowish calcareous mud. In this unit, the calcareous mud commonly occurs as centimeter-scale bioturbated patches. Overall, the sedimentary succession recovered at Site U1608 is consistent with deposition in a marine shelf setting with sedimentary contributions from glacigenic and minor hemipelagic biosiliceous sources.
4.6.3.2. Micropaleontology
Core catcher samples from the 60 cores from Hole U1608A were examined for foraminifera, diatoms, dinocysts, and other palynomorphs. Samples were also taken for sedaDNA analysis. The mudline was not recovered at Site U1608, and Cores 1R–3R contain washed gravel without fine-grained sediment suitable for microfossil analysis. All microfossil groups are present in Site U1608 cores and occur throughout much of the recovered sequence. Benthic foraminifera occur in 88% of the samples. Planktonic foraminifera are found in only three samples, represented in each case by a single specimen. Diatoms were observed in 70% of the samples, and dinocysts were observed in 84% of the samples.
Foraminifera are absent to ~74 m CSF-A. Below this depth, they become rare to intermittently common to the base of the hole and consist of typical Arctic Neogene shelf-slope benthic species with additional species reflecting subarctic to boreal environments (Feyling-Hansen, 1976). The long-ranging benthic species offer little age control, although the presence of Cassidulina teretis implies that the foraminifera-bearing sediments between ~74 and 562 m CSF-A are older than 700 ka but no older than Middle Miocene (Seidenkrantz, 1995). Diatoms are absent to ~100 m CSF-A, below which they are present in most core catcher samples. The diatom assemblages are diverse and well preserved in some samples, providing both age and paleoenvironmental constraints. Palynomorphs occur in every sample in varying abundance, including the uppermost 100 m, where other microfossils are rare or absent. The dinocyst assemblages, which consist mostly of species associated with neritic, nutrient-rich environments, are also diverse in some intervals, providing additional chronostratigraphic and paleoenvironmental insights. Pulses of terrestrially derived organic material are a distinct feature of Site U1608. This is evidenced by occurrences of micro/macrofossil wood and plant fragments in sieved foraminifera samples, as well as by smaller plant/wood fragments, pollen, spores, and fungal material in palynomorph preparations. These pulses of terrestrial material in the sieved (>63 µm) foraminifera samples occur intermittently and at times intensely from 64 to 488 m CSF-A.
4.6.3.3. Paleomagnetism
Pass-through paleomagnetic measurements from Site U1608 were performed using the SRM to investigate the magnetization of a total of 201 archive section halves. Measurements were not made on core catcher sections. All measurements on section halves were made at 2 cm intervals up to a peak AF demagnetization of 20 mT. Inclinations from the filtered 20 mT step archive halves are generally bimodal at the estimates of inclinations for normal and reversed polarities at this latitude calculated from the geocentric axial dipole, and the bimodal inclination distribution suggests that intervals of both normal and reversed polarity were recovered at Site U1608. A total of 192 discrete cube samples were collected from the working section halves; generally, we collected one sample per core, avoiding visually disturbed intervals. Discrete specimens from Cores 400-U1608A-9R through 40R were measured on the SRM up to a peak AF demagnetization of 50 mT. Cores 41R–60R were only demagnetized to a peak field of 40 mT. We utilized a filtering method that assessed the magnetic stability of archive-half and discrete sample data and used the filtered data to define 11 polarity zones at Site U1608.
4.6.3.4. Physical properties
Standard physical property measurements were made on cores from Hole U1608A using the WRMSL, SHMSL, and NGRL track instruments. Discrete measurements were also made for MAD analysis, thermal conductivity, and P-wave velocity on the PWC system. Prominent variations in physical property values occur at similar depths in NGR and density and are associated with major lithologic changes in the cores. The correlation between these physical properties distinguishes five PP units (I–V) at Site U1608. PP Unit I (0–130 m CSF-A) includes mostly irregular values of NGR, MS, and density, which is largely due to poor recovery and the occurrence of washed gravel in the uppermost 50 m at Site U1608. Thermal conductivity reaches a maximum value for Site U1608 in PP Unit I. In PP Unit II (130–215 m CSF-A), high-amplitude variability of NGR and MS corresponds to lithologies of mud, sandy mud, and muddy sand. Throughout PP Unit II, density decreases slightly downhole. PP Unit III (215–315 m CSF-A) is characterized by low-amplitude variability in NGR coupled with high-amplitude variability in MS in the upper half of the unit, followed by an increase in NGR and a decrease in MS intensity and variability in the lower half. NGR and MS trends in PP Unit III reflect the transition from sandy mud to muddy sand as the dominant lithology throughout the unit. Muddy sand is also the primary lithology of PP Unit IV (315–450 m CSF-A), although it also contains intervals of calcareous mud in the lower half of the unit where density becomes more variable. NGR and MS in PP Unit IV are both highly variable. PP Unit V (450–561 m CSF-A) is defined by low NGR and MS values, which further decrease downhole throughout the unit.
4.6.3.5. Geochemistry
Samples for headspace gas, IW chemistry, and bulk sediment geochemistry were analyzed for Site U1608. Headspace hydrocarbon gas concentrations were low in the uppermost 50 m. Below this depth, high concentrations of methane (average = 33,800 ppm) were found to the bottom of Hole U1608A. IW samples were not taken in the uppermost nine cores of the hole because of low recovery. The main findings from IW analysis include downhole increases in alkalinity, potassium, magnesium, and phosphate to around 250 m CSF-A and steadily decreasing values for these components below 300 m CSF-A. Elemental analysis of solid material revealed average concentrations of 0.5% organic carbon and 0.06% nitrogen throughout Hole U1608A.
4.6.3.6. Stratigraphic correlation
To analyze the extent of the core gaps and further improve the depth assessment of the recovered material, we correlated the physical properties measured on the cores to the downhole logs obtained from the borehole. Whole-round MS and NGR measured on the cores were imported into Correlator (v. 4), as well as downhole MS and natural gamma ray data, which were imported into the software as a single core table. Ties between downhole data and core data were assessed based on visual and statistical matches of the properties. This procedure has some significant uncertainties because of the presence of large-scale features in the downhole logging data that do not resemble the record measured on cores in the laboratory. However, the overall cyclicity of the records is well matched between the downhole logs and the cores, and the relative depth offset of each core provides information that can be used to confidently improve the depth constraints of the cores. The resulting depth scale is referred to as CCSF-A even though it is not a scale resulting from the alignment of two or more holes. The difference between the CSF-A and CCSF-A depths varies downhole from a few centimeters up to 10 m. The depth constraints provided by the downhole logging data allow an improved interpretation of the formation lithology, age, and physical properties.
4.6.3.7. Age model
The initial age constraints are based on magnetostratigraphic interpretations of inclination with two additional biostratigraphic constraints. The diatom P. barboi was identified in the interval between 180 and 507 m CSF-A and has an age range of 3.31–9.49 Ma (Koç and Scherer, 1996). The second potential constraint is from the occurrence of the diatom Thalassiosira nidulus throughout material recovered from Site U1608, whose first occurrence is at 4.57 Ma (Koç and Scherer, 1996) on the Icelandic Plateau. With these considerations, we have two possible age models. There are also possible hiatuses identified in the seismic data at 96 and 535 m CSF-A, the former of which eliminates the highest normal polarity zone as a possible constraint. Model 1 is inconsistent with the occurrence of P. barboi above 238 m CSF-A, and in this model the transition from normal (Polarity Zone N2) to reversed (Polarity Zone R1) is correlated to Chron C2An.1n. The average sediment accumulation rate for this age model is 18.5 cm/ky. In Model 2, the transition from normal (Polarity Zone N2) to reversed (Polarity Zone R1) is correlated to Chron C3n.1n and the N6–R5 reversal is correlated to Chron C3An.1n. The average sediment accumulation rate for this age model is 15.1 cm/ky.
4.6.3.8. Downhole measurements
Downhole logging was carried out in Hole U1608A upon completion of the coring operations. The quad combo tool string was deployed with the MSS, natural gamma ray, electrical laterolog resistivity, acoustic velocity, and density tools. Two of the four runs (initial down pass and final up pass) covered the full length of the hole to 2 m above the bottom (561 m CSF-A). The caliper showed a stable hole, and the instruments yielded reliable measurements; however, large washouts were observed to ~400 m CSF-A, and the lower 157 m of the hole were homogeneous.
Upon completion of the quad combo runs, the FMS was lowered downhole. Three runs (a down pass and two up passes) were completed. Vertical seismic profiling was implemented with the VSI after the FMS run to obtain an accurate time-depth relationship to tie the logging and coring results to the seismic data, and the geophones recorded the seismic signal at 24 stations located at an average spacing of 20 m. Successful measurements were made at 20 of the 24 planned stations; however, stations between 970 and 1030 mbrf needed further processing. VSI results were used in the core-log-seismic correlation at Site U1608. A protected species watch was in place before and during the use of the seismic source.
Logging measurements were crucial for covering recovery gaps during RCB coring. Core logging and downhole logging results differ in absolute values, but the relative trends of the logs are comparable. Hence, logging data could be used for covering the formation recovery gaps with confidence.
5. Preliminary scientific assessment
Anthropogenic warming may be forcing the GrIS to respond in ways that are unpredictable, potentially leading to major deglaciation and associated sea level rises (Christ et al., 2023). The closest analogs of modern atmospheric CO2 require comparison with Neogene climate records (Siegert et al., 2020). For this reason, it is important to understand the GrIS’s past warm-phase behavior and provide a deep temporal baseline for its variability. To address this knowledge gap, the goal of Expedition 400 was to retrieve a GrIS proximal sedimentary archive, hitherto only imaged on seismic data (Knutz et al., 2015, 2019; Newton et al., 2021), that could provide new information and cover knowledge gaps pertaining to the evolution of the GrIS.
Expedition 400 recovered 2299 m of sediment core by drilling a composite succession of 3084 m, covered by six sites along the transect traversing the northwest Greenland continental margin (Figures F1, F2, F4, F19, F20; Table T1). In addition, wireline logging was completed at four sites, three of which included VSI data. The average recovery was 51%, which was unsurprising for a glaciated margin, but considerable variations were seen between sites and stratigraphic units. Sites U1603 and U1604 in the deep water produced recoveries of 90%–100% in the interval to 250 m CSF-A, whereas recoveries in the drilled succession below 250 m CSF-A were generally below 30%. Site U1605 on the outer shelf margin turned out to be less promising, with only 13.6% recovery. For this reason and considering time constraints, we decided to omit proposed Site MB-30A. Site U1608 was drilled to 561 m CSF-A with a recovery of 48%, which is partly due to poor core return in the uppermost 100 m. The pattern of increased recovery below Megaunit A was also manifested by the four holes drilled at Site U1606. Most outstanding was Site U1607, which was cored to 978 m CSF-A and returned a recovery of 77%. Considering that we anticipated a total of 2000–3000 m of sediment at the outset, the actual amount of core gained meets our expectations. Four environmental and geologic settings were drilled as part of Expedition 400, each aimed at meeting specific scientific objectives.
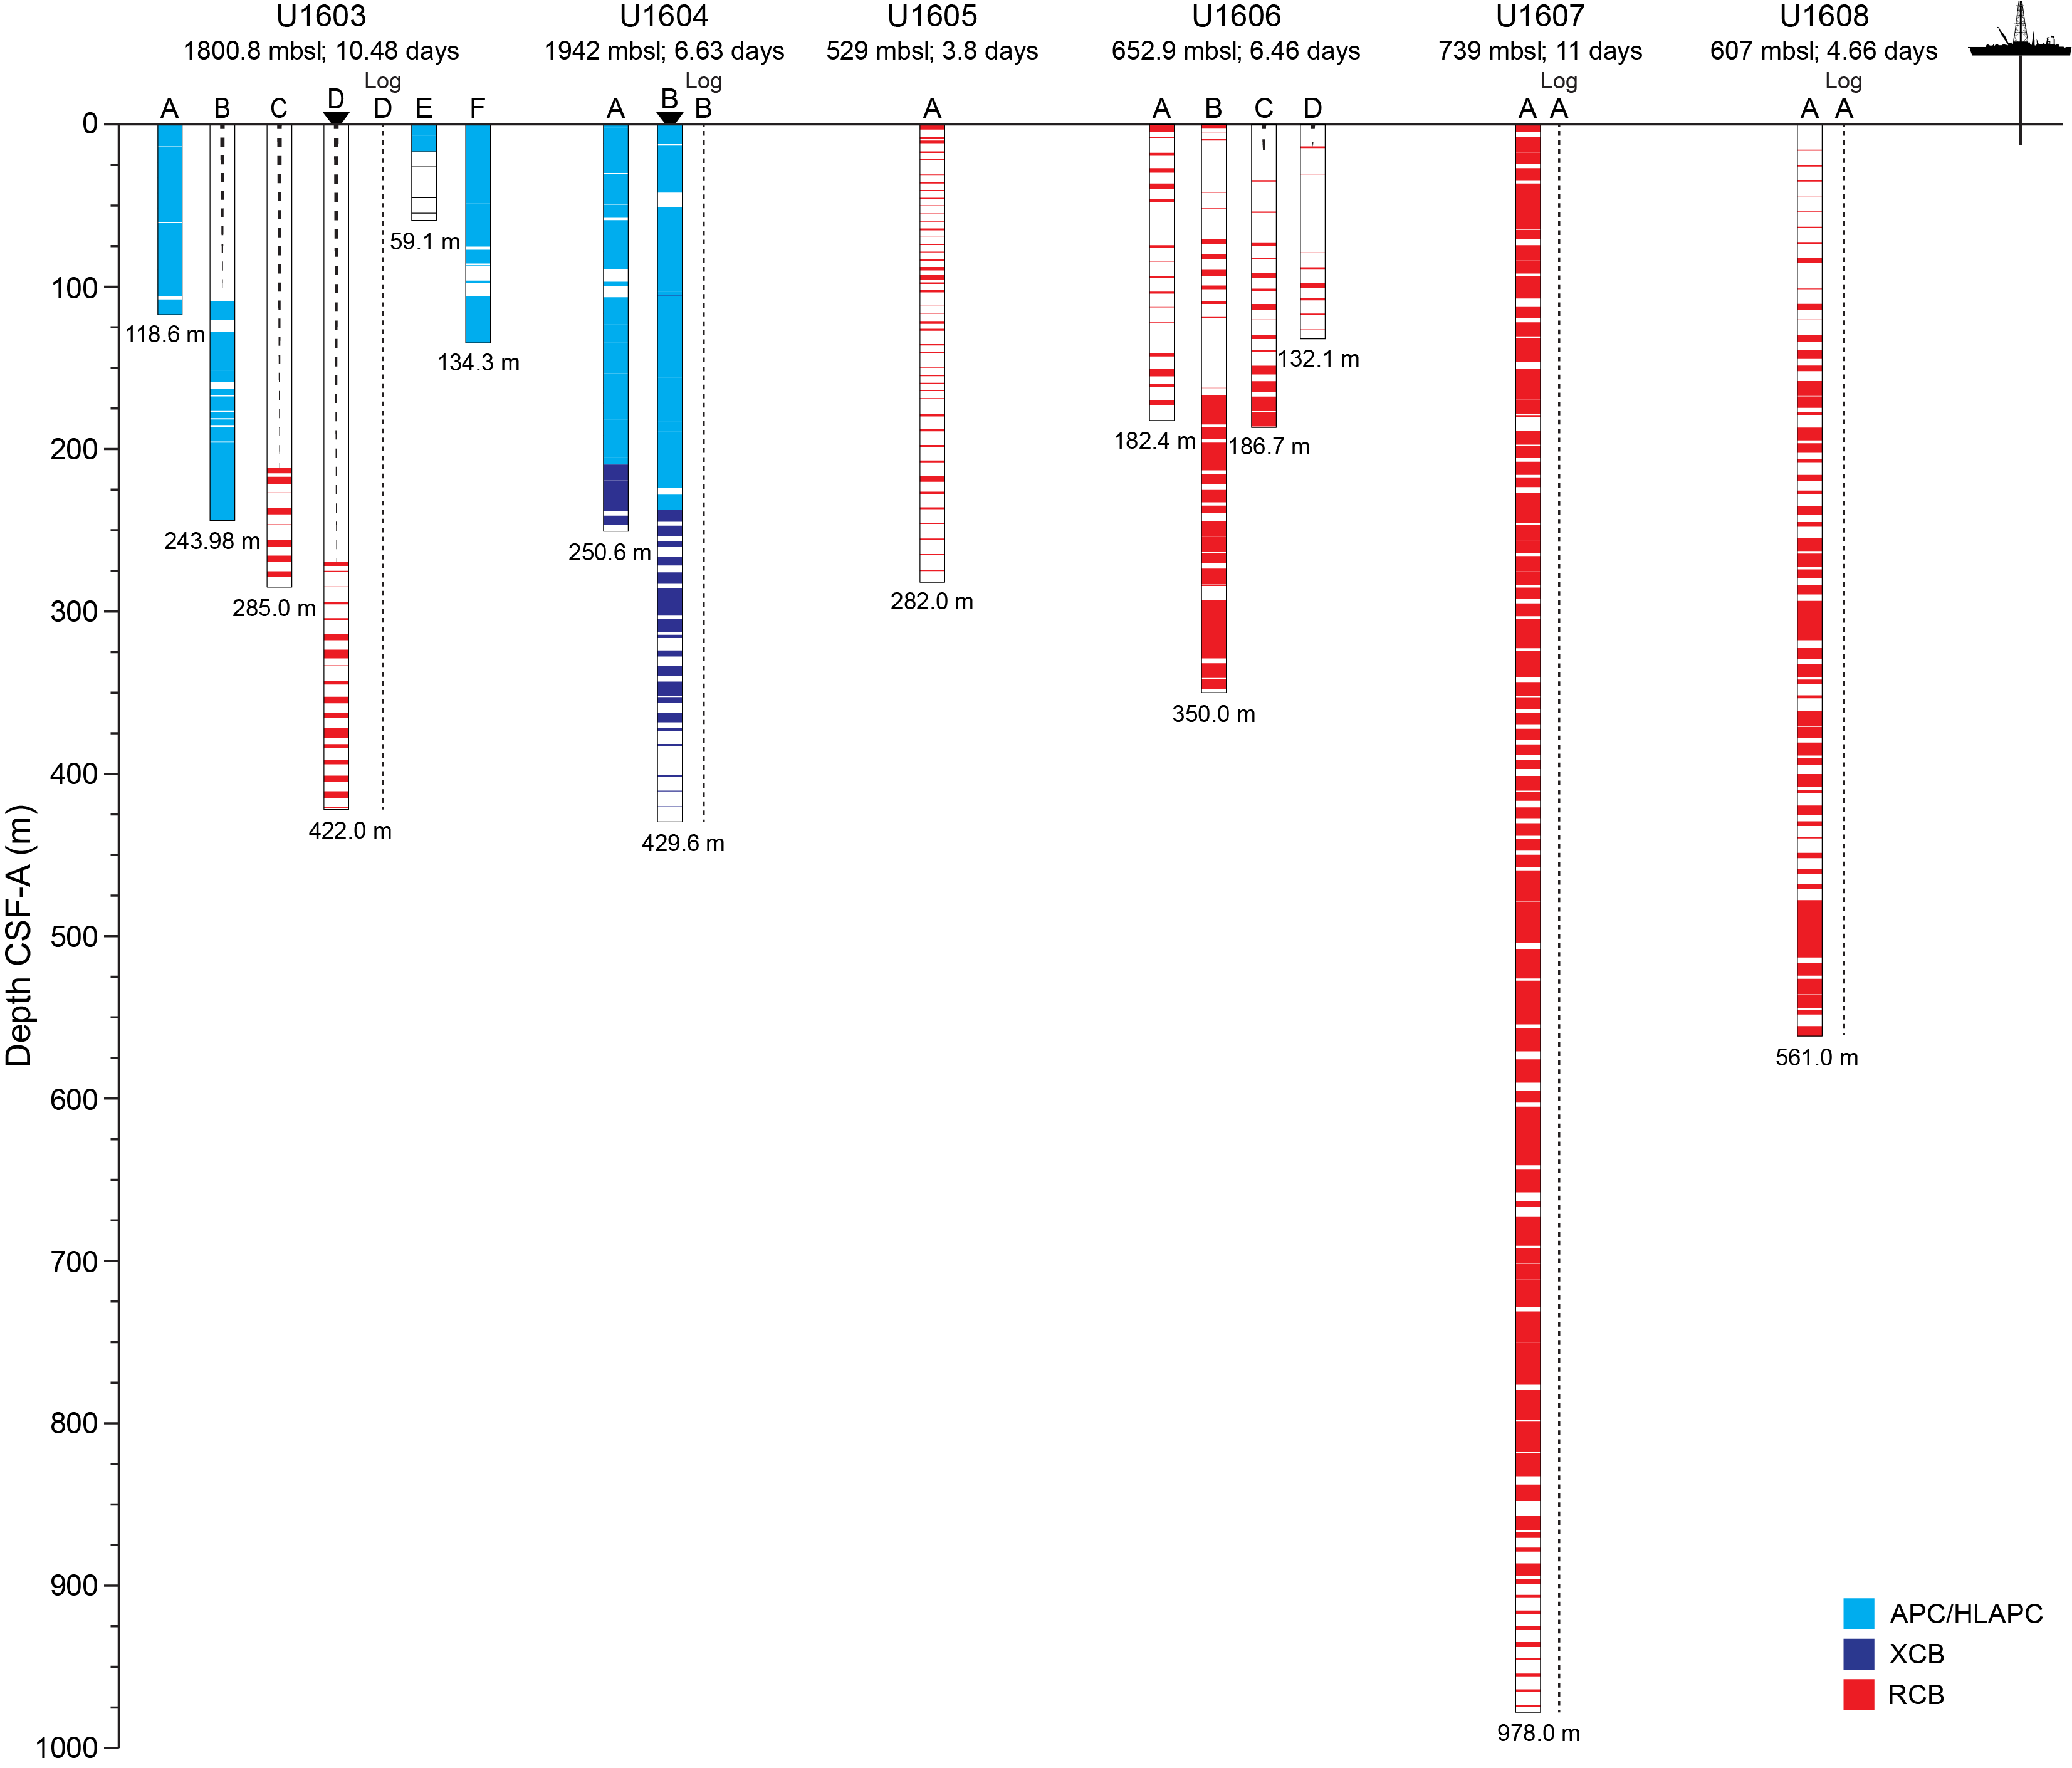
Figure F19. Coring systems and core recovery.

Figure F20. Age model overview.
5.1. Slope to deepwater basin of TMF: Sites U1603 and U1604
The aim of coring Sites U1603 and U1604 within a drift-channel system was to obtain high-resolution records that could test the notion that the NGrIS has experienced significant episodes of glacial retreat associated with warm interglacials, also referred to as super-interglacials, since the early Pleistocene. The age model for these sites was based on paleomagnetic reversals and relative paleomagnetic intensity stratigraphy. Sedimentation rates range 28–75 and 15–45 cm/ky for Sites U1603 and U1604, respectively, with the lowest values observed in the sections below 250 m CSF-A. This means that we can expect to gain continuous centennial-scale resolution records from these sites, which fulfills the requirement for identifying discrete pulses of sediment from Greenland. The lithology shows distinct changes in ice-rafted debris clasts, some of which fall within layers rich in detrital carbonate related to Baffin Bay Detrital Carbonate events (Andrews et al., 1998). The variation in clast composition throughout the lithologic sequence prescribes marked changes in the iceberg-emitting source regions. Further multiproxy studies will be needed to reach a detailed understanding of the evolution of the NGrIS and its interaction with ocean circulation and other glacial outlets (e.g., the Lancaster Sound and Nares Strait systems).
The content of microfossils in core catcher samples recovered at deepwater sites was generally sparse with only sporadic occurrences of assemblages. However, targeted sampling in core sections with low NGR improved the detection of microfossils, especially foraminifera, which is encouraging for further work.
The data produced from Sites U1603 and U1604 will allow us to test the potential Pleistocene scenarios for GrIS mass loss proposed by Schaefer et al. (2016): ice-free interglacials, ice-free super-interglacials, or one 280,000 y long ice-free period. An additional objective is to address the hypothesis originally proposed by Clark and Pollard (1998) suggesting that the transition from 40,000 to 100,000 y climate cyclicity across the MPT was related to continental ice sheets growing thicker once the regolith-soil on which they were grounded had been eroded away. Knutz et al. (2019) proposed a linkage between GrIS evolution and progressive regolith erosion based on seismic evidence indicating a pronounced shift in ice sheet configuration through the MPT. Bolstered by the age model and sedimentation rates indicated by the shipboard results, sediments cored at Sites U1603–U1605 provide a test for changes in basal ice-flow conditions related to progressive regolith-soil erosion since 1.2 Ma. Such changes might be revealed by the composition of detrital parent material or organic components reworked from land by successive glacial advances.
5.2. Outer shelf margin of TMF: Site U1605
Coring at Site U1605 was intended to capture interglacial muds potentially interbedded within the aggrading shelf wedge of the Melville Bugt TMF. It was also unique because it was the only site coring into Seismic Unit 7 that, unlike younger Seismic Units 8–11, displays an elongate slope front depocenter (Knutz et al., 2019). No muddy intervals were recovered at Site U1605. The material recovered at Site U1605, exclusive of drilled clasts, was mainly sandy to muddy diamicton. However, this lithology will be valuable for detrital archive analyses informing on weathering and landscape exposure (Christ et al., 2020) at the onset of the MPT.
5.3. Preglacial contourites: Sites U1606 and U1608
At Sites U1606 and U1608 the strategy was to core through the deposits of the first prograding unit, representing the onset of shelf-based glacial expansion (Megaunit A), and then continue into marine contourite sediments of Megaunit B, as defined by the seismic geometries. The overall recoveries achieved were low (<50%) as a result of large variations (excluding washed gravel) in Megaunit A representing the uppermost 100–160 m at Sites U1606 and U1608, whereas recovery increases in underlying contourite drifts of Megaunit B. A 450 m thick contourite sequence was drilled at Site U1608 with recoveries generally increasing with depth. A highlight from Site U1608 was the discovery of species in the form of diatoms and foraminifera with affinity toward conditions significantly warmer than today. The paleomagnetic results from Sites U1606 and U1608 were of generally unpredictable good quality through the lower part of the drilled succession where recovery was best. However, the interpretation of ages was not straightforward, resulting in two potential age models capturing different parts of the Pliocene. However, the micropaleontology results provide most support for the younger age model. Rare occurrences of foraminifera in glacial-marine sediments in Cores 400-U1606B-11R and 14R support an early Pleistocene age.
We cored a prominent Pliocene archive and probably the late Pliocene–early Pleistocene transition, but elaboration on developing a multiproxy paleoclimate record from Sites U1606 and U1608 is needed. This work will establish the paleoceanography and tectonic framework responsible for maintaining a geostrophic boundary current over millions of years along the West Greenland margin during the Pliocene, potentially connected to Atlantic meridional circulation. Application of paleoceanographic tracers and sedimentologic work may provide information on water mass sources, current strength, and potentially configuration of Arctic gateways, whereas coarse-grained detrital components can reveal the presence and variability of the past GrIS. The marine sedimentary succession recovered at Sites U1606 and U1608 forms a unique empirical database for establishing Arctic climate development and ice-ocean interactions during the Pliocene warm analog.
5.4. Postrift basin: Site U1607
We cored Site U1607 to 978 m CSF-A with the aim of understanding early ice sheet evolution in northwest Greenland and its behavior in past climate periods with stronger greenhouse forcing than the present. This was the primary site for capturing a sequence that was characterized by seismic data as a hemipelagic basin infill (Figure F4). From regional seismic lines, we also knew that there was a stratigraphic section, presumably over hundreds of meters, missing in the top part of the sedimentary succession (approximately the seabed) because of tectonic uplift and/or glacial erosion (Knutz et al., 2015; Gregersen et al., 2022). The site was drilled on the outer rim of a sedimentary basin situated between a major boundary fault against Greenland (east) and the Melville Bay Ridge (west). These tectonic elements originated during the Cretaceous rift phase prior to Baffin Bay opening and were later modified by a late Eocene transpressional regime as seafloor spreading halted (Figure F2).
Expedition 400 achieved a nearly continuous sedimentary record that according to biostratigraphic indexes goes back to the earliest Miocene–late Oligocene. Shipboard paleomagnetic stratigraphy was not affirmative and only possible to about 360 m CSF-A because of diagenetic influences on magnetic mineral components. With limited but important support from the shipboard micropaleontology team, two potential age models were presented, essentially capturing different parts of the Miocene. Onshore analyses, including further paleomagnetic work, micropaleontology based on comprehensive sampling and processing, and discrete radiogenic dating, will be necessary to produce a refined age model for Hole U1607A. With a better constrained age model, it may be possible to extract climate rhythms from the continuous proxy data (e.g., natural gamma ray or other wireline logging data) that can be orbitally tuned to the global climate record (cf. Miller et al., 2020). With further elaboration on lithologic and organic matter proxies, we hope to test the hypothesis that climate cooling in the late Miocene is associated with an ice sheet expansion in northwest Greenland from ephemeral glaciation to an ice dome drained by marine terminating outlets. Site U1607 has provided us with an Oligocene–Miocene archive adjacent to west Greenland sedimentary sources that will be crucial for understanding the response of the cryosphere to greenhouse gas forcing and associated tipping points. This information will also be a critical reference for paleoclimate ensemble models aimed at reconstructing warm analogs aimed at future warming scenarios.
Drilling Site U1607 to the planned target depth of nearly 980 m CSF-A was clearly a high-risk/high-gain operation, so we consider the results from Site U1607 to be an overachievement.
References
Abe-Ouchi, A., Saito, F., Kawamura, K., Raymo, M.E., Okuno, J.i., Takahashi, K., and Blatter, H., 2013. Insolation-driven 100,000-year glacial cycles and hysteresis of ice-sheet volume. Nature, 500(7461):190–193. https://doi.org/10.1038/nature12374
Acton, G., and the Expedition 344S Scientists, 2012. Proceedings of the Baffin Bay Scientific Coring Program: The Hague, Netherlands (Shell). https://greenland-resource-assessment.gl/wp-content/uploads/2020/07/2012-Proc-Baffin-Bay-Sci-Coring-Programme-S344web.pdf
Alley, R.B., Anandakrishnan, S., Christianson, K., Horgan, H.J., Muto, A., Parizek, B.R., Pollard, D., and Walker, R.T., 2015. Oceanic forcing of ice-sheet retreat: West Antarctica and more. Annual Review of Earth and Planetary Sciences, 43(1):207–231. https://doi.org/10.1146/annurev-earth-060614-105344
Alley, R.B., Anandakrishnan, S., Dupont, T.K., Parizek, B.R., and Pollard, D., 2007. Effect of sedimentation on ice-sheet grounding-line stability. Science, 315(5820):1838–1841. https://doi.org/10.1016/B978-0-12-817129-5.00009-3
Alley, R.B., Andrews, J.T., Brigham-Grette, J., Clarke, G.K.C., Cuffey, K.M., Fitzpatrick, J.J., Funder, S., Marshall, S.J., Miller, G.H., Mitrovica, J.X., Muhs, D.R., Otto-Bliesner, B.L., Polyak, L., and White, J.W.C., 2010. History of the Greenland Ice Sheet: paleoclimatic insights. Quaternary Science Reviews, 29(15–16):1728–1756. https://doi.org/10.1016/j.quascirev.2010.02.007
Andrews, J.T., Kirby, M.E., Aksu, A., Barber, D.C., and Meese, D., 1998. Late Quaternary detrital carbonate events in Baffin Bay (67°–74°N): correlation with Heinrich events in the North Atlantic? Quaternary Science Reviews, 17(12):1125–1137. https://doi.org/10.1016/S0277-3791(97)00064-4
Aubry, A.M.R., de Vernal, A., and Knutz, P.C., 2021. Baffin Bay late Neogene palynostratigraphy at Ocean Drilling Program Site 645. Canadian Journal of Earth Sciences, 58(1):67–83. https://doi.org/10.1139/cjes-2019-0227
Bâcle, J., Carmack, E.C., and Ingram, R.G., 2002. Water column structure and circulation under the North Water during spring transition: April–July 1998. Deep Sea Research, Part II: Topical Studies in Oceanography, 49(22):4907–4925. https://doi.org/10.1016/S0967-0645(02)00170-4
Baldauf, J.G., Clement, B.M., Aksu, A.E., de Vernal, A., Firth, J.V., Hall, F.R., Head, M.J., Jarrard, R.D., Kaminski, M.A., Lazarus, D., Monjanel, A.-L., Berggren, W.A., Gradstein, F.M., Knüttel, S., Mudie, P.J., and Russell, M.D., Jr., 1989. Magnetostratigraphic and biostratigraphic synthesis of Ocean Drilling Program Leg 105: Labrador Sea and Baffin Bay. In Srivastava, S.P., Arthur, M., Clement, B., et al., Proceedings of the Ocean Drilling Program, Scientific Results. 105: College Station, TX (Ocean Drilling Program), 935–956. https://doi.org/10.2973/odp.proc.sr.105.165.1989
Bamber, J.L., Griggs, J.A., Hurkmans, R.T.W.L., Dowdeswell, J.A., Gogineni, S.P., Howat, I., Mouginot, J., Paden, J., Palmer, S., Rignot, E., and Steinhage, D., 2013. A new bed elevation dataset for Greenland. The Cryosphere, 7(2):499–510. https://doi.org/10.5194/tc-7-499-2013
Bennike, O., Abrahamsen, N., Bak, M., Israelson, C., Konradi, P., Matthiessen, J., and Witkowski, A., 2002. A multi-proxy study of Pliocene sediments from Île de France, North-East Greenland. Palaeogeography, Palaeoclimatology, Palaeoecology, 186(1–2):1–23. https://doi.org/10.1016/S0031-0182(02)00439-X
Bennike, O., and Böcher, J., 1990. Forest-tundra neighbouring the North Pole: plant and insect remains from the Plio-Pleistocene Kap København Formation, North Greenland. Arctic, 43(4):301–414. https://doi.org/10.14430/arctic1629
Bennike, O., Colgan, W., Hedenäs, L., Heiri, O., Lemdahl, G., Wiberg-Larsen, P., Ribeiro, S., Pronzato, R., Manconi, R., and Bjørk, A.A., 2023. An Early Pleistocene interglacial deposit at Pingorsuit, North-West Greenland. Boreas, 52(1):27–41. https://doi.org/10.1111/bor.12596
Bennike, O., Knudsen, K.L., Abrahamsen, N., Böcher, J., Cremer, H., and Wagner, B., 2010. Early Pleistocene sediments on Store Koldewey, northeast Greenland. Boreas, 39(3):603–619. https://doi.org/10.1111/j.1502-3885.2010.00147.x
Berger, A.L., Gulick, S.P.S., Spotila, J.A., Upton, P., Jaeger, J.M., Chapman, J.B., Worthington, L.A., Pavlis, T.L., Ridgway, K.D., Willems, B.A., and McAleer, R.J., 2008. Quaternary tectonic response to intensified glacial erosion in an orogenic wedge. Nature Geoscience, 1(11):793–799. https://doi.org/10.1038/ngeo334
Berndt, C., Bünz, S., and Mienert, J., 2003. Polygonal fault systems on the mid-Norwegian margin: a long-term source for fluid flow. In Van Rensbergen, P., Hillis, R.R., Maltman, A.J., and Morley, C.K. (Eds.), Subsurface Sediment Mobilization. Geological Society Special Publication, 216: 283–290. https://doi.org/10.1144/GSL.SP.2003.216.01.18
Bierman, P.R., Shakun, J.D., Corbett, L.B., Zimmerman, S.R., and Rood, D.H., 2016. A persistent and dynamic East Greenland Ice Sheet over the past 7.5 million years. Nature, 540(7632):256–260. https://doi.org/10.1038/nature20147
Bourke, R.H., Addison, V.G., and Paquette, R.G., 1989. Oceanography of Nares Strait and northern Baffin Bay in 1986 with emphasis on deep and bottom water formation. Journal of Geophysical Research: Oceans, 94(C6):8289–8302. https://doi.org/10.1029/JC094iC06p08289
Briner, J.P., Alley, R.B., Bender, M.L., Csatho, B., Poinar, K., and Schaefer, J.M., 2017. How stable is the Greenland Ice Sheet? With contributions by Axford, Y., Born, A., Hatfield, R., Jennings, A.J., Keisling, B., Kelly, M., Langebroek, P., Miller, G.H., Morlighem, M., Osterberg, E.C., Otto-Bliesner, B., Robel, A., and Young, N.E. National Science Foundation Report. http://www.glyfac.buffalo.edu/Faculty/briner/greenlandworkshop/NSF_greenland_stability_whitepaper.pdf
Catania, G.A., Stearns, L.A., Moon, T.A., Enderlin, E.M., and Jackson, R.H., 2020. Future evolution of Greenland’s marine-terminating outlet glaciers. Journal of Geophysical Research: Earth Surface, 125(2):e2018JF004873. https://doi.org/10.1029/2018JF004873
Chalmers, J.A., Pulvertaft, T.C.R., Christiansen, F.G., Larsen, H.C., Laursen, K.H., and Ottesen, T.G., 1993. The southern West Greenland continental margin: rifting history, basin development, and petroleum potential. In Parker, J.R., Petroleum Geology of Northwest Europe: Proceedings of the 4th Conference. Geological Society, London, Petroleum Geology Conference Series, 4: 915–931. https://doi.org/10.1144/0040915
Christ, A.J., Bierman, P.R., Knutz, P.C., Corbett, L.B., Fosdick, J.C., Thomas, E.K., Cowling, O.C., Hidy, A.J., and Caffee, M.W., 2020. The Northwestern Greenland Ice Sheet during the Early Pleistocene was similar to today. Geophysical Research Letters, 47(1):e2019GL085176. https://doi.org/10.1029/2019GL085176
Christ, A.J., Rittenour, T.M., Bierman, P.R., Keisling, B.A., Knutz, P.C., Thomsen, T.B., Keulen, N., Fosdick, J.C., Hemming, S.R., Tison, J.-L., Blard, P.-H., Steffensen, J.P., Caffee, M.W., Corbett, L.B., Dahl-Jensen, D., Dethier, D.P., Hidy, A.J., Perdrial, N., Peteet, D.M., Steig, E.J., and Thomas, E.K., 2023. Deglaciation of northwestern Greenland during Marine Isotope Stage 11. Science, 381(6655):330–335. https://doi.org/10.1126/science.ade4248
Clark, P.U., Archer, D., Pollard, D., Blum, J.D., Rial, J.A., Brovkin, V., Mix, A.C., Pisias, N.G., and Roy, M., 2006. The Middle Pleistocene transition: characteristics, mechanisms, and implications for long-term changes in atmospheric pCO2. Quaternary Science Reviews, 25(23–24):3150–3184. https://doi.org/10.1016/j.quascirev.2006.07.008
Clark, P.U., and Pollard, D., 1998. Origin of the Middle Pleistocene transition by ice sheet erosion of regolith. Paleoceanography, 13(1):1–9. https://doi.org/10.1029/97PA02660
Cluett, A.A., and Thomas, E.K., 2021. Summer warmth of the past six interglacials on Greenland. Proceedings of the National Academy of Sciences of the United States of America, 118(20):e2022916118. https://doi.org/10.1073/pnas.2022916118
Couette, P.-O., Lajeunesse, P., Ghienne, J.-F., Dorschel, B., Gebhardt, C., Hebbeln, D., and Brouard, E., 2022. Evidence for an extensive ice shelf in northern Baffin Bay during the Last Glacial Maximum. Communications Earth & Environment, 3(1):225. https://doi.org/10.1038/s43247-022-00559-7
Cox, D.R., Huuse, M., Newton, A.M.W., Sarkar, A.D., and Knutz, P.C., 2021. Shallow gas and gas hydrate occurrences on the northwest Greenland shelf margin. Marine Geology, 432:106382. https://doi.org/10.1016/j.margeo.2020.106382
Cox, D.R., Knutz, P.C., Campbell, D.C., Hopper, J.R., Newton, A.M.W., Huuse, M., and Gohl, K., 2020. Geohazard detection using 3D seismic data to enhance offshore scientific drilling site selection. Scientific Drilling, 28:1–27. https://doi.org/10.5194/sd-28-1-2020
Csank, A.Z., Patterson, W.P., Eglington, B.M., Rybczynski, N., and Basinger, J.F., 2011. Climate variability in the Early Pliocene Arctic: annually resolved evidence from stable isotope values of sub-fossil wood, Ellesmere Island, Canada. Palaeogeography, Palaeoclimatology, Palaeoecology, 308(3–4):339–349. https://doi.org/10.1016/j.palaeo.2011.05.038
Dahl-Jensen, D., Bamber, J., Bøggild, C.E., Buch, E., Christensen, J.H., Dethloff, K., Fahnestock, M., Marshall, S., Rosing, M., Steffen, K., Thomas, R., Truffer, M., van den Broeke, M., and van der Veen, C.J., 2009. The Greenland ice sheet in a changing climate: snow, water, ice and permafrost in the Arctic (SWIPA) 2009. Arctic Monitoring and Assessment Programme Report. https:/pure.au.dk/ws/files/70671287/2009_vdBroeke_AMAP.pdf
de Vernal, A., and Hillaire-Marcel, C., 2008. Natural variability of Greenland climate, vegetation, and ice volume during the past million years. Science, 320(5883):1622–1625. https://doi.org/10.1126/science.1153929
de Vernal, A., and Mudie, P.J., 1989. Pliocene and Pleistocene palynostratigraphy at ODP Sites 646 and 647, eastern and southern Labrador Sea. In Srivastava, S.P., Arthur, M., Clement, B., et al., Proceedings of the Ocean Drilling Program, Scientific Results. 105: College Station, TX (Ocean Drilling Program), 401–422. https://doi.org/10.2973/odp.proc.sr.105.134.1989
DeConto, R.M., Pollard, D., Alley, R.B., Velicogna, I., Gasson, E., Gomez, N., Sadai, S., Condron, A., Gilford, D.M., Ashe, E.L., Kopp, R.E., Li, D., and Dutton, A., 2021. The Paris Climate Agreement and future sea-level rise from Antarctica. Nature, 593(7857):83–89. https://doi.org/10.1038/s41586-021-03427-0
DeConto, R.M., Pollard, D., Wilson, P.A., Pälike, H., Lear, C.H., and Pagani, M., 2008. Thresholds for Cenozoic bipolar glaciation. Nature, 455(7213):652–656. https://doi.org/10.1038/nature07337
Dorschel, B., 2017. Cruise Summary Report Maria S. Merian - MSM66, Nuuk–Reykjavik 22.07.2017–28.08.2017. Bremerhaven, Germany: Alfred Wegener Institute. https://www.ldf.uni-hamburg.de/merian/wochenberichte/wochenberichte-merian/msm65-msm68/msm66-scr.pdf
Dowdeswell, J.A., Hogan, K.A., Ó Cofaigh, C., Fugelli, E.M.G., Evans, J., and Noormets, R., 2014. Late Quaternary ice flow in a West Greenland fjord and cross-shelf trough system: submarine landforms from Rink Isbrae to Uummannaq shelf and slope. Quaternary Science Reviews, 92:292–309. https://doi.org/10.1016/j.quascirev.2013.09.007
Dowsett, H.J., Foley, K.M., Stoll, D.K., Chandler, M.A., Sohl, L.E., Bentsen, M., Otto-Bliesner, B.L., Bragg, F.J., Chan, W.-L., Contoux, C., Dolan, A.M., Haywood, A.M., Jonas, J.A., Jost, A., Kamae, Y., Lohmann, G., Lunt, D.J., Nisancioglu, K.H., Abe-Ouchi, A., Ramstein, G., Riesselman, C.R., Robinson, M.M., Rosenbloom, N.A., Salzmann, U., Stepanek, C., Strother, S.L., Ueda, H., Yan, Q., and Zhang, Z., 2013. Sea surface temperature of the mid-Piacenzian ocean: a data-model comparison. Scientific Reports, 3(1):2013. https://doi.org/10.1038/srep02013
Dutton, A., Carlson, A.E., Long, A.J., Milne, G.A., Clark, P.U., DeConto, R., Horton, B.P., Rahmstorf, S., and Raymo, M.E., 2015. Sea-level rise due to polar ice-sheet mass loss during past warm periods. Science, 349(6244):aaa4019. https://doi.org/10.1126/science.aaa4019
Dutton, A., and Lambeck, K., 2012. Ice volume and sea level during the last interglacial. Science, 337(6091):216–219. https://doi.org/10.1126/science.1205749
Eldrett, J.S., Harding, I.C., Wilson, P.A., Butler, E., and Roberts, A.P., 2007. Continental ice in Greenland during the Eocene and Oligocene. Nature, 446(7132):176–179. https://doi.org/10.1038/nature05591
Eyles, N., 1996. Passive margin uplift around the North Atlantic region and its role in Northern Hemisphere late Cenozoic glaciation. Geology, 24(2):103–106. https://doi.org/10.1130/0091-7613(1996)024<0103:PMUATN>2.3.CO;2
Fahnestock, M., Abdalati, W., Joughin, I., Brozena, J., and Gogineni, P., 2001. High geothermal heat flow, basal melt, and the origin of rapid ice flow in central Greenland. Science, 294(5550):2338–2342. https://doi.org/10.1126/science.1065370
Feng, R., Bhattacharya, T., Otto-Bliesner, B.L., Brady, E.C., Haywood, A.M., Tindall, J.C., Hunter, S.J., Abe-Ouchi, A., Chan, W.-L., Kageyama, M., Contoux, C., Guo, C., Li, X., Lohmann, G., Stepanek, C., Tan, N., Zhang, Q., Zhang, Z., Han, Z., Williams, C.J.R., Lunt, D.J., Dowsett, H.J., Chandan, D., and Peltier, W.R., 2022. Past terrestrial hydroclimate sensitivity controlled by Earth system feedbacks. Nature Communications, 13(1):1306. https://doi.org/10.1038/s41467-022-28814-7
Feyling-Hansen, R.W., 1976. The stratigraphy of the Quaternary Clyde Foreland Formation, Baffin Island, illustrated by the distribution of benthic foraminifera. Boreas, 5(2):77–94. https://doi.org/10.1111/j.1502-3885.1976.tb00333.x
Foster, G.L., Lear, C.H., and Rae, J.W.B., 2012. The evolution of pCO2, ice volume and climate during the middle Miocene. Earth and Planetary Science Letters, 341–344:243–254. https://doi.org/10.1016/j.epsl.2012.06.007
Foster, G.L., Lunt, D.J., and Parrish, R.R., 2010. Mountain uplift and the glaciation of North America – a sensitivity study. Climate of the Past, 6(5):707–717. https://doi.org/10.5194/cp-6-707-2010
Funder, S., Bennike, O., Böcher, J., Israelson, C., Petersen, K.S., and Símonarson, L.A., 2001. Late Pliocene Greenland – the Kap København Formation in North Greenland. Bulletin of the Geological Society of Denmark, 48:117–134. https://doi.org/10.37570/bgsd-2001-48-06
Fyles, J.G., Hills, L.V., Matthews, J.V., Barendregt, R., Baker, J., Irving, E., and Jetté, H., 1994. Ballast Brook and Beaufort Formations (late Tertiary) on Northern Banks Island, Arctic Canada. Quaternary International, 22–23:141–171. https://doi.org/10.1016/1040-6182(94)90010-8
Golledge, N.R., Thomas, Z.A., Levy, R.H., Gasson, E.G.W., Naish, T.R., McKay, R.M., Kowalewski, D.E., and Fogwill, C.J., 2017. Antarctic climate and ice-sheet configuration during the early Pliocene interglacial at 4.23 Ma. Climate of the Past, 13(7):959–975. https://doi.org/10.5194/cp-13-959-2017
Gosse, J.C., Ballantyne, A.P., Barker, J.D., Csank, A.Z., Fletcher, T.L., Grant, G.W., Greenwood, D.R., MacPhee, R.D.E., and Rybczynski, N., 2017. PoLAR-FIT: Pliocene landscapes and Arctic remains—frozen in time. Geoscience Canada, 44(1):47–54. https://doi.org/10.12789/geocanj.2017.44.116
Gregersen, U., Hopper, J.R., and Knutz, P.C., 2013. Basin seismic stratigraphy and aspects of prospectivity in the NE Baffin Bay, Northwest Greenland. Marine and Petroleum Geology, 46:1–18. https://doi.org/10.1016/j.marpetgeo.2013.05.013
Gregersen, U., Knutz, P.C., and Hopper, J.R., 2016. New geophysical and geological mapping of the eastern Baffin Bay region, offshore West Greenland. GEUS Bulletin, 35:83–86. https://doi.org/10.34194/geusb.v35.4945
Gregersen, U., Knutz, P.C., Pedersen, G.K., Nøhr-Hansen, H., Ineson, J.R., Larsen, L.M., Hopper, J.R., Bojesen-Koefoed, J.A., Dam, G., Funck, T., and Hovikoski, J., 2022. Stratigraphy of the West Greenland margin. In Dafoe, L.T., and Bingham-Koslowski, N. (Eds.), Geological Synthesis of Baffin Island (Nunavut) and the Labrador-Baffin Seaway. Geological Survey of Canada Bulletin, 608: 247–309. https://doi.org/10.4095/321849
Guillermic, M., Misra, S., Eagle, R., and Tripati, A., 2022. Atmospheric CO2 estimates for the Miocene to Pleistocene based on foraminiferal δ11B at Ocean Drilling Program Sites 806 and 807 in the western equatorial Pacific. Climate of the Past, 18(2):183–207. https://doi.org/10.5194/cp-18-183-2022
Hamilton, J., and Wu, Y., 2013. Synopsis and trends in the physical environment of Baffin Bay and Davis Strait. Canadian Technical Report of Hydrography and Ocean Sciences, 282.
Hansen, J., Sato, M., Hearty, P., Ruedy, R., Kelley, M., Masson-Delmotte, V., Russell, G., Tselioudis, T., Cao, J., Rignot, E., Velicogna, I., Kandiana, E., von Schuckman, K., Kharecha, P., Legrande, A.N., Bauer, M., and Lo, K.-W., 2016. Ice melt, sea level rise and superstorms: evidence from paleoclimate data, climate modeling, and modern observations that 2°C global warming is highly dangerous. Atmospheric Chemistry and Physics, 15:20059–20179. https://doi.org/10.5194/acpd-15-20059-2015
Haywood, A.M., Dowsett, H.J., and Dolan, A.M., 2016. Integrating geological archives and climate models for the mid-Pliocene warm period. Nature Communications, 7(1):10646. https://doi.org/10.1038/ncomms10646
Haywood, A.M., Dowsett, H.J., Otto-Bliesner, B., Chandler, M.A., Dolan, A.M., Hill, D.J., Lunt, D.J., Robinson, M.M., Rosenbloom, N., Salzmann, U., and Sohl, L.E., 2010. Pliocene Model Intercomparison Project (PlioMIP): experimental design and boundary conditions (Experiment 1). Geoscientific Model Development, 3(1):227–242. https://doi.org/10.5194/gmd-3-227-2010
Haywood, A.M., Tindall, J.C., Dowsett, H.J., Dolan, A.M., Foley, K.M., Hunter, S.J., Hill, D.J., Chan, W.L., Abe-Ouchi, A., Stepanek, C., Lohmann, G., Chandan, D., Peltier, W.R., Tan, N., Contoux, C., Ramstein, G., Li, X., Zhang, Z., Guo, C., Nisancioglu, K.H., Zhang, Q., Li, Q., Kamae, Y., Chandler, M.A., Sohl, L.E., Otto-Bliesner, B.L., Feng, R., Brady, E.C., von der Heydt, A.S., Baatsen, M.L.J., and Lunt, D.J., 2020. The Pliocene Model Intercomparison Project Phase 2: large-scale climate features and climate sensitivity. Climate of the Past, 16(6):2095–2123. https://doi.org/10.5194/cp-16-2095-2020
Hodell, D.A., and Channell, J.E.T., 2016. Mode transitions in Northern Hemisphere glaciation: co-evolution of millennial and orbital variability in Quaternary climate. Climate of the Past, 12(9):1805–1828. https://doi.org/10.5194/cp-12-1805-2016
Hodson, A., Bøggild, C., Hanna, E., Huybrechts, P., Langford, H., Cameron, K., and Houldsworth, A., 2010. The cryoconite ecosystem on the Greenland ice sheet. Annals of Glaciology, 51(56):123–129. https://doi.org/10.3189/172756411795931985
Hofmann, J.C., Knutz, P.C., Nielsen, T., and Kuijpers, A., 2016. Seismic architecture and evolution of the Disko Bay trough-mouth fan, central West Greenland margin. Quaternary Science Reviews, 147:69–90. https://doi.org/10.1016/j.quascirev.2016.05.019
Hogan, K.A., Larter, R.D., Graham, A.G.C., Arthern, R., Kirkham, J.D., Totten Minzoni, R., Jordan, T.A., Clark, R., Fitzgerald, V., Wåhlin, A.K., Anderson, J.B., Hillenbrand, C.D., Nitsche, F.O., Simkins, L., Smith, J.A., Gohl, K., Arndt, J.E., Hong, J., and Wellner, J., 2020. Revealing the former bed of Thwaites Glacier using sea-floor bathymetry: implications for warm-water routing and bed controls on ice flow and buttressing. The Cryosphere, 14(9):2883–2908. https://doi.org/10.5194/tc-14-2883-2020
Holland, D.M., Thomas, R.H., de Young, B., Ribergaard, M.H., and Lyberth, B., 2008. Acceleration of Jakobshavn Isbræ triggered by warm subsurface ocean waters. Nature Geoscience, 1(10):659–664. https://doi.org/10.1038/ngeo316
Hu, A., Meehl, G.A., Han, W., Otto-Bliestner, B., Abe-Ouchi, A., and Rosenbloom, N., 2015. Effects of the Bering Strait closure on AMOC and global climate under different background climates. Progress in Oceanography, 132:174–196. https://doi.org/10.1016/j.pocean.2014.02.004
Hulbe, C.L., MacAyeal, D.R., Denton, G.H., Kleman, J., and Lowell, T.V., 2004. Catastrophic ice shelf breakup as the source of Heinrich event icebergs. Paleoceanography, 19(1):PA1004. https://doi.org/10.1029/2003PA000890
Jackson, R., Kvorning, A.B., Limoges, A., Georgiadis, E., Olsen, S.M., Tallberg, P., Andersen, T.J., Mikkelsen, N., Giraudeau, J., Massé, G., Wacker, L., and Ribeiro, S., 2021. Holocene polynya dynamics and their interaction with oceanic heat transport in northernmost Baffin Bay. Scientific Reports, 11(1):10095. https://doi.org/10.1038/s41598-021-88517-9
Jakobsson, M., Mayer, L., Coakley, B., Dowdeswell, J.A., Forbes, S., Fridman, B., Hodnesdal, H., Noormets, R., Pedersen, R., Rebesco, M., Schenke, H.W., Zarayskaya, Y., Accettella, D., Armstrong, A., Anderson, R.M., Bienhoff, P., Camerlenghi, A., Church, I., Edwards, M., Gardner, J.V., Hall, J.K., Hell, B., Hestvik, O., Kristofferson, Y., Marcussen, C., Mohammad, R., Mosher, D., Nghiem, S.V., Pedrosa, M.T., Travaglini, P.G., and Weatherall, P., 2012. The International Bathymetric Chart of the Arctic Ocean (IBCAO) Version 3.0. Geophysical Research Letters, 39(12):L12609. https://doi.org/10.1029/2012GL052219
Jansen, E., Fronval, T., Rack, F., and Channell, J.E.T., 2000. Pliocene-Pleistocene ice rafting history and cyclicity in the Nordic Seas during the last 3.5 Myr. Paleoceanography, 15(6):709–721. https://doi.org/10.1029/1999PA000435
Japsen, P., Bonow, J.M., Green, P.F., Chalmers, J.A., and Lidmar-Bergström, K., 2006. Elevated, passive continental margins: long-term highs or Neogene uplifts? New evidence from West Greenland. Earth and Planetary Science Letters, 248(1–2):330–339. https://doi.org/10.1016/j.epsl.2006.05.036
Jennings, A., Reilly, B., Andrews, J., Hogan, K., Walczak, M., Jakobsson, M., Stoner, J., Mix, A., Nicholls, K.W., O’Regan, M., Prins, M.A., and Troelstra, S.R., 2022. Modern and Early Holocene ice shelf sediment facies from Petermann Fjord and northern Nares Strait, northwest Greenland. Quaternary Science Reviews, 283:107460. https://doi.org/10.1016/j.quascirev.2022.107460
Jennings, A.E., Andrews, J.T., Ó Cofaigh, C., St-Onge, G., Belt, S., Cabedo-Sanz, P., Pearce, C., Hillaire-Marcel, C., and Calvin Campbell, D., 2018. Baffin Bay paleoenvironments in the LGM and HS1: resolving the ice-shelf question. Marine Geology, 402:5–16. https://doi.org/10.1016/j.margeo.2017.09.002
Jennings, A.E., Andrews, J.T., Ó Cofaigh, C., St. Onge, G., Sheldon, C., Belt, S.T., Cabedo-Sanz, P., and Hillaire-Marcel, C., 2017. Ocean forcing of ice sheet retreat in central west Greenland from LGM to the early Holocene. Earth and Planetary Science Letters, 472:1–13. https://doi.org/10.1016/j.epsl.2017.05.007
Jennings, A.E., Andrews, J.T., Oliver, B., Walczak, M., and Mix, A., 2019. Retreat of the Smith Sound ice stream in the Early Holocene. Boreas, 48(4):825–840. https://doi.org/10.1111/bor.12391
Kaminski, M.A., Gradstein, F.M., Scott, D.B., and MacKinnon, K.D., 1989. Neogene benthic foraminifer biostratigraphy and deep-water history of Sites 645, 646, and 647, Baffin Bay and Labrador Sea. In Srivastava, S.P., Arthur, M., Clement, B., et al., Proceedings of the Ocean Drilling Program, Scientific Results. 105: College Station, TX (Ocean Drilling Program), 731–756. https://doi.org/10.2973/odp.proc.sr.105.123.1989
Keisling, B.A., Castañeda, I.S., and Brigham-Grette, J., 2017. Hydrological and temperature change in Arctic Siberia during the intensification of Northern Hemisphere Glaciation. Earth and Planetary Science Letters, 457:136–148. https://doi.org/10.1016/j.epsl.2016.09.058
Khan, S.A., Wahr, J., Bevis, M., Velicogna, I., and Kendrick, E., 2010. Spread of ice mass loss into northwest Greenland observed by GRACE and GPS. Geophysical Research Letters, 37(6):L06501. https://doi.org/10.1029/2010GL042460
King, C., 1989. Cenozoic of the North Sea. In Jenkins, D.G., and Murray, J.W. (Eds.), Stratigraphical Atlas of Fossil Foraminifera Chichester, England (Ellis Horwood).
Knies, J., Mattingsdal, R., Fabian, K., Grøsfjeld, K., Baranwal, S., Husum, K., De Schepper, S., Vogt, C., Andersen, N., Matthiessen, J., Andreassen, K., Jokat, W., Nam, S.-I., and Gaina, C., 2014. Effect of early Pliocene uplift on Late Pliocene cooling in the Arctic–Atlantic gateway. Earth and Planetary Science Letters, 387:132–144. https://doi.org/10.1016/j.epsl.2013.11.007
Knutz, P.C., Gregersen, U., Harrison, C., Brent, T.A., Hopper, J.R., and Nøhr-Hansen, H., 2022. Baffin Bay composite tectono-sedimentary element. Memoirs - Geological Society of London, 57. https://doi.org/10.1144/M57-2016-7
Knutz, P.C., Hopper, J.R., Gregersen, U., Nielsen, T., and Japsen, P., 2015. A contourite drift system on the Baffin Bay–West Greenland margin linking Pliocene Arctic warming to poleward ocean circulation. Geology, 43(10):907–910. https://doi.org/10.1130/G36927.1
Knutz, P.C., Jennings, A.E., Childress, L.B., Bryant, R., Cargill, S.K., Coxall, H.K., Frank, T.D., Grant, G.R., Gray, R.E., Ives, L., Kumar, V., Le Houedec, S., Martens, J., Naim, F., Nelissen, M., Özen, V., Passchier, S., Pérez, L.F., Ren, J., Romans, B.W., Seki, O., Staudigel, P., Tauxe, L., Tibbett, E.J., Yokoyama, Y., Zhang, Y., and Zimmermann, H., 2025a. Site U1603. In Knutz, P.C., Jennings, A.E., Childress, L.B., and the Expedition 400 Scientists, NW Greenland Glaciated Margin. Proceedings of the International Ocean Discovery Program, 400: College Station, TX (International Ocean Discovery Program). https://doi.org/10.14379/iodp.proc.400.103.2025
Knutz, P.C., Jennings, A.E., Childress, L.B., Bryant, R., Cargill, S.K., Coxall, H.K., Frank, T.D., Grant, G.R., Gray, R.E., Ives, L., Kumar, V., Le Houedec, S., Martens, J., Naim, F., Nelissen, M., Özen, V., Passchier, S., Pérez, L.F., Ren, J., Romans, B.W., Seki, O., Staudigel, P., Tauxe, L., Tibbett, E.J., Yokoyama, Y., Zhang, Y., and Zimmermann, H., 2025b. Site U1604. In Knutz, P.C., Jennings, A.E., Childress, L.B., and the Expedition 400 Scientists, NW Greenland Glaciated Margin. Proceedings of the International Ocean Discovery Program, 400: College Station, TX (International Ocean Discovery Program). https://doi.org/10.14379/iodp.proc.400.104.2025
Knutz, P.C., Jennings, A.E., Childress, L.B., Bryant, R., Cargill, S.K., Coxall, H.K., Frank, T.D., Grant, G.R., Gray, R.E., Ives, L., Kumar, V., Le Houedec, S., Martens, J., Naim, F., Nelissen, M., Özen, V., Passchier, S., Pérez, L.F., Ren, J., Romans, B.W., Seki, O., Staudigel, P., Tauxe, L., Tibbett, E.J., Yokoyama, Y., Zhang, Y., and Zimmermann, H., 2025c. Site U1605. In Knutz, P.C., Jennings, A.E., Childress, L.B., and the Expedition 400 Scientists, NW Greenland Glaciated Margin. Proceedings of the International Ocean Discovery Program, 400: College Station, TX (International Ocean Discovery Program). https://doi.org/10.14379/iodp.proc.400.105.2025
Knutz, P.C., Jennings, A.E., Childress, L.B., Bryant, R., Cargill, S.K., Coxall, H.K., Frank, T.D., Grant, G.R., Gray, R.E., Ives, L., Kumar, V., Le Houedec, S., Martens, J., Naim, F., Nelissen, M., Özen, V., Passchier, S., Pérez, L.F., Ren, J., Romans, B.W., Seki, O., Staudigel, P., Tauxe, L., Tibbett, E.J., Yokoyama, Y., Zhang, Y., and Zimmermann, H., 2025d. Site U1606. In Knutz, P.C., Jennings, A.E., Childress, L.B., and the Expedition 400 Scientists, NW Greenland Glaciated Margin. Proceedings of the International Ocean Discovery Program, 400: College Station, TX (International Ocean Discovery Program). https://doi.org/10.14379/iodp.proc.400.106.2025
Knutz, P.C., Jennings, A.E., Childress, L.B., Bryant, R., Cargill, S.K., Coxall, H.K., Frank, T.D., Grant, G.R., Gray, R.E., Ives, L., Kumar, V., Le Houedec, S., Martens, J., Naim, F., Nelissen, M., Özen, V., Passchier, S., Pérez, L.F., Ren, J., Romans, B.W., Seki, O., Staudigel, P., Tauxe, L., Tibbett, E.J., Yokoyama, Y., Zhang, Y., and Zimmermann, H., 2025e. Site U1607. In Knutz, P.C., Jennings, A.E., Childress, L.B., and the Expedition 400 Scientists, NW Greenland Glaciated Margin. Proceedings of the International Ocean Discovery Program, 400: College Station, TX (International Ocean Discovery Program). https://doi.org/10.14379/iodp.proc.400.107.2025
Knutz, P.C., Jennings, A.E., Childress, L.B., Bryant, R., Cargill, S.K., Coxall, H.K., Frank, T.D., Grant, G.R., Gray, R.E., Ives, L., Kumar, V., Le Houedec, S., Martens, J., Naim, F., Nelissen, M., Özen, V., Passchier, S., Pérez, L.F., Ren, J., Romans, B.W., Seki, O., Staudigel, P., Tauxe, L., Tibbett, E.J., Yokoyama, Y., Zhang, Y., and Zimmermann, H., 2025f. Site U1608. In Knutz, P.C., Jennings, A.E., Childress, L.B., and the Expedition 400 Scientists, NW Greenland Glaciated Margin. Proceedings of the International Ocean Discovery Program, 400: College Station, TX (International Ocean Discovery Program). https://doi.org/10.14379/iodp.proc.400.108.2025
Knutz, P.C., Newton, A.M.W., Hopper, J.R., Huuse, M., Gregersen, U., Sheldon, E., and Dybkjær, K., 2019. Eleven phases of Greenland Ice Sheet shelf-edge advance over the past 2.7 million years. Nature Geoscience, 12(5):361–368. https://doi.org/10.1038/s41561-019-0340-8
Koç, N., and Scherer, R.P., 1996. Neogene diatom biostratigraphy of the Iceland Sea Site 907. In Thiede, J., Myhre, A.M., Firth, J.V., Johnson, G.L., and Ruddiman, W.F. (Eds.), Proceedings of the Ocean Drilling Program, Scientific Results. 151: College Station, TX (Ocean Drilling Program), 61–74. https://doi.org/10.2973/odp.proc.sr.151.108.1996
Koenig, S.J., Dolan, A.M., de Boer, B., Stone, E.J., Hill, D.J., DeConto, R.M., Abe-Ouchi, A., Lunt, D.J., Pollard, D., Quiquet, A., Saito, F., Savage, J., and van de Wal, R., 2015. Ice sheet model dependency of the simulated Greenland ice sheet in the mid-Pliocene. Climate of the Past, 11(3):369–381. https://doi.org/10.5194/cp-11-369-2015
Larsen, H.C., Saunders, A.D., Clift, P.D., Beget, J., Wei, W., and Spezzaferri, S., 1994. Seven million years of glaciation in Greenland. Science, 264(5161):952–955. https://doi.org/10.1126/science.264.5161.952
Lear, C.H., Billups, K., Rickaby, R.E.M., Diester-Haass, L., Mawbey, E.M., and Sosdian, S.M., 2016. Breathing more deeply: deep ocean carbon storage during the mid-Pleistocene climate transition. Geology, 44(12):1035–1038. https://doi.org/10.1130/G38636.1
Lisiecki, L.E., and Raymo, M.E., 2005. A Pliocene-Pleistocene stack of 57 globally distributed benthic δ18O records. Paleoceanography, 20(1):PA1003. https://doi.org/10.1029/2004PA001071
Lofverstrom, M., Thompson, D.M., Otto-Bliesner, B.L., and Brady, E.C., 2022. The importance of Canadian Arctic Archipelago gateways for glacial expansion in Scandinavia. Nature Geoscience, 15(6):482–488. https://doi.org/10.1038/s41561-022-00956-9
Loutre, M.F., 2003. Clues from MIS 11 to predict the future climate – a modelling point of view. Earth and Planetary Science Letters, 212(1–2):213–224. https://doi.org/10.1016/S0012-821X(03)00235-8
Lunt, D.J., Foster, G.L., Haywood, A.M., and Stone, E.J., 2008. Late Pliocene Greenland glaciation controlled by a decline in atmospheric CO2 levels. Nature, 454(7208):1102–1105. https://doi.org/10.1038/nature07223
Matthews, J.V., and Ovenden, L.E., 1990. Late Tertiary plant macrofossils from localities in Arctic/subarctic North America: a review of the data. Arctic, 43:364–392. https://doi.org/10.14430/ARCTIC1631
Medvedev, S., Souche, A., and Hartz, E.H., 2013. Influence of ice sheet and glacial erosion on passive margins of Greenland. Geomorphology, 193:36–46. https://doi.org/10.1016/j.geomorph.2013.03.029
Melles, M., Brigham-Grette, J., Minyuk, P.S., Nowaczyk, N.R., Wennrich, V., DeConto, R.M., Anderson, P.M., Andreev, A.A., Coletti, A., Cook, T.L., Haltia-Hovi, E., Kukkonen, M., Lozhkin, A.V., Rosén, P., Tarasov, P., Vogel, H., and Wagner, B., 2012. 2.8 million years of Arctic climate change from Lake El’gygytgyn, NE Russia. Science, 337(6092):315–320. https://doi.org/10.1126/science.1222135
Miller, K.G., Browning, J.V., Schmelz, W.J., Kopp, R.E., Mountain, G.S., and Wright, J.D., 2020. Cenozoic sea-level and cryospheric evolution from deep-sea geochemical and continental margin records. Science Advances, 6(20):eaaz1346. https://doi.org/10.1126/sciadv.aaz1346
Molnar, P., and England, P., 1990. Late Cenozoic uplift of mountain ranges and global climate change: chicken or egg? Nature, 346(6279):29–34. https://doi.org/10.1038/346029a0
Münchow, A., Falkner, K.K., and Melling, H., 2015. Baffin Island and West Greenland current systems in northern Baffin Bay. Progress in Oceanography, 132:305–317. https://doi.org/10.1016/j.pocean.2014.04.001
Neem Community Members, 2013. Eemian interglacial reconstructed from a Greenland folded ice core. Nature, 493(7433):489–494. https://doi.org/10.1038/nature11789
Newton, A.M.W., Huuse, M., Cox, D.R., and Knutz, P.C., 2021. Seismic geomorphology and evolution of the Melville Bugt trough mouth fan, northwest Greenland. Quaternary Science Reviews, 255:106798. https://doi.org/10.1016/j.quascirev.2021.106798
Newton, A.M.W., Huuse, M., Knutz, P.C., and Cox, D.R., 2020. Repeated ice streaming on the northwest Greenland continental shelf since the onset of the Middle Pleistocene Transition. The Cryosphere, 14(7):2303–2312. https://doi.org/10.5194/tc-14-2303-2020
Newton, A.M.W., Knutz, P.C., Huuse, M., Gannon, P., Brocklehurst, S.H., Clausen, O.R., and Gong, Y., 2017. Ice stream reorganization and glacial retreat on the northwest Greenland shelf. Geophysical Research Letters, 44(15):7826–7835. https://doi.org/10.1002/2017GL073690
Nielsen, T., Andersen, C., Knutz, P.C., and Kuijpers, A., 2011. The Middle Miocene to Recent Davis Strait drift complex: implications for Arctic–Atlantic water exchange. Geo-Marine Letters, 31(5):419–426. https://doi.org/10.1007/s00367-011-0245-z
Nielsen, T., and Kuijpers, A., 2013. Only 5 southern Greenland shelf edge glaciations since the Early Pliocene. Scientific Reports, 3(1):1875. https://doi.org/10.1038/srep01875
Nøhr-Hansen, H., Pedersen, G.K., Knutz, P.C., Bojesen-Koefoed, J.A., Śliwińska, K.K., Hovikoski, J., Ineson, J.R., Kristensen, L., and Therkelsen, J., 2021. The Cretaceous succession of northeast Baffin Bay: stratigraphy, sedimentology and petroleum potential. Marine and Petroleum Geology, 133:105108. https://doi.org/10.1016/j.marpetgeo.2021.105108
Ó Cofaigh, C., Andrews, J.T., Jennings, A.E., Dowdeswell, J.A., Hogan, K.A., Kilfeather, A.A., and Sheldon, C., 2013. Glacimarine lithofacies, provenance and depositional processes on a West Greenland trough-mouth fan. Journal of Quaternary Science, 28(1):13–26. https://doi.org/10.1002/jqs.2569
O’Brien, C.L., Huber, M., Thomas, E., Pagani, M., Super, J.R., Elder, L.E., and Hull, P.M., 2020. The enigma of Oligocene climate and global surface temperature evolution. Proceedings of the National Academy of Sciences of the United States of America, 117(41):25302–25309. https://doi.org/10.1073/pnas.2003914117
Oakey, G.N., and Chalmers, J.A., 2012. A new model for the Paleogene motion of Greenland relative to North America: plate reconstructions of the Davis Strait and Nares Strait regions between Canada and Greenland. Journal of Geophysical Research: Solid Earth, 117(B10):B10401. https://doi.org/10.1029/2011JB008942
Ogg, J.G., 2020. Geomagnetic Polarity Time Scale. In Gradstein, F.M., Ogg, J.G., Schmitz, M., and Ogg, G. (Eds.), Geologic Time Scale 2020. Amsterdam (Elsevier), 159–192. https://doi.org/10.1016/B978-0-12-824360-2.00005-X
Otto-Bliesner, B.L., Jahn, A., Feng, R., Brady, E.C., Hu, A., and Löfverström, M., 2017. Amplified North Atlantic warming in the late Pliocene by changes in Arctic gateways. Geophysical Research Letters, 44(2):957–964. https://doi.org/10.1002/2016GL071805
Pagani, M., 2014. Biomarker-based inferences of past climate: the alkenone pCO2 proxy. In Holland, H.D. and Turekian, K.K., Treatise on Geochemistry (Second Edition). Oxford (Elsevier), 361–378. https://doi.org/10.1016/B978-0-08-095975-7.01027-5
Paillard, D., 1998. The timing of Pleistocene glaciations from a simple multiple-state climate model. Nature, 391(6665):378–381. https://doi.org/10.1038/34891
Patton, H., Swift, D.A., Clark, C.D., Livingstone, S.J., and Cook, S.J., 2016. Distribution and characteristics of overdeepenings beneath the Greenland and Antarctic ice sheets: implications for overdeepening origin and evolution. Quaternary Science Reviews, 148:128-145. https://doi.org/10.1016/j.quascirev.2016.07.012
Pearce, C., and Knutz, P., 2019. Baffin Bay Ice-Ocean-Sediment Interactions: Research Cruise on HDMS Lauge Koch Aasiat - Qaanaaq - Carey Islands - Aasiatt, 19 Aug–8 Sep 2019. https://geo.au.dk/fileadmin/ingen_mappe_valgt/Paleoceanography_group/LAKO_BIOS19_cruise_report.pdf
Pearson, P.N., and Palmer, M.R., 2000. Atmospheric carbon dioxide concentrations over the past 60 million years. Nature, 406(6797):695–699. https://doi.org/10.1038/35021000
Pérez, L.F., Nielsen, T., Knutz, P.C., Kuijpers, A., and Damm, V., 2018. Large-scale evolution of the central-east Greenland margin: new insights to the North Atlantic glaciation history. Global and Planetary Change, 163:141–157. https://doi.org/10.1016/j.gloplacha.2017.12.010
Pollard, D., DeConto, R.M., and Alley, R.B., 2015. Potential Antarctic Ice Sheet retreat driven by hydrofracturing and ice cliff failure. Earth and Planetary Science Letters, 412:112–121. https://doi.org/10.1016/j.epsl.2014.12.035
Raymo, M.E., Grant, B., Horowitz, M., and Rau, G.H., 1996. Mid-Pliocene warmth: stronger greenhouse and stronger conveyor. Marine Micropaleontology, 27(1–4):313–326. https://doi.org/10.1016/0377-8398(95)00048-8
Raymo, M.E., and Huybers, P., 2008. Unlocking the mysteries of the ice ages. Nature, 451(7176):284–285. https://doi.org/10.1038/nature06589
Reyes, A.V., Carlson, A.E., Beard, B.L., Hatfield, R.G., Stoner, J.S., Winsor, K., Welke, B., and Ullman, D.J., 2014. South Greenland ice-sheet collapse during Marine Isotope Stage 11. Nature, 510(7506):525–528. https://doi.org/10.1038/nature13456
Rial, J.A., Oh, J., and Reischmann, E., 2013. Synchronization of the climate system to eccentricity forcing and the 100,000-year problem. Nature Geoscience, 6(4):289–293. https://doi.org/10.1038/ngeo1756
Rogozhina, I., Petrunin, A.G., Vaughan, A.P.M., Steinberger, B., Johnson, J.V., Kaban, M.K., Calov, R., Rickers, F., Thomas, M., and Koulakov, I., 2016. Melting at the base of the Greenland ice sheet explained by Iceland hotspot history. Nature Geoscience, 9(5):366–369. https://doi.org/10.1038/ngeo2689
Ruddiman, W.F., 2006. Orbital changes and climate. Quaternary Science Reviews, 25(23):3092–3112. https://doi.org/10.1016/j.quascirev.2006.09.001
Ruddiman, W.F., and Kutzbach, J.E., 1989. Forcing of late Cenozoic northern hemisphere climate by plateau uplift in southern Asia and the American west. Journal of Geophysical Research: Atmospheres, 94(D15):18409–18427. https://doi.org/10.1029/JD094iD15p18409
Rybczynski, N., Gosse, J.C., Richard Harington, C., Wogelius, R.A., Hidy, A.J., and Buckley, M., 2013. Mid-Pliocene warm-period deposits in the High Arctic yield insight into camel evolution. Nature Communications, 4(1):1550. https://doi.org/10.1038/ncomms2516
Rysgaard, S., Boone, W., Carlson, D., Sejr, M.K., Bendtsen, J., Juul-Pedersen, T., Lund, H., Meire, L., and Mortensen, J., 2020. An updated view on water masses on the pan-West Greenland Continental Shelf and their link to proglacial fjords. Journal of Geophysical Research: Oceans, 125(2):e2019JC015564. https://doi.org/10.1029/2019JC015564
Scambos, T.A., Bell, R.E., Alley, R.B., Anandakrishnan, S., Bromwich, D.H., Brunt, K., Christianson, K., Creyts, T., Das, S.B., DeConto, R., Dutrieux, P., Fricker, H.A., Holland, D., MacGregor, J., Medley, B., Nicolas, J.P., Pollard, D., Siegfried, M.R., Smith, A.M., Steig, E.J., Trusel, L.D., Vaughan, D.G., and Yager, P.L., 2017. How much, how fast?: a science review and outlook for research on the instability of Antarctica’s Thwaites Glacier in the 21st century. Global and Planetary Change, 153:16–34. https://doi.org/10.1016/j.gloplacha.2017.04.008
Schaefer, J.M., Finkel, R.C., Balco, G., Alley, R.B., Caffee, M.W., Briner, J.P., Young, N.E., Gow, A.J., and Schwartz, R., 2016. Greenland was nearly ice-free for extended periods during the Pleistocene. Nature, 540(7632):252–255. https://doi.org/10.1038/nature20146
Seidenkrantz, M.S., 1995. Cassidulina teretis Tappan and Cassidulina neoteretis new species (Foraminifera): stratigraphic markers for deep sea and outer shelf areas. Journal of Micropalaeontology, 14(2):145–157. https://doi.org/10.1144/jm.14.2.145
Shackleton, N.J., Backman, J., Zimmerman, H., Kent, D.V., Hall, M.A., Roberts, D.G., Schnitker, D., Baldauf, J.G., Desprairies, A., Homrighausen, R., Huddlestun, P., Keene, J.B., Kaltenback, A.J., Krumsiek, K.A.O., Morton, A.C., Murray, J.W., and Westberg-Smith, J., 1984. Oxygen isotope calibration of the onset of ice-rafting and history of glaciation in the North Atlantic region. Nature, 307(5952):620–623. https://doi.org/10.1038/307620a0
Siegert, M., Alley, R.B., Rignot, E., Englander, J., and Corell, R., 2020. Twenty-first century sea-level rise could exceed IPCC projections for strong-warming futures. One Earth, 3(6):691–703. https://doi.org/10.1016/j.oneear.2020.11.002
Simon, Q., Hillaire-Marcel, C., St-Onge, G., and Andrews, J.T., 2014. North-eastern Laurentide, western Greenland and southern Innuitian ice stream dynamics during the last glacial cycle. Journal of Quaternary Science, 29(1):14–26. https://doi.org/10.1002/jqs.2648
Slabon, P., Dorschel, B., Jokat, W., Myklebust, R., Hebbeln, D., and Gebhardt, C., 2016. Greenland ice sheet retreat history in the northeast Baffin Bay based on high-resolution bathymetry. Quaternary Science Reviews, 154:182–198. https://doi.org/10.1016/j.quascirev.2016.10.022
Solgaard, A.M., Bonow, J.M., Langen, P.L., Japsen, P., and Hvidberg, C.S., 2013. Mountain building and the initiation of the Greenland Ice Sheet. Palaeogeography, Palaeoclimatology, Palaeoecology, 392:161–176. https://doi.org/10.1016/j.palaeo.2013.09.019
St. John, K., 2008. Cenozoic ice-rafting history of the central Arctic Ocean: terrigenous sands on the Lomonosov Ridge. Paleoceanography and Paleoclimatology, 23(1):PA1S05. https://doi.org/10.1029/2007PA001483
St. John, K.E.K., and Krissek, L.A., 2002. The Late Miocene to Pleistocene ice-rafting history of southeast Greenland. Boreas, 31(1):28–35. https://doi.org/10.1111/j.1502-3885.2002.tb01053.x
Straneo, F., Sutherland, D.A., Holland, D., Gladish, C., Hamilton, G.S., Johnson, H.L., Rignot, E., Xu, Y., and Koppes, M., 2012. Characteristics of ocean waters reaching Greenland’s glaciers. Annals of Glaciology, 53(60):202–210. https://doi.org/10.3189/2012AoG60A059
Suto, I., Jordan, R.W., and Watanabe, M., 2008. Taxonomy of the fossil marine diatom resting spore genus Goniothecium Ehrenberg and its allied species. Diatom Research, 23(2):445–469. https://doi.org/10.1080/0269249X.2008.9705769
Tan, N., Ladant, J.-B., Ramstein, G., Dumas, C., Bachem, P., and Jansen, E., 2018. Dynamic Greenland ice sheet driven by pCO2 variations across the Pliocene Pleistocene transition. Nature Communications, 9(1):4755. https://doi.org/10.1038/s41467-018-07206-w
Tang, C.C.L., Ross, C.K., Yao, T., Petrie, B., DeTracey, B.M., and Dunlap, E., 2004. The circulation, water masses and sea-ice of Baffin Bay. Progress in Oceanography, 63(4):183–228. https://doi.org/10.1016/j.pocean.2004.09.005
Thiede, J., Jessen, C., Knutz, P., Kuijpers, A., Mikkelsen, N., Norgaard-Pedersen, N., and Spielhagen, R.F., 2011. Millions of years of Greenland ice sheet history recorded in ocean sediments. Polarforschung, 80(3):141–159. https://epic.awi.de/id/eprint/30005/1/15-33.pdf
Thiede, J., and Myhre, A.M., 1996. The paleoceanographic history of the North Atlantic-Arctic gateways: synthesis of the Leg 151 drilling results. In Thiede, J., Myhre, A.M., Firth, J.V., Johnson, G.L., and Ruddiman, W.F. (Eds.), Proceedings of the Ocean Drilling Program, Scientific Results. 151: College Station, TX (Ocean Drilling Program), 645–658. https://doi.org/10.2973/odp.proc.sr.151.147.1996
Tripati, A.K., Eagle, R.A., Morton, A., Dowdeswell, J.A., Atkinson, K.L., Bahé, Y., Dawber, C.F., and et al., 2008. Evidence for glaciation in the Northern Hemisphere back to 44 Ma from ice-rafted debris in the Greenland Sea. Earth and Planetary Science Letters, 265(1):112–122. https://doi.org/10.1016/j.epsl.2007.09.045
Tripati, A.K., Roberts, C.D., and Eagle, R.A., 2009. Coupling of CO2 and ice sheet stability over major climate transitions of the last 20 million years. Science, 326(5958):1394–1397. https://doi.org/10.1126/science.1178296
Whittaker, R.C., Hamann, N.E., and Pulvertaft, T.C.R., 1997. A new frontier province offshore northwest Greenland: structure, basin development, and petroleum potential of the Melville Bay area. AAPG Bulletin, 81:978–998. https://www.osti.gov/biblio/494206
Willeit, M., Ganopolski, A., Calov, R., and Brovkin, V., 2019. Mid-Pleistocene transition in glacial cycles explained by declining CO2 and regolith removal. Science Advances, 5(4):eaav7337. https://doi.org/10.1126/sciadv.aav7337
Willerslev, E., Cappellini, E., Boomsma, W., Nielsen, R., Hebsgaard, M.B., Brand, T.B., Hofreiter, M., Bunce, M., Poinar, H.N., Dahl-Jensen, D., Johnsen, S., Steffensen, J.P., Bennike, O., Schwenninger, J.L., Nathan, R., Armitage, S., de Hoog, C.J., Alfimov, V., Christl, M., Beer, J., Muscheler, R., Barker, J., Sharp, M., Penkman, K.E., Haile, J., Taberlet, P., Gilbert, M.T., Casoli, A., Campani, E., and Collins, M.J., 2007. Ancient biomolecules from deep ice cores reveal a forested southern Greenland. Science, 317(5834):111–114. https://doi.org/10.1126%2Fscience.1141758
Yang, H., Krebs-Kanzow, U., Kleiner, T., Sidorenko, D., Rodehacke, C.B., Shi, X., Gierz, P., Niu, L., Gowan, E.J., Hinck, S., Liu, X., Stap, L.B., and Lohmann, G., 2022. Impact of paleoclimate on present and future evolution of the Greenland Ice Sheet. PloS One, 17(1):e0259816. https://doi.org/10.1371/journal.pone.0259816
Yao, T., and Tang, C.L., 2003. The formation and maintenance of the North Water polynya. Atmosphere-Ocean, 41(3):187–201. https://doi.org/10.3137/ao.410301
Yin, J., Overpeck, J.T., Griffies, S.M., Hu, A., Russell, J.L., and Stouffer, R.J., 2011. Different magnitudes of projected subsurface ocean warming around Greenland and Antarctica. Nature Geoscience, 4(8):524–528. https://doi.org/10.1038/ngeo1189
Yin, Q.Z., and Berger, A., 2010. Insolation and CO2 contribution to the interglacial climate before and after the Mid-Brunhes Event. Nature Geoscience, 3(4):243–246. https://doi.org/10.1038/ngeo771
Zachos, J.C., Dickens, G.R., and Zeebe, R.E., 2008. An early Cenozoic perspective on greenhouse warming and carbon-cycle dynamics. Nature, 451(7176):279–283. https://doi.org/10.1038/nature06588
Zhang, Y.G., Pagani, M., Liu, Z.H., Bohaty, S.M., and DeConto, R., 2013. A 40-million-year history of atmospheric CO2. Philosophical Transactions of the Royal Society A: Mathematical Physical and Engineering Sciences, 371:20130096. https://doi.org/10.1098/rsta.2013.0096
Ziegler, L.B., Constable, C.G., Johnson, C.L., and Tauxe, L., 2011. PADM2M: a penalized maximum likelihood model of the 0–2 Ma palaeomagnetic axial dipole moment. Geophysical Journal International, 184(3):1069–1089. https://doi.org/10.1111/j.1365-246X.2010.04905.x