Knutz, P.C., Jennings, A.E., Childress, L.B., and the Expedition 400 Scientists
Proceedings of the International Ocean Discovery Program Volume 400
publications.iodp.org
https://doi.org/10.14379/iodp.proc.400.107.2025
Site U16071
![]() P.C. Knutz,
P.C. Knutz,
![]() A.E. Jennings,
A.E. Jennings,
![]() L.B. Childress,
L.B. Childress,
![]() R. Bryant,
R. Bryant,
![]() S.K. Cargill,
S.K. Cargill,
![]() H.K. Coxall,
H.K. Coxall,
![]() T.D. Frank,
T.D. Frank,
![]() G.R. Grant,
G.R. Grant,
![]() R.E. Gray,
R.E. Gray,
![]() L. Ives,
L. Ives,
![]() V. Kumar,
V. Kumar,
![]() S. Le Houedec,
S. Le Houedec,
![]() J. Martens,
J. Martens,
![]() F. Naim,
F. Naim,
![]() M. Nelissen,
M. Nelissen,
![]() V. Özen,
V. Özen,
![]() S. Passchier,
S. Passchier,
![]() L.F. Pérez,
L.F. Pérez,
![]() J. Ren,
J. Ren,
![]() B.W. Romans,
B.W. Romans,
![]() O. Seki,
O. Seki,
![]() P. Staudigel,
P. Staudigel,
![]() L. Tauxe,
L. Tauxe,
![]() E.J. Tibbett,
E.J. Tibbett,
![]() Y. Yokoyama,
Y. Yokoyama,
![]() Y. Zhang, and
Y. Zhang, and
![]() H. Zimmermann2
H. Zimmermann2
1 Knutz, P.C., Jennings, A.E., Childress, L.B., Bryant, R., Cargill, S.K., Coxall, H.K., Frank, T.D., Grant, G.R., Gray, R.E., Ives, L., Kumar, V., Le Houedec, S., Martens, J., Naim, F., Nelissen, M., Özen, V., Passchier, S., Pérez, L.F., Ren, J., Romans, B.W., Seki, O., Staudigel, P., Tauxe, L., Tibbett, E.J., Yokoyama, Y., Zhang, Y., and Zimmermann, H., 2025. Site U1607. In Knutz, P.C., Jennings, A.E., Childress, L.B., and the Expedition 400 Scientists, NW Greenland Glaciated Margin. Proceedings of the International Ocean Discovery Program, 400: College Station, TX (International Ocean Discovery Program). https://doi.org/10.14379/iodp.proc.400.107.2025
2 Expedition 400 Scientists' affiliations.
1. Background and objectives
Site U1607 (proposed Site MB-07B), the easternmost site in the Expedition 400 site transect, was cored at 74°29.5499′N, 60°34.9900′W at 739 meters below sea level (mbsl) on the middle shelf (Figure F1). Extensive seismic and limited borehole data indicate that this site captures Megaunits C, D1, and D2, interpreted as a middle–late Miocene sediment drift that overlies a succession of mainly hemipelagic strata, possibly of early Miocene to Oligocene age (Knutz et al., 2022b) (Figures F2, F3). Accordingly, Site U1607 may capture the time period from 6 to 30 Ma.
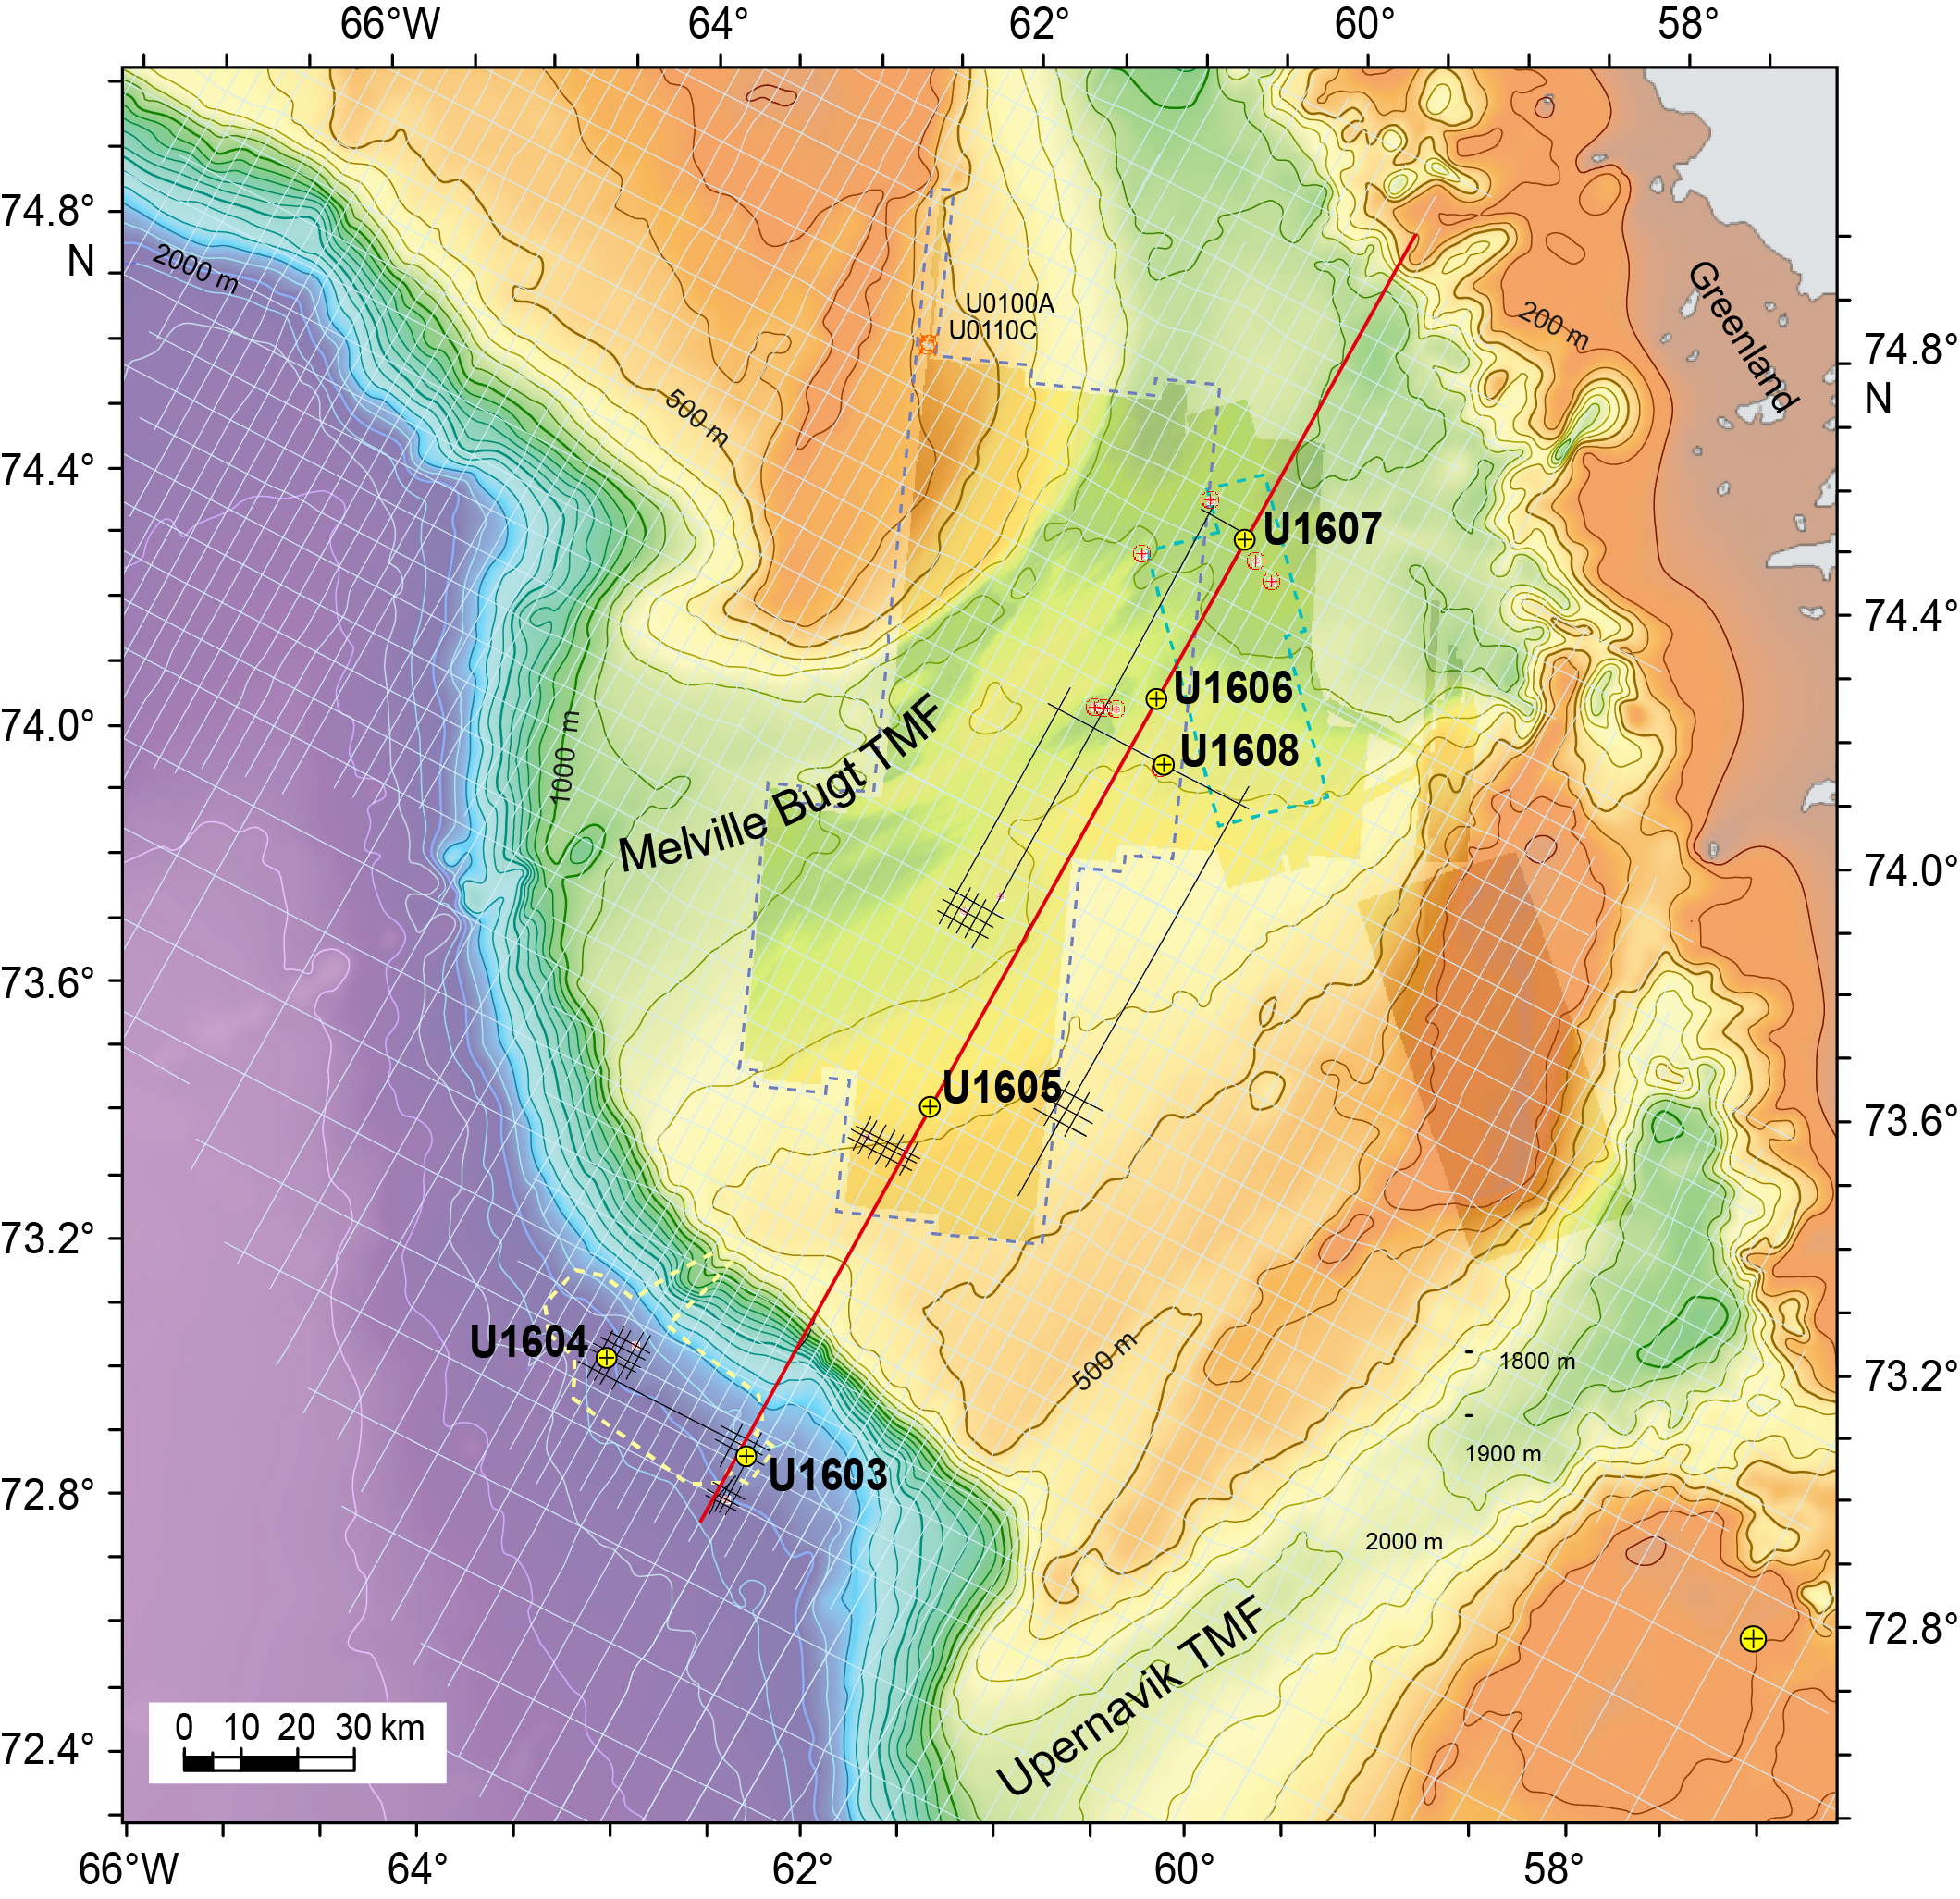
Figure F1. Bathymetry map.
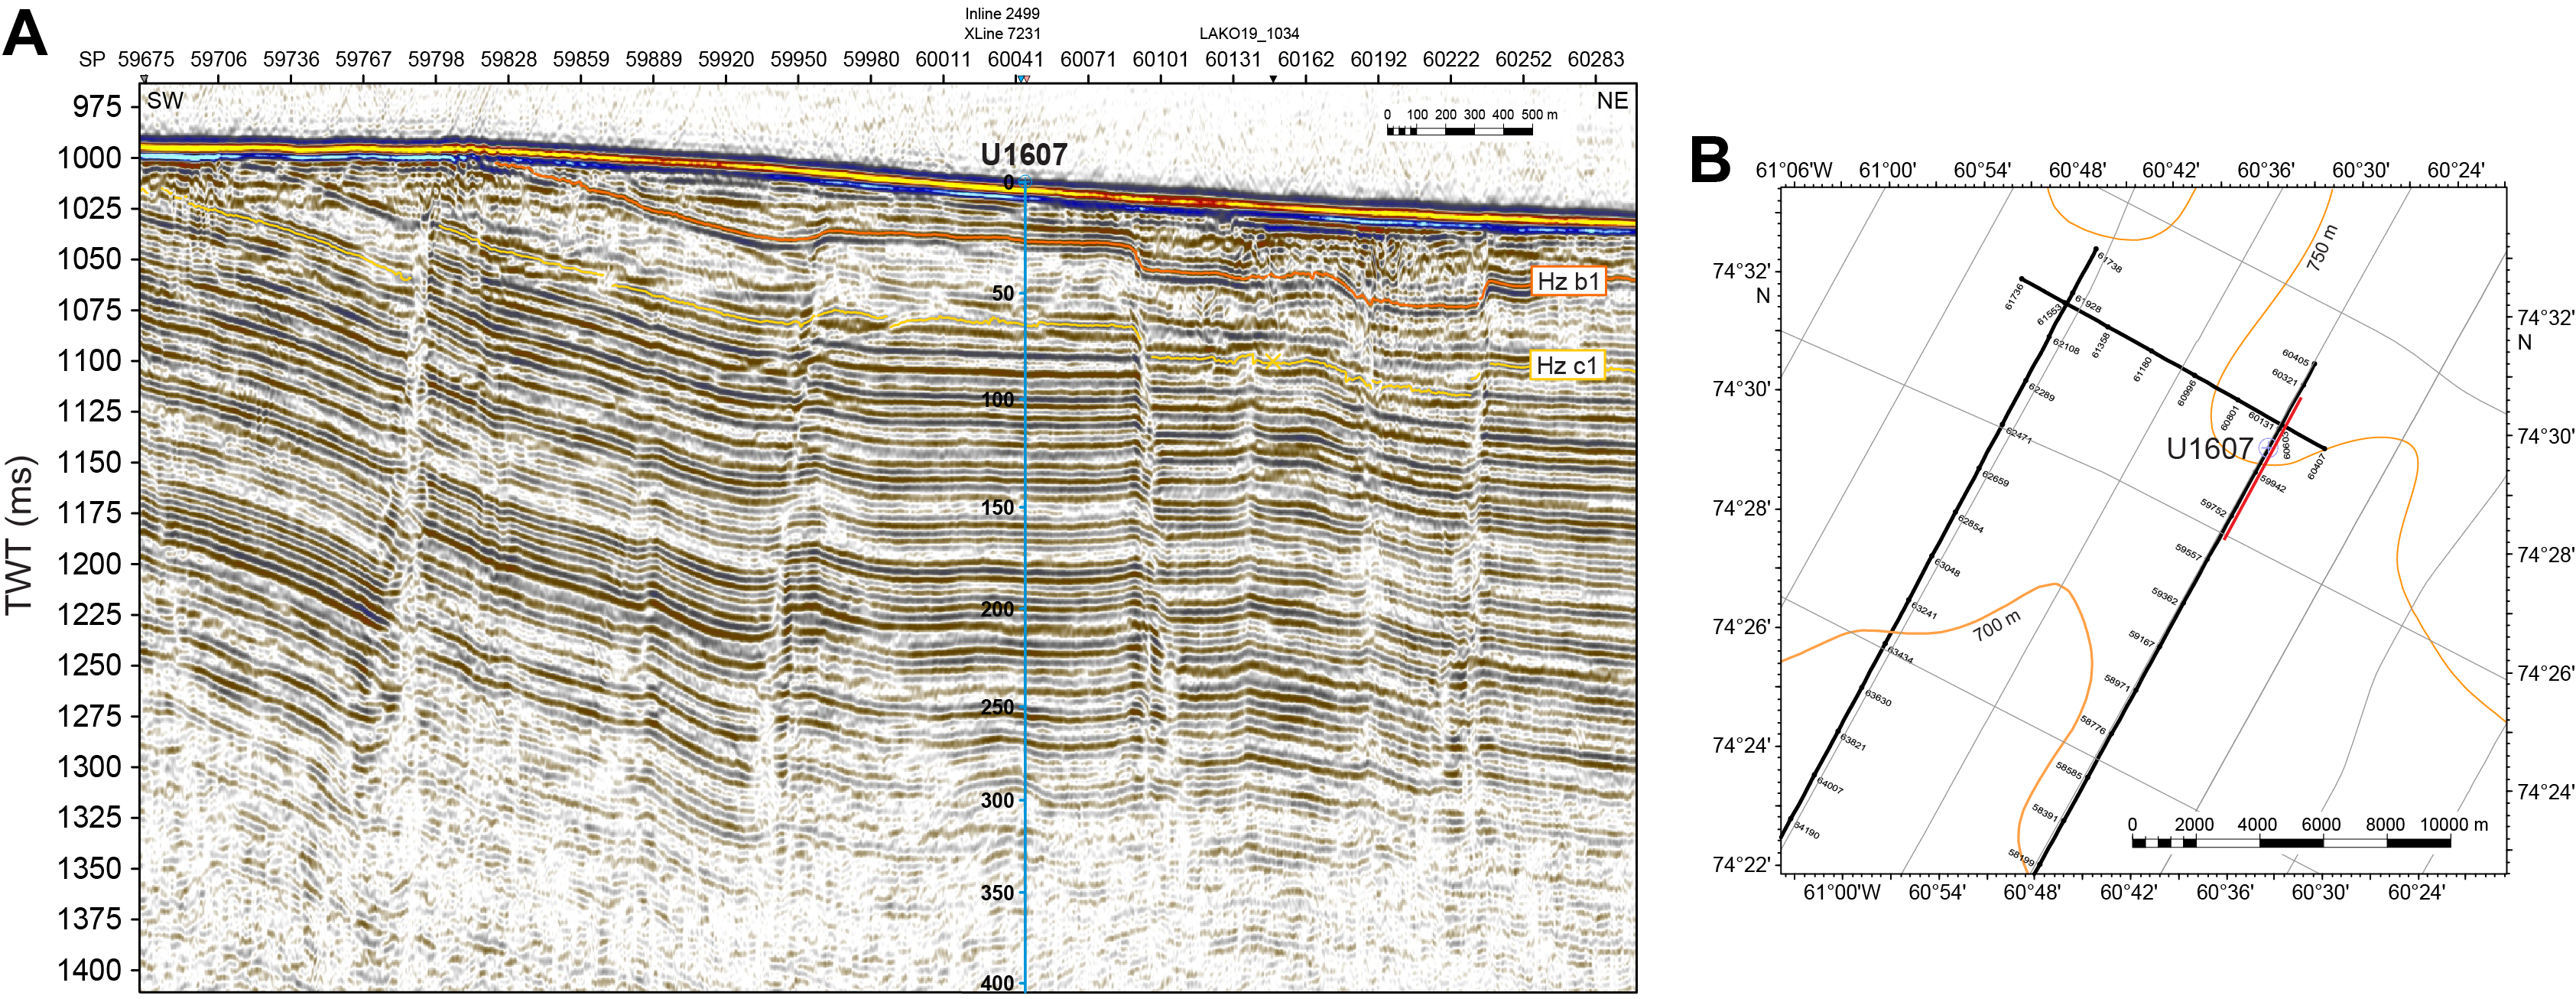
Figure F2. Seismic profile (LAKO19_1034) and close-up bathymetry map.
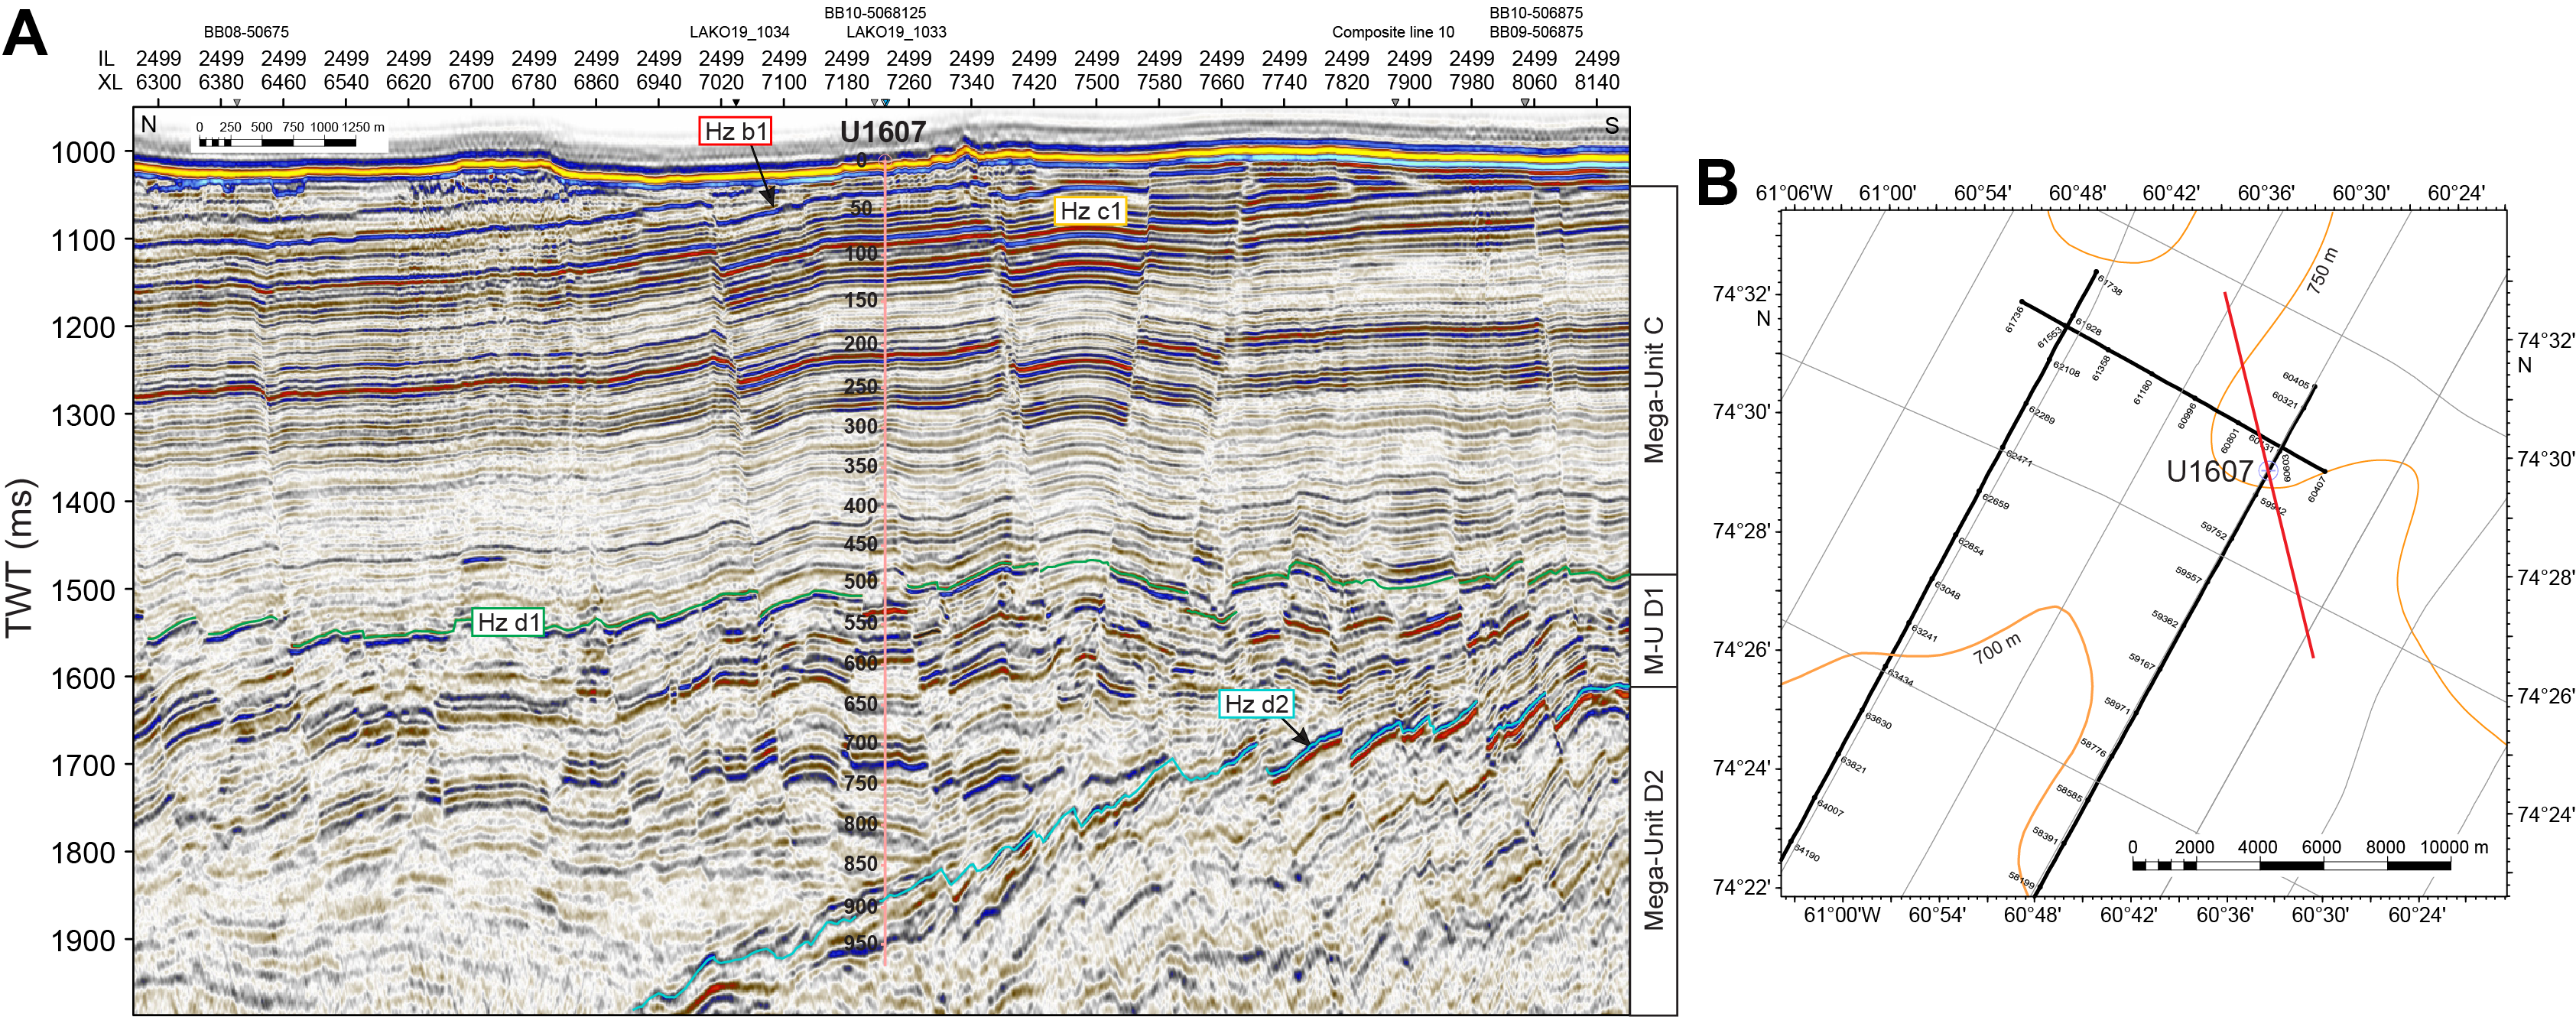
Figure F3. Seismic industry profile (PITU 3D) and close-up bathymetry map.
The sediment sequence comprising seismic Megaunits D1 and D2 represents gradual infilling of the remnant rift basin topography comprising the Melville Bay Graben (MBG) and adjacent ridge complex (see Figure F4 in the Expedition 400 summary chapter [Knutz et al., 2025b]). The MBG was formed during an Early Cretaceous phase of continental rifting and ended during the early Paleocene as active seafloor spreading commenced in Baffin Bay (Gregersen et al., 2022). The overlying seismic Megaunit C is interpreted as a shelf-based sediment drift receiving fine-clastic input from nearby prodeltaic environments (Knutz et al., 2015). The boundary between Megaunits D1 and C is described as the mid-Miocene Unconformity (Horizon d1) (Figure F3). It occurs within a conformable sequence in the basin but is marked by erosion on the adjacent structural highs. Two seismic unconformities, corresponding to regional horizons (c1 and b1), are seen near the top of the sequence (Figure F2). By correlating the seismic profile farther south, it becomes evident that part of Megaunit C has been removed by erosion (Knutz et al., 2015). Thus, in addition to the seabed truncation, some degree of hiatus development may be assigned to Horizons c1 and b1. Based on the reflection strength, Horizon b1 appears more prominently as an erosional unconformity.
The goal at Site U1607 was to reconstruct past ocean and terrestrial climates in northeastern Baffin Bay and Greenland, including testing the hypothesis that decreasing atmospheric CO2 from middle Oligocene to early Miocene is linked to the onset of ephemeral glaciation in northwest Greenland (Scientific Objective 2 in the Expedition 400 Scientific Prospectus [Knutz et al., 2022a]) (Figure F4). Additionally, the site may provide sediment core data that can investigate the influence of Neogene tectonic adjustments on the sediment record (Scientific Objective 3). The expected lithology is claystone with silty to sandy intervals and siliceous ooze, consistent with predicted hemipelagic marine environments. Planned drilling at Site U1607 included coring with the rotary core barrel (RCB) system from the seafloor to 620 m core depth below seafloor, Method A (CSF-A), in the first hole, followed by downhole logging including the triple combo tool string, Formation MicroScanner (FMS), and Versatile Seismic Imager (VSI) check shots. Casing was planned for the uppermost 600 m of the second hole, followed by RCB coring from 600 to 978 m CSF-A and downhole logging with the same tool strings as in the first hole.
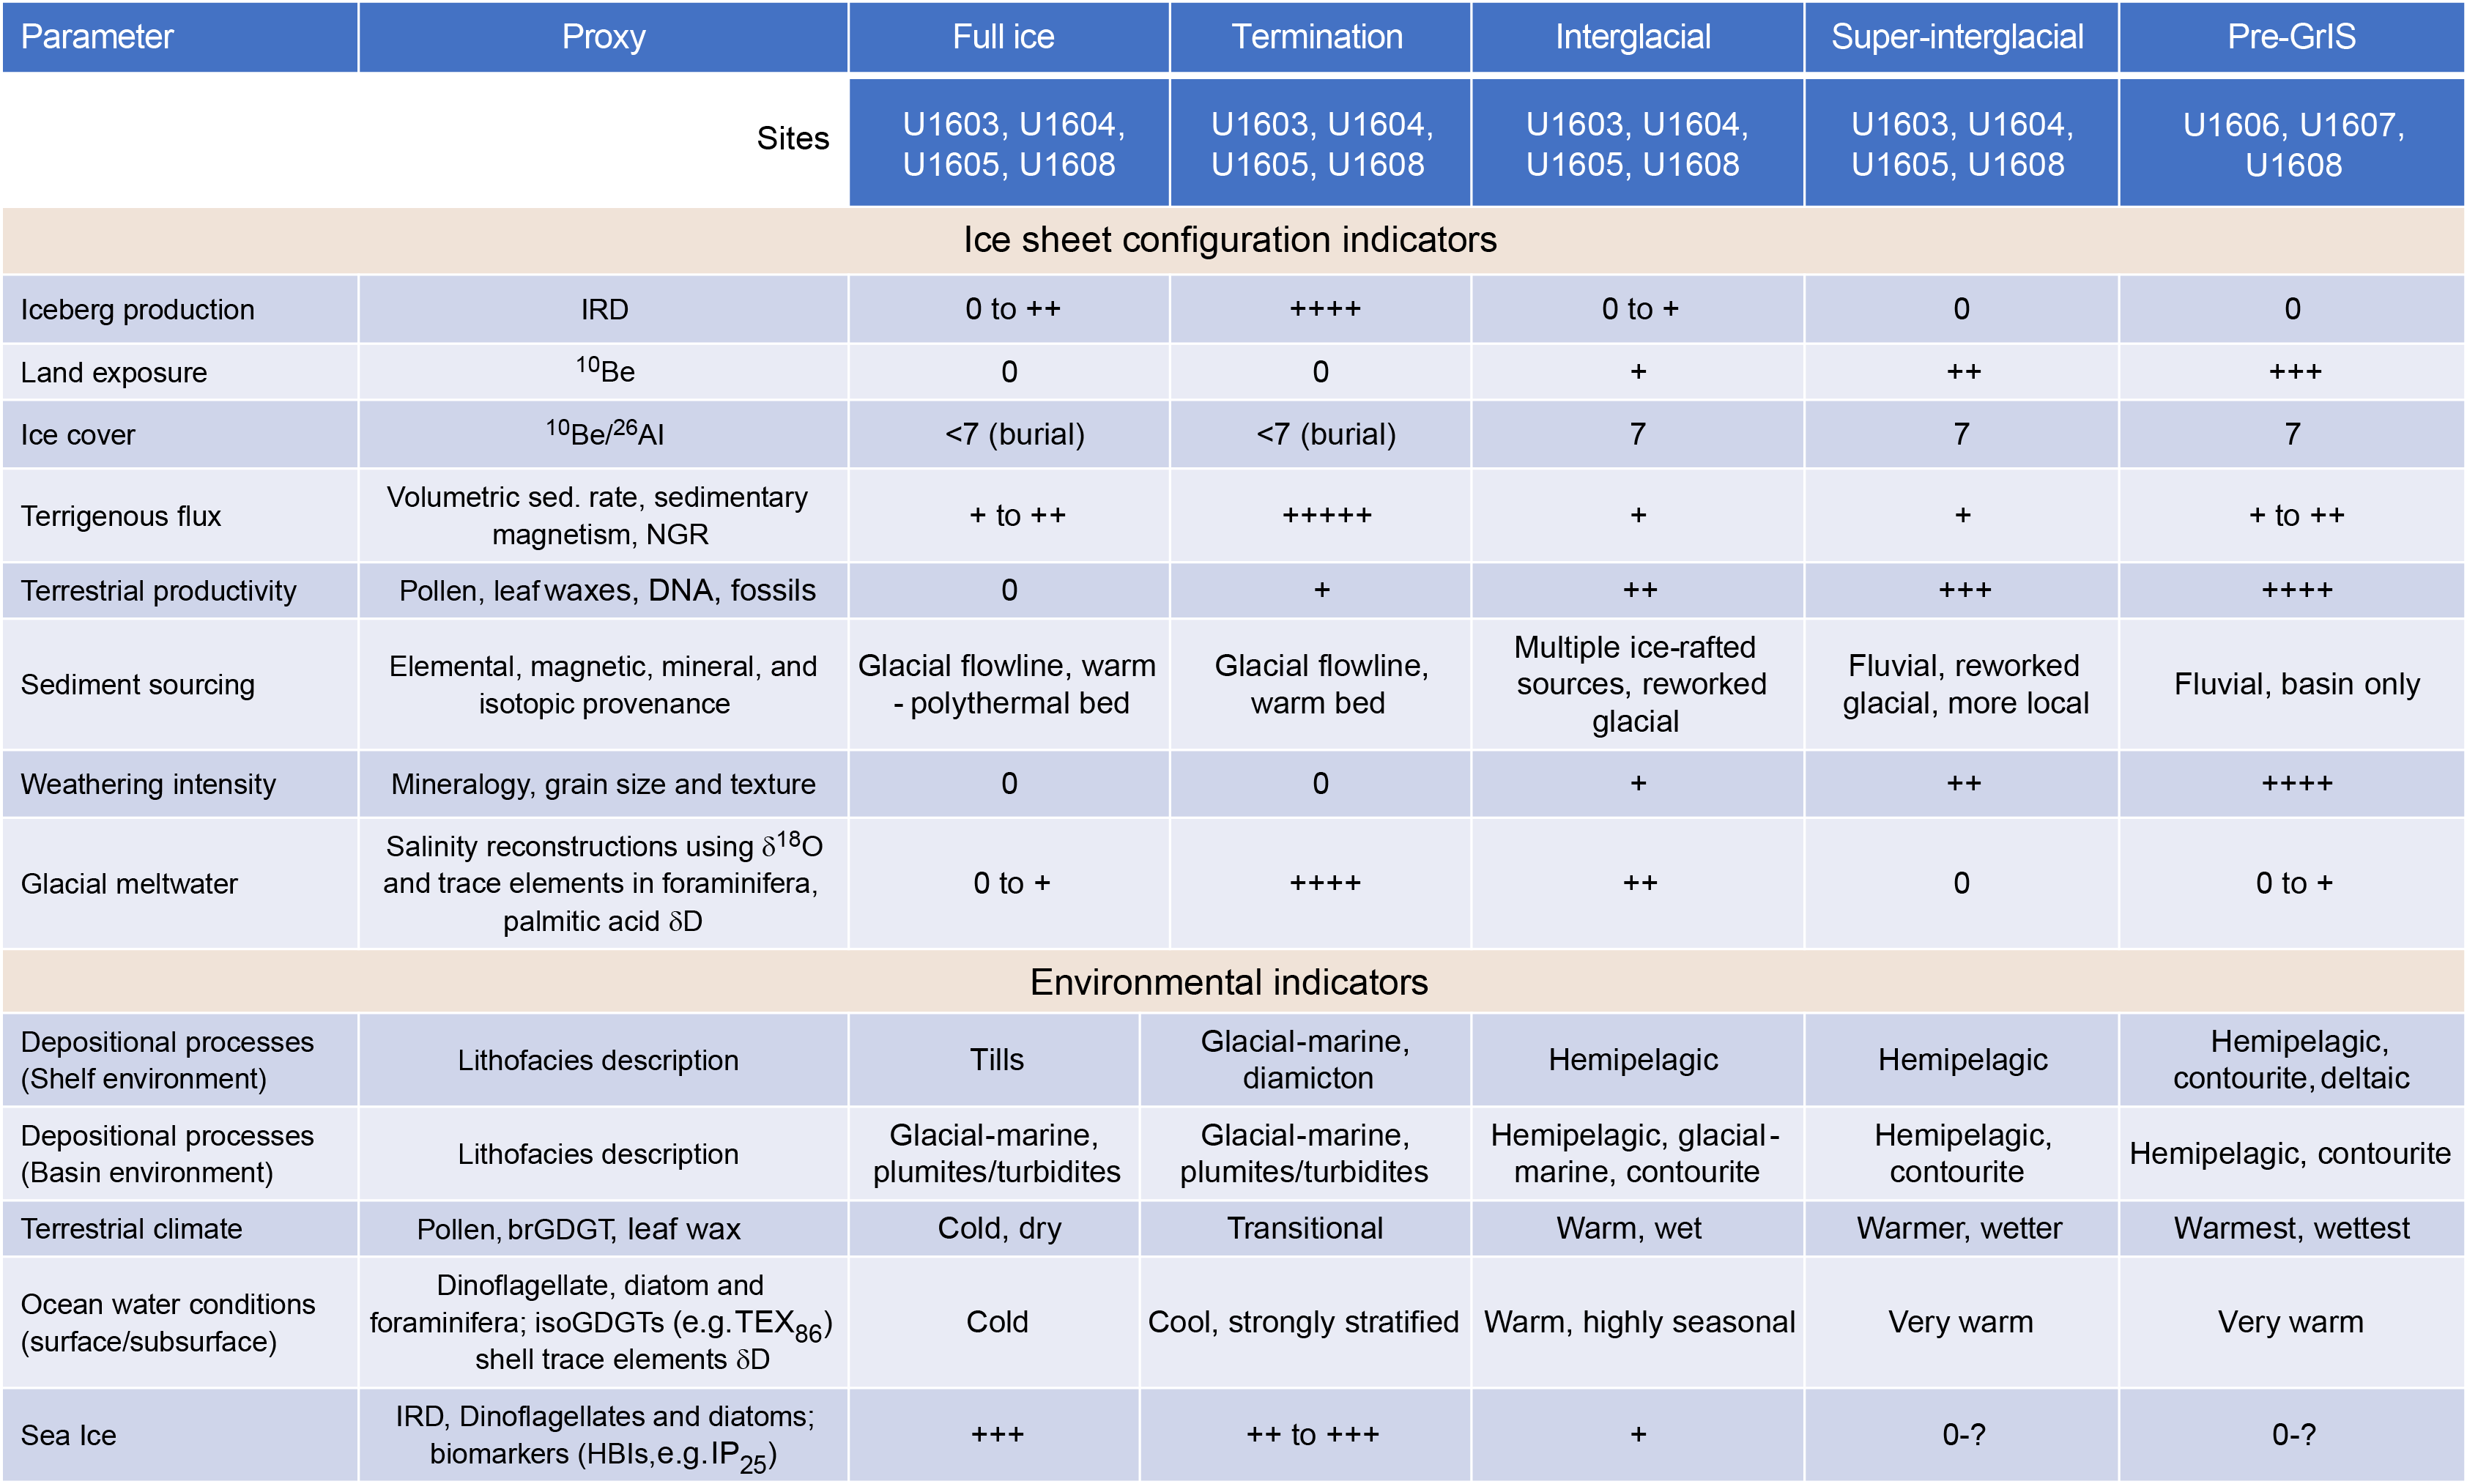
Figure F4. Diagnostic template for ice sheet evolution.
2. Operations
Site U1607 hole location, water depth, and the number of cores recovered are listed in Table T1. All times are local ship time (UTC − 3 h) unless otherwise noted.
2.1. Hole U1607A
The vessel transited 17 nmi from Site U1606 to Site U1607. The thrusters were lowered and secured, and the ship was fully in dynamic positioning (DP) mode at 1707 h on 15 September 2023. The rig crew made up an RCB bottom-hole assembly (BHA), and the drill string was tripped to near the seafloor. Hole U1607A was spudded at 2225 h, tagging the seafloor at 738.6 mbsl.
Cores 400-U1607A-1R through 60R advanced from 0 to 566.3 m CSF-A and recovered 470.47 m (83%). On 20 September, we began a bit change (70 h on bit). The pipe was raised to 53.4 m CSF-A, and a free-fall funnel (FFF) was deployed at 1542 h. The subsea camera system was then deployed at 1652 h to observe that the FFF had landed in position and ensure a clean exit from Hole U1607A. The bit cleared the seafloor at 1753 h, and the subsea camera system was back on board by 1834 h. The drill string was then tripped up with the bit at the surface at 2037 h. An RCB BHA was made up with a new C-4 bit, and the drill string was tripped back to the seafloor. The subsea camera system was deployed at 2245 h, and Hole U1607A was reentered at 0042 h on 21 September. The subsea camera was back on board at 0130 h. The drill string was lowered to 516.7 m CSF-A, and we washed back to 566.3 m CSF-A. Cores 61R–103R advanced from 566.3 to 978.0 m CSF-A and recovered 282.38 m (68%).
Sepiolite (drilling mud) was swept in the hole, and the bit was released at 1940 h on 24 September to prepare for logging. The hole was displaced with heavy mud (barite), and the end of the pipe was raised to 59.6 m CSF-A. The modified triple combo (quad combo) tool string was deployed to the base of Hole U1607A, and at 938 m CSF-A (40 m from the bottom of the hole) a hard contact was encountered. The drill pipe was raised to 42.1 m CSF-A for the main pass. Following a complete pass of the hole, the quad combo was pulled up to the rig floor and broken down. The VSI was rigged up, and the protected species watch began at 0930 h on 25 September. The VSI was deployed to 930 m CSF-A, and stations were measured every 30 m uphole until 1715 h, at which time the protected species watch also concluded. The VSI was brought back on board, and with logging completed, we tripped the pipe out of Hole U1607A, clearing the rig floor at 2111 h. The drill floor was secured for transit, and the thrusters were raised and secured for transit at 2124 h, ending Hole U1607A and Site U1607.
A total of 103 cores were taken in Hole U1607A over a 978.0 m interval with 77% recovery. Total time on Hole U1607A was 244.56 h (10.19 days).
3. Lithostratigraphy
Site U1607 consists of one hole (U1607A) cored to a total depth of 978 m CSF-A with 77% recovery. The stratigraphy of Site U1607 is divided into five lithostratigraphic units (I–V) with subunits (Figure F5; Table T2). Some of the named sedimentary lithofacies are present in all units with variable prominence, whereas others are characteristic of a particular unit. The lithofacies include (1) mud, sandy mud, and muddy sand with dispersed clasts; (2) calcareous mud; (3) bioturbated sandy mud and muddy sand; and (4) glauconite-rich sandy mud, muddy sand, and sandy granule conglomerate.
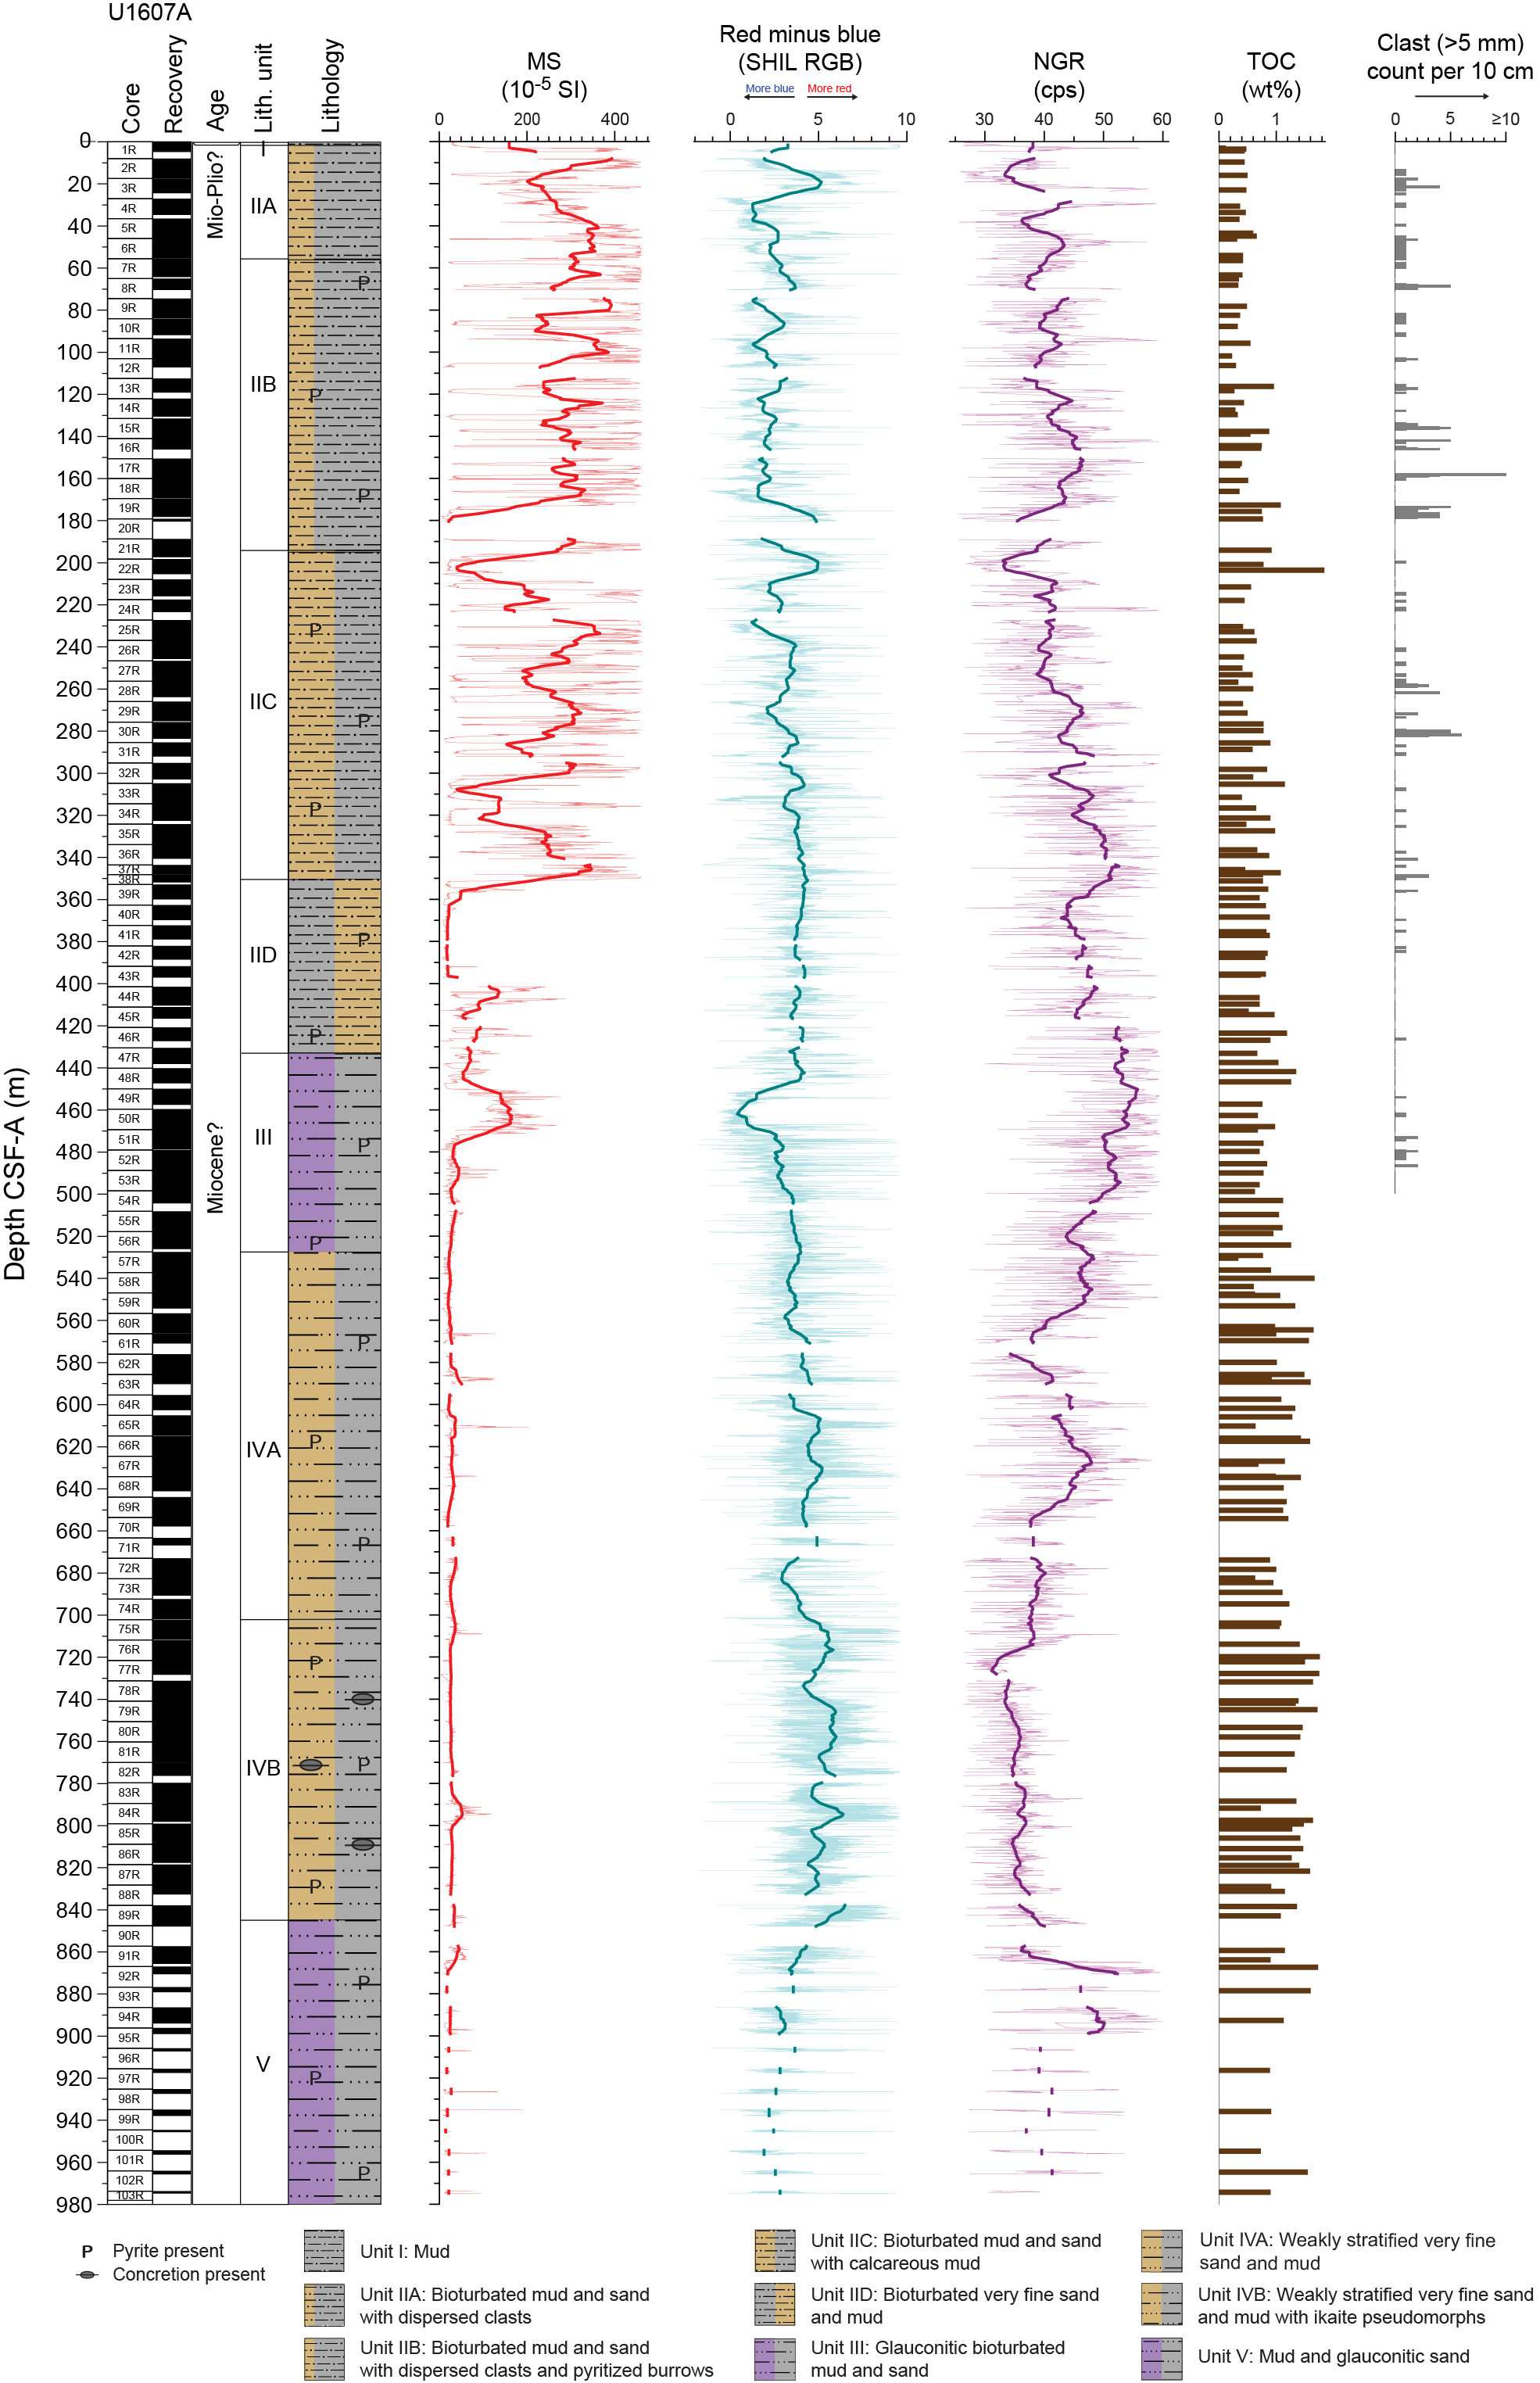
Figure F5. Lithostratigraphic summary.
Lithostratigraphic Unit I contains the uppermost 3.58 m of this site and consists of unlithified, soupy mud that possibly represents Holocene deposition. Unit II (3.58–434.72 m CSF-A) contains bioturbated mud, sandy mud, muddy sand, calcareous mud, and dispersed clasts. This unit is divided into four subunits (IIA–IID), broadly following a downcore coarsening of sediment (mud to sand) and a decrease in dispersed clasts. Subunit IIA is 53.49 m thick and contains meter-scale beds of bioturbated mud, sandy mud, and muddy sand with dispersed clasts and a few beds of cemented calcareous mud. Subunit IIB is 136.68 m thick and is lithologically similar to Subunit IIA but is distinguished by a color change from greenish gray to grayish brown, the first appearance downhole of iron sulfide–filled burrows, and common beds of cemented calcareous mud. Alternating mud and sandy mud to muddy sand lithologies on a decimeter scale are associated with Subunit IIC, which is 157.55 m thick, and represent an increase in the abundance of sand. Calcareous mud remains common, but a significant reduction in the occurrence of dark fine-grained iron sulfide–filled burrows and a decrease in dispersed clasts occurs within Subunit IIC. Subunit IID (83.42 m thick) is distinguished from Subunit IIC by an increasing dominance of sand lithologies, a decrease in calcareous mud and carbonate-cemented intervals, and rare occurrence of dispersed clasts. Unit III (434.72–530.47 m CSF-A) consists of bioturbated sand, muddy sand, and sandy mud. A distinguishing characteristic of Unit III is that it consists of glauconite-rich bioturbated sand, muddy sand, and sandy mud. Unit IV, which is 315.08 m thick, shows a significant decrease in detrital glauconite and is divided into two subunits (IVA and IVB). Subunit IVA is 171.63 m thick and has weakly stratified muddy sand and sandy mud as the dominant lithology. Although yellowish brown beds of calcareous mud occur in overlying units, they become more prominent in Subunit IVA, with beds ranging 3–77 cm thick. Subunit IVB is 143.45 m thick and has a similar lithology to Subunit IVA. Marked differences include an increase in the dominance of sand over mud, the appearance of common pseudomorphs after ikaite and spherical calcareous concretions, and a decrease in calcareous mud. Unit V, which is 132.45 m thick, continues to the bottom of Hole U1607A. This unit is distinguished by the abrupt reappearance of abundant glauconite as sand- to granule-grade intraclasts in sharp-based, graded, and stratified sandy lithologies, which is interbedded with and ultimately transitions downcore to brown and gray sparsely bioturbated mud.
Overall, the sedimentary succession recovered at Site U1607 is consistent with marine deposition within a subbasin situated inland of the Melville Bay Ridge (see Figure F4 in the Expedition 400 summary chapter [Knutz et al., 2025b]).
3.1. Unit descriptions
Site U1607 is divided into five lithostratigraphic units (I–V; youngest to oldest). Units II and IV are divided into four and two subunits (IIA–IID and IVA and IVB), respectively (Figure F5). Significant downhole changes in lithology were determined using a combination of visual core description, microscopic characterization (using smear slides and thin sections), reflectance spectroscopy and colorimetry, magnetic susceptibility (MS), and bulk and clay mineralogical data determined using X-ray diffraction (XRD) (see Lithostratigraphy in the Expedition 400 methods chapter [Knutz et al., 2025a]).
3.1.1. Unit I
- Interval: 400-U1607A-1R-1, 0 cm, to 1R-3, 57 cm
- Depth: 0–3.58 m CSF-A
- Thickness: 3.58 m
- Age: Holocene
- Lithology: mud
Lithostratigraphic Unit I is characterized by dark to medium brown and medium gray clay-rich mud. Drilling this unit led to severe soupy drilling disturbance. The lower contact of this unit is transitional over 40 cm, marked by a color change from medium to dark gray and a substantial increase in competence from soupy to stiff.
3.1.2. Unit II
3.1.2.1. Subunit IIA
- Interval: 400-U1607A-1R-3, 57 cm, to 7R-2, 7 cm
- Depth: 3.58–57.07 m CSF-A
- Thickness: 53.49 m
- Age: Miocene?–Pliocene?
- Lithology: bioturbated mud and sand with dispersed clasts and minor calcareous mud
Lithostratigraphic Subunit IIA is dominated by dark gray heavily bioturbated mud with dark millimeter- to centimeter-scale burrows and dark greenish gray to dark grayish brown sandy mud to muddy sand with dispersed clasts. Transitions between intervals of sandy mud and muddy sand are gradual over 5 to 30 cm. Infrequent beds of yellowish brown calcareous mud are 4–28 cm thick. The sediments are weakly stratified throughout. Shells and shell fragments up to ~3 cm long and with varying degrees of preservation occur throughout the subunit (see Diagenesis).
3.1.2.2. Subunit IIB
- Interval: 400-U1607A-7R-2, 7 cm, to 21R-4, 56 cm
- Depth: 57.07–193.75 CSF-A
- Thickness: 136.68 m
- Age: Miocene?
- Lithology: bioturbated mud and sand with dispersed clasts and calcareous mud
The top of Lithostratigraphic Subunit IIB is defined based on the first downhole occurrence of pyritized burrows. Framboidal pyrite is detected in smear slides of the sediment matrix. The interval is characterized by alternations between dark gray heavily bioturbated mud and sandy mud with millimeter- to centimeter-scale burrows and dark greenish gray to dark grayish brown sandy mud to muddy sand with dispersed to common clasts. Contacts between these lithologies are gradational over 10–30 cm. Strata are often massive due to the effects of bioturbation, which obscures primary physical sedimentary structures. Strata are rarely weakly stratified, showing irregular horizontal to planar structures. More prominent beds of calcareous mud range 4–20 cm in thickness. Shell fragments and articulated bivalves up to ~3 cm occur throughout the subunit.
3.1.2.3. Subunit IIC
- Interval: 400-U1607A-21R-4, 56 cm, to 38R-3, 20 cm
- Depth: 193.75–351.30 m CSF-A
- Thickness: 157.55 m
- Age: Miocene?
- Lithology: bioturbated mud, sandy mud and muddy sand with dispersed clasts, and calcareous mud
The transition from Lithostratigraphic Subunit IIB to IIC is defined by a higher frequency of interbedded sand and mud lithologies. Boundaries between beds are gradational on a centimeter to decimeter scale. Other distinguishing characteristics include a reduction of the abundance of black iron sulfide–filled burrows. Strata are consistently bioturbated, with the degree of bioturbation assessed as uncommon to moderate. Beds of calcareous mud (5–10 cm thick) are present throughout the subunit. Subunit IIC consists of meter-scale interbeds of dark greenish gray, brownish gray, and gray bioturbated mud, sandy mud, and muddy sand. Typically, dark brownish gray sandy mud grades upward into muddy sand with rare weak stratification. Bioturbation in most intervals is more cryptic than in the overlying intervals; individual traces cannot be distinguished. Bivalves are the most prominent macrofossils. High-angle faults with slickensides on the inferred fault plane were observed in multiple cores in this subunit.
3.1.2.4. Subunit IID
- Interval: 400-U1607A-38R-3, 20 cm, to 47R-3, 122 cm
- Depth: 351.30–434.72 m CSF-A
- Thickness: 83.42 m
- Age: Miocene?
- Lithology: very fine sand, muddy sand, sandy mud, and calcareous mud
Lithostratigraphic Subunit IID is distinguished from Subunit IIC by a significant increase in the proportion of muddy sand, a relative downward decrease in calcareous mud and carbonate-cemented intervals, and a reduction in the observation of dispersed clasts >5 mm (Figure F5). The subunit is dominated by dark grayish brown muddy sand with interbeds of medium grayish brown bioturbated mud and sandy mud that are separated by gradational contacts. Intervals with low bioturbation index contain more distinct lamination in sandier lithologies.
3.1.3. Unit III
- Interval: 400-U1607A-47R-3, 122 cm, to 57R-3, 23 cm
- Depth: 434.72–530.47 CSF-A
- Thickness: 95.75 m
- Age: Miocene?
- Lithology: glauconite-rich bioturbated sand, muddy sand, and sandy mud
Lithostratigraphic Unit III is marked by abundant glauconite, which occurs as green to black sand- to granule-sized clasts, clay laminae, and burrow fill and linings in bioturbated sand, muddy sand, and sandy mud. Sand and muddy sand intervals are faintly laminated and commonly contain large (>5 cm long), discrete burrows that are either nearly vertical or horizontal and filled with either calcareous mud or a fine mixture of pyrite and glauconite. Muddy sand beds contain scattered coarse sand- to granule-grade grains, along with fossil fragments. Possible Glossifungites surfaces, in which sharp-walled, sand-filled burrows extend downward from the base of sand layers into underlying sandy mud (Figure F6H), may represent the development of firmgrounds (semiconsolidated substrates). High-angle faults with slickensides on the inferred fault plane were observed in multiple cores in this unit.
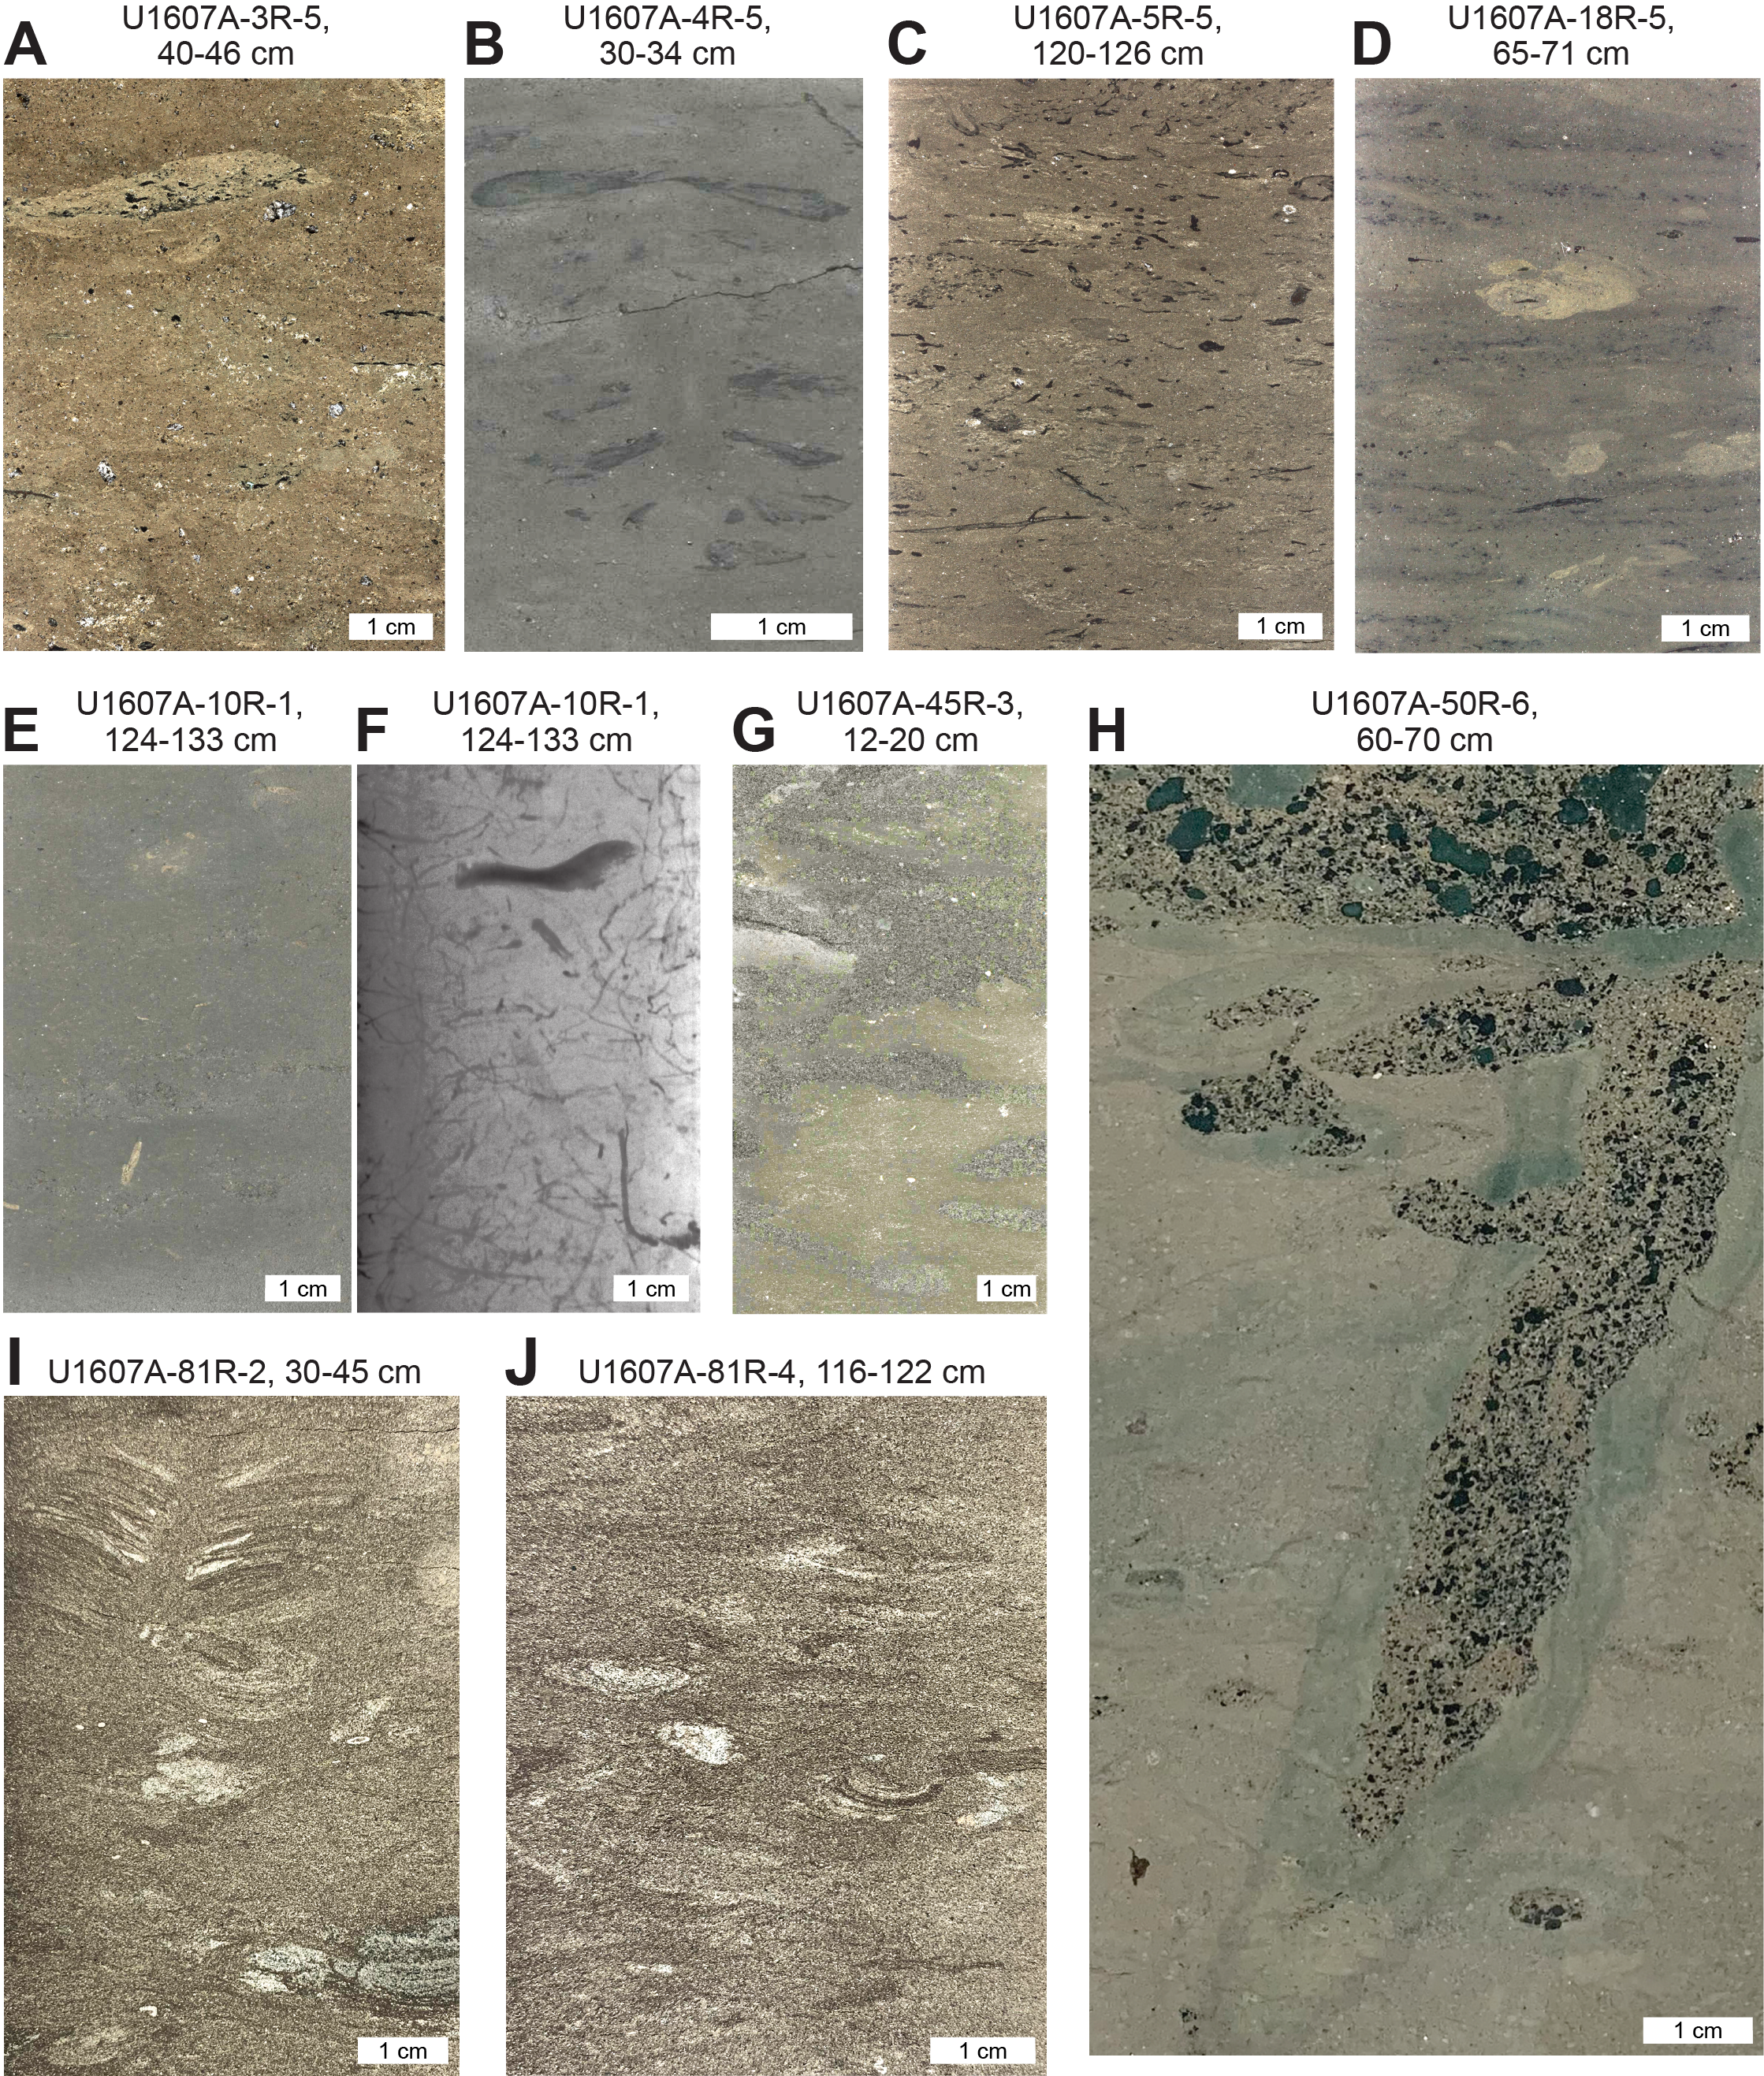
Figure F6. Bioturbation and trace fossils.
3.1.4. Unit IV
3.1.4.1. Subunit IVA
- Interval: 400-U1607A-57R-3, 23 cm, to 75R-1, 0 cm
- Depth: 530.47–702.10 CSF-A
- Thickness: 171.63 m
- Age: Miocene?
- Lithology: bioturbated and weakly stratified muddy very fine sand, sandy mud, and mud
Lithostratigraphic Subunit IVA is dominated by brown bioturbated and weakly stratified muddy very fine sand that grades into and out of interbeds of sandy mud and mud over decimeter to meter scales. Dispersed clasts >5 mm, coarse sand grains, or granules are notably absent from the top of this subunit down. Other distinguishing characteristics include a significant decrease in glauconite relative to Unit III, with occurrences limited mainly to burrow fills and linings. Yellowish brown calcareous mud is also prominent in this subunit. High-angle faults with slickensides on the inferred fault plane were observed in multiple cores in this subunit.
3.1.4.2. Subunit IVB
- Interval: 400-U1607A-75R-1, 0 cm, to 89R-6, 11 cm
- Depth: 702.10–845.55 CSF-A
- Thickness: 143.45 m
- Age: Miocene?
- Lithology: weakly stratified very fine sand and mud with ikaite pseudomorphs and calcareous concretions
Lithostratigraphic Subunit IVB is characterized by a decrease in muddy lithologies compared to Subunit IVA. The subunit is dominated by brown bioturbated and weakly stratified muddy very fine sand characteristic of Lithofacies 3 (bioturbated sandy mud and muddy fine to very fine sand). Other distinguishing characteristics are the appearance of pseudomorphs after ikaite and spherical-rimmed calcareous concretions.
3.1.5. Unit V
- Interval: 400-U1607A-89R-6, 11 cm, to 103R-1, 108 cm (bottom of the hole)
- Depth: 845.55–978.0 CSF-A
- Thickness: 132.45 m
- Age: Miocene?
- Lithology: mud, glauconite-rich sand, sand with abundant clasts, and sandy granule-grade conglomerate
Lithostratigraphic Unit V is marked by the abrupt reappearance of abundant glauconite as intraclasts in sharp-based, graded, and stratified sandy lithologies ranging from sand with abundant clasts to sandy granule-grade conglomerate (Lithofacies 4). These intraclast conglomerates overlie a sharp contact with a thick interval of massive to color-banded brown and gray mud in Section 400-U1607A-91R-5 that continues to the base of the hole. Within the mud-dominated intervals, pyritization of burrows and fossil debris is common, as are interbeds of yellowish brown calcareous mud.
3.2. Lithofacies descriptions
3.2.1. Lithofacies 1: mud, sandy mud, and muddy sand with dispersed clasts
Lithofacies 1 consists of 10 cm to 10 m beds of mud to sand-sized terrigenous material with a poorly sorted silty clay matrix that are grayish brown, gray, or greenish gray in color. The dispersed clast components of this facies (>2 mm) are generally granules (2–4 mm) and pebbles (>4 mm). Their relatively small sizes mean that they are not always associated with clast counts (clasts >5 mm) (see Lithostratigraphy in the Expedition 400 methods chapter [Knutz et al., 2025a]). Additionally, these clasts refer to igneous, metamorphic, or lithified sedimentary rocks and do not include intraclasts (i.e., material that was formed within the depositional setting and locally reworked). This lithofacies occurs as structureless/massive or shows weakly developed stratification in the form of disrupted laminae. Bioturbation is absent to moderate. The presence of bioturbation is associated with structureless intervals; when bioturbation is either absent or low-density, the stratification of this is more apparent. Shell fragments and larger (>1 mm) foraminifera are observed in the bioturbated intervals (Figure F7).
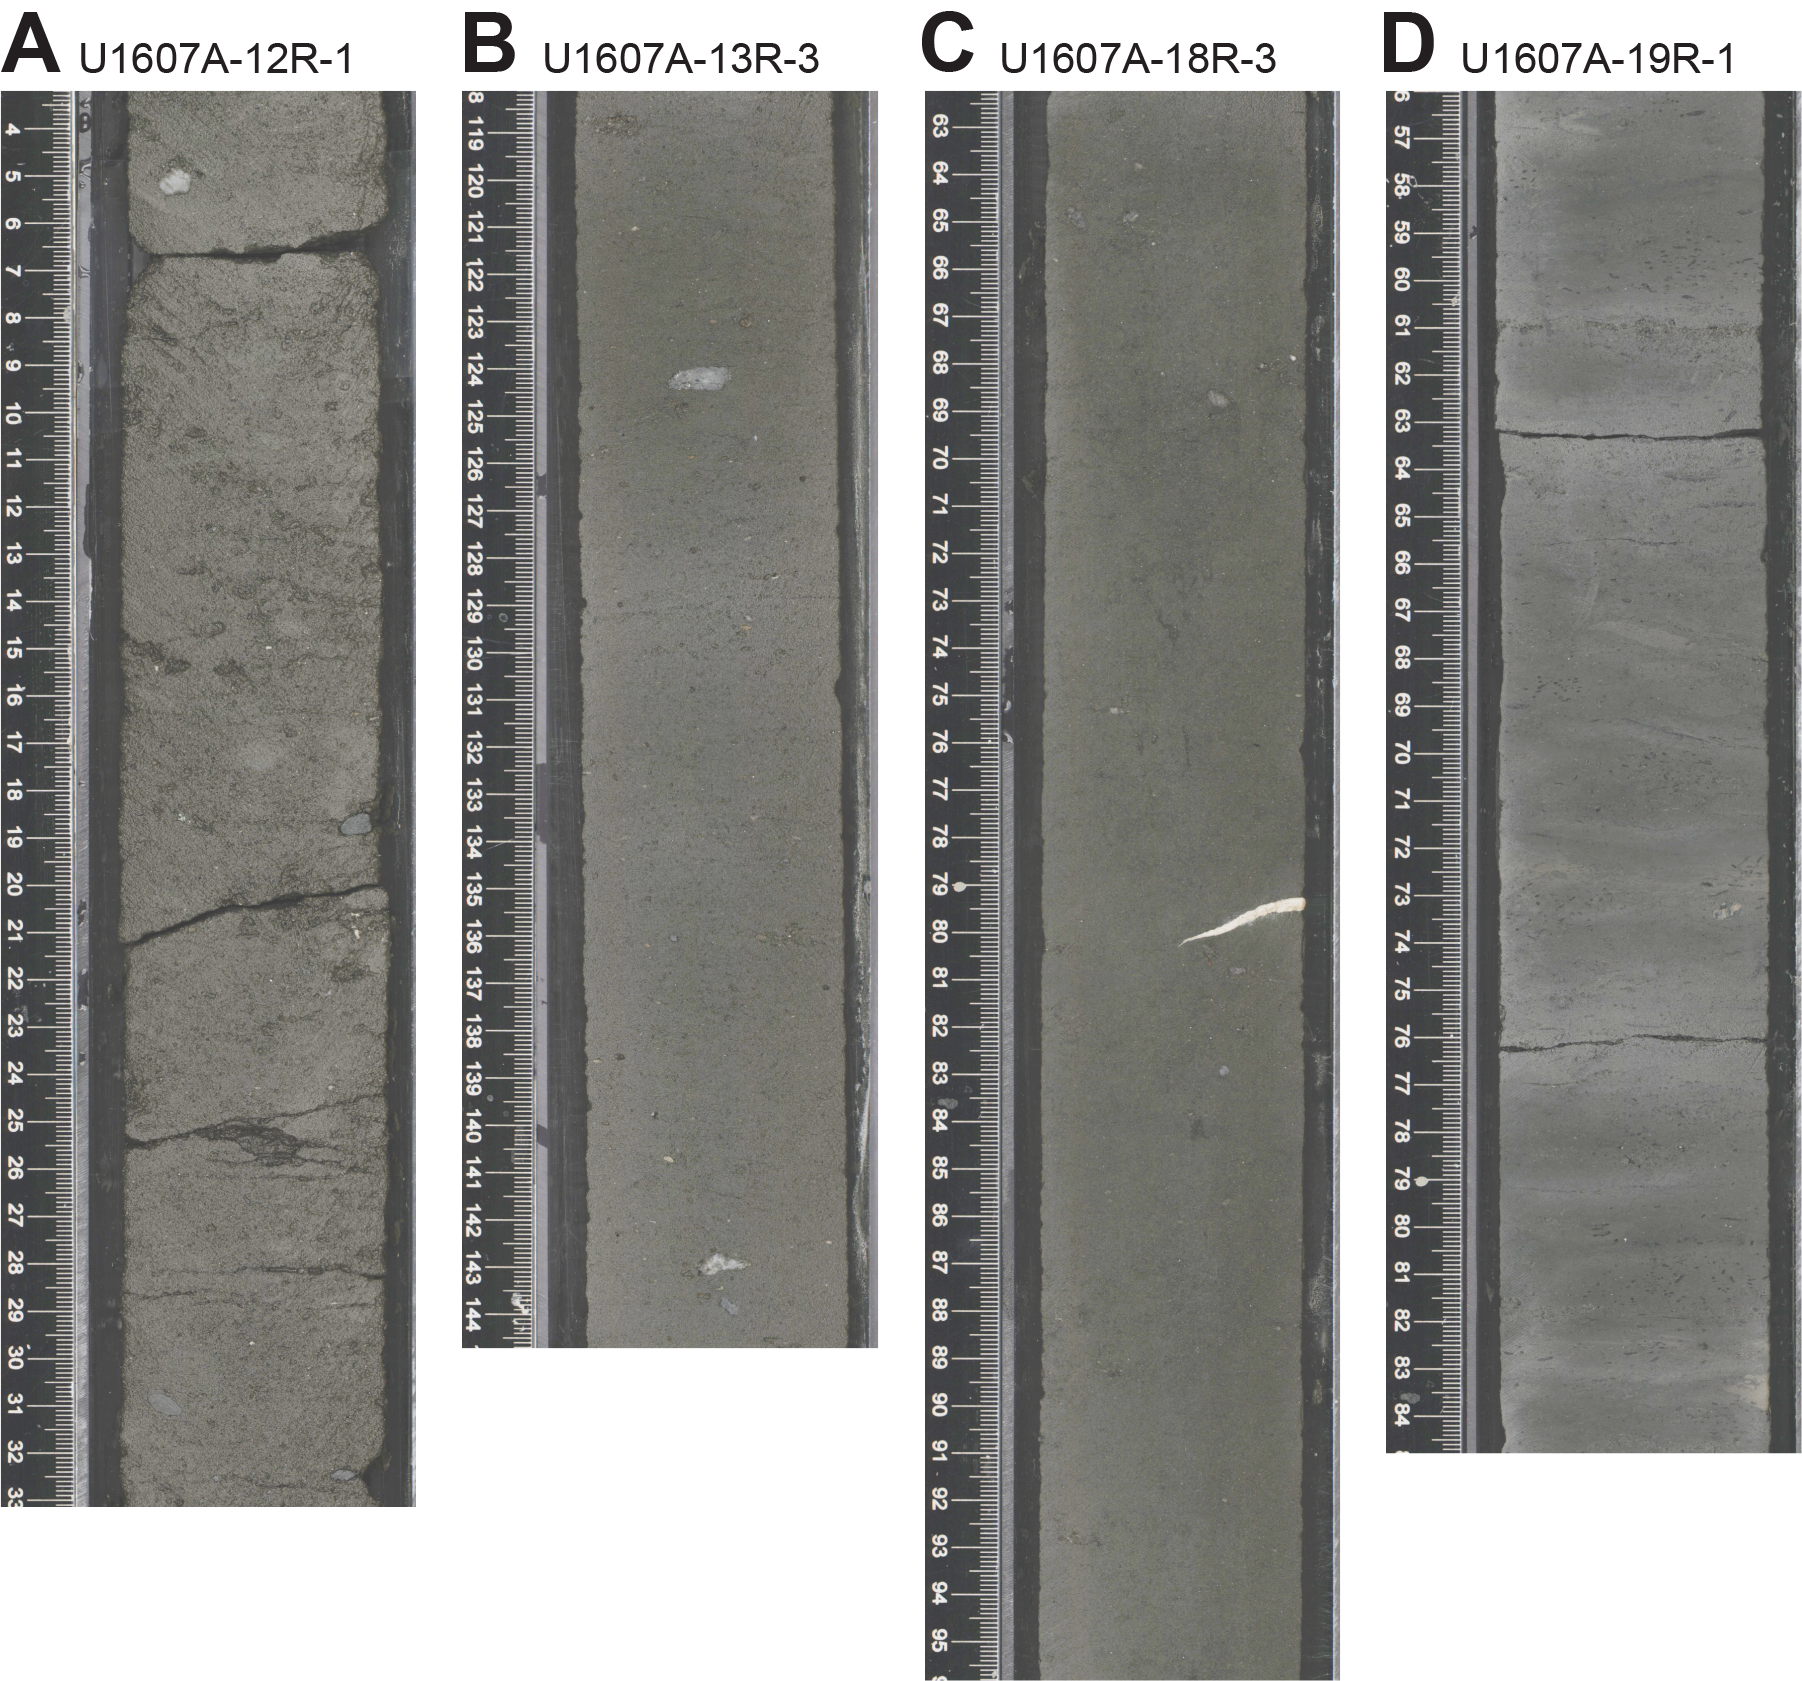
Figure F7. Lithofacies 1.
The dispersed clasts lithofacies is present above ~530 m CSF-A, occurring throughout Lithostratigraphic Units II and III, and is interpreted as deposition in a glaciomarine continental shelf environment with sediment delivery and transport by iceberg and/or sea ice rafting, suspension plumes, or sediment flows with modification by weak bottom currents.
3.2.2. Lithofacies 2: calcareous mud
Lithofacies 2 consists of isolated 5–15 cm thick beds of light gray to yellowish brown variably bioturbated carbonate mud, which occur throughout the succession. Beds are variably lithified with lower contacts bioturbated (Figure F8A, F8B). The yellowish brown variety of calcareous mud (Figure F8C, F8D) occurs below 530 m CSF-A and is commonly associated with fragments of shell or calcite-cemented nodules (Figure F8B). Thin sections and smear slides show that this lithofacies is characterized by a matrix of very fine micrite. Other components include dispersed silt- and sand-sized grains of quartz, feldspar, and other accessory minerals.

Figure F8. Lithofacies 2.
Lithofacies 2 is most likely the result of the deposition of carbonate mud and should not be confused with the calcite-cemented intervals that also occur at this site. These intervals are more likely to be depositional than diagenetic because the very fine-grained nature of the matrix is inconsistent with diagenetic replacement of terrigenous mud; such processes typically lead to the creation of coarser grains and do not involve the removal of terrigenous material such as silt. In addition, bioturbation in this lithofacies, including downward mixing of light-colored calcareous mud into darker enclosing sediments and vice versa, suggests that it was present when organisms were actively grazing and burrowing at the seafloor. The fine-grained nature of the deposit is most consistent with deposition out of suspension, with carbonate either carried in via plumes or wind or generated locally during bursts of surface productivity by calcifiers.
3.2.3. Lithofacies 3: bioturbated sandy mud and muddy fine to very fine sand
Lithofacies 3 consists of sandy mud to muddy fine to very fine sand with moderate to abundant bioturbation (Figure F9). The overall color of this lithofacies is dark brown (if mud is dominant) to medium or light brown (if sand is dominant). The proportion of mud versus sand in this lithofacies varies considerably, with gradational transitions from sandy mud to muddy sand and vice versa at the decimeter to meter scale. Bivalve, gastropod, and brachiopod shells, ranging from <1 cm to several centimeters in length, occur in this lithofacies. Many shells occur as single valves or fragments, but several articulated specimens were also found.
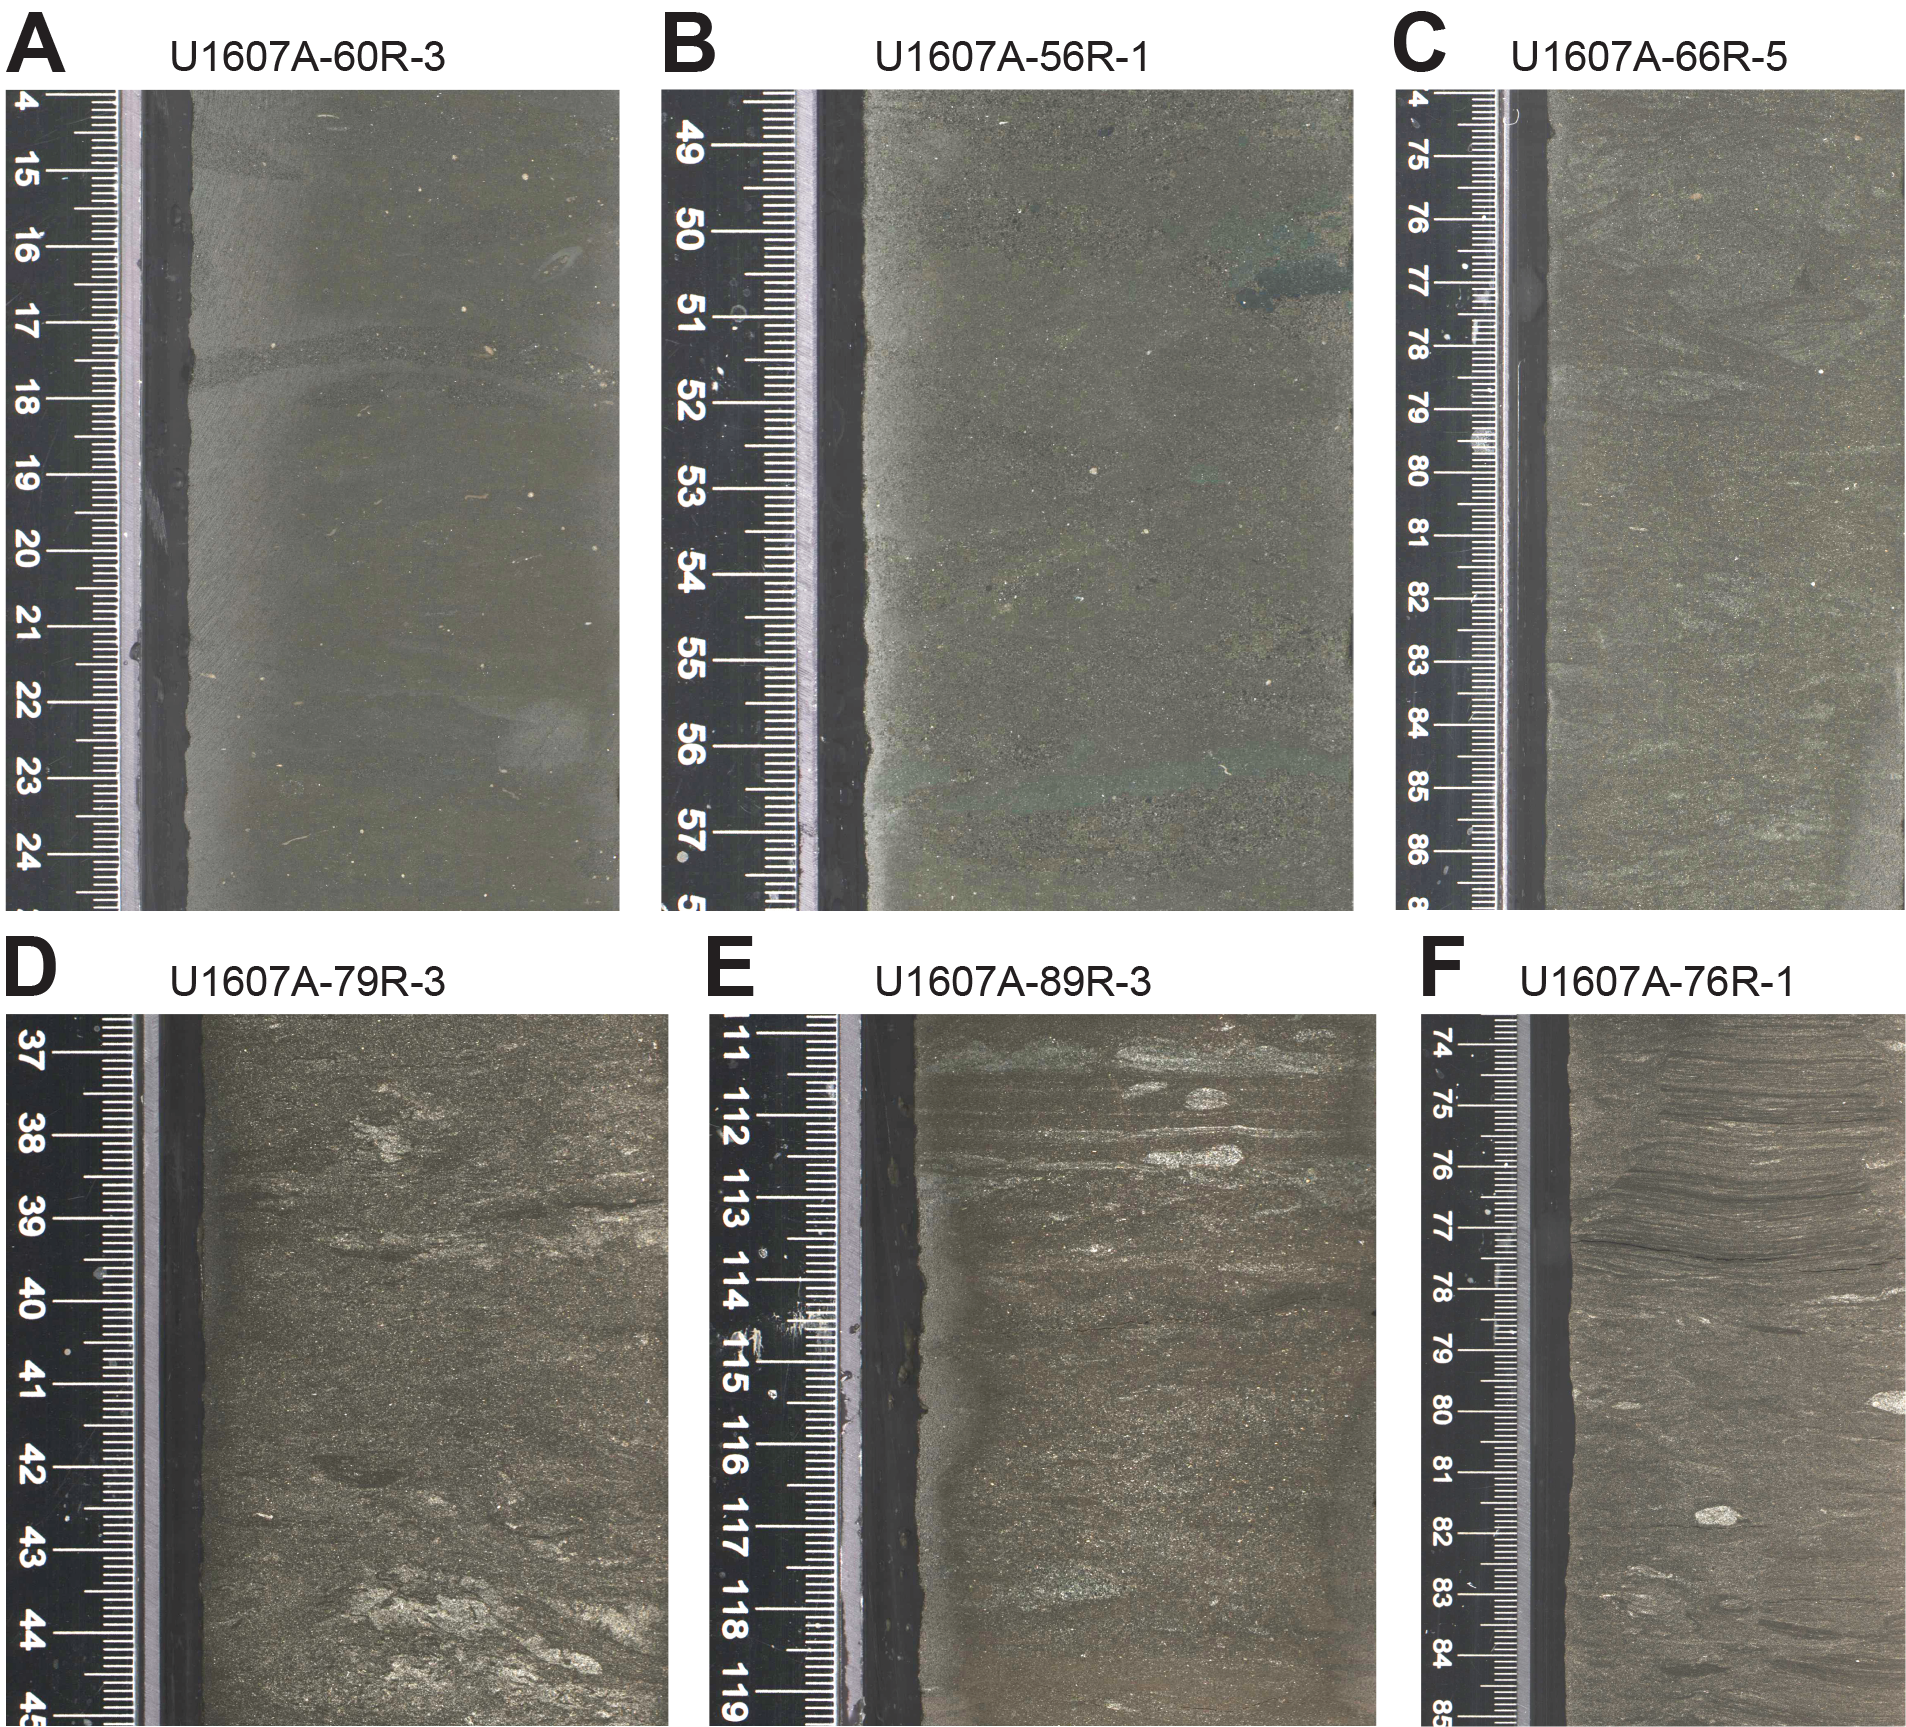
Figure F9. Lithofacies 3.
The high degree of bioturbation in this lithofacies generally obscures primary depositional structures and bedding relationships. Sediment textures are best expressed in sand-rich varieties of this lithofacies; sand grain sizes range from very fine to fine with common occurrences of lower medium-grained sand. The distribution of sand-sized material is strongly influenced by bioturbation, with sand often concentrated in burrow fills or linings in more heavily bioturbated intervals (see Bioturbation and trace fossil assemblages). Nonetheless, the presence of a range of sand grain sizes along with variable amounts of mud observed at the millimeter to decimeter scale plausibly suggests a primary interlaminated to interbedded depositional pattern. Rare occurrences of relatively well preserved physical sedimentary structures in this lithofacies exhibit millimeter-scale interlamination (Figure F9). Smear slide analysis of Lithofacies 3 indicates highly variable mixtures of clay-, silt-, and sand-sized material. The composition of silt and sand grains includes quartz (common to abundant), feldspar (rare to common), mica (rare to common), and rare to trace amounts of other lithic grains and accessory minerals.
The bioturbation associated with this lithofacies is a defining characteristic, with the intensity ranging from a bioturbation index of 2 (few distinct traces, bedding intact) to 6 (total homogenization of sediment, no original bedding visible). The mud-dominated end member of this lithofacies includes millimeter-scale oval to circular traces filled either with dark gray material (likely sulfides) or pyrite, and sand-filled burrows are millimeter to centimeter scale. The sand-dominated variety of Lithofacies 3 includes both mud- and sand-filled burrows with a significant range of sizes and geometries (Figure F9C–F9F).
Lithofacies 3 is interpreted to represent sedimentation in a low- to moderate-energy marine shelf setting in proximity to an input of terrigenous sediment and/or associated with currents of sufficient energy and persistence to transport fine to very fine sand. The postdepositional fabric associated with moderate to intense bioturbation leads to a high degree of uncertainty regarding a specific depositional environment interpretation.
3.2.4. Lithofacies 4: glauconite-rich sandy mud, muddy sand, and sandy conglomerate
Lithofacies 4 consists of dark greenish brown to dark greenish gray sand, muddy sand, and sandy mud containing abundant glauconite mud grains (Figure F10). The shape, distribution, and relationship of the glauconite grains to other components in this lithofacies indicate that the glauconite is almost entirely detrital; that is, it was brought to this position from somewhere else in a similar manner to the other clastic grains in this succession. The glauconite grains are very fine sand to granule in size, are well sorted to moderately well sorted, have colors that range from light green to almost black, and are rounded to subangular in shape. Where they occur in sand-dominated lithologies, the glauconite grains tend to be less well sorted than the other clastic components and appear to have larger diameters than other detrital components. Glauconite clasts sometimes occur alongside other mud clasts and can have irregular, elongate shapes that suggest postdepositional ductile deformation (Figure F10A).
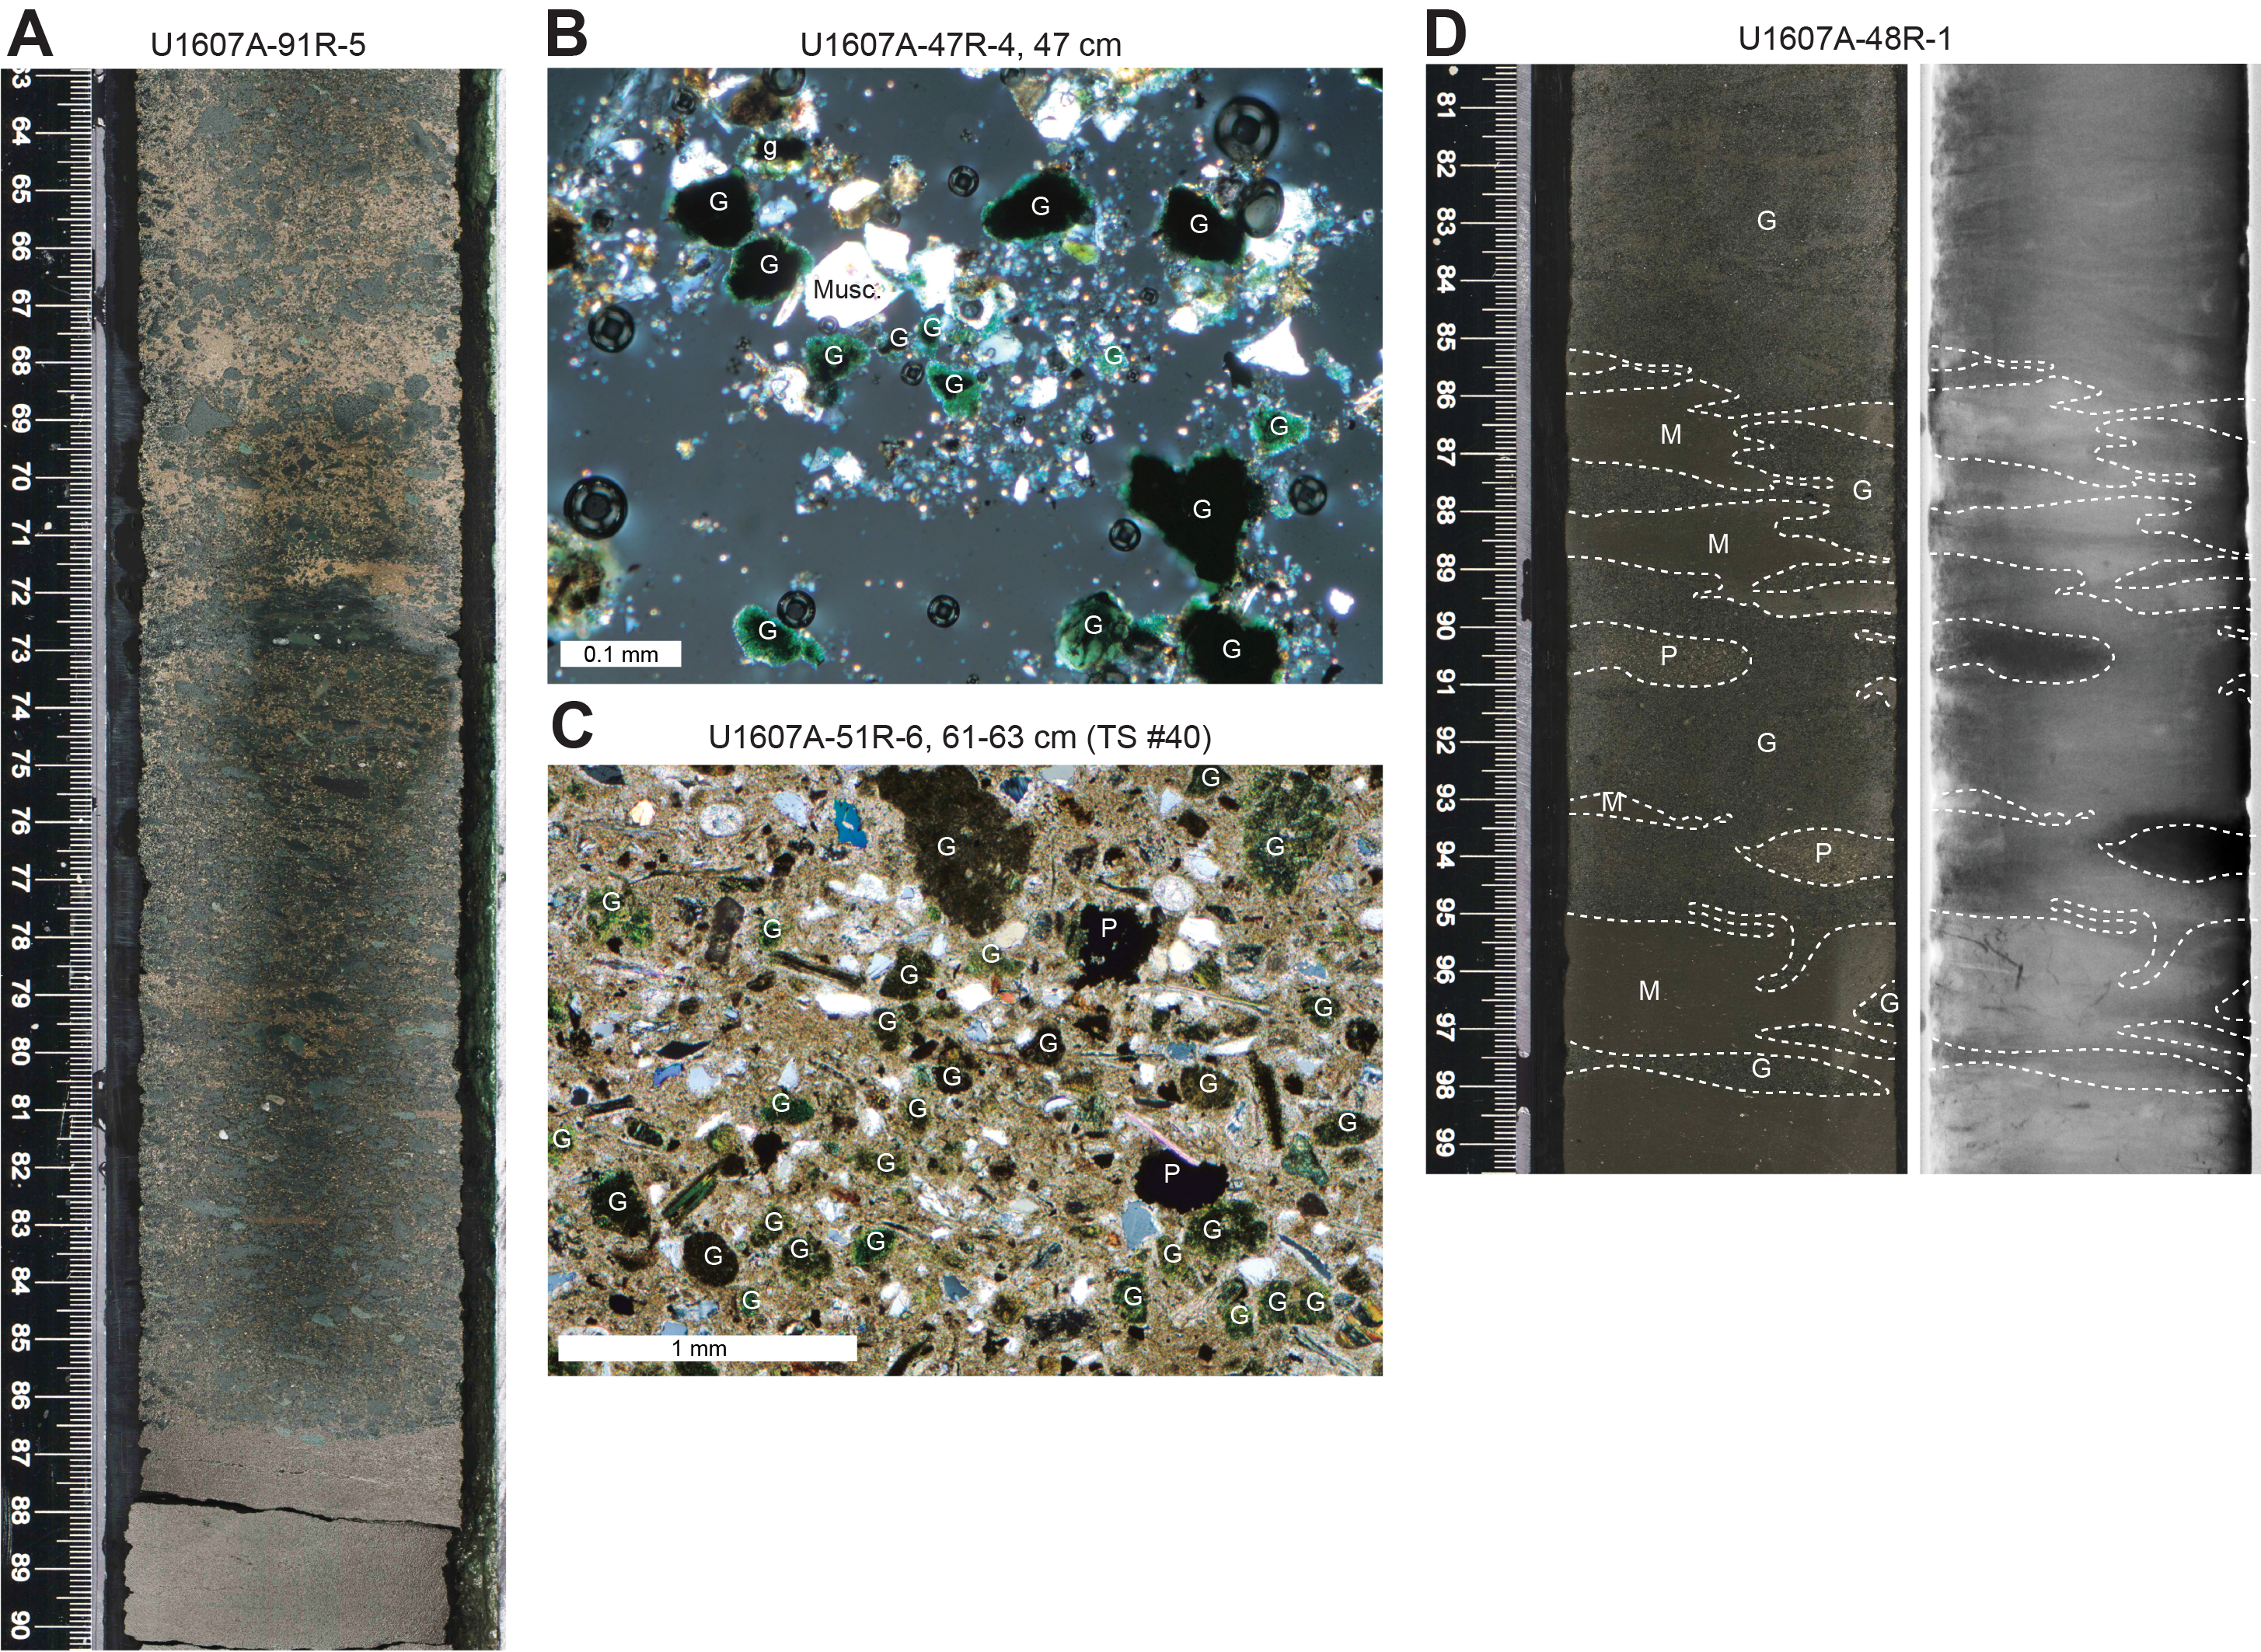
Figure F10. Lithofacies 4.
The presence of plastically deformed glauconite grains, their impressive abundance in this lithofacies, and their association with nonglauconitic mud clasts indicate that the glauconite clasts in this lithofacies are likely intraclasts. Intraclasts form by erosion within the depositional environment and transportation of partially lithified sediment. An intraclast origin for the glauconite grains is also supported by the large size of the glauconite grains relative to other clastic components. Because glauconite has a similar average density to quartz (~2.67 g/cm3 for glauconite versus 2.65 g/cm3 for quartz), the relatively large size of the grains suggests that the detrital glauconite had a different transport history than the other sand-sized components in this lithofacies—a typical feature of intraclasts. These glauconite mud intraclasts suggest that there was an intrabasinal, and likely proximal, source of glauconite mud being deposited at the same time or shortly before this unit, which was subsequently eroded and transported before being deposited in this location.
In situ, authigenic glauconite also occurs in this lithofacies and to a lesser extent in Lithofacies 3. The in situ glauconite is typically a lighter green hue than the intraclasts, follows the outline of sedimentary laminae and burrows, and has diffuse boundaries that extend into the surrounding sediment. The presence of in situ glauconite supports the intraclast interpretation because it implies glauconite was forming in this setting. Although the detrital glauconite and terrigenous components of this lithofacies reflect hydrodynamic conditions of sediment transport, the presence of authigenic glauconite implies low sedimentation rates and the periodic development of suboxic conditions near the sediment/water interface (Odin, 1988).
Lithofacies 4 is interpreted to represent sedimentation in a marine shelf setting with periods of low sedimentation, episodes of intrabasinal reworking, and in proximity to an input of terrigenous sediment.
3.3. Bioturbation and trace fossil assemblages
Bioturbation is a dominant characteristic of the sedimentary succession at Site U1607. The intensity of bioturbation varies but is present in all lithostratigraphic units and occurs in all lithofacies (to different degrees). A systematic characterization and identification of named traces, ichnofauna, and ichnofacies was not conducted at Site U1607 during shipboard description and analysis. However, the observed bioturbation fabrics (Figure F6) indicate a large range of trace types and associated burrowing behaviors dependent on factors such as the nature of the substrate, food supply, bottom water oxygenation, sedimentation rates, and chemistry of shallow subsurface pore waters (Seilacher, 2007).
3.4. Diagenesis
Diagenetic features at Site U1607 include iron sulfide minerals (e.g., pyrite), glauconite, carbonate concretions, and pseudomorphs after ikaite (Figure F11). Iron sulfide phases are visible in burrow fills (Figure F9A, F9B) and replace calcareous fossil material, including bivalves and microfossils (Figure F12). Thin section and smear slide analyses also show an association with glauconite in Lithostratigraphic Units III and V.
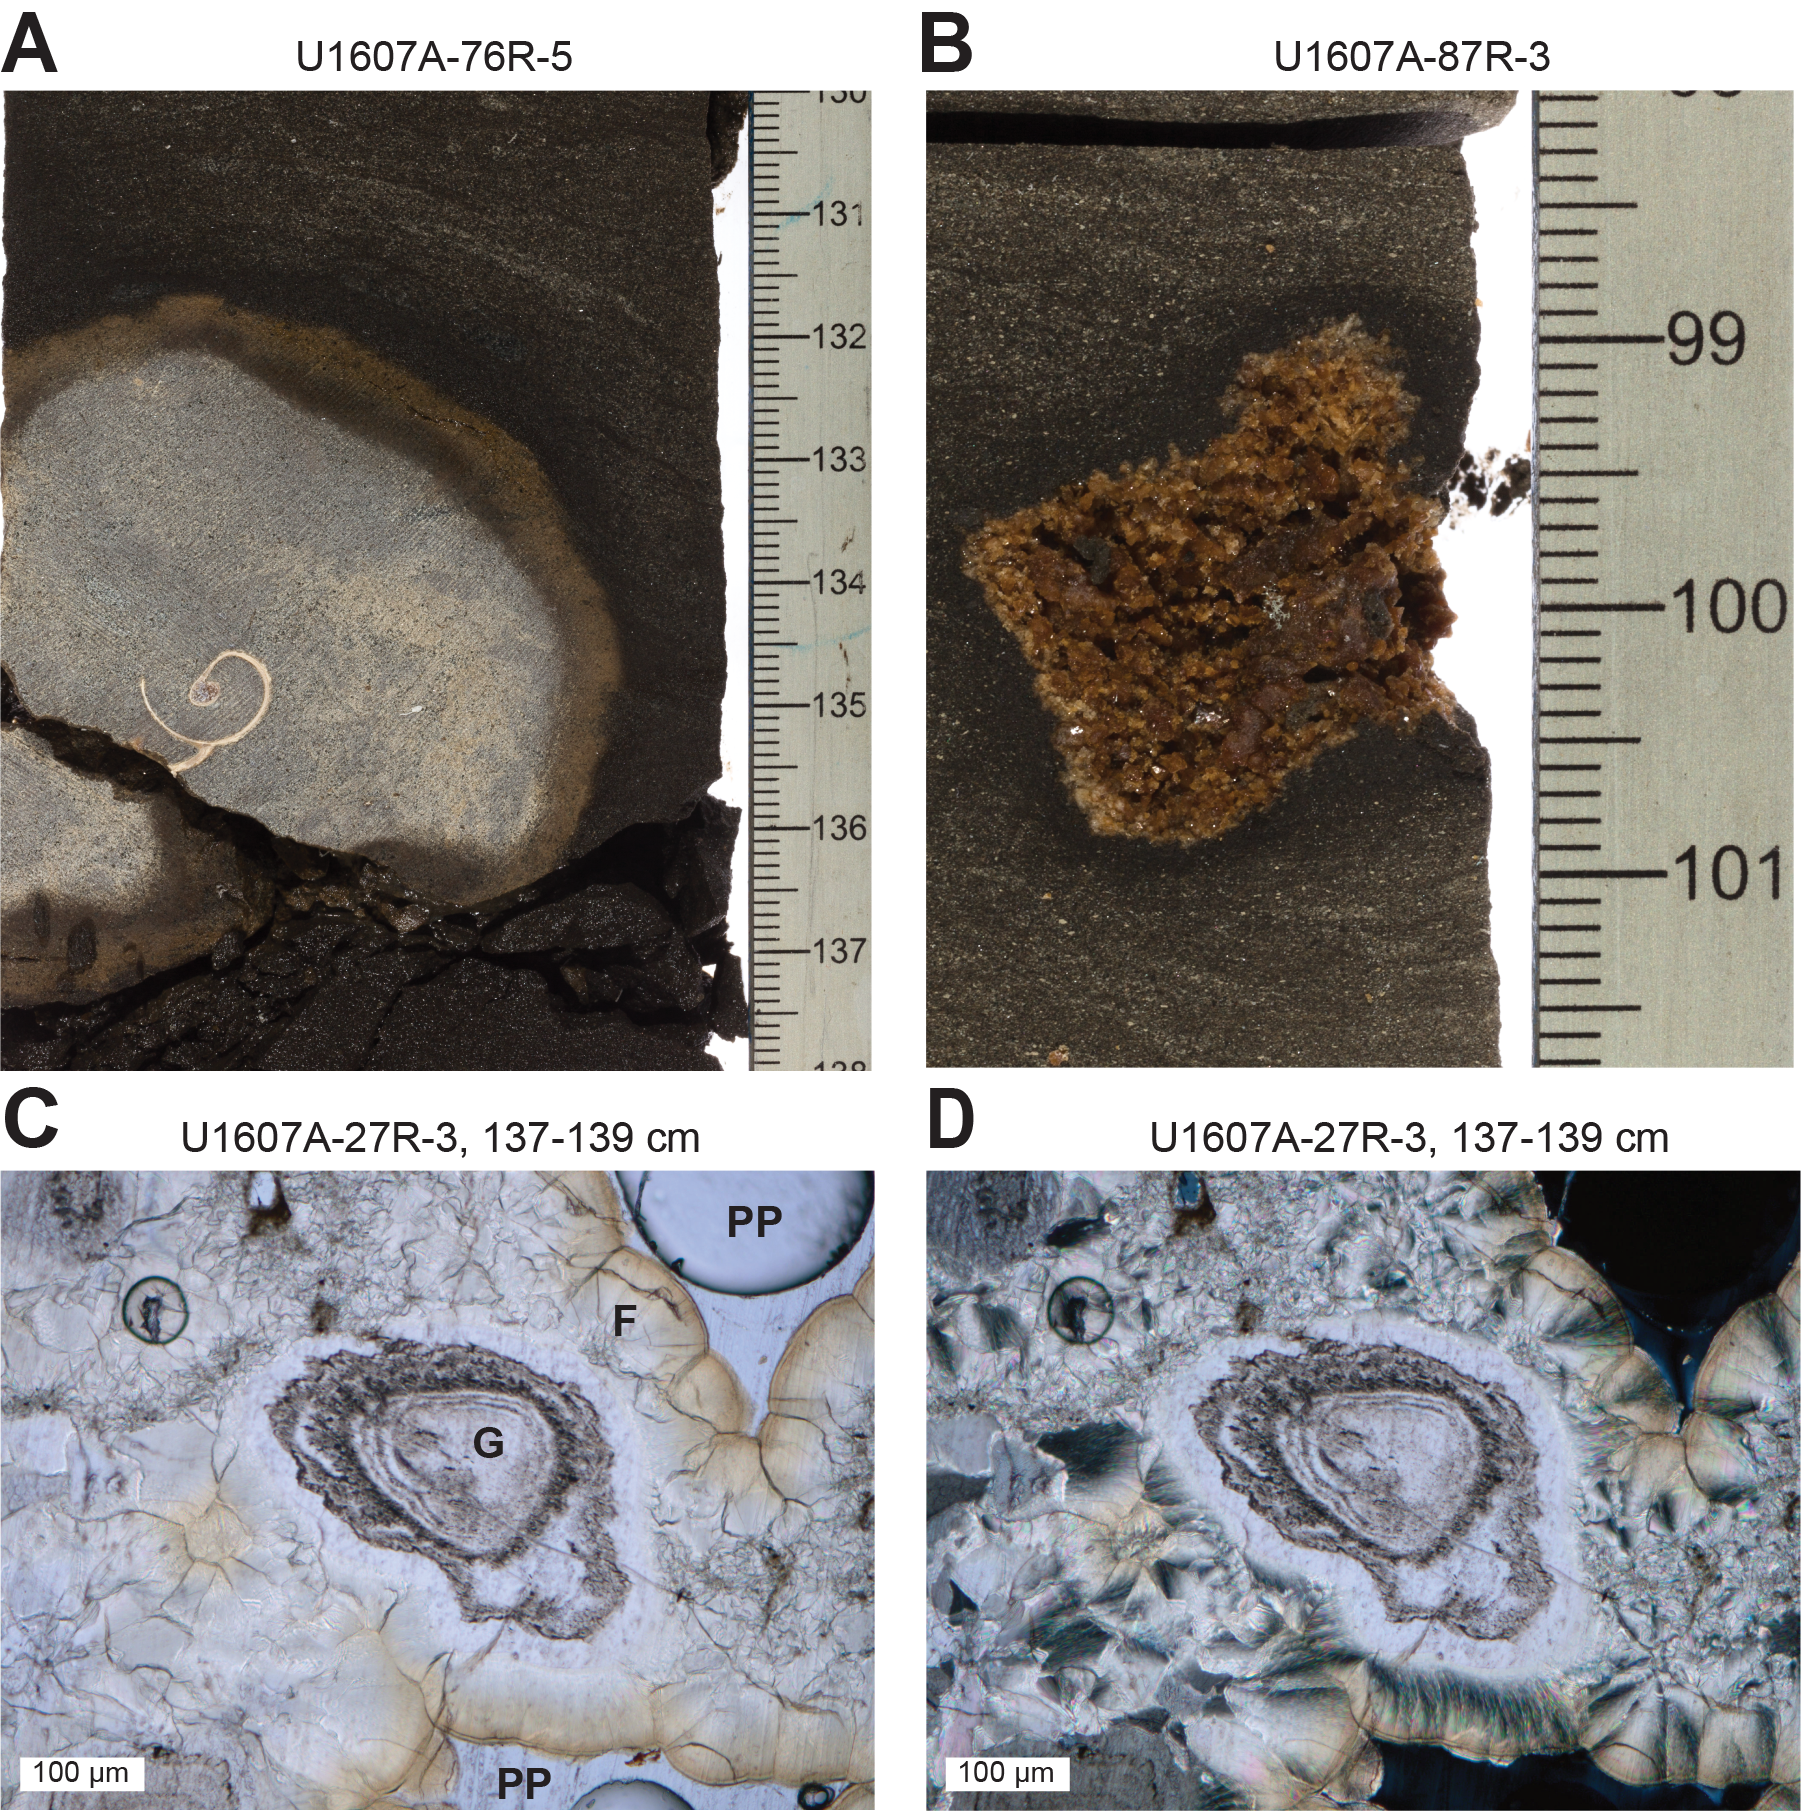
Figure F11. Diagenetic features.
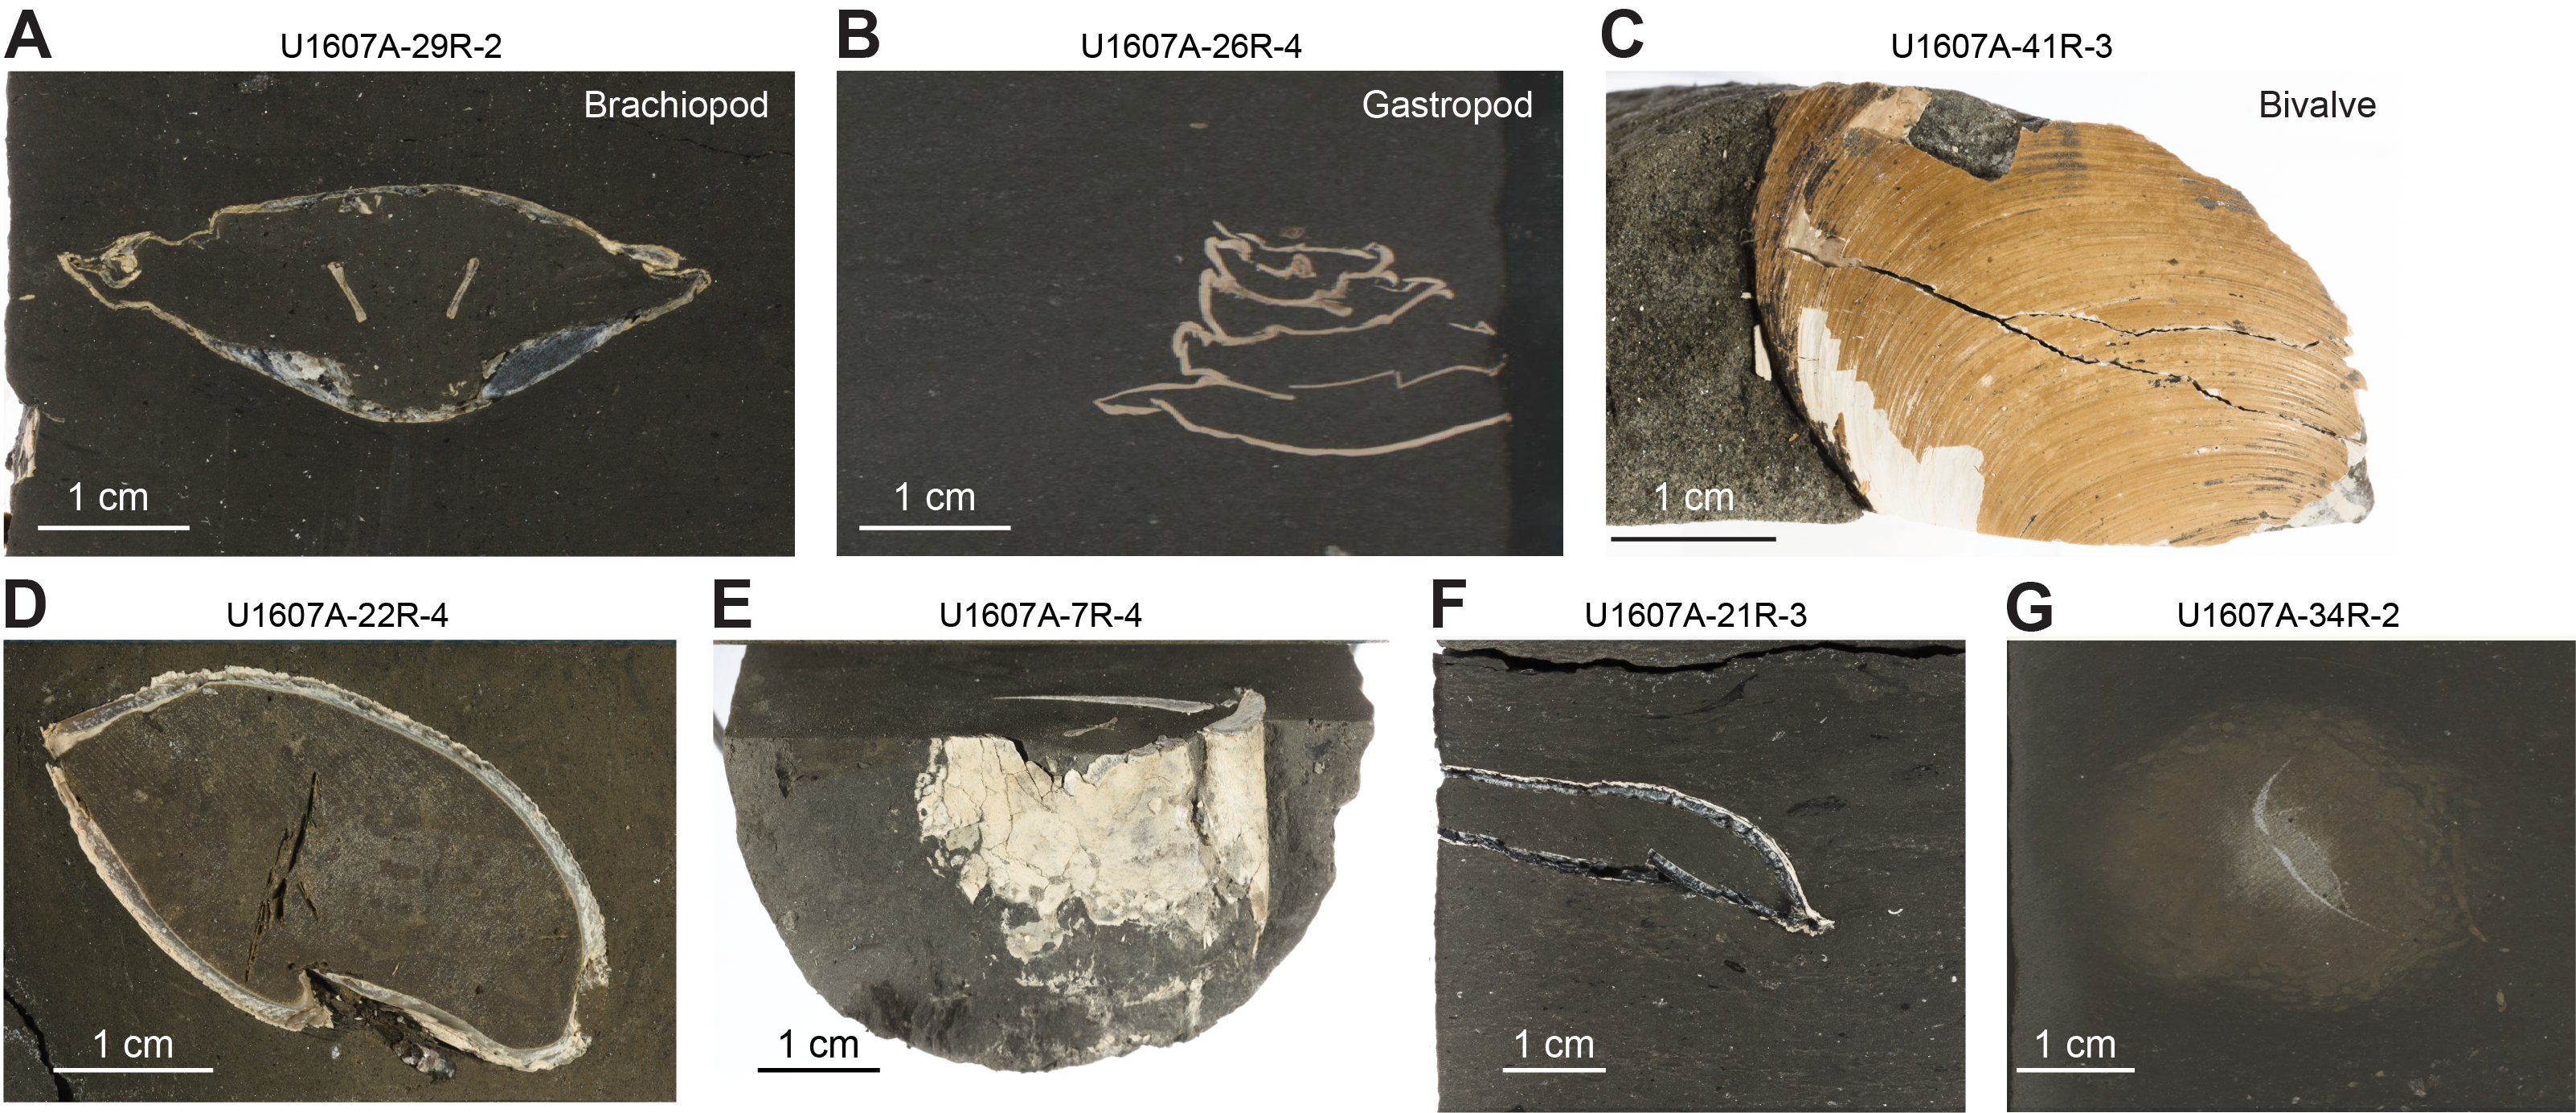
Figure F12. Macrofossils.
Glauconite, referring herein to the green glaucony mineral found in marine sediment, is present in varying amounts below 434.72 m CSF-A and is especially abundant in Units III and V, where it occurs as framework grains in sandy lithologies (Figure F9). As discussed above (see Lithofacies 4: glauconite-rich sandy mud, muddy sand, and sandy conglomerate), the glauconitic framework grains were likely detrital. Authigenic glauconite is found as burrow fills and linings in Units III and V, where it surrounds grains and extends into primary porosity (Figure F6H). Although the origin and significance of glauconite at Site U1607 is beyond the scope of this volume, the conditions required for its formation may provide some insight into depositional and early diagenetic conditions at this site. These conditions include relatively low sediment accumulation rates of detrital sediment, availability of organic matter, and low-oxygen redox conditions.
Carbonate-cemented intervals (<5 cm thick) and carbonate concretions are present below ~86 m CSF-A. Rimmed, spherical concretions ranging 1–5 cm in diameter are conspicuous elements of Subunit IVB. These concretions are characterized by a yellow-brown interior and a reddish rim up to 5 mm thick (Figure F11A). Sediment from the time of deposition is preserved within the concretion, implying concretions grew within primary intergranular pore space. Compactional draping of host sediment around these concretions indicates that formation occurred before the enclosing sediments were subjected to significant physical compaction. The presence of macrofossils at the center of some concretions (Figure F11A) suggests that fossil material, as well as the associated organic matter decay, may have fostered early diagenetic precipitation of carbonate.
Pseudomorphs after ikaite (CaCO3 · 6H2O), known as glendonites, occur below 255 m CSF-A. Together with the rimmed carbonate concretions discussed above, they are a prominent feature of Subunit IVB, where they occur within intervals of Lithofacies 3. The pseudomorphs occur as blades or stellate forms typically 2–3 cm in diameter; the largest specimen observed is >6 cm long. The pseudomorphs range in color from maroon to orange and contain coarse carbonate crystals (Figure F11B). Thin section analysis of one specimen reveals a guttulatic texture (sensu Scheller et al., 2022), characterized by coarse, inclusion-rich hexagonal to spherical calcite crystals, indicative of the early diagenetic transformation via dehydration of ikaite to calcite (Figure F11C, F11D). The volume change associated with this transformation leads to the production of secondary porosity between calcite crystals. The specimens from Site U1607 show that these calcite crystals were subsequently overgrown by a fibrous, botryoidal carbonate cement, which partially filled the remaining pore space. Because ikaite is known to be stable in marine settings only at frigid temperatures, its presence provides broad constraints for paleoclimate conditions at the time in which enclosing sediments were deposited.
At Site U1607, a range of invertebrate macrofossils with a diverse degree of preservation is observed. The fossil remains belong to the phyla Brachiopoda and Mollusca, including the classes Bivalvia and Gastropoda (Figure F12A, F12B). These macrofossils occur as articulated specimens, single valves, or shell fragments, most commonly in association with Lithofacies 3. Preservation varies from poor (corroded debris and fully pyritized shells; Figure F12E–F12G) to good or excellent preservation with visible internal structure (Figure F12D) and preserved periostracum (Figure F12C).
3.5. Smear slide and thin section analysis
Smear slides were taken during core description to ascertain the characteristics and composition of finer sediments, namely clay, silt, and very fine sand. Clay was too fine grained for mineralogical identification using petrographic methods. Silt- and sand-sized grains are mainly of terrigenous origin, dominated by clay minerals, quartz, and feldspar, with rare to common opaque (mainly pyrite) minerals. Lesser amounts of mica, chlorite, amphibole, organics, and other accessory minerals were identified. Glauconite ranges from trace to abundant in the smear slides. Biosilica-rich mud was found in a smear slide taken from Section 400-U1607A-1R-1, 14 cm, which contains common diatoms and trace to rare radiolarians and sponge spicules. Smear slides from calcareous mud intervals are dominated by clay- to silt-sized, nonbiogenic carbonate material. Quartz, feldspar, and clay are present in the calcareous mud samples in minor amounts, and one smear slide contains organic matter in Section 4R-2, 80 cm. Possible nannofossils occur in smear slides taken from Sections 67R-7, 30 cm, and 92R-1, 2 cm.
A total of 20 thin sections were made of material from Hole U1607A to improve understanding of various lithologies and diagenetic features. Thin sections (TS27–TS32 and remakes TS43 and TS44) were taken from six intervals of Lithofacies 2. These thin sections show that the calcareous mud is characterized by a matrix of silt-grade carbonate rhombs of uniform size. Often, silt-sized terrigenous grains, in particular quartz and feldspar, occur. Also present are very thin shell fragments, which are usually overgrown by fringes of bladed carbonate cement. Because of the poorly lithified nature of the calcareous mud, difficulties were encountered in making thin sections of uniform thickness. These difficulties hampered detailed observation.
Two thin sections were cut to compare the compositions of sand intervals in Cores 400-U1607A-37R (TS35) and 38R (TS36), which were characterized by high and low MS, respectively. TS35 has a muddier matrix and contains more igneous rock fragments, slightly more glauconite, and more pyrite than does TS36. Otherwise, they are very similar in terms of grain size and sorting.
Three thin sections were cut from glauconitic sands in Lithostratigraphic Units III (TS38 and TS39) and V (TS45). Framework grains in sands in Unit III include brown to green pellet-shaped glauconite grains, along with quartz and feldspar. Both contain common to abundant mica. Intergranular space is filled with fine material, likely clay minerals. The sample from Unit V is coarse grained relative to those from Unit III. Framework grains include green glauconite (irregular shapes), igneous rock fragments, quartz, and feldspar. The clay matrix is undergoing replacement by silt-sized rhombs of carbonate. A few clasts of fine carbonate are also present.
Additional thin sections were taken from diagenetic features. Information from thin section analysis of these features is provided in the discussion above (see Diagenesis).
3.6. Clay and bulk mineralogy results
Samples were collected from Hole U1607A for bulk mineralogical (146 samples) and clay mineral (99 samples) analysis using XRD. The overall bulk mineralogical composition of sediment from Site U1607 is dominated by quartz, K-feldspar, and plagioclase (Table T3), which (with few exceptions) are common to abundant in all samples. Carbonate minerals siderite, dolomite, and calcite are present in varying amounts. Calcite is present in four samples, three of which were from the calcareous mud lithofacies. Dolomite and siderite, which range in abundance from rare to few, occur more frequently than calcite. Dolomite is present in all lithostratigraphic units except Subunit IVB and Unit V. Siderite is present in Units II–V and most frequently occurs in Subunit IVA. Pyrite is present in samples from Core 7R and below, occurring with increasing frequency and abundance in Subunit IID through Unit V, confirming the pyritic nature of burrow fill observed during core description. Although identified in the bulk samples, clay mineral distributions are discussed below.
Samples for bulk clay mineralogy were taken from Units I–V (Table T4). Illite is present throughout the site and shows an overall decreasing trend downhole. Chlorite is also present throughout Hole U1607A and decreases in variability and concentration downhole. It appears most frequently in samples from Unit I through Subunit IIC. Chlorite/illite ratios range ~0.5−4, with values becoming higher and more variable with depth. Both smectite and kaolinite are prominent in Subunit IID through Unit V and present sporadically in overlying units. Kaolinite and chlorite show an antithetical relationship, with kaolinite occurring in samples where chlorite is absent and vice versa. There is no clear downhole trend in the kaolinite/illite ratio, but the smectite/illite ratio generally increases and becomes more variable with depth.
3.7. Preliminary depositional interpretation
Site U1607 recovered a complex and lengthy stratigraphic record that records sedimentation within a relatively deep marine shelf subbasin situated inland of the Melville Bay Ridge (see Figure F4 in the Expedition 400 summary chapter [Knutz et al., 2025b]). Mud-rich lithologies at the base of the succession are consistent with deposition via suspension settling below storm wave base. The introduction of sharp-based beds of coarse glauconite-rich lithologies is inferred to represent rapid deposition of material from upslope, perhaps sourced from the flank of the Melville Bay Ridge, via mass flow processes. Overlying deposits in Lithostratigraphic Unit IV, consisting of a thick succession including beds of weakly stratified very fine sand, are consistent with deposition in a setting proximal to an input of terrigenous sediment and associated with currents of sufficient energy and persistence to transport sand. Common pseudomorphs after ikaite in Subunit IVB point to frigid conditions (about −2° to +4°C) at the seafloor, whereas the abundance of glauconite in Unit III is suggestive of slower sedimentation rates and, potentially, warmer conditions (up to 15°C). An upward increase in the abundance and size of outsized clasts, interpreted as ice-rafted debris, through Unit II suggests a growing influence of floating ice. Holocene muds recovered in Unit I are entirely consistent with deposition below storm wave base in a deep midshelf environment.
4. Biostratigraphy
4.1. Biostratigraphy and paleoenvironment
Site U1607 (water depth = 738.6 m) was the third shelf site cored and includes the deepest hole of Expedition 400. It comprises one hole (U1607A). Located in the Melville Bay rift basin, the aim was to recover a sequence of Miocene to late Oligocene sediments that would provide a deep time view of Greenland's climate and environment during past warm periods of the mid- to late Cenozoic. Consistent with the seismic stratigraphy, only a thin cover (<1 m) of Pleistocene glaciomarine sediments occurs at Site U1607, permitting easy access to the finer grained Neogene and older strata. Core catcher samples and additional split core samples from Hole U1607A cores were examined for foraminifera, diatoms, dinoflagellate cysts (dinocysts), and other palynomorphs. Extra samples from the split cores targeted thin (typically centimeter scale) calcareous mud horizons and/or intervals close to mollusk shells, where carbonate/foraminifera preservation may have been enhanced, and intervals adjacent to where diatoms had been found in core catcher samples. Mudline samples were also examined for each microfossil group.
Microfossils generally occur only sporadically and discontinuously in the muddy sands, sandy muds, and muds typical of Site U1607, apart from palynomorphs, which have more continuous occurrences (Figure F13). A combination of paleoenvironmental restrictions (i.e., shelf/neritic environments unfavorable to pelagic species) and diagenetic influences on pore water chemistry and preservation potential is likely responsible for the paucity of biomineralized skeletal remains in many intervals. Biostratigraphic results are therefore limited but provide some degree of age control in different parts of Hole U1607A.
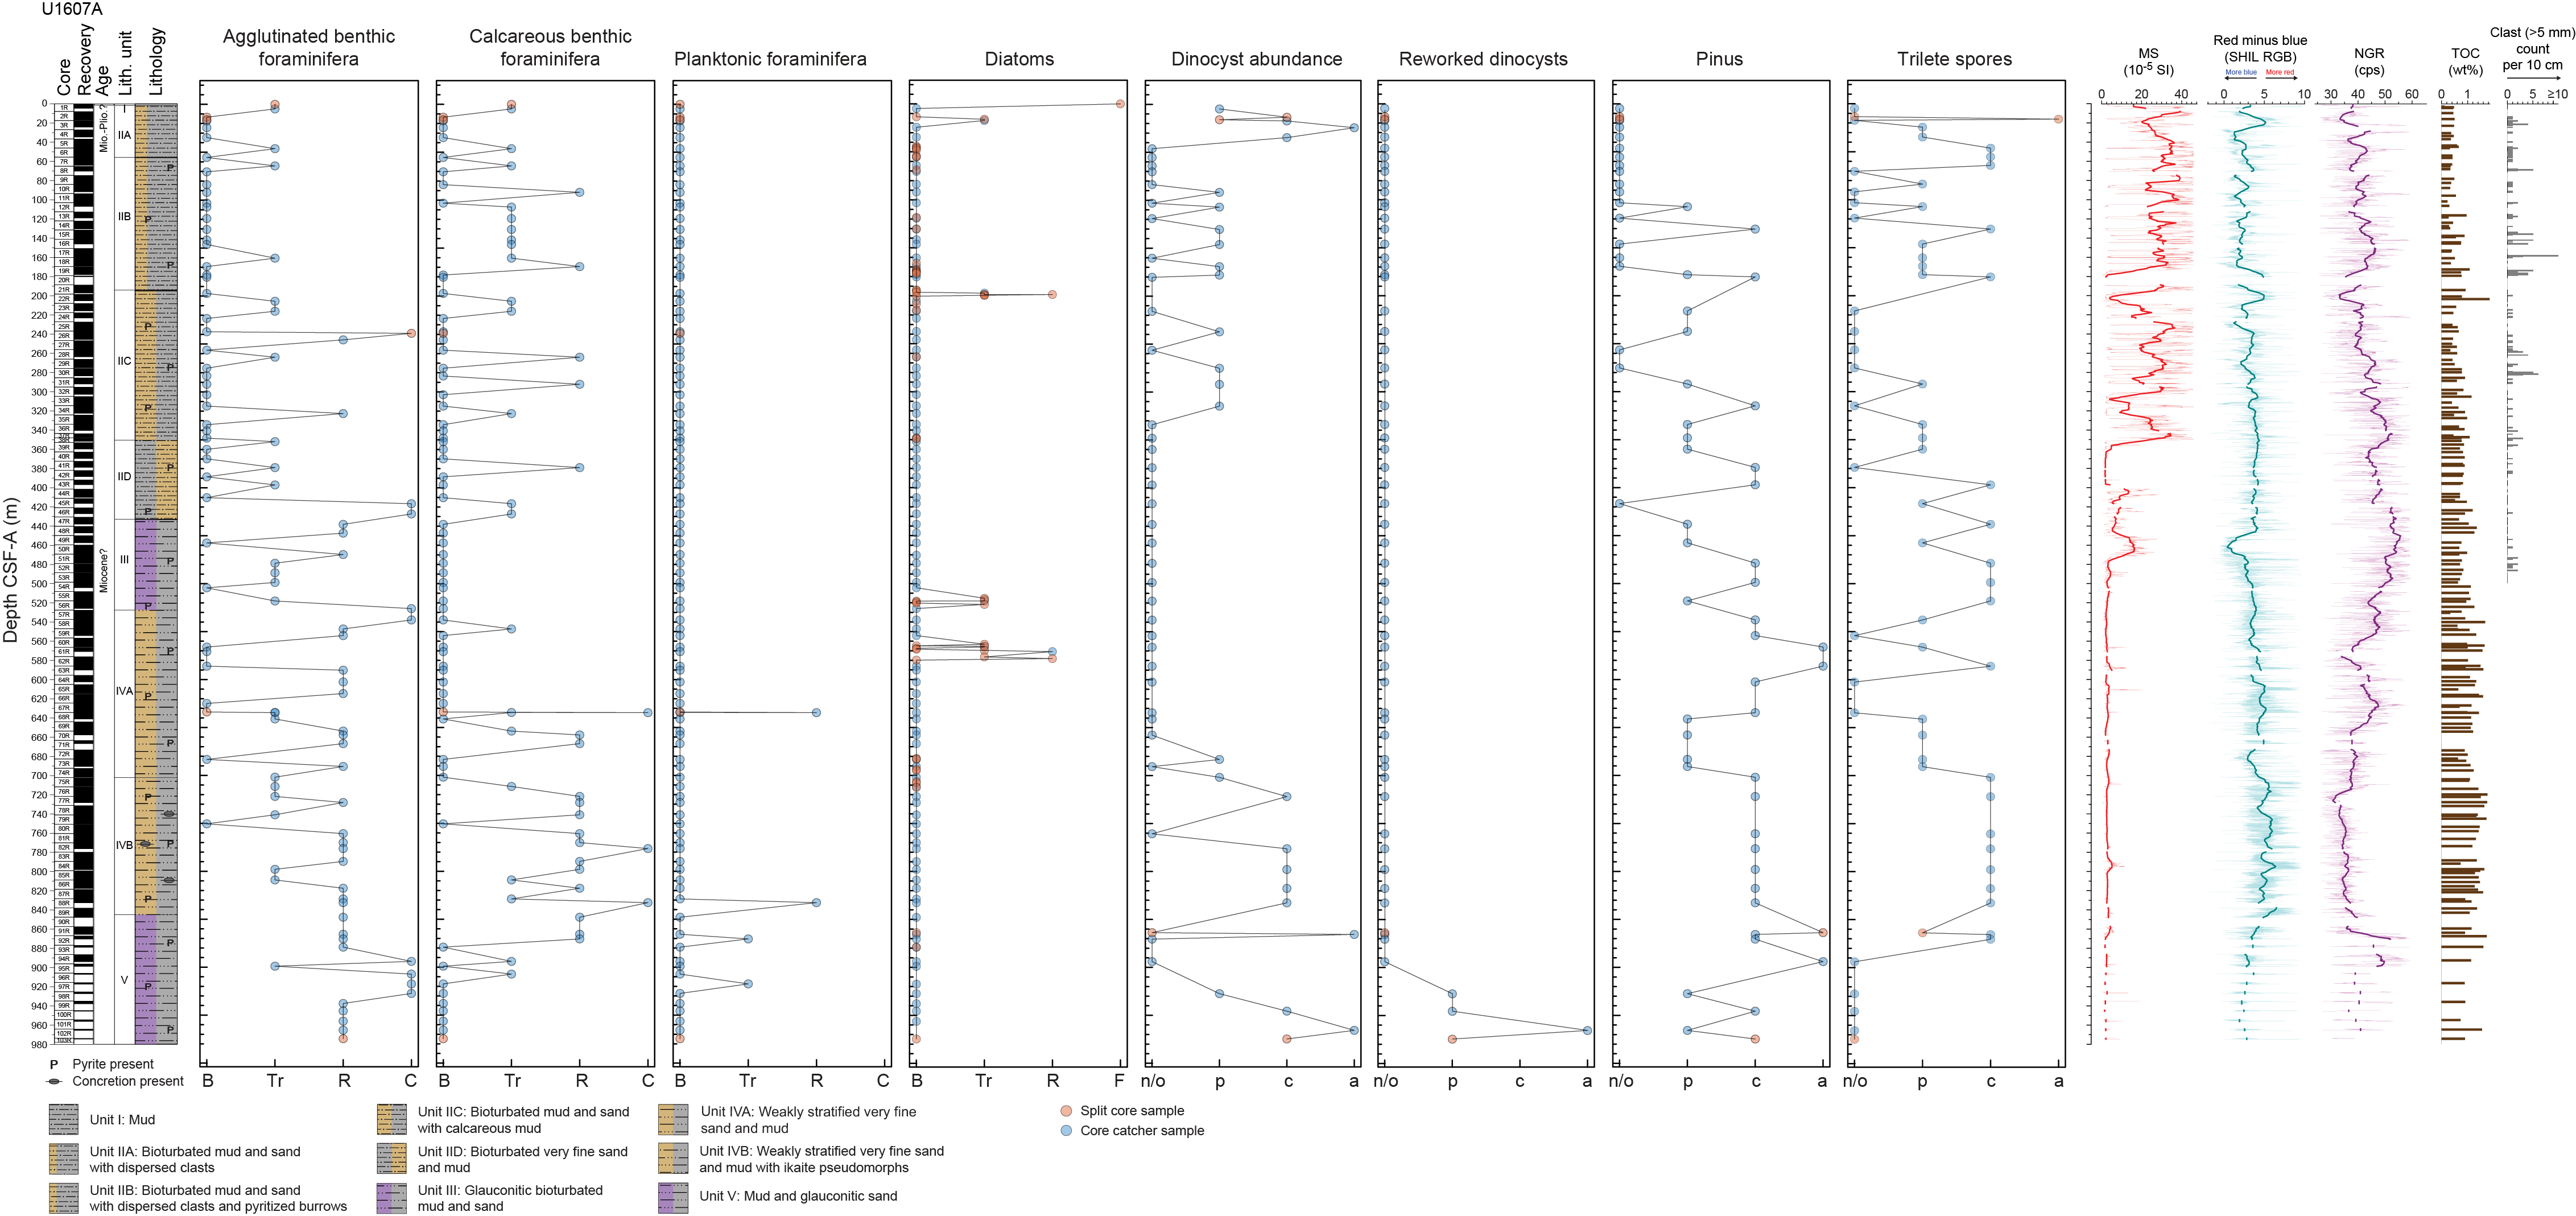
Figure F13. Trends across fossil groups.
Foraminifera are mostly limited to benthic species, with agglutinated species being most common. Diatoms were observed in 12% of the samples examined. Four samples from the weakly stratified very fine sands and muds of Lithostratigraphic Units IV and V (634–918 m CSF-A) contain scarce planktonic foraminifera species. Dinocysts are present in the uppermost three core catcher samples and two additional samples that were taken from Core 400-U1607A-2R. No dinocysts were observed in core catcher samples from Cores 19R–74R, which is likely a result of dilution by terrigenous sediment input and a low concentration of dinocysts. Dinocyst abundances increase from Sample 74R-CC downhole. Palynological processing using hydrofluoric acid (HF) will provide more constraints on dinocyst abundances throughout this interval. Mollusk shells and their fragments are regular features of Site U1607 cores and foraminifera samples, as are mineralized burrow fills, which are often pyritized.
Observed assemblages of all microfossil groups are generally composed of species with long geologic ranges. In terms of age control, all groups are consistent with Miocene ages, whereas downhole, some taxa are suggestive of Oligocene ages. The meager planktonic foraminifera assemblages are of low diversity and consist of few (5–20 specimens) small-sized individuals. The species composition of the deepest occurrence of planktonic foraminifera, which disappear below Sample 400-U1607A-88R-CC, is consistent with an early Miocene to late Oligocene age. The diatom species observed suggest Miocene ages and, downhole, the dinocyst taxa reflect mid-/late Miocene and older ages. In general, the microfossils from the upper part of the hole are characteristic of coastal or neritic environments with ample food/nutrient availability, whereas below ~500 m CSF-A, assemblages reflect more open marine environments, which at times are favorable to planktonic foraminifera (Figure F13). The prominence of agglutinated benthic foraminifera, which are more environmentally tolerant than calcareous species, is also consistent with a food-rich inner shelf environment corrosive to small calcitic tests. All microfossil assemblages have environmental and climatic affinities comparable to assemblages observed in the Miocene of the western Baffin Bay and the Labrador Sea (Ocean Drilling Program [ODP] Leg 105) and the North Sea (Kaminski et al., 1989; King, 1989).
4.1.1. Foraminifera
Of the 109 processed foraminifera samples, 39 are devoid of foraminifera, 57 have rare to trace foraminifera, and 13 have common foraminifera (Table T5). The >125 µm and 63–125 µm sieved fractions were examined separately, but because of the typically low numbers of foraminifera, observations are combined. In general, agglutinated benthic foraminifera appear in 60% of all samples, calcareous benthic foraminifera appear in 40%, and planktonic foraminifera are limited to four samples. The lithologies at Site U1607 are notably more indurated than those at Sites U1603–U1605 and in Hole U1606A. As such, samples were challenging to disaggregate; they sometimes required multiple washes and still resulted in mud clasts in all size fractions. Moreover, the high volumes of terrigenous sediment strongly diluted the microfossils, requiring much effort to find specimens.
The mudline sample from Hole U1607A contains trace agglutinated benthic foraminifera and a single calcareous benthic foraminifera of the genus Cassidulina. The sample also contains a range of other biological material, including fish debris, sponge spicules, diatom setae, arthropod remains, pteropods, and radiolarians. The mudline sample is the only sample from the soupy mud representing Lithostratigraphic Unit I (see Lithostratigraphy). The succeeding core catcher samples of Unit II are predominately mud, muddy sand with dispersed clasts, sandy mud, and sandy mud with dispersed clasts and pyritized burrows, with limited appearances of calcareous mud and sand.
Of the 49 samples from Unit II and its subunits, 28 are barren of foraminifera. In the foraminifera-bearing samples, foraminifera are trace to rare. Two samples (400-U1607A-26R-2, 47–49 cm, and 45R-CC) from sandy mud lithologies are the exception and have common foraminifera (Table T5). All observed specimens in this lithostratigraphic unit are benthic; planktonic foraminifera are absent from all samples. Trace to rare occurrences of calcareous benthic taxa are recorded down to ~430 m CSF-A. These include Melonis sp. (likely Melonis barleeanus = Melonis affinis after Holbourn et al. [2013]), Cassidulina cf. teretis, Islandiella sp., and Cibicides sp. (Figure F14A, F14F, F14G, F14Q, F14R). A yellow-brown staining of calcareous benthics is common (Figure F14F). The prominent agglutinated benthic genera observed are Ammodiscus (Figure F14C); Cyclammina sp. (Figure F14D, F14E, F14Q); and elongated forms including Rhizammina sp. (Figure F14I), Ammotium sp., and Trochammina sp. (Figure F14J). The majority of samples from Unit III contain foraminifera, and only two samples are barren (Table T5). In this unit, agglutinated benthic foraminifera are rare to trace in most samples but are common in Samples 56R-CC and 57R-CC. All the samples that are rich in agglutinated species are barren of calcareous taxa. Similar forms are recorded, including Cyclammina sp., Cribrostomoides sp., Rhizammina sp., Ammotium sp., and Trochammina sp. In the weakly stratified, very fine sand and muds of Unit IV, calcareous benthic foraminifera begin to appear again in trace amounts in Sample 58R-CC and increase from rare to common within Core 67R and below. In the lowermost muds of Unit V (~930–980 m CSF-A), all calcareous foraminifera disappear and agglutinated benthic foraminifera are rare to common (Table T5). In summary, we observe a downhole shift from benthic assemblages with representation of both calcareous and agglutinated forms (Unit II) to only agglutinated forms (Unit III) to again assemblages with both calcareous and agglutinated forms (Units IV and V) (Figure F13). This pattern of faunal change, particularly the occurrence of Martinottiella sp. in Sample 45R-CC (415.65 CSF) (Figure F14I), which features in Kaminiski et al.'s (1989) deepest assemblage zone, is comparable to the observed shifts in benthic foraminifera assemblages at ODP Leg 105 Site 645 and suggests an early Pliocene to early Miocene age (Kaminiski et al., 1989). Importantly, more thorough species diagnoses and assemblage analysis awaits postcruise research, which could also contribute to Site U1607 age control. Specifically, species are likely different within genera between the upper and lower lithostratigraphic units.
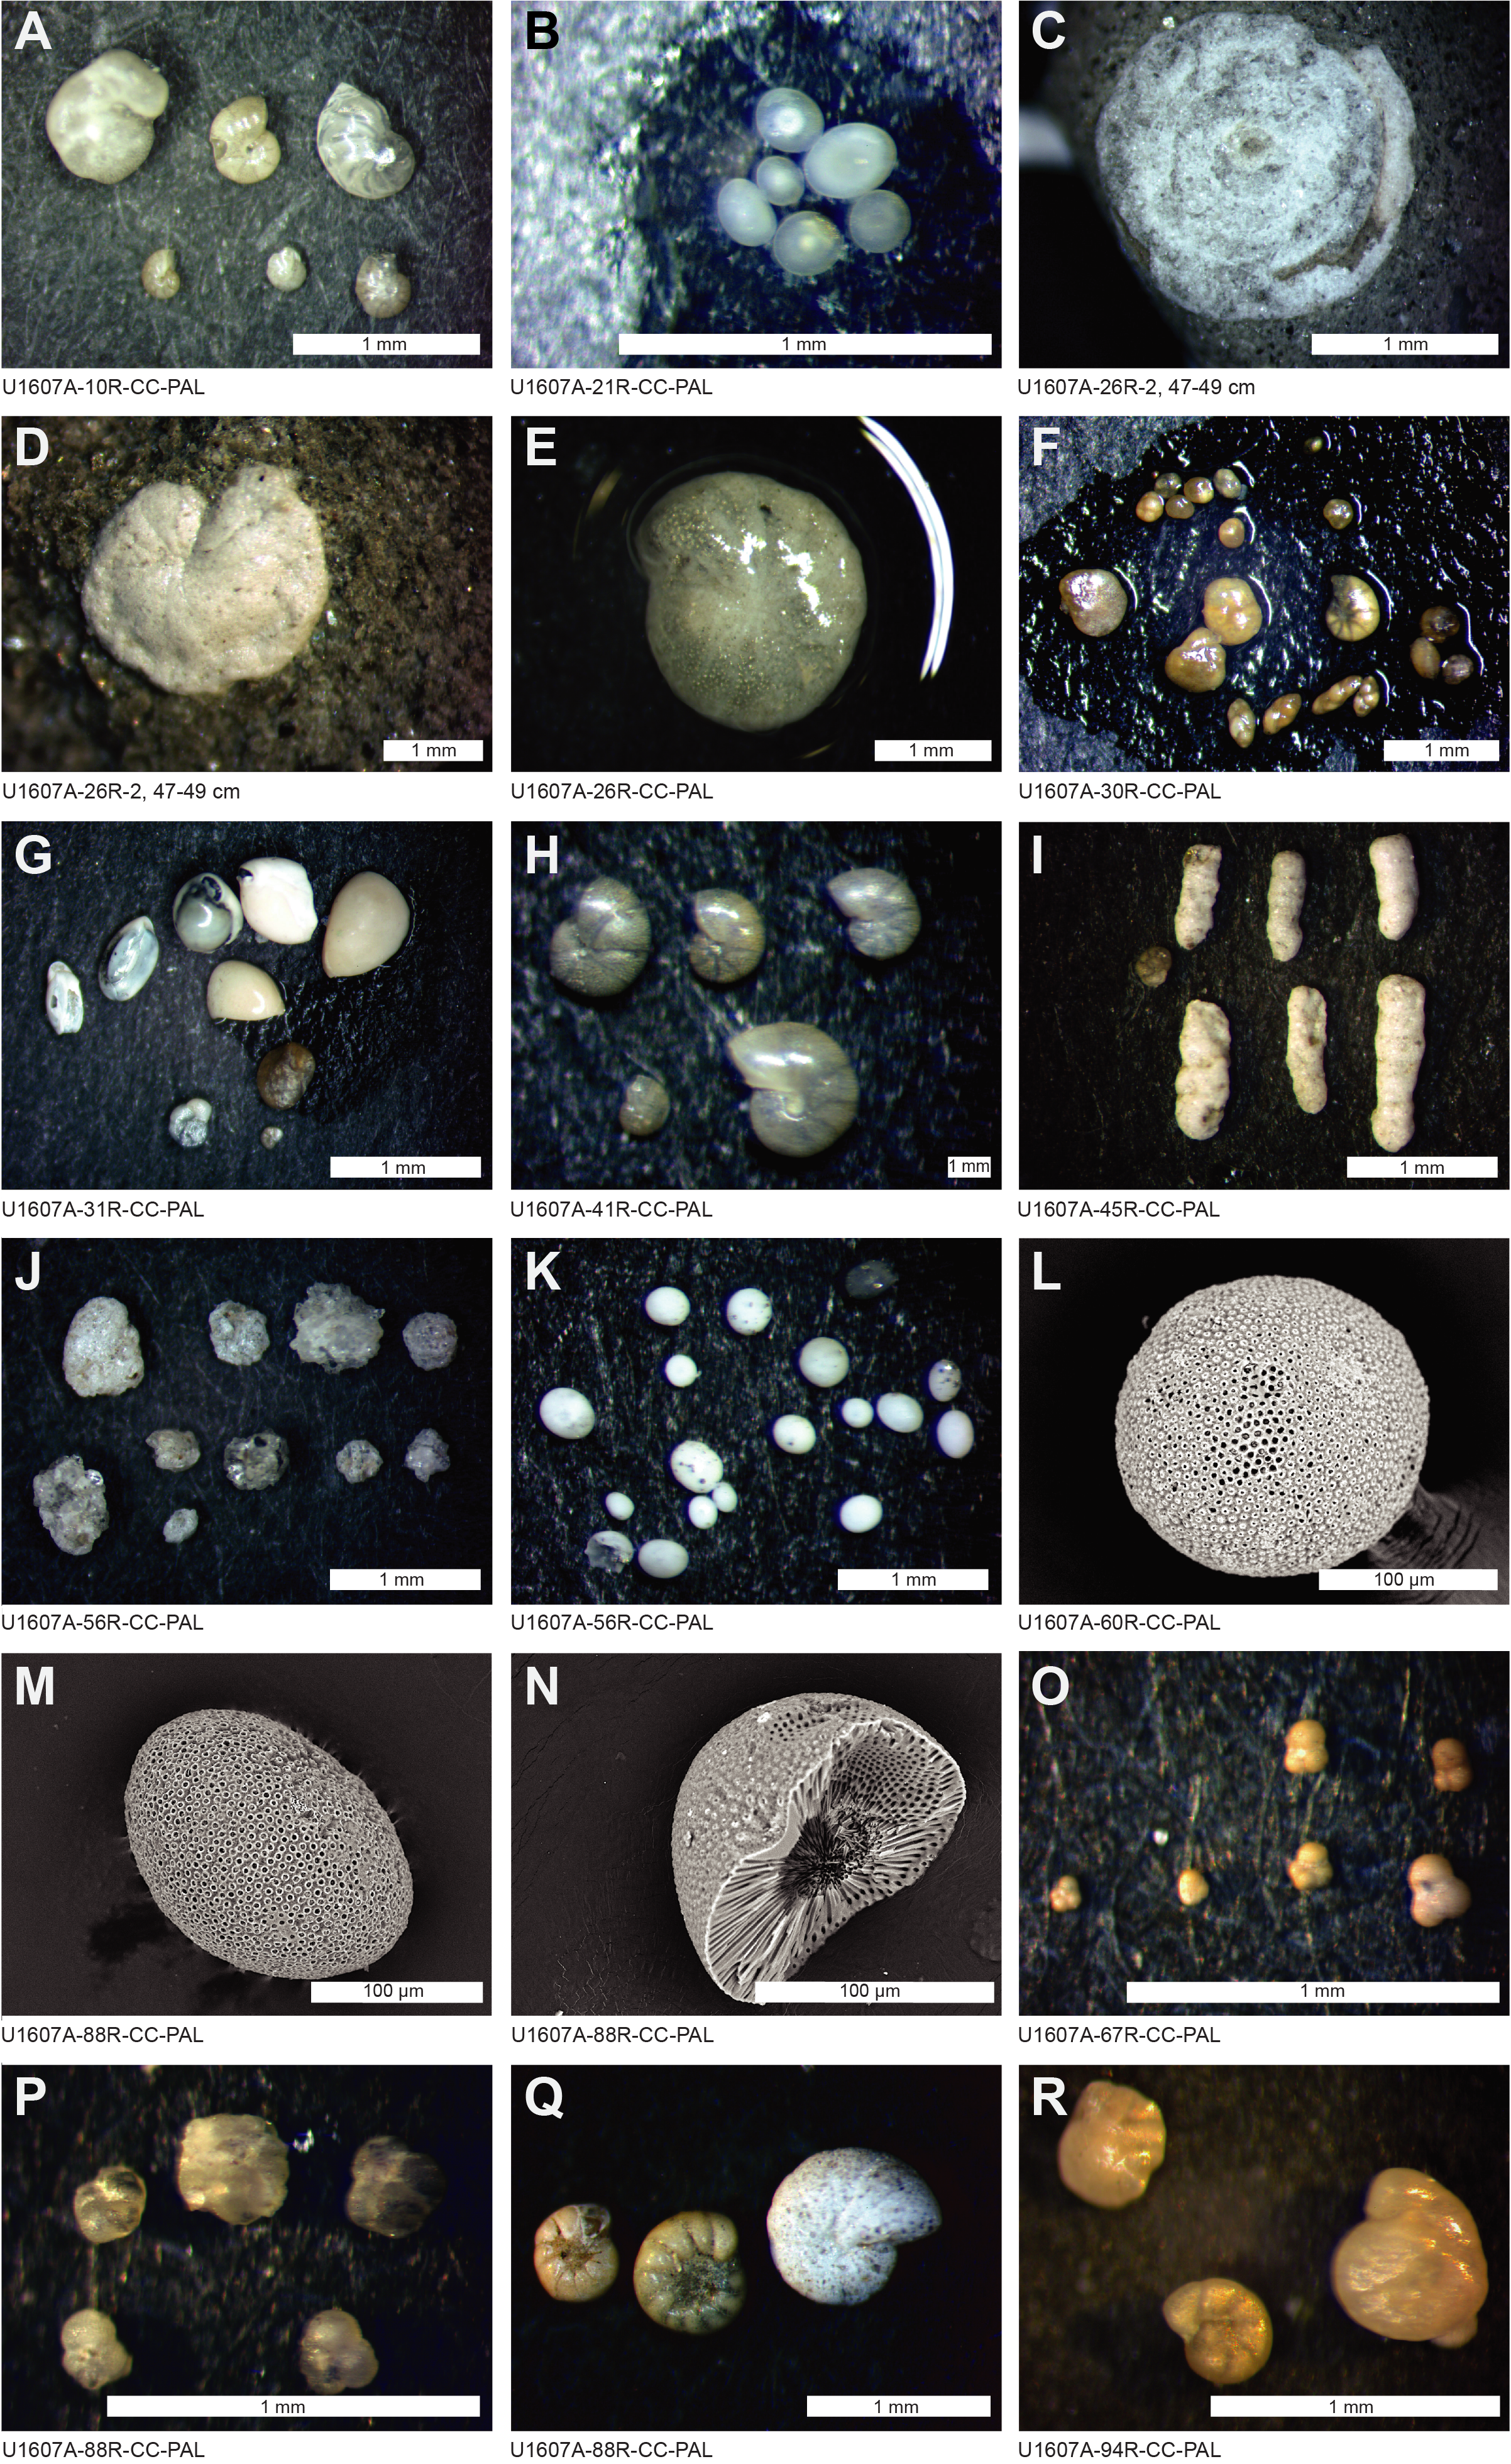
Figure F14. Benthic and planktonic foraminifera.
The common appearance of calcareous benthic foraminifera in Sample 400-U1607A-67R-CC is paralleled by the first downcore appearance of planktonic foraminifera. The Sample 67R-CC assemblages consist of 12 specimens (Figure F14O). Sample 88R-CC yielded ~20 specimens (Figure F14P). These are difficult to identify to species level because the specimens are small and preservation is moderate to poor, apertures are commonly obscured by adhering material, specimens mostly have calcite infills and/or signs of secondary crystal growth, and in Sample 88R-CC there is a tendency for specimens to be squashed. Planktonic foraminifera are identified as Catapsydrax unicavus, Globigerinella obesa, and Turborotalita praequinqueloba, with possible Ciperoella ciperoensis (Figure F14P). These long-ranging taxa collectively span a late Eocene to late Miocene age range. The species diagnoses were aided by scanning electron microscope (SEM) analyses to evaluate wall textures.
Silicious, ovoid microfossils occurring in the 63–125 µm fraction of core catcher samples are a notable feature of Site U1607 (Figure F14B, F14K–F14N). These structures are recorded as rare to few in multiple cores throughout the uppermost 600 m, but they become abundant in Samples 400-U1607A-56R-CC and 60R-CC (~538 and 566 m CSF-A). Initially uncertain of the identity of these structures, we conducted an SEM study to analyze their ultrastructure and likely affinity. The resulting SEM photomicrographs (Figure F14L–F14N) reveal the ovoid structures to have a distinctive porous surface, lacking an aperture or other ornamentation. Breaking the ovoids/spheres revealed an elaborate internal structure involving densely packed canals linking the externally opening pores to an internal vacuole. This structure is diagnostic of a spherical type of sponge spicule, known as a sterraster microsclere, called Geodia sp. (Łukowiak, 2015). Today, Geodia sp. is associated with the benthic sponge Chondrilla nucula. Identical structures to the Site U1607 examples were found in Eocene sediments from New Zealand (Łukowiak, 2015). They have also been reported from the Miocene of the Central Atlantic (Bukry, 1978) and the Holocene in Baffin Bay (A. Jennings, pers. comm., 2023). Further work is required to document the detailed stratigraphic range of this group in the Cenozoic of Baffin Bay and adjacent Arctic seas.
The foraminifera sand fractions provide an opportunity to observe variability in lithic and diagenetic grains through the cored section as well as additional fossil material that provides insights into the depositional environment to complement sedimentological analyses (see Lithostratigraphy). Figure F15 presents examples of bulk samples and disaggregated grain assemblages, arranged in core sequence order, that were obtained from sieved (>63 µm) foraminifera residues. The residues contain examples of quartz-dominated sands, with variable contributions of granular pyrite as grains or burrow fills (Figure F15C, F15D), dark gray/black grains, possibly a dark form of glauconite (Figure F14F), and typical green glauconite (Figure F15I, F15J, F15L–F15N). Rounded and polished grains including pink and red garnets and quartz occur sporadically (Figure F14B). Macrofossil remains, including mollusk shell material (Figure F14A, F14E), pyritized worm burrows (Figure F14D), and fossil wood and plant fragments (Figure F14H, F14K), are regular features in several of the lithostratigraphic units. Sample 400-U1607A-91R-5, 69–71 cm, taken from the glauconitic-rich sandy conglomerate sequence (Figure F14N), disaggregated into a gravel that was barren of foraminifera. Yellow grains are common contributors to the fine sand in the deepest core from Site U1607 (Core 103R). These are not calcareous (i.e., do not react with HCl) and are suggested to largely comprise fragments of agglutinated foraminifera tests involving quartz grains with brown cement (Figure F14O).
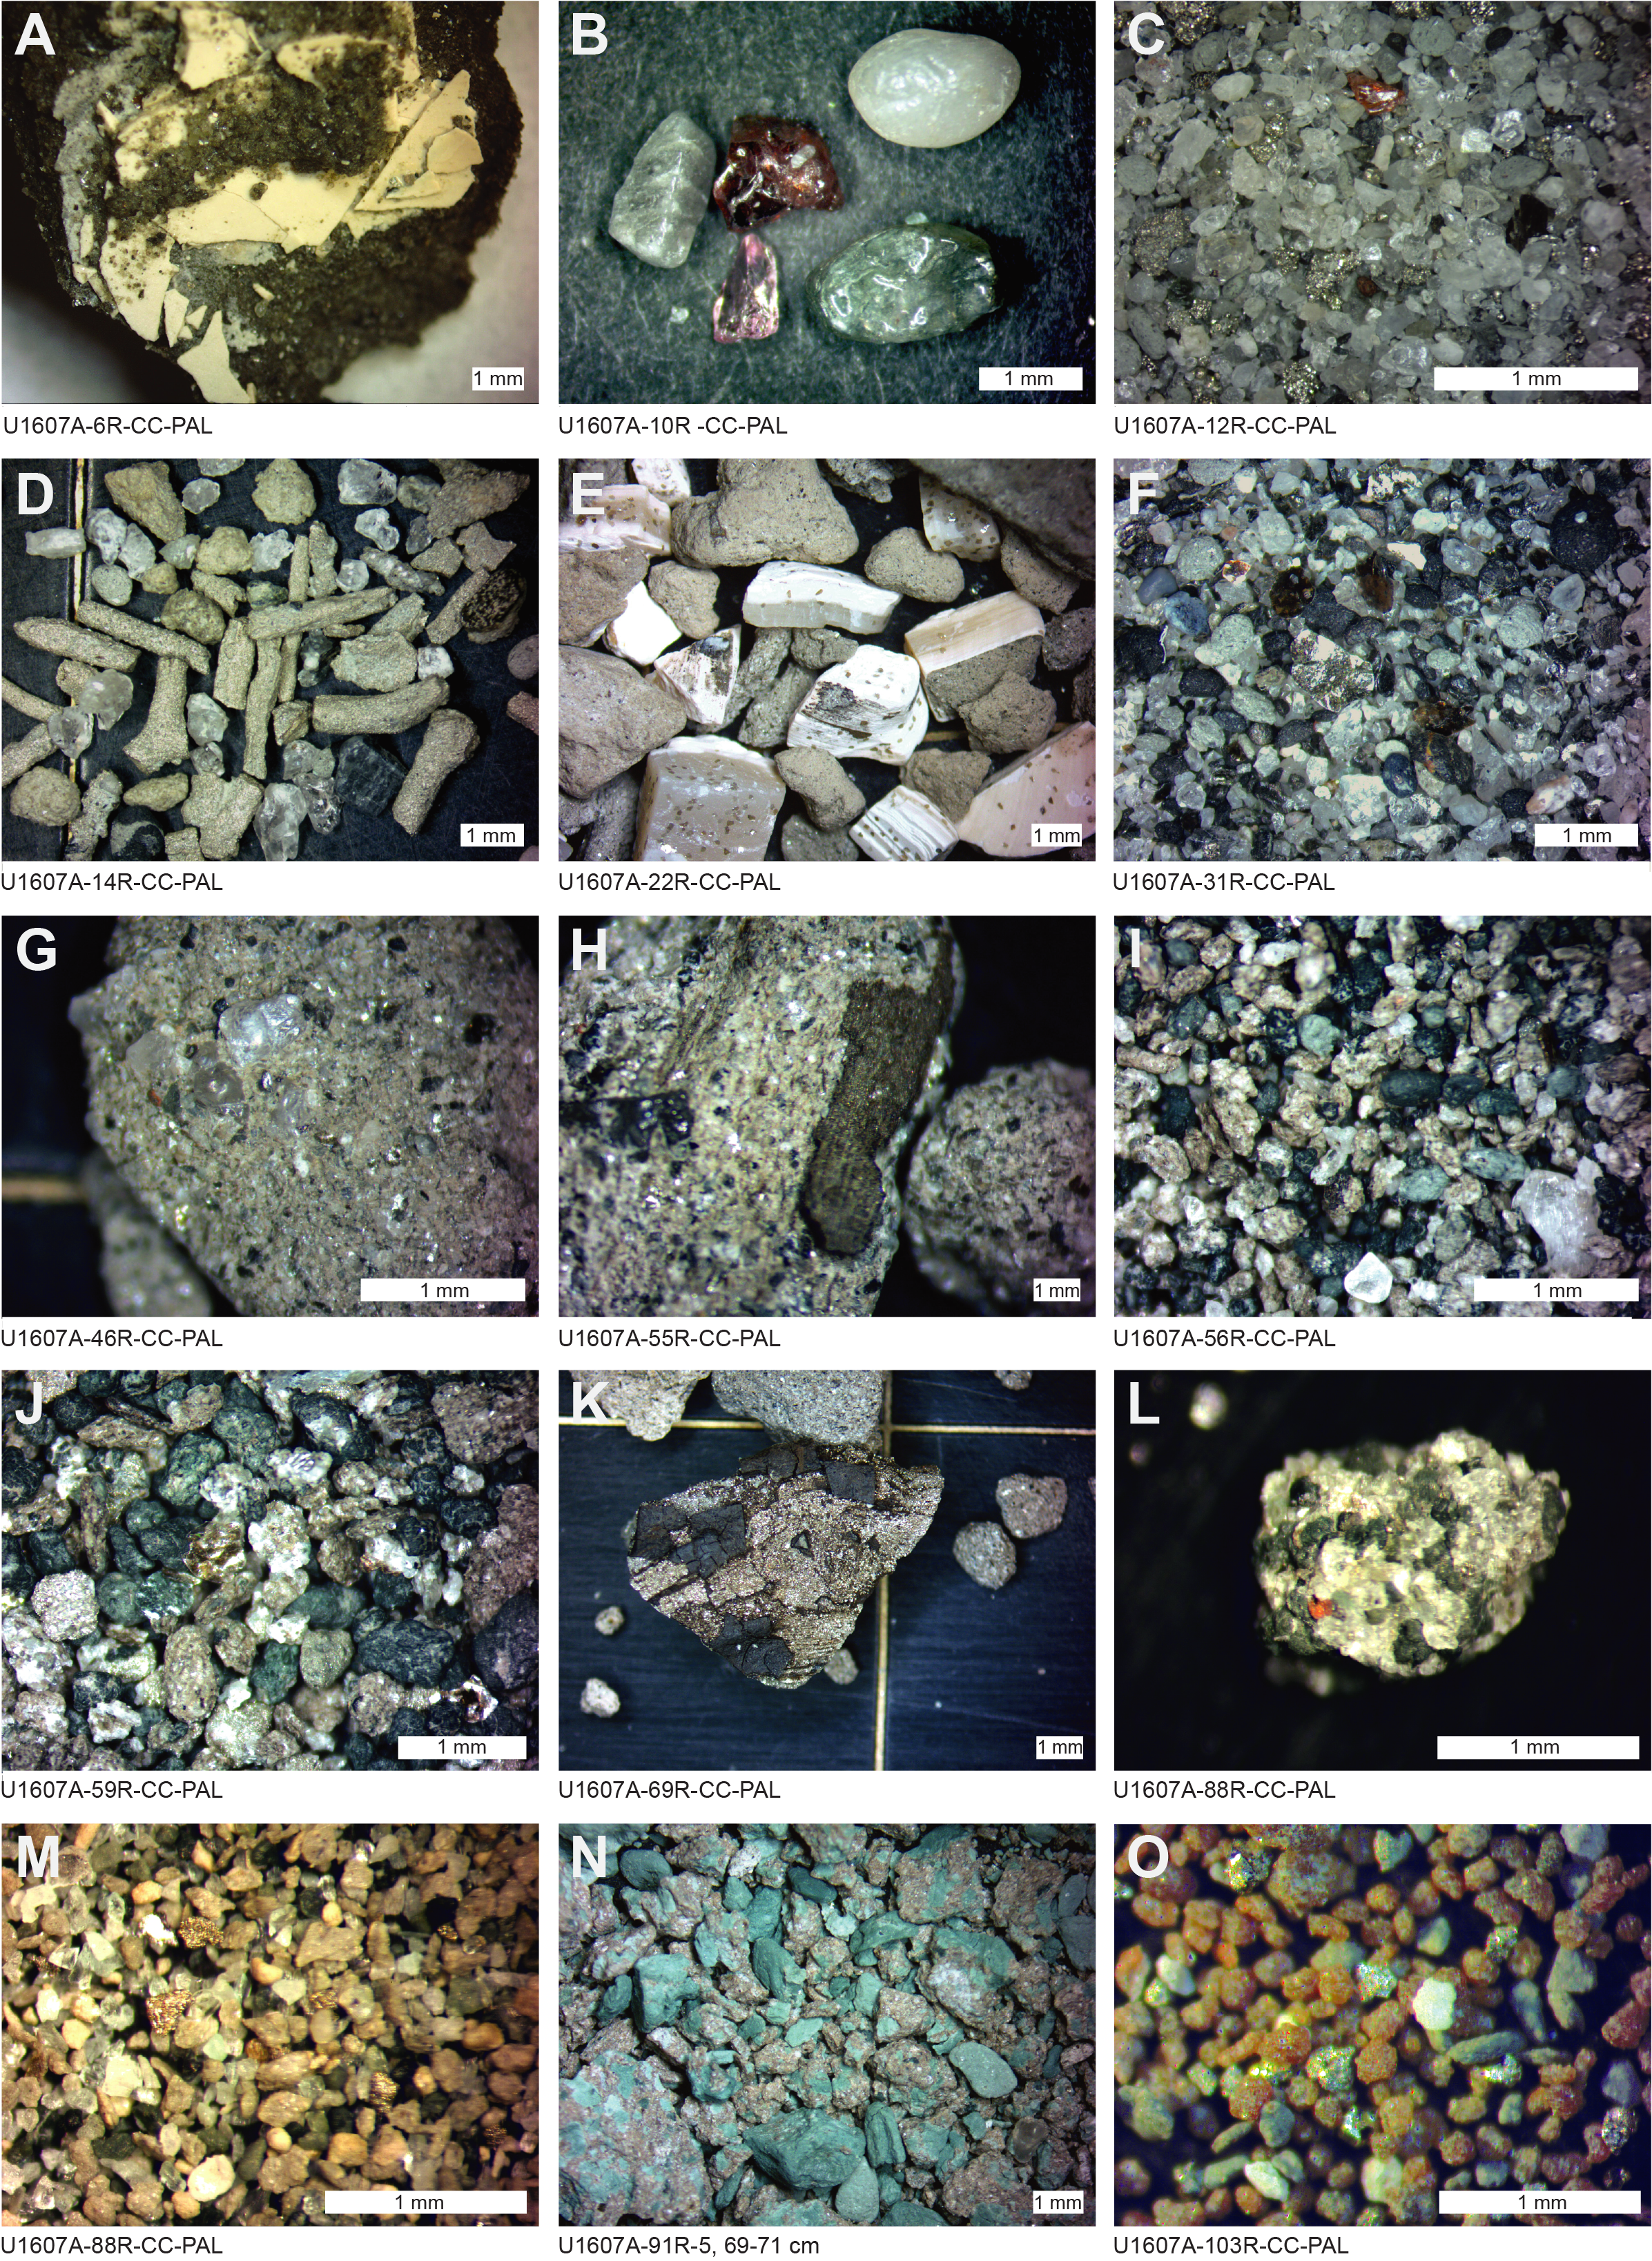
Figure F15. Bulk sediment and disaggregated grains.
4.1.2. Diatoms
At Site U1607, 155 samples from core catcher and section halves were processed and observed for diatoms. The majority of the samples are barren of diatoms. Trace to few amounts of diatoms were observed only in 19 samples (~12% of all samples) with poor to moderate preservation (Table T6; Figure F13).
In mudline Sample 400-U1607A-1H-1, 0 cm, diatoms were observed with common abundance and moderate preservation. The assemblage is dominated by the species Actinocyclus curvatulus, Asteromphalus robustus, Chaetoceros spp. Coscinodiscus oculus-iridis, Melosira arctica, Navicula spp., Nitzschia spp., Rhizosolenia hebetata f. hebetata, Rhizosolenia hebetata f. semispina, Shionodiscus trifultus, Thalassionema nitzschioides, and Thalassiothrix longissima. These species are typical for the modern Arctic environment.
Samples 400-U1607A-2R-6, 60 cm, and 2R-CC contain trace amounts of poorly preserved diatom specimens, including Actinoptychus senarius, Melosira sol, Paralia sulcata, and T. nitzschioides. Although diatom biostratigraphic indicators were not observed, the overall assemblage might indicate a Pliocene–Pleistocene age. Rod-shaped sponge spicules were also observed.
Sample 400-U1607A-21R-CC contains trace amounts of moderately preserved diatoms. The assemblage is characterized by trace to few amounts of Actinoptychus splendens, Aulacodiscus spp., Bacterosira bathyomphala resting spores, M. sol, P. sulcata, and R. hebetata f. hebetata. Aulacodiscus spp. specimens were only observed as fragments (Figure F16A, F16B). Although intact valves of Aulacodiscus sp. 2 were not observed, the presence of fragments of their characteristic rimoportulae suggest the occurrence of Aulacodiscus allorgei Chenevikre (Strelnikova et al., 2004). A pyritized diatom form in Sample 32R-CC features an elevated quadrangular area with bulb-shaped corners that resembles the outline of A. allorgei, although no detailed valve observation is possible (Figure F16C).
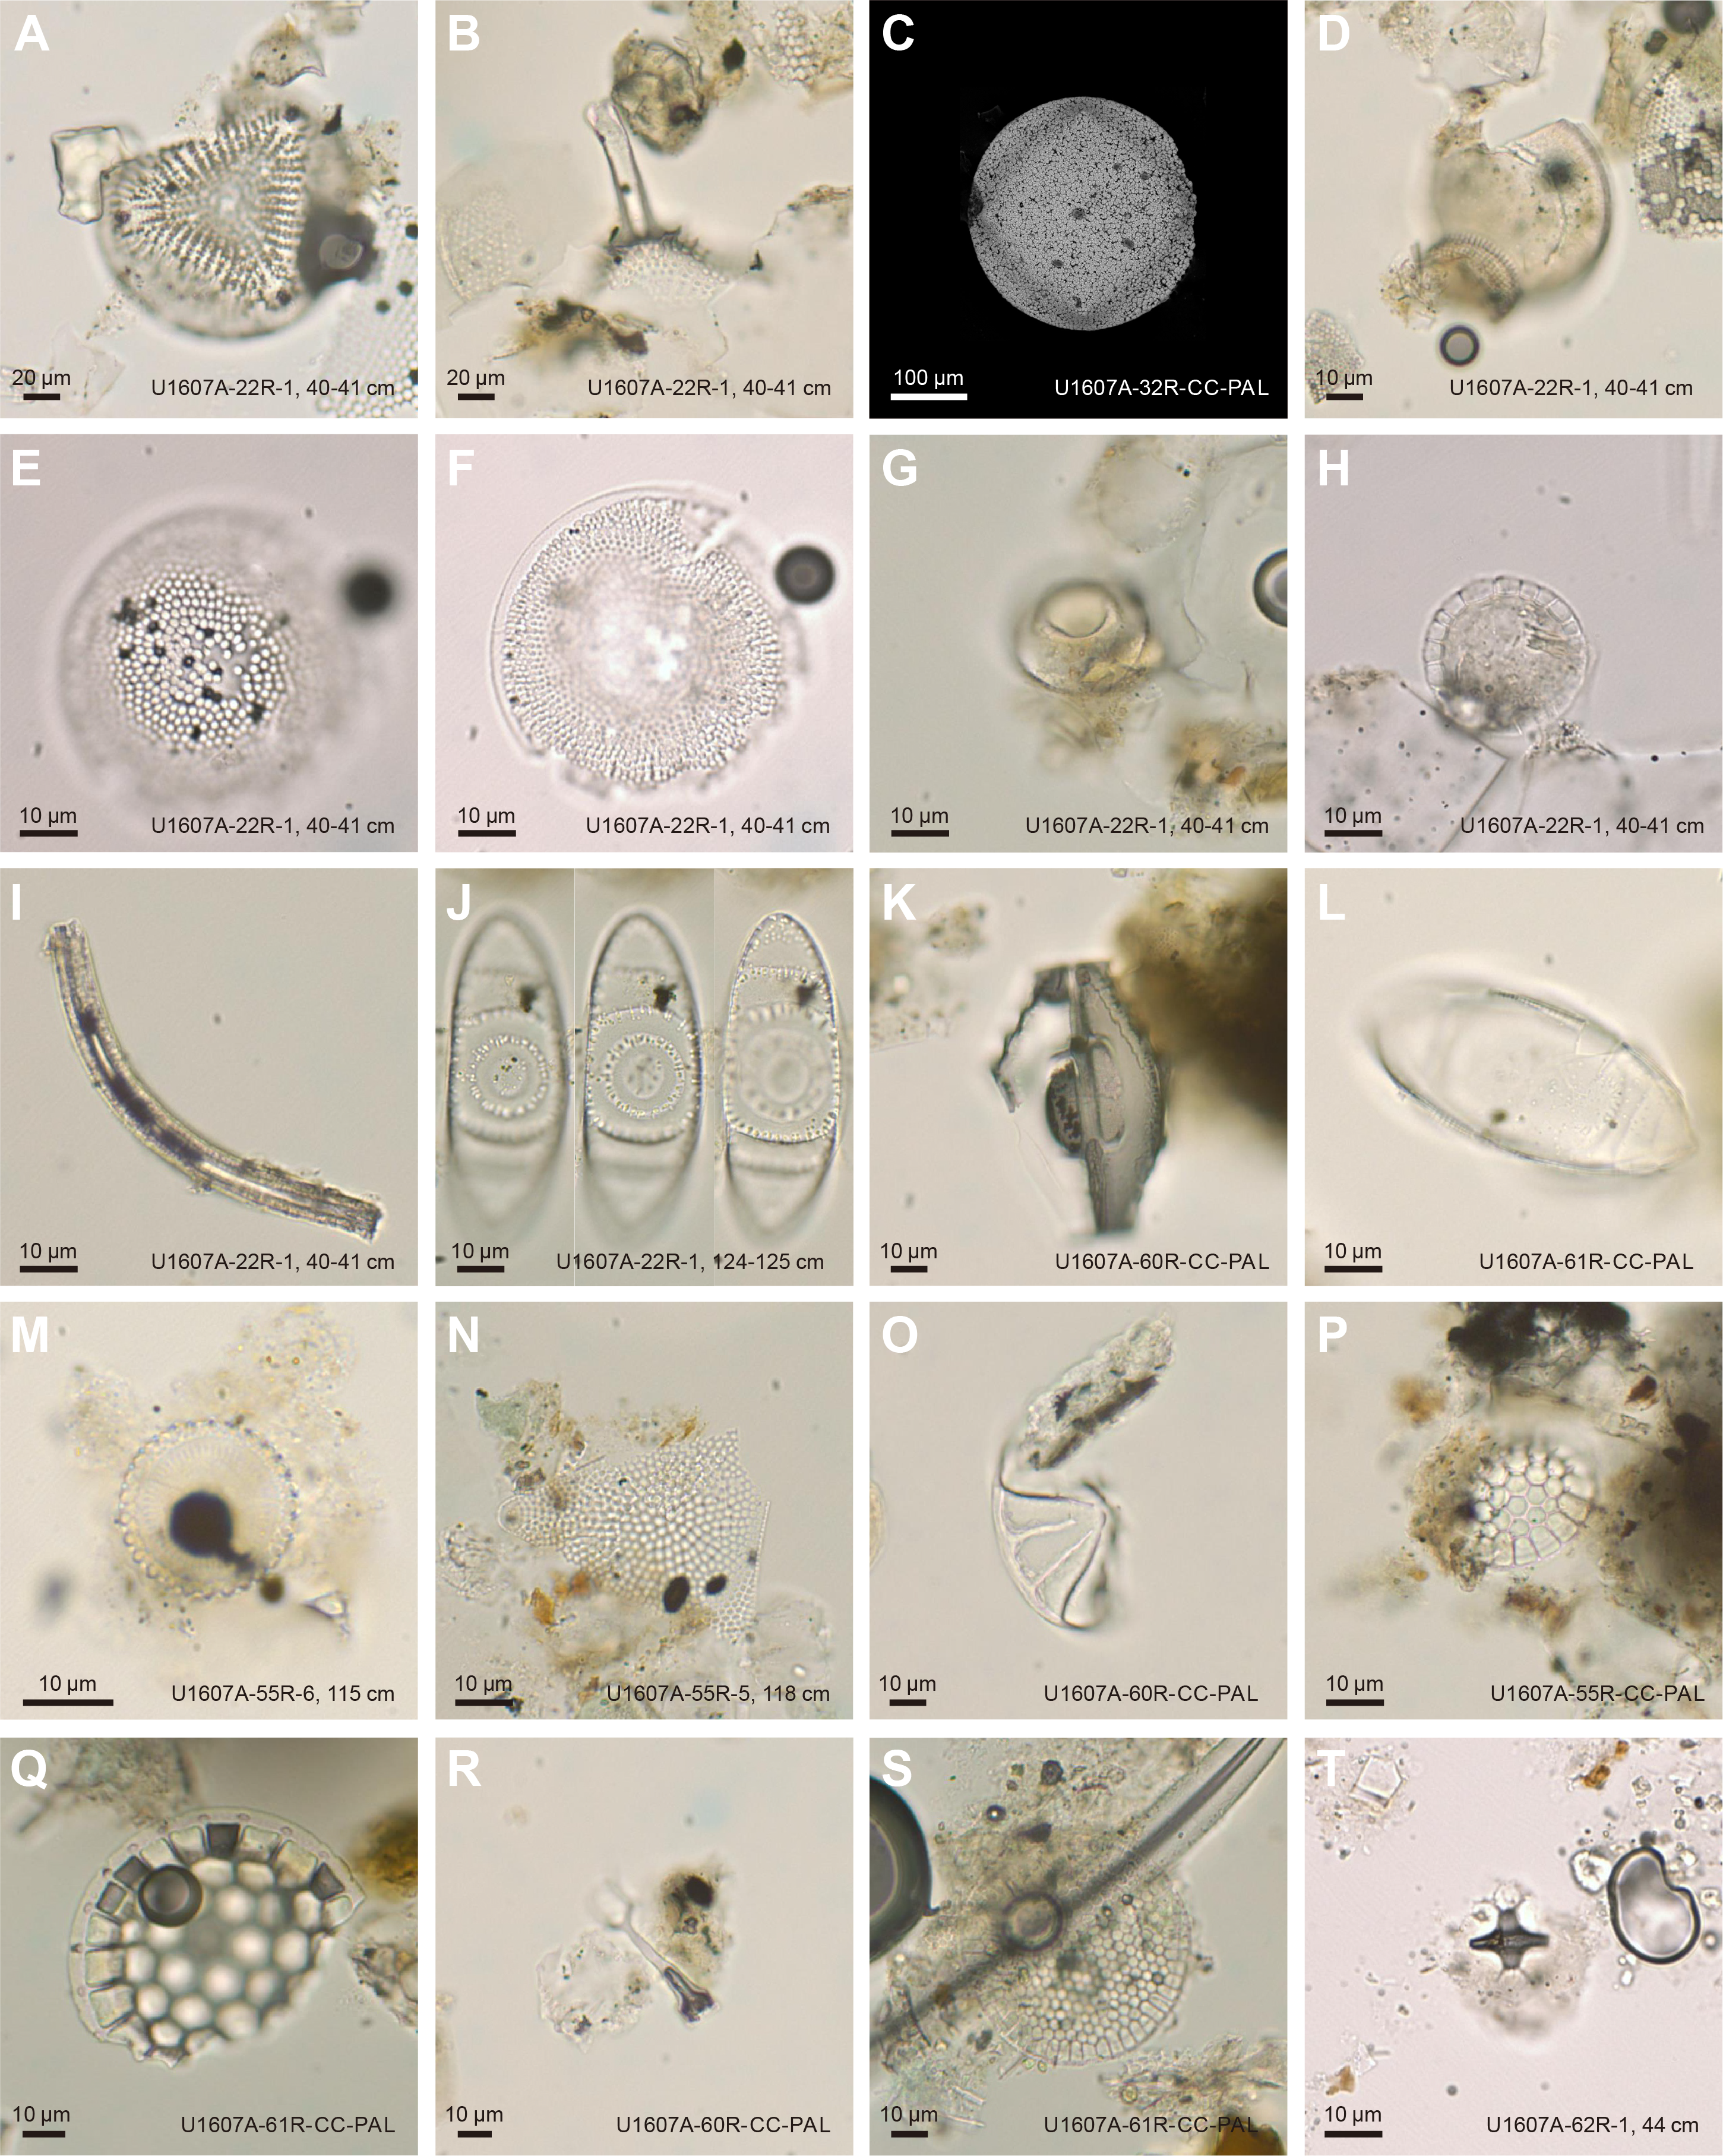
Figure F16. Diatoms.
In Samples 400-U1607A-22R-1, 40 cm, and 22R-1, 40–41 cm, in addition to aforementioned Aulacodiscus spp. fragments, the following species were observed in trace to few amounts with poor preservation: A. splendens, Cocconeis costata, Cestodiscus sp. 1, Hyalodiscus sp. 1, M. sol, P. sulcata, Proboscia barboi, Pseudopodosira sp. 1, R. hebetata f. hebetata, Stephanogonia sp. 1, and T. nitzschioides (Figure F16D–F16H). Trace specimens of P. barboi (mostly incomplete and poorly preserved) in Sample 22R-1, 40 cm (Figure F16I), suggest a late Miocene to early Pliocene age. This interpretation relies on the diatom biostratigraphy established at Site 907 (ODP Leg 151) from the Icelandic Plateau, where the first occurrence (FO) of P. barboi is located within the paleomagnetic Chron C4 and used as a secondary datum (Koç and Scherer, 1996). However, it is worth noting that navigating this species' stratigraphic range at Site U1607 is implausible because of the lack of continuous diatom-bearing intervals. Regarding paleoenvironment, the appearance of neritic species (C. costata, M. sol, and P. sulcata), which have also been observed in Baffin Bay at Site 645 (ODP Leg 105; Monjanel and Baldauf, 1989), implies a continental shelf environment.
The presence of Goniothecium species in trace to rare amounts in Samples 400-U1607A-22R-1, 123 cm, and 22R-1, 124–125 cm, marks its first appearance at Site U1607. Additionally, trace to rare amounts of Aulacodiscus spp. fragments, R. hebetata f. hebetata, and Stephanopyxis turris were observed in these samples. The co-occurrence of Goniothecium decoratum and Goniothecium rogersii in these samples (Figure F16J–F16L) may suggest an early Miocene age, based on Suto et al. (2008). However, given the geographic isolation of Baffin Bay from the North Atlantic and the potential for reworking, the possible age constraint based on the concurrent occurrence of G. decoratum and G. rogersii in these samples needs to be taken with caution. We also note that at Site 645 (ODP Leg 105), G. decoratum was found in interval 105-645E-9R-6, 37R, 1–39 cm (512 meters below seafloor [mbsf]), and Sample 9R-CC (513 mbsf). These specimens were interpreted as reworked (Monjanel and Baldauf, 1989).
In Samples 400-U1607A-55R-5, 118 cm, 55R-6, 115 cm, 55R-CC, and 56R-3, 90 cm, diatoms were observed with trace abundance and poor preservation. The diatom assemblage includes A. senarius, G. decoratum, G. rogersii, Monocladia norvegica, Monocladia spp., Paralia sp. 1, Pseudotriceratium sp. 1, Stephanogonia sp. 2, Stephanopyxis grunowii, Stephanopyxis marginata, S. turris, and Xanthiopyxis spp. (Figure F16M–F16P). Assemblage composition is significantly different from the assemblages observed in the samples of Cores 21R and 22R. Despite the presence of Goniothecium species, the Aulacodiscus species and the neritic species are not seen in these samples. Stephanopyxis species (including S. marginata) were observed with rare to few relative abundances in the assemblage (Table T6; Figure F16Q). S. marginata was seen in the late Oligocene at Deep Sea Drilling Project Site 338 (Schrader and Fenner, 1976), but that is not necessarily the case at Site U1607 because of its stratigraphic range uncertainty. Trace amounts of Monocladia species (including M. norvegica) specimens were observed in Samples 55R-5, 118 cm, 55R-6, 115 cm, and 56R-3, 90 cm (Figure F16R), which tentatively suggest an early to middle Miocene age for this interval (Suto, 2005). Observed species have long biostratigraphic ranges precluding age assessments. However, the co-occurrence of G. rogersii and G. decoratum suggests an early Miocene age for these sediments. Although diatoms occur with poor preservation in these samples, which is consistent with the observation that only robust species are present, the overall assemblage is similar to the samples from ODP Site 647 in the Labrador Sea with a late Oligocene to early Miocene age (Baldauf and Monjanel, 1989).
The diatom assemblages observed in Samples 400-U1607A-60R-5, 62 cm, 60R-7, 16 cm, 60R-CC, 61R-3, 43 cm, 61R-CC, 62R-1, 44 cm, and 62R-2, 67 cm, are generally similar to those found in Cores 55R and 56R but with higher diversity. Besides the aforementioned species, trace to few amounts of Biddulphia spp., Chaetoceros mitra resting spores, Coscinodiscus marginatus, Costopyxis throchlea, Hyalodiscus sp. 1, P. sulcata, Rhizosolenia spp., Stephanopyxis sp. 1, and Syndendrium humiliantemna are found in these samples (Figure F16S, F16T). The occurrence of G. rogersii, G. decoratum, M. norvegica, and S. humiliantemna suggests an early Miocene age for these intervals (Suto, 2005; Suto et al., 2008). The reoccurrence of the neritic species P. sulcata might imply a shelf environment.
The sporadic occurrence of diatom-bearing intervals in the sediment at Site U1607 precludes a systematic assessment of diatom zonation and a detailed biostratigraphical framework. However, although not very well constrained, the intermittent co-occurrence of G. rogersii and G. decoratum from Cores 400-U1607A-22R through 62R signifies early Miocene age in the North Atlantic (Suto et al., 2008), which might be the case for Site U1607. However, given regional differences between the North Atlantic and Baffin Bay, a younger biostratigraphic age of the co-occurrence of G. decoratum and G. rogersii of Site U1607 cannot be excluded.
4.1.3. Palynology
In total, 59 core catcher samples and 4 additional samples from targeted intervals were processed following the procedure described in Biostratigraphy in the Expedition 400 methods chapter (Knutz et al., 2025a). Because of time limitations, in some intervals only alternate core catcher samples were analyzed on board. From the mudline through Section 400-U1607A-20R-CC, all samples were analyzed. Between Sections 23R-CC and 59R-CC, only odd-numbered core catchers were analyzed. Between Sections 60R-CC and 102R-CC, all even-numbered core catcher samples were examined; in a few cases where even-numbered core catchers were empty, the odd-numbered core catchers were analyzed.
Overall, abundances of palynomorphs and notably dinocysts vary greatly across the studied interval. Dinocysts are present in the first 33 core catcher samples (0–314.75 m CSF-A) and in samples from Section 400-U1607A-74R-CC and deeper. Beginning in Sample 4R-CC and deeper, high abundances of minerals heavily dilute palynomorphs, making analysis challenging. Nevertheless, general trends in palynomorph assemblages were observed. Occurrences of palynofacies categories and palynomorphs for all samples of Site U1607 are shown in Table T7 and Figure F17.

Figure F17. Palynomorphs (dinocysts and minerals).
The presence of the dinocyst species Cristadinium diminituvum (Figure F17A) and Selenopemphix brevispinosa (Figure F17B) in Sample 400-U1607A-3R-CC implies a late Miocene or early Pliocene age based on their presence in Baffin Bay at ODP Site 645 during this period (Aubry et al., 2021). In some core catcher samples between Cores 4R and 33R, Brigantedinium spp. were observed, but their abundances are low and no other species were found. In core catcher samples from Cores 33R–74R, no dinocysts were observed, which is most likely a result of very high concentrations of minerals (Figure F17C). For core catcher samples between Cores 4R and 74R, palynological processing using HF will be crucial to constrain the age and depositional environment of these intervals.
In core catcher samples from Cores 400-U1607A-74R through 91R, the dinocyst Palaeocystodinium golzowense (Figure F17D, F17E) is present to abundant, with the highest abundances in Sample 91R-CC. This species has been recorded in Baffin Bay (ODP Site 645) during the early–mid-Miocene and ranges into dinocyst occurrence Zone BB5 (Head et al., 1989). This observation would place this sample (865.68 m CSF-A) in the early–mid-Miocene (Figure F18). The presence of the dinocyst Distatodinium paradoxum (Figure F17F) in Sample 91R-CC implies an older than middle Miocene age because this species has its last occurrence (LO) in Baffin Bay (ODP Site 645) in dinocyst Zone BB3 (Head et al., 1989). Only one individual specimen of this species was observed at Site U1607. Sample 94R-CC contains common Svalbardella spp. (Figure F17G, F17H). In the western North Atlantic (Integrated Ocean Drilling Program Expedition 342), Svalbardella spp. ranges 33.7–22.1 Ma (magnetostratigraphic calibration = 8% of Chron C13n to 61% of Subchron C6Bn.2n) (Egger et al., 2016). The presence of this dinocyst is associated with pulses of surface water cooling during glacial periods in the Paleogene (Śliwińska and Heilmann-Clausen, 2011). Core catcher samples from Core 98R and below are characterized by the presence of (presumably) reworked dinocysts of varying age. Abundant species include Alterbidinium spp. (Figure F17J), Phthanoperidinium spp. (Figure F17K), and Lentinia spp. (Figure F17L). Species within these genera have LO dates around the late Eocene (Egger et al., 2016). Another reworked species is the Cretaceous dinocyst Angustidinium acribes (Figure F19A).
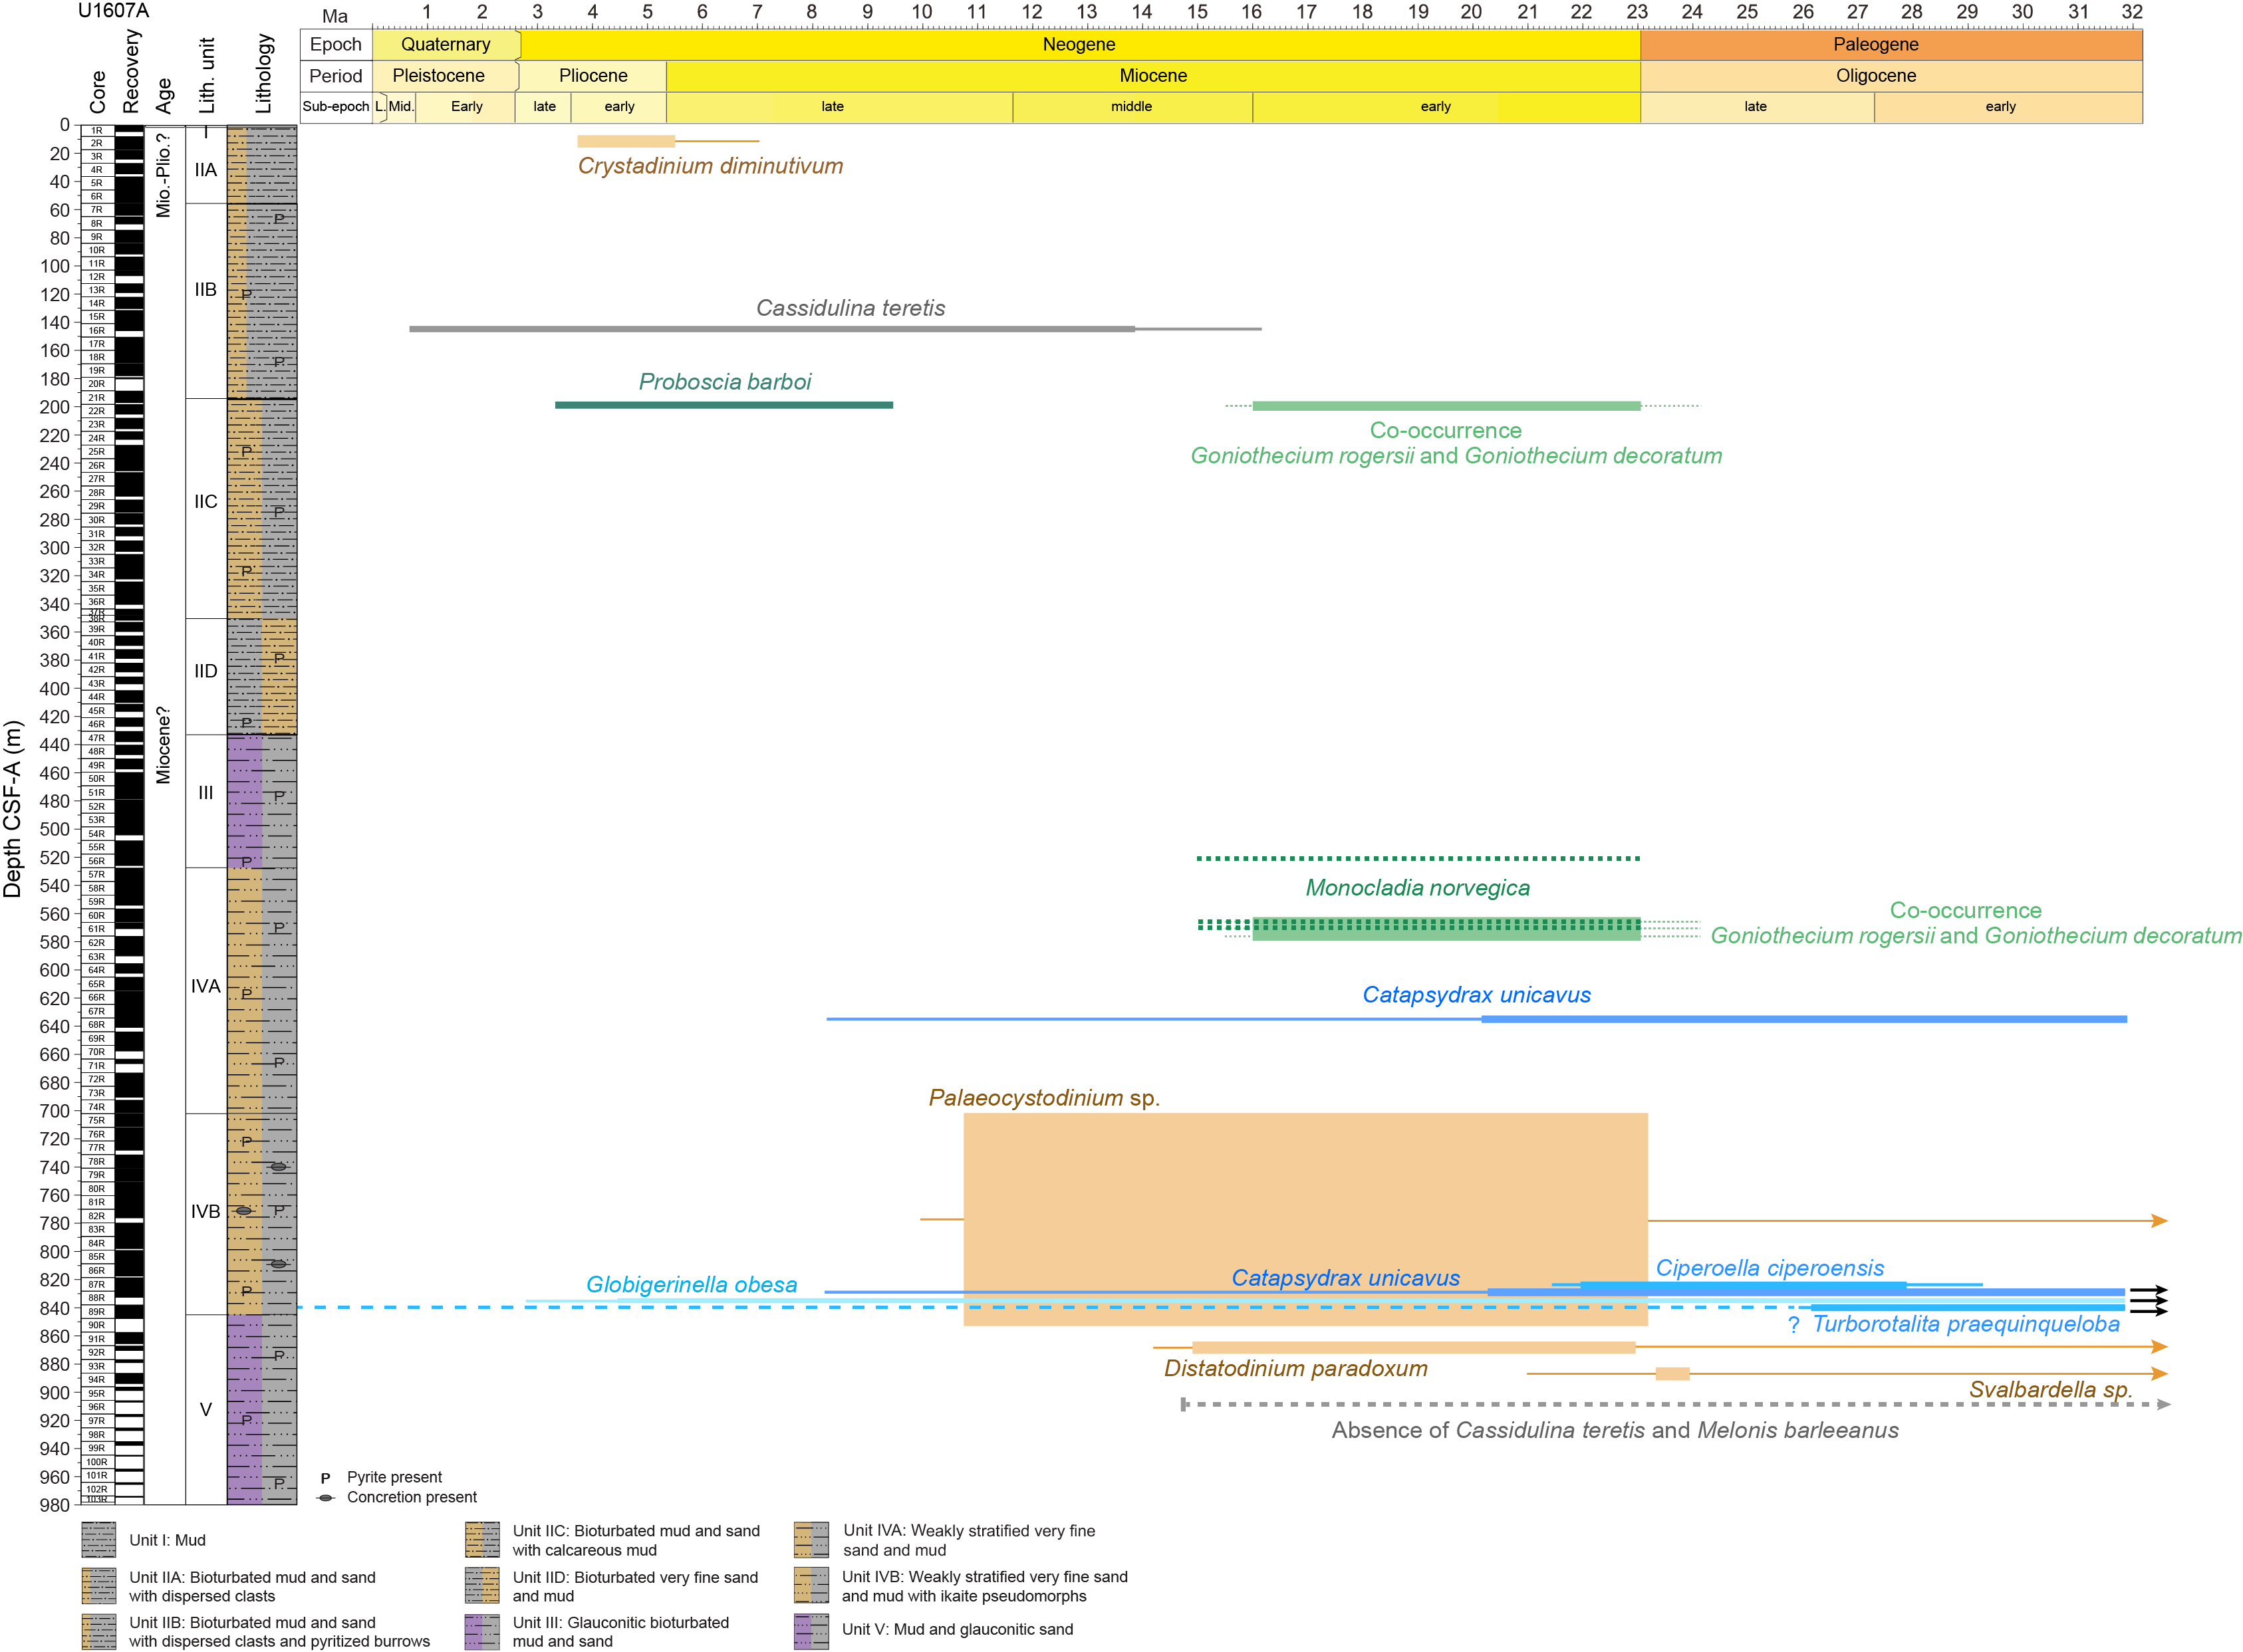
Figure F18. Chronostratigraphic constraints.
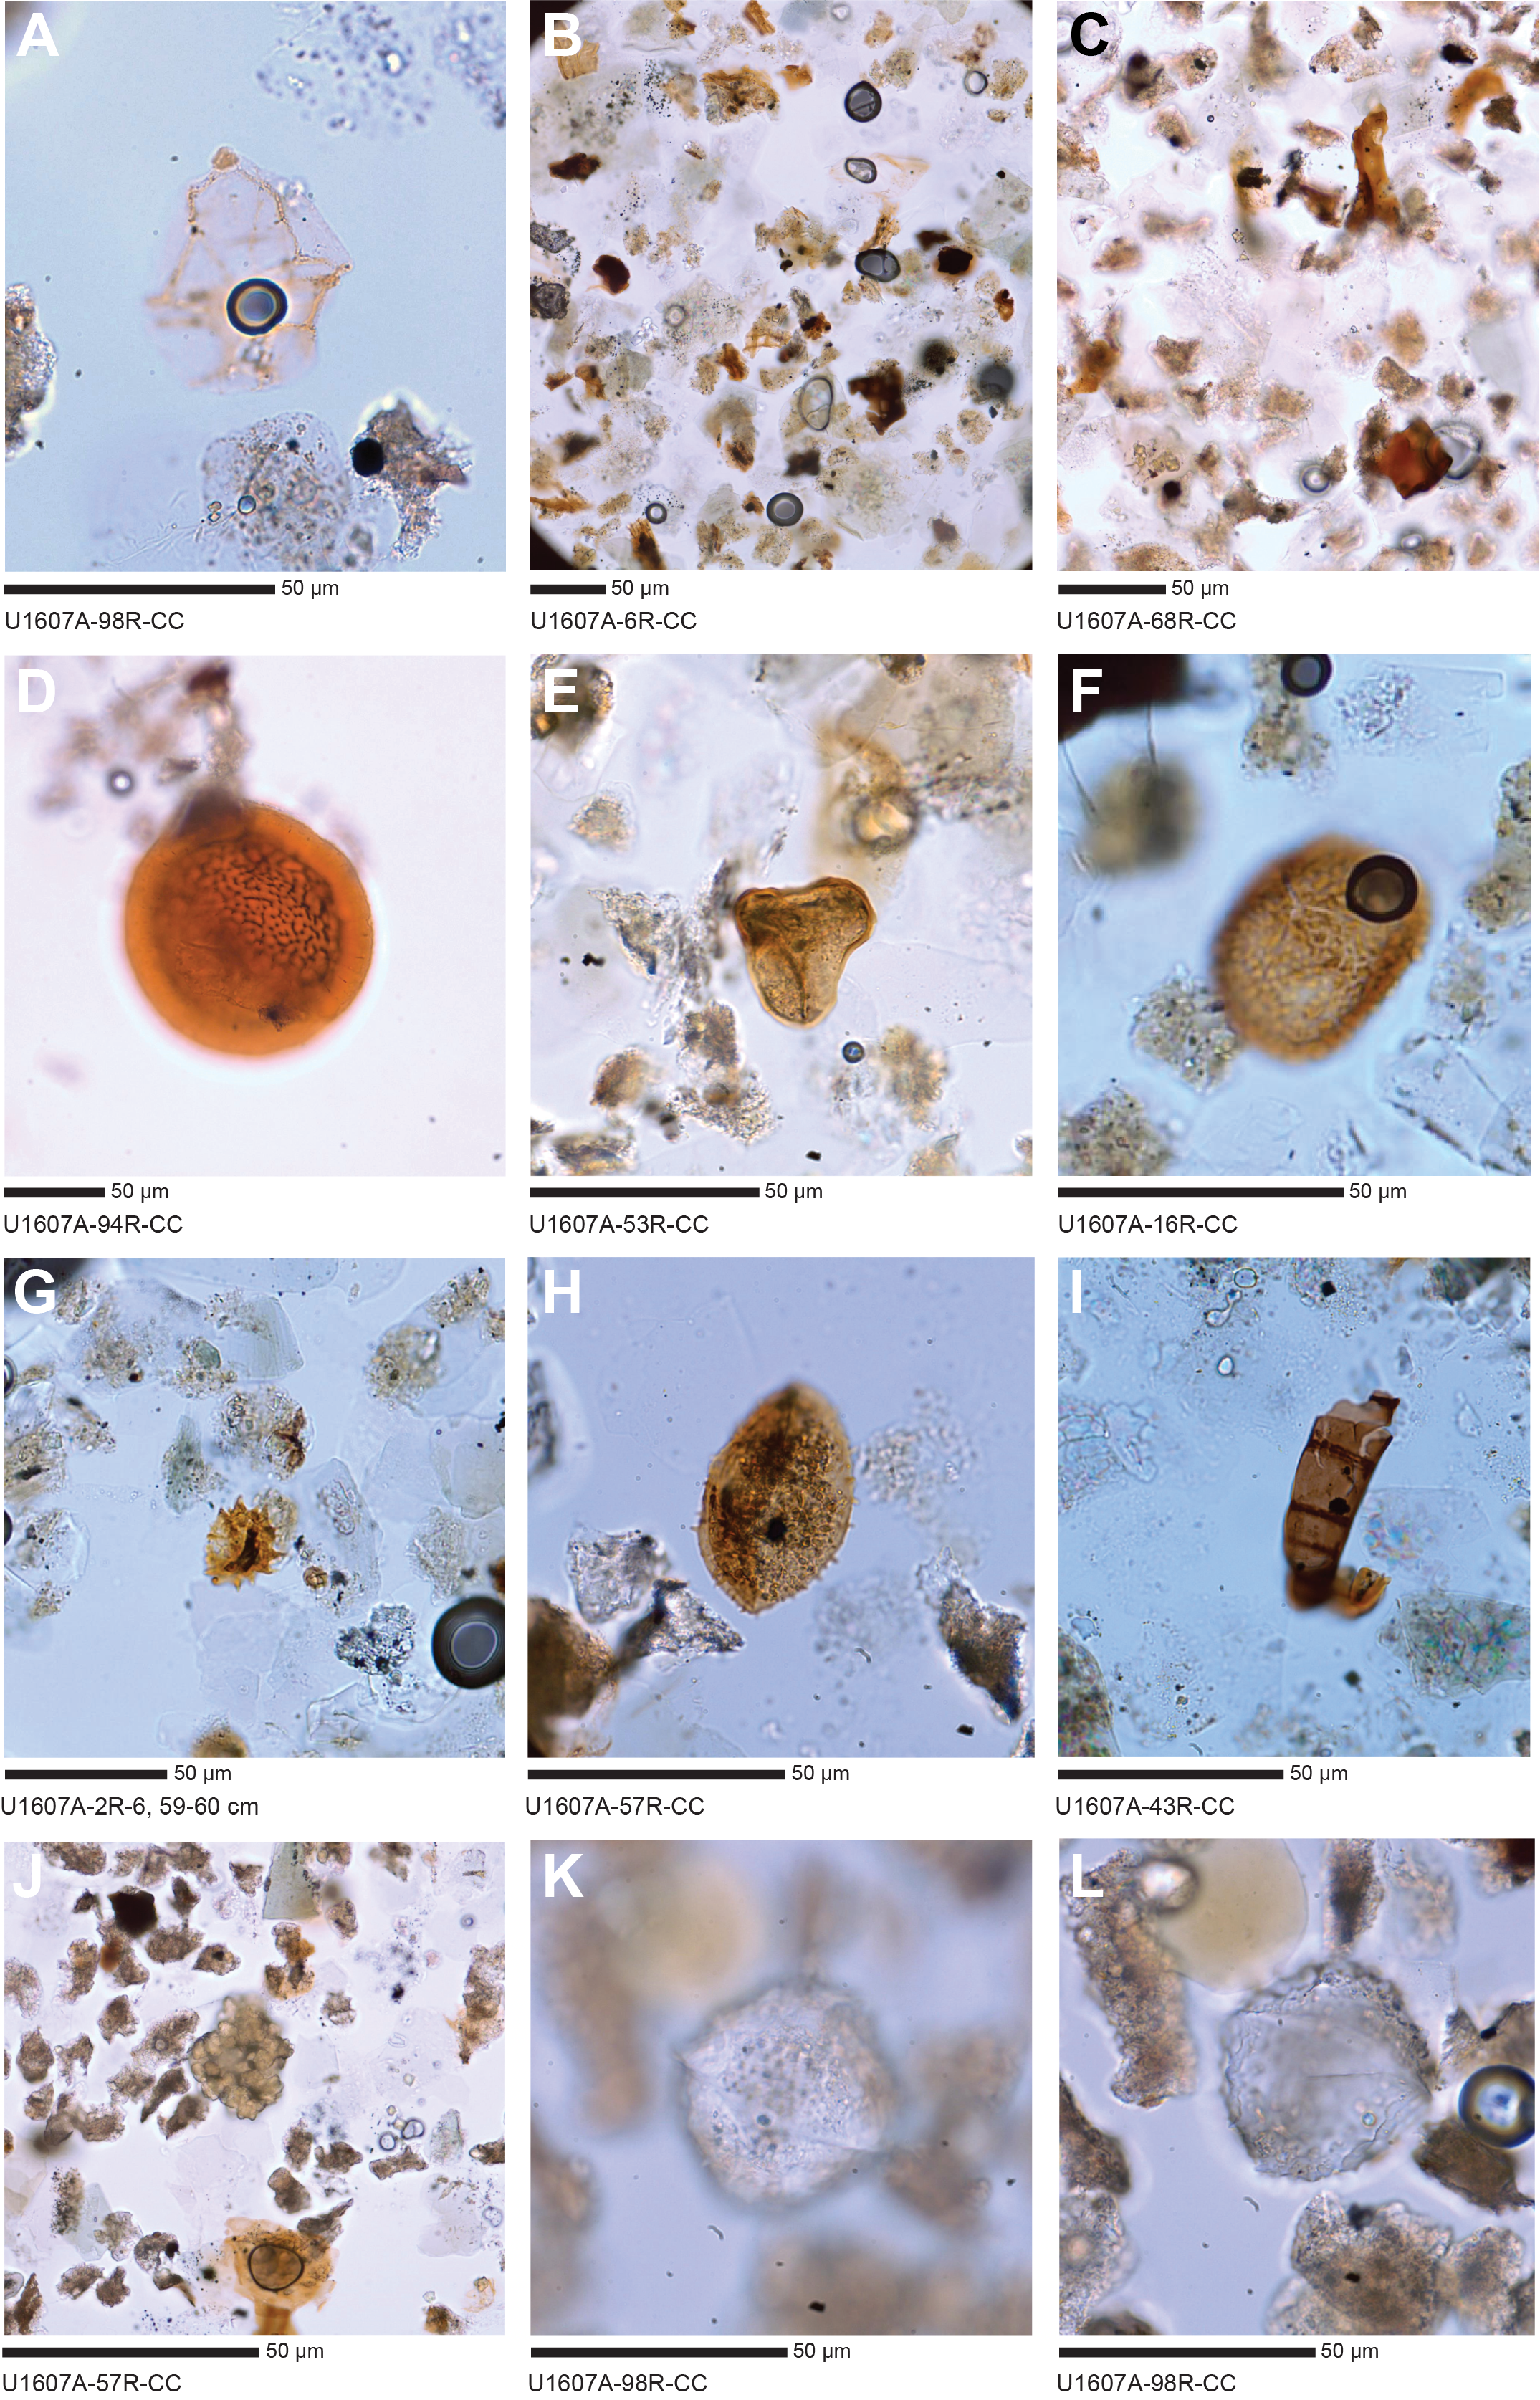
Figure F19. Palynomorphs.
Pollen and spores are a consistent feature of Site U1607 (Figure F13). Palynological assemblages in most samples from Site U1607 are dominated by terrestrial material (Figure F19B, F19C), including black and brown phytoclasts and cuticle remains. A wide variety of spores (Figure F19D–F19F) and some pollen (Figure F19G, F19H) were also observed. The high abundance of terrestrial material implies a shallow depositional environment with a large input of terrigenous material. The highest amounts of terrestrial material occur in Samples 400-U1607A-2R-4, 93 cm, 6R-CC, 17R-CC, 19R-CC, 20R-CC, and 27R-CC. Both reworked and in situ pollen and spores were recorded, but because it is often hard to distinguish these, future work integrating multiple proxies could further constrain the source and origin of the organic material.
Besides terrestrial material, some samples contain fungal remains, including fungal spores in Sample 400-U1607A-43R-CC (Figure F19I). Notably, the colonial freshwater algae Botryococcus is abundant in Sample 57R-CC (Figure F19J). In present day Baffin Bay, Botryococcus is found in areas affected by river input (Pieńkowski et al., 2020). Another interesting observation is the presence (common) of an unidentified palynomorph in Sample 98R-CC (Figure F19K, F19L).
4.1.4. Biochronology
Few robust biostratigraphic datum events or calibrated biohorizons can be identified at Site U1607 for the microfossil groups examined. This is because of a combination of low-diversity assemblages consisting of long-ranging taxa and/or intermittent occurrences of microfossils as a result of preservational or environmental variability. Nevertheless, we map the age depth distribution of significant occurring species, which provides some rudimentary age control (Figure F18; Table T8). The appearance of P. barboi (marine diatom) in Sample 400-U1607A-22R-1, 40 cm (198.7 m CSF-A), indicates an age range from 3.31–3.33 to 8.53–9.49 Ma (Koç and Scherer, 1996). The co-occurrence of G. rogersii and G. decoratum (marine diatom resting spores) in Samples 22R-1, 124–125 cm, 60R-CC, 61R-CC, and 62R-1, 44 cm, suggests an age range from late Oligocene to early Miocene (Suto et al., 2008). Trace amounts of M. norvegica (marine diatom resting spore) in Samples 56R-3, 90 cm, 60R-CC, and 61R-3, 43 cm, are tentatively dated to an age from early to middle Miocene (Suto, 2005).
Although sporadic in their occurrence, the distributions of calcareous benthic foraminifera provide coarse age constraints. Sample 400-U1607A-16R-CC contains a lenticular form of Cassidulina sp. The aperture of these specimens is too poorly preserved to directly determine whether it is Cassidulina neoteretis or C. teretis (i.e., using SEM analysis). However, the occurrence of this form at 146.16 m CSF-A, together with the dinocyst and diatom age constraints for this depth interval (Figure F18), suggests it is the older species, C. teretis, which first appeared in the North Atlantic in the mid- to late Miocene (Katz and Miller, 1993; Holbourn et al., 2013; Cage et al., 2021) and disappeared in the northern North Atlantic/Norwegian Sea at 0.7 Ma (Seidenkrantz, 1995) (Table T8). Samples containing C. teretis must therefore be older than 0.7 Ma. A second constraint comes from the apparent downhole disappearance of C. teretis and M. barleeanus. Calcareous benthic species are scarce and discontinuous at Site U1607. However, when they make an appearance in Sample 96R-CC (907.215 m CSF-A), we see Islandiella sp. and milliolids but not C. teretis and M. barleeanus, although these species do occur, albeit discontinuously, above. Assuming this is not just a preservation signal, we can add the middle Miocene FO of these species in the North Atlantic (Katz and Miller, 1993; Holbourn et al., 2013) as an age marker for the lower part of the hole. Thus, we suggest samples below and including 96R-CC are older than the middle Miocene based on the absence of C. teretis and M. barleeanus (Figure F18).
The occurrence of planktonic foraminifera in Sample 400-U1607A-88R-CC adds control in the lower part of the hole. C. unicavus, G. obesa, T. praequinqueloba, and C. ciperoensis, similar to the diatoms, are suggestive of an age range from the late Oligocene to the Miocene. The ranges of T. praequinqueloba and C. ciperoensis argue for a late Oligocene age. However, these range limits, especially the upper ranges, are highly approximate (Wade et al., 2018). Constraints from the North Sea offer regional LO dates for C. unicavus and C. ciperoensis of 20.26 and 27.3–22.0 Ma, respectively (Anthonissen, 2012), but the LO of T. praequinqueloba is more uncertain. It is possible that T. praequinqueloba extends higher into the Miocene or that the specimen we identified is attributable to Turborotalita quinqueloba, a species that exists today. Although dinocysts are absent in the interval between Cores 33R and 72R, their abundances above and below this interval provide some age constraints, as indicated in Table T8.
The presence of the dinocyst species C. diminituvum in Sample 400-U1607A-3R-CC implies a late Miocene or early Pliocene age based on its presence in Baffin Bay at ODP Site 645 during this period (Aubry et al., 2021). Within the Labrador Sea (Site 646), this species occurred from around 8.7 Ma (Head et al., 1989). The dinocyst P. golzowense has a long stratigraphic range and wide distribution. Globally, it ranges from 7.6 Ma (Brown and Downie, 1985) to 70.58 Ma (Lebedeva et al., 2013). In Baffin Bay (ODP Site 645), it has been recorded during the early mid-Miocene and ranges into dinocyst occurrence Zone BB5 (Head et al., 1989). D. paradoxum has a long stratigraphic range from 52.93 Ma (Soliman et al., 2012) to 13.87 Ma (Fensome et al., 2008). Within Baffin Bay (ODP Site 645), this species has its LO in Baffin Bay (ODP Site 645) in dinocyst Zone BB3 (Head et al., 1989), corresponding to an older than middle Miocene age. The genus Svalbardella spp. ranges from 42 Ma (Vasilyeva and Musatov, 2023) to 22.19 Ma (Egger et al., 2016). In the western North Atlantic (Expedition 342), Svarbardella spp. ranges 33.7–22.1 Ma (magnetostratigraphic calibration = 8% of Chron C13n to 61% of Subchron C6Bn.2n) (Egger et al., 2016).
4.1.5. Marine sedimentary ancient DNA
No samples other than the mudline were collected for sedimentary ancient DNA analysis. In the core catcher of Core 400-U1607A-60R, a gastropod shell (Figure F20A) that was split in half during core splitting contained a black filling in the archive and working halves, which was interpreted as organic remains. The black filling was collected for paleogenomic or paleoproteomic analysis following the procedure described in Marine sedimentary ancient DNA sampling in the Expedition 400 methods chapter (Knutz et al., 2025a) (Figure F20B).

Figure F20. Sampling a gastropod shell.
5. Paleomagnetism
Pass-through paleomagnetic measurements for Site U1607 were performed using the superconducting rock magnetometer (SRM) to investigate the remanent magnetization on a total of 491 archive section halves. Measurements were not made on core catcher sections. All measurements on archive section halves were made at 2 cm intervals, up to a peak alternating field (AF) demagnetization of 20 mT.
A total of 525 discrete cube samples were taken from working section halves. Generally, we collected one sample per core section, avoiding visually disturbed intervals. Of the 525 samples, 512 were taken using the parallel saw and the rest were sampled using the "Japanese" Natsuhara-Giken cubes (J-cubes) by inserting them into the working section half. We measured 476 specimens on the SRM with stepwise demagnetization up to 50 mT. The remaining specimens were preserved for further study.
At Site U1607, we utilized a filtering method that assesses the magnetic stability of archive section half and discrete specimen data. Above ~375 m CSF-A, we defined 13 magnetic polarity zones. Below ~375 m CSF-A, magnetic data were unreliable due to a diagenetic loss of remanence-carrying material, and it was not possible to define polarity intervals. Further constraint awaits other chronological information, including confirmation of possible unconformities or hiatuses.
5.1. Discrete sample measurements
Demagnetization behavior of discrete specimens is shown in Zijderveld diagrams (Zijderveld, 1967) in Figure F21. The drill string overprint is typically removed by the 15 mT demagnetization step. A representative discrete specimen that behaved in a manner consistent with normal polarity is shown in Figure F21A, F21E, and a typical reversely magnetized specimen is shown in Figure F21B, F21F. Many of the demagnetization diagrams did not decay to the origin but rather decayed to the horizontal plane (e.g., Figure F21C, F21D); this behavior is characteristic of gyromagnetic remanent magnetization, which is widely associated with the magnetic iron sulfide greigite (Stephenson and Snowball, 2001). Many also were demagnetized at such low coercivities (Figure F21D, F21H) that their polarity is in doubt.

Figure F21. AF demagnetization behavior.
We used two parameters to separate data with straightforward polarity interpretations (Figure F21A, F21B) from those for which polarity is difficult to determine (Figure F21C, F21D). The first parameter, the maximum angular deviation (Kirschvink, 1980), uses principal component analysis through the characteristic component of the magnetization vector. For Site U1607 specimens, we calculated the maximum angular deviation value for the vector measured between 20 mT and 50 mT as a proxy for scatter in the demagnetization vector data, with high scatter meaning low reliability. We considered maximum angular deviation values above 20° to be unreliable. The second parameter considers the magnetization remaining after demagnetization to 20 mT expressed as a fraction of the initial remanence (fractional magnetization). Fractional magnetization can be used as a proxy for magnetic stability, and we consider specimens with a fractional magnetization of less than 20% of the remanence remaining after 20 mT to be unstable. The advantage of this particular parameter is that it can be calculated for all SRM measurements for the archive section halves, as well as the discrete specimens. Examples for how maximum angular deviation and stability proxy values can be used to quantify reliability are shown in Figure F21. The maximum angular deviation values of the first two Zijderveld diagrams (Figure F21A, F21B) are very low (less than 5°), suggesting a high degree of reliability of the magnetic remanence vector. In addition, the stability proxies are quite high (greater than 50%; Figure F21E, F21F). In contrast, the maximum angular deviation values for the two unreliable examples are quite high (greater than 20°; Figure F21C, F21D) and the stability proxies are very low (less than 20%; Figure F21G, F21H).
5.2. Archive-half measurements
The natural remanent magnetization of sections from Hole U1607A was measured, followed by AF demagnetization steps to 10 mT and 20 mT to remove the drill string overprint. To filter out data from sections that were deemed unreliable (see above), the remanence data were filtered as follows:
- All measurements within 15 cm of section ends were deleted to remove the edge effects associated with pass-through measurements and disturbance from cutting of the core sections.
- Intervals with drilling disturbances as defined by the disturbance intensity code of "moderately disturbed" or greater (see Lithostratigraphy in the Expedition 400 methods chapter [Knutz et al., 2025a]) were removed.
- Intervals with less than 20% of the magnetic remanence remaining after demagnetization to 20 mT (the stability proxy described in Discrete sample measurements) were removed.
The data from the 20 mT demagnetization step are shown in Figures F22 and F23 for the upper and lower halves of Hole U1607A, respectively. Both unfiltered and filtered data are shown, the first as gray dots and the latter as black dots. The discrete specimen results are also plotted for comparison; low stability (either based on the maximum angular deviation or the stability proxy) data are shown as Xs and high reliability data as red stars. The discrete specimen data generally agree well with those from the archive halves.
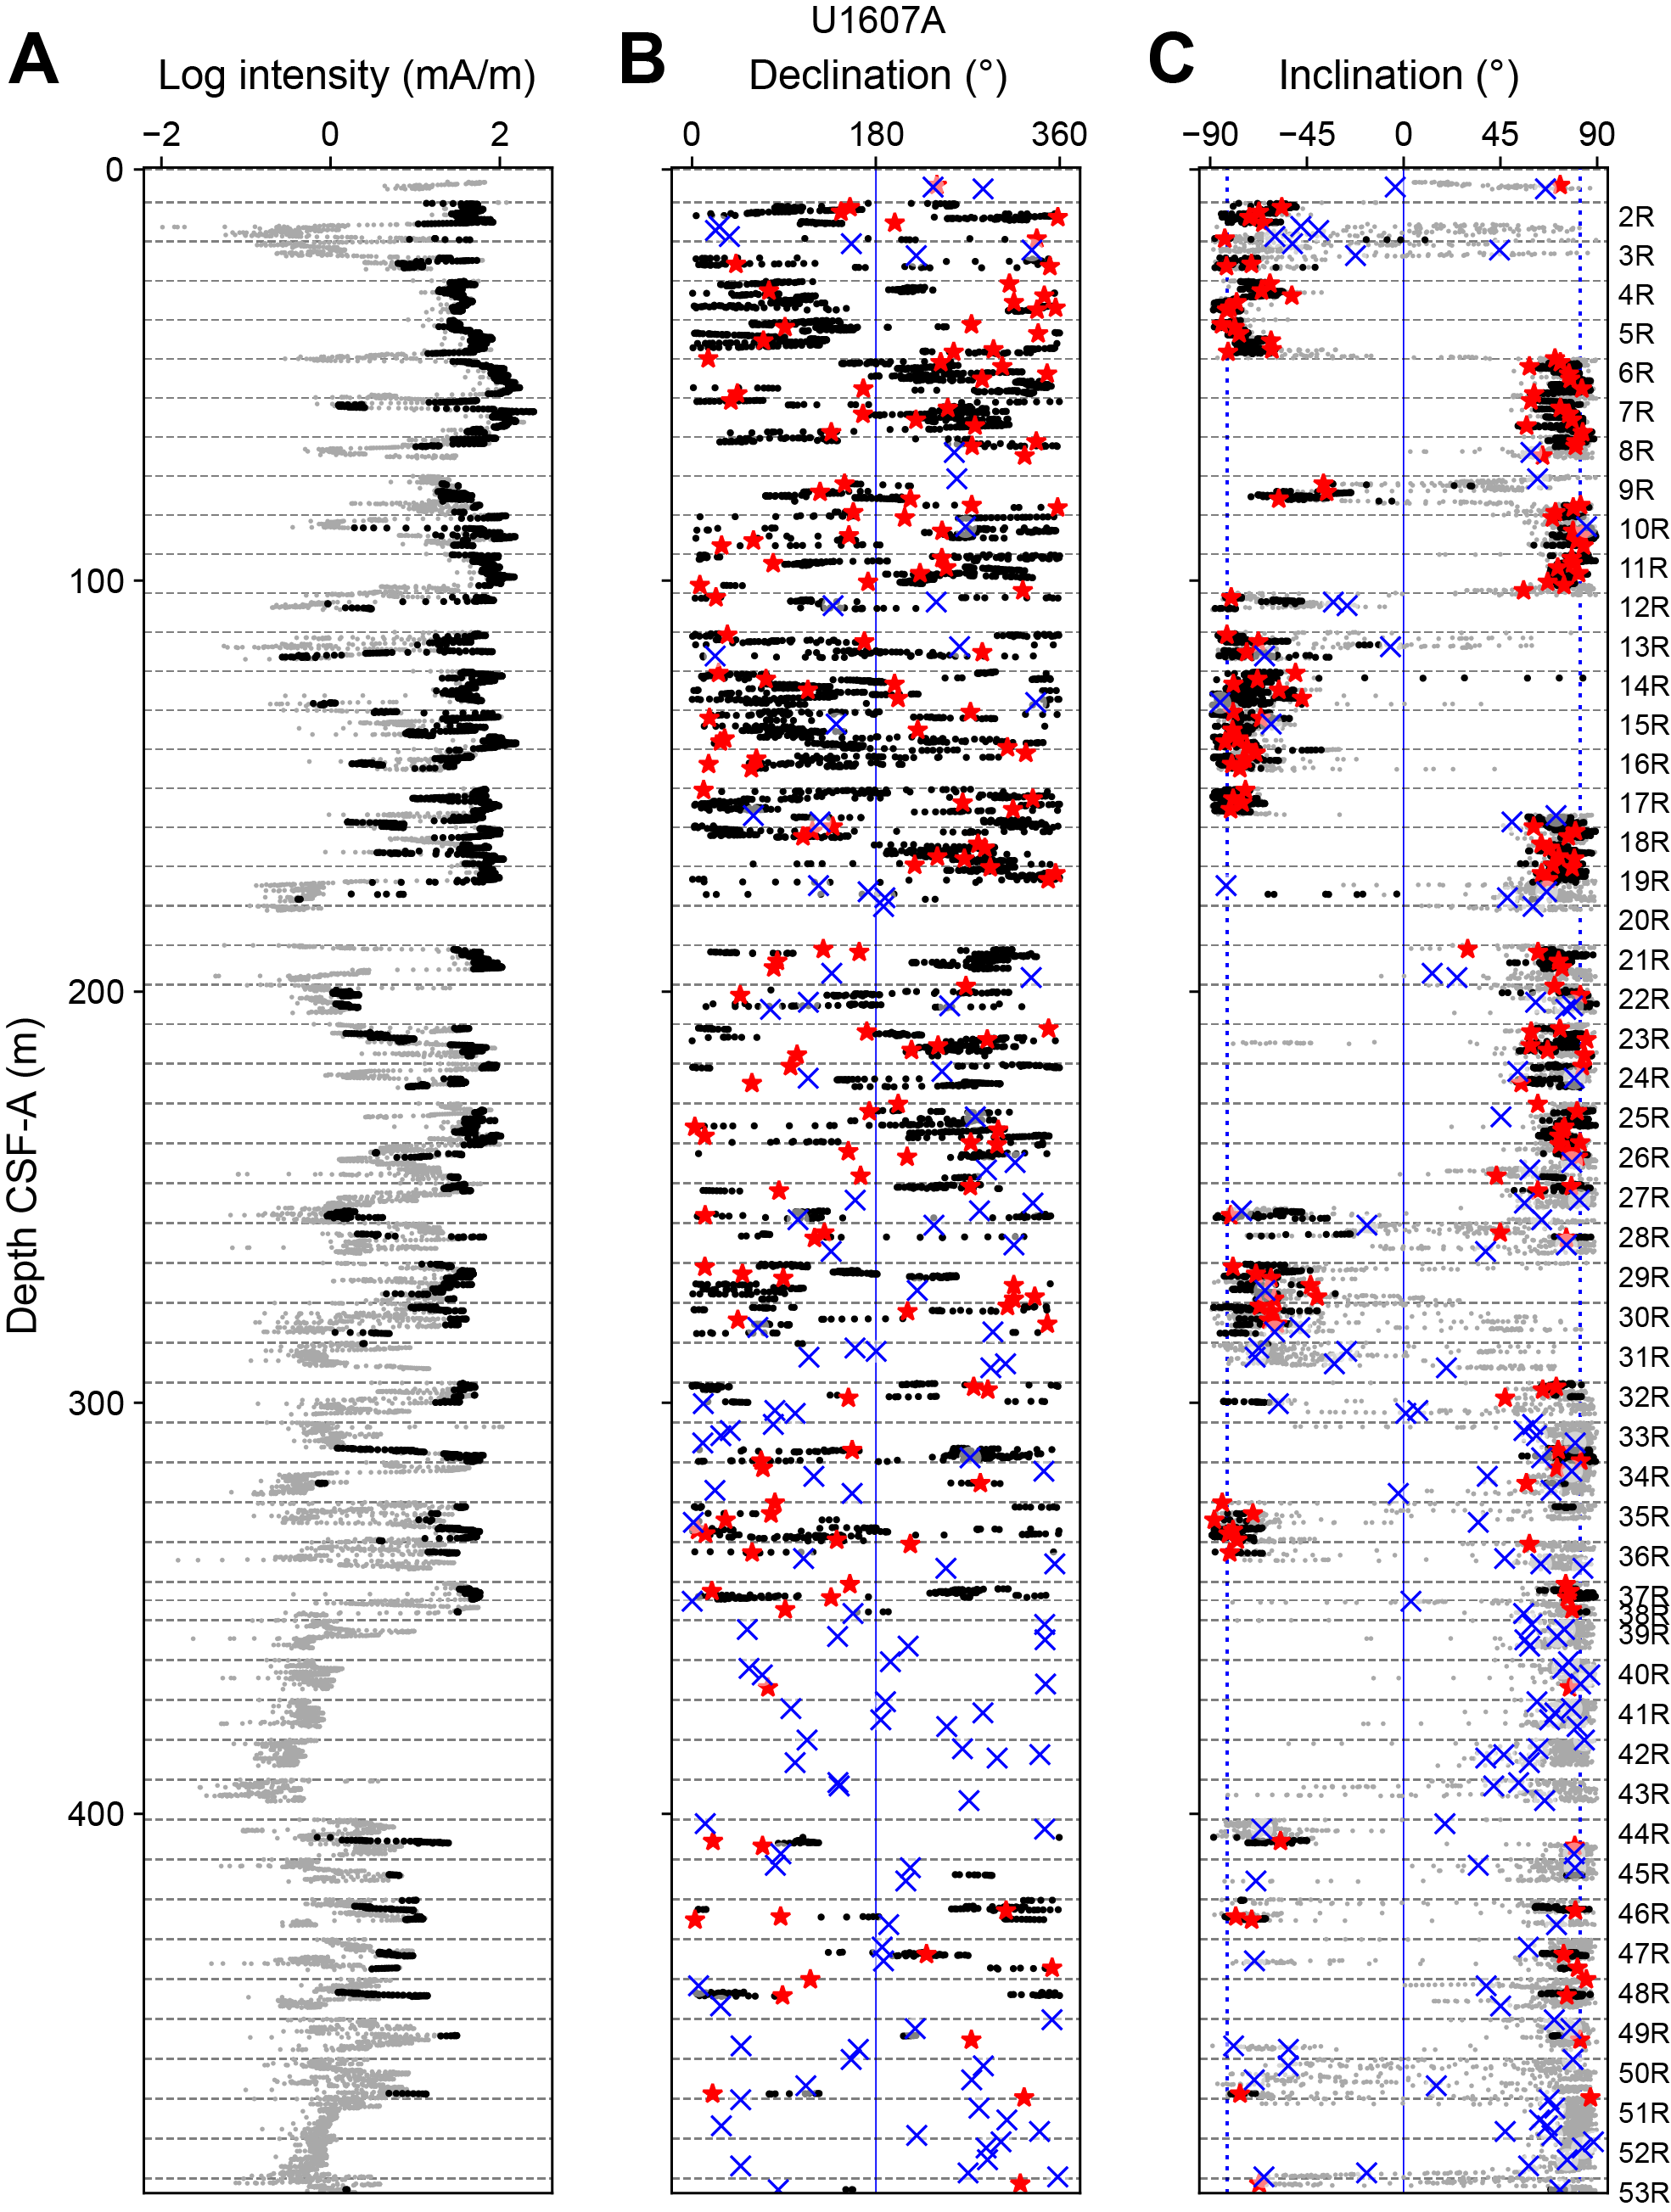
Figure F22. Intensity, declination, and inclination, top half of Hole U1607A.

Figure F23. Intensity, declination, and inclination, bottom half of Hole U1607A.
Interpretation of polarity requires that there be two distinct populations of inclinations. We examined kernel density estimates of both the unfiltered and filtered inclination data from archive section halves after the 20 mT demagnetization step (Figure F24). The inclination values are generally bimodal at the estimates from geocentric axial dipole inclinations for normal and reversed polarities at this latitude, suggesting that intervals of both normal and reversed polarity were recovered at Site U1607.

Figure F24. Inclination data.
5.3. Magnetostratigraphy
Magnetostratigraphic interpretations are based on inclinations calculated from archive section half and discrete specimen measurements made after the 20 mT AF demagnetization step, with downward-directed vectors being normal polarity and upward-directed vectors being reversed polarity. The depths of polarity zone boundaries are listed in Table T9. In Figure F25, we show the process whereby inclinations are interpreted as preliminary polarity zones for the uppermost 400 m. Poor magnetizations below 400 m CSF-A result in inclinations that are not possible to interpret as polarity zones. Gaps in recovery and low stability magnetizations in the uppermost 400 m result in some intervals of uncertain polarity. Interpretations as to chrons are discussed in Age model.

Figure F25. Magnetostratigraphy.
6. Physical properties
Physical property data were acquired on all cores from Hole U1607A. Natural gamma radiation (NGR) was measured with the Natural Gamma Radiation Logger (NGRL) in all sections longer than 50 cm upon arrival to the laboratory. Further logging using the Whole-Round Multisensor Logger (WRMSL) was performed 4 h after core arrival to the laboratory to allow equilibration to room temperature. The cores were too indurated for regular temperature measurements with the needle thermometer. The WRMSL provided wet bulk density from gamma ray attenuation (GRA), MS, and P-wave velocity (using the P-wave logger [PWL]) at a 2 cm resolution.
After the whole rounds were split, we acquired X-ray imaging on every archive section half. Thermal conductivity was measured on one working section half per core. The Section Half Multisensor Logger (SHMSL) was used to measure point MS (MSP) and color reflectance using the L*a*b* color system, and the red-green-blue color space (RGB) of the sediments was captured with the Section Half Imaging Logger (SHIL). In addition, we determined P-wave velocities at discrete points on the working section halves for all cores at Site U1607. In general, we measured P-wave velocity in three sections per core. Measurements were taken at variable intervals to accommodate lithologic variations. Two moisture and density (MAD) samples per core were taken and processed to obtain discrete wet bulk density, dry bulk density, grain density, and porosity measurements.
The sensors worked correctly, and the data are of good quality. Accordingly, the physical properties obtained from Hole U1607A provide valid and reproducible information on sediment composition and its variability for all cores. Prominent variations in physical property values occur at similar depths in NGR and density and are associated with major lithologic changes in the cores. Uniform lithologies are reflected by low variability in the physical property signals. All analyses described in this section are reported in meters CSF-A, unless otherwise stated.
6.1. Physical property measurements and measurement intervals
High-resolution physical property measurements were made on all cores from Holes U1607A to provide basic information on sediment composition and variability. The WRMSL measured bulk density by GRA, MS, and compressional P-wave velocity on the PWL at 2 cm intervals. WRMSL measurements were obtained upon equilibration to room temperature. The RCB system has a slightly smaller core diameter and does not fill the liner entirely. Thus, PWL readings lack close contact between the caliper and the sediment, leading to large standard deviations in the measurements. However, the PWL trend is consistent with that of discrete P-wave caliper (PWC) measurements. NGR was measured with a counting period of 300 s at 10 cm intervals (see Physical properties in the Expedition 400 methods chapter [Knutz et al., 2025a]) on all cores from Site U1607.
After the cores were split, the archive section halves were X-rayed. Thermal conductivity was measured using the TK04 (Teka Bolin) system in the working section halves, obtained with a puck probe. PWC measurements were acquired in three working section halves per core from Hole U1607A. Lithology and core disturbance prohibited the collection of PWC data on Cores 101R–103R. MSP and color reflectance were measured at 2 cm intervals using the SHMSL, and section-half images were collected with the SHIL on all archive section halves. Additionally, discrete samples from all cores from Hole U1607A were taken for MAD measurements as two samples per core, ideally representing different lithologies. The samples were processed on board to determine water content, wet bulk density, dry bulk density, porosity, and grain density.
All physical property analyses were carried out except the PWC measurements (see above). Core disturbances, such as upbowing of layers, did not diminish the quality of the physical property data in a way that prevents meaningful core-seismic integration.
6.1.1. Whole-Round Multisensor Logger measurements
Results from WRMSL measurements for Hole U1607A are compiled in Figure F26. We measured high-resolution data (2 cm intervals) for all the core sections and core catchers. All cores rested for around 4 h to equilibrate to room temperature (~20°C) before being logged in the WRMSL. We measured NGR for all the cores upon arrival to the laboratory. The logs described in this chapter (Figure F26; Table T10) have undergone preliminary processing including clipping, despiking, and smoothing. A positive correlation is found between density and NGR counts (Figures F26, F27), governing all measurements collected for Site U1607 (Figure F28). The correlation between these physical properties distinguishes five physical properties (PP) units (I–V) at Site U1607; the main signatures of those units are summarized in Table T10.

Figure F26. Physical properties.
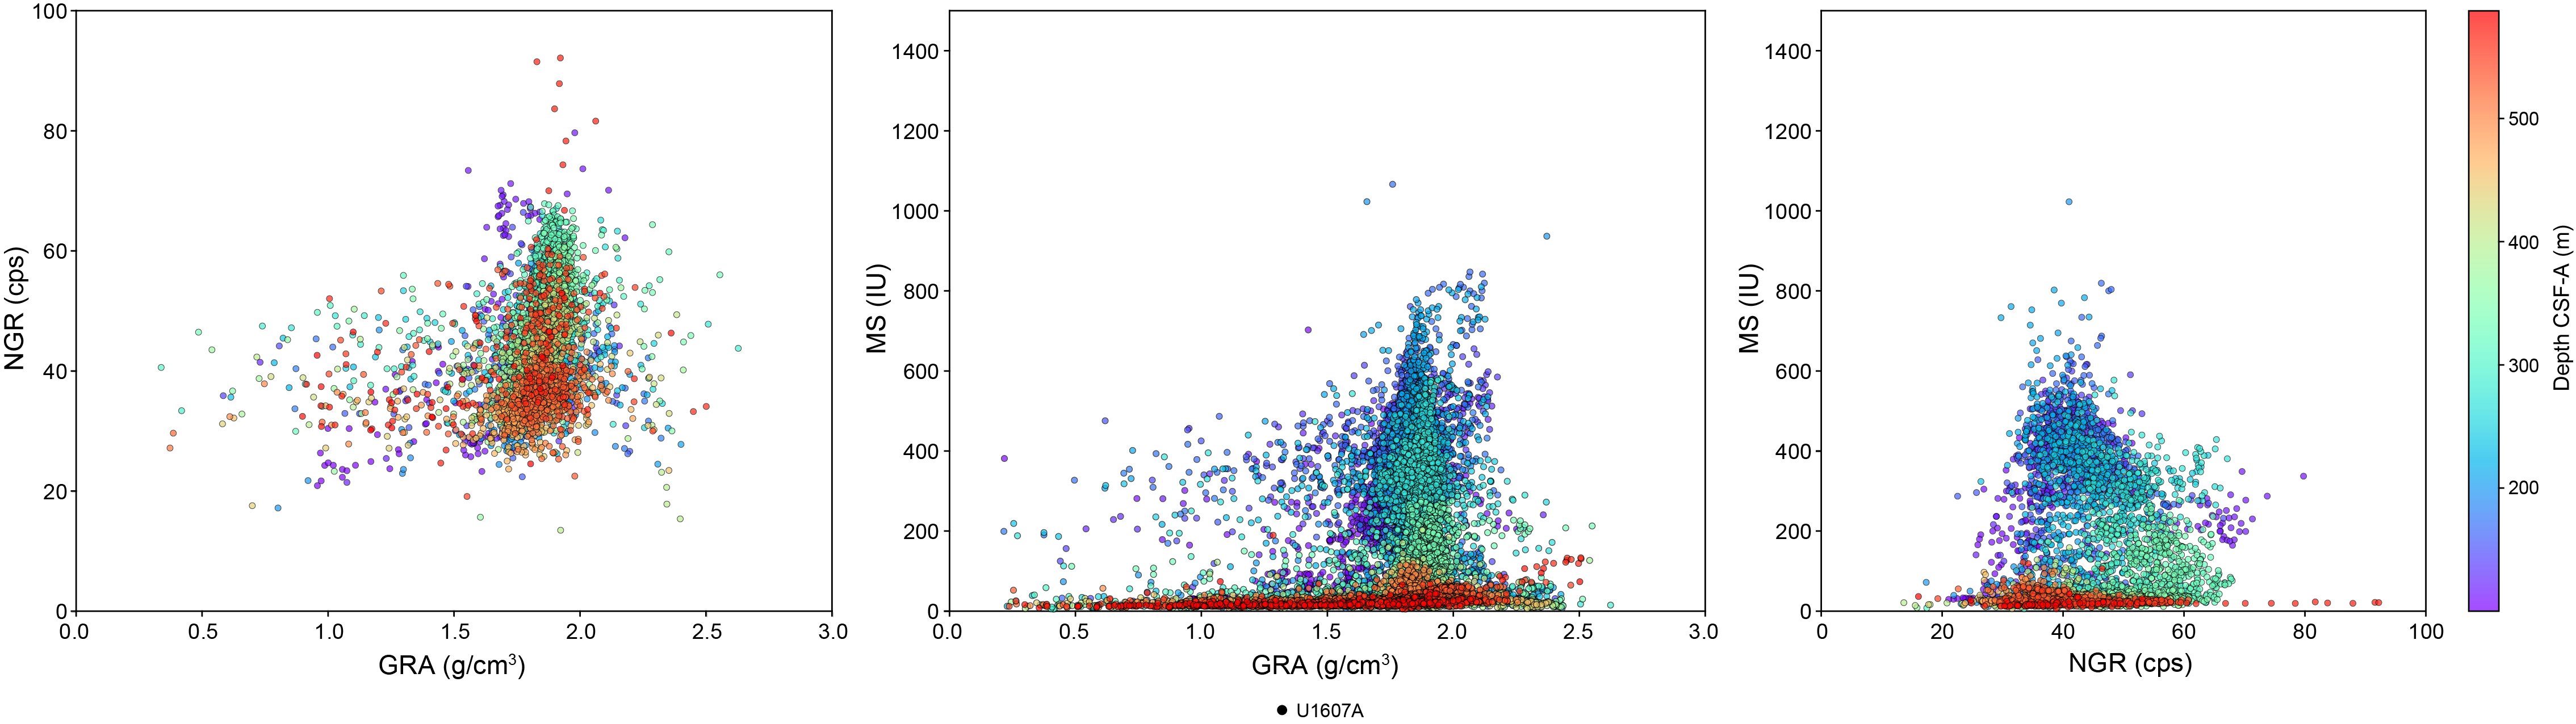
Figure F27. NGR, GRA bulk density, and MS.
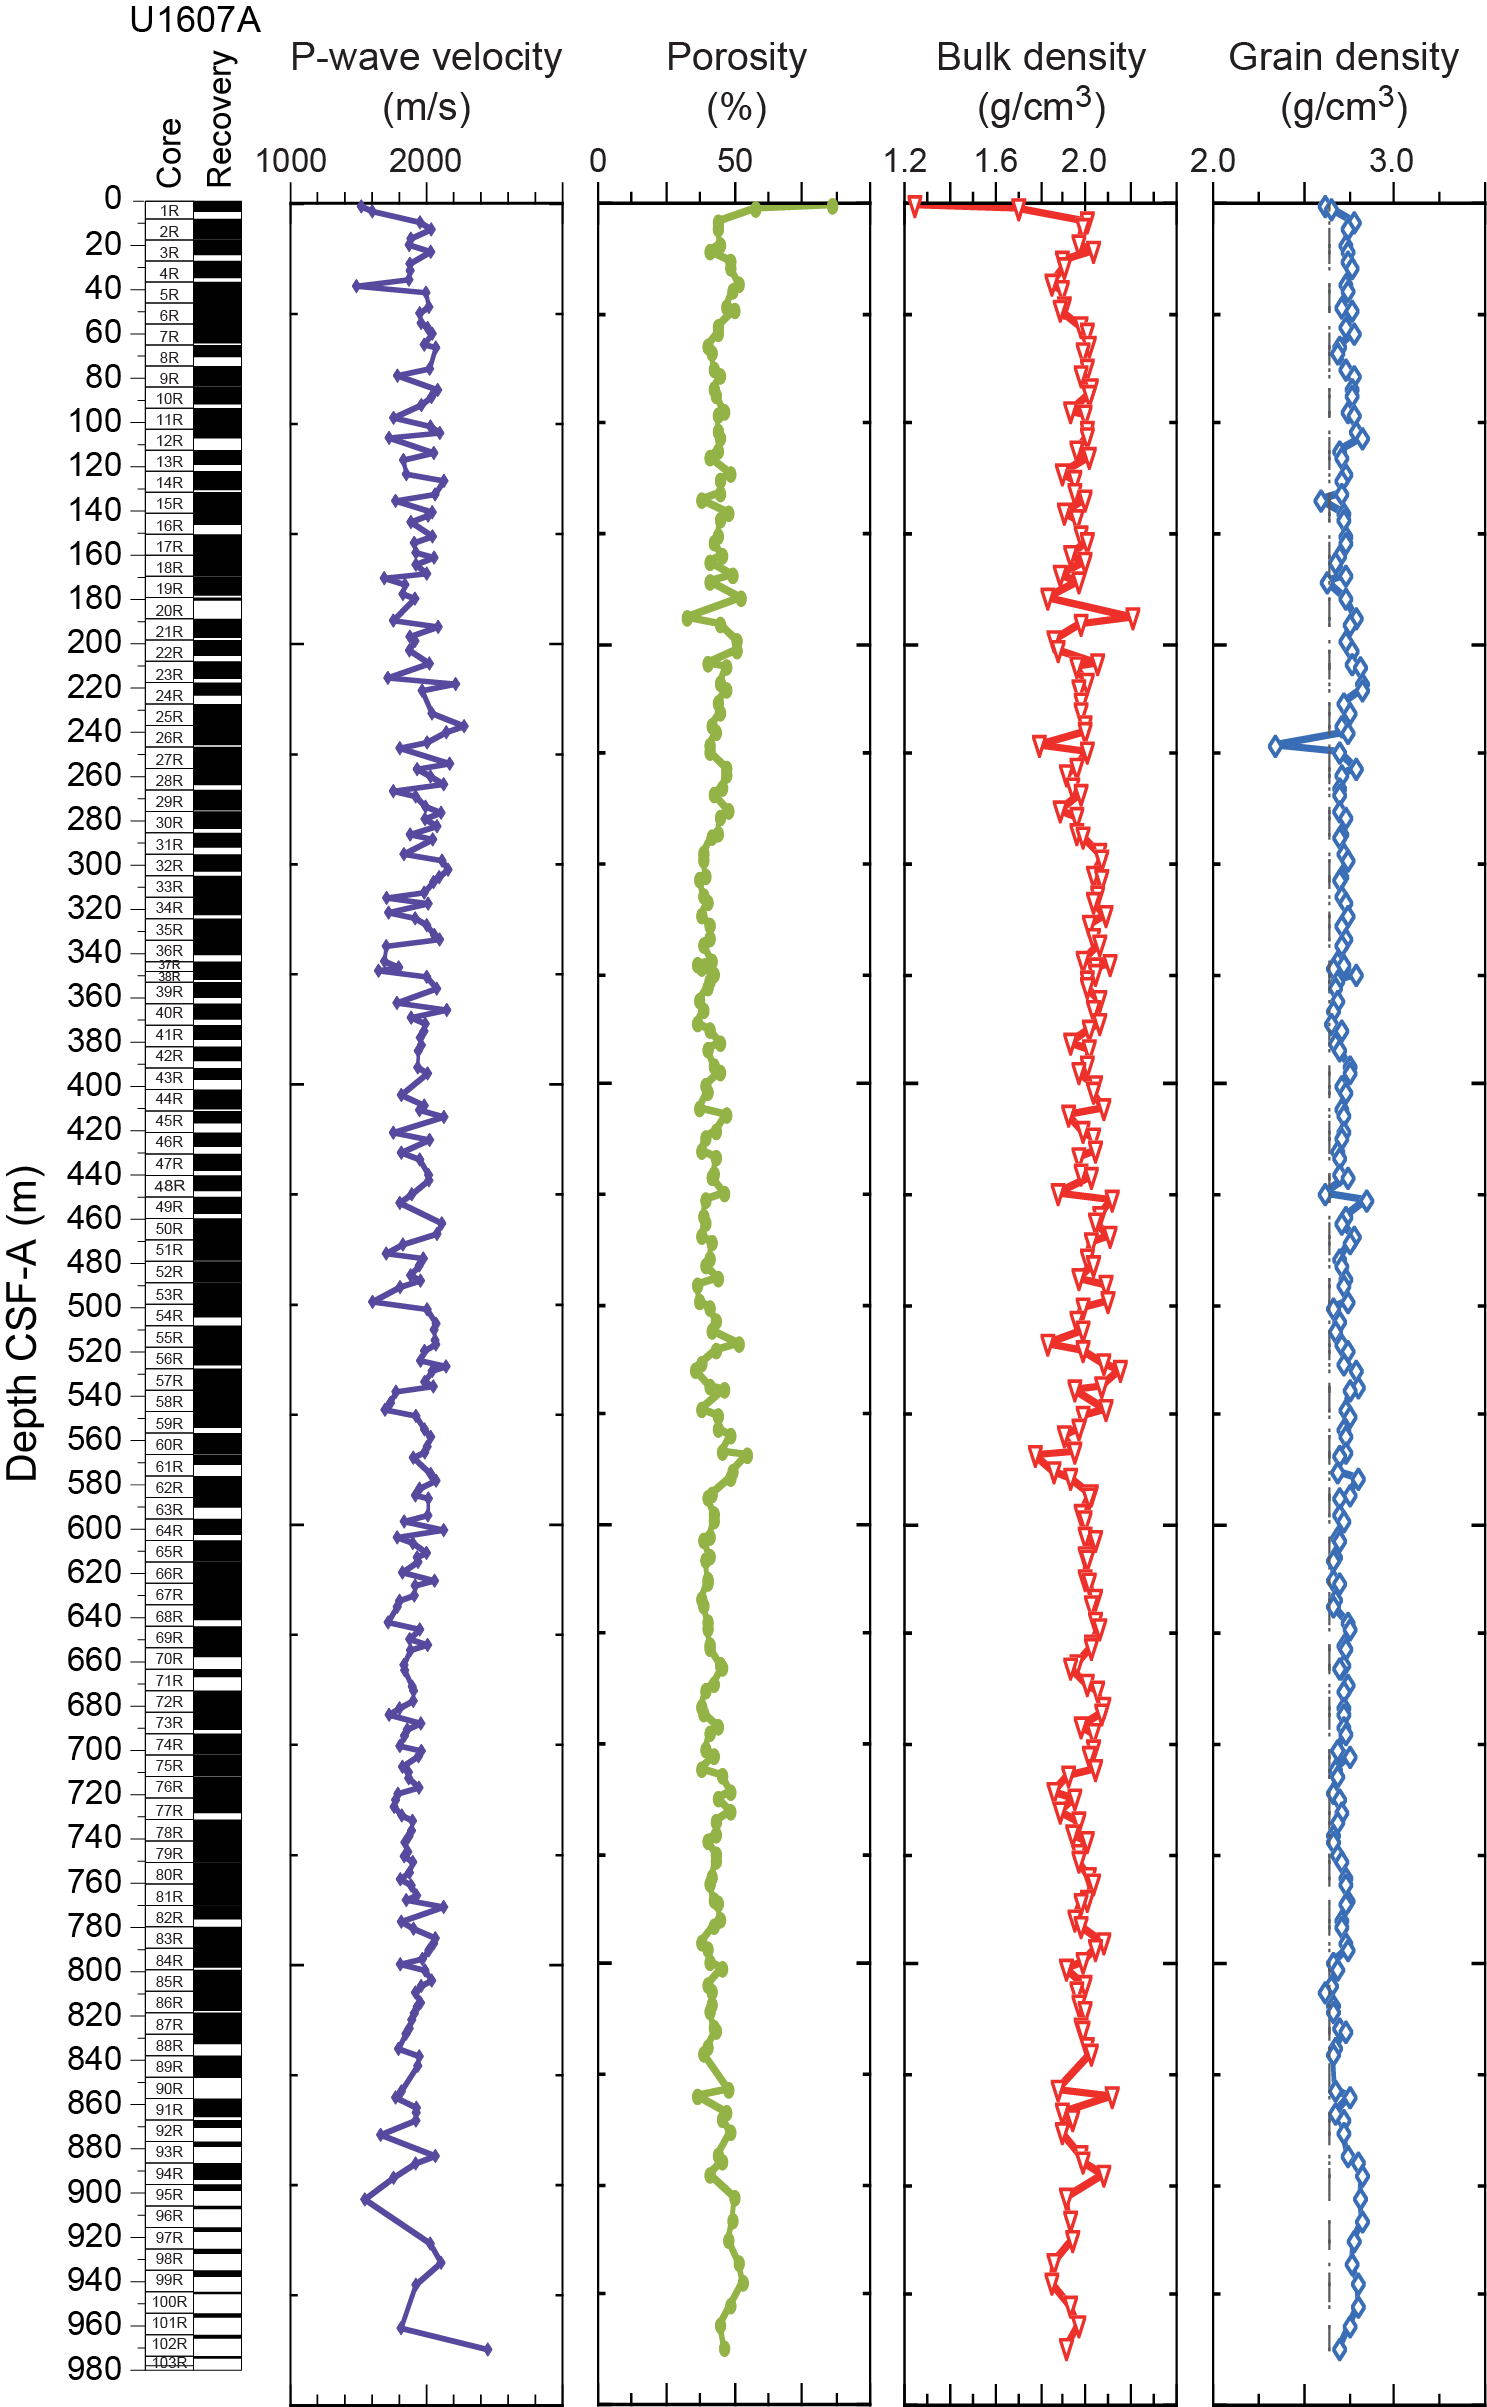
Figure F28. Gantry and MAD analyses.
6.1.1.1. Gamma ray attenuation bulk density
Wet bulk densities range 1.0–2.2 g/cm3 with a mean value of 1.8 g/cm3. GRA values show low-amplitude variability with a downhole decreasing trend from Core 400-U1607A-95R (~898 m CSF-A). The lowest values are found in Core 1R at the seafloor, and the highest values are observed in Cores 22R (~205 m CSF-A) and 64R (~602 m CSF-A) (Figure F26). The density trend shows a major change at ~420 m CSF-A, within PP Unit III. The upper part of the hole shows low-amplitude variability in the density values, whereas below this depth, density values oscillate within a larger range. The variability observed in the density values might be related to the transition from mud- and sand-dominated lithologies in the upper part of the hole toward a more diverse lithology, including glauconitic mud and sand with common concretions. A sharp decrease in density occurs below ~900 m CSF-A within Unit V (Table T10). GRA bulk density values are consistently ~0.2 g/cm3 lower than calculated densities from the MAD discrete samples (Figure F26).
6.1.1.2. Magnetic susceptibility
MS is sensitive to the concentration and type of magnetic minerals deposited in the sediments. MS variations downhole often appear as sharp peaks related to sedimentary events or high-amplitude variability in concentration of magnetic components, although they may also track gradual changes in lithology. Values at Site U1607 range 10 × 10−5 to 735 × 10−5 SI with a mean of 136 × 10−5 SI (Figures F26, F27). From the top and through Core 400-U1607A-51R (~470 m CSF-A), MS values display high-amplitude variability, seen as intervals with sharp peaks (jagged profile) changing abruptly to intervals with very low MS values. From this depth to the bottom of the hole, MS values are generally very low and show very low-amplitude variability (Figure F26).
6.1.1.3. P-wave velocity using the P-wave logger
PWL measurements are unreliable when made on sections with cracks or poor contact between the sediment and the liner. However, disregarding anomalously high PWL values (>4452 m/s), the measurements are relatively constant downhole, oscillating around an average of 1817 m/s (Figure F26). The lowest velocity values (~1000 m/s) are observed below Core 400-U1607A-98R (~926 m CSF-A) and are probably related to poor core quality.
6.1.2. Natural gamma radiation
NGR values display high-amplitude variability with cyclic changes and an overprinted long amplitude cyclicity at Site U1607 (Figure F26). NGR values oscillate between 22 and 82 counts/s with a mean of 43 counts/s. The baseline of NGR values increases downhole through Core 400-U1607A-47R (~435 m CSF-A), below which values decrease to the bottom of the hole (Figure F26). The NGR trend clearly defines five physical properties units (Table T10). High variability in NGR values for the upper units correlates with mud and sand layers. An interval of very constant NGR values around 33 counts/s is identified between Cores 77R (~720 m CSF-A) and 88R (~830 m CSF-A), forming PP Unit IV. The constant NGR in Unit IV corresponds to an interval dominated by muddy sand. The increase in NGR at the bottom of the hole in Unit V might reflect a high concentration of mud.
6.1.3. Thermal conductivity
Thermal conductivity varies between 1.2 and 2.32 W/(m·K) at Site U1607 (Figure F26). Thermal conductivity values slightly increase with depth through Core 400-U1607A-24R (~222 m CSF-A). From this depth through Core 59R (~550 m CSF-A), thermal conductivity oscillates around an average of 1.6 W/(m·K) and then decreases gradually below this depth to the bottom of the hole. Maximum relative values of thermal conductivity were measured in Cores 3R (~22 m CSF-A), 42R (~395 m CSF-A), and 59R (~550 m CSF-A). The lowest values were measured in Cores 2R (~14 m CSF-A) and 101R (~956 m CSF-A). No dependence on identified lithostratigraphic units or facies is observed for thermal conductivity (Figure F26).
6.1.4. Point magnetic susceptibility
MSP measurements show a good match with MS values obtained from the WRMSL (Figure F26). However, higher variability is observed with this instrument due to the smaller integration volume of the sensor (~1 cm; 1σ) compared to the loop (~18 cm; 1σ) used for the WRMSL (Weber et al., 1997). Values of MSP downhole are systematically higher than the equivalent MS at Site U1607.
6.1.5. Color reflectance
L*a*b* color reflectance values are variable in Hole U1607A. The L* baseline is relatively constant, with a slight increase from Core 400-U1607A-49R (~455 m CSF-A) to the bottom of the hole. An interval of high-amplitude variability in L* is identified between Cores 19R (~170 m CSF-A) and 31R (~293 m CSF-A) (Figure F26). The a* component shows low variability downhole, with major changes matching the depths where L* changes. The b* component presents high-amplitude variability downhole with an interval of minimum values between Cores 19R (~170 m CSF-A) and 31R (~293 m CSF-A) (Figure F26).
6.1.6. Gantry
Results of section-half gantry measurements for Hole U1607A are compiled in Figure F28. Correlation between GRA and MAD density and PWC and PWL values confirms the high quality of the data (Figure F26).
6.1.6.1. P-wave velocity using the P-wave caliper
Discrete P-wave measurements were carried out using the PWC (see Physical properties in the Expedition 400 methods chapter [Knutz et al., 2025a]). Measurement resolution within each core varied depending on lithology, recovery, and quality, with at least three measurements per core. The PWC measurements provide a correlation for PWL values measured on the whole-round cores with the WRMSL (Figure F26). PWC measurements were made in every core from Site U1607; however, for the lowermost three cores, the nature of the material prevented a reliable measurement.
PWC values ranging ~1486 to ~3500 m/s (Figures F26, F28) obtained for Hole U1607A are consistent with the trends observed in the PWL values from the WRMSL.
6.1.6.2. Moisture and density
Sediment samples were taken from the working halves of split cores for measuring MAD on all cores from Hole U1607A. Bulk density values were calculated from moisture and volume measurements (see Physical properties in the Expedition 400 methods chapter [Knutz et al., 2025a]). Sample resolution within each core varied depending on lithology, recovery, and quality, with at least two per core. A total of 193 samples were taken for MAD estimates.
MAD density values are consistently higher than GRA bulk density measured on the WRMSL (Figure F26). Differences of up to 0.2 g/cm3 are observed. Bulk density values for Site U1607 range 1.2–2.2 g/cm3 with a mean of 2.0 g/cm3 and exhibit an overall downhole increase. Trends observed at Site U1607 (Figures F26, F28) for grain density measurements closely follow those observed for bulk density. This likely reflects the grain density of the major lithologic components at this site: quartz (2.65 g/cm3), biotite (~3 g/cm3), common clays, and feldspars (~2.56 g/cm3).
Porosity represents the percent of pore space of wet sediment volume and generally decreases downhole as the sediments compact (Figure F28). Average porosity at Site U1607 is 43% and presents a very constant trend downhole. Maximum discrete porosity values were measured on Core 400-U1607A-1R up to ~86%. Minimum porosity is observed in Core 21R (190 m CSF-A) and is under 33%.
6.2. Core-log-seismic correlation
The seismic facies of the units defined by physical properties are described in Table T10. General changes of seismic facies in the seismic profile correspond to changes in the physical properties. Correlation of the seismic signal in two-way traveltime with depth in meters has been achieved through the construction of distinct velocity models. At Site U1607, velocity models were generated considering P-wave velocities measured in the laboratory (i.e., PWC and PWL), P-wave velocity from the Dipole Sonic Imager (DSI; sonic), and time-depth relations from the VSI experiment (see Downhole measurements in the Expedition 400 methods chapter [Knutz et al., 2025a]). The laboratory P-wave values (PWC and PWL) are very low (average 2020 m/s), resulting in an overexaggerated time-depth correlation. The low velocity values are probably related to core expansion upon resting in the laboratory. The DSI sonic and the VSI check shots result in a very similar time-depth correlation. VSI check shots are evenly distributed along the borehole and provide the most robust time-depth constraints. Thus, the core-log-seismic correlation for Site U1607 was based on the resulting time-depth correlations from the VSI experiment obtained for Hole U1607A (see Downhole logging). The resulting time-depth relationship has been applied in the figures of this chapter.
7. Geochemistry
Samples for headspace gas, interstitial water (IW) chemistry, and bulk sediment geochemistry were analyzed at Site U1607. Headspace hydrocarbon gas measurements revealed high concentrations below 5 m CSF-A, with methane concentrations up to 113,700 ppm. Ethane was found at concentrations up to 725 ppm. Longer chain hydrocarbon gases (propane, butane, and pentane) were detected at low yet consistent levels below 500 m CSF-A. The main findings from IW analysis include low salinity values within the uppermost 200 m of the site. IW iron, manganese, sulfate, and phosphate show elevated concentrations near the seafloor and sharp decreases to low concentrations with depth. Lithium and barium both increase significantly with depth. Elemental analysis of solid material revealed calcium carbonate (CaCO3) contents of largely <1%, although some intervals contained larger amounts (up to 59%). The contents of total organic carbon (TOC) and total nitrogen (TN) increased notably with increasing depth.
7.1. Volatile hydrocarbons
As part of routine environmental protection and safety monitoring, headspace hydrocarbons were analyzed for Hole U1607A (Figure F29). Samples for headspace gas analysis were taken at a resolution of two samples per core (9.6 m advance). A total of 188 samples were analyzed for headspace. Methane (CH4) concentrations were low (<20 ppm) in the uppermost 5 m but increased abruptly to concentrations of 2,600 ppm and higher, with an average concentration around 30,000 ppm and occasionally very high levels up to 113,700 ppm (758 m CSF-A). Ethane (C2H6) concentrations varied between 3 and 725 ppm in headspace samples sampled below 5 m CSF-A. Propane was also detected in most samples below 5 m CSF-A, with concentrations up to 135 ppm. Furthermore, low concentrations of iso-butane, n-butane, and iso-pentane were found sporadically, mostly below 500 m CSF-A, with maximum concentrations of 29, 14, and 13 ppm, respectively.
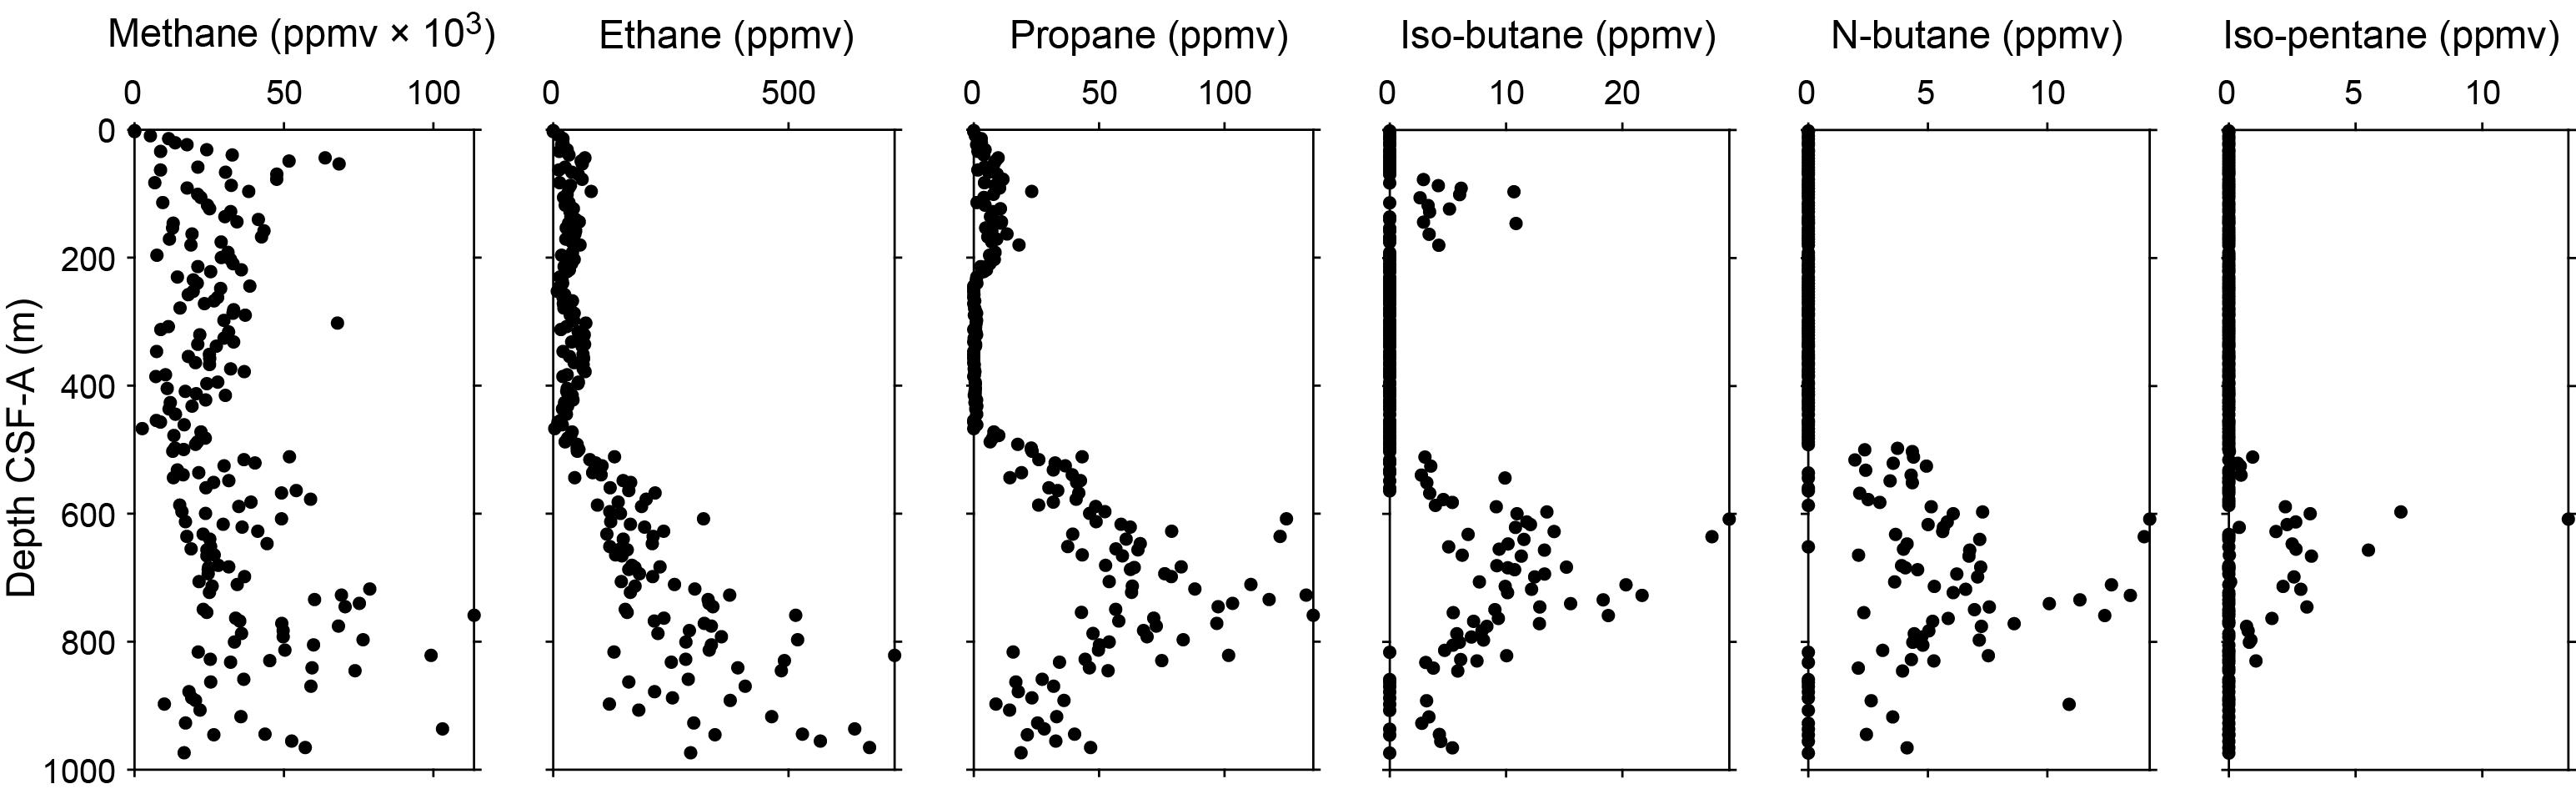
Figure F29. Hydrocarbon gas concentrations.
7.2. Interstitial water chemistry
A total of 83 IW samples were squeezed from 5 or 10 cm whole-round samples. Typical samples yielded up to 30 cm3 of water for subsequent analysis. Well-consolidated sediments from below ~500 m CSF-A yielded minimal water and required a modification of the squeezing protocol that allowed for 30,000 lb squeezing pressures. Additional samples were collected and analyzed: one from the mudline of Hole U1607A and three from the water column using Niskin bottles during a reentry operation at 38, 382, and 707 mbsl. Five Rhizon water samples (approximately one per meter) were collected from Core 1R. Deeper cores were too well consolidated for Rhizon sampling.
7.2.1. pH and alkalinity
The measured pH values range 7.45–8.17 (Figure F30). The mudline sample from Hole U1607A has a pH of 7.66, and pH generally increases over the uppermost 80 m to a maximum of 8.17. Values below this interval range 7.45–8.17 with no discernible trend. Water column sample pH values decrease from shallower to deeper water from 7.71 to 7.62.
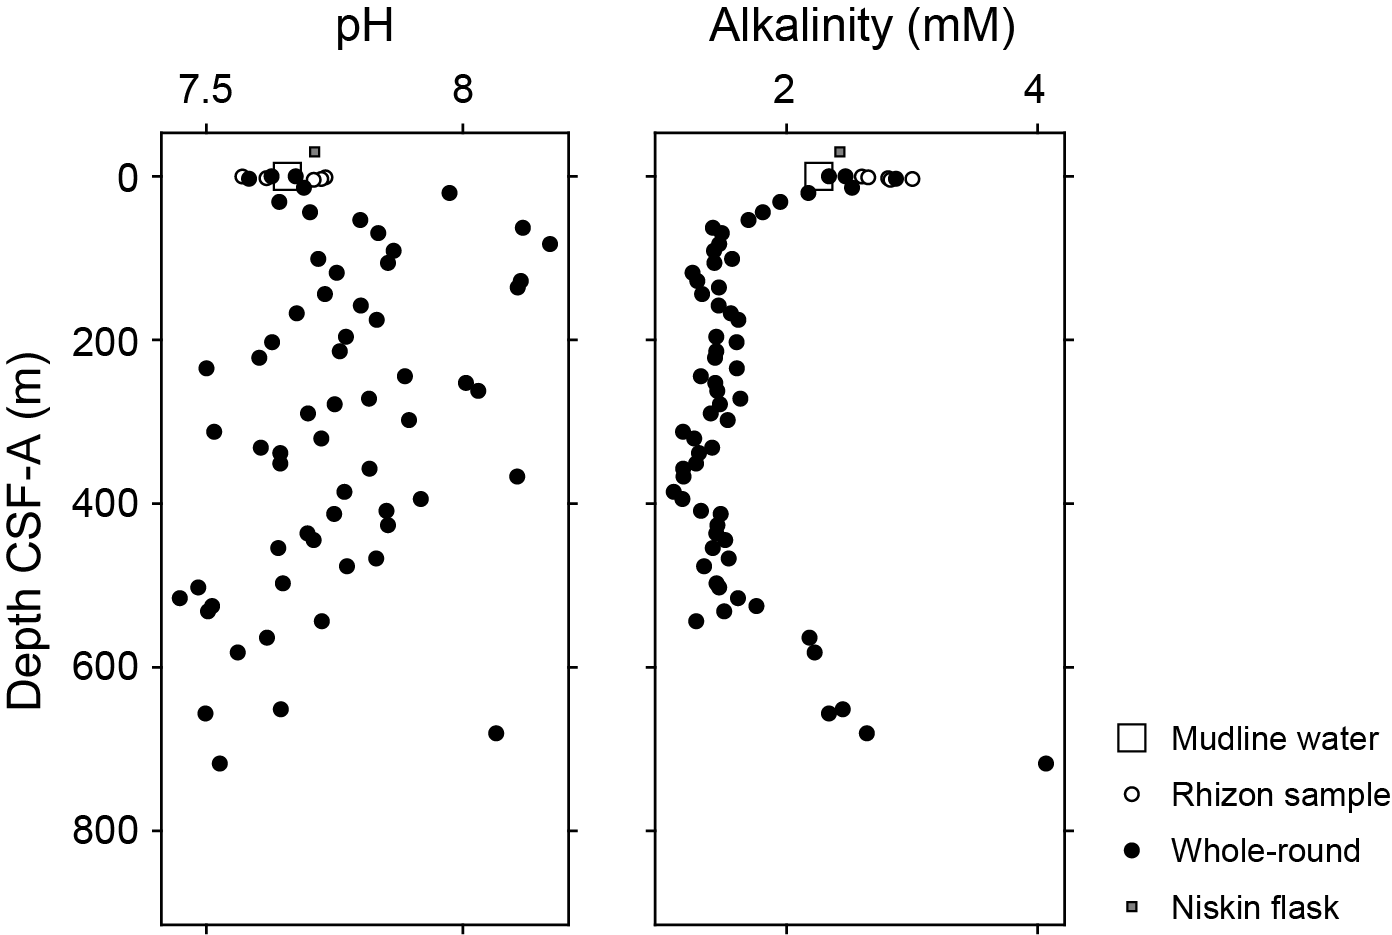
Figure F30. IW pH and alkalinity.
Alkalinity values increase from 2.26 mM at the mudline to a maximum of 3.00 mM at 3.26 m CSF-A (Figure F30) and then decrease downhole to a minimum of 1.25 mM at 117.89 m CSF-A. These values remain largely unchanged to ~500 m CSF-A, below which alkalinity increases to a maximum value of 4.07 mM at 717.65 m CSF-A, which is the deepest sample to yield sufficient water for an alkalinity measurement. Water column samples range 2.3–2.5 mM.
7.2.2. Salinity, sodium, chloride, lithium, potassium, and bromide
Salinity, sodium, chloride, lithium, potassium, and bromide are shown in Figure F31. IW salinity decreases downhole from the mudline water salinity of 33 to a minimum of 27 between 13.92 and 31.25 m CSF-A. Salinity below 32 m CSF-A increases to a value of 33 at 175.4 m CSF-A, below which it remains largely unchanged, although some lower values are observed in the deepest samples.
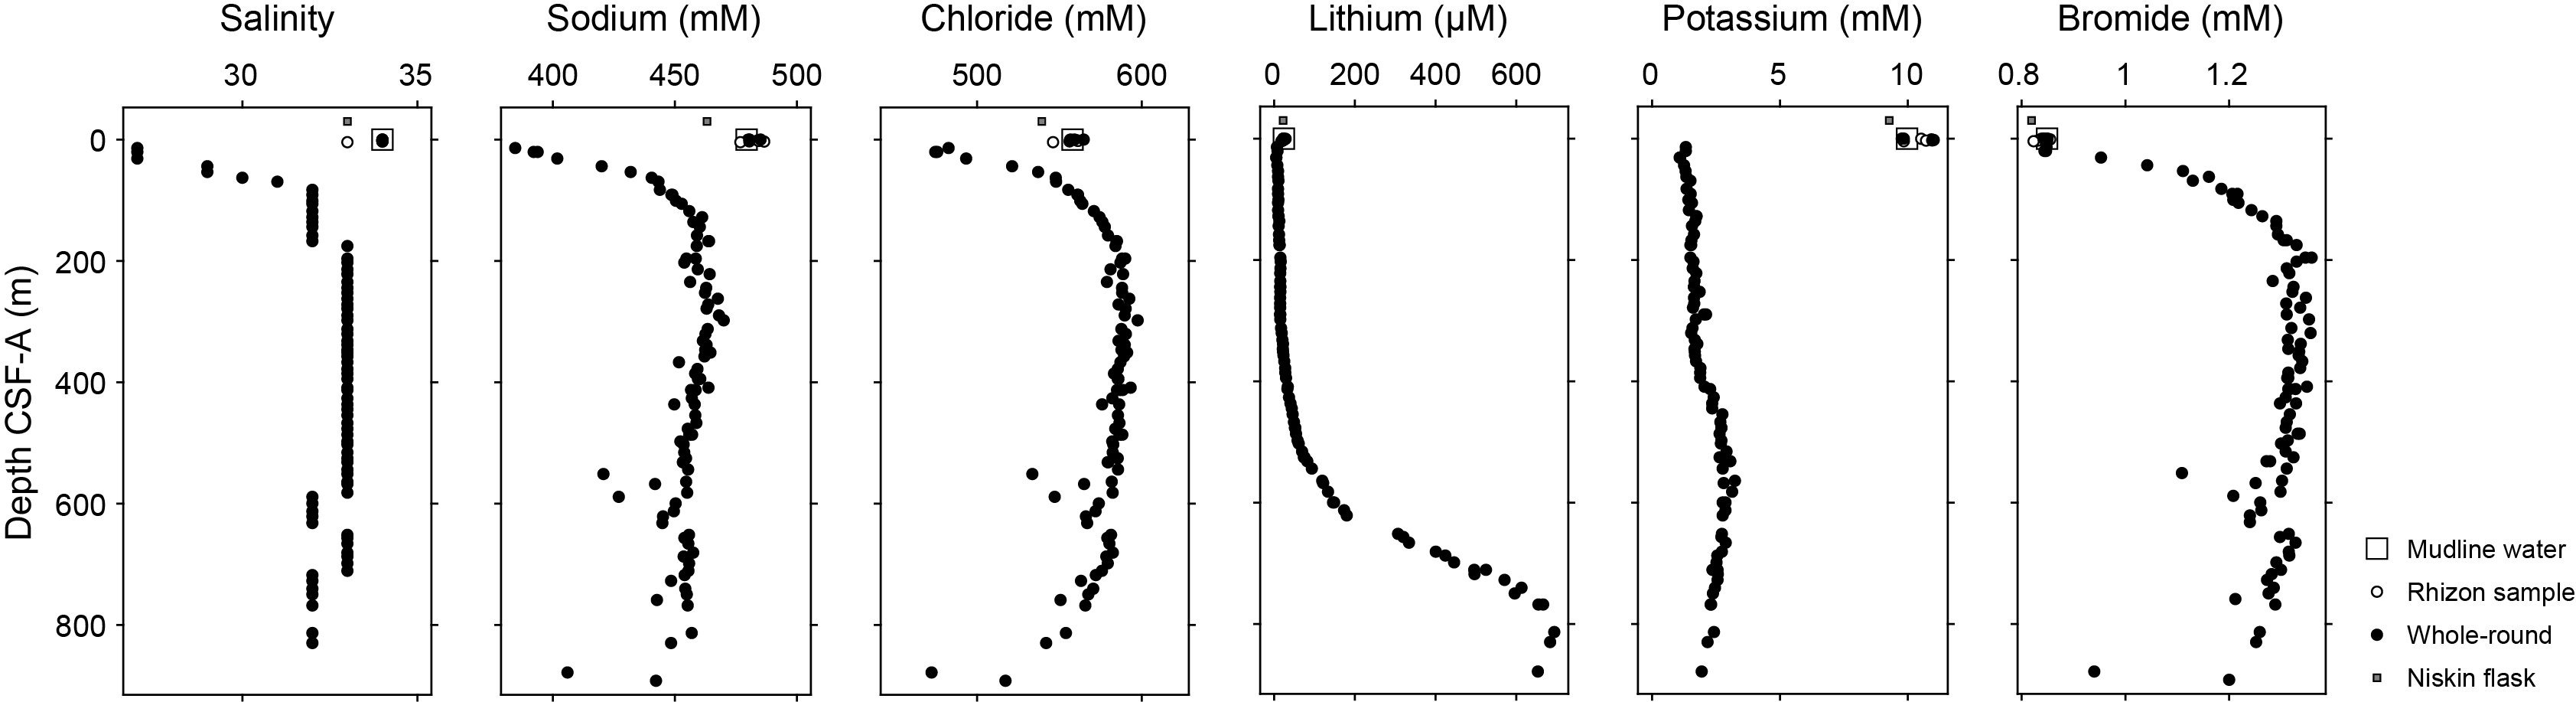
Figure F31. IW salinity, Na, Cl, Li, K, and Br.
Chloride largely follows the salinity trend, decreasing from mudline values of 557.9 mM to a minimum of 474.6 mM at 20.35 m CSF-A. Below this depth, values increase, reaching a broad maximum of ~580 mM between 200 and 600 m CSF-A, below which the values decrease again.
Sodium (as measured by ion chromatography) likewise follows the salinity and chloride trend, decreasing from mudline values of 479.4 mM to a minimum of 384.5 mM at 13.92 m CSF-A. Values then increase roughly to 150 m CSF-A, below which they show no discernible trend.
Lithium varies in the uppermost ~15 m of Hole U1607A, increasing from a mudline value of 23.2 µM to 28.4 µM at 0.25 m CSF-A and then decreasing to a minimum of 5.2 µM at 31.25 m CSF-A. Below this depth, values increase over the remainder of the hole, reaching a peak concentration of 694.8 µM at 813.11 m CSF-A. Lithium concentrations increase gradually from approximately 300 to 600 m CSF-A and then more sharply from ~600 m CSF-A to the bottom of the hole. This increase in lithium downhole distinguishes Site U1607 from the other expedition sites, which show monotonic decreases in the upper sediment with no further change downhole. Lithium concentrations at Site U1607 do not differ significantly in the water column samples from the mudline values.
Potassium (as measured by ion chromatography) decreases in the uppermost pore waters from a maximum value of 11.7 mM at 1.25 m CSF-A to 1.3 mM at 13.92 m CSF-A. Below this depth, potassium increases very gradually to ~575 m CSF-A, where it reaches a broad plateau of ~3 mM and below which it decreases to ~2 mM at the bottom of the hole. There is no observable change in potassium concentrations in the water profile.
Bromide increases in concentration in the uppermost sediment from a minimum of 0.8 mM at 0.25 m CSF-A to a maximum of 1.4 mM at 196.1 m CSF-A. Below this depth, bromide gradually decreases downhole, with several isolated samples yielding values less than 1.2 mM, although most range 1.2–1.3 mM.
7.2.3. Ammonium, manganese, iron, sulfate, phosphate, and boron
Ammonium, manganese, iron, sulfate, phosphate, and boron concentrations are shown in Figure F32. Ammonium increases from 4 µM in the mudline water to 2685 µM at 13.92 m CSF-A in Hole U1607A. Ammonium concentrations then gradually increase downhole, reaching a maximum of 4095 µM at 680.69 m CSF-A, but then decrease slightly to 3469 µM at the deepest measured value.
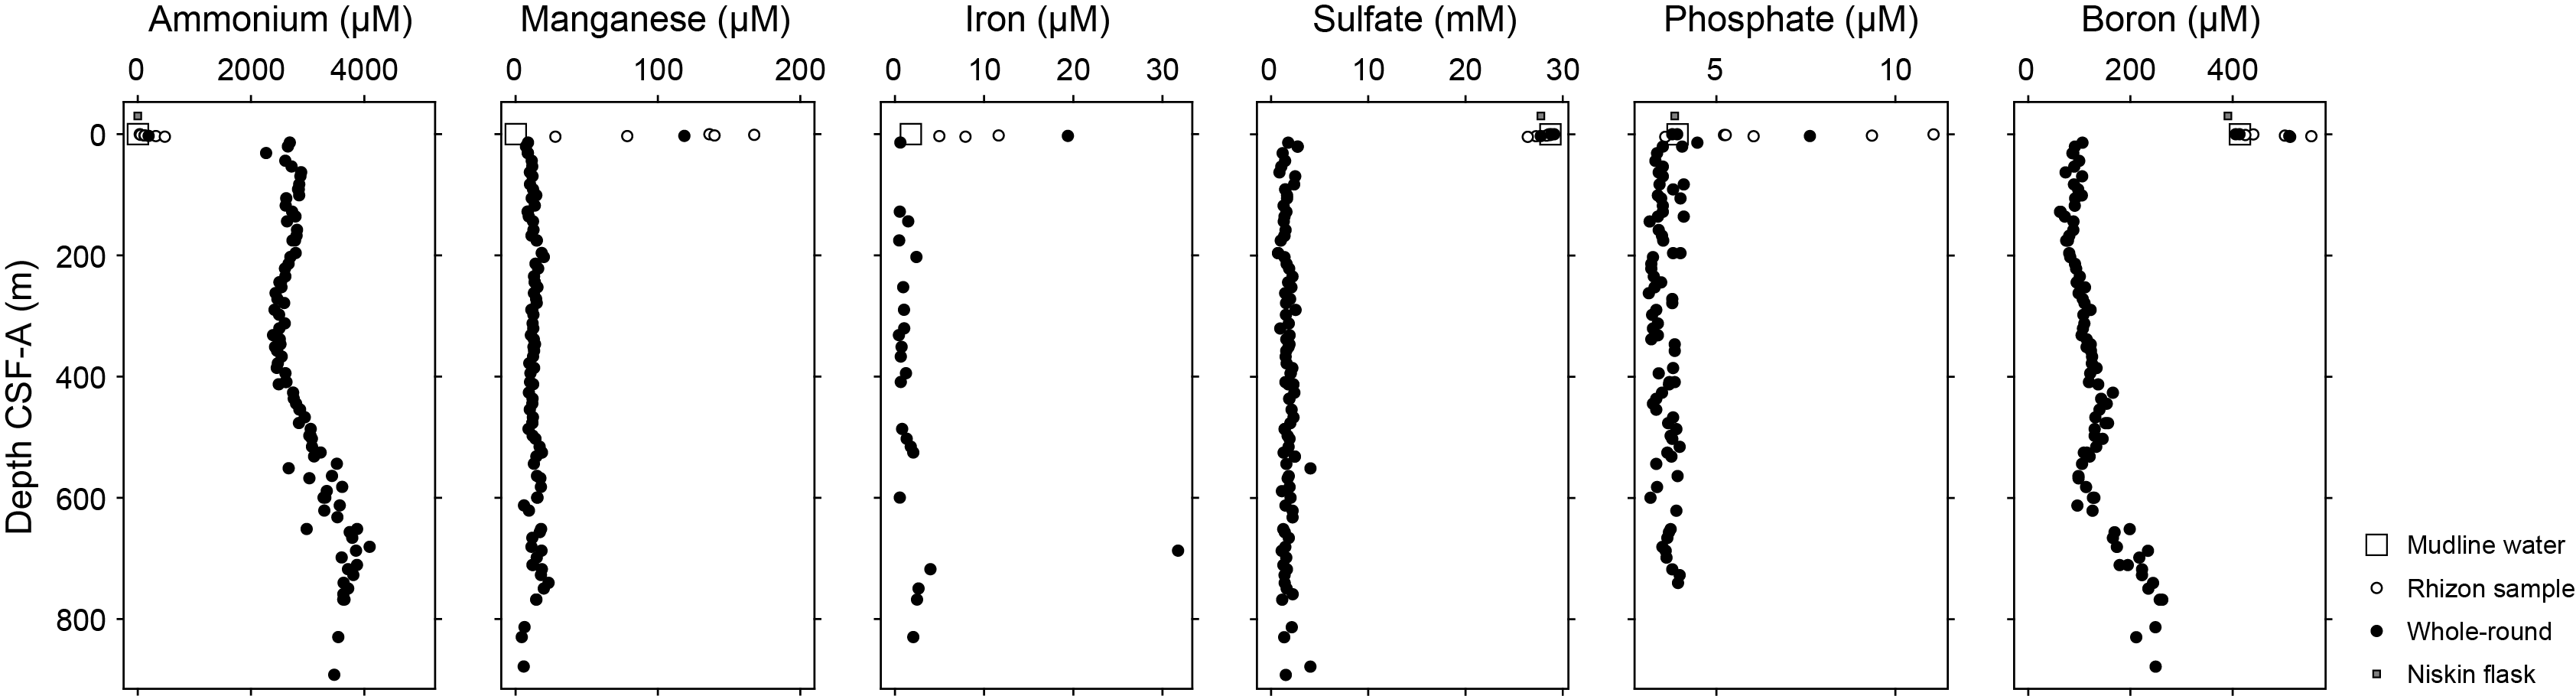
Figure F32. IW ammonium, Mn, Fe, sulfate, phosphate, and B.
Dissolved manganese increases from trace quantities at the sediment/water interface to a maximum of 167 µM at 1.25 m CSF-A, below which its concentration remains roughly constant downhole between 5 and 20 µM.
Iron increases in concentration in the IW from trace concentrations at the sediment/water interface to a maximum of 19 µM at 2.96 m CSF-A. Below 13.92 m CSF-A, iron concentrations are generally less than 1 µM and frequently below the instrument detection limit, with sporadic higher values (generally less than 5 µM) below 515.53 m CSF-A.
Sulfate concentrations decrease sharply downhole from seawater concentrations of 28 mM to ~1 mM over the uppermost 13.92 m. Water extracted below this depth is consistently low in sulfate, typically <2 mM, with no sample exceeding 4 mM.
Phosphate concentrations increase from a seawater concentration of 3.9 µM to a maximum of 11.1 µM at 0.25 m CSF-A. Values decrease back to approximately 3–4 µM within the uppermost 20 m and remain consistent downhole.
Boron decreases from a seawater concentration of 414.3 µM at the mudline to 106.1 µM at 13.92 m CSF-A (Figure F32). Boron concentrations are relatively constant below this depth and then show a general increase from approximately 620 m CSF-A to the bottom of Hole U1607A.
7.2.4. Calcium, magnesium, strontium, silicon, and barium
Calcium, magnesium, strontium, silicon, and barium concentrations are shown in Figure F33. Calcium concentrations (as measured by inductively coupled plasma–atomic emission spectroscopy [ICP-AES]) generally increase in Hole U1607A from a seawater value of 10.2 mM at the mudline to a maximum value of 40.2 mM at 486.32 m CSF-A. Below this depth, calcium concentrations show an overall decrease, reaching a value of 23.2 mM at 878.14 m CSF-A.
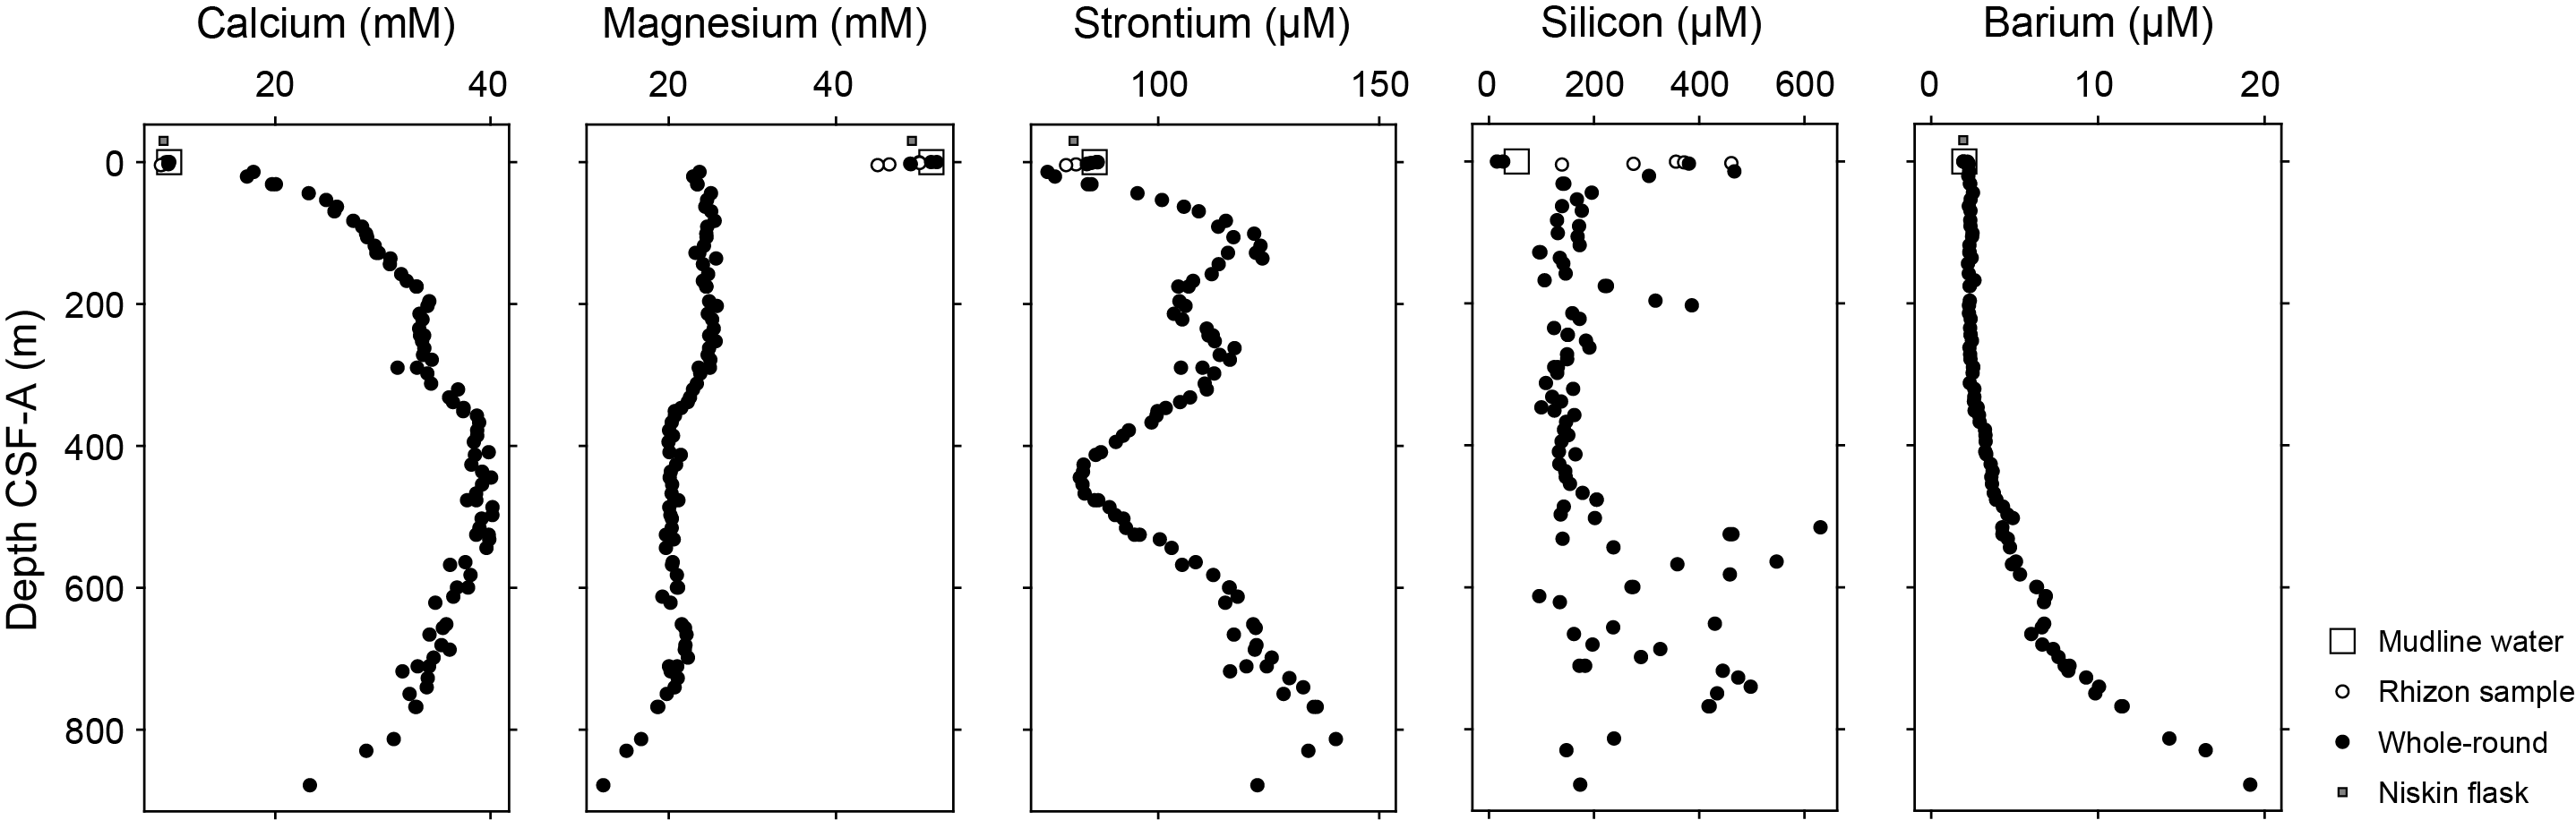
Figure F33. IW Ca, Mg, Sr, Si, and Ba.
Magnesium concentrations (as measured by ICP-AES) decrease from a mudline value of 51.4 mM to 23.7 mM at 13.92 m CSF-A. Magnesium values remain consistent, generally between 23 and 26 mM, to 320.40 m CSF-A. Below this depth, magnesium values decrease and generally range 18–22 mM. Magnesium decreases further from 767.73 m CSF-A to the bottom of the hole, reaching a minimum of 12.2 mM at 878.1 m CSF-A, the deepest pore water measurement for the site.
Strontium concentrations in Hole U1607A show multiple changes in trend and range from a minimum value of 74.9 µM to a maximum of 140.2 µM. Notably, strontium reaches a local minimum from approximately 436 to 454 m CSF-A.
Dissolved silicon concentrations increase from a minimum value of 53.1 µM at the mudline to a local maximum of 461.0 µM at 0.75 m CSF-A and then decrease, reaching 140.1 µM at 31.25 m CSF-A. From this depth to 502.43 m CSF-A, silicon generally ranges 100–200 µM, with elevated concentrations from 175.4 to 202.7 m CSF-A. Below 502.43 m CSF-A, silicon concentrations range 95.8–630.5 µM, with no significant trends.
Dissolved barium concentrations remain relatively constant from the mudline to 312.18 m CSF-A, ranging ~1.9 to ~2.5 µM. Below this depth, concentrations gradually increase, reaching a maximum of 19.1 µM at the deepest measurement (878.14 m CSF-A).
7.3. Bulk sediment geochemistry
7.3.1. Carbon, nitrogen, and carbonate
The shipboard solid phase analysis at Hole U1607A from all major lithostratigraphic units identified consisted of measurements of CaCO3, total carbon (TC), and TN using shipboard sampling by plastic cylinder and other means of sampling from more lithified sections. Discrete solid phase samples were taken at an average resolution of two samples per core (9.6 m advance), depending on the variety of the core lithology, with a total of 183 samples taken. TOC was calculated from measurements of CaCO3 and TC. Downhole profiles of CaCO3, TOC, and TN contents (weight percent) at Site U1607 are shown in Figure F34. The content of CaCO3 is below 1% across most samples; however, individual intervals contain larger amounts of CaCO3, with contents up to 59%. Slightly higher CaCO3 concentrations (approximately 3%) are observed at 700–850 m CSF-A. The TOC content ranges 0.12%–1.8% throughout Hole U1607A, showing a long-term increasing trend with depth. The TN content varies from 0.01% to 0.1% throughout all samples analyzed.
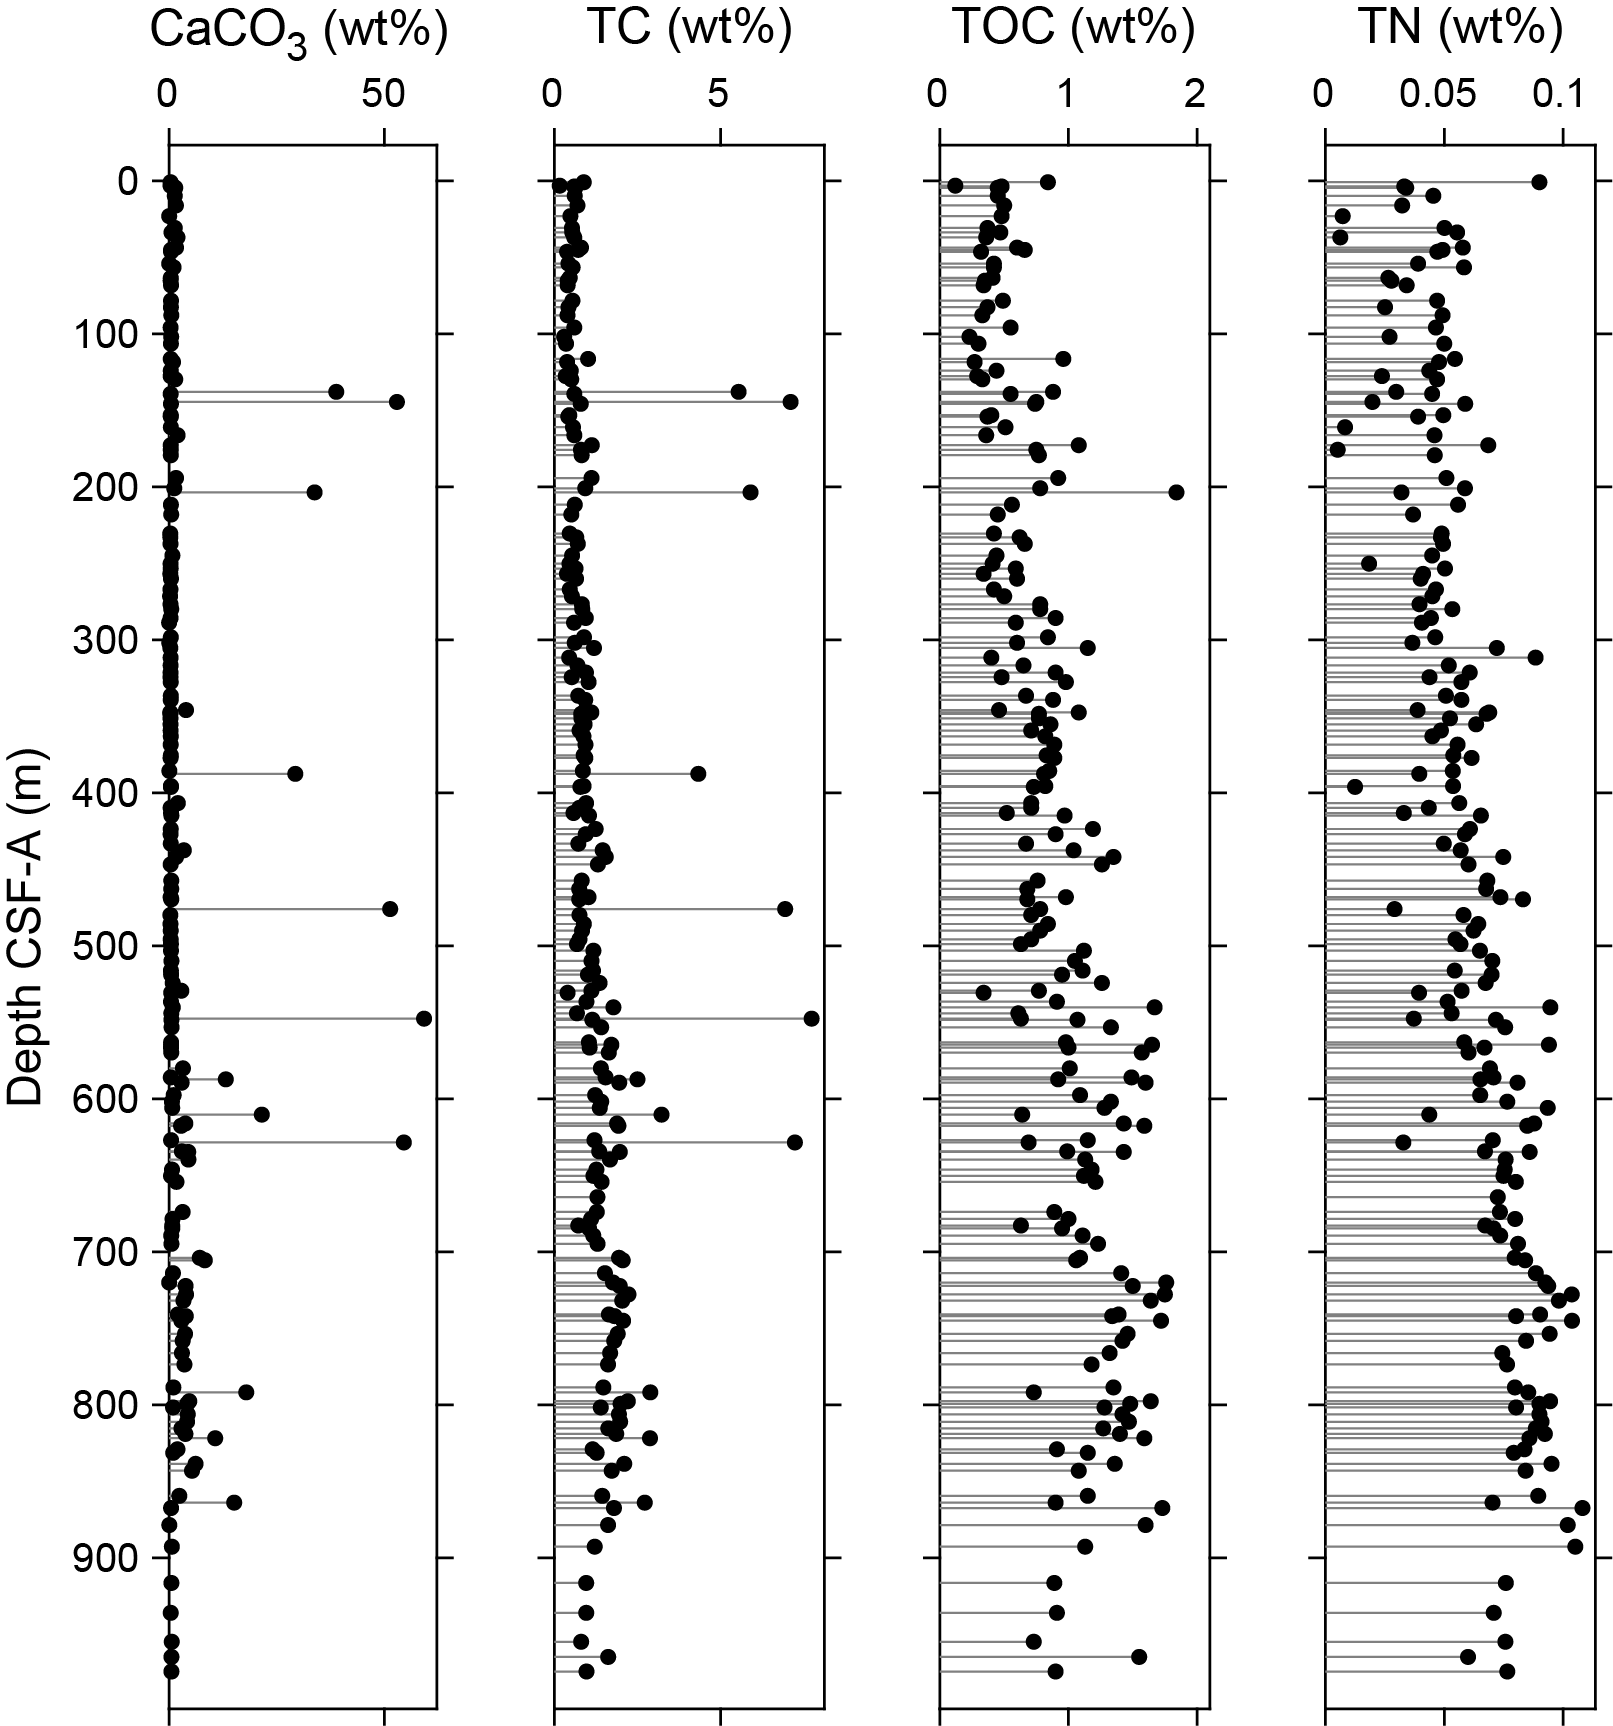
Figure F34. CaCO3, TC, TOC, and TN.
8. Stratigraphic correlation
A single hole was drilled at Site U1607 to 978 m CSF-A. Downhole logging was implemented to 939 m CSF-A upon completion of the coring activities and aimed to establish connections to seismic data and to provide additional data from cored (but possibly not recovered) intervals (see Downhole logging). The quality of the borehole was very good, and the logging data provide a continuous record that may allow better interpretation of the depth positions of recovered material.
The recovery in Hole U1607A was 77%, providing a good representation of the cored formation lithologies, despite coring gaps. However, drilling deformation related to RCB core disturbances, shattered core liners, and other issues impacting core quality mean that the stratigraphic coherence of the recovered (sediments is variable. To analyze the extent of the core gaps and further improve the depth assessment of the recovered material, we correlated the physical properties measured on the cores to the downhole logs obtained in the borehole.
Whole-round MS and NGR measured on the cores were imported into Correlator (v. 4) following the standard procedure (see Stratigraphic correlation in the Expedition 400 methods chapter [Knutz et al., 2025a]). Downhole MS and natural gamma ray data were also imported into the software as a single core table. Ties between downhole data and core data were assessed based on visual and statistical matches of the properties. This procedure has some significant uncertainties due to the presence of large-scale features in the downhole logging data that do not resemble the record measured on cores in the laboratory. However, the overall cyclicity is well matched between the downhole logs and the cores. Therefore, the relative depth offset of each core provides information that confidently improves the depth constraints of the cores (Table T11), particularly for intervals of low recovery (Figure F26). The resulting depth scale is referred to as core composite depth below seafloor, Method A (CCSF-A), even though it is not the scale resulting from the alignment of two or more holes. The difference between depth CSF-A and depth CCSF-A varies downhole from a few centimeters to 3 m (Figure F35). The correlation confidence also varies downhole, particularly considering that below 470 m CCSF-A only NGR was used to implement the correlation due to very low MS values. The depth constraints provided by the downhole logging data allow an improved interpretation of the formation lithology, age, and physical properties.
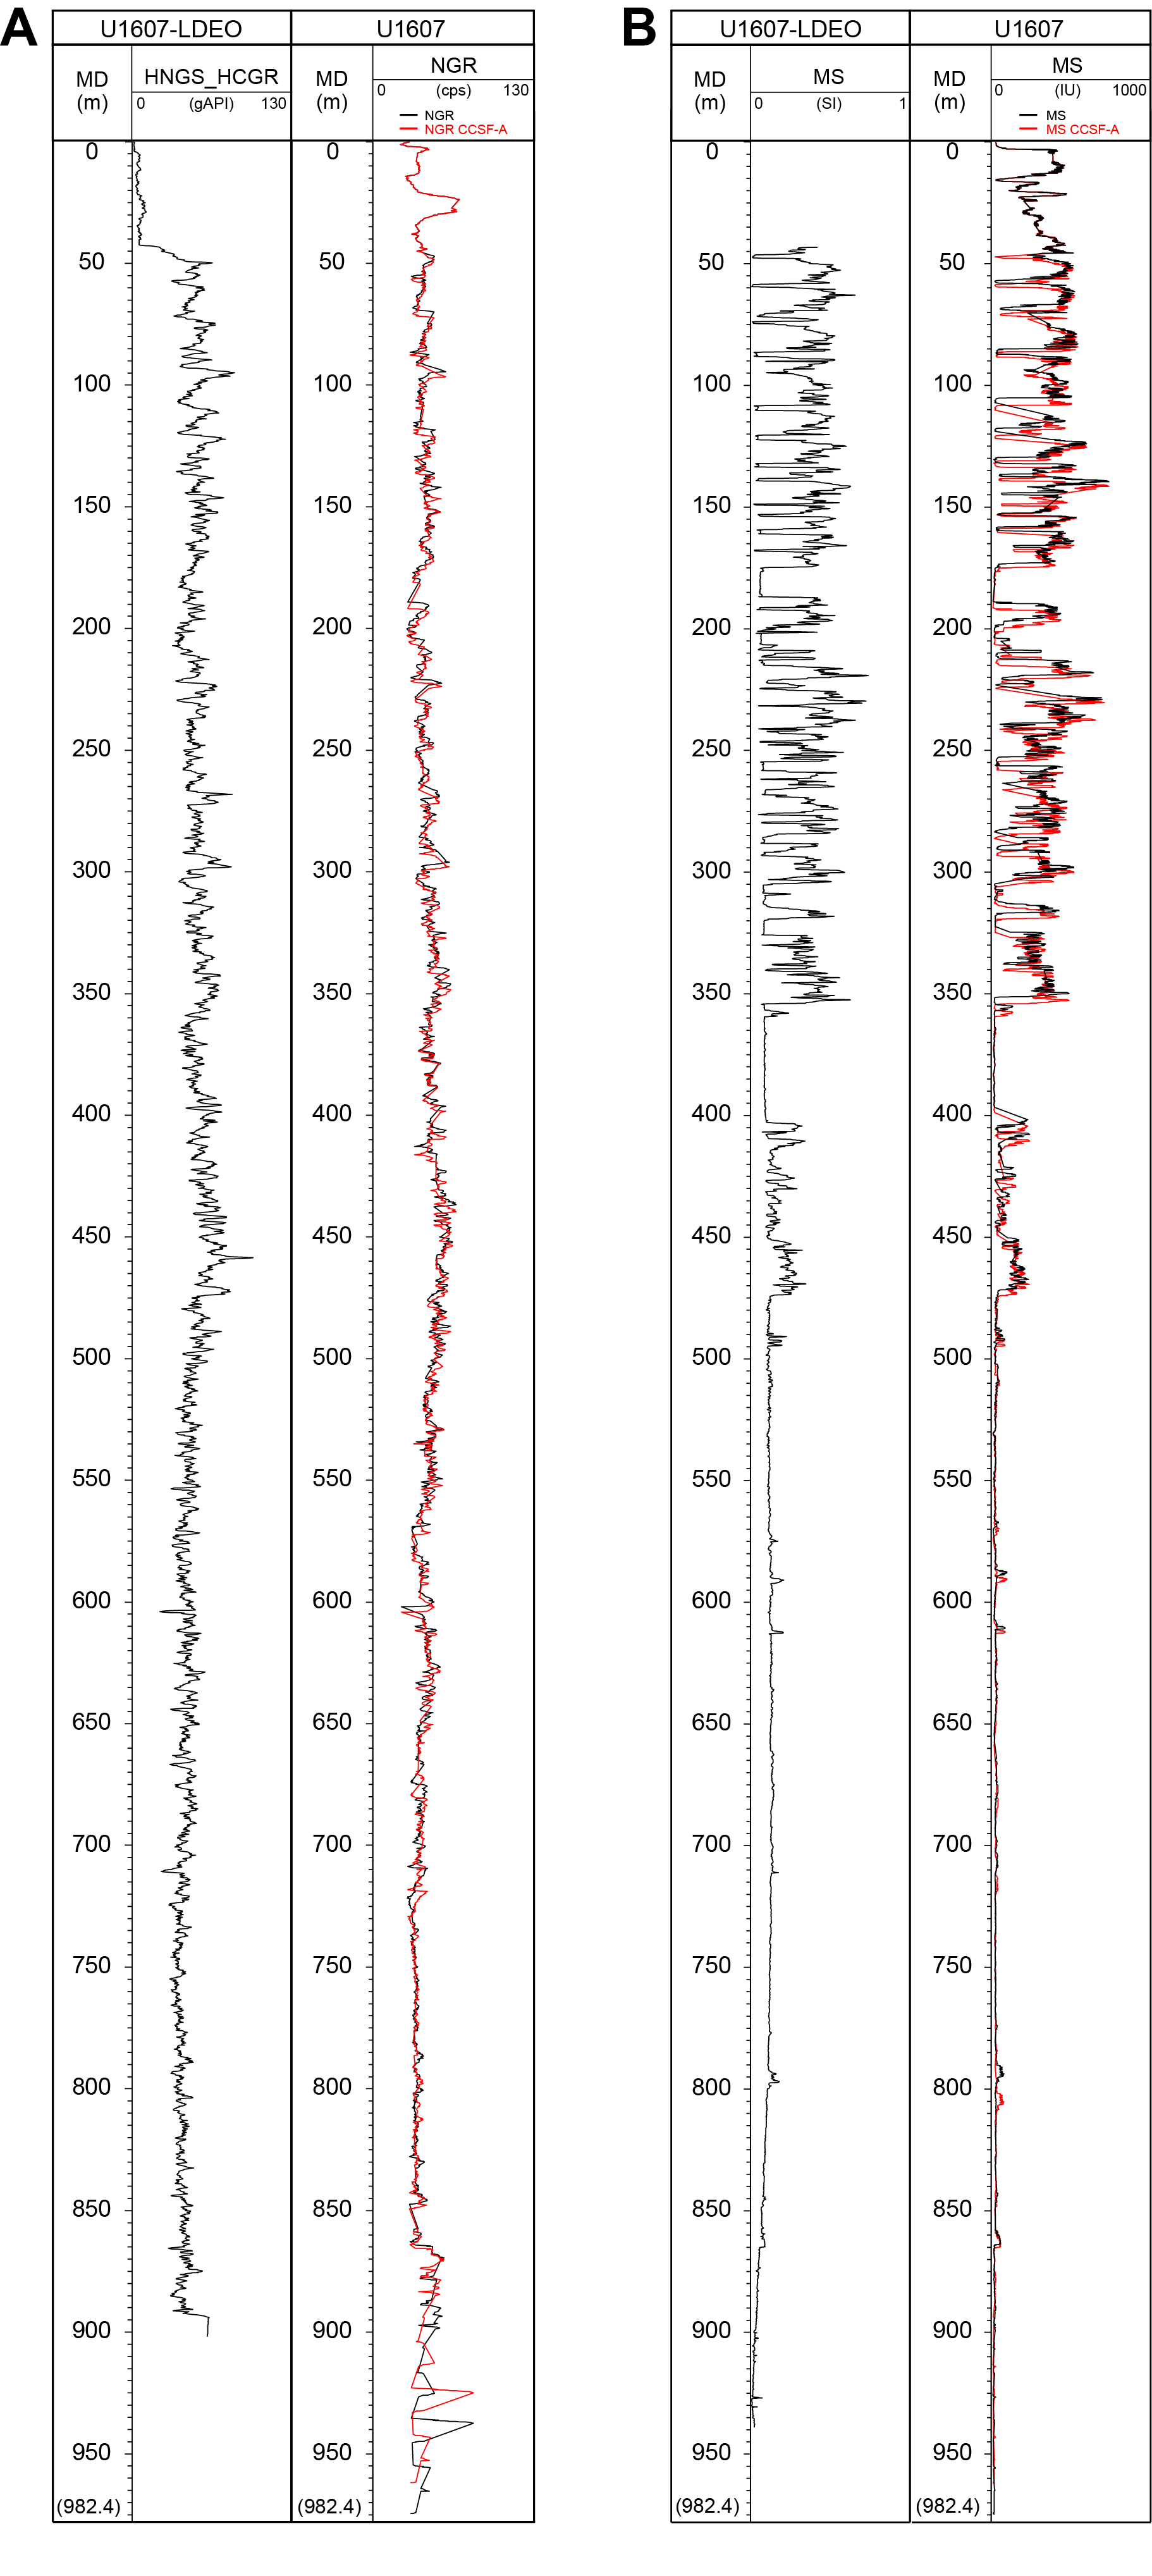
Figure F35. NGR and MS data from downhole and core logging.
9. Age model
The initial age constraints for Site U1607 are based on magnetostratigraphic interpretations of inclination with additional biostratigraphic constraints (Figure F18). The diatom P. barboi is present at 198.7 m CSF-A and has an age range of 3.31–9.57 Ma (Koç and Scherer, 1996). Another possible constraint is from the co-occurrence of two diatom resting spore morphospecies (G. rogersii and G. decoratum) at 199.54 m CSF-A, whose age ranges overlap between 16 and 23 Ma in the North Atlantic (Suto et al., 2008). These two observations are mutually inconsistent and lead to two possible age models (Table T12). Possible hiatuses were also identified in the seismic data around 32, 64, and 73 m CSF-A (Figure F2), which eliminates polarity zones above 73 m as possible constraints. A third biostratigraphic tie point includes the presence of the dinocyst species C. diminituvum at 24.41 m CSF-A, which implies a late Miocene to early Pliocene age based on their presence in Baffin Bay at ODP Site 645 during this period (Aubry et al., 2021). Because the depth of this interval is above the identified hiatus at 32 m, this constraint does not exclude one of the two models.
The first age model (Figure F36) is based on the occurrence of P. barboi at 198.7 m CSF-A. In this model, the transition from normal polarity (N2) to reversed polarity (R2) is correlated to the transition from Chron C4r.1n to Chron C4r.1r, and the lowest transition from normal polarity (N7) to reversed polarity (R6) is correlated to the transition from Chron C4Ar.2n to Chron C4Ar.2r (Model 1 in Table T12). The age-depth plot for this age model is shown in Figure F37A. The average sediment accumulation rate for this age model is 19 cm/ky.
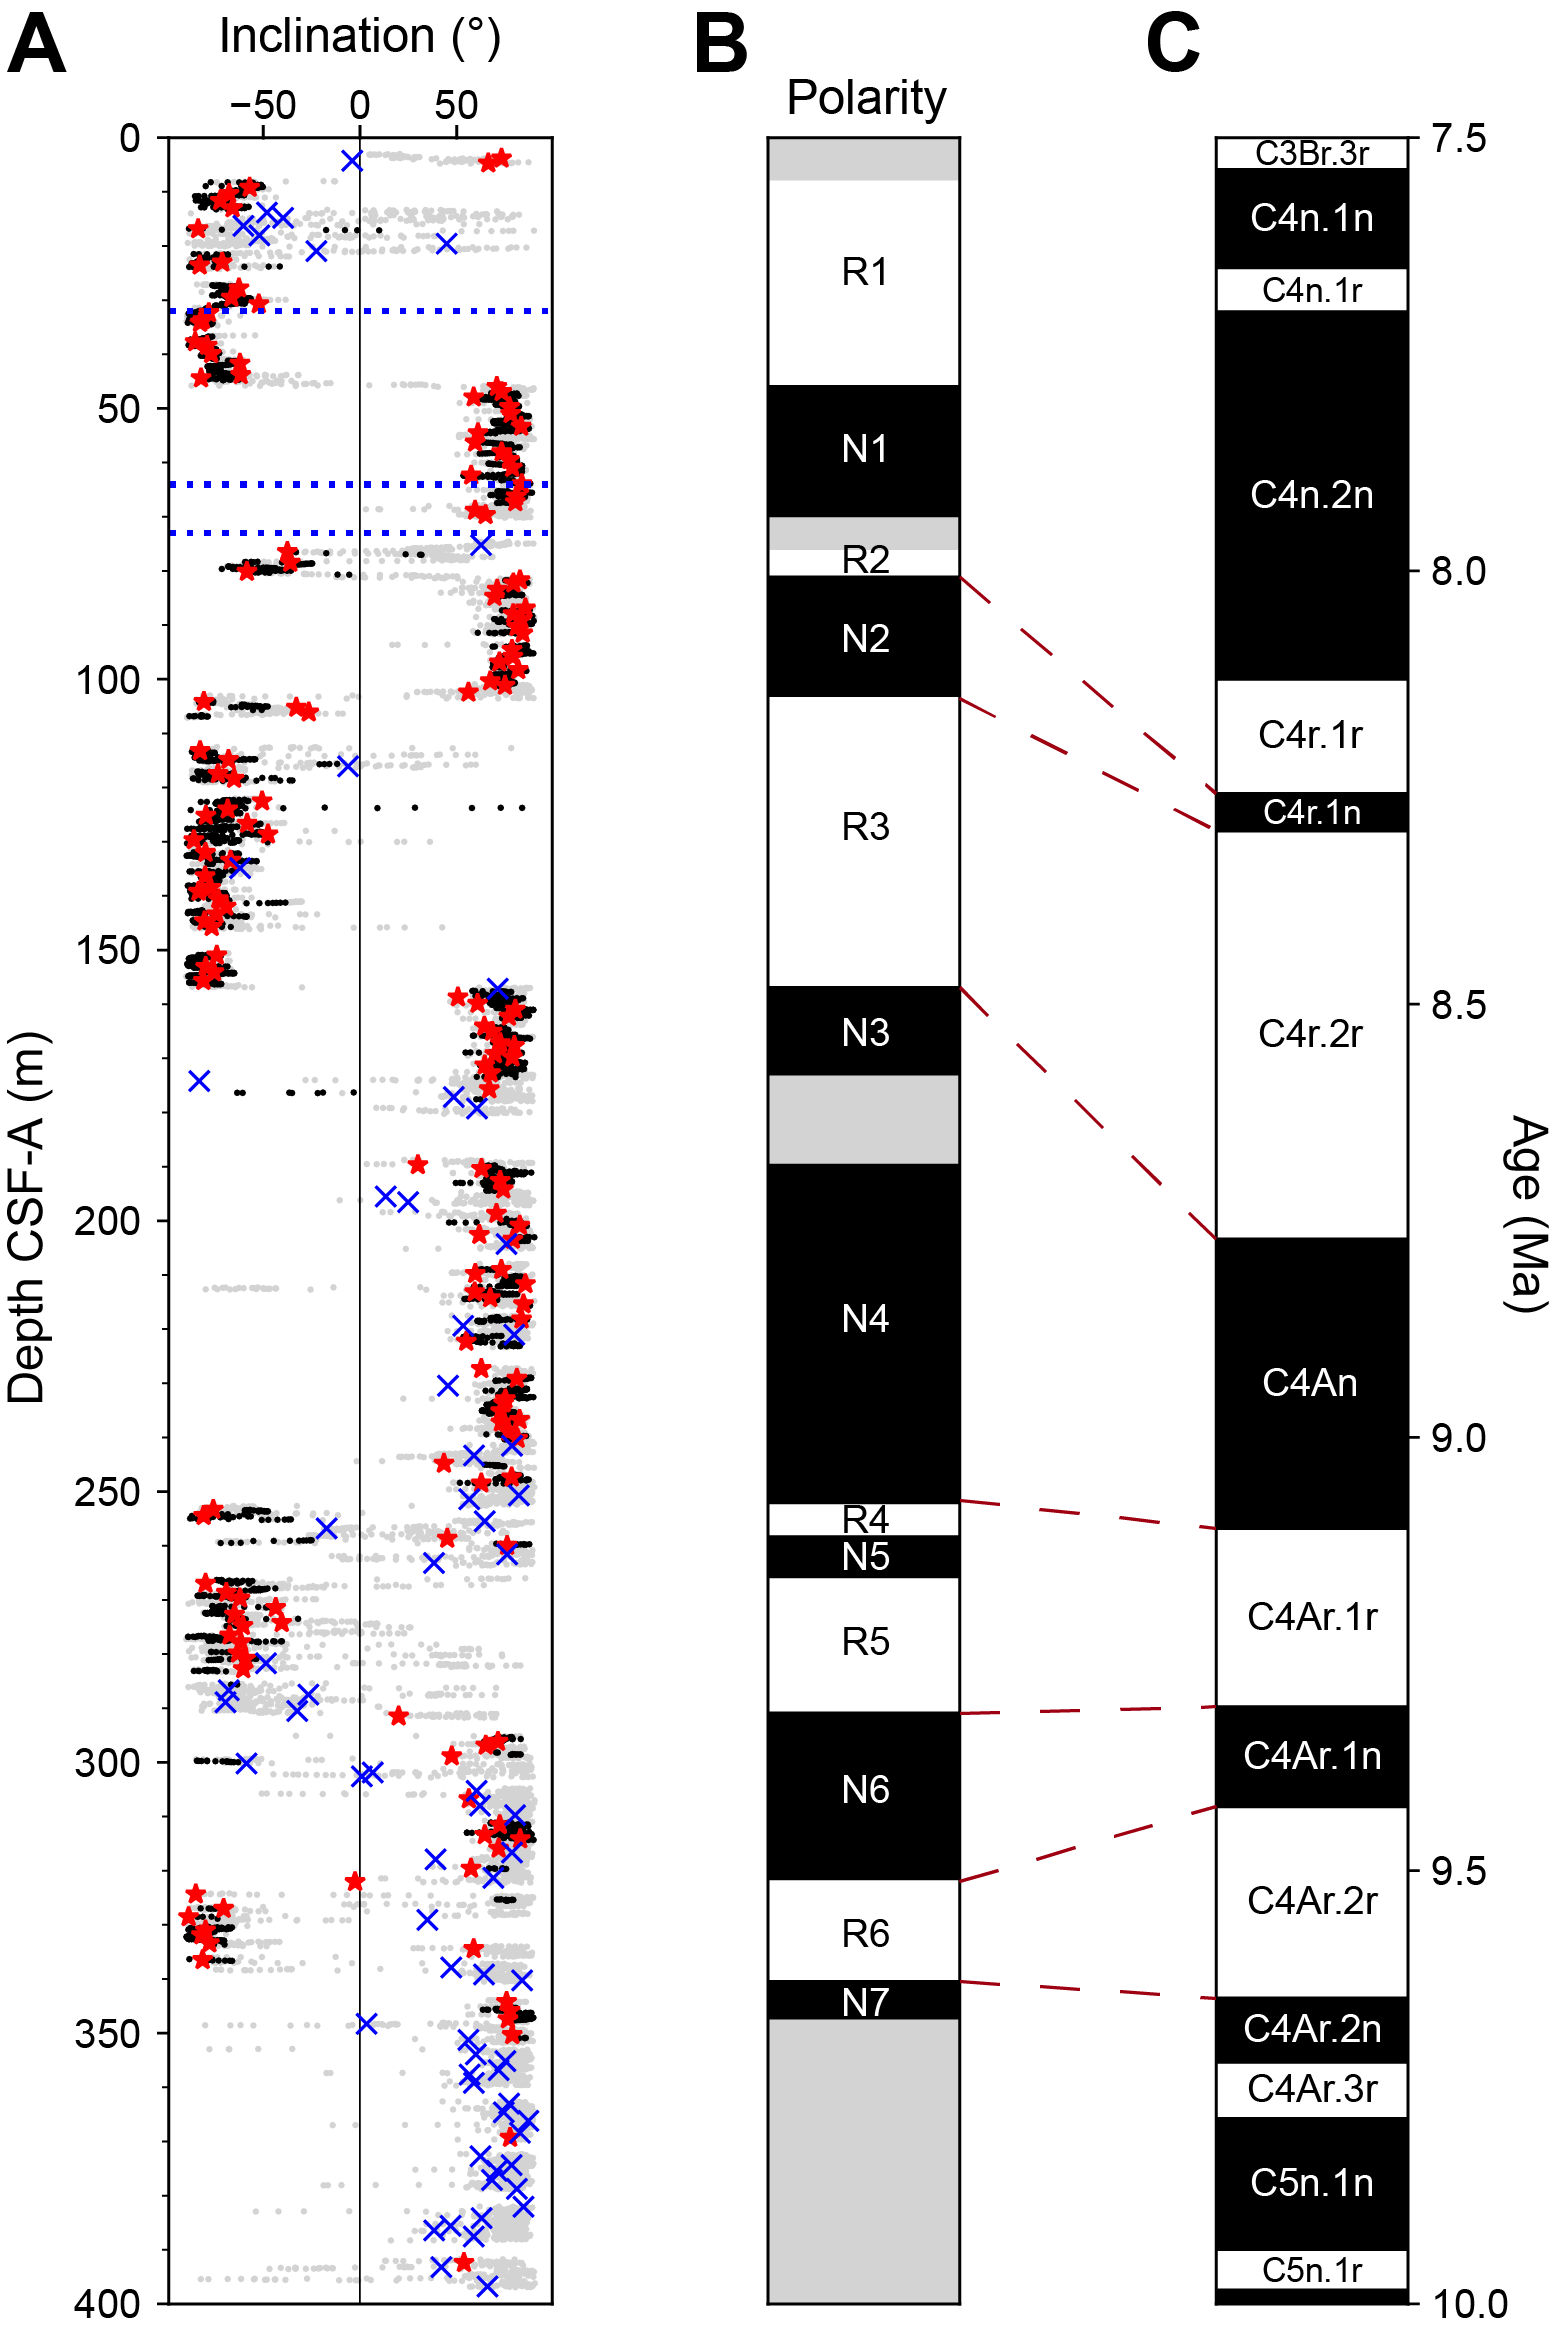
Figure F36. Magnetostratigraphic correlation for Age Model 1.
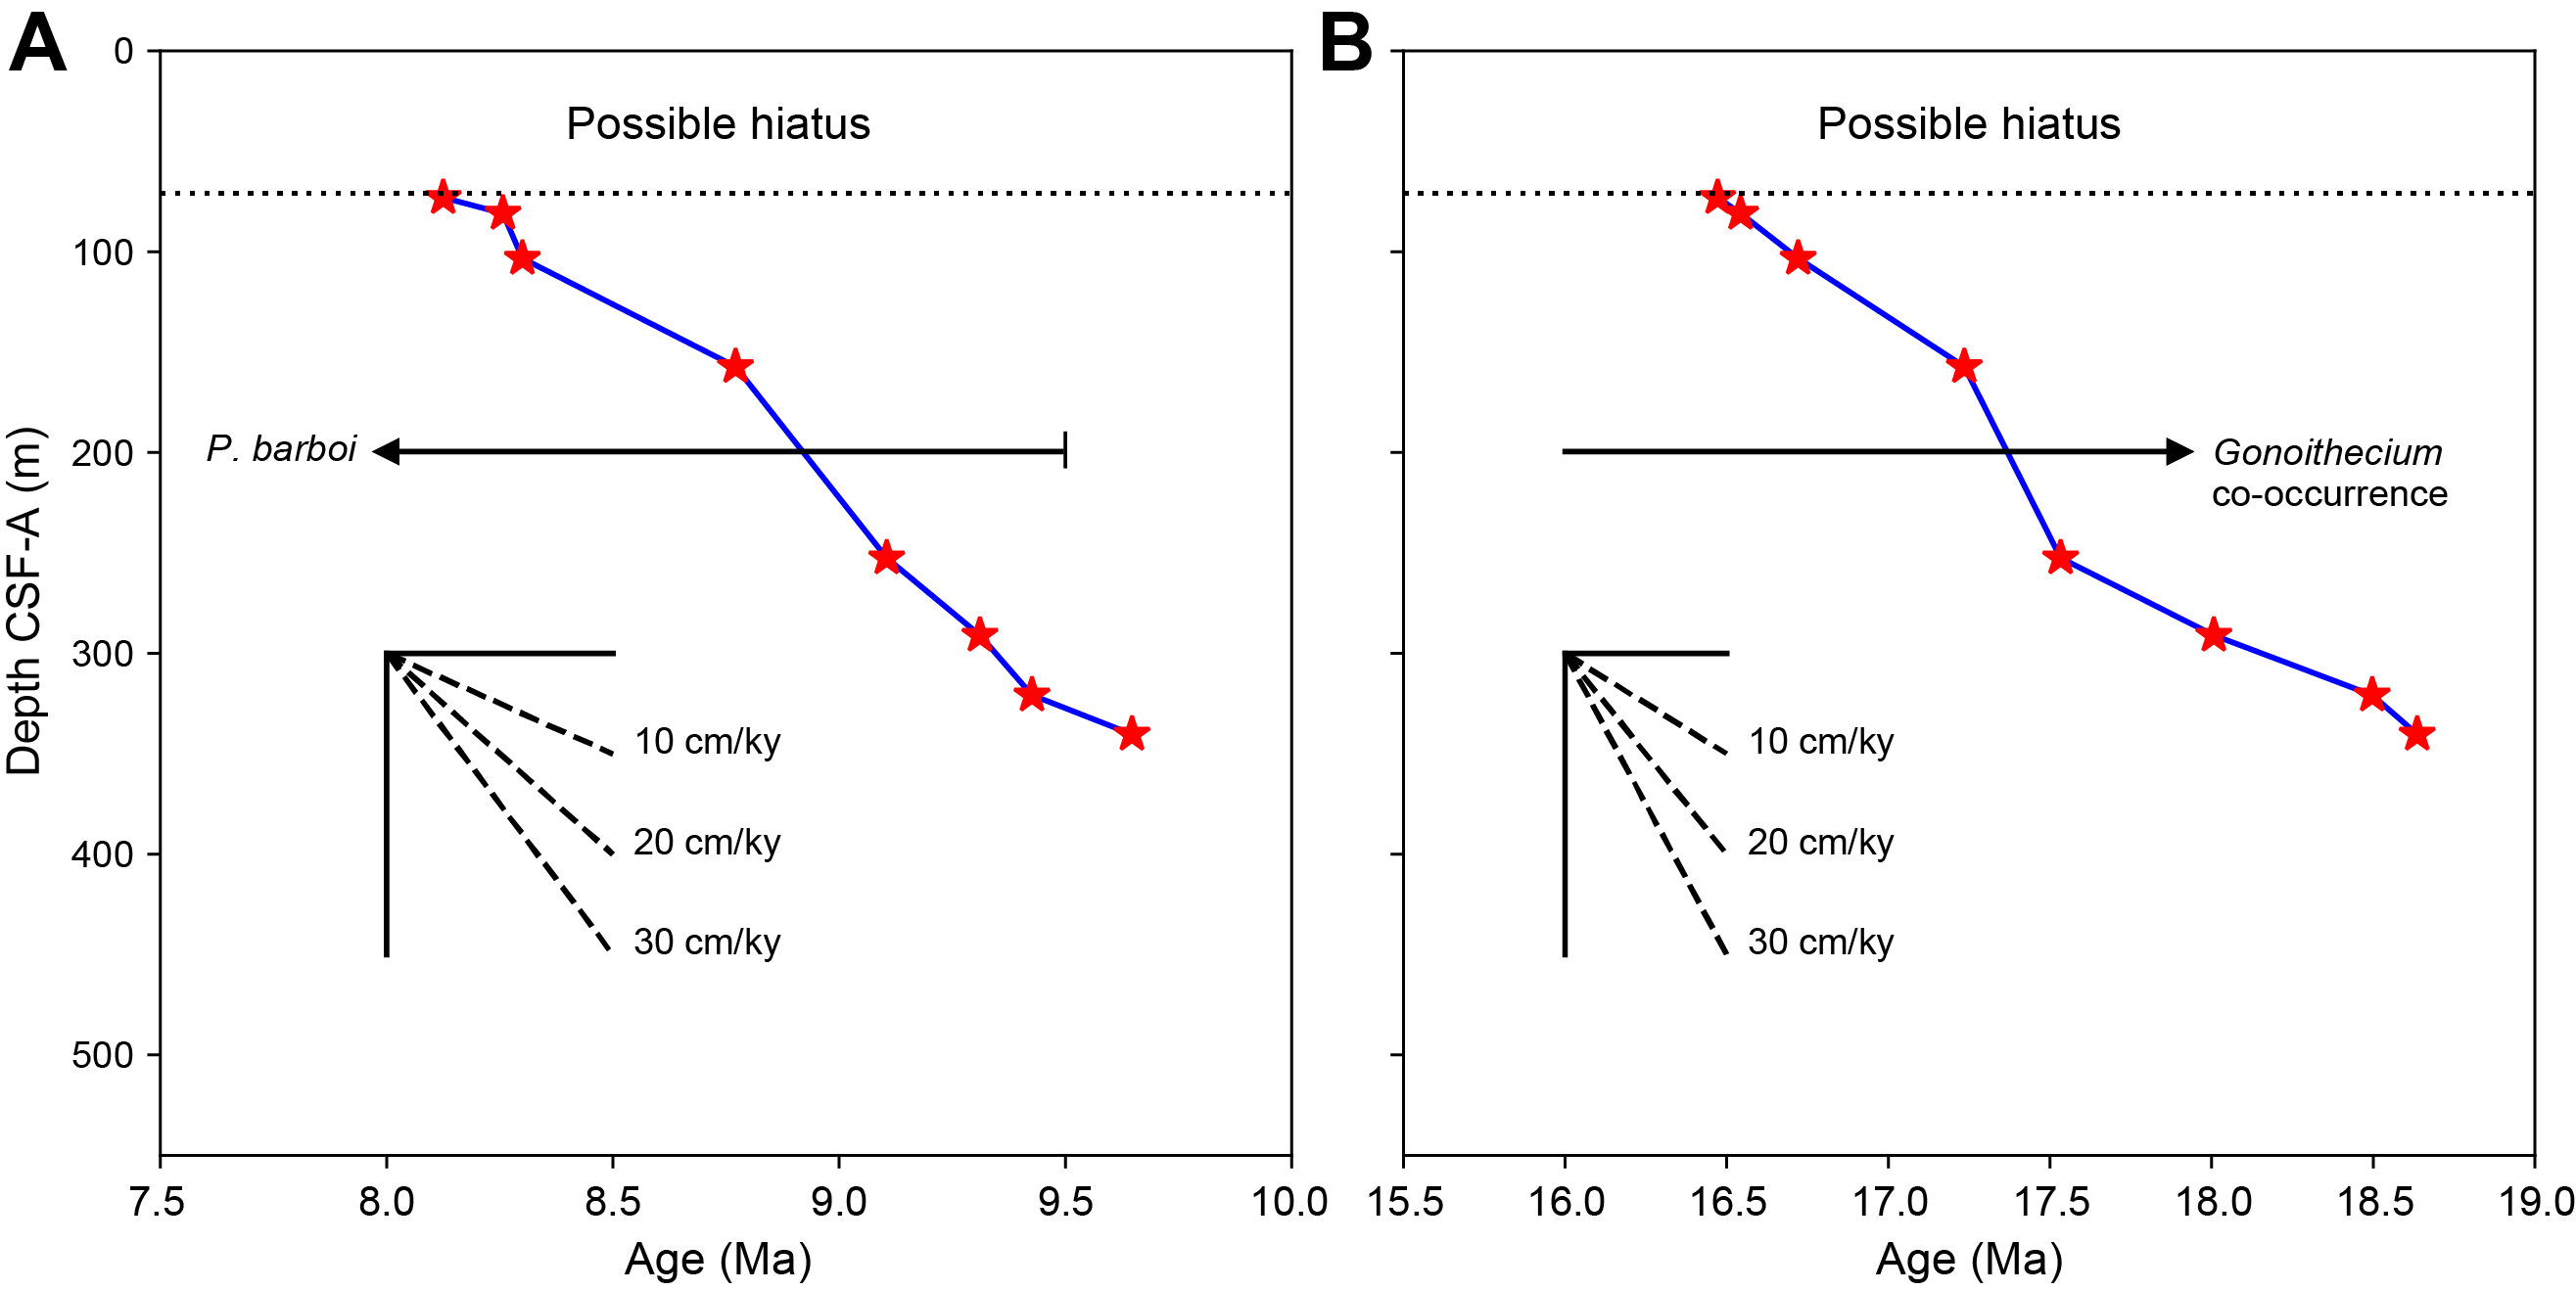
Figure F37. Age-depth plots.
The second age model (Figure F38) is based on the co-occurrence of the G. rogersii and G. decoratum species. In this model, the transition from normal polarity (N2) to reversed polarity (R2) is correlated to the transition from Chron C5Cn.3n to Chron C5Cn.2r and the lowest transition from normal polarity (N7) to reversed polarity (R6) is correlated to the transition from Chron C6n to Chron C5Er (Model 2 in Table T12). The age-depth plot for this age model is shown in Figure F37B. The average sediment accumulation rate for this age model is 13 cm/ky.
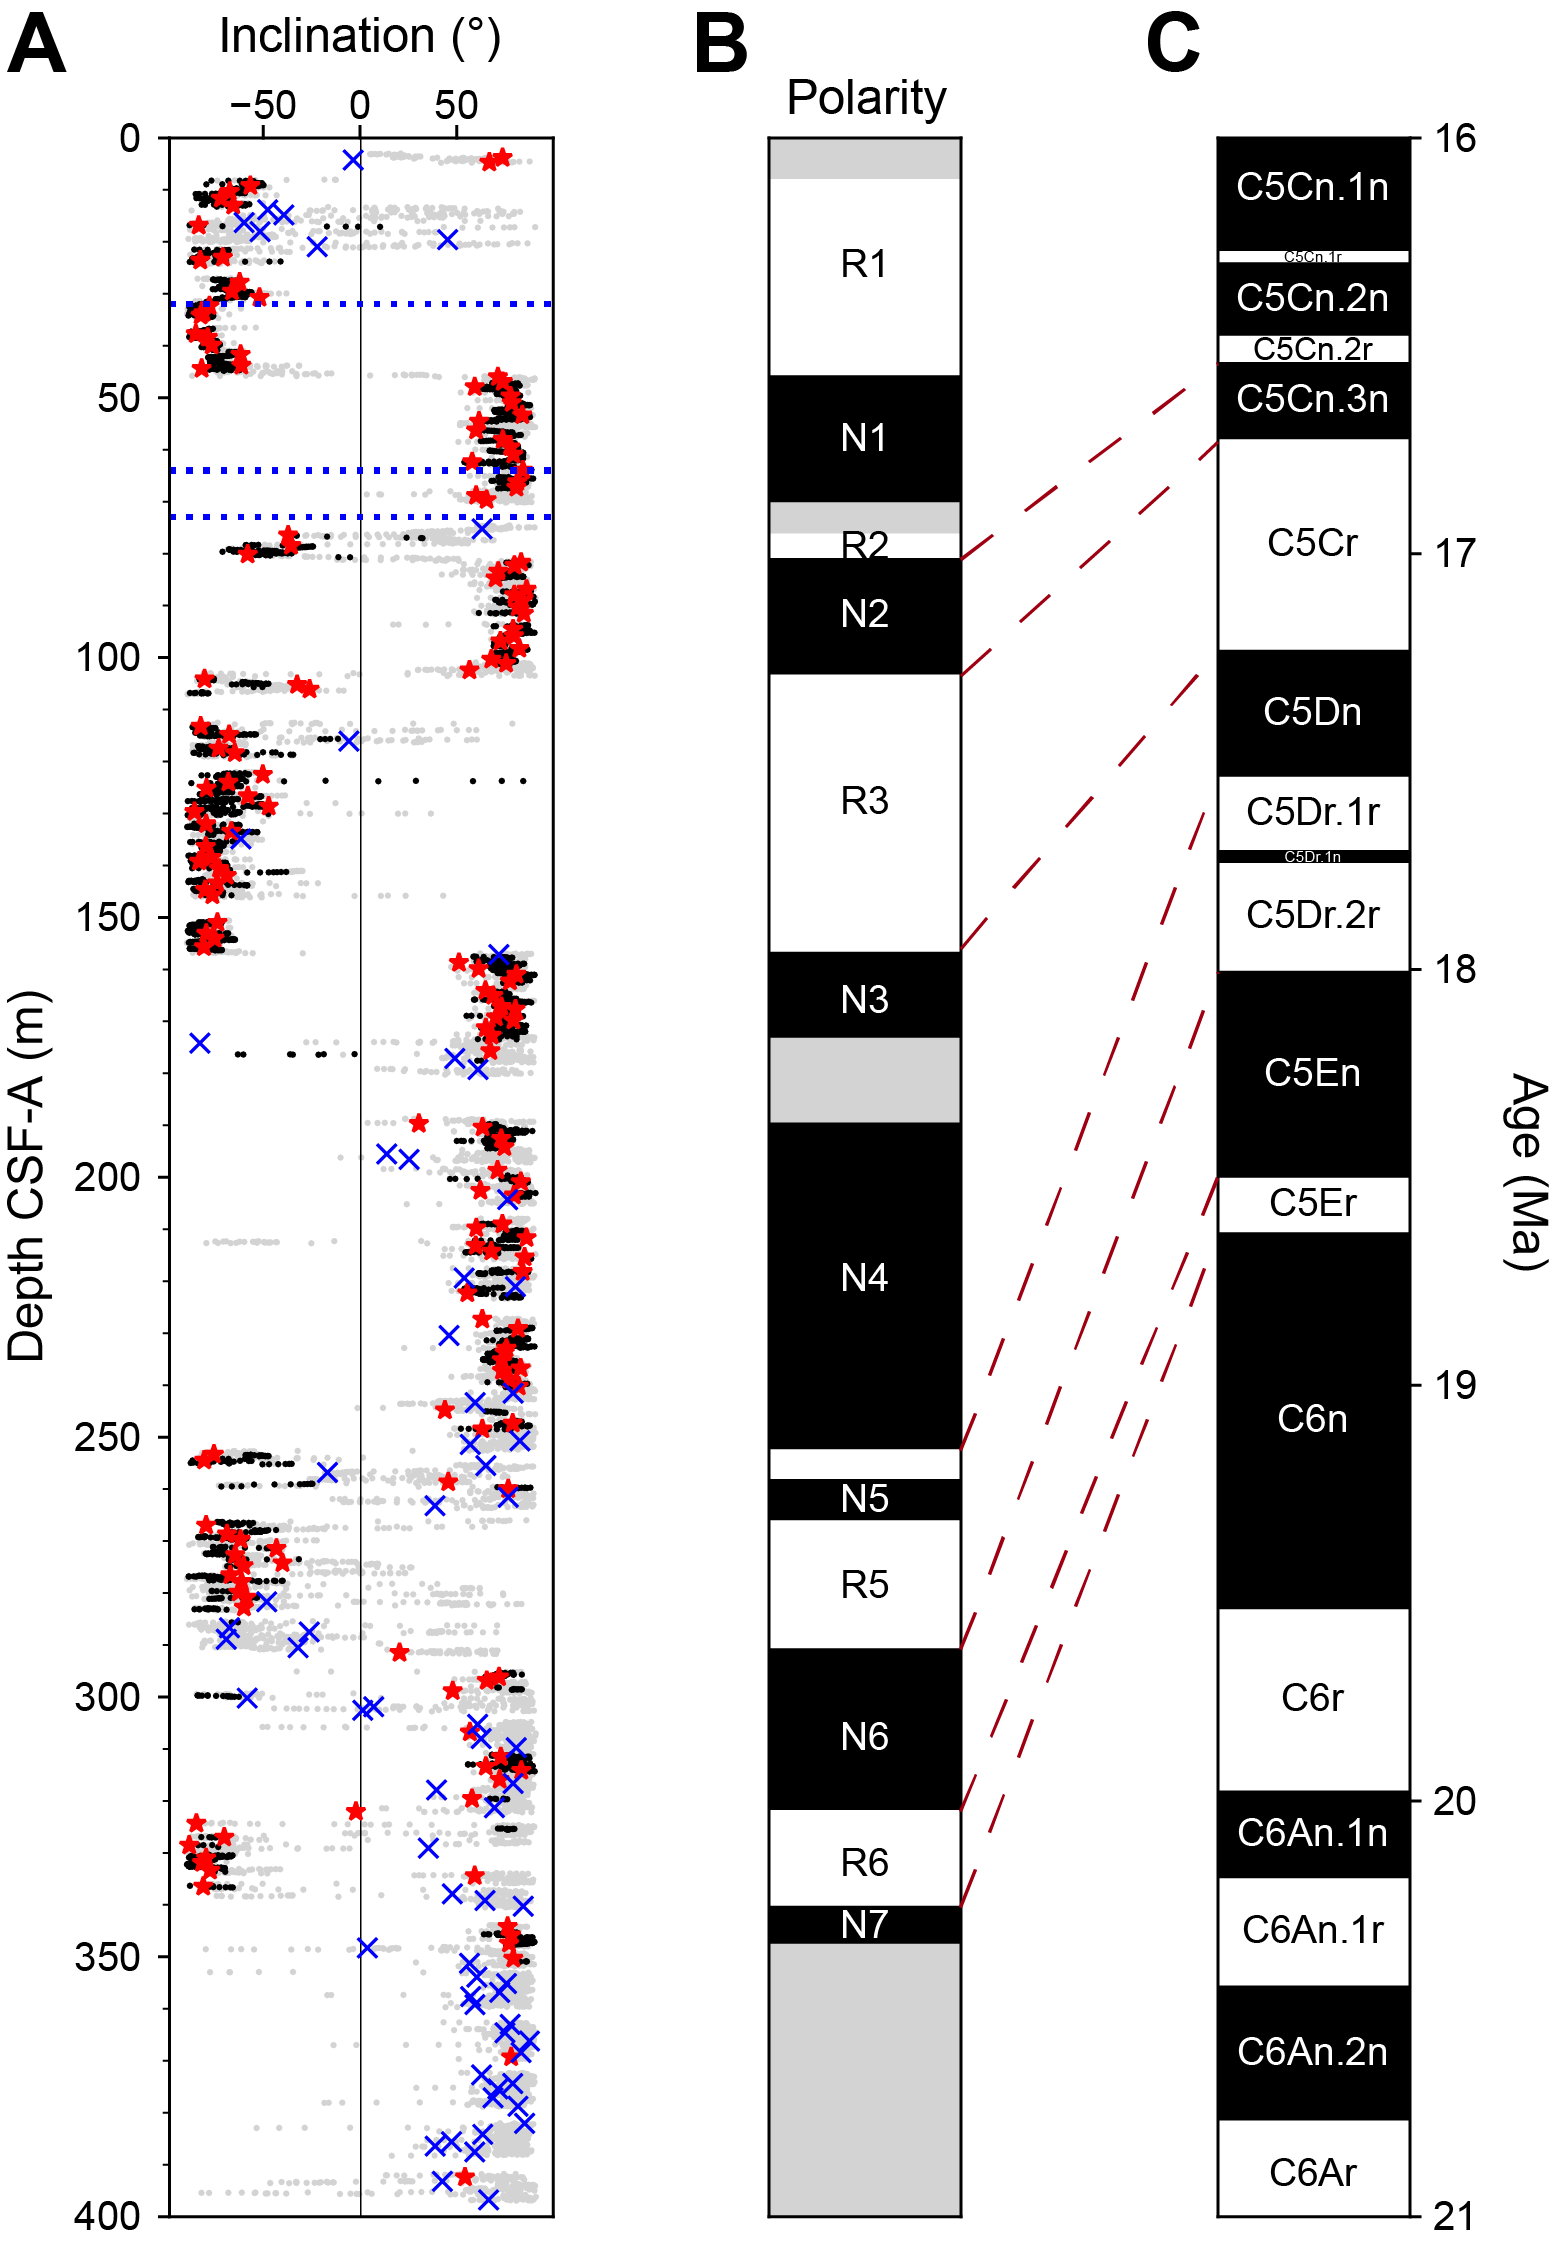
Figure F38. Magnetostratigraphic correlation for Age Model 2.
Refinement of the age model for Site U1607 must await shore-based studies.
10. Downhole logging
Downhole logging was carried out in Hole U1607A upon completion of coring operations. A quad combo tool string was deployed, including MS, natural gamma ray, electrical laterolog resistivity, acoustic velocity, and density tools. Four runs (two down passes plus two up passes) were carried out with the sensors recording on the way down and up. Two of the runs (initial down and final up) covered the full length of the hole to 40 m above the bottom. Two calibration runs (one up and one down) were logged on the deepest 100 m of the hole. The caliper showed a homogeneous and stable hole with minimum washouts down to 1688 meters below rig floor (mbrf) (938 m CSF-A), and the instruments yielded reliable measurements.
Upon completion of the downhole logging with the quad combo tool string, vertical seismic profiling was implemented with the VSI. The goal was to obtain an accurate time-depth relationship to tie the logging and coring results to the seismic data. The seismic source was lowered 5 m into the water and fired with increasing intensity according to the guidelines for a soft start (see Downhole measurements in the Expedition 400 methods chapter [Knutz et al., 2025a]). The VSI was lowered to the bottom of Hole U1607A. The geophones recorded the seismic signal on 33 stations (average spacing = 30 m). Three good shots were recorded on most of the stations. A protected species watch was in place before and during the use of the seismic source.
Logging measurements were crucial for covering recovery gaps during RCB coring, especially near the bottom of Hole U1607A. Core logging and downhole logging results differ on absolute values, but the relative trends of the logs are comparable. Hence, logging data could be used to cover the formation recovery gaps with confidence.
10.1. Logging operations
The last core from Hole U1607A arrived on deck at 1910 h (all times provided in local ship time, UTC − 3 h, unless otherwise noted) on 24 September 2023. Hole preparation for the logging program started at 0112 h on 25 September and included a high-viscosity mud sweep followed by releasing of the RCB drill bit to the bottom of the hole and displacing the open hole with 10.5 lb/gal heavy mud (barite) to help with hole stability. The end of the pipe was raised to 42 mbsf and maintained at this depth throughout the entire logging operation, leaving ~896 m of open hole. The logging runs were implemented to 1688 and 1680 mbrf, respectively, because the lower ~40 m of the hole was blocked, possibly by material that fell into the hole. The wireline heave compensator was used to reduce the effect of vertical ship motion on the wireline depth. Rigup for downhole logging started at 0229 h on 25 September under good weather and ice conditions, after observing the closest iceberg moving away from the ship.
The quad combo tool string was assembled for the first run and consisted of the following tools from bottom to top (see Downhole measurements in the Expedition 400 methods chapter [Knutz et al., 2025a]): Magnetic Susceptibility Sonde (MSS), DSI, High-Resolution Laterolog Array (HRLA), Hostile Environment Litho-Density Sonde (HLDS; with source), Hostile Environment Natural Gamma Ray Sonde (HNGS), and Enhanced Digital Telemetry Cartridge (EDTC). The quad combo tool string was lowered into Hole U1607A at 0302 h on 25 September. All tools were run on the downlog except the density tool, which was run together with the caliper (borehole diameter) measurement tool on the uplog. The downlog started at 730 mbrf, the seafloor gamma peak was identified at 750 mbrf, and the log penetrated to 1688 mbrf. No problems were encountered getting down through the pipe or the open hole. Total penetration was 938 m (i.e., 40 m above the total depth of the hole). The loss of tension from the tool string at this depth indicated that the borehole was filled with fall-in debris from this depth to its bottom. After reaching total depth, the caliper arms were opened and the density tool was enabled. The hole was logged up for a 100 m calibration pass. The tool was lowered back to 1688 mbrf, and the main uplog was collected. Downhole logging with the quad combo tool string was completed, and it was rigged down by 1000 h on 25 September.
The second logging run consisted of the VSI with the EDTC (see Downhole measurements in the Expedition 400 methods chapter [Knutz et al., 2025a]). Observation for protected species began at 0900 h on 25 September. The seismic source consisted of two 250 inch3 Sercel G guns in parallel array lowered 5 m into the water at 0720 h. The VSI was lowered to 1680 mbrf in Hole U1607A at 0815 h. A total of 33 stations at 30 m spacing were occupied to obtain the best correlation with the seismic data (Table T13). The 33 planned stations were successfully recorded after obtaining three successful shots. The VSI experiment was finished at 1730 h, and the tool string returned to the surface at 1800 h on 25 September.
10.1.1. Log data quality
The main control on log data quality is the diameter of the borehole measured by the caliper on the HLDS logging tool (Figure F39). The borehole was homogeneous with a diameter of 10 inches with a standard deviation of 1.8 during Run 1, leading to robust quality of the logs that require good contact with the borehole wall, such as the density log (Figure F39). Log data were transmitted to the Lamont-Doherty Earth Observatory for depth matching and data processing. All readings are within the expected ranges. The drilling pipe was located at 42 mbsf during all main readings; thus, the upper section of the formation is not described in the following text. Density ranges 1.5–2.7 g/cm3, with a baseline slightly increasing downward. Two intervals of high-amplitude variability are identified on the density values between 180 and 210 mbsf and between 450 and 600 mbsf. Deep resistivity presents high variability downhole and ranges 1.9–13.1 Ωm. Average gamma ray value is 60 American Petroleum Institute gamma ray units (gAPI); it progressively increases downhole to 460 mbsf (192 gAPI) and then decreases to the bottom of the hole. MS shows high-amplitude variability down to 360 mbsf. Below this depth, the curve flattens toward very low values except in the interval between 400 and 470 mbsf. Values oscillate between 0.045 and 0.161 SI with mean values of 0.053 SI. P-wave velocity averages 2223 m/s, with a general trend of downward increase. In general, the downhole logs show high-amplitude variability below 1610 mbrf.
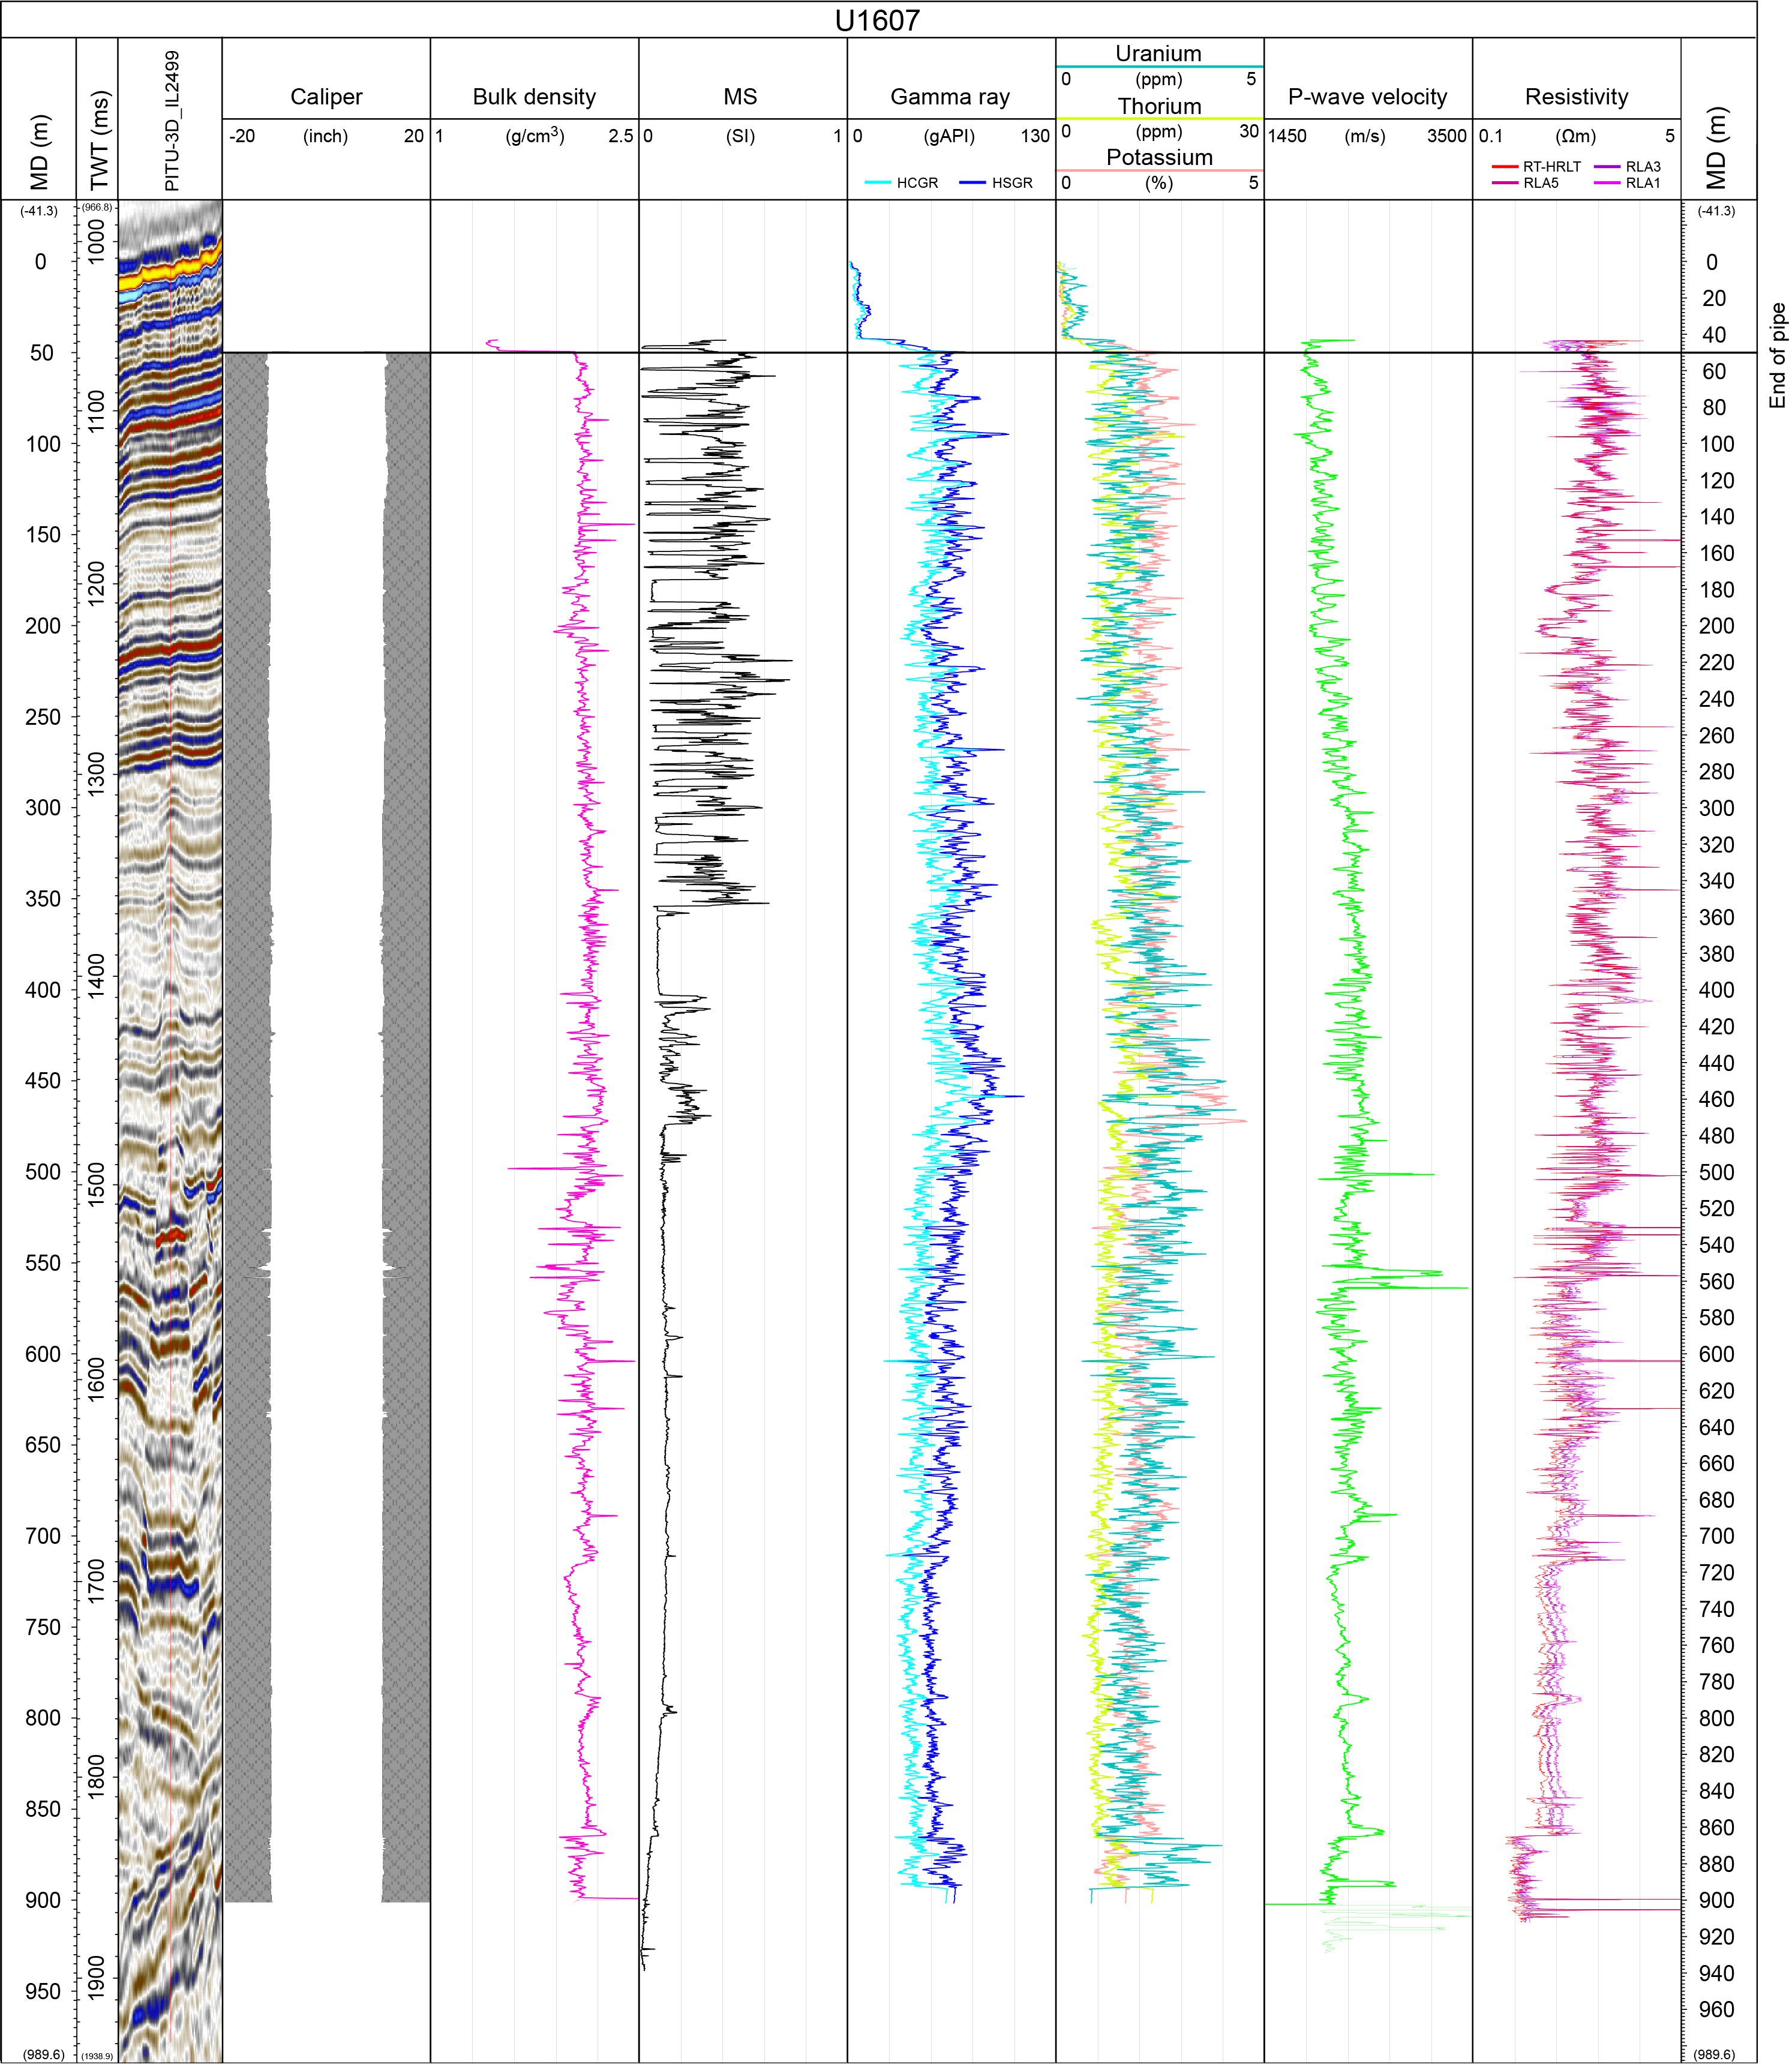
Figure F39. Downhole logs.
The downlog and uplog data of each measurement do not always perfectly match. In the case of gamma radiation, differences occur in absolute values because the uplog is corrected for borehole diameter as measured by the caliper and the presence of barite-weighted mud whereas the downlog is not corrected because the caliper is closed when the tool is lowered downhole. DSI passes were run at standard (high) frequency with the exception of the calibration up and down passes, during which low frequency was tested. Sonic velocity values are consistently higher in downhole measurements compared to the values measured on cores (PWC) because downhole measurements are made under in situ conditions of pressure and temperature. In addition, recovered material was fairly indurated and the contact between sediment and liner was an irregular surface. Thus, PWC measurements show large discrepancies. Ultimately, the applied time-depth relationship is the one obtained from the VSI (see Core-log-seismic correlation).
The physical properties measured downhole are interpreted in a similar way to those measured on the cores in the laboratory (see Physical properties). The downhole natural gamma ray and density logs have features in common with the equivalent laboratory data from Site U1607 (Figure F40) with small offsets between log and core data due to the assignment of core depths when core recovery was not 100% and other effects. However, the physical properties units distinguished on the values from the laboratory core measurements (Figure F26) are not clearly identified on the downhole logs, where the main change is recorded around 460 mbsf (Figure F39).
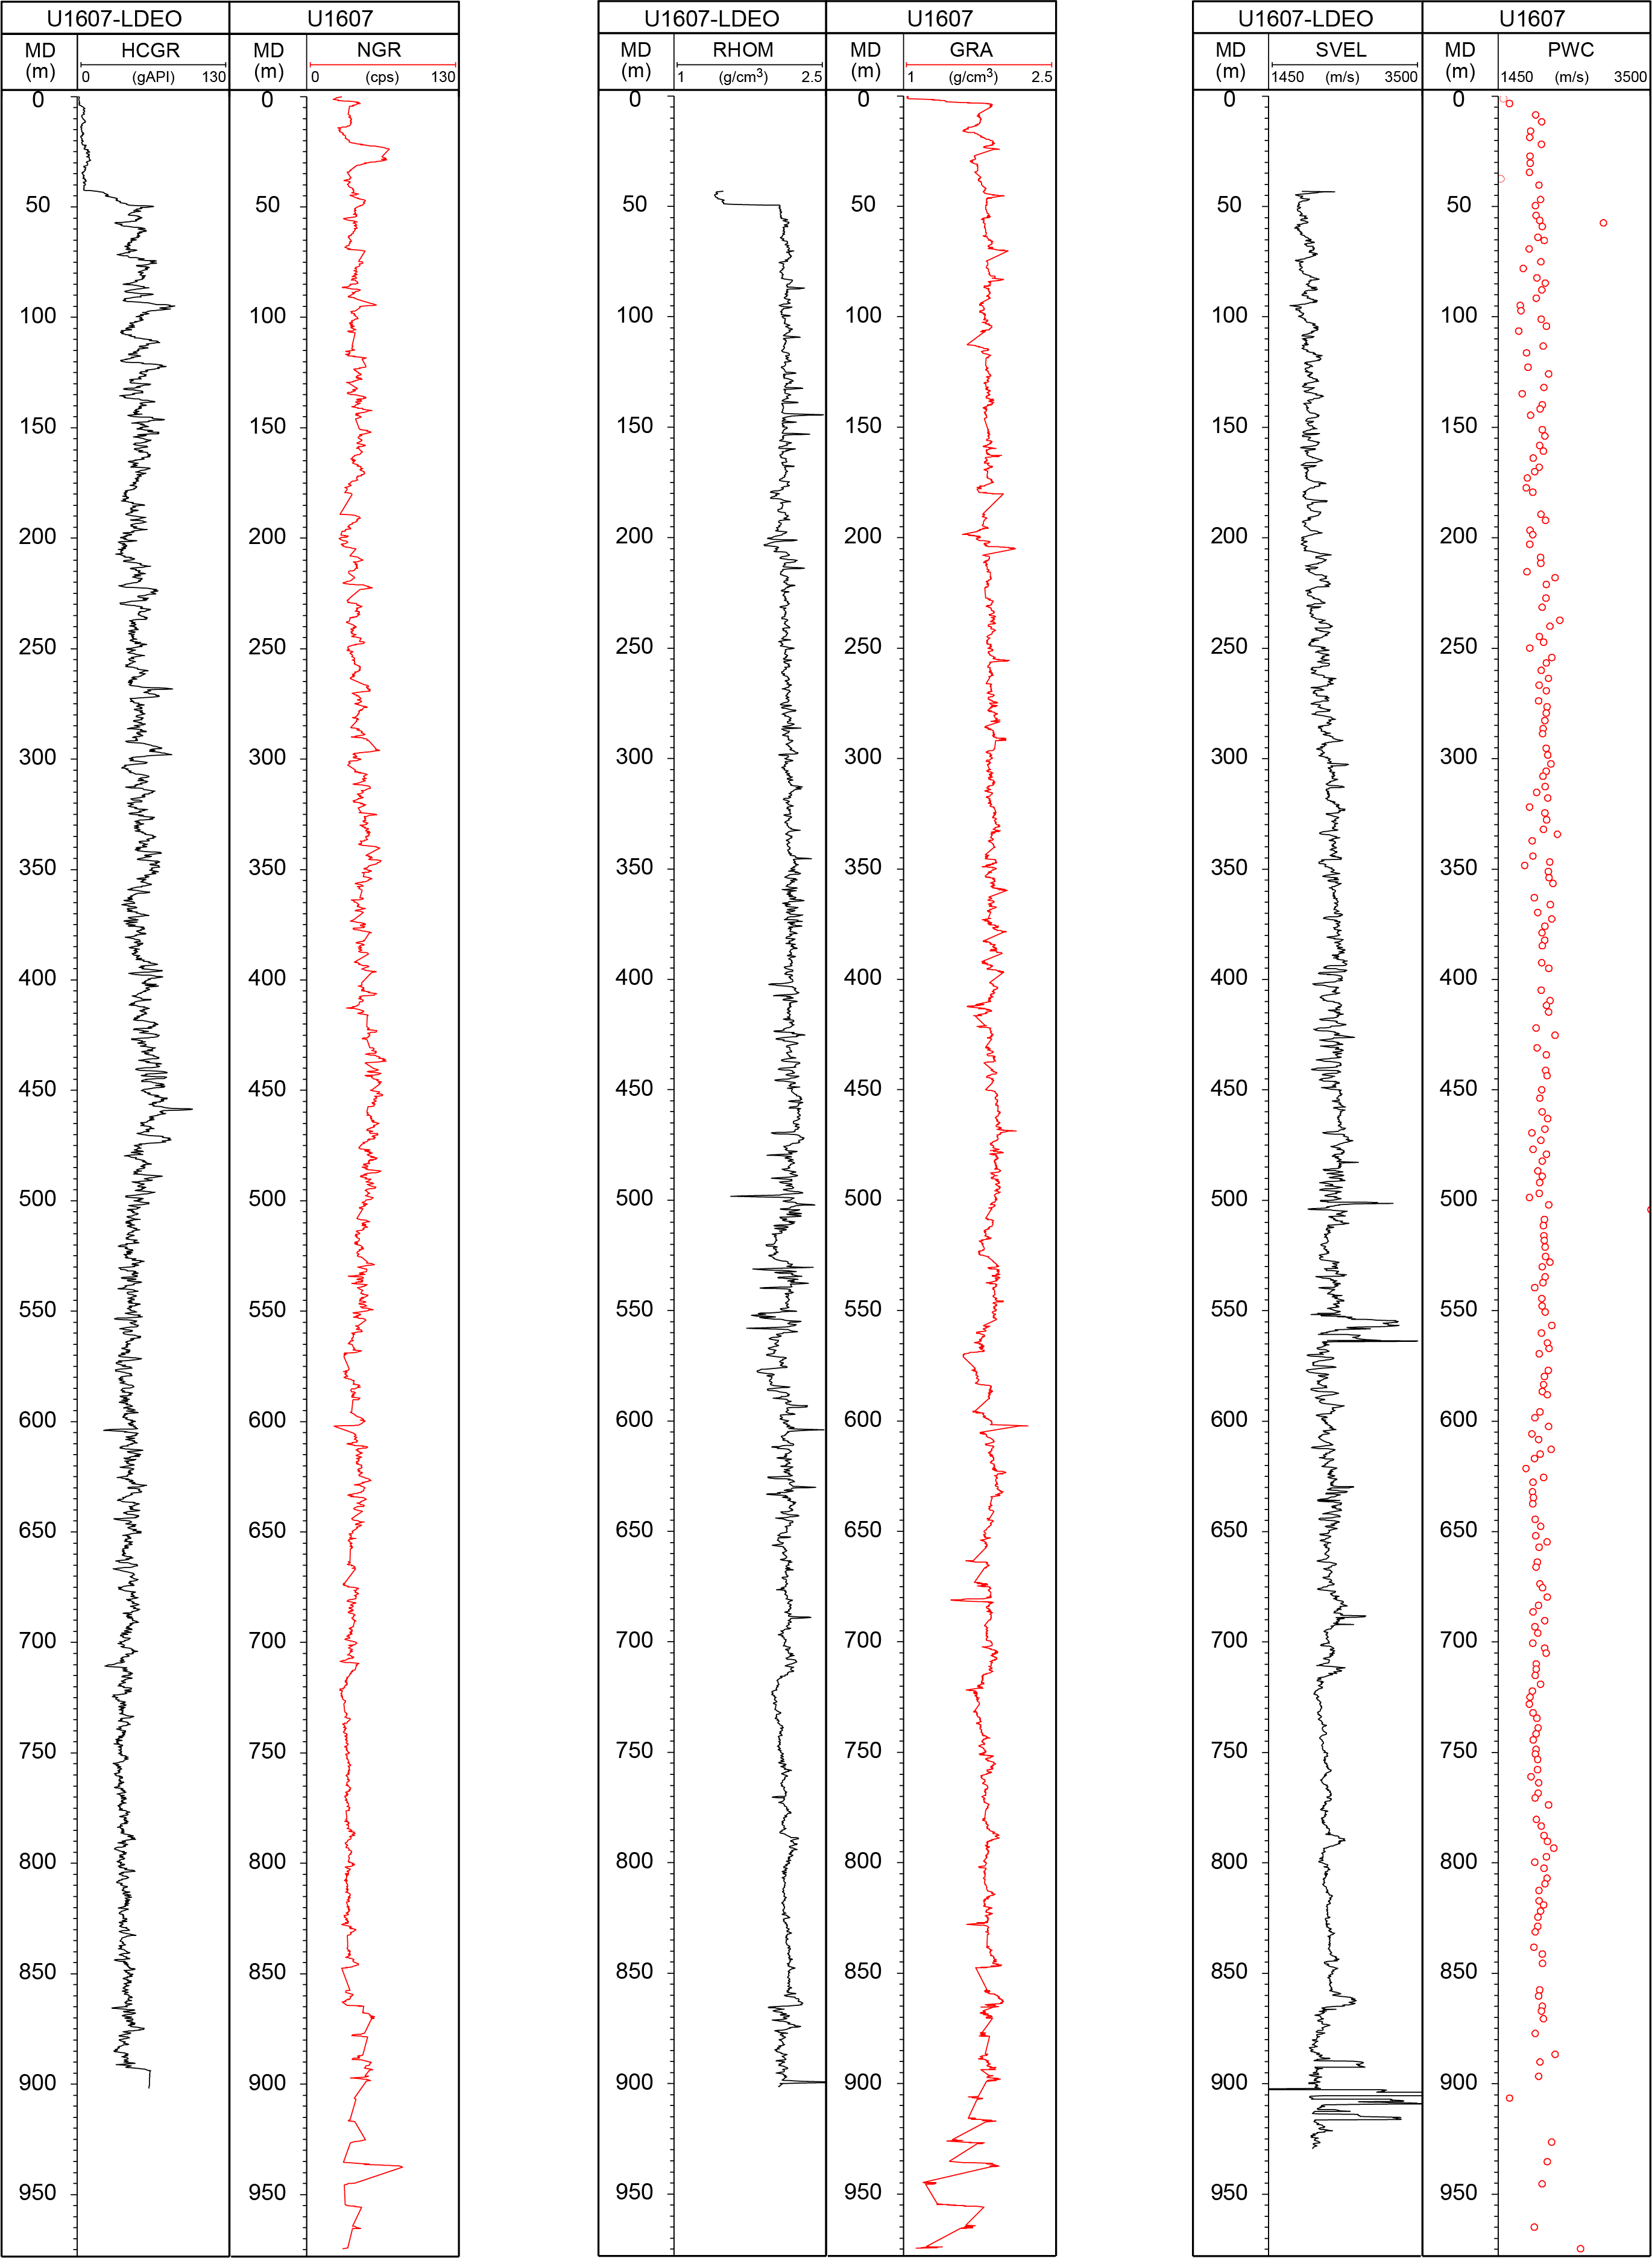
Figure F40. Gamma radiation, density, and velocity.
References
Anthonissen, E.D., 2012. A new Miocene biostratigraphy for the northeastern North Atlantic: an integrated foraminiferal, bolboformid, dinoflagellate and diatom zonation. Newsletters on Stratigraphy, 45(3):281–307. https://doi.org/10.1127/0078-0421/2012/0025
Aubry, A.M.R., de Vernal, A., and Knutz, P.C., 2021. Baffin Bay late Neogene palynostratigraphy at Ocean Drilling Program Site 645. Canadian Journal of Earth Sciences, 58(1):67–83. https://doi.org/10.1139/cjes-2019-0227
Baldauf, J.G., and Monjanel, A.-L., 1989. An Oligocene diatom biostratigraphy for the Labrador Sea: DSDP Site 112 and ODP Hole 647A. In Srivastava, S.P., Arthur, M., Clement, B., et al., Proceedings of the Ocean Drilling Program, Scientific Results. 105: College Station, TX (Ocean Drilling Program), 323–347. https://doi.org/10.2973/odp.proc.sr.105.129.1989
Brown, S., and Downie, C., 1985. Dinoflagellate cyst stratigraphy of Paleocene to Miocene sediments from the Goban Spur (Sites 548–550, Leg 80). In Graciansky, P.C.d., Poag, C. W., et al., Initial Reports of the Deep Sea Drilling Project. 80: Washington, DC (US Government Printing Office), 643–651. https://doi.org/10.2973/dsdp.proc.80.120.1985
Bukry, D., 1978. Cenozoic coccolith, silicoflagellate, and diatom stratigraphy, Deep Sea Drilling Project, Leg 44. In Benson, W.E., Sheridan, R.E., et al., Initial Reports of the Deep Sea Drilling Project. 44: Washington, DC (US Government Printing Office), 807–863. https://doi.org/10.2973/dsdp.proc.44.137.1978
Cage, A.G., Pieńkowski, A.J., Jennings, A., Knudsen, K.L., and Seidenkrantz, M.S., 2021. Comparative analysis of six common foraminiferal species of the genera Cassidulina, Paracassidulina, and Islandiella from the Arctic–North Atlantic domain. Journal of Micropalaeontology, 40(1):37–60. https://doi.org/10.5194/jm-40-37-2021
Cox, D.R., Huuse, M., Newton, A.M.W., Sarkar, A.D., and Knutz, P.C., 2021. Shallow gas and gas hydrate occurrences on the northwest Greenland shelf margin. Marine Geology, 432:106382. https://doi.org/10.1016/j.margeo.2020.106382
Egger, L.M., Sliwinska, K.K., van Peer, T.E., Liebrand, D., Lippert, P.C., Friedrich, O., Wilson, P.A., Norris, R.D., and Pross, J., 2016. Magnetostratigraphically-calibrated dinoflagellate cyst bioevents for the uppermost Eocene to lowermost Miocene of the western North Atlantic (IODP Expedition 342, Paleogene Newfoundland sediment drifts). Review of Palaeobotany and Palynology, 234:159–185. https://doi.org/10.1016/j.revpalbo.2016.08.002
Fensome, R., Crux, J., Gard, G., MacRae, A., Williams, G., Thomas, F., Fiorini, F., and Wach, G., 2008. The last 100 million years on the Scotian Margin, offshore eastern Canada: an event-stratigraphic scheme emphasizing biostratigraphic data. Atlantic Geoscience, 44:93–126. https://doi.org/10.4138/6506
Gregersen, U., Knutz, P.C., Pedersen, G.K., Nøhr-Hansen, H., Ineson, J.R., Larsen, L.M., Hopper, J.R., Bojesen-Koefoed, J.A., Dam, G., Funck, T., and Hovikoski, J., 2022. Stratigraphy of the West Greenland margin. In Dafoe, L.T., and Bingham-Koslowski, N. (Eds.), Geological Synthesis of Baffin Island (Nunavut) and the Labrador-Baffin Seaway. Geological Survey of Canada Bulletin, 608: 247–309. https://doi.org/10.4095/321849
Head, M.J., Norris, G., and Mudie, P.J., 1989. Palynology and dinocyst stratigraphy of the Miocene in ODP Leg 105, Hole 645E, Baffin Bay. In Srivastava, S.P., Arthur, M., Clement, B., et al., Proceedings of the Ocean Drilling Program, Scientific Results. 105: College Station, TX (Ocean Drilling Program), 467–514. https://doi.org/10.2973/odp.proc.sr.105.137.1989
Holbourn, A., Henderson, A.S., and MacLeod, N., 2013. Atlas of Benthic Foraminifera: United Kingdom (John Wiley & Sons, Ltd.). https://doi.org/10.1002/9781118452493
Huber, B.T., Petrizzo, M.R., Young, J.R., Falzoni, F., Gilardoni, S.E., Bown, P.R., and Wade, B.S., 2016. Pforams@microtax: a new online taxonomic database for planktonic foraminifera. Micropaleontology, 62(6):429–438. https://www.jstor.org/stable/26645533
Jakobsson, M., Mayer, L., Coakley, B., Dowdeswell, J.A., Forbes, S., Fridman, B., Hodnesdal, H., Noormets, R., Pedersen, R., Rebesco, M., Schenke, H.W., Zarayskaya, Y., Accettella, D., Armstrong, A., Anderson, R.M., Bienhoff, P., Camerlenghi, A., Church, I., Edwards, M., Gardner, J.V., Hall, J.K., Hell, B., Hestvik, O., Kristofferson, Y., Marcussen, C., Mohammad, R., Mosher, D., Nghiem, S.V., Pedrosa, M.T., Travaglini, P.G., and Weatherall, P., 2012. The International Bathymetric Chart of the Arctic Ocean (IBCAO) Version 3.0. Geophysical Research Letters, 39(12):L12609. https://doi.org/10.1029/2012GL052219
Jansen, E., Sjøholm, J., Bleil, U., and Erichsen, J.A., 1990. Neogene and Pleistocene glaciations in the Northern Hemisphere and Late Miocene — Pliocene global ice volume fluctuations: evidence from the Norwegian Sea. In Bleil, U., and Thiede, J. (Eds.), Geological History of the Polar Oceans: Arctic versus Antarctic. NATO ASI Series, 308: 677–705. https://doi.org/10.1007/978-94-009-2029-3_35
Kaminski, M.A., Gradstein, F.M., Scott, D.B., and MacKinnon, K.D., 1989. Neogene benthic foraminifer biostratigraphy and deep-water history of Sites 645, 646, and 647, Baffin Bay and Labrador Sea. In Srivastava, S.P., Arthur, M., Clement, B., et al., Proceedings of the Ocean Drilling Program, Scientific Results. 105: College Station, TX (Ocean Drilling Program), 731–756. https://doi.org/10.2973/odp.proc.sr.105.123.1989
Katz, M.E., and Miller, K.G., 1993. Latest Oligocene to Earliest Pliocene benthic foraminiferal biofacies of the northeastern Gulf of Mexico. Micropaleontology, 39(4):367–403. https://www.jstor.org/stable/pdf/1485856.pdf
King, C., 1989. Cenozoic of the North Sea. In Jenkins, D.G., and Murray, J.W. (Eds.), Stratigraphical Atlas of Fossil Foraminifera Chichester, England (Ellis Horwood).
Kirschvink, J.L., 1980. The least-squares line and plane and the analysis of palaeomagnetic data. Geophysical Journal International, 62(3):699–718. https://doi.org/10.1111/j.1365-246X.1980.tb02601.x
Knutz, P., Jennings, A., and Childress, L.B., 2022a. Expedition 400 Scientific Prospectus: NW Greenland Glaciated Margin. International Ocean Discovery Program. https://doi.org/10.14379/iodp.sp.400.2022
Knutz, P.C., Gregersen, U., Harrison, C., Brent, T.A., Hopper, J.R., and Nøhr-Hansen, H., 2022b. Baffin Bay composite tectono-sedimentary element. Memoirs - Geological Society of London, 57. https://doi.org/10.1144/M57-2016-7
Knutz, P.C., Hopper, J.R., Gregersen, U., Nielsen, T., and Japsen, P., 2015. A contourite drift system on the Baffin Bay–West Greenland margin linking Pliocene Arctic warming to poleward ocean circulation. Geology, 43(10):907–910. https://doi.org/10.1130/G36927.1
Knutz, P.C., Jennings, A.E., Childress, L.B., Bryant, R., Cargill, S.K., Coxall, H.K., Frank, T.D., Grant, G.R., Gray, R.E., Ives, L., Kumar, V., Le Houedec, S., Martens, J., Naim, F., Nelissen, M., Özen, V., Passchier, S., Pérez, L.F., Ren, J., Romans, B.W., Seki, O., Staudigel, P., Tauxe, L., Tibbett, E.J., Yokoyama, Y., Zhang, Y., and Zimmermann, H., 2025a. Expedition 400 methods. In Knutz, P.C., Jennings, A.E., Childress, L.B., and the Expedition 400 Scientists, NW Greenland Glaciated Margin. Proceedings of the International Ocean Discovery Program, 400: College Station, TX (International Ocean Discovery Program). https://doi.org/10.14379/iodp.proc.400.102.2025
Knutz, P.C., Jennings, A.E., Childress, L.B., Bryant, R., Cargill, S.K., Coxall, H.K., Frank, T.D., Grant, G.R., Gray, R.E., Ives, L., Kumar, V., Le Houedec, S., Martens, J., Naim, F., Nelissen, M., Özen, V., Passchier, S., Pérez, L.F., Ren, J., Romans, B.W., Seki, O., Staudigel, P., Tauxe, L., Tibbett, E.J., Yokoyama, Y., Zhang, Y., and Zimmermann, H., 2025b. Expedition 400 summary. In Knutz, P.C., Jennings, A.E., Childress, L.B., and the Expedition 400 Scientists, NW Greenland Glaciated Margin. Proceedings of the International Ocean Discovery Program, 400: College Station, TX (International Ocean Discovery Program). https://doi.org/10.14379/iodp.proc.400.101.2025
Koç, N., and Scherer, R.P., 1996. Neogene diatom biostratigraphy of the Iceland Sea Site 907. In Thiede, J., Myhre, A.M., Firth, J.V., Johnson, G.L., and Ruddiman, W.F. (Eds.), Proceedings of the Ocean Drilling Program, Scientific Results. 151: College Station, TX (Ocean Drilling Program), 61–74. https://doi.org/10.2973/odp.proc.sr.151.108.1996
Lebedeva, N.K., Aleksandrova, G.N., Shurygin, B.N., Ovechkina, M.N., and Gnibidenko, Z.N., 2013. Paleontological and magnetostratigraphic data on upper Cretaceous deposits from borehole no. 8 (Russkaya Polyana District, Southwestern Siberia). Stratigraphy and Geological Correlation, 21(1):48–78. https://doi.org/10.1134/S086959381301005X
Łukowiak, M., 2015. Late Eocene siliceous sponge fauna of southern Australia: reconstruction based on loose spicules record. Zootaxa, 3917(1). https://doi.org/10.11646/zootaxa.3917.1.1
Monjanel, A.-L., and Baldauf, J.G., 1989. Miocene to Holocene diatom biostratigraphy from Baffin Bay and Labrador Sea, Ocean Drilling Program Sites 645 and 646. In Srivastava, S.P., Arthur, M.A., Clement, B., et al., Proceedings of the Ocean Drilling Program, Scientific Results. 105: College Station, TX (Ocean Drilling Program), 305–322. https://doi.org/10.2973/odp.proc.sr.105.127.1989
Newton, A.M.W., Knutz, P.C., Huuse, M., Gannon, P., Brocklehurst, S.H., Clausen, O.R., and Gong, Y., 2017. Ice stream reorganization and glacial retreat on the northwest Greenland shelf. Geophysical Research Letters, 44(15):7826–7835. https://doi.org/10.1002/2017GL073690
Odin, G.S., 1988. Green Marine Clays. In Developments in Sedimentology. 45.
Ogg, J.G., 2020. Geomagnetic Polarity Time Scale. In Gradstein, F.M., Ogg, J.G., Schmitz, M., and Ogg, G. (Eds.), Geologic Time Scale 2020. Amsterdam (Elsevier), 159–192. https://doi.org/10.1016/B978-0-12-824360-2.00005-X
Osterman, L.E., and Qvale, G., 1989. Benthic foraminifers from the Voring Plateau (ODP Leg 104). In Eldholm, O., Thiede, J., Taylor, E., et al., Proceedings of the Ocean Drilling Program, Scientific Results. 104: College Station, TX (Ocean Drilling Program), 745–768. http://doi.org/10.2973/odp.proc.sr.104.159.1989
Pieńkowski, A.J., Kennaway, S., and Lang, S.I., 2020. Aquatic palynomorphs from modern marine sediments in a reconnaissance transect across the Northwest Passage – Baffin Bay region. Marine Micropaleontology, 156:101825. https://doi.org/10.1016/j.marmicro.2020.101825
Scheller, E.L., Grotzinger, J., and Ingalls, M., 2022. Guttulatic calcite: a carbonate microtexture that reveals frigid formation conditions. Geology, 50(1):48–53. https://doi.org/10.1130/G49312.1
Schrader, H.-J., and Fenner, J., 1976. Norwegian Sea Cenozoic diatom biostratigraphy and taxonomy: Part I: Norwegian Sea Cenozoic diatom biostratigraphy. In Andrews, J.E., Packham, G. et al., Initial Reports of the Deep Sea Drilling Project. 38: Washington, DC (US Government Printing Office), 921–1099. https://doi.org/10.2973/dsdp.proc.38.130.1976
Seidenkrantz, M.S., 1995. Cassidulina teretis Tappan and Cassidulina neoteretis new species (Foraminifera): stratigraphic markers for deep sea and outer shelf areas. Journal of Micropalaeontology, 14(2):145–157. https://doi.org/10.1144/jm.14.2.145
Seilacher, A., 2007. Trace Fossil Analysis: New York (Springer Link).
Śliwińska, K.K., and Heilmann-Clausen, C., 2011. Early Oligocene cooling reflected by the dinoflagellate cyst Svalbardella cooksoniae. Palaeogeography, Palaeoclimatology, Palaeoecology, 305(1):138–149. https://doi.org/10.1016/j.palaeo.2011.02.027
Soliman, A., Ćorić, S., Head, M.J., Piller, W.E., and El Beialy, S.Y., 2012. Lower and Middle Miocene biostratigraphy, Gulf of Suez, Egypt based on dinoflagellate cysts and calcareous nannofossils. Palynology, 36(1):38–79. https://doi.org/10.1080/01916122.2011.633632
Stephenson, A., and Snowball, I.F., 2001. A large gyromagnetic effect in greigite. Geophysical Journal International, 145(2):570–575. https://doi.org/10.1046/j.0956-540x.2001.01434.x
Strelnikova, N.I., Fourtanier, E., and Kociolek, J.P., 2004. Morphological studies of Aulacodiscus species from the "Russian collection" of the California Academy of Sciences. Diatom Research, 19(2):283–310. https://doi.org/10.1080/0269249X.2004.9705876
Suto, I., 2005. Taxonomy and biostratigraphy of the fossil marine diatom resting spore general Dicladia Ehrenberg, Monocladia Suto and Syndendrium Ehrenberg in the North Pacific and Norwegian Sea. Diatom Research, 20(2):351–374. https://doi.org/10.1080/0269249X.2005.9705642
Suto, I., Jordan, R.W., and Watanabe, M., 2008. Taxonomy of the fossil marine diatom resting spore genus Goniothecium Ehrenberg and its allied species. Diatom Research, 23(2):445–469. https://doi.org/10.1080/0269249X.2008.9705769
Vasilyeva, O.N., and Musatov, V.A., 2023. Dinoflagellate cyst and nannoplankton assemblages from the Middle Eocene Kuma Formation of Crimean Peninsula — biostratigraphy and palynofacies. Palaeoworld, 32(3):523–546. https://doi.org/10.1016/j.palwor.2022.11.006
Wade, B.S., Olsson, R.K., Pearson, P.N., Huber, B.T., and Berggren, W.A., 2018. Atlas of Oligocene Planktonic Foraminifera. Special Publication - Cushman Foundation for Foraminiferal Research, 46.
Weber, M.E., Niessen, F., Kuhn, G., and Wiedicke, M., 1997. Calibration and application of marine sedimentary physical properties using a multi-sensor core logger. Marine Geology, 136(3–4):151–172. https://doi.org/10.1016/S0025-3227(96)00071-0
Zijderveld, J.D.A., 1967. AC demagnetization of rocks: analysis of results. In Runcorn, S.K.C., Creer, K.M., and Collinson, D.W. (Eds.), Methods in Palaeomagnetism. Developments in Solid Earth Geophysics. J.R. Balsley (Series Ed.), 3: 254–286. https://doi.org/10.1016/B978-1-4832-2894-5.50049-5