Zitellini, N., Malinverno, A., Estes, E.R., and the Expedition 402 Scientists
Proceedings of the International Ocean Discovery Program Volume 402
publications.iodp.org
https://doi.org/10.14379/iodp.proc.402.105.2025
Site U16141
![]() N. Zitellini,
N. Zitellini,
![]() A. Malinverno,
A. Malinverno,
![]() E.R. Estes,
E.R. Estes,
![]() N. Abe,
N. Abe,
![]() N. Akizawa,
N. Akizawa,
![]() M. Bickert,
M. Bickert,
![]() E.H. Cunningham,
E.H. Cunningham,
![]() A. Di Stefano,
A. Di Stefano,
![]() I.Y. Filina,
I.Y. Filina,
![]() Q. Fu,
Q. Fu,
![]() S. Gontharet,
S. Gontharet,
![]() L.E. Kearns,
L.E. Kearns,
![]() R.K. Koorapati,
R.K. Koorapati,
![]() C. Lei,
C. Lei,
![]() M.F. Loreto,
M.F. Loreto,
![]() L. Magri,
L. Magri,
![]() W. Menapace,
W. Menapace,
![]() T. Morishita,
T. Morishita,
![]() A. Pandey,
A. Pandey,
![]() V.L. Pavlovics,
V.L. Pavlovics,
![]() P.A. Pezard,
P.A. Pezard,
![]() E.M. Poulaki,
E.M. Poulaki,
![]() M.A. Rodriguez-Pilco,
M.A. Rodriguez-Pilco,
![]() A. Sanfilippo,
A. Sanfilippo,
![]() B.D. Shuck,
B.D. Shuck,
![]() P. Vannucchi, and
P. Vannucchi, and
![]() X. Zhao2
X. Zhao2
1 Zitellini, N., Malinverno, A., Estes, E.R., Abe, N., Akizawa, N., Bickert, M., Cunningham, E.H., Di Stefano, A., Filina, I.Y., Fu, Q., Gontharet, S., Kearns, L.E., Koorapati, R.K., Lei, C., Loreto, M.F., Magri, L., Menapace, W., Morishita, T., Pandey, A., Pavlovics, V.L., Pezard, P.A., Poulaki, E.M., Rodriguez-Pilco, M.A., Sanfilippo, A., Shuck, B.D., Vannucchi, P., and Zhao, X., 2025. Site U1614. In Zitellini, N., Malinverno, A., Estes, E.R., and the Expedition 402 Scientists, Tyrrhenian Continent–Ocean Transition. Proceedings of the International Ocean Discovery Program, 402: College Station, TX (International Ocean Discovery Program). https://doi.org/10.14379/iodp.proc.402.105.2025
2 Expedition 402 Scientists' affiliations.
1. Background and objectives
Site U1614 is located in the Vavilov Basin, which lies near the center of the Tyrrhenian Sea and includes its deepest parts (about 3600 m water depth; Figure F1). The basin contains the prominent Vavilov Volcano, which is composed of intraplate basalts (Peccerillo, 2017). Mid-ocean-ridge basalts (MORBs) were cored at Ocean Drilling Program (ODP) Leg 107 Site 656 on the Gortani Ridge (Kastens and Mascle, 1990) and Deep Sea Drilling Program (DSDP) Leg 42 Site 373 (Shipboard Scientific Party, 1978). In addition, island arc basalts were recovered above 30 m of serpentinized peridotite at ODP Site 651 (Beccaluva et al., 1990; Bonatti et al., 1990). Continental basement outcrops are found at several locations in the Vavilov Basin; dredging the steep escarpments of the Central fault and the De Marchi, Flavio Gioia, and Farfalla Seamounts returned a variety of continental rocks, including granites, gneisses, quartzites, schists, phyllites, and shallow-water carbonates (Heezen et al., 1971; Colantoni et al., 1981).
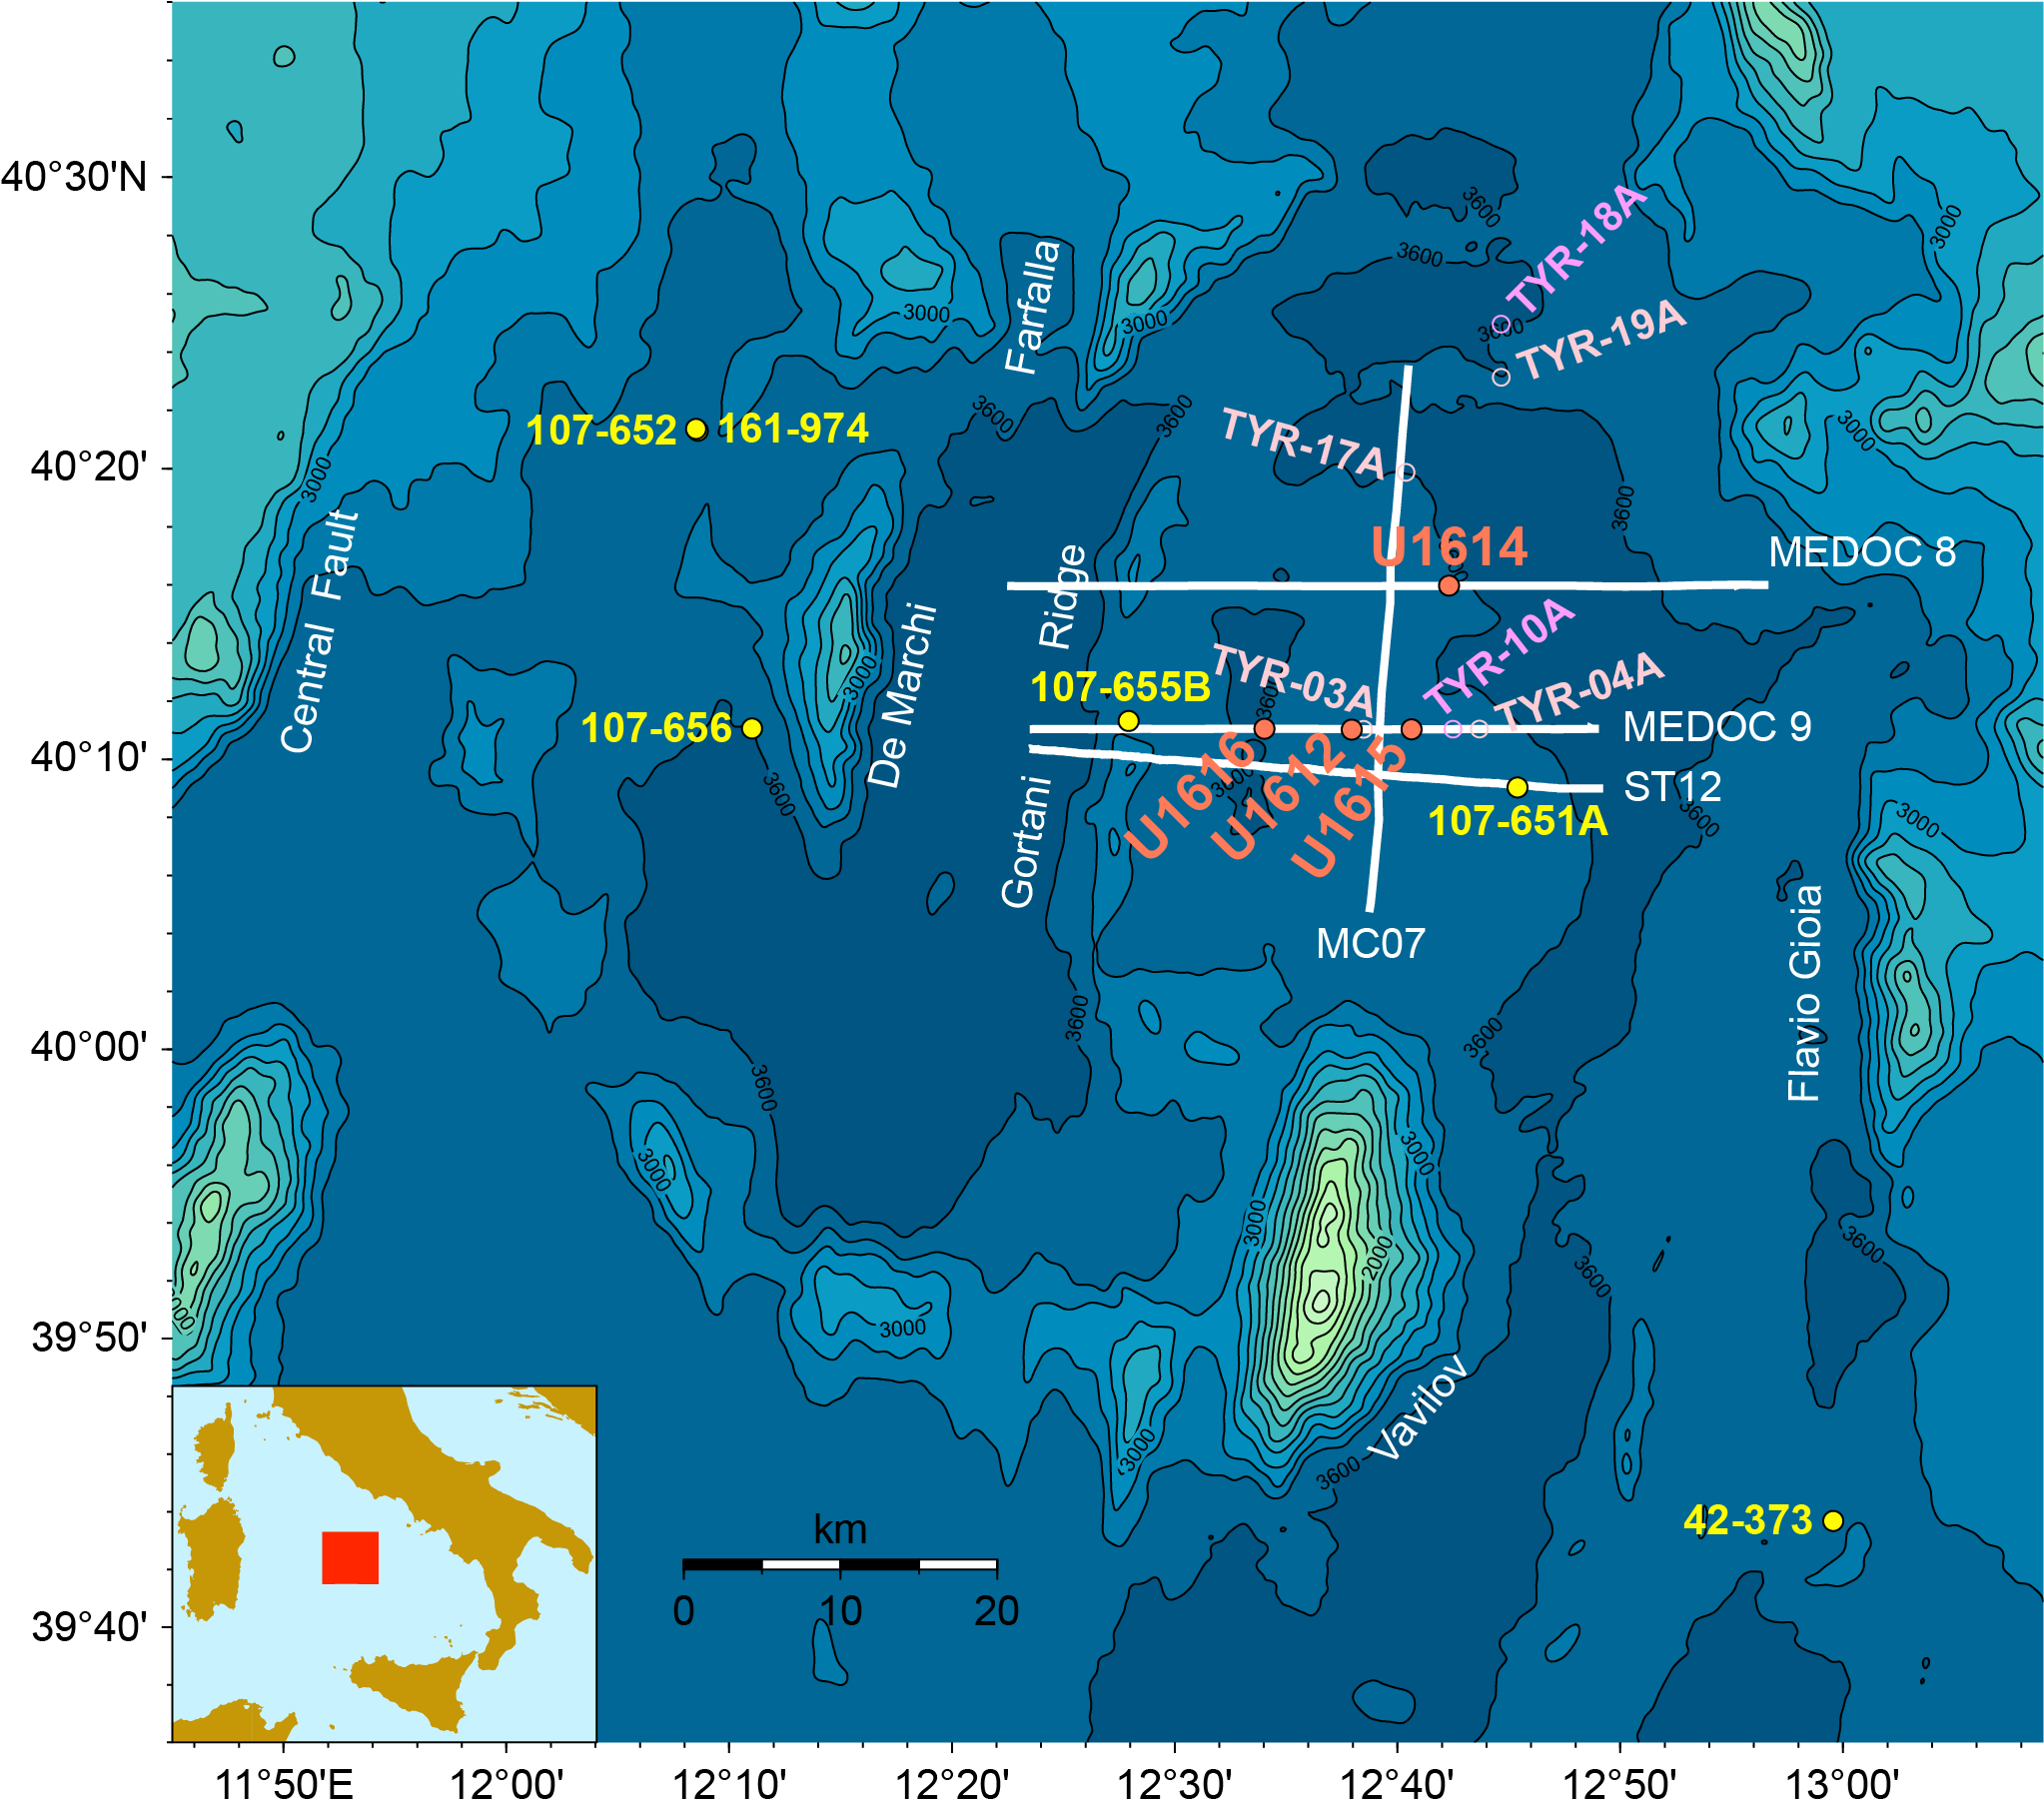
Figure F1. Location map.
Recent analyses of high-quality seismic data show a seismic velocity structure in the Vavilov Basin similar to that of continent–ocean transitions (COTs) where peridotitic mantle has been exhumed by low-angle normal faults and serpentinized by interaction with seawater (Prada et al., 2014). This finding led to the suggestion that most of the basement in the deep Vavilov Basin is composed of mantle peridotite (Prada et al., 2015), whereas previous interpretations considered it to be basaltic oceanic crust (e.g., Kastens and Mascle, 1990). A major goal of Expedition 402 is to test these alternative hypotheses by directly sampling the geologic basement of the Vavilov Basin and advance our still incomplete understanding of COT evolution.
The plan for Expedition 402 was to drill a total of six sites forming two transects: an east–west transect targeting the progression from continental crust to magmatic basaltic crust and exhumed mantle and a north–south transect mapping the area of inferred mantle basement. Site U1614 is one of four proposed sites targeting mantle peridotites and is located at the center of the north–south transect in the Vavilov Basin between Site U1612 to the south and proposed Site TYR-18A at the northern end (Figures F1, F2). Site U1614 is located on the flank of a basement high interpreted to be the uplifted footwall of a long-offset low-angle detachment fault that exhumed the mantle. Similar low-angle normal faults have been proposed to expose to the surface deep-seated crustal rocks in continental metamorphic core complexes (Lister and Davis, 1989) and mantle peridotites in the Galicia Atlantic margin (Boillot and Winterer, 1988) and at the axis of the Mid-Atlantic Ridge (Tucholke et al., 1998). The structural trends in the Vavilov Basin seem to suggest that the basement high at Site U1614 may be connected to a similar high about 10 km south sampled along the east–west transect at Sites U1612, U1615, and U1616, forming an extended north–south-trending basement ridge. However, north–south Seismic Line MC07 shows that these two basement highs are separated by a trough with a sediment thickness of at least 800 m (Figure F3).
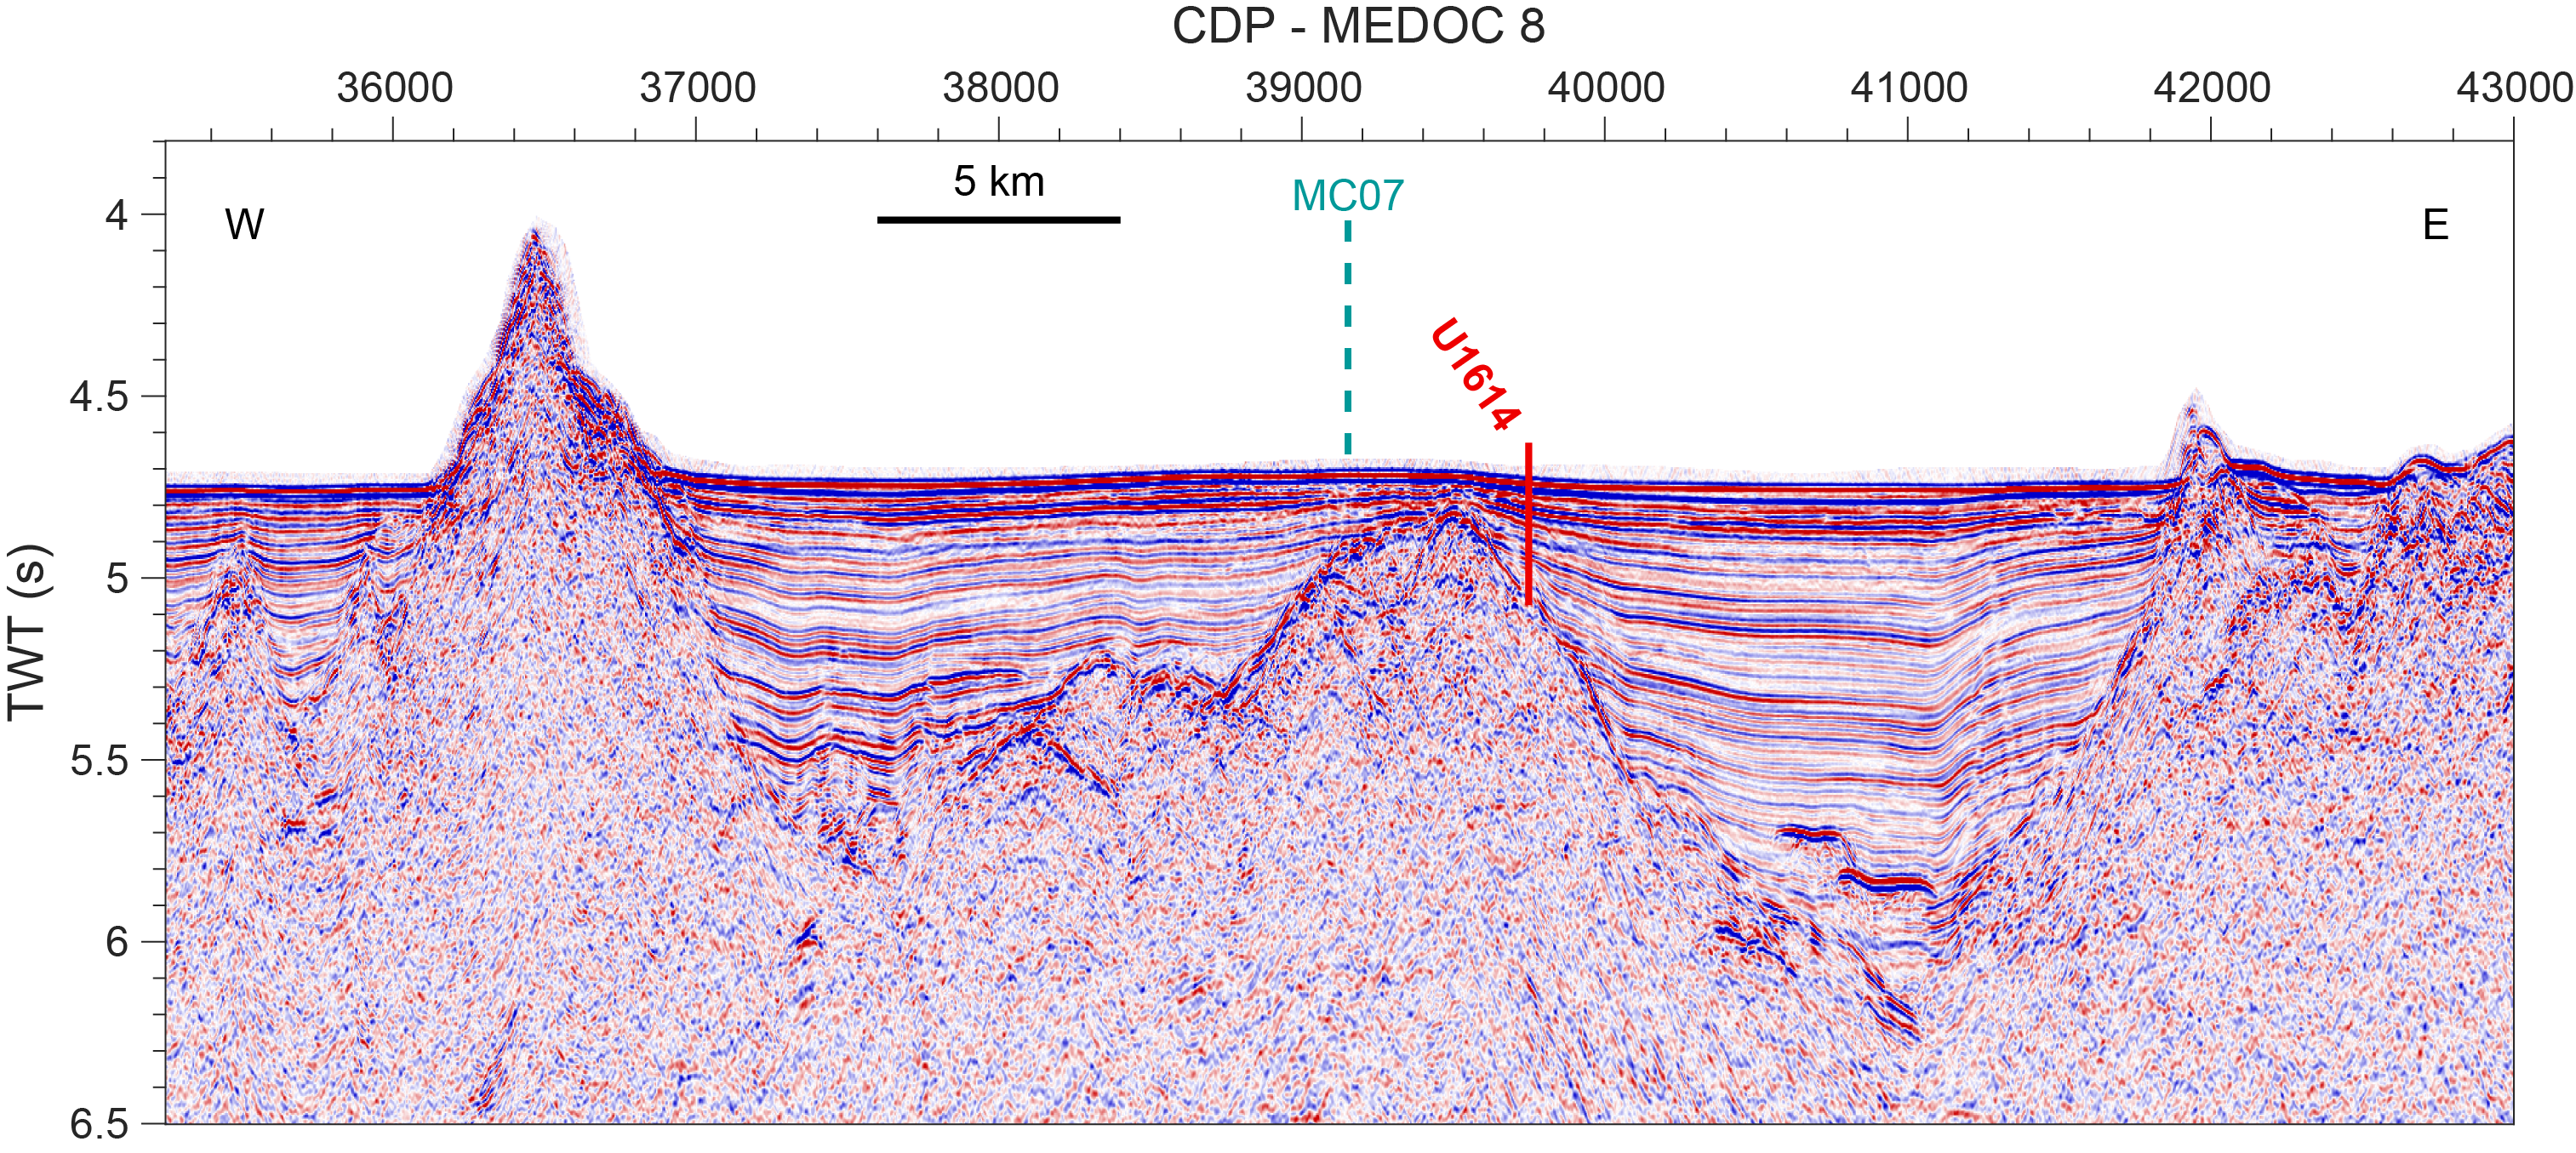
Figure F2. Seismic Reflection Line MEDOC 8.
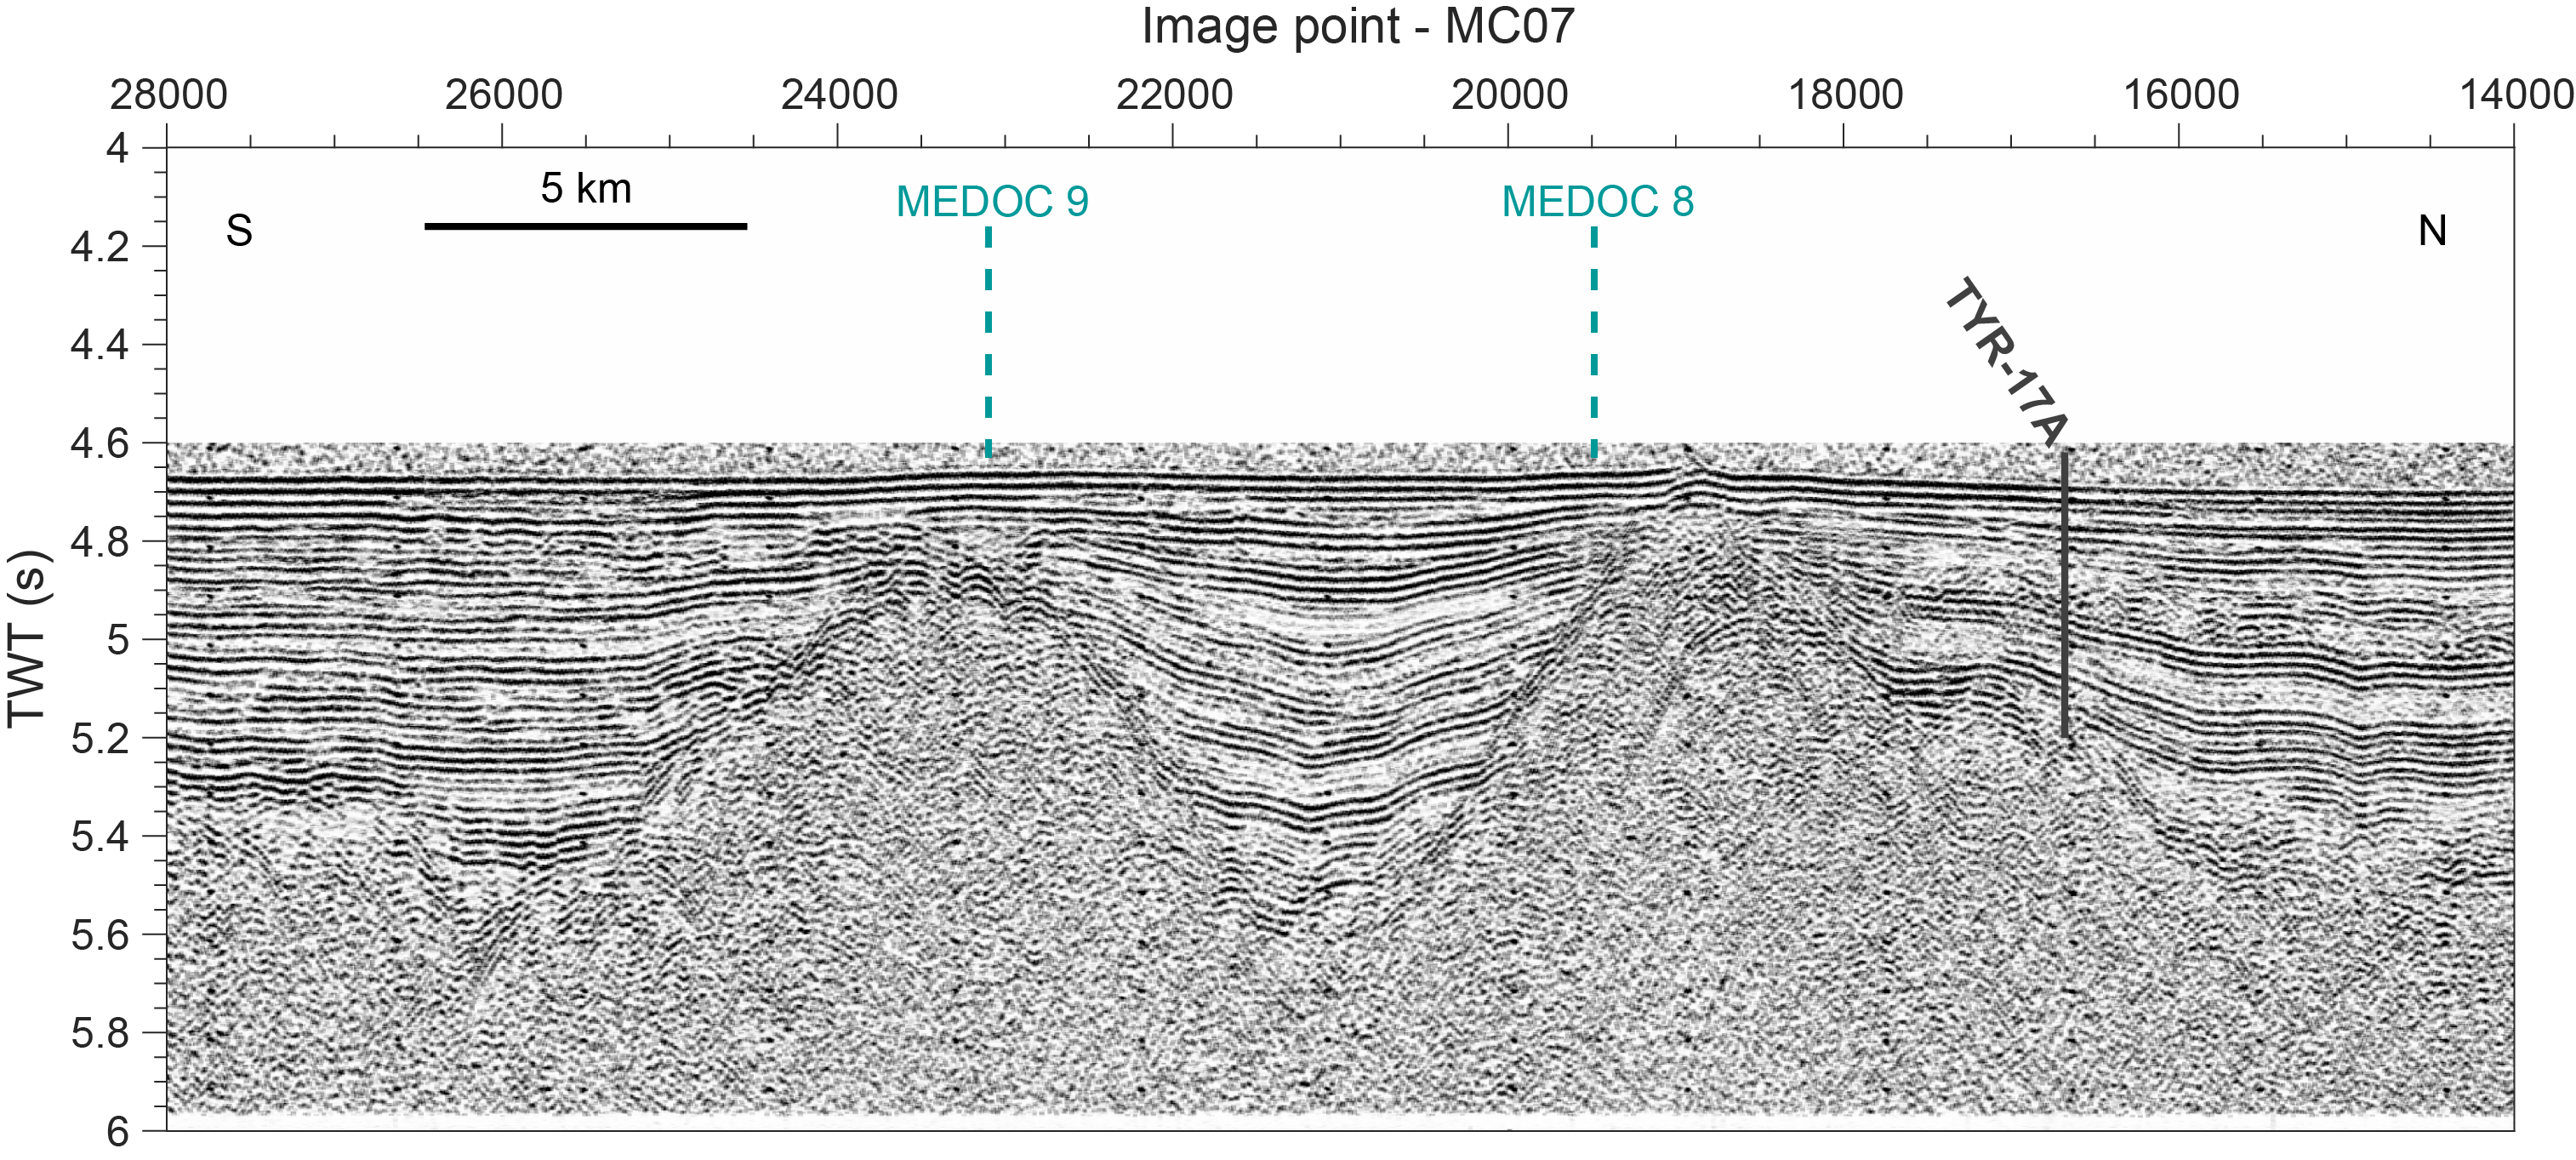
Figure F3. Seismic Line MC07.
As for the other sites in the Vavilov Basin, the scientific objectives of Site U1614 were to date the oldest sediment above the basement contact using biostratigraphy, magnetostratigraphy, and tephrostratigraphy to constrain the timing of mantle exhumation; sample sediments and pore fluids above the basement contact to investigate fluid-rock interactions; and sample the basement to determine the heterogeneous composition of the exhumed mantle, its degree of serpentinization and alteration, and structural deformation patterns. Consequently, the original plan for Site U1614 was to drill a first hole using the rotary core barrel (RCB) system to a total penetration of 342 meters below seafloor (mbsf), including an estimated 202 m of sediment and 140 m of basement to ensure crossing of the exhumation fault zone (estimated to be 100 m thick). Recovery would be particularly important in the few tens of meters above the basement to determine the age of the oldest sediment (and hence the time of basaltic magmatism and/or mantle exhumation) from biostratigraphy and magnetostratigraphy and to collect biogeochemical evidence of fluid-rock interactions due to active serpentinization at depth. Based on the sediment recovery in the RCB hole, the plan allowed for a second hole to be drilled using the advanced piston corer (APC)/extended core barrel (XCB) system to ensure adequate sampling of the lowermost sediment interval and the sediment/basement interface.
The original drilling plan for Site U1614 was modified after the bottom-hole assembly (BHA) became irremediably stuck in the previously drilled Hole U1612A, likely due to material falling into the hole from thick intervals of unconsolidated volcaniclastic sediments in the upper part of the sediment column. The original order of drilling operations was reversed to first core a hole with the APC/XCB system. The expected high recovery of the sediment interval in this hole would provide a high-quality record above the sediment/basement interface and would allow determination of the extent and depth distribution of unconsolidated volcaniclastics. The results obtained in the first hole would also be used to design a casing string that would reach below the base of the problematic volcaniclastics in a second hole. The second hole would then be RCB cored starting below the casing and above the sediment/basement interface with the goal of recovering the target 140 m thick basement interval. After coring, downhole logging was planned in the second RCB hole with a focus on obtaining electrical and ultrasonic borehole wall images to complement the core recovery and provide key input to the interpretation of the drilled basement interval.
2. Operations
Site U1614 hole locations, water depths, and coring statistics are listed in Table T1. All times are provided in local ship time (UTC + 1 h).
2.1. Hole U1614A
The 80.4 nmi transit from Site U1613 on the Cornaglia Terrace to Site U1614 took 7.6 h at an average speed of 10.6 kt. We arrived on site and switched to dynamic positioning (DP) mode at 1755 h on 23 February 2024. The precision depth recorder estimated the seafloor at 3580.1 meters below sea level (mbsl). An APC/XCB BHA with a 9⅞ inch polycrystalline diamond compact (PDC) bit was assembled and deployed to 5 m above the seafloor. Prior to spudding, we pumped enough microbial contamination tracer with circulating drilling fluid to fill the drill string.
Hole U1614A was spudded at 0645 h on 24 February, and the first core recovered 5.7 m of sediment as well as the mudline. Based on this recovery, the seafloor was calculated to be 3579.0 mbsl. Cores 1H–9H are full-length APC cores that advanced 77.3 m and recovered 76.21 m of sediment (98%). Measurements with the third-generation advanced piston corer temperature (APCT-3) tool were made while coring Cores 4H and 7H, and all APC cores were oriented. Cores 7H and 9H were partial strokes, and Core 9H experienced 30,000 lb of overpull. As a result, Cores 10F–14F were drilled using the half-length APC (HLAPC) system. These cores advanced 16.4 m to a total depth of 93.7 mbsf and recovered 12.72 m of sediment (78%). Gravel recovered in the tops of several cores was interpreted to be fall-in.
Cores 402-U1614A-15X through 34X advanced 186.4 m to a total depth of 280.1 mbsf, and 90.41 m of core material (49%) was recovered. Recoveries across this interval ranged 0%–103%. The basement contact was encountered in Core 33X. Core 34X penetrated an additional 9.8 m but only recovered 0.76 m (8%). We attempted to use the XCB system to drill another core but experienced high torque after deploying the core barrel and instead recovered a ghost core (35G) containing 2.16 m of fill from an undetermined depth and ended the hole. The pipe was tripped back to the surface, and the drill collars were racked. We then laid out the top guide horn to prepare for a jet-in test for the planned casing installation at this site. In total, the 35 cores collected in Hole U1614A recovered 179.36 m of material (64%) and took 3.2 days to complete.
2.2. Hole U1614B
The planned casing installation consisted of a 13⅜ inch casing string to ~60 mbsf and a second 10¾ inch casing string extending to ~40 m above the basement interface (Figure F4). To determine if the full 60 m length of the 13⅜ inch casing string could be installed, a jet-in test in Hole U1614B was required. We set the BHA with a 14¾ inch tricone bit, tripped the pipe to the seafloor, and spudded Hole U1614B at 0900 h on 27 February 2024. The jet-in test was successful, penetrating to 65.5 mbsf. We then pulled out of the hole and tripped the bit back to the surface, clearing the rig floor and completing Hole U1614B at 1900 h.
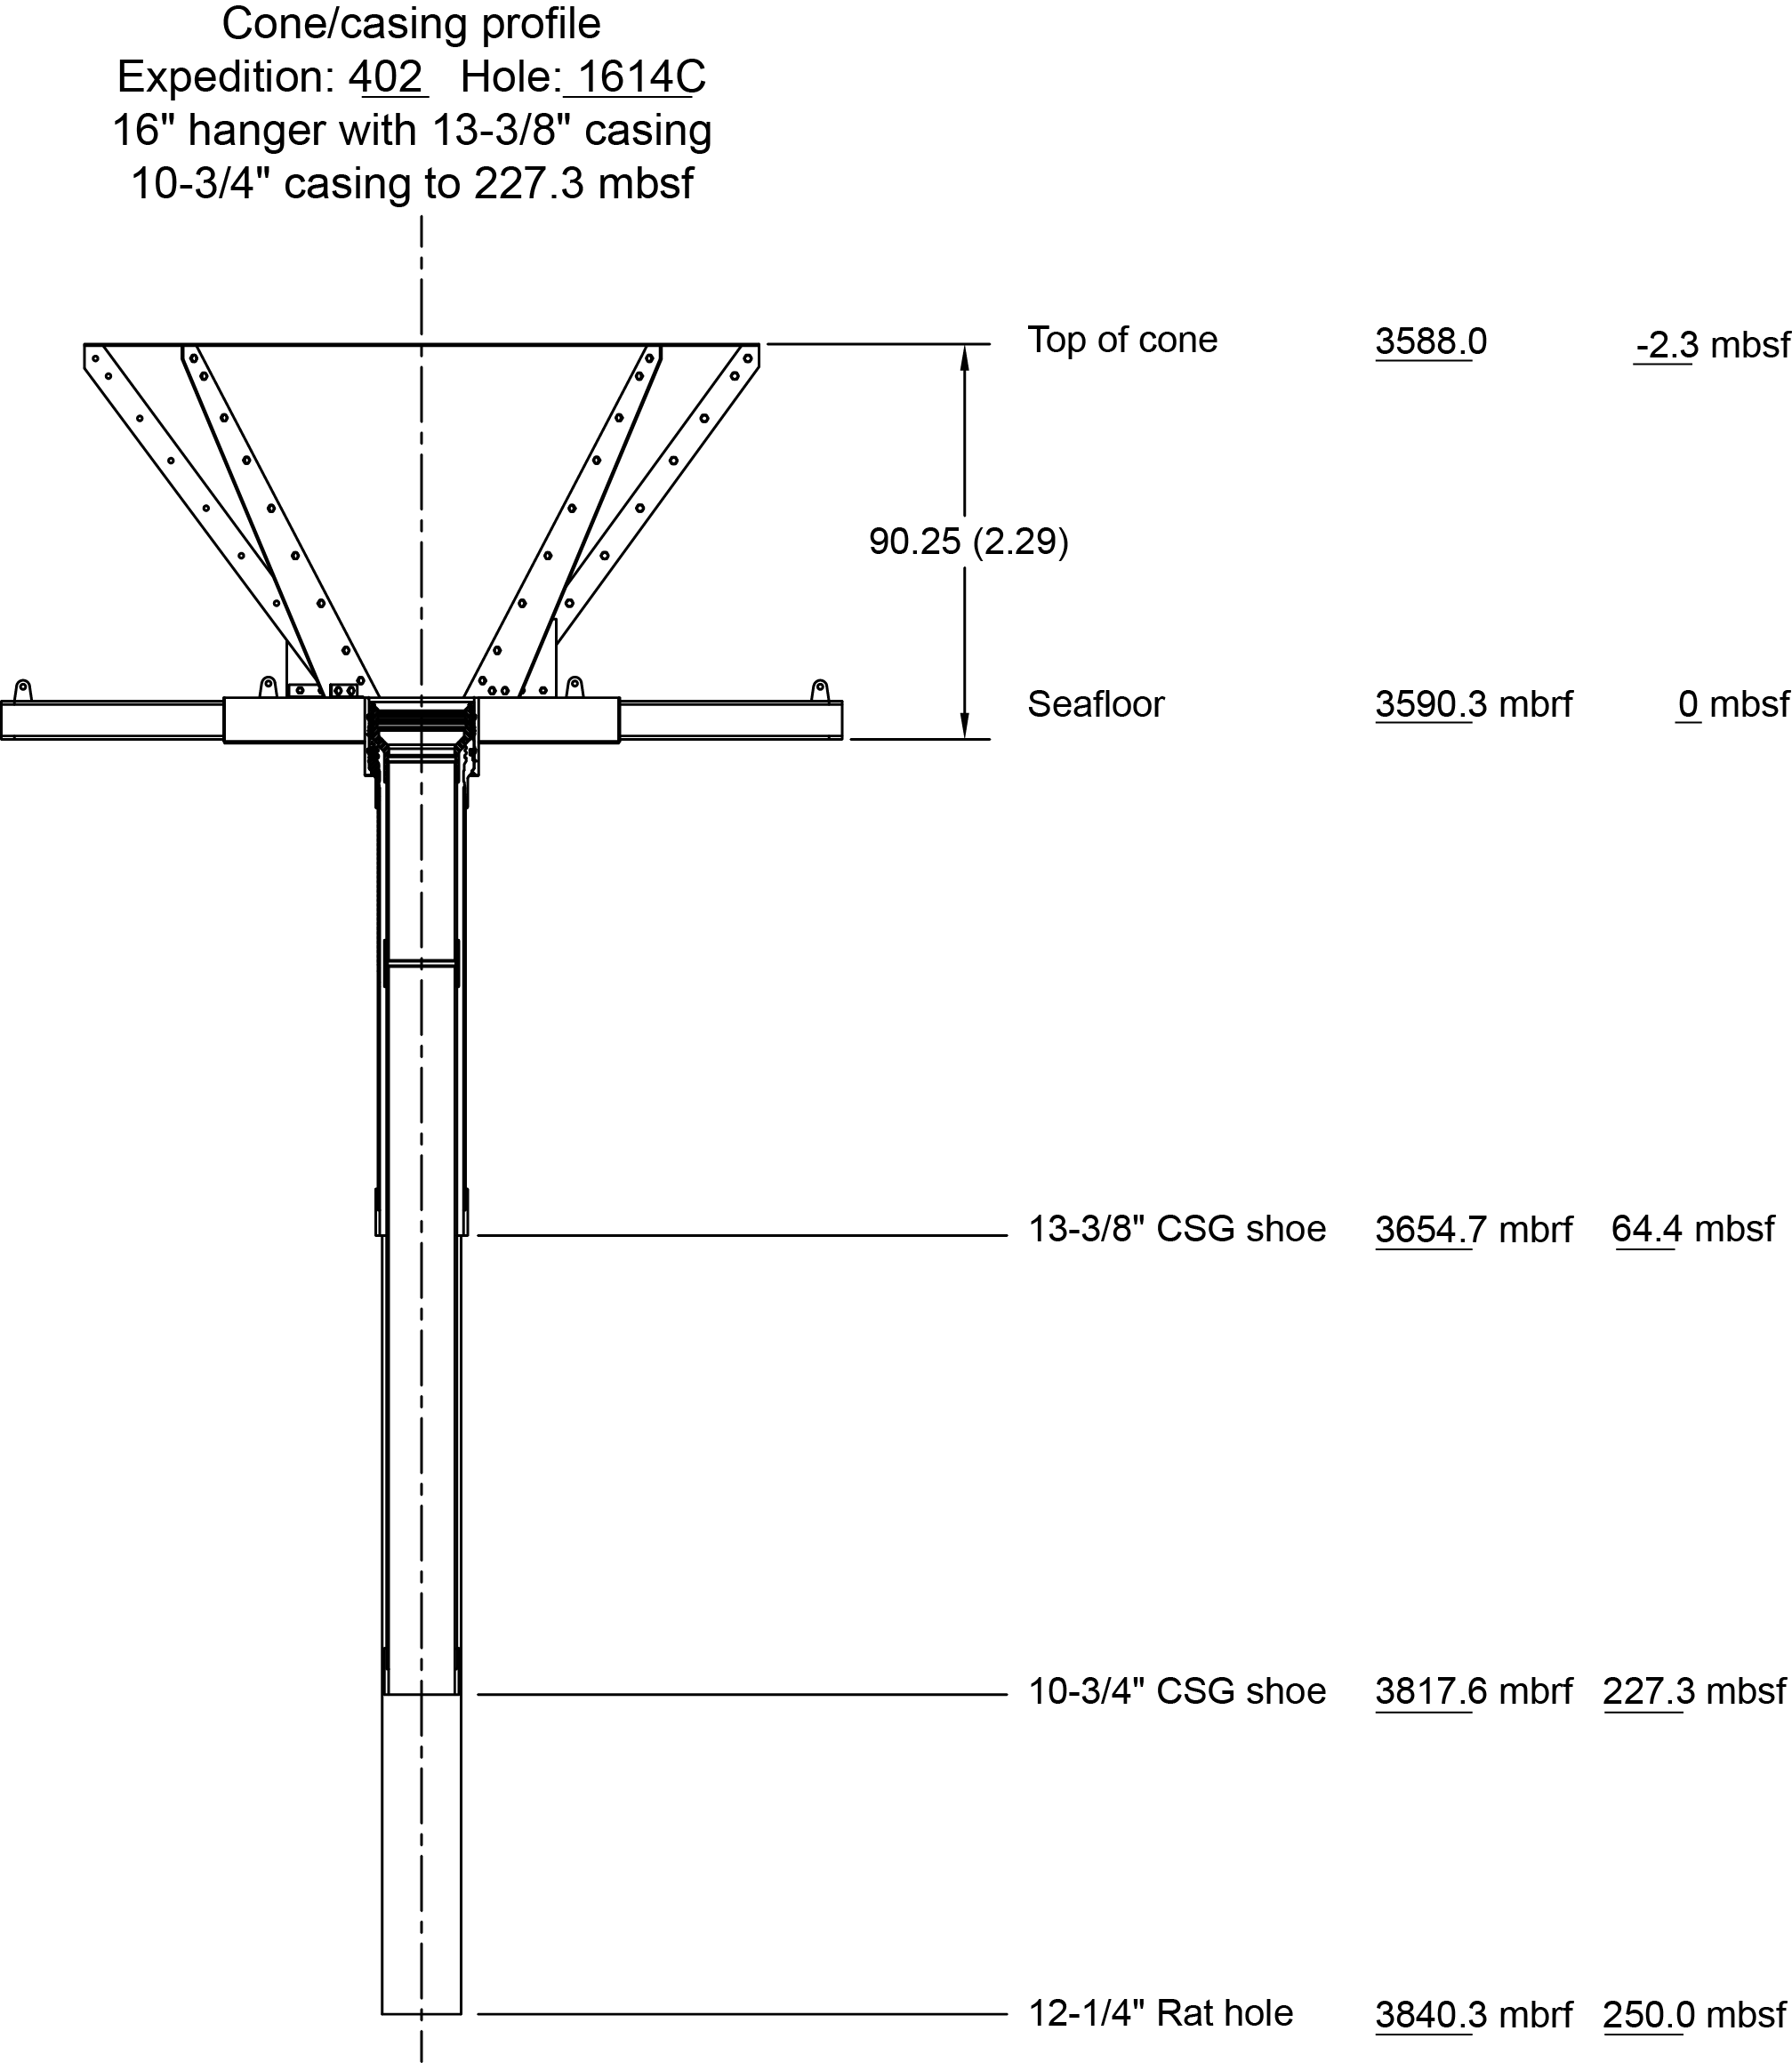
Figure F4. Reentry cone and casing installation.
2.3. Hole U1614C
To install casing and a reentry cone in Hole U1614C, the reentry cone was positioned in the moonpool and the five joints of 13⅜ inch casing and a shoe joint were hung in the guide base using a 16 inch casing hanger and a 16 inch to 13⅜ inch crossover. The stinger with the running tool and BHA were assembled and latched into the casing and reentry cone, which was deployed through the moonpool at 0515 h on 28 February 2024. The pipe was tripped to the seafloor, and the vibration isolated television (VIT) camera system was deployed after 60 stands of pipe to follow the reentry cone. At 1400 h, we installed the top drive and spudded Hole U1614C, jetting in casing to 64.4 mbsf. We detached the running tool from the casing by rotating the drill string 3½ times to the right at 1550 h, began pulling out of the hole, and recovered the VIT. We then tripped the pipe back toward the surface.
To facilitate the installation of the 10¾ inch casing string, we drilled ahead to ~20 m above the expected basement contact. The drilling BHA was assembled and deployed with a 12¼ inch bit and reentered Hole U1614C at 1100 h on 29 February using the VIT camera system to guide reentry. After retrieving the VIT, the drill bit successfully penetrated to 250.0 mbsf, after which the hole was displaced with 100 bbl of heavy mud and the pipe was tripped back to surface. The Conductivity-Temperature-Depth (CTD) sensor and the Niskin bottle water sampler were attached to the VIT camera system frame and deployed during the first two VIT runs to profile the water column, temperature, and conductivity and collect bottom seawater samples for chemistry and microbiology.
The final casing step was to install the 10¾ inch casing string. The running tool and drill collars were set up, and a standard slip and cut of the drill line was performed prior to running the 20 joints of casing. With the casing hanging off the moonpool doors, we set up the BHA, latched into the casing hanger, and began tripping toward the seafloor. The VIT camera system was launched and lowered to guide reentry. The second reentry into Hole U1614C occurred at 0030 h on 2 March. We washed in the casing to 227.3 mbsf, working through an obstruction at 172.7 mbsf by picking up the top drive and using the rig pumps. The casing was latched and released at 0345 h. We recovered the VIT camera system and tripped the pipe back to the surface, and the drill bit cleared the rig floor at 1300 h. After racking the drill collars in the derrick and reinstalling the upper guide horn, we prepped the RCB system and made up a 181.1 m long BHA with a C-7 RCB drill bit for basement coring in Hole U1614C.
The third reentry into Hole U1614C to begin RCB drilling occurred at 0135 h on 3 March and was guided by the VIT camera system. We then picked up the top drive, recovered the VIT, and dropped a core barrel with the bit at 229.7 mbsf. The core barrel was washed down to the bottom of the previous drilled interval (250.0 mbsf) before we began coring.
Cores 402-U1614C-2R through 28R advanced 160.6 m to a total hole depth of 410.6 mbsf with a recovery of 71.58 m (44%). Recoveries ranged 6%–99%. Cores 8R–28R were run as half-advances to improve recovery. After drilling Core 11R, we experienced high overpull and loss of rotation but were able to work the pipe free. Recovery was relatively high in Cores 5R–19R (61%) and 22R–28R (49%) and very low in Cores 20R (9%) and 21R (21%), likely due to the differences in the recovered lithology.
After recovery of Core 402-U1614C-28R, we lost pipe rotation and got stuck. By working the pipe, we were able to regain rotation and lay out two single pieces of pipe from the drill string. The drill string became stuck again, with no rotation or vertical movement. Good circulation suggested that we were losing circulating fluids into the formation. From 1430 to 1700 h on 6 March, we worked the pipe without regaining movement. The vessel was offset to retrieve the core barrel and release the bit as a last attempt to free ourselves. When this effort failed, we made the decision to deploy a severing charge and cut the pipe just below the depth of the casing string. A severing charge was lowered to 234.7 mbsf on the Schlumberger wireline. The charges were detonated with 20,000 lb of overpull on the pipe; an immediate drop in string weight indicated that we were free. The Schlumberger wireline was recovered, and we began pulling out of the hole. Once the end of the pipe cleared the seafloor at 0500 h on 7 March, the vessel started to move in DP mode at 0.5 kt toward Site U1615. The end of the pipe reached the rig floor at 1000 h, ending Hole U1614C and Site U1614.
3. Lithostratigraphy
Sediment was recovered at Site U1614 in Holes U1614A and U1614C. Hole U1614A captured the full sedimentary succession with the APC/XCB system, and Hole U1614C recovered the sediment/basement interface and penetrated the basement with the RCB system. Hole U1614A cored a 280.1 m thick sequence of sediments and rocks (recovery = 64%) (Figure F5). Sedimentary Lithostratigraphic Units I–III (Figure F6) range in age from Holocene to Early Pleistocene, as determined by calcareous nannofossil and planktic foraminifera stratigraphy (see Biostratigraphy). Despite the tentative age assignments to different lithostratigraphic units, repetitions of younger biozones below stratigraphically older biozones is common at this and other Vavilov Basin sites (Sites U1615 and U1616) because of the presence of mass transport deposits. The boundary between Unit III and IV is the primary contact between the sedimentary cover and the basement.
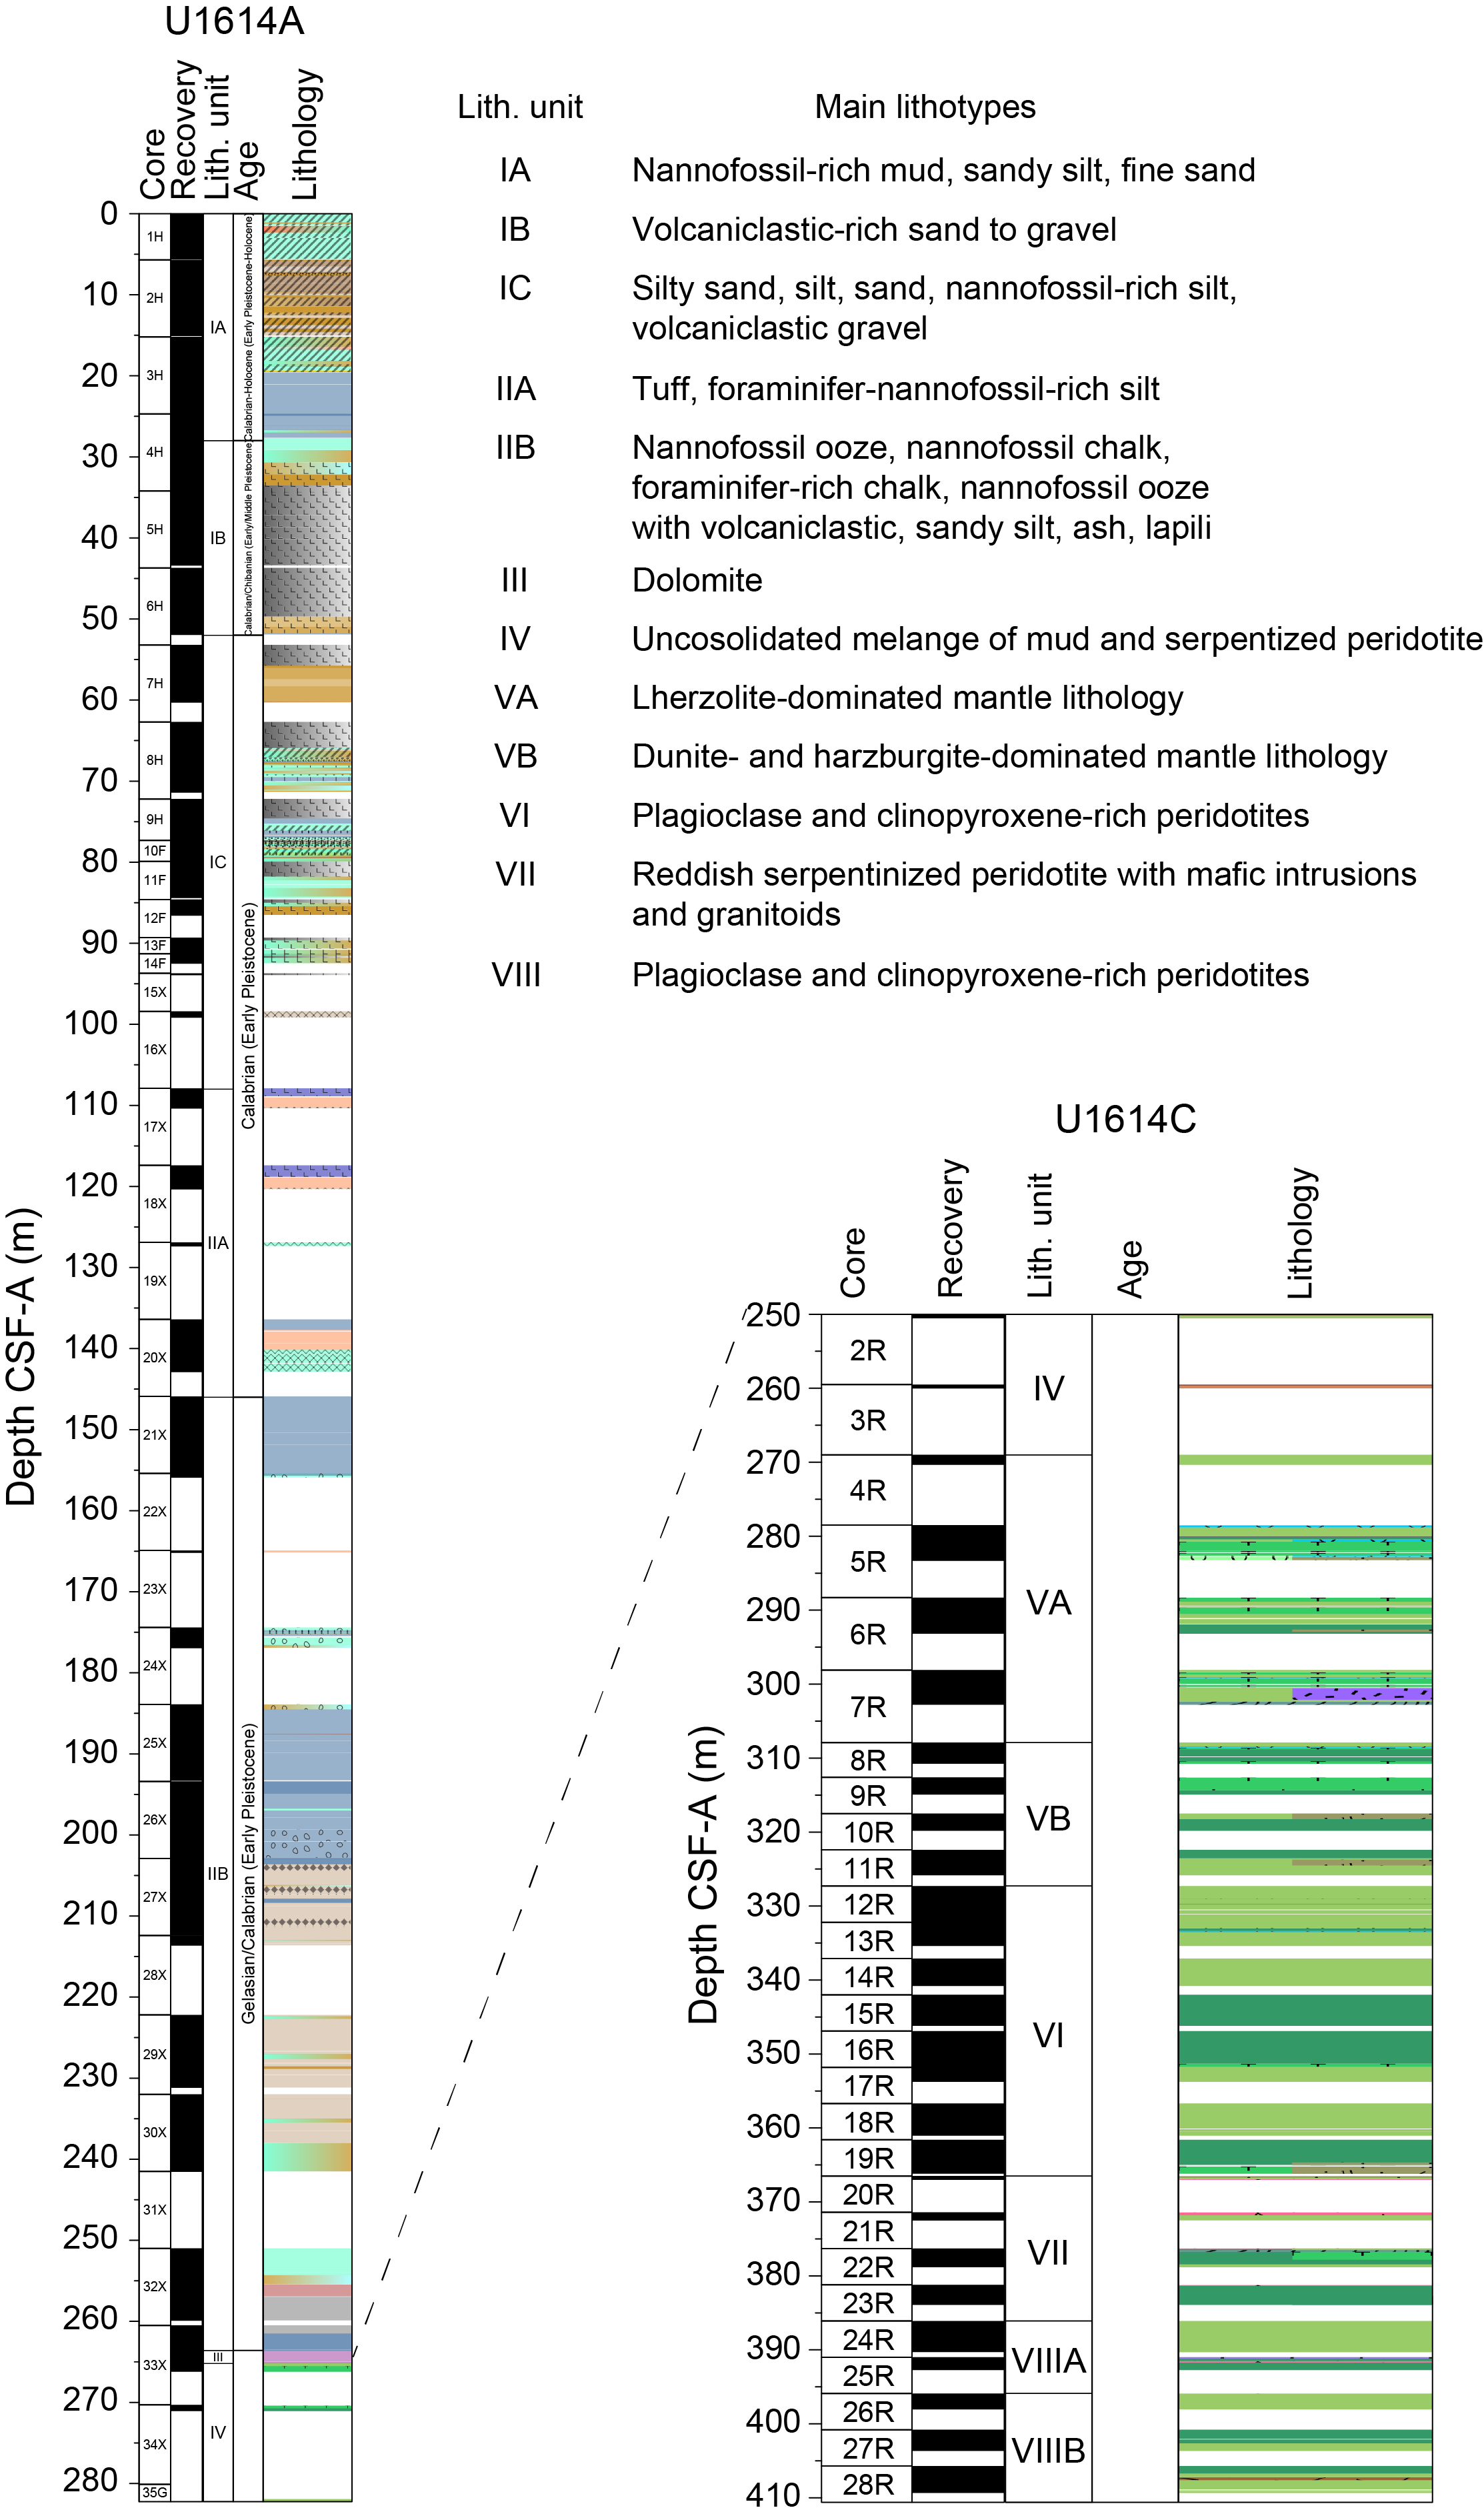
Figure F5. Lithostratigraphic summary, Hole U1614A.
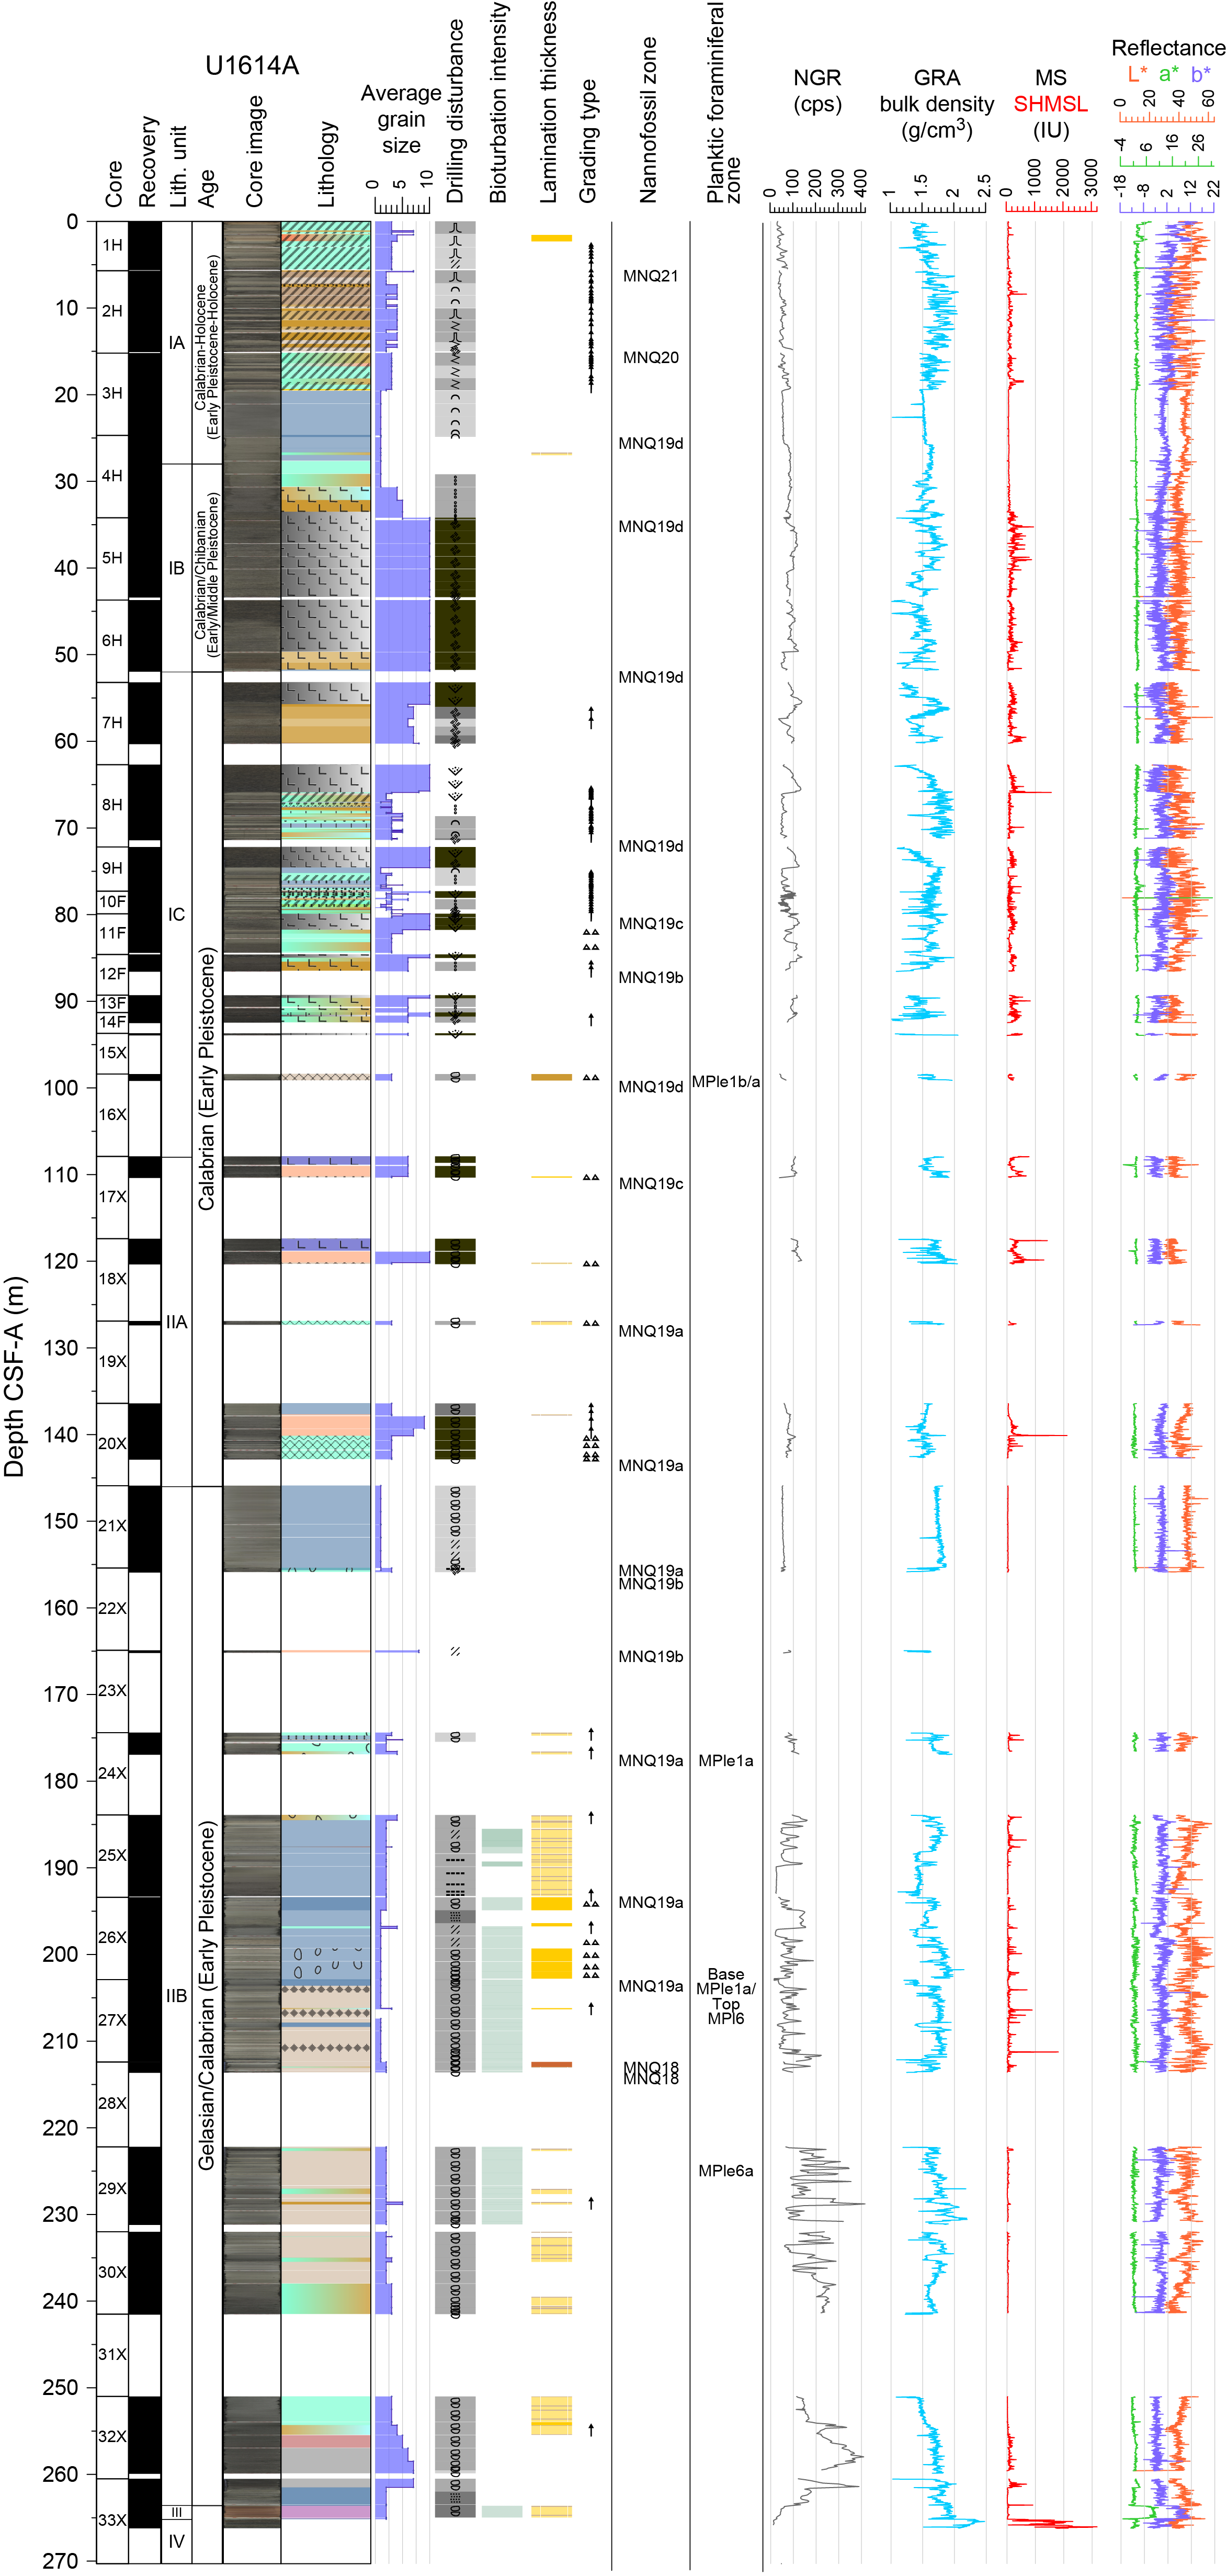
Figure F6. VCD.
The location of Site U1614 in the Vavilov Basin east of the Gortani Ridge is reflected by the nature of the sedimentary column recovered here, where most of the recent sedimentation consists of turbidites and volcaniclastic sediments (Figure F7). Unit I consists of nannofossil-rich mud intercalated with thick layers of volcaniclastic sedimentation (Figure F7; see Lithostratigraphic Subunit IB). Unit II is composed of nannofossil- and/or foraminifera-rich silt interbedded with meters-thick tuff deposits (Figure F7). Approximately 2 m of Unit III sediments were recovered, consisting mainly of reddish mud rich in dolomite (Figure F7). Unit IV is serpentinized peridotite of the exhumed mantle (see Igneous and metamorphic petrology).
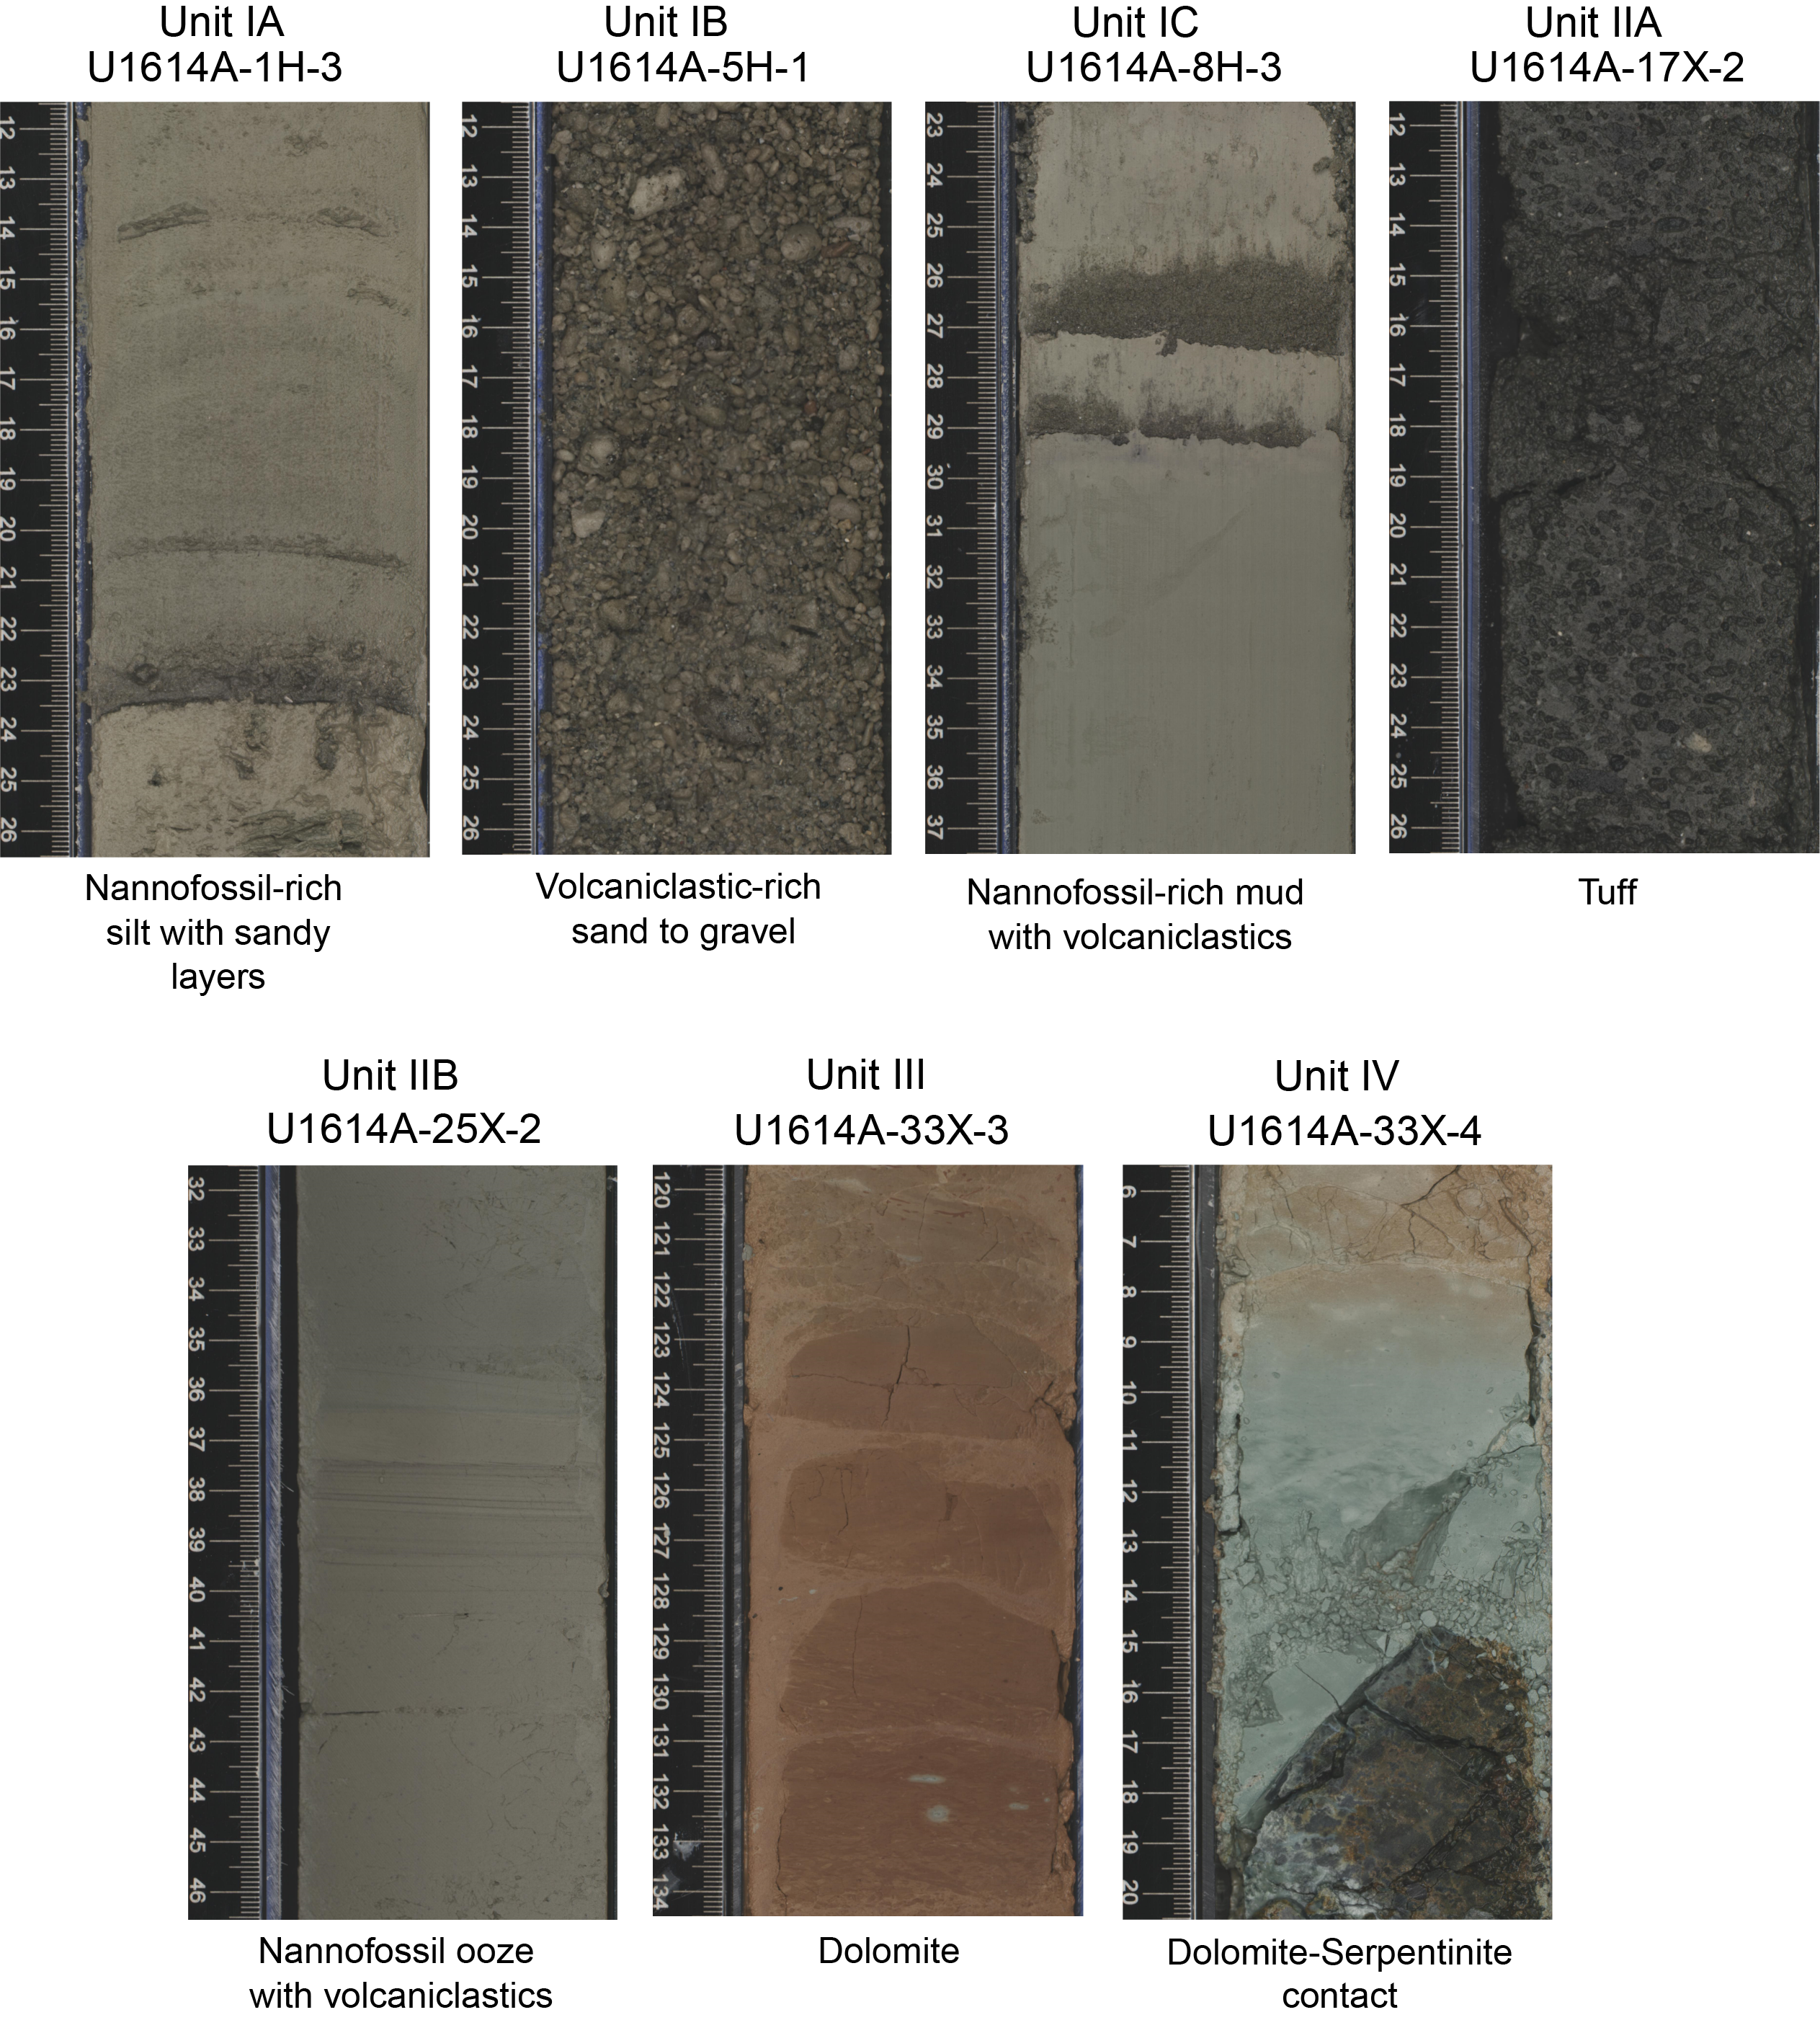
Figure F7. Examples of main lithologies.
Lithostratigraphic units are determined based on lithologic changes described in the visual core description (VCD) forms (Figure F6), smear slide observations (Figure F8), physical properties, and mineralogy as measured by X-ray diffraction (XRD). The observed lithologic differences are primarily the result of grain size variation with color changes (identified using a Munsell color chart), reflecting major shifts in mineralogical and/or biogenic components. Neither lithologic primary contacts nor clear transitions between different sediment types were recovered at intervals where the biostratigraphy indicated hiatuses in the sediment column, likely because of poor core recovery (see Biostratigraphy).
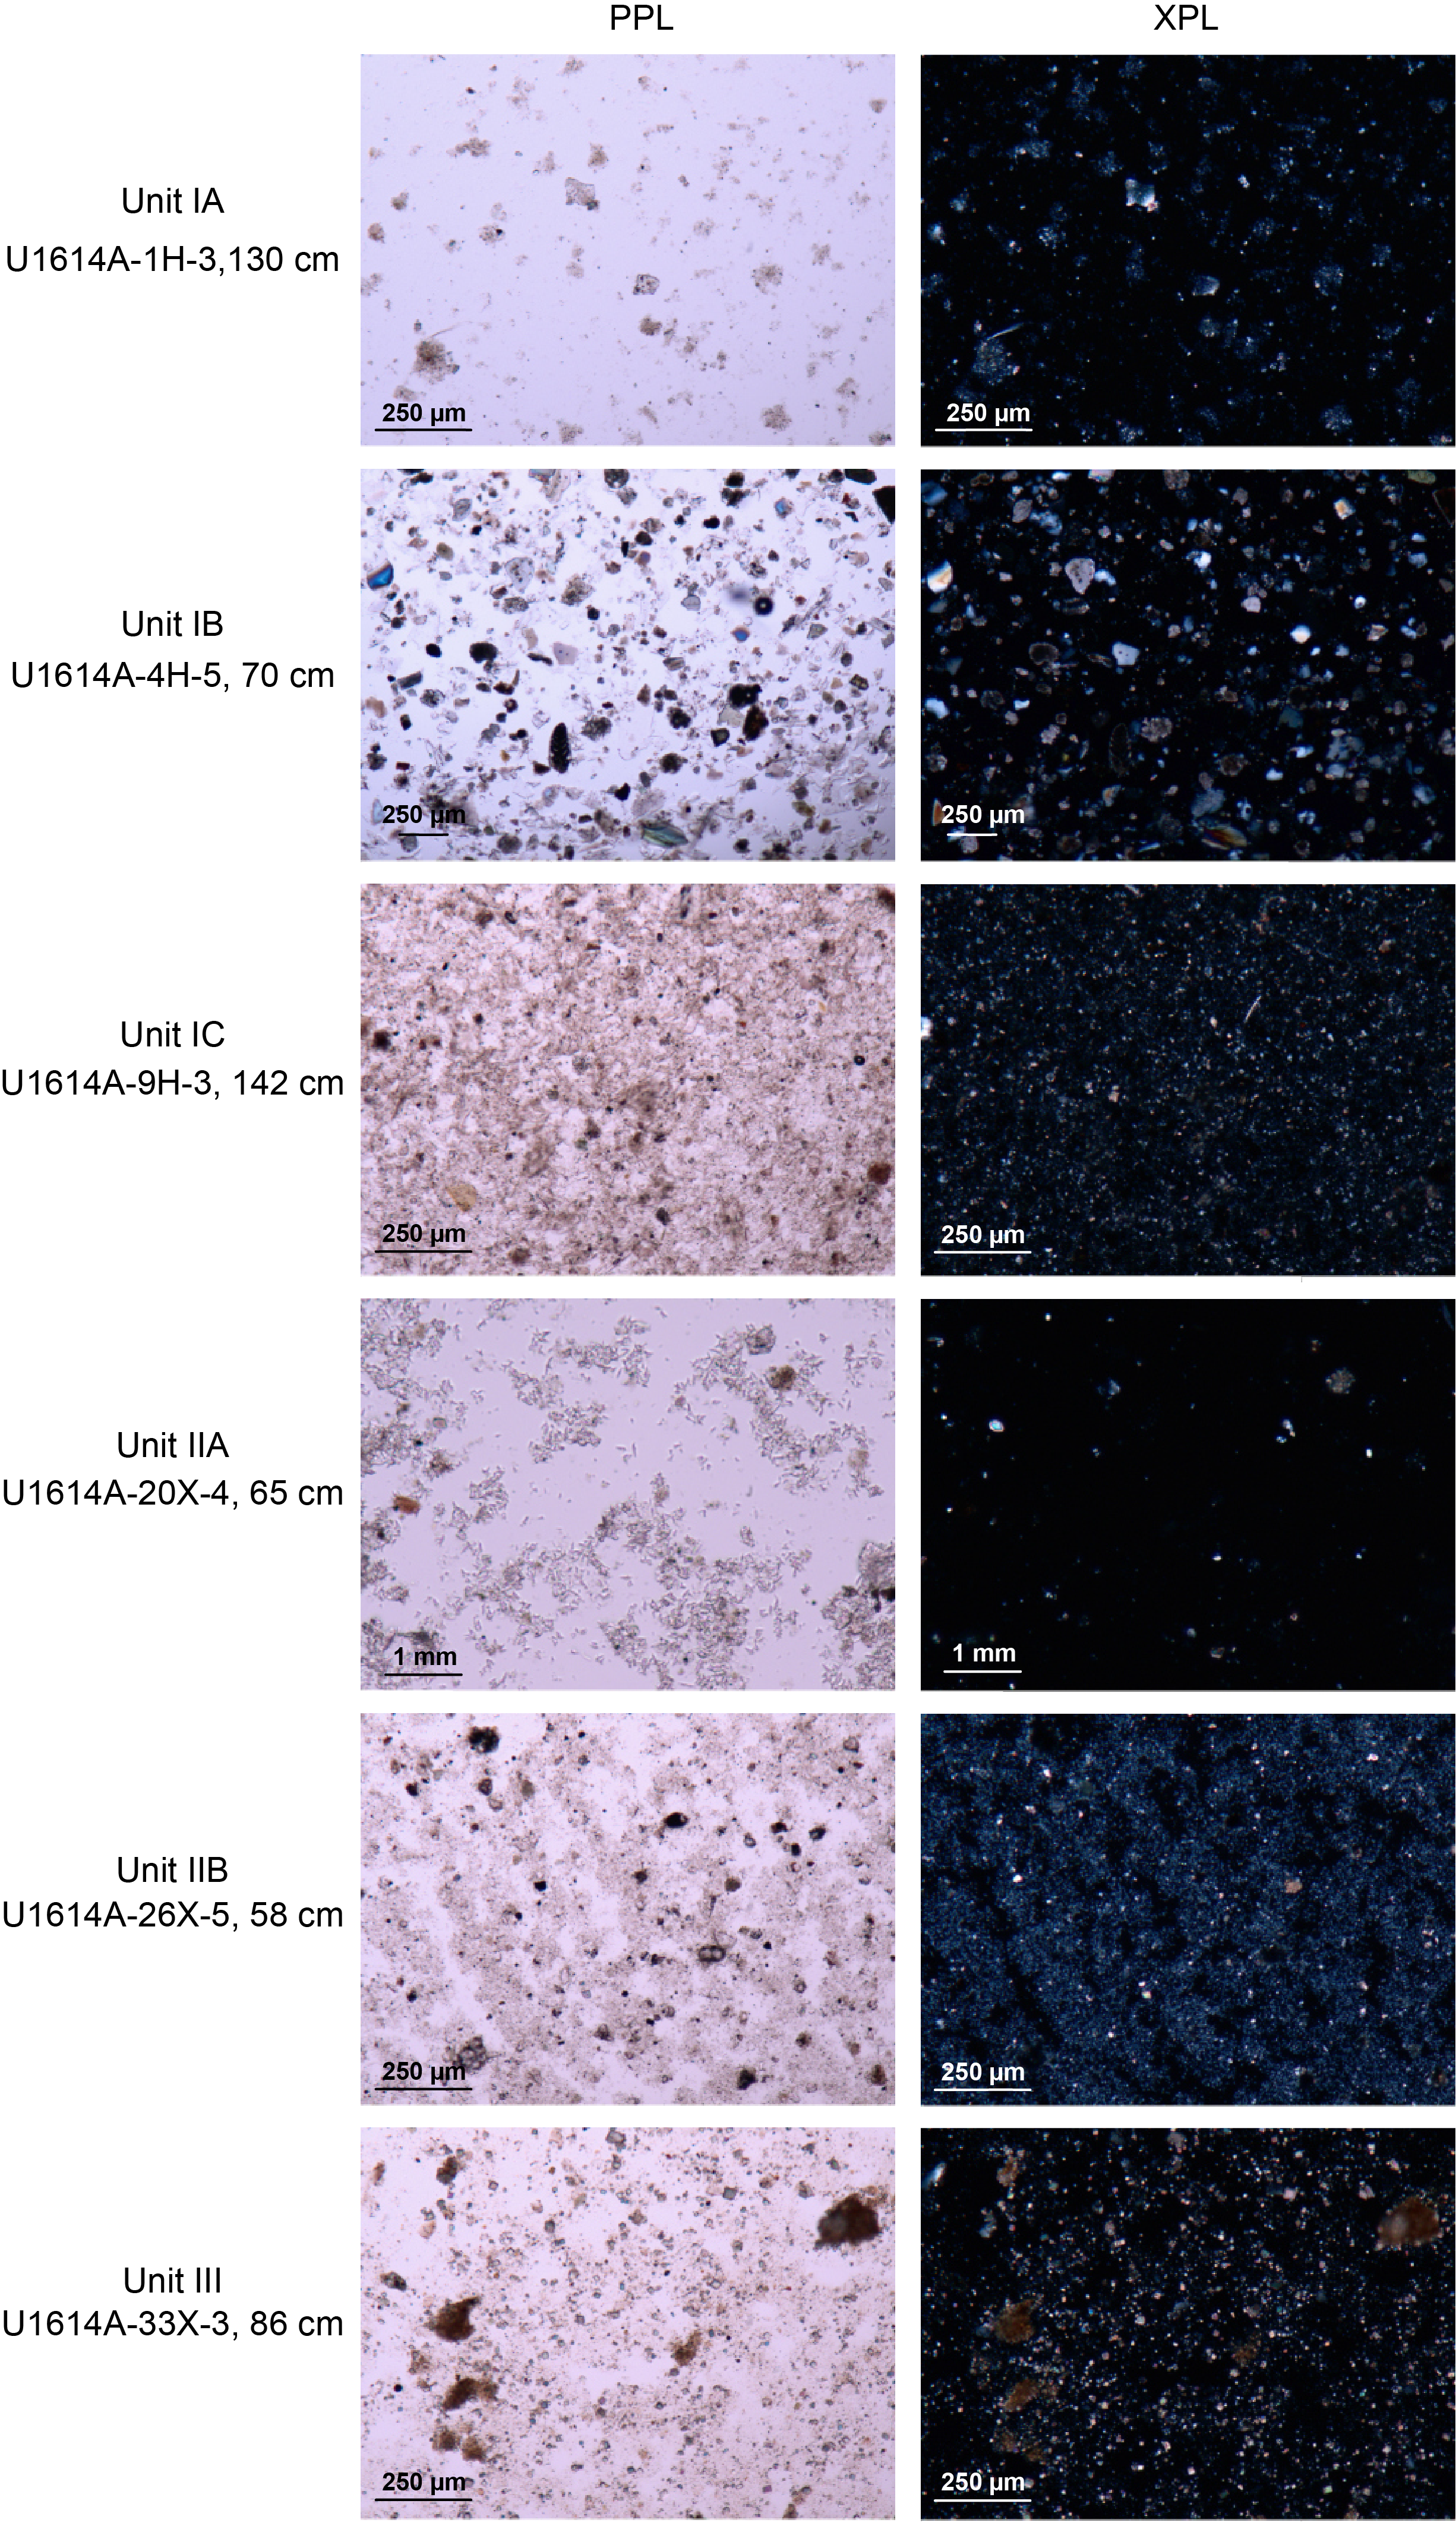
Figure F8. Main lithologies.
3.1. Lithostratigraphic unit descriptions
3.1.1. Lithostratigraphic Unit I
3.1.1.1. Lithostratigraphic Subunit IA
- Interval: 402-U1614A-1H-1 through 4H-2
- Depth: 0–28 m core depth below seafloor, Method A (CSF-A)
- Age: Holocene to Middle/Early Pleistocene (present to Chibanian/Calabrian)
- Major lithologies: nannofossil-rich mud, sandy silt, and sand
Most of Subunit IA consists of turbidite deposits with erosive bases, usually deposited in fining-upward sequences from coarse sand at the bottom of the layer to nannofossil-rich silt at the top of each turbidite layer (Figures F7, F8, F9). The succession of several depositional events is evident in the petrophysical data, where both magnetic susceptibility (MS) and gamma ray attenuation (GRA) bulk density values increase downhole from the top to the base of such events (Figure F9A). Turbidite events are also evident in the color reflectance data, where luminosity (L*) is low at the base of the event deposits, when coarser, darker material is deposited and then increases as background pelagic sedimentation resumes. This background pelagic sedimentation normally has a higher carbonate content that causes the observed increases in L* (Figure F9A, F9B). However, even in these intervals, carbonate content remains consistently less than 40%. Most of the turbidites are moderately disturbed by the coring process, which distributes coarser sediments along the exterior of the core between the sediments and the plastic liner. In some cases, this disturbance may have caused cross contamination between sand layers separated by thin (tens of centimeters) pelagic sediment layers. Few volcaniclastic layers are also present, possibly tephra (with MS values of ~200–700 instrument units [IU]). Toward the base of the subunit (~19 m CSF-A), background pelagic sedimentation is continuous without event deposition and is reflected by constant values of both L* and GRA bulk density (Figure F9). No obvious bioturbation is observed in this subunit, but macrofossils are present, although rare, in the form of shell fragments that could not be identified. Wood fragments are also found in some of the depositional event layers.
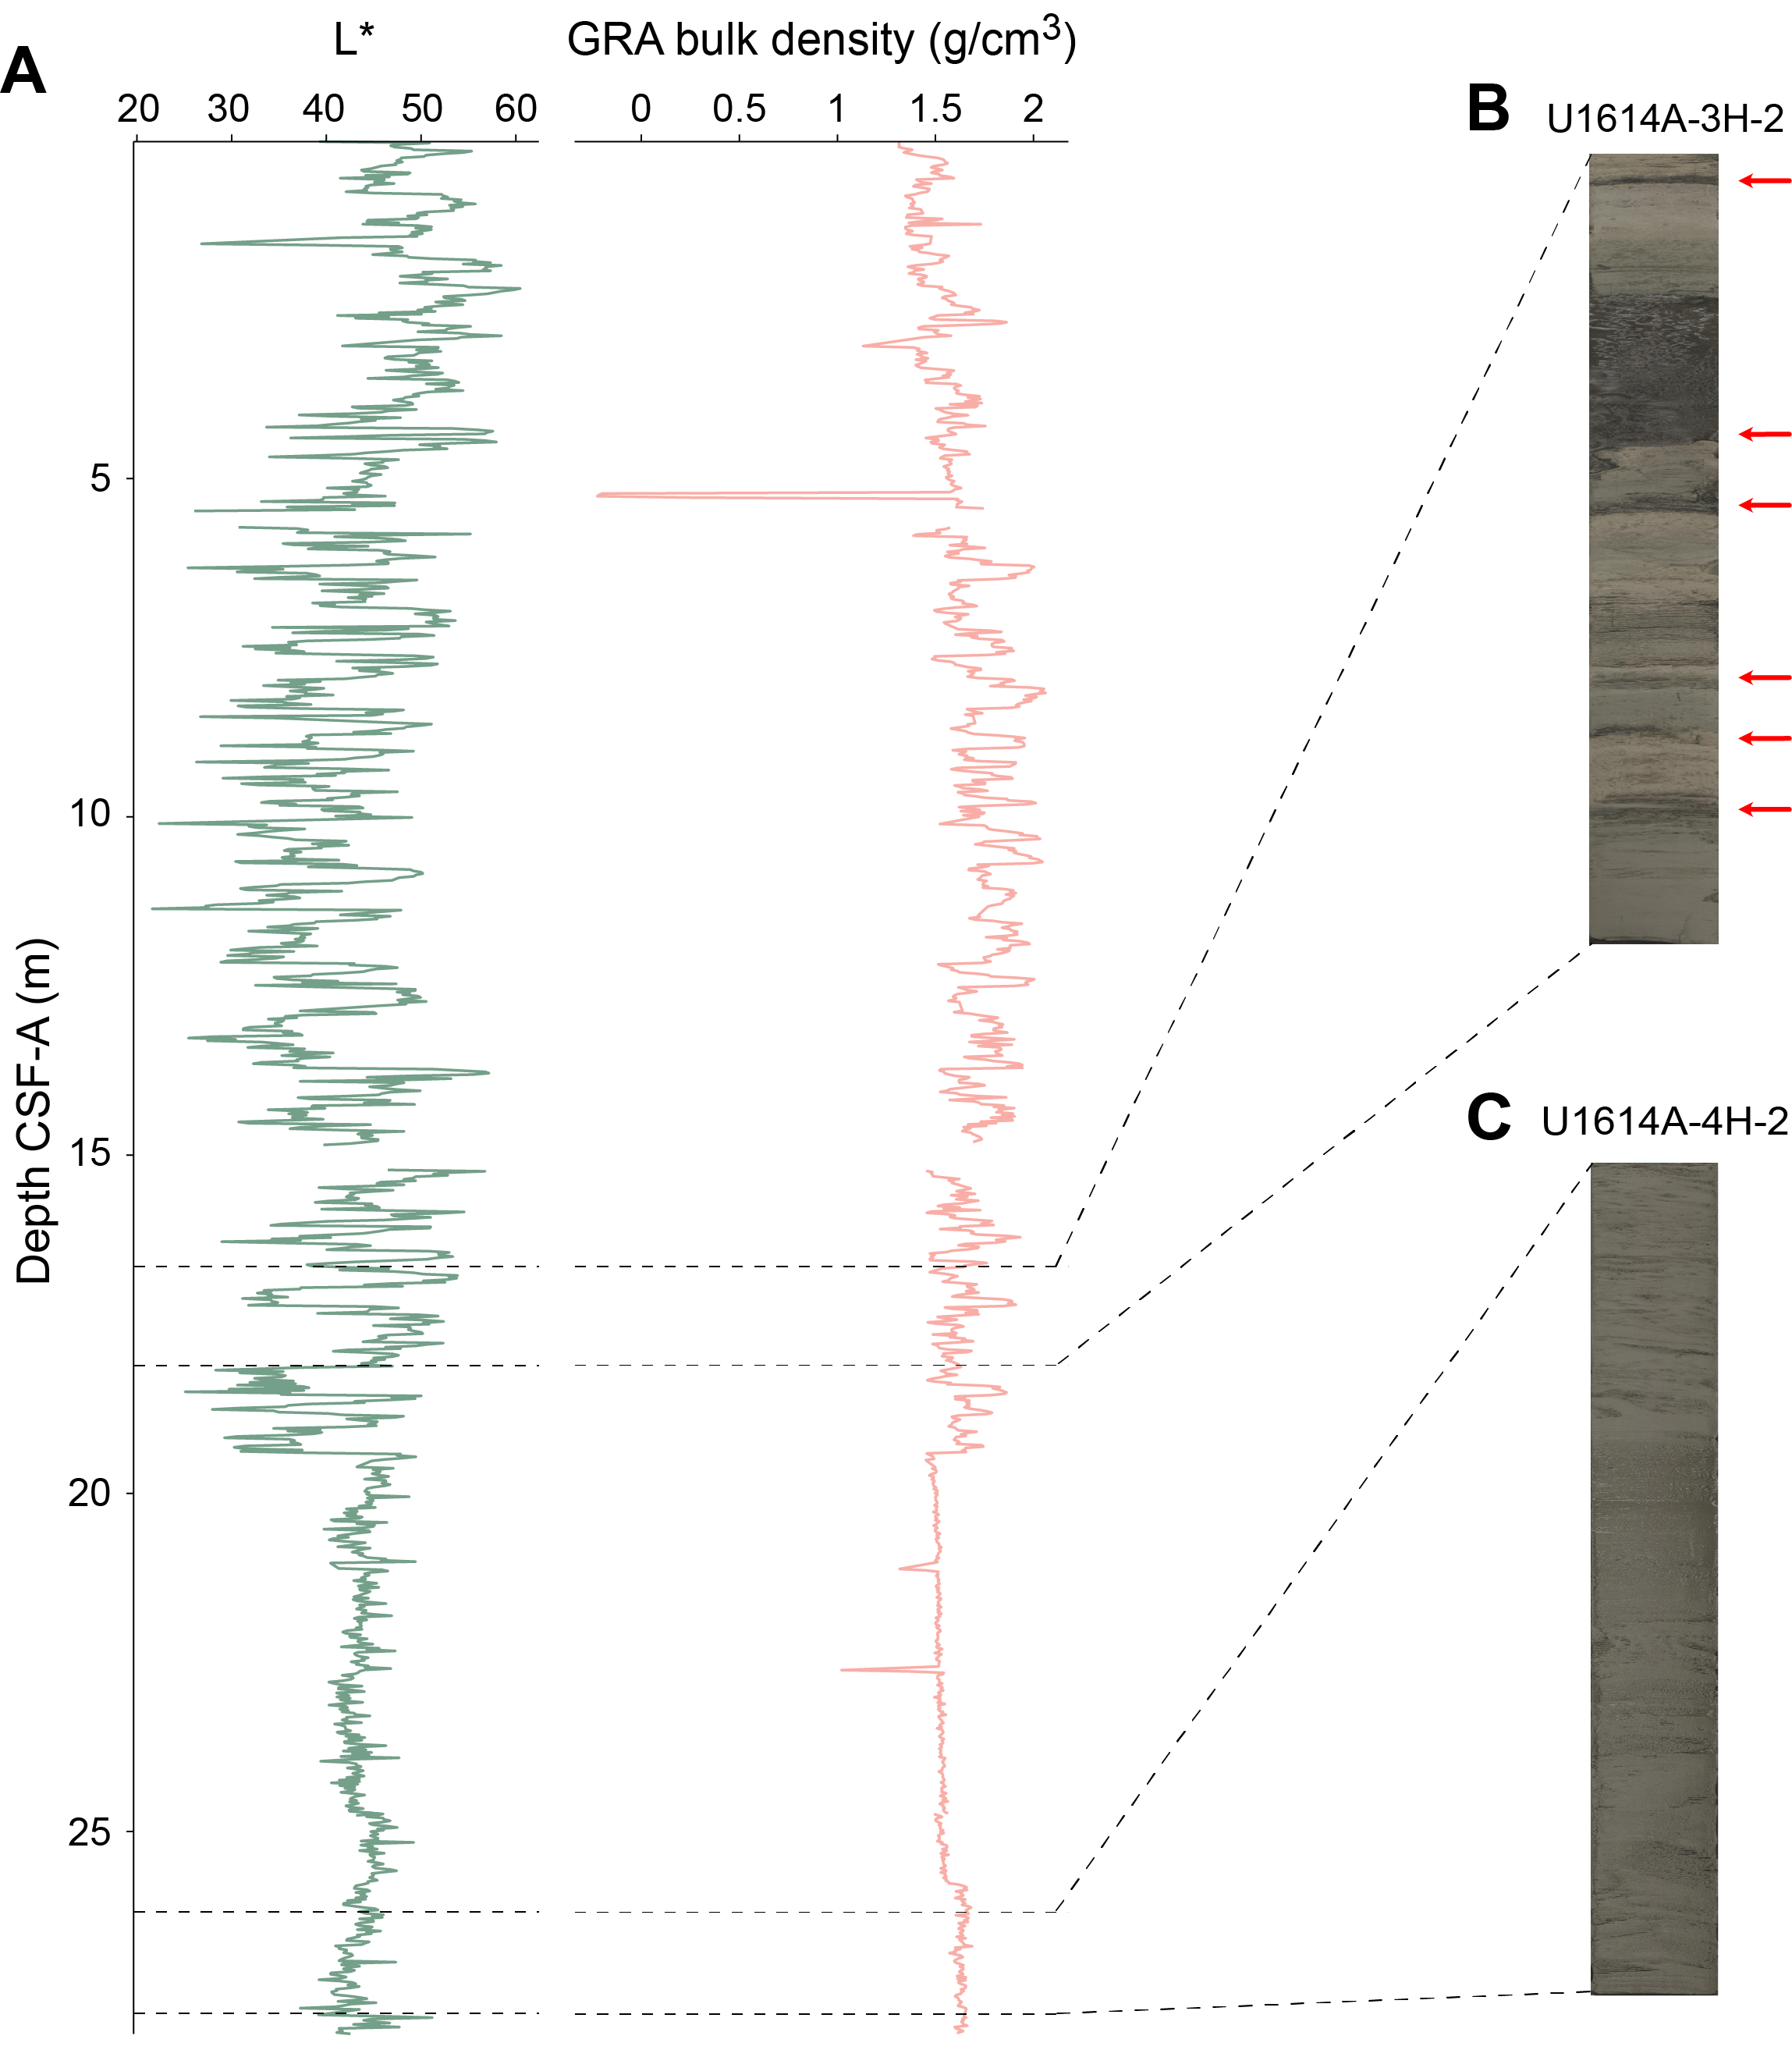
Figure F9. Depositional styles.
3.1.1.2. Lithostratigraphic Subunit IB
- Interval: 402-U1614A-4H-3 through 6H-CC
- Depth: 28–52 m CSF-A
- Age: Middle/Early Pleistocene (Chibanian/Calabrian)
- Major lithologies: volcaniclastic rich sand and volcaniclastic gravel
Subunit IB is composed entirely of volcaniclastic gravel with a high abundance of quartz, pumice, and lithics (Figures F7, F8). There is an apparent normal grading through the subunit, but it is difficult to interpret how much of the grading is real as opposed to being induced by fall-in from overlying layers during drilling. Light-colored pumice-rich layers are common and apparently randomly distributed throughout the subunit. Several fossils are observed throughout Subunit IB, including large benthic foraminifera, gastropods, and scaphopod shells. The recovery of pelagic sediments below this subunit, in Section 402-U1614A-6H-CC, marks the lower limit of this gravel deposit.
3.1.1.3. Lithostratigraphic Subunit IC
- Interval: 402-U1614A-7H-1 through 16X-1
- Depth: 52–108 m CSF-A
- Age: Middle/Early Pleistocene (Chibanian/Calabrian)
- Major lithologies: sandy silt, silt, sand, and volcaniclastic gravel
Throughout Subunit IC, several occurrences of gravel in an otherwise sandy silt subunit are interpreted to be fall-in. Gravel material is considered fall-in if (1) the fragments are found at the top of the core, (2) the fragments are composed of material that is recognizable as occurring in Subunit IB, (3) there are no preserved contacts between the gravel and adjacent units, and (4) the gravel contains no trace of the Subunit IB mud matrix, which was presumably washed out during drilling. Fall-in occurrences are not classified as separate units but are recorded in the broader unit in which they were observed. Postcruise integration of core descriptions with onshore analyses can help refine the true stratigraphic placement of sediment and gravel intervals.
Typically, the first and second sections of a core are filled with clean volcaniclastic gravel (fall-in), followed by silt and volcaniclastic-rich pelagic sediments (Figures F7, F8, F10). In the lower half of each core, drilling disturbance is generally limited to slight uparching. Recovery is good in the upper part of this subunit but drops dramatically in Cores 402-U1614A-15X and 16X. Coarser pumice intervals occur in Cores 12F and 13F.
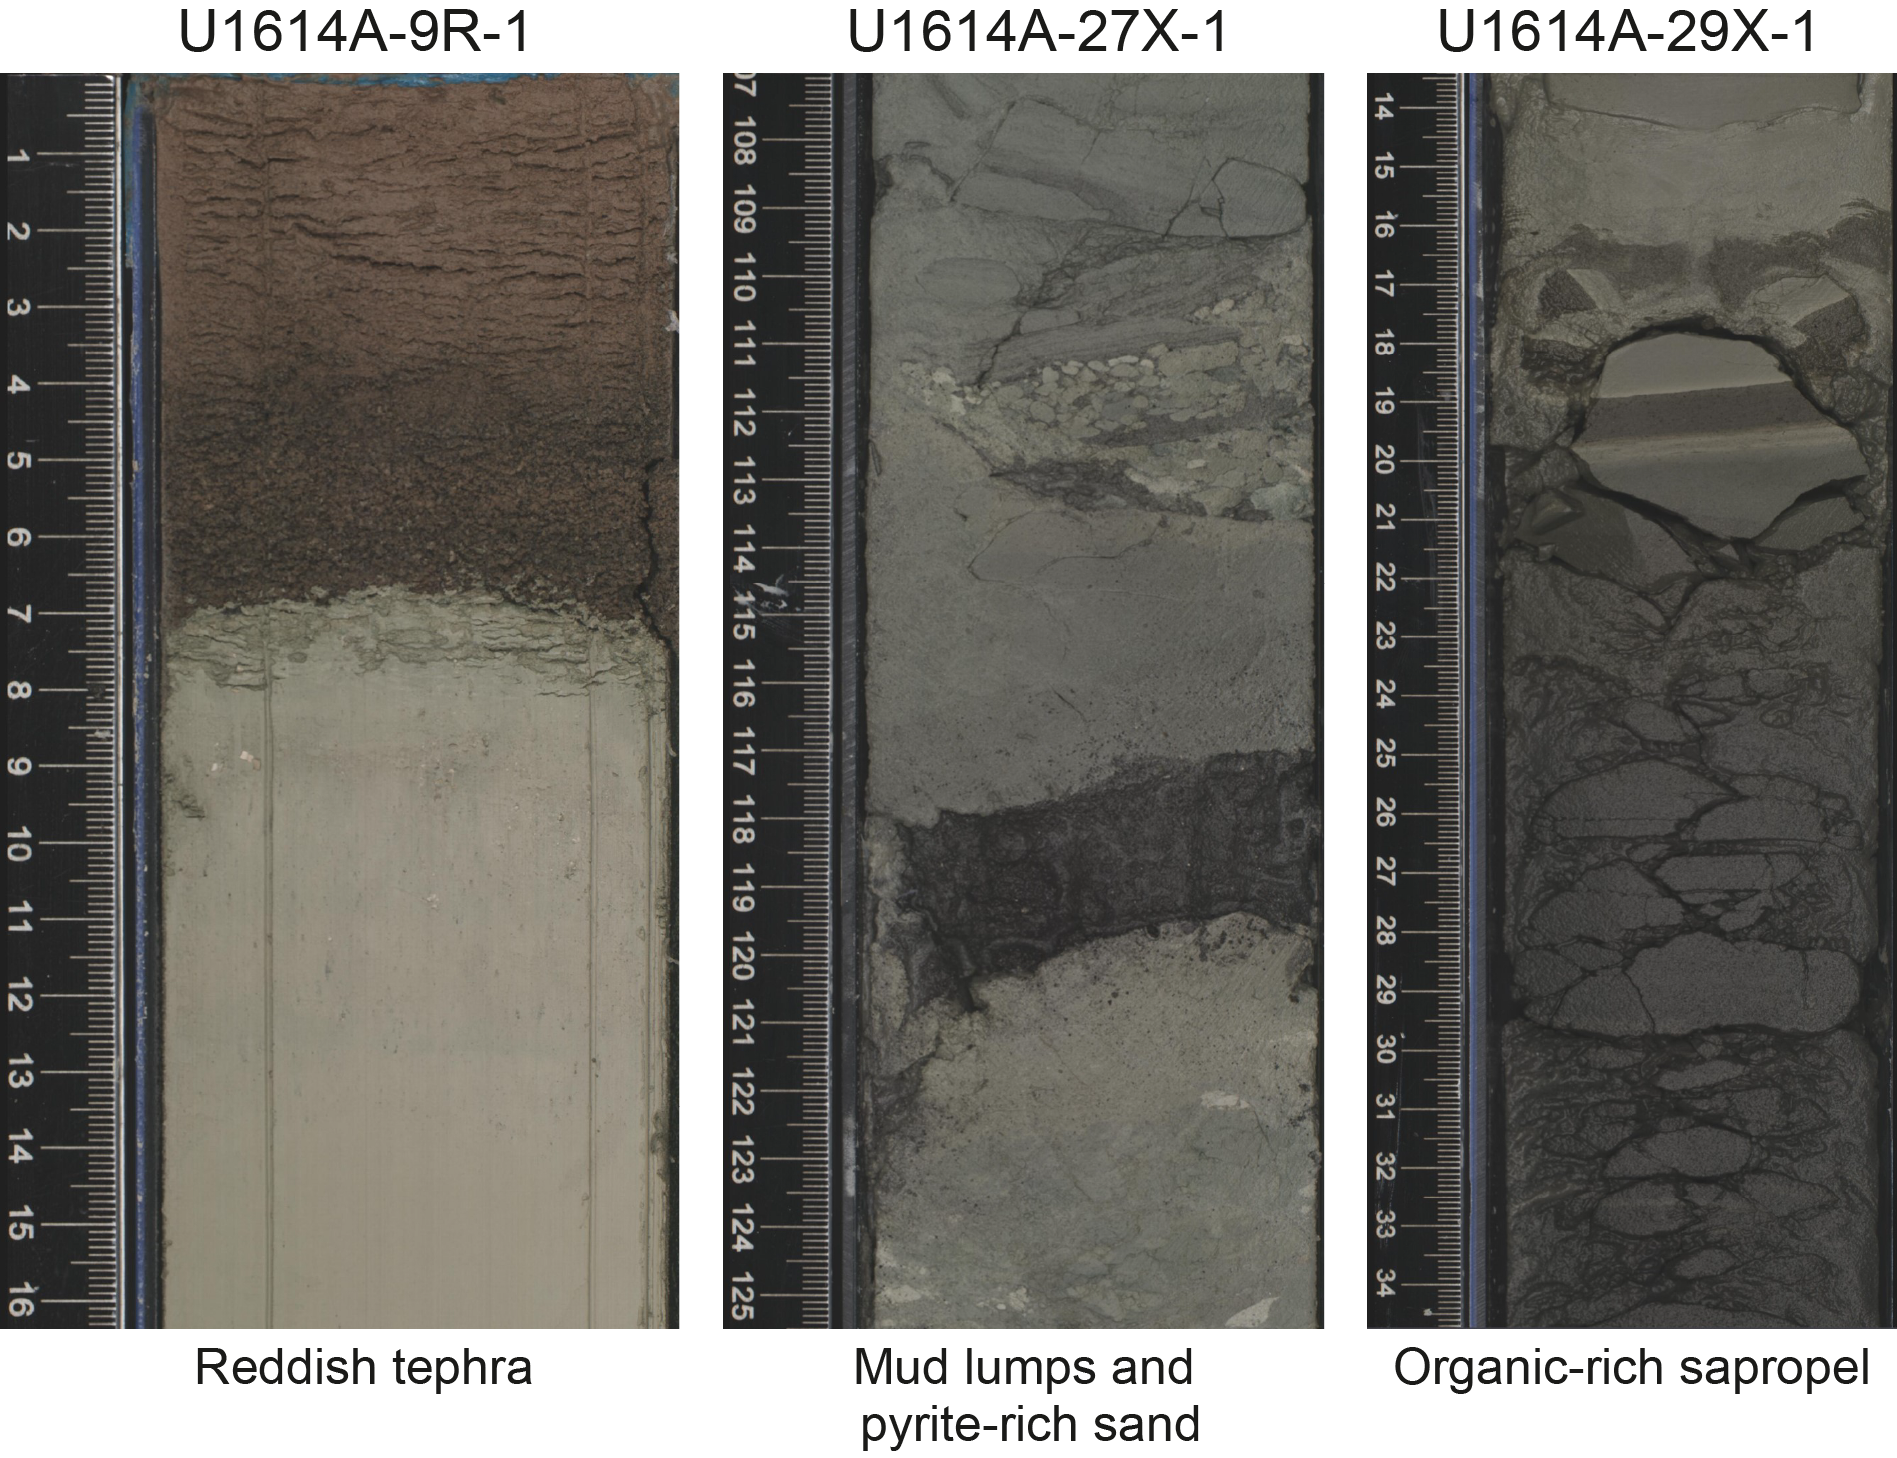
Figure F10. Distinctive features.
3.1.2. Lithostratigraphic Unit II
3.1.2.1. Lithostratigraphic Subunit IIA
- Interval: 402-U1614A-17X-1 through 20X-CC
- Depth: 108–146 m CSF-A
- Age: Early Pleistocene (Calabrian)
- Major lithologies: tuff and foraminifera-nannofossil-rich silt
The upper part of Cores 402-U1614A-17X and 18X consists of volcaniclastic breccia, which is possibly a contact facies that has been pulverized by drilling, with the appearance and composition of the more solid tuff present downcore. The tuff layers are analogous to and possibly correlate with those recovered in Hole U1612A (Figure F7) and are typically <10% carbonate. Three distinct tuff layers were recovered, each one with finely laminated silty mud at the base. Foraminifera-nannofossil-rich silt is observed between the tuff layers, showing biscuiting from drilling disturbance. The silt layers have several intervals of normal grading within.
3.1.2.2. Lithostratigraphic Subunit IIB
- Interval: 402-U1614A-21X-1 through 33X-2
- Depth: 146–263.6 m CSF-A
- Age: Early Pleistocene (Calabrian/Gelasian)
- Major lithologies: nannofossil ooze with volcaniclastic, nannofossil chalk, sandy silt, ash, and lapilli
The upper part of Subunit IIB consists of homogeneous nannofossil ooze and chalk. The transition from nannofossil ooze to chalk is accompanied by an increase in brittle deformation (horizontal cracking) and in drilling disturbance (biscuiting) because of increased lithification. Volcaniclastics are again present throughout the subunit, although they are minor components. Glauconite-rich intervals (e.g., Core 402-U1614A-26X) and several brown to dark brown sapropel intervals (total organic carbon [TOC] = ~2.5%) as thick as several decimeters are present (Figure F10). Pyrite is also common in the form of pyritized planktic foraminifera (Figure F11A) as well as framboids (Figure F11B, F11C) and is concentrated in dark gray intervals (e.g., Core 27X; Figure F10). Color banding from light gray to dark gray is present throughout the subunit with glauconite-rich bands giving the cores a greenish hue (Figure F7).
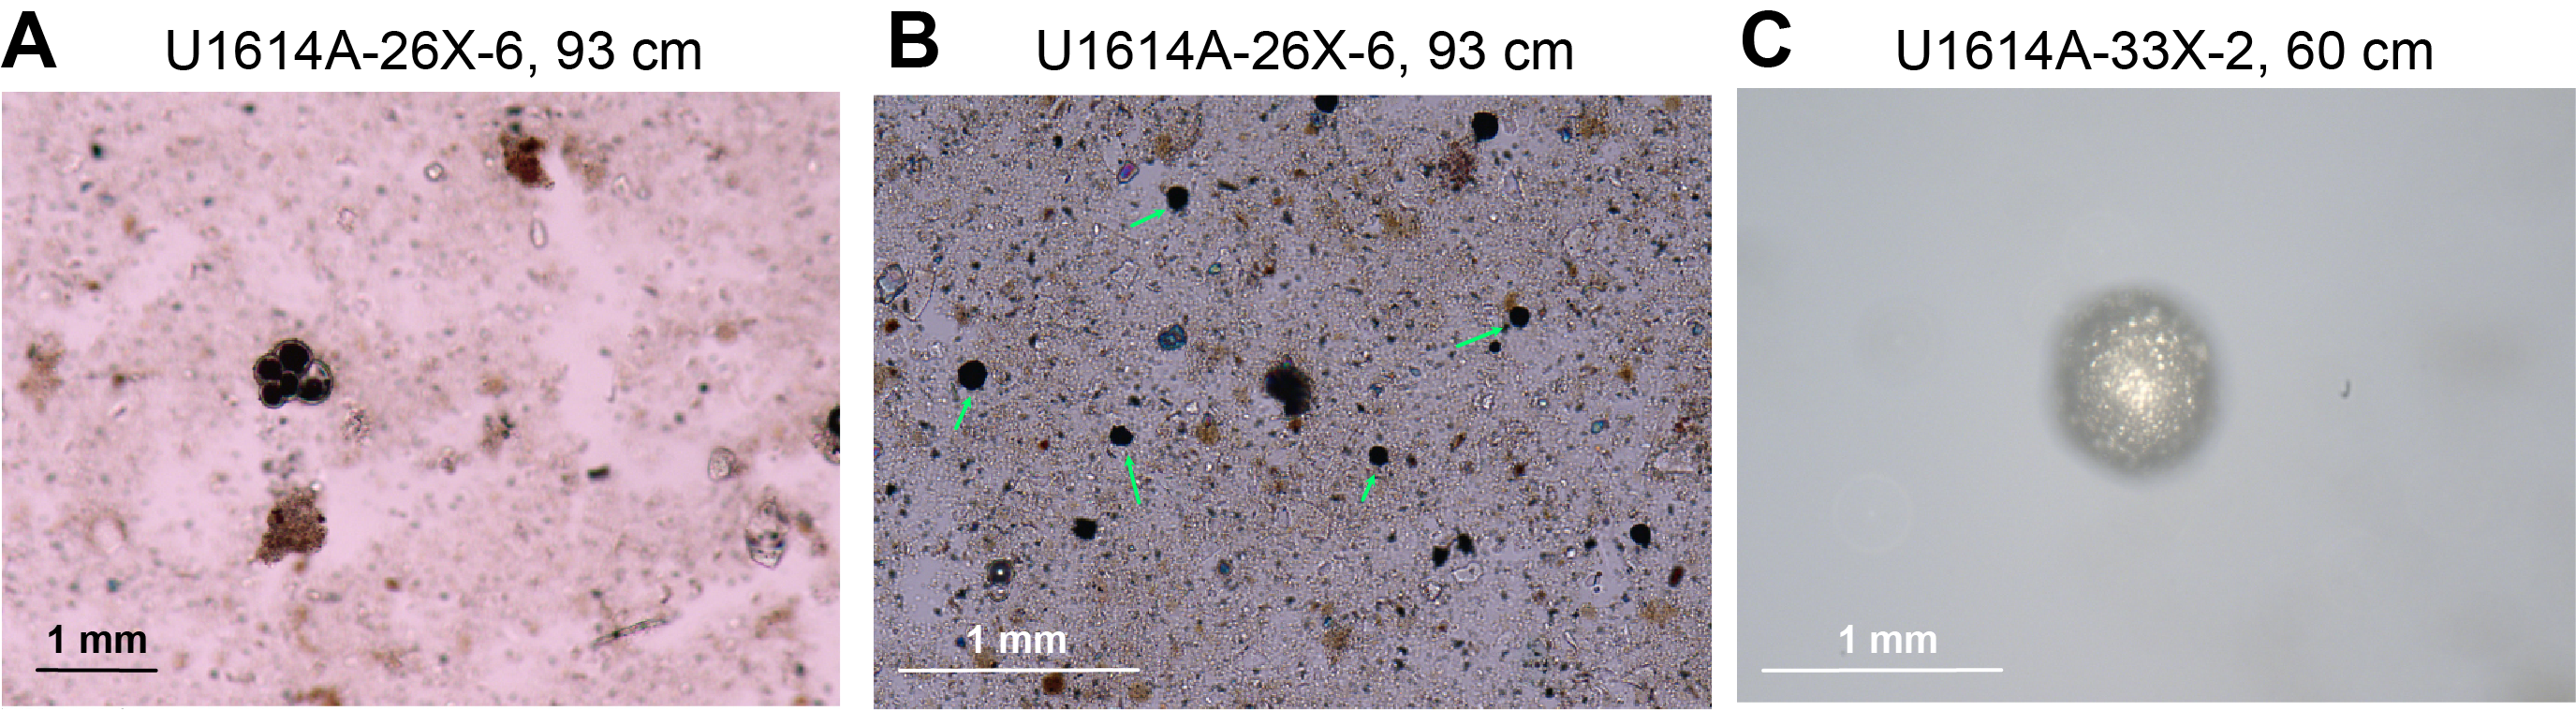
Figure F11. Pyrite in Subunit IIB.
Cross-lamination structures and several coarse fining-upward events ending in a bioturbated interval at the top of the event horizon confirm the presence of turbidites in this subunit. Moreover, we report the presence of an unconsolidated conglomerate at the base of the subunit that is rich in radioactive minerals such as zircon and apatite (natural gamma radiation [NGR] > 400 counts/s; see Physical properties) with maximum calculated U and Th concentrations of ~38 and ~93 ppm, respectively.
3.1.3. Lithostratigraphic Unit III
- Interval: 402-U1614A-33X-3 through 33X-4
- Depth: 263.6–265.2 m CSF-A
- Age: undetermined
- Major lithology: dolomite
Unit III consists of reddish dolomitic muds (Figures F7, F8) similar to those seen in Hole U1612A (see Figure F6 in the Site U1612 chapter [Malinverno et al., 2025b]) with a very high carbonate content (78%). The dolomite may have formed within the basal carbonate sediments in association with low-temperature hydrothermal alteration of the igneous basement.
3.2. Igneous and metamorphic units
Lithostratigraphic Units IV–VIII are described in Igneous and metamorphic petrology.
4. Biostratigraphy
Calcareous nannofossil and planktic foraminifera specimens extracted from core catcher samples and from core sections when needed were analyzed to develop a biostratigraphic framework for Site U1614. Two holes, U1614A and U1614C, were cored at this site with sediment recoveries of 64% and 44%, respectively. The age constraints and biozonal boundaries across the sedimentary successions were established by analyzing the semiquantitative data from moderately to well-preserved calcareous nannofossil and planktic foraminifera assemblages. The Mediterranean biozonation schemes of Di Stefano et al. (2023) and Lirer et al. (2019) were used for this purpose.
4.1. Planktic foraminifera
4.1.1. Hole U1614A
4.1.1.1. Sedimentary compositions of collected samples
The sediment samples were collected primarily from Sections 402-U1614A-1H-CC (5.58–5.63 mbsf) through 33X-CC (265.83–265.85 mbsf). Some additional samples were selected to refine ages, particularly in cores where the core catcher sample was unlikely to contain abundant foraminifera. All samples were washed using a 63 µm sieve to remove clay and/or silt particles. The residues were dried, further sieved through a 125 µm sieve to filter out any juvenile microfossil species, and analyzed under the microscope. The extracted residues (>125 µm) from the samples contain volcaniclastic sedimentary particles and/or planktic foraminiferal assemblages. Volcaniclastic sedimentary layers with a median grain size larger than 2 mm are widespread at this site and devoid of foraminifera. The remaining few nannofossil ooze layers contain moderately to well-preserved planktic foraminifera. Foraminiferal abundances were observed to be relatively low compared to Sites U1612 and U1613. Benthic foraminifera, ostracod, and radiolarian species were also observed along with broken molluscan shell fragments. Although the taxonomy and abundance of these species were not recorded because of time constraints, their presence provides valuable information for any future analysis.
Sedimentary intervals are dated from Early Pleistocene (upper Gelasian stage) to Holocene based on biohorizons of planktic foraminiferal events. Of the 35 samples collected, 25 yielded residues that contained volcanogenic sediments dominated by particles such as pumice, scoria, and volcanic glass, which reduced the microfossil content to a minimum level (Figure F12). Planktic foraminifera species are almost completely absent from these samples, except for a few intervals with rare and poorly preserved Orbulina universa, Globoconella inflata, and Globigerina bulloides species. Because the individuals of these species occur in very low numbers (≤5) in intervals dominated by volcanogenic sediments, it is difficult to assign a biozone to these layers.
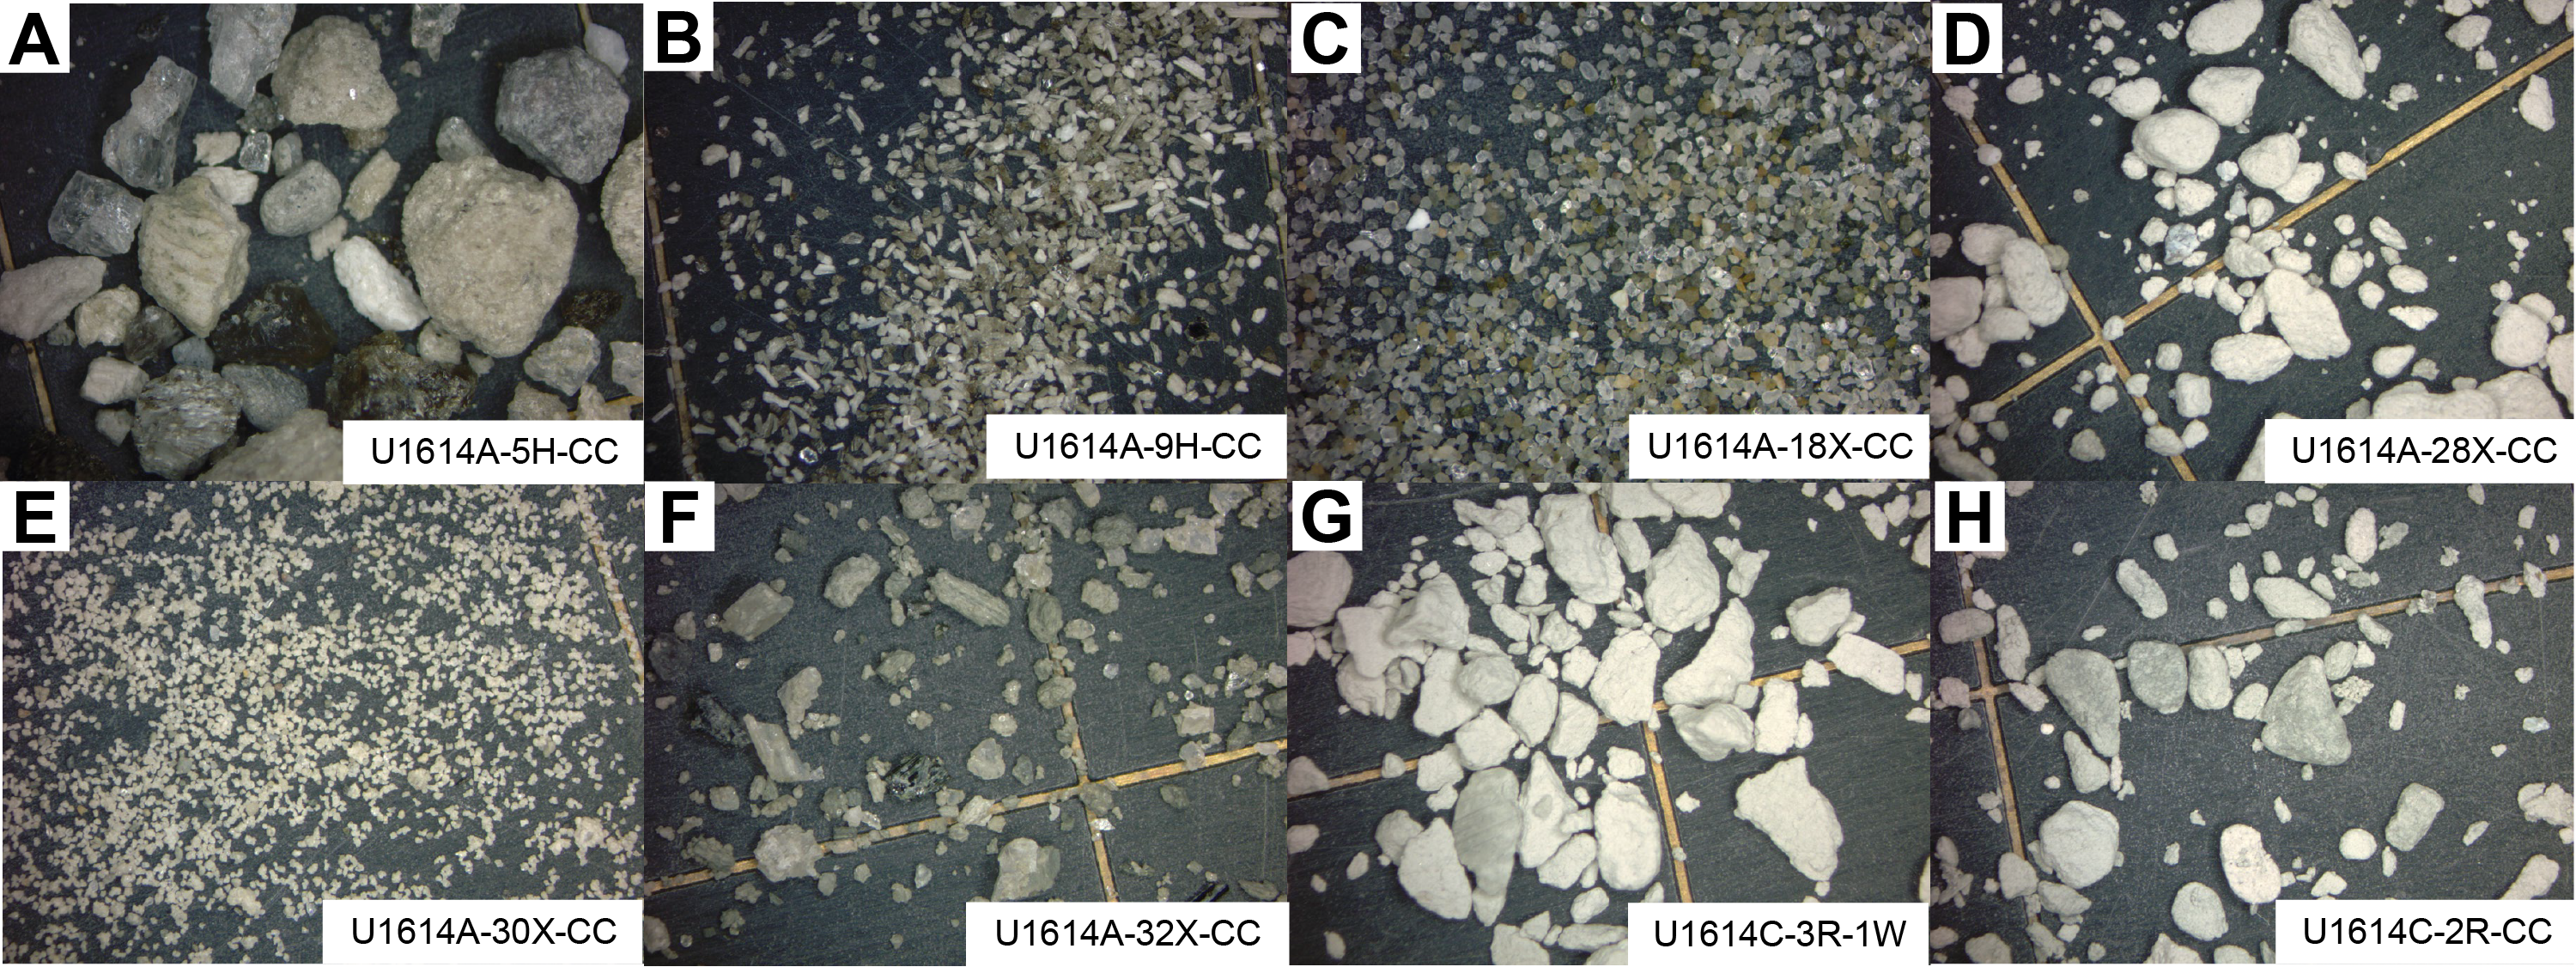
Figure F12. Sediments.
The remaining 10 samples from nannofossil ooze zones contain moderately to well-preserved planktic foraminifera species that were helpful in recognizing the biostratigraphic zonations at this site.
4.1.1.2. Planktic foraminifera biozonation
Planktic foraminifera marker species were examined from samples collected in Hole U1614A, and biozones were assigned according to the biozonation scheme described in Lirer et al. (2019). The biostratigraphic zonation scheme used in Hole U1614A is presented in Table T2 and is consistent with the nannofossil events observed at Site U1614.
The planktic foraminifera fauna between Sections 402-U1614A-1H-CC (5.58–5.63 mbsf) and 33X-CC (265.83–265.85 mbsf) is typical of the Mediterranean biostratigraphic MPle2b–base MPle1a/top MPl6b zones and is primarily composed of G. bulloides, Globigerinoides obliquus, O. universa, Globigerinella siphonifera, Neogloboquadrina acostaensis, G. inflata, Globigerinoides ruber var. white, Globorotalia scitula, Globorotalia crassaformis, Neogloboquadrina spp. (sin), Globorotalia truncatulinoides, and Turborotalia quinqueloba (Figures F13, F14, F15).
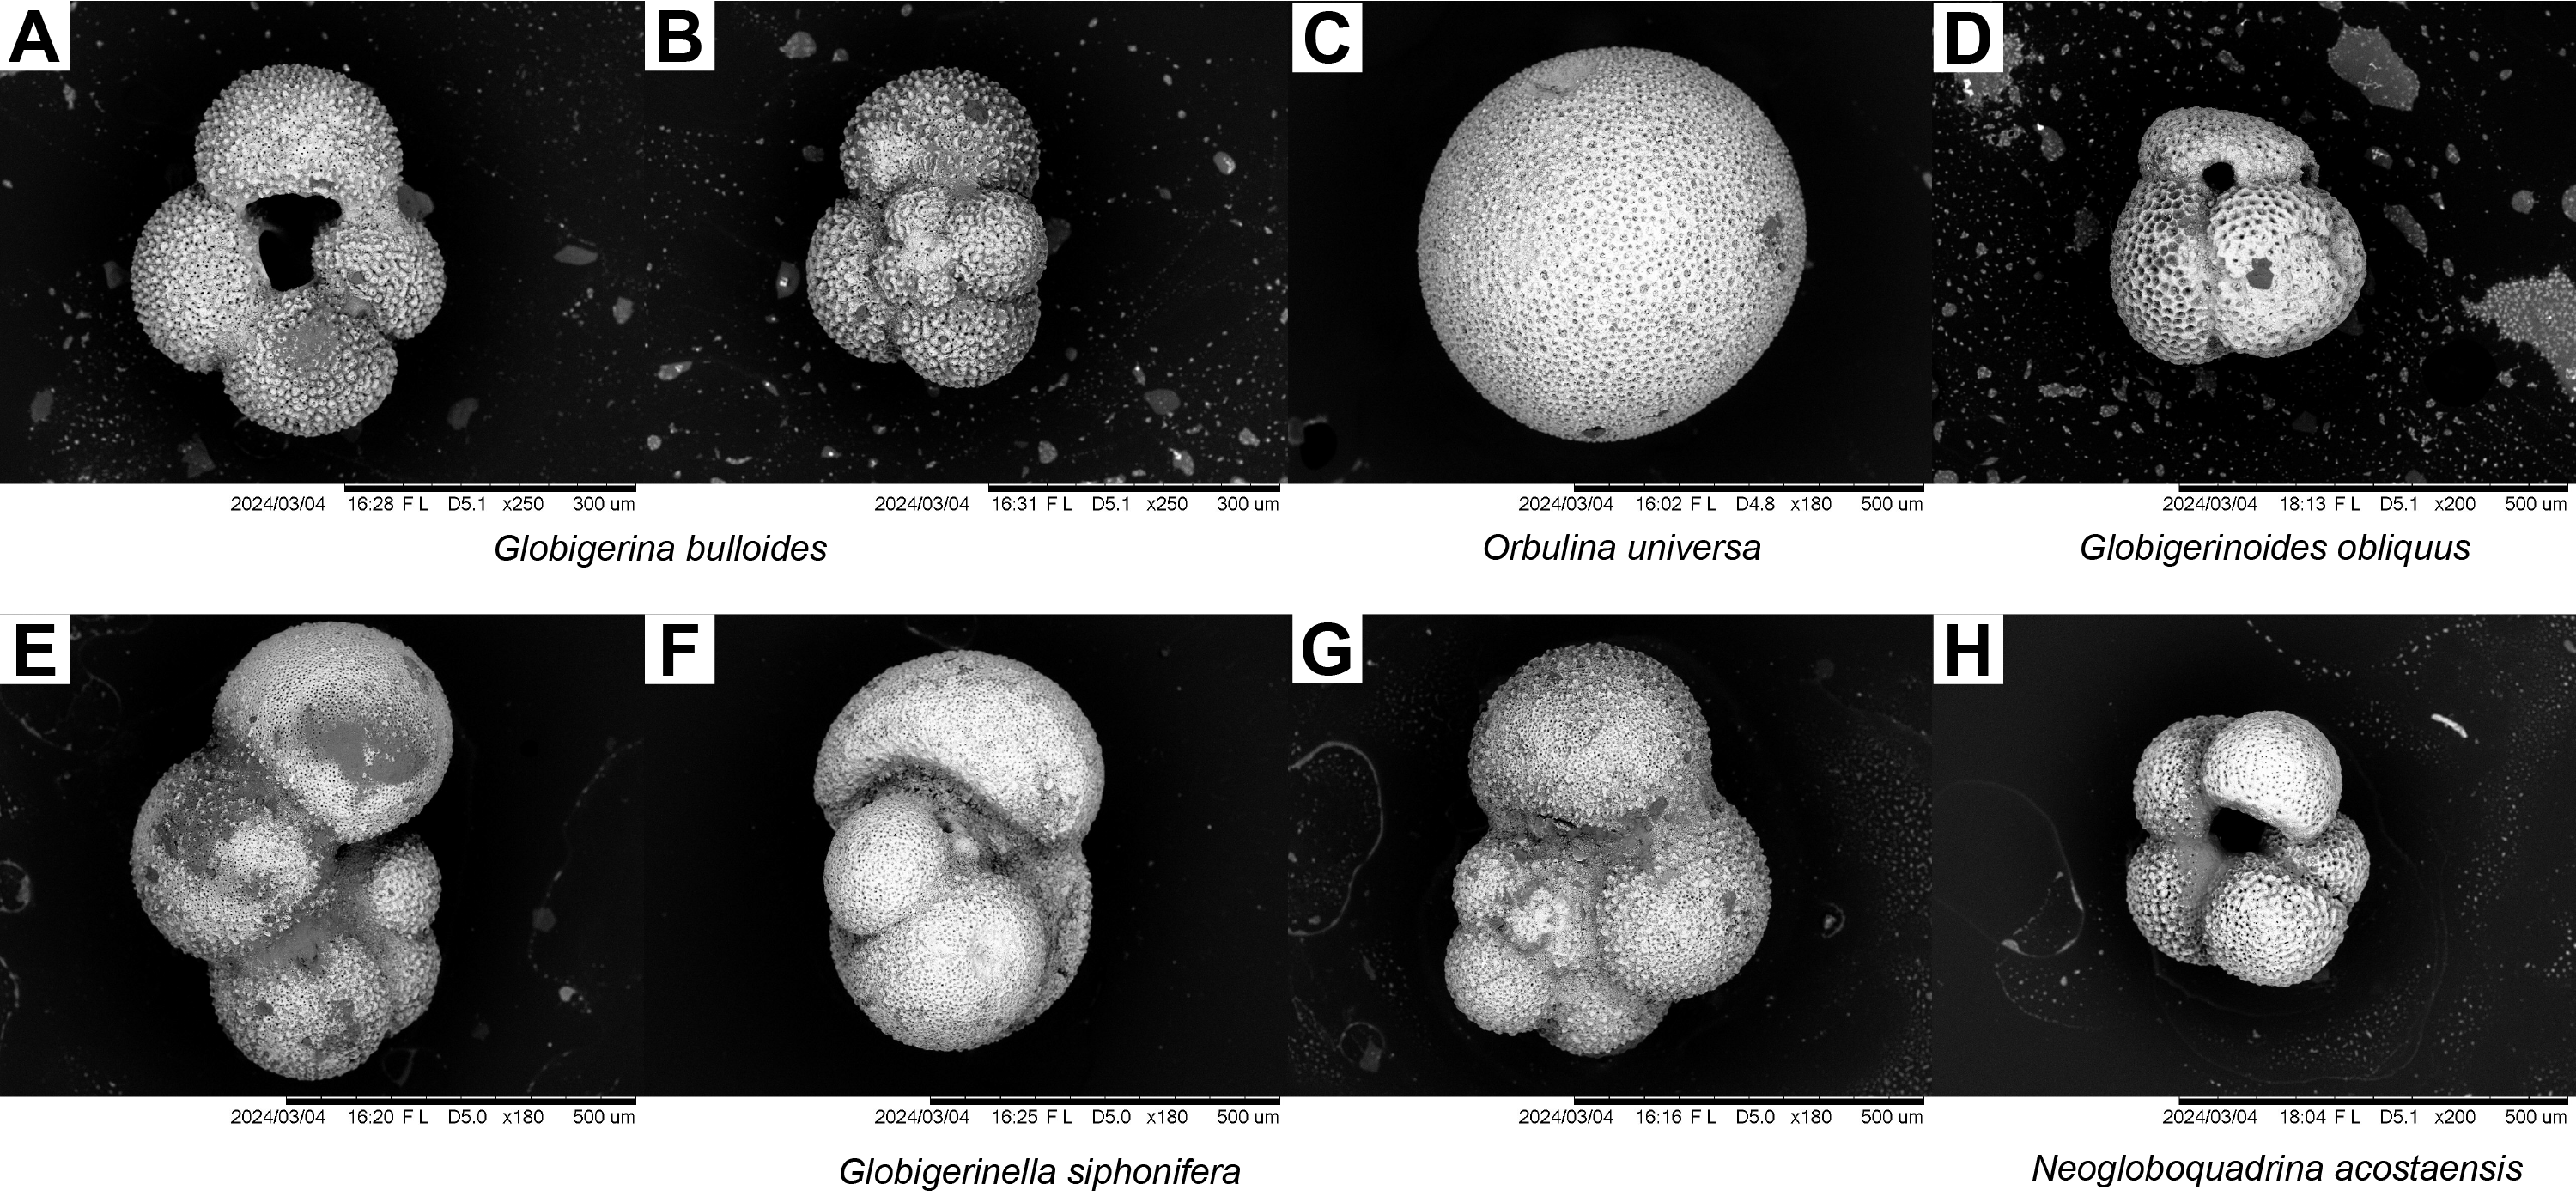
Figure F13. Globigerina, Orbulina, Globigerinoides, Globigerinella, and Neogloboquadrina.
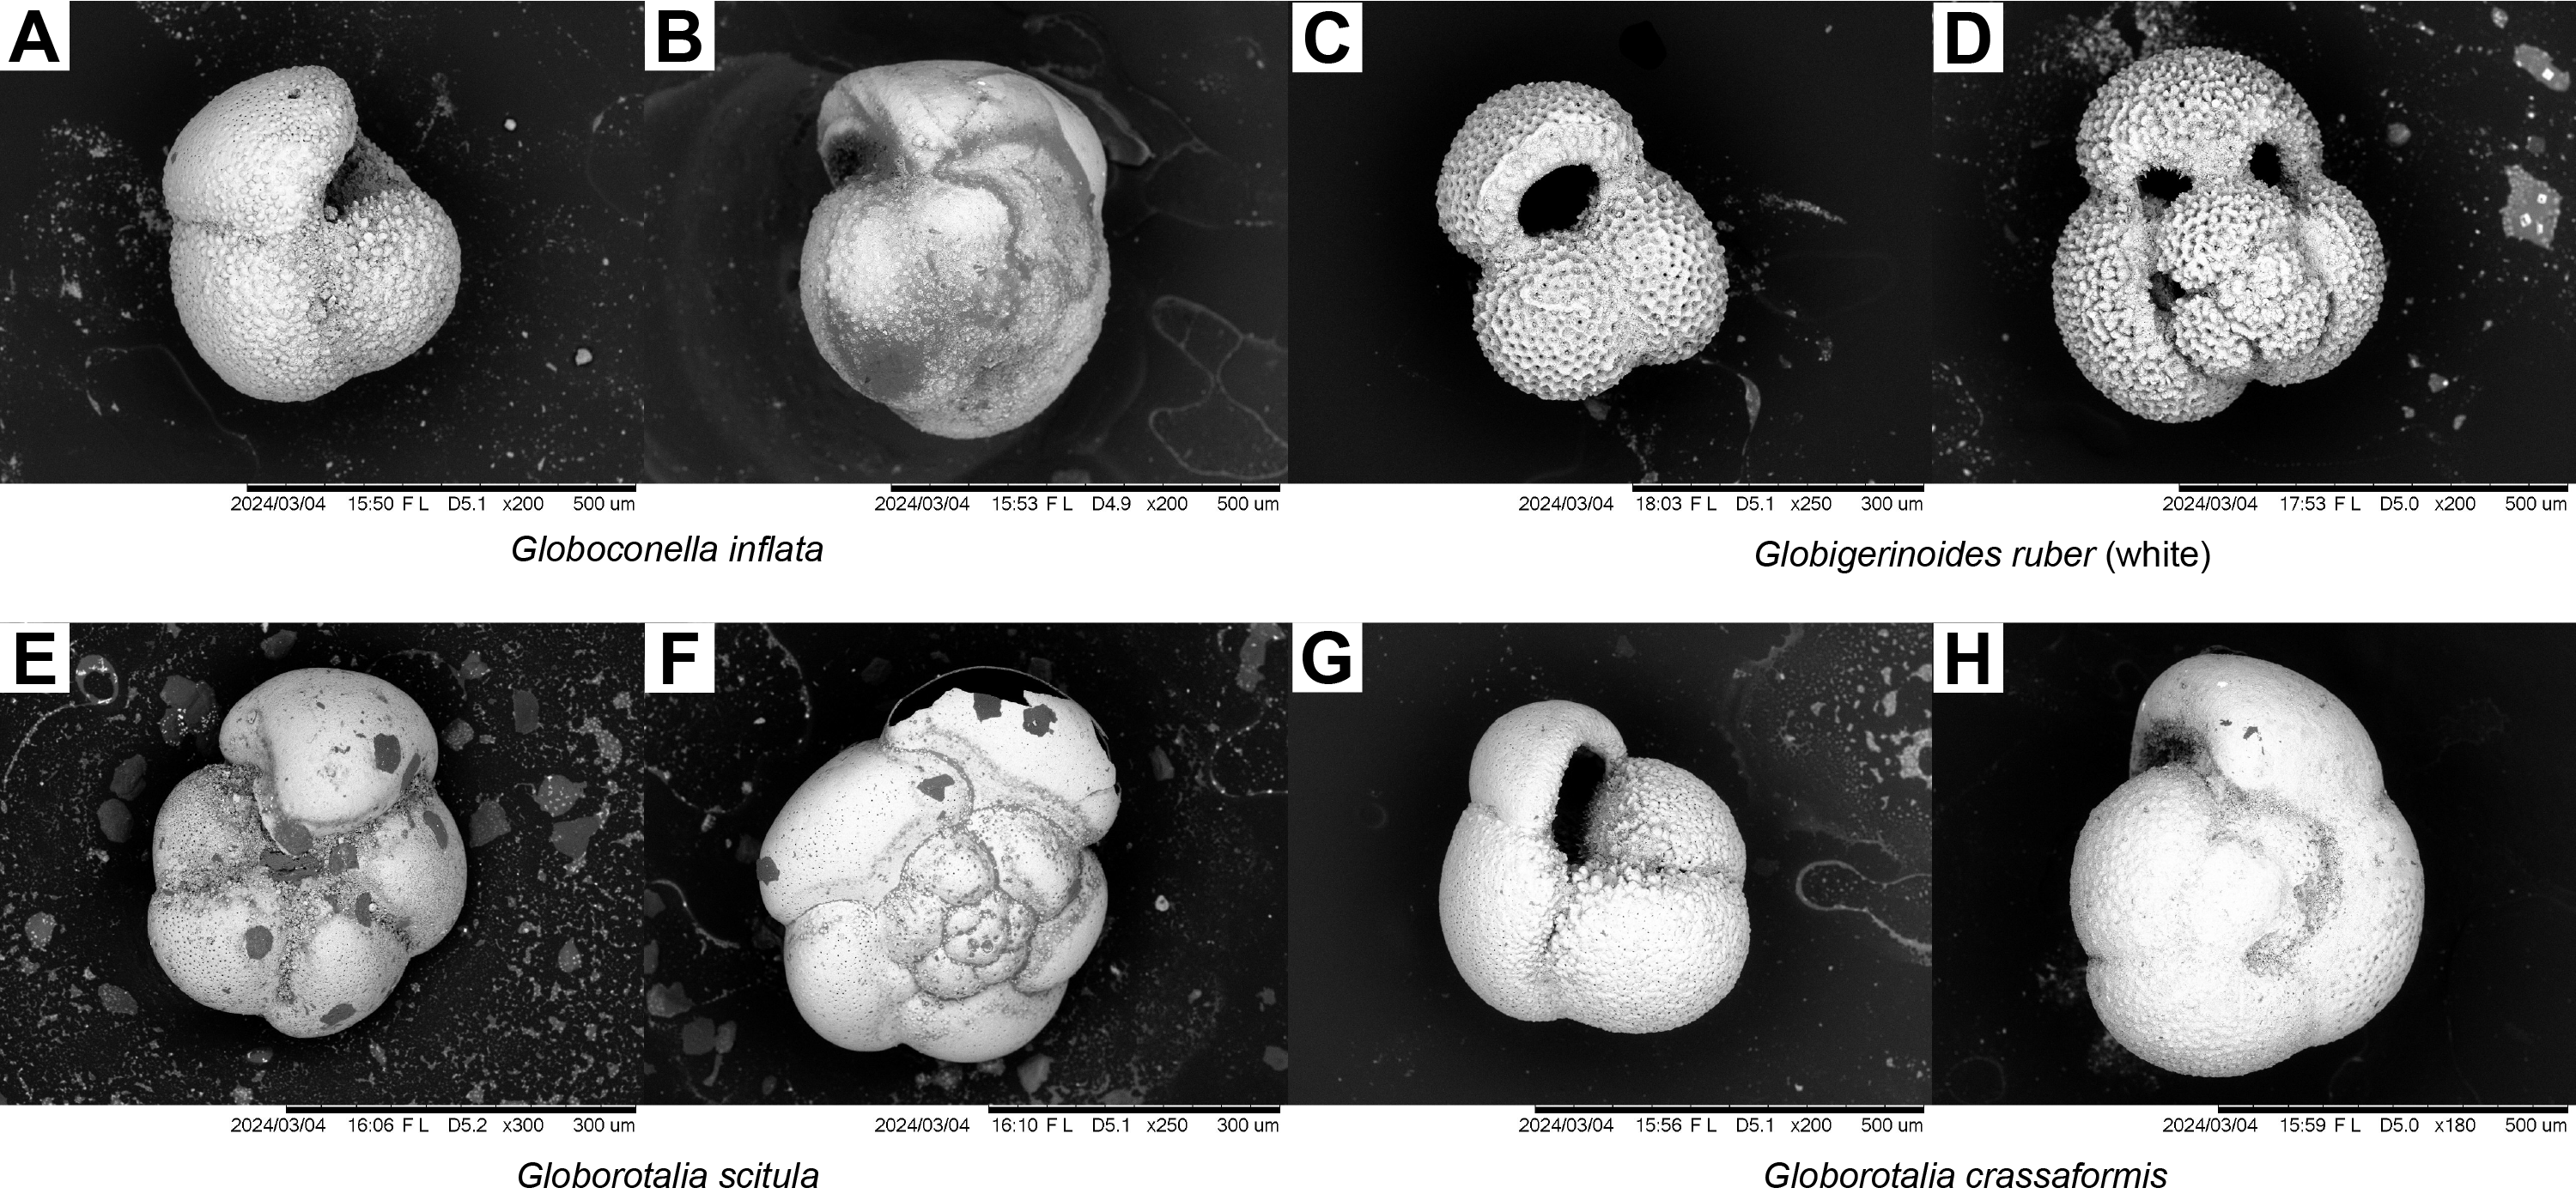
Figure F14. Globoconella, Globigerinoides, and Globorotalia.
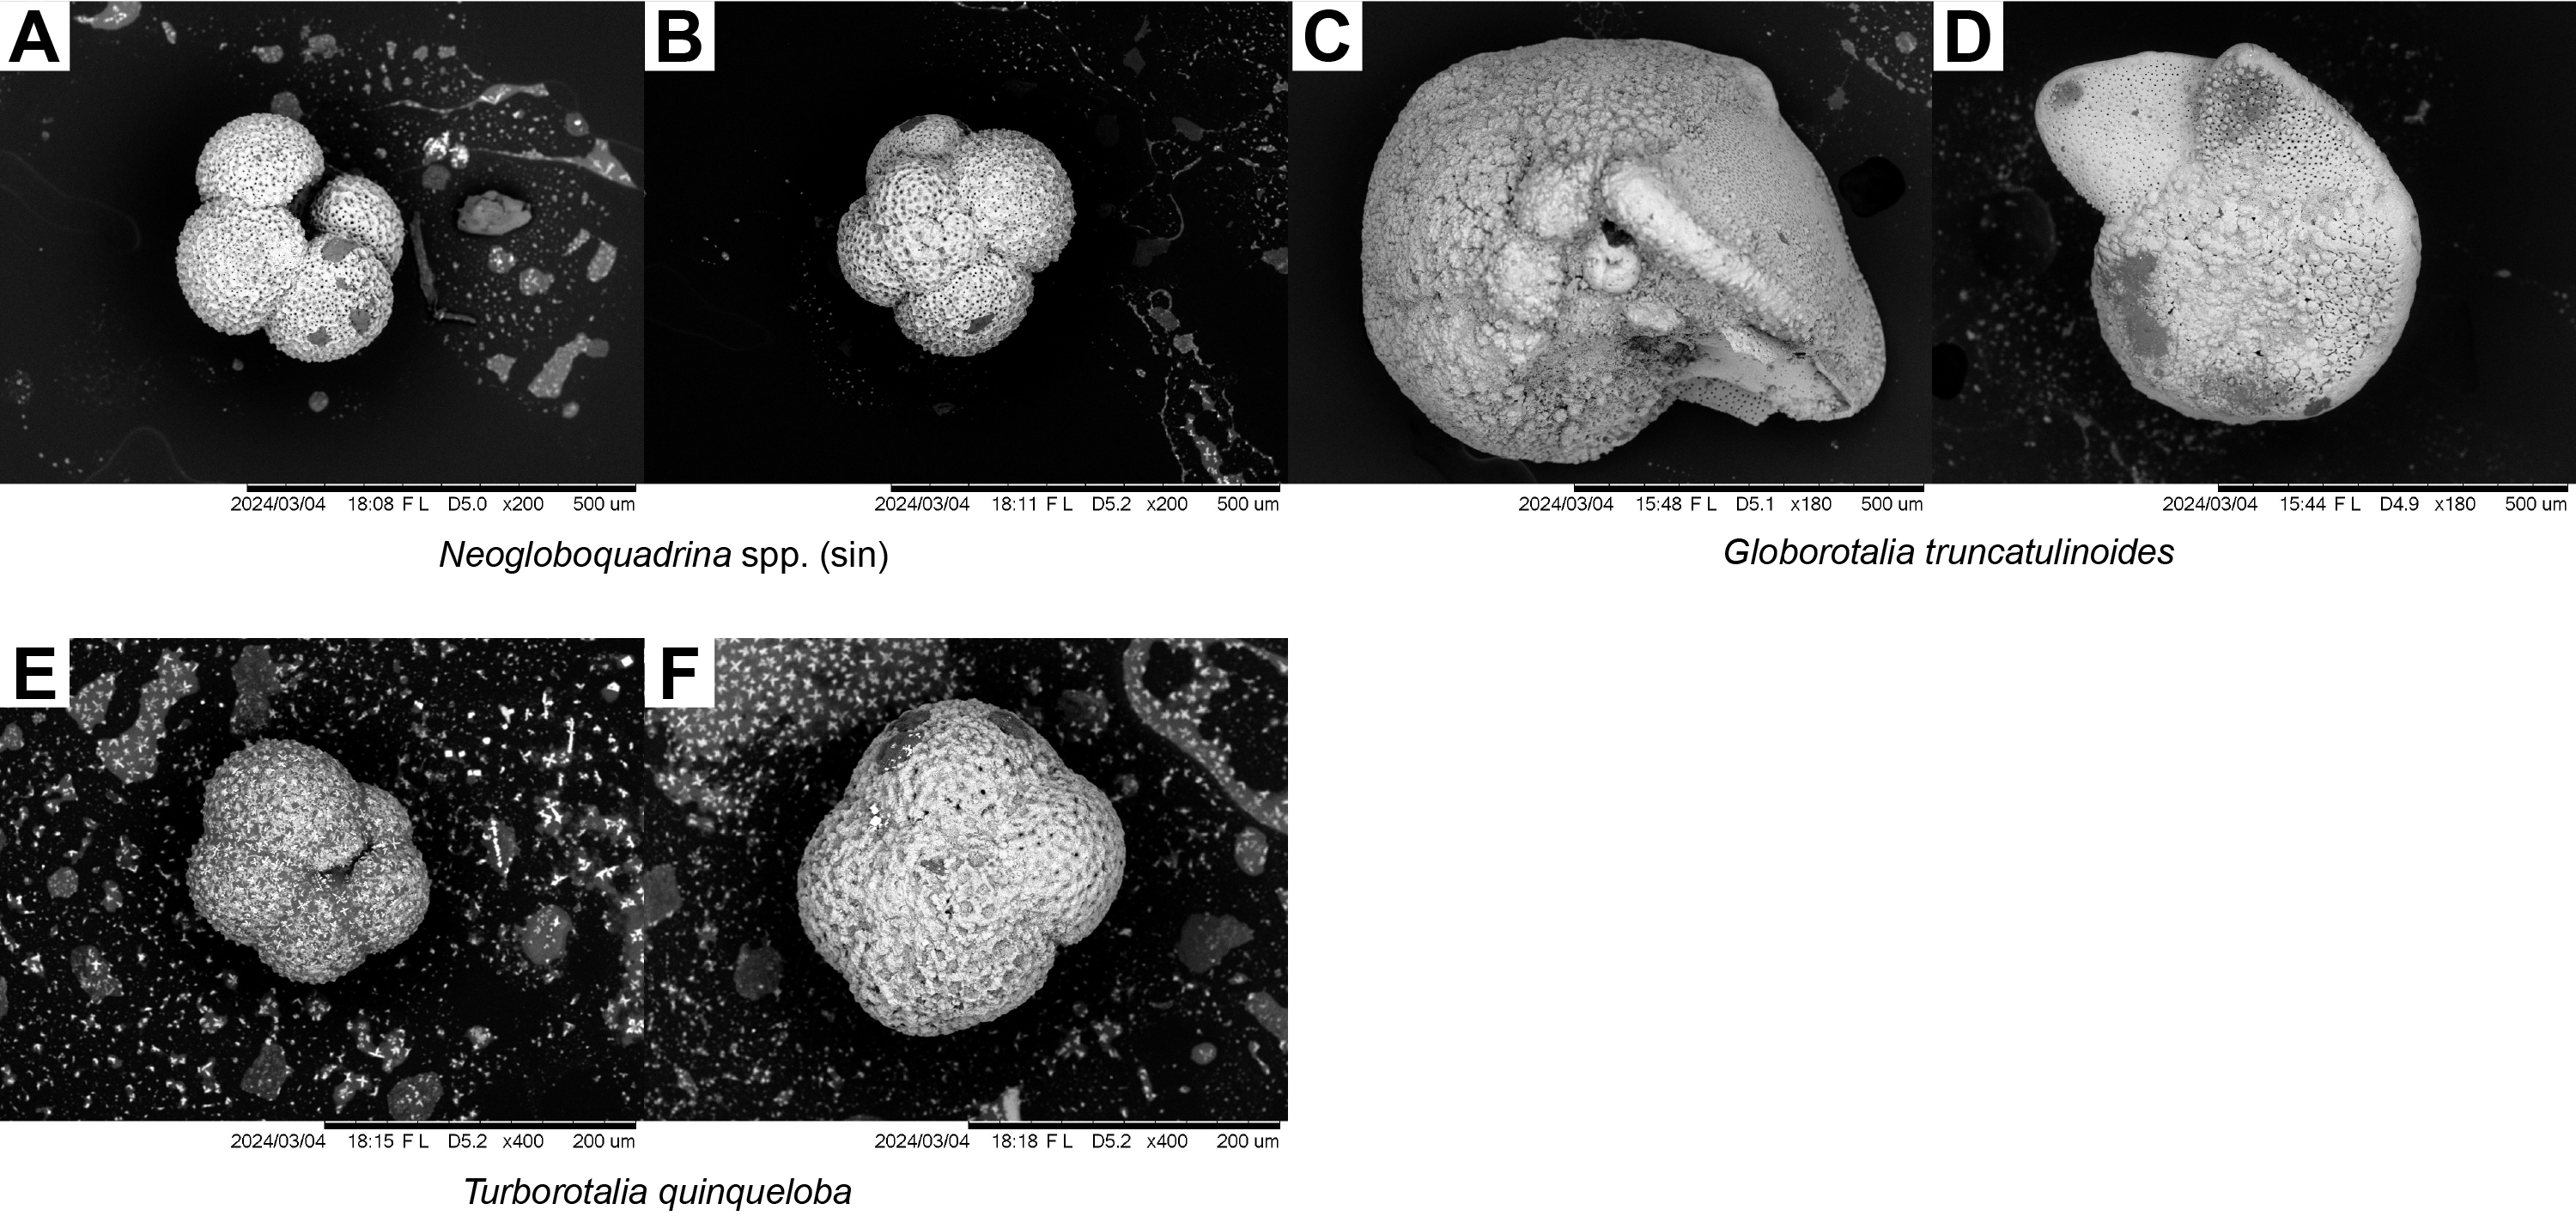
Figure F15. Neogloboquadrina, Globorotalia, and Turborotalia.
Biozones were delineated based on the faunal succession of marker species as defined below.
4.1.1.2.1. Zone MPle2b
Samples 402-U1614A-1H-CC (5.58–5.63 mbsf) and 2H-CC (14.98–15.03 mbsf) mostly contain volcanogenic sedimentary particles; however, O. universa, G. bulloides (Figure F13), and G. scitula (Figure F13) species were commonly present (>10 but <50 individuals). These species were dominant in the Upper Pleistocene–Holocene. Therefore, these samples were assigned to the MPle2b zone.
Samples 402-U1614A-3H-6, 54–56 cm (23.13–23.15 mbsf), to 7H-CC (60.27–60.32 mbsf) were not assigned to any planktic foraminiferal biozone because these sedimentary intervals were dominated by volcanogenic particles and lack any marker species.
4.1.1.2.2. Zone MPle2a
Samples 402-U1614A-8H-CC (71.37–71.42 mbsf) and 9H-2, 108–110 cm (74.79–74.81 mbsf), were assigned to the MPle2a zone based on the paracme top and paracme base (~1.37 Ma; Sample 9H-2) of Neogloboquadrina spp. (sin) (Figure F14) species, respectively.
Samples 402-U1614A-9H-CC (80.35–80.4 mbsf) to 15X-CC (93.92–93.94 mbsf) contain only volcanogenic sedimentary particles and were devoid of any foraminifera, so these sedimentary intervals could not be assigned to a biozone.
4.1.1.2.3. Zone MPle1b
Sample 402-U1614A-16X-1, 18–20 cm (98.58–98.6 mbsf), from a nannofossil ooze layer, was assigned to the MPle1b biozone based on the common occurrence of G. inflata, G. ruber var. white (Figure F14), and Neogloboquadrina spp. (sin) species. This sedimentary layer was underlain by volcanogenic sediments (devoid of planktic foraminifera) dominating the intervals between Samples 16X-CC (99.14–99.19 mbsf) and 20X-CC (142.85–142.9 mbsf) and were therefore not assigned to any biozone. However, based on the sedimentary succession below, this layer lies within the MPle1b biozone.
Sample 402-U1614A-21X-4, 70–72 cm (151.11–151.13 mbsf), was also assigned to the MPle1b biozone, coinciding with another paracme top occurrence of Neogloboquadrina spp. (sin) species.
4.1.1.2.4. Zone MPle1a
Samples 402-U1614A-23X-CC (165.15–165.2 mbsf) and 24X-CC (176.9–176.95 mbsf) were assigned to the MPle1a zone concurrent with the common occurrences of G. inflata and Neogloboquadrina spp. (sin) species. The sample below, 25X-CC (193.25–193.3 mbsf), is volcaniclastic. However, based on the sedimentary successions below it, it was assigned to the MPle1a zone.
Sample 402-U1614A-26X-6, 69–71 cm (201.52–201.54 mbsf), was observed to have abundant G. inflata and G. crassaformis species (Figure F14), coincident with the first common occurrence of Neogloboquadrina spp. (sin) species (~1.79 Ma), and was determined to be a part of the MPle1a zone. The underlying sedimentary layers in Samples 402-U1614A-27X-CC (212.37–212.42 mbsf) and 28X-CC (213.6–213.65 mbsf) were volcaniclastic and devoid of any planktic foraminifera.
4.1.1.2.5. Base Zone MPle1a/Top MPl6b
Sample 402-U1614A-29X-2, 52–54 cm (224.22–224.24 mbsf), was interpreted to be at the base of the MPle1a zone or the uppermost part of the MPl6b zone, coinciding with the common occurrence of G. inflata and G. truncatulinoides species (Figure F15) and the last occurrence of G. obliquus species (Figure F13). This interval was the deepest layer above the basement to which a biozone was assigned (upper MPl6b zone; younger than 2 Ma; upper Gelasian stage). The samples below Sections 29X-CC (231.15–231.2 mbsf) through 33X-CC (265.83–265.85 mbsf) contain sediments devoid of any planktic foraminifera and were not assigned to any biozone.
4.1.2. Hole U1614C
Hole U1614C was drilled at Site U1614 with the objective of using the RCB system to drill into the basement rocks. As a result, only the lowermost sediment layers above the basement rocks were sampled. Two core catcher samples and two additional samples from the core sections were examined to determine the ages of the sedimentary layers directly above the basement contact. Samples 402-U1614C-2R-1, 3–7 cm (250.03–250.07 mbsf), to 3R-1, 3–6 cm (259.53–259.56 mbsf), contain volcanogenic sediments (Figure F12G, F12H) and could not be assigned to any biozone. Common G. inflata and some rare Neogloboquadrina spp. (sin) and G. obliquus species were found in sample 3R-CC (260–260.03 mbsf), which was assigned to the MPl6b zone concurrent with the nannofossil events observed in this hole. The biostratigraphic zonation scheme recognized in Hole U1614C is presented in Table T3 and is consistent with the nannofossil biostratigraphy observed in this hole.
4.2. Calcareous nannofossils
Figure F16 displays the calcareous nannofossil biozones determined in Holes U1614A and U1614C.
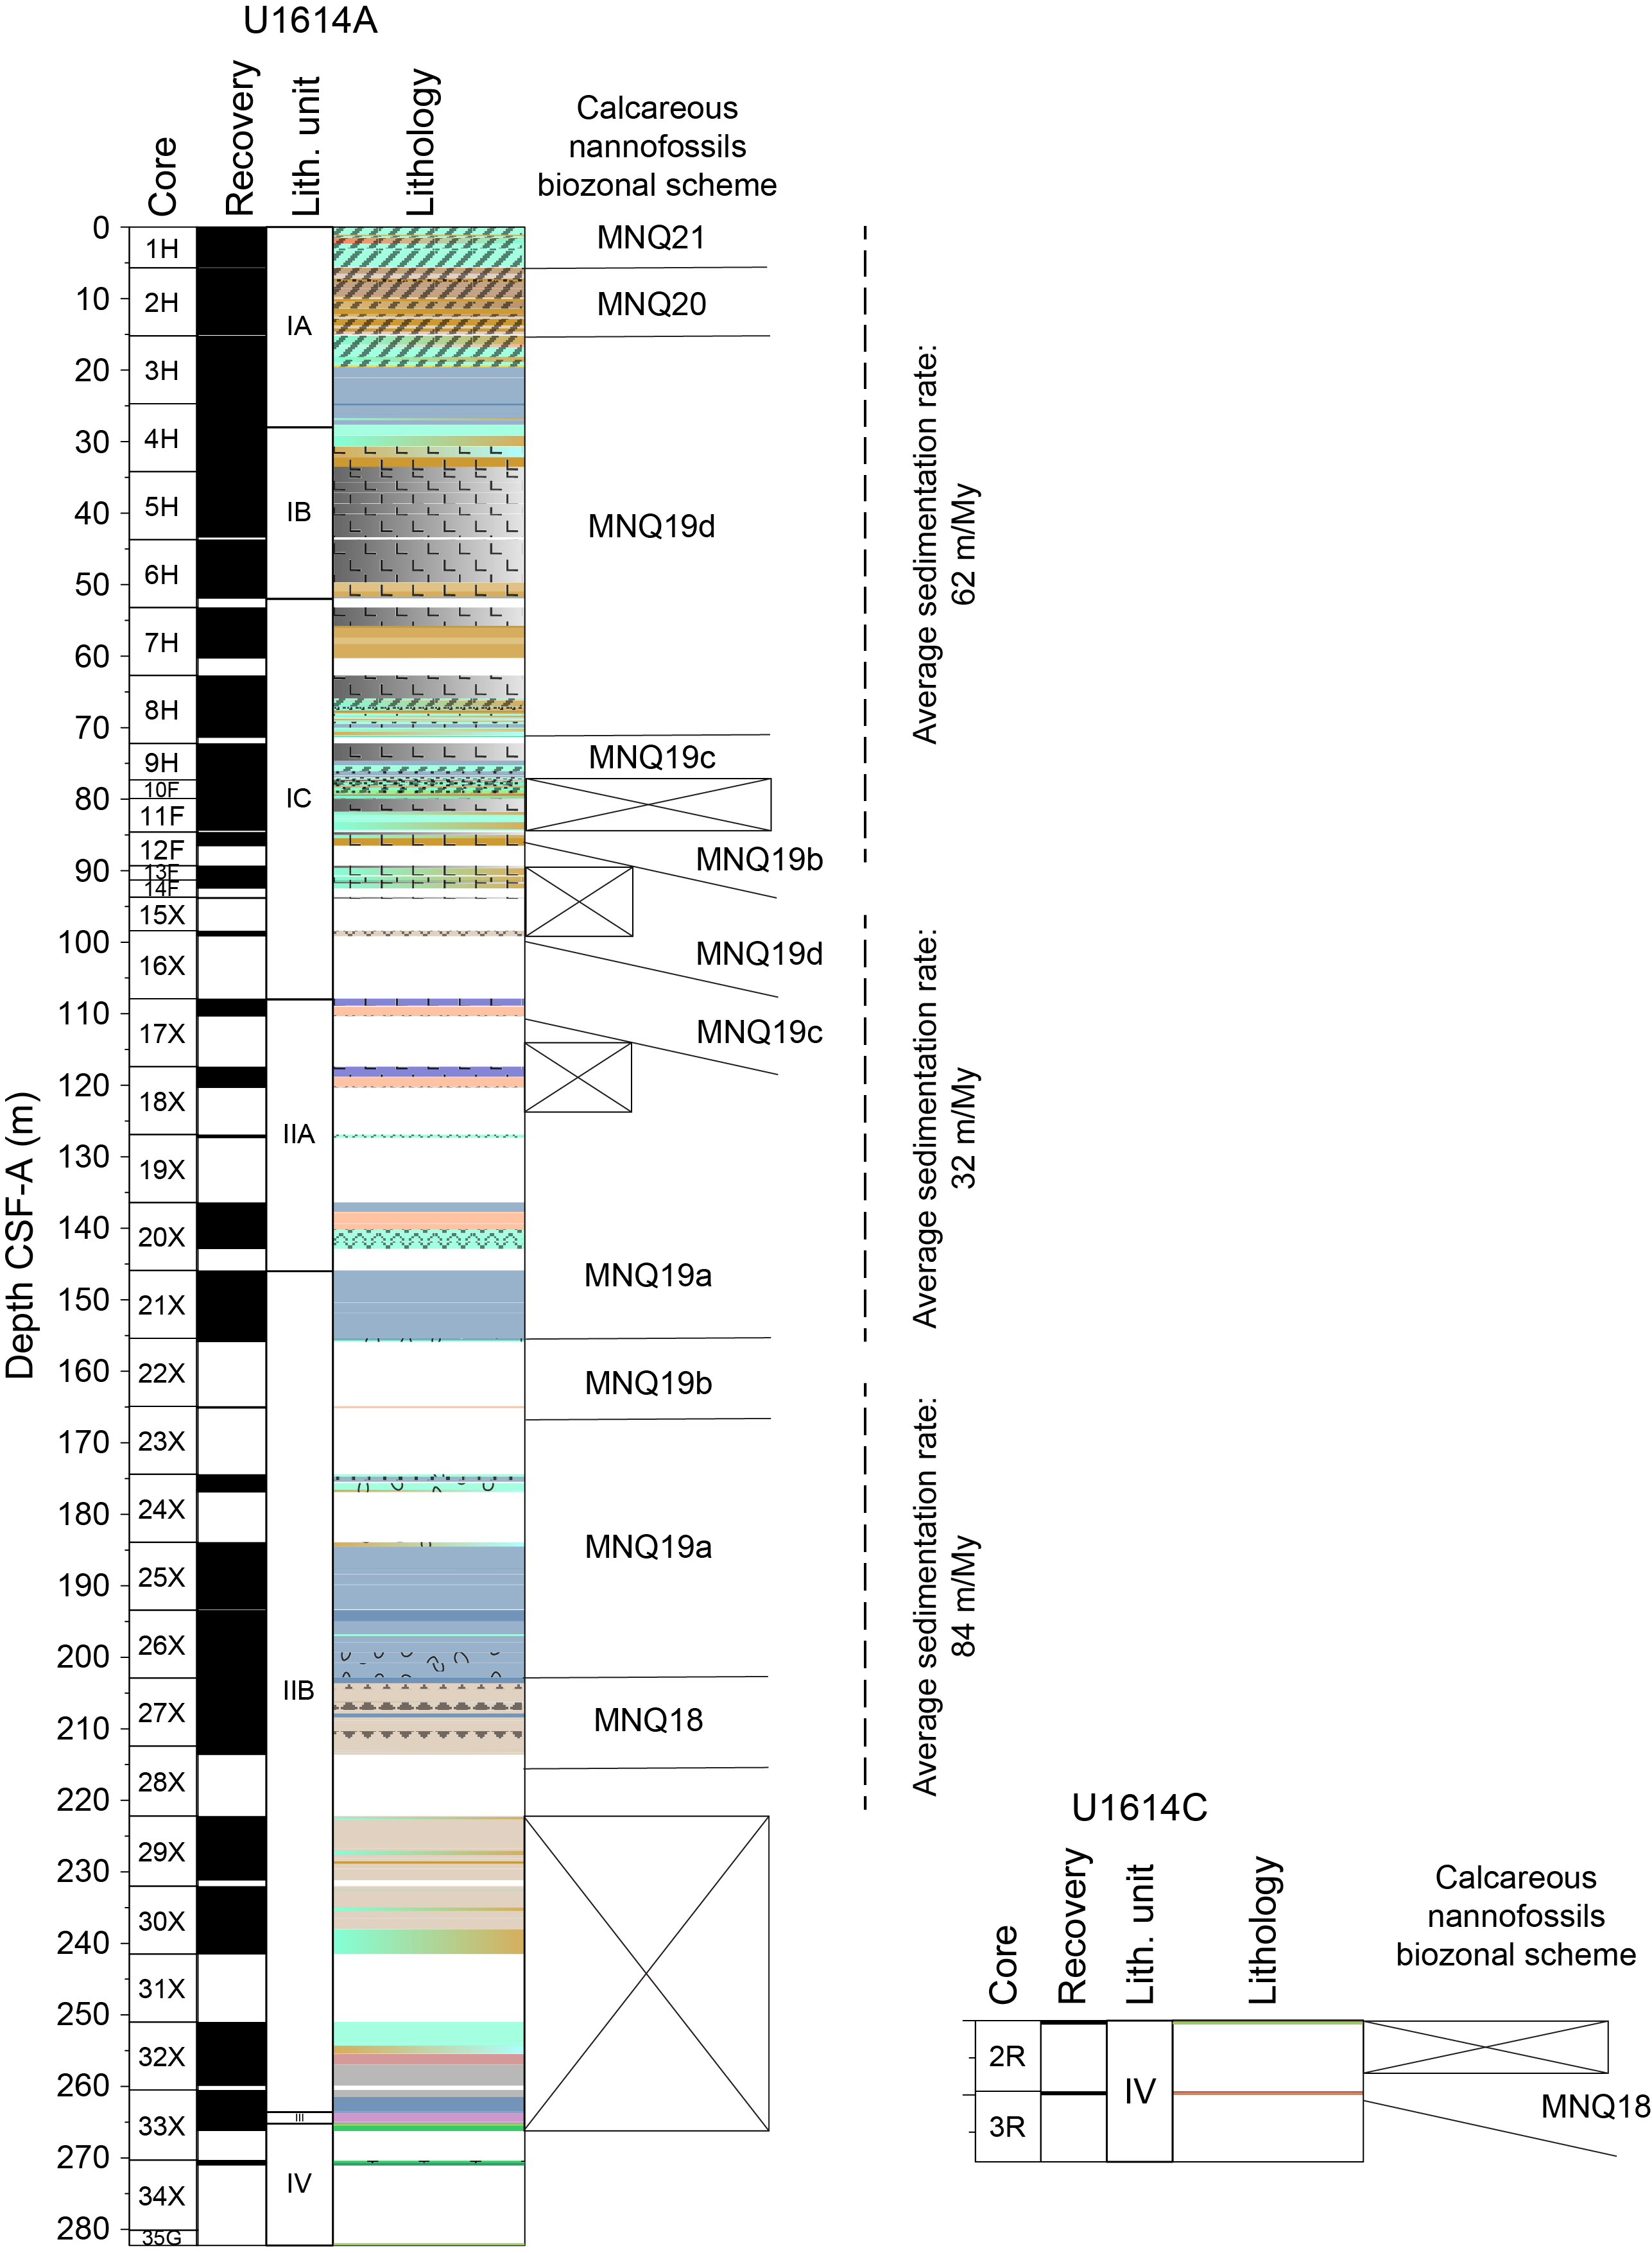
Figure F16. Calcareous nannofossil biozones.
4.2.1. Hole U1614A
The uppermost part of Hole U1614A to Sample 12F-CC (86.59 mbsf) is an almost continuous succession ranging from Holocene to early Calabrian (MNQ21–MNQ19b biozones), with an average sedimentation rate of ~62 m/My. Sample 1H-CC was assigned to the late Chibanian–Holocene MNQ21 biozone (younger than 0.26 Ma) because of the presence of abundant and well-preserved nannofossil assemblages characterized by the presence of Emiliania huxleyi. Sample 2H-CC was assigned to the middle Chibanian MNQ20 zone (0.46–0.26 Ma) with nannofossils represented by small-sized Gephyrocapsa, middle-sized Gephyrocapsa, Helicosphaera carteri, Helicosphaera inversa, Calcidiscus leptoporus, Coccolithus pelagicus, Coronosphaera spp., and Syracosphaera pulchra.
Samples 3H-CC to 8R-CC (24.7–71.42 mbsf) were assigned to the late Calabrian–Chibanian MNQ19d subzone (0.46–0.96 Ma) based on the presence of Pseudoemiliania lacunosa and Gephyrocapsa omega.
Sample 9H-CC (80.4 mbsf) was assigned to the late Calabrian MNQ19c subzone (0.96–1.24 Ma), which is characterized by the presence of abundant small-sized Gephyrocapsa, H. carteri, Helicosphaera sellii, C. leptoporus, and P. lacunosa, and Sample 12F-CC (~86.59 mbsf) was assigned to the Calabrian MNQ19b subzone (1.24–1.61 Ma), which is characterized by the presence of large-sized Gephyrocapsa.
In Samples 16X-CC (99.19 mbsf) to 21X-CC (155.72 mbsf), the succession above is partially repeated and ranges from Chibanian to early Calabrian (MNQ19d–MNQ19a biozones); here, the calculated average sedimentation rate is ~32 m/My, with a hiatus (~0.26 Ma) corresponding to the MNQ19b biozone, probably connected to the low recovery of sediments.
Again, the interval corresponding to Samples 22X-CC (155.92 mbsf) to 28X-CC (213.65 mbsf) ranges from Calabrian to late Gelasian (MNQ19b–MNQ18 biozones) with an average sedimentation rate of ~84 m/My. The oldest sediments in this hole were found in Cores 26X–28X (202.99–213.65 mbsf) and were assigned to the MNQ18 biozone at the Gelasian–Calabrian transition (Lower Pleistocene) (younger than 1.95 Ma).
Samples 31X-CC (241.53 mbsf) to 33X-1, 124 cm (265.85 mbsf) just above the basement yielded mixed up calcareous nannofossil assemblages that contain taxa typical of different biozones from the MNQ19d to MNQ19a zones (e.g., G. omega and large Gephyrocapsa).
These repeated intervals may occur because of the presence of possible slumps, folds, or reverse faults in the area and must be verified by comparing the biostratigraphic data with other geologic evidences.
4.2.2. Hole U1614C
Two samples from Hole U1614C were analyzed for nannofossil content. Sample 2R-CC (250.53 mbsf) contains only lithic fragments and no nannofossils. Sample 3R-CC (260.03 mbsf) was assigned to the MNQ18 zone at the Gelasian–Calabrian transition (1.95–1.71 Ma), characterized by the presence of abundant small-sized Gephyrocapsa, H. carteri, H. sellii, C. leptoporus, C. macintyrei, P. lacunosa, and Geminilithella (Umbilicosphaera) rotula. The latter sample contains the oldest sediment found lying above the basement at Site U1614.
5. Paleomagnetism
5.1. Sediment
5.1.1. Paleomagnetic results
Paleomagnetic analyses were conducted on 35 cores recovered from Hole U1614A using the APC/XCB system, including several HLAPC cores, with an overall recovery of 64%. Natural remanent magnetization (NRM) was measured at 2 cm intervals on section halves before and after demagnetization at 5, 10, 15, and 20 mT peak alternating field (AF). The sediments (to the sediment/basement contact at 265.2 m CSF-A) recorded NRM with normal polarity (Figure F17) except for the soupy sediments with strong drilling disturbance between 34.2 and 53.2 m CSF-A. The inclination values after demagnetization at 20 mT peak AF (Figure F17) are distributed around an average of 54.96°, which is slightly less than the predicted inclination assuming a geocentric axial dipole (GAD) field (Ic_GAD = 59.45°) at the hole latitude (40°15.9781′N) (Figure F18).
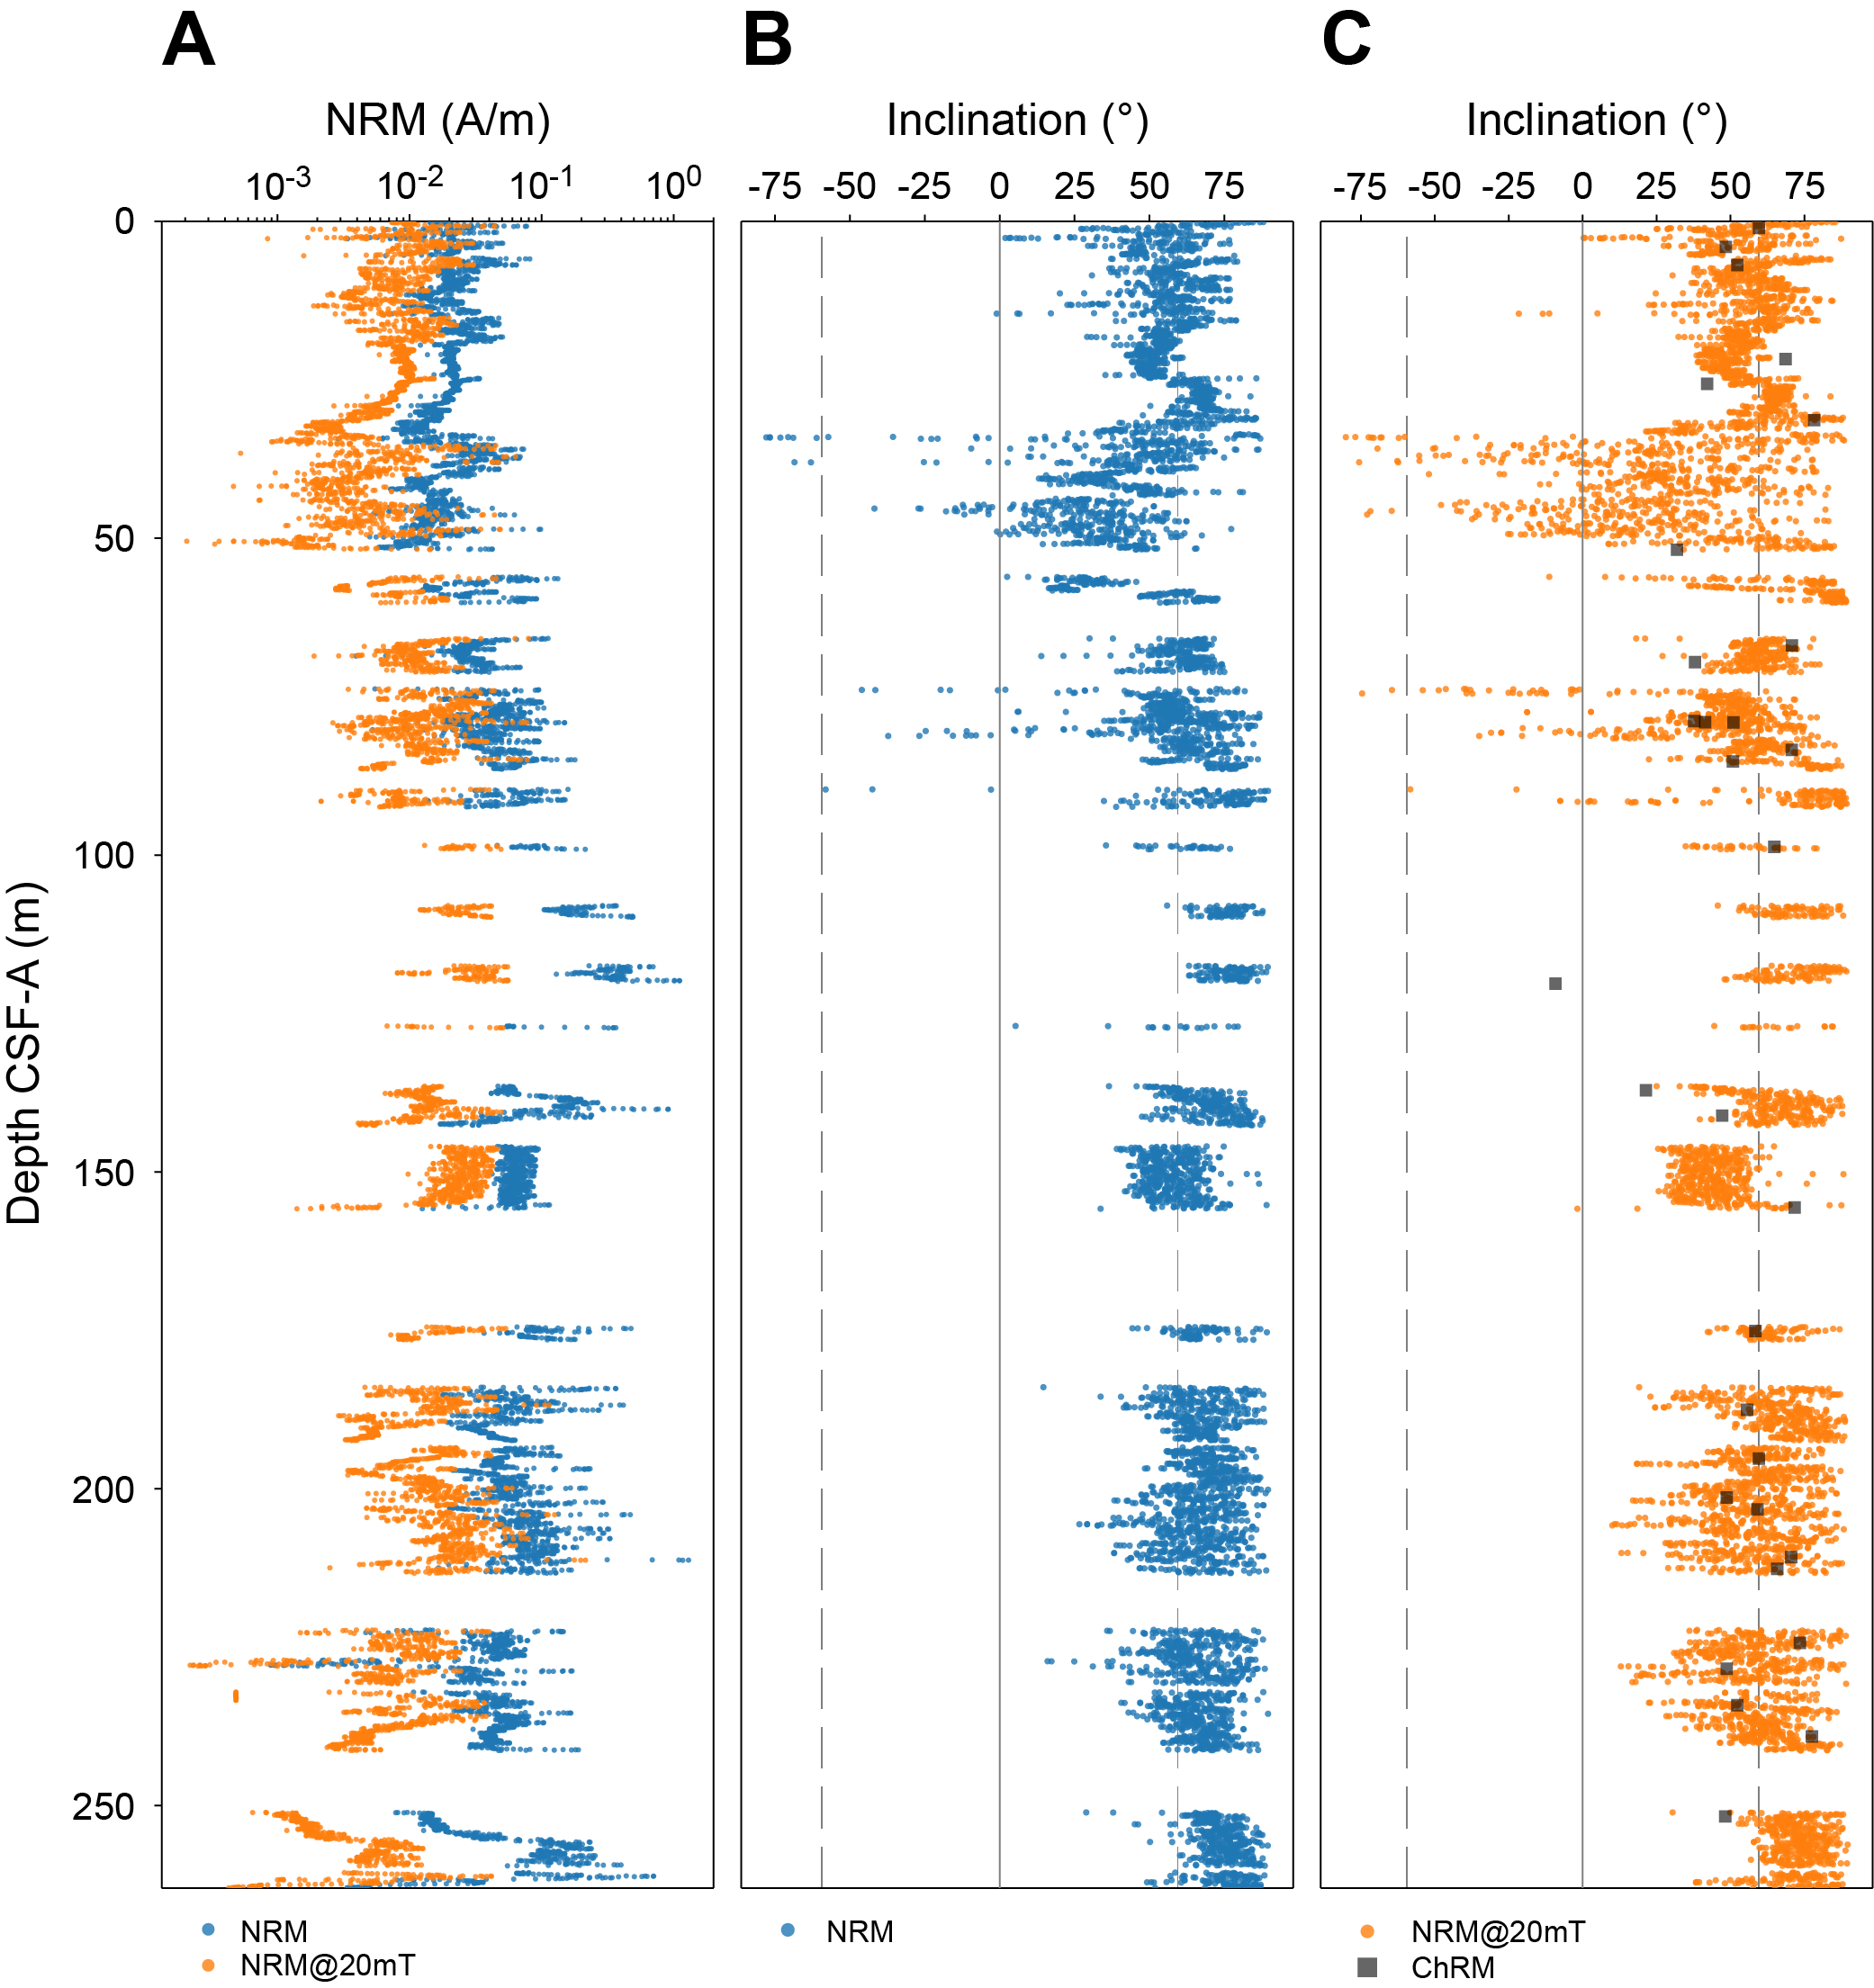
Figure F17. NRM variation.
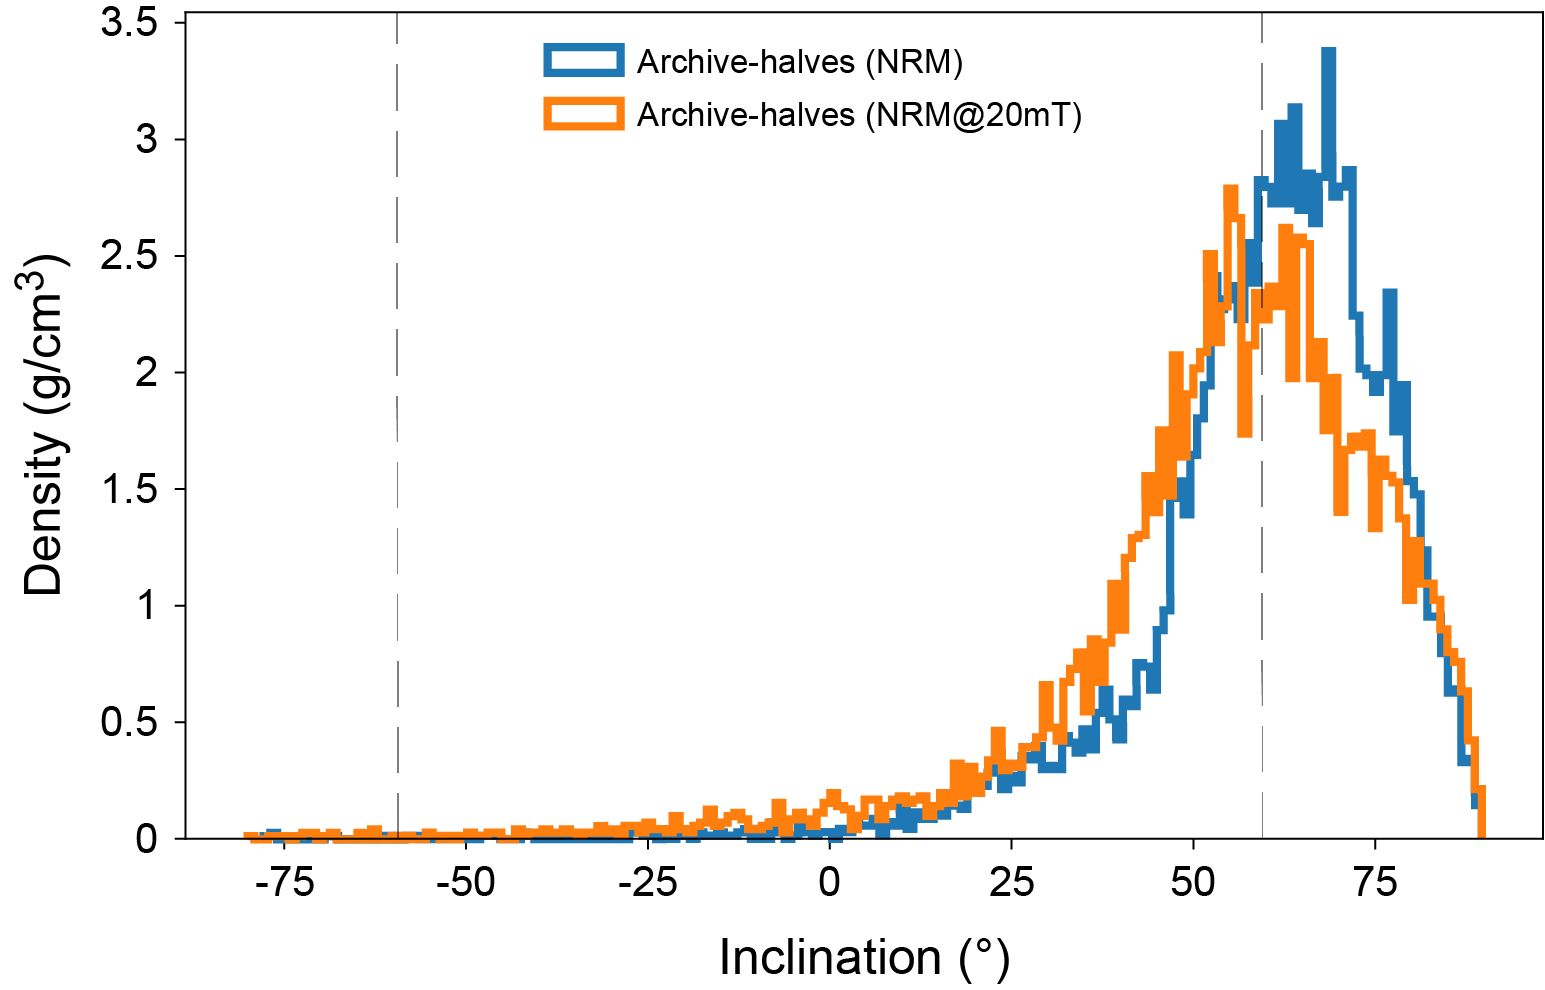
Figure F18. NRM and NRM after demagnetization at 20 mT.
The anisotropy of magnetic susceptibility (AMS) of 38 discrete samples shows that the minimum principal axes (K3) of AMS ellipsoids are well clustered without a preferred orientation and distinct from the maximum (K1) and intermediate (K2) axes. This feature is characteristic of an oblate sedimentary fabric (Tauxe, 2010), which indicates that the cores are undeformed by drilling (Rosenbaum et al., 2000) (Figure F19).
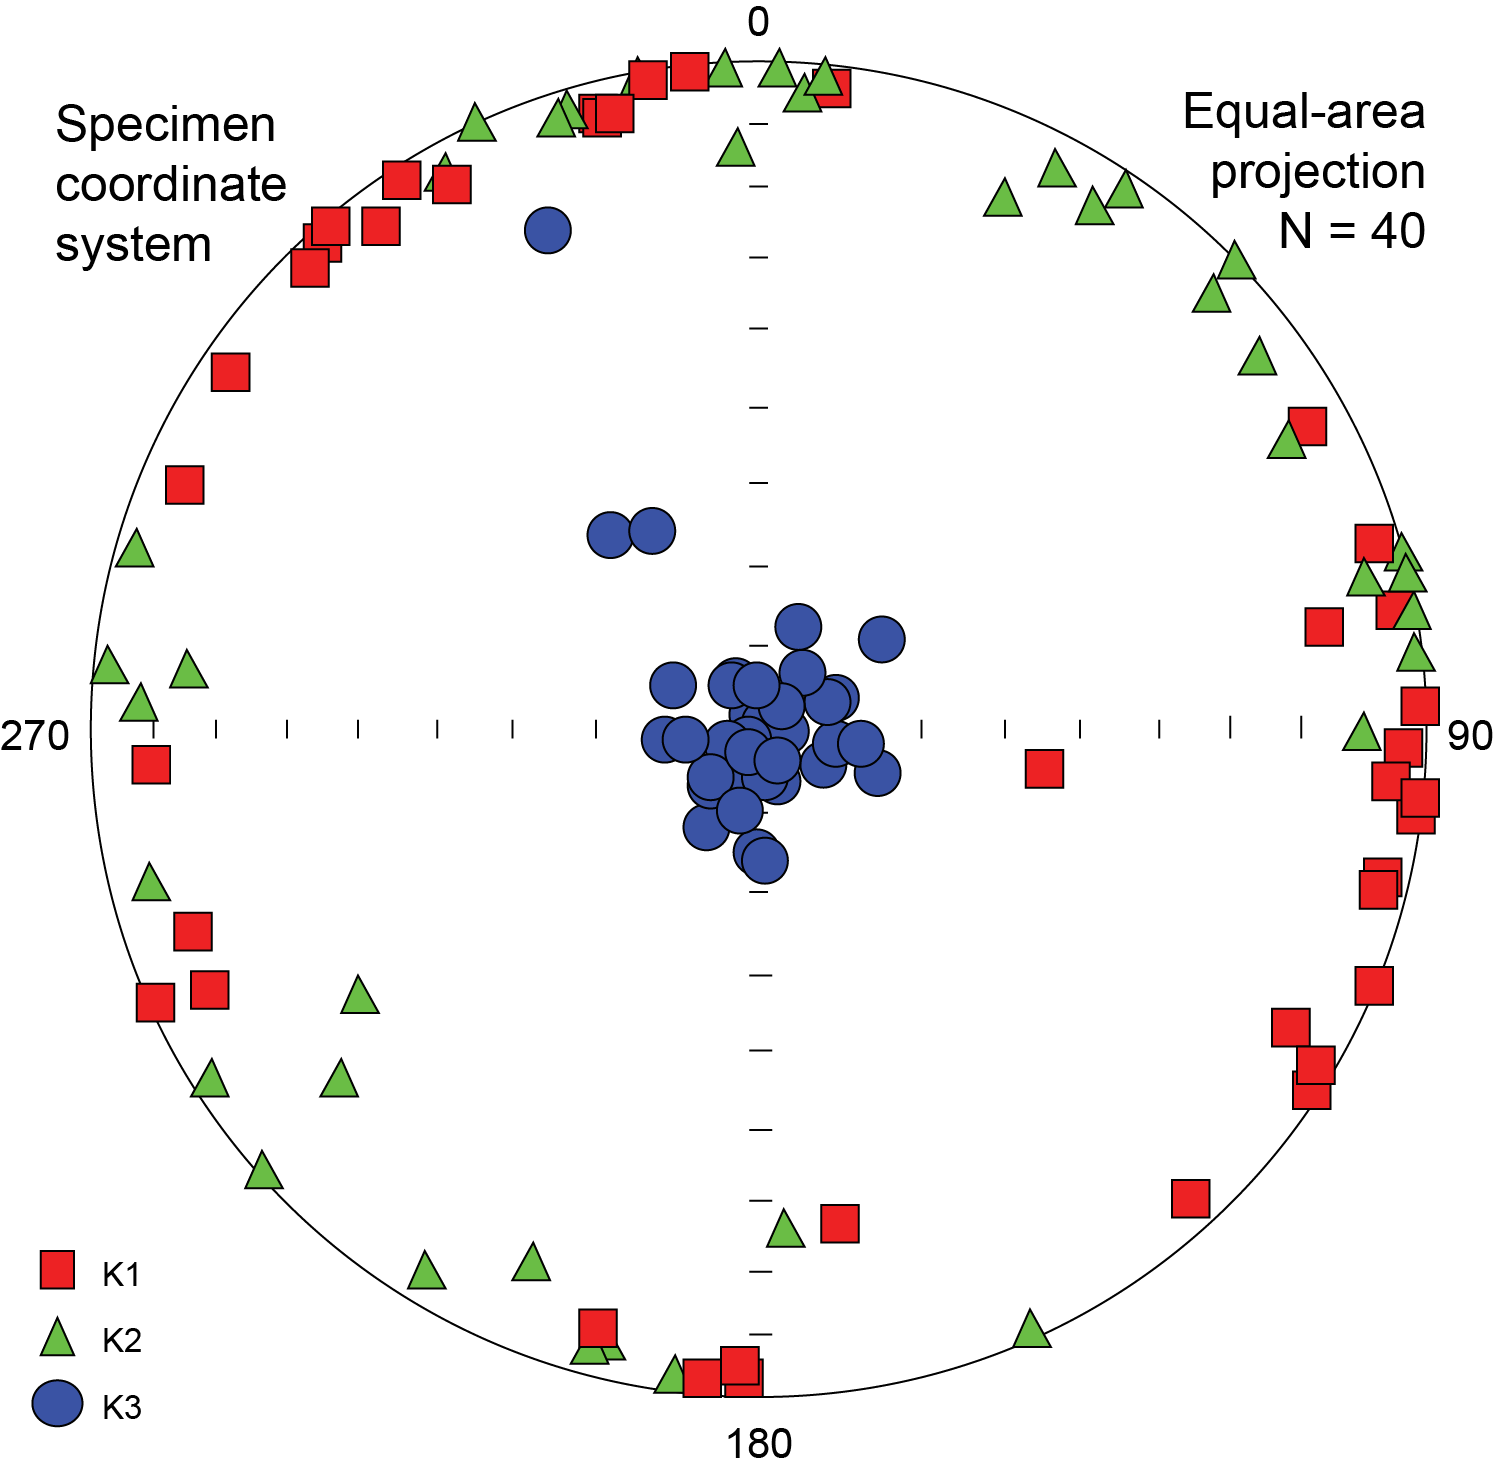
Figure F19. AMS.
AF demagnetization up to 100 mT peak AF was performed on the discrete samples to preliminarily evaluate the quality of NRM data from archive-half sections. The results suggest that a secondary NRM component, likely due to drill string overprinting, can be effectively removed at 10 mT peak AF. Demagnetization data between the 20 and 80 mT interval linearly tends toward the origin, which is used for principal component analysis to define the characteristic remanent magnetization (ChRM) (Kirschvink, 1980). The ChRM inclination of the discrete samples is consistent with inclination of the archive-half sections after demagnetization at 20 mT (average ChRM = 61.8°; average maximum angular deviation = 7.5°). However, the fact that no reversal was found in Hole U1614A is puzzling because the base of the sediment column is estimated to be older than the Brunhes Chron (see Biostratigraphy).
5.1.2. Rock magnetism
To gain insights into the magnetic properties of NRM carriers, anhysteretic remanent magnetization (ARM) was applied with a 70 mT peak AF and 50 µT direct field to the discrete samples and demagnetized up to 80 mT peak AF in 20 steps. The results are very similar among samples with a median destructive field (MDF) of less than 30 mT (Figure F20), indicating that magnetic properties of NRM carriers are not distinctively different.
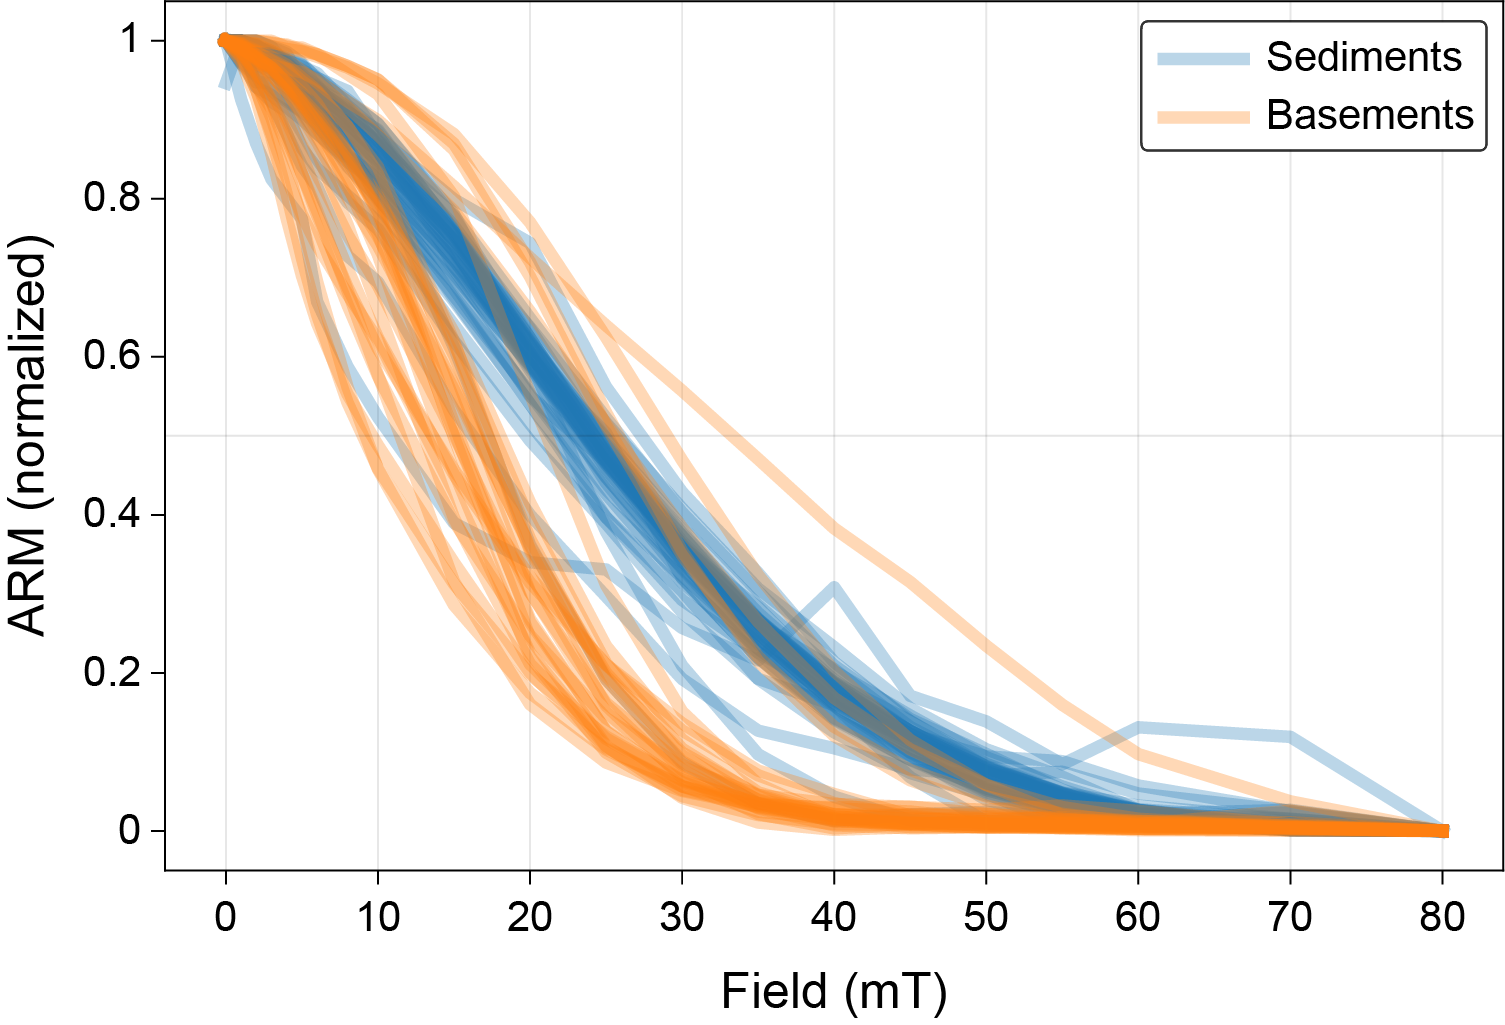
Figure F20. Demagnetization of ARM.
Isothermal remanent magnetization (IRM) curves were constructed for five discrete samples exhibiting characteristic AF demagnetization curves (Figure F21). Stepwise magnetizing fields of 5, 10, 20, 40, 80, 150, 300, 500, 700, and 1000 mT were applied, and the samples were subsequently measured for magnetic remanence. These curves give an indication of the magnetic carriers in the sediments. All samples measured were saturated by 300 mT, indicating magnetite as the major magnetic mineral. However, the sediment/basement interface, Section 402-U1614A-33X-3 (265.01–263.50 m CSF-A), was reddish in color and described as dolomitic by shipboard sedimentologists. This oxidized lithology is usually associated with hematite as a magnetic carrier, as evidenced by the IRM data.
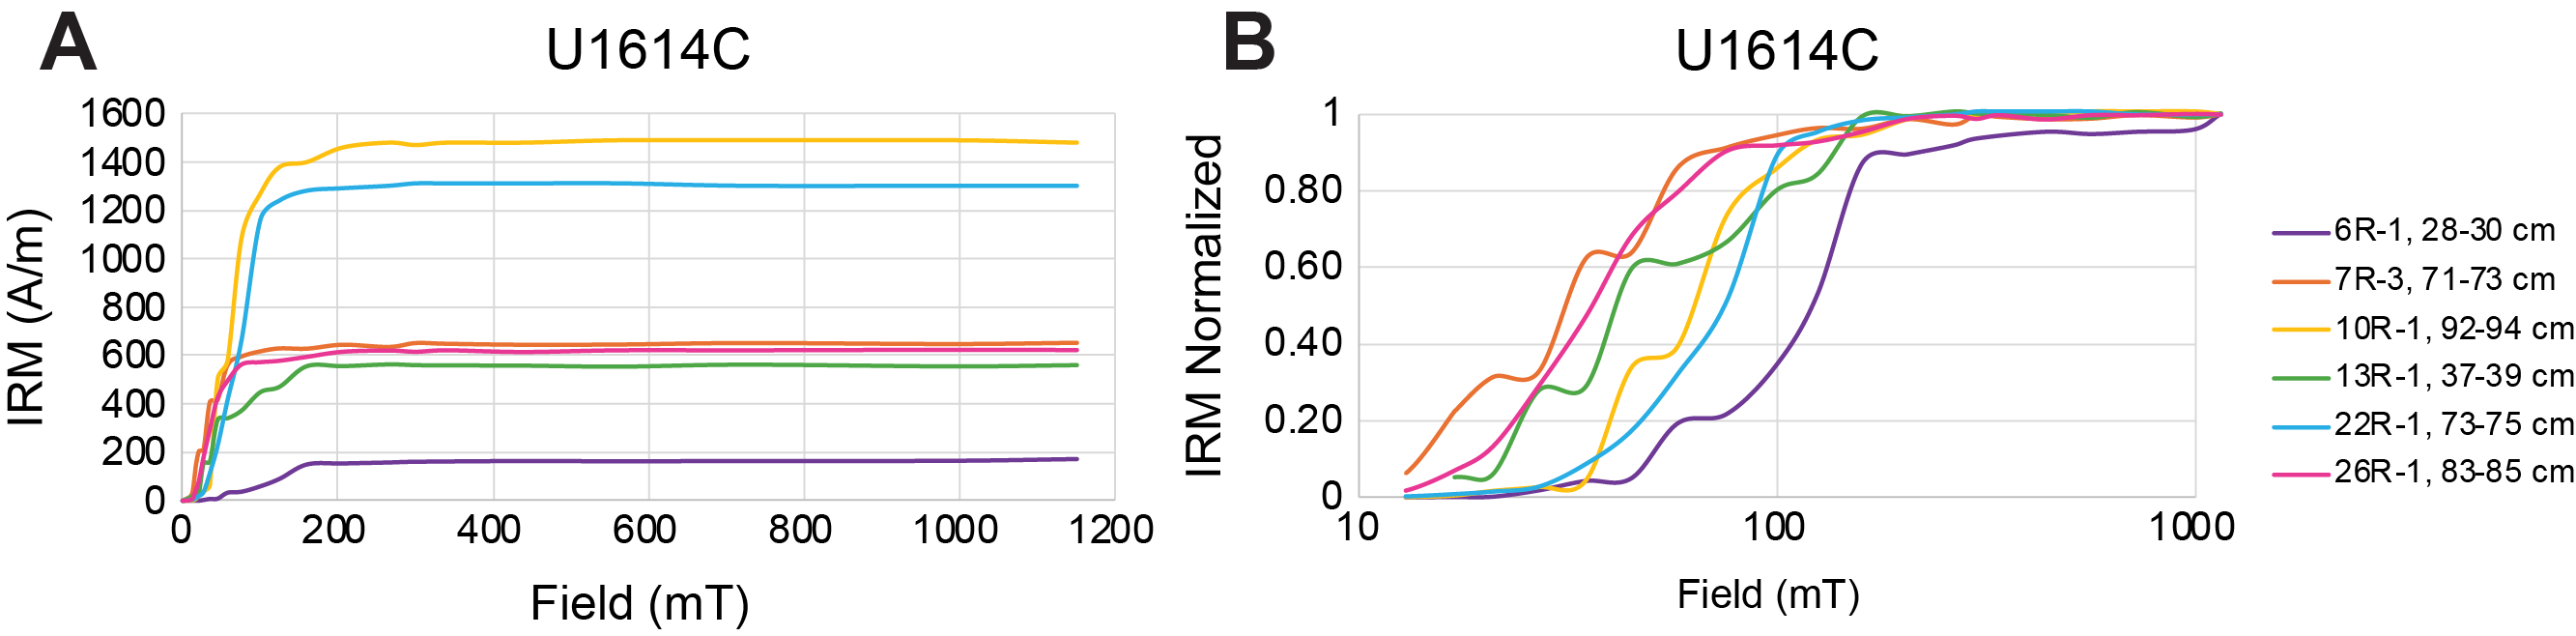
Figure F21. IRM curves.
5.2. Basement rocks
5.2.1. Paleomagnetic results
Basement rocks were measured in Hole U1614C and Cores 402-U1614A-33X and 34X. The basement rock in Hole U1614A was sampled in Section 33X-4 and Core 34X (265.15–271.06 m CSF-A). The serpentinized peridotites in Section 33X-4 and Core 34X are associated with strong initial NRM averaging 2.89 A/m. After demagnetization at 20 mT peak AF, however, the average NRM drops to 0.32 A/m (Figure F22). This same NRM intensity pattern is found for the basement rocks sampled in Hole U1614C (Figure F23). The sharp drop in intensity at low levels of demagnetization (≤20 mT) suggests that most of the NRM is likely a drill string overprint.
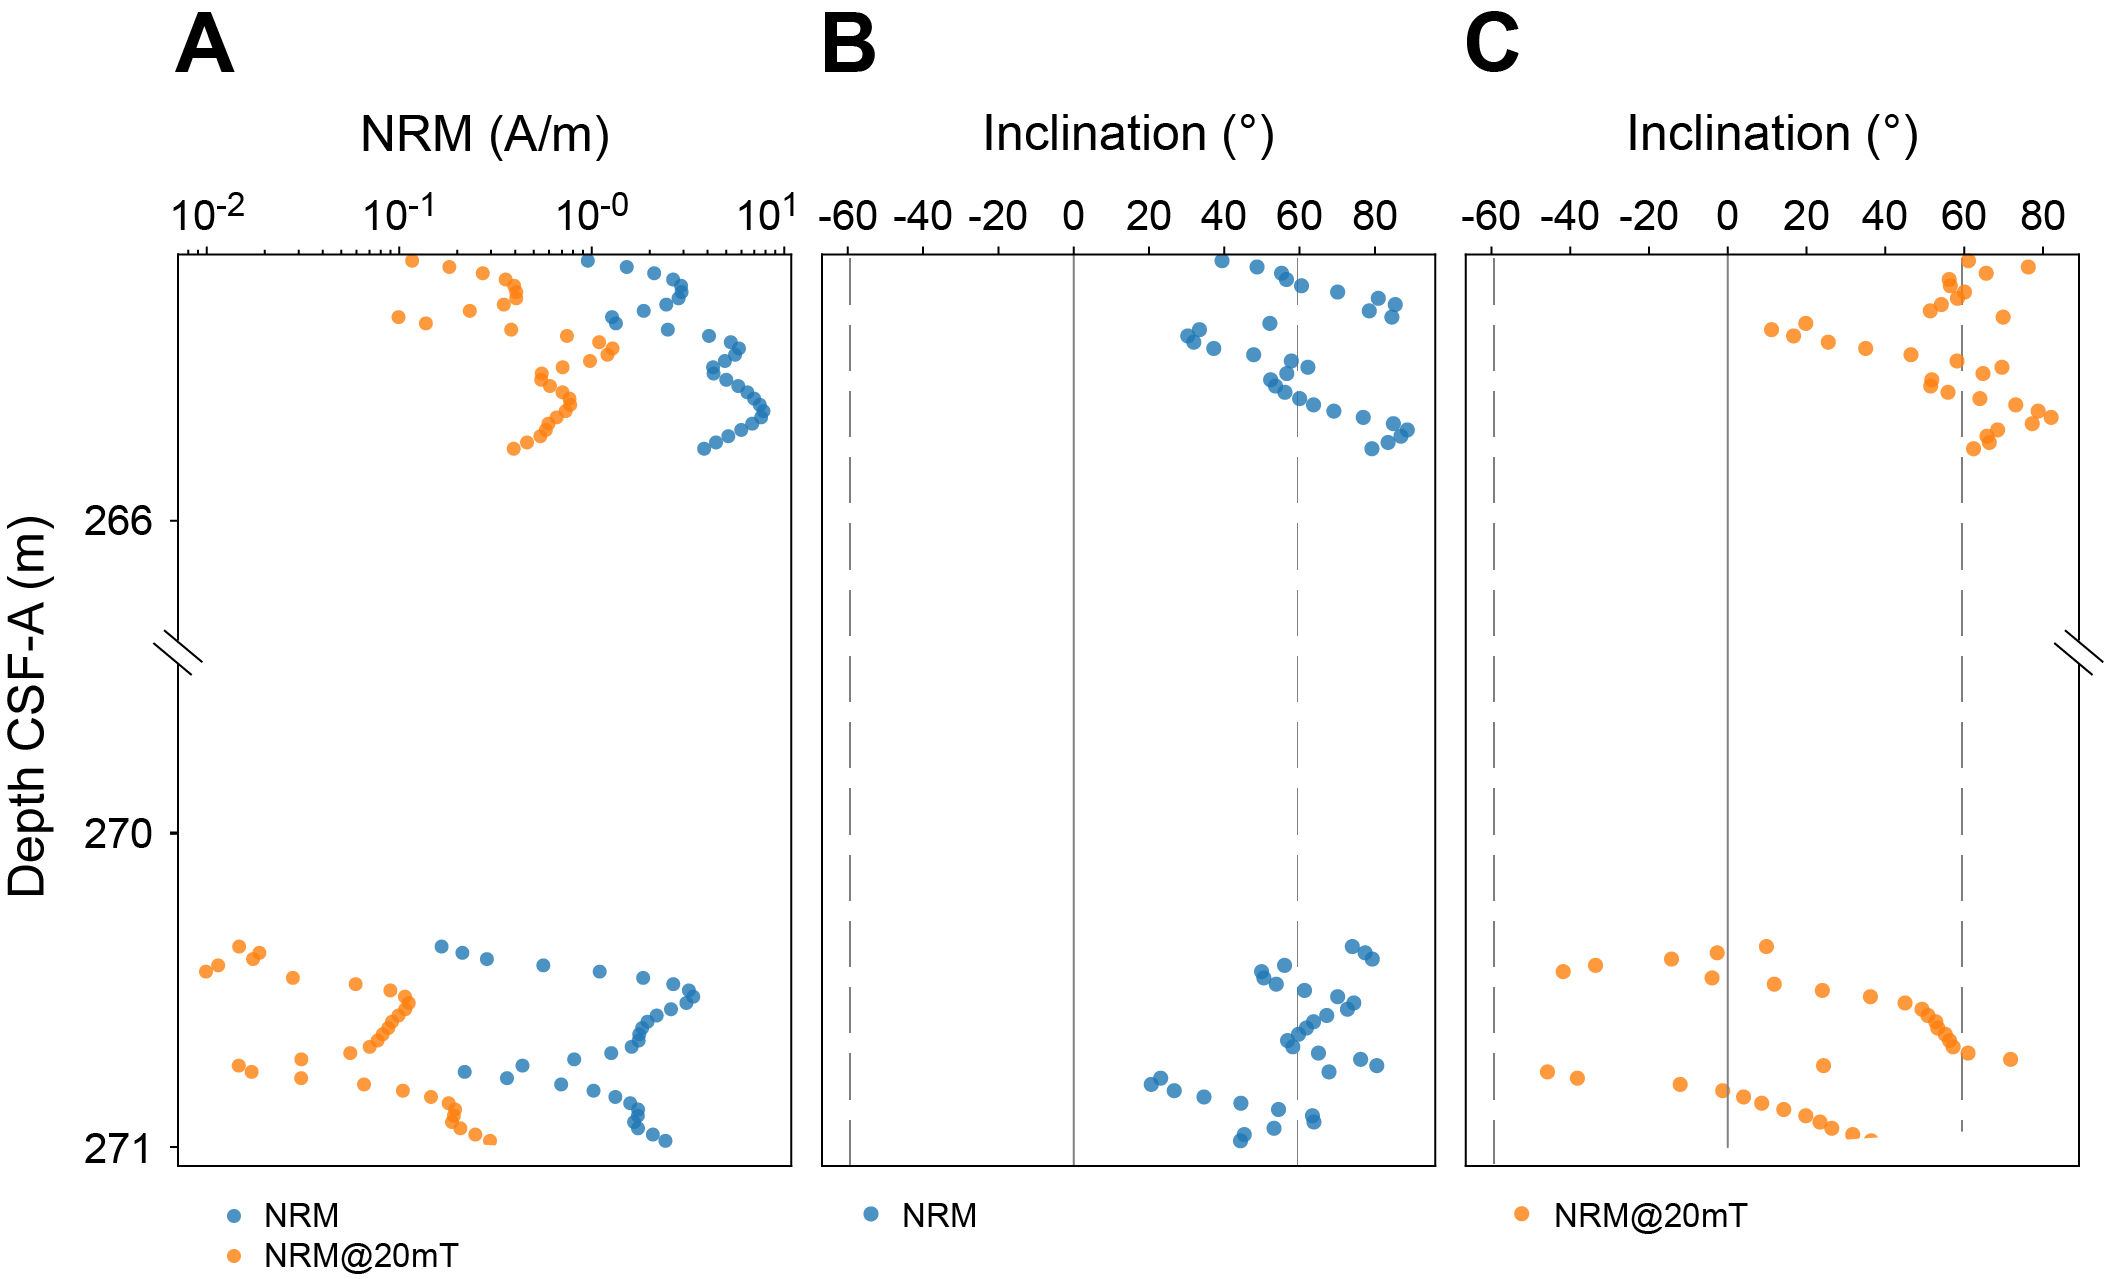
Figure F22. NRM basement variation, Hole U1614A.
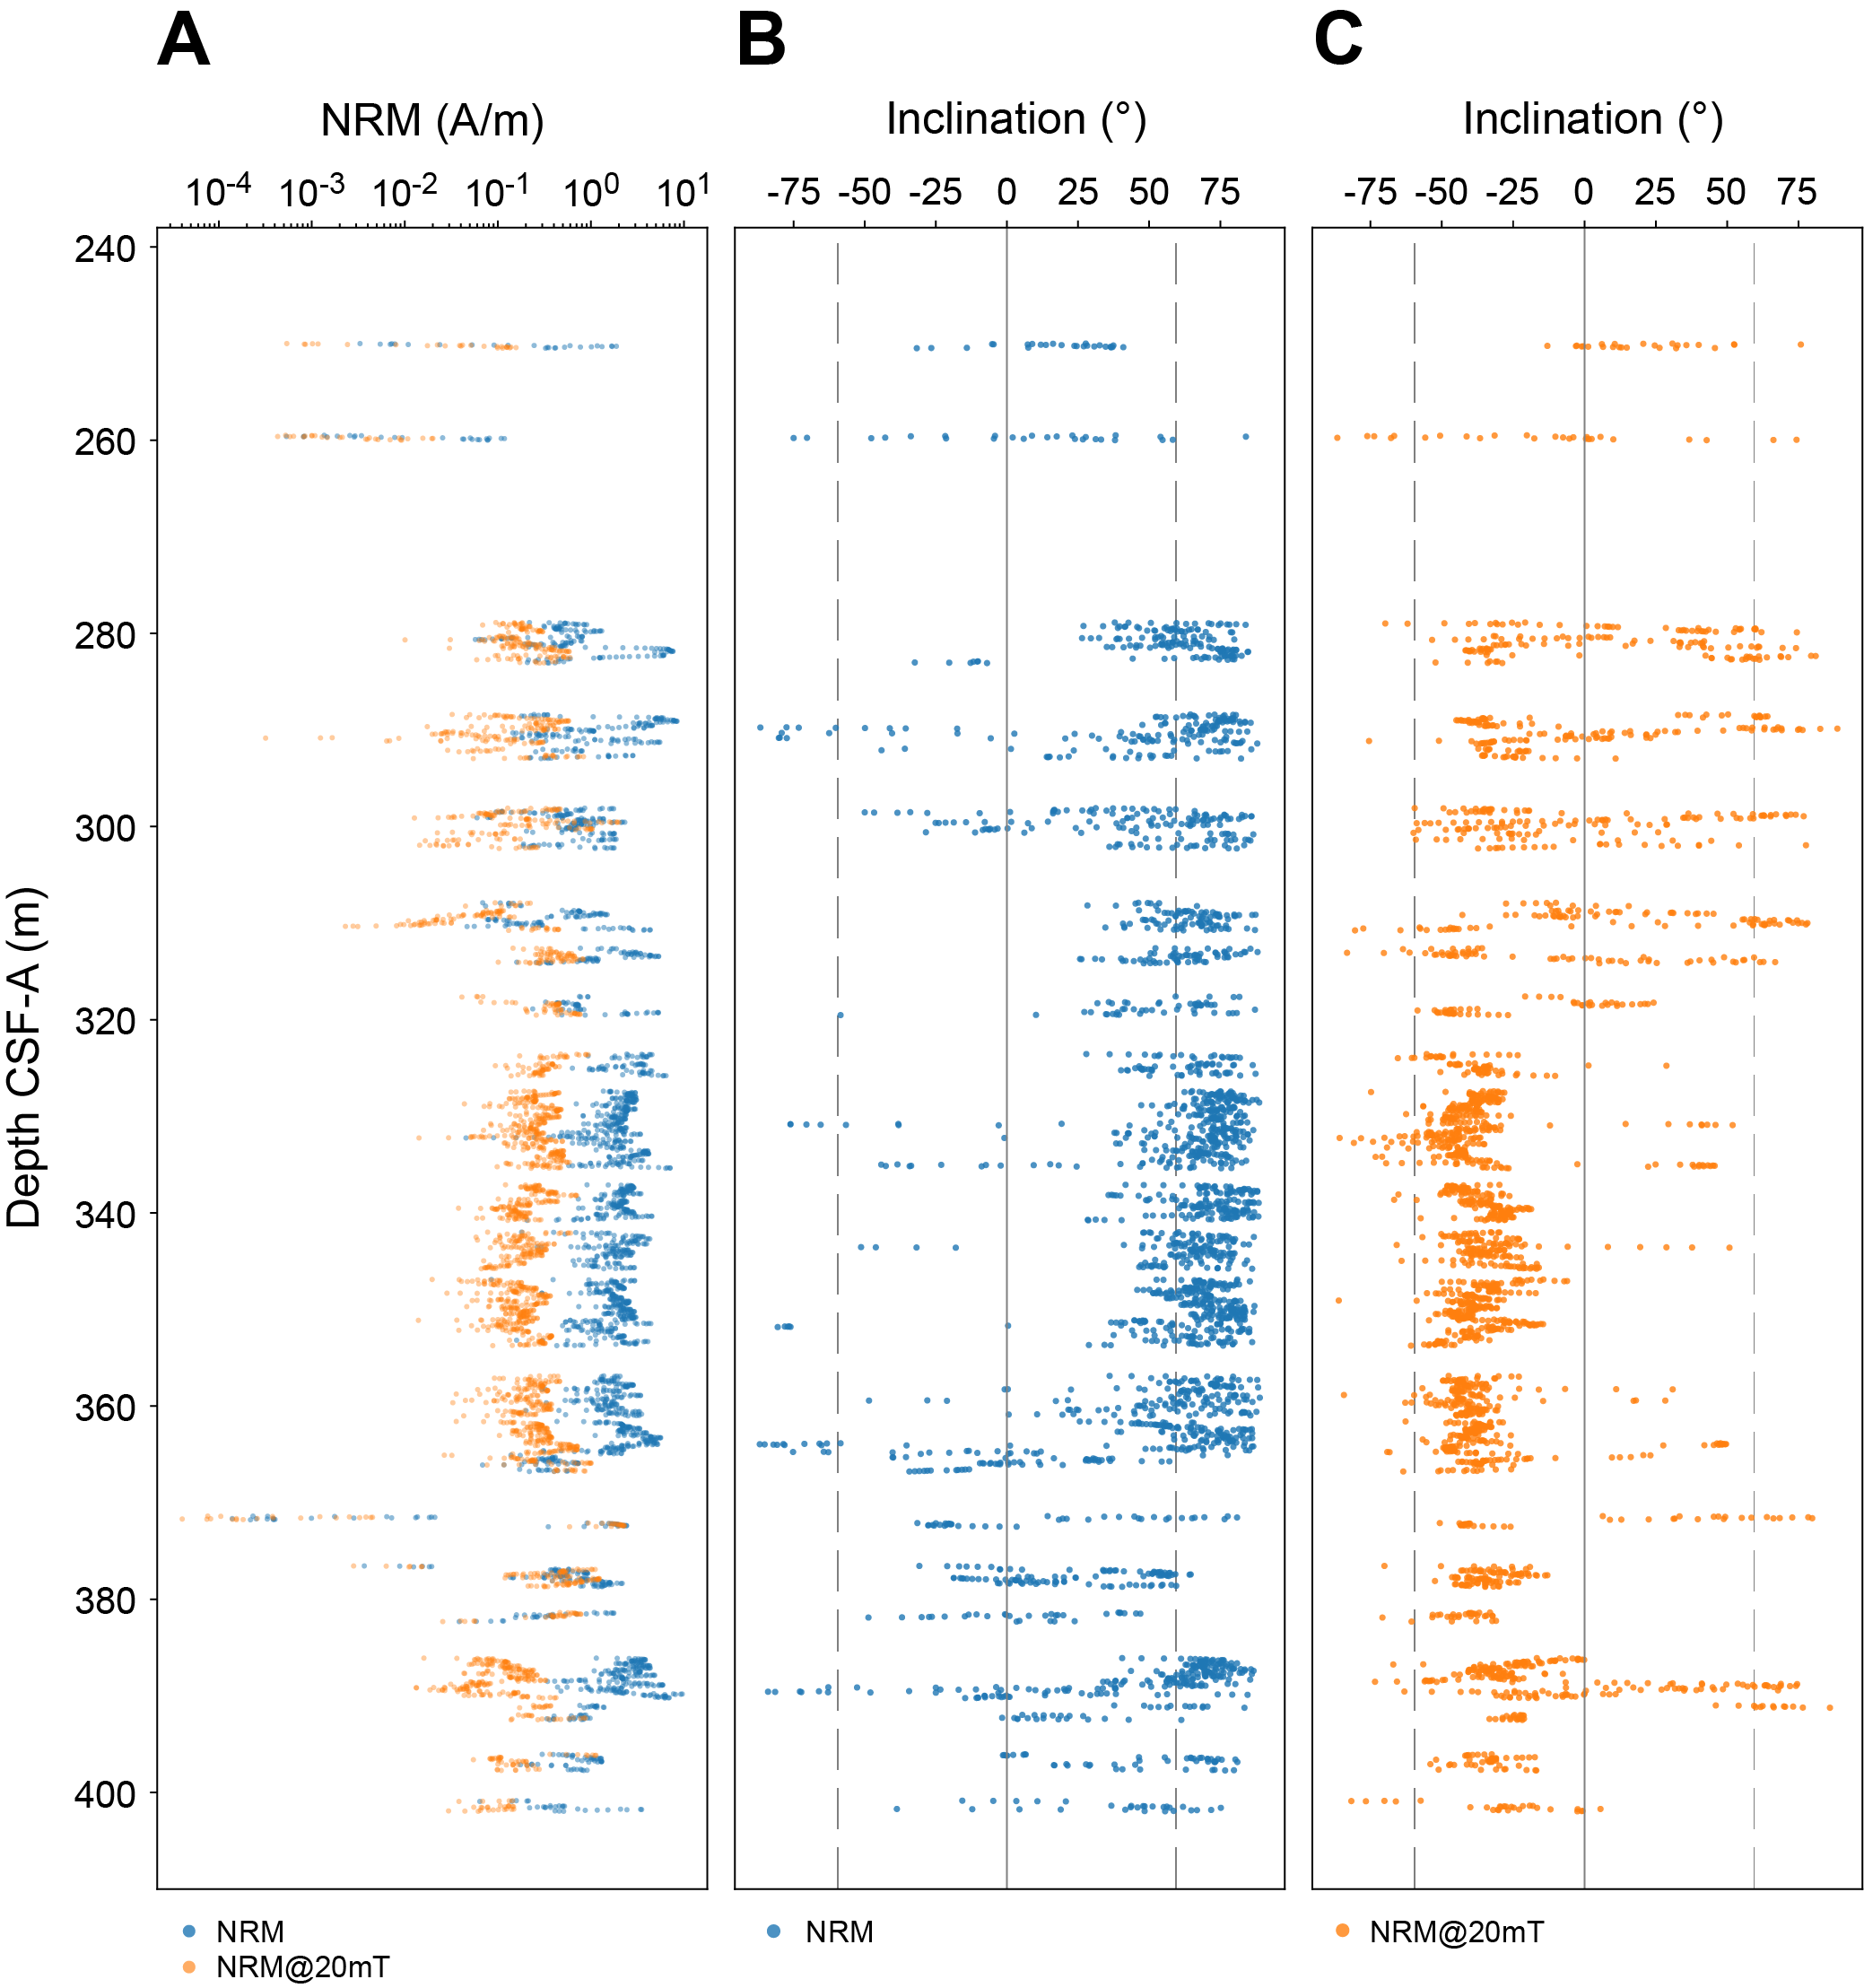
Figure F23. NRM basement variation, Hole U1614C.
Archive halves from Hole U1614C show an NRM of normal polarity. After the drilling overprint was removed at AF 20 mT, it reverses to negative polarity with a slightly shallower inclination than expected for this latitude (40°15.9781′N) (Ic_GAD = 59.45°) (Figure F23). After demagnetization at 20 mT peak AF, the inclination of most analyzed intervals of Hole U1614C discrete samples confirm that the negative inclination persists at higher demagnetization levels, suggesting that the rock's NRM was likely acquired in a reverse polarity. However, the demagnetization data does not consistently show a stable direction after 40 mT peak AF; therefore, a ChRM cannot be defined for most samples. In addition, several discrete samples show slightly increasing NRM intensity after demagnetization at 80 mT peak AF, which may be due to remanent gyromagnetic magnetization. Two samples contain hematite based on IRM data, which contributes a significant fraction of their NRM. These samples correspond to Sections 402-U1614C-6R-1 (288.3–289.73 m CSF-A; dunite) and 7R-3 (300.6–302.1 m CSF-A; plagioclase-bearing lherzolite), both showing reddish colors as evidence of weathering under oxidizing conditions, in agreement with the presence of hematite.
5.2.2. Rock magnetism
ARM was applied to the discrete samples at 70 mT peak AF and 50 µT direct field and demagnetized to 80 mT peak AF in 20 steps. The demagnetization curves are more variable compared to the sediments from Hole U1614A, and the MDF is generally lower, ranging 10–20 mT (Figure F20). These results demonstrate the existence of low-coercivity magnetite, probably resulting from coarse grain sizes and strong magnetic interaction. IRM acquisition curves were measured on representative discrete samples, magnetized from 5 to 1000 mT in 10 steps. The results show that IRM increases very quickly at low fields but with varying slopes (Figure F21). Both ARM and IRM curves suggest the presence of multidomain magnetite as a dominant magnetic component in the peridotites.
6. Igneous and metamorphic petrology
Site U1614 targeted the Tyrrhenian basement beneath a ~270 m thick sedimentary cover. Compared to ODP Site 951, where the mantle peridotites were recovered below a 50 m thick interval of basaltic breccias and pillow basalts, the basement at Site U1614 consists of a highly heterogeneous mantle section with no overlying basalt and slivers of granitoids in between the mantle rocks. Hole U1614A recovered the intact primary contact between dolomitized sediments and mantle peridotites. Highly fractured dunites and lherzolites in Hole U1614A reveal a high degree of weathering under oxidizing conditions. Hole U1614C also recovered the contact between sediments and highly serpentinized peridotites. The 153 m cored interval below the contact reveals substantial lithologic heterogeneity in the basement rocks. The recovered mantle rocks consist of lherzolites and harzburgites that occur in almost equal proportions but with varying distribution throughout the hole. Lherzolites and harzburgites frequently show plagioclase-rich layers, often locally oriented along a foliation plane. Dunite is widespread in the upper part of Hole U1614C and in the lower part of Hole U1614A. Several generations of felsic to mafic intrusions cut the peridotites and show strong heterogeneity of migrating melts. These magmatic intrusions range from granitoids to oxide-gabbros to mica-bearing mafic material. Static, ductile, and brittle alteration is widespread throughout the hole but less intense at intermediate depths in the cored interval. Ductile deformation is most common in pyroxene- and plagioclase-rich layers. Intense brittle and/or ductile deformation is also present around the recovered granitoids and highly altered lithologies. Core samples are occasionally cut by multiple generations of serpentine and carbonate veins.
6.1. Lithostratigraphic units
Hole U1614A reached the basement below a 265.2 m thick sedimentary sequence. At the sediment/basement contact, Section 402-U1614A-33X-4 (265–265.9 mbsf) contains highly serpentinized mantle peridotites with ductile deformation, cataclastic features, and thick carbonate-bearing veins. The contact with the sediments is marked by a thin layer of dolomite and gray nannofossil chalk with <1 mm serpentinite clasts in a muddy matrix. Sediments above the contact are brownish in color, similar to Unit III at Site U1612. The peridotites at the contact with the sediments are completely serpentinized, and their original structural features may have been partially disturbed by drilling. The rocks range in color from brown to gray because of varying degrees of serpentinization and/or oxidative weathering. Serpentinized peridotites in Cores 33X–35G locally preserve evidence of the original mantle texture, revealing foliation defined by the alignment of olivine and pyroxene pseudomorphs. Dunites are abundant in these cores, with minor intercalation of plagioclase-bearing lherzolites. The original mantle features are more evident in the peridotite pebbles recovered in Core 35G; here, the peridotites are moderately serpentinized lherzolites that locally contain trace amounts of plagioclase, often organized in irregular patches or veins. Widespread pyrite crystals are found on the surface of these pebbles, suggesting hydrothermal alteration following the fracturing of the rock.
The sediment/basement interface was partly sampled in Hole U1614C, where coring started at 250 mbsf. In Core 402-U1614C-2R, mudstone contacts highly fractured plagioclase-bearing lherzolites, which overlies more mudstone and unconsolidated conglomerate (Core 3R). A ~153 m thick basement interval was recovered from Cores 3R–28R. Based on the variation in the abundance of lithologies and their alteration features, five lithostratigraphic units were defined in the basement of Hole U1614C. These units are briefly described below, followed by a detailed description of the lithologic and alteration features. See Structural geology for a description of the structural features. In the following, we describe in detail the lithostratigraphic units and their corresponding depths.
6.1.1. Lithostratigraphic Unit IV
The top of the uppermost basement unit at Site U1614 (Unit IV) is at the contact of serpentinized peridotite and the sediments and consists of an unconsolidated mélange of mud and variably serpentinized peridotite. Sulfides are observed throughout this section and only in the higher parts of the peridotites.
6.1.2. Lithostratigraphic Unit V
Unit V consists of variable mantle lithologies and is crosscut by numerous centimeter-scale gabbro and carbonate veins. The upper part of this unit contains clinopyroxene-rich and plagioclase-bearing lithologies, and the lower part of the unit shows clinopyroxene- and plagioclase-free lithologies (Figure F24). Based on this variation in clinopyroxene and plagioclase, the unit is divided into Subunit VA (269–307.9 mbsf), which consists of lherzolite-dominated lithologies, and Subunit VB (307.9–327.3 mbsf), which consists of dunite and harzburgite (Figure F25). The two subunits are separated by an interval of ophicarbonates. Subunit VB is also characterized by the occurrence of several pyroxenites at different depths.
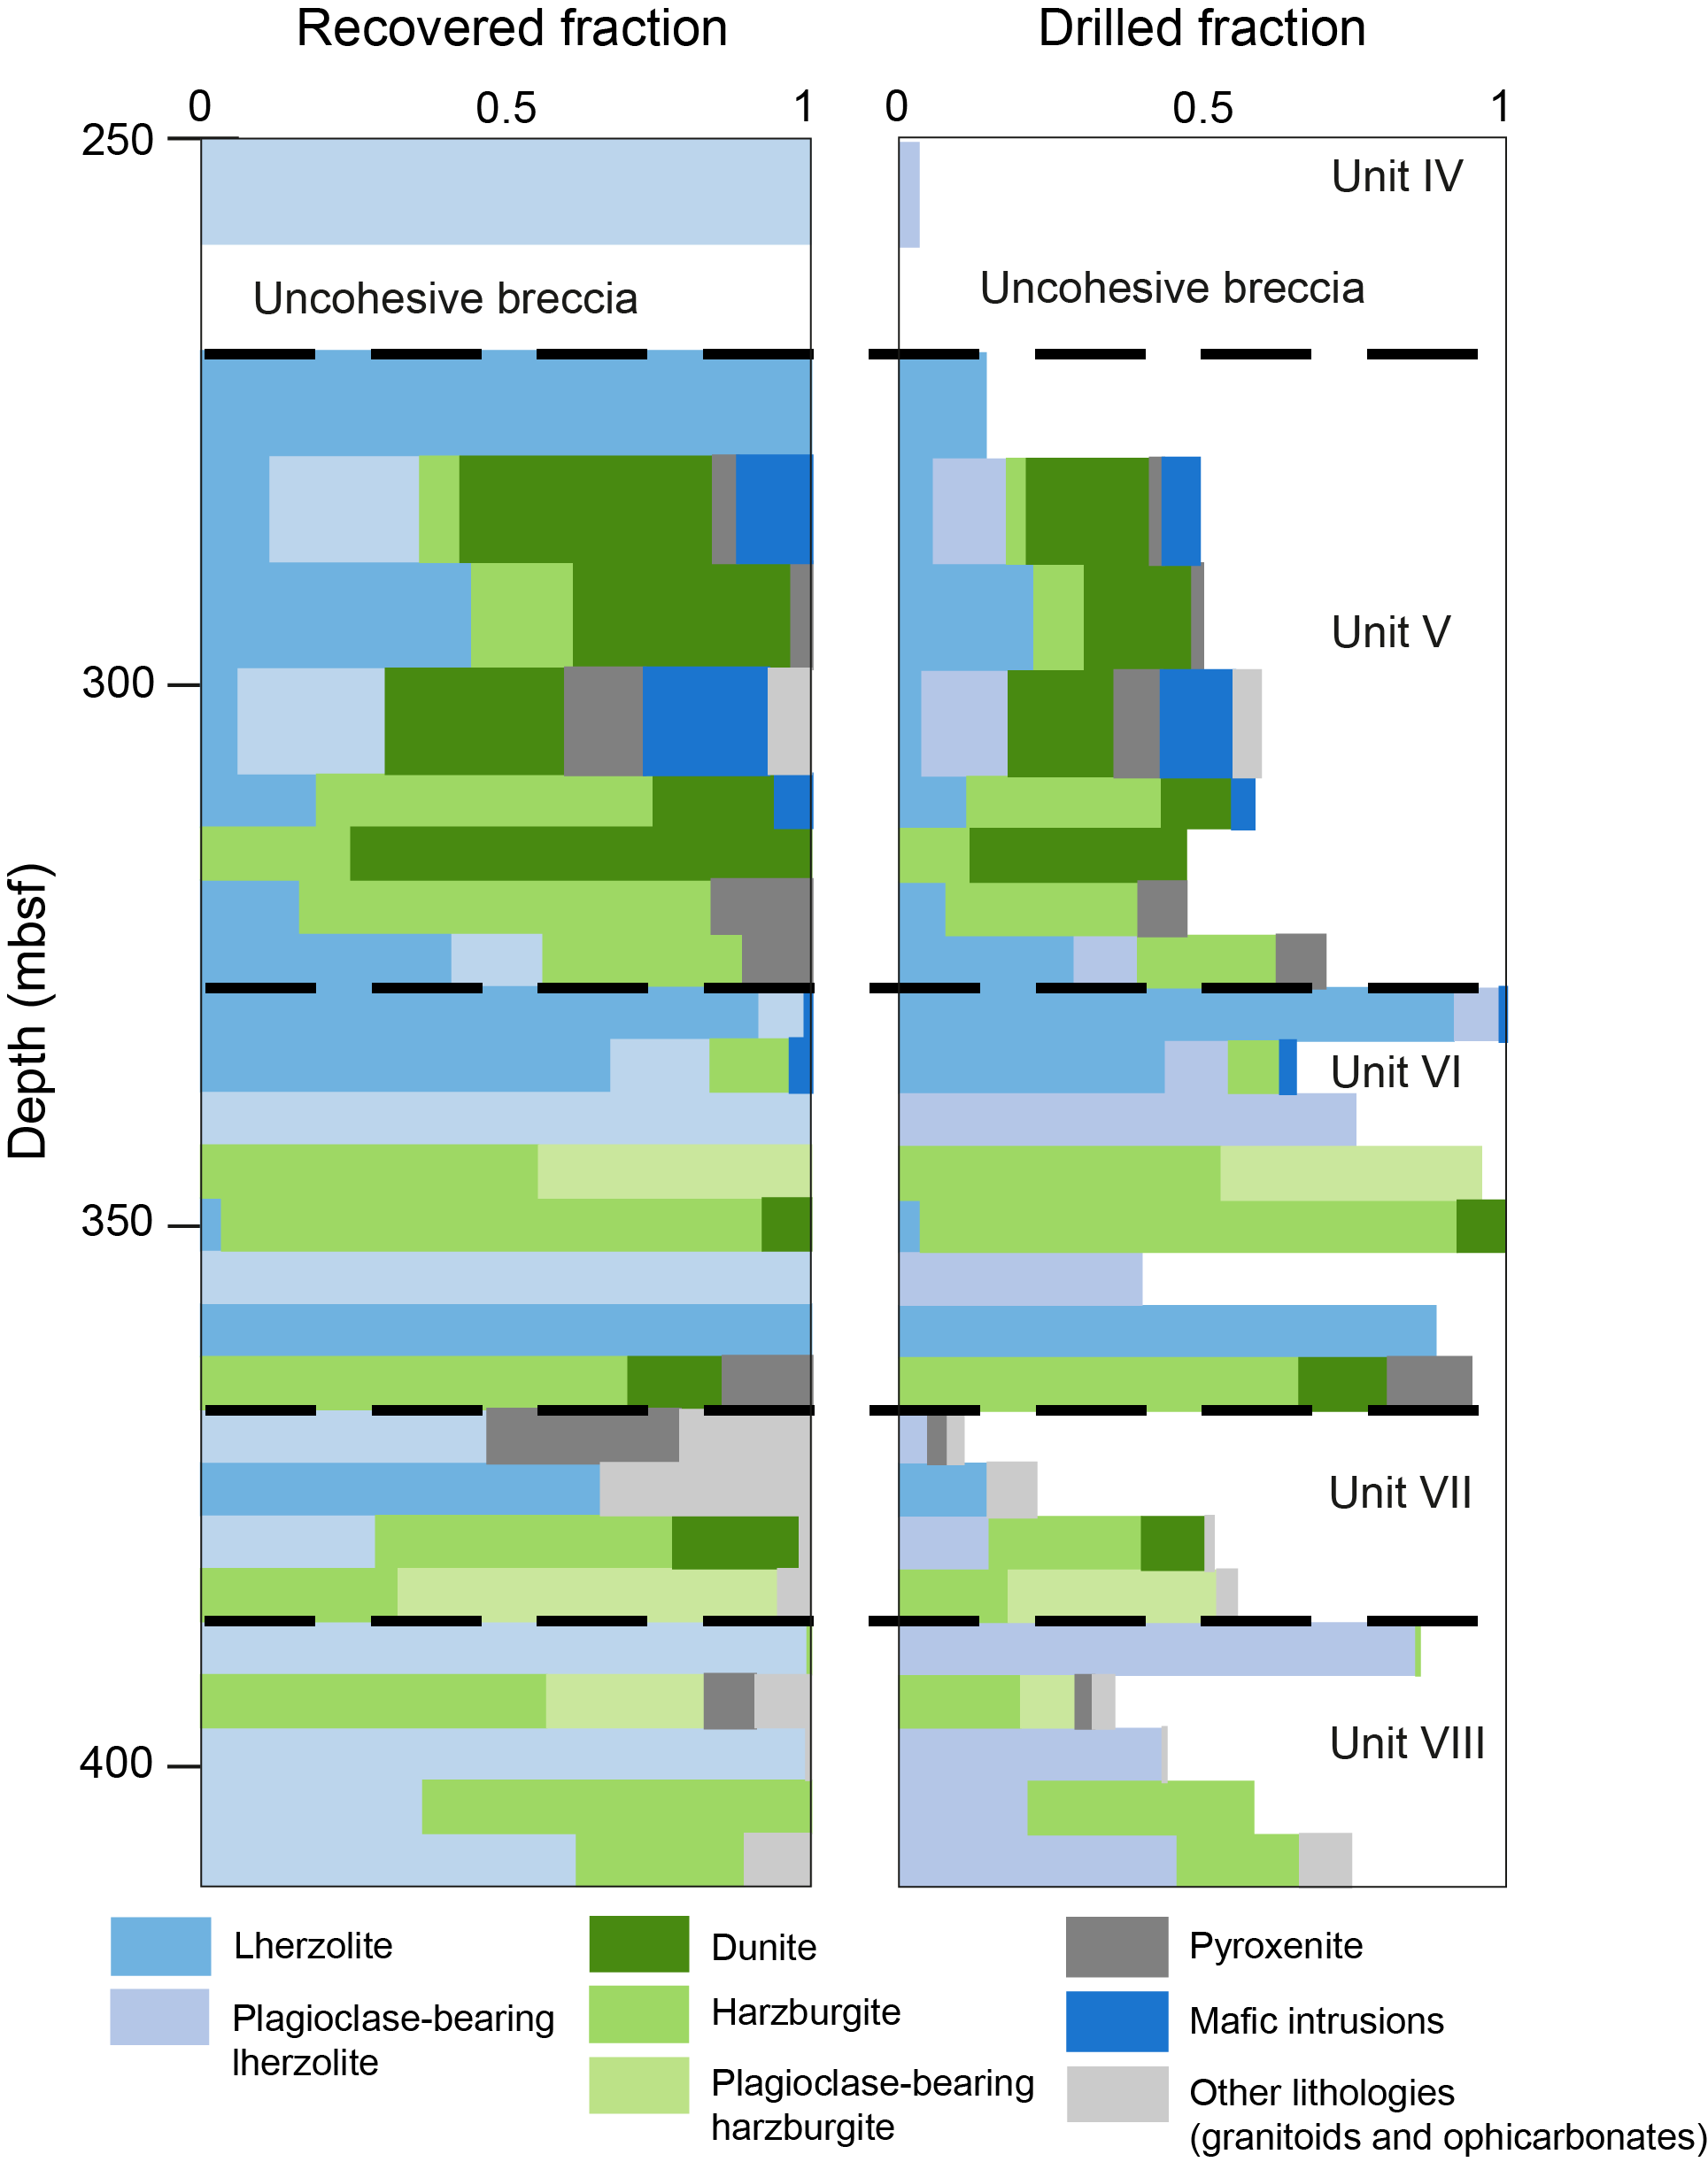
Figure F24. Lithostratigraphic variations, basement.
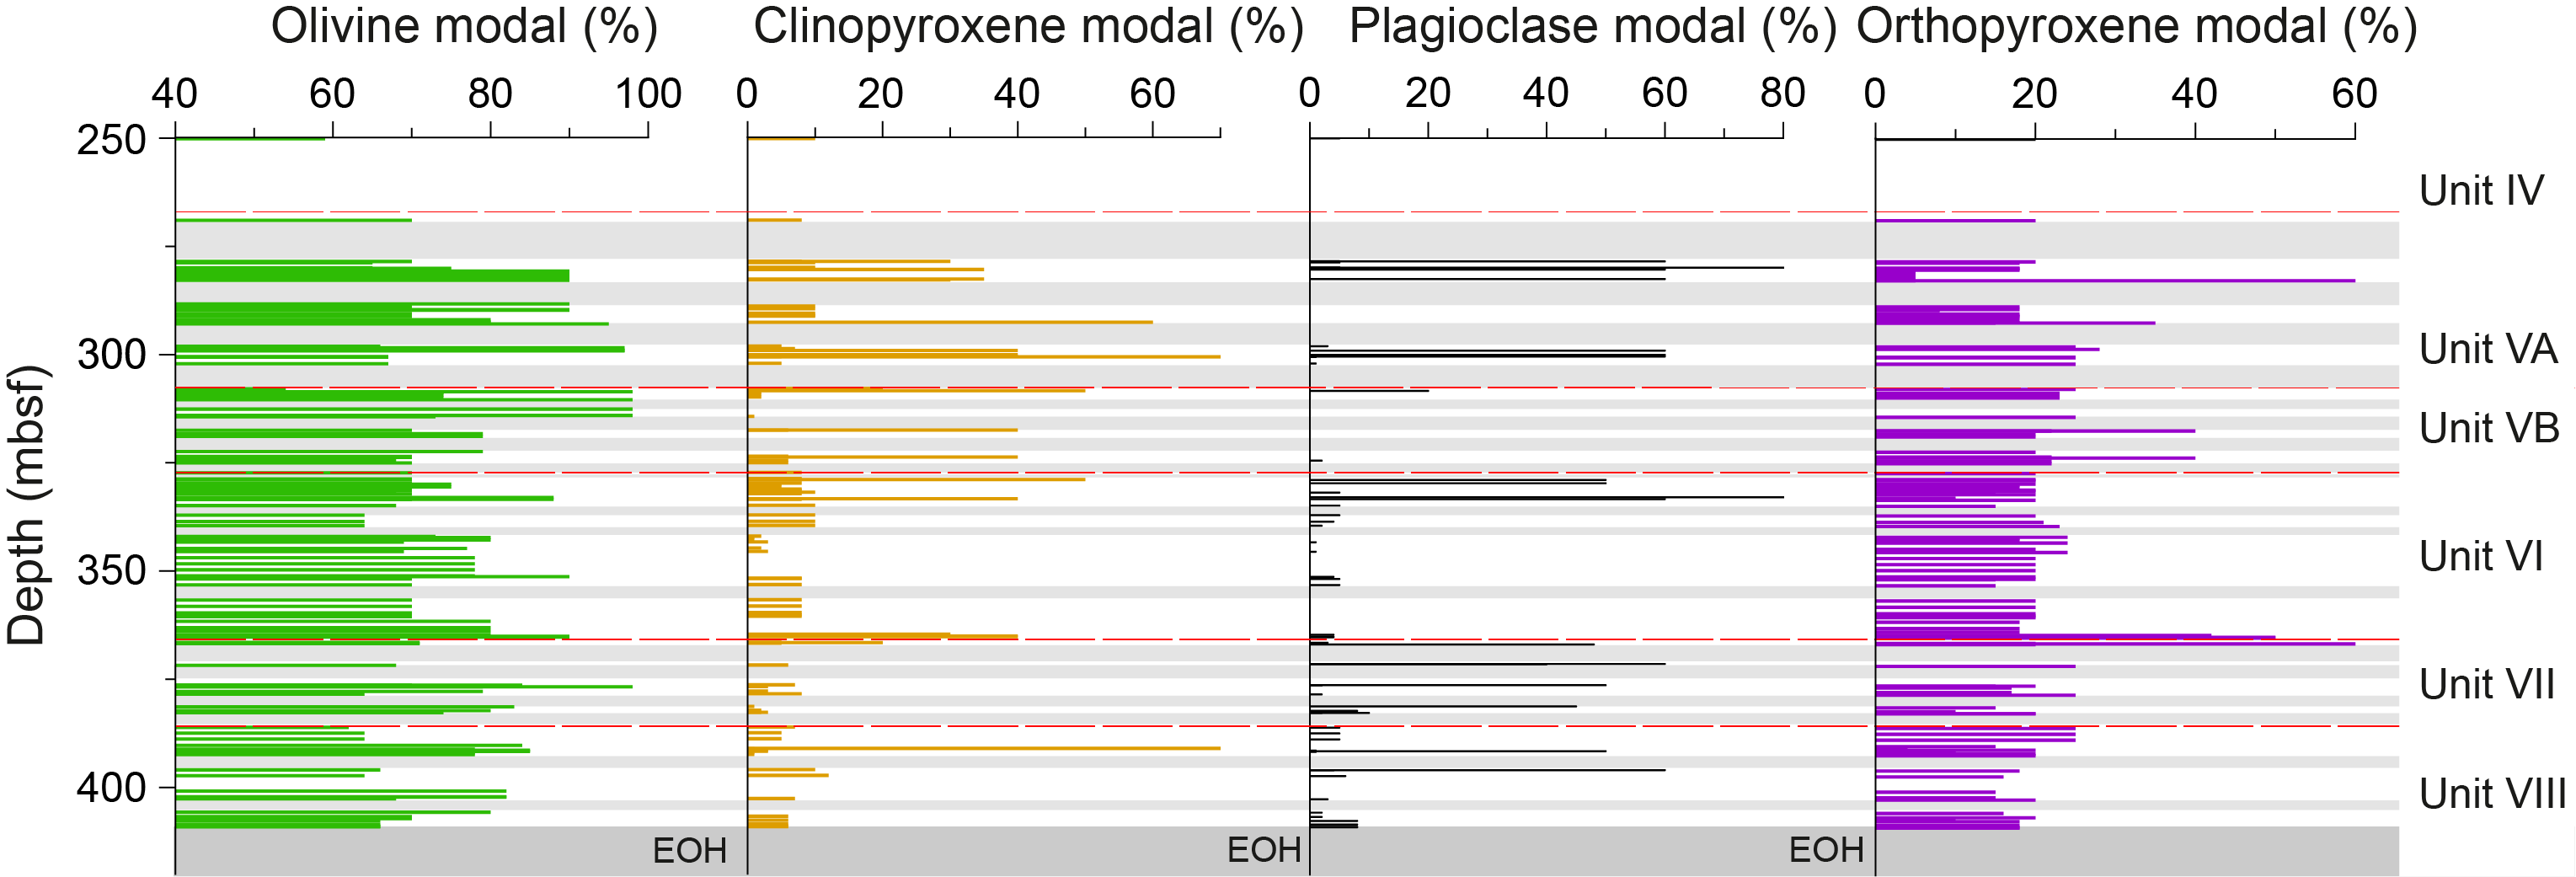
Figure F25. Major mineral abundance, mafic–ultramafic rocks.
6.1.3. Lithostratigraphic Unit VI
Unit VI consists of variable plagioclase-bearing and clinopyroxene-rich peridotites (Figure F24). The peridotites in this unit are less altered than those in the other units. General lithologic homogeneity, weak foliation, and a dense network of magmatic veins characterize this unit. A pyroxenite defines the lower boundary of this unit.
6.1.4. Lithostratigraphic Unit VII
Unit VII consists of reddish serpentinized peridotite along with granitoids and several mafic intrusions. Dense carbonate-rich veins crosscut the rocks subvertically, and overall the unit shows a strong foliation fabric throughout.
6.1.5. Lithostratigraphic Unit VIII
The lowest unit cored in the basement, Unit VIII (Cores 402-U1614C-24R through 28R) consists of variable plagioclase- and clinopyroxene-rich ultramafic rocks (Figure F24). The unit is divided into Subunit VIIIA, which consists of homogeneous lherzolites with mylonitic textures and carbonate-rich veins, and Subunit VIIIB, which consists of reddish peridotites with weak foliation, sporadic mylonites, and gabbro veins. Subunit VIIIB contains some of the freshest peridotites sampled in this hole, with more than 50% preserved olivine, orthopyroxene, and clinopyroxene.
6.2. Main rock types
6.2.1. Lherzolite and plagioclase-bearing lherzolite
Lherzolite and plagioclase-bearing lherzolite account for 45% of the recovered rocks. These lithologies were encountered along the entire hole with higher proportions in the upper parts of Units IV, V, and VIII (Figures F26, F27). Most of the lherzolites have a porphyroclastic texture with weak foliation defined by the preferential elongation of pyroxene and spinel, a feature also observed in the X-ray scans (see Physical properties). Olivine, when preserved, is present as equigranular crystals with grain sizes as large as 1 cm. Orthopyroxene is generally subequant with average grain sizes of 0.3–0.7 cm. In most fresh samples, orthopyroxene porphyroclasts are locally surrounded by finer grained orthopyroxene neoblasts, sometimes associated with clinopyroxene. Clinopyroxene in lherzolites is mostly subhedral to anhedral, with grain sizes in the range of 0.2–3 mm. The association of irregular clinopyroxene grains with spinel forms pyroxene-rich veins in the lherzolites. Less commonly, clinopyroxene occurs as millimeter-sized porphyroclasts. Spinel is elongated to subequant and locally interstitial in shape. In many cases, spinel is associated with interstitial clinopyroxene within the pyroxene-rich veins.
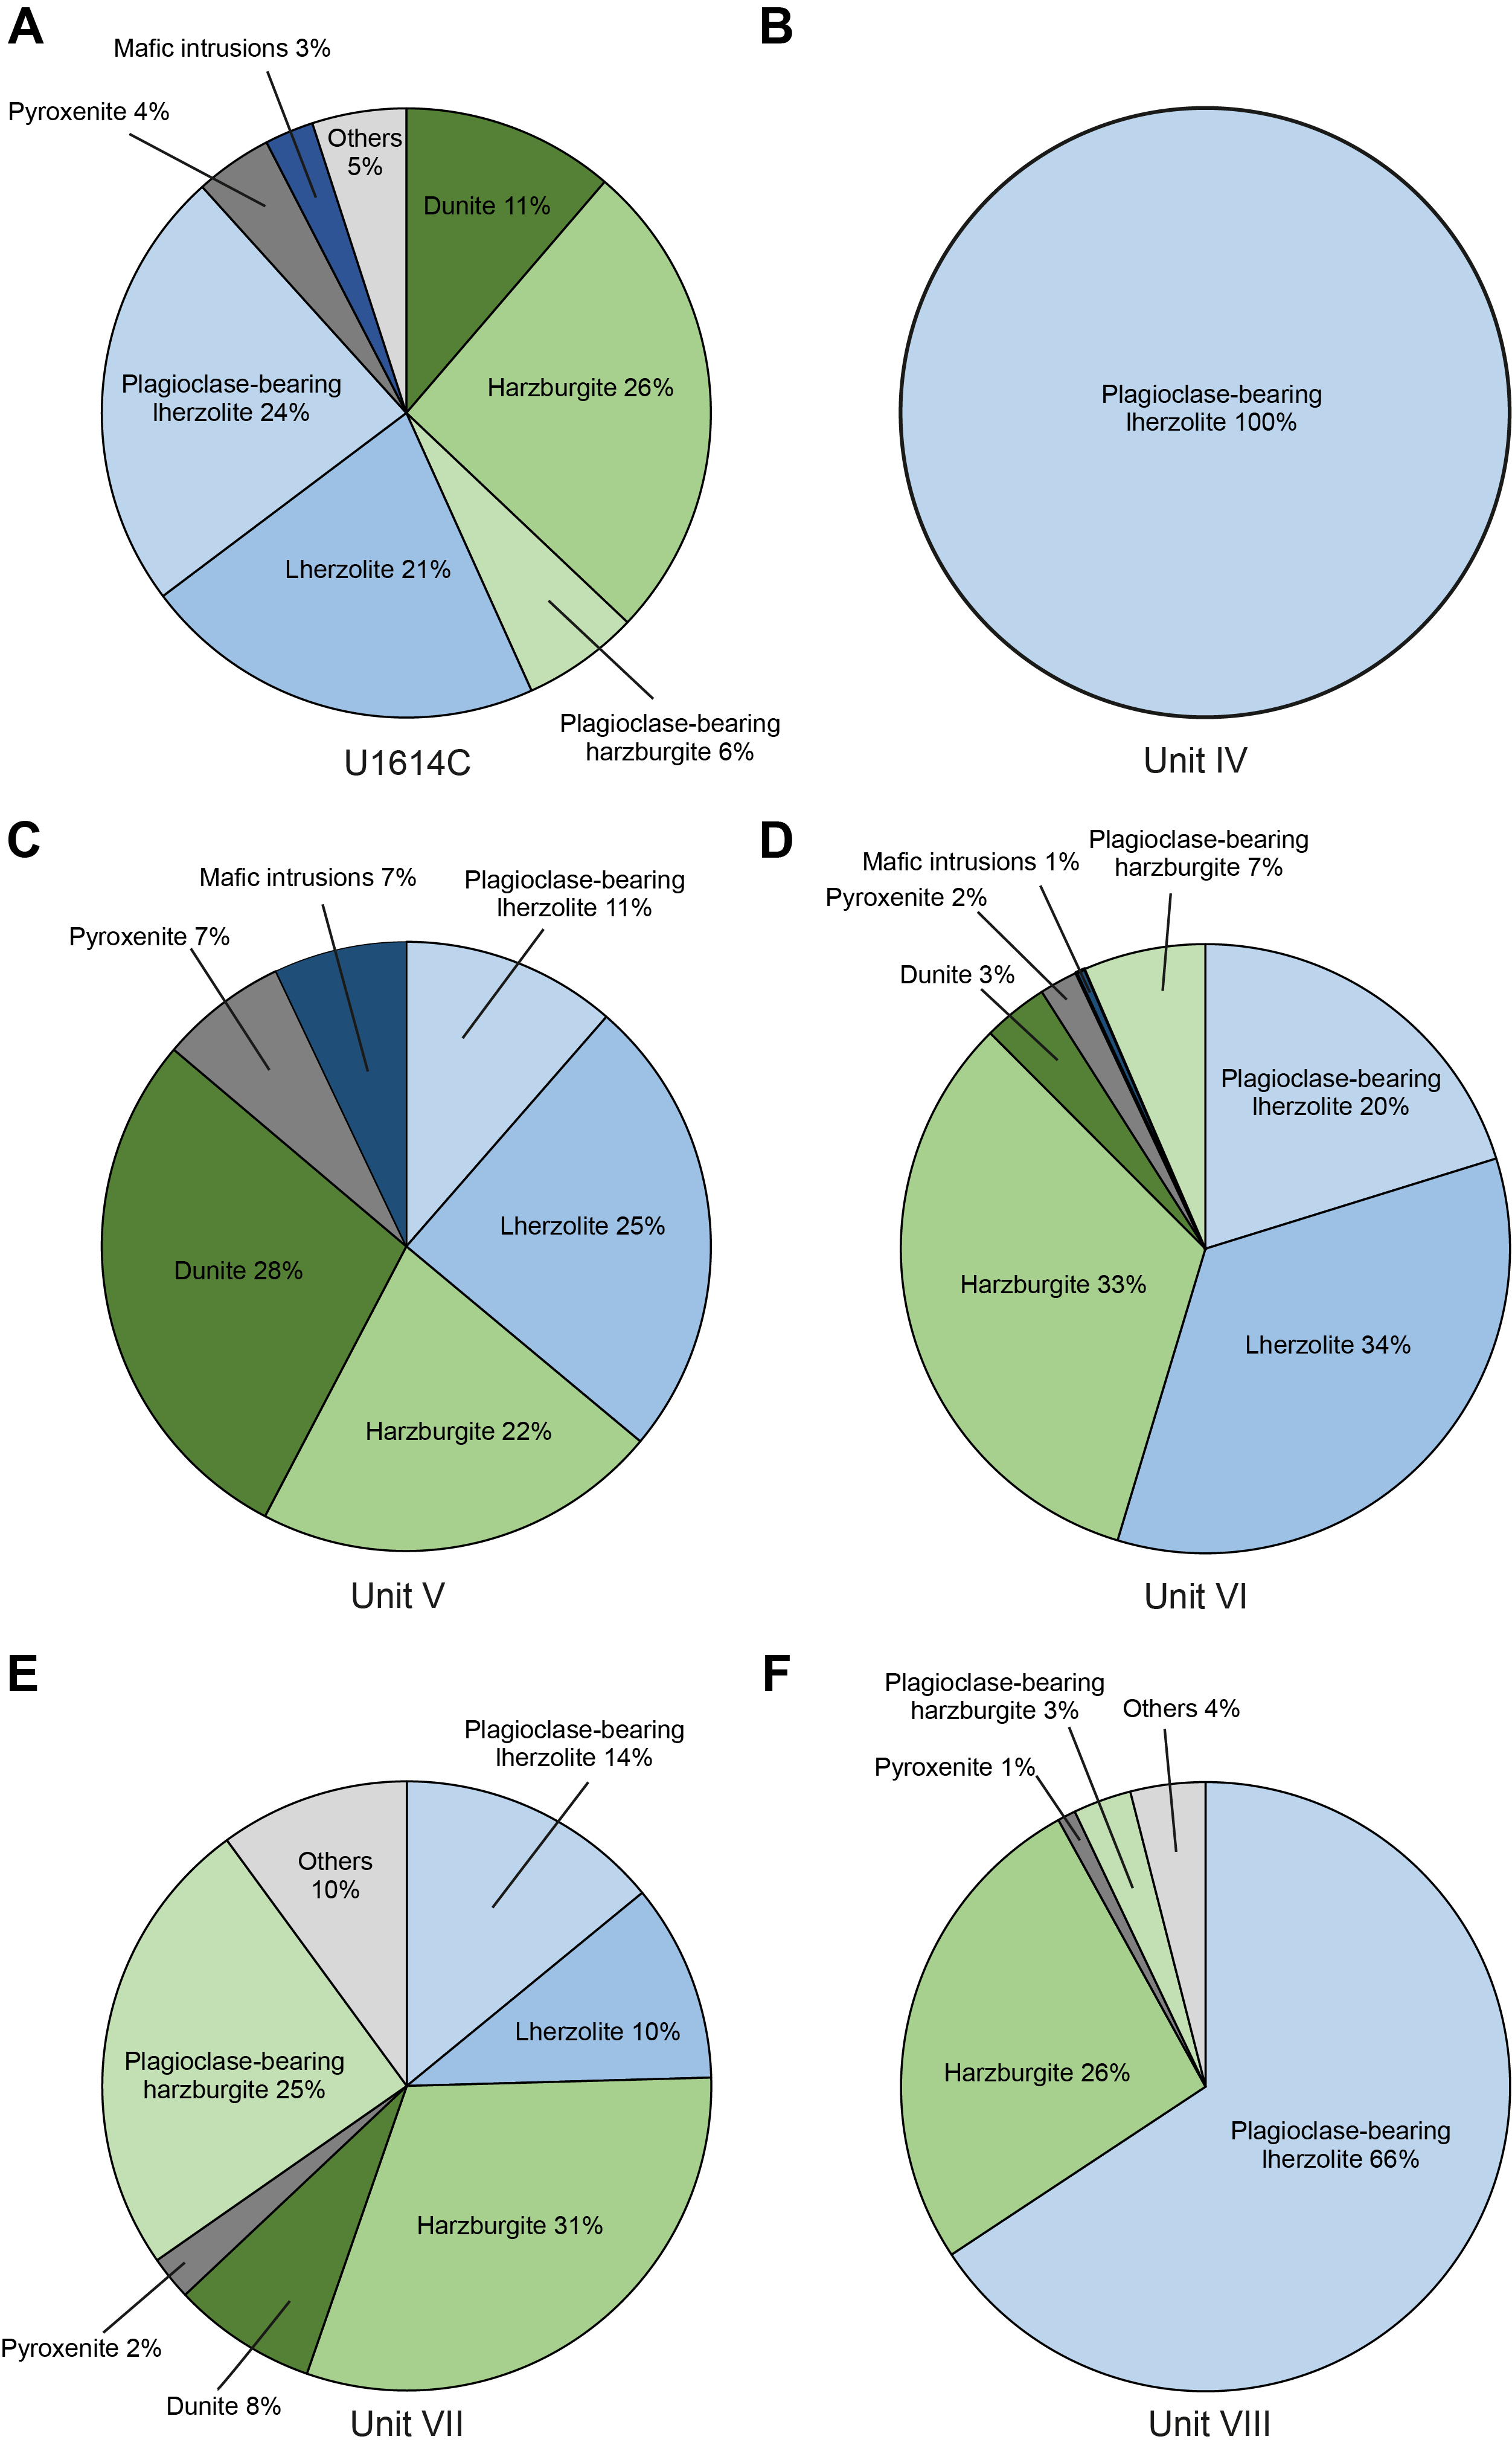
Figure F26. Abundance of lithologies, basement.
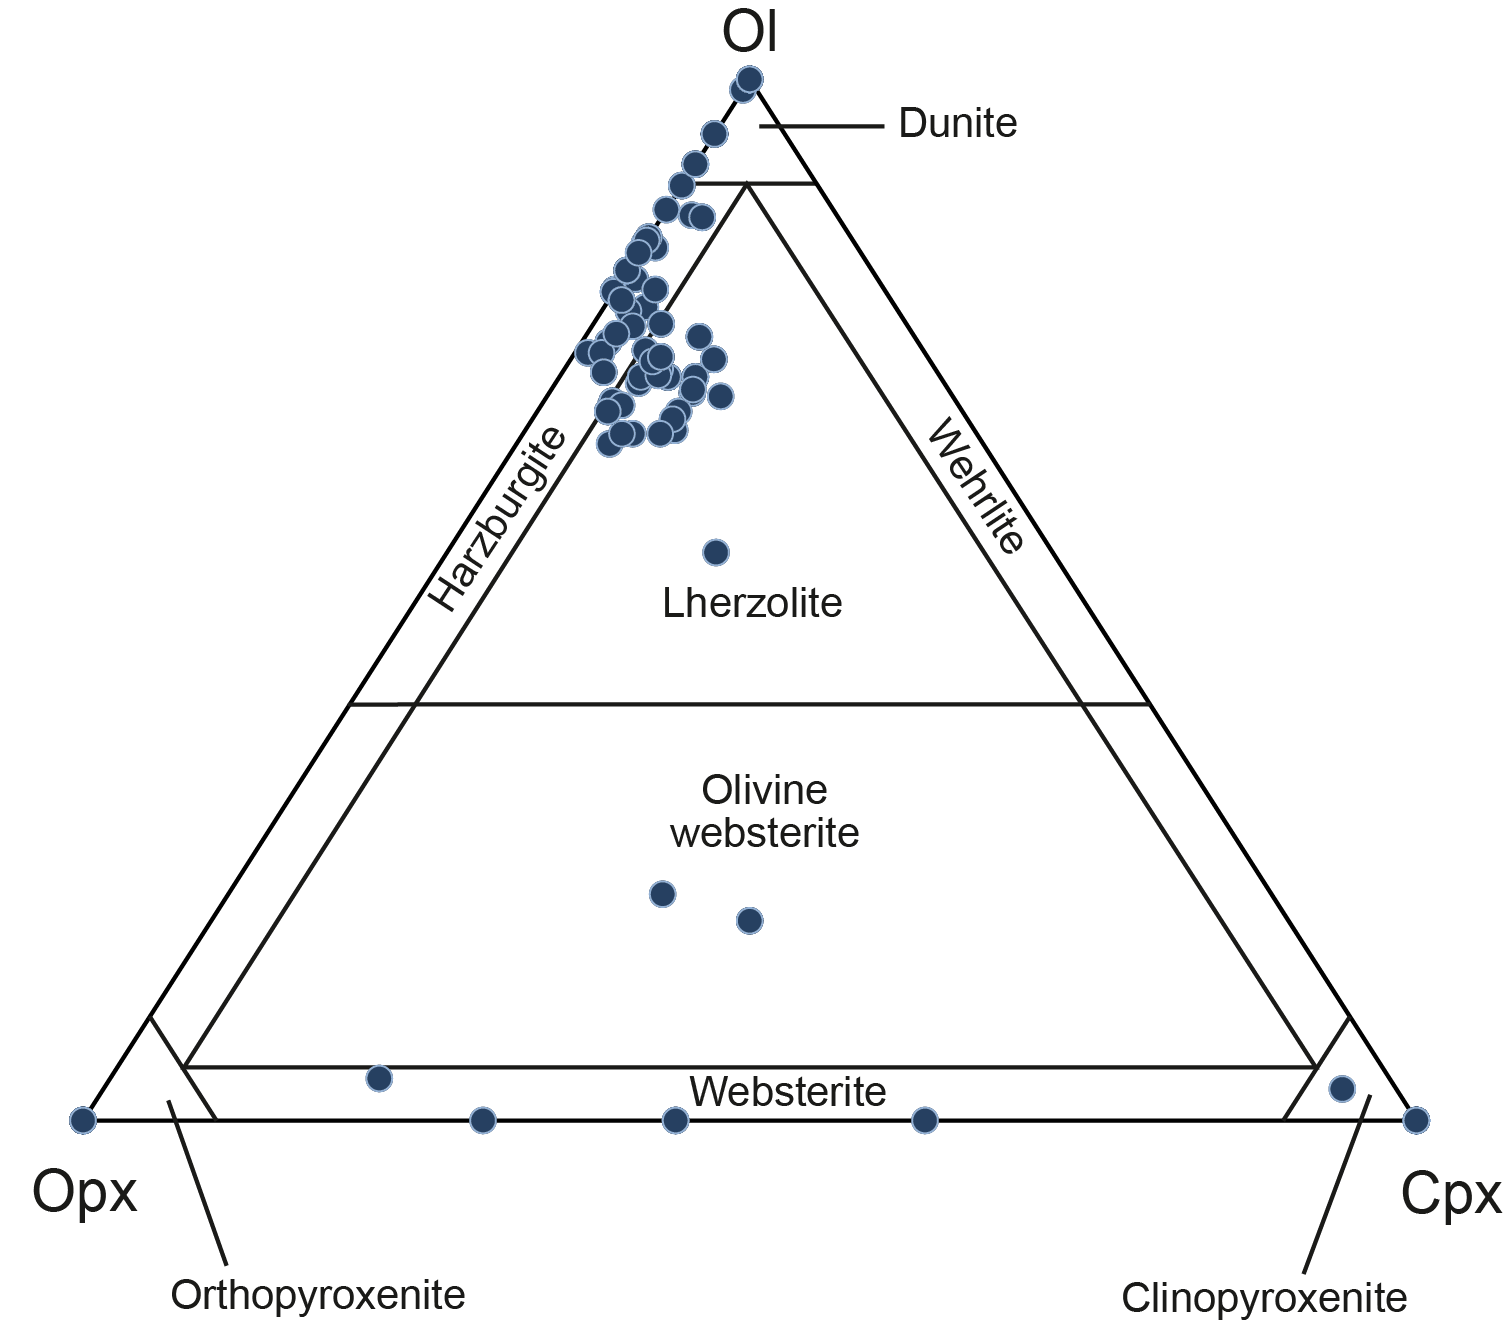
Figure F27. Ternary classification, ultramafic lithologies.
Plagioclase-bearing lherzolite accounts for nearly half of the observed lherzolite or 24% of all rocks in Hole U1614C. It occurs throughout the recovered basement but is predominantly concentrated in the lowermost Unit VIII (Figure F24). The plagioclase occurs as submillimetric patches sparsely distributed within the peridotite matrix or as millimeter-scale veinlets elongated along the ductile foliation plane. Plagioclase is locally associated with the millimeter-scale clinopyroxene-rich layers that are widespread in the lherzolites (Figure F28A). Plagioclase-bearing lherzolites have gradational contacts with the plagioclase-free lherzolites, sometimes elongated along the main foliation plane. In rare cases lherzolites directly grade into harzburgite or dunite.
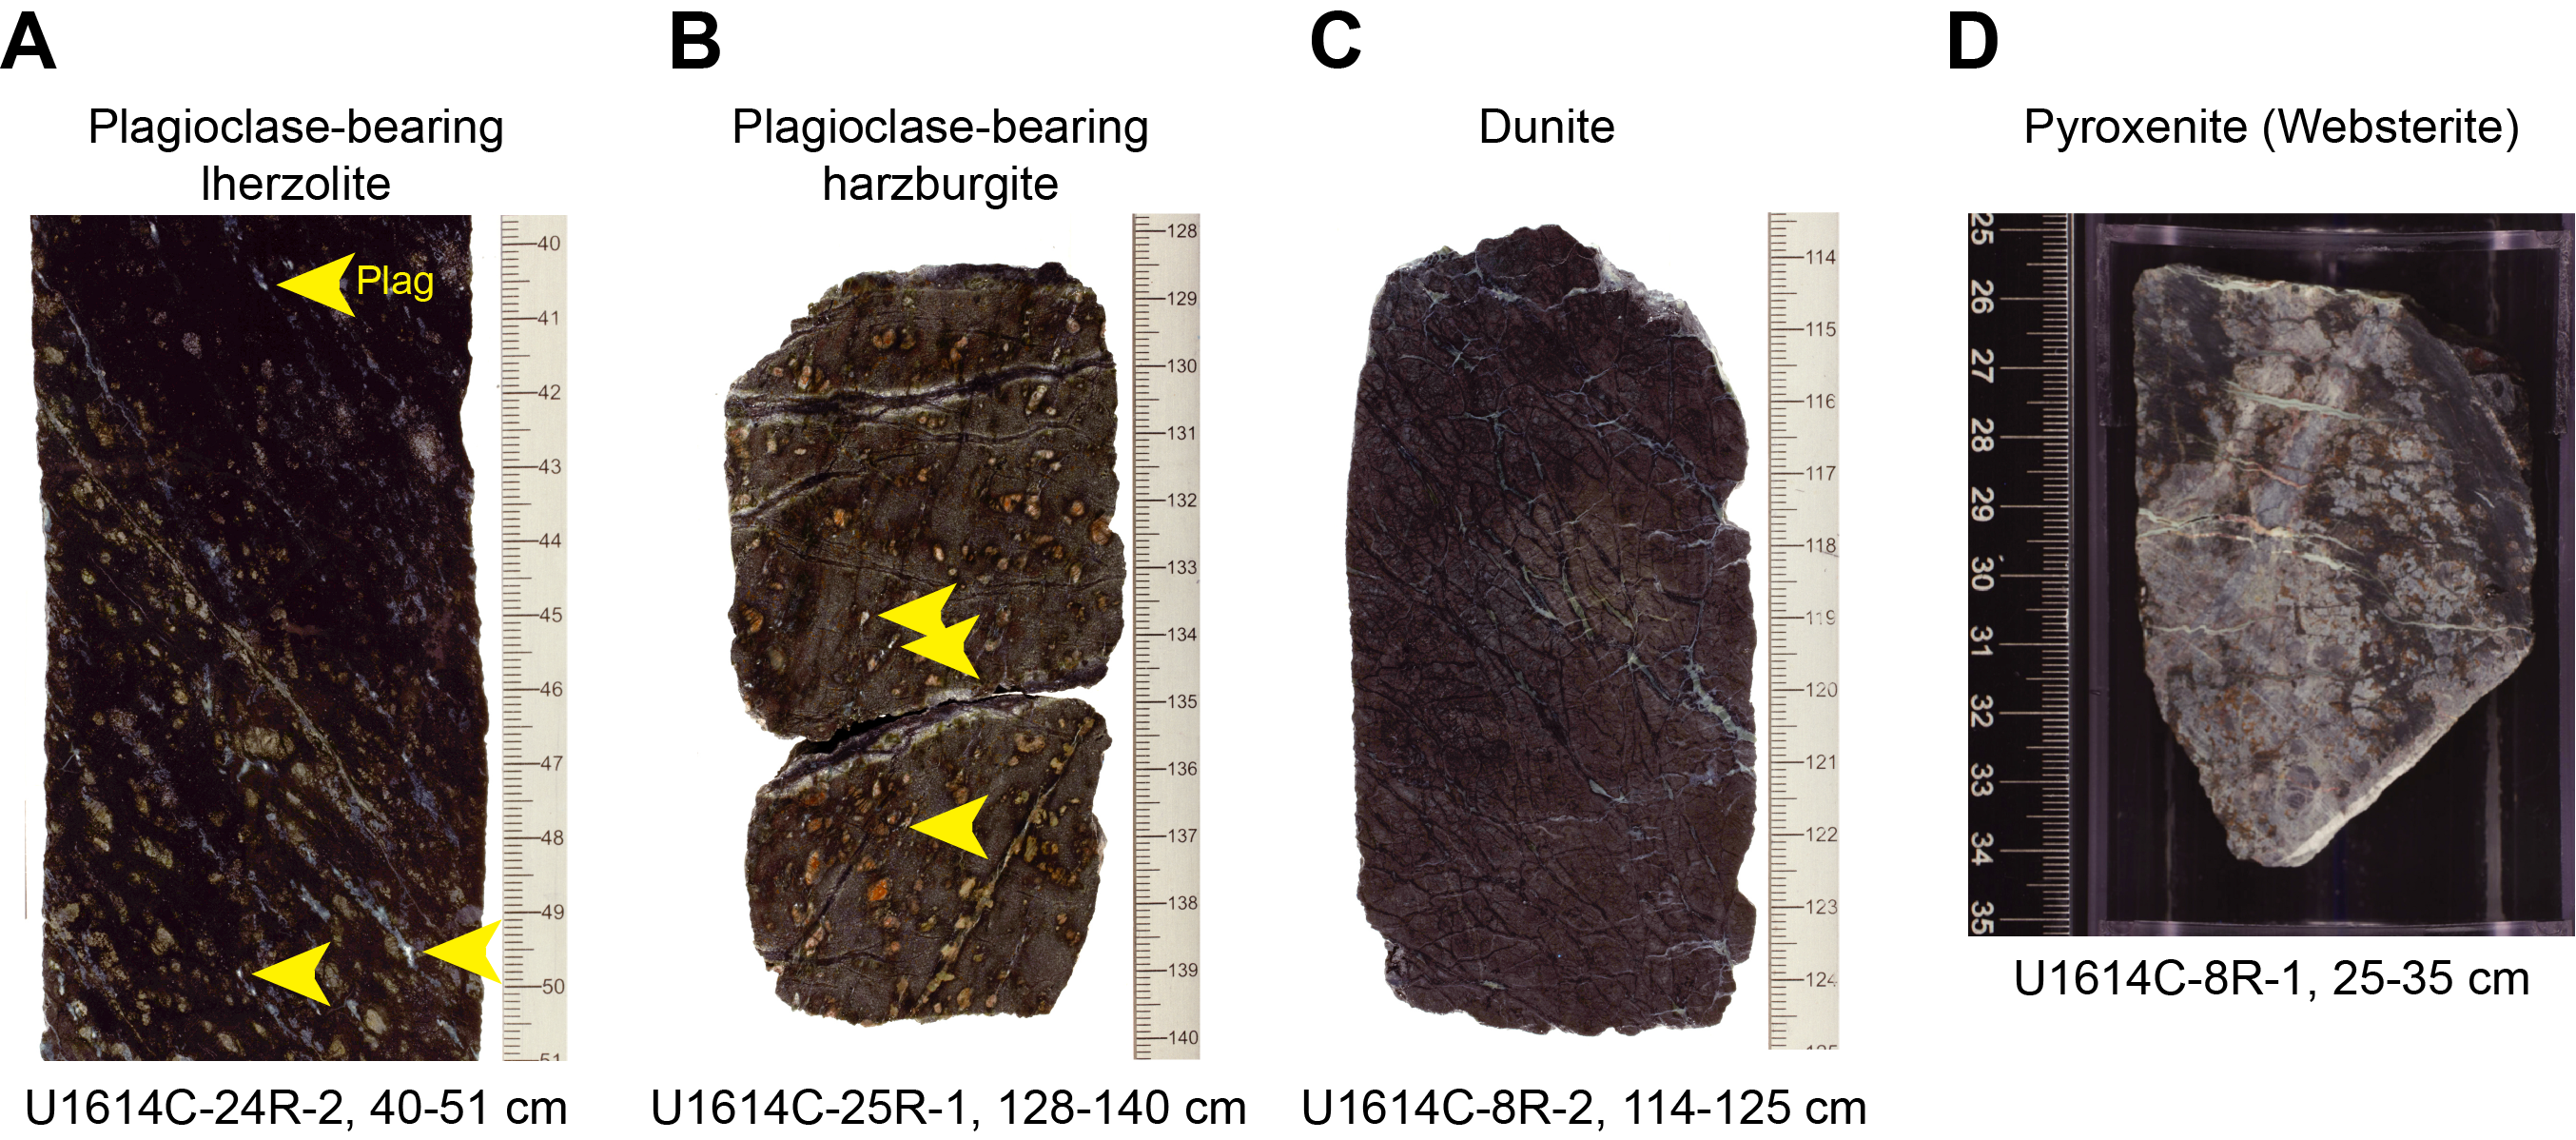
Figure F28. Main rock types.
6.2.2. Harzburgite and plagioclase-bearing harzburgites
Harzburgites and plagioclase-bearing harzburgites represent 32% of the rocks in Hole U1614C (Figures F26, F27). Most harzburgites occur in the lowermost interval of Unit V (Subunit VB) and at intermediate depths of Unit VI. Rarely, the harzburgites contain plagioclase in the form of discrete interstitial minerals or millimeter-scale veinlets ranging 0.5–2 mm in size (Figure F28B). Harzburgites are extensively serpentinized, but the primary mineralogy was inferred from hand specimens and confirmed by thin section observations. Harzburgites consist of millimeter-size grains of olivine associated with deformed orthopyroxene porphyroclasts and minor clinopyroxene (as long as 5 mm). Pyroxenes are locally rimmed by aggregates made up of clinopyroxene, orthopyroxene, and spinel. Porphyroclastic orthopyroxene commonly shows clinopyroxene exsolution lamellae, undulose extinction, and kink bands. The plagioclase-rich veinlets commonly crosscut the porphyroclasts of orthopyroxene and locally show sinuous apophyses and concave contacts against the peridotite matrix.
6.2.3. Dunite
Intervals of dunite were collected throughout Hole U1614C. They range from pyroxene-free to orthopyroxene-bearing dunites. Most dunites occur in Unit V and are particularly abundant in Subunit VB, where a ~20 m thick harzburgite-dunite association is observed. Some dunites also occur in Unit VI and are spatially associated with plagioclase-bearing lithologies. Olivine is rarely preserved in these lithologies, but their subrounded habit and coarse grain size (up to 12 mm) is clear from their pseudomorphs. Chrome spinel is common in the dunites as euhedral to subequant grains that are locally elongated along a preferred orientation that changes from vertical to subparallel trails. The correlation of the orientation of the spinel trails and the structural levels remains unclear. The spinel trails reach 2 mm in width. Dunites often preserve gradational contacts with harzburgites, indicated by a decrease in pyroxene and an increase in spinel modal proportion (Figure F28C). These contacts are common in mantle dunite-harzburgite associations and may be related to a process of local dissolution of pyroxene and crystallization of olivine. In Section 402-U1614C-16R-4, the dunites contain a small amount of plagioclase, which are organized in microveins parallel to the spinel foliation. Such microveins also contain pyroxene and mica locally.
6.2.4. Pyroxenites
Pyroxenite constitutes 4% of the rocks in Hole U1614C and ranges from websterite to rare clinopyroxenite. Because the distinction between clinopyroxene and orthopyroxene on macroscopic observation was hampered by late-stage alteration, the pyroxenites were classified as orthopyroxenite, websterite, and clinopyroxenite based on portable X-ray fluorescence (pXRF) analyses (see Igneous geochemistry) and observations of representative thin sections. Websterite layers as thick as ~8 cm are found in Core 402-U1614C-8R (308–312.6 mbsf) (Figure F28D). The websterite intervals consist of deformed porphyroclasts of orthopyroxene and minor clinopyroxene (up to 5 mm in size). Spinel in the websterite is widespread, euhedral, and locally rimmed by whitish grains that are probably altered plagioclase. Plagioclase-rich veinlets are locally found parallel to the websterite/peridotite contact. One large websterite layer was found in interval 5R-4, 1–72 cm, where the primary contact with the peridotite is still preserved. Although this interval has undergone extensive secondary alteration, some millimeter-scale clinopyroxene and orthopyroxene grains are preserved. The clinopyroxenite consists of large grains of clinopyroxene, interstitial olivine, and spinel. The contact with the host peridotite is not preserved; based on macroscopic observations, the rock appears diffusely altered with pale colored amphiboles inferred to be of secondary origin.
6.2.5. Mafic intrusions
Mafic veins and/or patches of magmatic origin are observed throughout the cores. Discrete intrusions thicker than 2 cm are described as individual intervals, and the intrusions of magmatic veins less than 2 mm in thickness are grouped as magmatic veins and reported in Structural geology. Magmatic intrusions are most widespread in Unit V, and the maximum concentration occurs in Core 402-U1614C-8R, where they make up 20% of the core. Magmatic intrusions decrease downhole and are absent below Core 13R (347 mbsf). The intrusions consist of fine-grained oxide-bearing microgabbro (e.g., interval 5R-2, 5–31 cm) to gabbro (e.g., intervals 12R-2, 24–26 and 100–103 cm). The igneous veins/patches are classified into two main lithologies: gabbroic and mica-rich mafic lithologies. Plagioclase and clinopyroxene are commonly altered in the gabbroic veins, and a subophitic texture typical of tholeiitic intrusions is evident. Mica-rich rocks (e.g., Sample 8R-1, 53–56 cm; Thin Section [TS] 25) (Figure F29) consist mainly of dark mica (>40 mol% including chloritized portions) and plagioclase with minor amounts of rutile, monazite/titanite, and oxide minerals. Dark mica usually consists of randomly oriented, elongated grains about 0.2 mm long. Occasionally, large dark mica grains up to 2 mm in diameter are observed, often containing titanite, with rutile nearby. Plagioclase is mostly altered to a fine-grained secondary association, likely of epidote or albite. Oxides are typically less than 0.1 mm in size and are randomly oriented. Several other brownish mafic intrusions have been identified as high K-Ti mafic intrusions (e.g., interval 23R-1A, 129–135 cm) based on pXRF analytical results.
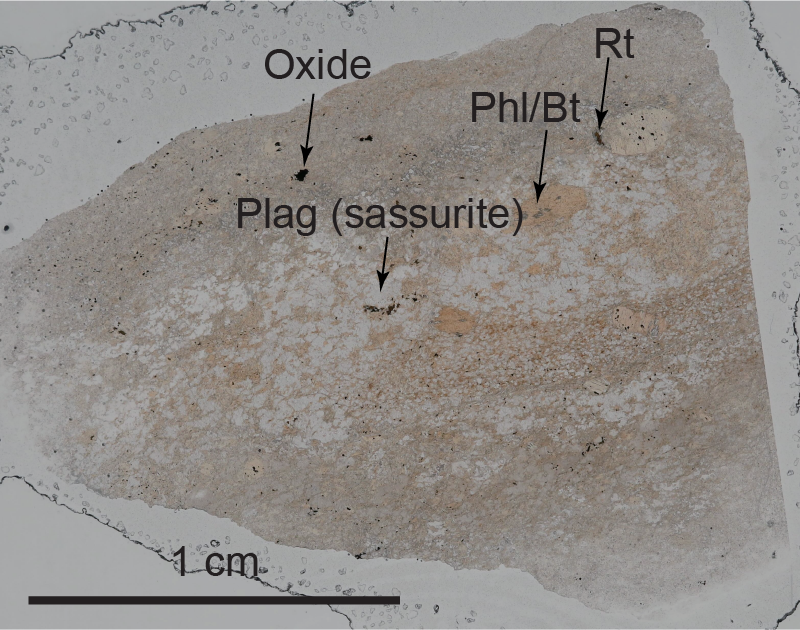
Figure F29. Mica-rich mafic rock.
6.2.6. Other lithologies
A minor fraction of Hole U1614C (<1%) consists of ophicarbonates and granitoids. Carbonate-cemented clasts of serpentinites are found at the base of Subunit VA, where they probably mark a cataclastic fault zone. This zone transitions into a 5 m thick zone in which ophicarbonates constitute a large fraction of the recovery (Section 8R-2) (Figure F30A). The ophicarbonates have a brecciated texture that is largely composed of angular serpentinite clasts (up to 10 cm in size) disrupted by a polyphase network of calcite veins. The serpentinite retains structural relicts of the mantle peridotite protolith and locally shows a strong ductile fabric. The calcite veins range in thickness from a few millimeters to several centimeters and are white to reddish in color. Locally, the carbonate veins are subvertical and retain primary porosity. Oxides and hydroxides can be found on the surface.
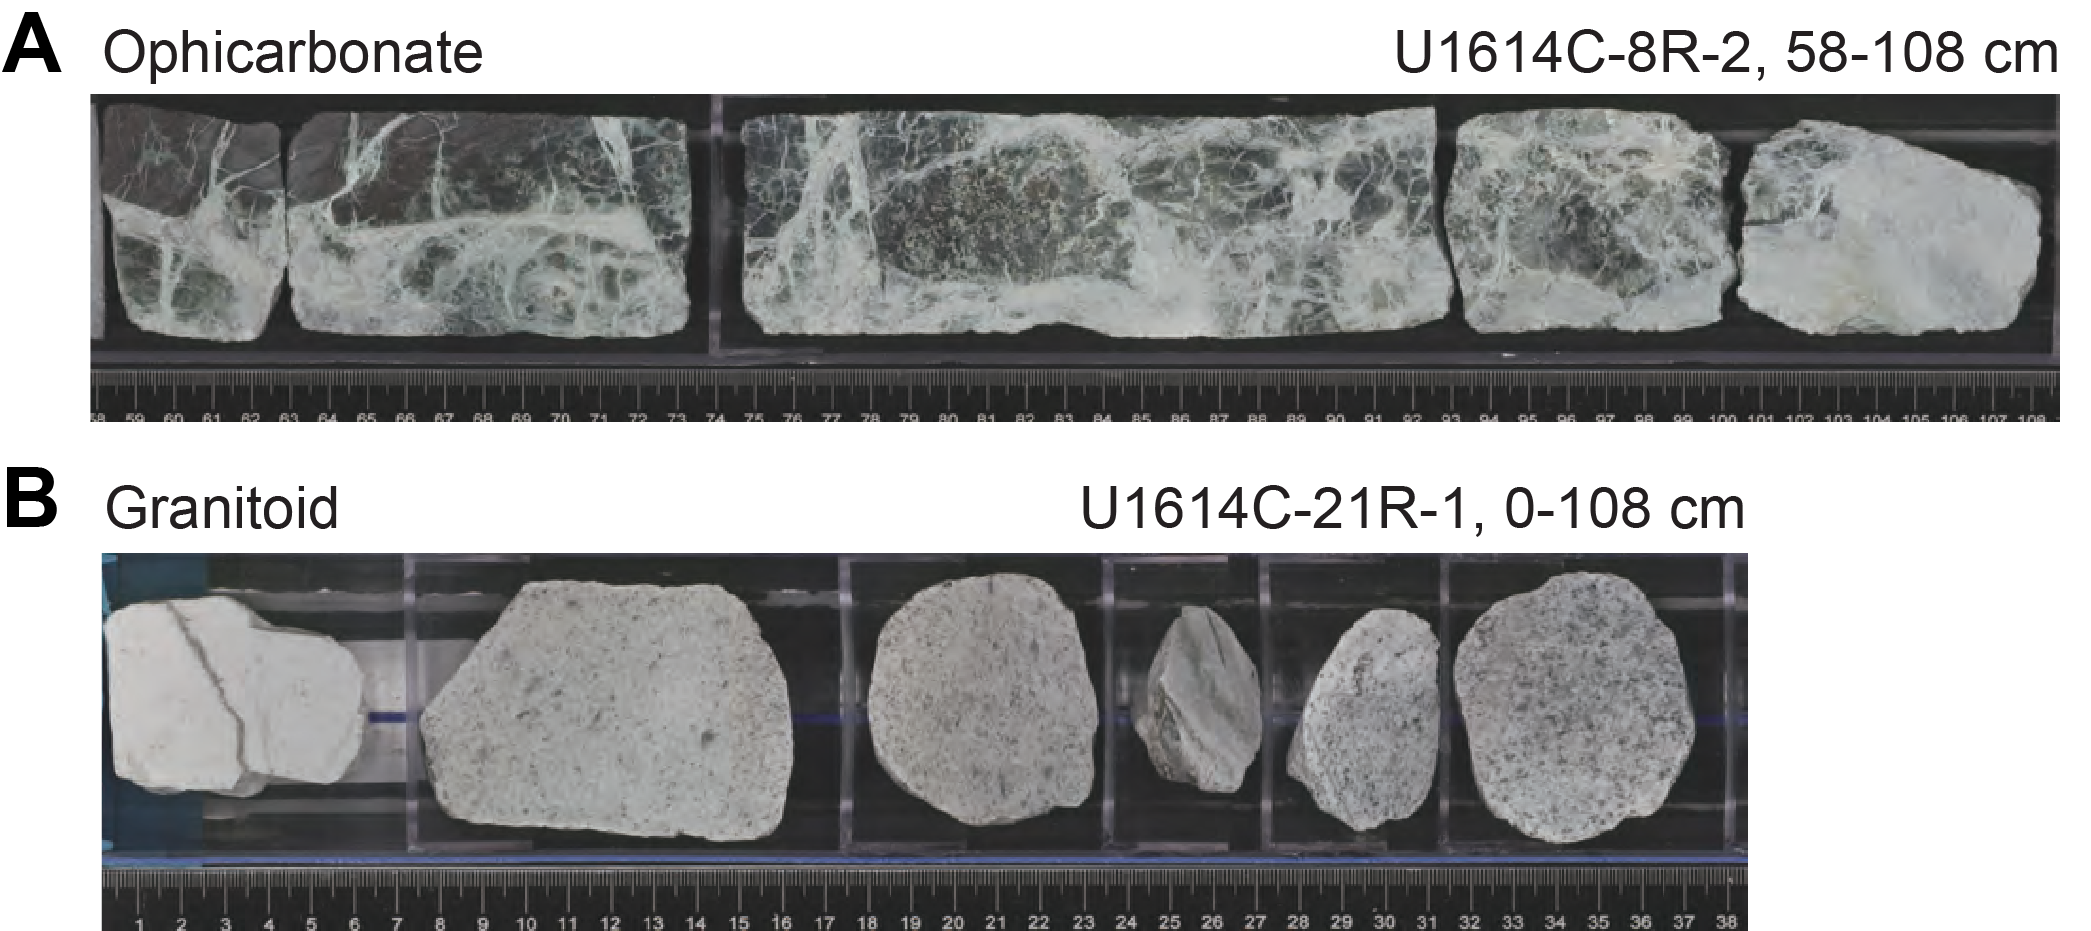
Figure F30. Ophicarbonate and granitoid.
Granitoid rocks were recovered in Cores 402-U1614C-20R through 23R and 25R (Figure F30B). Their composition ranges from plagioclase-rich leucogranites to granitoids with higher mafic modal content (>10%), which is confirmed by preliminary pXRF analyses (see Igneous geochemistry). These granitoids have a composition similar to those at Site U1612, and they fall into the granitoid field (see Igneous geochemistry). In some cases, there is a sharp lithologic contact between leucogranites and granitoids richer in mafic material. In contrast to Site U1612, the recovered granitoids from Site U1614 do not show any ductile deformation even though the adjacent peridotites are mylonitic.
6.3. Main alteration features
Different generations of serpentine-rich veins in peridotites and mafic rocks throughout the cores indicate multiple stages of alteration at a wide range of temperatures. In general, serpentinized areas are blackish, whereas weathered olivine-rich rocks are reddish to brownish in color. Usually, the contact between the serpentinized and weathered part of the peridotites is sharp and irregular. The total degree of alteration of the igneous lithology is the sum of the degree of serpentinization and weathering. The alteration degree throughout the recovered core ranges from moderate to high or complete alteration (Figure F31). Olivine alteration is higher in the uppermost part of the hole and at the boundary between Subunits VA and VB; this agrees with the occurrence of ophicalcites in which olivine is almost completely altered. In contrast, Unit VI represents the least altered portion of peridotites in Hole U1614C.
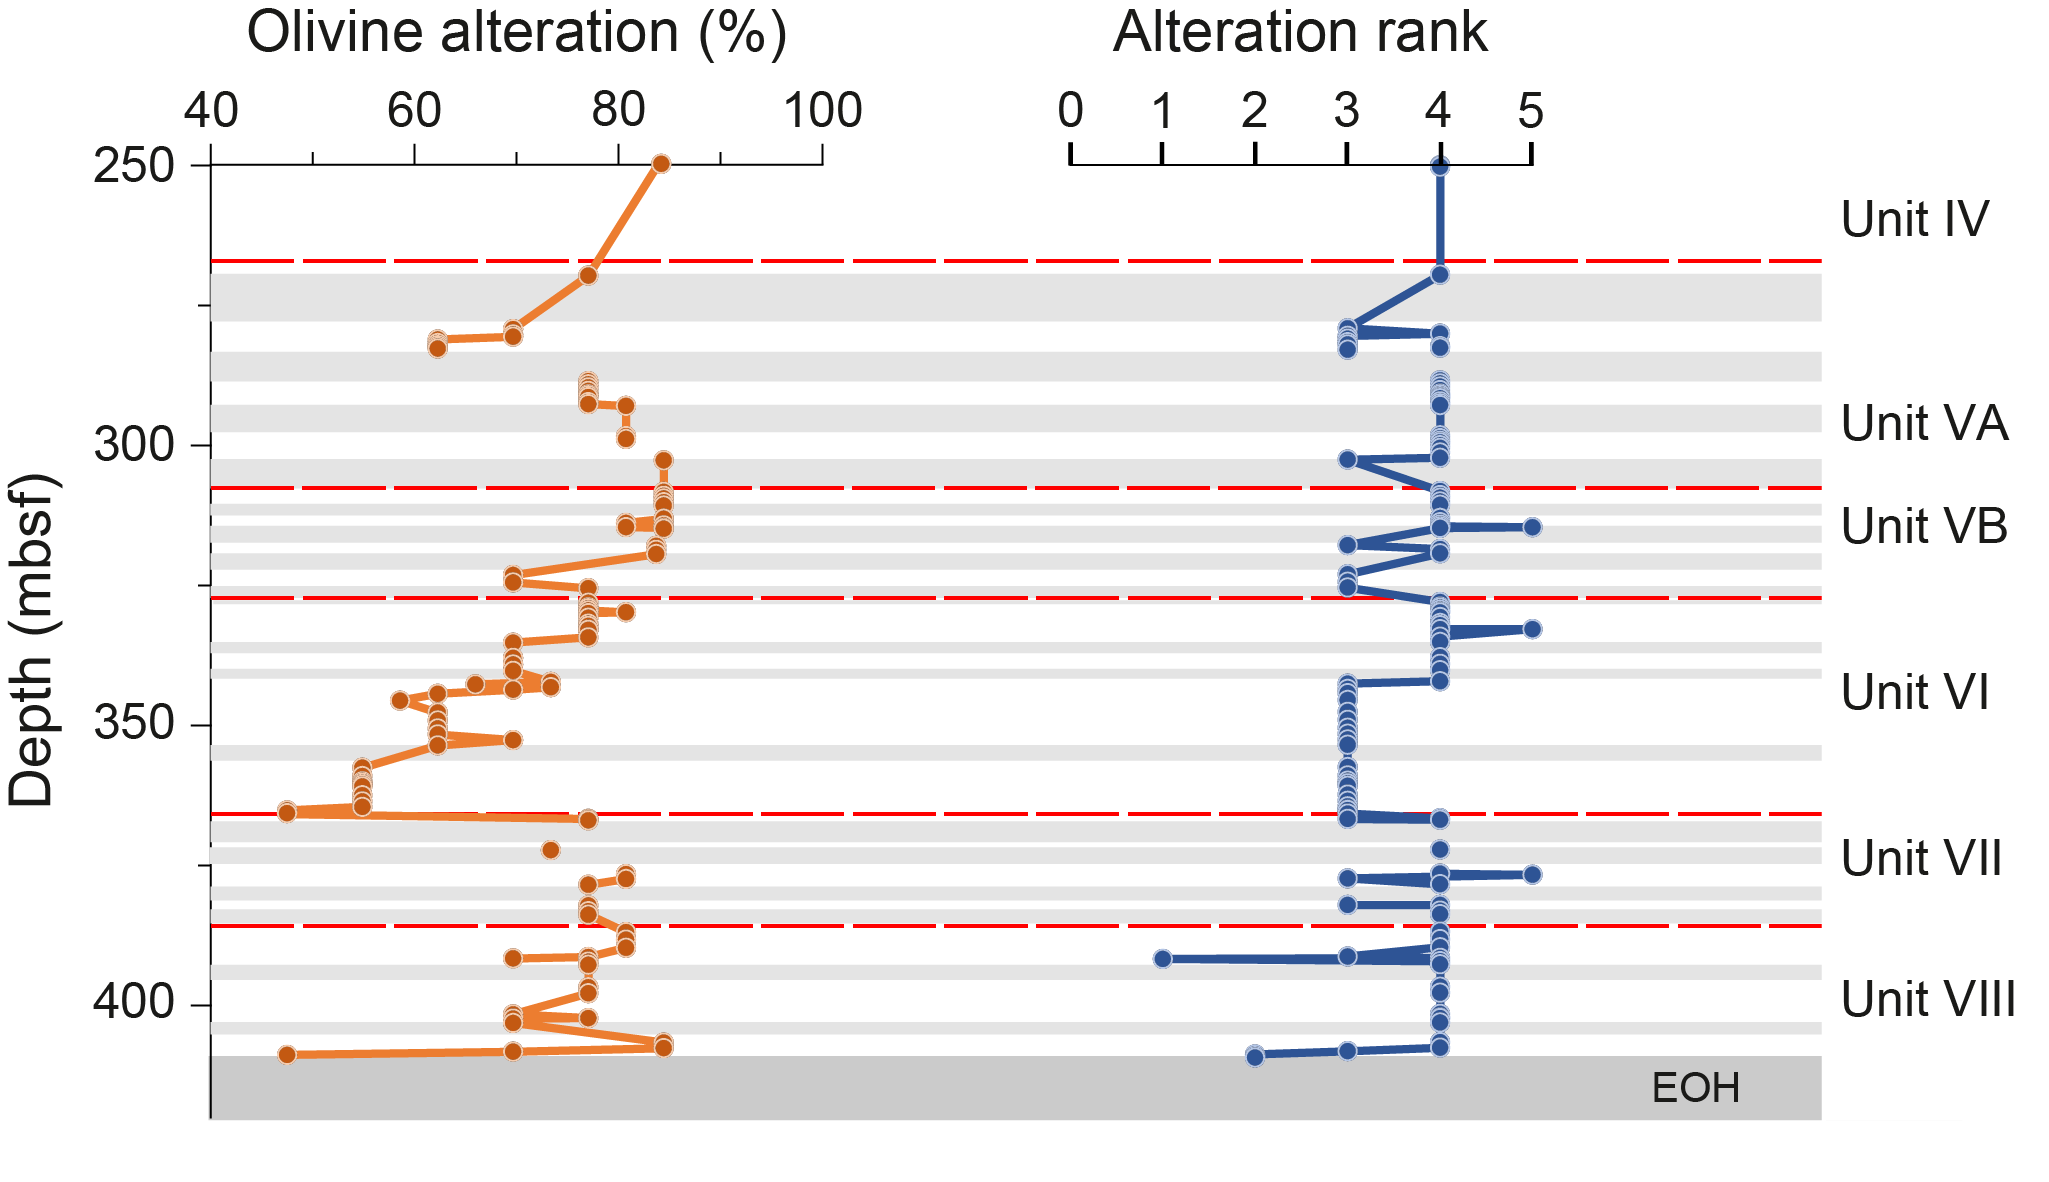
Figure F31. Alteration log, basement lithologies.
6.3.1. Static alteration
6.3.1.1. Serpentinization in mantle peridotite
In areas of serpentinization, a mesh texture consisting mainly of serpentinite and magnetite is commonly observed (Figure F32A, F32B). Orthopyroxene is generally altered to bastite, often rimmed by tremolite (± talc ± chlorite ± serpentine) (Figure F32C, F32D) and cut by veins of tremolite (± talc ± chlorite ± serpentine). Plagioclase is completely saussuritized and is recognizable by the occurrence of gray, very fine grained chlorite-rich domains (Figure F32E, F32F). The uppermost parts of the peridotite interval in Holes U1614A (Core 35G) and U1614C (Core 4R) are rich in sulfide minerals, which are mostly present at the surface of the samples. The abundance of sulfide minerals in the rest of the cored interval is generally low and will not be described further.
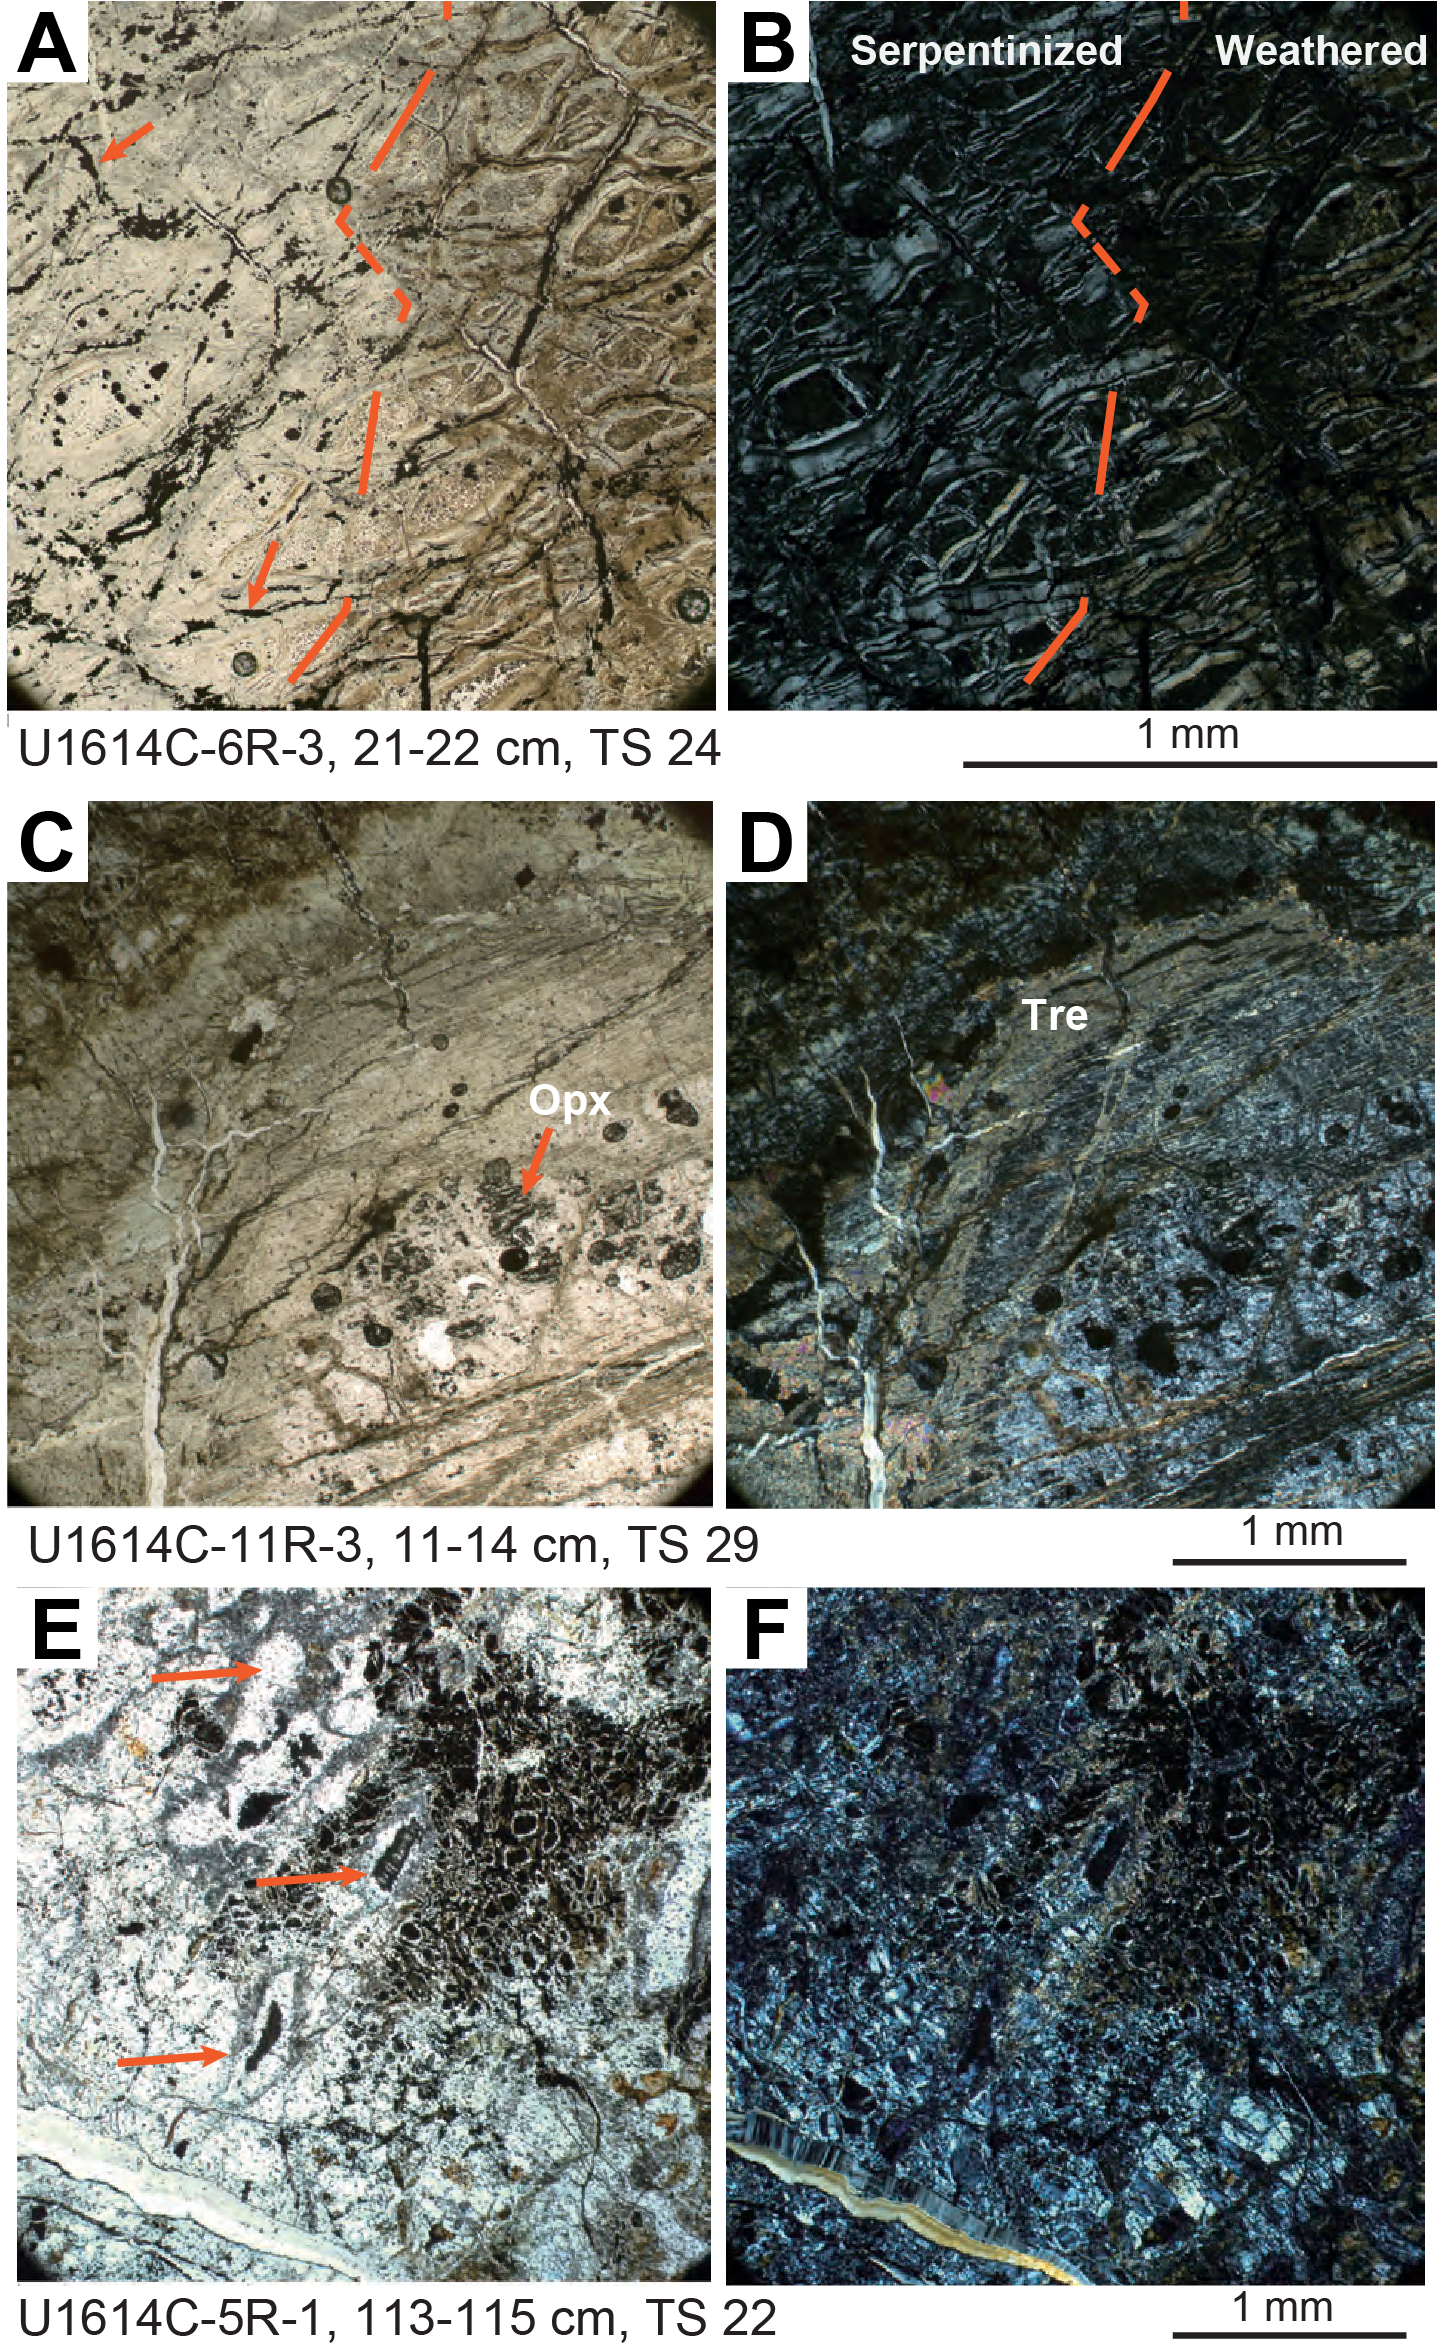
Figure F32. Serpentinized peridotite.
6.3.1.2. Alteration of originally mafic material
Pyroxenites and gabbroic material locally showed significant alteration, making it challenging to define the protolith. Tremolite and/or talc-rich rocks occur locally and have been recognized based on pXRF analyses (see Igneous geochemistry). These rocks are in most cases associated with the granitoids in zones of widespread ductile and/or brittle deformation. Microscopically, several generations of fabrics related to ductile and brittle deformation are observed. The replacement of initial magmatic minerals may precede or coincide with the ductile deformation that has led to a strong lattice-preferred orientation. Subsequently, brittle folding deformation is observed in the hinges of the folds that do not show any clear ductile shearing.
6.3.1.3. Weathering
The texture of the weathered peridotites is essentially similar to the texture in the serpentinized peridotites (Figure F32A). The major difference between the two is the presence of brown material surrounding the olivine vestiges in the weathered areas. Pores are often observed in the center of the serpentine-mesh texture of weathered areas (Figure F33). The pore spaces are interpreted to be where primary olivine was present and has been mechanically or chemically removed by weathering. Red-colored serpentinite appears to occur in close association with domains where carbonate veins and breccias are common. Carbonate vein thickness spans from millimeter to centimeter scale. The red color is probably due to oxide minerals, hematite, and/or Fe hydroxides. Further analysis is needed to better constrain the exact composition of the red-oxidized lithologies.
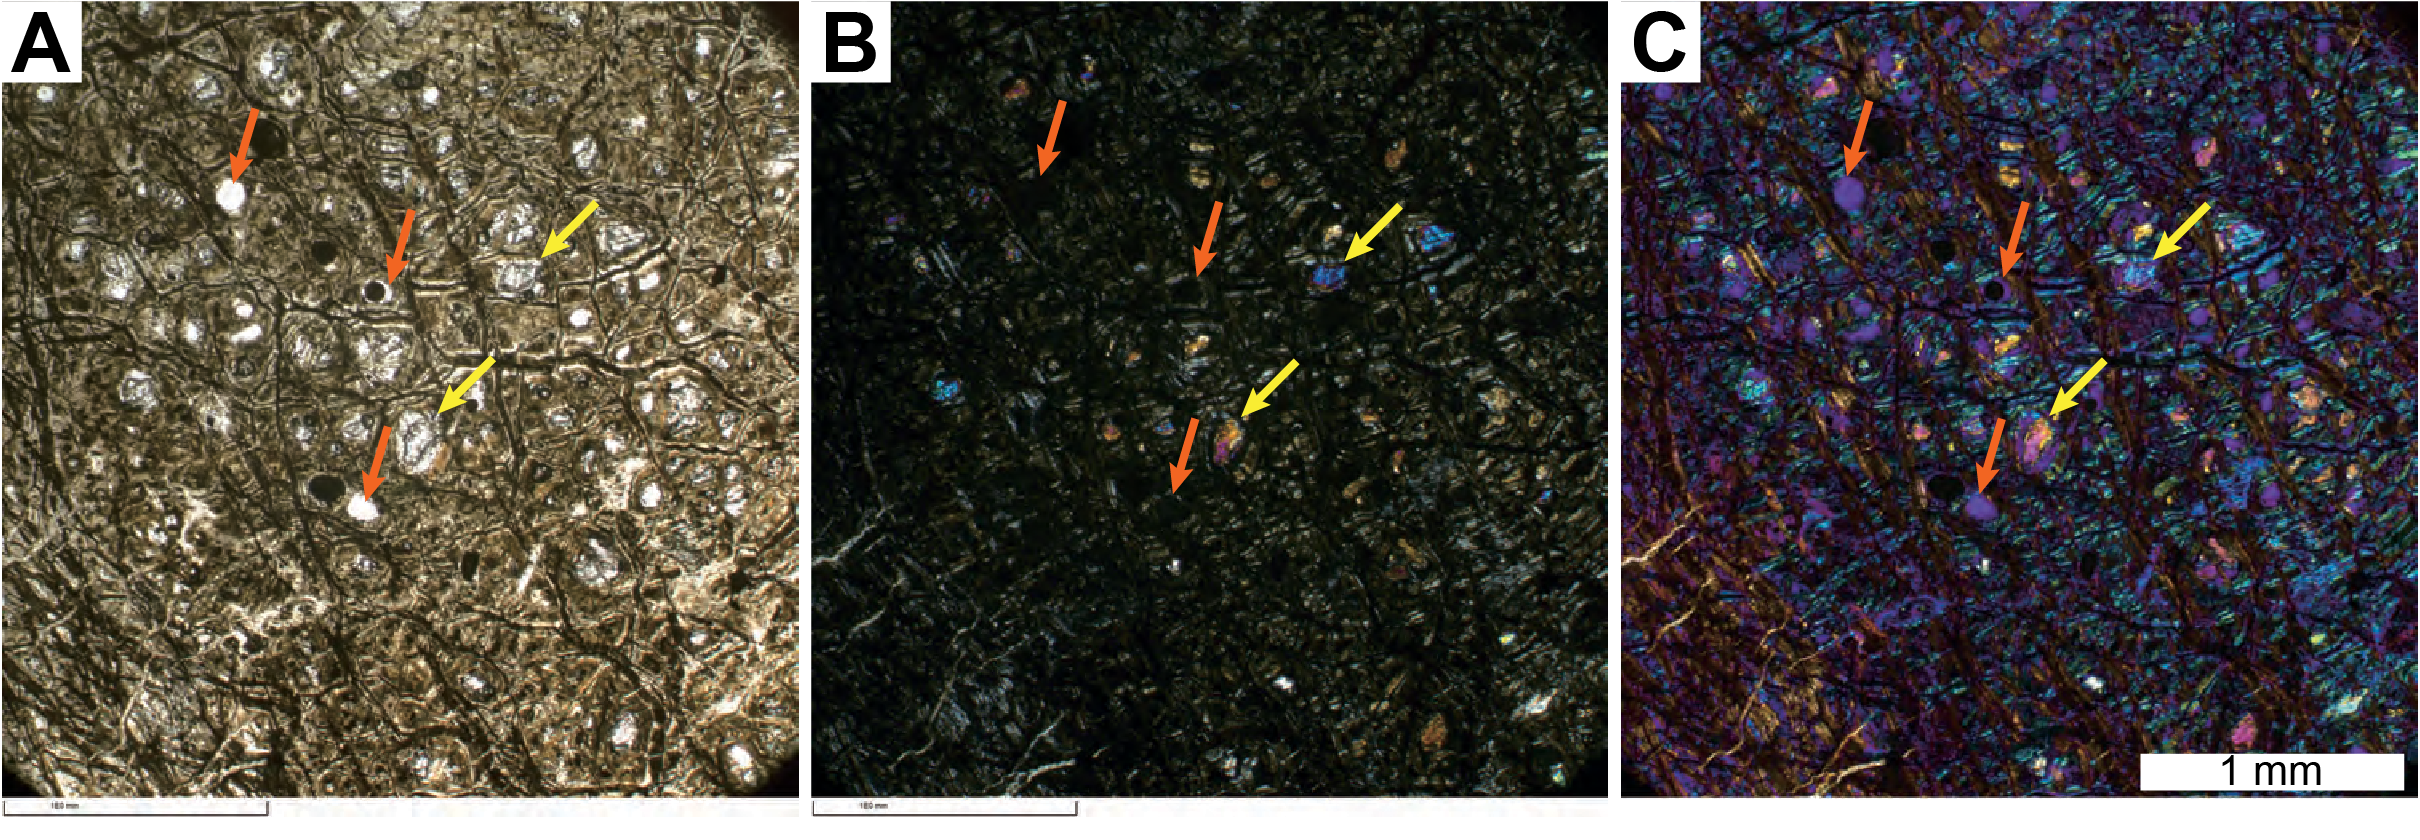
Figure F33. Weathered olivine-rich area.
6.3.2. Veins and halos
Several generations of serpentine and carbonate veins are present in the recovered rocks and show crosscutting relationships (see Structural geology) related to fluid-rock interactions during various stages of serpentinization and deformation. Originally, igneous veins and halos are likely to have acted as weak zones of alteration and accommodated significant geochemical and metamorphic and/or deformation changes where tremolite, talc, and serpentine are commonly observed.
6.3.3. Ductile deformation
Depth variations in the degree and style (static, brittle, and/or ductile) of alteration contribute to differentiation of the units. Ductile deformation with weak foliation and mylonites and/or ultramylonites occurs throughout the cored interval and is associated with high-temperature alteration events. Mylonites and ultramylonites are most abundant in the lower part of Unit V, the lower parts of Unit VI, and Unit VIII. In contrast to Site U1612, mylonites at Site U1614 are only observed in the peridotites. Increased mylonitization is observed in peridotites adjacent to granitoids. Additionally, mylonitization is associated with the alignment and size reduction of pyroxene-rich layers. A separate fabric is observed with a distinct plagioclase fabric, which in many cases is at an angle to the original foliation. Details of ductile and brittle deformation were observed throughout the hole and are described in more detail in Structural geology.
7. Structural geology
Structural features in both sediment and hard rock from cores recovered from Holes U1614A and U1614C were documented using descriptions, measurements, and imaging. The sedimentary sequence and the sediment/basement interface was recovered in Hole U1614A, and variably weathered and serpentinized peridotites were recovered in Hole U1614C.
The seismic reflection data indicate that Site U1614 is located within an undeformed sedimentary basin (Figure F2) with little evidence of structural activity (Figure F34). Analysis of Site U1614 cores confirms the absence of significant faults cutting the sedimentary section (Figure F34). The small number of mesoscale faults, both normal and reverse, are less than 1 mm thick and exhibit displacements of a few millimeters (Figures F35, F36A, F36B). These fault structures are most prevalent in the intermediate layers of the drilled sedimentary section, suggesting that their origin is related to sediment instability rather than large-scale tectonic deformation.
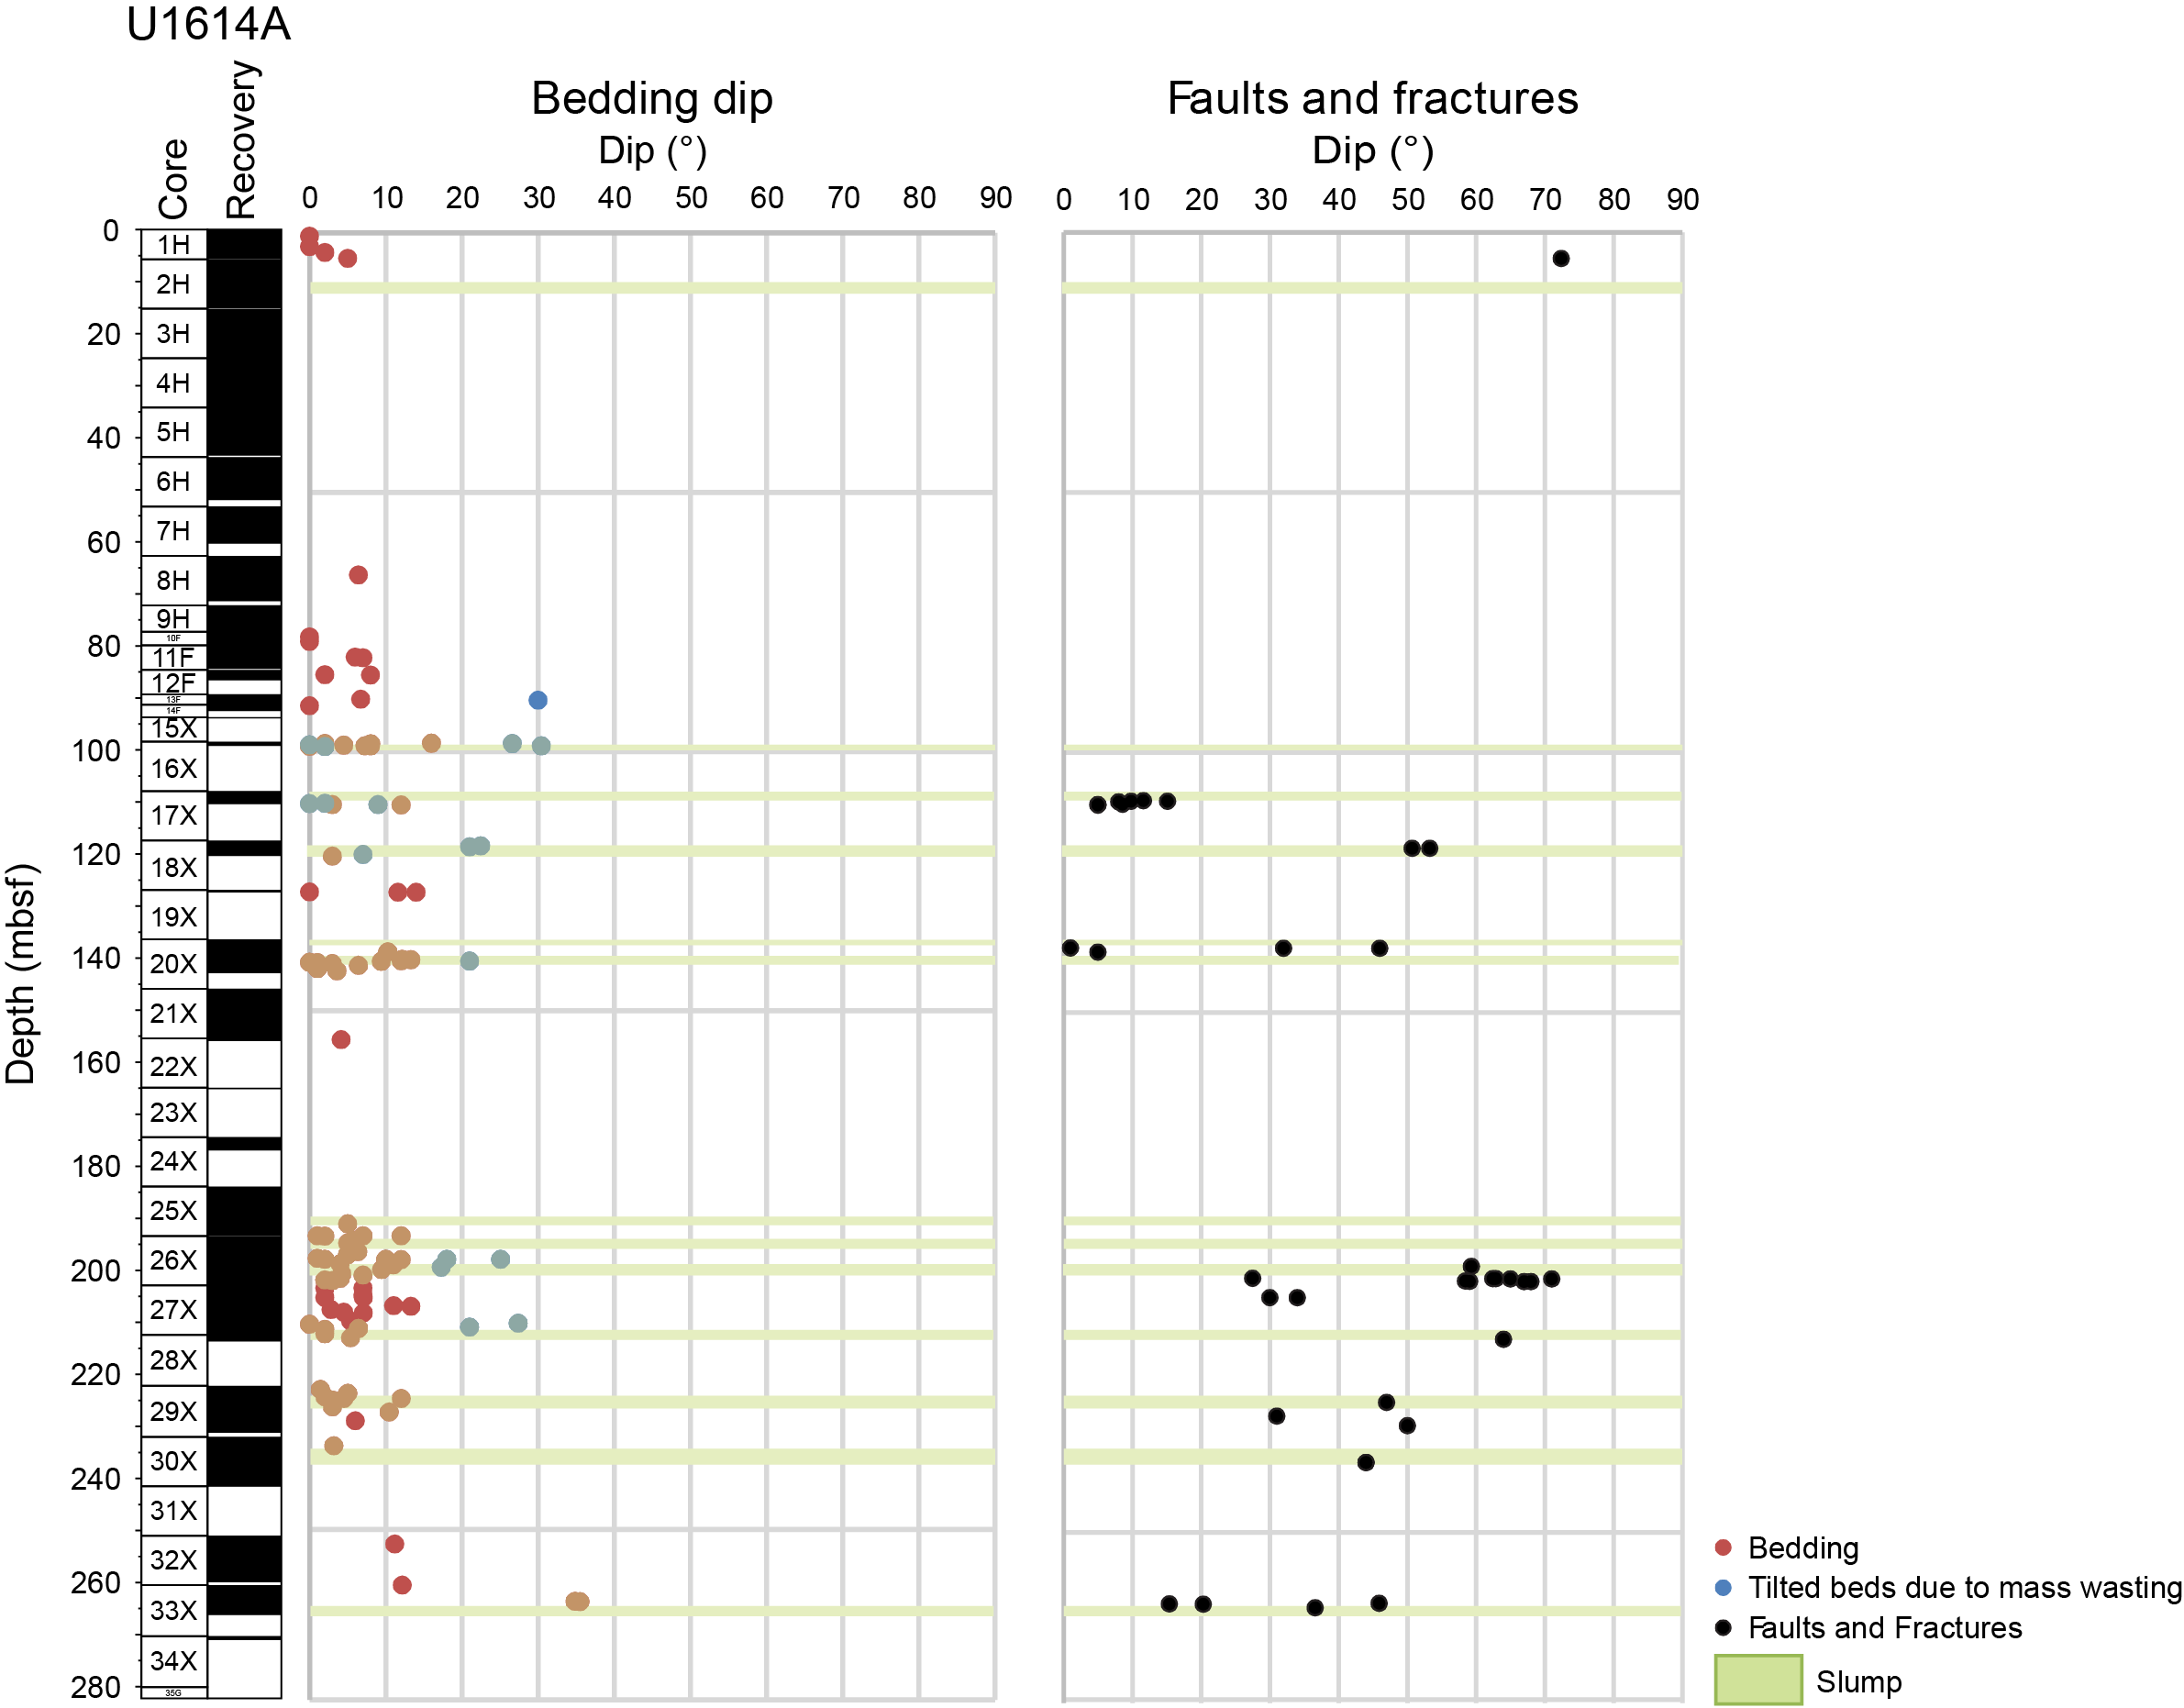
Figure F34. Bedding dip angles and fault, fracture, and fold frequency.
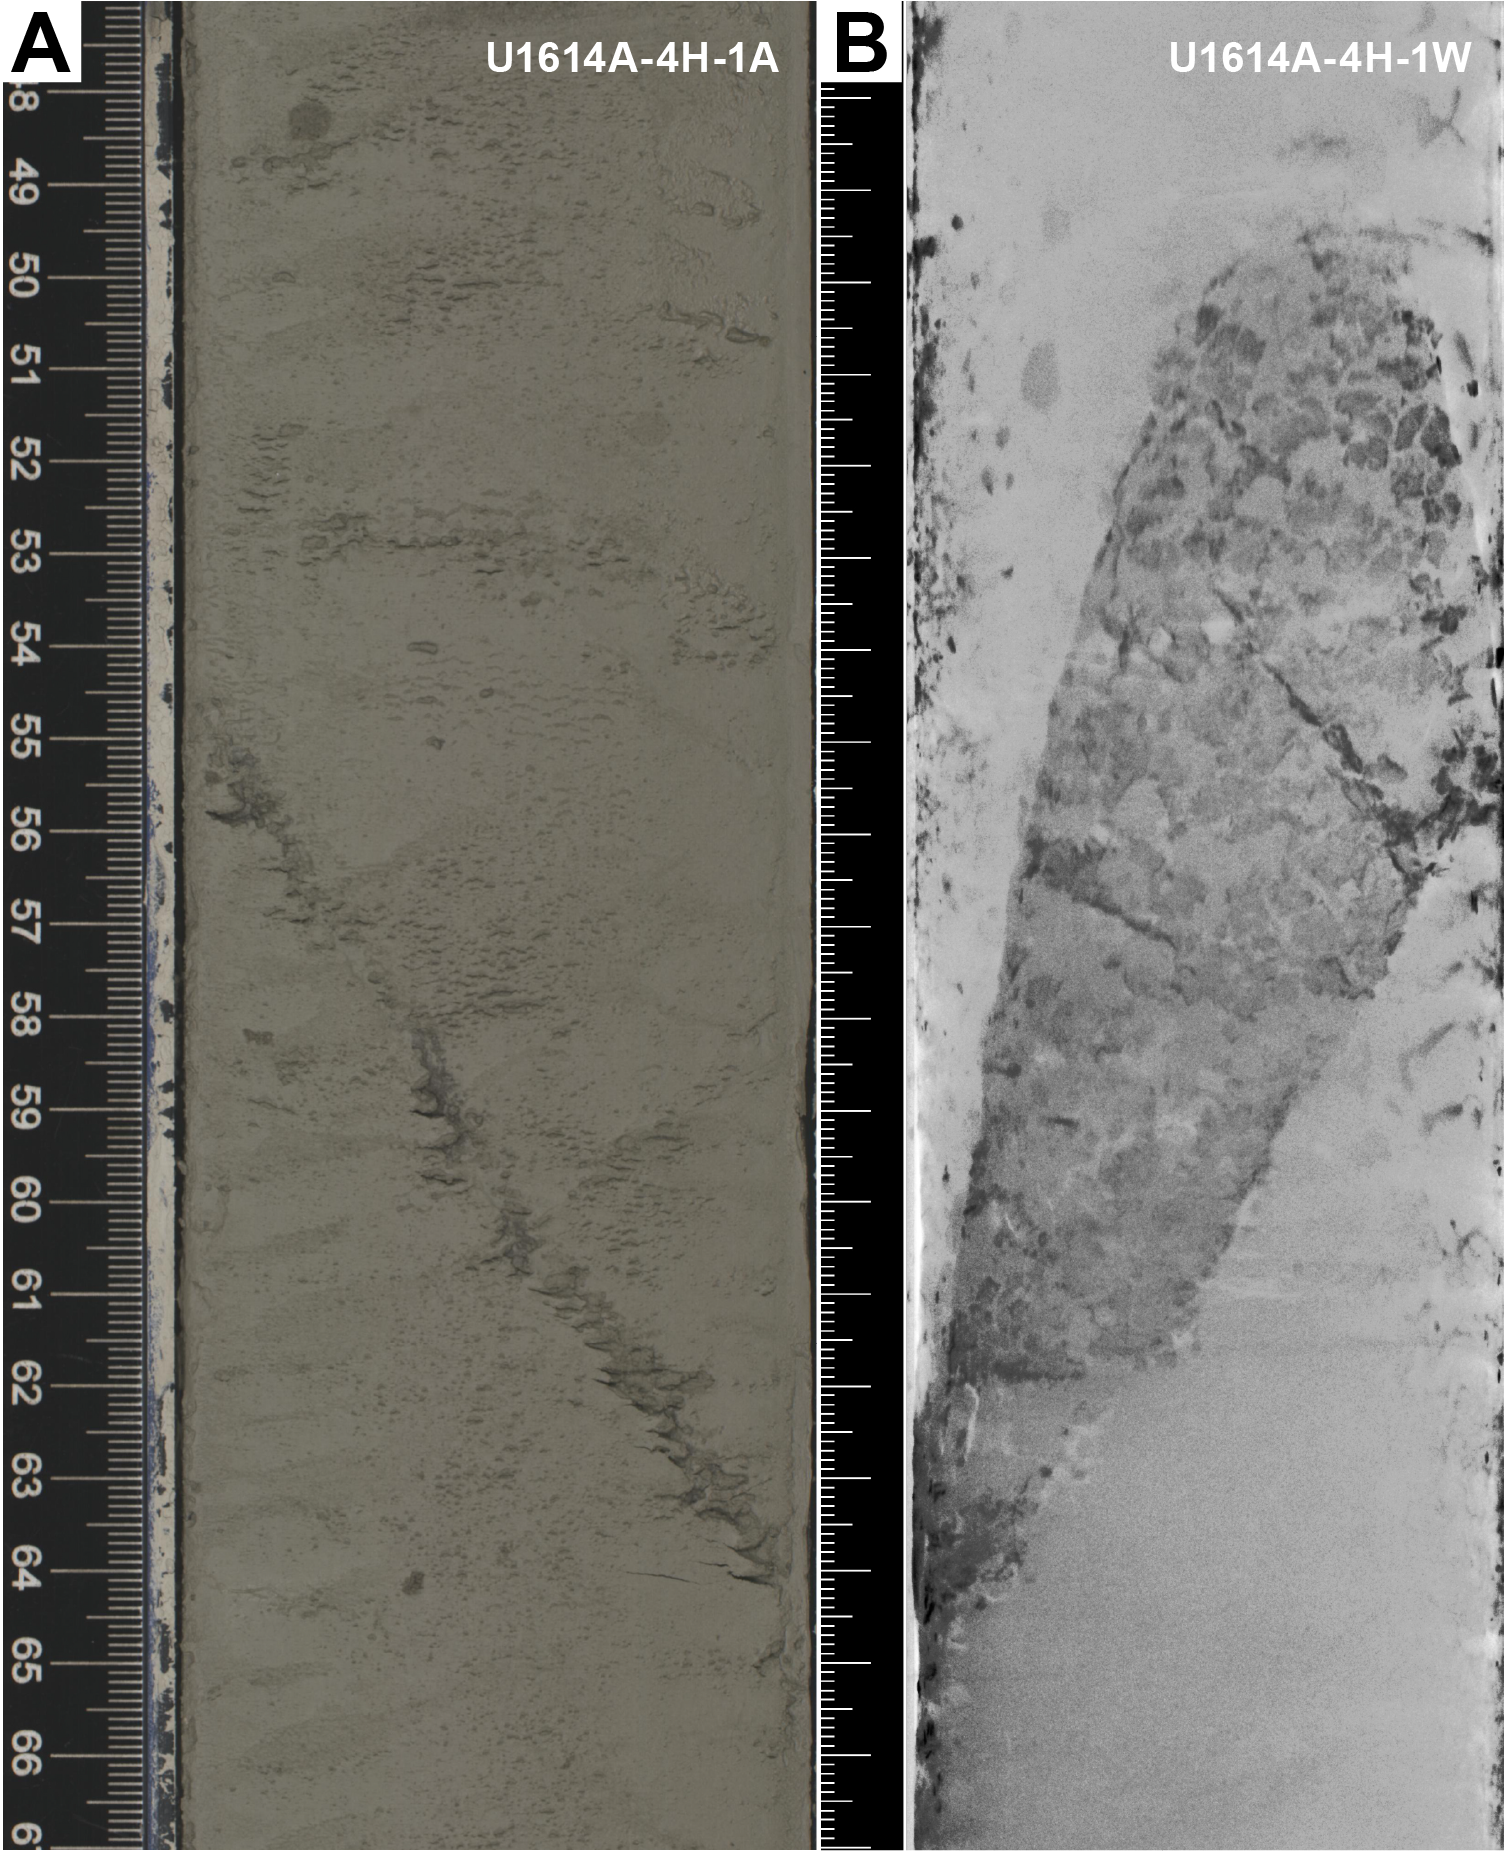
Figure F35. Fault in Unit I.
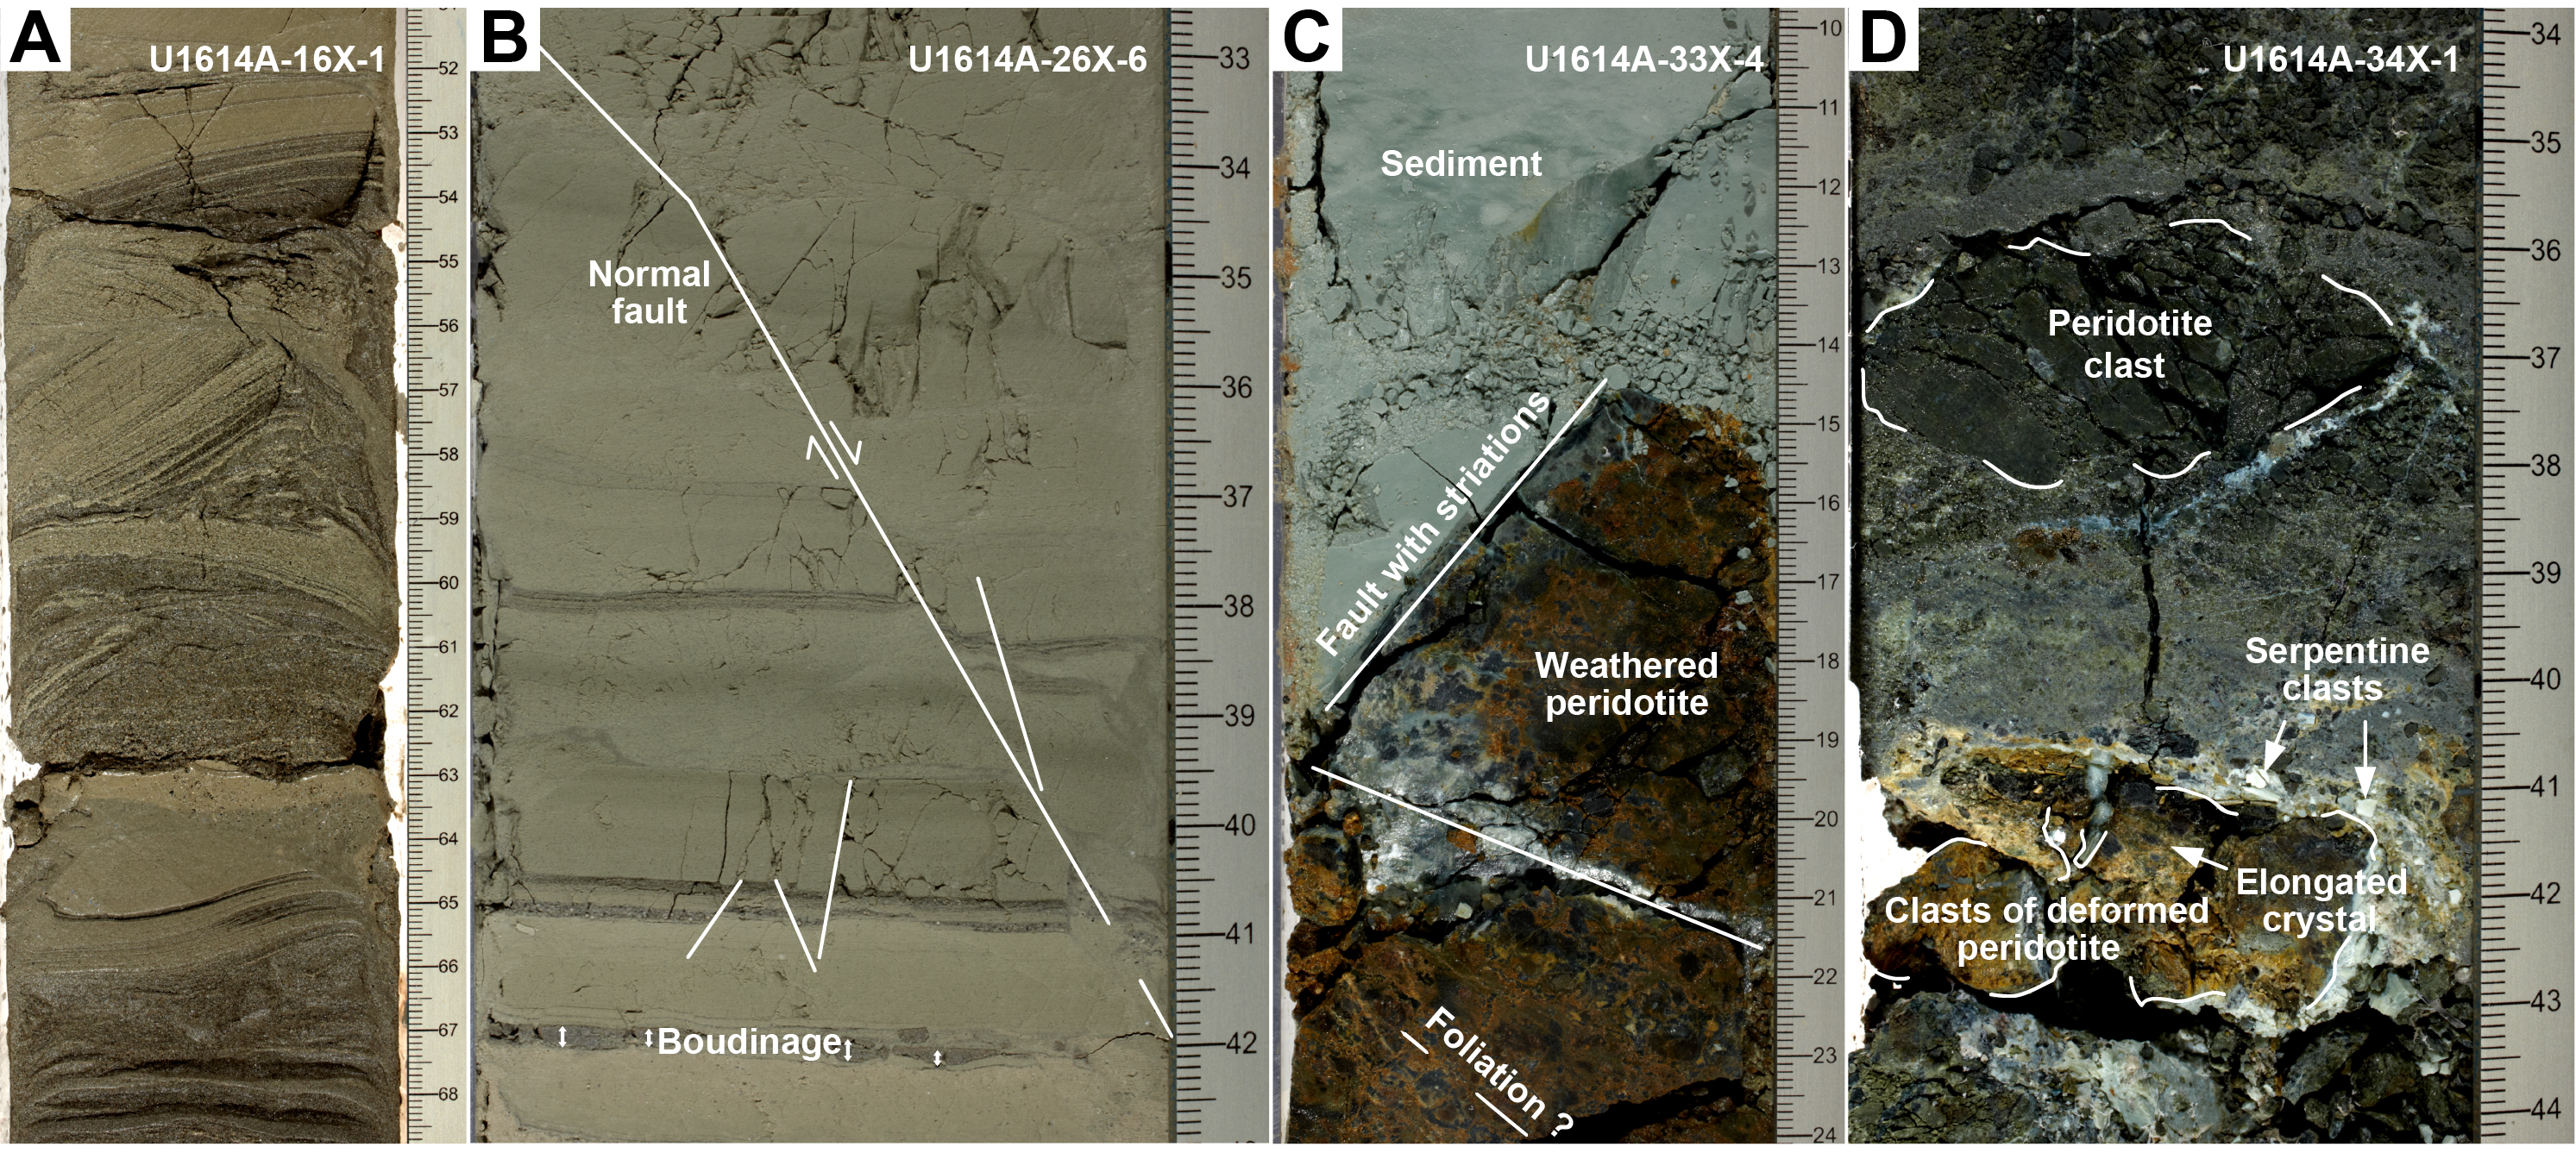
Figure F36. Sedimentary structures and sediment/basement interface.
The sedimentary sequence overlies ultramafic igneous basement with minor felsic and mafic lithologies. The contact is sharp (Figure F36C), and the thickness of the drilled basement interval is approximately 150 m. The basement is characterized by both ductile and brittle deformation structures and records several episodes of melt intrusion, as evidenced by the presence of pyroxene-rich veins and disseminated impregnation traces. In addition, the entire sequence is characterized by hydrothermal fluid-rock interaction through the presence of serpentine and carbonate veins. In the following sections, we divide the interval recovered at Site U1614 into three domains: sedimentary, transitional, and hard rocks.
7.1. Sediments and sedimentary rocks
Cores from Site U1614 consist of sediments and sedimentary rocks from 0 to 265.2 mbsf (Section 402-U1614A-33X-4, 15 cm) (Figure F36), where they contact the serpentinized peridotite basement. Bedding orientations in the core coordinate system (see Structural geology in the Expedition 402 methods chapter [Malinverno et al., 2025a]) were routinely measured in the working-half sections. Bedding is generally subhorizontal (<10°) with a few exceptions that have much larger dip angles, the latter interpreted to be slumping (Figure F36A). The average dip angle is nearly horizontal and does not increase with burial depth. Occasional soft-sediment faults, both normal and reverse, were measured along with fractures and two folds (Figures F35, F36A, F36B). The distribution of faults, fractures, and folds with depth correlates with the distribution of bedding dips with values up to 30° (Figure F34), confirming that the sediments and sedimentary rocks at Site U1614 are affected by slumping (Figure F36A).
7.2. Sediment/basement interface
The sediment/basement interface is marked by a sharp contact between dolomitic sediments overlying weathered peridotite, which is particularly well preserved in Hole U1614A (Figure F36C). The dips of the dolomitic sediment beds are greater than the dips of the overlying layers (Figure F34). No deformation microstructures were observed in this dolomitic unit.
7.3. Basement rocks
In the 153 m thick interval of mantle peridotites recovered in Hole U1614C, we measured several deformation structures, including crystal-plastic and brittle deformation, fractures and microfaults, magmatic impregnations, magmatic intrusions (gabbros and granitoids), and metamorphic veins (mainly serpentine and carbonate). The distribution of crystal-plastic fabrics (CPFs), brittle deformation, and magmatic and metamorphic veins is shown as a function of depth in Figure F37 along with the lithology and the recovery. The intensity of the CPFs varies greatly with depth and lithology (Figure F37). In particular, the most deformed samples seem to correlate with the presence of harzburgites.
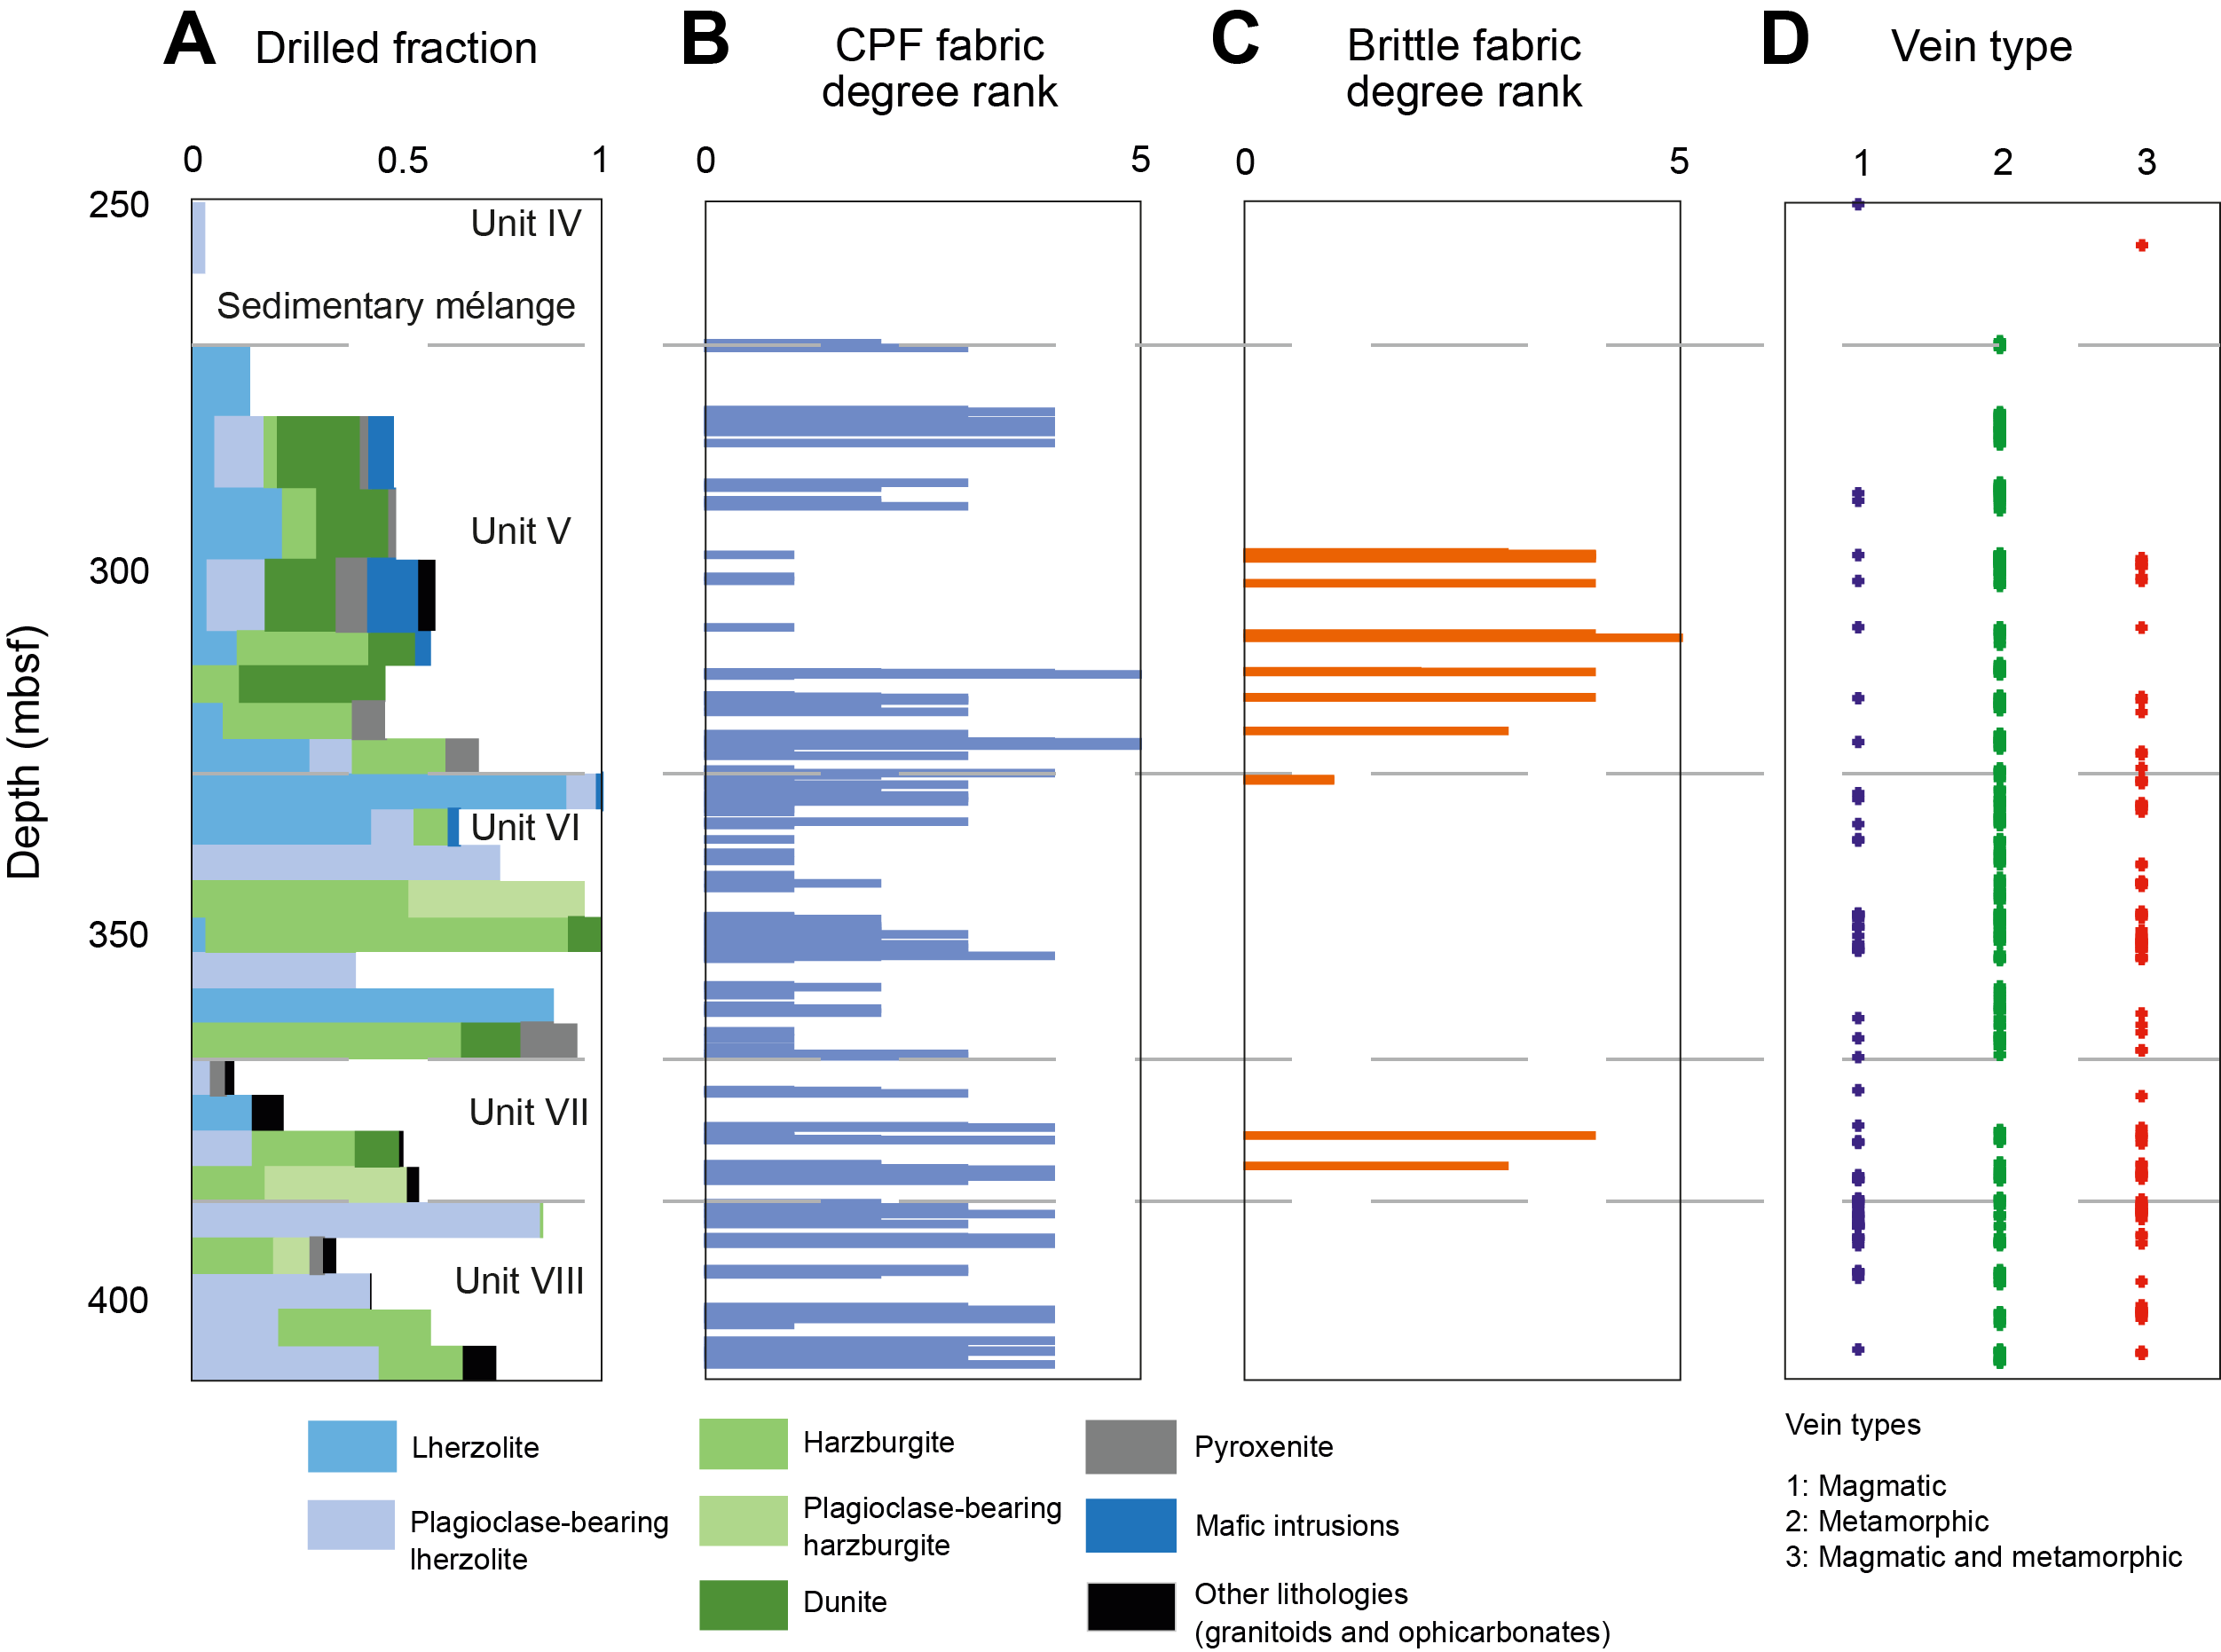
Figure F37. Drilled fraction, recovered lithologies, and CPF.
We also observed two intervals of well-developed breccia (see Structural geology in the Expedition 402 methods chapter [Malinverno et al., 2025a]) that seem to correlate with intervals of poor recovery and greater lithologic diversity that are mostly characterized by the presence of ophicarbonates (Cores 402-U1614C-7R and 8R; 298–311 mbsf) and granitoids (Cores 20R–21R).
The observed deformation structures are described below in chronological order, following the progression of alteration from mantle fabric to low-temperature alteration. Peridotite crystal-plastic deformation or CPF ranges from protogranular (CPF = 0) to ultramylonitic (CPF = 5) (Figures F37, F38). Mylonitic and ultramylonitic samples were recovered in Cores 402-U1614C-5R, 8R, 11R, 22R, 23R, 25R, 27R, and 28R (Figures F37, F38). The observed CPF is at a high angle to the core reference frame from 260 to 400 mbsf (mostly >40°) and at slightly lower angles deeper than 400 mbsf (Figures F38, F39). Regular subvertical impregnations of pyroxene-rich and/or plagioclase-rich minerals and gabbroic intrusions also cut the initial mantle fabric at high angles (mostly >40°) to the core reference frame (Figure F40A, F40B, F40C, F40E).
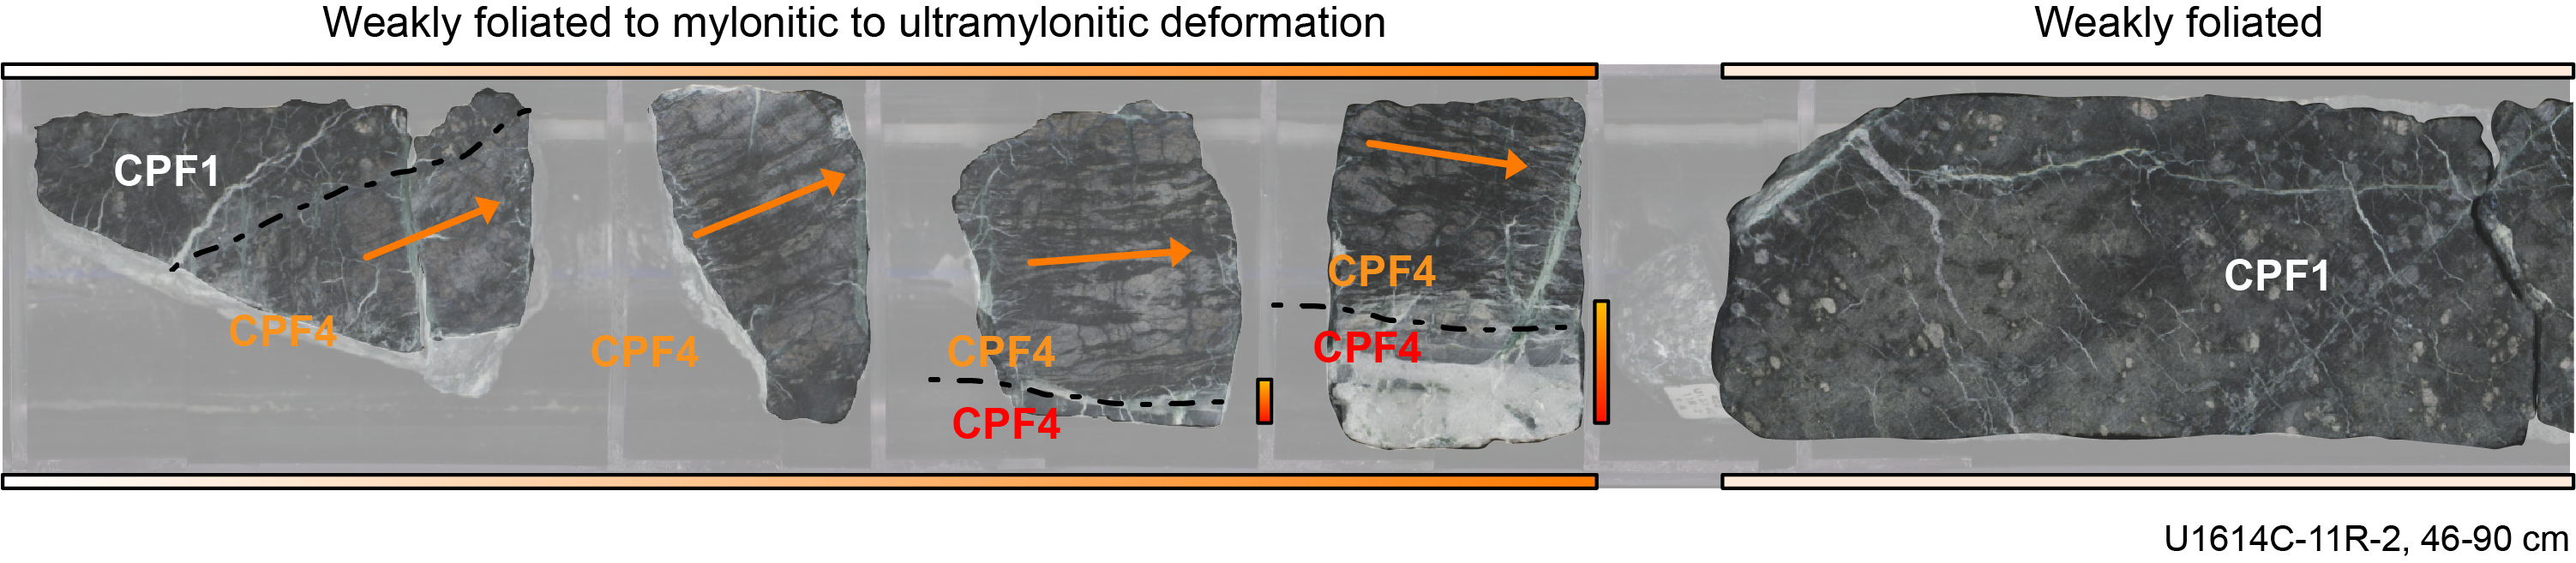
Figure F38. Crystal-plastic deformation in mantle peridotites.
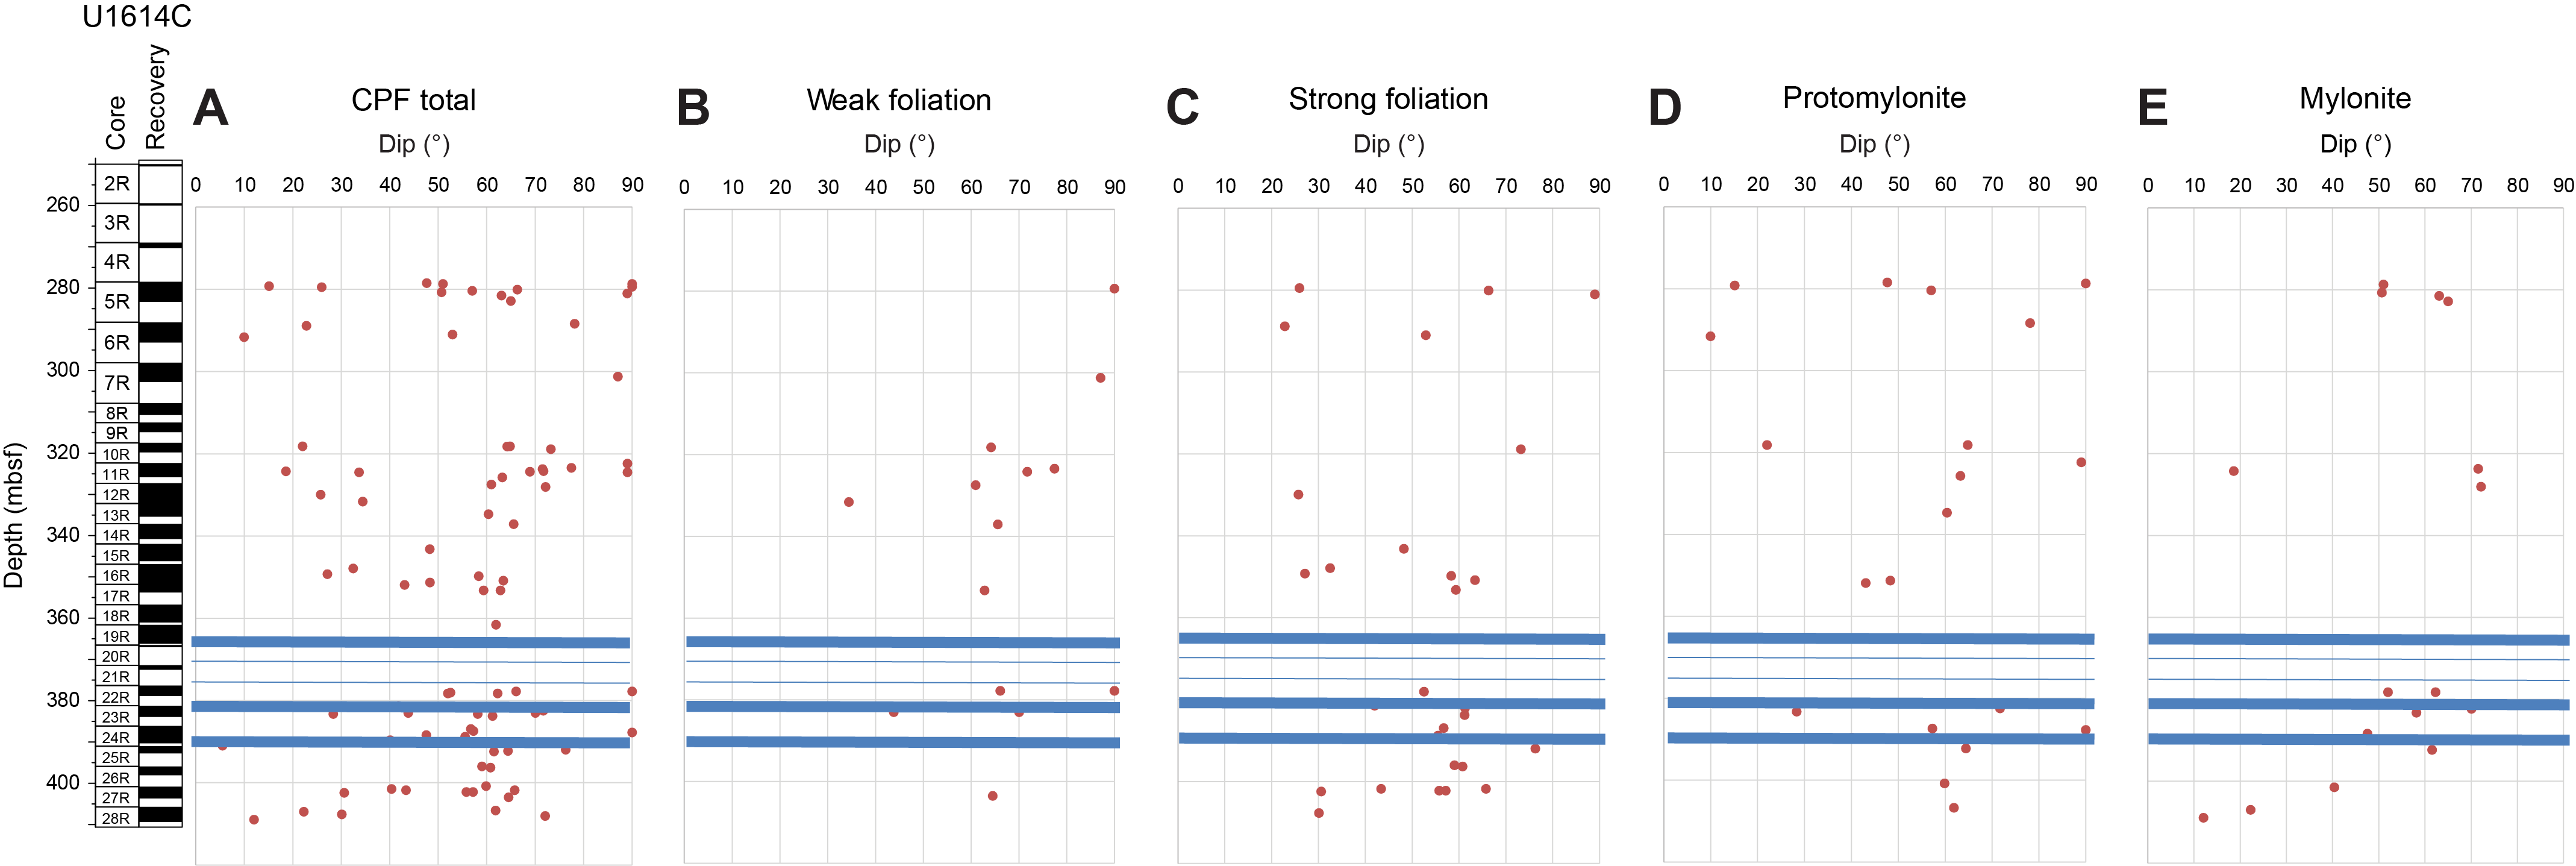
Figure F39. Dip of CPF vs. depth.
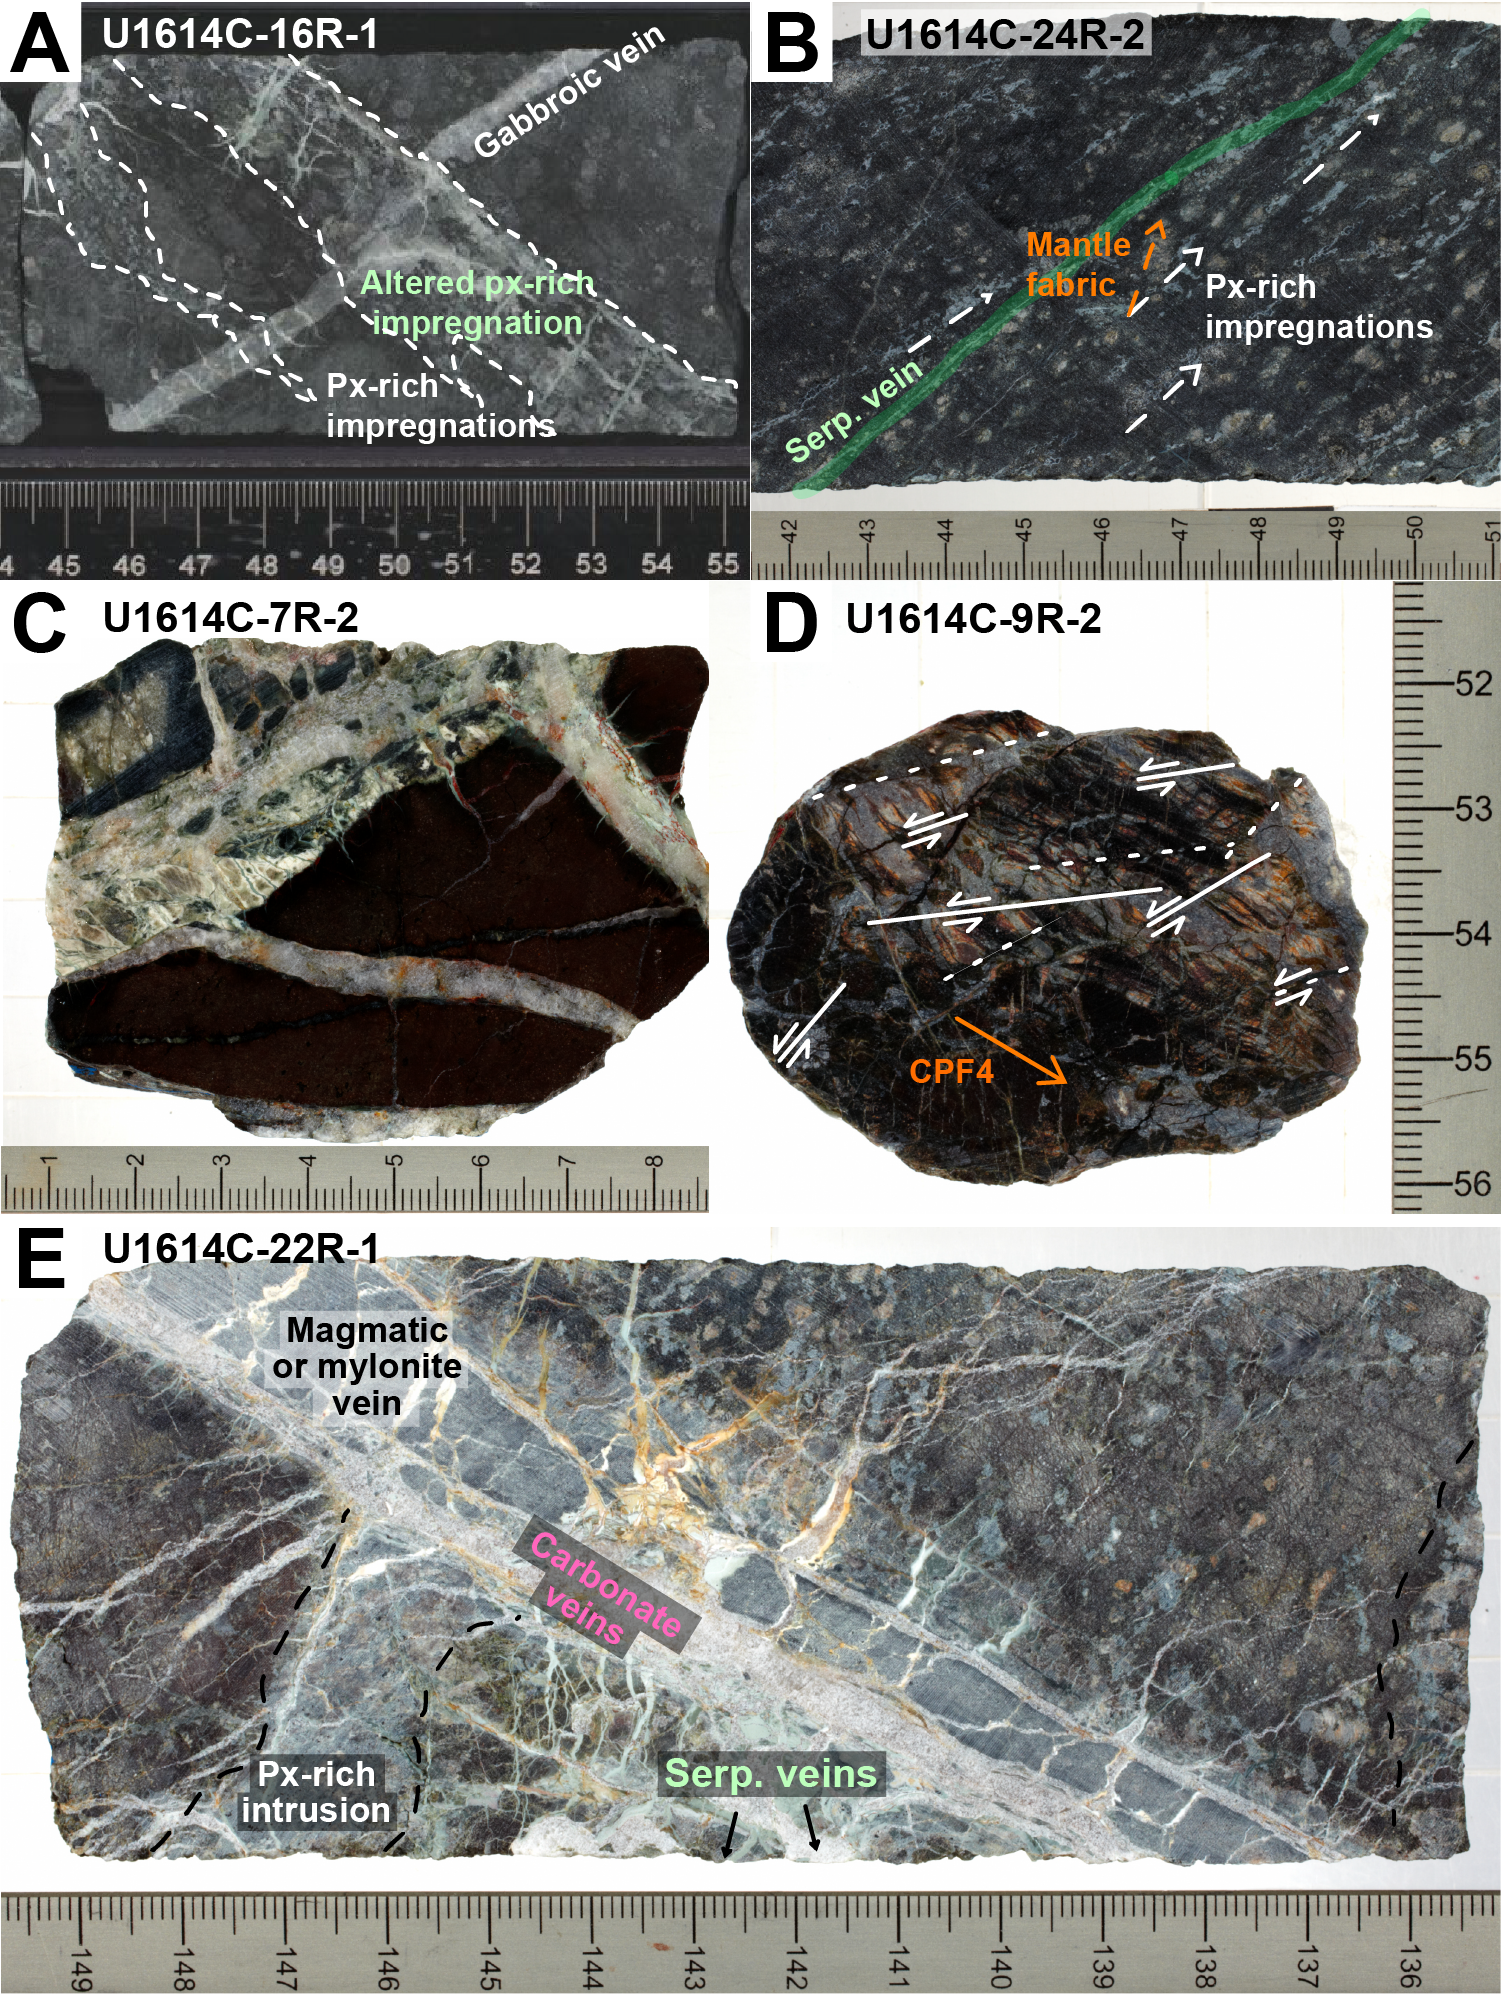
Figure F40. Deformation structures in mantle peridotites.
In addition to pervasive alteration of the peridotites, metamorphic veins seem to follow preexisting lithologic contrasts in the mantle peridotites, such as deformation bands (mylonites and ultramylonites; Figures F38, F40C), impregnations (Figure F40A, F40B), and gabbroic/magmatic veins (Figure F40A, F40E). This observation is supported by the similar orientation of the metamorphic veins as magmatic veins (mostly 310–410 mbsf). From 270 to 310 mbsf, metamorphic veins have more diverse orientations, ranging 0°–90° in the core reference frame (Figure F41). A consistent sequence in the alteration pattern is observed, starting with serpentine veins and shear zones that rim the intrusions/veins. Once sufficiently developed, another set of veins forms orthogonally to the first set, cutting the intrusion/vein. Calcite veins brecciate the serpentine veins (Figure F40C) and overprint both the initial structure and the serpentine veins (Figure F40A, F40C, F40E). We also regularly found a network of thin orthogonal calcite and/or serpentine veins throughout the entire sequence (Figure F40E).
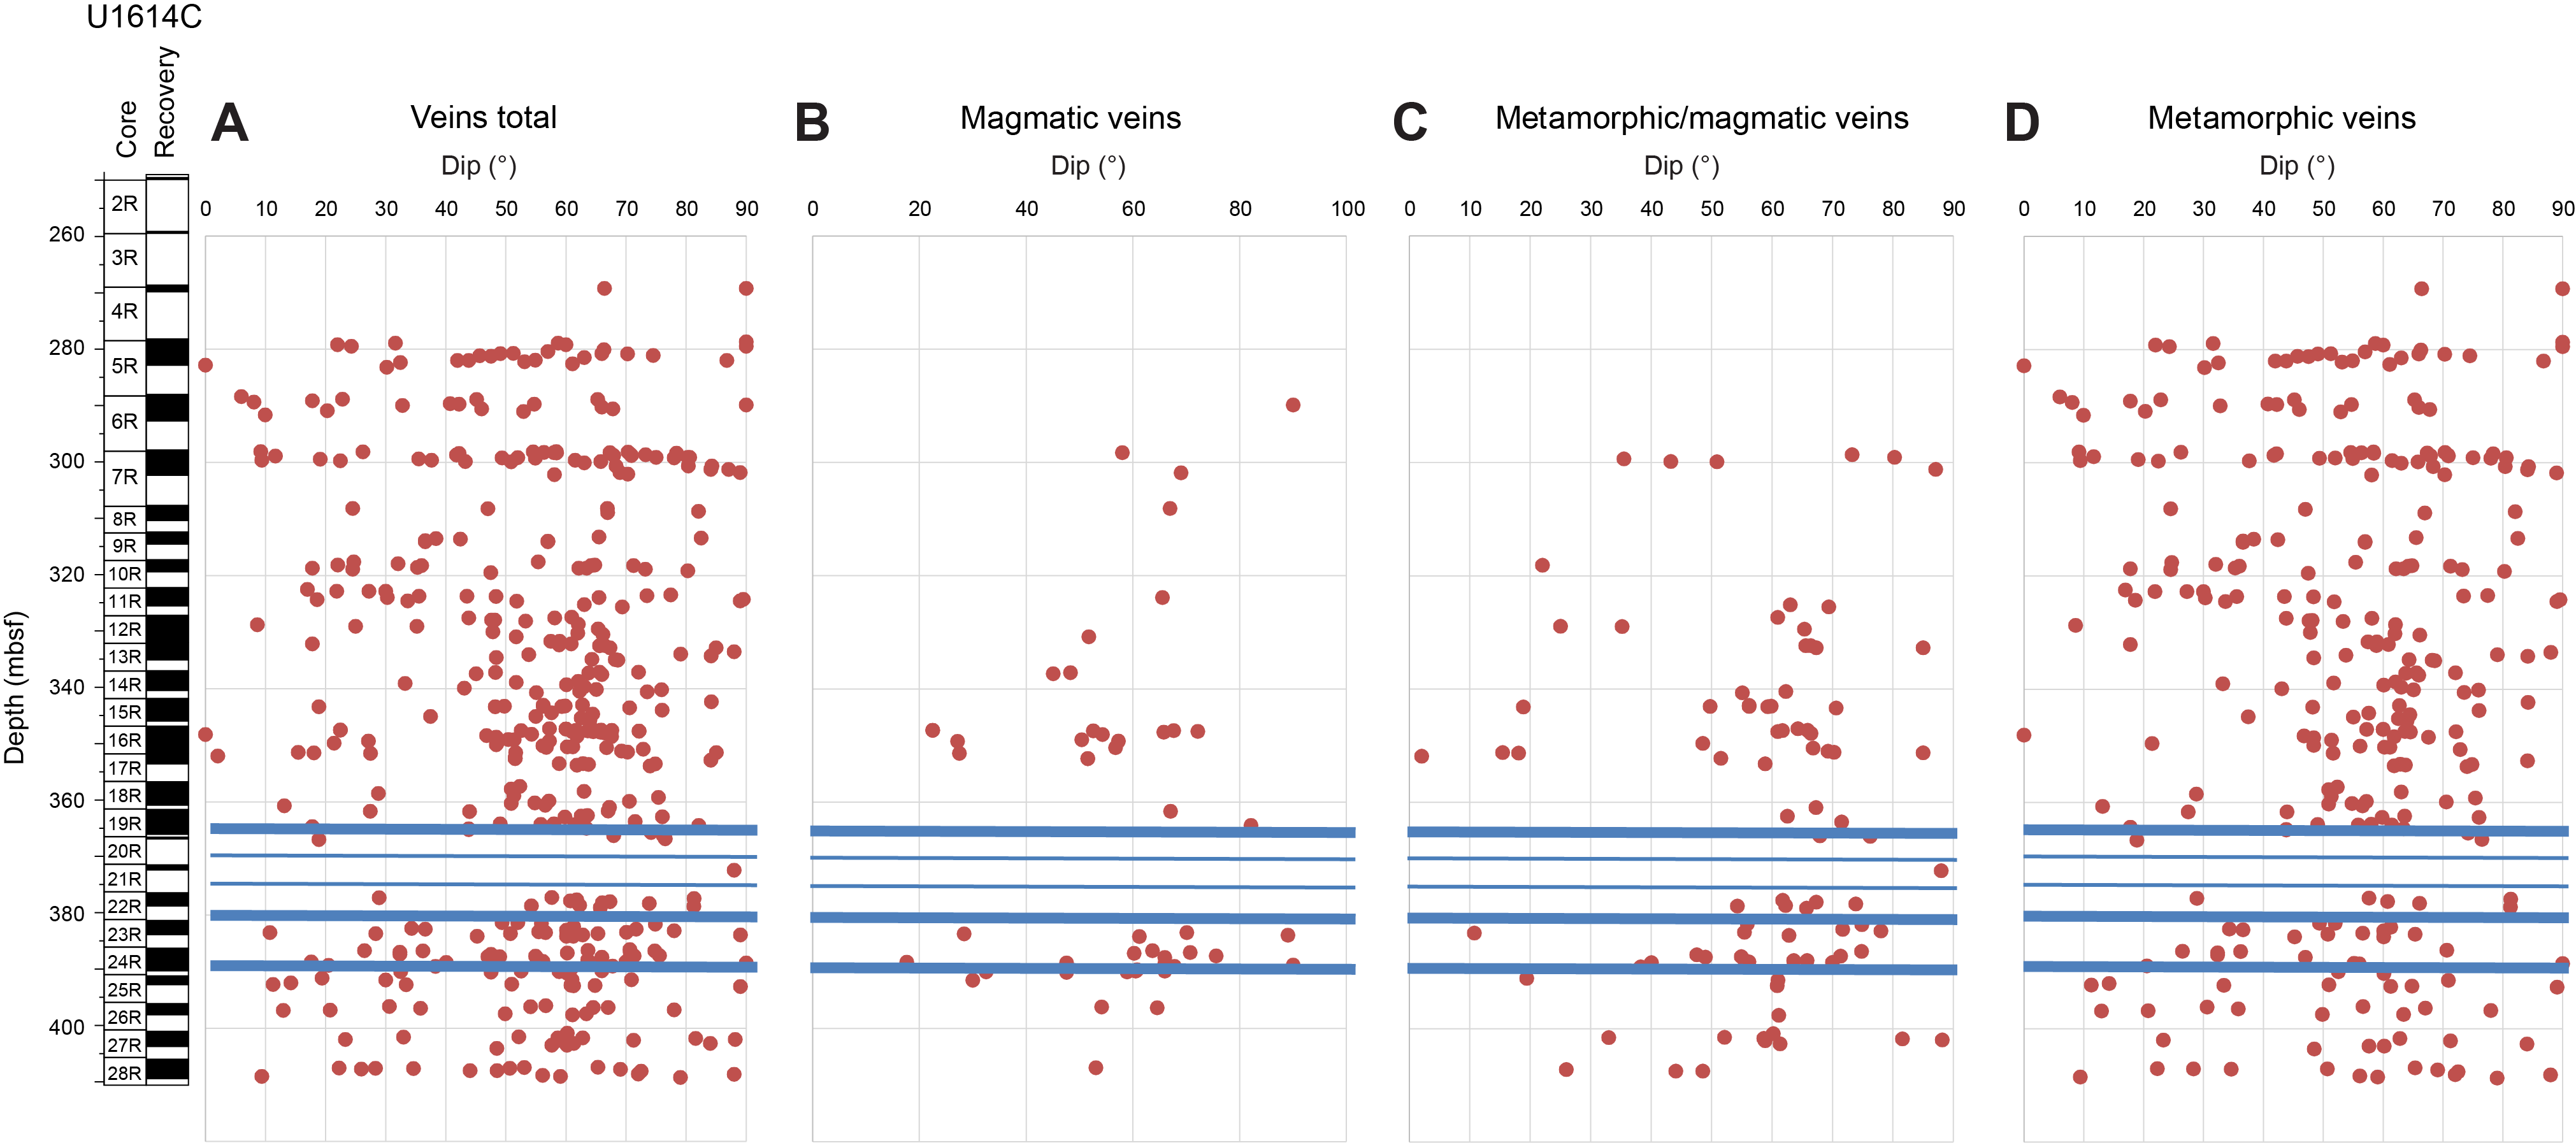
Figure F41. Dip of veins vs. depth.
Mesoscale and microscale faults were also observed and measured throughout the whole sequence, mostly at high angles to the core reference frame (Figures F40D, F42). They mostly represent normal shear, with rare reverse instances concentrated around 300 mbsf in the ophicarbonates (Figures F40D, F42).
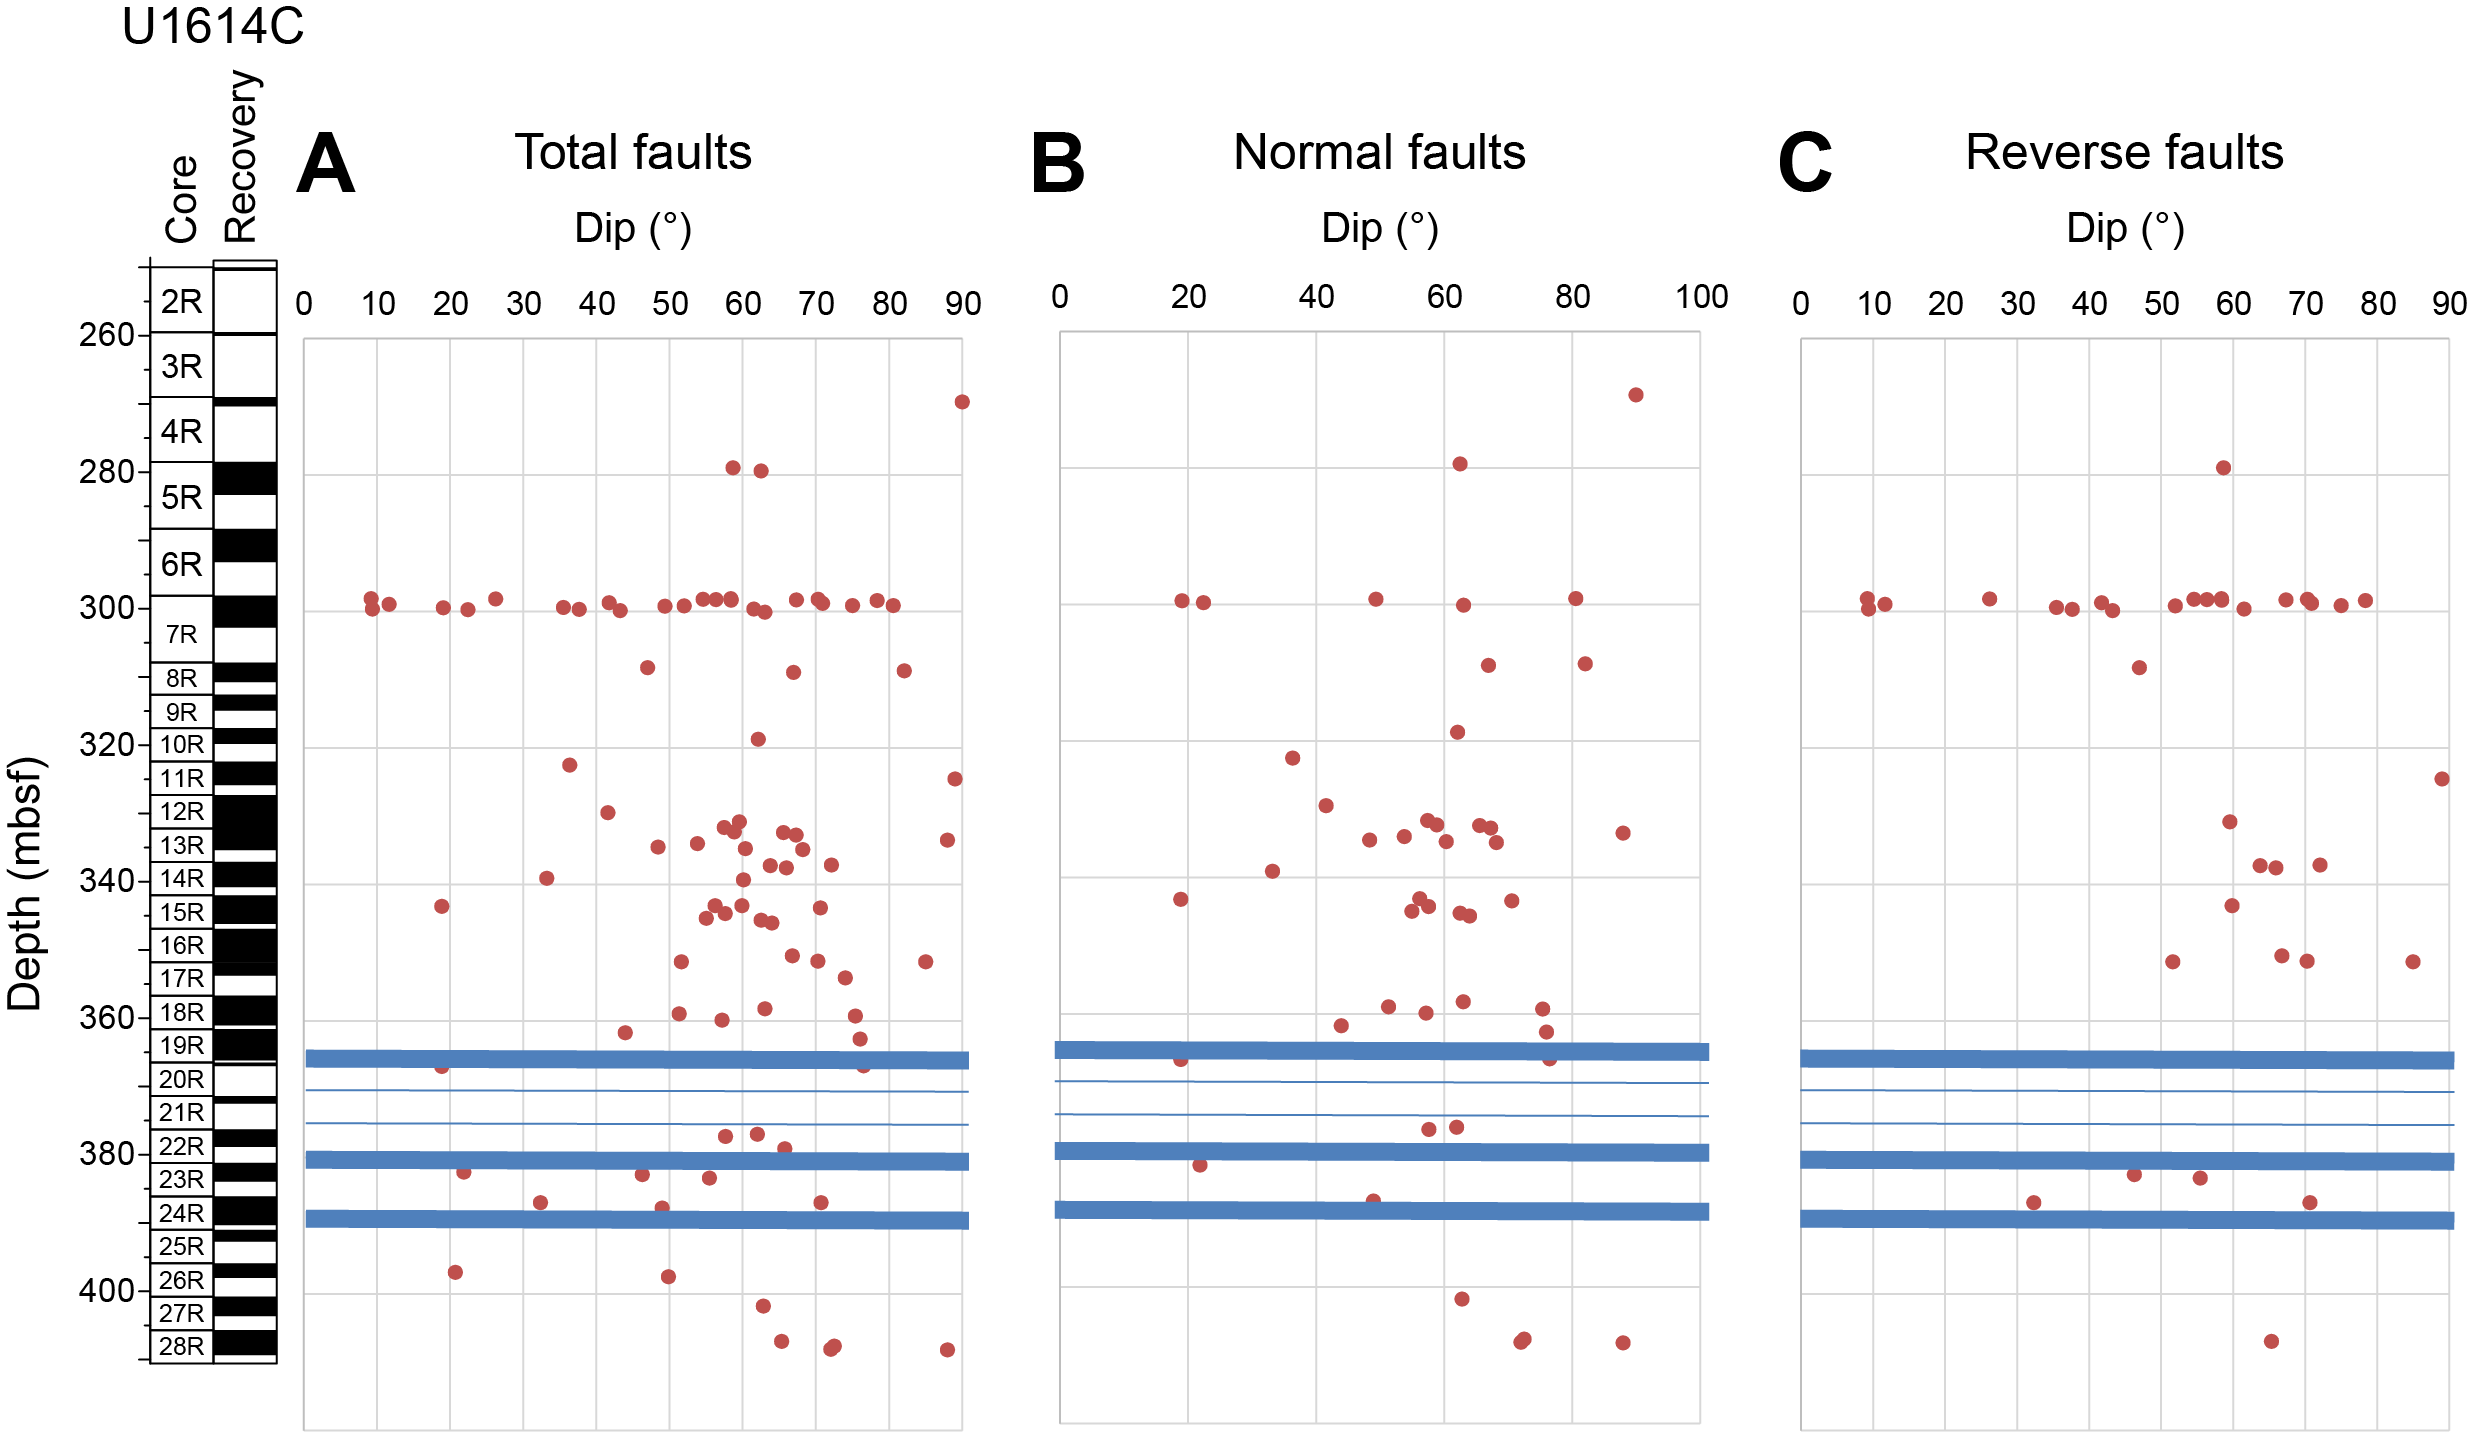
Figure F42. Dip of faults vs. depth.
8. Sediment and interstitial water geochemistry
Whole-round samples from Hole U1614A were hydraulically pressed to extract interstitial water (IW) for chemical analyses. The depth of IW samples ranges 0.0–265.0 mbsf. Both sediment and IW were subsequently processed to determine their chemical and elemental composition and variability with depth. Headspace gas sampling was also performed at this site to measure the composition and abundance of C1–C6 hydrocarbon gases.
8.1. Inorganic geochemistry
8.1.1. Alkalinity, pH, and salinity
The alkalinity of IW varies from 1.5 to 8.5 mM, with a value of 2.7 mM occurring near the seafloor (Table T4). In the uppermost 78.2 m, above Section 402-U1614A-9H-4, alkalinity is always greater than 2.7 mM, peaking at 8.5 mM at 21.0 mbsf and then decreasing to 4.8 mM at 78.2 mbsf. Below this depth, alkalinity fluctuates at lower values between 1.5 and 2.8 mM (Figure F43). Alkalinity values less than 4 mM are in the same interval range as found in IW collected at Site 974 in the Tyrrhenian Sea during ODP Leg 161 (Bernasconi, 1999).
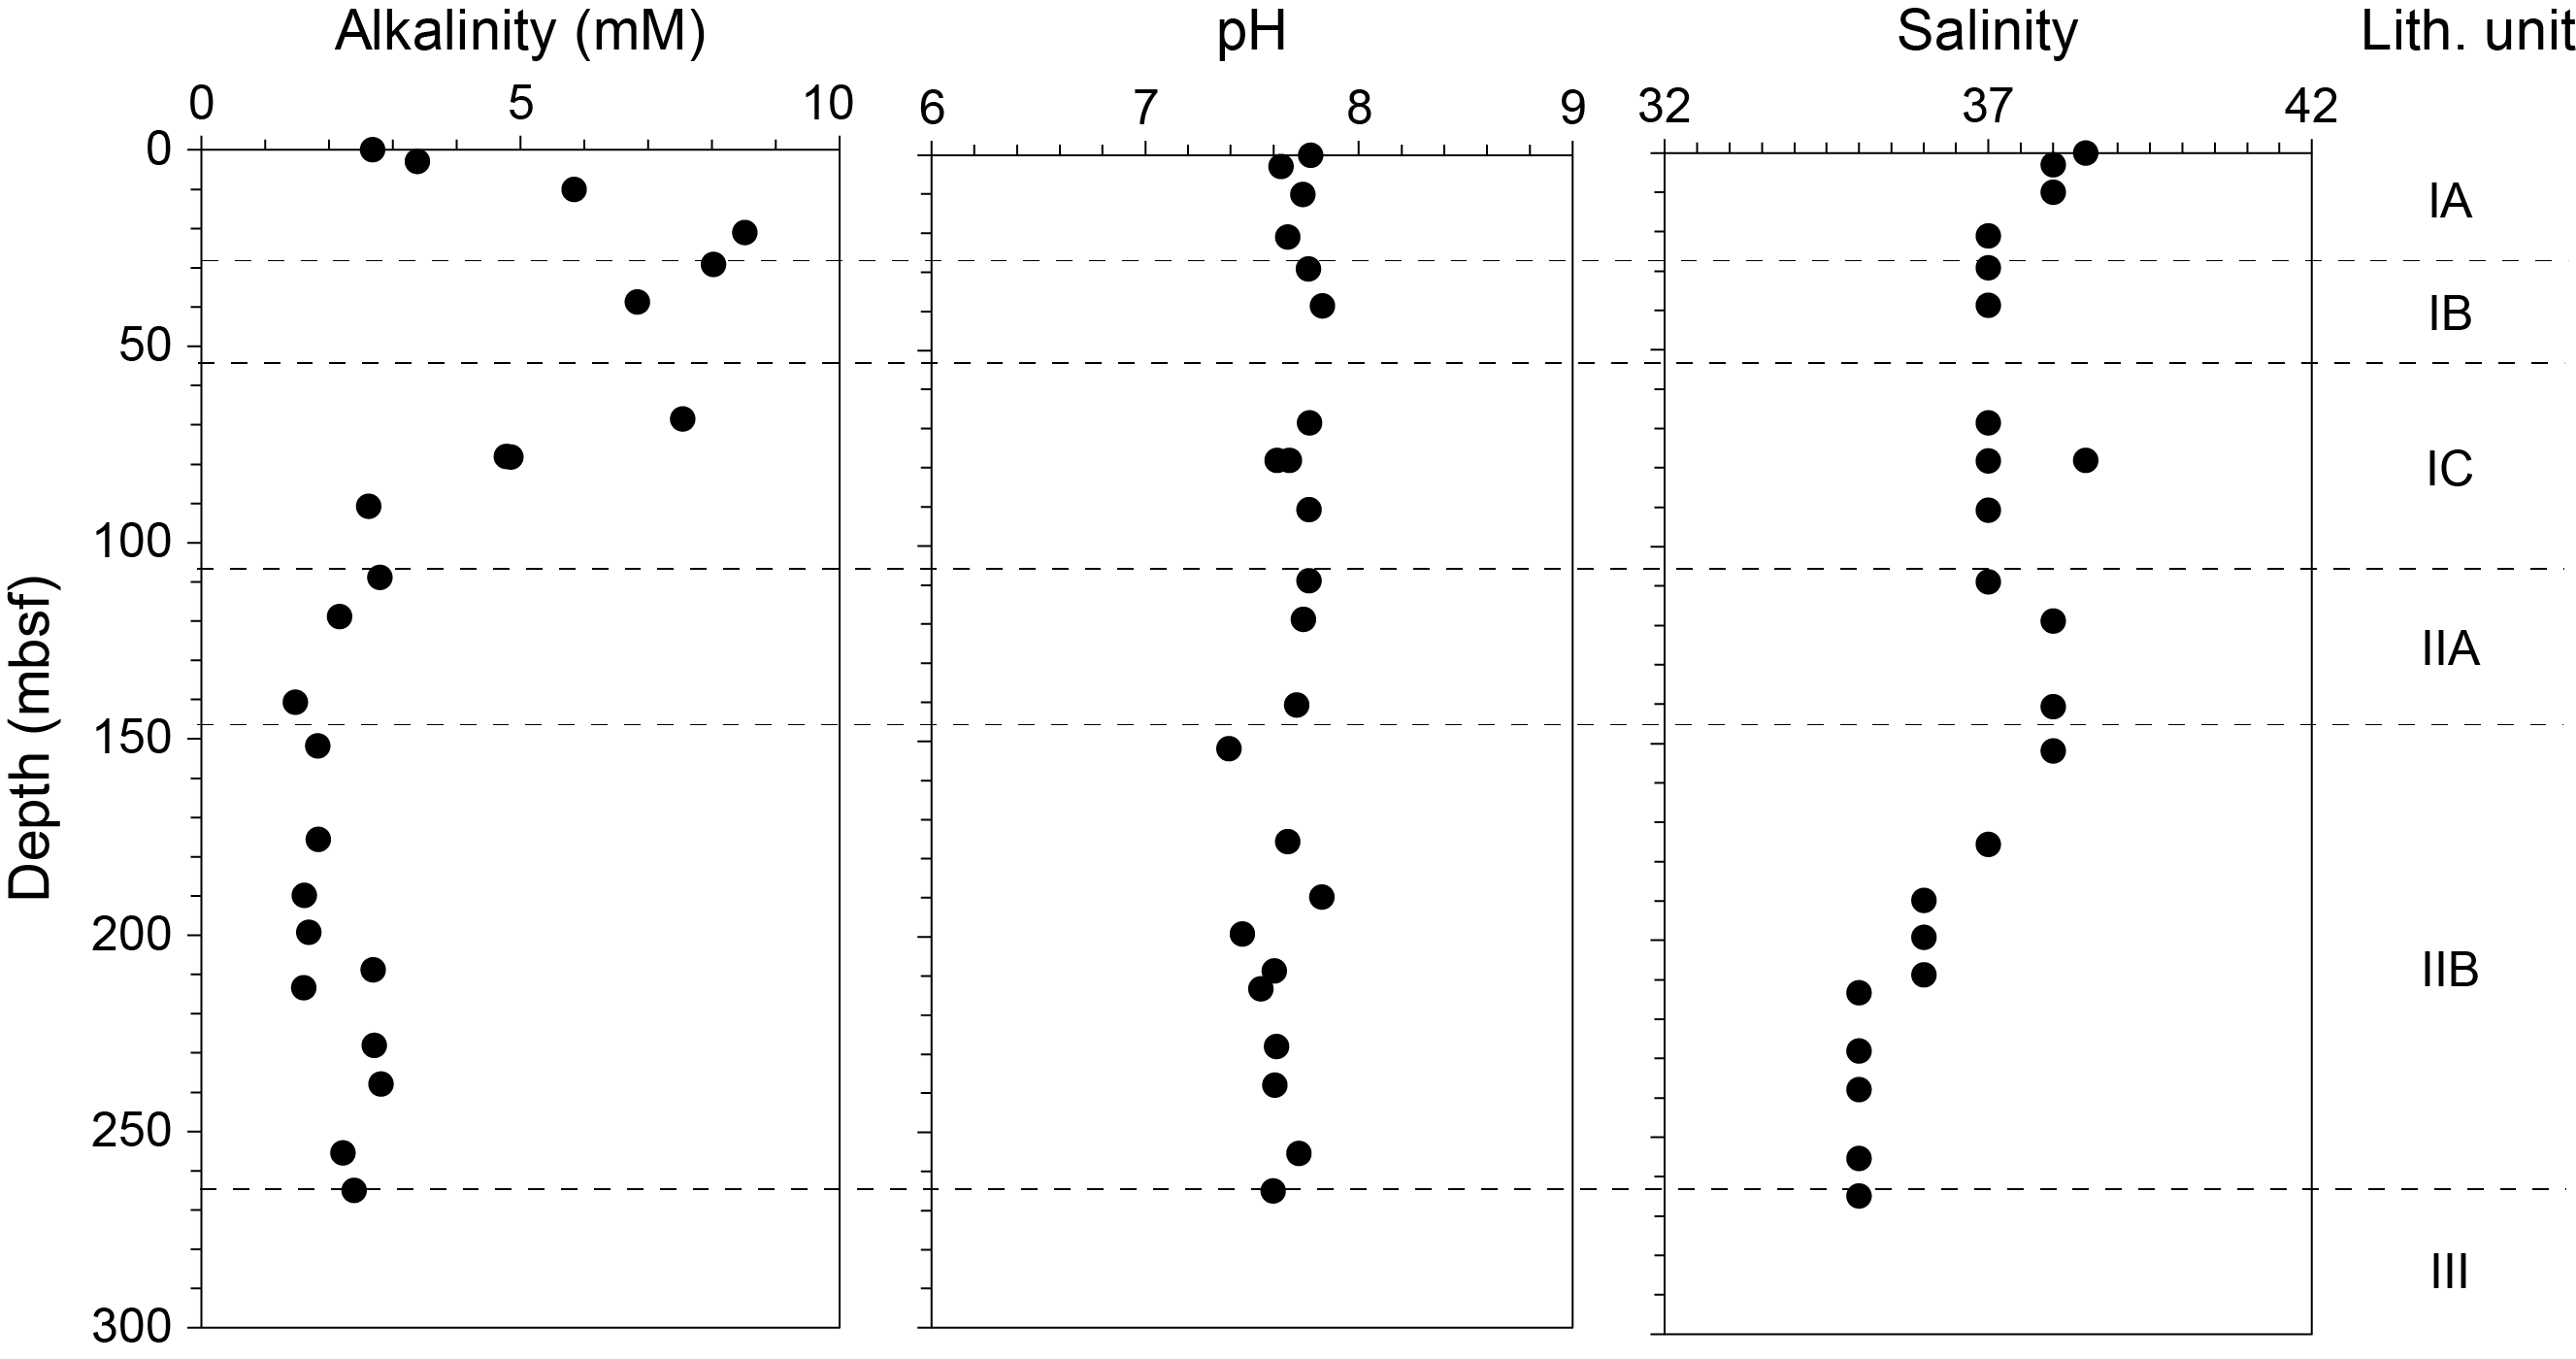
Figure F43. IW alkalinity, pH, and salinity.
The pH value of IW shows little variation and remains within a narrow range of 7.4–7.8 throughout the entire cored interval (Figure F43). It may indicate a balanced transfer of acidic (e.g., NH4+) and basic (e.g., HCO3−) ions between IW and minerals in sediments.
IW salinity is also within a limited range of 35.0–38.5 (Table T4). There is an overall decreasing trend with depth, except at 78.1 mbsf and between 118.9 and 151.9 mbsf. Salinity reaches a minimum of 35.0 at the base of the cored interval (Figure F43). Except at 0 and 78.1 mbsf, all salinity values are lower than the value of 38.5–38.6 that was previously obtained for Mediterranean bottom water (Roether et al., 1996; Tsimplis and Baker, 2000; Tanhua et al., 2013).
8.1.2. Major elements
Concentrations of sodium (Na+) and chlorine (Cl−), the dominant cation and anion species, vary from 470.88 to 613.0 mM and 601.8 to 655.7 mM, respectively (Table T4). The concentrations of Cl− and Na+ generally increase with depth to 189.8 mbsf and then decrease to the bottom of the cored sediments (Figure F44). Because no halite deposits are known from this site, the increasing concentration of both these elements could have derived from NaCl release from fluid inclusions by alteration of the volcanogenic quartz minerals that have been found in this site. The increase of Cl− could also be caused by removal of H2O from interstitial fluid during authigenesis of hydrous minerals (Martin, 1994), such as during clay formation.
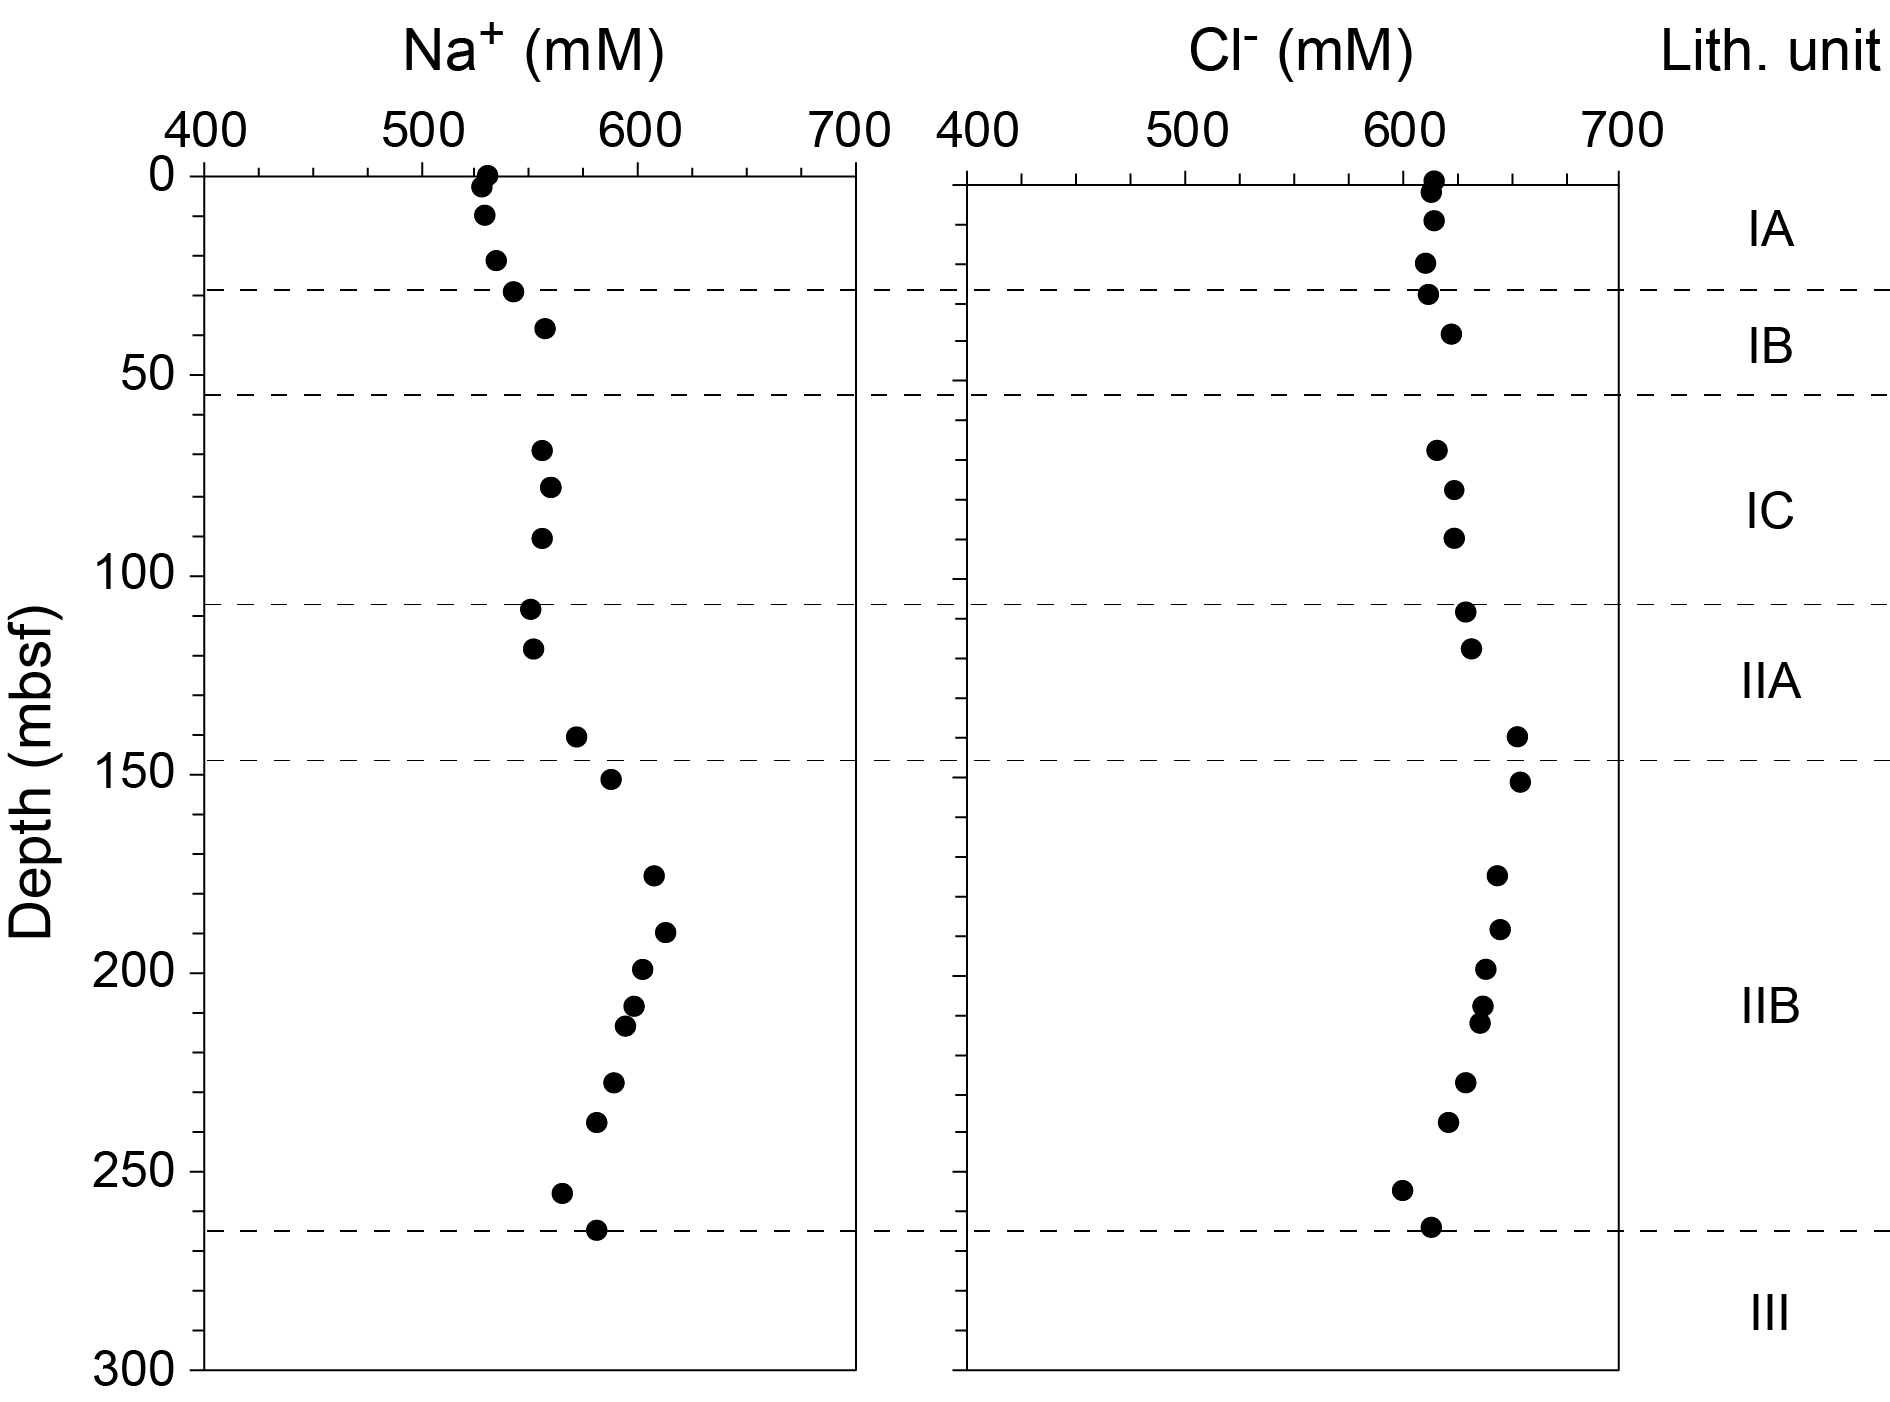
Figure F44. IW sodium and chloride.
Magnesium (Mg2+) concentrations decrease from 58.7 to 3.4 mM in the uppermost ~200 m (Figure F45; Table T4). Calcium (Ca2+) becomes elevated below 78.2 mbsf, and potassium (K+) has lower values below the same depth. At 28.0–263.6 mbsf, which is characterized by sediments containing volcaniclastic materials, the concentration-depth profile of Na+, Ca2+, Mg2+, and K+ could be explained by diagenetic processes within the volcaniclastic- and ash-rich material and biogenic carbonates. The slight decrease in K+ concentration between 108.9 and 199.3 mbsf could be attributed either to ion exchange in clays or to the formation of K-rich clays (e.g., Sayles and Mangelsdorf, 1977; Kastner, 1981). Below 237.9 mbsf, an increasing concentration of these elements is generally observed, probably indicating a possible influence of hydrothermal activity on IW composition. The concentration of bromide (Br−) shows little variation throughout the whole cored interval (Table T4). Its concentration could be slightly modified by postdepositional diagenetic reactions and organic matter decomposition (Martin et al., 1993).
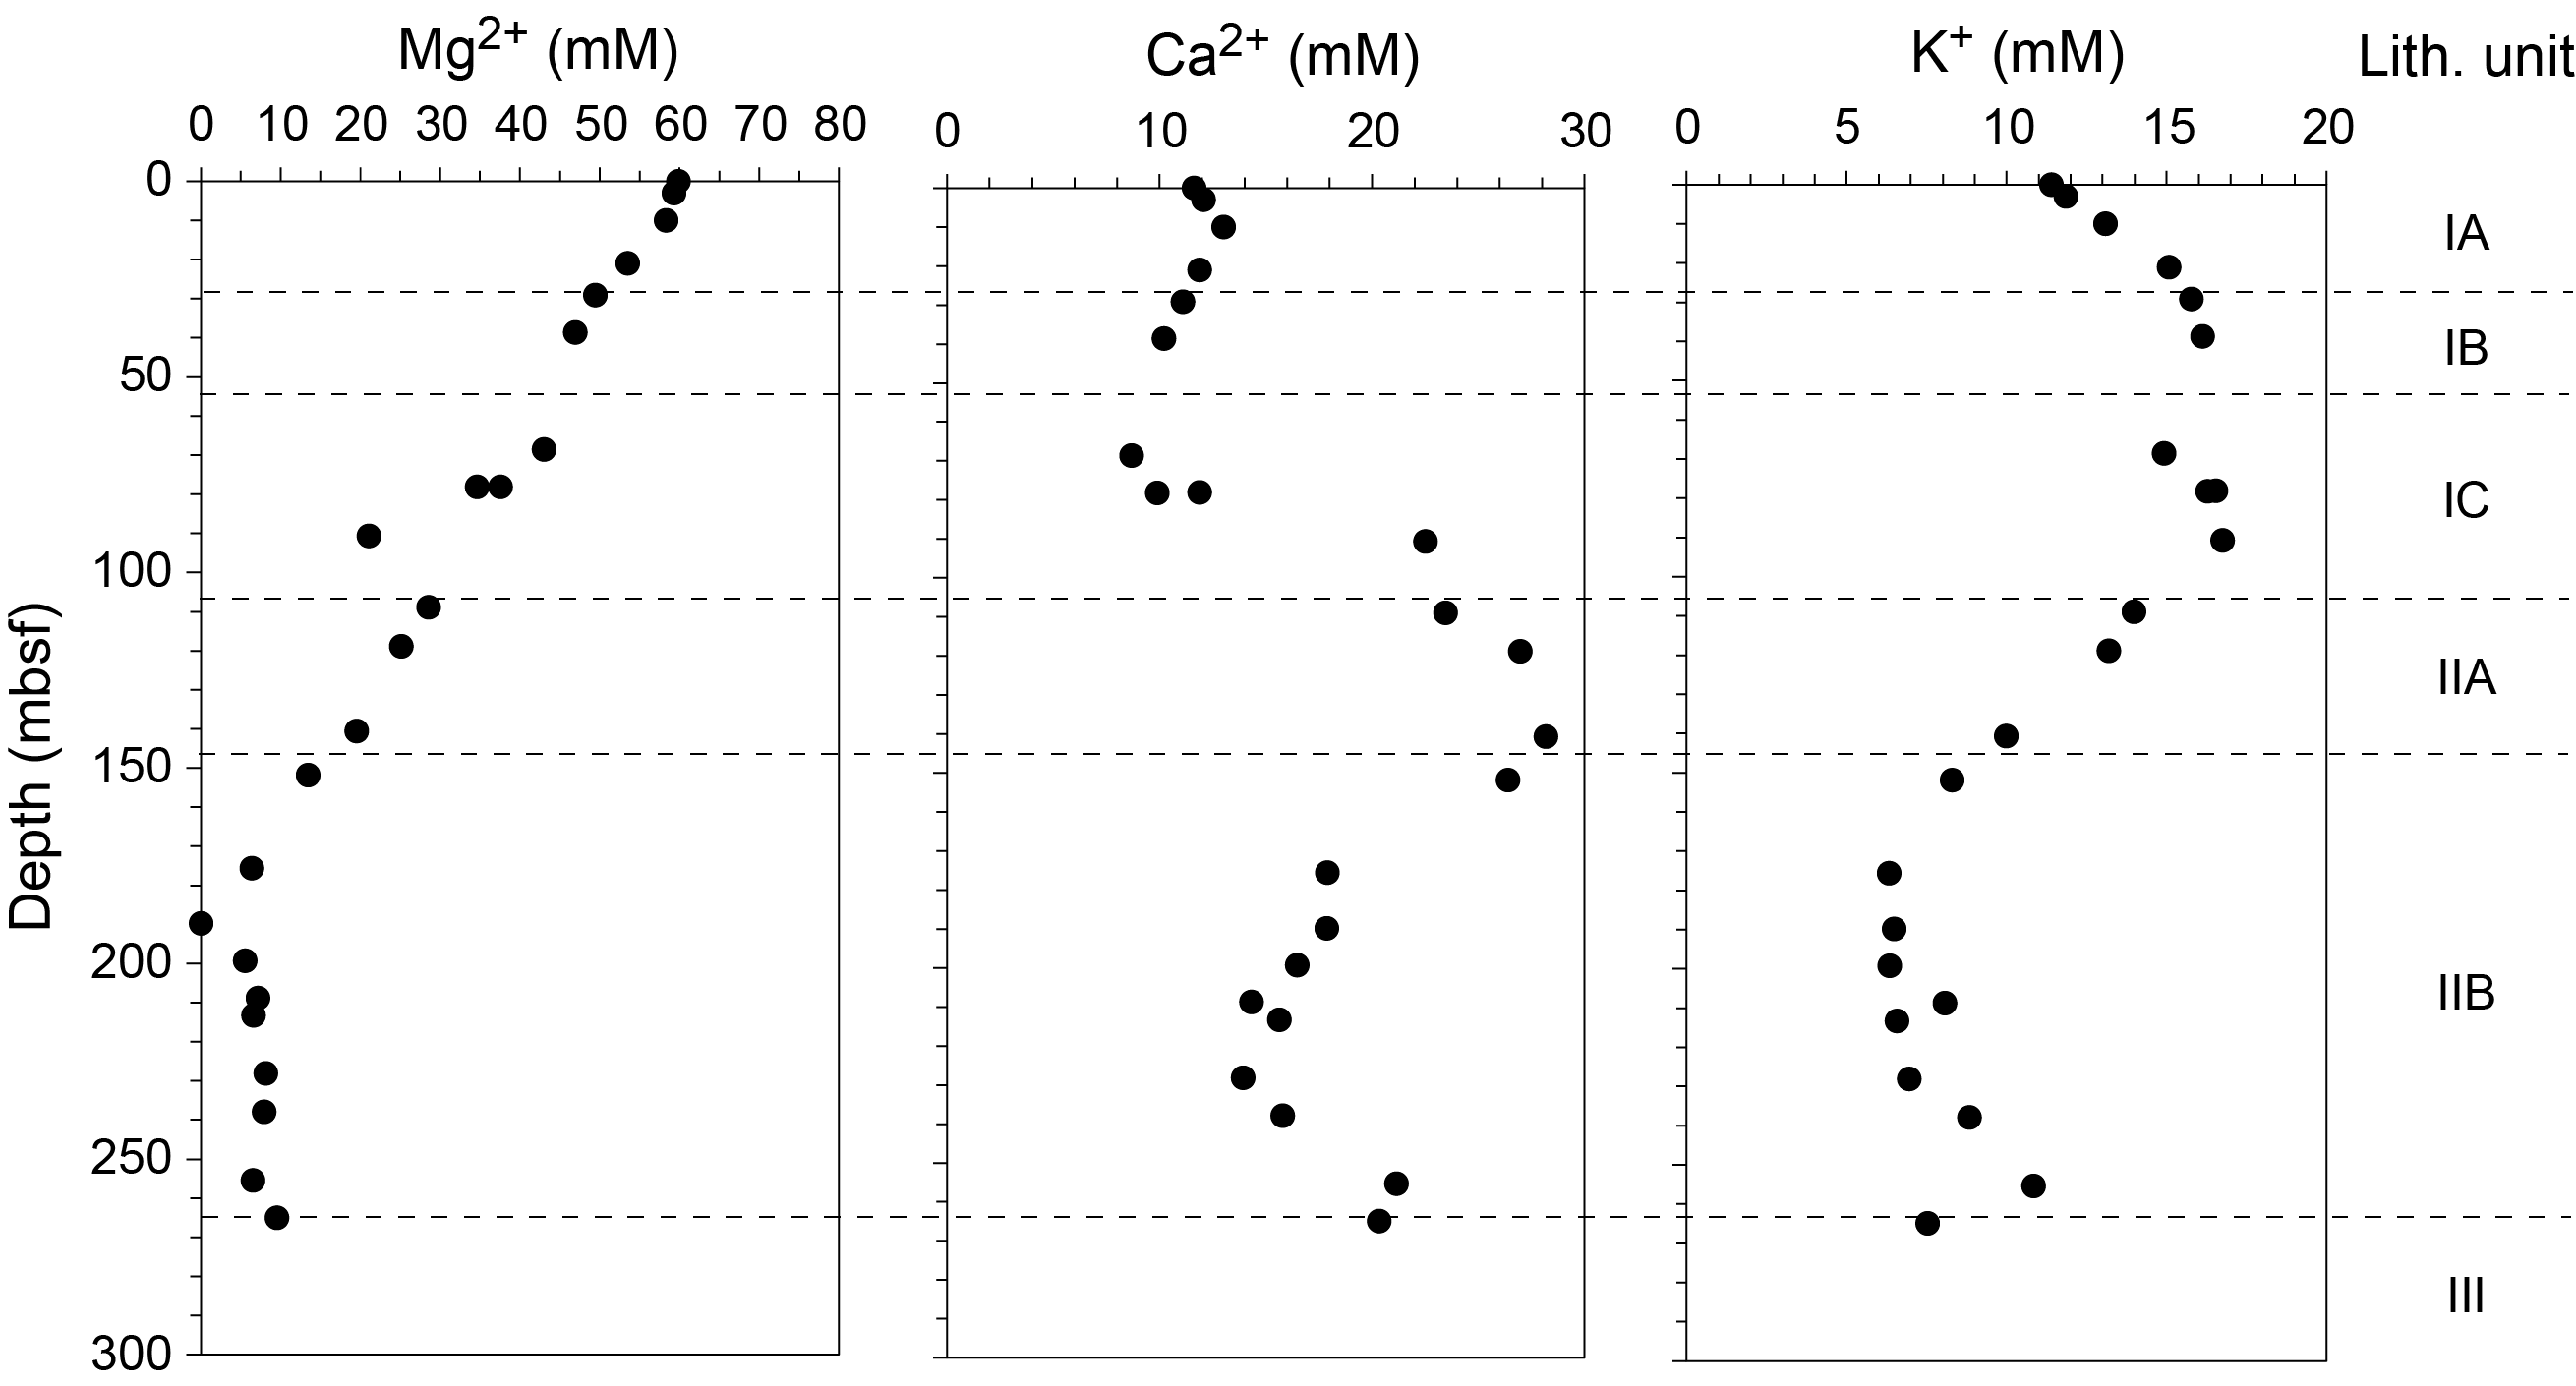
Figure F45. IW magnesium, calcium, and potassium.
8.1.3. Minor elements
Elements observed at lower concentrations include lithium (Li), boron (B), strontium (Sr), silicon (Si), iron (Fe), manganese (Mn), and barium (Ba) (Figure F46; Table T5). The Si concentration shows no obvious pattern with depth, except for maxima at 21.0 mbsf (435.5 µM) and 189.8 mbsf (629.0 µM), which are probably controlled by silicate diagenesis. Concentrations vary from undetectable to 11.9 mM for Ba, 348.9–2079.3 µM for B, 23.7–193.8 µM for Li, and 95.6–602.2 µM for Sr. Below roughly 21.0–38.7 mbsf, an increasing concentration-depth profile is mostly observed for Ba, B, Li, and Sr, probably resulting from diagenetic processes and/or the influence of hydrothermal fluid circulation in IW composition.
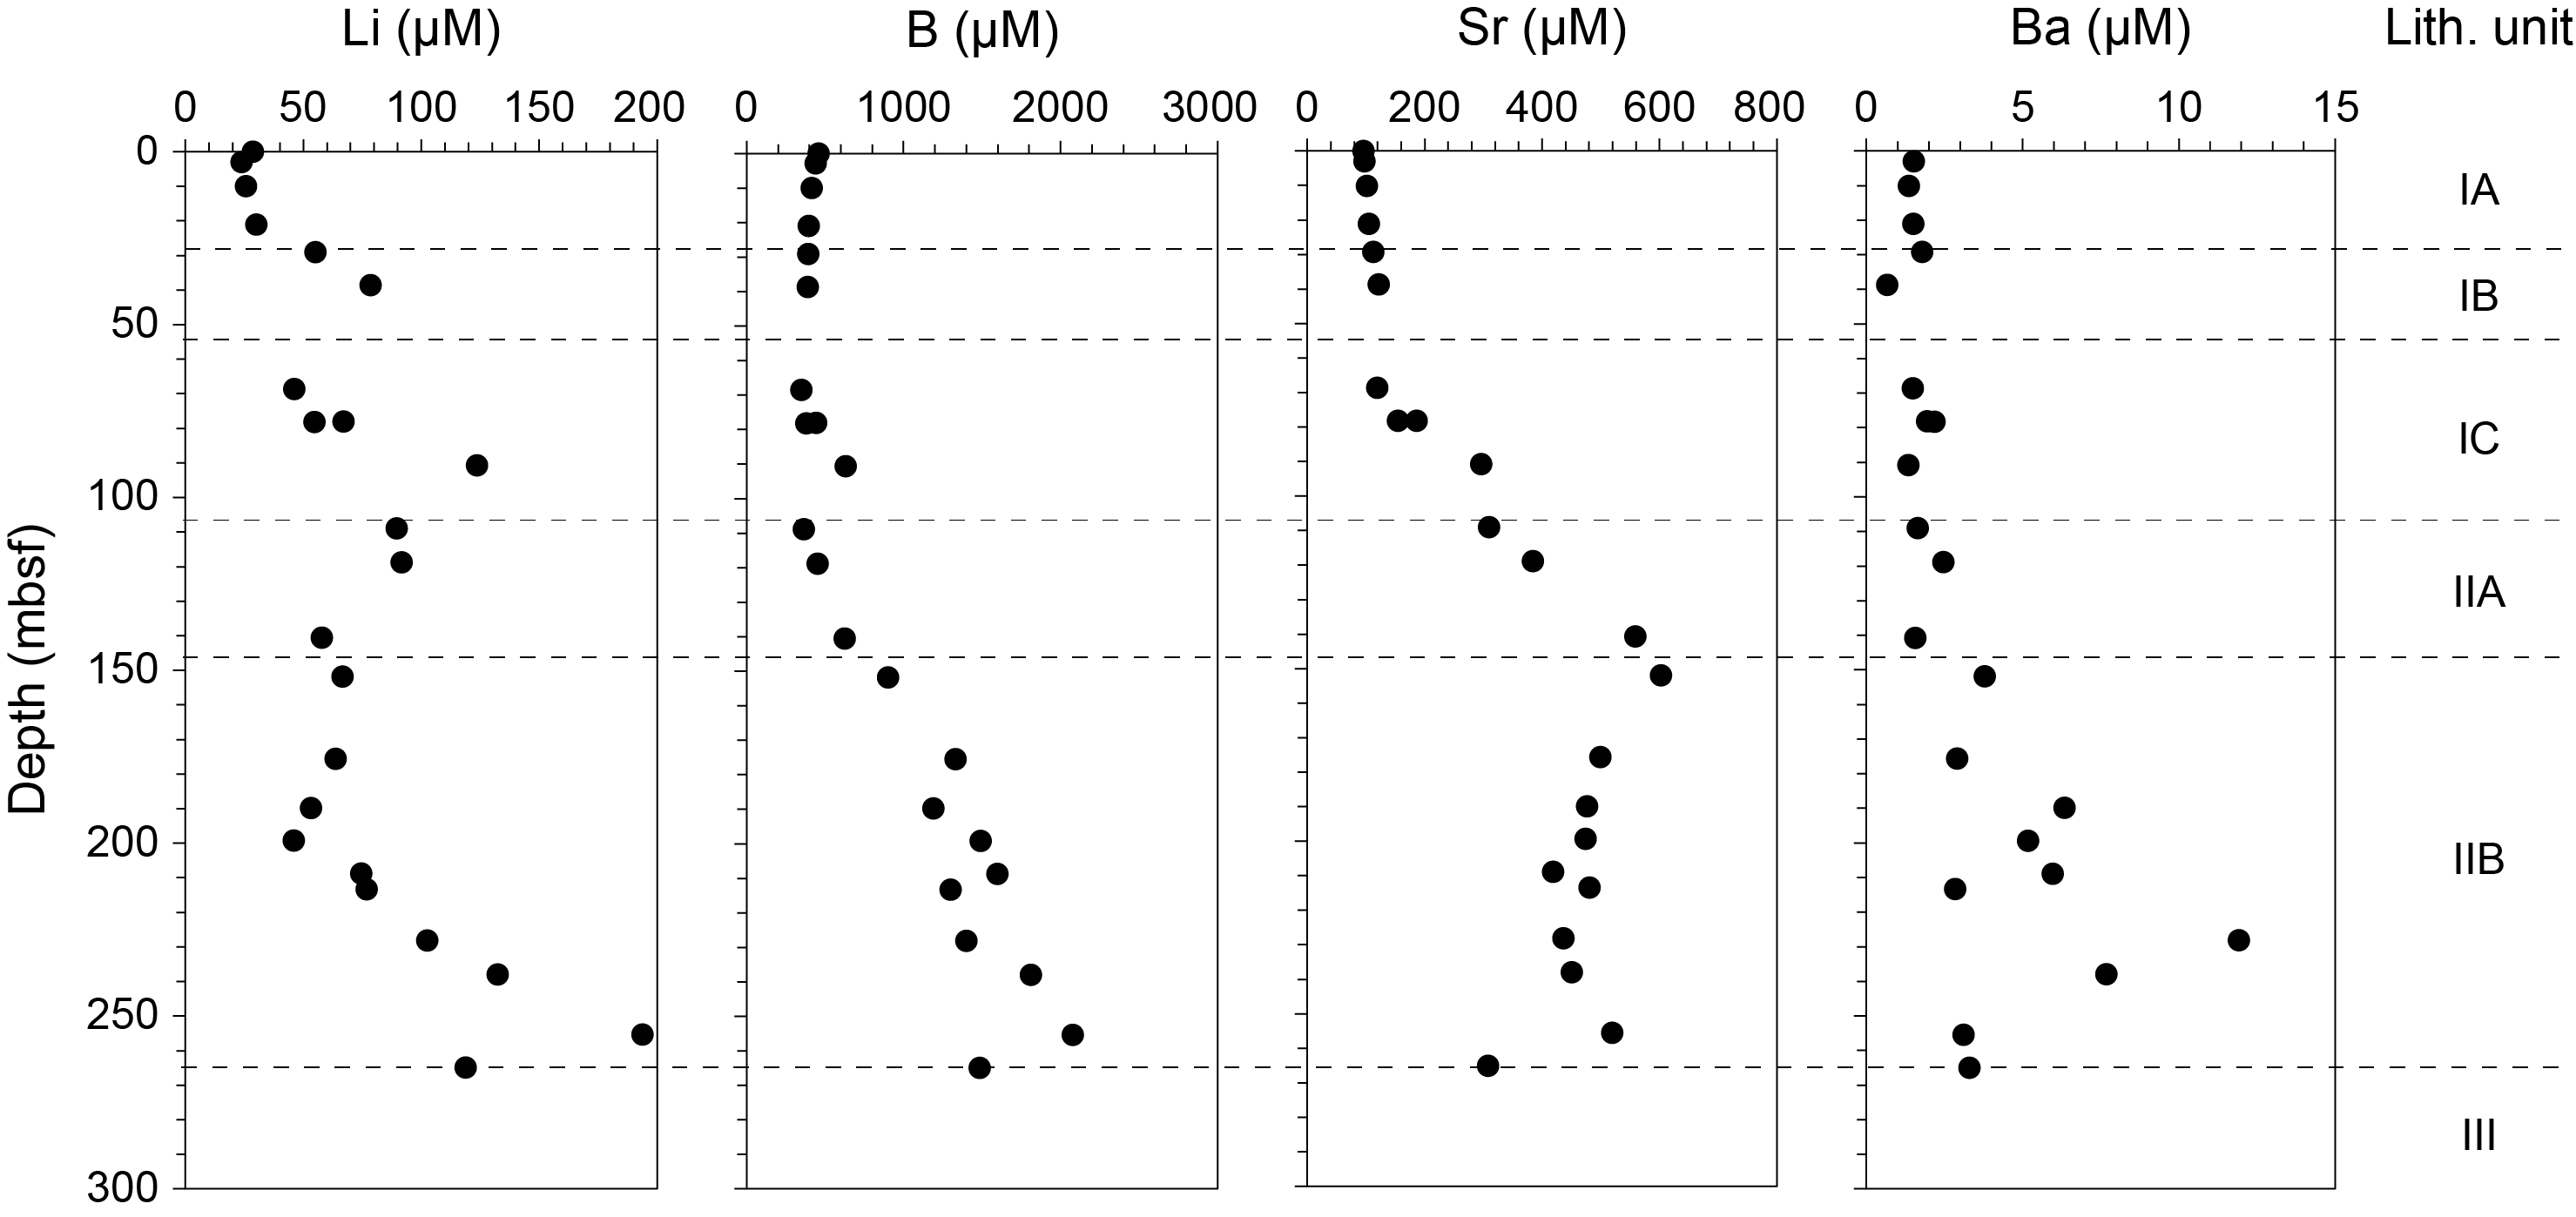
Figure F46. IW lithium, boron, strontium, and barium.
The concentrations of iron (Fe = Fe2+ + Fe3+) and manganese (Mn = Mn2+ + Mn4+) range from undetectable to 15.6 µM and undetectable to 82.5 µM, respectively. The highest concentrations occur near the seafloor for both of these elements and could be due to biologically mediated reactions such as organic matter mineralization using (oxy)hydroxides (Jørgensen, 2000), oxidation, and solubilization of metal sulfides (Jørgensen et al., 2004).
8.1.4. Sulfate, nutrients, and sulfide
The sulfate (SO42−) concentration is highest near the seafloor at 31.9 mM, which is similar to the reported value for the bottom seawater in the eastern Mediterranean Sea (Haese et al., 2003; Werne et al., 2004). It shows a continuous decreasing trend to a minimum of 4.4 mM at 228.1 mbsf, probably resulting from bacterially mediated sulfate reduction (Figure F47). The highest alkalinity value at 21.0 mbsf, the NH4+ maximum of 1164 µM at 68.6 mbsf, and the PO43− maximum of 10.8 µM at 21.0 mbsf also argue for biogenic oxidation of organic matter (Figure F47; Table T5). Because PO43− is preferentially released during degradation of organic matter, the maximum concentration of PO43− occurs at a shallower depth than the NH4+ maximum (Gieskes, 1983). At the bottom of the cored interval, the sulfate content increases again to 16.5 mM (Figure F47), indicating a deeper source of this component and probably a possible influence of hydrothermal fluids at this depth.
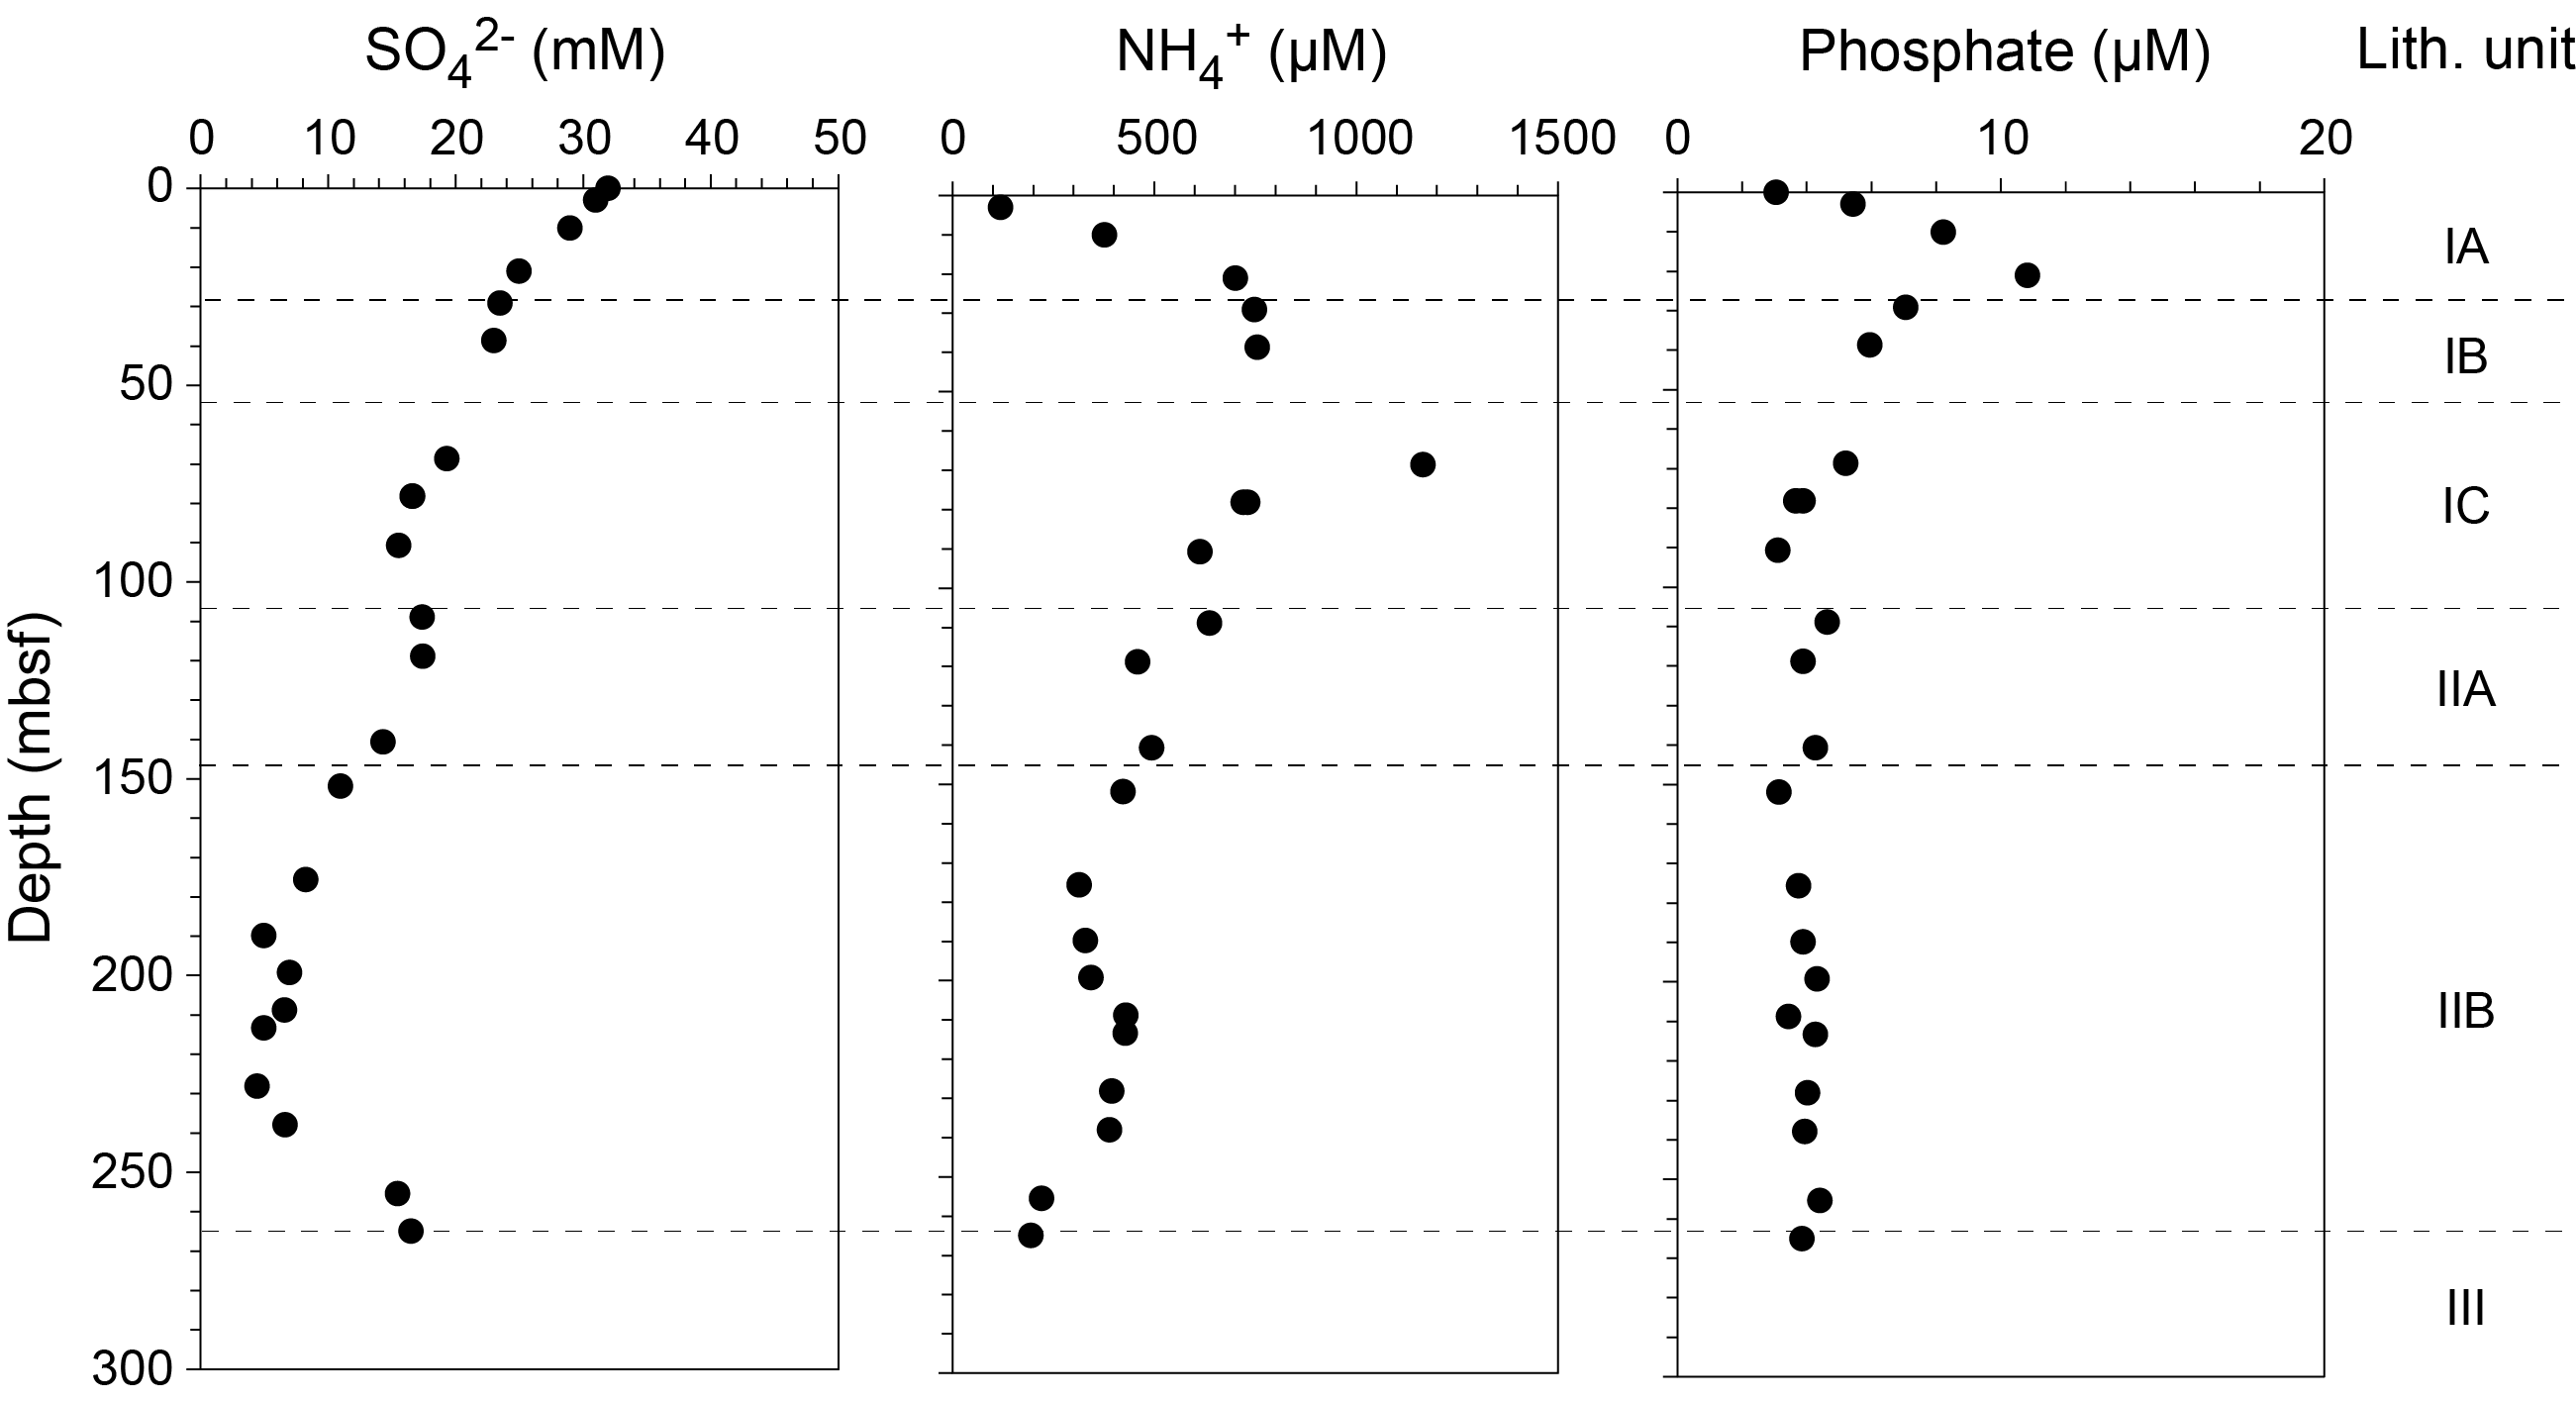
Figure F47. IW sulfate, ammonium, and phosphate.
Sulfide concentration (ΣH2S = S2 + HS− + H2S; Table T5) is low and ranges 0.1–0.6 µM. The highest value of sulfide coincides with the maximum of NH4+ at 68.6 mbsf in Lithostratigraphic Subunit IC, which consists of sandy silt, silt, sand, and volcaniclastic gravel layer.
8.2. Organic geochemistry
Solid-phase sediment samples were analyzed to determine (1) the percent by weight of calcium carbonate (CaCO3); (2) the percent of total carbonate (including both calcium carbonates and other carbonate phases); (3) the percent of total organic matter; and (4) TOC, total nitrogen (TN), and total sulfur (TS). Sediment samples were only collected from Hole U1614A. Samples analyzed included 22 squeeze cakes and an additional 25 samples selected by the core description team from the sediment lithologies of interest. For Hole U1614A, organic geochemists also performed sampling and analysis of 31 gas samples, with one headspace gas sample from Cores 1H–35G (excluding Cores 11F, 13F, and 31X) to monitor C1–C6 hydrocarbons in accordance with the standard safety protocol during drilling (Pimmel and Claypool, 2001).
8.2.1. Carbonates
Table T6 and Figure F48 show results obtained for CaCO3 content and percentage of total carbonate contents. CaCO3 contents of the bulk sediments from Hole U1614A vary from 0.4 to 77.8 wt% and are lithology dependent (see Lithostratigraphy). The average CaCO3 content is 20.3 ± 10.7 wt% in Unit I (23.9 ± 9.1 wt% in Subunit IA, 6.9 ± 5.4 wt% in Subunit IB, and 21.7 ± 10.8 wt% in Subunit IC), 18.6 ± 14.6 wt% in Unit II (5.7 ± 3.7 wt% in Subunit IIA and 21.3 ± 14.6 wt% in Subunit IIB), and 77.8 wt% in Unit III. The lowest CaCO3 contents occur in layers associated with volcaniclastic materials such as volcaniclastic-rich gravel (CaCO3 = 3.0 wt%; 38.7 mbsf; Subunit IB), volcaniclastic-rich unconsolidated breccia and tuff (CaCO3 = 3.5–3.8 wt%; 108.9–118.9 mbsf; Subunit IIA), and lapilli (CaCO3 = 0.4 wt%; 255.4 mbsf; Subunit IIB). CaCO3 contents higher than the mean value of 21.2 ± 16.3 wt% are observed in nannofossil-rich silt with sand (CaCO3 = 39.6 wt%; 3.0 mbsf; Subunit IA), silty-rich nannofossil ooze (CaCO3 = 37.6 wt%; 175.0 mbsf; Subunit IIB), nannofossil ooze with foraminifera (CaCO3 = 48.7 wt%; 199.3 mbsf; Subunit IIB), and dolomite (CaCO3 = 77.8 wt%; 165.0 mbsf; Unit III). Compared to the CaCO3 contents, the percentage of total carbonate content shows higher values, ranging from 5.7% (Core 402-U1614A-5H-3; 38.5 mbsf; Subunit IB) to 77.9% (Core 33X-3; 265.0 mbsf; Unit III), due to the presence of carbonates other than calcium carbonates. XRD patterns show that the d(104) values of calcite vary in the range 3.037–2.885 Å; a low-Mg calcite group, mostly from calcite of pelagic or detrital sediment, is predominant between 3.037 and 3.032 Å, containing 0 to 1% mole fraction of MgCO3 (Goldsmith et al., 1958); and a high-Mg calcite group, probably authigenic, predominates in the range 3.012–2.983 Å, containing 8%–17% mole fraction of MgCO3. Two groups of dolomite are identified: one group, characterized by d(104) values between 2.900 and 2.885 Å, is considered to be near stoichiometric dolomite; the second group, with d(104) values between 2.925 and 2.902 Å, corresponds to dolomites in which some Mg2+ is substituted by larger cations such as Fe2+ or Ca2+. Using both XRD data and percentage of total carbonate contents, low-Mg calcite is the dominant carbonate phase occurring in the sediments between 2.1 and 228.1 mbsf in Hole U1614A, most probably originating from biogenic precipitation (Figure F48; Table T6). In this depth interval, low-Mg calcite is associated with minor amounts of high-Mg calcite (0.0%–3.6%), Fe- and/or Ca-rich dolomite (0.0%–15.2%), and stoichiometric dolomite (0.0%–7.2%). At 255.4 and 265.0 mbsf, Fe- and/or Ca-rich dolomite is the only carbonate phase identified.
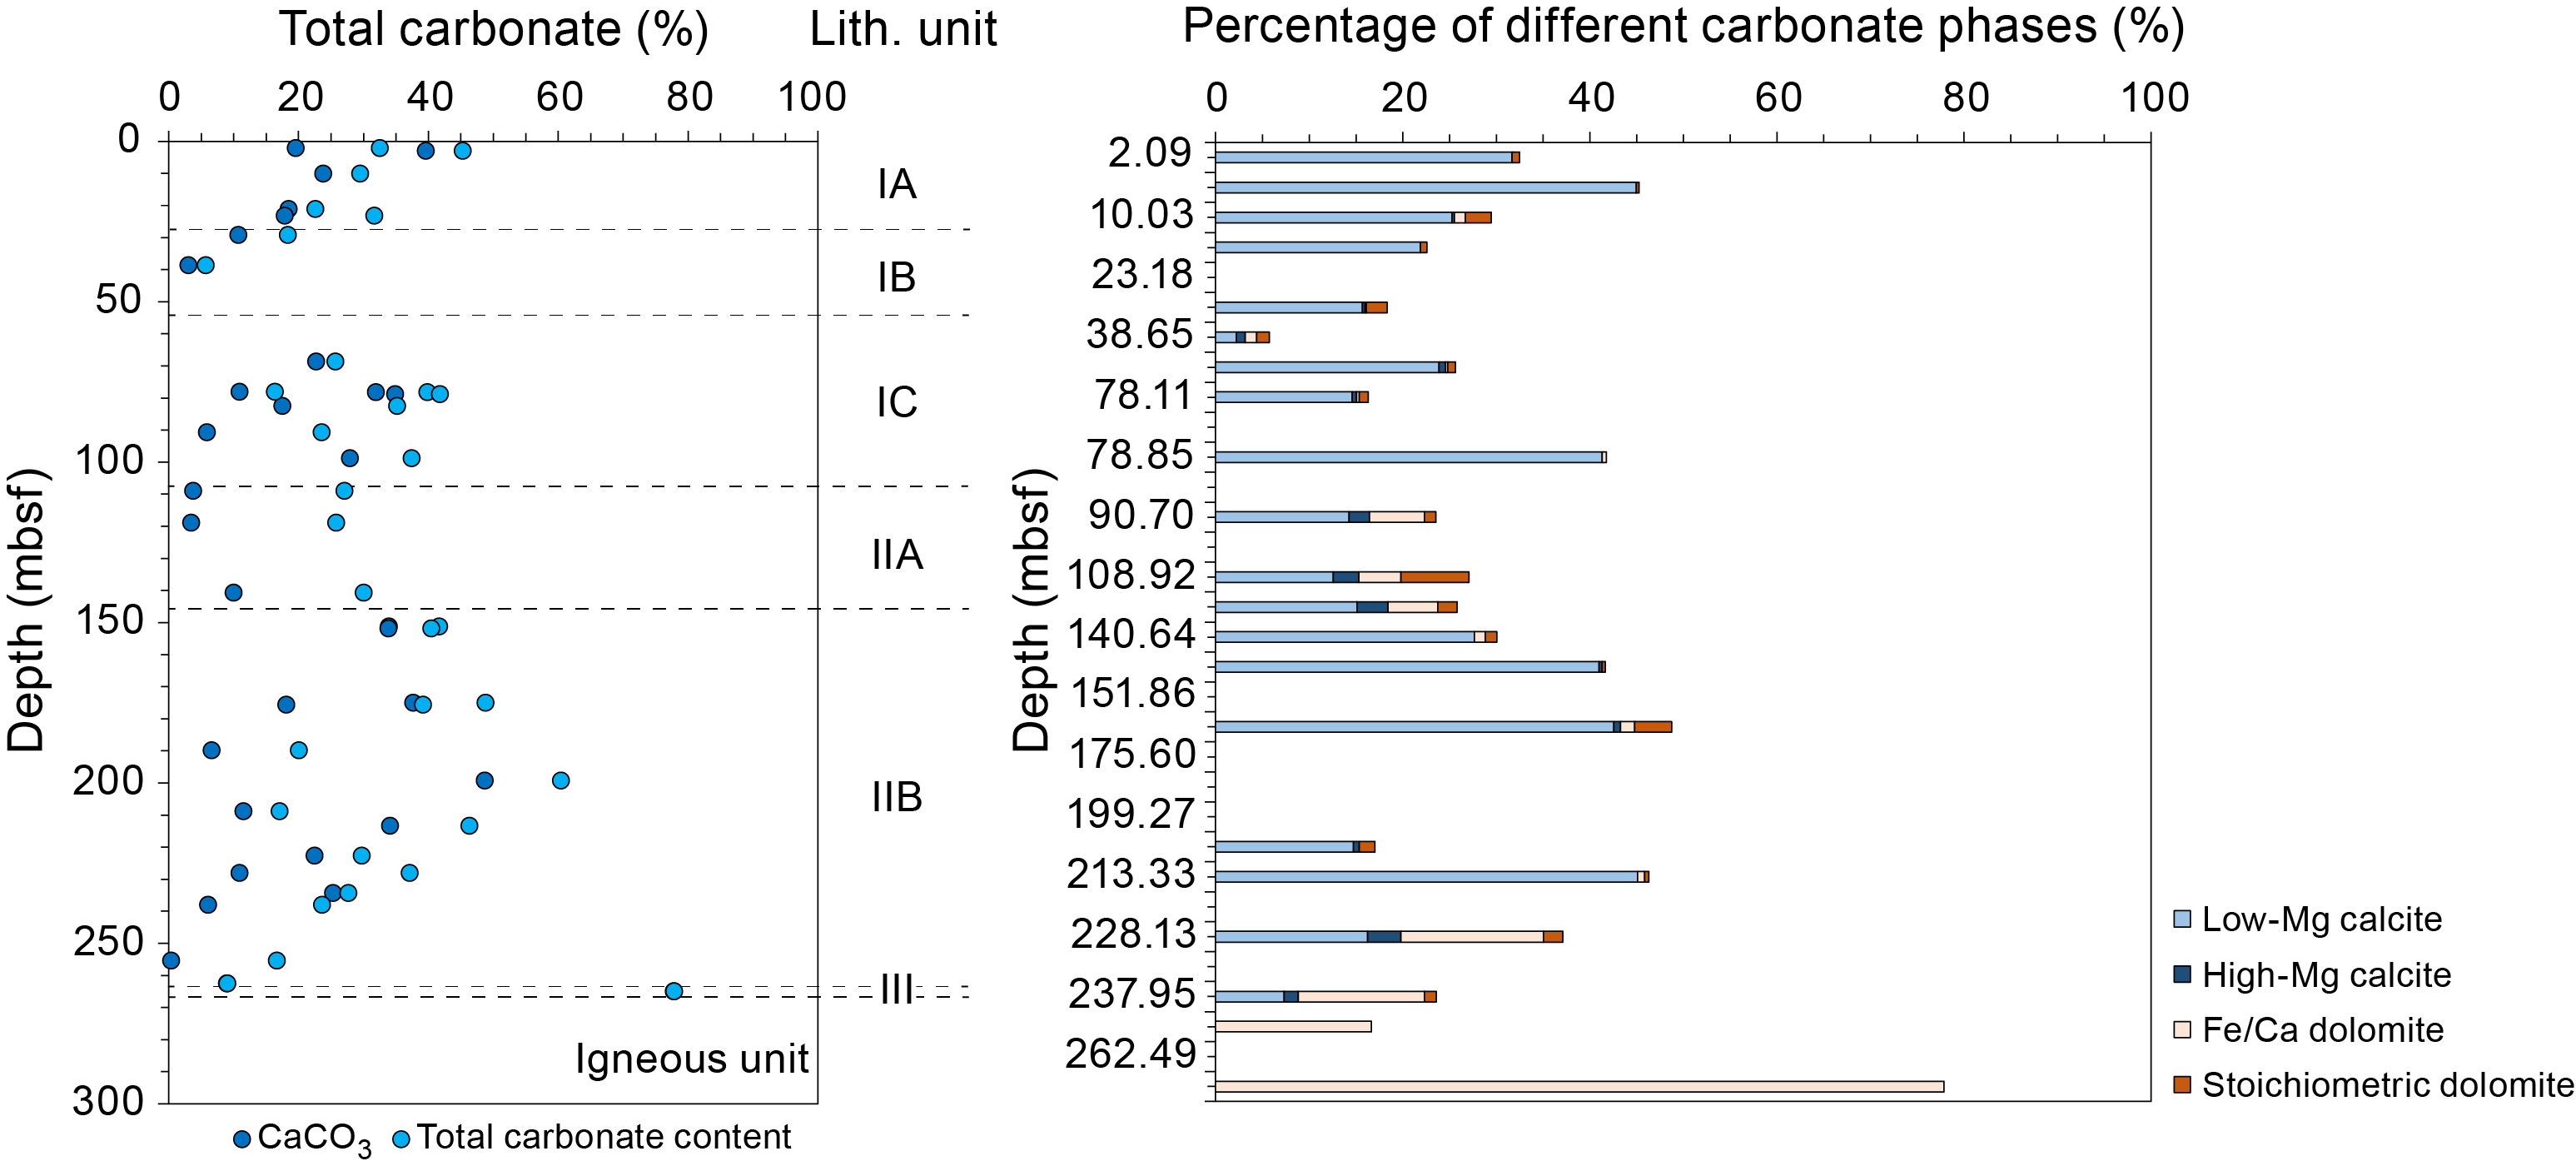
Figure F48. Carbonate and carbonate phases.
8.2.2. Total organic matter, organic carbon, nitrogen, and sulfur in solid-phase samples
Data for total organic matter, TOC, TN, and TS in solid-phase samples are shown in Table T7 and Figure F49. The percentage of total organic matter varies from 3.1% to 17.3%. The mean value is 9.0 ± 4.2% in Unit I (10.6 ± 4.1% in Subunit IA, 4.0 ± 1.4% in Subunit IB, and 9.3 ± 4.0% in Subunit IC), 10.1 ± 2.8% in Unit II (10.7 ± 3.5% in Subunit IIA and 9.9 ± 2.8% in Subunit IIB) and 5.7% in Unit III. TOC levels vary from undetectable to 2.50 wt% with a mean value of 0.3 ± 0.5 wt%. Although a higher mean TOC value is observed in Subunits IA (0.4 ± 0.1 wt%) and IC (0.4 ± 0.1 wt%), a lower mean TOC value occurs in Subunits IB (0.1 ± 0.1 wt%) and IIA (0.1 ± 0.1 wt%). Sediments from Subunit IIB exhibit greater variations in TOC content, ranging from undetectable in layers associated with volcaniclastic materials (at 189.8, 199.3, and 255.4 mbsf) to 2.50 wt% in a sandy silt layer (222.6 mbsf). TN values are low, ranging from less than 0.01 (silt sand/lapilli layers; 255.4 mbsf; Subunit IIB) to 0.21 wt% (sandy silt/mud with calcareous nannofossil layers; 222.6 mbsf; Subunit IIB) with a mean value of 0.08 ± 0.05 wt%. Although lower TN content occurs in Subunit IB (0.03 ± 0.01 wt%) and Unit III (0.004 wt%), Subunit IC exhibits a higher mean value of TN contents (0.10 ± 0.04 wt%). TN values greater than 0.13 wt% are present at 78.1 mbsf (Subunit IC; nannofossil-rich silt/medium sand with volcaniclastic layers), 140.6 mbsf (Subunit IIA; foraminifera-nannofossil-rich silt), 189.8 mbsf (Subunit IIB; nannofossil ooze with volcaniclastics), and 222.6 mbsf (Subunit IIB; sandy silt/mud with calcareous nannofossils). Because higher TOC and TN values do not always occur in the same layers, a weak linear positive correlation between these two geochemical parameters is observed (R2 = 0.3209), and a slightly positive intercept of this correlation with a value of 0.0702 reveals the presence of a non-negligible amount of inorganic nitrogen in sediments (Goñi et al., 1998) (Figure F50). Atomic TOC/TN ratios range 0.1–13.9 with a mean value of 4.4 ± 3.4. Most sediment samples show an atomic TOC/TN value less than 5, resulting from the occurrence of inorganic nitrogen bound to surface mineral particles (Faganeli et al., 1991). Atomic TOC/TN ratios of 12.4 and 13.9 are measured at 29.3 mbsf (Subunit IB; silt/sandy layers) and 222.6 mbsf (Subunit IIB; sandy silt/mud with calcareous nannofossils), respectively, indicating higher inputs of marine-derived organic matter (Meyers, 1994) and/or preferential remineralization of N relative to C during organic matter diagenesis (Goldman et al., 1987; Hopkinson et al., 1997). The TS content varies from undetectable to 2.4 wt%, with the highest value observed at 222.6 mbsf, coinciding with the highest TOC and TN levels.
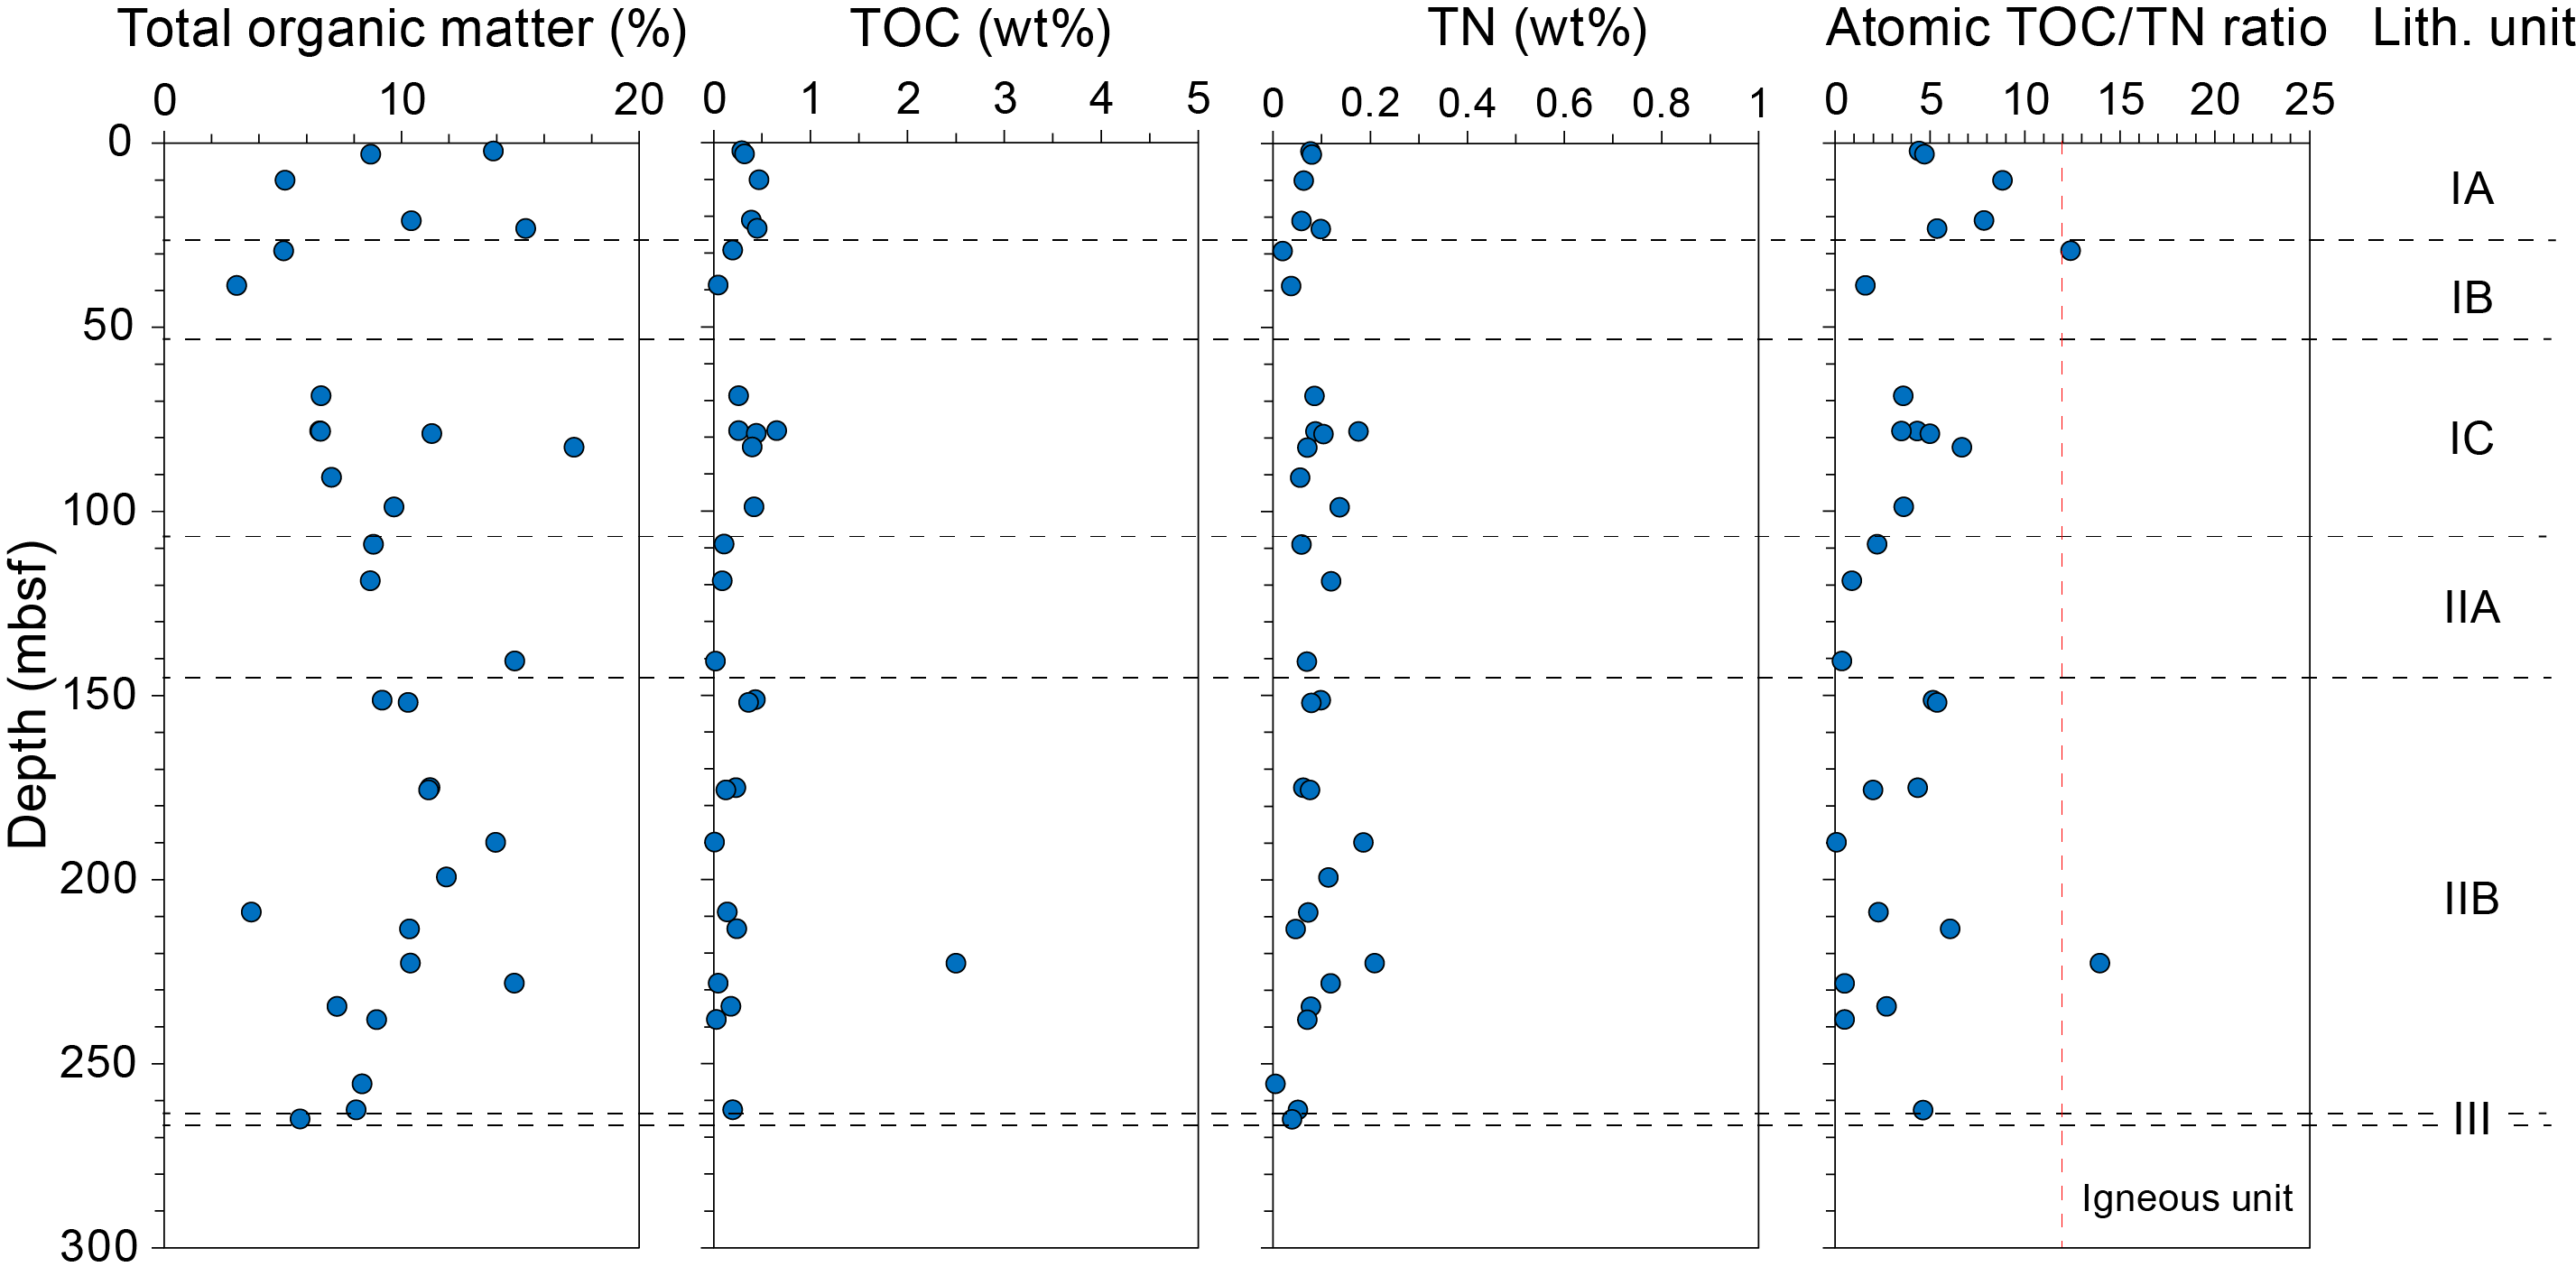
Figure F49. Total organic matter, TOC, TN, and atomic TOC/TN ratio.
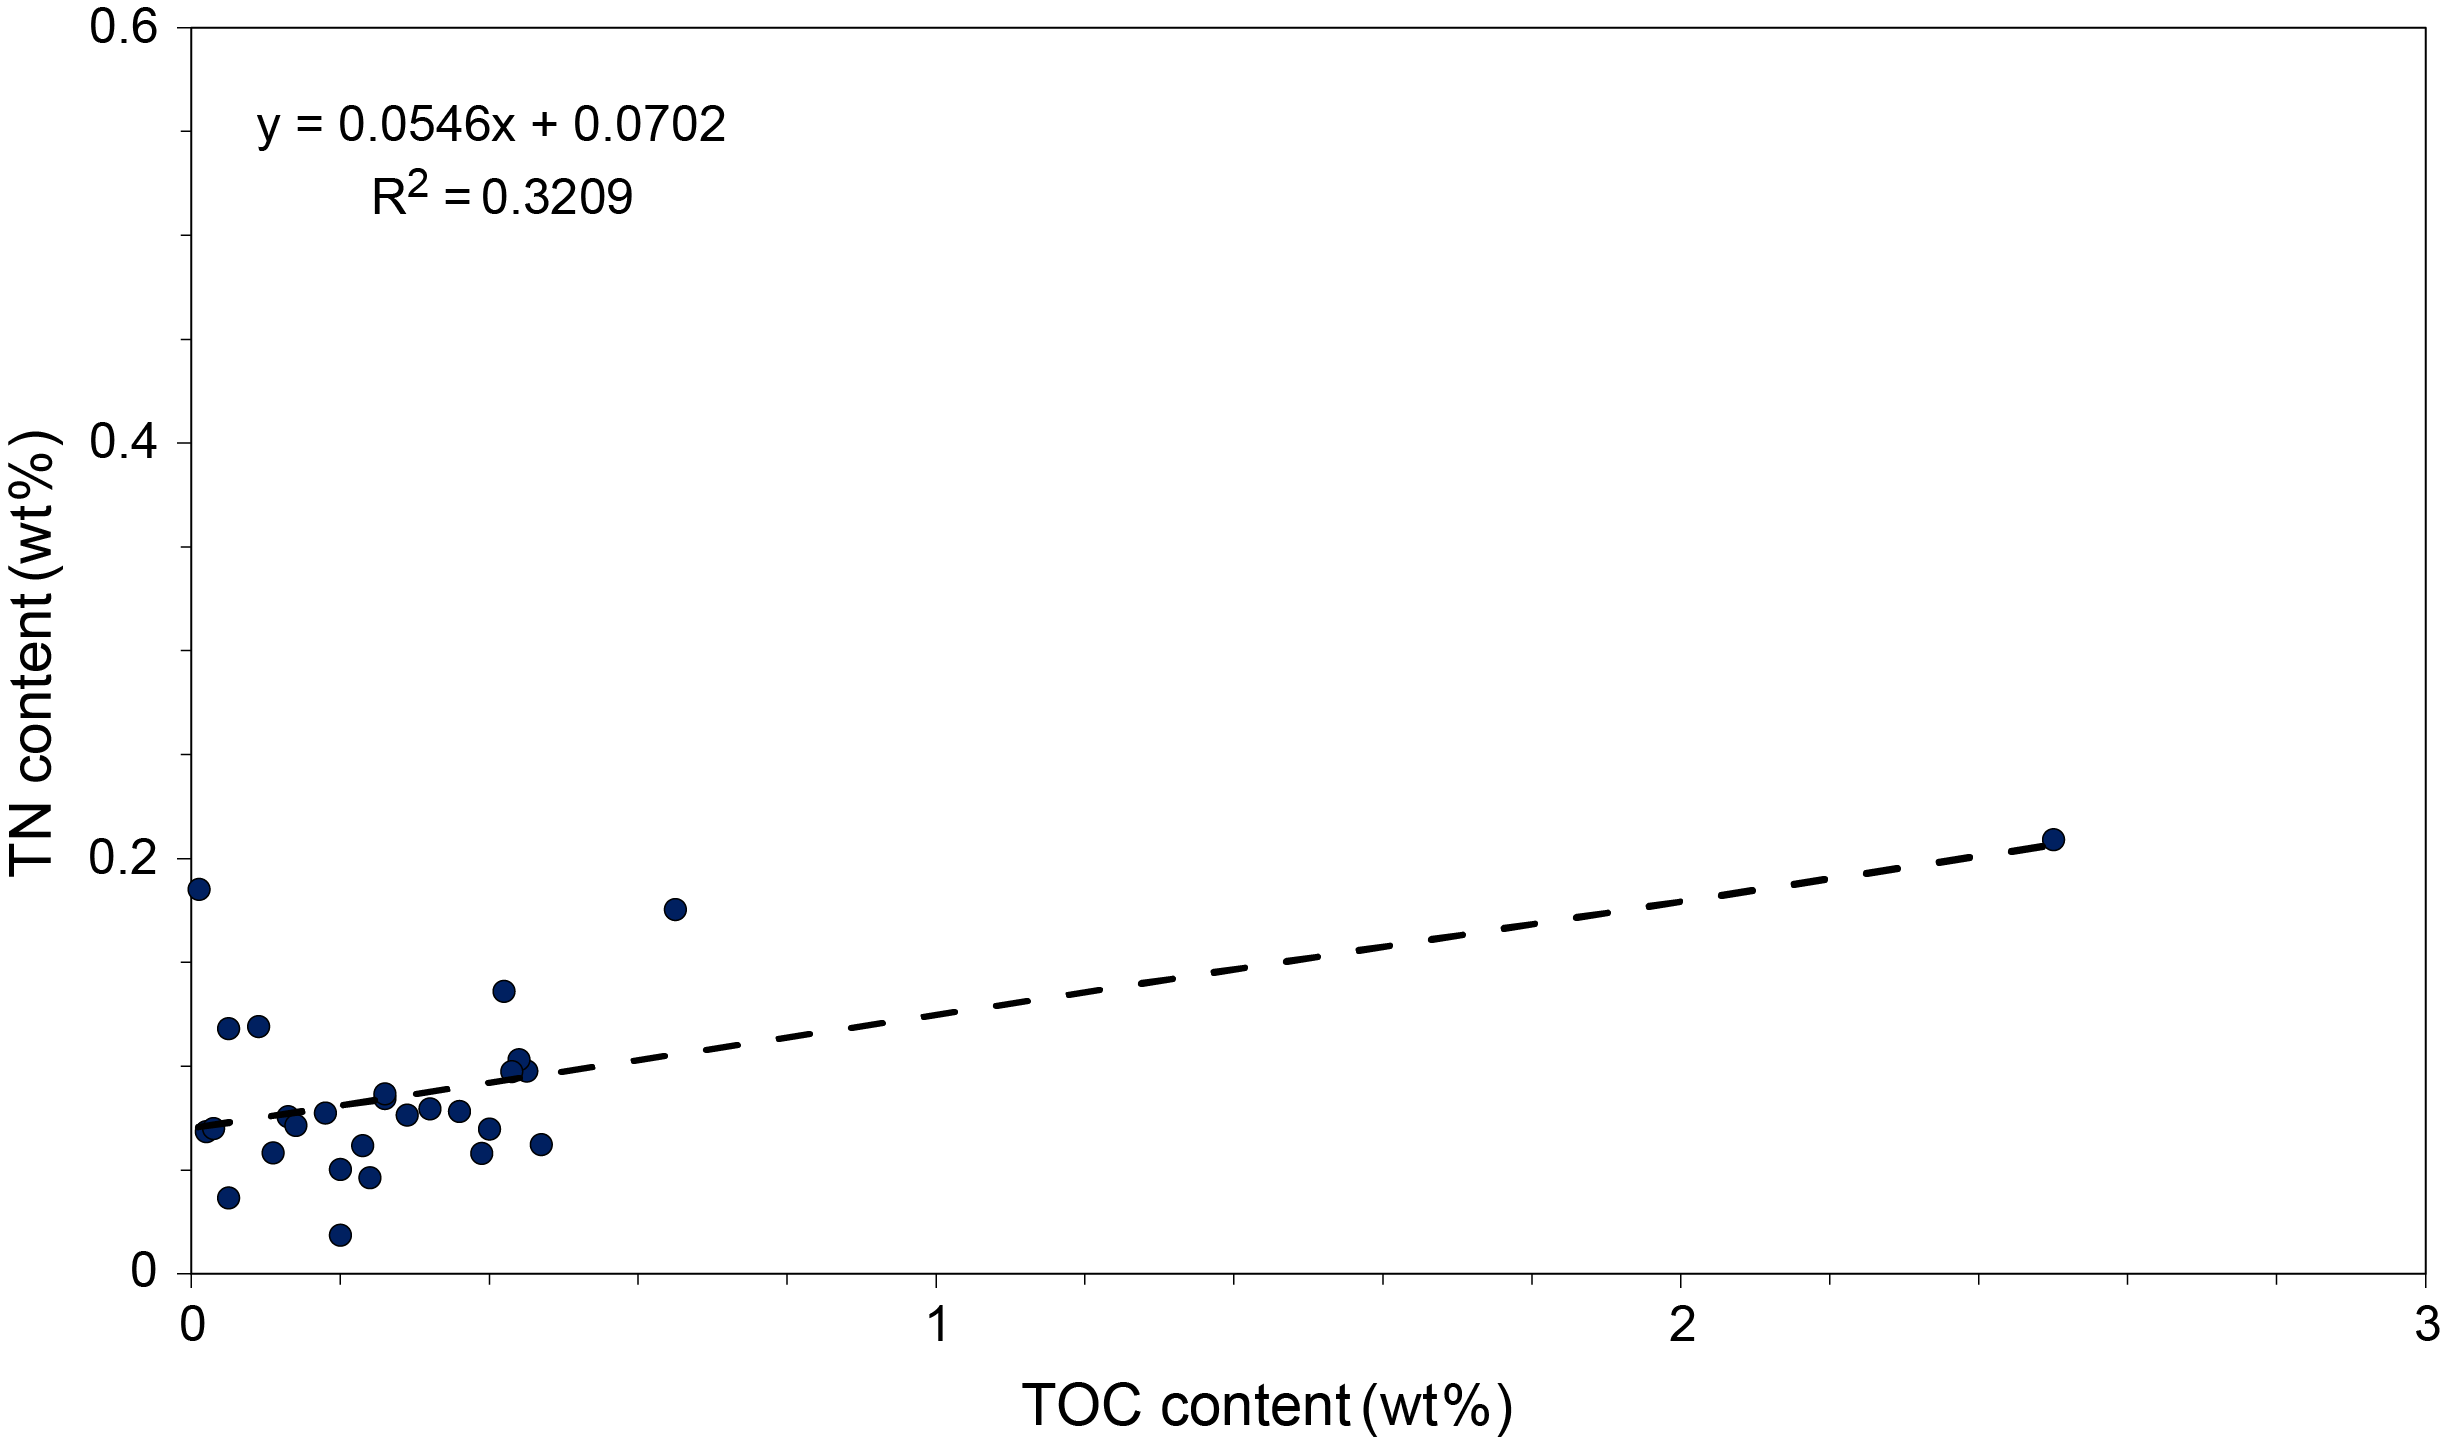
Figure F50. TOC and TN.
8.2.3. Major, minor, and trace element content of sediments
A total of 22 IW squeeze cakes and their adjacent 18 core section intervals in the same section halves were analyzed with pXRF and inductively coupled plasma–atomic emission spectrometry (ICP-AES). Scans of four section halves (402-U1614A-5H-3, 13F-1, 20X-3, and 25X-4) are not reported because of low analytical totals, generally due to an uneven surface caused by coarse grains of sediments. The corrected and raw values for these analyses are shown in Tables T8 and T9, respectively. One selected sediment sample above the contact with the underlying lherzolite in Hole U1614A was subjected to loss on ignition (LOI) and was analyzed using ICP-AES (Table T10). The LOI value is 20.8 wt% (Table T10).
The sediments show gradual changes in the uppermost ~50 m in Hole U1614A, where K2O and Rb increase, whereas CaO, Ni, Cu, and Sr decrease downhole (Figure F51). The uppermost ~50 m is mainly composed of nannofossil-rich materials (see above). Between ~50 mbsf and the sediment/basement interface, all the elements and oxides show a high degree of scatter (Figure F51) where volcaniclastic/ash-rich materials are irregularly interbedded with nannofossil/foraminifera-rich materials.
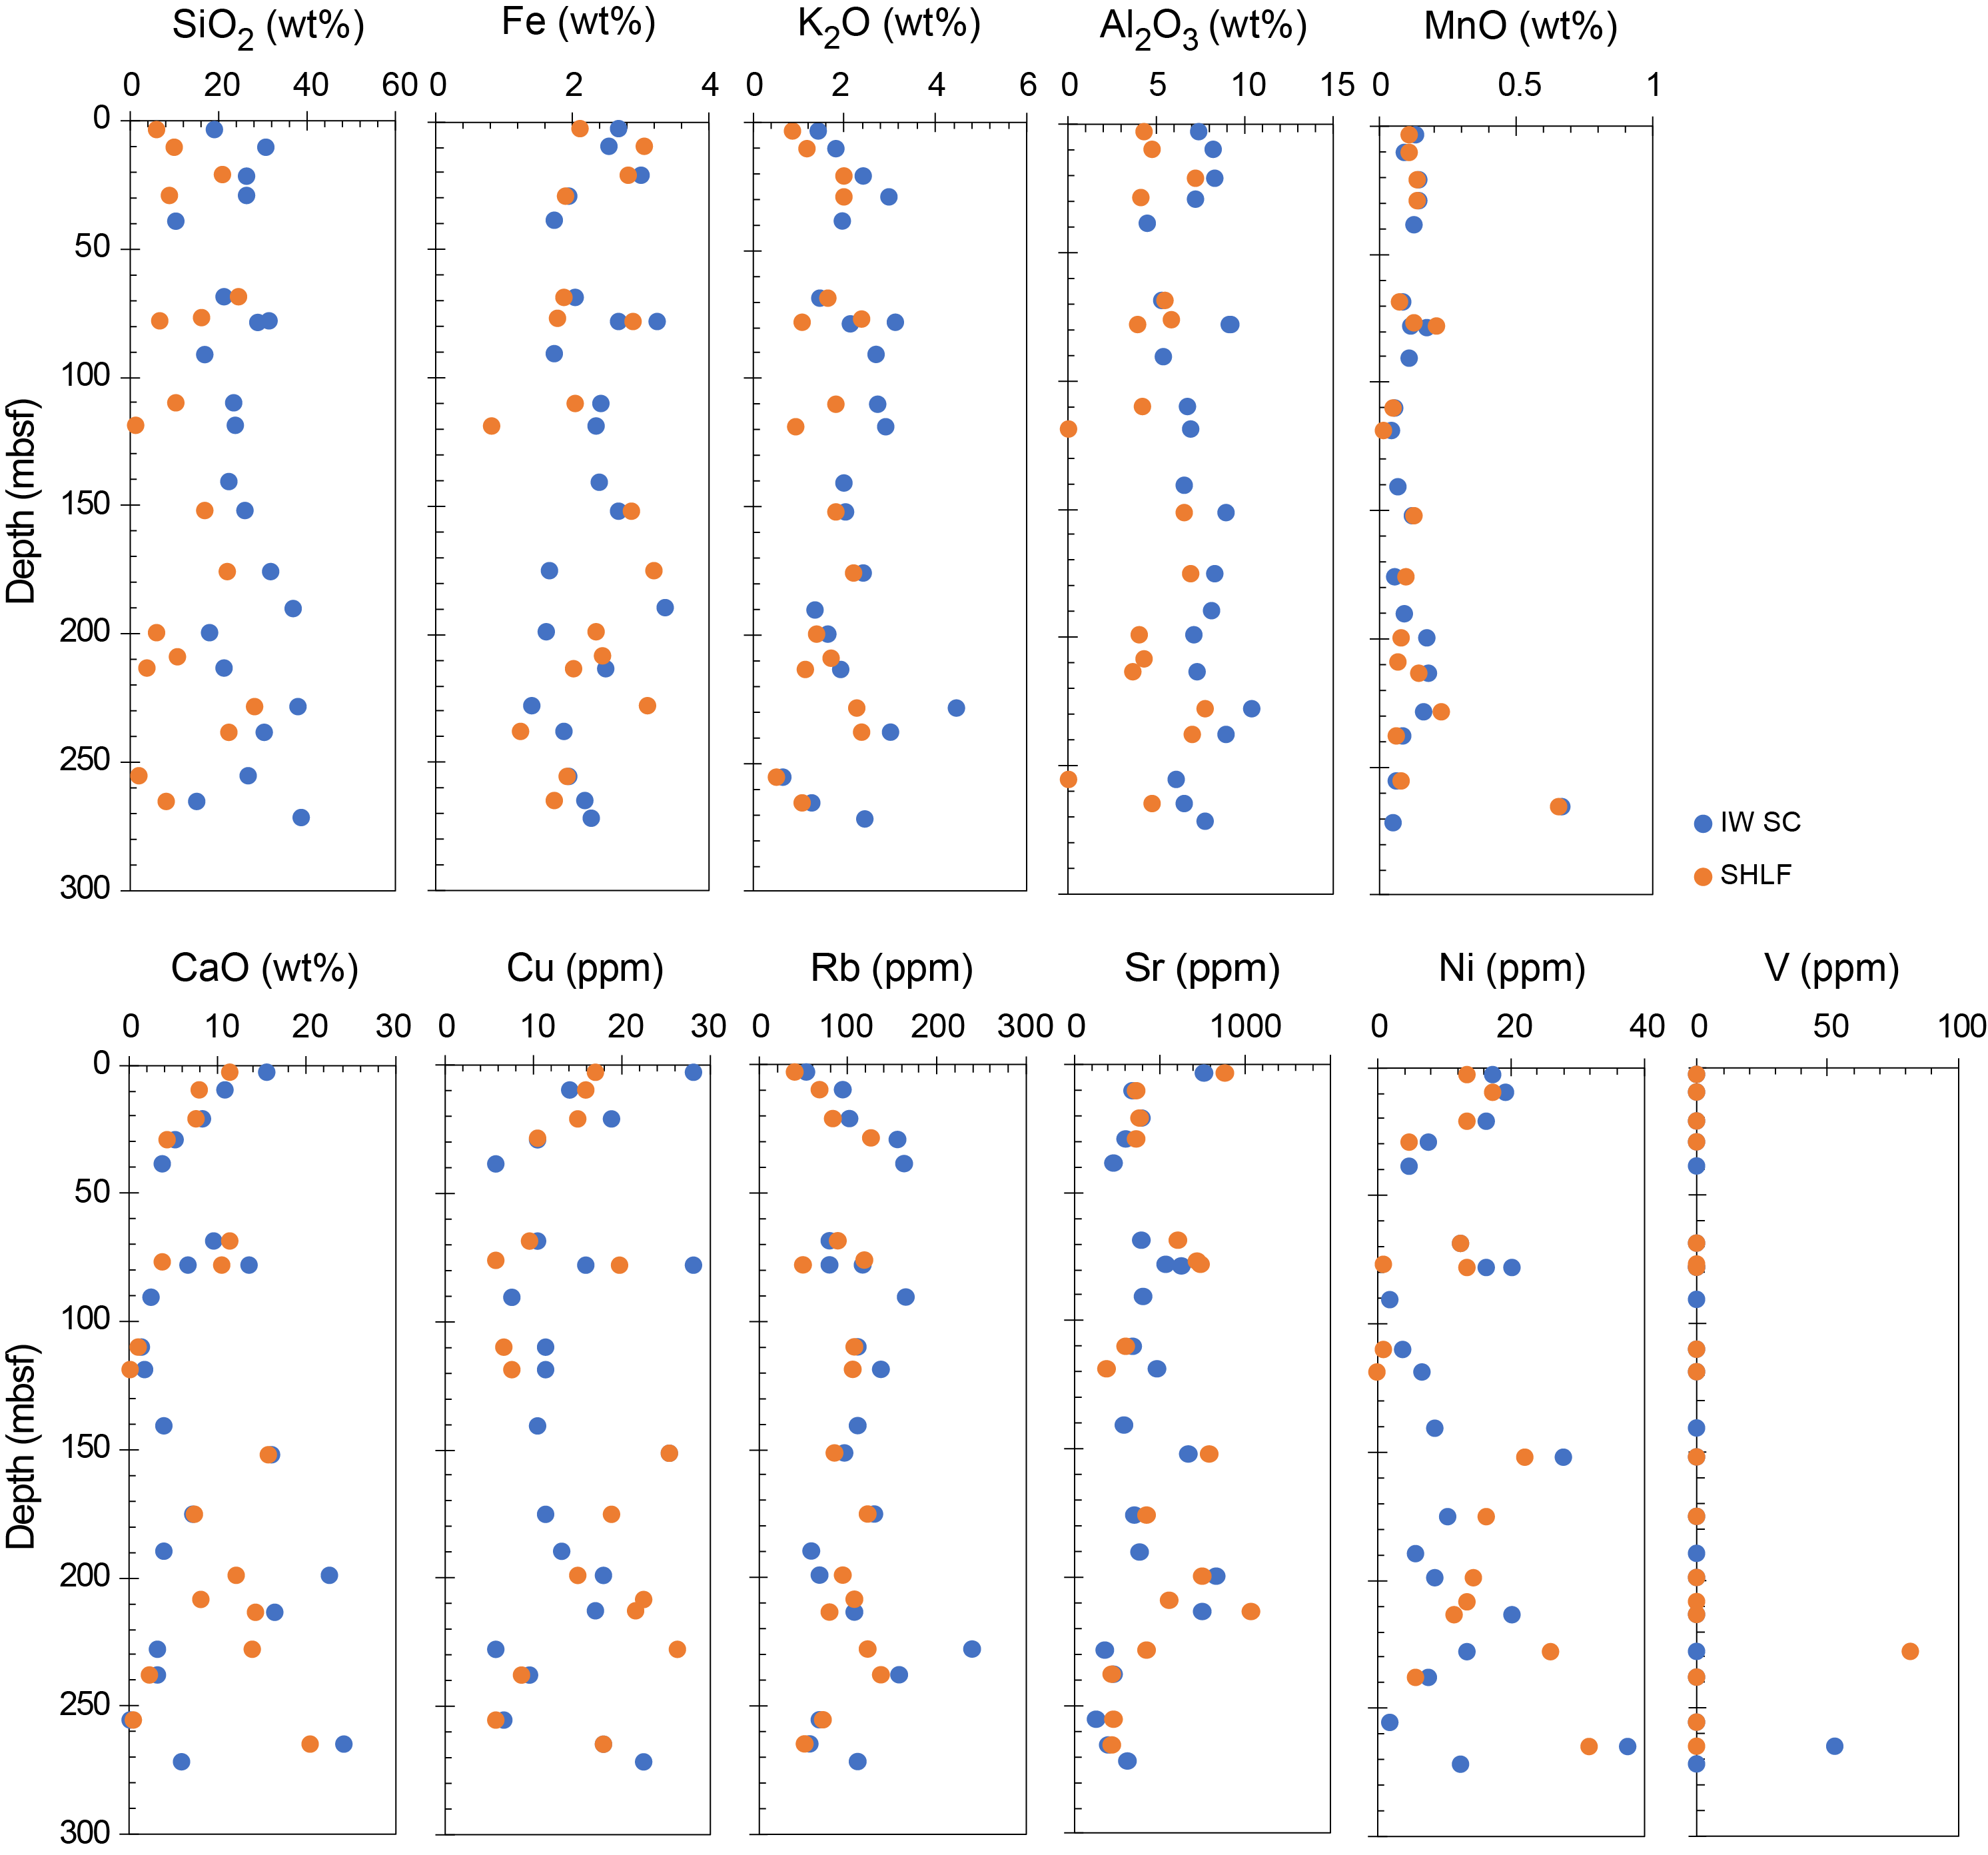
Figure F51. pXRF elemental concentration.
8.3. Headspace gas sample analysis
The concentration of each hydrocarbon gas is reported in parts per million by volume (Figure F52; Table T11). For Hole U1614A, the only hydrocarbon gas encountered in the headspace samples is methane (CH4), which is characterized by a concentration range of 0.1–49.6 ppmv. The CH4 concentration is relatively stable with a mean value of 1.1 ± 0.5 ppmv, except for three intervals (140.7–155.4, 174.4–208.8, and 228.2–271.0 mbsf) where higher concentrations are observed (mean values of 8.1 ± 2.4, 4.9 ± 0.7, and 20.7 ± 17.6 ppmv, respectively). The highest CH4 concentration (49.6 ppmv) is found in the dolomite of Unit III. Because C2–C6 hydrocarbon gases are absent in this hole, the C1/C2 and C1/C+ values are not calculated.
Figure F52. Dissolved methane concentrations.
9. Igneous geochemistry
Igneous rocks were recovered in 3 cores from Hole U1614A and 27 cores from Hole U1614C. Preliminary geochemical data were collected using pXRF on 2 intervals in 1 core from Hole U1614A and 85 intervals in 32 cores from Hole U1614C. Corrected and raw pXRF values are summarized in Tables T12 and T13, respectively.
Representative samples (1 from Hole U1614A and 36 from Hole U1614C) were collected from core sections, measured for LOI, and analyzed for major, minor, and trace element contents using ICP-AES; results are shown in Table T14. A total of 10 powdered samples previously measured using ICP-AES were also selected for analyses of calcium carbonate, total carbon, organic carbon, and total sulfur contents, and the results are listed in Table T15. Sampling intervals relative to section halves for pXRF and ICP-AES analyses are shown in Figures F53 and F54, respectively.
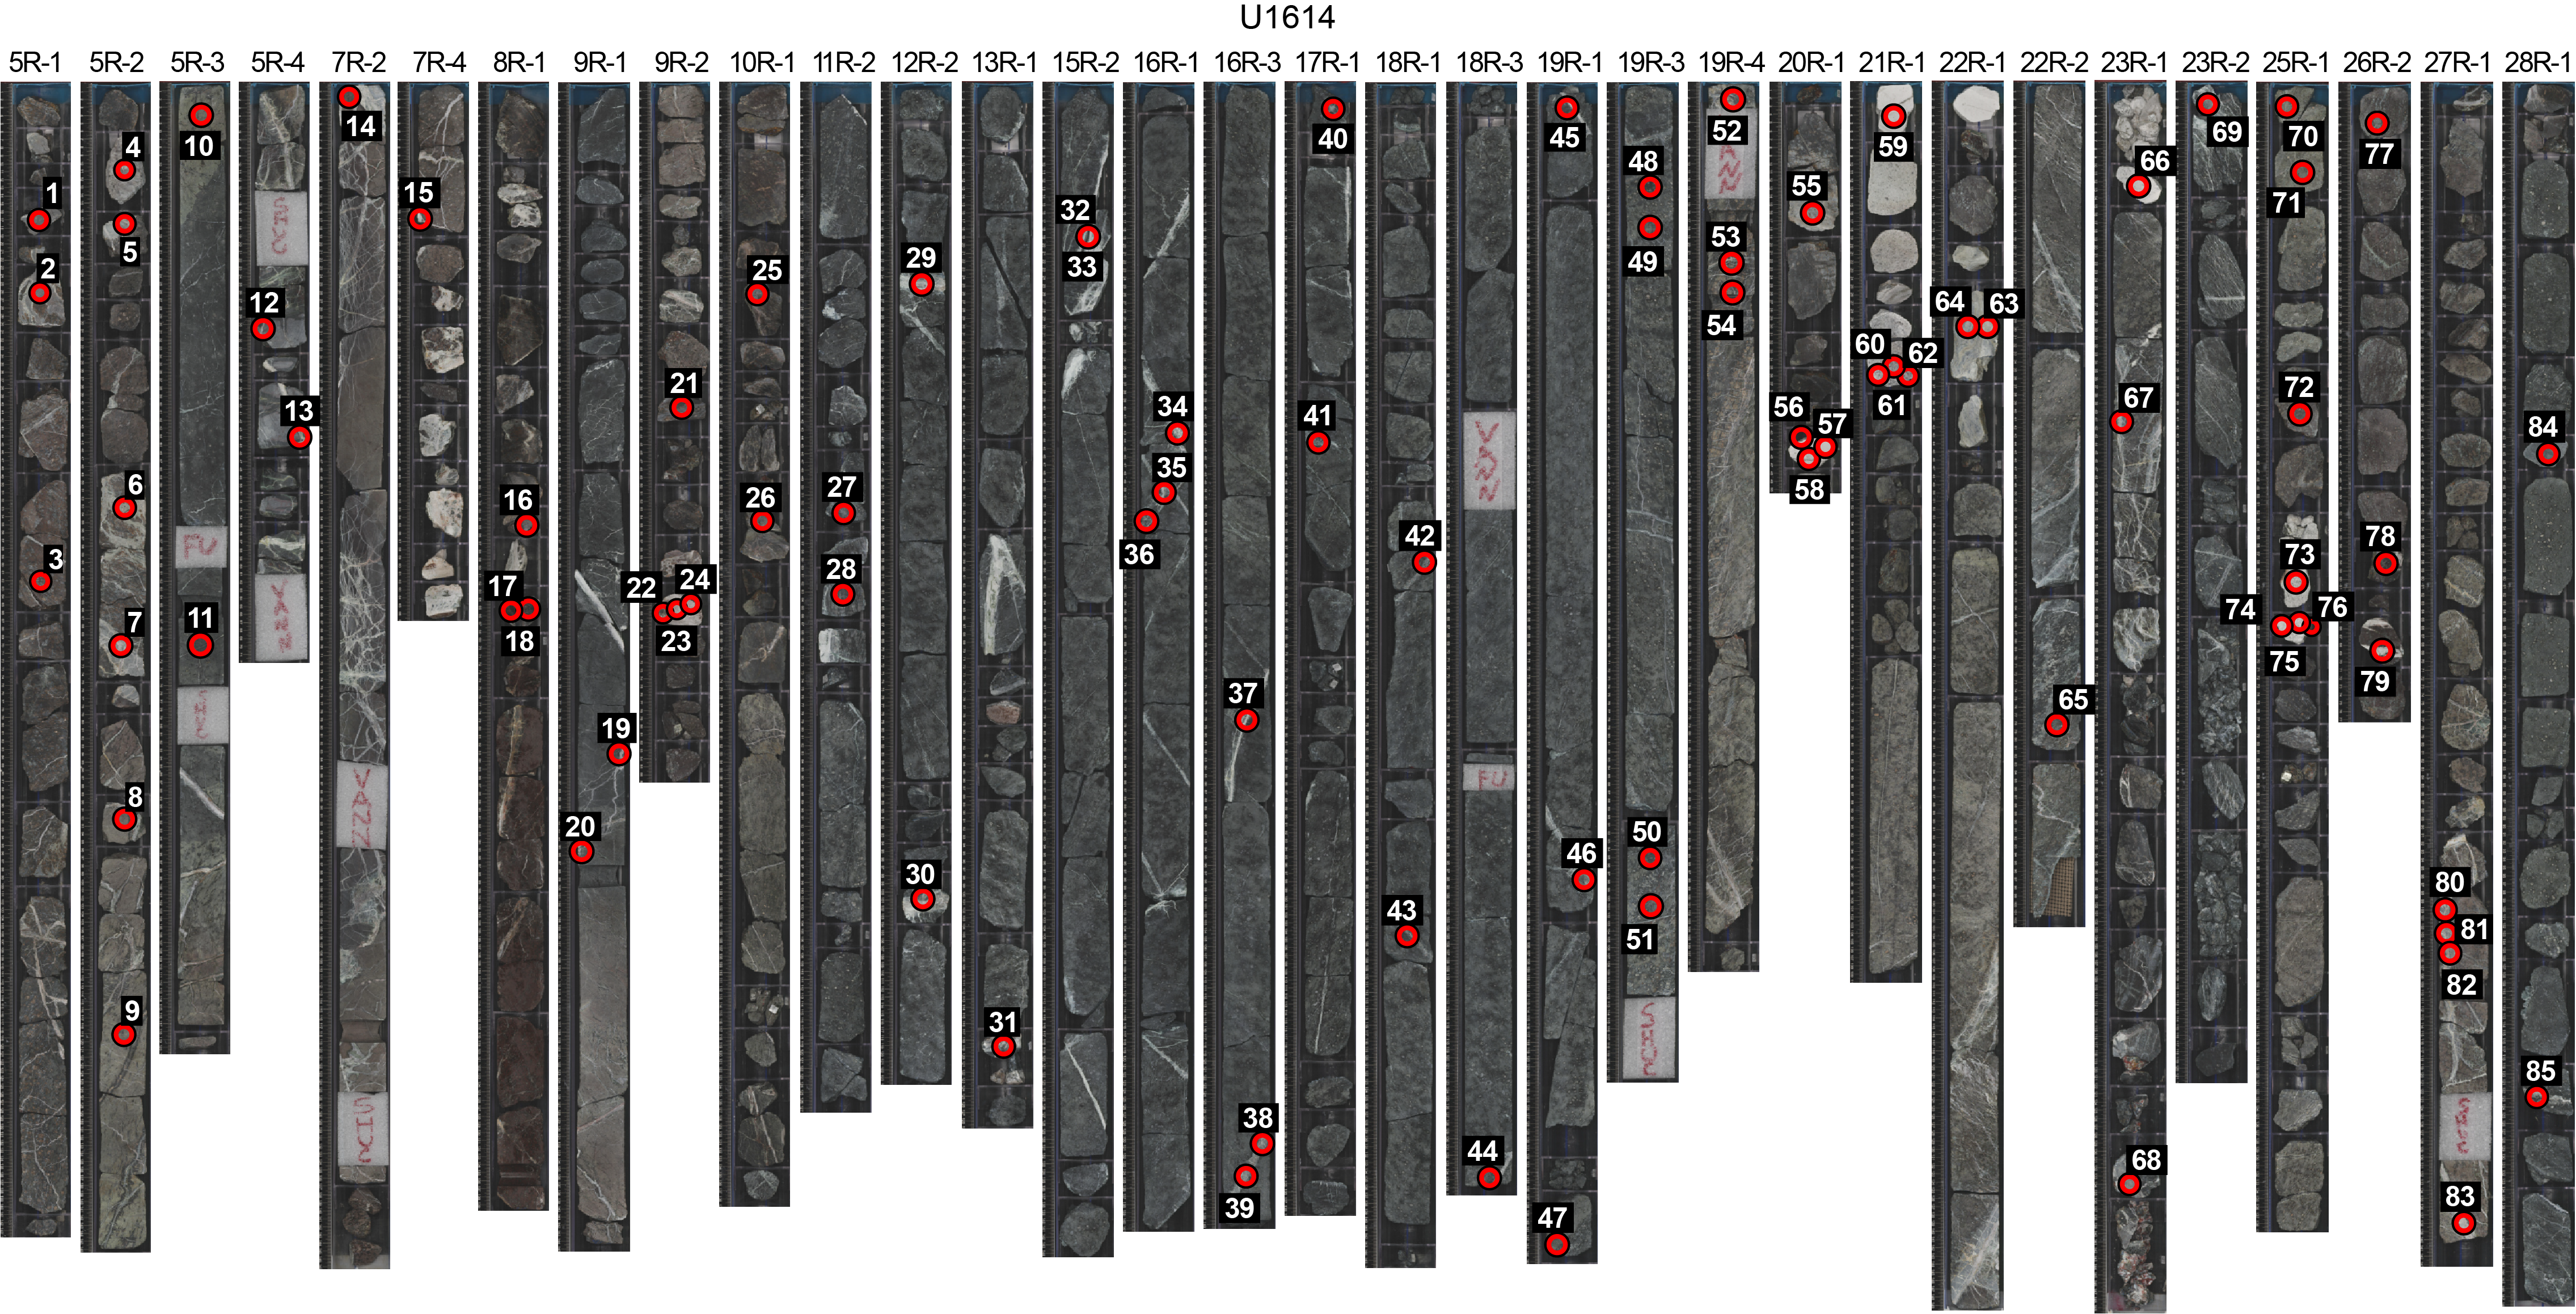
Figure F53. pXRF samples.
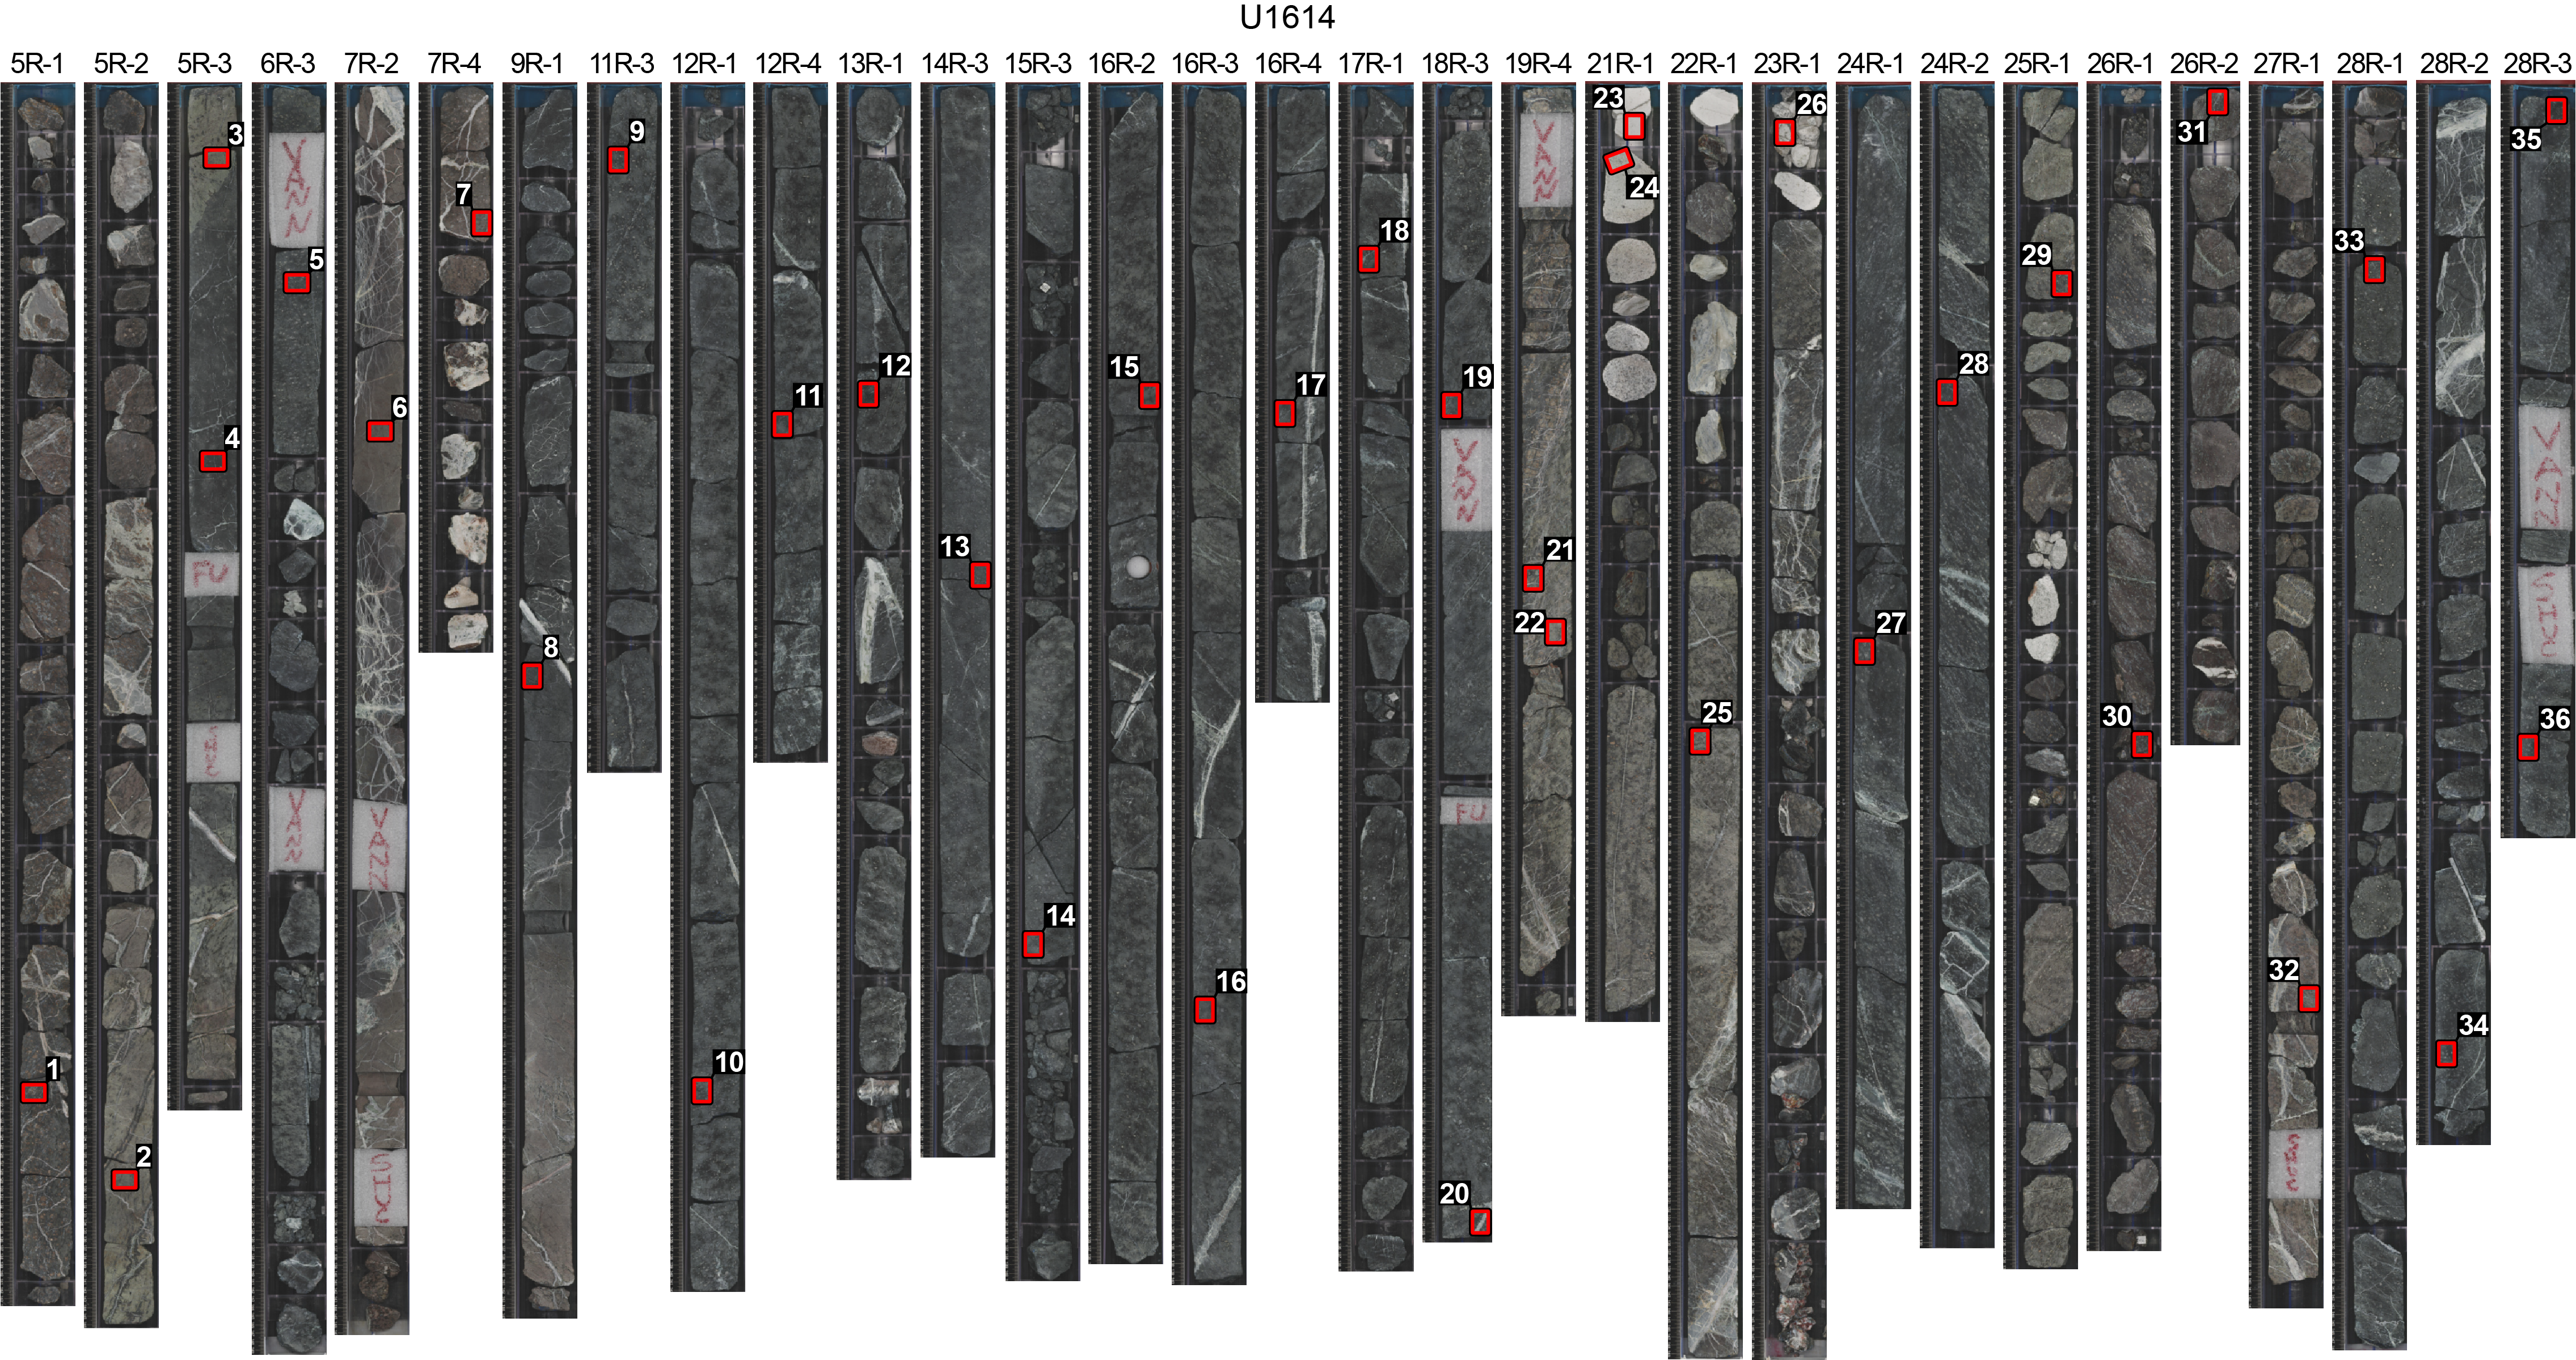
Figure F54. ICP-AES samples.
9.1. Loss on ignition
LOI varied from 0.7 to 18.8 wt% (Table T14). The lowest overall LOI values were recorded for granitoids, which ranged 0.7–0.9 wt%. In mantle lithologies, the lowest LOI value was from an interval of plagioclase-bearing lherzolite (11.7 wt%; Section 402-U1614C-5R-1, 118–120 cm), indicating that primary minerals are likely present even though the recovered mantle rocks have undergone severe serpentinization and weathering. The highest LOI value was from plagioclase-bearing websterite (18.8 wt%; Section 19R-4, 57–60 cm), indicating a higher degree of alteration.
9.2. Major, minor, and trace element compositions using portable X-ray fluorescence spectrometry
Major element compositions determined using pXRF vary as expected with changes in lithology. However, pXRF data quality seems to vary from site to site and occasionally from scan to scan. Analytical totals ranged 16.0–100.1 wt%, although most analytical totals ranged 70–90 wt%. Analytical totals <100% are common in pXRF analyses because of the instrument's inability to accurately measure light elements (see Igneous geochemistry in the Expedition 402 methods chapter [Malinverno et al., 2025a]).
Analytical totals in peridotites are occasionally very low, between 16.0 and 25.1 wt% (Table T12), where the peridotites are severely fractured, leading to poor pXRF measurements. However, they are highly abundant in Cr and Ni (Table T12), supporting their lithologic classification as refractory peridotites. The pXRF data show that lithologies recovered in Hole U1614C are diverse in chemical composition (Figure F55), as confirmed by petrographic and structural observations (see Igneous and metamorphic petrology). Hole U1614C was divided into four main lithostratigraphic units (Units V–VIII), two of which were divided into two subunits (Subunits VA, VB, VIIIA, and VIIIB) (see Igneous and metamorphic petrology). Mafic and granitoid intervals are characterized by high contents of Al2O3, CaO, and K2O (Figures F55, F56). To better understand the constituent mineral phases of the mafic rocks and granitoids, some mineral compositions are compiled and compared with pXRF data in Figure F57. In a K2O–Al2O3 space, some of the high-K rocks (>3 wt% K2O) are close in composition to micas, such as biotite and phlogopite (Figure F57), suggesting their presence in the analyzed intervals (see Igneous and metamorphic petrology for their petrographic characteristics). Because some of the mafic rocks and granitoids occur in veins as thin as ~1 cm, pXRF data from these intervals might represent a mixed composition with the host peridotites, where the main elemental components of olivine and orthopyroxene such as Mg and Fe are abundant to some degree (Figures F55, F56). Although peridotites are naturally depleted in incompatible elements and thus generally have low Ca content, many peridotites collected in Hole U1614C are abundant in CaO (up to ~5 wt%) due either to the presence of plagioclase precipitated from metasomatic melt intrusion or of carbonate veins associated with weathering and low-temperature alteration processes (Figures F55, F56).
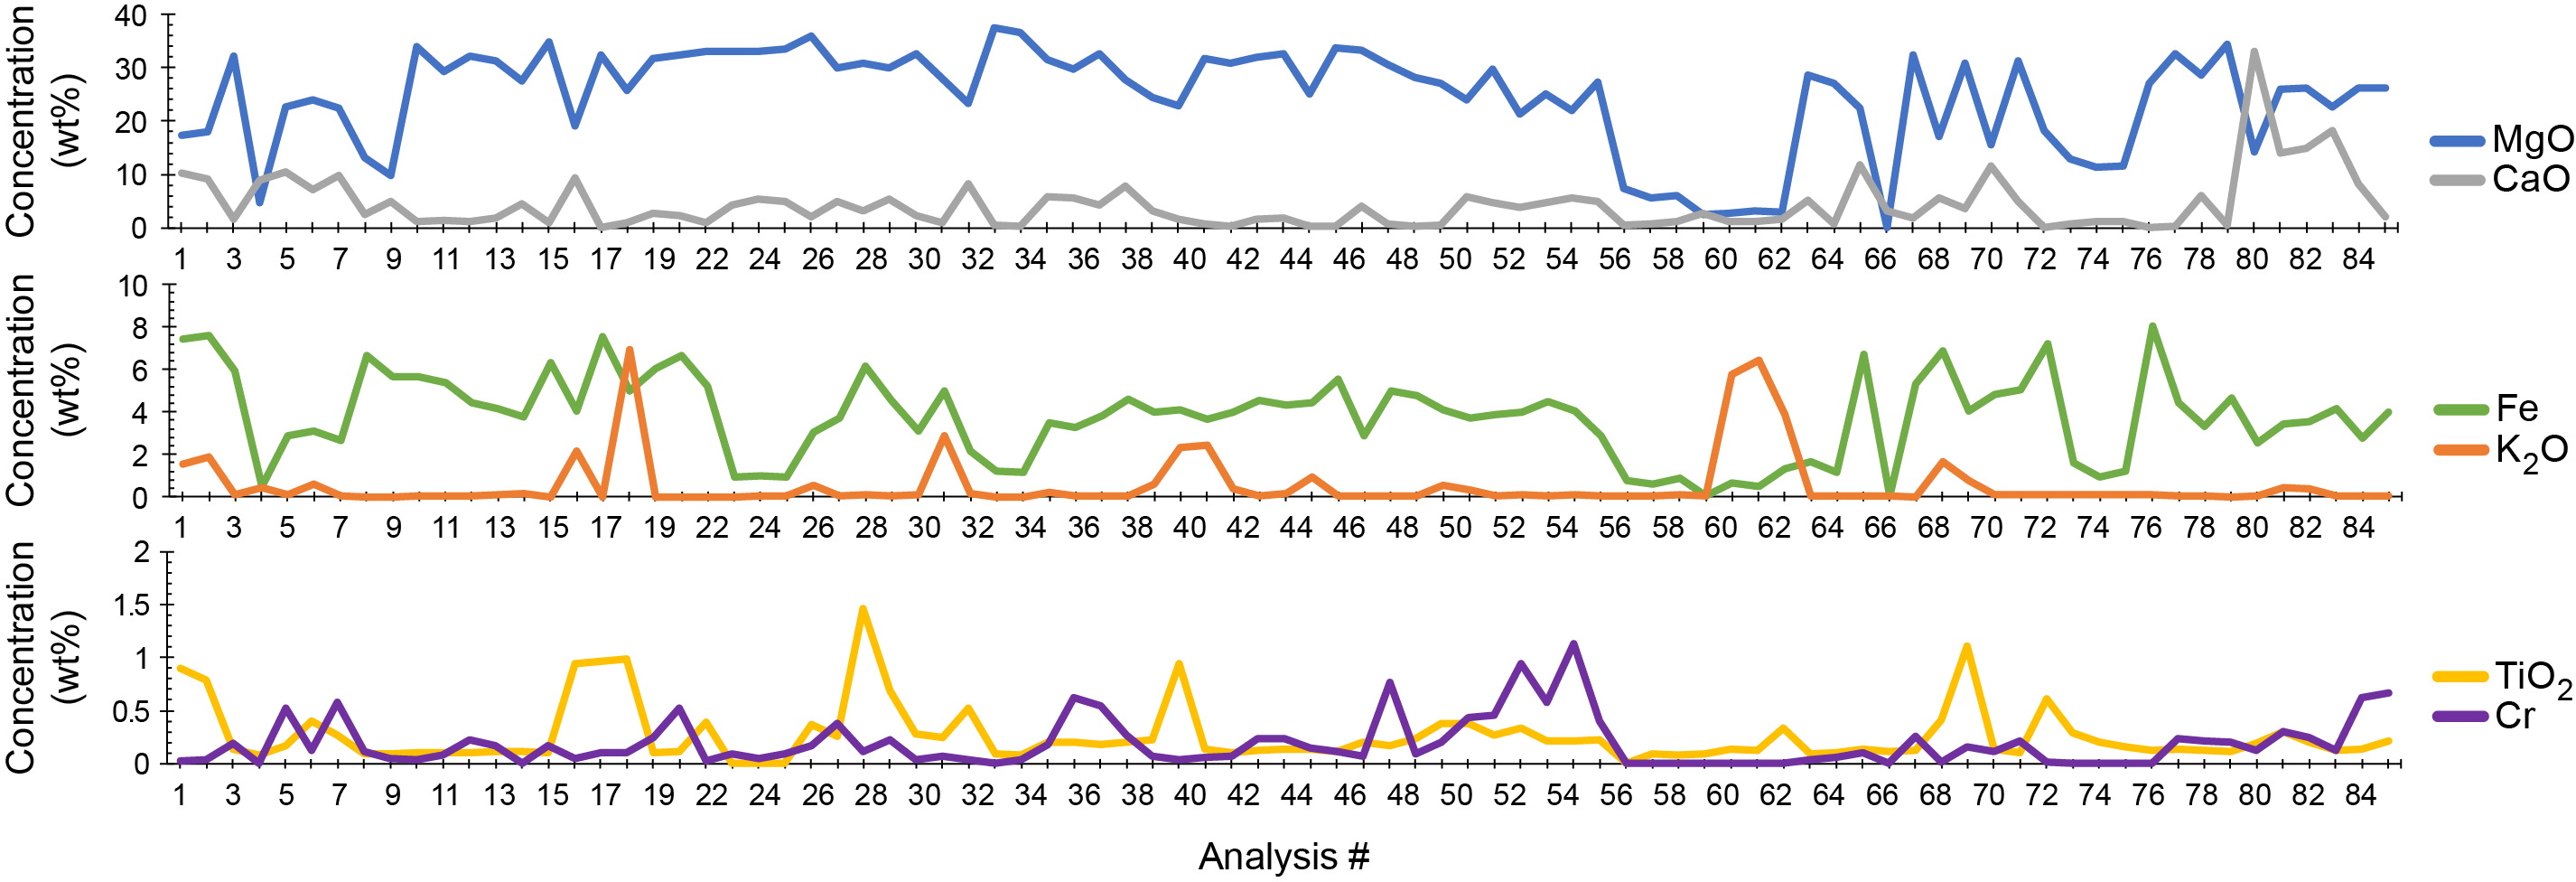
Figure F55. pXRF data variation.
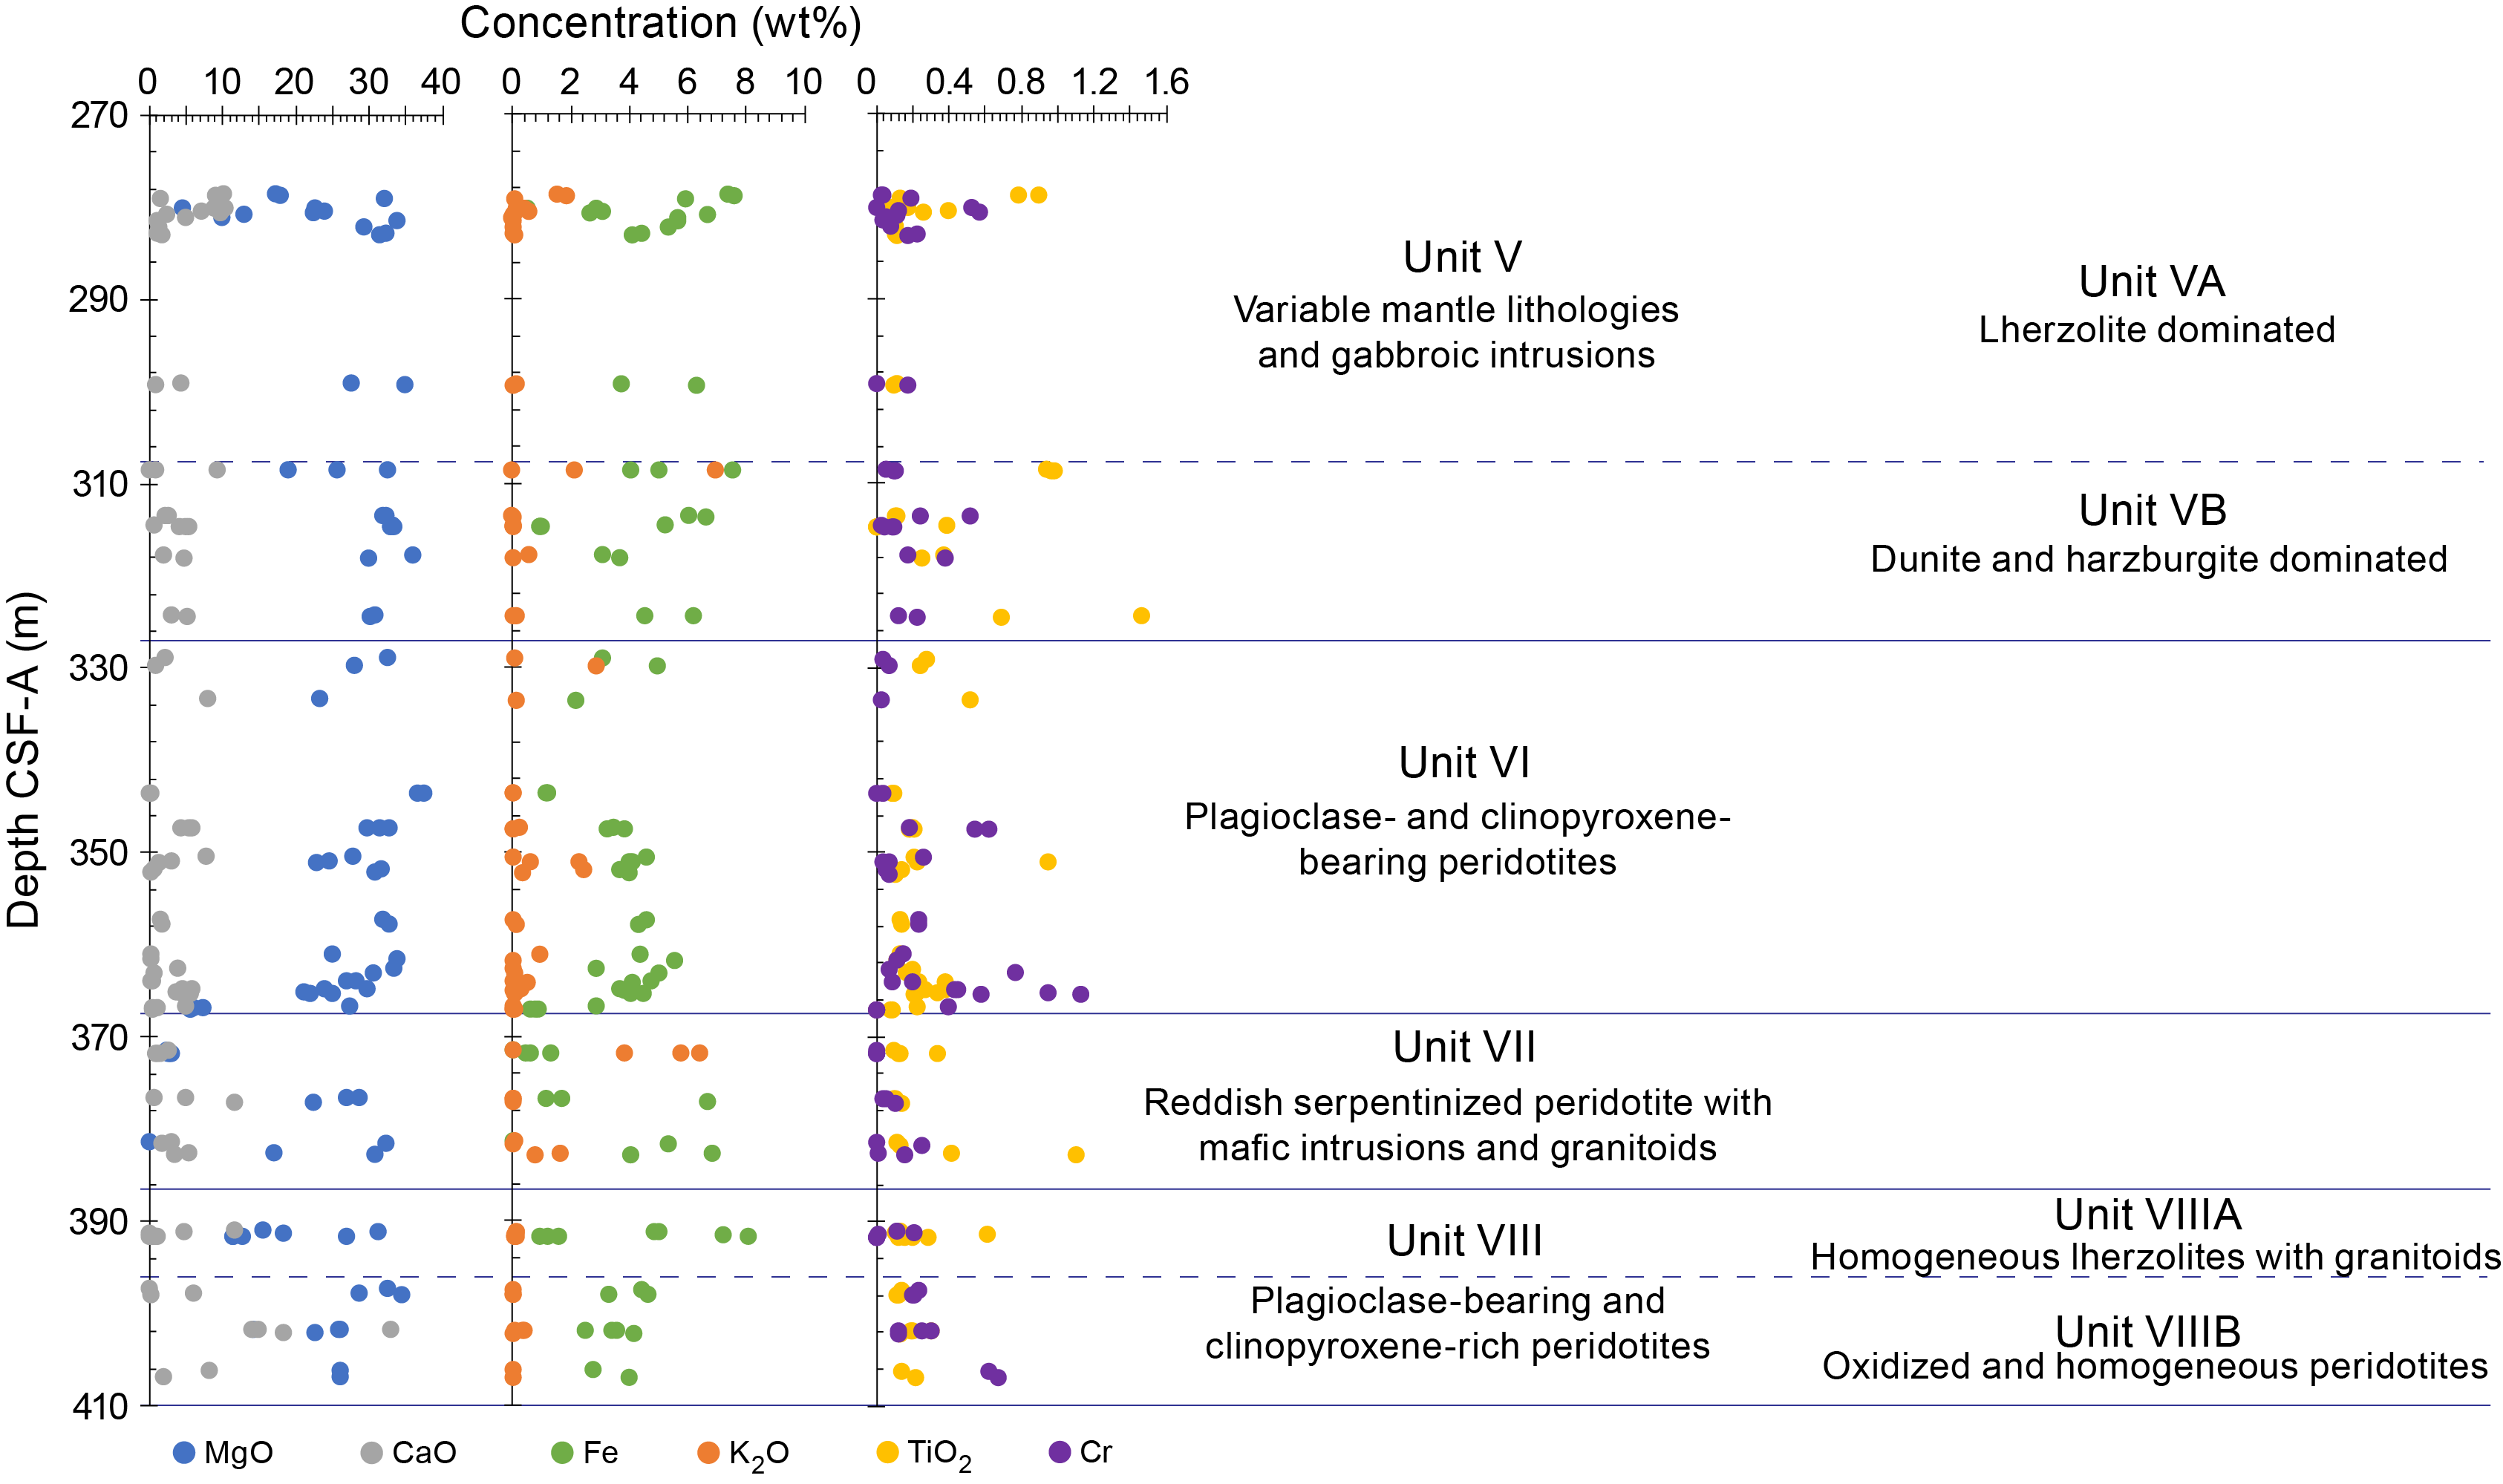
Figure F56. pXRF data variation vs. lithostratigraphic units.
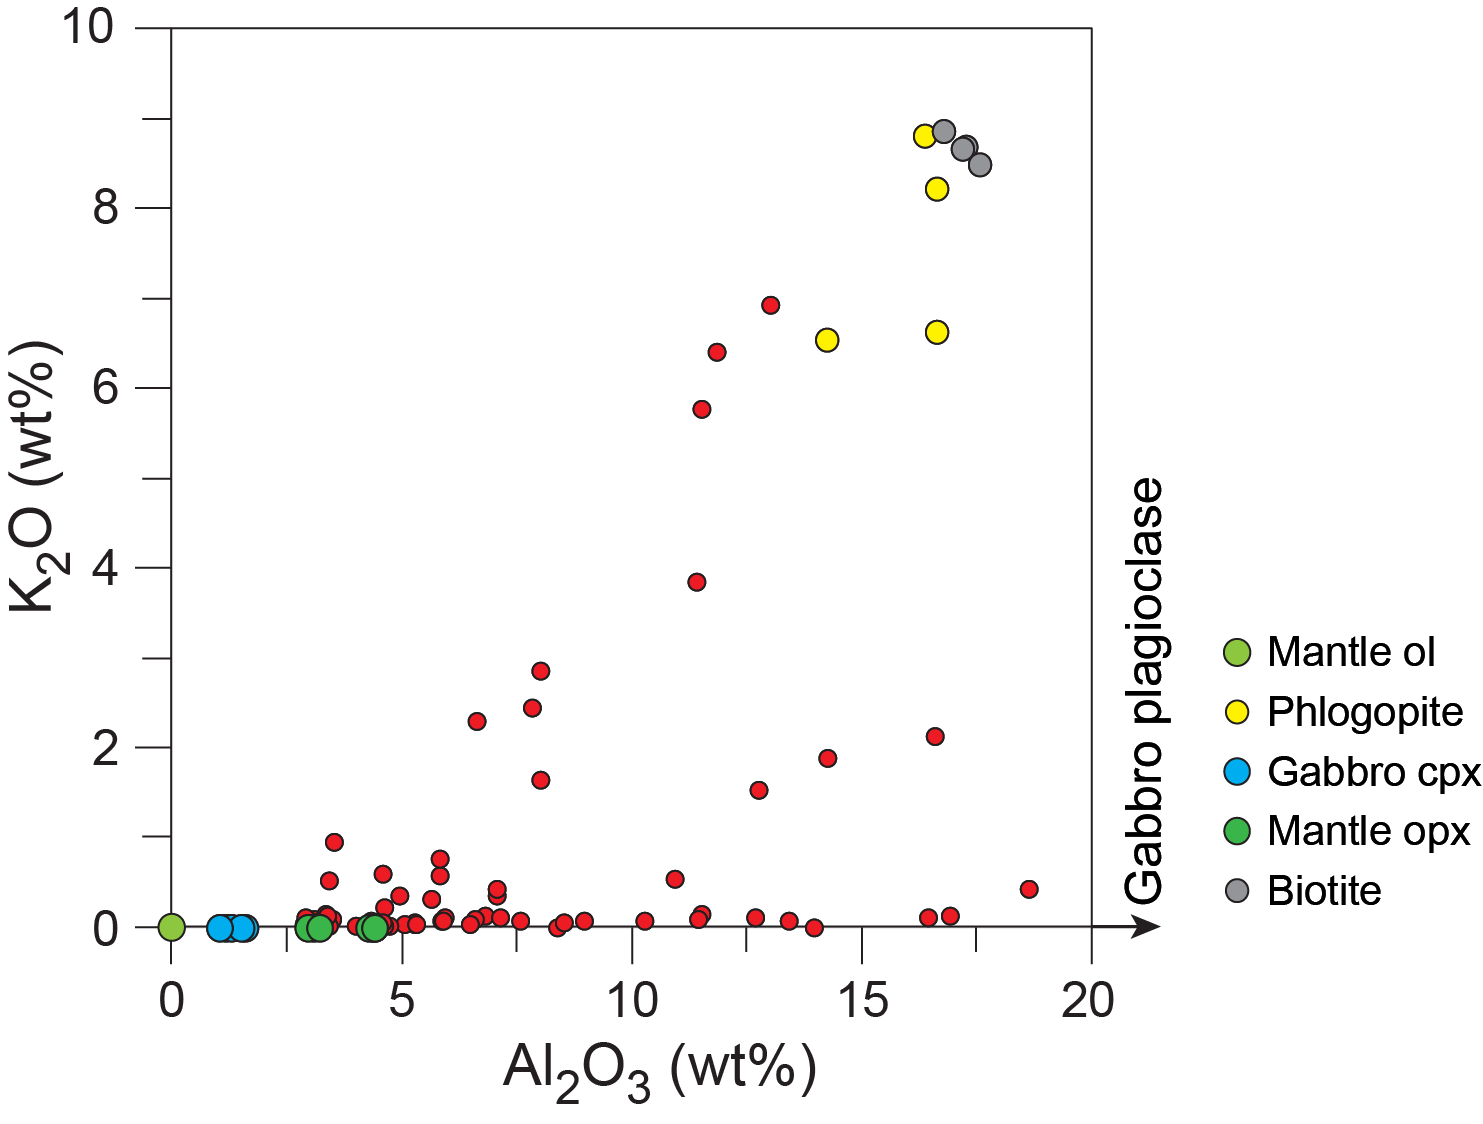
Figure F57. K2O vs. Al2O3.
9.3. Inductively coupled plasma–atomic emission spectrometry
ICP-AES analyses were performed on samples representative of the lithologies observed at Site U1614. A single igneous sample from the top of the basement section was analyzed from Hole U1614A, and 36 igneous samples were analyzed from Hole U1614C. Sample locations are shown in Figure F54. In total, 20 lherzolites, 7 dunites, 5 harzburgites, 2 plagioclase-bearing websterites, and 3 granitoids were analyzed using ICP-AES. Of the 37 samples, 14 contain plagioclase and 1 was collected near a thin (~0.5 cm thick) high-K mafic vein (Sample 402-U1614C-18R-3, 131–135 cm).
Figure F58 compares the bulk chemistry of peridotites (dunite, harzburgite, and lherzolite) collected at Site U1614 with magma-poor Iberian margin peridotites (Hébert et al., 2001), back-arc basin peridotites (Akizawa et al., 2021), and mid-ocean-ridge peridotites (Godard et al., 2009; Niu, 2004; Regelous et al., 2016). The global peridotites have wide chemical variations from depleted to fertile compositions. It is noteworthy that the 153 m thick interval in Hole U1614C covers almost the full range of the chemical variation across these global peridotites, even though the majority of our samples show lower Al2O3 (<2 wt%) and TiO2 (<0.05 wt%) (Figure F58D) and higher MgO (>42 wt%) (Figure F58A). Therefore, peridotites at Site U1614 are generally depleted of incompatible elements with the exception of K2O and CaO, which are remarkably abundant in some samples compared to those of depleted MORB mantle (DMM) (a hypothetical upper mantle reservoir sourcing MORB; Workman and Hart, 2005) and primitive upper mantle (PUM) (a hypothetical undifferentiated fertile upper mantle reservoir; McDonough and Sun, 1995) (Figure F58B, F58C).
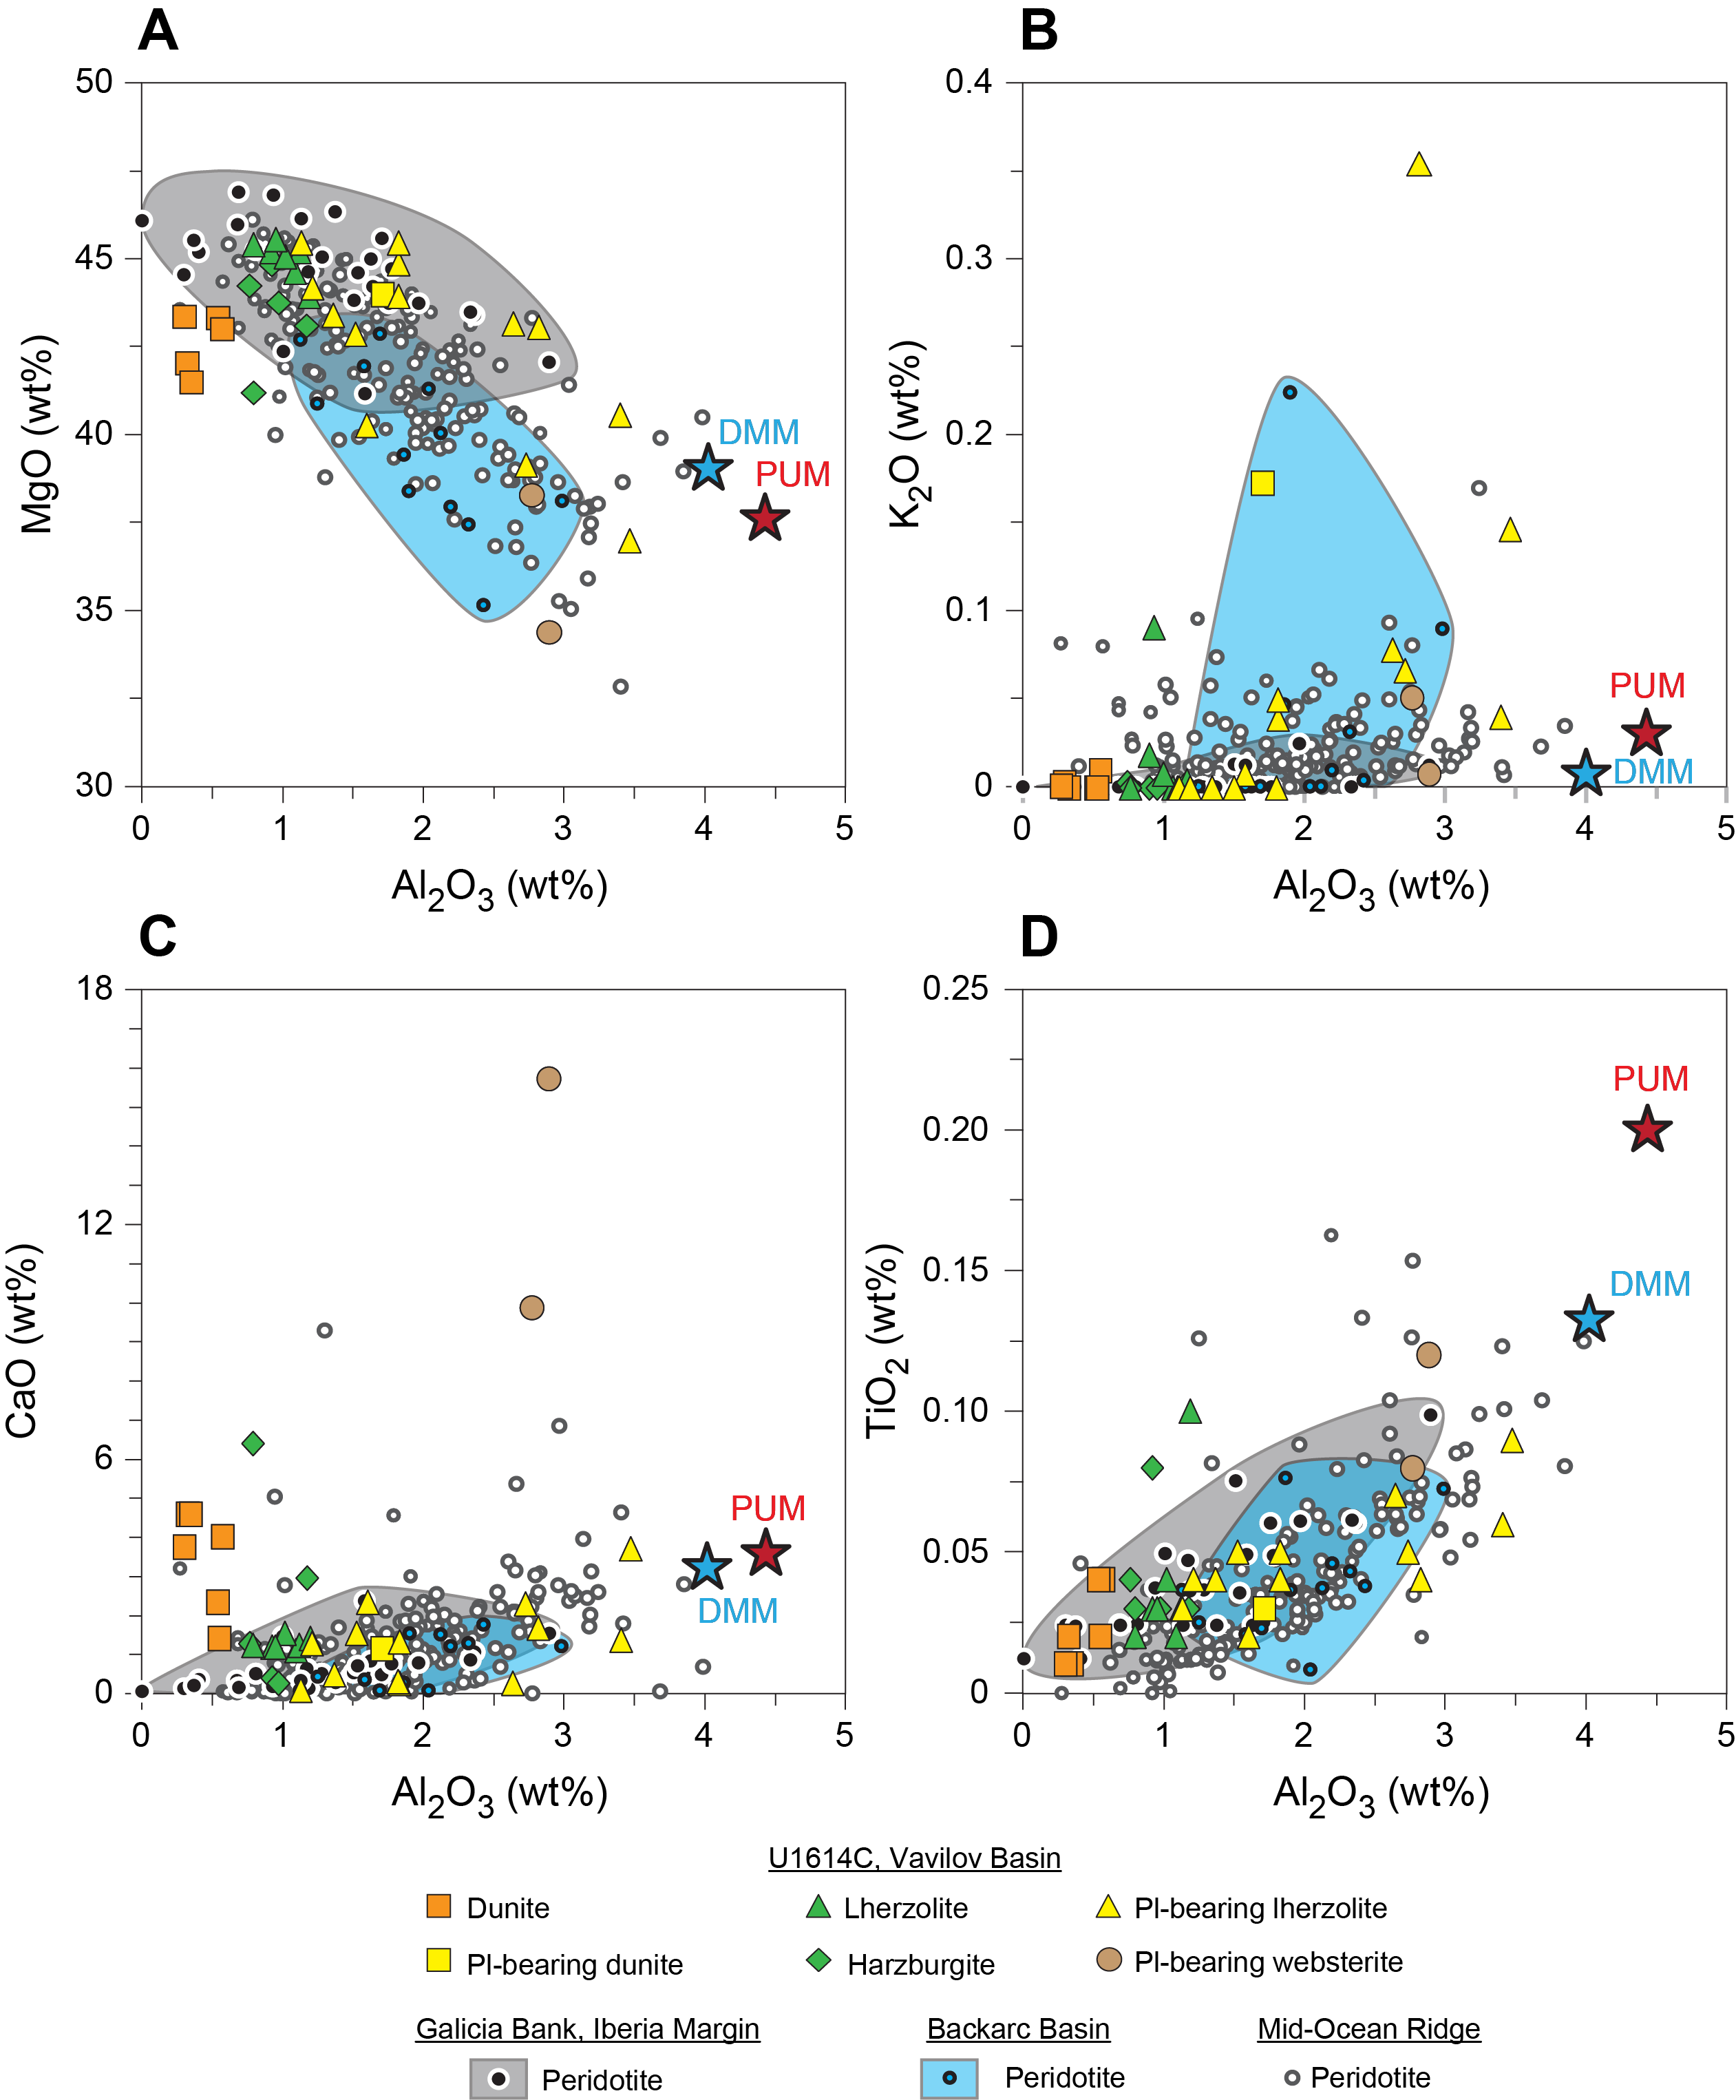
Figure F58. Bulk chemistry, mantle rocks.
Downhole trends in the geochemistry of the igneous rocks recovered in Hole U1614C are shown in Figures F59 and F60. The peridotites show an increase in Mg/(Mg+Fe) atomic ratio (Mg#) downhole in Unit V, whereas the values of Mg# remain constant in Units VI–VIII (Figure F59). The plagioclase-bearing peridotites tend to be enriched in Al2O3, CaO, Ba, Sr, and V (Figures F59, F60). As mentioned above, some of the peridotites are exceptionally abundant in K2O (Figures F58B, F59). Considering that the K-rich plagioclase-bearing lherzolite (yellow triangle with ~0.35 wt% K2O in Figures F58, F59) was collected close to the high-K mafic vein, the peridotites abundant in K2O were likely metasomatized in places by K-rich mafic melt intrusions.
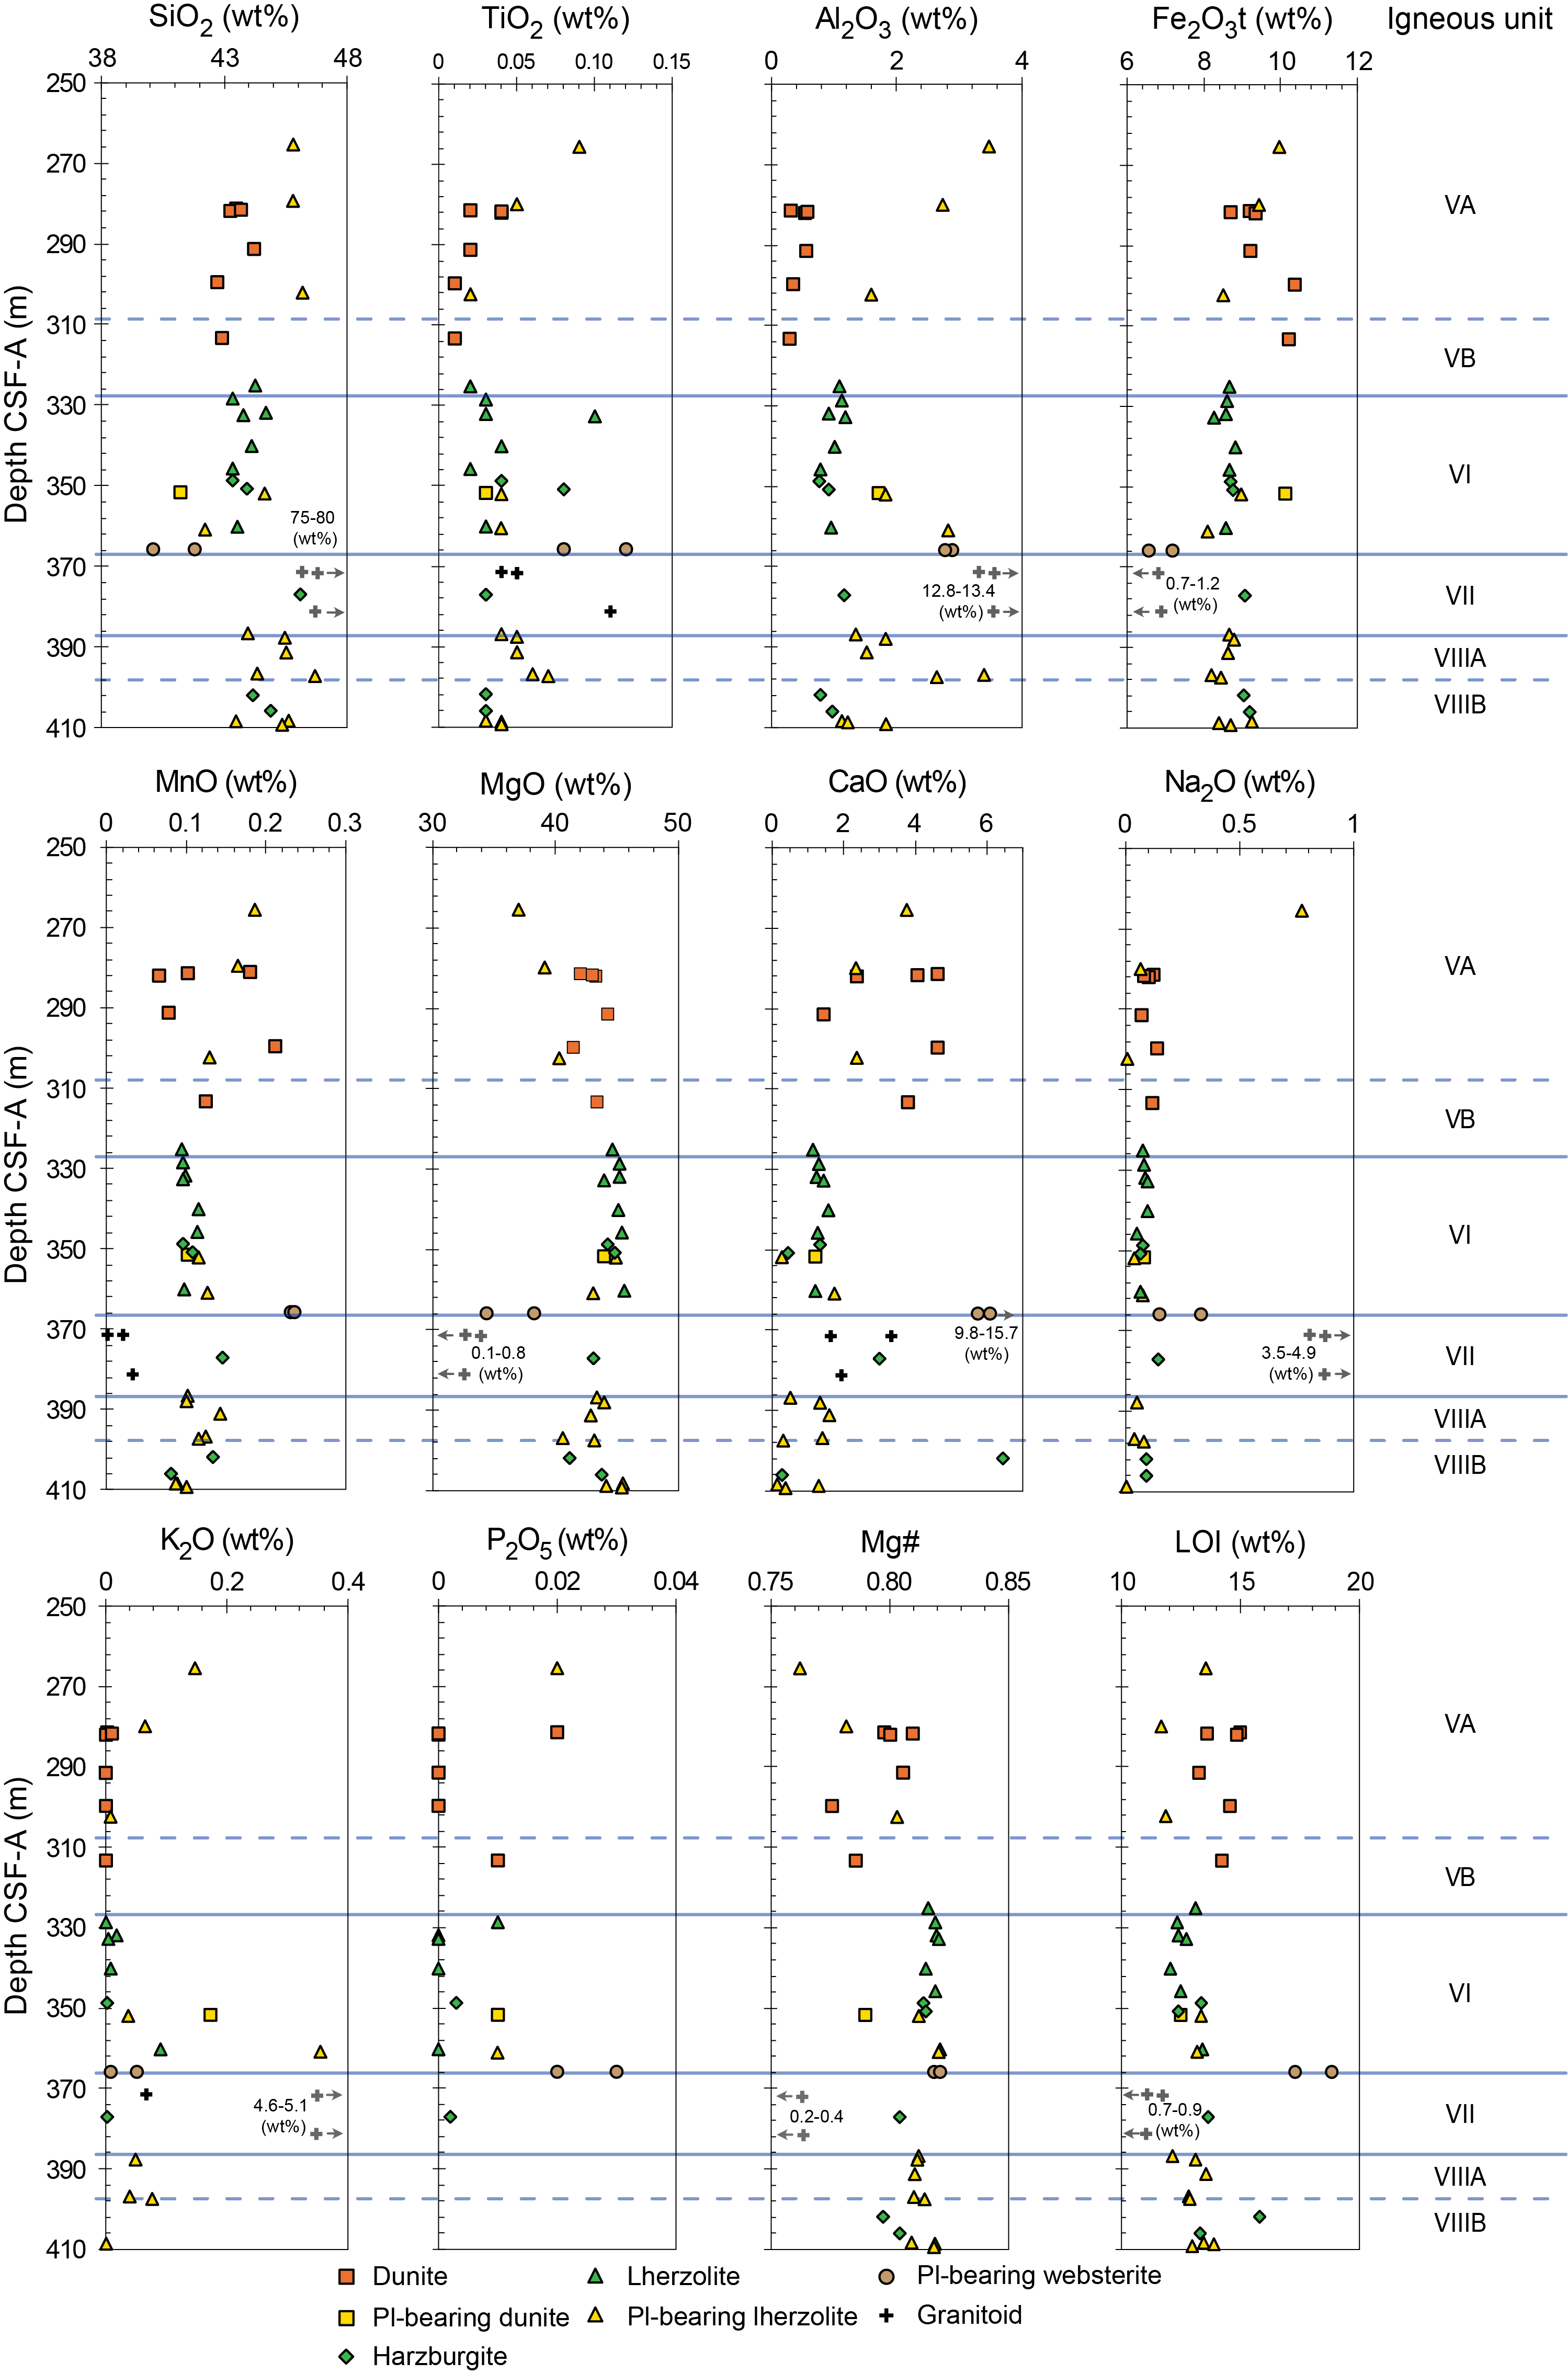
Figure F59. LOI and ICP-AES major and minor element geochemistry.
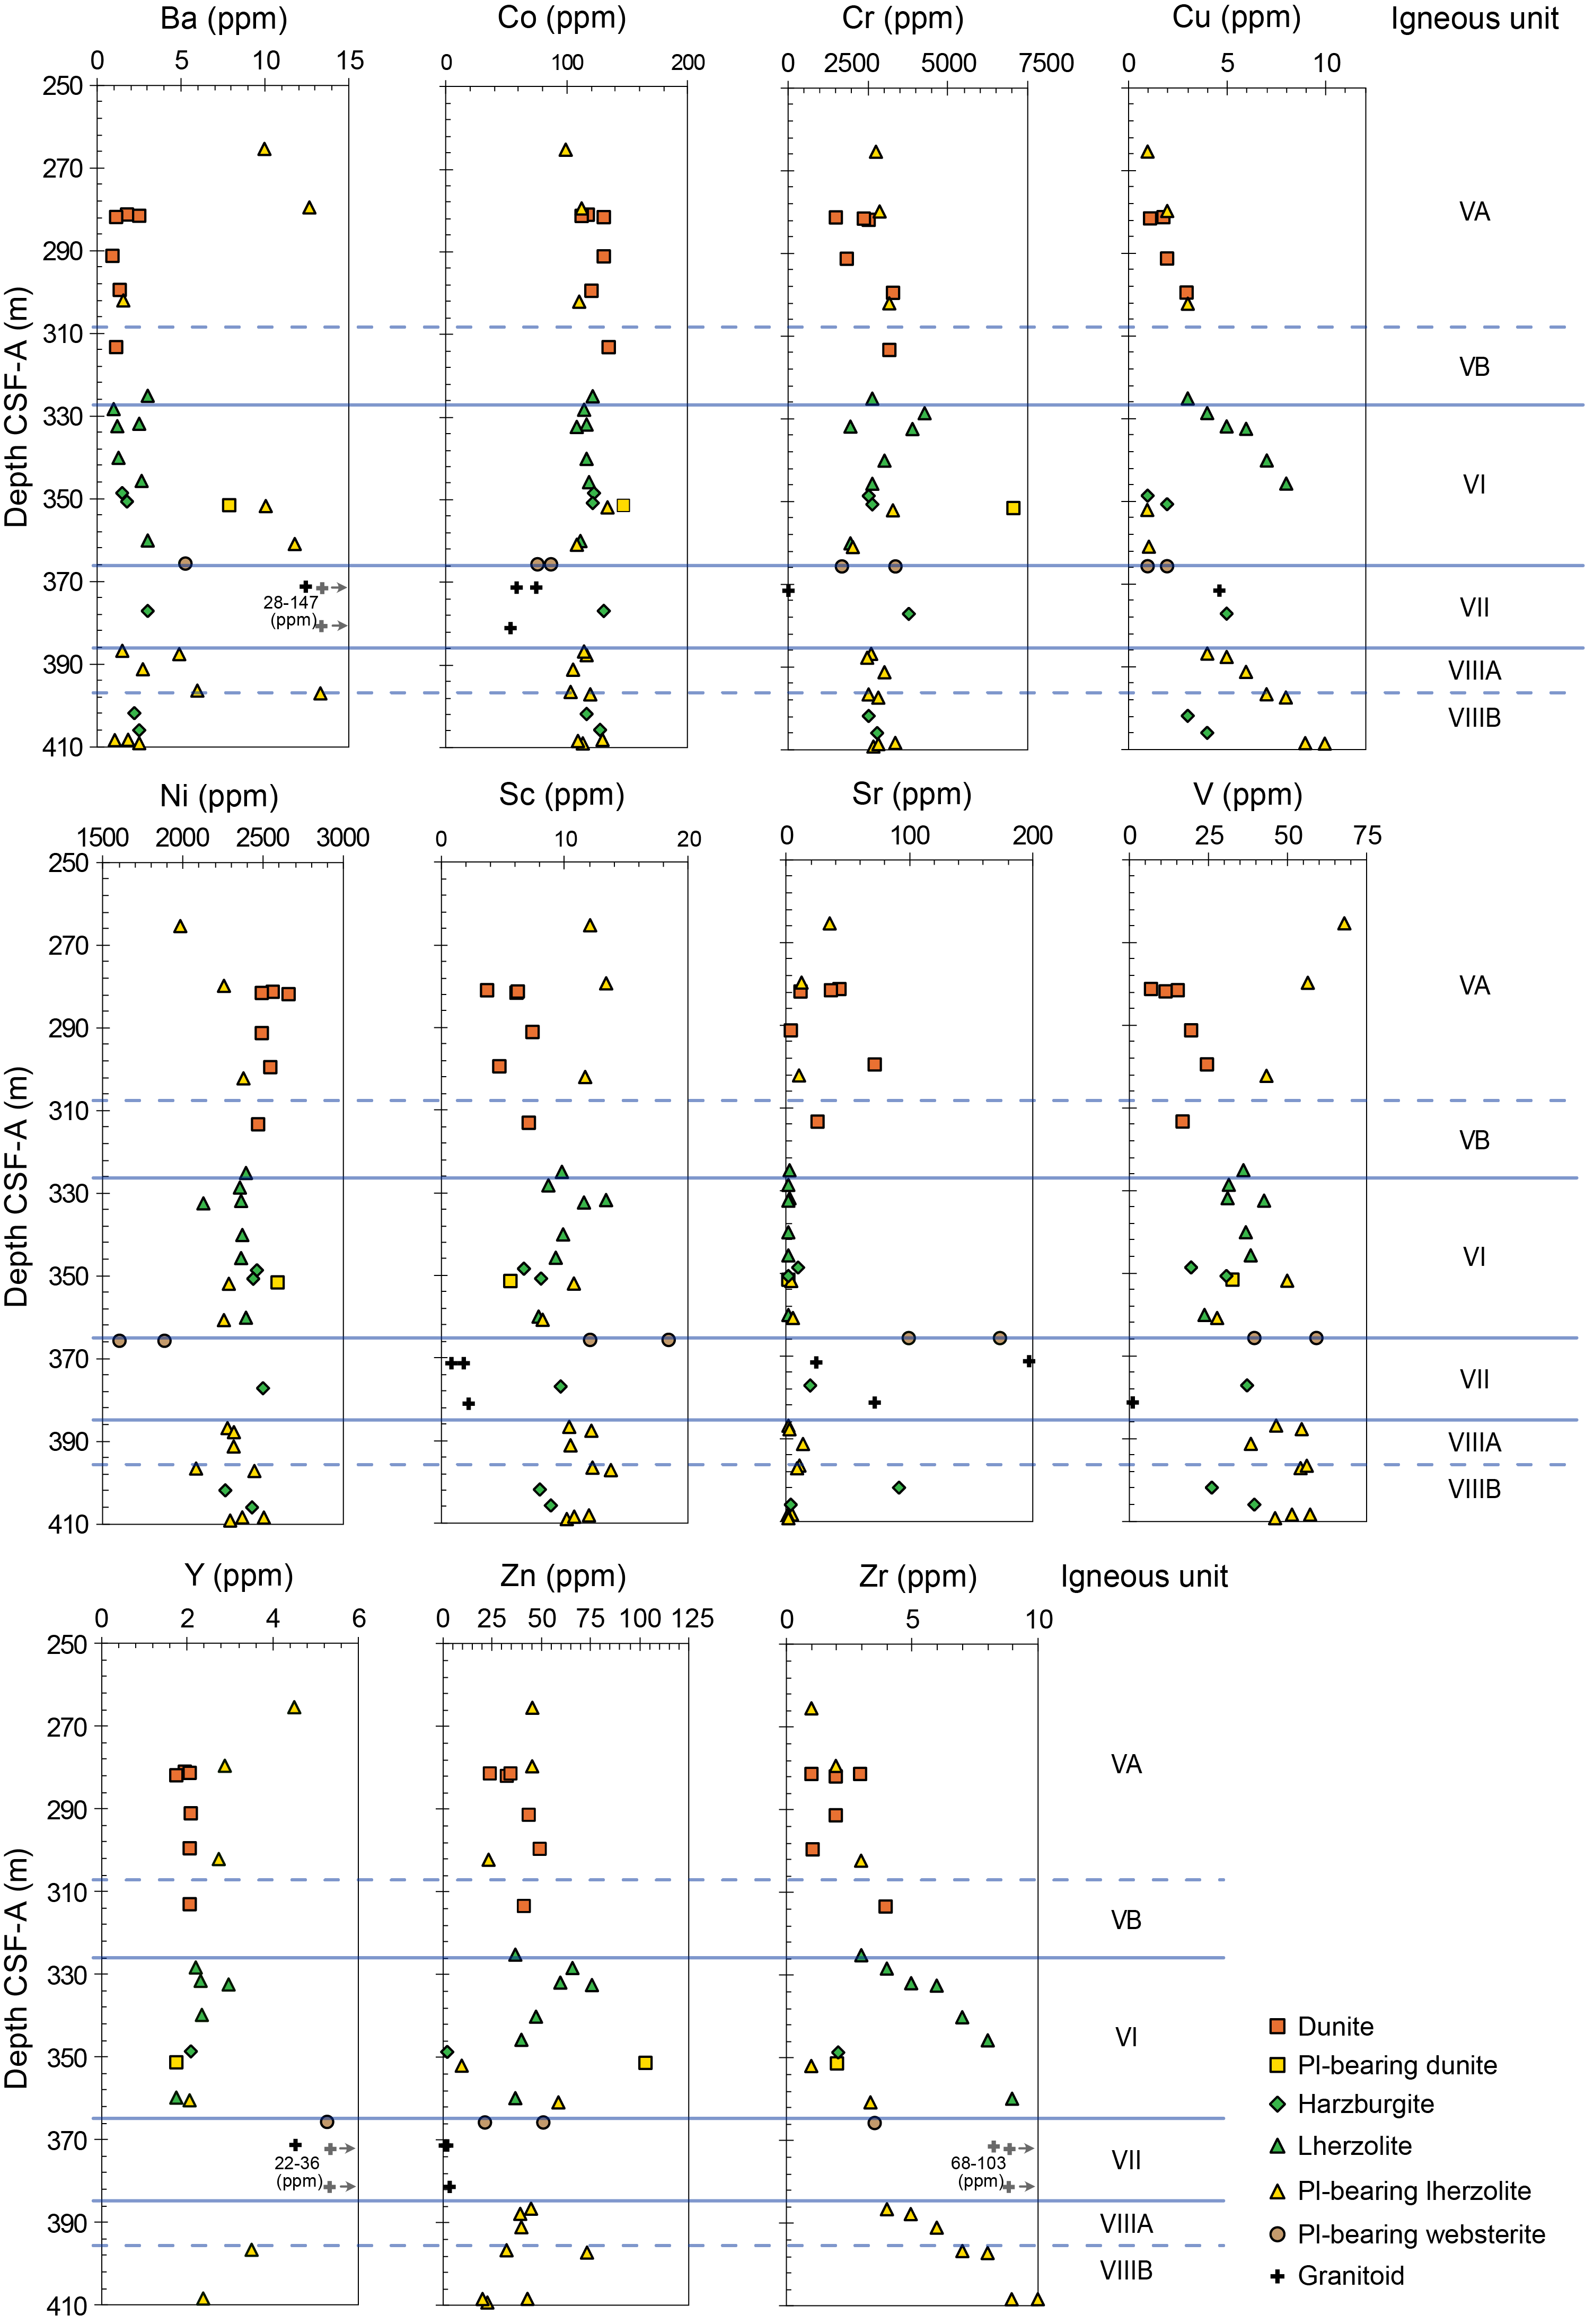
Figure F60. ICP-AES minor/trace element geochemistry.
Granitoids collected at Sites U1612 and U1614 are plotted and compared on a plutonic total alkali-silica (TAS) diagram (Figure F61). The analyzed granitoids have similar compositions and are classified as granites using the TAS diagram.
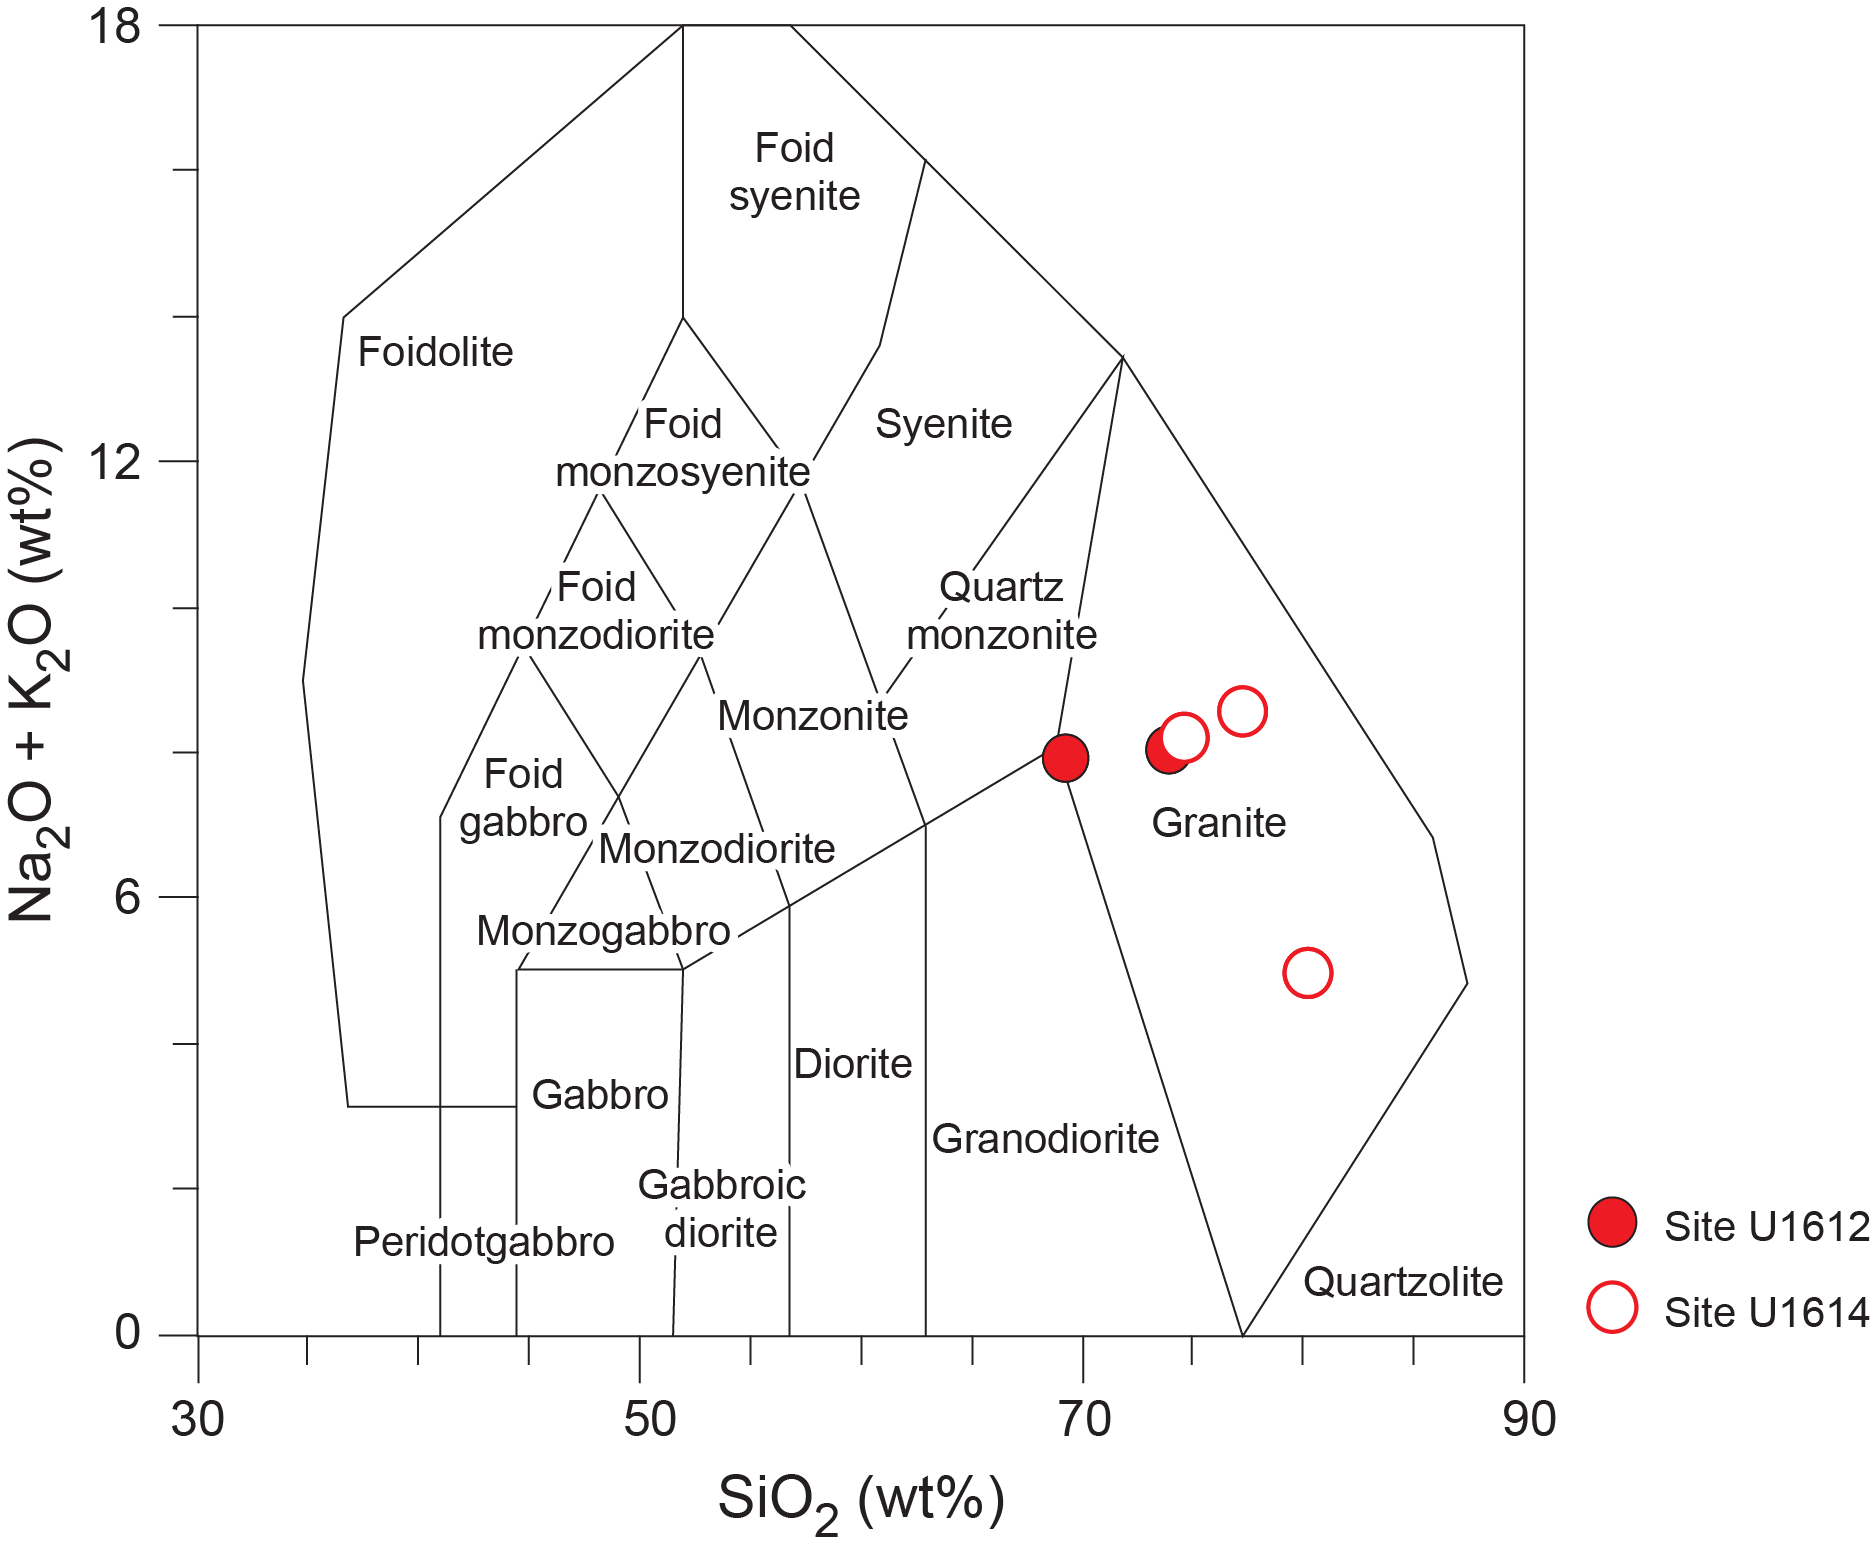
Figure F61. Plutonic rock compositions.
9.4. Calcium carbonate, total carbon, and total sulfur contents of rocks and veins
The peridotites at Site U1614 are intruded by numerous network-like carbonate veins (see Igneous and metamorphic petrology), which is evidenced by enrichments in bulk CaO and calcium carbonate contents (Figure F62; Table T15). The presence of carbonate is also supported by XRD analyses for the powders used for ICP-AES analyses, which identified Mg-bearing calcite, in addition to lizardite, chrome spinel, and olivine (Figure F63). The magnesium content of the carbonate was determined semiquantitatively to be about 2.5 mol% Mg using the equation proposed by Goldsmith et al. (1958). Because the upper basement interval of Site U1614 is strongly intruded by carbonates, the dunites emplaced therein are enriched in CaO content up to ~5 wt% (Figures F58C, F59). Two harzburgites with high CaO contents (Samples 402-U1614C-22R-1, 76–78 cm, and 27R-1, 106–109 cm) were collected near ~1 cm thick carbonate veins, therefore being enriched in Ca as an effect of addition of carbonate (see green diamond plotting well outside the range of typical mantle peridotites in Figure F58C). Similarly, the high contents of CaO (15.7 wt%; Table T14) and calcium carbonate (21.5 wt%; Table T15; Figure F62B) of the plagioclase-bearing websterite vein (Sample 402-U1614C-19R-4, 57–60 cm) is likely related to the occurrence of a diffuse network of submillimeter-scale carbonate veins.
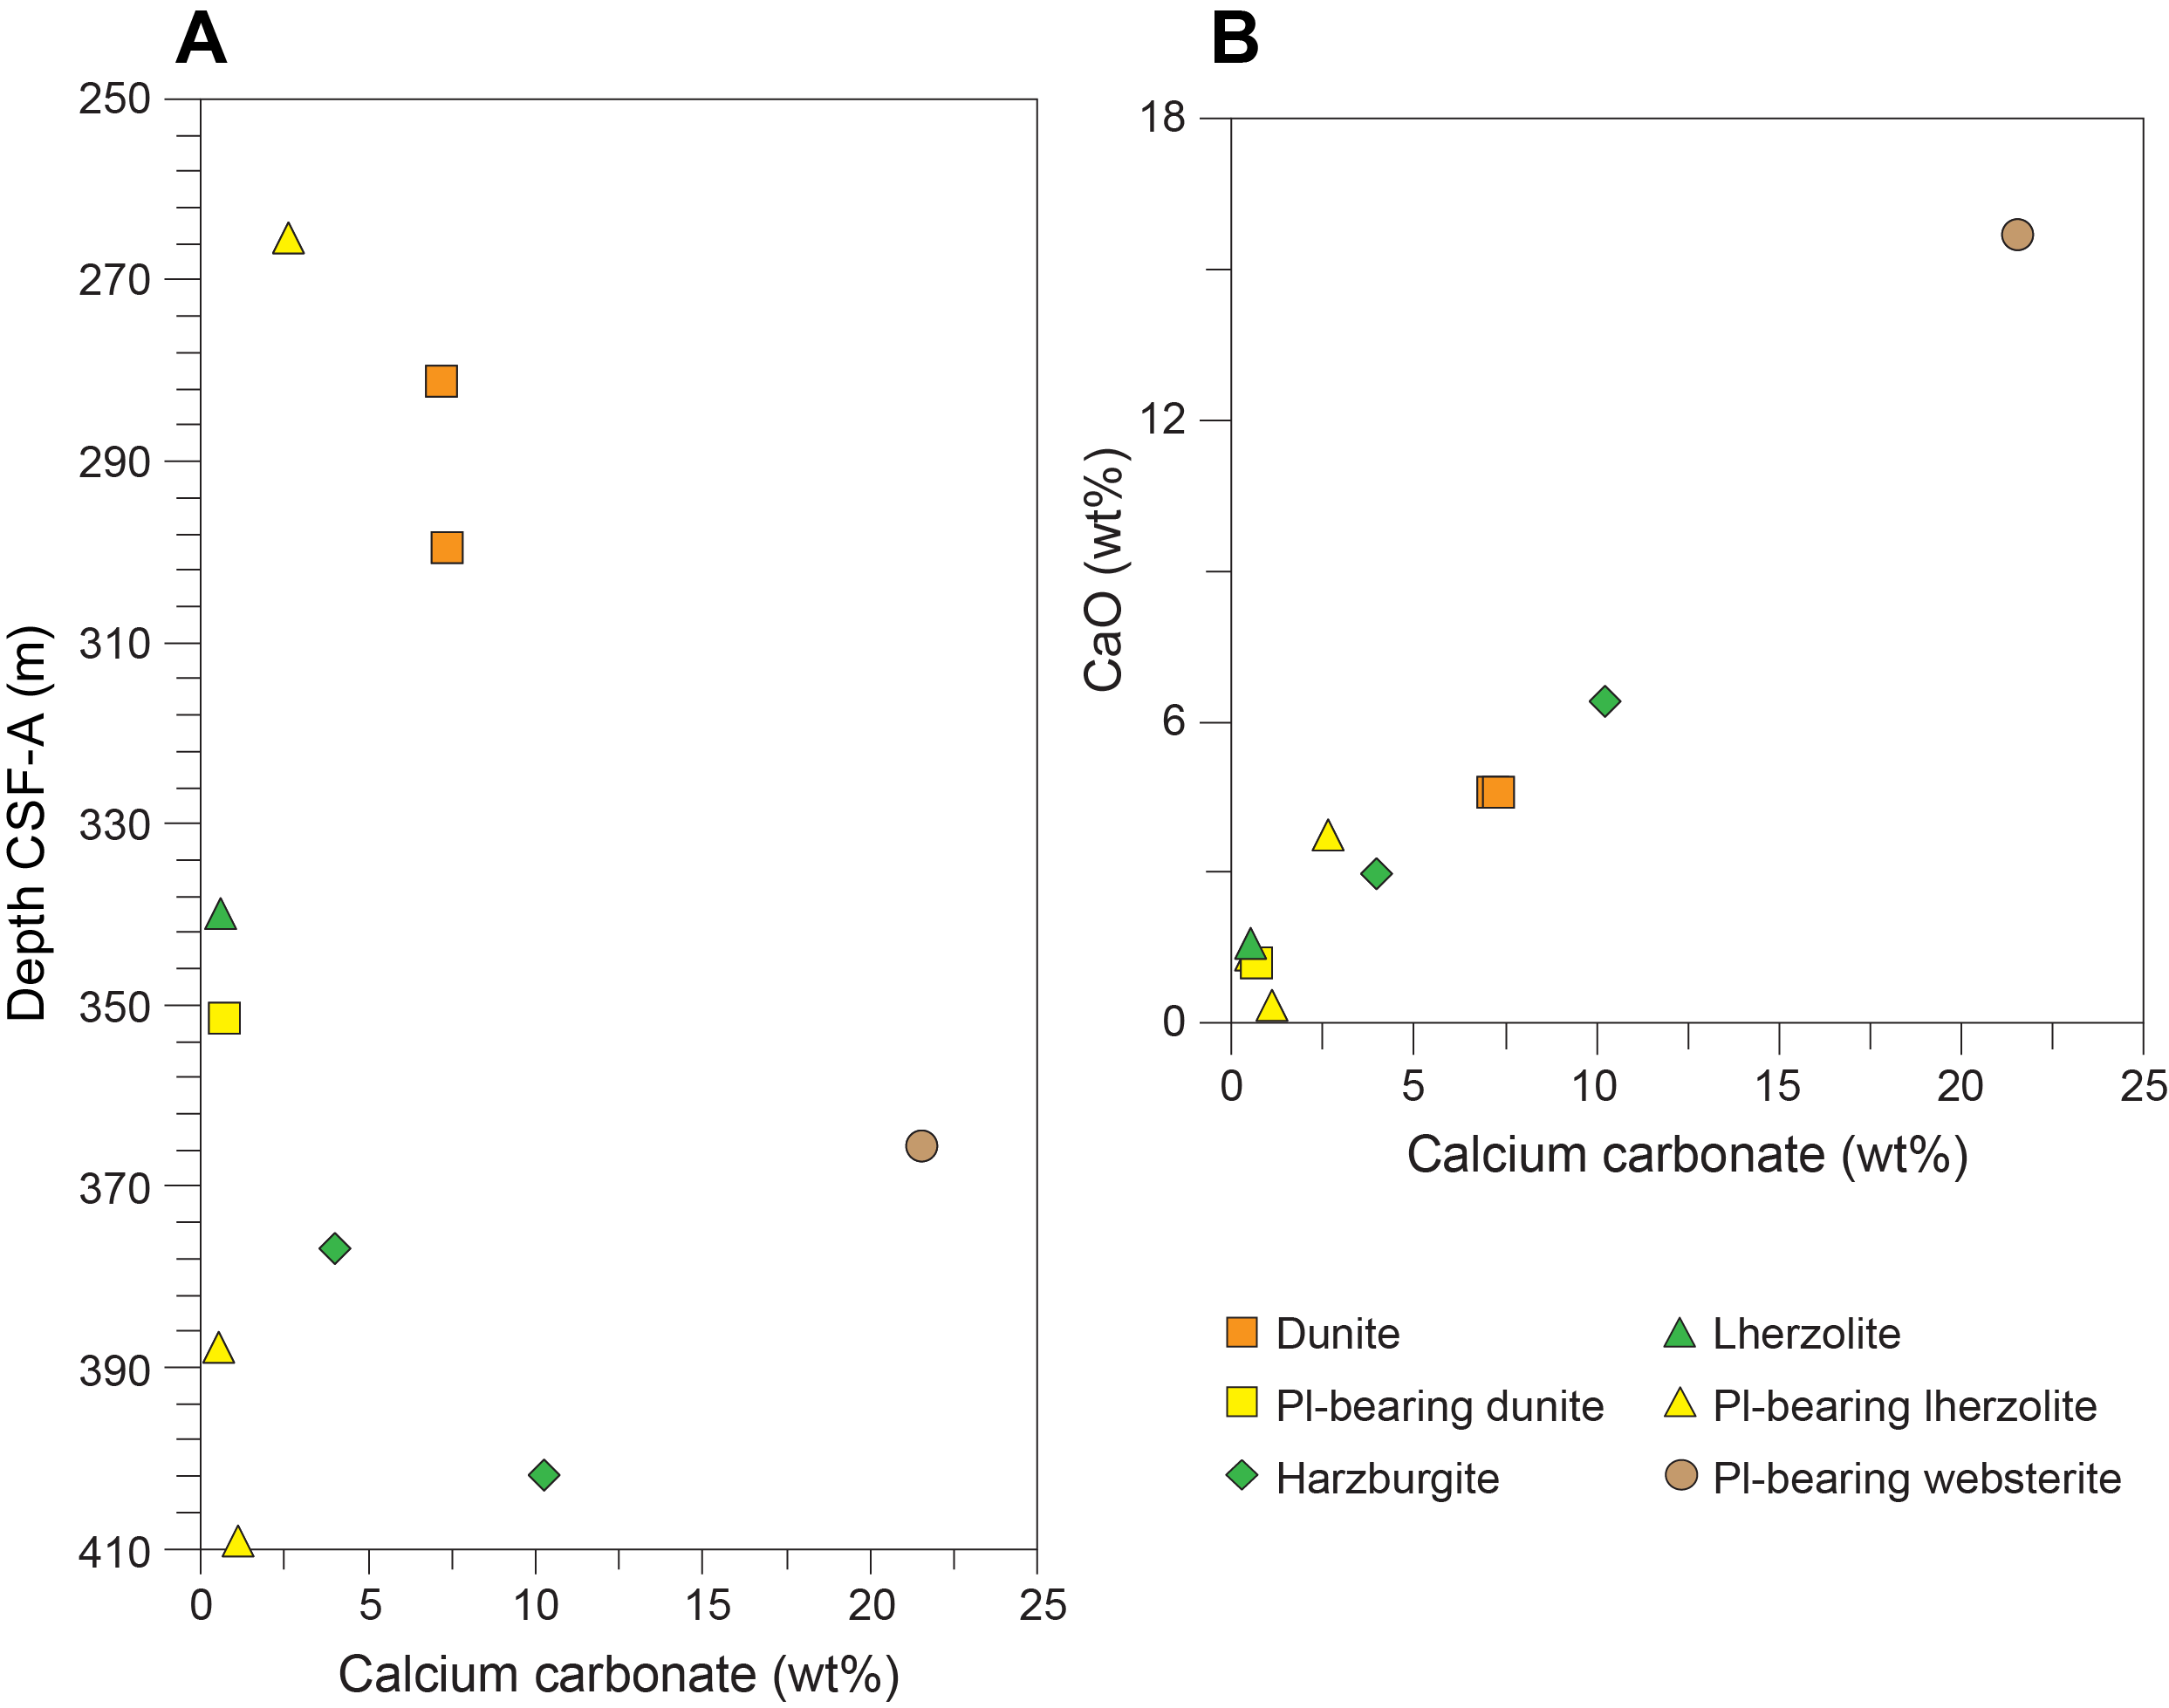
Figure F62. Bulk calcium carbonate and correlation with bulk CaO content.
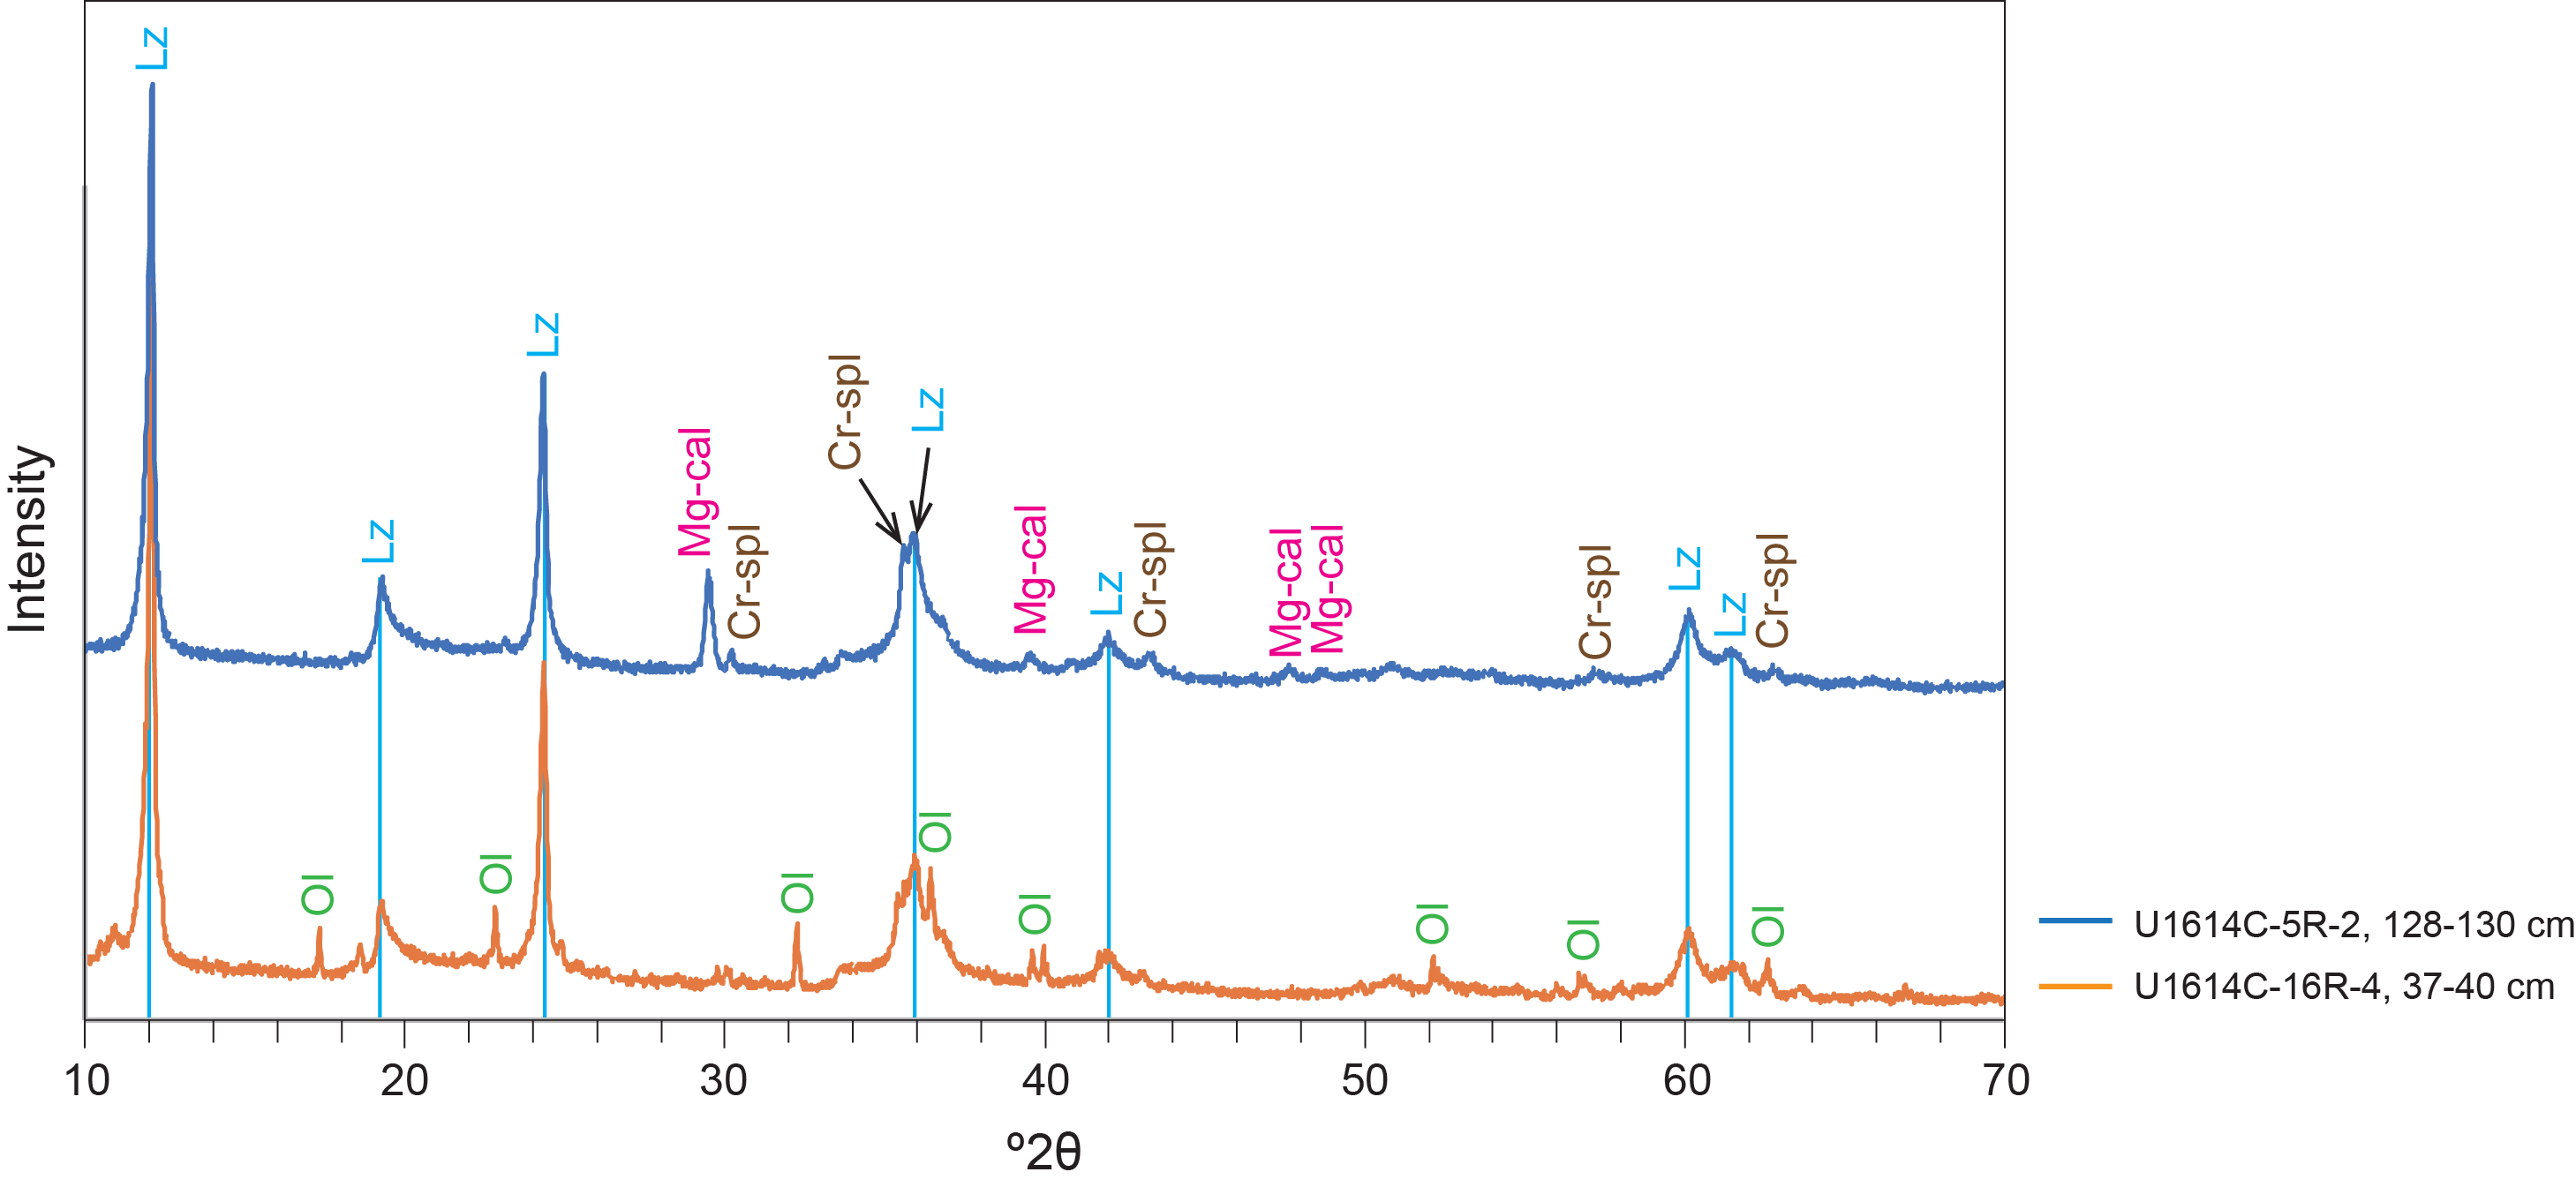
Figure F63. XRD spectra, phase characterization of dunites.
10. Physical properties
Two holes were drilled at Site U1614: Hole U1614A was cored through the sediment column, and Hole U1614C penetrated 153 m into the crystalline basement. Physical properties measured with the Whole-Round Multisensor Logger (WRMSL) included NGR and GRA bulk density, MS, and compressional P-wave velocity (VP). We also obtained X-Ray Linescan Logger (XSCAN) images for the split core sections of both sediment and hard rock. We adjusted the settings of the XSCAN to image the internal structures of the basement rocks such as veins, fractures, or foliation and determined that images from section halves provided better information than whole rounds (Figure F64). After splitting the core, we performed discrete VP measurements with the Gantry system in the X-direction (see Physical properties in the Expedition 402 methods chapter [Malinverno et al., 2025a]) and thermal conductivity measurements. We also collected samples for moisture and density (MAD) testing (Table T16).
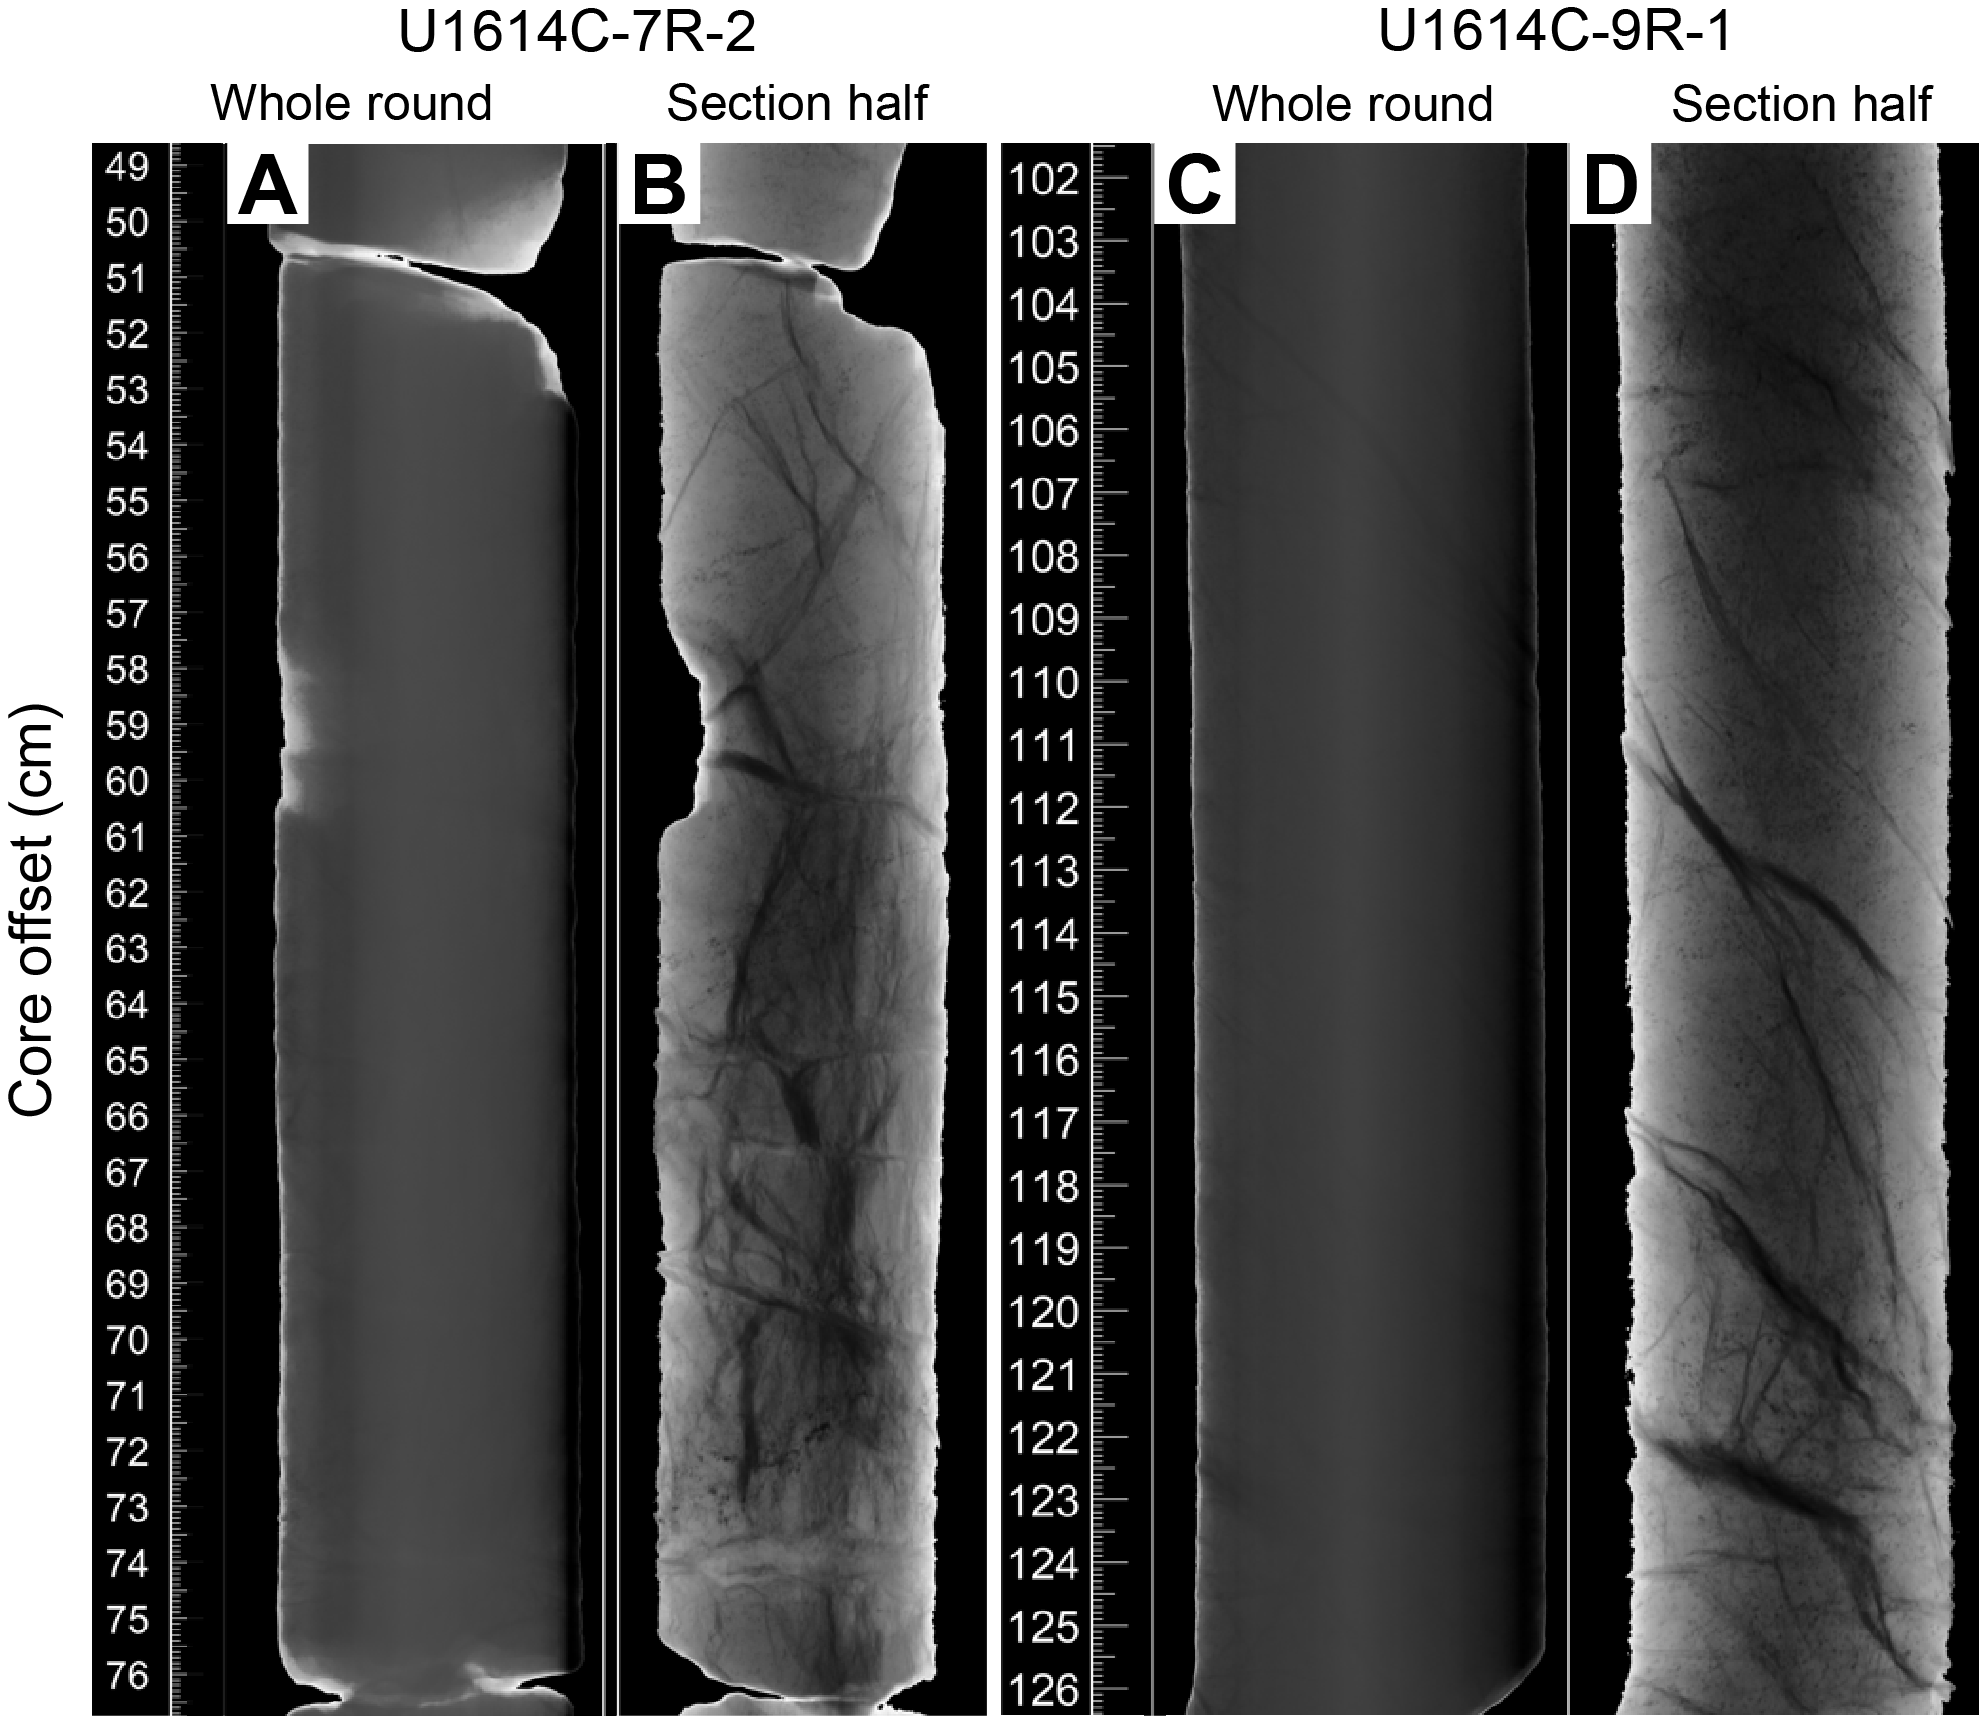
Figure F64. Whole-round vs. section half images.
The physical properties measured in Hole U1614A show distinct variations within the sedimentary section that can be related to lithologic changes across and within lithostratigraphic units (Figure F65). In general, the recovered sediment varies from unconsolidated material that is highly porous (~78%) and low density (~1.28 g/cm3) to denser (up to 2.064 g/cm3) and sometimes consolidated volcaniclastic tuffs with porosity of 37%. VP ranges from 1480 km/s for unconsolidated material such as nannofossil-rich mud to 2586 m/s for tuff, and thermal conductivity ranges 0.655–1.251 W/(m∙K) with the lowest values recorded across the tuff interval in Section 17X-1. Notably, each lithostratigraphic unit has characteristic NGR contents, with Subunit IIB (Cores 29X–32X) showing very high NGR up to 420 counts/s. Within the uppermost 19.5 mbsf (Cores 1X–3X), physical properties measurements are characterized by density variations from 1.02 to 2.06 g/cm3, a slow increase of NGR with depth, and a wide range of VP (Figure F65; Table T17).
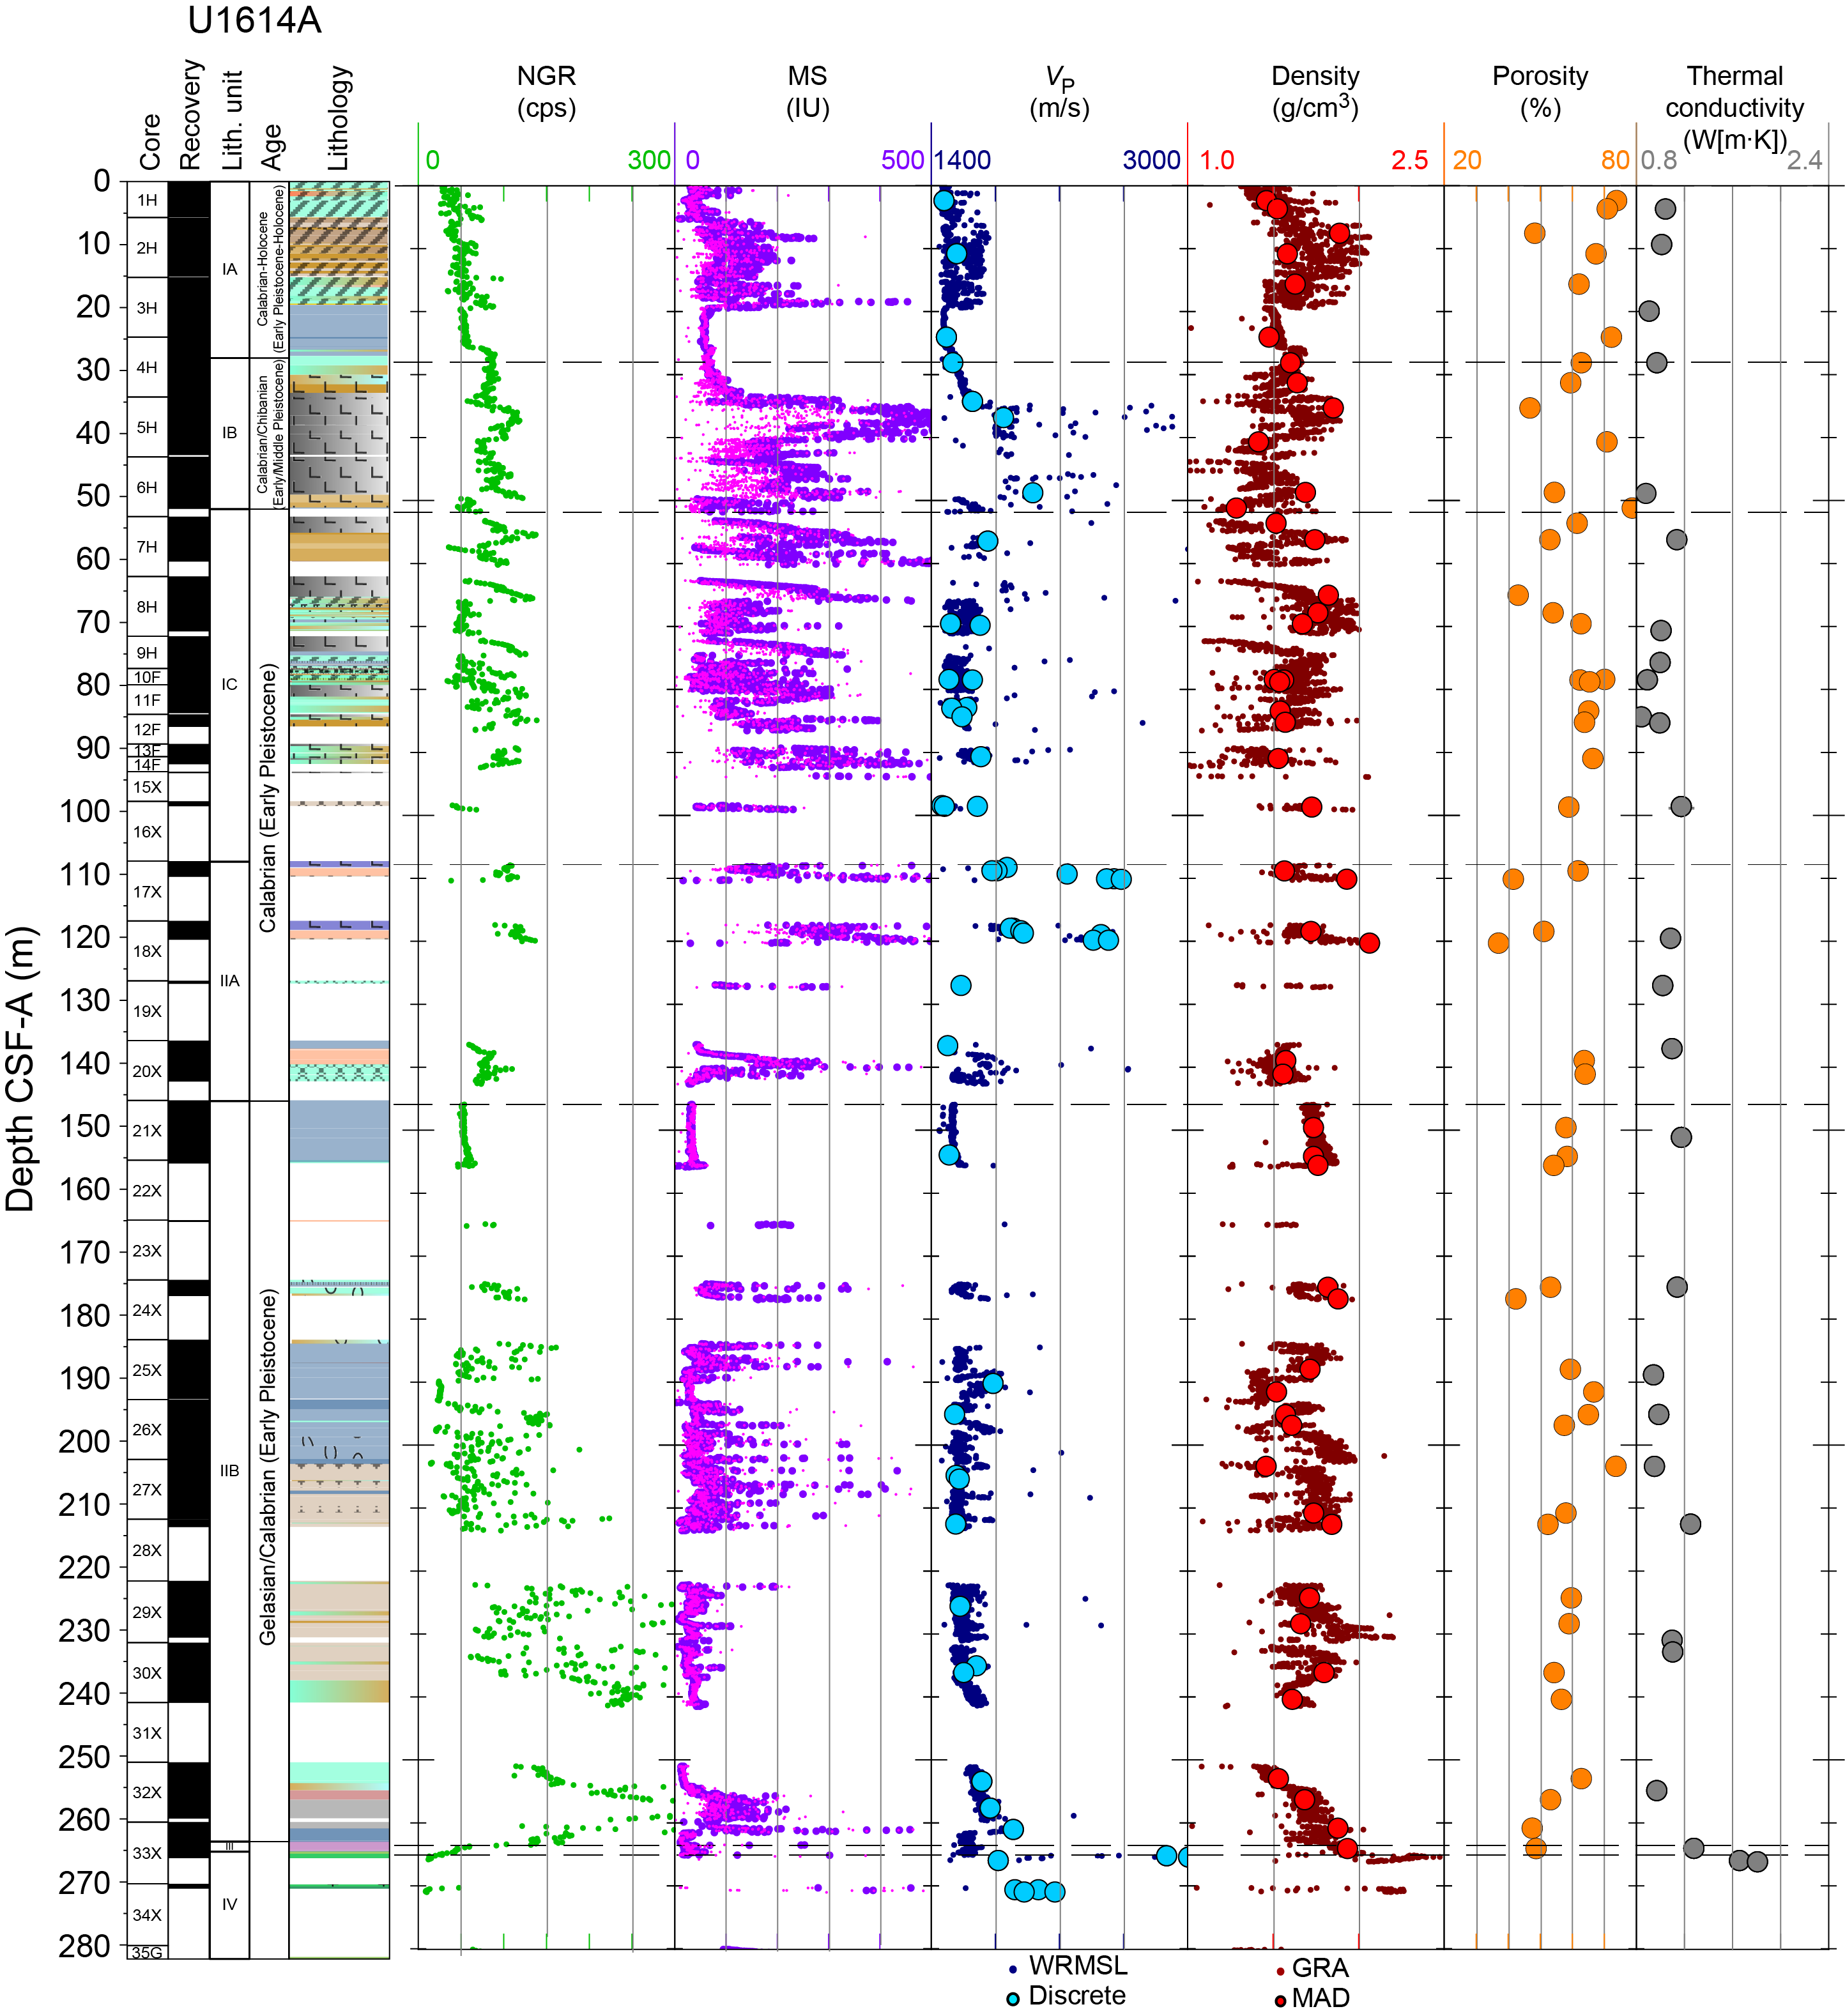
Figure F65. Physical properties, Hole U1614A.
10.1. Lithostratigraphic Unit I
10.1.1. Lithostratigraphic Subunit IA
Lithostratigraphic Subunit IA includes the interval from the seafloor to the base of Section 402-U1614A-4H-2 (0–28 mbsf). Sediment porosity in this interval varies from ~74% to 48% based on six MAD samples, and bulk density ranges 1.46–1.89 g/cm3. The average VP in this interval is 1538 m/s (WRMSL) and 1511 m/s (Gantry). NGR and MS both show generally increasing trends with depth (Figure F65). Notably, GRA bulk density, VP, MS, and NGR data in the upper part of this subunit (through Section 3H-4) are very variable, whereas all these physical properties are nearly constant in the rest of Subunit IA, where homogeneous nannofossil ooze was encountered. Four thermal conductivity measurements in this subunit give an average value of 0.982 W/(m∙K).
10.1.2. Lithostratigraphic Subunit IB
Lithostratigraphic Subunit IB extends from Section 402-U1614A-4H-3 to the base of Core 6H (28.0–52.0 mbsf). Bulk density in this interval varies from 1.285 to 1.852 g/cm3 based on six MAD samples, and porosity ranges 79%–47%. This interval is composed of unconsolidated volcaniclastic material with an average VP of 1729 m/s (WRMSL) and 1769 m/s (Gantry). Thermal conductivity was difficult to measure on these rocks, and only two measurements were made, resulting in an average value of 0.92 W/(m∙K). MS and NGR show generally increasing trends with multiple spikes (Figure F65). All average values are listed in Table T17.
10.1.3. Lithostratigraphic Subunit IC
Lithostratigraphic Subunit IC extends from the top of Core 402-U1614A-7H to the base of Section 16X-1 (52.0–108.0 mbsf). Bulk density in this interval varies from 1.51 to 1.82 g/cm3 based on 12 MAD samples, and porosity ranges 70%–43%. The average VP is 1603 m/s based on 12 discrete Gantry measurements and 1623 m/s based on WRMSL measurements. MS has a chaotic pattern with individual spikes up to 500 IU and an average of 185 IU. NGR also contains spikes in Subunit IC from 34 to 139 counts/s, and thermal conductivity varies from 0.655 to 1.173 W/(m∙K) (Figure F65).
10.2. Lithostratigraphic Unit II
Lithostratigraphic Unit II extends from Core 402-U1614A-17X through Section 33X-2 (108.0–263.6 mbsf). This unit has two subunits: the tuff layer of Subunit IIA extends from Core 17X through Section 20X-CC, and the nannofossil-rich ooze and chalk of Subunit IIB extends from Core 21X through Section 33X-2.
In general, recovery was poor in Lithostratigraphic Subunit IIA, so the measurements are irregular over this interval (Figure F65). Six MAD samples collected from Subunit IIA gave an average density of 1.74 g/cm3 and porosity of 53%. The VP, measured on 6 tuff fragments and 10 other sediments, averages 2096 m/s (Gantry); the average velocity measured using the WRMSL is 1759 m/s, which is largely representative of the mud intervals abundant in Subunit IIA. MS data show spikes from 16 to 1125 IU (WRMSL). NGR data also show spiky character in the range of 38–136 counts/s. Three thermal conductivity measurements were nearly identical at ~1 W/(m∙K) in Subunit IIA.
A total of 19 MAD samples were collected from Lithostratigraphic Subunit IIB (146–263.6 mbsf) with bulk densities ranging 1.46–1.88 g/cm3 and porosity ranging 42%–74%. The upper part of the interval (Core 402-U1614A-21X) has relatively uniform NGR, VP, and MS around 124 counts/s, 54 IU (WRMSL), and 1610 m/s (WRMSL), respectively. The character of all WRMSL measurements becomes highly variable in the lower interval of Subunit IIB with NGR, VP, and density generally increasing with depth and MS generally low but containing irregular spikes to much higher values (Figure F65). The average thermal conductivity is 1.07 W/(m∙K) based on nine measurements.
10.3. Lithostratigraphic Unit III: dolomitic mud
Lithostratigraphic Unit III is a 1.6 m thick interval (Sections 402-U1614A-33X-3 through 33X-4; 263.6–265.2 mbsf) that consists of dolomitic mud with a characteristic reddish color. One MAD sample collected from this interval (Section 33X-4) gave a density of 1.935 g/cm3 and a porosity of ~49% (Figure F65; Table T17). NGR counts drop from 91 to 25 counts/s in this interval, and MS remains relatively low (17–IU on WRMSL) and increases sharply just above the basement.
10.4. Lithostratigraphic Unit IV: transitional unit
Lithostratigraphic Unit IV is a thin interval that was recovered in Holes U1614A and U1614C (Sections 402-U1614A-33X-4 and 33X-CC; 265.2–266.2 mbsf; Sections 402-U1614C-2R-1 and 3R-1; 250–260 mbsf) consisting of an unconsolidated mélange of mud and serpentinized peridotite. The data from VP and density measurements made with the WRMSL (Figure F65) are of low quality because the hard rocks do not completely fill the liner, so velocity and density measurements become unreliable. Three velocity measurements with the Gantry system done on the rocks from Sections 33X-4 and 33X-CC range from 1818 (over the mud interval) to 3006 m/s (over a peridotite fragment at 266.4 mbsf). NGR values are very low with an average of 14.23 counts/s, and MS has a spiking trend ranging 704–2595 IU. Two thermal conductivity measurements in Unit IV average 1.7 W/(m∙K).
10.5. Basement rocks
The sediment/basement interface was captured in Hole U1614A at 265.2 mbsf and consists of an intact contact between serpentinized peridotites and overlying dolomitized sediments. Below this interface, Hole U1614C drilled 153 m of basement rocks, recovering ~68 m of basement material with an average recovery of 44%. The basement rocks are partially serpentinized peridotites with varying degrees of alteration and structural deformation. Figure F66 and Table T18 summarize the physical properties measured in Hole U1614C.
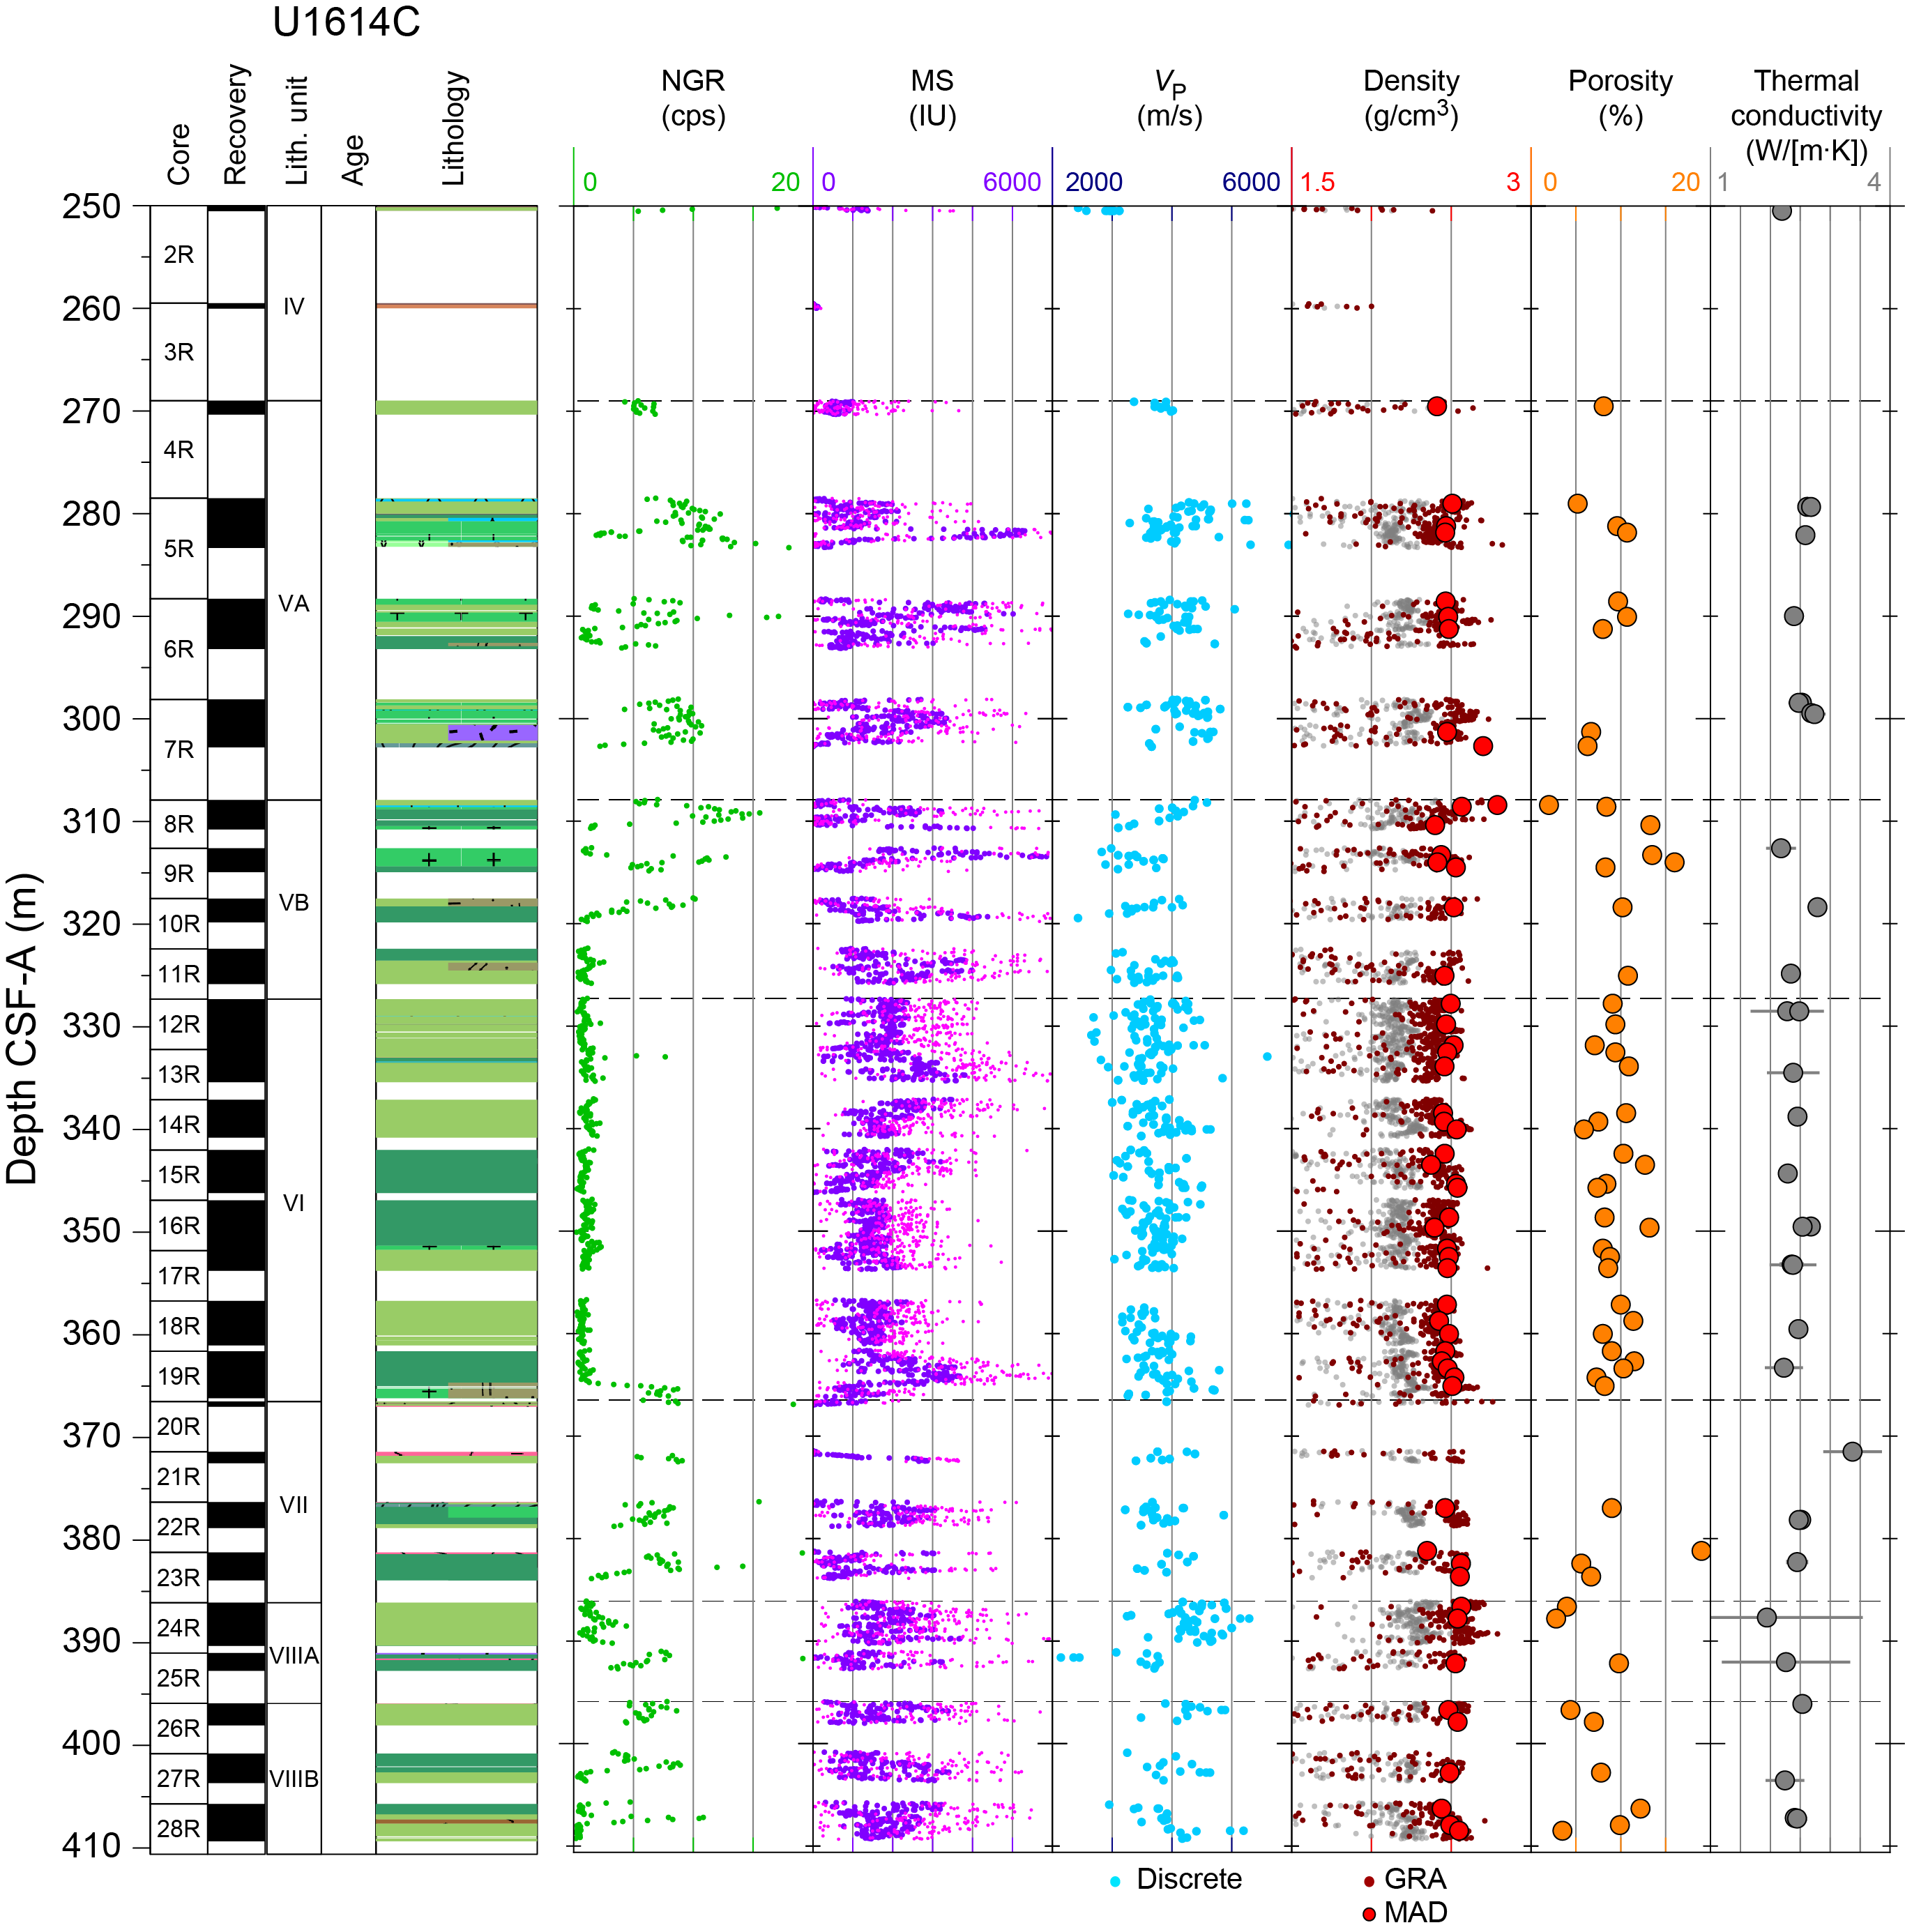
Figure F66. Physical properties, Hole U1614C.
Basement rocks recovered from Hole U1614C have densities ranging from 2.35 (granitoid sample from Section 27R-1) to 2.79 g/cm3 (altered gabbro sample from Section 8R-1). Partially serpentinized peridotites showed an average density of 2.48 g/cm3 and an average porosity of 9%. Of note, we measured extreme values for porosity of 2% in the gabbro sample and 19% in the granitoid samples. All VP measurements were conducted as discrete measurements on the Gantry system because the hard rocks did not fill the core liner fully, making WRMSL measurements unreliable. Because of the same issue, we found that the GRA bulk density measurements of the whole-round sections were lower than those from the MAD analyses. We tested various correction factors for the GRA bulk density data to account for the issue of incomplete core liners. A simple 12% correction applied to the WRMSL GRA bulk density data results in an excellent match with the upper envelope of corrected bulk density values and of the discrete MAD measurements (Figure F66). VP ranges from 2453 m/s for granitoid rocks (average of two measurements for the sample from Section 25R-1) to 6102 m/s for the gabbro fragment from Section 5R-2. The average VP for the peridotite samples is 4137 m/s.
Thermal conductivity measurements (n = 29) range 1.94–3.55 W/(m∙K), with the highest value recorded over a magmatic vein in the sample from Section 402-U1614C-21R-1. The average thermal conductivity value for peridotites is 2.43 W/(m∙K). Notably, some basement intervals show distinct NGR signatures; Cores 2R–10R (250–317.5 mbsf) and cores below Core 20R (366.5–410.6 mbsf) show a spiky pattern between 0 and 18 counts/s, and the interval between spikes has a uniform NGR signature between 1 and 3 counts/s. The contents of K, Th, and U percentages were determined from the NGR spectra to more closely examine trends. K contents are generally less than 1 wt% in serpentinite samples, whereas granitoids have much higher K values, up to almost 6 wt% (Figure F67). Note that the K contents estimated from NGR are substantially higher than K2O concentrations obtained using ICP-AES and pXRF (see Igneous geochemistry). Several individual basement units were identified by the igneous and metamorphic petrology team, and statistics on their physical properties are listed in Table T18.
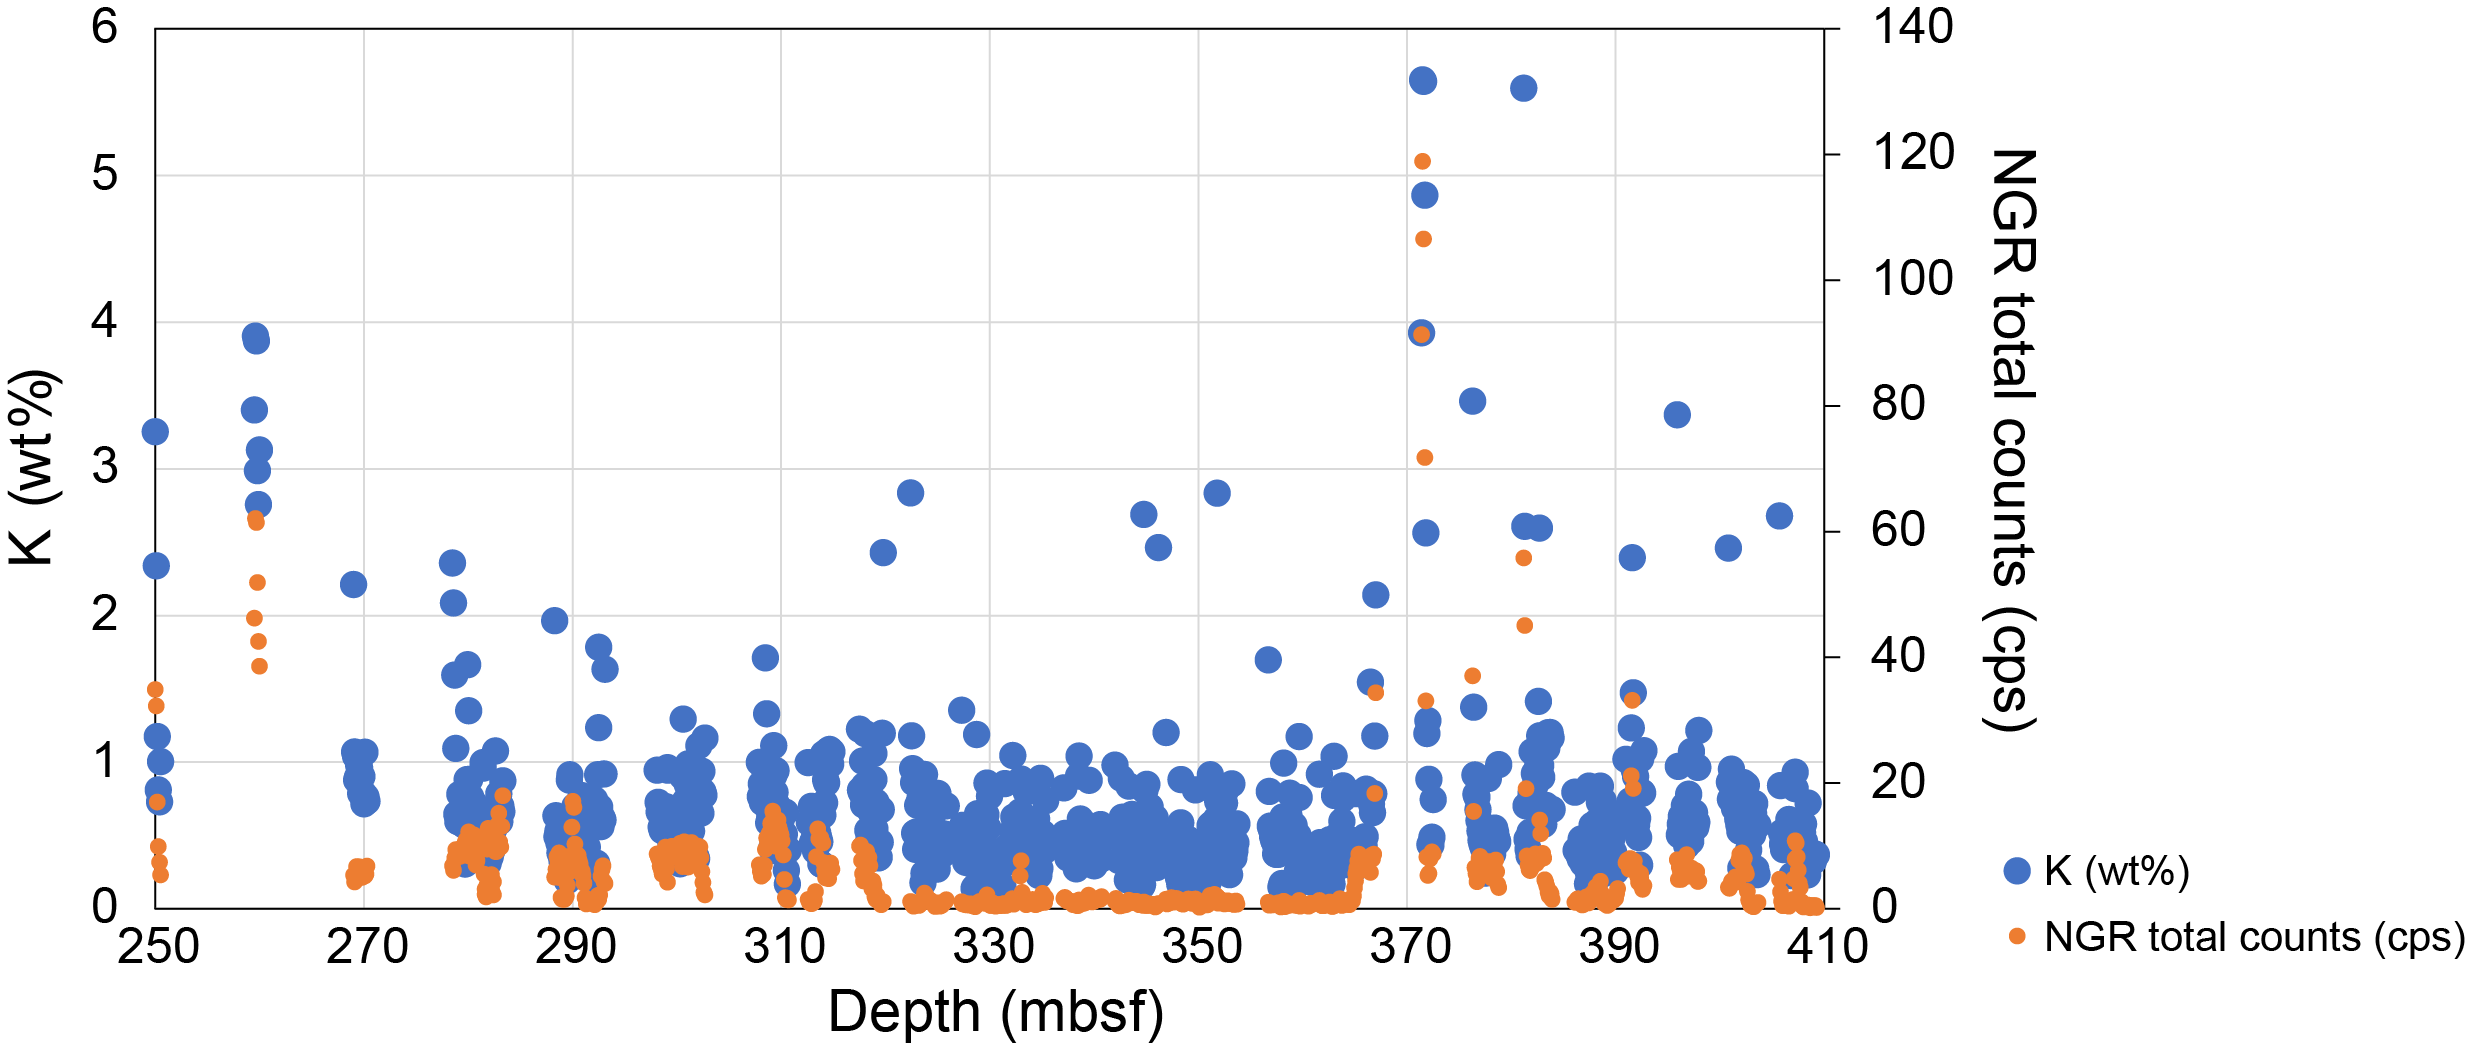
Figure F67. K and NGR total counts.
10.6. Basement Unit V
Lithostratigraphic Unit V consists of a variety of mantle rocks, mafic intrusions, and veins that are divided into the more lherzolite-dominated Subunit VA and the more dunite- and harzburgite-dominated Subunit VB. Subunits VA and VB both show moderate NGR values (average of 7 and 5 counts/s, respectively) associated with magmatic intrusions (Figure F67; Table T18). Subunit VA is clearly distinguishable from Subunit VB in physical properties measurements. In particular, Subunit VA has higher VP (average of 4134 m/s) and corrected GRA bulk density (average of 2.25 g/cm3); both increase with depth within the subunit. In contrast, Subunit VB has an average lower VP and bulk density of 3568 m/s and 2.14 g/cm3, respectively. Subunit VA also shows lower porosity (average of 8%) compared to Subunit VB (average of 10%). MS values are somewhat similar between the subunits, but they are slightly higher in Subunit VA than in Subunit VB. These observations are consistent with petrologic interpretations of Subunit VA, which consists of less altered clinopyroxene-rich and plagioclase-bearing peridotites crosscut by gabbroic intrusions, compared to Subunit VB, where the alteration intensity is greater and the peridotites do not contain plagioclase.
10.7. Basement Unit VI
Basement Unit VI consists of plagioclase- and clinopyroxene-bearing peridotites and pervasive serpentinization alteration. This unit is relatively homogeneous in lithology and physical properties (Figure F66; Table T18). The low VP and density and relatively high porosity are also consistent with broad serpentinization of the mantle rocks and relatively few carbonate-filled veins and intrusions.
10.8. Basement Unit VII
Basement Unit VII consists of altered reddish serpentinized peridotites with mafic intrusions and granitoids. The top of this unit is clearly distinguished by a marked increase in NGR, which remains high throughout the unit (average of 14 counts/s). The VP, density, and thermal conductivity values are slightly higher than those in the overlying Unit VI with values of 3827 m/s, 2.48 g/cm3 and 2.7 W/(m∙K), respectively. Values of porosity (5.6%–19%) and MS (1.1–3051 IU) are more scattered, reflecting the greater heterogeneity in Unit VII (Figure F66; Table T18).
10.9. Basement Unit VIII
Basement Unit VIII was divided into Subunits VIIIA and VIIIB by the igneous and metamorphic petrology team, although the subunits have similar physical properties (Figure F66; Table T18). The homogeneous serpentinized peridotites and granitoids in this unit have some of the highest VP and density and lowest porosity values in all of Hole U1614C and similar physical properties to Subunit VA, except for a slightly lower thermal conductivity (2.1 W/[m∙K] for Subunit VIIIA and 2.4 W/[m∙K] for Subunit VIIIB) (Table T18). Higher velocities and densities were measured where the peridotites are largely crosscut by carbonate veins (likely calcite and magnesite). Notably, VP and bulk density apparently decrease with depth in Unit VIII, a pattern not seen in any of the other units in Hole U1614C.
10.10. Comparison with peridotites from Site 651
The peridotites recovered from Hole U1614C show slightly different physical properties when compared to those recovered from Site 651 (Kastens et al., 1988). In particular, the porosity within the upper 20 m of the recovered peridotites is generally higher (5%–11%) than that observed at Site 651 (3%). Measured density is also lower in Hole U1614C (2.41–2.51 g/cm3) compared to Site 651 (2.56–2.65 g/cm3). VP measurements, however, show better agreement and fall into a similar range as shown in Figure F68. Because the two sites are about 13.5 km apart, this discrepancy in density and porosity could be related to different alteration processes that affected the mantle rocks at these two sites.
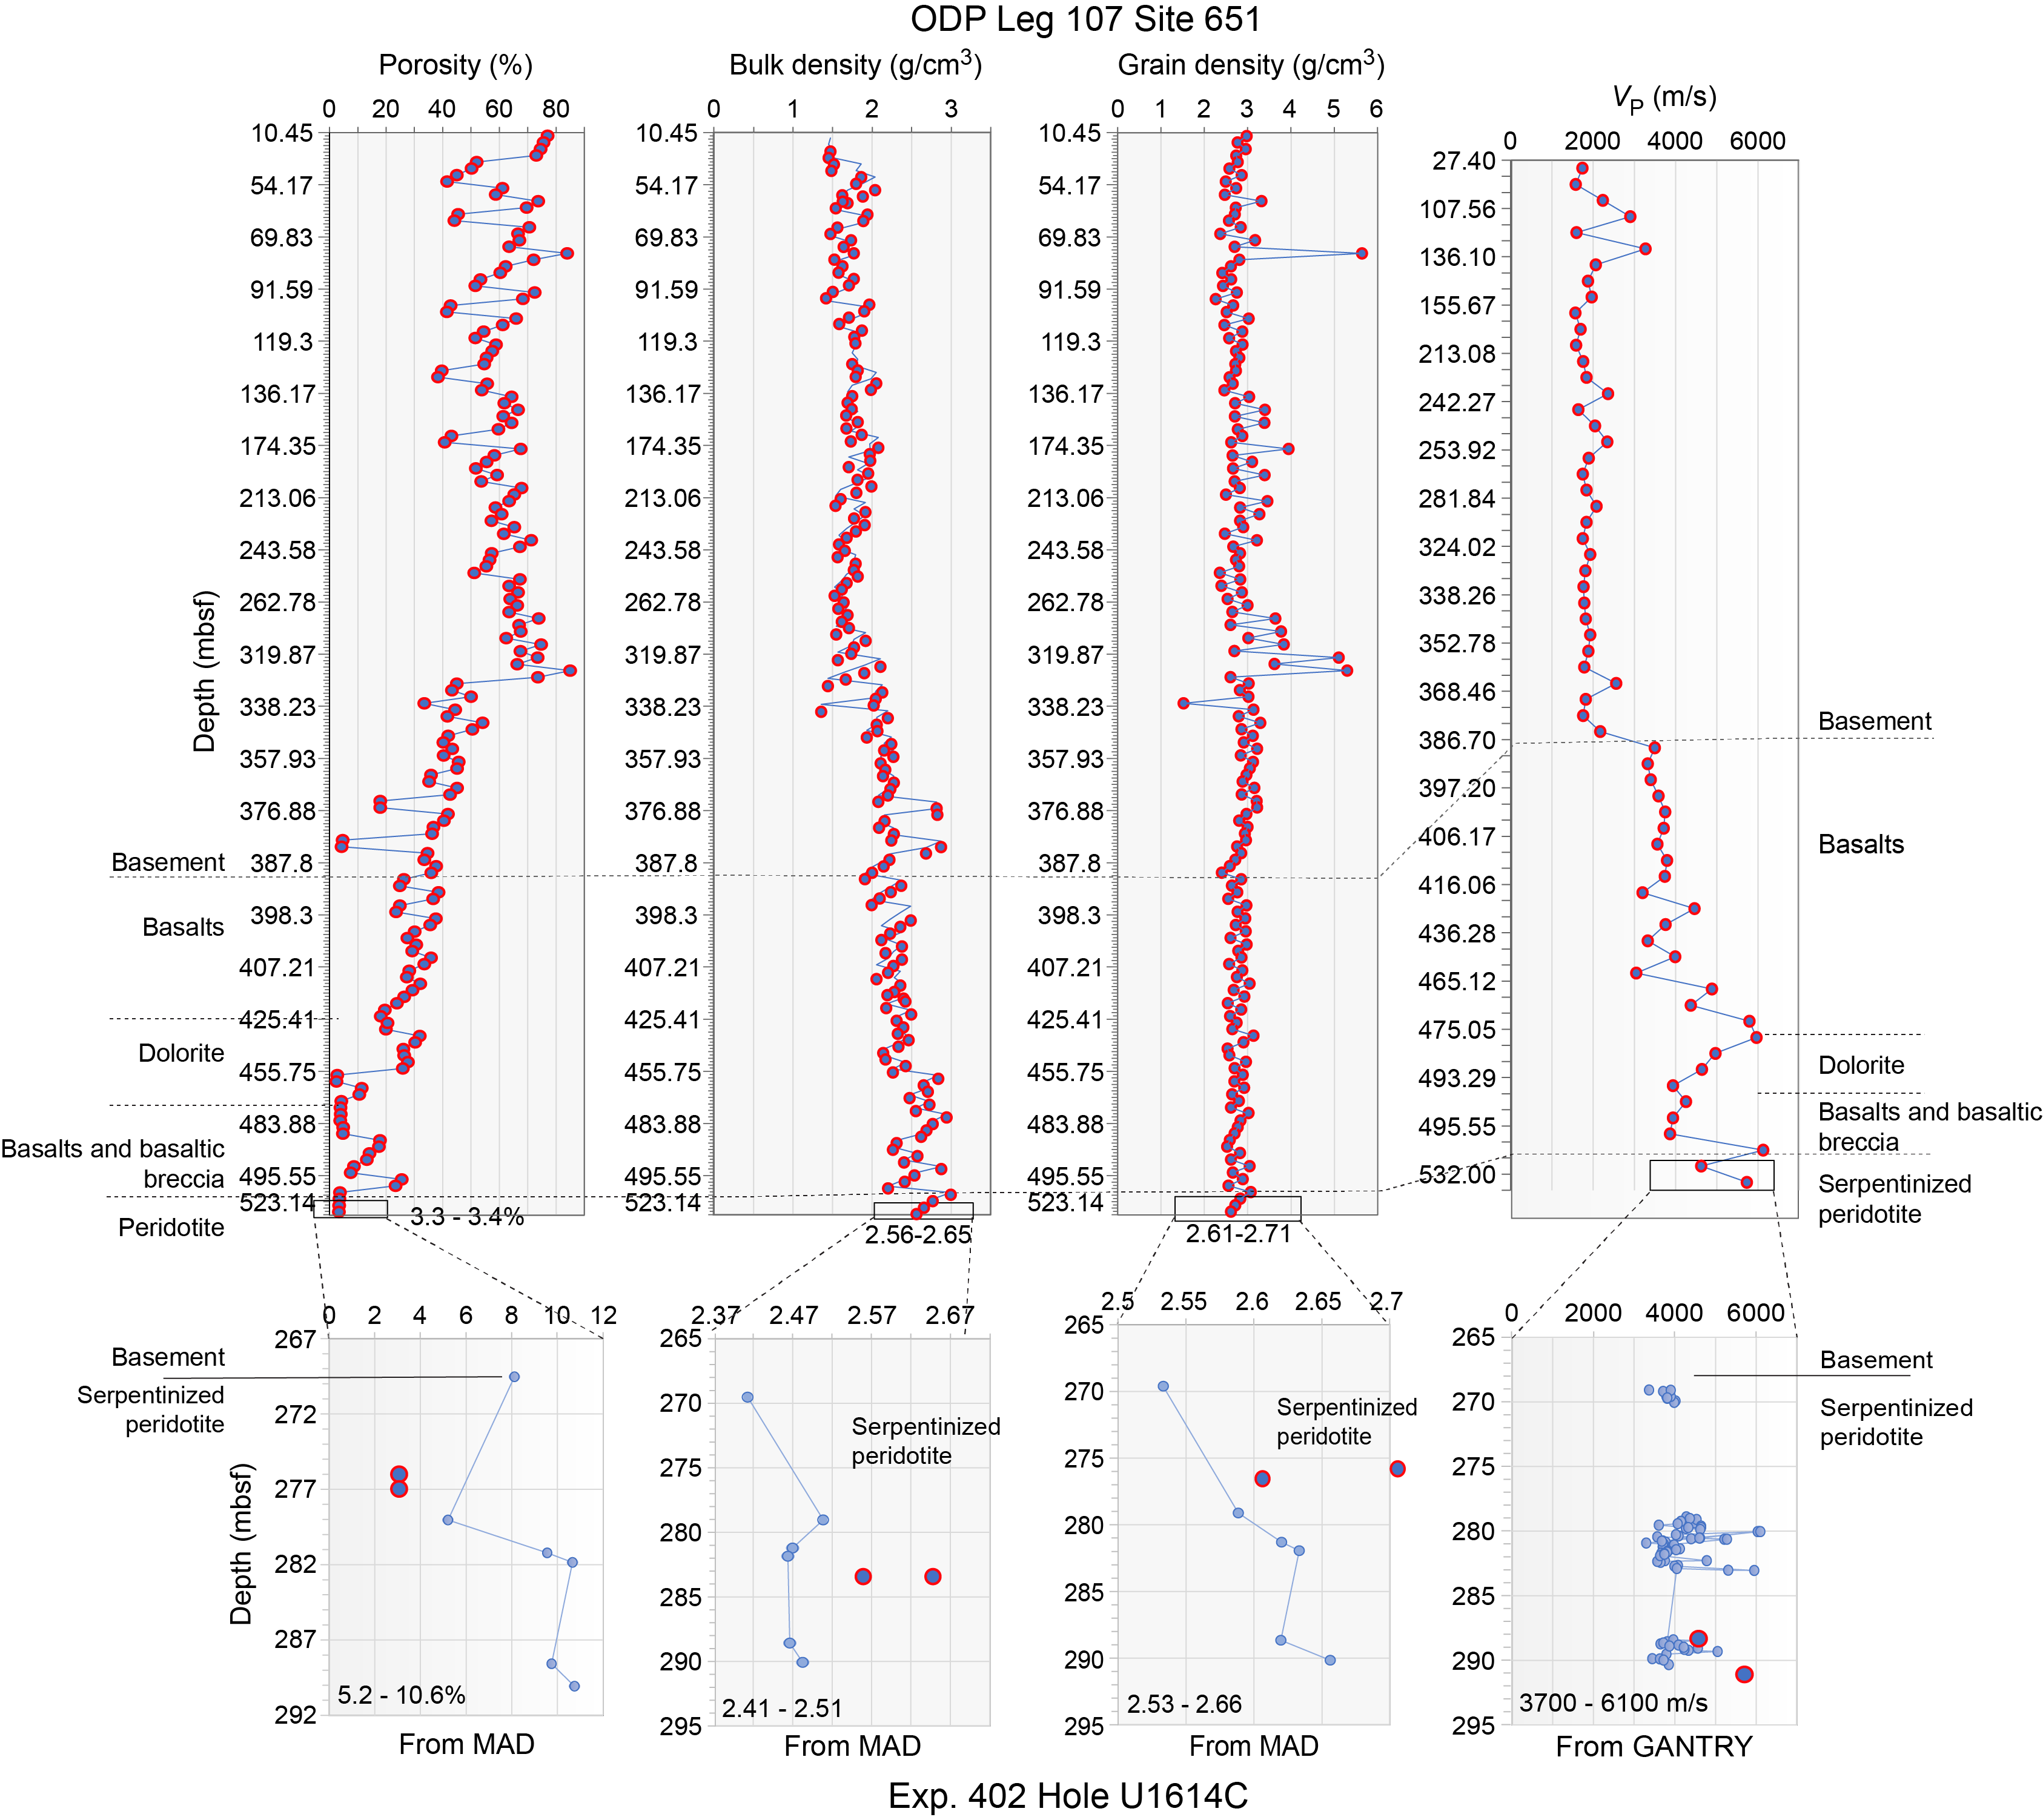
Figure F68. Peridotite physical properties.
10.11. Depth-time relationship
A preliminary depth-time relationship was established from VP measurements of the cores from Holes U1614A and U1614C. Unfortunately, because the drill pipe became stuck shortly after reaching the target depth, we were unable to obtain logging data at this location to perform a detailed core-seismic tie. Nevertheless, the velocity-depth data allow us to estimate the position of the recovered cores in two-way traveltime on the Mediterràneo Occidental (MEDOC) project seismic reflection data (Ranero and Sallarès, 2017). VP data showed more scatter and heterogeneity in the sedimentary section at this site compared to other sites. Some elevated WRMSL VP values are likely due to poor automated first arrival picks, and others (such as those in Lithostratigraphic Subunits IA and IIA) reflect coarse volcaniclastic deposits (Figure F65). Smooth and ultrasmooth velocity-depth functions result in a ~10 m difference in core positions at the bottom of the hole. We estimate that the vertical resolution of the seismic data is likely ~1–2 cores based on the VP and frequency content of the MEDOC data (Figure F69).
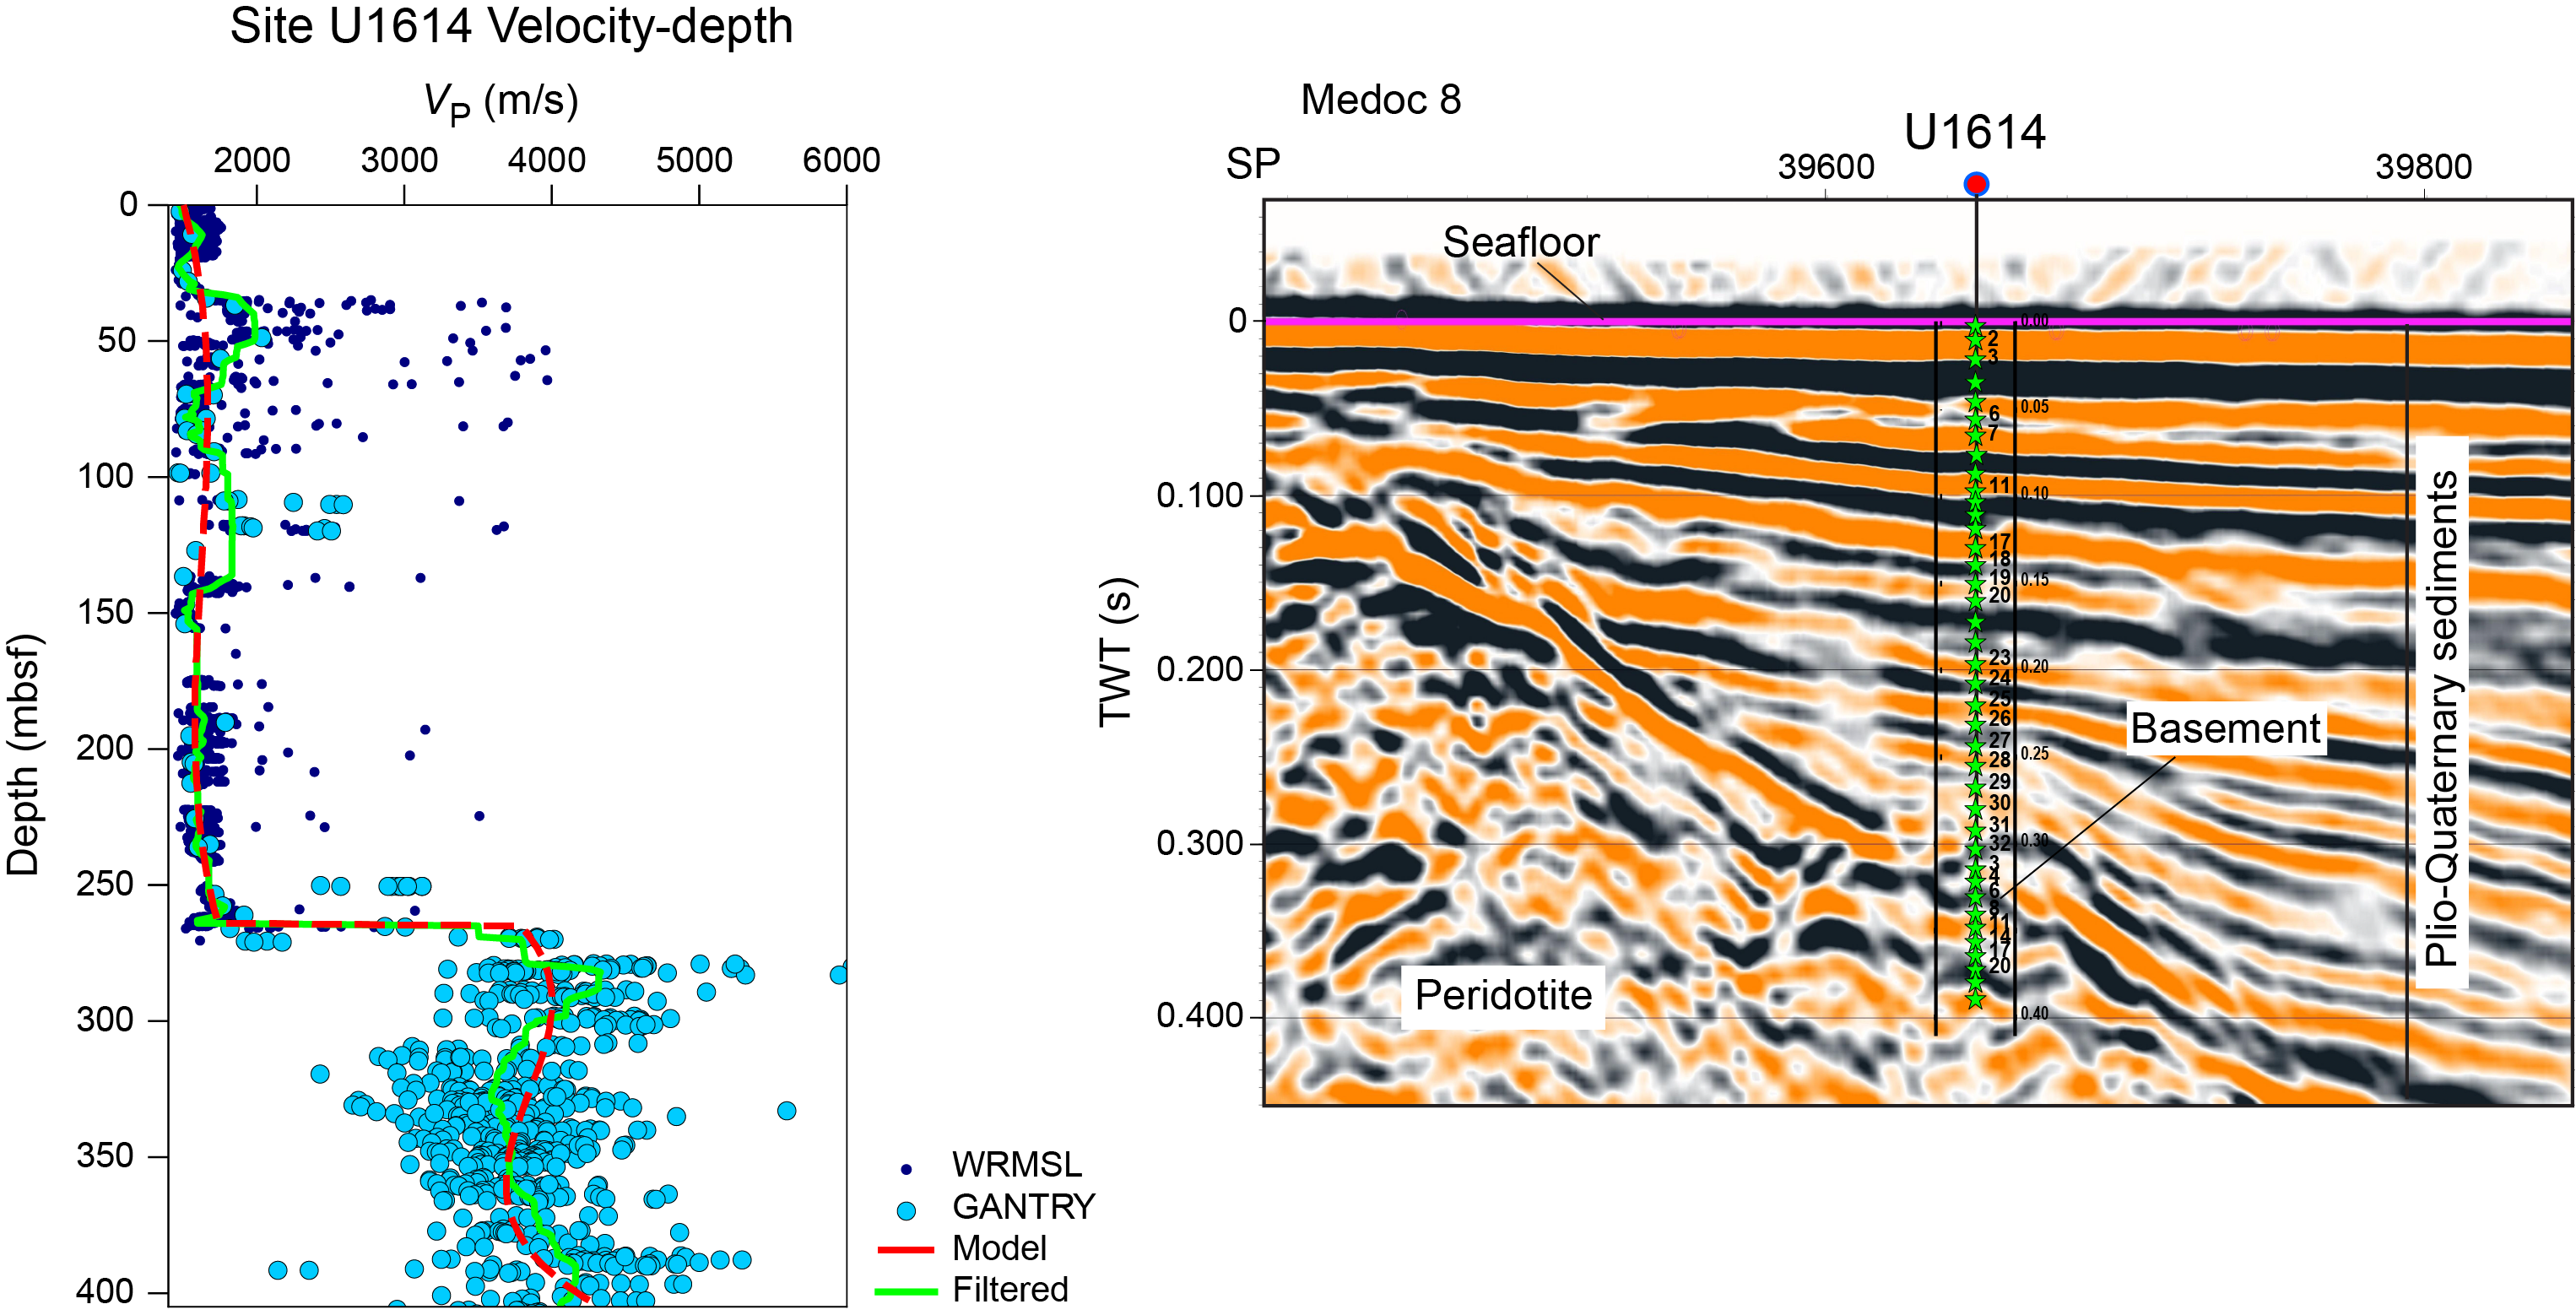
Figure F69. VP profile and TWT plot of core tops.
Cores 402-U1614A-5R through 6R, containing coarse volcanic gravel, correspond to a low-amplitude chaotic reflectivity layer on the seismic reflection data just below the seafloor that can be traced throughout the Vavilov Basin (Figure F69). Cores 7R–12R correspond to an interval of high-amplitude, laterally continuous reflections. Cores 13R–23R, where recovery was poor, correspond to a muted low-frequency, low-amplitude zone of reflectivity. Finally, Cores 24R–33R, which had high recovery, correspond to moderate amplitude and moderately continuous reflections that are slightly tilted, which agrees well with higher bedding dip angles observed in the recovered cores. Several lateral pinch-outs of reflectors within this layer are clearly visible toward the basement high and probably result from angular unconformities. The basement reflection is locally complex at Site U1614. Core 33X, where the dolomite/serpentine contact was encountered, aligns with a negative polarity reflection. The reversal appears to be local to Site U1614, whereas the lateral flanks have a strong positive polarity basement reflection. A negative polarity reflection aligns well with Core 402-U1614C-20X, where a heterogeneous fault zone consisting of deformed serpentinized mantle peridotites, cataclasite and mylonitic granitoids, and deformed talc-tremolite schist was encountered.
11. Downhole measurements
Downhole measurements at Site U1614 consisted of two runs of the third-generation APCT-3 tool to measure in situ sediment temperatures in Hole U1614A while coring Cores 4H and 7H. Each run also included a seafloor temperature measurement. A third measurement was not possible because formation conditions required the use of the HLAPC system starting from Core 10F. As part of the reentry procedure into Hole U1614C, a CTD sensor was deployed on the VIT frame to measure the temperature, salinity, and electrical conductivity of seawater from the sea surface to the seafloor (see Operations).
The downhole geophysical measurements planned for Hole U1614C could not be carried out after the pipe became stuck and was severed just below the base of the casing string.
11.1. Downhole temperature measurements and heat flow
11.1.1. Downhole temperature measurements
The two APCT-3 measurements were successful at 34.2 (Core 402-U1614A-4H) and 62.70 mbsf (Core 7H), yielding equilibrium temperatures of 20.43° and 27.42°C, respectively, after applying the shipboard correction factor (Table T19; see Downhole measurements in the Expedition 402 methods chapter [Malinverno et al., 2025a]). These temperatures are consistent with an equilibrium seafloor temperature of 13.65°C recorded prior to the second run.
A near-seafloor temperature of 13.57°C was measured using the CTD tool, confirming the temperature measured with the APCT-3 sensor.
11.1.2. Heat flow
The sediment temperatures measured in Hole U1614A define a thermal gradient of 21.89°C/100 m (Figure F70; Table T19). Using the average thermal conductivity of 0.991 W/(m∙K) that was measured in the uppermost 62.7 m of Hole U1614A (see Physical properties), we obtained a heat flow of 217 mW/m2 for Site U1614. Although somewhat higher, this result compares favorably with those obtained from nearby seafloor measurements (Della Vedova et al., 2001) and with results from ODP Leg 107 Sites 650 (132 mW/m2), 651 (131 mW/m2), and 655 (63 mW/m2) (Shipboard Scientific Party, 1987a, 1987b, 1987c) and Site U1612 (184 mW/m2).
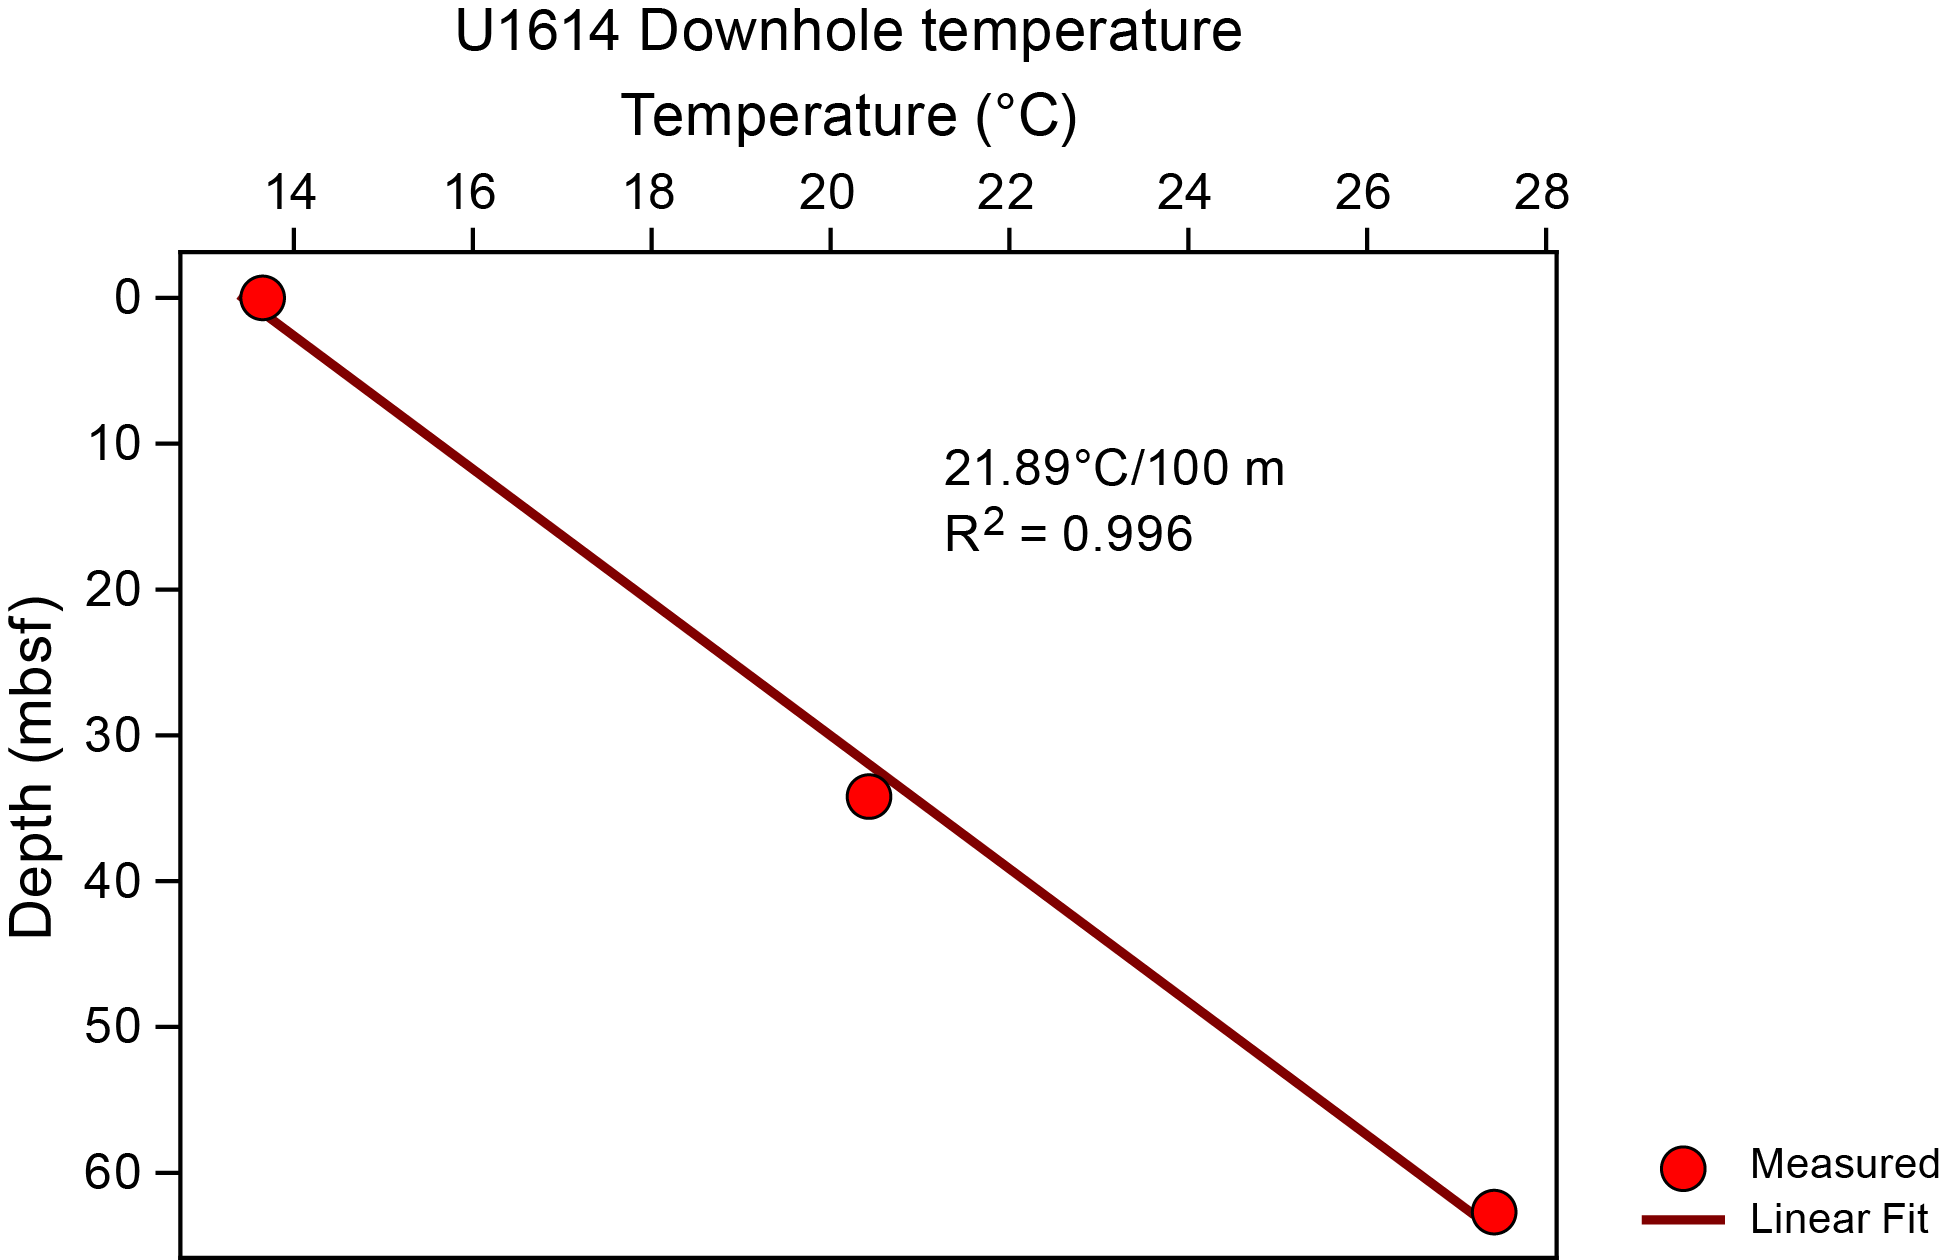
Figure F70. Temperatures in Vavilov Basin and local temperature gradient.
12. Microbiology
12.1. Sediment
At Site U1614, we drilled to a total depth of 280.1 mbsf with the APC/XCB system in Hole U1614A, reaching below the contact between sediments and mantle peridotites. Samples were collected for microbiological analyses, including dissolved oxygen measurements in sediment pore waters, contamination testing using perfluorodecalin (PFD) tracer pumped with the drilling fluid, sampling of near-seafloor water with the Niskin bottles attached to the VIT camera system, and collection of whole-round and syringe plug samples for shore-based molecular biology and culture studies.
12.1.1. Oxygen profiles
Oxygen concentrations in Hole U1614A were measured immediately after core recovery, starting with Core 1H. Core 1H was measured at multiple intervals from 4 to 20 cm and showed significant oxygen concentrations and a clear decrease with depth. Low concentrations of oxygen were detected downhole, and the minimum above-zero value of 0.6 µmol/L was found at 21.59 mbsf (Figure F71; Table T20). Attempts were made to measure oxygen below Core 8H, but the sandy and gravelly composition of the cored sediment made probe insertion and a quality contact between the probe and sample difficult, preventing further measurements.
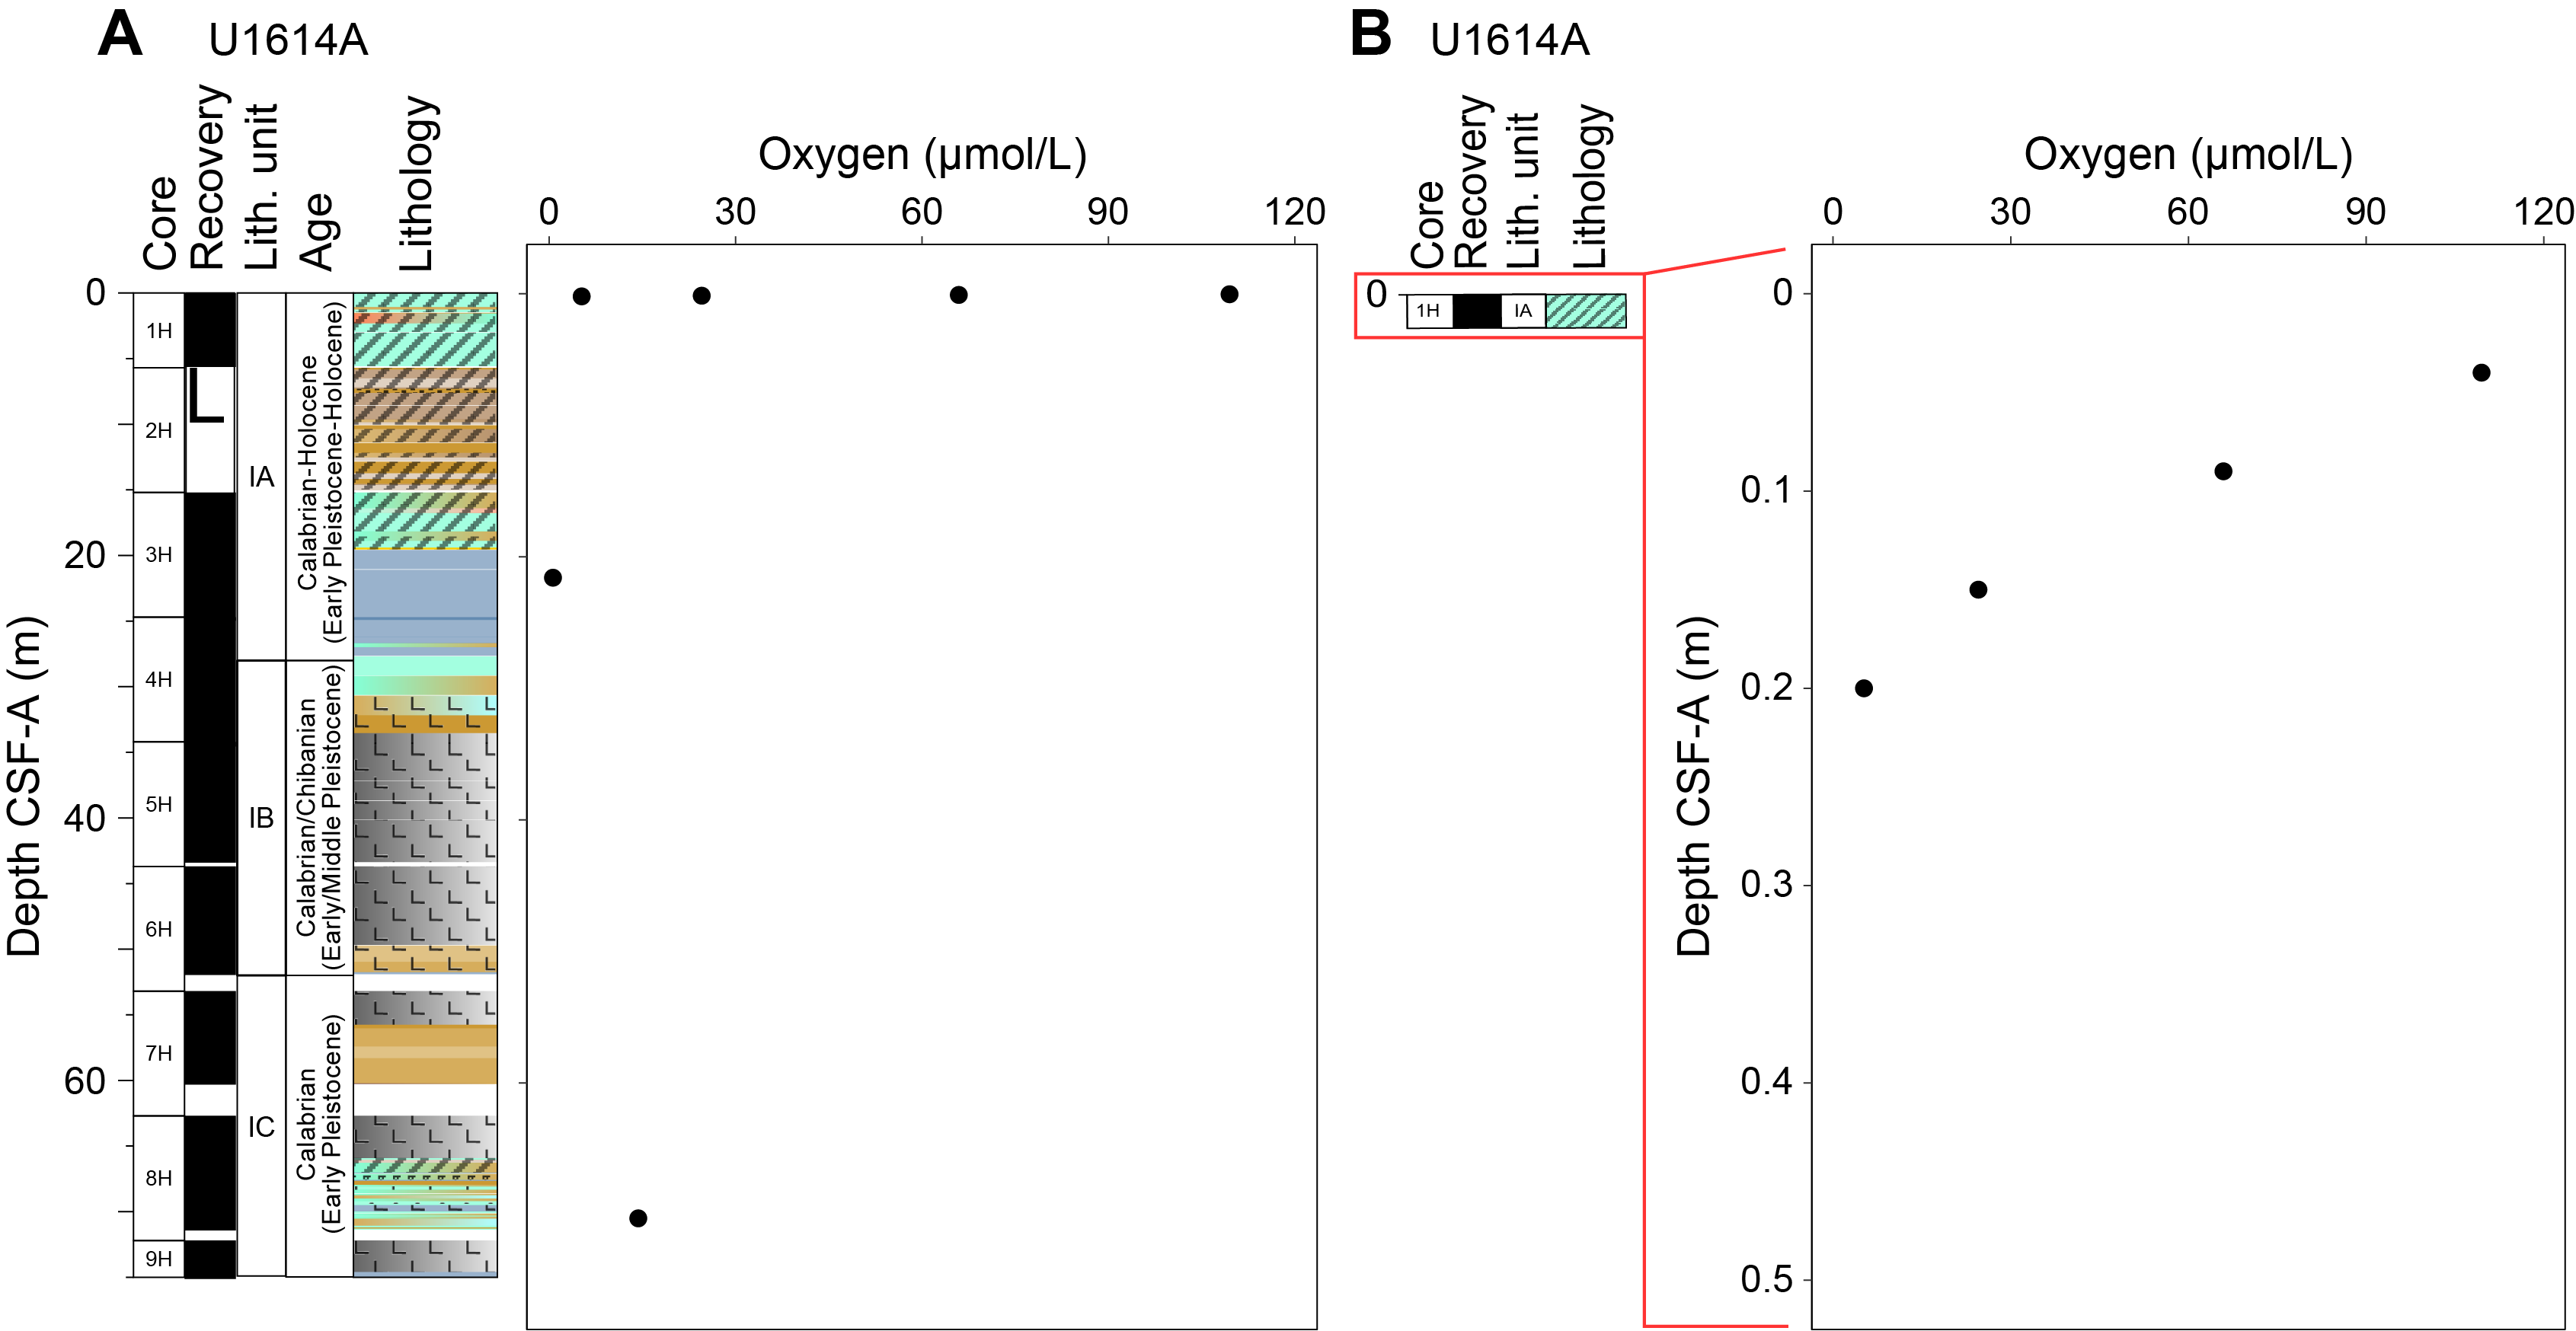
Figure F71. Oxygen concentration profile.
12.1.2. Microbiological contamination testing
Sediment samples can be easily contaminated by the intrusion of drilling fluid, which is used to cool equipment, control pressure, wash out cuttings, and stabilize the borehole wall (Sylvan et al., 2021). The PFD tracer was used to determine the extent of contamination in microbiological samples. It was injected into the drilling fluid at a concentration of 0.4 mL/L during circulation in sediments in Hole U1614A. Three samples were collected from each core for analysis of PFD: drilling fluid from the top of the core, a plug of sediment from the core exterior to verify delivery of the tracer to the core, and a plug of sediment from the core interior, adjacent to the microbiological samples, to evaluate the extent of contamination. All samples were stored in glass headspace vials until gas chromatograph (GC) analysis. A total of 15 paired samples of drilling fluid, core exterior, and core interior were collected on the catwalk.
PFD was mainly detected in the outer core samples at a mean of 0.12 ng/g, demonstrating consistent release of the tracer. A total of 13 interior samples were free of contamination (Figure F72; Table T21). However, samples from Sections 402-U1614A-1H-4 and 17X-2 showed significant PFD content, indicating potential contamination from drilling fluid intrusion.
Figure F72. PFD tracer concentrations.
12.1.3. Deep seawater sample
During reentry operations in Hole U1614C, the VIT camera system was lowered to the ocean floor with a Niskin bottle attached to the camera frame that sampled 1 L of deep water (water depth of 3550 m), which was brought to the surface and placed in a sterile glass bottle. Sample aliquots were taken for cell counts and metagenomic analyses of bacteria in the water. Water samples of 5 mL were distributed into 1 mL cryotubes and fixed with 4% formaldehyde for the cell counts. The remaining water was filtered through a 0.2 µm polycarbonate membrane filter, retaining the cells for future molecular biology analyses. The entire filter was wrapped in an aluminum envelope and frozen at −86°C along with the cell count samples for onshore analysis.
12.1.4. Microbiological sampling
12.1.4.1. Microbial community
Sediment samples were collected from Hole U1614A for analysis of the resident microbial communities. For this analysis, 5 cm long whole rounds were collected every 20 m for metagenomic analysis, and a 10 mL plug was extracted from the center of each core (every ~10 m) for 16S rRNA gene amplification and sequencing. These samples were bagged and frozen at −86°C immediately after collection for onshore analysis.
12.1.4.2. Microbial experiments
Additional whole-round samples were collected on the catwalk from Sections 402-U1614A-2H-5, 5H-4, and 13F-1 from possible geochemical transition zones. These zones are important to study because the changes in sediment and pore water composition affect the distribution and availability of nutrients and elements essential for life. One whole-round sample was selected for processing in the anaerobic chamber and stored at 11°C.
Samples from Sections 402-U1614A-2H-5 and 13F-1 were not processed because they consisted of sand and gravel. A sample from Section 5H-4 was used to perform viral production, prophage induction, and enrichment experiments. To detect viral activity, the sample was incubated in a 100 mL serum vial under dark conditions while maintaining an anaerobic headspace. Incubations were subsampled at t = 0, t = 4, t = 8, t = 12, and t = 24 h. For each subsample, 1 mL of sample was collected in triplicate, fixed with 54 µL of 37% formaldehyde, and stored at −86°C. The incubations were performed in the anaerobic chamber, and the subsampling was performed in the biosafety cabinet (clean air) without opening the incubation bottles.
In addition, the same sample from Section 402-U1614A-5H-4 was used to generate enrichment cultures using two anaerobic culture media (MMJHS and MJYPGS) (see Microbiology in the Expedition 402 methods chapter [Malinverno et al., 2025a]), which were then stored in the dark at room temperature. The sediment was diluted in synthetic anaerobic seawater to facilitate transfer of the sediment to the vials.
12.1.4.3. Viral counts
Plug samples (1 cm3) were taken from each core (9.5 m), fixed with 4 mL of a solution of formaldehyde with phosphate-buffered saline (PBS) (100 mM), and stored at 4°C for onshore analysis.
References
Akizawa, N., Ohara, Y., Okino, K., Ishizuka, O., Yamashita, H., Machida, S., Sanfilippo, A., Basch, V., Snow, J.E., Sen, A., Hirauchi, K.-i., Michibayashi, K., Harigane, Y., Fujii, M., Asanuma, H., and Hirata, T., 2021. Geochemical characteristics of back-arc basin lower crust and upper mantle at final spreading stage of Shikoku Basin: an example of Mado Megamullion. Progress in Earth and Planetary Science, 8(1):65. https://doi.org/10.1186/s40645-021-00454-3
Beccaluva, L., Bonatti, E., Dupuy, C., Ferrara, G., Innocenti, F., Lucchini, F., Macera, P., Petrini, R., Rossi, P.L., Serri, G., Seyler, M., and Siena, F., 1990. Geochemistry and mineralogy of volcanic rocks from ODP Sites 650, 651, 655, and 654 in the Tyrrhenian Sea. In Kastens, K.A., Mascle, J., et al., Proceedings of the Ocean Drilling Program, Scientific Results, 107: College Station, TX (Ocean Drilling Program), 49–47. https://doi.org/10.2973/odp.proc.sr.107.140.1990
Bernasconi, S.M., 1999. Interstitial water chemistry in the western Mediterranean: results from Leg 161. In Zahn, R., Comas, M.C., and Klaus, A. (Eds.), Proceedings of the Ocean Drilling Program, Scientific Results. 161: College Station, TX (Ocean Drilling Program). https://doi.org/10.2973/odp.proc.sr.161.228.1999
Boillot, G., and Winterer, E.L., 1988. Drilling on the Galicia margin: retrospect and prospect. In Boillot, G., Winterer, E. L., et al., Proceedings of the Ocean Drilling Program, Scientific Results. 103: College Station, TX (Ocean Drilling Program), 809–828. https://doi.org/10.2973/odp.proc.sr.103.180.1988
Bonatti, E., Seyler, M., Channell, J.E.T., Giraudeau, J., and Mascle, G., 1990. Peridotites drilled from the Tyrrhenian Sea, ODP Leg 107. In Kastens, K.A., Mascle, J., et al., Proceedings of the Ocean Drilling Program, Scientific Results. 107: College Station, TX (Ocean Drilling Program), 37–47. https://doi.org/10.2973/odp.proc.sr.107.141.1990
Colantoni, P., Fabbri, A., Gallignani, P., Sartori, R., and Rehault, J.P., 1981. Carta Litologica e Stratigrafica dei Mari Italiani, scala 1/1.500.000. Italy: Litografia Artistica Cartografica.
Della Vedova, B., Bellani, S., Pellis, G., and Squarci, P., 2001. Deep temperatures and surface heat flow distribution. In Vai, G.B. and Martini, I.P., Anatomy of an Orogen: the Apennines and Adjacent Mediterranean Basins. (Springer), 65–76. https://doi.org/10.1007/978-94-015-9829-3_7
Di Stefano, A., Baldassini, N., Raffi, I., Fornaciari, E., Incarbona, A., Negri, A., Negri, A., Bonomo, S., Villa, G., Di Stefano, E., and Rio, D., 2023. Neogene-Quaternary Mediterranean calcareous nannofossil biozonation and biochronology: a review. Stratigraphy, 20(4):259–302. https://www.micropress.org/microaccess/check/2342
Faganeli, J., Planinc, R., Pezdič, Smodiš, B., Stegnar, P., and Ogorelec, B., 1991. Marine geology of the Gulf of Trieste (northern Adriatic): geochemical aspects. Marine Geology, 99(1):93–108. https://doi.org/10.1016/0025-3227(91)90085-I
Gieskes, J.M., Lawrence, J.R., Perry, E.A., Grady, S.J., and Elderfield, H., 1987. Chemistry of interstitial waters and sediments in the Norwegian-Greenland Sea, Deep Sea Drilling Project Leg 38. Chemical Geology, 63(1):143–155. https://doi.org/10.1016/0009-2541(87)90081-7
Godard, M., Awaji, S., Hansen, H., Hellebrand, E., Brunelli, D., Johnson, K., Yamasaki, T., Maeda, J., Abratis, M., Christie, D., Kato, Y., Mariet, C., and Rosner, M., 2009. Geochemistry of a long in-situ section of intrusive slow-spread oceanic lithosphere: results from IODP Site U1309 (Atlantis Massif, 30°N Mid-Atlantic-Ridge). Earth and Planetary Science Letters, 279(1–2):110–122. https://doi.org/10.1016/j.epsl.2008.12.034
Goldman, J.C., Caron, D.A., and Dennett, M.R., 1987. Regulation of gross growth efficiency and ammonium regeneration in bacteria by substrate C: N ratio. Limnology and Oceanography, 32(6):1239–1252. https://doi.org/10.4319/lo.1987.32.6.1239
Goldsmith, J.R., Graf, D.L., Chodos, A.A., Joensuu, O.I., and Mcvicker, L.D., 1958. Relation between lattice constants and composition of Ca-Mg carbonates. American Mineralogist, 43(1–2):84–101.
Goñi, M.A., Ruttenberg, K.C., and Eglinton, T.I., 1998. A reassessment of the sources and importance of land-derived organic matter in surface sediments from the Gulf of Mexico. Geochimica et Cosmochimica Acta, 62(18):3055-3075. https://doi.org/10.1016/S0016-7037(98)00217-8
Haese, R.R., Meile, C., Van Cappellen, P., and De Lange, G.J., 2003. Carbon geochemistry of cold seeps: methane fluxes and transformation in sediments from Kazan mud volcano, eastern Mediterranean Sea. Earth and Planetary Science Letters, 212(3):361–375. https://doi.org/10.1016/S0012-821X(03)00226-7
Hébert, R., Gueddari, K., Laflèche, M.R., Beslier, M.-O., and Gardien, V., 2001. Petrology and geochemistry of exhumed peridotites and gabbros at non-volcanic margins: ODP Leg 173 West Iberia ocean-continent transition zone. In Wilson, R.C.L., Whitmarsh, R.B., and Taylor, B., and Froitzheim, N. (Eds.), Non-Volcanic Rifting of Continental Margins: A Comparison of Evidence from Land and Sea. Geological Society, London, Special Publications, 187. https://doi.org/10.1144/GSL.SP.2001.187.01.09
Heezen, B.C., Gray, C., Segre, A.G., and Zarudski, E.F.K., 1971. Evidence of foundered continental crust beneath the central Tyrrhenian Sea. Nature, 229(5283):327–329. https://doi.org/10.1038/229327a0
Hopkinson, C.S., Fry, B., and Nolin, A.L., 1997. Stoichiometry of dissolved organic matter dynamics on the continental shelf of the northeastern U.S.A. Continental Shelf Research, 17(5):473–489. https://doi.org/10.1016/S0278-4343(96)00046-5
Jørgensen, B.B., 2000. Pathways of organic matter degradation. In Schulz, H.D., and Zabel, M. (Eds.), Marine Geochemistry (2nd edition). Berlin (Springer-Verlag).
Jørgensen, B.B., Nelson, D.C., Amend, J.P., Edwards, K.J., and Lyons, T.W., 2004. Sulfide oxidation in marine sediments: geochemistry meets microbiology. In Amend, J.P., Edwards, K.J., and Lyons, T.W. (Eds.), Sulfur Biogeochemistry - Past and Present. 379: Special Paper - Geological Society of America. https://doi.org/10.1130/0-8137-2379-5.63
Kastens, K.A., and Mascle, J., 1990. The geological evolution of the Tyrrhenian Sea; an introduction to the scientific results of ODP Leg 107. In Kastens, K.A., Mascle, J., et al., Proceedings of the Ocean Drilling Program, Scientific Results. 107: College Station, TX (Ocean Drilling Program), 3–26. https://doi.org/10.2973/odp.proc.sr.107.187.1990
Kastens, K., Mascle, J., Auroux, C., Bonatti, E., Broglia, C., Channell, J., Curzi, P., Emeis, K.C., Glaçon, G., Hasegawa, S., Hieke, W., Mascle, G., Mccoy, F., Mckenzie, J., Mendelson, J., Müller, C., Réhault, J.P., Robertson, A., Sartori, R., Sprovieri, R., and Torii, M., 1988. ODP Leg 107 in the Tyrrhenian Sea: insights into passive margin and back-arc basin evolution. Geological Society of America Bulletin, 100(7):1140–1156. https://doi.org/10.1130/0016-7606(1988)100<1140:OLITTS>2.3.CO;2
Kastner, M., 1981. Authigenic silicates in deep sea sediments: formation and diagenesis. In Emiliani, C., The oceanic lithosphere. The Sea, 7: New York (Wiley), 915–980.
Kirschvink, J.L., 1980. The least-squares line and plane and the analysis of palaeomagnetic data. Geophysical Journal International, 62(3):699–718. https://doi.org/10.1111/j.1365-246X.1980.tb02601.x
Lirer, F., Foresi, L.M., Iaccarino, S.M., Salvatorini, G., Turco, E., Cosentino, C., Sierro, F.J., and Caruso, A., 2019. Mediterranean Neogene planktonic foraminifer biozonation and biochronology. Earth-Science Reviews, 196:102869. https://doi.org/10.1016/j.earscirev.2019.05.013
Lister, G.S., and Davis, G.A., 1989. The origin of metamorphic core complexes and detachment faults formed during Tertiary continental extension in the northern Colorado River region, U.S.A. Journal of Structural Geology, 11(1):65–94. https://doi.org/10.1016/0191-8141(89)90036-9
Malinverno, A., Zitellini, N., Estes, E.R., Abe, N., Akizawa, N., Bickert, M., Cunningham, E.H., Di Stefano, A., Filina, I.Y., Fu, Q., Gontharet, S., Kearns, L.E., Koorapati, R.K., Lei, C., Loreto, M.F., Magri, L., Menapace, W., Morishita, T., Pandey, A., Pavlovics, V.L., Pezard, P.A., Poulaki, E.M., Rodriguez-Pilco, M.A., Sanfilippo, A., Shuck, B.D., Vannucchi, P., and Zhao, X., 2025a. Expedition 402 methods. In Zitellini, N., Malinverno, A., Estes, E.R., and the Expedition 402 Scientists, Tyrrhenian Continent–Ocean Transition. Proceedings of the International Ocean Discovery Program, 402: College Station, TX (International Ocean Discovery Program). https://doi.org/10.14379/iodp.proc.402.102.2025
Malinverno, A., Zitellini, N., Estes, E.R., Abe, N., Akizawa, N., Bickert, M., Cunningham, E.H., Di Stefano, A., Filina, I.Y., Fu, Q., Gontharet, S., Kearns, L.E., Koorapati, R.K., Lei, C., Loreto, M.F., Magri, L., Menapace, W., Morishita, T., Pandey, A., Pavlovics, V.L., Pezard, P.A., Poulaki, E.M., Rodriguez-Pilco, M.A., Sanfilippo, A., Shuck, B.D., Vannucchi, P., and Zhao, X., 2025b. Site U1612. In Zitellini, N., Malinverno, A., Estes, E.R., and the Expedition 402 Scientists, Tyrrhenian Continent–Ocean Transition. Proceedings of the International Ocean Discovery Program, 402: College Station, TX (International Ocean Discovery Program). https://doi.org/10.14379/iodp.proc.402.103.2025
Martin, J.B., 1994. Diagenesis and hydrology at the New Hebrides forearc and intra-arc Aoba Basin. In Greene, H.G., Collot, J.-Y., Stokking, L.B., et al., Proceedings of the Ocean Drilling Program, Scientific Results. 134: College Station, TX (Ocean Drilling Program), 109–130. https://doi.org/10.2973/odp.proc.sr.134.008.1994
Martin, J.B., Gieskes, J.M., Torres, M., and Kastner, M., 1993. Bromine and iodine in Peru margin sediments and pore fluids: implications for fluid origins. Geochimica et Cosmochimica Acta, 57(18):4377–4389. https://doi.org/10.1016/0016-7037(93)90489-J
McDonough, W.F., and Sun, S., 1995. The composition of the Earth. Chemical Geology, 120(3):223–253. https://doi.org/10.1016/0009-2541(94)00140-4
Meyers, P.A., 1994. Preservation of elemental and isotopic source identification of sedimentary organic matter. Chemical Geology, 114(3–4):289–302. https://doi.org/10.1016/0009-2541(94)90059-0
Middlemost, E.A.K., 1994. Naming materials in the magma/igneous rock system. Earth-Science Reviews, 37(3–4):215–224. https://doi.org/10.1016/0012-8252(94)90029-9
Niu, Y., 2004. Bulk-rock major and trace element compositions of abyssal peridotites: implications for mantle melting, melt extraction and post-melting processes beneath mid-ocean ridges. Journal of Petrology, 45(12):2423–2458. https://doi.org/10.1093/petrology/egh068
Peccerillo, A., 2017. Cenozoic Volcanism in the Tyrrhenian Sea Region: (Springer). https://doi.org/10.1007/978-3-319-42491-0
Pimmel, A., and Claypool, G., 2001. Introduction to shipboard organic geochemistry on the JOIDES Resolution. Ocean Drilling Program Technical Note, 30. https://doi.org/10.2973/odp.tn.30.2001
Prada, M., Sallares, V., Ranero, C.R., Vendrell, M.G., Grevemeyer, I., Zitellini, N., and de Franco, R., 2014. Seismic structure of the Central Tyrrhenian basin: Geophysical constraints on the nature of the main crustal domains. Journal of Geophysical Research: Solid Earth, 119(1):52–70. https://doi.org/10.1002/2013JB010527
Prada, M., Sallares, V., Ranero, C.R., Vendrell, M.G., Grevemeyer, I., Zitellini, N., and de Franco, R., 2015. The complex 3-D transition from continental crust to backarc magmatism and exhumed mantle in the Central Tyrrhenian basin. Geophysical Journal International, 203(1):63–78. https://doi.org/10.1093/gji/ggv271
Ranero, C.R., and Sallarès, V., 2017. Seismic Data from MEDOC-2010 cruise [dataset]. Pangaea. https://doi.org/10.1594/PANGAEA.880761
Regelous, M., Weinzierl, C.G., and Haase, K.M., 2016. Controls on melting at spreading ridges from correlated abyssal peridotite – mid-ocean ridge basalt compositions. Earth and Planetary Science Letters, 449:1–11. https://doi.org/10.1016/j.epsl.2016.05.017
Roether, W., Manca, B.B., Klein, B., Bregant, D., Georgopoulos, D., Beitzel, V., Kovačević, V., and Luchetta, A., 1996. Recent changes in eastern Mediterranean deep waters. Science, 271(5247):333–335. https://doi.org/10.1126/science.271.5247.333
Rosenbaum, J., Reynolds, R., Smoot, J., and Meyer, R., 2000. Anisotropy of magnetic susceptibility as a tool for recognizing core deformation: reevaluation of the paleomagnetic record of Pleistocene sediments from drill hole OL-92, Owens Lake, California. Earth and Planetary Science Letters, 178(3–4):415–424. https://doi.org/10.1016/S0012-821X(00)00077-7
Sayles, F.L., and Mangelsdorf, P.C., 1977. The equilibration of clay minerals with sea water: exchange reactions. Geochimica et Cosmochimica Acta, 41(7):951–960. https://doi.org/10.1016/0016-7037(77)90154-5
Shipboard Scientific Party, 1978. Site 373: Tyrrhenian Basin. In Hsü, K., Montadert, L., et al., Initial Reports of the Deep Sea Drilling Project. 42(1): Washington, DC (US Government Printing Office), 151–174. https://doi.org/10.2973/dsdp.proc.42-1.104.1978
Shipboard Scientific Party, 1987a. Site 650: Marsili Basin. In Kastens, K.A., Mascle, J., Auroux, C., et al., Proceedings of the Ocean Drilling Program, Initial Reports. 107: College Station, TX (Ocean Drilling Program), 129–285. https://doi.org/10.2973/odp.proc.ir.107.106.1987
Shipboard Scientific Party, 1987b. Site 651: Tyrrhenian Sea. In Kastens, K.A., Mascle, J., Auroux, C., et al., Proceedings of the Ocean Drilling Program, Initial Reports. 107: College Station, TX (Ocean Drilling Program), 287–401. https://doi.org/10.2973/odp.proc.ir.107.107.1987
Shipboard Scientific Party, 1987c. Site 655: Gortani Ridge, western Vavilov Basin. In Kastens, K.A., Mascle, J., Auroux, C., et al., Proceedings of the Ocean Drilling Program, Initial Reports. 107: College Station, TX (Ocean Drilling Program), 877–949. https://doi.org/10.2973/odp.proc.ir.107.111.1987
Sylvan, J.B., Estes, E.R., Bogus, K., Colwell, F.S., Orcutt, B.N., and Smith, D.C, 2021. Technical Note 4: Recommendations for microbiological sampling and contamination tracer use aboard the JOIDES Resolution following 20 years of IODP deep biosphere research. International Ocean Discovery Program Technical Note. https://doi.org/10.14379/iodp.tn.4.2021
Tanhua, T., Hainbucher, D., Schroeder, K., Cardin, V., Álvarez, M., and Civitarese, G., 2013. The Mediterranean Sea system: a review and an introduction to the special issue. Ocean Science, 9(5):789–803. https://doi.org/10.5194/os-9-789-2013
Tauxe, L., 2010. Essentials of Paleomagnetism: Oakland, CA (University of California Press).
Tsimplis, M.N., and Baker, T.F., 2000. Sea level drop in the Mediterranean Sea: an indicator of deep water salinity and temperature changes? Geophysical Research Letters, 27(12):1731–1734. https://doi.org/10.1029/1999GL007004
Tucholke, B.E., Lin, J., and Kleinrock, M.C., 1998. Megamullions and mullion structure defining oceanic metamorphic core complexes on the Mid-Atlantic Ridge. Journal of Geophysical Research: Solid Earth, 103(B5):9857-9866. https://doi.org/10.1029/98JB00167
Werne, J.P., Haese, R.R., Zitter, T., Aloisi, G., Bouloubassi, I., Heijs, S., Fiala-Médioni, A., Pancost, R.D., Sinninghe Damsté, J.S., de Lange, G., Forney, L.J., Gottschal, J.C., Foucher, J.-P., Mascle, J., and Woodside, J., 2004. Life at cold seeps: a synthesis of biogeochemical and ecological data from Kazan mud volcano, eastern Mediterranean Sea. Chemical Geology, 205(3):367–390. https://doi.org/10.1016/j.chemgeo.2003.12.031
Workman, R.K., and Hart, S.R., 2005. Major and trace element composition of the depleted MORB mantle (DMM). Earth and Planetary Science Letters, 231(1–2):53–72. https://doi.org/10.1016/j.epsl.2004.12.005