Kodaira, S., Conin, M., Fulton, P., Kirkpatrick, J., Regalla, C., Ujiie, K., Okutsu, N., Maeda, L., Toczko, S., Eguchi, N., and the Expedition 405 Scientists
Proceedings of the International Ocean Discovery Program Volume 405
publications.iodp.org
https://doi.org/10.14379/iodp.proc.405.201.2026
Data report: thermal properties of JTRACK (IODP Expedition 405) core samples from Sites C0019 and C0026, Japan Trench1
Patrick M. Fulton2
1 Fulton, P.M., 2026. Data report: thermal properties of JTRACK (IODP Expedition 405) core samples from Sites C0019 and C0026, Japan Trench. In Kodaira, S., Conin, M., Fulton, P., Kirkpatrick, J., Regalla, C., Ujiie, K., Okutsu, N., Maeda, L., Toczko, S., Eguchi, N., and the Expedition 405 Scientists, Tracking Tsunamigenic Slip Across the Japan Trench (JTRACK). Proceedings of the International Ocean Discovery Program, 405: College Station, TX (International Ocean Discovery Program). https://doi.org/10.14379/iodp.proc.405.201.2026
2 Expedition 405 Scientists’ affiliations. Correspondence author: [email protected]
Abstract
I report laboratory measurements of thermal conductivity (λ), thermal diffusivity (α), and calculated volumetric heat capacity (ρc = λ/α) for 45 core samples from International Ocean Discovery Program Expedition 405, Tracking Tsunamigenic Slip Across the Japan Trench (JTRACK), at Sites C0019 and C0026 within the Japan Trench. Site C0019 hosts two subseafloor temperature observatories, and advanced piston corer temperature (APCT-3) measurements were collected at both sites. Measurements used a single-sided transient plane source (Hot Disk) approach with repeated runs for quality control.
At Site C0019, shallow muds in Hole C0019M (2.17–71.63 meters below seafloor [mbsf]) yield mean λ ≈ 0.86 W/(m·K), α ≈ 2.74 × 10⁻⁷ m2/s, and ρc ≈ 3.51 MJ/(m3·K). Consolidated mud and mudstone from Holes C0019J–C0019K (150.68–849.37 mbsf) average λ ≈ 0.99 W/(m·K), α ≈ 3.48 × 10⁻⁷ m2/s, and ρc ≈ 2.99 MJ/(m3·K). A chert at 873.43 mbsf shows higher values (λ ≈ 2.33; α ≈ 10.79 × 10⁻⁷; ρc ≈ 2.16), and basalts at 935.43–945.67 mbsf average λ ≈ 1.56, α ≈ 6.31 × 10⁻⁷, and ρc ≈ 2.48. At Site C0026 (3.71–78.74 mbsf), siliceous vitric mud yields λ ≈ 0.84, α ≈ 2.49 × 10⁻⁷, and ρc ≈ 3.39.
Thermal conductivities agree with shipboard values, and α falls within the range of prior determinations at Site C0019. The results indicate modest variability within lithofacies and support the use of empirical α–λ trends where direct α is unavailable. These results supply the property bounds required for reliable interpretation of temperature time series and for modeling thermal processes at small and large scales.
1. Introduction
Thermal properties of rocks and sediments are fundamental to modeling and interpreting temperature observations and characterizing hydrologic and thermal processes from core-sample scale to plate-boundary fault zones and the subduction system as a whole. Borehole and in situ temperature records can capture signals from frictional heating associated with earthquake slip, advection by transient or sustained fluid flow, and background conductive structure, but robust interpretation requires site-specific constraints on thermal conductivity (λ), thermal diffusivity (α), and volumetric heat capacity (ρc).
As part of International Ocean Discovery Program (IODP) Expedition 405, Tracking Tsunamigenic Slip Across the Japan Trench (JTRACK), two borehole temperature observatories were installed at Site C0019 and shallow temperature data were collected using the advanced piston corer temperature (APCT-3) tool at Sites C0019 and C0026. Shipboard analysis of core samples produced abundant thermal conductivity measurements, but thermal diffusivity remained poorly constrained because it is not measured shipboard. Existing thermal diffusivity constraints at Site C0019 comprised four laboratory measurements on samples obtained in 2012 during Integrated Ocean Drilling Program Expedition 343, Japan Trench Fast Drilling Project (JFAST) (Lin et al., 2014). In many modeling efforts, α is otherwise estimated from λ using empirical relationships, such as those of Hyndman et al. (1979).
JTRACK follows upon JFAST, during which a temperature sensor string was also installed within a subseafloor borehole observatory at Site C0019. The JFAST temperature record documented (1) a frictional heating signal from the 11 March 2011 M9 Tohoku-oki earthquake around the plate-boundary fault (Fulton et al., 2013); (2) persistent and transient fluid-flow signals in discrete permeable zones, including responses to regional earthquakes (Fulton et al., 2013; Fulton and Brodsky, 2016); and (3) depth-dependent postdrilling thermal recovery, the variations of which are interpreted as a proxy for permeability, with longer recovery times attributed to infiltration of colder drilling fluids into more permeable zones during drilling (Fulton et al., 2013). These observations motivated development of a quantitative framework to infer permeability from recovery transients (Purwamaska and Fulton, 2026). Quantitative interpretation of the JFAST and JTRACK observatory records, however, is strengthened by improved constraints on α and its downhole variability.
Here, I present 45 new laboratory measurements of λ and α on JTRACK core material from Sites C0019 and C0026. Volumetric heat capacity (ρc) is calculated using ρc = λ/α. Measurements target depths where temperature observations exist: across the full Site C0019 interval spanning the two observatories and the shallow APCT-3 measurement intervals at Sites C0019 and C0026. Throughout, thermal conductivity is denoted by λ (W/[m·K]), thermal diffusivity by α (m2/s), and volumetric heat capacity by ρc (J/[m3·K]).
1.1. Geologic and sampling context
Site C0019 is located in the trench axis and targets the plate-boundary fault at about 820 meters below seafloor (mbsf) in the region of large coseismic slip during the 11 March 2011 M9 Tohoku-oki earthquake (Chester et al., 2013). Two borehole observatories, in Holes C0019D and C0019Q, span the fault at this site. I measured thermal conductivity (λ) and thermal diffusivity (α) on 39 samples from Holes C0019M, C0019J, C0019K, and C0019P spanning 2.17–945.67 mbsf. The lithologies of the samples analyzed here are predominantly siliceous vitric mud(-stone) with three exceptions: one chert sample from 873.43 mbsf in Hole C0019K and two basalt samples from 935.43 and 945.67 mbsf in Hole C0019P.
Site C0026 is situated on the incoming Pacific plate seaward of the trench and serves as a reference site. Six shallow samples of siliceous vitric mud roughly coincide with the depths of APCT-3 measurements: one from Hole C0026D at 3.71 mbsf and five from Hole C0026E between 18.20 and 78.74 mbsf. These data provide local constraints on α needed to interpret short APCT-3 temperature time series and to improve extrapolations to formation temperature.
Further descriptions of the lithostratigraphy and physical properties of the sites are provided in the Expedition 405 Site C0019 and C0026 chapters (Regalla et al., 2025; Conin et al., 2025).
1.2. Thermal properties and theoretical background
In this study, I focus on thermal conductivity (λ; W/[m·K]), thermal diffusivity (α; m2/s), and volumetric heat capacity (ρc; J/[m3·K]).
Thermal conductivity (λ) describes a material’s ability to conduct heat. For predominantly vertical, one-dimensional conduction, Fourier’s law gives the conductive heat flux q as
(1)
where the minus sign indicates that heat flows in the opposite direction of the temperature gradient. Depth variations in λ produce compensating changes in dT/dz for a given q. Where conductivity contrasts occur along interfaces that are not orthogonal to the background heat flux, heat refraction can perturb local vertical heat flow and temperature gradients (Bullard et al., 1956; Lee and Henyey, 1974; Mildren and Sandiford, 1995; Fulton and Saffer, 2009). Understanding downhole variability of λ is therefore important for distinguishing steady conductive structure from temperature anomalies that require additional processes such as heat generation or fluid advection (e.g., Tanaka et al., 2007; Fulton et al., 2010; Lin et al., 2014).
Temporal changes in temperature reflect the combined effects of advection and diffusion, expressed by
(2)
where u is fluid velocity and components are shown to allow for anisotropy in α.
Thermal diffusivity links conductivity and volumetric heat capacity as
(3)
Two useful scalings follow from the diffusion term. The characteristic diffusion length after time t is
(4)
and the characteristic time for a perturbation to influence a location a distance d away is
(5)
These relations emphasize that realistic interpretation of transient temperature signals hinges on appropriate values of α.
Constraints on λ and α are required to assess whether observed temperature changes are consistent with diffusion alone or indicate additional hydrologic processes. This is central to evaluating frictional heating transients following earthquakes (Brodsky et al., 2010; Fulton et al., 2013; Li et al., 2015) and to interpreting postdrilling thermal recovery and other time-dependent signals that can inform permeability and flow (Fulton et al., 2013; Purwamaska and Fulton, 2026; Read et al., 2013; Maldaner et al., 2019). In particular, quantitative use of recovery transients and short APCT-3 records requires realistic α at the relevant depths.
2. Methods
2.1. Instrumentation
Thermal conductivity λ (W/[m·K]), thermal diffusivity α (m2/s), and volumetric heat capacity ρc (J/[m3·K]) were determined on JTRACK core samples using a Hot Disk 2250 transient thermal properties instrument (Cornell University, USA). The instrument implements the transient plane source method (ISO 22007-2) (International Organization for Standardization, 2008; Gustafsson, 1991): a foil sensor functions as both heater and thermometer, and the temperature rise at the source ΔT is recorded during and after a controlled heating interval. A photo of the Kapton-insulated sensor used (Model 5465; 6.4 mm element) is shown in Figure F1A; a schematic of the measurement configuration is shown in Figure F1B.
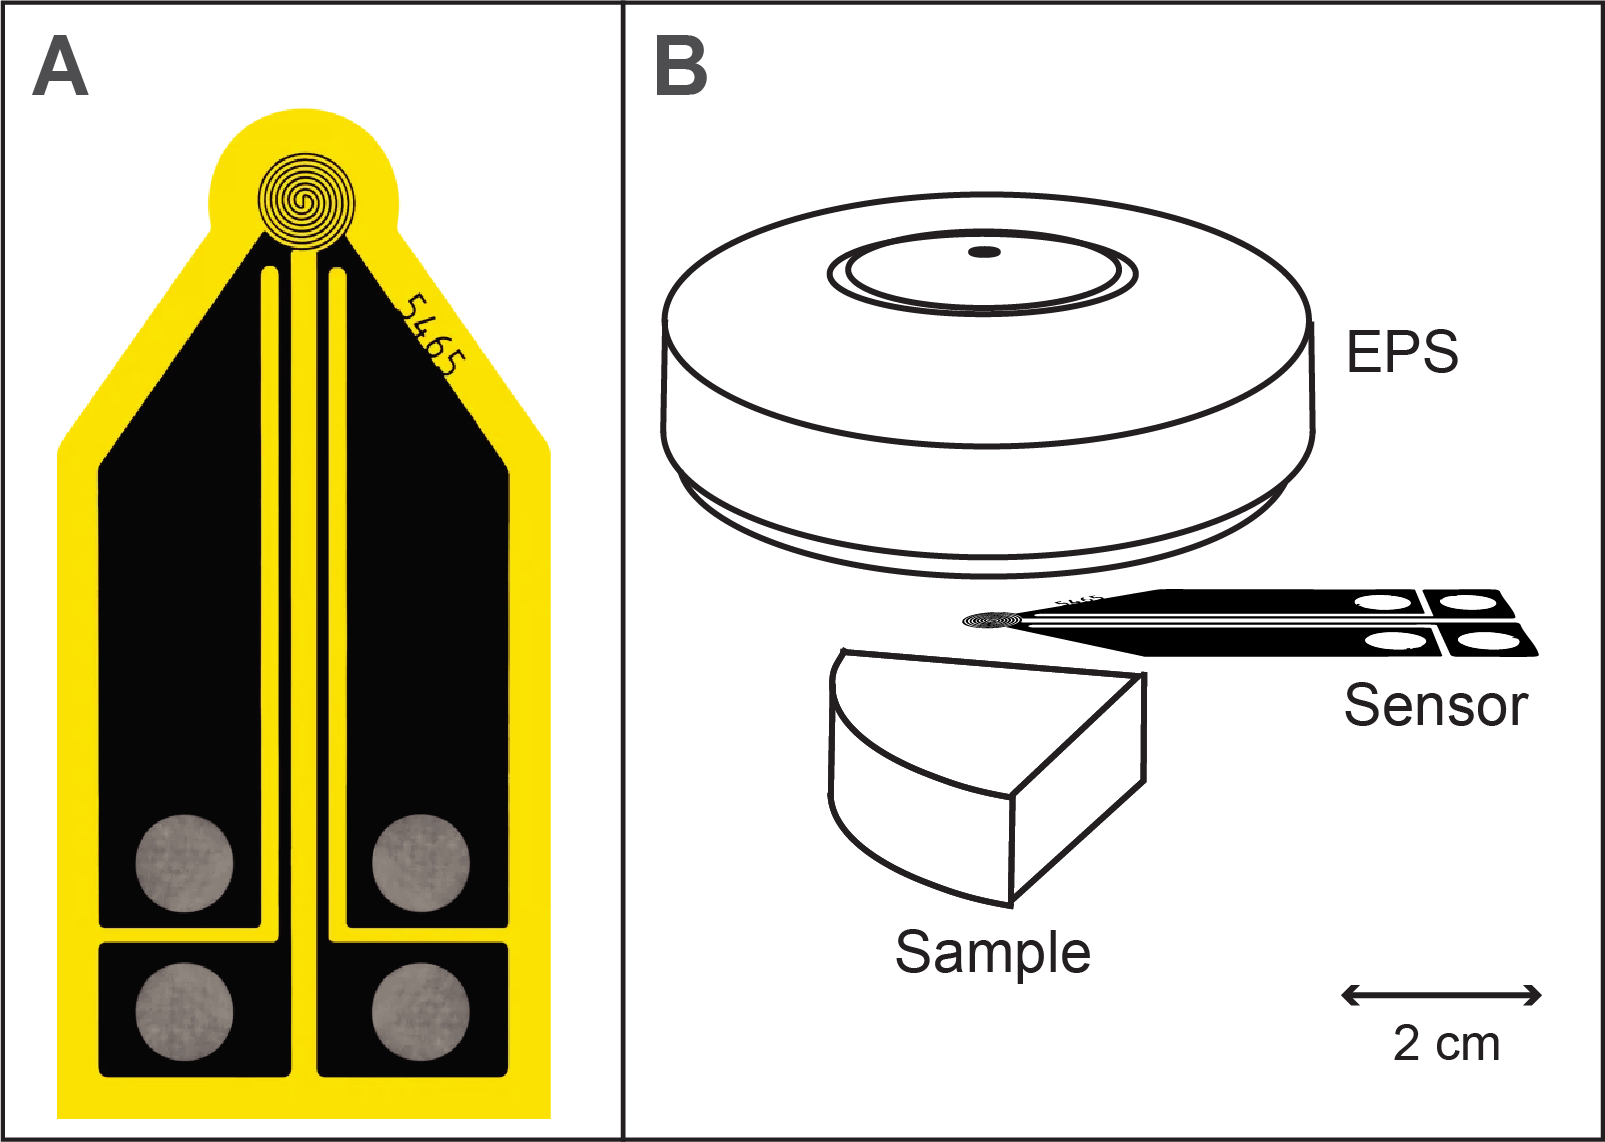
Figure F1. Hot Disk sensor and single-sided measurement configuration.
2.2. Sample preparation and single-sided configuration
Most samples were quarter-round wedges cut from the working half, typically 1–2 cm thick. The several-centimeter-wide radial face (perpendicular to the core axis) was used as the measurement surface so that the sensor contacted an intact, planar area. A Kapton-insulated sensor was placed flat on this surface and covered with a ~2 cm thick disk of expanded polystyrene (EPS) (λEPS ≈ 0.032 W/[m·K]) to provide thermal insulation. A screw applied gentle, uniform compression through the EPS to maintain full sensor contact, and a hood enclosed the assembly to limit ambient temperature fluctuations. This single-sided configuration directs heat predominantly into the sample, and the low-λ EPS minimizes loss from the opposite side (Figure F1B). The approach also simplifies preparation and permits measurements on many small-volume subsamples (typically ~10 cm3 to 20 cm3), increasing depth coverage and the number of measurements relative to the two-sided sandwich geometry used in earlier studies at Site C0019 and Hikurangi (Lin et al., 2014; Fulton and Kitajima, 2025). Only subsamples that remained sufficiently intact, large enough for reliable contact and not overly friable, cracked, or fragmented, were measured; consequently, measurements were not possible at some depths where material condition or size was inadequate for appropriate sensor contact and insulation.
2.3. Transient plane source response
In the symmetric two-sided (sandwich) arrangement of the transient plane source method, the temperature rise is
(6)
where r is the heating radius and H(τ) is a dimensionless response function (Gustafsson, 1991). The similarity time τ and the characteristic time Θ used here are
(7)
(8)
In the single-sided configuration used here, the temperature rise doubles under the ideal assumption that all heat flows into the sample on one side of the sensor:
(9)
2.4. Experimental conditions
Power and duration were selected so the thermal penetration depth (√(α·t)) remained within the sample thickness and sample radius, avoiding finite-size and edge effects while maintaining signal quality. Typically, five runs were completed per sample with heating power P0 ≈ 50 mW applied for ~20 s. At least 10 min of thermal reequilibration were used prior to each run, including the first run. Reported values are the mean of accepted runs; uncertainties are ±1σ and reflect run-to-run variability only. Determinations of λ and α were based on model fits to subsets of the temperature-rise data, typically excluding the earliest time steps to minimize near-sensor complexities and initial heat-transfer effects. High-quality results were identified by mean residuals between observed and modeled temperatures of less than 10−3°C; runs not meeting this criterion were repeated or excluded.
2.5. Example data and model fit
An example of five repeated experiments on Sample 405-C0019J-61K-1W, 13.0–15.0 cm, is shown in Figure F2. The upper panel shows ΔT(τ). The middle panel plots the same data against H(τ), illustrating the linearization used to estimate α and then λ with the single-sided formulation (Equations 9, 7, and 8). The lower panel shows residuals versus √(t), meeting the global quality criterion (mean residual < 10−3°C). Results will be compared with shipboard λ from Expedition 405 and with two-sided α values on larger samples from Lin et al. (2014) (see Results).
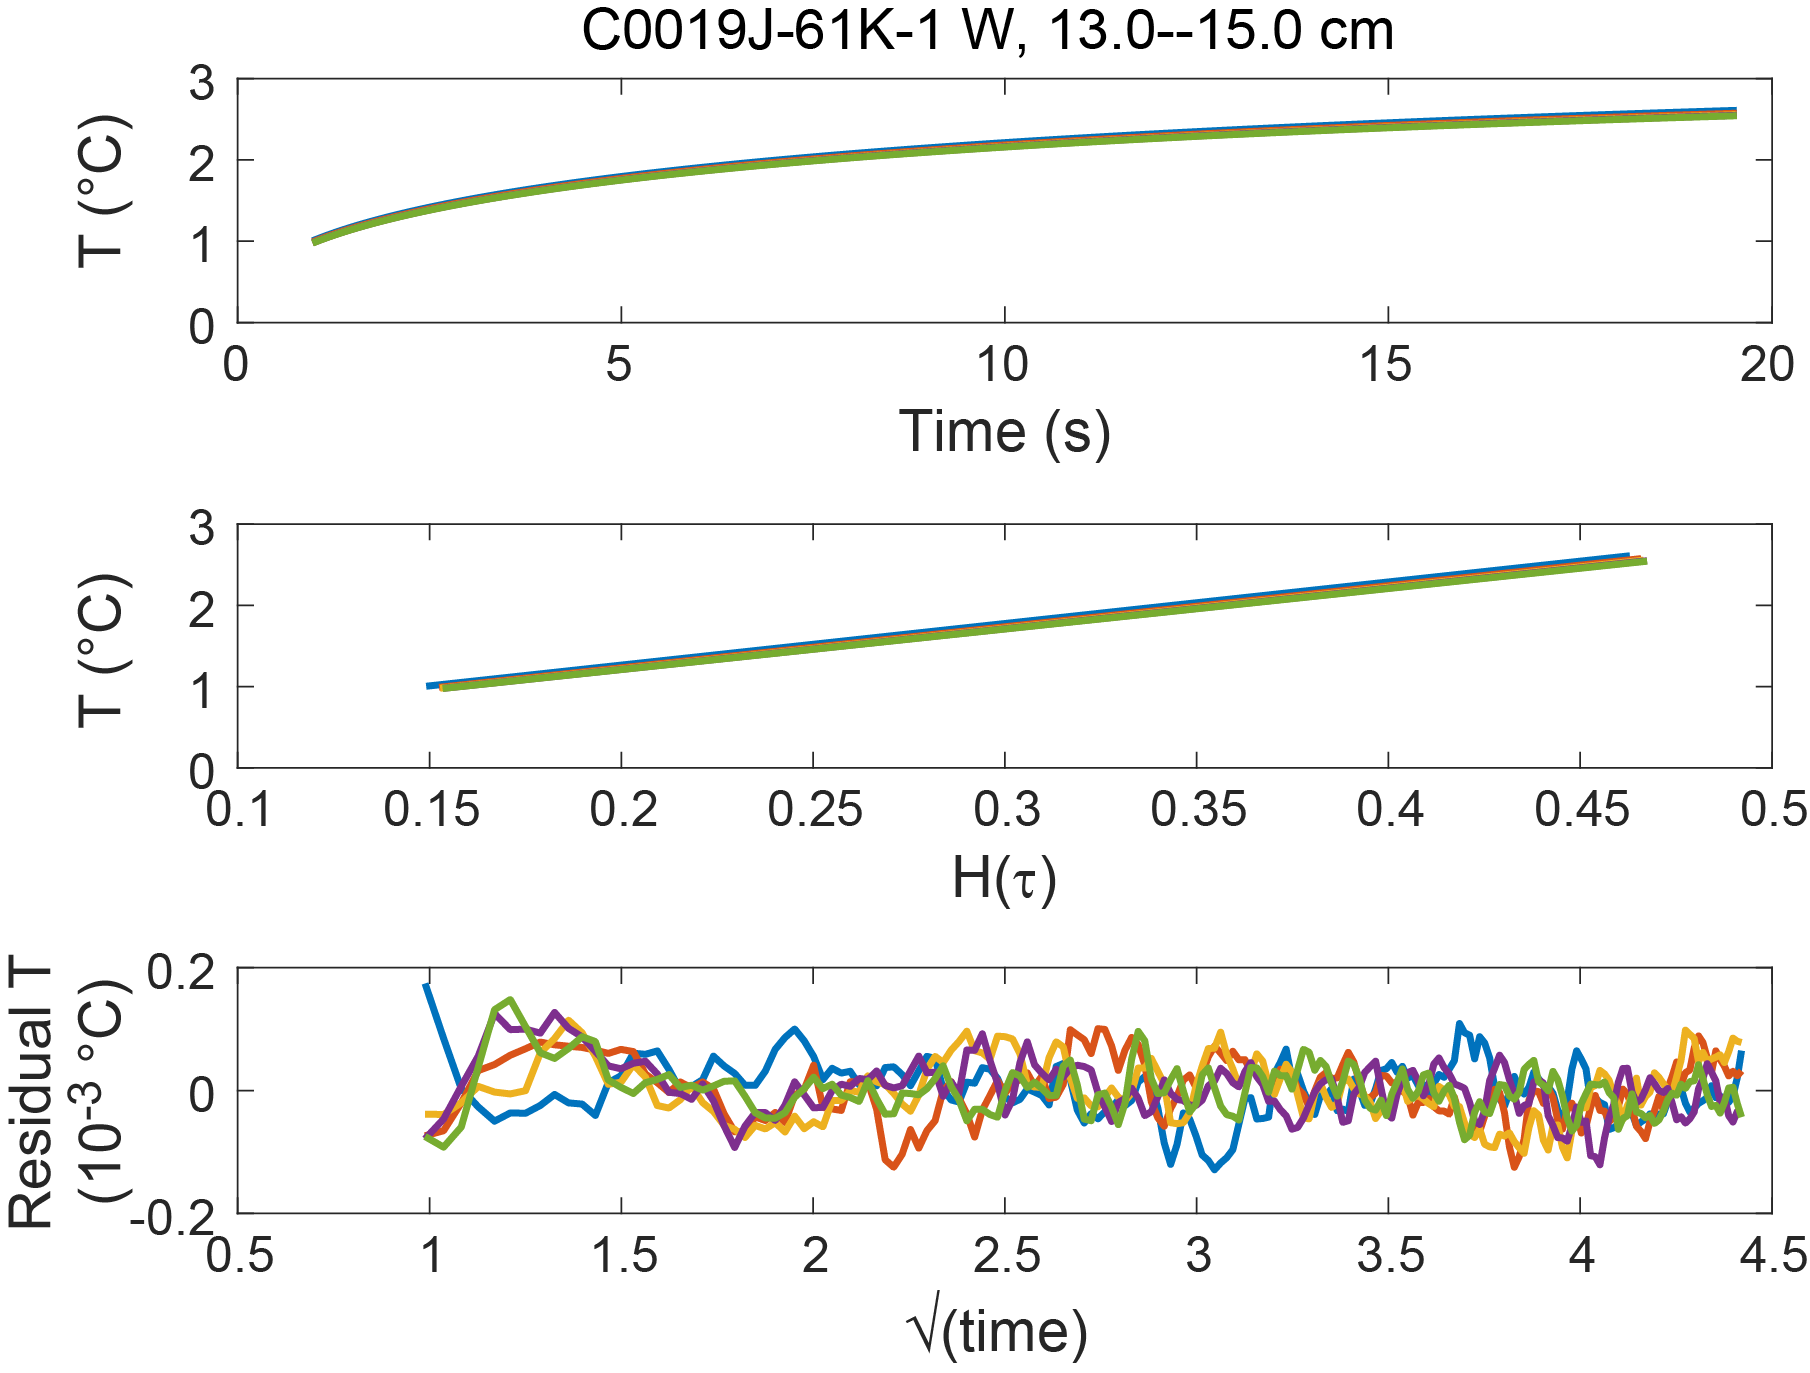
Figure F2. Example data set and model fit.
2.6. Accuracy and validation
Instrument accuracy was evaluated with a stainless steel reference measured using the same Hot Disk 2250 instrument, Kapton-insulated sensor (Model 5465), and single-sided configuration used for the core samples. Certified values are λ = 13.64 W/(m·K), α = 3.778 × 10⁻⁷ m2/s, and ρc = 3.61 MJ/(m3·K). Five repeat single-sided measurements yielded λ = 14.03 ± 0.041 W/(m·K), α = (3.724 ± 0.023) × 10−7 m2/s, and ρc = 3.767 ± 0.033 MJ/(m3·K). The percent differences relative to the certified values are +2.86% for λ, −1.43% for α, and +4.35% for ρc. Reported uncertainties elsewhere in this study (±1σ) reflect run-to-run repeatability; these accuracy checks indicate absolute errors of a few percent for λ and α and ~4%–5% for ρc under the conditions tested.
3. Results
3.1. Site C0019
Thermal properties measured in this study at Site C0019 span shallow, less consolidated muds in Hole C0019M, more consolidated mudstones across Holes C0019J and C0019K, a single chert sample in Hole C0019K, and basalts in Hole C0019P. Values are plotted versus depth in Figure F3: Panel A shows thermal conductivity (λ; W/[m·K]), Panel B shows thermal diffusivity (α; ×10−7 m2/s), and Panel C shows volumetric heat capacity (ρc; MJ/[m3·K]) (Table T1). Shipboard thermal conductivities from the Site C0019 chapter (Regalla et al., 2025) are shown as open cyan circles, and the four JFAST points from Lin et al. (2014) as open red circles.
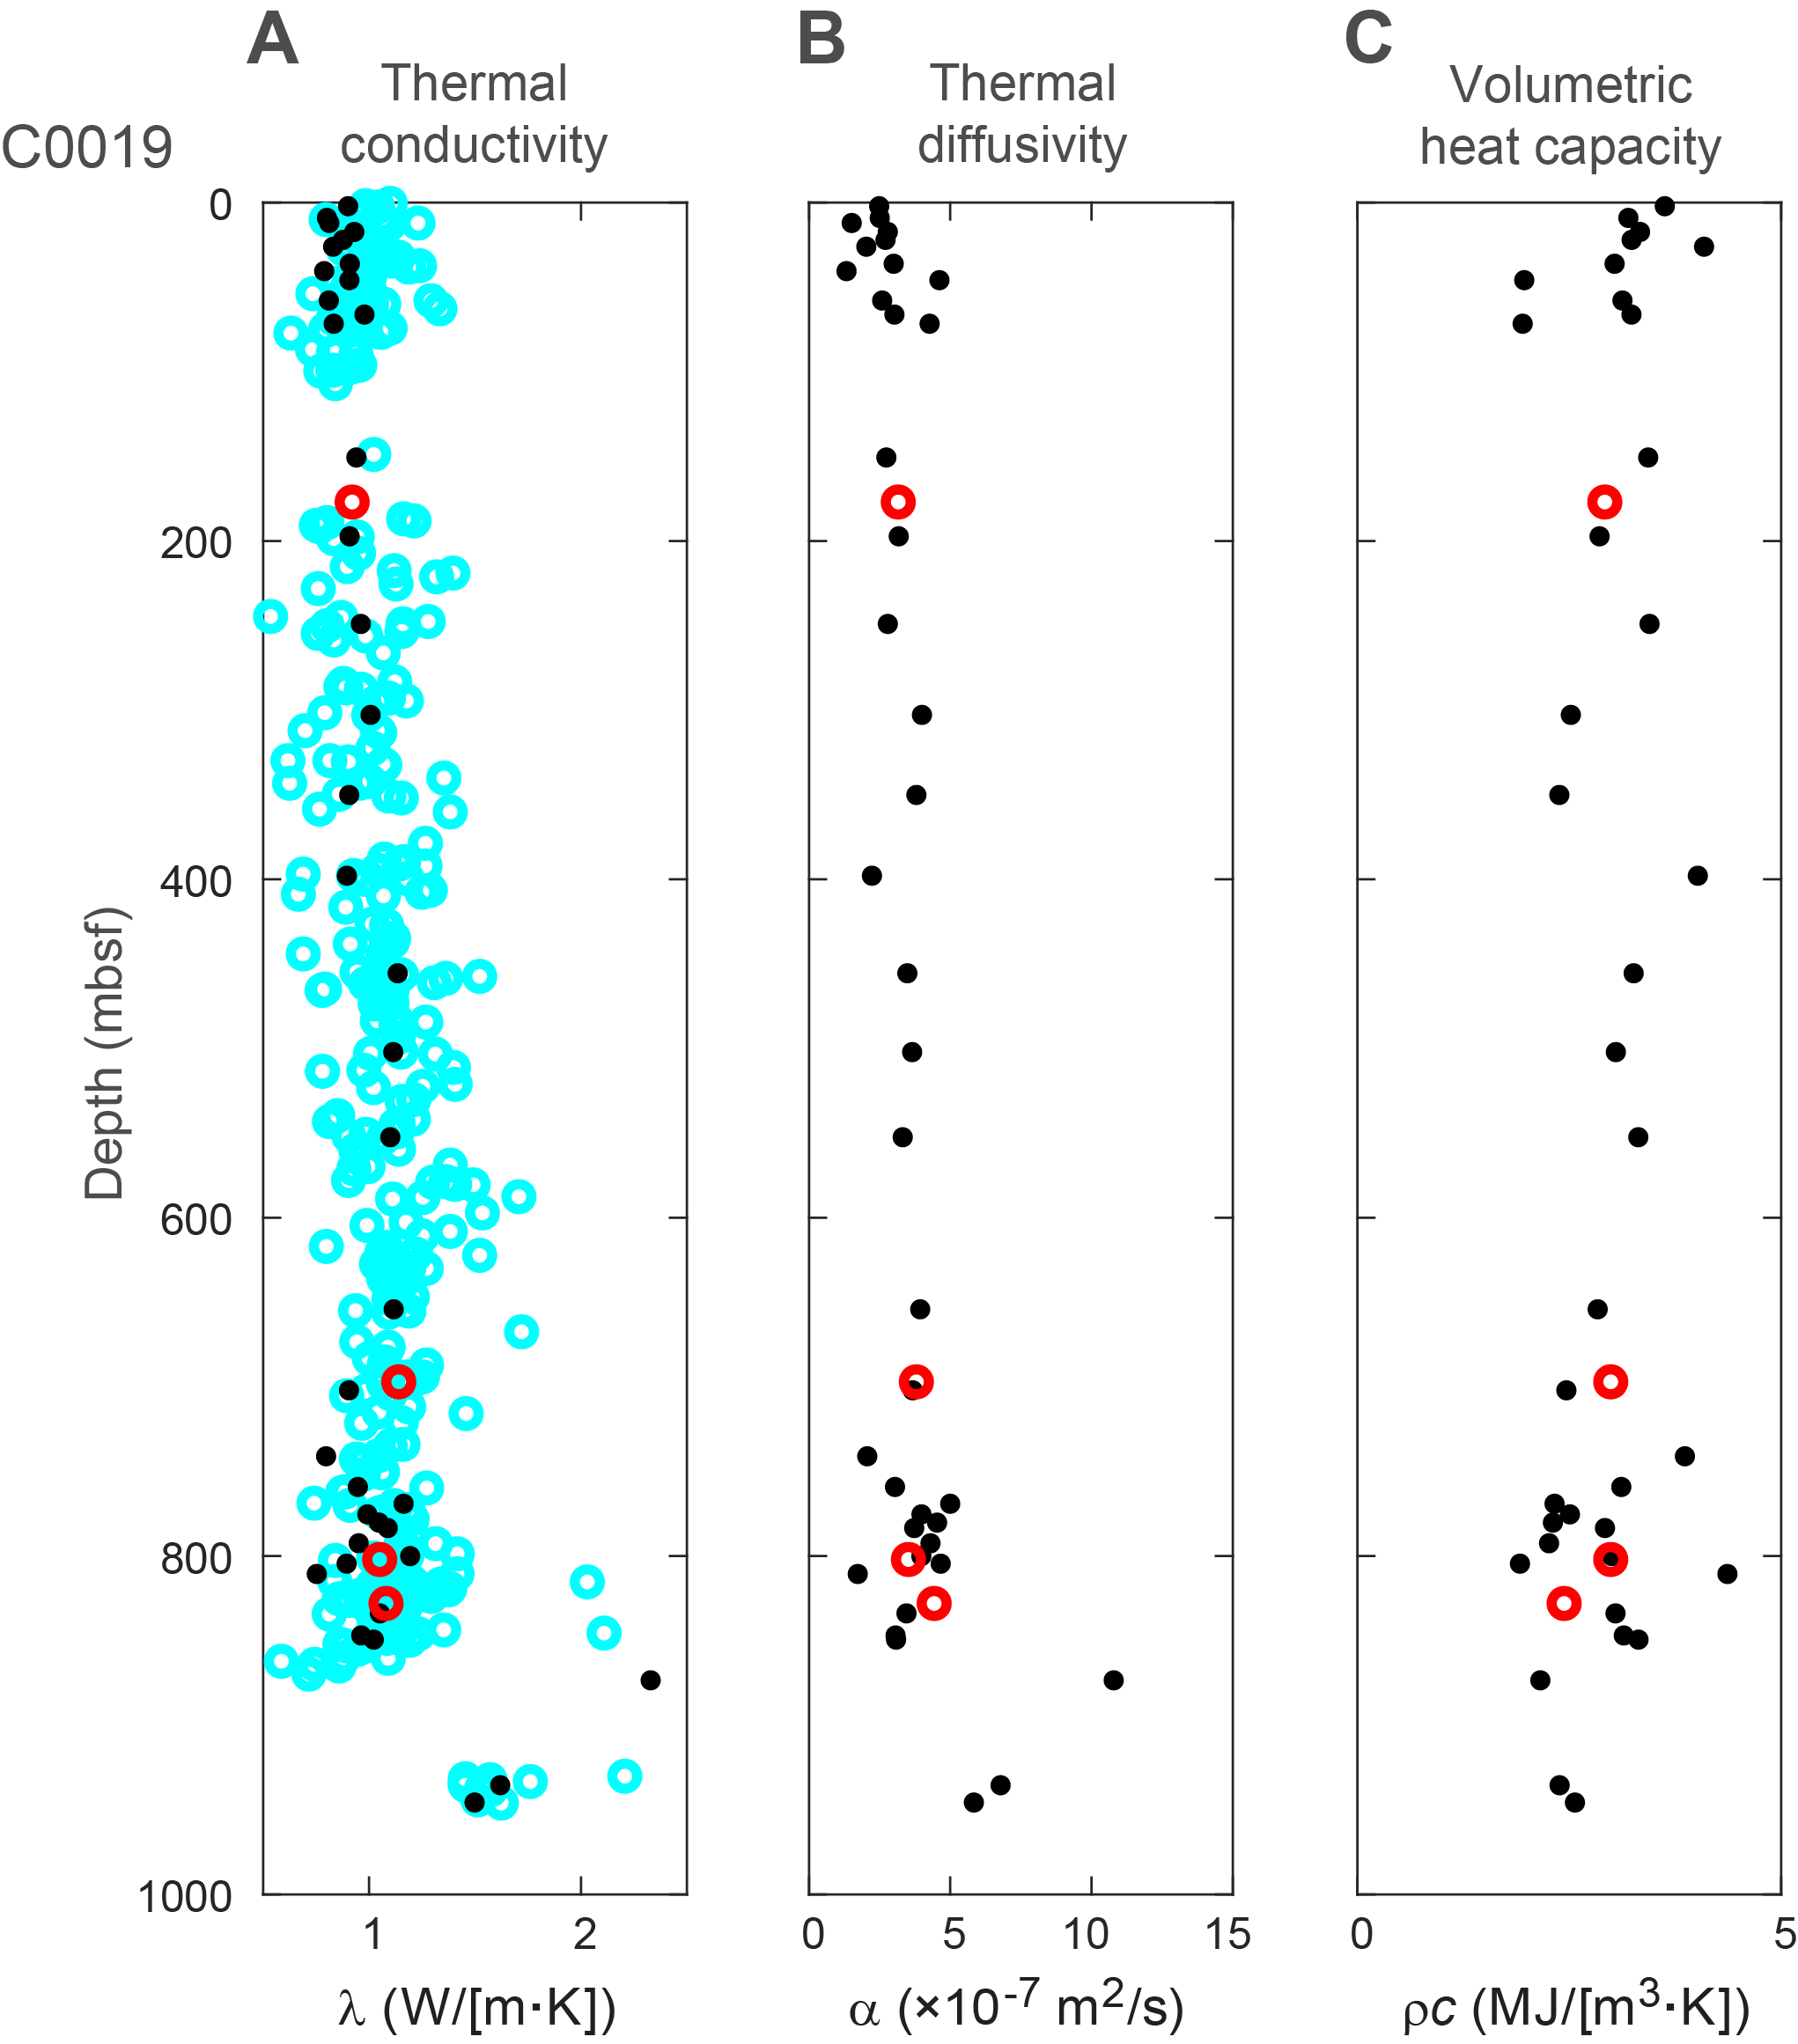
Figure F3. Thermal properties versus depth, Site C0019.
3.1.1. Hole C0019M, mud
A total of 12 shallow mud samples between 2.17 and 71.625 mbsf yield a mean λ = 0.865 ± 0.059 W/(m·K), α = (2.738 ± 0.931) × 10−7 m2/s, and ρc = 3.509 ± 1.134 MJ/(m3·K). These less consolidated sediments lie toward the lower end of the shipboard thermal conductivity range for shallow Site C0019 intervals, and no strong downhole trend is evident, which is consistent with the site report narrative.
3.1.2. Holes C0019J and C0019K, mud and mudstones
Across 24 mud and mudstone samples measured between 150.68 and 849.37 mbsf, the averages are λ = 0.994 ± 0.111 W/(m·K), α = (3.475 ± 0.806) × 10−7 m2/s, and ρc = 2.987 ± 0.592 MJ/(m3·K). Thermal conductivities cluster near 1 W/(m·K), align with shipboard means for Holes C0019J and C0019K, and show limited downhole trend. No systematic differences in λ, α, or ρc are observed between the more consolidated mudstones above the plate-boundary fault and the underthrust muds to about 850 mbsf, so these results are reported together. A sample at 810.58 mbsf (405-C0019J-82K-1W, 56.0–60.0 cm) shows slightly lower λ, lower α, and higher ρc than neighboring mudstones; although it may reflect sample quality, the values are retained because they remain within the overall variability.
3.1.3. Chert
One chert sample at 873.43 mbsf (405-C0019K-17K-1W, 41.5–43.5 cm) exhibits the highest λ and α observed (λ = 2.329 ± 0.001 W/(m·K); α = (10.786 ± 0.017) × 10−7 m2/s), and ρc = 2.159 ± 0.003 MJ/(m3·K), which is comparable to mudstones and basalts, consistent with a high-silica lithology.
3.1.4. Basalt
Two basalt samples from 935.43 and 945.67 mbsf (Hole C0019P) average λ = 1.559 ± 0.064 W/(m·K), α = (6.310 ± 0.500) × 10−7 m2/s, and ρc = 2.478 ± 0.096 MJ/(m3·K). Thermal conductivities are higher than typical mudstones at the site and are consistent with shipboard thermal conductivities at similar depths on basaltic material, as shown in Figure F3A.
3.1.5. Comparison with JFAST and shipboard data
The four mudstone samples from Hole C0019E reported by Lin et al. (2014) at approximately 177, 697, 802, and 828 mbsf have mean λ = 1.0475 ± 0.0831 W/(m·K), mean α = (3.728 ± 0.479) × 10−7 m2/s, and mean ρc = 2.835 ± 0.2397 MJ/(m3·K) (each ±1σ, six runs per sample). Thermal conductivities and thermal diffusivities from Lin et al. (2014) fall within the ranges, variability, and depth relations observed here in Figure F3. Present Site C0019 thermal conductivities also align well with the JTRACK shipboard data set (Regalla et al., 2025). The agreement among shipboard values, two-sided JFAST measurements, and the single-sided measurements reported here, together with an independent single-sided test against a stainless steel reference standard that shows percent differences of about +2.9% for λ, −1.4% for α, and +4.4% for ρc (see Accuracy and validation), supports the robustness of the single-sided approach used in this study.
3.2. Site C0026
Thermal properties were measured on six samples of siliceous vitric mud spanning 3.71–78.74 mbsf from Holes C0026D (3.71 mbsf) and C0026E (18.20–78.74 mbsf). Each sample was measured five times. Although deeper material and shipboard thermal conductivities exist for Site C0026, the focus here is the shallow interval where APCT-3 measurements were collected. Values are plotted versus depth in Figure F4 with shipboard λ shown as open cyan circles (Table T2).
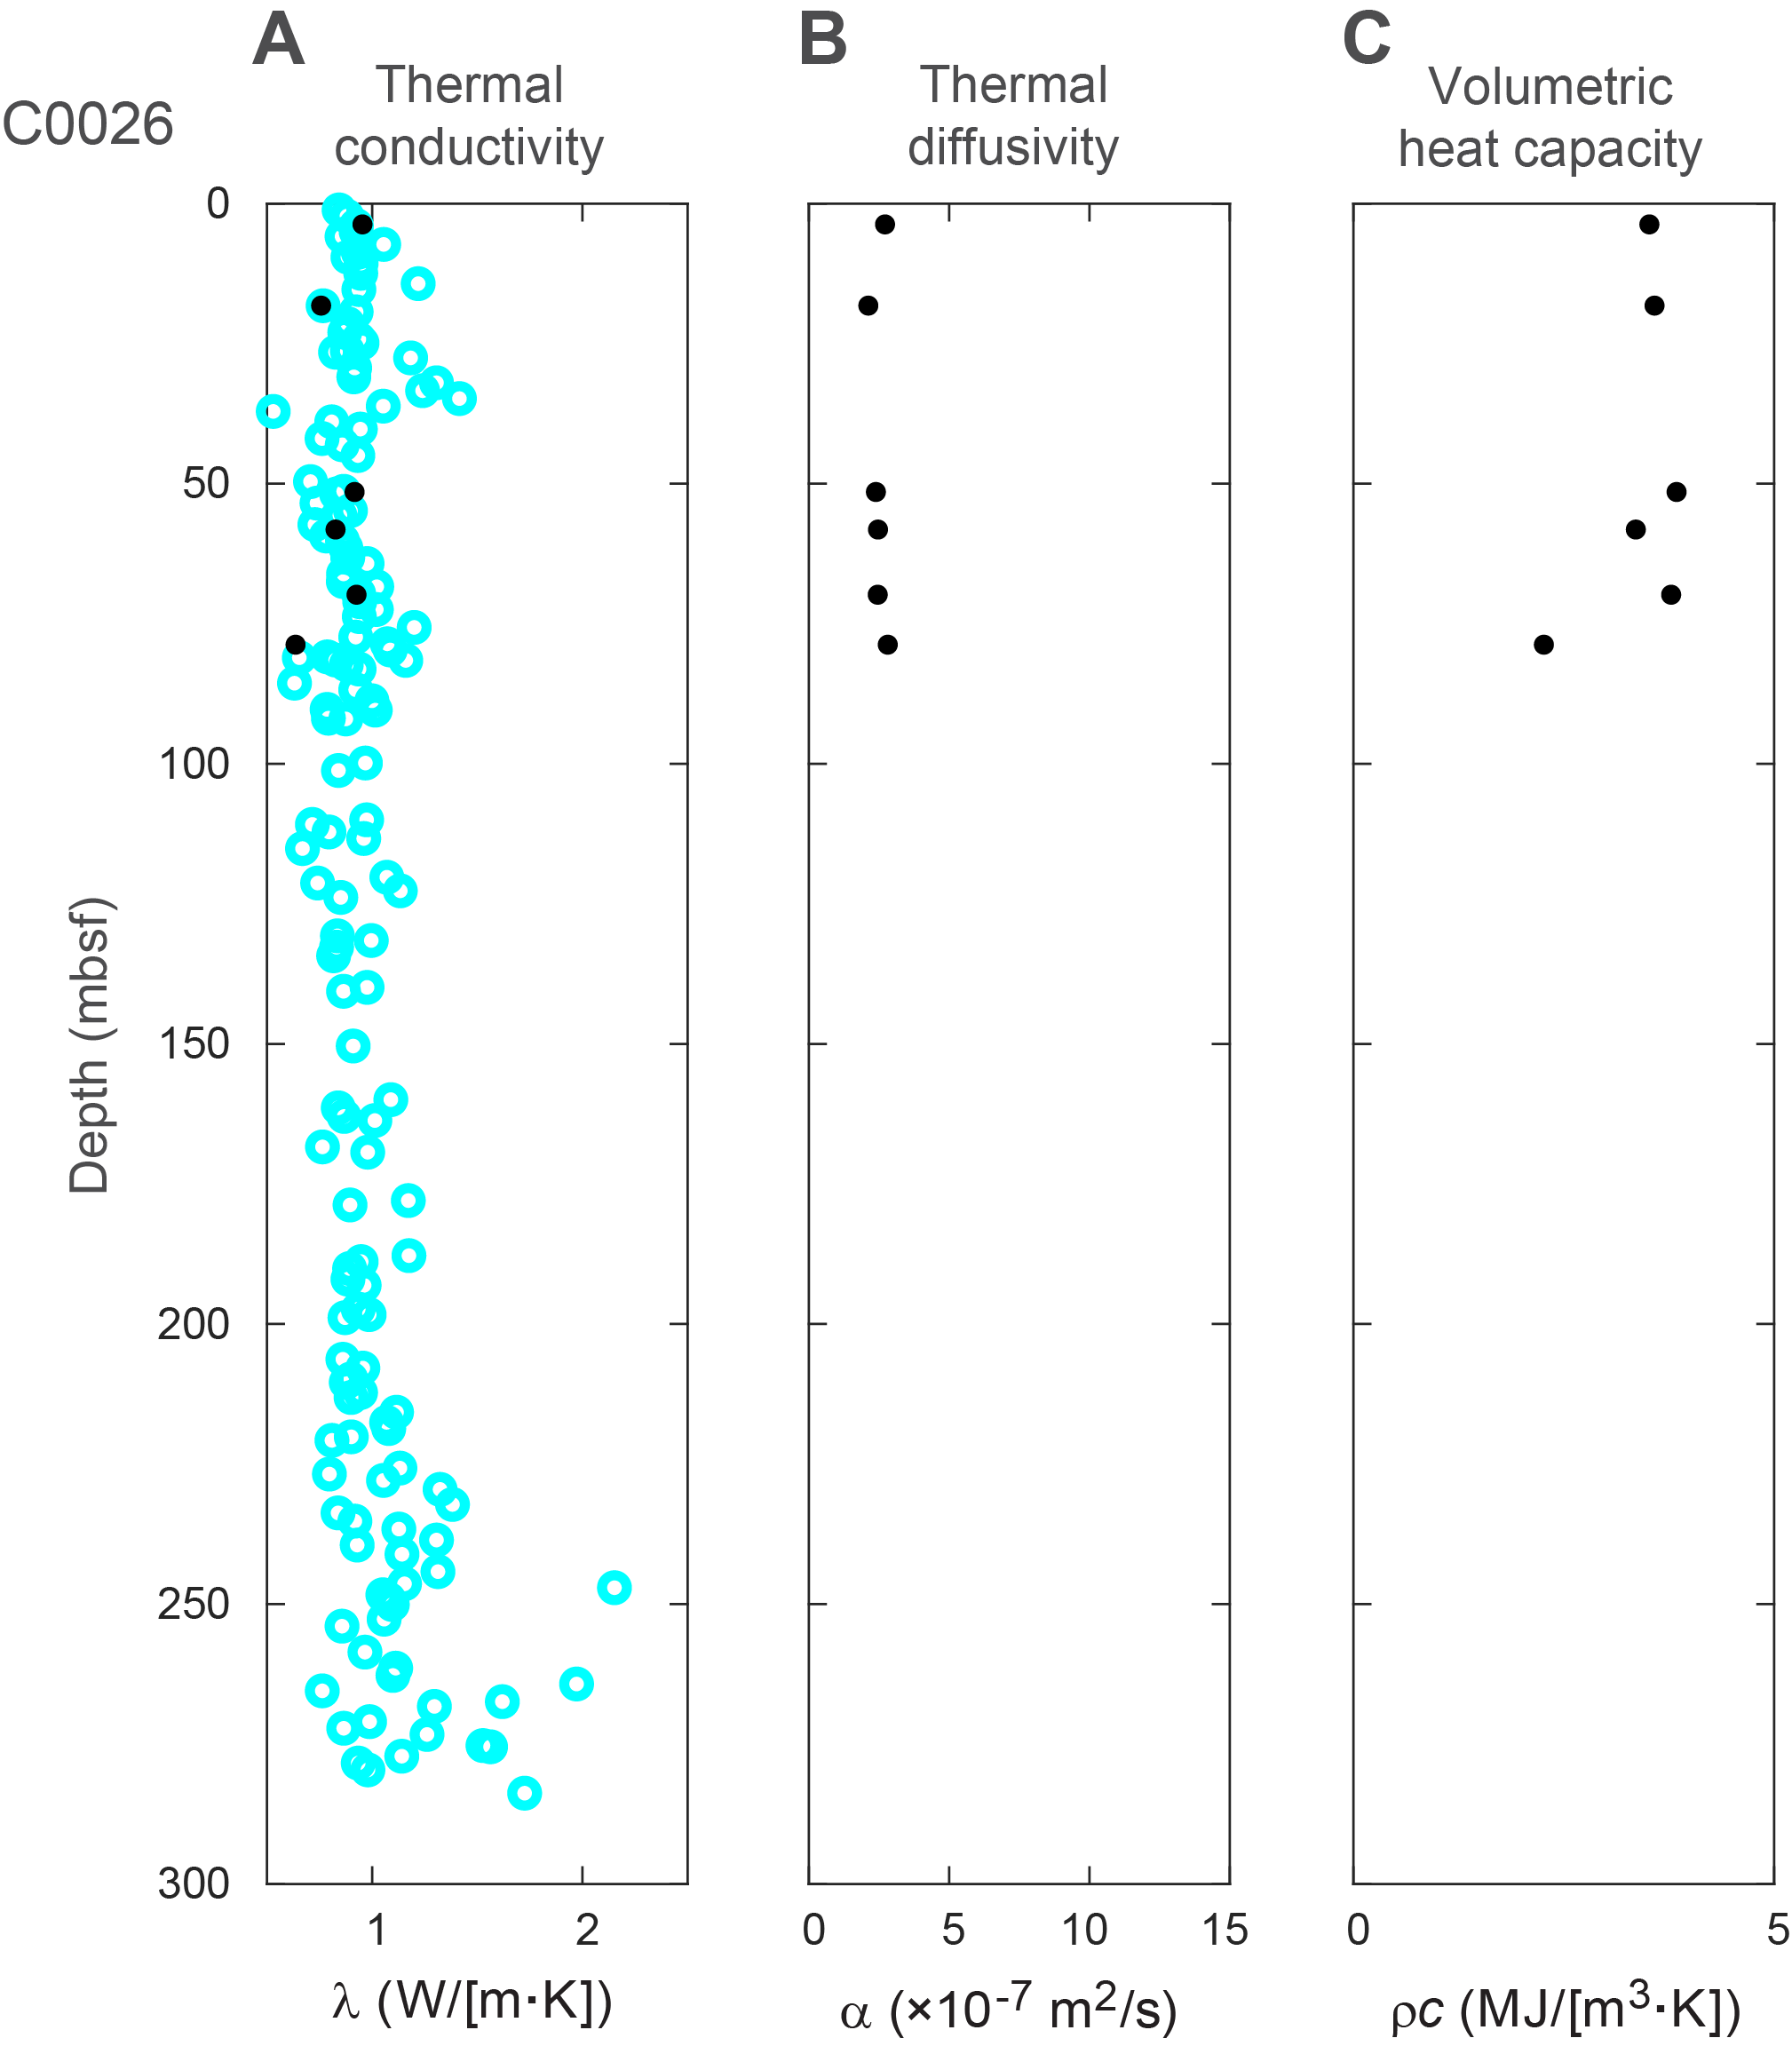
Figure F4. Thermal properties versus depth, Site C0026.
3.2.1. Shallow mud
Across the six samples, the mean values are λ = 0.836 ± 0.114 W/(m·K), α = (2.490 ± 0.229) × 10−7 m2/s, and ρc = 3.388 ± 0.537 MJ/(m3·K). Thermal conductivity lies within the lower part of the shipboard range for shallow Site C0026 sediments, likely reflecting the shallow depth extent of these samples, which encompass less consolidated material than deeper intervals. No coherent trend with depth is evident over the APCT-3 measurement interval (Figure F4). Compared to shallow muds in Hole C0019M, the average λ is similar, α is slightly lower on average at Site C0026, and ρc overlaps within uncertainty. The Site C0026 thermal conductivities also align well with the shipboard observations.
3.3. Cross-property relationships and comparison to empirical trends
Figure F5 compares how thermal diffusivity and volumetric heat capacity relate to thermal conductivity, which is more commonly available, following a format similar to Lin et al. (2014). I plot all measurements from this study at Sites C0019 and C0026 as black dots together with the four JFAST values reported by Lin et al. (2014) (open red circles). In Panel A, α is shown versus λ along with the Hyndman et al. (1979) empirical curve in cyan. Muds and mudstones cluster near λ ~0.8–1.1 W/(m·K) with α ~2.4–3.8 × 10⁻⁷ m2/s, and the chert and two basalt samples plot at higher λ and α, consistent with lithology. In Panel B, ρc is plotted versus λ and shows a relatively narrow band for muds and mudstones, with chert and basalt overlapping that range.
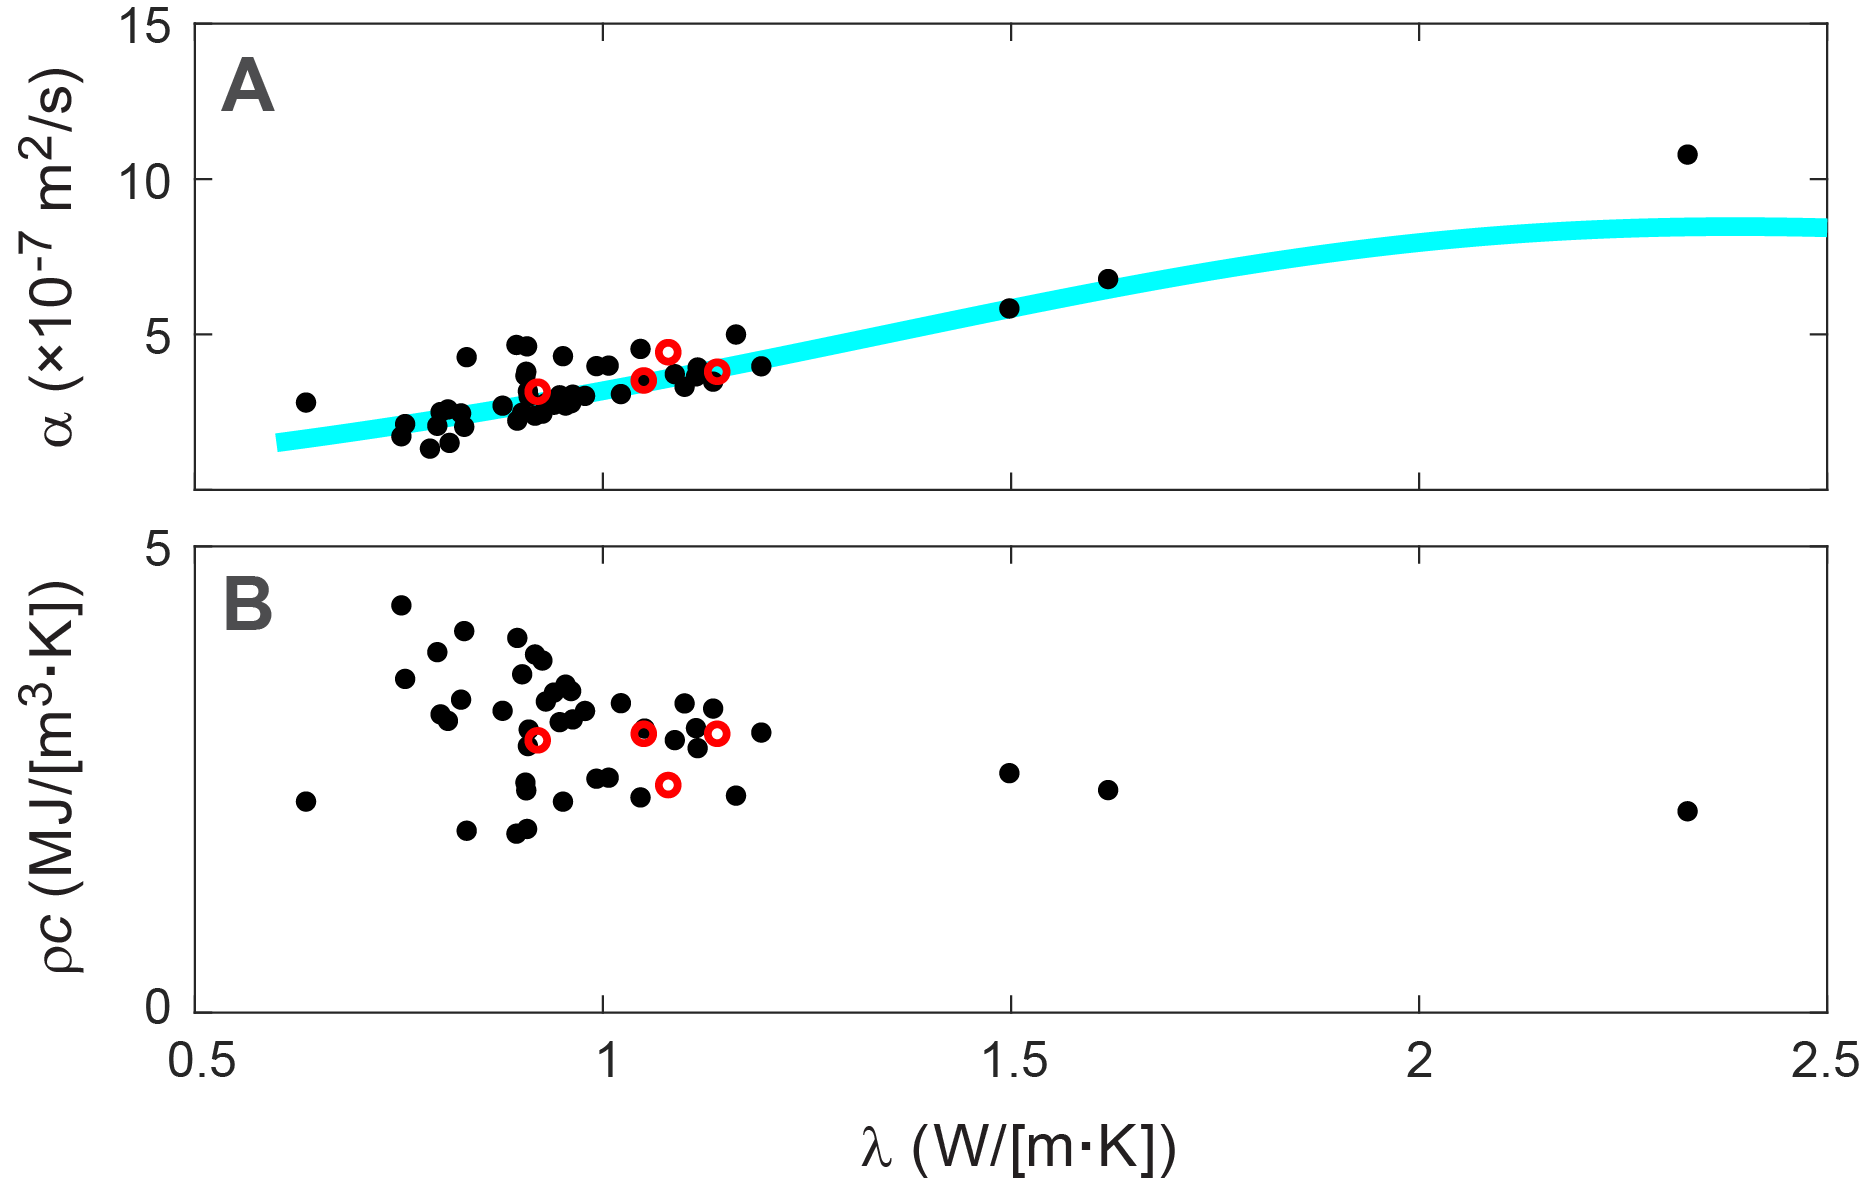
Figure F5. Cross-property sample relationships.
Taken together with the alignment between shipboard thermal conductivities, the two-sided JFAST measurements, and the single-sided measurements reported here, these patterns indicate that the single-sided transient plane-source approach provides robust and comparable estimates of λ, α, and ρc for Japan Trench rocks and sediments. Practically, this supports using shipboard λ together with the Hyndman et al. (1979) curve to approximate α where direct measurements are unavailable, and it provides tight property bounds for interpreting observatory and APCT-3 measurement data in terms of hydrologic and thermal processes.
4. Acknowledgments
This work was supported by a postcruise activity award from the U.S. Science Support Program (USSSP) for IODP. Sampling was conducted under IODP sample request number 105522IODP. I thank Huiyun Guo for assistance with sample selection and collection and Masa Kinoshita for constructive reviewer comments and suggestions.
References
Brodsky, E.E., Mori, J., and Fulton, P.M., 2010. Drilling into faults quickly after earthquakes. Eos, Transactions American Geophysical Union, 91(27):237–238. https://doi.org/10.1029/2010EO270001
Bullard, E.C., Maxwell, A.E., and Revelle, R., 1956. Heat flow through the deep sea floor. In Landsberg, H.E., Advances in Geophysics. 3: (Elsevier), 153–181. https://doi.org/10.1016/S0065-2687(08)60389-1
Chester, F.M., Rowe, C., Ujiie, K., Kirkpatrick, J., Regalla, C., Remitti, F., Moore, J.C., Toy, V., Wolfson-Schwehr, M., Bose, S., Kameda, J., Mori, J.J., Brodsky, E.E., Eguchi, N., Toczko, S., and Expedition 343 and 343T Scientists, 2013. Structure and composition of the plate-boundary slip zone for the 2011 Tohoku-Oki earthquake. Science, 342(6163):1208–1211. https://doi.org/10.1126/science.1243719
Conin, M., Kirkpatrick, J., Regalla, C., Ujiie, K., Fulton, P., Kodaira, S., Okutsu, N., Maeda, L., Toczko, S., Eguchi, N., Bellanova, P., Brown, C., Brunet, M., Castillo, M., Chang, Y.-C., Doan, M.-L., Everard, J., Fintel, A., Ford, J., Fukuchi, R., Gough, A., Guo, H., Gürer, D., Hackney, R., Hagino, M., Hamada, Y., Hosono, H., Ijiri, A., Ikari, M., Ishikawa, T., Iwai, M., Jeppson, T., Jurado, M.-J., Kamiya, N., Kanamatsu, T., LaPlante, A., Lin, W., Miyakawa, A., Morono, Y., Nakamura, Y., Nicholson, U., Okuda, H., Pei, P., Pizer, C., Rasbury, T., Robertson, R.V.M., Ross, C., Satolli, S., Savage, H., Schaible, K., Shreedharan, S., Sone, H., Sun, C., Turel, C., Uchida, T., Yamaguchi, A., Yamamoto, Y., Yoshimoto, T., Zhang, J., Wspanialy, A., Le Ber, E., Rydzy, M.B., and Schuba, N., 2025. Site C0026. In Kodaira, S., Conin, M., Fulton, P., Kirkpatrick, J., Regalla, C., Ujiie, K., Okutsu, N., Maeda, L., Toczko, S., Eguchi, N., and the Expedition 405 Scientists, Tracking Tsunamigenic Slip Across the Japan Trench (JTRACK). Proceedings of the International Ocean Discovery Program, 405: College Station, TX (International Ocean Discovery Program). https://doi.org/10.14379/iodp.proc.405.104.2025
Fulton, P.M., and Brodsky, E.E., 2016. In situ observations of earthquake-driven fluid pulses within the Japan Trench plate boundary fault zone. Geology, 44(10):851–854. https://doi.org/10.1130/G38034.1
Fulton, P.M., Brodsky, E.E., Kano, Y., Mori, J.J., Chester, F.M., Ishikawa, T., Harris, R.N., Lin, W., Eguchi, N., and Toczko, S., 2013. Low coseismic friction on the Tōhoku-Oki fault determined from temperature measurements. Science, 342(6163):1214–1217. https://doi.org/10.1126/science.1243641
Fulton, P.M., Harris, R.N., Saffer, D.M., and Brodsky, E.E., 2010. Does hydrologic circulation mask frictional heat on faults after large earthquakes? Journal of Geophysical Research: Solid Earth, 115:B09402. https://doi.org/10.1029/2009JB007103
Fulton, P.M., and Kitajima, H., 2025. Data report: thermal diffusivity, thermal conductivity, and volumetric heat capacity at borehole observatory Sites U1518 and U1519, Hikurangi Subduction Zone, IODP Expedition 375. In Wallace, L.M., Saffer, D.M., Barnes, P.M., Pecher, I.A., Petronotis, K.E., LeVay, L.J., and the Expedition 372/375 Scientists, Hikurangi Subduction Margin Coring, Logging, and Observatories. Proceedings of the International Ocean Discovery Program, 372B/375: College Station, TX (International Ocean Discovery Program). https://doi.org/10.14379/iodp.proc.372B375.213.2025
Fulton, P.M., and Saffer, D.M., 2009. Effect of thermal refraction on heat flow near the San Andreas Fault, Parkfield, California. Journal of Geophysical Research: Solid Earth, 114:B06408. https://doi.org/10.1029/2008JB005796
Gustafsson, S.E., 1991. Transient plane source techniques for thermal conductivity and thermal diffusivity measurements of solid materials. Review of Scientific Instruments, 62(3):797–804. https://doi.org/10.1063/1.1142087
Hyndman, R.D., Davis, E.E., and Wright, J.A., 1979. The measurement of marine geothermal heat flow by a multipenetration probe with digital acoustic telemetry and insitu thermal conductivity. Marine Geophysical Researches, 4(2):181–205. https://doi.org/10.1007/BF00286404
International Organization for Standardization, 2008. Plastics - determination of thermal conductivity and thermal diffusivity - Part 2: transient plane heat source (hot disc) method (ISO Standard No. 22007-2).
Lee, T.-C., and Henyey, T.L., 1974. Heat-flow refraction across dissimilar media. Geophysical Journal International, 39(2):319–333. https://doi.org/10.1111/j.1365-246X.1974.tb05457.x
Li, H., Xue, L., Brodsky, E.E., Mori, J.J., Fulton, P.M., Wang, H., Kano, Y., Yun, K., Harris, R.N., Gong, Z., Li, C., Si, J., Sun, Z., Pei, J., Zheng, Y., and Xu, Z., 2015. Long-term temperature records following the Mw 7.9 Wenchuan (China) earthquake are consistent with low friction. Geology, 43(2):163–166. https://doi.org/10.1130/G35515.1
Lin, W., Fulton, P.M., Harris, R.N., Tadai, O., Matsubayashi, O., Tanikawa, W., and Kinoshita, M., 2014. Thermal conductivities, thermal diffusivities, and volumetric heat capacities of core samples obtained from the Japan Trench Fast Drilling Project (JFAST). Earth, Planets and Space, 66(1):48. https://doi.org/10.1186/1880-5981-66-48
Maldaner, C.H., Munn, J.D., Coleman, T.I., Molson, J.W., and Parker, B.L., 2019. Groundwater flow quantification in fractured rock boreholes using active distributed temperature sensing under natural gradient conditions. Water Resources Research, 55(4):3285–3306. https://doi.org/10.1029/2018WR024319
Mildren, S.D., and Sandiford, M., 1995. Heat refraction and low‐pressure metamorphism in the northern Flinders Ranges, South Australia. Australian Journal of Earth Sciences, 42(3):241–247. https://doi.org/10.1080/08120099508728198
Purwamaska, I., and Fulton, P.M., 2026. Borehole thermal recovery as a method for quantifying subsurface permeability. Geochemistry, Geophysics, Geosystems, 27(e2025GC012508). https://doi.org/10.1029/2025GC012508
Read, T., Bour, O., Bense, V., Le Borgne, T., Goderniaux, P., Klepikova, M.V., Hochreutener, R., Lavenant, N., and Boschero, V., 2013. Characterizing groundwater flow and heat transport in fractured rock using fiber-optic distributed temperature sensing. Geophysical Research Letters, 40(10):2055–2059. https://doi.org/10.1002/grl.50397
Regalla, C., Ujiie, K., Fulton, P., Kirkpatrick, J., Conin, M., Kodaira, S., Okutsu, N., Maeda, L., Toczko, S., Eguchi, N., Bellanova, P., Brown, C., Brunet, M., Castillo, M., Chang, Y.-C., Doan, M.-L., Everard, J., Fintel, A., Ford, J., Fukuchi, R., Gough, A., Guo, H., Gürer, D., Hackney, R., Hagino, M., Hamada, Y., Hosono, H., Ijiri, A., Ikari, M., Ishikawa, T., Iwai, M., Jeppson, T., Jurado, M.-J., Kamiya, N., Kanamatsu, T., LaPlante, A., Lin, W., Miyakawa, A., Morono, Y., Nakamura, Y., Nicholson, U., Okuda, H., Pei, P., Pizer, C., Rasbury, T., Robertson, R.V.M., Ross, C., Satolli, S., Savage, H., Schaible, K., Shreedharan, S., Sone, H., Sun, C., Turel, C., Uchida, T., Yamaguchi, A., Yamamoto, Y., Yoshimoto, T., Zhang, J., Wspanialy, A., Le Ber, E., Rydzy, M.B., and Schuba, N., 2025. Site C0019. In Kodaira, S., Conin, M., Fulton, P., Kirkpatrick, J., Regalla, C., Ujiie, K., Okutsu, N., Maeda, L., Toczko, S., Eguchi, N., and the Expedition 405 Scientists, Tracking Tsunamigenic Slip Across the Japan Trench (JTRACK). Proceedings of the International Ocean Discovery Program, 405: College Station, TX (International Ocean Discovery Program). https://doi.org/10.14379/iodp.proc.405.103.2025
Tanaka, H., Chen, W.M., Kawabata, K., and Urata, N., 2007. Thermal properties across the Chelungpu fault zone and evaluations of positive thermal anomaly on the slip zones: Are these residuals of heat from faulting? Geophysical Research Letters, 34(1):L01309. https://doi.org/10.1029/2006GL028153