Arculus, R.J., Ishizuka, O., Bogus, K., and the Expedition 351 Scientists, 2015
Proceedings of the International Ocean Discovery Program Volume 351
publications.iodp.org

doi:10.14379/iodp.proc.351.103.2015
Site U14381
R.J. Arculus, O. Ishizuka, K. Bogus, M.H. Aljahdali, A.N. Bandini-Maeder, A.P. Barth, P.A. Brandl, R. do Monte Guerra, L. Drab, M.C. Gurnis, M. Hamada, R.L. Hickey-Vargas, F. Jiang, K. Kanayama, S. Kender, Y. Kusano, H. Li, L.C. Loudin, M. Maffione, K.M. Marsaglia, A. McCarthy, S. Meffre, A. Morris, M. Neuhaus, I.P. Savov, C.A. Sena Da Silva, F.J. Tepley III, C. van der Land, G.M. Yogodzinski, and Z. Zhang2
Keywords: International Ocean Discovery Program, IODP, JOIDES Resolution, Expedition 351, Site U1438, Izu Bonin Mariana, arc origins, subduction initiation, Earth connections, Amami Sankaku Basin, Kyushu-Palau Ridge, basalt, volcanic ash, breccia-conglomerate, biostratigraphy, magnetostratigraphy, oceanic crust, arc basement, Neogene, Paleogene, foraminifers, radiolarians, volcaniclastic, back arc, tuffaceous mud, hemipelagic, East Asian Monsoon, subduction factory
MS 351-103: Published 25 August 2015
Background and objectives
Understanding how subduction zones are initiated and continental crust forms in intraoceanic arcs requires knowledge of the inception and evolution of a representative intraoceanic arc, such as the Izu-Bonin-Mariana (IBM) arc system. An intraoceanic setting is mandatory to avoid the obscuring geochemical, geophysical, and structural veils of preexisting continental crust and the practicality of recovery depth of basement cores by drilling. The IBM satisfies these criteria. Understanding the evolution of the IBM system, particularly in the more recent half of its 50 My history, has improved considerably over the past three decades, not the least from studies of ash and other pyroclastic material recovered by ocean drilling. However, we have poorer records for the nature of arc development in the first half of the system’s history and very limited understanding of how this (or any other) arc was initiated. International Ocean Discovery Program (IODP) Expedition 351 targeted, in particular, evidence for the earliest evolution of the IBM system following inception.
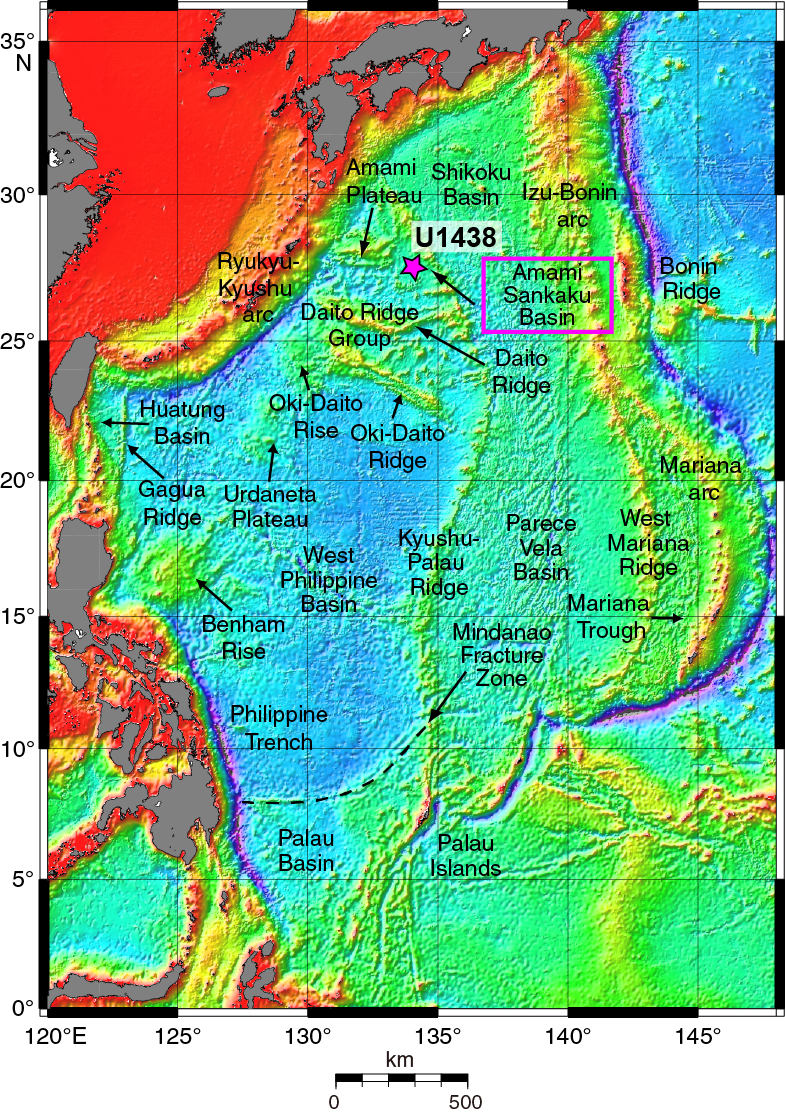
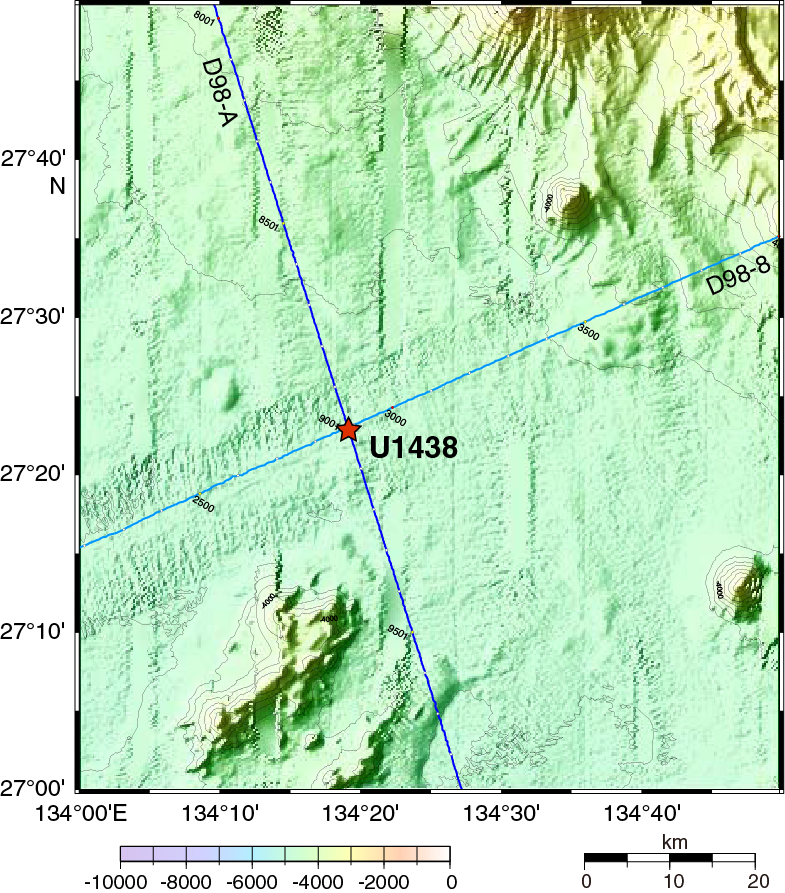
Site U1438 (proposed Site IBM-1; Figure F1) is located in the Amami Sankaku Basin (ASB), <100 km west of the northern portion of the Kyushu-Palau Ridge (KPR). The KPR is a remnant arc of the intraoceanic IBM arc in the western Pacific on the northern part of the Philippine Sea plate. Site U1438 is located at the intersection of two seismic reflection profiles (Lines D98-A and D98-8) obtained by the Japan Oil, Gas, and Metals National Corporation (JOGMEC) (Figures F2, F3). For a more detailed discussion of the regional setting for Site U1438, see Regional setting in the Expedition 351 summary chapter (Arculus et al., 2015b).

Site U1438 was chosen as an ideal location because it fulfilled the following criteria: (1) there are remnants of drillable oceanic crust that existed in the region immediately before arc inception, (2) the initial IBM magmatic record is preserved and includes geological evidence of the tectonic setting at subduction initiation, (3) temporal variations of magmatism in the rear IBM arc are preserved in a sequence of volcaniclastic sediments and tephra, and (4) the effects of along-strike variation are minimized or well understood, which highlights the temporal evolution of the IBM arc crust.
There were two primary targets during Expedition 351: the basement and the overlying sedimentary sequence of Site U1438. Recovering oceanic basement samples allows us to determine the petrological, geochemical, and age characteristics of the pre-KPR (IBM) crust and mantle in the region prior to subduction initiation in the middle Eocene. Overlying sediments preserve a volcanic and geologic record spanning the pre-arc, arc initiation, and remnant arc stages of the IBM. These sediments, combined with basement samples, identify and help model the subduction initiation process and initial arc formation. They also help constrain the geophysical properties of the ASB. Sediment samples permit determination of the Paleogene compositional evolution of the IBM arc and the evolution of the Ryukyu-Kyushu arc, located west of the ASB, through an extensive ash record. The sedimentary record further aids in environmental reconstructions in the western Pacific, including the onset and persistence of the East Asian Monsoon.
During Expedition 351, Site U1438 was cored using all of the IODP coring systems: advanced piston corer (APC), half-length APC, extended core barrel (XCB), and rotary core barrel (RCB). Overall, we accomplished 1611.0 m of penetration, 1461.08 m in the sediment sequence and 150 m into basement. Of the drilled intervals, we recovered 1182 m of sediments and 44 m of basement (see Operations).
Operations
Transit to Site U1438
Expedition 351 departed from Yokohama, Japan, on 4 June 2014 at 0552 h. The transit was uneventful until we were advised of an immigration issue involving several technicians and scientists. At ~1800 h on 4 June, the ship reversed course and prepared for a rendezvous with a tug boat at 2308 h. Once documents were transferred to allow revision of the passengers’ visas, the ship headed back toward Site U1438. The 562 nmi transit to Site U1438 was completed at 0245 h on 7 June, and the ship stabilized over the site location.
Prior to commencing rig floor operations, we conducted a visual seafloor survey using the subsea camera system. We systematically moved in an expanding box pattern out to 50 m using the dynamic positioning console. No seafloor features were observed. At the outer area of the survey, an acoustic positioning beacon was deployed (Falmouth Scientific BAP-547, SN 1008, 15 kHz, 211 dB), and the ship was moved back to the original site coordinates. An observed seafloor tag with the drill string indicated a water depth of 4700 m for the site. Thereafter, the subsea camera system was recovered and preparations for coring were made.
Drilling, coring, and logging operations
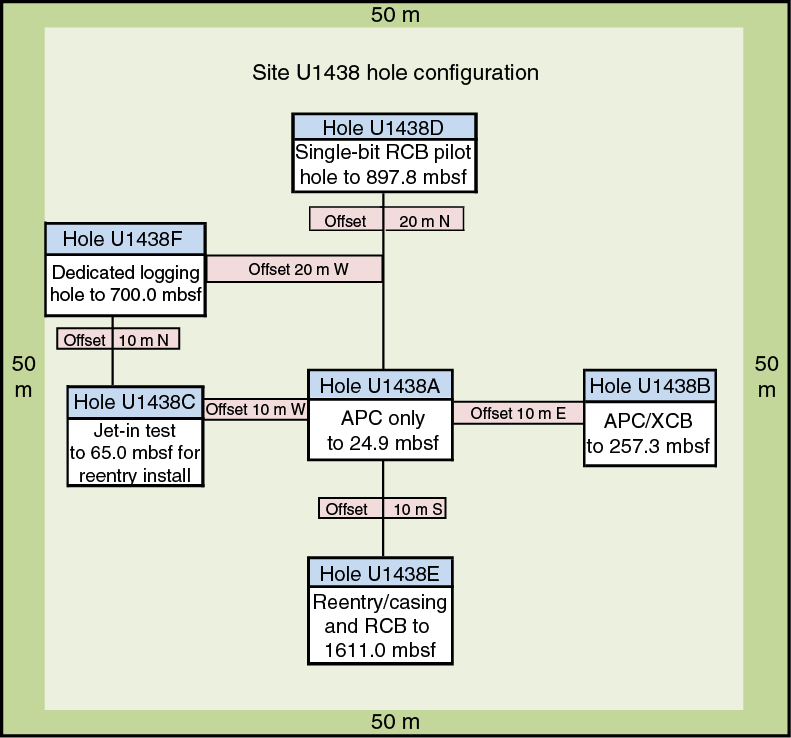
The APC, half-length APC, XCB, and RCB systems were all used during Expedition 351. The APC, half-length APC, and XCB systems were used to recover sediment cores in Holes U1438A and U1438B, and the RCB system was used to recover sediment and basement cores in Holes U1438D and U1438E (Table T1; Figure F4; see Table T1 in the Expedition 351 summary chapter [Arculus et al., 2015b]).
Table T1. Coring summary, Site U1438. Download table in .csv format. View PDF table.
Hole U1438A
Hole U1438A (27°23.0108′N, 134°19.1020′E) was spudded on 8 June 2014, and three APC cores were recovered to 26.5 mbsf before terminating the hole (at 1400 h). Recovery for the entire hole was 94% (24.9 m recovered). This hole was intended only to gain additional material for higher resolution sampling of the upper 20 m, so no discrete samples were taken for shipboard analyses.
Hole U1438B
The ship was offset 10 m east of Hole U1438A, and Hole U1438B (27°23.0111′N, 134°19.1087′E) was spudded on 8 June 2014. Six successful temperature measurements were taken using the advanced piston corer temperature (APCT-3) tool on Cores 3H, 4H, 5H, 6H, 7H, and 9H at 26.2, 35.7, 45.2, 54.7, 64.2, and 83.2 mbsf, respectively. Oriented APC coring continued in this hole through Core 19H to 168.9 mbsf. Incomplete strokes on the last two core barrels and 65,000 lb of overpull indicated that APC refusal had been reached. The unoriented half-length APC coring system was then used to recover Cores 20F through 22F (to 180.6 mbsf) before refusal, after which the XCB coring system was used. XCB coring (9–10 June) continued until the decision was made to terminate the hole in the interest of time. XCB coring ended with Core 30X (257.3 mbsf). In total, 19 full-length APC cores were recovered (168.9 m penetration; 159.2 m recovered; 94.2% recovery), 3 cores were collected with the half-length (4.7 m core barrels) APC (11.7 m penetration; 11.96 m recovered; 102% recovery), and 8 cores were recovered with the XCB (76.6 m penetration; 55.9 m recovered; 73% recovery). Overall recovery for the hole was 227.04 m (88%).
Hole U1438C
The ship was then offset 20 m west of Hole U1438B (and thus 10 m west of U1438A) for the reentry cone jet-in test (Hole U1438C; 27°22.9963′N, 134°19.0883′E). Controlled jetting reached 65.0 mbsf in ~2.5 h. After successfully completing the jet-in test, the bit was pulled clear of the seafloor and Hole U1438C concluded on 11 June 2014.
Hole U1438D
Hole U1438D (27°23.0218′N, 134°19.1023′E) was intended as the pilot hole for reentry operations. It was spudded on 11 June 2014 and drilled without coring to 219 mbsf. Coring began with nonmagnetic core barrels to 286.7 mbsf and recovered up to Core 9R before coring was halted on 12 June. At this point, the weather had deteriorated significantly; a forecasted low-pressure system was upgraded to a full-blown tropical storm and passed directly over the site. RCB coring resumed later the same day and continued until 17 June to a total depth of 897.8 mbsf with the recovery of Core 72R. In all, 71 cores were collected over a cored interval of 678.9 m, totaling 523.2 m of material (77% recovery).
The hole was surprisingly stable with no detected fill on connections, overpull, or drag. As a result of the excellent hole conditions, a single casing string (10.75 inches) was deemed necessary for the reentry hole (Hole U1438E). The hole was then swept and displaced with heavy mud in preparation for wireline logging. Before logging, however, the drill string was raised to 304 mbsf and a free-fall funnel (FFF) was deployed as a contingency plan if the reentry hole (U1438E) encountered problems. After releasing the bit on the seafloor, the hole was reentered and the end of the drill string was positioned at logging depth (95 mbsf). Rig-up of the first tool string began on 19 June. The triple combination (triple combo) tool string, measuring temperature, resistivity, density, porosity, and natural gamma (see Physical properties and downhole measurements), downlog reached 303 mbsf, where the tool string encountered a bridge. As the depth of the obstruction corresponded to the depth of the pipe during deployment of the FFF, it was concluded that the pipe itself created the bridge. An attempt to pursue further logging operations was organized. The pipe was lowered to 328.15 mbsf (below the bridge), and the triple combo tool string was run back into the hole. Unfortunately, another bridge was encountered at 362 mbsf. Because of the difficulty of passing through the bridge and the shallow depth, it was decided to stop logging operations for Hole U1438D. No uplog was recorded for the second phase of logging, and the seafloor was cleared on 20 June. Hole U1438D officially ended on 20 June.
Hole U1438E
Hole U1438E (27°23.0153′N, 134°19.0898′E) was spudded on 21 June 2014 when the reentry cone and casing assembly was jetted-in to 60.1 mbsf. Afterward, a 14.75 inch hole was drilled to 613.0 mbsf, finishing on 24 June. The hole was swept multiple times with high-viscosity sepiolite mud, and only one wiper trip was conducted because of the good borehole conditions. On 25 June, preparations began for making up and deploying the 10.75 inch casing string. On 27 June, the 10.75 inch casing string was lowered into the hole to 605 mbsf escorted by a mud motor–powered underreamer and a 9.875 inch tricone pilot bit. Drilling then continued to 867.3 mbsf with the RCB center bit.
At 0900 h on 30 June, RCB coring began in Hole U1438E. Coring continued to 1319.8 mbsf. Coring stopped at 1825 h on 5 July because of impending severe weather. A super typhoon (Neoguri) necessitated our transit to a safe standby location east of Site U1438. At 0600 h on 7 July, the ship was positioned 144 nm east of Site U1438. Upon arriving back on site at 0830 h on 10 July, we continued to wait for sea conditions to moderate enough to resume operations. At 1315 h on 11 July, we deployed the subsea camera system, and Hole U1438E was reentered at 1655 h. RCB coring resumed with nonmagnetic core barrels on 12 July. Coring continued to 1461 mbsf, where the sediment/basement contact was identified (top of Core 69R). RCB coring continued through basaltic basement rocks to a total depth for the hole, and site, of 1611 mbsf. In total, 85 RCB cores were recovered from this hole. For a total of 743.7 m cored, 450.73 m was recovered (61%). More specifically, 407 m of sediment was recovered from 593.6 m cored (69%), and 44 m of basement was recovered from 150 m cored (29%).
In general, coring conditions were good, but there were several times when remedial hole conditioning was required. The sediment/basement contact was the depth at which the drill string had the most trouble rotating. As a result, a wiper trip was conducted prior to wireline logging operations. Heavy mud was not used, as it was suspected to have affected conditions in Hole U1438D. The drill pipe was pulled to 190 mbsf (inside the casing), and the triple combo was readied. Because of the difficult hole conditions, the radioactive source was removed and a “hole finder” was attached at the bottom of the tool string. The triple combo was deployed and reached 1186 mbsf, where it encountered a bridge and was unable to pass after several attempts. During the uplog, caliper measurements indicated that the hole diameter was >18 inches for the entire logged depth. This precluded the use of the vertical seismic imager (VSI) and Formation MicroScanner–sonic (FMS-sonic) tool strings. However, the Göttingen Borehole Magnetometer (GBM) is not affected by borehole diameter. The GBM was deployed and reached the same total depth as the triple combo (1186 mbsf). Logging operations were completed and the hole was terminated on 22 July.
Hole U1438F
Hole U1438F (27°23.0167′N, 134°19.0905′E), offset 10 m north of Hole U1438C and 20 m west of Hole U1438A, was a dedicated wireline logging hole. The hole was drilled to 700 mbsf, and logging operations began on 25 July. Hole preparation for logging included a wiper trip and circulation with seawater, after which the pipe was pulled to 95 mbsf. The triple combo began a downlog on 25 July. The triple combo reached ~700 mbsf and began an uplog. The triple combo was recovered on 26 July, after which the VSI was run to take advantage of full daylight hours. The VSI was rigged up and deployed. Protected species observation began at sunrise (~0500 h), and ramp-up of the air guns began 1 h later, as no protected species were observed in the 940 m diameter exclusion zone for this site. The air guns fired every 5–10 min. The VSI took measurements at nine stations on the uplog. The last deployment was the FMS-sonic tool string to 689 mbsf. Logging operations were completed late on 26 July. With the recovery of the drill string on 27 July, operations for Expedition 351 concluded.
Lithostratigraphy
During Expedition 351, Site U1438 was drilled in the ASB primarily to investigate the sedimentary record of Izu-Bonin arc initiation and the nature of the underlying oceanic basement. The lithostratigraphic record at this site is composed of sediment, sedimentary rocks, and igneous rocks recovered in Holes U1438A, U1438B, U1438D, and U1438E.
Sediments and sedimentary rocks at Site U1438 were sampled from the seafloor to 1461 mbsf (Figure F5) and are divided into four lithostratigraphic units. The thin upper sediment layer at Site U1438, Unit I, is primarily terrigenous and volcaniclastic mud with interspersed ash layers, as well as rare biogenic ooze layers. The much thicker, underlying sedimentary section is split into three units based on textural attributes, degree of lithification, and proportions of rock types. Unit II sedimentary rocks are tuffaceous mudstone and fine sandstone with localized moderate to intense deformation. Unit III sedimentary rocks are on average coarser grained than those of Unit II, including tuffaceous mudstone, tuffaceous sandstone, and conglomerate with volcanic and rare sedimentary clasts commonly up to pebble and rarely cobble size. A diverse suite of sedimentary rocks comprises Unit IV, including medium to coarse sandstone, siltstone, and mudstone with radiolarians, together with three 10–20 cm intervals of igneous rock.

Approximately 150 m of igneous basement rock was cored beneath the sedimentary rocks of Unit IV. This interval was described as a single basement Unit 1 composed of sparsely vesicular, microcrystalline to fine-grained, aphyric to sparsely porphyritic basalt.
Unit I (Holes U1438A and U1438B)
- Intervals: 351-U1438A-1H-1, 0 cm, to 3H-CC, 60 cm (all of Hole U1438A); 351-U1438B-1H-1, 0 cm, to 18H-1, 109 cm
- Thickness: 160.3 m
- Depths: Hole U1438A = 0–24.9 mbsf; Hole U1438B = 0–160.3 mbsf
- Age: recent to latest Oligocene (Pleistocene in Hole U1438A)
- Lithology: tuffaceous mud, mud with ash, mud, and clay with some discrete ash beds
Unit I sediments were identified in the combined records of Hole U1438A and the upper part of Hole U1438B. A total of 24.9 m of sediment was recovered in Hole U1438A. The first two sections of Core 351-U1438A-1H, at and within the first few meters below the mudline, were soupy with high water content, below which relatively intact sediments were recovered. The ship was offset 10 m east, and a total of 257 m of sediment and sedimentary rocks were drilled in Hole U1438B. In this second hole, significant downhole changes in grain size, lithification, and degree of bioturbation were observed in the recovered section deeper than that reached at the bottom of Hole U1438A, and these changes continue into Hole U1438D, drilled 20 m north (Figure F6). These observations allow division of the upper part of the section at Site U1438 into two major stratigraphic units, Units I and II (Table T2).
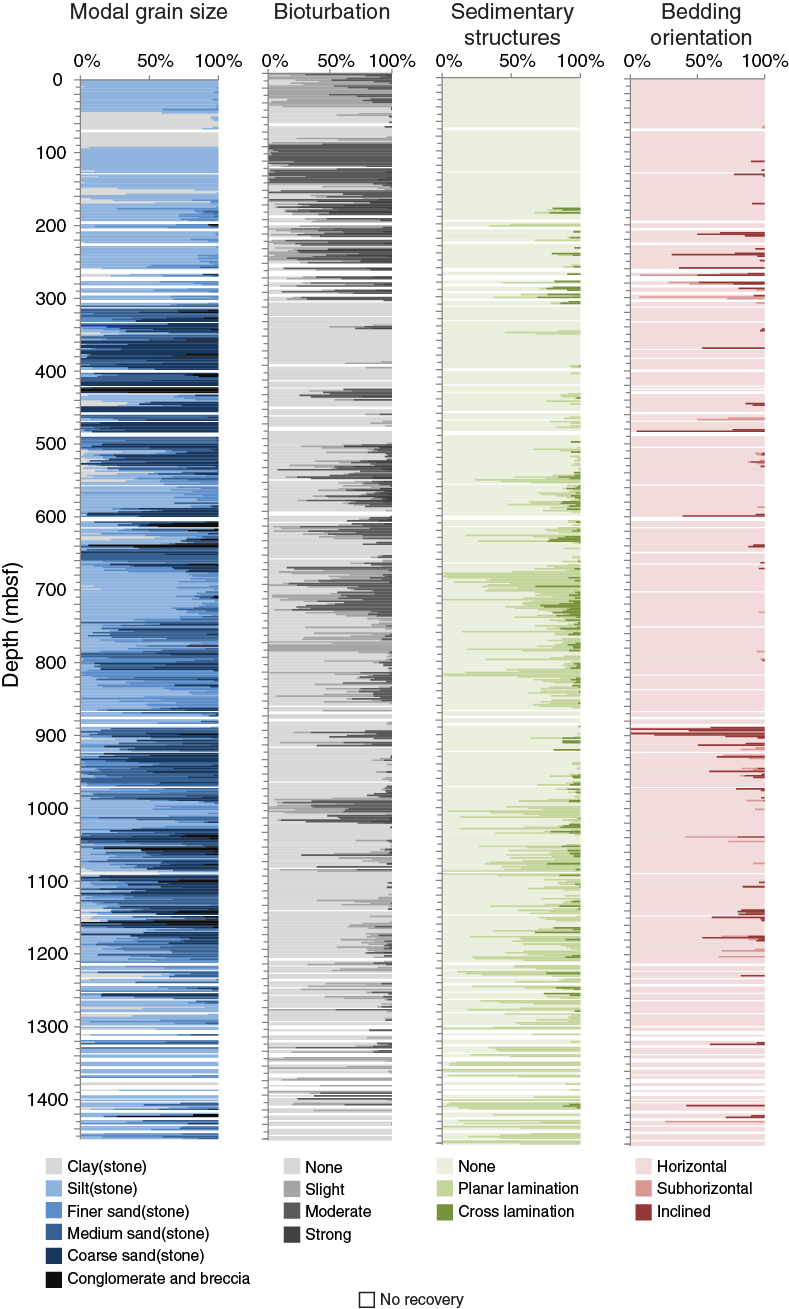
Table T2. Lithostratigraphic summary, Site U1438. Download table in .csv format.
Description
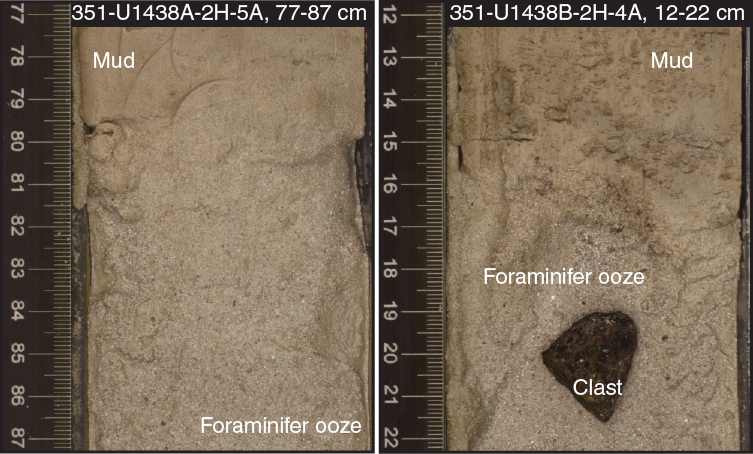
The cores from Holes U1438A and U1438B that make up Unit I consist of a range of fine-grained sediments from pelagic and hemipelagic to volcaniclastic in origin. Based on color and textural variations in the sediments and smear slide analysis of selected sediment intervals, Unit I has been broadly divided into two parts: an upper mud interval with a significant biogenic component and a lower mud interval that transitions downhole into hemipelagic clay near the contact with Unit II (Figures F6, F7; Table T2). Superimposed on this change in background sedimentation is variable ash content, resulting in both discrete ash layers and intervals with disseminated ash. Hole U1438A cores comprise solely muddy sediment with a biogenic component, whereas in Hole U1438B, such sediments extend to 28.6 mbsf at the base of tuffaceous foraminifer ooze in Section 351-U1438B-4H-2, 90 cm. These sediments have been slightly to moderately mixed by burrowing organisms, resulting in various degrees of bioturbation throughout the cored interval.
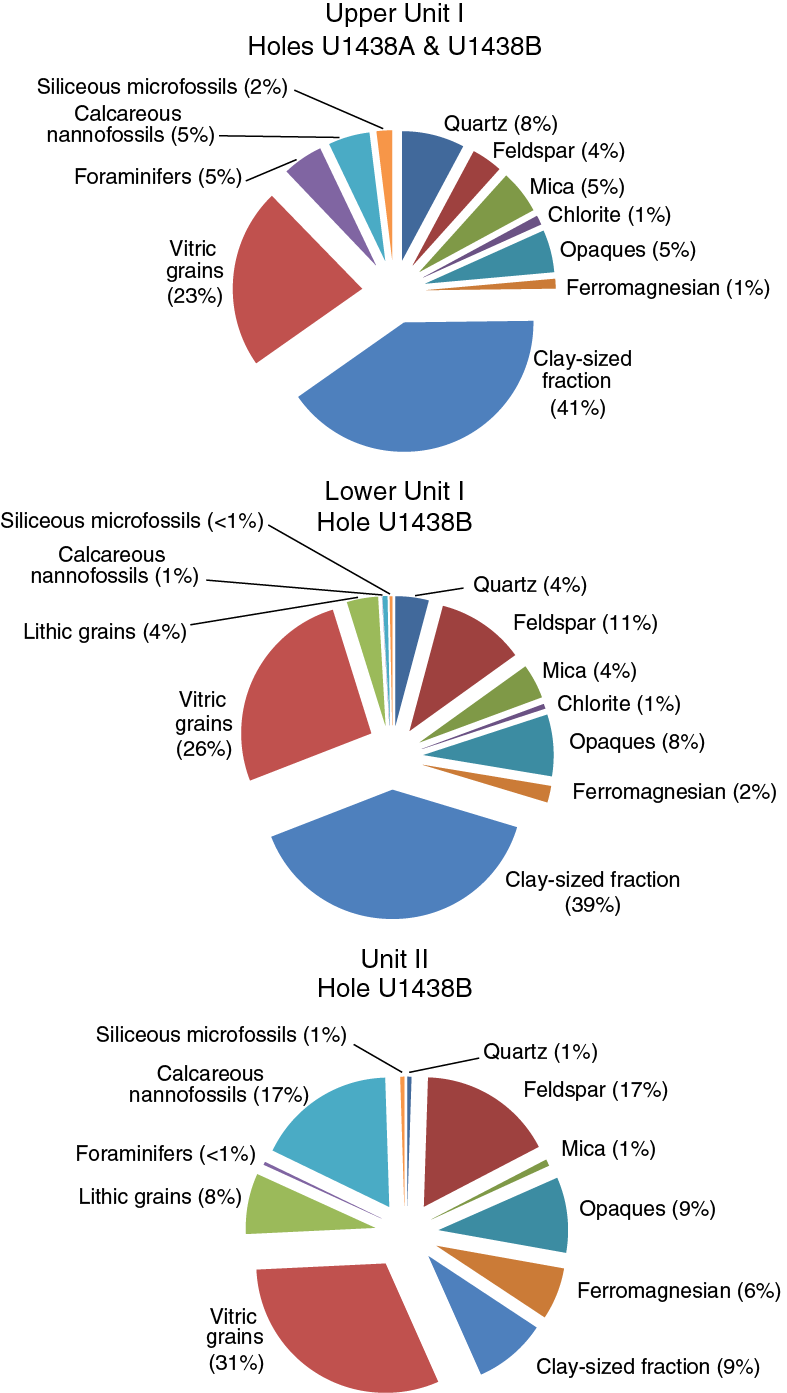
Figure F7. Overview of component proportions for Units I and II based on smear-slide data (see Smear slides in Core descriptions).
The pelagic biogenic components in the upper muddy interval are dominantly siliceous in Cores 351-U1438A-1H and 351-U1438B-1H, ranging up to 22% in some intervals; radiolarians are most abundant with fewer diatoms, sponge spicules, and silicoflagellates. This composition is reflected in the nomenclature used to describe the core (see Lithostratigraphy in the Expedition 351 methods chapter [Arculus et al., 2015a]) with the modifier “radiolarian-rich” or suffix “with radiolarians” used in several intervals. In Cores 351-U1438A-2H and 351-U1438B-2H, the pelagic biogenic components are dominant over the terrigenous and volcaniclastic components, particularly in the lighter colored layers, where foraminifers and nannofossils compose 32%–60% of the sediments (see Geochemistry carbonate content), and are classified as foraminifer/nannofossil mud or foraminifer ooze, respectively (Figure F8). There are also traces (up to <1%) of organic matter, spores, and plant remains preserved in Core 351-U1438A-1H (see Smear slides in Core descriptions).
The color of the biogenic muddy intervals exhibits rhythmic alternation between more brownish (moderate yellowish brown, 10YR 5/4, to pale yellowish brown, 10YR 6/2) and greenish gray (light olive-gray, 5Y 5/2) colors at a meter to decimeter scale. These color variations become more pronounced downhole through the three Hole U1438A cores and are particularly distinct in Core 351-U1438A-3H, where smear slide analysis of the end-members indicates no observable differences in their mineralogical compositions (see discussion below). The color changes are gradational and may reflect the addition of trace amounts of Fe oxides in the brown intervals, perhaps due to the oxidation state of iron.
The lower muddy sediments are primarily composed of tuffaceous mud, mud with ash, mud, and clay, with some discrete ash beds (Figure F9). There are traces of sponge spicules and radiolarian fragments in a few smear slides in the uppermost section of Core 351-U1438B-15H, but no biogenic sediment modifiers were used in their description. The rhythmic alternation between more olive-gray (5Y 5/2) or yellowish brown (10YR 4/2) to moderate yellowish brown (10YR 5/4) sediment at meter to decimeter scale continues, albeit in a more inconsistent fashion, through Core 351-U1438B-9H. Core 10H is fairly uniform moderate yellowish brown (10YR 5/4) with slightly darker sections being more clay rich than lighter colored intervals, as shown by smear slides from these intervals. From Core 11H to the top of 18H, the sediment becomes progressively darker, with distinctly lighter intervals and burrow fills. Reaction with hydrogen peroxide indicates the presence of Mn oxides in the core. These Mn oxides in the lower section impart a dark yellowish brown (10YR 4/2) to dusky yellowish brown (10YR 2/2) color to the mud. The lighter intervals and regions of the core in this lower section are in some cases rich in ash or are composed of mud or clay without the Mn oxide stain.

The lower interval of muddy sediment locally exhibits slight to moderate bioturbation. Bioturbated intervals are rare in Cores 351-U1438B-4H through 10H and common in Cores 11H through 18H (Figure F6). It is likely that intervals where no discrete burrows were noted may instead be thoroughly homogenized by burrowing organisms. The contacts change from more gradational in the upper cores (4H through 13H) to more bioturbated in the lower part (Cores 14H through 18H). The sharp contacts are commonly associated with variations in ash or clay content. Discrete burrows and bioturbated contacts may be more recognizable where the color contrast between alternating muds is strongest. Some burrows filled by ash are noted as “ash pods” in the core. There is one thicker ash bed that shows normal grading and fining upward in Core 351-U1438B-16H (Figure F9).
Representative X-ray diffraction (XRD) patterns of samples from Cores 351-U1438B-1H through 17H (Figure F10) illustrate the variation in mineral composition throughout Unit I. The relative abundances of minerals present in bulk samples from Cores 351-U1438B-1H through 10H, which were modeled from the XRD data, are shown in Table T3. These model results indicate that the mud samples are dominated by quartz, plagioclase feldspar, chlorite (clinochlore), and an undifferentiated mixture of sheet silicate minerals (muscovite; illite + other clays). Significant calcite is evident in only one of the analyzed samples, near the top of Hole U1438B at 10.5 mbsf (Sample 351-U1438B-2H-3, 42–44 cm). Small quantities of halite also appear to be present in several samples.
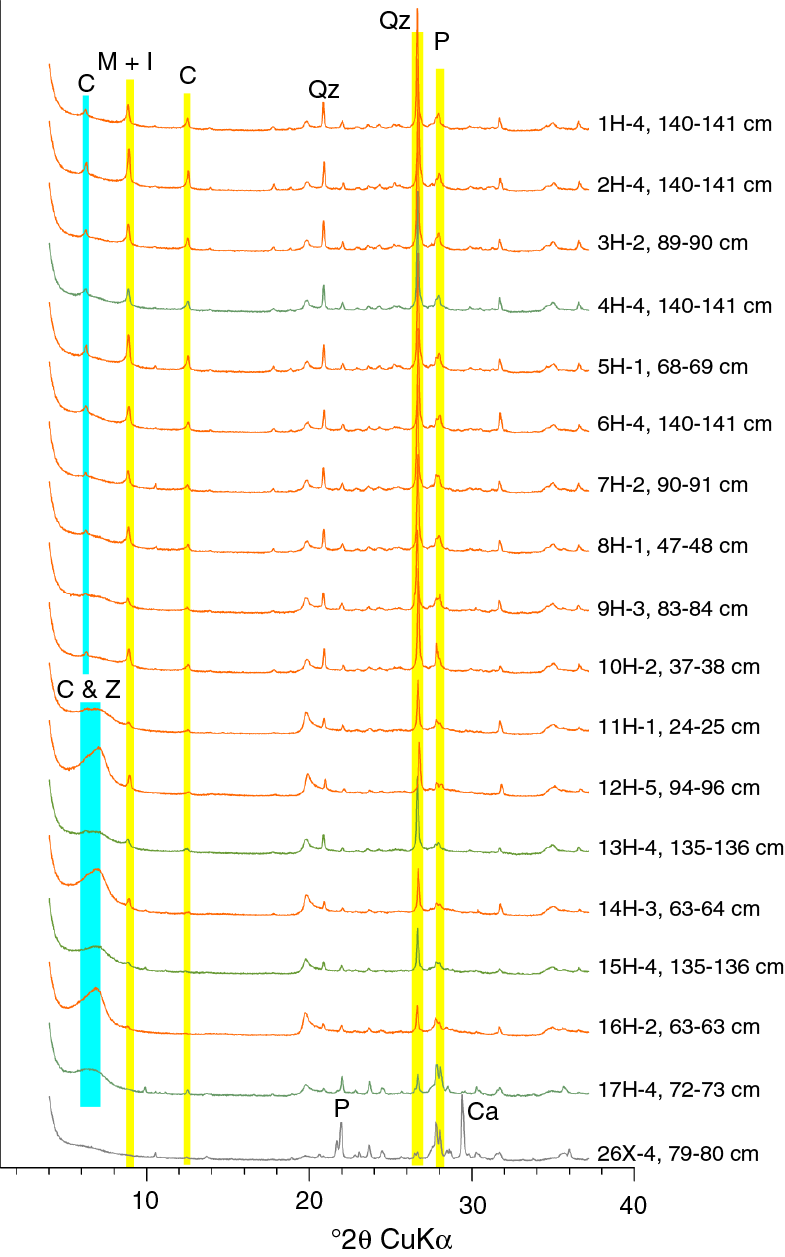
Figure F10. X-ray diffractograms for mud lithologies in cores through Unit I, Hole U1438B. Prominent peaks include quartz (Qz), plagioclase (P), muscovite + illite (M + I), chlorite (C), chlorite + zeolite minerals (C & Z), and calcite (Ca), which produce a broad peak at low 2θ angles for many samples collected in Cores 351-U1438B-11H through 17H.
Table T3. Results of modeled XRD data (semi-quantitative, expressed as relative abundances totaling 1.00), Hole U1438B. Download table in .csv format.
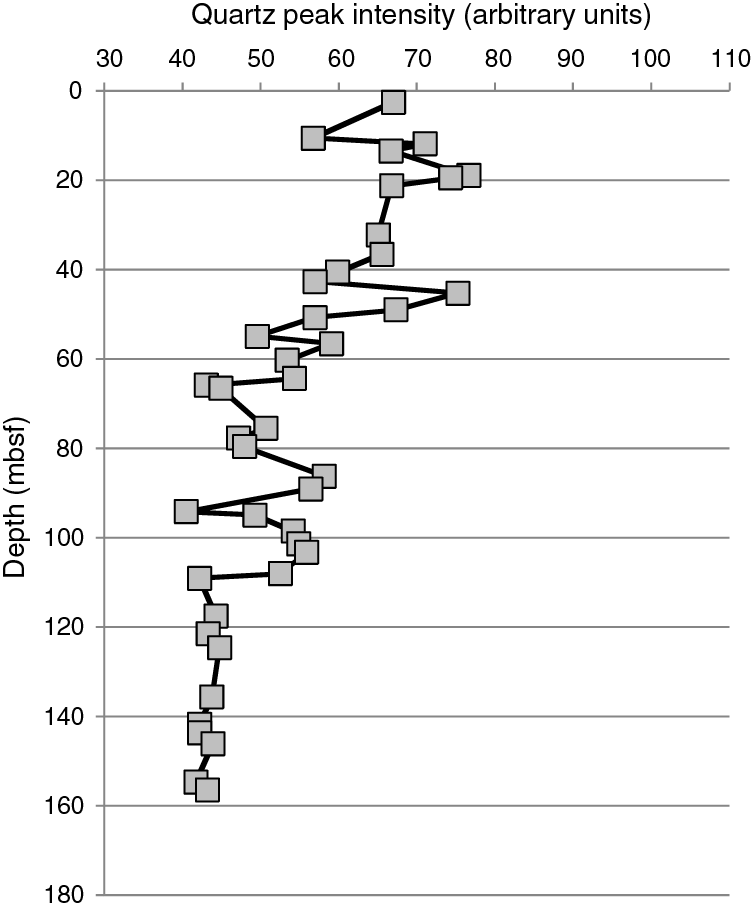
No difference in mineralogy between the yellowish brown and gray-green muds in the lower sediments is revealed in the XRD data, but samples from the muddy intervals deeper than Core 351-U1438B-10H have progressively less variable and lower quantities of quartz (Figures F10, F11). The compositions of plagioclase feldspars present in lower Hole U1438B mud samples also appear to be more variable and more calcic than in shallower parts of the core, where database searches returned primarily albite. Samples deeper than Core 10H appear to have higher quantities of clay and zeolite minerals, which produce a broad peak at less than 8°2θ. Database searches appear to confirm the presence of clinoptilolite and phillipsite in lower Unit I mud samples, but other zeolite minerals may also be present. Because the clay and zeolite minerals have not been thoroughly characterized, the mineralogy of mud samples from Cores 11H through 17H is not well constrained and was not modeled.
Potential authigenic mineral phases include fine (<63 µm) euhedral opaque minerals locally concentrated in darker mud intervals and ash layers. Magnetic susceptibility data suggest that these are Fe-bearing minerals or mineral mixtures (see Physical properties and downhole measurements). Mn enrichment at the bottom of Unit I culminates in Section 351-U1438B-17H-3, where small (<1 cm) Mn nodules were noted. The first occurrence of zeolite minerals was noted in a smear slide from Sample 351-U1438B-11H-5, 138 cm. In this core, there are also minor amounts of rhombic authigenic carbonate and opaque minerals. These increase in Sample 351-U1438-12H-3, 75 cm, where a smear slide contains authigenic carbonate (3%), zeolites (trace), and clay minerals (1%). Authigenic clay minerals are in the form of birefringent rims on silt grains. In Sections 14H-1 through 14H-3, several layers are interpreted as altered ash, where the vitric component had been replaced by clay minerals and/or zeolites. Faint Fe-rich circular features in one sample (351-U1438B-14H-1, 125 cm) may be hydration rims in former vesicular glass.
Volcanic ash is concentrated in several discrete layers (Table T4), ranging in thickness from 1 to 13 cm and in grain size up to lapilli (e.g., ~2 mm in Core 14H). In addition to discrete ash layers, we observed significant but variable downcore amounts of disseminated ash in mud intervals as noted in the visual core descriptions (VCDs). In discrete ash beds, the bases are often sharp, with tops grading into tuffaceous or bioturbated mud (Figures F9, F12). The ash-dominated intervals exhibit a range of colors from pale red (10R 6/2) in Core 351-U1438B-4H, to yellowish brown (10YR 6/2, 10YR 5/4, 10Y 4/2), to shades of gray (N8, 5Y 5/2, 5YR 5/2) through Core 13H, and then, in underlying cores, locally becomes more pinkish (5YR 7/2). In Core 14H, ash-bearing intervals are composed of a complex alternation of ash beds and tuffaceous muds.
Table T4. Occurrence of ash/tuff layers in Units I, II, and III, in Holes U1438A, U1438B, and U1438D as determined from a combination of visual description, smear slide (SS), and/or thin section (TS) analysis, and intensity of magnetic susceptibility (MS) measurements. Download table in .csv format.
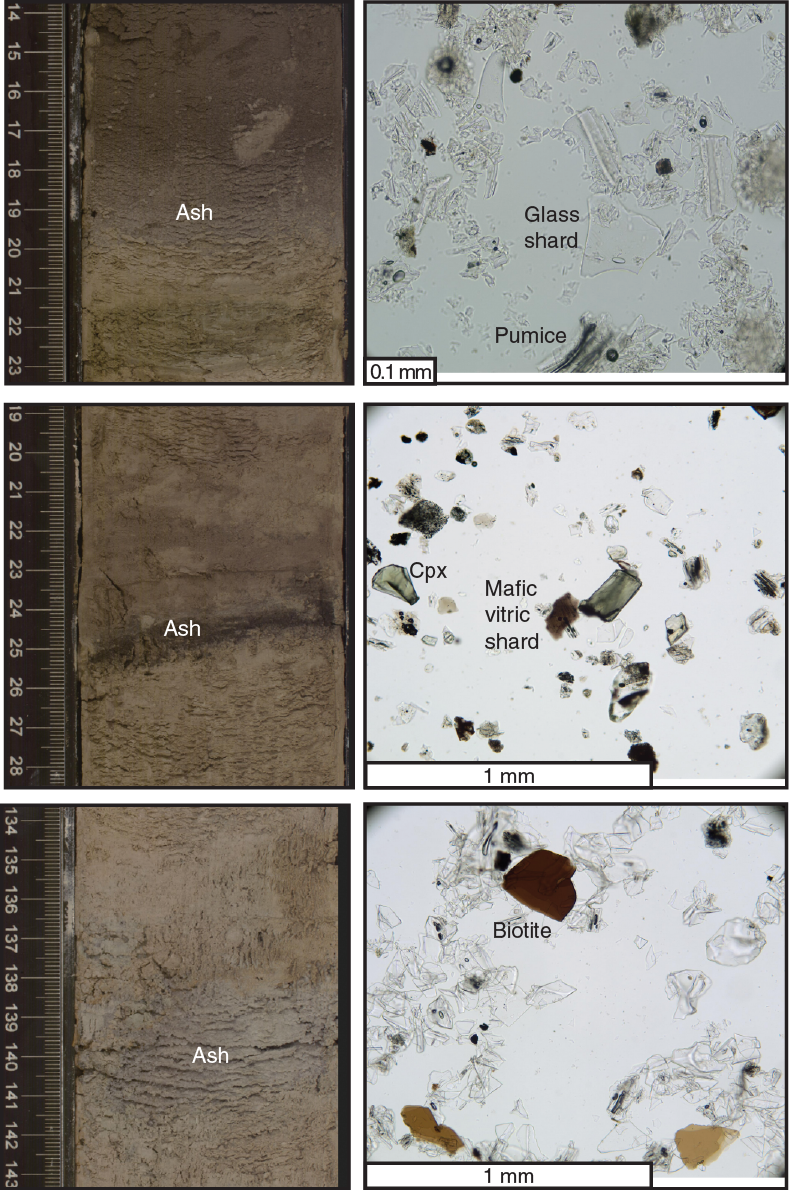
The pyroclastic components are dominantly colorless vitric pumice and shards with traces of brown vitric fragments. Phenocrysts and isolated volcanogenic crystals were noted by smear slide examination using transmitted light microscopy as well as by observation of the >63 µm and chemically leached clay-free fraction of the core catcher samples used by the radiolarian specialist. These include pyroxene, opaque minerals, plagioclase, minor biotite, and quartz. Some ash fractions are notably enriched in lithic fragments and crystals. It is possible that the less robust vitric components have been entirely dissolved, as we observed abundant zeolites in many of the ash-rich beds (e.g., Sample 351-U1438B-11H-5, 138 cm). As there are muddy intervals with crystals but lacking distinct vitric components (e.g., mud with crystals in Core 10H), it is uncertain if glass was present but has been dissolved (see below and Geochemistry).
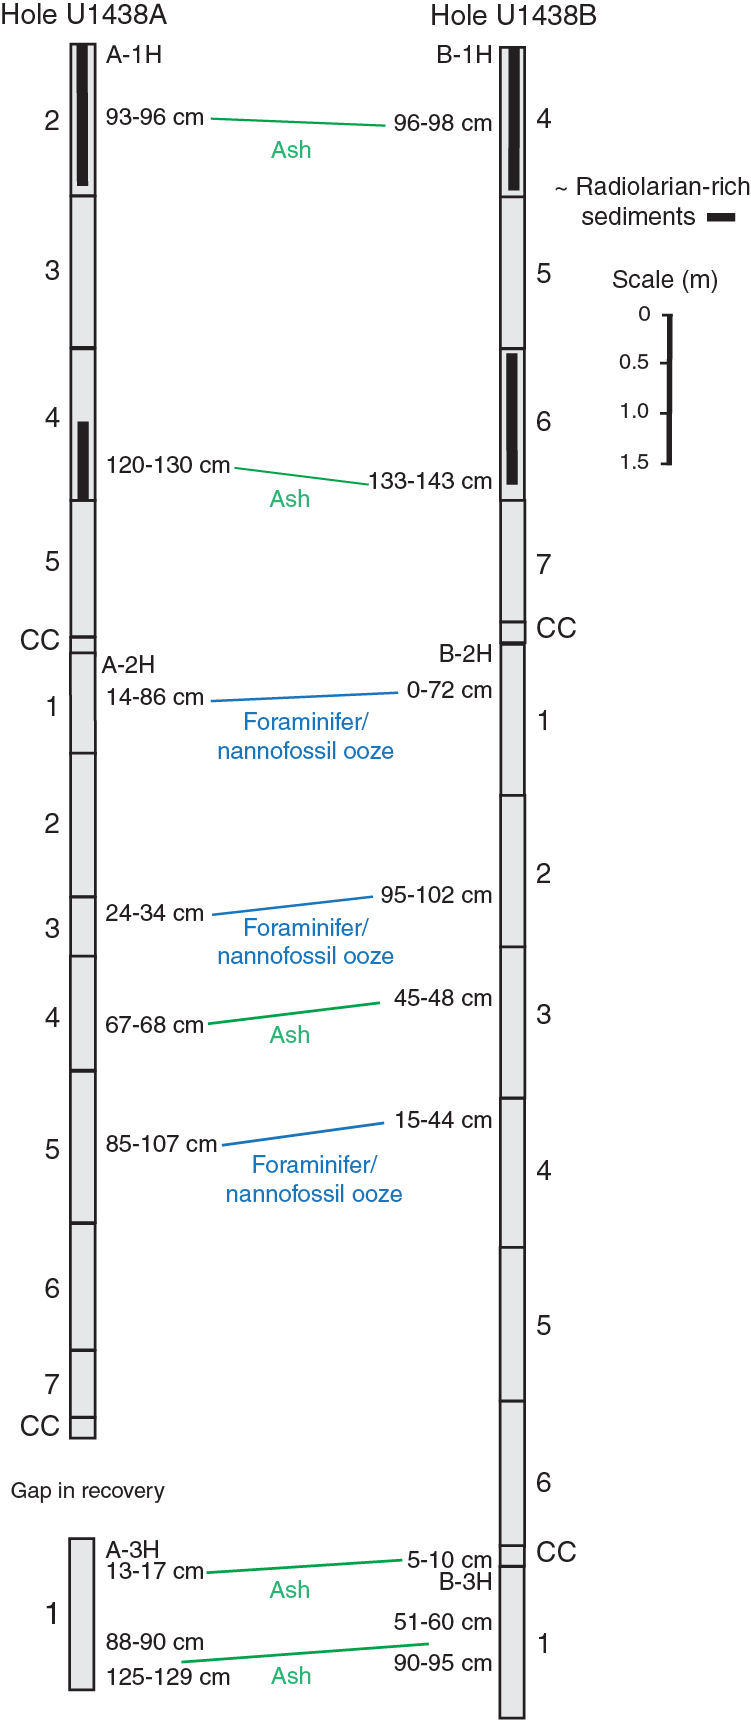
Correlation between holes
The top two cores of Hole U1438B are essentially the same part of the stratigraphy encountered in Hole U1438A (Unit I), and the two holes can be correlated on a bed-by-bed scale (Figure F13). A gap in recovery was identified in the transition between Cores 351-U1438A-2H and 3H using two key tie points (ash layers) found in each hole. The first correlated pair occurs in intervals 351-U1438B-2H-CC, 5–10 cm, and 351-U1438A-3H-1, 13–17 cm. The second is the ash bed found in intervals 351-U1438A-3H-1, 88–90 cm, and 351-U1438B-3H-1, 51–60 cm. These pairs indicate that there is material missing between Cores 351-U1438A-2H and 3H that was likely lost owing to a mechanical failure of the core liner.
Unit II (Holes U1438B and U1438D)
- Intervals: 351-U1438B-18H-1, 109 cm, to 30X-CC, 29 cm (bottom of Hole U1438B); 351-U1438D-2R-1, 0 cm (top of cored interval in Hole U1438D), to 12R-3, 75 cm
- Thickness: 139.4 m (9.9 m offset in bedding between Holes U1438B and U1438D)
- Depths: Hole U1438B = 160.3 mbsf; Hole U1438D = 309.6 mbsf
- Age: Oligocene
- Lithology: tuffaceous mudstone, siltstone, and fine sandstone
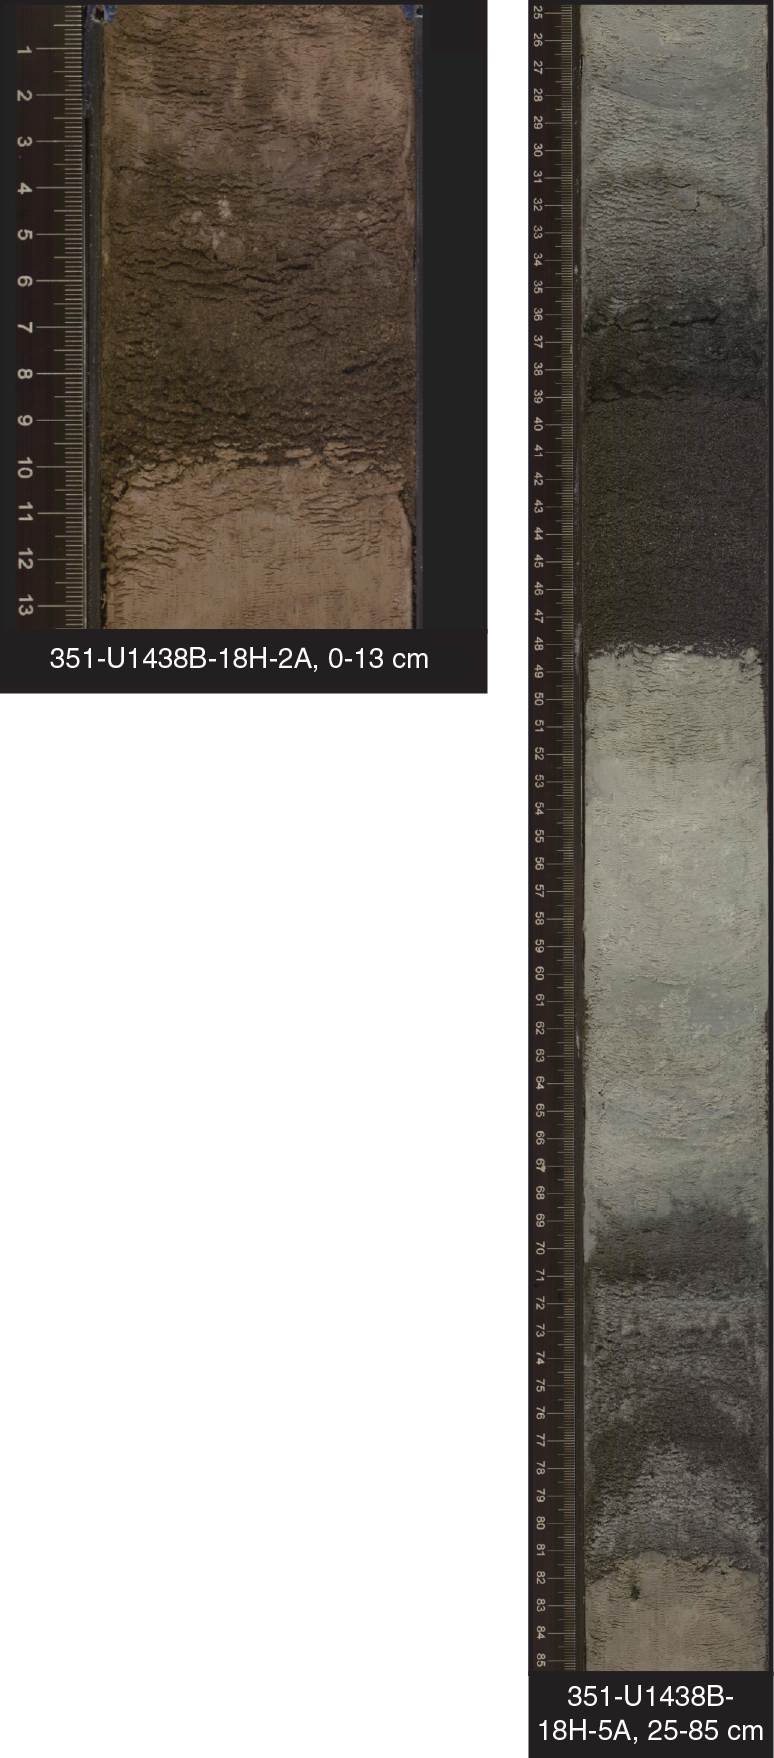
Unit I is underlain by Unit II, which was recovered in Holes U1438B and U1438D. Over the length of Core 351-U1438B-18H, there is a change over several meters from brown mud to lighter colored tuffaceous sediments. The upper contact of Unit II was chosen as the bottom of a mud layer in Section 351-U1438B-18H-1, 109 cm (Table T2). Deeper than this level, sediments become progressively more lithified, have coarser average grain sizes, and have higher carbonate contents and magnetic susceptibilities, defining Unit II (see Physical properties and downhole measurements and Geochemistry). Though complicated by poor recovery, the lower two-thirds of Unit II is also identified in Hole U1438D (see Correlation between holes, this section).
Description
Hole U1438B cores that comprise Unit II can be broadly described as intercalated <1 m intervals of medium to dark greenish gray tuffaceous mud/mudstone (5G 4/1, N5), silt/siltstone (N5, N4), and sand/sandstone (N3, N2) with intervening pale brown (5YR 5/2) ash/tuff layers (Figure F14). In Hole U1438D, these transition down to intercalated decimeter-scale intervals of medium to greenish gray, to dark greenish gray, to dark gray tuffaceous siltstone and mudstone (5GY 4/1, 5GY 6/1) and bluish gray tuffaceous mudstone (5B 5/1). Collectively, they are similar to the lithified sediments defined in Unit III but are less consolidated. Nannofossils are ubiquitous throughout the mud/mudstone, typically composing 10%–40% based on smear slide analysis. This increase correlates with a pronounced increase in measured carbonate content in Unit II: 5%–38% versus 0.4% in the overlying Unit I (see Geochemistry).
Tuffaceous mudstone, siltstone, and sandstone intervals form normally graded beds with sharp lower boundaries at the siltstone or sandstone base and bioturbated mudstone caps (Figures F15, F16). A typical sequence (bed) comprises sandstone overlying a sharp, often scoured contact with underlying mudstone normally graded uphole into laminated and then cross-laminated siltstone, locally deformed, and then mudstone with increasing bioturbation uphole.
Smear slides of the mud to fine sand components indicate they contain 25%–75% volcanic vitric and lithic grains in addition to minerals of volcanic origin such as plagioclase, pyroxene, amphibole, and opaque oxides. Both brown and colorless glass fragments are present. Nonvolcanogenic constituents are mainly clay derived in part from altered volcanic glass, as well as biogenic debris. Biogenic debris is mainly nannofossils with minor sponge spicules. Nannofossil-bearing, nannofossil-rich, and nannofossil mudstones, siltstones, and sandstones are found throughout Unit II.
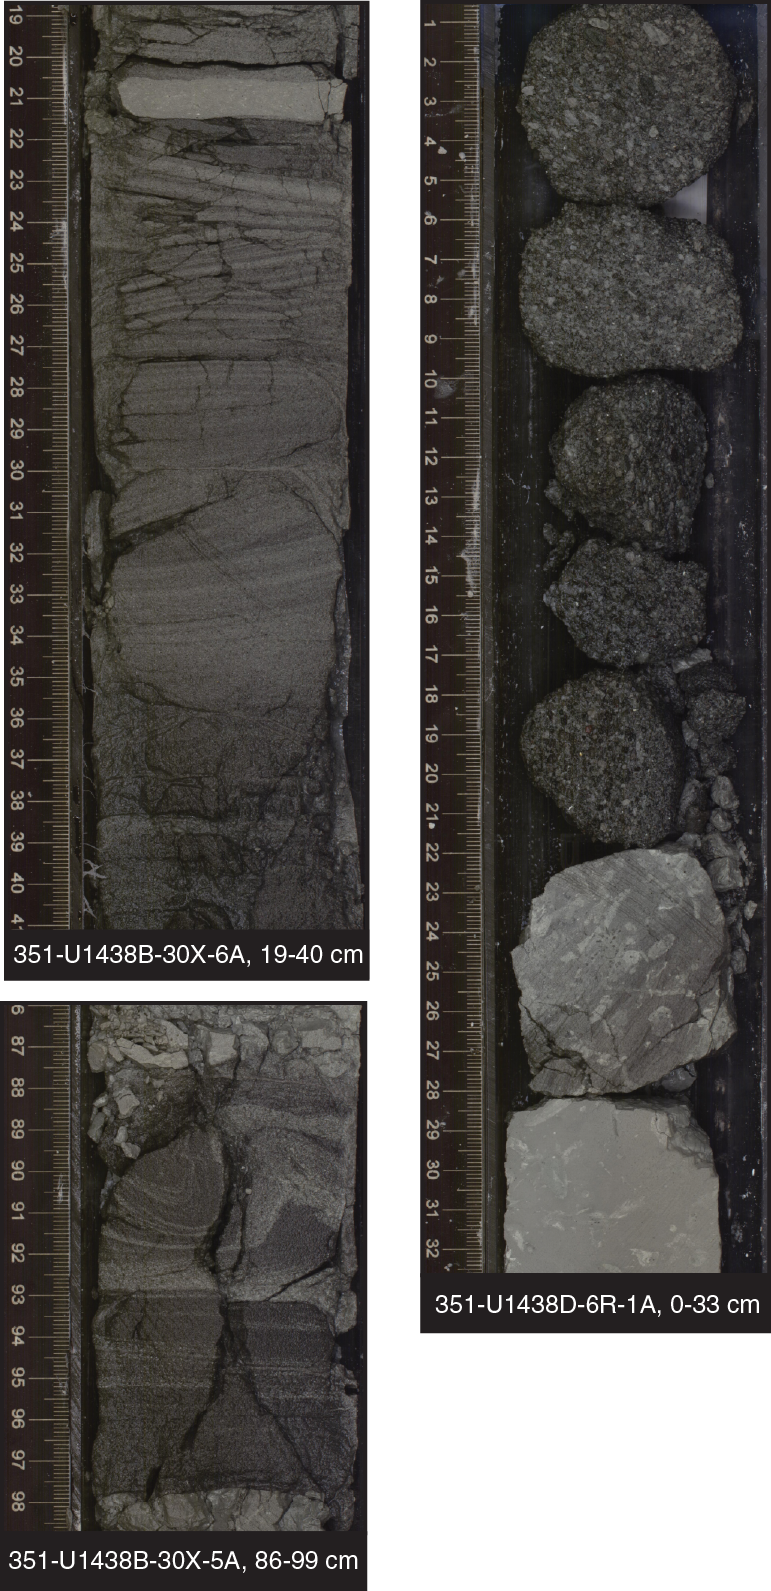
In Unit II there are two intervals with abundant coarse sandstone at ~177 and 198–208 mbsf and two intervals dominated by mud at 162–168 and 223–227 mbsf. Prominent, relatively thick (0.7–1.6 m) dark gray sandstone layers are found in Sections 351-U1438B-21H-2 (176.4–178.1 mbsf), 25X-1 (200.0–200.7 mbsf), and 30X-6 (255.1–256.7 mbsf). Tuffaceous coarse sandstone with gravel and breccia-conglomerate are present in Hole U1438D only as heavily fractured intervals and within biscuits (core disturbances associated with drilling, e.g., Figure F16) and may have been lost during drilling, as suggested by the locally overall poor recovery. The coarse rocks are similar to those in several intervals in Unit II, Hole U1438B: polymictic matrix-supported dark gray (N3) sandstone to breccia-conglomerate, with clasts including pumice and a variety of volcanic rock fragments.
Ash/tuff layers occur throughout Unit II in Hole U1438B (Figure F17; Table T4). These are typically light brown in color and featureless with no bioturbation or lamination. Smear slide observations show them to contain colorless glass shards (up to 90%), volcanic lithic grains (up to 40%), and igneous mineral grains including feldspars, ferromagnesian silicates, and opaque minerals.
Identification of tuff beds (consolidated ash layers) in Unit II is complicated by the presence of the graded beds described above, which comprise sharp-based beds of tuffaceous siltstone grading upward into bioturbated mudstone, except locally where they have an interval of darker tuffaceous sandstone at the base. Some decimeter-thick tuffaceous siltstone beds (e.g., interval 351-U1438B-23X-1, 4–30 cm) are composed entirely of well-preserved vitric shards and feldspar, mirroring the mineralogy of tuff, with nannofossils. The contrast between volcanic tuff beds and tuffaceous deposits associated with these graded beds may be identified at the macroscopic scale by identifying the morphology of lower boundaries of individual sequences, as is illustrated by interval 351-U1438B-23X-4, 60–100 cm. Here, the white crystal vitric tuff, which grades from coarser grained crystal vitric tuff to finer grained vitric tuff, overlies a tuffaceous mudstone with a sharp contact at 99 cm, suggesting a volcanic air fall deposit. On the other hand, the upper part of Figure F18 shows a dark-colored, crystal-rich (altered feldspar; hornblende), tuffaceous fine-grained sandstone, the base of which appears to be a scoured contact, suggesting erosional processes during deposition, more consistent with a higher energy gravity-flow deposit. Glass shards and minerals are fresh in both lithologic types, as shown in smear slides (Figure F19).
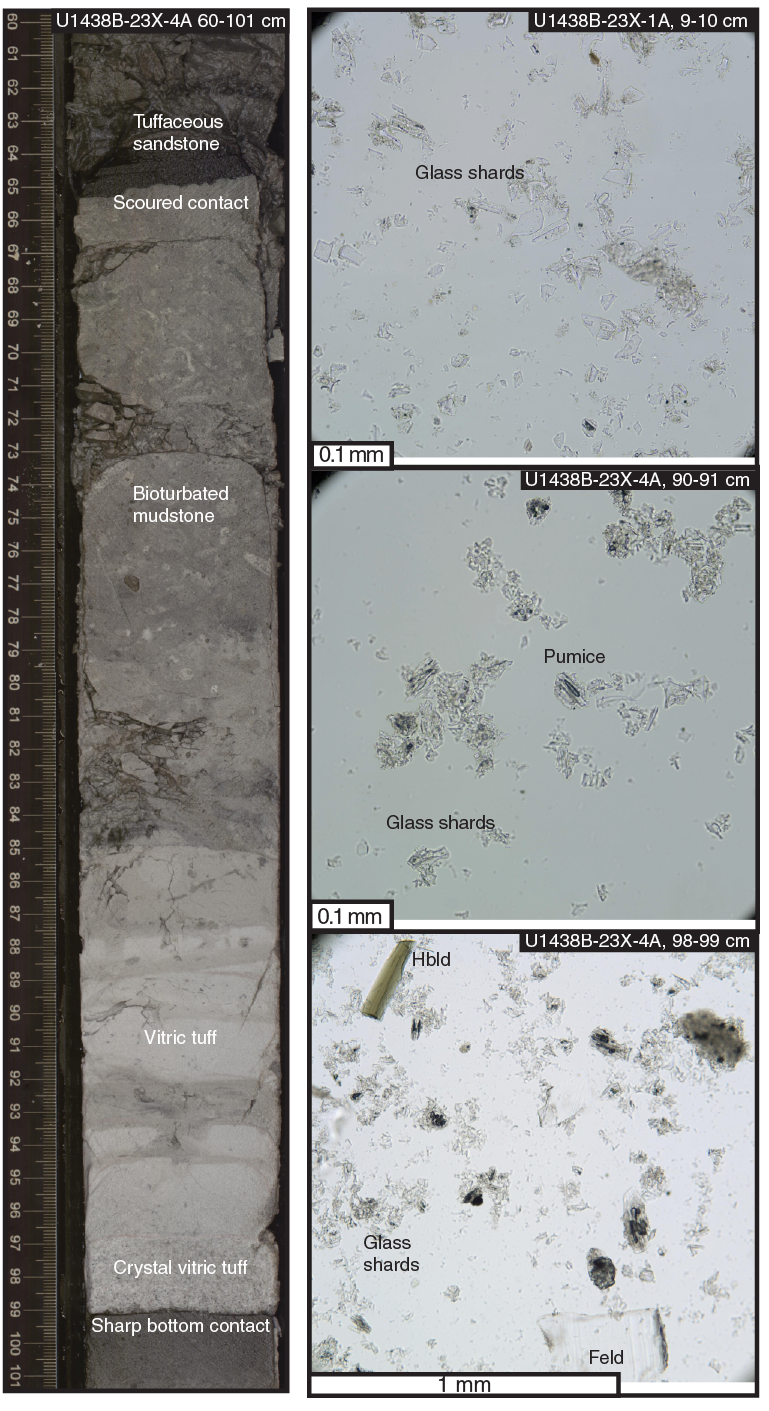
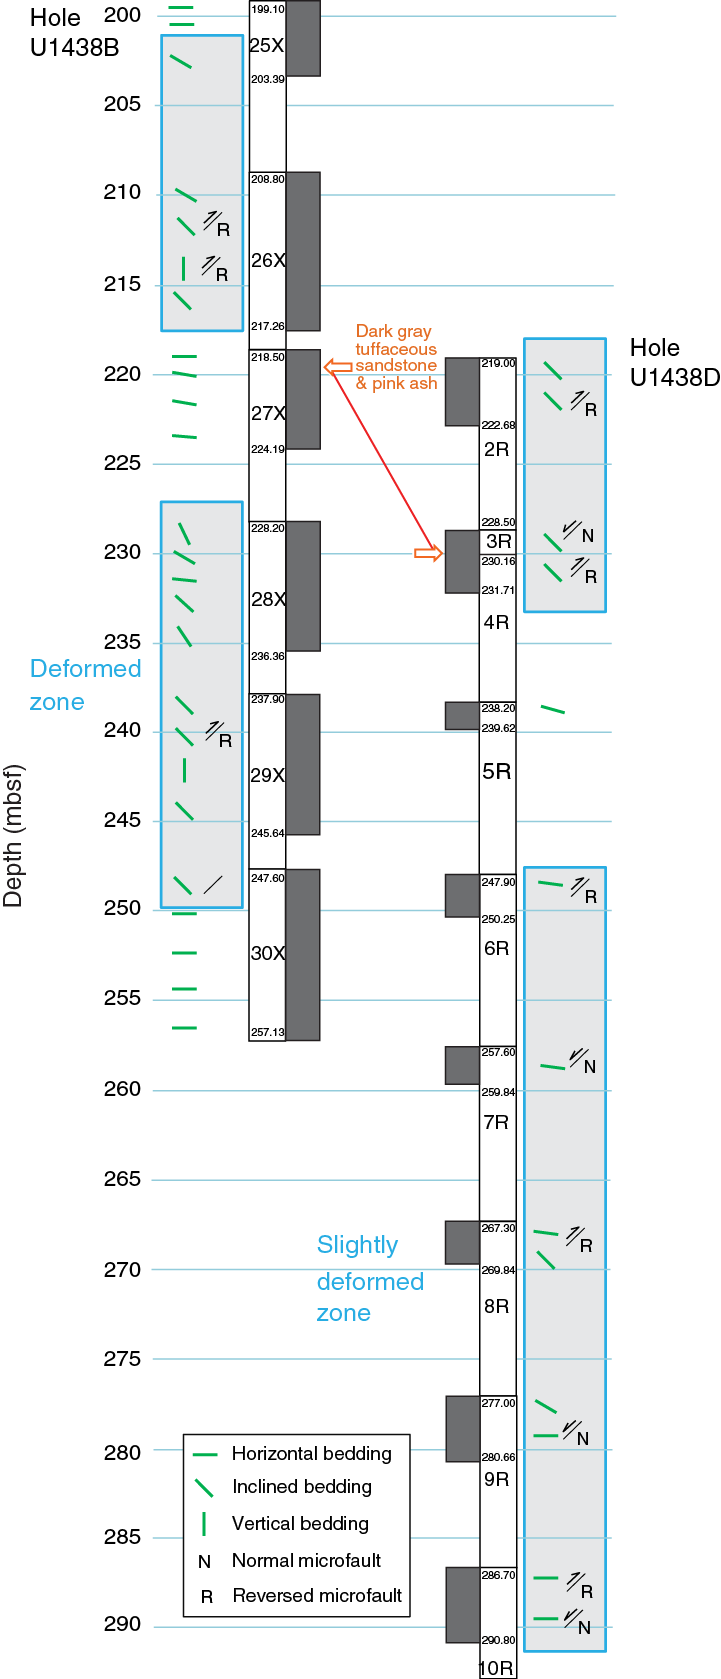
Figure F19. Schematic column and structural features for the lower part of Hole U1438B (24X–30X) and upper part of Hole U1438D (2R–12R). Two arrows show the position of key beds (dark gray tuffaceous sandstone and pale red ash). Zones enclosed by blue lines indicate deformed or slightly deformed zones.
Tuff beds are rare in Unit II in Hole U1438D or perhaps only rarely identified owing to the intense drilling disturbance and poor recovery in the upper part of the hole. However, one specific reddish gray (5YR 5/2) ash layer is located within interval 351-U1438D-4R-1, 56–62 cm, and is described in detail below.
Correlation between holes
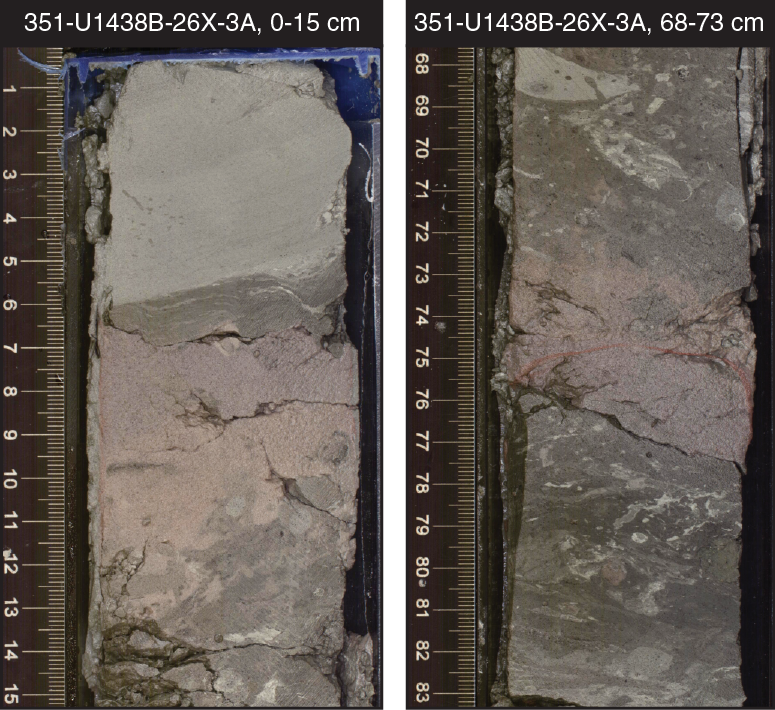
Holes U1438B and U1438D were cored 22.4 m from each other. Hole U1438B was cored from the surface to 257 mbsf, and Hole U1438D was cored from 219 to 897 mbsf. The 38 m of overlap between the two holes was complicated by initial relatively poor recovery in Hole U1438D and by the presence of dipping beds and faults in both holes at the level of the overlap (Figure F19). The overlap zones between the two holes were examined in detail, and a distinctive 1 m thick sequence of beds was identified in Cores 351-U1438B-27X and 351-U1438D-4R, consisting of a dark gray tuffaceous sandstone bed and a pale red ash layer intercalated with moderately bioturbated tuffaceous mudstone. This distinctive sequence of layers occurs in intervals 351-U1438B-27X-1, 57–74 cm (219.07–220.24 mbsf), and 351-U1438D-4R-1, 40–64 cm (229.90–230.14 mbsf) (Figure F20).
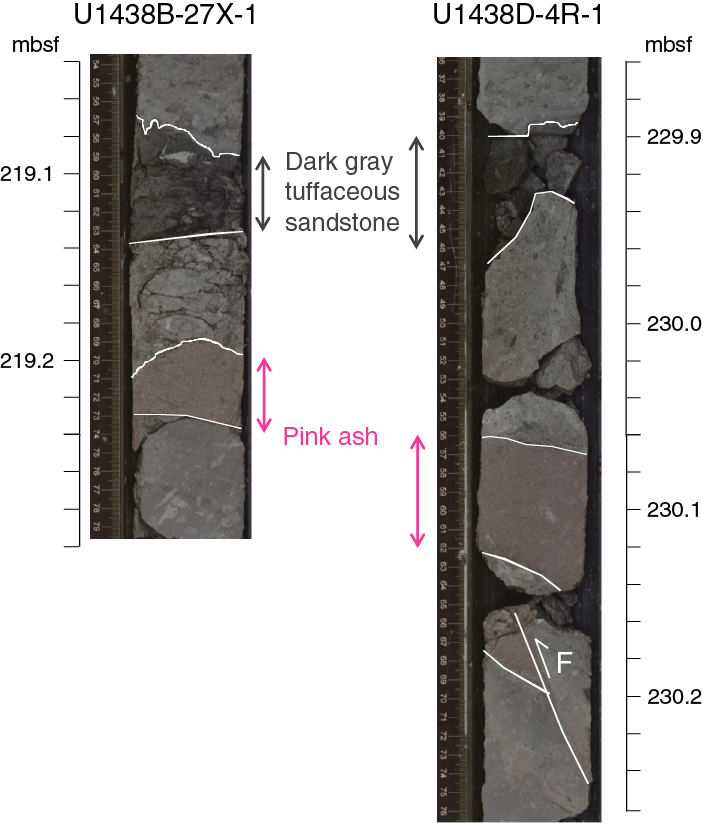
The dark gray (N2) laminated tuffaceous sandstone is 5 cm thick in Core 351-U1438B-27X and 4 cm thick in Core 351-U1438D-4R. The top contact with the tuffaceous mudstone shows a wavy boundary in both Cores 351-U1438B-27X and 351-U1438D-4R. The bottom contact with the tuffaceous mudstone is a sharp boundary in Core 351-U1438B-27X, whereas in Core 351-U1438D-4R, the bottom contact is lost by drilling disturbance. The tuffaceous sandstone is composed of fine to medium sand-sized vesiculated fresh pumice and contains opaque minerals, colorless glass shards, plagioclase, hornblende, clinopyroxene, magnetite, and minor sponge spicules, radiolarians, and nannofossils. The presence of biogenic grains mixed with fresh volcanogenic materials and sedimentary lamination indicate the tuffaceous sandstone is reworked ash.
The slightly bioturbated pale red (10R 6/2) ash marker horizon occurs between 6 and 12 cm deeper than the bottom of the dark gray tuffaceous sandstone in Cores 351-U1438B-27X and 351-U1438D-4R. Thickness of the layer is 5 and 7 cm in Cores 351-U1438B-27X and 351-U1438D-4R, respectively. The top contact with the tuffaceous mudstone shows an irregular shape because of bioturbation. The bottom contact with the tuffaceous mudstone is sharp. In Core 351-U1438D-4R, the pale red ash and lower tuffaceous mudstone are cut by a reverse fault dipping steeply relative to the orientation of the core. The ash consists of silt to medium sand-sized fresh, colorless glass shards and vesiculated pumice containing opaque minerals, plagioclase, clinopyroxene, hornblende, and magnetite.
The 9.9 m difference between the depths of the marker horizon in the two cores is probably related to the structures that are present in the cores at the depths of the overlap. These consist of moderately dipping (40°–60°) faults that offset bedding (Figure F21). Most of the offsets show a reverse or thrust geometry with respect to the orientation of the fault plane. The zone of faulting and the steep dips of the beds occur in the same area, suggesting drag of bedding around a small reverse fault. Small 10 m offsets of major reflectors are present in the east–west seismic sections near the drill site (Figure F22).


Unit III (Holes U1438D and U1438E)
- Intervals: 351-U1438D-12R-3, 75 cm, to 72R-CC, 35 cm (bottom of Hole U1438D); 351-U1438E-4R-1, 0 cm, to 55R-3, 5 cm
- Thickness: 1046.38 m (5.4 m offset in bedding between Holes U1438D and U1438E)
- Depths: Hole U1438D = 309.6–895.09 mbsf; Hole U1438E = 867.3–1361.35 mbsf
- Age: Oligocene to Eocene
- Lithology: tuffaceous sandstone, tuffaceous mudstone, tuffaceous breccia-conglomerate
Unit II is underlain by Unit III, which comprises the bulk of the stratigraphic interval recovered in Hole U1438D. The base of Unit II was chosen as the top of a prominent coarse sandstone interval in Section 351-U1438D-12R-3, 75 cm (Table T2). Deeper than this interval in Holes U1438D and U1438E, coarse-grained sedimentary rocks predominate in Unit III. When viewed as a whole, Unit III is characterized by repetitive conglomerate- and sandstone-dominated intervals with thinner intervening mudstone-dominated intervals lacking discrete conglomerate horizons. The base of Unit III is transitional into Unit IV, with progressively finer and thinner greenish sandstone to siltstone beds passing down into thicker intervals of reddish radiolarian-bearing mudstone in Core 351-U1438E-55R. The boundary between Units III and IV was chosen at the top of the first thick interval of red mudstone with radiolarians in Section 351-U1438E-55R-3, 5 cm.
Description
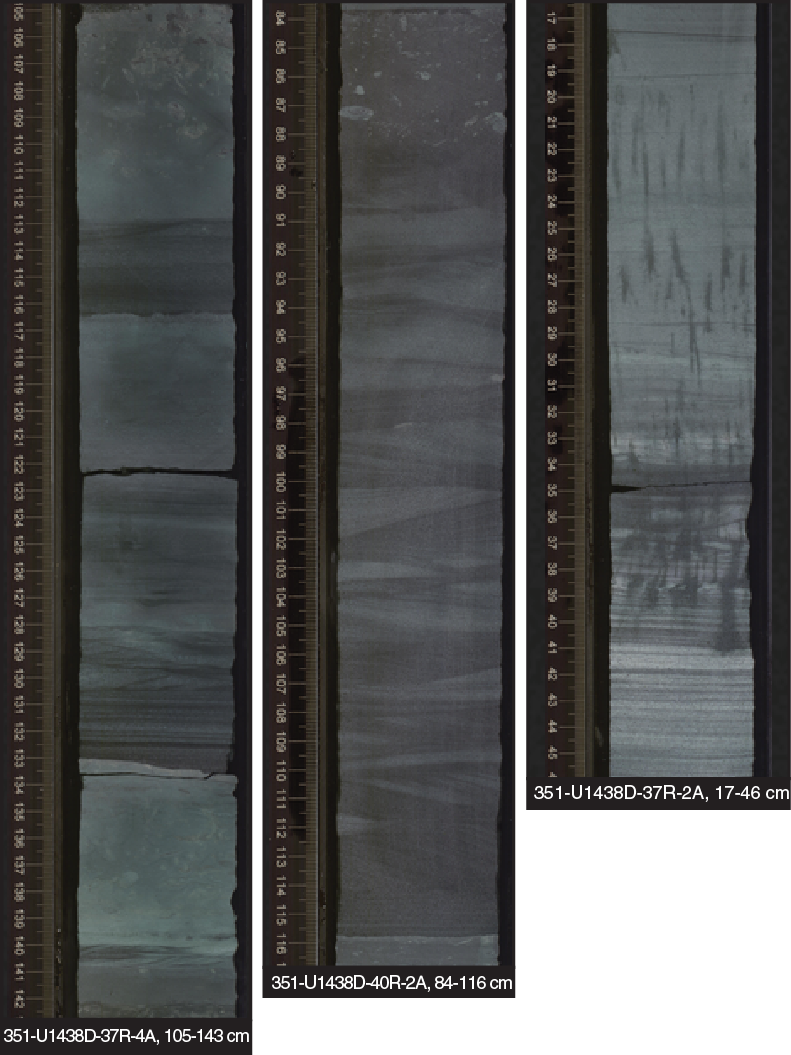
Tuffaceous mudstone is predominantly present between 500 and 590, 610 and 640, 660 and 730, and 860 and 870 mbsf in Hole U1438D and in Hole U1438E from 1225 mbsf to the base of Unit III. It is a minor component in the remaining intervals dominated by tuffaceous coarse sandstones and breccia-conglomerates, for example, between 890 and 910, 1085 and 1095, 1025 and 1035, and 1110 and 1155 mbsf in Hole U1438E. Tuffaceous mudstone can be either homogeneous or moderately to intensely bioturbated or show planar- to cross-laminated sedimentary structures where silt content is high. Mudstone colors range from gray (N5) and dark gray (5YR 4/1) to dark greenish gray (5G 4/1) and grayish red (10R 4/2) (Figure F23). Tuffaceous mudstone intervals are mainly 5–20 cm thick and are usually found as the upper part of an upward-fining sequence from tuffaceous fine sandstone or tuffaceous siltstone or as individual thin to medium beds with sharp and sometimes scoured basal contacts. Tuffaceous mudstones show a downhole change starting at Core 351-U1438D-43R toward slight to moderately bioturbated centimeter-thick mudstone beds alternating between very dark brown (10YR 2/2), dusky red (10R 3/4), and dark greenish gray (5G 4/1), with the occasional presence of alternating fine (<3 cm) beds of dark greenish gray fine sandstone.
Thin section examination shows that the mudstone is composed of clay-sized material, biogenic material, and mineral grains including plagioclase, pyroxene, and opaque oxides. In bioturbated areas, clay and opaque minerals are redistributed but the overall mineral content does not change. Smear slides reveal the presence of nannofossils, which decrease in abundance downhole.
In Unit III, tuffaceous siltstone layers are usually well sorted, but individual layers span the range in grain size from clay (fine) to sand (coarse) and overlie graded but poorly sorted tuffaceous sandstone and breccia-conglomerate. Compared with the coarser grained rock types, siltstone is more commonly laminated, frequently in sequences with planar-laminated, fine sandstone grading upward to siltstone, in turn grading upward into intervals with finely cross-laminated and ripple–cross laminated siltstone (Figure F23). Colors are typically medium to dark gray (N3 or N5), except in the interval marked by alternating dusky red (10R 3/4) and dark greenish gray (5G 4/1). Tuffaceous siltstone is particularly common from 985 to 1025 and 1245 to 1305 mbsf in Hole U1438E.
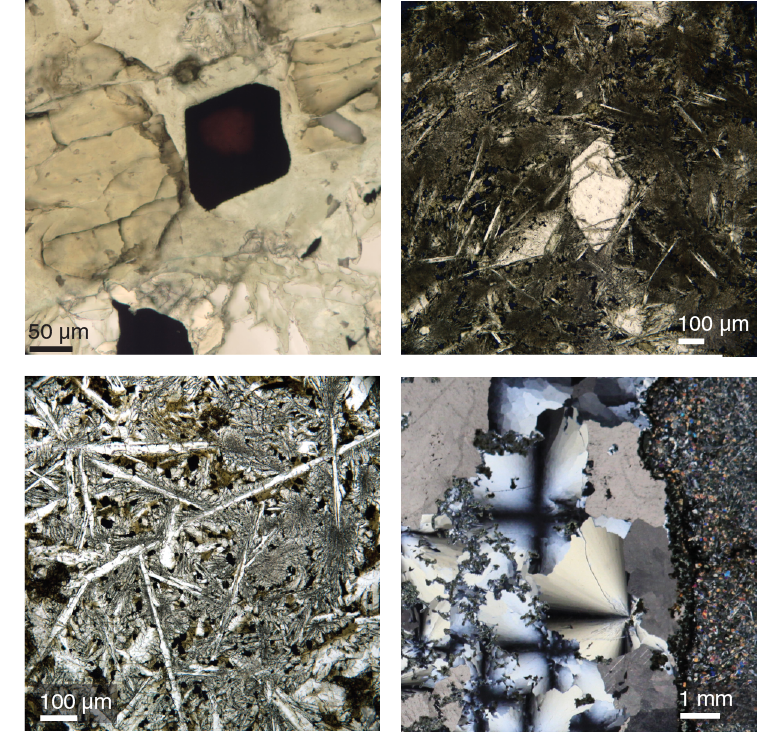
In thin section, tuffaceous siltstone consists of volcanic lithic fragments mixed with mineral grains, fresh and altered glass, and clay-sized material. Biogenic material is less abundant than in the tuffaceous mud and sandstone. Downhole, zeolite minerals replace or displace clay-sized and silt-sized mineral grains in the siltstone beds, in some cases forming abundant ~1 mm spheres (micronodules) of mixed zeolite and magnetite (Figure F24) or large (1 cm) pods of coarse zeolite aggregates. The alternating green and red mudstone and siltstone that are abundant from 600 to 875 mbsf consist of green clay, zeolites, and opaque oxides (Figure F24; see Downhole changes in mineralogy (diagenesis and alteration) for detailed analysis).
Tuffaceous sandstone is one of the main components of Unit III, as layers intercalated with tuffaceous breccia-conglomerate or alternating with tuffaceous mudstone. This sandstone may be in gradational contact with underlying conglomerate/breccia or show abrupt scoured to planar contact with underlying finer grained sedimentary rocks. Abundant normal grading is present in sandstone intervals throughout the unit. This grading may begin with breccia-conglomerate grading upward into sandstone or just a graded sandstone bed with no lower coarser interval, which, in turn, may grade upward into siltstone and mudstone. Planar lamination, cross-lamination, and inverse grading are also common. In thin section, tuffaceous sandstone samples are composed of approximately 10%–20% crystals and volcanic clasts regardless of their grain size or gravel content (Figure F25). Clasts are divided into three types: highly vesiculated vitric clasts (scoria), lithic clasts, and pumice. Pumice is the dominant clast type in tuffaceous sandstone, and the pumice content has an inverse correlation with crystal content. Based on percentage estimates, scoria is present with tuffaceous breccia conglomerate at 310–370 and 630–680 mbsf.
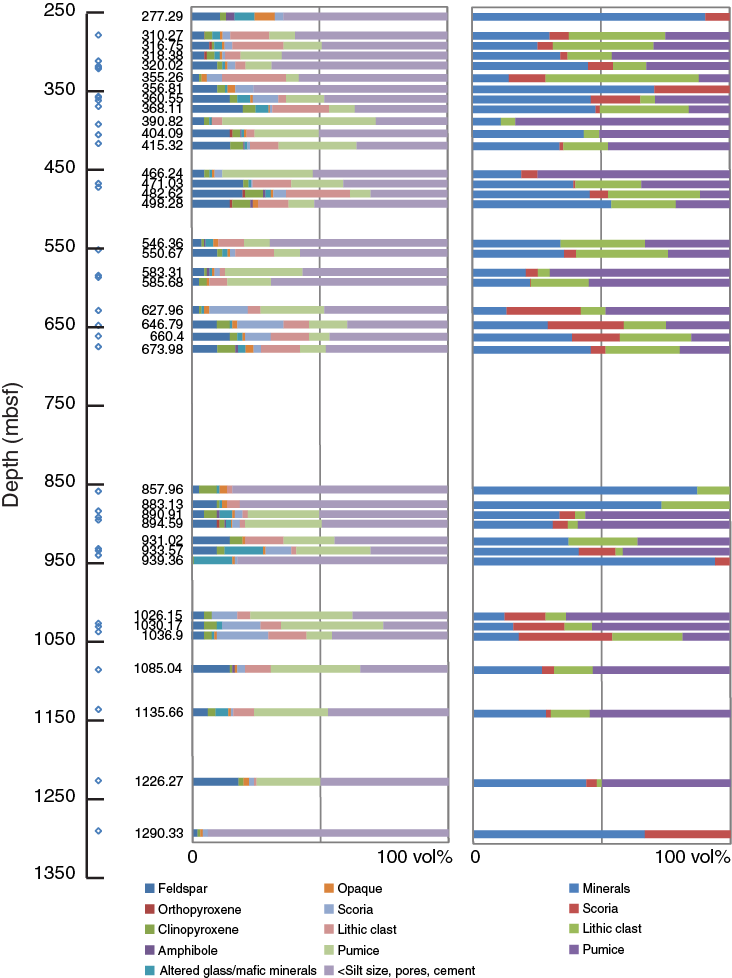
Figure F25. Estimated volume of tuffaceous sandstone components in thin section. Left: total components in sandstone. Right: simplified volume estimation without grain size <silt, pores, and cement materials. Phenocrysts in volcanic clasts are counted as “clast.” Fine, medium, and coarse sands are included, but gravel is excluded.
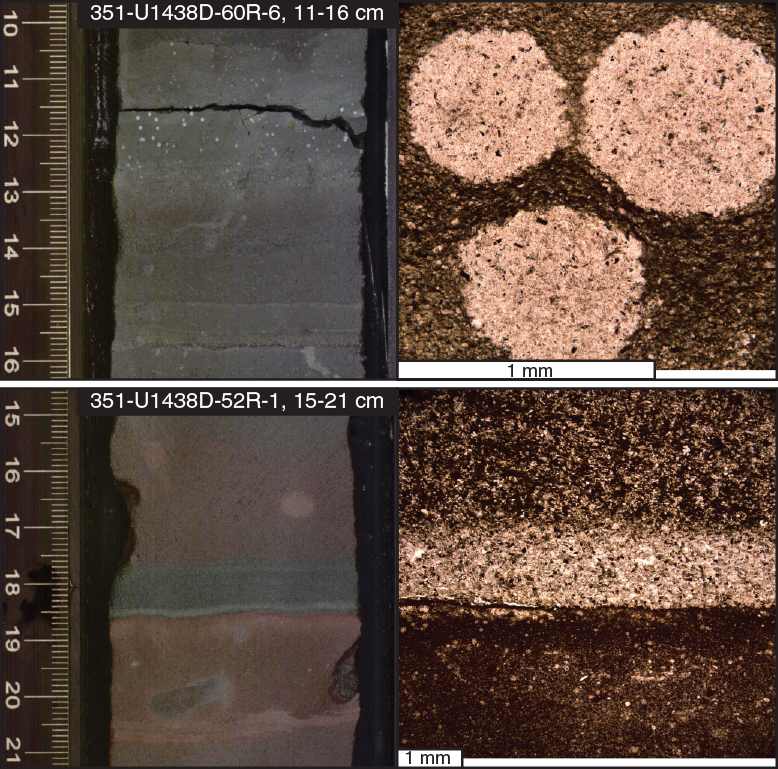
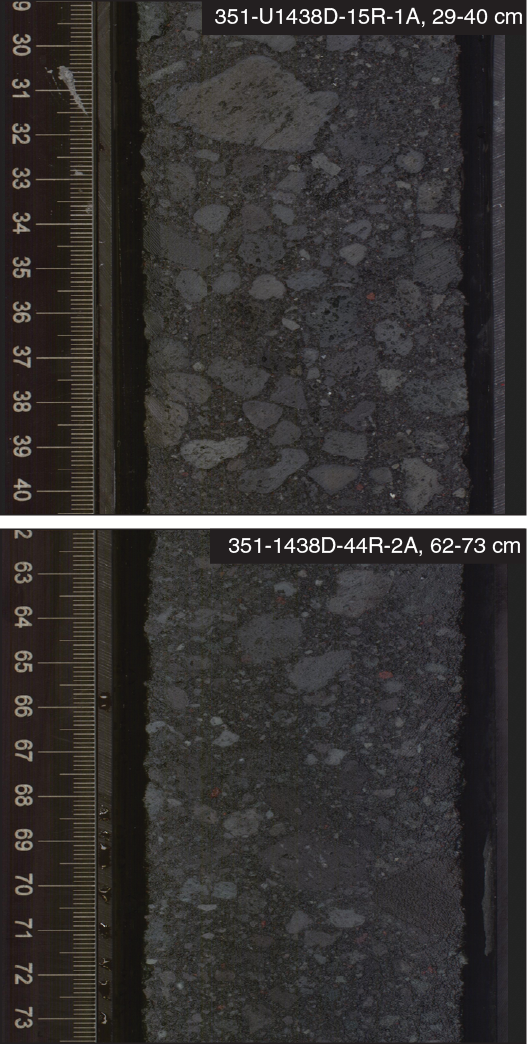
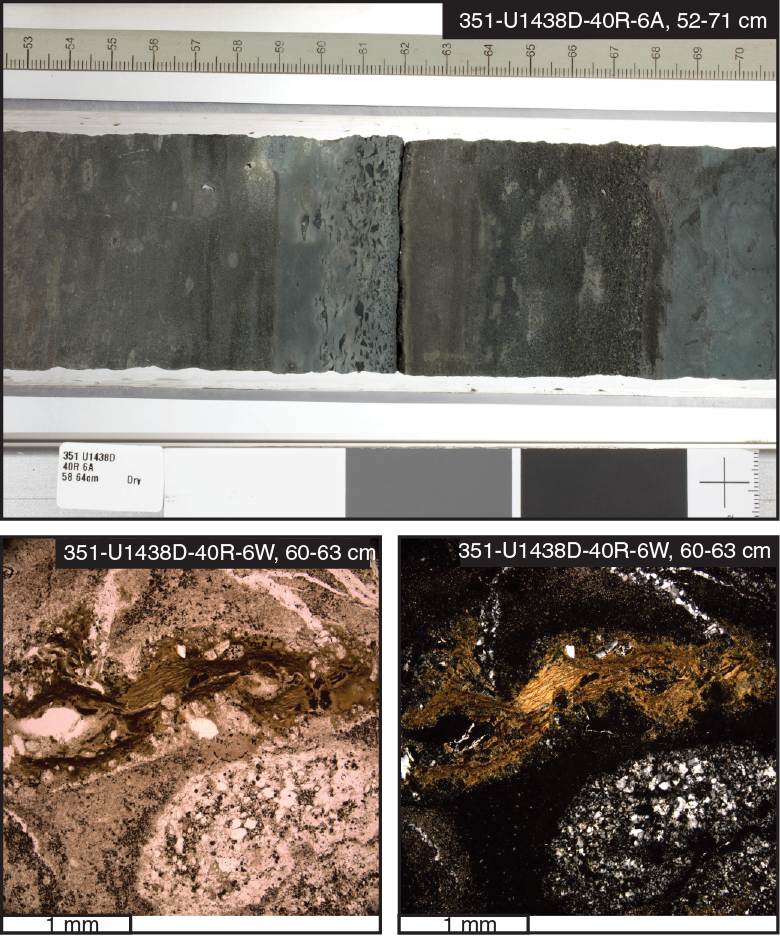
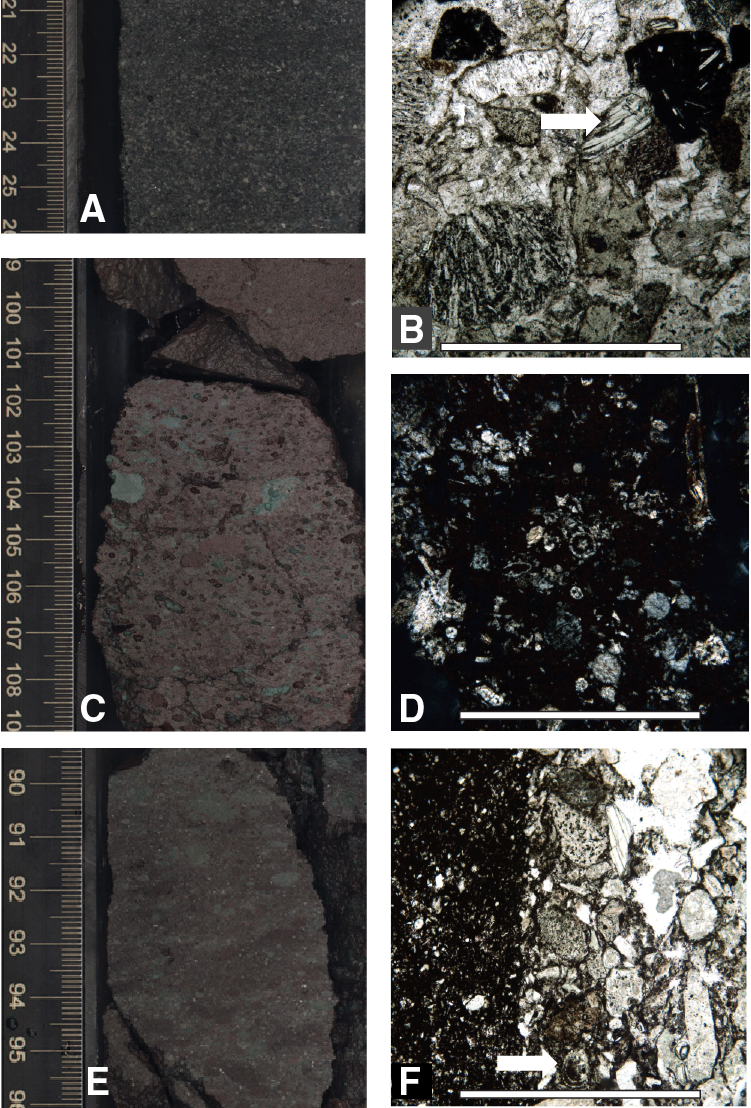
Abundant tuffaceous breccia-conglomerate beds and intervals are a defining characteristic of Unit III; these show increasing abundance in the interval 310–440 mbsf in Hole U1438D and occur locally between 520 and 800 mbsf in Hole U1438D; in Hole U1438E they are common from 1030 to 1060 and 1090 to 1180 mbsf, deeper than which gravel clasts are only found dispersed in Unit III sandstone (Figure F26). Typically, the tuffaceous breccia-conglomerate beds form the base and/or midlayer of coarse volcaniclastic sequences with sharp lower boundaries (bedding planes) and range in color from grayish black to dark grayish green to grayish green (N3 to 5BG 5/2 to 5G 5/2), with a weak red (10R 4/2) variety at 899–900 mbsf in Hole U1438E. There is a continuum between two common types of tuffaceous breccia-conglomerate (Figure F26): (1) monomict or nearly monomict clast-supported pumice breccia-conglomerate, most abundant in the upper section (Cores 351-U1438D-13R through 27R); and (2) polymict clast-supported breccia-conglomerate with clasts of a variety of volcanic rocks, including pumice, scoria, and lava throughout Unit III. A third type may be represented by a layer of dark colored 3–4 mm lapilli (lapillistone) in Section 351-U1438D-40R-6 (Figure F27); these lapilli are also observed deeper in Unit III.
Pumice clasts range up to ~2 cm in size. In thin section, the groundmass is glassy or contains plagioclase microlites with isolated large (1 mm) plagioclase, pyroxene, opaque oxide phenocrysts, or glomerocrysts (clusters of phenocrysts) (Figure F28). The matrix for the breccia-conglomerate consists of clay- through sand-sized particles of pale- and dark-colored glass and volcanic minerals, including plagioclase, pyroxene, hornblende, opaque minerals, and biogenic material (foraminifers and radiolarians). Clasts are typically rounded and matrix grains angular.
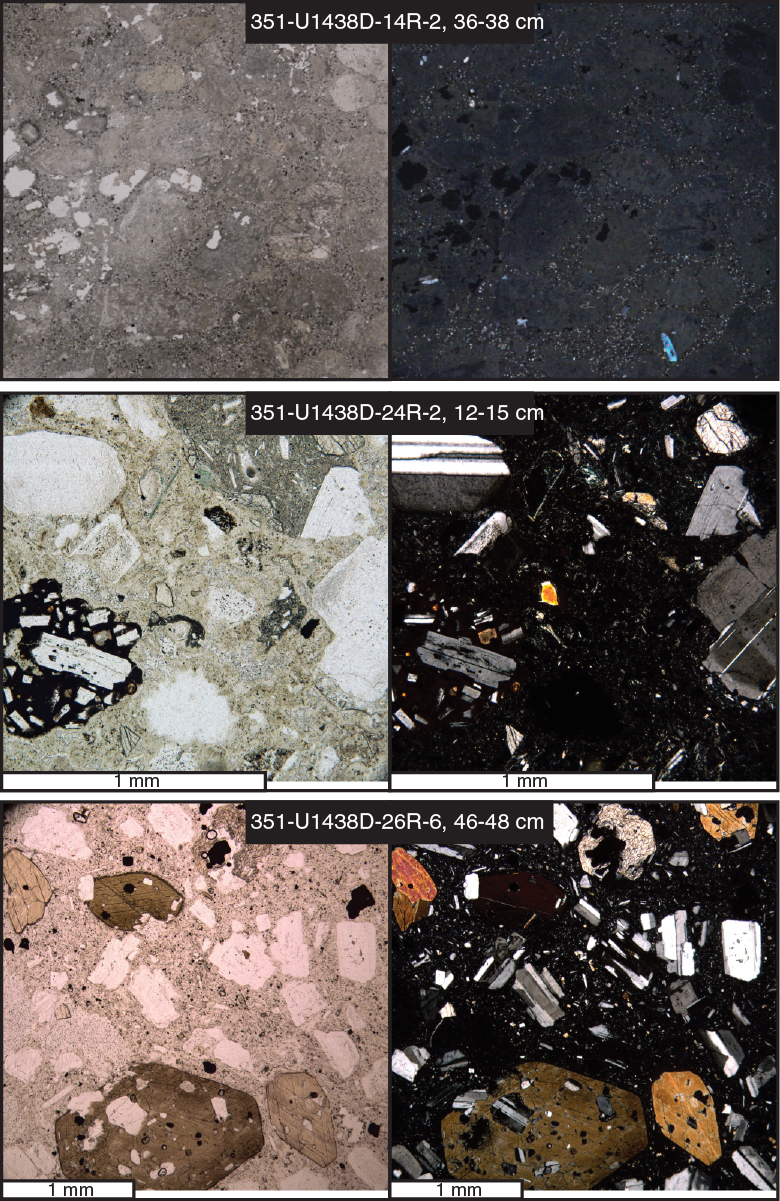
The most common type of lava clast has plagioclase microlites and phenocrysts in a nearly opaque groundmass of glass and oxide minerals (Figure F27). These range in size from 2 cm to sand size and increase in abundance relative to other clast types downhole. Scoriaceous versions of this clast type are often red-colored from oxidation. Gray- and tan-colored holocrystalline clasts contain large (up to 2 mm) blocky plagioclase, clinopyroxene, and oxide phenocrysts. One clast with large hornblende phenocrysts was found in Core 351-U1438D-26R (Figure F28). Matrix for the polymict breccia/conglomerate intervals consists of progressively smaller lithic fragments and isolated angular mineral grains of volcanic origin, similar to the monomict pumice-rich breccia-conglomerate beds.
In the upper cores of Unit III shallower than approximately Core 351-U1438D-30R, a minority of pumice clasts and clear and brown glass fragments are fresh, but volcanic minerals are generally unaltered (Figure F29). Glass alters to light brown clay and then green clay with depth in the core. In Core 351-U1438D-53R and deeper, pumice clasts are replaced by anhydrite. Deeper than Core 351-U1438D-30R, plagioclase grains and matrix become more heavily altered and are replaced with green clay and zeolites. By Core 351-U1438D-46R, most feldspar is replaced by zeolites, whereas pyroxene grains are fresh (see Downhole changes in mineralogy (diagenesis and alteration) for detailed analysis).
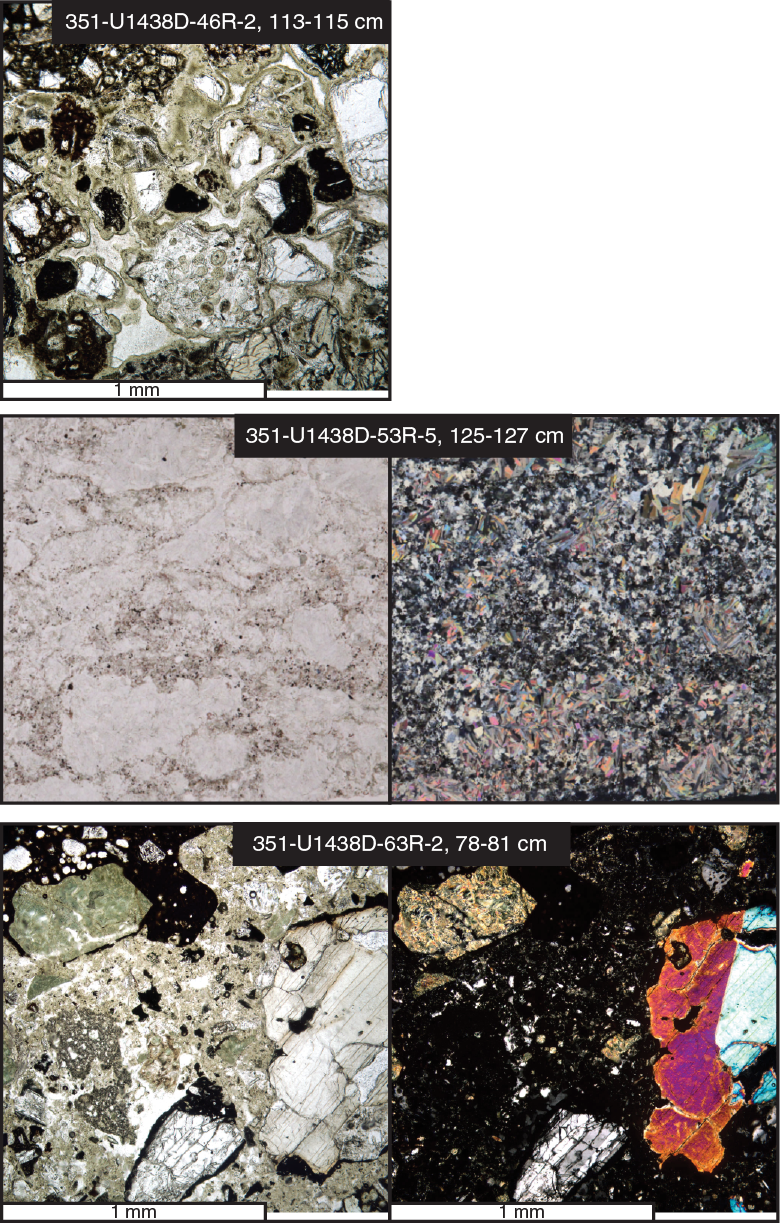
Figure F29. Alteration features in breccia-conglomerate clasts and matrix in the deeper cores of Unit III. Top: green clay mineral cementation. Middle: pumice clasts. Bottom: breccia-conglomerate matrix, clast groundmass, and a former ferromagnesian mineral, possibly olivine, are largely replaced by chlorite and zeolites.
Rare 1–9 cm thick tuff beds (Figures F27, F30) with sharp bottom contacts are present in Section 351-U1438D-40R-6 and are composed of a light olive-gray (5Y 6/1) clay containing pale green (5G 7/2) elongated, rounded, and/or angular shaped coarse ash and lapilli (pumice) clasts. Fresh glass shards, clinopyroxene, and feldspar crystals in the clay-sized fraction are rarely distinguishable, owing to pervasive zeolitization and chloritization (see Downhole changes in mineralogy (diagenesis and alteration)). The coarse ash and lapilli clasts range from 0.5 to 5 mm in size and mostly preserve their original magmatic textures. These include vesiculated, aphyric, porphyritic, and/or pilotaxitic (dacitic) textures that are dominated by elongated euhedral to subhedral feldspar and clinopyroxene phenocrysts/laths, as well as microphenocrysts of the same minerals. Ash components <0.5 mm in size tend to be more spherical, whereas larger lapilli-size pumices tend to be elongated, oriented parallel to the bedding, and altered to chlorite and clay minerals.
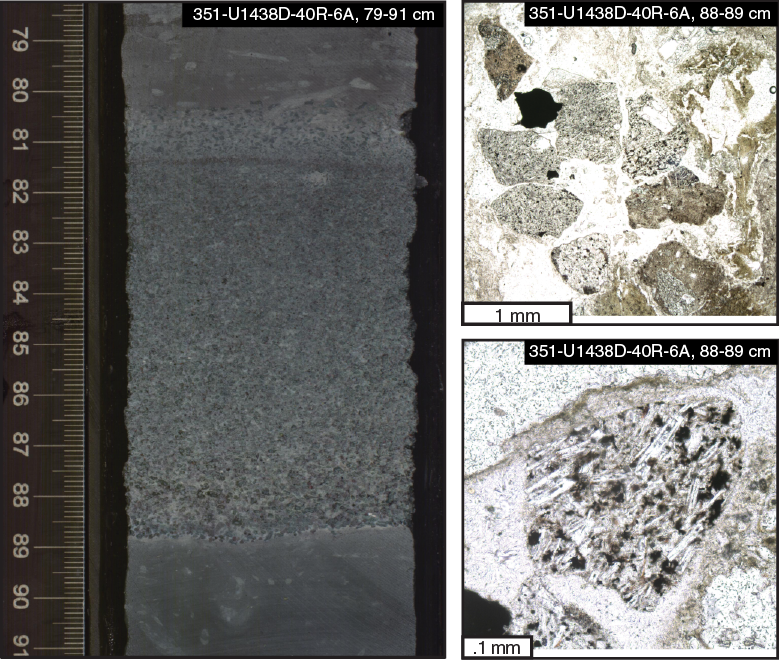
Figure F30. Left: 9 cm thick mafic tuffaceous sandstone or tuff bed with a sharp bottom contact and gradational upper contact into tuffaceous mud. Top right: aphyric and porphyritic coarse ash grains in zeolite-dominated matrix (PPL). Bottom right: aphyric coarse ash grain dominated by oriented euhedral feldspar microphenocrysts (PPL).
Other possible 1–3 cm thick tuff beds are found in Cores 351-U1438D-65R, 67R, and 68R (Table T4). These have been interpreted as tuff on the basis of sharp contacts with the surrounding tuffaceous mudstones and gray colors contrasting with the green mudstones. In thin section, we also recognize higher concentrations of opaque minerals, colorless glass shards (now mostly altered to zeolites), and poorly preserved pumice fragments. Large plagioclase and subhedral clinopyroxene crystals appear to be well preserved within these tuffs. Mafic lithic fragments with dark brown (in plane polarized light) groundmass and phenocrysts of feldspar and clinopyroxene are also present.
Correlation between holes
Holes U1438D and U1438E are located 30 m from each other, with Hole U1438D cored from 219 to 895 mbsf and Hole U1438E cored from 867 to 1361 mbsf. Cores spanning the 28 m of overlap between the two holes were examined in detail, and there is a good overlap sequence of rocks that occur in Sections 351-U1438D-72R-3 and 351-U1438E-7R-1 based on the patterns in magnetic susceptibility and gamma ray intensity and on visual inspection of grain size, rock type, and the presence of key beds. The key marker beds are characterized by decimeter-scale beds of dusky red (10R 3/4) tuffaceous siltstone within a larger domain of greenish black (5G 2/1) tuffaceous medium to coarse sandstone. These layers occur in intervals 351-U1438D-72R-3, 127–142 cm (891.93–892.08 mbsf), and 351-U1438E-7R-1, 110–128 cm (897.30–897.48 mbsf) (Figure F31). The apparent 5.4 m difference between the depths of the marker horizon in the two cores is probably related to poor core recovery across this interval.

Unit IV (Hole U1438E)
- Interval: 351-U1438E-55R-3, 5 cm, to 351-U1438E-69R-1, 18 cm
- Thickness: 99.72 m
- Depth: 1361.35–1461.08 mbsf
- Age: Eocene
- Lithology: mudstone with radiolarians, tuffaceous siltstone and siltstone, tuffaceous sandstone and sandstone, breccia-conglomerate
Unit IV is the most lithologically diverse suite of rocks encountered at Site U1438. Although it contains several thin siltstone/sandstone beds and laminae similar to those in the lower part of Unit III, Unit IV is distinct in that it comprises significant intervals of mudstone with radiolarians, with the top of Unit IV chosen at the first occurrence of a thick mudstone interval in Section 351-U1438E-55R-3. Deeper than this, radiolarian-bearing mudstone dominates the recovery for 50 m (~1352–1405 mbsf). The bottom half of the unit is characterized by an interval of medium to coarse sandstone and breccia-conglomerate passing downcore into an assemblage of fine to coarse tuffaceous rocks. The lower contact with igneous rocks of Unit 1 is overlain by a 4 m section of dark reddish mudstone and sandstone (see further description of contact in Unit 1 (Hole U1438E)). Drilling deformation and poor recovery in some intervals make lithologic relationships hard to decipher.
Description
Mudstone dominates both the upper and the lower part of Unit IV and is interbedded with the coarser grained rocks in the middle part. Radiolarians are a prominent part of the mudstone in the upper part of the unit, forming up to 20% of the rocks. The upper part is mainly reddish in color, and some of the lighter colored intervals also contain zeolite concretions (up to 5 mm in diameter) that give the mudstone an uneven texture. Deeper in the hole toward the contact with the basement, the mudstone is darker and more brown in color. Unlike the mudstone intervals in the younger lithostratigraphic units, bioturbation in Unit IV is either slight or absent (Figure F6). In thin section, the mudstone consists of variously recrystallized radiolarians and rare plagioclase, clinopyroxene, and opaque crystals in a fine-grained, dark, clay-size matrix. Some mudstone (e.g., in Core 351-U1438E-58R) contains large (up to 10 mm) altered (chloritized) and deformed (flattened) pumice with plagioclase phenocrysts. Fish teeth and bone fragments were noted toward the top of the unit (e.g., in Core 351-U1438E-55R).
Thin siltstone laminae within the radiolarian-bearing mudstone in the upper part of Unit IV range from black (N2.5) to dusky blue green (5BG 3/2) in color and are locally mottled with reddish hues, often because of bioturbation and/or alteration. Lower in the unit, starting in Core 351-U1438E-61R, tuffaceous siltstone is present as part of graded sandy intervals that become thicker in Core 351-U1438E-64R and grade vertically down into sandstone. In contrast to the siltstone in the upper part of the unit, smear slide and thin section observations indicate the siltstone in the lower part ranges from crystal rich to tuffaceous and is very dark gray (N3) to grayish black (N2) to weak red (9R 4/2) in color. Throughout the unit, siltstone intervals locally exhibit parallel and cross laminae. The siltstone intervals are in some cases only a few centimeters thick and too thin to be indicated on the VCDs.
A few laminae of greenish gray (5G 6/1) tuffaceous fine sandstone with pebbles and dispersed sand grains occur within the mudstone in the upper half of the unit. In the lower half of the unit, starting in Core 351-U1438E-61R, centimeter- to decimeter-scale layers of fine to medium to coarse sandstone beds range in color from dark gray (5YR 4/1) and dark greenish gray (5G 4/1) to very dark gray (N3) (Figure F32A). These layers exhibit normal grading, lamination, cross lamination, and in one instance, high-angle cross-bedding, in some cases starting at a scoured base. They locally contain irregularly shaped lithic fragments of porphyritic basalt. As with the associated siltstone beds, these are thickest in Core 351-U1438E-64R. Thin sections from Cores 351-U1438E-61R through 66R show that the sandstone intervals consist of common to abundant volcanic rock fragments exhibiting microlitic to vesicular to pumiceous textures, in addition to rounded to subangular grains of plagioclase, pyroxene, amphibole, and opaque minerals (Figure F32). Sedimentary (siltstone/mudstone) rock fragments are rare in these cores, which also contain some black tachylitic glass fragments with plagioclase microlites. The feldspar, ferromagnesian minerals, and volcanic grains are variably altered to zeolites and clay minerals, which also occur as cementing phases, although clinopyroxene grains are unaltered. In Core 351-U1438E-68R, sandstone laminae are unusual in that they are crystal rich and dominantly plagioclase and green amphibole. These also contain some red amphibole and amphibole-bearing volcanic fragments with felsic groundmass.
Tuffaceous breccia-conglomerate occurs at three stratigraphic levels in Unit IV, all beneath the igneous rocks (Sections 351-U1438E-62R-2 and 63R-2). These coarse-grained beds typically overlie mudstones along sharp bedding planes (Figure F32C, F32E). Unlike the sandstones, breccia-conglomerates are poorly sorted, and clasts include igneous and sedimentary rocks in subequal amounts, as well as abundant biogenic sediment. Clasts range up to 1 cm in reddish brown and pale green colors. Microscopically, igneous clasts include mafic lithic fragments with plagioclase microlites and pumice and are severely altered, with feldspar and groundmass replaced by zeolite, hematite, and clay minerals (Figure F32D, F32F). Plagioclase and clinopyroxene grains (up to 1 mm) also occur loose in the matrix; plagioclase is heavily replaced by zeolites and pyroxene appears unaltered. Sedimentary clasts are mostly mudstone, frequently with radiolarians. Thus, although radiolarian-rich mudstones were not sampled in situ in the lower part of Unit IV, they were available to form clasts in the breccia-conglomerates. The matrix for the breccia-conglomerates consists mainly of clay, hematite, and zeolites. Radiolarians are also abundant in the matrix (Figure F32D, F32F).
Igneous rocks in Hole U1438E Unit IV are present in three locations that lie 49–55 m above the top of the basement at 1461 mbsf. The first (youngest) occurrence is at 1406.33 mbsf, where igneous rock is present at the bottom of Section 351-U1438E-61R-1 and the top of Section 61R-2. The second occurrence is in the bottom of Section 61R-2 at 1407.24 mbsf. The third (oldest) occurrence is at 1411.64 mbsf, at the bottom of Section 62R-1 and the top of Section 62R-2 (Figure F5).
In all three locations, Unit IV igneous rock intervals are sparsely phyric, with 3%–5% phenocrysts and microphenocrysts of clinopyroxene (0.2–1.0 mm) set in a groundmass of devitrified glass with microlites of plagioclase and pyroxene (Figure F33). Alteration minerals including chlorite-clay, zeolite, hematite, and titanite are also present. The presence of solely clinopyroxene phenocrysts, the fine groundmass, and the absence of plagioclase readily distinguish the Unit IV igneous rocks from basalts of the underlying basement. Geochemical analysis (see Geochemistry) shows these igneous rocks are high-Na basaltic andesite.
All of the Unit IV basaltic andesites have quench features (e.g., Figure F33), and contacts with the overlying and underlying sedimentary rocks are horizontal to subhorizontal. These features suggest the basaltic andesites are shallow intrusive rocks, probably sills, and not volcanic blocks or sedimentary cobbles deposited on the sediment surface. This interpretation is underscored by the occurrence at the bottom of Section 351-U1438E-61R-1 of basaltic andesite entirely enclosed within a sandy interval that was likely deposited rapidly and in a single event. Under these circumstances, the co-occurrence of a >12 cm volcanic block or sedimentary cobble is unlikely. Petrographic observations also provide evidence for mingling of mud/mudstone and magma, as would be expected in an intrusive contact. These relationships may be seen in Sample 351-U1438E-62R-1, TS 95 (1411.61 mbsf), where coarsely zeolitized rock near the center of the section encloses both phenocrysts of clinopyroxene from the basaltic andesite and opaque clots of mudstone. These relationships would be expected if formation of zeolite minerals was concentrated in glassy and fragmented material formed by mingling of magma and mud/mudstone in the contact area between the two lithologies. Based on this reasoning, it appears likely the Unit IV basaltic andesites were emplaced from a local intrusion (dike/sill). The petrographic similarity of the basaltic andesites and their clustering within <6 m of core suggest that all three of the occurrences may have been emplaced in a single event. It is not clear whether the basaltic andesites were intruded into solidified sedimentary rock or unconsolidated sediment, but the location of the sills, 50 m above the basement surface and in mostly fine-grained sedimentary rock, suggests the Unit IV basaltic andesites are significantly younger than the basement basalts.
Unit 1 (Hole U1438E)
- Interval: 351-U1438E-69R-1, 18 cm, to 88R-1, 150 cm
- Thickness: 149.9 m
- Depth: 1461.08–1611.0 mbsf
- Age: Eocene(?)
- Lithology: basalt
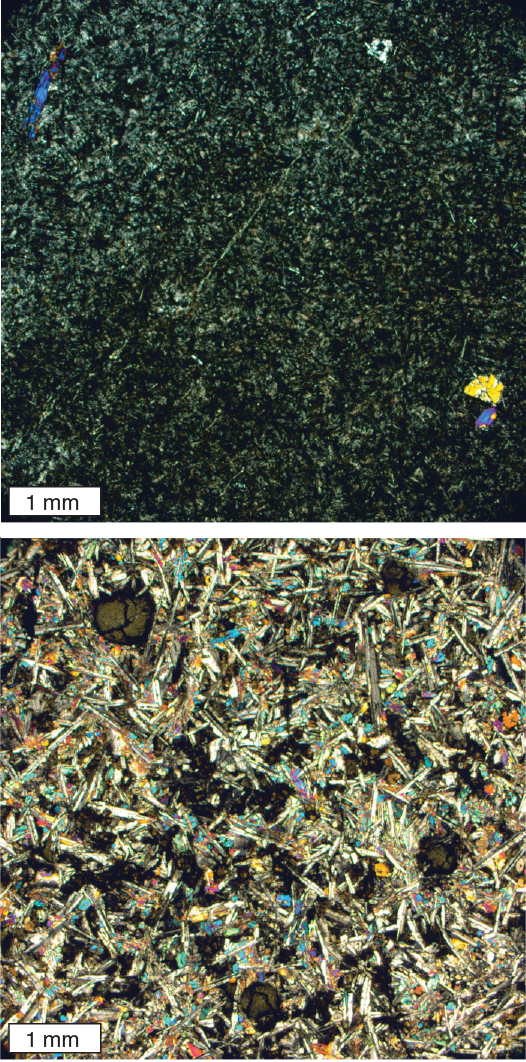
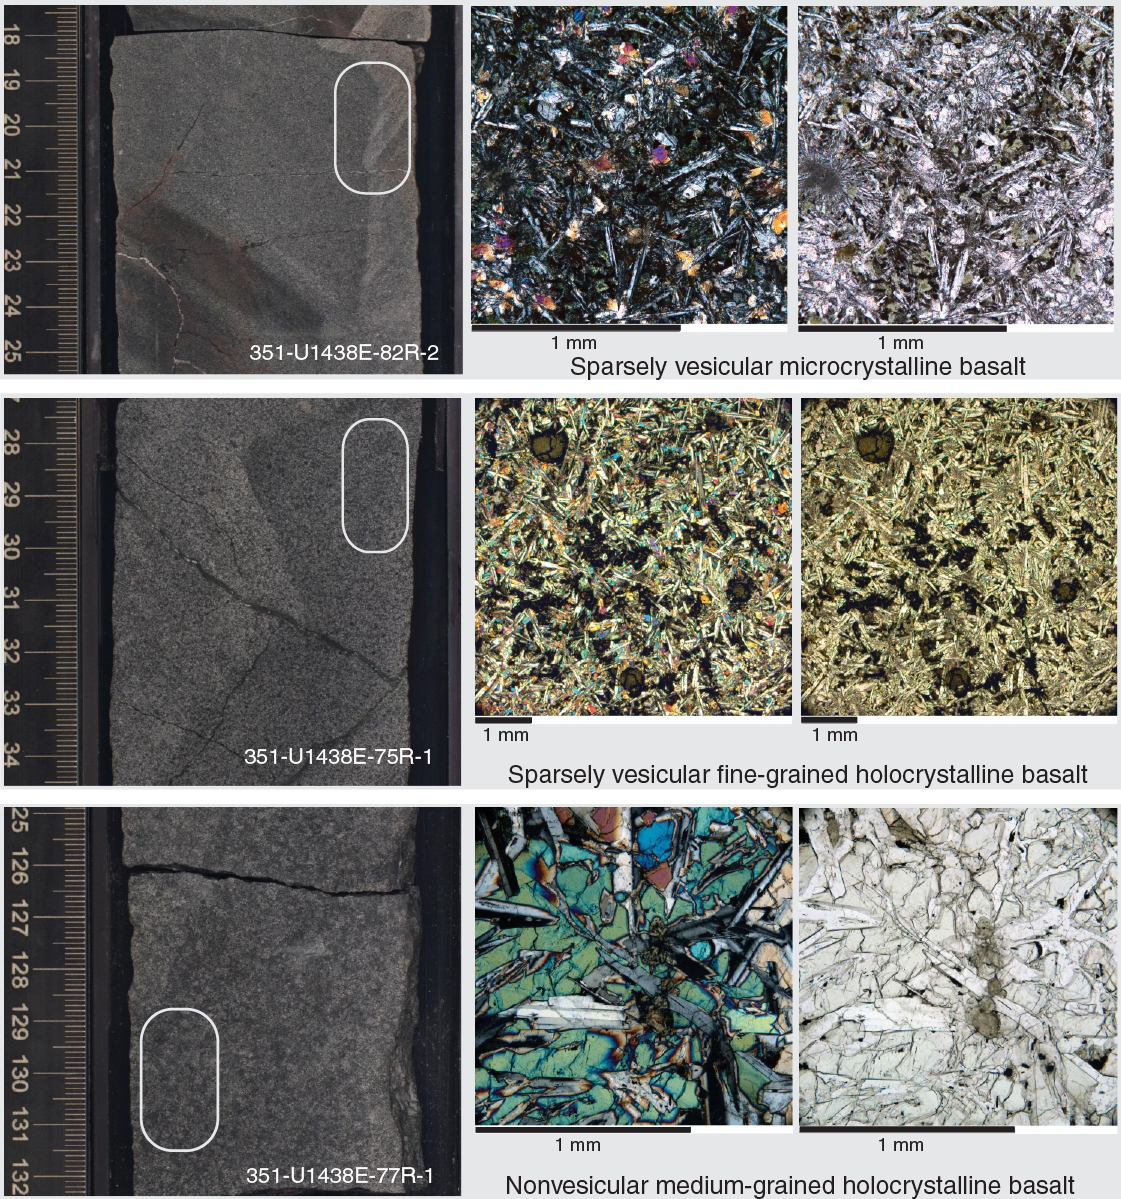
At 1461.08 mbsf, along a rubbly contact, brown laminated mudstone of Unit IV is underlain by oxidized basalt rocks of Unit 1 which extend to the bottom of the hole at 1611 mbsf. Note that unit numbers follow IODP convention where the sedimentary units are characterized by Roman numerals and igneous units with Arabic numbers. In the ~150 m cored interval of Unit 1, only 44 m (29%) of core was recovered. Although probable contacts were recognized between adjacent individual core pieces based on grain size variations and chilled margins, substantial drilling disturbance made consistent recognition of individual unit boundaries and estimation of thicknesses impractical, so all igneous basement rocks are grouped together in a single unit. Unit 1 is primarily composed of sparsely vesicular to nonvesicular, microcrystalline to fine-grained, aphyric to sparsely porphyritic basalts (Figure F34). Rare phenocrysts of olivine, pyroxene, and/or plagioclase up to 3 mm in maximum dimension are set in holocrystalline groundmass characterized by abundant feathery plagioclase. Macroscopic alteration is predominantly patchy chlorite and oxides replacing phenocrysts and groundmass, chlorite and carbonate filling sparse vesicles, and veins filled with chlorite + carbonate ± sulfides and/or oxides. Alteration in the basalts is strong in Cores 351-U1438E-69R through 73R and decreases to moderate intensity from Core 74R to the bottom of the hole.
Description
In thin section, the microcrystalline to medium-grained basalts have diverse textures that include (sub)ophitic, spherulitic, intersertal, dendritic, variolitic, (glomero)porphyritic, vitrophyric, aphyric, amygdaloidal, and glassy varieties. Vesicles are present in approximately one-third of the rocks but are usually sparsely distributed within each rock. However, one sample is moderately vesiculated (30%) with irregular vesicle shapes (Sample 351-U1438E-81R-1, 98–102 cm; TS 127).
Phenocrysts are present in approximately half of the basalts and consist of plagioclase, clinopyroxene, titanomagnetite, and olivine in order of decreasing abundance. The majority of phenocrysts range in size from 0.2 to 4 mm. Plagioclase phenocryst abundances range from 0% to 30%, although observations made of thin sections show 0%–5% is most common. These plagioclase phenocrysts tend to be blocky and sometimes zoned. Clinopyroxene phenocrysts occur more rarely and tend to be smaller (0.2 mm) than plagioclase. The occurrence of olivine either as a phenocryst or in the groundmass is difficult to estimate due to the strong alteration. In four cores however, olivine that is pseudomorphed by chlorite is recognizable by shape and the presence of small, partially translucent reddish chrome spinel inclusions (Cores 351-U1438E-71R, 75R, 80R, and 84R) (Figure F35). It is possible that olivine occurs more widely but is now difficult to recognize due to the alteration.
The groundmass of the basalts is mostly holocrystalline and is composed primarily of plagioclase, clinopyroxene, and titanomagnetite. Glass can be significant in the groundmass (up to 85%; average = 25%), but it is entirely altered mostly to chlorite. Plagioclase mostly occurs as narrow, elongated crystals in subophitic relationships with clinopyroxene. Plagioclase is the most common crystalline phase, comprising between 10% and 45% of the groundmass, whereas clinopyroxene comprises 11% and 40% of the groundmass (Figure F35).
Numerous flow contacts were identified in Unit 1, but their interpretation in terms of volcanic stratigraphy is hindered by the overall low recovery in basement rocks (29%). The majority of magmatic contacts are gradational in the core, showing a diffuse change in grain size to micro- or even cryptocrystalline (Figure F36). Moreover, several chilled margins could be identified, but only very few of those preserved a glassy margin (altered) (Figure F37). A full list of possible flow contacts can be found in Table T5. The average flow thickness calculated from the thickness of the intervals between each boundary (or their mean when only a long gradational interval could be identified) is about 3.1 m, but this value is highly biased by the low recovery. Paleomagnetic measurements provide constraints on the lava flow type, and consistent shallow plunges of maximum anisotropy axes indicate a dominant flow direction. Thus, lava emplacement by lava flows (e.g., sheet flows) are more likely than pillow lavas (see Paleomagnetism).
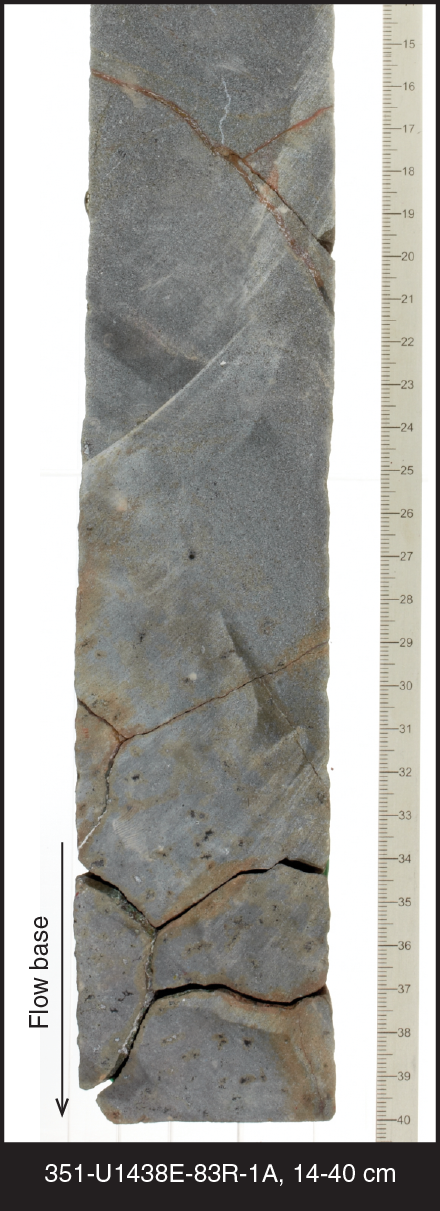
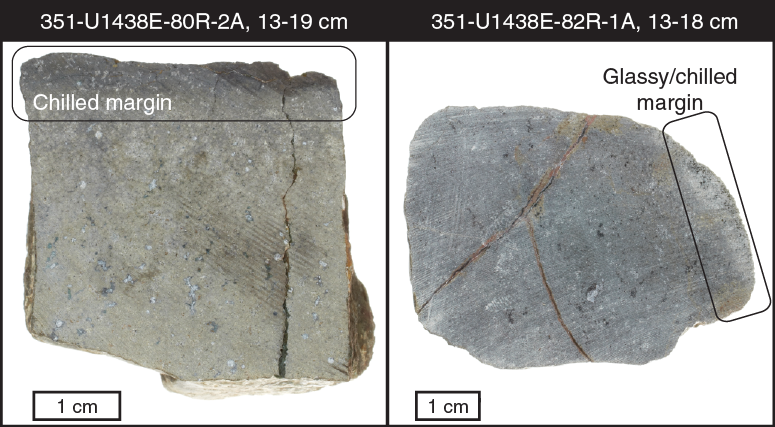
Table T5. Chilled margin summary. Download table in .csv format.
Veins and alteration
Veins are much more common in the basaltic lavas than in the overlying sedimentary rock sequence. Although these veins vary widely in orientation, slightly more horizontal or shallow-dipping veins were recorded than vertical or steep veins. Most of the veins are small (average = 3 mm wide) and filled with calcite, chlorite, and clay minerals, and they tend to form branched networks. There are small differences in the mineralogy of the veins downhole, particularly in the oxidation state of the iron minerals that accompany the ubiquitous carbonate and chlorite + clay. Logging shows broad 20–40 m zones dominated by veins containing hematite, calcite, and chlorite with red halos alternating with zones that contain veins containing pyrite, chlorite + clay, and calcite ± magnetite without halos.
Two zones contain veins or alteration patches with crystalline and microcrystalline silica:
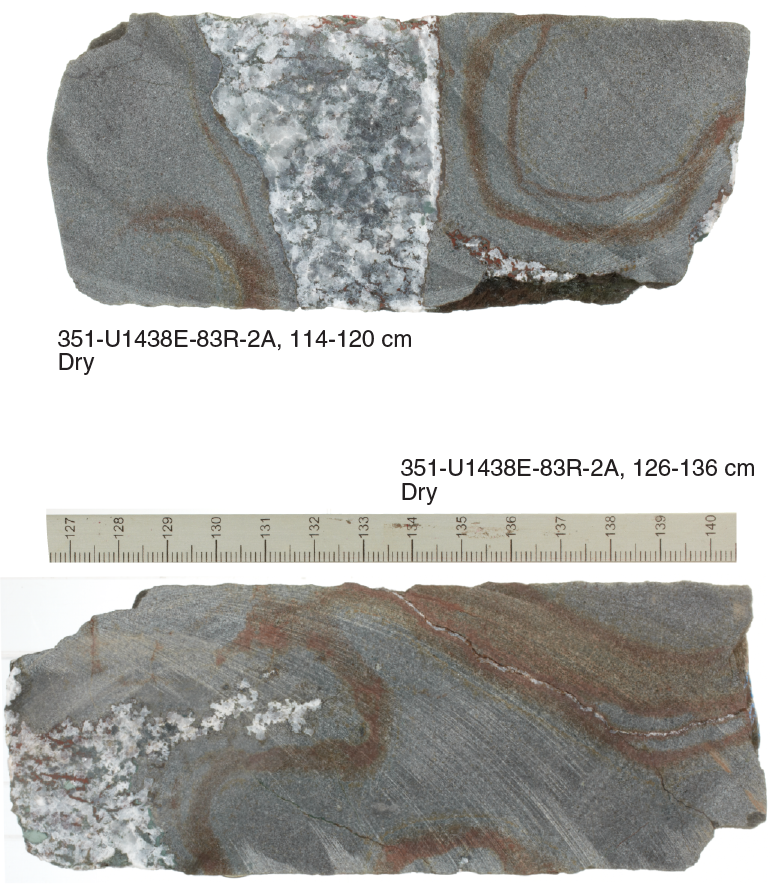
- Large (2–4 cm) alteration patches in Section 351-U1438E-83R-2 have spectacular large (4 mm diameter) radiating rosettes of quartz intergrown with large subhedral calcite, small zeolite minerals, and small anhedral clay and chlorite crystals (Figure F35).
- Small veins (2 mm) in Section 351-U1438E-87R-3 contain hematite, calcite, microcrystalline silica, and chalcopyrite.
Downhole changes in mineralogy (diagenesis and alteration)
Downhole changes in mineralogy at Site U1438 are documented from smear slide, XRD, and thin section observations and show that dominantly fresh volcanogenic minerals and glass within Unit II (depths <300 mbsf) are transformed into mixtures of dominantly clay and zeolite minerals (Unit III at depths >500 mbsf). We refer to these mineralogical changes as diagenetic given the thermal gradient and bottom-hole temperature estimates for Site U1438 (see Physical properties and downhole measurements), but they could be equally well described as effects of alteration or secondary mineral formation.
Plagioclase, pyroxene, and calcite are the dominant minerals in Unit II cores deeper than the downhole transition from Unit I to Unit II. Plagioclase compositions appear to be calcic, and pyroxenes include both monoclinic (clinopyroxene) and orthorhombic (orthopyroxene) varieties. Peaks in many Unit II sample X-ray diffractograms at 10°–11°2θ indicate the presence of amphibole(s), and their presence is confirmed by smear slide observations. Database searches on XRD patterns most commonly identify these as calcic amphiboles (e.g., pargasite, magnesiohornblende, or edenite), but other more sodic or magnesian varieties (e.g., crossite, riebeckite, or gedrite) might also be present. Identification of foraminifers and nannofossils in many smear slides from Unit II indicates that calcite occurs primarily as a sedimentary/biogenic component. Smear slide observations indicate the silicate minerals and associated volcanic glass in Unit II are largely free of hydrous alteration effects. Significant quantities of diagenetic minerals were observed only in XRD data for bioturbated mudstone Sample 351-U1438D-11R-2, 49–50 cm. Database searches for this XRD pattern return the zeolite mineral clinoptilolite.
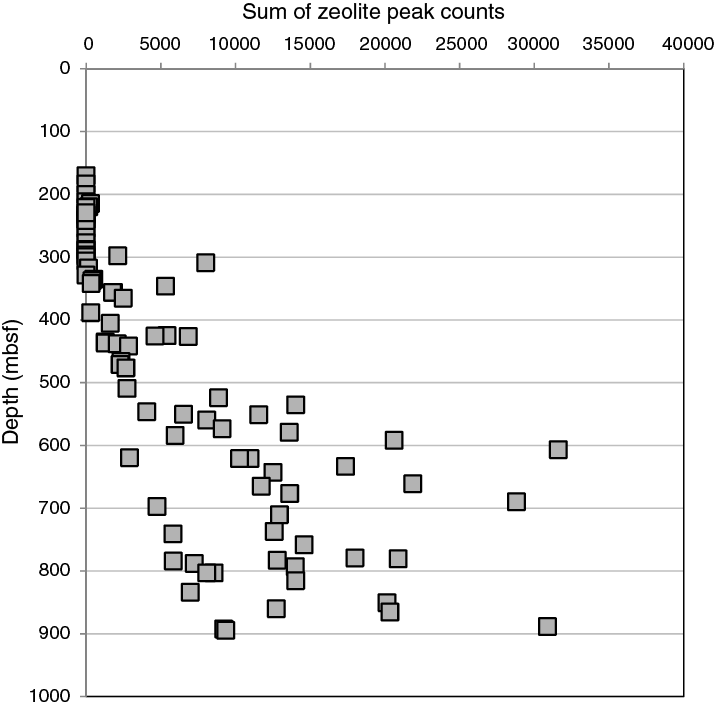
In the upper part of Unit III, at about 300–500 mbsf, zeolite minerals observed in trace quantities in Unit II become common and their abundance relative to fresh, volcanogenic components increases. This downhole change, which increases progressively to the bottom of Hole U1438D, is illustrated in Figure F38, where summed peak counts for selected zeolite group and related minerals are plotted against depth for all XRD scans from Units II and III. At 300–500 mbsf, Unit III XRD data show that calcic plagioclase and pyroxene are still abundant minerals, as they were in Unit II. Calcite is also commonly present, as in Unit II, but in contrast, thin sections confirm its presence as minor authigenic cement. Most Unit III samples at 300–500 mbsf also contain one or more zeolite group minerals in combination with sheet silicate and other minerals that appear to be diagenetic. Database searches indicate that clinoptilolite is the most common zeolite present in these samples, but thompsonite, phillipsite, and mordenite were also identified. The XRD data confirm the presence of chlorite (clinochlore) in Unit III from 300 to 500 mbsf. Database searches also return celadonite, vermiculite, and smectite group clays, such as saponite and sauconite. The smectite minerals do not appear to be abundant in Unit II mudstones, so their presence in many Unit III samples (along with zeolites) indicates they are not detrital but instead have formed by diagenetic processes. Brown and yellowish brown material in the groundmass of tuffaceous sandstones (e.g., Figure F27) shows second-order birefringence, and in combination with XRD patterns, this material is interpreted to be mixtures of chlorite, smectite group clays, celadonite, and vermiculite. The texture of this mixture, where it commonly forms grain coatings and with radiating fibers (pore fills), also indicates a diagenetic origin. The XRD data indicate that zeolite minerals are present in most samples in the 300–500 mbsf interval, but these minerals are not easily identified in thin section. Where observed, they form irregular masses of weakly birefringent, low-relief minerals in the groundmass, sometimes in fibrous and radiating forms.
Deeper than 500 mbsf in Unit III and to the bottom of Hole U1438D, XRD data indicate that many samples are dominated by zeolite and related framework and sheet silicate minerals that are formed by diagenetic processes. In turn, the volcanogenic components that dominate Unit II diminish in importance in Unit III. The main diagenetic phases deeper than 500 mbsf are clinoptilolite, laumontite, and analcite. Mixtures of clay minerals produce broad peaks below 8°2θ in many samples, as in shallower parts of the core, but in several samples the appearance of sharp and intense peaks at 6.1°2θ indicate the presence of a new and well-crystallized mineral. Database searches indicate that this may be the zeolite mineral faujasite mixed with vermiculite and saponite or other smectite group minerals. Chabazite, wairakite, and stellerite (all zeolite minerals) are also identified in some samples. Thin section (Figure F29) and XRD data show that anhydrite is present locally, where it appears together with zeolite minerals in replacement of pumice lapilli and in millimeter-scale veins. The most thorough recrystallization and formation of diagenetic minerals has taken place in the finer grained mud- and clay-rich rocks. In some cases, these have been reduced to simple monomineralic and bimineralic zeolite (e.g., Figure F24). Based on evaluation of XRD scans, calcic plagioclase and pyroxene appear to be absent from many fine-grained samples, but thin sections show these minerals persist in diagenetically altered tuffaceous sandstones even at the bottom of Hole U1438D. Plagioclase crystals are often corroded and partially or wholly replaced by zeolites, but most pyroxene appears to have been little affected by diagenesis (e.g., Figure F29). Well-preserved volcanic glass is rare in Unit III but has been observed in thin section to the bottom of Hole U1438D. The general style of diagenetic alteration of volcaniclastic rocks at Site U1438 was also documented in nearly time-equivalent and lithologically similar IBM fore-arc cores recovered during Ocean Drilling Program (ODP) Leg 126 (Marsaglia and Tazaki, 1992).
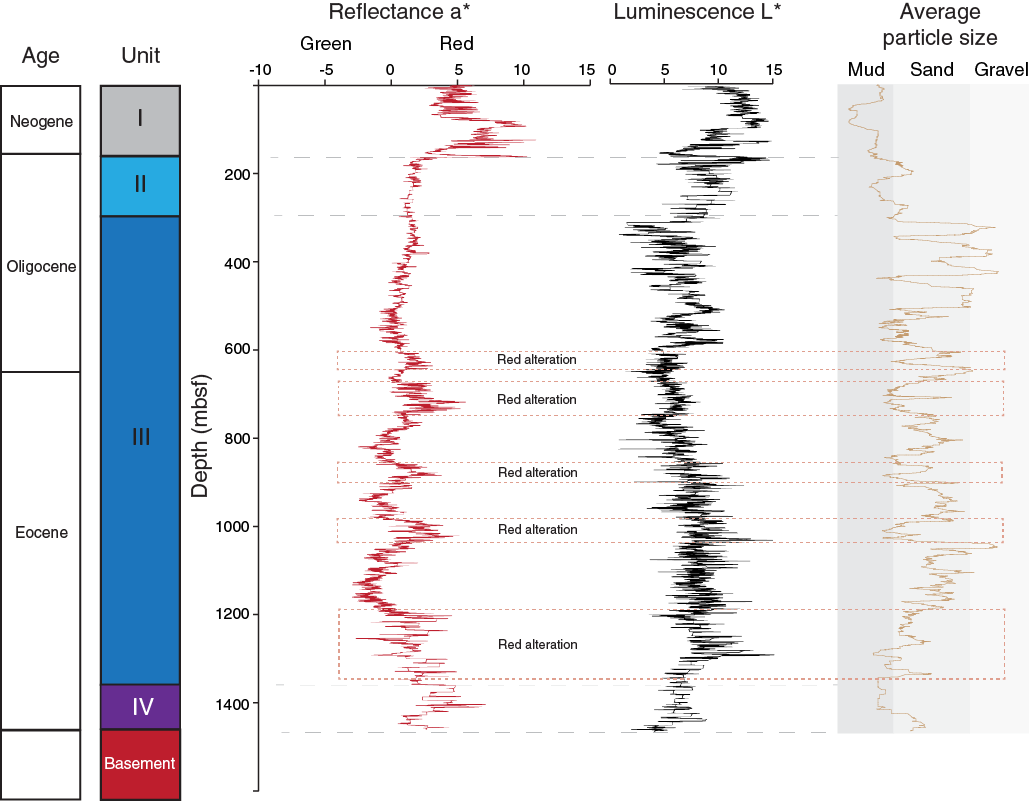
An additional style of diagenetic alteration is evident in Hole U1438D deeper than 600 mbsf, where a red and reddish brown stain has overprinted the dominantly grayish green, green, and black colors of the diagenetically altered rocks from overlying Units II and III. The reddish brown and red color is seen in four distinct intervals between 610 and 890 mbsf (Figure F39), where it affects almost exclusively the finer grained siltstone and mudstone (e.g., Figure F24). Deeper than 1200 mbsf, the red alteration becomes the dominant color in the fine-grained sedimentary rocks of Unit IV and at the bottom of Unit III (Figure F39). It is likely that the red coloration reflects a change in the oxidation state of iron, along with the formation of hematite at the expense of magnetite in the fine-grained sediments. This mineralogical change is not evident in the XRD data because the Fe oxide minerals are, in general, not well expressed. Targeted sampling and XRD analysis of closely spaced and varicolored horizons reveal no clear and systematic differences between the dominantly red layers compared to green, grayish green, and black layers of similar grain size in nearby parts of the core. All of the varicolored rocks are similarly dominated by the diagenetic minerals as described above.
Additional downhole changes in mineralogy are evident in the bottom third of Unit III, in the transition to Unit IV. These changes are most clearly expressed in the appearance of quartz in the XRD data for most Unit III samples deeper than 1120 mbsf, compared to shallower parts of Unit III, where quartz is rarely or only occasionally present. Other minerals that appear sporadically in lower Unit III and in Unit IV, which were not present in the upper part of Unit III, include K-feldspar, prehnite, serpentine, and hematite.
The causes of the downhole changes in mineralogy in lower Unit III and Unit IV are uncertain. Some detrital quartz or microcrystalline silica grains have been observed in sandstones and mudstones in lower Unit III and in Unit IV, but their abundance appears to be no more than several percent, even in rocks where quartz dominates the XRD pattern. This suggests that abundant quartz deeper than 1120 mbsf may be cryptocrystalline silica. The source of the silica could have been biogenic or volcaniclastic or both. The emergence of quartz deeper than 1120 mbsf may also reflect changes in physical conditions to allow the formation of quartz from pore fluids in the rocks. Alternatively, the increase in quartz downhole near the bottom of Unit III could reflect changes in the dominant source of the sediment, to include a higher proportion of silt-and-finer detrital grains, perhaps of continental origin. In this case, the increase in quartz near the bottom of Unit III and in Unit IV would reflect a reversal of the trend that was observed from the unconsolidated muds of Unit I, where quartz was abundant, to the volcaniclastic sediments and sedimentary rocks of Units II and III, where quartz was mostly absent. This would imply a downhole trend to more quiet conditions of sediment deposition in Unit IV that prevailed in the time period after basement formation and prior to the flooding of the basin with the volcaniclastic sediment reflected in Unit III rocks. It is worth noting the similarity between the appearance of quartz in Unit IV immediately above the basement and late Eocene sedimentary cover of the basaltic basement recovered at ODP Leg 195 in the West Philippine Sea at Site 1201 (Salisbury et al., 2006).
Alteration minerals present in Unit 1 basalts are evident macroscopically in millimeter-scale veins and patches. The dominant alteration mineral identified by XRD is calcite. Macroscopic and petrographic observations show hematite is commonly associated with calcite. Veins and patches of soft, dark-colored minerals appear to be primarily saponite and/or vermiculite and less commonly chlorite or serpentine. The dark green and brown alteration mineral seen in thin section where it replaces olivine and groundmass glass (Figures F33, F34) is probably also a mixture of clay, chlorite, and serpentine. Pyrite is also present in the dark-colored, altered parts of the basalts. Alteration minerals occur in the basalts in the form of centimeter-scale veins or inclusions (Figure F40). These have textures that resemble plutonic igneous rocks or disaggregating cognate inclusions, but their mineralogy appears to be entirely hydrothermal. Thin section and XRD observations indicate that coarsely crystalline calcite, quartz, zeolite, and clay minerals are present (Figure F35).
Structural geology
Whereas inclined beds are present at various intervals cored at Site U1438 (Figure F6), faulted beds are restricted to the middle part of Unit II, around the overlap zone between the two holes (U1438B and U1438D) and are probably responsible for the 10 m difference between the depths of the marker horizon in the two cores. The deformed zone is characterized by strong drilling disturbance in both holes, but the original structures can be observed in a few of the cores. These consist of moderately dipping (40°–65°) planar structures that offset the inclined bedding (Figure F21). Most of the offsets show reverse (thrust) geometry with respect to the orientation of the bedding planes. The zone of deformation is 50–70 m wide and intersects Hole U1438B at a shallower level (20–40 m) than in Hole U1438D, located northwest of Hole U1438B, suggesting a northwesterly dip to the structure at a moderate angle (40°–60°). The deformation and steep dips of the beds occur in the same area, suggesting either drag of bedding around a small reverse fault or slumping of partially lithified sediment to create small displacements and inclined beds.
Small 10 m reverse offsets of major reflectors are present in the southwest to northeast seismic sections near Site U1438 (Figure F22). These have approximately the same orientation and geometry (including dip direction) to account for the structures and offsets visible in Unit II.
The majority of Unit III to the bottom of Hole U1438D contains flat-lying beds and no faults. A few inclined beds were noted at widely spaced locations, but these tend to coincide with fine-grained rocks overlain by thick beds of sandstone and conglomerate (Figure F6), suggesting deformation occurred because of localized slumping and loading. Toward the bottom of Hole U1438D around 880 mbsf, bedding orientation changes rapidly, suggesting chaotic folding. Small reverse offsets on moderately dipping bedding planes become ubiquitous. However, veins are rare and fault gouge or cataclastic textures are absent, with most of the displacements occurring on very fine fractures that have now been filled by very fine secondary minerals.
Biostratigraphy
Preliminary biostratigraphic determination for Site U1438 is based on analysis of calcareous nannofossils, foraminifers, and radiolarians (Figures F41, F42; Table T6). All core catcher (CC) samples and some additional samples were examined (Tables T7, T8, T9, T10, T11, T12, T13).
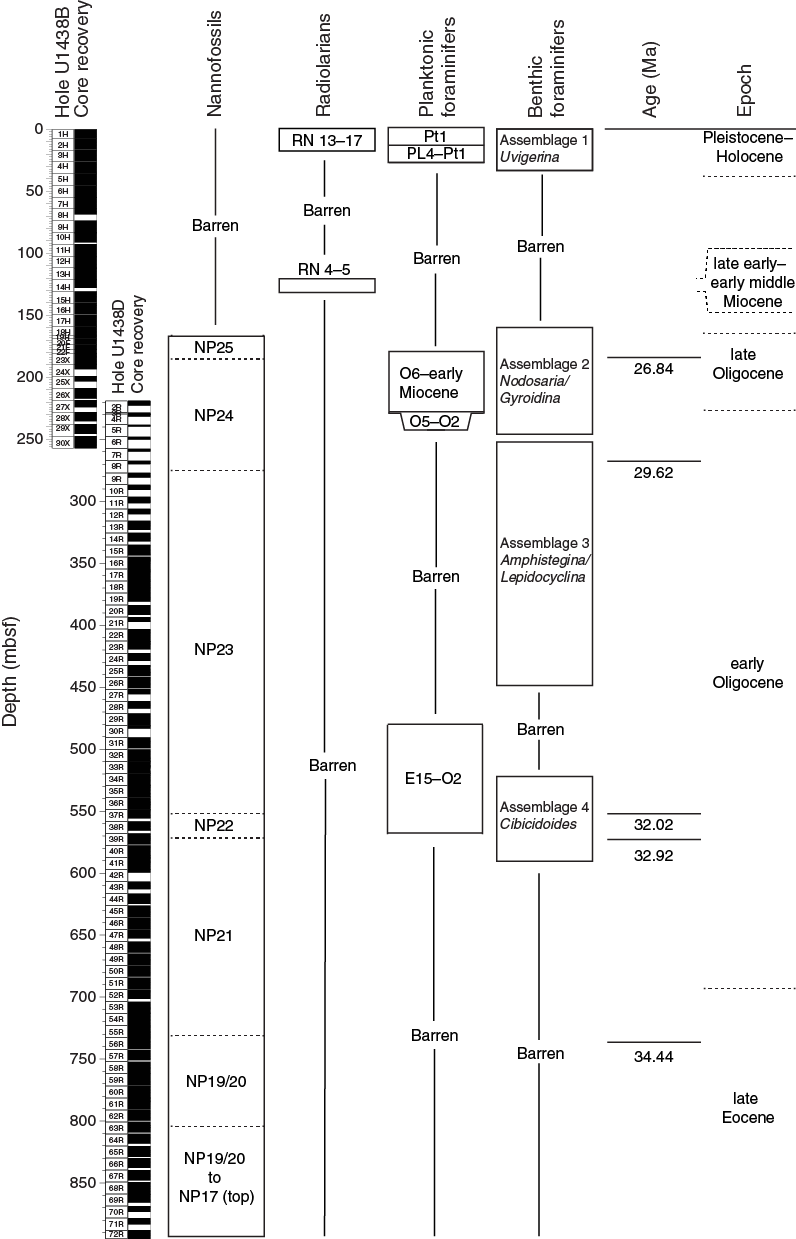
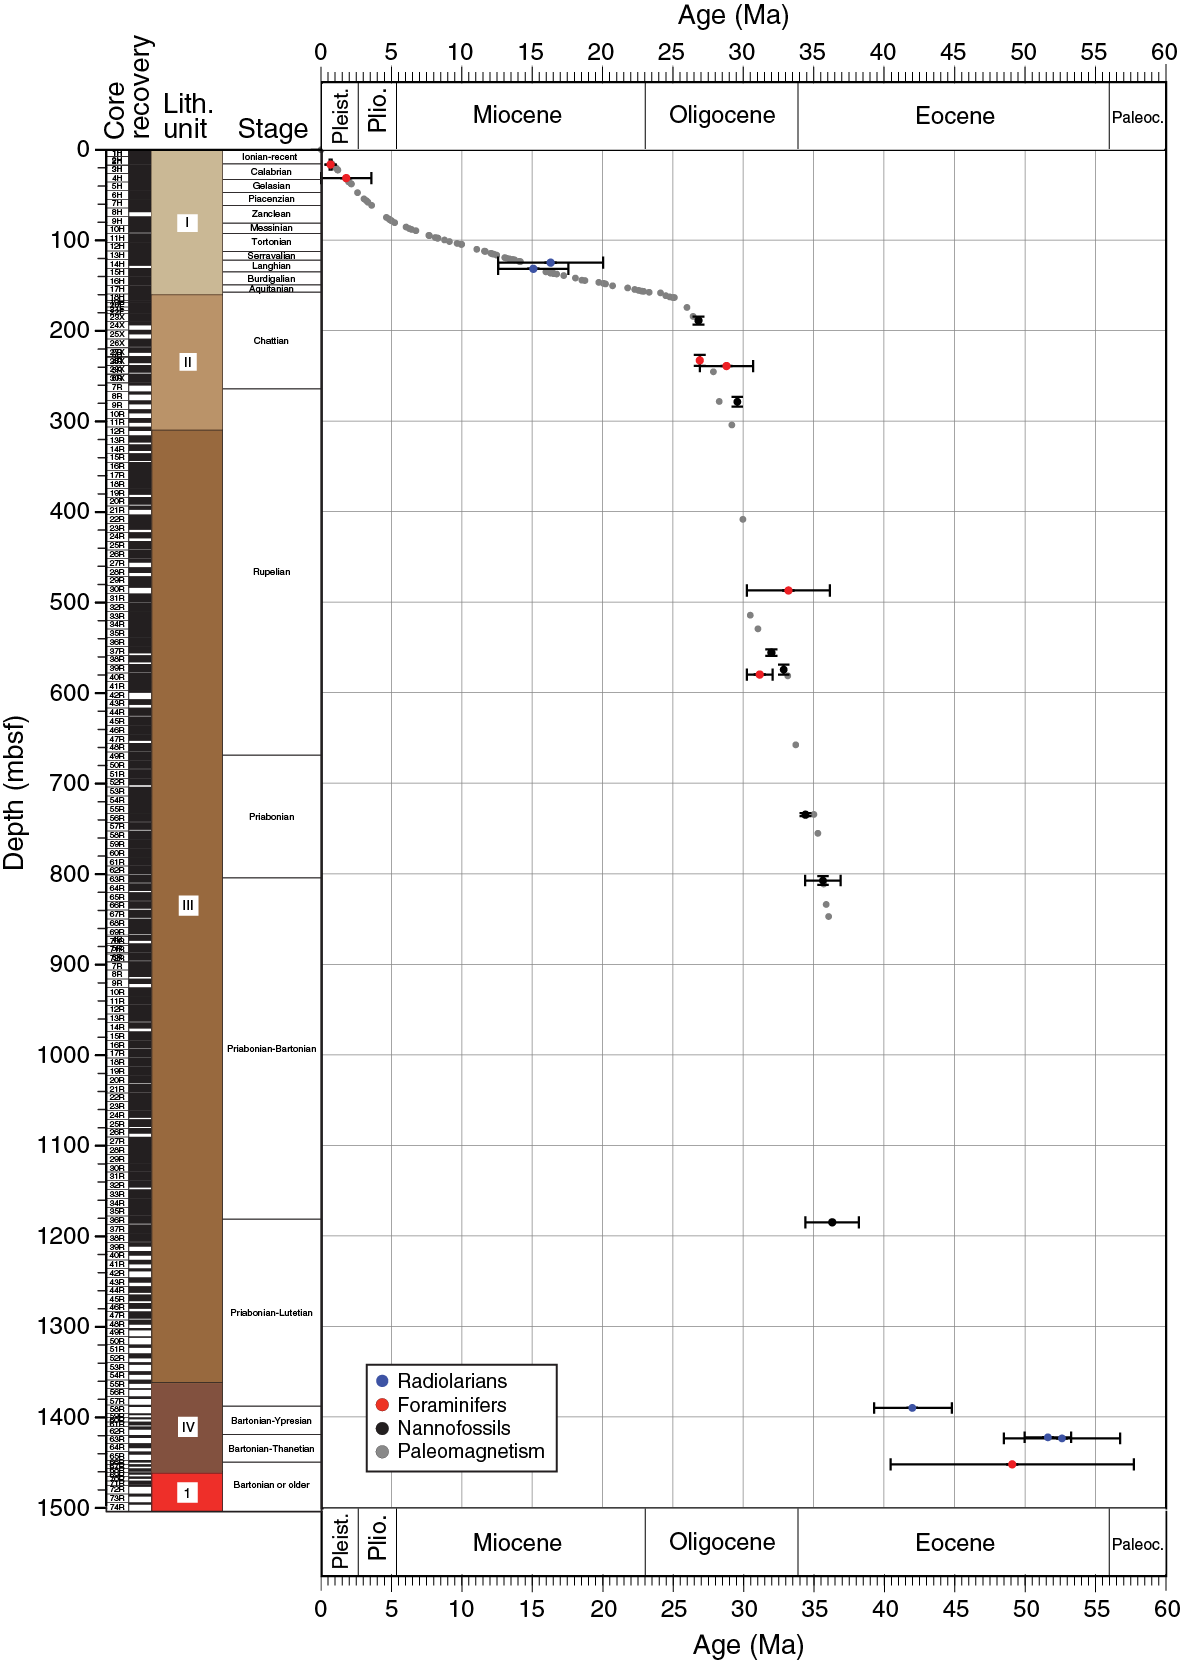
Table T6. Age-depth tie points of biostratigraphic marker events, Site U1438. Download table in .csv format.
Table T7. Nannofossil range chart, Holes U1438A and U1438B. Download table in .csv format.
Table T8. Nannofossil range chart, Holes U1438D and U1438E. Download table in .csv format.
Table T9. Foraminifer range chart, Holes U1438A and U1438B. Download table in .csv format.
Table T10. Foraminifer range chart, Holes U1438D and U1438E. Download table in .csv format.
Table T11. Radiolarian range chart, Hole U1438A. Download table in .csv format.
Table T12. Radiolarian range chart, Hole U1438B. Download table in .csv format.
Table T13. Radiolarian range chart, Hole U1438E. Download table in .csv format.
Calcareous nannofossils
Hole U1438A
Three core catcher samples were recovered in Hole U1438A, all of which are barren of calcareous nannofossils. An additional two toothpick samples were analyzed from Samples 351-U1438A-1H-3W, 104–105 cm, and 2H-1W, 80–81 cm. Sample 1H-3, 104–105 cm, has low nannofossil recovery with rare occurrences of the genus Ceratolithus, mainly Ceratolithus cristatus. The range of these taxa is Pliocene to Pleistocene. Sample 2H-1, 80–81 cm, contains an abundant assemblage also composed mainly of Pliocene to Pleistocene species, including Reticulofenestra minuta, Pseudoemiliania lacunosa, and Gephyrocapsa spp. Significant reworking of Oligocene/Miocene species, such as Sphenolithus ciperoensis and Cyclicargolithus abisectus, was also found.
Hole U1438B
Of the 30 core catcher samples recovered from Hole U1438B, only 13 contain nannofossils with reliable ages. Calcareous nannofossils first appear in the lower section from Samples 351-U1438B-18H-CC to 30X-CC. Nannofossils are common to abundant and exhibit moderate to good preservation. Samples largely consist of Oligocene species such as Reticulofenestra bisecta, C. abisectus, S. ciperoensis, Sphenolithus distentus, and Sphenolithus predistentus. This interval therefore falls within nannofossil Zones NP25 and NP24.
Samples 18H-CC to 22F-CC (166.4–180.67 mbsf) were assigned to Zone NP25 based on the presence of both S. ciperoensis and R. bisecta (23.13 Ma) and the absence of S. distentus and S. predistentus. The last (youngest) occurrence (LO) of R. bisecta (23.13 Ma) defines the top of this zone, as does the LO of S. ciperoensis (Martini, 1971). The LO of S. distentus (26.84 Ma) defines the base. The assemblages include common to abundant Triquetrorhabdulus carinatus, Discoaster deflandrei, C. abisectus, Cyclicargolithus floridanus, and Reticulofenestra stavensis, with preservation ranging from moderate to good.
Samples 23F-CC to 30X-CC (189.44–257.08 mbsf) were assigned to Zone NP24 based on the presence of S. distentus and S. ciperoensis. The top of this zone is defined by the LO of S. distentus (26.84 Ma), and the base is defined by the first (earliest) occurrence (FO) of S. ciperoensis (29.62 Ma). The rare occurrence of S. predistentus is consistent with this zone (Gradstein et al., 2012). Nannofossils are generally rare to few and have poor to moderate preservation, possibly as a result of coarser grained sediment. In poorly preserved samples, it was occasionally not possible to distinguish between S. distentus, S. ciperoensis, and S. predistentus because most were observed without the base. However, in Sample 28X-CC, where preservation is better, S. ciperoenesis and S. distentus were recorded together.
Hole U1438D
Nannofossil marker species for Zones NP24 to NP19/NP20 were observed within the 72 core catcher samples of Hole U1438D, although the majority of samples are barren. Samples 351-U1438D-2R-CC (222.62 mbsf) to 8R-CC (269.84 mbsf) were assigned to Zone NP24 based on the presence of both S. distentus and S. ciperoensis. These samples yielded a typical Oligocene assemblage, such as R. bisecta, C. abisectus, C. floridanus, and D. deflandrei, with common abundance and moderate preservation. Other species that are present within this zone include S. predistentus in Samples 6R-CC to 8R-CC. Discoaster tanii, a typical Eocene marker species, was found in Sample 7R-CC and is considered to have been reworked.
Samples 9R-CC (280.66 mbsf) to 36R-CC (548.7 mbsf) were assigned to Zone NP23 based on the presence of S. predistentus and the absence of S. ciperoensis. The FO of S. ciperoensis (29.62 Ma) defines the top of this zone, whereas the base is defined by the LO of Reticulofenestra umbilica (32.02 Ma). Many core catcher samples in this zone are barren of nannofossils, including Samples 12R-CC to 14R-CC and 16R-CC to 24R-CC. All additional toothpick samples taken contained nannofossils assigned to Zone NP23.
Samples 37R-CC (555.71 mbsf) to 38R-CC (565.7 mbsf) were assigned to Zone NP22 based on the presence of R. umbilica and the absence of Coccolithus formosus. The base of this zone is defined by the LO of C. formosus (32.92 Ma), whereas the top is defined by the LO of R. umbilica (32.02 Ma). Abundance within this zone ranges between common and abundant, and specimens exhibit poor to good preservation.
Samples 39R-CC (576.79 mbsf) to 55R-5, 65–66 cm (729.58 mbsf), were assigned to Zone NP21 based on the presence of R. umbilica and C. formosus and the absence of Discoaster saipanensis and Discoaster barbadiensis. The top of this zone is defined by the LO of C. formosus (32.92 Ma), and the base is defined by the LO of D. saipanensis (34.44 Ma). Additional toothpick samples confirm the age. Nannofossil presence is rare to few, and preservation varies from poor to moderate. Nevertheless, C. formosus was found to be common and moderately preserved in each sample.
Samples 56R-1, 17–18 cm (733.07 mbsf), 57R-4, 103–104 cm (747.52 mbsf), and 62R-CC (799.63 mbsf) contained assemblages recognized as Zone NP19/NP20, based on the presence of Eocene marker species D. saipanensis, D. barbadiensis, and Isthmolithus recurvus. The base of this zone is defined by the FO of I. recurvus (36.97 Ma), and the top is defined by the LO of D. saipanensis (34.44 Ma). Samples 63R-CC to 72R-CC are barren. Only Sample 69R-4, 59–60 cm, from the lowermost part of Hole U1438D, yielded common to abundant nannofossils with poor to moderate preservation, including D. saipanensis and D. barbadiensis. With the absence of I. recurvus, these samples are constrained to the top of NP16 because of the presence of Reticulofenestra reticulata, which has its FO at 41.66 Ma (Gradstein et al., 2012).
Hole U1438E
Samples 351-U1438E-5R-4, 48–49 cm (881.24 mbsf), to 38R-2, 142–143 cm (1199.8 mbsf), contain generally few to barren occurrences of nannofossils with moderate to poor preservation. These samples were placed within Zones NP19/NP20 to NP17 (mid) because of the occurrence of D. saipanensis, D. barbadiensis, and R. bisecta. The upper boundary (Zone NP19/NP20) is defined by the LO of D. saipanensis and D. barbadiensis, and the lower boundary (NP17 [mid]) is defined by the FO of R. bisecta (38.25 Ma). All samples below this are barren of nannofossils.
Planktonic foraminifers
Hole U1438A
No planktonic foraminifers occur in the top of Core 351-U1438A-1H (mudline sample), which is expected, as Site U1438 is below the current carbonate compensation depth (CCD). Sample 2H-5, 90–91 cm, was taken from a foraminifer-rich layer and comprises abundant planktonic foraminifers, including Globorotalia tosaensis and Globorotalia hessi. The ranges of these two species overlap in Zone Pt1a between 0.61 and 0.75 Ma (Gradstein et al., 2012). Other species present include Globorotalia inflata, Globorotalia menardii, Globorotalia tumida, and Globorotalia truncatulinoides. Sample 2H-CC contains a very sparse assemblage that includes G. inflata, a long-ranging extant taxon from Zone PL4 (3.59 Ma) to recent, and poorly preserved unidentifiable fragments. Preservation of planktonic foraminifers is generally good, with frosted shells common from secondary calcite overgrowth.
Hole U1438B
Sample 351-U1438B-2H-1W, 68–71 cm, is a toothpick sample taken from a foraminifer-rich horizon and consists of dominant planktonic foraminifers, including G. inflata (ranging from Zone PL4, 3.59 Ma, to recent) and the long-ranging species Pulleniatina obliquiloculata, Globigerina bulloides, G. tumida, G. truncatulinoides, and Neogloboquadrina pachyderma.
Sample 2H-CC contains a sparse assemblage consisting of indeterminate forms and G. inflata, P. obliquiloculata, and G. tumida. Sample 4H-1W, 136–137 cm, is a toothpick sample taken at the deepest (earliest) foraminifer-rich horizon and consisting of abundant planktonic foraminifers, including the stratigraphically important G. inflata (3.59 Ma to recent), and the long-ranging Neogene species G. bulloides, G. tumida, G. crassaformis, G. menardii, Orbulina universa, and Sphaeroidinella dehiscens.
Samples 4H-CC to 20F-CC are barren of foraminifers, except for one unidentifiable planktonic specimen in Sample 18H-CC. Samples 21F-CC and 22F-CC contain sparse planktonic foraminifers largely indeterminate but including Paragloborotalia nana, which is long-ranging from the Eocene to late Miocene (Pearson et al., 2006). Sample 22F-CC also contains a well-preserved specimen of Paragloborotalia mayeri, which ranges from within Oligocene Zone P22 (~27–23 Ma), according to Bolli and Saunders (1985), to Miocene Zone M11 (10.46 Ma), according to Gradstein et al. (2012). Catapsydrax unicavus, ranging from late Eocene Zone P14 to early Miocene Zone N6 (Pearson et al., 2006), is the only identifiable species to occur in Samples 24X-CC and 26X-CC.
Sample 27X-CC contains a slightly more diverse assemblage of planktonic foraminifers, including a very well-preserved specimen of Globoquadrina praedehiscens, which ranges from Oligocene Zone P22 (26.93 Ma) to Miocene Zone N6 (Kennett and Srinivasan, 1983), indicating this sample is no older than late Oligocene. This sample is likely within Zone O6 (base of Zone P22), as the sample below (28X-CC) is assigned to Zones O2–O5. The sample also includes the long-ranging C. unicavus and Globoquadrina venezuelana. The following Sample 28X-CC contains a sparse assemblage of largely unidentifiable etched and poorly preserved planktonics but also well-preserved Paragloborotalia opima-nana group specimens ranging up to ~300 µm in size. According to Bolli and Saunders (1985), specimens >320 µm are restricted to the Oligocene P. opima range, which is from Zone O2 (30.72 Ma) to Zone O5 (26.93 Ma) (Gradstein et al., 2012).
Hole U1438D
Samples 351-U1438D-2R-CC to 9R-CC are either barren or contain very few broken and unidentifiable planktonic foraminifers. Toothpick Sample 10R-2A, 44–45 cm, was taken from a fine-grained sand interval containing common poorly preserved to moderately well-preserved species. These include Globigerina euapertura, ranging from late Eocene Zone P16/P17 (<35.71 Ma) to early Miocene Zone N7 (>16.36 Ma) (Bolli and Saunders, 1985), and the long-ranging C. unicavus. Samples 10R-CC to 28R-CC are barren, except for a solitary broken specimen in Sample 28R-CC.
Sample 29R-CC contains only rare, poorly preserved, yellow planktonics that include solitary specimens of Turborotalia ampliapertura, which ranges from Eocene Zone E15 (36.18 Ma) (Pearson et al., 2006) to Oligocene Zone O2 (30.28 Ma) (Gradstein et al. 2012), and the long-ranging Catapsydrax dissimilis (Oligocene to early Miocene). The species Globigerina praebulloides (Eocene to Miocene) occurs in Sample 31R-CC, and G. euapertura (late Eocene Zone P16/P17 to early Miocene Zone N7) occurs again in Sample 33R-CC, and then the samples are barren until Sample 38R-CC, which contains common and well-preserved planktonic foraminifers. The specimens here are largely composed of T. ampliapertura (36.18–30.28 Ma), which could be indicative of the T. ampliapertura highest occurrence Zone O2 (Gradstein et al., 2012) between 30.28 and 32.10 Ma, although it could range into the earlier Oligocene. Other species in this sample include C. dissimilis, G. euapertura, G. praebulloides, and Dentoglobigerina pseudovenezuelana, which ranges from Eocene Zone E14 (38.25 Ma) to possibly Oligocene Zone O5 (26.93 Ma), according to Pearson et al. (2006).
Sample 39R-CC contains a very sparse and poorly preserved assemblage including the long-ranging C. unicavus and G. euapertura, and Sample 43R-CC contains the long-ranging G. praebulloides, and therefore age diagnosis beyond Eocene–Oligocene is not possible from planktonic foraminifers alone. All other samples down to 72R-CC are barren of planktonic foraminifers.
Hole U1438E
Sample 351-U1438E-28R-CC contains five specimens of planktonic foraminifers, which are mostly broken and unidentifiable to species level. However, one specimen appears to belong to the long-ranging genus Catapsydrax (early Eocene to middle Miocene). The only other sample to contain foraminifers is Sample 66R-CC. This sandy sample contains two specimens of very poorly preserved, partially recrystallized planktonic foraminifers. One specimen appears to belong to the genus Acarinina, with its characteristic robust wall and coarse wall texture, although the lack of a visible aperture precludes definite identification (Figure F43). The overall quadrate test shape and subangular periphery indicates it probably belongs to the species Acarinina bullbrooki (Zones E7–E11; 50.2–40.49 Ma), or possibly Acarinina soldadoensis (Zones P4c–P9; 57.79–44.49 Ma) (Pearson et al., 2006), although the profile of the last chamber is somewhat angular, as in A. bullbrooki.
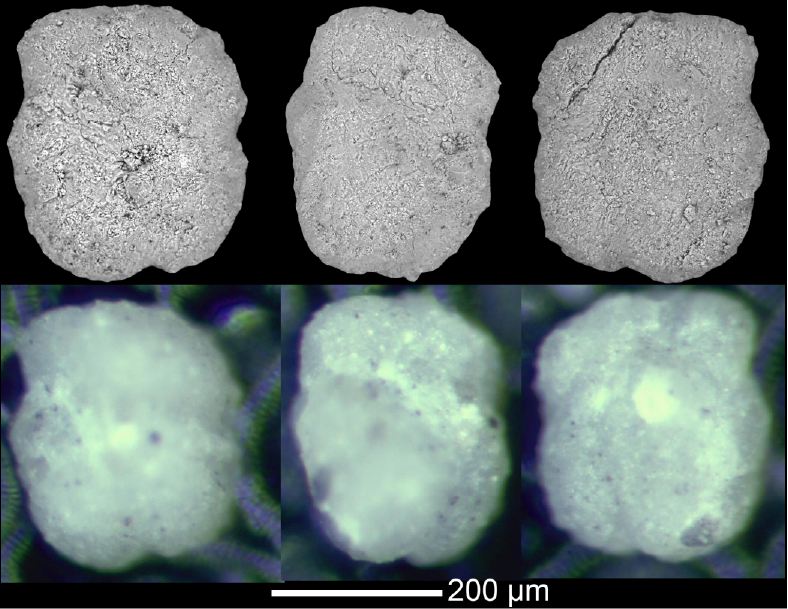
Benthic foraminifers
The occurrence of benthic foraminifers is generally low and sporadic, with many barren samples. However, some broad assemblage zones can be defined, and the paleoenvironmental implications presented below are based on the most common species and on preservation state. The assemblage zones are listed in order of total depth (mbsf), rather than by hole (Figure F41). Paleobathymetric and paleoenvironmental designations are based on published studies, such as van Morkhoven et al. (1986), Kaiho (1992), and Holbourn et al. (2013).
Assemblage 1: Uvigerina
- Depth: 0–28 mbsf
- Age: Quaternary (0–1.6 Ma)
- Samples: 351-U1438A-1H to mudline; 351-U1438A-2H-5W, 90–91 cm; 351-U1438B-2H-1W, 68–71 cm; 351-U1438B-4H-1W, 136–137 cm
Characteristics
The relative proportion of benthic foraminifers is small compared to planktonic foraminifers. This assemblage is composed of relatively well preserved smaller benthic foraminifers, including the species Rhizammina sp., Reophax sp., Nonionella sp., and Saccammina sp. in the core-top mudline sample and Uvigerina peregrina, Cibicidoides mundulus, Planulina wuellerstorfi, Uvigerina hispida, Nodosaria spp., Quinqueloculina sp., Cibicidoides spp., Fursenkoina complanata, Melonis barleeanum, Stilostomella spp., Fissurina sp., Eggerella bradyi, Gyroidina sp., and Globocassidulina subglobosa. The lithology is predominantly clay, and several samples are barren of foraminifers.
Remarks
The surface mudline sample contains predominantly (although not exclusively) agglutinated species, as Site U1438 is currently below the CCD. The occurrence of agglutinated foraminifers is extremely low in the rest of the Site U1438 samples, which may be an indication that agglutinated foraminifers usually disaggregate after burial and are not preserved. The sporadically high abundances of calcareous species in some samples in this assemblage could either be related to CCD changes or possibly rapid burial due to gravity flows. There is, however, no evidence of transported shallow-water (shelf) benthics and no obvious sorting of foraminifers on test size and shape that may be indicative of gravity flows. The overlapping depth ranges of these species in the modern ocean is generally considered to be lower bathyal to upper abyssal (1000–3000 m water depth), although this is primarily controlled by the level of the CCD (currently about 4.5 km in the Pacific Ocean) and organic carbon flux, controlled partly by surface ocean productivity and intermediate water mass properties that are globally changeable. These parameters are considered to have been highly variable over the Quaternary (see Pälike et al., 2012, for Pacific CCD changes). Thus, using benthic foraminifers for detailed paleodepth reconstructions in deeper water (bathyal and deeper) is not generally regarded as accurate (e.g., Holbourn et al., 2013). Further work is needed to ascertain if this assemblage is primarily related to environmental changes (CCD and/or organic carbon flux) or lateral transport.
Barren interval
This interval includes fine clays and silts with rare to common fish teeth, likely deposited below the CCD.
Assemblage 2: Nodosaria/Gyroidina
- Depth: 166–245 mbsf
- Age: mid-Oligocene (~25.5–28 Ma)
- Intervals: 351-U1438B-18H-CC to 29X-CC; 351-U1438D-2R-CC and 3R-CC
Characteristics
This assemblage zone contains a number of samples, and although the overall diversity is quite high, species diversity in individual samples is generally less than 5. Planktonic foraminifers are usually rare. Preservation is good, although some specimens are broken. The lithology is predominantly clay. The most common species in the samples include Cibicidoides spp., Nodosaria spp., Globocassidulina moluccensis, and Gyroidina sp. Other species present are Pullenia sp., Nodosaria longiscata, Uvigerina sp., Trifarina sp., Nuttalides sp., Stilostomella spp., Glandulina spp., Pleurostomella subcylindrica, Cibicidoides grimsdalei, Oridorsalis umbonatus, Cribrostomoides subglobosus, Pullenia simplex, Sphaeroidina bulloides, Stilostomella abyssorum, Karrerulina sp., Rhabdammina sp., Cibicidoides laurisae, C. mundulus, Cibicidoides havanensis, and Lagena sulcata.
Remarks
The benthic foraminifers are typically found at lower bathyal to abyssal depths (1000 to >4000 m water depth), although as stated above, the primary control on depth preferences for deep-sea foraminifers is organic carbon flux and the level of the CCD. The low species abundances may be related to sediment dilution due to high sedimentation rates. However, the very low proportion of planktonic foraminifers may suggest that these samples have been affected by dissolution and therefore deposited below or very near to the CCD, which was at ~4.7 km during the mid-Oligocene in the east Pacific (Pälike et al., 2012).
Assemblage 3: Amphistegina/Lepidocyclina
- Depth: 257–430 mbsf
- Age: early Oligocene (~28–30.2 Ma)
- Samples: 351-U1438B-30X-CC; 351-U1438D-12R-CC; 351-U1438D-13R-CC; 351-U1438D-14R-CC; 351-U1438D-16R-CC; 351-U1438D-17R-CC; 351-U1438D-22R-CC; 351-U1438D-23R-3A, 95–98 cm; 351-U1438D-23R-CC; 351-U1438D-24R-2A, 105–107 cm
Characteristics
Very sparse, poorly preserved, grayish/yellowish, commonly etched specimens of species belonging to the genera Amphistegina and Lepidocyclina. These specimens always occur within sandy intervals.
Remarks
Both genera are “larger” benthic foraminifers that produce a complex wall structure of numerous chambers used to house photosynthetic symbionts. These species therefore show strong evidence of being transported from a shallow (<200 m?) reef environment along with the sands. More detailed thin section analysis is required to speciate these specimens, although the genera are long-ranging from Eocene to Miocene.
Barren interval
This interval contains predominantly fine sands.
Assemblage 4: Cibicidoides
- Depth: 520–587 mbsf
- Age: early Oligocene (~31–33.2 Ma)
- Samples: 351-U1438D-32R-CC, 36R-CC, 38R-CC, 39R-CC
Characteristics
Only four samples in this interval contain foraminifers, and these are in low abundance. However, there are a number of species present, including Cibicidoides pachyderma, C. havanensis, C. laurisae, Stilostomella sp., Nonionella sp., Rhabdammina spp., Bathysiphon sp., Sigmavirgulina tortuosa, C. subglobosus, P. simplex, Stilostomella sp., and Haplophragmoides sp. Planktonic foraminifers occur in low abundance in some samples. The lithology is clay, apart from Sample 351-U1438D-38R-CC, which contains fine sand.
Remarks
C. pachyderma may be of some stratigraphic significance here, as it ranges from early Oligocene to recent (Holbourn et al., 2013). The majority of species are typical for bathyal to abyssal assemblages. However, Holbourn et al. (2013) list S. tortuosa and C. pachyderma as neritic to upper bathyal, so it is possible that some transportation of material from shallower water has occurred in this sandy sample. It is unlikely that the paleobathymetry of this site was bathyal at this time because of the presence of the abyssal C. havanensis in this assemblage zone (Holbourn et al., 2013). The occurrence of a number of well-preserved agglutinated Rhabdammina spp. in Sample 32R-CC is interesting because of the absence of abundant agglutinated forms in other samples. It is possible that a higher proportion of silica from ash has helped preserve the fauna by replacing the primary organic cement.
Barren interval
- Depth: 597–1460.9 mbsf
- Age: Eocene to possibly latest Paleocene (>33.5 Ma)
- Intervals: 351-U1438D-40R-CC to 72R-CC; 351-U1438E-4R-CC to 68R-CC
Other than a few poorly preserved benthics and planktonics in Samples 351-U1438D-42R-CC, 43R-CC, and 45R-CC and 351-U1438E-4R-CC and 28R-CC, all samples in this interval are barren. The lithology largely ranges from coarse sands to pinkish and grayish clays, passing into darker red and finally brown clay. It is possible that the significantly shallower position of the CCD in the Pacific in the Eocene, compared to the Oligocene, impacted the preservation potential of foraminifers in these samples. The single identifiable benthic foraminifer to occur in this interval, in Sample 351-U1438E-4R-CC, is C. subglobosus, an agglutinated (noncalcareous) species that typically inhabits bathyal to abyssal depths in the modern ocean (Holbourn et al., 2013).
Radiolarians
Hole U1438A
All core catcher samples from Hole U1438A were examined. Only Quaternary radiolarians are present in the studied samples. Additionally, a relatively abundant and well-preserved radiolarian assemblage was recovered from the mudline sample, consistent with a water depth below the CCD. However, radiolarian abundance and preservation decrease drastically downhole. Samples 351-U1438A-1H-CC and 3H-CC are barren of radiolarians or contain only occasional radiolarian fragments. Sample 2H-CC is assigned to the Pleistocene–Holocene RN13–RN17 zones based on the presence of Lamprocyrtis nigriniae, which corresponds to the 1.26–0 Ma interval.
Hole U1438B
Rare, moderately preserved Quaternary radiolarians are present in Sample 351-U1438B-1H-CC. Samples 2H-CC to 11H-CC are generally barren of radiolarians, and only very rare and poorly preserved specimens were observed in that interval. Radiolarians become slightly more abundant and better preserved in Samples 12H-CC to 15H-CC. The only dated radiolarian record from this interval is 17.59–12.6 Ma based on the presence of Calocycletta costata, which suggests assignment to the late early Miocene to early middle Miocene RN5 or RN4 Zones. No identifiable faunas were found in, or deeper than, Sample 16H-CC. Radiolarians are present in some samples, but they are typically recrystallized and have suffered significant dissolution.
Hole U1438D
Samples 351-U1438D-2R-CC to 72R-CC are generally barren of radiolarians or only contain very rare and poorly preserved specimens, which have typically been recrystallized and suffered extreme dissolution.
Hole U1438E
Radiolarian occurrences are low in the majority of samples from Hole U1438E. The skeletons of most recovered radiolarians are recrystallized as quartz, clay minerals, or zeolites and filled by matrix or cement.
Samples from Cores 351-U1438E-4R through 53R are mostly barren of radiolarians, except for a few samples. These samples contain rare and poorly preserved indeterminate specimens, which have typically been recrystallized and suffered extreme dissolution.
Samples from Cores 54R through 68R yielded slightly more abundant but also indeterminable radiolarian assemblages, except for Samples 58R-2, 47–49 cm, 63R-1, 23–25 cm, and 63R-1, 78–81 cm, which contain moderately preserved Paleogene radiolarians.
Sample 58R-2, 47–49 cm, is characterized by the occurrence of Eusyringium fistuligerum, Lithocyclia ocellus, Periphaena tripyramis, Phormocyrtis striata striata, Sethochyrtis cf. triconiscus, Thyrsocyrtis rhizodon, and Thyrsocyrtis triacantha, which indicates a Lutetian–early Bartonian age (Zone RP12–RP14; 46.21–40.65 Ma).
Sample 63R-1, 23–25 cm, yielded an assemblage characterized by the presence of Buryella tetradica, Calocycloma castum, Lamptonium fabaeforme, Phormocyrtis cf. striata exquisita, Theocotyle cryptocephala, Theocotylissa ficus, and Theocotyle nigrinae (Figure F44), which indicates a Ypresian age (Zone RP8; 53.35–50.05 Ma).

The lowest sample yielding determinable radiolarians was Sample 63R-1, 78–81 cm (Figure F44). The assemblage contains radiolarian genera characteristic of the latest Paleocene–early Eocene. Based on the presence of Buryella spp., Phormocyrtis spp., Podocyrtis spp., and Theocotylissa spp., the age of the sample was tentatively interpreted as latest Thanetian–Ypresian (RP7 [top]–9; 56.83–48.57 Ma).
Cores 64R through 69R contain mostly indeterminable radiolarians.
Geochemistry
Interstitial water
To determine the inorganic constituents of interstitial water (IW), 67 whole-round samples were collected at Site U1438 (see the Expedition 351 methods chapter for sampling procedures [Arculus et al., 2015a]). Aliquots of IW were used for shipboard analyses, and the remaining fluid was sampled for shore-based analyses, following protocols specified by individual scientists. From cores recovered in Hole U1438B, 17 samples were taken in lithostratigraphic Unit I and 9 samples were taken in Unit II (see Core descriptions and Figure F45 for lithostratigraphic unit designations). In Hole U1438D, 6 samples were taken in Unit II and 35 were taken in Unit III. Only 4 samples were taken from Unit III in Hole U1438E. Where possible, IW samples were taken in the middle of the core; however, sample locations were adjusted to accommodate changes in lithology, drilling disturbance, and core recovery. In Hole U1438B, some lithologies were too indurated to yield pore water, namely the fine-grained sediments at the bottom of Unit I (Figure F45).
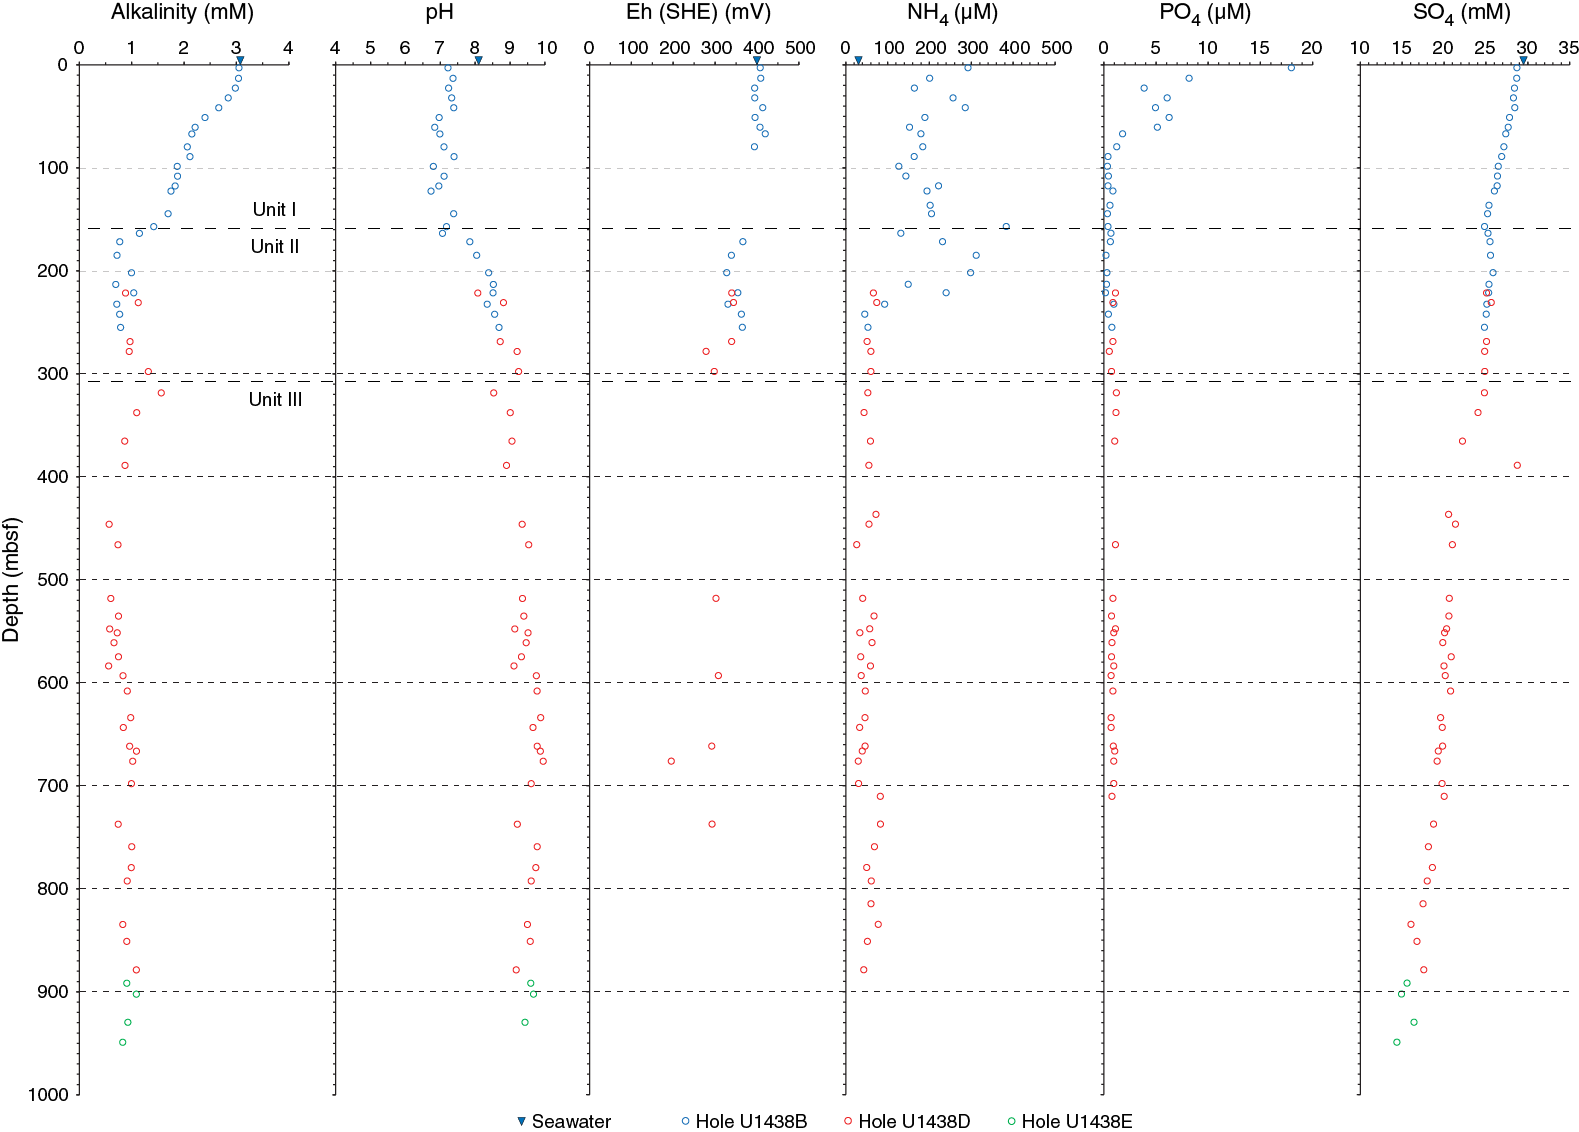
On 10 June 2014, a seawater sample was taken at ~6 m below the sea surface and analyzed for comparison with IW (Table T14). Seawater values are plotted as arrows at the top of the IW downhole profiles.
Table T14. Chemical data of seawater collected 6 m below the sea surface, 10 June 2014. Download table in .csv format.
Alkalinity and pH
Depth profiles of alkalinity and pH are shown in Figure F45. In Unit I (0 to ~160 mbsf), alkalinity decreases downhole from 3.05 to 1.42 mM, whereas pH is nearly constant at ~7, suggesting predominantly carbonate alkalinity. In Unit II (~160 to ~310 mbsf), alkalinity remains nearly constant, averaging ~0.92 ± 0.19 mM, whereas pH increases to a maximum of 9.25 at the bottom of Unit II. This indicates that aqueous carbonate species (HCO3– and CO32–) no longer constitute the major alkalinity component. Specifically, a downhole increase in aqueous silicates and borates results in a pH increase and consistently low alkalinity values. In Unit III (~310 to ~1360 mbsf), alkalinity remains relatively stable, varying from 0.56 mM at 583.65 mbsf (Section 351-U1438D-40R-5) to 1.09 mM at 878.68 mbsf (Section 71R-1). pH slightly increases to a maximum of 9.95 at 676.18 mbsf (Section 351-U1438D-50R-2) and then decreases to 9.43 at 929.65 mbsf (Section 351-U1438E-10R-3).
Redox potential, sulfate, phosphate, and ammonium
The redox potential (Eh) of IW was also measured (see the Expedition 351 methods chapter [Arculus et al., 2015a]) (Figure F45). The redox potential decreases from ~400 mV (Unit I) to ~300 mV (Unit II). Because of the limited IW volume, only five measurements were made in Unit III, yielding a consistent redox potential of ~300 mV with the exception of ~676 mbsf (195 mV). The redox potentials in Holes U1438B and U1438D are relatively oxidizing and in agreement with the relatively high sulfate concentrations, which range from 28.7 mM (~3 mbsf) to 14 mM (~949 mbsf).
Ammonium concentrations vary between 127.1 and 383.4 µM in the uppermost 220 mbsf and do not show a clear trend (Figure F45). Below this depth, ammonium concentrations are relatively stable and low (~26–78 µM). Phosphate concentrations decrease sharply from ~18.0 µM at the surface to 0.4 µM at 100 mbsf and remain around 0.4 µM deeper than 100 mbsf. The depletion of ammonium and phosphate deeper than 250 mbsf is best explained by a sharp downhole decline of microbial activity.
Salinity, chloride, bromide, sodium, potassium, calcium, and magnesium
Salinity varies from 36.5 to 37.5 throughout Unit I, slightly increases to 39 in Unit II, and then rapidly increases in Unit III to the maximum value of 47 at the bottom of Hole U1438D (Figure F46). The maximum in salinity is mainly due to a downhole increase in Ca concentration, reaching a maximum concentration ~27 times greater than seawater.
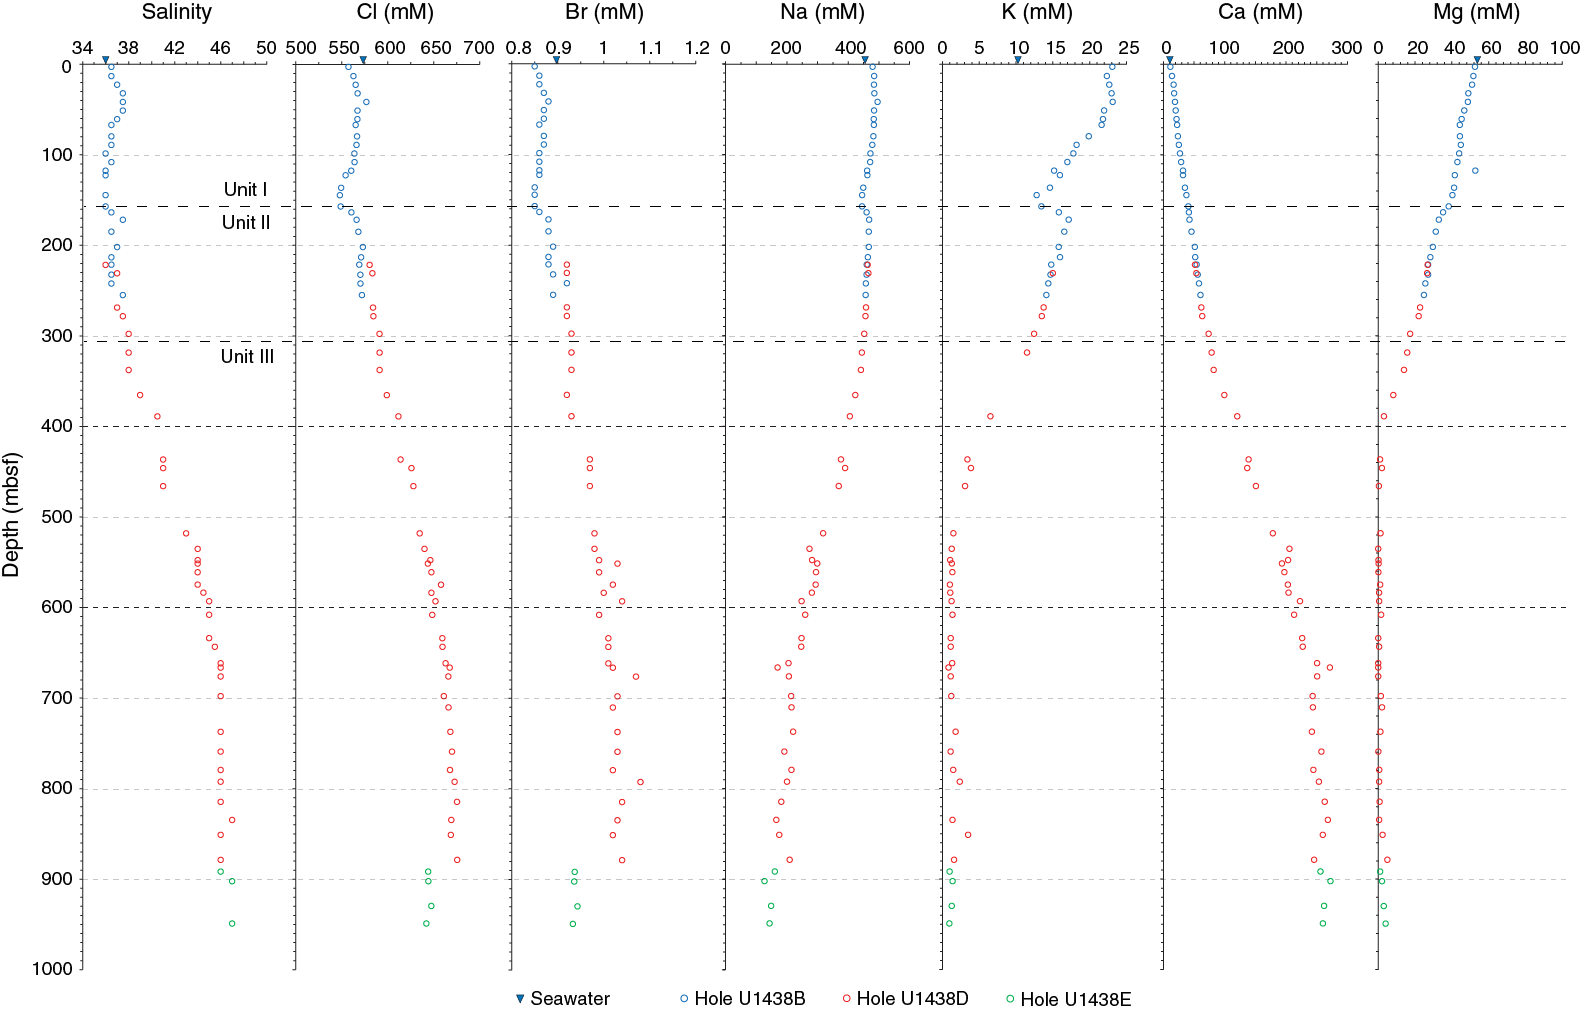
Chloride concentrations vary from ~560 to 548 mM in Unit I. It is possible that the clay content at the base of Unit I, in particular, acts as a semipermeable membrane impeding diffusion of the anions across the Unit I/II boundary, causing a lower concentration in Unit I (see discussion in Egeberg et al., 1990). Chloride concentrations increase through Unit II and III and reach a maximum concentration of 675.61 mM at the base of Hole U1438D. Bromide concentrations range from 0.85 to 1.08 mM, three orders of magnitude less than that of chloride, but exhibit a similar trend to the latter with depth (Figure F46). The downcore increase in chloride and bromide concentrations is most likely due to hydration reactions in the mineral lattice, which preferentially incorporates hydroxyl anions rather than chloride and bromide, resulting in chloride and bromide enrichment in IW (Egeberg et al., 1990; Wei et al., 2008). This enrichment is in agreement with the formation of secondary hydrated mineral phases such as zeolites identified by XRD (see Core descriptions).
Sodium concentrations decrease slightly from ~479.6 to 445.2 mM in Unit I (Figure F46), increase slightly at the Unit I/II boundary (~164 mbsf), and then progressively decrease to a minimum of 127.1 mM at ~902 mbsf (Core 351-U1438E-7R). Overall, Na concentrations decrease downcore by ~66%. Potassium behaves similarly to Na in that the concentrations decrease until the Unit I/II boundary, increase in the first three cores of Unit II, and then decrease to a minimum value of 1.59 mM at ~879 mbsf (Core 351-U1438D-71R) (Figure F46).
Calcium concentrations increase linearly from ~11.5 mM (3 mbsf) to ~271.5 mM (~298 mbsf; Core 351-U1438D-49R), and continue to increase linearly, at a higher rate, reaching a maximum of ~272 mM (~666 mbsf), below which concentrations vary within a narrow range of 246–272 mM to ~949 mbsf (Figure F46). Magnesium concentrations decrease linearly downhole from 53 mM (~3 mbsf) to depletion in the aqueous phase at ~437 mbsf (Figure F46). To 389 mbsf, Ca and Mg concentration profiles show opposite trends and no clear differences across the interface of Units I and II, indicating that diffusion and ion exchange influence their mobility in the IW. The synchronous increase in Ca and decrease in Mg concentrations was observed in western Pacific marginal basins and attributed to the diagenesis of volcaniclastic sediments (e.g., Gieskes and Lawrence, 1981; Egeberg et al., 1990; Torres et al., 1995; Salisbury, Shinohara, Richter, et al., 2002). Leaching of Ca from the volcanic glass in the sediment is a potential source for Ca in IW, and Mg and K presumably replace Ca through ion exchange and diffusion into the sediments.
Boron, lithium, silica, manganese, barium, and strontium
Boron concentrations increase from 568.67 µM at ~3 mbsf (Core 351-U1438B-1H) to 635.47 µM at ~108 mbsf (Core 12H) and then decreased to 316.05 µM at the base of Hole U1438D (~879 mbsf) (Figure F47). Lithium concentrations increase from 21.54 µM at 3 mbsf (Core 351-U1438B-1H) to 32.29 µM at ~136 mbsf (Core 351-U1438B-15H), then decrease to 5.95 µM at ~792 mbsf (Core U1438D-62R) (Figure F47). Both Li and B concentrations increased at ~518 and ~737 mbsf (Cores 351-U1438D-33R and 56R), possibly as a result of remobilization and ion exchange in secondary minerals. Li concentrations increase significantly from Core 351-U1438D-66R to the bottom of Hole U1438D, occurring coincident with faulted beds (see Core descriptions). The major changes in Li and B concentrations occur independently of lithostratigraphic unit boundaries; however, both elements covary with pH (Figures F45, F47), suggesting that B and Li may be released in the upper sediment where pH is lower as a result of silicate dissolution and desorption of clay minerals, but retained in secondary minerals down hole where pH increased.
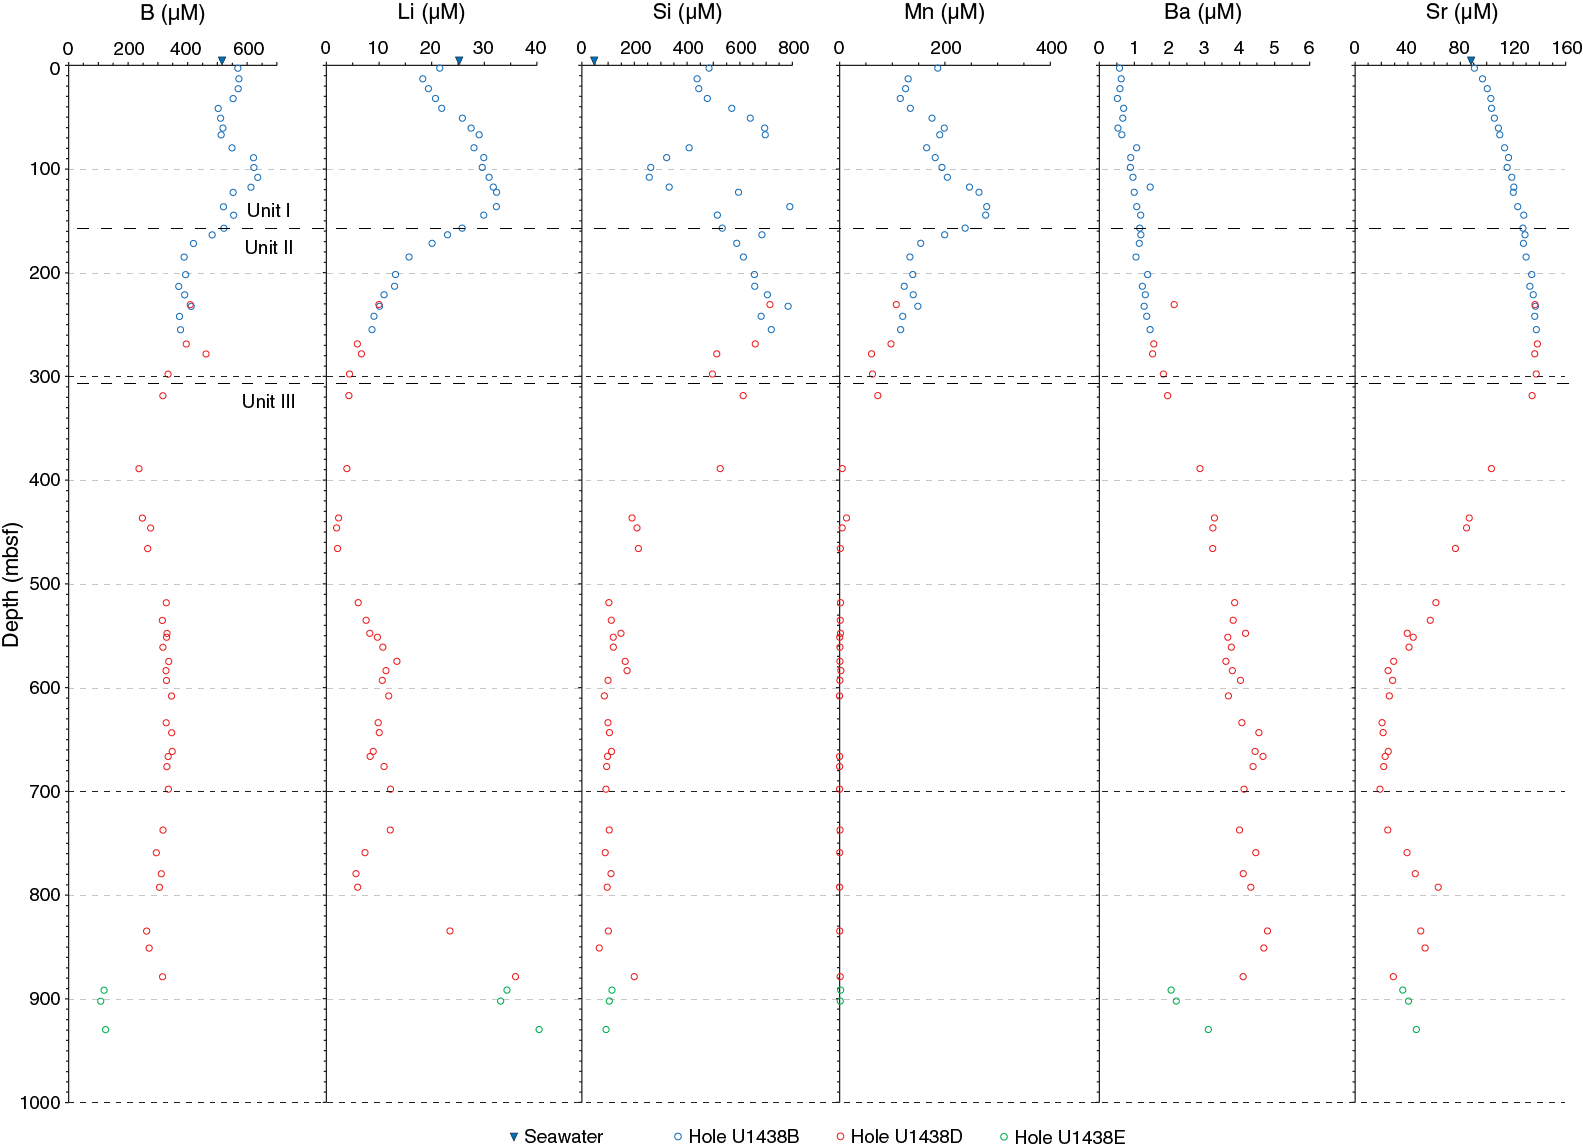
Silica concentrations vary significantly through Unit I (Figure F47) and can be generally correlated with the presence of volcanic ash layers (see Core descriptions), probably as a result of the dissolution of volcanic glass and silica phases concentrated in the ash layers. Si concentrations increase gradually to 255 mbsf (Core 351-U1438B-30X), possibly a zone of maximum silicate mineral dissolution, and then decrease through the remainder of Unit II and into Unit III to 851 mbsf (Core 351-U1438D-68R). Deeper than Core 68R, Si concentrations increase slightly and occur coincident with faulted beds (see Core descriptions). The downhole profile of manganese concentrations is similar to Si (Figure F47). Enhanced reduction of Mn oxides is indicated by the Mn concentration maximum near the base of Unit I.
The profile of barium resembles that of Ca, showing a downhole increase of ~900% (Figure F47), probably indicating that the alteration of volcaniclastic sediments and the basement released these cations into the IW. In addition, both Ba and Ca are present in sulfate minerals, the former in barite and the latter in gypsum and anhydrite. The presence of these minerals was confirmed by shipboard petrographic microscopy and XRD analysis (see Core descriptions). Preliminary pore water geochemical calculations indicate that barite was likely oversaturated throughout the sampled depths, whereas gypsum was oversaturated deeper than ~390 mbsf, corroborating the influence of these sulfate minerals on the patterns of Ca and Ba in the pore water.
Strontium concentrations increase from 90.63 µM at the surface (Core 351-U1438B-1H) to 138.50 µM at 269 mbsf (Core 351-U1438D-8R) (Figure F47). The steady increase of Sr with depth through Units I and II is most likely the result of low-temperature alteration of volcaniclastic sediment releasing Sr (Hawkesworth and Elderfield, 1978) and the recrystallization of calcium carbonate, as seen at ODP Site 1201 (Salisbury, Shinohara, Richter, et al., 2002). The highest Sr concentration occurs near the base of Unit II, consistent with an upper reaction zone of fresh volcaniclastic material (see Core descriptions). In Unit III, Sr concentrations decrease rapidly and reach a minimum of 18.94 µM at 698 mbsf.
Crystalline precipitates in acidified IW samples
White and translucent crystalline needles were observed inside 15 vials of IW samples after acidification (see the Expedition 351 methods chapter [Arculus et al., 2015a]). The precipitates were photographed (Figure F48) and subsequently investigated under the petrographic microscope and by XRD. In addition, precipitates in three of the IW samples were filtered with a 0.45 μm (pore size) filter, and the remaining solution was analyzed by inductively coupled plasma–atomic emission spectroscopy (ICP-AES) and ion chromatography. The results show that the precipitates account for a loss of 18–21 mM of Ca (7.7%–8.9%), 6–8 mM of Na (2.6%–4.2%), 25–30 mM of Cl (3.8%–4.5%), and 3–6 mM of SO42– (16.7%–28.7%). Petrographic microscopy of these crystals reveals relatively low birefringence, twinning, and extinction at 45°. The XRD pattern confirms the presence of gypsum. Although the ICP-AES data point to the formation of chloride minerals like CaCl2 or NaCl, these were not observed in the XRD, probably because these precipitates were subject to possible dissolution in deionized water, which was used to spread the sample across the holder for the XRD analysis.
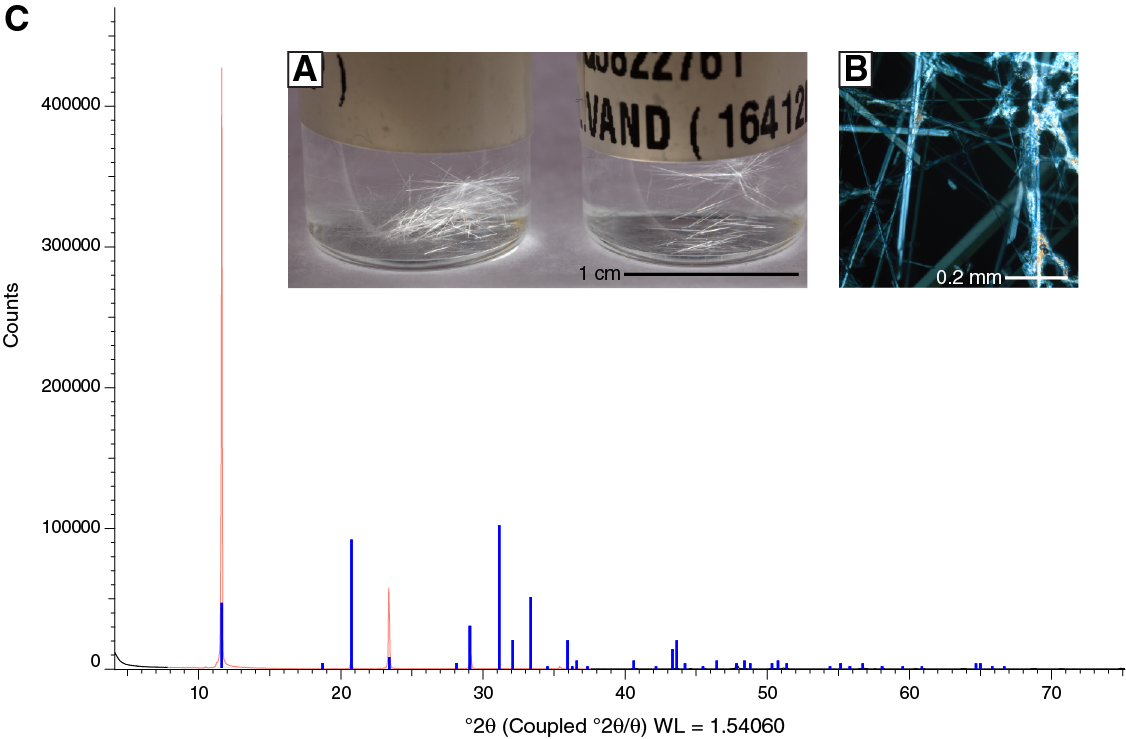
Solid phase analyses
Headspace gas
Samples were taken from 160 sediment cores from Units I–IV at Site U1438 for headspace gas analyses. No samples were taken from Unit 1 (basement). Methane concentrations range from 1.12 to 9.1 ppmv with an average of 2.35 ppmv (Figure F49), indicating a background level. Ethane was detected in four cores, with a maximum concentration of 2.03 ppmv. No propane or longer chain hydrocarbons were detected in any Site U1438 cores.

Carbonate, total organic carbon, and total nitrogen
Carbonate content in the solid phase is generally low in Unit I, typically <0.5 wt% (Figure F49). Two foraminiferal oozes from 7.8–8.3 mbsf (Sections 351-U1438B-2H-1 and 2H-2) and ~12.5 mbsf (Section 2H-5) are characterized by very high CaCO3 contents, 28.7 wt% (n = 3) and 59.7 wt% (n = 1), respectively. Unit II is distinct from Unit I with a higher average (12.2 wt%) and variation between 0.1 and 37.6 wt% CaCO3. For the upper part of Unit III (309.6–666.5 mbsf), the carbonate content varies between 0.2 and 14.3 wt% (average = 4.2 wt%), whereas from 666.5 mbsf (Section 351-U1438D-49R-1) to 949 mbsf (Section 351-U1438E-12R-3), it is less than 1 wt%. One exception is a sample at the base of Unit III (Section 351-U1438E-52R-3) that contains 10.5 wt% CaCO3. No samples were analyzed for carbonate content between 950 and 1332 mbsf. The average carbonate content of Unit IV was ~1 wt%, with a maximum of 3.4 wt% in Section 351-U1438E-66R-CC.
Total organic carbon (TOC) decreases rapidly from 0.22 wt% at the top of Unit I (Section 351-U1438B-1H-1; 2.9 mbsf) to 0.04 wt% at the bottom (Section 17H-1; 157.05 mbsf) but abruptly rises to 0.51 wt% at the top of Unit II (Section 20F-2; 171.75 mbsf) and remains relatively high in the rest of Unit II (0–0.25 wt%) (Figure F49). The TOC of Unit III exceeds 0.1 wt% on only four occasions. From 535.4 mbsf to Unit IV, TOC values were all <0.1 wt%.
Total nitrogen content decreases from 0.05 wt% at the top of Unit I (Section 351-U1438B-1H-1; 2.9 mbsf) to 0.01 wt% at the bottom (Section 17H-1; 157.05 mbsf) and is 0 wt% in Units II–IV (Figure F49).
Sediment geochemistry
A total of 27 sedimentary samples were chosen for ICP-AES analysis. Ten were selected from the squeeze cake sections to compare solid-phase chemical compositions with IW compositions, and the remaining 17 samples were selected at ~50 m intervals downhole. Downhole profiles for major elements are shown in Figure F50, and bulk chemical compositions are reported in Table T15. Loss on ignition (LOI) for sediment samples ranges from 3.91 to 14.47 wt%. The highest LOI values are from unconsolidated sediments in Unit II. During sample preparation (see the Expedition 351 methods chapter [Arculus et al., 2015a]), no undissolved macroscopic residue was observed after nitric acid digestion. In order to avoid microscopic undigested residue from the rock samples entering the ICP-AES, samples were filtered with a 0.45 μm filter.
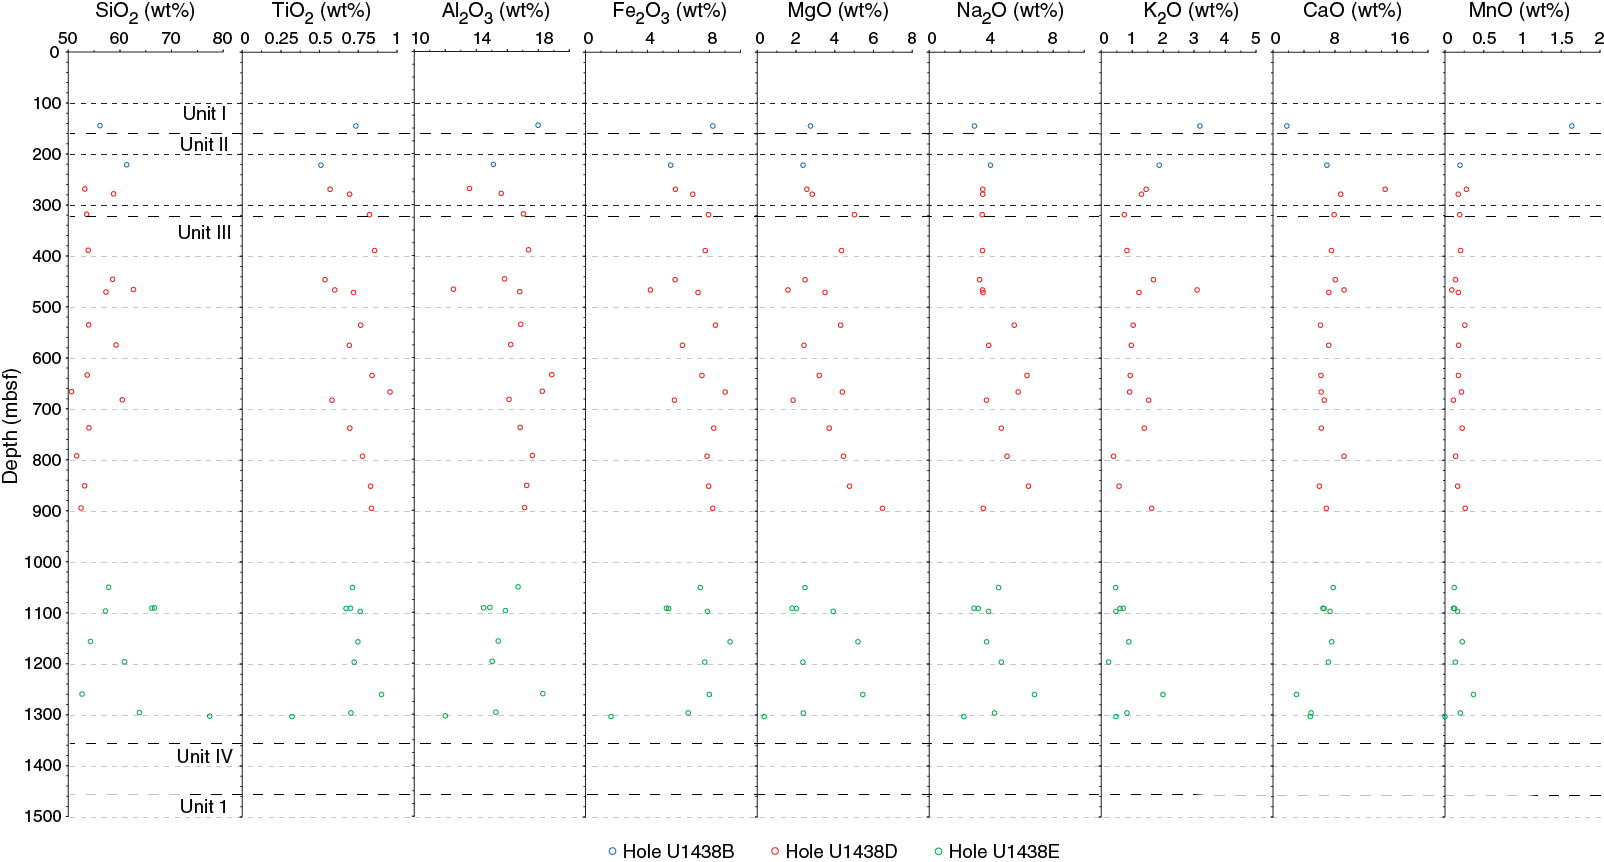
Table T15. Sediment and hard rock bulk chemistry: SiO2, Al2O3, TiO2, Fe2O3t, MgO, K2O, CaO, MnO, Na2O, LOI, Ba, Cr, Sc, Sr, V, Y, and Zr. Download table in .csv format.
In Unit III, CaO decreases in the sediments from 9.17 wt% at ~466 mbsf (Core 351-U1438D-28R) to 3.04 wt% at ~1260 mbsf (Core 351-U1438E-44R), varying inversely with the increase of Ca in the IW (Figure F50). Concentrations of SiO2 range from ~53 to ~78 wt%. Downhole variations in Si/Mg ratios are roughly correlated with changes in grain size (Figure F51). Maxima in Si/Mg ratios occur near conglomerate intervals, presumably from increased abundances of volcanic-derived detritus (see Core descriptions). The observed Si/Mg maxima near these zones suggest that the source of volcaniclastic sediment during these intervals was probably andesitic to rhyolitic/dacitic in composition. Al2O3 also correlates with grain size distribution downhole. In the conglomerate intervals, decreases in Al2O3 content are observed (Figure F51).
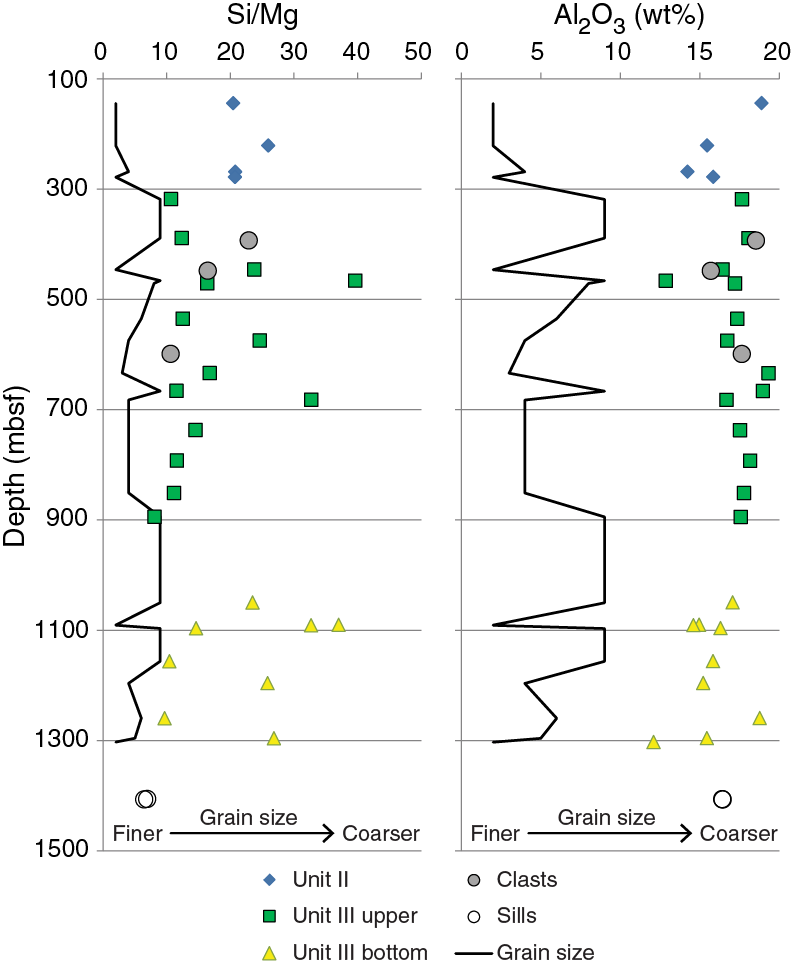
Igneous geochemistry
Thirty-seven samples from the lava flows of Unit 1 were collected in Cores 351-U1438E-70R through 88R and analyzed for major and trace elements by ICP-AES (Table T15). LOI for the basement samples ranges between 0.80 and 5.80 wt%. One outlier, altered Sample 351-U1438E-83R-2, has an LOI of 11.23 wt% and contains 77.84 wt% SiO2 and only 3.75 wt% Fe2O3. The majority of the lava flow samples are high-MgO (mostly >8 wt%), low-TiO2 (0.6–1.1 wt%), low-Zr (mostly <50 ppm), high-Sc (mostly >40 ppm), and high-Cr (up to ~400 ppm) tholeiitic basalts. They are compositionally very similar to the ~49 Ma basalts recovered from ODP Leg 195 Hole 1201D in the West Philippine Basin (Savov et al., 2005) and the ~52 Ma fore-arc basalts recovered from the present-day Izu-Bonin Trench wall (Reagan et al., 2010; Ishizuka et al., 2011) (Figure F52). Compared with global mid-ocean-ridge basalt compositions (Jenner and O’Neill, 2012), Hole U1438E basalts have high MgO/FeO with markedly low TiO2, low Zr, and high Sc abundances; they are relatively primitive melts and likely derived from strongly depleted upper mantle sources, as indicated by very low Zr/Y ratios. Igneous rocks sampled in Unit IV above the basement in Cores 351-U1438-61R and 62R are Na-rich basaltic andesite.
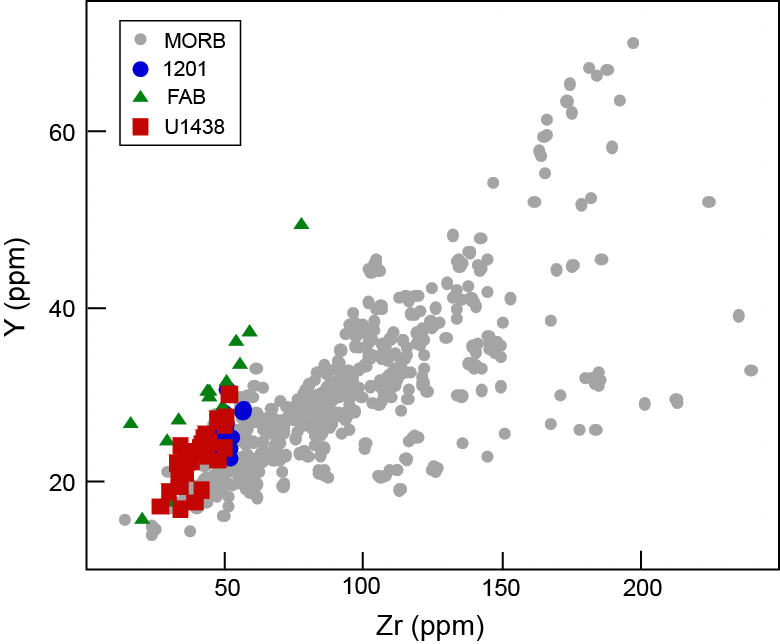
Paleomagnetism
Archive-half core remanence data
Remanence measurements were made at 2 cm intervals on all archive-half APC cores in Holes U1438A and U1438B, on archive-half XCB core pieces in Hole U1438B, and on archive-half RCB core pieces longer than approximately 10 cm in Holes U1438D and U1438E. All archive-half samples were subjected to stepwise alternating field (AF) demagnetization at 25, 35, and 40 mT, following experiments on pilot sections that were demagnetized in 5 mT steps up to 40 mT. These experiments showed that the ubiquitous drilling-induced magnetic overprint could be largely removed by treatment at 25 mT, allowing the paleomagnetic polarity of most core sections to be determined. Additional measurements after treatment at 35 and 40 mT were conducted, however, to allow the reliability of data to be checked. Demagnetization in AFs > 40 mT was not attempted because of a well-documented problem with the superconducting rock magnetometer (SRM) demagnetization coils that has been a characteristic problem of the SRM system observed during several IODP expeditions (e.g., see Teagle, Ildefonse, Blum, and the Expedition 335 Scientists, 2012), which results in acquisition of spurious, laboratory-imparted anhysteretic remanent magnetizations (ARMs) along the z-axis of the SRM system at higher applied fields.
Remanence data were filtered to discard data obtained within 4.5 cm of section or piece ends, and archive-half core point magnetic susceptibility (Section Half Multisensor Logger [SHMSL]) data were filtered to preserve only data corresponding to the intervals where remanence measurements were made. In general, the quality of magnetic data from APC-recovered intervals is much higher than for data from half-APC and XCB cores. The latter are frequently disturbed by “biscuiting,” characterized by intervals of coherent or relatively undisturbed rotated core segments a few to tens of centimeters long separated by highly disturbed intervals as thick as several centimeters. Hence, magnetization directions and intensity are substantially less noisy and more coherent in APC-recovered intervals. Some interpretable demagnetization data were obtained from XCB Core 351-U1438B-23X, but remaining XCB cores in this hole were too disturbed by biscuiting to yield usable remanence data. RCB cores in Holes U1438D and U1438E consist of unoriented pieces of variable length, and the majority of core sections contained pieces of sufficient length to allow remanence measurements. However, data from RCB cores have a more pervasive drilling-induced magnetic overprint, which was difficult to remove adequately by demagnetization to 40 mT, especially in samples from Hole U1438E.
For the purpose of characterization based on bulk magnetic parameters, the lithologies recovered from Site U1438 are grouped into lithostratigraphic units defined by the core description team. Unit I, which includes all of Hole U1438A and the top of Hole U1438B to 160.3 mbsf (Section 351-U1438B-18H-1, 110 cm), dominantly consists of tuffaceous mud, mud with ash, mud, clay, and ash. Unit II, which includes Hole U1438B deeper than 160.3 mbsf and Hole U1438D to 309.6 mbsf, dominantly consists of tuffaceous siltstones, mudstones, and sandstones. Unit III, which includes Hole U1438D deeper than 309.6 mbsf and Hole U1438E to 1361.4 mbsf, dominantly consists of tuffaceous mudstones, siltstones, sandstones, and breccia-conglomerates. Unit IV, which includes Hole U1438E between 1361.4 and 1461.1 mbsf, dominantly consists of mudstones, sandstones, tuffaceous mudstones, tuffaceous siltstones, and tuffaceous sandstones. Unit 1, at the base of Hole U1438E from 1461.1 to 1611.1 mbsf, consists of basaltic rocks representing the basement to the overlying sedimentary succession. The variations in low-field magnetic susceptibility and the intensity of natural remanent magnetization (NRM) through these units are illustrated in Figures F53 and F54, respectively. The frequency distributions of these parameters in each unit are illustrated in the histograms of Figure F55. Susceptibility increases in maximum values in successive units downhole, with the finer grained lithologies of Unit I having susceptibilities two orders of magnitude lower than the basement rocks of Unit 1. NRM intensities are variable in the sedimentary rocks, reaching maximum values of approximately 1 A/m but with peak values of 7 A/m in Unit II (potentially representing ash layers in the succession). These variations probably reflect higher concentrations of multidomain magnetite grains in the coarser clastic sediments. Basaltic basement rocks of Unit 1 have maximum NRM intensities in excess of 10 A/m, suggesting these rocks may represent a source for marine magnetic anomalies (see below). Figure F56 shows biplots of NRM intensity against susceptibility for all units. Both parameters are dependent on the concentration of magnetic minerals (dominantly magnetite) in samples, and linear trends in such plots indicate a constancy of magnetic mineralogy and ferromagnetic grain size. Such trends are evident in Units I, III, and IV. However, differences in the fields occupied by each unit suggest that there may be contributions to the sedimentary units from sources with different rock magnetic properties. These differences may be resolved using a wider range of magnetic parameters and by employing environmental magnetic principles (Thompson and Oldfield, 1986) to perform unmixing of different magnetic fractions in these sediments.
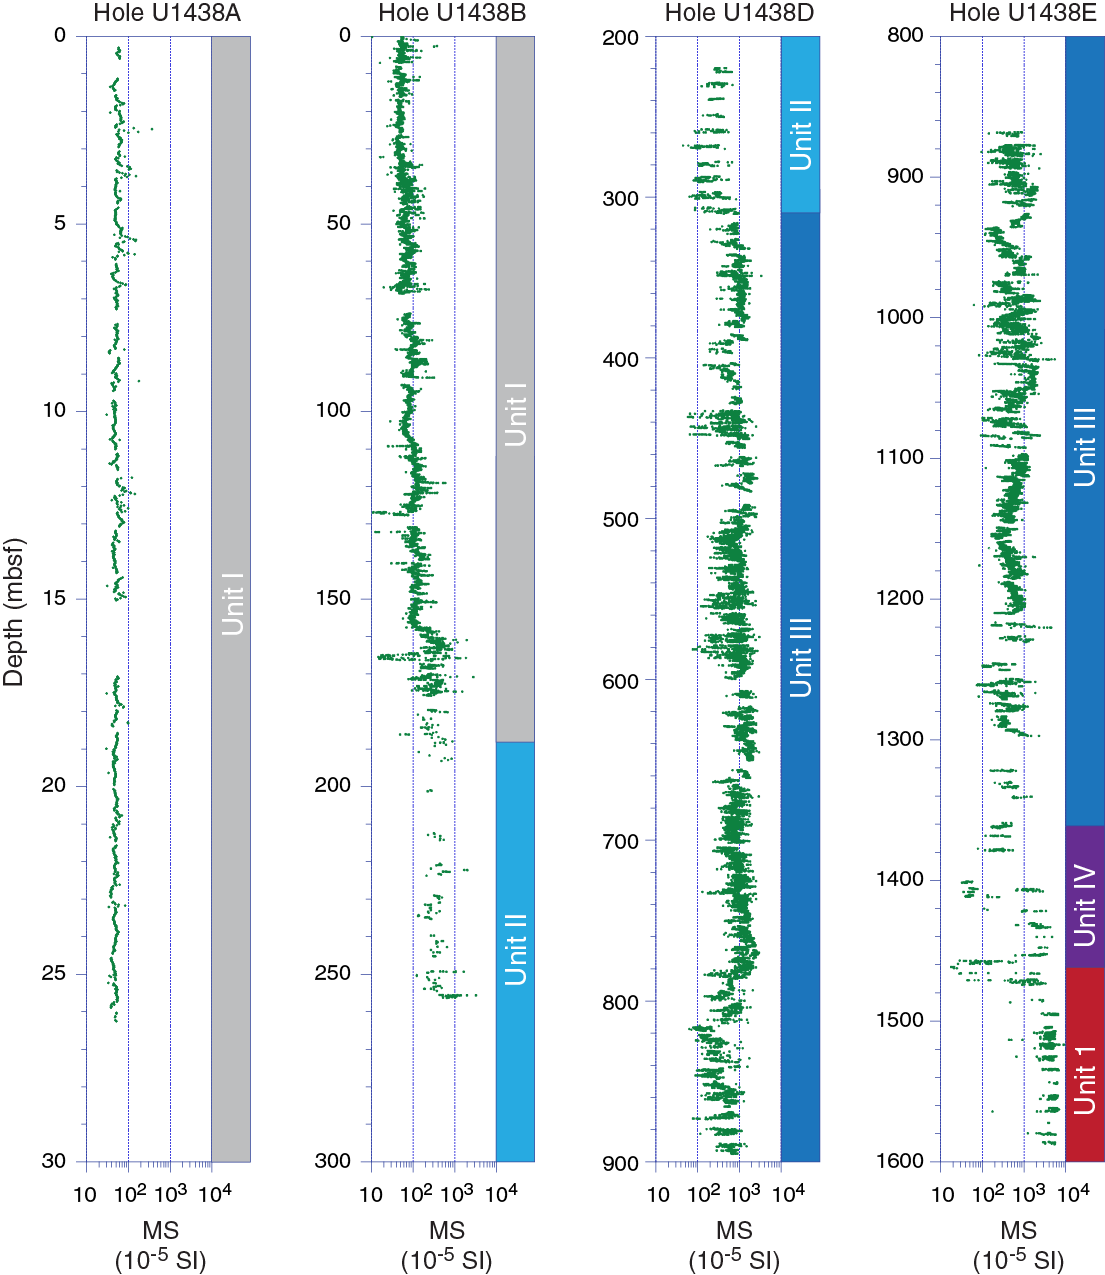
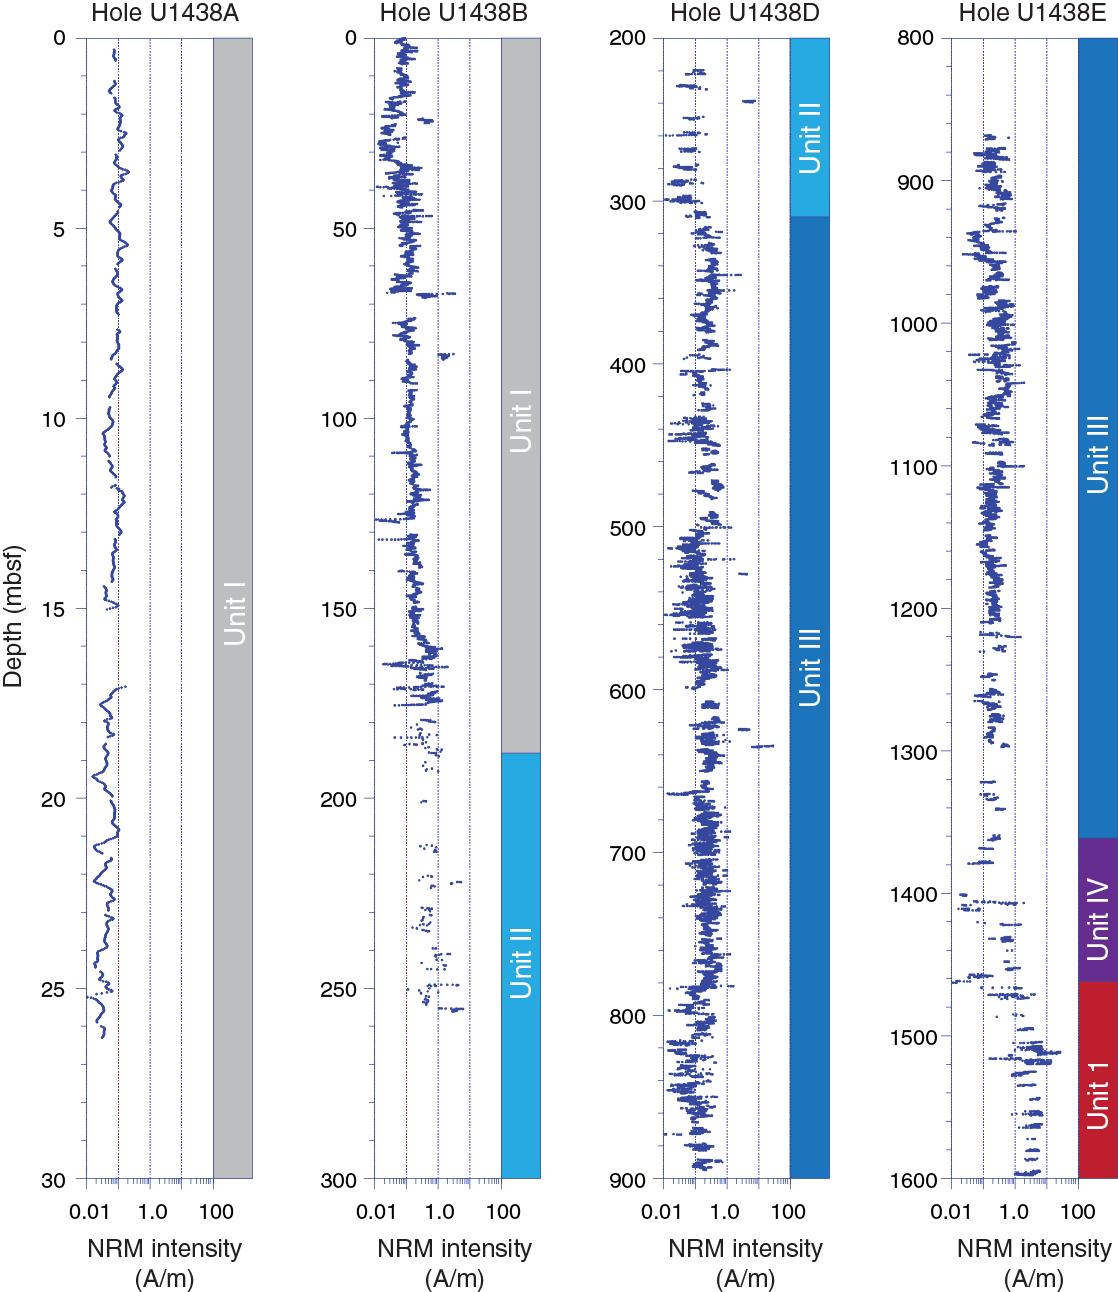
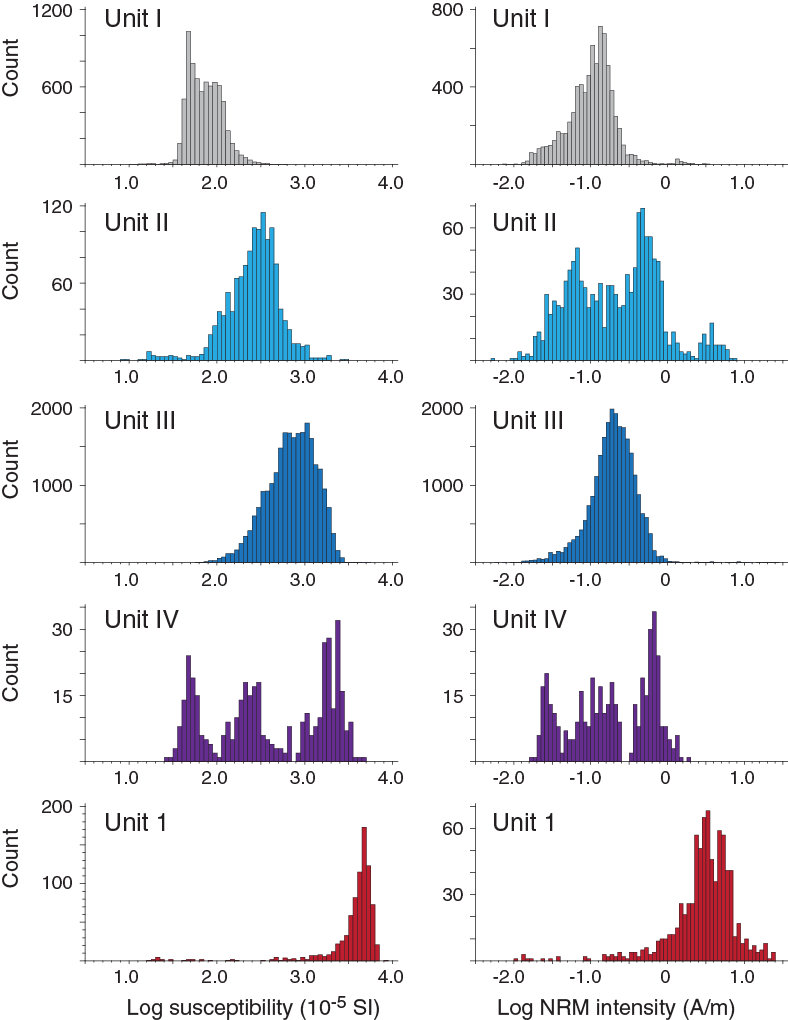
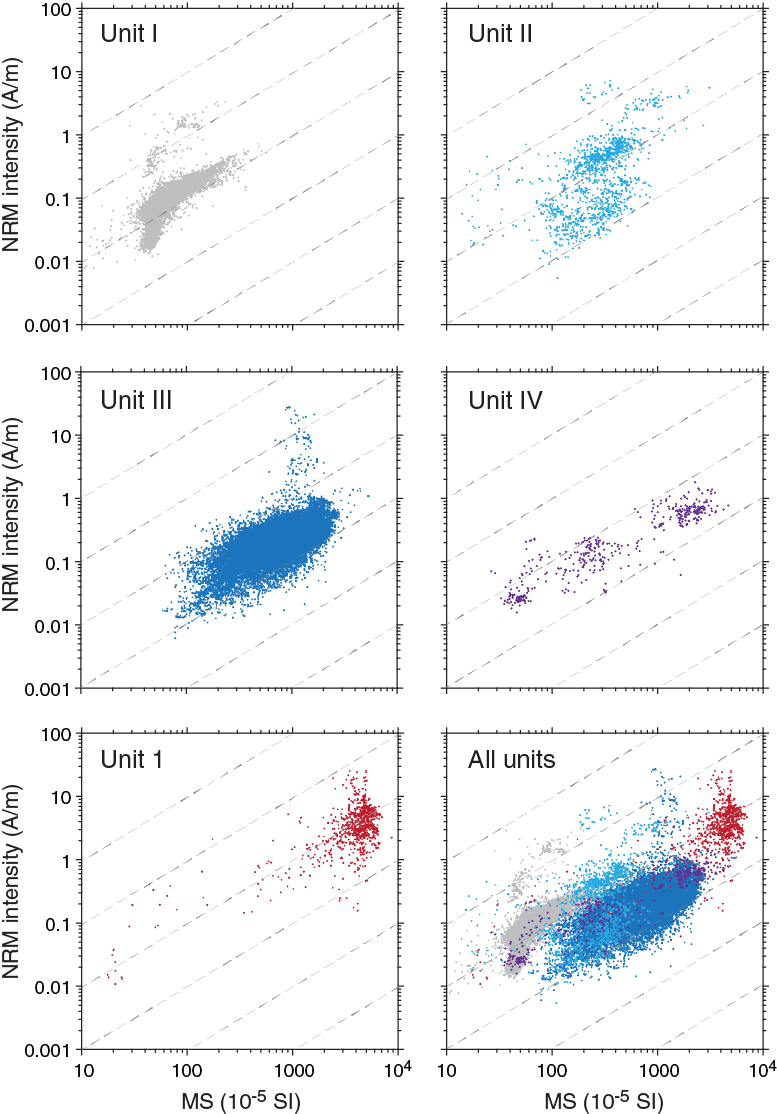
Despite using nonmagnetic core barrels and cutting shoes during collection of cores, NRM directions in both holes are dominated by a pervasive, steeply inclined, drilling-induced magnetic overprint (Figure F57), as documented during numerous ODP and IODP legs/expeditions (Acton et al., 2002). Samples with the highest magnetic susceptibilities ubiquitously have NRM inclinations that are steep and positive as a result of this drilling-induced component, and only samples with susceptibilities less than 1500 × 10–5 SI record NRMs with negative inclinations (Figure F58), suggesting that the overprint resides predominantly in coarse, multidomain magnetite. This spurious magnetization is largely removed by low AF treatments in archive-half section samples. For example, treatment at 25 mT results in a more bimodal distribution of remanence inclinations (reflecting the presence of normal and reversed polarity natural magnetizations). However, the drilling-induced overprint can persist to higher demagnetization levels, potentially biasing normal and reversed polarity magnetizations to steeper and shallower inclinations, respectively, and in some cases making determination of polarity difficult.
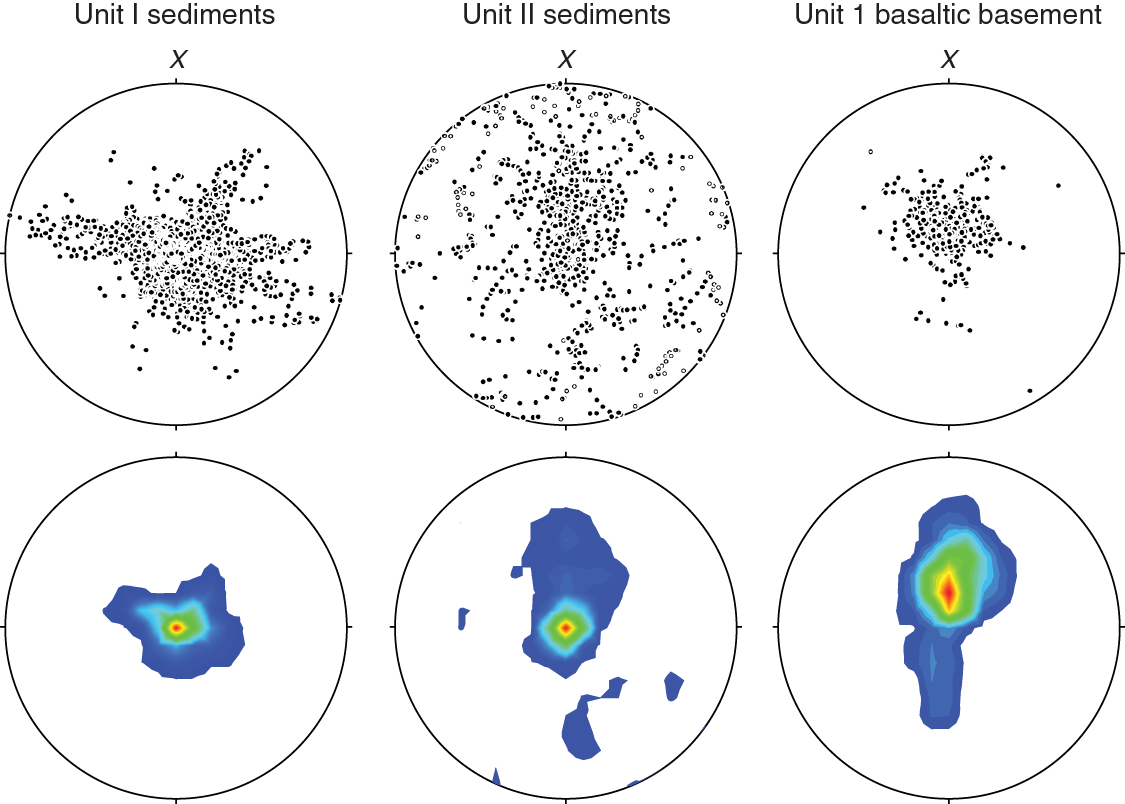
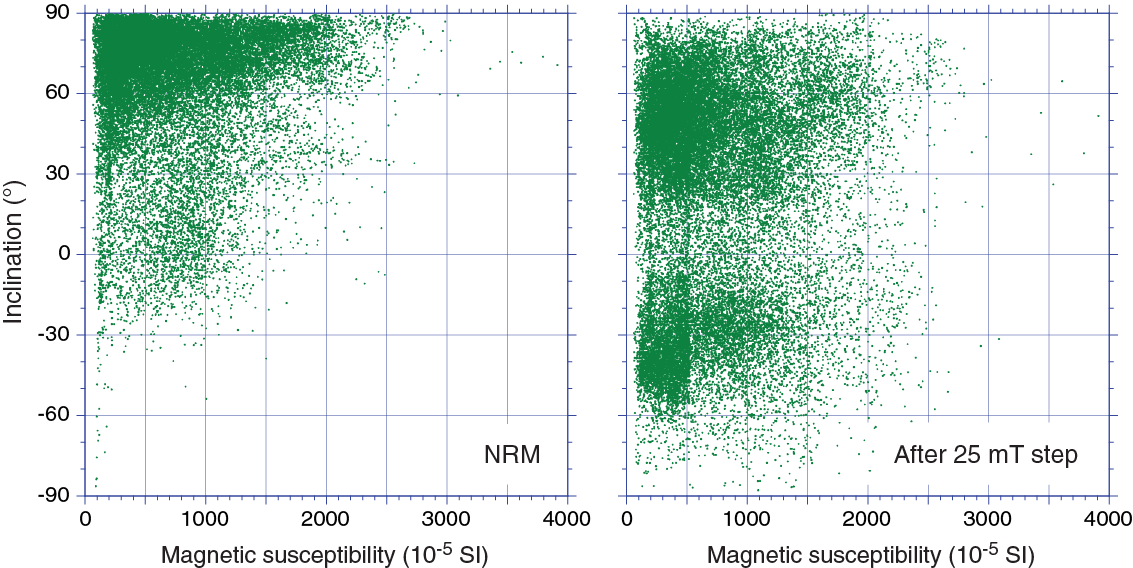
Figures F59, F60, and F61 show representative examples of AF demagnetization behavior in archive-half core samples where components that are not related to drilling have been successfully isolated. The majority of samples have an initially downward-directed remanence due to the drilling-induced component, most of which is removed by AF treatment at 20–25 mT. This is followed by removal of a moderately inclined, either downward- or upward-directed component that decays toward the origin (up to the maximum applied field of 40 mT) on orthogonal vector plots that represent the characteristic remanent magnetization (ChRM). However, demagnetization paths are also frequently observed that do not trend toward the origin by AF treatment up to 40 mT, following removal of the steep drilling-induced component (Figures F62, F63, F64). In some of these examples, the polarity of the ChRM component is readily determined, allowing the SRM data to be used with confidence for magnetostratigraphic purposes. In other cases, successive AF treatment steps define linear components that have positive inclinations but that pass onto the upper hemisphere, requiring a more subjective decision regarding polarity. In some rarer instances, demagnetization paths still trend away from the origin at the highest applied field, making determination of ChRM inclination impossible. Finally, in Unit IV (Hole U1438E), AF demagnetization was effective at removing the drilling-induced overprint but in some cases failed to demagnetize the natural remanence as a result of the presence of hematite-hosted remanences with high coercivities, requiring thermal demagnetization to isolate ChRMs. Shore-based rock magnetic experiments on discrete samples are required in order to fully understand this variability, but we note that polarity was determined unambiguously for the majority of SRM determinations conducted on samples from Holes U1438A, U1438B, and U1438D. Samples from Hole U1438E, however, have ubiquitously steep magnetizations after treatment at the maximum applied field of 40 mT. It is likely that this hole is dominated by normal polarity magnetizations, but shore-based analysis of discrete samples (using higher AFs or thermal demagnetization) is required to identify any magnetozones present deeper than 850 mbsf.
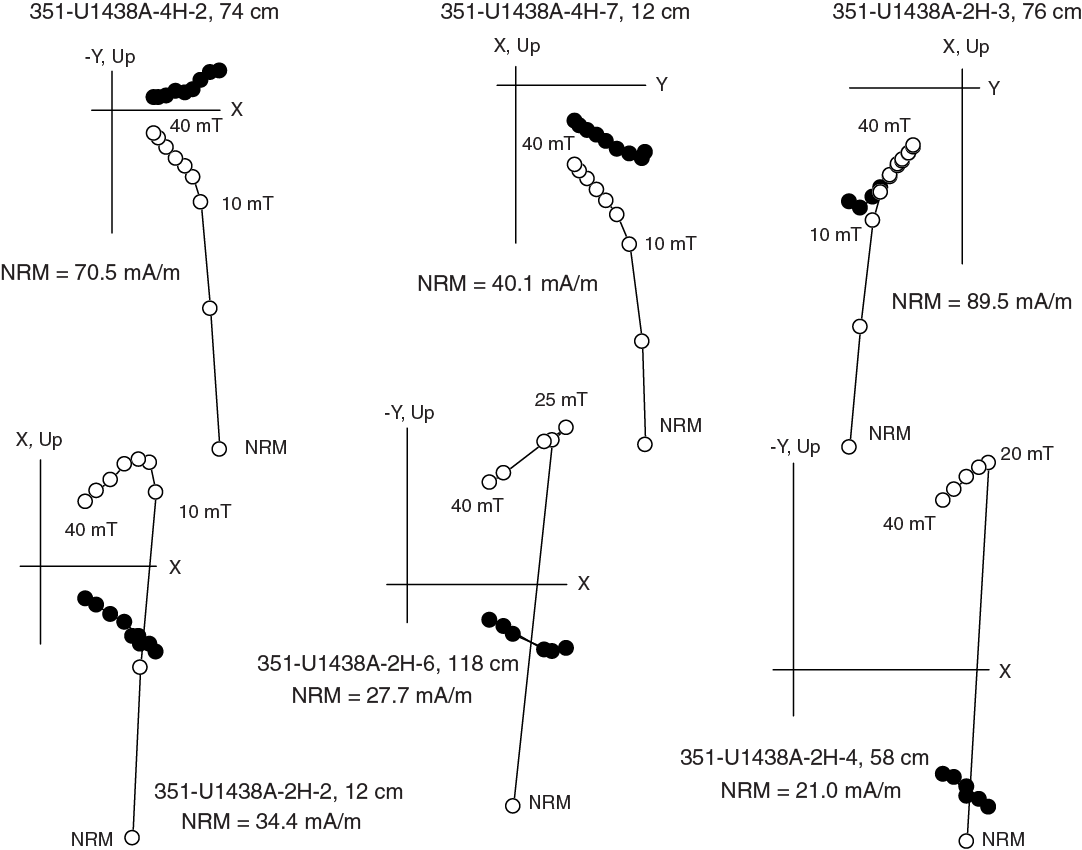
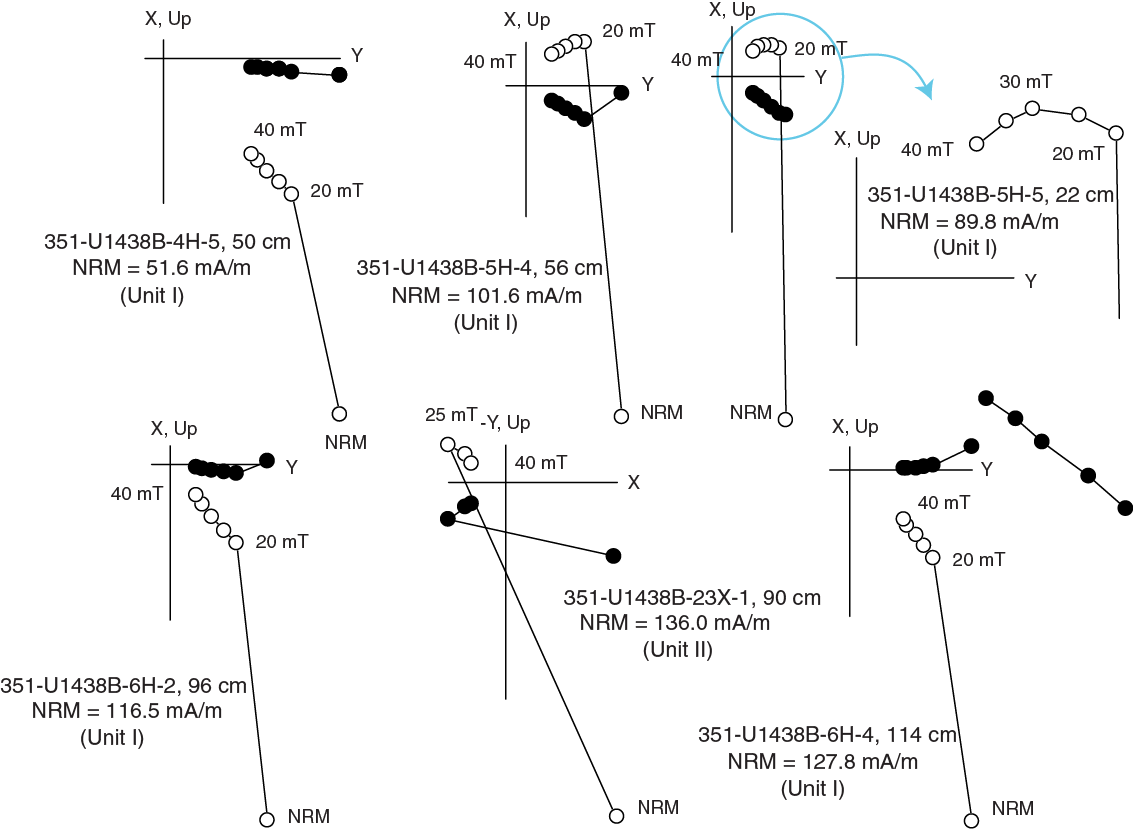

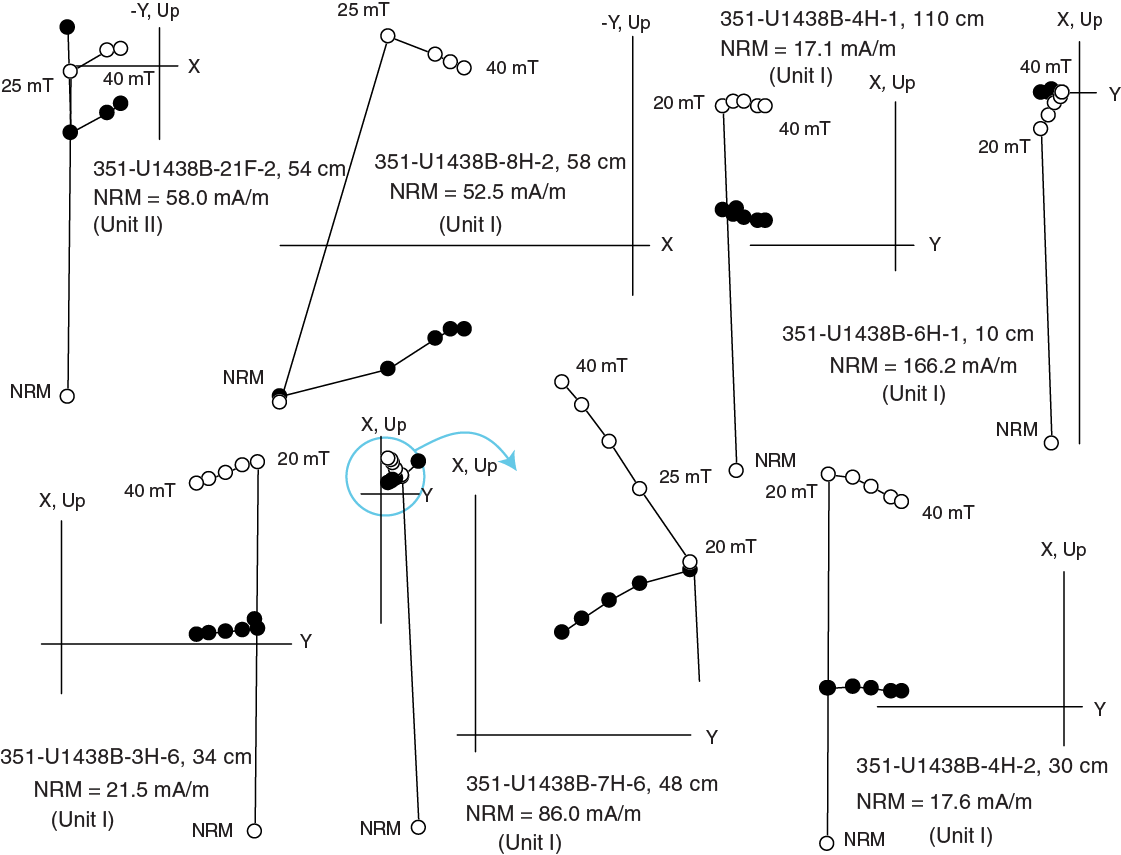
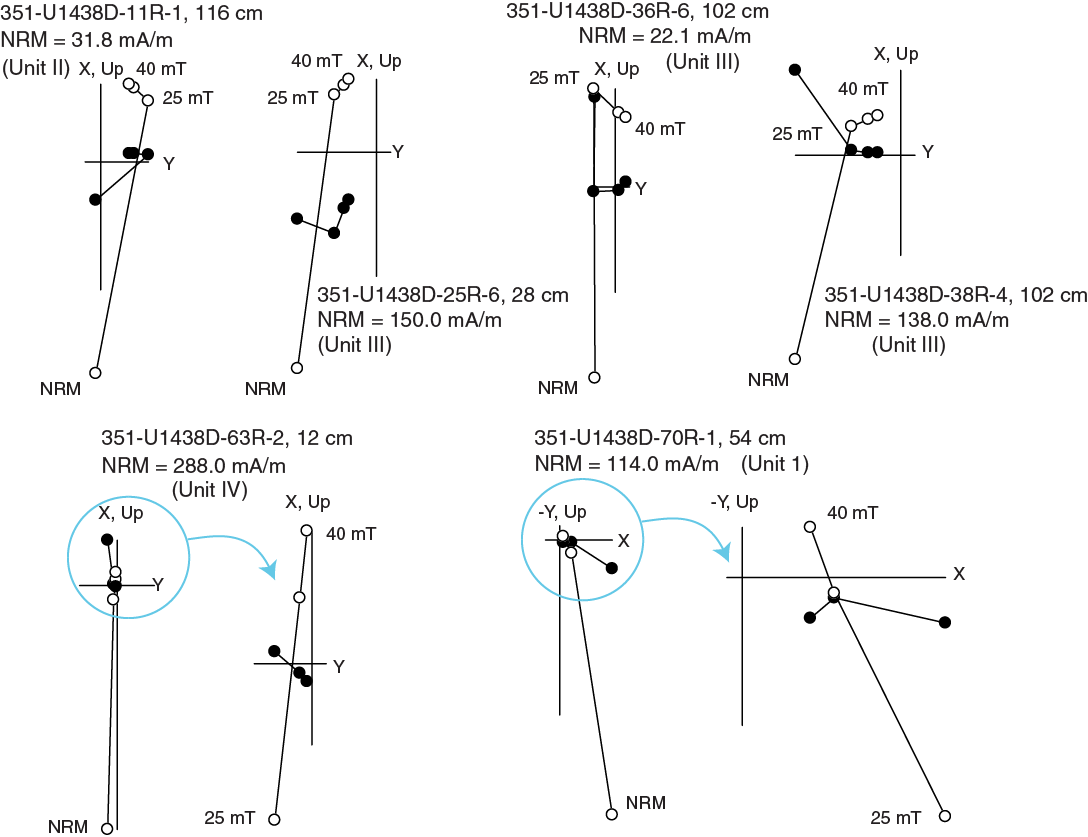
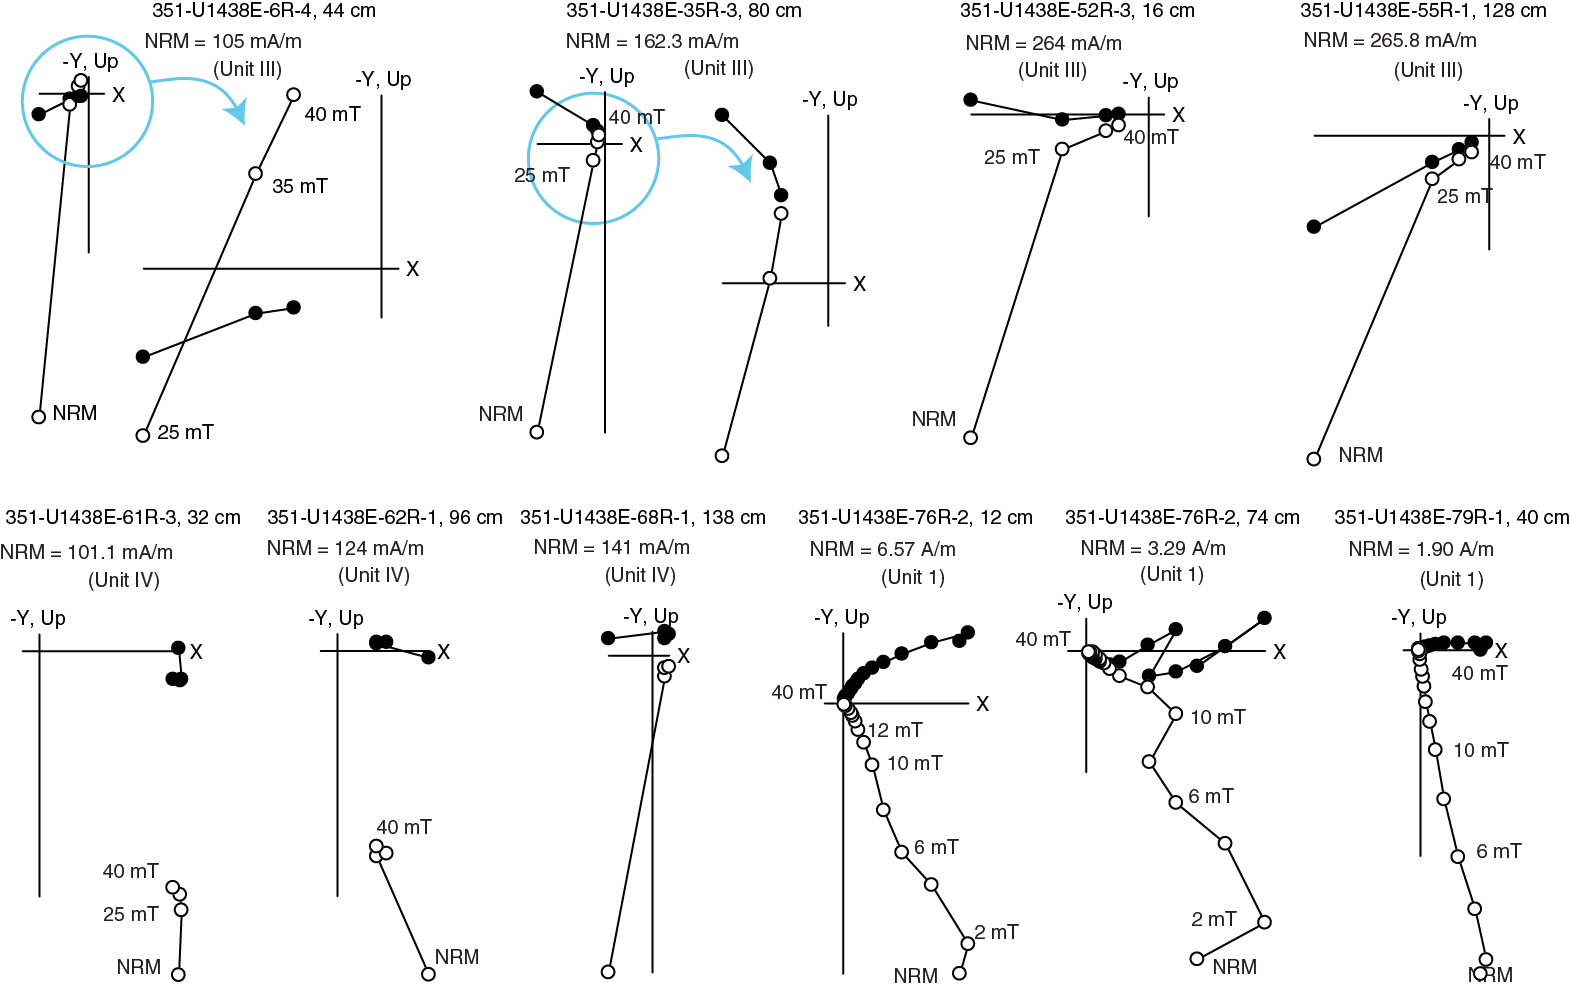
The FlexIT core orientation tool was used with all full-stroke APC deployments in Hole U1438B (0–168.88 mbsf). The orientation tool uses three orthogonally mounted fluxgate magnetometers to record the orientation of the double lines scribed on the core liner with respect to magnetic north, providing an angular correction from core to geographic reference frameworks for each deployment that allows recovery of magnetic declination data. Figure F65 shows the result of applying these corrections to the 25 mT treatment level data. Compared to the uncorrected data, magnetization directions clearly separate into two broadly north–south oriented polarity groups upon FlexIT correction. These groups are more clearly discernable in Kamb-contoured equal area stereographic projections (Figure F66). Considerable scatter in the distribution of individual remanence determinations exists in this data set, but this is comparable to that expected from paleosecular variation (PSV) of the geomagnetic field. Statistical field models allow prediction of the variability of field directions due to PSV. Figure F66 shows a modeled distribution at the latitude of Site U1438, calculated using the statistical field model TK03.GAD of Tauxe and Kent (2004) from 6853 realizations (equivalent to the number of FlexIT reoriented remanence determinations in Hole U1438B). Comparison with the distribution of observed remanence directions indicates that PSV is adequately sampled in the reoriented data set from Hole U1438B. Moreover, the downhole distribution of FlexIT-corrected remanences (Figure F67) shows ~180° alternations of declination, and these values cluster at ~0° and ~180°, providing important additional constraints that inform the identification of geomagnetic reversal boundaries and magnetozones to ~170 mbsf.

Figure F65. Archive-half core section magnetizations after AF demagnetization in a 25 mT applied field, Hole U1438B. Top: data in core reference frame. Bottom: data in geographic reference frame, following application of azimuthal corrections provided by the FlexIT tool. Produced using Rick Allendinger’s Stereonet program v. 8.9.6 (Cardozo and Allmendinger, 2013).
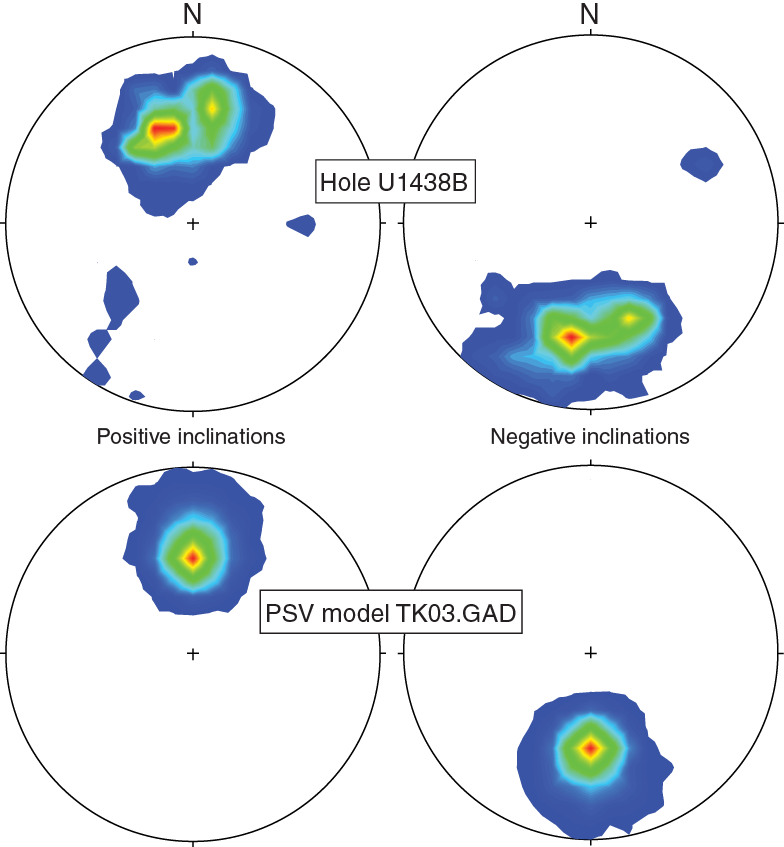
Figure F66. Top: Kamb-contoured archive-half core section magnetizations after AF demagnetization at 25 mT (6853 measurement points), Hole U1438B. Bottom: instantaneous geomagnetic field directions calculated from 6853 realizations of the statistical field model TK03.GAD of Tauxe and Kent (2004) for the location of Site U1438.
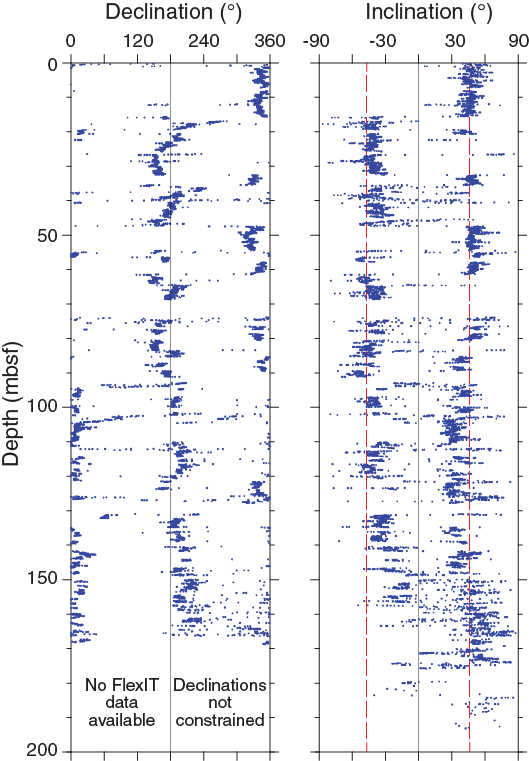
Figure F67. Remanence inclinations and declinations, Hole U1438B. Red dashed lines = axial geocentric dipole inclination expected at this site. Declinations have been recovered using azimuthal corrections supplied by the FlexIT tool. Note the clear pattern of geomagnetic field reversals marked by switches in both inclination and declination across reversal boundaries.
Discrete sample remanence data
A total of 190 discrete samples were demagnetized during Expedition 351 (47 by AF treatment and 143 using thermal demagnetization), mainly to check the reliability of archive-half core data from the SRM system. Representative examples are shown in Figures F68 and F69. In most cases, these examples demonstrate removal of the drilling-induced overprint by applied fields of 10–20 mT or temperatures of ~200°C, leaving a linear ChRM that decays toward the origin by peak applied fields of 80 mT or temperatures of 580°C. These data are consistent with remanence being carried by magnetite. Samples from red mudstones and siltstones from Unit IV in Hole U1438E required thermal treatment to 630°–660°C to fully demagnetize the natural remanence (after removal of the drilling-induced overprint by temperatures of ~200°C), consistent with remanence carried by hematite. The high-quality data obtained from the shipboard discrete samples are insufficient in quantity to define magnetostratigraphic intervals but indicate that shore-based demagnetization of a larger suite of discrete samples will yield reliable remanence directions that may be used for both magnetostratigraphic and tectonic purposes.
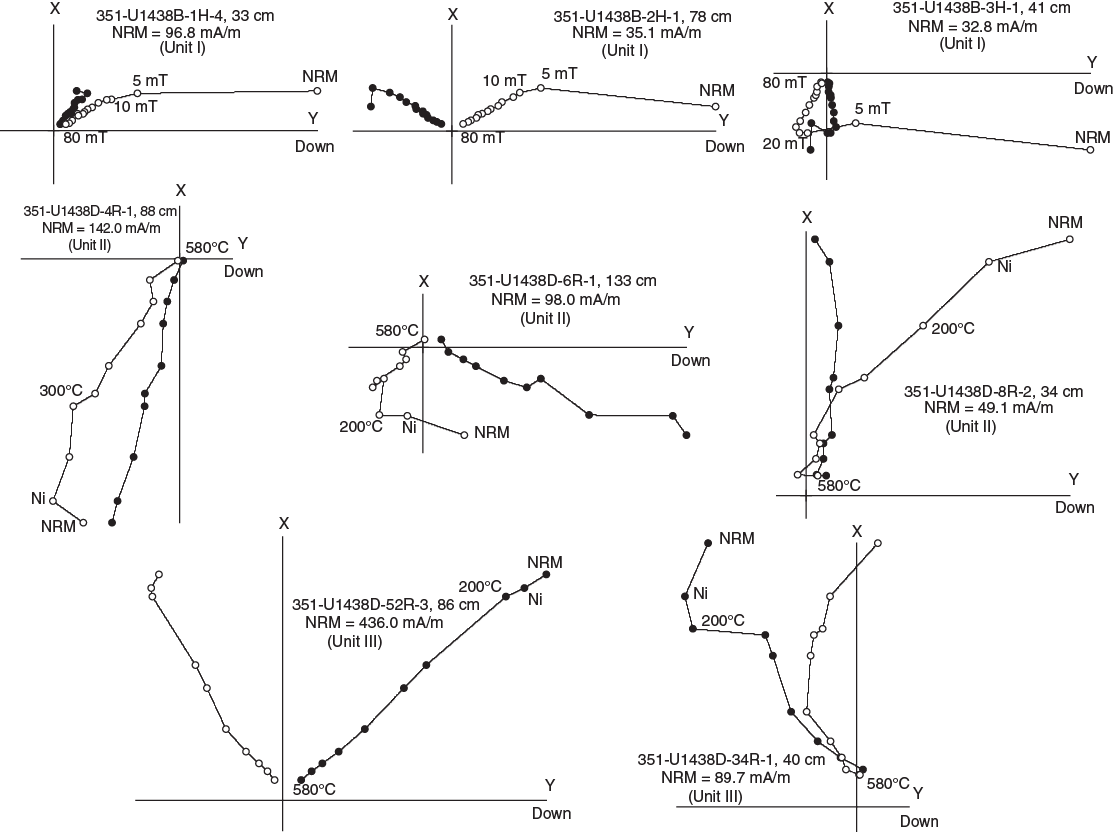
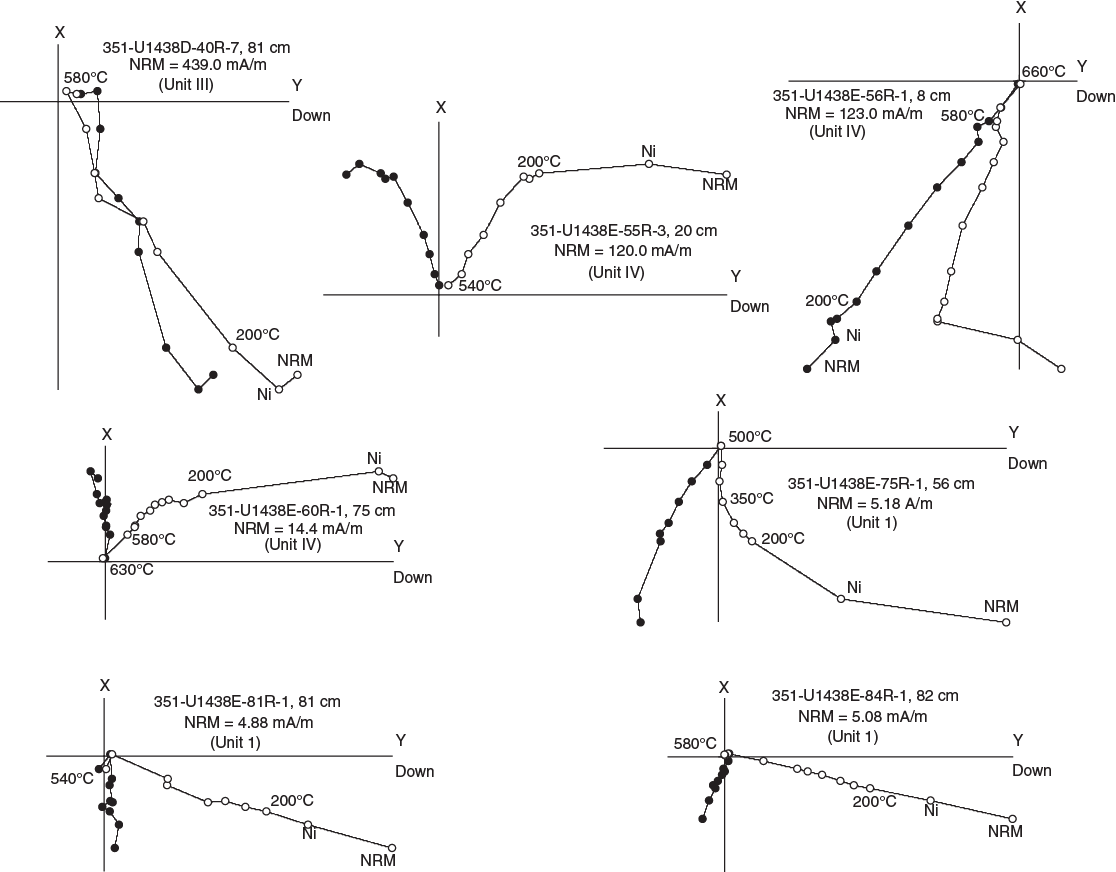
Anisotropy of low-field magnetic susceptibility (AMS) was determined from a subset of discrete samples with AMS signals sufficiently high to allow measurement on ship using the AGICO Kappabridge KLY4 system. Results for fine-grained sedimentary rocks of Units III and IV and basaltic basement rocks of Unit 1 (Hole U1438E) are shown in Figure F70. Sedimentary samples have oblate fabrics that define a typical depositional fabric, with k3 (minimum) principal axes oriented normal to bedding. k1 (maximum) principal axes are distributed in the horizontal plane, but without reorientation parameters for these samples, it is impossible to determine whether there is a preferred magnetic lineation in these rocks. Basaltic rocks display k1 principal axes that are generally shallowly plunging with steeply plunging k3 principal axes, suggesting that a planar magnetic fabric is also present in these rocks. This supports the interpretation that these rocks represent extrusive flows.

Magnetostratigraphy
After examining downhole plots of single demagnetization step inclination data from Holes U1438A and U1438B, data from the 25 mT treatment were used as the primary observations in determining magnetostratigraphy. However, inspection of orthogonal vector plots of the full demagnetization data at each measurement point confirmed polarity in intervals where the 25 mT step data were not clear cut. For Holes U1438D and U1438E, data from individual demagnetization steps did not allow unambiguous identification of patterns of magnetozones. A robust interpretation for Hole U1438D was made possible by using a combination of: (1) principal component analysis (PCA) of data from individual measurement points (filtered to exclude PCA picks with maximum angular deviations >10°), (2) averaging of PCA directions within individual RCB core pieces, and (3) filtering of anomalous PCA directions by comparing them with data from the 25 and 40 mT steps to identify samples with demagnetization paths trending broadly to the origin (see the Expedition 351 methods chapter [Arculus et al., 2015a]).
Shipboard paleomagnetic results identify a series of normal and reversed magnetozones to 846.8 mbsf (throughout Holes U1438A [Figure F71], U1438B [Figures F72, F73, F74, F75], and U1438D [Figure F76]). These examples show an excellent correlation to the geomagnetic polarity timescale (GPTS; Gradstein et al., 2012; Cande and Kent, 1995), providing a high-resolution magnetostratigraphy that extends to the base of GPTS Chron C16n.1r (36.051 Ma; Priabonian stage of the Eocene). Deeper in Hole U1438E, no clear reversals were identified, although positive inclinations throughout the sedimentary succession in this hole are consistent with paleontological constraints that place much of this succession in the latest middle to upper Eocene (when the geomagnetic field had a dominantly normal polarity) (Figure F77).
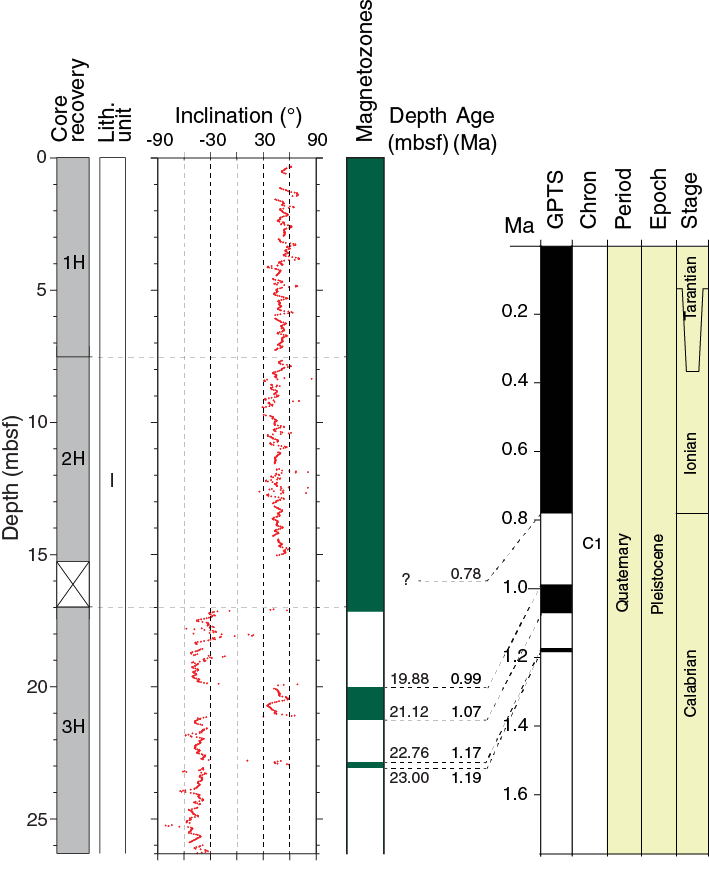
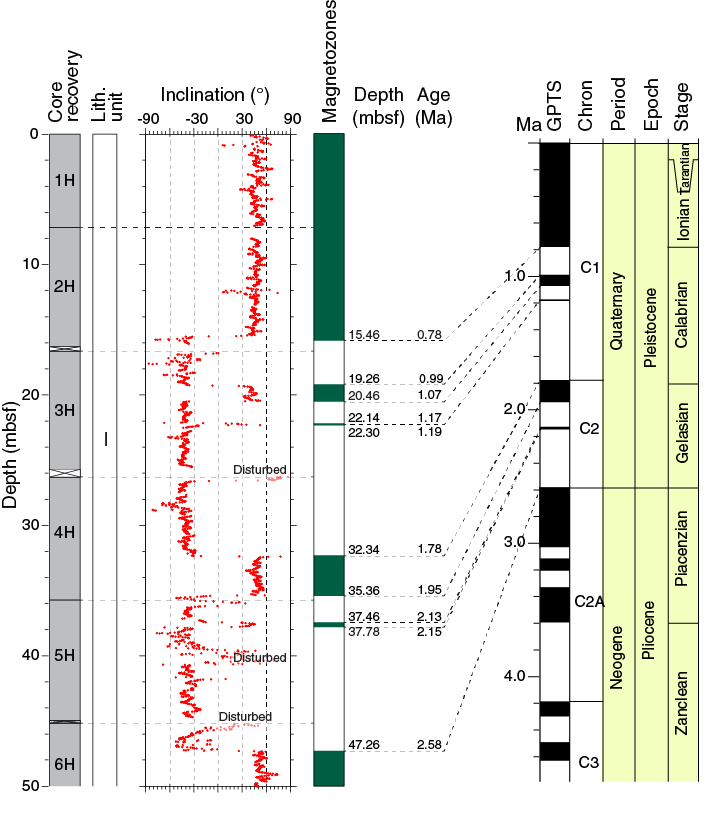
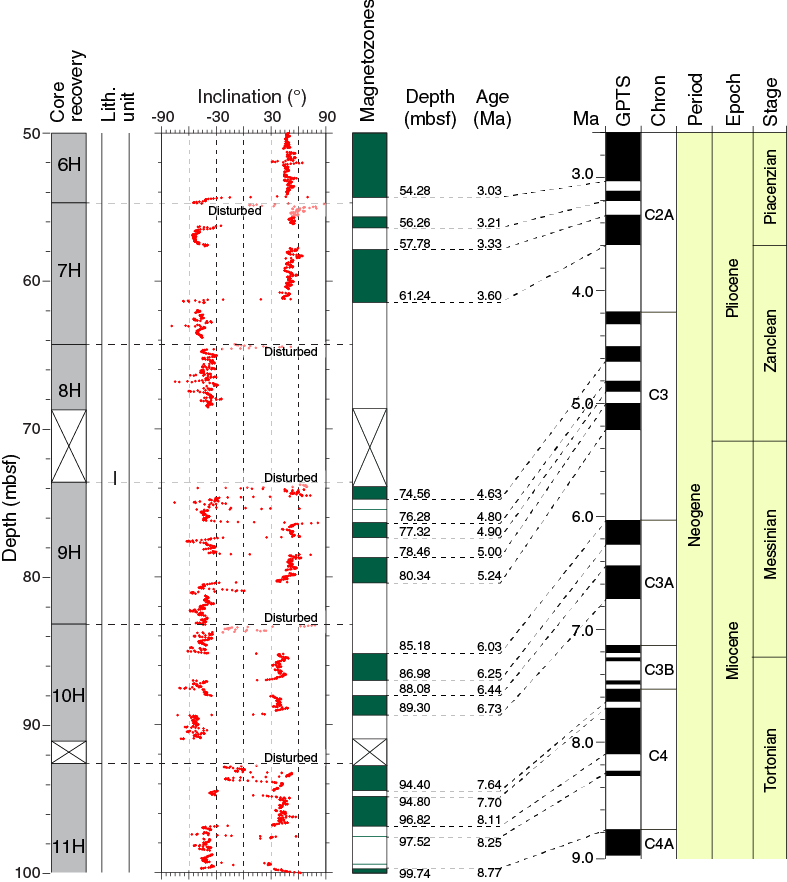
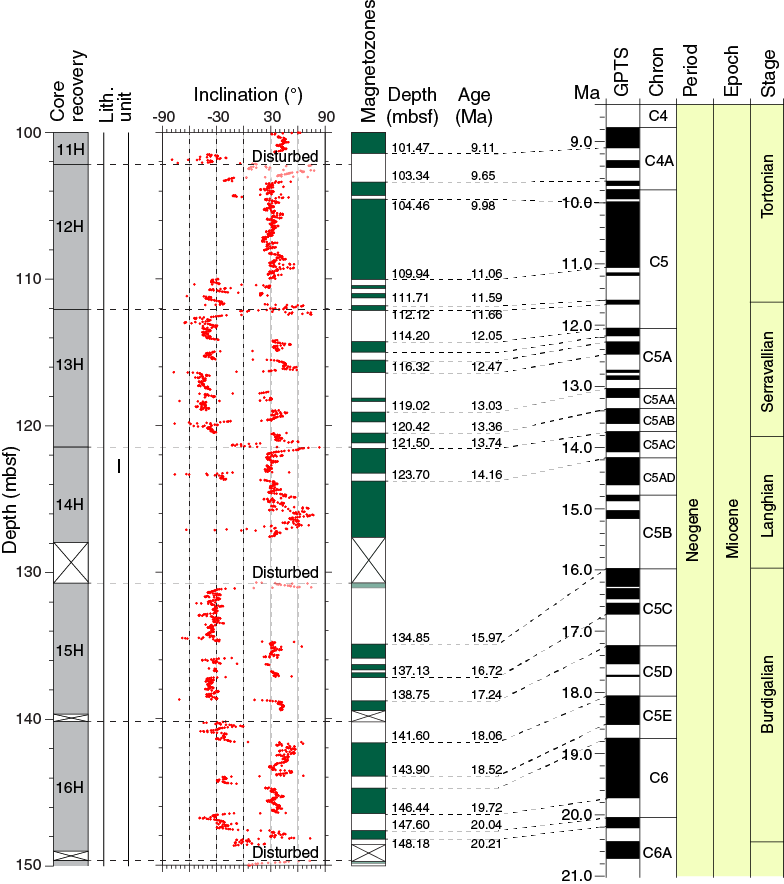
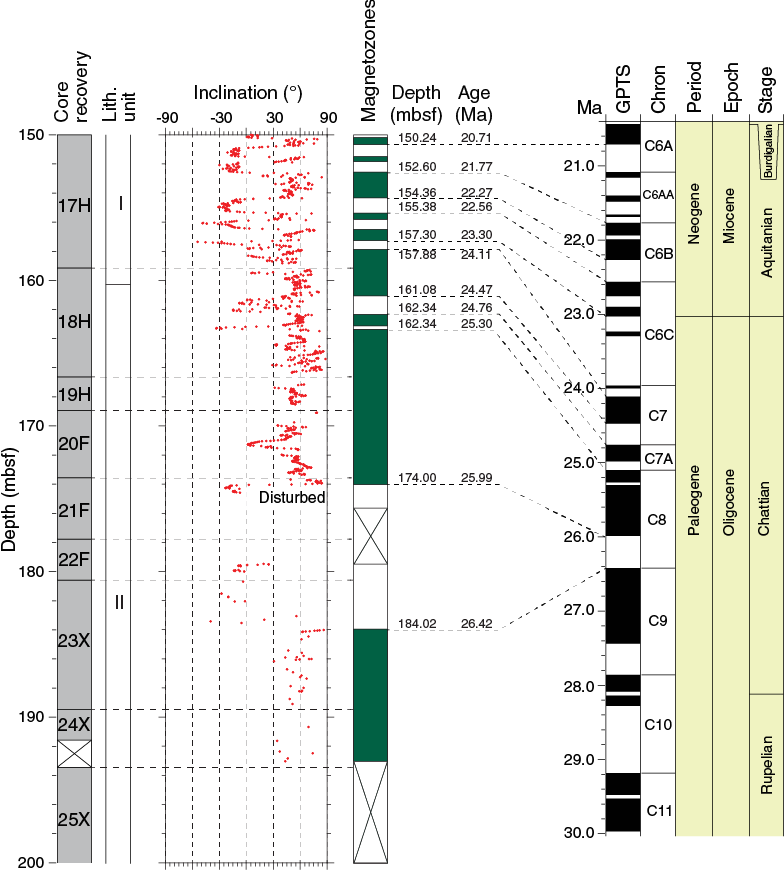
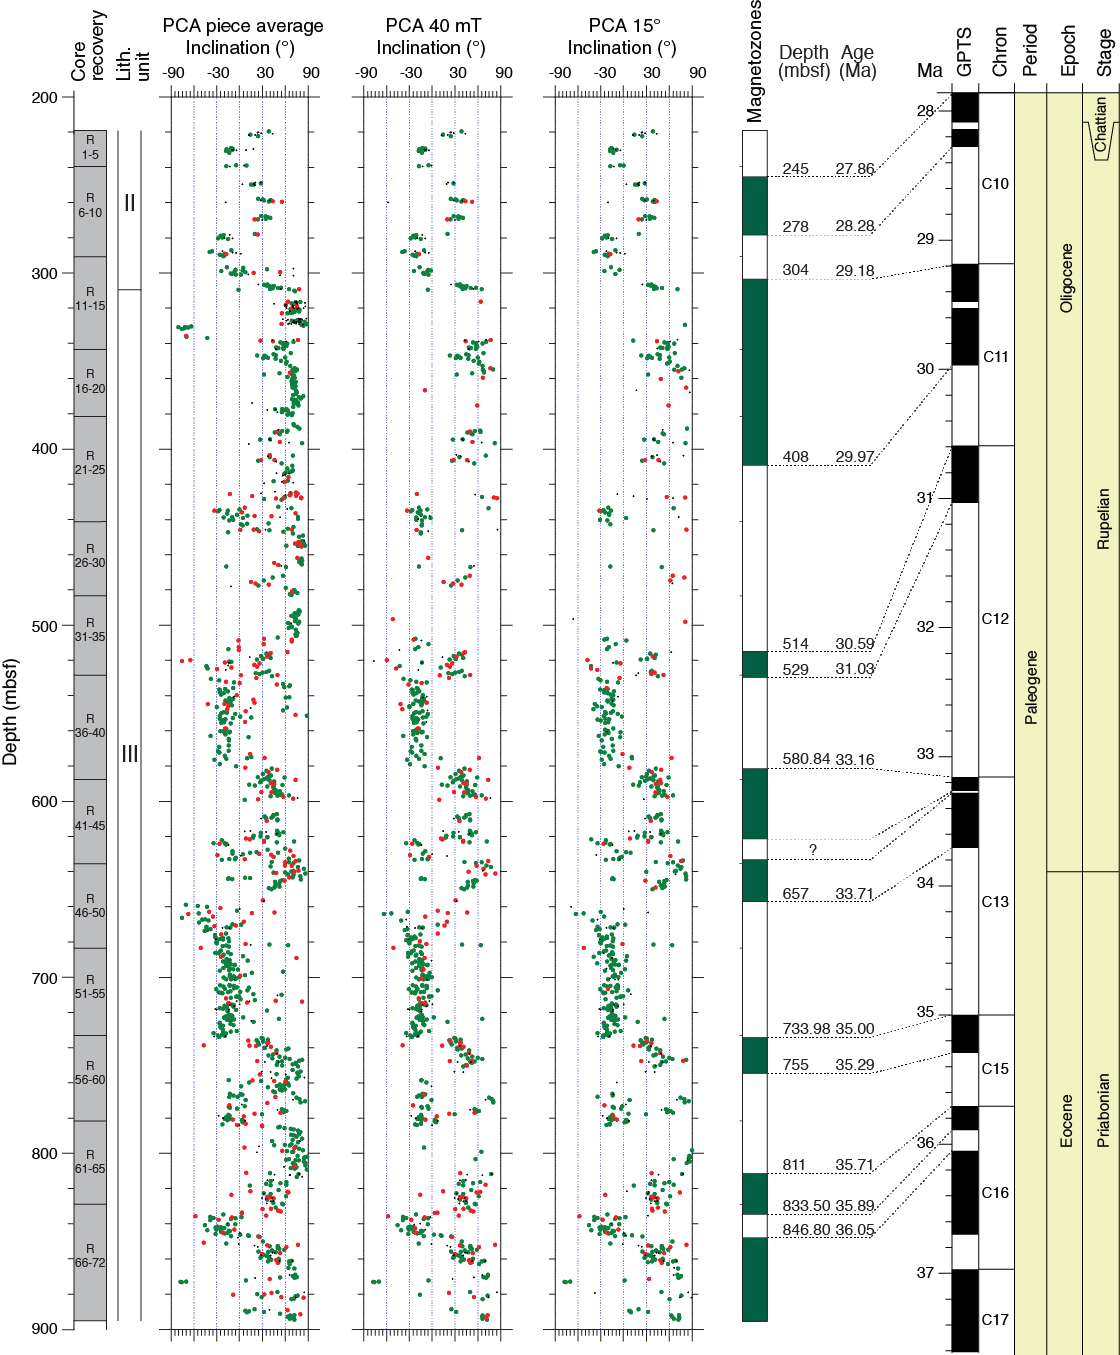
Figure F76. Archive-half core remanent inclination data and magnetostratigraphy, Hole U1438D, 200–900 mbsf. Magnetozones are based on the inclination data and examination of orthogonal vector plots of demagnetization data, and are correlated to the geomagnetic polarity and geological timescales of Gradstein et al. (2012).
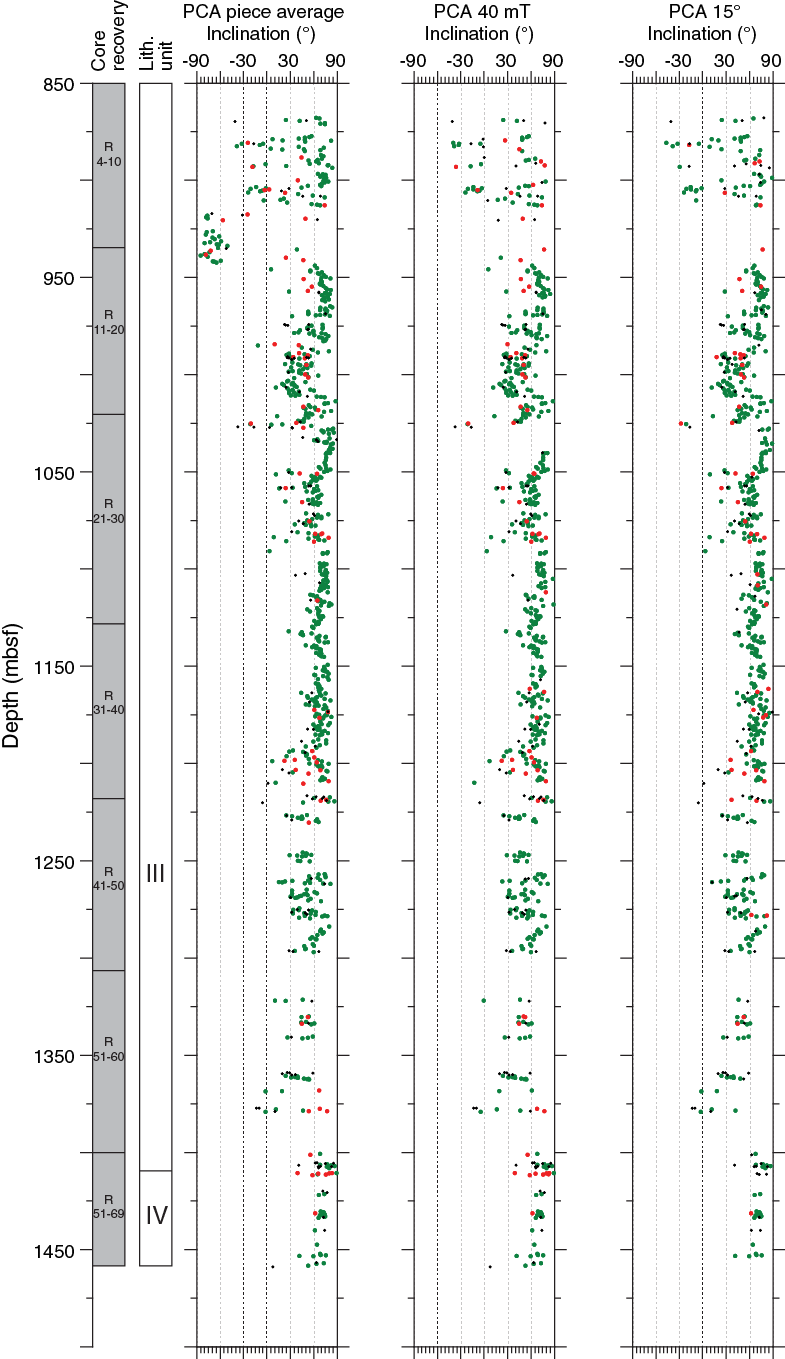
Overall, a total of 87 geomagnetic reversals may be correlated to the GPTS with confidence, providing a high-quality age-depth model for Site U1438. These correlations provide a shipboard chronostratigraphic framework for interpreting the Pleistocene to late Eocene sediment record at Site U1438 (Table T16). The most salient features of this age model (Figure F78) include the following:
- Average linear sedimentation rates during the Pliocene–Pleistocene were 1.4–2.2 cm/ky.
- Lower sedimentation rates of 0.25–0.5 cm/ky prevailed throughout the Miocene.
- Sedimentation rates were significantly higher during the Oligocene to late Eocene with a maximum of ~20 cm/ky.
Table T16. Age-depth relationships for Hole U1438B, based on correlation between magnetozones and the geomagnetic polarity timescale. Download table in .csv format.
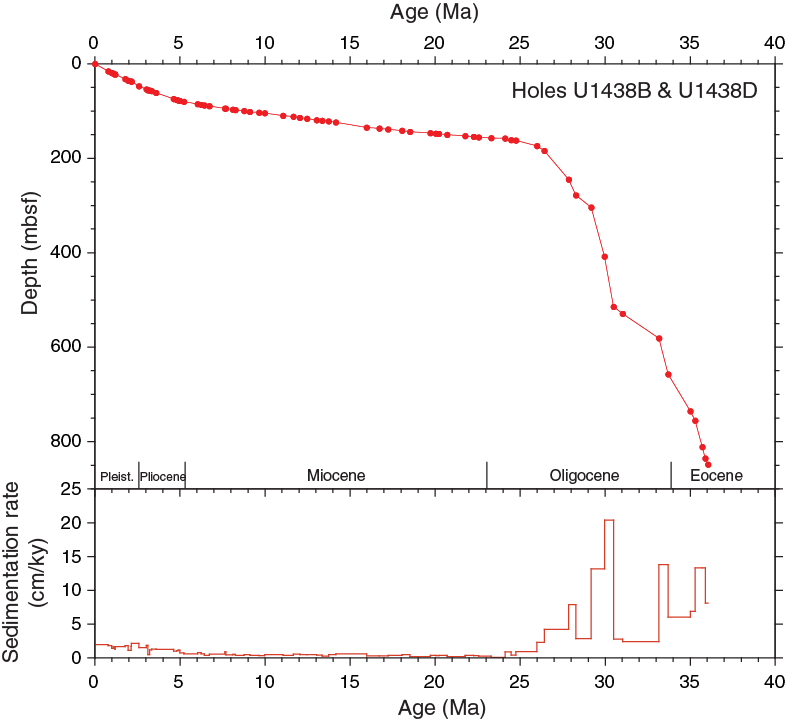
Basaltic basement rocks as a potential source of marine magnetic anomalies
In mafic igneous rocks, low-field magnetic susceptibility (k) is principally controlled by the volume concentration of magnetite. NRM variability is also controlled by variations in magnetite content but may additionally be influenced by variability in the magnitude of drilling-induced remanent magnetizations. The relationship between NRM intensity and susceptibility is expressed by the Königsberger ratio, Q, which is defined as the ratio of remanent to induced magnetization in a rock (where induced magnetization equals the product of k [SI] and the geomagnetic field strength in A/m). Values of Q > 1 indicate that remanence dominates the magnetization of a rock unit.
Figure F79 shows a log-log plot of NRM intensity against k for archive-half core samples from basaltic rocks of Hole U1438E, together with lines of equal Q calculated for a field of 32.2 A/m. The majority of samples plot above Q = 1. This suggests that these rocks have the potential to contribute a significant fraction to marine magnetic anomalies. However, caution is required in the interpretation of Q ratios calculated for these samples, as NRM intensities may be artificially increased by drilling-induced magnetization.
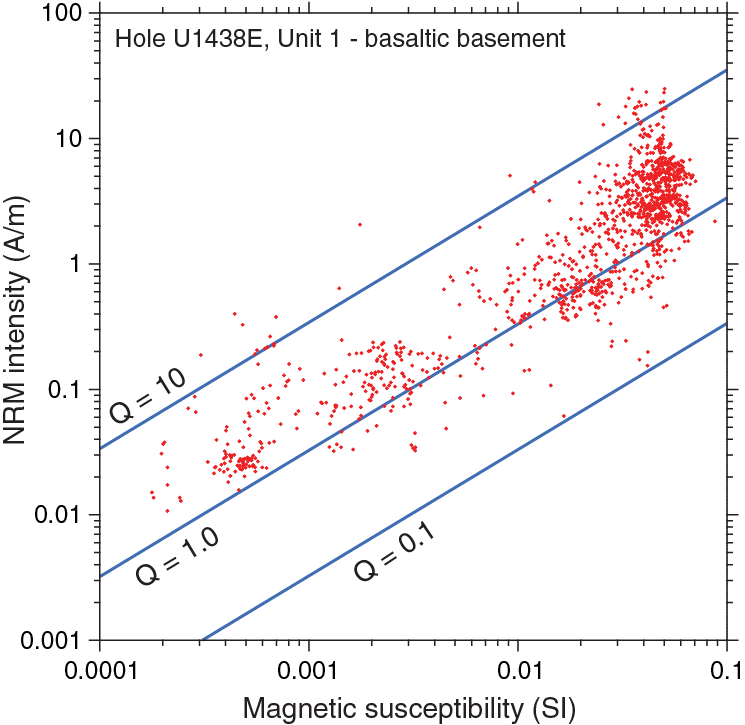
Physical properties and downhole measurements
At Site U1438, physical property and downhole measurements were made to help characterize lithostratigraphic units and provide a basis for linking lithostratigraphy to crossing seismic lines. In addition, with the logging results we have characterized the thermal state of the site and in turn estimated the heat flux from the lithosphere. We also estimated the strength of the sediments within the upper part of the site (Hole U1438B).
After the recovered cores reached thermal equilibrium with room temperature (~4 h), whole cores were scanned with the Whole-Round Multisensor Logger (WRMSL) to measure gamma ray attenuation (GRA) as a proxy for material density, magnetic susceptibility, and P-wave velocity. The whole rounds were then logged for natural gamma radiation (NGR) and thermal conductivity. After splitting the cores, the archive-half core sections were run through a digital imaging logger (Section Half Imaging Logger [SHIL]), magnetic susceptibility point analyzer, and color spectrophotometer on the Section Half Multisensor Logger (SHMSL). On working-half sections, shear strength and P-wave velocity were measured. Discrete samples were also taken from the working half, generally one per section, for measurements of thermal conductivity, moisture and density (MAD), and P-wave velocity. Details of all measurements made on the whole-round core sections, the working-half sections, and discrete samples are included in Physical properties in the Expedition 351 methods chapter (Arculus et al., 2015a).
Additionally, Holes U1438D–U1438F were logged. Several meters of overlap between each hole were measured to have a continuous record of the sediment physical properties and to compare and create a link between data from each hole. Because of hole conditions in Holes U1438D and U1438E, only data from the triple combo (see Downhole measurements in the Expedition 351 methods chapter [Arculus et al., 2015a]) tool string were collected (see Operations). Only Hole U1438F was measured with the entire set of tool strings available, leading to a complete data set from 90 to 700 mbsf. Finally, the third-party tool, the Göttingen Borehole Magnetometer (GBM), was run in Hole U1438E, potentially giving magnetic orientation data from 605 to 1200 mbsf when these data are processed postexpedition.
Logging data quality
From 90 to 160 mbsf, rapid variations in borehole diameter were observed and may result in underestimation of the density data and overestimation of the porosity data (Figure F80). From 160 to 300 mbsf, the hole diameter was smaller and smoother, and from 300 to 700 mbsf, the hole was in gauge. Both of these intervals provided the best conditions for logging, leading to acquisition of high-quality data. Deeper than 700 mbsf, the hole diameter was greater than 43 cm. Resistivity, gamma ray, and magnetic susceptibility are less affected by wide borehole diameter. Variations of hole size encountered in the upper 300 mbsf may reflect lithology. Throughout the logged intervals, gamma ray, resistivity, magnetic susceptibility, velocities, and Formation MicroScanner (FMS) images are all judged to be of good quality. In Holes U1438D and U1438F, the main pass of the triple combo was used as the depth reference, whereas we used the resistivity data for Hole U1438E. In general, all logging data show a good agreement with core data (Figures F80, F81, F82). Logging data also co-vary, confirming they are overall of good quality. Moreover, the data do not show gaps or jumps in values between the different logged holes. Four logging units were defined. Logging Units 1 and 2 essentially correspond to lithostratigraphic Units I and II, whereas lithostratigraphic Unit III was divided into two logging units (3 and 4).


Density and porosity
Sample density and porosity were obtained by measuring the wet and dry density and dry volume of discrete samples as described in Physical properties in the Expedition 351 methods chapter (Arculus et al., 2015a).
Porosity decreases overall with depth at Site U1438 from 75% to 25% through Units I–IV, at which point, at the boundary with Unit 1, the porosity drops to a only few percent over 40 m (Figure F83). The reduction in porosity within Units I to IV is fit approximately by an exponential function with a decay constant of 1200 m, typical of the behavior seen for shales. With the overall reduction in porosity reflecting compaction and lithification of the sediments, deviations from the exponential allow identification of changes not simply related to compaction. Alongside this change in porosity through the units, bulk density shows a small progressive increase from 1.45 g/cm3 at the seafloor to 2.3 g/cm3 at the boundary between Unit IV and Unit 1. Grain density shows important changes in value with depth that are more closely associated with variations in lithology.
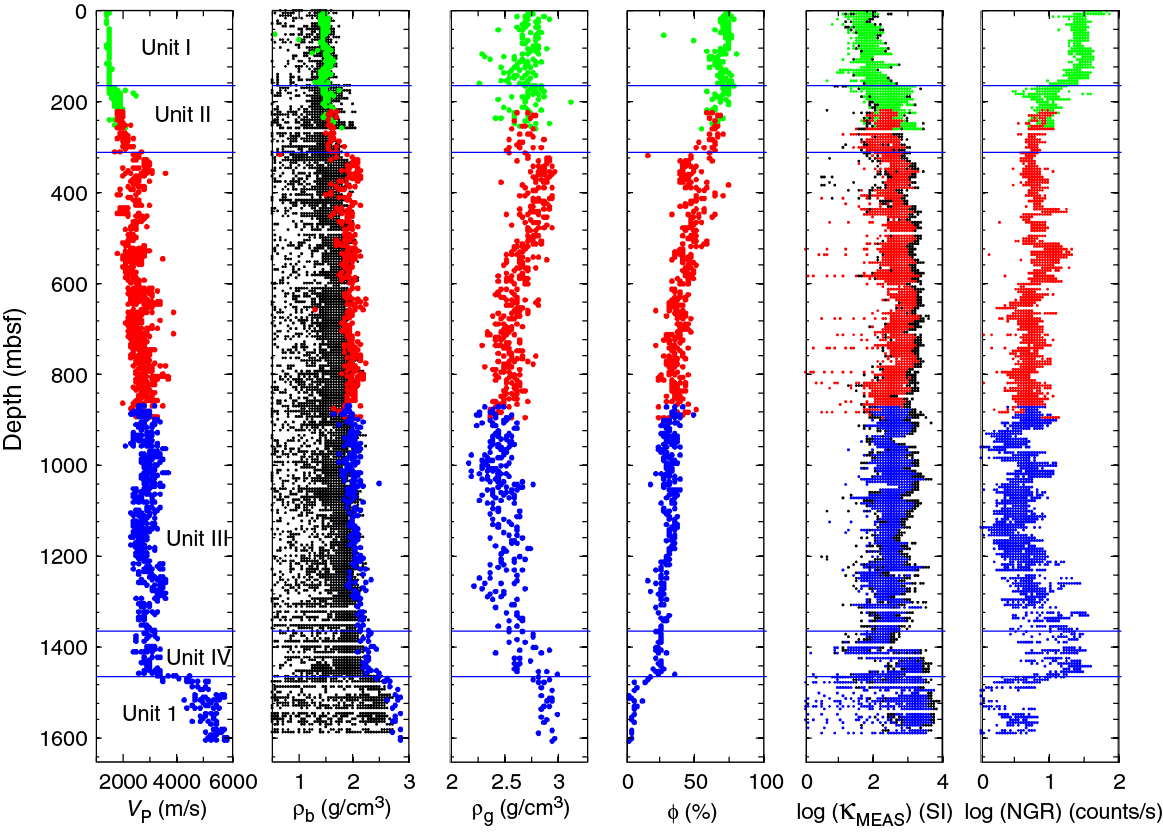
Although porosity decreases as a whole with depth, we also find significant variations from this overall trend (Figure F83). One of the largest changes coincides with the boundary between Units II and III, at which bulk density and grain density change from 1.75 to 2.0 g/cm3 and from 2.75 to 2.9 g/cm3, respectively. These changes occur over 20 m just below the boundary between Unit II and III. The upper 40 m of Unit III is characterized by a reduction in porosity from 62% to 45%. Another major change occurs at the boundary between Unit III and IV and is most noticeable in grain density, which increases from 2.6 to 2.7 g/cm3.
Other notable changes occur in the properties of the cores. Outside of the isolated reduction in porosity within the upper 40 m of Unit III, the porosity of this unit progressively decreases and is well fit by the aforementioned exponential decay. However, when the variance between discrete samples is accounted for, the average grain density reaches a minimum at ~800–900 mbsf with a grain density of 2.5 g/cm3. The average grain density then slowly increases again to the base of Unit III, where the average value is about 2.6 g/cm3.
The downhole logging data also decrease overall in porosity with depth at Site U1438 with a sharp decrease between logging Units 2 and 3 at 310 mbsf (Figure F80). All of these variations correspond with what is observed in the cores, even if porosity recorded by logging was slightly greater than porosity measured in the cores. The bulk density values measured in the logs are in good agreement with the bulk density measured on cores and display the same variations with notable changes at 160, 310, and 660 mbsf. These variations correspond to changes in lithology. In addition, porosity calculated from the density profile assuming a grain density of 2.8 g/cm3 (from core data) is in agreement with the porosity obtained down the hole, except where the larger diameter of the upper part of the hole (upper 300 mbsf, Holes U1438D and U1438F) led to overestimation of the porosity measured with the APS sonde (see Downhole measurements in the Expedition 351 methods chapter [Arculus et al., 2015a]).
Sediment strength
The upper layers recovered from Hole U1438B are unconsolidated muds with little strength. Shear strength measurements were made with the automated vane shear (AVS) instrument in Unit I. Shear strength increased from 18 kPa at 2 mbsf to 70 kPa at 90 mbsf (Figure F84), reflecting progressive consolidation and partial lithification of sediments. Measurements were interrupted between about 90 and 160 mbsf, as the sediments were initially deemed to be too stiff to continue with the AVS, which in general requires undrained core samples. Measurements continued again between 160 and 170 mbsf because the mud layers there were judged to have sufficient pore water. Deeper in the hole, we found that shear strength ranged widely from 53 to 176 kPa, potentially depending on abundance of pore water.
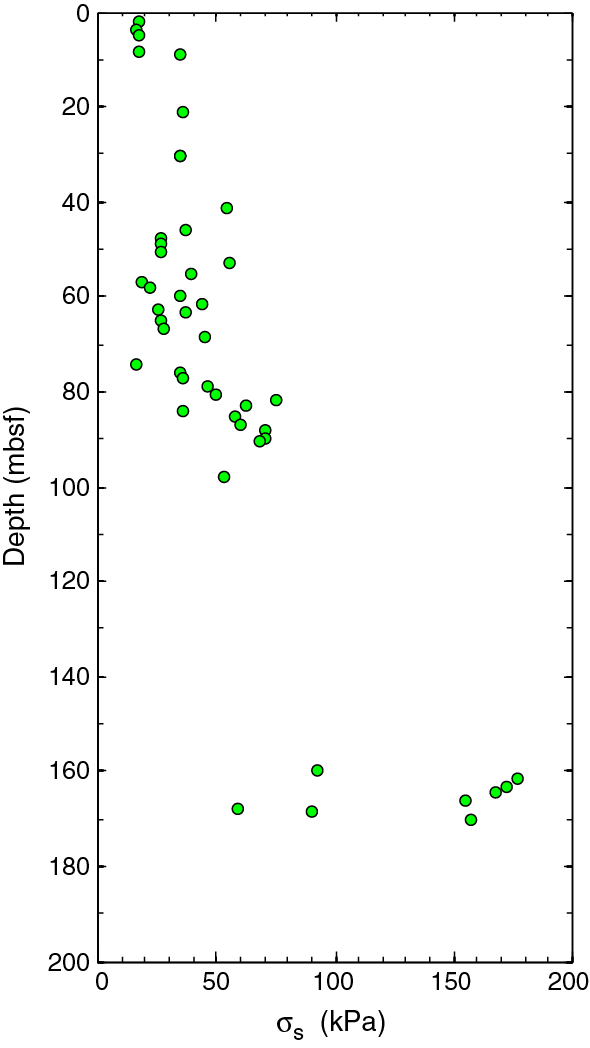
Sonic and seismic velocities
P-wave sonic velocities were measured in a number of ways through the entire depth range recovered at Site U1438. In cores from Hole U1438B to 174 mbsf (Core 351-U1438B-20F), sonic velocities were obtained from both whole rounds and working-half core sections using calipers in the x-direction and bayonets in the z-direction, respectively. Sonic velocity measured using the bayonets did not give consistent values, and values faster than 1800 m/s in the shallow depth range of Hole U1438B were judged to be spurious and removed. Figure F85 shows sonic velocities measured on the cores in different ways. In Hole U1438B, measurements of GRA with the WRMSL (small black dots), calipers in the x-direction (red dots), and bayonets in the z-direction (blue dots) gave consistent results. In Hole U1438D, sonic velocities were only measured in the x-direction with the caliper on the working-half section. In Hole U1438E, sonic velocities were measured using calipers (small red dots) and orientated cubes in the x-, y-, and z-directions (green dots). These final measurements were judged to be superior because the square edges of the cut cubes had good contact with the calipers (green dots), but we found these to be consistent with those on the working-half sections (small red dots). The anisotropy of the sonic velocities was also directly determined from these measurements.
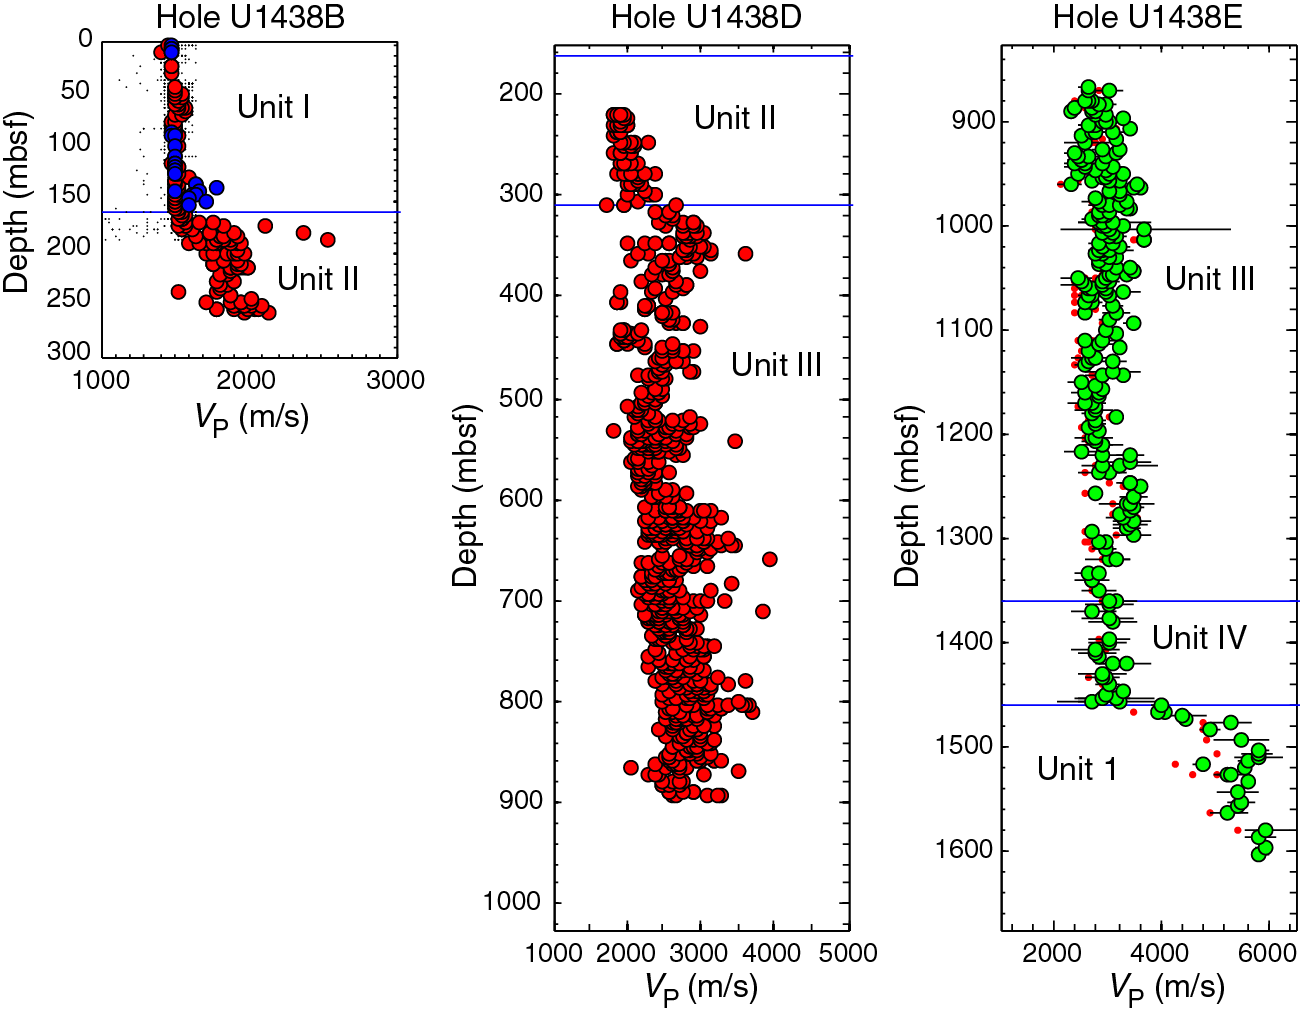
The average sonic velocity is 1500 m/s to 160 mbsf (Core 351-U1438B-18H), consistent with unconsolidated mud. Velocity measurements from the whole rounds and from the caliper for the split sections are shown in Figure F85. Measured values in the x- and z-directions are in agreement, indicating the velocities are isotropic, consistent with the lack of any substantial horizontal layering in the muds. At ~160–170 mbsf, the sonic velocities start to increase from 1500 to 1900 m/s, and the increase is complete by about 190 mbsf. The change in velocity is associated with a change from mud to mudstone with clasts and is correlated with the transition from Unit I to II. The variation in P-wave sonic velocity within the depth interval 190–250 mbsf (Cores 351-U1438B-24X through 30X; Unit II) is between 1700 and 2000 m/s, where higher velocities are associated with mudstones with clasts and lower velocities are associated with mudstones without clasts. Three P-wave sonic velocity data points exceeding 2000 m/s between 170 and 190 mbsf may be artifacts, as there was not a substantially notable change in lithology within Cores 351-U1438B-20X through 23X. Sonic velocity of 1540 m/s at ~240 mbsf is also likely an artifact, as the corresponding core section (351-U1438B-29X-1) is severely broken up.
At 255 mbsf (Section 351-U1438B-30X-5), there is another increase in P-wave sonic velocity that is complete by ~340 mbsf (Section 351-U1438D-15R-4) (Figure F85); this velocity increase is associated with the appearance of Unit III (conglomerates with volcanic and sedimentary clasts) at 310 mbsf (Core 351-U1438D-12R). Within the interval of 310–900 mbsf, the velocities on average increase from about 2400 to 2800 m/s; however, there are distinct zones of higher velocity (around 2800–3200 m/s) around 320–360, 600–660, and 780–810 mbsf that correlate with the occurrence of tuffaceous sandstone, breccia, and conglomerate, also with density higher than mudstone and siltstone (grain density = ρg ~ 2.7–3.0 g/cm3) (Figure F85). A higher velocity zone is also found around 520–540 mbsf that correlates with the occurrence of tuffaceous sandstone. Within this layer, there are sharp reductions in sonic velocity, most clearly shown at 540 mbsf (Sections 351-U1438D-36R-1 and 36R-2) (Figure F85), that correspond to an increase of tuffaceous mudstone as the dominant lithology.
P-wave sonic velocities within Unit III in Hole U1438E show a similar range of variation as found in Hole U1438D, ranging in value from 2400 to 3200 m/s (Figure F85). The most significant change in sonic velocity occurs in the depth range 1250–1300 mbsf, which is characterized by occurrence of siltstone as the dominant lithology. Sonic velocities between 1250 and 1300 mbsf also display a form of transverse anisotropy. The azimuthal variation in sonic velocities that is around a horizontal plane are generally around 2% and are much smaller than those between the horizontal and vertical planes, which are between 0% and 15% (Figure F86). The sonic anisotropic values are correlated with lithology; mudstones and fine sandstones with and without apparent bedding planes generally have higher sonic anisotropic values than the coarser sandstones. The apparent seismic anisotropy in the core data within Unit III is large enough to have an effect on the inference of structure from the seismic reflection profiles.
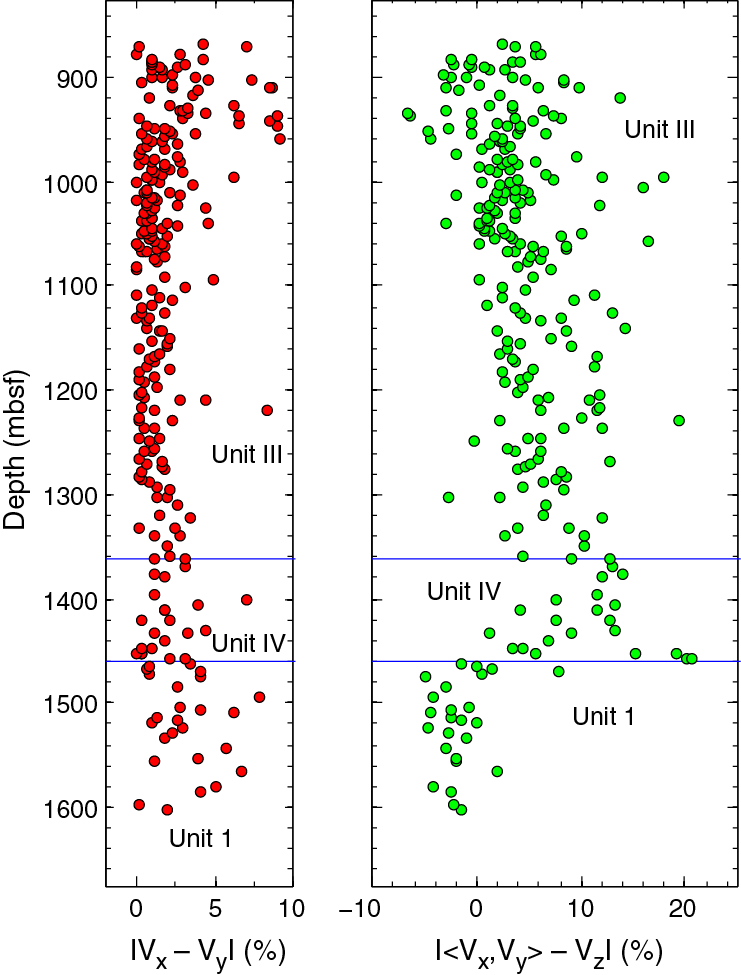
Within the lithologically diverse Unit IV, composed of mudstone, siltstone, and conglomerates, the average sonic P-wave velocity is around 2800 m/s. The start of Unit IV at 1361 mbsf is not characterized by a change in P-wave sonic velocity compared to overlying Unit III. The sample-to-sample variance in P-wave sonic velocities in this layer is smaller than that in overlying Unit III. However, within the top half of Unit IV, the apparent seismic anisotropy, in which horizontal velocities are 13% higher than the vertical velocities, is larger than that in Unit III near the Unit III/IV boundary (<10%) (Figure F86).
The start of Igneous Unit 1 at 1461 mbsf is characterized by an abrupt increase in P-wave sonic velocity (Figure F85). The first measurement of sonic velocity at 1461.4 mbsf (Core 351-U1438E-69R) has an average value of 3984 m/s. However, the sonic velocities rapidly increase to 5600 m/s over a depth range of 80 m. The apparent seismic anisotropy of Unit 1 rapidly decreases from nearly 20% above the boundary to near 0% below the boundary at 1461 mbsf. The large and rapid jump in sonic character within the core gives rise to a distinct and unambiguous seismic reflector.
P-wave velocities measured downhole were repeatable between logging runs and so were considered to be robust. The P-wave velocities obtained from logging also correlate well with the core data (Figure F81), which may sometimes be underestimated in comparison with in situ velocities because of removal of high-pressure conditions. The velocities obtained during logging show an increasing trend with depth, range from 1500 to 3500 m/s for the P-wave and from 300 to 3000 m/s for the S-wave, and exhibit distinct variations between the different logging units. The average P-wave velocity is 1500 m/s to 160 mbsf and then increases to an average velocity of 1850 m/s to 310 mbsf. At that depth, P-wave velocities increase again to a mean value of 2500 m/s. They slightly decrease from 420 to 590 mbsf, where they reach values around 2700 m/s. The interval between 420 and 460 mbsf is particularly low, with values at 2000 m/s. In addition to P-wave velocities, we recorded S-wave velocities during logging. Both lower and upper values of shear and compressional velocities are highly correlated. To 310 mbsf, S-wave velocities are slow and typical of water-saturated clay and shales (from 300 to 900 m/s). From 310 to 420 mbsf, S-wave velocities average around 1100 m/s and decrease to a mean velocity of 655 m/s in the 420–460 mbsf interval. From 460 to 540 mbsf, S-wave velocities increase again to about 1000 m/s and reach an average velocity of 1355 m/s at 590 mbsf. All of these velocities are reasonable and are in the ranges expected for the sediment types encountered at Site U1438.
Downhole temperature and thermal conductivity
Successful temperature measurements were made at seven depths using the APCT-3 from the mudline to 83.2 mbsf in Hole U1438B (see Operations for core numbers). The temperatures as a function of depth did not show any substantial deviation from a linear geothermal gradient of 77.6°C/km (Figure F87). We also made 28 measurements of thermal conductivity (k) on cores from Hole U1438B that were approximately evenly spaced to 100 mbsf and found they did not vary substantially, with a mean of 0.951 ± 0.046 W/(m·K). A combination of temperature measurements and thermal conductivity using Bullard-type analysis (see Downhole measurements in the Expedition 351 methods chapter [Arculus et al., 2015a]) indicated the thermal gradient did not change with depth in the upper part of Hole U1438B. This suggests the geotherm is undisturbed by local processes, such as sediment compaction, fluid flow within the porous sediments, or internal heat production from radioactive decay. With these thermal conductivities measured on the recovered core, the calculated heat flow is 73.7 mW/m2. In addition, thermal conductivity was also measured throughout Holes U1438A, U1438B, U1438D, and U1438E (Figure F88).
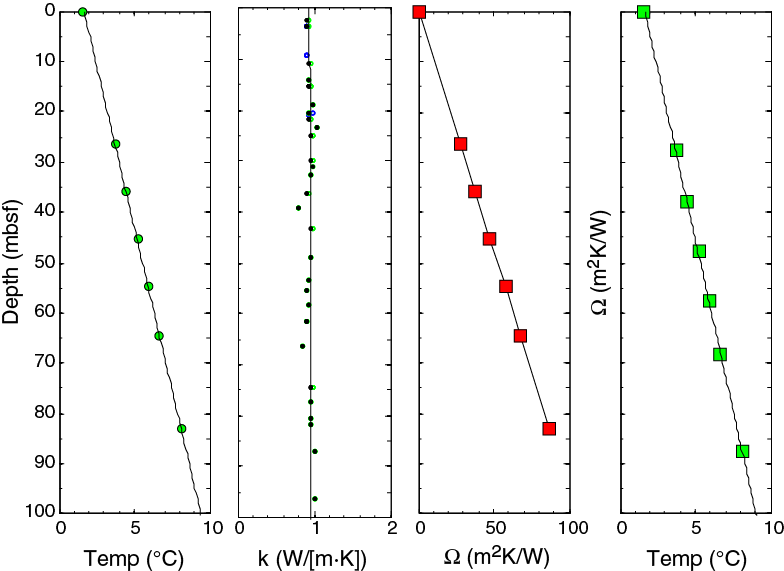
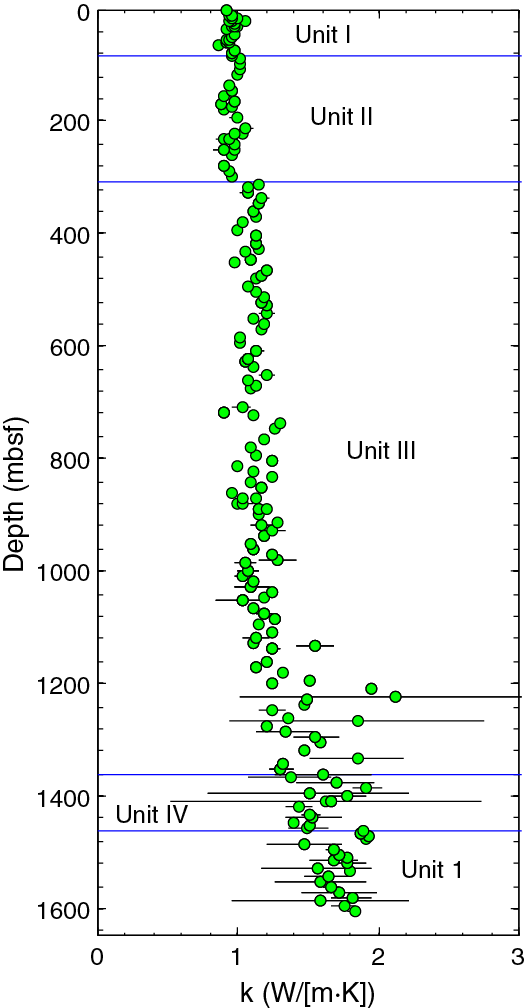
In Unit I, thermal conductivity is constant within error between about 0.9 and 1 W/(m·K). At the Unit II/III boundary, thermal conductivity jumps by a small amount from about 0.95 to 1.0 W/(m·K) and then through Unit III slowly increases from 1.0 to about 1.4 W/(m·K) at 1200 mbsf. The rate of increase in thermal conductivity increases with depth below 1200 mbsf. The variance in measured values precludes any assessment of a significant change in the rate of increase of thermal conductivity with depth at the Unit IV/Unit 1 boundary. The increase in thermal conductivity with depth in Unit III is mostly controlled by the decrease in the porosity of the mud and sand in this unit (Figure F83).
Color spectrometry
Reflectance of visible light from the archive-half sections was measured with the automated SHMSL. Spectral data are routinely reduced to the L*a*b* color space, in which L* is luminescence (light/dark), a* is the red–green value, and b* is the blue–yellow value (see Physical properties in the Expedition 351 methods chapter [Arculus et al., 2015a]). To 160 mbsf (Unit I), three major peaks in a* and L* values at 80–100, 125–140, and ~160 mbsf are characterized by the occurrence of thick light brown mud layers (Figure F39). Between 160 and 310 mbsf (Unit II), a* and L* values are relatively uniform where thick tuffaceous mudstone dominates. Below the Unit II/III boundary at 310 mbsf, L* and a* values progressively decrease. These color spectrometric changes are related to the occurrence of sandstone and conglomerate in Unit III. Peaks of L* values observed at ~510, 560, and 580 mbsf correspond to negative peaks of a* values and average particle sizes. These negative peaks are related to the occurrence of green-colored tuffaceous siltstone and/or mudstone. Below 600 mbsf, major peaks of a* values occur at ~630, ~730, ~880, and ~1030 mbsf and are correlated with the occurrence of red mudstone. Oscillation of a* values observed deeper than 1200 mbsf (Units III–IV) originates from the frequent occurrence of red and green intercalated layers.
Natural gamma radiation
Some of the changes evident in the sonic velocities, porosity, and density, and their correlation with unit boundaries and grain size, are evident in the NGR data (Figure F83). Overall, Unit I is characterized by both large average NGR as well as large variations in NGR with depth, with the highest levels of NGR, 25 and 50 counts/s, occurring within the upper 10 m of Hole U1438B. There is a strong decay in the NGR within this upper layer of unconsolidated mud. Outside of this thin, high-NGR layer, Unit I can be divided into two regions. In the upper region above 70 mbsf (but below the upper 10 m of mud), NGR is around 30 counts/s, whereas in the region between 70 and 160 mbsf (Cores 351-U1438B-9H through 17H), NGR is much higher and characterized by readings of about 40 counts/s. These variations in NGR reflect compositional variations in U, Th, and K and are more clearly evident in the downhole logging data (Figure F80). The upper 160 m section, characterized by uniform but low P-wave sonic velocities (as detailed above), has higher NGR compared to the region deeper than 160 mbsf, likely associated with the higher mud-to-sand ratio of the upper layer.
The Unit I/II boundary (160 mbsf) is associated with a substantial decrease in NGR, with Unit II having values around 8–10 counts/s. The change in NGR reflects a compositional change from a unit dominated by mud and clay to one with mudstone, siltstone, and fine sandstone and with much smaller concentrations of K, Th, and U, as evident from downhole logging (Figure F82). The unit boundary is also characterized by a small increase in grain density (but not bulk density) and a small increase in porosity. Within the sandstones, mudstones, and breccia-conglomerates of Unit III, NGR oscillates between 3 and 24 counts/s. NGR reaches a minimum between 920 and 990 mbsf (Cores 351-U1438E-10R through 17R), with values of 2–5 counts/s. Some of the largest NGR values occur within the lowest parts of Unit III from 1290 mbsf (Core 351-U1438E-49R) to the base of Unit III (Section 55R-3), where NGR increases from 4 counts/s to about 25 counts/s over 70 m (Figure F83). On average, Unit IV, composed of mudstone, siltstone, sandstone, and conglomerates, has relatively high NGR with values of 15–25 counts/s, but still less than those of Unit I. These elevated values indicate a distinct change in the trace element composition of Unit IV in comparison with the average of Unit III.
NGR drops abruptly at the boundary between Unit IV and Unit 1 to 2–5 counts/s within the basement. Across the sedimentary rock/basement boundary, the drop in NGR is much more abrupt than that evident in P-wave velocity and porosity, indicative of an abrupt change in composition but a gradual change in the physical characteristics of the basement rock.
In the downhole logging data, from ~90 to 160 mbsf (logging Unit 1), gamma ray data have high values (average = 58 gAPI). Gamma radiation decreases to values averaging around 22 gAPI from 160 to 300 mbsf (logging Unit 2). Gamma ray values from deeper intervals average around 10 gAPI to 1200 mbsf with increases to 30 gAPI in the 420–450 and 500–600 mbsf intervals (Figure F82). Potassium generally shows high concentrations in Unit 1 (~1.3%) and in the intervals from 420 to 450 and from 500 to 580 mbsf (Figure F82) but decreases deeper in the hole, eventually reaching less than 1% with few exceptions. Thorium (Th) and uranium (U) share these same general concentration trends, but are present in high concentrations (Th = 8 ppm; U = 1.1 ppm) in logging Unit 1 and then decrease to average values of ~1.6 ppm (Th) and 0.3 ppm (U) in logging Unit 2 (Figure F82). The high radiation present in logging Units 1 and 2 may reflect the presence of discrete ash layers described throughout lithostratigraphic Units I and II in the cores (see Lithostratigraphy). These layers are characterized by a large increase in total gamma radiation and, particularly, in thorium content (Figure F82). The logging data might also indicate ash layers that cannot be visually observed in the cores (Figure F89; blue dotted lines) and therefore may help to refine the eruptive volcanic history of the region around the site.
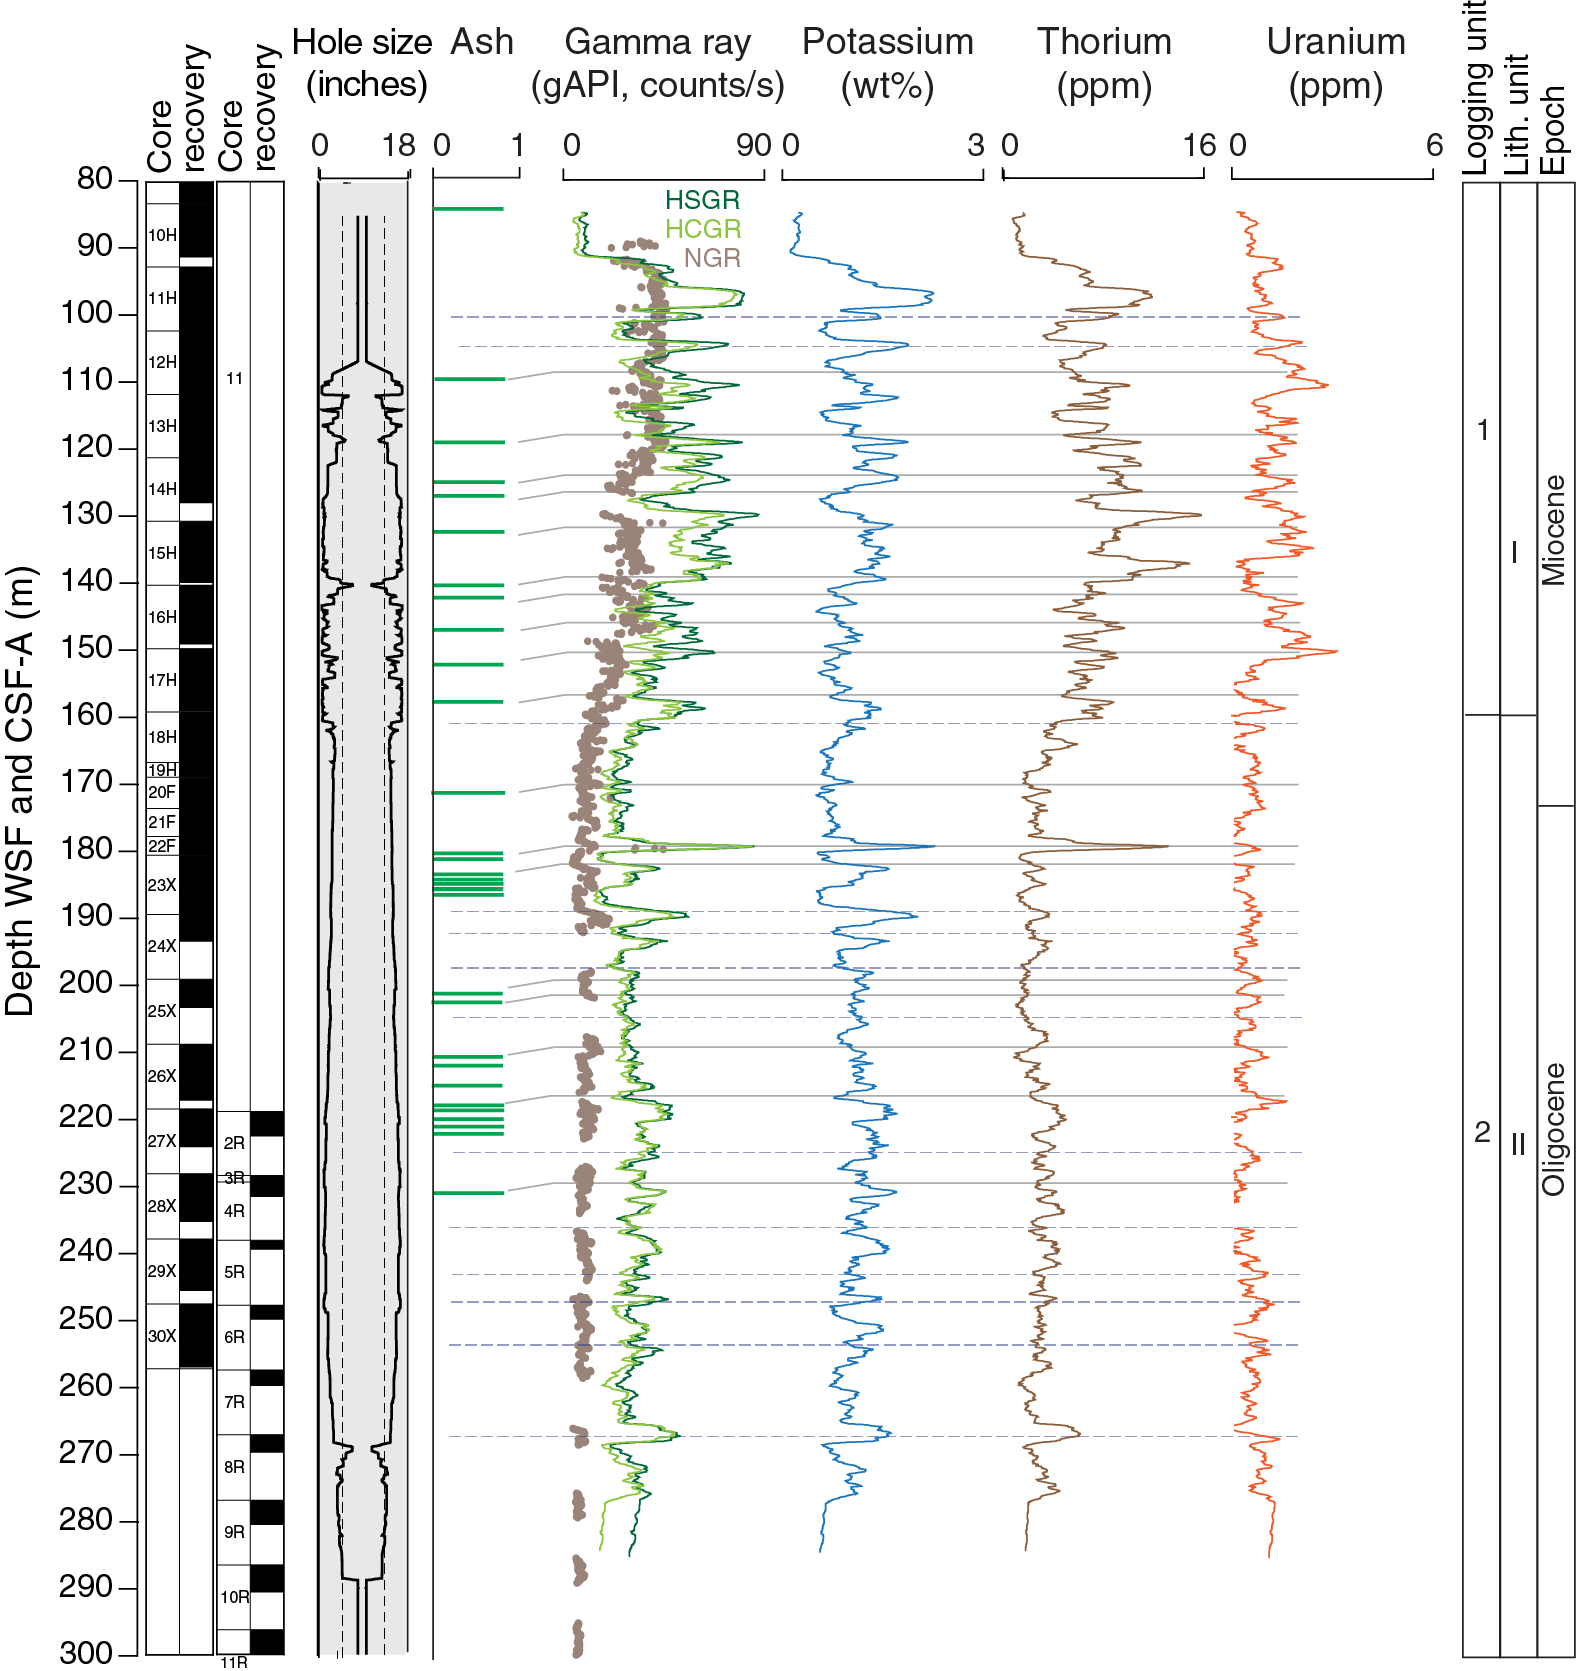
Magnetic susceptibility
Magnetic susceptibility is an additional tool used in identification of compositional variation and varies primarily in response to the type and concentration of magnetic grains. Loop and point magnetic susceptibility (κMEAS) were measured on both the whole-round cores (with the WRMSL) and the archive-half sections (with the SHMSL), respectively (Figure F83). Downhole logging also recorded magnetic susceptibility data; both logs and laboratory measurements show the same variations (Figure F80).
The upper 160 m (Unit I) has the lowest average magnetic susceptibilities of the entire site, which reflects the lithologic dominance of mud. The Unit I/II boundary (160 mbsf) is associated with a sharp increase in magnetic susceptibility that is correlated with the small increase in grain density and porosity described above. This reflects the more coarse grained nature of Unit II. The Unit II/III boundary is also characterized by a steep increase in magnetic susceptibility that stays high but variable. The oscillation of magnetic susceptibility through Units II and III is correlated with average grain size such that those core sections with higher sand and gravel relative to mud have higher magnetic susceptibility. These variations might be related to the alternations of mud and coarser material described within Unit III.
One of the largest changes downhole in magnetic susceptibility is a steep drop within Unit IV (Figure F83). The reduction is associated with the reappearance of mud at the top of Unit IV. Magnetic susceptibility jumps at ~1405 mbsf (Core 351-U1438E-61R) and increases to higher values in the mafic basement rocks of Unit 1.
Göttingen Borehole Magnetometer
Variations in magnetic flux density determined from the GBM data (Figure F90) show good correlation between data acquired on downward and upward passes. During data acquisition on both passes (downlogs and uplogs), the GBM followed a stable course with a constant and slow rotation inside the hole. However, there were a few sections with increased rotational velocity due to the release of built-up cable torque, creating “spikes” in the data. While running the uplog in the upper part of the open hole, these spikes developed into a constant oscillation. Given the fact that rotational velocities did not appear to be severely high and because of tight scheduling, the pulling speed was not reduced. Rotational rates during the spike events and oscillations in the later part of the uplog exceeded 40°/s, outranging the limits of the fluxgates’ low-pass filters and resulting in incorrect measurement of the horizontal component of the magnetic flux density in these areas. This affects 12% of the downlog data and 24% of the uplog data but may be reduced by combining intervals of undisturbed data during postexpedition processing. The orientation measurements of the GBM are not influenced because of their higher acquisition rate. Additionally, five major data losses of approximately 1 min each occurred during operations. As a result, the second heading measurement at the end of the logging run cannot be used for data correction. This may be compensated for in postcruise processing by using data acquired at the bottom of the hole and comparing the downlog data to the undisturbed parts of the uplog data. Nevertheless, these problems only appear within sharp defined regions, and the data quality in the unaffected areas is good.
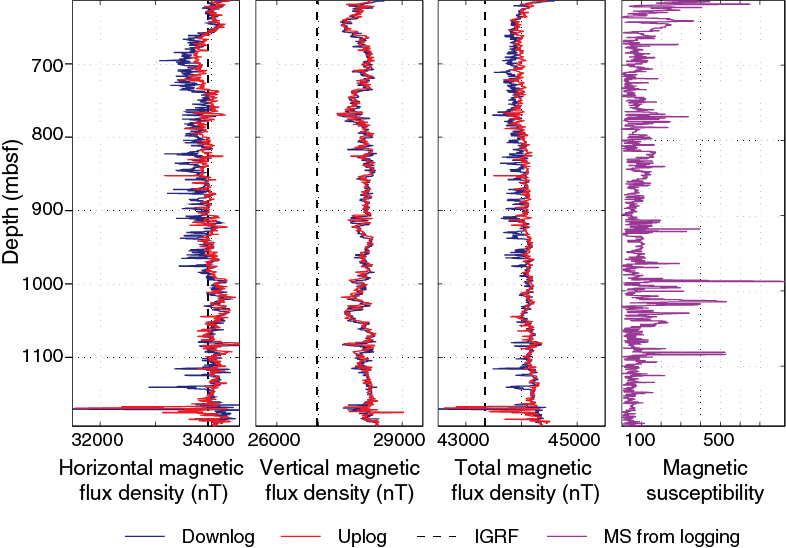
Two data sets were retained following logging operations. The first contains the raw data from the GBM, and the second contains the calibrated magnetic flux density over depth. These data were depth corrected to the susceptibility from the triple combo tool string and split into vertical and horizontal components using the inclinometer data (Figure F90).
Self-potential and resistivity
Self potential
Self-potential (SP) data repeat between the different logging passes, display major variations in Hole U1438F at the transitions between units, and are inversely correlated with resistivity indicative of good quality measurements. SP data are high and constant within logging Unit 2; these values are considered the baseline for other measurements (Figure F80). At 310 mbsf, SP decreases by about 40 mV and stays at this level to 385 mbsf, where an increase of about 20 mV occurs. At ~510 mbsf, SP data show an increasing trend and reach values 20 mV above the baseline. In Hole U1438E, SP data do not display meaningful variations, except between 1100 and 1200 mbsf, where a large decrease is observed.
Resistivity
Resistivity data were obtained in the three logged holes and range from 1.5 to 10.0 Ωm (Figure F80). The data show good agreement and an overall increasing trend with depth. Logging Unit 1 displays the lowest resistivity measured for the site (average = ~1.8 Ωm). The transition between logging Units 2 and 3 is characterized by a large increase in resistivity up to an average of 3.5 Ωm. At 399 mbsf, resistivity values are lower (~2 Ωm). From 580 to 1200 mbsf, values increase again and show intervals of low and high values that might be related to the alternating, normally size graded layers described in cores (see Lithostratigraphy).
Formation MicroScanner Images
FMS images reveal differences in textures and lithology throughout Hole U1438F. Bedding has been observed and picked, allowing determination of the orientation of structures observed in the resistivity images (Figure F91). The FMS images contain meter-scale alternations of high- and low-resistivity units. All alternations correlate well with resistivity data from the triple combo and can be related to changes in lithology. To 310 mbsf, the sediments appear to be more conductive and display few features. FMS images of deeper intervals show that the sediments are more resistive, with very resistive layers that might relate to sand or ash. Some clasts are also visible in this interval. Dipping beds are observed from 206 to 300 mbsf. Deeper than 300 mbsf, the sediments are very resistive and are more or less horizontally bedded. The beds are several meters in height and show a gradation within them from very resistive layers at the bottom to more conductive at the top.

References
Acton, G.D., Okada, M., Clement, B.M., Lund, S.P., and Williams, T., 2002. Paleomagnetic overprints in ocean sediment cores and their relationship to shear deformation caused by piston coring. Journal of Geophysical Research: Solid Earth, 107(B4):2067–2081. http://dx.doi.org/10.1029/2001JB000518
Arculus, R.J., Ishizuka, O., Bogus, K., Drab, L., Aljahdali, M.H., Bandini-Maeder, A.N., Barth, A.P., Brandl, P.A., do Monte Guerra, R., Gurnis, M.C., Hamada, M., Hickey-Vargas, R.L., Jiang, F., Kanayama, K., Kender, S., Kusano, Y., Li, H., Loudin, L.C., Maffione, M., Marsaglia, K.M., McCarthy, A., Meffre, S., Morris, A., Neuhaus, M., Savov, I.P., Sena Da Silva, C.A., Tepley, F.J., III, van der Land, C., Yogodzinski, G.M., and Zhang, Z., 2015a. Expedition 351 methods. In Arculus, R.J., Ishizuka, O., Bogus, K., and the Expedition 351 Scientists, Proceedings of the International Ocean Discovery Program, Expedition 351: Izu-Bonin-Mariana Arc Origins: College Station, TX (International Ocean Discovery Program). http://dx.doi.org/10.14379/iodp.proc.351.102.2015
Arculus, R.J., Ishizuka, O., Bogus, K., Drab, L., Aljahdali, M.H., Bandini-Maeder, A.N., Barth, A.P., Brandl, P.A., do Monte Guerra, R., Gurnis, M.C., Hamada, M., Hickey-Vargas, R.L., Jiang, F., Kanayama, K., Kender, S., Kusano, Y., Li, H., Loudin, L.C., Maffione, M., Marsaglia, K.M., McCarthy, A., Meffre, S., Morris, A., Neuhaus, M., Savov, I.P., Sena Da Silva, C.A., Tepley, F.J., III, van der Land, C., Yogodzinski, G.M., and Zhang, Z., 2015b. Expedition 351 summary. In Arculus, R.J., Ishizuka, O., Bogus, K., and the Expedition 351 Scientists, Proceedings of the International Ocean Discovery Program, Expedition 351: Izu-Bonin-Mariana Arc Origins: College Station, TX (International Ocean Discovery Program). http://dx.doi.org/10.14379/iodp.proc.351.101.2015
Bolli, H.M., and Saunders, J.B., 1985. Oligocene to Holocene low latitude planktic foraminifera. In Bolli, H.M., Saunders, J.B., and Perch-Nielsen, K. (Eds.), Plankton Stratigraphy (Vol. 1): Planktic Foraminifera, Calcareous Nannofossils and Calpionellids: Cambridge, UK (Cambridge University Press), 155–262.
Cande, S.C., and Kent, D.V., 1995. Revised calibration of the geomagnetic polarity timescale for the Late Cretaceous and Cenozoic. Journal of Geophysical Research: Solid Earth, 100(B4):6093–6095. http://dx.doi.org/10.1029/94JB03098
Cardozo, N., and Allmendinger, R.W., 2013. Spherical projections with OSXStereonet. Computers & Geosciences, 51:193–205. http://dx.doi.org/10.1016/j.cageo.2012.07.021
Egeberg, P.K., and the Leg 126 Shipboard Scientific Party, 1990. Unusual composition of pore waters found in the Izu-Bonin forearc sedimentary basin. Nature, 344(6263):215–218.
Fisher, R.A., 1953. Dispersion on a sphere. Proceedings of the Royal Society of London, Series A, 217:295–305.
Gieskes, J.M., and Lawrence, J.R., 1981. Alteration of volcanic matter in deep-sea sediments: evidence from the chemical composition of interstitial waters from deep sea drilling cores. Geochimica Cosmochimica Acta, 45(10):1687–1703. http://dx.doi.org/10.1016/0016-7037(81)90004-1
Gradstein, F.M., Ogg, J.G., Schmitz, M.D., and Ogg, G.M. (Eds.), 2012. The Geological Time Scale 2012: Amsterdam (Elsevier).
Hawkesworth, C.J., and Elderfield, H., 1978. The strontium isotopic composition of interstitial waters from Sites 245 and 336 of the Deep Sea Drilling Project. Earth and Planetary Science Letters, 40(3):423–432. http://dx.doi.org/10.1016/0012-821X(78)90165-6
Holbourn, A., Henderson, A.S., and MacLeod, N., 2013. Atlas of Benthic Foraminifera: Chichester (John Wiley & Sons, Ltd.). http://dx.doi.org/10.1002/9781118452493
Ishizuka, O., Tani, K., Reagan, M.K., Kanayama, K., Umino, S., Harigane, Y., Sakamoto, I., Miyajima, Y., Yuasa, M., and Dunkley, D.J., 2011. The timescales of subduction initiation and subsequent evolution of an oceanic island arc. Earth and Planetary Science Letters, 306(3–4):229–240. http://dx.doi.org/10.1016/j.epsl.2011.04.006
Jenner, F.E., and O’Neill, H.St.C., 2012. Analysis of 60 elements in 616 ocean floor basaltic glasses. Geochemistry, Geophysics, Geosystems, 13(2):Q02005. http://dx.doi.org/10.1029/2011GC004009
Japan National Oil Corporation, 1998. Technology Research Center Report: Deep Sea Survey Technologies for Natural Resources. (in Japanese).
Kaiho, K., 1992. Eocene to Quaternary benthic foraminifers and paleobathymetry of the Izu-Bonin arc, Legs 125 and 126. In Taylor, B., Fujioka, K., et al., Proceedings of the Ocean Drilling Program, Scientific Results, 126: College Station, TX (Ocean Drilling Program), 285–310. http://dx.doi.org/10.2973/odp.proc.sr.126.137.1992
Kennett, J.P., and Srinivasan, M.S., 1983. Neogene Planktonic Foraminifera: A Phylogenetic Atlas: Stroudsburg, PA (Hutchinson Ross).
Marsaglia, K.M., and Tazaki, K., 1992. Diagenetic trends in Leg 126 sandstones. In Taylor, B., Fujioka, K., et al., Proceedings of the Ocean Drilling Program, Scientific Results, 126: College Station, TX (Ocean Drilling Program), 125–138. http://dx.doi.org/10.2973/odp.proc.sr.126.123.1992
Martini, E., 1971. Standard Tertiary and Quaternary calcareous nannoplankton zonation. In Farinacci, A. (Ed.), Proceedings of the Second Planktonic Conference, Roma 1970: Rome (Edizioni Tecnoscienza), 2:739–785.
Pälike, H., Lyle, M.W., Nishi, H., Raffi, I., Ridgwell, A., Gamage, K., Klaus, A., Acton, G., Anderson, L., Backman, J., Baldauf, J., Beltran, C., Bohaty, S.M., Bown, P., Busch, W., Channell, J.E.T., Chun, C.O.J., Delaney, M., Dewangan, P., Dunkley Jones, T., Edgar, K.M., Evans, H., Fitch, P., Foster, G,L., Gussone, N., Hasegawa, H., Hathorne, E.C., Hayashi, H., Herrle, J.O., Holbourn, A., Hovan, S., Hyeong, K., Iijima, K., Ito, T., Kamikuri, S., Kimoto, K., Kuroda, J., Leon-Rodriguez, L., Malinverno, A., Moore, T.C., Jr., Murphy, B.H., Murphy, D.P., Nakamura, H., Ogane, K., Ohneiser, C., Richter, C., Robinson, R., Rohling, E.J., Romero, O., Sawada, K., Scher, H., Schneider, L., Sluijs, A., Takata, H., Tian, J., Tsujimoto, A., Wade, B.S., Westerhold, T., Wilkens, R., Williams, T., Wilson, P.A., Yamamoto, Y., Yamamoto, S., Yamazaki, T., and Zeebe, R.E., 2012. A Cenozoic record of the equatorial Pacific carbonate compensation depth. Nature, 488(7413):609–614. http://dx.doi.org/10.1038/nature11360
Pearson, P.N., Olsson, R.K., Huber, B.T., Hemleben, C., and Berggren, W.A. (Eds.), 2006. Atlas of Eocene Planktonic Foraminifera. Special Publication - Cushman Foundation for Foraminiferal Research, 41.
Reagan, M.K., Ishizuka, O., Stern, R.J., Kelley, K.A., Ohara, Y., Blichert-Toft, J., Bloomer, S.H., Cash, J., Fryer, P., Hanan, B.B., Hickey-Vargas, R., Ishii, T., Kimura, J.-I., Peate, D.W., Rowe, M.C., and Woods, M., 2010. Fore-arc basalts and subduction initiation in the Izu-Bonin-Mariana system. Geochemistry, Geophysics, Geosystems, 11(3):Q03X12. http://dx.doi.org/10.1029/2009GC002871
Salisbury, M.H., Shinohara, M., Richter, C., et al., 2002. Proceedings of the Ocean Drilling Program, Initial Reports, 195: College Station, TX (Ocean Drilling Program). http://dx.doi.org/10.2973/odp.proc.ir.195.2002
Salisbury, M.H., Shinohara, M., Suetsugu, D., Arisaka, M., Diekmann, B., Januszczak, N., and Savov, I.P., 2006. Leg 195 synthesis: Site 1201—a geological and geophysical section in the West Philippine Basin from the 660-km discontinuity to the mudline. In Shinohara, M., Salisbury, M.H., and Richter, C. (Eds.), Proceedings of the Ocean Drilling Program, Scientific Results, 195: College Station, TX (Ocean Drilling Program), 1–27. http://dx.doi.org/10.2973/odp.proc.sr.195.113.2006
Savov, I.P., Hickey-Vargas, R., D’Antonio, M., Ryan, J., and Spadea, P., 2005. Petrology and geochemistry of west Philippine basin basalts and early Palau-Kyushu arc volcanic clasts from ODP Leg 195, Site 1201D: implications for the early history of the Izu-Bonin-Mariana arc. Journal of Petrolology, 47(2):277–299. http://dx.doi.org/10.1093/petrology/egi075
Tauxe, L., and Kent, D.V., 2004. A simplified statistical model for the geomagnetic field and the detection of shallow bias in paleomagnetic inclinations: was the ancient magnetic field dipolar? In Channell, J.E.T., Kent, D.V., Lowrie, W., and Meert, J.G. (Eds.), Timescales of the Paleomagnetic Field. Geophysical Monograph, 145:101–115. http://dx.doi.org/10.1029/145GM08
Teagle, D.A.H., Ildefonse, B., Blum, P., and the Expedition 335 Scientists, 2012. Proceedings of the Integrated Ocean Drilling Program, 335: Tokyo (Integrated Ocean Drilling Program Management International, Inc.). http://dx.doi.org/10.2204/iodp.proc.335.2012
Thompson, R., and Oldfield, F., 1986. Environmental Magnetism: London (Allen and Unwin).
Torres, M.E., Marsaglia, K.M., Martin, J.B., and Murray, R.W., 1995. Sediment diagenesis in western Pacific basins. In Taylor, B., and Natland, J. (Eds.), Active Margins and Marginal Basins of the Western Pacific. Geophysical Monograph, 88:241–258. http://dx.doi.org/10.1029/GM088p0241
van Morkhoven, F.P.C.M., Berggren, W.A., Edwards, A.S.,and Oertli, H.J., 1986. Cenozoic cosmopolitan deep-water benthic foraminifera. Bulletin des Centres de Recherches Exploration-Production Elf-Aquitaine, 11.
Wei, W., Kastner, M., and Spivack, A., 2008. Chlorine stable isotopes and halogen concentrations in convergent margins with implications for the Cl isotopes cycle in the ocean. Earth and Planetary Science Letters, 266(1–2):90–104. http://dx.doi.org/10.1016/j.epsl.2007.11.009
1Arculus, R.J., Ishizuka, O., Bogus, K., Aljahdali, M.H., Bandini-Maeder, A.N., Barth, A.P., Brandl, P.A., do Monte Guerra, R., Drab, L., Gurnis, M.C., Hamada, M., Hickey-Vargas, R.L., Jiang, F., Kanayama, K., Kender, S., Kusano, Y., Li, H., Loudin, L.C., Maffione, M., Marsaglia, K.M., McCarthy, A., Meffre, S., Morris, A., Neuhaus, M., Savov, I.P., Sena Da Silva, C.A., Tepley, F.J., III, van der Land, C., Yogodzinski, G.M., and Zhang, Z., 2015. Site U1438. In Arculus, R.J., Ishizuka, O., Bogus, K., and the Expedition 351 Scientists, Proceedings of the International Ocean Discovery Program, Expedition 351: Izu-Bonin-Mariana Arc Origins: College Station, TX (International Ocean Discovery Program). http://dx.doi.org/10.14379/iodp.proc.351.103.2015