France-Lanord, C., Spiess, V., Klaus, A., Schwenk, T., and the Expedition 354 Scientists
Proceedings of the International Ocean Discovery Program Volume 354
publications.iodp.org
doi:10.14379/iodp.proc.354.103.2016

Site U14491
C. France-Lanord, V. Spiess, A. Klaus, R.R. Adhikari, S.K. Adhikari, J.-J. Bahk, A.T. Baxter, J.W. Cruz, S.K. Das, P. Dekens, W. Duleba, L.R. Fox, A. Galy, V. Galy, J. Ge, J.D. Gleason, B.R. Gyawali, P. Huyghe, G. Jia, H. Lantzsch, M.C. Manoj, Y. Martos Martin, L. Meynadier, Y.M.R. Najman, A. Nakajima, C. Ponton, B.T. Reilly, K.G. Rogers, J.F. Savian, T. Schwenk, P.A. Selkin, M.E. Weber, T. Williams, and K. Yoshida2
Keywords: International Ocean Discovery Program, IODP, Expedition 354, JOIDES Resolution, Site U1449, Bengal Fan
MS 354-103: Published 7 September 2016
Site summary
Site U1449 (proposed Site MBF-6A) is part of our seven-site transect designed to document turbiditic transport processes and the architecture of deposition in the Middle Bengal Fan at 8°N since the Pleistocene. Sediments will also be used to trace sources of eroded material in the Himalaya and reconstruct erosion rates as a function of climate change. Site U1449 is located at 08°0.419′N, 088°6.599′E in a water depth of 3653 m. The main Hole U1449A penetrated to 213.5 m drilling depth below seafloor (DSF) and was cored by a combination of the advanced piston corer (APC), half-length APC (HLAPC), and extended core barrel (XCB) systems. Hole U1449B consists of a single APC core from the mudline taken for microbiological studies.
Principal results
Different structural elements of the sedimentary fan were cored, including a more than 40 m thick levee succession, interlevee sand sheets, and hemipelagic sequences. General lithologic boundaries correlate well with downcore variability in all physical properties and were attributed to major seismic facies types and reflectivity characteristics. In situ and average core seismic velocities are in close agreement, which confirms that the major lithologies were properly sampled and sections not recovered by XCB drilling likely contained unconsolidated sand.
Cored sediments allowed us to characterize the sedimentological, physical, and geochemical properties of the material delivered mostly through turbidity currents and likely originating from the Himalayan range. Integration of lithology, physical properties, seismic facies, and geochronological data shows that sedimentation varies over several orders of magnitude between centimeters per thousand years for hemipelagic units that represent a local absence of turbiditic sedimentation and much higher rates (>>10 cm/ky) for interlevee units and levees that built up rapidly.
High accumulation rates of turbiditic deposition in the lower 120 m of Hole U1449A since ~2 Ma were followed by a low-accumulation hemipelagic episode around ~0.8–1.3 Ma. Intercalated levee and interlevee deposits then formed until ~300 ky ago, after which hemipelagic sedimentation dominated again.
Operations
Hole U1449A was drilled to total depth of 213.5 m DSF. The APC system penetrated 57.1 m of formation and recovered 52.37 m (92%). The HLAPC penetrated 71.9 m of formation and recovered 74.98 m (104%). The XCB system penetrated 83.5 m of formation and recovered only 2.03 m (2%). Because of low recovery with the XCB system and because most objectives were achieved, drilling was terminated before reaching the initially planned depth of 300 meters below seafloor (mbsf) to save time. Hole U1449B consists of a single APC core from the mudline taken for microbiological investigations and recovered 7.91 m of sediments.
This first Expedition 354 drilling experience in the fan sediments allowed us to refine the drilling strategy for subsequent drill sites. As expected, recovery of sands intercalated between muddy units was challenging, but the HLAPC system proved to be particularly efficient for sampling both turbiditic sequences and loose sand intervals.
Lithostratigraphy
The predominant lithology is siliciclastic and composed of normally graded intervals of mica-rich quartz-dominant fine sand, silt, and clay of varying thicknesses (i.e., turbidites). The observed mineralogical assemblage is characteristic of sediments found in Himalayan rivers. Turbidite sequences are generally separated by hemipelagic intervals (mottled calcareous clays) and occasional glassy volcanic ash layers. Lithologic differences between siliciclastic units and variations in grain size and bed thickness reflect cycles of proximal turbidity current channel activity, including activation, flow-stripping, avulsion, and abandonment. Bioturbated calcareous clays likely represent times of channel-levee inactivity at Site U1449 and hence reduced deposition of terrigenous material.
Biostratigraphy
Calcareous nannofossils and planktonic foraminifers provide biostratigraphic constraints at Site U1449. Overall, the abundance and preservation of these microfossils is dependent on the type of lithology recovered. Coarser sandy intervals contain few to barren calcareous nannofossils and barren to <0.1% foraminifers, but abundance and preservation improve considerably in the pelagic and hemipelagic intervals. These intervals are discontinuous at this site because of the regular influx of turbidites and levee sedimentation. Biostratigraphic controls are based on 53 nannofossil and 34 planktonic foraminifer samples, which provide a total of six biomarker horizons and a lower Pleistocene age at the bottom of Hole U1449A.
Paleomagnetism
We studied 38 of the 30 cores collected from Hole U1449A, avoiding deformed or sandy intervals. Most cores were unoriented, so polarity reversals were identified using declination data within each core, both from discrete samples and archive section halves. The upper 91 m in Hole U1449A reveals normal polarity corresponding to the Brunhes Chron (<0.781 Ma). A pelagic deposit between 88 and 97 m core depth below seafloor (CSF-A) contains several magnetic polarity transitions, including the Brunhes/Matuyama boundary and the boundaries of the Jaramillo and Cobb Mountain Subchrons. Interpretation of the magnetic polarity beneath the hemipelagic unit is difficult, but at least two cores (20H and 22H) may have reverse magnetization. Correlation between multiple holes from our transect, particularly in pelagic and hemipelagic intervals, is expected to clarify the interpretation of the magnetostratigraphy of Hole U1449A.
Physical properties
Acquired data allow three lithologic groups to be distinguished. Sand-dominated lithologies reveal high acoustic velocity (~1700 m/s), high wet bulk density (~2.1 g/cm3), generally high magnetic susceptibility (~50 × 10–5 to 200 × 10–5 SI), and intermediate levels of natural gamma radiation (NGR) (~70 counts/s). Silty clay lithologies show intermediate values of acoustic velocity (~1550 m/s), wet bulk density (~2.0 g/cm3), and magnetic susceptibility (30 × 10–5 to 100 × 10–5 SI) and the highest NGR levels (~90 counts/s). Hemipelagic lithologies are easily distinguished by their low acoustic velocity (~1500 m/s), low wet bulk density (~1.6 g/cm3), very low magnetic susceptibility (0–20 × 10–5 SI), low NGR (~25 counts/s), and the lightest color. Detailed comparisons between lithology and physical properties on selected intervals confirm the predictive capabilities of physical property data for high-resolution reconstruction of depositional processes. Also, the data show a particularly high variability in coarser grained intervals, which were probably disturbed by coring; thus, deviation from in situ properties cannot be excluded.
Geochemistry
Shipboard sampling allowed analysis of 39 interstitial water samples, including a detailed sampling of the upper 9 m in single-core Hole U1449B. Inorganic and organic geochemical analyses were acquired on 12 samples for major and trace elements and 37 samples for organic and inorganic carbon. Data from turbidite sediments exhibit geochemical compositions similar to those observed for sediments from Himalayan rivers and from the upper fan levees and shelf. A total of 31 samples were taken for postexpedition microbiological research.
Background and objectives
Site U1449 (see Figures F3, F4, and F8 in the Expedition 354 summary chapter [France-Lanord et al., 2016d]) is the first of a seven-site transect drilled during Expedition 354 to study Pleistocene fan architecture and the evolution of the Middle Bengal Fan at 8°N. Seismic data along the transect reveal that the upper section of the fan is characterized by deposition related to channel-levee systems (Schwenk and Spiess, 2009), whereas below that section, fewer and smaller scale channel systems are present. The onset of this pervasive channel-levee transport and deposition likely occurred during the latest Miocene. Since then, the fan appears to have been built by an accumulation of lenses corresponding to distinct channel-levee episodes intercalated with more slowly accumulating intervals of fine-grained sediment. Thus, accumulation at any point is likely highly variable in rate and composition, and changes are very irregular in space and time.
The objectives for this site were to provide characteristics of lithologies building the structural and depositional elements of the fan and to estimate accumulation rates for different sedimentary deposition processes. Combined with the other six transect sites, this site should document depocenter migration and overall accumulation rates since the Pliocene.
Turbiditic sediments throughout the Bengal Fan carry detrital particles dominantly supplied by the Ganges and Brahmaputra Rivers (France-Lanord et al., 1993). Therefore, sediment collected at Site U1449 will be used to document Pleistocene erosion rates and erosion processes, as well as links between erosion and climate. This site was selected to initiate the expedition and provide the initial experience of drilling/coring conditions in this type of environment so that we could refine the overall drilling strategy for the rest of the expedition.
Site U1449 is located in a relatively flat environment with a smooth morphology. Topographic expressions of channels are absent in the vicinity (Figure F1), but an abandoned channel is present ~35 km west. Minor incisions <10 m deep are observed in the seismic data throughout the area but are not resolved by multibeam bathymetry.
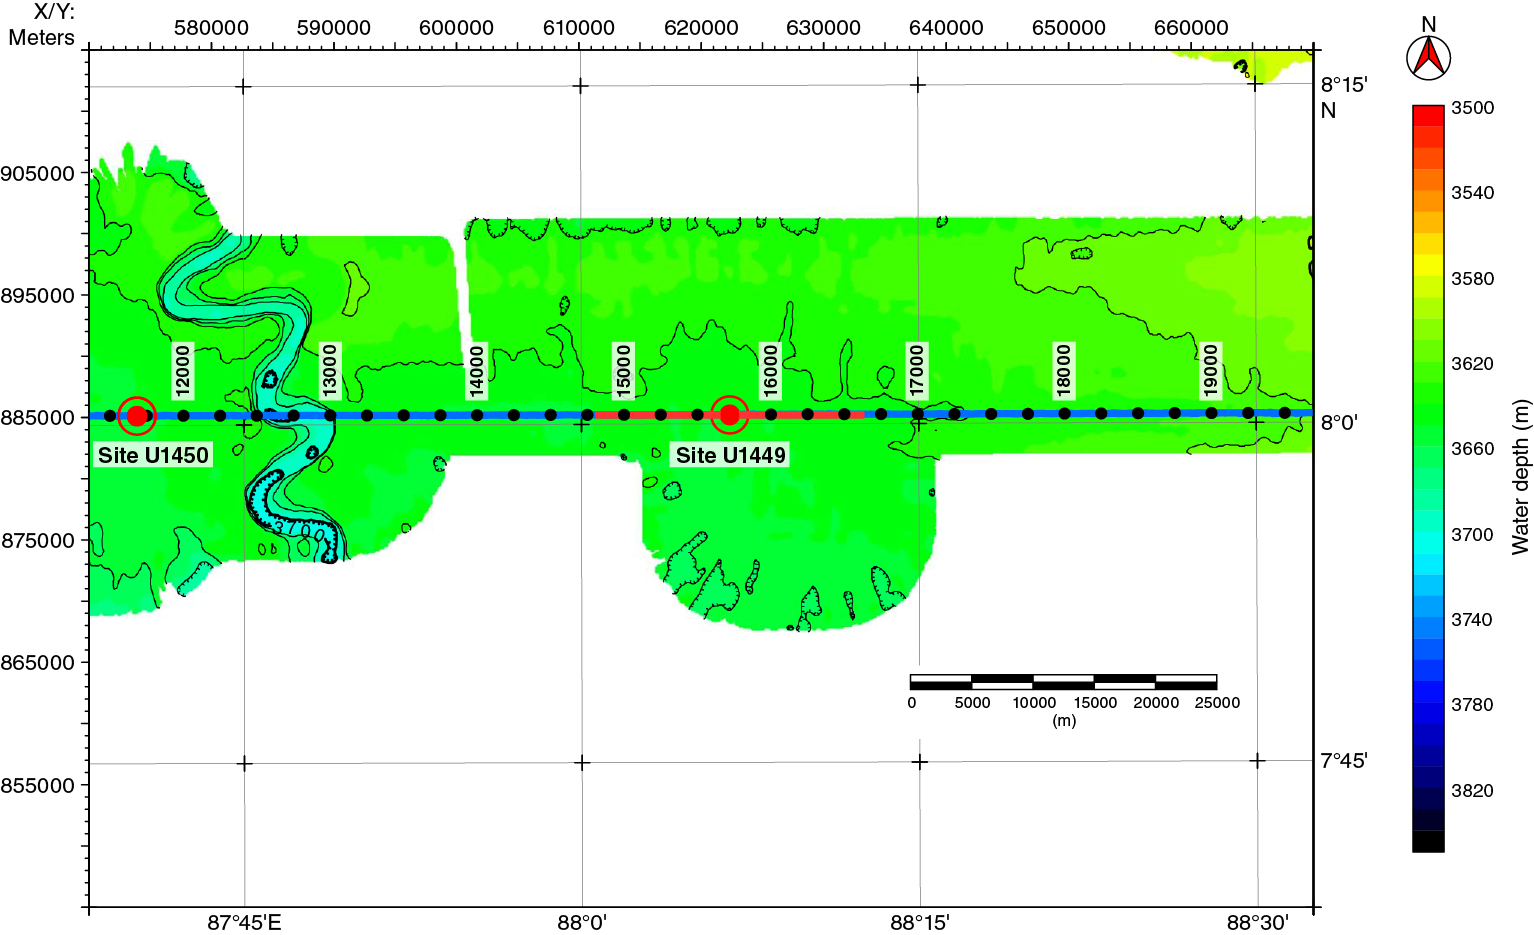
Figure F1. Bathymetric and track chart, Site U1449. Projection is UTM Zone 45N. Multibeam bathymetry was acquired during R/V Sonne Cruises SO125 and SO188.
Figure F2 shows a portion of the transect seismic profile in the vicinity of Site U1449. Two major buried channel systems are presthin the uent wipper 300 ms two-way traveltime (TWT); they formed levees and contributed to the sedimentary succession drilled at Site U1449. Coarser grained interlevee units, onlapping onto the levees, are intercalated. Channel switching and associated depocenter migration, as well as the lifetime of such units, were investigated by coring at this site.

Figure F2. Seismic Line SO125-GeoB97-027 across Site U1449. Total penetration depth is 213 m DSF, assuming an average velocity of 1640 m/s.
Operations
Singapore port call
The R/V JOIDES Resolution was scheduled to arrive at Loyang offshore terminal in Singapore in the early morning of 29 January 2015 but had to anchor outside the port. The ship occupying our intended berth had a mechanical problem, and the arrival had to be shifted to the next day (30 January). In the late afternoon, water taxis were used to disembark Expedition 353 (Indian Monsoon) scientists and JOIDES Resolution Science Operator (JRSO) staff. The Expedition 354 Co-Chief Scientists and JRSO staff also boarded the ship by water taxi.
At 0600 h on 30 January, the pilot boarded the ship, and we started the short 9 nmi transit to Loyang port. The first line ashore at 0821 h marked the end of Expedition 353 and the start of Expedition 354. This first day of port call activities included boarding the Bengal Fan scientists, completing ship operator crew change, offloading Expedition 353 core and sample shipments, and shipping a variety of items to and from the ship. The Bengal Fan scientists settled in their rooms, were introduced to life on board, and then were given an initial safety orientation, laboratory tours, and an introduction to information technology on the ship.
On 31 January, the scientists and JRSO technical staff were introduced to each other and the Co-Chief Scientists kicked off the expedition with a presentation of the expedition science objectives. In the afternoon, the Captain introduced key staff and gave the overall ship safety orientation. The International Ocean Discovery Program (IODP) Expedition Project Manager then gave the scientists an orientation. Port call activities continued with loading drilling mud, fueling the ship, completing a variety of shipments to and from the ship, and giving tours for a group of Texas A&M University (USA) alumni from Singapore and journalism students from Nanyang Technological University (Singapore). Port call continued with activities at the Loyang Offshore Supply Base jetty, including loading drilling equipment, expedition stores, and food. All public relation activities were concluded on 1 February. On 2 February, we conducted our first safety drills (fire and boat; anti-piracy security), and then all scientists and staff were given the afternoon off because our departure from Singapore was scheduled for the next day. In the afternoon, the final port call activities included loading life rafts and the remainder of fresh food and dry goods, securing the ship for heading out to sea, and preparing for the installation of a new core line.
Transit to Site U1449
At 0800 h on 3 February 2015, we were cleared by immigration for departure. The pilot arrived on board at 1020 h, and the last line was released at 1048 h. Our departure was assisted by two harbor tugs, and we proceeded to the pilot station, where the pilot departed the vessel (1202 h). We then began our transit through the Malacca Strait, into the Bay of Bengal, and to Site U1449. During the transit, we retarded the ship’s clock 2 h to UTC + 6 h. All times from this point until the end of Expedition 354 coring operations are given in this ship local time (UTC + 6 h). During the transit, the Co-Chief Scientists, key IODP staff, and the ship’s crew met to review the coring and logging plan for the expedition.
Site U1449
The original plan for Site U1449 was to core a single hole with the APC and XCB systems to 300 mbsf. Instead, two holes were cored. Hole U1449A was cored with the APC, HLAPC, and XCB systems to 213.5 m DSF. The nature of the formation (interbedded sands, silts, and muds) created coring challenges that reduced penetration rate and recovery. Hole U1449B consisted of a single mudline core for high-resolution microbiology and geochemistry.
Hole U1449A
After completing the transit from Singapore (1105 nmi; 3.9 days; 11.8 nmi/h), we arrived at Site U1449 at 0623 h on 7 February 2015. We assembled a bit and bottom-hole assembly (BHA), verified the correct space-out of the core barrel, and lowered it to the seafloor. The BHA included a nonmagnetic drill collar, and we used nonmagnetic core barrels throughout coring at Site U1449. We placed the bit at 3660 m drilling depth below rig floor (DRF) and prepared to spud Hole U1449A. After a failed first attempt APC core (the shear pins did not break), Hole U1449A was spudded at 2125 h on 7 February. Core 1H recovered 6.27 m and established the seafloor at 3652.7 meters below sea level (3663.3 m DRF). We used the APC, HLAPC, and XCB systems to penetrate and recover core in Hole U1449A. All cores, penetration depths, core recovery, and time recovered on deck are presented in Table T1.
Table T1. Site U1449 core summary. Download table in .csv format. View PDF table.
Core orientation started with Core 2H, but after it only penetrated 3.72 m the orientation tool was removed from the system. After Core 2H, we drilled 1 m without coring through a hard layer (9.9–10.9 m DSF) and then XCB cored to 17 m without any recovery. We then used both piston coring systems and penetrated 22.5 m (17.0–39.5 m DSF; Cores 5H, 6F, 7H, and 8H) and recovered 18.3 m of core (82%). Orientation was attempted on Cores 8H and 9H with poor results; Core 8H was also the only time we deployed the advanced piston corer temperature tool (APCT-3) to obtain a formation temperature measurement. Core 9H did not penetrate the formation, so we switched to XCB coring. Cores 10X–12X extended from 39.5 to 68.4 m DSF but recovered only 0.86 m (3%). We switched back to the HLAPC system, and Cores 13F–17F penetrated 19.6 m of formation (68.4–88.0 m DSF) and recovered 20.03 m (102%). Because we wanted to core deeply at this site, the formation appeared soft enough, and the HLAPC system takes longer, we switched back to the APC system. Cores 18H–21H extended from 88.0 to 113.4 m DSF and recovered 25.02 m of core (99%); however, all but the first were only partial strokes (7.6, 4.9, and 3.4 m) and were advanced by recovery.
We switched back to the HLAPC system, and Cores 22F–31F penetrated 43.1 m (113.4–156.5 m DSF) and recovered 45.33 m; the last two were only partial strokes. As the formation still appeared to be too firm for full APC coring and achieving our primary objective of obtaining deeper samples would take much longer with the HLAPC system, we deployed the XCB coring system. Cores 32X–36X penetrated 48.5 m (156.5–205.0 m DSF) but only recovered 1.17 m of sediment (2%). We then switched back to APC coring, first with HLAPC Core 37F, which penetrated from 205.0 to 209.7 m DSF and recovered 4.79 m (102%). The final core of Hole U1449A was another attempt at APC Core 38H that only partially stroked out from 209.7 to 213.5 m DSF and recovered 3.87 m of core.
Because we (1) had achieved a substantial part of this site’s objectives, (2) had exceeded the operational time allocated for this site, and (3) had many high-priority expedition objectives remaining, we decided to not to spend any more time attempting to sample to the full 300 mbsf originally planned.
The APC system penetrated a total of 57.1 m of formation and recovered 52.37 m (91%, but includes advance by recovery and one core that did not penetrate the formation) (Table T2). The HLAPC system penetrated 71.9 m of formation and recovered 74.98 m (104%). The XCB system penetrated a total of 83.5 m of formation and recovered only 2.03 m (2%). Ten barrels of sepiolite mud was circulated during or shortly after cutting Cores 10X and 33X.
Table T2. Core recovery by coring system, Site U1449. Download table in .csv format.
Hole U1449B
After finishing coring in Hole U1449A, we offset the ship 20 m east and obtained a single mudline core in Hole U1449B for high-resolution microbiological and geochemical sampling. The bit was spaced out to 3661.0 m DRF in an attempt to recover approximately 7.0 m with the mudline core. Core 1H extended from the seafloor to 7.9 m DSF. We then retrieved the drill string, secured the rig floor, and started the short transit to Site U1450 at 1530 h on 10 February 2015.
Lithostratigraphy
At Site U1449, two holes were cored (U1449A and U1449B) to total depths of 213.5 m DSF (61% recovery) and 7.9 m DSF (100% recovery), respectively. The sediments recovered from these holes are divided into five lithostratigraphic units based on lithologic and paleontological characteristics obtained through macroscopic and smear slide analyses, as well as physical properties (Figure F3; Table T3). The overall predominant lithology is siliciclastic and composed of normally graded intervals of fine sand, silt, and clay (i.e., turbidites). Turbidite sequences are generally separated by clay- and silt-sized pelagic and hemipelagic intervals and occasionally by volcanic ash layers. Lithostratigraphic Unit I (Hole U1449A = 0–6.27 m CSF-A; Hole U1449B = 0–6.57 m CSF-A) is dominated (95%) by bioturbated nannofossil-rich calcareous clay containing foraminifers. Additionally, Unit I contains three volcanic ash layers composed of fine-grained glass particles: two in Hole U1449A (1.80–2.01 and 2.17–2.23 m CSF-A) and one in Hole U1449B (1.70–1.90 m CSF-A). Lithostratigraphic Unit II (Hole U1449A = 6.20–83.35 m CSF-A; Hole U1449B = 6.57–7.80 m CSF-A) is composed of successions of dominantly silty and fine-sandy intervals (silt/sand turbidites; 71%) and intervals predominantly composed of clay and silt of varying thicknesses (mud turbidites). Also present is nannofossil-rich calcareous clay. Lithostratigraphic Unit III (Hole U1449A = 83.35–97.00 m CSF-A) is characterized by nannofossil-rich calcareous clay (73%) topped with mottled clays. This unit contains only one thin (~40 cm) turbidite interval and a volcanic ash layer. Lithostratigraphic Unit IV (97.00–147.8 m CSF-A) is dominated by repeated sequences of laminated silt and silty clay turbidites of varying thicknesses (>99%). Turbidites here have sharp planar lower boundaries and fine upward from laminated silt to silty clay. The unit also contains a very thin calcareous clay and a thin volcanic ash layer. Lithostratigraphic Unit V (Hole U1449A = 157.97–213.54 m CSF-A) has poor recovery. The dominant (56%) lithology of recovered sections is thick-bedded fine sands. The lowermost sand intervals contain thin layers of alternating clay and silt, as well as nannofossil-rich calcareous clays.
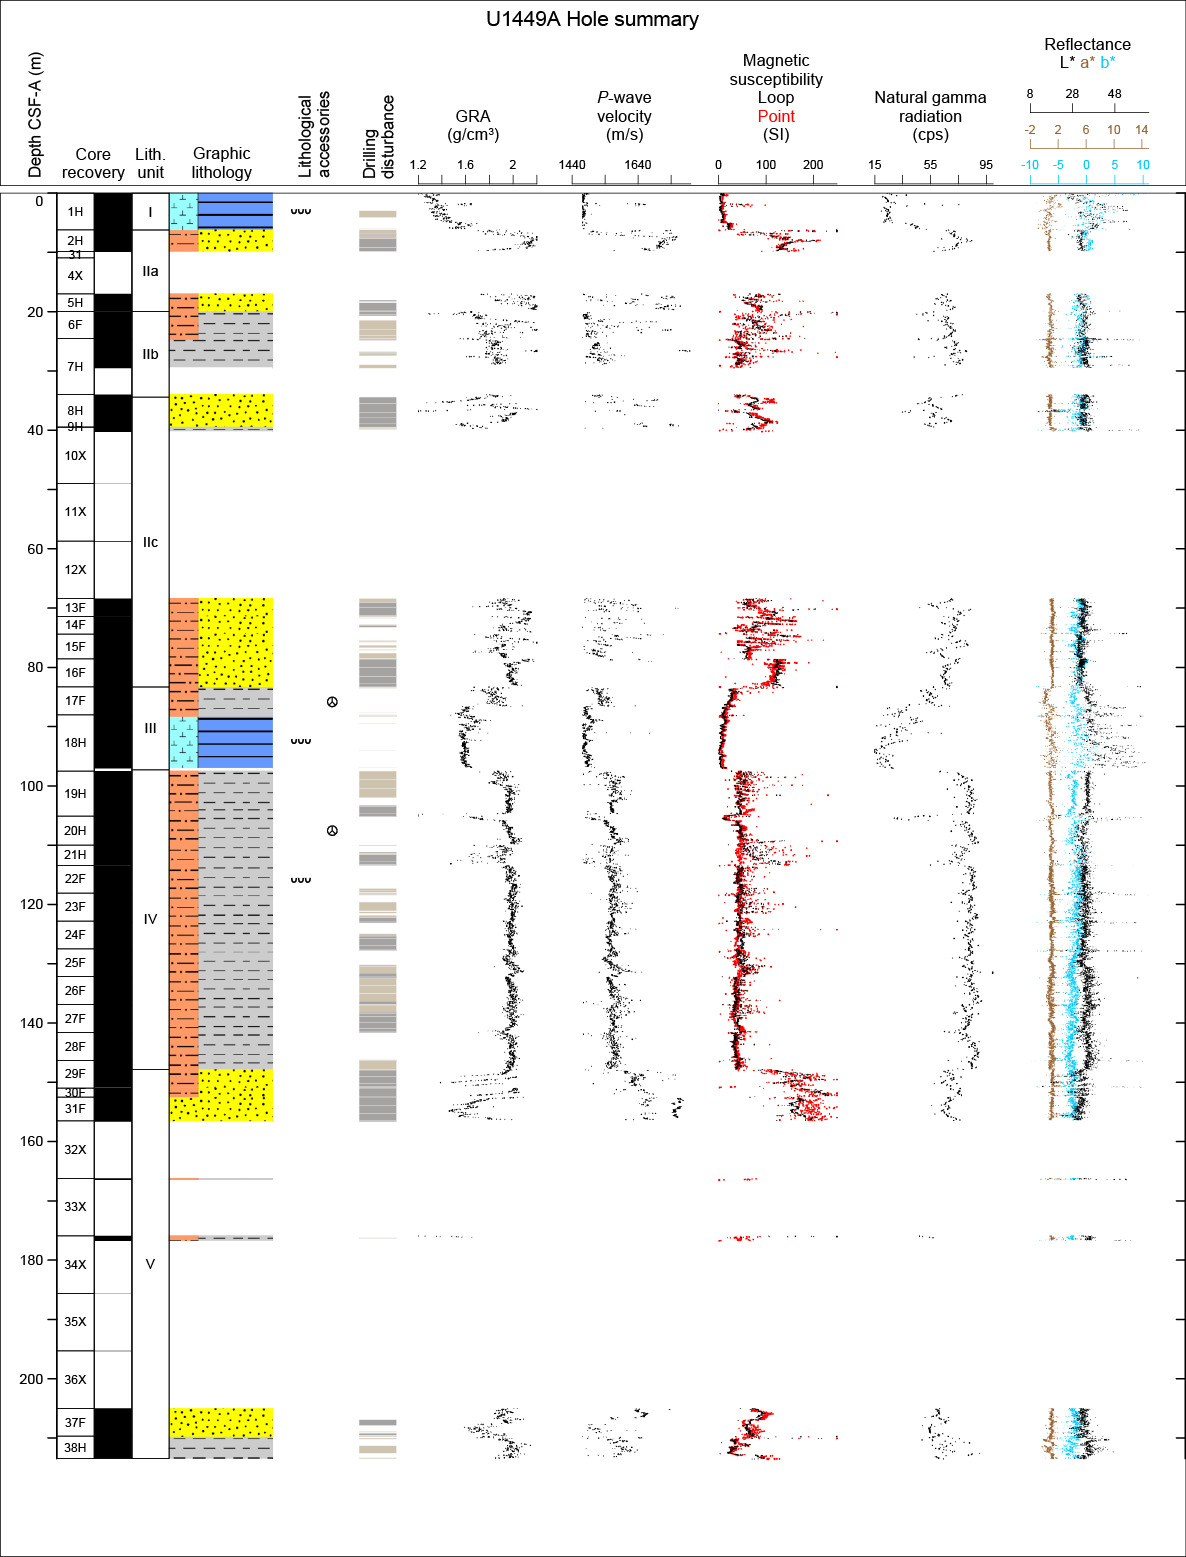
Figure F3. Lithostratigraphic summary, Hole U1449A.
Table T3. Intervals, depths, major and minor lithologies, and ages of units, Site U1449. Download table in .csv format.
Turbidite sequences at Site U1449 are compositionally classified as mica rich (muscovite and biotite) and quartz dominant. Feldspars and heavy minerals (e.g., tourmaline, apatite, zircon, and opaque minerals) are common in silt- and sand-rich layers, whereas organic and pyritized aggregations (i.e., preserved burrows) appear occasionally in silty sections and within calcareous clays. Intervals of calcareous clay consistently include foraminifers, radiolarians, and diatoms.
Lithologic differences between siliciclastic units and variations in grain size and bed thickness most probably reflect cycles of proximal turbidity current channel activity, including activation, flow stripping, avulsion, and abandonment. These differences are consistent with the channel-levee stacking patterns observed in seismic Profile GeoB97-020/027 collected on the Bengal Fan during the R/V Sonne SO125 cruise (Schwenk and Spiess, 2009). Bioturbated pelagic and hemipelagic calcareous clays likely represent times of local channel-levee inactivity and hence reduced siliciclastic deposition expressed as a relative increase in the influx of suspended sediment from the pelagic zone. Many calcareous intervals show repeated sequences of color-graded beds corresponding to upward-increasing entrainment of siliciclastic material.
The nomenclature for lithologic descriptions of fine sediments containing carbonate consists of a principal name and a modifier based on the composition estimated from visual description of the cores and from smear slide observations. The principal name of sediment that appears to contain >75% carbonate is calcareous ooze (see Figure F4 in the Expedition 354 methods chapter [France-Lanord et al., 2016a]). The principal name of sediment that appears to contain <10% carbonate is clay. If sediment contains a mixture of clay-sized siliciclastic particles and calcareous components (i.e., carbonate content between 10% and 75%), the principal name is calcareous clay. This nomenclature was adopted to describe the continuum of sediments recovered from almost pure clay to almost pure calcareous ooze. In most cases, lithologic names assigned using this protocol match well with measured carbonate content and accurately reflect the continuum of sediments recovered at this site. Examples can be seen in Figure F6 in the Site U1451 chapter (France-Lanord et al., 2016b) and Figure F5 in the Site U1452 chapter (France-Lanord et al., 2016c), respectively.
Drilling disturbances observed in recovered sediments from Site U1449 vary in intensity from slight to high and include fractures, up-arching, flow-in, and “soupy” sand-rich layers. See Figure F6 in the Expedition 354 methods chapter (France-Lanord et al., 2016a) for a more detailed description and graphic examples of drilling disturbance types.
Unit I
- Intervals: 354-U1449A-1H-1, 0 cm, to 1H-CC, 15 cm; 354-U1449B-1H-1, 0 cm, to 1H-5, 57 cm
- Depths: Hole U1449A = 0–6.27 m CSF-A; Hole U1449B = 0–6.57 m CSF-A
- Age: Middle Pleistocene–recent
- Lithology: nannofossil-rich calcareous clay with foraminifers (major); volcanic ash (minor)
Description
Unit I is composed of 6.57 m of light brown to light gray nannofossil-rich calcareous clay with foraminifers. Figure F4 shows an example of such a lithology taken from Unit III. Greenish layers (<1 cm thick) occur in five intervals (354-U1449A-1H-1, 143–150 cm; 1H-2, 133–150 cm; 1H-3, 56–114 cm; 1H-4, 47–101 cm; 1H-5, 0–56 cm). In most cases, these layers are identified by slight color variations. The only exception to this case is a layer of dark greenish silty clay at 1H-3, 76–83 cm, that is slightly coarser than the surrounding sediment. Mottling (due to bioturbation) occurs throughout the core, and prominent burrows filled with white foraminifer-rich fine sand were observed at 1H-1, 57 and 75 cm. A single vertical Zoophycos backfill trace is present at 1H-2, 92–100 cm (1 cm thick). Two layers of brown volcanic ash (Figure F4B) are present at 1H-2, 30–51 and 67–73 cm. The upper ash layer fines upward from fine sand– to silt-sized glass fragments; the grain size of the lower layer is fine sand and shows no internal variation in structure.
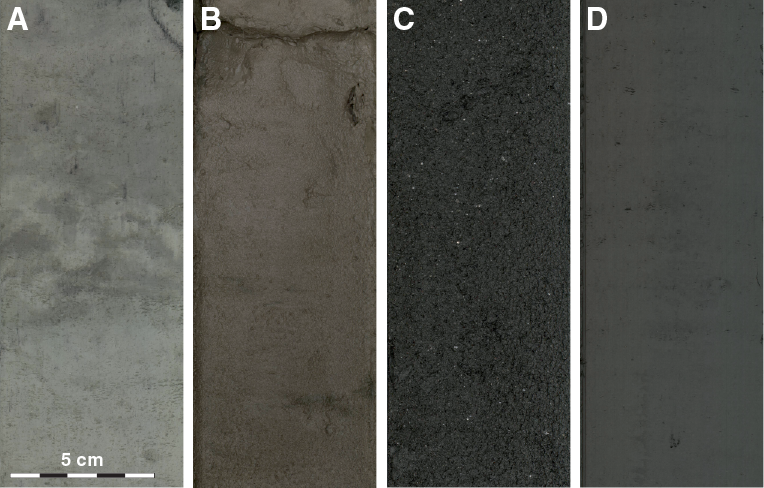
Figure F4. Line-scan images of major lithologies recovered in Hole U1449A. A. White to light gray nannofossil-rich calcareous clay with foraminifers. B. Brownish gray volcanic ash. C. Dark gray silty fine sand with mica. D. Dark gray silty clay.
Composition from smear slides
See Figure F5 for representative smear slide images.
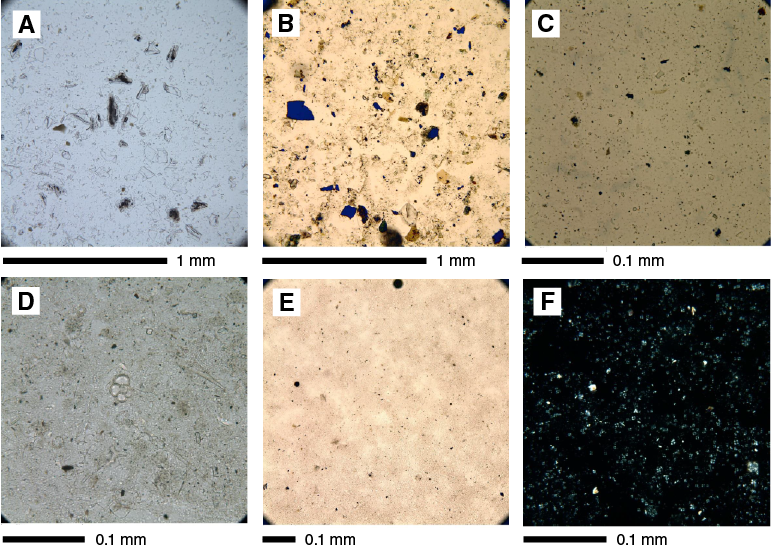
Figure F5. Representative smear slide images, Hole U1449A. A. Volcanic ash with abundant glass shards. B. Silty sand including quartz, feldspars, and heavy minerals. C. Clay containing clay-sized grains and clay minerals. D. Foraminifer-rich calcareous clay with diatoms and radiolarians. E. Nannofossil-rich calcareous clay. F. Nannofossil-rich calcareous clay.
Calcareous clay
Calcareous clay mainly consists of calcareous nannofossils with small fragments of radiolarians and diatoms. Minor amounts of clay minerals were also found.
Ash
Ash layers mainly contain volcanic glass shards 0.01–0.3 mm in diameter, accompanied by minor feldspar, quartz, and mica grains. Volcanic glass usually occurs in the form of clear plates, flakes, and strands, with a relatively low refractive index. The typical range for the volcanic glass proportion is 85%–95% of total grains.
Silty sand
Silty sand layers intercalated in the upper part of the unit consist of quartz, feldspar, mica, and lithic fragments. Heavy minerals including tourmaline, zircon, apatite, and opaque minerals are frequently recorded. The maximum diameter of sand grains is 0.25 mm.
Unit II
- Intervals: 354-U1449A-2H-1, 0 cm, to 16F-CC, 18 cm; 354-U1449B-1H-5, 57 cm, to 1H-6, 80 cm
- Depths: Hole U1449A = 6.20–83.35 m CSF-A; Hole U1449B = 6.57–7.80 m CSF-A
- Age: Middle Pleistocene
- Lithology: silty fine sand (major); clay, silty clay, nannofossil-rich calcareous clay (minor)
Description
Unit II is composed of 77.15 m of dark gray silty fine sands deposited in thick beds (sand turbidites) interbedded with gray clays and silty clays of varying thickness (0.05–1.83 m; mud turbidites). This unit is divided into three subunits. Subunit IIa (354-U1449A-2H-1, 0 cm, to 5H-CC, 19 cm) is 13.63 m thick and composed of turbidites dominated by silty fine sands (Figure F4C). Subunit IIb (6F-1, 0 cm, to 8H-1, 41 cm) is a 14.64 m thick succession of mud and sand turbidites. The upper 1.42 m consists of a massive clay bed. Figure F4D shows an example of such a bed taken from Unit IV. The massive clay is followed by silty sands, silty clays, and clays. Sandy intervals contain mud clasts. Subunit IIb also contains a 13 cm thick white bed of calcareous nannofossil–rich clay with burrows (7H-3, 56–69 cm). Subunit IIc (8H-1, 41 cm, to 16F-CC, 18 cm) is 48.87 m thick and comprises dark gray fine sands and silty fine sands (sand turbidites) with one 2.24 m interval of silty clays (14F-1 through 14F-2; mud turbidites).
Composition from smear slides
See Figure F5 for representative smear slide images.
Silty clay and clayey silt
Silty clay and clayey silt consist of silt- and clay-sized grains of quartz, feldspar, mica, and heavy minerals. Minor amounts of large grains of quartz and mica (reaching 0.8 mm in diameter) sporadically occur in this lithology. Several black layers intercalated within the silty clay and clayey silt contain organic material, including altered wood and plant debris and very fine grained needle-shaped opaque minerals.
Nannofossil-rich calcareous clay
Occasionally intercalated, white calcareous clay is mainly composed of calcareous nannofossils with radiolarians. The average range of the nannofossil component is 65%–80%.
Silty sand
Silty sand consists of quartz, feldspar, and mica. As accessory minerals, heavy minerals including tourmaline, zircon, apatite, and opaque minerals are found. The maximum grain size is 0.1–0.41 mm in diameter.
Unit III
- Interval: 354-U1449A-17F-1, 26 cm, to 18H-6, 150 cm; Hole U1448B not recovered
- Depth: 83.30–97.00 m CSF-A
- Age: early–Middle Pleistocene
- Lithology: clay, calcareous clay (major); silty clay, clayey silt, volcanic ash (minor)
Description
The upper part of Unit III (16F-CC, 18 cm, to 18H-1, 15 cm) is principally composed of light gray laminated clay with frequent foraminifers (Figure F4A). Silty clay and clayey silt are found in two intervals, at 17F-1, 0–26 cm, and 17F-3, 0–28 cm, respectively. The latter shows normal grading. Mottling (bioturbation) is commonly present, and mud clasts are also found. The lower part of the section, from 18H-1, 15 cm, to 18H-6, 150 cm, predominantly comprises mottled (bioturbated) gray and white calcareous clay. Foraminiferal horizons are frequent, and nannofossil-rich horizons are also found. In Section 18H-3, a volcanic ash layer (11–16 cm) is overlain by silty clay (0–11 cm).
Composition from smear slides
See Figure F5 for representative smear slide images.
Clayey silt
Clayey silt contains silt-sized quartz and feldspar grains with mica and heavy minerals.
Calcareous clay
Calcareous clay–sized grains and aggregates are the dominant constituents, and clay minerals rarely occur. Nannofossil-rich calcareous clay mainly consists of nannofossils with minor radiolarians and diatoms.
Ash
The ash layer intercalated in the middle part of this unit consists of platy and flaky volcanic glass. The typical range for the volcanic glass proportion is 65%–85%. Euhedral quartz, feldspar, and very small amounts of mica grains were also observed.
Unit IV
- Interval: 354-U1449A-19H-6, 0 cm, to 29F-1, 150 cm; Hole U1449B not recovered
- Depth: 97.50–147.80 m CSF-A
- Age: early Pleistocene
- Lithology: silt, silty clay (major); nannofossil-rich calcareous clay with foraminifers, volcanic ash (minor)
Description
Unit IV mostly consists of repeated silt to silty clay sequences (i.e., mud turbidites) from 97 to 147.8 m CSF-A intercalated with medium-bedded calcareous clay between 105.23 and 105.83 m CSF-A and thin volcanic ash between 118.15 and 118.18 m CSF-A. Individual turbidite sequences consist of lower normally graded laminated silt or clayey silt with sharp planar lower boundaries and upper homogeneous to faintly laminated silty clay (Figure F6). The boundary between the lower silt and upper silty clay units is gradational and often characterized by a series of silt-clay couplet laminae. Turbidite sequences are mainly thin to medium bedded, showing overall fining upward indicated by decreasing thickness and frequency of laminated silt units. The thickness of fining-upward trends is variable from a few tens of centimeters to more than a meter.

Figure F6. A. Three successive laminated silt to silty clay turbidite beds, Hole U1449A. Note sharp planar boundaries of the lower laminated silt units and gradational contacts with the upper silty clay units characterized by silt-clay couplet laminae. B. Lithologic log.
Composition from smear slides
See Figure F5 for representative smear slide images.
Clayey silt and silty sand
These lithologies consists of quartz, feldspar, and heavy minerals with mica. Mica grains reaching 0.2 mm in diameter, considerably larger than the average grain size, frequently occur. Additionally, occasional thin black layers comprise organic material and pyrite aggregations. The maximum grain size is 0.08–0.2 mm in diameter.
Nannofossil-rich calcareous clay and ash
Nannofossil-rich calcareous clay in the upper part of the unit contains calcareous nannofossils, radiolarians, and clay minerals. Part of this clay is contaminated by significant amounts of platy volcanic glass, clay minerals, and radiolarians.
Unit V
- Interval: 354-U1449A-29F-1, 150 cm, to 38H-3, 99 cm; Hole U1449B not recovered
- Depth: 147.80–213.54 m CSF-A
- Age: early Pleistocene
- Lithology: sand, silty sand (major); silty clay, silt, clay, calcareous clay (minor)
Description
This unit has poor recovery. Thick-bedded, dark gray, fine micaceous sands and silty sands dominate the lithology (i.e., sand turbidites). From Section 33X-CC downhole, finer grained facies are recorded. Micaceous silt, dark gray silty clay sometimes alternating with very thinly bedded dark gray silt (mud turbidites), calcareous clay with nannofossils interbedded with thin bedded silt, and one bed of nannofossil-rich calcareous clay (38H-1, 46–80 cm) occur.
Composition from smear slides
See Figure F5 for representative smear slide images.
Silty sand
Silty sand consists primarily of quartz, feldspar, lithic fragments, mica, and heavy minerals. Rock fragments are typically volcanic and granitic in texture. Gneiss lithic fragments exhibit mosaic texture with biotite and quartz. Large fragments of mica and quartz, reaching 0.5 mm in diameter, are ubiquitous.
Clayey silt
Clayey silt mainly contains detrital grains, calcareous nannofossils, and radiolarians. The mineralogy of clayey silt is similar to that of silty sand.
Nannofossil-rich calcareous clay
Nannofossil-rich calcareous clay frequently contains clay minerals, radiolarians, and foraminifers.
Maximum grain size
Maximum grain size was determined at approximately 9 m intervals at Site U1449. In each case, the coarsest and/or thickest lithology in the individual core (generally from the base of the coarsest turbidite) was chosen for smear slide analysis, and the largest five equant detrital grains (quartz and feldspar) were measured (Figure F7). The maximum grain size ranges from 0.05 to 0.47 mm (coarse silt to medium sand) and corresponds to the sand and silt turbidite at the base of Subunit IIa. However, background values throughout the sequence show that coarse silt–sized material reached the fan setting at Site U1449 via turbidity currents since at least the early Pleistocene.
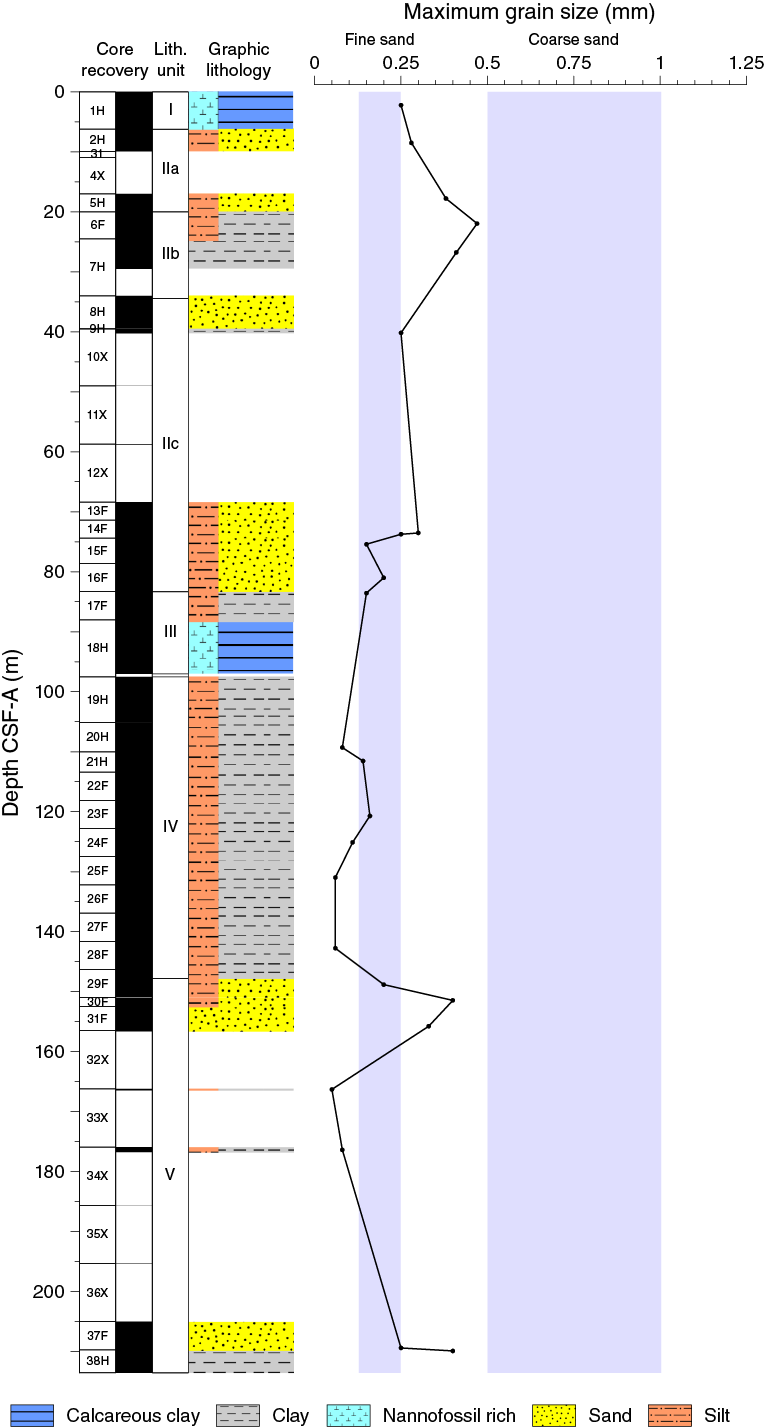
Figure F7. Maximum grain size, Hole U1449A.
XRD
Samples were taken at an interval of approximately one every four cores. Clay minerals were extracted from representative lithologies (sand, silt, clay, and calcareous clay). The observed clay mineral assemblages are mainly composed of illite, chlorite, smectite, and kaolinite (Figure F8). Minor sepiolite was detected in some samples, and its presence is probably due to injections of drilling mud during coring of Cores 354-U1449A-10X and 33X. Illite is the dominant clay mineral. Bulk mineralogy analyzed in ash layers shows high calcite content (31.1 wt% from inorganic geochemistry), clay minerals, mica, and minor detrital quartz kaolinite (Figure F9). Fine sand contains quartz, feldspar, calcite, and clay minerals.
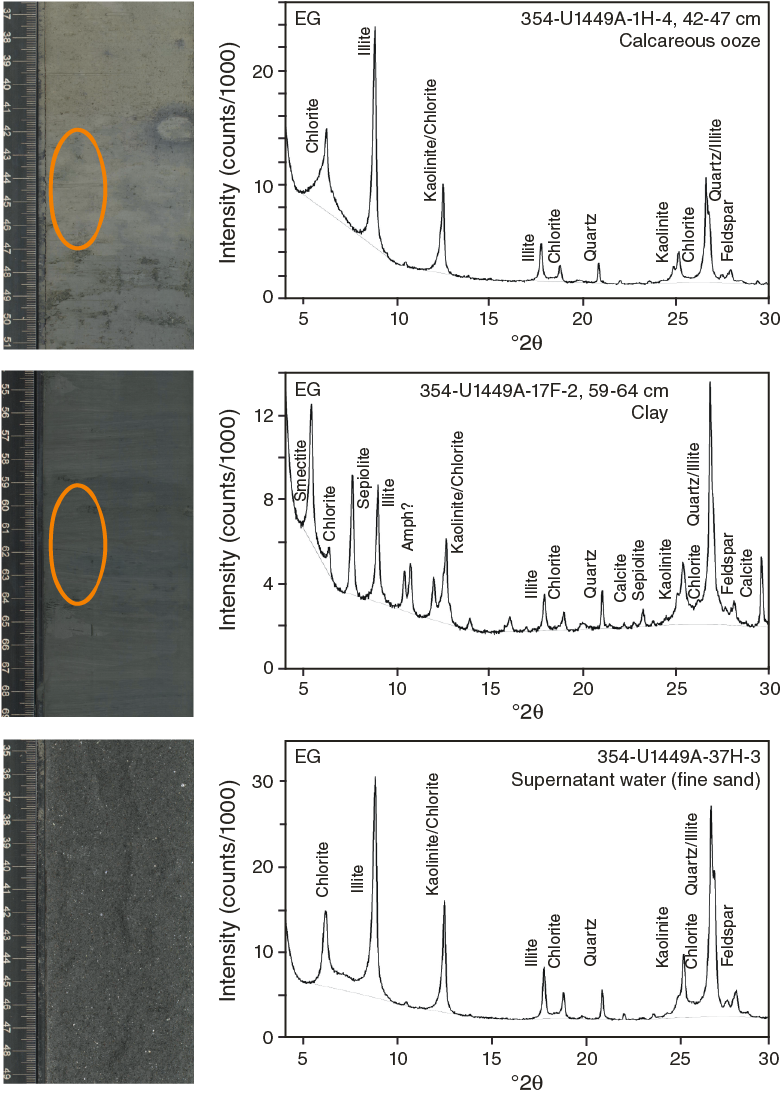
Figure F8. Ethylene glycol–treated X-ray diffractograms of oriented clay aggregates, Hole U1449A. CaCO3 content of the clay sample is relatively high.
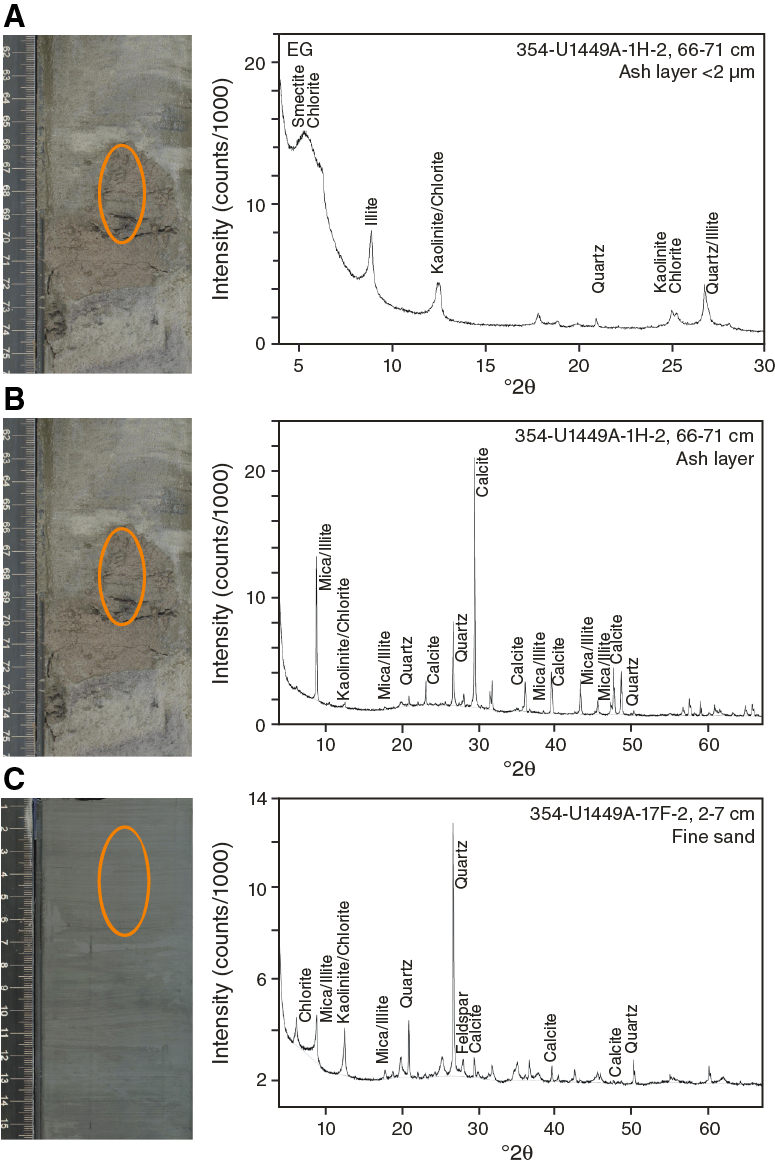
Figure F9. X-ray diffractograms, Hole U1449A. A. Ethylene glycol–treated X-ray diffractogram of oriented clay aggregates. B, C. X-ray diffractograms of bulk samples.
Biostratigraphy
Calcareous nannofossils and planktonic foraminifers provide biostratigraphic constraints at Site U1449. Overall, the abundance and preservation of these microfossils are dependent on the type of lithology recovered. Coarser sandy intervals contain few to barren calcareous nannofossils and barren to <0.1% foraminifers, but abundance and preservation improve considerably in the pelagic and hemipelagic intervals. These pelagic and hemipelagic layers were interrupted by turbidites and levee sedimentation. The biostratigraphic controls identified at this site are shown in Table T4.
Table T4. Biostratigraphic age datums and midpoint calculations, Site U1449. Download table in .csv format.
Calcareous nannofossils
The distribution of calcareous nannofossils is shown in Table T5. Based on nannofossil biostratigraphy, the sediments from Hole U1449A extend to the lower Pleistocene. Identified biomarkers include the first occurrence (FO) of Emiliania huxleyi in Sample 2H-CC. Unfortunately, no core was recovered in the next two intervals, but the presence of Pseudoemiliania lacunosa in Sample 5H-CC suggests that the Zone NN20/NN19 boundary (0.44 Ma) is in Core 5H. The appearance of Helicosphaera sellii in Section 20H-2 indicates a depositional age older than 1.26 Ma. The presence of Calcidiscus macintyrei in Sample 36X-CC suggests an age older than 1.6 Ma. Two Discoaster spp. were also observed in Sample 38X-CC, which would date the bottom of the hole to the early Pleistocene (>1.93 Ma).
Table T5. Calcareous nannofossils, Site U1449. Download table in .csv format.
Planktonic foraminifers
The planktonic foraminifer biostratigraphy for Site U1449 is based on the shipboard study of Hole U1449A core catcher samples. Supplementary samples were taken from core sections when time permitted or when no foraminifers were found in the core catcher. Sandy samples are predominantly barren (or contained <0.1% foraminifers), whereas mud-rich samples have foraminifers in abundances ranging from rare (<5%) to abundant (>25%). Foraminiferal preservation ranges from moderate to very good in samples where foraminifers occur, and planktonic foraminifer fragmentation varies from light (>10%) to severe (25%–50%).
Though few index species are present, planktonic foraminifer biostratigraphic biomarkers and the assemblages present indicate the sediments at Site U1449 are Pleistocene in age. Sample 36X-CC contains the FO of Globigerinoides fistulosus, a biomarker species for foraminiferal Zone PL6 (>1.88 Ma).
Group and species abundances of planktonic foraminifers are shown in Table T6. Biostratigraphic datums and absolute ages are shown in Table T4 and are taken from the compiled list in Table T2 in the Expedition 354 methods chapter (France-Lanord et al., 2016a).
Planktonic foraminifer assemblages at Site U1449 are tropical throughout the cored section. These assemblages are dominated by Globigerinoides ruber, Globigerinoides sacculifer, Neogloboquadrina dutertrei, Pulleniatina obliquiloculata, and Sphaeroidinella dehiscens. There are occasional horizons dominated by Orbulina universa.
Table T6. Planktonic foraminifers group and species abundance, Site U1449. Download table in .csv format.
Paleomagnetism
We completed a preliminary paleomagnetic study on 30 of the 38 cores collected from Hole U1449A, with our work focused on identifying polarity reversals and matching them to the timescale of Gradstein et al. (2012).
Incomplete core recovery and sandy lithologies presented challenges for the collection and interpretation of paleomagnetic data in some intervals of Hole U1449A. Recovery was limited in the levee and channel fill deposits between ~40 and ~60 m CSF-A (see Lithostratigraphy). Recovered sands are often waterlogged (soupy) or deformed. Coring deformation is common in fine-grained intervals as well, including calcareous clay, mud turbidites, and levee deposits.
Full-vector paleomagnetic data, typically used to make polarity interpretations at low-latitude sites, were not available for most Site U1449 cores. Low inclinations (15.7°) of the geomagnetic field were expected at Site U1449 based on the geocentric axial dipole (GAD) prediction. Only two APC cores (2H and 8H) were fully oriented using the Icefield MI-5 tool; however, drilling disturbance rendered the declination data from these oriented cores questionable. Accordingly, the declination data reported here allow identification of polarity transitions within cores; polarity transitions between cores are inferred. The declinations reported here are not oriented geographically. However, declinations measured on these cores may allow reorientation of cores for future magnetic anisotropy studies.
Remanent magnetization measurements were made on most archive section halves (Nsections = 95) and on discrete samples from working section halves (Nsamples = 42) for Hole U1449A (Figure F10; Tables T7, T8). The natural remanent magnetization (NRM) of archive section halves was measured on the shipboard superconducting rock magnetometer (SRM) before and after 20 mT alternating field (AF) demagnetization. Remanence vectors measured after 20 mT peak AF demagnetization are used here for polarity determinations. Sections were visually inspected before measurements and were not measured when the sediment was soupy or heavily disturbed by the coring process. Some sections were remeasured after correcting a problem with position measurements along the SRM core track (see Paleomagnetism in the Expedition 354 methods chapter [France-Lanord et al., 2016a]).
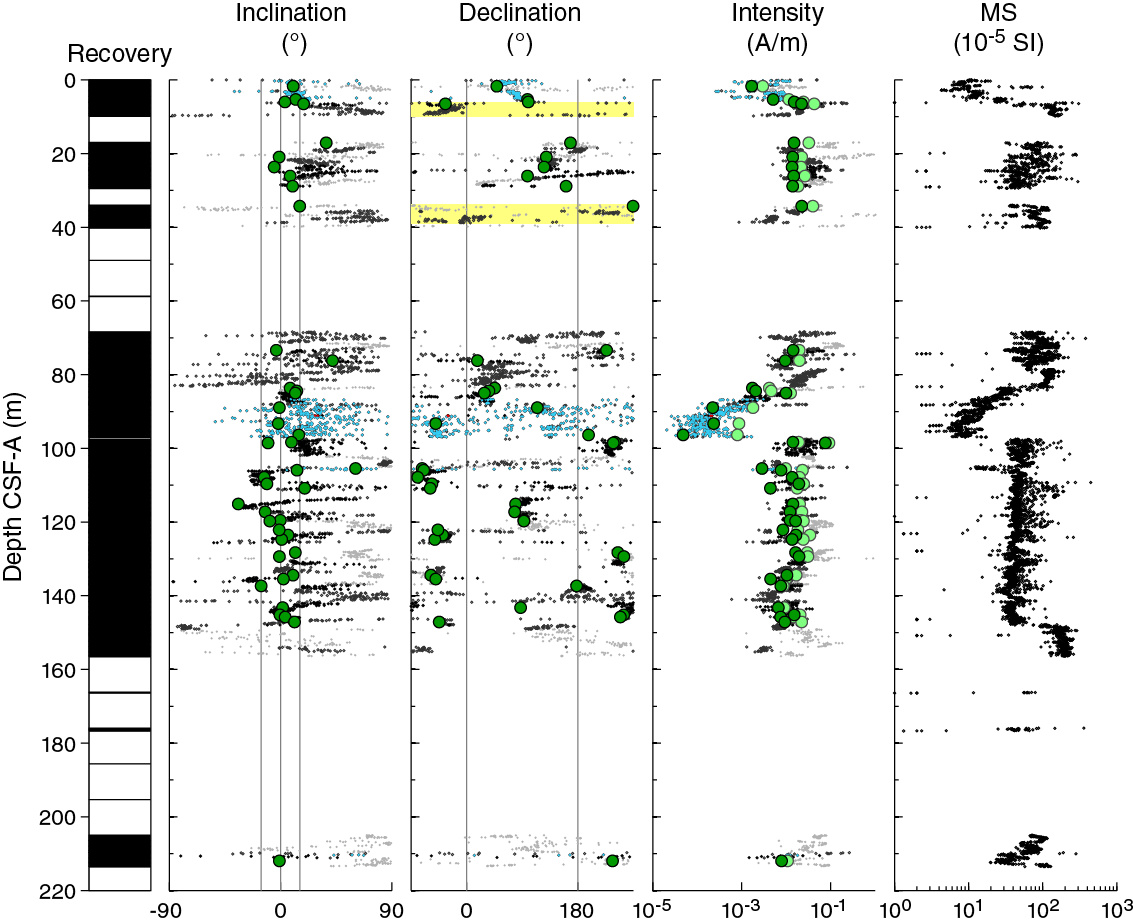
Figure F10. NRM of archive section halves and discrete samples before and after 20 mT AF demagnetization, Hole U1449A.
Table T7. ChRM of discrete samples, Hole U1449A. Download table in .csv format.
Table T8. Orientation data, Hole U1449A. Download table in .csv format.
Discrete sample locations were chosen in fine-grained intervals where drilling deformation was not visible or minimal. These samples were measured on either the SRM or JR-6 spinner magnetometer before and after 10, 15, 20, 25, 30, 35, 40, and in some cases 50 and 60 mT AF demagnetization, with a measurement protocol designed to minimize gyroremanent magnetization (GRM) and anhysteretic remanent magnetization (ARM) used above 40 mT (see Paleomagnetism in the Expedition 354 methods chapter [France-Lanord et al., 2016a]; Table T7). AF steps ranging between 10 and 40 mT were included in the direction determination for all samples. Specific steps were chosen based on the demagnetization behavior of each sample. Demagnetization behavior of discrete samples demonstrate that 20 mT was sufficient to remove the vertical remagnetization associated with the drill string overprint (Figure F11). Coercivities of the remanence carriers are consistent with magnetite and/or titanomagnetite as the principal NRM carrier. The specific magnetic mineral assemblages will be assessed during postexpedition research.
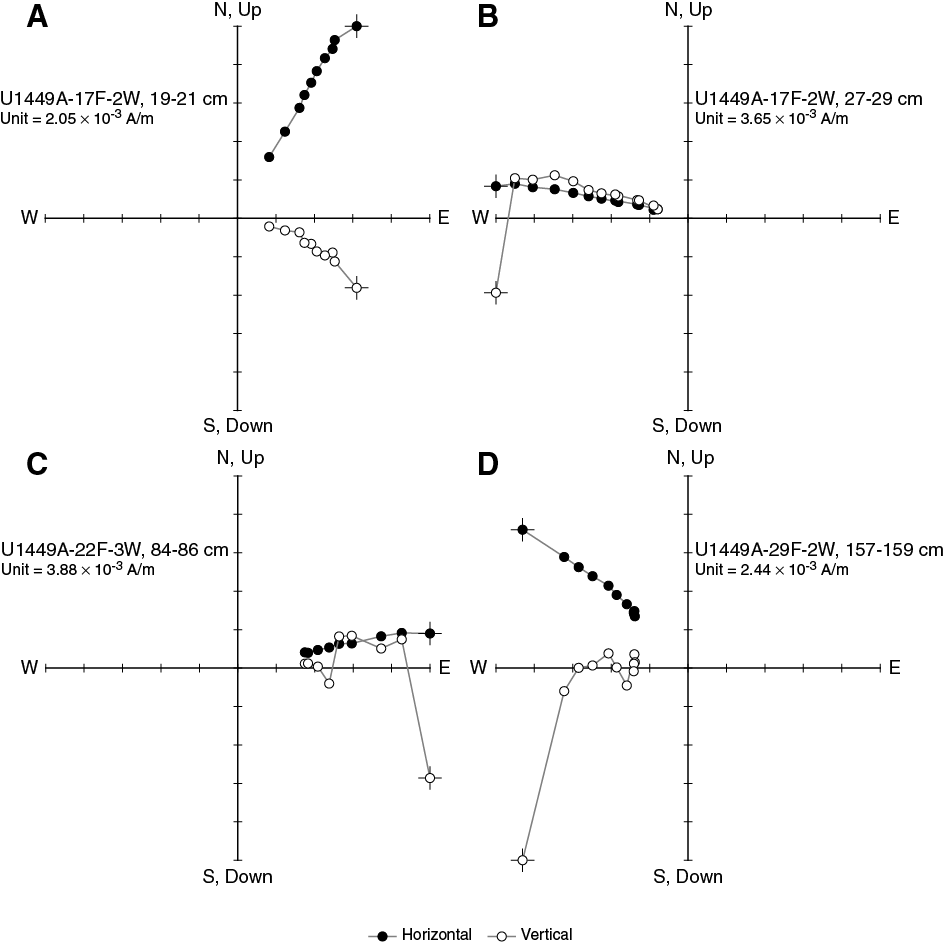
Figure F11. AF demagnetization diagrams of four discrete samples, Hole U1449A.
Results
More than 98% of the NRM intensities from Hole U1449A archive section halves range between 10–4 and 1 A/m. The pattern of NRM intensities remains the same after 20 mT AF demagnetization, although it decreases by approximately an order of magnitude. Variations due to lithology occur in both magnetic susceptibility and NRM intensity values. Lithologic contrasts are particularly clear in the low NRM intensities (and low magnetic susceptibilities) associated with calcareous clay between 0 and ~6 m CSF-A and between ~86 and ~97 m CSF-A (see Lithostratigraphy). Calcareous layers in Cores 8H and 20H are also associated with low NRM intensities. Sandy turbidites in Cores 5H–8H and 13F–16F are associated with some variability in NRM intensity, although perhaps not significantly more than in muddy facies deeper in the hole (Figure F10).
Magnetostratigraphy
Based on section-half and discrete sample data, we interpret the paleomagnetic data from Hole U1449A to indicate intervals of both normal and reversed polarity, as well as intervals in which the polarity is uncertain. Although both positive and negative inclinations are present in Hole U1449A, the amount of noise in the inclination data and the shallow expected inclination at the site make it difficult to use inclination for magnetic polarity assignment. Nonetheless, the majority of section halves from Cores 1H, 6F, 7H, and 8H and their discrete samples all have inclinations consistent with normal polarity. One discrete sample (6F-3, 65–67 cm) in this interval has a low-angle, negative characteristic remanent magnetization (ChRM) inclination (–3.8°). The range of declinations in Core 7F is large, possibly due to twisting during drilling, although the inclinations are consistent with a normal magnetization. Cores 17F, 19H, 24F, and 25F and the top of Core 29F have well-defined positive inclinations and uniform declinations, consistent with normal polarity. Cores 20H and 22F have well-defined negative inclinations.
Calcareous clay sediments in Core 18H have ChRM declinations that appear to be clustered in two groups with modes separated by 180°. Close examination of the declination data from this interval in Core 18H indicates five polarity transitions, including a short interval present near the bottom the core (Figure F12).

Figure F12. Polarity interpretation, Core 354-U1449A-18H.
Core 38H, at the bottom of Hole U1449A, has considerable scatter in ChRM directions. Although many of the inclinations measured on the archive section half could be interpreted as normal polarity, many are too steep for this location. In addition, the ChRM of the discrete sample from this interval does not agree with the archive-half measurements. We do not assign a polarity to this core.
Interpretation of the magnetic polarity zones is relatively straightforward to Core 18H (Table T9). We interpret Cores 1H–17F as having acquired magnetization during the Brunhes Chron (C1n; 0–0.78 Ma; Gradstein et al., 2012). Assuming no missing time between Cores 17F and 18H and no large changes in sedimentation rates in the pelagic interval of Core 18H, we identify the polarity zones in Core 18H as the normal polarity Brunhes Chron (C1n), the reversed polarity Matuyama Chron (C1r), and the Jaramillo (C1r.1n) and Cobb Mountain (C1r.2n) Subchrons. The normal polarity interpretation of Core 19H is problematic. Although it is tempting to match it with the Olduvai Subchron (C2n; 1.778–1.945 Ma), this match implies an age that is much older than that determined from biostratigraphic markers, particularly Helicosphaera sellii, which does not make its first appearance until Core 20H (see Biostratigraphy). It is possible that Core 19H has been remagnetized, either during the coring process or in situ by a chemical remanent magnetization (CRM). We plan to investigate these possibilities in postexpedition studies.
Table T9. Magnetostratigraphy, Hole U1449A. Download table in .csv format.
We expect that lithologic correlation between multiple sites in the Expedition 354 transect and the use of seismic reflectors as tie points from one site to another will help to clarify our interpretation of the magnetostratigraphy of Hole U1449A.
Geochemistry and microbiology
Sediment gas sampling and analysis
Headspace gas samples were taken at a frequency of one sample per core in Hole U1449A as part of the routine safety monitoring program (Table T10; Figure F13). Methane concentrations are consistently very low (1–12 ppmv) from 4.5 to 78.5 m CSF-A, peak at 7450 ppmv at 87.5 m CSF-A, and decrease sharply to reach background level (~1 ppmv) at 116.4 m CSF-A. Methane concentrations start to rise again at 130.5 m CSF-A and vary between 155 and 6908 ppmv to the base of the hole. Ethane, ethene, propane, and propene are below the quantification limit in all samples.
Table T10. Methane concentrations, Hole U1449A. Download table in .csv format.
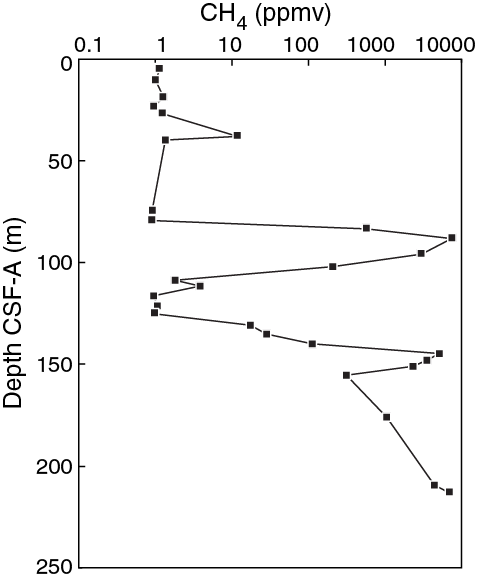
Figure F13. Methane concentrations, Hole U1449A.
Interstitial water sampling and chemistry
A total of 39 samples from Holes U1449A and U1449B were analyzed for interstitial water chemistry (Table T11). In Hole U1449A, 10 samples, including one duplicate, were obtained by Rhizon sampling from the uppermost 81 m CSF-A, with coarser sampling (one per 10 m) obtained from deeper whole-round samples. High-resolution (one per section) pore water profiling was conducted in Hole U1449B (0–7 m CSF-A). In certain sections, notably lithostratigraphic Units II and V (6–83 and 148–213 m CSF-A, respectively), sampling was limited by poor recovery and loose sands that were not suitable for pore water analyses.
Table T11. Interstitial water geochemical data, Site U1449. Download table in .csv format.
Except for one anomalous value (not duplicated by ion chromatography) of 582 mM, chloride concentrations vary from 550 to ~575 mM in Hole U1449B with no downcore pattern (Table T11). Thereafter, only the chloride concentrations obtained by ion chromatography are used and are expressed as salinity (see Geochemistry and microbiology in the Expedition 354 methods chapter [France-Lanord et al., 2016a]). They vary between 35.4 near the water/sediment interface to 37.0 g/kg. Bromide concentrations are closely correlated with chloride concentrations, and Br–/Cl– ratios rise from 154 × 10–5 (close to seawater ratio) near the water/sediment interface to 161 × 10–5 at 115 m CSF-A.
Alkalinity increases rapidly in the uppermost 22 m CSF-A, reaching a peak of 21.4 mM before starting to decrease (Figure F14). A secondary peak of 12.2 mM at 126 m CSF-A corresponds to the middle of lithostratigraphic Unit IV. In the deepest sample from Hole U1449A (212.48 m CSF-A), alkalinity decreases to 5.6 mM. Sulfate concentrations drop rapidly to values between 0 and 1 mM around 32 m CSF-A and remain constant throughout the rest of the hole. A notable exception is the duplicate of a fast-flowing Rhizon (8H-2, 75–82 cm) with values of 0.5 and 2.9 mM for the first and the last liquid sampled by the Rhizons, respectively, suggesting that fast-flowing Rhizons sample coarse-enough lithology to allow drilling fluid to penetrate to the inner part of the core. That duplicate, with higher sulfate concentrations, is not considered in the following description and is not included in Figure F14. Phosphate and ammonium (only measured on Hole U1449B samples) concentrations show similar increases (from 3.4 and 2.8 µM near the water/sediment interface to 69 and 18 µM, respectively) in the uppermost 2 m and are decoupled from 2 m CSF-A to the bottom of Hole U1449B (Figure F15). The ammonium concentration at 7 m CSF-A in Hole U1449B is 248 µM. In Hole U1449A, phosphate concentrations reach a maximum in excess of 110 µM between 22 and 36 m CSF-A. Phosphate concentrations decrease below this interval and drop rapidly to less than 10 µM at the bottom of Unit II, with some scatter in Units III and V but never exceeding 41 µM. Silica concentrations show a downward trend in Unit I from 738 to 349 µM and remain at 150–350 µM in Units II–V with only elevated values associated with ash layers (2.22 m CSF-A in Hole U1449A) or calcareous clay in lithostratigraphic Units I and III, likely related to the local dissolution of siliceous tests within these hemipelagic units.
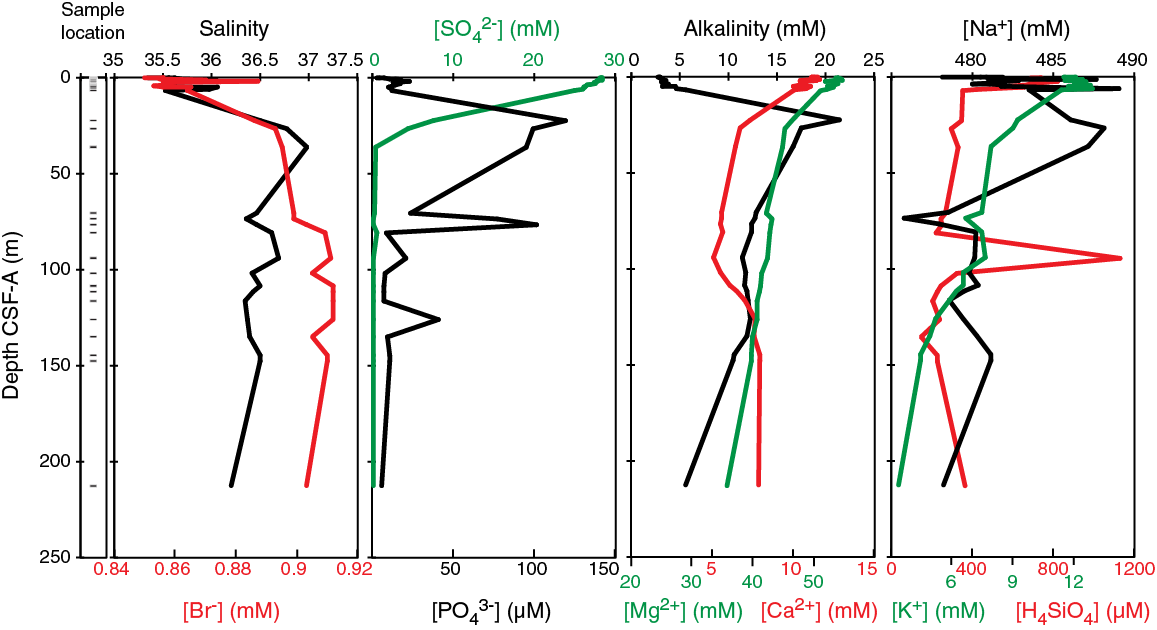
Figure F14. Variations of salinity, bromide, sulfate, phosphate, alkalinity, magnesium, calcium, sodium, potassium, and silicon concentrations in interstitial waters, Site U1449.
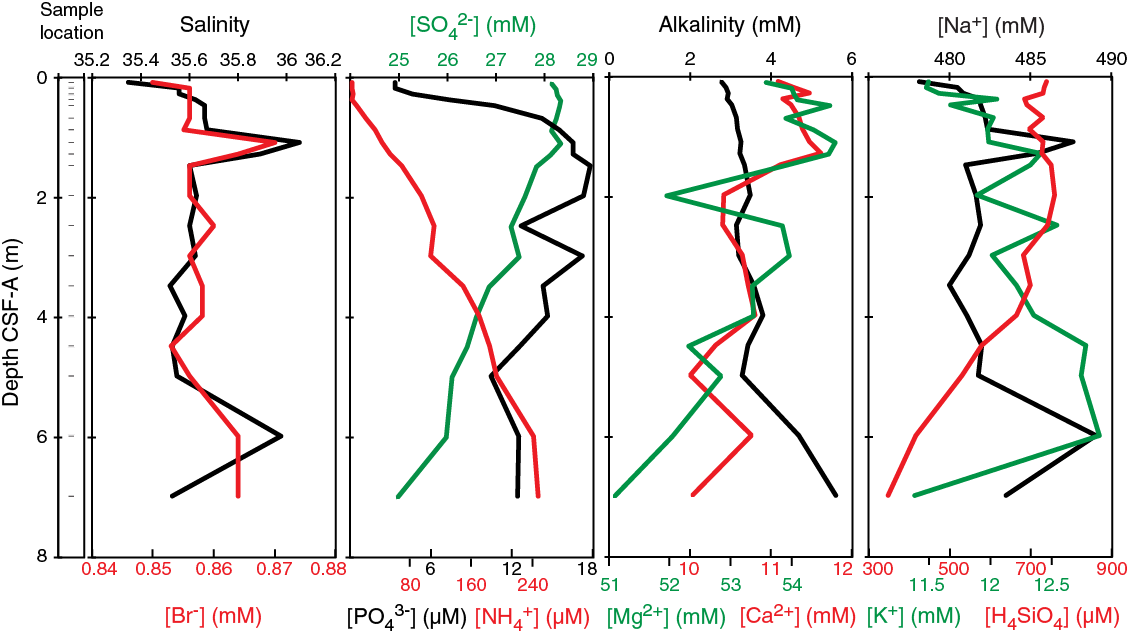
Figure F15. Variations of salinity, bromide, sulfate, phosphate, alkalinity, magnesium, calcium, sodium, potassium, and silicon concentrations in interstitial waters, Unit I, Hole U1449B.
None of the major cation concentrations, including sodium, calcium, magnesium, and potassium, are strongly correlated with any of the anions. All exhibit a decrease with depth (Figure F14). Within uncertainties of the sampling and analytical methods, magnesium concentrations decrease monotonously from 55 mM at 0.5 m CSF-A to 36 mM at 212 m CSF-A. In detail, the rate of decrease is greater in the uppermost 50 m CSF-A and is correlated to a decrease in calcium concentrations. This rate likely reflects authigenic carbonate deposition in response to coeval increase of alkalinity and decrease of sulfate concentrations in lithostratigraphic Units I–II. Sodium concentrations slightly increase in Units I and II to a maximum of 488 mM at 27–36 m CSF-A before decreasing to values between 476 and 481 mM for the rest of the hole. Potassium first rises from the seawater/sediment interface to a peak of 12.9 mM near the bottom of Unit I, and then concentrations decrease with depth from seawater values to 3.4 mM at 212 m CSF-A, with a secondary peak of 7.6 mM in Unit III. In Units IV and V, all of the cations, including sodium, appear to exhibit the influence of water-sediment exchange: K, Na, and Mg concentrations decrease, Ca concentrations increase, and Si concentrations remain constant.
Bulk-sediment geochemistry
Total inorganic carbon (TIC) concentrations were determined on 37 sediment samples from Hole U1449A (Table T12; Figure F16). TIC values expressed as weight percent calcium carbonate (CaCO3) content (i.e., assuming inorganic carbon is exclusively present as CaCO3) range between 1.2 and 61.0 wt% (average = 8.3 wt%) and do not show systematic variation with depth. Turbiditic sediments are characterized by low carbonate contents (1.2–5.6 wt%; average = 3.6 wt%), whereas hemipelagic intervals (calcareous clays) are characterized by higher carbonate contents (26.7–61.0 wt%). Within turbidites, no systematic covariation between grain size, as deduced from Al/Si (see below), and carbonate content was observed. Furthermore, the range in carbonate content and its independence to grain size match similar observations in the modern Ganga-Brahmaputra river system (Galy et al., 1999; Lupker et al., 2012). Our results are also consistent with findings in active channel-levee sediments deposited over the past 18 ky in the Bay of Bengal at 16°N and with isotopic compositions diagnostic of predominant detrital origin (Lupker et al., 2013). Together, these observations suggest that detrital carbonates derived from erosion of Himalayan rocks dominate the carbonate load in turbiditic sediments recovered at Site U1449.
Table T12. CaCO3, inorganic carbon, TC, and organic carbon contents, Hole U1449A. Download table in .csv format.
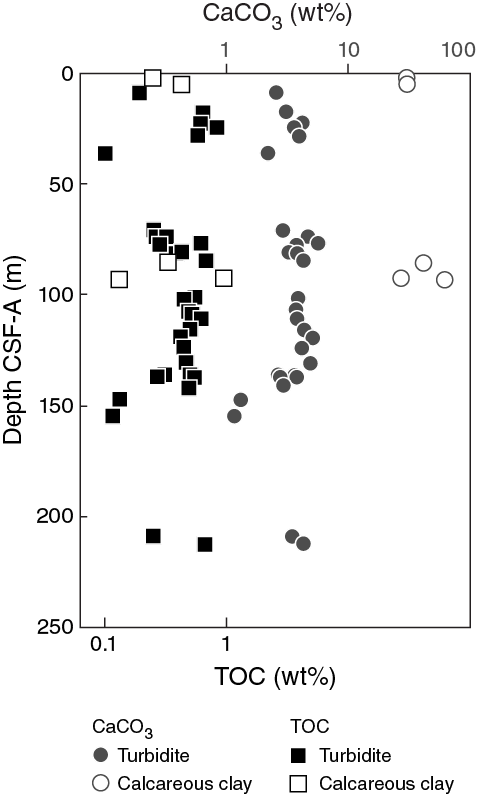
Figure F16. TIC content, expressed as CaCO3, and TOC content, Hole U1449A.
Major and trace element concentrations were determined on 12 sediment samples from Hole U1449A by inductively coupled plasma–atomic emission spectroscopy (ICP-AES) (Table T13). Bulk-sediment samples were processed without any seawater or pore water component cleaning prior to analysis; thus, Na concentrations are affected by contribution from these fluids. As expected, bulk-sediment major element compositions largely reflect lithology. SiO2 ranges between 72.3 wt% (sands) and 19.9 wt% (calcareous clays). Al2O3 is highest in turbiditic clay-rich facies (18.5 wt% ± 0.6; N = 3) and lowest in calcareous clays (5.1 wt%). CaO content is highest in calcareous lithologies (range = 31.2–17.6 wt%) and relatively invariant in turbiditic sediments that have >49 wt% SiO2 (CaO = 2.4 wt% ± 0.3; N = 9). Fe2O3/SiO2 ratios show clear divisions at the 2σ level separating turbiditic sediments as a function of grain size (average sand = 0.052 ± 0.009; silty clay = 0.094 ± 0.001; clay = 0.145 ± 0.013). The Fe/Si versus Al/Si trend for this data set closely tracks that published by Galy and France-Lanord (2001) and Lupker et al. (2012) for modern sediments in the Ganga-Brahmaputra river system (Figure F17) and is controlled by the mineralogical sorting of primarily quartz-rich sand and mica-enriched silt and clay during transport (Garzanti et al., 2011). As such, Al/Si provides a proxy for grain size and mineralogy, with low values representing quartz-rich sandy sediments and high Al/Si ratios reflecting fine-grained sediments enriched in phyllosilicate minerals. Bulk-sediment trace element concentrations for Hole U1449A also correspond strongly with lithologic type. Sr is well correlated with Ca (Figure F18) but does not intercept to 0. This result from variable Sr/Ca ratios that distinguish calcareous lithologies (Sr/Ca mol/mol = 1.66 ± 0.17 × 10⁻³; N = 3) from noncalcareous lithologies (Sr/Ca mol/mol = 4.13 ± 1.24 × 10⁻³; N = 9). No systematic trends with depth were observed in the bulk-sediment chemistry, which mainly reflects the variations in the depositional environments recorded at this site.
Table T13. Major elements and selected trace element contents, Hole U1449A. Download table in .csv format.
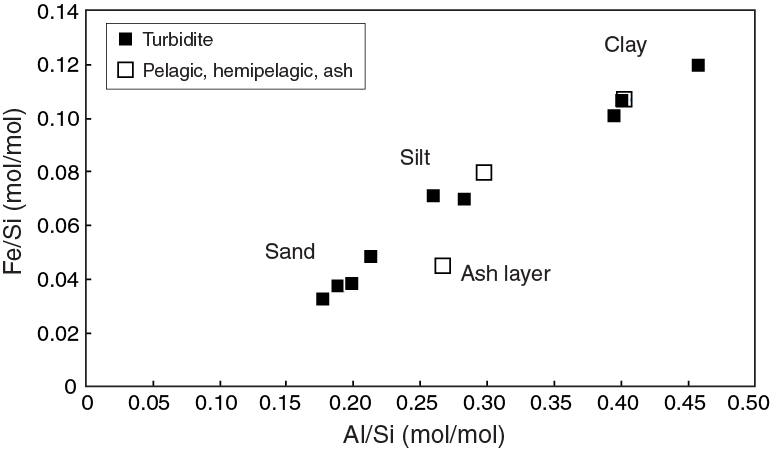
Figure F17. Fe/Si vs. Al/Si, Hole U1449A.

Figure F18. CaO vs. Sr, Hole U1449A.
Total carbon (TC) concentrations were determined on 37 sediment samples from Hole U1449A (Table T12). TC values range from 0.3 to 7.5 wt% (average = 1.4 wt%) and do not show any systematic variation with depth. TIC accounts for 34–98 wt% of the TC present in sediments (average = 57 wt%). Total organic carbon (TOC) contents, calculated by the difference between TC and TIC, are low (average 0.4 wt%) and range between 0.1 and 0.9 wt% (Figure F16). In turbiditic sediments, TOC closely covaries with the Al/Si ratio (Figure F19), reflecting the preferential association of organic matter with clays. Similar organic carbon loadings and relationship between sediment properties and TOC have been documented in both the modern Ganga-Brahmaputra river system and in active channel-levee sediments in the Bay of Bengal deposited over the past 18 ky (Galy et al., 2007, 2008a, 2008b). To the notable exception of smectite-rich turbiditic sediments of the distal fan, Middle (Deep Sea Drilling Project Site 218) and Deep (Ocean Drilling Program Leg 116) Bengal Fan turbidites show a similar range of TOC values (Cochran et al., 1989; France-Lanord and Derry, 1994; Galy et al., 2010; von der Borch, Sclater, et al., 1974). Based on organic carbon analyses, the organic matter associated to these turbiditic sediment is mainly of terrestrial origin (Poynter and Eglinton, 1990; Freeman and Colarusso, 2001). Calcareous clay TOC values range from 0.1 to 0.9 wt% and are not statistically different from TOC values in turbiditic sediments.
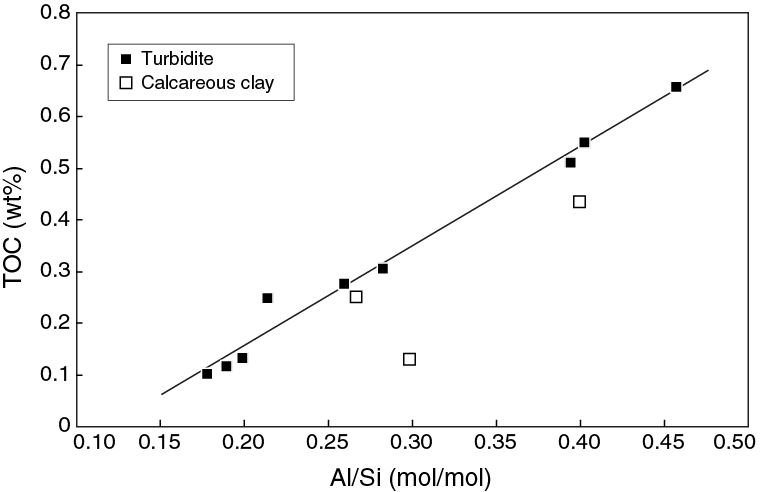
Figure F19. Relationship between TOC content and Al/Si ratio, Hole U1449A.
Microbiology
A total of 31 samples from near the sediment/water interface to 220 mbsf in Holes U1449A and U1449B were routinely taken for postexpedition microbiological investigation. Microbial cell counting in closely spaced samples from Hole U1449B in a 7 m long mudline core was initiated shipboard, with further processing of the samples to be carried out on shore.
Physical properties
Physical property data were acquired on almost all Site U1449 cores using the Whole-Round Multisensor Logger (WRMSL) to measure wet bulk density using gamma ray attenuation (GRA), magnetic susceptibility, and compressional wave velocity on the P-wave logger (PWL) and using the Section Half Multisensor Logger (SHMSL) to measure point magnetic susceptibility and color reflectance using the L*, a*, b* color system. Also, each core was placed in the Section Half Imaging Logger (SHIL) to obtain high-resolution digital color images and pixel-based red, green, and blue (RGB) data. In addition, we determined NGR, P-wave velocities at discrete points on the working section halves, and thermal conductivity. Discrete samples were collected for moisture and density (MAD) measurements of wet bulk density, dry bulk density, and grain density. The sensors mostly worked well, and the data are of good quality, depending on the level of disturbance in the core sections. All analyses in this section are from Hole U1449A.
Based on the principal lithologic name from the core description (see Lithostratigraphy), average physical properties were calculated for five lithologies (Table T14), as described in Physical properties in the Expedition 354 methods chapter (France-Lanord et al., 2016a). At this site, sand accounts for 39 m (32%), silt for 4 m (4%), clay for 62 m (50%), and calcareous clay for 18 m (14%) and ash occurs in thin layers. The turbiditic sequences recovered from Hole U1449A vary from fine-grained, muddy turbidites (primarily 98–146 m CSF-A; Cores 19H–29F) to coarse-grained and sandy turbidites (6–10 m, Core 354-U1449A-2H; 17–20 m, Core 5H; 34–39 m, Core 8H; 68–83 m, Cores 13F–16F; 146–157 m, Cores 29F–31F; 205–209 m CSF-A, Core 37F). Average wet bulk densities are rather uniform (1.87–2.03 g/cm3) in terrigenous sediment, whereas PWL data and magnetic susceptibility are elevated in sandy lithologies and clayey lithologies show higher NGR (~79 counts/s). Also, two longer intervals of hemipelagic to pelagic sediment (0–6 m, Core 1H; 88–92 m CSF-A, Core 18H) are distinguished by low average densities (~1.55 g/cm3), low velocities (~1485 m/s), low NGR (~32 counts/s), and lighter color reflectance. Accordingly, the physical properties obtained for Holes U1449A and U1449B provide valid and reproducible information on sediment composition and variability for undisturbed sections, which is crucial to understanding processes of turbidite sedimentation on the Bengal Fan.
Table T14. Total sediment thickness, percentage of recovered material, and average physical properties with respect to lithology, Site U1449. Download table in .csv format.
Physical property measurements and measurement intervals
High-resolution physical property measurements were made on Hole U1449A and U1449B cores to provide basic information on sediment composition and variability. Specifically, the finer and coarser grained intervals of turbiditic successions and hemipelagic to pelagic sections were distinguished using the WRMSL to measure density by GRA, magnetic susceptibility, and PWL data at 2.5 cm increments. On whole-round cores, we also measured NGR (at 10 cm increments), thermal conductivity (one measurement per core), and P-wave caliper (PWC) data (one or two measurements per section, where possible). On split cores, point magnetic susceptibility and color reflectance were measured at 1–2 cm increments using the SHMSL, and core images and pixel-based RGB data were obtained with the SHIL. Additionally, we took discrete samples for MAD measurements (one to three samples per core, ideally representing coarse-, medium- and fine-grained intervals) to determine water content, wet bulk density, dry bulk density, porosity, and grain density.
Whole-Round Multisensor Logger measurements
Results from Hole U1449A WRMSL measurements are compiled in Figure F20. For the purposes of the figure, data from the section ends were filtered out because they often represent part sediment and part air. Data with geologically unlikely values, such as density <1.05 g/cm3 and velocity <1425 m/s, were also filtered out. All original data remain in the LIMS database.
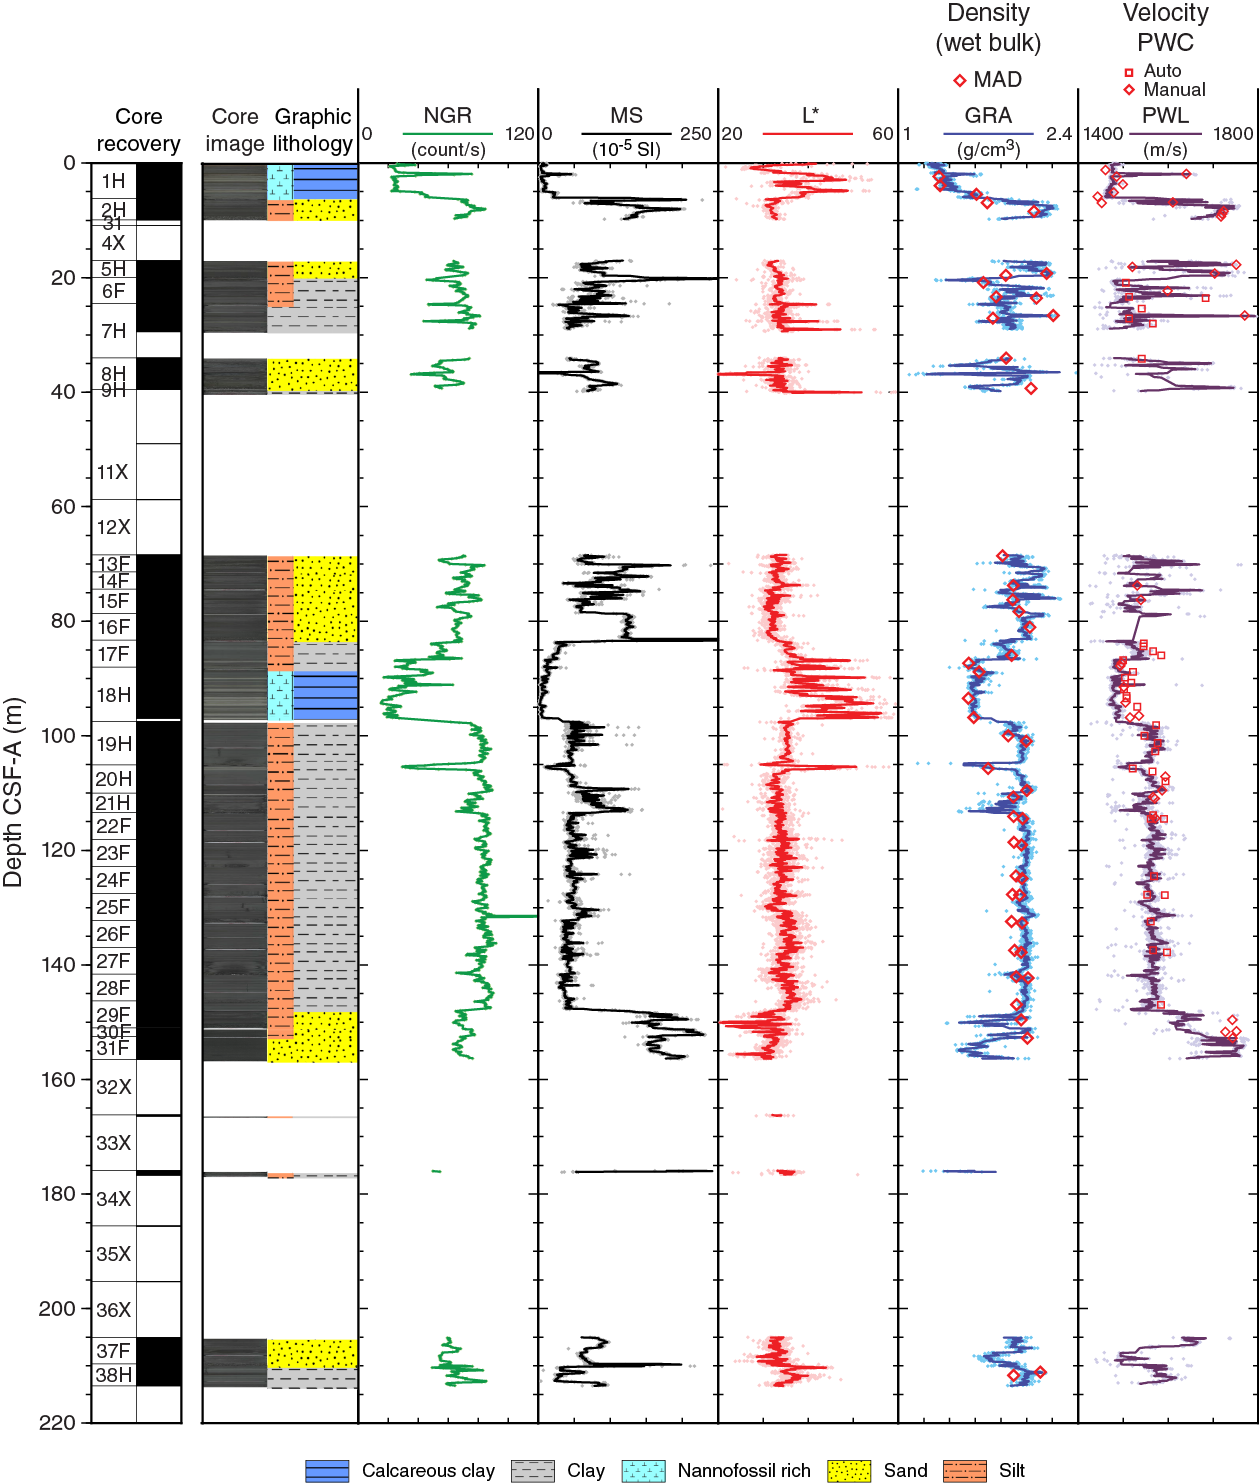
Figure F20. Physical property measurements, Hole U1449A.
Gamma ray attenuation bulk density
Wet bulk densities range from 1.4 to 2.2 g/cm3. The lowest average values (~1.55 g/cm3) (Table T14) are found in hemipelagic sediment in Cores 17F–18H (83–92 m CSF-A), consisting of fine-grained calcareous clay with elevated contents of biogenic carbonate and silica. Intermediate values are typical for fine grained detrital (muddy) turbidites, primarily detected in Cores 19H–29F. According to the seismic survey data, these sections should correspond to levee sedimentation. The highest densities are documented for the coarsest (sandy) sediment in Cores 2H (6–10 m); 5H (17–20 m), 8H (34–39 m), 13F–16F (68–83 m), and 29F–31F (146–157 m CSF-A) (Figure F20).
Magnetic susceptibility
Magnetic susceptibility is sensitive to the concentration and type of magnetic minerals. The data were extremely helpful in identifying turbiditic successions. Average values strongly vary with lithology (Table T14). The lowest values (≤30 × 10–5 SI) are observed for fine-grained pelagic Cores 17F–18H (83–92 m CSF-A). Intermediate values (40 × 10–5 to 120 × 10–5 SI) are typical for fine-grained detrital (muddy) turbidites present in Cores 19H–28F (92–146 m CSF-A). The highest values (≥140 × 10–5 to 120 × 10–5 SI) are documented for the coarsest sediment in Cores 2H (17–20 m CSF-A), 5H (17–20 m CSF-A), 8H (34–39 m CSF-A), 13F–16F (68–83 m CSF-A), and 29F–31F (146–157 m CSF-A) (Figure F20). Pronounced changes in magnetic susceptibility are observed at major lithologic boundaries. In Core 29F, values decrease substantially from sandy to muddy turbidites at 148 m CSF-A. Between muddy Core 17F and sandy Core 16F, there is a distinct increase at 84 m CSF-A. Generally, a rather strong correlation among all physical properties was determined with the WRMSL.
P-wave velocity
P-wave velocities from the PWL range from 1480 to 1800 m/s. The lowest values were observed for hemipelagic Cores 17H–18H (83–92 m) and for fine-grained, muddy Cores 6F–7H (20–30 m CSF-A). Intermediate values (1550–1600 m/s) were measured for fine-grained turbidites in Cores 19H–29F (92–146 m CSF-A). The highest velocities occur in the sandy sediment of Cores 2H (17–20 m) 5H (17–20 m), 8H (34–39 m), 13F–16F (68–83 m), and 29F–31F (146–157 m CSF-A) (Figure F20). P-wave velocities were acquired from most sections, but results could not be obtained on some segments of core, probably because either there was an air gap between the core and liner or expansion cracks in the core, which was increasingly the case deeper in the hole and in some sections with homogenized sand.
Natural gamma radiation
NGR values vary significantly with lithology (Table T14), with the highest NGR counts for muddy turbidites (~70–90 counts/s), lower counts for sandy sediment (~40–70 counts/s), and lowest for pelagic and hemipelagic strata (~20–40 counts/s). There is, however, one spike in NGR of 150 counts/s toward the base of Section 25F-3 (~131.9 m CSF-A) that is not reproduced by any of the other sensors (Figure F20).
Thermal conductivity
Thermal conductivity varies between 0.89 and 2.19 W/(m·K) in Hole U1449A. There is no clear downcore trend, but variability depends on the sediment facies. The lowest values were detected in the pelagic to hemipelagic facies (Cores 17F–18H, 83–92 m CSF-A). The highest values occur in sandy sections (Core 5H, 17–20 m CSF-A; Core 27F, ~140 m CSF-A).
Point magnetic susceptibility
Point magnetic susceptibility measurements agree well with WRMSL susceptibility results (Table T14, Figure F20). The point magnetic measurements have higher variability because of the denser measurement spacing (1 cm compared to 2.5 cm for WRMSL) and the smaller integration volume of the sensor (~25 m compared to the ~8 cm for WRMSL; see Physical properties in the Expedition 354 methods chapter [France-Lanord et al., 2016a]). Accordingly, point magnetic measurements detected a number of spikes in centimeter-scale turbiditic sections that are not reproduced by loop magnetic measurements (e.g., in Cores 19H–28F; 92–146 m CSF-A).
Discrete compressional wave velocity
PWC data are in very good overall agreement with WRMSL PWL results (Table T14, Figure F20). Minor differences, however, were detected for hemipelagic to pelagic Cores 17F–18H (83–92 m CSF-A), where PWC measurements were 20–50 m/s higher than WRMSL measurements. P-wave velocities were difficult to obtain on the sandier lithologies below about 100 m CSF-A, and deeper data are mostly from muddy lithologies.
Moisture and density
Water content, porosity, and wet and dry bulk densities are interdependent. Wet bulk densities determined with MAD procedures have slightly lower average values than those measured with the WRMSL (Figure F20). Grain densities calculated from MAD pycnometer measurements vary from 2.67 to 2.84 g/cm 3 . The average value of 2.78 g/cm3 is higher than the grain density of quartz (2.64 g/cm3), which is the major sediment component of both fine-grained and sandy turbidites of the Bengal Fan (Weber et al., 2003) (Figure F21). The cause of this difference is not yet known, but it could be due to the presence of heavy minerals, which are observed in relatively high proportion in smear slides at this site. Alternatively, offsets might be introduced during volume detection on the pycnometer. We will investigate these possibilities postexpedition. Porosities range from 30% to 90%. A few values over 90% near the top of Hole U1449A appear to represent sediments oversaturated with water.
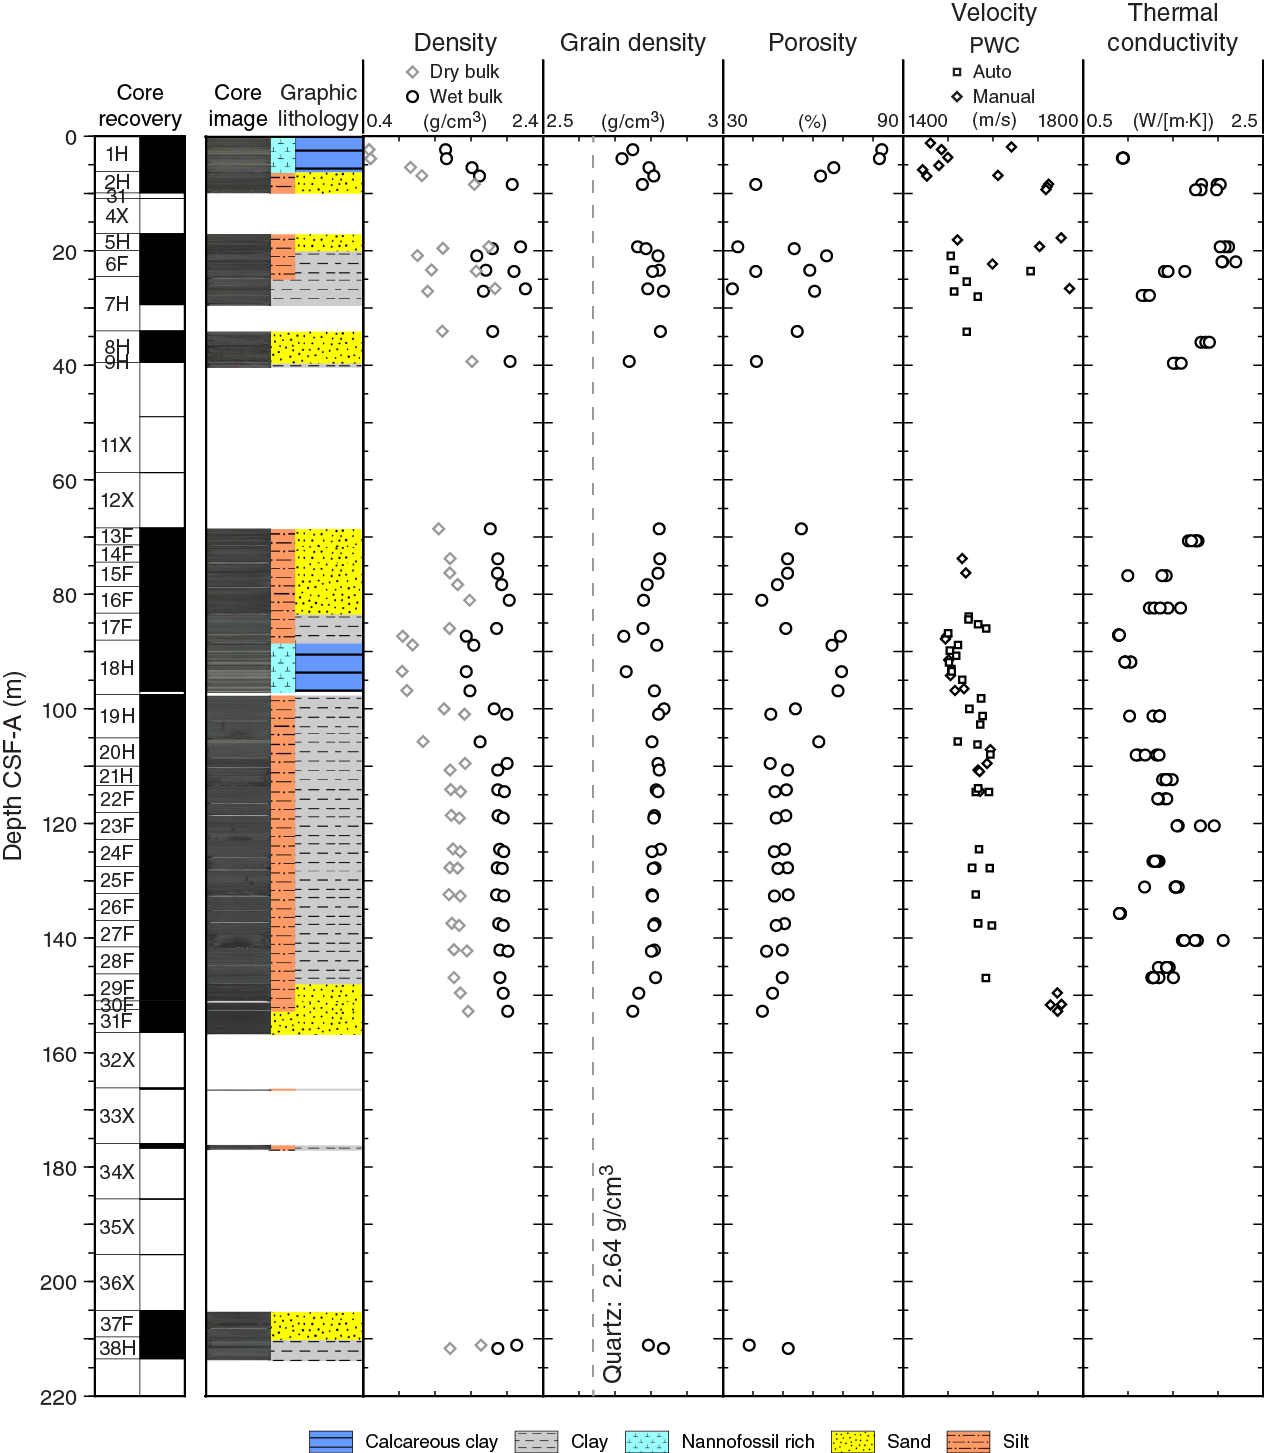
Figure F21. Moisture and density results, Hole U1449A.
Color reflectance
Reflectance data provide valid information for interpreting sediment composition (e.g., Balsam and Damuth, 2000). The L* axis measures the black–white color component, known as lightness or gray value. It is a reliable tracer for the content of biogenic carbonate in marine sediment (Weber, 1998). Cores 17F–18H (83–88 m CSF-A) have the highest L* values with multiple cycles of high L* values, likely indicative for orbitally induced carbonate cycles.
The a* axis is the green–red component and usually a tracer of changing redox conditions in the sediments. In Hole U1449A, a* values are elevated in the lower part of hemipelagic Core 18H (88–92 m CSF-A). The b* axis is the yellow–blue component. Elevated values appear to be associated with horizons rich in biogenic opal (e.g., Core 20H; 105–106 m CSF-A).
Core disturbances and data quality
Core disturbances are shown in Figure F3. They affect the quality and reliability of physical properties in various ways. Sandy intervals in Hole U1449A with in-flow of water and washout of grains no longer possess the original sediment texture or fabric. Accordingly, PWL measurements of P-wave velocity and GRA density underestimate the true values (e.g., in Core 8H; 34–39 m CSF-A) in homogenized coarse-grained sections (Table T14) or provide no PWL data at all (e.g., Core 16H; 79–83 m CSF-A). Core disturbances in muddy turbidites (Core 24F, 124–128 m CSF-A; Core 27F, 124–128 m CSF-A) also affect the overall quality of GRA and PWL data but only slightly underestimate average values. WRMSL magnetic susceptibility and NGR will be lower if the liner is not filled entirely (i.e., there is a significant loss of material) because both measurements are volume dependent. An indication of material loss is given when WRMSL magnetic susceptibility values are substantially lower than point magnetic susceptibility values (e.g., Core 31F; 152–156 m CSF-A). Color reflectance data will not be affected unless cracks occur in the sections.
Data interpretation
In general, physical properties correlate with lithology and composition. Coarse-grained (sandy) sediments are mostly associated with maxima in P-wave velocity, wet and dry bulk density, and magnetic susceptibility, all of which exhibit great potential to trace Bouma turbidite sequences in detail (Figure F22). This potential is an important finding, as the identification and characterization of turbiditic successions is one the top priorities of Expedition 354. Fine-grained sediments usually have lows in wet bulk density, P-wave velocities, magnetic susceptibility, and NGR but highs in L* and a*.

Figure F22. Tubiditic sequences, Core 354-U1449A-6F. Data identify four Bouma sequences fining-upward from sandy to muddy sediment of variable thickness (centimeter to meter).
Downhole measurements
Downhole temperature
One APCT-3 downhole temperature deployment in Hole U1449 yielded a value of about 3.3°C at a depth of 39.5 m DSF. The temperature equilibration was not smooth (Figure F23), so there is some uncertainty about this value. The temperature at the seafloor was 1.55°C. Based on these two data points, the geothermal gradient at Site U1449 is estimated at 44°C/km with a high level of uncertainty.
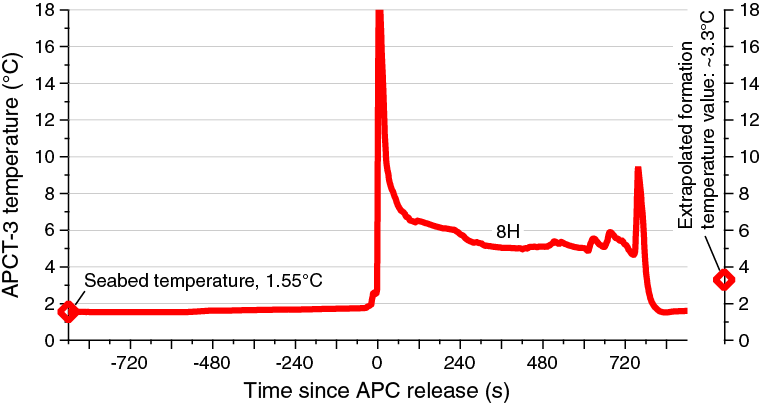
Figure F23. APCT-3 temperature-time series with an extrapolated formation temperature estimate of 3.3°C at 39.5 mbsf.
Stratigraphic synthesis
The main objective for Site U1449 was to contribute to the reconstruction of Pleistocene fan evolution as part of the seven-site drilling transect. In the vicinity of this site, the depositional style is dominated throughout the cored section by two major channel systems (C1 and C2; Figure F24), providing the opportunity to characterize main structural elements and depositional units as levees, sandy to fine-grained interlevee deposits, and hemipelagic sections.
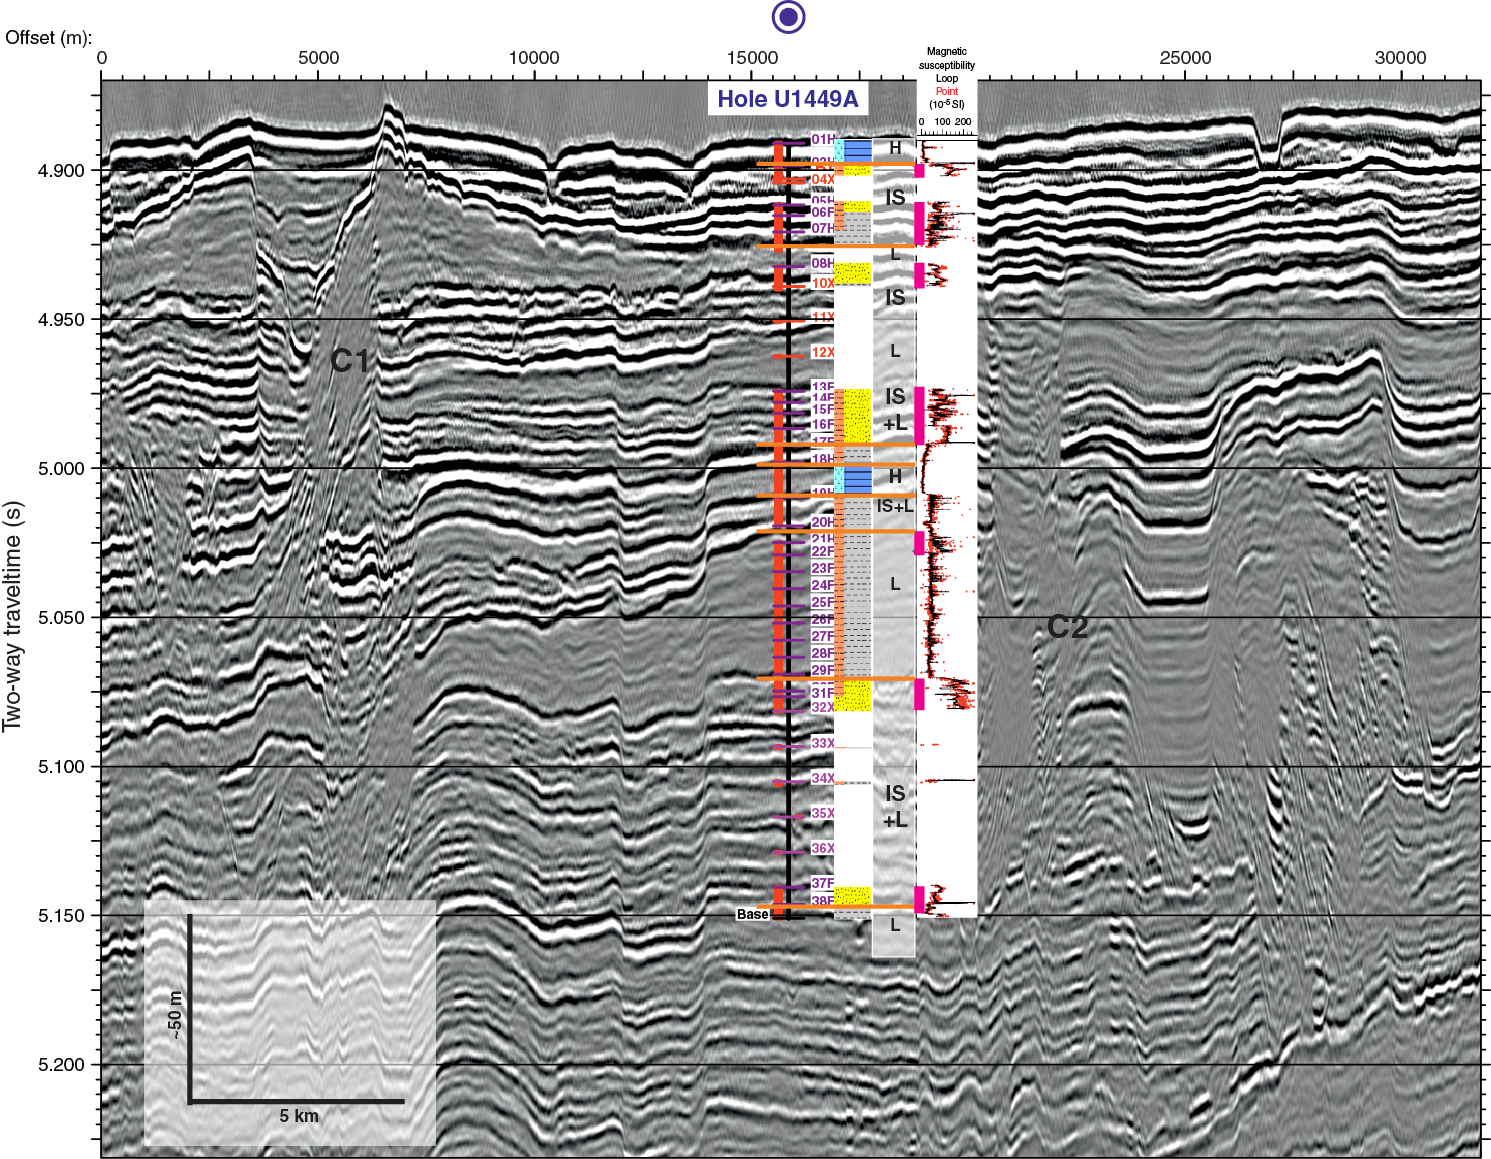
Figure F24. Seismic Line SO125-GeoB97-027, Site U1449. Magnetic susceptibility is sensitive to grain size and mineral composition.
Seismic, physical properties, and lithology
In the seismic data (Figure F24), the main structural elements are clearly identified based on geometry, reflectivity, and seismic facies. The wedge-shaped low-amplitude units reveal levees (L); thin units of uniform thickness and low reflectivity represent hemipelagic intervals (H). Higher amplitude lens-shaped packages with overall higher reflectivity and irregular bounding reflectors are attributed to interlevee sedimentation (IS). Two main channel systems (C1 and C2) are located 10 km west and 7 km east of Site U1449, respectively. They presumably deliver most sediment to the location of Site U1449 within the time interval cored. Deposits from both channels are interfingering.
Variations in impedance, the product of P-wave velocity and wet bulk density, are responsible for reflectivity, which is integrated with reflector geometry and roughness into seismic facies types. Because impedance is directly dependent on grain size, the excellent correlation between physical property core logs and lithology (see Physical properties) might be used to finally identify fan architectural elements and successions and estimate dominant grain sizes from the seismic data.
Major lithologic boundaries derived from cores show a marked correlation with seismic facies changes if an average seismic velocity of 1640 m/s is used. That value is somewhat higher than the values determined by the PWL (1570 m/s on average) and PWC (1595 m/s on average), but sandy intervals (1711 m/s average caliper measurement velocities) were presumably not very well represented in XCB cores, so seismic velocity may be underestimated by averaging physical property data. Detailed comparisons to various physical property data sets (e.g., GRA, PWL data, NGR, magnetic susceptibility, and color reflectance) further confirm that seismic reflectivity correlates with the variability of physical properties of muddy and silty turbidite intervals, representing levee units. These levee units exhibit an overall low seismic reflectivity and intermediate range of impedance contrasts represented in all physical property data but are clearest visible in the magnetic susceptibility data. Interlevee sediments have distinctly higher seismic amplitudes related to the overall highest variability of acoustic impedance parameters and graded bedding (pink bars, Figure F24) and likely linked to larger grain size variations in thicker turbidites and sheeted sands and silts.
Hemipelagic layers appear uniform and homogeneous in their physical properties. The boundaries above and below correlate with distinct regional seismic horizons. For instance, the interval from 84 to 97 m CSF-A (Cores 354-U1449A-17H through 18H) shows distinct, large amplitude contrasts at the base (muddy turbidite to calcareous ooze) and top (muddy turbidite to sand). Accordingly, embedded hemipelagic to pelagic units are correlated to seismic reflectors and may be used as stratigraphic marker horizons throughout the drilling transect.
It is noteworthy, particularly because of the challenges in recovery of sandy and silty lithologies, that these core-seismic observations confirm that the cores collected are representative of the original sedimentary succession. Any sampling bias resulting from poor recovery of coarser material is likely to be limited at this site. The comparison of a weighted mean of caliper measurement velocity data for Hole U1449A (1595 m/s) with an average seismic velocity of 1640 m/s required for a matching time-to-depth conversion suggests that only a limited proportion of higher velocity material, namely sands, is missing, likely in the nonrecovered intervals of XCB Cores 10X–12X and 32X–35X and that these units likely contribute typical sand velocities leading to this average.
Age-depth relationship
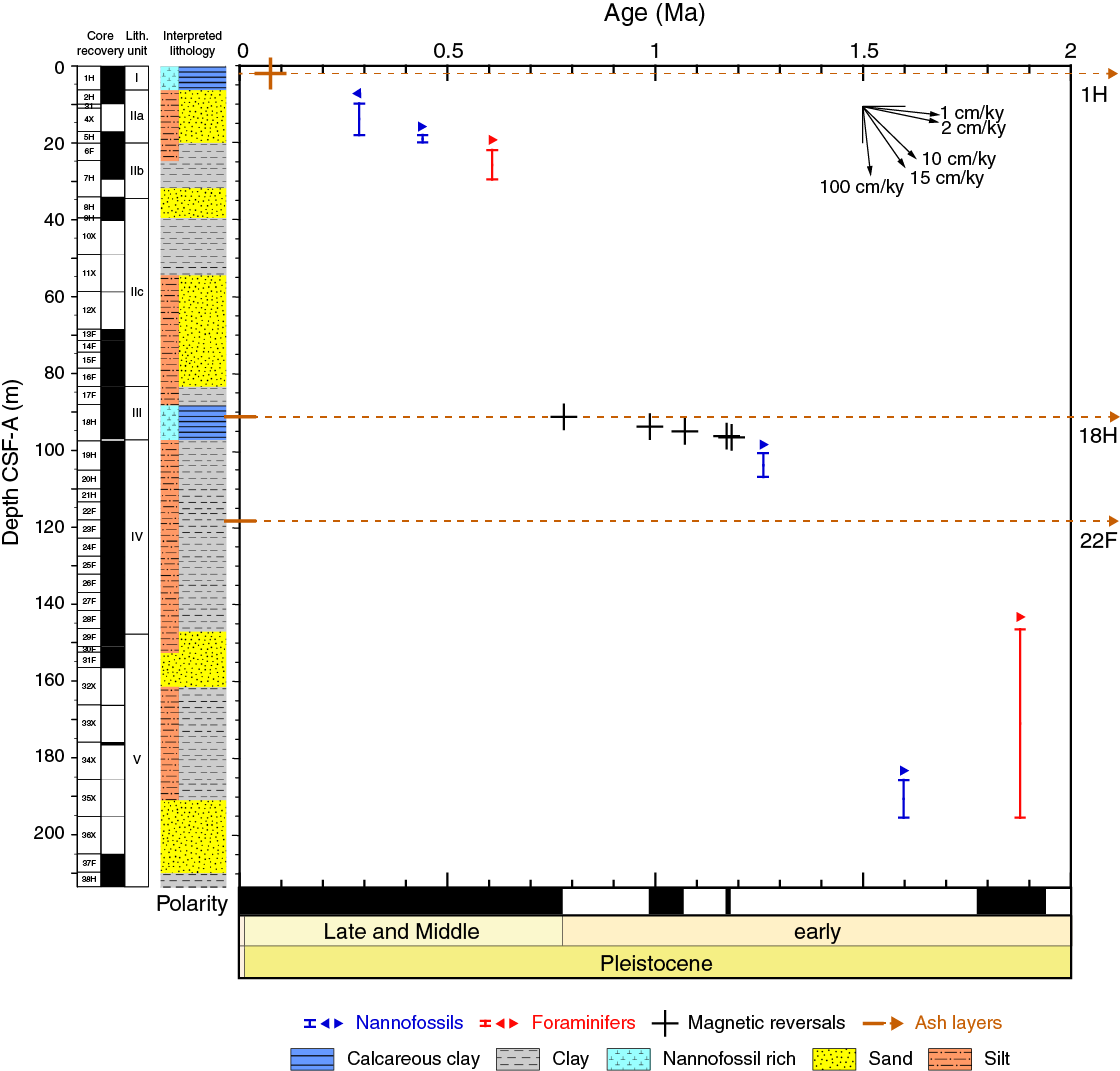
Chronostratigraphic assignments and age-depth relationships are based on preliminary shipboard work and may be subject to substantial changes/improvements after postexpedition research. Figures F25 and F26 were constructed after determining both uncertainties of assigned biostratigraphic ages and ranges and uncertainties in depth due to gaps in recovery and sample spacing. The position of nannofossil (blue) and foraminiferal (red) biomarkers are plotted as midpoints, and the length of the symbol marks the depth uncertainty (see Biostratigraphy; Table T4). Barren samples were not used when calculating the midpoints. The biohorizons (first occurrence [FO] and last occurrence [LO]) can be located anywhere within this depth interval, and the error equals half the distance. Arrows denote FO (right arrow) or LO (left arrow). Most age assignments are based on core catcher samples, thus providing a depth resolution of ~5 or ~10 m, and are intended to be refined postexpedition. Magnetic reversals are represented by black crosses. Only reversals identified with confidence are included in Figure F26 (Tables T4, T8).

Figure F25. Compilation of biostratigraphic and chronostratigraphic markers, Site U1449.
Achievements
Because different lithologic units are constructed through very different depositional processes, sedimentation rates vary drastically with lithology. The average sedimentation rate for the cored interval is on the order of 7–15 cm/ky. Sedimentation rates in hemipelagic sediments, calculated from magnetic reversal tie points, however, range from 0.5 to 2 cm/ky. In contrast, sedimentation rate in levees can and must be as high as 1 m/ky, three orders of magnitude higher than pelagic sedimentation rates.
As seen in Figure F26, the lower portion of Site U1449 has built up since 2 Ma, followed by an episode of hemipelagic deposition between 1.2 and 0.8 Ma, indicating the absence of fan deposition in this segment of the drilling transect. Channel activity has resumed since then, terminating again ~300 ky ago, when a thicker hemipelagic draped the fan. This hemipelagic unit is present at all of the sites drilled and provides an excellent stratigraphic marker to use across the transect.
The deposition of detrital sediments can dilute the pelagic input to the extent where biostratigraphic ages cannot be determined and the number of foraminiferal specimens may be insufficient for further dating with oxygen isotopes. It becomes evident that channel-levee complexes, although providing the architectural units, represent short-lived phenomena, whereas hemipelagic oozes represent the majority of geologic time. At a given site, fan activity is therefore limited to very short time intervals compared to the overall geologic time recorded in the cored interval. Evidently, determining the duration and age of such short-lived depositional events may be challenging because of the lack of sufficient chronostratigraphic tie points in any levee succession.
As part of the Bengal Fan transect, Site U1449 provided an excellent section through a levee unit >40 m thick and the overlying hemipelagic and interlevee sediments. Characterization of these fan elements will allow comparison with the other transect sites. Stratigraphic marker horizons were cored and will allow transect-wide correlations. However, incomplete recovery of sandy and silty lithologies makes it difficult to evaluate their relative proportion.
References
Balsam, W.L., and Damuth, J.E., 2000. Further investigations of shipboard vs. shore-based spectral data: implications for interpreting Leg 164 sediment composition. In Paull, C.K., Matsumoto, R., Wallace, P., and Dillon, W.P. (Eds.), Proceedings of the Ocean Drilling Program, Scientific Results, 164: College Station, TX (Ocean Drilling Program), 313–324. http://dx.doi.org/10.2973/odp.proc.sr.164.222.2000
Cochran, J.R., Stow, D.A.V., et al., 1989. Proceedings of the Ocean Drilling Program, Initial Reports, 116: College Station, TX (Ocean Drilling Program). http://dx.doi.org/10.2973/odp.proc.ir.116.1989
Fisher, R.A., 1953. Dispersion on a sphere. Proceedings of the Royal Society of London, Series A, 217:295–305.
France-Lanord, C., and Derry, L.A., 1994. δ13C of organic carbon in the Bengal Fan: source evolution and transport of C3 and C4 plant carbon to marine sediments. Geochimica et Cosmochimica Acta, 58(21):4809–4814. http://dx.doi.org/10.1016/0016-7037(94)90210-0
France-Lanord, C., Derry, L., and Michard, A., 1993. Evolution of the Himalaya since Miocene time: isotopic and sedimentological evidence from the Bengal Fan. In Treloar, P.J., and Searle, M. (Eds.), Himalayan Tectonics. Geological Society Special Publication, 74(1):603–621. http://dx.doi.org/10.1144/GSL.SP.1993.074.01.40
France-Lanord, C., Spiess, V., Klaus, A., Adhikari, R.R., Adhikari, S.K., Bahk, J.-J., Baxter, A.T., Cruz, J.W., Das, S.K., Dekens, P., Duleba, W., Fox, L.R., Galy, A., Galy, V., Ge, J., Gleason, J.D., Gyawali, B.R., Huyghe, P., Jia, G., Lantzsch, H., Manoj, M.C., Martos Martin, Y., Meynadier, L., Najman, Y.M.R., Nakajima, A., Ponton, C., Reilly, B.T., Rogers, K.G., Savian, J.F., Schwenk, T., Selkin, P.A., Weber, M.E., Williams, T., and Yoshida, K., 2016a. Expedition 354 methods. In France-Lanord, C., Spiess, V., Klaus, A., Schwenk, T., and the Expedition 354 Scientists, Bengal Fan. Proceedings of the International Ocean Discovery Program, 354: College Station, TX (International Ocean Discovery Program). http://dx.doi.org/10.14379/iodp.proc.354.102.2016
France-Lanord, C., Spiess, V., Klaus, A., Adhikari, R.R., Adhikari, S.K., Bahk, J.-J., Baxter, A.T., Cruz, J.W., Das, S.K., Dekens, P., Duleba, W., Fox, L.R., Galy, A., Galy, V., Ge, J., Gleason, J.D., Gyawali, B.R., Huyghe, P., Jia, G., Lantzsch, H., Manoj, M.C., Martos Martin, Y., Meynadier, L., Najman, Y.M.R., Nakajima, A., Ponton, C., Reilly, B.T., Rogers, K.G., Savian, J.F., Schwenk, T., Selkin, P.A., Weber, M.E., Williams, T., and Yoshida, K., 2016b. Site U1451. In France-Lanord, C., Spiess, V., Klaus, A., Schwenk, T., and the Expedition 354 Scientists, Bengal Fan. Proceedings of the International Ocean Discovery Program, 354: College Station, TX (International Ocean Discovery Program). http://dx.doi.org/10.14379/iodp.proc.354.105.2016
France-Lanord, C., Spiess, V., Klaus, A., Adhikari, R.R., Adhikari, S.K., Bahk, J.-J., Baxter, A.T., Cruz, J.W., Das, S.K., Dekens, P., Duleba, W., Fox, L.R., Galy, A., Galy, V., Ge, J., Gleason, J.D., Gyawali, B.R., Huyghe, P., Jia, G., Lantzsch, H., Manoj, M.C., Martos Martin, Y., Meynadier, L., Najman, Y.M.R., Nakajima, A., Ponton, C., Reilly, B.T., Rogers, K.G., Savian, J.F., Schwenk, T., Selkin, P.A., Weber, M.E., Williams, T., and Yoshida, K., 2016c. Site U1452. In France-Lanord, C., Spiess, V., Klaus, A., Schwenk, T., and the Expedition 354 Scientists, Bengal Fan. Proceedings of the International Ocean Discovery Program, 354: College Station, TX (International Ocean Discovery Program). http://dx.doi.org/10.14379/iodp.proc.354.106.2016
France-Lanord, C., Spiess, V., Klaus, A., Schwenk, T., Adhikari, R.R., Adhikari, S.K., Bahk, J.-J., Baxter, A.T., Cruz, J.W., Das, S.K., Dekens, P., Duleba, W., Fox, L.R., Galy, A., Galy, V., Ge, J., Gleason, J.D., Gyawali, B.R., Huyghe, P., Jia, G., Lantzsch, H., Manoj, M.C., Martos Martin, Y., Meynadier, L., Najman, Y.M.R., Nakajima, A., Ponton, C., Reilly, B.T., Rogers, K.G., Savian, J.F., Selkin, P.A., Weber, M.E., Williams, T., and Yoshida, K., 2016d. Expedition 354 summary. In France-Lanord, C., Spiess, V., Klaus, A., Schwenk, T., and the Expedition 354 Scientists, Bengal Fan. Proceedings of the International Ocean Discovery Program, 354: College Station, TX (International Ocean Discovery Program). http://dx.doi.org/10.14379/iodp.proc.354.101.2016
Freeman, K.H., and Colarusso, L.A., 2001. Molecular and isotopic records of C4 grassland expansion in the late Miocene. Geochimica et Cosmochimica Acta, 65(9):1439–1454. http://dx.doi.org/10.1016/S0016-7037(00)00573-1
Galy, A., and France-Lanord, C., 2001. Higher erosion rates in the Himalaya: geochemical constraints on riverine fluxes. Geology, 29(1):23–26. http://dx.doi.org/10.1130/0091-7613(2001)029<0023:HERITH>2.0.CO;2
Galy, V., France-Lanord, C., Beyssac, O., Faure, P., Kudrass, H., and Palhol, F., 2007. Efficient organic carbon burial in the Bengal Fan sustained by the Himalayan erosional system. Nature, 450(7168):407–410. http://dx.doi.org/10.1038/nature06273
Galy, A., France-Lanord, C., and Derry, L.A., 1999. The strontium isotopic budget of Himalayan rivers in Nepal and Bangladesh. Geochimica et Cosmochimica Acta, 63(13–14):1905–1925. http://dx.doi.org/10.1016/S0016-7037(99)00081-2
Galy, V., France-Lanord, C., and Lartiges, B., 2008a. Loading and fate of particulate organic carbon from the Himalaya to the Ganga–Brahmaputra delta. Geochimica et Cosmochimica Acta, 72(7):1767–1787. http://dx.doi.org/10.1016/j.gca.2008.01.027
Galy, V., France-Lanord, C., Peucker-Ehrenbrink, B., and Huyghe, P., 2010. Sr-Nd-Os evidence for a stable erosion regime in the Himalaya during the past 12 Myr. Earth and Planetary Science Letters, 290(3–4):474–480. http://dx.doi.org/10.1016/j.epsl.2010.01.004
Galy, V., François, L., France-Lanord, C., Faure, P., Kudrass, H., Palhol, F., and Singh, S.K., 2008b. C4 plants decline in the Himalayan basin since the Last Glacial Maximum. Quaternary Science Reviews, 27(13–14):1396–1409. http://dx.doi.org/10.1016/j.quascirev.2008.04.005
Garzanti, E., Andó, S., France-Lanord, C., Censi, P., Vignola, P., Galy, V., and Lupker, M., 2011. Mineralogical and chemical variability of fluvial sediments, 2. Suspended-load silt (Ganga–Brahmaputra, Bangladesh). Earth and Planetary Science Letters, 302(1–2):107–120. http://dx.doi.org/10.1016/j.epsl.2010.11.043
Gradstein, F.M., Ogg, J.G., Schmitz, M.D., and Ogg, G.M. (Eds.), 2012. The Geological Time Scale 2012: Amsterdam (Elsevier).
Kirschvink, J.L., 1980. The least-squares line and plane and the analysis of palaeomagnetic data. Geophysical Journal of the Royal Astronomical Society, 62(3):699–718. http://dx.doi.org/10.1111/j.1365-246X.1980.tb02601.x
Lupker, M., France-Lanord, C., Galy, V., Lavé, J., Gaillardet, J., Gajurel, A.P., Guilmette, C., Rahman, M., Singh, S.K., and Sinha, R., 2012. Predominant floodplain over mountain weathering of Himalayan sediments (Ganga basin). Geochimica et Cosmochimica Acta, 84:410–432. http://dx.doi.org/10.1016/j.gca.2012.02.001
Lupker, M., France-Lanord, C., Galy, V., Lavé, J., and Kudrass, H., 2013. Increasing chemical weathering in the Himalayan system since the Last Glacial Maximum. Earth and Planetary Science Letters, 365:243–252. http://dx.doi.org/10.1016/j.epsl.2013.01.038
Martini, E., 1971. Standard Tertiary and Quaternary calcareous nannoplankton zonation. In Farinacci, A. (Ed.), Proceedings of the Second Planktonic Conference, Roma 1970: Rome (Edizioni Tecnoscienza), 2:739–785.
Okada, H., and Bukry, D., 1980. Supplementary modification and introduction of code numbers to the low-latitude coccolith biostratigraphic zonation (Bukry, 1973; 1975). Marine Micropaleontology, 5:321–325. http://dx.doi.org/10.1016/0377-8398(80)90016-X
Poynter, J., and Eglinton, G., 1990. Molecular composition of three sediments from Hole 717C: the Bengal Fan. In Cochran, J.R., Stow, D.A.V., et al., Proceedings of the Ocean Drilling Program, Scientific Results, 116: College Station, TX (Ocean Drilling Program), 155–161. http://dx.doi.org/10.2973/odp.proc.sr.116.151.1990
Schwenk, T., and Spieß, V., 2009. Architecture and stratigraphy of the Bengal Fan as response to tectonic and climate revealed from high-resolution seismic data. In Kneller, B.C., Martinsen, O.J., and McCaffrey, B. (Eds.), External Controls on Deep-Water Depositional Systems. Special Publication - SEPM (Society of Sedimentary Geologists), 92:107–131.
von der Borch, C.C., Sclater, J.G., et al., 1974. Initial Reports of the Deep Sea Drilling Project, 22: Washington (U.S. Government Printing Office). http://dx.doi.org/10.2973/dsdp.proc.22.1974
Wade, B.S., Pearson, P.N., Berggren, W.A., and Pälike, H., 2011. Review and revision of Cenozoic tropical planktonic foraminiferal biostratigraphy and calibration to the geomagnetic polarity and astronomical time scale. Earth-Science Reviews, 104(1–3):111–142. http://dx.doi.org/10.1016/j.earscirev.2010.09.003
Weber, M.E., 1998. Estimation of biogenic carbonate and opal by continuous non-destructive measurements in deep-sea sediments: application to the eastern equatorial Pacific. Deep-Sea Research, Part I, 45(11):1955–1975. http://dx.doi.org/10.1016/S0967-0637(98)00028-4
Weber, M.E., Wiedicke-Hombach, M., Kudrass, H.R., and Erlenkeuser, H., 2003. Bengal Fan sediment transport activity and response to climate forcing inferred from sediment physical properties. Sedimentary Geology, 155(3–4):361–381. http://dx.doi.org/10.1016/S0037-0738(02)00187-2
1 France-Lanord, C., Spiess, V., Klaus, A., Adhikari, R.R., Adhikari, S.K., Bahk, J.-J., Baxter, A.T., Cruz, J.W., Das, S.K., Dekens, P., Duleba, W., Fox, L.R., Galy, A., Galy, V., Ge, J., Gleason, J.D., Gyawali, B.R., Huyghe, P., Jia, G., Lantzsch, H., Manoj, M.C., Martos Martin, Y., Meynadier, L., Najman, Y.M.R., Nakajima, A., Ponton, C., Reilly, B.T., Rogers, K.G., Savian, J.F., Schwenk, T., Selkin, P.A., Weber, M.E., Williams, T., and Yoshida, K., 2016. Site U1449. In France-Lanord, C., Spiess, V., Klaus, A., Schwenk, T., and the Expedition 354 Scientists, Bengal Fan. Proceedings of the International Ocean Discovery Program, 354: College Station, TX (International Ocean Discovery Program). http://dx.doi.org/10.14379/iodp.proc.354.103.2016