MacLeod, C.J., Dick, H.J.B., Blum, P., and the Expedition 360 Scientists
Proceedings of the International Ocean Discovery Program Volume 360
publications.iodp.org
doi:10.14379/iodp.proc.360.103.2017

Site U14731
C.J. MacLeod, H.J.B. Dick, P. Blum, N. Abe, D.K. Blackman, J.A. Bowles, M.J. Cheadle, K. Cho, J. Ciążela, J.R. Deans, V.P. Edgcomb, C. Ferrando, L. France, B. Ghosh, B.M. Ildefonse, M.A. Kendrick, J.H. Koepke, J.A.M. Leong, C. Liu, Q. Ma, T. Morishita, A. Morris, J.H. Natland, T. Nozaka, O. Pluemper, A. Sanfilippo, J.B. Sylvan, M.A. Tivey, R. Tribuzio, and L.G.F. Viegas2
Keywords: International Ocean Discovery Program, IODP, JOIDES Resolution, Expedition 360, Site U1473, Moho, Mohorovičić discontinuity, Southwest Indian Ridge, SloMo, Atlantis Bank, mid-ocean ridge, slow-spreading rate, Atlantis II Transform
MS 360-103: Published 30 January 2017
Background and objectives
International Ocean Discovery (IODP) Expedition 360 constituted Phase I Leg 1 of the SloMo (shorthand for “The nature of the lower crust and Moho at slower spreading ridges”) Project, a multiphase drilling program that aims ultimately to drill through the Mohorovičić seismic discontinuity (Moho) at a slow-spreading mid-ocean ridge. The overall goal of SloMo is to test the hypothesis that the Moho may represent an alteration horizon such as a serpentinization front rather than the igneous crust/mantle boundary. If correct, the igneous crust/mantle boundary could lie at any depth above the seismic boundary; furthermore, because serpentinization is a methanogenic process, it raises the possibility that a significant biosphere exists below the crust at slow-spreading ridges.
The site chosen for this endeavor is Atlantis Bank, an oceanic core complex on the Southwest Indian Ridge (SWIR) proven from previous drilling to expose a substantial section of gabbro (e.g., Dick et al., 1991, 2000; Pettigrew, Casey, Miller, et al., 1999) and local areas of serpentinite (MacLeod et al., 1998), beneath which a Moho reflector is present at ~5.5 km below the seafloor (Muller et al., 2000). Phase I of SloMo is to drill 3 km through lower crustal gabbro and to penetrate the inferred crust/mantle boundary; Phase II proposes using the Japanese riser D/V Chikyu to drill to 6 km through the Moho itself and into the mantle.
The principal aim of Expedition 360 was to establish a legacy hole at Atlantis Bank suitable for deep penetration (now Hole U1473A) and then drill as deep as possible into the lower crustal gabbro layer. By doing so, Expedition 360 could in its own right address a number of first-order scientific questions about the mechanisms of accretion of the igneous lower ocean crust and exhumation by oceanic detachment faults. By comparing the results of Expedition 360 drilling with those from prior Ocean Drilling Program (ODP) drilling at Atlantis Bank (Holes 735B and 1105A), we had the opportunity to examine for the first time the lateral continuity of igneous, metamorphic, and structural stratigraphy on a kilometer scale, and hence to assess the spatial and temporal scales of magmatic accretion of the plutonic lower crust and the mechanisms by which it is exhumed. A further aim was to determine the nature of the source rock in the lower crust responsible for magnetic anomalies by drilling through a magnetic reversal boundary that dips southward beneath Atlantis Bank. In addition, by employing modern protocols for obtaining samples free from contamination, we aimed to determine the microbiology of the nonvolcanic ocean crust and hence explore the extent to which life exists in the subseafloor.
Operations
Expedition 360 was of 61 operational days’ duration (30 November 2015–30 January 2016). The expedition achieved the deepest igneous rock penetration from the seafloor during a single R/V JOIDES Resolution expedition to date (789.7 m drilling depth below seafloor [DSF]) and recovered 469.4 m of core (59% recovery over the entire interval, 63% of the cored interval). The sequence of operational events can be grouped into eight successive episodes (Figures F1, F2; Tables T1, T2; also see OPERATIONS in Supplementary material).
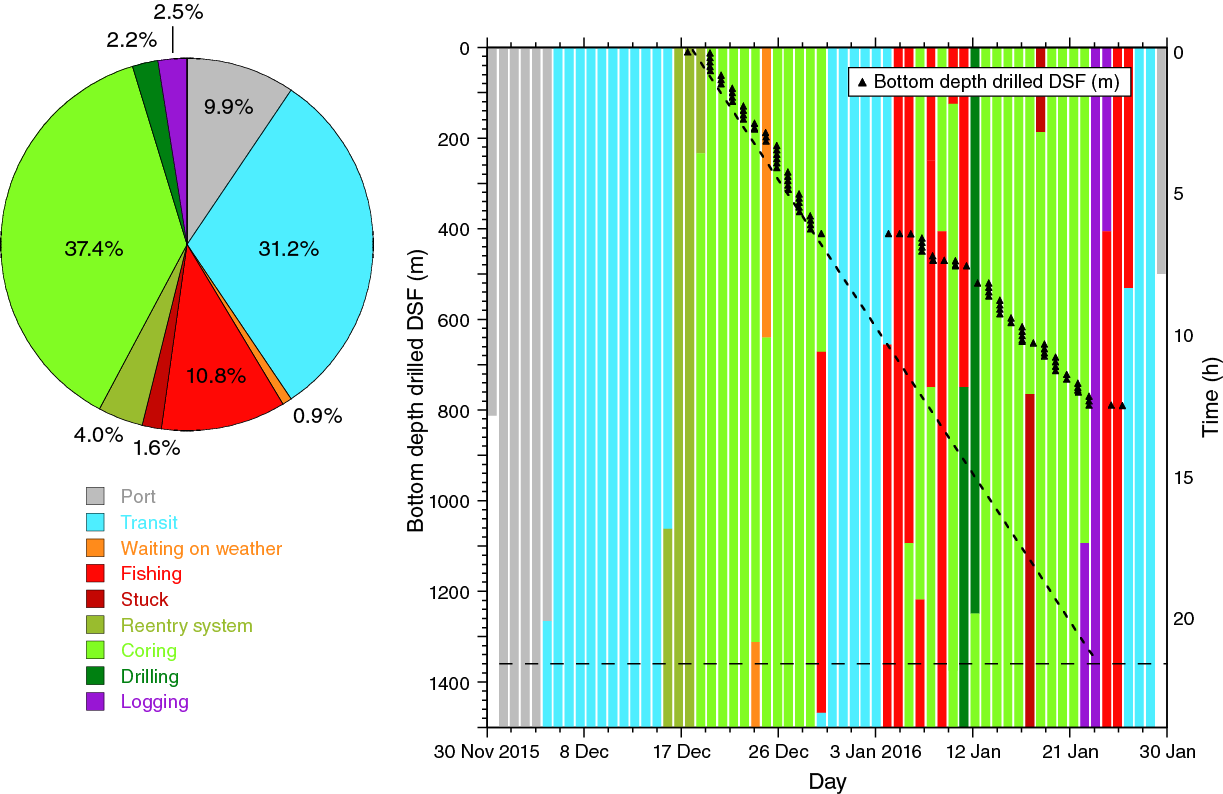
Figure F1. Expedition 360 operational time distribution.
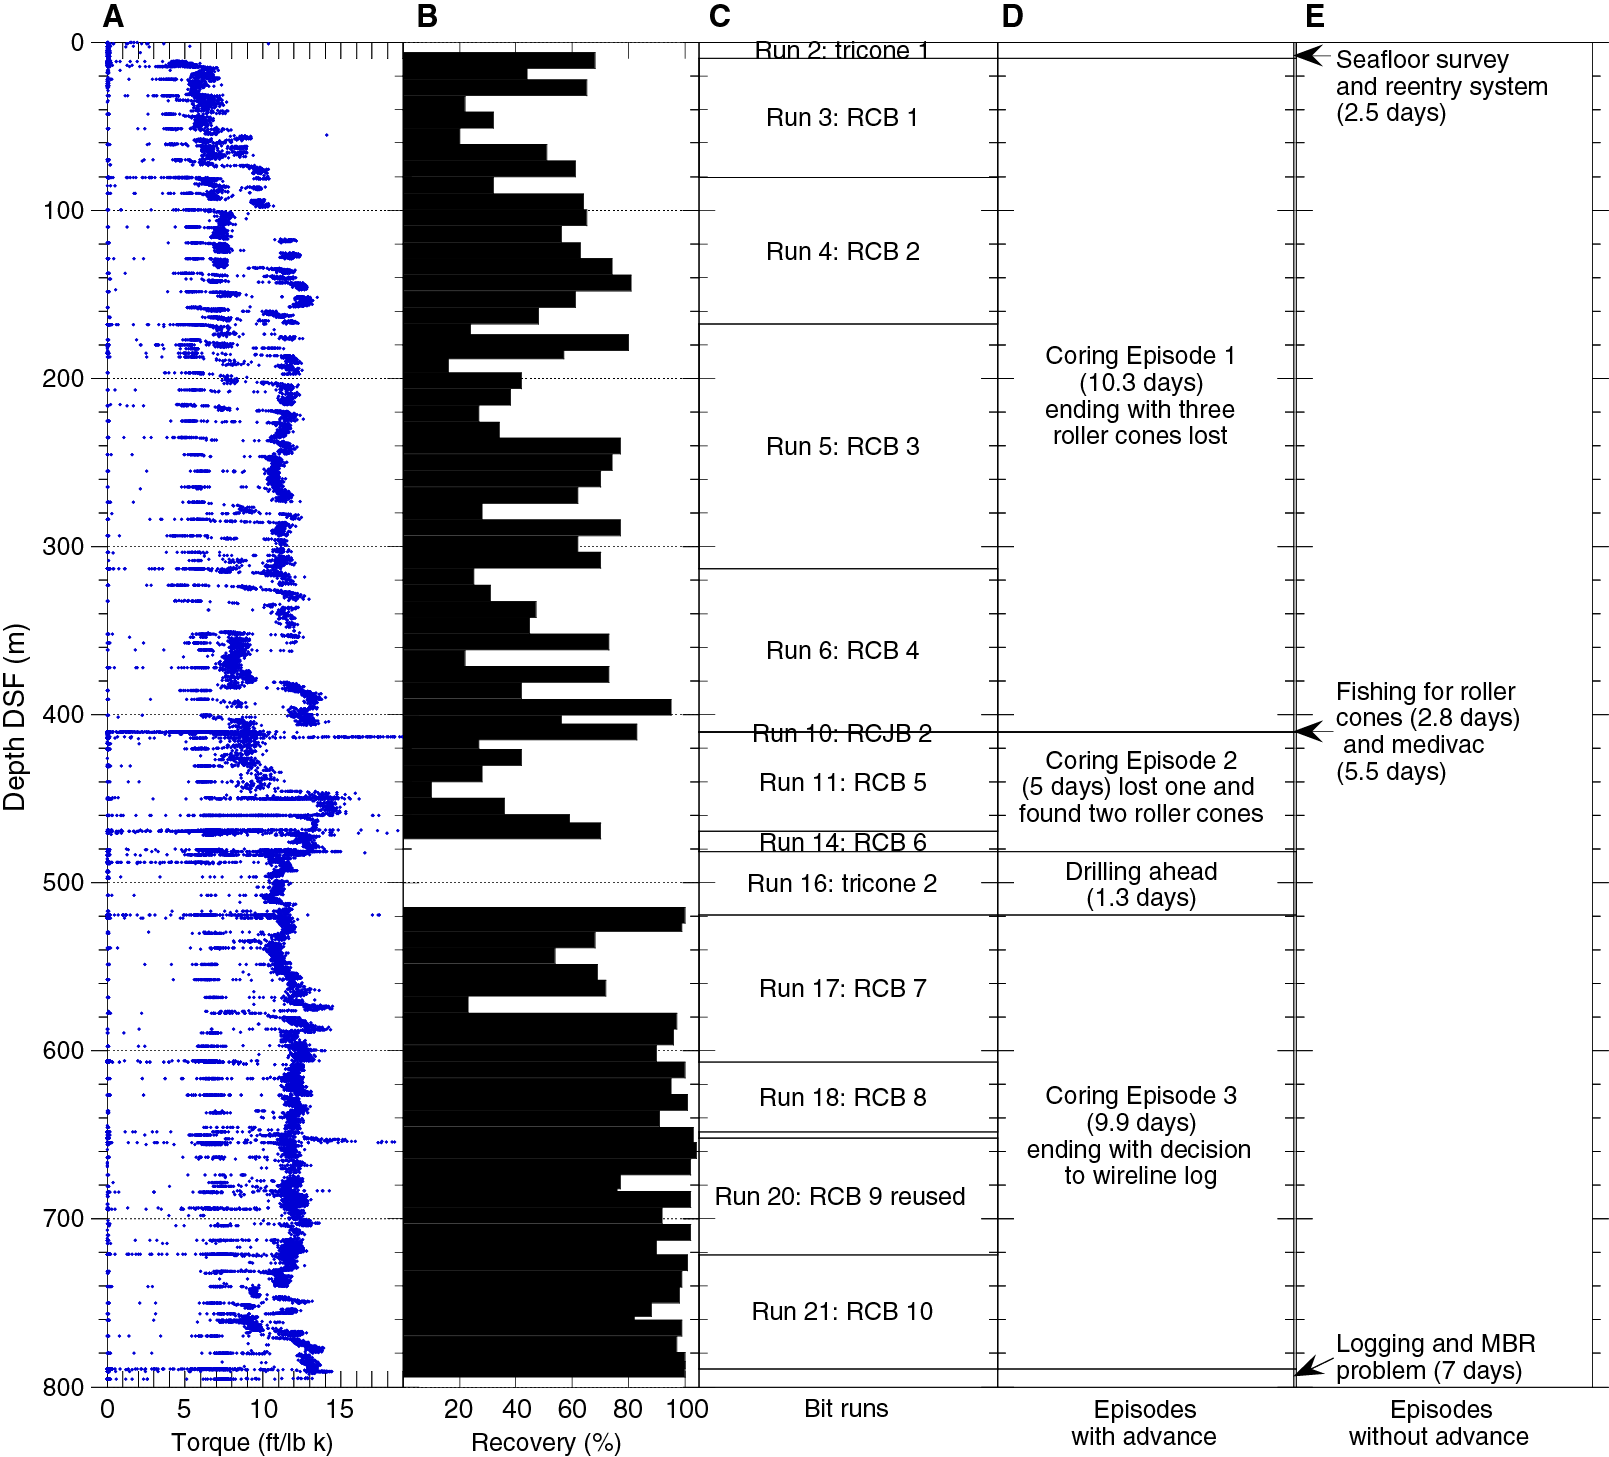
Figure F2. Expedition 360 operational events plotted against depth.
Table T1. Site U1473 core summary. Download table in .csv format. View PDF table.
Table T2. Operational summary information by BHA run number, Hole U1473A. Download table in .csv format.
Summary
Port call and transit to Site U1473 (30 November–16 December)
Expedition 360 spent the first 5.6 days in port in Colombo, Sri Lanka, to offload and load samples, equipment, and supplies. The 2817 nmi transit to Site U1473 took 10.9 days.
Seafloor survey and installing reentry system (17–19 December)
We established a reentry system using a drill-in casing assembly with a mud motor and underreamer and completed it with a free-fall funnel (FFF) at a water depth of 710.2 m (Figure F3). Following a 1.0 day seafloor survey to select the exact drill site, the method and design used for the Site U1473 reentry system took only 1.5 days to install. The drilled depth is 9.5 m DSF, the casing shoe is at 7.4 m DSF, and the top of the cone is at 703.2 meters below sea level (mbsl) (7.0 m above the seafloor). The casing was not cemented into the hole, and the reentry installation proved stable throughout the expedition.
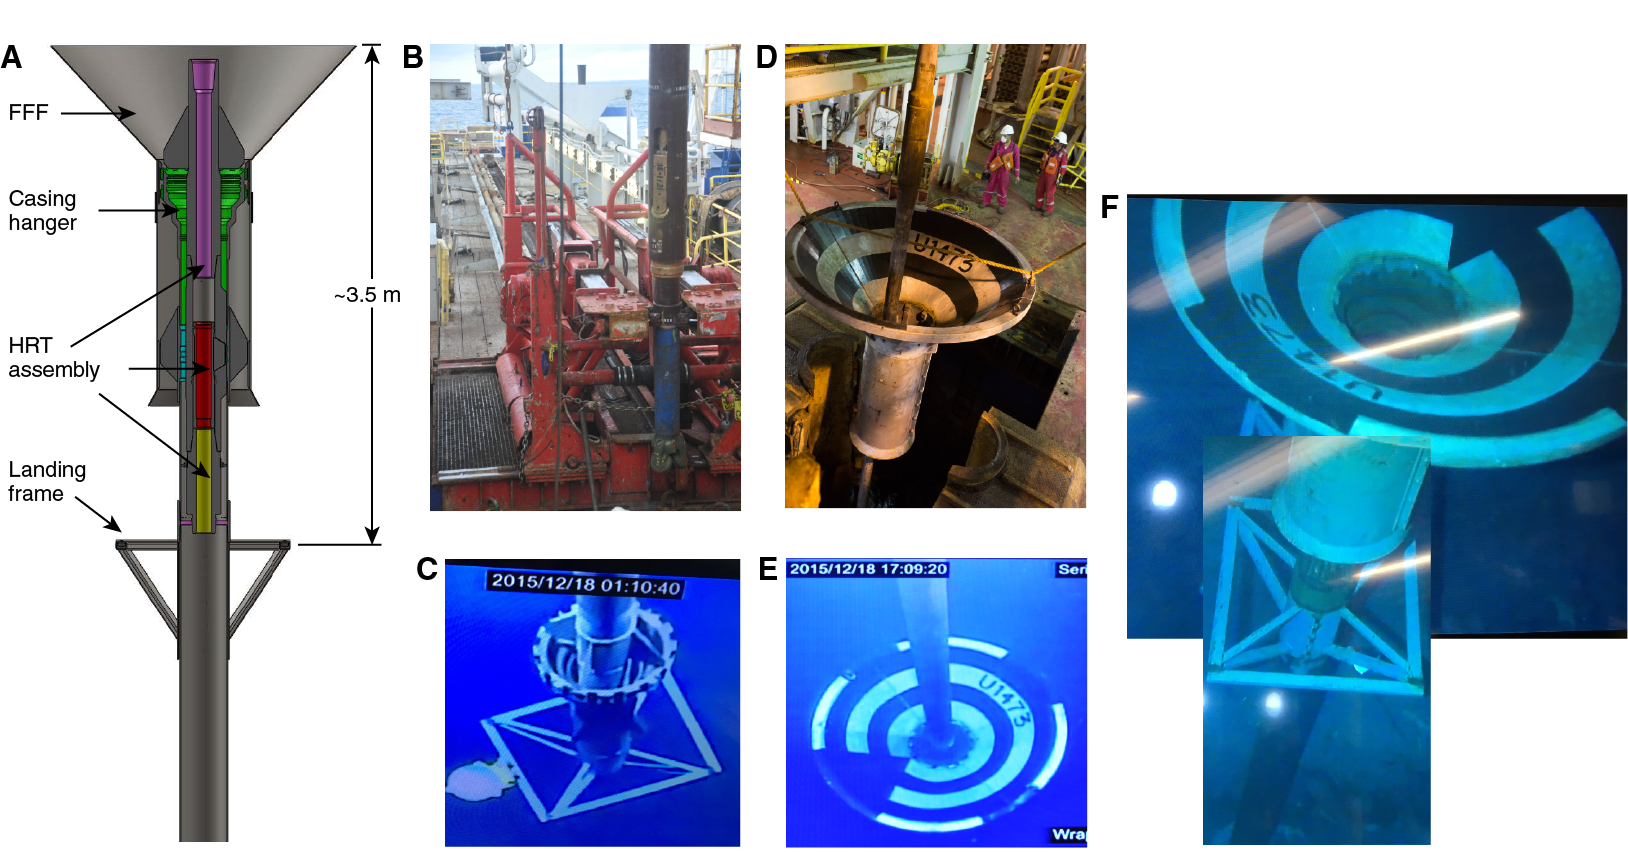
Figure F3. Reentry system deployed, Hole U1473A.
First coring episode (19–30 December)
During this successful 10.3 day coring episode (including 0.6 days waiting on weather [WOW]) we retrieved Cores 360-U1473A-2R through 44R (9.5–410.2 m DSF) with a recovery of 207.0 m (52%), using four rotary core barrel (RCB) drilling bits. Projecting the advance per day of this episode (including WOW) to the total remaining coring time, we would have reached a total depth of >1200 m DSF, close to the 1300 meters below seafloor (mbsf) precruise estimate (Figure F1).
Fishing for roller cones and medical evacuation (30 December–7 January 2016)
Three roller cones were lost in problematic coring conditions at the end of the first coring episode while cutting Core 360-U1473A-44R (Figure F4). We made a total of four fishing attempts, first with two fishing magnet runs (Figure F5) then with two reverse circulation junk basket (RCJB) runs, for a total of 2.8 days, without recovering any cones. However, to everyone’s surprise, the last RCJB run (Figure F6) recovered an unprecedented 0.5 m long, 18 cm diameter core (Core 45M; 410.2–410.8 m DSF). This made it seem extremely unlikely that we had a roller cone present at the bottom of the hole and we hence decided to resume coring.
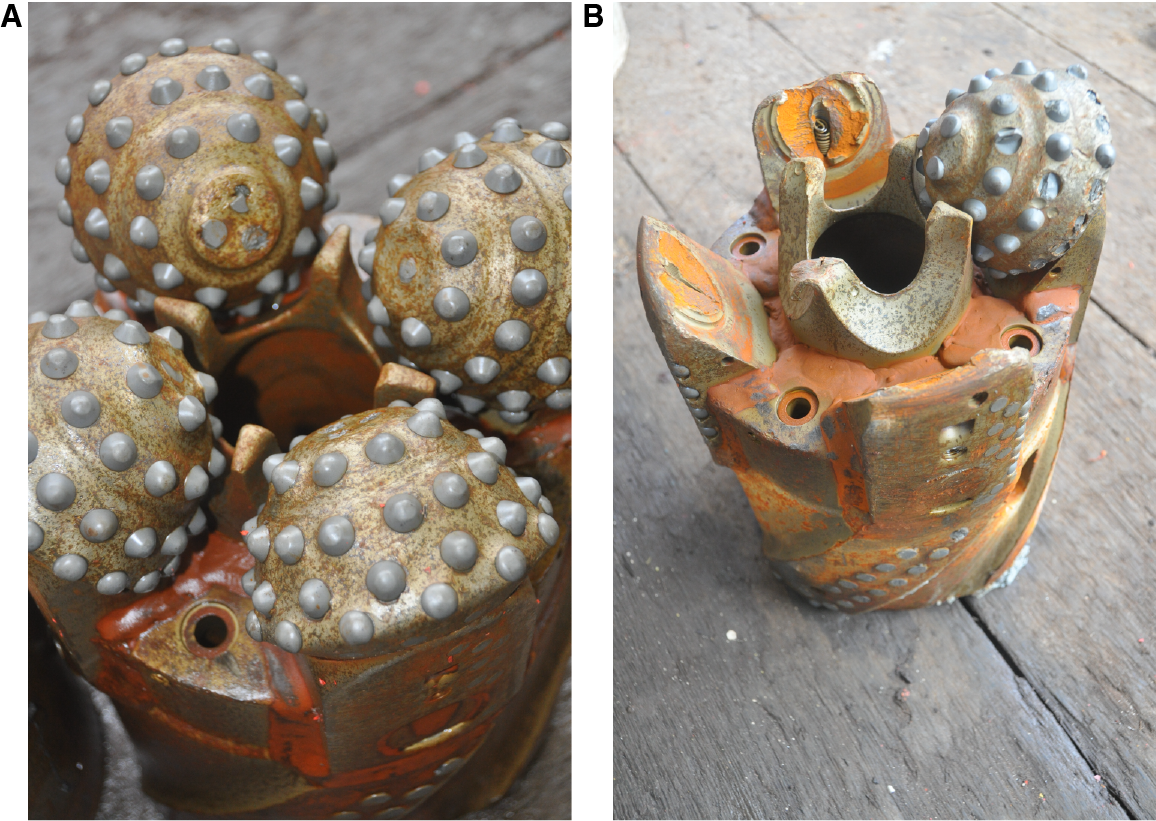
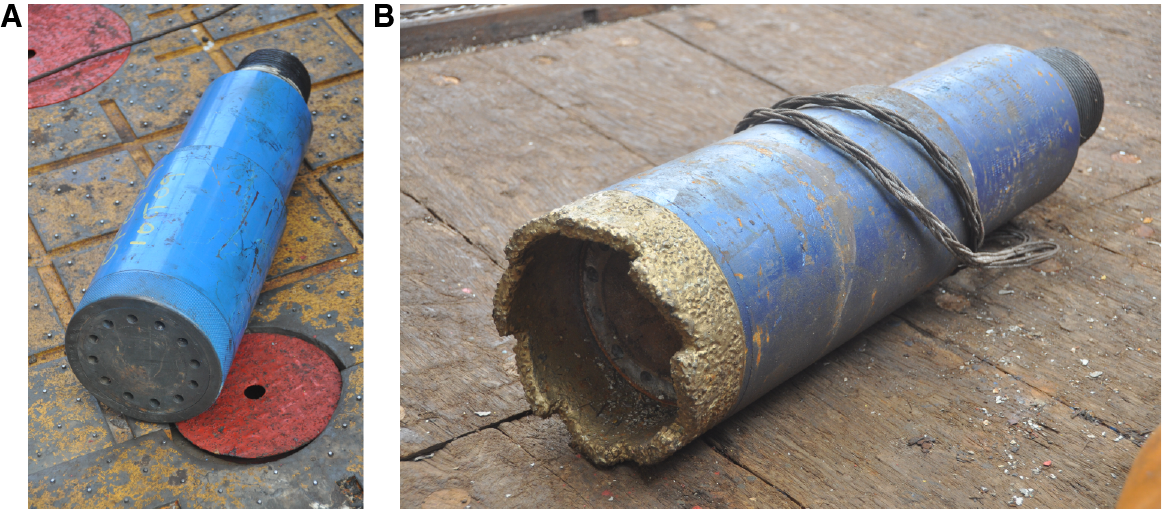
Figure F4. A. Typical coring bit wear after BHA Run 4. B. Bit failure during BHA Run 6.
Figure F5. Fishing magnets used in attempts to recover lost roller cones, Hole U1473A.
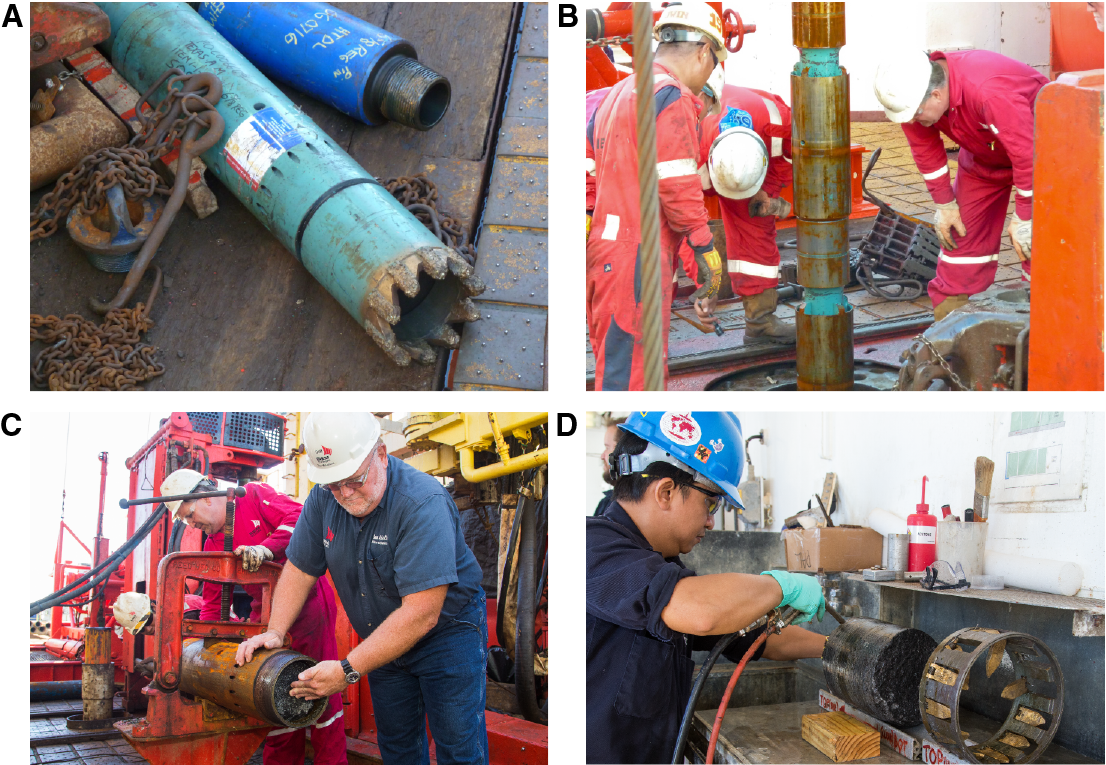
Figure F6. Hole U1473A BHA Run 10 recovered a 0.5 m long × 18 cm fat core.
Between the first and second fishing run we were obliged to sail to a helicopter rendezvous site near Mauritius for a medical emergency. The 1320 nmi round-trip consumed 5.5 days of operational time.
Second coring episode, one roller cone lost and two found (7–12 January)
Cores 360-U1473A-46R through 55R (410.8–481.7 m DSF) were retrieved with a total recovery of 20.0 m (28%). Penetration rates were high, recovery was low, and cores were highly fractured, indicating a weak (faulted) formation. Because of excessive torque (Figure F2) and the need for a wiper trip and reaming the hole, we decided to retrieve the drill string, only to discover that the RCB bit was missing one of its four roller cones. The second of two RCJB fishing runs that followed recovered one missing roller cone (Figure F7) but left three lost cones still unaccounted for. We decided to resume coring; however, Cores 53R through 55R (469.6–481.7 m DSF) had zero recovery. Deployment of depluggers had no effect. We retrieved the drill string and found that the bit had damage attributable to a roller cone (Figure F8A). We deployed the fishing magnet and recovered a heavily abraded roller cone that had evidently been stuck in the center of the drill bit, preventing advance and recovery (Figure F8B–F8C).
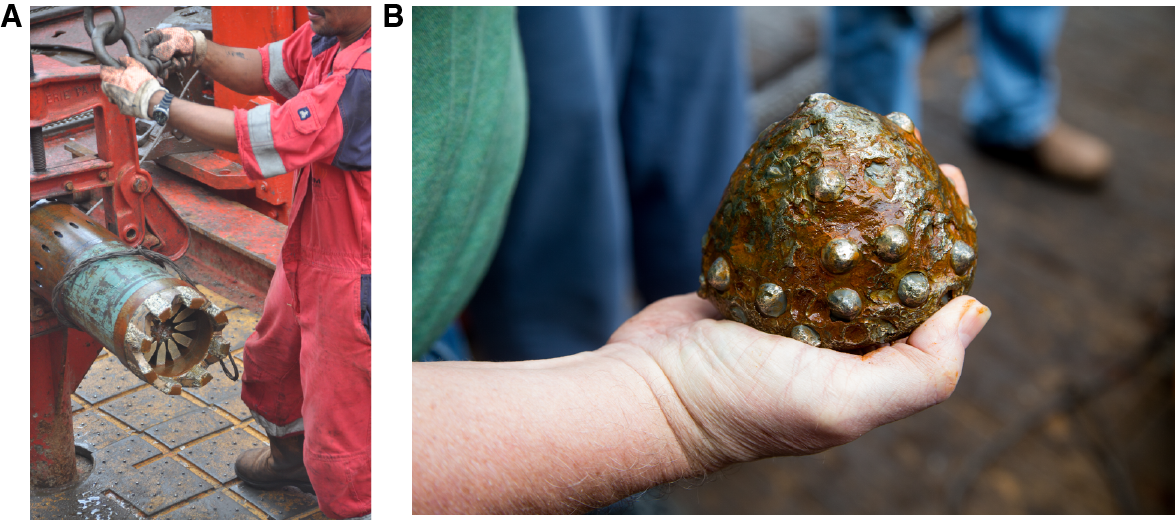
Figure F7. Hole U1473A BHA Run 13 recovered one of the four lost roller cones.
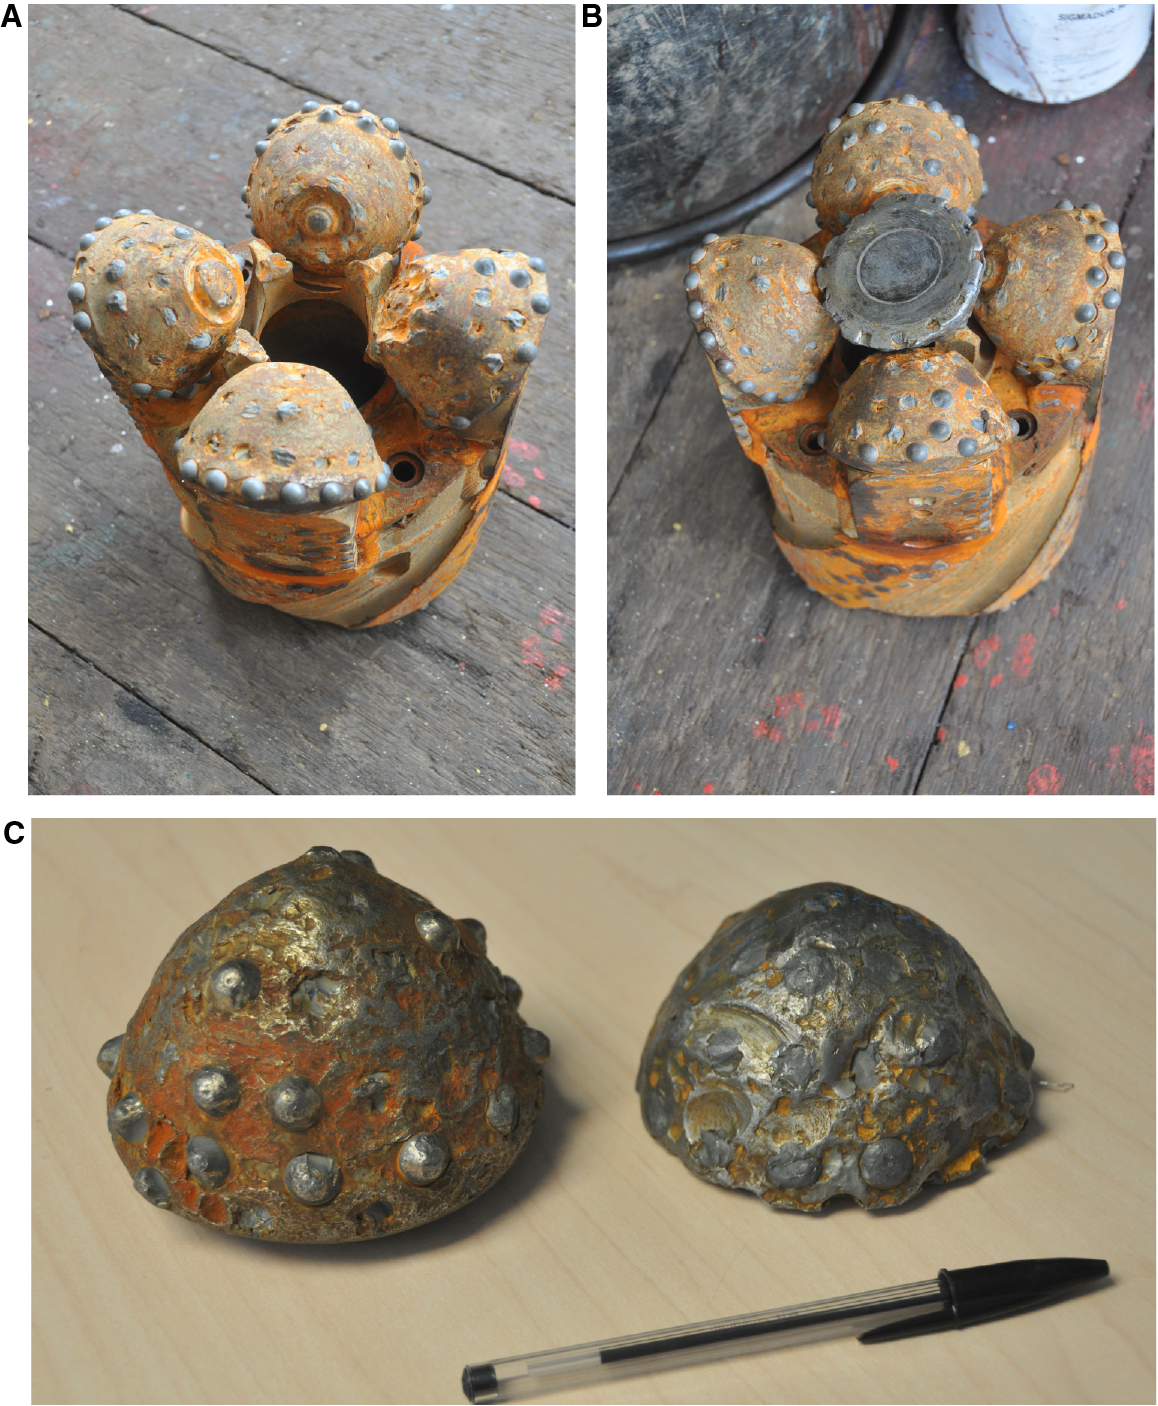
Figure F8. Recovered roller cone ground to about half of original volume.
Drilling ahead (12–13 January)
We decided to drill ahead without coring for an interval not to exceed 100 m using a tricone bit, which is more robust than the RCB coring bit and therefore more suitable to mitigate potential issues near the bottom of the hole, such as reaming a slightly tight hole (Figure F9). We also wanted to get an idea of how much faster drilling would deepen the hole compared to coring. We drilled ahead from 481.7 to 519.2 m DSF (37.5 m), found that the advance rate was not greater compared to that of coring, and after 1.3 days decided therefore to resume coring.
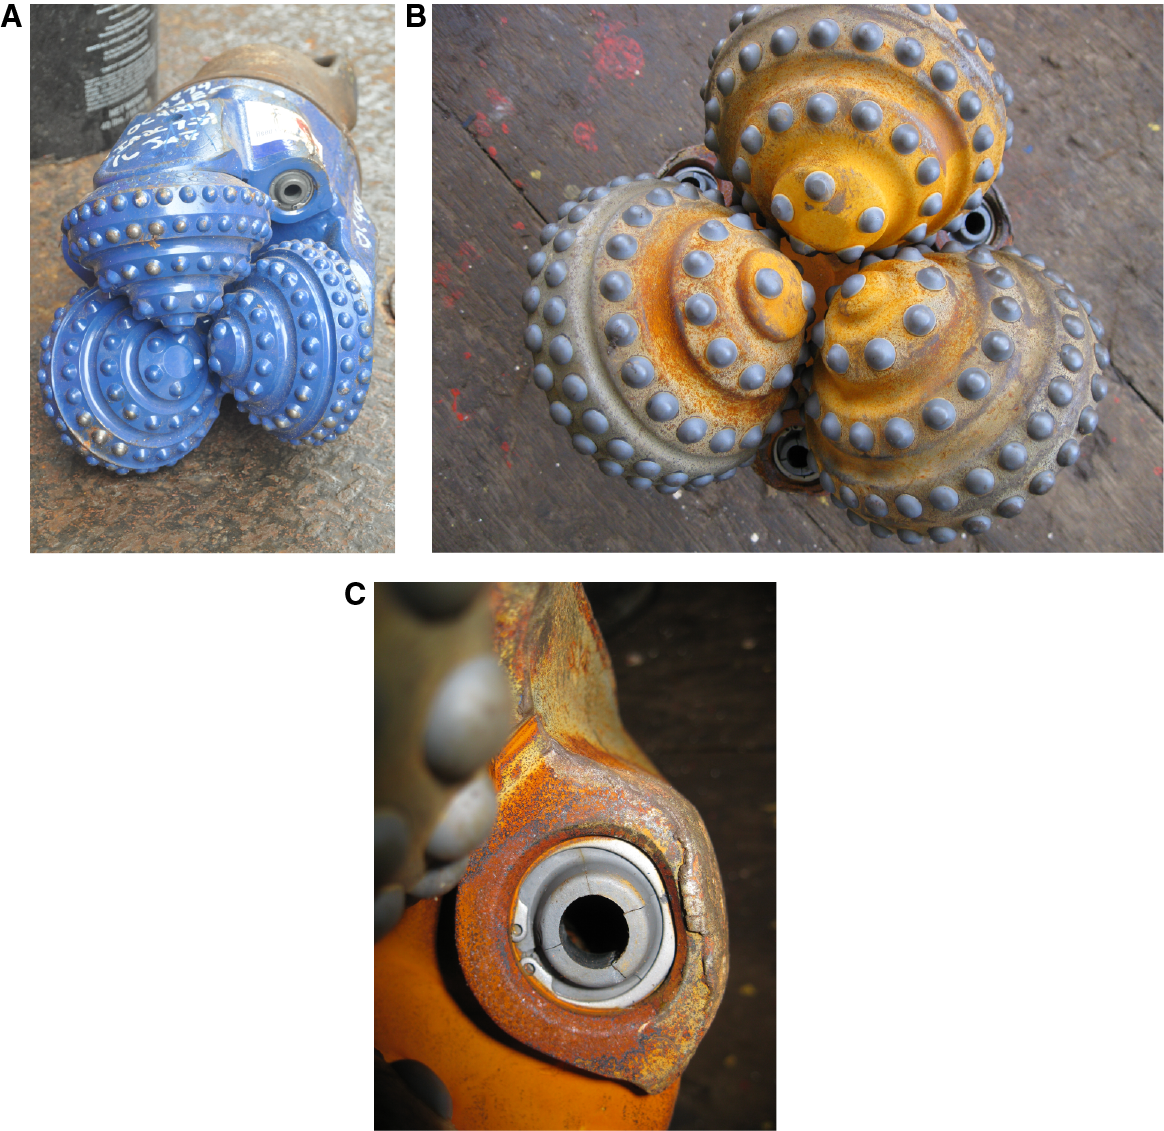
Figure F9. Tricone bit used to advance Hole U1473A without coring before and after drilling.
Third coring episode (13–23 January)
During this coring episode of 9.9 days (including 0.6 day when the pipe was stuck in the hole at 651.9 m DSF), we retrieved Cores 360-U1473A-57R through 89R (519.2–789.2 m DSF) and recovered 241.4 m (89%) using four RCB coring bits. Coring conditions were ideal for the most part in these less fractured gabbroic rocks. We arguably recovered the single longest piece of igneous rock ever (2.85 m) in Core 84R (Figure F10). On 18 January the drill string stuck in the hole and it took 15 h to resume coring operations. Nevertheless, as with the first coring episode, extrapolating the average daily advance during this episode (including stuck time) over the total number of coring days available, we would have reached >1200 m DSF.
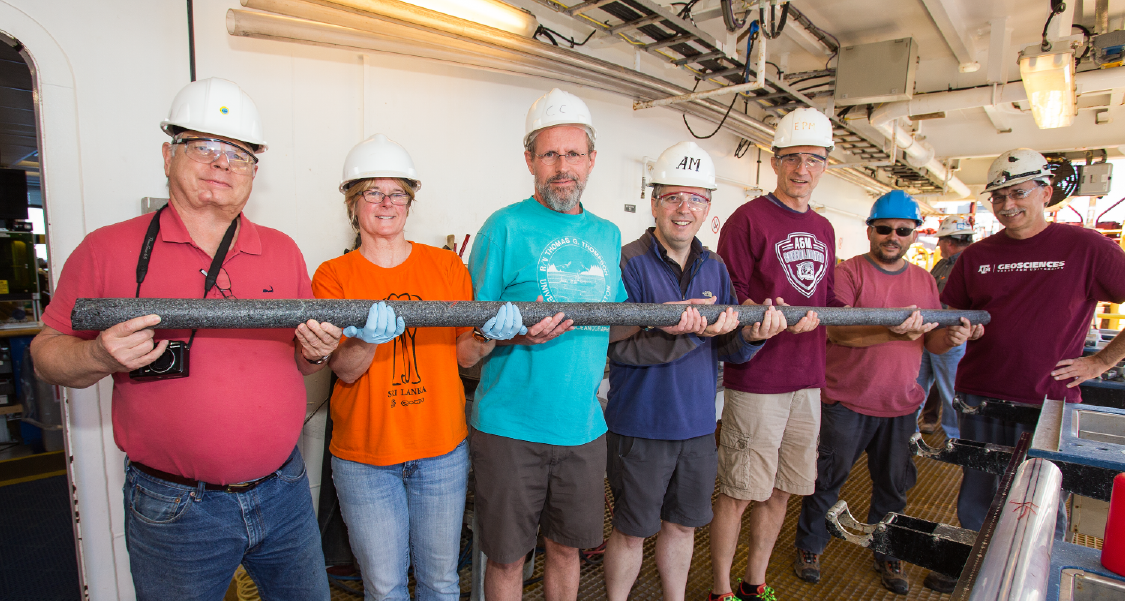
Figure F10. Longest piece of rock recovered during Runs 17–21, Hole U1473A.
Successful logging and mechanical bit release problem (23–30 January)
The last coring bit deployed during coring Episode 3 was mounted with a mechanical bit release (MBR) system to drop the bit on the seafloor and save pipe tripping time before logging. After successfully releasing the bit, we conducted successful wireline logging runs with (1) the “triple combo” tool string, (2) the Formation MicroScanner (FMS)-sonic tool string, and (3) the Ultrasonic Borehole Imager (UBI). When the drill string was recovered, the MBR top connector was missing the sleeve retainer ring, which was presumed to have fallen into the bottom of the hole. We first used a fishing magnet trying to recover the ring without success. Next, we deployed a coring bit in the hope that the missing part may have dropped onto the seafloor when the previous RCB bit was released prior to logging; however, we immediately experienced excessive torque that was attributed to contact with metal at the bottom of the hole. The presence of the sleeve retainer ring at the bottom of Hole U1473A was confirmed with a subsequent RCJB deployment, which recovered two rounded boulders with tool marks that fit the sleeve retainer perfectly (Figure F11). At this point in time we had to leave Site U1473 and get under way for Mauritius.
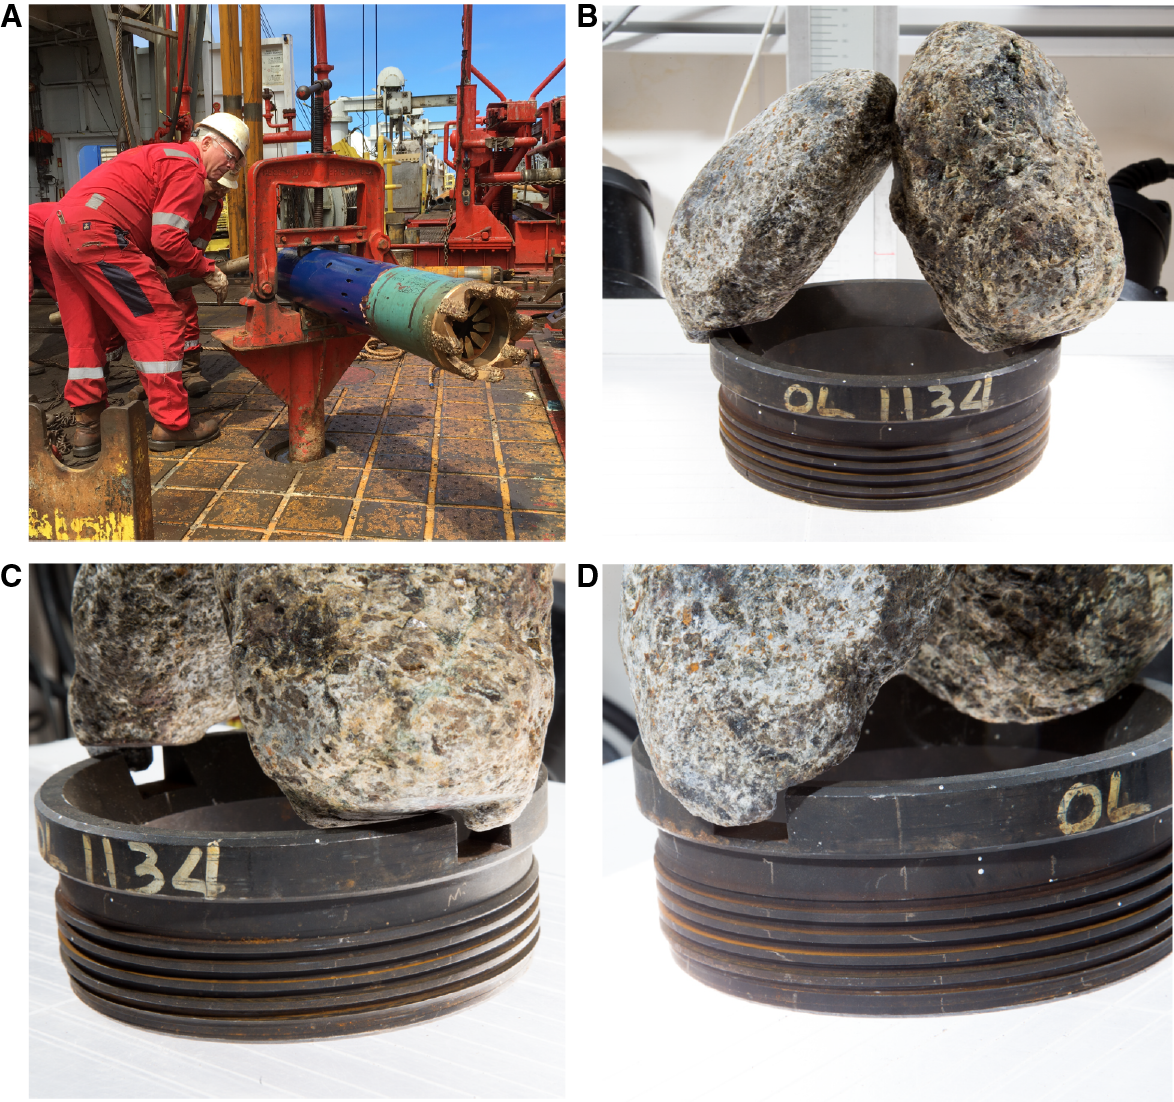
Figure F11. A. Attempts at fishing MBR retainer sleeve. B–D. Two gabbro cobbles with tool marks that perfectly fit a spare retainer sleeve.
Port call and transit to Site U1473 (30 November–16 December)
Expedition 360 (SWIR lower crust and Moho) began with the first line ashore at the Unity Container Terminal Berth in Colombo, Sri Lanka, at 1100 h on 30 November (UTC + 5.5 h). The Co-Chief Scientists, IODP technical staff, and the Expedition Project Manager boarded the ship. The remainder of the science party and the ship’s crew boarded the vessel on the second day of the port call (1 December).
Port call activities took place from 30 November through 5 December and included routine offloading of cores and miscellaneous freight from IODP Expedition 359 and loading miscellaneous drilling equipment, expedition stores, and food for Expedition 360. Activities also included offloading 5½ inch and 5 inch drill pipe for inspection and refurbishment, loading 295 joints of new 5 inch drill pipe, and pumping 900 metric tons of marine gas oil from barges to the ship’s fuel tanks. On 4 December, the port authority required the ship to move from the Unity Container Terminal berth to the JCT Transfer Jetty to complete port call operations, including pumping of 60 metric tons of barite and 54 metric tons of sepiolite from trucks into the ship’s bulk tanks. Loading of all supplies was concluded at 1800 h on 5 December and the last line was released at 2018 h, getting the ship under way to the Atlantis Bank at full speed of 11.2 kt.
During the transit, ship time was changed by −0.5 h on 6 December and by −1.0 h on 7 December, resulting in UTC + 4 h, which was the time zone for the remainder of Expedition 360. Plans for the reentry installation were finalized, and all reentry hardware was located and inspected. Ship tours were given to the science party. The hydraulic release tool (HRT) was assembled in preparation for running the drill-in casing system. Appropriate space-out drawings were completed, defining the drill-in casing program. The dual elevator handler was overhauled and all other drilling and coring equipment had the prespud maintenance checks completed.
On 13 December, the ship’s speed was reduced and the course changed to maneuver around the center of tropical depression Ex-Bohale. On 16 December, we arrived at the coordinates for proposed primary Site AtBk6 (32°42.3402′S, 57°16.6910′E), and at 1700 h we switched to dynamic positioning mode. The 2817 nmi sea voyage was completed in 10.9 days at an average speed of 10.7 kt.
Seafloor survey and installing reentry system (17–19 December)
On 17 December, an advanced piston corer/extended core barrel bit, bit sub, drill collars, and new 5 inch drill pipe were made up and lowered to 668 meters below rig floor (mbrf) (bottom-hole assembly [BHA] Run 1). The subsea camera system was installed and lowered to just above the bit in preparation for a survey to select a site appropriate for drilling at or near proposed Site AtBk6. The survey strategy was to proceed in a square spiral pattern, increasing at 10 m intervals away from the start point (Site AtBk6) until a sufficiently flat bare-rock spot at least 5 m in diameter was located. During the survey, the drill pipe and camera were raised and lowered by up to several meters as required by the seafloor morphology. No suitable site was found during the initial 50 m × 50 m survey. The survey was extended south by a further 50 m in the direction of the most promising seafloor. After a total of 5.5 h of survey, a suitable location for Hole U1473A was found at 32°42.3622′S, 057°16.6880′E (710.2 mbsl), 40 m south of the original start point. Total survey operations took place from 0530 to 1530 h. After recovery of the camera system and drill pipe, an acoustic beacon was dropped to provide additional positioning information into the dynamic positioning system.
Later on 17 December we began to assemble the drill-in casing reentry system, consisting of a 12¼ inch tricone bit, bit sub, underreamer, and mud motor. A pump-in sub was installed on top of the mud motor and connected with a high-pressure hose to the mud manifold to verify the proper functioning of the mud motor and underreamer. The mud motor began turning at 15–20 strokes/min, and the retractable arms on the underreamer opened at 40 strokes/min and 300 psi. The HRT running tool was attached to the drilling assembly, and this entire drilling stinger was racked back in the derrick (Figure F3B).
One joint of 13⅜ inch casing was picked up and trimmed to 11.35 m length. The previously assembled drilling stinger was inserted into the casing, and the 13⅜ inch casing hanger and the HRT were made up to the casing, with all casing connections stitch-welded. The assembly (BHA Run 2) was lowered to the moonpool, and the hard rock landing skirt was welded underneath the casing collar. The entire assembly was lowered to the seafloor, and the subsea camera system was run to just above the casing hanger to observe the drill-in process (Figure F3C). The top drive was picked up, and drilling in Hole U1473A started at 0535 h on 18 December. During the first hour, drilling was punctuated with erratic torque, which was only detectable by the camera system. Drilling smoothed noticeably after the underreamer was drilled into the seafloor. A bull’s eye level mounted on the landing skirt broke off and disappeared from view about 1 h into the drill-in process.
The signals from the two subsea cameras were lost at 1445 h, and the camera was pulled to the surface. A backup telemetry pod was installed and the cameras redeployed by 1700 h. Drilling continued without the camera system except while handling the camera frame at the surface. After a period of no advancement, at 1845 h we stopped drilling out of concern that the underreamer and bit assembly may have had a problem. With the 16½ inch cased hole now extending to 11.5 m DSF, we circulated a mud sweep and started recovering the subsea camera system.
The HRT FFF was assembled and dropped at 2015 h (Figure F3D). We observed its successful landing on the 13⅜ inch casing hanger via the redeployed subsea camera system from 1915 to 2045 h (Figure F3E). The stinger with bit, mud motor, and underreamer was released from the casing by pumping a release piston down the pipe and into the HRT. The casing dropped ~1.7 m to the bottom of the 16½ inch hole. The camera system and the stinger with HRT, mud motor, underreamer, and bit were pulled clear of the reentry system by 2230 h on 18 December and tripped back to the surface.
With the knowledge that the 13⅜ inch casing had landed on the bottom of the 16½ inch hole, we decided that attempting to cement the casing would not be prudent. If we were unable to push cement into the annulus between the casing and the hole we might instead end up cementing inside the casing and up to the funnel.
First coring episode (19–30 December)
From 0500 to 1215 h on 19 December, the RCB BHA was made up with a C-7 coring bit and lowered to 668 mbrf (BHA Run 3). Next, we deployed the subsea camera system and performed a short survey of the reentry system, which showed that the reentry installation was higher than our initial numbers indicated (Figure F3F). Our current estimate has the seafloor at 721 mbrf (710.2 mbsl). The initial drilled depth is 730.5 mbrf (9.5 m DSF), with the casing shoe at 728.4 mbrf (7.4 m DSF). The 12¼ inch rathole was ~2 m deep, and the top of the cone is at ~714 mbrf (703.2 mbsl). The reentry installation appeared stable.
We picked up the top drive and reentered Hole U1473A at 1535 h on 19 December (first reentry). At 1745 h after recovering the camera system and washing back to bottom (~2 m of fill), the core barrel was dropped and cutting of the first core (360-U1473A-2R) began. Coring continued through Core 9R (80.4 m DSF), when drill bit use had reached 39.5 h at 1500 h on 21 December. The hole was cleaned and the drill pipe was pulled to the surface, equipped with a new C-7 RCB bit, and redeployed (BHA Run 4). Hole U1473A was reentered for the second time at 2335 h on 21 December. No fill was recorded at the bottom of the hole. RCB coring resumed at 1315 h on 22 December from 80.4 m DSF. At 0400 h on 24 December when coring had reached 167.7 m DSF (Core 18R) and bit rotating hours were 42.5 h, the drill string was again retrieved to install a new bit. We reentered Hole U1473A with the third RCB bit at 1137 h on 24 December (BHA Run 5). No fill was detected on bottom and coring resumed at 1415 h from 167.7 m DSF. While cutting Core 19R, the ship’s heave increased continuously. The situation worsened while attempting to cut Core 20R. When it became impossible to keep the bit on bottom after a 2.7 m advance, we suspended coring. Core 19R was recovered and the drill string tripped out of the hole and secured with the end of the pipe in the water column at 624 mbsl while we waited on the swell to subside. Ship heave of more than 6 m total amplitude was recorded while WOW.
After a 1 h period with heave consistently <4 m, the ship was positioned to reenter Hole U1473A at 1122 h on 25 December. After reentering the hole and lowering the bit to the bottom, no fill was observed and RCB coring continued at 1400 h from 180.1 m DSF, recovering Cores 21R through 34R (313.2 m DSF), when rotation time on the third RCB coring bit reached 41.9 h. The hole was cleaned and the drill string retrieved, with the bit clearing the rotary table at 1755 h on 27 December.
The fourth C-7 RCB bit was made up to the BHA and the drill string was redeployed and reentered Hole U1473A at 0008 h on 28 December. When the drill string was lowered to the bottom of the hole, 1.5 m of soft fill was encountered, which was washed out and followed by another mud sweep to remove the cuttings from the hole. RCB coring resumed at 313.2 m DSF and continued through Core 44R at 410.2 m DSF. At the end of cutting Core 44R, a mud sweep was pumped, which was followed by an increase in drill string torque to ~700 A. The drill string was worked for ~3 h with a combination of excessive pull (50,000 lb), rotation (800 A), and circulation. The drill string became free at 0100 h on 30 December. Core 44R was retrieved and another core barrel was dropped. While attempting to get back on bottom to continue coring, the driller experienced erratic torque, up to 450 A. After a few minutes of attempting to core, the decision was made to pull the drill string even though we had only 34.6 rotating hours on the bit. Upon clearing the rotary table at 0740 h, the bit was found to be missing three of four roller cones (Figure F4).
This first coring episode with four BHA runs and four RCB bits recovered Cores 2R through 44R (9.5–410.2 m DSF) with 161.3 m recovered (49%). Recovery was below expectations when compared with Hole 735B. Hole conditions and lithologic evidence indicated one or more major fault zones, including one at ~400 m DSF.
Fishing for roller cones and medical evacuation (30 December–7 January 2016)
A new BHA was assembled with a 9 inch Bowen fishing magnet to attempt to retrieve the cones left in the bottom of the hole (Figure F5A). Hole U1473A was reentered at 1244 h on 30 December (BHA Run 7), and the fishing magnet was lowered to the bottom of the hole with circulation and slight rotation, in accordance with the Bowen procedures. The drill string was tripped back to the surface and the fishing magnet arrived at the rig floor at 2020 h. The magnet had picked up some magnetic debris (core catcher parts); however, none of the three roller cones was retrieved.
During the trip out of the hole we were informed by the ship’s physician of a medical emergency necessitating transfer of the patient to a medical facility for examination and treatment. At 2324 h on 30 December, the ship started the transit toward Mauritius. A helicopter was scheduled, and the vessel sailed to a rendezvous point south of Mauritius. A recently formed tropical depression was between the vessel and the meeting point, necessitating a course deviation to the west to avoid the worst of the bad weather. The vessel arrived at the agreed upon rendezvous point at 1634 h on 2 January 2016 and switched to dynamic positioning mode. The helicopter from the Mauritius Police Department touched down at 1717 h and departed at 1725 h with the patient on board. The ship started the transit back to Site U1473 at 1742 h. It arrived at 1035 h on 5 January, switching from cruise mode to dynamic positioning mode. The total transit distance covered for the medical evacuation was 1320 nmi and consumed 5.6 days of operational time allocated for Expedition 360.
In preparation for our second attempt to retrieve the three roller cones left at the bottom of Hole U1473A, the BHA was made up with new drill collars and a Bowen fishing magnet with a milling guide and two boot-type junk baskets (Figure F5B). Hole U1473A was reentered at 2146 h on 5 January (BHA Run 8; seventh reentry). The bit landed on fill at 316.7 m DSF and was washed to the bottom of the hole with slight rotation. A 30-barrel mud sweep was pumped and the string was worked up and down three times and slowly turned five times. The drill string was retrieved and the fishing magnet arrived at the rig floor at 0800 h on 6 January. The magnet picked up some metal debris from the lost core catcher but none of the missing cones from the main RCB coring bit.
Next, we made up a Gotco RCJB with a milling guide (Figure F6A) and two boot-type junk baskets (Figure F6B) and reentered Hole U1473A at 1330 h (BHA Run 9; eighth reentry). The bit was rotated and washed to the bottom of the hole with slight rotation. After tagging the bottom of the hole, a 20-barrel mud sweep was pumped to clean out the hole. The RCJB was worked up and down three times before the flow-deviating steel ball was dropped down the drill pipe to activate the reverse circulation. The driller attempted to advance the bit for 20 min using low weight (2000 lb) before the drill string was tripped back to the surface, clearing the rig floor at 0110 h on 7 January. The RCJB assembly recovered gravel, including a few boulders, of gabbroic and fault rock material but no signs of the missing roller cone parts.
The same RCJB assembly was made up once more and reentered in Hole U1473A at 0555 h (BHA Run 10; ninth reentry). With the bit near the bottom of the hole, two 30-barrel high-viscosity mud sweeps were pumped before the bit was worked up and down from 0845 to 1030 h. Reverse circulation was activated and the driller spent nearly 1 h advancing to ~410.8 m DSF, using greater weight than during the previous run (2000–4000 lb; 200–400 A; 160 strokes/min). The drill string was recovered, clearing the rig floor at 1510 h. To everyone’s surprise, the RCJB had recovered an unprecedented 0.5 m long, 18 cm diameter core from a cored interval of 0.6 m (83% recovery; Figure F6C–F6D). The core was given the core type designation Core 45M. However, none of the three roller cones previously lost in the hole were recovered.
Given the tight fit of the RCJB assembly in the hole, it was extremely unlikely that any roller cone bits could have remained at the bottom of the hole. We speculated that the cones may have been lifted out of the hole with one or more of the previous three runs with two fishing magnets and the RCJB (Run 07-FM, Run 08-FMM, and Run 09-RCJB) and dropped on the seafloor before they could reach the rig floor, or they could be lodged in the borehole sidewall where breakouts created cavities. On 7 January, we decided to resume RCB coring.
Second coring episode, one roller cone lost and two found (7–12 January)
A BHA was assembled with a new RCB C-7 bit and reentered Hole U1473A for the tenth time (BHA Run 11) at 2320 h on 7 January. A wash core barrel was deployed to facilitate cleaning out of debris before resumption of coring. The last meter of the hole had to be reamed because the RCJB had created a slightly undersized hole. We pumped 50 barrels, then 30 barrels of high-viscosity mud and retrieved the wash core barrel at 0515 h. Another core barrel was dropped, and Cores 46R through 52R (410.8–469.6 m DSF) were retrieved with a total recovery of 20.5 m (34%). Penetration rates were high for several cores, with a maximum of 8.9 m/h for Core 48R. In addition, recovery was low and cores were highly fractured, indicating a weak formation. Coring operations included five 30-barrel mud sweeps. Because of excessive torque (500 A) in the lowermost part of the hole, a wiper trip was conducted to condition the hole and 1 h was spent reaming the hole. After advancing through 1.5 m of fill on the bottom of the hole, the bit was advanced 0.6 m for Core 52R, with erratic high torque. Given the large amount of reaming that had been required and despite the low bit hours (12.1 h), we decided to retrieve the drill string, which cleared the rig floor at 1545 h on 9 January 2016. We discovered that the RCB bit was missing one of its four roller cones.
An RCJB with tandem boot junk baskets was assembled and deployed in an attempt to recover the missing cone (BHA Run 12). The bit reentered Hole U1473A at 2007 h on 9 January and was washed to the bottom of the hole at 469.6 m DSF with circulation and slight rotation. The RCJB was worked up and down near the bottom of the hole. After activating reverse circulation by dropping the steel ball down the hole and working some more on the bottom, the drill string was recovered. It cleared the rig floor at 0500 h on 10 January, recovering some gravel but no roller cone.
The RCJB was reassembled with a new mill tooth cutting shoe and catcher assembly and deployed once more (BHA Run 13), reentering Hole U1473A for the twelfth time at 0846 h. After a 30-barrel mud sweep, the RCJB was worked and activated again according to protocol. The drill string was retrieved, clearing the rig floor at 1605 h on 10 January. This time the recovery consisted of a large cobble and the lost roller cone (Figure F7).
We decided to resume coring and made up an RCB BHA with a new RCB C-7 bit, lowered it to the seafloor, and reentered Hole U1473A at 2037 h (BHA Run 14; sixth RCB run). The bit was washed to the bottom of the hole, which included a 50-barrel mud sweep after noting 0.5 m of fill at the bottom. Our attempt to cut Core 53R (469.6–470.6 m DSF) from 0015 to 0400 h on 11 January advanced only 1 m and achieved no recovery. Erratic torque was observed during this advance and repeated mud sweeps were pumped. Then we cut Core 54R (470.6–480.3 m DSF), advancing the full 9.7 m but not recovering any core. Based on the assumption that rock had jammed the bit throat, we deployed a deplugger (1045–1130 h) in an attempt to dislodge the obstacle. This was followed with another failed attempt to core (55R; 480.3–481.7 m DSF; 1.4 m advance, no recovery). We ran another bit deplugger and dropped another core barrel; however, no penetration could be achieved. At 1745 h on 11 January, we decided to recover the drill string and the bit cleared the rig floor at 2150 h. Upon inspection, the bit had lost most of the tungsten carbide inserts, particularly toward the inside of the roller cones (Figure F8A), and was missing one of the four core guides.
The bit had obviously encountered metal at the bottom of the hole, at a minimum its own missing core guide, and possibly one of the missing cones lost in the hole a few days ago. At 2215 h on 11 January, we began to make up and deploy a fishing magnet with mill tooth guide (FMM) and two boot-type junk baskets in an attempt to recover the metal junk at the bottom of Hole U1473A (Run 15-FMM). We reentered Hole U1473A at 0321 h on 12 January and tagged the bottom of the hole at 0615 h without encountering any fill. Two 30-barrel mud sweeps were pumped while working the magnet and its milling shoe according to protocol. The drill string was retrieved, clearing the rig floor at 1105 h, and we found that the fishing magnet had successfully recovered a heavily eroded roller cone (Figure F8B–F8C). As we suspected from inspection of the bit from BHA Run 14, the cone had plugged the RCB bit and prevented advancement and recovery of core the previous day. Some gravel was recovered as well in the boot-type junk baskets.
Drilling ahead (12–13 January)
We decided to drill ahead without coring for an interval not to exceed 100 m using a tricone bit. The tricone drilling bit is more robust than the RCB coring bit and therefore more suitable to mitigate potential issues near the bottom of the hole, such as reaming a slightly tight hole (Figure F9A). We also wanted to get an idea of how much faster drilling would deepen the hole compared to coring, and we wanted to do that before reaching the modeled depth interval (~600 m DSF or deeper) where we expect to penetrate the magnetic transition from reversed to normal polarity.
We started to make up a 9⅞ inch tricone bit at 1200 h on 12 January, reentered Hole U1473A at 1545 h, washed and reamed down a tight hole to the bottom at 481.7 m DSF, began to drill new hole at 2300 h, and deepened the drilled interval to 519.2 m DSF. Drilling conditions were reasonably good; however, the rate of advance barely matched the rates we had achieved with RCB coring earlier in the hole. We decided in the afternoon of 13 January to switch back to coring. The drill string was retrieved and cleared the rig floor at 2010 h. Inspection of the tricone drill bit showed slight wear of the outside diameter caused by the narrow-gauge hole, but the cones and bearings were all in good condition (Figure F9B). The wear was severe enough to crack all 3 tungsten carbide bit nozzles (Figure F9C).
Third coring episode (13–23 January)
A new 9⅞ inch RCB C-7 bit was made up and deployed to near the seafloor (BHA Run 17; seventh RCB bit), at which point deployment was suspended to allow the rig crew to slip and cut 115 ft of drilling line as part of their routine rig maintenance. Hole U1473A was reentered at 0210 h on 14 January, reamed down from 510.6 to 519.2 m DSF, and cleaned with a 30-barrel high-viscosity mud sweep. When the intended wash barrel was recovered at 0730 h, it surprisingly contained a 0.2 m long freshly trimmed core plus 0.2 m of additional material, which was registered as Core 57R (519.2–519.6 m DSF). We subsequently recovered Cores 58R through 66R (519.6–606.6 m DSF) and recovered 64.9 m (75%). Coring conditions were optimal during this run. Average torque on bottom remained ~350 A, and recovery was improving downhole. High-viscosity mud sweeps of 30 barrels were pumped every 5 m.
With 39.6 h on the bit, we decided at 0700 h on 16 January to retrieve the drill string for another bit change, clearing the rig floor at 1055 h. Upon inspection, the RCB coring bit was intact, with very little wear on the skirt or its tungsten carbide inserts. The inserts on the nose of the bit showed appreciable signs of wear but were intact. A new 9⅞ inch C-7 bit was made up and, following some rig servicing tasks, reentered Hole U1473A at 1424 h (BHA Run 18; eighth RCB bit). Coring resumed at 1830 h and continued through Core 71R (648.4 m DSF), with 30-barrel mud sweeps pumped as required. At 2215 h on 17 January, we had to suspend coring and pull out of the hole because of high ship heave. Given the time spent on the bit already, we decided to use the down time for an early bit change and retrieved the drill string with the bit clearing the rig floor at 0240 h on 18 January. BHA Run 18 (Cores 67R through 71R) recovered 41.3 m (a staggering 99%).
A new RCB C-7 drill bit was installed and lowered toward the seafloor (BHA Run 19; ninth RCB bit). By that time, the swell had subsided and we reentered Hole U1473A at 0653 h (eighteenth reentry). RCB coring resumed at 1030 h on 18 January, and Core 72R was advanced from 648.4 to 651.9 m DSF with varying torque and mud sweeps every few meters. At 1215 h, the drill pipe became stuck with the bit at 651.9 m DSF, with loss of rotation despite applying torque up to 800 A and overpull up to 175,000 lb. The driller gradually increased the pressure and overpull on the drill string, opening and closing the heave compensator in the process, and was able to work the bit up to 648 m DSF. The pipe suddenly became free at 1400 h, and rotation and circulation were reestablished. As we pulled up to 555 m DSF, the torque gradually normalized and we retrieved Core 72R (648.4–651.9 m DSF) at 1615 h. We think that a significant piece of rock fell from higher up in the hole onto the tapered drill collar and the drill string became free when the rock was gradually broken up. The sudden release of energy when freeing the pipe was cause for concern. It was therefore decided to retrieve and inspect the BHA and the drill bit to minimize the overall risk to the hole. Before pulling the drill string, the major traveling equipment on the rig was inspected for any visible damage. While pulling the drill string with the top drive, the torque was carefully monitored; everything appeared normal. The bit arrived back on the rig floor at 2015 h and was inspected. With <2 h of coring time, the bit looked as good as new and was reassembled to the BHA.
Hole U1473A was reentered at 2350 h on 18 January (BHA Run 20; nineteenth reentry) and the bit was lowered to the bottom of the hole without encountering any fill. Coring resumed and BHA Run 20 retrieved Cores 73R through 81R (651.9–721.3 m DSF), recovering 65.6 m (95%). We pumped 30-barrel high-viscosity mud sweeps every 5 m to keep the hole clean. At 0200 h on 21 January, drill bit rotating time had reached 40 h and it was time for a pipe trip to replace the bit. The drill string was retrieved and the bit arrived back on the rig floor at 0635 h on 21 January.
We made up another RCB C-7 coring bit, this time with an MBR to allow us to drop the bit on the seafloor after coring, reenter the hole, and conduct wireline logging without the need for a full pipe trip. The bit was lowered to the seafloor, and Hole U1473A was reentered for the twentieth time at 1038 h on 21 January. The bit reached the bottom of the hole without drag or excessive torque and, after a 30-barrel mud sweep, coring resumed at 1515 h. We retrieved Cores 82R through 89R (721.3–789.2 m DSF) and recovered 66.0 m (a whopping 97%), pumping 30-barrel high-viscosity mud sweeps every 5 m and a 50-barrel mud sweep at the end.
Successful logging and MBR problem
At 1445 h on 23 January, we began our wireline logging program for Hole U1473A, which had a total depth of 789.2 m DSF. With the bit near the bottom of the hole, we displaced the hole with 290 barrels of drill water (freshwater) to reduce the electrical resistivity contrast between the borehole fluid and the highly resistive formation. We raised the drill bit to 205 m DSF and displaced the upper part of the hole with another 49 barrels of drill water. Next, we pulled the bit out of the hole, clearing the seafloor at 1830 h, and offset the ship 30 m east with the bit ~10 m above the seafloor. The subsea camera system was deployed to document the bit release operation. Using two wireline runs with the rotary shifting tool, we dropped the drill bit onto the seafloor at 1930 h. Next, we repositioned the ship and reentered Hole U1473A at 2145 h on 23 January (twenty-first reentry), lowering the end of the pipe to 45.5 m DSF. The subsea camera system was recovered and the rig floor prepared for logging.
At 2330 h on 23 January, we began to rig up the logging tools for the first of three logging runs with the triple combo tool string, which measures bulk density, bulk resistivity, spectral gamma radiation, magnetic susceptibility, total gamma radiation, and temperature. The triple combo was deployed at 0045 h on 24 January. The run included a 150 m upward calibration pass from the bottom of the hole and the main upward logging pass from 787.8 m wireline log depth below seafloor (WSF). During the main log, the tool string temporarily lost power at 354.0 m WSF and was dropped back down to 383.1 m WSF before the log was completed. The tool string was back at the surface at 0530 h.
The second run with the FMS-sonic tool string, which measures microresistivity to generate a partial borehole wall image, propagation of compressional and shear waves, total gamma radiation, and temperature, was deployed at 0815 h. After the tool string was run to bottom at 785.5 m WSF, the controller of the heave compensator had to be rebooted to correct a problem. The run included three logging passes. The first was from 785.5 m WSF to just below the end of pipe at 88.9 m WSF. The second pass was from 785.5 to 568.2 m WSF; it was aborted because one of the FMS arms didn’t open and the tool was dropped back to the bottom. The third pass was from 785.5 m WSF to the seafloor. The tool string was back at the surface at 1530 h and rigged down by 1645 h on 24 January.
The third run with the UBI tool string, which generates a borehole wall image using ultrasound, was deployed at 1800 h on 24 January. The tool string was also configured to measure spectral gamma radiation as well as total gamma radiation and temperature. A downhole pass was measured from just above the seafloor to 785.2 m WSF. The uplog started at 778.6 m WSF. A small problem was encountered with an apparent ledge at ~579 m WSF in both directions. The tool string was back on the rig floor at 0330 h on 25 January.
After all logging equipment was rigged down, the drill string was retrieved and cleared the rig floor at 0555 h. Upon inspection of the MBR top connector, we found that the sleeve retainer ring was missing. The locking bolt securing the sleeve retainer was sheared. The most likely situation was that the sleeve retainer backed out during logging operations and fell into the open hole. We therefore needed to retrieve it before we could resume coring. We made up and deployed a fishing magnet with mill guide, reentered Hole U1473A at 1012 h, and reached the bottom of the hole at 789.2 m DSF. A significant amount of fill and hard material was encountered on the way to bottom. A 30-barrel mud sweep was pumped, and the fishing magnet was worked up and down near the bottom of the hole according to protocol (1430–1530 h). The drill string was retrieved and cleared the rig floor at 1850 h. The sleeve retainer ring was not recovered.
Because a small possibility existed that the retainer dropped to the seafloor when the bit was dropped, rather than into the hole, we decided to attempt a coring run. An RCB bit was made up and deployed, reentering Hole U1473A at 2229 h on 25 January. The drill string was washed and reamed to the bottom of the hole at 789.2 m DSF, which included a 30-barrel high-viscosity mud sweep and the deployment and recovery of a wash barrel. Next, a core barrel was dropped at 0315 h on 26 January and an attempt was made at coring. Applying a maximum of 2000–3000 lb of weight and 350 A of torque, the driller noted erratic torque on bottom. After several careful attempts at coring, it became clear that metal junk was preventing advancement. The drill string was retrieved, clearing the rig floor at 1020 h. Upon inspection, the drill bit showed only a few scratches but was otherwise in excellent condition.
The RCJB was made up with a mill tooth cutting shoe and two boot-type junk baskets and deployed in an attempt to retrieve the missing MBR sleeve retainer ring (BHA Run 24). The bit reentered Hole U1473A at 1420 h on 26 January. At 1745 h when the top drive was picked up to lower the pipe to the bottom of the hole, power to the top drive was lost for 5.73 h. The circulation head was installed so we could keep circulating and raising/lowering the drill string while the top drive electrical problem was being repaired. At 2300 h, the top drive was picked up again and the drill string was washed toward the bottom of the hole to complete the fishing attempt. A 30-barrel mud sweep was pumped, and the string was worked up and down three times before the activation ball was dropped down the pipe to trigger reverse circulation. After circulating and rotating on bottom for 80 min, the top drive was set back and the drill string was retrieved, clearing the rig floor at 0545 h on 27 January. The sleeve retainer was not recovered; however, its presence at the bottom of Hole U1473A was confirmed with the recovery of three rounded cobbles that have clear tool marks characteristic of contact with the sleeve retainer (Figure F11).
With no expedition time left, the remaining drill collars were laid out to the drill collar racks and the rig floor was cleaned up and secured for transit. At 0440 h, the single acoustic positioning beacon was recovered. The thrusters and hydrophones were then raised.
A total of 86 RCB cores were taken over a 741.6 m interval with a total recovery of 468.15 m of core. The RCJB recovered a surprise large-diameter core on one run and other samples on a subsequent run. The total advance for the tool was recorded at 1.1 m with 1.0 m of material recovered. There were a number of other junk baskets recovered with sample material. With the exception of the last junk basket runs, these were curated and entered into the database referenced to the hole. On the next to last junk basket run, the material was recorded as a ghost core and entered into the database from 9.5 to 788.2 m DSF. The final RCJB was recorded as an advance of 0.5 m with 0.5 m of material recovered. The overall core recovery for Hole U1473A was 468.65 m over an interval of 742.2 m, yielding a recovery percentage for Hole U1473A of 63.2%. The ghost core was not considered in recovery statistics. The total time spent on Hole U1473A was 868.5 h or 36.19 days.
Transit to Port Louis, Mauritius
At 0830 h on 27 January, the transit to Port Louis, Mauritius, began. Expedition 360 ended at 0800 h on 30 January with the first line ashore.
Igneous petrology
Expedition 360 recovered 89 cores from Hole U1473A, composed of gabbros, diabase dikes, and felsic veins (Figure F12). Eight lithologic units were identified based on changes in mineral modes, grain size, texture, and the occurrence of other igneous features such as layering and the presence of felsic material (either patchy or in the form of veins). Both magnetic susceptibility and geochemical variations were also considered in defining these units. Primary magmatic gabbro textures to ~400 m core composite depth below seafloor (CCSF) are largely erased by intense crystal-plastic deformation; when preserved, there and deeper in the hole, texture is mostly subophitic and locally granular. The main lithology is dominated by olivine gabbro (<1% oxide; 76.5%), followed in abundance by disseminated-oxide gabbro (containing 1%–2% oxide; 9.5% abundance), gabbro (sensu stricto; <1% oxide; 5.1%), oxide gabbro (>5% oxide; 3.7%), oxide-bearing gabbro (2%–5% oxide; 3.7%), and felsic veins (1.5%). Oxide abundance decreases slightly downhole, with the exception of the lowermost intervals where various oxide gabbros again recur. Oxide-bearing and oxide gabbros are typified by strong localized crystal-plastic deformation, though those in the deepest part of the hole (Unit VIII) are mostly undeformed. Oxide gabbro crystallization is most likely related to late-stage melt percolation. The occurrence of late-stage evolved melts is also inferred on the basis of the nearly ubiquitous presence of brown amphibole, either interstitially or as rims around clinopyroxene and/or olivine, and generally associated to Fe-Ti oxides. When rimming olivine, brown amphibole is also accompanied by orthopyroxene. These late-stage melt-related features are less abundant in the undeformed samples from the deeper levels of the hole. Felsic veins comprise ~1.5% of the cores and mainly consist of leucodiorite, quartz diorite, diorite, trondhjemite, and rare tonalite and occur in discrete horizons. Trondhjemites predominate deeper than 500 m CCSF, whereas leucodiorite, quartz diorite, and diorite are instead dominant shallower than 500 m CCSF. These felsic lithologies may locally contain oxide minerals, sometimes within and sometimes along the margins of the veins. Seven diabase dikes were found at various depths, locally intruding gabbros previously deformed under conditions ranging from granulite down to greenschist facies conditions. Primary minerals in diabase dikes are locally recrystallized in a granoblastic assemblage of brown amphibole, plagioclase, clinopyroxene, and orthopyroxene, likely reflecting recrystallization at lower granulite facies conditions (~800°C). Diabases appear locally to have partially melted the adjacent gabbro to form thin felsic veins directly at the contact to the gabbro.
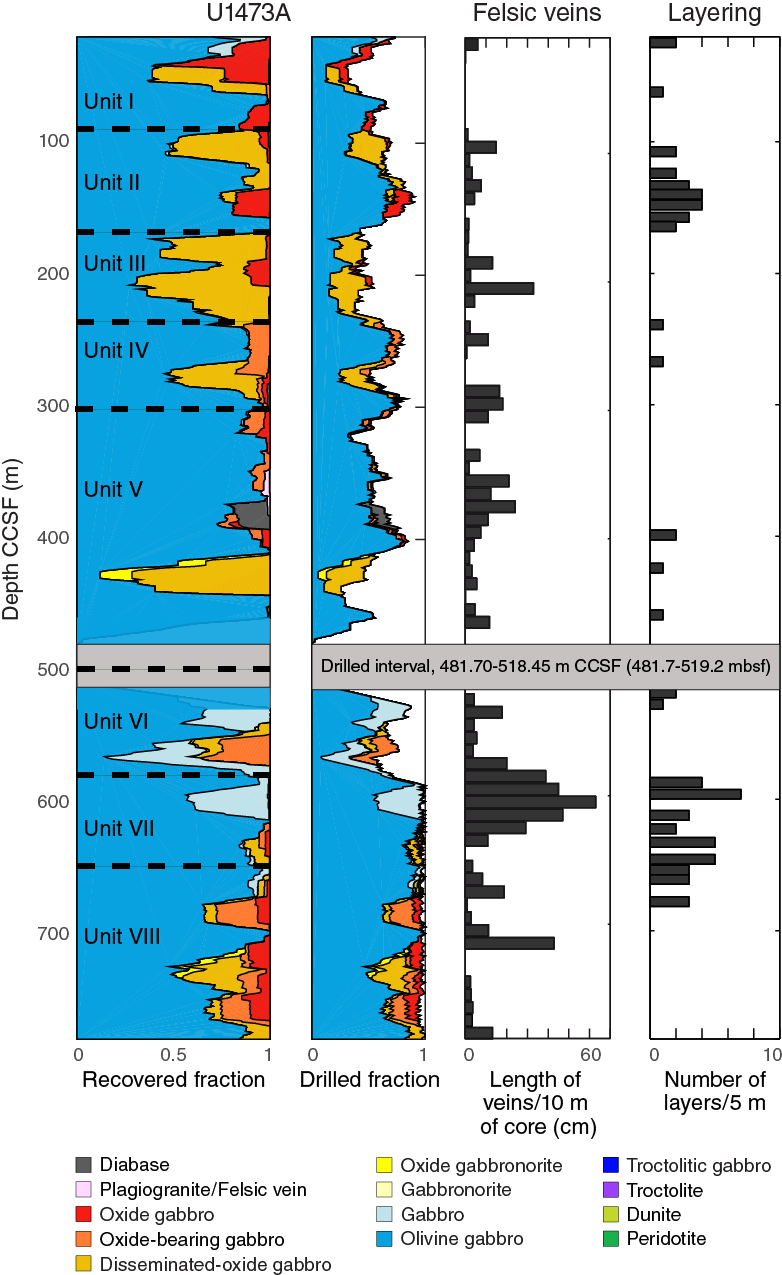
Figure F12. Lithostratigraphic variations, Hole U1473A.
Although predominantly coarse-grained, in some instances olivine gabbros may display local-scale variations in grain size, ranging from fine to very coarse grained. These regions tend to form irregular domains with intrusive or sutured contacts. In other instances, more systematic grain size variations give rise to apparent igneous layering, which is well developed in Units II and VII (i.e., 91.29–175 and 577.68–642 m CCSF, respectively). In most cases, contacts between different grain size layers are subparallel to each other, though less commonly irregular contacts are also found. Grain size variability is also generally accompanied by variation in mineral mode.
Lithostratigraphy
Major rock types
Rock nomenclature is defined in Igneous petrology in the Expedition 360 methods chapter (MacLeod et al., 2017a). The major rock types were distinguished principally by variations in the abundance of olivine and oxides. Where present, orthopyroxene, primary amphibole, and quartz were also used to define lithologies. Hole U1473A is composed of a variety of gabbroic rocks as represented in proportion by the running average presented in Figure F12 (see LITH in Supplementary material for method of calculating lithology fractions). Oxide-free (oxide < 1 vol%) to disseminated-oxide (oxide = 1–2 vol%) olivine gabbros represent the principal rock types, forming 76.5 and 9.5 vol% of the sections, respectively (Figure F13). On the other hand, olivine-free to olivine-bearing gabbros (<5 vol% olivine) are rare, constituting ~5.1% of the section. Oxide-bearing and oxide gabbros are abundant and represent 7.4% of the section. Very few nongabbroic intervals occur; these are felsic rocks (1.5 vol%) ranging from diorites to trondhjemites. A volumetrically insignificant percentage of sparsely phyric diabase dikes and enclaves (see Dikes) was encountered (~0.5%; not included in volume totals above).
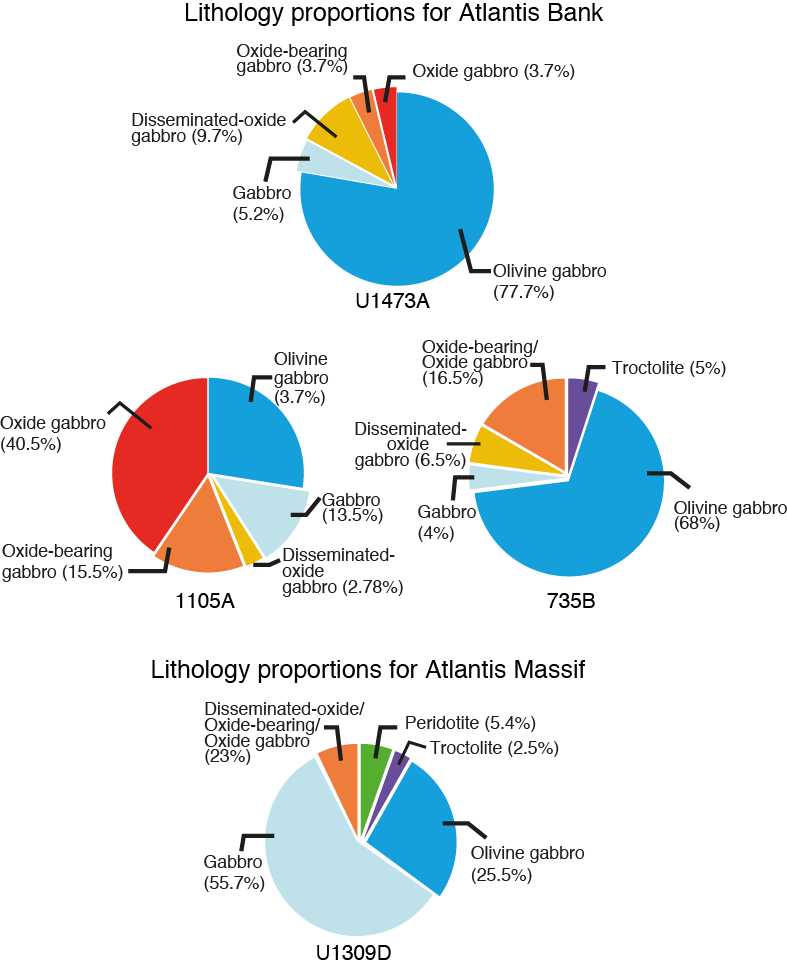
Figure F13. Pie charts of lithologic proportions for Atlantis Bank and Hole U1309D.
Lithologic units
We recognize eight major lithologic units in Hole U1473A. The units were distinguished on the basis of their modal mineralogy, grain size, texture, and other igneous features, including layering, veins, and/or patchy felsic material (Table T3). Magnetic susceptibility and geochemical data were also taken into consideration when defining the units. Depth distributions of rock types and unit boundaries are presented in Figure F12.
Table T3. Igneous intervals, Hole U1473A. Download table in .csv format.
Unit I
- Interval: Sections 360-U1473A-2R-1 through 11R-1
- Igneous intervals: 1–41
- Depth: 0–91.29 m CCSF
- Lithology: subophitic olivine gabbro
The main lithology of Unit I is represented by coarse-grained olivine gabbro with minor medium- to fine-grained intercalations or patches of the same lithology. These gabbros show a subophitic nearly equigranular texture, in rare instances obliterated by weak to intense crystal-plastic deformation. This unit is also characterized by repeated occurrences of oxide gabbro locally intruding the olivine gabbro host. The oxide gabbros are preferentially associated with crystal-plastic deformation. Both olivine gabbros and oxide gabbros show broad variations in grain size from coarse (up to 10 mm) to very coarse (up to 20 mm) and pegmatitic (>30 mm). Seven diabase dikes (0.5%) crosscut the section (see Dikes for further details).
Unit II
- Interval: Sections 360-U1473A-11R-1 through 19R-2
- Igneous intervals: 41–103
- Depth: 91.29–175.00 m CCSF
- Lithology: interlayered series of coarse-grained subophitic gabbros and medium-grained subophitic gabbros
The main lithology in Unit II is represented by coarse-grained olivine gabbros containing medium- to fine-grained layers, locally displaying subparallel contacts (see Igneous layering). Although rocks are locally characterized by various extents of crystal-plastic deformation along the entire unit, single 4–10 cm layers are present with sharp grain size and intrusive contacts. Interstitial sulfides are also present near contacts. Oxide gabbros occur rarely and are most commonly associated with high-grade crystal-plastic deformation. Average grain size is generally <10 mm and fairly constant. Very coarse grained and pegmatitic patches are absent. Transition from Unit I is clearly identified with magnetic susceptibility data.
Unit III
- Interval: Sections 360-U1473A-20R-1 through 26R-2
- Igneous intervals: 104–119
- Depth: 175.00–228.59 m CCSF
- Lithology: coarse-grained granular olivine gabbro enriched in oxides and displaying numerous felsic veins and patches
Unit III consists mostly of coarse-grained granular olivine gabbro to disseminated-oxide gabbro. Rare oxide gabbro is also observed. The general granular texture may not be primary, as Unit III has experienced extensive plastic deformation (see Structural geology). Numerous felsic veins and patches are present throughout Unit III (Figure F12). Transition from Unit II is clearly identified by the presence of oxide-rich lithologies.
Unit IV
- Interval: Sections 360-U1473A-26R-2 through 34R-6
- Igneous intervals: 120–154
- Depth: 228.59–297.13 m CCSF
- Lithology: coarse-grained subophitic olivine gabbro, with rare igneous layering, and dikes
Unit IV consists mostly of coarse-grained subophitic gabbro with rare horizons enriched in oxide. Medium-grained subhorizontal layers of olivine gabbro are locally observed. Dikes crosscut Unit IV and are associated locally with felsic veins (see Dikes for further details).
Unit V
- Interval: Sections 360-U1473A-34R-6 through 52R-1
- Igneous intervals: 155–230
- Depth: 297.13–469.60 m CCSF
- Lithology: coarse-grained subophitic to granular olivine gabbro with dikes
Unit V consists mostly of coarse-grained subophitic to granular gabbro with horizons enriched in oxide. The general texture is patchy and highlighted by grain size variations from fine to very coarse grained. Five dikes are present in the section (see Dikes for further details). Transition from Unit IV is not clearly identified and may be located between Section 360-U1473A-33R-3 (297.13 m CCSF) and the top of Section 35R-1 (313.2 m CCSF) where olivine is less abundant and deformation is very intense. Transition to Unit VI corresponds to the interval (49.71 m) that was drilled without coring.
Unit VI
- Interval: Sections 360-U1473A-57R-1 through 64R-1
- Igneous intervals: 231–266
- Depth: 518.45–577.68 m CCSF
- Lithology: coarse-grained subophitic olivine gabbro
Unit VI consists mostly of coarse-grained olivine gabbro with minor medium- to fine-grained intercalations or patches. These gabbros show a subophitic, nearly equigranular texture. A level enriched in oxide-bearing gabbros is more intensively deformed. Transition from Unit V corresponds to the interval (49.71 m) that was drilled without coring.
Unit VII
- Interval: Sections 360-U1473A-64R-2 through 70R-5
- Igneous intervals: 266–308
- Depth: 577.68–642.00 m CCSF
- Lithology: coarse-grained subophitic olivine gabbro with abundant igneous layering
Unit VII consists mostly of fine- to coarse-grained subophitic olivine gabbro that displays grain size layering. Igneous layer thicknesses vary from some centimeters to tens of centimeters. Most of the contacts are planar and subparallel. Some patchy grain size variations are also locally observed.
Unit VIII
- Interval: Sections 360-U1473A-70R-6 through 89R-8
- Igneous intervals: 308–424
- Depth: 642.00–790.00 m CCSF
- Lithology: coarse-grained subophitic olivine gabbro with minor gabbros containing oxide
Unit VIII is composed of a homogeneous coarse-grained subophitic gabbro with abundant horizons enriched in oxides and sulfides (disseminated-oxide to oxide-bearing gabbro). Compared to Unit VII, the olivine gabbros of Unit VIII have a well-developed subophitic texture, where olivine is abundant and locally interstitial to poikilitic. Deformation is exclusively localized within the oxide-bearing horizon.
Core descriptions
Modal variations
Modal abundances of the primary magmatic phases were estimated visually on core samples and refined where possible by subsequent thin section observations. We defined 424 igneous lithologic intervals varying from 13.2 m to 3 cm in thickness, with an average of 1.8 m. There is little significant variability in interval thickness with depth, although the interlayered gabbro Unit II shows the highest number of small intervals, whereas a higher number of thick lithologic intervals characterize the lowermost part of the hole. In most intervals, olivine and clinopyroxene were heterogeneously distributed, so an average modal proportion was recorded.
Figure F14 shows the mineral proportions of the gabbros, excluding felsic rocks and diabases, in Hole U1473A. Overall, there is no visible correlation between olivine and plagioclase modal contents in the different rock types. In contrast, relatively good correlations are noted between plagioclase and clinopyroxene and between olivine and clinopyroxene contents (Figure F15). Surprisingly, these correlations do not clearly correspond to the different rock types, except that those rocks in which oxides are present tend to have less plagioclase and more clinopyroxene. This is likely due to the preferential association of oxide patches with clinopyroxene and olivine (see Textures). Olivine gabbros and disseminated-oxide olivine gabbros have 5–16 vol% olivine, 40–60 vol% plagioclase, and 20–50 vol% clinopyroxene. The few gabbros have <5 vol% olivine, 50–60 vol% plagioclase, and 40–55 vol% clinopyroxene. Oxide-bearing and oxide gabbros have 2–30 vol% oxides, 30–67 vol% plagioclase, 0–12 vol% olivine, and 20–60 vol% clinopyroxene.
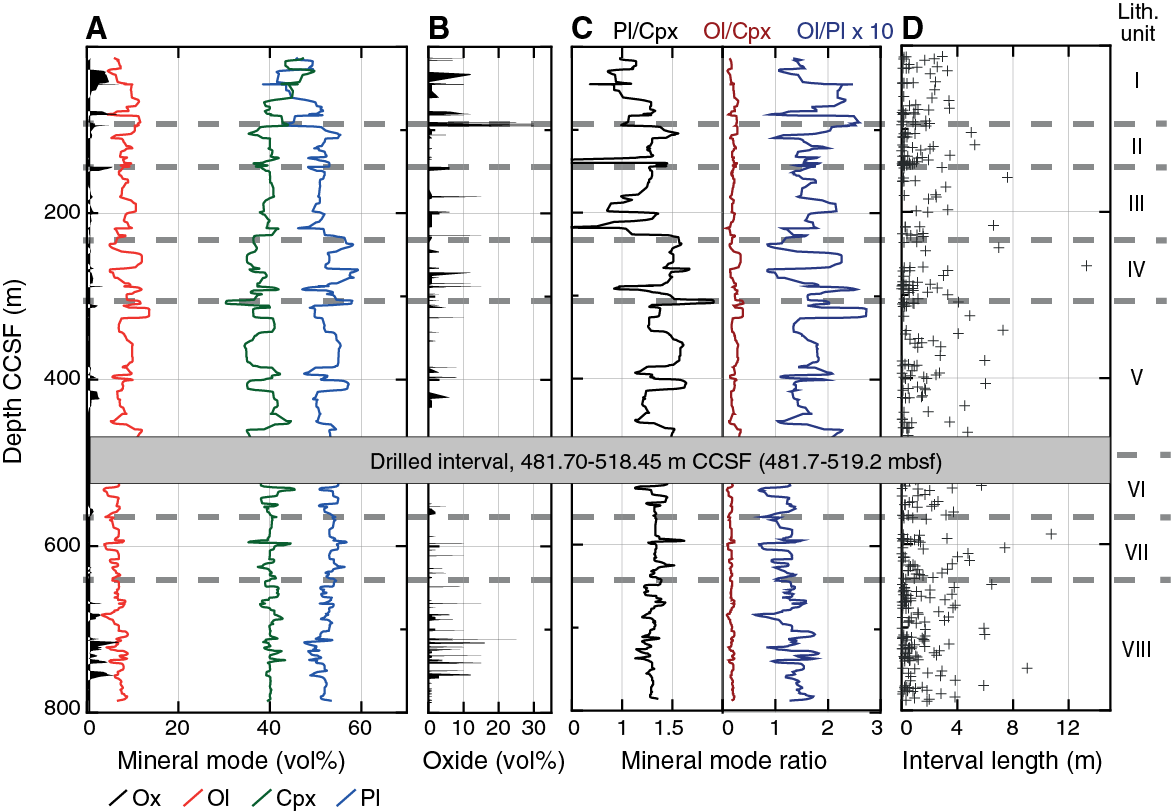
Figure F14. Mineral mode variations with depth, Hole U1473A.
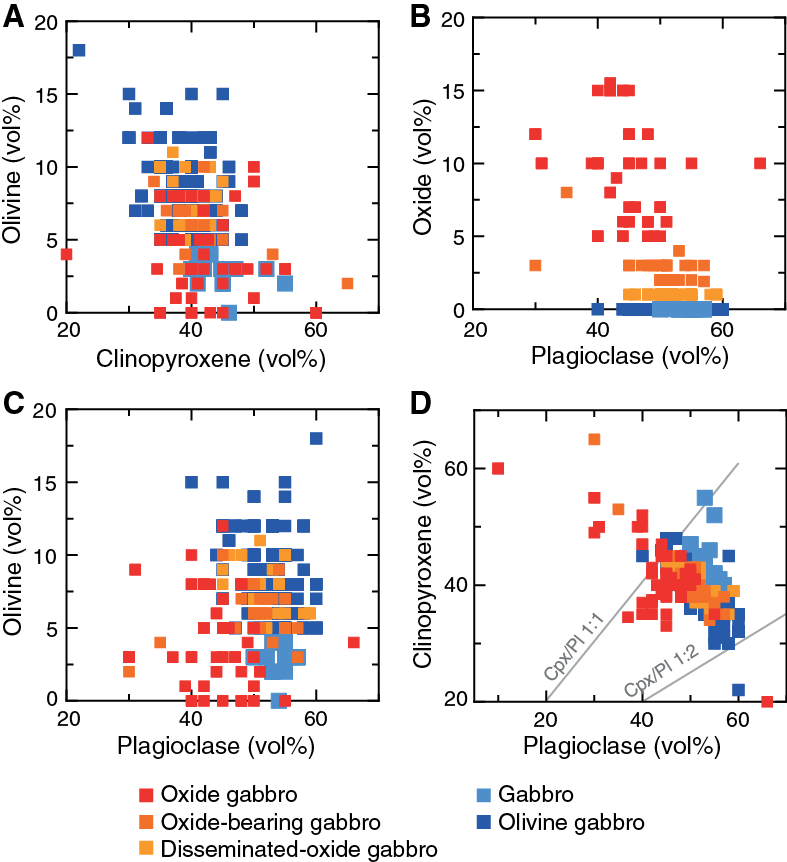
Figure F15. Relationships in mineral mode for each lithology, Hole U1473A.
Downhole modal variability is given as a weighted running average for 10 intervals (see Igneous petrology in the Expedition 360 methods chapter [MacLeod et al., 2017a]) in Figure F14. Mineral modes do not appear to vary systematically with depth. However, some variability does exist, especially in the plagioclase (Pl)/clinopyroxene (Cpx) ratio, which locally delineates the different lithologic units. For instance, a generally low Pl/Cpx ratio characterizes Unit I (mean = ~1.1) and is probably related to the occurrence of oxide gabbros in the shallower portion of the hole (~90 m CCSF). Similarly, negative spikes in the Pl/Cpx ratio are also visible downhole where oxide gabbros are present. Another important change in the Pl/Cpx ratio is observed at the transition between Units III and IV, where the mean ratio varies from 1.2 to 1.4, respectively. This ratio decreases again from Unit VI, where the Pl/Cpx ratio is more constant at a mean value of ~1.3.
Contacts
A total of 424 lithologic contacts and breaks in lithology, corresponding to the same number of intervals, were recognized in Hole U1473A. Because of recovery gaps (35% of the total) many contacts were not observed directly other than as a change in lithology across a gap in recovery. The contacts recovered were classified at first order as either lithologic or structural (Figure F16). Lithologic contacts were further classified based on variations in either modal mineralogy or grain size, whereas structural contacts are related to the juxtaposition of different lithologies by intrusion or tectonic shearing. Lithologic and structural contacts constitute 65% and 35% of the total observed, respectively.
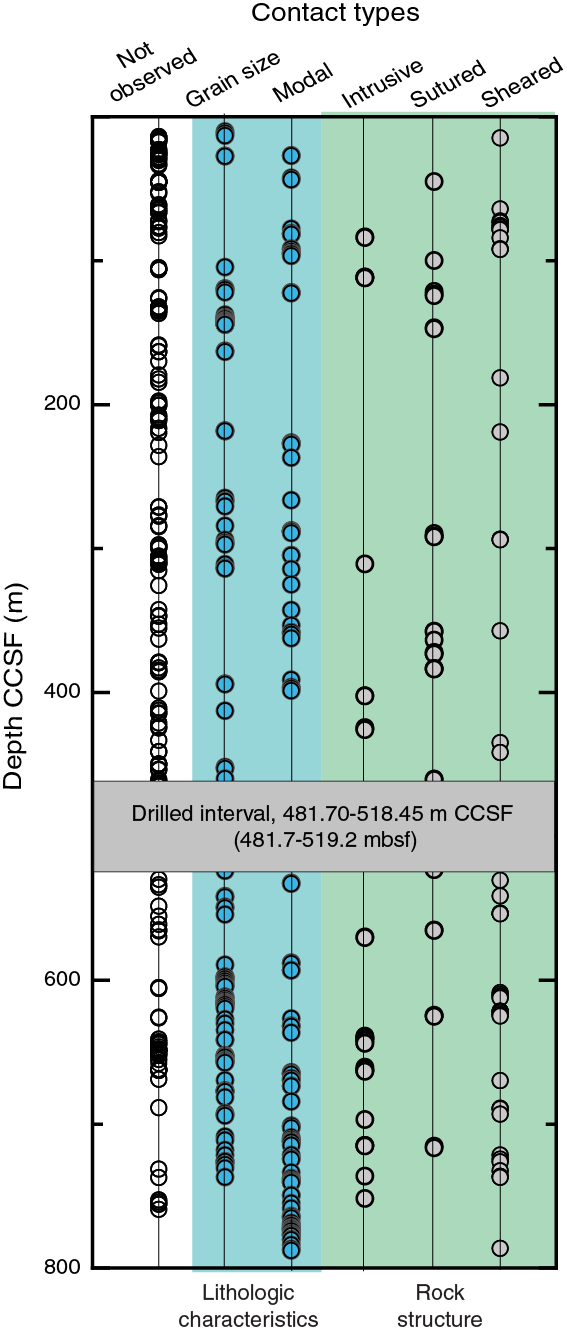
Figure F16. Variations in contact type with depth, Hole U1473A.
The nature of both lithologic and structural contacts is that they may be either sharp or gradational. Gradational lithologic contacts are interpreted to be intraformational, in that small differences in volatile contents or crystal nucleation and growth rate in the residing magma may have resulted in formation of the different rock types, rather than formation resulting from the arrival of a new batch of magma. Other gradational contacts may have resulted from percolation of melt along fractures and grain boundaries beyond the boundaries of the intruding magma body. This may have been the case for some of the oxide-rich veins and networks present in some parts of the core (see below). In the case of gradational structural contacts, one rock type gradually changes into another and this change is marked by a change of the deformation style. This is the case in Section 360-U1473A-69R-5, where at the transition between olivine gabbro and oxide-bearing gabbro there is a change in plastic deformation style (Figure F17C; see also Structural geology).
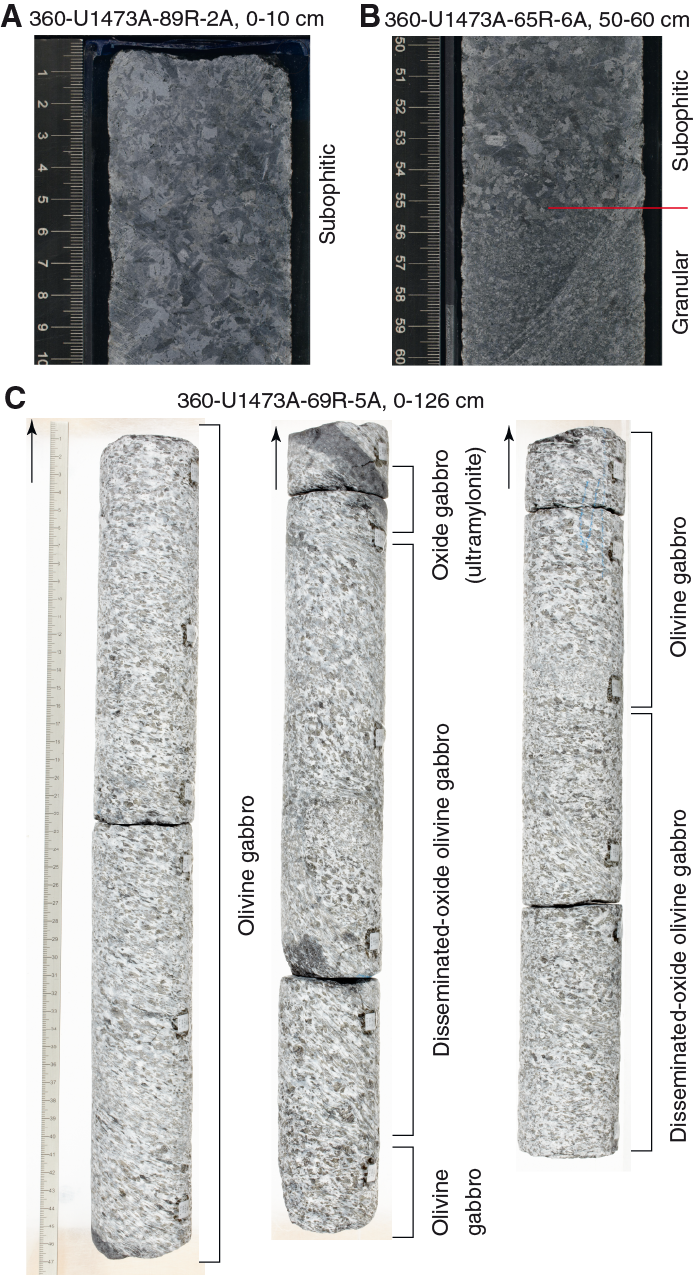
Figure F17. Subophitic textures and gradational structural contacts, Hole U1473A.
Two contact types (“planar” and “sutured”) are generally the result of intrusive relationships between one lithology and another. Together they constitute 35% of the total observed contacts. Planar intrusive contacts are defined by brittle failure of the minerals composing the invaded rock, resulting in contacts that cut across grain boundaries (e.g., most dike/gabbro contacts). On the contrary, sutured contacts follow the outlines of grain boundaries, and grains in the invaded rock are not broken to make room for the invading magma. One interpretation of sutured contacts is that a melt intruded a partly consolidated crystal mush so that grains of the invaded country rock were easily separated from one another during intrusion. Sutured contacts, which could equally be termed “reactive contacts,” can also be produced where the intruded rock has a dissolution-reprecipitation relationship to the invading melt. Sutured contacts may also be due to magmatic sedimentation with the appearance or disappearance of a phase from the liquidus of the crystallizing melt.
Sheared contacts commonly display a weak foliation adjacent to the contact in one or both bordering lithologies, and in many cases crystal-plastic deformation is developed along the contact. Where the shear zone is >5 cm in thickness, it was logged as a separate lithology. Sheared contacts imply that a fault zone (whether deforming in a ductile or brittle regime) has juxtaposed differing lithologies that may not have been in contact originally.
Grain size variations
The average grain size of samples varies from fine grained (<1 mm) to pegmatitic (>30 mm) on centimeter to meter scales and is generally in the coarse range (5–15 mm) for all rock types (Figures F18, F19; Table T4). Pegmatitic intervals (average grain size > 30 mm) are not common, although the maximum plagioclase and clinopyroxene grain sizes are >30 mm in some intervals.
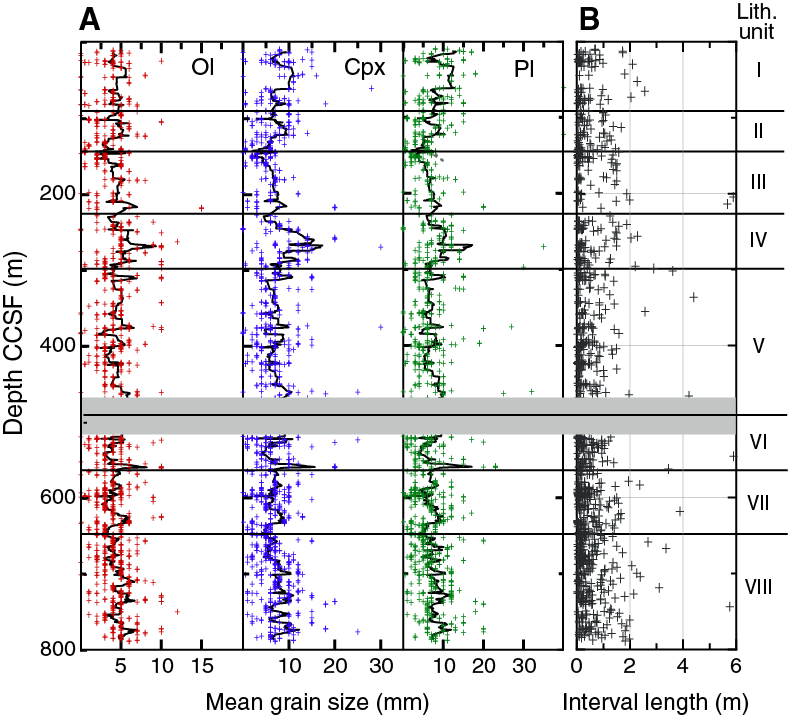
Figure F18. Grain sizes of plagioclase, clinopyroxene, and olivine, Hole U1473A.
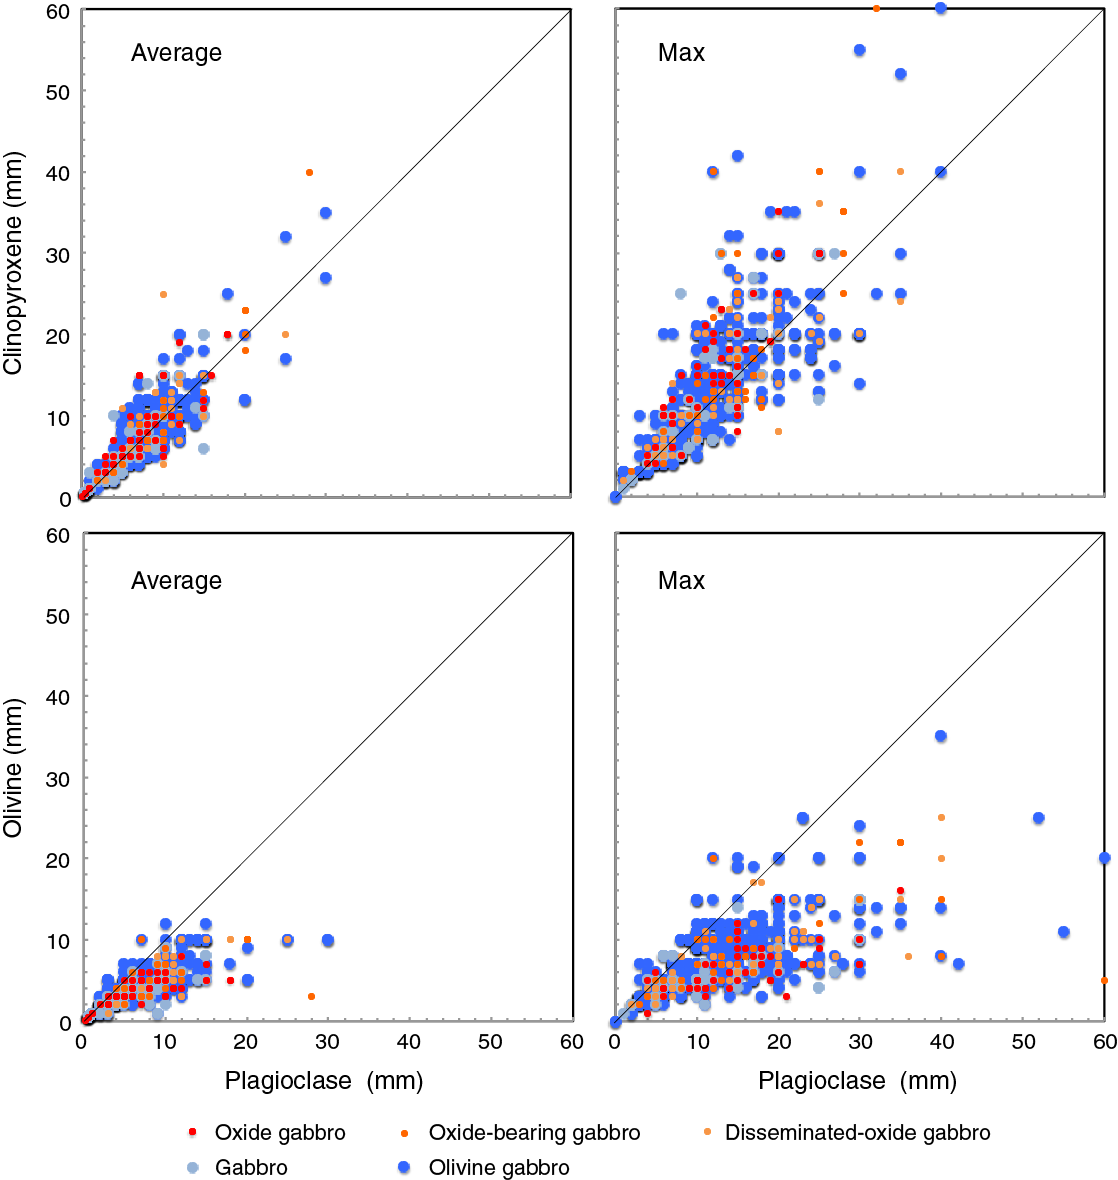
Figure F19. Correlation of grain sizes between plagioclase and clinopyroxene and olivine, Hole U1473A.
Table T4. Grain size intervals, Hole U1473A. Download table in .csv format.
There is generally a positive correlation between olivine, plagioclase, and clinopyroxene grain sizes, with clinopyroxene > plagioclase > olivine, especially for grains >10 mm in size (Figures F18, F19). These correlations are independent of rock type. Clinopyroxene is relatively coarser than plagioclase for grains >10 mm, whereas olivine is generally <10 mm. The maximum grain size for clinopyroxene is >60 mm. As a result, very coarse grained gabbro and few pegmatitic gabbro intervals have ophitic texture.
We recognized 963 grain size intervals as distinct from lithologic intervals, because grain size varies independently. Many grain size intervals represent zones of dynamic recrystallization that crosscut the gabbros, whereas others represent variations in igneous grain size within an otherwise uniform lithologic interval. Average interval length is 0.5 m (± 0.7 1σ), and the maximum interval length is 5.9 m. Thin intervals tend to occur in clusters at several depths.
A running average of grain size over 10 intervals still shows many coarse and fine spikes (Figure F18). These spikes are caused by relatively long intervals with either very coarse grain size or fine grain size. Irrespective of these spikes, running grain size averages show a general trend: a gradual decrease in grain size from 0 to 140 m CCSF, a minimum in grain size (<5 mm) from 140 to 160 m CCSF, relatively fine grained units (5–7 mm) from 160 to 240 m CCSF and from 300 to 430 m CCSF, and relatively coarse grained units (around 10 mm) from 240 to 300 m CCSF. Of note is that the general grain size trend is inversely correlated with degree of crystal-plastic deformation (see Figures F18, F19), thus grain size is dependent on both magmatic and tectonic processes with neither the primary control.
Textures
Most of the gabbros have experienced some degree of crystal-plastic deformation (see Structural geology) that modified the original magmatic features. In addition, many samples have undergone metamorphic (hydrothermal) alteration that also partly obscures the original igneous (and/or structural) textures. However, primary igneous textures are still preserved in many of the least deformed and least altered samples. Coarse-grained rocks are generally characterized by subophitic texture (Figures F20, F17). Olivine crystals are generally subhedral and equant to subequant and occur either as an early cumulus phase locally occluded in plagioclase or as an interstitial to poikilitic phase (mostly in olivine gabbros from Unit VIII). Clinopyroxene is commonly subhedral to anhedral, with subequant to poikilitic habit, and generally encloses tabular plagioclase (totally or partially) and rarely olivine. The pegmatitic facies is characterized by the presence of large clinopyroxene oikocrysts. Plagioclase occurs as euhedral to subhedral tabular minerals partly or totally engulfed by large clinopyroxenes. Brown amphibole is seen in thin section as interstitial grains, filmlike coronae around clinopyroxenes, or exsolved blebs within clinopyroxenes. Irregular oxides are also present in olivine gabbros, within patches interstitial to olivine, plagioclase, and clinopyroxene, often associated with amphibole and orthopyroxene.
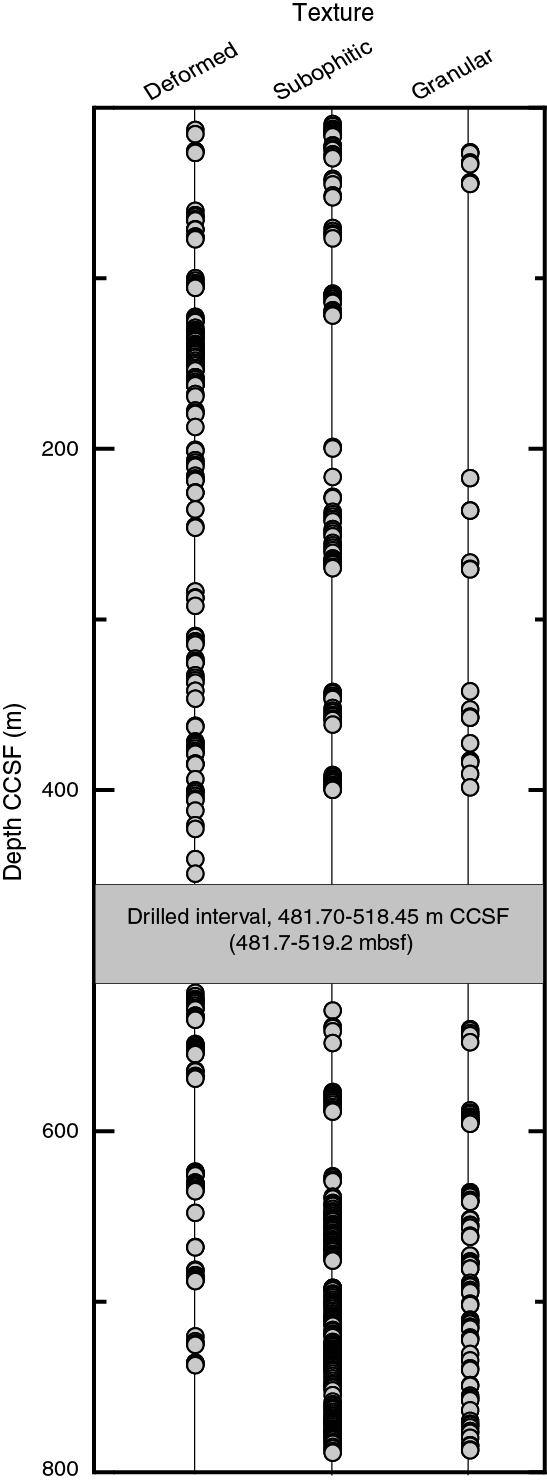
Figure F20. Variations in texture types with depth, Hole U1473A.
Medium-grained rocks are mostly characterized by granular texture in hand specimen, although they often show local subophitic textures under the microscope. Because these rocks are commonly deformed, it is an open question as to how far the granular textures represent a magmatic fabric.
Thin section descriptions
Hole U1473A gabbros display systematic variations in texture that correlate with degree of deformation. A few coarse-grained olivine gabbros and gabbros are less deformed and display subophitic texture, in which subhedral tabular plagioclase is partly or fully enclosed within clinopyroxene (Figure F21A). Such textures are locally preserved in the clinopyroxene porphyroclasts of more deformed samples (Figure F21B). With increasing deformation, plagioclase is partly or completely recrystallized and foliated (Figure F21B–F21C). The most highly deformed gabbros (Figure F21D) have mylonitic or ultramylonitic textures (see Structural geology).

Figure F21. Deformation-related features.
Olivine is typically present in Hole U1473A gabbros as subhedral grains but locally shows anhedral to amoeboid shape and may locally enclose plagioclase crystals in an oikocrystic to poikilitic habit (Figure F22A). In most samples, olivine is partly or fully recrystallized. Some porphyroclasts are rimmed by orthopyroxene and brown amphibole. Olivine neoblasts are mostly elongate and occasionally occur as aggregates surrounding clinopyroxene. Polygonalized olivine aggregates are observed in a few samples due to annealing recrystallization of highly strained olivine grains (Figure F22B). Euhedral olivines are found only as phenocrysts in the diabase dikes.
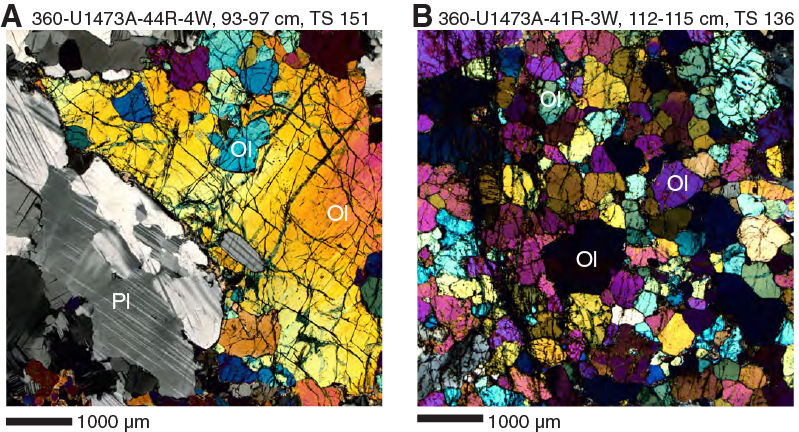
Figure F22. Olivine textures in gabbros.
In a few undeformed gabbros, plagioclase occurs as tabular crystals and displays magmatic twins (Figure F23A). Deformation twins are well developed in some samples (Figure F23B), whereas plagioclase is recrystallized and has undulose extinction in most samples (Figure F23C–F23D). Plagioclase subgrain boundaries locally occur along the margins of large porphyroclasts where they represent the initial stage of neoblast formation (Figure F23C). In some cases, plagioclase laths with undulose extinction in a matrix of polygonalized plagioclase may represent a partially recrystallized magmatic plagioclase foliation or, alternatively, grow preferentially oriented new plagioclase laths in a recrystallized plagioclase matrix (Figure F23D).
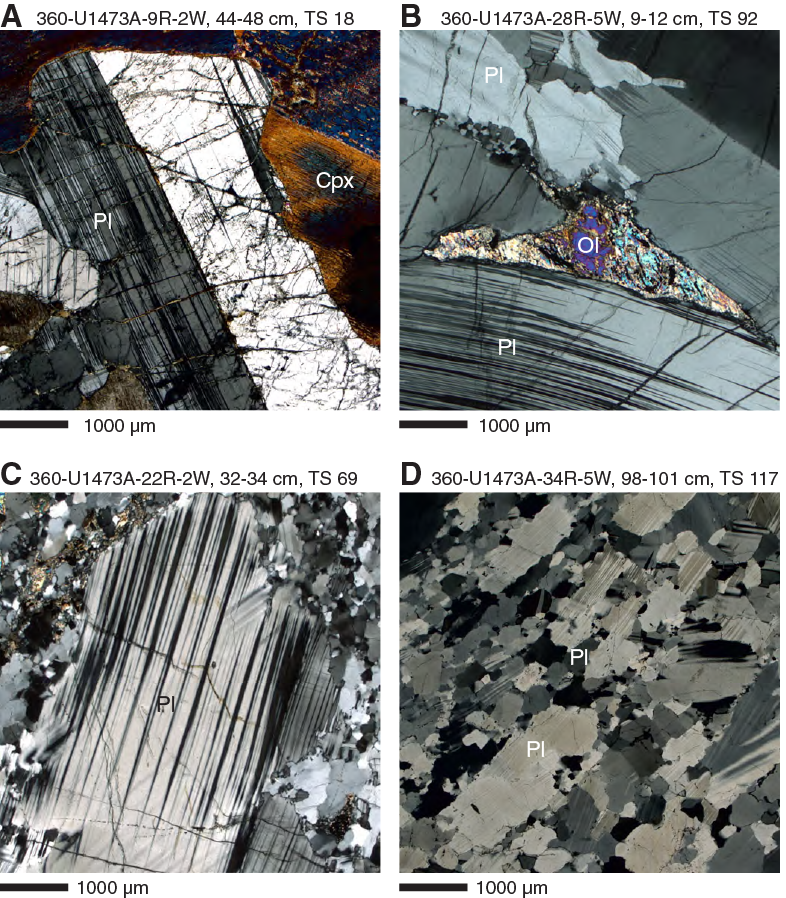
Figure F23. Plagioclase textures in gabbros.
Clinopyroxene is the second most abundant phase in Hole U1473A gabbros. It is commonly present as coarse anhedral, intergranular, or subequant grains with well-developed exsolution lamellae (Figure F24A) or as a subophitic phase with plagioclase and olivine; however, it also commonly forms large oikocrysts enclosing plagioclase chadacrysts. Clinopyroxene in most samples is commonly recrystallized and the neoblasts are closely aggregated around the porphyroclasts (Figure F24B). Clinopyroxene porphyroclasts commonly display a consertal intergrowth texture of irregular interlocking crystals (Figure F24C). Symplectic texture between secondary (partly exsolved) clinopyroxene, orthopyroxene, and brown amphibole can be seen in a few instances (Figure F24D).
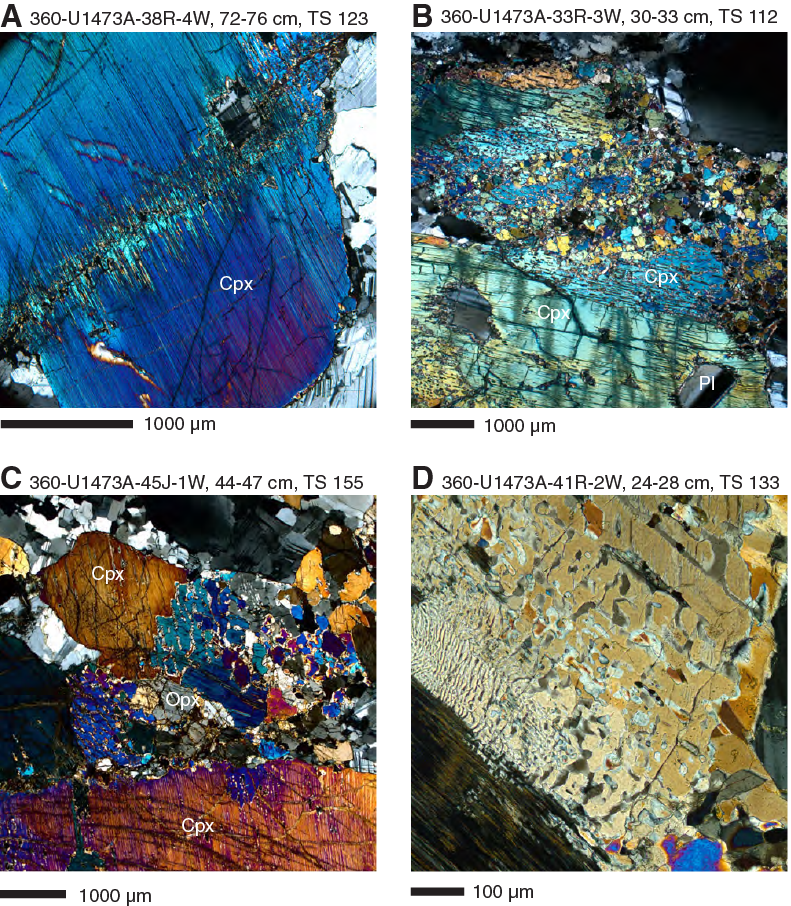
Figure F24. Clinopyroxene textures in gabbros.
Orthopyroxene is an accessory phase throughout the Hole U1473A gabbroic cores. It appears as thin selvages or reaction rims (Figure F25A–F25B), in most cases between olivine and plagioclase, but also as minor overgrowths on clinopyroxene. Orthopyroxene is also present as a relatively coarse grained granular phase in some orthopyroxene-bearing gabbros and gabbronorites (Figure F25C–F25D); the oxide gabbronorite of Core 360-U1473A-47R, for example, contains up to 20 vol% primary orthopyroxene.
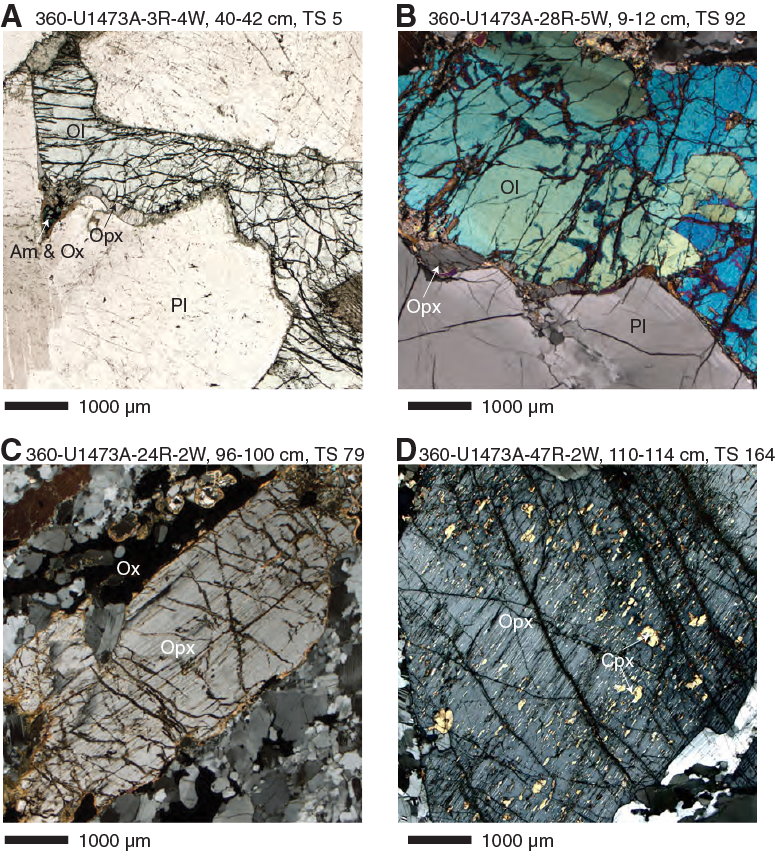
Figure F25. Orthopyroxene textures in gabbros.
Opaque minerals occur as interstitial phases among silicate phases. In oxide and oxide-bearing gabbro, they commonly surround clinopyroxene (Figure F26A) or occur in association with neoblastic clinopyroxene within the pressure shadows of clinopyroxene porphyroclasts in deformed samples. In other gabbros, oxides are commonly associated with brown amphibole (Figure F26B), forming interstitial patches at the rims of clinopyroxene and olivine grains. Opaque minerals also occur within secondary clinopyroxene in association with amphibole blebs. Opaque minerals in most thin sections are predominantly ilmenite, though a few fresh olivine gabbros contain trace amounts of sulfide in greater proportion than ilmenite. Both chalcopyrite and pyrrhotite occur (Figure F26C), and intergrowths are quite common: both between ilmenite and sulfide and between ilmenite and magnetite (Figure F26D).
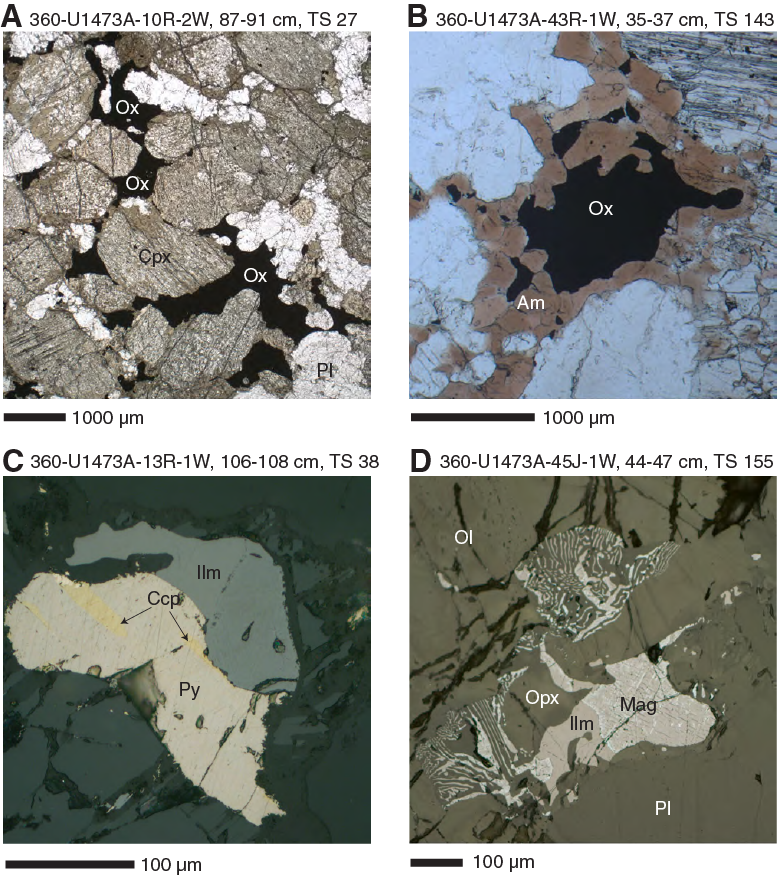
Figure F26. Opaque mineral textures in gabbros.
Brown amphibole is nearly ubiquitous in Hole U1473A gabbros but only rarely exceeds trace proportions (<1 vol%). It is commonly present as intergranular selvages between olivine, pyroxene, and plagioclase with much the same growth habit as orthopyroxene (Figure F27A). Brown amphibole appears to have a particular spatial affinity with oxide minerals and is commonly found intergrown with or enclosing them (Figure F27B). It also locally occurs as “blebs” and lamellae within secondary clinopyroxene, mostly associated with orthopyroxene and oxides. Brown amphibole reaches its greatest abundance in oxide-rich gabbros, where it may be present in more than trace amounts (1–5 vol%). Tiny interstitial brown amphiboles are very common among clinopyroxene neoblasts (Figure F27C). In gabbros crosscut by felsic veins, abundant brown amphibole is also present as coronae around clinopyroxene (Figure F27D).
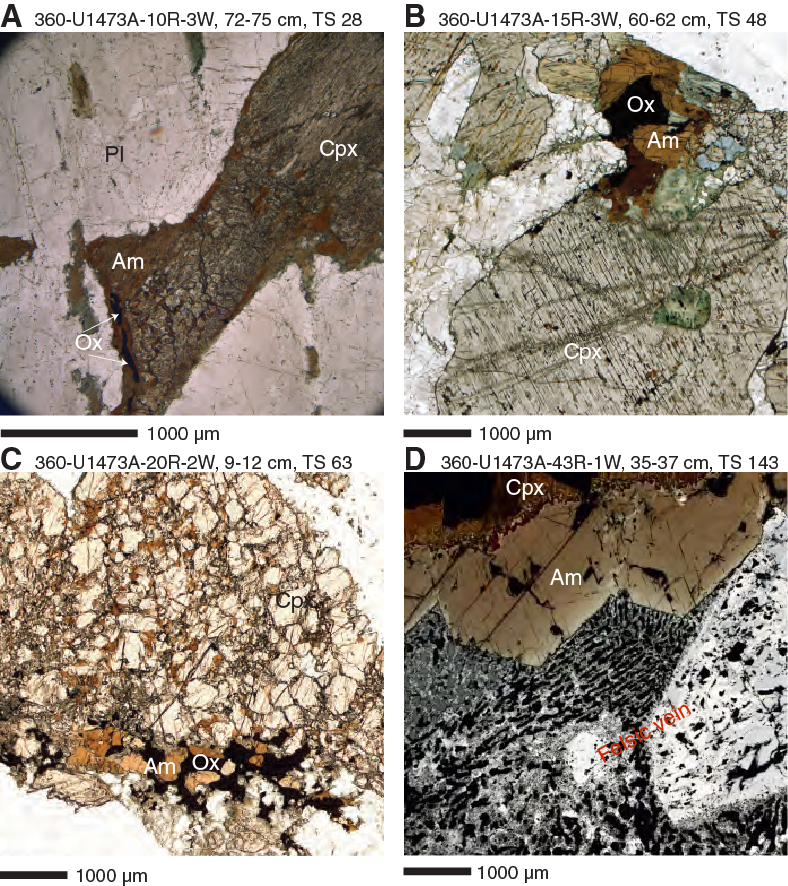
Figure F27. Brown amphibole textures in gabbros.
Biotite, though rare, occurs in a few felsic veins and also in gabbros associated with felsic veins (see Metamorphic petrology). Accessory minerals, such as zircon, titanite, and apatite (Figure F28A, F28B, F28D), occur in some thin sections associated with the intrusion of felsic veins. Zircon is usually euhedral, with variable size ranging from <100 µm to ~2 mm (Figure F28A–F28B). Where present, titanite (Figure F28C) commonly shows a reaction texture with ilmenite (Figure F28D). Within the reaction halos between gabbros and felsic veins, apatite forms crystals, sometimes needlelike, enclosed within amphibole or else as euhedral crystals among plagioclase (Figure F28D).
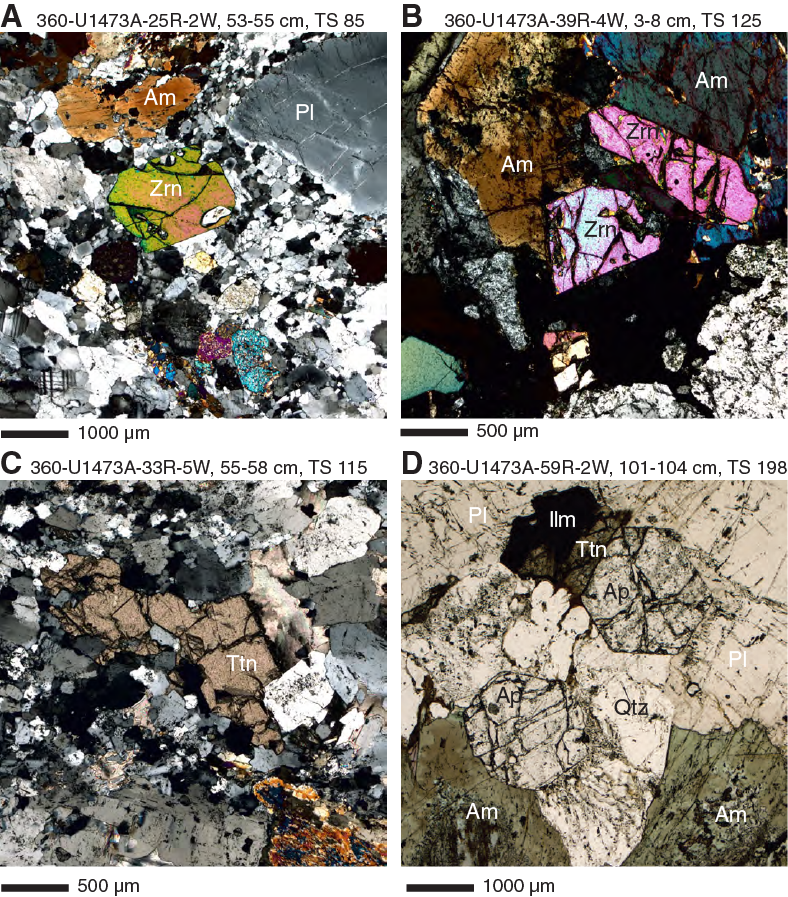
Figure F28. Accessory mineral occurrences in gabbros.
Igneous features
Oxides and sulfides
Petrographic observations of oxide minerals and sulfides from Hole U1473A were made using transmitted and reflected light microscopy. Quantitative modal estimates of the proportions of oxides and sulfides were obtained using ImageJ image analysis software applied to whole thin section photographs taken in transmitted light and, for fine-grained rocks, photomicrographs taken in both transmitted and reflected light (see Igneous petrology in the Expedition 360 methods chapter [MacLeod et al., 2017a]).
Rocks in which the sum of ilmenite and magnetite is very low include olivine gabbro, olivine-bearing gabbro, and gabbro (sensu stricto). Magnetic susceptibilities of these rocks are low, <800 instrument units (IU) (see Petrophysics; Figure F29). The two minerals occur as tiny, usually uniformly dispersed, interstitial grains, as do less abundant sulfides, usually traces of pyrrhotite only. Most of the time, all such grains are bordered by interstitial brown amphibole. All three comprise an interstitial mineral assemblage that is common to these rocks and is of widespread occurrence in all rock types cored from Atlantis Bank.
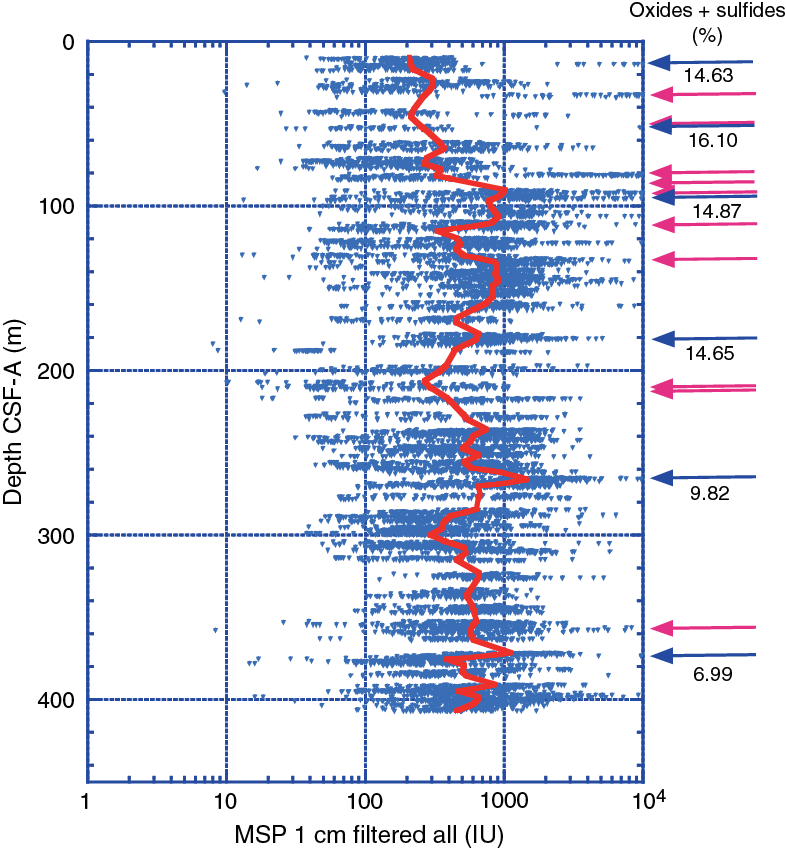
Figure F29. SHMSL MSP data, Hole U1473A.
In rocks with <1% magmatic oxides, the oxides tend to be uniformly dispersed, whether the rocks have crystal-plastic deformation textures or not. Rocks with greater percentages of oxides, disseminated-oxide gabbros, oxide-bearing gabbros, oxide gabbros, and oxide olivine gabbros are almost always restricted to narrow veinlike structures or seams. They are typically, but not universally, related to the deformation fabric of surrounding rock, which may also contain dispersed oxides and sulfides. Oxide-bearing and oxide-rich seams in Hole U1473A gabbros have conformable or nearly conformable relationships to the deformation fabric in adjacent rocks. All told, hundreds of these seams occur in Hole U1473A.
Figures F30 and F31 illustrate general characteristics of oxide-rich seams and oxide gabbros from Hole U1473A, respectively. In all cases, the photomicrographs are oriented with the tops up. The sections are thus also shown in consistent relationship to patterns of foliation in their host rock (the core reference frame [CRF]), in which the deformation fabric dips to the left. Three general categories are shown. The first (Figure F31A–F31C) is massive oxide gabbro, in which high percentages of oxide minerals separate and in some cases surround mats or aggregates of disrupted plagioclase and clinopyroxene that internally have partly or completely recrystallized granoblastic textures. The larger plagioclases have bent and somewhat twisted twin planes, and the edges of clinopyroxenes can have granoblastic subgrains and sievelike internal structure. As illustrated elsewhere, however, using reflected light (e.g., Shipboard Scientific Party, 1999b; also see the Hole 1105A redescription chapter [MacLeod et al., 2017b]) the coarse patches of oxide minerals can be seen to be themselves undeformed. Figure F31A–F31C shows the general relationship between them and adjacent silicate minerals. In all three examples, the oxide minerals are in both horizontal and vertical concentrates. These are interpenetrative structures that give rise to the brittle deformation and brecciation of the silicates during the introduction of the oxide minerals.
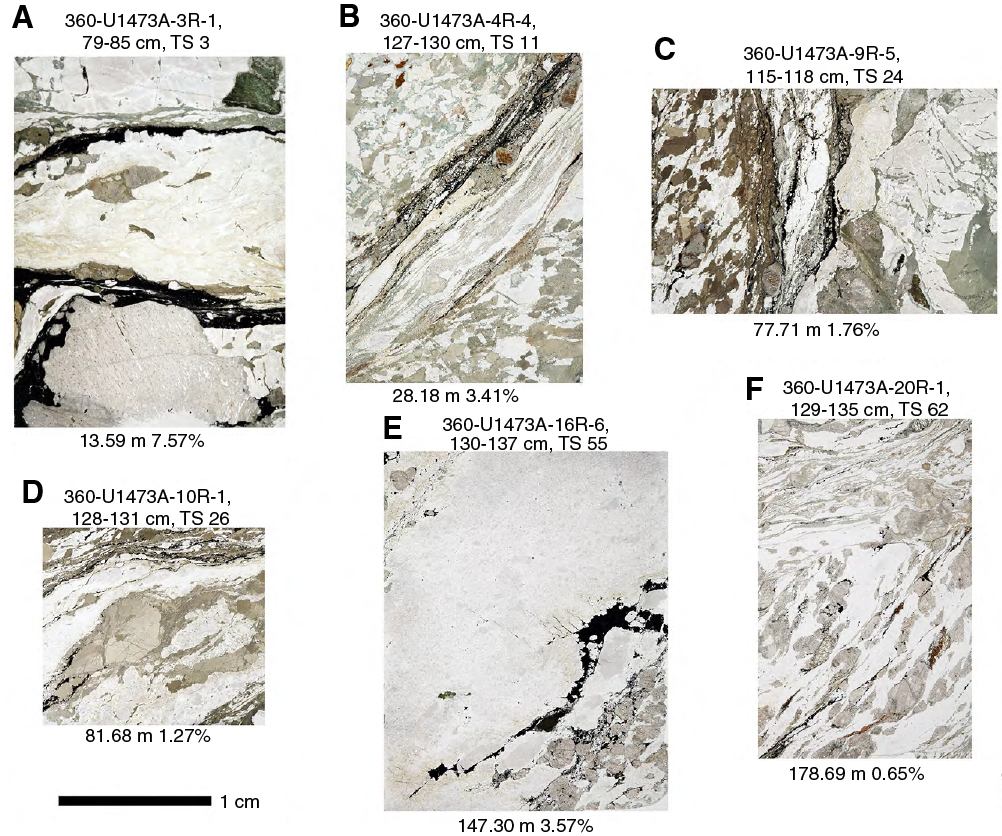
Figure F30. Representative texture of oxide-rich seam in gabbros.
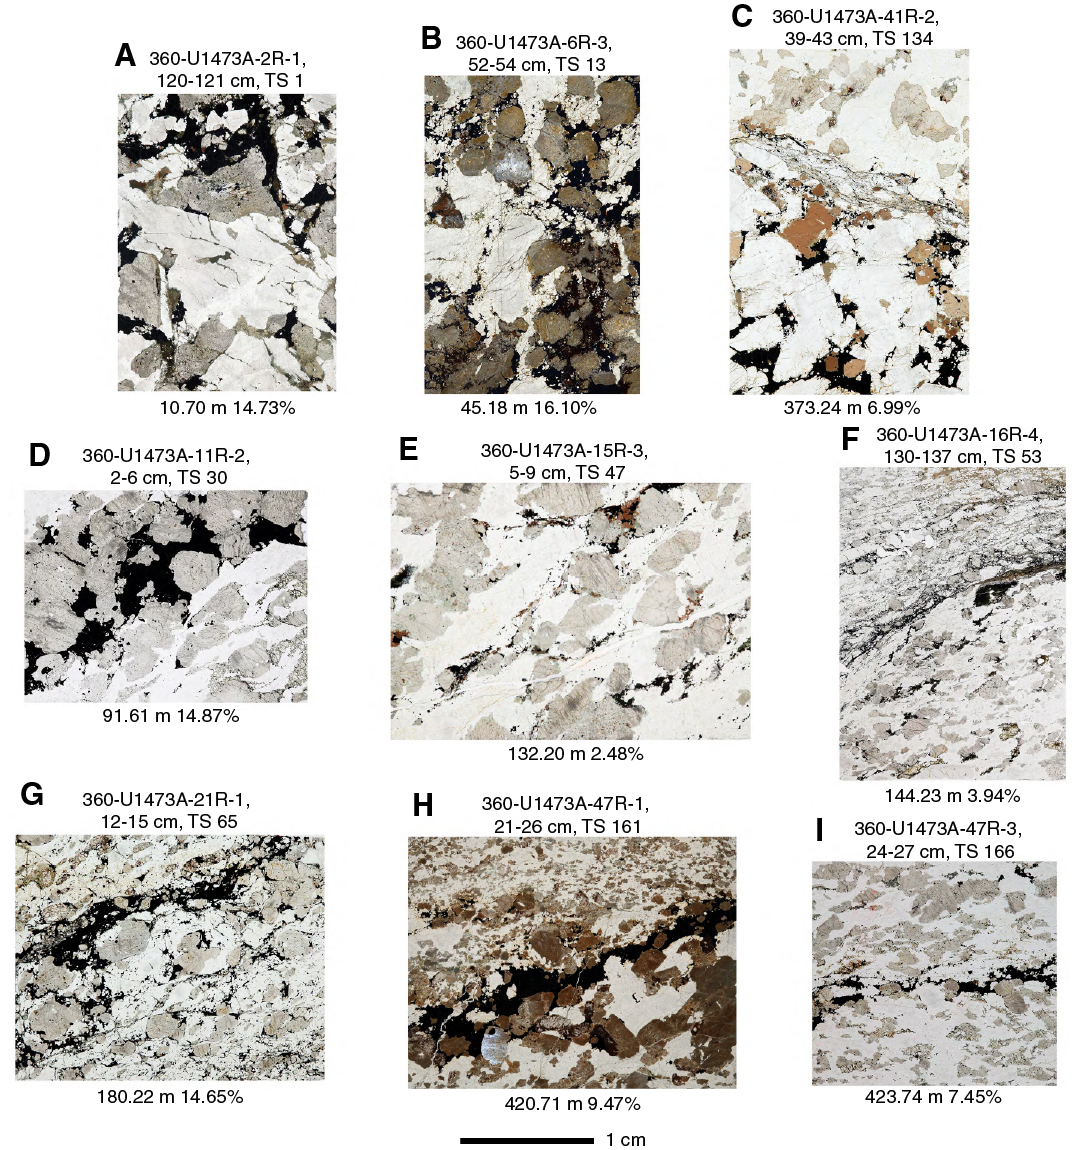
Figure F31. Representative texture of oxide gabbros.
Far more typical are narrow (0.1–1 cm) seams of oxide minerals that are parallel or nearly parallel to foliation in adjacent rock (Figure F31D–F31I). Some of the same characteristics of the more massive oxide gabbros are preserved, including broken and rounded mineral grains (Figure F31D, F31G–F31H), embedded granoblastic crystals, and association with brown amphibole (Figure F31E [upper center], F31H). Some have high proportions of clinopyroxene but almost no plagioclase (Figure F31D, F31G). The narrow planar aspect of these seams rather consistently dips as foliation dips or crosses it at a very low angle (Figure F31G). Slightly higher dips occur in thin sections from near the top of the hole, and through the 20 thin sections in which these structures occur, they flatten with depth, as does the foliation evident in the thin sections. The pattern is only partly evident in Figure F31D–F31I. Oxide percentages measured in these rocks are not those of the separate seams, which might exceed 70%, but of entire thin sections, most of which comprise adjacent rock. Textures in these rocks suggest significant porosity in the late-stage crystallization history of these rocks; silicate mineral gains may be deeply embayed, with the embayments now filled with oxide minerals.
The final category of oxide seams is that in which the oxide minerals occur in strongly foliated porphyroclastic to mylonitic shear zones (Figure F30). The orientation of these zones varies with depth. Some of these seams are up to 1 mm wide (Figure F30A), but many are narrower and strongly sheared (Figure F30B–F30D). The oxide minerals can be concentrated along bands displaying intense crystal-plastic deformation, juxtaposing different lithologies or rocks of different grain size. Some of these mylonitic zones crosscut older deformation fabric, which itself may be plastically transposed by the later stage of ductile deformation. These narrow, oxide-bearing mylonite shear bands tend to be later-stage features, generally crosscutting the older, more penetrative deformation fabrics within which the more prominent oxide-rich seams occur (Figure F31).
Figure F31H shows an aggregate of oxide minerals within a seam apparently lying on clinopyroxene grains—a true relative spatial relationship deduced from the oriented thin section. Although the oxide minerals are much denser than the clinopyroxene, the liquid from which they precipitated was not; depending on the mineral composition, it was less than ~3.3 g/cm3, the density of clinopyroxene at the magmatic stage (Niu and Batiza, 1991). The sequence of crystallization, presumably as the melts cooled, was possibly clinopyroxene, then the oxide minerals, which probably were simultaneous with plagioclase, as in an amphibole diorite dike rock described next. The invading fluid, however, was denser than plagioclase in a basaltic melt (~2.6 g/cm3), which is absent in this seam. The feldspar may have been dissolved and carried away with the migrating fluid.
Section 360-U1473A-51R-1 preserves a distinctive late intrusion of magnetite-rich amphibole diorite. Its contact with surrounding rock is irregular (Figure F32A) and portions of it are incorporated into the intrusion; it is coarse grained and contains abundant phenocrysts of euhedral to subhedral magnetite that coprecipitated with plagioclase (Figure F32B–F32D). Grains of both plagioclase and magnetite are enclosed by oikocrysts of brown amphibole that filled in the late-stage porosity structure (Figure F32B–F32C). This dike is close to fine-grained granoblastically overprinted dikes in the core and may be related to them. It appears to be indicative of a greatly advanced stage of hydrous differentiation of the mafic plutonic mass or may be related to hydrous anatexis of host gabbros while the dike intruded.

Figure F32. Oxide and amphibole association in a diorite vein.
Several samples of undeformed oxide gabbro from Cores 360-U1473A-81R, 83R, and 86R are particularly rich in magmatic oxides and sulfide (Figure F33). Sample 83R-1, 10–14 cm (TS 297) contains 24.1% of magmatic oxides and sulfides, as determined using image analysis procedures (Figure F34). In this sample, the oxide minerals form coarse patches between euhedral clinopyroxene and plagioclase. They are partly skeletal in morphology. Intergrown ilmenite and magnetite are readily distinguished because of incipient alteration cracking of the magnetite. Intergrown rounded sulfide globules are even visible on the thin section surface with the unaided eye and are up to 1 mm long. Both chalcopyrite and pyrrhotite occur in some of them. The thin section also contains large 1 mm sized apatite crystals within the oxide patches.
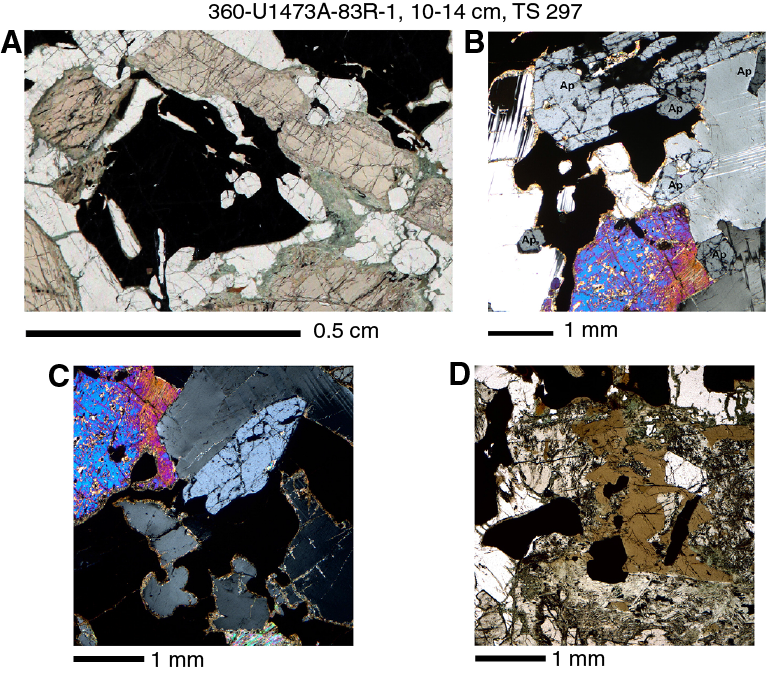
Figure F33. Oxide gabbros.
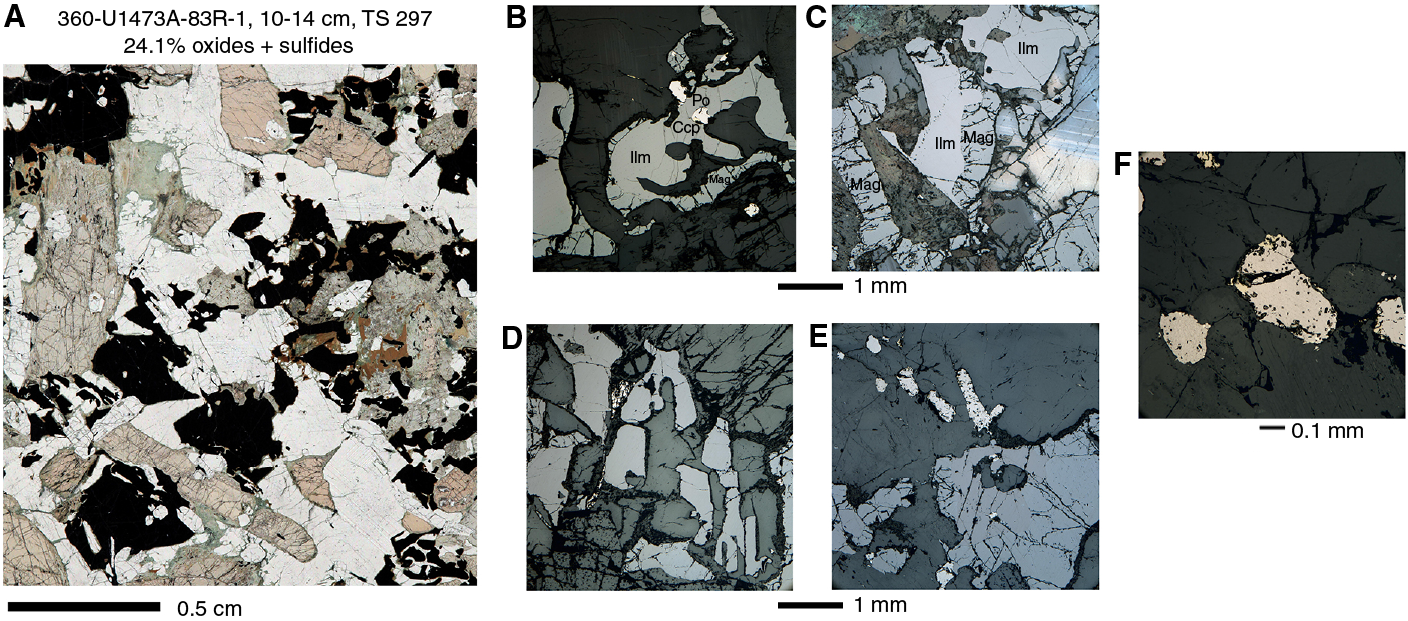
Figure F34. Texture of oxide in oxide gabbro, skeletal oxide patches, and sulfide globules.
Sample 360-U1473A-81R-3, 77–80 cm (TS 292), has 12.3% oxides and even coarser-grained pyrrhotite-chalcopyrite intergrowths, up to 2 mm long. The oxide minerals again are partly skeletal. The section also contains some large intersertal crystals of biotite adjacent to brown amphibole. Sample 86R-2, 0–3 cm (TS 310), is a coarse-grained oxide gabbro in which both patches and very elongate (up to 4 mm) strings of ilmenite-magnetite are arranged between large clinopyroxene and plagioclase crystals. The melts that crystallized the oxide minerals were thus able to penetrate the intergranular structure.
The crystallization/segregation sequence was as follows. Thin sections from deep in Hole U1473A document places in the core where the magmatic oxide minerals and globular immiscible sulfides accumulated within spaces between silicate minerals in high proportions but without apparent deformation. One of the sections encloses euhedral apatite, which thus formed before ilmenite and magnetite, and in all sections the oxide minerals are rimmed with brown amphibole and then with biotite, which formed sequentially later. Sulfides segregated throughout and are larger and more abundant than anywhere shallower in the core. The coarsest oxides are oikocrysts that grew in stagnant oxide gabbro around previously crystallized apatite.
Igneous layering
Igneous layering occurs mainly in Units II and VII and locally in other units (Figure F12). Layering is highlighted by grain size variations between two intervals, with upper and lower contacts that are mostly subplanar and sharp (Figures F35, F36). As plastic deformation is strong in the corresponding units, most of those layers are overprinted by deformation, such that a primary magmatic origin for the grain size variation is not always evident. Some alternating grain size layers that are undeformed are nevertheless observed (e.g., Section 360-U1473A-13R-1) and attest to their magmatic origin. Magmatic fabrics are locally present, in which case foliations are parallel to layer contacts (e.g., Section 65R-5). Modal proportions of plagioclase and clinopyroxene can differ between coarse- and medium-grained layers, but in most cases it is simply a grain size layering (Figure F37).

Figure F35. Igneous layering, Hole U1473A.
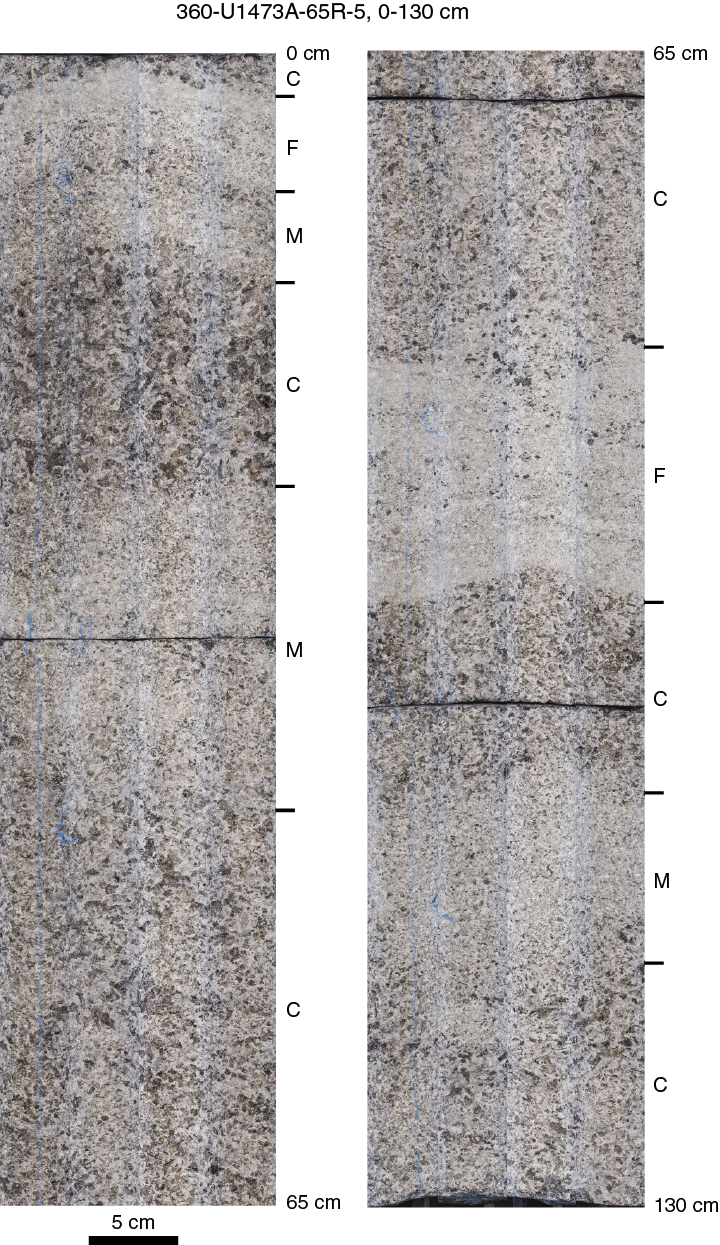
Figure F36. Igneous layering displayed by grain size variations, Hole U1473A.
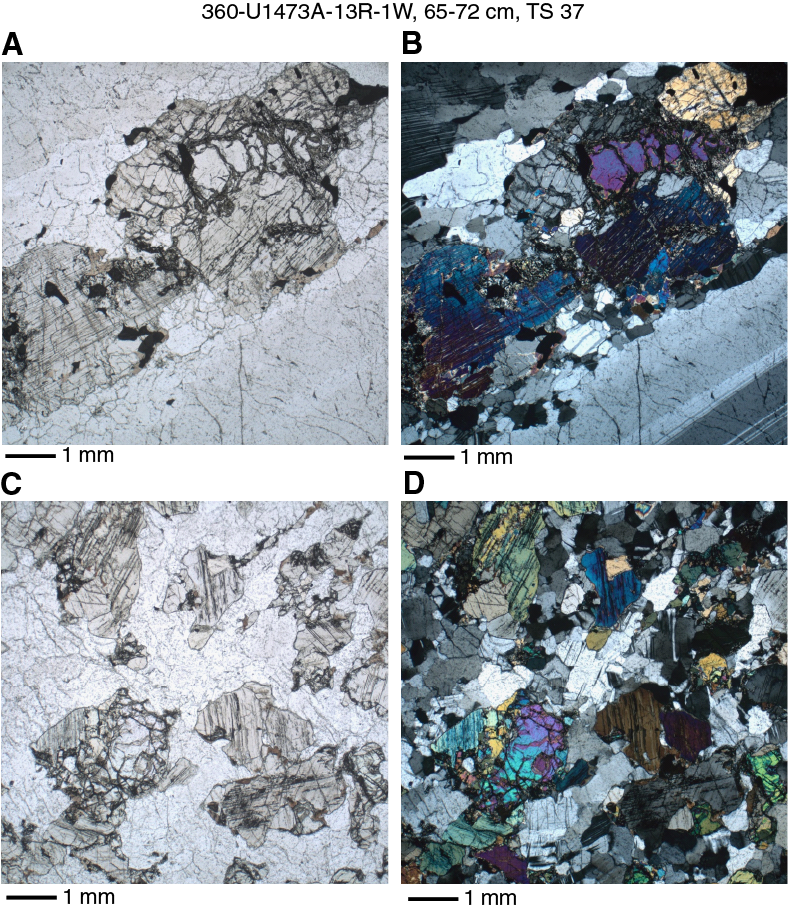
Figure F37. Different layers.
Felsic veins and patches
A total of 381 igneous felsic veins were identified in Hole U1473A cores (Tables T5, T6, T7). Felsic veins vary in geometry from regular planar dikes/dikelets (Figure F38) with sharp or irregular boundaries to irregularly shaped patches and networks and vary in thickness from a few millimeters to several centimeters. Felsic dikes are often associated with halos characterized by the formation of amphibole around clinopyroxene and changing to white in color macroscopically due to alteration of the plagioclase to a more sodic composition (Figure F39). Some felsic patches seem to infiltrate into grain boundaries between pyroxenes and olivines in the host gabbro (Figure F40). Figure F12 shows the location of felsic veins and patches in the cores. Felsic veins mostly intrude olivine gabbro and gabbro and are particularly concentrated at depth ranges 100–140, 180–220, 290–310, 380–410, 580, 630, and 700–710 m CCSF. These veins vary in width, geometry, and mineralogical composition.
Table T5. Summary of each section, Hole U1473A. Download table in .csv format.
Table T6. Numbers and thickness of felsic rocks, Hole U1473A. Download table in .csv format.
Table T7. Igneous veins described, Hole U1473A. Download table in .csv format.
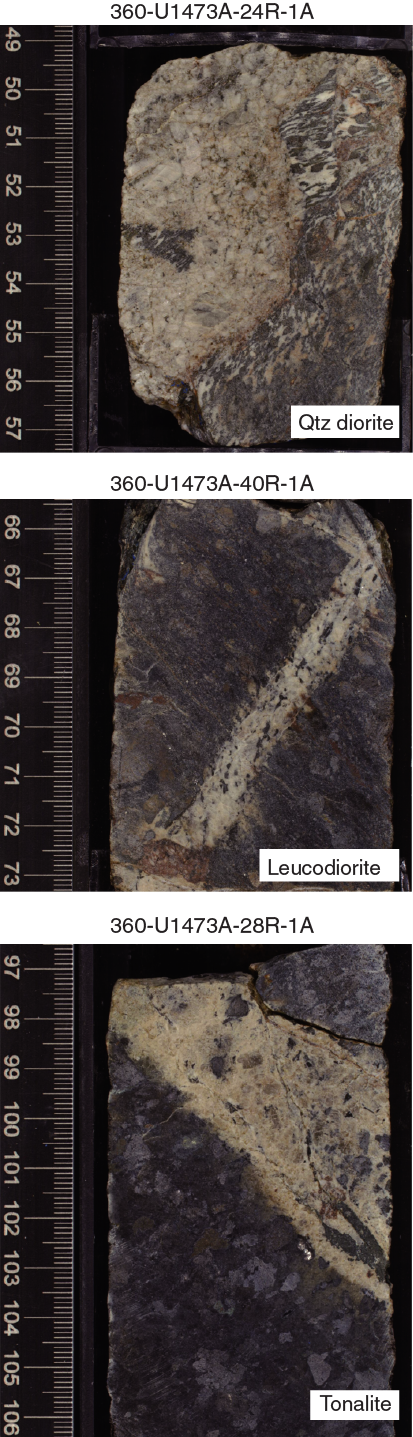
Figure F38. Quartz diorite, leucodiorite, and tonalite, Hole U1473A.

Figure F39. Felsic vein with halo, Hole U1473A.

Figure F40. Felsic patch in gabbro, Hole U1473A.
Although most of the felsic rocks have clearly undergone postemplacement high- and low-temperature alteration, many of them have primary igneous textures. Most are composed primarily of plagioclase and amphibole. Plagioclase is generally subhedral to euhedral in shape and may display concentric zoning (Figure F41). Quartz may occur as patches of several grains and have in places a granophyric texture with feldspar (Figure F42). Amphibole is pleochroic, pale to darker brown, and some is euhedral (Figure F43). Subhedral brown amphibole occurs at contacts between felsic veins and clinopyroxene of the host gabbros (Figure F42A). Biotite occurs rarely within felsic veins and at the contacts between biotite-bearing felsic veins and olivine in the host gabbro (Figure F44A; see Metamorphic petrology). Minor minerals are apatite, zircon, titanite, and opaque minerals (Figure F44B). Opaque minerals occur more frequently in felsic veins deeper in the section. They comprise five types according to mineral modes (Figure F45; Table T6): diorite (21% by number and 18% by thickness), leucodiorite (30% by number and 26% by thickness), quartz diorite (23% by number and thickness), tonalite (2% by number and 4% by thickness), and trondhjemite (24% by number and 30% by thickness). There is an obvious change downhole in felsic vein compositions with the most evolved, trondhjemites, appearing almost exclusively deeper than 500 m CCSF (Figure F97).
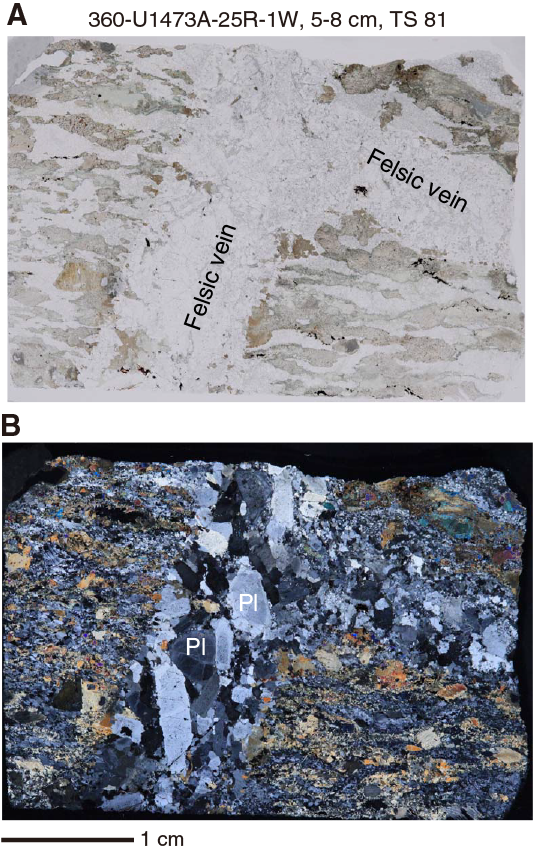
Figure F41. Branching felsic vein.
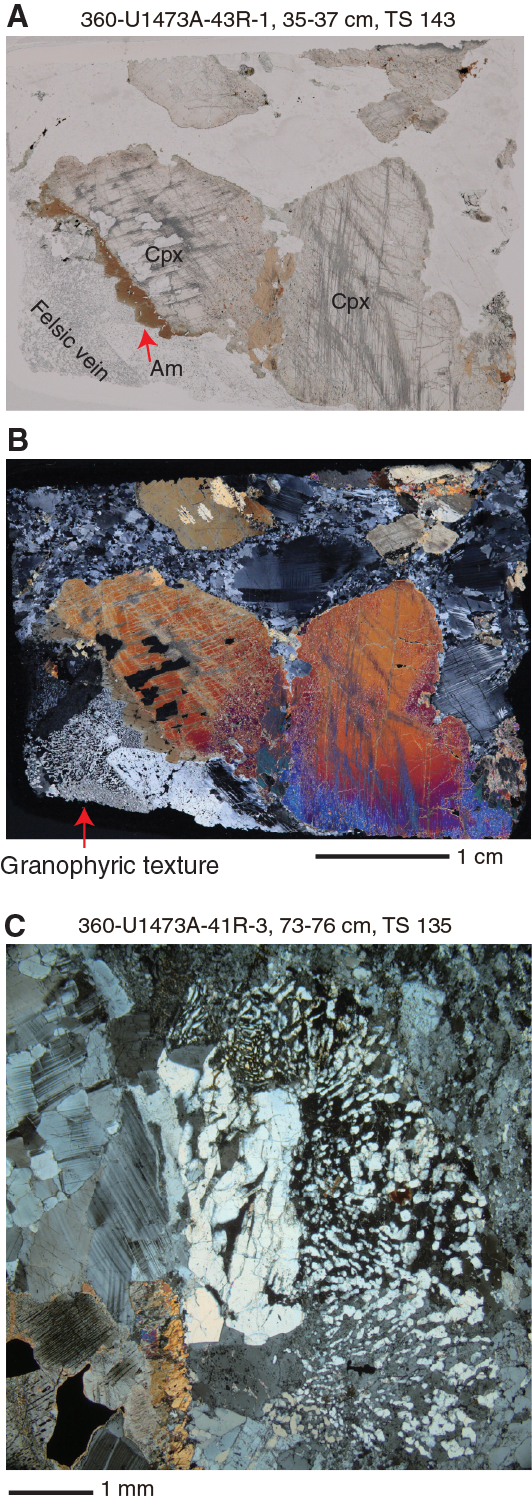
Figure F42. Felsic vein with granophyric texture.
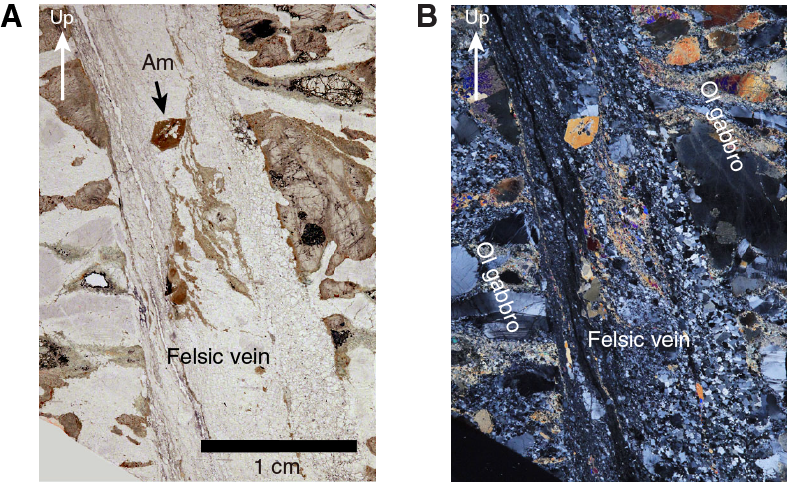
Figure F43. Sheared normal sense felsic vein with euhedral amphibole grain.
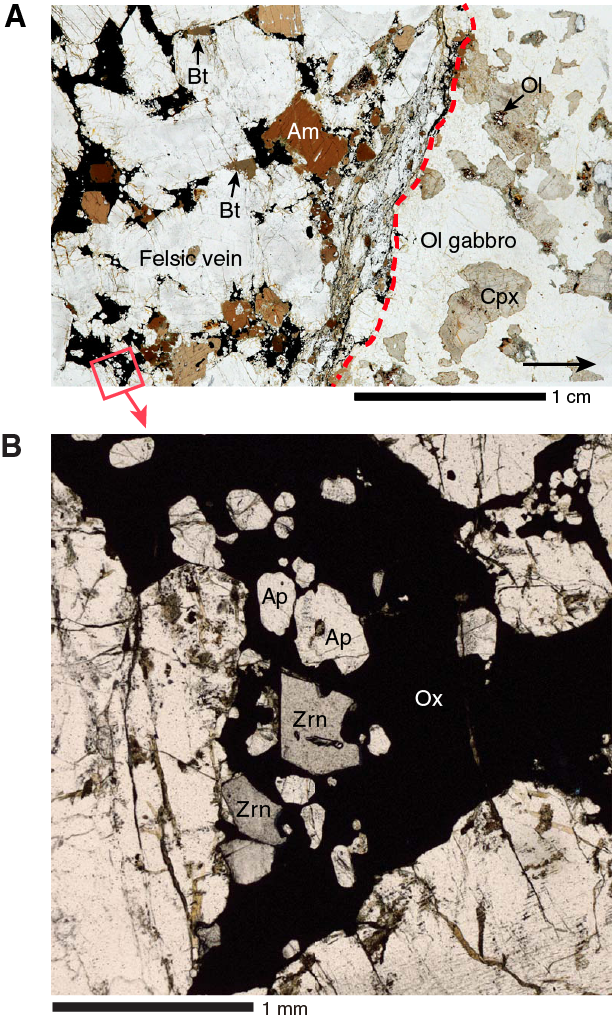
Figure F44. Biotite-bearing felsic vein with brown amphibole and massive oxide.
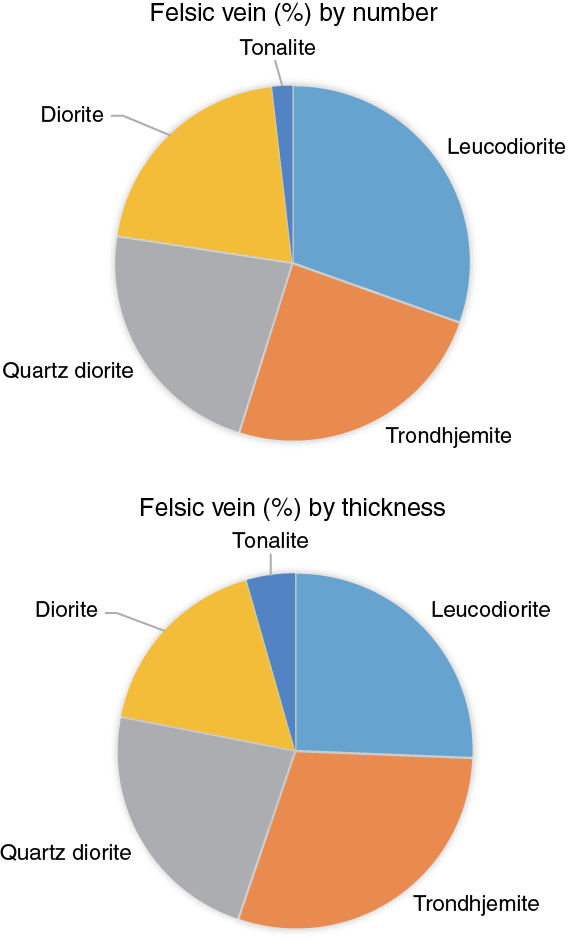
Figure F45. Pie charts of numbers and thickness of felsic rocks, Hole U1473A.
Dikes
Seven dikes were cored in Hole U1473A (Cores 360-U1473A-6R, 32R through 33R, 41R through 42R, and 51R through 52R). One diabase dike (Core 6R) displays intergranular and fluidal texture and contains plagioclase phenocrysts. Plagioclase from the groundmass clearly displays skeletal textures related to fast growth due to undercooling (Figure F46). The diabase is characteristic of late dikes emplaced in relatively cool host rock. The remaining six dikes, however, display granoblastic textures with assemblages characteristic of the amphibole hornfels facies (Cores 32R through 33R) and of the transition between amphibole and the two-pyroxene hornfels facies (Cores 42R and 51R through 52R) (Figures F89, F90, F91). Some of the granoblastic dikes also contain plagioclase phenocrysts (Cores 32R through 33R); these are associated with relict skeletal olivine phenocrysts (Core 42R). Plagioclase phenocrysts display tiny clinopyroxene and/or amphibole inclusions that mimic their former euhedral shape (Figure F90). Plagioclase from the groundmass is oriented parallel to the margins (Figure F47). When dike margins display apophyses (Core 33R), plagioclase lath orientations parallel the local-scale geometry of the margin.
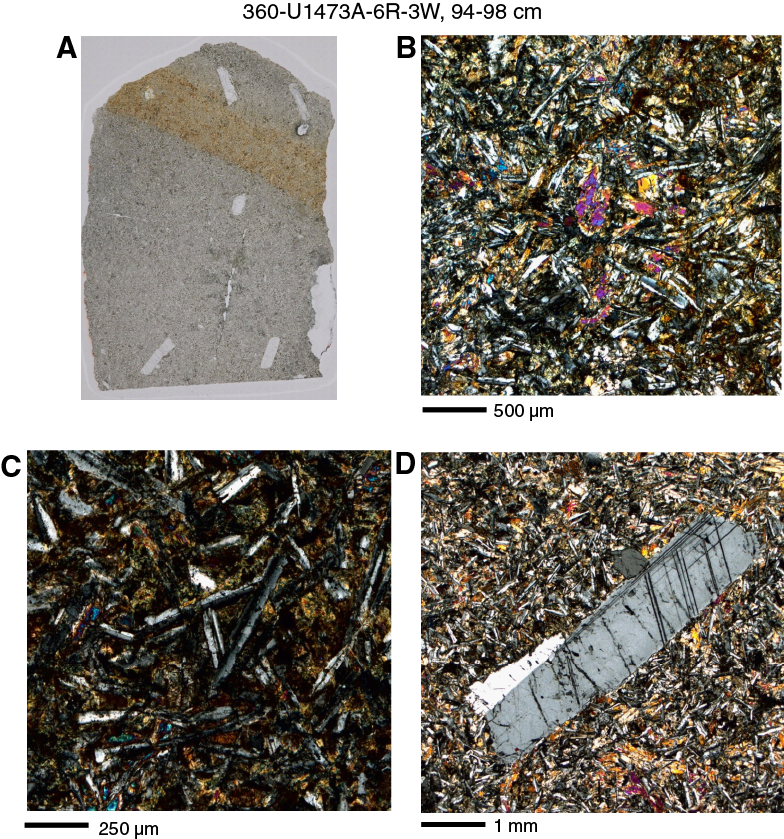
Figure F46. Diabase.
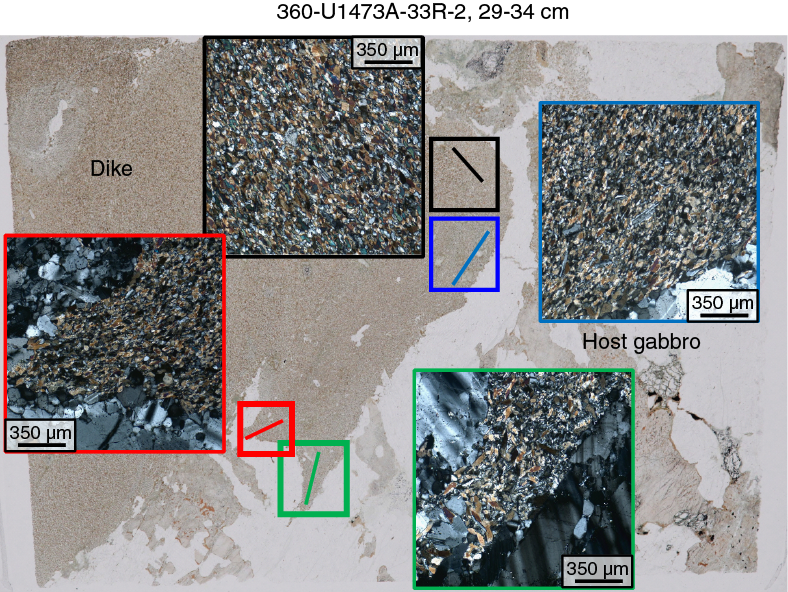
Figure F47. CPO of plagioclase and amphibole at granoblastic dike margins.
Felsic veins and patches are found along the contacts of the granoblastic dikes (Figure F48), evidently the product of anatexis of the gabbro at their margins (see Felsic veins at granoblastic dike/gabbro contacts). A large dike (>1.5 m thick) in Cores 360-U1473A-41R through 42R contains plagioclase and skeletal olivine phenocrysts and has an intergranular texture with late magmatic brown hornblende associated with oxides (Ox) (Figures F89, F90, F91). Although the general texture is intergranular, pyroxene and plagioclase nevertheless display slightly rounded boundaries. Plagioclase phenocrysts contain small amounts of pyroxene and/or tiny inclusions of brown amphibole close to their rims, in the same way as they occur in the granoblastic dikes. Although the dike/gabbro contact was not recovered, a decrease in grain size is observed from the center of the dike toward its rim. The granoblastic dike with a mineral assemblage characteristic of the transition between amphibole and the two-pyroxene hornfels facies is located 23 cm below the last recovered piece of diabase.
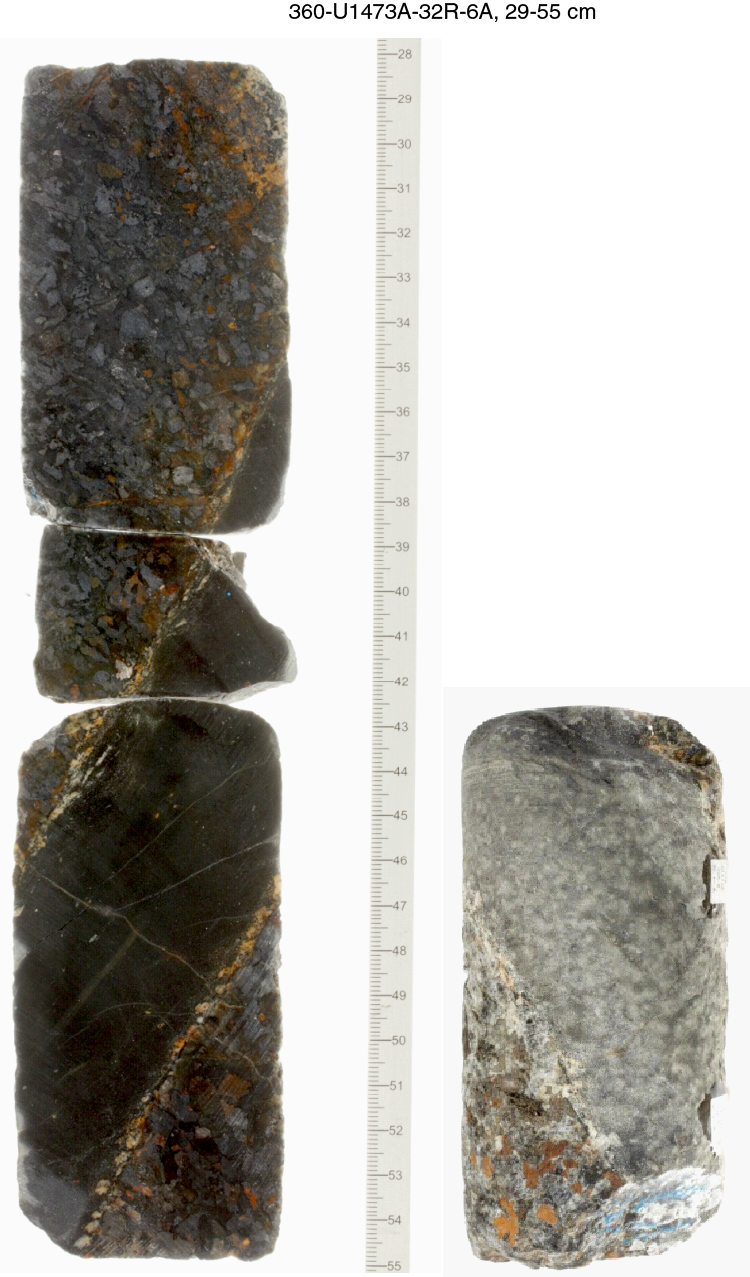
Figure F48. First encountered granoblastic dike, Hole U1473A.
General interpretations from Hole U1473A
Crystallization of olivine gabbros: evidence for melt-rock reaction processes
The textural features and chemical composition of olivine gabbros suggest that these rocks crystallized from a melt with relatively primitive chemical composition. In particular, the ophitic to subophitic texture and occurrence of olivine ranging in form from a rounded to an interstitial phase suggest the synchronous crystallization of olivine, plagioclase, and clinopyroxene. This was followed by the formation of interstitial phases such as brown amphibole and orthopyroxene, mostly associated with Fe-Ti oxides. Of particular interest is the local occurrence of plagioclase chadacrysts having irregular shape and resorbed grain boundaries against the enclosing clinopyroxene oikocrysts. This feature is commonly documented in olivine gabbros from other gabbroic occurrences (Blackman, Ildefonse, John, Ohara, Miller, MacLeod, and the Expedition 304/305 Scientists, 2006; Lissenberg and Dick, 2008; Lissenberg et al., 2013) and is interpreted as evidence for assimilation of plagioclase by an invading melt that was crystallizing clinopyroxene. Similarly, partially corroded plagioclase crystals are also found within or at the contacts with the large olivine oikocrysts, also likely indicative of dissolution processes (Sanfilippo et al., 2013). These observations suggest that melt-rock reaction processes occurred during the first phases of crystallization of olivine gabbros in Hole U1473A. Although this inference must be tested with detailed mineral chemical determinations postcruise, the hypothesis is supported by good correlations between clinopyroxene and plagioclase or olivine modal composition in these rocks (Figure F15), which may be interpreted to suggest that clinopyroxene crystallized locally at the expense of plagioclase and olivine.
Other evidence for melt-rock reactions might be seen in the complex textural relationships between brown (magmatic) amphibole and the cumulus phases. Brown amphibole is the principal high-temperature hydrous mineral in oceanic gabbros (Mevel, 1988; Gillis, 1996; Manning et al., 1996), where it has been interpreted as either (i) a product of crystallization of evolved silicate melt (e.g., Dick et al., 2000) or (ii) evidence for of high-temperature seawater-rock (e.g., Coogan et al., 2001). The textures and mineralogical characteristics of brown amphibole within Hole U1473A gabbros are similar to the high-Ti interstitial amphibole and amphibole blebs commonly reported in mid-ocean-ridge basalt (MORB)-type gabbros (Tribuzio et al., 2000b; Gillis and Meyer, 2001), suggesting a magmatic origin for this mineral. In particular, the common association of amphibole with Ti-Fe oxides and the local occurrence of irregular grain boundaries between amphibole and clinopyroxene suggest that brown amphibole (Am) might have formed through a reaction involving clinopyroxene and a H2O-, TiO2-rich melt through a reaction of the type
Cpx + Melt 1 = Am + Ox + Melt 2.
The origin of this melt can be attributed to the crystallization of chemically evolved melts, produced either by (i) extensive fractional crystallization (Meyer et al., 1989) or (ii) melt-crystal interaction processes (e.g., Coogan et al., 2001). An alternative hypothesis is that the melt crystallizing brown amphibole and oxides was produced by low degrees of partial melting of the gabbro triggered by the ingress of hydrothermal fluids (e.g., Koepke et al., 2007).
One interesting observation is that in those olivine gabbros where clinopyroxene is partly or completely recrystallized, abundant brown amphiboles occur as interstitial or filmlike phases between the clinopyroxene neoblasts. On the basis of this observation we can thereby infer that there is a correlation between the amount of brown amphibole and the deformation intensity. These textures and their implication for the occurrence of hydrous melt during deformation are described in Metamorphic petrology and Structural geology.
Oxide gabbros
Ilmenite and magnetite join crystallization assemblages late in the MORB igneous differentiation sequence, typically at ~4 wt% MgO. After that, crystallization assemblages are oxide bearing and even oxide rich. Oxide minerals can be abundant in abyssal gabbros as a result. Oceanic gabbros in general, including those from Hole U1473A, are predominantly cumulates, and if, while early olivine, plagioclase, and clinopyroxene predominate, compaction and deformation are completely efficient at expelling intercumulus basaltic liquids, there will be no magmatic oxides in the rocks. Very small amounts of incompatible elements (e.g., TiO2 or Y) mean that almost no intercumulus melt has been left in the cumulate gabbros. The expelled liquids can then migrate and accumulate to produce highly differentiated rocks that are rich in oxides. Hole U1473A gabbros, like those of Holes 735B and 1105A, thus have a bimodal distribution of rock types: those with almost no magmatic oxide and those with a lot.
From thin section observations of rocks from both Holes U1473A and 1105A (see the Hole 1105A redescription chapter [MacLeod et al., 2017b]), the character of the late melt that deposited the oxide gabbro seams may be deduced to have been as follows:
- It had the two magmatic oxides (ilmenite and magnetite) on the liquidus.
- It was very rich in total iron (FeO + Fe2O3) and TiO2.
- Data obtained from Hole 1105A rocks (Shipboard Scientific Party, 1999b; Thy, 2003; Casey et al., 2007), thin section observations of those rocks (see the Hole 1105A redescription chapter [MacLeod et al., 2017b]), and one occurrence from Hole U1473A indicate that it was locally saturated in apatite (P2O5).
- It was also saturated in sulfur, which resulted in widespread immiscible segregation of molten precursors to pyrrhotite and chalcopyrite.
- Its density can be inferred to have been somewhere between that of plagioclase and clinopyroxene at the magmatic stage (between 2.6 and 3.3 g/cm3) but denser than MORB ferrobasalt liquid (approximately 2.7 g/cm3).
- It was hydrous and invariably produced brown amphibole after precipitating the oxide minerals.
- Based on mineral studies of very similar rocks from Holes 735B and 1105A, the amphibole is mainly high-TiO2 pargasite in composition; it crystallized at <1000°C and perhaps down to temperatures as low as 700°C (Ernst and Liu, 1998).
- Globular sulfides carrying chalcopyrite were partly molten down to 645°C, the solidus temperature of chalcopyrite (Barton and Skinner, 1979).
- The melt had extremely low viscosity and was capable of penetrating very fine intergranular porosity structure, even along cleavage surfaces in clinopyroxene.
The aggregate of these properties is antipathetic to that of normal basaltic liquids. Of particular concern is melt viscosity at the liquidus, which tends to increase dramatically from about 15 to ≥30 Pa·s at the point when oxide minerals join the liquidus. Eventually their ongoing crystallization and differentiation increases the SiO2 contents of residual liquids and melt viscosities accordingly. Ferroandesitic liquids, for example, have viscosities two to three orders of magnitude higher than their immediate basaltic precursors, based on calculations using the model of Shaw (1972). Rhyodacite and rhyolite liquids, which intruded as leucodiorite, quartz diorite, diorite, trondhjemite, and tonalite dikes with sharp contacts in the rocks of Hole U1473A, are an even greater problem: their dry viscosities are seven orders of magnitude higher than those of basalts.
Two conditions can reduce the viscosities of very iron rich liquids and thus allow them to become fluidal: an increase in H2O content and addition of superheat. Both can break down the polymers of network silicates in glass. The formulation of Shaw (1972) suggests that quantities of water of about 2% for iron-rich basaltic liquids or MORB ferroandesite and 6% for rhyolite, plus up to 200°C of superheat, can bring viscosities down to the level of typical basalt and thus allow mobility of both as either dikes or interpenetrative fluids. The heat could be provided by injection of very primitive basalt into a crystal mush or otherwise partly molten magma body, but the amount of heat necessary to reduce viscosities sufficiently, especially for hydrous siliceous liquids, is surprising. Granoblastic former basaltic dikes that recrystallized with abundant brown amphibole are clear evidence for high water content in intrusive rocks in Hole U1473A, and they would have provided enough heat. Basalt melts intruded rocks that were clearly already hydrous and crystallizing amphibole at the magmatic stage.
A second but related matter concerns the segregation of the iron titanium–rich liquids into narrow seams. This by itself seems unlikely for molten materials with high viscosity, but we also see here evidence for very fluidal mobility during a pervasive pattern of strong crystal-plastic deformation. This had to be at fairly high temperature, but the pattern also seems to be one of dilatancy or an increase of porosity structure during that deformation. At the point the host rocks were on the cusp of the transition from crystal-plastic to brittle deformation, the major oxide-rich seams, with highest proportions of massive magmatic oxides, instead formed magmatic breccias. Volume increase, to accommodate the magmatic fluids and receive crystal precipitates from them, occurred, at least locally, leading to simultaneous flow into a wide network of veins and seams of oxide-rich and felsic melts with very different properties. The proximate driving force for the flow is the compaction of the complementary rocks, mainly olivine gabbro, that form the bulk of the crystal mush host and the very efficient expulsion of differentiated liquids from them.
Felsic material intrusions
Despite their small volume (1.5%) in the gabbro body, felsic rocks play an important role in the physical and chemical processes in the magmatic and tectonic evolution of the lower crust at Atlantis Bank. In particular, they are critical to any chemical mass balance involving incompatible elements.
Euhedral brown amphibole and granophyric texture coupled with the dikelike features of felsic veins indicate that some felsic veins formed by crystallization from high-SiO2 hydrous melts. High-SiO2 felsic rocks have been reported from the ocean floor (e.g., Aumento, 1969; Nakamura et al., 2007), including in Hole 735B of Atlantis Bank (Dick et al., 2000; Natland and Dick, 2001). The origin of high-SiO2 melts for felsic rocks is still debated. Koepke et al. (2007) summarized the origin of high-SiO2 melts for the mid-ocean ridges and ophiolites as the following four possibilities: (1) late-stage highly fractionated melt, (2) partial melting of gabbroic rocks, (3) liquid immiscibility, and (4) assimilation and partial melting of previously hydrothermally altered sheeted dikes. Although we need further geochemical analyses, some aspects of this are discussed based on visual and microscopic observations.
Felsic veins were formed during late stages of crystallization, evident from their low liquidus temperatures, as some of them cut lithologic boundaries between fine-grained gabbro, coarse-grained gabbro, and deformed gabbro. Some felsic veins also underwent crystal-plastic deformation. Genetic relationships between oxide gabbros and felsic veins are not clear. Biotites in some felsic veins and at contact with olivine in the host gabbro indicate relatively high-K2O melts for their origin. Because MORB sources are generally low in K2O and water content, interaction with an external fluid originating from seawater in the system is a plausible explanation for the origin of hydrous K2O- and SiO2-rich melts. Felsic rocks also occur in patches and/or discontinuous small pods in gabbro, indicating infiltration of felsic melt. Amphibole-bearing gabbros were identified in several locations where these felsic rocks occur (Figure F40) and can be explained as having formed at the same time.
Origin of various dikes
Of the seven dikes recovered from the hole, there was one relatively unaltered diabase dike (Core 360-U1473A-6R) and six partially recrystallized granoblastic dikes. The texture of the diabase (intergranular with numerous skeletal plagioclase in the groundmass) strongly supports the hypothesis that it was intruded into a partially cooled gabbro body after the crystal-plastic deformation stage, and thus after the partial uplift but prior to exhumation of these rocks at the rift valley wall. The granoblastic dikes display well-equilibrated textures with mineral assemblages that are, depending on the samples, typical of the amphibole hornfels facies conditions or of the transition between amphibole and the two-pyroxene hornfels facies. The granoblastic texture is well developed for brown amphibole and clinopyroxene (orthopyroxene when present) but is also evident from recrystallized plagioclase laths in the groundmass. The phenocrysts present in those dikes, the orientation of plagioclase from the groundmass parallel to dike margins, and the fact that those plagioclase display skeletal shapes (now partially erased by granoblastic recrystallization) indicate that the injected magma experienced a significant undercooling against the colder host rocks (temperature of magma >> temperature of the host rock). The granoblastic texture and the associated mineral assemblage highlight that, once crystallized, dikes remained at high temperatures (probably >800°C) in a hydrous environment long enough to allow recrystallization. This suggests that granoblastic dikes were intruded in a still hot gabbro host (probably >800°C) that was already exposed to hydrothermal circulation.
Granoblastic dikes are associated with late felsic material either at the contact between dike and host gabbro, within the gabbro, or within the dike itself. Where close to granoblastic dikes, the felsic material is always restricted to <20 cm of distance from the dike margins. This close association, together with the locally diffuse transition between the felsic material and the dikes, and the lack of chilled margins, suggest that the felsic vein genesis is closely related to the granoblastic dikes. The intrusion of hot basaltic magma (>1100°C) within a still hot but partially cooled (probably >800°C) and hydrothermally altered gabbro host may be associated with local hydrous partial melting of the host. Indeed, the altered gabbro solidus temperature is <900°C (e.g., Koepke et al., 2004), which is consistent with this. Additionally, the dike itself may have undergone hydrous partial melting by back-reacting, after initial or partial solidification, with the rhyolitic melt of the wall rock to produce more felsic melt. Hydrous partial melting of basaltic dikes has been shown to occur at temperatures down to 850°C (France et al., 2010; Erdmann et al., 2015). Further discussion on the recrystallization stage can be obtained in Metamorphic petrology.
Comparison with other deep holes at slow-spreading ridges
Figures F49 and F13 compare the lithologic proportions and igneous stratigraphy of four deepest holes into slow and ultraslow-spreading ridge lower crust. Three of these holes were drilled within the lower oceanic crust at Atlantis Bank; the other hole (Integrated Ocean Drilling Program Hole U1309D) was drilled at the top of the Atlantis Massif core complex, along the Mid-Atlantic Ridge at 30°N.
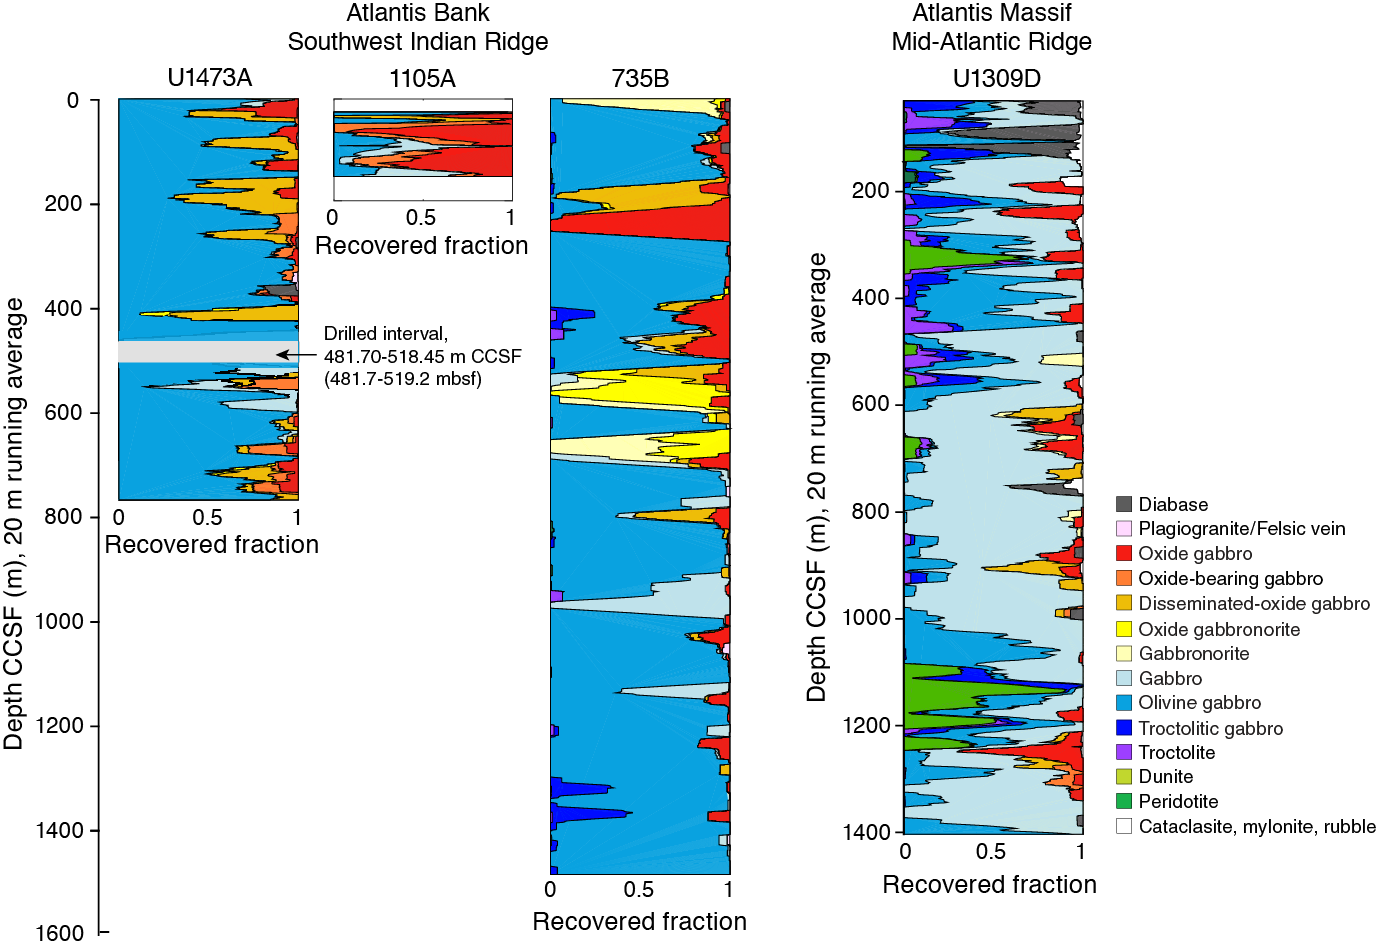
Figure F49. Hole U1473A lithostratigraphy compared with other holes from Atlantis Bank and Atlantis Massif.
Hole U1473A displays a number of similarities when compared to Holes 735B and 1105A, to shallow rock cores, and to dredge hauls at Atlantis Bank. This suggests that very similar igneous and tectonic processes acted during the genesis of the 400 km2 Atlantis Bank gabbro massif (Figure F49). Striking is the first-order observation that the plutonic sections in Holes 735B and U1473A are principally composed of olivine gabbro (68% and 77%, respectively) but interspersed with numerous intercalations of oxide-bearing gabbros (23% and 17%, respectively). Troctolite and troctolitic gabbros are observed in Hole 735B (5%) but are absent in the other holes. Remarkable in Holes 735B and 1105A, in many shallow BGS 5 m drill and BRIDGE 1 m drill cores, and in dredges and Shinkai 6500 and R/V Kaire remotely operated vehicle dive sections, is the occurrence of intensely deformed oxide-rich gabbros at shallow levels right across the surface of Atlantis Bank. By contrast, a thick oxide-rich layer is not observed in Hole U1473A, where oxide gabbros are instead sparsely distributed along the sections and slightly decrease with depth. One possible explanation for this difference is that the shallowest section of the platform at Site U1473 may have been removed by erosion (Palmiotto et al., 2013). The inferred proportion of late-stage hydrous melt, as indicated by the presence of secondary brown amphibole around clinopyroxene, also decreases with depth, along with the degree of crystal-plastic deformation and alteration. Felsic rocks are also ubiquitously documented over Atlantis Bank and are represented by veins or patches that appear randomly distributed in Hole U1473A. Diabase dikes with characteristic granoblastic textures and lack of chilled margins are also observed at Atlantis Bank. These rocks testify to the intrusion of basaltic melts into a relatively hot (~800°C) gabbroic body and imply the occurrence of melt bodies deeper in the section. In Hole U1473A, dike margins are invaded by felsic melts that were most likely generated by hydrous anatexis of the previously hydrothermally altered host gabbro.
Another feature common to the three holes drilled at Atlantis Bank is the occurrence of 100–400 m thick lithologic units defined by variations in texture, grain size, and modal and geochemical compositions. In particular, variations in whole-rock composition downhole reveal apparent broad-scale upward differentiating geochemical trends defined by decreases in Mg#, Cr, and Ni coupled with an increase in Na upsection (see Geochemistry). Each unit is in turn characterized by meter-scale heterogeneity classically documented in all the drill holes at Atlantis Bank. Overall, the evolution of these igneous intervals was likely governed by a complex interplay between magmatic processes (new melt injections, fractional crystallization, melt-rock reaction, and late-stage melt migration) and deformation.
Taken as a whole, the igneous stratigraphy of Holes 735B, 1105A, and U1473A suggests that this ~1.5 km thick portion of the Atlantis Bank plutonic section is relatively homogeneous on a lateral scale of at least a few kilometers. Key features are (i) the occurrence of olivine gabbro as main lithology; (ii) the presence of disseminated-oxide gabbros, oxide-bearing gabbros, and oxide gabbros often associated with crystal-plastic deformation at shallow levels; and (iii) the presence of ~100–400 m thick units showing upward differentiating geochemical trends. Although the three ODP/IODP holes display striking similarities between each other, we can’t (at least at this stage) correlate individual igneous units between holes; rather than documenting laterally continuous mush bodies, they probably instead document a common and recurring igneous accretion process acting at Atlantis Bank. The pertinent question then is to what extent the processes documented at Atlantis Bank are applicable to plutonic bodies exposed at other oceanic core complexes and to what degree its igneous stratigraphy is representative of slow- and ultraslow-spread ocean crust.
In the latter context, we compare the Atlantis Bank igneous architecture to that described at Atlantis Massif, an oceanic core complex on the Mid-Atlantic Ridge at 30°N (Hole U1309D; Blackman, Ildefonse, John, Ohara, Miller, MacLeod, and the Expedition 304/305 Scientists, 2006; Blackman et al., 2011). The first striking difference relates to the lithologic variability of the two regions. In particular, the Atlantis Bank lithologies are generally more evolved: they contain a lower proportion of chemically primitive (clinopyroxene-free) lithologies (olivine-rich troctolite, troctolite, and troctolitic gabbro) and more gabbros containing oxide (Figure F49). Olivine gabbro is by far the main lithology at Atlantis Bank, whereas gabbro (sensu stricto) is the most abundant rock at Atlantis Massif. A second important difference is the presence of mantle peridotite horizons embedded within or between the gabbro bodies at Atlantis Massif, a feature that has not been observed at Atlantis Bank. A third difference is the degree of crystal-plastic deformation to which the different gabbro bodies have been subjected: as a whole Atlantis Bank is much more deformed than Atlantis Massif and some other Mid-Atlantic Ridge oceanic core complexes (e.g., MacLeod et al., 2002; Escartín et al., 2003; Blackman, Ildefonse, John, Ohara, Miller, MacLeod, and the Expedition 304/305 Scientists, 2006; Blackman et al., 2011; Kelemen et al., 2007; Schroeder and John, 2004). Nonetheless, similar deformation is documented at the Kane Megamullion (Dick et al., 2008; Hansen et al., 2013) and at ODP Sites 921–924 at 23°30′N on the Mid-Atlantic Ridge (e.g., Karson and Lawrence, 1997), where similar oxide-rich gabbros are also associated with crystal-plastic deformation (Agar and Lloyd, 1997). These observations lead us to recognize that the mechanisms of accretion of the lower ocean crust at slower spreading ridges differ in important ways, with the observed variability probably resulting from the complex interplay between magma supply and locus of delivery, tectonic activity, and thermal regime, which is likely to produce heterogeneous lower crustal sections. Differences between the Atlantis Bank and Atlantis Massif sections could also be due to the fact of exposing different stratigraphic levels within the core complexes and/or relative positions in a magmatic segment.
Metamorphic petrology
Hole U1473A gabbros show three distinct modes of alteration: (1) static hydrothermal alteration, (2) alteration associated with crystal-plastic deformation, and (3) alteration associated with cataclastic deformation. These are discussed below in detail, together with the abundant metamorphic and magmatic veins and the contact alteration and retrograde autometamorphism of the late diabase dikes.
Static background alteration occurs throughout the hole, although with alteration mineral abundance varying widely from <3% to 90%. In some intervals with intense veining, alteration mineral abundance reaches >90%. Static alteration minerals consist mainly of (i) colorless amphibole, talc, serpentine, and clay minerals after olivine; (ii) secondary clinopyroxene and brown to green or colorless amphibole after clinopyroxene; (iii) colorless amphibole and talc after orthopyroxene; and (iv) secondary plagioclase and chlorite after primary plagioclase. These minerals occur in different abundances in each core or hand specimen and indicate variable temperature and fluid conditions and fluxes for alteration. Textural relationships document overprinting of lower-temperature over higher-temperature assemblages during the cooling of the gabbroic sequence. The formation of the secondary clinopyroxene and brown amphibole association most likely took place at near-solidus temperatures (>800°C). Brownish green and green amphibole and tremolite/actinolite + chlorite ± talc assemblages formed at amphibolite to greenschist facies metamorphic conditions (700°–400°C). The assemblage of secondary plagioclase + chlorite + pale green amphibole (actinolite) with minor amounts of zoisite and titanite indicates greenschist facies conditions (450°–350°C). Serpentinization of olivine most likely took place at temperatures in the range 350°–200°C (i.e., lower than greenschist facies alteration but higher than that of clay mineral formation). Clay minerals are the latest products of alteration at lowest temperatures (<150°C). The downhole trend in background alteration is related to the metamorphic vein distribution mentioned below.
Much of the Hole U1473A gabbroic sequence has been subjected to crystal-plastic deformation (see Structural geology). In the upper portion of the hole, static background alteration of these porphyroclastic and mylonitic rocks tends to be high, with much amphibole (mostly green to brown-green in thin section), making identification of the synkinematic mineral assemblages difficult. Deeper in the hole, where subsequent background alteration is typically much less, the plastically deformed rocks are characterized by neoblasts of olivine, plagioclase, and clinopyroxene with minor brown amphibole and Fe-Ti oxide minerals. This mineral assemblage, effectively granulite facies, indicates deformation at near-solidus temperature conditions (>800°C). Lower temperature amphibolite facies crystal-plastic deformation tends to be present in the form of discrete high-strain mylonitic shear zones largely composed of brown-green hornblende and plagioclase. They are commonly associated with local concentrations of Fe-Ti oxides. The amphibolite facies mineral assemblage also occurs in the halos associated with amphibole veins, some of which themselves display evidence of minor crystal-plastic deformation (see below). Amphibolite mylonites and amphibole vein halos show cooling of the gabbroic sequence to temperature conditions around the ductile–brittle transition (~700°C).
Intervals recording cataclastic deformation, sometimes intense, occur throughout the upper two-thirds of the hole (see Structural geology) and are associated with abundant carbonate and brownish clay mineral(s). Clays and carbonates show textural relationships indicative of simultaneous formation. These observations indicate that cataclastic deformation occurred under low-temperature alteration (<150°C) conditions.
Amphibole veins and amphiboles replacing primary mafic minerals are dominant at shallower levels (<180 m CCSF), whereas carbonate or carbonate-clay veins are conspicuous instead in the interval 180–580 m CCSF. Oxidative reddish clay-mineral replacement of primary minerals is also significant from the seafloor to 580 m CCSF. In these intervals, millimeter-wide veins commonly have alteration halos that may be centimeters wide. At deeper levels (>580 m CCSF), micro veins filled with chlorite ± amphibole are more abundant than the millimeter-wide veins.
Felsic veins are typically more altered than host gabbros. The most prominent feature in the felsic rocks is the replacement of primary plagioclase and sometimes quartz by secondary plagioclase, which has a characteristic whitish milky appearance and often contains fluid inclusions. Together with the association of a relatively high abundance of secondary sulfide and patches of clay minerals in these veins, this implies that the felsic veins were pathways for large volumes of hydrothermal fluids, particularly at lower temperatures (below greenschist facies). Local occurrence of biotite in host gabbros is evidence for metasomatic alteration related to felsic vein intrusion.
Intrusive diabase dikes and apophyses occur at several levels in Hole U1473A, some with granoblastic textures and local contact metamorphism that may have led to the formation of felsic veins. The mafic phases in small apophyses may consist in part or entirely of brown hornblende, whereas larger dikes may have brown hornblende as the mafic phase on the margins.
Static alteration
Downhole variation of alteration intensity
Overall, 37% of the Hole U1473A section exhibits <10 vol% secondary replacement, 41% has 10–30 vol% replacement, and 18% is 30–60 vol% replaced, whereas ~4% of the core is extensively altered (60–90 vol%), and only 0.1% has undergone >90 vol% alteration. Downhole variations in total background alteration intensity and those of the primary igneous phases are shown in Figure F50. Downhole variations obtained from thin section observations are plotted in Figures F51, F52, F53, and F54.
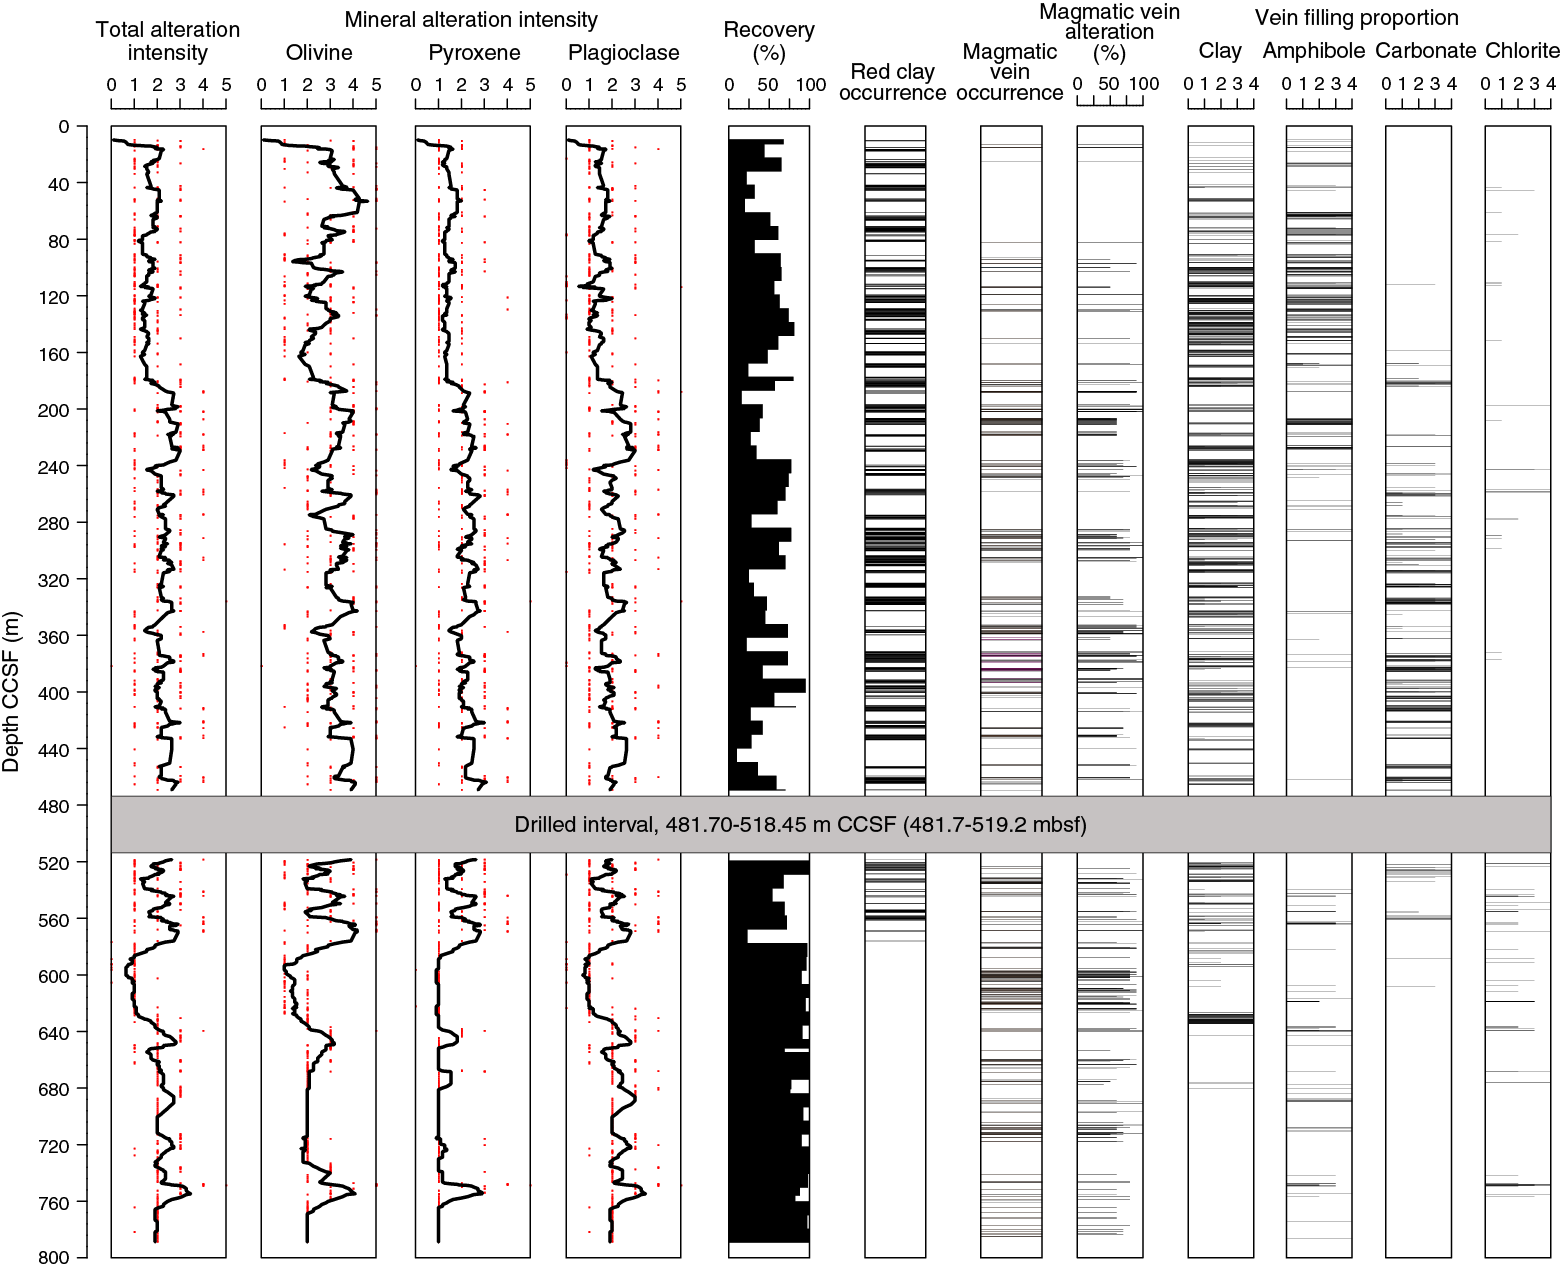
Figure F50. Alteration intensity, reddish clay after olivine, magmatic veins, and vein filling minerals, Hole U1473A.
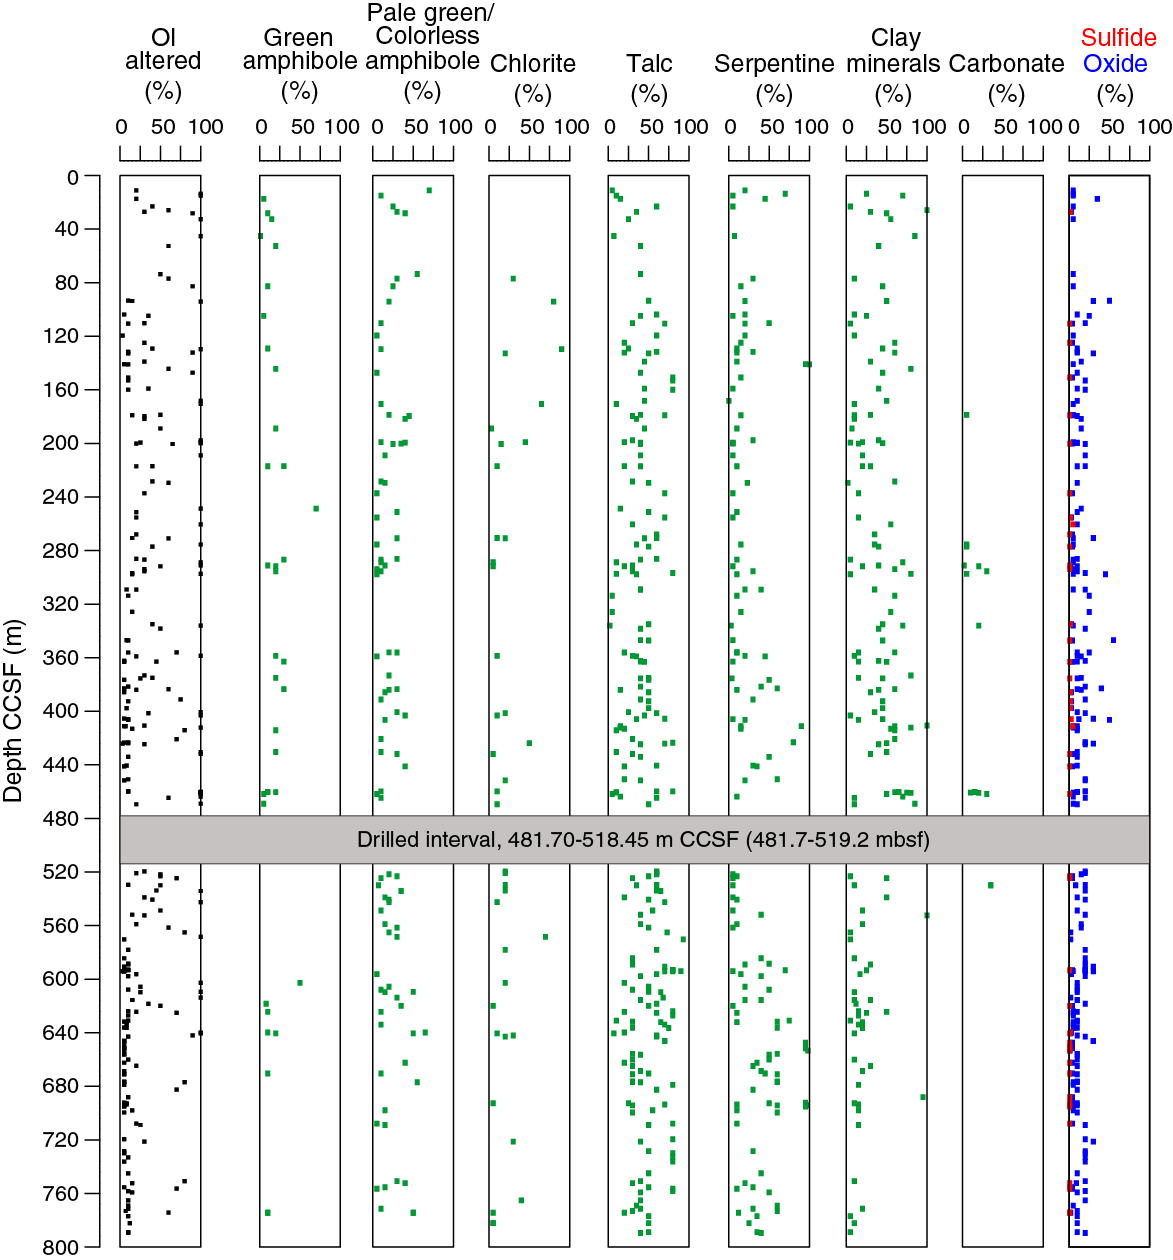
Figure F51. Hole U1473A olivine alteration minerals and intensity.
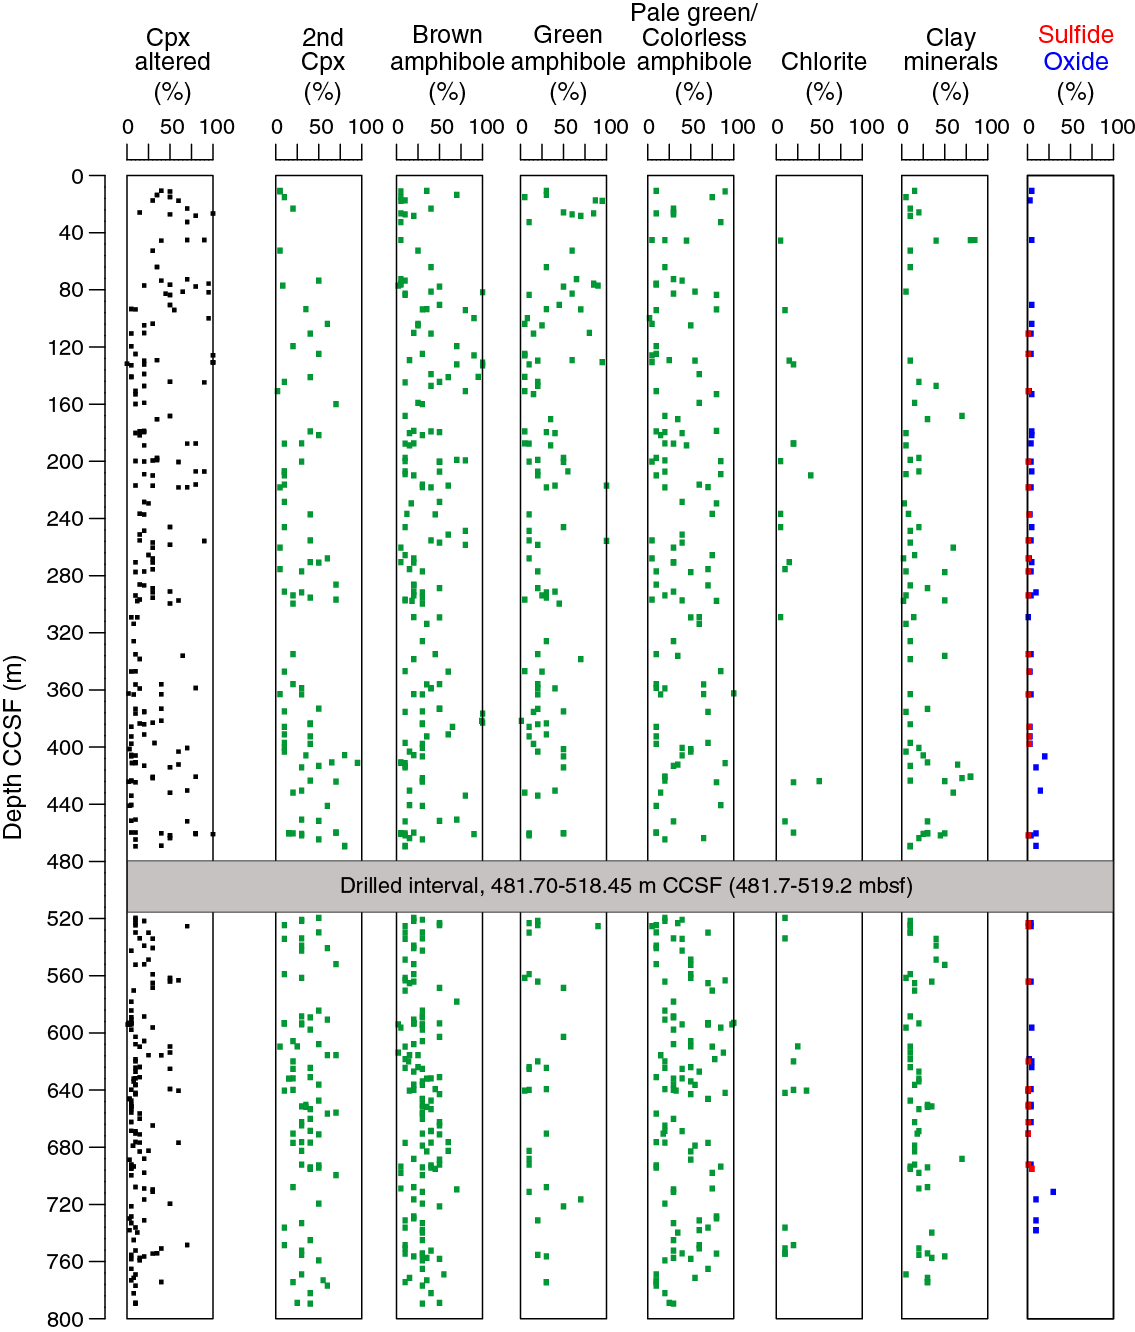
Figure F52. Hole U1473A clinopyroxene alteration minerals and intensity.
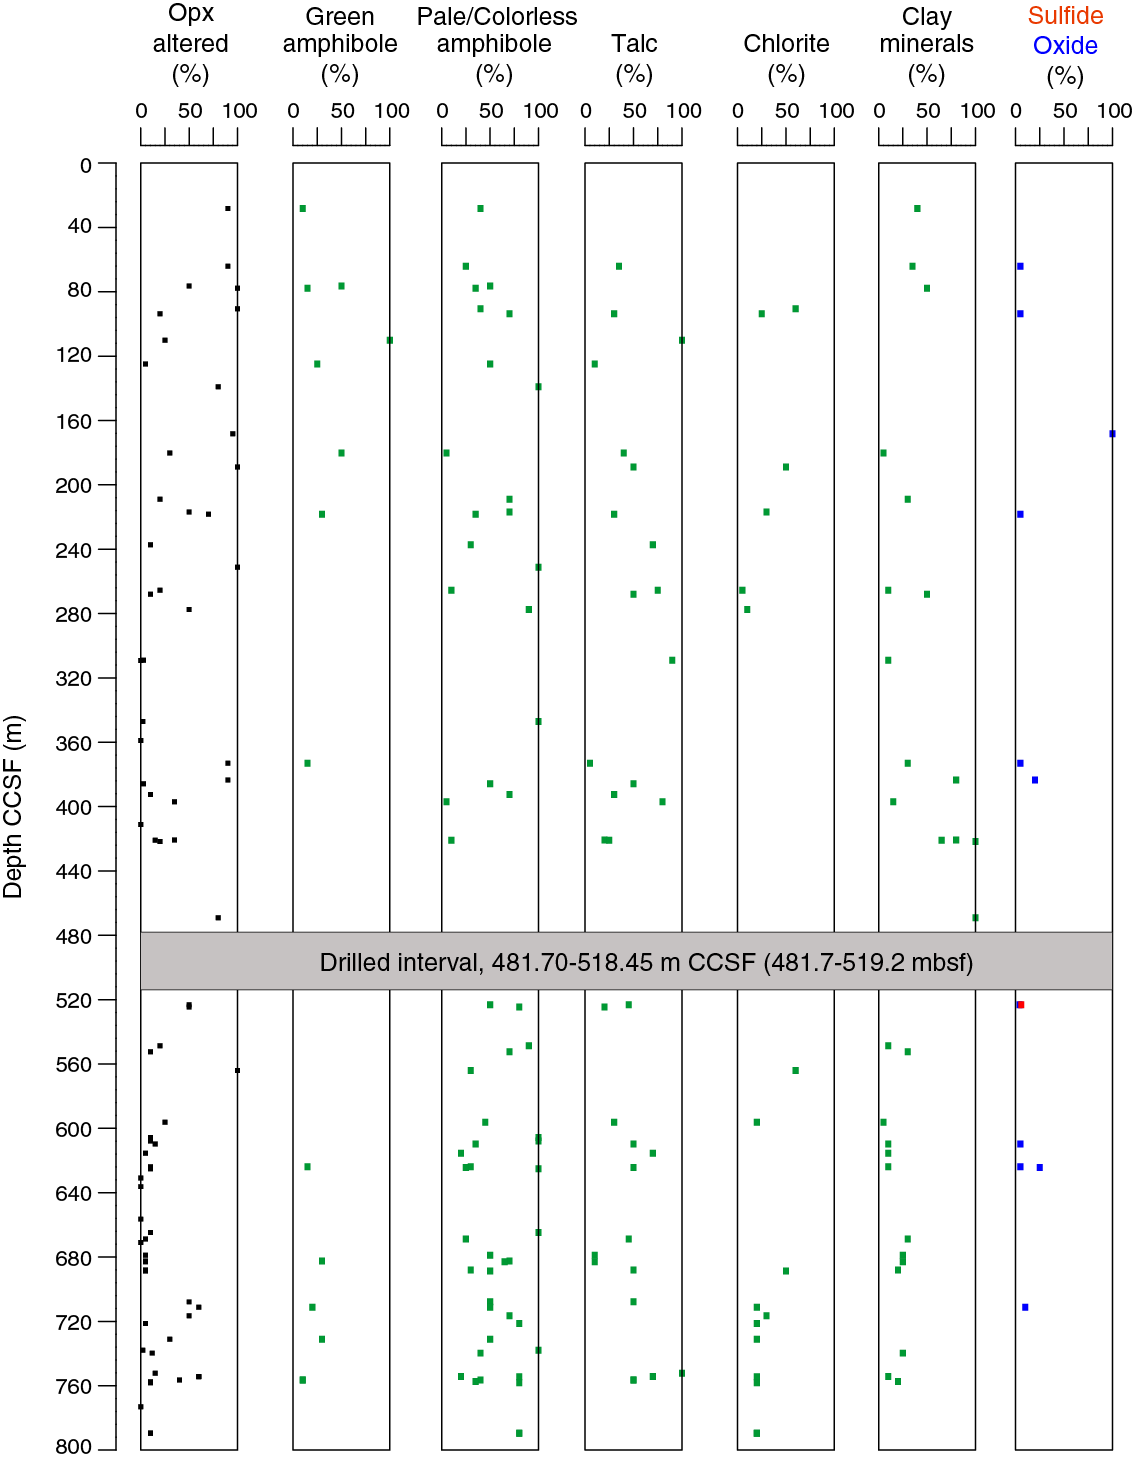
Figure F53. Hole U1473A orthopyroxene alteration minerals and intensity.

Figure F54. Hole U1473A plagioclase alteration minerals and intensity.
In the upper part of the core, alteration is highly heterogeneous and shows variable intensity within the same thin section. The most pronounced alteration is typically observed in areas proximal to veins (Figure F55). The upper 180 m CCSF is composed of rocks that exhibit slight to moderate alteration, with a few spikes of increased alteration associated with high fracture density. Cores from 180 to 580 m CCSF are more altered overall than those from shallower and deeper. Extensive alteration observed in this interval is associated with an increased proportion of faults, fractures, carbonate veins, and heavily altered felsic patches deeper than 180 m CCSF (see Structural geology). Although amphibole veins are dominant in the upper 180 m CCSF of the hole, carbonate veins are common from 180 to 580 m CCSF and correspond to the most intensely altered part of the hole. Oxidative clay replacement is common in the upper part of the hole but is very rare deeper than 580 m CCSF. Overall, the spikes in alteration intensity within Hole U1473A are generally related to the presence of faults and dense fracturing (e.g., 50–70 and 180–580 m CCSF), suggesting structural controls on fluid flow and consequential alteration processes.
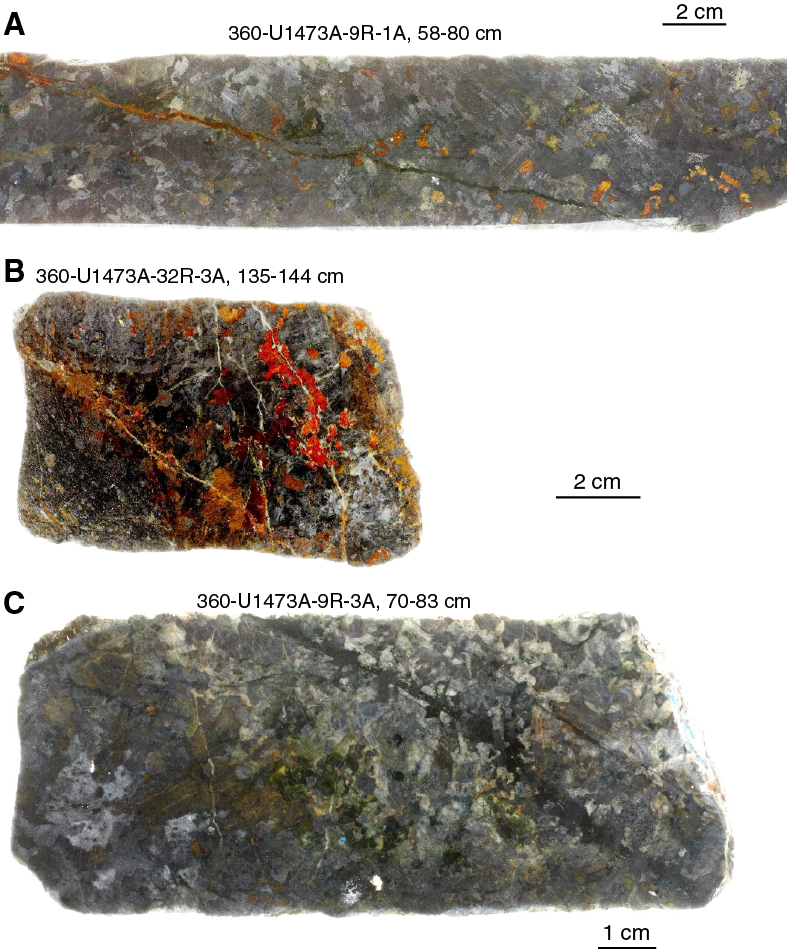
Figure F55. Hole U1473A core pieces with intense alteration close to veins.
In general, rocks recovered from 580 m CCSF to the bottom of the hole exhibit only slight low-temperature alteration; correspondingly, recovery rates from this interval are the highest in the hole (~96%). A few spikes of elevated alteration intensity associated with localized greenschist facies replacement occur in conjunction with the sporadic occurrence of chlorite and amphibole veins, which are slightly more common than in the interval above. In contrast to the upper part of the hole, which is dominated by hornblende, the amphibole veins here are instead commonly composed of tremolite/actinolite (see Metamorphic and magmatic veins).
Figure F50 indicates an increase in overall alteration intensity deeper than ~620 m CCSF on the basis of the appearance of milky white plagioclase in the core, some of which is associated with abundant microfracturing. Thin section observations reveal that the milky appearance is a combination of hydrothermal alteration associated with the microcracking and extensive plagioclase neoblast formation associated with crystal-plastic deformation. The total alteration and plagioclase mineral alteration intensity indexes shown in Figure F50 do not therefore correlate simply with the degree of fluid-rock interaction associated with hydrothermal circulation.
Magmatic veins are common deeper than 200 m CCSF (for compositional variation of these veins, see Metamorphic and magmatic veins). These veins are generally more altered (>50 vol%) than their host gabbros.
Olivine alteration
Olivine is the most heavily altered primary phase and is characterized by mesh, corona, and pseudomorphic alteration textures. Its static alteration intensity is variable throughout the hole, even within individual description intervals. Secondary mineral modal proportion and assemblages replacing olivine display conspicuous variations even at the thin section scale (Figure F51). Intensive alteration of olivine is generally associated with high vein density. Although olivine alteration intensity shallower than 580 m CCSF is variable, deeper than 580 m CCSF it is homogeneous except for several intervals of more intense greenschist alteration. Where the rock contains veins, the olivine alteration assemblage is typically related to those of the veins.
Pale green/colorless amphibole
Pale green/colorless amphibole showing acicular shape mainly occurs as coronas around olivine. Where occurring at the boundary between primary olivine and plagioclase, it is generally associated with a rim of chlorite (Figure F56B). Pale green/colorless amphibole (probably actinolite) is also present in the center of pseudomorphic talc replacing olivine, with or without oxides (Figure F56C–F56D). This replacement mode is typical of greenschist grade alteration in Hole U1473A. It also rarely occurs as aggregates in the external portions of pseudomorphs modally dominated by talc (Figure F57A–F57B).

Figure F56. Examples of olivine alteration.

Figure F57. Talc pseudomorphing olivine.
Talc
Talc is the most widespread secondary mineral replacing olivine. The replacement modes of olivine by talc have been divided into three types. The most frequent mode is represented by coronitic aggregates of talc and oxide rimming mesh textures (Figure F56A). In the second alteration mode, talc occurs in mesh rims coexisting with serpentine, clay minerals, and oxide phases (Figure F58C), as well as rare calcite (Figure F59B, F59D) in those instances where the rock hosts calcite veins. In general, talc in mesh rims is too fine grained to be identified under the microscope. Talc identification was inferred on the basis of its dark appearance in backscattered electron (BSE) images (Figure F58A, F58C). In few cases, talc occurs with green clay in mesh centers (Figure F60B). Finally, less frequently and only at depths shallower than 580 m CCSF, olivine is completely replaced by talc + oxide phases ± actinolite (Figure F57A) or by talc + actinolite ± oxide phases (Figure F56C–F56D). These form olivine pseudomorphs with no mesh texture, which in contrast occurs frequently in the greenschist alteration zone deeper than 580 m CCSF.

Figure F58. Olivine alteration.
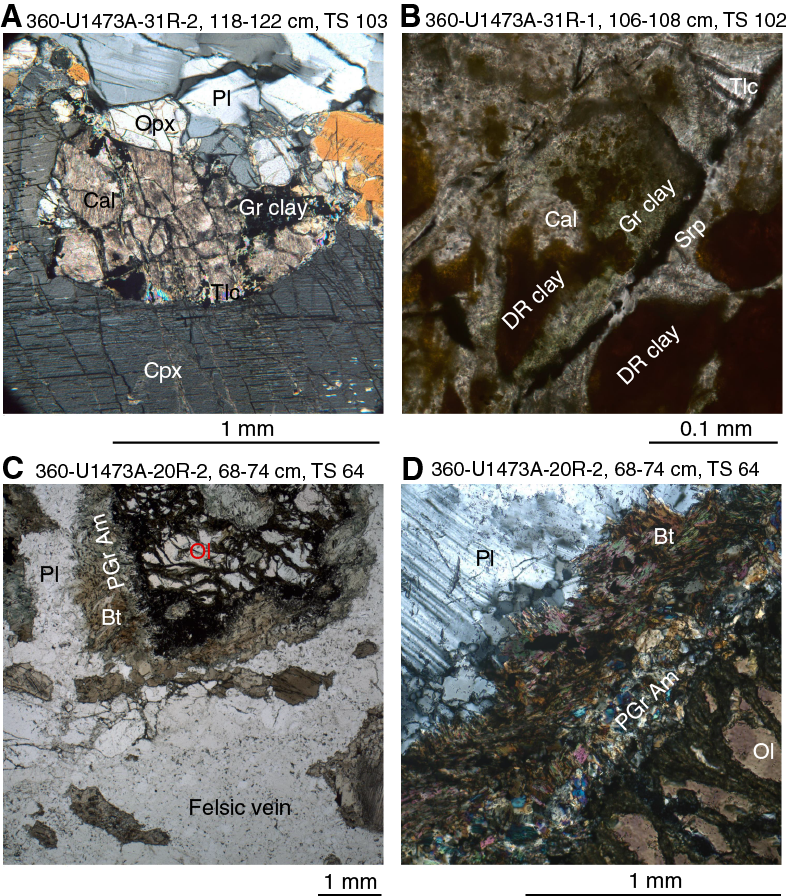
Figure F59. Olivine alteration.
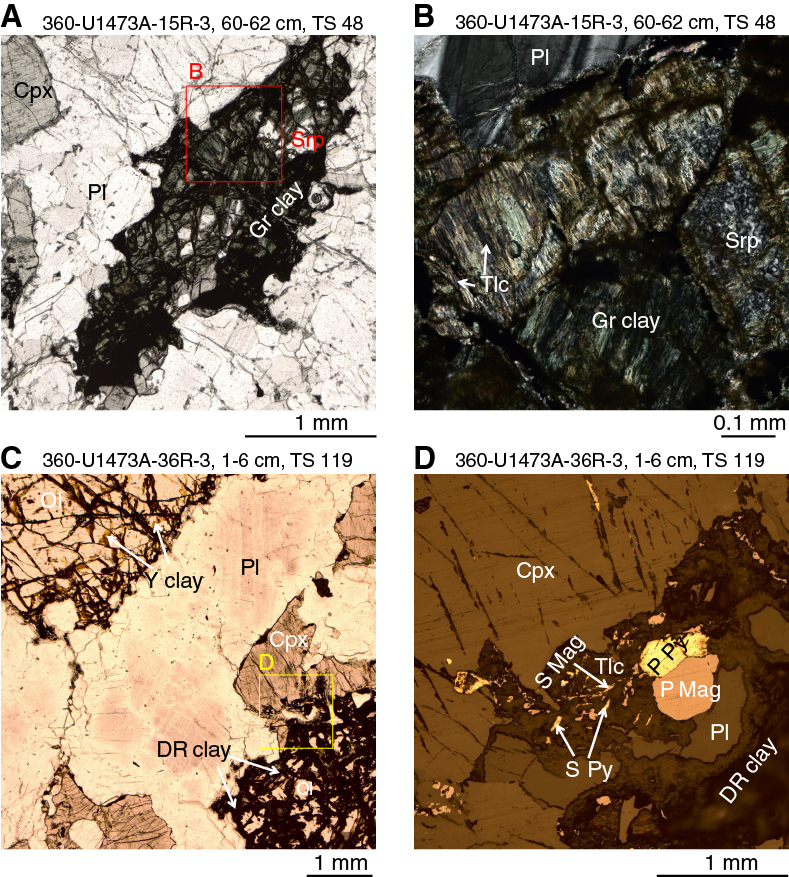
Figure F60. Olivine alteration.
Serpentine
Serpentine is present in mesh textures preserving the shape of previous olivine grains. Tiny serpentine flakes (probably lizardite) occur in mesh rims and mesh centers (Figure F58B, F58D), where some of the mesh centers are also occupied by dark red clay and calcite. In another sample, some parts of mesh rims consist of tiny serpentine flakes and the other parts consist of talc and calcite (Figure F56B). In this case, mesh centers are completely replaced by dark red clay and calcite. The brightness in a BSE image indicates that these serpentine flakes are relatively Fe rich (Figure F58A). The fibers associated with the linear arrangement of oxide phases inside the mesh rims could also be serpentine on the basis of optical observations (Figure F58C).
Clay minerals
Clay minerals are dominant in Hole U1473A at 0–580 m CCSF where olivine is more intensely altered (Figure F50). The colors of clay minerals vary from green (Figure F60A) to yellow (Figure F60C) to red (Figure F55B) to dark red (Figure F60C). Clay minerals regularly occur in mesh textures or pseudomorphic textures after olivine (Figure F58B). Red clay usually coexists with yellow clay and dark red clay. Red clay and dark red clay, which form mesh textures with talc, serpentine, and oxides, are probably associated with considerable amounts of goethite (Figures F58C, F61), which is generally found in highly oxidizing conditions. In contrast, green clay ± talc forming mesh centers (Figure F60B) and aggregates of green clay, talc, serpentine, oxide phases, and calcite (Figure F59B) occur in some samples and indicate relatively reducing conditions. In several samples, domains similar to saponite-talc layers (Nozaka et al., 2008) occur between talc-oxide layers and mesh-forming serpentine (Figure F58A). A saponite-like phase has acicular shape, low birefringence, and low relief under the optical microscope (Figure F58D). The brightness in BSE images indicates that this phase is relatively enriched in Fe (Figure F58A).

Figure F61. XRD pattern of red and dark red clays drilled from pseudomorph.
Other minerals
Oxide phases (magnetite was identified under the microscope) are typically associated with talc and form irregular linear arrangements (Figure F57A). Tiny linear aggregates of oxide phases, talc, and serpentine in mesh rims commonly occur in most samples (e.g., 360-U1473A-3R-4, 40–42 cm; TS 5). Sulfides (pyrite was identified under the microscope) are also locally present together with magnetite in talc matrix (Figure F60D). In addition, the assemblage of sulfide, talc, serpentine, and oxide is locally observed in mesh rims. Near felsic veins, brown to pale green amphibole rims olivine and is locally associated with biotite (Figure F59C–F59D). Chlorite coronas, locally intimately associated with talc, are common where olivine is surrounded by plagioclase (Figure F56B–F56D; see Plagioclase alteration). The presence of calcite as an olivine alteration product is typically related to carbonate veining. In particular, calcite pseudomorphs and calcite rims are observed in thin section (Figure F59A).
Clinopyroxene alteration
Clinopyroxene alteration is variable, estimated under the microscope as ranging from 2% to 100%. The high degree of alteration is mainly ascribed to abundant formation of amphiboles in mylonitic rocks and halos related to amphibole veins, as well as to the formation of clay minerals. Macroscopic downhole logs show that pyroxene alteration intensity increases from 180 to 580 m CCSF, correlating with that of olivine, plagioclase, and the whole rock (Figure F50). These increases in alteration intensity, averaged in each descriptive alteration interval (see Metamorphic petrology in the Expedition 360 methods chapter [MacLeod et al., 2017a]), are attributed to clay mineral formation related to carbonate or carbonate-clay veining and/or faulting. Clinopyroxene alteration minerals observed under the microscope are secondary clinopyroxene, brown amphibole, brown-green amphibole, green amphibole, pale green or colorless amphibole, chlorite, clay minerals, sulfides, oxides, and carbonates. Clinopyroxene alteration intensity in thin section shows a correlation with the amount of green amphibole after clinopyroxene (Figure F52).
Secondary clinopyroxene
Secondary clinopyroxene was identified only in thin section. Compared with primary clinopyroxene, which has apparent cleavage and pale brownish color, secondary clinopyroxene is characterized by poorer cleavage and colorless/clear appearance in plane-polarized light (PPL) (Figure F62). Secondary clinopyroxene commonly occurs as patches replacing primary clinopyroxene with an elongated shape parallel to cleavage surfaces of primary clinopyroxene and hosts minor amounts of parallel orthopyroxene lamellae. These lamellae are subparallel to the cleavage surfaces of relict primary clinopyroxene.

Figure F62. Clinopyroxene alteration to secondary clinopyroxene and brown amphibole.
Secondary clinopyroxene never replaces other alteration minerals but is frequently subjected to partial replacement itself, and is therefore the earliest alteration product of magmatic clinopyroxene. Secondary clinopyroxene in mylonitic rocks may be bent along with the host primary clinopyroxene (Figure F63A–F63B). In some cases, undeformed secondary clinopyroxene replaces bent crystals of primary clinopyroxene (Figure F63C–F63D). Clinopyroxene neoblasts formed by crystal-plastic deformation are similar to secondary clinopyroxene in their clear appearance and in close association with brown amphibole; however, they were not classified with secondary clinopyroxene because it was too difficult to distinguish neoblastic aggregates from porphyroclasts in macroscopic descriptions.
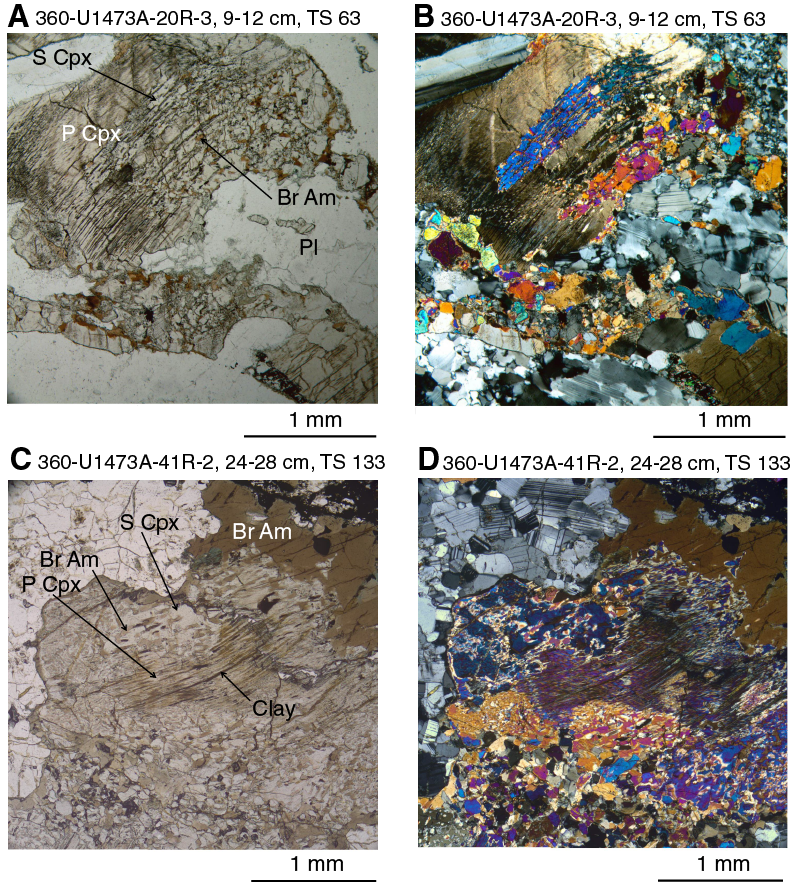
Figure F63. Plastic deformation of clinopyroxene.
Brown amphibole
Brown amphibole is the most frequent clinopyroxene replacement (Figure F52). Its pleochroic color is slightly variable between grains, including reddish brown, relatively dark brown, and pale brown. It occurs as blebs within and fringes mantling primary, secondary, and neoblastic clinopyroxene (Figures F62, F63). Brown amphibole blebs occur along the contacts between the orthopyroxene lamellae and host secondary clinopyroxene or along the cleavage surfaces of primary clinopyroxene. In some cases, brown amphibole blebs appear to be deformed along with the host clinopyroxene. Brown amphibole is also typically found as thin discontinuous rims around clinopyroxene, along the contact with plagioclase (Figure F62), locally including oxide phases (ilmenite and/or magnetite) and/or sulfides.
Alteration of primary clinopyroxene to brown amphibole was also observed in gabbros near felsic veins and patches. Clinopyroxene is typically rimmed by brown amphibole, locally in association with zircon and/or biotite (Figure F64A–F64B). These brown amphibole coronae around primary clinopyroxene in places include an inner portion made up of secondary clinopyroxene and vermicular brown amphibole (Figure F64C–F64D). The alteration of clinopyroxene to brown amphibole is locally substantial where the clinopyroxene is entirely in felsic material.
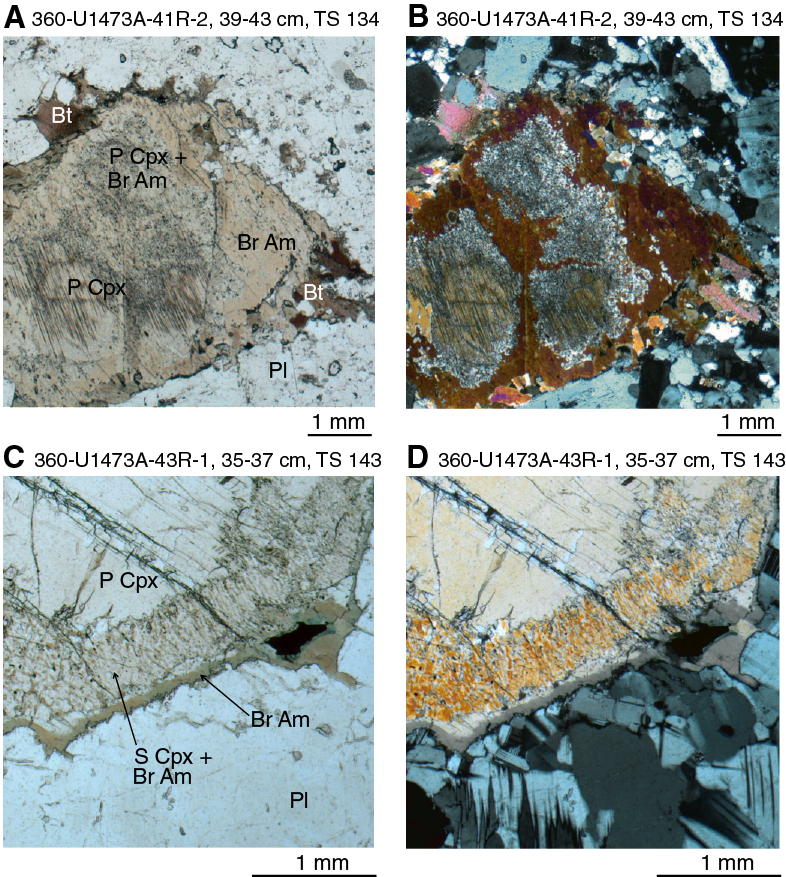
Figure F64. Clinopyroxene alteration near felsic veins.
Brown-green amphibole in vein halos
Veins filled with brown-green amphibole typically crosscut the foliation of the host gabbro at a high angle and have up to centimeter-wide halos shown by the milky white appearance of plagioclase in hand specimen. Clinopyroxene in vein halos is replaced by brown-green amphibole, with the amphibole/clinopyroxene modal ratio progressively decreasing from the vein outward. Close to the amphibole vein, clinopyroxene is completely replaced by amphibole (Figure F65). Replacement of clinopyroxene by brown-green amphibole is also observed where an amphibole vein crosscuts an undeformed gabbro. In this case, the clinopyroxene is replaced by single grains or aggregates of brown-green amphibole. Away from the vein wall, at the thin section scale, clinopyroxene is commonly preserved and rimmed by brown-green amphibole coronae.
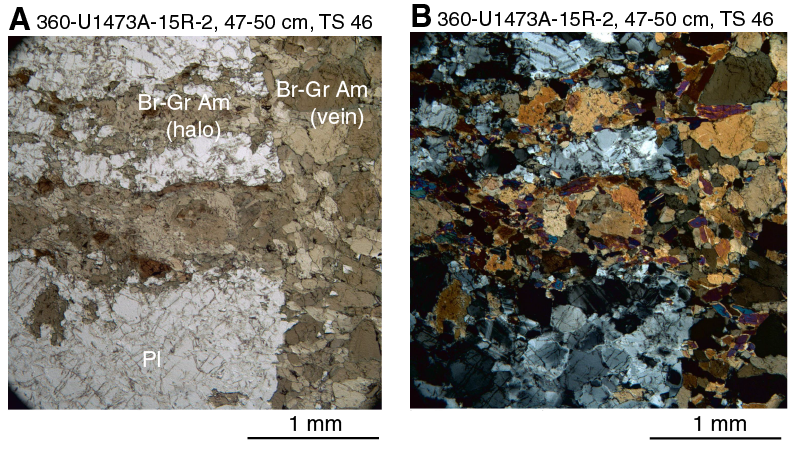
Figure F65. Clinopyroxene alteration to brown-green amphibole near a vein filled with brown-green amphibole.
Green amphibole
Green amphibole includes here the brownish green variation but shows a different mode of occurrence from the brown-green amphibole mentioned above. Green amphibole typically occurs as fringes rimming clinopyroxene and brown amphibole (Figure F66A–F66B), thereby indicating formation later than brown amphibole. In highly altered rocks, green amphibole forms pseudomorphs after clinopyroxene (Figure F66C–F66D).
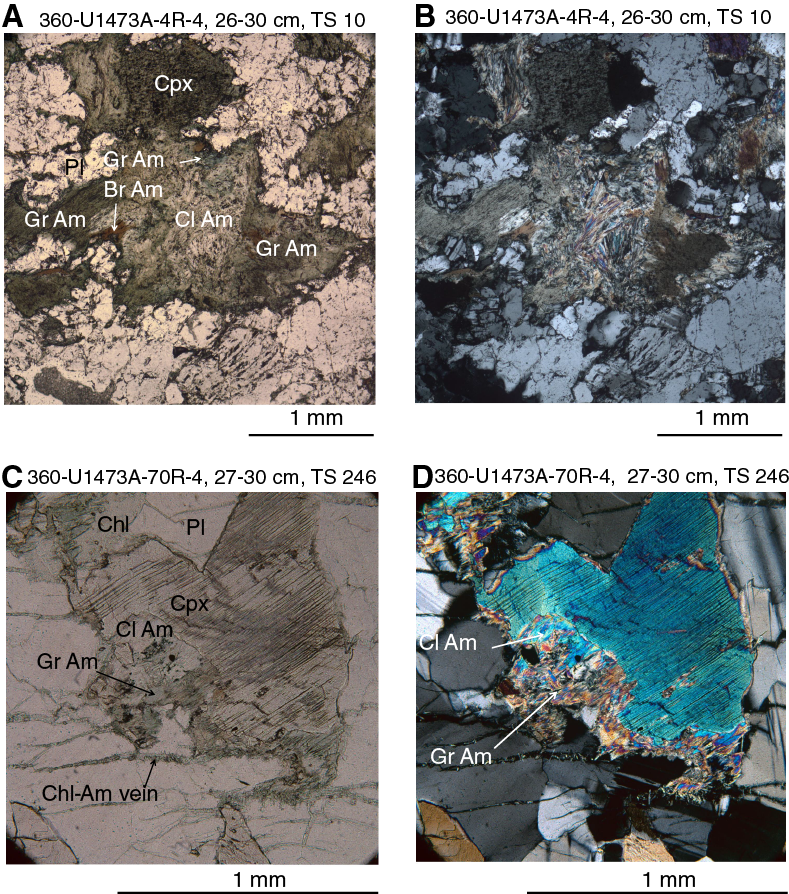
Figure F66. Clinopyroxene alteration to green amphibole and pale green/colorless amphibole.
Pale green and colorless amphibole
The pale green/colorless amphibole group generally has acicular shape, suggesting that it belongs to the tremolite/actinolite amphibole series. It occurs as thin fringes rimming clinopyroxene or brown amphibole or pseudomorphic aggregates after clinopyroxene (Figure F66C–F66D).
Other minerals
Brownish clay minerals locally occur along microcracks or cleavage surfaces of clinopyroxene or forming pseudomorphs near carbonate or carbonate-clay veins. In some samples, talc and chlorite occur at rims of clinopyroxene grains. Some of the chlorite-forming coronitic texture could also be considered as an alteration product of adjacent plagioclase (see Plagioclase alteration). Trace amounts of tiny grains of oxide(s) and sulfide(s) occur in association with brown amphibole, talc, and clay formation after clinopyroxene. Carbonate(s) replaces clinopyroxene in cataclastic zones (see Alteration associated with cataclasis).
Orthopyroxene alteration
Orthopyroxene is a minor constituent of Hole U1473A gabbros and shows no systematic downhole variations in alteration (Figure F53). Alteration minerals after orthopyroxene include green amphiboles, pale green amphiboles, colorless amphiboles, talc, chlorite, clay minerals, oxides, and sulfides. Orthopyroxene and clinopyroxene alteration degree may vary significantly in individual samples, presumably because of localized vein-related alteration.
Amphibole
Pale green or colorless amphibole aggregates occur at rims, within micro veins, or along cleavage surfaces of orthopyroxene (Figure F67). Amphibole has an acicular shape with a width of 0.01–0.03 mm and typical length of 0.05–0.2 mm. Its color and shape indicate that this amphibole belongs to the tremolite/actinolite series. Green amphibole rims orthopyroxene or tremolite/actinolite aggregates, particularly along plagioclase contacts. Brown amphibole rimming small orthopyroxene grains in some samples may be formed by orthopyroxene alteration or may be continuous with amphibole replacing adjacent clinopyroxene.
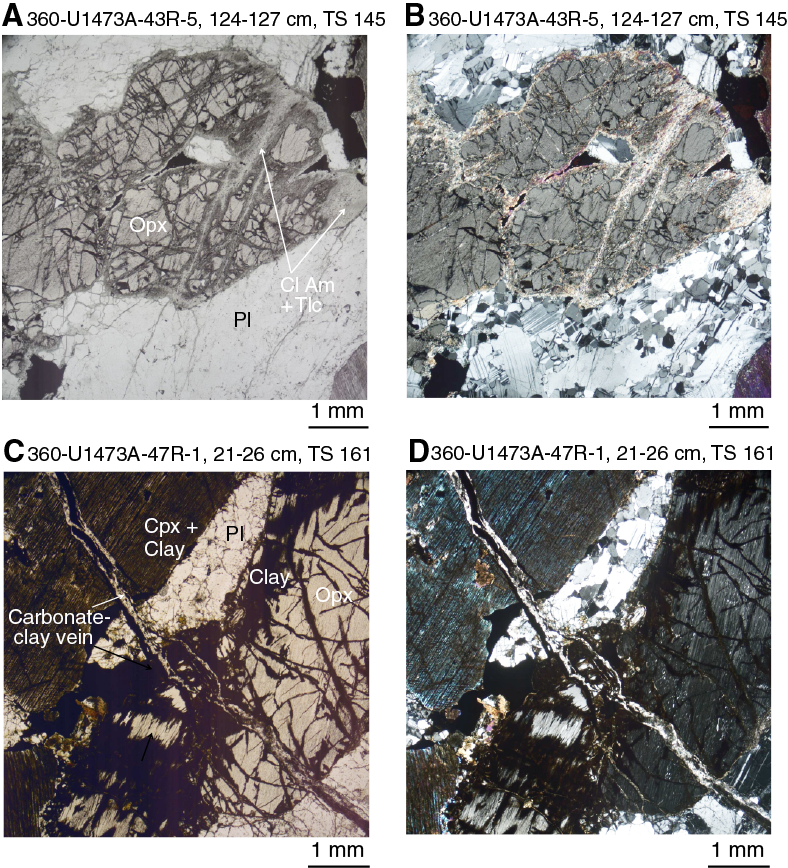
Figure F67. Orthopyroxene alteration.
Talc
Talc occurs at rims, in micro veins, or along cleavage surfaces of orthopyroxene in association with actinolitic aggregates. Talc shows a flaky shape and similar size to the acicular actinolite crystals (Figure F67).
Other minerals
Chlorite aggregates with fringes of subordinate tremolite occur near amphibole veins in a few rare instances (e.g., Sample 360-U1473A-11R-1, 43–47 cm; TS 29). These aggregates are likely pseudomorphs after orthopyroxene because chlorite is considered too abundant to be a pseudomorph after olivine. In addition, within the same thin section, clinopyroxene is typically replaced by amphibole, not by chlorite, and plagioclase is fresh. Brownish clay minerals occur at rims and in micro veins of orthopyroxene or form pseudomorphs after orthopyroxene near carbonate or carbonate-clay veins (Figure F67C–F67D). Trace amounts of tiny oxide and sulfide grains occur in association with actinolitic amphibole + talc aggregates or brownish clay minerals.
Plagioclase alteration
From hand specimen description it is estimated that in 44% of the cores plagioclase is only slightly altered (<10 vol% alteration), whereas 37% has moderately altered plagioclase (10–30 vol% alteration). Only 14% of the plagioclase in Hole U1473A gabbro is substantially (30–60 vol%) and 5% is extensively altered (60–90 vol%), whereas complete alteration (>90 vol%) is rare. Downhole variations of plagioclase alteration intensity and secondary phases obtained from thin section observations are shown in Figure F54. It should be noted that “alteration” as defined from observation of hand specimens here encompasses both low-temperature replacement associated with hydrothermal alteration and high-temperature neoblast formation related to crystal-plastic deformation.
Secondary plagioclase
Secondary plagioclase is the most common replacement mineral after primary plagioclase. At hand sample scale, secondary plagioclase is distinguished by its milky white appearance, whereas primary plagioclase is darker and more translucent. “Milky” plagioclase frequently rims primary plagioclase grains and occurs near amphibole veins (Figure F55C). Microscopically, secondary plagioclase mostly occurs at the grain boundary, along cleavage and twinning planes of primary plagioclase, often in close proximity to microfractures (Figure F68) filled with other secondary minerals such as amphibole and chlorite. Primary plagioclase is characterized by a faint brown color in PPL, whereas secondary plagioclase is clear and colorless. A high-contrast PPL photomicrograph was often used to distinguish between the two plagioclase generations (see Metamorphic petrology in the Expedition 360 methods chapter [MacLeod et al., 2017a]). It is difficult to distinguish secondary plagioclase resulting from static alteration from that produced by dynamic recrystallization. Recrystallized plagioclase is widespread throughout Hole U1473A. As a consequence and as discussed in Metamorphic petrology in the Expedition 360 methods chapter (MacLeod et al., 2017a), accounting for secondary plagioclase static background replacement is prone to overestimation even in thin section.
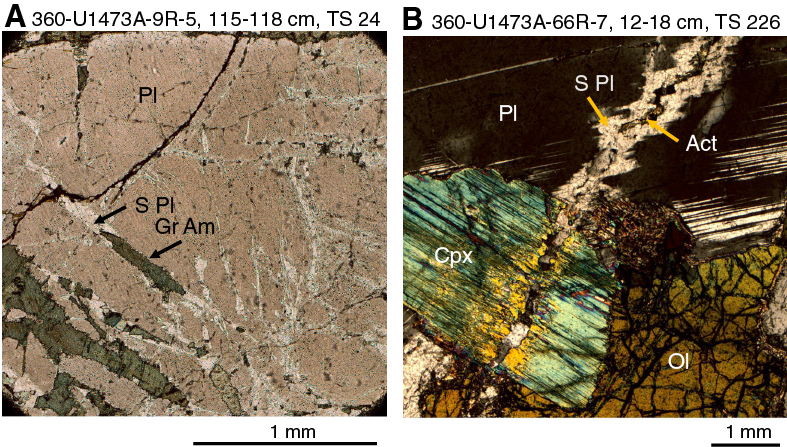
Figure F68. Secondary plagioclase close to microfractures filled by green amphibole and actinolite.
Shallower than 620 m CCSF, pronounced occurrences of secondary plagioclase are mostly associated with veins and felsic intrusions. In contrast, milky white plagioclase is particularly conspicuous throughout most cores deeper than 620 m CCSF without any relation to veining and felsic intrusions; instead, plagioclase grains from this interval are characterized by abundant microfractures. Thin section observations show that secondary plagioclase at this interval is associated with epidote, chlorite, and tremolite/actinolite. Locally, secondary plagioclase is also associated with chlorite and calcite in the same interval.
Chlorite
Chlorite is the second most common alteration mineral replacing plagioclase. Macroscopically, chlorite is identified as a green to dark green mineral typically occurring in micro veins. Chlorite also occurs together with secondary plagioclase in zones of intense alteration such as vein halos (Figure F55C). Microscopically, chlorite is present in micro veins within a single plagioclase grain or in veinlets crosscutting several grains. In proximity to pyroxene and, particularly, olivine, plagioclase is rimmed by chlorite (Figures F69D, F70). In some cases, plagioclase is completely replaced by chlorite, often associated with epidote, titanite, and a rim of tremolite and/or actinolite (Figure F69A, F69C). Chlorite in most samples shows a bluish interference color, whereas in a few samples it shows a yellowish-grayish interference color (Figure F69B).

Figure F69. Chlorite replacing plagioclase.
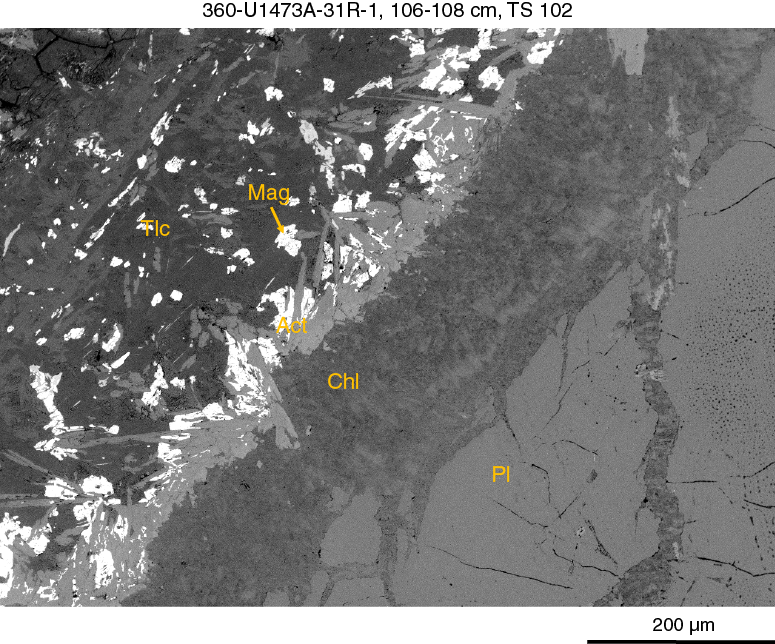
Figure F70. Plagioclase-olivine reaction rim showing talc, magnetite, actinolite, and chlorite.
Other minerals
Green, pale green, and colorless amphiboles usually occur as infilling minerals in plagioclase micro veins and cleavage surfaces. These amphiboles are likely to be tremolite or actinolite due to acicular habit. Tremolite and/or actinolite were also observed at the contact between plagioclase and olivine (Figure F70), typically with chlorite rimming plagioclase and talc rimming olivine. Where plagioclase is completely altered to chlorite, the pseudomorph has an outermost actinolite rim (Figure F69A).
Epidote grains were identified under microscope and by X-ray diffraction (XRD) analysis. In thin section, epidote is closely associated with chlorite and tremolite. Epidote also occurs in aggregates within veins (see Metamorphic and magmatic veins). Clinozoisite was identified by XRD, and both clinozoisite and zoisite were identified in thin section.
Garnet (likely hydrogrossular) was identified in a few thin sections. It occurs in the cores of plagioclase grains (Figure F71A) and as micro vein fillings. Some plagioclase grains have cores altered to a mineral with high relief and low birefringence (Figure F71B), likely hydrogrossular or epidote.
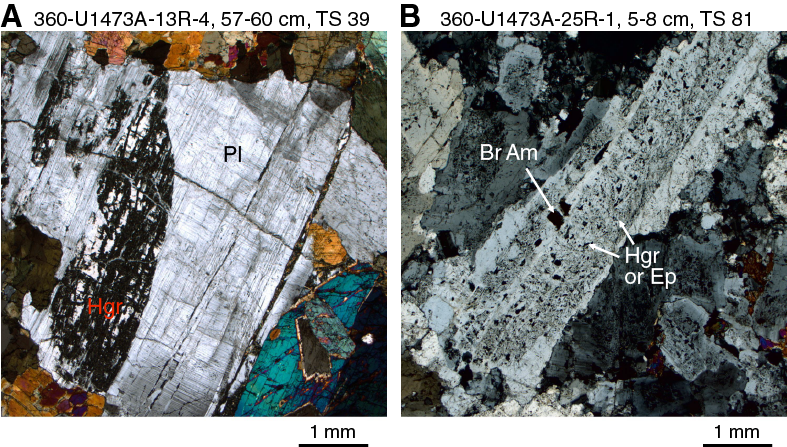
Figure F71. Hydrogrossular partially replacing plagioclase.
Yellowish to reddish clays were observed replacing plagioclase, particularly in the more intensely altered samples. At the thin section scale, these clays occur in micro veins and along grain boundaries, particularly near brownish clay veins. Kaolinite and, to a lesser extent, the pyrophyllite group of clay minerals were identified through XRD analysis of altered felsic veins, characterized by ~7 and ~9.5 Å peaks in the X-ray diffractograms, respectively. In particular, some of the samples have peaks indicating halloysite, a polymorph of kaolinite.
Reactions and emplacement processes at gabbro contacts
From thin section observation of felsic vein/gabbro contacts it is apparent that a number of magmatic and metamorphic reactions occur in the primary host minerals in proximity to the veins. Most commonly observed is the replacement of primary clinopyroxene by brown amphibole at the contact where the gabbro initially ruptured, as well as replacements/overgrowth of primary clinopyroxene by a secondary clinopyroxene, sometimes with symplectic texture. Plagioclase grains in the felsic veins adjacent to the contact often show epitaxial overgrowth of the primary plagioclases. Replacement of primary olivine by orthopyroxene due to interaction between olivine and the felsic melt is rare (Figure F72). In some cases, initial fracture of the gabbro during intrusion can be traced by petrographic features along the contact: beginning with epitaxial overgrowth in combination with precipitation of oxide minerals in plagioclase, trails of tiny relict clinopyroxene inclusions in brown hornblende, and the crystallization of small apatite needles in the felsic groundmass (Figures F73, F74).
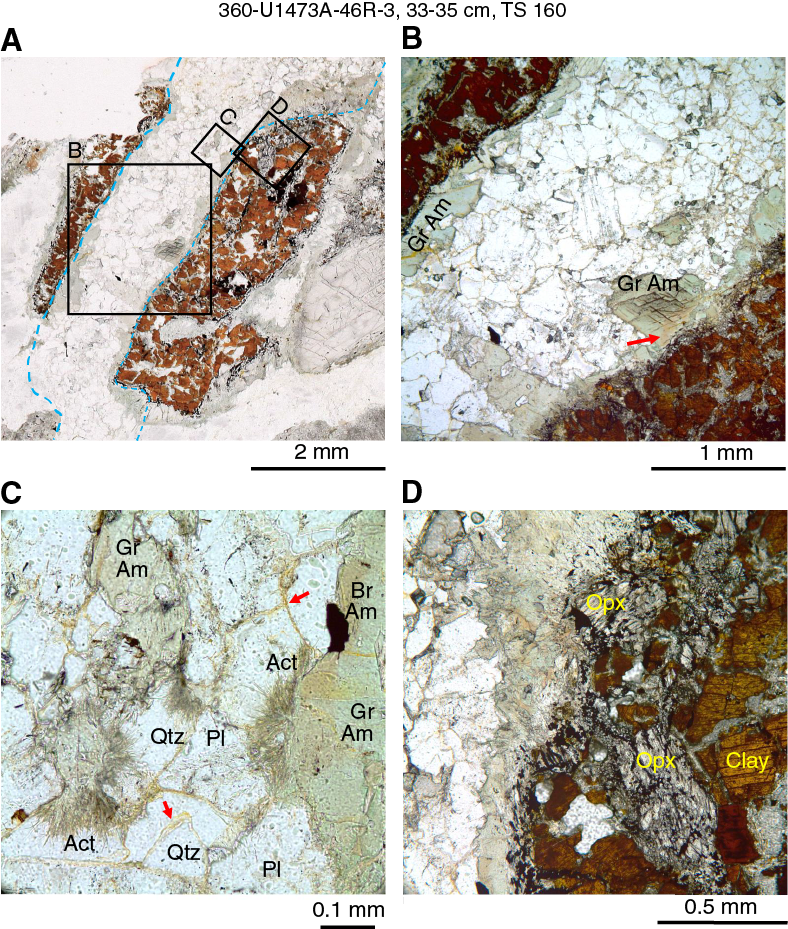
Figure F72. Alteration features in a felsic vein cutting an olivine gabbro.
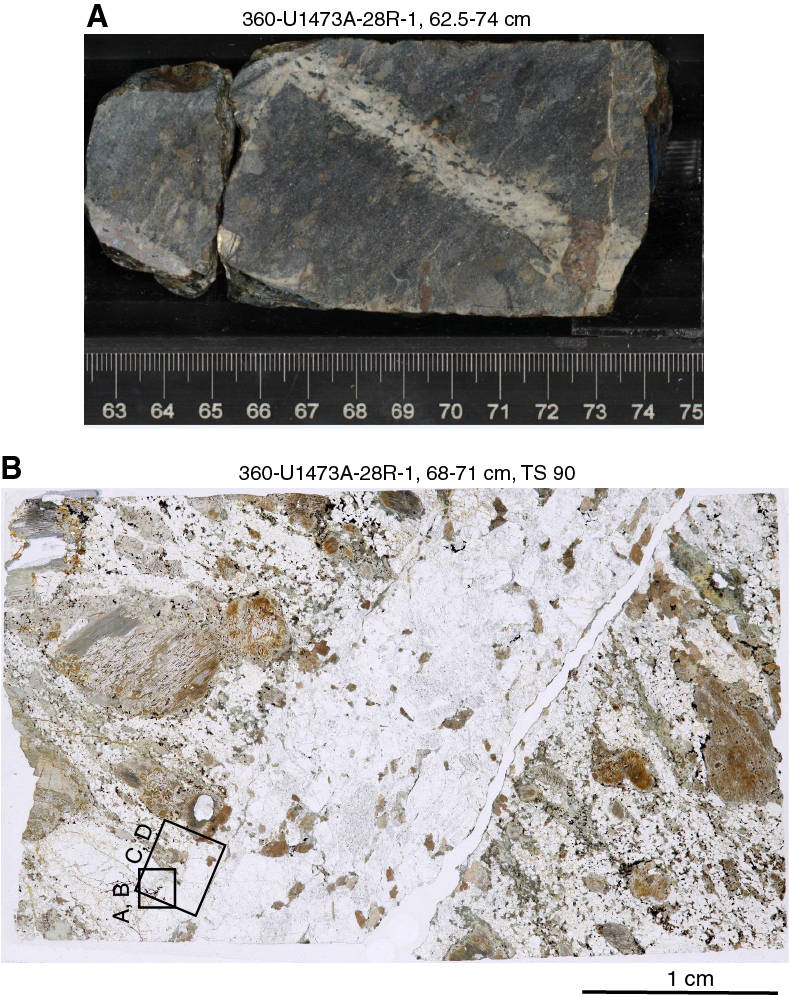
Figure F73. Reactions and emplacement processes at the contact of a felsic vein to host gabbro.
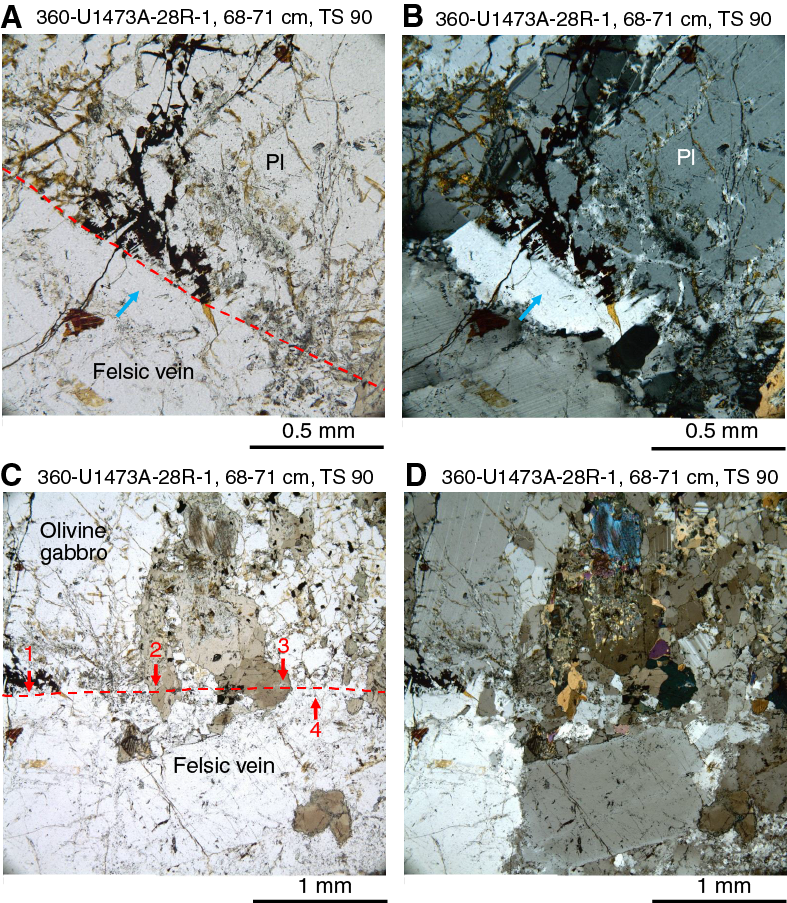
Figure F74. Reactions and emplacement processes at contact between a leucodiorite vein and a gabbro.
Deformed felsic veins
Felsic veins locally record crystal-plastic deformation, which produces mylonitic foliation modally dominated by fine-grained plagioclase. The foliation in the veins frequently crosscuts the porphyroclastic or mylonitic foliation in the gabbro at a high angle. In these cases, the host gabbro shows coronitic replacement of clinopyroxene by brown amphibole close to the deformed felsic vein (Figure F75A). Where felsic veins and host gabbros have concordant foliation, clinopyroxene rims in the gabbro are replaced by brown amphibole. Euhedral to subhedral grains of plagioclase and brown amphibole, locally associated with quartz and/or zircon, are present in deformed felsic veins and interpreted as magmatic relics.
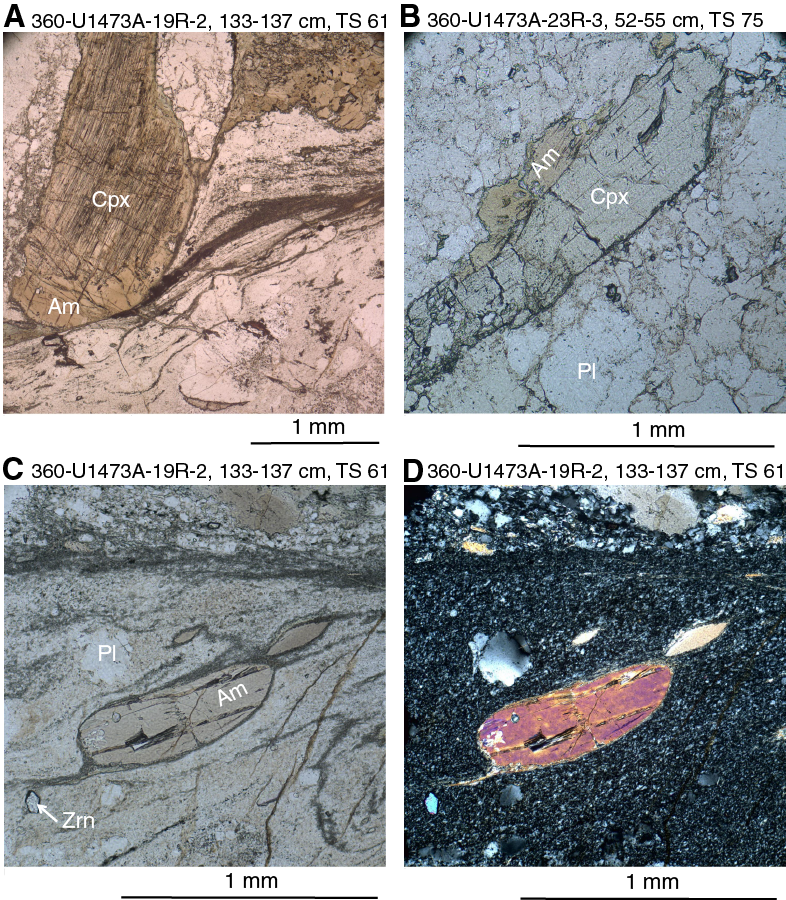
Figure F75. Characteristic microstructures of deformed felsic veins.
In deformed felsic veins, plagioclase may be associated with brown amphibole, clinopyroxene, and/or quartz. Clinopyroxene is colorless, has elongate morphology, and is aligned along the foliation. In some cases, clinopyroxene forms aggregates defined by elongated aligned grains indicative of synkinematic growth. Elongated clinopyroxenes and amphiboles locally exhibit planar contact relationships, thereby documenting equilibrium relationships between these two phases (Figure F75B). Deformed felsic veins locally exhibit a further recrystallization event, producing an extremely fine grained plagioclase matrix enclosing lens-shaped porphyroclastic amphibole and/or clinopyroxene (Figure F75C–F75D). This event was associated with dynamic crystallization of amphibole of extremely fine grain size, whose pleochroism could not be ascertained.
Recrystallization associated with crystal-plastic deformation
Two main mineral assemblages were recognized in crystal-plastically deformed gabbros. The more common assemblage was formed by recrystallization of plagioclase, olivine, and clinopyroxene ± brown amphibole and is inferred to have formed under granulite facies conditions. Less commonly, dynamic crystallization of plagioclase is accompanied by brown-green amphibole, equating to amphibolite facies conditions. These rocks are hereafter referred to as amphibolite mylonites.
Granulite facies assemblage
In these rocks, plagioclase and olivine typically develop nearly polygonal aggregates, and neoblastic clinopyroxene aggregates typically include minor amounts of brown amphibole and/or oxide phases (ilmenite and/or magnetite, Figure F76A). In places, brown amphibole is also associated with neoblastic olivine, and orthopyroxene occurs within the neoblastic clinopyroxene aggregates. Brown amphibole associated with clinopyroxene neoblasts occurs as (i) irregular veinlike grains interstitial to clinopyroxenes and (ii) nearly equant grains at clinopyroxene triple junctions. Undeformed brown amphibole rimming both primary and adjacent neoblastic clinopyroxene is also locally seen (Figure F76B). Recrystallization of interstitial brown amphibole into granoblastic aggregates locally occurs, particularly around ilmenite and/or magnetite (Figure F76C–F76D).
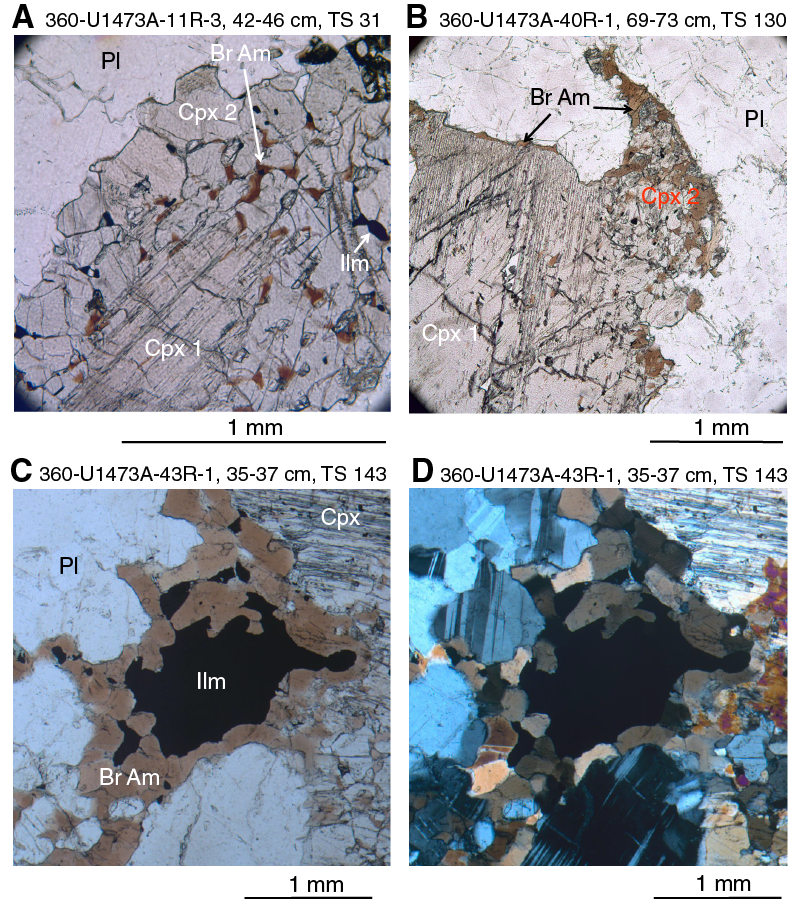
Figure F76. Characteristic microstructures in gabbro mylonites.
Amphibolite facies assemblage
These rocks typically have a plagioclase and brown-green amphibole assemblage that is typically found in thin mylonitic bands, often discordant to the main crystal-plastic foliation in the gabbro. These shear bands may locally be associated with felsic veins that were also subjected to crystal-plastic deformation. Amphibolite facies crystal-plastic deformation unrelated to felsic veins largely occurs shallower than 200 m CCSF and is apparently restricted to oxide gabbros or to thin oxide-bearing mylonitic bands.
Foliation in the amphibolite facies crystal-plastically deformed rocks is typically defined by alternating irregular bands of fine-grained plagioclase and amphibole enclosing clinopyroxene and plagioclase porphyroclasts (Figure F77A–F77B). Brown-green amphibole typically also occurs as (i) tails of clinopyroxene porphyroclasts (Figure F77C) and (ii) coronae and pseudomorphs after clinopyroxene. Moreover, amphibole that statically replaced clinopyroxene is dynamically recrystallized (Figure F77D).
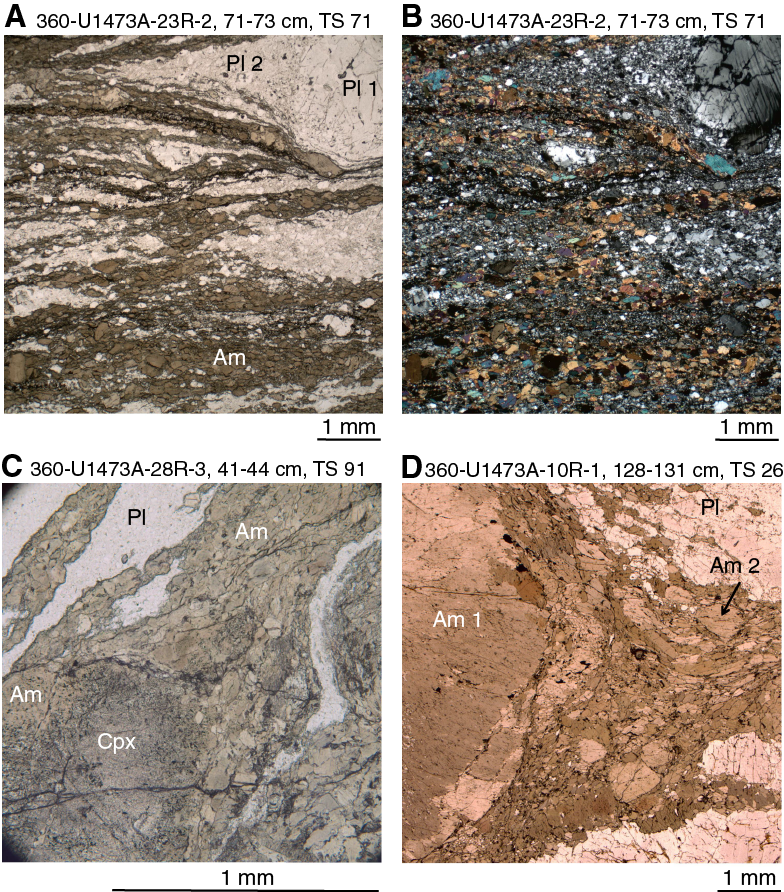
Figure F77. Characteristic microstructures of amphibole mylonites.
Alteration associated with cataclasis
Carbonates and brownish clay minerals are abundant in cataclastic intervals (e.g., interval 360-U1473A-37R-3, 38–53 cm), with carbonate and clay veins generally abundant nearby. These observations indicate a close association of cataclasis with the formation of carbonates and clay. In a representative sample (Figure F78), rock and crystal clasts are cemented in a matrix of carbonate, identified as calcite by XRD. Textural observations in thin section indicate that calcite fills microcracks in plagioclase and invades clinopyroxene fragmented along cleavage surfaces. It displays wavy extinction, indicating that it may be plastically deformed (Figure F79A–F79B). Completely altered olivine grains in this sample show mesh texture where calcite and brown clay minerals occur in the mesh rims and centers in one domain, and calcite occurs in the mesh centers with clay minerals in the mesh rims in other domains (Figure F79C–F79D). These observations indicate that calcite and clay formed simultaneously penecontemporaneous to cataclastic deformation and therefore provide a constraint on deformation temperature.
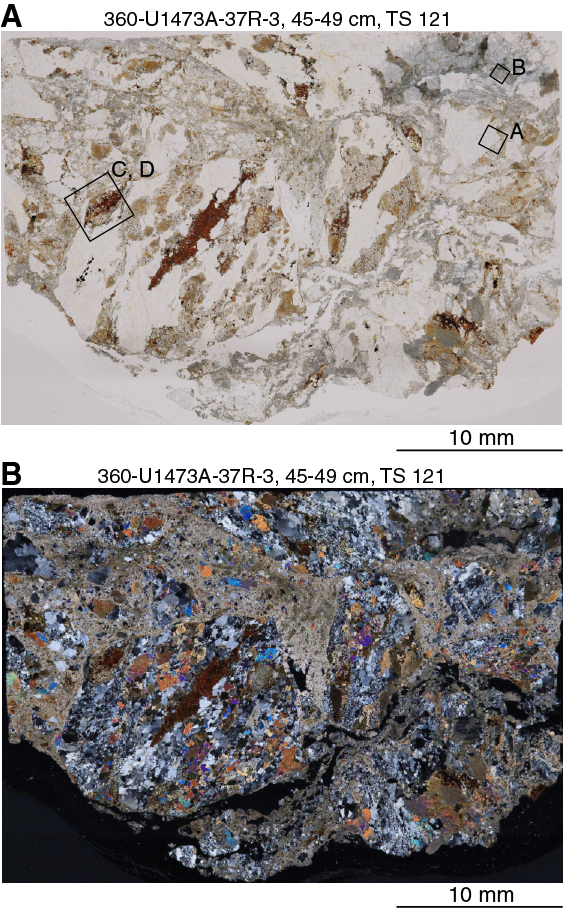
Figure F78. Whole thin section images of an olivine gabbro cataclasite.
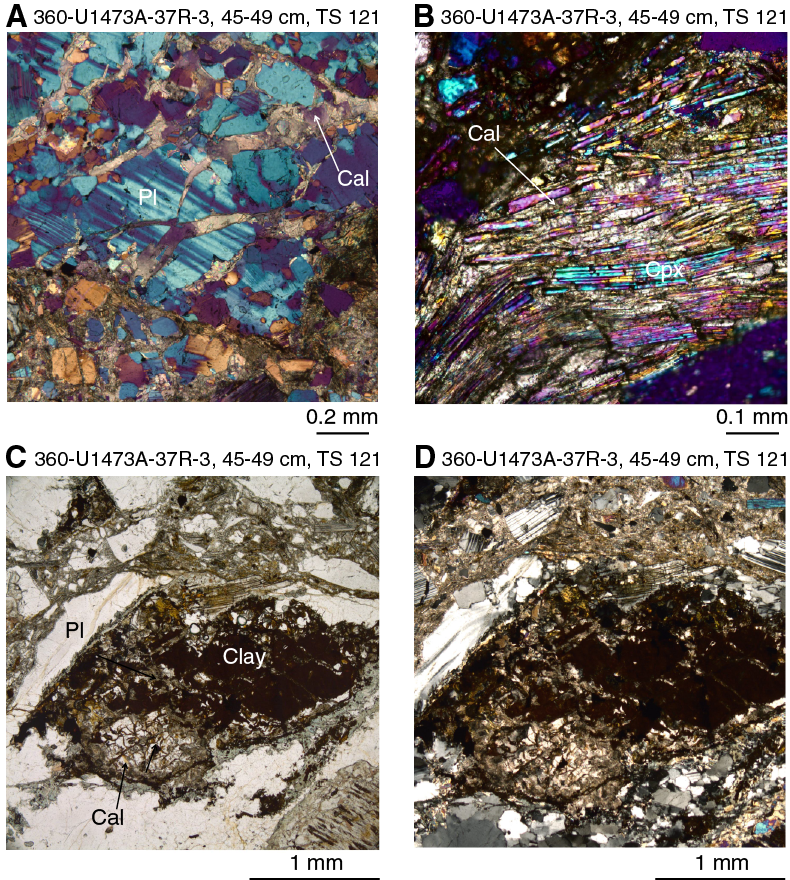
Figure F79. Alteration features in cataclasite.
Metamorphic and magmatic veins
In combination with the structural geology team, 2445 veins were described and measured. All details concerning vein density and distribution, mineral association with depth, and correlations with other structural and alteration parameters are presented in Structural geology. All igneous aspects of the veins are presented in Igneous petrology.
Based on macroscopic descriptions and depending on their mineral paragenesis and abundances, 10 distinct vein assemblages were identified in cores drilled during Expedition 360. The results are presented in Table T8. The different vein assemblages and their abundances in Hole U1473A are given as percentages based on their number and thickness (Figure F80A–F80B). As a proportion of all veins, the most abundant are white clay veins (38.8%) followed by magmatic veins with an abundance of 20.1% (felsic veins were the only type counted in this magmatic vein category). Other vein types are amphibole (16.0%), carbonate (14.3%), brown clay (5.0%), carbonate-clay (2.3%), chlorite (1.5%), plagioclase (1.1%), plagioclase-chlorite (0.3%), and other veins (0.5%). A comparison with the corresponding vein data from Hole 735B (Shipboard Scientific Party, 1999b [table T9; figure F48]) shows relatively good correspondence with respect to clay, amphibole, and carbonate veins: 46% smectite veins from Hole 735B compared to 44% from Hole U1473A (both gray and brown clay minerals), 24% amphibole-dominated veins from Hole 735B compared to 16% from Hole U1473A, and 9% carbonate-dominated veins from Hole 735B compared to 14% from Hole U1473A. A significant difference is recorded with respect to felsic veins: only 4% felsic veins from Hole 735B compared to 20% from Hole U1473A. Emerald green diopside veins seen in Hole 735B were not seen in Hole U1473A. All percentages above relate to vein percent by count.
Table T8. Macroscopically estimated vein types, Hole U1473A. Download table in .csv format.
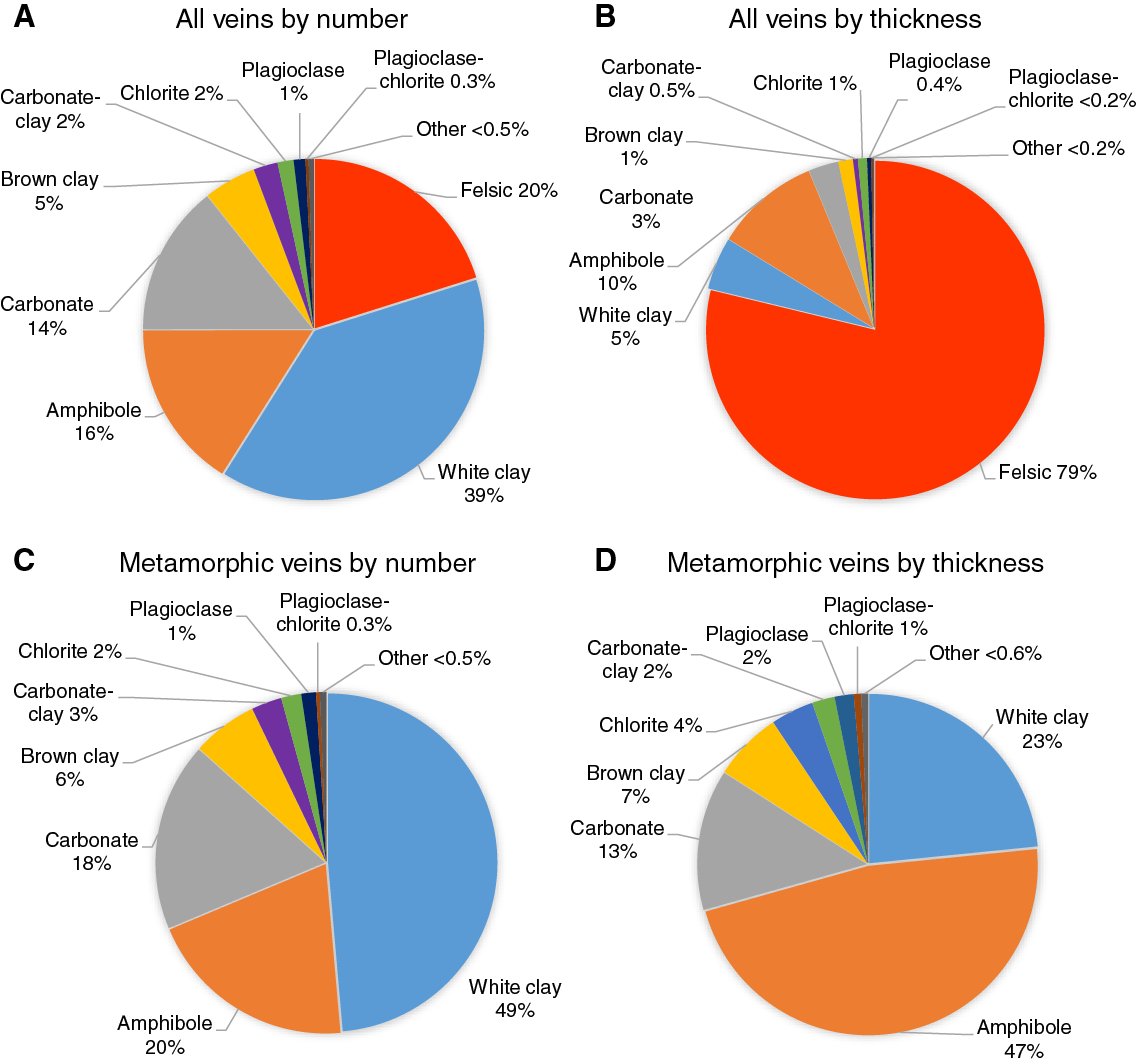
Figure F80. Proportions of different vein types in Hole U1473A.
XRD identification of metamorphic and magmatic veins
A number of veins were sampled for further mineral identification using the shipboard X-ray diffractometer. Table T9 lists all samples analyzed (including nonvein-related samples) together with their preliminary mineral identification.
Table T9. XRD analysis of shipboard samples, Hole U1473A. Download table in .csv format.
Because of their ubiquitous presence and multiphase assemblages, many of the samples were taken from magmatic veins. XRD peaks that are characteristic of the plagioclase group and the amphibole group were always detected in these samples. Specific plagioclase minerals were not identified shipboard because of similarities in mineral peaks within the plagioclase group. Aside from plagioclase and amphibole, quartz was also identified in a number of felsic veins (Figure F81A). Common secondary phases identified in felsic veins are phyllosilicates such as kaolinite and pyrophyllite. Chlorite was identified together with plagioclase and amphibole in greenish and bluish fracture coatings that are likely remnants of plagioclase or plagioclase-amphibole veins. Biotite was also characterized in a few altered felsic veins (Figure F81A).
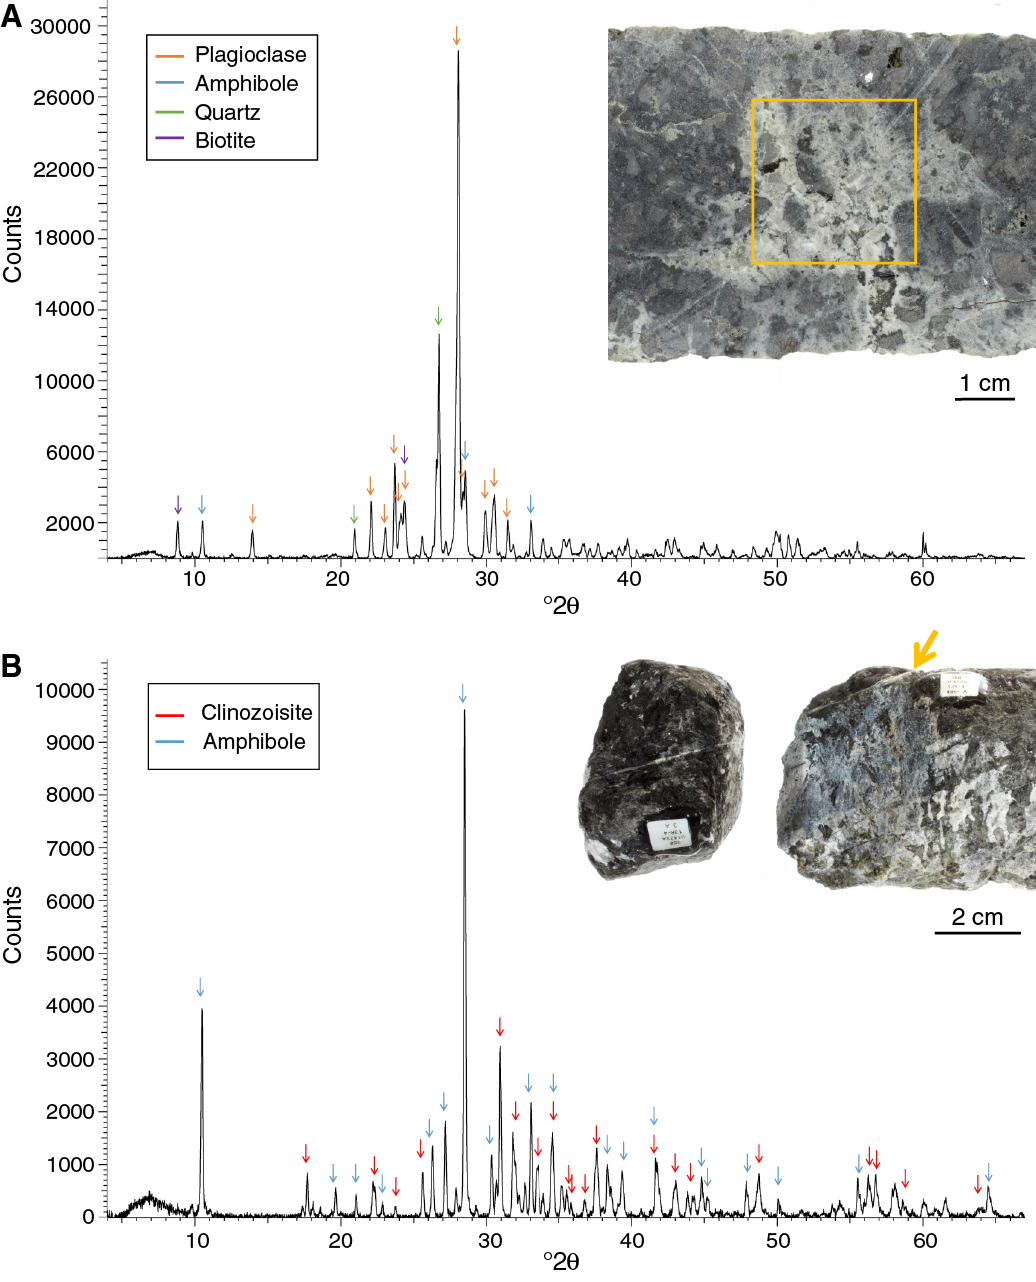
Figure F81. Minerals identified on board using XRD, Hole U1473A.
A number of amphibole veins were also analyzed, with grains displaying different habits (acicular, massive, or prismatic) targeted for analysis. As with plagioclase, it was difficult to identify the specific amphibole minerals due to similarities in XRD peaks of the different minerals in the amphibole group.
Clinozoisite and/or epidote were identified in association with felsic and amphibole veins (Figure F81B). Greenish veins are composed of either or both amphibole and chlorite. Chlorite was further confirmed using the ethylene glycol test, where 13–14 Å peaks did not shift to the higher d-spacings that characterize the smectite group.
Almost all of the carbonate veins were composed of calcite. Both aragonite and calcite were only identified in one carbonate vein in the upper part of the hole. Some cataclastic carbonate vein material is characterized by tiny plagioclase, amphibole, clinopyroxene, and clay mineral peaks.
Minerals of the zeolite group were identified from fracture coatings at the bottom part of the hole (~750 m CCSF). XRD peaks closely match those of natrolite and mesolite. Chlorite and/or smectite as well as calcite were also identified in the same samples.
Metamorphic veins
Based on the mineral paragenesis within metamorphic veins (i.e., excluding felsic veins), nine different metamorphic vein types were defined. Their abundances within the cores are presented as percentages with respect to their count and thickness (Figure F80C–F80D). In terms of abundance by count, white clay veins are by far the most common veins (48.6%), followed by amphibole veins (20.1%) and carbonate veins (18%). Veins filled with brown clay (6.2%), carbonate-clay (2.9%), chlorite (1.9%), plagioclase (1.4%), plagioclase-chlorite (0.4%), and other assemblages (0.6%) are of minor importance. Because the white clay veins are in general very thin, they represent a significantly lower volume of the cores than other vein types despite their abundance. Considered together with the brown clay veins, clay veins as a whole represent 30.0% of the total thickness of metamorphic veins (100.0 cm). By volume, amphibole veins are the most abundant (47.2%) veins. The thickness of these veins varies considerably, from a few micrometers up to several centimeters. The diameter of the thickest amphibole vein recorded in Hole U1473A is larger than the diameter of the cores (6 cm) (Figure F82). Volumetrically, the third most important group are carbonate-dominated veins, which represent 15.6% of the total vein thickness. Other vein types are of minor importance and add up to 7.2% of the total vein thickness. These include veins filled with chlorite, plagioclase, carbonate-quartz, oxide/hydroxide, epidote, clinozoisite, quartz, and zoisite (for details see Figure F80). Veins filled with minerals from the epidote group were very thin, occurring as the innermost zones within compound amphibole veins (see below). Core close-ups from typical veins filled with white clay, carbonate, and felsic material are presented in Structural geology (Figures F127, F129).
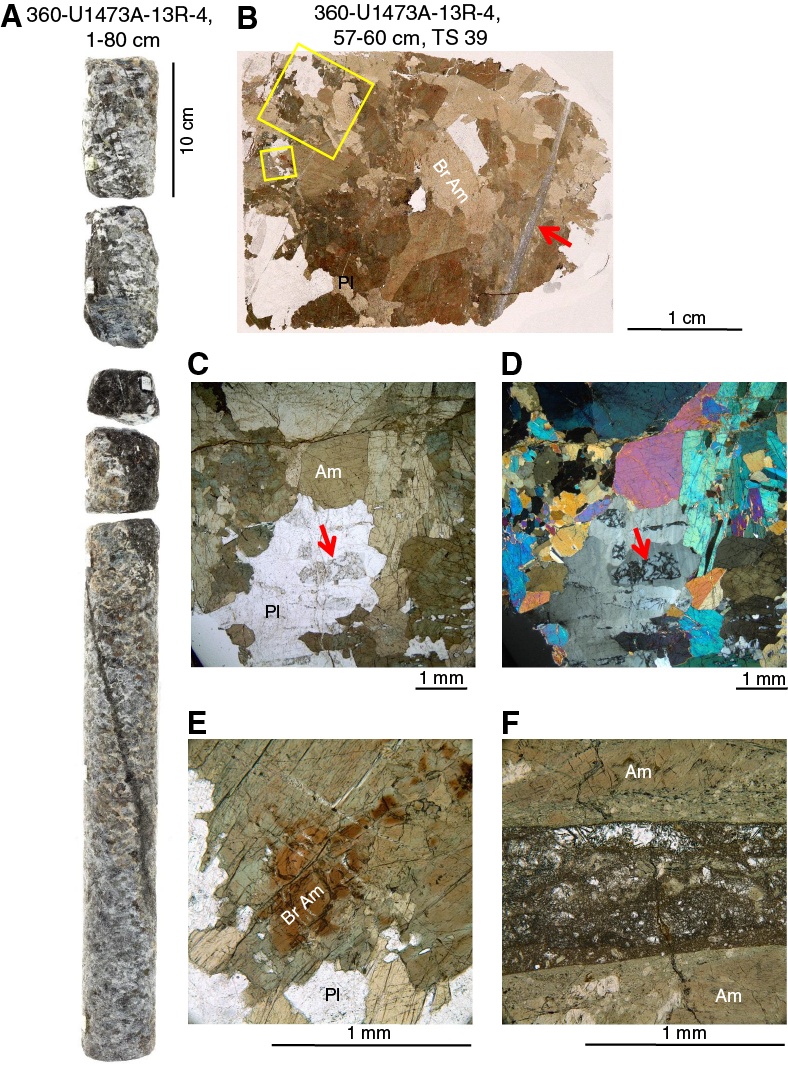
Figure F82. Amphibole veins.
In addition to the macroscopic observations, veins and their mineral assemblages were evaluated in thin section (for details see Table T10). Amphibole veins amounted to 44% of the 115 veins recorded in thin section, followed by chlorite-dominated veins (22%), carbonate (14%), and clay (10%). Other veins (11%) observed in thin section contain minerals from the epidote group, oxide/hydroxide, hydrogrossular, plagioclase, zeolite, and biotite. Mostly, the mineral assemblages in the veins correspond directly to the background alteration in the related primary minerals of the rock. This documents the importance of veins as a pathway for the transport of hydrothermal fluids under a range of conditions. Details of the thin section vein analyses and illustrations of their assemblages and petrographic features are presented below.
Table T10. Vein types estimated in thin sections, Hole U1473A. Download table in .csv format.
Amphibole-dominated veins
Monomineralic amphibole veins and those in which amphibole is the major constituent are by far the most common. These veins include different varieties, reflecting different temperature regimes. Out of 48 amphibole veins observed, 19% were composed of brown amphibole formed at very high temperature in the transition between magmatic and metamorphic conditions, 17% are brown-green amphibole corresponding to the amphibolite facies, 47% are green amphibole corresponding to amphibolite to greenschist facies, and 17% are pale or colorless amphibole, including fibrous actinolite corresponding to the greenschist to sub-greenschist facies.
Examples of brown amphibole veins are shown in Figures F82, F83, and F84. As seen in these figures, brown amphibole occurs only as relics in the innermost part of the veins and is in general replaced by brown-green amphibole. An observation in Sample 360-U1473A-13R-4, 57–60 cm (TS 39), where brown amphibole only occurs as a diffuse patch, implies that the brown amphibole was probably formed under magmatic conditions. This is supported by diffuse plagioclase crystal cores in the vein assemblages, which are interpreted as former xenocrysts from the hosting gabbro incorporated during the formation of the vein (Figure F82) at the boundary between magmatic and metamorphic conditions.
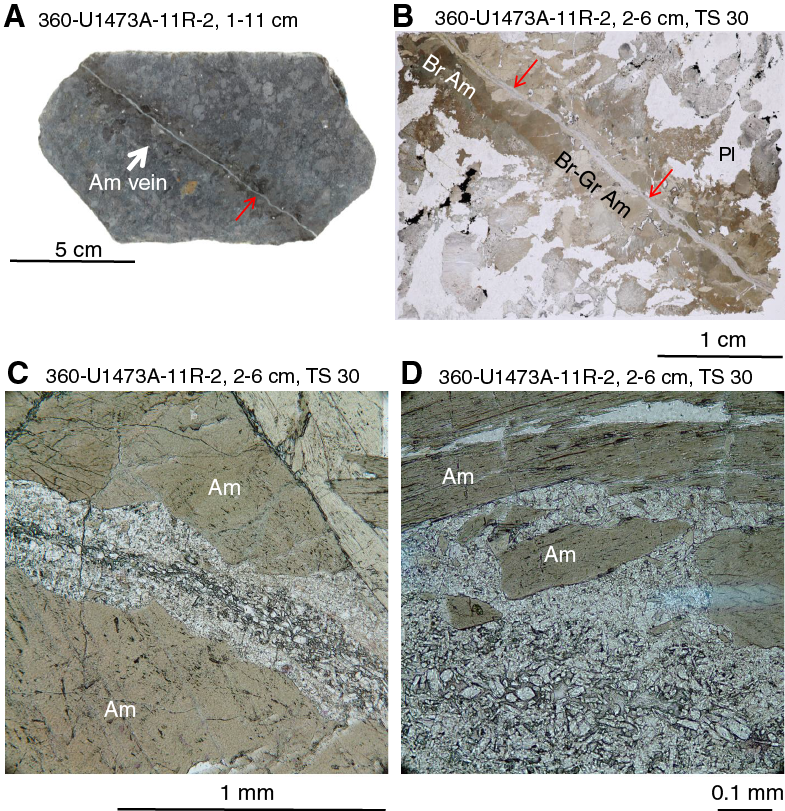
Figure F83. Centimeter-thick amphibole vein cutting weakly foliated gabbro.
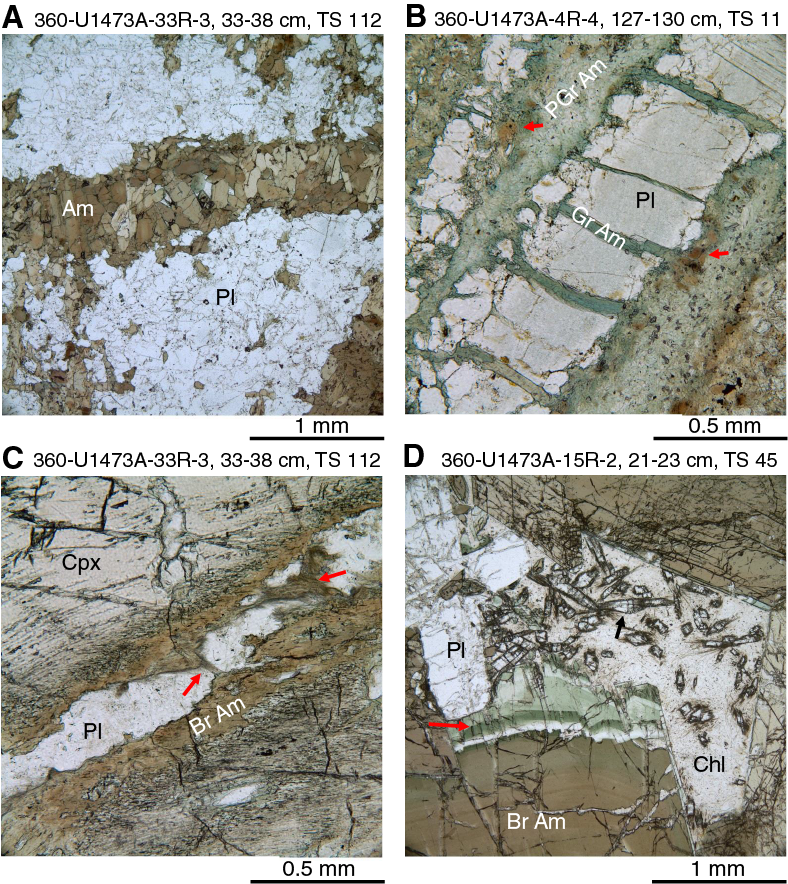
Figure F84. Veins crosscutting Hole U1473A gabbros.
Many of the millimeter-thick amphibole veins are composed of brown-green amphiboles. Their brown-green color is likely a result of high TiO2 contents (Ernst and Liu, 1998), which corresponds to temperatures of the upper amphibolite facies. They often form granoblastic monomineralic patterns, often with millimeter-scale grain size (Figures F82, F83, F84).
Monomineralic veins composed of green prismatic amphibole, mostly with ~100 µm grain size, are by far the most common amphibole veins. Sometimes green amphibole in these veins replaces brown and brown-green amphiboles, reflecting replacement under lower amphibolite to greenschist conditions. In some thin sections, strong zoning associated with this replacement can be observed (Figure F84).
Pale and colorless amphiboles normally occur as aggregates of often micrometer-sized acicular to fibrous crystals, often replacing or overgrowing prismatic green amphibole (Figures F82, F84). In some thin sections, pale and colorless amphiboles are associated with chlorite (Figure F84), which corresponds to a typical greenschist facies phase assemblage. On the other hand, aggregates of micrometer-sized pale and colorless fibrous amphiboles are associated with clay minerals, which is a paragenesis typical of the sub-greenschist facies.
In some thin sections (e.g., Samples 360-U1473A-13R-4, 57–60 cm; TS 39 [Figure F82]; and 15R-2, 21–23 cm; TS 45 [Figure F84]), the whole replacement sequence from brown to pale amphibole is recorded, showing that the corresponding veins were pathways for hydrothermal processes that operated under decreasing temperature conditions from very high temperatures, probably within the magmatic regime, down to sub-greenschist facies conditions.
Chlorite-dominated veins
Vein chlorite forms colorless or slightly greenish aggregates, often with microcrystalline granoblastic textures with interpenetrating fibrous to flaky minerals. Chlorite often occurs with pale to colorless fibrous amphibole and/or tiny prismatic crystals of the epidote group (Figures F84, F85), reflecting greenschist facies conditions. In other mostly yellowish color veins, chlorite forms microcrystalline assemblages with clay minerals, implying temperature conditions below the greenschist facies (sub-greenschist facies and eventually within the regime of the prehnite-pumpellyite facies).
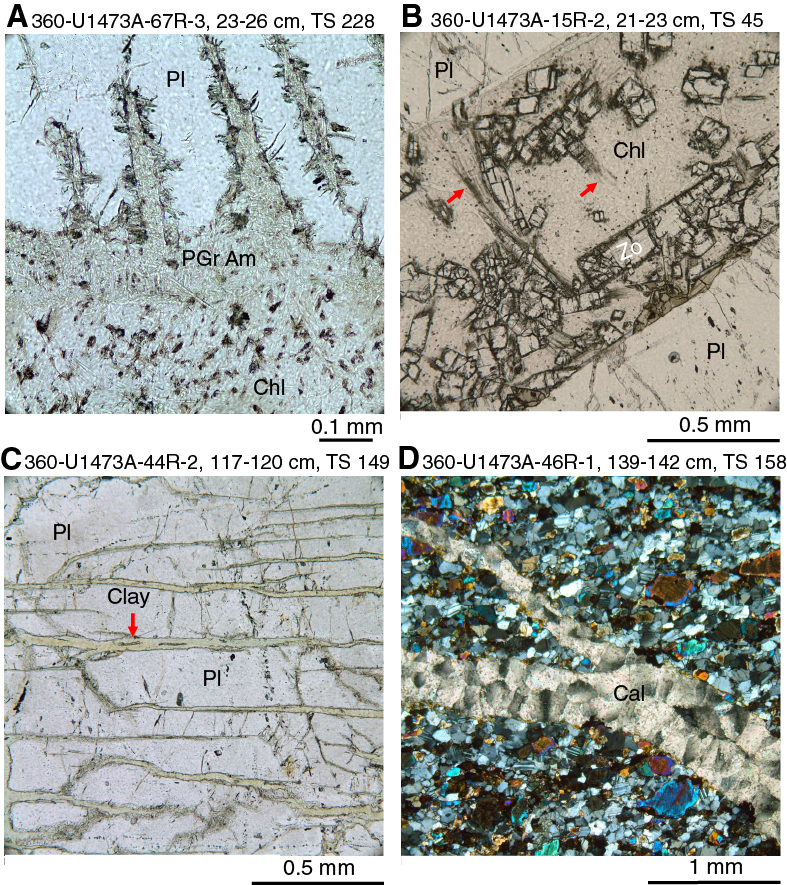
Figure F85. Hole U1473A vein types.
Epidote veins
Epidote veins are composed of minerals from the epidote group, which includes assemblages dominated by colorless clinozoisite or zoisite, mostly forming tens of micrometer-sized prismatic crystals. Minerals of the epidote group with pistachio green color corresponding to very iron rich epidote minerals were not observed. In two samples, clinozoisite veins are macroscopically visible as thin inner bands within centimeter-thick veins composed of brown and brown-green amphibole (Figures F82, F83). Here, clinozoisite forms assemblages together with chlorite in zones that are also characterized by cataclastic deformation, implying that the same pathways were used at high temperatures during the formation of the amphibole veins and at low temperatures under greenschist facies conditions in the brittle regime, when the clinozoisite–chlorite associations were formed. Zoisite was observed in one thin section as prismatic colorless crystals embedded in a groundmass of chlorite (Figure F85).
Clay veins
Although veins filled with gray and brown clay were the most common vein type, their abundance in thin section is relatively low (10% of all the metamorphic veins). This is likely due to clay forming soft fillings that were easily removed during thin section preparation. In thin section, they form yellowish microcrystalline aggregates (Figure F85). Often, the clays are associated with oxide/hydroxide, chlorite, and/or carbonate. In general, clay veins crosscut most other veins, including veins with chlorite-clay intergrowth, supporting a model of low-temperature formation under sub-greenschist facies conditions. According to the typical facies scheme in textbooks, the prehnite-pumpellyite facies follows the greenschist facies to lower metamorphic conditions. However, prehnite veins, common in lower gabbros from fast-spread East Pacific Rise crust drilled at Hess Deep (Gillis, Snow, Klaus, and the Expedition 345 Scientists, 2014), were not observed.
Carbonate veins
Carbonate veins represent the latest stage of rock fracturing and filling. In thin section, it can be seen that carbonates form anhedral granoblastic patterns or spherical aggregates of microcrystalline fibers (Figure F85).
Felsic veins
Felsic veins were described both for magmatic and alteration features by the metamorphic petrology team in collaboration with the structural geology team, but details of the variation of the different rock types within the felsic veins and other primary magmatic features such as grain size and the proportion of felsic veins with respect to the other magmatic lithologies are presented in Igneous petrology. We note that the felsic veins appear to have been synkinematic; some of the late-magmatic felsic veins were deformed along with the gabbros, some were undeformed and clearly crosscut plastically deformed gabbro, and others show evidence for a cataclastic overprint.
Macroscopic observations in general reveal much stronger alteration in felsic veins than in the host gabbros. This can be seen in the downhole log of Figure F50. In general, the grade of alteration based on macroscopic observation in felsic veins varies from 40% to 100% with an average of 78%, whereas gabbro alteration intensity is much lower with only slight to moderate alteration (78% of all gabbros have alteration intensities between 0% and 30%). The most prominent feature is the formation of milky whitish secondary plagioclase, which is present in all of the veins for which estimation of alteration was possible (387). Typical mafic alteration phases are secondary amphibole (present in 94.3% of the veins) and chlorite (62.5%). Secondary oxides (21.2%) and secondary sulfides (4.7%) were relatively common. The large extent of felsic vein alteration is especially expressed in the high amount of clay minerals (greenish soft minerals; in one vein kaolinite was identified by XRD), which were observed in 53.2% of all the veins. Another common indicator of extensive alteration is orange staining, especially associated with quartz grains (31.3% of all the veins), which is likely due to the presence of limonite or goethite surrounding quartz. This orange staining was only observed in the upper part of the hole to Core 360-U1473A-64R (~580 m CCSF). Deeper cores do not show this effect, which could be due to changes in redox conditions from more oxidizing (presence of limonite and goethite) to more reducing.
Relatively often, felsic veins are associated with alteration halos in the adjacent gabbro: 56% of all observed felsic veins have alteration halos. The halos are thin (0.4 cm in average), and alteration intensity of the adjacent gabbro is relatively low (37% average, varying from 20% to 100%).
In thin section, felsic veins are moderately to strongly altered and always more so than the adjacent gabbro. Primary plagioclase is often strongly, even completely, recrystallized to secondary plagioclase, which is extensively filled with cloudy, dusty opaque inclusions that could not be identified under the microscope. Primary brown and brown-green amphiboles often of igneous origin in the felsic veins are generally altered to secondary amphibole, often associated with chlorite and clay minerals. In some felsic veins, primary biotite occurs, which is often replaced by chlorite/clay minerals. In other sections, biotite can be observed as an alteration phase replacing amphibole. Quite often, the granular felsic matrix shows signs of cataclastic overprint with grain boundaries overgrown by fine masses of actinolite, colorless amphibole, clay minerals, iron oxides or hydroxides, and cloudy “dirty” masses. In rare cases, clinozoisite is associated with the background alteration mineral assemblage. Often, quartz grains show some kind of orange-opaque coating, probably corresponding to iron hydroxides (see also macroscopic_workbooks in DESC in Supplementary material). In places, quartz is replaced by secondary plagioclase or calcite (see below). Locally, both secondary plagioclase and quartz contain fluid inclusions, often arranged in trails within the crystals, providing evidence that these veins acted as pathways for hydrothermal fluid. In addition, felsic veins may also localize strain, as expressed by slight cataclastic deformation within the felsic vein groundmass, whereas similar cataclastic textures are not present in the adjacent gabbro.
It is obvious from the mineral assemblages seen petrographically that alteration started at very high temperature, shortly after the formation of the felsic veins, and then continued downward under amphibolite and greenschist facies conditions to very low temperatures, where clay minerals and carbonate minerals are stable. This process is illustrated in Figure F72, where the evolution with decreasing temperatures is recorded by a change in petrographic features of the amphiboles. Sample 360-U1473A-46R-3, 33–35 cm (TS 160), shows where intrusion of a felsic vein broke a millimeter-sized prismatic olivine in an olivine gabbro. At the contact, the olivine first reacted to orthopyroxene followed by rimming by brown amphibole, which also occurs as euhedral crystals in the vein. At a subsequent stage, this brown amphibole was replaced by green hornblende, likely under amphibolite facies conditions. Later, the green amphibole was replaced in turn by fine needles of actinolite, a typical greenschist facies mineral. Finally, clay minerals grew on boundaries of the intergranular felsic network.
A special alteration case is seen in Sample 360-U1473A-24R-3, 47–50 cm (TS 80), where a crystal-plastically deformed leucodiorite with clinopyroxene porphyroclasts enclosed in neoblasts cuts a foliated gabbro at a high angle (Figures F86, F87). The leucodiorite, however, has also undergone strong crystal-plastic deformation parallel to its contacts. The deformation is restricted to a narrow millimeter-scale band along the center of the vein, whereas the outer part in contact with the gabbro shows only slight cataclasis (Figure F86B). These two outer zones of the vein show completely different textures: one granophyric and the other granular. In the granophyric part, quartz (implying that this rock was once a trondhjemite) is completely replaced by secondary plagioclase. Primary plagioclase is relatively clear and translucent, whereas the secondary plagioclase replacing the quartz is filled with tiny inclusions of actinolite, clinozoisite, chlorite, titanite, and darkish brownish dust (Figure F87). These features imply that quartz reacted with a hydrothermal fluid rich in sodium and aluminum, producing the secondary plagioclase (probably albite) by dissolution-reprecipitation. Dolejš and Manning (2010) show by thermodynamic modeling of quartz solubility in aqueous fluids that transport of silica in hydrothermal fluids can readily occur. For example, these authors showed that quartz solubility in pure water is strongly pressure dependent and can reach up to 1 wt% at 600°C and 2 kbar pressure. This does not mean replacement occurred at such high temperatures but shows the potential for quartz, which is normally regarded as highly stable, to be dissolved and transported by hydrothermal fluids in the deep crust.
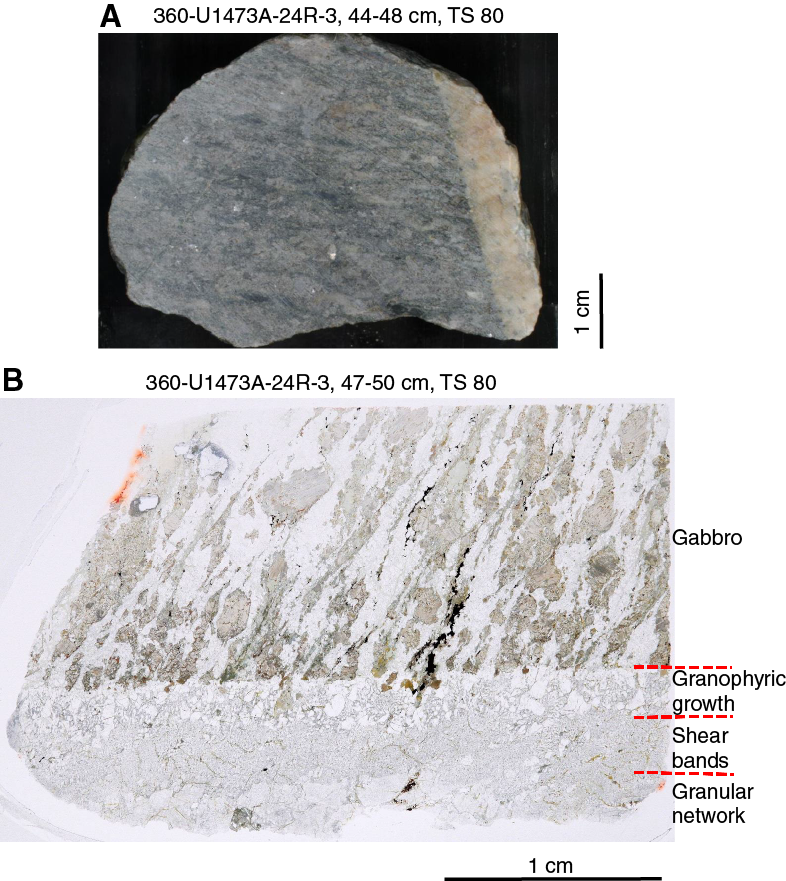
Figure F86. Alteration features in leucodiorite cutting a foliated gabbro.
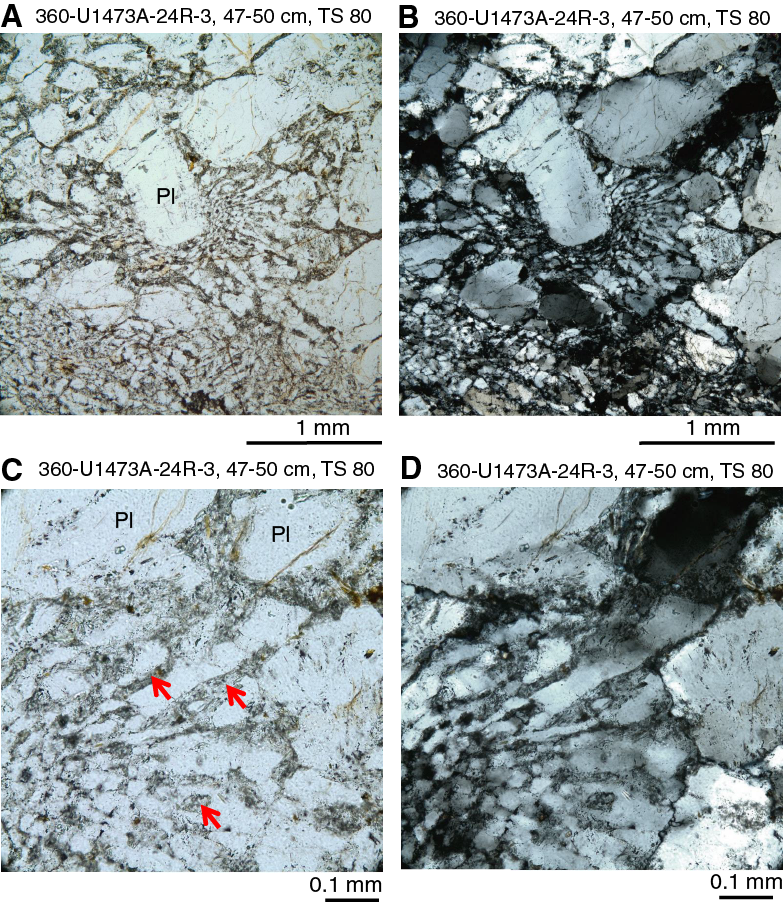
Figure F87. Details of granophyric zone in leucodiorite vein.
Replacement of quartz by CO2-rich fluids was also found where many carbonate veins and carbonate-supported breccias are present (e.g., in Sections 360-U1473A-33R-5 and 51R-2). In thin section, the calcite invading the granular felsic groundmass replaces quartz and other primary minerals such as amphibole and titanite. This is illustrated by reactive contacts between quartz and calcite in Figure F88. Amphibole and primary titanite grain boundaries, which are sharp and undisturbed within the felsic groundmass, become blurred and diffuse when in contact with calcite, implying progressive replacement by carbonate. Because clay minerals are involved within this process, this implies that the reactions occurred at low temperatures, eventually within the regime of the prehnite-pumpellyite facies or lower.
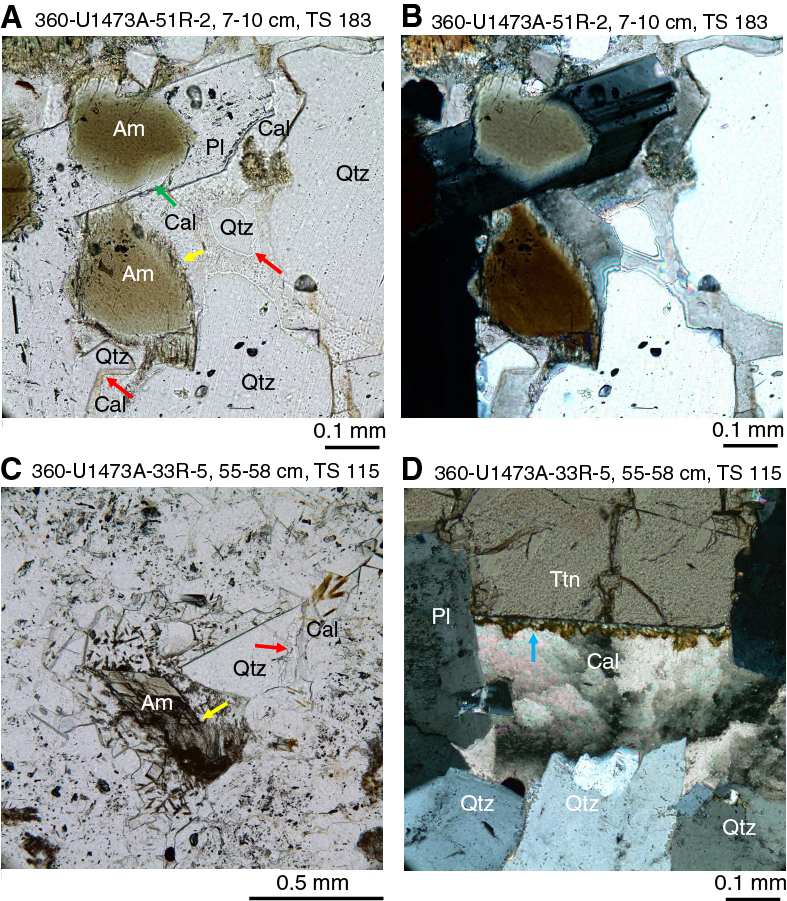
Figure F88. Primary mineral replacements by calcite in felsic veins.
Granoblastic diabase
Several diabase dikes intruding Hole U1473A gabbros are largely recrystallized to microcrystalline granoblastic hornfels (Sections 360-U1473A-32R-6, 33R-2, 42R-2, 51R-1, 51R-2, and 52R-1). The contact relations imply that these represent intrusions or apophyses of intrusions that were emplaced when host gabbros were still at near-solidus conditions. In thin section, magmatic relics were identified in the diabase, often in the form of well-aligned plagioclase microphenocrysts produced by magmatic flow (Figure F89), providing clear evidence of the magmatic origin of the diabase. Although plagioclase phenocrysts still preserve most of their magmatic features (see below), olivine phenocrysts (xenocrysts?) are largely altered to a dark dusty mass and brownish clay. It is possible that some of these crystals could be fragments of the gabbro, as for example suggested by the orthopyroxene reaction rim around the olivine pseudomorph in Figure F89, which indicates that the olivine was not in equilibrium with the enclosing melt despite its apparent subhedral form.
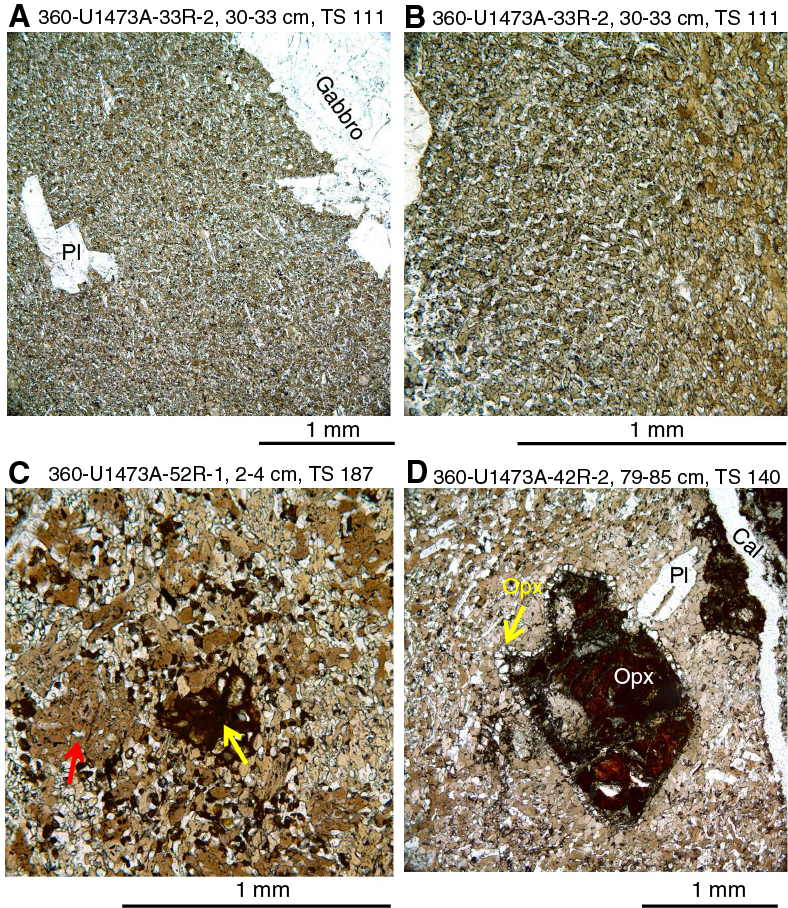
Figure F89. Recrystallization and metamorphism in diabase.
The following metamorphic parageneses are illustrated in Figure F89; these parageneses imply metamorphism within the hornblende to pyroxene hornfels facies:
- Brown amphibole − plagioclase − Fe-Ti oxide.
- Brown amphibole − plagioclase − clinopyroxene − Fe-Ti oxide.
- Brown amphibole − plagioclase − clinopyroxene − orthopyroxene − Fe-Ti oxide.
Granoblastic diabase is well known from the dike–gabbro transition at the fast-spreading East Pacific Rise, where they are interpreted as due to hornfels contact metamorphism by an upward progressing axial melt lens. Examples for this are recorded from the EPR (Wilson et al., 2006; Koepke et al., 2008; France et al., 2009), and from the Troodos (Gillis and Coogan, 2002) and Oman ophiolites (France et al., 2009, 2014).
Granoblastic hornfels diabase in both Hole U1473A and ODP Hole 1256D contain similarly altered plagioclase phenocrysts. The latter site is located in the equatorial Eastern Pacific, where the first penetration of fast-spreading oceanic crust from the basalts to the uppermost gabbros was made in intact ~15 Ma EPR crust (Wilson et al., 2006). Plagioclase phenocrysts from both locations contain cores of magmatic plagioclase free of granoblastic inclusions but rims that are integrated into the granoblastic matrix, displaying characteristic epitaxial overgrowth of plagioclase that contains tiny inclusions of the granoblastic paragenesis. The similarity in these overgrowth features within plagioclase microphenocrysts is remarkable, as shown in Figure F90, implying a similar formation process, viz. the metamorphic overprint of a primary magmatic intergranular texture at very high temperature.
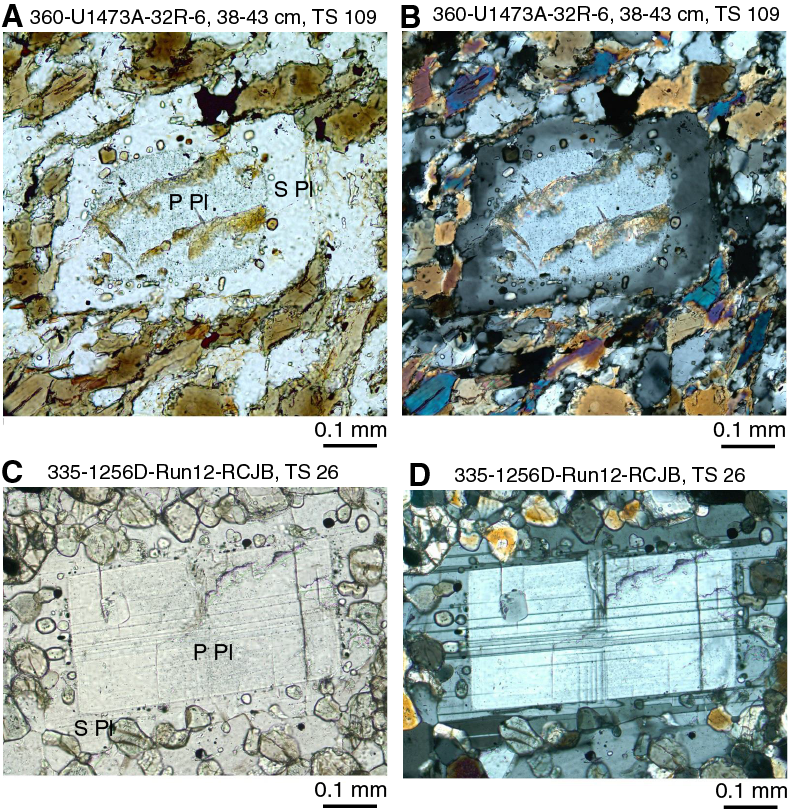
Figure F90. Comparison of granoblastically overprinted plagioclase microphenocrysts, Holes 1256D and U1473A.
There is, however, a clear difference in metamorphic conditions at these two sites. Although the metamorphic overprint at Site 1256 proceeded mostly at very high temperatures (up to 1050°C estimated using two-pyroxene geothermometry), this was under conditions of reduced water activity (as demonstrated by the absence of amphibole; Erdmann et al., 2015). The principal mafic mineral in Hole U1473A hornfels diabase, however, is brown amphibole, indicating high water activities near the contacts with the gabbro. The source of this water would have to be the intruded gabbros, as the interior of the larger dikes that contain brown hornblende hornfels near their margins lack this alteration deeper within the dike. It is unlikely, therefore, that the contact metamorphism model for granoblastic hornfels formation at Site 1256 can also be applied to Hole U1473A diabase. First, contact relations show that Hole U1473A diabase intruded the gabbro far from any sheeted dike–gabbro transition. Second, dynamic upward- and downward-migrating melt lenses are not known from slow-spreading ridges and would not be predicted from magma-starved ultraslow-spreading ridges like the SWIR. Therefore, in the absence of any heat source for contact metamorphism, we assume that the granoblastic overprint occurred during the cooling of the diabase in the lower crust under hydrous conditions (as shown by the presence of amphibole).
In one granoblastic brown hornfels diabase, a change in texture between the inner and outer parts of the intrusion can be observed: from regions with a pure granoblastic interpenetrating texture (Figure F91A) to a more open granular texture where the morphology of the crystals preserves the original igneous texture, with more subhedral to euhedral relic plagioclase laths and intergranular brown hornblende (Figure F91B). This can be interpreted as a transition from regions with a pure metamorphic texture in the inner part of the diabase to a more magmatic texture at the margin (shown in Sample 360-U1473A-42R-2, 79–85 cm; TS 140) (Figure F91). Finally, the evolution from metamorphic to magmatic conditions culminates in the development of poikilitic brown amphibole–bearing euhedral to subhedral plagioclase chadacrysts at the contact with the gabbro, a feature that is typically interpreted as the record of a magmatic process (shown in Sample 51R-1, 97–100 cm; TS 180). The presence of tiny inclusions of minerals of the granoblastic assemblage within the enclosed chadacrysts (brown hornblende, clinopyroxene, and Fe-Ti oxide) provides further evidence that these poikilitic crystals were developed from a granoblastic precursor domain.

Figure F91. Granoblastic overprint near/at contacts between metamorphosed diabase and gabbro.
All these observations are in accord with a model whereby the source of water was outside of the diabase intrusion and that small amounts of water, probably liberated from hydroxyl-bearing alteration phases within the gabbro, penetrated into the intrusion, resulting in a partially molten state at the outer part of the intrusion, whereas metamorphism occurred under subsolidus conditions at lower water activity the inner part of the diabase.
Felsic veins at granoblastic dike/gabbro contacts
A characteristic feature of several of the diabase intrusions in Hole U1473A is the presence of a thin zone of evolved felsic rock at their contact with the gabbro (observed at intervals 360-U1473A-32R-6, 29–55 cm; 51R-1, 96–108 cm; and 42R-2, 79–99 cm). This is illustrated in the close-up photographs in Figure F92. In principle, there are two major processes that could account for this relationship: (1) late-stage felsic melts in the pore space of the surrounding gabbro were mobilized and intruded into the granoblastic diabase or (2) felsic melts were produced by partial melting of the gabbros at the intrusive contacts. The conclusion from the previous section that water was liberated from the gabbros and diffused into the granoblastic dikes supports the latter hypothesis. The fluids necessary to suppress the solidus of normal oceanic gabbro from ~1100° to ~850°C (Beard and Lofgren, 1991; Koepke et al., 2004) could be derived from the destabilization of hydroxyl-bearing phases in host gabbros. Further support for this view comes from the observation that felsic veins occur only at the contacts of granoblastic brown hornblende dikes and not along the contacts of other dikes drilled in Hole U1473A. These observations, along with the very close association of felsic veins with the granoblastic dikes leads us to conclude that they represent contact anatexis of the gabbro by the dikes.

Figure F92. Basis for interpretation of felsic melt formation.
Metamorphic conditions and history
General scheme of alteration sequence
Gabbros from Hole U1473A were subjected to an alteration sequence reflecting variable conditions, including temperature, pressure, fluid composition (PH2O and PCO2), and flux. In order to examine the conditions of alteration, temperature-silica activity diagrams in the simplified systems CaO-MgO-Al2O3-SiO2-H2O (Figure F93) and CaO-MgO-Al2O3-SiO2-H2O-CO2 (Figure F94) were drawn using the software Perple_X version 6.6.8 (Connolly, 2005, 2009) with the data set of Holland and Powell (2011) and the CORK equation of state of fluids (Holland and Powell, 1991, 1998). It should be noted that actual temperature conditions are not strictly constrained by this simplified model system. Textural observations indicate sequential overprinting effects of lower-temperature alteration.
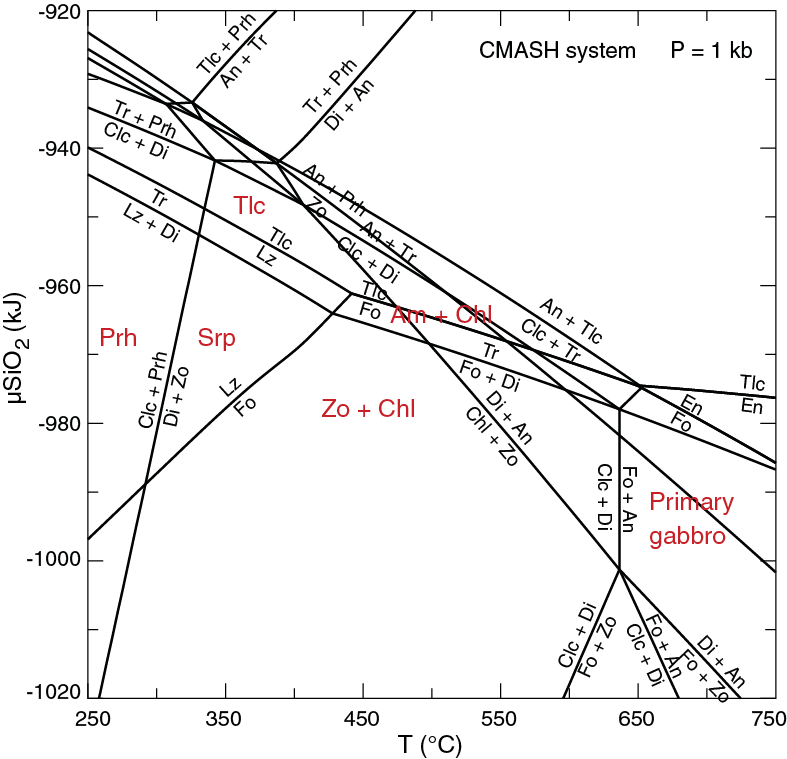
Figure F93. Silica chemical potential vs. temperature diagram in the system CaO-MgO-Al2O3-SiO2-H2O.

Figure F94. Silica chemical potential vs. temperature diagram showing conditions in the system CaO-MgO-Al2O3-SiO2-H2O-CO2.
Secondary clinopyroxene and brown amphibole are the products of the earliest and highest-temperature granulite or pyroxene hornfels (800°–950°C) to upper amphibolite facies alteration (>700°C; Miranda and John, 2010). Crystal-plastic deformation, which caused dynamic recrystallization and formation of neoblasts of olivine + clinopyroxene ± orthopyroxene ± brown amphibole, took place in close association with this hydrothermal alteration stage. Subsequently, brown amphibole was overgrown and plagioclase microfractures were filled by green amphibole at slightly lower temperatures. Pale green or colorless amphibole + chlorite ± talc formed at lower amphibolite to greenschist facies conditions (~700°–350°C). Subsequently, pale green or colorless amphibole (actinolite) + chlorite ± zoisite were formed at greenschist facies conditions (<450°C). Talc could also be a sub-greenschist facies product, along with serpentine. Calcite and clay minerals are the lowest-temperature alteration products. The lack or rarity of prehnite and zeolite, which is typically reported for oceanic gabbro alteration (e.g., Blackman, Ildefonse, John, Ohara, Miller, and the Expedition 304/305 Scientists, 2006; Gillis, Snow, Klaus, and the Expedition 345 Scientists, 2014), could be attributed to high-CO2 activity, low-SiO2 activity, or both (Figure F94).
Formation of clinopyroxene–brown amphibole association
The association of clinopyroxene and brown amphibole is observed almost everywhere in Hole U1473A gabbros. In undeformed gabbros, accessory brown amphibole forms interstitial discontinuous rims along contacts between clinopyroxene and plagioclase (Figure F62A–F62B) and locally includes Fe-Ti oxide phases and/or sulfides. Accessory brown amphibole is also typically present as (i) blebs within primary and secondary clinopyroxene (Figure F62C–F62D) and (ii) grains associated with neoblastic clinopyroxene aggregates in gabbros that experienced crystal-plastic deformation under granulite facies conditions (Figure F76A). Similar brown amphibole occurrences were reported from Atlantis Bank gabbros in Holes 735B (e.g., Robinson et al., 2002) and 1105A (Casey et al., 2007).
Several geochemical studies dealing with the origin of interstitial brown amphiboles from undeformed oceanic gabbros have been conducted. These studies encompass gabbros from the Mid-Atlantic Ridge Kane Fracture Zone (MARK) area in the North Atlantic (Coogan et al., 2001), Hess Deep in the eastern Pacific (Gillis and Meyer, 2001), and Alpine Jurassic ophiolites (Tribuzio et al., 2000a). Mostly on the basis of amphibole chemical compositions (e.g., high concentrations of F, rare earth elements, and Nb), the different investigations concluded that interstitial brown amphiboles formed by reaction of clinopyroxene and plagioclase with a hydrous silicate melt.
On the basis of microstructures alone, the origin of the clinopyroxene–brown amphibole associations in Hole U1473A gabbros is not straightforward. A plausible scenario involves the following sequence of events: (1) crystallization of brown amphibole in interstices between clinopyroxene and plagioclase directly from a hydrous melt during the latest stages of gabbro solidification; (2) early cooling of the solidified gabbro and reaction with an aqueous fluid exsolved from a late melt, leading to the association of secondary clinopyroxene, orthopyroxene lamellae, and brown amphibole blebs; and (3) crystal-plastic deformation under subsolidus amphibolite facies conditions in the presence of a hydrous fluid. However, the occurrence of undeformed brown amphibole rimming both primary and neoblastic clinopyroxenes (Figure F76B) shows that interstitial brown amphibole developed at least locally after the early phase of crystal-plastic deformation. This implies that alternative or additional petrogenetic scenarios may be envisaged. For instance, the cooling gabbro could recurrently interact with migrating H2O-rich melts or fluids, and crystal-plastic deformation could have been assisted by a small proportion of melt, as indeed shown by sheared Fe-Ti oxide–rich gabbros from Hole 735B (e.g., Shipboard Scientific Party, 1999b).
Whatever the nature of the different clinopyroxene–brown amphibole associations, microstructures indicate that they are related to near-solidus conditions. This inference is consistent with temperature estimates clustering at 870° ± 40°C for the crystallization of interstitial amphiboles and amphiboles associated with neoblastic clinopyroxenes in other oceanic crustal gabbros (e.g., Tribuzio et al., 2000a; Coogan et al., 2001; Gillis and Meyer, 2001; Sanfilippo and Tribuzio, 2011).
A peculiar clinopyroxene–brown amphibole association was observed in gabbros near felsic veins and patches. There, clinopyroxene is rimmed by brown amphibole (Figure F64A–F64B), locally including an inner portion consisting of secondary clinopyroxene and vermicular brown amphibole (Figure F64C–F64D). This structure postdated the development of the crystal-plastic foliation in the gabbro and is attributed to reactive grain boundary migration of the felsic vein–forming melt or of a fluid exsolved from the melt. Maximum temperature conditions for the crystallization of this clinopyroxene–brown amphibole association are those of the migrating melt.
Formation of amphibolite mylonites
Amphibolite mylonites typically develop in thin bands discordant to the foliation of crystal-plastically deformed gabbros. The amphibolite mylonites consist of brown amphibole and plagioclase, commonly coexisting with ilmenite and/or titanomagnetite (Figure F77). In some instances they are intimately associated with felsic veins, which have also suffered ductile deformation. In deformed felsic veins, brown amphibole and plagioclase locally coexist with quartz and/or clinopyroxene (Figure F75B). The association of amphibolite mylonites with deformed felsic veins raises the possibility that the late crystal-plastic deformation was locally promoted by a small proportion of melt. The amphibolite facies mineral assemblage was also observed in halos associated with amphibole veins (Figure F65). Amphibolite mylonites and amphibole vein halos show the cooling of the Hole U1473A gabbroic sequence to temperature conditions near the transition from ductile to brittle behavior at ~700°C.
Moderate-temperature static alteration
The moderate-temperature regime includes lower amphibolite, greenschist, and sub-greenschist facies (as low as serpentinization) conditions. Moderate-temperature assemblages commonly occur throughout Hole U1473A and are the dominant secondary phases deeper than 580 m CCSF, where low-temperature assemblages do not overprint them. Alteration mineral assemblages formed under these conditions are summarized as follows:
- Widespread assemblage of talc + tremolite/actinolite + chlorite ± magnetite, which typically forms corona textures between olivine and plagioclase.
- Formation of tremolite/actinolite rims around clinopyroxene.
- Replacement of plagioclase by secondary plagioclase and chlorite.
- Minor epidote (zoisite/clinozoisite) replacement of plagioclase.
- Serpentine ± magnetite in mesh textures replacing olivine.
- Local plagioclase replacement by hydrogrossular.
The coronitic assemblage (Assemblage 1) is the most common throughout Hole U1473A. It was formed by a reaction between olivine and plagioclase. In some cases, the reaction went to completion with tremolite/actinolite + talc in olivine pseudomorphs and, less frequently, chlorite + tremolite/actinolite completely replacing plagioclase. This assemblage is common in olivine gabbros and troctolites from Atlantis Massif (Hole U1309D; Expedition 304/305 Scientists, 2006) and Hess Deep (Integrated Ocean Drilling Program Site U1415; Gillis, Snow, Klaus, and the Expedition 345 Scientists, 2014). In both localities, the coronitic assemblage formed in primitive high-Mg# gabbroic rocks has been interpreted to be the product of lower amphibolite facies alteration (Nozaka and Fryer, 2011; Gillis, Snow, Klaus, and the Expedition 345 Scientists, 2014; also see Figure F93). In more differentiated gabbroic rocks, however, the assemblage could be formed under greenschist facies conditions. This assemblage indicates the immobility of Al and the mobility of Ca, Mg, Fe, and Si, because chlorite occurs near plagioclase and tremolite/actinolite and talc occurs near olivine. In some cases, either talc or tremolite/actinolite is present or predominant, suggesting variations in silica and calcium mobility. A considerable amount of Fe should be hosted in magnetite grains associated with talc. Talc, however, is usually Mg rich, as indicated by shipboard BSE images (Figure F57B). BSE images indicate that actinolite could also be a potential host for iron (Figure F70 and colorless amphibole in Figure F58A). In some cases, sulfides, including pyrite, may also be associated with this assemblage (Figure F60D), consistent with high sulfur fugacity conditions.
Tremolite/actinolite replaces clinopyroxene (Assemblage 2) along rims and overgrows brown amphibole (Figure F84D), indicating a lower-temperature overprinting. Plagioclase alteration is characterized by secondary plagioclase, chlorite, and tremolite/actinolite replacement (Assemblage 3). At hand sample scale, this assemblage is noticeable in proximity to tremolite/actinolite and chlorite veins (Figure F55). At thin section scale, complete replacement of plagioclase by chlorite with a tremolite/actinolite rim is only observed close to chlorite veins. Epidote occurs in a few Hole U1473A gabbros, commonly in association with chlorite, tremolite/actinolite, and titanite (Assemblage 4). A more common occurrence of epidote is as a plagioclase alteration product in felsic and amphibole-plagioclase metamorphic veins or as a vein-filling mineral that crosscuts amphibole veins. Epidote is a typical phase in mafic rocks that experienced greenschist facies metamorphism (Figure F93). In gabbros from Hole U1309D (Atlantis Massif), epidote in association with chlorite was inferred to postdate the development of the talc-amphibole-chlorite assemblages and was formed by olivine-plagioclase reaction at temperature conditions <350°C (Expedition 304/305 Scientists, 2006; Nozaka and Fryer, 2011). In Hole U1473A, Assemblages 2–4 could also be greenschist facies alteration products, but their exact temperatures and timing of formation have yet to be constrained.
Throughout Hole U1473A, olivine is mostly characterized by minor replacement of serpentine ± magnetite (Assemblage 5) in micro veins, presumably reflecting an incipient stage of the mesh-forming process. In general, mesh rim serpentine consists of lizardite with rare exceptions of antigorite (e.g., O’Hanley, 1996; Beard et al., 2009). In the presence of water, olivine starts to break down into serpentine at temperatures <400°C (Figure F93; see also Frost and Beard, 2007). From textural relationships, serpentinization in Hole U1473A gabbros likely took place later, hence at lower temperature, than coronitic amphibole-chlorite and talc alteration (Assemblage 1), as was also found in the case of Atlantis Massif gabbros (Expedition 304/305 Scientists, 2006; Nozaka and Fryer, 2011).
Prehnite is a common low- to moderate-temperature metamorphic phase in oceanic gabbros (Figure F93), for instance in Atlantis Massif (Hole U1309D; Expedition 304/305 Scientists, 2006) and Hess Deep (Site U1415; Gillis, Snow, Klaus, and the Expedition 345 Scientists, 2014); however, it is absent from Hole U1473A. Prehnite was only reported in the deepest intervals of Hole 735B (Shipboard Scientific Party, 1999b; Alt and Bach, 2002). The near-absence of prehnite at Atlantis Bank is therefore peculiar. At Atlantis Massif, prehnite in association with hydrogrossular and chlorite was inferred to be stable at temperatures <350°C. This association presumably developed in conjunction with olivine serpentinization (Expedition 304/305 Scientists, 2006). The mobilization of aluminum and silica during plagioclase alteration can form prehnite adjacent to plagioclase and grossular next to prehnite, whereas excess silica reacts with olivine to form serpentine (Frost et al., 2008). Secondary phases after plagioclase can also be controlled by silica and proton activities wherein low and high values stabilize grossular and epidote, respectively. Prehnite is favored at intermediate values between these two secondary phases (Bach and Klein, 2009). In Hole U1473A, both epidote and hydrogrossular were only observed in a few samples; therefore, it is unlikely that the variations of aluminum, silica, and proton activities caused the lack of prehnite throughout most of Hole U1473A. Other possible reasons for the absence of prehnite and the rarity of hydrogrossular could be linked to the presence of CO2-saturated fluid, which promoted crystallization of other minerals such as calcite (Figure F94). This would imply that some of the carbonates were formed at temperatures as high as the prehnite stability field (~300°C) (Figure F93). Another possibility for the lack of prehnite is the effect of clay mineral formation. To understand formation conditions of these minerals, an aqueous activity diagram for the simplified MgO-CaO-Al2O3-SiO2-H2O system was drawn using Geochemist Workbench (Bethke and Yeakel, 2015) with the Thermoddem database (Blanc et al., 2012). The diagram shows that higher Mg activity would favor the formation of the chlorite and smectite group instead of prehnite (Figure F95). Indeed, smectite and chlorite are common secondary phases in Hole 735B deeper than 600 mbsf (Bach et al., 2001), and chlorite micro veins in plagioclase were frequently observed in Hole U1473A.
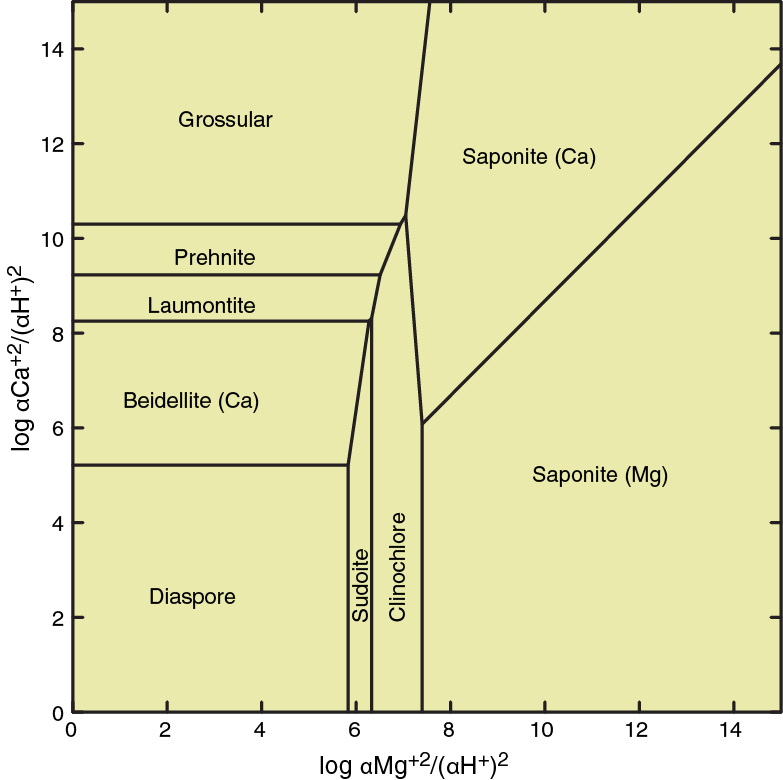
Figure F95. Activity diagram for simplified MgO-CaO-Al2O3-SiO2-H2O system at 200°C and 15 bar.
Low-temperature static alteration
Low-temperature minerals are visible throughout most of Hole U1473A. The following mineral assemblages were found:
- Reddish clay minerals and goethite after olivine (“iddingsite”), common to 580 m CCSF.
- Clay minerals (kaolinite and pyrophyllite) in altered felsic veins, as well as coatings in fractures likely to be late-stage precipitates or remnants of felsic veins.
- Carbonate veins, mostly made up of calcite, that are ubiquitous from 170 to 580 m CCSF.
- Zeolite veins, occurring shallower than 700 m CCSF.
One of the most conspicuous alteration characteristics throughout Hole U1473A is the occurrence of reddish clay minerals after olivine and, in some cases, pyroxene and plagioclase. A similar mode of olivine alteration was described by Bach et al. (2001) in the upper 40 mbsf and in the 500–600 mbsf intervals of Hole 735B, the latter corresponding to a fault zone. During Expedition 360, this assemblage was identified through XRD analysis to be composed of phyllosilicates and goethite. However, the bulk Fe-rich composition of this assemblage makes it hard to obtain clean diffractograms using the shipboard X-ray diffractometer, which uses Cu as an X-ray source. Further identification of this assemblage therefore requires shore-based analysis.
Clay minerals replace olivine to varying degrees from reddish stains on grain surfaces and fractures to complete pseudomorphic replacement. Saponite-forming pseudomorphs after olivine have been reported from Atlantis Massif and interpreted to be formed at a temperature <150°C (Nozaka et al., 2008). Saponite could also be formed at lower temperatures still (<100°C; e.g., Velde, 1985). If an olivine pseudomorph is rimmed by talc and tremolite/actinolite, clay would only occur in the center of the pseudomorph, presumably replacing relict olivine and rarely replacing talc and tremolite/actinolite. In addition, clay replacement is more intense in proximity to veins and predominant in cores with high fracture density. Such a selective alteration trend shows that this process is highly dependent on structures responsible for providing oxygen-rich seawater. Clay minerals show variable colors such as green, yellow, red, and dark red, which likely result from different chemical compositions and/or proportions of iron oxyhydroxides. These variations occur at centimeter to millimeter scales, thereby indicating that the structural controls may also produce significant gradients in the activities of various aqueous species (e.g., fO2, αSiO2(aq)). In addition, different generations of clay minerals were observed to replace olivine. Figure F59B shows that green clay is replaced by dark red clay. This texture reflects a system shifting to more oxidizing conditions that is likely brought on by an increase in fracture permeability.
Clays were also identified in fracture coatings and altered veins. Fractures are filled with minerals of various habits and colors. Some of these fracture coatings could be late-stage precipitates or remnants of an altered vein. For instance, most of the bluish and greenish fracture coatings were identified using XRD to be composed of plagioclase (likely albite), amphibole, and various sheet silicates (chlorite or smectite group). Some fracture precipitates are too small to be sampled for XRD analysis, but the wide variety of colors observed (green/blue to yellow/red) indicates that these different minerals formed at various aqueous conditions. Unreacted seawater rich in oxygen is likely to form the more oxidized precipitates (e.g., goethite); on the other hand, hydrothermal fluids depleted in oxygen because of prior water–rock interactions could form the reduced minerals.
Zeolites, a common group of low-temperature secondary minerals after plagioclase, were only observed at the base of Hole U1473A. Zeolites were likewise only observed in the deeper parts of Hole 735B (Bach et al., 2001). As shown in a simplified aqueous activity diagram (Figure F96), formation of zeolite minerals needs higher silica and Ca activities and/or higher pH than kaolinite and pyrophyllite. Indeed, both kaolinite and pyrophyllite were identified in altered felsic veins in Hole U1473A. Another possible cause for the absence of zeolites is high fCO2, which is indicated by the widespread occurrence of calcite (Figure F94). Calcite veins cutting felsic veins indicate that Ca from plagioclase was taken up by the carbonates, whereas Al and Si were transferred into kaolinite or pyrophyllite. In the deeper parts of Holes U1473A and 735B, zeolite could be saturated by low fCO2, more dissolved Ca and SiO2, and a low water/rock ratio in a more rock dominated system.
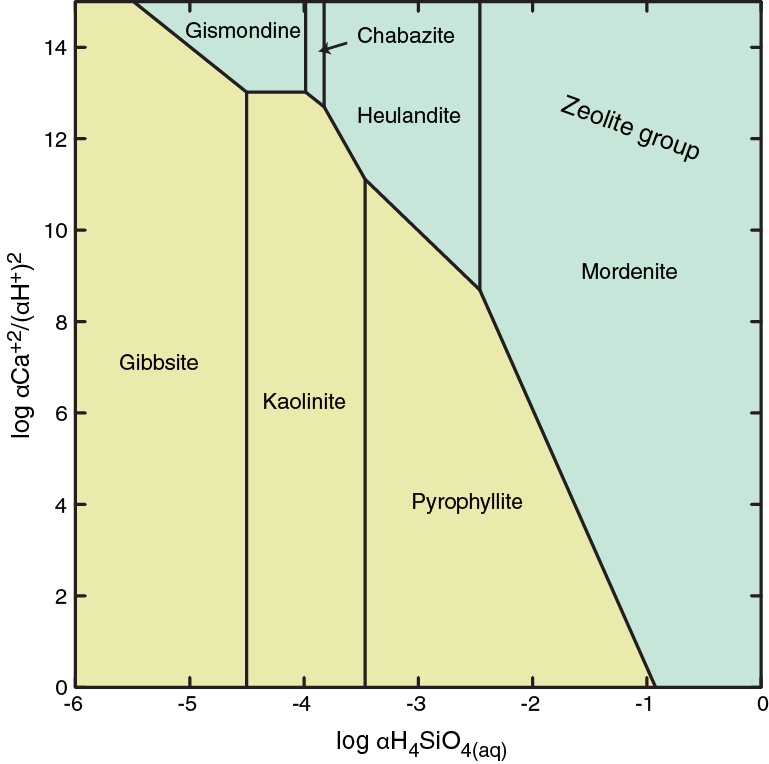
Figure F96. Activity diagram for simplified CaO-Al2O3-SiO2-H2O system at low temperature and pressure.
Carbonate veins are common in Hole U1473A, especially from 170 to 580 m CCSF. Carbonate veins are mostly made up of calcite, often with reddish stains that could come from co-precipitating iron oxyhydroxides or mixing of fine-grained reddish clays. Some carbonate veins contain clasts from brecciated rocks. In fault breccias, the matrix consists of carbonates and is associated with reddish clays (Figure F78). Overall, carbonate formation seems to be the latest-stage event, cutting higher-temperature veins (i.e., chlorite, amphibole, and felsic veins), and is likely synchronous with the clay formation process. Carbonate veins crosscut each other, possibly reflecting multiple generations and variable chemical and temperature conditions for their formation. Nevertheless, the co-occurrence of calcite with iron oxyhydroxide seems to indicate an oxic fluid source and not a reduced fluid from a source at depth.
Structural geology
The Atlantis Bank oceanic core complex preserves a record of down-temperature deformation from primary magmatic fabrics and crosscutting magmatic veins to near and subsolidus crystal-plastic fabrics (CPFs), to brittle fracture and veining. The interplay between magmatic and tectonic processes and subsequent brittle overprint and alteration is fundamental to our understanding of the evolution of oceanic core complexes.
We present results from core and thin section observations in Hole U1473A based on a structural scheme defined and detailed in Structural geology in the Expedition 360 methods chapter (MacLeod et al., 2017a). The results are presented in down-temperature order from magmatic contacts and veins, magmatic fabrics and layering, CPFs, alteration veins, to brittle deformation. The results are followed by a discussion of temporal and spatial relationships between the various structures in Hole U1473A. Finally, a brief discussion on the deformation recorded within Hole U1473A in comparison with Holes 735B and 1105A is given. The results and discussion presented here demonstrate that the crustal sections sampled in different parts of Atlantis Bank are structurally distinct. However, the presence of intense, penetrative crystal-plastic deformation forming a shear zone up to 600 m thick strongly indicates the presence of a detachment shear zone/fault that records a temperature-time path of decreasing temperature and deformation.
Magmatic veins
Magmatic veins and magmatic breccias occur throughout much of Hole U1473A, and in total 482 veins and breccias were documented. Summation of the perpendicular thickness of each vein, corrected to core parallel thickness using the dip of the vein and corrected for recovery, leads to an estimate that magmatic veins comprise 1.5% ± 0.2% of the core volume. Magmatic veins consist of five compositional types: diorite (15 vol%), leucodiorite (26 vol%), quartz diorite (23 vol%), tonalite (3 vol%), and trondhjemite (33 vol%). Although most veins are moderately to heavily altered (see Metamorphic petrology), the least altered veins contain assemblages of plagioclase + quartz ± clinopyroxene ± brown hornblende ± amphibole ± biotite ± titanite ± apatite ± zircon. Trondhjemite veins occur mainly at or deeper than 400 m CCSF, whereas the other four magmatic vein types primarily occur shallower than 600 m CCSF (Figure F97). All magmatic vein types show a broad scatter in dip down the core and no overall preferred orientation. Figure F98 shows histograms of dip for all magmatic veins and the two dominant vein types (trondhjemites and leucodiorites) and a reference curve for the expected dip distribution for randomly oriented veins. In all three cases, the measured distribution does not depart significantly from that expected for a random distribution (see Structural geology in the Expedition 360 methods chapter [MacLeod et al., 2017a]). However, examination of Figure F97 suggests that at certain depths, clusters of similar dip can occur (e.g., the dip of quartz-diorite veins at 210 m CCSF [mean dip ~20°] and 300 m CCSF [mean dip ~65°]).
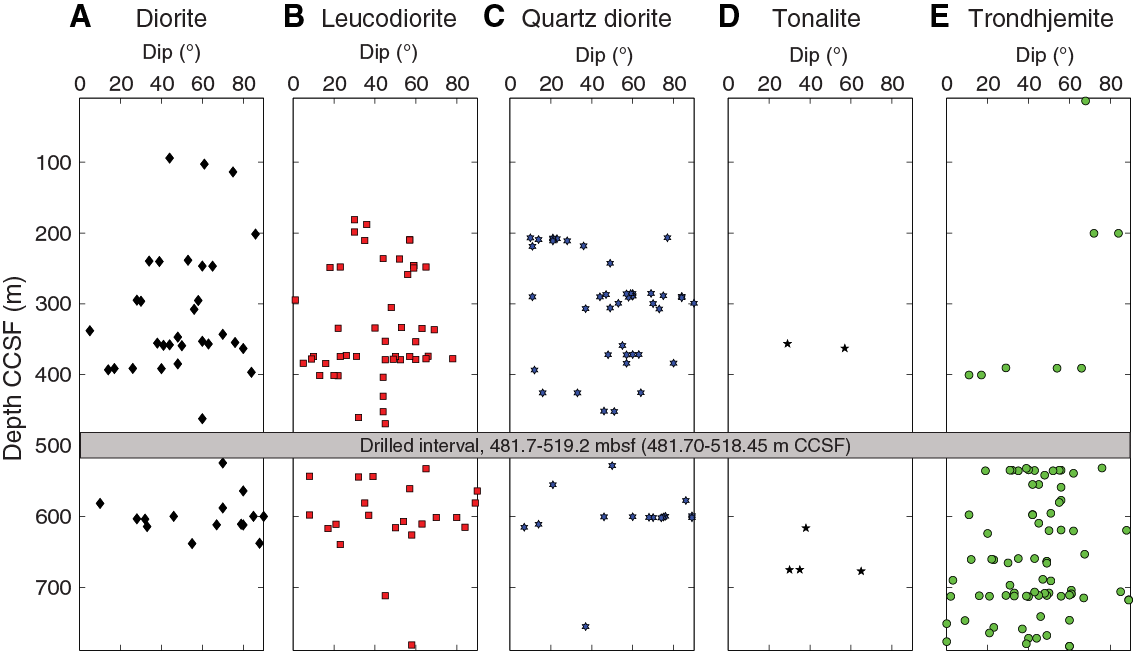
Figure F97. Depth distribution of magmatic vein dips, Hole U1473A.
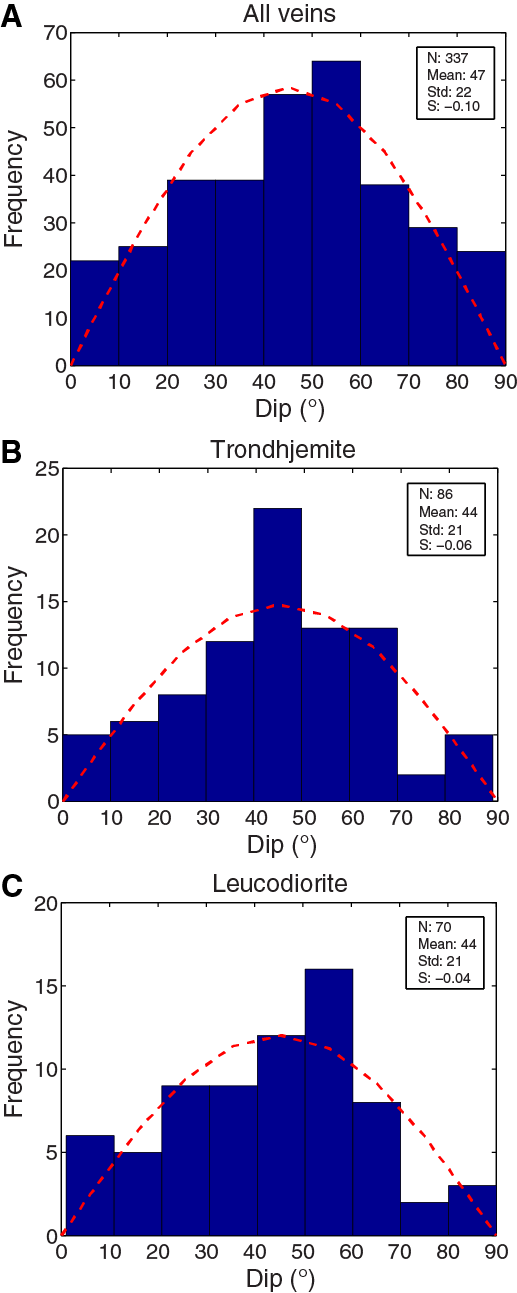
Figure F98. Frequency distribution of measured magmatic vein dips, Hole U1473A.
The apparent absence of veins in the top 200 m of the core is partly an artifact due to poor recovery. Figure F97 only shows veins for which a dip can be determined, and lower recovery in the top of the core leads to many veins occurring in nonoriented pieces (see Structural geology in the Expedition 360 methods chapter [MacLeod et al., 2017a]). Figure F99 gives an estimate of the volumetric distribution of all magmatic veins present in the core and shows that veins are only lacking in the top 100 m of the core and are otherwise generally present from 100 m CCSF to the base of the core. Overall, the volume of veins appears to increase downward to 600 m CCSF and, most importantly, occur in relatively discrete horizons (e.g., at 200, 300, 370, and 600 m CCSF). Some of the horizons are dominated by particular vein types. For example, comparison of Figures F97 and F99 shows that the peak at 300 m CCSF is dominated by quartz-diorite veins and the peak at 700 m CCSF is dominated by trondhjemite veins. The largest peak at 600 m CCSF appears to consist of all five major vein types (diorite, leucodiorite, quartz diorite, tonalite, and trondhjemite). There is no obvious relationship of vein volume to CPF intensity (compare Figures F99 and F100), although some of the peaks in vein volume do correspond to areas of overall weak crystal-plastic deformation intensity (300, 600, 670, and 700 m CCSF).

Figure F99. Distribution and volume of magmatic veins with depth, Hole U1473A.
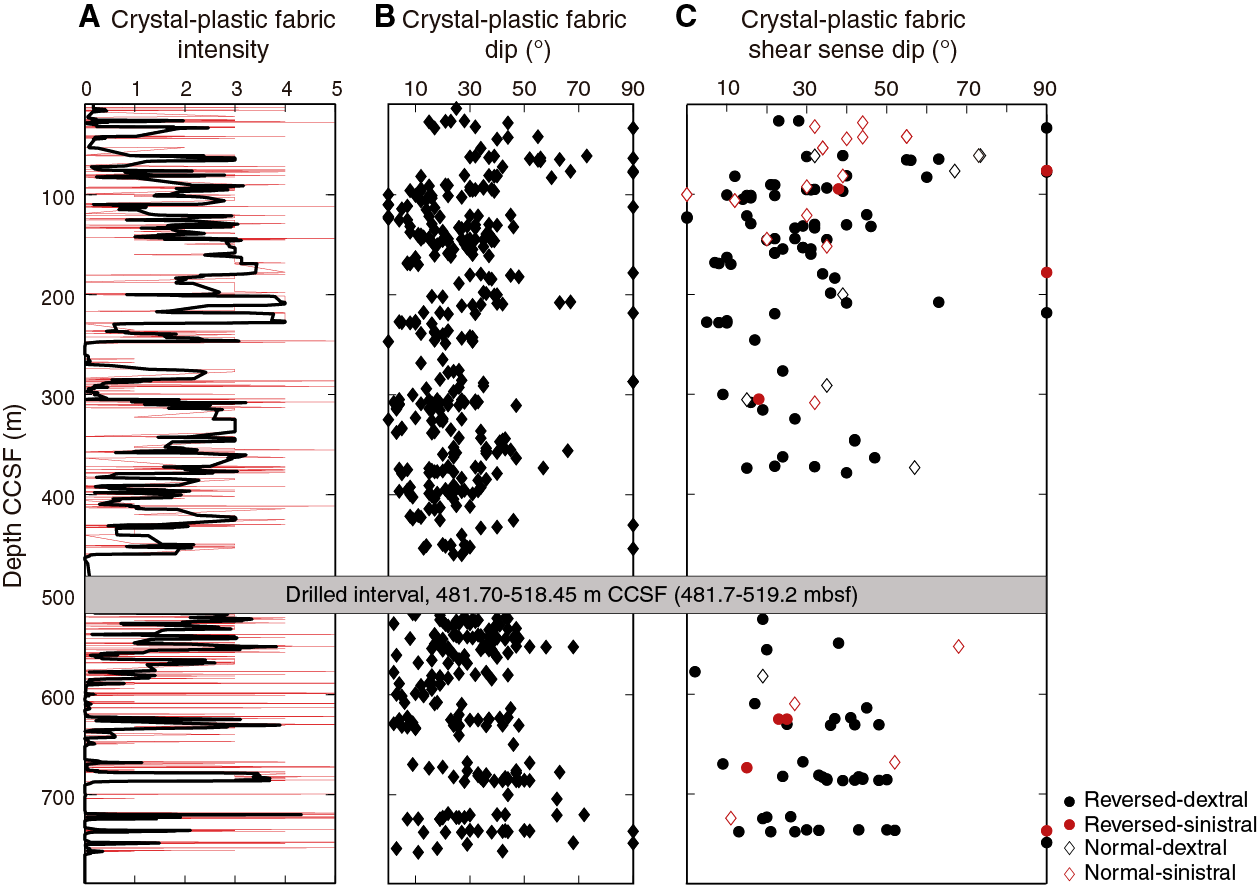
Figure F100. CPF characteristics plotted against depth, Hole U1473A.
Magmatic veins range from 1 mm to several centimeters wide and from straight parallel veins (Figures F101, F102, F103, F104) to more complicated branching veins (Figure F105) to irregular patches several centimeters in thickness. The latter have diffuse and complicated nonparallel margins and are incipient to fully developed magmatic breccias (Figures F106, F107). Morphologically, 70% of the veins are planar with parallel sides, 21% have irregular geometries, 4% are vein tips, 2% are curved, and 2% form pull-apart structures (Figure F108). A total of 12 veins show extensional melt-filled pull-apart structures such as those illustrated in Figure F108.
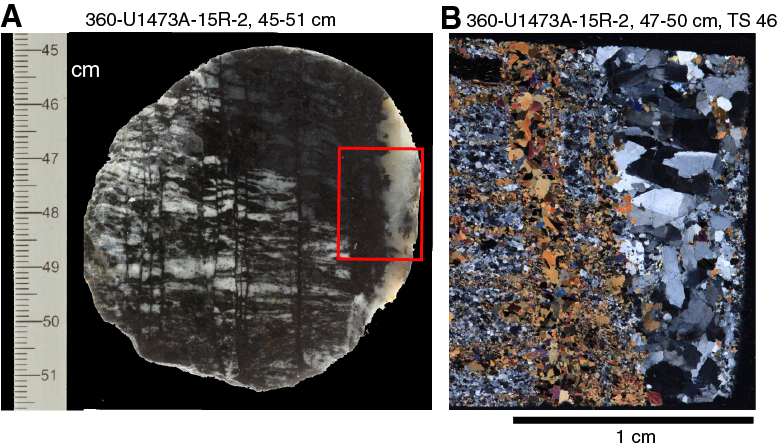
Figure F101. Undeformed diorite vein, plagioclase and minor amphibole in vein.
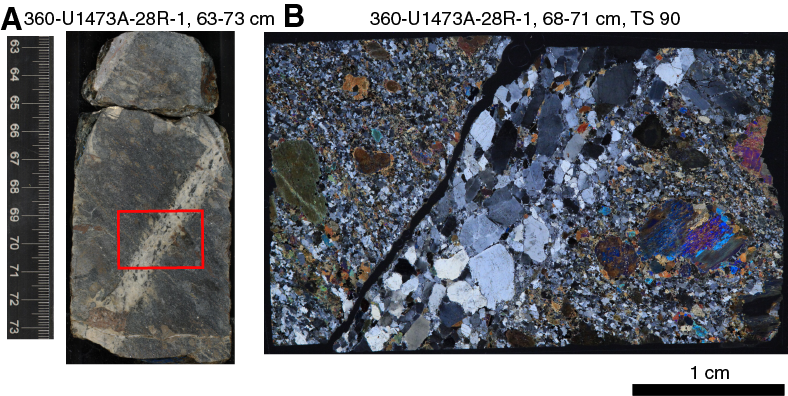
Figure F102. Weakly deformed leucodiorite vein crosscutting altered gabbro mylonite.
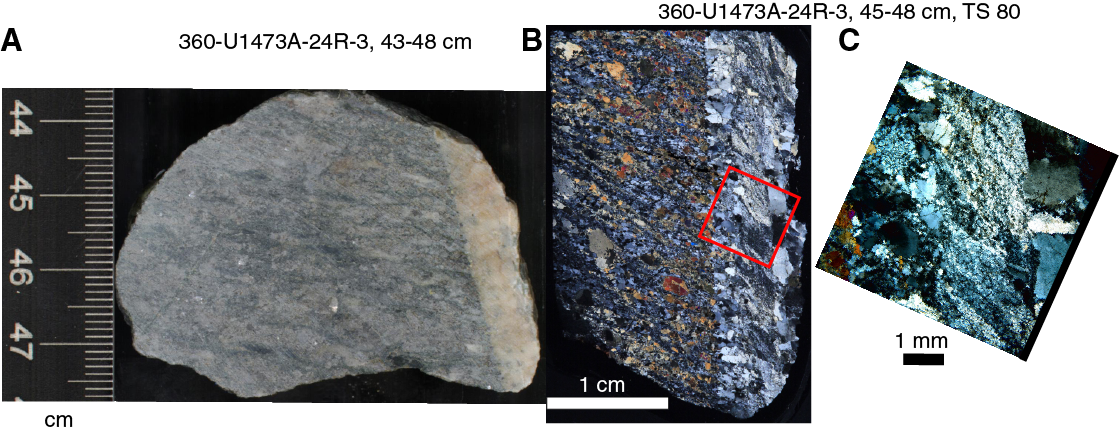
Figure F103. Moderately deformed leucodiorite vein crosscutting a gabbro mylonite.
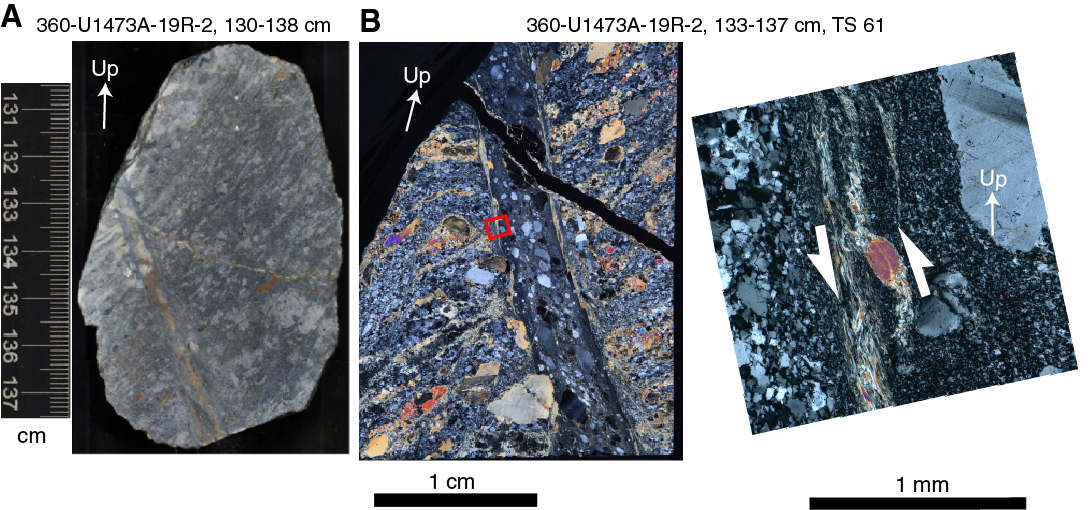
Figure F104. Heavily internally deformed but coherent felsic vein crosscutting a gabbro mylonite.
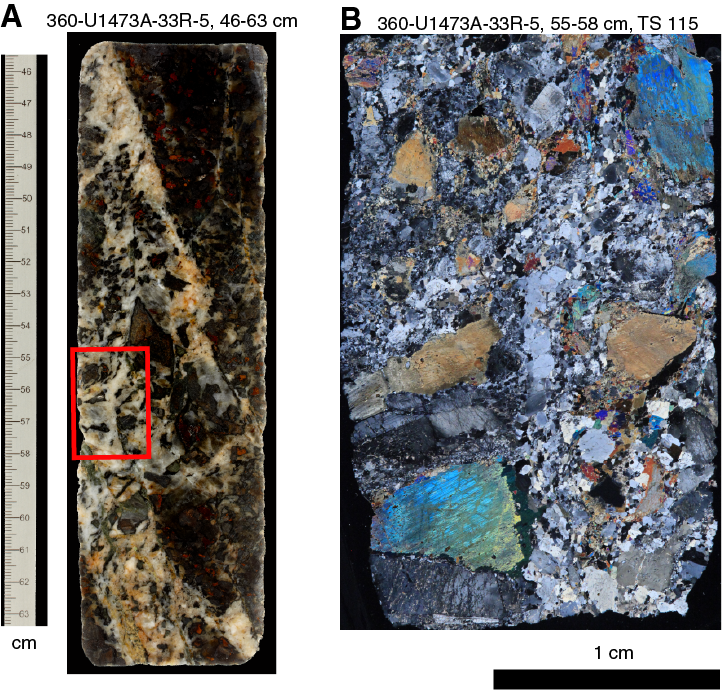
Figure F105. Relatively undeformed quartz-diorite vein showing diffusive boundaries with host gabbro crosscutting an olivine gabbro protomylonite.

Figure F106. Incipient leucodioritic magmatic breccia.
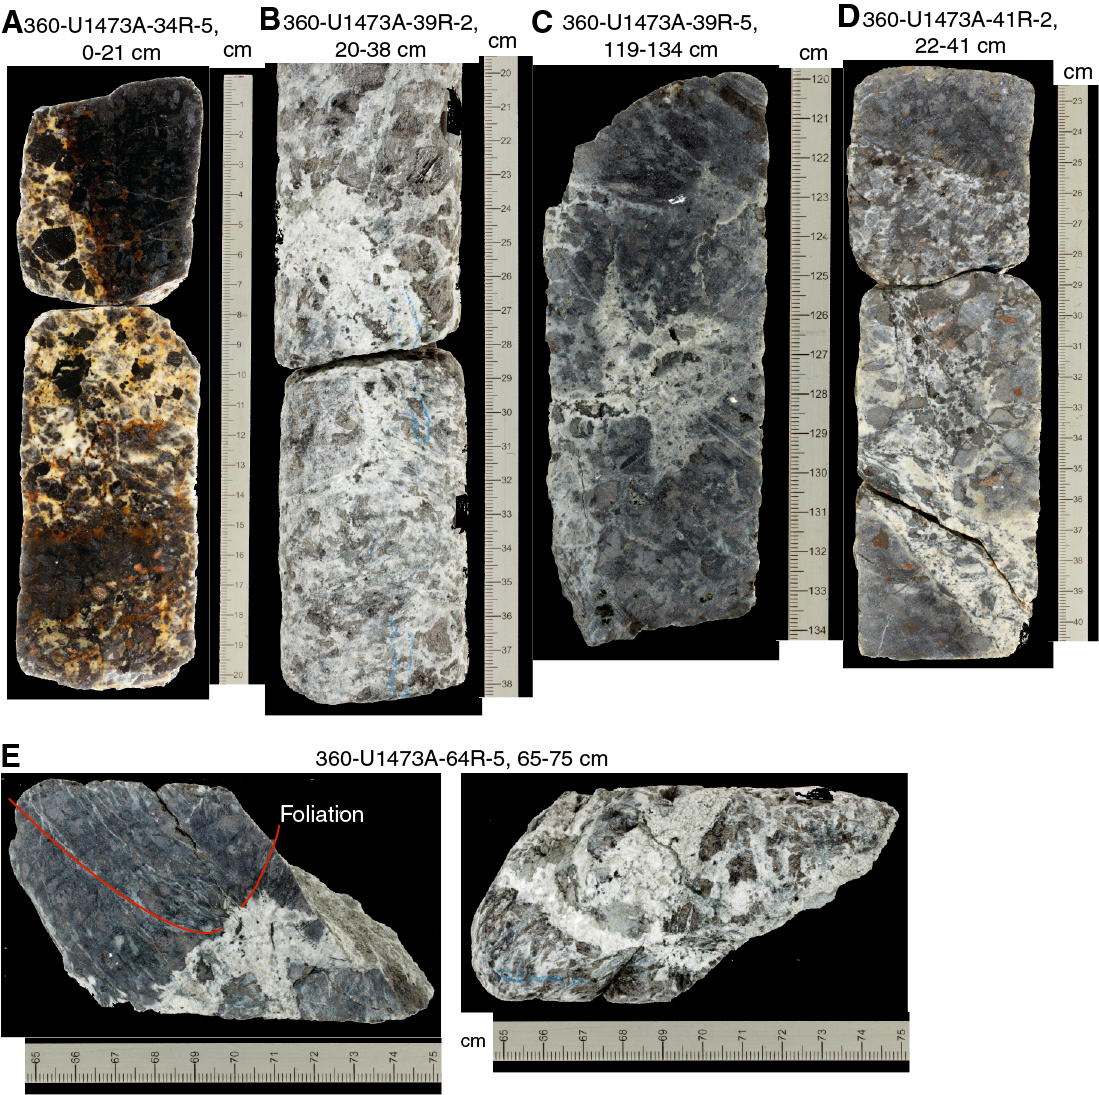
Figure F107. Magmatic breccias in core.
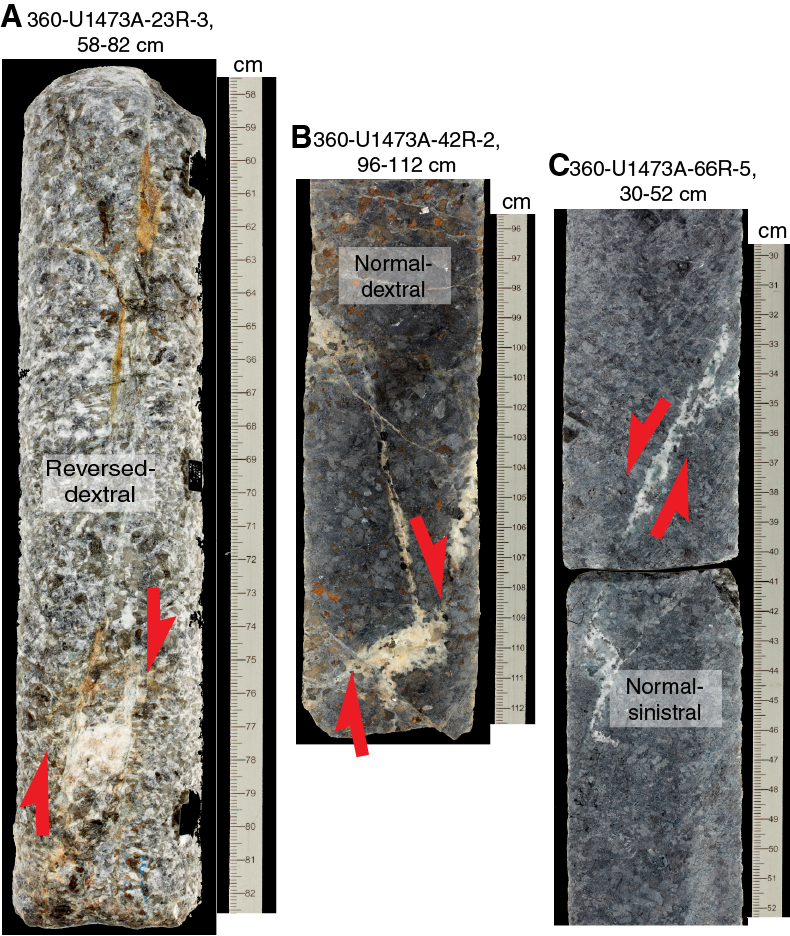
Figure F108. Semibrittle pull-apart structures bounded and filled by vein systems.
There are several generations of magmatic veins reflecting a protracted history of injection during ongoing deformation. The earliest magmatic veins/breccias have diffuse margins having intruded, infiltrated, and brecciated the host gabbro at near-solidus temperatures (Figures F105, F106, F107). Some veins are folded by shearing (Figure F106A), whereas later veins keep coherent vein geometry but provide heterogeneity for strain localization (Figures F103, F104). Nearly all veins show at least some evidence of deformation, such as minor plagioclase neoblast formation along grain boundaries and subgrain development (Figure F102), with only a minority of undeformed veins (e.g., Figure F101). Most veins have undergone high- and low-temperature alteration and have developed diffusive or reactive boundaries with the host gabbro. Many have undergone alteration during hydrothermal fluid migration or as a result of fluid exsolution during the final stages of felsic crystallization.
Magmatic contacts
Magmatic contacts correspond to boundaries separating igneous intervals and include changes in grain size (30% of all contacts), changes in mode (21%), sheared/tectonic (15% of all contacts), and intrusive (6%); 28% of the boundaries between igneous intervals correspond to gaps in core recovery, and thus their nature is unknown. Planar contact orientations were recorded in the plutonic_mantle worksheet in the DESClogik macroscopic workbook, whereas no orientation was entered for irregular or very gradational contacts.
Figure F109A–F109B presents histograms of the dips of the two most abundant igneous contact types: grain size contacts and sheared contacts. The histogram for grain size contacts has a mean dip of 28°, whereas that for sheared contacts is broadly similar at 35°. There is no preferred distribution of the dips of the different contact types with depth, as shown in Figure F109C. More contacts were found deeper than 500 m CCSF, likely due to less crystal-plastic deformation obscuring them.
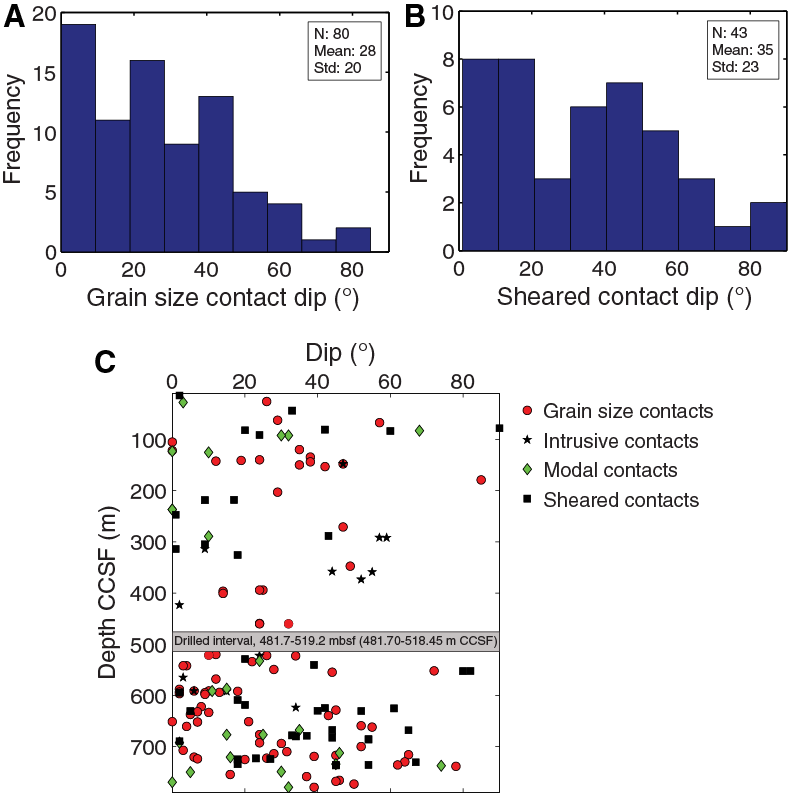
Figure F109. Frequency and distributions of magmatic contact dips, Hole U1473A.
Figures F110, F111, and F112 give examples of the four types of magmatic contacts. Figure F110A–F110B shows examples of planar igneous grain size contacts, and Figures F110C and F111C show an irregular grain size contact, all within a layered gabbro series (see Igneous petrology) and one example of a modal boundary. Figure F111 shows examples of intrusive contacts, including planar contacts between intrusive diabase dikes and the host gabbro and a more complicated boundary between a fine-grained intrusive gabbro and a coarse-grained host gabbro. Figure F112 shows examples of sheared/tectonic boundaries between intervals. These contacts vary from vertical to horizontal and from approximately 1 mm wide to more complicated and thicker contact zones.
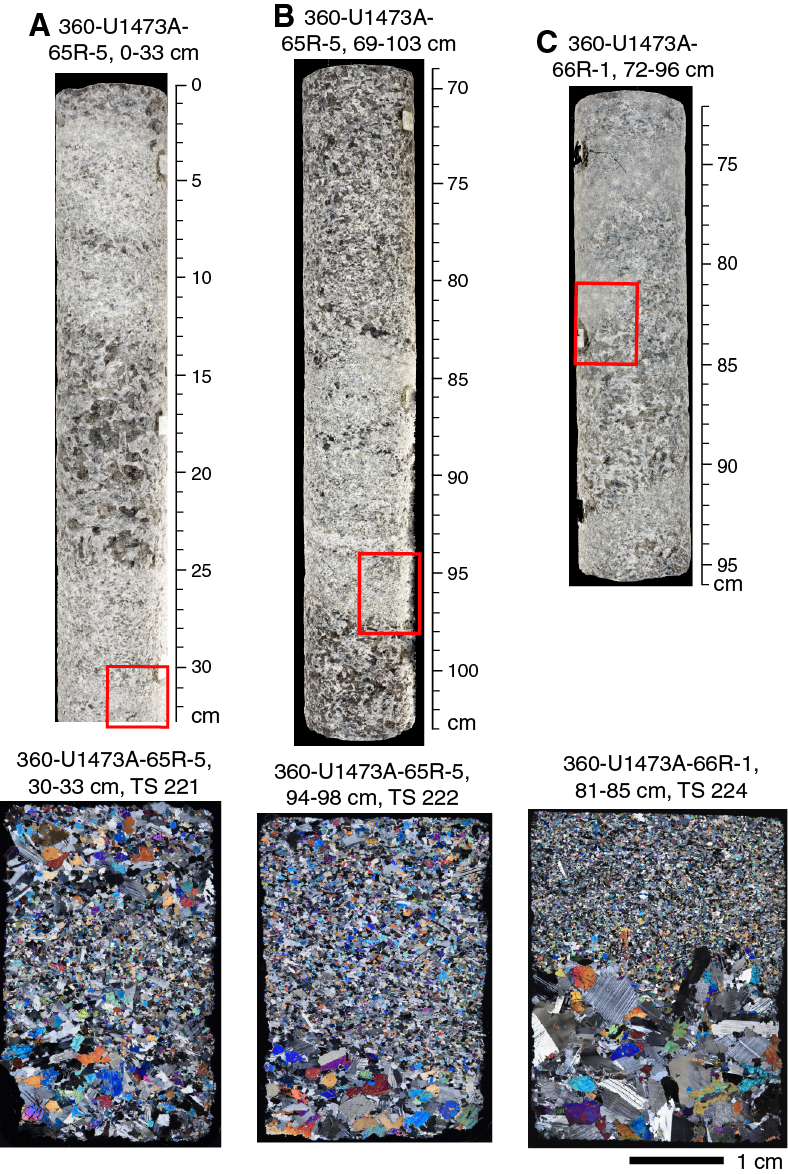
Figure F110. Modal and grain size contacts.

Figure F111. Intrusive contacts.
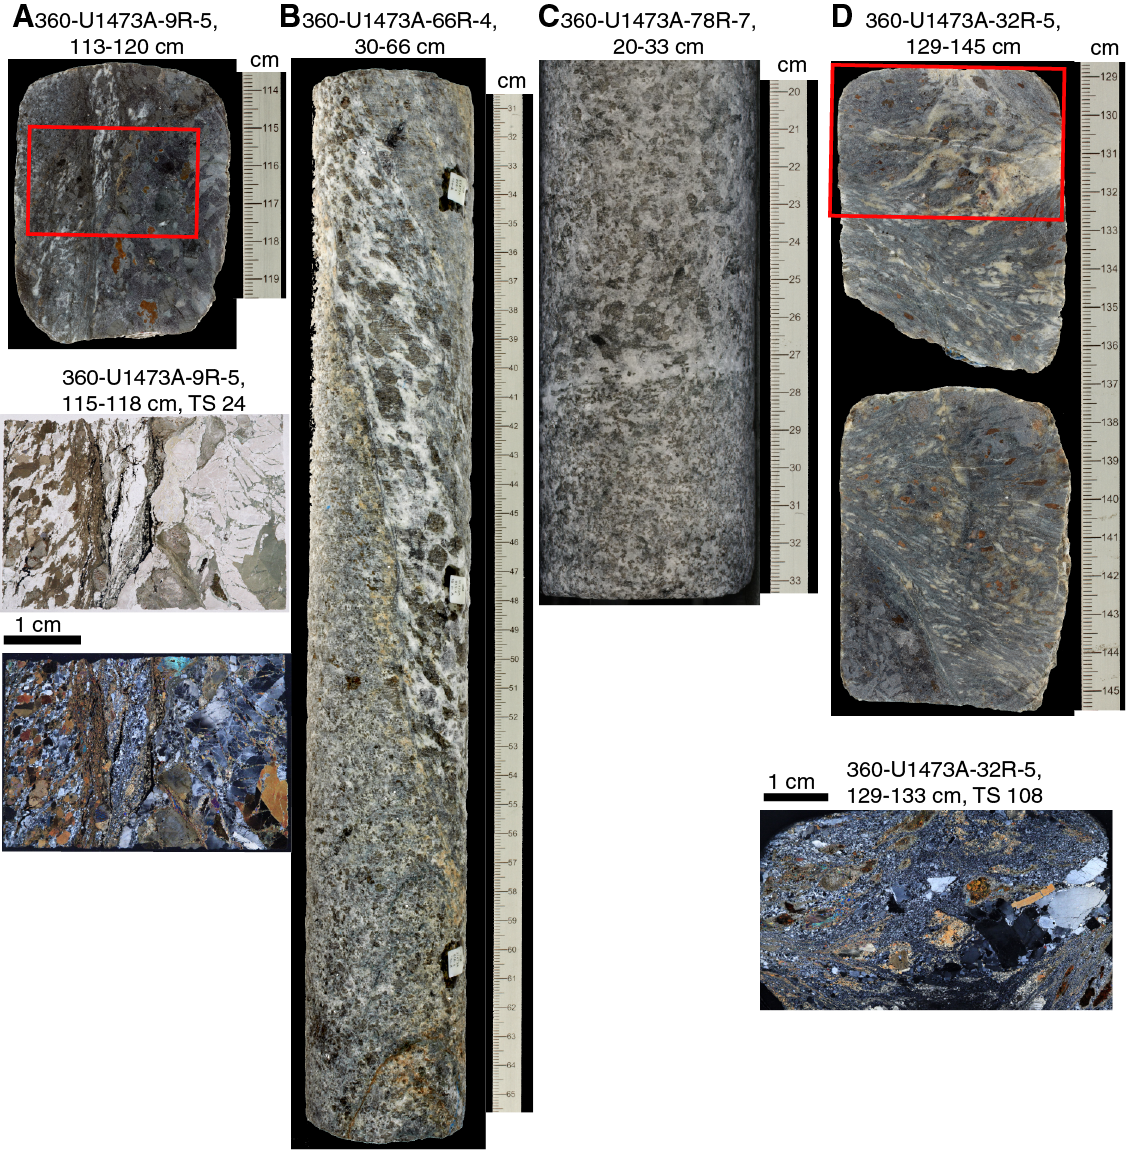
Figure F112. Sheared or tectonic contacts.
Magmatic fabrics and igneous layering
Magmatic fabrics
Identifiable magmatic textures are preserved in 42% of Hole U1473A gabbros. They can be recognized both in undeformed cores and in those displaying evidence for moderate degrees of crystal-plastic deformation (i.e., crystal-plastic intensities < 3) (see Crystal-plastic deformation and alteration). The majority of the gabbros display random orientation of subhedral (e.g., plagioclase) to anhedral (e.g., poikilitic clinopyroxene) primary igneous minerals (Figures F113A, F114A) that range from fine- to coarse-grained subophitic and granular textures (see Igneous petrology). Weakly to moderately developed magmatic fabrics, defined by elongated laths of euhedral to subhedral tabular plagioclase and sometimes pyroxene showing shape-preferred orientation (SPO) (Figure F113B), were observed in discrete intervals of about 80 cm maximum thickness. Throughout the uppermost 400 m CCSF of Hole U1473A, magmatic fabrics are present in medium- to coarse-grained intervals at 20–145, 230–300, and 355–465 m CCSF (Figure F115). Interlayered fine-grained intervals are overprinted by crystal-plastic deformation and do not retain their presumed original magmatic fabric (Figures F115C, F116) or have isotropic fabrics. Deeper than 500 m CCSF, magmatic fabrics are better preserved because of the broad decrease of CPF intensity (Figure F115C).
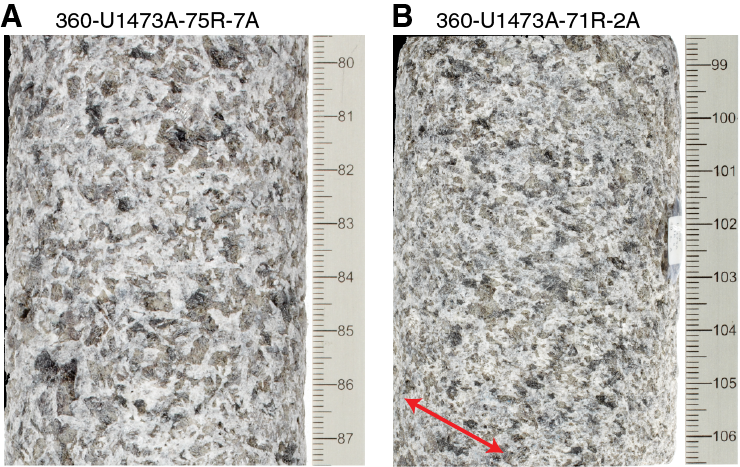
Figure F113. Typical isotropic fabric, weakly to moderately developed magmatic fabric.

Figure F114. Igneous and tapered twins.

Figure F115. Magmatic fabrics, Hole U1473A.
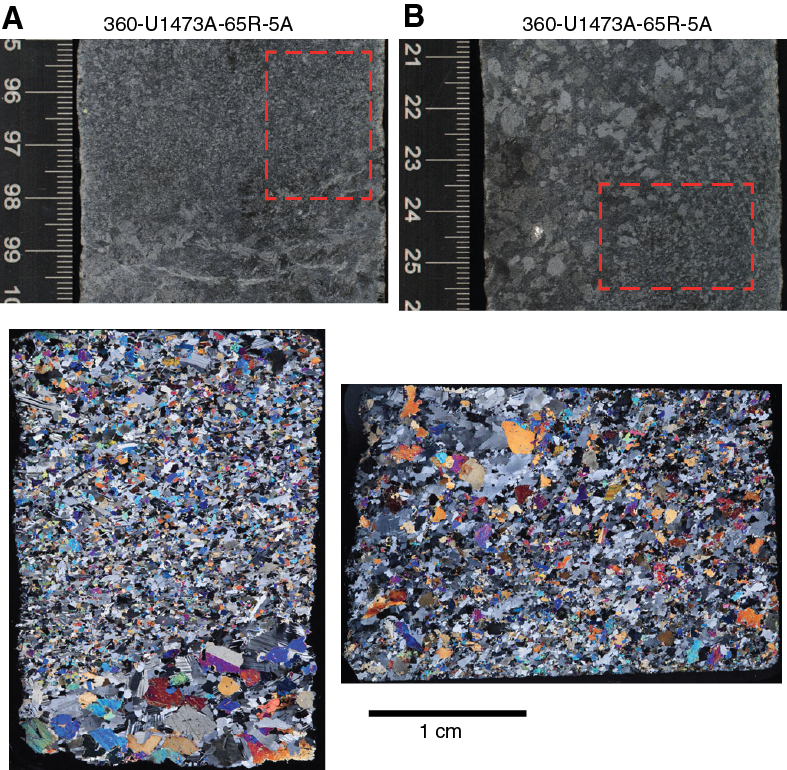
Figure F116. A. Weak magmatic fabric. B. Fine-grained layer grading to coarse-grained material.
No systematic variation of magmatic fabric intensity is observed with depth (Figure F115C). Generally, magmatic fabrics are shallow to moderately dipping, ranging between 10° and 50° (Figure F115A–F115B). No systematic variation in dip with depth is observed. There also appears to be no correlation between magmatic fabric intensity and grain size in plagioclase and clinopyroxene (Figure F115D).
The mineral phases that define magmatic fabric in a particular interval were confirmed by thin section observation. Magmatic textures free of crystal-plastic overprint represent 10% of all samples observed in thin section. Overall, the primary igneous minerals are randomly oriented; for example, Sample 360-U1473A-3R-2, 89–98 cm (TS 4) (Figure F114A), contains undeformed elongated euhedral plagioclase with no obvious SPO. However, a few fine-grained olivine gabbros display weak magmatic fabrics defined principally by tabular plagioclase SPO (Figure F116). Well-preserved plagioclase crystals display igneous twinning with straight margins and sharp terminations (Figure F114). Tapered twins and undulose extinction are common in plagioclase and indicate weak crystal-plastic deformation. Olivine is characterized by anhedral habit and displays variably preserved straight subgrain boundaries. Olivine is variably fractured and partially replaced by serpentine and oxide. Clinopyroxene is subhedral to anhedral, subophitic to poikilitic, and generally undeformed. Pyroxene oikocrysts may have inclusions of euhedral plagioclase chadacrysts that are randomly or weakly to moderately oriented.
Igneous layering
Igneous layering was observed throughout Hole U1473A, characterized by variations in grain size, either patchy or with planar contacts (see Igneous petrology). A total of 67 series of igneous grain size layers were identified downhole with particular intervals exhibiting intense igneous layering at 105–165 and 580–680 m CCSF. These intervals correspond to lithologic Units II and overlap Units VII and VIII, respectively (see Igneous petrology).
Grain size layering is generally characterized by sharp changes in grain size between fine- and medium-grained or medium- and coarse-grained gabbro (Figure F117). Of these layered series, 50% show planar and subparallel boundaries between layers of 5–10 to 15–20 cm thickness (Figures F110, F117). Other intervals that display grain size variations are often limited within centimeter-scale patches with irregular boundaries (Figures F117C, F118). Some of the contacts have subparallel magmatic fabrics, observed in several intervals, in particular 140–150, 238–340, 590–600, and 650–670 m CCSF (Figures F115B, F118C). However, the majority of grain size layers do not display SPO (Figure F117B) (e.g., in Cores 360-U1473A-13R, 16R, 64R, 65R, 74R, and 88R).
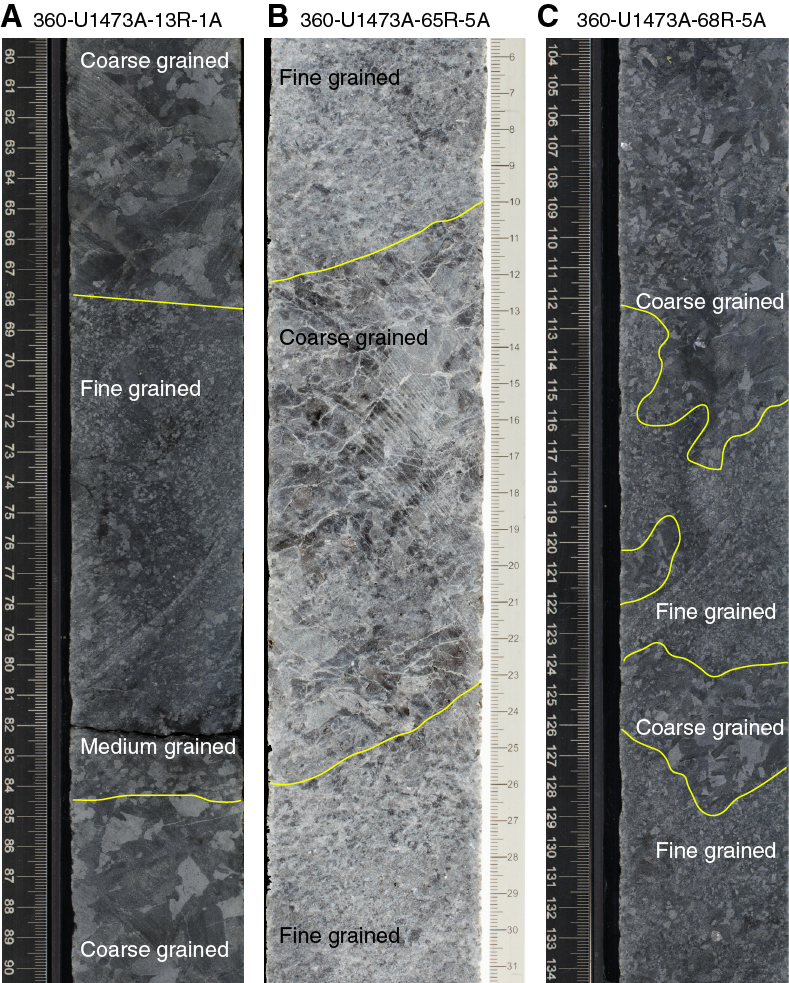
Figure F117. Grain size layering.
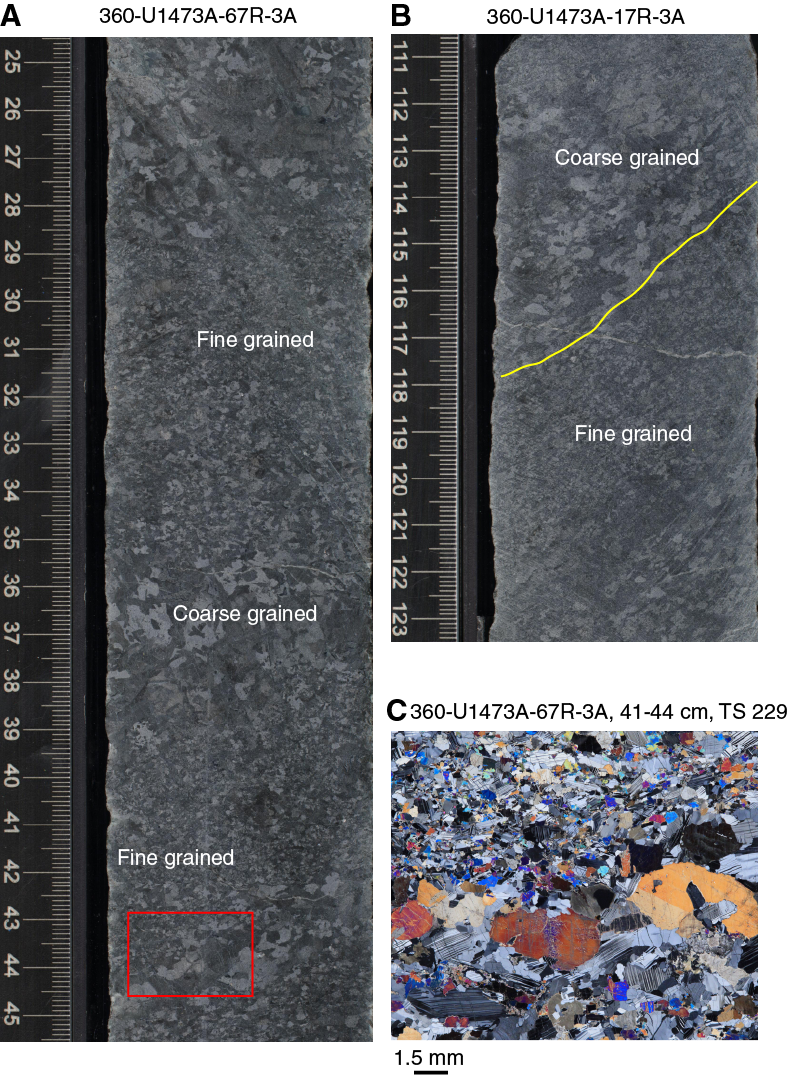
Figure F118. A. Irregular grain size variation. B. Grain size contact with subparallel magmatic fabric.
Crystal-plastic fabrics
The distribution and intensity of CPFs in Hole U1473A is variable, with most of the section having enjoyed at least some crystal-plastic deformation. CPFs were categorized using a qualitative intensity scale based on the alignment and observable recrystallization of constituent phases ranging from undeformed (Rank 0) to ultramylonitic (Rank 5; see Structural geology in the Expedition 360 methods chapter [MacLeod et al., 2017a]). Systematic measurements of intensity, orientation, and constituent mineral phases defining the fabric were made. Relative shear sense indicators were recorded if possible, and the relationships with magmatic fabrics and alteration were documented.
In some instances, the transition from magmatic fabrics (when the magma consisted of interlocking crystals with a matrix of residual melt, e.g., Bouchez et al., 1992) to CPFs is seen in the gabbros. This transition, where there is a crystal-plastic overprint but the magmatic texture is still preserved, is best identified in thin section. It is exemplified by euhedral, primary igneous plagioclase with bent igneous twins and tapered twins and in some cases by undulose extinction and subgrain development around the crystal edges (Figure F119). Olivine has undulose to rectilinear extinction defining subgrains. In contrast, clinopyroxene is commonly undeformed but in some cases has kinked cleavage planes.
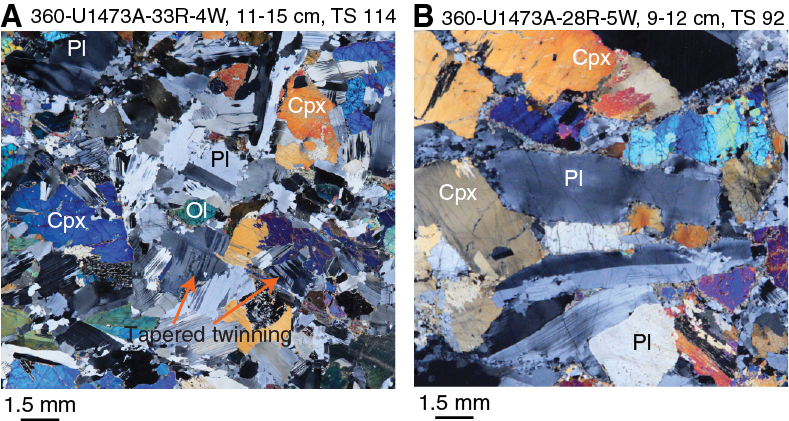
Figure F119. Early transition from magmatic to crystal-plastic deformation.
CPFs are always defined by elongated and recrystallized plagioclase regardless of the CPF intensity (Figures F120, F121, F122, F123, F124). In samples with high CPF intensities, pyroxene forms elongated porphyroclasts and can have tails of neoblasts. Olivine, if present, is generally recrystallized, but some porphyroclasts may be preserved. Fe-Ti oxide segregations and stringers, characterized by several contiguous Fe-Ti oxide grains, are most often parallel to the foliation and typically localized near mafic phases (Figure F124A–F124B).
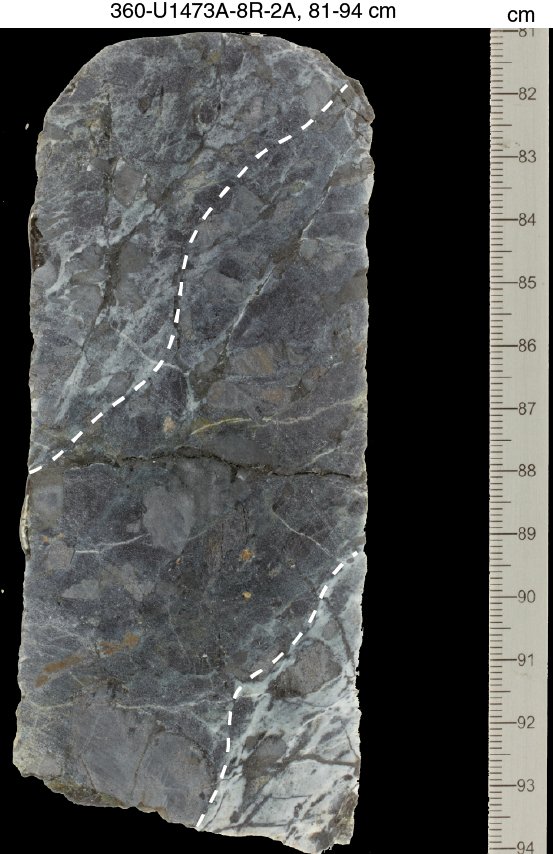
Figure F120. Porphyroclastic fabric marked by coarse clinopyroxene and olivine clasts and recrystallized plagioclase.
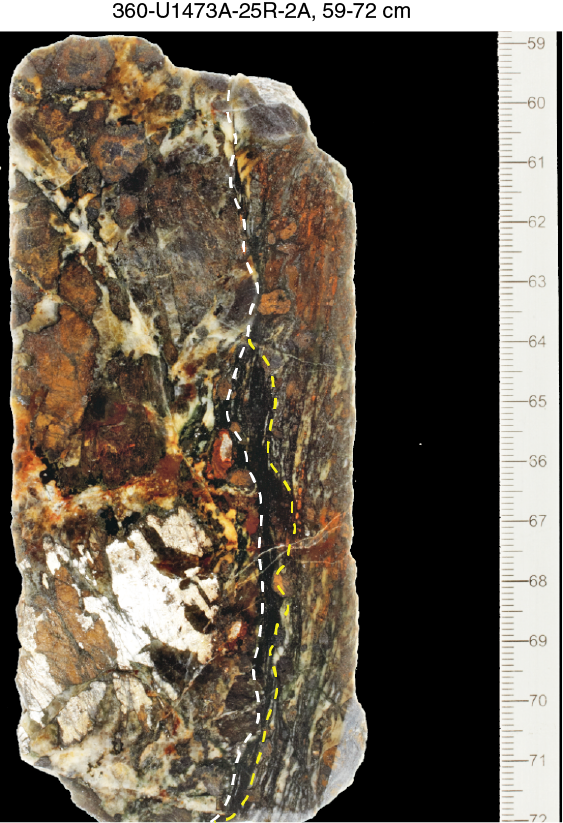
Figure F121. Mylonitic shear zone along oxide gabbro/olivine gabbro contact.
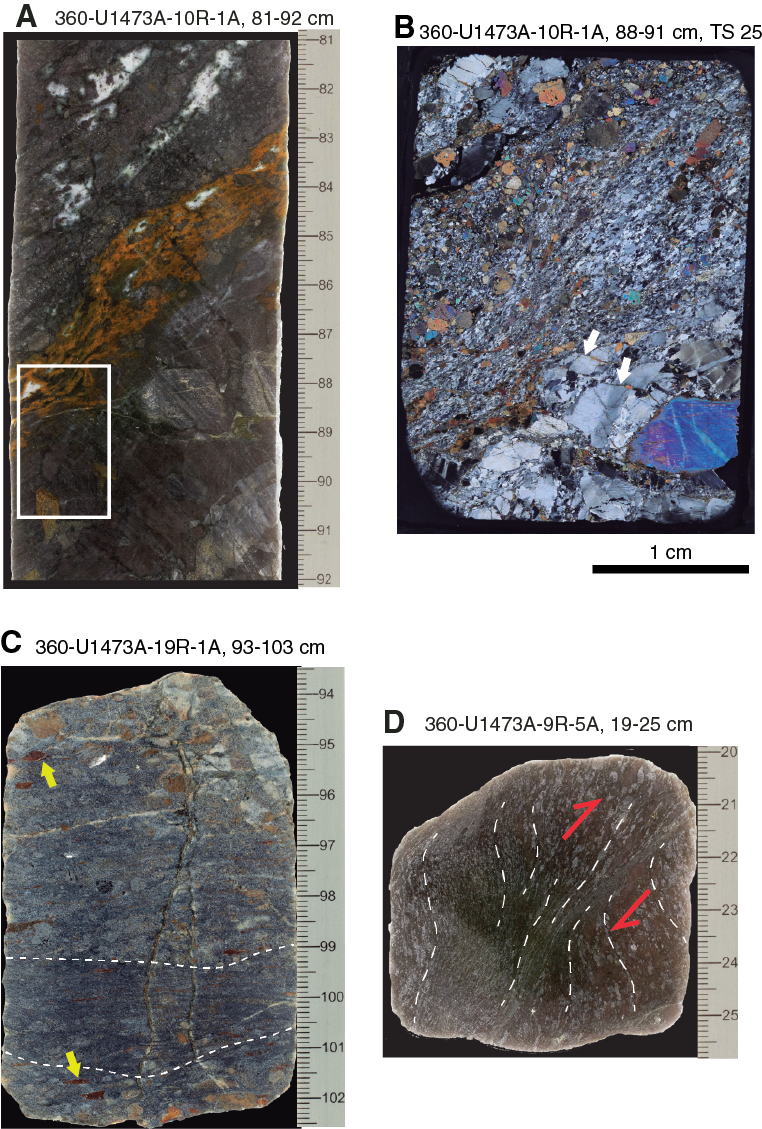
Figure F122. Shear zone morphologies.
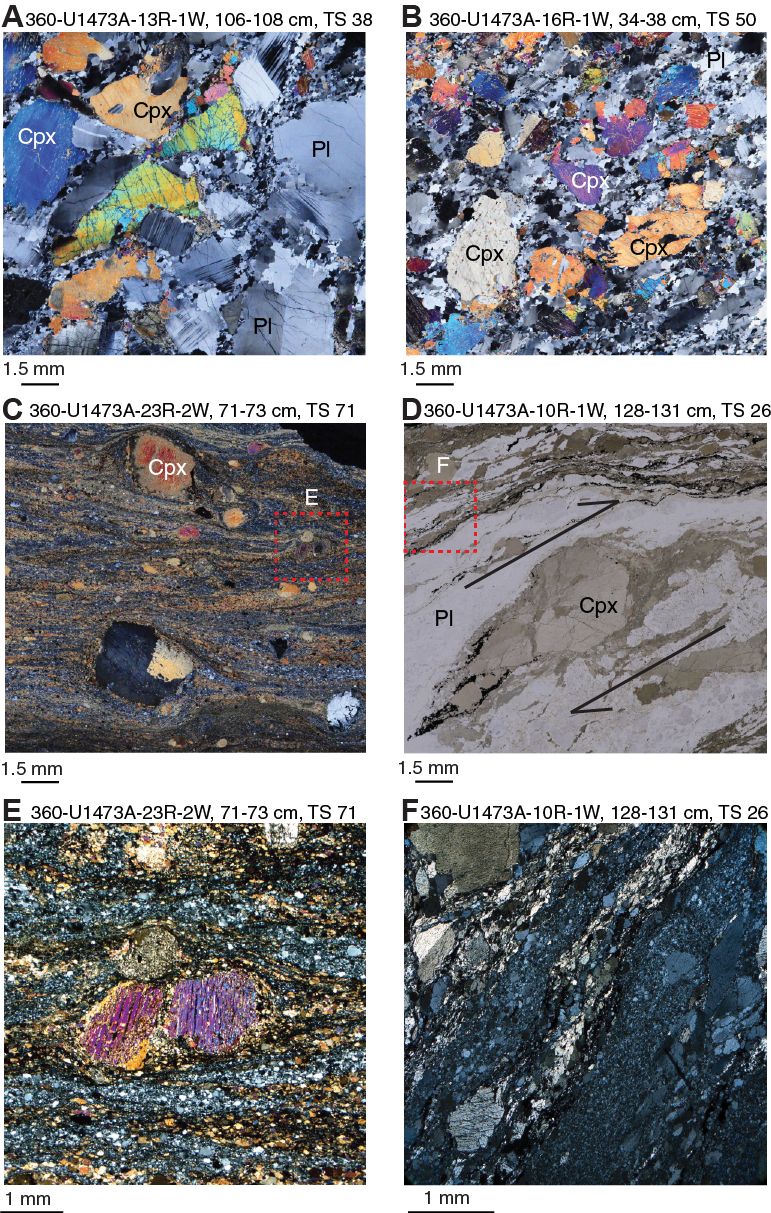
Figure F123. A, B. Porphyroclastic fabric. C. Fine-grained mylonite. D. Clinopyroxene porphyroclast. E. Fractures displacing clinopyroxene porphyroclast. F. Mylonite layer.
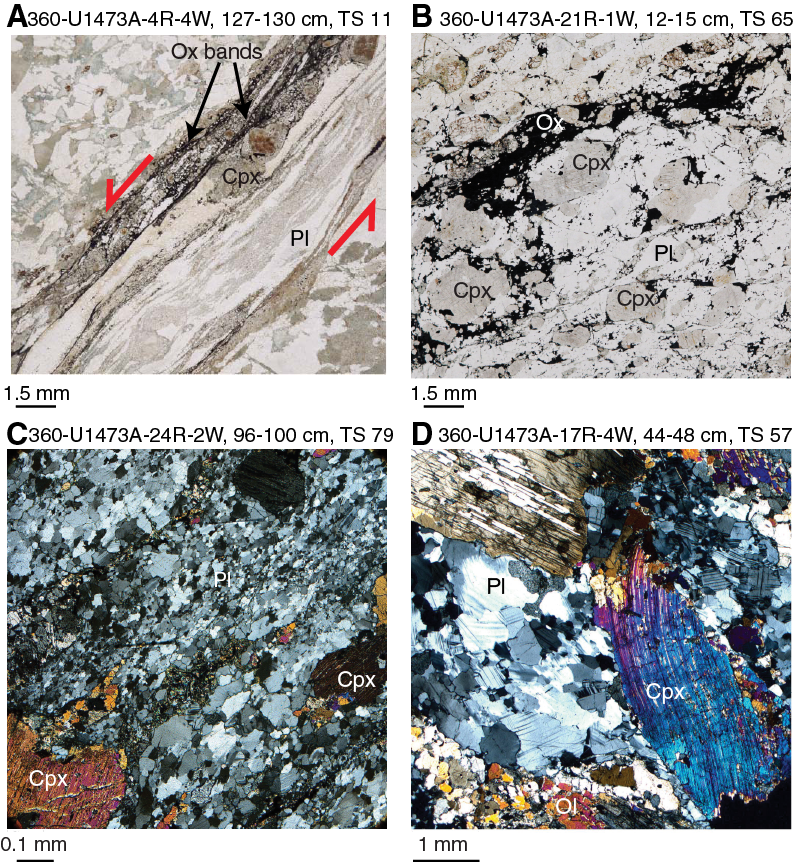
Figure F124. Aspects of oxide-bearing shear zones.
Intensity and distribution of crystal-plastic fabrics with depth
Hole U1473A is characterized by significant, near-pervasive crystal-plastic deformation, with only few intervals apparently completely devoid of such deformation (e.g., 250–275 and 700–720 m CCSF) (Figure F100A). The proportion and overall intensity of crystal-plastic deformation in the core decreases downhole; however, ultramylonites (CPF intensity Rank 5) are present throughout the core. The upper 100 m of the core has a lower overall CPF intensity, increasing downhole to a peak between 200 and 230 m CCSF. The interval between 200 and 230 m CCSF consists of two 10 m thick shallow to moderately dipping mylonitic zones (CPF intensity Rank 4; 200–210 and 220–230 m CCSF) separated by a 10 m thick porphyroclastic zone (CPF intensity Rank 3; Figures F100A–F100B, F123C, F123E). These two mylonitic zones are part of a larger 100 m thick zone of deformation starting at ~150 m CCSF and ending at ~250 m CCSF. This 100 m thick zone is the thickest near-continuous zone of high-intensity crystal-plastic deformation in the hole. Another zone of almost continuous crystal-plastic deformation occurs between 300 and 400 m CCSF. Deeper than 400 m CCSF, CPF intensity is much less variable.
Ultramylonites are heterogeneously distributed throughout the cores, commonly present in the middle of a broader porphyroclastic shear zone, or crosscutting a previous porphyroclastic foliation, or developed at the contacts between major discontinuities (e.g., veins and/or contacts) (Figures F121, F122B, F122D). The upper 500 m of the hole has more distributed deformation with fewer ultramylonites. In contrast, deeper than 500 m CCSF ultramylonites are more common but occur in more discrete intervals. Ultramylonites are characterized by a fine-grained mixture of recrystallized olivine + plagioclase ± clinopyroxene ± amphibole ± oxides (Figures F121, F122).
Postkinematic reaction products are commonly observed within the shear zones, typically consisting of amphibole and clay minerals derived from alteration of clinopyroxene and olivine, respectively. Amphibole is mainly concentrated at the grain boundaries of clinopyroxene and may also fill veins and shear zones that crosscut the porphyroclastic fabric (Figure F122D; see Metamorphic petrology).
The distribution of CPF dip magnitudes in Hole U1473A varies from horizontal to vertical; however, the majority of CPFs dip less than 50° (Figure F100B). The shallower 10°–30° dips mostly correspond to porphyroclastic fabrics (CPF intensity Rank 3), whereas the steeper dips generally relate to mylonitic and ultramylonitic fabrics that may locally crosscut the porphyroclastic fabric.
Shear sense indicators, when observed, were collected relative to the orientation of the CRF. Shear senses in mylonites from Hole U1473A were documented primarily by foliation asymmetries (Figure F125) and porphyroclast tails (see Structural geology in the Expedition 360 methods chapter [MacLeod et al., 2017a]). All shear senses were observed, with both apparent normal and apparent reversed senses; however, the majority of shear sense determinations indicated an apparent reversed (dextral) component (Figure F100C). Apparent normal senses of shear appear to be more prevalent in the upper ~150 m of the cores.
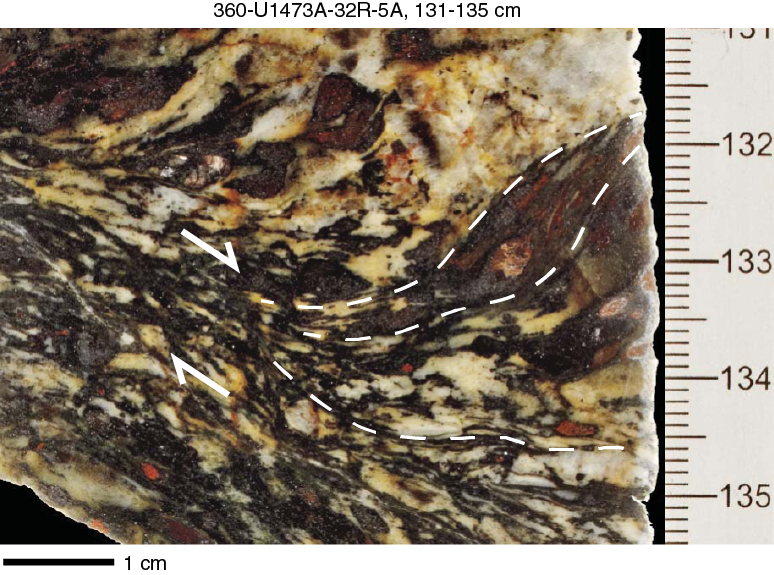
Figure F125. Coarse-grained mylonite with asymmetric pattern of mylonitic foliation indicating dextral shear sense.
Microstructural observations
Crystal-plastic deformation is widely observed within the Hole U1473A thin sections examined during Expedition 360. In general, macroscopic observations of fabric intensity correlate well with microscale structures.
Incipient crystal-plastic deformation of the gabbro developed during the final stages of magma crystallization, as evinced by coarse subhedral plagioclase grains that display mechanical twins and local undulose extinction mainly at grain boundaries (Figure F126A–F126B). Microfractures are widespread as late-stage structures crosscutting the twinning and cleavage of plagioclase and clinopyroxene, respectively.
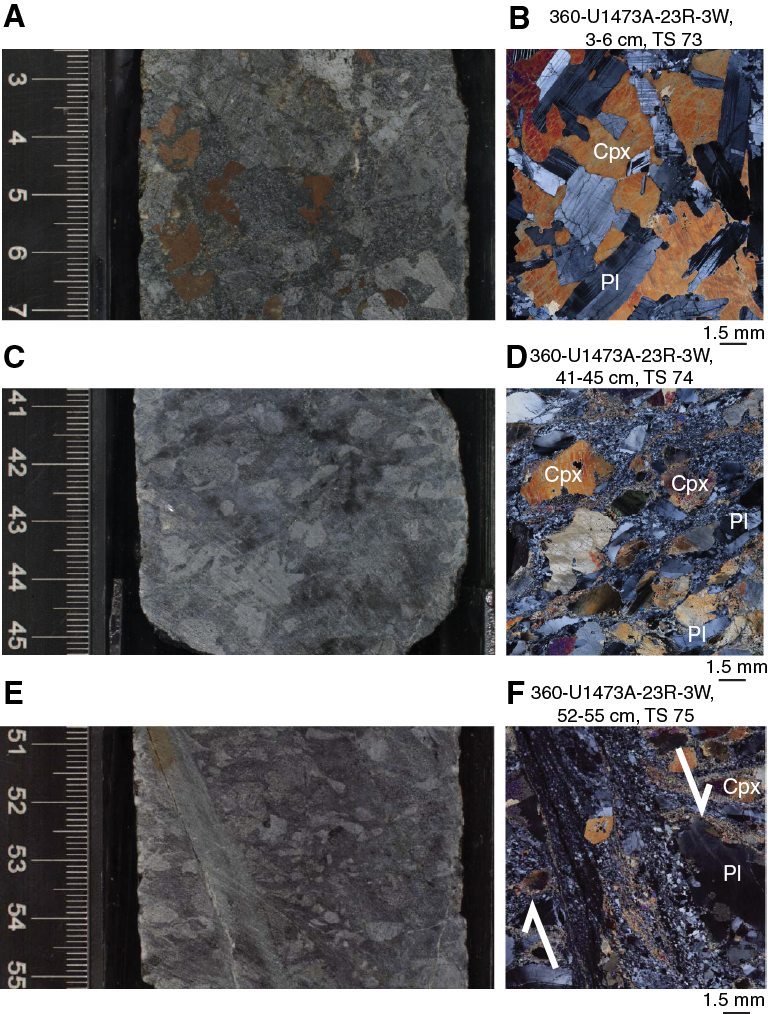
Figure F126. Progressive mylonite development from macro- to microscale.
More pronounced solid-state deformation (CPF deformation intensity Rank 3) results in broad recrystallization and grain size reduction of initial plagioclase porphyroclasts into medium- to fine-grained crystals that may form polygonal aggregates (Figures F126B, F123B). Clinopyroxene porphyroclasts undergo microfracturing and tend to orient their long axes parallel to the SPO, defining a coarse-grained solid-state foliation (Figure F123A–F123B). Fine, recrystallized olivine grains might develop at the margins of porphyroclasts.
CPFs with intensities ranging from Ranks 4 to 5 (corresponding to mylonite and ultramylonite) can be observed as a final product of progressive deformation of the section (Figure F123C–F123D). Fine-grained shear zones with sharp boundaries develop as a result of intense recrystallization of plagioclase grains in the matrix (Figure F123C). The internal regions of the shear zones are commonly characterized by fine-grained plagioclase and alteration products, such as amphibole, whereas oxides typically localize at the shear zone walls or at the tails of porphyroclasts (Figures F123A, F123D, F124A). Reaction products are commonly observed as part of the fine-grained mixture within the sheared domains and mostly consist of (probably postkinematic) green amphibole (Figures F123C–F123E, F124A).
Clinopyroxene crystals are progressively fractured and experience a moderate degree of plastic deformation, as shown by fractured and bent crystals both parallel and discordant with the foliation (Figures F123E, F124D). Deformation of clinopyroxene is commonly associated with increasing crystallization of green amphibole, which is mostly localized at clinopyroxene grain boundaries. In intervals where the rock is not altered, clinopyroxene undergoes local recrystallization at the periphery of the grains and bending of cleavage planes (Figure F124D).
Alteration veins
Vein distribution
The structural analysis of downhole vein patterns focuses on the three major types of alteration veins: (1) high-temperature amphibole veins, (2) low-temperature clay veins, and (3) carbonate veins. A total of 59% of all identified veins are clay veins, 21% carbonate veins, and 20% amphibole veins; however, by volume, the three types of alteration veins are present in comparable overall proportions: 0.13 vol% amphibole veins, 0.12 vol% clay veins, and 0.10 vol% carbonate veins.
The average total alteration vein density, including all three compositional types, in Hole U1473A is ~1 vein/10 cm in the top ~640 m and decreases to fewer than 0.5 veins/10 cm from 640 m CCSF to the bottom of the hole (Figure F127).
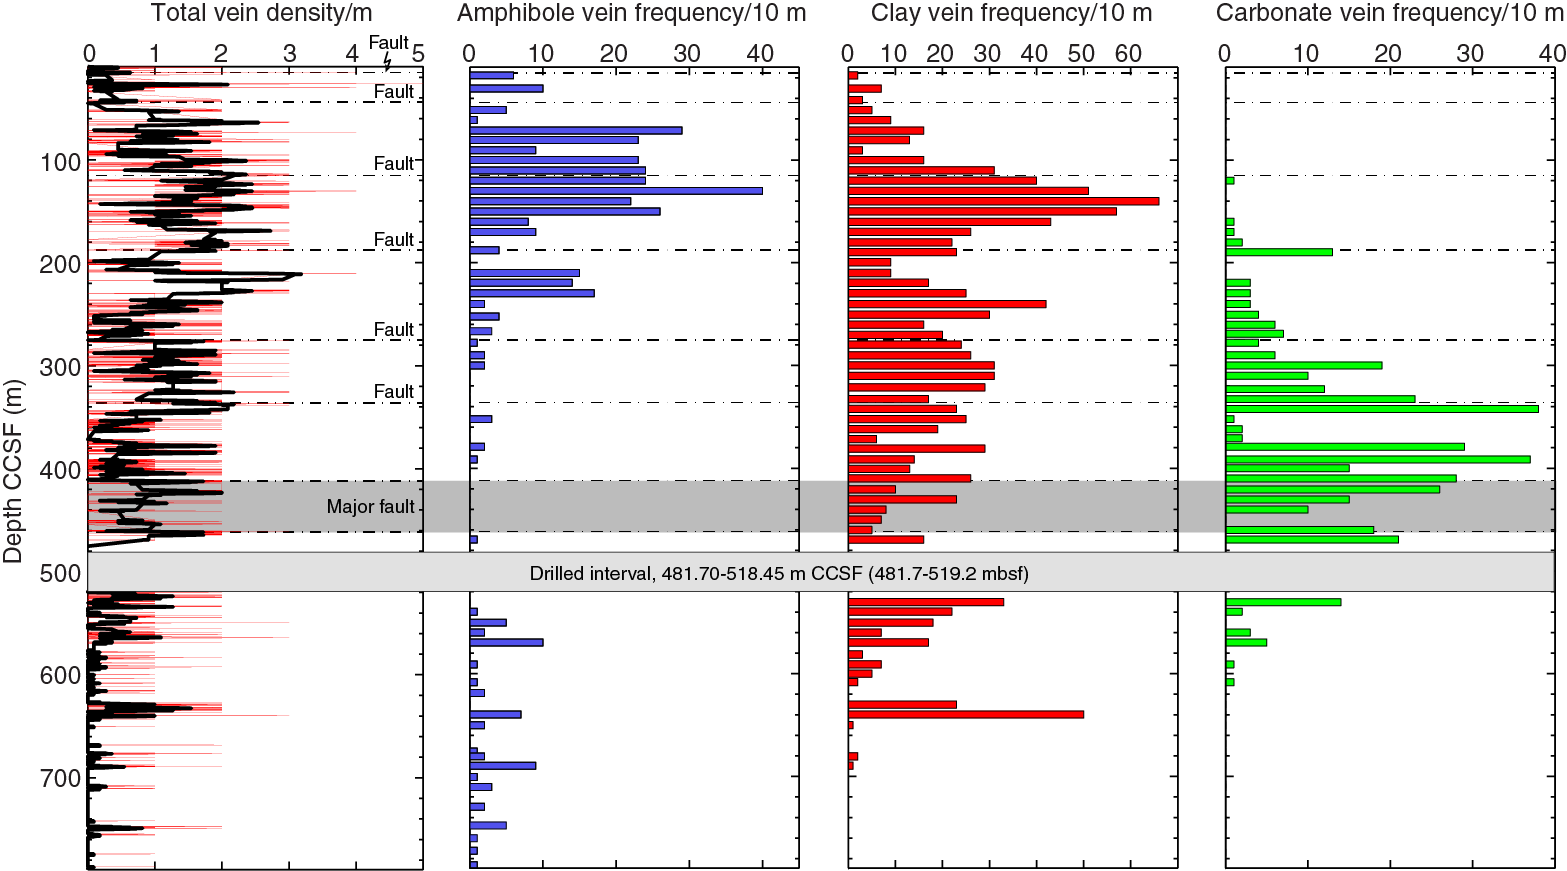
Figure F127. Metamorphic vein density and amphibole, clay, and carbonate vein frequency, Hole U1473A.
Amphibole veins are mainly concentrated in the top ~170 m of the borehole. Deeper than 170 m CCSF, amphibole vein abundance decreases drastically with a minor frequency maximum at 210–230 m CCSF (Figure F127). Amphibole veins to ~230 m CCSF are mainly composed of brown/green amphibole, suggesting amphibole formation temperatures of 600°–700°C. Deeper than 230 m CCSF, amphibole veins drop off rapidly in abundance. From ~540 m CCSF to the base of the hole, they recur but sporadically and are dominantly composed of pale green amphibole, suggesting formation temperatures of ~400°C. For a more detailed investigation of the amphibole mineralogy please refer to Metamorphic petrology.
Clay veins occur continuously downhole (Figure F127) with a frequency maximum at ~150 m CCSF and several local maxima such as between 240 and 250 m CCSF and at ~620 m CCSF. A substantial number of clay veins show signs of dissolution and removal of mineral fillings, resulting in cavitation. We interpret these veins as low-temperature phenomena and not as drilling-induced or unloading features (a definition of drilling-induced fractures logged in Hole U1473A can be found in Structural geology in the Expedition 360 methods chapter [MacLeod et al., 2017a]). For a more detailed investigation of the clay mineralogy see Metamorphic petrology.
In contrast to amphibole veins, carbonate veins are nearly absent in the uppermost 170 m of the hole. The first occurrence of more than 10 carbonate veins/10 m is found between 180 and 190 m CCSF (Figure F127). From 220 m CCSF, carbonate vein frequency increases continuously downsection, with maxima of 38 veins/10 m and 37 veins/10 m between 340 and 350 m CCSF and between 390 and 400 m CCSF, respectively. Between 400 and 470 m CCSF, 20–25 carbonate veins are present per 10 m. Deeper than 470 m CCSF, carbonate veins decrease steadily and cease at ~610 m CCSF.
With regard to vein width, amphibole veins exhibit the greatest thickness with an average of 0.15 cm, followed by carbonate and clay veins with thicknesses of 0.12 cm and 0.07 cm, respectively.
Vein dips
The dips and dip directions of veins were measured throughout Hole U1473A (Figure F128). Because the measurements were made relative to an arbitrary CRF (see Structural geology in the Expedition 360 methods chapter [MacLeod et al., 2017a]), the measured dip directions cannot be compared between pieces or relative to a geographical reference frame; hence, we are restricted to consideration of dip magnitudes only.
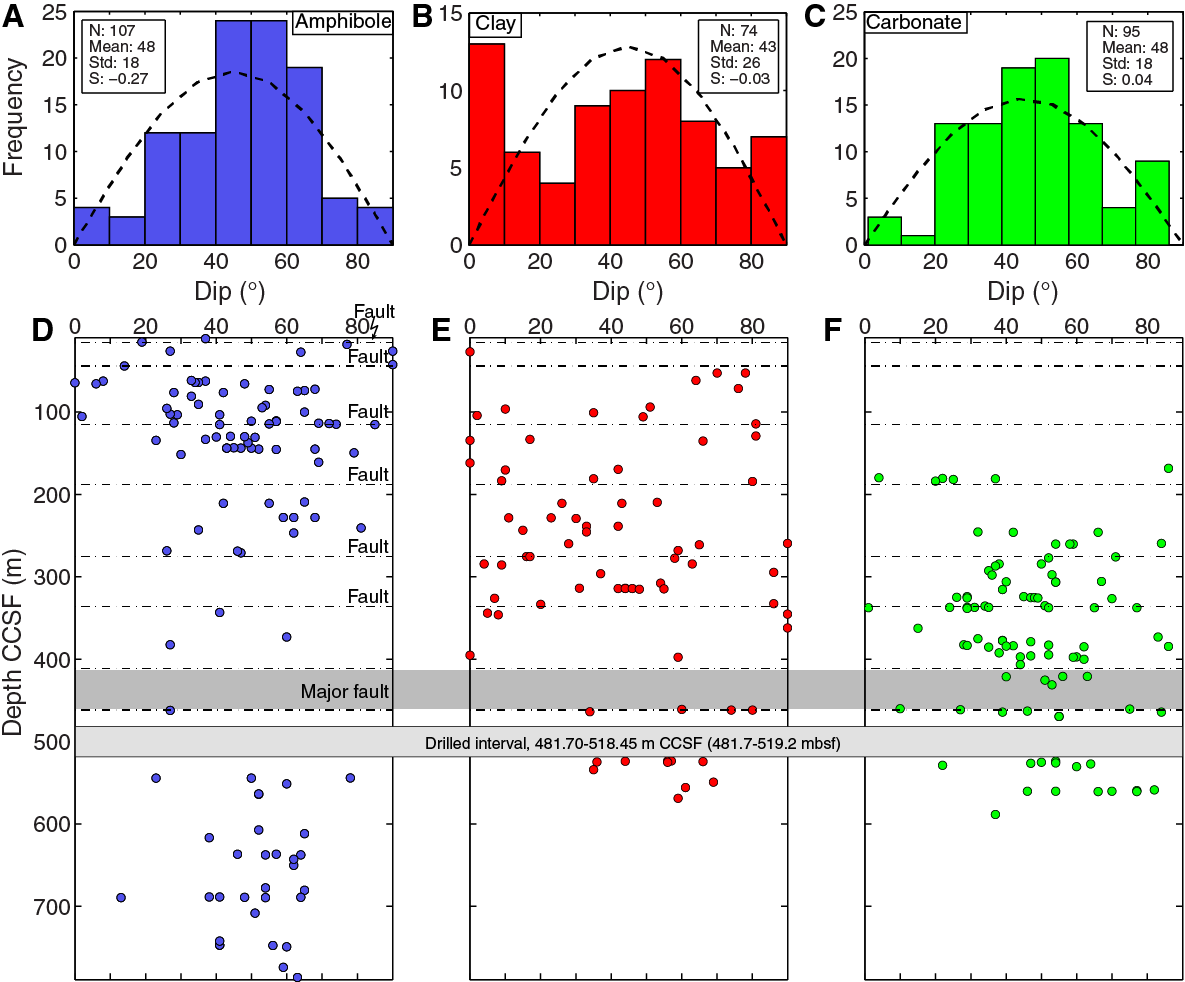
Figure F128. Dip orientations of amphibole, clay, and carbonate veins, Hole U1473A.
Amphibole veins have an average dip of 48° with a standard deviation of 18°. Comparison of these vein orientations with a theoretical distribution of a random set of planes in a vertical borehole (see Structural geology in the Expedition 360 methods chapter [MacLeod et al., 2017a]) indicates that amphibole vein dips in Hole U1473A are nonrandom (Figure F128A) and tend to have a dominant moderately steep dip between 50° and 70° throughout most of Hole U1473A.
Clay veins are typically isolated, but single veins extending through the core piece (> ~5 cm) have a mean dip of 43°, with a standard deviation of 26° (Figure F128B). Comparison to the theoretical random vein distribution shows that the clay vein dip distribution is nonrandom, with a greater than expected proportion of near-horizontal or near-vertical dips.
Carbonate veins have an average dip of 48° with a standard deviation of 18° and display a near random distribution (Figure F128C). However, carbonate veins tend to be more steeply inclined in the vicinity of fault zones (see Brittle deformation). Visual inspection of the core, in cases where discrete orientation measurements were not possible, confirms the presence of steeply dipping carbonate veins in the vicinity of the major fault zone starting at 411 m CCSF.
Vein shape and structure of vein-filling material
Figure F129 depicts the morphologies of typical high-temperature amphibole veins, and Figure F130 illustrates the occurrences of low-temperature clay and carbonate veins.
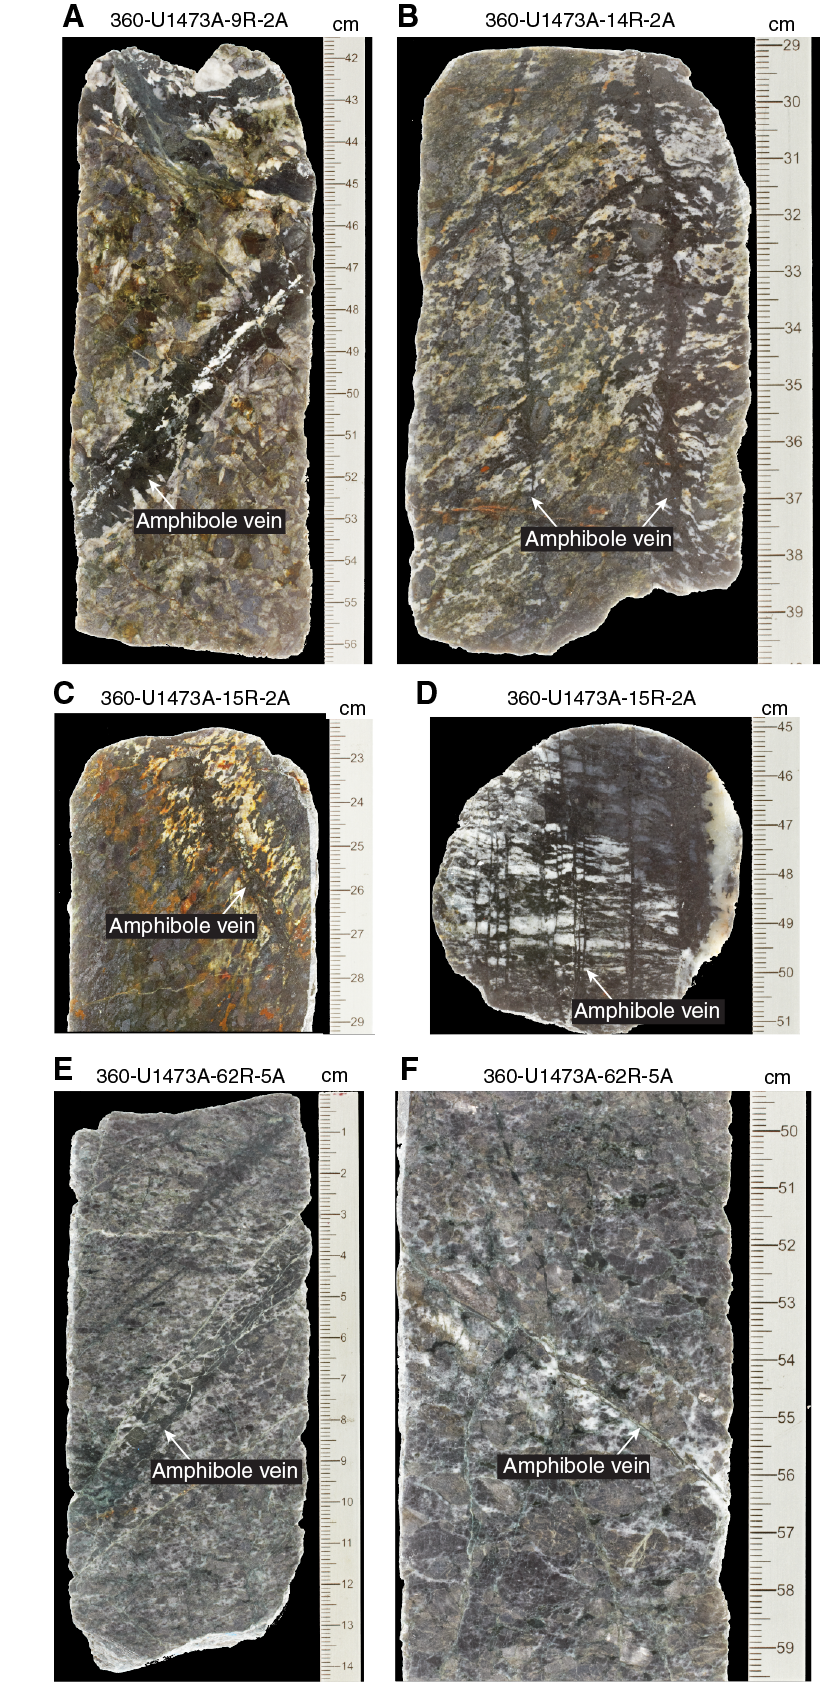
Figure F129. High-temperature amphibole veins.
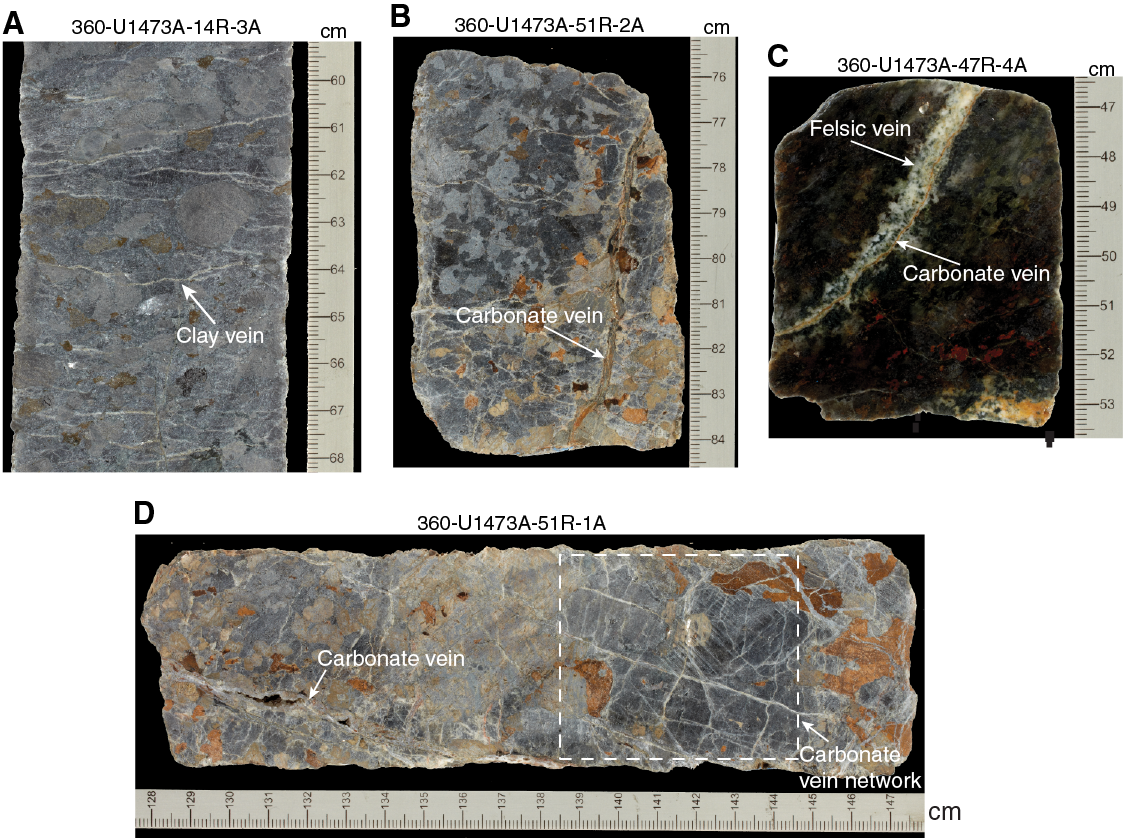
Figure F130. Low-temperature clay and carbonate veins.
Amphibole vein morphologies observed in 407 veins from Hole U1473A are divided into five categories: (1) planar (59%), (2) irregular (24%), (3) curved (12%), (4) faulted (3%), and (5) other morphologies (2%). A total of 63% of the veins are single features (i.e., they extend through the core piece [greater than ~5 cm]), whereas 18% are parallel to each other, 8% are branched, 6% are organized in networks, 3% are anastomosing, 1% exhibit en echelon connectivity, and 1% are isolated veins (i.e., their length is contained within the core piece). Out of all of the amphibole veins, 78% have clear-cut relationships with their igneous host, 13% have alteration halos, and 9% have diffuse boundaries. Where halos developed, extensive feldspar replacement was observed to have migrated outward away from the veins (Figure F129B–F129C).
Clay vein morphologies observed in 1174 veins range from irregular (87%) to planar (8%) and curved (5%). Most of the clay veins (93%) are single veins as shown in Figure F130A, 5% exhibit branching, and 2% are organized in networks. All clay veins have clear-cut relationships with the wall rock and do not exhibit any reaction halos.
Carbonate vein morphologies observed in 425 veins are dominated by planar (65%) and irregular (32%) vein morphologies; 91% of carbonate veins are single veins extending through the core pieces, 5% show branching, and 1% exhibit macroscopically visible network development. Out of all identified carbonate veins, 46% are related to or are fracture surface coatings; 3% exhibit macroscopically visible geodelike cavities such as shown in Figure F130D.
Crosscutting relationship of veins with other structural features
In several places, crosscutting relationships are observed between different vein types, indicating a relative time sequence of vein formation. In general, amphibole veins postdate magmatic veins, whereas carbonate and clay-bearing veins postdate both magmatic and amphibole veins. An example of a carbonate vein crosscutting a felsic vein is shown in Figure F130C. Amphibole veins typically crosscut the high-temperature crystal-plastic foliation and, in some cases, may transpose or displace the foliation as discussed further below (Figure F129B–F129C).
Brittle deformation
Fault zones
The presence and intensity of fault rocks and density of fracturing were measured systematically and plotted downhole to reveal the variations in brittle deformation and identify fault and fractured zones. Fault rock intensity and fault density generally agree and decrease downhole (Figure F131). The fault rock intensity plot effectively identifies the faults themselves, whereas the fracture density plot is essentially indicative of the accompanying fault damage zones. The variation in fault rock intensity reveals 7 main faults with 12 subsidiary faults and fracture zones. The seven main fault zones occur near 44, 114, 130, 187, 274, 315, and 411–460 m CCSF. Five out of the seven fault zones correlate with increases in the diameter of the borehole determined by the downhole logging caliper tool and changes in other physical properties (e.g., resistivity) (see Figure F188). The thickest fault zone occurs over the interval 411–469 m CCSF (Sections 360-U1473A-46R-1 through 51R-2) and is composed of seven discrete fault breccias, two of which are hydrothermal breccias that in total form a ~50 m thick fault zone (Figure F131). Additional fault material was recovered from junk basket Runs 12, 13, and 15, consisting of a chlorite-rich matrix and millimeter-thick plagioclase and pyroxene cataclasites (Figure F132). The true thickness of this fault has not been determined because at the bottom of this interval the recovery was very low and we drilled ahead without coring (“drilled interval” marked on several figures [e.g., Figure F131]); therefore, the 50 m fault zone thickness is a minimum estimate.
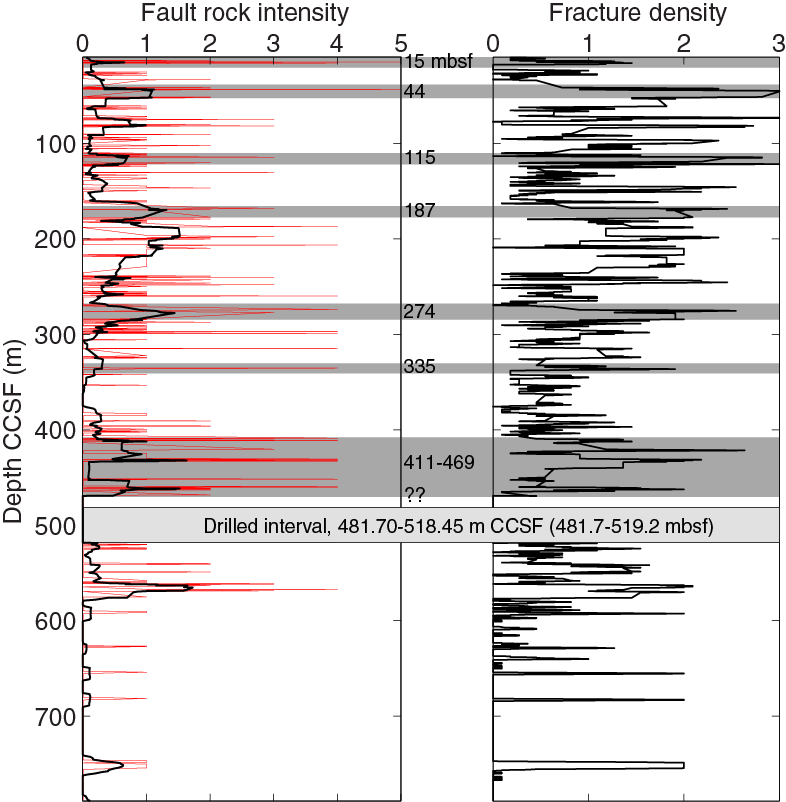
Figure F131. Fault rock intensity and fracture density with depth, Hole U1473A.
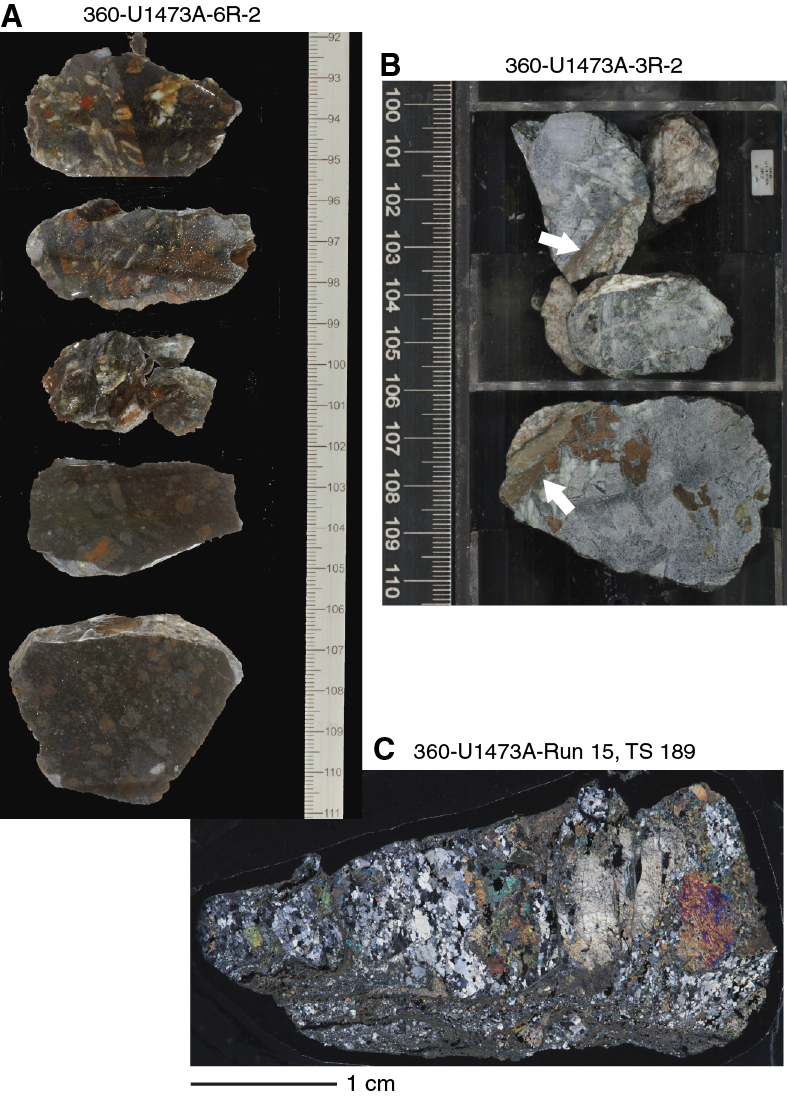
Figure F132. A,B. Cataclasite, Hole U1473A. C. Fault breccia.
The five fault breccias that compose the 50 m fault zone range from 1 to 24 cm thick and are surrounded by zones of minor to moderate fracturing and incipient brecciation. All of the breccias over this interval comprise carbonate material and correlate with an increase in the number of calcite veins (see Alteration veins). XRD results from within this broad fault zone (Sample 360-U1473A-48R-2, 20–21 cm) indicate the presence of calcite, plagioclase, and minor clinopyroxene, amphibole, and clay in a hydrothermal breccia (see Metamorphic petrology). The core of the fault is most likely represented by the 24 cm thick fault breccia that occurs within Section 41R-1 (431 m CCSF) and material that was recovered in the junk baskets.
The other faults in Hole U1473A range from 1 cm thick cataclasites to 50 cm thick fault and magmatic breccias (e.g., interval 360-U1473A-63R-1, 25–71 cm; for more on the magmatic breccias see Magmatic veins). Cataclasites occur in the top 50 m of the hole and consist of a very fine grained matrix with few silicate clasts (Figure F132). The fault breccias consist of a brown to green calcite-bearing matrix and a greater proportion of silicate clasts (Figure F133). The second largest fault zone after that near 415 m CCSF occurs in Section 31R-1 at 315 m CCSF. This fault zone is represented by a ~50 cm thick fault breccia surrounded by a 10 m thick zone of fracturing. The fault breccia is composed of a matrix of chlorite with clasts of plagioclase and amphibole, determined by XRD (see Metamorphic petrology). The fault breccia in Section 31R-1 overprinted a moderately dipping porphyroclastic crystal-plastic shear zone.
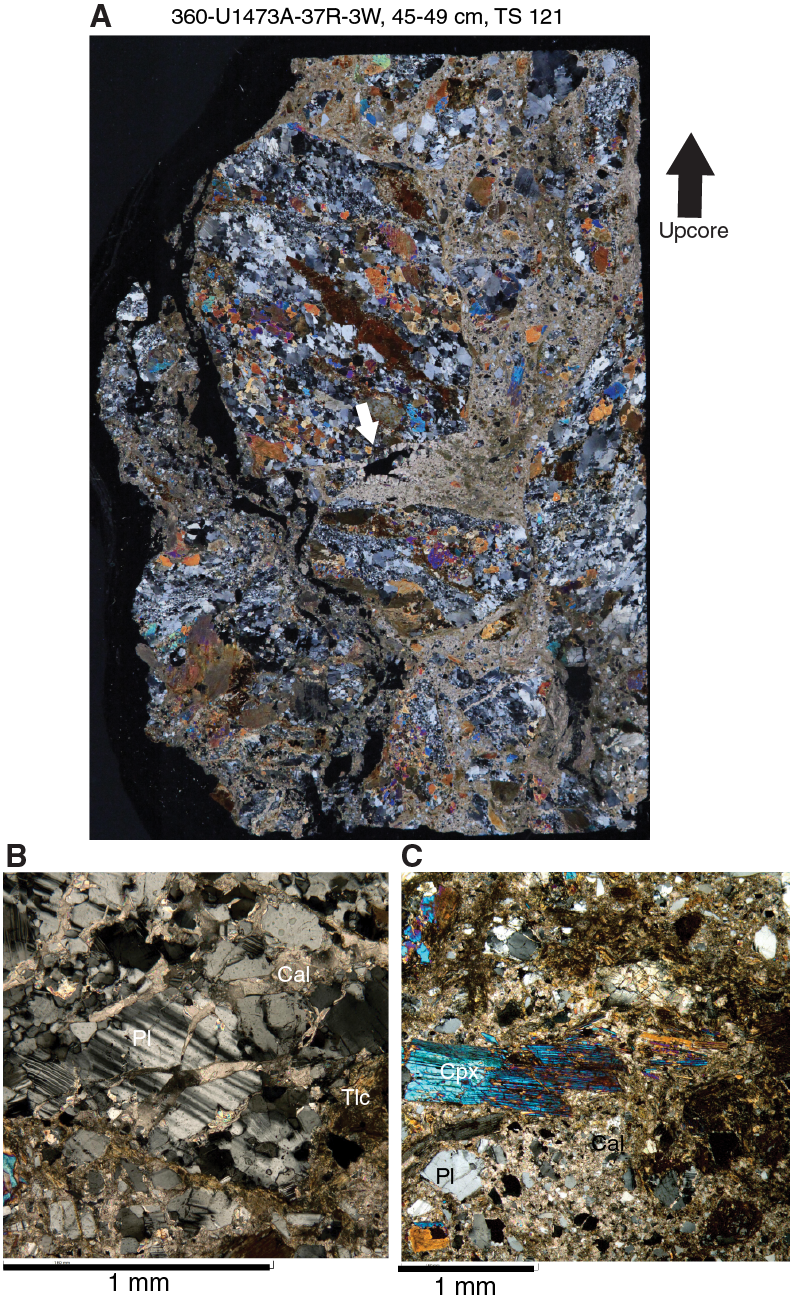
Figure F133. A. Carbonate-rich fault breccia and fractured (B) plagioclase and (C) pyroxene.
The subsidiary faults and fractured zones range from 1 to 6 cm thick incipient breccias to moderately fractured intervals. The majority of the subsidiary faults are filled with calcite with primary void space preserved (Figure F134). The fault zones with limited offset typically comprise very fine grained calcite that define the core of the fault and sparry calcite fill (Figure F135). This indicates at least two generations of calcite formation: syntectonic and posttectonic.

Figure F134. A, B. Carbonate-filled faults. C. Fault/ and host gabbro contact. D. Sparry calcite filling center of fault.
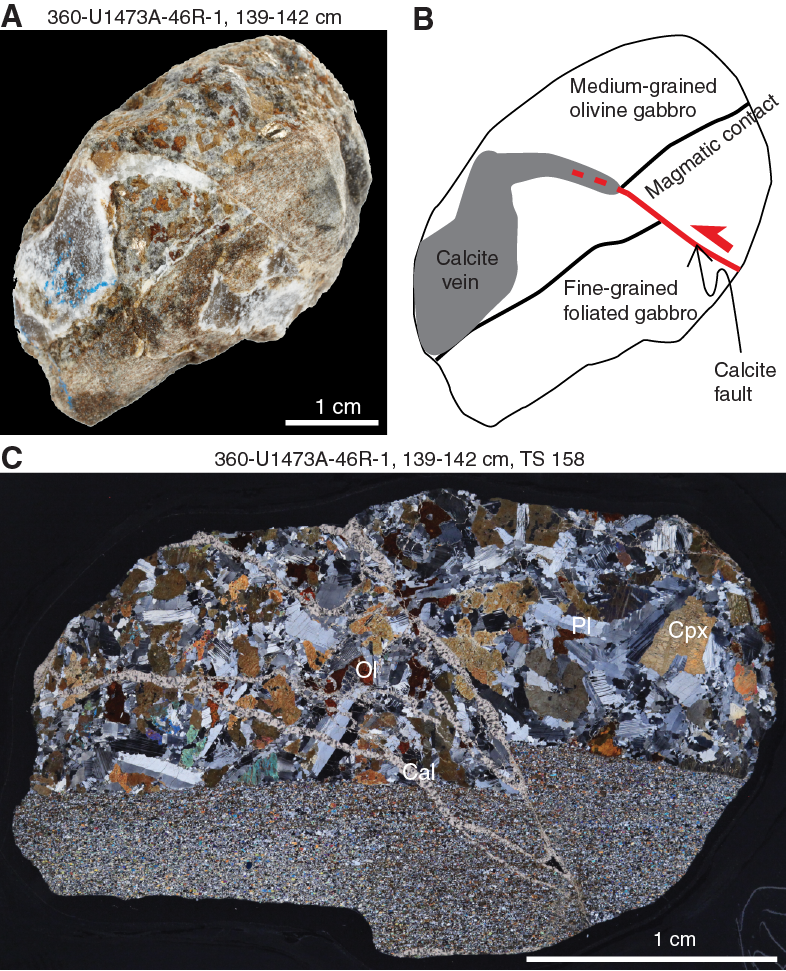
Figure F135. A, C. Faults filled with calcite. B. Crosscutting relationships between contact, fault, and calcite vein. C. Branched fault filled with calcite.
Discrete fractures
We measured 969 discrete fractures/joints, which over the 790 m interval roughly equates to a fracture every 81 cm (Figure F136). The majority of the fractures are planar (56%), with the remainder either irregular (28%), curved (14%), or stepped (2%). A total of 25% of the open fractures are partially filled with vein material, most likely to be along stepped or planar fractures. Amphibole veins are most common along open fractures in the top part of the hole, and carbonate is most common in the middle part of the hole, starting at 177 m CCSF (Section 360-U1473A-20R-1). In one case (Sample 35R-2, 58–64 cm), a fracture filled with carbonate crosscuts a fracture with an amphibole slickenline, indicating a younger carbonate vein. For more discussion on the distribution of vein fill and their orientation see Alteration veins and Metamorphic petrology.
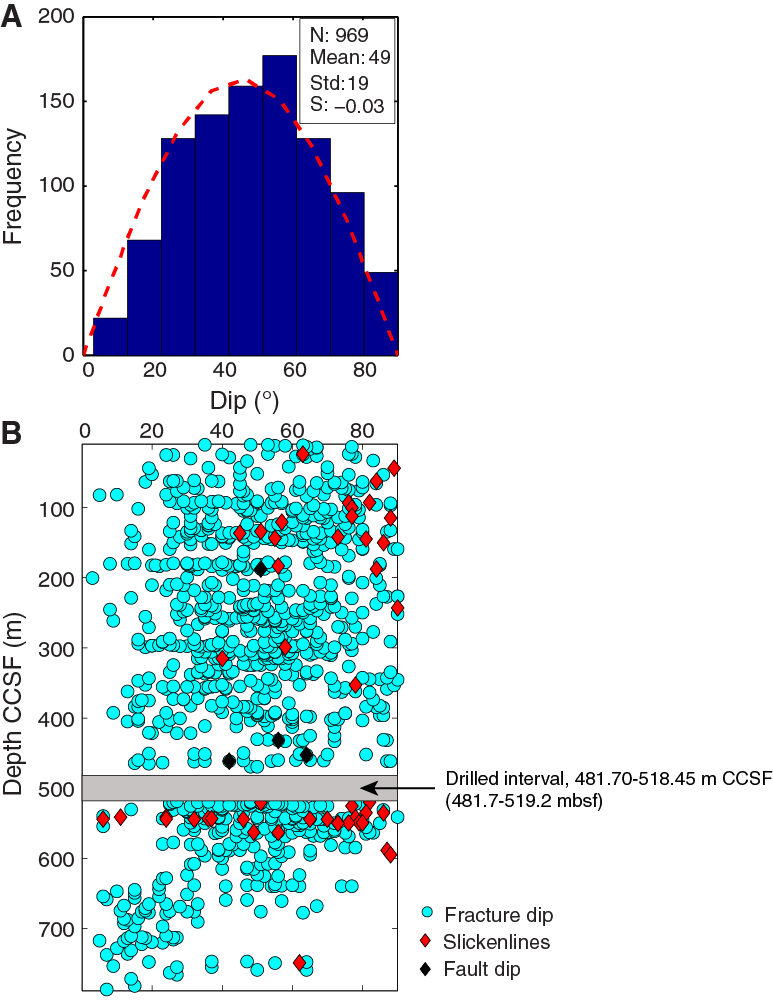
Figure F136. A. Histogram of discrete fracture dips, Hole U1473A. B. Distribution of dip magnitude with depth.
Fracture dips vary between 3° and 90° (Figure F136). The relatively few dips between 0° and 5° and between 80° and 90° are probably artifacts of vertical borehole bias (see Structural geology in the Expedition 360 methods chapter [MacLeod et al., 2017a]). The mean fracture dip is 49° with a standard deviation of 19°. The distribution of fracture dips is similar to the predicted distribution of a randomly oriented population.
Slickenlines were observed on 64 fractures (Figure F136). The majority of the slickenlines occur in the upper 250 m CCSF; however, a large maximum occurs near 530 m CCSF. The interval between these two maxima has the highest abundance of carbonate veins. The carbonate veins, which fill preexisting fractures, could have grown over the slickenlines, therefore obscuring them. The rakes of the slickenlines range from 6° to 90° with an average of 64°. Rakes indicate that most of the faults are oblique-slip with a minority that is purely dip-slip (Figure F137). Five of the slickenlines have shear sense indicators (e.g., steps along the slickenside): four are normal and the other is reversed.
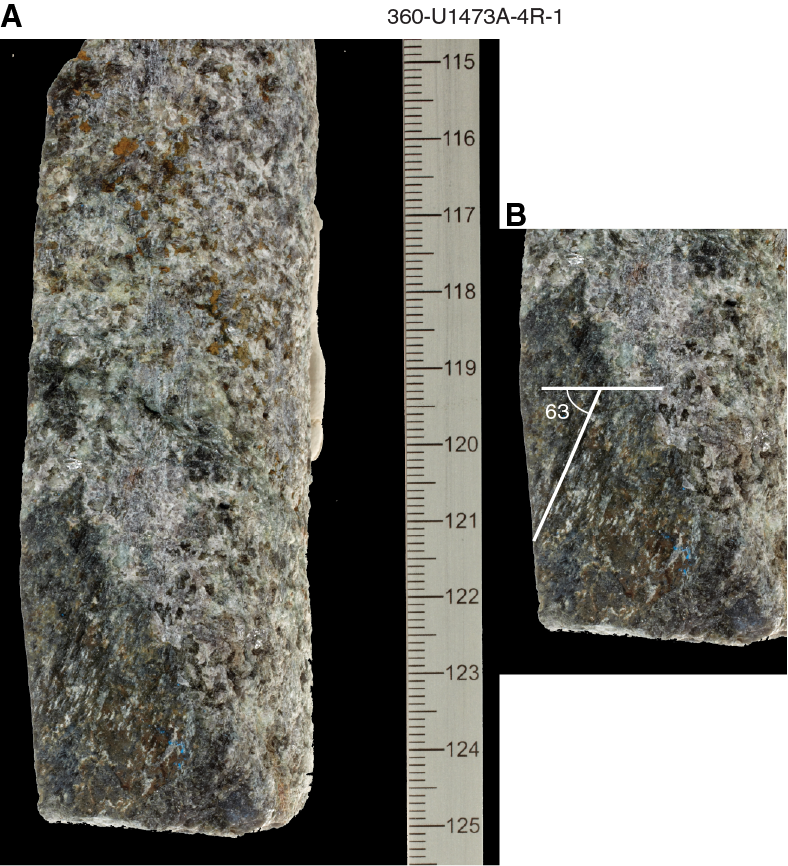
Figure F137. A. Fracture surface with slickenlines on olivine gabbro. B. Slickenlines with rake of 63° from y in the CRF.
Hole U1473A structural summary
The variety, distribution, and intensity of deformation in Hole U1473A illustrates the structural evolution of an oceanic core complex. The following is an attempt to summarize the broad range of observed structures and their relative timing. A down-temperature history of the deformation is presented starting with (i) the transition from magmatic fabrics to CPFs; (ii) evidence for multiple generations of CPFs; (iii) the relationships between CPFs, magmatic contacts, and Fe-Ti oxides; (iv) the subsequent crosscutting of CPFs by alteration veins; and (v) brittle structures. The results establish the continuum of deformation recorded in the Atlantis Bank oceanic core complex as the lower crust is exhumed along a detachment shear zone/fault.
Transition from magmatic to crystal-plastic fabrics
The transition from foliated or isotropic magmatic textures to porphyroclastic fabrics, and in some cases to mylonites and ultramylonites, forms a scenario of continually increasing ductile deformation through a variety of deformation mechanisms. Several parameters control the localization of strain, encompassing (i) the remaining melt percentage, (ii) mineralogical composition, (iii) grain size, and (iv) the amount of water at grain boundaries and within the intracrystalline lattice of recrystallized grains. Different minerals deform by different deformation mechanisms under the same conditions. For example, at low remaining melt fractions, clinopyroxene and plagioclase may deform by diffusion creep, whereas olivine deforms by dislocation creep (e.g., Yoshinobu and Hirth, 2002). In Hole U1473A, further investigation of thin sections highlight that a weak crystal-plastic overprint is recorded in discrete intervals that display little to no macroscopically visible crystal-plastic deformation. Of these, the majority of samples contain plagioclase crystals displaying tapered twins, olivine crystals show curved subgrain boundaries, and clinopyroxene deformation is restricted to microfracturing (Figure F138). These features occur under conditions of decreasing temperature and increasing fraction of solid particles derived from magmatic crystallization (i.e., submagmatic regime). Deformation related to cooling in the presence of melt results in strain partitioning between the melt fraction and the crystallizing phases, ultimately leading to strain localization in the rheologically weaker phases, such as plagioclase and olivine.
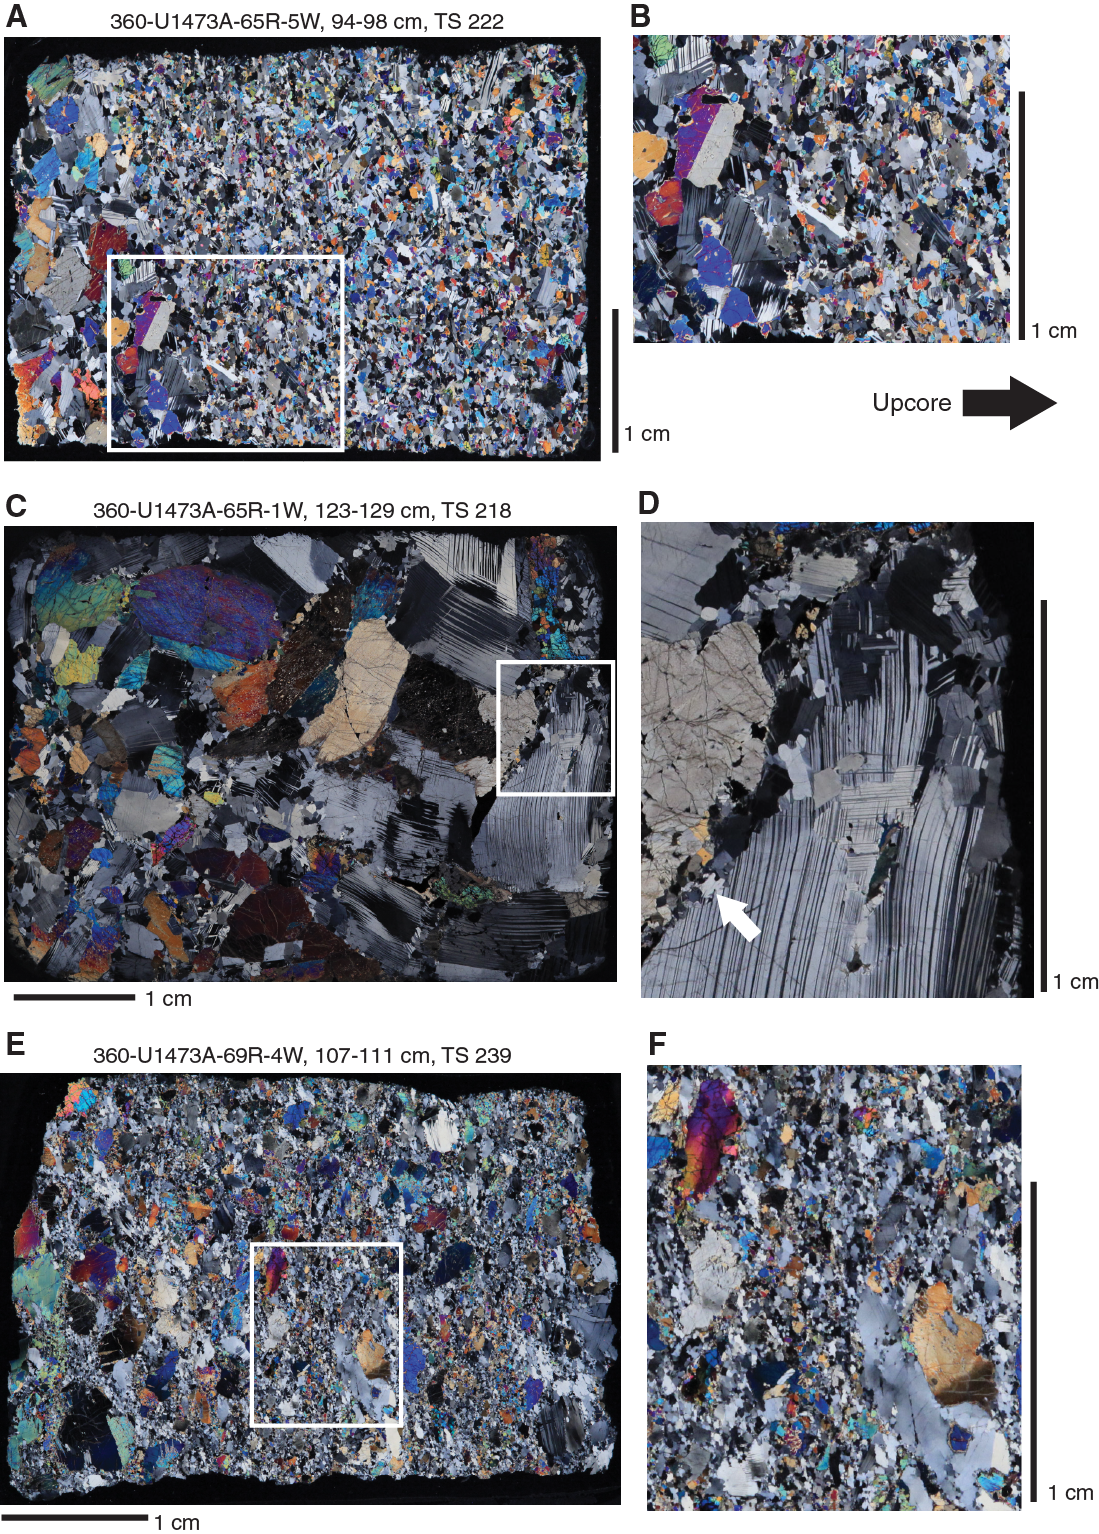
Figure F138. Transition from magmatic to crystal-plastic deformation textures in gabbros.
When the crystal/melt ratio is high, the solid framework of newly formed grains forms a load-bearing framework that accommodates strain by solid-state deformation processes (dislocation creep, dissolution-precipitation, and/or brittle deformation; e.g., Handy et al., 2007). For example, fractures in basalt xenoliths or in discrete clinopyroxene crystals are filled with plagioclase crystals (Figure F139A–F139B), indicating that while the basalt xenolith or the clinopyroxene was fracturing, melt was present and eventually crystallized plagioclase. In other examples, plagioclase porphyroclasts have fractures filled with fine-grained recrystallized plagioclase. This indicates that plagioclase was capable of contemporaneously deforming by brittle (i.e., fracturing) and ductile (i.e., dynamic recrystallization) deformation mechanisms. These features have been described in granitoids (e.g., Blumenfeld and Bouchez, 1988) and are interpreted as the transition from magmatic to crystal-plastic conditions, during which submagmatic to crystal-plastic foliations may develop.
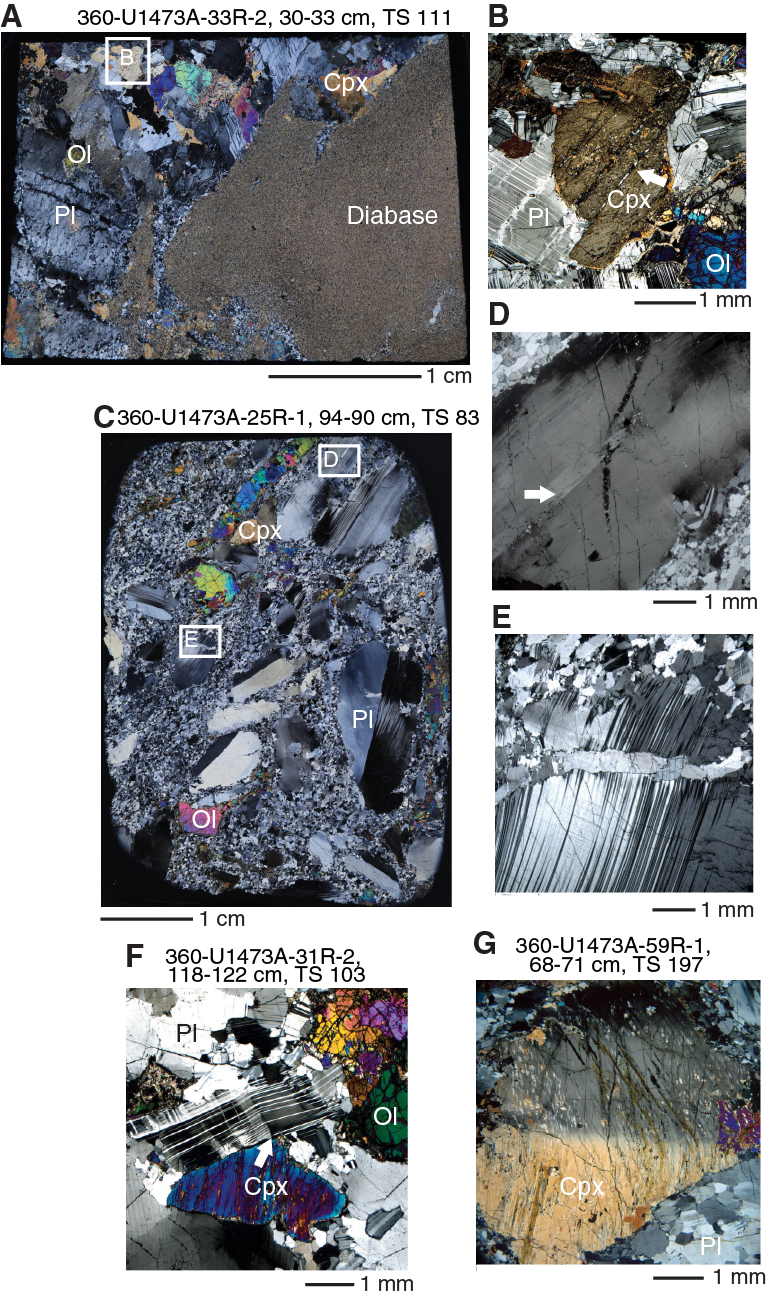
Figure F139. Submagmatic and semibrittle structures.
Weak to moderate CPFs commonly have strong SPOs defined by elongated coarse plagioclase and pyroxene crystals and only limited plagioclase recrystallization. Given the amount of recrystallization observed, it appears unlikely that ductile deformation could have caused the alignment of the coarse crystals. Therefore, it is more likely that plagioclase and pyroxene were originally aligned during magmatic flow and subsequently overprinted by localized crystal-plastic deformation. Additionally, the grain size layering may have acted as a favored planar anisotropy for a subsequent CPF to nucleate. In some examples, the layering has a strong crystal-plastic overprint, particularly when it has a moderate dip (Figure F117).
The transition from magmatic flow to solid-state crystal-plastic deformation is marked by the increase of plagioclase recrystallization. The presence of a previously formed planar anisotropy, such as SPO of magmatic crystals, may guide subsequent solid-state deformation to be preferentially parallel to these early formed anisotropic structures. Therefore, as temperature decreases and extension at the spreading ridge and along the detachment shear zone continues, strain might be mainly accommodated along previously formed magmatic structures that act as preferential sites for the nucleation of localized shear zones. It is reasonable to suggest that the microstructures observed in Hole U1473A preserve a variety of stages along the path from magmatic fabric to CPF development. Samples that record a moderate to strong CPF may have formed along a cooling path in which the relationships between previous magmatic anisotropy and the crystal-plastic overprint are no longer observed due to continued deformation.
Multiple generations of crystal-plastic fabrics
There are several examples in Hole U1473A of multiple generations of CPFs with different shear senses, dips, dip directions, and metamorphic grades. For example, in Sample 360-U1473A-20R-1, 129–135 cm (TS 62), an older mylonitic fabric with moderate dip and a reversed sense of shear is cut and transposed by a younger mylonitic fabric with subhorizontal dip and a normal sense of shear (Figure F140A). In another example (Sample 23R-3, 65–72 cm; TS 76), a moderately dipping reversed sense porphyroclastic fabric is crosscut by a subvertical normal sense mylonite (Figure F140B). In both examples, amphibole is more prevalent in the younger crosscutting fabric.
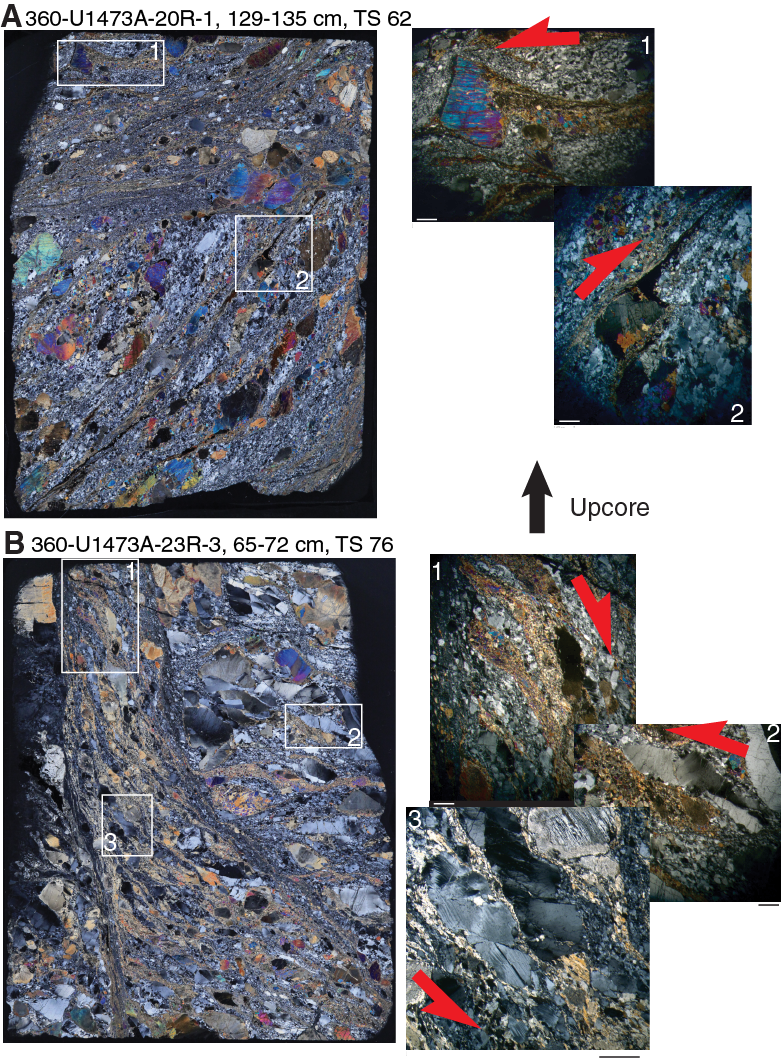
Figure F140. Crosscutting relationships between different fabric generations.
The variety of crosscutting relationships indicates an evolving strain field through time, but the change in orientation and kinematics are difficult to resolve because of the lack of azimuthal orientation of the drill cores. Additionally, the original fabric is primarily preserved at granulite grade conditions of deformation, whereas the younger fabric is amphibolite facies. The difference in metamorphic facies indicates that in some instances granulite grade CPFs have different orientations compared to amphibolite grade fabrics. This result does not match the simple prediction of continuous extension along the detachment fault, and suggests that the deformation path of the rocks in the lower oceanic crust is more complex and protracted.
Relationships between crystal-plastic fabrics, magmatic contacts, and Fe-Ti oxides
Fe-Ti oxides are a significant component of the lower oceanic crust at slow-spreading ridges (Dick, Natland, Miller, et al., 1999; Dick et al., 2000; Natland, 2002). Fe-Ti oxide–rich domains are heterogeneously distributed throughout Hole U1473A, as demonstrated by the distribution of magnetic susceptibility, which is an approximation for the amount of Fe-Ti oxides (see Petrophysics; Figure F141). The relationship between deformation and Fe-Ti oxides is not simple, however, as Fe-Ti oxides occur in both deformed and undeformed samples (Figure F142), and deformed samples may or may not be oxide bearing. Whereas the majority of occurrences of ultramylonites and mylonites within Hole U1473A correlate with peaks in magnetic susceptibility (Figure F141), the two largest contiguous zones of deformation (Figure F100), consisting of 10 m thick mylonites, from 201 to 210 m CCSF (Cores 360-U1473A-23R through 24R) and from 219 to 228 m CCSF (Cores 25R through 26R) are Fe-Ti oxide poor.
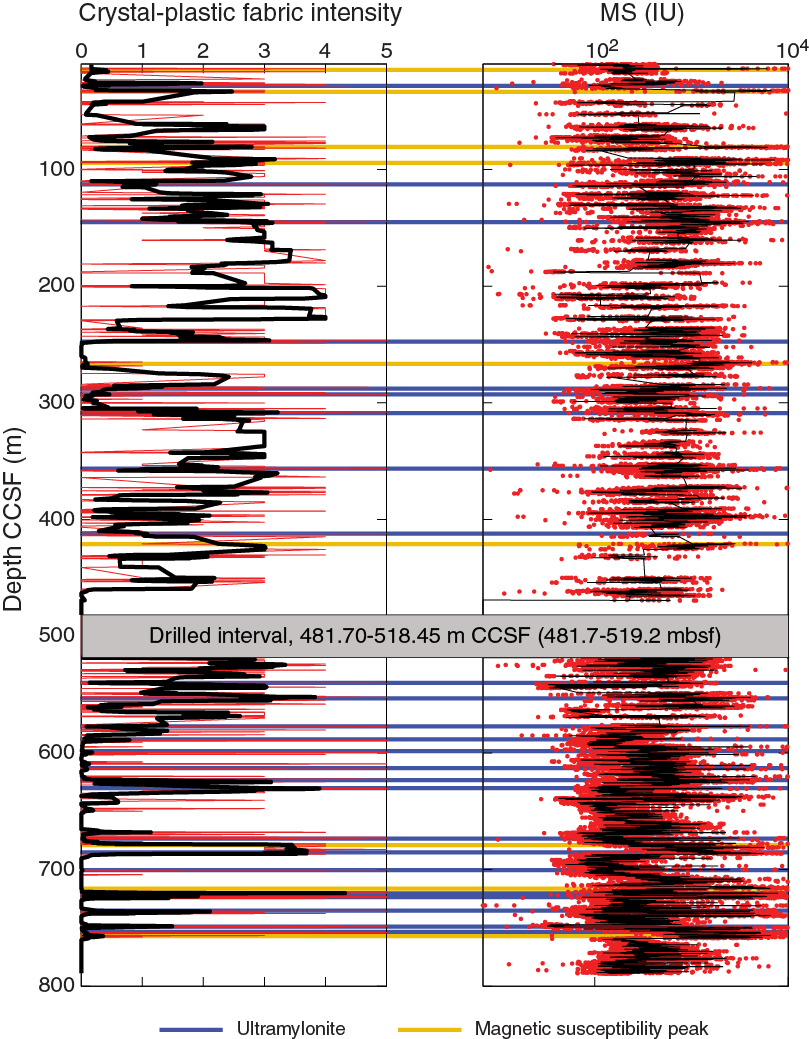
Figure F141. CPF intensity and magnetic susceptibility, Hole U1473A.
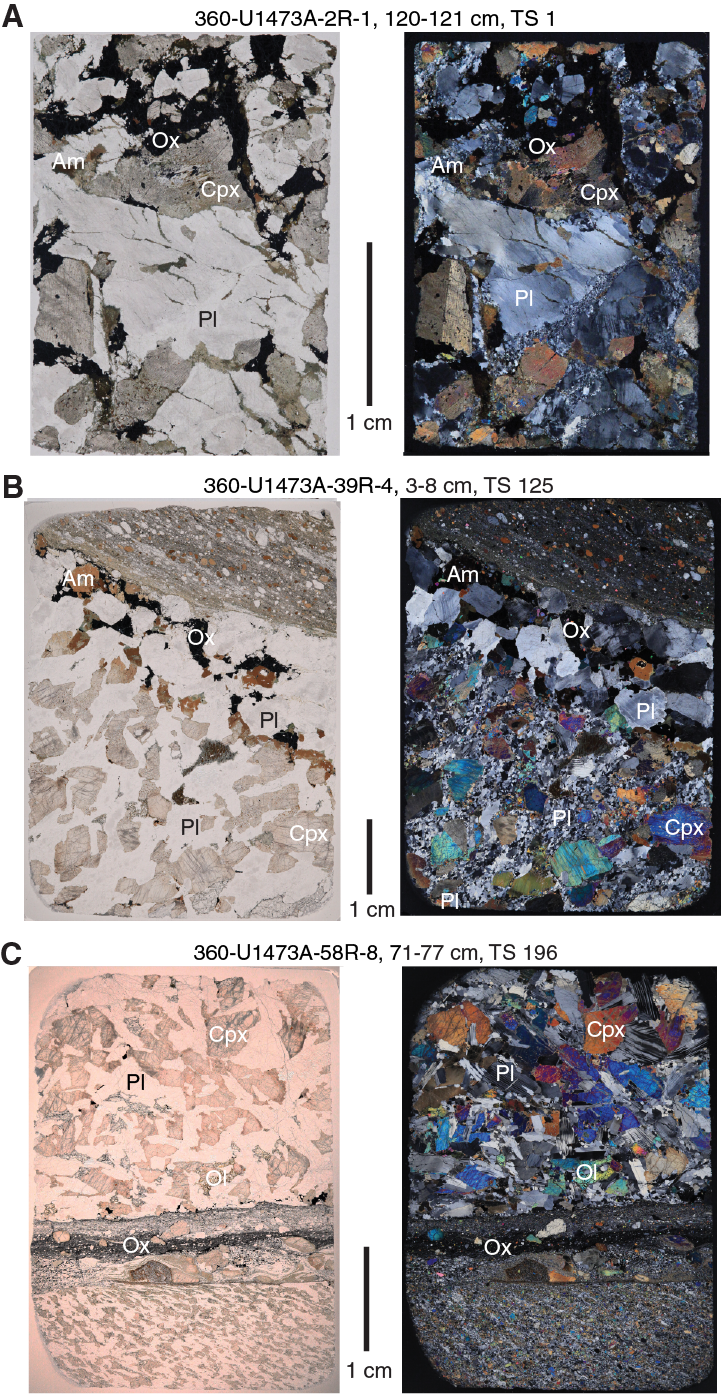
Figure F142. Oxide and olivine gabbros.
Out of 321 thin sections, 250 were described in terms of the presence and qualitative abundance of Fe-Ti oxides, CPF intensity, magmatic fabric intensity, and the presence of an igneous contact. Of these thin sections, 62% have Fe-Ti oxides present. These accessory Fe-Ti oxides occur either in the interstitial space between silicate minerals or along edges of mafic phases. Commonly, these samples have suffered very little crystal-plastic deformation (CPF intensity ≤ Rank 1). A total of 8 out of 10 thin sections of ultramylonite and 14 out of 17 thin sections of mylonite contain Fe-Ti oxides. Additionally, 85% of the porphyroclastic fabrics have Fe-Ti oxides present. Therefore, the relationship between the occurrence of porphyroclastic to ultramylonitic fabrics and presence of Fe-Ti oxides in thin section is consistent with the observations on core samples outlined above.
The common (although not systematic) association of Fe-Ti oxides and localized crystal-plastic deformation suggests a strong correlation between the most intense deformation and the presence of Fe-Ti oxides. However, in the majority of samples, the proportion of Fe-Ti oxides is low; therefore, the rheology of the samples is still dominated by plagioclase (John and Cheadle, 2010). However, because Fe-Ti oxides are very weak compared to silicates (Agar and Lloyd, 1997; Till and Moskowitz, 2013), a small proportion of Fe-Ti oxides may be all that is required to reduce the strength of an interval and therefore preferentially localize discrete zones of strain.
Magmatic and sheared contacts present throughout Hole U1473A commonly have Fe-Ti oxides present. Out of 37 contacts observed in the 250 thin sections analyzed, 28 have Fe-Ti oxides present. In many of these examples the contact is sheared, whether subhorizontal or subvertical (Figure F142). In one of the examples (Sample 360-U1473A-39R-4, 3–8 cm; TS 125), an Fe-Ti oxide–rich ultramylonite is in contact with an Fe-Ti oxide–rich felsic vein, which is itself in contact with an Fe-Ti oxide–poor gabbro (Figure F142B). Most igneous contacts with Fe-Ti oxides have the oxides localized near the contact and not distributed throughout either unit. Some of the highest abundances of Fe-Ti oxides occur at the contact between felsic veins and host gabbro.
Crystal-plastic deformation and alteration
The conditions over which ductile deformation occurred in Hole U1473A range from near-solidus granulite grade to amphibolite grade (see Metamorphic petrology). The granulite grade shear zones that are not overprinted by amphibolite facies assemblages likely did not continue to deform below granulite grade conditions, and therefore did not stabilize amphibole. The deformation mechanisms between granulite and amphibolite grade change from subgrain rotation recrystallization to amphibole-accommodated dissolution-precipitation creep (Miranda and John, 2010) or dissolution-precipitation creep of silicates in general. In cases where a mylonite crosscuts and transposes an older CPF, the younger fabric often contains amphibole (Figure F140). The distribution of amphibole within mylonites is not restricted to the top of the hole, as are the discrete amphibole veins, but instead extend to at least ~670 m CCSF (e.g., Sample 360-U1473A-75R-6, 2–5 cm; TS 264). The presence of amphibole shear zones to 670 m CCSF indicates that crystal-plastic shear zones may have formed preferential pathways for fluids.
The relationship between CPFs and veins is more complex. Amphibole veins, both brown (hornblende) and pale green (actinolite) amphibole, exhibit a wide variety of crosscutting relationships with CPFs. Amphibole veins commonly crosscut the crystal-plastic foliation at high angles (Figure F143). This crosscutting relationship is highlighted in the close-up core images shown in Figure F129B and F129D and in the microscopic description found in Metamorphic petrology. Amphibole veins may transpose an older CPF (Figure F144), indicating that the amphibole veins formed at moderate to high temperatures. In contrast, amphibole veins may fault an older CPF, indicating a thermal contrast between a previously formed CPF and the intrusive vein (Figure F129D). The crosscutting relationships between amphibole veins and crystal-plastic deformation demonstrate that the lower oceanic crust has a complex thermal history with cycles of ductile–brittle deformation to at least amphibolite facies, and probably greenschist facies, conditions.
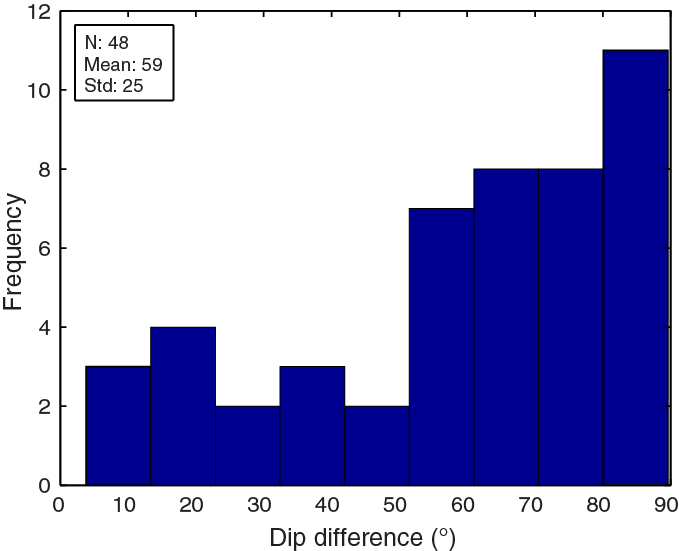
Figure F143. Angles between amphibole vein dips and crystal-plastic foliations, Hole U1473A.
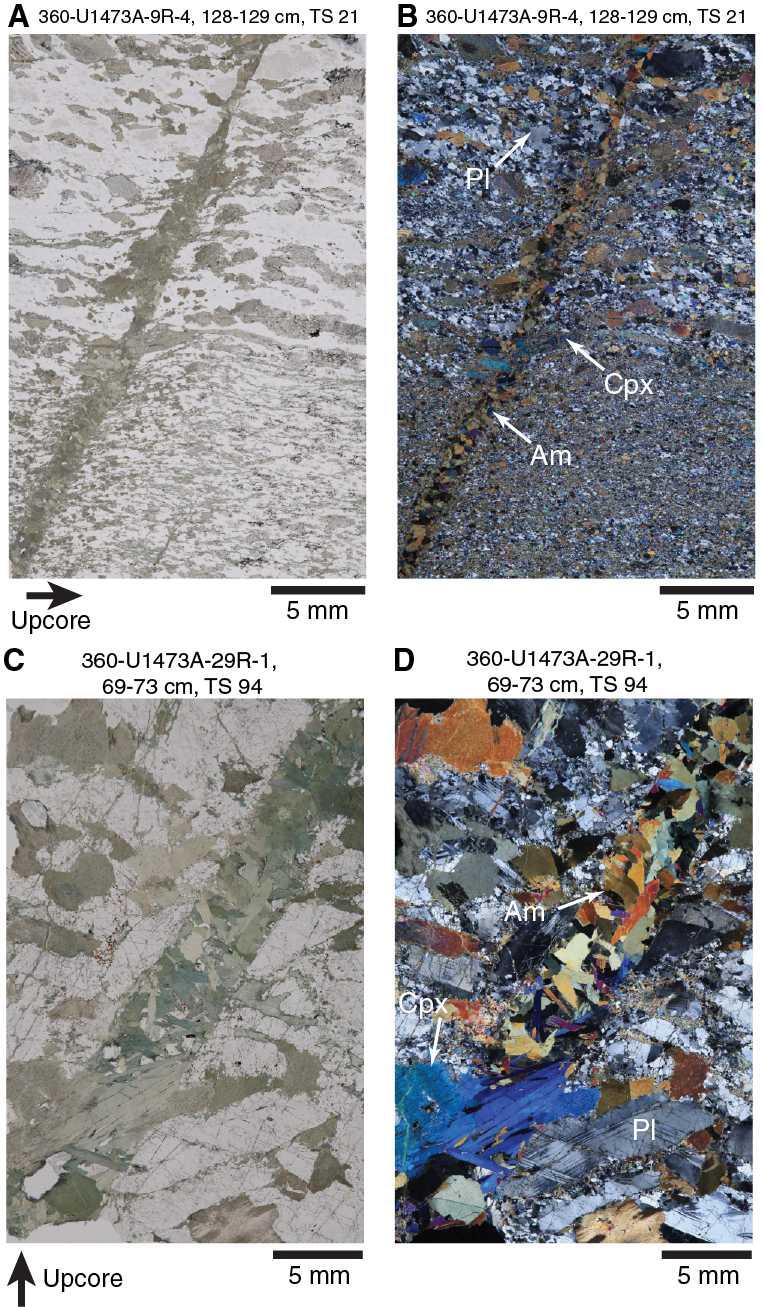
Figure F144. Crosscutting relationships of amphibole veins in gabbros.
No clear relationship exists between the distributions of amphibole veins and CPFs in Hole U1473A (Figure F145). Whereas high CPF intensities occur in the upper ~250 m CCSF where the majority of amphibole veins are found, zones of high CPF intensity elsewhere (e.g., between 300 and 400 m CCSF and between 500 and 600 m CCSF) are marked by very low numbers of amphibole veins. Hence, we suggest that the controlling factor for amphibole vein development may instead be the extensive brittle fracturing that affects the shallowest intervals of Hole U1473A. This mechanism is closely associated with veining and fluid percolation at decreasing temperature conditions and may be associated with depths corresponding to the brittle–ductile transition.
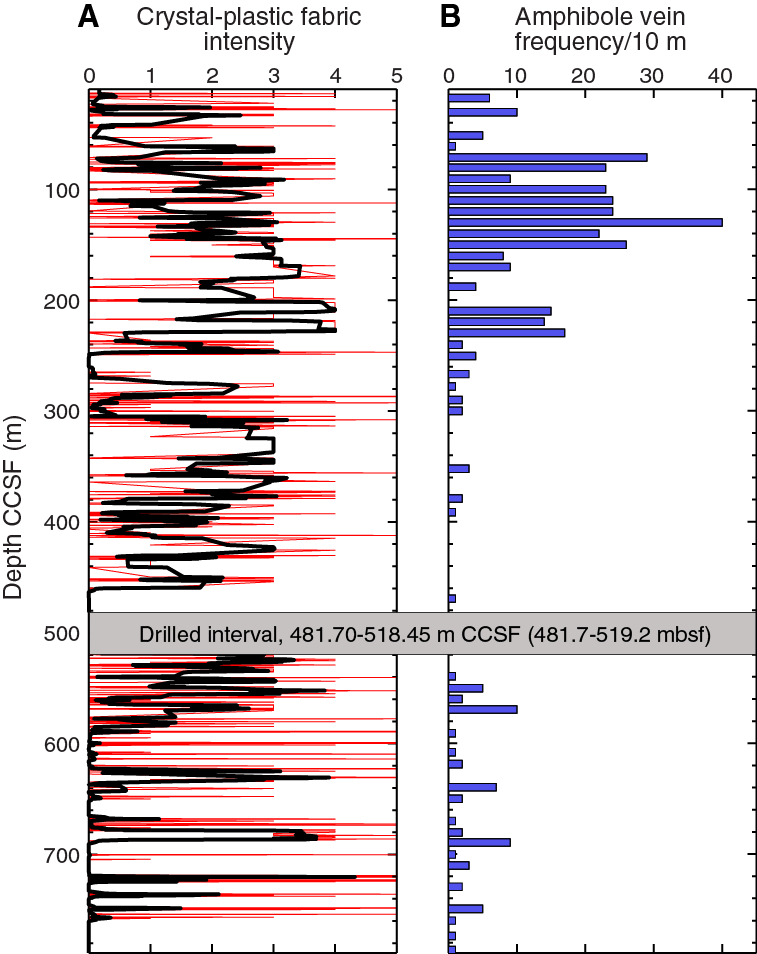
Figure F145. Comparison of CPF intensity and amphibole vein occurrence, Hole U1473A.
Relationships between crystal-plastic fabrics and brittle deformation
The direct interaction between ductile and brittle deformation is observed mainly in the upper sections of Hole U1473A, specifically from 0 to ~300 m CCSF. Solid-state fabrics are overprinted and offset by brittle fractures and local faults with dominantly normal senses of shear; however, brittle reversed shear sense indicators are also observed. In most cases, the fractures and faults within plagioclase and pyroxene are filled with amphibole (Figure F146C–F146D). These microstructural relationships suggest that the brittle–ductile overprint occurred at lower temperatures, mainly ranging from amphibolite to greenschist facies conditions. Some of the shear zones contain Fe-Ti oxides (Figure F146A), which are significantly weaker than the silicate phases (e.g., Till and Moskowitz, 2013). This may suggest that discrete parts of the shear zone were still deforming by ductile deformation mechanisms at the same time as other zones were deforming by brittle fracturing. The resulting microstructures are characterized by coeval ductile and brittle deformation mechanisms that were activated by variations in the thermal gradient, composition, and grain size.
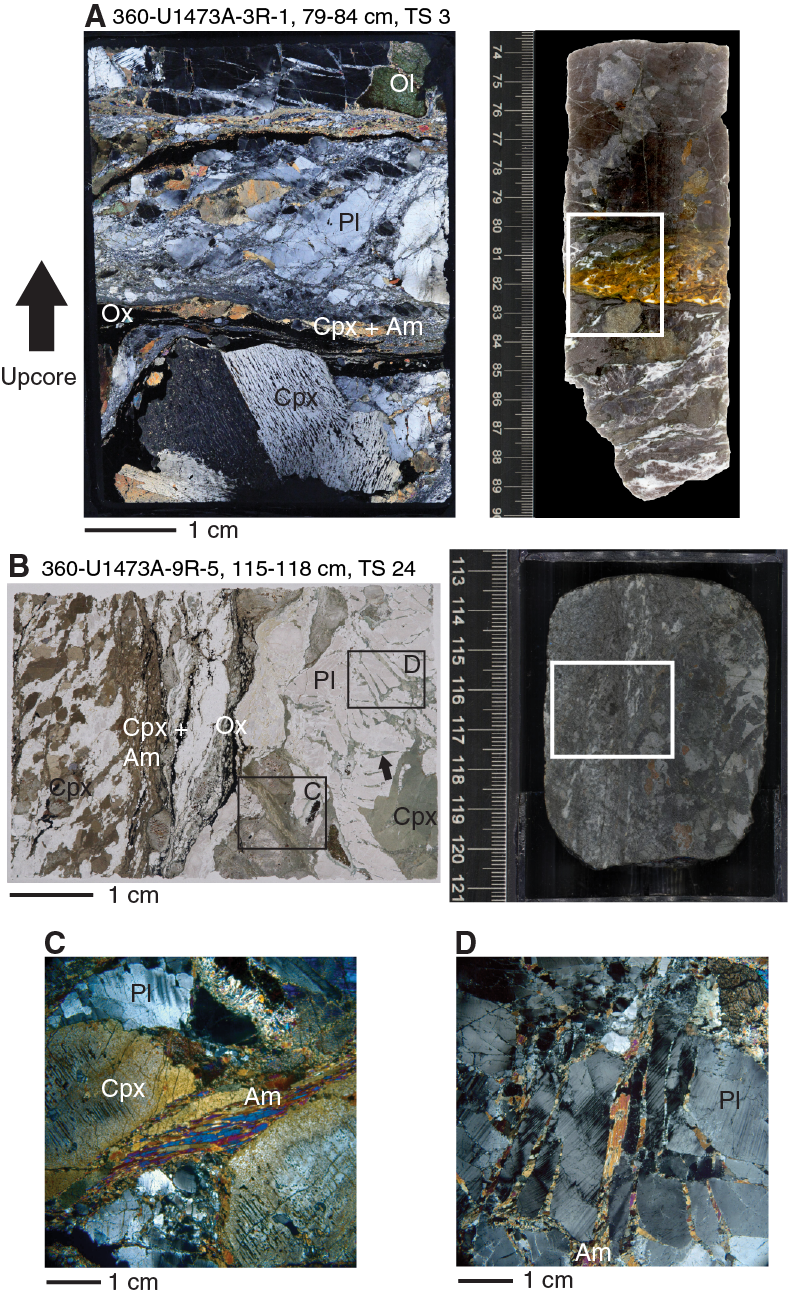
Figure F146. Brittle overprint of CPFs.
Correlation between brittle deformation, carbonate veining, and low-temperature background alteration
Downhole carbonate veining is positively correlated to an increase in fault rock intensity (Figure F127). Fault zones at 187, 274, and 335 m CCSF and between 411 and 461 m CCSF correlate with maxima in carbonate veining. The downhole frequency of carbonate veins exhibits a pattern of increasing toward a fault zone then almost disappearing below it. The background alteration and olivine alteration increases with the degree of carbonate veining, suggesting that low-temperature olivine alteration is enhanced in the vicinity of carbonate veins. This is supported by macroscopic core observations displaying the pronounced red-stained alteration of olivine in the vicinity of carbonate veins (see Metamorphic petrology; Figure F130B, F130D). Additionally, these carbonate-alteration zones correlate with areas of increased borehole diameter, borehole wall resistivity, discrete sample seismic velocity, and discrete sample porosity (see Petrophysics) suggesting that they are likely the focus of active fluid flow.
Summary/Conclusions
Gabbros from Hole U1473A exhibit a range of deformation mechanisms from high-temperature, melt-present to low-temperature conditions, consistent with synkinematic exhumation and cooling during extension along a detachment shear zone/fault. The following are the principal structural conclusions from Hole U1473A:
- The history of melt generation and deformation overlapped: some late-magmatic felsic veins were deformed along with the gabbros, whereas others, themselves undeformed, clearly crosscut plastically deformed gabbro.
- Primary igneous layering and magmatic fabrics constitute preferential planar anisotropies that were exploited during development of CPFs.
- The 600 m thick zone of crystal-plastic deformation represents high-temperature ductile deformation in the footwall of a detachment shear zone/fault.
- The 600 m thick zone of crystal-plastic deformation in Hole U1473A is much more intense and extensive than the ductile deformation encountered in Holes 735B and 1105A.
- Differences in thickness of the crystal-plastically deformed intervals between Holes U1473A, 735B, and 1105A (Figure F147) may be due to one or more factors, including original heterogeneities along the detachment fault shear zone, later high-angle normal faulting, and/or differential erosion.
- Multiple generations of CPFs exist, with different orientations, shear senses, and metamorphic grades, indicating a protracted history of ductile deformation.
- The majority of CPFs in the first 50 m have normal sense of shear, but at greater depths instead have a reversed sense of shear. Hole 735B has a similar change in shear sense, but the transition in this hole occurs at ~450 mbsf.
- A correlation is identified between the presence of Fe-Ti oxides, mylonites/ultramylonites, and/or magmatic contacts. However, the modal abundance of Fe-Ti oxides does not seem to correlate with deformation, and weaker CPFs tend not to correlate with the presence or absence of Fe-Ti oxides.
- The transition from crystal-plastic to brittle deformation is associated with granulite to amphibolite facies metamorphism and in some cases greenschist grade alteration by way of ductile, semibrittle, and brittle deformation mechanisms. This is similar to results presented by Miranda and John (2010) using samples from the top of Atlantis Bank; however, the degree of greenschist grade deformation is much less in Hole U1473A than in samples collected from the seafloor.
- Amphibole veins are restricted to the upper 400 m of the hole and transpose (i.e., deflect) or offset (i.e., fault) previous CPFs at high angles (~50°–90°).
- Relatively limited brittle overprint of high-temperature CPFs is restricted to the upper 300 m of the hole.
- A high-angle fault zone defined by several fault breccias, an increase in carbonate veins, an increase in borehole size, and a decrease in borehole resistivity and downhole temperature profile occurs from 411 to 469 m CCSF, probably representing a hydrologically active fault zone.
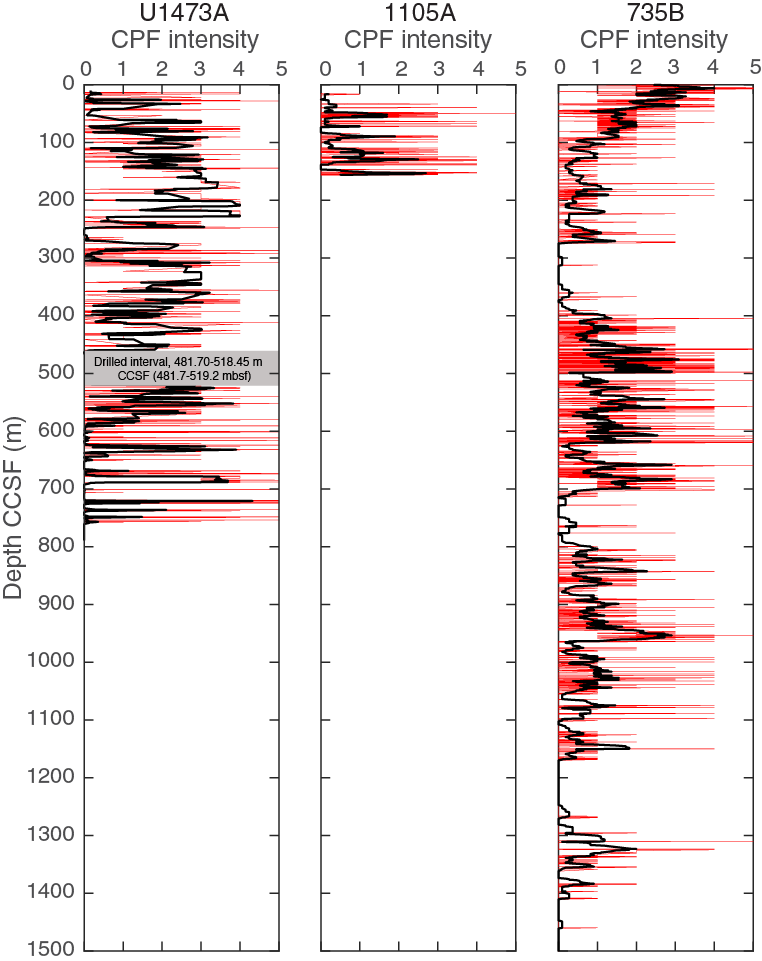
Figure F147. Comparison of CPF intensity between Holes U1473A, 1105A, and 735B.
Geochemistry
A representative selection of the lithologies recovered at Site U1473 was chosen for shipboard geochemical analysis (see Igneous petrology and Metamorphic petrology for characterization of the lithologic units). Sample selection was based on discussion among representatives from all shipboard science party expertise groups. The 219 samples analyzed included 113 fresh olivine gabbros, which represent the dominant lithology recovered from Hole U1473A, 9 olivine-bearing gabbros and gabbros, 24 disseminated-oxide gabbros, 17 oxide gabbros, 12 felsic veins, and 4 diabase dikes. In addition, 41 altered olivine gabbros were analyzed to examine the effects of low-temperature chemical exchange with seawater and hydrothermal fluids.
Major and trace elements (Ni, Cr, Co, Sc, V, Sr, Zr, Y, Cu, and Zn) were analyzed on board by inductively coupled plasma–atomic emission spectroscopy (ICP-AES). Volatiles were measured by weight loss on ignition (LOI) and by carbon-hydrogen-nitrogen-sulfur (CHNS) gas chromatography (H2O, CO2, and S). In most of this report we assume that the total carbon (TC) measured by CHNS represents predominantly CO2, which facilitates comparison with previous hard rock expeditions that all reported C measured by CHNS as CO2. However, this assumption was explored during Expedition 360 by analyzing a subset of 10 geochemistry samples and 9 microbiology samples for organic carbon (OC) and inorganic carbon (IC) by combining CHNS (which measures TC) with coulometry, which measures CO2. The complete ICP and CHNS data set is reported in Table T11, in which major and trace element concentrations are reported on a volatile-free basis (see Geochemistry in the Expedition 360 methods chapter [MacLeod et al., 2017a]). The average composition of Hole U1473A is estimated in Table T12. TC, based on CHNS measurements, and IC, based on coulometry, are reported in Table T13 together with estimated external uncertainties.
Table T11. Geochemical data, Hole U1473A. Download table in .csv format.
Table T12. Average primary crustal composition at Atlantis Bank, Atlantis Massif, Hess Deep, and MORB. Download table in .csv format.
Table T13. TC by CHNS and IC by coulometry, Hole U1473A. Download table in .csv format.
Major and trace elements in igneous samples
The suite of olivine gabbros, gabbros, disseminated-oxide gabbros, oxide gabbros, diabase dikes, and felsic veins analyzed encompasses a wide range of igneous differentiation. The degree of chemical differentiation can, in principle, be estimated from a number of indexes, including the Mg and Ca numbers (Mg# = molar ratio of Mg/[Mg + Fe] × 100 and Ca# = molar ratio of Ca/[Ca + Na] × 100) and concentrations of compatible (Ni and Cr) or incompatible (e.g., Y) elements, which all co-vary in a systematic manner (e.g., Figure F148). Whole-rock Mg# and Ti content are often used as indexes of fractionation in mafic igneous systems but are not good guides to the differentiation of oxide gabbros or felsic veins because these parameters are disproportionately affected by the presence of Fe-Ti oxides in oxide gabbros and felsic veins are strongly depleted in all mafic components. The Ca# and Ni, Cr, and Y concentrations allow the degree of olivine gabbro and oxide gabbro differentiation to be more easily compared, and felsic veins are best evaluated in oxide-oxide plots.

Figure F148. Geochemistry of rocks recovered, Hole U1473A.
Olivine gabbros encompass a range of differentiation and include the most primitive lithologies recovered from Hole U1473A. Olivine gabbros have Mg# of 82–62, Ca# of 81–58, and contain up to 1380 ppm Cr and 244 ppm Ni, with 0.2–1.1 wt% TiO2 (average = 0.5 wt%) and 5–29 ppm Y (Figure F148; Table T11). In comparison, disseminated-oxide gabbros have slightly lower Mg# of 77–59, Ca# of 75–60, lower concentrations of Cr (<316 ppm) and Ni (<154 ppm), and higher average concentrations of TiO2 (0.6 wt%) and Y (5–57 ppm). Oxide gabbros have the lowest Mg# of 70–32 and highest TiO2 contents (up to 7 wt%), which reflect the high abundance of Fe-Ti oxides in these rocks. Oxide gabbros have Ca# of 76–48, some of the highest Y concentrations (up to 168 ppm), and the lowest concentrations of Cr (<260 ppm, average = 82 ppm) and Ni (<194 ppm, average = 53 ppm). Oxide gabbros lie at the evolved end of the trends defined by olivine gabbros, gabbros, and disseminated-oxide gabbros in Figure F148, indicating that they are significantly more evolved than the majority of gabbros recovered from Hole U1473A. Felsic veins appear decoupled from the gabbroic lithologies in the Mg# plots, but it is clear from the MgO versus CaO plot that felsic veins could be distinguished from the other lithologies by a much greater degree of igneous differentiation (Figure F149). The origin of the felsic veins is beyond the scope of this report, but they could have formed either by extreme fractionation of the melts producing the oxide gabbros or by independent petrogenesis involving remelting of the gabbro sequence due to serial intrusion of gabbro bodies or fluid ingress.
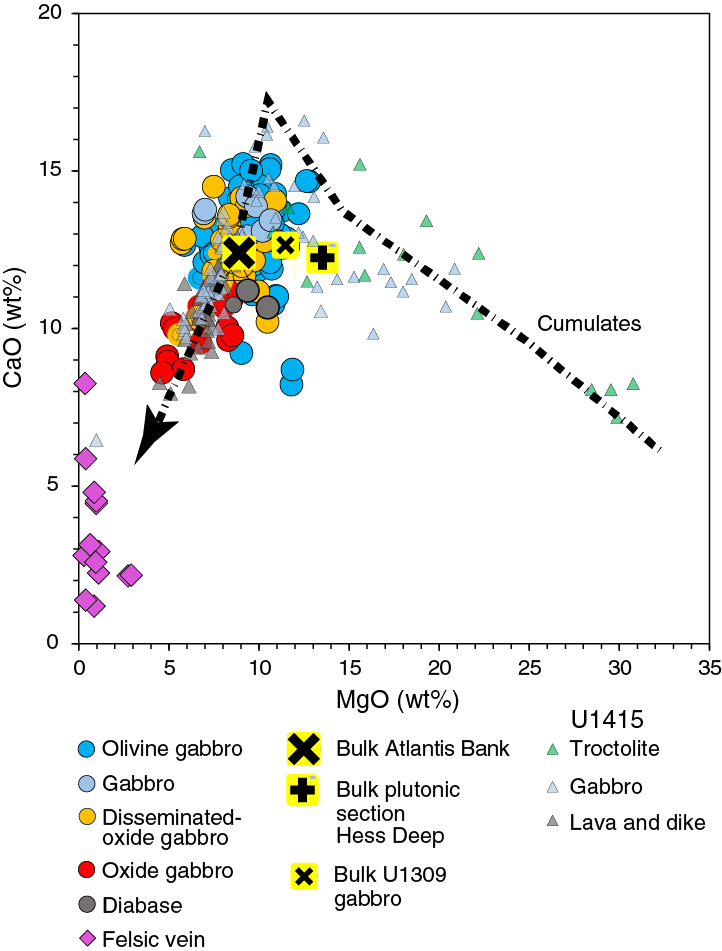
Figure F149. CaO vs. MgO for lithologies recovered from Hole U1473A and Hess Deep.
The Mg#, Ca#, and Cr, Ni, TiO2, and Y concentrations of the major lithologies exhibit broadly systematic downhole variation, with maxima in Mg#, Ca#, and Cr and Ni concentrations occurring at ~60–90, ~300, and ~700 m CCSF (Figures F150, F151). Interestingly, the breaks at ~60–90 and ~300 m CCSF coincide with the Unit I/II and IV/V boundaries in the igneous stratigraphy, respectively (see Igneous petrology). The break at ~300 m CCSF is most obvious in the Mg#, Ca#, and Cr and Ni concentrations (Figure F150), although there is a considerable scatter in the TiO2 and Y contents (Figure F151). It should be noted that the variation in Ni and Cr concentrations cannot be explained by the modal mineralogy of the cumulate alone (see Igneous petrology). Olivine gabbros have pyroxene and plagioclase modes that vary by only ~10%, whereas the Cr concentrations vary by a factor of 10, which should equate to 1000% difference (Figure F148). Furthermore, with the exception of Fe2O3 and TiO2 abundances, which are broadly correlated with the modal oxide abundance, there are no other correlations between the modal mineralogy and whole-rock chemistry. The complex downhole variation more probably results from the combination of multiple factors that may include (1) the different extent of crystal accumulation, (2) the presence of trapped melt, (3) migration of late-stage melts and reaction with cumulus minerals, and (4) chemical changes in response to recrystallization during crystal-plastic deformation. The latter process could have been particularly important between ~150 and ~250 m CCSF and at ~350 m CCSF (see Structural geology), where crystal-plastic deformation is particularly intense.

Figure F150. Chemical variations of Mg# and Ni and Cr, Hole U1473A.
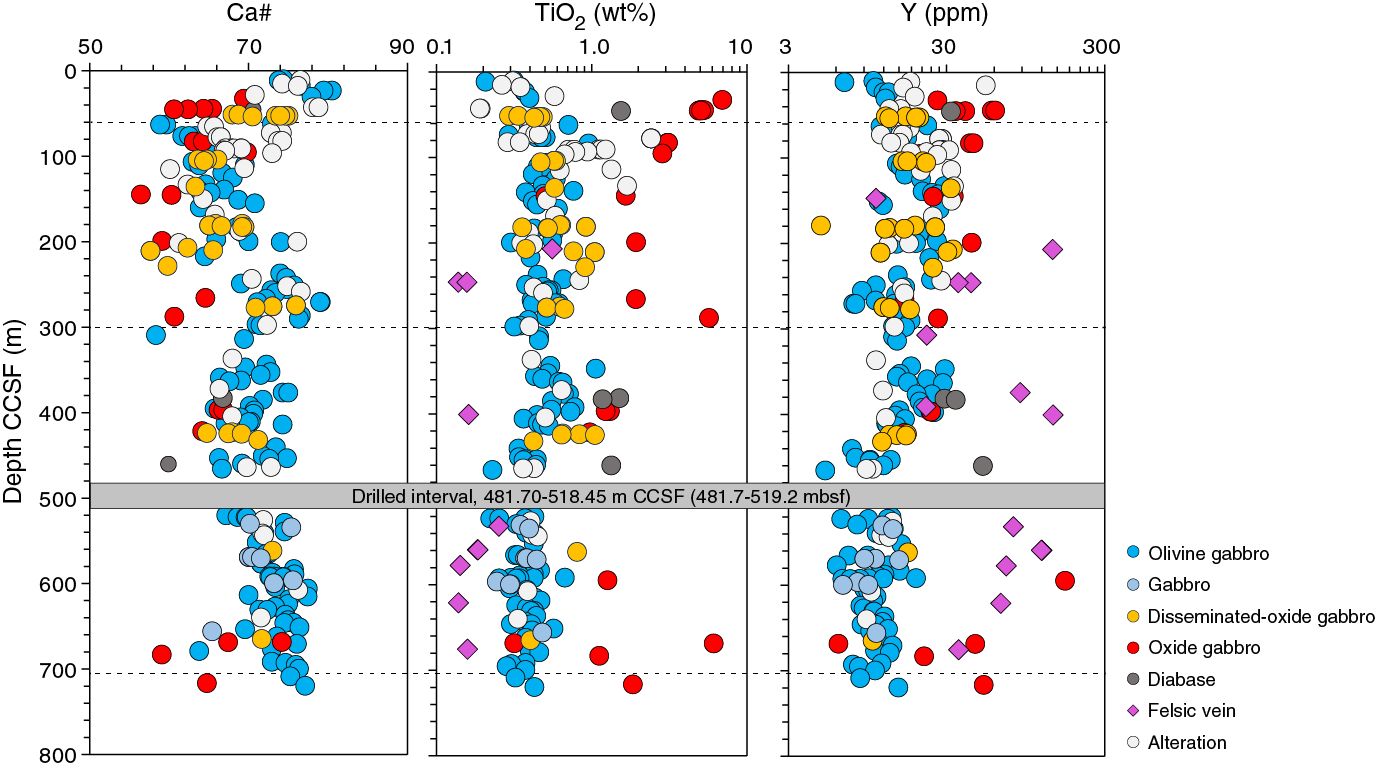
Figure F151. Chemical variations of Ca# and TiO2 and Y, Hole U1473A.
Despite the complexity in the observed profiles, the first-order control of the gross variation in Mg#, Ca#, and Cr and Ni concentrations between the discontinuities at ~60–90, 300, and 700 m CCSF seems to result from fractional crystallization of the basaltic melt supplied to the system. The 200–400 m thick intervals may therefore represent intrusion of individual magma batches, and the high Cr and Ni concentrations at the base of each cycle could result from the accumulation of chemically primitive olivine and pyroxene and/or the low amount of evolved melt trapped within the cumulus minerals. In comparison, lithologies higher in each interval would contain a higher proportion of trapped melt and more evolved (i.e., having lower Ni and Cr concentrations, respectively) olivine and pyroxene. Geochemical cycles similar to the ones identified here (Figure F150) but encompassing a slightly wider range of Mg# (up to 85), were identified in olivine gabbros from Hole 735B and were interpreted in a similar way (Shipboard Scientific Party, 1999a; Dick et al., 2000). The downhole variation in Mg# in Holes U1473A and 735B is shown in Figure F152. It is possible that a correlation exists between the unit at the top of Hole U1473A and ~450 mbsf in Hole 735B. If the correlated abrupt change in Mg# is correct, it indicates lateral continuity of ~400 m thick units over a distance of 2.2 km and over a timescale of ~160 ka. However, the downhole variation in Mg# in these holes is clearly complex, and it is only possible to make tentative correlations between the other discontinuities in the downhole sections of the holes. As concluded from the study of petrological variations (see Igneous petrology), the more robust conclusion is that the similarity in nature and scale of vertical geochemical variation between holes suggests a direct comparability in the fundamental igneous accretion process over a timescale of hundreds of thousands of years at Atlantis Bank.
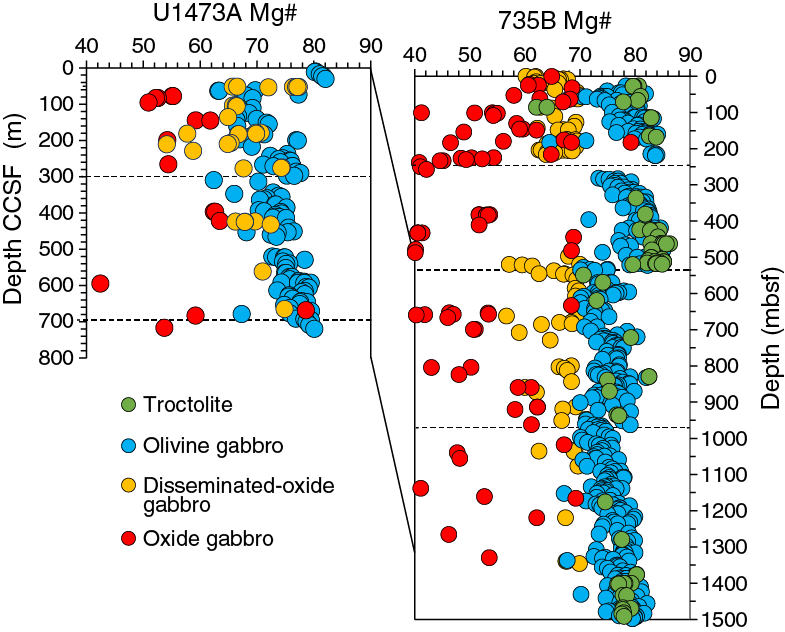
Figure F152. Comparison of downhole variation in Mg#, Holes U1473A and 735B.
A calculation to estimate the bulk chemical composition of the crustal section penetrated in Hole U1473A is given in Table T12. The overall proportions of the lithologies recovered from Hole U1473A are estimated to be 74% olivine gabbro, 4% gabbro, 12% disseminated-oxide gabbro, 8% oxide-bearing gabbro (>2% oxide) and oxide gabbro, 1.2% felsic veins and impregnations, and 0.5% diabase dikes (see Igneous petrology). Based on the average compositions, densities, and relative proportions of these lithologies, the new crustal section penetrated in Hole U1473A is estimated to have an average composition with ~7.4 wt% Fe2O3, ~9.0 wt% MgO, and ~0.7 wt% TiO2. This is essentially indistinguishable from Hole 735B (Table T12) (Shipboard Scientific Party, 1999a). In comparison, the 156 m deep Hole 1105A has higher Fe2O3 and TiO2 (~14.0 and ~2.4 wt%) and slightly lower MgO (7.3 wt%) than Holes U1473A and 735B (Table T12), reflecting the higher proportion of oxides in the Hole 1105A section (Casey et al., 2007; Shipboard Scientific Party, 1999a).
The bulk compositions of Holes U1473A and 735B are considered representative of the upper plutonic section formed at the slow-spreading SWIR at the time of its crystallization and emplacement (Table T12). The bulk composition of the plutonic section sampled at Atlantis Bank is similar to the bulk estimate of gabbros (i.e., bulk of Hole U1309D excluding troctolites) from the slow-spreading Atlantis Massif (Godard et al., 2009). However, the bulk compositions of both Atlantis Bank and Atlantis Massif gabbros are more evolved in composition (e.g., lower MgO and higher TiO2 contents) than the bulk plutonic section from Hess Deep (Figure F149) (Gillis et al., 2014). This difference in composition could indicate that more primitive lithologies exist at depth and are still to be sampled at Atlantis Bank. However, an alternative possibility is that the Atlantic Bank plutonic section and Atlantis Massif gabbros differ from the Hess Deep plutonic section because a much smaller proportion of evolved magma is extracted from gabbroic bodies emplaced in the footwalls of detachment faults at slow-spreading ridges (Godard et al., 2009; MacLeod et al., 2009). This would be consistent with models in which Atlantis Bank gabbros crystallized in place without producing abundant overlying lavas. In comparison with the gabbros, the minor diabase dikes that are present in the Atlantis Bank crust (recovered from 46, 380, and 460 m CCSF), have a narrow range of compositions that are intermediate between the gabbroic lithologies and basalts erupted east of the Atlantis II Transform (e.g., 49.9 wt% SiO2 and 1.4 wt% TiO2; Table T12) (Dick et al., 1991).
The following principal conclusions can be drawn from the shipboard chemical analyses of igneous lithologies recovered from Hole U1473A:
- The main rock type is a moderately fractionated olivine gabbro with between 0.2 and 1.2 wt% TiO2. Fe-Ti oxide gabbros containing up to 7 wt% TiO2 and up to 20 wt% Fe2O3 occur in centimeter- to decimeter-thick intervals in isolated parts of the core.
- Olivine gabbros with systematically varying Mg#, Ca#, and Ni, Cr, and Ti concentrations form a continuum with disseminated-oxide and oxide gabbros, implying a genetic relationship between this spectrum of different rock types (Figure F148). However, the oxide gabbros occur interleaved with variably evolved olivine gabbros in different parts of the section, and the Mg#, Ca#, and Ni, Cr, and Ti content of oxide gabbros and olivine gabbros do not vary in a systematic manner downhole (Figures F150, F151). The close proximity of these different rock types and the lack of a gradual transition from olivine gabbro to oxide gabbro downhole suggest the current interlayering of oxide gabbros and olivine gabbros is not a result of simple in situ fractional crystallization within the plutonic section. Textural relationships, including crosscutting veins, indicate that in many cases oxides crystallized from late-stage melts that percolated through the cumulate pile or lithified rock.
- Felsic veins transect the gabbroic lithologies throughout the hole, demonstrating intrusion at a late stage in the igneous accretion history. Geochemical data demonstrate a possible petrologic relationship between felsic veins and the gabbroic lithologies (Figure F149), but further work is required to understand the nature of that relationship and determine whether the veins were produced by, for example, late-stage melting of gabbros triggered by infiltration of seawater, by fractional crystallization, or by liquid immiscibility.
- Geochemical data spanning the uppermost 720 m of the 789 m section drilled during Expedition 360 define three major chemical units, with boundaries at ~60, ~300, and ~700 m CCSF (Figures F150, F151). The chemical unit boundaries show some correspondence with igneous unit boundaries. The thickness of the separate units varies from ~200 to ~400 m, which probably represents the scale at which individual magmatic events at the SWIR constructed the lower ocean crust at Atlantis Bank. Downhole variation in Hole U1473A shows some similarities to Hole 735B, probably indicating comparability of process in the accretion of igneous units over a distance of a few kilometers and timescales of >100 ka (Figure F152).
Volatiles and alteration
Volatiles were measured by multiple techniques during Expedition 360 (see Geochemistry in the Expedition 360 methods chapter [MacLeod et al., 2017a]). Our results show that the H2O measured by CHNS is on average ~0.5 wt% higher than the LOI (Figure F153). In most cases, the discrepancy reflects weight gain resulting from oxidation of Fe2+ to Fe3+ during ignition (see Geochemistry in the Expedition 360 methods chapter [MacLeod et al., 2017a]). In contrast to H2O, the LOI data are not related to sample CO2 content, which represents a minor component of total volatiles LOI in most of the samples (Figure F153). The CHNS technique was demonstrated to reliably reproduce H2O concentrations with an average precision of ~5% during Expedition 360. In contrast, LOI and CO2 concentration measurements of <0.5 wt% CO2 (0.14 wt% C) have a much lower reproducibility (see below; see also Figure F21 in the Expedition 360 methods chapter [MacLeod et al., 2017a]).
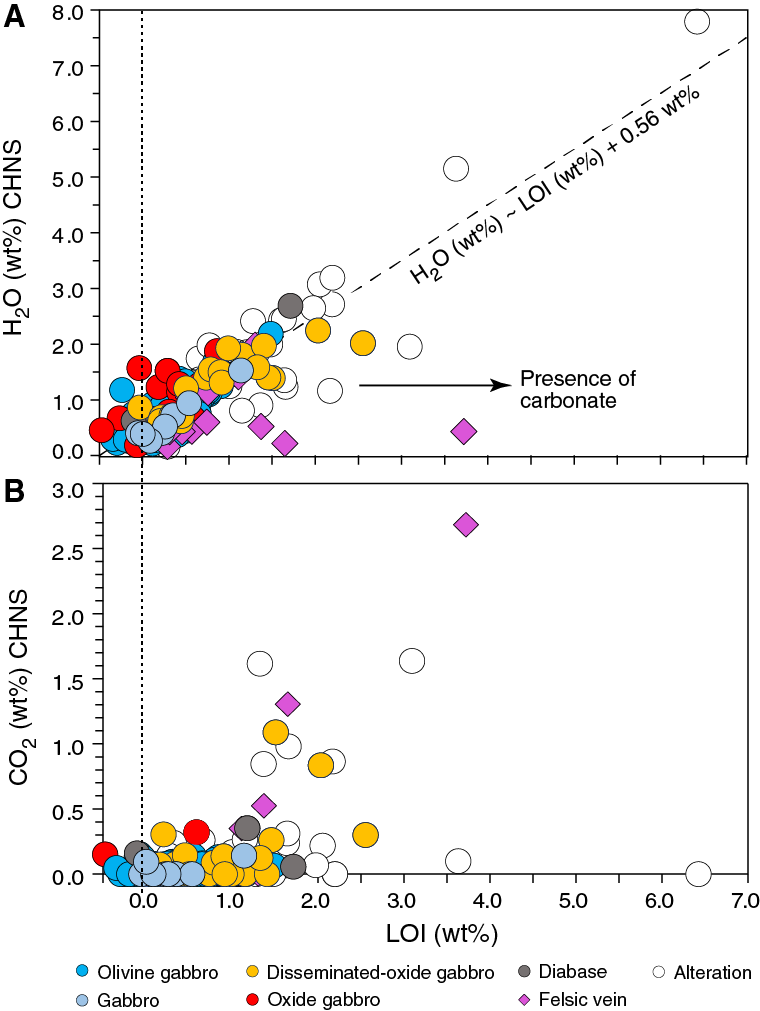
Figure F153. Volatile content of Hole U1473A lithologies by LOI and CHNS analyzer.
CHNS analyses indicate that samples recovered from Hole U1473A contain 0.2–8 wt% H2O (mean = 1.0 ± 0.9 wt%, median = 0.8 wt%) and, in the majority of samples, <0.3 wt% CO2 (Figures F153, F154). The H2O concentration data are scattered in the downhole plot but have a baseline that decreases from ~0.7 wt% at the top of the hole to ~0.3 wt% at 700 m CCSF (Figure F154). In contrast, the CO2 data are frequently below detection limit and only show elevated concentrations in proximity to carbonate veins at 200–400 m CCSF. In many cases, the highest CO2 concentrations are due to the presence of very small carbonate veins that are sometimes only visible in thin section and were not identified during shipboard sampling. However, a surprising finding is that two of the samples with the highest C content are dominated by OC rather than carbonate (Table T13; see Inorganic and organic carbon). H2O concentration is not correlated with CO2 concentration in Hole U1473A lithologies (Figure F154).
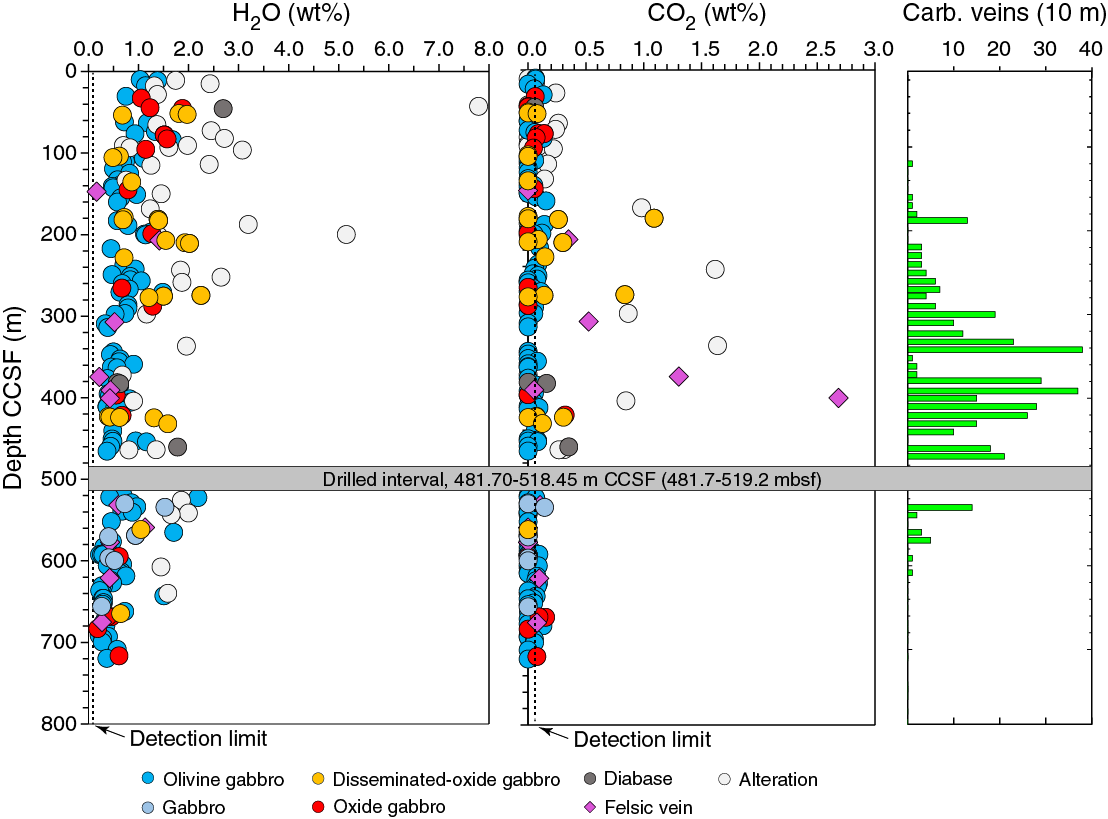
Figure F154. H2O and CO2 downhole depth, Hole U1473A.
Previous expeditions recovered gabbroic rocks from Holes 735B and 1105A on Atlantis Bank with similar ranges of H2O and CO2 concentrations as in the lithologies recovered from Hole U1473A (Figure F153) (Casey et al., 2007; Shipboard Scientific Party, 1999a). In comparison, olivine gabbros recovered from Hess Deep were reported to have broadly similar CO2 contents but significantly higher H2O contents that are mostly between 2 and 4 wt%, with olivine-rich troctolites containing even higher H2O contents of 5–10 wt% (Gillis et al., 2014). These figures compare to typical ranges of 0.2–0.4 wt% H2O in MORB glasses that have not degassed H2O (Dixon et al., 1995; Michael, 1995) and the expectation that unaltered cumulate rocks in the lower crust would be depleted in all incompatible elements (including H2O) relative to MORB. Therefore, the high H2O concentrations observed (Figure F154) strongly suggest that all the samples recovered by deep drilling of oceanic basement rocks, including the freshest samples selected, have been affected to some extent by seawater alteration. In contrast with H2O, mid-ocean-ridge magmas degas CO2 at an early stage, meaning that the initial CO2 content of oceanic magmas is poorly defined (Dixon et al., 1995). Nonetheless, the relationship between CO2 content and distribution of carbonate veins suggests that like H2O, the CO2 content of the gabbros is related to alteration.
The effects of alteration on the major and minor elements measured during Expedition 360 were investigated by examining the composition of altered samples relative to unaltered (or less altered) equivalent lithologies from the same interval. These data are presented as altered/fresh ratios in Figure F155, which shows that almost all of the elements investigated scatter around a ratio of 1. The scatter of fluid immobile elements such as Ti, Zr, and Y indicates that the rock pairs selected from some intervals were not exactly equivalent. However, H2O and CO2, which are assumed to have been almost entirely introduced during alteration, and K2O are significantly enriched in the altered samples. In addition, S and Cu are both depleted in the altered samples, but because the S and Cu measurements have relatively low precision (see Geochemistry in the Expedition 360 methods chapter [MacLeod et al., 2017a]), further work is required to test if this apparent depletion is real. The altered samples are distinguished on the downhole plots in Figures F150 and F151 and demonstrate good coherence with the unaltered samples. Therefore, we conclude that alteration has not significantly influenced any of the elements discussed in Major and trace elements in igneous samples.
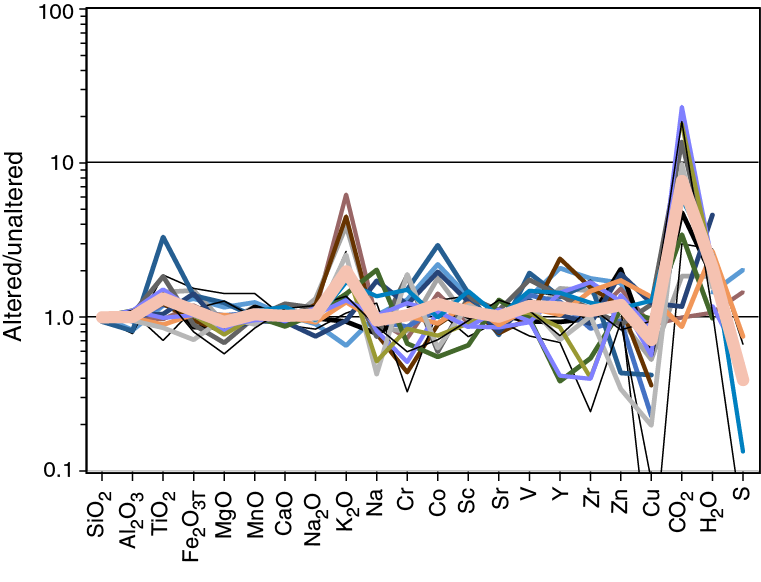
Figure F155. Relative element abundances in adjacent altered vs. fresh samples, Hole U1473A.
Inorganic and organic carbon
The procedural blank of the CHNS analyzer limited the reproducibility of TC measurements during Expedition 360 (see Figure F21 in the Expedition 360 methods chapter [MacLeod et al., 2017a]); however, the microbiology samples run in two CHNS runs with optimally low blank results gave reproducible results at the 200 ppm C level (equivalent to 700 ppm CO2; Table T13). The IC component measured in these samples by coulometry had a higher reproducibility for those samples for which replicate measurements are available. However, when uncertainty in the calibration is taken into account (external precision), none of the microbiology samples contain OC that is significant at the 66% confidence level.
Following the initial results, coulometry measurements were made on 10 geochemistry samples for which CHNS had indicated high and therefore reliable C concentration measurements >1000 ppm. The coulometric measurements then indicated that four of the selected samples contain OC that is statistically significant at the 1σ or 66% confidence level (Table T13). Furthermore, the results for Samples 360-U1473A-15R-3, 60–64 cm, and 27R-6, 95–99 cm, which contain 0.4–0.5 wt% OC, are significant at the 3σ or 99% confidence level. The low concentration of CO2 measured by coulometry was reproduced for two of the samples, suggesting that it did not result from an equipment malfunction. Therefore, the results indicate that some of the samples with the highest TC concentrations, in the interval 130–240 m CCSF, where carbonate veins start to become important, are dominated by OC rather than carbonate (cf. Figure F153 and Table T13).
The samples containing OC include a felsic vein, disseminated-oxide gabbro, and two olivine gabbros, all of which are altered to varying extents. An examination of the thin sections for these samples revealed that only Sample 360-U1473A-21R-1, 96–99 cm, contains microscopically visible carbonate in thin section, consistent with it containing a mixture of ~1000 ppm OC and ~2000 ppm IC (Table T13). Carbonate was not observed in the thin sections of Samples 15R-3, 60–64 cm, 24R-1, 51–53 cm, and 27R-6, 95–99 cm, which are all dominated by ~900–5000 ppm OC. The only feature all four samples share in common is clay alteration. Clay alteration occurs in most of the geochemistry samples investigated for OC but is only intense enough to replace plagioclase in the samples that contain measurable OC.
As points of comparison, oceanic gabbros and serpentinized lithologies from the Iberian margin of the Atlantic Ocean, the MARK area, the East Pacific Rise Hess Deep, and elsewhere on the SWIR typically contain ~10–2000 ppm of OC (Delacour et al., 2008; Früh-Green et al., 2004). However, palagonitic glass alteration, which comprises a mixture of clay minerals, oxides, and zeolites, can contain weight percent levels of OC (e.g., 0.4–1.5 wt%; Kruber et al., 2008). The origins of C in these systems is of critical importance: OC in serpentinites could be advected into place by the seawater-derived fluids responsible for serpentinization (Delacour et al., 2008) or C could precipitate during reaction of CO2 and CH4 produced during serpentinization. In contrast, OC in palagonite is attributed to living and fossilized biomass responsible for the alteration of glass, implying the C is sequestered into the rock in situ rather than by advection (Kruber et al., 2008).
It is surprising that the altered whole rocks analyzed in this study with alteration intensities between 30% and 60% have OC concentrations of up to 0.4–0.5 wt%. These levels are much higher than usually attributed to seawater advection in serpentinites and are comparable to palagonite formed by microbial replacement of glass (Table T13). Further work is clearly required in order to verify the measurements reported here, track the origin of C in the rock using other geochemical tracers, and investigate the nature of the clay alteration with advanced microscopy.
Microbiology
Microbiology sampling during Expedition 360 focused on exploring evidence for life in the lower crust and hydrated mantle using culture-based and culture-independent approaches, microscopy, and enzyme assays. Sampling efforts focused on core sections with evidence of alteration or fracturing within all lithologies encountered. A total of 68 whole-round samples (4–22 cm long) were collected from Hole U1473A for microbiological analysis (Figure F156). Lithologies of the samples collected, as defined by the igneous petrology group, were granular or subophitic olivine gabbro (36), coarse-grained olivine gabbro (16), subophitic olivine-bearing gabbro (1), disseminated-oxide or oxide olivine gabbro (11), coarse-grained granular disseminated-oxide olivine gabbro with fine-grained granular oxide-bearing trondhjemite felsic domain (2), olivine-bearing gabbro (1), coarse-grained granular oxide gabbronorite (1), and fine-grained aphyric diabase (1).
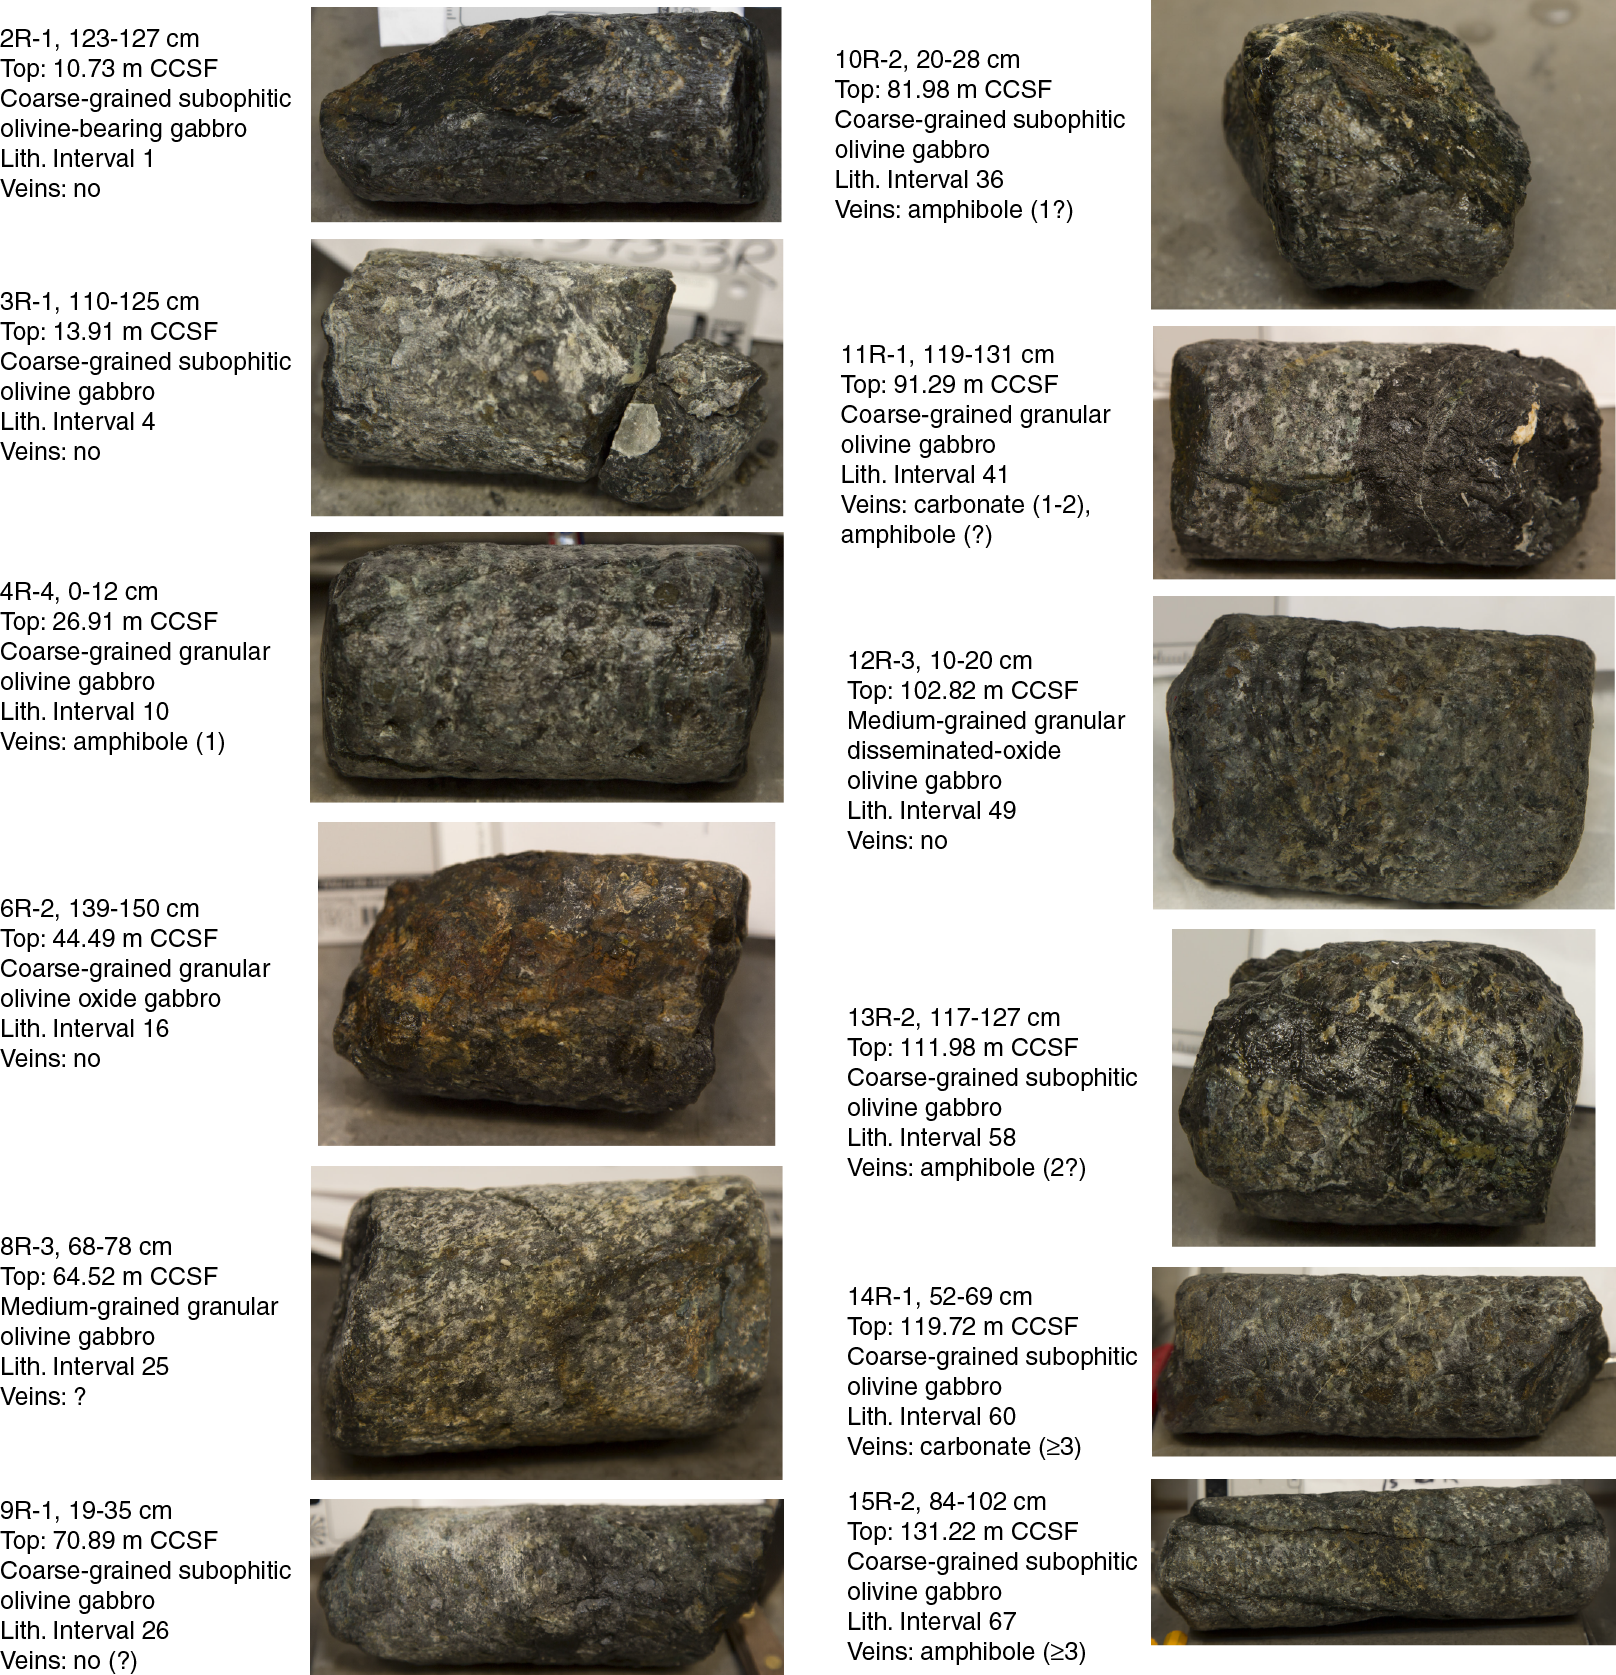
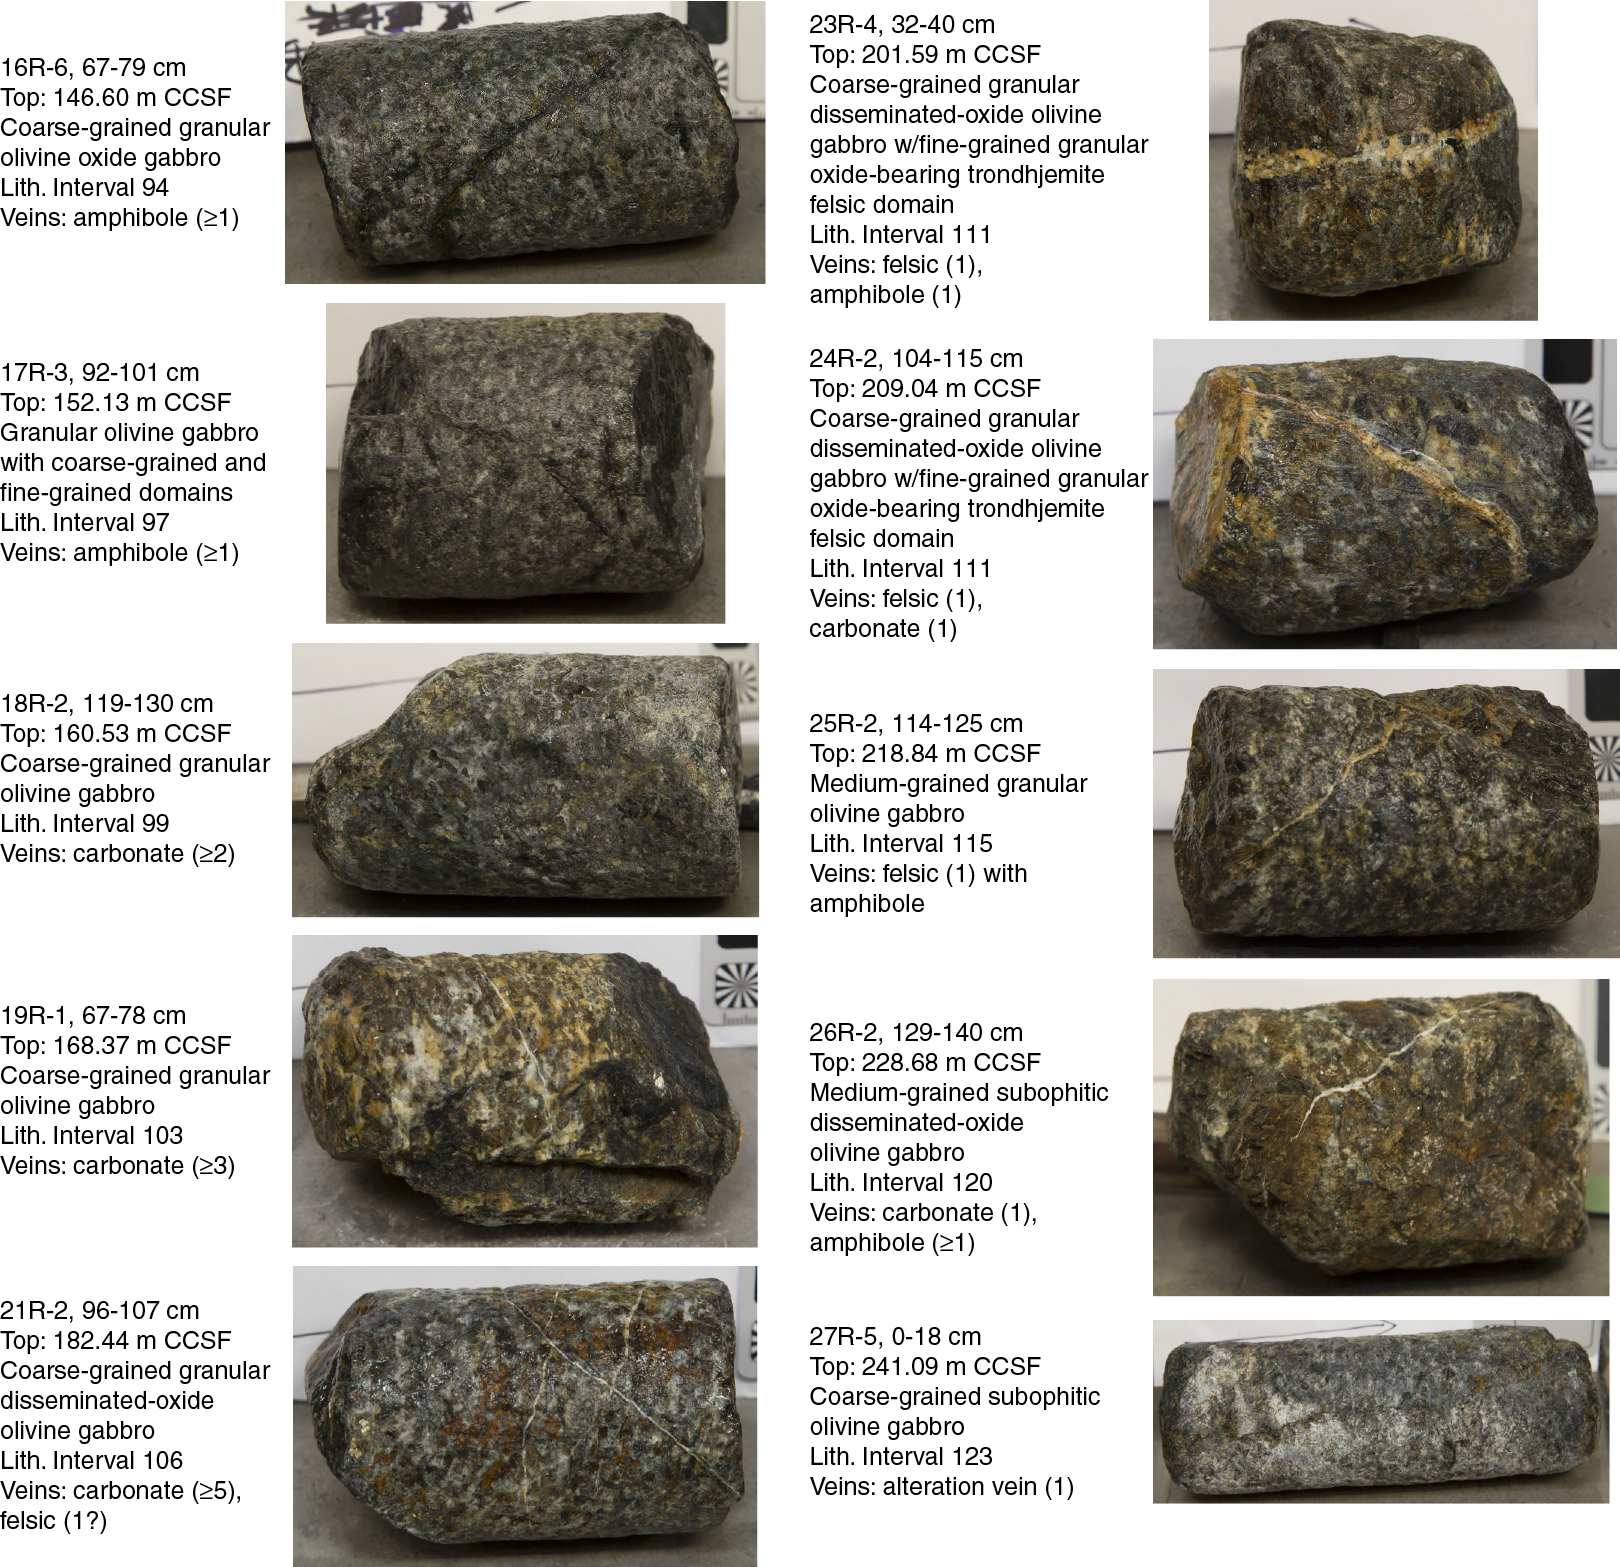
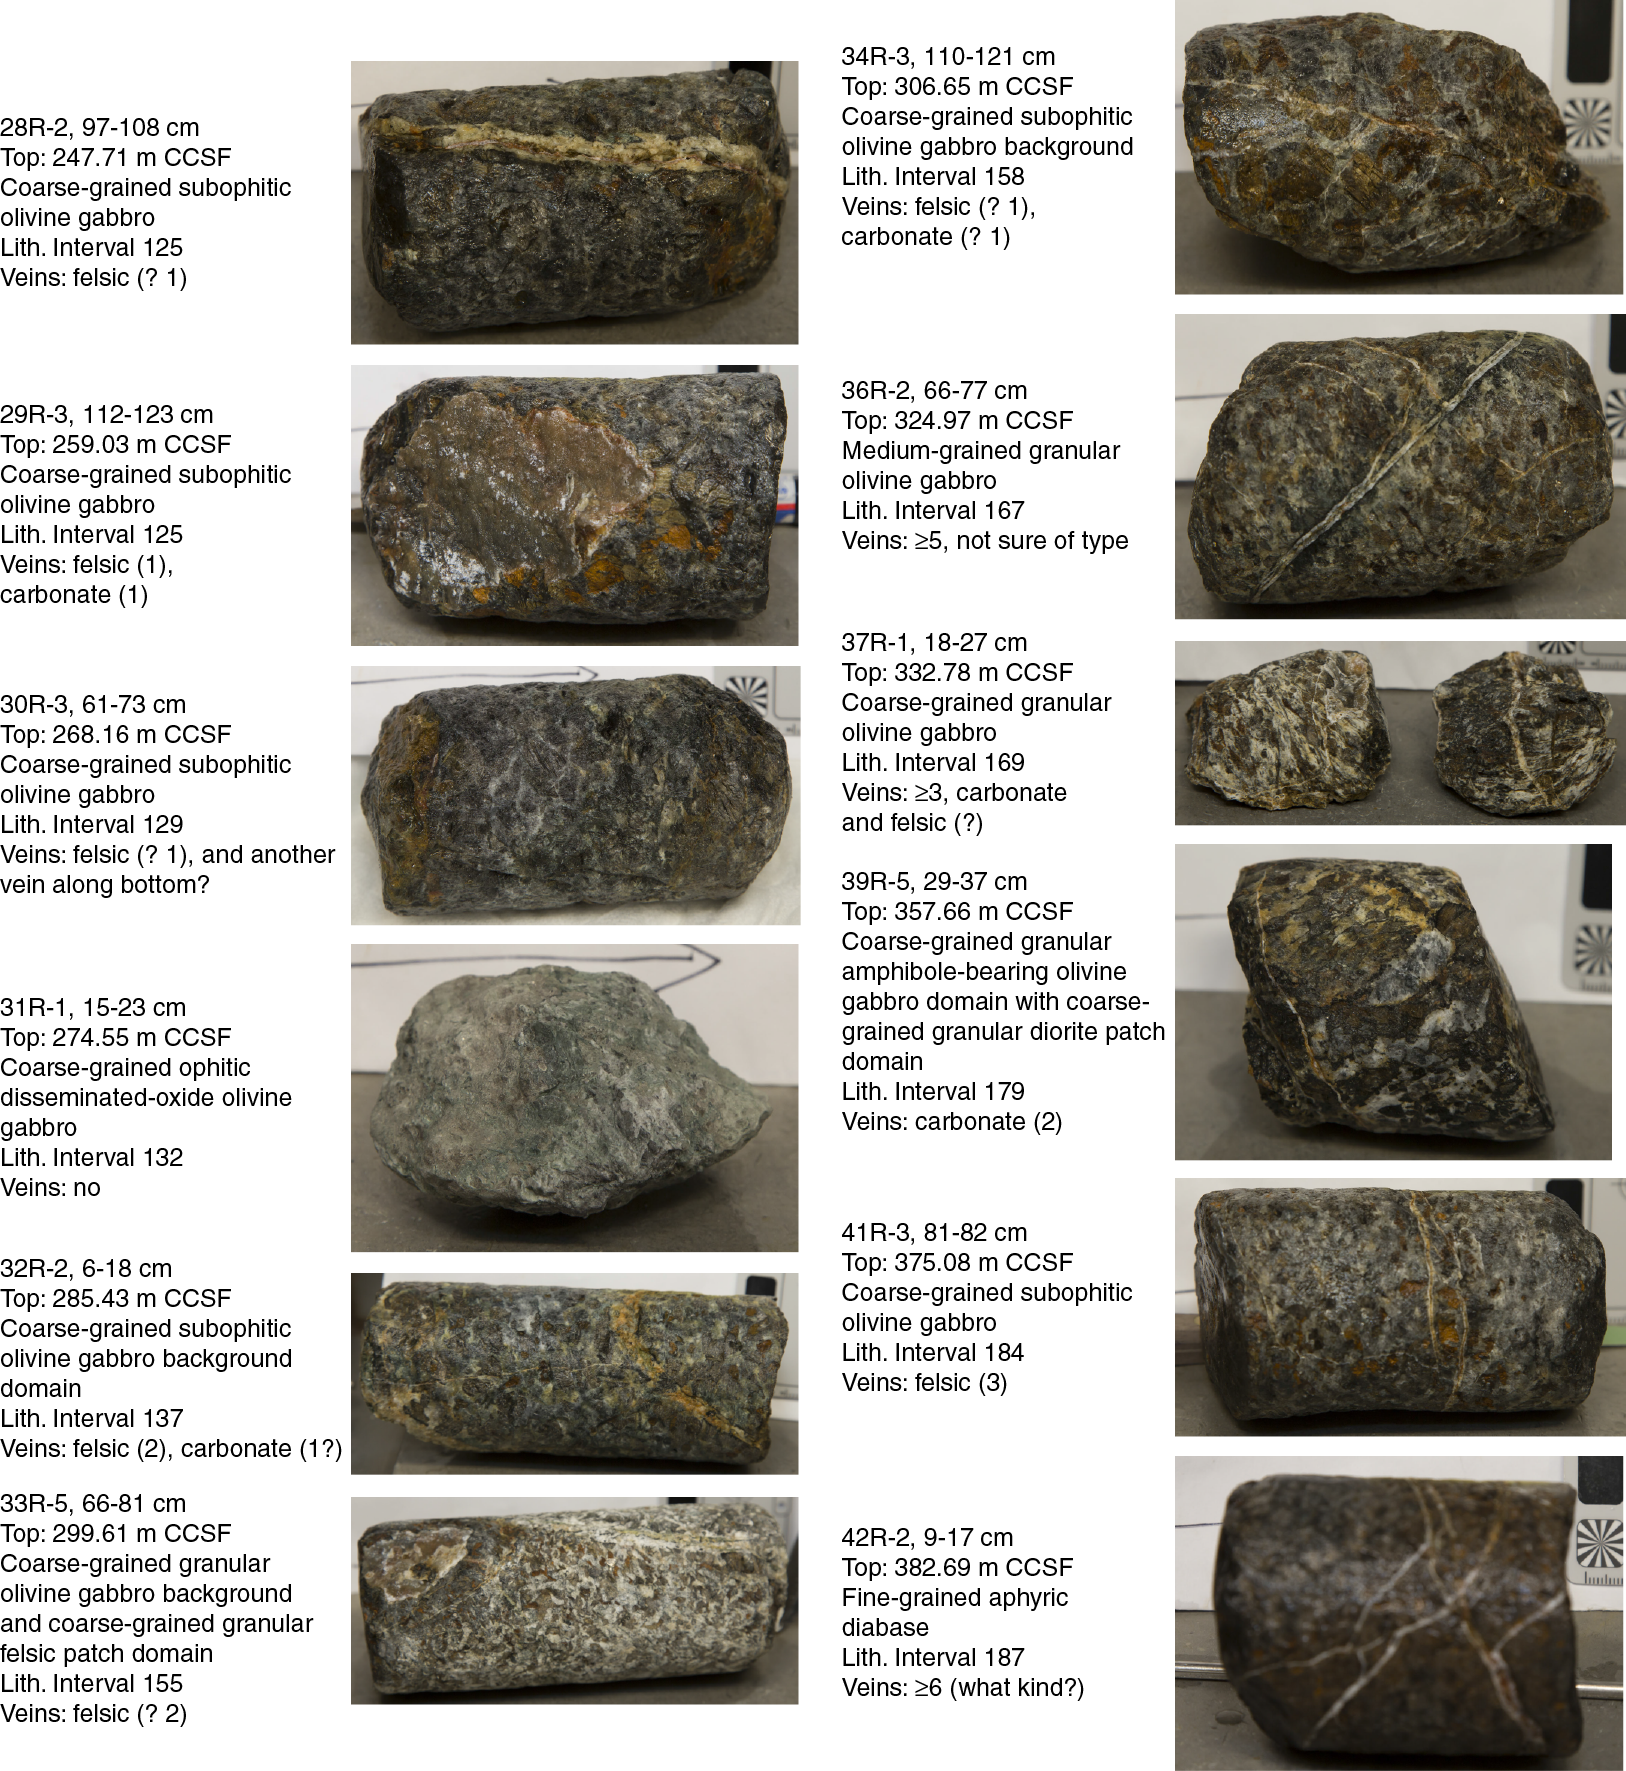
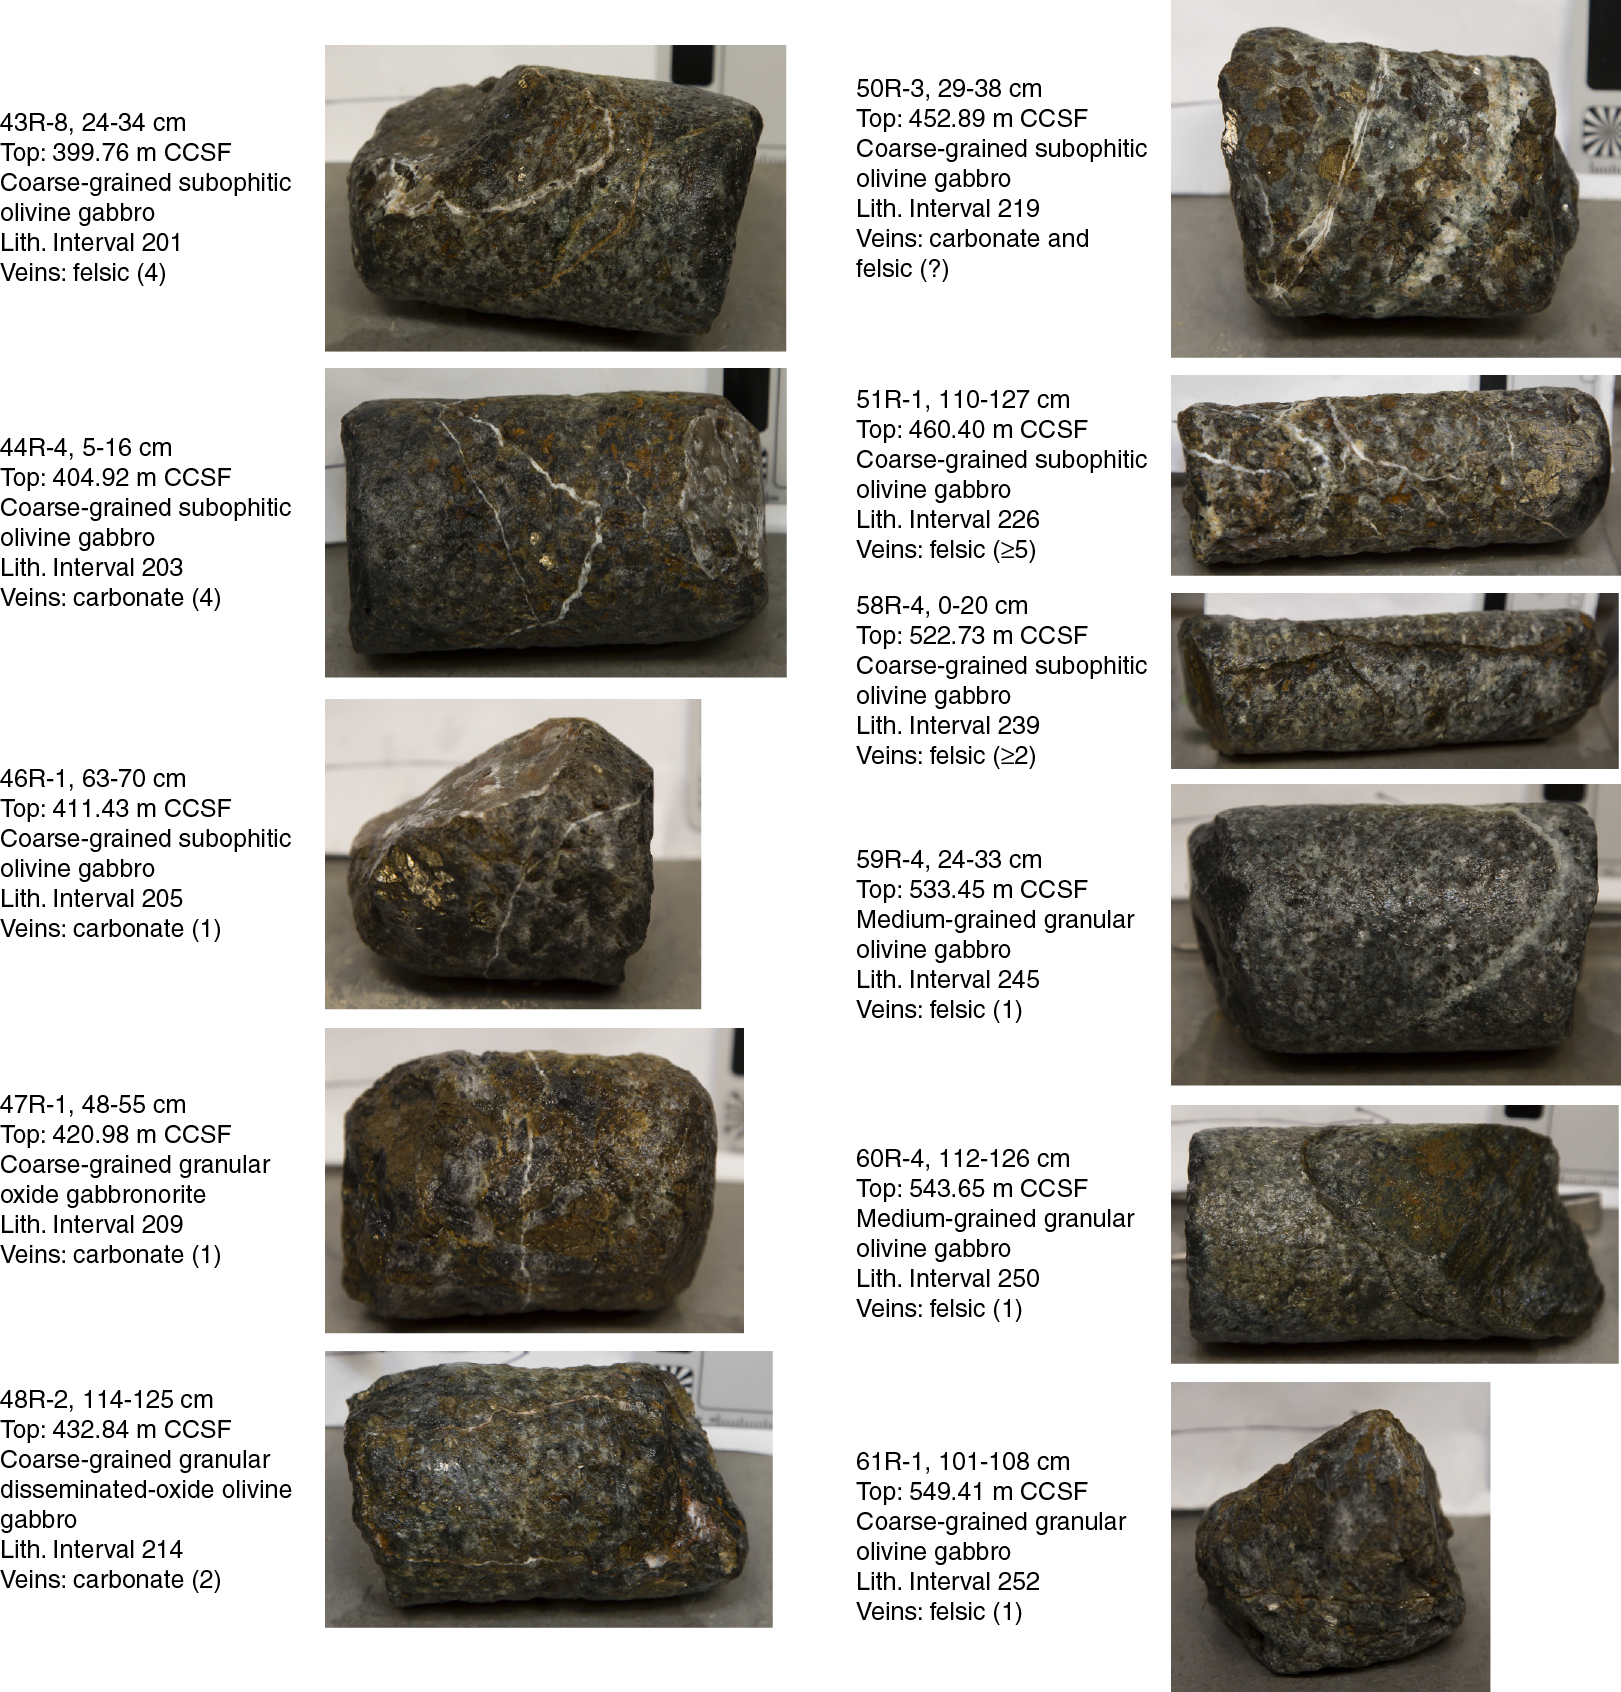
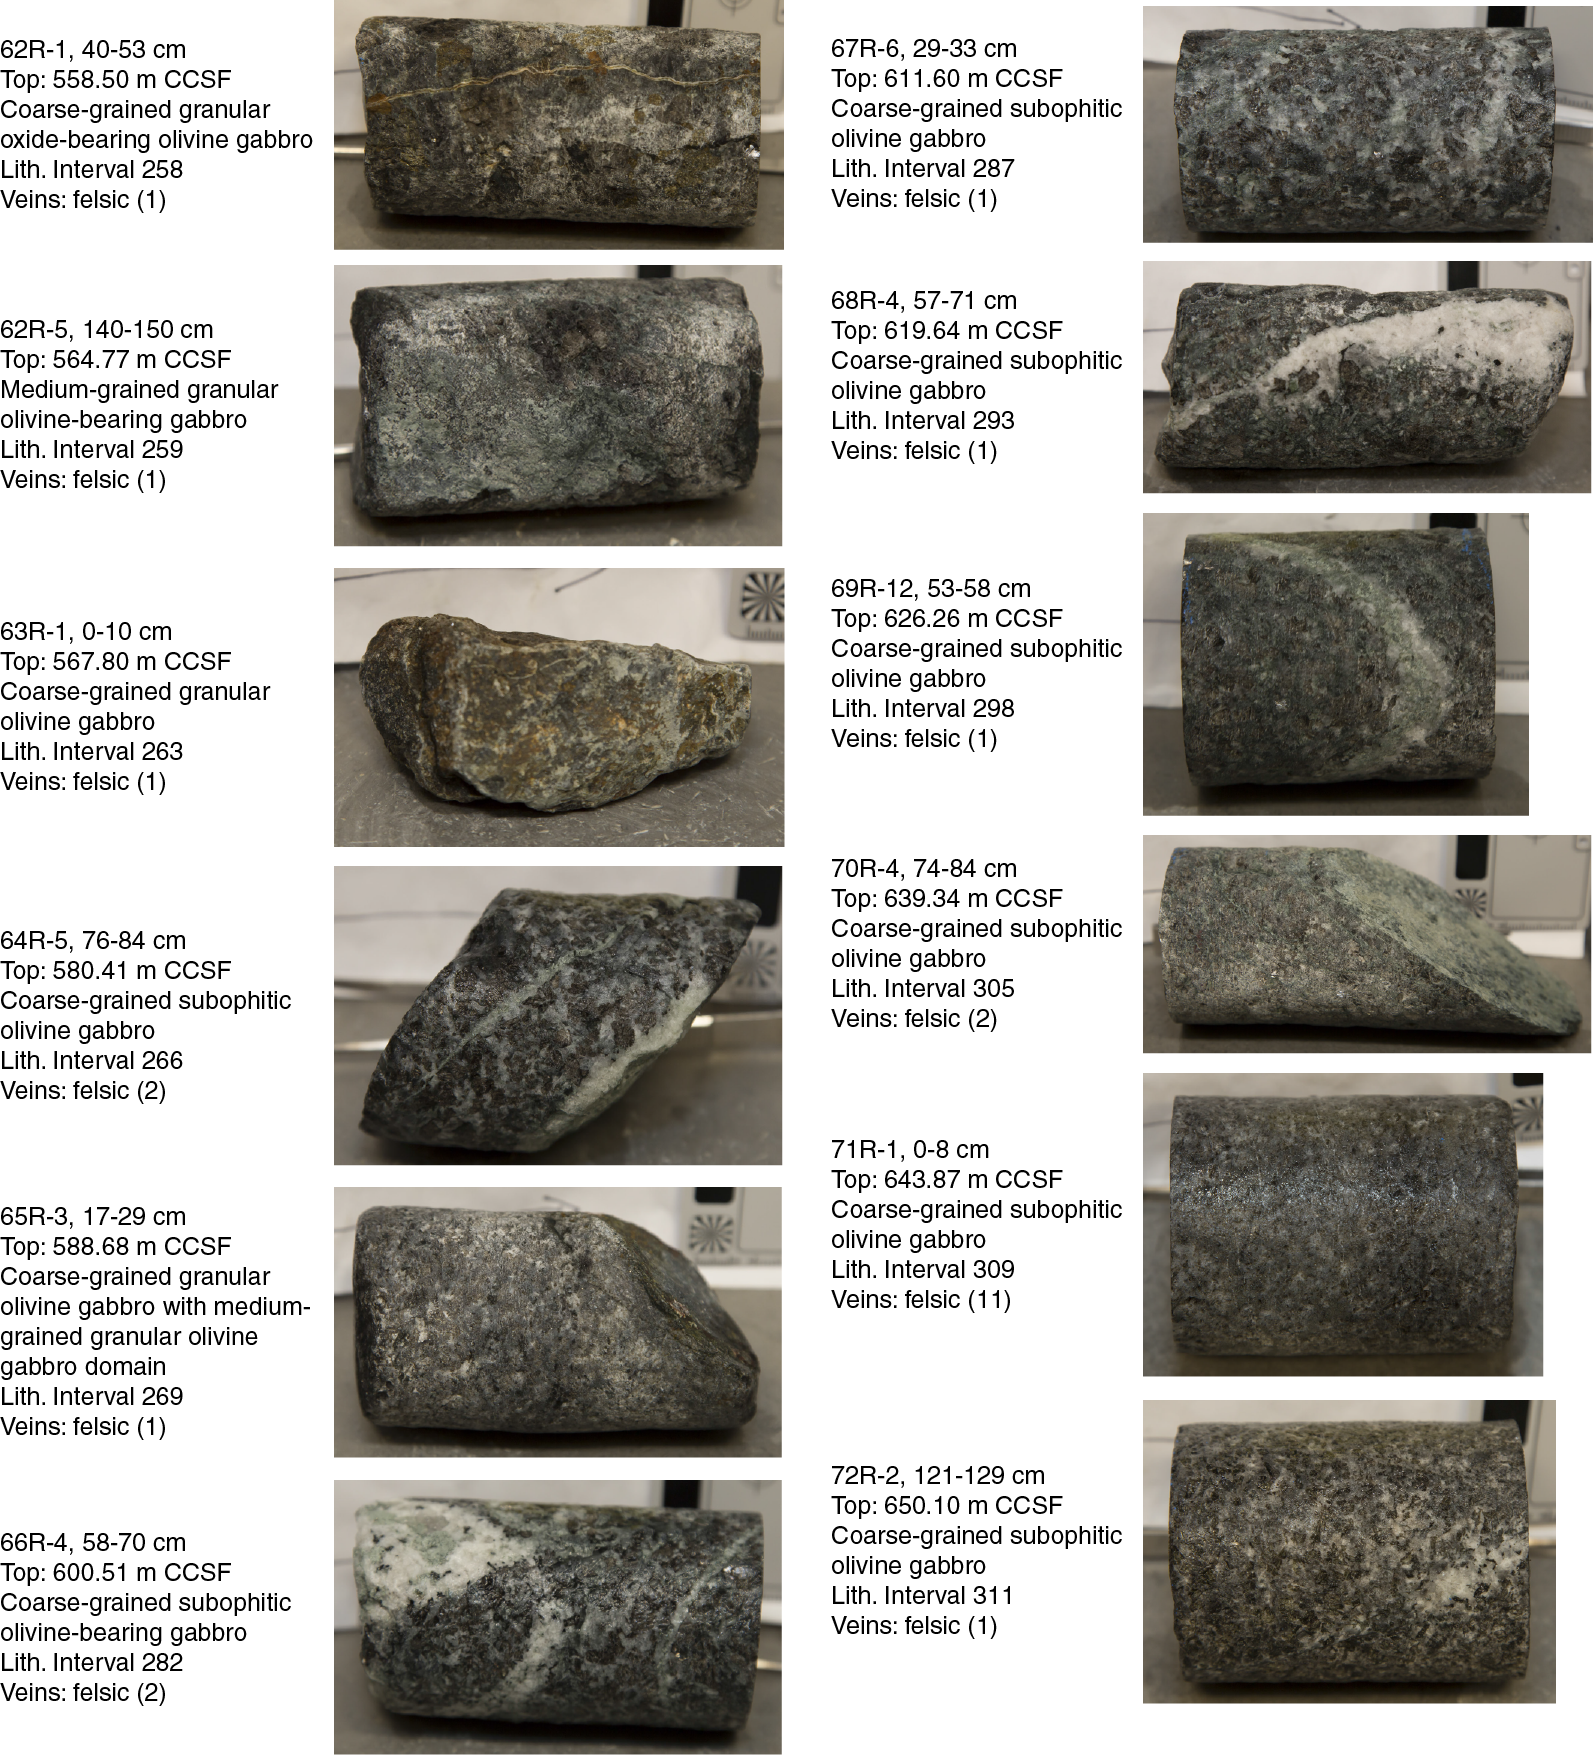

F156. Whole-round samples collected for microbiology, Hole U1473A.
The number of analyses possible for each sample depended on the size of the core sample available for microbiology, and hence, the amount of material we were able to harvest for analyses:
- 64 samples were processed for shore-based DNA iTAG (small subunit ribosomal RNA [SSU rRNA] gene diversity) analysis, and of those, 45 samples had sufficient material for coupled RNA iTAG analyses.
- Of the 45 samples above, 11 were processed for metatranscriptome analyses, 21 were processed for metagenome analyses, and 21 were processed for lipid analyses. It should be noted that low biomass expected in these samples may prevent success for some of these analyses.
- 66 samples were processed for cell counts.
- 58 samples were prepared for thin section and scanning electron microscopy.
- 66 samples were analyzed on board for adenosine triphosphate (ATP) concentration (Table T14).
- 16 samples were used to initiate exoenzyme assays to determine the rates of metabolic activity in subseafloor gabbroic basement (Table T15).
- 38 samples were inoculated into up to 10 different kinds of microbial media targeting specific archaea, bacteria, or fungi (Table T16).
- 12 samples were used to initiate nutrient addition bioassays with inorganic nitrogen and phosphorus or organic carbon to determine the nutritional constraints on biomass in this environment (Table T16).
Table T14. ATP raw luminescence and concentration, Hole U1473A. Download table in .csv format.
Table T15. Exoenzyme activity rates from assays, Hole U1473A. Download table in .csv format.
Table T16. Microbiology samples for enrichment cultures and nutrient addition experiments, Hole U1473A. Download table in .csv format.
Additionally, a new chemical tracer, perfluoromethyldecaline (PFMD), was used for contamination testing for the first time (Table T17). This was run during coring operations for 10 samples. PFMD was consistently detected in the drilling fluid, usually detected on the outside of uncleaned cores, and on rare occasions was above detection levels on the cleaned outside of cores. It was always below detection on the inside of cores, indicating penetration of drilling fluid to the interior of whole-round drill cores (where we collected our samples) is unlikely. We ran the more volatile tracer perfluoromethylcyclohexane (PMCH) during three coring runs at the end of the cruise. It was more difficult to successfully clean the core exteriors with this more volatile tracer, and tracer was detected on occasion on core interiors.
Table T17. PFMD and PMCH tracers in drilling fluids and samples, Hole U1473A. Download table in .csv format.
Sampling for shore-based DNA, RNA, and lipid analyses
DNA, RNA, and lipid analyses will be performed in shore-based laboratories. Material for DNA, RNA, and lipid analyses was collected as indicated in Microbiology in the Expedition 360 methods chapter (MacLeod et al., 2017a) and placed into sterile 50 mL Falcon tubes, labeled, and immediately frozen at −80°C. A total of 64 samples were processed for shore-based DNA-based iTAG (SSU rRNA gene diversity) analysis, and of those, sufficient material was provided for 45 coupled RNA-based (expressed SSU rRNA gene diversity) iTAG analyses. We predict that 20–40 g of material is required to obtain sufficient DNA for metagenomics. This amount of rock was available for 21 of the 64 DNA samples. Sufficient material (an additional 40 g) for metatranscriptome analyses of gene expression was only obtained for 11 samples. A total of 21 samples were collected for lipid analyses.
Cell counts
Performing shipboard cell counts on rock samples is difficult due to the time required to separate cells from rock material in addition to sample processing and other shipboard tests. Therefore, shipboard cell counts were not attempted on samples from Site U1473; instead, the samples were powdered and preserved for postcruise analysis in a 1:5 slurry of rock powder and 4% paraformaldehyde.
ATP measurements
The presence of ATP is indicative of the presence of nucleic acids, and if this ATP is coming from living cells, it should be proportional to cell abundance, although there are complicating factors that prevent direct correlation (e.g., low-activity cells have lower than average ATP concentrations). The assay for ATP concentrations uses the luciferase enzyme and light detection, which makes it easy to employ and relatively sensitive. We regard positive detection of ATP as supporting the possibility of subsurface microbial biomass; however, we do not view negative results to indicate a lack of biomass but, more likely, biomass below the detection limit of the ATP assay.
ATP was detectable in 23 of the 66 analyzed samples (Table T14). The highest values were detected in Samples 360-U1473A-2R-1, 123–137 cm, 71R-1, 0–8 cm, and 72R-2, 121–129 cm. ATP in Sample 2R-1, 123–137 cm, was an order of magnitude lower than surface seawater at Site U1473, whereas ATP in the other two samples was in the same order of magnitude as that in seawater. For Samples 2R-1, 123–137 cm, through 24R-2, 104–115 cm, we used a homogeneous mix of powder from different parts of the sampled core for the ATP analysis. The reasoning for this was to generate a value for the whole rock, but this reasoning evolved as the cruise progressed. Starting with Sample 25R-2, 114–125 cm, we changed our strategy specifically to collect only vein and adjacent material for ATP analysis, where available (as indicated in Table T14). Our strategy changed because we felt we were diluting the signal of microbial biomass in veins, where cells are more likely to occur, with sample from the background rock material. Indeed, a higher proportion of samples collected this way were positive than when we collected homogeneous rock powder. The samples positive for ATP detection will be initial priority targets for shore-based research, and ATP concentrations will also be used later for correlation with cell counts, exoenzyme analyses, and molecular biology data.
Exoenzyme assays
A total of 16 samples were used to initiate exoenzyme assays to determine the rates of metabolic activity in subseafloor plutonic basement rocks (Table T15). We assayed alkaline phosphatase (AP) and leucine aminopeptidase (LeuAP) for all 16 of these samples. We initially tried to assay also for esterase activity using the substrate 4-methylumbelliferyl acetate (MUF-acetate), but blanks and samples were consistently off-scale above the highest readable value of the plate reader. This may be due to one or a combination of the following factors: (1) interference from the reducing agent in the anoxic artificial seawater (ASW360), although tests with reducing agent in Milli-Q water and MUF-acetate did not exhibit this interference; (2) salt in the ASW360, although it is notable that tests with surface seawater and MUF-acetate were also off-scale, indicating perhaps it is not the reducing agent alone in ASW360 that causes interference; or (3) acetone in the working solution. Regarding the third possibility, because the assay substrate will not dissolve in water, it is initially dissolved and diluted in acetone, which does increase fluorescence when added to MUF standards in the same concentration as it would be added to the sample assays. However, the increased fluorescence caused by adding acetone to MUF standards did not push the values off-scale, so interference cannot be attributed to this factor alone. After observing trouble with the MUF-acetate assays, we switched to assaying for arginine aminopeptidase (ArgAP) and continued this for Samples 360-U1473A-27R-5, 0–18 cm, and deeper.
Experiments were conducted with powdered rock from Samples 360-U1473A-9R-1, 19–35 cm, 51R-3, 110–127 cm, 74R-7, 40–44 cm, and 75R-2, 0–3 cm, to determine the amount of fluorophore adsorbance to rock powder in the exoenzyme experiments. Adsorbance was found to behave in a systematic manner, resulting in a straight line when comparing fluorescence standards in ASW alone to fluorescence standards in ASW plus rock powder, although this relationship was found to be different when measured at 4 h versus days later. Therefore, a correction factor for adsorbance was applied to generate the enzyme data presented in Table T15, and a different correction factor was applied to the initial measurement (T0) (y = 1.90x − 676 for MUF and y = 2.02x − 69.7 for 7-amino-4-methylcoumarin [AMC]) than to the second and third measurements (T1 and T2) (y = 4.64x − 303 for MUF and y = 2.15x for AMC).
During Expedition 360, three time points were measured for Samples 360-U1473A-2R-1, 123–137 cm, 6R-2, 139–150 cm, and 9R-1, 19–35 cm. For these samples, AP activity rates were 2.3 × 10⁻³ to 2.8 × 10⁻³ nmol/(g·h) and LeuAP activity was below detection. The goal is to measure three time points for all samples. For Sample 2R-1, 123–137 cm, the second sampling was performed 30 h after the initial sampling and no increase in fluorophore was detected. We therefore decided to allow incubations to proceed for at least 3 weeks prior to the second sampling. During Expedition 360, Samples 2R-1, 123–137 cm, through 9R-1, 19–35 cm, were sampled three times; Samples 11R-1, 119–131 cm, through 37R-1, 18–27 cm, were sampled twice; and Samples 68R-4, 57–71 cm, through 89R-2, 95–102 cm, were sampled only for their initial measurement. For those samples with two measurements (T0 and T1), AP activity was often above detection but low (8.7 × 10⁻⁵ to 2.3 × 10⁻³ nmol/[g·h]), whereas both LeuAP and ArgAP were consistently below detection (Table T15). A final time point for these samples will be taken postcruise. Negative controls, consisting of the same ASW used for the sample incubations plus substrate but no sample, were consistently below detection or at least an order of magnitude lower than the values measured in the experimental samples. To clearly verify the veracity of the low but positive AP activity rates, postcruise negative controls with killed rock chips will be conducted. This will reveal whether there is any reaction between the rock itself with the 4-methylumbelliferyl phosphate (MUF-P) substrate used for the AP assays.
Culturing experiments
A total of 38 samples were used to inoculate enrichment cultures using 10 different types of cultivation media. These included media targeting fungi: potato glucose agar with and without chloramphenicol and penicillin, marine broth agar 2216 with and without chloramphenicol and penicillin, and YEPG media with and without chloramphenicol and penicillin (see Table T6 in the Expedition 360 methods chapter [MacLeod et al., 2017a]). Selective media were used to initiate enrichment cultures for methanogenic archaea, sulfate-reducing bacteria, iron-reducing microbes, and sulfur-oxidizing microbes as well (see Table T7 in the Expedition 360 methods chapter [MacLeod et al., 2017a]). Samples for which culturing experiments were initiated are listed in Table T16. The sample slurry used to inoculate all media for each sample was turbid; therefore, visual inspection of liquid cultures for increased turbidity could not be used to assess growth during the cruise. Additionally, supplies for staining cells for visualizing them under the microscope were not available on the ship; therefore, growth was not assessed during the cruise. Shore-based research will focus on assessing growth and isolating new microbes from these subsurface enrichments.
Nutrient addition experiments
Twelve samples were used to initiate nutrient addition bioassays to determine the nutritional constraints on biomass in this environment (Table T16). For four of these experiments, 5 cm3 of rock powder (fine particles < 3 mm) were added to 30 mL serum vials and the volume of the experiment was brought up to 27 mL using ASW360 (see Table T7 in the Expedition 360 methods chapter [MacLeod et al., 2017a]). Nutrients were then added to bottles according to the conditions tested:
- No added nutrients (control).
- Added 750 µM NH4Cl.
- Added 750 µM NH4Cl and 50 µM K2HPO4.
- Added 200 µM each of acetate, formate, and lactate.
Because of the small sample sizes typically available for hard rock microbiology sampling, these enrichments were established using one vial per treatment, with the exception of Sample 360-U1473A-9R-1, 19–35 cm, which was processed with duplicates for each treatment. Following inoculation and nutrient addition, vials were sealed, crimped, gassed with a mixture of 90%:5%:5% N2:CO2:H2, and kept at 10°C for the remainder of the cruise. These enrichments will be allowed to incubate in the laboratory postcruise for at least 6 months prior to sampling to test for cell growth and microbial diversity.
Contamination tracer testing
A new chemical tracer, PFMD, was used for contamination testing during Expedition 360 for the first time (Table T17). PFMD was run during coring operations for 10 samples. It was always detected in the drilling fluid collected from the sampling port on the rig floor (on the way down the drill pipe prior to contact with the core) and was usually detected on the outside of core samples that we had not yet subjected to our cleaning procedure; however, it was below detection on almost all of the samples collected from the whole-round exterior following the standard cleaning procedure used during Expedition 360 and was never detected on the insides of cores, indicating that penetration of drilling fluids to the interior of whole-round drill cores, where we collected our samples, is unlikely. We tested the sepiolite drilling mud for detection of PFMD tracer prior to its mixing with seawater and found that it was below detection. During collection of Sample 360-U1473A-12R-3, 10–20 cm, we used a sterile plastic pipette to collect some drilling fluid directly from the core liner in the core splitting room; PFMD was measured at 28.73 ppb in that sample. No additional core liner samples were collected.
A challenge for our tracer tests throughout the cruise was that tracer is pulsed into the drilling fluid; therefore, when a drilling fluid sample is collected at the spigot on the coring deck, the concentration may vary depending on the moment of sampling. Also, technicians sampling the fluid needed to let the spigot run for a few minutes onto the deck before collecting the sample in order to clear seawater without tracer out of the pipes. These times varied. For this reason, we focused on quantifying the removal of tracer from the core exterior by our washing procedures relative to the starting concentration detected on the prewashed core exterior rather than on comparing final concentrations in our samples to starting concentrations in the more variable drilling fluid.
We ran three runs of the much more volatile tracer PMCH at the end of the cruise for comparison with PFMD. PMCH has been the standard tracer used for microbiology sampling during ODP, Integrated Ocean Drilling Program, and IODP expeditions for the past 15 y (Smith et al., 2000; Lever et al., 2006; Yanagawa et al., 2013). Because of the volatility of PMCH, it becomes increasingly difficult to achieve a clean blank reading between runs because the PMCH permeates the atmosphere of the laboratory. There was more variability in results using this tracer, and it was more difficult to successfully achieve readings that indicated clean core exteriors. Preliminary analysis of our data indicates data from PMCH are more difficult to interpret, likely due to the much higher volatility of this tracer. PMCH was detected on occasion on core interiors, which we do not necessarily interpret as proof of contamination given the volatility of this tracer and likelihood of it contaminating our cleaned samples. PFMD tracer may be a more consistent and reliable tracer to use, and analyses of our contamination control samples using DNA-based approaches will inform on the value of using tracers in drilling fluid as a contamination control for microbiological analyses.
Paleomagnetism
Archive section half remanence data
Remanence measurements were made on archive section half pieces recovered during Expedition 360 by RCB coring in Hole U1473A using the superconducting rock magnetometer (SRM) system. Remanence was measured every 2 cm, and the resulting data were filtered to reject measurement points within 4 cm of piece ends (Table T18). Pieces <8 cm long were removed from the tray during demagnetization and measurement. A list of these pieces is provided in PALEOMAG in Supplementary material. Point susceptibility data obtained from the archive section halves were also filtered to preserve only data corresponding to the intervals where remanence measurements were made.
Table T18. Piece-averaged remanence data, Hole U1473A. Download table in .csv format.
For the purpose of characterization based on bulk magnetic parameters, the lithologies recovered from Hole U1473A are grouped into three categories based on oxide content (Figure F157). Group 1 consists of gabbros with no visible oxide content (including gabbro and olivine gabbro) and has a geometric mean natural remanent magnetization (NRM) intensity of 0.45 A/m (range = 0.49 mA/m to 9.0 A/m; N = 10,146) and a geometric mean low-field susceptibility of 298 IU (range = 24.7–9,820 IU; N = 9,999). Group 2 consists of disseminated-oxide and oxide-bearing gabbros (i.e., with <5% oxides including disseminated-oxide and oxide-bearing gabbro and olivine gabbro) and has a geometric mean NRM intensity of 1.07 A/m (range = 40.8 mA/m to 10.3 A/m; N = 1423) and a geometric mean susceptibility of 710 IU (range = 38.7–9760 IU; N = 1411). Group 3 consists of oxide gabbros (i.e., with >5% oxides including oxide gabbro and oxide olivine gabbro) and has a geometric mean NRM intensity of 2.11 A/m (range = 13.3 mA/m to 19.7 A/m; N = 448) and a geometric mean susceptibility of 1999 IU (range = 72.7–9994 IU; N = 445). Range and mean susceptibility values for Group 3 in particular are likely underestimated due to an instrument artifact that “wraps” data ≥10,000 IU because of limited dynamic range and returns lower values by subtracting 10,000 IU (see Petrophysics in the Expedition 360 methods chapter [MacLeod et al., 2017a]). These data demonstrate that with increasing oxide content the oxide-bearing gabbro (<5% oxides; Group 2) and oxide gabbro (>5% oxides; Group 3) have progressively higher NRM intensities and susceptibilities than the gabbro and olivine gabbro (Group 1) (Figure F157). However, all groups have wide ranges of NRM and susceptibility that overlap considerably.
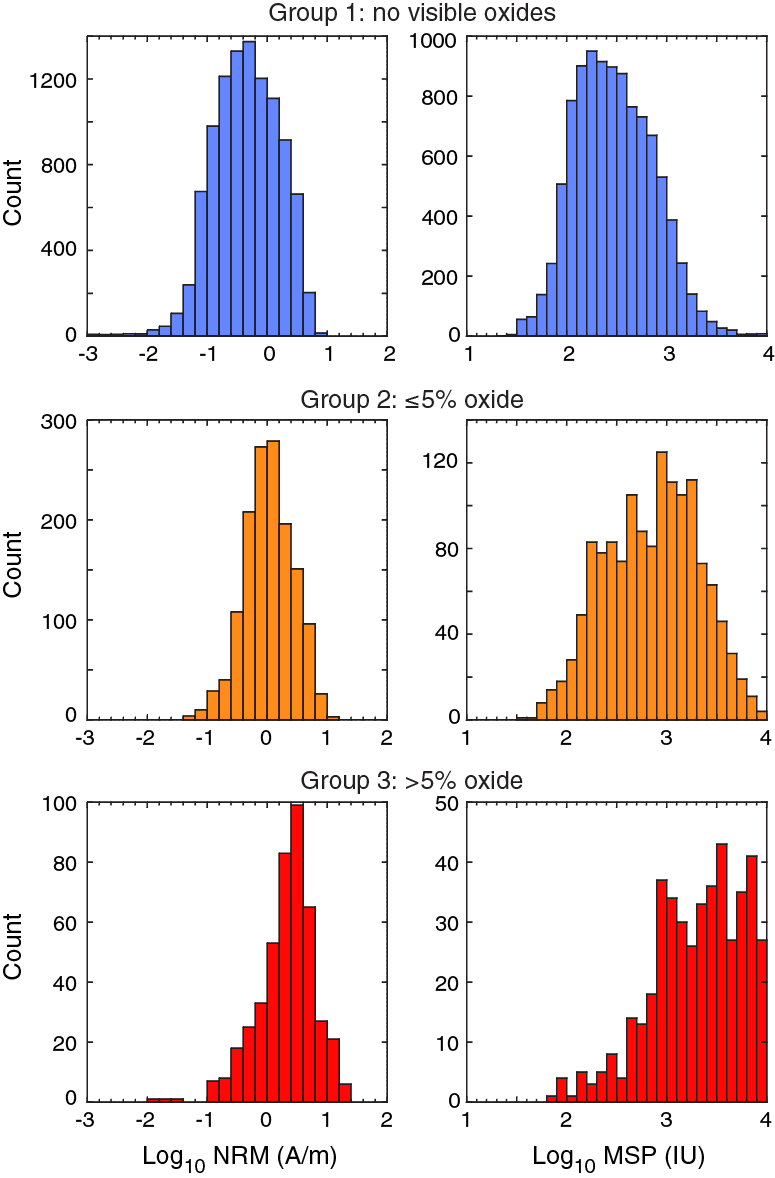
Figure F157. NRM intensity and low-field magnetic susceptibility for simplified lithologic groups, Hole U1473A.
Alternating field (AF) demagnetization of archive section halves during Expedition 360 generated a data set consisting of 12,017 individual orthogonal vector plots for principal component analysis (PCA) (see PALEOMAG in Supplementary material). Visual inspection of orthogonal vector plots revealed four types of AF demagnetization behavior:
- Samples with linear demagnetization trajectories toward the origin (Figure F158A), representing the highest quality data.
- Samples with progressive changes in remanence direction ending in linear segments directed toward the origin, representing the most commonly observed type of demagnetization path (Figure F158B, F158F–F158G).
- Samples with demagnetization trajectories that are not directed toward the origin (Figure F158C).
- Samples with high coercivities that have significant remanence left after demagnetizing at 50 mT (Figure F158D–F158E).
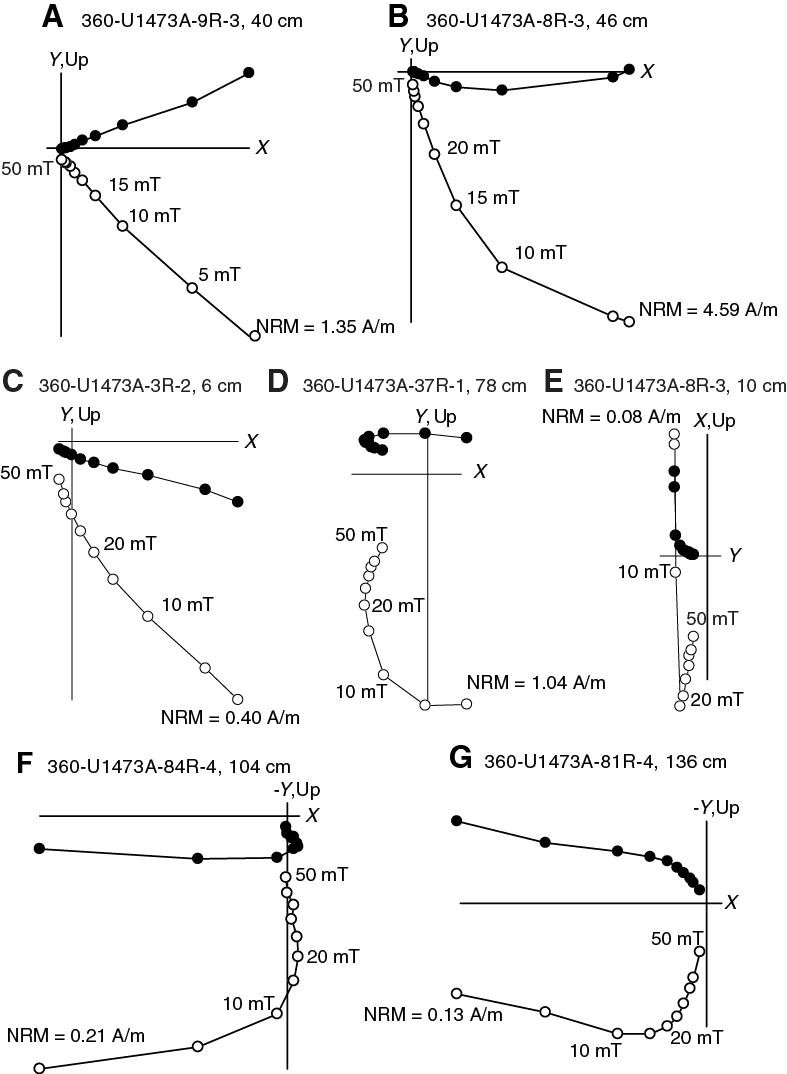
Figure F158. AF demagnetization of archive section halves, Hole U1473A.
Upward-directed low-coercivity overprints are sometimes observed (e.g., Figure F158E), but overprints with shallow inclinations are more common (e.g., Figure F158B, F158D, F158F–F158G). These overprints have coercivities that partially overlap those of the characteristic remanent magnetization (ChRM), resulting in initially curvilinear demagnetization paths. They are commonly directed toward +X in the CRF (i.e., out of the archive section halves; declinations toward 000°/360°) in the upper 410 m of the hole and toward −X (in the CRF; declinations toward 180°) in the lower half of the hole deeper than 410 m CCSF (see Figure F159). This change in overprint corresponds directly to the location where drilling operations encountered difficulties with the loss of three roller cones from one bit and the subsequent fishing attempts with a strong magnet and RCJBs to recover the lost cones. It is speculated that the magnet may have magnetized the BHA of the drill string and the adjacent drill pipe resulting in a change of overprint. Previous studies of the geometry of drilling-induced remanent magnetizations (DIRMs) have documented a pronounced radial-inward DIRM component in addition to a subvertical component. In particular, experiments conducted during ODP Leg 206 on a suite of samples cut from a whole-round basaltic core piece in Hole 1256D (Wilson, Teagle, Acton, et al., 2003) demonstrated that DIRM results in bias of archive section half remanences toward +X in the CRF. The common X-directed overprints observed in archive section halves from the upper 410 m of Hole U1473A result in a similar pronounced bias of NRM declinations toward 000°/360° (Figure F159A) and are therefore likely to represent such radial DIRM components. Deeper than 410 m CCSF, the overprint is predominantly toward −X in the CRF, resulting in a pronounced bias in NRM declination toward 180°, which in turn implies that there is a net outward radial component. To test this assumption, we carried out a whole-round test similar to Wilson, Teagle, Acton, et al. (2003). A 1 cm thick whole round was sampled (360-U1473A-72R-3, 63–64 cm) and then cut into 16 small ~1 cm3 cubes as shown in Figure F160A. NRMs were measured on the SRM with cubes spaced sufficiently far apart (40 cm) to obtain an accurate measurement of each small sample using the SRM discrete measurement program. Figure F160C–F160D shows the resultant directional data for the cubes and demonstrates that a strongly outward radial component is indeed present near the outside of the core and would generate a net −X (i.e., a 180°) declination overprint in archive-half measurements. PCA of the archive section half demagnetization data indicate that this drilling overprint persists after AF demagnetization at 50 mT (Figure F159) and that higher AFs (or thermal demagnetization) are required to recover predrilling remanence directions in these rocks. This outward/inward-directed drilling overprint dominates the outer periphery of the core but has less of an effect on the core interior from where discrete samples are taken, as previously reported by Wilson, Teagle, Acton, et al. (2003). These observations suggest that discrete sample data are more reliable than archive section half data, as they are likely to be less affected by drilling overprints, and that caution is required when interpreting archive section half data in terms of tectonic rotations or when attempting core reorientation.
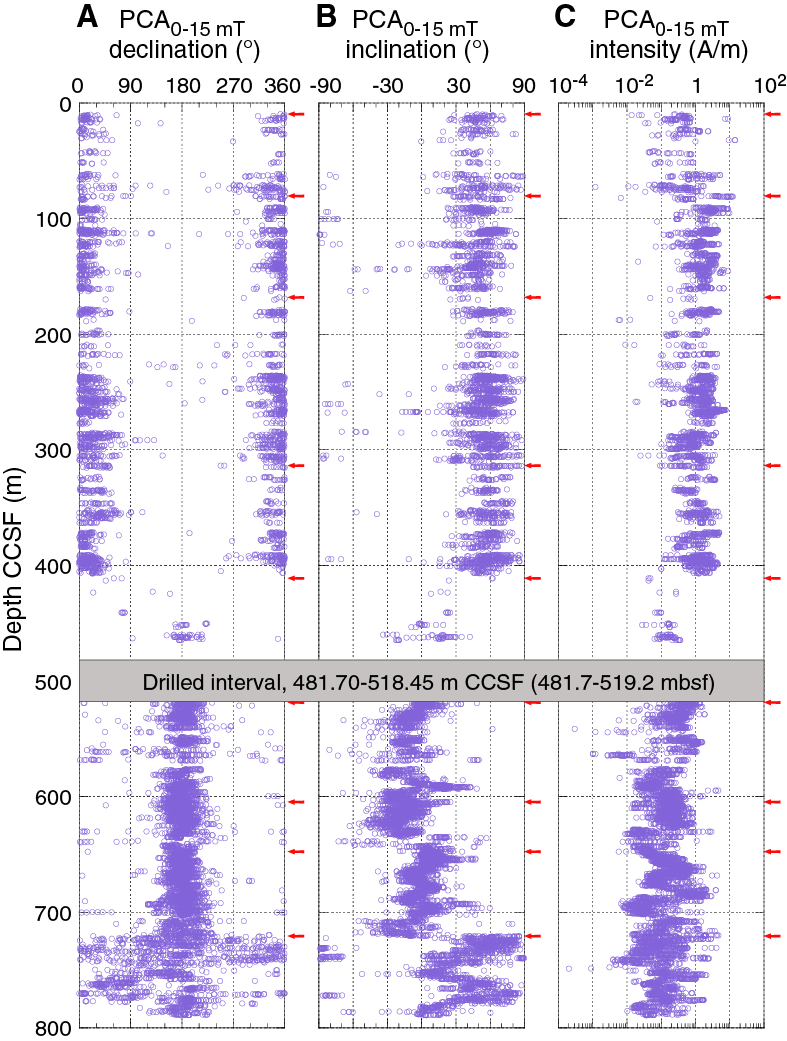
Figure F159. Low-coercivity remanence components in archive section halves, Hole U1473A.
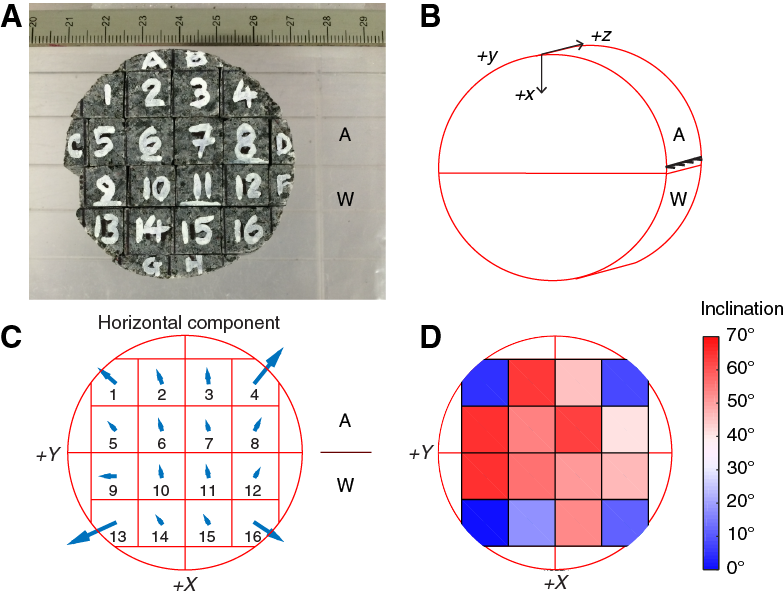
Figure F160. NRM run to investigate change in declination bias.
The majority of NRM inclinations in Hole U1473A are positive (Figure F161), typically with values between 30° and 90° in the upper 480 m CCSF and with a broader spread of inclinations extending to shallow or negative inclinations in some intervals deeper than 518 m CCSF. Following AF demagnetization, PCA of the resulting data, and quality filtering (see Paleomagnetism in the Expedition 360 methods chapter [MacLeod et al., 2017a]), the archive section half data set for Hole U1473A consists of 5497 remanence determinations with well-constrained inclinations (Figure F161). With two exceptions, all PCA inclinations are positive, indicating that the drilled interval at the site carries a reversed magnetization, consistent with interpretation of marine magnetic anomalies (Allerton and Tivey, 2001).
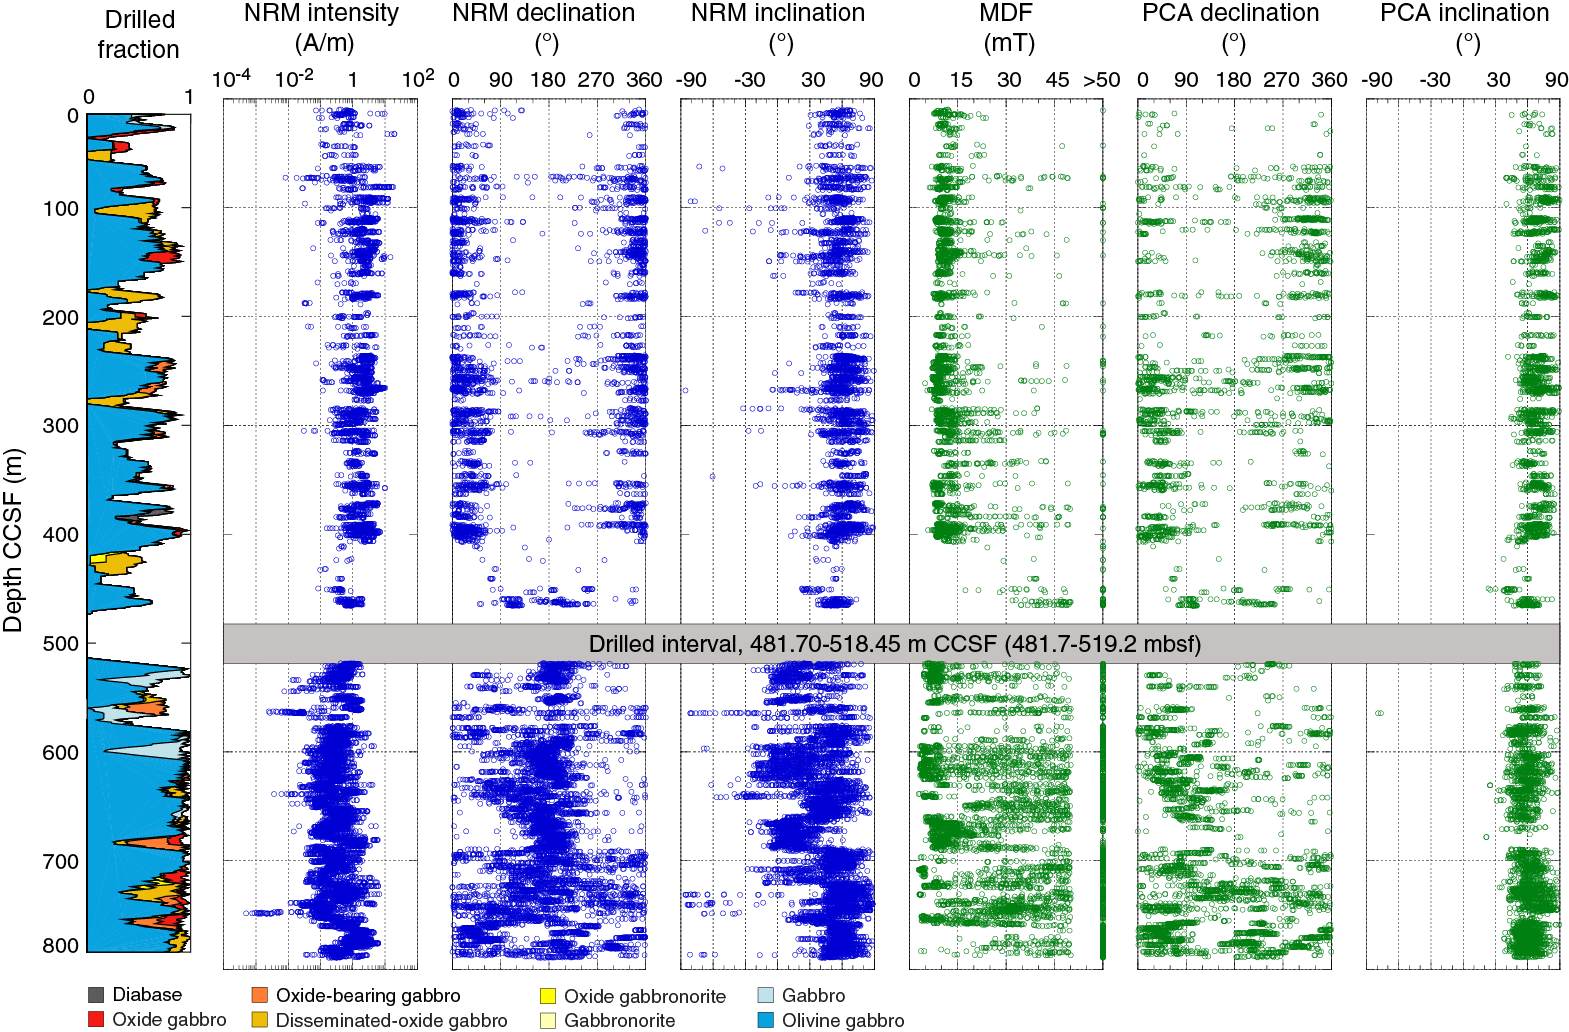
Figure F161. Archive section half magnetic data, Hole U1473A.
Working section half discrete sample data
Cubic samples (8 cm3) were cut from the working section halves for detailed paleomagnetic analyses. For Cores 360-U1473A-2R through 44R, discrete samples were shared with the petrophysics team. For Cores 45R and higher, separate paleomagnetic (PMAG) and physical properties (PP) samples were taken. Anisotropy of magnetic susceptibility (AMS) and NRM were measured on all samples (PMAG and PP). Shared samples and PMAG-only samples were also subjected to either thermal or AF demagnetization (see Paleomagnetism in the Expedition 360 methods chapter [MacLeod et al., 2017a]). For samples shared with the petrophysics team, AMS and NRM measurements, as well AF demagnetization, took place in the paleomagnetic laboratory prior to physical properties analyses. Treatments in the physical properties laboratory included 24 h in a drying oven at 105°C, after which magnetic remanence was measured upon sample return to the paleomagnetic laboratory. Prior to thermal demagnetization, most samples were subjected to a low-temperature demagnetization (LTD) step to minimize any viscous magnetization carried by multidomain magnetite (see Paleomagnetism in the Expedition 360 methods chapter [MacLeod et al., 2017a]). Samples lost up to 60% of their magnetization during the LTD step.
Results of AF demagnetization can be separated into two broad categories. A few samples have extremely low coercivities and are almost entirely demagnetized by 15–20 mT (e.g., Figure F162A). Others show variable proportions of a higher coercivity component that is not removed until 100–200 mT. Samples with contributions from both coercivity fractions typically show two-component directional behavior (e.g., Figure F162C).

Figure F162. AF and thermal demagnetization of discrete samples, Hole U1473A.
The effects of the thermal treatment in the physical properties laboratory must be considered in interpretation of the thermal demagnetization data. A large proportion of the shared samples acquired a significant thermoviscous overprint during the 105°C 24 h treatment. A total of 63% of samples (52 out of 83) had a >50% change in magnetization as measured by the vector difference between the NRM and the post-PP step. This remanence is partially removed by the LTD treatment (Figures F163, F164) but persists until ~580°C. The effect is most clearly seen in six samples that were AF demagnetized before the 105°C treatment. All of these samples acquired a magnetization that was only partially removed by LTD and persisted to at least 580°C (Figure F164). This magnetization represented between 6% and 76% of the samples’ NRM. This is consistent with multidomain behavior, which can have a considerable partial thermal remanent magnetization tail that is not fully unblocked until the Curie temperature is reached (e.g., Xu and Dunlop, 1994).
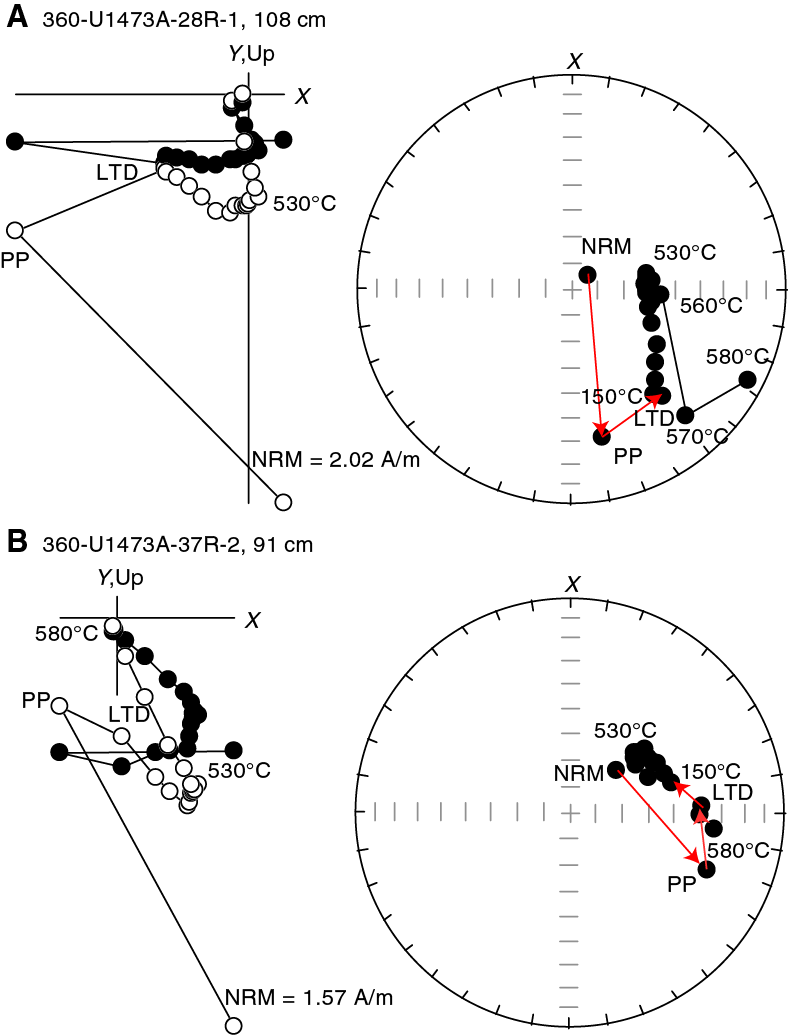
Figure F163. Demagnetization behavior in discrete samples, showing effects of physical properties treatment, Hole U1473A.
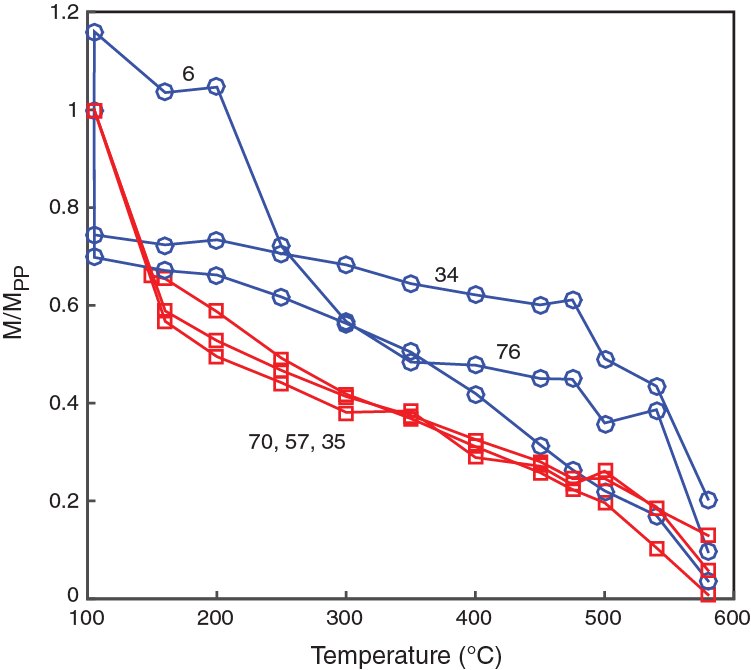
Figure F164. Thermal demagnetization of thermoviscous remanence acquired during heating, Hole U1473A.
In many samples the PP overprint is sufficiently small compared to the NRM or is sufficiently removed by ~530°C so that a stable principal component can still be isolated. Figure F162B and F162D–F162F shows characteristic demagnetization behavior. In most cases a characteristic remanence is isolated at temperatures greater than 500°–530°C. In cases where both AF and thermal demagnetization were carried out on adjacent samples, both the demagnetization behavior and the ChRM direction are in reasonable agreement (Figure F162B–F162C).
Representative unblocking temperature characteristics (excluding PP treatment and LTD steps) of thermally demagnetized discrete samples are illustrated in Figure F165 and are divided into two categories: (i) samples with discrete unblocking at high temperatures, marked by >70% of remanence remaining after demagnetization to 510°C, representing samples with the highest stability; and (ii) samples with more distributed unblocking, with <70% of remanence remaining after demagnetization to 510°C, potentially reflecting a wider distribution of magnetite grain sizes or contributions from titanomagnetite in these samples. In addition, Figure F165 shows unblocking curves for several samples that were not subjected to LTD (green lines) prior to thermal demagnetization. These display more significant unblocking at lower temperatures, reflecting contributions from multidomain magnetite that are removed by LTD in other samples.

Figure F165. Representative unblocking temperature curves for thermally demagnetized discrete samples, Hole U1473A.
In the final interpretation of both thermal and AF data, we require that the principal components have maximum angular deviation ≤ 10° and Dang < 10° (see Paleomagnetism in the Expedition 360 methods chapter [MacLeod et al., 2017a]). Samples that pass these criteria are shown in Figure F166. In general, inclinations derived from AF demagnetized samples or thermally demagnetized samples without LTD treatment are shallower than thermally demagnetized samples with LTD treatment. This suggests that the LTD treatment is effective in removing a shallow overprint, either acquired during drilling or in the physical properties laboratory.

Figure F166. Discrete sample bulk magnetic properties and principal component directions, Hole U1473A.
Inclination data and deformation of the Atlantis Bank footwall section
Quality-filtered archive section half inclination data from Hole U1473A are summarized in Figure F167. Piece-averaged inclination values provide the most robust estimates of the true mean inclination of the sampled section and are consistently steeper than the expected reversed polarity geocentric axial dipole field direction at Site U1473 (52°; red dashed line in Figure F167). This suggests significant footwall rotation at Atlantis Bank. However, significant variations in inclination are observed that are used to define five inclination zones. Mean inclinations of magnetization in each zone have been calculated (using the method of McFadden and Reid [1982]) for archive section half pieces with multiple measurement points after quality filtering (Table T19). These are accompanied by Fisherian statistics (Fisher, 1953) for pieces containing ≥4 measurements. These data indicate a 12° difference in inclination between Zones I and II, corresponding to the top of a major fault zone at ~400 mbsf (probably corresponding to the major fault zone with an upper limit at 411 mbsf; see Structural geology). This suggests that relative tectonic rotation of the footwall section has been accommodated by this structure. Inclinations become steeper again in a narrow zone between 734 and 750 m CCSF, again suggesting partitioning of strain within the footwall.
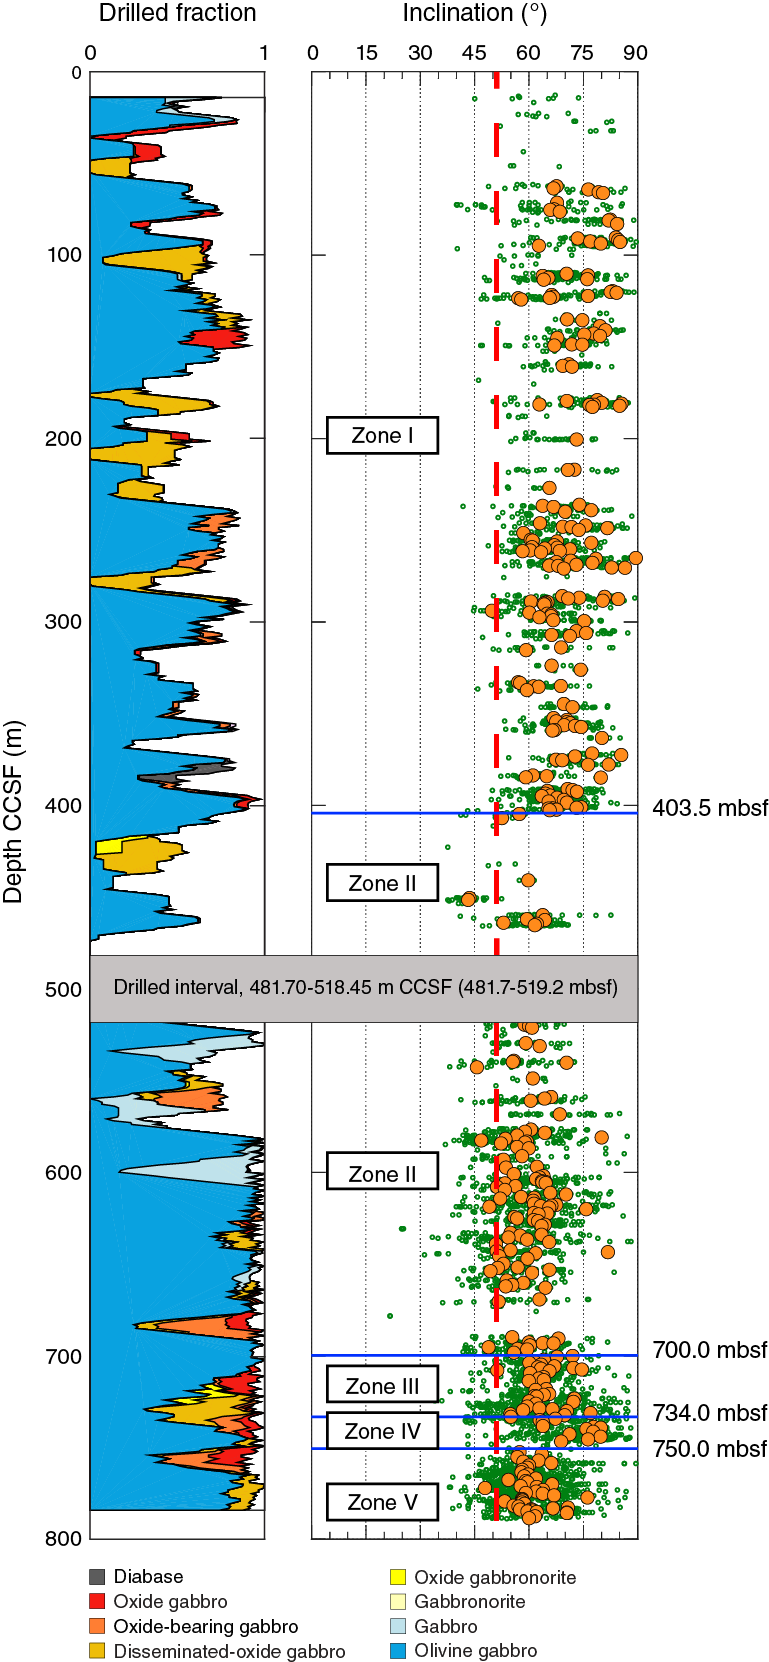
Figure F167. Inclination data from Hole U1473A before and after piece averaging.
Table T19. Inclination-only mean statistics, Holes U1473A, 1105A, and Atlantis Bank. Download table in .csv format.
Evidence for normal polarity magnetizations associated with alteration
Although the majority of Hole U1473A carries a reversed polarity magnetization, thermal demagnetization of discrete samples and AF demagnetization of archive section half pieces reveals characteristic remanences with negative inclinations in some narrow zones of altered greenschist-facies gabbro (around ~564, 678, and 749 m CCSF). Examples of demagnetization data from such samples are shown in Figure F168. The presence of these zones within broader intervals with reversed polarity indicates (near) complete remagnetization of these rocks during a subsequent normal polarity period. The timing of the alteration cannot be uniquely determined from these data, but the presence of these components in the lower part of the hole suggests that the reversal boundary between reversed geomagnetic polarity Chron C5r.3r and normal polarity Chron C5r.2n may occur in close proximity to the current bottom of Hole U1473A. Further sampling of these altered intervals for postcruise study will allow the nature of this remagnetization to be characterized.
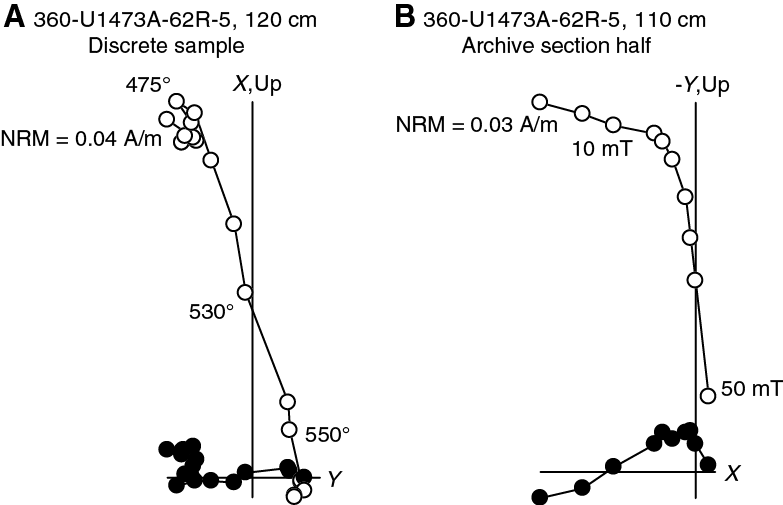
Figure F168. Samples with characteristic normal polarity components, Hole U1473A.
Magnetic susceptibility, NRM intensity, and Königsberger ratio
In mafic igneous rocks, low-field magnetic susceptibility (k) is principally controlled by the volume concentration of (titano)magnetite. NRM intensity variability is also controlled by variations in magnetite content, but may also be influenced by variability in the magnitude of DIRMs. The relation of NRM intensity and susceptibility is expressed by the Königsberger ratio (Q), which is defined as the ratio of remanent to induced magnetization in a rock (where induced magnetization equals the product of k [SI] and the geomagnetic field strength in A/m). Values of Q > 1 indicate that remanence dominates the magnetization of a rock unit.
Figure F169 shows a log-log plot of NRM intensity against k for archive section half and discrete samples from Hole U1473A together with lines of equal Q calculated for a field of 31.8 A/m (equal to the International Geomagnetic Reference Field intensity at Site U1473). Virtually all samples plot between Q = 1 and Q = 100, with a strong cluster around Q = 10. These data suggest that gabbroic lithologies sampled in Hole U1473A are capable of producing observed marine magnetic anomalies over Atlantis Bank. However, caution is required in the interpretation of Q ratios calculated for these samples, as NRM intensities (particularly in the archive section halves) may be artificially modified by drilling-induced magnetization.
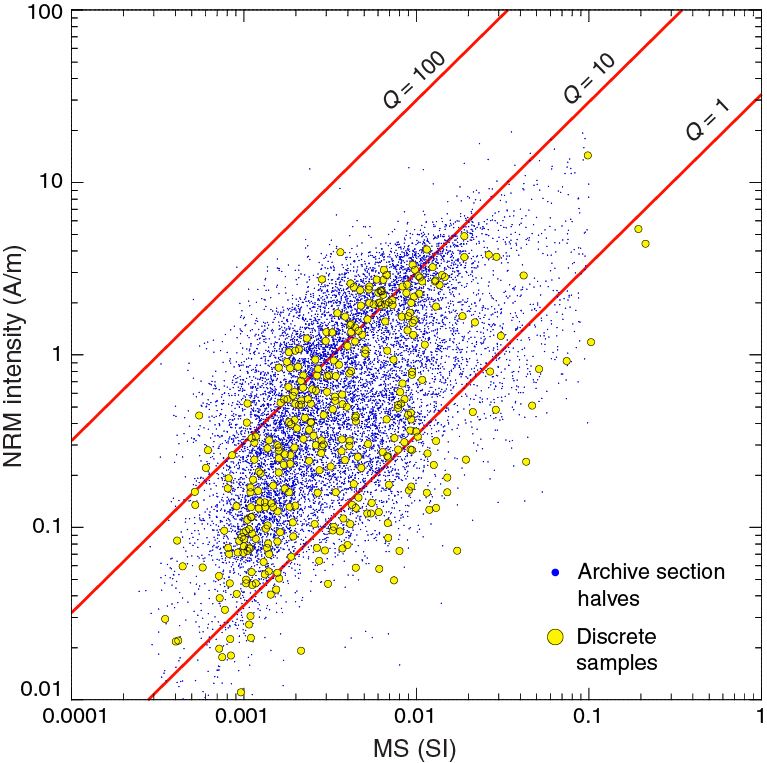
Figure F169. Log-log plot of NRM vs. magnetic susceptibility, Hole U1473A.
Anisotropy of magnetic susceptibility
Discrete samples measured for AMS have weak to moderate anisotropy with corrected anisotropy (P′) (Jelinek, 1981), ranging between 1.01 and 1.56. All samples (except two) show statistically triaxial fabrics (Hext, 1963) but the majority have a stronger foliation than lineation (Figure F170), as measured by the shape factor (T) (Jelinek, 1981). There is a slight trend toward more foliated fabrics with increasing degree of anisotropy (Figure F170) and with depth in the upper part of the hole to 480 m CCSF (Figure F171A).
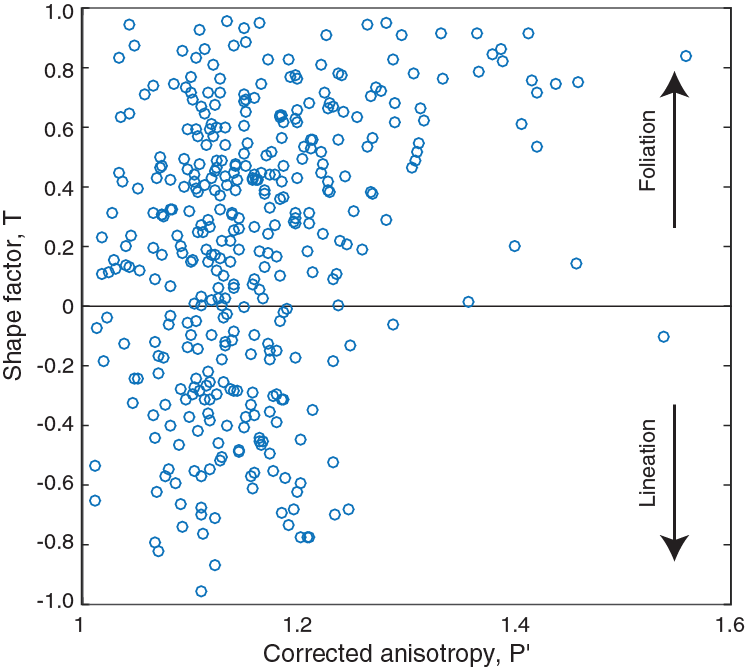
Figure F170. Shape factor vs. corrected anisotropy degree for AMS, Hole U1473A.
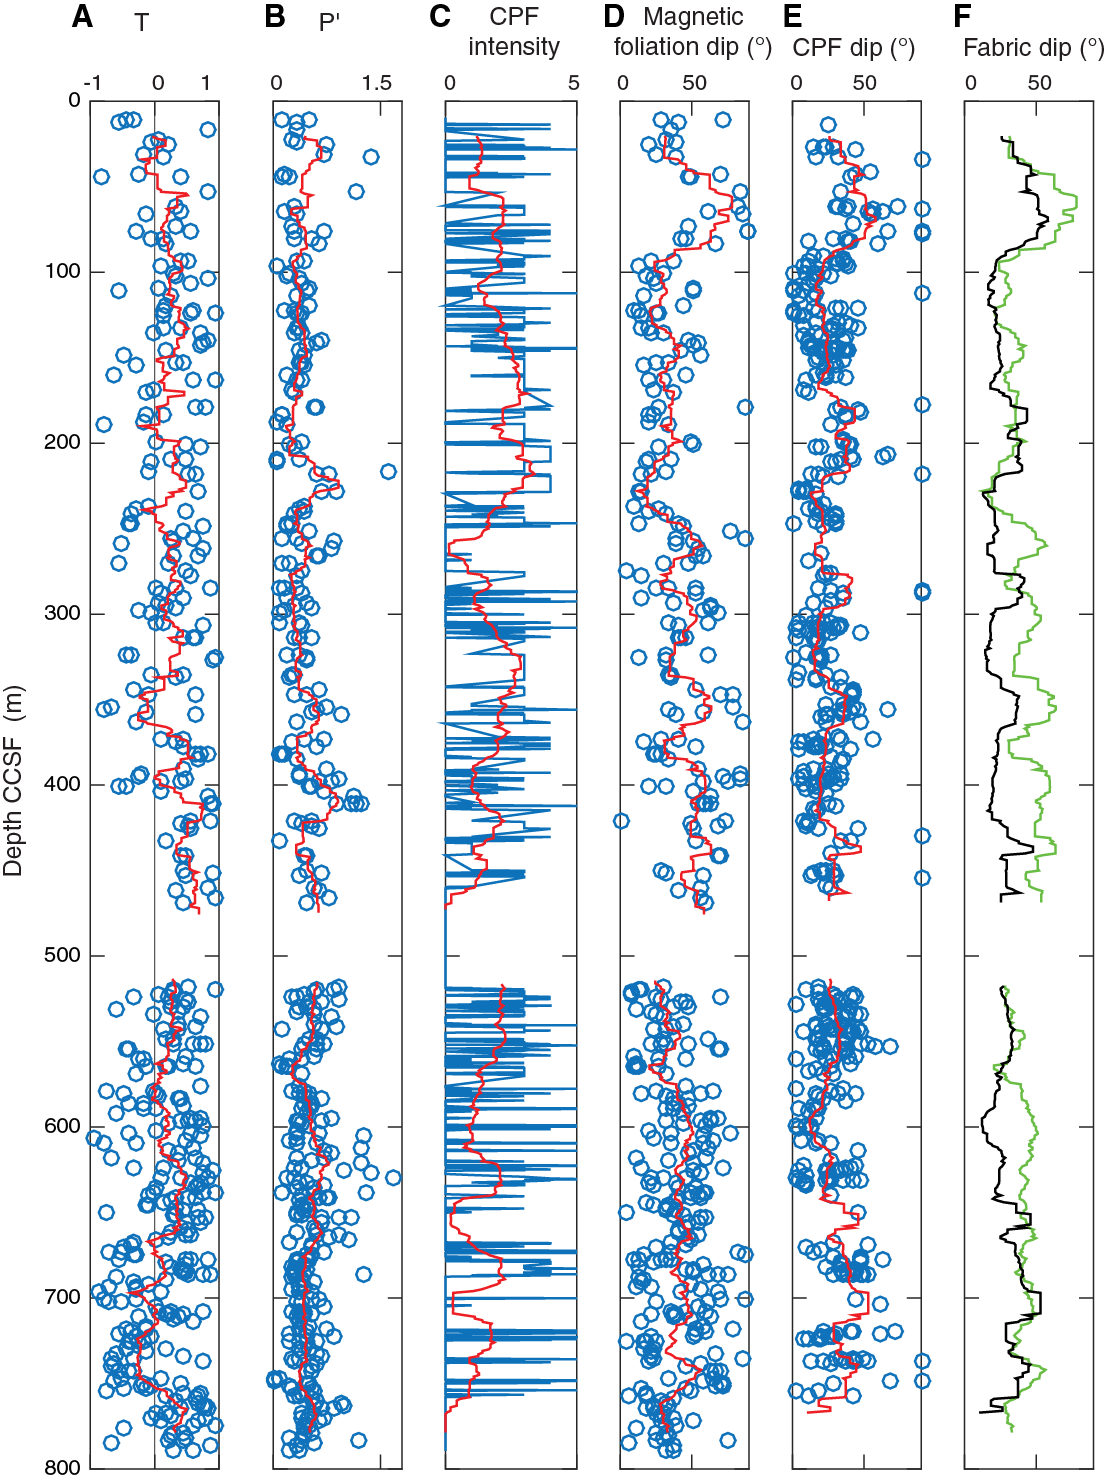
Figure F171. Comparison of magnetic fabrics and CPFs, Hole U1473A.
The average pole to foliation (kmin) is subvertical (Figure F172), but there are considerable downhole variations. Whereas there is little to no correlation between downhole magnetic fabric intensity and CPF intensity (Figure F171B–F171C), there is a reasonable correlation between the magnetic fabric and CPF dips (Figure F171D–F171F). The correlation is strong in the upper ~225 m and lower ~100 m of the hole (650–780 m CCSF) but is weaker and with steeper magnetic fabric dips between 225 and ~650 m CCSF.
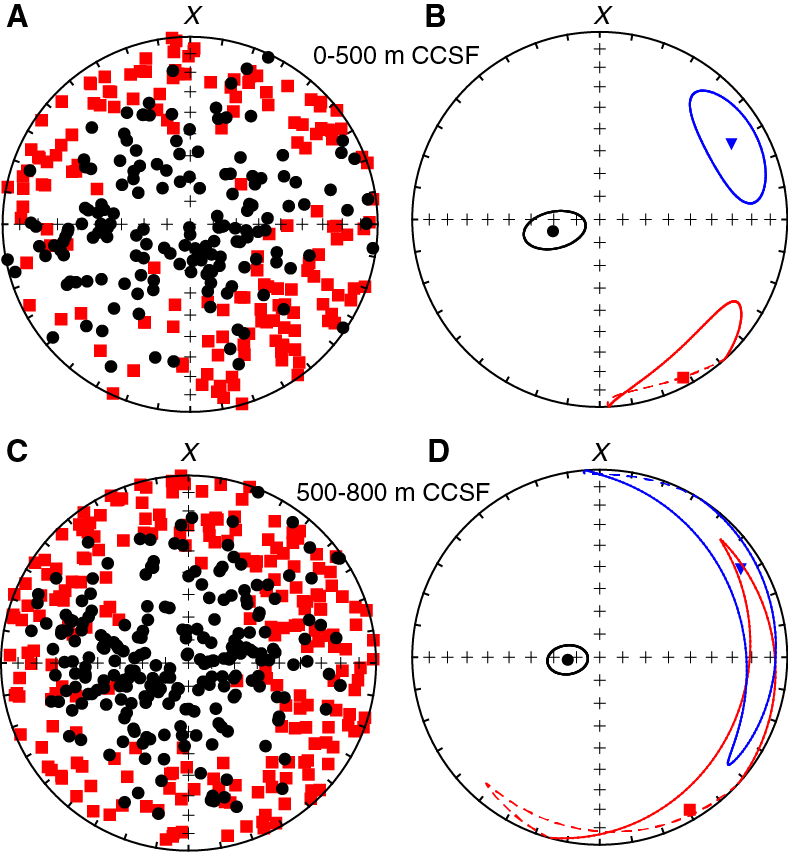
Figure F172. AMS results in core coordinates, Hole U1473A.
For subvertical kmin and randomly oriented cores, one would expect kmax to have no preferential orientation. However, we see instead a preferential grouping of the kmax directions toward the southeast in core coordinates in the upper part of the hole (shallower than 480 m CCSF; Figure F172A–F172B). This grouping likely arises from the fact that the cores are cut down the dip of the observed macroscopic foliation (i.e., with a dip direction of 090° in core coordinates). Clustering of kmax away from 090° (+Y in core coordinates) therefore suggests that the magnetic lineation is not predominantly aligned down the dip of the macroscopic fabric. This clustering is no longer statistically significant in the lower part of the hole (>500 m CCSF; Figure F172C–F172D).
Petrophysics
The physical properties of gabbroic rocks recovered in Hole U1473A were characterized through a series of measurements on whole-round sections, section halves, section half pieces, and discrete samples (see Petrophysics in the Expedition 360 methods chapter [MacLeod et al., 2017a]). We measured natural gamma ray attenuation (GRA) density and magnetic susceptibility with the Whole-Round Multisensor Logger (WRMSL), natural gamma ray radiation (NGR) with the Natural Gamma Radiation Logger (NGRL), point magnetic susceptibility (MSP) and reflectance spectroscopy and colorimetry with the Section Half Multisensor Logger (SHMSL), thermal conductivity on section half pieces, and compressional wave velocity, density, and porosity on discrete samples. The rock names reported in data tables correspond to the primary lithologies assigned by the igneous petrology team (Tables T20, T21, T22). Data are summarized as a function of depth in Figure F173.
Table T20. Discrete physical properties measurements, Hole U1473A. Download table in .csv format.
Table T21. Velocity, density, and porosity measurements, Hole U1473A. Download table in .csv format.
Table T22. Thermal conductivity measurements, Hole U1473A. Download table in .csv format.
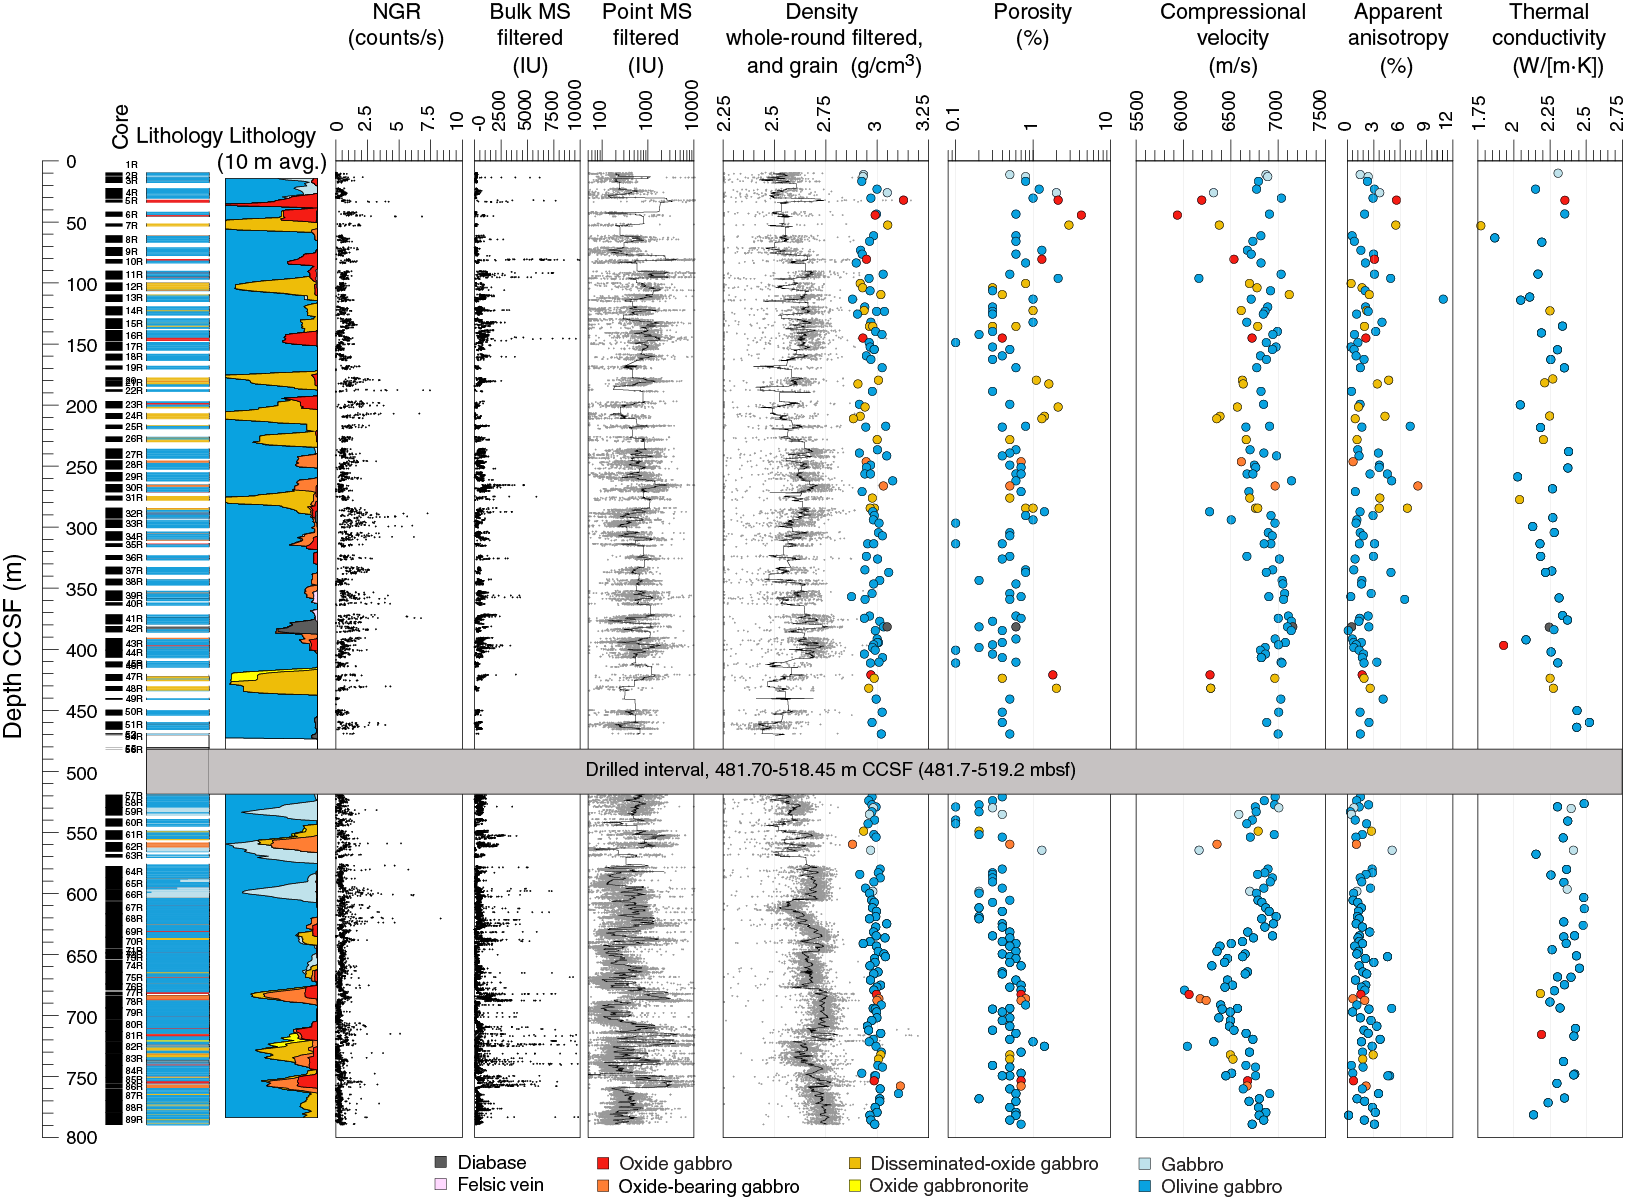
Figure F173. Petrophysics measurements, Hole U1473A cores.
The formation properties were measured during a series of downhole logging runs. Wall rock density, gamma radiation, resistivity, and magnetic susceptibility were measured during the first run. Seismic velocity and FMS imagery data were collected during the second run. The final run obtained UBI acoustic imagery data.
Relationships between the measured core, discrete samples and formation physical properties, and the shipboard petrological, alteration, and structure descriptions were preliminarily assessed to arrive at petrophysical results reported here.
Whole-round and section half measurements
Natural gamma radiation
A total of 404 core sections from Hole U1473A were measured with the NGRL. NGR is generally low (<1 count/s on average), except in a few cores where narrow intervals that contain felsic material return significantly higher counts (up to ~8 counts/s) (Figures F173, F174).
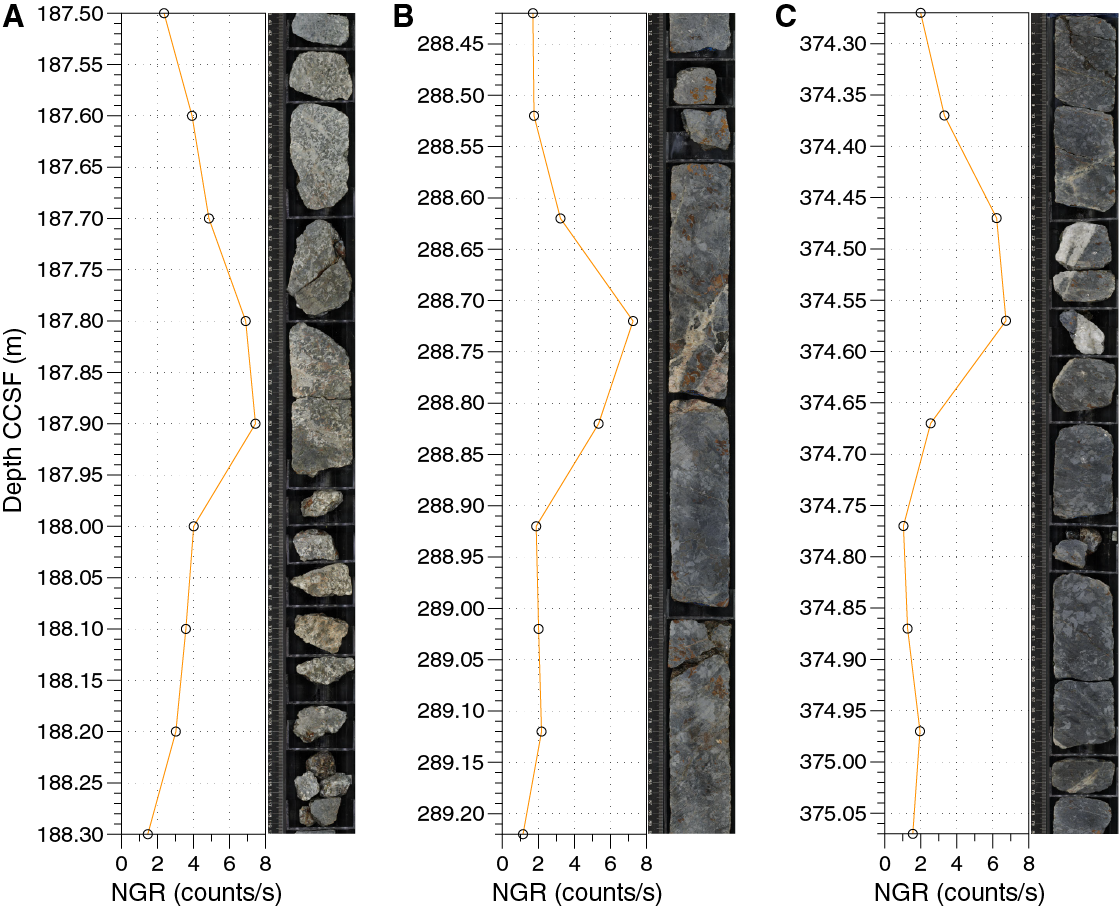
Figure F174. Higher NGR values correspond to felsic intervals, Hole U1473A.
Gamma ray attenuation density
All core sections but one (Section 360-U1473A-64R-1, which only contains three small pieces) from Hole U1473A were measured with the WRMSL. Raw GRA data were filtered following the procedure described in Petrophysics in the Expedition 360 methods chapter (MacLeod et al., 2017a). Raw data are available in the Laboratory Information Management System (LIMS) database; filtered data are provided in PETROPHYS in Supplementary material. GRA density measurements are core diameter (thickness) dependent, and filtered data range between 2.1 and 3.2 g/cm3 with an average of 2.65 g/cm3 (~2% of the values are <2.3 g/cm3 and are not shown in Figure F173). GRA density values, calibrated under the assumption of a 6.6 cm core diameter, are generally significantly lower than the bulk density measured on discrete samples in the same cores.
Magnetic susceptibility
Magnetic susceptibility was measured on whole-round sections with the MS2C pass-through coil on the WRMSL and on archive section halves using the MS2E probe on the SHMSL (407 core sections). Raw data were filtered following the procedure described in Petrophysics in the Expedition 360 methods chapter (MacLeod et al., 2017a). Nine intervals with magnetic susceptibility values >10,000 IU that were wrapped around and recorded as low values by the pass-through magnetic susceptibility logger were manually corrected (intervals 360-U1473A-5R-1, 24 cm; 10R-1, 58–84 cm; 66R-1, 120 cm; 75R-4, 110–112 cm; 81R-3, 49–113 cm; 81R-6, 67 cm; 82R-2, 108–122 cm; 83R-8, 108–116 cm; and 83R-9, 60–64 cm). Filtered data are available in PETROPHYS in Supplementary material. When measured on whole-round sections, magnetic susceptibility is less often underestimated for Hole U1473A cores than inferred in previous hard rock expeditions; whole-round instrumental values track section half MSP values rather well (Figure F175). Magnetic susceptibility averages ~570 IU for whole-round filtered data and ~650 IU for MSP filtered data. The magnetic susceptibilities of rocks recovered in Hole U1473A were compared with those from Holes 735B and 1105A (Figure F176). The upper part of Hole U1473A shows significantly lower magnetic susceptibility than Hole 1105A at the same depth below seafloor.

Figure F175. Magnetic susceptibility from the upper part of Hole U1473A.
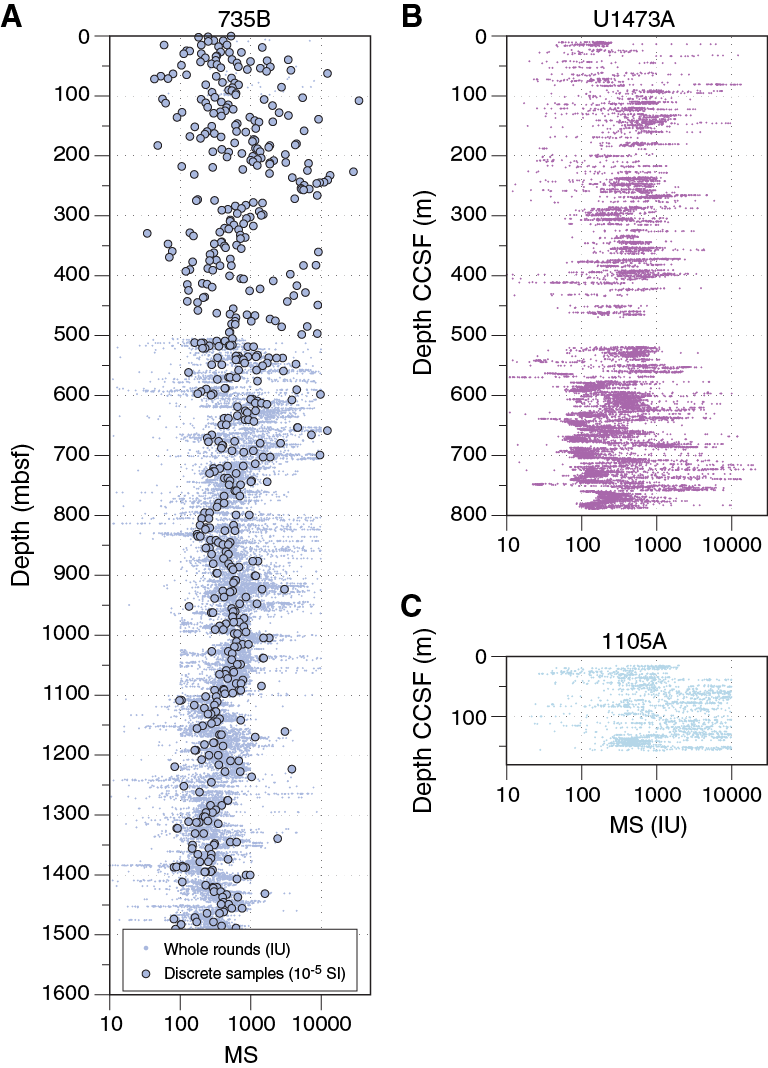
Figure F176. Comparison of magnetic susceptibility from Holes 735B, 1105A, and U1473A, Atlantis Bank.
Discrete sample measurements
Density and porosity
Bulk density, grain density, and porosity were calculated from measurements on 186 cubic samples (2 cm × 2 cm × 2 cm) taken from the working section halves (Tables T20, T21; Figure F173). These samples comprise several rock types; olivine gabbro (including orthopyroxene-bearing olivine gabbro and oxide-bearing olivine gabbro) is the predominant lithology. Oxide gabbro (and oxide olivine gabbro), gabbro (including oxide-bearing and disseminated-oxide gabbro), and diabase are represented in the sampled lithologies. Bulk density and grain density average 2.97 and 2.98 g/cm3, respectively (Table T20). These values are similar to densities measured previously on igneous crustal rocks from slow-spread crust (Sites 735 and U1309; Figure F177). Porosity is generally very low, ranging from 0.1% to 4.2% with an average of 0.6% (Figure F173), reflecting the low degree of brittle deformation in the cube samples; 85% of the samples have porosities lower than 1%.
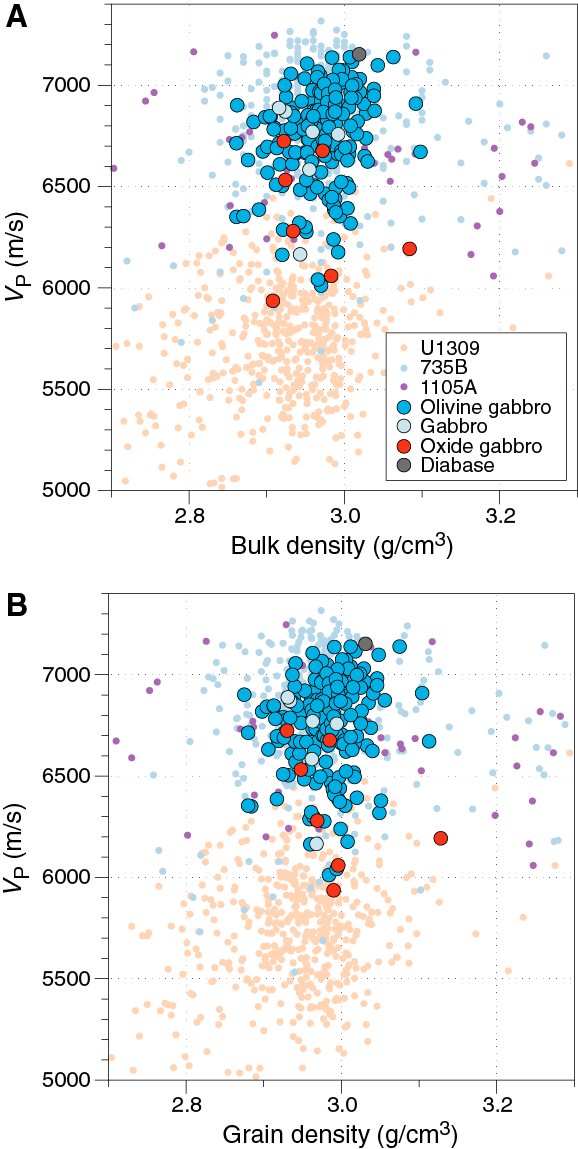
Figure F177. Compressional velocity vs. bulk and grain density in Hole U1473A, compared with Hole 735B and Site U1309.
Four specimens from microbiological sample locations in two core sections were measured to determine their porosity (Table T21). These felsic vein specimens have porosity ranging from 3.0% to 6.4%.
P-wave velocity
P-wave velocity was measured on 184 cube samples along the three principal directions x, y, and z in the CRF (see Figure F3 in the Expedition 360 methods chapter [MacLeod et al., 2017a]). Results are listed in Tables T20 and T21 and plotted in Figures F173, F177, and F178. Average VP is 6.7 km/s, and the apparent anisotropy varies from 0% to 11%. As detailed in Petrophysics in the Expedition 360 methods chapter (MacLeod et al., 2017a), the precision of our VP measurements is on the order of 1%. Hence, the lowest measured apparent anisotropies should be treated with caution.
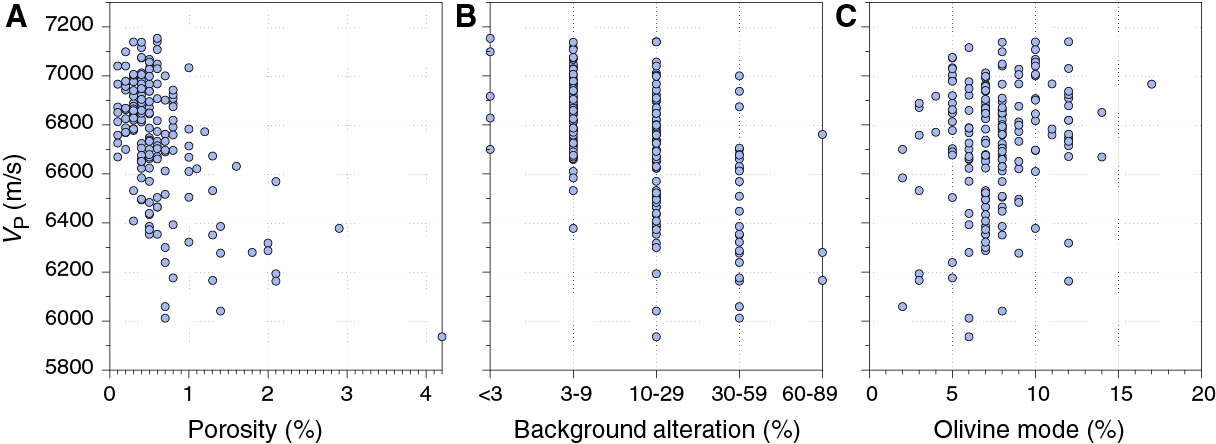
Figure F178. Compressional velocity vs.t porosity, background alteration, and olivine mode, Hole U1473A.
Results for all samples from Site U1473 are plotted in Figure F177 together with VP and density measurements made during ODP Legs 176 and 179 and Integrated Ocean Drilling Program Expeditions 304 and 305 on gabbroic and troctolitic samples from slow-spread oceanic crust at Atlantis Bank and Atlantis Massif, respectively. VP values from Hole U1473A are consistent with previous measurements done on gabbroic rocks at Atlantis Bank, although Hole U1473A data are less scattered than those from Holes 735B and 1105A. VP measurements done on board over time vary notably for these hard rock investigations, which may not be solely explained by petrophysical variations. There is a ~1 to 1.5 km/s difference in velocity between Hole 735B data and Site U1309 data, although they have similar composition, porosity, and alteration. It is possible that changes in the shipboard acquisition system contribute to this difference, but sonic log data (see Downhole logging) indicate that VP does differ downhole between Atlantis Bank and Atlantis Massif, with the latter having lower velocities in general.
Although the range of measured porosity values is small, the measured velocities at room pressure show a general inverse correlation with porosity (Figure F178A). Downhole (negative) correlation between velocity and porosity occurs in several intervals (Figure F173). Two of these intervals are in the upper 100 m of the hole. Three others occur over distinct ~20–30 m long intervals between 380 and 640 m CCSF. A broad correlation between sample VP and background alteration (Figure F178B) or olivine mode estimated by the metamorphic and igneous petrology teams (Figure F178C) also exists.
Magnitude or orientation of VP anisotropy and the intensity or dip of crystal-plastic foliations have no simple relationship (Figures F179, F180). VP anisotropy in most samples is relatively small (average = 2.97%). Compressional velocity is on average lowest along the vertical direction (z) in the CRF (Table T21). Only three samples have VP along z more than 200 m/s slower than the average VP (Figure F180C); all three samples are from intervals where the foliation dip measured by the structural geology team is relatively shallow (<20°). The absence of a clear relationship between VP anisotropy and the crystal-plastic structure of the samples may be partly explained by the primary control of porosity on VP (Figure F178A). Also, anisotropy is expected to be variable in gabbroic rocks because the fast VP direction for a foliated plagioclase aggregate is perpendicular to the foliation (e.g., Satsukawa et al., 2013), orthogonal to that expected for a foliated olivine and/or clinopyroxene-rich rock. Hence, the orientation and magnitude of anisotropy depends not only on the fabric strength and orientation but also on the proportions of plagioclase and olivine/clinopyroxene in the rock.
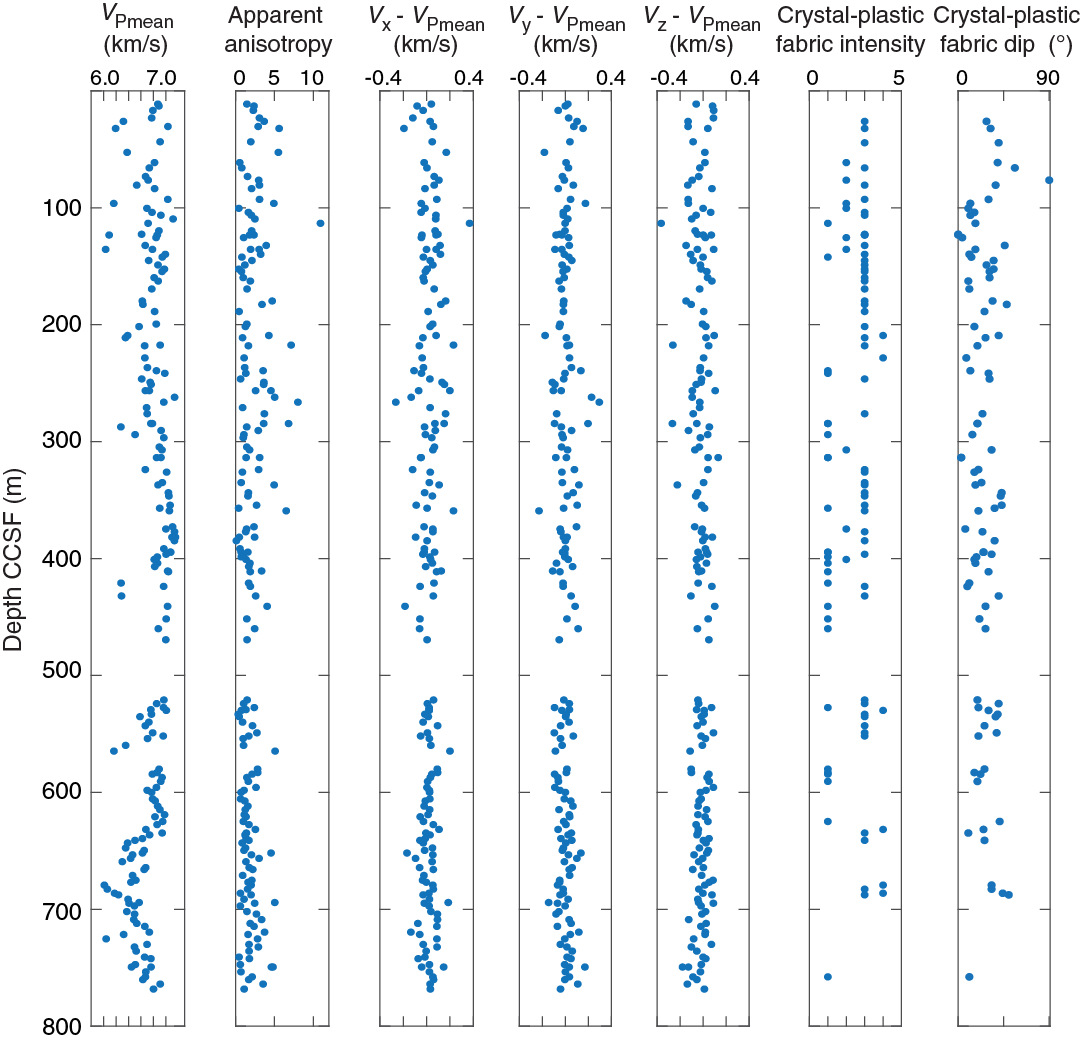
Figure F179. Variation in VP anisotropy, Hole U1473A.
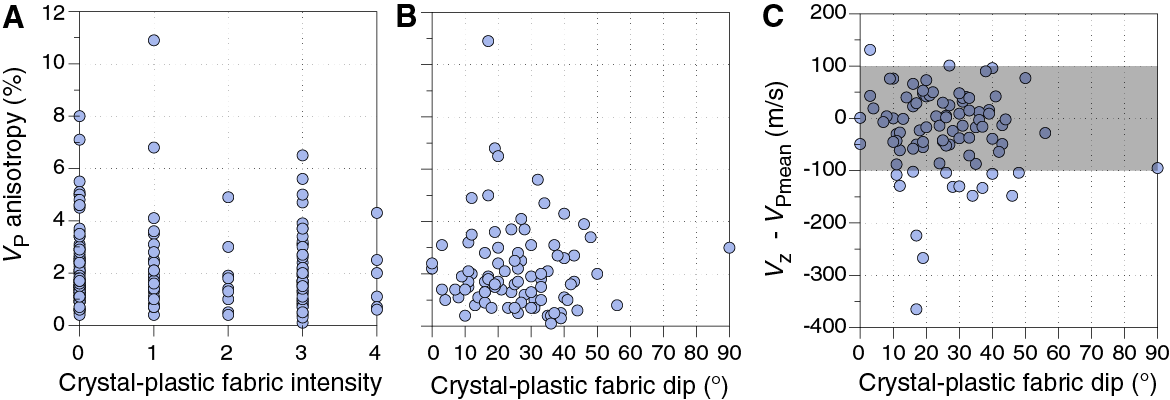
Figure F180. VP apparent anisotropy as a function of CPF intensity and dip, Hole U1473A.
Thermal conductivity
Thermal conductivity was measured in 86 gabbroic section half pieces (≥8 cm long and representative of the various recovered lithologies) taken at irregularly spaced intervals along Hole U1473A (Tables T20, T22; Figure F173). Measured values range from 1.77 to 2.52 W/(m·K) and average 2.28 W/(m·K). The standard deviation of the measurements is <2% (average = 0.44%). These values are in general agreement with thermal conductivities measured in similar lithologies during previous ODP legs and Integrated Ocean Drilling Program expeditions (Figure F181). Values are slightly higher in the deepest section of the core (average = 2.35 W/[m·K]), below the major fault zone at ~411–462 m CCSF, than in the upper part of the hole (average = 2.21 W/[m·K]). This may partly reflect the general change in background alteration at the bottom of the hole, in particular deeper than 560 m CCSF, where olivine is less altered and secondary clays are absent.

Figure F181. Thermal conductivity measurements in selected gabbroic cores.
Downhole logging
Operations
Prior to logging, freshwater was pumped with the drill string at the bottom of Hole U1473A. A second freshwater pump was done after tripping up to 205 m DSF, to fill in the volume no longer displaced by pipe. The triple combo run (Run 1), including an ~100 m repeat pass at the bottom of Hole U1473A, was followed by a two-pass FMS-sonic run (Run 2), then a UBI run (Run 3). A short repeat run with the FMS-sonic was also conducted near the bottom of the hole but not for the UBI.
Local weather was calm throughout downhole logging. A modest swell at the start of logging increased somewhat to include occasional heave maxima of 3 m by the middle of the logging period and then tapered off by the end of logging to 1–2 m. No significant operational delays or issues occurred, although a few minor hiccups did. During the triple combo main pass, the power dropped out when the string was ~1075 m wireline depth below rig floor (WRF). This was apparently due to a rack power supply problem of unclear cause. Restart was straightforward, took about 10 min, and the system operated normally from then on. The triple combo string was lowered to ~1105 m WRF, and a short interval of overlapping data were collected to allow a clean splice for the main pass. Twice during the subsequent runs the onboard logging rack power unit sounded a brief alarm, but it did not stop. During Run 2 (FMS-sonic), the heave compensator was consistently below the center position on the downlog. When the tool reached bottom, it was pulled up a few meters and the compensator system was rebooted after mechanical reset to the center position. This took ~15 min; the problem did not recur. During Run 3 (UBI), the tool string had trouble passing a ledge at 1288 m WSF. Repeated lifting up of several meters and trying to pass down worked after about 10 min. On the uplog part of the run, the tool passed through this section without stopping, but a brief period of higher tension occurred and the UBI motor stopped at 1305 m WRF. The motor restarted fine and we experienced no further problem while running up the formation. Just after the tool entered the pipe, the motor stopped once more. Again, restart was quick and straightforward. A brief period of data collection (with reset parameters tuned for pipe diameter) inside the pipe was successful, clearly imaging a pipe connection.
The drill pipe was set at 40–50 m DSF for all runs. For both the FMS-sonic and UBI runs, the pipe was pulled up at the end of the run to collect an additional 15 m of logs in the shallowest section (to ~30 m DSF).
Total logging time during Expedition 360 was about 30 h. The number of runs conducted was one less than laid out in the Scientific Prospectus. Early during the expedition, the priority of the check shot (Versatile Seismic Imager) run was discussed, relative to both the other logs and to coring, with a consensus that these data could be high priority if intervals with significantly variable properties (lithology and/or alteration) were encountered in the core, particularly troctolitic lenses that might signal the beginning of a transition from crust to mantle. However, this criterion was not met. Obtaining a general measure of compressional velocity in the upper several hundred meters of gabbroic rock exposed in an oceanic core complex has been previously accomplished, including in this area. Other work had higher priority at this stage of the expedition.
An overview of borehole geophysical measurements throughout the hole is shown in Figure F182. Caliper data are consistent between runs, showing several ragged overbore intervals. There is a complete lack of useful data from a ~5 m interval (dubbed “Cone Cavern”) at 272–277 m WSF. A very ragged zone with average hole diameter of 15 inches occurs in the interval 420–450 m WSF. A more variable zone, where hole diameter reaches 14–15 inches for several 1 m scale intervals occurs between 308 and 348 m WSF. The shallowest uneven interval has smaller excursions, but borehole diameter averages 12–13 inches for much of the 160–210 m WSF interval. The latter section is near the limit of data quality for several tools deployed; the larger, more ragged intervals are beyond tool specifications, although some imagery data may be useful in parts of the zones. Deeper than 570 m WSF, the borehole has a much more regular and clean shape, in the interval where core recovery was always close to 100%. The following sections describe the log data, and then Initial core-log integration combines both the log and core data to draw some initial inferences about petrophysical characteristics of the site.
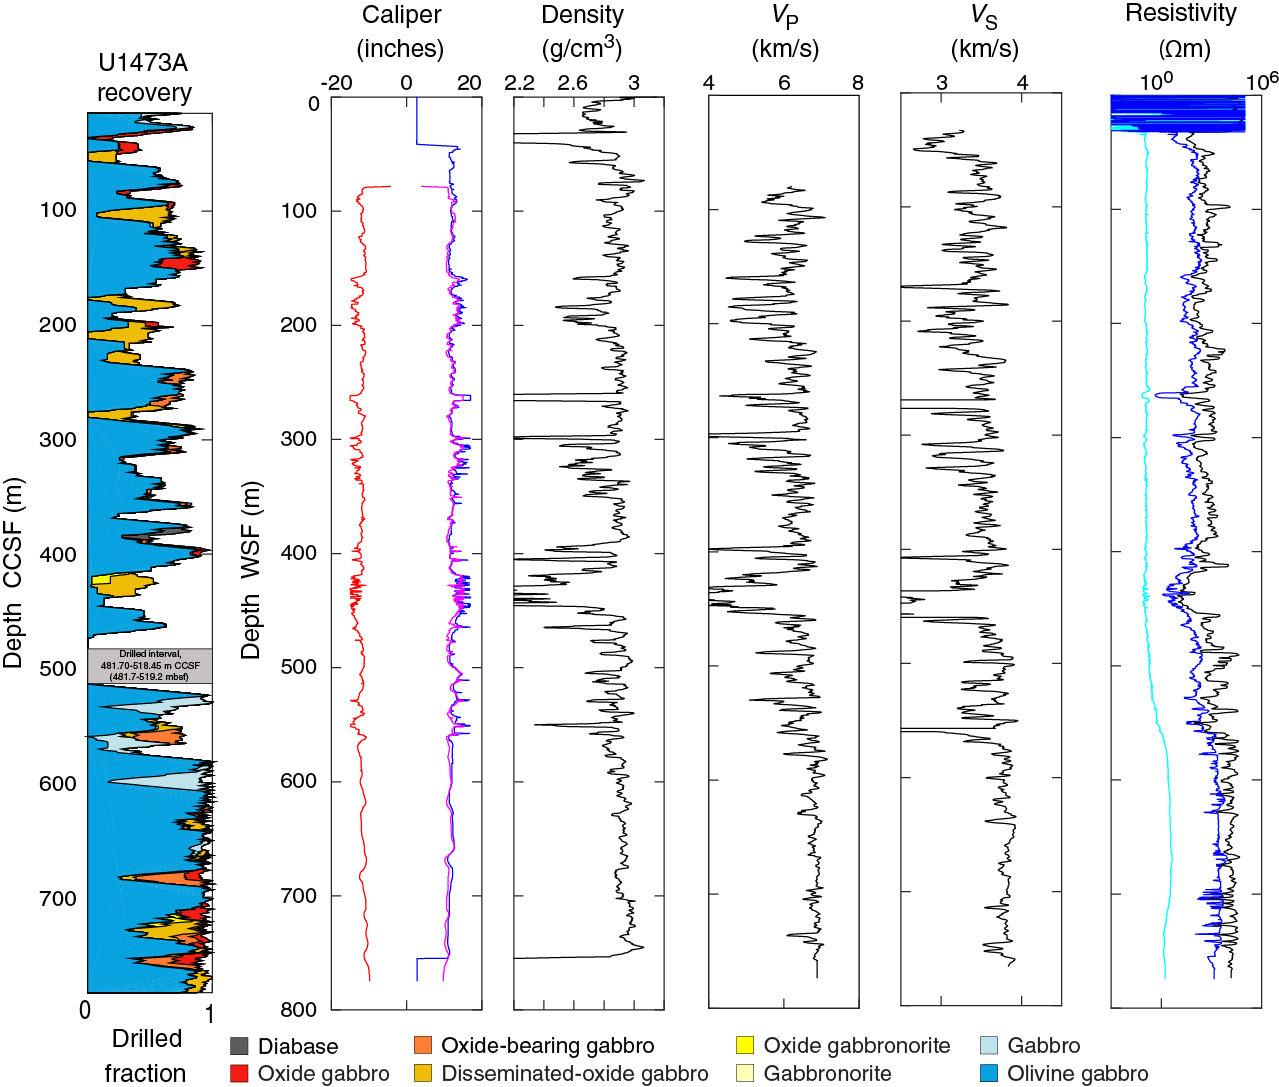
Figure F182. Downhole logs of unprocessed data, Hole U1473A.
Temperature
The temperature sensor in the cablehead (Enhanced Digital Telemetry Cartridge [EDTC]) obtained repeat logs of the borehole fluid for each logging pass. The surface seawater temperature is within 1° of 22°C; both the flushing during drilling and the freshwater pumping prior to logging introduced fluid of this temperature into the hole. During the logging run, the temperature of the borehole fluid, as recorded in the raw data from the cablehead sensor (MTEM), progressively decreased (Figure F183). This cooling was consistently just over 1°C in the upper 430 m. Deeper, the amount of cooling with time decreases steadily with depth to the bottom of the hole, where <0.2°C of cooling was recorded.
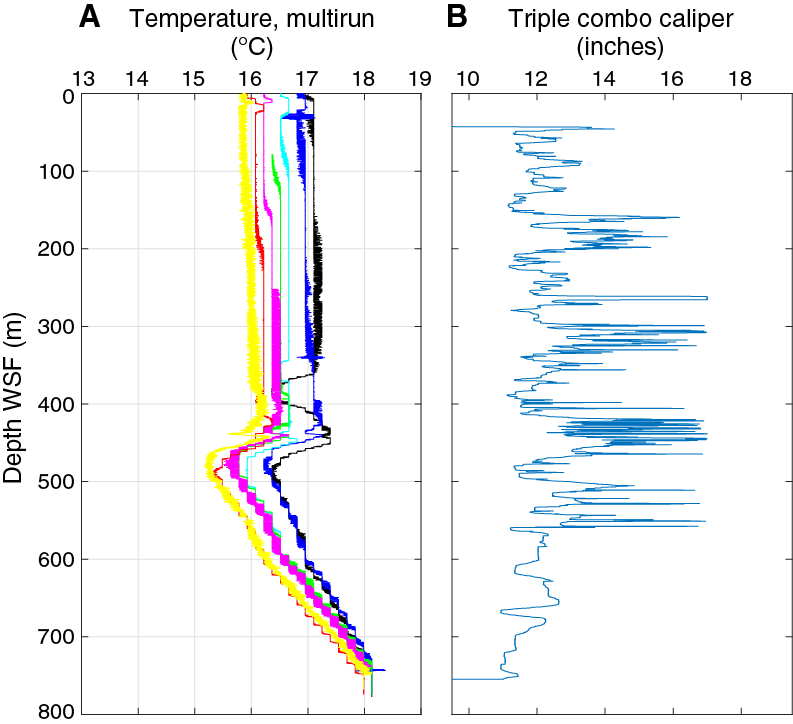
Figure F183. Borehole fluid temperature at end of Expedition 360.
The most prominent signal in the temperature logs is the clear and repeated deviation of −1°C, sharply over the 440–470 m WSF interval, and then a steady increase to the bottom of the hole, where the 18°C temperature is 0.6° higher than at the top of the hole. A smaller deviation (0.2°–0.3°C) persists just above it. The constancy of fluid temperature above these deviations indicates that mixing is efficient in this zone from 430 m WSF to the seafloor. Deeper, the effect of the cool deviation does not notably deepen over the ~24 h period of our observations. During the first downlog, a shallower negative deviation (0.8°C) was measured at ~360–430 m WSF. This did not persist, although narrower deviations with smaller amplitude were consistently measured just above this location.
Given the location of the deviations within a documented fault zone (see Initial core-log integration) and having noted apparent outflow from the reentry cone during camera runs after bit changes in the later part of the expedition, we infer that cooler fluid is flowing into the hole from the fractured zone. Further work is required to estimate and correct for temperature impacts of the drilling, pumping, and logging, but the magnitude of the deviation is large compared to previously documented deviations in other ODP, Integrated Ocean Drilling Program, and IODP hard rock holes where variations of a fraction of a degree were measured near a fault (e.g., von Herzen and Scott, 1991; Blackman et al., 2014).
Formation radiation
NGR is generally very low, with peak amplitudes of 2–4 American Petroleum Institute gamma radiation units (gAPI). The peaks correlate well with those in the gamma radiation measured on the cores (Figure F184). Although the amplitude of the peaks is low, they are distinctive in the largely unradiative formation. Thorium is the radiation source best correlated with the total NGR record and uranium is the least correlated, although uranium peaks are often associated with the veins that give rise to these signals. Unlike the NGRL data from cores, the amplitude of the peaks in the wireline log data is highest deeper than ~680 m WSF.

Figure F184. NGR, Hole U1473A.
Formation density and seismic velocity
The raw borehole density and compressional velocity data do not vary greatly downhole when screened to eliminate the out-of-bore sections (Figure F182). Density is generally 2.9 g/cm3 shallower than 700 m WSF; deeper, it increases rapidly to ~3.0 g/cm3 and stays at that value for the remaining ~50 m of the hole that could be logged. Small-scale variability warrants additional assessment in conjunction with core data. In the clean portion of the borehole, these should be reliable measures of small-scale variation.
The raw compressional velocity averages ~6.9 km/s deeper than 600 m WSF and is more variable in the upper part of the section. An average value of ~6.4 km/s characterizes the 220–580 m WSF section away from the ragged, out-of-bore intervals. It would be reasonable for velocity to be reduced in the porous fractured zones but data in a majority of these intervals should not be interpreted quantitatively unless advanced processing can confirm sufficient coherence in seismic returns.
During acquisition, the shear (VS) and Stoneley wave data appeared to be of good quality in the clean portions of the hole, and it appeared that some useful data would be available in portions of some of the ragged sections. The downhole variation in VS tracks that of VP in general (Figure F182), but differences do occur in intervals up to several tens of meters thick. Based on the logged density and VP data, this section would not be expected to be highly reflective, as impedance contrasts downhole are modest.
Formation magnetic susceptibility
Several narrow anomalies in the magnetic susceptibility of the wall rock were recorded with the Magnetic Susceptibility Sonde (MSS) tool (Figure F185). A majority of these anomalies correspond to peaks in core magnetic susceptibility; the double peak at ~360 m WSF being an exception as the large MSS amplitudes only show in the downhole logs. A number of smaller MSS peaks show elsewhere in the log where core data are either unavailable or do not show a peak, indicating that the wall rock does contain material that was not documented in core measurements.
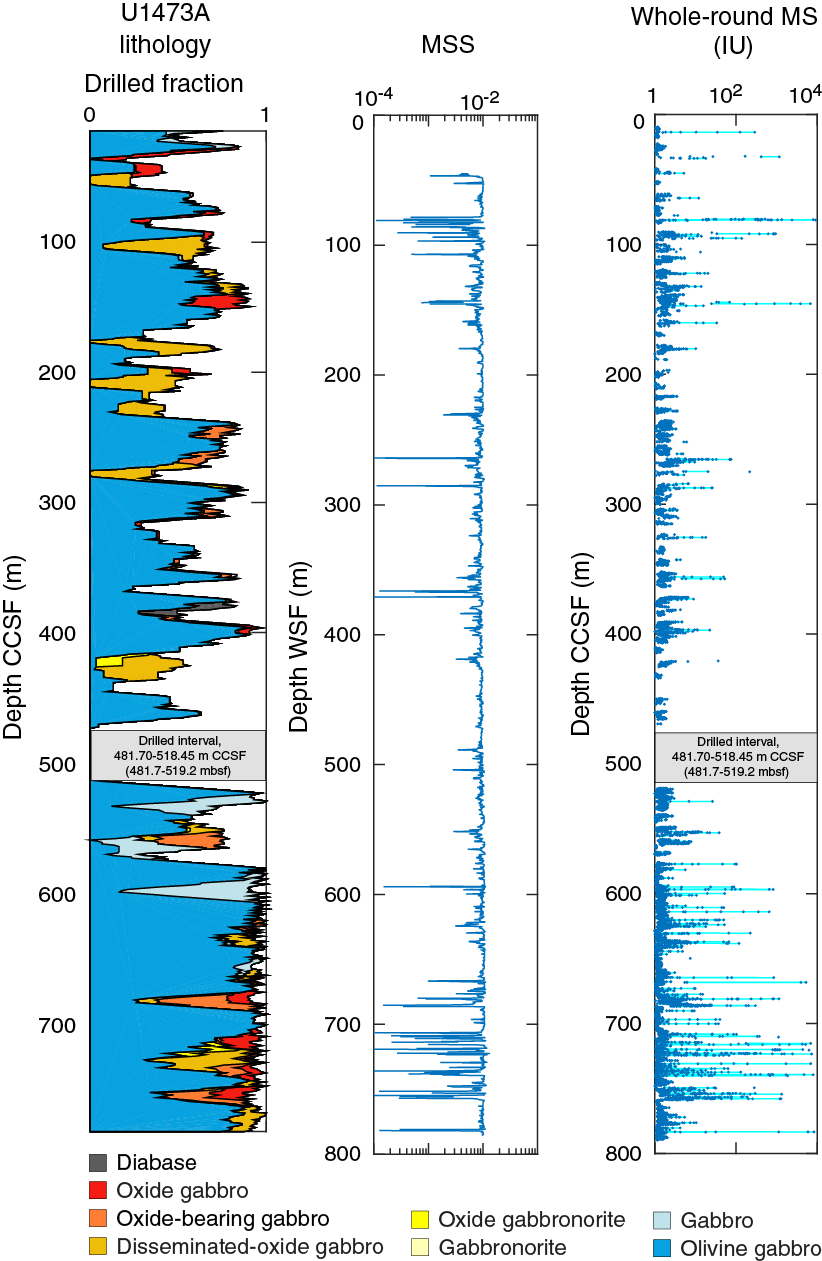
Figure F185. Comparison of core logging vs. downhole magnetic susceptibility, Hole U1473A.
The MSS data appear to detect susceptibility anomalies reliably, but the recording is neither calibrated nor to be taken at face value. The recorded anomalies are of the opposite sign than high-susceptibility material would produce, and background values should be lower than these anomalous zones. This type of recording problem was previously recognized and IODP thought it had been addressed, based on work in low-resistivity formations. Clearly, further work is required to understand tool behavior in very resistive formations.
Formation electrical resistivity
Electrical resistivity was measured in the borehole fluid and in five successively increasing depths of penetration in the wall rock. Downhole resistivity (Figure F182) is most stable (1.1 × 10⁴ to 1.4 × 10⁴ Ωm) and highest in the deep section (>580 m WSF), similar to VP and density. Resistivity increases steadily downhole by 1.5 orders of magnitude, from ~8 × 10² to ~9 × 10⁴ Ωm, from 300 m WSF to the top of the severely fractured interval at 410 m WSF. The lowest resistivity characterizes the lower part of the main fractured zone, centered at 430 m WSF. Resistivity values increase in the 450–490 m WSF interval, where data quality should be good.
Formation imaging
Geologic features were observed during acquisition of both the FMS and UBI data. Features appeared to be sparse throughout the deepest section of the hole, but isolated features were observed there (Figure F186). In the middle portion of the hole, features in the borehole wall are more common, many with classic sinusoidal shape that are certain to be useful in determining structural dips. Rare, possibly coherent features are also present in the out-of-bore fractured intervals. Geologic features were definitely observed between the two large fractured intervals (410–460 and 300–350 m WSF). In the section at 160–200 m WSF, the raw UBI images show occasional features. The shallowest section seems mostly devoid of clear features, except near the very top.
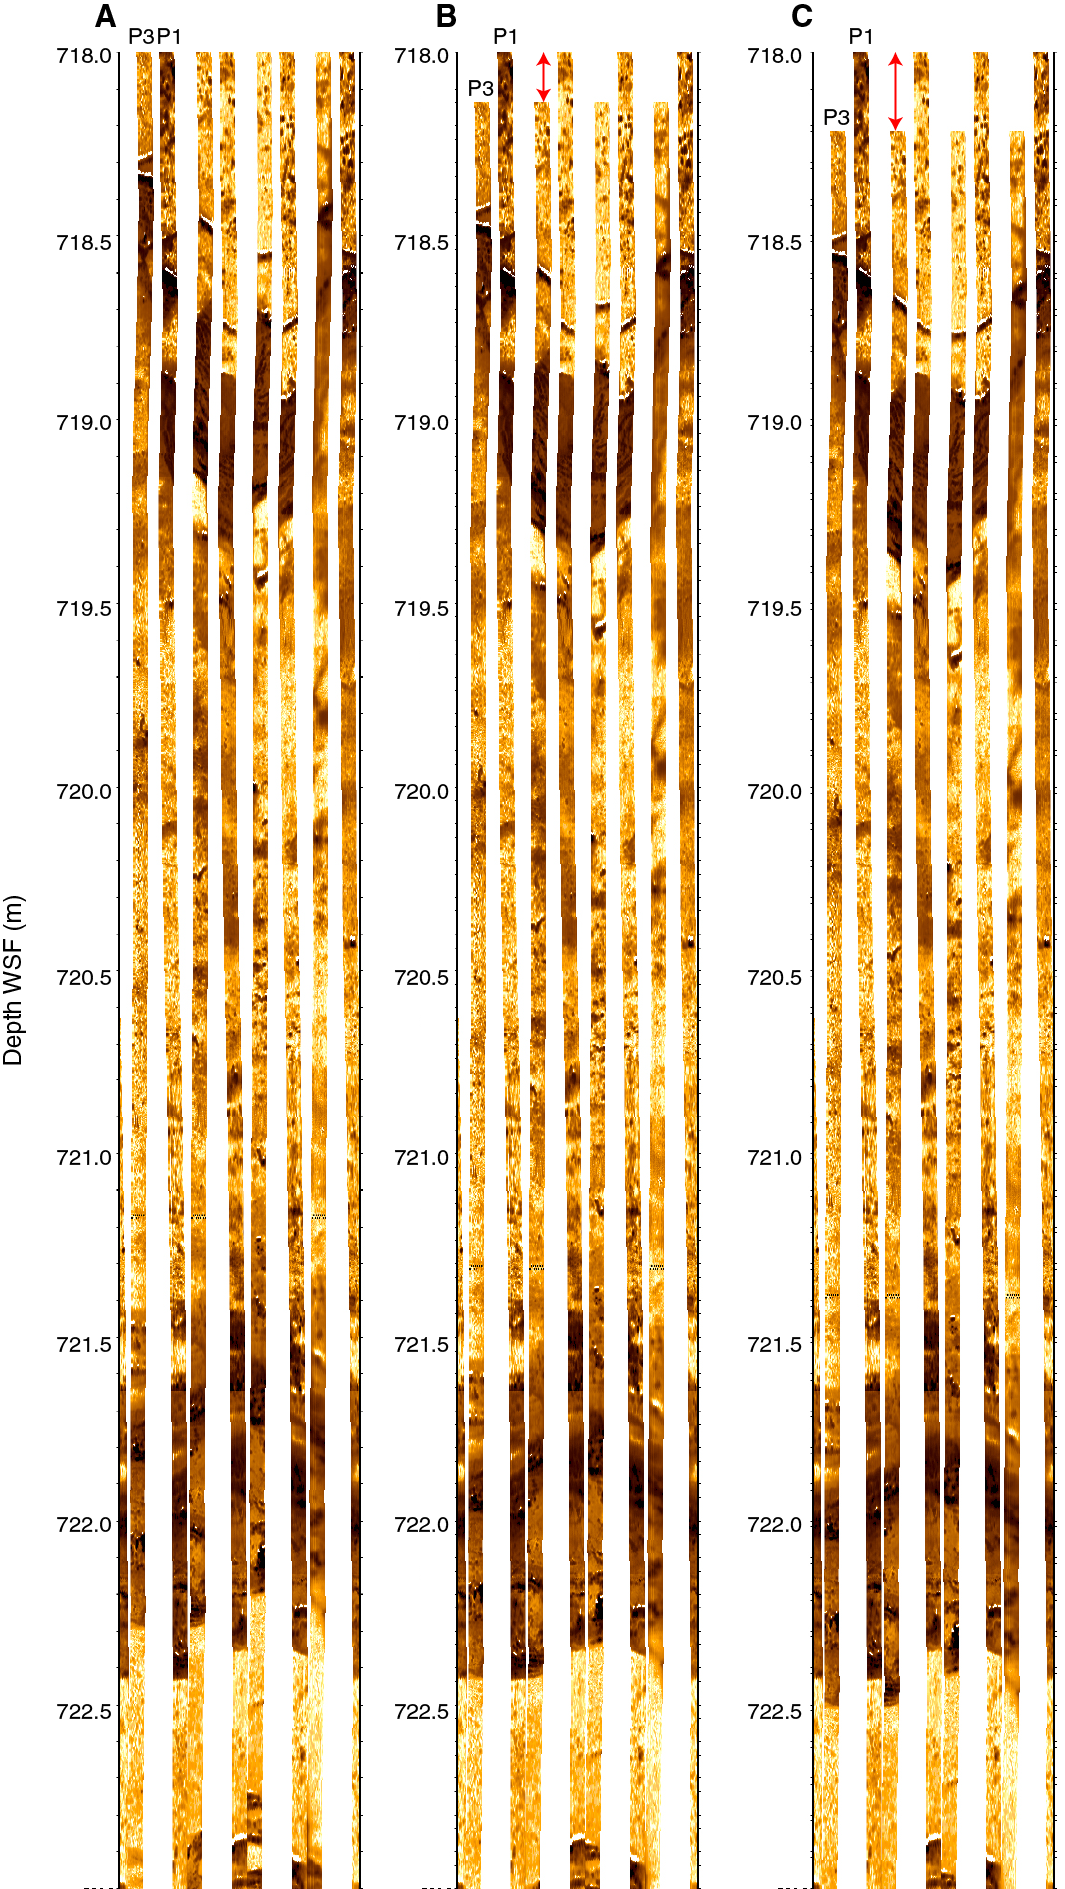
Figure F186. FMS data from the deepest section of Hole U1473A.
The initially processed FMS data were received at the time of writing. First viewing of these images indicated that depth corrections have not fully accounted for either between-run shifts or during-run acceleration (Figure F186). Additional processing will be required before routine qualitative or any quantitative work with the imagery is possible.
The processed UBI data show only sparse features in the deepest part of the hole (Figure F187), but structural and/or lithologic features are commonly observed and show notable complexity in some intervals throughout the section shallower than ~600 m WSF.
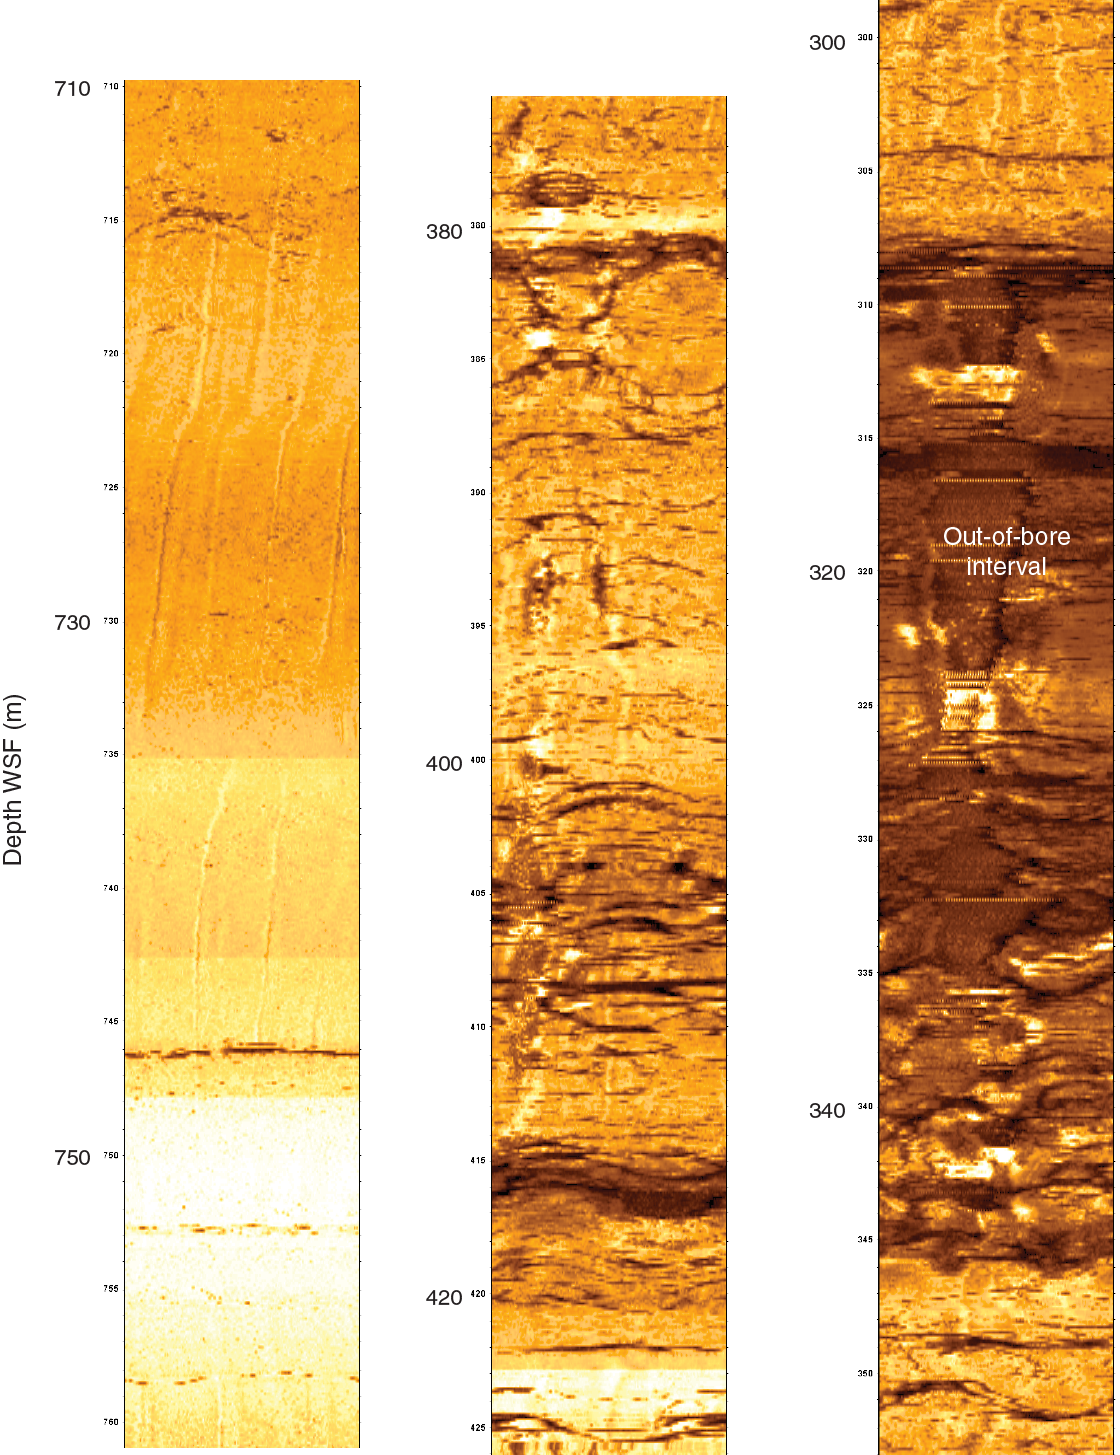
Figure F187. UBI images of the borehole from three different depth intervals.
Initial core-log integration
Overall, physical properties are as expected for a gabbroic section where alteration style and intensity varies moderately throughout the section. Measurements on the core and in the borehole are generally in line with prior results from oceanic core complex drilling. Density, porosity, seismic velocity, and thermal conductivity are more variable in the upper 600 m of the section at Site U1473 than in the underlying 200 m, which is not surprising given the greater lithologic, structural, and metamorphic complexity in the upper section. Alteration has a somewhat stronger association with physical properties in the deeper section.
Gradients in one or more physical properties correspond to either a fault or a lithologic boundary in several locations downhole (Figure F188). Porosity, seismic velocity, and resistivity each change along the downhole approach to the major faulted interval identified by the structural geology team and recognized from the poor drilling and borehole conditions at ~411–469 m CCSF. Velocity and electrical resistivity also show gradients to higher values in the ~50 m below this faulted zone. Although their minimum values within the zone are not constrained due to poor log quality, velocity and resistivity measured along the gradient region below are reliable. Smaller faults identified at 187 and 274 m WSF (see Structural geology) occur where our sample suite included several high porosity values, compared to immediately surrounding intervals. The fault at 335 m WSF does not mark a change in physical properties. The base of lithologic Unit II is characterized by a decrease in resistivity and an increase in the variability of seismic velocity. Both of these properties increase again toward the base of Unit III. Throughout Unit VI, velocity and resistivity are variable, and they increase fairly sharply across the boundary with underlying Unit VII, suggesting some factors (faulting or alteration) beyond a purely lithologic change play a role in the existence of this boundary. Sample velocities are highest in the least altered interval that dominates Unit VII, whereas formation velocity, at the meter scale, is similar to that within Unit VIII, although more variable.
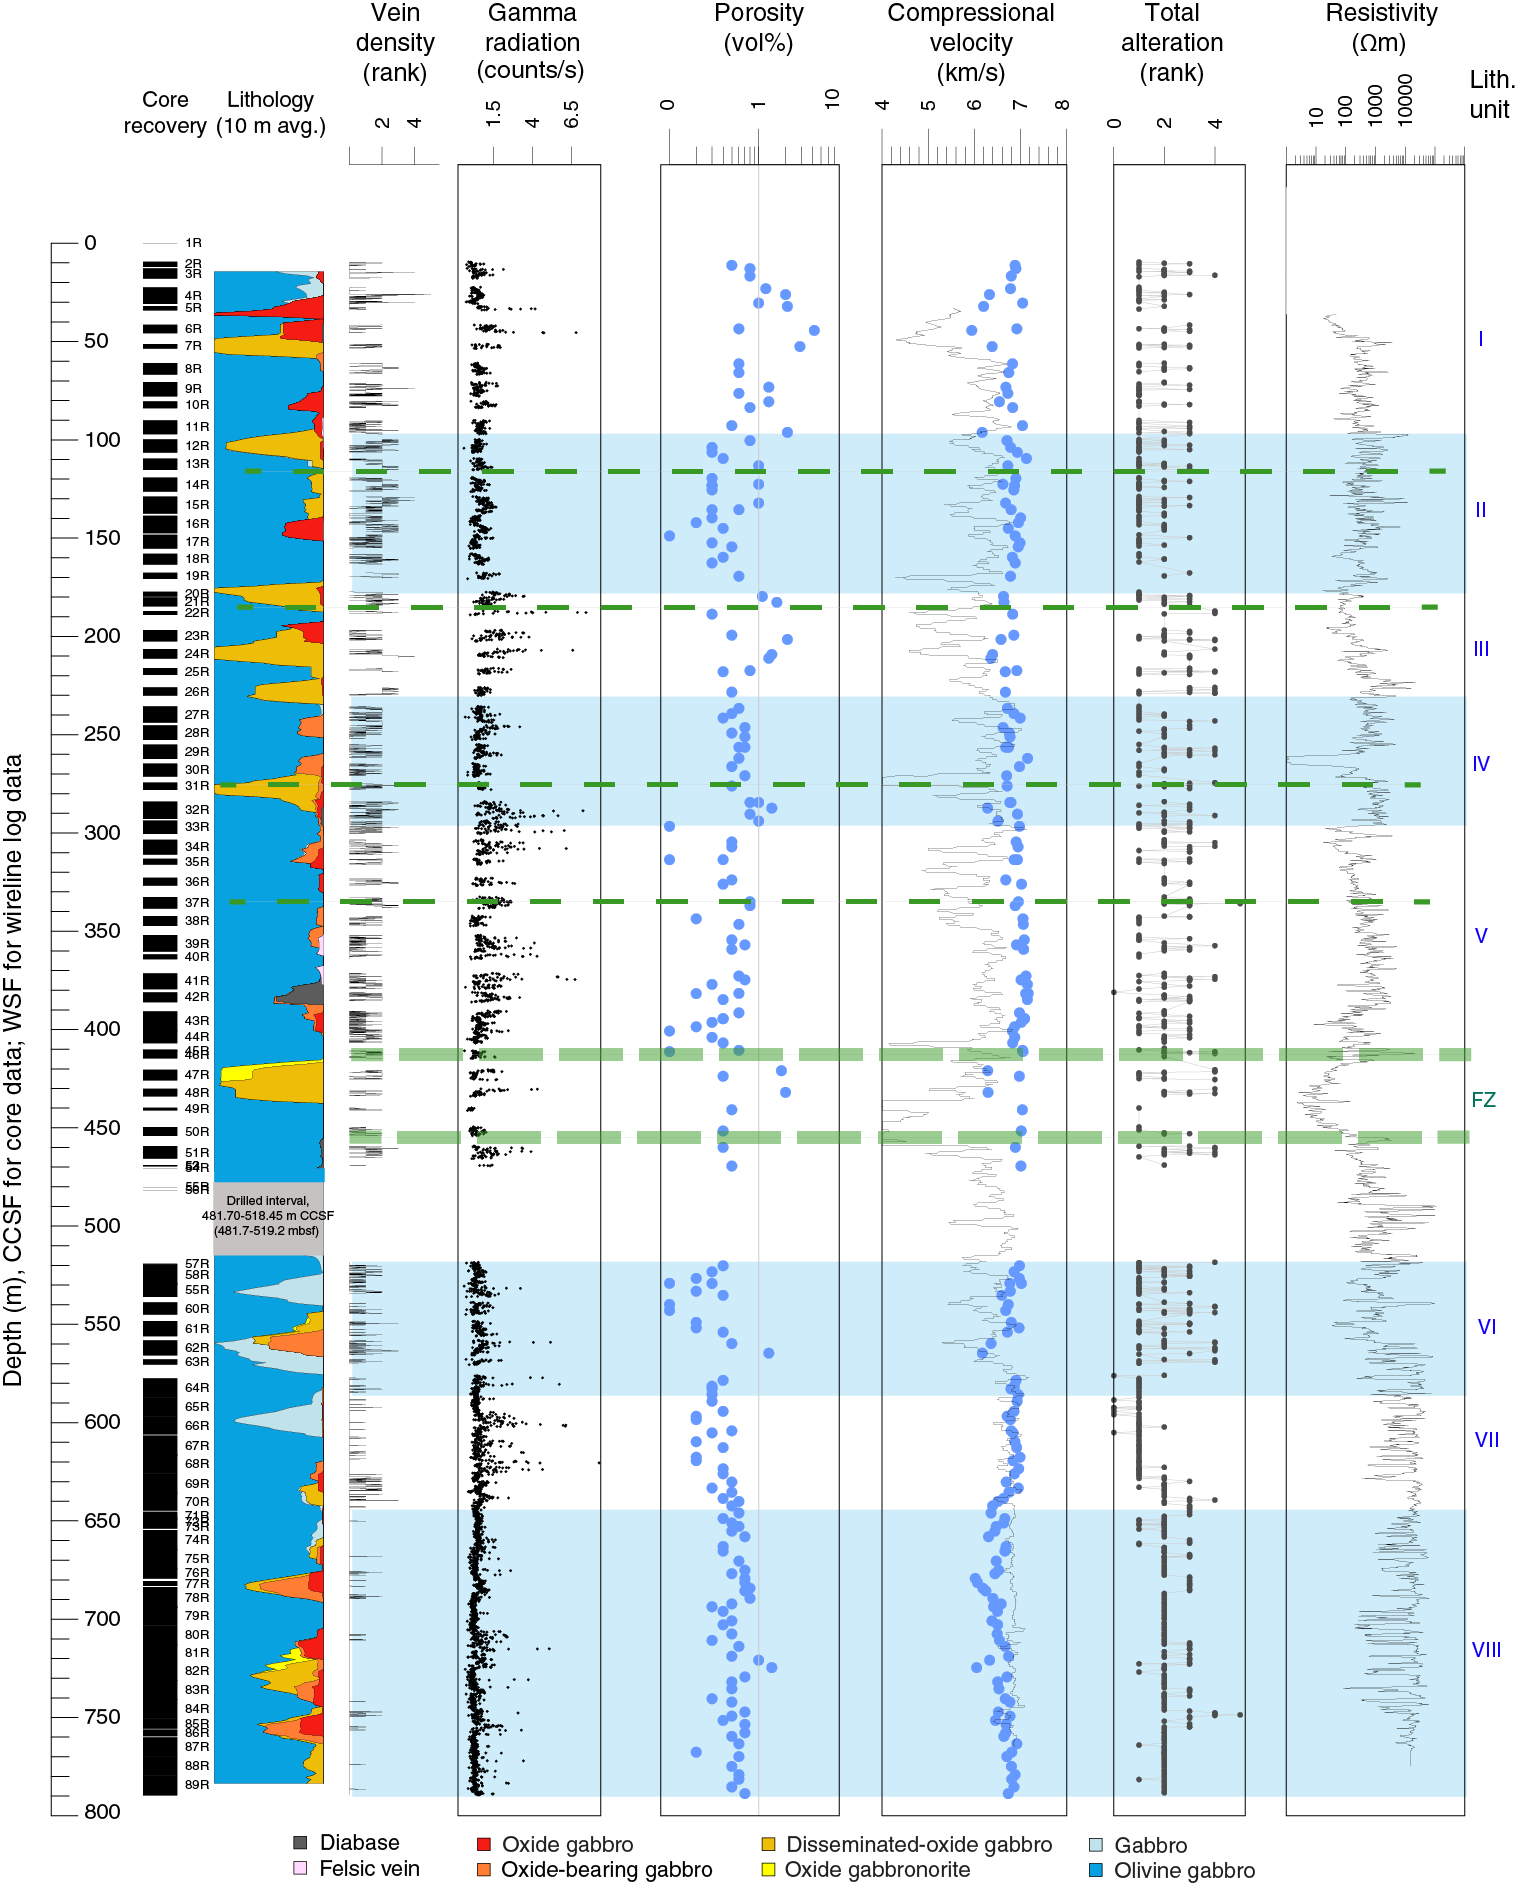
Figure F188. Initial petrophysical summary, Hole U1473A.
References
Agar, S.M., and Lloyd, G.E., 1997. Deformation of Fe-Ti oxides in gabbroic shear zones from the MARK area. In Karson, J.A., Cannat, M., Miller, D.J., and Elthon, D. (Eds.), Proceedings of the Ocean Drilling Program, Scientific Results, 153: College Station, TX (Ocean Drilling Program), 123–141. http://dx.doi.org/10.2973/odp.proc.sr.153.009.1997
Allerton, S., and Tivey, M.A., 2001. Magnetic polarity structure of the lower oceanic crust. Geophysical Research Letters, 28(3):423–426. http://dx.doi.org/10.1029/2000GL008493
Alt, J.C., and Bach, W., 2002. Data report: low-grade hydrothermal alteration of uplifted lower oceanic crust, Hole 735B: mineralogy and isotope geochemistry. In Natland, J.H., Dick, H.J.B., Miller, D.J., and Von Herzen, R. (Eds.), Proceedings of the Ocean Drilling Program, Scientific Results, 176: College Station, TX (Ocean Drilling Program), 1–24. http://dx.doi.org/10.2973/odp.proc.sr.176.013.2001
Arevalo, R., Jr., and McDonough, W.F., 2010. Chemical variations and regional diversity observed in MORB. Chemical Geology, 271(1–2):70–85. http://dx.doi.org/10.1016/j.chemgeo.2009.12.013
Aumento, F., 1969. Diorites from the Mid-Atlantic Ridge at 45°N. Science, 165(3898):1112–1113. http://dx.doi.org/10.1126/science.165.3898.1112
Bach, W., Alt, J.C., Niu, Y., Humphris, S.E., Erzinger, J., and Dick, H.J.B., 2001. The geochemical consequences of late-stage low-grade alteration of lower ocean crust at the SW Indian Ridge: results from ODP Hole 735B (Leg 176). Geochimica et Cosmochimica Acta, 65(19):3267–3287. http://dx.doi.org/10.1016/S0016-7037(01)00677-9
Bach, W., and Klein, F., 2009. The petrology of seafloor rodingites: insights from geochemical reaction path modeling. Lithos, 112(1–2):103–117. http://dx.doi.org/10.1016/j.lithos.2008.10.022
Barton, P.B., Jr., and Skinner, B.J., 1979. Sulfide mineral stabilities. In Barnes, H.L. (Ed.), Geochemistry of Hydrothermal Ore Deposits (2nd edition): New York (Wiley), 278–403.
Beard, J.S., Frost, B.R., Fryer, P., McCaig, A., Searle, R., Ildefonse, B., Zinin, P., and Sharma, S.K., 2009. Onset and progression of serpentinization and magnetite formation in olivine-rich troctolite from IODP Hole U1309D. Journal of Petrology, 50(3):387–403. http://dx.doi.org/10.1093/petrology/egp004
Beard, J.S., and Lofgren, G.E., 1991. Dehydration melting and water-saturated melting of basaltic and andesitic greenstones and amphibolites at 1, 3, and 6.9 kb. Journal of Petrology, 32(2):365–401. http://dx.doi.org/10.1093/petrology/32.2.365
Bethke, C.M., and Yeakel, S., 2015. The Geochemist Workbench Release 10.0: GWB Essentials Guide: Champaign, IL (Aqueous Solutions, LLC). https://www.gwb.com/pdf/GWB10/GWBessentials.pdf
Blackman, D.K., Ildefonse, B., John, B.E., Ohara, Y., Miller, D.J., Abe, N., Abratis, M., Andal, E.S., Andreani, M., Awaji, S., Beard, J.S., Brunelli, D., Charney, A.B., Christie, D.M., Collins, J., Delacour, A.G., Delius, H., Drouin, M., Einaudi, F., Escartín, J. Frost, B.R., Früh-Green, G., Fryer, P.B., Gee, J.S., Godard, M., Grimes, C.B., Halfpenny, A., Hansen, H.-E., Harris, A.C., Tamura, A., Hayman, N.W., Hellebranc, E., Hirose, T., Hirth, J.G., Ishimaru, S., Johnson, K.T.M., Karner, G.D., Linek, M., MacLeod, C.J., Maeda, J., Mason, O.U., McCaig, A.M., Michibayashi, K., Morris, A., Nakagawa, T., Nozaka, T., Rosner, M., Searle, R.C., Suhr, G., Tominaga, M., von der Handt, A., Yamasaki, T., and Zhao, X., 2011. Drilling constraints on lithospheric accretion and evolution at Atlantis Massif, Mid-Atlantic Ridge, 30°N. Journal of Geophysical Research: Solid Earth, 116(B7):B07103. http://dx.doi.org/10.1029/2010JB007931
Blackman, D.K., Ildefonse, B., John, B.E., Ohara, Y., Miller, D.J., MacLeod, C.J., and the Expedition 304/305 Scientists, 2006. Proceedings of the Integrated Ocean Drilling Program, 304/305: College Station, TX (Integrated Ocean Drilling Program Management International, Inc.). http://dx.doi.org/10.2204/iodp.proc.304305.2006
Blackman, D.K., Slagle, A., Guerin, G., and Harding, A., 2014. Geophysical signatures of past and present hydration within a young oceanic core complex. Geophysical Research Letters, 41(4):1179–1186. http://dx.doi.org/10.1002/2013GL058111
Blanc, Ph., Lassin, A., Piantone, P., Azaroual, M., Jacquemet, N., Fabbri, A., and Gaucher, E.C., 2012. Thermoddem: a geochemical database focused on low temperature water/rock interactions and waste materials. Applied Geochemistry, 27(10):2107–2116. http://dx.doi.org/10.1016/j.apgeochem.2012.06.002
Blumenfeld, P., and Bouchez, J.-L., 1988. Shear criteria in granite and migmatite deformed in the magmatic and solid states. Journal of Structural Geology, 10(4):361–372. http://dx.doi.org/10.1016/0191-8141(88)90014-4
Bouchez, J.L., Delas, C., Gleizes, G., Nédélec, A., and Cuney, M., 1992. Submagmatic microfractures in granites. Geology, 20(1):35–38. http://dx.doi.org/10.1130/0091-7613(1992)020<0035:SMIG>2.3.CO;2
Cannat, M., Karson, J.A., Miller, D.J., et al., 1995. Proceedings of the Ocean Drilling Program, Initial Reports, 153: College Station, TX (Ocean Drilling Program). http://dx.doi.org/10.2973/odp.proc.ir.153.1995
Casey, J.F., Banerji, D., and Zarian, P., 2007. Leg 179 synthesis: geochemistry, stratigraphy, and structure of gabbroic rocks drilled in ODP Hole 1105A, Southwest Indian Ridge. In Casey, J.F., and Miller, D.J. (Eds.), Proceedings of the Ocean Drilling Program, Scientific Results, 179: College Station, TX (Ocean Drilling Program), 1–125. http://dx.doi.org/10.2973/odp.proc.sr.179.001.2007
Connolly, J.A.D., 2005. Computation of phase equilibria by linear programming: a tool for geodynamic modeling and its application to subduction zone decarbonation. Earth and Planetary Science Letters, 236(1–2):524–541. http://dx.doi.org/10.1016/j.epsl.2005.04.033
Connolly, J.A.D., 2009. The geodynamic equation of state: what and how. Geochemistry, Geophysics, Geosystems, 10(10):Q10014. http://dx.doi.org/10.1029/2009GC002540
Constable, C., and Tauxe, L., 1990. The bootstrap for magnetic susceptibility tensors. Journal of Geophysical Research: Solid Earth, 95(B6):8383–8395. http://dx.doi.org/10.1029/JB095iB06p08383
Coogan, L.A., Wilson, R.N., Gillis, K.M., and MacLeod, C.J., 2001. Near-solidus evolution of oceanic gabbros: insights from amphibole geochemistry. Geochimica et Cosmochimica Acta, 65(23):4339–4357. http://dx.doi.org/10.1016/S0016-7037(01)00714-1
Delacour, A., Früh-Green, G.L., Bernasconi, S.M., Schaeffer, P., and Kelley, D.S., 2008. Carbon geochemistry of serpentinites in the Lost City hydrothermal system (30°N, MAR). Geochimica et Cosmochimica Acta, 72(15):3681–3702. http://dx.doi.org/10.1016/j.gca.2008.04.039
Dick, H.J.B., Natland, J.H., Alt, J.C., Bach, W., Bideau, D., Gee, J.S., Haggas, S., Hertogen, J.G.H., Hirth, G., Holm, P.M., Ildefonse, B., Iturrino, G.J., John, B.E., Kelley, D.S., Kikawa, E., Kingdon, A., LeRoux, P.J., Maeda, J., Meyer, P.S., Miller, D.J., Naslund, H.R., Niu, Y.-L., Robinson, P.T., Snow, J., Stephen, R.A., Trimby, P.W., Worm, H.-U., and Yoshinobu, A., 2000. A long in situ section of the lower ocean crust: results of ODP Leg 176 drilling at the Southwest Indian Ridge. Earth and Planetary Science Letters, 179(1):31–51. http://dx.doi.org/10.1016/S0012-821X(00)00102-3
Dick, H.J.B., Natland, J.H., Miller, D.J., et al., 1999. Proceedings of the Ocean Drilling Program, Initial Reports, 176: College Station, TX (Ocean Drilling Program). http://dx.doi.org/10.2973/odp.proc.ir.176.1999
Dick, H.J.B., Schouten, H., Meyer, P.S., Gallo, D.G., Bergh, H., Tyce, R., Patriat, P., Johnson, K.T.M., Snow, J., and Fisher, A., 1991. Tectonic evolution of the Atlantis II Fracture Zone. In Von Herzen, R.P., Robinson, P.T., et al., Proceedings of the Ocean Drilling Program, Scientific Results, 118: College Station, TX (Ocean Drilling Program), 359–398. http://dx.doi.org/10.2973/odp.proc.sr.118.156.1991
Dick, H.J.B., Tivey, M.A., and Tucholke, B.E., 2008. Plutonic foundation of a slow-spreading ridge segment: oceanic core complex at Kane Megamullion, 23°30′N, 45°20′W. Geochemistry, Geophysics, Geosystems, 9(5):Q05014. http://dx.doi.org/10.1029/2007GC001645
Dixon, J.E., Stolper, E.M., and Holloway, J.R., 1995. An experimental study of water and carbon dioxide solubilities in mid-ocean ridge basaltic liquids, Part I. Calibration and solubility models. Journal of Petrology, 36:1607–1631. http://petrology.oxfordjournals.org/content/36/6/1607.short
Dolejš, D., and Manning, C.E., 2010. Thermodynamic model for mineral solubility in aqueous fluids: theory, calibration and application to model fluid-flow systems. Geofluids, 10(1–2):20–40. http://dx.doi.org/10.1111/j.1468-8123.2010.00282.x
Erdmann, M., Fischer, L.A., France, L., Zhang, C., Godard, M., and Koepke, J., 2015. Anatexis at the roof of an oceanic magma chamber at IODP Site 1256 (equatorial Pacific): an experimental study. Contributions to Mineralogy and Petrology, 169:39. http://dx.doi.org/10.1007/s00410-015-1136-5
Ernst, W.G., and Liu, J., 1998. Experimental phase-equilibrium study of Al- and Ti-contents of calcic amphibole in MORB: a semiquantitative thermobarometer. American Mineralogist, 83(9–10):952–969. http://ammin.geoscienceworld.org/content/83/9-10/952.extract
Escartín, J., Mével, C., MacLeod, C.J., and McCaig, A.M., 2003. Constraints on deformation conditions and the origin of oceanic detachments: the Mid-Atlantic Ridge core complex at 15°45′N. Geochemistry, Geophysics, Geosystems, 4(8):1067. http://dx.doi.org/10.1029/2002GC000472
Expedition 304/305 Scientists, 2006. Site U1309. In Blackman, D.K., Ildefonse, B., John, B.E., Ohara, Y., Miller, D.J., MacLeod, C.J., and the Expedition 304/305 Scientists, Proceedings of the Integrated Ocean Drilling Program, 304/305: College Station, TX (Integrated Ocean Drilling Program Management International, Inc.). http://dx.doi.org/10.2204/iodp.proc.304305.103.2006
Fisher, R.A., 1953. Dispersion on a sphere. Proceedings of the Royal Society of London, Series A, 217:295–305.
France, L., Ildefonse, B., and Koepke, J., 2009. Interactions between magma and hydrothermal system in Oman ophiolite and in IODP Hole 1256D: fossilization of a dynamic melt lens at fast spreading ridges. Geochemistry, Geophysics, Geosystems, 10(10):Q10O19. http://dx.doi.org/10.1029/2009GC002652
France, L., Koepke, J., Ildefonse, B., Cichy, S.B., and Deschamps, F., 2010. Hydrous partial melting in the sheeted dike complex at fast spreading ridges: experimental and natural observations. Contributions to Mineralogy and Petrology, 160(5):683–704. http://dx.doi.org/10.1007/s00410-010-0502-6
France, L., Koepke, J., MacLeod, C.J., Ildefonse, B., Godard, M., and Deloule, E., 2014. Contamination of MORB by anatexis of magma chamber roof rocks: constraints from a geochemical study of experimental melts and associated residues. Lithos, 202–203:120–137. http://dx.doi.org/10.1016/j.lithos.2014.05.018
Frost, B.R., and Beard, J.S., 2007. On silica activity and serpentinization. Journal of Petrology, 48(7):1351–1368. http://dx.doi.org/10.1093/petrology/egm021
Frost, B.R., Beard, J.S., McCaig, A., and Condliffe, E., 2008. The formation of micro-rodingites from IODP Hole U1309D: key to understanding the process of serpentinization. Journal of Petrology, 49(9):1579–1588. http://dx.doi.org/10.1093/petrology/egn038
Früh-Green, G.L., Connolly, J.A.D., Plas, A., Kelley, D.S., and Grobéty, B., 2004. Serpentinization of oceanic peridotites: implications for geochemical cycles and biological activity. In Wilcock, W.S.D., DeLong, E.F., Kelley, D.S., Baross, J.A., and Cary, C. (Eds.), The Subseafloor Biosphere at Mid-Ocean Ridges. Geophysical Monograph, 144:119–136. http://onlinelibrary.wiley.com/doi/10.1029/144GM08/summary
Gillis, K., Mével, C., Allan, J., et al., 1993. Proceedings of the Ocean Drilling Program, Initial Reports, 147: College Station, TX (Ocean Drilling Program). http://dx.doi.org/10.2973/odp.proc.ir.147.1993
Gillis, K.M., 1996. Rare earth element constraints on the origin of amphibole in gabbroic rocks from Site 894, Hess Deep. In Mével, C., Gillis, K.M., Allan, J.F., and Meyer, P.S. (Eds.), Proceedings of the Ocean Drilling Program, Scientific Results, 147: College Station, TX (Ocean Drilling Program), 59–75. http://dx.doi.org/10.2973/odp.proc.sr.147.012.1996
Gillis, K.M., and Coogan, L.A., 2002. Anatectic migmatites from the roof of an ocean ridge magma chamber. Journal of Petrology, 43(11):2075–2095. http://dx.doi.org/10.1093/petrology/43.11.2075
Gillis, K.M., and Meyer, P.S., 2001. Metasomatism of oceanic gabbros by late stage melts and hydrothermal fluids: evidence from the rare earth element composition of amphiboles. Geochemistry, Geophysics., Geosystems, 2(3):1012. http://dx.doi.org/10.1029/2000GC000087
Gillis, K.M., Snow, J.E., Klaus, A., and the Expedition 345 Scientists, 2014. Proceedings of the Integrated Ocean Drilling Program, 345: College Station, TX (Integrated Ocean Drilling Program). http://dx.doi.org/10.2204/iodp.proc.345.2014
Gillis, K.M., Snow, J.E., Klaus, A., Abe, N., Adrião, Á.B., Akizawa, N., Ceuleneer, G., Cheadle, M.J., Faak, K., Falloon, T.J., Friedman, S.A., Godard, M., Guerin, G., Harigane, Y., Horst, A.J., Hoshide, T., Ildefonse, B., Jean, M.M., John, B.E., Koepke, J., Machi, S., Maeda, J., Marks, N.E., McCaig, A.M., Meyer, R., Morris, A., Nozaka, T., Python, M., Saha, A., and Wintsch, R.P., 2014. Primitive layered gabbros from fast-spreading lower oceanic crust. Nature, 505(7482):204–207. http://dx.doi.org/10.1038/nature12778
Godard, M., Awaji, S., Hansen, H., Hellebrand, E., Brunelli, D., Johnson, K., Yamasaki, T., Maeda, J., Abratis, M., Christie, D., Kato, Y., Mariet, C., and Rosner, M., 2009. Geochemistry of a long in-situ section of intrusive slow-spread oceanic lithosphere: results from IODP Site U1309 (Atlantis Massif, 30°N Mid-Atlantic-Ridge). Earth and Planetary Science Letters, 279(1–2):110–122. http://dx.doi.org/10.1016/j.epsl.2008.12.034
Handy, M., Hirth, G., and Burgmann, R., 2007. Continental fault structure and rheology from the frictional-to-viscous transition downward. In Handy, M., Hirth, G., and Hovius, N. (Eds.), Tectonic Faults: Agents of Change on a Dynamic Earth (Dahlem Workshop Reports): Cambridge, MA (The MIT Press), 139–181.
Hansen, L.N., Cheadle, M.J., John, B.E., Swapp, S.M., Dick, H.J.B., Tucholke, B.E., and Tivey, M.A., 2013. Mylonitic deformation at the Kane oceanic core complex: implications for the rheological behavior of oceanic detachment faults. Geochemistry, Geophysics, Geosystems, 14(8):3085–3108. http://dx.doi.org/10.1002/ggge.20184
Hext, G.R., 1963. The estimation of second-order tensors, with related tests and designs. Biometrika, 50(3–4):353–373. http://dx.doi.org/10.1093/biomet/50.3-4.353
Holland, T., and Powell, R., 1991. A Compensated-Redlich-Kwong (CORK) equation for volumes and fugacities of CO 2 and H 2O in the range 1 bar to 50 kbar and 100–1600°C. Contributions to Mineralogy and Petrology, 109(2):265–273. http://dx.doi.org/10.1007/BF00306484
Holland, T.J.B., and Powell, R., 1998. An internally consistent thermodynamic data set for phases of petrological interest. Journal of Metamorphic Geology, 16(3):309–343. http://dx.doi.org/10.1111/j.1525-1314.1998.00140.x
Holland, T.J.B., and Powell, R., 2011. An improved and extended internally consistent thermodynamic dataset for phases of petrological interest, involving a new equation of state for solids. Journal of Metamorphic Geology, 29(3):333–383. http://dx.doi.org/10.1111/j.1525-1314.2010.00923.x
Jelinek, V., 1981. Characterization of the magnetic fabric of rocks. Tectonophysics, 79(3–4):T63–T67. http://dx.doi.org/10.1016/0040-1951(81)90110-4
John, B.E., and Cheadle, M.J., 2010. Deformation and alteration associated with oceanic and continental detachment fault systems: are they similar? In Rona, P.A., Devey, C.W., Dyment, J., and Murton, B.J. (Eds.), Diversity of Hydrothermal Systems on Slow Spreading Ocean Ridges. Geophysical Monograph Series, 188:175–205. http://dx.doi.org/10.1029/2008GM000772
Karson, J.A., and Lawrence, R.M., 1997. Tectonic window into gabbroic rocks of the middle oceanic crust in the MARK area near Sites 921–924. In Karson, J.A., Cannat, M., Miller, D.J., and Elthon, D. (Eds.), Proceedings of the Ocean Drilling Program, Scientific Results, 153: College Station, TX (Ocean Drilling Program), 61–76. http://dx.doi.org/10.2973/odp.proc.sr.153.005.1997
Kelemen, P.B., Kikawa, E., Miller, D.J., and Shipboard Scientific Party, 2007. Leg 209 summary: processes in a 20-km-thick conductive boundary layer beneath the Mid-Atlantic Ridge, 14°–16°N. In Kelemen, P.B., Kikawa, E., and Miller, D.J. (Eds.), Proceedings of the Ocean Drilling Program, Scientific Results, 209: College Station, TX (Ocean Drilling Program), 1–33. http://dx.doi.org/10.2973/odp.proc.sr.209.001.2007
Kelemen, P.B., Kikawa, E., Miller, D.J., et al., 2004. Proceedings of the Ocean Drilling Program, Initial Reports, 209: College Station, TX (Ocean Drilling Program). http://dx.doi.org/10.2973/odp.proc.ir.209.2004
Kikawa, E., and Pariso, J.E., 1991. Magnetic properties of gabbros from Hole 735B, Southwest Indian Ridge. In Von Herzen, R.P., Robinson, P.T., et al., Proceedings of the Ocean Drilling Program, Scientific Results, 118: College Station, TX (Ocean Drilling Program), 285–307. http://dx.doi.org/10.2973/odp.proc.sr.118.148.1991
Koepke, J., Berndt, J., Feig, S.T., and Holtz, F., 2007. The formation of SiO 2-rich melts within the deep ocean crust by hydrous partial melting of gabbros. Contributions to Mineralogy and Petrology, 153(1):67–84. http://dx.doi.org/10.1007/s00410-006-0135-y
Koepke, J., Christie, D.M., Dziony, W., Holtz, F., Lattard, D., Maclennan, J., Park, S., Scheibner, B., Yamasaki, T., and Yamazaki, S., 2008. Petrography of the dike–gabbro transition at IODP Site 1256 (equatorial Pacific): the evolution of the granoblastic dikes. Geochemistry, Geophysics, Geosystems, 9(7):Q07O09. http://dx.doi.org/10.1029/2008GC001939
Koepke, J., Feig, S.T., Snow, J., and Freise, M., 2004. Petrogenesis of oceanic plagiogranites by partial melting of gabbros: an experimental study. Contributions to Mineralogy and Petrology, 146(4):414–432. http://dx.doi.org/10.1007/s00410-003-0511-9
Kruber, C., Thorseth, I.H., and Pedersen, R.B., 2008. Seafloor alteration of basaltic glass: textures, geochemistry, and endolithic microorganisms. Geochemistry, Geophysics, Geosystems, 9(12):Q12002. http://dx.doi.org/10.1029/2008GC002119
Lever, M.A., Alperin, M., Engelen, B., Inagaki, F., Nakagawa, S., Steinsbu, B.O., Teske A., and IODP Expedition 301 Scientists, 2006. Trends in basalt and sediment core contamination during IODP Expedition 301. Geomicrobiology Journal, 23(7):517–530. http://dx.doi.org/10.1080/01490450600897245
Lissenberg, C.J., and Dick, H.J.B., 2008. Melt–rock reaction in the lower oceanic crust and its implications for the genesis of mid-ocean ridge basalt. Earth and Planetary Science Letters, 271(1–4):311–325. http://dx.doi.org/10.1016/j.epsl.2008.04.023
Lissenberg, C.J., MacLeod, C.J., Howard, K.A., and Godard, M., 2013. Pervasive reactive melt migration through fast-spreading lower oceanic crust (Hess Deep, equatorial Pacific Ocean). Earth and Planetary Science Letters, 361:436–447. http://dx.doi.org/10.1016/j.epsl.2012.11.012
MacLeod, C.J., Dick, H.J.B., Allerton, S., Robinson, P.T., Coogan, L.A., Edwards, S.J., Galley, A., Gillis, K.M., Hirth, G., Hunter, A.G., Hutchinson, D., Kvassnes, A.J., Natland, J.H., Salisbury, M., Schandl, E.S., Stakes, D.S., Thompson, G.M., and Tivey, M.A., 1998. Geological mapping of slow-spread lower ocean crust: a deep-towed video and wireline rock drilling survey of Atlantis Bank (ODP Site 735, SW Indian Ridge). InterRidge News, 7(2):39–43.
MacLeod, C.J., Dick, H.J.B., Blum, P., Abe, N., Blackman, D.K., Bowles, J.A., Cheadle, M.J., Cho, K., Ciążela, J., Deans, J.R., Edgcomb, V.P., Ferrando, C., France, L., Ghosh, B., Ildefonse, B.M., Kendrick, M.A., Koepke, J.H., Leong, J.A.M., Liu, C., Ma, Q., Morishita, T., Morris, A., Natland, J.H., Nozaka, T., Pluemper, O., Sanfilippo, A., Sylvan, J.B., Tivey, M.A., Tribuzio, R., and Viegas, L.G.F., 2017a. Expedition 360 methods. In MacLeod, C.J., Dick, H.J.B., Blum, P., and the Expedition 360 Scientists, Southwest Indian Ridge Lower Crust and Moho. Proceedings of the International Ocean Discovery Program, 360: College Station, TX (International Ocean Discovery Program). http://dx.doi.org/10.14379/iodp.proc.360.102.2017
MacLeod, C.J., Dick, H.J.B., Blum, P., Abe, N., Blackman, D.K., Bowles, J.A., Cheadle, M.J., Cho, K., Ciążela, J., Deans, J.R., Edgcomb, V.P., Ferrando, C., France, L., Ghosh, B., Ildefonse, B.M., Kendrick, M.A., Koepke, J.H., Leong, J.A.M., Liu, C., Ma, Q., Morishita, T., Morris, A., Natland, J.H., Nozaka, T., Pluemper, O., Sanfilippo, A., Sylvan, J.B., Tivey, M.A., Tribuzio, R., and Viegas, L.G.F., 2017b. Hole 1105A redescription. In MacLeod, C.J., Dick, H.J.B., Blum, P., and the Expedition 360 Scientists, Southwest Indian Ridge Lower Crust and Moho. Proceedings of the International Ocean Discovery Program, 360: College Station, TX (International Ocean Discovery Program). http://dx.doi.org/10.14379/iodp.proc.360.104.2017
MacLeod, C.J., Escartin, J., Banerji, D., Banks, G.J., Gleeson, M., Irving, D.H.B., Lilly, R.M., McCaig, A.M., Niu, Y., Allerton, S., and Smith, D.K., 2002. Direct geological evidence for oceanic detachment faulting: the Mid-Atlantic Ridge, 15°45′N. Geology, 30(10):879–882. http://dx.doi.org/10.1130/0091-7613(2002)030<0879:DGEFOD>2.0.CO;2
MacLeod, C.J., Searle, R.C., Murton, B.J., Casey, J.F., Mallows, C., Unsworth, S.C., Achenbach, K.L., and Harris, M., 2009. Life cycle of oceanic core complexes. Earth and Planetary Science Letters, 287(3–4):333–344. http://dx.doi.org/10.1016/j.epsl.2009.08.016
Manning, C.E., Weston, P.E., and Mahon, K.I., 1996. Rapid high-temperature metamorphism of East Pacific Rise gabbros from Hess Deep. Earth and Planetary Science Letters, 144(1–2):123–132. http://dx.doi.org/10.1016/0012-821X(96)00153-7
McFadden, P.L., and Reid, A.B., 1982. Analysis of paleomagnetic inclination data. Geophysical Journal of the Royal Astronomical Society, 69(2):307–319. http://dx.doi.org/10.1111/j.1365-246X.1982.tb04950.x
Mevel, C., 1988. Metamorphism of oceanic Layer 3, Gorringe Bank, eastern Atlantic. Contributions to Mineralogy and Petrology, 100(4):496–509. http://dx.doi.org/10.1007/BF00371379
Meyer, P.S., Dick, H.J.B., and Thompson, G., 1989. Cumulate gabbros from the Southwest Indian Ridge, 54°S–7°16′E: implications for magmatic processes at a slow spreading ridge. Contributions to Mineralogy and Petrology, 103(1):44–63. http://dx.doi.org/10.1007/BF00371364
Michael, P., 1995. Regionally distinctive sources of depleted MORB: evidence from trace elements and H 2O. Earth and Planetary Science Letters, 131(3–4):301–320. http://dx.doi.org/10.1016/0012-821X(95)00023-6
Miranda, E.A., and John, B.E., 2010. Strain localization along the Atlantis Bank oceanic detachment fault system, Southwest Indian Ridge. Geochemistry, Geophysics, Geosystems, 11(4):Q04002. http://dx.doi.org/10.1029/2009GC002646
Muller, M.R., Minshull, T.A., and White, R.S., 2000. Crustal structure of the Southwest Indian Ridge at the Atlantis II Fracture Zone. Journal of Geophysical Research: Solid Earth, 105(B11):25809–25828. http://dx.doi.org/10.1029/2000JB900262
Nakamura, K., Morishita, T., Chang, Q., Neo, N., and Kumagai, H., 2007. Discovery of lanthanide tetrad effect in an oceanic plagiogranite from an Ocean Core Complex at the Central Indian Ridge 25°S. Geochemical Journal, 41(2):135–140. http://dx.doi.org/10.2343/geochemj.41.135
Natland, J.H., 2002. Magnetic susceptibility as an index of the lithology and composition of gabbros, ODP Leg 176, Hole 735B, Southwest Indian Ridge. In Natland, J.H., Dick, H.J.B., Miller, D.J., and Von Herzen, R.P. (Eds.), Proceedings of the Ocean Drilling Program, Scientific Results, 176: College Station, TX (Ocean Drilling Program), 1–69. http://dx.doi.org/10.2973/odp.proc.sr.176.008.2002
Natland, J.H., and Dick, H.J.B., 2001. Formation of the lower ocean crust and the crystallization of gabbroic cumulates at a very slowly spreading ridge. Journal of Volcanology and Geothermal Research, 110(3–4):191–233. http://dx.doi.org/10.1016/S0377-0273(01)00211-6
Niu, Y., and Batiza, R., 1991. In situ densities of MORB melts and residual mantle: implications for buoyancy forces beneath mid-ocean ridges. Journal of Geology, 99(5):767–775. http://dx.doi.org/10.1086/629538
Nozaka, T., and Fryer, P., 2011. Alteration of the oceanic lower crust at a slow-spreading axis: insight from vein-related zoned halos in olivine gabbro from Atlantis Massif, Mid-Atlantic Ridge. Journal of Petrology, 52(4):643–664. http://dx.doi.org/10.1093/petrology/egq098
Nozaka, T., Fryer, P., and Andreani, M., 2008. Formation of clay minerals and exhumation of lower-crustal rocks at Atlantis Massif, Mid-Atlantic Ridge. Geochemistry, Geophysics, Geosystems, 9(11):Q11005. http://dx.doi.org/10.1029/2008GC002207
O’Hanley, D.S., 1996. Serpentinites: records of tectonic and petrological history. Oxford Monographs on Geology and Geophysics, 34.
Palmiotto, C., Corda, L., Ligi, M., Cipriani, A., Dick, H.J.B., Douville, E., Gasperini, L., Montagna, P., Thil, F., Borsetti, A.M., Balestra, B., and Bonatti, E., 2013. Nonvolcanic tectonic islands in ancient and modern oceans. Geochemistry, Geophysics, Geosystems, 14(10):4698–4717. http://dx.doi.org/10.1002/ggge.20279
Perfit, M.R., Fornari, D.J., Ridley, W.I., Kirk, P.D., Casey, J., Kastens, K.A., Reynolds, J.R., Edwards, M., Desonie, D., Shuster, R., and Paradis, S., 1996. Recent volcanism in the Siqueiros transform fault: picritic basalts and implications for MORB magma genesis. Earth and Planetary Science Letters, 141(1–4):91–108. http://dx.doi.org/10.1016/0012-821X(96)00052-0
Pettigrew, T.L., Casey, J.F., Miller, D.J., et al., 1999. Proceedings of the Ocean Drilling Program, Initial Reports, 179: College Station, TX (Ocean Drilling Program). http://dx.doi.org/10.2973/odp.proc.ir.179.1999
Rao, D.G., and Krishna, K.S., 2002. Magnetic rock properties of the gabbros from the ODP Drill Hole 1105 A of the Atlantis Bank, Southwest Indian Ridge. Journal of Earth System Science, 111(4):467–481. http://dx.doi.org/10.1007/BF02702059
Robinson, P.T., Erzinger, J., and Emmermann, R., 2002. The composition and origin of igneous and hydrothermal veins in the lower ocean crust—ODP Hole 735B, Southwest Indian Ridge. In Natland, J.H., Dick, H.J.B., Miller, D.J., and Von Herzen, R.P. (Eds.), Proceedings of the Ocean Drilling Program, Scientific Results, 176: College Station, TX (Ocean Drilling Program), 1–66. http://dx.doi.org/10.2973/odp.proc.sr.176.019.2002
Robinson, P.T., Von Herzen, R., et al., 1989. Proceedings of the Ocean Drilling Program, Initial Reports, 118: College Station, TX (Ocean Drilling Program). http://dx.doi.org/10.2973/odp.proc.ir.118.1989
Sanfilippo, A., Dick, H., and Ohara, Y., 2013. Melt-rock reaction in the mantle: mantle troctolites form the Parece Vela ancient spreading center. Journal of Petrology, 54(5):861–885. http://dx.doi.org/10.1093/petrology/egs089
Sanfilippo, A., and Tribuzio R., 2011. Melt transport and deformation history in a nonvolcanic ophiolitic section, northern Apennines, Italy: implications for crustal accretion at slow spreading settings. Geochemistry, Geophysics, Geosystems, 12(7):Q0AG04. http://dx.doi.org/10.1029/2010GC003429
Satsukawa, T., Ildefonse, B., Mainprice, D., Morales, L.F.B., Michibayashi, K., and Barou, F., 2013. A database of plagioclase crystal preferred orientations (CPO) and microstructures—implications for CPO origin, strength, symmetry and seismic anisotropy in gabbroic rocks. Solid Earth, 4:511–542. http://dx.doi.org/10.5194/se-4-511-2013
Schroeder, T., and John, B.E., 2004. Strain localization on an oceanic detachment fault system, Atlantis Massif, 30°N, Mid-Atlantic Ridge. Geochemistry, Geophysics, Geosystems, 5:Q11007 http://dx.doi.org/10.1029/2004GC000728
Shaw, H.R., 1972. Viscosities of magmatic silicate liquids; an empirical method of prediction. American Journal of Science, 272(9):870–893. http://dx.doi.org/10.2475/ajs.272.9.870
Shipboard Scientific Party, 1999a. Leg 176 summary. In Dick, H.J.B., Natland, J.H., Miller, D.J., et al., Proceedings of the Ocean Drilling Program, Initial Reports, 176: College Station, TX (Ocean Drilling Program), 1–70. http://dx.doi.org/10.2973/odp.proc.ir.176.101.1999
Shipboard Scientific Party, 1999b. Site 735. In Dick, H.J.B., Natland, J.H., Miller, D.J., et al., Proceedings of the Ocean Drilling Program, Initial Reports, 176: College Station, TX (Ocean Drilling Program), 1–314. http://dx.doi.org/10.2973/odp.proc.ir.176.103.1999
Smith, D.C., Spivack, A.J., Fisk, M.R., Haveman, S.A., Staudigel, H., and the Leg 185 Shipboard Scientific Party, 2000. Technical Note 28: Methods for Quantifying Potential Microbial Contamination during Deep Ocean Coring. Ocean Drilling Program. http://dx.doi.org/10.2973/odp.tn.28.2000
Teagle, D.A.H., Alt, J.C., Umino, S., Miyashita, S., Banerjee, N.R., Wilson, D.S., and the Expedition 309/312 Scientists, 2006. Proceedings of the Integrated Ocean Drilling Program, 309/312: Washington, DC (Integrated Ocean Drilling Program Management International, Inc.). http://dx.doi.org/10.2204/iodp.proc.309312.2006
Thy, P., 2003. Igneous petrology of gabbros from Hole 1105A: oceanic magma chamber processes. In Casey, J.F., and Miller, D.J. (Eds.), Proceedings of the Ocean Drilling Program, Scientific Results, 179: College Station, TX (Ocean Drilling Program), 1–76. http://dx.doi.org/10.2973/odp.proc.sr.179.017.2003
Till, J.L., and Moskowitz, B., 2013. Magnetite deformation mechanism maps for better prediction of strain partitioning. Geophysical Research Letters, 40(4):697–702. http://dx.doi.org/10.1002/grl.50170
Tribuzio, R., Tiepolo, M., and Thirlwall, M.F., 2000a. Origin of titanian pargasite in gabbroic rocks from the Northern Apennine ophiolites (Italy): insights into the late-magmatic evolution of a MOR-type intrusive sequence. Earth and Planetary Science Letters, 176(3–4):281–293. http://dx.doi.org/10.1016/S0012-821X(00)00014-5
Tribuzio, R., Tiepolo, M., and Vannucci, R., 2000b. Evolution of gabbroic rocks of the Northern Apennine ophiolites (Italy): comparison with the lower oceanic crust from modern slow-spreading ridges. Special Paper - Geological Society of America, 349:129–138. http://dx.doi.org/10.1130/0-8137-2349-3.129
Velde, B. (Ed.), 1985. Developments in Sedimentology (Volume 40): Clay Minerals: A Physico-Chemical Explanation of Their Occurrence: Amsterdam (Elsevier).
Von Herzen, R.P., and Scott, J.H., 1991. Thermal modeling for Hole 735B. In Von Herzen, R.P., Robinson, P.T., et al., Proceedings of the Ocean Drilling Program, Scientific Results, 118: College Station, TX (Ocean Drilling Program), 349–356. http://dx.doi.org/10.2973/odp.proc.sr.118.139.1991
White, W.M., and Klein, E.M., 2014. Composition of the oceanic crust. In Holland, H.D., and Turekian, K.K. (Eds.), Treatise on Geochemistry (Volume 4): The Crust: Amsterdam (Elsevier), 457–496. http://dx.doi.org/10.1016/B978-0-08-095975-7.00315-6
Wilson, D.S., Teagle, D.A.H., Acton, G.D., et al., 2003. Proceedings of the Ocean Drilling Program, Initial Reports, 206: College Station, TX (Ocean Drilling Program). http://dx.doi.org/10.2973/odp.proc.ir.206.2003
Wilson, D.S., Teagle, D.A.H., Alt, J.C., Banerjee, N.R., Umino, S., Miyashita, S., Acton, G.D., Anma, R., Barr, S.R., Belghoul, A., Carlut, J., Christie, D.M., Coggon, R.M., Cooper, K.M., Cordier, C., Crispini, L., Durand, S.R., Einaudi, F., Galli, L., Gao, Y., Geldmacher, J., Gilbert, L.A., Hayman, N.W., Herrero-Bervera, E., Hirano, N., Holter, S., Ingle, S., Jiang, S., Kalberkamp, U., Kerneklian, M., Koepke, J., Laverne, C., Vasquez, H.L.L., Maclennan, J., Morgan, S., Neo, N., Nichols, H.J., Park, S.-H., Reichow, M.K., Sakuyama, T., Sano, T., Sandwell, R., Scheibner, B., Smith-Duque, C.E., Swift, S.A., Tartarotti, P., Tikku, A.A., Tominaga, M., Veloso, E.A., Yamasaki, T., Yamazaki, S., and Ziegler, C., 2006. Drilling to gabbro in intact ocean crust. Science, 312(5776):1016–1020. http://dx.doi.org/10.1126/science.1126090
Xu, S., and Dunlop, D.J., 1994. Theory of partial thermoremanent magnetization in multidomain grains: 2. Effect of microcoercivity distribution and comparison with experiment. Journal of Geophysical Research: Solid Earth, 99(B5):9025–9033. http://dx.doi.org/10.1029/93JB02571
Yanagawa, K., Nunoura, T., McAllister, S.M., Hirai, M., Breuker, A., Brandt, L., House, C.H., Moyer, C.L., Birrien, J.-L., Aoike, K., Sunamura, M., Urabe, T., Mottl, M.J., and Takai, K., 2013. The first microbiological contamination assessment by deep-sea drilling and coring by the D/V Chikyu at the Iheya North hydrothermal field in the Mid-Okinawa Trough (IODP Expedition 331). Frontiers in Microbiology, 4:327. http://dx.doi.org/10.3389/fmicb.2013.00327
Yoshinobu, A.S., and Hirth, G., 2002. Microstructural and experimental constraints on the rheology of partially molten gabbro beneath oceanic spreading centers. Journal of Structural Geology, 24(6–7):1101–1107. http://dx.doi.org/10.1016/S0191-8141(01)00094-3
1 MacLeod, C.J., Dick, H.J.B., Blum, P., Abe, N., Blackman, D.K., Bowles, J.A., Cheadle, M.J., Cho, K., Ciążela, J., Deans, J.R., Edgcomb, V.P., Ferrando, C., France, L., Ghosh, B., Ildefonse, B.M., Kendrick, M.A., Koepke, J.H., Leong, J.A.M., Liu, C., Ma, Q., Morishita, T., Morris, A., Natland, J.H., Nozaka, T., Pluemper, O., Sanfilippo, A., Sylvan, J.B., Tivey, M.A., Tribuzio, R., and Viegas, L.G.F., 2017. Site U1473. In MacLeod, C.J., Dick, H.J.B., Blum, P., and the Expedition 360 Scientists, Southwest Indian Ridge Lower Crust and Moho. Proceedings of the International Ocean Discovery Program, 360: College Station, TX (International Ocean Discovery Program). http://dx.doi.org/10.14379/iodp.proc.360.103.2017
- F1. Expedition 360 operational time distribution.
- F2. Expedition 360 operational events plotted against depth.
- F3. Reentry system deployed, Hole U1473A.
- F4. A. Typical coring bit wear after BHA Run 4. B. Bit failure during BHA Run 6.
- F5. Fishing magnets used in attempts to recover lost roller cones, Hole U1473A.
- F6. Hole U1473A BHA Run 10 recovered a 0.5 m long × 18 cm fat core.
- F7. Hole U1473A BHA Run 13 recovered one of the four lost roller cones.
- F8. Recovered roller cone ground to about half of original volume.
- F9. Tricone bit used to advance Hole U1473A without coring before and after drilling.
- F10. Longest piece of rock recovered during Runs 17–21, Hole U1473A.
- F11. A. Attempts at fishing MBR retainer sleeve. B–D. Two gabbro cobbles with tool marks that perfectly fit a spare retainer sleeve.
- F12. Lithostratigraphic variations, Hole U1473A.
- F13. Pie charts of lithologic proportions for Atlantis Bank and Hole U1309D.
- F14. Mineral mode variations with depth, Hole U1473A.
- F15. Relationships in mineral mode for each lithology, Hole U1473A.
- F16. Variations in contact type with depth, Hole U1473A.
- F17. Subophitic textures and gradational structural contacts, Hole U1473A.
- F18. Grain sizes of plagioclase, clinopyroxene, and olivine, Hole U1473A.
- F19. Correlation of grain sizes between plagioclase and clinopyroxene and olivine, Hole U1473A.
- F20. Variations in texture types with depth, Hole U1473A.
- F21. Deformation-related features.
- F22. Olivine textures in gabbros.
- F23. Plagioclase textures in gabbros.
- F24. Clinopyroxene textures in gabbros.
- F25. Orthopyroxene textures in gabbros.
- F26. Opaque mineral textures in gabbros.
- F27. Brown amphibole textures in gabbros.
- F28. Accessory mineral occurrences in gabbros.
- F29. SHMSL MSP data, Hole U1473A.
- F30. Representative texture of oxide-rich seam in gabbros.
- F31. Representative texture of oxide gabbros.
- F32. Oxide and amphibole association in a diorite vein.
- F33. Oxide gabbros.
- F34. Texture of oxide in oxide gabbro, skeletal oxide patches, and sulfide globules.
- F35. Igneous layering, Hole U1473A.
- F36. Igneous layering displayed by grain size variations, Hole U1473A.
- F37. Different layers.
- F38. Quartz diorite, leucodiorite, and tonalite, Hole U1473A.
- F39. Felsic vein with halo, Hole U1473A.
- F40. Felsic patch in gabbro, Hole U1473A.
- F41. Branching felsic vein.
- F42. Felsic vein with granophyric texture.
- F43. Sheared normal sense felsic vein with euhedral amphibole grain.
- F44. Biotite-bearing felsic vein with brown amphibole and massive oxide.
- F45. Pie charts of numbers and thickness of felsic rocks, Hole U1473A.
- F46. Diabase.
- F47. CPO of plagioclase and amphibole at granoblastic dike margins.
- F48. First encountered granoblastic dike, Hole U1473A.
- F49. Hole U1473A lithostratigraphy compared with other holes from Atlantis Bank and Atlantis Massif.
- F50. Alteration intensity, reddish clay after olivine, magmatic veins, and vein filling minerals, Hole U1473A.
- F51. Hole U1473A olivine alteration minerals and intensity.
- F52. Hole U1473A clinopyroxene alteration minerals and intensity.
- F53. Hole U1473A orthopyroxene alteration minerals and intensity.
- F54. Hole U1473A plagioclase alteration minerals and intensity.
- F55. Hole U1473A core pieces with intense alteration close to veins.
- F56. Examples of olivine alteration.
- F57. Talc pseudomorphing olivine.
- F58. Olivine alteration.
- F59. Olivine alteration.
- F60. Olivine alteration.
- F61. XRD pattern of red and dark red clays drilled from pseudomorph.
- F62. Clinopyroxene alteration to secondary clinopyroxene and brown amphibole.
- F63. Plastic deformation of clinopyroxene.
- F64. Clinopyroxene alteration near felsic veins.
- F65. Clinopyroxene alteration to brown-green amphibole near a vein filled with brown-green amphibole.
- F66. Clinopyroxene alteration to green amphibole and pale green/colorless amphibole.
- F67. Orthopyroxene alteration.
- F68. Secondary plagioclase close to microfractures filled by green amphibole and actinolite.
- F69. Chlorite replacing plagioclase.
- F70. Plagioclase-olivine reaction rim showing talc, magnetite, actinolite, and chlorite.
- F71. Hydrogrossular partially replacing plagioclase.
- F72. Alteration features in a felsic vein cutting an olivine gabbro.
- F73. Reactions and emplacement processes at the contact of a felsic vein to host gabbro.
- F74. Reactions and emplacement processes at contact between a leucodiorite vein and a gabbro.
- F75. Characteristic microstructures of deformed felsic veins.
- F76. Characteristic microstructures in gabbro mylonites.
- F77. Characteristic microstructures of amphibole mylonites.
- F78. Whole thin section images of an olivine gabbro cataclasite.
- F79. Alteration features in cataclasite.
- F80. Proportions of different vein types in Hole U1473A.
- F81. Minerals identified on board using XRD, Hole U1473A.
- F82. Amphibole veins.
- F83. Centimeter-thick amphibole vein cutting weakly foliated gabbro.
- F84. Veins crosscutting Hole U1473A gabbros.
- F85. Hole U1473A vein types.
- F86. Alteration features in leucodiorite cutting a foliated gabbro.
- F87. Details of granophyric zone in leucodiorite vein.
- F88. Primary mineral replacements by calcite in felsic veins.
- F89. Recrystallization and metamorphism in diabase.
- F90. Comparison of granoblastically overprinted plagioclase microphenocrysts, Holes 1256D and U1473A.
- F91. Granoblastic overprint near/at contacts between metamorphosed diabase and gabbro.
- F92. Basis for interpretation of felsic melt formation.
- F93. Silica chemical potential vs. temperature diagram in the system CaO-MgO-Al2O3-SiO2-H2O.
- F94. Silica chemical potential vs. temperature diagram showing conditions in the system CaO-MgO-Al2O3-SiO2-H2O-CO2.
- F95. Activity diagram for simplified MgO-CaO-Al2O3-SiO2-H2O system at 200°C and 15 bar.
- F96. Activity diagram for simplified CaO-Al2O3-SiO2-H2O system at low temperature and pressure.
- F97. Depth distribution of magmatic vein dips, Hole U1473A.
- F98. Frequency distribution of measured magmatic vein dips, Hole U1473A.
- F99. Distribution and volume of magmatic veins with depth, Hole U1473A.
- F100. CPF characteristics plotted against depth, Hole U1473A.
- F101. Undeformed diorite vein, plagioclase and minor amphibole in vein.
- F102. Weakly deformed leucodiorite vein crosscutting altered gabbro mylonite.
- F103. Moderately deformed leucodiorite vein crosscutting a gabbro mylonite.
- F104. Heavily internally deformed but coherent felsic vein crosscutting a gabbro mylonite.
- F105. Relatively undeformed quartz-diorite vein showing diffusive boundaries with host gabbro crosscutting an olivine gabbro protomylonite.
- F106. Incipient leucodioritic magmatic breccia.
- F107. Magmatic breccias in core.
- F108. Semibrittle pull-apart structures bounded and filled by vein systems.
- F109. Frequency and distributions of magmatic contact dips, Hole U1473A.
- F110. Modal and grain size contacts.
- F111. Intrusive contacts.
- F112. Sheared or tectonic contacts.
- F113. Typical isotropic fabric, weakly to moderately developed magmatic fabric.
- F114. Igneous and tapered twins.
- F115. Magmatic fabrics, Hole U1473A.
- F116. A. Weak magmatic fabric. B. Fine-grained layer grading to coarse-grained material.
- F117. Grain size layering.
- F118. A. Irregular grain size variation. B. Grain size contact with subparallel magmatic fabric.
- F119. Early transition from magmatic to crystal-plastic deformation.
- F120. Porphyroclastic fabric marked by coarse clinopyroxene and olivine clasts and recrystallized plagioclase.
- F121. Mylonitic shear zone along oxide gabbro/olivine gabbro contact.
- F122. Shear zone morphologies.
- F123. A, B. Porphyroclastic fabric. C. Fine-grained mylonite. D. Clinopyroxene porphyroclast. E. Fractures displacing clinopyroxene porphyroclast. F. Mylonite layer.
- F124. Aspects of oxide-bearing shear zones.
- F125. Coarse-grained mylonite with asymmetric pattern of mylonitic foliation indicating dextral shear sense.
- F126. Progressive mylonite development from macro- to microscale.
- F127. Metamorphic vein density and amphibole, clay, and carbonate vein frequency, Hole U1473A.
- F128. Dip orientations of amphibole, clay, and carbonate veins, Hole U1473A.
- F129. High-temperature amphibole veins.
- F130. Low-temperature clay and carbonate veins.
- F131. Fault rock intensity and fracture density with depth, Hole U1473A.
- F132. A,B. Cataclasite, Hole U1473A. C. Fault breccia.
- F133. A. Carbonate-rich fault breccia and fractured (B) plagioclase and (C) pyroxene.
- F134. A, B. Carbonate-filled faults. C. Fault/ and host gabbro contact. D. Sparry calcite filling center of fault.
- F135. A, C. Faults filled with calcite. B. Crosscutting relationships between contact, fault, and calcite vein. C. Branched fault filled with calcite.
- F136. A. Histogram of discrete fracture dips, Hole U1473A. B. Distribution of dip magnitude with depth.
- F137. A. Fracture surface with slickenlines on olivine gabbro. B. Slickenlines with rake of 63° from y in the CRF.
- F138. Transition from magmatic to crystal-plastic deformation textures in gabbros.
- F139. Submagmatic and semibrittle structures.
- F140. Crosscutting relationships between different fabric generations.
- F141. CPF intensity and magnetic susceptibility, Hole U1473A.
- F142. Oxide and olivine gabbros.
- F143. Angles between amphibole vein dips and crystal-plastic foliations, Hole U1473A.
- F144. Crosscutting relationships of amphibole veins in gabbros.
- F145. Comparison of CPF intensity and amphibole vein occurrence, Hole U1473A.
- F146. Brittle overprint of CPFs.
- F147. Comparison of CPF intensity between Holes U1473A, 1105A, and 735B.
- F148. Geochemistry of rocks recovered, Hole U1473A.
- F149. CaO vs. MgO for lithologies recovered from Hole U1473A and Hess Deep.
- F150. Chemical variations of Mg# and Ni and Cr, Hole U1473A.
- F151. Chemical variations of Ca# and TiO2 and Y, Hole U1473A.
- F152. Comparison of downhole variation in Mg#, Holes U1473A and 735B.
- F153. Volatile content of Hole U1473A lithologies by LOI and CHNS analyzer.
- F154. H2O and CO2 downhole depth, Hole U1473A.
- F155. Relative element abundances in adjacent altered vs. fresh samples, Hole U1473A.
- F156. Whole-round samples collected for microbiology, Hole U1473A.
- F157. NRM intensity and low-field magnetic susceptibility for simplified lithologic groups, Hole U1473A.
- F158. AF demagnetization of archive section halves, Hole U1473A.
- F159. Low-coercivity remanence components in archive section halves, Hole U1473A.
- F160. NRM run to investigate change in declination bias.
- F161. Archive section half magnetic data, Hole U1473A.
- F162. AF and thermal demagnetization of discrete samples, Hole U1473A.
- F163. Demagnetization behavior in discrete samples, showing effects of physical properties treatment, Hole U1473A.
- F164. Thermal demagnetization of thermoviscous remanence acquired during heating, Hole U1473A.
- F165. Representative unblocking temperature curves for thermally demagnetized discrete samples, Hole U1473A.
- F166. Discrete sample bulk magnetic properties and principal component directions, Hole U1473A.
- F167. Inclination data from Hole U1473A before and after piece averaging.
- F168. Samples with characteristic normal polarity components, Hole U1473A.
- F169. Log-log plot of NRM vs. magnetic susceptibility, Hole U1473A.
- F170. Shape factor vs. corrected anisotropy degree for AMS, Hole U1473A.
- F171. Comparison of magnetic fabrics and CPFs, Hole U1473A.
- F172. AMS results in core coordinates, Hole U1473A.
- F173. Petrophysics measurements, Hole U1473A cores.
- F174. Higher NGR values correspond to felsic intervals, Hole U1473A.
- F175. Magnetic susceptibility from the upper part of Hole U1473A.
- F176. Comparison of magnetic susceptibility from Holes 735B, 1105A, and U1473A, Atlantis Bank.
- F177. Compressional velocity vs. bulk and grain density in Hole U1473A, compared with Hole 735B and Site U1309.
- F178. Compressional velocity vs.t porosity, background alteration, and olivine mode, Hole U1473A.
- F179. Variation in VP anisotropy, Hole U1473A.
- F180. VP apparent anisotropy as a function of CPF intensity and dip, Hole U1473A.
- F181. Thermal conductivity measurements in selected gabbroic cores.
- F182. Downhole logs of unprocessed data, Hole U1473A.
- F183. Borehole fluid temperature at end of Expedition 360.
- F184. NGR, Hole U1473A.
- F185. Comparison of core logging vs. downhole magnetic susceptibility, Hole U1473A.
- F186. FMS data from the deepest section of Hole U1473A.
- F187. UBI images of the borehole from three different depth intervals.
- F188. Initial petrophysical summary, Hole U1473A.
- T1. Site U1473 core summary.
- T2. Operational summary information by BHA run number, Hole U1473A.
- T3. Igneous intervals, Hole U1473A.
- T4. Grain size intervals, Hole U1473A.
- T5. Summary of each section, Hole U1473A.
- T6. Numbers and thickness of felsic rocks, Hole U1473A.
- T7. Igneous veins described, Hole U1473A.
- T8. Macroscopically estimated vein types, Hole U1473A.
- T9. XRD analysis of shipboard samples, Hole U1473A.
- T10. Vein types estimated in thin sections, Hole U1473A.
- T11. Geochemical data, Hole U1473A.
- T12. Average primary crustal composition at Atlantis Bank, Atlantis Massif, Hess Deep, and MORB.
- T13. TC by CHNS and IC by coulometry, Hole U1473A.
- T14. ATP raw luminescence and concentration, Hole U1473A.
- T15. Exoenzyme activity rates from assays, Hole U1473A.
- T16. Microbiology samples for enrichment cultures and nutrient addition experiments, Hole U1473A.
- T17. PFMD and PMCH tracers in drilling fluids and samples, Hole U1473A.
- T18. Piece-averaged remanence data, Hole U1473A.
- T19. Inclination-only mean statistics, Holes U1473A, 1105A, and Atlantis Bank.
- T20. Discrete physical properties measurements, Hole U1473A.
- T21. Velocity, density, and porosity measurements, Hole U1473A.
- T22. Thermal conductivity measurements, Hole U1473A.