Hall, I.R., Hemming, S.R., LeVay, L.J., and the Expedition 361 Scientists
Proceedings of the International Ocean Discovery Program Volume 361
publications.iodp.org
doi:10.14379/iodp.proc.361.105.2017

Site U14761
I.R. Hall, S.R. Hemming, L.J. LeVay, S. Barker, M.A. Berke, L. Brentegani, T. Caley, A. Cartagena-Sierra, C.D. Charles, J.J. Coenen, J.G. Crespin, A.M. Franzese, J. Gruetzner, X. Han, S.K.V. Hines, F.J. Jimenez Espejo, J. Just, A. Koutsodendris, K. Kubota, N. Lathika, R.D. Norris, T. Periera dos Santos, R. Robinson, J.M. Rolinson, M.H. Simon, D. Tangunan, J.J.L. van der Lubbe, M. Yamane, and H. Zhang2
Keywords: International Ocean Discovery Program, IODP, JOIDES Resolution, Expedition 361, Site U1476, Agulhas Current, Agulhas Leakage, Agulhas Plateau, Agulhas Retroflection, Agulhas Return Current, Agulhas Rings, Agulhas Undercurrent, Atlantic Meridional Overturning Circulation, boundary current, Cape Basin, Circumpolar Deep Water, Congo Air Boundary, Delagoa Bight, East Madagascar Current, human evolution, Indian Ocean, Indonesian Throughflow, interocean exchange, Intertropical Convergence Zone, Last Glacial Maximum, Limpopo River, Middle Pleistocene Transition, Miocene, Mozambique Channel, Natal Valley, North Atlantic Deep Water, ocean circulation, paleoceanography, paleoclimate, Pleistocene, Pliocene, salinity, southern Africa, Southern Ocean, Subantarctic Zone, Subtropical Front, Subtropical Gyre, thermohaline circulation, Warm Water Route, Western Boundary Current, Zambezi River
MS 361-105: Published 30 September 2017
Background and objectives
Site U1476 is located on Davie Ridge at the northern entrance of the Mozambique Channel (15°49.25′S; 41°46.12′E) in the immediate vicinity of Deep Sea Drilling Project (DSDP) Site 242 (Simpson, Schlich, et al., 1974) at a water depth of 2166 m below sea level (mbsl) (Figure F1, F2).
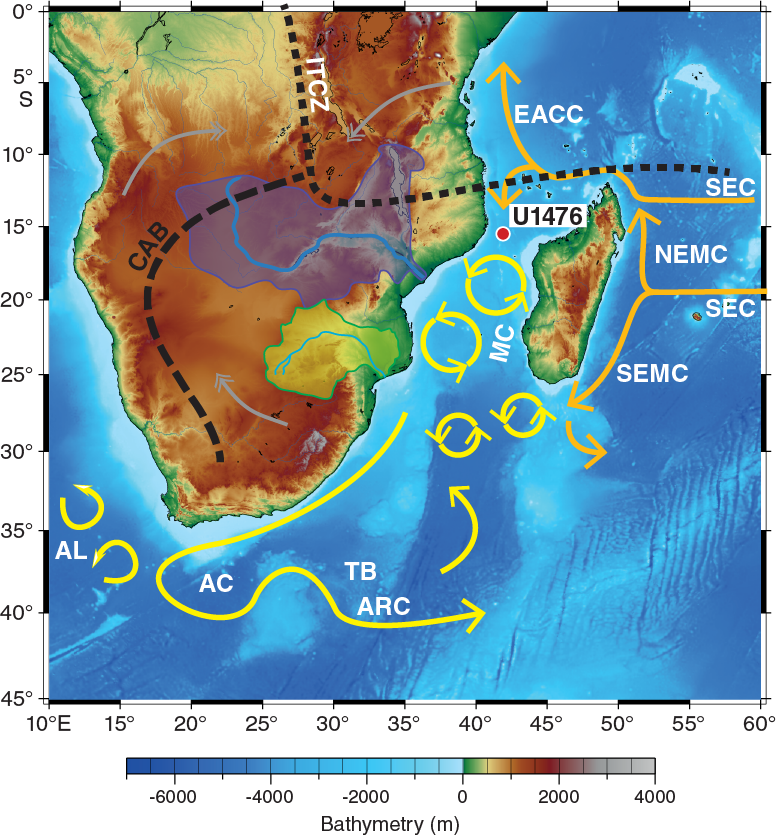
Figure F1. Location map of Site U1476 with main surface currents in the southwest Indian Ocean.
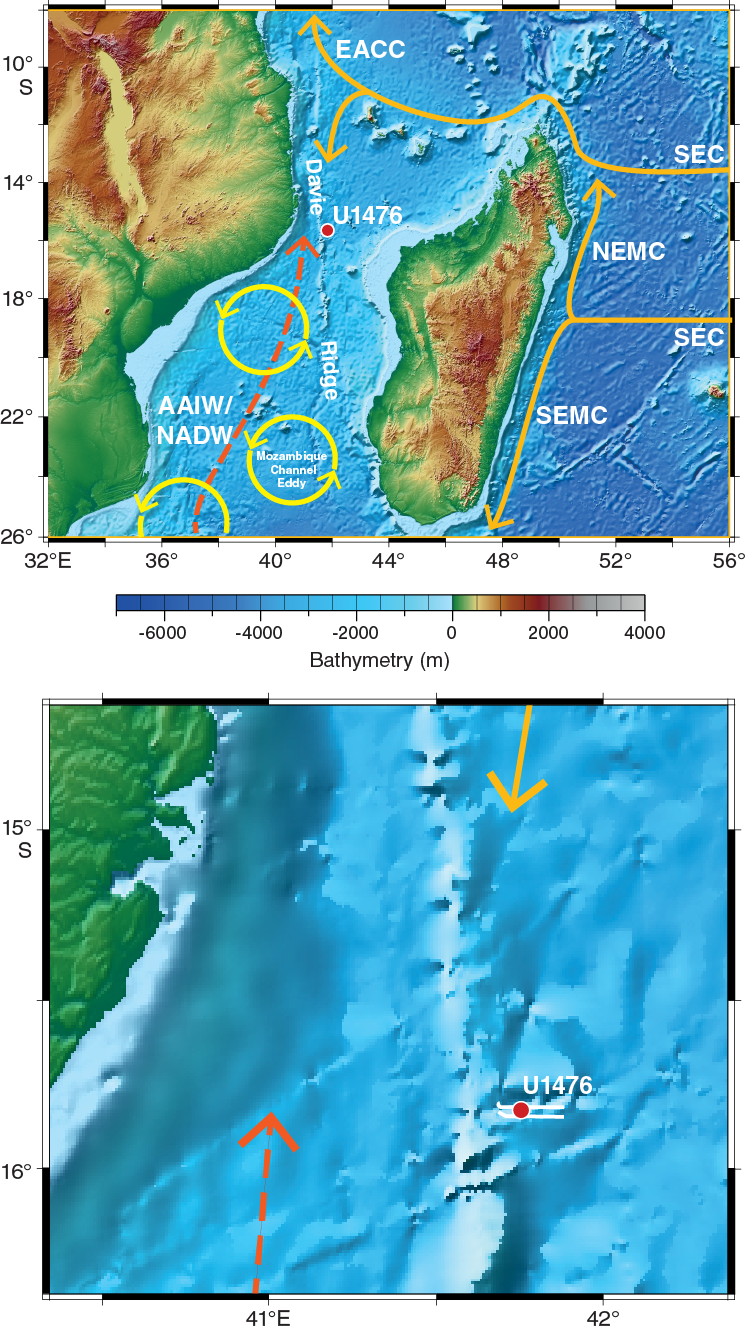
Figure F2. Geomorphologic and oceanographic features near Site U1476.
The Mozambique Channel is considered to be one of the most turbulent areas in the world ocean (Ternon et al., 2014). It is bordered by Madagascar to the east and the coast of Mozambique to the west, and at its southern border the channel feeds into the greater Agulhas Current system. The Mozambique Channel is characterized by complex and variable surface and subsurface circulation (Figure F2). Several water masses converge within the Mozambique Channel (Figure F3), transporting Tropical Surface Water (TSW), Subtropical Surface Water (STSW), Equatorial Indian Ocean Water (EIOW), Arabian Sea High Salinity Water (ASHSW), and Red Sea Intermediate Water (RSIW) into the Agulhas Current (de Ruijter et al., 2002, 2005; Schott et al., 2009; Collins et al., 2016). At depth, the Mozambique Undercurrent carries North Atlantic Deep Water (NADW), South Indian Central Water (SICW), and Antarctic Intermediate Water (AAIW) toward the Equator along the continental slope (de Ruijter et al., 2002; Ullgren et al., 2012). In general, the circulation is dominated by mesoscale activity (e.g., Biastoch and Krauss, 1999; de Ruijter et al., 2002; Ridderinkhof and de Ruijter, 2003; Schouten et al., 2003; Lutjeharms, 2006) and is related to the inflow of the Indonesian Throughflow, the Tasman Strait Throughflow, and the strength of the tropical and subtropical surface gyres in the Indian Ocean (Penven et al., 2006; Palastanga et al., 2006; Ridderinkhof et al., 2010; Schott et al., 2009; Backeberg and Reason, 2010). Satellite observations (e.g., Schouten et al., 2003; Quartly and Srokosz, 2004) and ocean models (Biastoch and Krauss, 1999) have shown that mesoscale eddies generally form as the channel narrows, close to Davie Ridge (~16°S), between the northern and central basin. These anticyclonic eddies typically maintain rotational velocity that is often >1.5 m/s (Schouten et al., 2003; Ullgren et al., 2012), as ~4–7 eddies migrate southward through the channel per year. Ridderinkhof and de Ruijter (2003) have shown that the hydrographic influence of these eddies extends to 2000 mbsl, with vertical migration of isopycnals occasionally exceeding 40 m per day in the upper layer (σθ = 25.0 kg/m) during the passage of an eddy (Ullgren et al., 2012). The development of eddies in the Mozambique Channel and their southward propagation within the greater Agulhas Current system seed the generation of solitary meanders that progress downstream in the Agulhas Current, the so-called Natal Pulses (Schouten et al., 2002; Tsugawa and Hasumi, 2010). Accordingly, processes in the Mozambique Channel have downstream implications for the Agulhas Current including its leakage into the South Atlantic Ocean (e.g., Bryden et al., 2005; Biastoch et al., 2008, 2009). In turn, Mozambique Channel eddies may also be linked with interannual modes of Indian and Pacific Ocean variability, implying a connection with the Indian Ocean Dipole and Pacific Ocean La Niña/El Niño phases (Schouten et al., 2002; Palastanga et al., 2006).
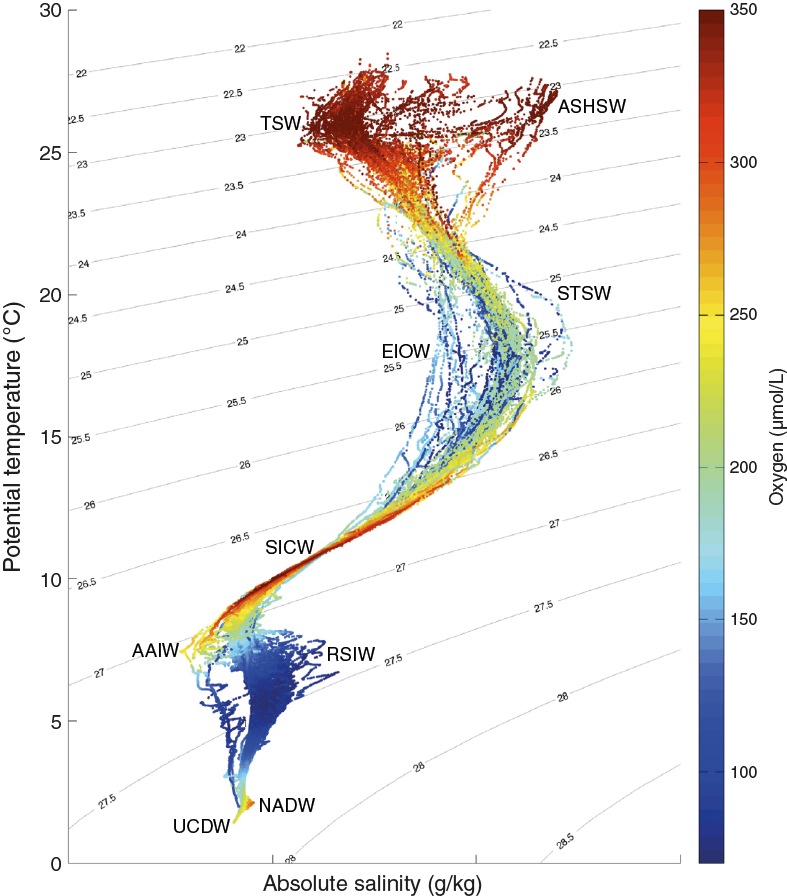
Figure F3. Temperature-salinity diagram of hydrographic stations from the Comoros Basin, close to the location of Site U1476.
Despite such potentially significant upstream connections, only limited paleoceanographic evidence currently exists to document the longer term linkage between variability in the northern source waters of the Agulhas Current and its eventual leakage into the South Atlantic Ocean. Unpublished data from presite survey sediment Core GIK16162-2 (2045 mbsl) located on Davie Ridge and spanning the last three glacial–interglacial cycles (0–350 ka) suggest the potential for obtaining high-quality paleoceanographic records (Parari et al., 2013). Site U1476 primary objectives are to
- Recover a complete Pliocene–Pleistocene sedimentary succession, including the early Pliocene warm period, mid-Pliocene expansion of Northern Hemisphere ice sheets, and the mid-Pleistocene transition, from the northern Mozambique Channel;
- Reconstruct Mozambique Current warm-water transports during periods of orbitally modulated and suborbitally accelerated climate changes; and
- Assess the influence of remote upstream forcing (i.e., monsoonal, Indonesian Throughflow, and Red Sea outflow) on southeast African warm-water transports.
Specific questions that will be addressed include the following: Did the restriction of the Indonesian Seaway and the associated change in character of the Indonesian Throughflow in the Pliocene (e.g., Cane and Molnar, 2001; Karas et al., 2009, 2011; Fedorov et al., 2013) affect the Agulhas Current source region in the western tropical Indian Ocean and thus impact warm- and salt-water transports along the southeast African margin? Did the Agulhas Current, by way of far-field controls on tropical-subtropical wind forcing, respond to the long-term development of tropical climates and the associated weakening of the monsoons in the course of the global cooling of the Pliocene (e.g., Haywood and Valdes, 2004; Haywood et al., 2016; Rosenbloom et al., 2013; Wan et al., 2010; Zhang et al., 2013)?
Figure F2 illustrates the complex regional bathymetry of the Mozambique Channel, which is the result of early spreading between Africa and Madagascar and associated formation of oceanic crust and volcanic basement features (e.g., Salman and Abdula, 1995; Leinweber et al., 2013; Geiger et al., 2004; Rabinowitz and Woods, 2006; Mahanjane, 2012, 2014). The Mozambique Channel is divided into two distinct ocean basins (northern and central) by the pronounced approximately north-south–trending (along the 42°E meridian) and weakly seismic Davie Ridge. The ridge, a post-Cretaceous expression of the Davie fracture, has steep eastern and western flanks extending to an average of ~3000 mbsl in the channel. The ridge disappears as a morphological feature at ~19°S where it merges with the lower Zambezi Canyon (Simpson, Schlich, et al., 1974).
DSDP Site 242 (15°50.65′S; 41°49.23′E) is located on Davie Ridge in a water depth of 2275 mbsl. The site was spot cored through the pelagic sediment cover, providing a 9.5 m core every ~50 to ~100 m. Although the stratigraphy is quite coarse, the 676 m sequence appears to be essentially nannofossil ooze with at least 50% calcareous components and extends to the upper Eocene, suggesting that (1) there was nearly uniform, uninterrupted deposition since the late Eocene with average accumulation rate of ~2 cm/ky and (2) the site was at oceanic depth by the late Eocene and has been above the carbonate compensation depth ever since.
The location for Site U1476 is not quite the same as Site 242, although in effect the intention is to replicate that record. The reason for shifting Site U1476 away from Site 242 comes mainly from additional presite survey data collected during the R/V Meteor Cruise M75/3 in 2008 (Figures F3, F4). The subbottom profile (parasound) data collected during this cruise reveal the presence of hyperbolic returns at the location of Site 242 (Figure F5), which are to some extent regularly spaced. These reflectors are attributed to small-scale sediment waves and are inferred to indicate strong current influence or perhaps near-surface sediment slumping. In contrast at Site U1476, where almost the same thickness of the overall section is found, the uppermost sediment reflectors appear mostly simple and parallel (Figures F6, F7).
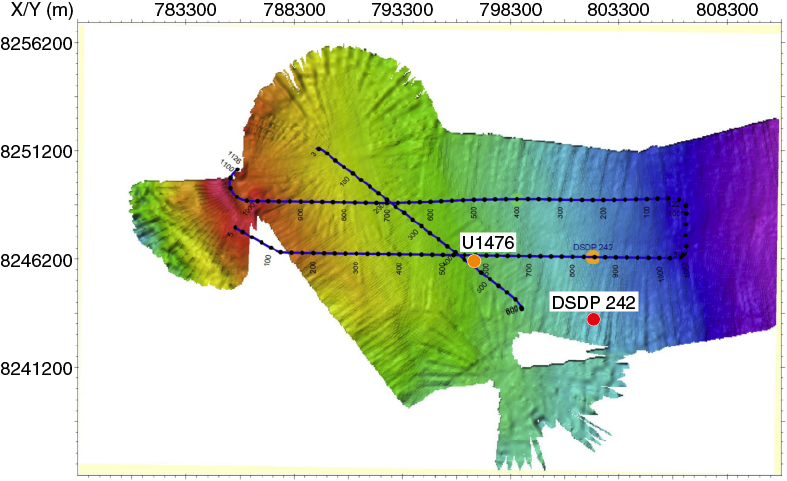
Figure F4. Multibeam bathymetry around Site U1476 and DSDP Site 242.
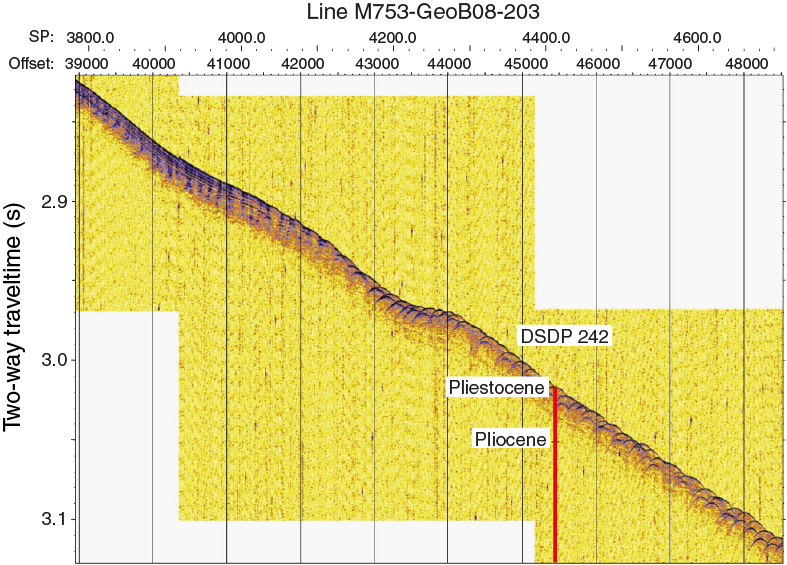
Figure F5. Parasound data along seismic Line M753-GeoB08-203 across DSDP Site 242.
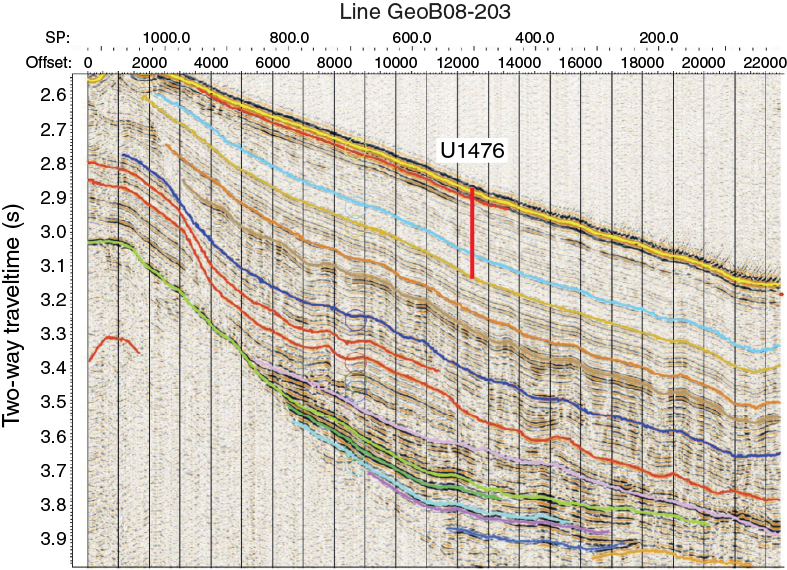
Figure F6. Seismic Line M753-GeoB08-205 across Site U1476.
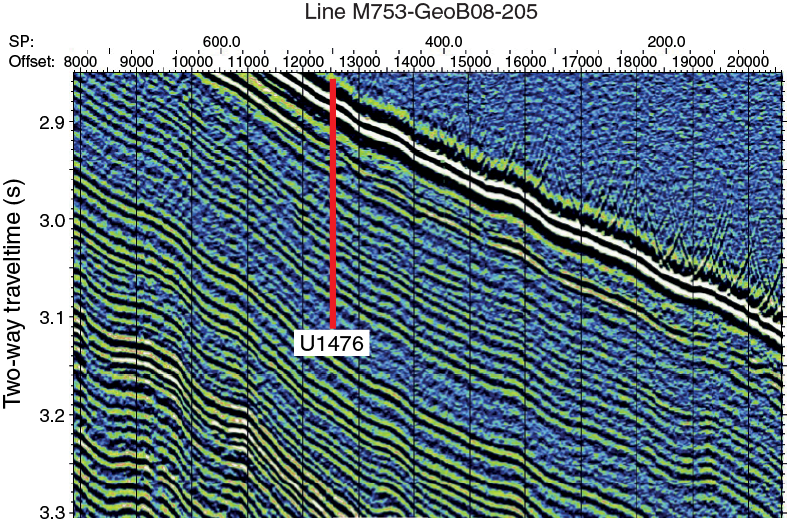
Figure F7. Detail of seismic Line M753-GeoB08-205 at Site U1476.
Site U1476 was occupied on 8 March 2016. Five holes were drilled and cored using the advanced piston corer (APC), achieving a depth of 234.8 m drilling depth below seafloor (DSF) in Hole U1476E. The total cored interval at Site U1476 was 841.1 m, and total recovery was 873.85 m (104%).
Operations
Transit to Site U1476
After completing operations at Site U1475, the vessel initially transited toward the Mozambique Channel. However, after not receiving clearance to operate within the Mozambique Exclusive Economic Zone by the end of the day on 2 March 2016, the decision was made at 1730 h to halt the transit to Site U1477 and abandon the Mozambique sites. Rather, an alternative operations plan consisting of Site U1479 and a redrill of Ocean Drilling Program (ODP) Site 1089 would be carried out.
At 1313 h on 3 March, the vessel received news that the clearance documents had been signed by Mozambique officials (35 days after the start of the expedition) and the diplomatic note would be sent to the vessel and the R/V JOIDES Resolution Science Operator when it was received by the embassy. The decision was made to transit to the northernmost site (U1476) so that reduced coring operations could be attempted at all of the primary proposed sites within the remaining expedition days. The vessel changed course and was under way to Site U1476 at 1318 h on 3 March. After an 1888 nmi transit from Site U1475, the vessel arrived on site at 0048 h on 8 March.
Site U1476
Site U1476 consisted of 5 holes, ranging in depth from 5.7 to 234.8 m DSF (Table T1). Overall, 90 cores were recorded for the site. A total of 873.85 m of core over an 841.1 m interval was recovered using the APC system (104% core recovery). One interval was advanced without coring over 1.0 m. The total time spent at Site U1476 was 4.1 days.
Table T1. Site U1476 core summary. Download table in .csv format. View PDF table.
Hole U1476A
The vessel arrived at Site U1476 at 0048 h on 8 March 2016. The first APC core was filled with water, and the bit was lowered 7 m for a second attempt. Hole U1476A was spudded at 0935 h, and a 5.72 m core was retrieved (Core 361-U1476A-1H). Seafloor depth was calculated at 2165.7 mbsl. Cores 1H through 24H (0–224.2 m DSF) were taken using nonmagnetic core barrels with 104% core recovery. Hole U1476A was terminated after reaching APC refusal depth. The drill string was pulled out of the hole, with the bit clearing the seafloor at 0705 h on 9 March, ending Hole U1476A.
Hole U1476B
The vessel was offset 20 m north of Hole U1476A, and Hole U1476B was spudded at 0815 h on 9 March. Seafloor was calculated at 2166.5 mbsl based on recovery from Core 361-U1476B-1H. Cores 1H through 16H (0–148.4 m DSF) were recovered with 154.42 m of sediment (104%). Interstitial water whole-round samples were taken from every core section for postcruise research. The drill string was pulled from the hole and cleared the seafloor at 2115 h on 9 March, ending Hole U1476B.
Hole U1476C
The vessel was offset 20 m east of Hole U1476A. Hole U1476C was spudded at 2225 h on 9 March, and Core 361-U1476C-1H recovered 5.72 m of sediment. The stratigraphic correlation specialists determined that the coring gaps were aligned, and Hole U1476C was ended at 2245 h.
Hole U1476D
Hole U1476D was spudded at 2330 h with a 1.0 m drilled interval. This was done to ensure offset coring gaps between holes. Cores 361-U1476D-2H through 25H (1.0–229.0 m DSF) were recovered with 228.0 m of sediment (103% core recovery). After reaching 229.0 m DSF, the drill string was pulled from the hole, and the bit cleared the seafloor at 2015 h on 10 March, ending Hole U1476D. At total of 237.02 m of core was retrieved over a 228.0 m cored interval.
Hole U1476E
The vessel was offset 20 m south of Hole U1476A, and Hole U1475E was spudded at 2125 h on 10 March. Cores 361-U1476E-1H through 25H (0–234.8 m DSF) recovered 243.77 m of sediment (104% core recovery). After reaching 234.8 m DSF, the drill string was pulled from the hole, and the bit cleared the seafloor at 2050 h on 11 March. The positioning beacon was recovered at 0102 h on 12 March. The rig floor was secured for transit at 0335 h, and the thrusters were raised at 0349 h. The vessel began the transit to Site U1477 at 0400 h, ending Site U1476.
Sedimentology
Drilling at Site U1476 recovered a total of ~874 m of sediment from five holes (Figures F8, F9; also see Operations). The penetrated interval represents an uninterrupted sedimentary record from the late Miocene to the Holocene. Hole U1476A was cored to 224.57 m coring depth below seafloor (CSF-A), Hole U1476B to 148.99 m CSF-A, Hole U1476C to 5.72 m CSF-A, Hole U1476D to 229.42 m CSF-A, and Hole U1476E to 235.41 m CSF-A. The APC system was applied in all holes. One interval was advanced without coring over 1 m in Hole U1476D (0–1.0 m CSF-A). Visual description of all cores was performed and recorded using the shipboard lithostratigraphic DESClogik program, which involves visual assessment of average grain size, sediment color, sedimentary structures, and bioturbation intensity. Disturbances induced by drilling were also described. Lithologic characteristics were further determined using smear slide analyses, and a total of 657 shipboard samples were collected from the working halves of the cores from Holes U1476A and U1476B for paleontological, physical property, paleomagnetic, and geochemical analyses (Table T2).
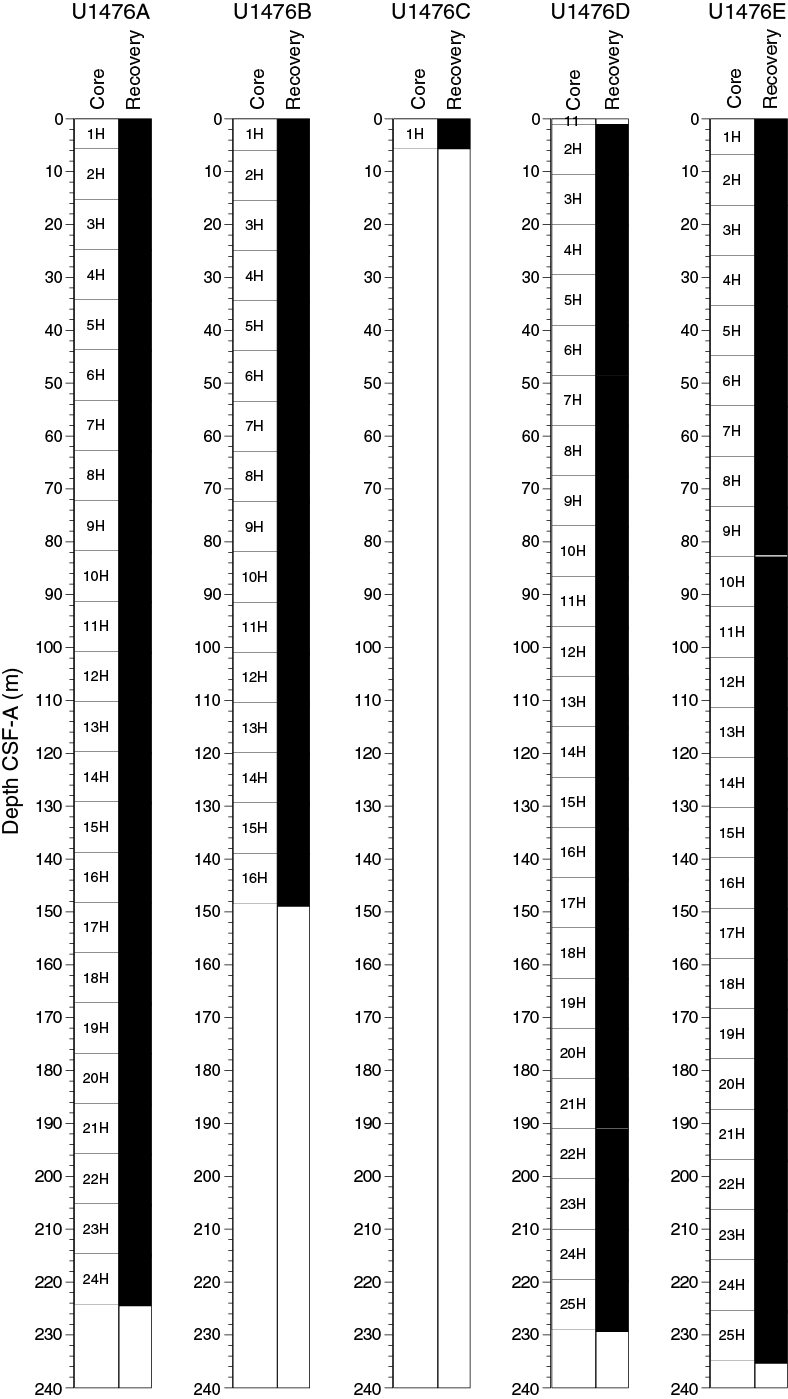
Figure F8. Core recovery, Holes U1476A–U1476E.
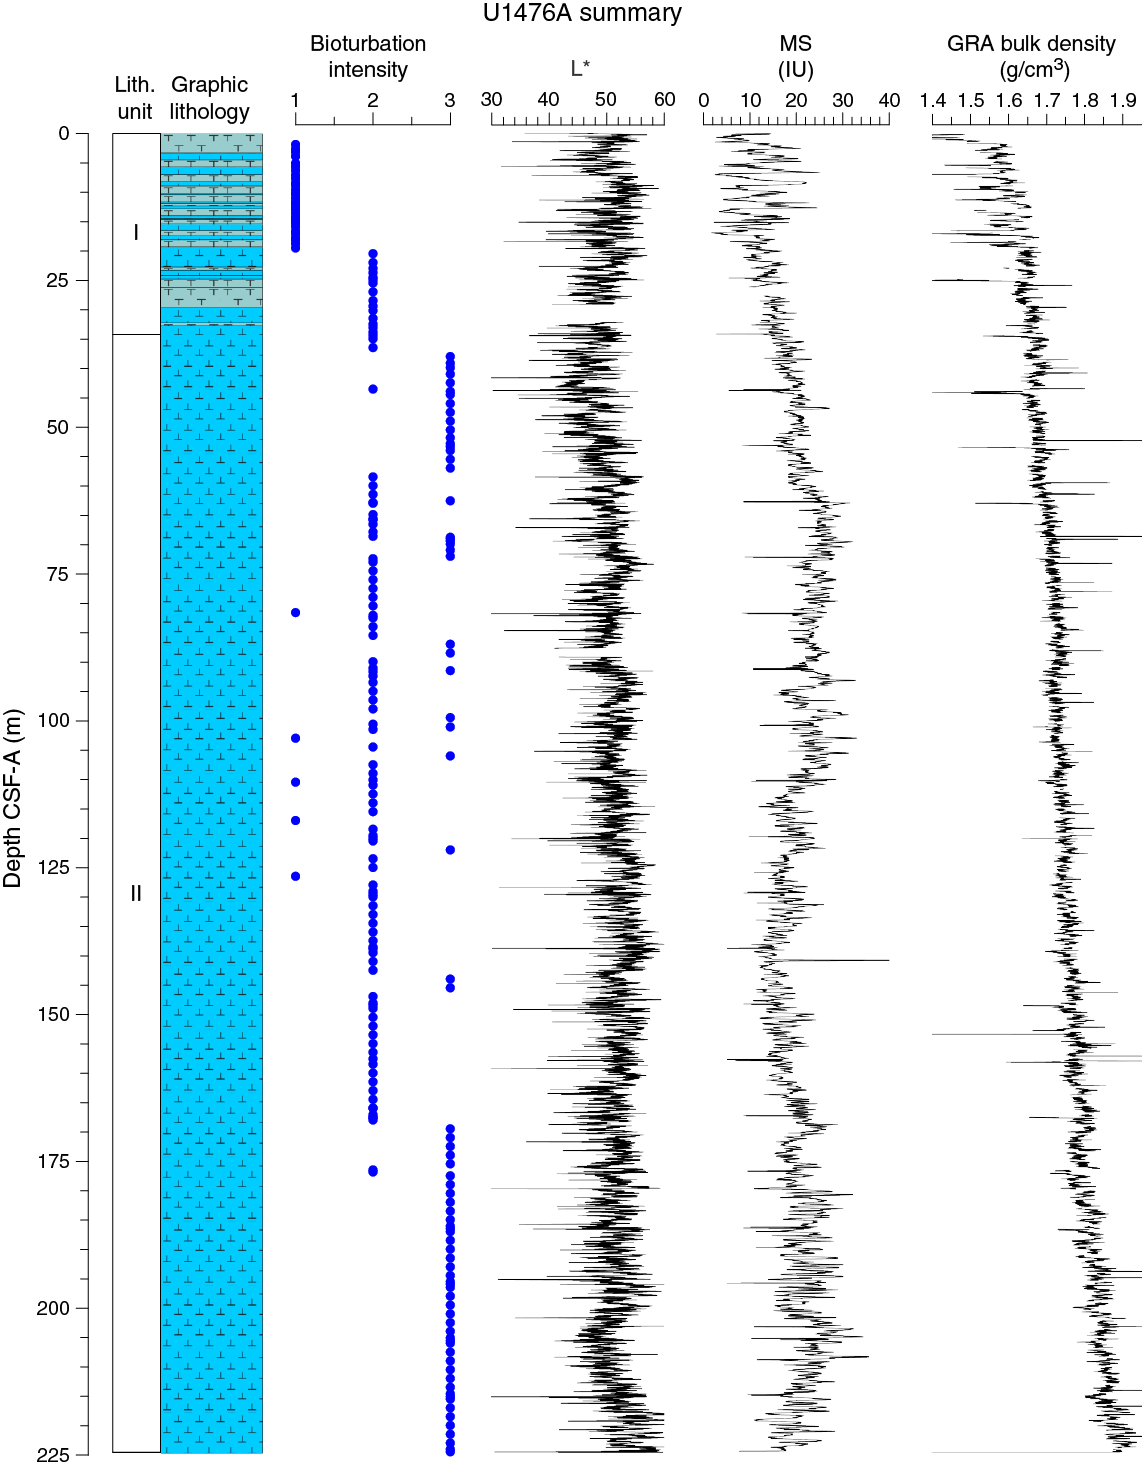
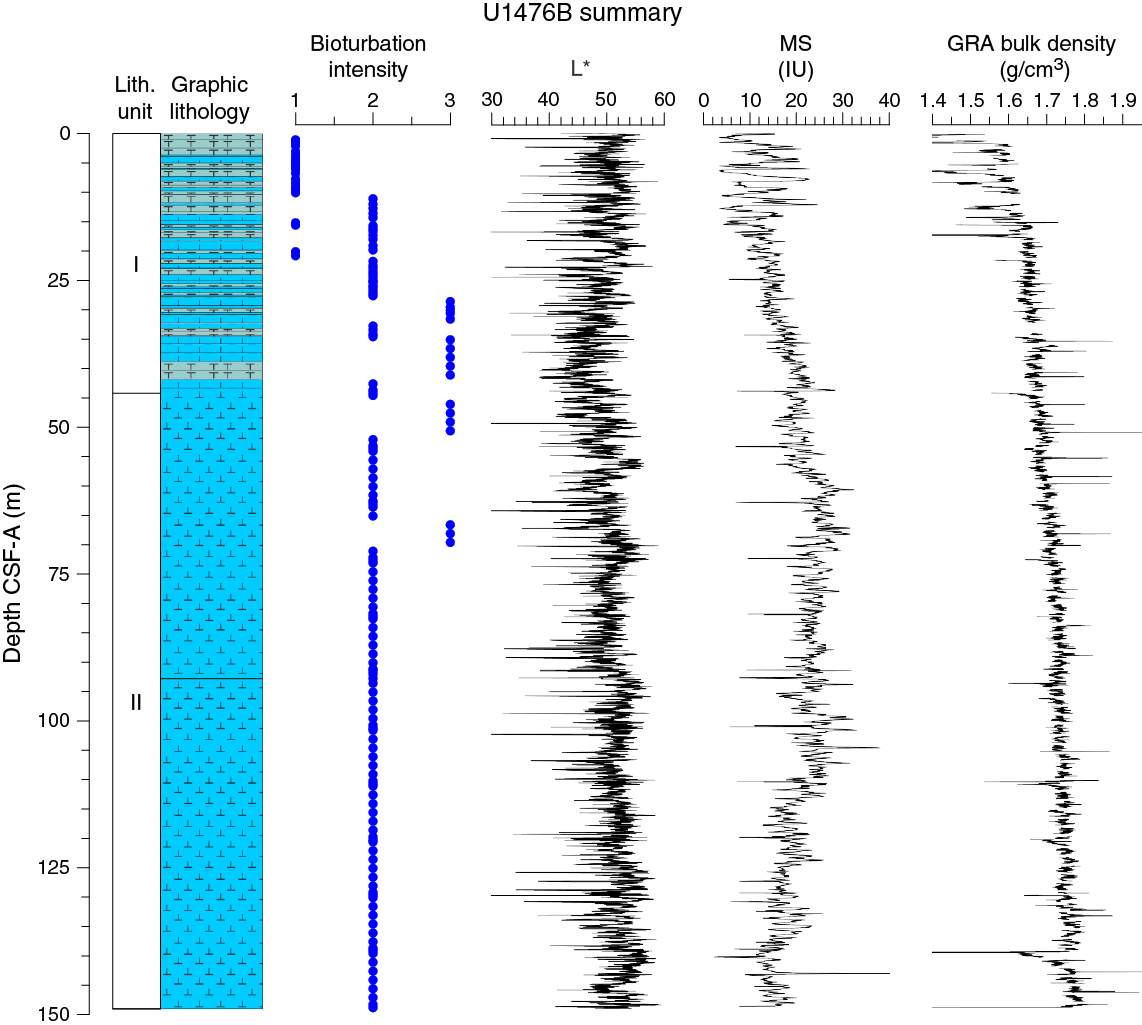
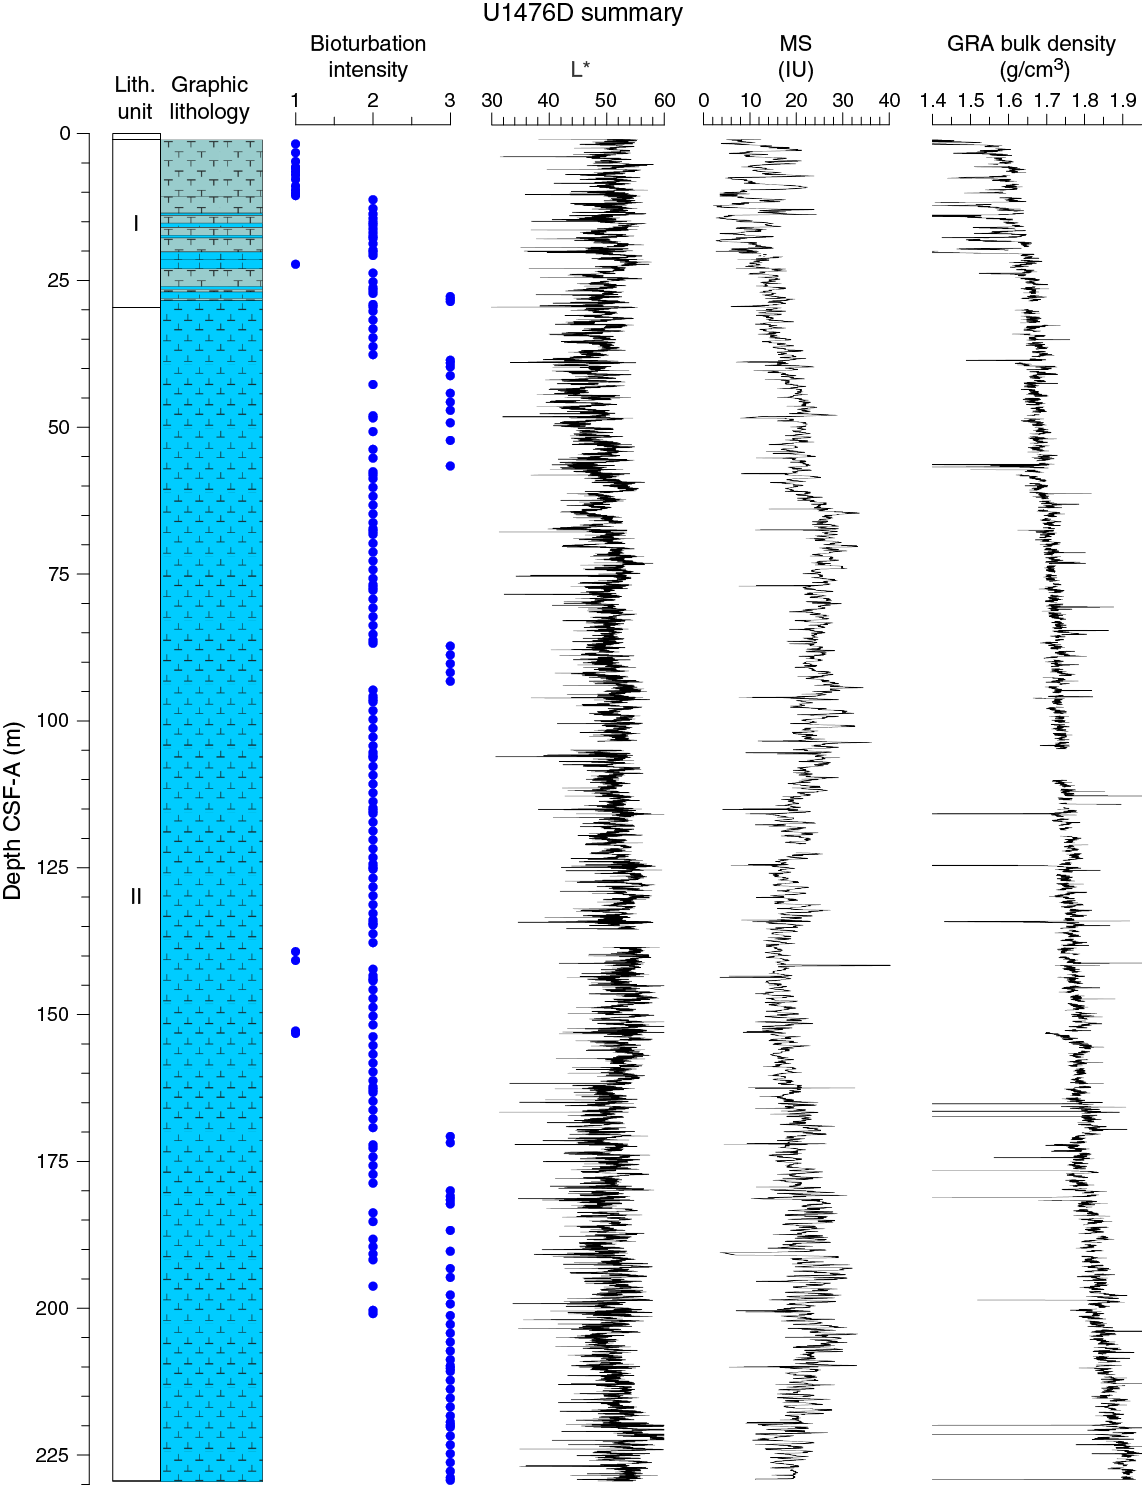
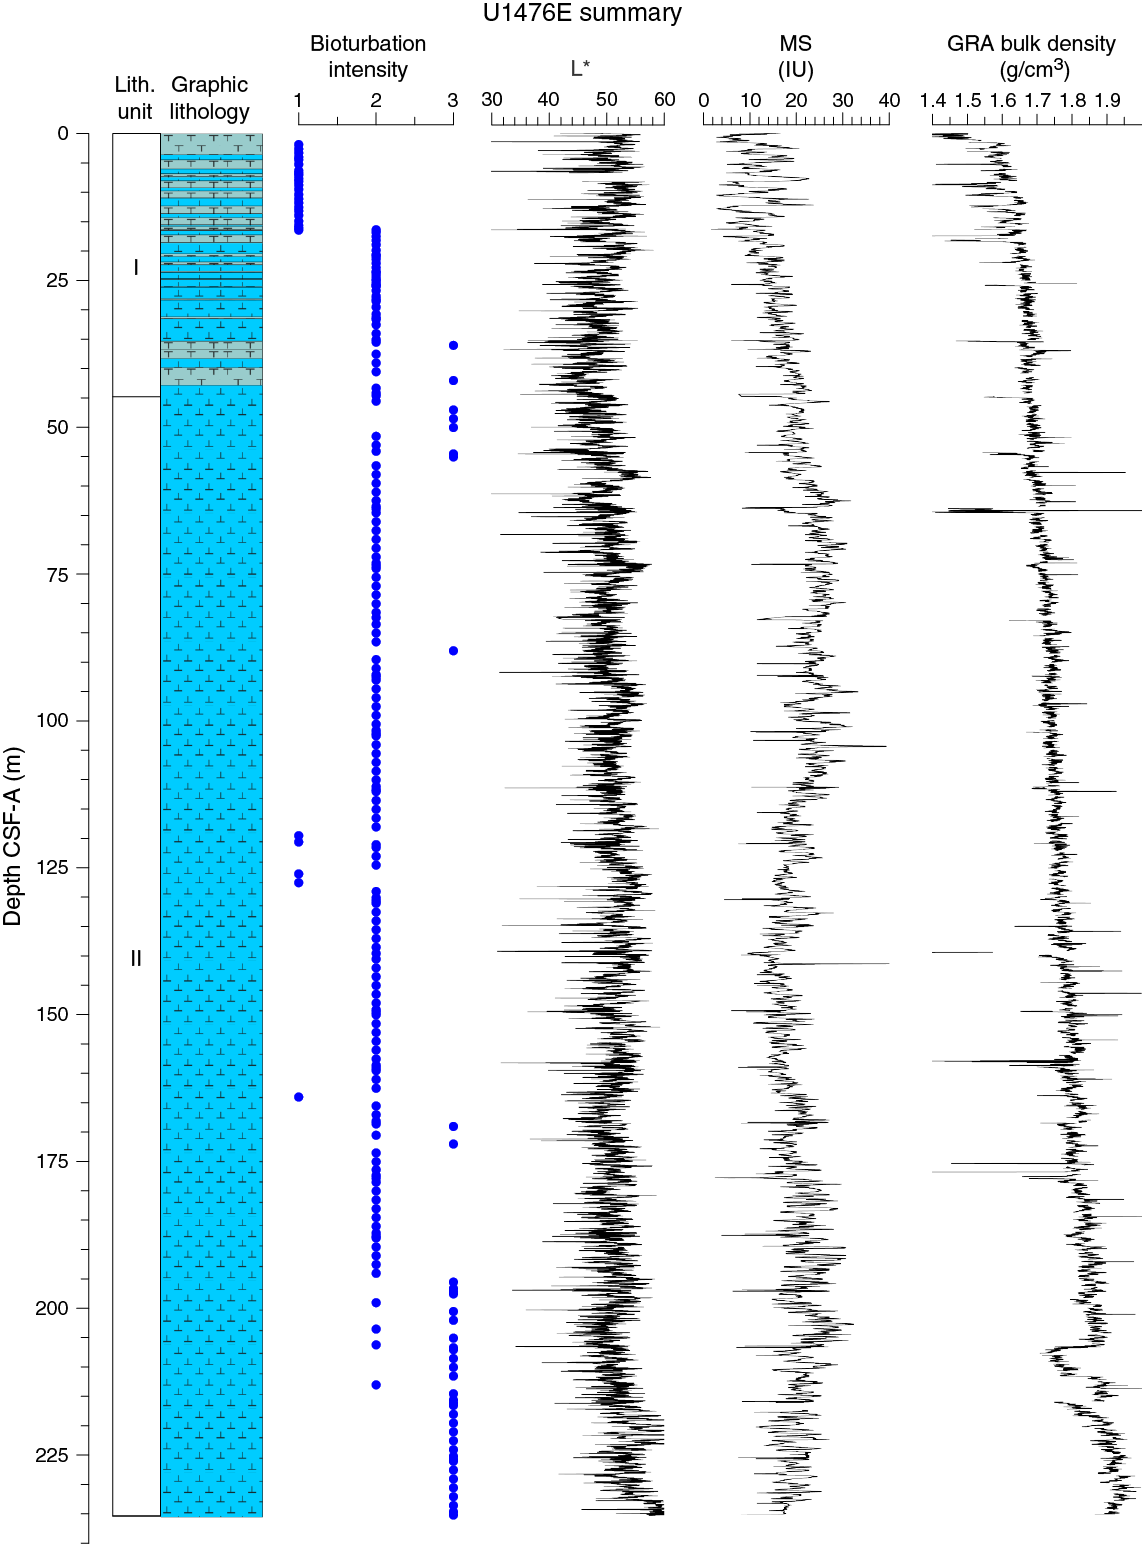
Figure F9. Lithostratigraphic summary with selected physical property and geochemical data.
Table T2. Overview of shipboard sampling, Site U1476. Download table in .csv format.
Lithostratigraphic unit description
Unit I
- Intervals: 361-U1476A-1H-1, 0 cm, through 4H-CC, 33 cm; 361-U1476B-1H-1, 0 cm, through 5H-CC, 29 cm; 361-U1476C-1H-1, 0 cm, through 1H-CC, 15 cm; 361-U1476D-2H-1, 0 cm, through 4H-CC, 23 cm; 361-U1476E-1H-1, 0 cm, through 5H-CC, 41 cm
- Depths: Hole U1476A = 0–34.57 m CSF-A; Hole U1476B = 0–44.23 m CSF-A; Hole U1476C = 0–5.72 m CSF-A; Hole U1476D = 1–29.61 m CSF-A; Hole U1476E = 0–44.85 m CSF-A
- Age: Middle Pleistocene to Holocene
Unit I is composed of light brown (7.5YR 6/4) to light greenish gray or greenish gray (GLEY 1 7/10Y; GLEY 1 6/10Y) alternations between foraminifer ooze with nannofossils or nannofossil-rich foraminifer ooze and foraminifer-rich nannofossil ooze (with or without fine sand) (Figure F10).

Figure F10. Representative lithologies per interval, Site U1476.
Unit II
- Intervals: 361-U1476A-5H-1, 0 cm, through 24H-CC, 22 cm; 361-U1476B-6H-1, 0 cm, through 16H-CC, 33 cm; 361-U1476D-5H-1, 0 cm, through 25H-CC, 25 cm; 361-U1476E-6H-1, 0 cm, through 25H-CC, 37 cm
- Depths: Hole U1476A = 34.20–224.57 m CSF-A; Hole U1476B = 43.90–148.99 m CSF-A; Hole U1476D = 29.50–229.42 m CSF-A; Hole U1476E = 44.80–235.41 m CSF-A
- Age: late Miocene to Middle Pleistocene
Unit II is composed of greenish gray (GLEY 1 6/10Y) foraminifer-rich or foraminifer-bearing nannofossil ooze (with or without silt) or nannofossil ooze with foraminifers/silt/clay (Figure F10).
Drilling disturbance
Cores from Site U1476 show only minor drilling disturbances. The uppermost centimeters of the first sections of a few cores are soupy; fractures or flow-in disturbance were occasionally observed in the middle to bottom sections of some cores (Figure F11). Fragmented sediment and voids were also occasionally observed.
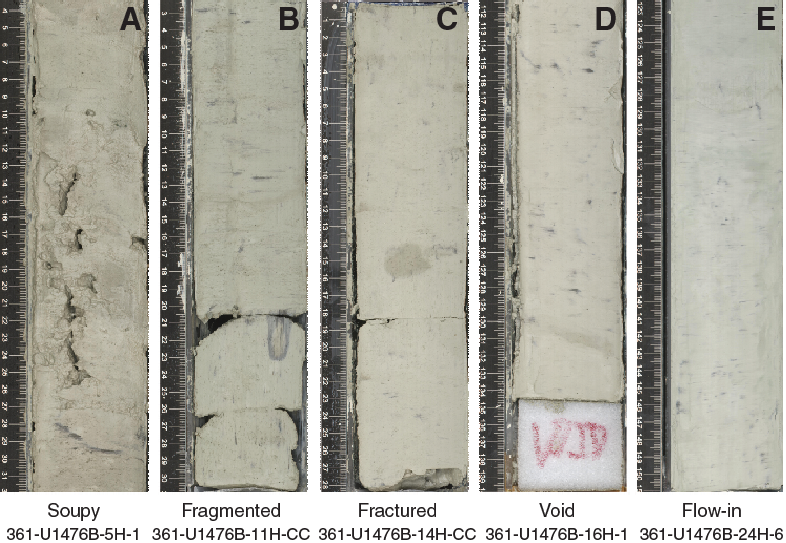
Figure F11. Sediment deformations and disturbances, Site U1476.
Lithology and composition
Smear slide observations show that biogenic materials (67% ± 8% on average) are the principal component of the sediment (Table T3; Figure F12). The biogenic fraction in both units is dominated by nannofossils and foraminifers; their percentages in Unit I account for 36% (±12%) and 35% (±11%), respectively; whereas in Unit II they account for 51% (±10%) and 17% (±7%), respectively.
Table T3. Smear slide textures, compositions, and lithologic names, Holes U1476A–U1476E. Download table in .csv format.
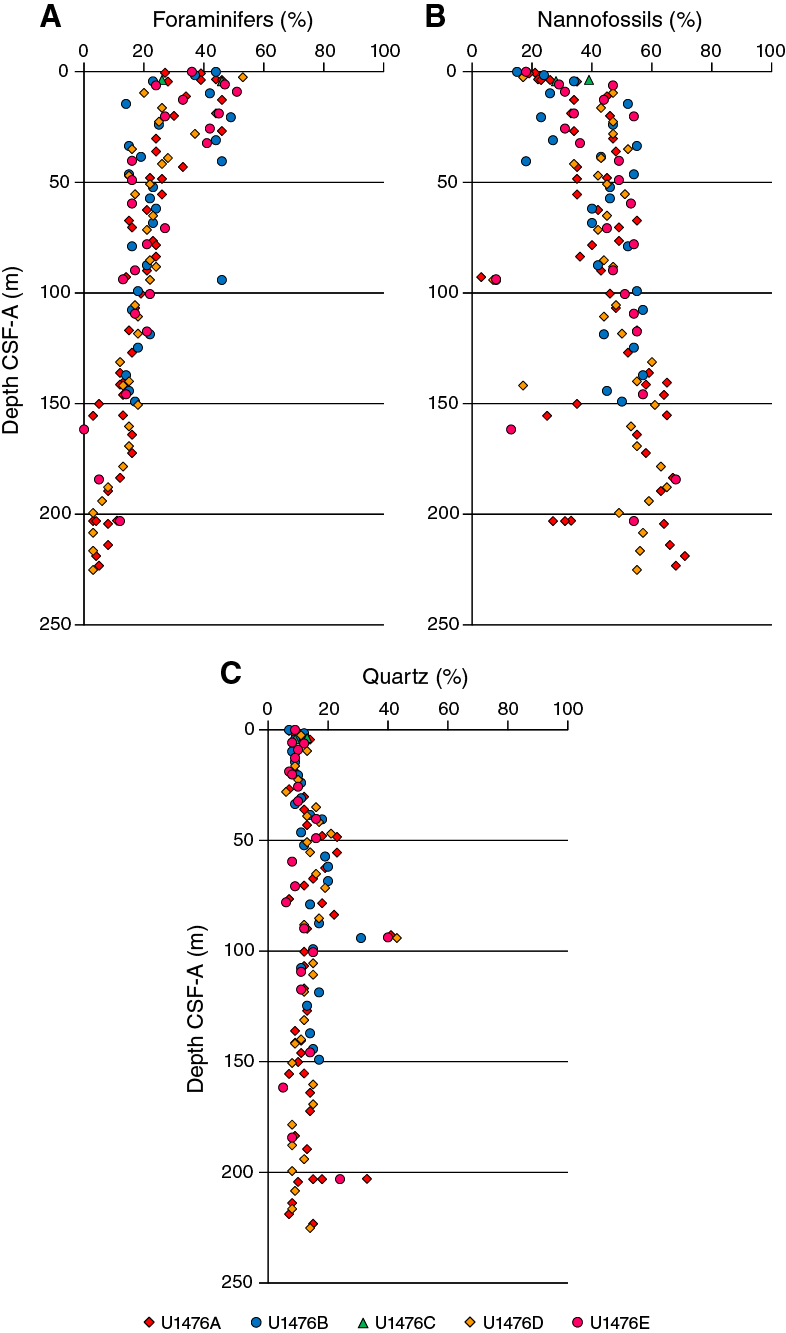
Figure F12. Relative percentages of major compositions of sediment determined by smear slide observations, Holes U1476A–U1476E.
Sediment grain sizes consist of 28% (±15%) sand on average, 28% (±6%) silt, and 45% (±15%) clay in Unit I and 8% (±6%) sand, 26% (±10%) silt, and 66% (±12%) clay in Unit II. The composition of the terrigenous component is dominated by quartz (12% ± 4% on average of the total biogenic and terrigenous sum) and clay minerals (8% ± 3%) in both units, with trace amounts of zircon, plagioclase, hornblende, and dolomite. Pyrite (usually associated with burrows) is also present throughout the cores. Thin green layers occur at irregular intervals. These color bands may be associated with the presence of glauconite, although they may also be related to a slight degree of carbonate recrystallization, potentially reflecting siderite formation (Fe carbonate).
The average abundance of total biogenic carbonate in the sediment in Hole U1476A was estimated at 69% ± 6% based on smear slides descriptions (Table T3). This result is in broad agreement with geochemical analyses (see Geochemistry), which measured the carbonate content at ~58 wt% (range = 43–76 wt%) (Figure F13).
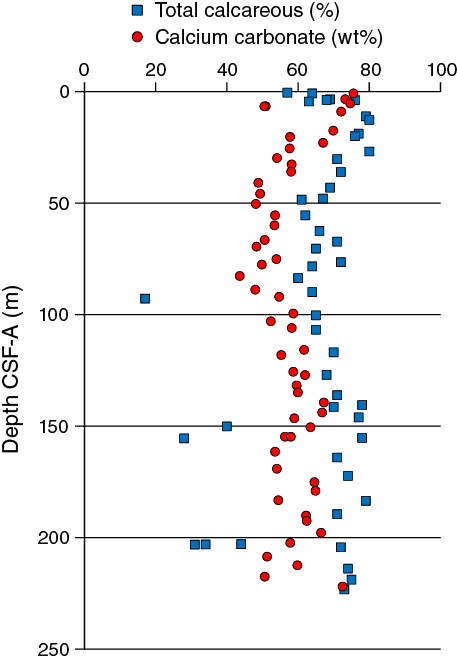
Figure F13. Comparison of CaCO3 from discrete samples and biogenic carbonate estimated in smear slides, Hole U1476A.
Fine-sand intervals occur in Sections 361-U1476A-11H-1, 361-U1476B-11H-1, 361-U1476D-11H-5, and 361-U1476E-11H-2. These intervals are mainly composed of subangular, medium sand–sized minerals of quartz. Pyrite and foraminifer shells are also abundant in these layers in Holes U1476A, U1476B, and U1476D.
X-ray diffraction (XRD) analyses were carried out on four selected samples. Specifically, three samples were taken in dark burrow layers in Hole U1476A and one sample in Hole U1476B from a distinct magnetic susceptibility peak (see Physical properties). The results of the XRD analyses indicate that all samples are rich in carbonates and quartz. Samples 361-U1476A-17H-1, 96–97 cm, and 17H-1, 97–98 cm, contain silt-sized opaque minerals and calcite. Sample 22H-4, 45–146 cm, contains dolomite, which is in agreement with the smear slide observations. Sample 361-U1476D-16H-6, 16 cm, taken from a prominent magnetic susceptibility peak visible in all holes (see Physical properties) contains magnetite (Figure F14). This is in agreement with smear slide observations of the same magnetic susceptibility peak in Hole U1476B (Sample 361-U1476B-16H-3, 117–118 cm).
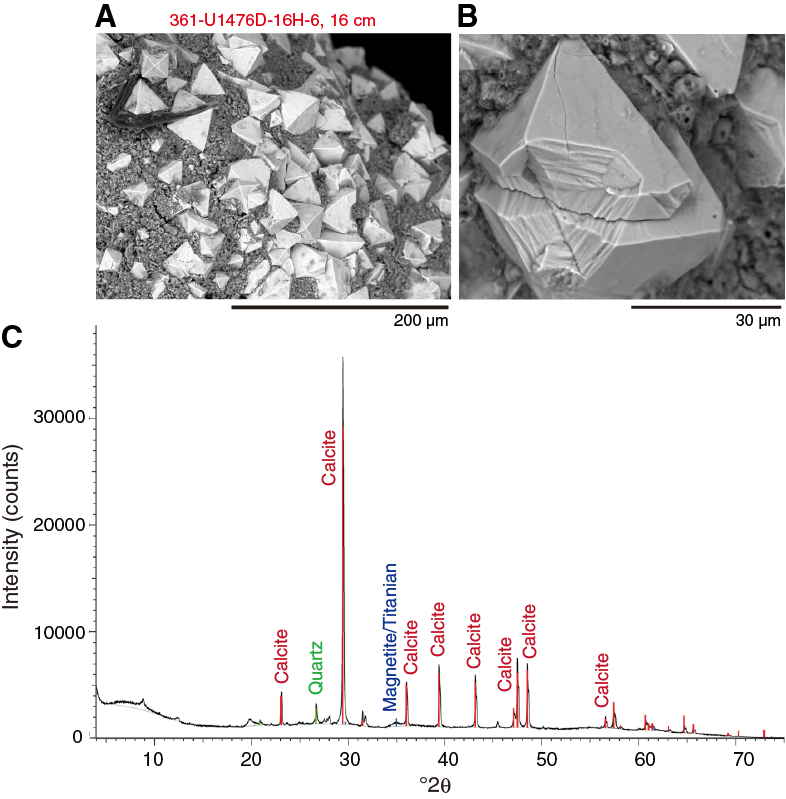
Figure F14. SEM images of magnetite in Hole U1476D and XRD diffractogram of a bulk sediment sample in Hole U1476B.
Structures
No primary sedimentary structures were observed. Bioturbation is the only secondary sedimentary structure and is widespread throughout the sequence. The most common indicator of bioturbation is centimeter-scale diffuse mottling. Discrete ichnofossil burrows (Planolites) were commonly observed. Thin darker bands commonly surround burrows and macroscopic pyritized burrows are also common. The bioturbation intensity ranges from slight to strong and increases with depth (Figure F9).
Color
The color of the alternation between foraminifer ooze and nannofossil ooze in Unit I ranges between light brown (7.5YR 6/4), light greenish gray, and greenish gray (GLEY 1 7/10Y; GLEY 1 6/10Y). Greenish gray (GLEY 1 6/10Y) nannofossil ooze characterizes Unit II.
Discussion
Site U1476 is located on the eastern flank of Davie Ridge at the northern entrance of the Mozambique Channel. The Mozambique Channel is divided into two distinct basin compartments by the asymmetric (steep to the west) Davie Ridge, which follows the 41°30′E meridian southward until it disappears as a positive morphological feature near 19°S.
The dominance of calcareous nannofossils and foraminifers plus the low amounts of terrigenous material (Figure F12) indicate that Site U1476 has been under the influence of pelagic sedimentation since the late Miocene. The gradual increase of foraminifer abundances in parallel with the decrease of nannofossil abundances from the base of the sequence to the surface (Figure F12) could represent major shifts in sedimentation processes related to long-term climate change. Alternations between foraminifer ooze and nannofossil ooze in Unit I are probably associated with glacial–interglacial changes of the past 1My (see Age model). Productivity changes associated with the glacial–interglacial cycles could explain this pattern. Alternatively, it could be also attributed to winnowing effects caused by changes in bottom-current intensity at glacial–interglacial timescales.
The fine-sand intervals that occur between 91.4 and 95.3 m CSF-A in intervals 361-U1476A-11H-1, 81–82 cm; 361-U1476B-11H-1, 133–140 cm; 361-U1476D-11H-5, 79–81 cm; and 361-U1476E-11H-2, 1.5–3.5 cm, could be the expression of a contourite or a sediment slump. The different lithologic compositions observed for these sand intervals between individual holes suggest they have significant spatial variability.
The low amounts of silt-sized detrital minerals (quartz) (Figure F12) represent terrigenous material originating from Africa and/or Madagascar that is probably transported to Site U1476 by counter-currents occurring in the Mozambique Channel (de Ruijter et al., 2002; Ullgren et al., 2012; Collins et al., 2016).
The presence of bioturbation and diagenetic alterations (grayish and/or greenish layers) in the sediment of Site U1476 suggests an oxygen-rich deep-sea environment present throughout the sequence. This could be potentially attributed to the penetration and ventilation of deep water masses (presently NADW and AAIW; DiMarco et al., 2002; de Ruijter et al., 2002; van Aken et al., 2004; Ullgren et al., 2012; Collins et al., 2016), although deep-water property changes might be expected at glacial–interglacial and longer timescales. Pyrite forms when bacterial processes couple organic carbon oxidation with the reduction of sulfate. This reaction creates sulfide that can in turn react with dissolved or mineral iron to produce pyrite (Canfield and Raiswell, 1991; Schoonen, 2004). The presence of pyrite in Units I and II points to the presence of available Fe in the sediment, probably associated with the terrigenous supply, which would enhance early diagenesis processes at Site U1476.
Physical properties
Physical property measurements were completed on whole-round sections and section halves from cores collected in Holes U1476A–U1476E. Gamma ray attenuation (GRA) density, magnetic susceptibility (MS), P-wave velocity (VP), and natural gamma radiation (NGR) measurements were made on all whole-round sections using the Special Task Multisensor Logger (STMSL), the Whole-Round Multisensor Logger (WRMSL), and the Natural Gamma Radiation Logger (NGRL). In all cases, STMSL and WRMSL sampling resolution was set to 2.5 cm, and the NGRL resolution was set to 10 cm. All sections were first logged using the STMSL without waiting for thermal equilibration, generating a set of GRA density and magnetic susceptibility data used for stratigraphic correlation. Following thermal equilibration (19°C), the sections were logged using the WRMSL, generating VP and another set of GRA density and magnetic susceptibility data, and then logged using the NGRL.
Following core splitting, samples were taken for moisture and density (MAD) measurements from the working-half sections. The MAD (index) properties determined at Site U1476 include bulk density, dry density, grain density, porosity, void ratio, and water content. Three samples per core from the working-half sections of Hole U1476A were taken for MAD measurements. The samples (71 in total) were taken typically from Sections 1, 3, and 5 with some latitude based on visual inspection. Spectral color reflectance and magnetic susceptibility were measured at a resolution of 1 and 2 cm, respectively, on the archive-half sections using the Section Half Multisensor Logger (SHMSL). Red, green, and blue (RGB) were measured on the Section Half Imaging Logger (SHIL).
Diffuse reflectance spectrometry and digital color image
In general, L* ranges from 36 to 64 and shows a marked cyclic variability around an average value of 51. These cycles vary in their wavelengths along the records. The minimum values occur in a zone of lower reflectance between 20 and 60 m CSF, whereas a maximum value of 63 is reached near the bottom of Hole U1476A (Figure F15). In the interval between ~60 and ~110 m CSF-A, L* shows distinct wavelengths of ~20 m. Color reflectance values for a* and b* range, in general, between 7 and –1 (average = 1.1 ± 0.8) and between 15 and –1 (average = 2.5 ± 1.7), respectively.
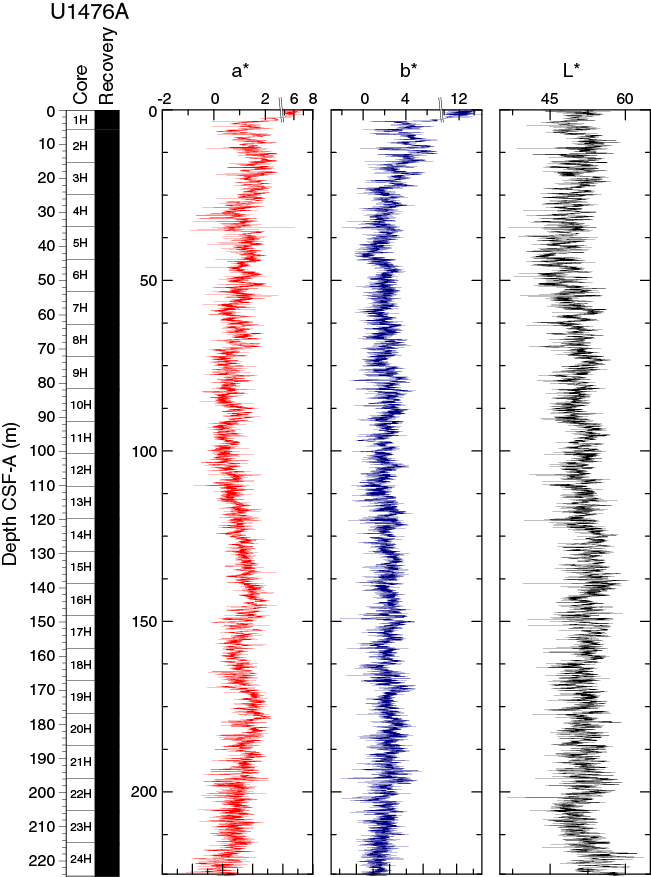
Figure F15. Color reflectance, Hole U1476A.
Maxima in a* and b* values were observed in the first core of all holes of Site U1476 but do not show a strong coherence with L* values. The most significant change in the cyclic pattern of a* takes place at ~90 m CSF-A. Below this depth, significantly lower amplitude cycles are observed. Spectral reflectance data are very similar between holes and likely represent compositional changes (e.g., carbonate versus clay mineral concentration) within the sequence. Deviations from good hole-to-hole correspondence are typically due to drilling disturbance.
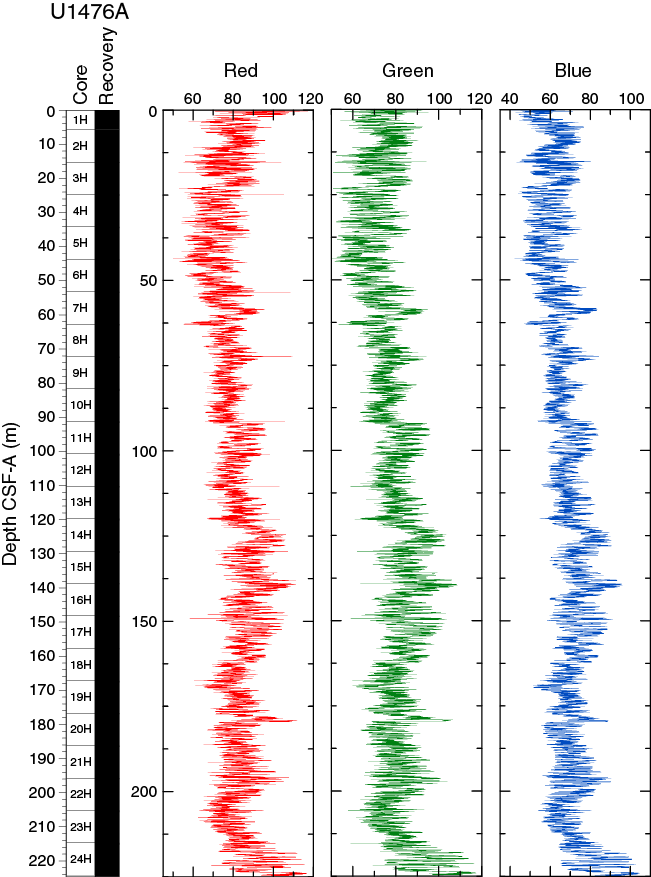
The SHIL records of RGB data were obtained from the freshly split archive halves of cores. RGB data have an average value of R = 81 ± 9, G = 79 ± 9, and B = 68 ± 9 (Figure F16). RGB data show a marked cyclic pattern with complex wavelength variations along the entire sequence and broadly correspond with L* but clearly differ for the mudline core.
Figure F16. SHIL RGB color data, Hole U1476A.
Natural gamma radiation
Changes in NGR represent the total variation in the activity of the radioactive elements and are likely related to variable amounts of terrigenous versus biogenic sediment components at Site U1476. In Hole U1476A, NGR values range from 8 to 29 counts/s with an average of 20 counts/s (Figure F17). In the uppermost 17 m CSF-A, NGR decreases from 20 to 10 counts/s. Superimposed on this trend are cycles with amplitude changes of up to 10 counts/s and wavelengths of 2–2.5 m. Below 17 m CSF-A, cyclic changes in NGR superimposed on the long-term trend are of lower wavelengths (1.0–1.5 m) and lower amplitudes (~ 5 counts/s). From 17 to 31 m CSF-A, average NGR values linearly increase from 11 to 21 counts/s.

Figure F17. NGR and magnetic susceptibility, Hole U1476A.
Between 31 and 110 m CSF-A, an interval of relatively high average NGR (22 ± 2 counts/s) occurs. Downhole from 110 m CSF-A, NGR decreases to 15 counts/s at 139 m CSF-A and increases again to 27 counts/s at 169 m CSF-A. At 169–170 m CSF-A, NGR counts drop to 17 counts/s and increase again linearly to 24 counts/s at 207 m CSF-A. From this depth NGR values decrease downhole through the sequence to a minimum of 18 counts/s at the base of the hole.
Magnetic susceptibility
The average magnetic susceptibility in Hole U1476A derived from whole-round core (WRMSL) measurements (Figure F17) is 19.7 ± 4.9 instrument units (IU; ~10–5 SI). The highest variability (2–25 instrument units [IU]) in magnetic susceptibility was observed in the upper 17 m CSF-A where cyclic changes with wavelengths from 2 to 2.5 m are easily recognizable. From 17 to 62 m CSF-A, average magnetic susceptibility values increase linearly from 12 to 26 IU. Superimposed on this trend are cyclic changes with lower amplitudes (<8 IU) and lower wavelengths (0.6–1.5 m) compared to the uppermost interval. This lower amplitude, higher frequency variability continues to the bottom of the hole, on the very long wavelength (~100 m) long-term trend in higher and lower average magnetic susceptibility. Between 62 and 110 m CSF-A is an interval of relatively high average magnetic susceptibility (24 ± 3 IU) underlain by a sediment package with linearly decreasing values to 12 IU at 139 m CSF-A. Below 139 m CSF-A, magnetic susceptibility average values increase to 29 IU at 203 m CSF-A before they decrease again to 17 IU at the bottom of the hole. A sharp maximum in magnetic susceptibility (47.7 IU) was observed at 140.81 m CSF-A, also identified in all drilled holes at Site U1476. Smear slide and XRD analyses (see Sedimentology) indicate a high concentration of well-crystallized magnetite at this depth, and it is inferred that this potentially corresponds to an ash layer. The point magnetic susceptibility data from the split core measurements (SHMSL) closely track the loop sensor magnetic susceptibility fluctuations but with slightly higher absolute values when compared to whole-round core data (Figure F17).
Compressional wave velocity
P-wave velocity outliers caused by section breaks were removed prior to plotting (Figure F18). The average P-wave velocity in Hole U1476A is 1512 ± 16 m/s. From the seafloor to 16 m CSF-A, velocities fluctuate between 1500 and 1560 m/s with an average of 1530 m/s. The interval below 16 m CSF-A is characterized by a linear trend of decreasing average velocities to 1504 m/s at 45 m CSF-A. From 45 to 92 m CSF-A, velocities remain low with an average value of 1504 ± 9 m/s. Within the 92–190 m CSF-A interval, the long-term trend in average P-wave velocity exhibits alternating phases of linearly increasing and decreasing values. A maximum of 1520 m/s occurs at 113 and 156 m CSF-A, whereas a minimum of 1480 m/s was observed at 134 and 190 m CSF-A. From 190 m CSF-A downward velocity increases again to maximum values of 1580 m/s, which were measured at the bottom of Hole U1476A.

Figure F18. P-wave velocity and bulk density, Hole U1476A.
Moisture and density
Bulk density at Site U1476 was determined on whole-core sections using the STMSL and WRMSL (GRA density) and on discrete MAD samples. Changes in GRA and MAD bulk densities are well correlated throughout Site U1476 (Figure F18) with the exception of one outlier. GRA bulk density values vary from 1.4 to 1.93 g/cm3 and are very consistent, with an average MAD bulk density of 1.69 ± 0.1 g/cm3. Bulk densities generally increase downhole, revealing a compaction trend with large variations in the uppermost 16 m that is also seen in other physical properties. Grain density is 2.78 ± 0.1 g/cm3 on average and varies between 2.10 and 2.93 g/cm3 (Figure F19).
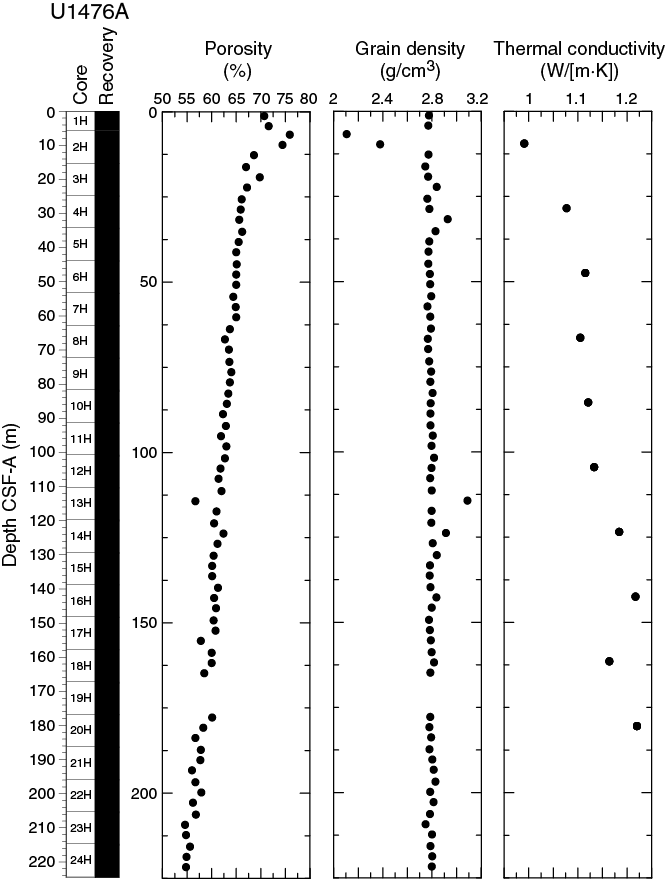
Figure F19. Porosity, grain density, and thermal conductivity, Hole U1476A.
Overall, the porosity profile (Figure F19) shows a trend of gradually decreasing values downhole that is consistent with sediment compaction. Porosities range between 75.9% and 54.6%.
Thermal conductivity
Thermal conductivity measurements were performed on every other core in Hole U1476A (Figure F19). The full-space needle probe was used, usually near the middle of Section 3. Overall, thermal conductivity values increase downhole from 0.9 to 1.22 W/(m·K).
Summary
Despite the homogeneous lithology, different physical parameters show significant trends downhole as well as cyclic variations along the sediment column. Physical property records at Site U1476 show high-amplitude cyclic changes in the uppermost 16 m CSF-A in all holes. These cyclic changes continue downward to the bottom of the holes with lower amplitude and higher frequency. Variations in color reflectance indicate compositional changes (e.g., carbonate versus clay mineral concentration), and RGB data broadly correspond with color reflectance parameter L*. The sharp peak observed in the magnetic susceptibility record at 140 m CSF-A in all the holes indicates a high concentration of well-crystallized magnetite at this depth and potentially corresponds to an ash layer. Bulk densities increase downhole at the site, revealing a compaction trend with large variations in the uppermost 16 m CSF-A that is also seen in other physical properties.
Micropaleontology
Site U1476 spans the Late Pleistocene to the late Miocene inferred from the combined analysis of calcareous nannofossils and planktonic foraminifers. Diatoms are present only in the core top and are not used for biostratigraphy. The sequence is biostratigraphically complete at the biozone level for calcareous nannofossils and planktonic foraminifers. Biozonations are based on sampling at a resolution of 1 sample per section in Hole U1476A. Diatoms were studied in the mudline core top and were initially surveyed in smear slides from core catchers, but this was discontinued upon finding no biosiliceous component below the core top in Hole U1476A. Calcareous nannofossils are well preserved throughout the Pliocene–Pleistocene, but preservation degrades to moderate in the early Pliocene–late Miocene sequence with an increase in fragmentation of both planktonic foraminifers and calcareous nannofossils. The assemblages of all three microfossil groups are dominated by tropical and warm subtropical taxa.
The calcareous nannofossil and planktonic foraminifer age assignments are in broad agreement with each other (see Age model) as well as with the inferred glacial–interglacial cycles observed in physical property measurements (see Stratigraphic correlation). The integrated calcareous microfossil zonation is shown in Figure F20 with microfossil datums reported in Tables T4 and T5. Tables of calcareous nannofossil occurrences are presented in Table T6, and planktonic foraminifer occurrences are shown in Table T7. Typical examples of calcareous nannofossils at Site U1476 are presented in Figure F21. Representative species of planktonic foraminifers at Site U1476 are shown in Figures F22 and F23. The age-depth plot, including the biochronology and magnetostratigraphic datums, is discussed in Age model and is shown in Figure F38. The degree of reliability for each datum is based on distinct taxonomy, abundance, and consistency of occurrence through the identified range, ranging from 1 (>80% reliability) to 3 (<50% reliability).
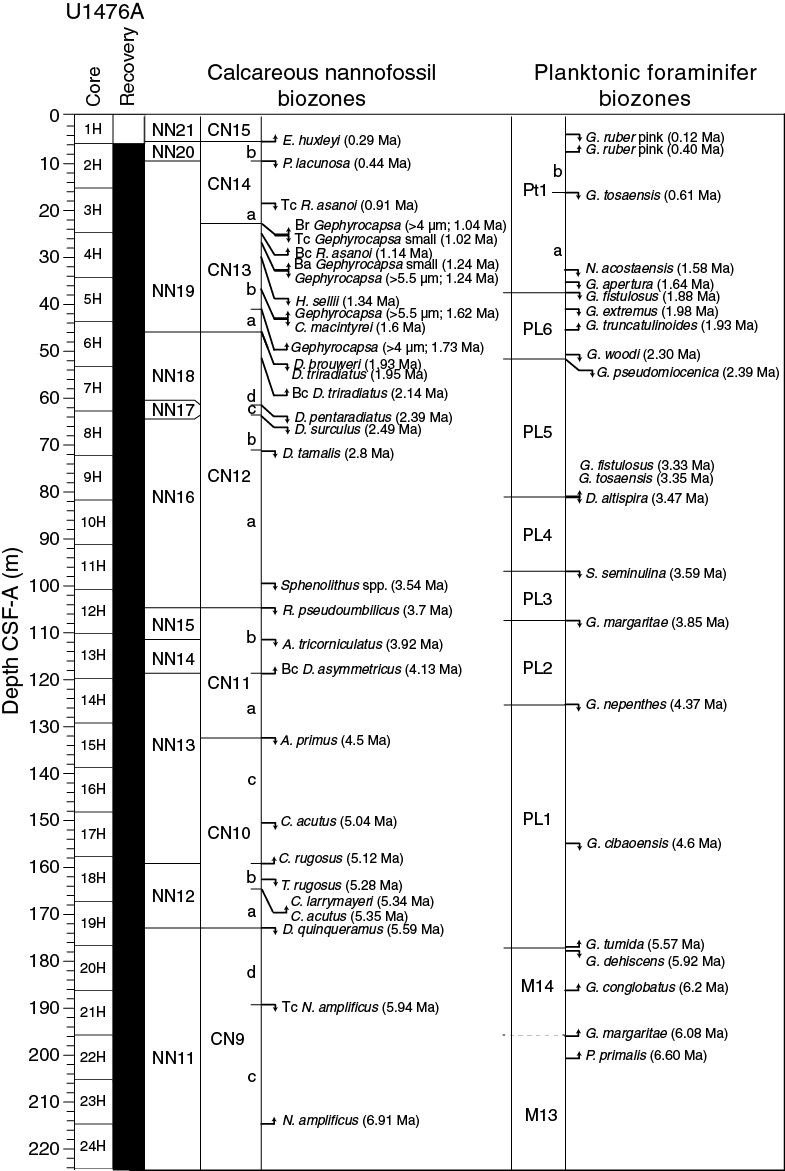
Figure F20. Biochronology at Site U1476 with significant planktonic foraminifer and calcareous nannofossil events.
Table T4. Biostratigraphic planktonic foraminifer datums, Site U1476. Download table in .csv format.
Table T5. Biostratigraphic calcareous nannofossil datums, Site U1476. Download table in .csv format.
Table T6. Calcareous nannofossil occurrence, Site U1476. Download table in .csv format.
Table T7. Planktonic foraminifer occurrence, Site U1476. Download table in .csv format.
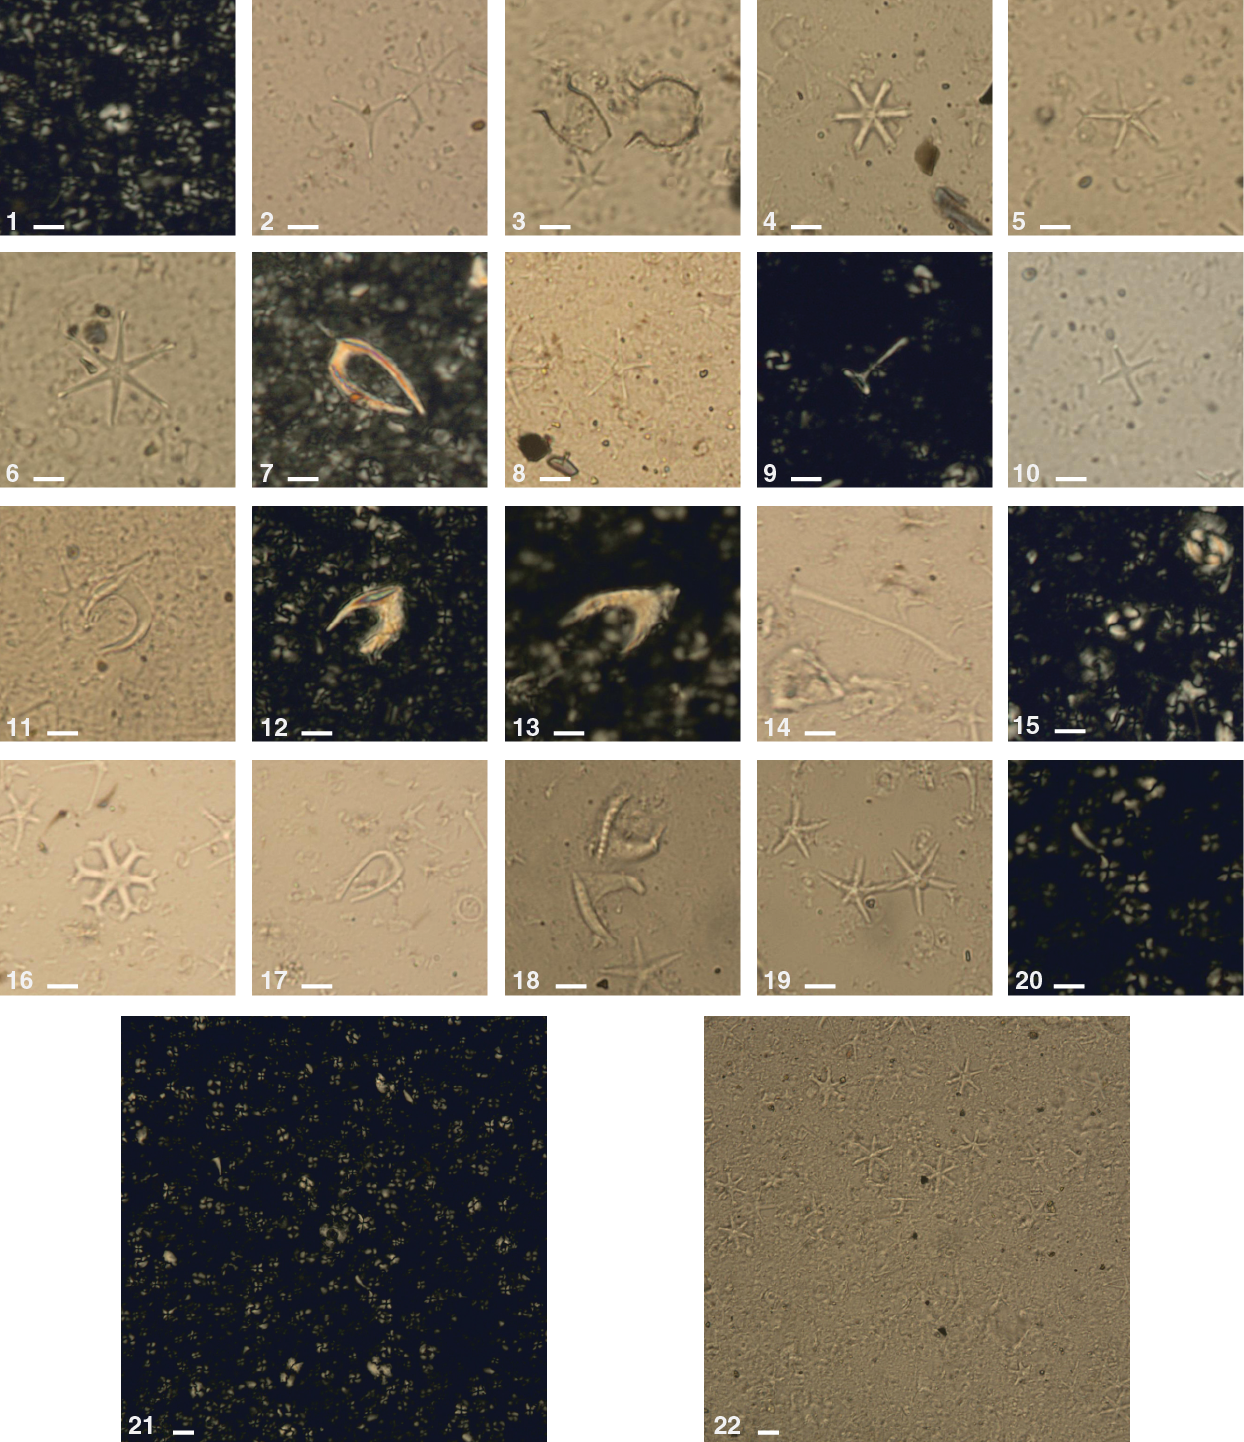
Figure F21. Calcareous nannofossils, Hole U1476A.
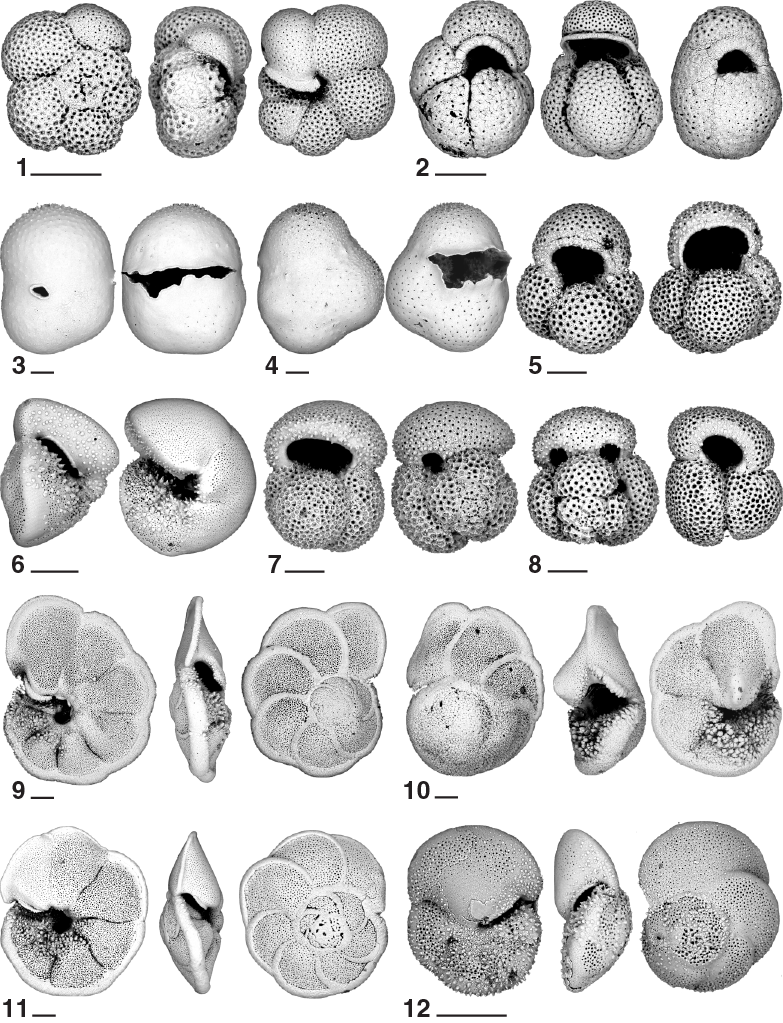
Figure F22. Planktonic foraminifers, Hole U1476A.
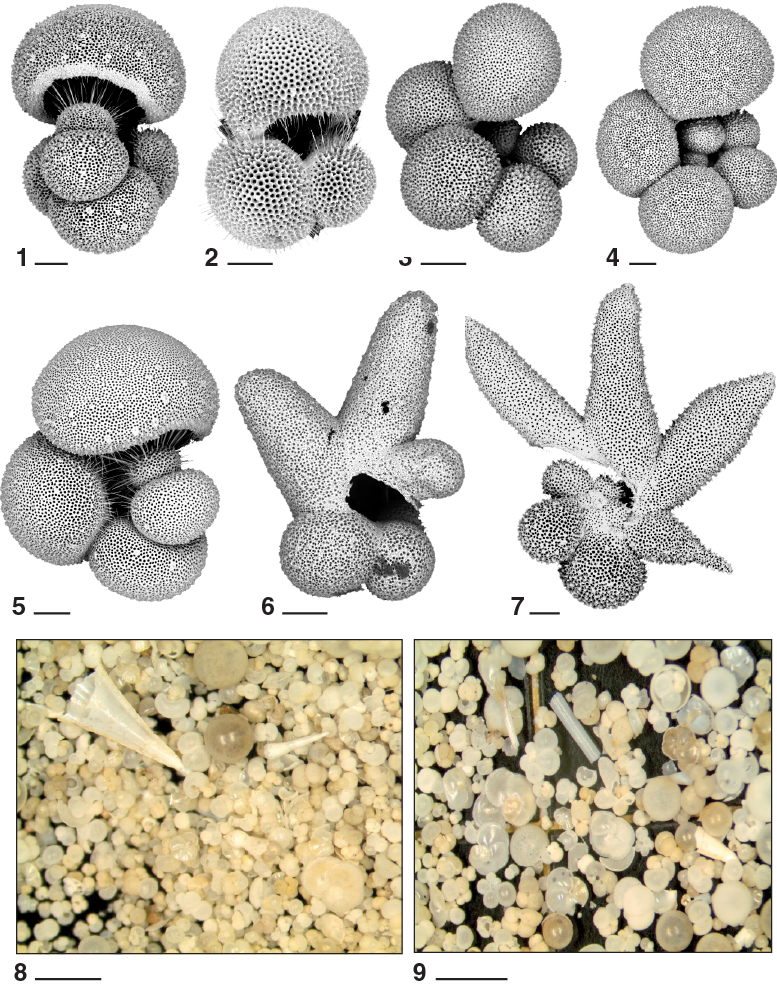
Figure F23. Planktonic foraminifers, Hole U1476A.
Calcareous nannofossils
The calcareous nannofossil biostratigraphy at Site U1476 is based on the analysis of core catcher samples, and selected intervals in the split-core sections (total of 147 samples) in Hole U1476A. Group and individual abundances of discrete species are recorded from the core catcher samples, whereas the split-core section samples were only used to refine the marker species datums. Thirty-one nannofossil datums calibrated by Lourens et al. (2004) and Gradstein et al. (2012) from the late Miocene to Pleistocene are identified at Site U1476 (Table T6). Based on occurrence and abundance, the nannofossil datums are considered reliable unless otherwise stated. Diverse calcareous nannofossil taxa indicative of the tropical and subtropical regimes are recorded throughout the hole with a temperate species, the small form of Coccolithus pelagicus, periodically occurring in low abundances within the sequence.
Site U1476 is characterized by a relatively high abundance (>50% of sediment particles) of well-preserved calcareous nannofossils. A total of 64 species belonging to 24 genera are identified (for examples, see Figure F21). Minor occurrences of reworked Eocene and middle Miocene species such as Catinaster coalitus, Cyclicargolithus floridanus, Discoaster neohamatus, Reticulofenestra umbilica, Sphenolithus spp., and Tribrachiatus orthostylus are recorded.
Nannofossil Biozones NN21 and CN15 (Late Pleistocene to recent) span from the top of the sequence to Sample 361-U1476A-1H-CC (5.72 m CSF-A) and are marked by the base occurrence of Emiliania huxleyi (<0.29 Ma). Scanning electron microscopy enabled us to confirm the presence/absence of E. huxleyi in the samples, which can be uncertain under the light microscope. These biozones are composed of relatively high abundances of Gephyrocapsa oceanica and Gephyrocapsa spp. (4–4.5 μm). Biozone NN20 and Subzone CN14b are recognized based on the presence of G. oceanica and the absence of E. huxleyi and Pseudoemiliania lacunosa. The top occurrence of P. lacunosa (0.44 Ma) in Sample 2H-3, 75 cm (9.45 m CSF-A), defines the top of Biozone NN19 and Subzone CN14a (Late Pleistocene). These biozones also contain the top common occurrence of Reticulofenestra asanoi (0.91 Ma) in Sample 3H-3, 75 cm (18.95 m CSF-A). Within Biozone NN19, the Subzone CN14a/CN13b boundary is delineated by the base reentrance of Gephyrocapsa spp. (>4 µm; 1.04 Ma) in Sample 3H-6, 75 cm (23.45 m CSF-A). The top common occurrence of small Gephyrocapsa spp. (1.02 Ma) also occurs in the same sample. Subzone CN13b contains the base common occurrence of R. asanoi (1.14 Ma) in Sample 4H-1, 75 cm (25.45 m CSF-A). The lower part of Biozone NN19 contain five nannofossil events:
- Top occurrence of Gephyrocapsa spp. (>5.5 µm; 1.24 Ma) in Sample 4H-2, 75 cm (26.95 m CSF-A);
- Base of acme of small Gephyrocapsa spp. (<4 µm; 1.24 Ma) also in Sample 4H-2, 75 cm (26.95 m CSF-A);
- Top occurrence of Helicosphaera sellii (1.34 Ma) in Sample 4H-4, 75 cm (29.95 m CSF-A);
- Top occurrence of Calcidiscus macintyrei (1.6 Ma) in Sample 4H-CC (34.57 m CSF-A); and
- Base occurrence of Gephyrocapsa spp. (>5.5 µm; 1.62 Ma) also in Sample 4H-CC (34.57 m CSF-A).
The base of Subzone CN13b is recognized in Sample 5H-6, 75 cm (42.45 m CSF-A), with the base occurrence of Gephyrocapsa spp. (>4 µm; 1.73 Ma). Dominance of small reticulofenestrids and common occurrences of well-preserved discoasters are observed in the subsequent sequence. The Biozone NN19/NN18 and Subzone CN13a/CN12d boundaries are determined by the top occurrence of Discoaster brouweri (1.93 Ma) in Sample 6H-2, 75 cm (45.95 m CSF-A). The top occurrence of Discoaster triradiatus (1.95 Ma) is also recorded in this sample. The base common occurrence (2.14 Ma) of D. triradiatus in Biozone NN18 and Subzone CN12d was identified in Sample 6H-6, 60 cm (51.80 m CSF-A). The top of Biozone NN17 and Subzone CN12c were recognized in Sample 7H-6, 75 cm (61.45 m CSF-A), where the top occurrence of Discoaster pentaradiatus (2.39 Ma) occurs. Pleistocene biostratigraphy at this site is mainly based on the Gephyrocapsa datums, which are considered reliable markers. Other nannofossil taxa of the Pleistocene sequence are Calcidiscus leptoporus, Calciosolenia murrayi, C. pelagicus, Florisphaera profunda, Gephyrocapsa caribbeanica, G. oceanica, Helicosphaera carteri, Helicosphaera spp., Pontosphaera spp., Rhabdosphaera clavigera, Scyphosphaera spp., Syracosphaera spp., Umbellosphaera spp., and Umbilicosphaera spp.
The Biozone NN17/NN16 and Subzone CN12c/CN12b boundaries are defined by the top occurrence of Discoaster surculus (2.49 Ma) in Sample 8H-1, 75 cm (63.45 m CSF-A), at the beginning of the Pliocene/Pleistocene boundary. The top occurrence of Discoaster tamalis (2.8 Ma) in Sample 8H-6, 75 cm (70.95 m CSF-A), marks the Subzone CN12b/CN12a boundary within Biozone NN16, which is also characterized by the top occurrence of Sphenolithus spp. (3.54 Ma) in Sample 11H-6, 75 cm (99.45 m CSF-A). The transition to Biozone NN15 and Subzone CN11b is recorded by the top occurrence of Reticulofenestra pseudoumbilicus (3.7 Ma) in Sample 12H-3, 75 cm (104.45 m CSF-A), and the transition to Biozone NN14 within Subzone CN11b is observed in Sample 12H-CC (110.51 m CSF-A) with the top occurrence of Amaurolithus tricorniculatus (3.92 Ma). The base common occurrence of Discoaster asymmetricus (4.13 Ma) occurs in Sample 13H-6, 75 cm (118.45 m CSF-A), and marks the Biozone NN14/NN13 and Subzone CN11b/CN11a boundaries. The Subzone CN11a/CN10c boundary is marked by the top occurrence of Amaurolithus primus (4.5 Ma) in Sample 15H-1, 75 cm (132.20 m CSF-A). Biozone NN13 and Subzone CN10c are characterized by the top occurrence of Ceratolithus acutus (5.04 Ma) in Sample 17H-2, 75 cm (150.45 m CSF-A). This nannofossil occurrence is also recorded in shallower samples; however, its common abundance (>1–10 specimens per field of view) was observed from the above-mentioned sample downcore. The Biozone NN13/NN12 and Subzone CN10c/CN10b boundaries are defined by the base occurrence of Ceratolithus rugosus (5.12 Ma), which occurs in Sample 18H-1, 75 cm (158.45 m CSF-A). This datum is considered to be of lower reliability due to its fragmented occurrence. The top occurrence of Triquetrorhabdulus rugosus (5.28 Ma) characterizes Biozone NN12 and Subzone CN10a in Sample 18H-4, 75 cm (162.95 m CSF-A), defining the earliest Pliocene event. Among the marker species, nannofossils identified in the Pliocene sequence are composed of Amaurolithus delicatus, Ceratolithus armatus, Discoaster blackstockae, D. challengeri, Discoaster quadramus, Discosphaera tubifera, Scyphosphaera spp., Reticulofenestra spp., and Sphenolithus abies.
The base occurrence of Ceratolithus larrymayeri (5.34 Ma) and C. acutus (5.35 Ma) in Sample 18H-5, 75 cm (164.45 m CSF-A), occurs within Biozone NN12, and the base of C. acutus marks the Subzone CN10b/CN10a boundary. The transition to Biozone NN11 and Subzone CN9d is defined by the top occurrence of Discoaster quinqueramus (5.59 Ma) in Sample 19H-4, 75 cm (172.45 m CSF-A). Finally, within Biozone NN11 the top common (5.94 Ma) and base occurrence (6.91 Ma) of Nicklithus amplificus in Samples 21H-2, 75 cm (188.45 m CSF-A), and 24H-1, 75 cm (215.45 m CSF-A), define the Subzone CN9d/CN9c and CN9c/CN9b boundaries, respectively.
Planktonic foraminifers
Planktonic foraminifers were examined in core catcher samples and 10 cm3 samples taken from working halves in Hole U1476A for a total of 165 samples. We were able to dry the samples from section halves before washing, noticeably improving the quality of the resulting foraminifer residues compared to the rapidly processed core catcher samples. Examples of the major foraminifer taxa present in Site U1476 are illustrated in Figures F22 and F23. Foraminifer residues (>63 µm) typically constitute 10%–15% of the total sediment volume, though in some parts of the Pleistocene, foraminifer content approaches 40% of dry sediment volume. Pleistocene–Pliocene foraminifer preservation is typically very good to excellent, with the common occurrence of semi-glassy, translucent specimens, empty chambers, and little evidence of surface pitting, dissolution, or recrystallization. Preservation falls to moderate and even poor in the early Pliocene–late Miocene sequence because of an increase in fragmentation of dissolution-susceptible taxa.
A notable feature of the planktonic foraminifer biota at Site U1476 is the abundance of tropical species, including well-developed examples of most Pliocene–Pleistocene biozone markers. These markers include nearly all the calibrated species currently in use in the Pliocene–Pleistocene portion of the Gradstein et al. (2012) timescale, and most of these species have regular occurrences within their expected ranges. There are some notable exceptions where the Gradstein et al. (2012) timescale places marker events well off the Site U1476 age-depth profile defined by other biostratigraphic events; these discrepancies are described below and in Age model. Site U1476, with its promise of a suborbital age model based on cyclostratigraphy and biostratigraphy offers an unprecedented opportunity to calibrate the major tropical markers to the astronomical time scale.
Stratigraphic ranges of species are shown in Table T7. Because of the short period of time available to process samples, we focused on recording the relative abundances of species only in the core catchers and recorded primarily the presence or absence of most other species in samples taken from the section halves. However, we also recorded the relative abundance of marker taxa near their datum events in order to provide some indication of the relative confidence in the reported datums.
The Pleistocene Biozone Pt1 sequence (0–1.88 Ma) extends from the mudline to Sample 361-U1476A-5H-3, 70–72 cm (37.9 m CSF-A). The core top (mudline Sample 1H-1, 0–1 cm) contains a rich assemblage of species that includes taxa absent from the underlying sediment column (Figure F23). Species that primarily occur in the mudline include Globigerinella adamsi, Hastigerina pelagica, and Beella digitata as well as numerous individuals of Globigerinoides sacculifer and Globigerinella siphonifera with preserved spines. Globigerinoides ruber (pink) has its top occurrence (0.12 Ma) in Sample 1H-3, 70–72 cm (3.8 m CSF-A), while its bottom occurrence (0.4 Ma) is found in Sample 2H-2, 70–72 cm (7.9 m CSF-A). The base occurrence of Globigerinella calida has a calibrated age of 0.22 Ma, but although we have numerous typical specimens with large, very loosely coiled shells (Figure F23), we found this taxon to range well below other foraminifer and nannofossil markers for the Pleistocene, as is also the case in other Expedition 361 sites. The top occurrence of Globorotalia tosaensis is in Sample 3H-1, 70–72 cm (15.9 m CSF-A), marking the Biozone Pt1b/Pt1a boundary at 0.61 Ma. Globorotalia tosaensis has regular occurrence in Hole U1476A, suggesting that it is a reliable biozone marker. Specimens close to the extinction datum of G. tosaensis tend to have relatively acute margins; therefore, a more detailed examination is required in order to distinguish them from the close relative Globorotalia truncatulinoides. Globorotalia tosaensis is characterized by the presence of perforations through the margin as opposed to the imperforate keel of Globorotalia truncatulinoides. Deeper in Hole U1476A, G. tosaensis becomes both more abundant and lower-spired with more rounded chambers than is the case near its extinction. The top occurrence of Globigerinoides obliquus (1.3 Ma) occurs far below its expected top appearance in Hole U1476A in Sample 11H-5, 70–72 cm (97.9 m CSF-A); G. obliquus tends to be most abundant in subtropical sites, so its earlier-than-expected top occurrence may reflect ecological exclusion from the region sampled by Hole U1476A. We found the top occurrence of Neogloboquadrina acostaensis (1.58 Ma) in Sample 4H-6, 70–72 cm (32.8 m CSF-A), and the top occurrence of Globoturborotalita apertura (1.64 Ma) in Sample 5H-1, 70–72 cm (34.9 m CSF-A). Locating the top occurrence of G. apertura was made complex by the co-occurrence of both Globigerinoides tenellus, and Globoturborotalita rubescens in the same samples, most of which also have large apertures resembling the morphology of G. apertura. The biozone marker for the base of Subzone Pt1a, the top occurrence of Globigerinoides fistulosus (1.88 Ma), occurs in Sample 5H-3, 70–72 cm (37.9 m CSF-A). Globigerinoides fistulosus is typically represented by a few specimens in every sample within its range, suggesting that the base of Biozone Pt1 is a reliable datum in Hole U1476A. However, the taxonomic identification of G. fistulosus must be strictly applied to individuals with distinct tubulospines; indeed we find individuals with sac-like chambers surmounted by small bumps above the top occurrence of G. fistulosus sensu stricto (Sample 3H-CC; 25 m CSF-A).
Biozone PL6 includes the base occurrence of G. truncatulinoides (1.93 Ma) in Sample 6H-2, 70–72 cm (45.9 m CSF-A), and the top occurrence of Globigerinoides extremus (1.98 Ma) in Sample 5H-5, 70–72 cm (40.8 m CSF-A). The calibrations of both species are seemingly out of their expected order; however, the base occurrence of G. truncatulinoides agrees with its astronomically identified first occurrence in the tropical Atlantic (2.03 Ma; Sexton and Norris, 2008) or its paleomagnetically calibrated base occurrence (2.10 Ma) at ODP Site 763 (Eastern Indian Ocean) by Sinha and Singh (2008). The top occurrence of Globoturborotalita woodi (2.3 Ma) occurs in Sample 6H-5, 70–72 cm (50.3 m CSF-A), and the marker for the base of Biozone PL6, the top occurrence of Globorotalia pseudomiocenica (2.39 Ma), is in Sample 6H-6, 70–72 cm (51.9 m CSF-A). Both datums are distinctive events, with the top occurrence of G. pseudomiocenica being marked by the presence of large, typical representatives of this species.
The Pleistocene foraminifer assemblage is dominated by G. ruber, G. sacculifer, Globorotalia menardii, Globorotalia tumida, and Neogloboquadrina dutertrei. Other common species are Globorotalia crassaformis, G. truncatulinoides, G. siphonifera, Orbulina universa, Pulleniatina obliquiloculata, and Sphaeroidinella dehiscens. Minor elements of the Pleistocene biota include Globorotalia inflata, Neogloboquadrina pachyderma (dextral), Globigerina falconensis, Globigerina obesa, and Candeina nitida. Specimens of G. inflata tend to have heavy crusts with narrow, slit-like apertures, in contrast to the forms with high-arched apertures seen at Sites U1474 and U1475.
Biozone PL5 includes the base occurrence of G. fistulosus (3.33 Ma), the base occurrence of G. tosaensis (3.35 Ma), and the top occurrence of Dentoglobigerina altispira (3.47 Ma), all in the same sample (9H-6, 70–72 cm; 80.4 m CSF-A). The co-occurrence of these datums is consistent with a hiatus, but it is also possible that the marker events, which represent a mixture of top and bottom occurrences and are only 140 ky apart, occur within in the ~3 m of core between Samples 9H-5, 70-72 cm and 9H-CC (78.9 - 82.2 m CSF-A). The identification of the marker species in the same sample, could therefore be due to sampling resolution. Notably, the usefulness of the base occurrence of G. fistulosus as a calibrated event requires a strict definition of the species as possessing well-developed tubular projections from its sac-like chambers. Indeed, we find specimens with small bumps and projections on the sac-like chamber as deep as Sample 11H-4, 70–72 cm (96.4 m CSF-A). In contrast, the top occurrence of D. altispira (defining the top of Biozone PL4) and base occurrence of G. tosaensis are both well-marked events. The top of Biozone PL3 is defined on the top occurrence of Sphaeroidinellopsis seminulina (3.59 Ma) that occurs in Sample 11H-4, 70–72 cm (96.4 m CSF-A). The Sphaeroidinellopsis group is well represented in Hole U1476A, although specimens of S. seminulina are accompanied by common S. dehiscens with small secondary apertures that require flipping specimens over to identify the number of apertures.
Biozones PL5 through PL3 are represented by a tropical assemblage that includes G. pseudomiocenica, G. ruber, G. sacculifer, G. extremus, G. menardii, Globigerinoides conglobatus, Neogloboquadrina acostaensis, and Neogloboquadrina humerosa. Pulleniatina obliquiloculata, G. siphonifera, G. falconensis, and G. crassaformis are also consistent elements of the fauna. Neogloboquadrina pachyderma (dextral), Globorotalita hexagona, G. apertura, G. woodi, and Globorotalia scitula have rare but consistent occurrences in samples. One unusual element is the regular occurrence of Globoquadrina conglomerata in most samples of this interval. Dentoglobigerina altispira and S. seminulina are both common elements of the biozones they define.
The top of Biozone PL2 occurs with the top occurrence of Globorotalia margaritae (3.85 Ma) in Sample 12H-5, 70–72 cm (107.3 m CSF-A). Globorotalia margaritae is a regular component of the foraminifer assemblage throughout Biozone PL2 and into the upper part of Biozone PL1 but then becomes rare and difficult to trace toward its base occurrence in the late Miocene. The top occurrence of G. margaritae is represented by specimens that are mostly biconvex rather than the spiral-convex forms typical of the middle and lower parts of the range. The top occurrence of Globoturborotalita nepenthes in Sample 14H-4, 70–72 cm (124.9 m CSF-A), is also distinctive, providing that a strict definition of the species is employed. We require that the species have a distinct, thumb-like chamber that juts off the rest of the test. The final chamber also must have a distinct thickened lip that commonly forms a shelf-like structure above the aperture. We employed this definition because there are specimens of cf. G. apertura that have a distinct protruding final chamber somewhat resembling that of G. nepenthes; these cf. G. apertura specimens occur above the top occurrence of G. nepenthes as high as Sample 13H-CC (119.9 m CSF-A). The top occurrence of G. nepenthes (4.37 Ma) is closely approximated by the top occurrence of Sphaeroidinellopsis kochi (4.53 Ma), which occurs in Sample 12H-4, 70–72 cm (105.9 m CSF-A), and has a consistent pattern of occurrences below this top datum.
The base of the Pliocene is approximated by the base occurrence of G. tumida (5.57 Ma) in Sample 20H-1, 60–62 cm (177.3 m CSF-A). Below this, the late Miocene section is divided into Biozones M14 and M13 by the top occurrence of Globorotalia lenguaensis (6.14 Ma) in Sample 22H-4, 60–62 cm (200.8 m CSF-A). This datum is not well defined because of the rare and irregular appearance of the marker species below its top occurrence. The base of Biozone M14 is approximated by the lowest occurrence of Globoquadrina dehiscens (5.92 Ma) in Sample 20H-2, 60–62 cm (178.8 m CSF-A), and the base occurrence of G. conglobatus (6.20 Ma) in Sample 20H-CC (186.4 m CSF-A). The base occurrence of G. margaritae (6.08 Ma) in Sample 22H-2, 70–72 cm (197.8 m CSF-A), is also a potential datum to approximate the Biozone M13/M14 boundary, but we found this species becomes very rare in the lower part of its stratigraphic range in Hole U1476A, preventing us from establishing a reliable base occurrence datum level. The base occurrence of Pulleniatina primalis (6.6 Ma) is well defined in Sample 22H-4, 70–72 cm (203.8 m CSF-A), marking the lowest well-established foraminifer datum in the sequence.
The foraminifer biota of the early Pliocene is similar to that of the late Pliocene, but near the Miocene/Pliocene boundary the assemblage becomes increasingly dissolved, leading to the dominance of dissolution-resistant G. nepenthes and S. seminulina. The late Miocene biota is particularly dominated by these two species, but there are also low abundances of Globorotalia plesiotumida, G. menardii, G. sacculifer, O. universa, and G. obliquus.
Siliceous microfossils
Diatoms, silicoflagellates, phytoliths, and sponge spicules make up a minor component of mudline samples and exhibit moderate preservation (Table T8). The diatom assemblage is characteristic of the modern Indian Ocean assemblage described in Schrader (1974), which includes Azpeitia nodulifera, Azpeitia tabularis, Actinoptychus senarius, Fragilariopsis doliolus, Nitzschia marina, Shionodiscus oestrupii, Rhizosolenia bergonii, and Triceratium cinnamomeum. Also present are littoral taxa such as Cocconeis spp., Diploneis bombus, Navicula hennedyi, and Navicula spp. Trace presence of phytoliths suggests either freshwater input and/or wind transportation.
Table T8. Diatom and other siliceous microfossil occurrence, Site U1476. Download table in .csv format.
Samples from below the mudline to Sample 361-U1476A-8H-CC (72.56 m CSF-A) are barren of siliceous microfossils.
Paleomagnetism
Five holes were drilled at Site U1476 using the APC and HLAPC, ranging in depth from 5.7 to 234.8 m DSF (see Operations). Archive halves from Holes U1476A, U1476B, U1476D, and U1476E were analyzed for their natural remanent magnetization (NRM). The orientation of Cores 361-U1476A-1H through 17H, 361-U1476D-1H through 16H, and 361-U1476E-1H through 16H was measured using the Icefield MI-5 core orientation tool; however, the instrument was broken and the recorded data are unreliable. For Cores 361-U1476A-18H through 24H, 361-U1476D-17H through 25H, and 361-U1476E-17H through 25H, core orientation data were obtained using the FlexIt tool.
Discrete sample measurements
At least two discrete samples were taken from all cores of Hole U1476A. Additional samples were taken from Cores 361-U1476B-1H through 16H (Table T9). Magnetic susceptibility, NRM, demagnetization, and isothermal remanent magnetization (IRM) acquisition experiments were carried out on discrete samples. The saturation IRM (SIRM) is typically between 1.2 and 5 A/m for these samples. The highest SIRM values occur between 50 and 125 m CSF-A in Hole U1476A and coincide with relatively high magnetic susceptibility values, whereas hard IRM (HIRM) is relatively stable throughout Hole U1476A. S-ratios are relatively stable within the upper 100 m CSF-A, indicating that the magnetic signal is mainly carried by magnetite. Below 100 m CSF-A, S-ratios gradually decrease and rise again to higher values below 175 m CSF-A (Figure F24). Overall, rock magnetic data imply that the concentration of high-coercivity minerals (e.g., hematite and titanomagnetite) is relatively stable, whereas magnetite concentrations show variations that parallel the long-term trend of the magnetic susceptibility signal, which is attributed to changes in carbonate concentrations (see Geochemistry).
Table T9. Analyzed discrete whole-round samples, Site U1476. Download table in .csv format.
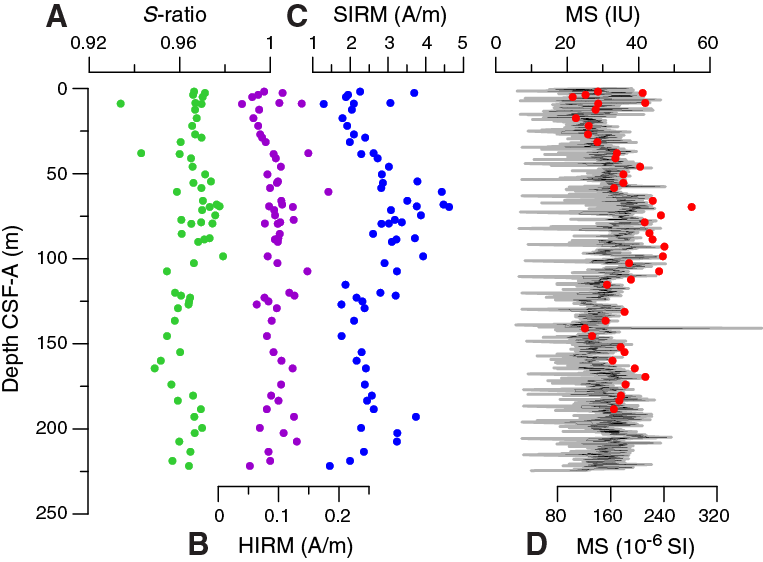
Figure F24. S-ratio, HIRM, SIRM, and magnetic susceptibility, Site U1476.
Initial inclinations before demagnetization are steep downward (~80°), as is typically observed for drill string overprint. After 25 mT demagnetization, the samples from 2.6 to 7.6 m CSF-A have inclinations between –30° and –50°, which approximate the present-day inclination of –49° at the geographic location of Site U1476. For the upper 50 m CSF-A, inclinations after 25 and 40 mT demagnetization are similar. However, in the lower part of Hole U1476A, inclination continues to change with progressive demagnetization. For some samples, flattened or negative inclinations after 25 mT demagnetization reversed after 40 or 60 mT demagnetization (Figure F25), suggesting a viscous overprint that was not sufficiently removed upon 25 mT demagnetization. We performed principal component analysis (PCA) of the demagnetization data only for samples whose directional data showed median angular deviations of <20° during progressive demagnetization (Figure F26A). Higher resolved demagnetization experiments on discrete samples could potentially improve the directional record at Site U1476 and disentangle viscous overprints from depositional remanent magnetization.
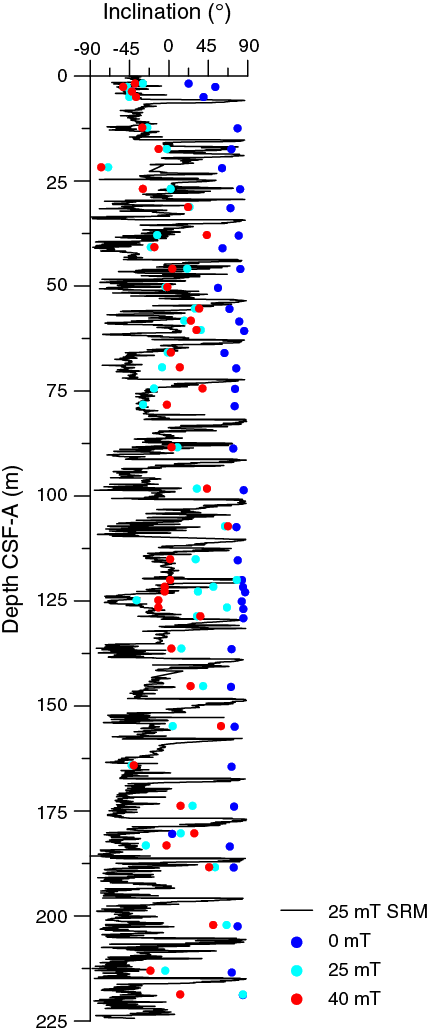
Figure F25. Comparison between section-half and discrete sample inclinations, Site U1476.
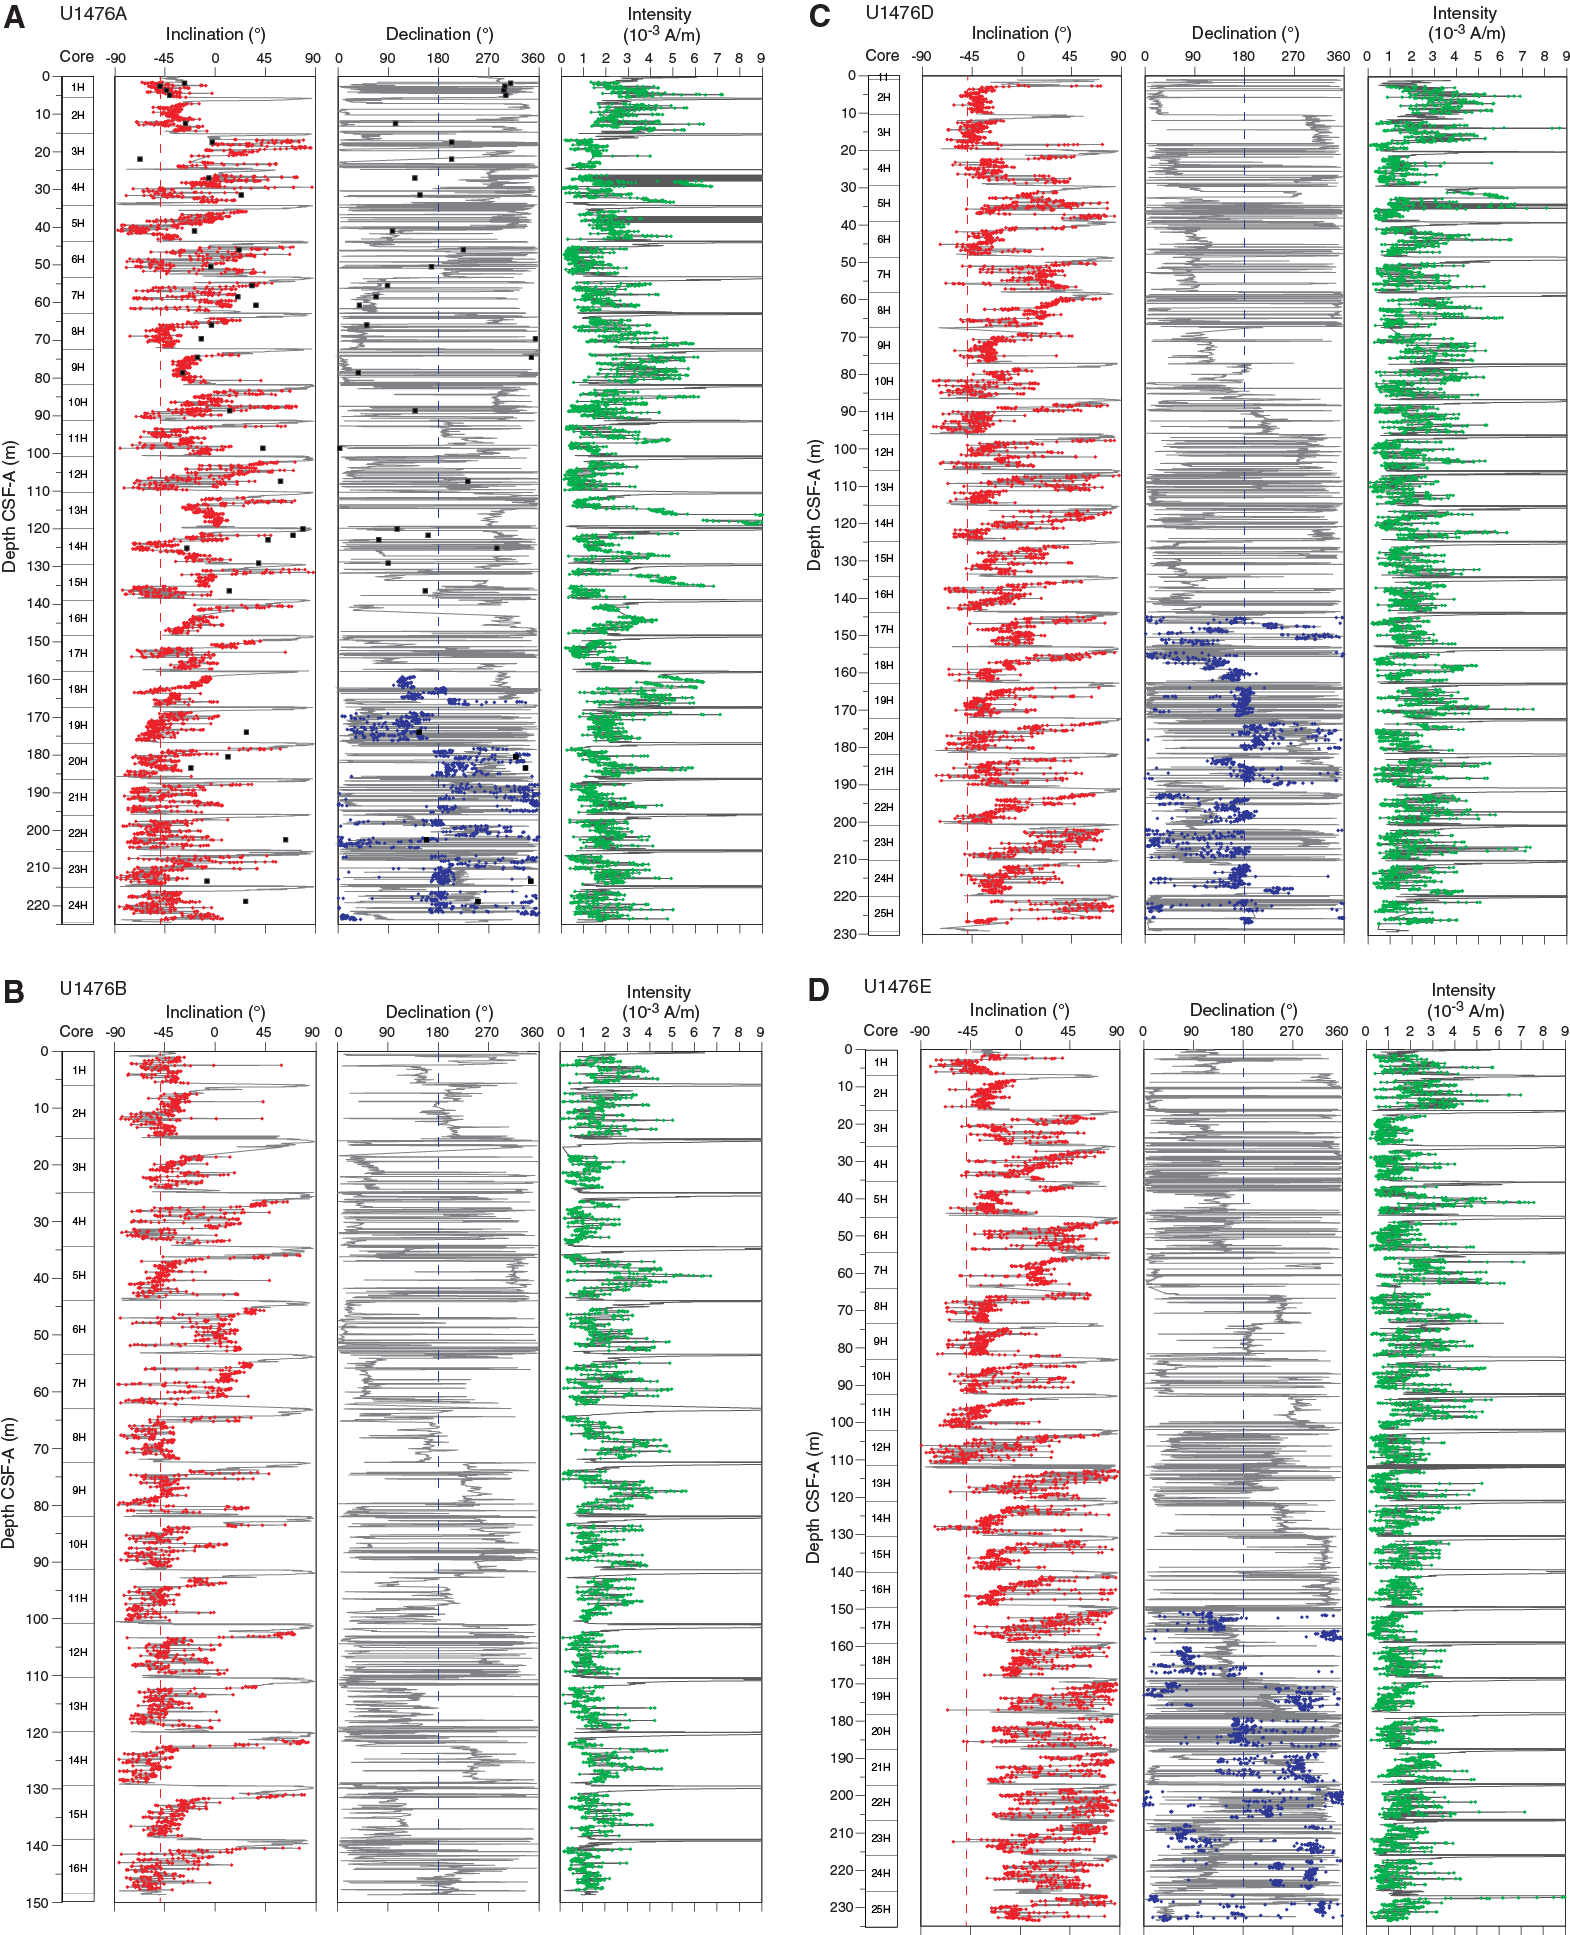
Figure F26. Downhole inclination, declination, and intensity, Site U1476.
Archive-half measurements
Archive halves from Holes U1476A, U1476B, U1476D, and U1476E were analyzed for their NRM. Cores 361-U1476A-1H through 13H and 361-U1476B-1H through 4H were demagnetized at 15 and 25 mT. Because of time constraints associated with high core recovery, Holes U1476A and U1476B and Cores 361-U1476E-13H through 25H were only demagnetized at the 25 mT level. In order to allow future demagnetization experiments, Hole U1476D and Cores 361-U1476E-1H through 12H were demagnetized at a maximum of 20 mT.
The maximum preferred demagnetization level for archive halves on board was not sufficient to remove the strong drilling-induced magnetic overprint, in particular in the uppermost 1–3 m of each core (Figure F26). Notably, only the uppermost core of Hole U1476C, which contains the mudline, does not display a clear coring overprint. The stronger overprint at the core tops suggests that sediment was probably magnetized by the bottom-hole assembly or drill string, as highlighted by Fuller et al. (2006), who investigated a similar signal recorded in the material of ODP Legs 182, 189, and 194.
The archive-half directional data for the upper 100 m CSF-A in Hole U1476A match the discrete sample inclination data. However, below this depth there are distinctive differences between the core and cube measurements (Figure F26). In the uppermost 15 m CSF-A, inclinations modulate around –45°, which is in accordance with present-day inclination at the study site. Further downhole, cores reveal alternating steep upward (–50°) and shallow downward (0°–10°) inclinations. This could be related to insufficient removal of a viscous overprint, as discussed in the previous section. Unfortunately, the declination data of the upper parts of Holes U1476A, U1476D, and U1476E could not be corrected with respect to core orientation because of failure of the Icefield MI-5 tool. Where orientation data from the FlexIt tool were available, declinations were corrected for core orientation (Figure F26).
Magnetostratigraphy
Although inclination data show phases of normal and shallow reverse polarities, the directional signal was not clear enough to develop an unequivocal magnetostratigraphy for Site U1476. However, when plotting inclination data from the splice on the preliminary shipboard age scale (see Age model), phases of normal upward and shallow downward inclinations appear to align with expected polarity chrons, suggesting further work on shore may allow a generation of a magnetic reversal record (Figure F27).
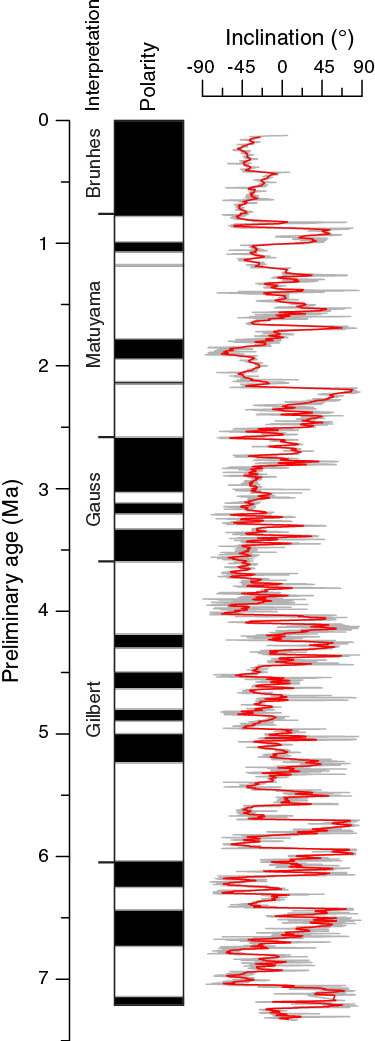
Figure F27. Spliced inclination record, Site U1476.
Stratigraphic correlation
Stratigraphic correlation of the five holes drilled at Site U1476 was rendered completely straightforward by a combination of circumstances: (1) ideal weather conditions with little or no swell, (2) generally excellent core quality with little disturbance in any of the holes, (3) a set of sedimentary signals (primarily magnetic susceptibility but also NGR and color RGB) with diagnostic features throughout the length of the sequence cored, and (4) small interhole differences in sequence stretching/squeezing. As a result of these ideal conditions, a demonstrably complete sequence was recovered to the base of Hole U1476E at ~242 m CCSF-A (see Stratigraphic correlation in the Expedition 361 methods chapter [Hall et al., 2017a] for an explanation of depth scales) (Figure F28). Real-time stratigraphic correlation was possible because of the unambiguous structure of the magnetic susceptibility record. Downhole adjustments to drilling at any of the holes were not necessary after setting the initial core break staggers from the mudline cores, because core gaps among holes never came into complete alignment (Table T10).

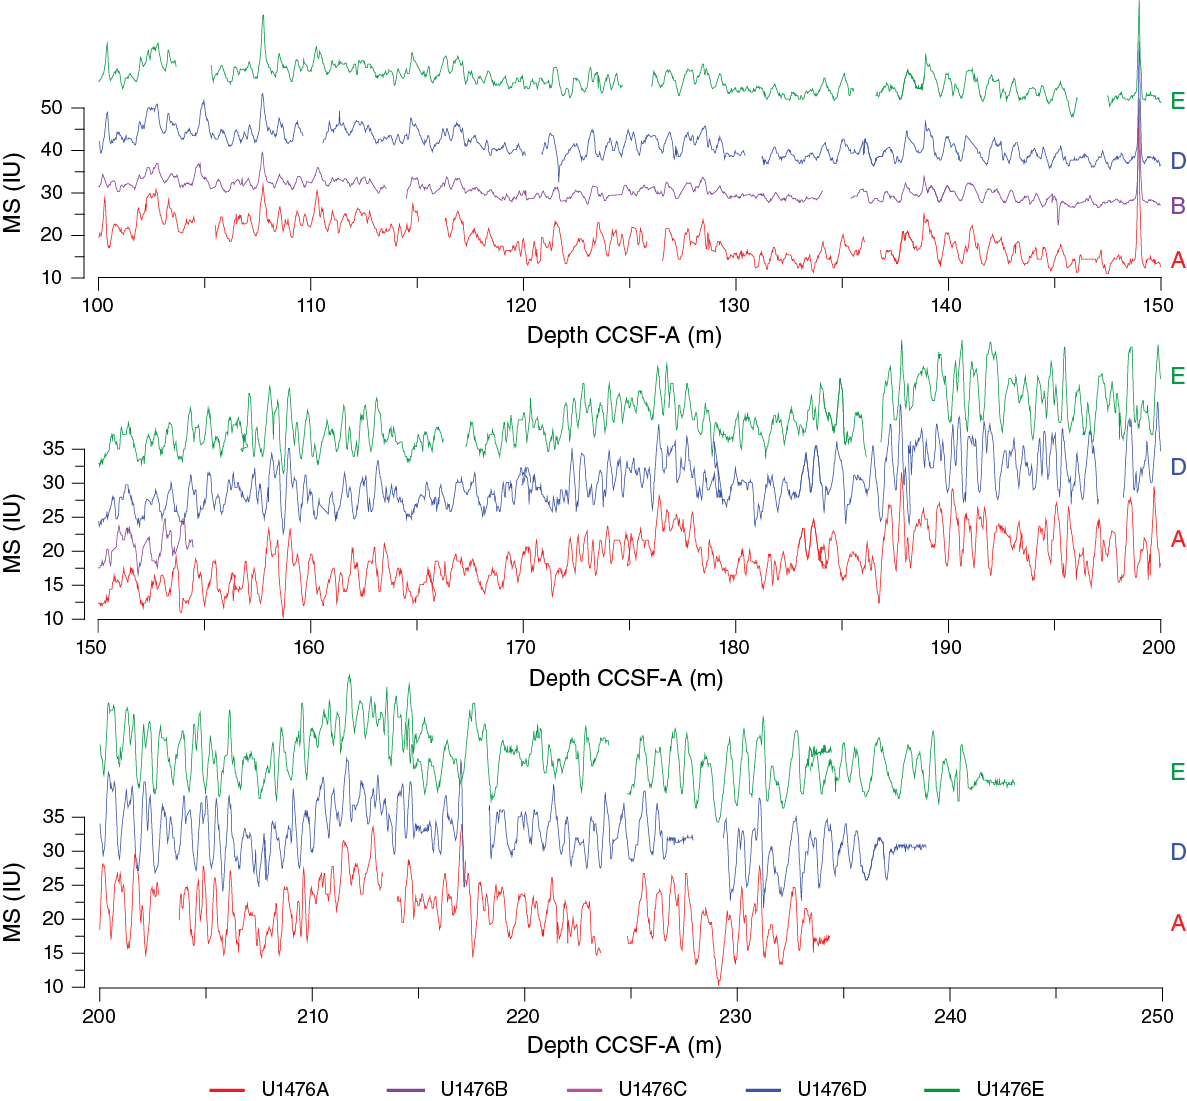
Figure F28. Magnetic susceptibility records, Site U1476.
Table T10. Affine table, Site U1476. Download table in .csv format.
A robust spliced sequence was also straightforward to achieve. The splice comprised correlated sections of Holes U1475D (which provides the mudline anchor), U1475E, and, for one short interval, Hole U1475A. Cores from Holes U1475D and U1475E were used for the splice because these holes were not sampled shipboard. Cores from Hole U1475B were placed on the CCSF-A depth scale but did not contribute to the splice, because this hole was dedicated to whole-round interstitial water samples. Hole U1475C was a single mudline calibration core that was not used for the splice.
Compositing of holes
Compositing of sequences was accomplished primarily by correlating distinctive features in the magnetic susceptibility record from the STMSL; however, identical results would have been achieved using WRMSL data. Both the local mean value of magnetic susceptibility and the variability about the local mean proved to be completely diagnostic for stratigraphic ties. Other variables such as NGR and RGB blue were checked for consistency of the stratigraphic ties. However, the stratigraphic ties from magnetic susceptibility were never ambiguous enough to require significant adjustment when compared to the stratigraphic relationships inferred from other variables. Thus, we are extremely confident of the composite depth scale to the base of the total sequence drilled. Core depth offsets were determined systematically, working from the mudline anchor (Table T11). For those cores not used in the spliced record, the stratigraphic ties (and therefore core depth offsets) were determined as near as possible to the top of the core. In some instances, with stratigraphic ties near the top of the core, the variable expansion of the within-core sequences leads to apparent miscorrelation of features that are clearly correlative among holes. However, as noted above, the intervals of variable stretching among holes were infrequent and of minor magnitude. The average growth rate of the CCSF-A depth scale, relative to CSF-A, is ~5% for all holes. As with the sediment at Site U1475, this expansion is somewhat lower than is typical for APC-recovered sequences (see Stratigraphic correlation in the Site U1475 chapter [Hall et al., 2017c]). In this case, and unlike at Site U1475, the relatively low growth rate of the composite depth scale did not result from drilling disturbance but rather the relatively low water content of the sediment at Site U1476, limiting the expansion of cores.
Table T11. Splice interval table, Site U1476. Download table in .csv format.
Construction of the splice
Once the composite depth scale was created, selected sequences from Holes U1476D and U1476E were spliced together to create the most complete and representative section possible (Figure F29). Sedimentological logs were consulted in the process of constructing the splice to avoid inclusion of any disturbed sections and/or sections with completely unique features (relative to the other holes). The result is reported in the splice interval Table T11. The splice constitutes a continuous sequence with a total length of ~242 m. Splice ties were checked to ensure that there were no major jumps across the splices in any of the variables used for correlation (spliced magnetic susceptibility, RGB blue, b*, and NGR). Confidence in the splice is uniformly high throughout the sequence.
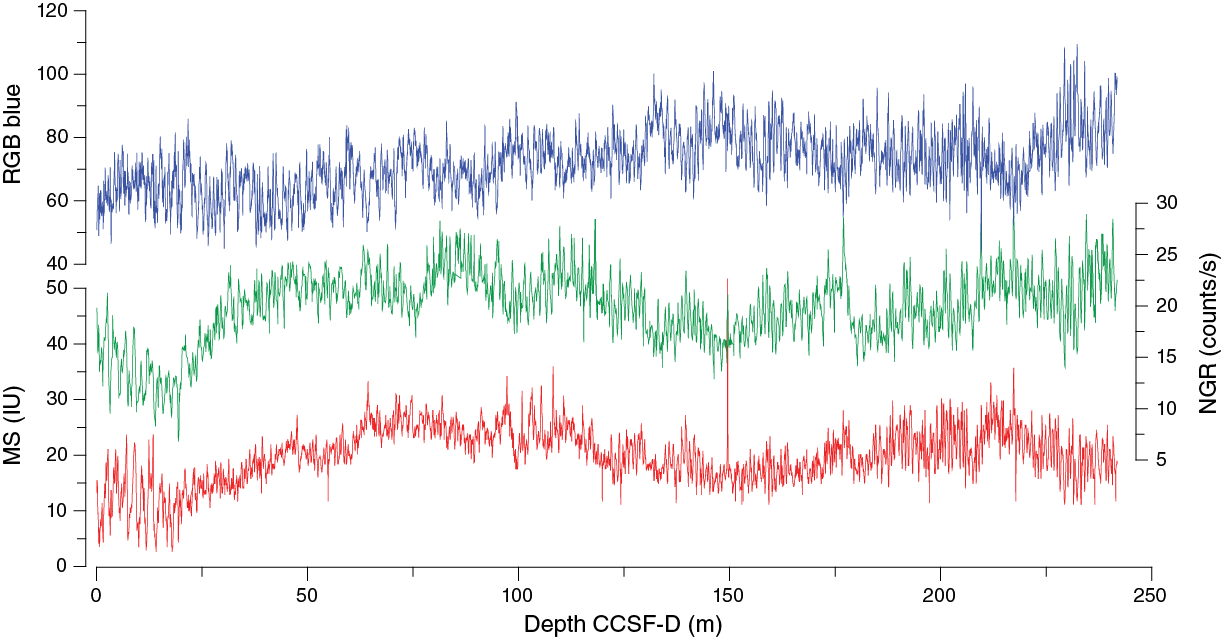
Figure F29. Composite spliced records of RGB blue values, magnetic susceptibility, and NGR, Site U1476.
Geochemistry
The chemical compositions of headspace gases, interstitial water, and bulk sediments were investigated at Site U1476. Sampling for shipboard analyses was largely focused in Hole U1476A. A dedicated high-resolution interstitial water sampling campaign to accomplish the objectives of the Ancillary Project Letter (APL-845) was conducted in Hole U1476B. Downhole profiles of interstitial water chemistry largely reflect postdepositional microbially mediated reactions driven by the relatively modest deposition of organic carbon, with an average concentration of 0.24 wt%. Sedimentary carbonate contents range from 44 to 76 wt%, with an average of 58 wt%.
Interstitial water for ship-based measurements was squeezed from 5 cm whole rounds at ~3 m resolution between 2.41 and 24.2 m CSF-A in Holes U1476A and U1476B and ~9.5 m resolution between 24.2 and 204.7 m CSF-A in Hole U1476A. A total of 22 samples were collected from Hole U1476A and 5 samples from Hole U1476B for shipboard analysis of interstitial water chemistry. An additional 95 interstitial water samples from Hole U1476B (17 cm × 5 cm whole rounds and 78 cm × 10 cm whole rounds) were collected for shore-based analysis of δ18O and Cl– related to the APL. A single additional 5 cm whole-round sample from Hole U1476B was cut but archived as part of the core rather than being squeezed because it was compromised by drilling disturbance. Rhizon samplers were used to collect interstitial water in Cores 361-U1476B-1H and 2H. These samples were split for shipboard nitrate measurements and shore-based work. Bulk sediment in Hole U1476A was measured for total organic carbon (TOC) and total inorganic carbon (TIC) content in samples selected as representative of the lithology.
Sedimentary hydrocarbon gases
Headspace gas samples were collected from each core in Hole U1476A. A total of 24 samples were measured. In all samples, CH4 was the only hydrocarbon present, remaining near background concentrations throughout the cored sequence. Methane concentrations increased to their highest level in Core 361-U1476A-16H (9.13 ppmv) and then decreased for the remainder of the sampled sections.
Interstitial water chemistry
Salinity, chloride, sodium, magnesium, and potassium
Salinity, chloride, and sodium are relatively constant and near or slightly elevated above average seawater values in all samples (Figure F30). Average values (±1σ) are 558 ± 3 mM chloride and 470 ± 4 mM sodium. Chloride increases slightly downhole in the upper ~25 m CSF-A but then remains relatively constant. Replicate measurements of chloride in the upper 150 m of Hole U1476A help reduce some of the noise in the profile, but analytical uncertainty still hinders further interpretation. Magnesium and potassium concentrations decrease downhole from maximum values of 53.3 mM Mg at 4.45 m CSF-A and 12.5 mM K at 3.9 m CSF-A to minima of ~41.9 mM Mg and 6.2 mM K near the bottom of Hole U1476A (Cores 21H and 22H) (Figure F30). The drawdown of potassium to ~50% of the uppermost concentrations suggests significant uptake by clay minerals at depth.
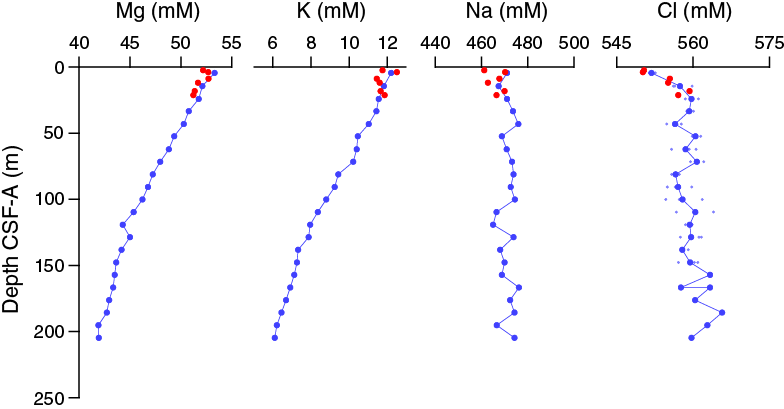
Figure F30. Dissolved magnesium, potassium, sodium, and chloride profiles, Holes U1476A and U1476B.
Alkalinity, phosphate, nitrate, and pH
Alkalinity is ~3.4 mM in the upper few meters, increasing slightly to ~4.5–4.9 mM at 43.15 m CSF-A and the base of the section (Figure F31). Phosphate concentrations are mostly near the detection limit of 1.33 µM (average blank + 3 × standard deviation of blank) with the exception of two depth intervals, ~0–21 and ~70–120 m CSF-A. In the uppermost 21.3 m CSF-A, phosphate concentrations range from below detection limit to a maximum of 3.54 µM at 4.45 m CSF-A (Sample 361-U1476A-1H-3, 145–150 cm); between 70 and 120 m CSF-A, phosphate concentrations vary between 1.51 and 3.04 µM. Nitrate concentration is 44.26 µM at 0.1 m CSF-A (Sample 361-U1476B-1H-1, 10 cm), below which it decreases to below detection limits by 1.55 m CSF-A (Sample 1H-2, 50 cm) (Figure F32). Nitrate in the overlying water (Section 361-U1476E-1H-1; mudline) is 31.5 µM, which is consistent with regional hydrographic measurements for bottom water (Donohue and Toole, 2003). Nitrate concentrations are above average seawater values in the upper 0.4 m CSF-A due to production by nitrifying bacteria. The consumption of nitrate below this depth reflects denitrification. pH is fairly constant at this site, scattered around an average of 7.34 ± 0.10 with two notable outliers (Samples 361-U1476A-4H-6, 117–122 cm, and 7H-6, 145–150 cm) and slightly higher values (>7.4) in the uppermost 5 m CSF-A (Figure F31).
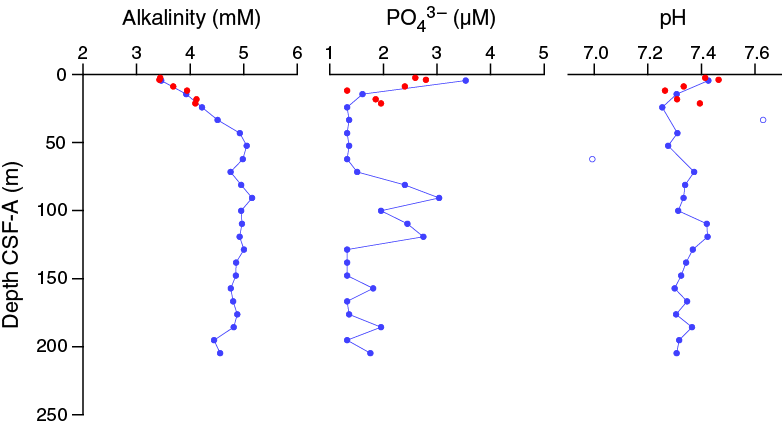
Figure F31. Alkalinity, dissolved phosphate, and pH profiles, Holes U1476A and U1476B.
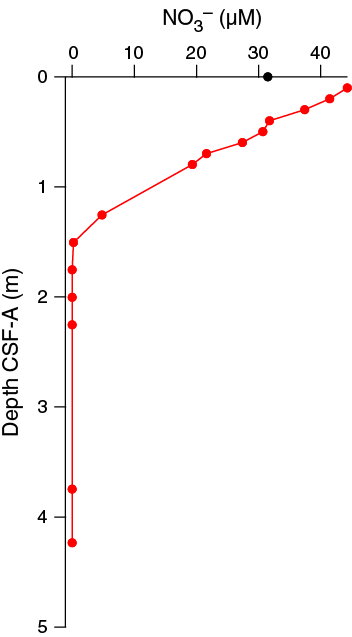
Figure F32. Dissolved nitrate from Rhizon sampling in Core 361-U1476B-1H and bottom-water nitrate from Hole U1476E mudline sample.
Iron and manganese
Dissolved iron and manganese concentrations at Site U1476 are significantly higher than at the more southern sites (see Geochemistry in the Site U1474 chapter and Geochemistry in the Site U1475 chapter [Hall et al., 2017b, 2017c]). Dissolved iron concentrations range from 5.94 to 47.4 µM, with the highest values in the upper ~60 m CSF-A. Iron concentrations are apparently offset between the two holes, with significantly lower values in Hole U1476B compared to those in Hole U1476A (Figure F33). Manganese concentrations are at a maximum of 16.72 µM in the uppermost sample (361-U1476B-1H-2, 140–145 cm) and decrease rapidly downhole to ~14.5 m CSF-A. Between ~14.5 and 33 m CSF-A, dissolved manganese concentrations are 5.73 ± 0.20 µM and increase to ~6.9 µM from 43 to 53 m CSF-A (Samples 361-U1476A-5H-6, 145–150 cm, and 6H-6, 145–150 cm) before decreasing to values below 3 µM by ~80 m CSF-A. Below 80 m CSF-A, manganese concentrations are fairly constant at 1.73 ± 0.62 µM. Decreasing dissolved manganese concentrations below the zone of dissolution in the uppermost 2 m CSF-A likely reflect the element’s combination with HCO3– and formation of manganese carbonate minerals (Calvert and Pedersen, 1994). Variable dissolved iron concentrations imply that Fe reduction is active through much of the core and that reprecipitation into sulfide minerals acts as only a weak sink for dissolved Fe.
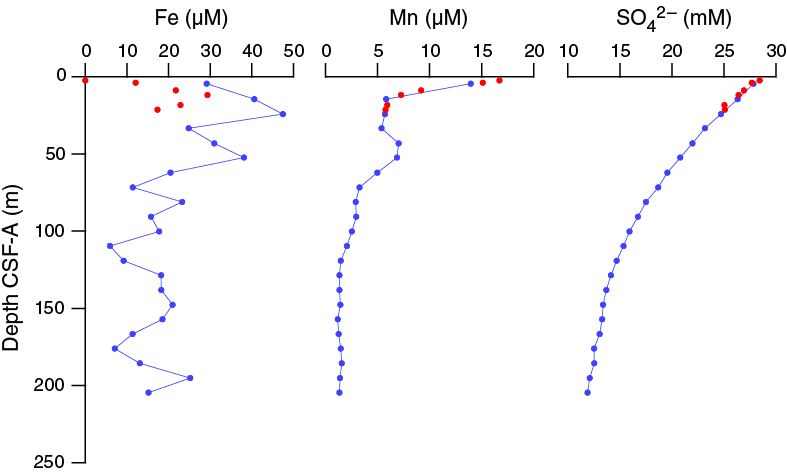
Figure F33. Dissolved iron, manganese, and sulfate, Holes U1476A and U1476B.
Sulfate and barium
Sulfate concentrations are 28.4 mM in the first sample (361-U1476B-1H-2, 140–145 cm), near average seawater concentration. Sulfate decreases steadily in a concave profile downhole to 11.90 mM at 204.65 m CSF-A in Hole U1476A (Figure F33). This is likely the result of microbial sulfate reduction, in which sulfate is used as an electron receptor in the anaerobic oxidation of organic matter:
53 SO42– + (CH2O)106(NH3)16(H3PO4) → 39 CO2 + 67 HCO3– + 16 NH4+ + 53 HS– + 39 H2O + HPO42–.
In sediment where sulfate reduction is rapid and intense, barite (BaSO4) will dissolve. At Site U1476, barium concentrations are below detection limits in all but 9 samples, with a maximum concentration of 0.4 μM (Sample 361-U1476A-8H-6, 145–150 cm), implying no significant barite dissolution (not shown). This observation and the variable iron concentrations are consistent with the incomplete drawdown of sulfate through the section.
Calcium and strontium
The dissolved calcium profile at Site U1476 is very similar to that observed at Sites U1474 and U1475. The concentrations of calcium in interstitial water decrease from a maximum of 10.5 mM in the uppermost sample (361-U1476B-1H-2, 140–145 cm) to minimum concentrations of 6.8 mM at 119.15 m CSF-A (Sample 361-U1476A-13H-6, 145–150 cm) and then increases to 7.9 mM in the deepest sample collected (204.65 m CSF-A; Sample 22H-6, 145–150 cm) (Figure F34). Strontium concentrations increase steadily with depth from 91.8 μM (2.41 m CSF-A) to a maximum concentration of 402 μM at 204.65 m CSF-A, with the most rapid change occurring in the uppermost ~21 m CSF-A.
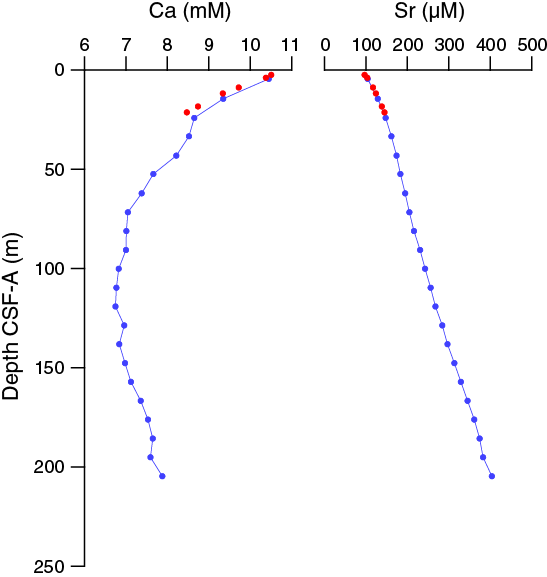
Figure F34. Dissolved calcium and strontium profiles, Holes U1476A and U1476B.
Silicon, lithium, and boron
The dissolved silicon profile shows a maximum silicon concentration of 260 μM in the uppermost sample (361-U1476B-1H-2, 140–145 cm), a decrease downhole to a minimum concentration of 159 μM at 71.65 m CSF-A (Sample 361-U1476A-8H-6, 145–150 cm), and then an increase to ~194 μM near the bottom of Hole U1476A (Cores 21H and 22H) (Figure F35).

Figure F35. Dissolved silicon, lithium, and boron profiles, Holes U1476A and U1476B.
Lithium concentrations increase with depth from a minimum of 17.0 μM in the uppermost sample (361-U1476B-1H-2, 140–145 cm) to a maximum of 42.2 μM in the deepest sample (361-U1476A-22H-6, 145–150 cm) (Figure F35). Boron concentrations at Site U1476 are elevated above average seawater values, varying around 523.6 ± 24.8 (1σ) μM with somewhat higher values in the upper ~50 m CSF-A. As with Sites U1474 and U1475, boron concentrations are offset ~5% in the of samples from Hole U1476B relative to those in Hole U1476A in the upper ~25 m CSF-A, which is within the analytical precision of the boron concentration measurement but may possibly reflect natural environmental variability in boron concentrations between holes.
Bulk sediment geochemistry
Total organic carbon
Total organic carbon varies from below detection limit to 0.47 wt%, with an average of 0.24 wt% for all samples measured (Figure F36). Values decrease downhole from ~0.25 wt% in the upper 140 m CSF-A to near zero between 140 m CSF-A and the base of the section.
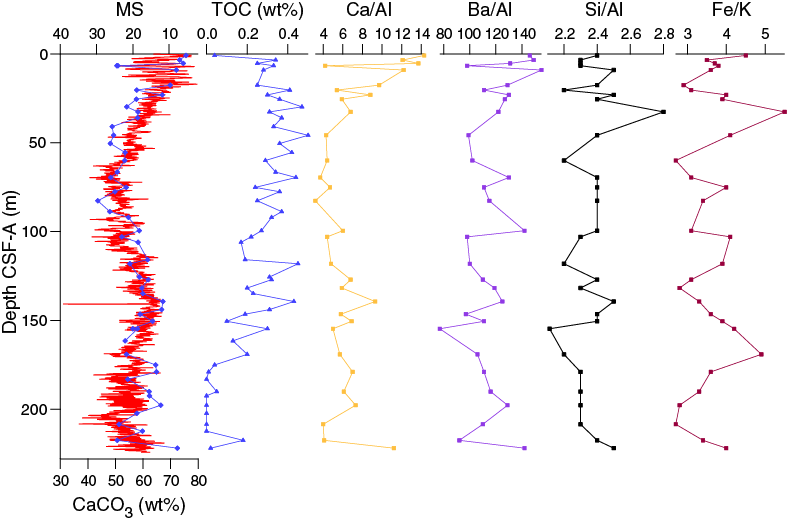
Figure F36. Calcium carbonate and magnetic susceptibility, TOC, and bulk sediment elemental ratios, Hole U1476A.
Calcium carbonate
Calcium carbonate contents range between 44 and 76 wt%, with an average of ~58 wt% at Site U1476 (Figure F36). Carbonate contents vary downhole with large variations over tens of meters and smaller fluctuations on the meter scale. In the upper ~40 m CSF-A, carbonate contents generally decrease downhole from their maximum value of 76 wt% at 0.8 m CSF-A (Sample 361-U1476A-1H-1, 80–81 cm) to ~49 wt%. The low carbonate value at 6.6 m CSF-A (51 wt% carbonate; Sample 2H-1, 90–91 cm) was replicated, and the value was reproduced. Between ~40 and 80 m CSF-A, carbonate contents vary, with minima around 48 wt% and maxima up to 54 wt%. A minimum carbonate content of 44 wt% was measured at 82.65 m CSF-A. Carbonate contents then increase downhole to 67 wt% at ~140 m CSF-A, with meter-scale fluctuations of ~6 wt% on top of the overall trend. Below ~140 m CSF-A, carbonate contents vary on the tens of meter scale, with minima of ~51–54 wt% and maxima of 65–72 wt% and with increasing amplitude variations downhole.
Variability in carbonate contents and magnetic susceptibilities are broadly similar downhole (Figure F36), likely because variations in carbonate concentration dominate observed lithologic variations at Site U1476. The one notable carbonate measurement of 51 wt% at 6.6 m CSF-A (Sample 361-U1476A-2H-1, 90–91 cm) corresponds to a particularly high peak in magnetic susceptibility, whereas the majority of the carbonate samples that were measured correspond to magnetic susceptibility minima.
Major and trace elements
Major and trace element concentrations were measured for 31 of the samples taken for calcium carbonate analyses from Hole U1476A (Table T12). Most elements show a positive correlation with aluminum and near-zero intercept, which is consistent with the dilution of lithogenic material by calcium carbonate (Figure F37). The lithogenic end-member appears to be slightly enriched in Al, Ti, and Fe and depleted in Si compared to average upper continental crust (Taylor and McLennan, 1985). Barium is also enriched, but this is probably due to the presence of marine barite. Phosphorous, manganese, and sodium oxides show no correlation with aluminum oxide content and are most likely impacted by the variable presence of authigenic minerals (especially phosphates and carbonates) and salts from dried interstitial water. Strontium displays an inverse relationship with aluminum and is enriched above average crustal values, which is likely due to the incorporation of strontium into biogenic carbonates. The structure of the Sr versus Al2O3 profile may indicate the presence of two distinct high-Sr, low-Al end-members, perhaps representing foraminiferal calcite and nannofossils.
Table T12. Bulk sediment geochemistry data, Hole U1476A. Download table in .csv format.
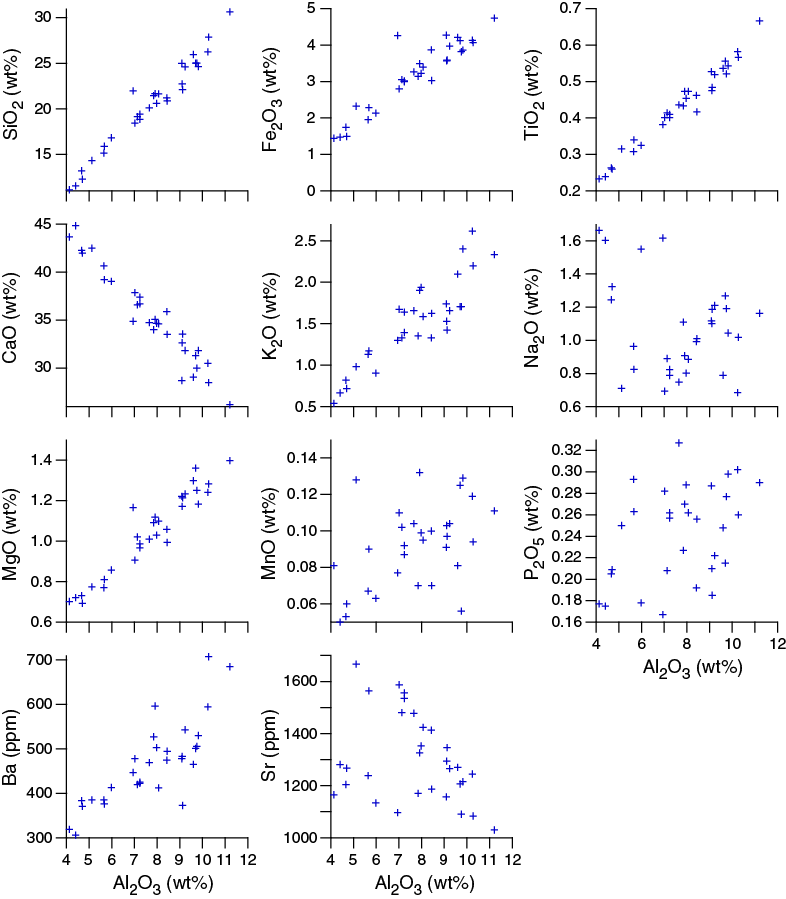
Figure F37. Sedimentary major and trace element concentrations vs. aluminum oxide content, Hole U1476A.
Elemental ratios vary downhole at this site. Ca/Al values closely follow percent carbonate throughout the record, as expected (Figure F36). Because of the low abundance of diatoms at Site U1476, variations in Si/Al can be interpreted as a lithogenic signal, probably reflecting the relative abundance of quartz versus clay minerals. Ba/Al variations display no correlation with total organic carbon at this site; instead, Ba/Al values appear to oscillate between a biogenic (marine barite) and lithogenic signal, and in some intervals they correlate with Ca/Al values and percent carbonate, whereas in other intervals they correlate with Si/Al. Ratios of other lithogenic elements also display downhole variability on various scales. For example, Fe/K values vary by up to a factor of two over a few tens of meters, alluding to the potential for further studies regarding sediment provenance, transport, and/or weathering.
Age model
A 224 m long sequence of late Miocene to Late Pleistocene sediment was recovered from Hole U1476A. The age model is based on the biochronology of calcareous nannofossils and planktonic foraminifers. Biostratigraphic sampling in Hole U1476A included 24 core catcher samples and an additional 141 samples from the working-halves for planktonic foraminifer examination and 123 samples for calcareous nannofossil examination. We report biostratigraphic events in Tables T4 and T5 and illustrate the major age-depth trends in Figure F38.
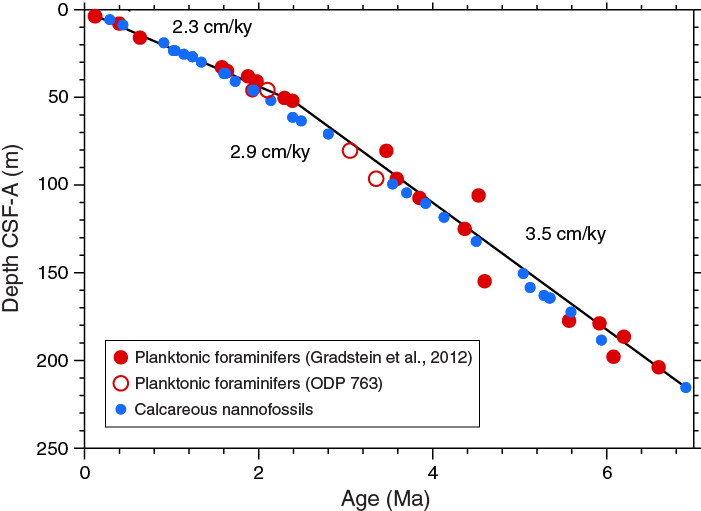
Figure F38. Age-depth relationships based on calcareous nannofossils and planktonic foraminifers, Site U1476.
The age-depth model reveals that inferred sedimentation rates are consistent throughout the recovered sequence, with no apparent hiatuses. The sedimentation rate based upon a linear fit to the nannofossil datums plotted on the CSF-A depth scale is ~3.0 cm/ky (r2 = 0.995). The fit can be somewhat improved (r2 = 0.999) by fitting a third-order polynomial to these data. The polynomial fit suggests that sedimentation rates are slightly lower in the upper 150 m CSF-A than in the deeper part of Hole U1476A. In detail, the implied sedimentation rates are ~2.3 cm/ky between the recent and 1.6 Ma (0–35 m CSF-A); rates increase to 2.9 cm/ky in the interval between 1.6 and 2.8 Ma (35–71 m CSF-A) and finally increase again to ~3.5 cm/ky after 2.8 Ma to the bottom of the hole at ~7 Ma (71–224 m CSF-A). Plotting the biostratigraphic events on the CCSF-A scale has minimal impact on the apparent sedimentation rates because of the small growth factor in the composite spliced record (~18 m over the full 242 m splice).
Calcareous nannofossil datums have remarkably good internal agreement, forming a cubic spline fit with r2 = 0.99. Calcareous nannofossils are well preserved throughout the hole, even in the deeper parts of the section where preservation degrades to moderate and planktonic foraminifers are partially dissolved. The biochronology based on the planktonic foraminifer assemblage is also of good quality (r2 = 0.92). Most planktonic foraminifer datums are based upon calibrations for low-latitude species that were found continuously through their ranges. Globorotalia multicamerata, D. altispira, and S. kochi, which show high abundances, are characterized by top occurrences that fall in the age model earlier than expected in relation to the other biostratigraphic markers (see open symbols in Figure F38; an alternative age assignment for these species is suggested below). These top occurrences might reflect upward postdepositional reworking of the species. However, we do not observe any other evidence of reworking such as differential preservation or mixture of different datum markers within the planktonic foraminifer fauna and/or within the calcareous nannofossil assemblages. Indeed, the calcareous nannofossil record suggests overall reworking is minor and does not support large-scale sediment transport or winnowing, which could effectively cause such a mismatch in the planktonic foraminifer datums. An alternative explanation is that the ranges of the affected species are currently incorrectly calibrated in the tropical western Indian Ocean. Magnetostratigraphic-calibrated ranges of the affected species in the eastern Indian Ocean (ODP Hole 763A; e.g., Sinha and Singh, 2008) support the hypothesis of diachronous ranges, where datums for G. multicamerata, D. altispira, and S. kochi show datum events of 2.1, 3.05, and 3.35 Ma, respectively (open symbols in Figure F38)—all younger than the Gradstein et al. (2012) calibrations of 2.98, 3.47, and 4.53 Ma, respectively.
References
Backeberg, B.C., and Reason, C.J.C., 2010. A connection between the South Equatorial Current north of Madagascar and Mozambique Channel eddies. Geophysical Research Letters, 37(4):L04604. http://dx.doi.org/10.1029/2009GL041950
Biastoch, A., Böning, C.W., and Lutjeharms, J.R.E., 2008. Agulhas leakage dynamics affects decadal variability in Atlantic overturning circulation. Nature, 456(7221):489–492. http://dx.doi.org/10.1038/nature07426
Biastoch, A., Böning, C.W., Schwarzkopf, F.U., and Lutjeharms, J.R.E., 2009. Increase in Agulhas leakage due to poleward shift of Southern Hemisphere westerlies. Nature, 462(7272):495–498. http://dx.doi.org/10.1038/nature08519
Biastoch, A., and Krauss, W., 1999. The role of mesoscale eddies in the source regions of the Agulhas Current. Journal of Physical Oceanography, 29(9):2303–2317. http://dx.doi.org/10.1175/1520-0485(1999)029<2303:TROMEI>2.0.CO;2
Bryden, H.L., Beal, L.M., and Duncan, L.M., 2005. Structure and transport of the Agulhas Current and its temporal variability. Journal of Oceanography, 61(3):479–492. http://dx.doi.org/10.1007/s10872-005-0057-8
Calvert, S.E., and Pedersen, T.F., 1994. Sedimentary geochemistry of manganese; implications for the environment of formation of manganiferous black shales. Economic Geology, 91(1):36–47. http://dx.doi.org/10.2113/gsecongeo.91.1.36
Cane, M.A., and Molnar, P., 2001. Closing of the Indonesian Seaway as a precursor to East African aridification around 3–4 million years ago. Nature, 411(6834):157–162. http://dx.doi.org/10.1038/35075500
Canfield, D.E., and Raiswell, R., 1992. Pyrite formation and fossil preservation. In Allison, P.A., and Briggs, D.E.G. (Eds.), Topics in Geobiology (Volume 9): Taphonomy: Releasing the Data from the Fossil Record: New York (Plenum Press), 337–387.
Collins, C., Hermes, J.C., Roman, R.E., and Reason, C.J.C., 2016. First dedicated hydrographic survey of the Comoros Basin. Journal of Geophysical Research: Oceans, 121(2):1291–1305. http://dx.doi.org/10.1002/2015JC011418
de Ruijter, W.P.M., Ridderinkhof, H., Lutjeharms, J.R.E., Schouten, M.W., and Veth, C., 2002. Observations of the flow in the Mozambique Channel. Geophysical Research Letters, 29(10):140-1–140-3. http://dx.doi.org/10.1029/2001GL013714
de Ruijter, W.P.M., Ridderinkhof, H., and Schouten, M.W., 2005. Variability of the southwest Indian Ocean. Philosophical Transactions of the Royal Society A: Mathematical, Physical and Engineering Sciences, 363(1826):63–76. http://dx.doi.org/10.1098/rsta.2004.1478
DiMarco, S.F.D., Chapman, P., Nowlin, W.D., Jr., Hacker, P., Donohue, K., Luther, M., Johnson, G.C., and Toole, J., 2002. Volume transport and property distributions of the Mozambique Channel. Deep Sea Research Part II: Topical Studies in Oceanography, 49(7–8):1481–1511. http://dx.doi.org/10.1016/S0967-0645(01)00159-X
Donohue, K.A., and Toole, J.M., 2003. A near-synoptic survey of the Southwest Indian Ocean. Deep Sea Research Part II: Topical Studies in Oceanography, 50(12–13):1893–1931. http://dx.doi.org/10.1016/S0967-0645(03)00039-0
Fedorov, A.V., Brierley, C.M., Lawrence, K.T, Liu, Z., Dekens, P.S, and Ravelo, A.C., 2013. Patterns and mechanisms of early Pliocene warmth. Nature, 496(7443):43–49. http://dx.doi.org/10.1038/nature12003
Fuller, M., Molina-Garza, R., Touchard, Y., and Kidane, T., 2006. Paleomagnetic records from carbonate legs in the Southern Oceans and attendant drilling and coring related effects. In Sager, W.W., Acton, G.D., Clement, B.M., and Fuller, M. (Eds.), ODP Contributions to Paleomagnetism. Physics Of The Earth And Planetary Interiors, 156(3–4):242–260. http://dx.doi.org/10.1016/j.pepi.2005.08.007
Geiger, M., Clark, D.N., and Mette, W., 2004. Reappraisal of the timing of the breakup of Gondwana based on sedimentological and seismic evidence from the Morondava Basin, Madagascar. Journal of African Earth Sciences, 38(4):363–381. http://dx.doi.org/10.1016/j.jafrearsci.2004.02.003
Gradstein, F.M., Ogg, J.G., Schmitz, M.D., and Ogg, G.M. (Eds.), 2012. The Geological Time Scale 2012: Amsterdam (Elsevier).
Hall, I.R., Hemming, S.R., LeVay, L.J., Barker, S., Berke, M.A., Brentegani, L., Caley, T., Cartagena-Sierra, A., Charles, C.D., Coenen, J.J., Crespin, J.G., Franzese, A.M., Gruetzner, J., Han, X., Hines, S.K.V., Jimenez Espejo, F.J., Just, J., Koutsodendris, A., Kubota, K., Lathika, N., Norris, R.D., Periera dos Santos, T., Robinson, R., Rolinson, J.M., Simon, M.H., Tangunan, D., van der Lubbe, J.J.L., Yamane, M., and Zhang, H., 2017a. Expedition 363 methods. In Hall, I.R., Hemming, S.R., LeVay, L.J., and the Expedition 361 Scientists, South African Climates (Agulhas LGM Density Profile). Proceedings of the International Ocean Discovery Program, 361: College Station, TX (International Ocean Discovery Program). http://dx.doi.org/10.14379/iodp.proc.361.102.2017
Hall, I.R., Hemming, S.R., LeVay, L.J., Barker, S., Berke, M.A., Brentegani, L., Caley, T., Cartagena-Sierra, A., Charles, C.D., Coenen, J.J., Crespin, J.G., Franzese, A.M., Gruetzner, J., Han, X., Hines, S.K.V., Jimenez Espejo, F.J., Just, J., Koutsodendris, A., Kubota, K., Lathika, N., Norris, R.D., Periera dos Santos, T., Robinson, R., Rolinson, J.M., Simon, M.H., Tangunan, D., van der Lubbe, J.J.L., Yamane, M., and Zhang, H., 2017b. Site U1474. In Hall, I.R., Hemming, S.R., LeVay, L.J., and the Expedition 361 Scientists, South African Climates (Agulhas LGM Density Profile). Proceedings of the International Ocean Discovery Program, 361: College Station, TX (International Ocean Discovery Program). http://dx.doi.org/10.14379/iodp.proc.361.103.2017
Hall, I.R., Hemming, S.R., LeVay, L.J., Barker, S., Berke, M.A., Brentegani, L., Caley, T., Cartagena-Sierra, A., Charles, C.D., Coenen, J.J., Crespin, J.G., Franzese, A.M., Gruetzner, J., Han, X., Hines, S.K.V., Jimenez Espejo, F.J., Just, J., Koutsodendris, A., Kubota, K., Lathika, N., Norris, R.D., Periera dos Santos, T., Robinson, R., Rolinson, J.M., Simon, M.H., Tangunan, D., van der Lubbe, J.J.L., Yamane, M., and Zhang, H., 2017c. Site U1475. In Hall, I.R., Hemming, S.R., LeVay, L.J., and the Expedition 361 Scientists, South African Climates (Agulhas LGM Density Profile). Proceedings of the International Ocean Discovery Program, 361: College Station, TX (International Ocean Discovery Program). http://dx.doi.org/10.14379/iodp.proc.361.104.2017
Haywood, A.M., Dowsett, H.J., and Dolan, A.M., 2016. Integrating geological archives and climate models for the mid-Pliocene warm period. Nature Communications, 7:10646. http://dx.doi.org/10.1038/ncomms10646
Haywood, A.M., and Valdes, P.J., 2004. Modelling Pliocene warmth: contribution of atmosphere, oceans and cryosphere. Earth and Planetary Science Letters, 218(3–4):363–377. http://dx.doi.org/10.1016/S0012-821X(03)00685-X
Karas, C., Nürnberg, D., Gupta, A.K., Tiedemann, R., Mohan, K., and Bickert, T., 2009. Mid-Pliocene climate change amplified by a switch in Indonesian subsurface throughflow. Nature Geoscience, 2(6):434–438. http://dx.doi.org/10.1038/ngeo520
Karas, C., Nürnberg, D., Tiedemann, R., and Garbe-Schönberg, D., 2011. Pliocene Indonesian Throughflow and Leeuwin Current dynamics: implications for Indian Ocean polar heat flux. Paleoceanography, 26(2):PA2217. http://dx.doi.org/10.1029/2010PA001949
Leinweber, V.T., Klingelhoefer, F., Neben, S., Reichert, C., Aslanian, D., Matias, L., Heyde, I., Schreckenberger, B., and Jokat, W., 2013. The crustal structure of the Central Mozambique continental margin—wide-angle seismic, gravity and magnetic study in the Mozambique Channel, eastern Africa. Tectonophysics, 599:170–196. http://dx.doi.org/10.1016/j.tecto.2013.04.015
Lourens, L., Hilgen, F., Shackleton, N.J., Laskar, J., and Wilson, D., 2004. The Neogene period. In Gradstein, F.M., Ogg, J.G., and Smith, A. (Eds.), A Geologic Time Scale 2004: Cambridge, United Kingdom (Cambridge University Press), 409–440. http://dx.doi.org/10.1017/CBO9780511536045.022
Lutjeharms, J.R.E., 2006. The Agulhas Current: Berlin (Springer-Verlag). http://dx.doi.org/10.1007/3-540-37212-1
Mahanjane, E.S., 2012. A geotectonic history of the northern Mozambique Basin including the Beira High—a contribution for the understanding of its development. Marine and Petroleum Geology, 36(1):1–12. http://dx.doi.org/10.1016/j.marpetgeo.2012.05.007
Mahanjane, E.S., Franke, D., Lutz, R., Winsemann, J., Ehrhardt, A., Berglar, K., and Reichert, C., 2014. Maturity and petroleum systems modelling in the offshore Zambezi Delta depression and Angoche Basin, northern Mozambique. Journal of Petroleum Geology, 37(4):329–348. http://dx.doi.org/10.1111/jpg.12589
Palastanga, V., van Leeuwen, P.J., and de Ruijter, W.P.M., 2006. A link between low-frequency mesoscale eddy variability around Madagascar and the large-scale Indian Ocean variability. Journal of Geophysical Research: Oceans, 111(C9):C09029. http://dx.doi.org/10.1029/2005JC003081
Parari, M., Zahn, R., and Blanz, T., 2013. Multi-millennial reconstructions of Mozambique Channel hydrography and the link to Agulhas System variability [paper presented at the Ocean Gateways Past and Present: Significance for Ocean Circulation and Terrestrial Climates, The Hebrew University of Jerusalem, Israel, 5–7 May 2013].
Penven, P., Lutjeharms, J.R.E., and Florenchie, P., 2006. Madagascar: a pacemaker for the Agulhas Current system? Geophysical Research Letters, 33(17):L17609. http://dx.doi.org/10.1029/2006GL026854
Quartly, G.D., and Srokosz, M.A., 2004. Eddies in the southern Mozambique Channel. Deep Sea Research Part II: Topical Studies in Oceanography, 51(1–3):69–83. http://dx.doi.org/10.1016/j.dsr2.2003.03.001
Rabinowitz, P.D., and Woods, S., 2006. The Africa-Madagascar connection and mammalian migrations. Journal of African Earth Sciences, 44(3):270–276. http://dx.doi.org/10.1016/j.jafrearsci.2005.12.005
Reason, C.J.C., Landman, W., and Tennant, W., 2006. Seasonal to decadal prediction of southern African climate and its links with variability of the Atlantic Ocean. Bulletin of the American Meteorological Society, 87(7):941–955. http://dx.doi.org/10.1175/BAMS-87-7-941
Ridderinkhof, H., and de Ruijter, W.P.M., 2003. Moored current observations in the Mozambique Channel. Deep Sea Research Part II: Topical Studies in Oceanography, 50(12–13):1933–1955. http://dx.doi.org/10.1016/S0967-0645(03)00041-9
Ridderinkhof, H., van der Werf, P.M., Ullgren, J.E., van Aken, H.M., van Leeuwen P.J., and de Ruijter, W.P.M., 2010. Seasonal and interannual variability in the Mozambique Channel from moored current observations. Journal of Geophysical Research: Oceans, 115(C6):C06010. http://dx.doi.org/10.1029/2009JC005619
Rosenbloom, N.A., Otto-Bliesner, B.L., Brady, E.C., and Lawrence, P.J., 2013. Simulating the mid-Pliocene Warm Period with the CCSM4 model. Geoscientific Model Development, 6(2):549–561. http://dx.doi.org/10.5194/gmd-6-549-2013
Salman, G., and Abdula, I., 1995. Development of the Mozambique and Ruvuma sedimentary basins, offshore Mozambique. Sedimentary Geology, 96(1–2):7–41. http://dx.doi.org/10.1016/0037-0738(95)00125-R
Schoonen, M.A.A., 2004. Mechanisms of sedimentary pyrite formation. In Amend, J.P., Edwards, K.J., and Lyons, T.W. (Eds.), Sulfur Biogeochemistry: Past and Present. Special Paper - Geological Society of America, 379:117–134. http://dx.doi.org/10.1130/0-8137-2379-5.117
Schott, F.A., Xie, S.-P., and McCreary, J.P., Jr., 2009. Indian Ocean circulation and climate variability. Reviews of Geophysics, 47(1):RG1002. http://dx.doi.org/10.1029/2007RG000245
Schouten, M.W., de Ruijter, W.P.M., and van Leeuwen, P.J., 2002. Upstream control of Agulhas ring shedding. Journal of Geophysical Research: Oceans, 107(C8):23-1–23-11. http://dx.doi.org/10.1029/2001JC000804
Schouten, M.W., de Ruijter, W.P.M., van Leeuwen, P.J., and Ridderinkhof, H., 2003. Eddies and variability in the Mozambique Channel. Deep Sea Research Part II: Topical Studies in Oceanography, 50(12–13):1987–2003. http://dx.doi.org/10.1016/S0967-0645(03)00042-0
Schrader, H.-J., 1974. Cenozoic marine planktonic diatom stratigraphy of the tropical Indian Ocean. In Fisher, R.L., Bunce, E.T., et al., Initial Reports of the Deep Sea Drilling Project, 24: Washington, DC (U.S. Government Printing Office), 887–967. http://dx.doi.org/10.2973/dsdp.proc.24.122.1974
Sexton, P.F., and Norris, R.D., 2008. Dispersal and biogeography of marine plankton: long-distance dispersal of the foraminifer Truncorotalia truncatulinoides. Geology, 36(11):899–902. http://dx.doi.org/10.1130/G25232A.1
Simpson, E.S.W., Schlich, R., et al., 1974. Initial Reports of the Deep Sea Drilling Project, 25: Washington, DC (U.S. Government Printing Office). http://dx.doi.org/10.2973/dsdp.proc.25.1974
Sinha, D.K., and Singh, A.K., 2008. Late Neogene planktic foraminiferal biochronology of the ODP Site 763A, Exmouth Plateau, southeast Indian Ocean. Journal of Foraminiferal Research, 38(3):251–270. http://dx.doi.org/10.2113/gsjfr.38.3.251
Taylor, R.S., and McLennan, S.M., 1985. The Continental Crust: Its Composition and Evolution: Oxford, United Kingdom (Blackwell Scientific Publications, Ltd.).
Ternon, J.F., Bach, P., Barlow, R., Huggett, J., Jaquemet, S., Marsac, F., Ménard, F., Penven, P., Potier, M., and Roberts, M.J., 2014. The Mozambique Channel: from physics to upper trophic levels. Deep Sea Research Part II: Topical Studies in Oceanography, 100:1–9. http://dx.doi.org/10.1016/j.dsr2.2013.10.012
Tsugawa, M., and Hasumi, H., 2010. Generation and growth mechanism of the Natal Pulse. Journal of Physical Oceanography, 40(7):1597–1612. http://dx.doi.org/10.1175/2010JPO4347.1
Ullgren, J.E., van Aken, H.M., Ridderinkhof, H., and de Ruijter, W.P.M., 2012. The hydrography of the Mozambique Channel from six years of continuous temperature, salinity, and velocity observations. Deep Sea Research Part I: Oceanographic Research Papers, 69:36–50. http://dx.doi.org/10.1016/j.dsr.2012.07.003
van Aken, H.M., Ridderinkhof, H., and de Ruijter, W.P.M., 2004. North Atlantic Deep Water in the south-western Indian Ocean. Deep Sea Research Part I: Oceanographic Research Papers, 51(6):755–776. http://dx.doi.org/10.1016/j.dsr.2004.01.008
Wan, S., Tian, J., Steinke, S., Li, A., and Li, T., 2010. Evolution and variability of the East Asian summer monsoon during the Pliocene: evidence from clay mineral records of the South China Sea. Palaeogeography, Palaeoclimatology, Palaeoecology, 293(1–2):237–247. http://dx.doi.org/10.1016/j.palaeo.2010.05.025
Zhang, R., Yan, Q., Zhang, Z.S., Jiang, D., Otto-Bliesner, B.L., Haywood, A.M., Hill, D.J., Dolan, A.M., Stepanek, C., Lohmann, G., Contoux, C., Bragg, F., Chan, W.-L., Chandler, M.A., Jost, A., Kamae, Y., Abe-Ouchi, A., Ramstein, G., Rosenbloom, N.A., Sohl, L., and Ueda, H., 2013. Mid-Pliocene East Asian monsoon climate simulated in the PlioMIP. Climate of the Past, 9(5):2085–2099. http://dx.doi.org/10.5194/cp-9-2085-2013
1 Hall, I.R., Hemming, S.R., LeVay, L.J., Barker, S., Berke, M.A., Brentegani, L., Caley, T., Cartagena-Sierra, A., Charles, C.D., Coenen, J.J., Crespin, J.G., Franzese, A.M., Gruetzner, J., Han, X., Hines, S.K.V., Jimenez Espejo, F.J., Just, J., Koutsodendris, A., Kubota, K., Lathika, N., Norris, R.D., Periera dos Santos, T., Robinson, R., Rolinson, J.M., Simon, M.H., Tangunan, D., van der Lubbe, J.J.L., Yamane, M., and Zhang, H., 2017. Site U1476. In Hall, I.R., Hemming, S.R., LeVay, L.J., and the Expedition 361 Scientists, South African Climates (Agulhas LGM Density Profile). Proceedings of the International Ocean Discovery Program, 361: College Station, TX (International Ocean Discovery Program). http://dx.doi.org/10.14379/iodp.proc.361.105.2017
2 Expedition 361 Scientists’ addresses.
This work is distributed under the Creative Commons Attribution 4.0 International (CC BY 4.0) license.
- F1. Location map of Site U1476 with main surface currents in the southwest Indian Ocean.
- F2. Geomorphologic and oceanographic features near Site U1476.
- F3. Temperature-salinity diagram of hydrographic stations from the Comoros Basin, close to the location of Site U1476.
- F4. Multibeam bathymetry around Site U1476 and DSDP Site 242.
- F5. Parasound data along seismic Line M753-GeoB08-203 across DSDP Site 242.
- F6. Seismic Line M753-GeoB08-205 across Site U1476.
- F7. Detail of seismic Line M753-GeoB08-205 at Site U1476.
- F8. Core recovery, Holes U1476A–U1476E.
- F9. Lithostratigraphic summary with selected physical property and geochemical data.
- F10. Representative lithologies per interval, Site U1476.
- F11. Sediment deformations and disturbances, Site U1476.
- F12. Relative percentages of major compositions of sediment determined by smear slide observations, Holes U1476A–U1476E.
- F13. Comparison of CaCO3 from discrete samples and biogenic carbonate estimated in smear slides, Hole U1476A.
- F14. SEM images of magnetite in Hole U1476D and XRD diffractogram of a bulk sediment sample in Hole U1476B.
- F15. Color reflectance, Hole U1476A.
- F16. SHIL RGB color data, Hole U1476A.
- F17. NGR and magnetic susceptibility, Hole U1476A.
- F18. P-wave velocity and bulk density, Hole U1476A.
- F19. Porosity, grain density, and thermal conductivity, Hole U1476A.
- F20. Biochronology at Site U1476 with significant planktonic foraminifer and calcareous nannofossil events.
- F21. Calcareous nannofossils, Hole U1476A.
- F22. Planktonic foraminifers, Hole U1476A.
- F23. Planktonic foraminifers, Hole U1476A.
- F24. S-ratio, HIRM, SIRM, and magnetic susceptibility, Site U1476.
- F25. Comparison between section-half and discrete sample inclinations, Site U1476.
- F26. Downhole inclination, declination, and intensity, Site U1476.
- F27. Spliced inclination record, Site U1476.
- F28. Magnetic susceptibility records, Site U1476.
- F29. Composite spliced records of RGB blue values, magnetic susceptibility, and NGR, Site U1476.
- F30. Dissolved magnesium, potassium, sodium, and chloride profiles, Holes U1476A and U1476B.
- F31. Alkalinity, dissolved phosphate, and pH profiles, Holes U1476A and U1476B.
- F32. Dissolved nitrate from Rhizon sampling in Core 361-U1476B-1H and bottom-water nitrate from Hole U1476E mudline sample.
- F33. Dissolved iron, manganese, and sulfate, Holes U1476A and U1476B.
- F34. Dissolved calcium and strontium profiles, Holes U1476A and U1476B.
- F35. Dissolved silicon, lithium, and boron profiles, Holes U1476A and U1476B.
- F36. Calcium carbonate and magnetic susceptibility, TOC, and bulk sediment elemental ratios, Hole U1476A.
- F37. Sedimentary major and trace element concentrations vs. aluminum oxide content, Hole U1476A.
- F38. Age-depth relationships based on calcareous nannofossils and planktonic foraminifers, Site U1476.
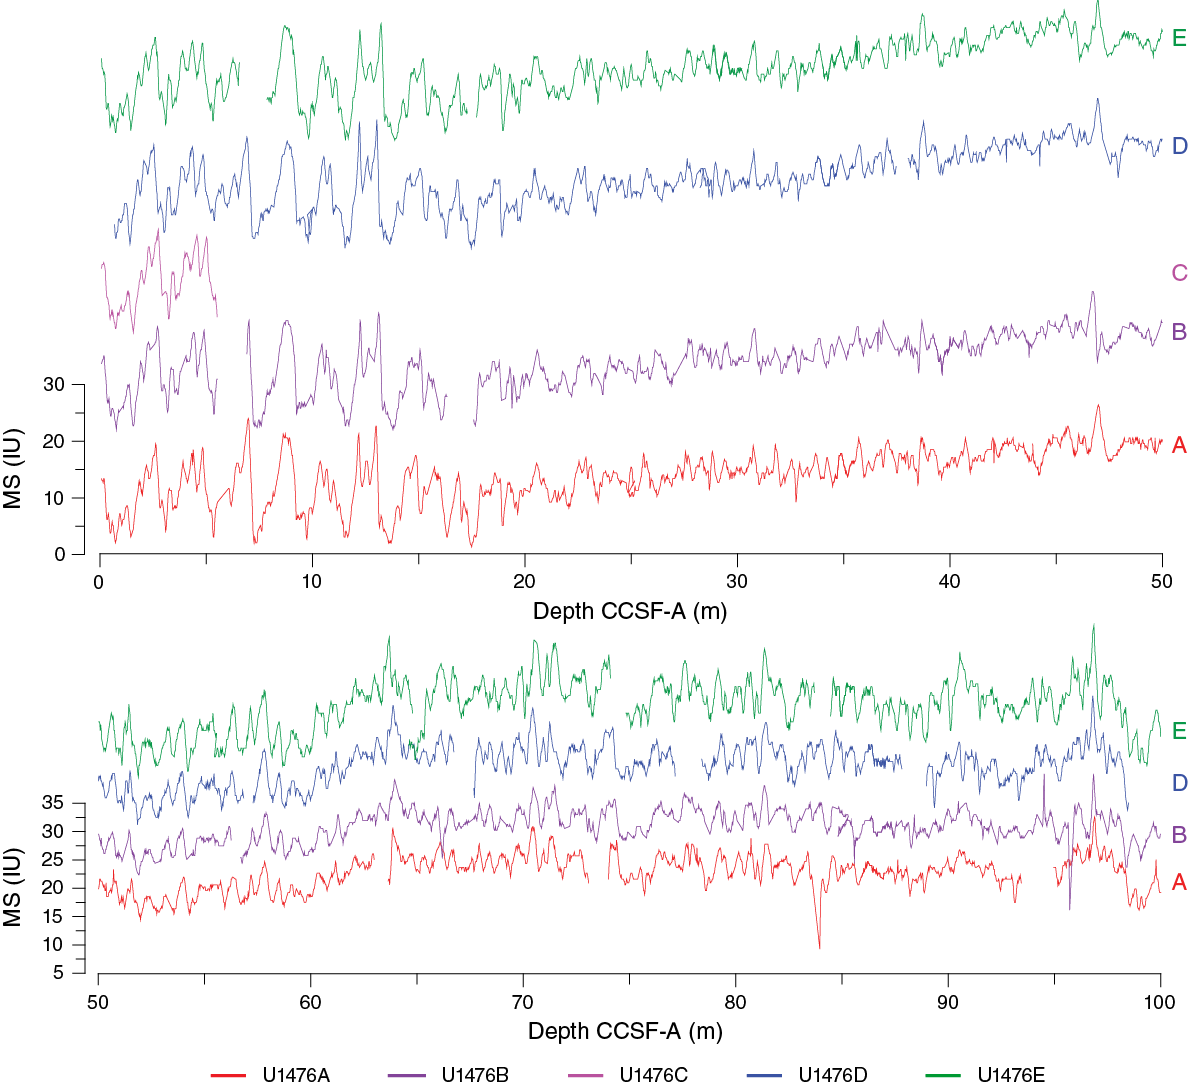
- T1. Site U1476 core summary.
- T2. Overview of shipboard sampling, Site U1476.
- T3. Smear slide textures, compositions, and lithologic names, Holes U1476A–U1476E.
- T4. Biostratigraphic planktonic foraminifer datums, Site U1476.
- T5. Biostratigraphic calcareous nannofossil datums, Site U1476.
- T6. Calcareous nannofossil occurrence, Site U1476.
- T7. Planktonic foraminifer occurrence, Site U1476.
- T8. Diatom and other siliceous microfossil occurrence, Site U1476.
- T9. Analyzed discrete whole-round samples, Site U1476.
- T10. Affine table, Site U1476.
- T11. Splice interval table, Site U1476.
- T12. Bulk sediment geochemistry data, Hole U1476A.