McNeill, L.C., Dugan, B., Petronotis, K.E., and the Expedition 362 Scientists
Proceedings of the International Ocean Discovery Program Volume 362
publications.iodp.org
https://doi.org/10.14379/iodp.proc.362.104.2017

Site U14811
L.C. McNeill, B. Dugan, K.E. Petronotis, J. Backman, S. Bourlange, F. Chemale, W. Chen, T.A. Colson, M.C.G. Frederik, G. Guèrin, M. Hamahashi, T. Henstock, B.M. House, A. Hüpers, T.N. Jeppson, S. Kachovich, A.R. Kenigsberg, M. Kuranaga, S. Kutterolf, K.L. Milliken, F.L. Mitchison, H. Mukoyoshi, N. Nair, S. Owari, K.T. Pickering, H.F.A. Pouderoux, S. Yehua, I. Song, M.E. Torres, P. Vannucchi, P.J. Vrolijk, T. Yang, and X. Zhao2
Keywords: International Ocean Discovery Program, IODP, JOIDES Resolution, Expedition 362, Site U1481, Sumatra, Sumatra subduction zone, Sunda subduction zone, Andaman-Nicobar Islands, Wharton Basin, Indo-Australian plate, Bengal Fan, Nicobar Fan, Himalaya, Ninetyeast Ridge, Sumatra-Andaman 2004 earthquake, shallow seismogenic slip, décollement, megathrust, tsunami, forearc, Neogene, late Miocene, Late Cretaceous, subduction input sediment, diagenesis, sediment gravity flow, pelagic, oceanic crust, volcanic ash, mud, clay, silt, sand, siliciclastic, calcareous ooze, chalk
MS 362-104: Published 6 October 2017
Background and objectives
Site U1481 (proposed Site SUMA-12A) is located on the Indian oceanic plate, east of the Ninetyeast Ridge, west of the North Sumatran subduction margin, and 35 km southeast of Site U1480 (Figure F1; see also Figures F4 and F5 in the Expedition 362 summary chapter [McNeill et al., 2017c]). The primary drilling objectives at Site U1481 were
- To core the deeper interval of the subduction input sedimentary section and basement;
- To determine if the lower Nicobar Fan, pelagic section, and basement at Site U1480 are representative of this part of the Indian plate; and
- To understand the degree of heterogeneity of sediment and basement over short distances.

Figure F1. Bathymetric map.
Drilling without coring and installing a reentry/casing system minimized the duration of open hole operations and thus offered an increased chance of successful wireline logging and deep coring. Based on seismic interpretations, the sedimentary section at Site U1481 is similar to that at Site U1480 and includes
- A thin distal trench wedge section underlain by an unconformity (seismic Horizon A);
- The Nicobar submarine fan sequence composed of an upper reflective section and a deeper less reflective section separated by seismic Horizon B*;
- The prefan sequence is separated from the primary Nicobar Fan sediment by seismic Horizon C (preexpedition, this boundary was predicted to be seismic Horizon B*); and
- Acoustic basement (seismic Horizon D marks its top).
Seismic Horizon B is the transition from the reflective to less reflective section at Site U1480 correlated to Site U1481. This transition sits at a shallower stratigraphic level at Site U1480 than at Site U1481 (Horizon B* marks this transition at Site U1481). Seismic Horizon C was previously identified as a potential horizon for localization of the décollement at the subduction zone (Dean et al., 2010) (Figure F2). The deeper part of the stratigraphic section at Site U1481 was targeted for coring and drilling because it includes many of the potential horizons that may evolve into the plate boundary décollement in both the shallow and deep subduction zone, and includes sedimentary and basement materials that may be sources of fluids influencing fault slip behavior. Cores and logs provide constraints on the initial lithological, physical, chemical, and mechanical properties and potentially the state of stress of the lower part of the input section where the plate boundary fault develops. The sedimentary section thickens significantly on approaching the subduction zone (see Figure F7 in the Expedition 362 summary chapter [McNeill et al., 2017c]); therefore, postexpedition experimental and numerical modeling work will be used at this site, as at Site U1480, to constrain the impact of increasing burial, temperature, fluid interactions, and diagenetic alteration. Site U1481 will therefore allow us to address the three expedition primary objectives to determine how the properties of the input section may lead to shallow seismogenic slip and to unusual forearc development as related to the basal properties of the prism (see Scientific objectives in the Expedition 362 summary chapter [McNeill et al., 2017c]). Site U1481 also offers the opportunity to test local variations in pre- and early Nicobar Fan deposition through comparison with Site U1480.
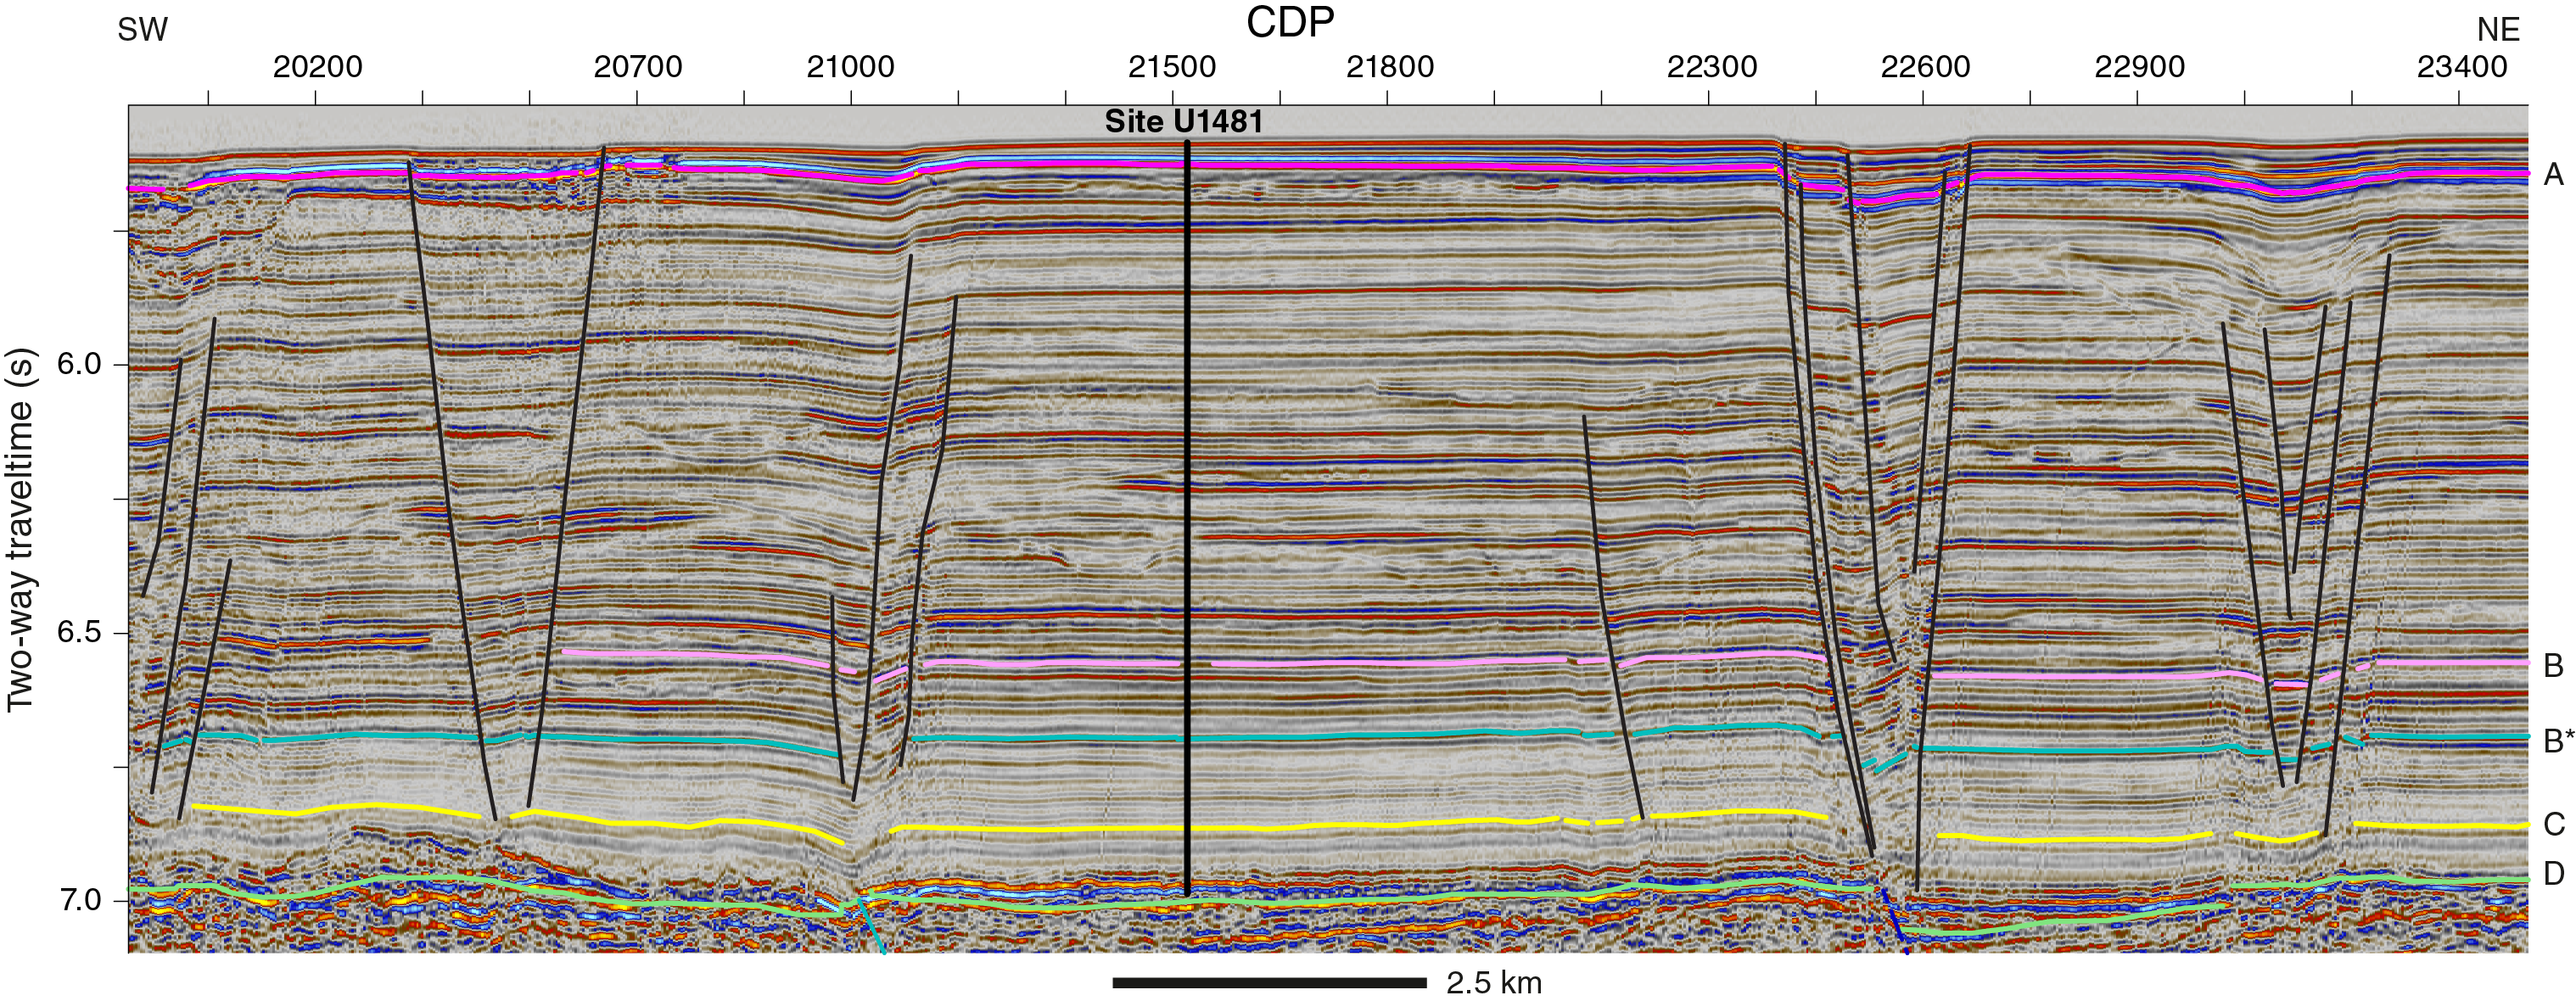
Figure F2. Seismic reflection profile BGR06-103.
Specific objectives for this site include the following:
- To establish the onset of Nicobar Fan deposition and to determine the primary sources of sediment delivered to the site during early fan history;
- To identify the principal lithologies that may be involved in development of the plate boundary fault;
- To establish how the mechanical/strength properties of the different lithologies change with depth to determine trends and the effects of burial rate and burial time;
- To identify potential discontinuities that may be candidates for décollement positions;
- To identify any thermal history indicators and any effects of early diagenesis;
- To identify fluid sources and changes with depth;
- To determine the composition and origin of basement at the site and its effect on overlying sediments; and
- To compare the lithostratigraphy, geochemistry, and physical/mechanical properties with those at Site U1480 to establish local variations of the stratigraphic succession.
Site U1481 is located at 2°45.29′N, 91°45.58′E in a water depth of 4178 m. Hole U1481A was cased to 730.5 m below seafloor (mbsf), drilled to 1149.7 mbsf, and penetrated to 1500 mbsf with rotary core barrel (RCB) coring from 1149.7 to 1500 mbsf. Wireline logging was conducted within the casing and open hole with log data successfully obtained to 6 m from the bottom of the hole (data to 1494 mbsf).
Operations
Transit to Site U1481
The 19.3 nmi transit from Site U1480 to Site U1481 was completed in 2.4 h at an average speed of 8.0 kt. After arriving at Site U1481 at 0436 h on 8 September 2016 (ship local time UTC + 7 h), the thrusters and hydrophones were lowered, an acoustic seafloor-positioning beacon was deployed, and the dynamic positioning system was engaged.
Site U1481
Hole U1481A
The target depth in Hole U1481A was ocean crust basement, which was estimated to be at 1600 mbsf (see Introduction in the Expedition 362 methods chapter [McNeill et al., 2017b] for depth scale definitions). To achieve this goal, we installed a reentry system (Figure F3), which took ~3.5 days and involved the following steps:
- A 730.5 m long casing string was assembled out of 56 joints of 10¾ inch casing and suspended from the mud skirt.
- A drilling assembly was made up with a 9⅞ inch tricone bit, an underreamer, and a mud motor; the mud motor and underreamer were tested in the moonpool.
- Approximately 659 m of 5 inch drill pipe was assembled above the drilling assembly and connected to the Hydraulic Release Tool (HRT).
- The drilling assembly and pipe were lowered into the casing until the HRT running tool was bolted onto the casing hanger.
- The mud skirt, casing, and drill string were lowered to ~4180 m below rig floor (mbrf; see Introduction in the Expedition 362 methods chapter [McNeill et al., 2017b] for depth scale definitions).
- A free-fall funnel (FFF) was assembled in the moonpool and dropped to land on the reentry system. The subsea camera was deployed to confirm the FFF was seated correctly and to observe the drilling operation.
- Hole U1481A was spudded at 1500 h on 9 September (Table T1), with the mudline at 4178.3 mbsf (4189.8 mbrf). Drilling continued until the reentry system landed on the seafloor at 1910 h on 10 September. The depth of the hole was calculated at 734.1 mbsf, with the casing shoe at 730.5 mbsf.
- The HRT was released from the casing at ~2000 h, and the subsea camera was recovered.
- While pulling the drill string to the surface very early on 11 September, with the bit at 3830.3 mbrf, smoke and noise were discovered coming from the forward bearing on the drawworks aft Elmagco (eddy current) brake. Operations were suspended so that the situation could be evaluated, and the brake was decoupled from the drawworks. Operations resumed shortly after so that the rest of the drill string could be pulled to the surface, with the casing running tool reaching the rig floor at 0630 h. The mud motor, underreamer, and drill bit were flushed with water and disassembled by 1115 h. It was noted that one of the underreamer cones was missing. Because the damaged brake could not be repaired on board, the decision was made to sail to Singapore to make the necessary repairs.
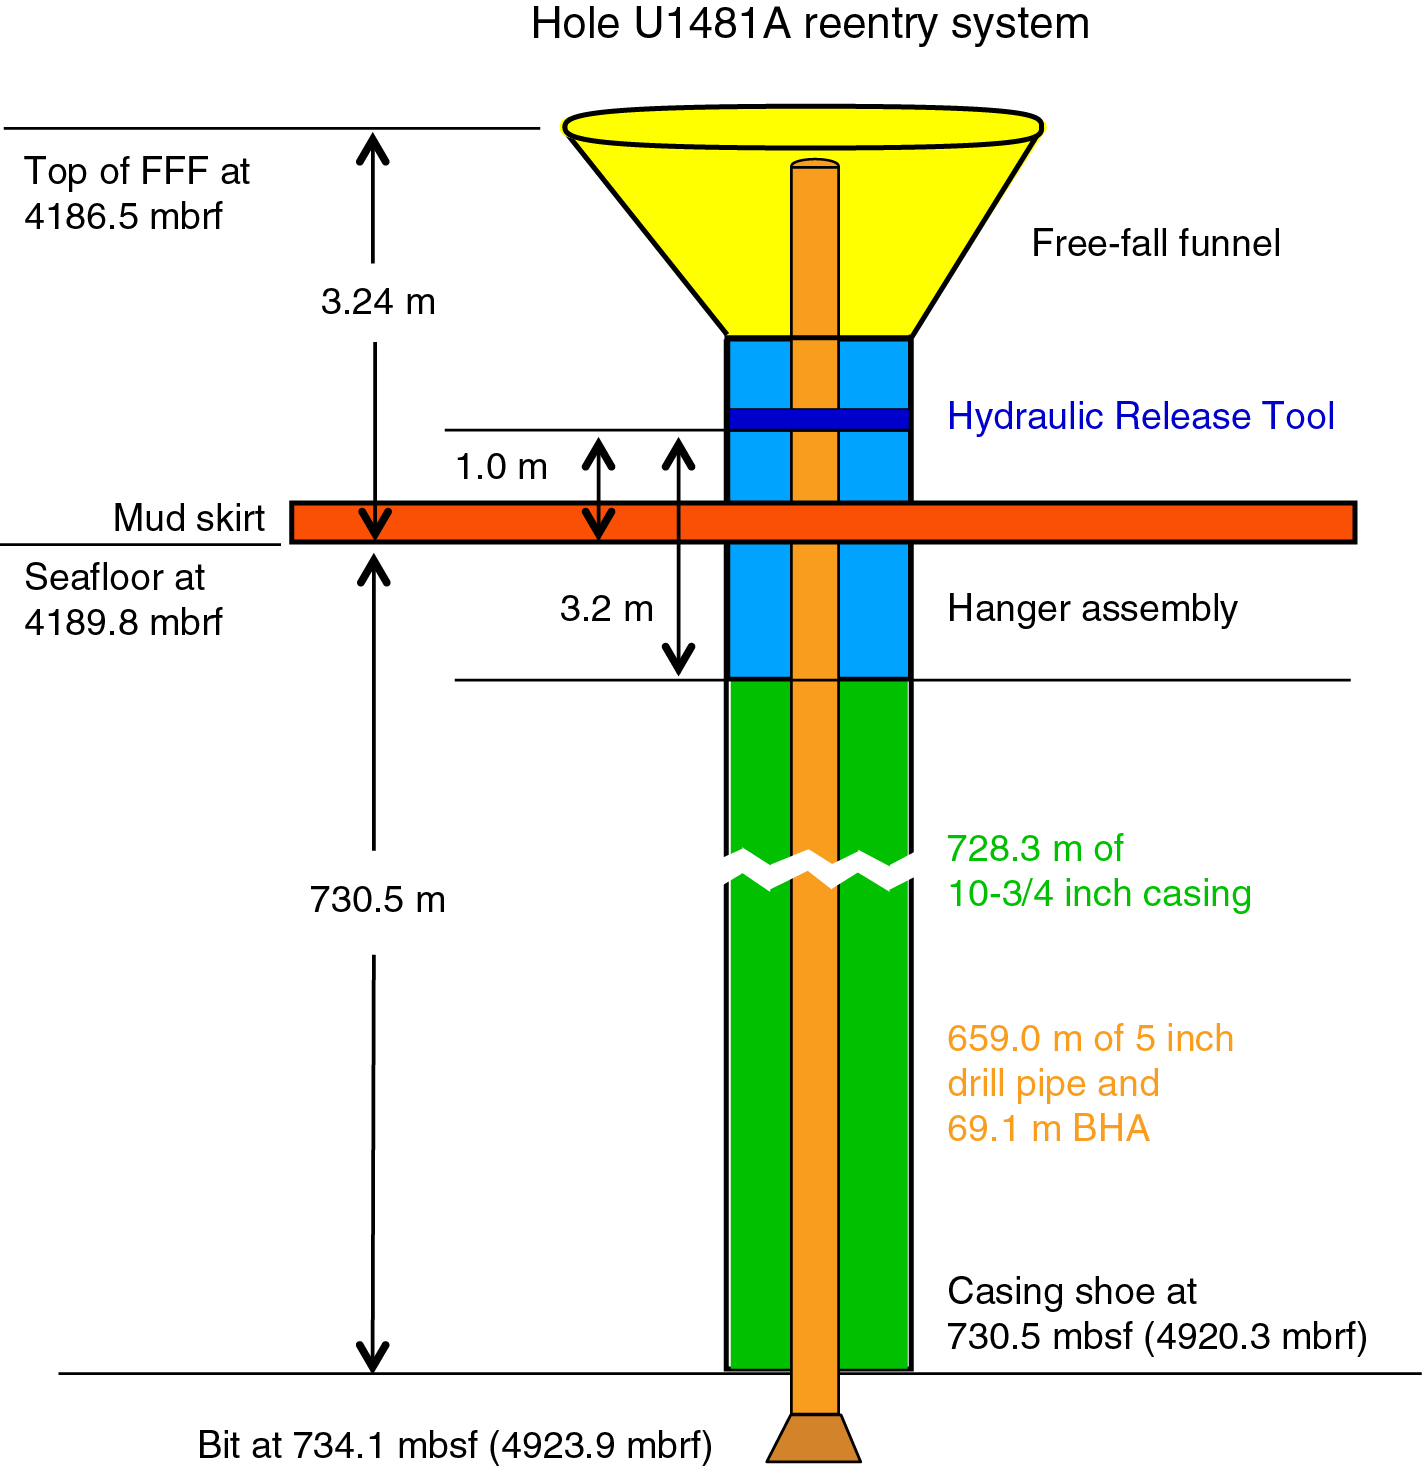
Figure F3. Site U1481 reentry system.
Table T1. Site U1481 core summary. Download table in .csv format. View PDF table.
Transit to Singapore
The rig floor was secured for transit at 1300 h on 11 September 2016, the acoustic beacon was recovered at 1103 h, and the hydrophones were raised in preparation for transit. The rig remained over the site for several hours so that the damaged brake could be prepared for removal. The thrusters were finally raised at 2030 h and the R/V JOIDES Resolution got under way for Singapore. During the transit, the failed brake was removed from the drawworks and secured on the rig floor. The 996 nmi transit was completed in 83.4 h at an average speed of 11.9 kt, and the vessel docked at the Loyang Offshore Terminal in Singapore at 1106 h on 15 September (UTC + 8 h). The failed brake was sent to the repair facility immediately after arrival, and the replacement brake was delivered to the vessel at 2100 h. The coupling was installed on the brake on 16 September, and the brake was aligned and tested on 17 September.
Return to Site U1481
When the repairs were completed, the vessel was secured for transit. The last line was released at 1206 h on 18 September 2016, and the sea passage back to Site U1481 began at 1354 h after the pilot left the vessel. The 989 nmi transit was completed in 93.1 h at an average speed of 10.6 kt. The vessel arrived at Site U1481 at 1100 h on 22 September (UTC + 8 hours for the remainder of the expedition). The thrusters and hydrophones were lowered, an acoustic seafloor-positioning beacon was deployed, and the dynamic positioning system was engaged.
Resumption of operations at Hole U1481A
An RCB bottom-hole assembly (BHA) was assembled, and the drill string was lowered to just above the FFF. The subsea camera was deployed to aid with the reentry, which took 3.75 h to complete. Hole U1481A was reentered at 0150 h on 23 September 2016, and the drill string was lowered until it encountered fill at 552.2 mbsf (~178 m above the bottom of the cased hole). The fill was removed and the hole was swept with high-viscosity mud. Having previously obtained the necessary permissions from the Environmental Pollution and Safety Panel and the Texas A&M University Safety Panel, drilling without recovery started at 734.1 mbsf and continued to 1149.7 mbsf. RCB coring began at 1100 h on 25 September with Core 362-U1481A-2R and ended on 30 September with Core 38R at 1500.0 mbsf (Table T1). Of the 350.3 m cored, 219.8 m was recovered (63%). Nonmagnetic core barrels were used for all cores.
In preparation for logging, the bit was released at 2315 h on 30 September, and the hole was displaced with 350 bbl of 11.0 lb/gal mud. The drill string was raised with the end of pipe at a logging depth of ~60 mbsf. A modified triple-combo tool string was made up with the Magnetic Susceptibility Sonde (MSS), High-Resolution Laterolog Array (HRLA), Dipole Sonic Imager (DSI), Hostile Environment Litho-Density Sonde (HLDS; for caliper measurements only, with no source), and the Hostile Environment Natural Gamma Ray Sonde (HNGS). The tools were lowered to the seafloor at 0845 h on 1 October and reached 6 m from the bottom of the hole (1494 mbsf) without resistance. Data were collected from 1494 mbsf to the seafloor, and the logging tools were back at the surface by 1940 h and rigged down by 2100 h. The drill string was raised to the surface, and the rig floor was secured for transit. An attempt was made to recover the acoustic positioning beacon, but the beacon failed to release from the seafloor. The thrusters and hydrophones were retracted at 0830 on 2 October, and the vessel departed Site U1481. The total time spent at Site U1481 was 317.25 h, or 13.22 days.
Transit to Singapore
Upon departure from Site U1481, an approximately south-to-north magnetic profile was collected between Sites U1481 and U1480. The 1039 nmi transit to Singapore was completed in 94.4 h at an average speed of 11.0 kt. The last line ashore at the Loyang Offshore Terminal was at 0848 h on 6 October 2016, ending Expedition 362.
Sedimentology and petrology
Site U1481 was drilled to investigate local variations of the older stratigraphic part of the Nicobar Fan, pelagic sediment, and igneous basement. Sediment and sedimentary rock were recovered from 1149.7 to 1500 mbsf in Hole U1481A (Figure F4; Table T2). Overall, the succession at Site U1481 consists of siliciclastic sediment interpreted as the older stratigraphic part of the last active Nicobar Fan, equivalent to Subunit IIC at Site U1480 (see Sedimentology and petrology in the Site U1480 chapter [McNeill et al., 2017d]) and the underlying hemipelagic to pelagic sediment (Subunit IIIA at Site U1480), which includes some minor intercalated sands that we interpret as the deposits of the earliest Nicobar Fan. Because of time constraints, drilling into the underlying deepest prefan pelagic sediment (Subunit IIIB and Unit IV, if present and equivalent, at Site U1480) and basement was not possible. The recovered sediment represents the lower–upper Miocene (see Biostratigraphy) section of the deep-marine sedimentary cover between the Ninetyeast Ridge and the North Sumatra (Sunda) subduction zone, ~35 km southeast of Site U1480. Core recovery by RCB coring was very good (63%).

Figure F4. Schematic summary of lithologic units.
Table T2. Summary of lithostratigraphic units. Download table in .csv format.
The sedimentary succession for Hole U1481A was divided on the basis of lithologic attributes. Sediment was classified based on both texture and composition of the grain assemblage (see Sedimentology and petrology in the Expedition 362 methods chapter [McNeill et al., 2017b]). All of the sediment at this site contained ≥50% siliciclastic components and thus is classified by texture (sand/silt/clay ratio) alone. Where appropriate and practical in discussion of lithologic data, the term “mud” or “mudstone” is used to refer collectively to sediment textural classes having ≥50% grains of silt size or less (<62.5 μm) (e.g., silt, silty clay, and clay). Similarly, “muddy sand” (or muddy sandstone) refers to sandy sediment containing ≥25% silt + clay.
Based on regional seismic data and the fully cored section at Site U1480, two major lithostratigraphic units were identified, Units II and III, corresponding to Subunits IIC and IIIA at Site U1480, respectively (Figure F4; Table T2; see also Figure F5 and Table T3 in the Site U1480 chapter [McNeill et al., 2017d]). Unit II (1149.7–1360.12 mbsf) is bioturbated black and dark gray clay/claystone and silty clay/claystone and structureless muddy sand/sandstone with plant material and mud clasts (Figures F4, F5). Within Unit II, sediment is mostly partially lithified, but localized lithified materials were encountered (carbonate-cemented sandstone and mudstone). The base of Unit II marks a transition to sediment that is essentially lithified and, therefore, classified as “-stone” (see Sedimentology and petrology in the Expedition 362 methods chapter [McNeill et al., 2017b]).
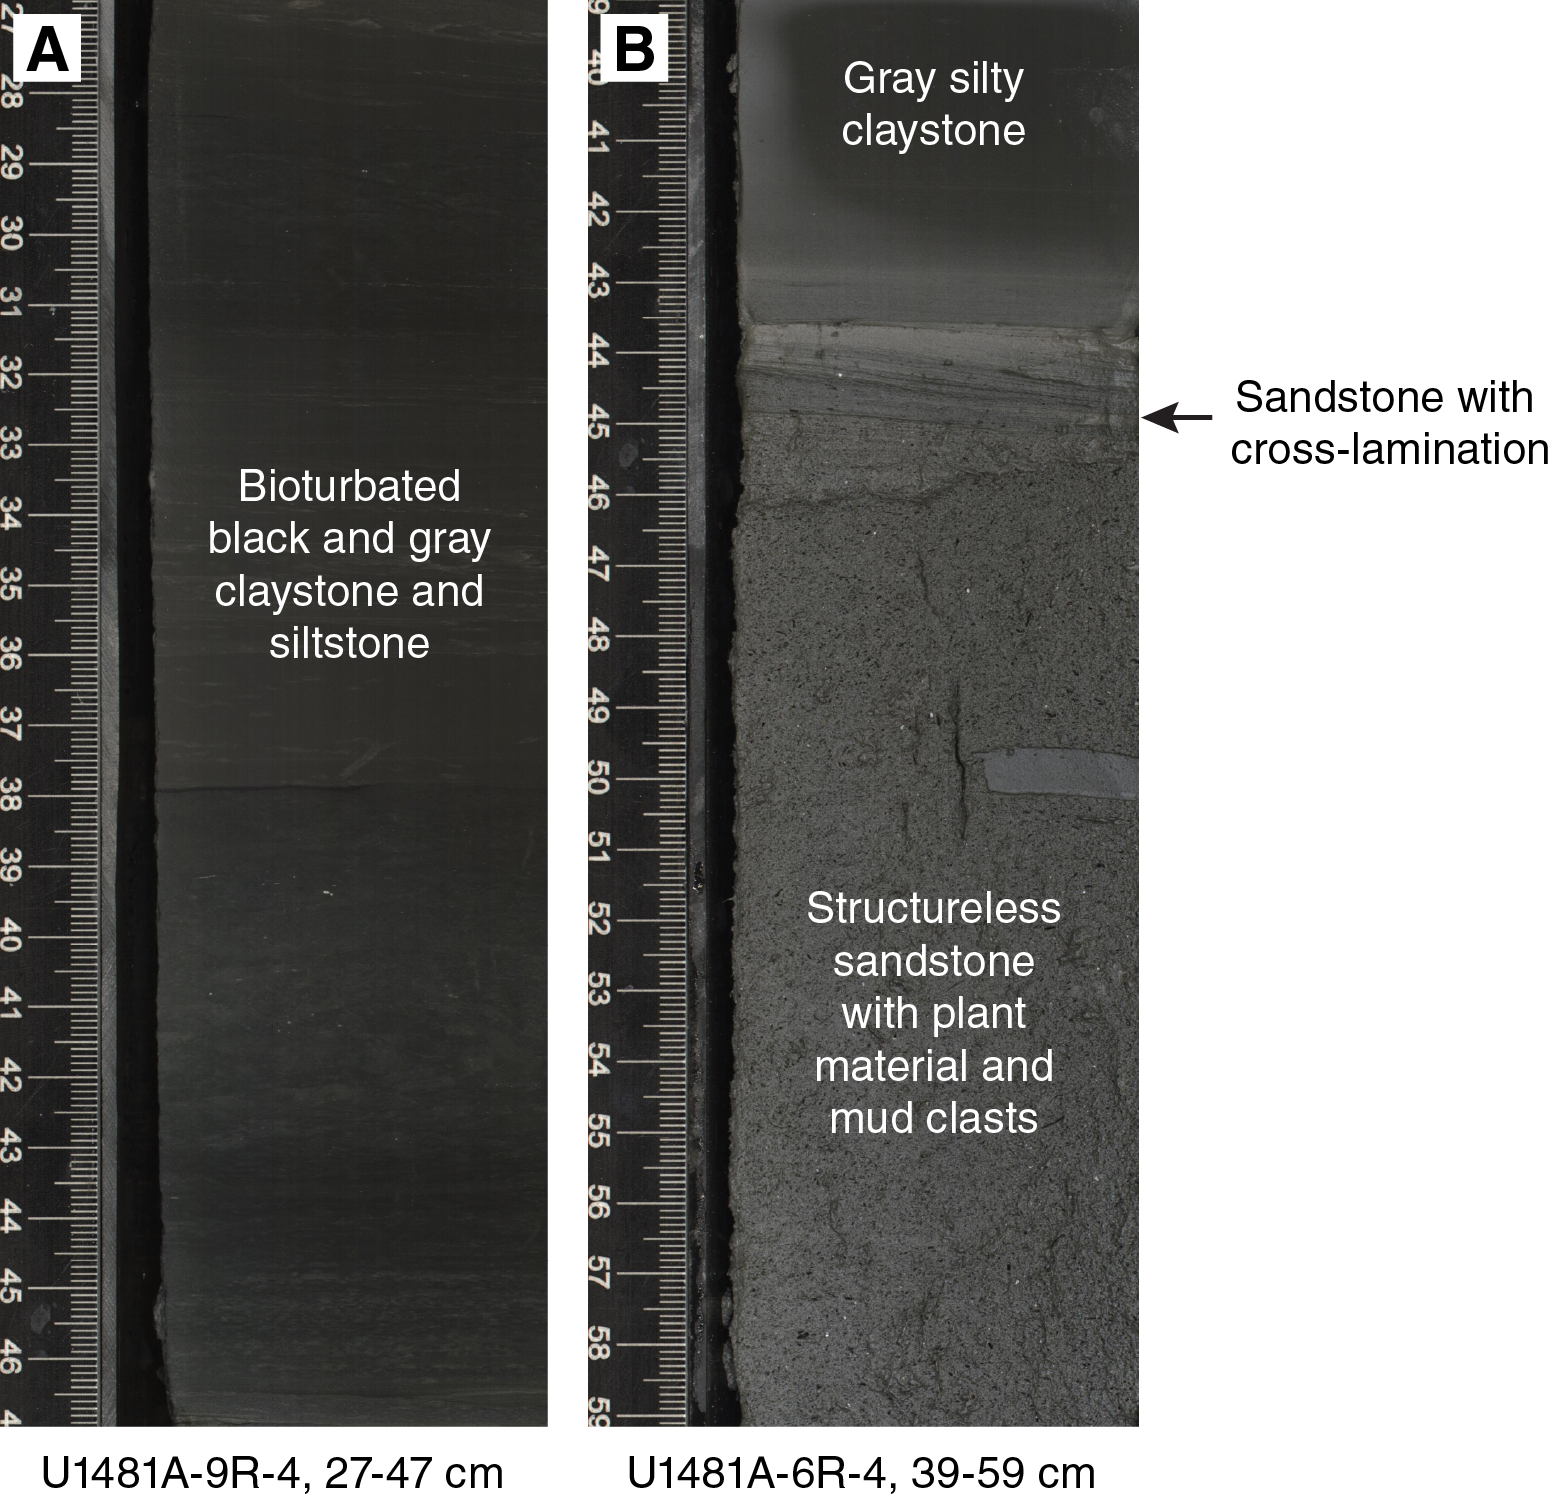
Figure F5. Bioturbated black and gray silty clay/claystone and intercalated dark gray silt/siltstone.
Table T3. Distribution and composition of lithologies. Download table in .csv format.
According to the unit and subunit definitions at Site U1480, we recovered a Subunit IIIA–equivalent at Site U1481 that contains gray-green and minor reddish brown claystone (1360.12–1498.72 mbsf) with agglutinated foraminifers (Figures F4, F6). The lower part of Unit III (~1400–1498.72 mbsf) differs from Subunit IIIA at Site U1480 by the appearance of more tuffaceous content and by intercalated sandstones present in the 1474.58–1490.74 mbsf interval.
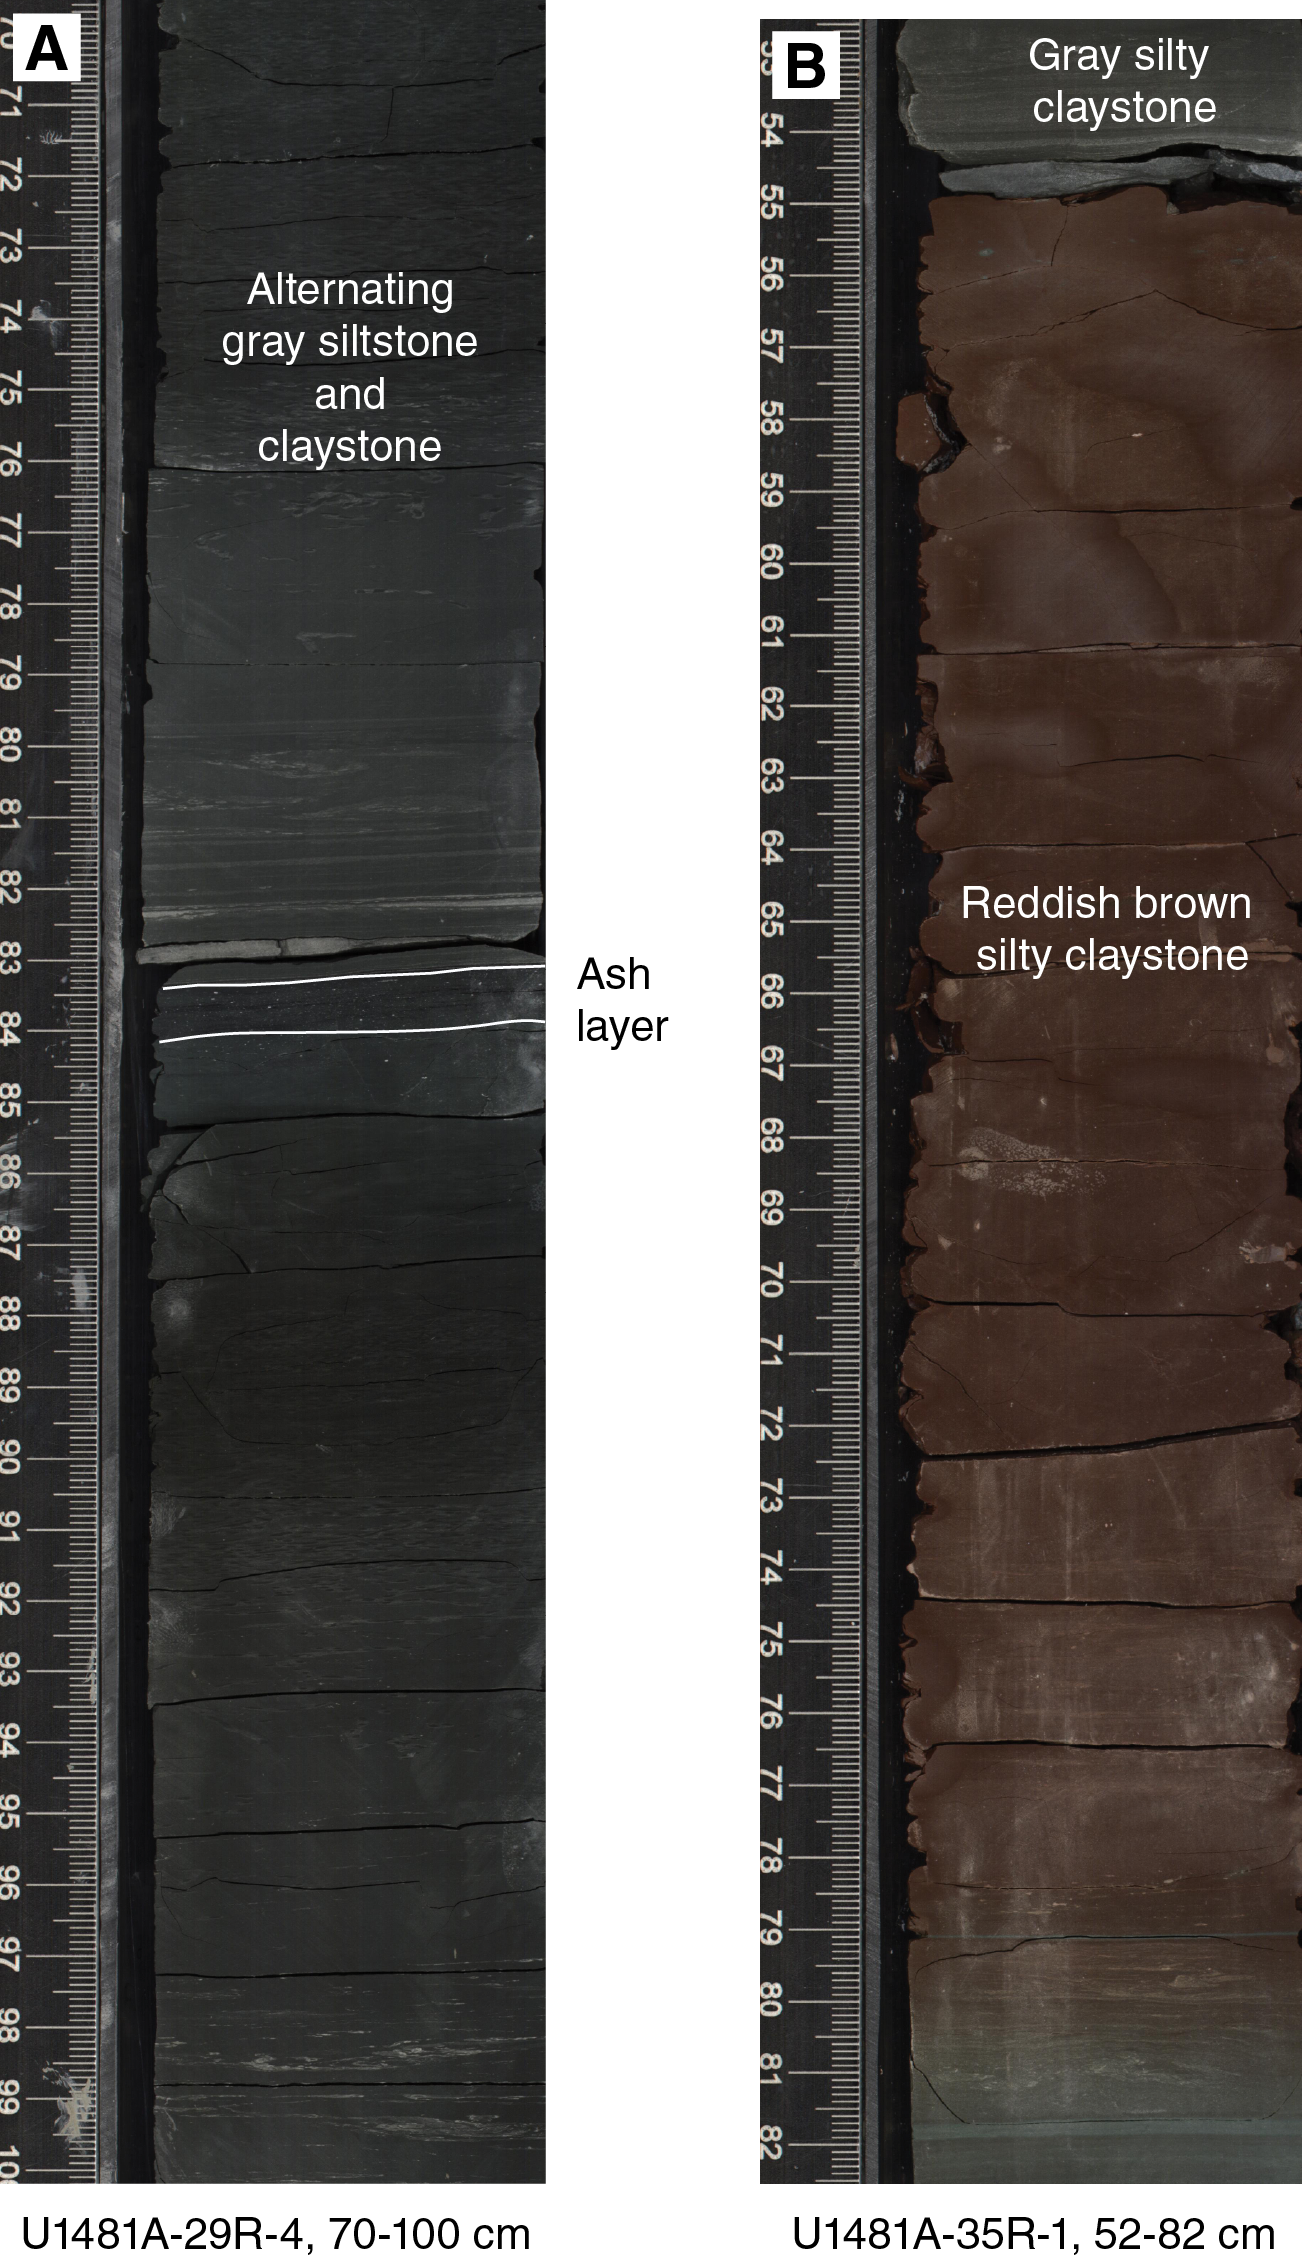
Figure F6. Alternating gray siltstone and claystone.
Lithostratigraphic units
Major lithologies at Site U1481 are summarized in Figure F4 and Table T2. The main lithologies encountered at Site U1481 are siliciclastic mud/mudstone and siliciclastic sand. Dominant, partially lithified to lithified, siliciclastic lithologic variants are clay (clay-mineral dominated), silty clay, clayey silt, well-sorted fine-grained sand, and muddy fine-grained sand.
The silt/siltstone and sand/sandstone of Units II and III are quartzofeldspathic (Figure F7; Table T3). Based on the ratio of detrital quartz (q) to quartz + feldspar (f) in X-ray diffraction (XRD) analysis ([f/(q + f)] = 0.36) and visual estimates of the lithic grain content (~5%–10% pelitic metamorphic lithic grains), this sediment is arkose to lithic arkose by the classification of Folk (1980). The pelitic lithic grain assemblage includes a variety of mica-slate and quartz-mica–slate, phyllite, and schist (Figure F8A). Carbonate sand and silt also appear to be part of the extrabasinal detrital assemblage (Figure F8B). The sands are predominantly micaceous with an abundance of biotite in addition to chlorite and muscovite (Figure F8C). The heavy mineral assemblage is diverse and dominated by green amphibole and pyroxene. Other heavy minerals include garnet, kyanite, staurolite, apatite, zircon, and rutile. Organic matter of fine silt to clay size occurs in trace amounts in most of the mud and in larger amounts (up to 3%) and as coarser particles (up to coarse-grained sand size) in sand. Organic matter in the sand appears to be dominantly terrigenous and typically shows a pronounced stringy texture, suggestive of woody material; in mud, however, the origin of the organic material is unclear.
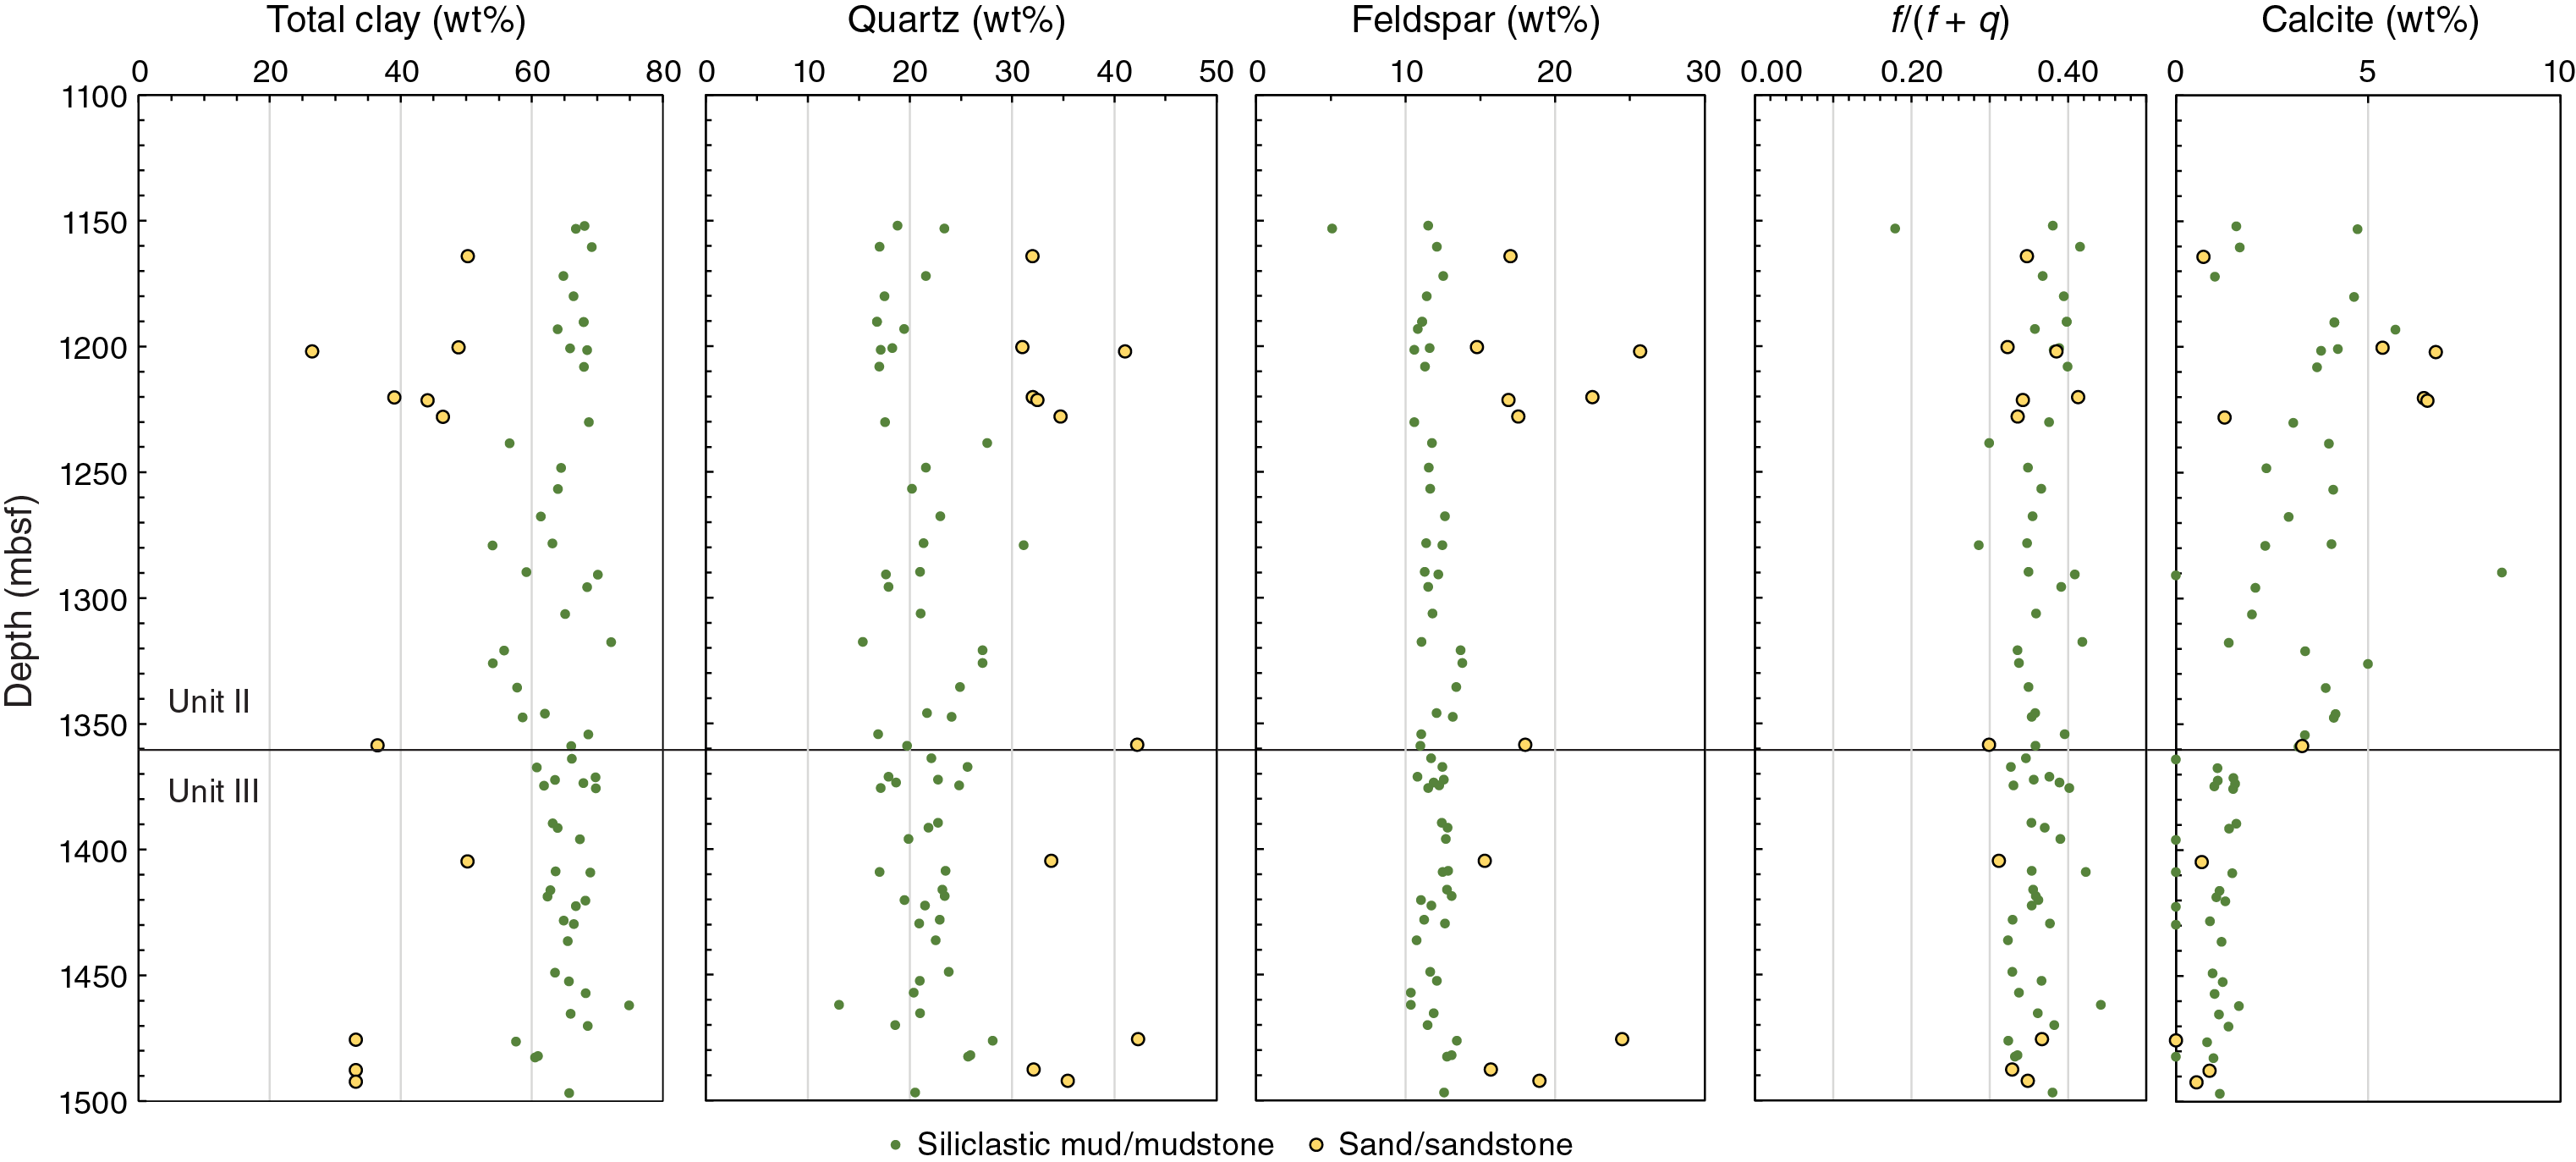
Figure F7. Bulk mineralogy.
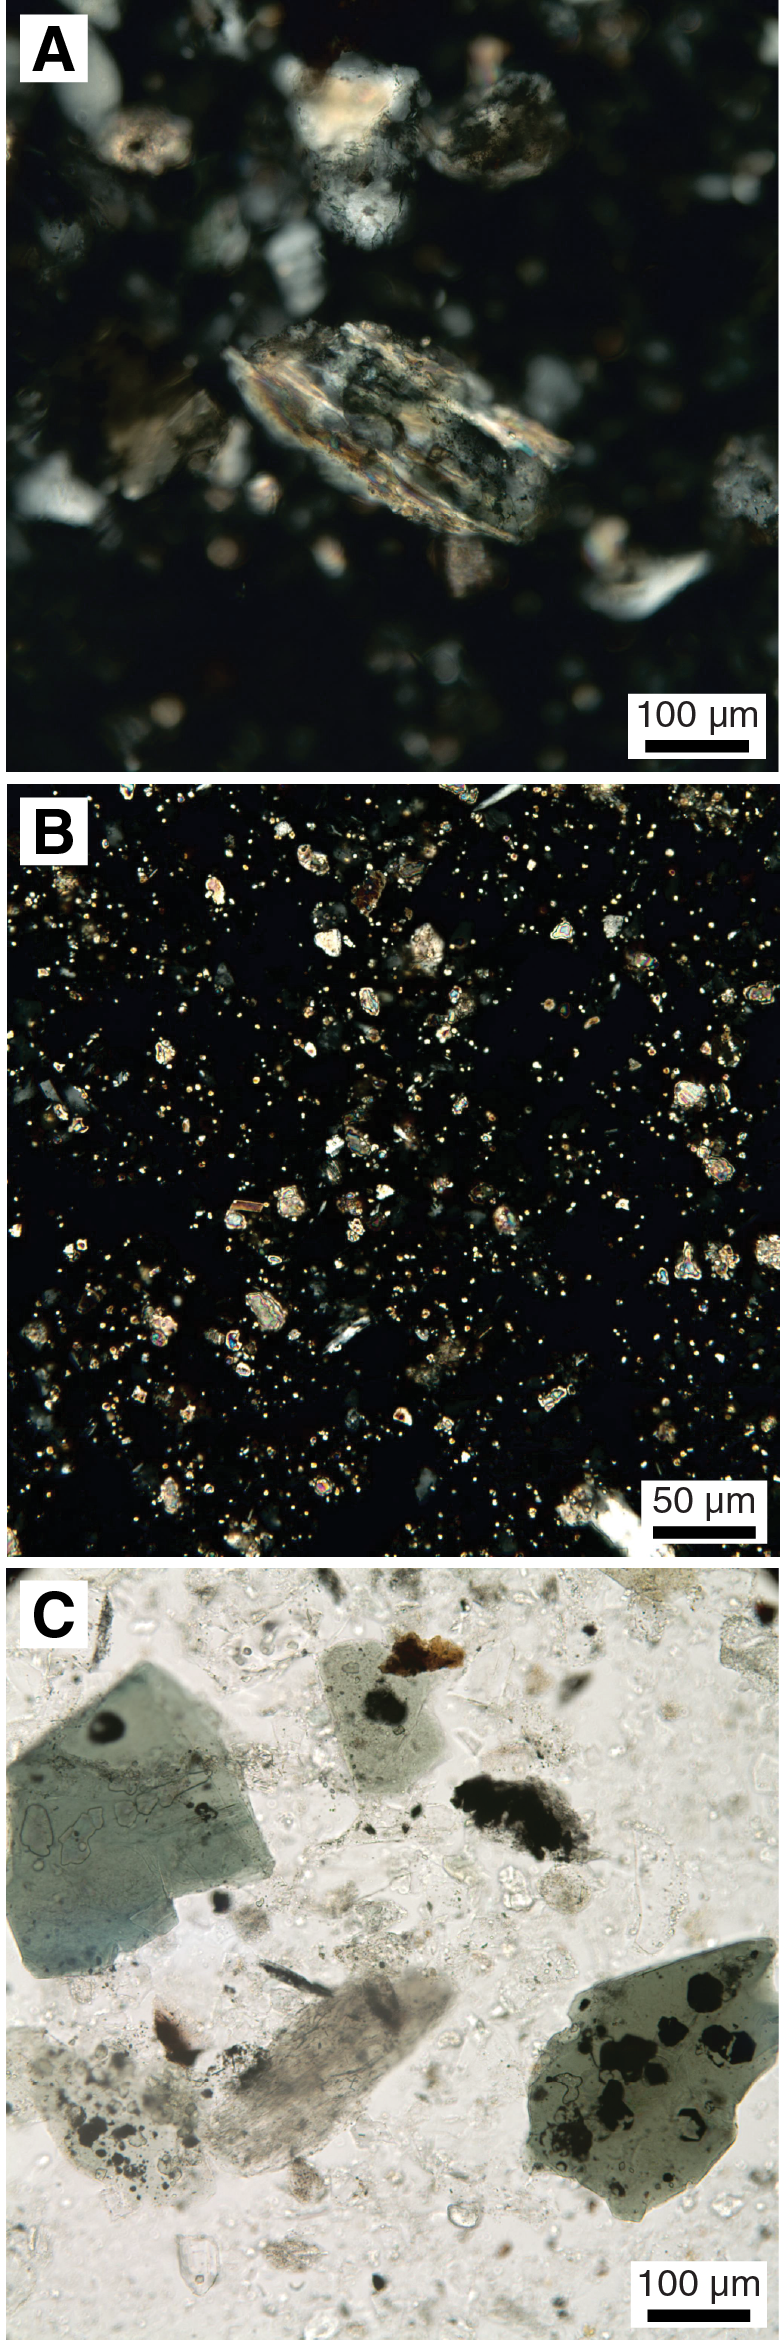
Figure F8. Examples of distinctive sand- and silt-size components.
The sediment at Site U1481 is partially lithified to lithified. Materials that are lithified (see criteria in Sedimentology and petrology in the Expedition 362 methods chapter [McNeill et al., 2017b]) are referred to as “-stones.” The boundary into more lithified material at the Unit II/III boundary in Section 362-U1481A-23R-6 (1360.12 mbsf) was also observed in the trends of several physical properties (see Physical properties).
Unit II (equivalent to Subunit IIC at Site U1480)
- Interval: 362-U1481A-2R-1, 0 cm, to 23R-6, 24 cm
- Thickness: 210.42 m
- Depth: 1149.7–1360.12 mbsf
- Age: late Miocene
- Lithology: bioturbated black and gray clay/claystone and silty clay/claystone and structureless muddy sand/sandstone with plant material and mud clasts
Unit II at Site U1481 is equivalent to Subunit IIC at Site U1480 (Figure F4; Table T2; see also Figure F5 and Table T3 in the Site U1480 chapter [McNeill et al., 2017d]). The major lithology is intensively bioturbated, very dark gray clay with silt that is interspersed with parallel-laminated, millimeter- to centimeter-scale laminae of normally graded silt and very fine grained sand (Figure F5A). There appear to be no significant differences between the lithology of this unit and its equivalent subunit at Site U1480. Dark gray, structureless, normally graded, medium- to thick-bedded, very fine to fine-grained muddy sand/sandstone commonly appears as a minor lithologic component and contains reworked and rounded mudstone clasts up to pebble size (Figure F5B). Abundant pyritized and coaly wood fragments, up to granule size, occur throughout these sand/sandstone beds. Well-sorted quartzofeldspathic silt is another minor lithology observed in Unit II. This lithology is distinctly light in color (light gray) and occurs in thin (a few millimeters to 1 cm) layers with parallel laminations. In the absence of substantial carbonate and ash, the overall compositional variation with depth within the mud-rich and sand-rich lithologies of Unit II is minor (Figure F7).
Few diagenetic features were observed in Unit II, and the diagenesis that is present is compaction dominated. Some pyroxene grains display crystallographically controlled etch fabrics that can be interpreted as postdepositional (Figure F9B). The delicate projections on the surviving remnant of this crystal are unlikely to have survived fluvial and sediment gravity-flow transport, and thus this dissolution feature likely formed as an in situ subsurface dissolution (cf. Milliken, 1988).
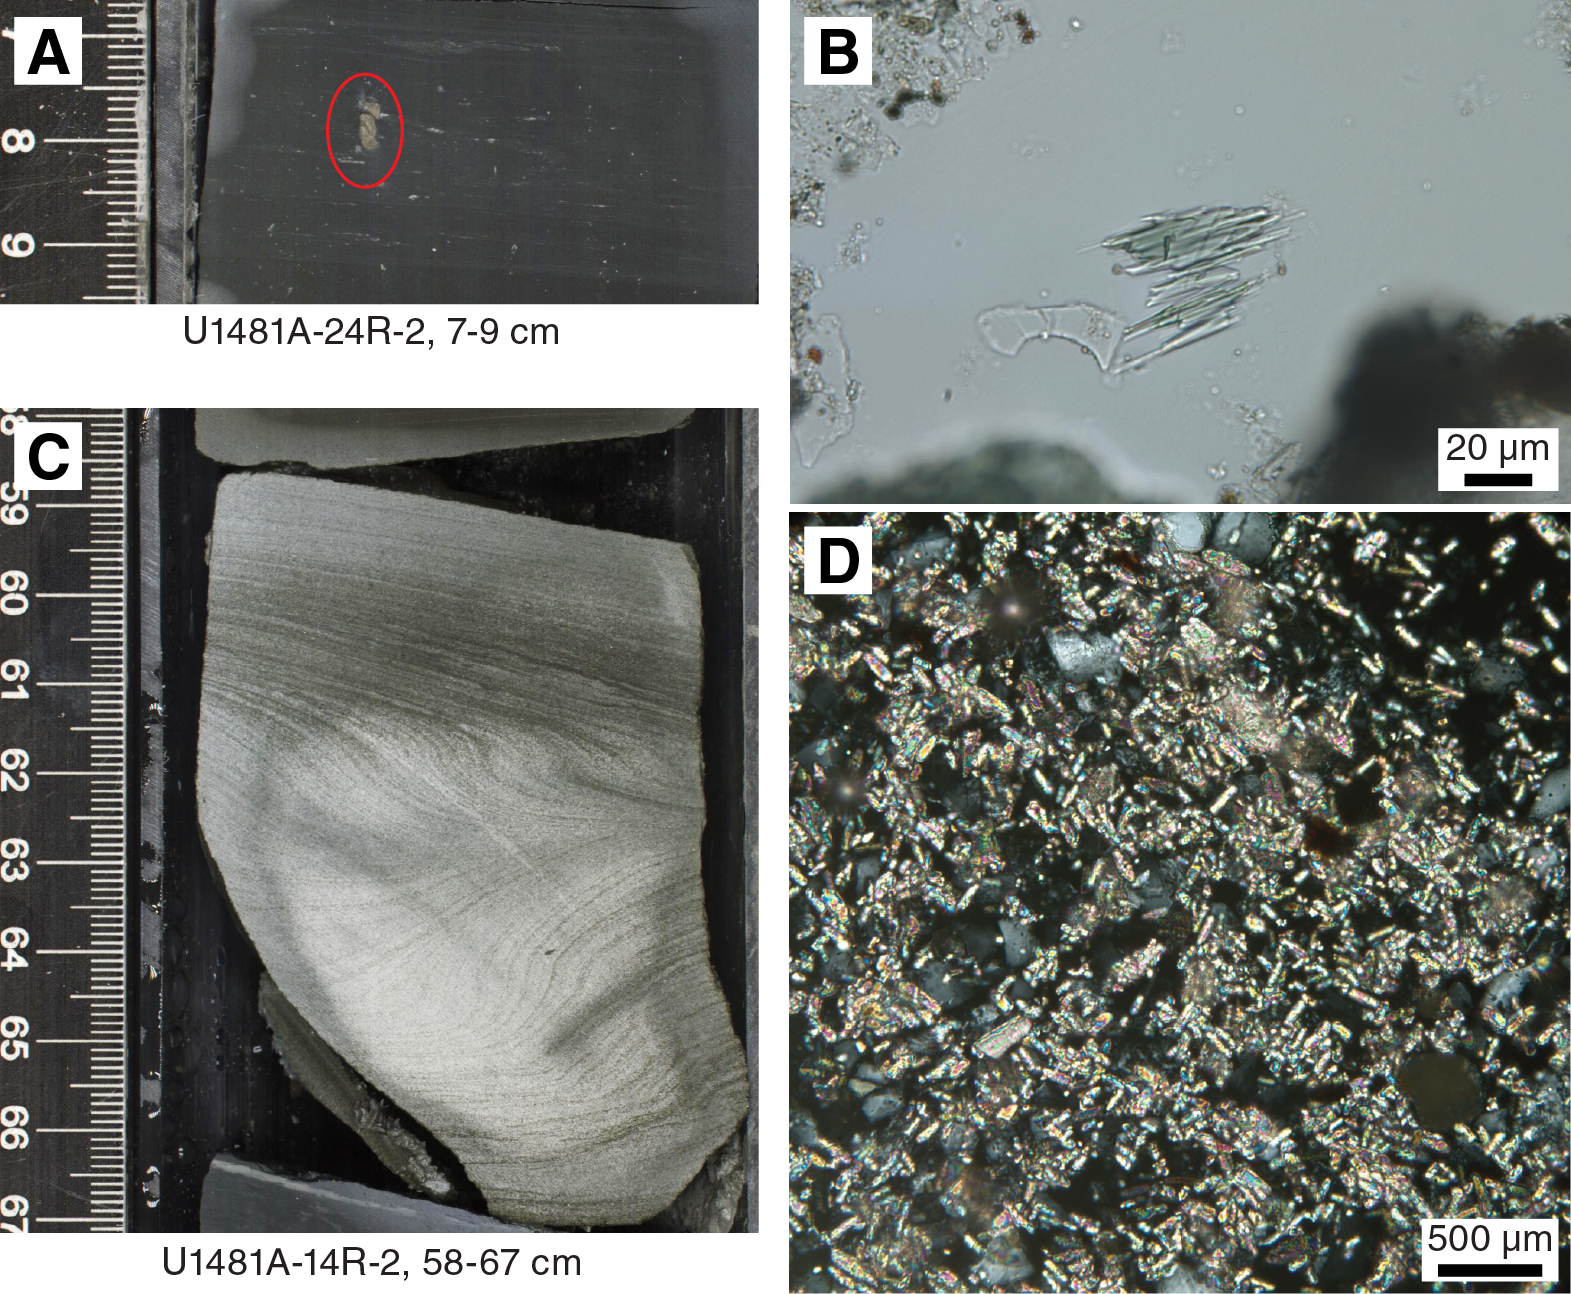
Figure F9. Diagenetic features of Unit II.
The occurrences of authigenic minerals are localized. The most common authigenic mineral is pyrite (or possibly other amorphous or crystalline Fe sulfides) in a variety of forms, including framboids, euhedra of coarse clay–size and fine silt–size microcrystalline grain coatings, and rare spiky rosettes. Pyrite was observed in mud and sand, but in the sand it is more coarsely crystalline and typically takes the form of grain coatings, especially in material that contains abundant organic matter. Pyrite as a lining or filling of millimeter- to centimeter-scale burrows is common (Figure F9A). Concretionary sandstone and calcareous claystone occur locally throughout Unit II, similar to the occurrences of cemented lithologies observed at Site U1480 (Figure F9C, F9D).
XRD analysis shows the average composition of Unit II to be siliciclastic mud (64% total clay, 21% quartz, 12% plagioclase, and 3% calcite) and sand (40% total clay, 36% quartz, 19% plagioclase, and 5% calcite) (Table T3). Carbonate values generally correspond to values determined by coulometry (Figure F40), but in some instances the data sets diverge, reflecting the local development of carbonate enrichment by either diagenetic or sediment deposition processes.
Unit III (equivalent to Subunit IIIA at Site U1480)
- Interval: 362-U1481A-23R-6, 24 cm, to 38R-CC, 16 cm
- Thickness: 138.60 m
- Depth: 1360.12–1498.72 mbsf
- Age: early Miocene–late Miocene
- Lithology: gray-green and reddish brown claystone with ash and minor structureless very fine to fine-grained muddy sandstone with plant material and mud clasts
The top of Unit III (Figure F4; Table T2) is placed at the base of the last occurrence of an interval of micaceous quartzofeldspathic sandstone above the mudstone-dominated succession, which is coincident with an increase in lithification. The top of Unit III also marks the transition to mudstones containing reduced calcite (Figure F7; Table T3).
Unit III at Site U1481 includes only the sedimentary succession inferred to be equivalent to Subunit IIIA at Site U1480 and an absence of Subunit IIIB. Sediment is dominated by clay-rich materials with various admixtures of siltstone and consists mainly of thin- to medium-bedded gray-green or dusky red claystone and silty claystone with minor intercalated siltstones (Figure F6). Beds have diffuse parallel laminations toward their base and scattered agglutinated foraminifers (Figure F10) in structureless mudstone toward their tops. Rare, very thin bedded, parallel-laminated, isolated siltstones occur throughout the cores (see below). Some beds grade from silty claystone at the base to claystone at the top, with upward-increasing bioturbation.
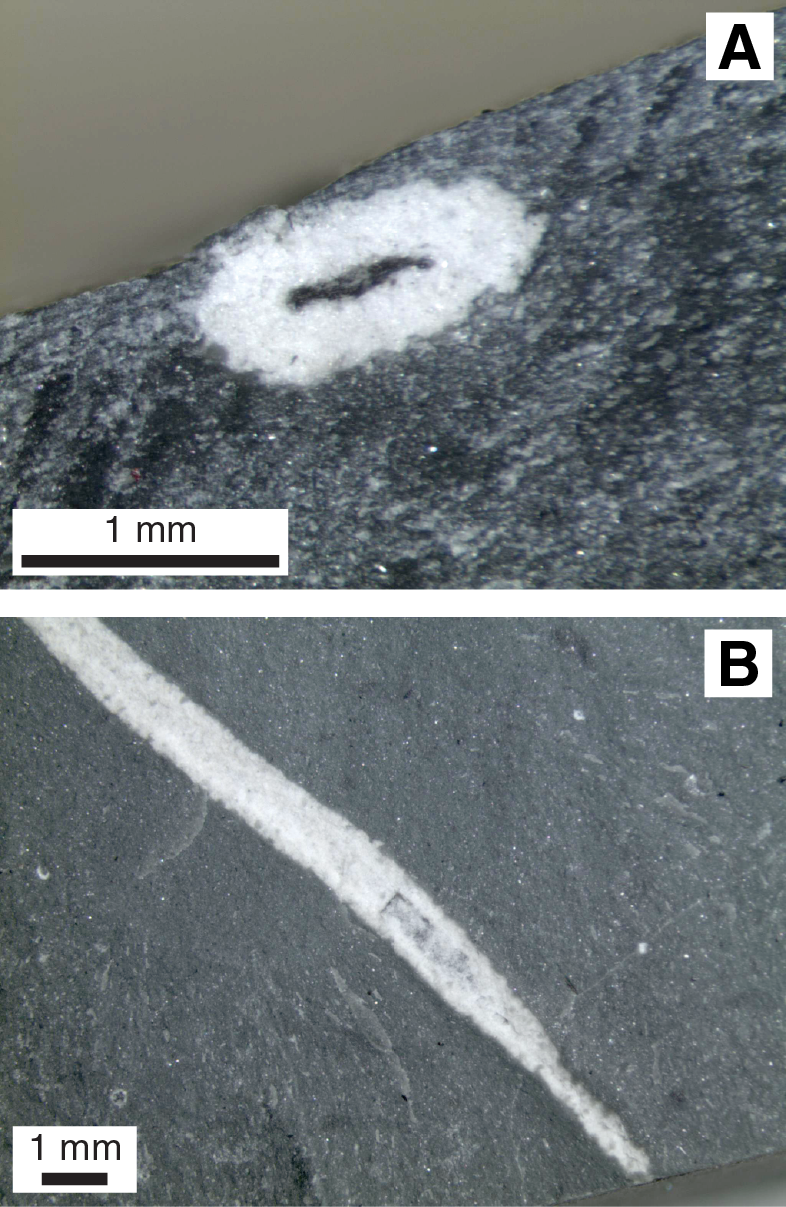
Figure F10. Agglutinated foraminifer typical of the claystones and silty claystones.
Muddy lithologies in Unit III display four common variants. The most common variant is apparently structureless mudstone (Figure F11); however, closer inspection typically reveals subtle and diffuse laminations with bioturbation in nearly all muddy lithologies. A second common variant is a silty bioturbated mudstone (Figure F12) with contorted siltstone laminae, which in many cases is spatially correlated with the third variant, parallel-laminated mudstone (Figures F12C, F13). Inspection of the parallel-laminated mudstone reveals the presence of microscopic-scale truncations and ripple cross-stratification (Figure F13). Nereites trace fossils characterize the fourth common mudstone variant, displaying a wide range of bioturbation intensity (Figure F14).
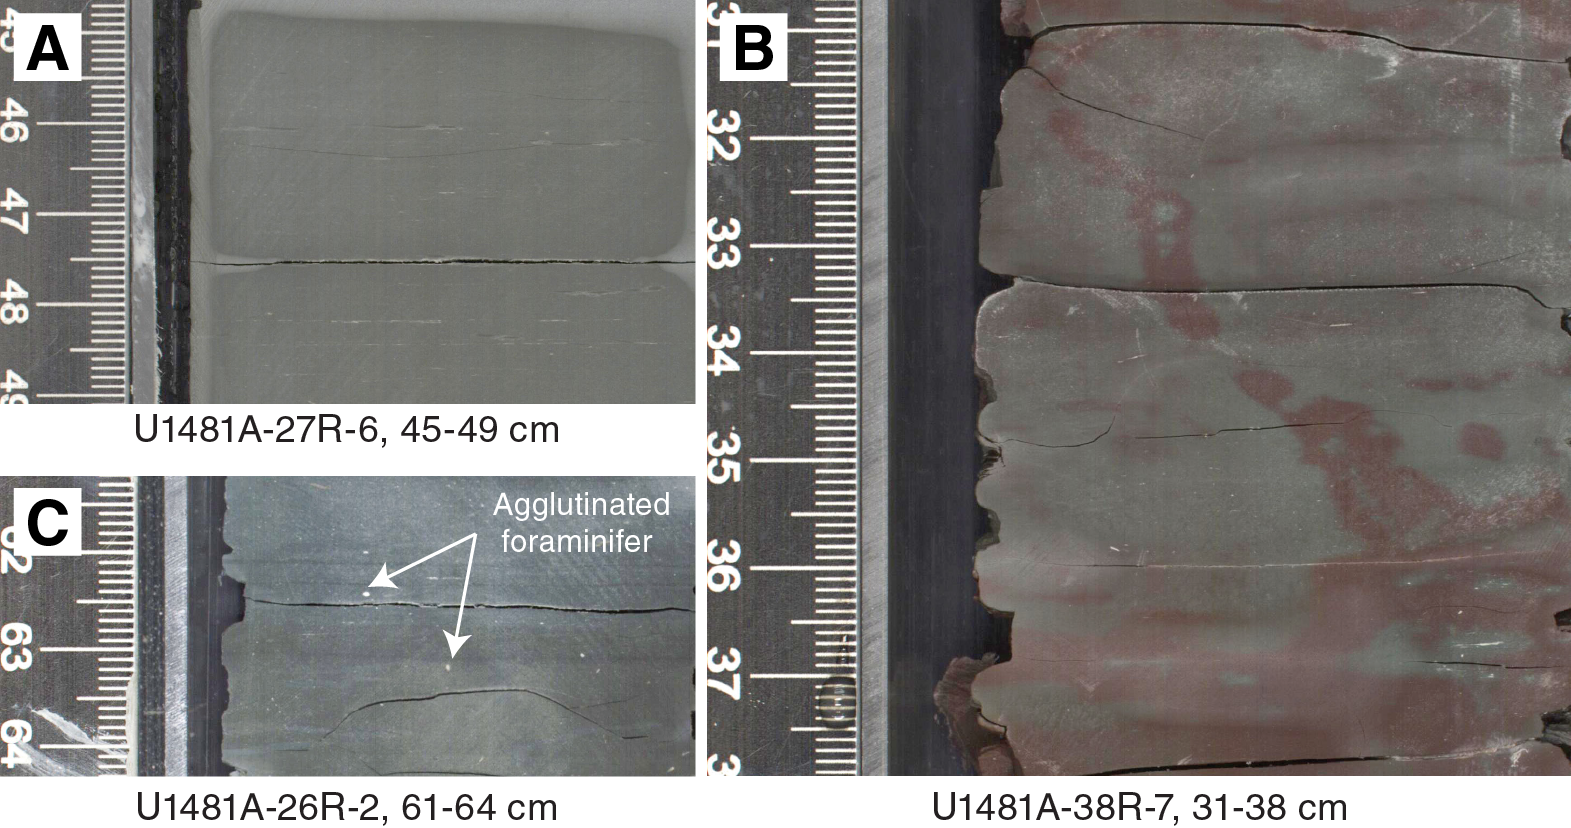
Figure F11. Structureless dark greenish gray mudstone.
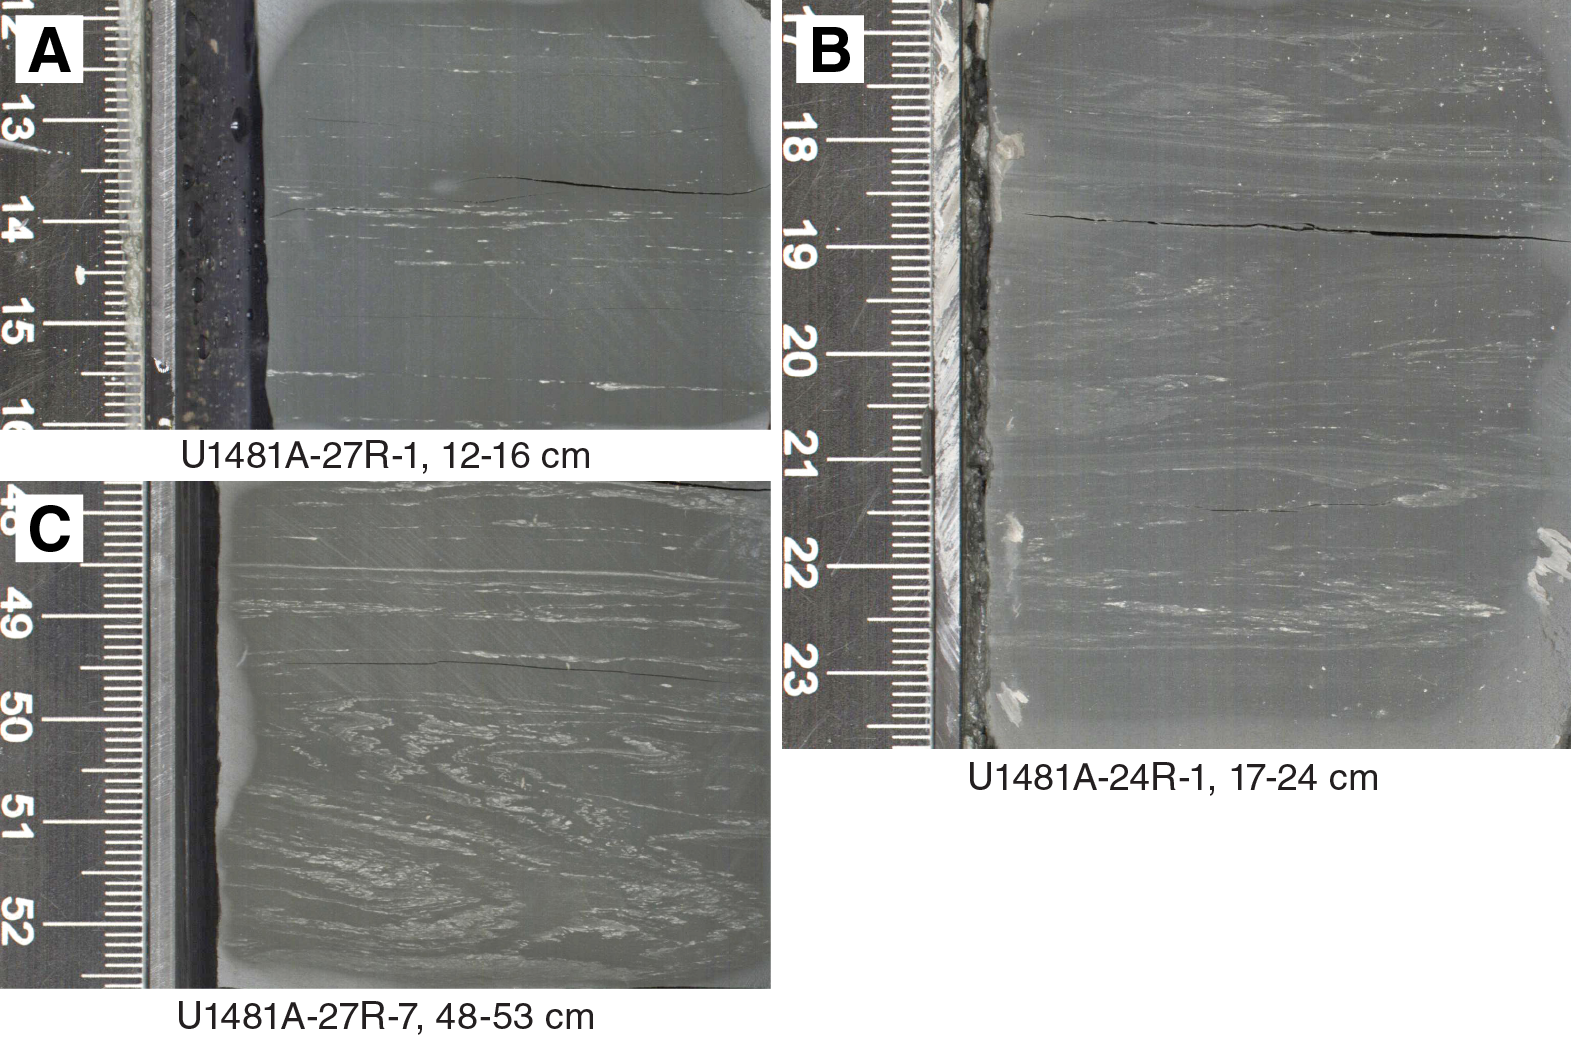
Figure F12. Bioturbated silty mudstone with claystone to silty claystone and siltstone.
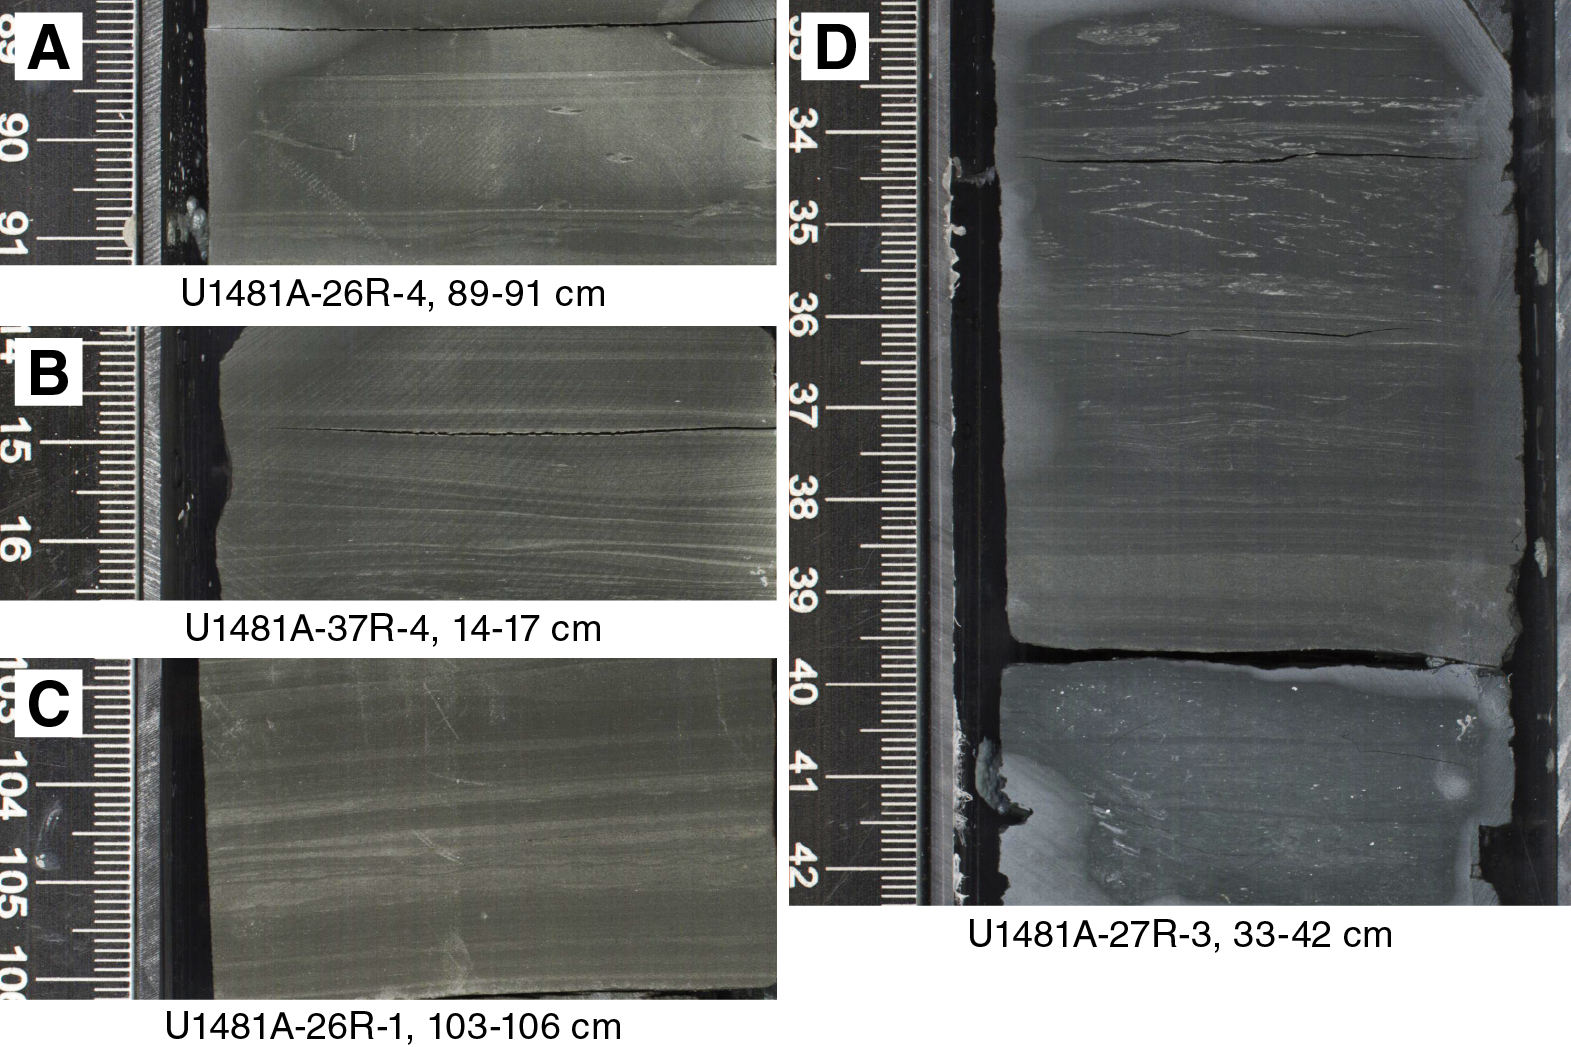
Figure F13. Parallel-laminated mudstone.
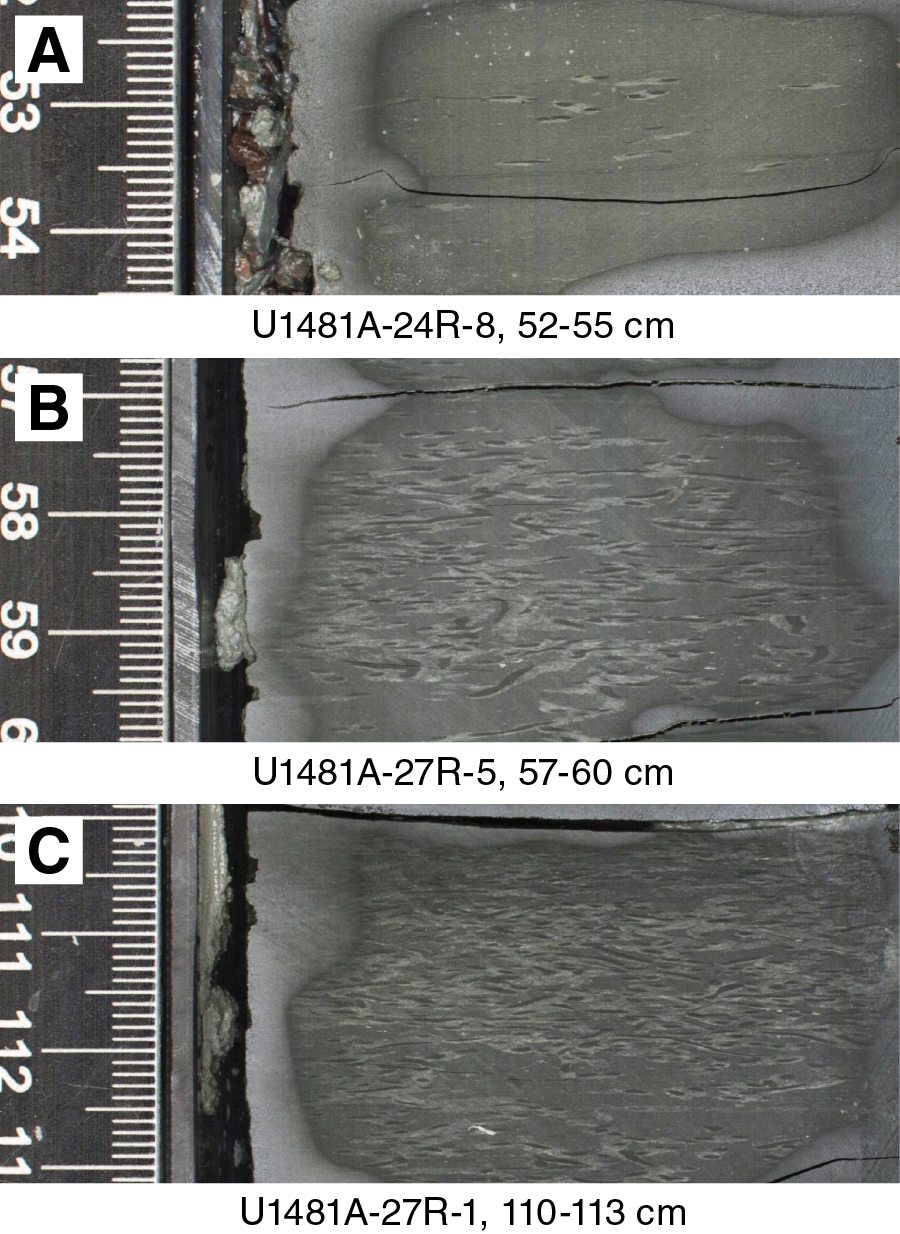
Figure F14. Nereites-modified mudstone.
Ash in the background sediment increases in abundance downhole through Unit III and is more common especially between Cores 362-U1481A-28R and 34R (1400–1460 mbsf), correlating with the appearance of discrete and disseminated ash layers (Figure F4). Twelve intercalated structureless and nongraded gray to pale yellowish brown felsic ash and tuff layers from 0.3 to 3 cm thick were recorded in Unit III and commonly show planar sharp and horizontal basal and top contacts.
At 1370.54–1486.15 mbsf (Sections 24R-6 through 37R-5), dusky pink to dusky red ash-rich to tuffaceous claystones occur in intervals that typically range between 5 and 60 cm (Figure F6). These lithologies are much more abundant at Site U1481 than in Subunit IIIA at Site U1480. These intervals also contain a higher amount of palagonized, dispersed transparent and brownish ash matter in the background sediment, especially concentrated between Sections 33R-5 and 34R-7 (1447.65–1459.69 mbsf). Nevertheless, the occurrence of this tuffaceous sediment is consistent with Site U1480 in being a characteristic component of Unit III.
A striking difference in the lower part of Unit III, compared to Subunit IIIA at Site U1480, is the occurrence of structureless to planar-laminated, normally graded, fine- to very fine grained sandstone and siltstone in the interval between 1474.44 and 1495.93 mbsf. These lithologies are intercalated with the typical pelagic to hemipelagic background deposits observed in Unit III at Site U1480. Overall, the grain size of these coarser grained beds decreases within this interval from fine-grained sandstone at the top (Section 36R-3, 120 cm) to siltstone at the base (Section 38R-5, 62.5 cm). The coarse-grained layers contain abundant plant fragments and mud clasts and show sediment slide/slump structures and convolute lamination.
XRD analysis of 32 samples defines the average composition of the siliciclastic mudstone in Unit III as 64% total clay, 23% quartz, 12% plagioclase, and 1% calcite (Table T3). One sandstone has 33% total clay, 42% quartz, 24% plagioclase, and 0% calcite. Diagenetic effects in this unit are, in general, difficult to detect either macroscopically or using light microscopy, though a degree of increased lithification compared to overlying lithologies in Unit II of Site U1481 (and Units I and II of Site U1480) is denoted by increasing difficulty in disaggregating the mudstone for smear slide preparation.
Ash petrology
Only Unit III contains minor amounts of vitric ash. Ash is dispersed in the background sediment and also appears as discrete ash layers. The cored succession at Site U1481 includes 12 discrete ash layers or ash-pod layers. Textures and vesicles of pyroclasts vary slightly between the ash layers. Ash layers are typically dark pinkish gray to black, or show light yellowish brown colors, and are fine grained. In Unit III, the mostly lithified ash layers (tuffs) show slight to strong alteration (devitrified and palagonized), and zeolite is commonly observed in smear slides.
Overall, the moderately crystal rich tuffs or tuffaceous sediment contain common to rare feldspar and quartz as well as rare to trace amounts of amphibole and biotite and are commonly mixed with biogenic constituents, mostly calcareous nannofossils and some radiolarians and diatom fragments, with authigenic calcite and claystone. The tuffs are predominantly composed of low-vesicular, dense, blocky, and rare cuspate glass shards together with probable traces of pumiceous clasts that have some elongate and round gas bubbles. More detailed observations are obscured by the high grade of alteration. In comparison to Site U1480, the occurrence is not only limited to transparent, most likely felsic ash material, but also includes a significant amount of brownish, small, dense, blocky mafic glass shards.
Interpretation of lithostratigraphic units at Site U1481 and comparison to Site U1480
The overall succession from ~1150 to 1500 mbsf at Site U1481 is interpreted as siliciclastic Nicobar Fan and underlying pelagic sediment with mixed tuffaceous material, deposited on an abyssal plain. However, at the base of Unit III in Hole U1481A, the appearance of sand is interpreted as an early depositional phase of the (paleo-) Nicobar Fan. Figure F15 shows a comparative lithostratigraphy for Sites U1480 and U1481 indicating similarities and differences and proposed correlations from the Late Cretaceous to late Miocene. At both sites, late Miocene (base at ~9–9.5 Ma) deposits consist of a siliciclastic interval of mud/mudstone and sand/sandstone of the Nicobar Fan (Unit II at Site U1481 and Subunit IIC at Site U1480) underlain by an early to late Miocene (~9–19 Ma) hemipelagic-dominated succession interpreted as an abyssal plain environment with pelagic and hemipelagic siliciclastic mud/mudstone (Unit III) containing a substantial component of volcanic ash increasing with depth (Figure F15). At Site U1481, some influence of a paleo-Nicobar Fan (fine-grained sandstones) may be present within the early Miocene (~19 Ma).
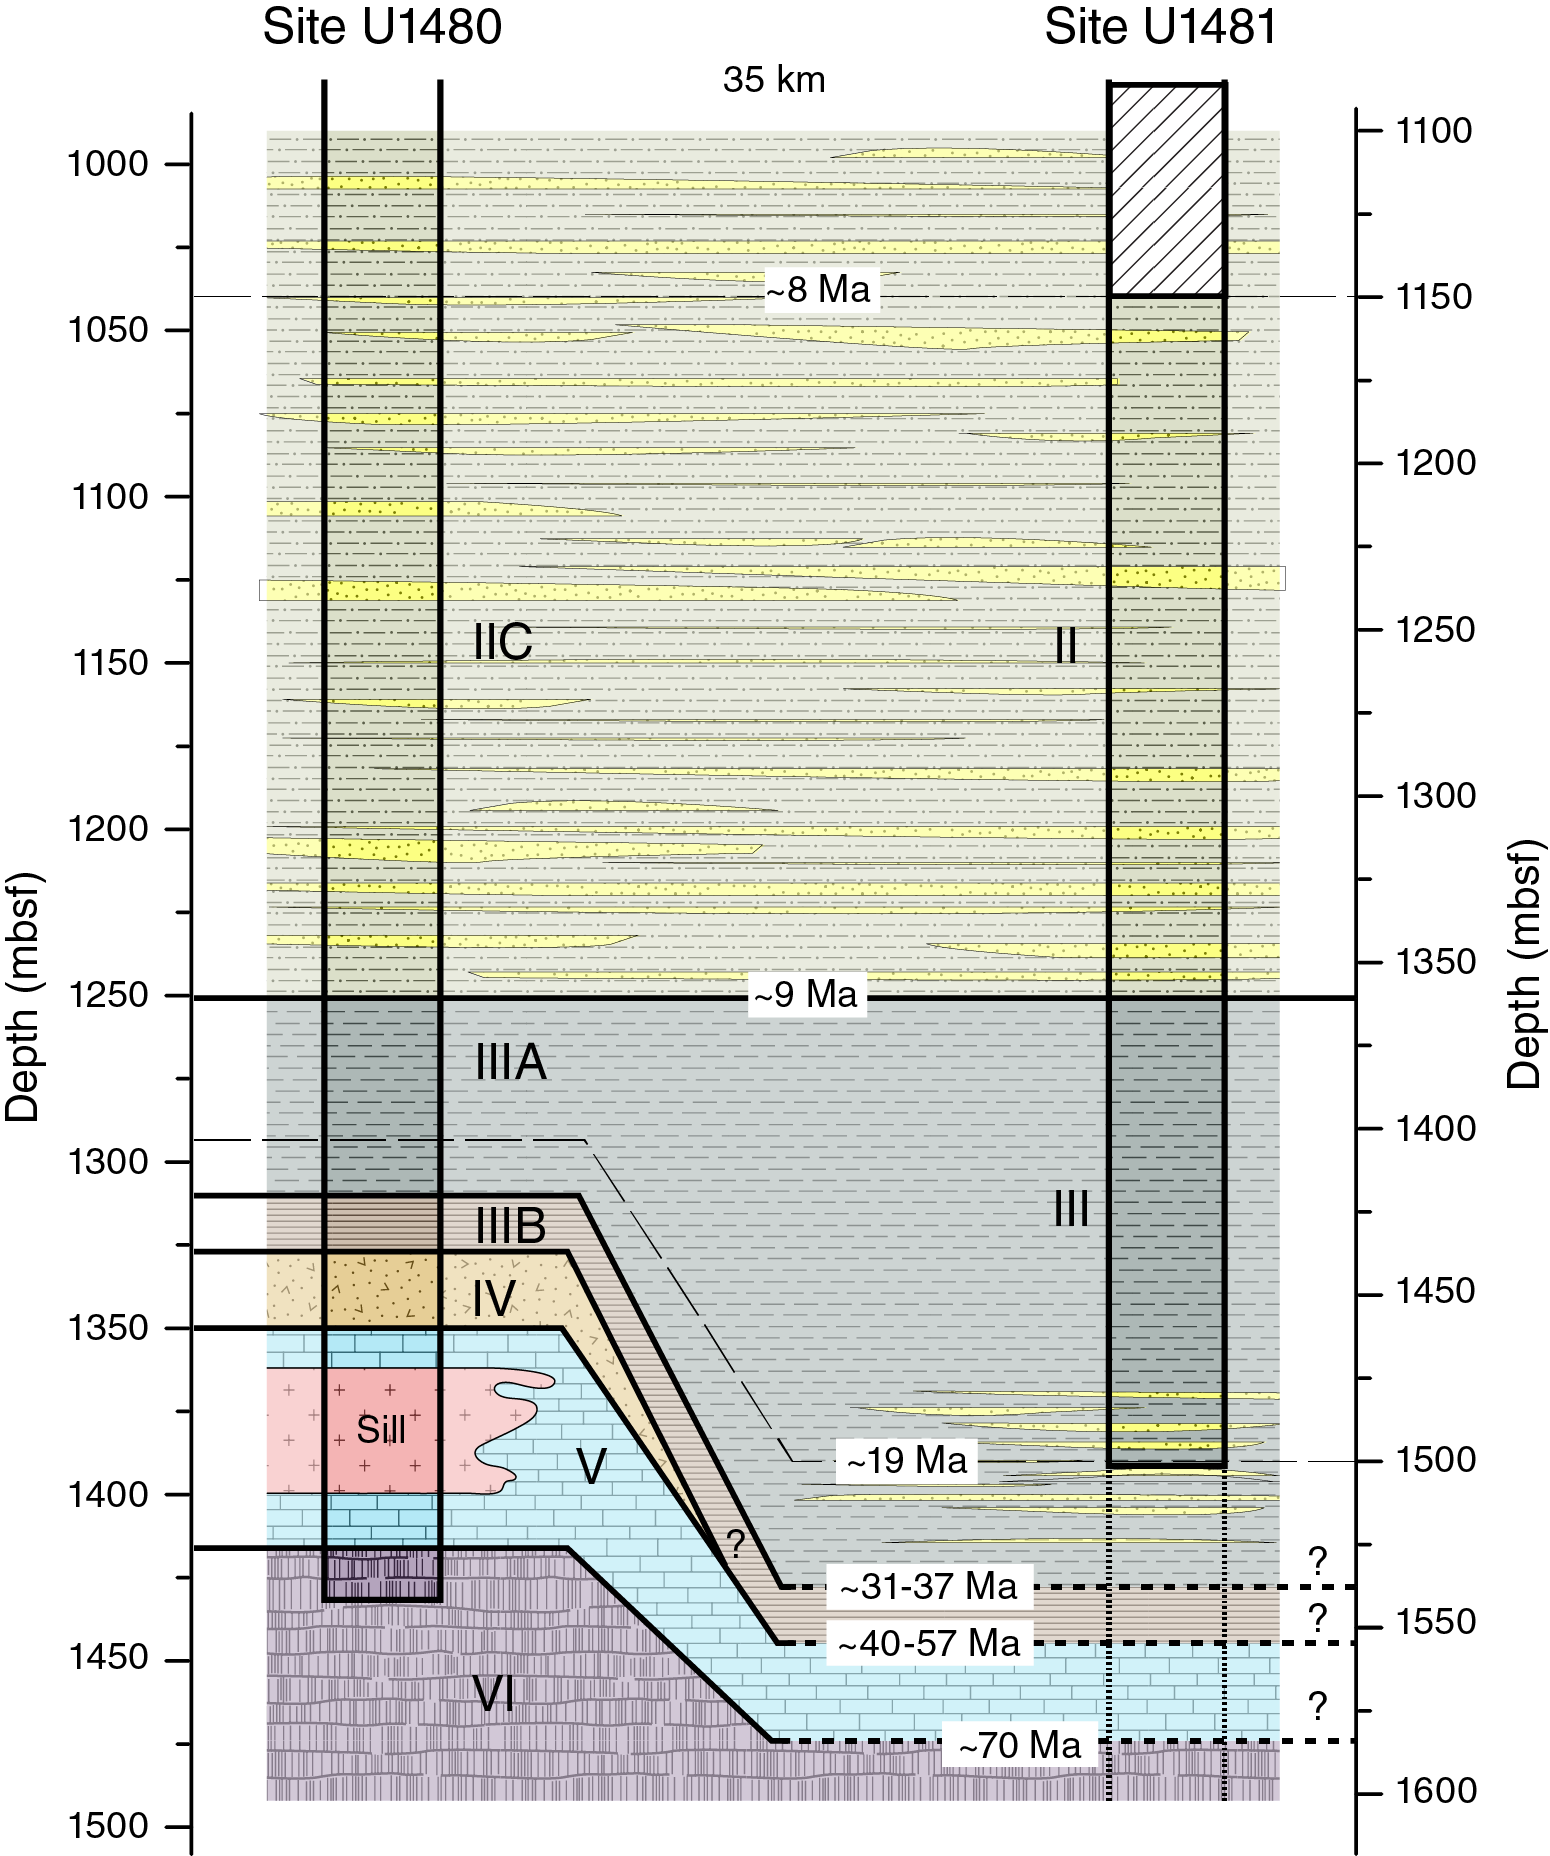
Figure F15. Schematic comparative lithostratigraphy for Sites U1480 and U1481.
At Site U1480, a transition toward pelagic-dominated prefan deposits (Subunit IIIB to Unit IV) is observed from the Oligocene (31–37 Ma) to the Paleocene–Late Cretaceous (<70 Ma). This probably includes several unconformities within the carbonate mud/mudstone, chalk, siltstone, sandstone, and conglomerate (Site U1480 Subunit IIIB to Unit V), and also contains a substantial component of volcanic ash from a local (coarse-grained mafic ash) and a distant (fine-grained felsic ash) source. At Site U1481, this lowermost part of the stratigraphy was not drilled; therefore, we can only speculate how it may correlate to Site U1480, and we cannot discount the fact that parts of the Site U1480 succession may be absent due to nondeposition and/or faulting (Figure F15).
Drilling at Site U1481 has shown that the younger Nicobar Fan (younger than ~9 Ma) is lithologically similar to that encountered at Site U1480. The appearance of sandstone at ~19 Ma at Site U1481 suggests an earlier period of relatively coarser grained siliciclastic input and fan accumulation that is absent at Site U1480, potentially due to topographic variations. Similar to the thick section of sand in Unit II at Site U1480 (initiated at 9–9.5 Ma at both sites) and inferred to be mainly sourced from the Himalayan region (see Sedimentology and petrology in the Site U1480 chapter [McNeill et al., 2017d]), it suggests a multistage evolution of the regional submarine fan system. For further information on the evolution of the Nicobar Fan, its stratigraphic context within the Indian Ocean and environs, and the provenance of the Nicobar Fan sands, see McNeill et al. (2017a).
Structural geology
We made observations of both natural and drilling-induced deformation features in the cores recovered at Site U1481. Our workflow also includes an evaluation of drilling parameters (Structural geology in the Expedition 362 methods chapter [McNeill et al., 2017b]) and their impact on core recovery and drilling-induced deformation. Compilation of observations and interpretations of all types of core deformation leads us to a qualitative inference of relative strength downhole (see workflow defined in Structural geology in the Expedition 362 methods chapter [McNeill et al., 2017b]).
Reflection seismic data show that Site U1481 is located 2.5–3 km away from complex, steeply dipping faults with apparent normal offset (Figure F67) that cut the Indian plate sedimentary sequence and in some cases develop fault scarps at the seafloor. The few tectonic structures observed and described in cores confirm that Site U1481 failed to intersect any major faults. Subhorizontal bedding dips (Figure F16) further support the inference of minimal deformation.
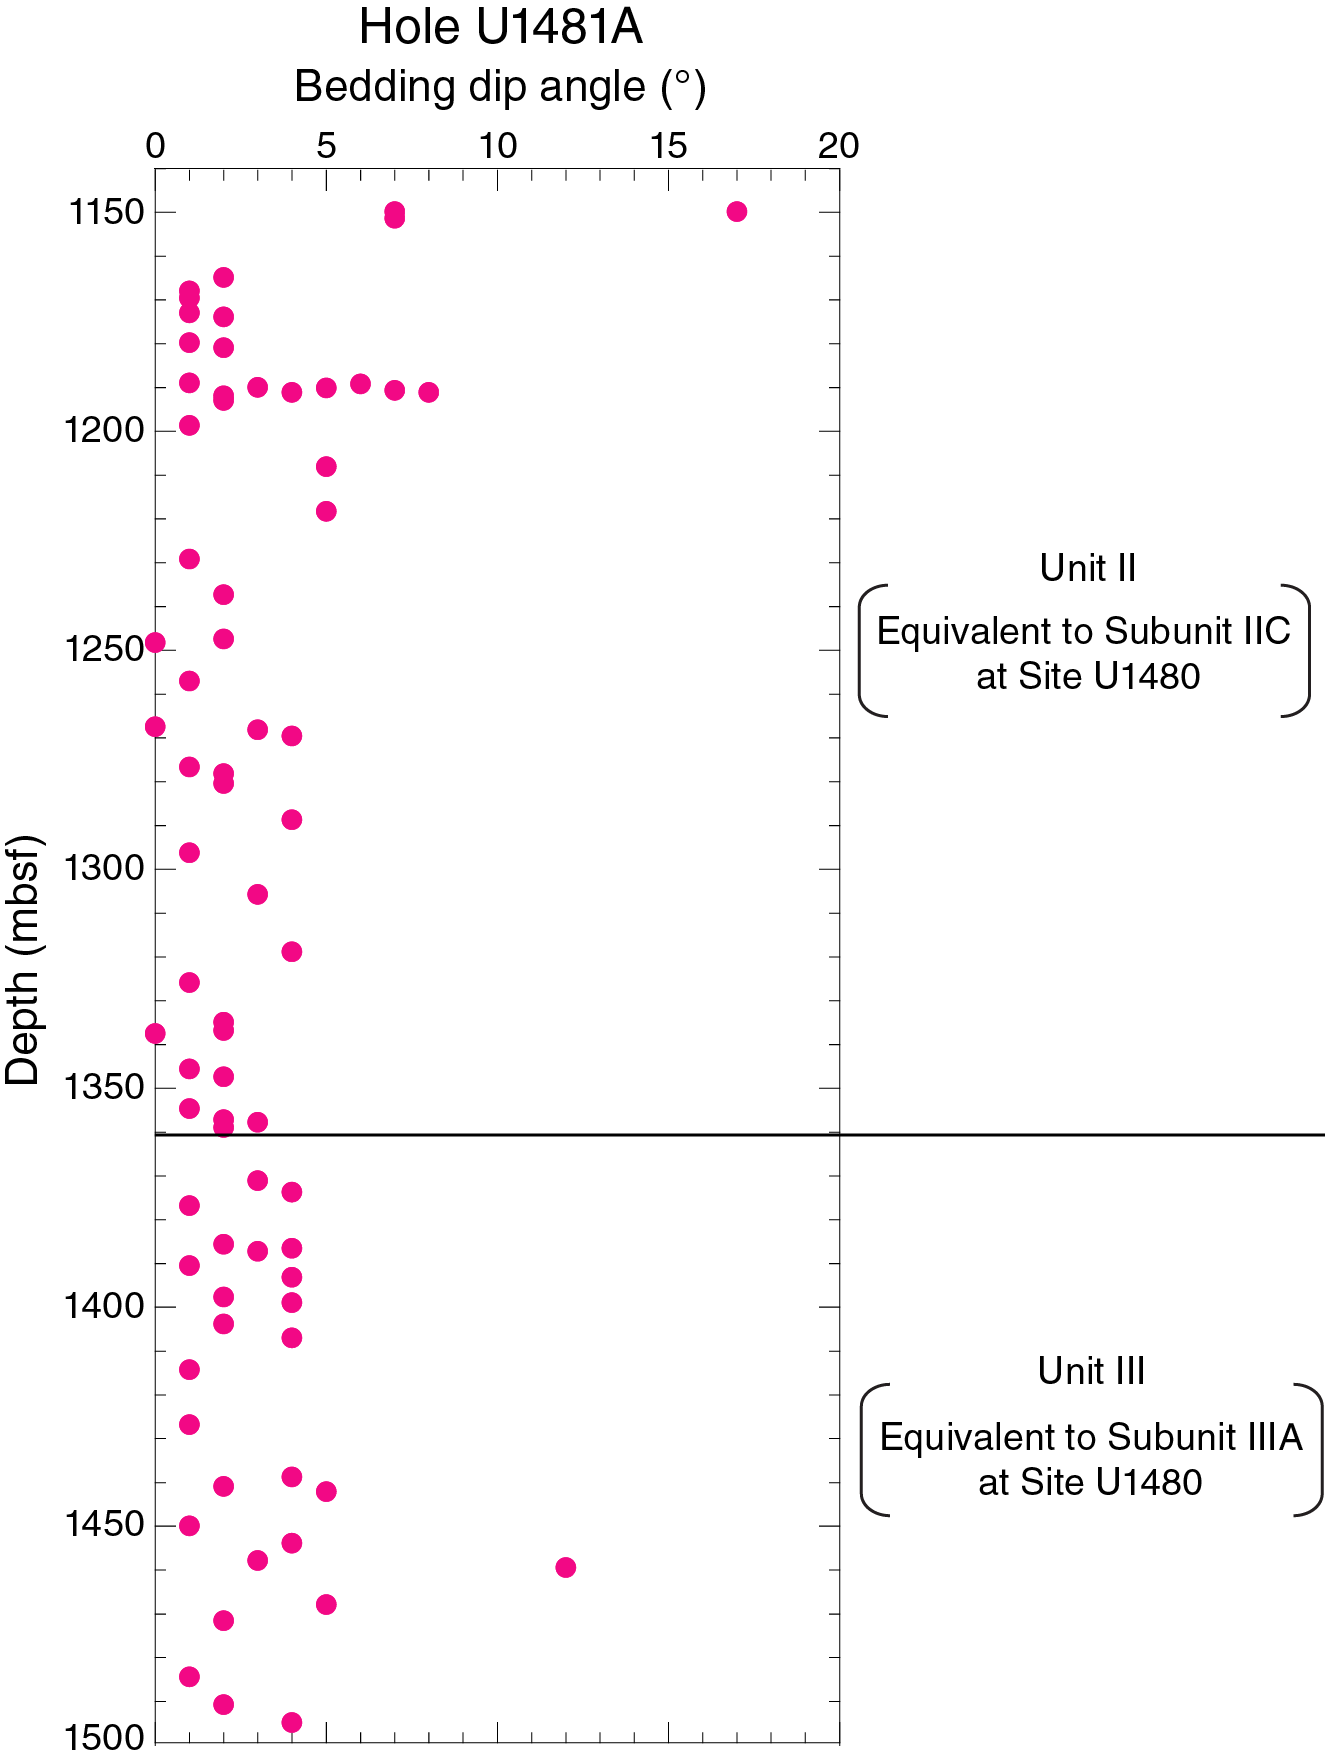
Figure F16. Bedding dip angles.
A key characteristic of Site U1481 cores is the pervasive development of postdrilling fracturing perpendicular to the core axis (see Drilling-induced structures). Intervals with fracture formation (Figure F17) coincide with core lengthening (expansion) and suggest one-dimensional core strain resulting from unloading and clay swelling. In principle, observations of horizontal strain (i.e., perpendicular to core axis) could also be measured and related to 3-D stress orientation and magnitude, but this type of analysis is beyond the scope of the current study.
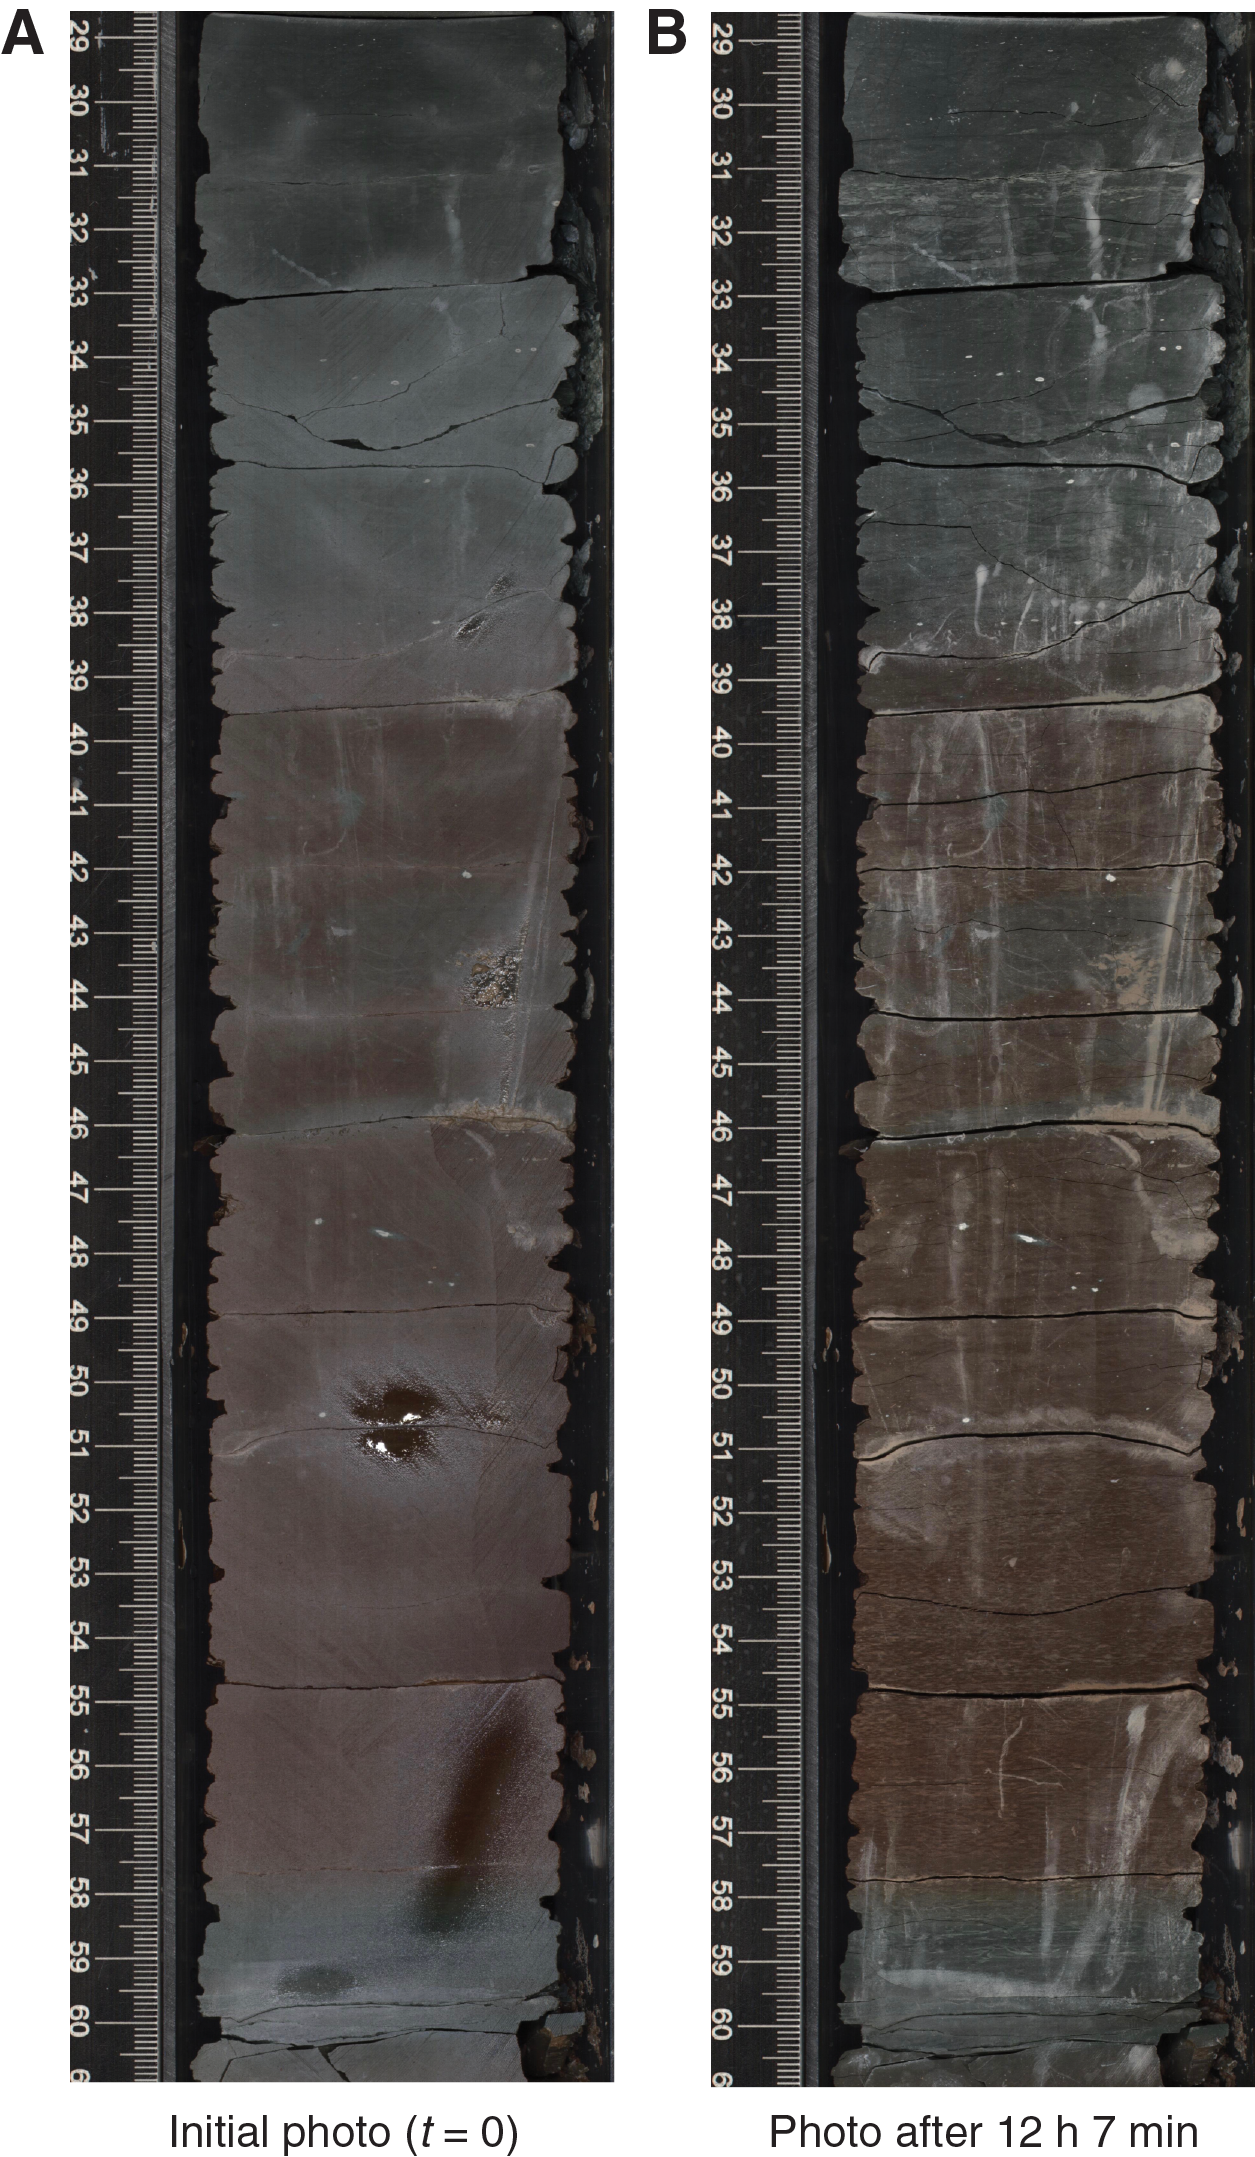
Figure F17. Core images after core splitting and ~12 h later.
Observed structures
Bedding orientations in the core coordinate system (see Structural geology in the Expedition 362 methods chapter [McNeill et al., 2017b]) were measured routinely on the working-half cores (Figure F16). Bedding is generally subhorizontal (<5°), but local dips up to 17° are interpreted to be related to sedimentary slump folds or the use of diagenetic surfaces as bedding proxies.
Faults recognized at Site U1481 are concentrated in Cores 33R through 35R (1441–1470 mbsf). These faults are mostly noncohesive normal faults characterized by striated and/or polished surfaces (Figure F18) that become exposed in the core as the hanging wall and footwall blocks separate. Offsets are of the order of few millimeters to a maximum of 2 cm, but offset markers are rarely visible. The slip sense is therefore mostly determined by steps on striated and slickensided fault surfaces. In the interval with faults, but also above and below it, bedding is horizontal to subhorizontal (Figure F16). The “open” appearance of these faults in the cores raises the question whether they are natural or drilling induced. We applied an interpretive confidence factor (see Structural geology in the Expedition 362 methods chapter [McNeill et al., 2017b]), and these faults range between 0.2 to 0.7 (wherein higher values indicate higher confidence of a natural fault origin and a value of 0.5 reflects an equal confidence in either interpretation). An anomalous concentration of faults between 1447 and 1464 mbsf (Figure F19; see also Site U1481 VCDs in Core descriptions) contrasts with the fault-free intervals above and below this 17 m section. This limited occurrence indicates a more fracture prone interval.
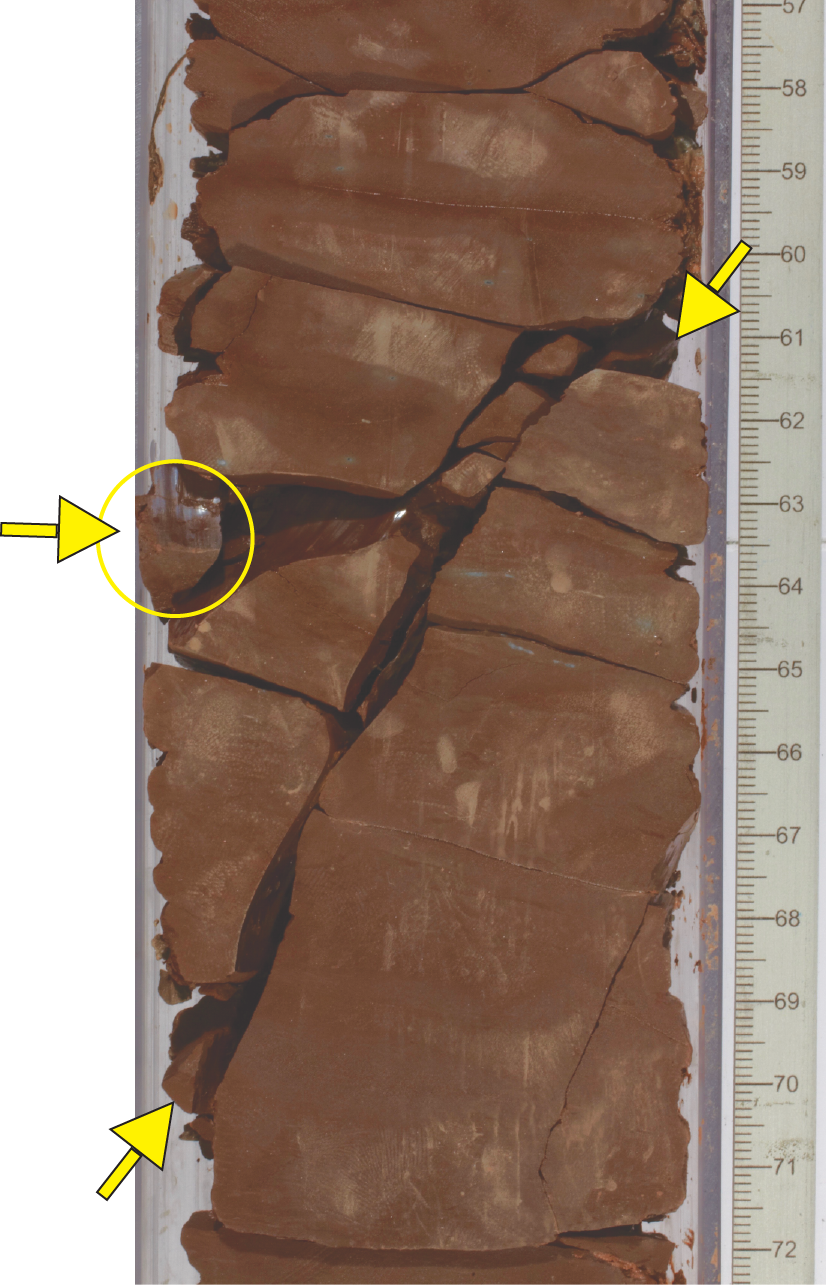
Figure F18. Fault in red claystone.

Figure F19. Histogram of fault frequency.
Parallel arrays of black traces of submillimeter thickness and <1 cm length are tentatively interpreted as sediment-filled veins or “vein structure” (e.g., Ogawa, 1980; Cowan, 1982; Ogawa and Miyata, 1985; Helm and Vollbrecht, 1985; Knipe, 1986; Lundberg and Moore, 1986; Brown and Behrmann, 1990). The observed structures occur with a spacing of several millimeters, are subperpendicular to bedding, and are confined to thin beds of clay deeper than 1370 mbsf. The veins are generally irregular and wispy, occasionally with splaying tips. Sigmoidal and en echelon vein arrays, a key characteristic of vein structure, are rare. Deformation bands have only been observed in one case (Figure F20).
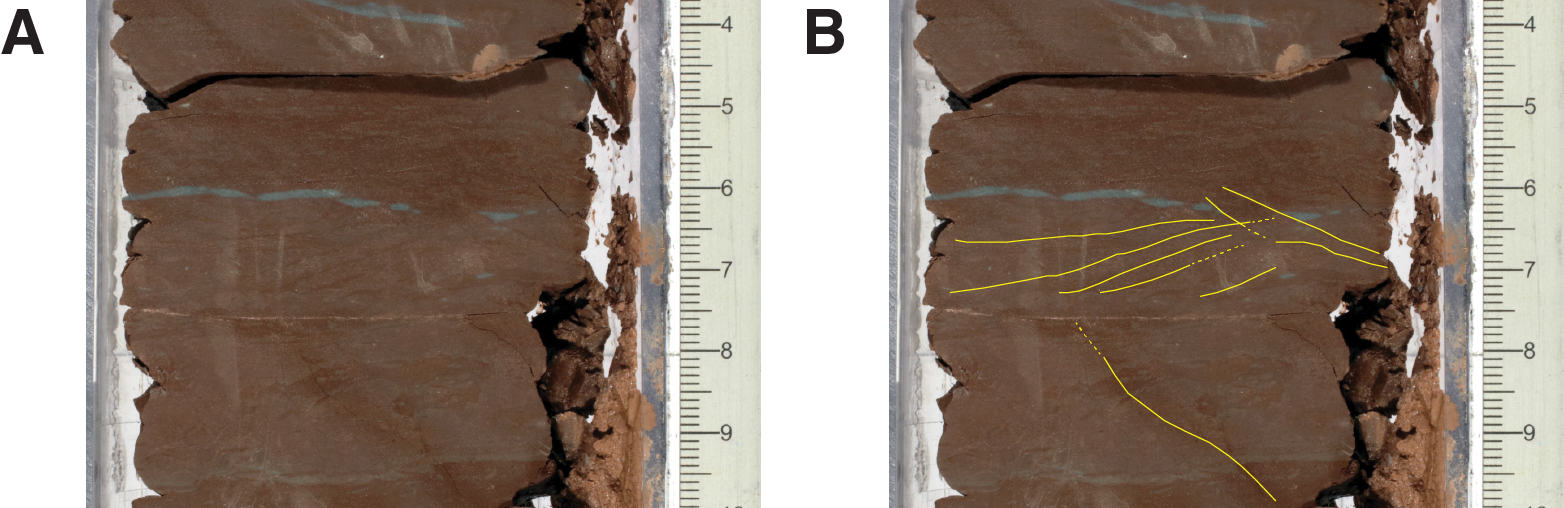
Figure F20. Deformation bands in red claystone.
Drilling-induced structures
Two significant observations of drilling-induced deformation include intervals with no core deformation and intervals with high fracture intensity (Figure F21). Intervals of undisturbed core occur in the 1150–1325 and 1480–1490 mbsf intervals, whereas the most fractured core intervals occur at 1325–1500 mbsf.

Figure F21. Distribution of drilling disturbance structures.
Between 1150 and 1325 mbsf, many sections of core were recovered without any drilling disturbance (Figure F21). Local drilling biscuits formed over this interval: slight to moderate biscuit formation between 1159 and 1168 mbsf (Figure F22) and otherwise only local development of biscuits and fractures. Fall-in occurs sporadically over this interval (Figure F23). Preliminary evaluation of the caliper log over this interval suggests borehole segments with consistent but enlarged diameter and in some cases exceeding the 17 inch maximum caliper measurement (see Downhole measurements). The observation of borehole enlargement despite rarity of fall-in suggests that borehole spalling occurred as small fragments, and these were removed to the seafloor by mud circulation.
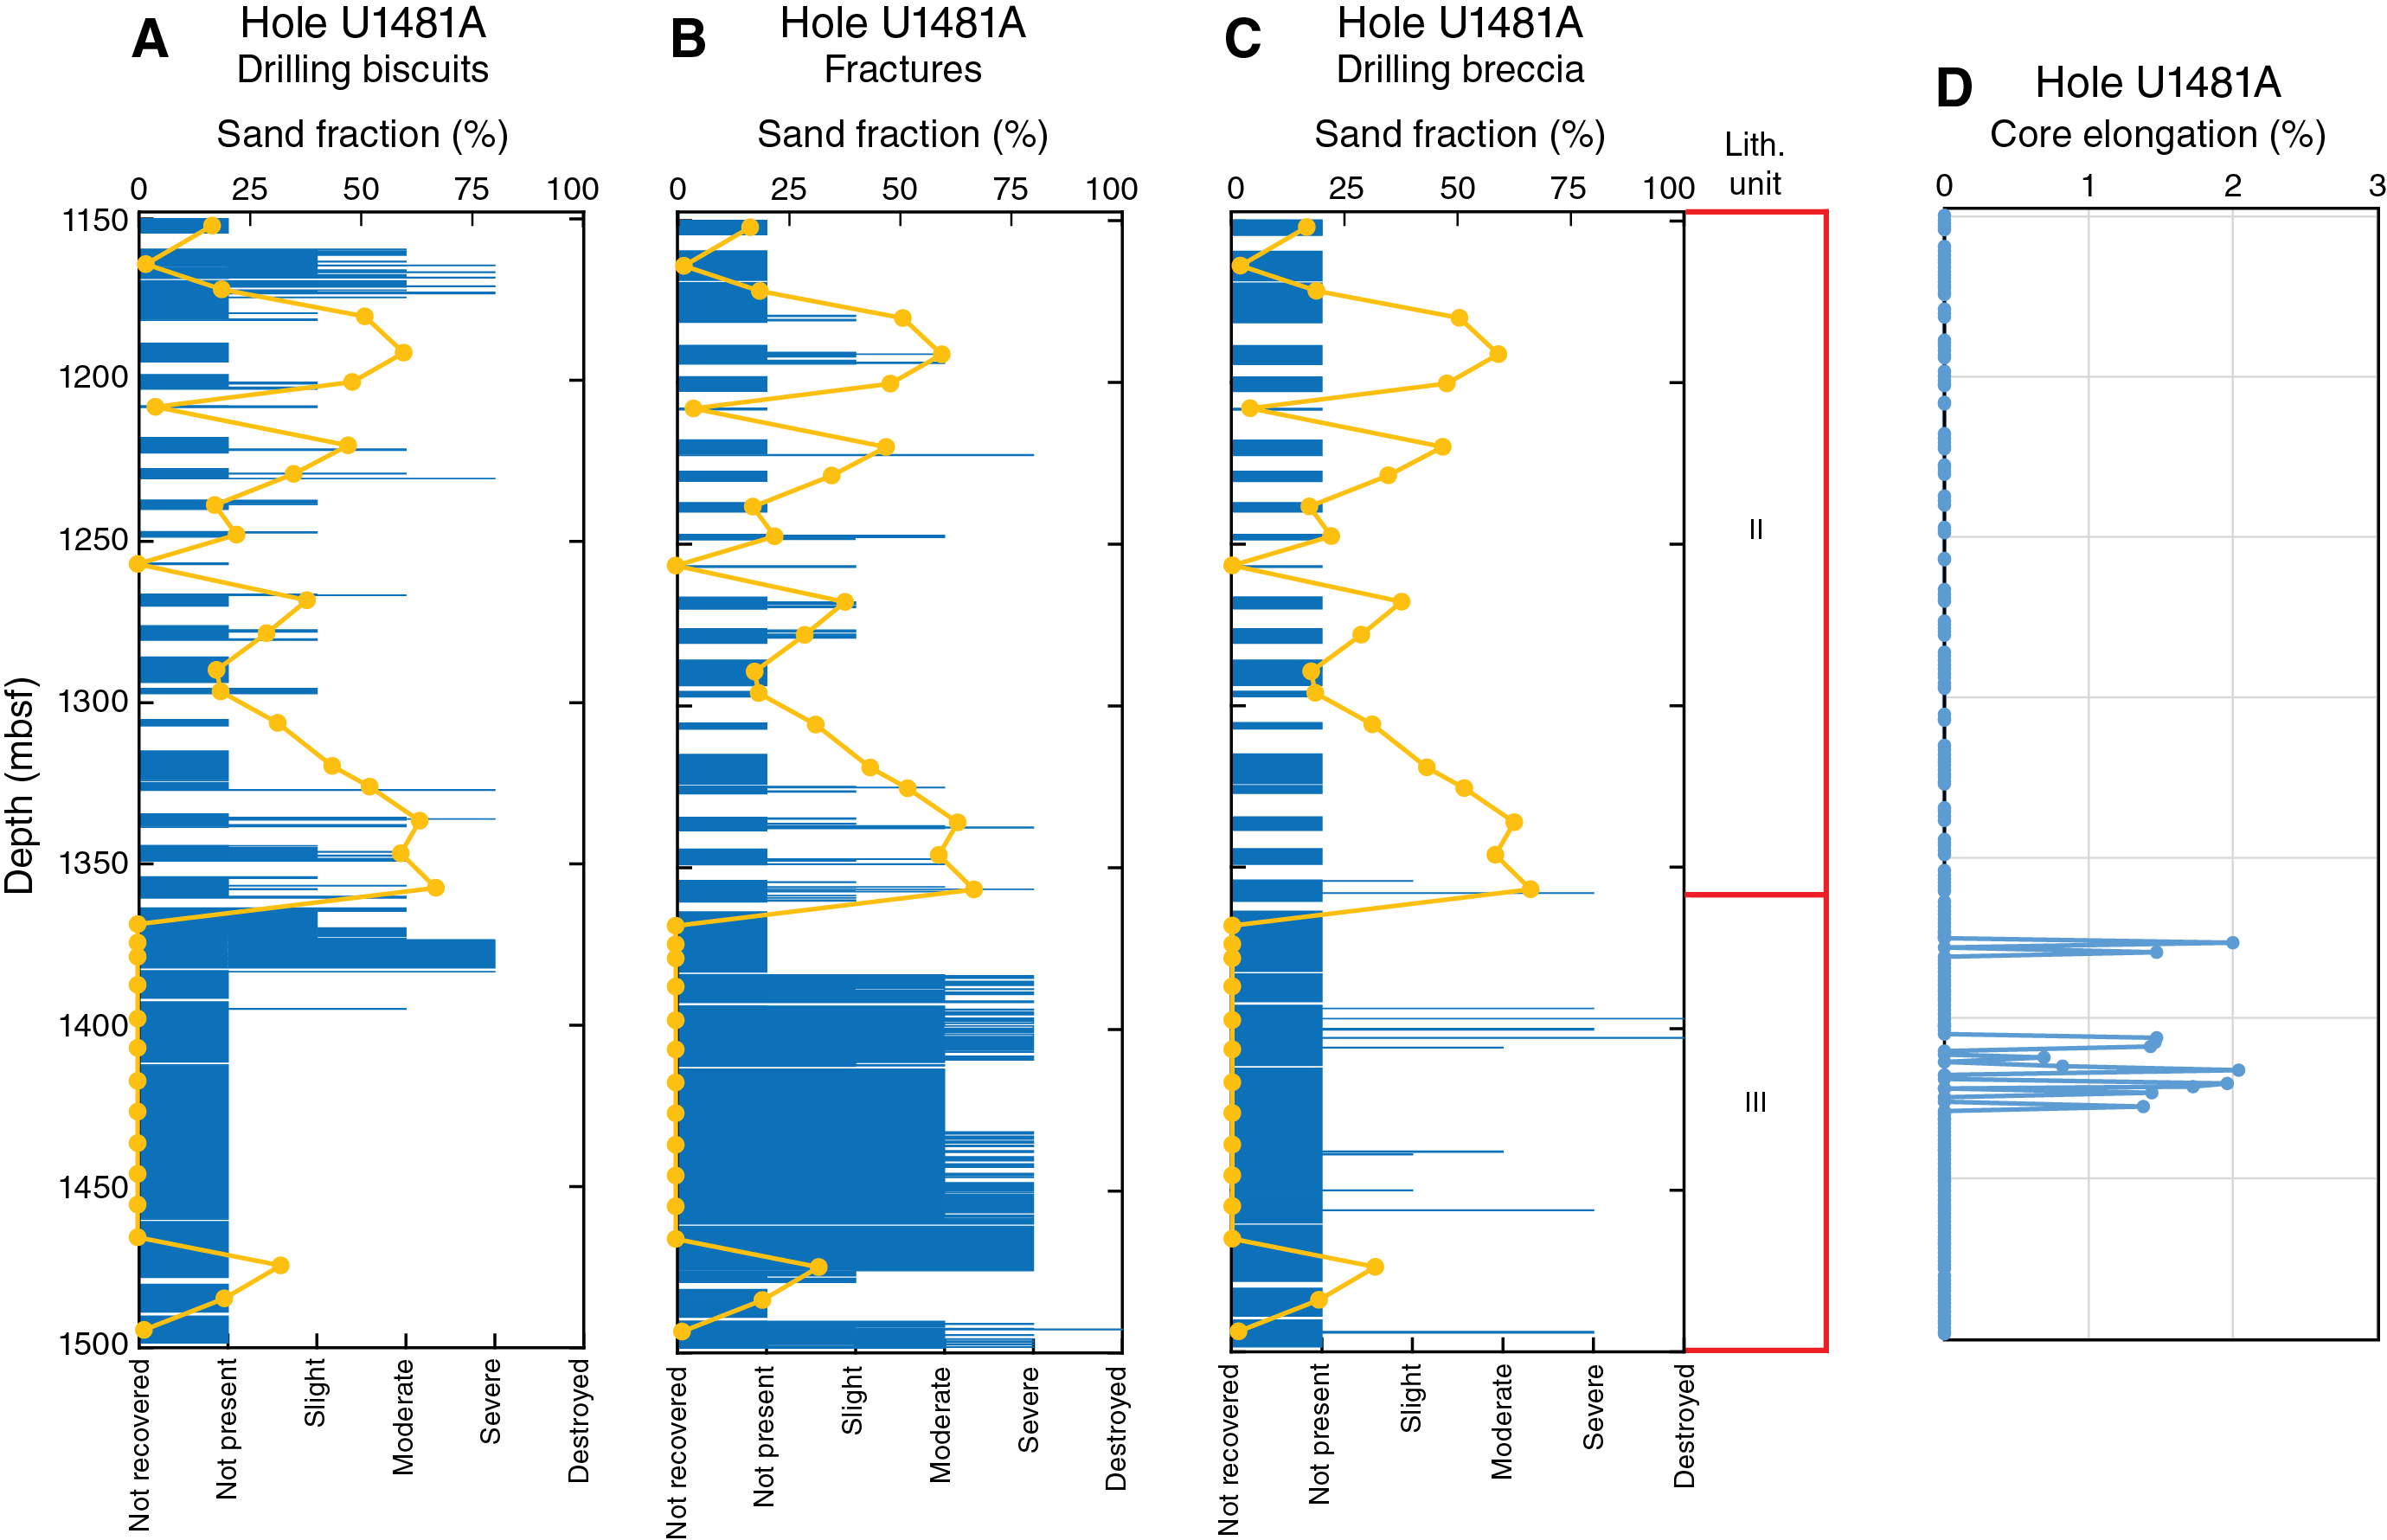
Figure F22. Intensity of drilling biscuits, fractures, drilling breccia, and final core elongation.
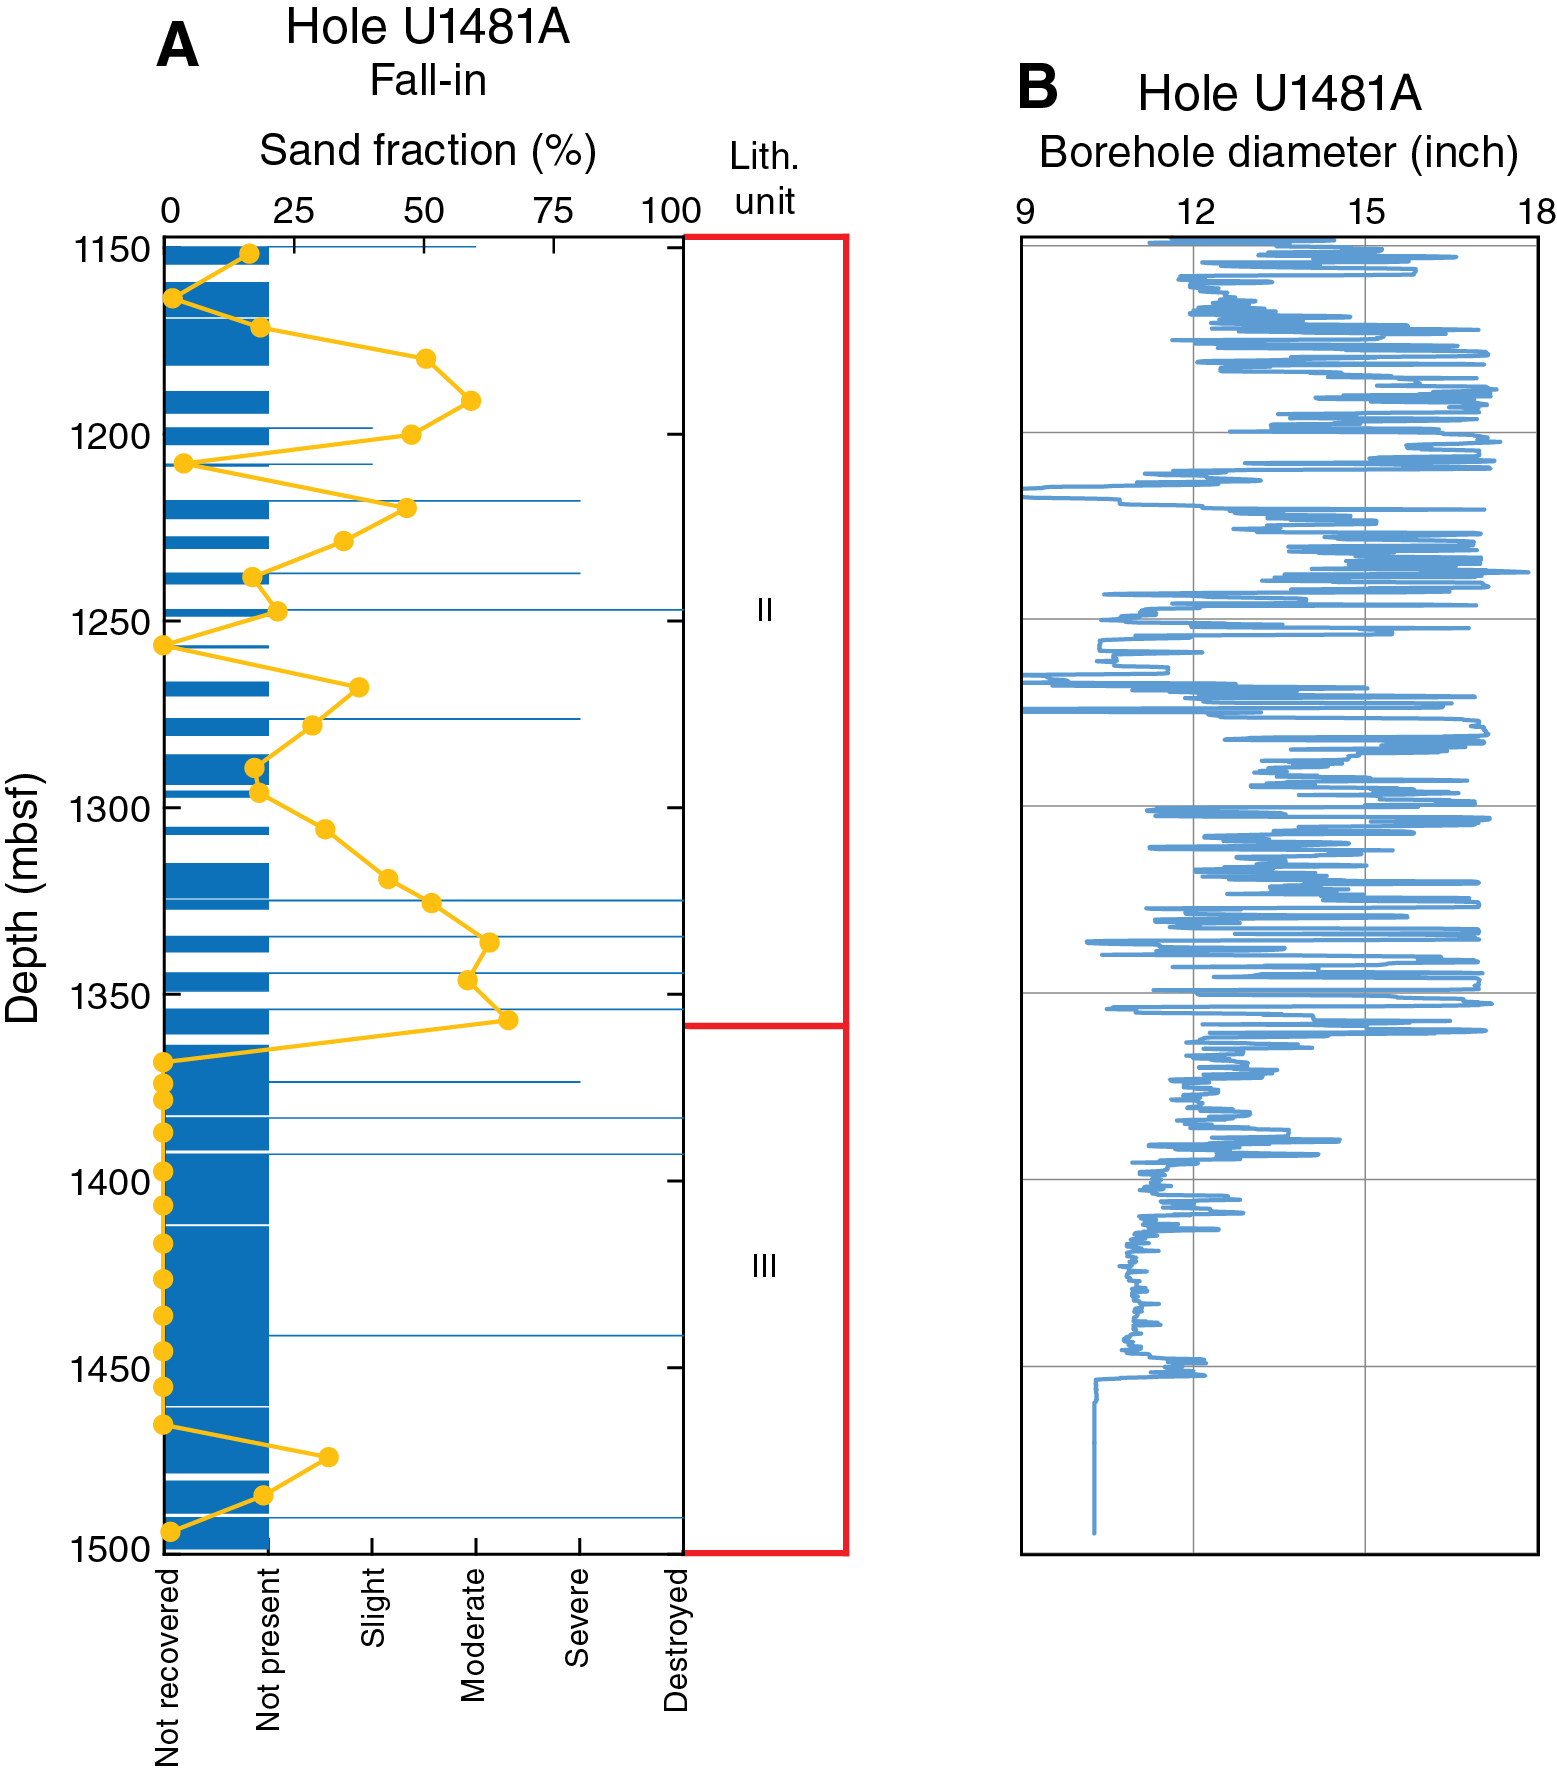
Figure F23. Intensity of fall-in and borehole diameter.
The deeper section (1325–1500 mbsf) with more intense drilling deformation is dominated by fractures (Figures F17, F22). Many fractures formed and grew after cores were brought to the surface. When the cores were first observed on the catwalk, the primary drilling deformation feature was often biscuits at least several centimeters long and often 50–80 cm long. Once the core was cut and began to dry, the number and intensity of fractures increased (Figure F17). In some cases this was associated with elongation of the core (Figure F22), although the greatest elongation (e.g., 1405–1425 mbsf) occurred away from the most intense fractures. This may reflect complementary mechanisms that seek to accommodate a similar inelastic stress recovery process. Drilling breccias (Figure F22) also develop in this deeper, fractured section (~1400 mbsf). Further integration with physical property data and postcruise experimentation will help evaluate the geomechanical significance of drilling-induced fracturing and core elongation.
The confident identification of faults observed in the core as either natural tectonic faults or drilling-induced faults proved to be challenging. We did find some intervals with curved, polished surfaces at a low angle to bedding, interpreted as drilling induced with the greatest confidence. Other faults with steeper dips, striations, and undulations on the fault surface are more difficult to classify, especially because small natural faults may be overprinted by drilling deformation. The structure log (see Core Description in DESC_WKB in Supplementary material) documents the confidence parameter interpreted for each fault observed. Drilling-induced faults occur deeper than 1450 mbsf (Figure F24C).
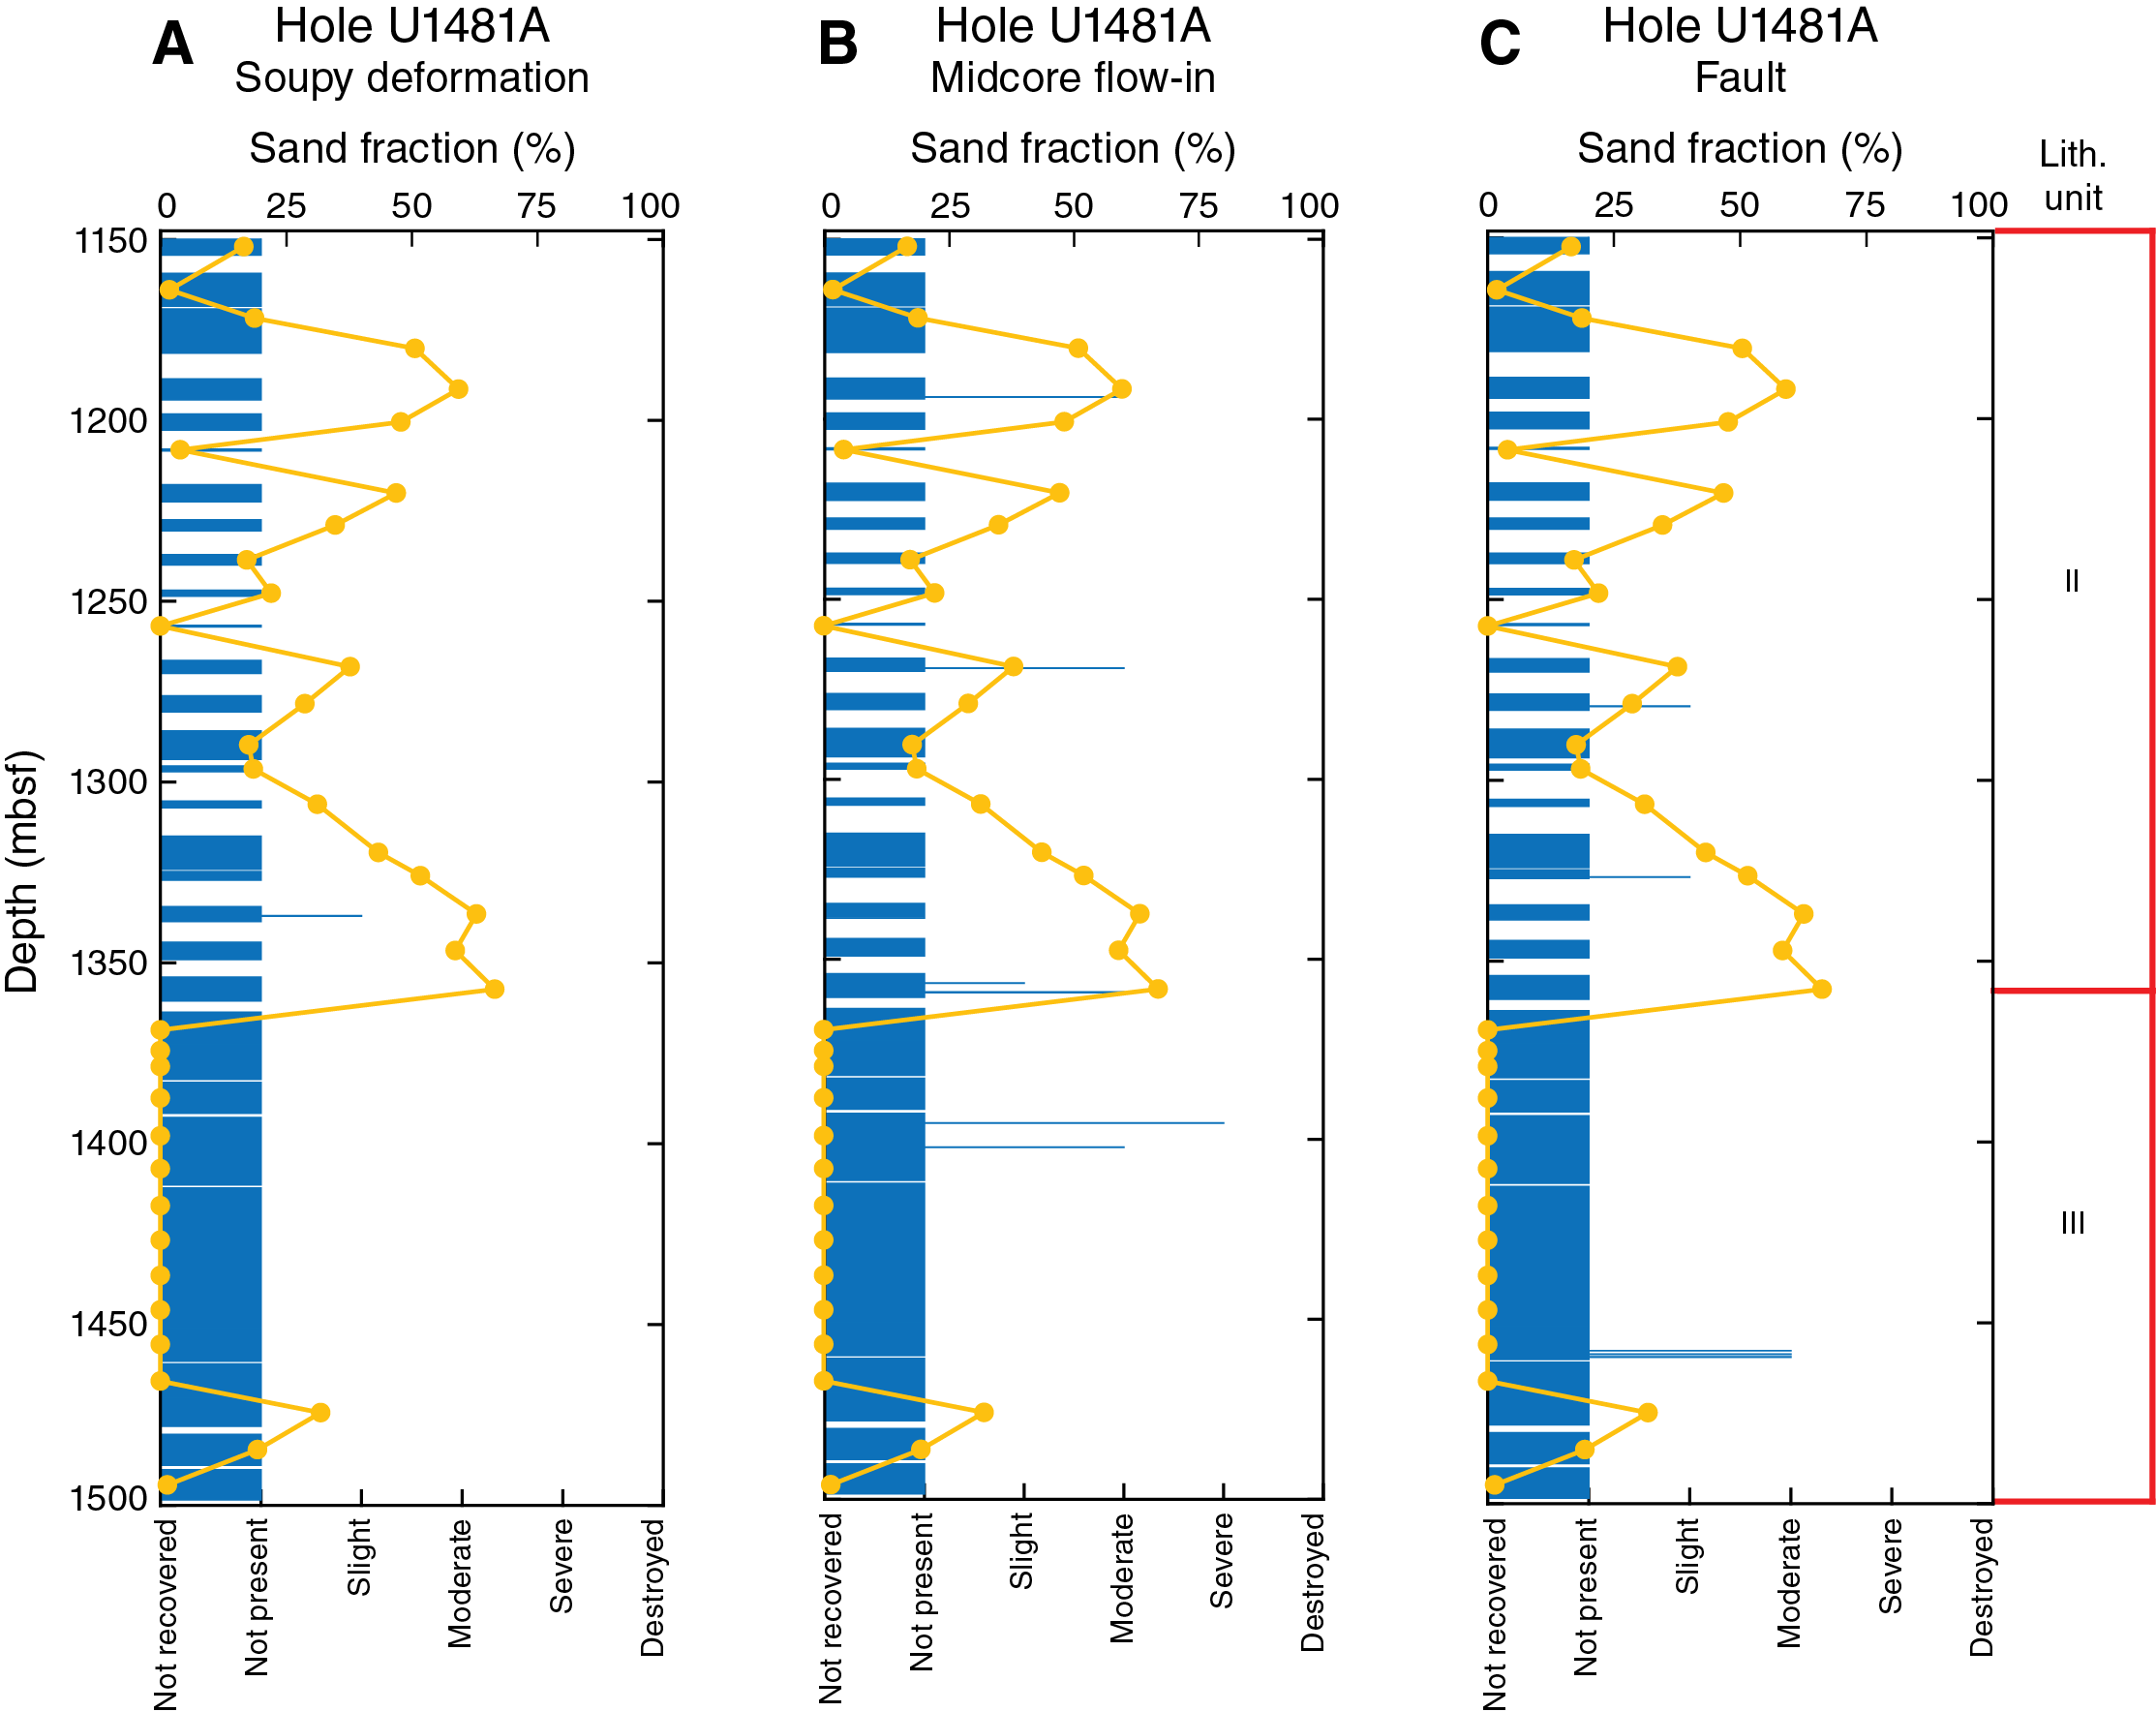
Figure F24. Intensity of soupy deformation, midcore flow-in, and faults.
Although it is tempting to try to place a boundary between lesser and greater drilling disturbance at the Unit II/III boundary (1360 mbsf), significant intervals of drilling deformation occur between 1325 and 1360 mbsf. The cause of this change in drilling deformation style and intensity awaits further analysis and integration with physical property and mineralogy data sets.
Midcore flow-in, the product of drilling-created cuttings fragments abraded from the core and interspersed between biscuits, is rare at this site but occurs most frequently deeper than 1325 mbsf (Figure F24). Soupy core disturbance only occurred once and is considered insignificant.
Two additional types of drilling disturbance only developed during short periods of increased ocean swell. The first type reflects a short core segment, dropped out of the core barrel to the bottom of the hole and recut by the bit (Figure F25). We observed this both at the top of a core and within a core in the form of locally rotated bedding with two cutting surfaces on the core fragment. The second type reflects the separation of the core in the bit from the bottom of the hole as a result of partial heave compensation. Fracturing of the younger sediment in the bit (Figure F26) is interpreted to reflect impingement of the core back onto the uncored material, generating radial fractures.

Figure F25. Core segment that was drilled, dropped back into hole, and recored.
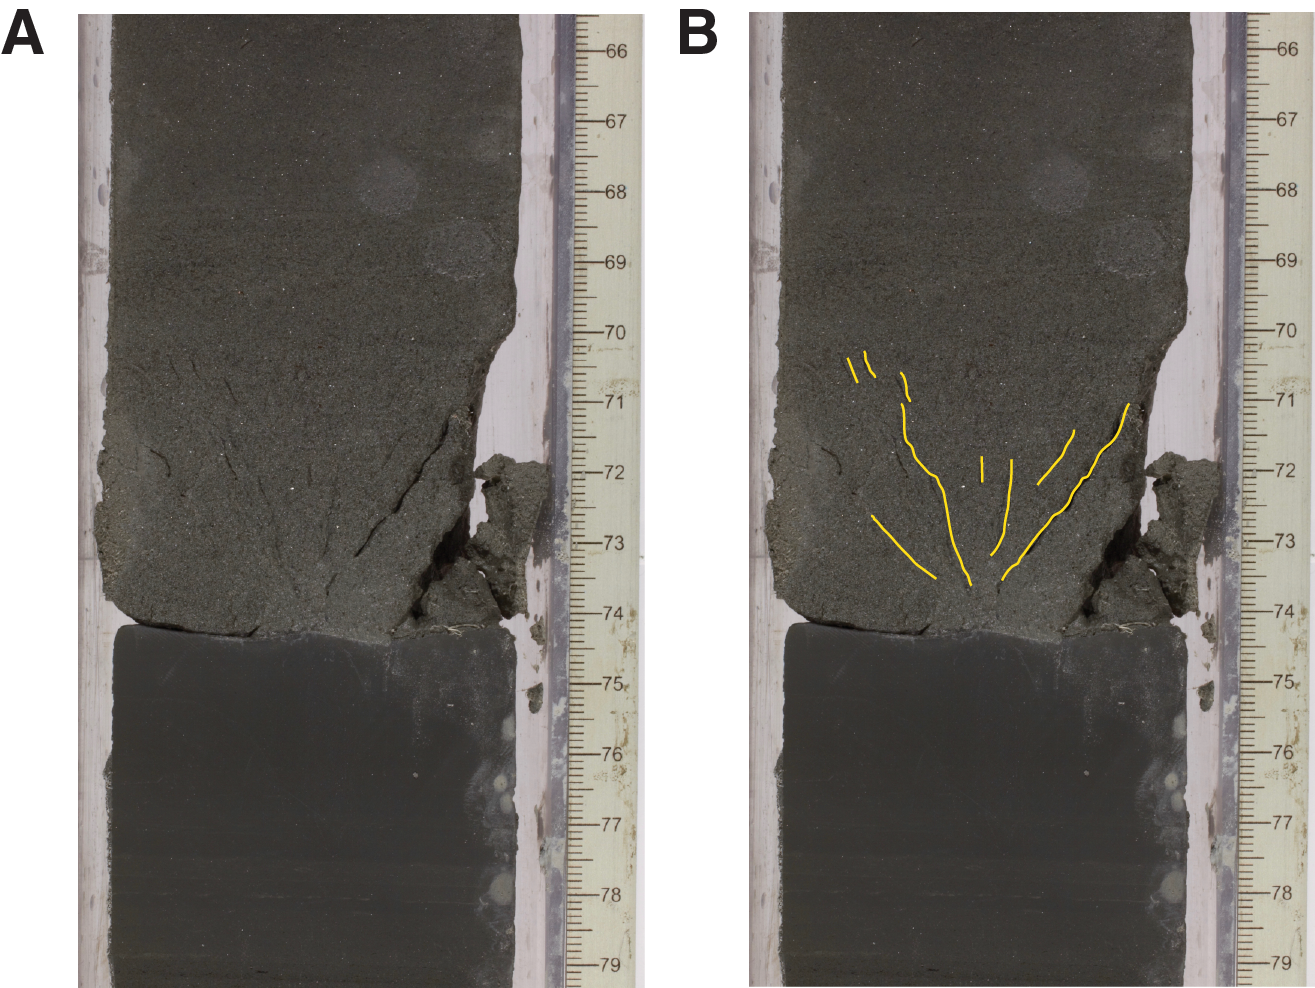
Figure F26. Drilling-induced impact fractures.
In summary, drilling deformation at Site U1481 is modest, occurs predominantly in the deeper part of the cored section (>1325 mbsf), and is dominated by fracture development that forms and continues after the core is split. Correlation of drilling deformation with the caliper log (see Downhole measurements) yields no simple pattern, but further postcruise analysis will be undertaken.
Drilling conditions
Sand fraction, recovery, time to core, and specific energy factor (SEF) were evaluated as a function of depth for Hole U1481A (Figure F27). In Unit II (1150–1360 mbsf), the fraction of sand in the core varies from 0% to 60%. From 1150 to 1175 mbsf, cores without sand have high core recovery, but from 1175 mbsf to the Unit II/III boundary at 1360 mbsf, sand fraction and recovery track one another. Deeper than 1360 mbsf, sand is in only the basal cores, and recovery is consistently high. Both the time-to-core and SEF increase in Unit III over Unit II. These relationships are further defined in Figure F28 where it is apparent that (1) there is little sand in Unit III and (2) it took longer to drill a core in Unit III than Unit II. Within Unit II, a weak positive correlation exists between the time to cut a core and the amount of sand in the core.
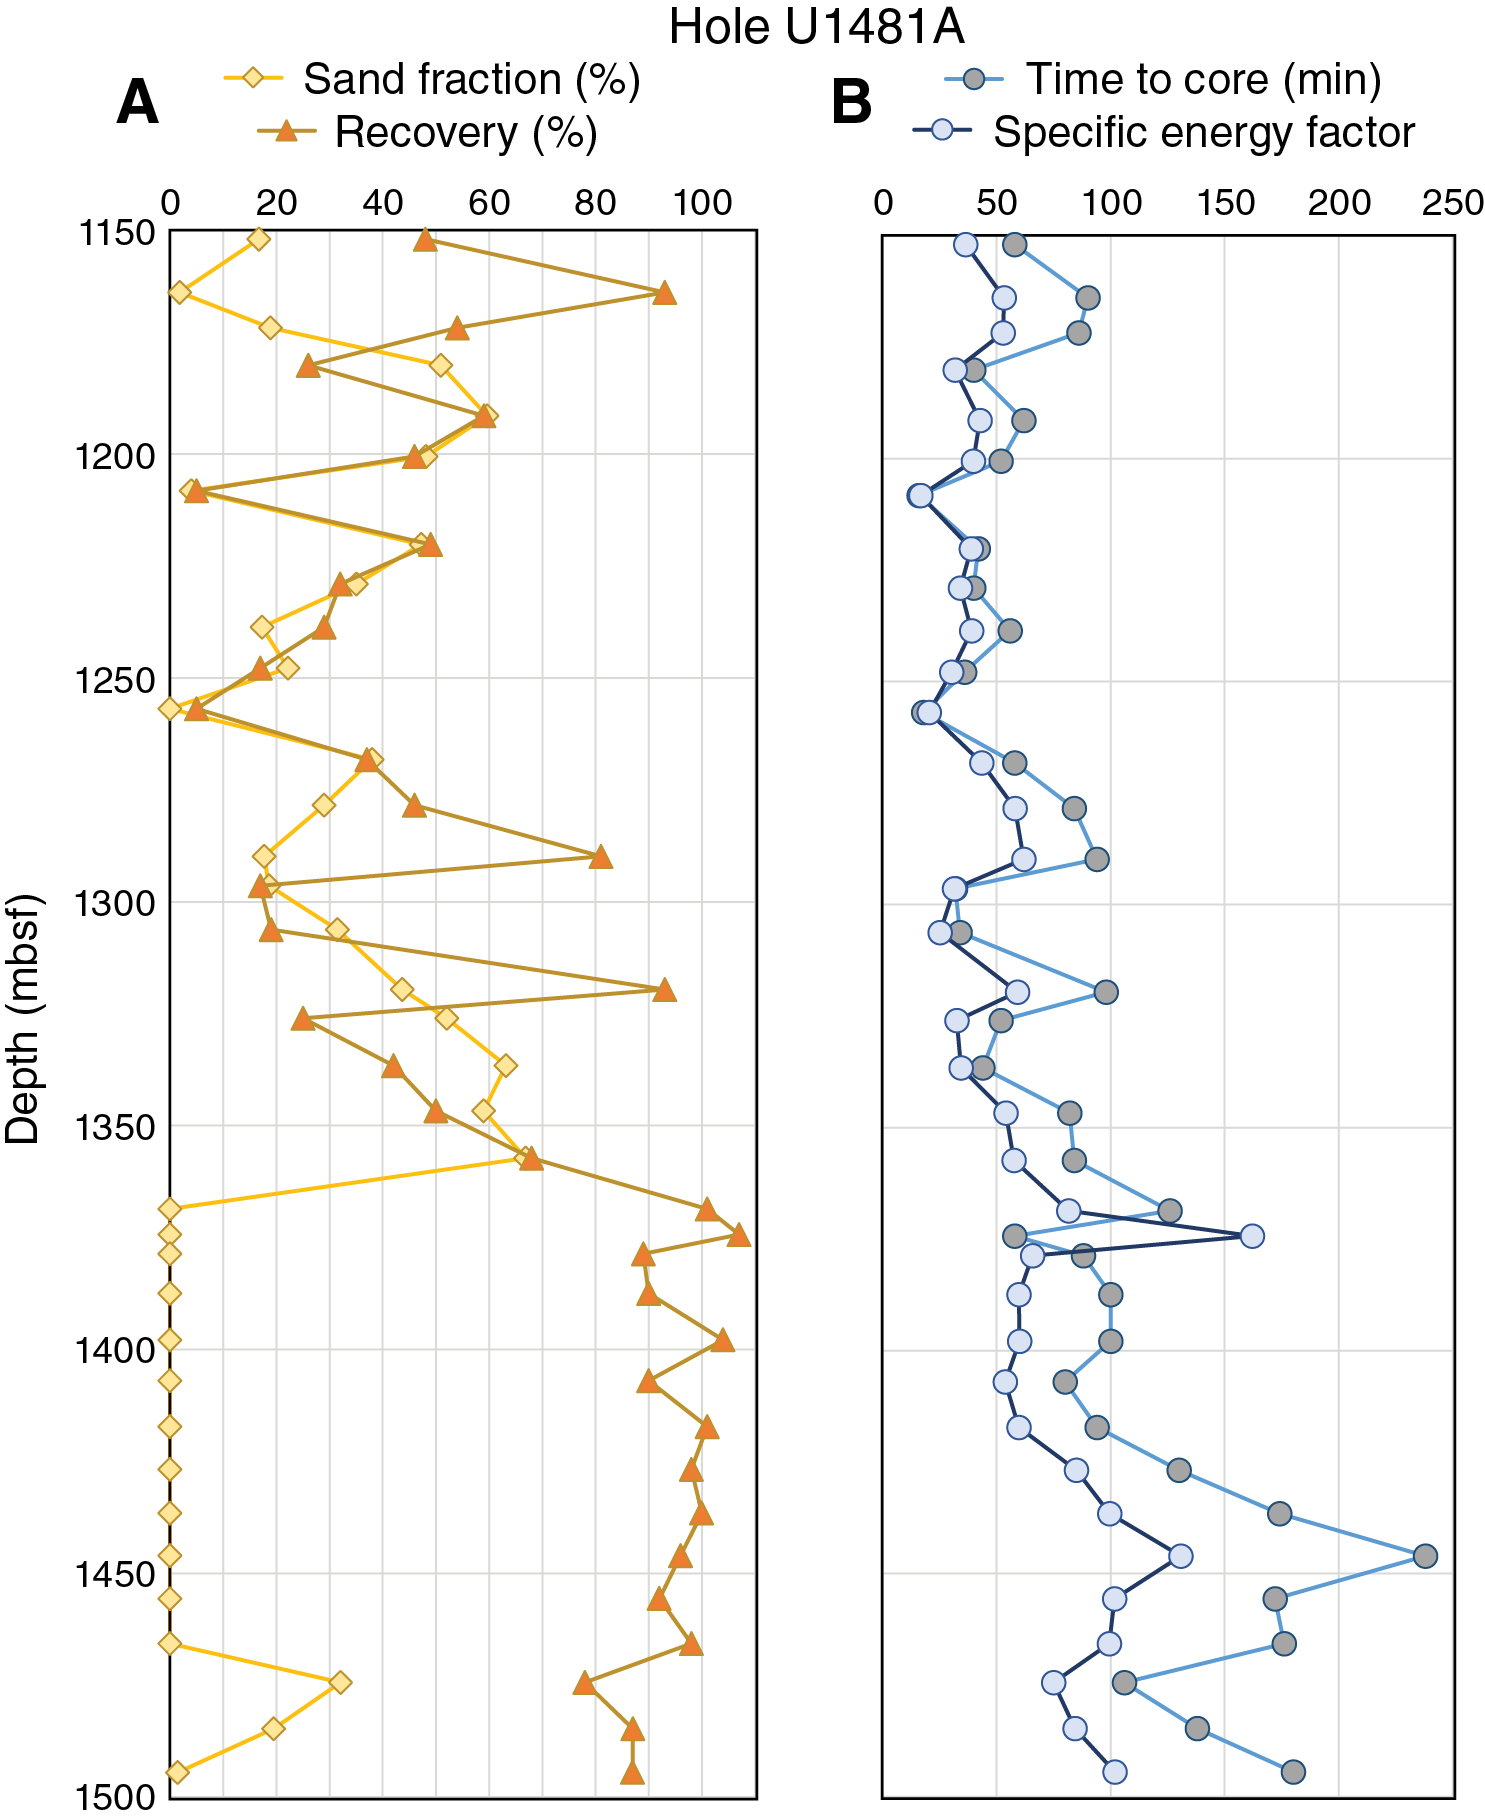
Figure F27. Sand fraction, recovery, SEF, and time to core.
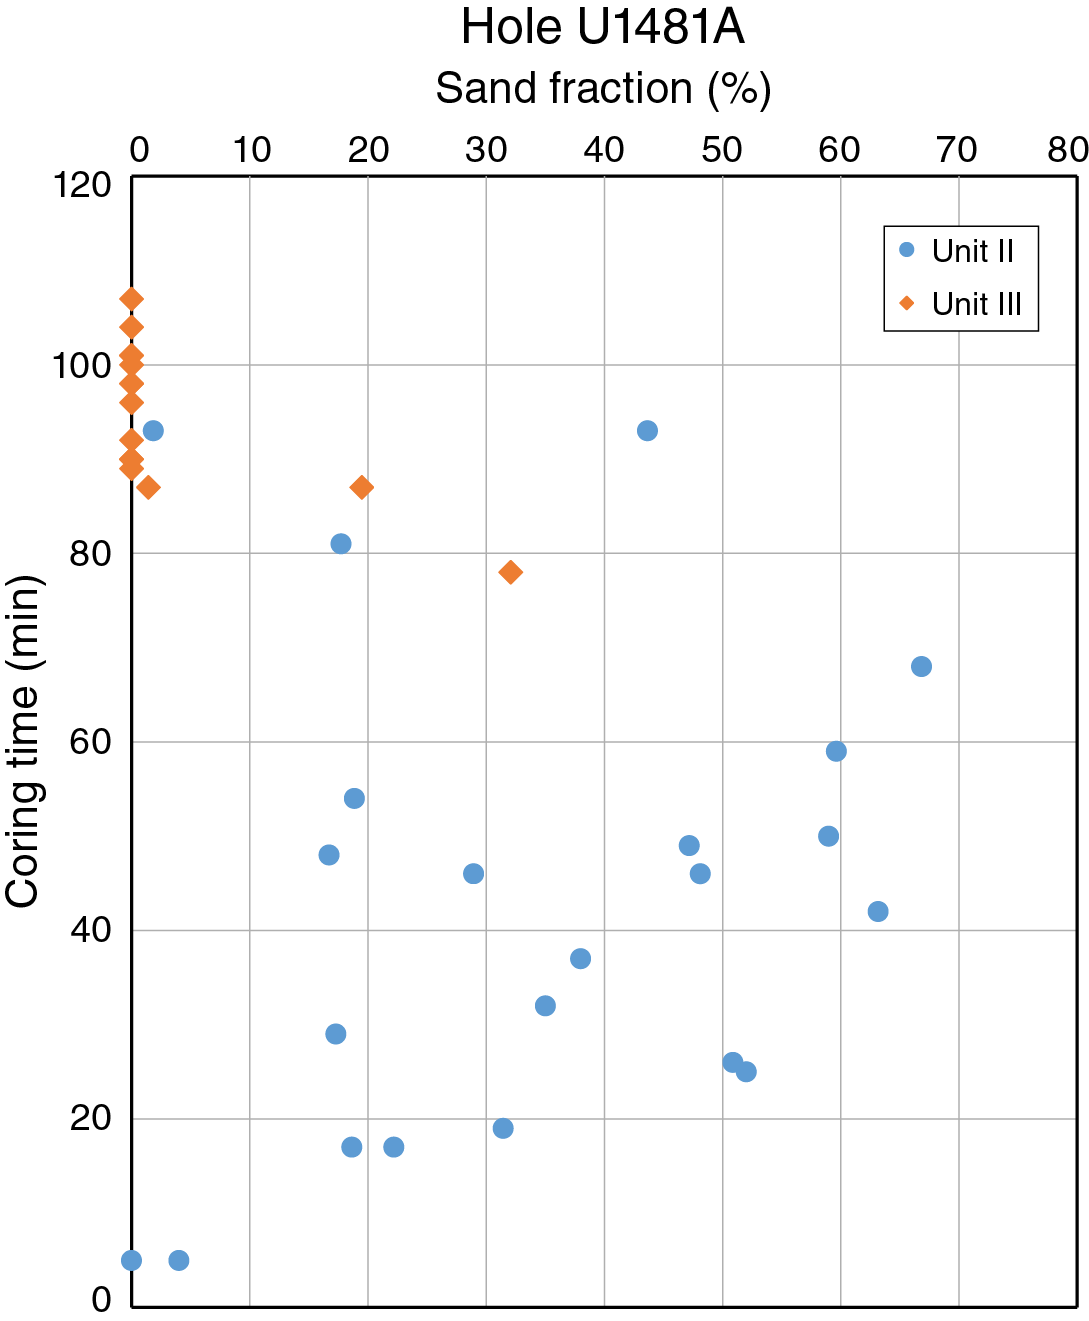
Figure F28. Coring time versus sand fraction.
Core recovery is better correlated with coring time (Figure F29), although there is a wide divergence of coring times at the highest levels of recovery (>80%). The core recovery plot versus SEF yields a similar positive correlation (Figure F30), and it becomes clear that a wide range of SEF at high core recovery arises in Unit III cores.
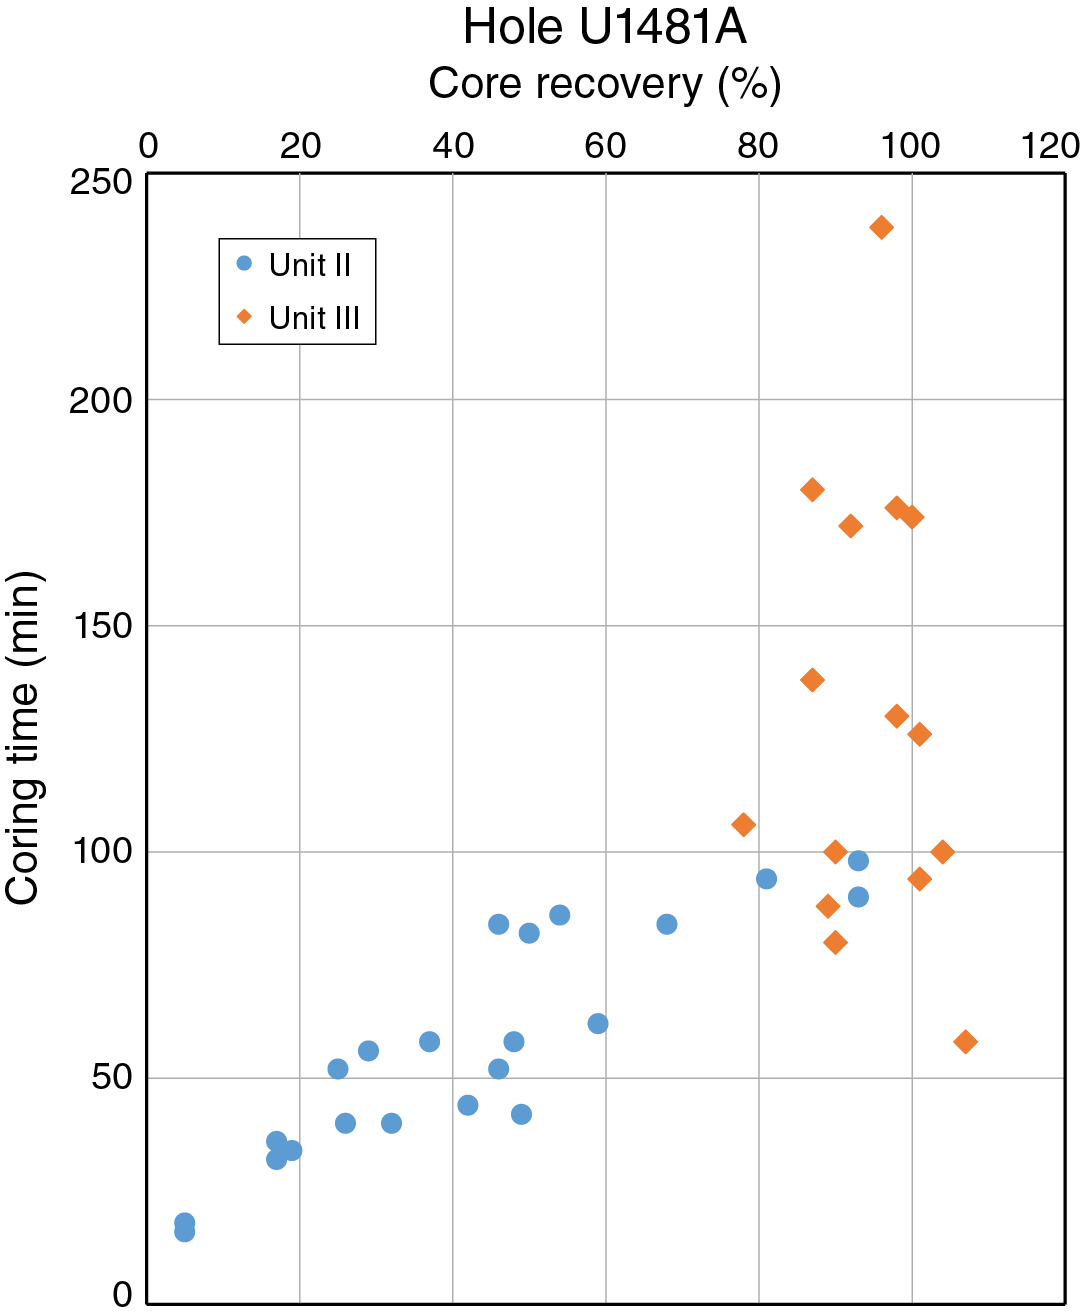
Figure F29. Coring time versus core recovery.

Figure F30. SEF versus core recovery.
The interval from Core 362-U1481A-33R through 35R (1441–1470 mbsf), where faults are abundant, corresponds to high SEF values. The highest SEF value occurs in Core 33R (Figure F27B). In addition, P-wave velocities determined on discrete samples (Figure F41) are higher in Unit III than in Unit II, consistent with the Unit III section becoming stronger. Core 33R also correlates with the zero-crossing above the first positive peak where the seismic reflectivity increases markedly in strength (~6.945 s two-way traveltime [TWT]) for this site (Figure F66). These preliminary correlations show promise for further postcruise evaluation in which correlations with other parameters, such as strength properties, detailed velocity and porosity data, and XRD mineralogy, may be identified.
Strength interpretation
Our strength interpretation at Site U1481 (see Site U1481 VCDs in Core descriptions) is consistently defined as intermediate, and the materials are expected to deform with brittle mechanisms. Local calcite-cemented concretions are interpreted as strong and brittle. One entire core (16R; 1285.9–1295.6 mbsf) is interpreted as strong (mostly siltstone and silty claystone), and this likely reflects overall strengths between intermediate and strong rather than a basic difference in the strength of this particular core. This anomaly likely reflects the subjective quality of this interpretation.
Based on the anomalous abundance of fault structures in Cores 33R through 35R (Figure F19), we identify a strain localization candidate between 1447.10 and 1464.09 mbsf. This interval is below the interval of core elongation (Figure F22) and also below the depth of the caliper log (Figure F23), so at this point we lack any supporting information to suggest that this interval is significant.
Biostratigraphy
A single hole was drilled at Site U1481. Continuous coring began at 1149.7 mbsf (Core 362-U1481A-2R) and ended at 1500.0 mbsf (Section 38R-CC). Planktonic foraminifers mainly occur in the upper 50 m of the recovered sequence. Biosilica is chiefly preserved in two intervals, one interval between 1385 and 1411 mbsf and a second interval between 1495 and 1500 mbsf. Rare calcareous nannofossils occur discontinuously in all three of these intervals.
Calcareous nannofossils
A total of 105 samples were investigated from Hole U1481A with respect to their content of calcareous nannofossils, but 77 of these samples were barren. The remaining 28 samples contained rare and mostly poorly preserved calcareous nannofossils (Table T4).
Table T4. Calcareous nannofossil biostratigraphy. Download table in .csv format.
Sample 2R-CC (1154.36 mbsf) contained a late Miocene assemblage that included Discoaster bellus, Discoaster brouweri, Discoaster pentaradiatus, Discoaster prepentaradiatus, and Coccolithus pelagicus. This sample was attributed to Biozones CNM14–CNM15 based on the presence of the above species and absence of Discoaster berggrenii and Discoaster hamatus. This assemblage of discoasters indicates an age range from 10.4 Ma (base of D. bellus) to 8.2 Ma (base of the D. berggrenii/Discoaster quinqueramus plexus). Sample 14R-CC (1270.03 mbsf) contained a similar assemblage. The lowermost occurrence of D. brouweri (base at 10.74 Ma) was observed in Sample 26R-CC (1382.22 mbsf), and the lowermost occurrence of D. bellus (base at 10.4 Ma) was observed in Sample 27R-CC (1391.79 mbsf). Both observations suggest an early late Miocene age.
All samples between Sample 27R-CC and 37R-CC are barren. Samples 37R-CC (1488.95 mbsf) and 38R-1, 45 cm (1490.65 mbsf), contained rare Discoaster deflandrei, suggesting an age older than 15.7 Ma.
Samples barren of calcareous nannofossils are interpreted to have been deposited below the calcite compensation depth. Samples containing calcareous nannofossils show a dominance of discoasters with little to no secondary overgrowth of calcite, suggesting that these layers were affected by enhanced calcite dissolution.
Planktonic foraminifers
Planktonic foraminifers were examined in 37 core catcher samples from Hole U1481A. The biostratigraphic results of planktonic foraminifers are shown in Table T5.
Table T5. Planktonic foraminifer biostratigraphy. Download table in .csv format.
Between Samples 2R-CC and 22R-CC (1154.36–1349.11 mbsf), planktonic foraminifers occur sporadically and in low abundance. The preservation is generally poor. The interval from Sample 5R-CC through 15R-CC (1181.44–1280.65 mbsf) was assigned to Subzone M13b (6.14–8.58 Ma), primarily based on the concurrent occurrence of Globorotalia lenguaensis (top at 6.14 Ma) and Globorotalia plesiotumida (base at 8.58 Ma). Globorotalia juanai (base at 9.69 Ma), Globigerinoides extremus (base at 8.93 Ma), and Globoquadrina dehiscens (top at 5.92 Ma) also occur in this interval. However, no age-diagnostic foraminifers except for Globigerinoides trilobus (base at 22.96 Ma) were found in the interval from Sample 16R-CC through 22R-CC (1293.73–1349.11 mbsf). Planktonic foraminifers were not found between Samples 23R-CC and 38R-CC (1360.58–1498.70 mbsf).
Diatoms
Several intervals in Hole U1481A contained biostratigraphically useful siliceous, though more often pyritized, early and late Miocene diatom assemblages. For details of all marker species observations see Table T6.
Table T6. Diatom biostratigraphy. Download table in .csv format.
Lithostratigraphic Unit II (see Sedimentology and petrology) was barren of diatoms, with the exception of Sample 362-U1481A-3R-5, 49 cm (1164.90 mbsf), which was unusually organic rich and contained two siliceous specimens of Alveus marina (base at 8.29 Ma). Below the transition into Unit III, pyritized centric diatom fragments were sporadically observed in Samples 24R-5, 85 cm, through 31R-CC (1370.04–1431.53 mbsf). Relatively diverse though poorly preserved and pyritized diatom assemblages were also present in several samples from 28R-1, 78 cm, through 29R-CC (1393.58–1411.38 mbsf). Notable observations included Actinocyclus ellipticus f. lanceolata (base at 10.62 Ma), Coscinodiscus temperei var. delicata (base at 12.01 Ma), and Rossiella praepaleacea (base at 11.96 Ma), limiting the age of the upper portion of Unit III to the late Miocene. Other species identified in samples from Cores 28R and 29R include Asterolampra grevillei, Actinocyclus ellipticus, and Stephanogonia hanzawae, as well as the asperoid-oriented silicoflagellate Dictyocha brevispina.
Below this interval, Cores 32R through 37R (1434.12–1488.93 mbsf) were barren of diatoms. However, more pyritized diatoms were observed in Core 38R. Sample 38R-5, 120 cm (1496.51 mbsf), contained the most diverse flora, which markedly differs from the pyritized assemblages above. Although poor preservation mostly prevented identification to species level, several taxa of the neritic genera Raphoneis, Meloneis, Diploneis, and Sceptroneis were observed within silt pods in this sample. In addition, relatively abundant Thalassionema and Thalassiothrix spp. were present, indicating a high-productivity environment. The more biostratigraphically useful Azpeitia praenodulifera (base at 21.85 Ma) and Triceratium pileus were also observed in Sample 38R-5, 120 cm (1496.51 mbsf), constraining the basal age in Hole U1481A to between the top and base of this species (17.82–18.92 Ma), within the early Miocene Triceratium pileus Biozone.
Radiolarians
Preliminary radiolarian biostratigraphic constraints at Site U1481 were provided from core catcher and additional samples. For details of all marker species observations see Table T7. Good preservation was due to abundant pyritization of radiolarians, diatoms, and silicoflagellates (Figure F31). Early to late Miocene (Figure F31J) pyritized radiolarians, which contain numerous pyrite framboids, were found in association with gray-green mud in Samples 24R-5, 84–86 cm, through 38R-5, 120–121 cm (1370.05–1496.52 mbsf). Radiolarians were rarely preserved with their original amorphous silica. However, because of the nontransparency of pyrite, picking and observation with the scanning electron microscope was required for species identification.
Table T7. Radiolarian biostratigraphy. Download table in .csv format.

Figure F31. Composite plate of Quaternary radiolarians.
Sample 28R-6, 6–8 cm (1398.92 mbsf) contained few well-preserved silica specimens of Diartus hughesi (8.39–9.73 Ma), which contributed to constraining the change in sediment rates from 203 to 10 m/My. Radiolarians provided no biostratigraphic information between Samples 29R-CC and 38R-5, 120–121 cm (1411.40–1496.52 mbsf), where they were virtually absent, with only rare and broken pyritized specimens. A diverse radiolarian fauna was observed in Sample 38R-5, 32–34 cm (1495.64 mbsf), including the marker species Calocycletta virginis, Dorcadospyris simplex, and Didymocyrtis violina.
Ichthyoliths, microscopic fish skeletal debris, were observed throughout Hole U1481A. Figure F31X shows details of dissolution striations in the area between the outline and inline when observed in transmitted light. The triangular morphologic characters, with prominent angular flexures, are common at this site.
Sedimentation rates
Linear sedimentation rates (LSRs) at Site U1481 were established using biostratigraphic and biochronologic information. These biostratigraphic constraints are distributed in three depth clusters: (1) between 1154 and 1208 mbsf, (2) between 1370 and 1411 mbsf, and (3) between 1491 and 1497 mbsf (Figure F32). The LSR between cluster 1 and 2 is 218 m/My, decreasing to 10 m/My between clusters 2 and 3 (Table T8). In total, 35 biohorizons are used.

Figure F32. Linear sedimentation rates based on biostratigraphic data.
Table T8. Tie points and linear sedimentation rates. Download table in .csv format.
It is likely that LSRs are more variable than shown in Figure F32 considering that only three tie points are used, one in each of the three biostratigraphic cluster intervals. The suggested LSRs, however, are considered to reflect the accumulation history of sediments at Site U1481 and significant changes in sedimentation rate. A single biohorizon is off the suggested LSR lines, namely the base of planktonic foraminifer G. plesiotumida at 1280.65 mbsf; the reason for this remains unclear.
Rather than establishing a rate change over the 13.6 m interval immediately below 1385.32 mbsf (dashed line in Figure F32), we chose to extrapolate the rate from above, downhole to the depth of radiolarian D. hughesi at 1398.92 mbsf, where the major rate change is placed. Using the age midpoint (9.26 Ma; 1385.32 mbsf) of radiolarian D. antepenultima as reference, the major rate change was determined to have occurred at 9.3 Ma.
Comparing the proposed LSRs in Holes U1481A and U1480G shows virtually identical rates in lithostratigraphic Unit II (Hole U1481A) and Subunit IIC (Hole U1480G) (Figure F33; see Biostratigraphy in the Site U1480 chapter [McNeill et al., 2017d]). A 14.5× downhole decrease in LSR occurred in Hole U1480G at 9.3 Ma (D. antepenultima; 1255 mbsf), followed by a further 7.5× decrease in LSR at 1369 mbsf (diatom age midpoint between the top of A. moroensis and base of A. ellipticus f. lanceolata at 10.2 Ma). In Hole U1481A, a 21.8× downhole decrease in LSR occurred at 9.3 Ma (1399 mbsf; depth of D. hughesi). The timing of the decrease in LSRs between the two sites is practically identical and is well constrained. The difference in depths of this rate change event between the two holes is caused by the presence of a thicker sediment sequence in Hole U1481A relative to Hole U1480G.
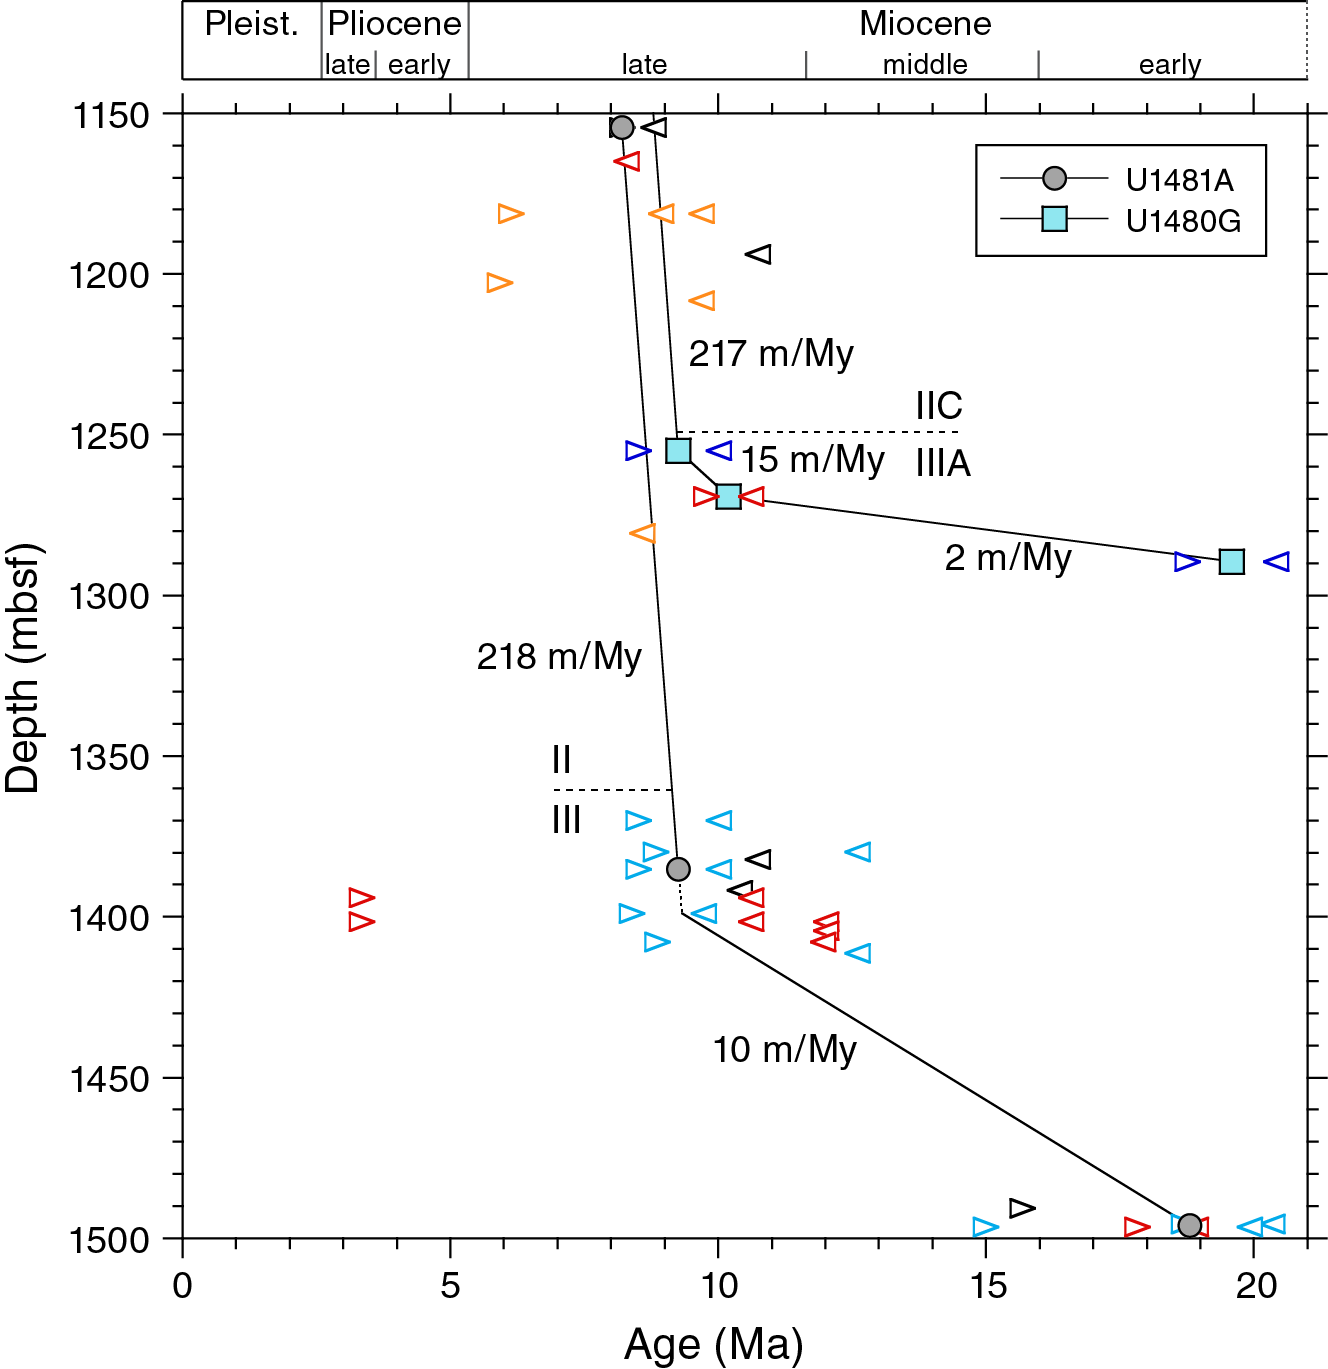
Figure F33. Comparison of linear sedimentation rates based on biostratigraphic data.
Paleomagnetism
Shipboard paleomagnetic studies at Site U1481 consisted of measurements of archive-half sections and progressive demagnetization of 18 representative discrete samples taken from the working-half sections. Pass-through magnetometer measurements on the archive-half sections were made at 2.5 cm intervals after stepwise alternating field (AF) demagnetization up to 25 mT. Discrete samples were AF demagnetized with an ASC Scientific D-2000 AF demagnetizer using steps of 5, 10, 15, 20, 25, 30, 40, 60, 80, 100, 120, 140, 160, and 180 mT. We analyzed the paleomagnetic results with Zijderveld diagrams (Zijderveld, 1967) and calculated the characteristic remanent magnetization (ChRM) direction using principal component analysis (PCA; Kirschvink, 1980). In Hole U1481A, Cores 2R through 38R were retrieved from 1150 to 1500 mbsf with the RCB coring system using nonmagnetic core barrels. Because RCB cores are not oriented, no corrected declinations are available to construct a magnetostratigraphy for Hole U1481A.
Natural remanent magnetization
Downhole variations of paleomagnetic data obtained from Hole U1481A are shown in Figure F34. The large decrease in intensity between the NRM (0 mT; red circles) and 20 mT steps (green circles) reveals the existence of pervasive drilling-induced remagnetization (DIRM). Variations of magnetic properties between different lithologies are similar to those observed at Site U1480. Overall, sediment in lithostratigraphic Unit II (1149.70–1360.12 mbsf) has relatively high NRM intensity values (averaging ~21 mA/m) compared to those of the gray-green and minor reddish brown claystone in Unit III (1360.12–1500 mbsf), with an average NRM intensity value of ~5 mA/m. In the lower part of Unit III (~1400–1500 mbsf), NRM shows a stepwise increase from ~2.5 mA/m at 1400 mbsf to ~5.0 mA/m at the bottom of the hole (1500 mbsf), potentially reflecting a change in the depositional environment associated with the reddish brown silty claystone and fine- to very fine grained sandstone at these depth intervals (see Sedimentology and petrology).
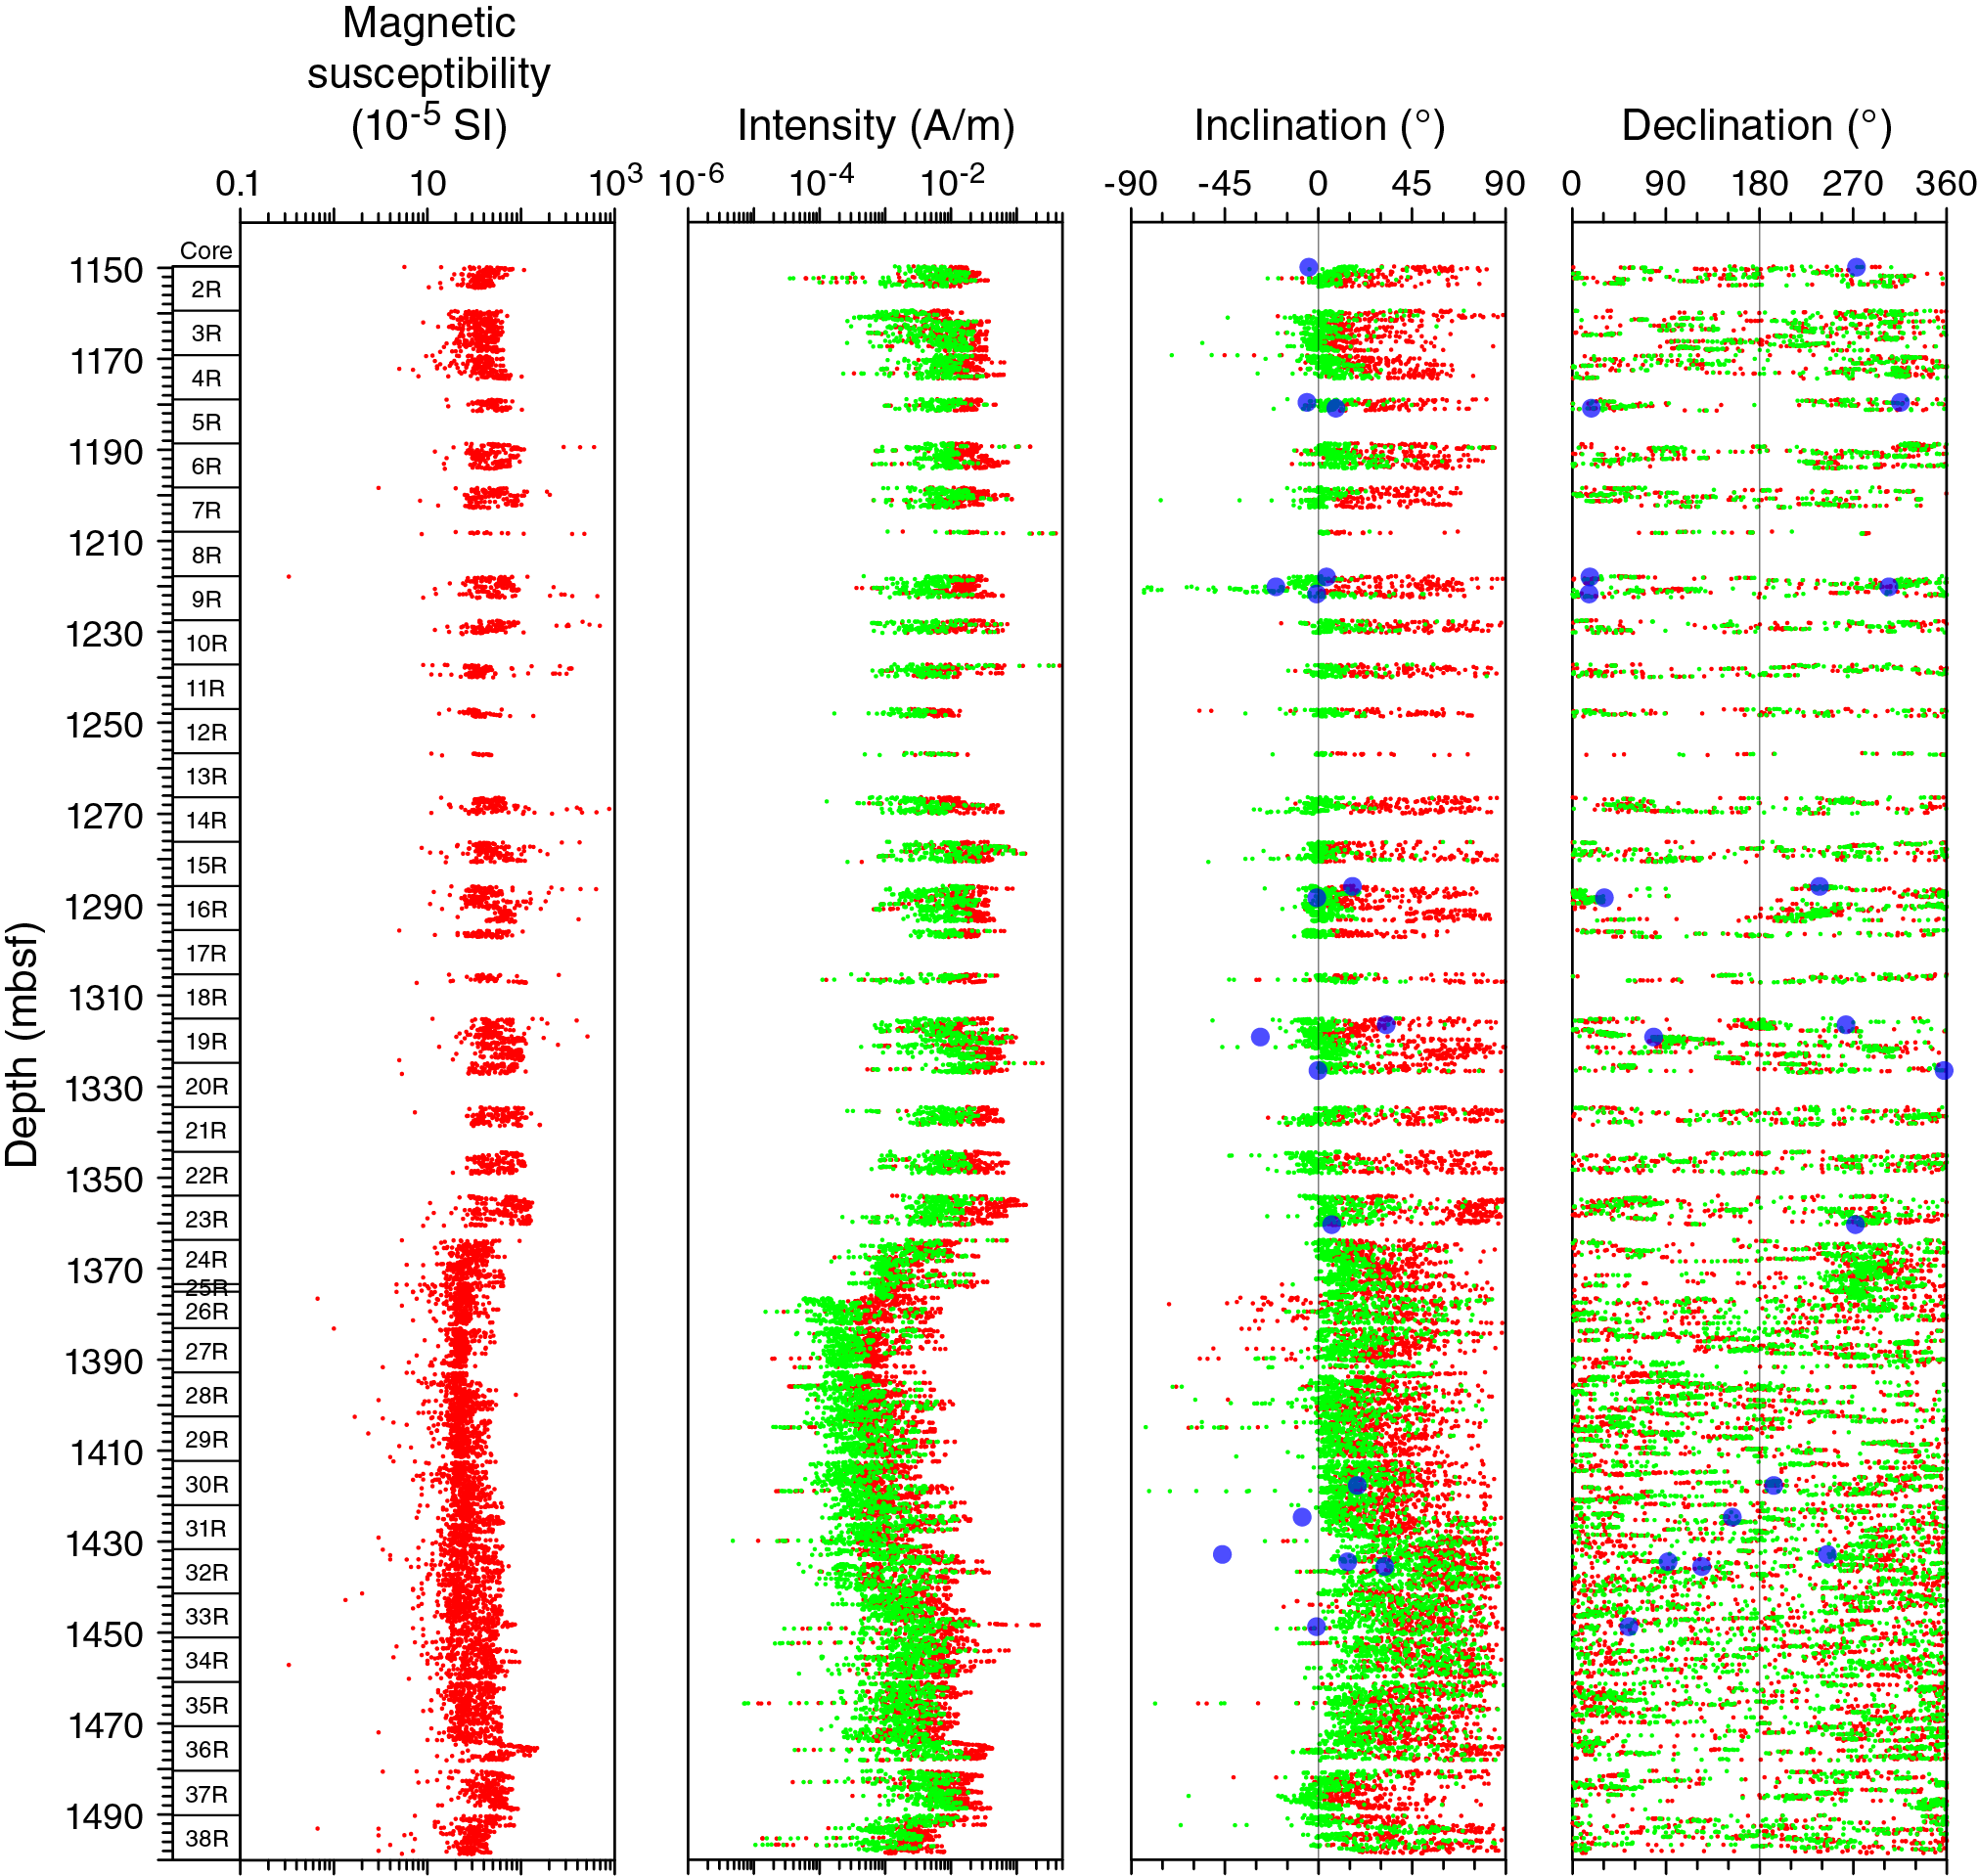
Figure F34. Magnetic susceptibility, NRM intensity, inclination, and declination.
Magnetic susceptibility and NRM intensity variations through the recovered intervals are closely correlated (Figure F34). Like the NRM record, magnetic susceptibility values are generally ~50 × 10–5 SI for the gray-green clay/claystone in Unit II (see Physical properties) but significantly lower (~30 × 10–5 SI) for the fine sandstones in Unit III. Interestingly, the stable inclinations also increase from near zero in Unit II to much steeper values deeper than ~1430 mbsf.
Paleomagnetic demagnetization results
Remanent magnetization of discrete samples was investigated using stepwise AF demagnetization techniques in order to isolate the primary component of magnetization acquired at the time of deposition. Because of time constraints and because AF demagnetization appears to be more effective in removing the DIRM, as seen at Site U1480, AF demagnetization was preferred over the thermal technique for sediments and rocks in Hole U1481A. A histogram of inclinations isolated from the 18 discrete samples is shown in Figure F35. Inclinations from these discrete samples are mostly concentrated at –15° ± 15°, suggesting that these samples maintain an inclination close to the theoretically predicted value for the latitude of this site in the middle to late Miocene (approximately –5°, following the latest state-of-the art plate reconstructions; van Hinsbergen et al., 2015). Steeper inclinations (>30°) are present throughout the lower part of Unit III (>1430 mbsf; Figure F34). Closer examination of core materials reveals that these higher values are associated with drilling disturbances (abundant biscuits) within the recovered clay sections. Figure F36 illustrates the magnetic stability behavior of several representative discrete samples from the two lithostratigraphic units. Figure F36A–F36C shows examples of reliable results. The behavior demonstrates the removal of a nearly vertical downward DIRM after AF demagnetization at 5 mT and the isolation of a stable component of magnetization that univectorially decays toward the origin of the vector plots (Zijderveld, 1967). We also noted that several samples from lithostratigraphic Unit III display higher remanent magnetization stability (Figure F36F), indicating the presence of a higher coercivity component that cannot be completely removed by AF demagnetization as high as 180 mT. Two samples (Figure F36D, F36E) displayed erratic or incoherent demagnetization behavior at higher applied AF fields with data points that could not be fit to a line using PCA (Kirschvink, 1980). The most likely cause of this erratic behavior is drilling-related deformation and weaker NRM intensity.
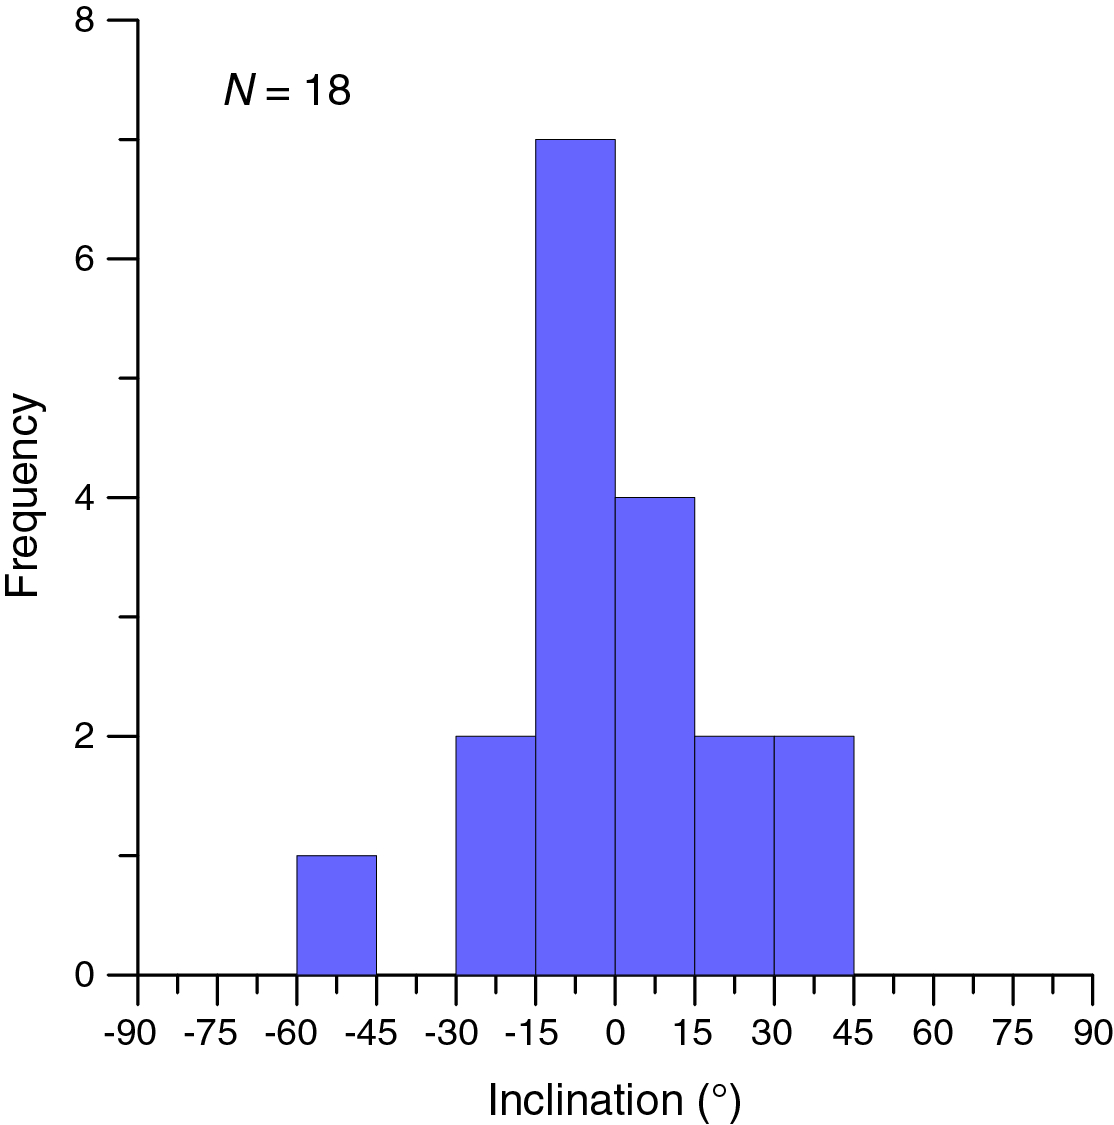
Figure F35. Histogram of inclinations determined from discrete samples.

Figure F36. Representative vector end-point diagrams of magnetization directions.
Polarity sequence and magnetostratigraphy
Similar to the magnetic records at Site U1480, demagnetization of coherent core sections (e.g., Sections 362-U1481A-5R-1, 5R-2, 16R-5, 19R-2, 19R-3, 20R-1, 22R-1, and 22R-3) sometimes also showed antipodal relative declinations within the same interval of core section. After AF demagnetization at 20 mT, the reversal indicated by the difference in inclination polarity is confirmed in these intervals by the near 180° change in declination. This positive “antipodal test” is perhaps a compelling argument for isolating the primary ChRM, although this test is not sufficient by itself. As shown in Figure F34, stable declinations and inclinations identified from discrete samples and corresponding archive sections of Core 19R (1315.9–1320.1 mbsf) are close to antiparallel, indicating the ChRM directions of these samples are likely representative of the polarity changes of the geomagnetic field. On the basis of shipboard biostratigraphic data, the sediment in Hole U1481A was deposited between 19.2 and 9 Ma (early to late Miocene), which can be used to determine whether the observed magnetic polarity zones can be correlated with magnetic chrons in the geomagnetic polarity time scale.
In summary, preliminary shipboard paleomagnetic data have revealed important magnetic signatures that await further verification in terms of age and origin. Further integrated work with biostratigraphic data is required to constrain the timing and origin of the magnetization recorded by Hole U1481A sediments and rocks.
Geochemistry
Inorganic geochemistry
The main objective of the inorganic geochemistry program at Site U1481 is to document variations in chemical composition of interstitial water in the deeper sedimentary section at this site for comparison with deep sediment from Site U1480. Geochemical data can inform how fluid–rock interactions between these two sites may vary and relate to variations in stratigraphy, lithology, and physical properties, which in turn affect the geomechanical properties of the formation before and during subduction. Because of time limitations, the sediment section was washed down to 1149.7 m (see Operations). From this depth to the bottom of Hole U1481A (1500 mbsf), we collected a total of 28 whole-round samples (20–25 cm in length) for interstitial water analyses. Samples were collected on the catwalk at a frequency of 1 or 2 samples per core from Cores 362-U1481A-2R through 38R.
All samples were thoroughly cleaned for drill fluid contamination. The cleaned samples were placed in Ti squeezers and squeezed at maximum pressures of 24.5 MPa (gauge forces of up to 35,000 lb). The volume of interstitial water recovered varied with lithology and depth and ranged from 0 to 16 mL. Specific aliquots were used for shipboard analyses, and the remaining fluid was subsampled for shore-based analyses.
Major and minor element concentrations are listed in Tables T9 and T10. Because sulfate concentration of deep fluids may be impacted by diffusional communication with a basement aquifer (see Geochemistry in the Site U1480 chapter [McNeill et al., 2017d]), concentration data are not corrected for any potential drill fluid contamination. Figures F37 and F38 illustrate downhole concentration profiles for Hole U1481A and their comparison to concentrations at equivalent lithostratigraphic units at Site U1480 (see Sedimentology and petrology; also see Sedimentology and petrology in the Site U1480 chapter [McNeill et al., 2017d]). Samples with insufficient fluid yield are indicated by data gaps in the figures.
Table T9. Organic metabolites and major element concentration in interstitial water. Download table in .csv format.
Table T10. Minor element concentrations in interstitial water. Download table in .csv format.
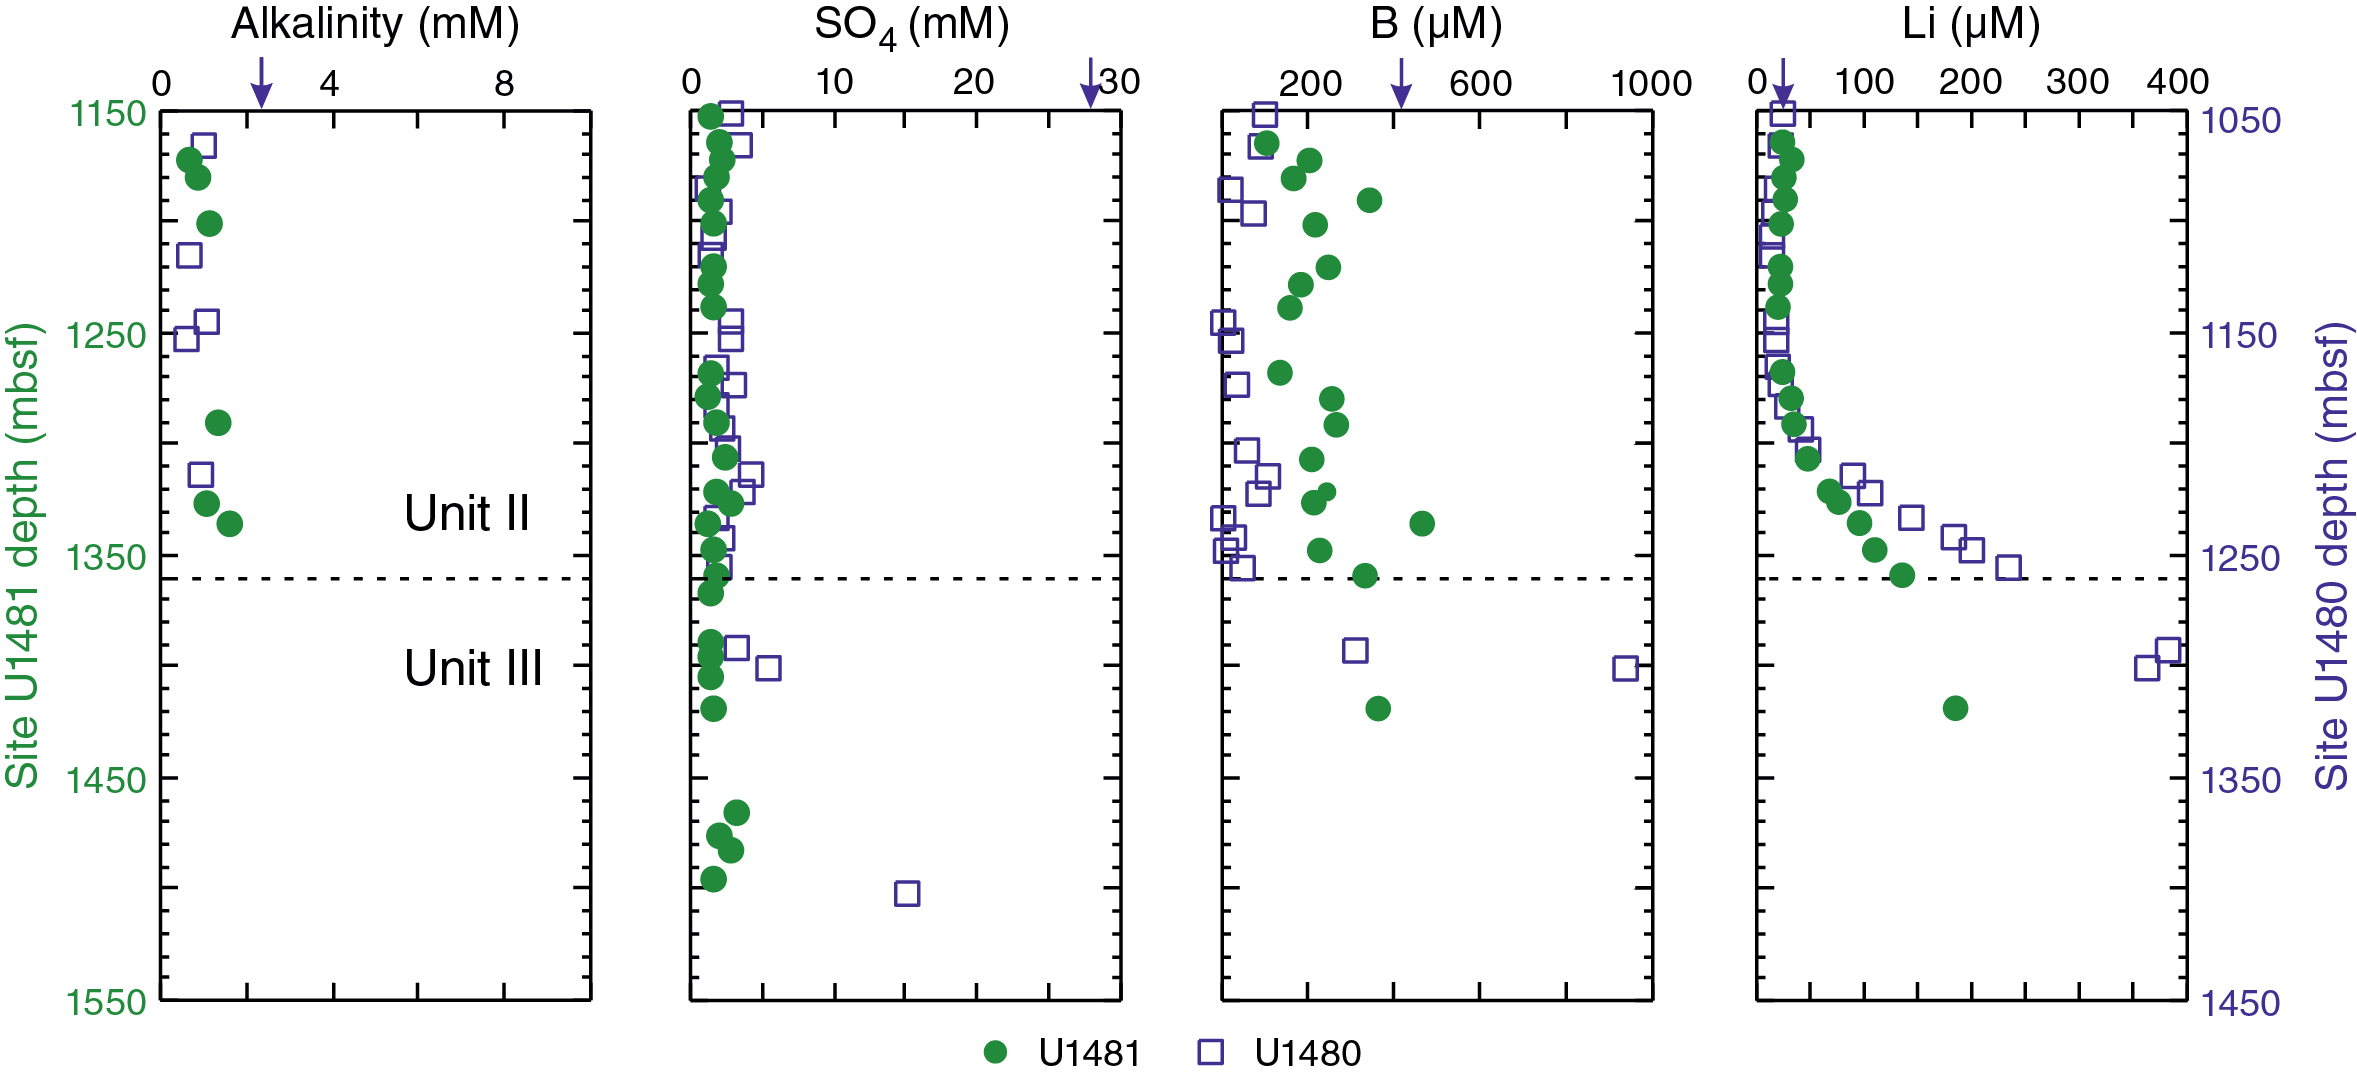
Figure F37. Alkalinity, sulfate, boron, and lithium profiles.
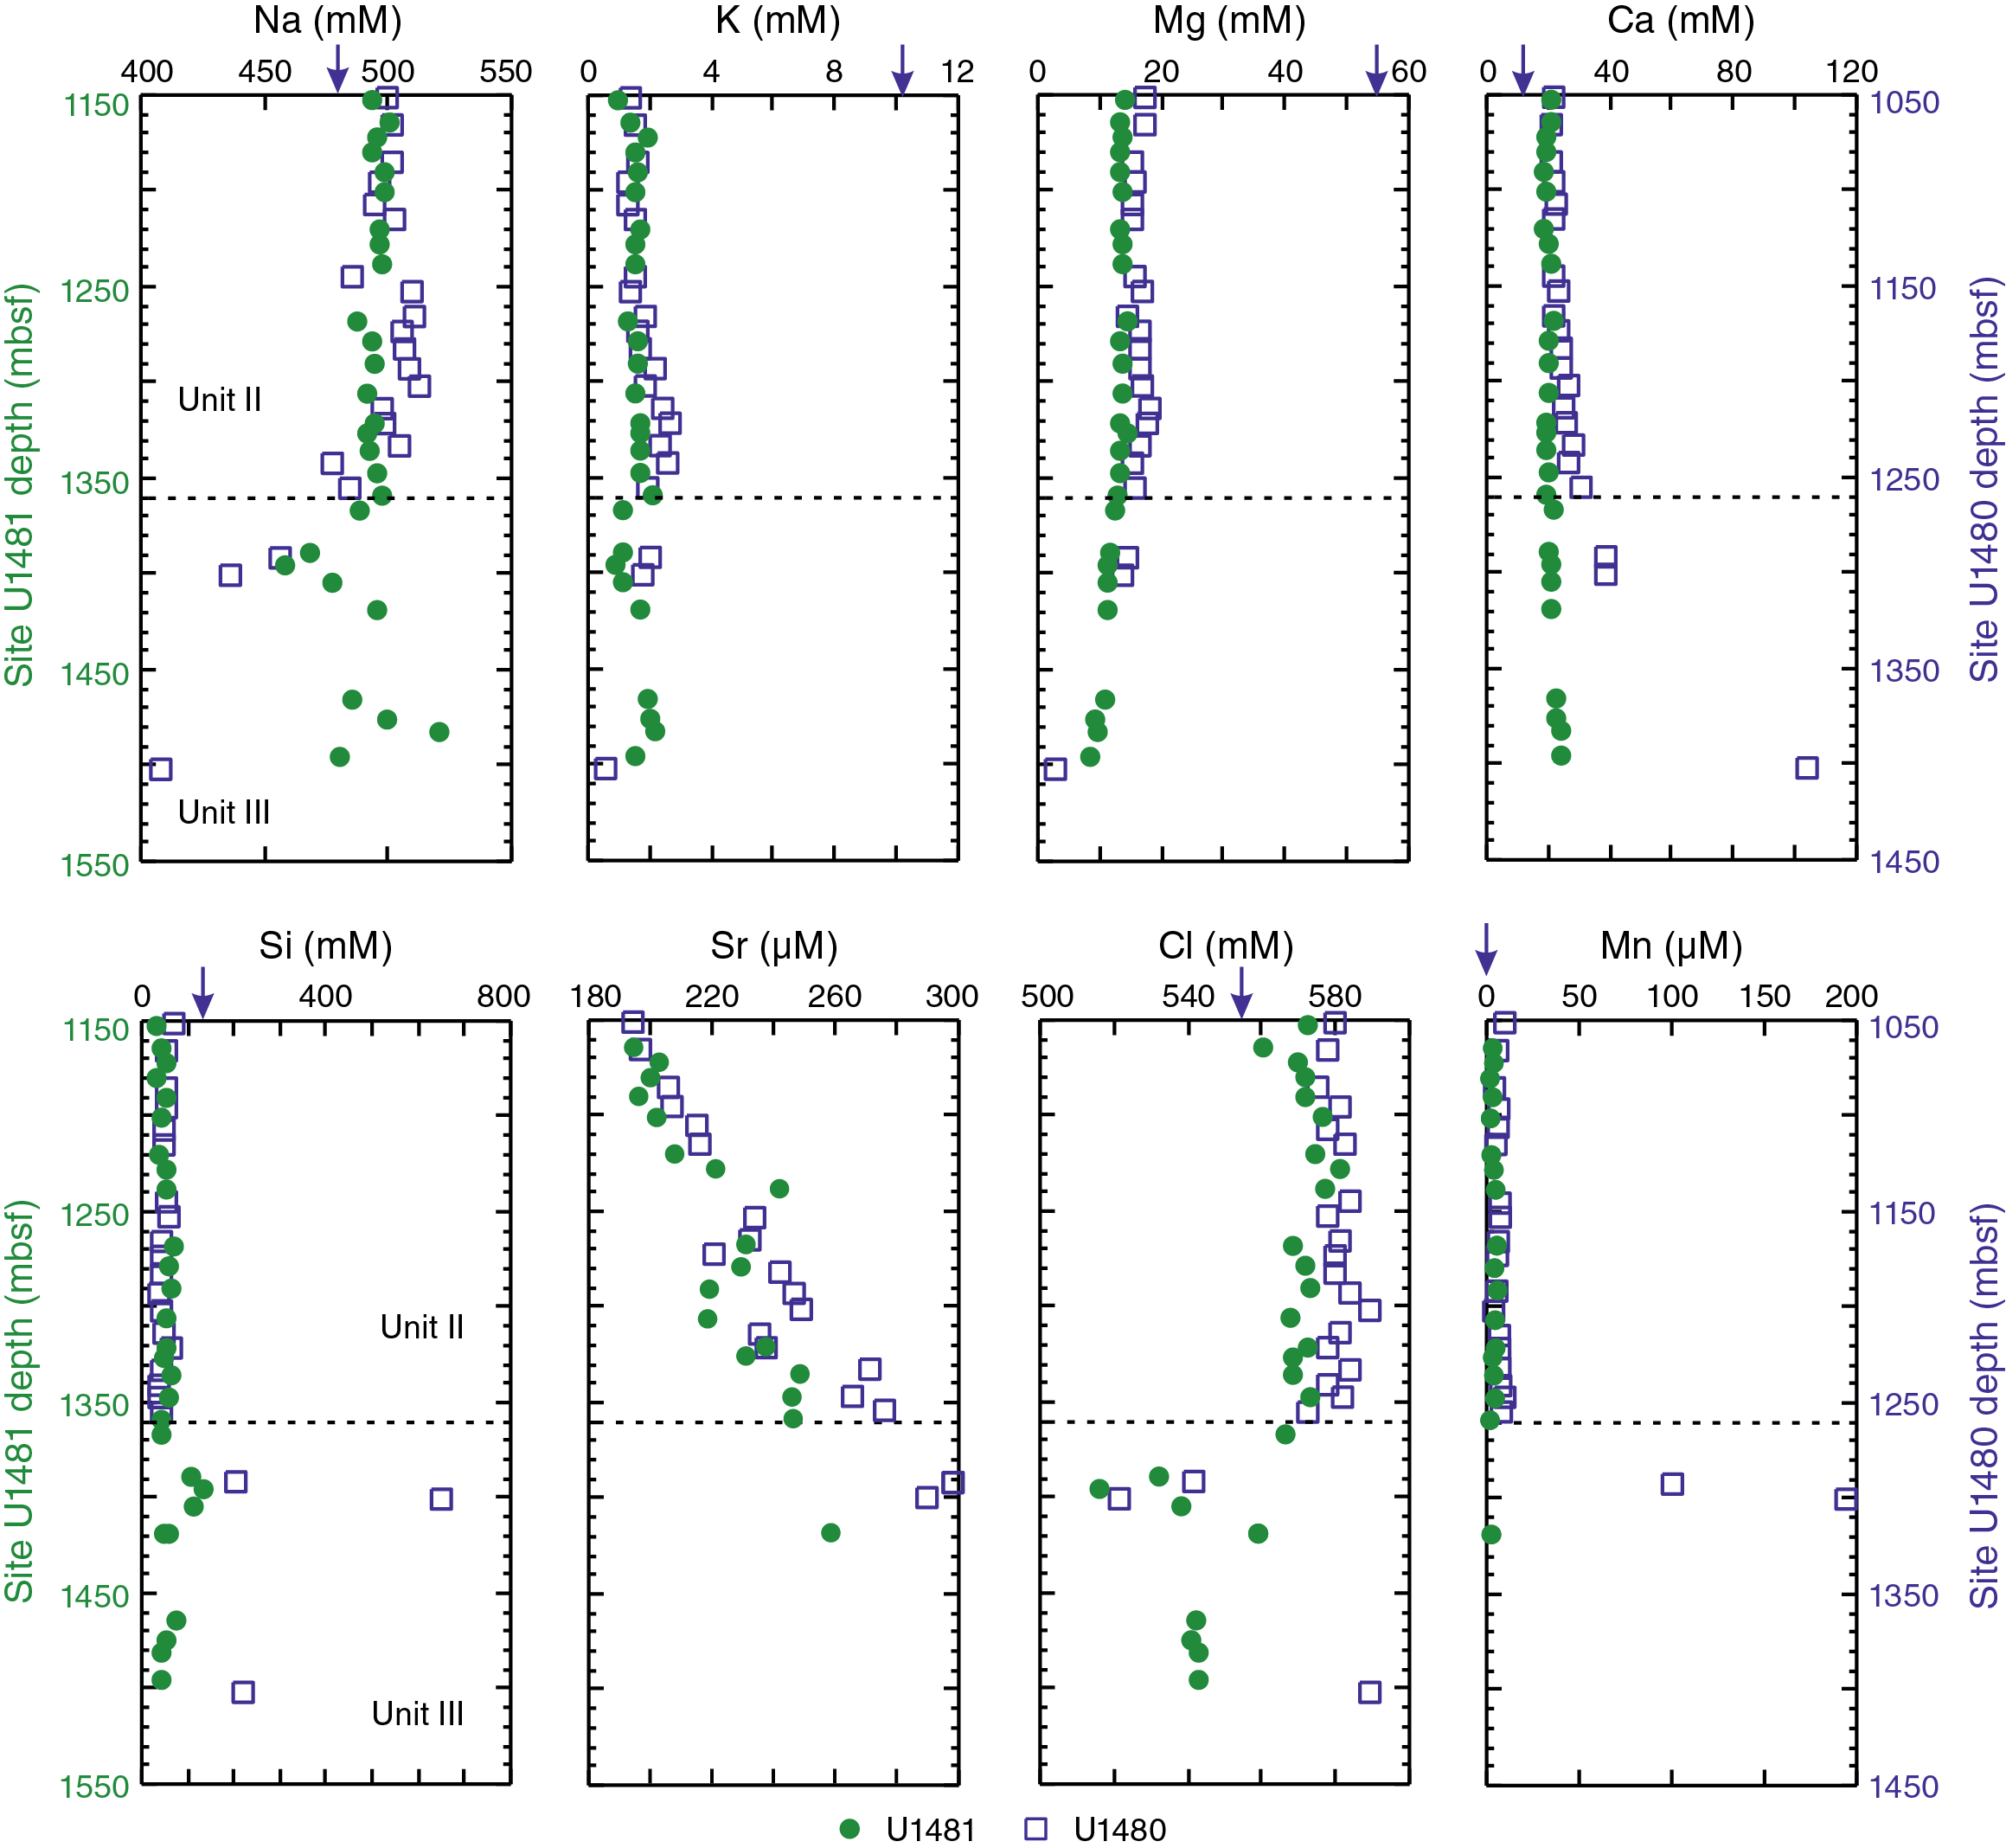
Figure F38. Sodium, potassium, magnesium, calcium, silica, strontium, chloride, and manganese profiles.
Reactions in deep sediment sections
Alkalinity in all measured samples is significantly lower than the value for seawater and ranges from 0.6 to 1.6 mM (Figure F37). There was insufficient fluid recovered in samples deeper than 1340 mbsf for alkalinity analyses. The low alkalinity values measured at Site U1481 are similar to those measured at Site U1480 (see Geochemistry in the Site U1480 chapter [McNeill et al., 2017d]), and at both sites these low alkalinity values are attributed to carbonate cementation.
At Site U1481, chloride values are constant at ~575 mM from 1153 to 1347 mbsf and decrease from 573 mM at 1347 mbsf to 516 mM at 1395 mbsf (Figure F38). This low-chloride zone is very similar to that observed in Hole U1480G both in terms of magnitude and equivalent stratigraphic position, corresponding to the top of lithostratigraphic Unit III. As noted for Site U1480 (see Geochemistry in the Site U1480 chapter [McNeill et al., 2017d]), this depth level can be correlated to the high-amplitude negative polarity (HANP; Dean et al., 2010) horizon closer to the subduction zone (see Horizon C in Core-log-seismic integration). Analysis of the implications of this freshening anomaly for diagenetic dehydration reactions and their influence on development of the plate boundary décollement and its properties are discussed in Hüpers et al. (2017). Water release that causes the freshening may be due to dehydration of opal and/or hydrated volcanoclastic silicates (Kastner al., 2014). At Site U1481, the freshening is accompanied by a subtle increase in Si from 44 to 136 µM and in Li from ~30 to 184 µM, which is much less than the increase observed at Site U1480 (Figures F37, F38). In contrast to observations at Site U1480, there is no increase in B or Mn where freshening is observed (1347–1395 mbsf at Site U1481) (Figure F38). These data may indicate a larger contribution of opal dehydration at Site U1481 and/or may reflect that alteration of volcaniclastics at Site U1481 has proceeded further to form more stable minerals than at the equivalent section in Site U1480, as formation of smectite consumes Si, B, and Mn. Postcruise isotopic analyses may provide additional information as to the significance of each of these reactions.
The highest Li concentration measured at Site U1481 is 256 µM at 1389 mbsf (Figure F37); such a high value requires temperatures above 100°C (e.g. Wei, 2007; Hüpers and Kopf, 2012), which are higher than the estimated current temperature of 61°C at 1389 mbsf based on temperature data for Site U1480 (see Downhole measurements in the Site U1480 chapter [McNeill et al., 2017d]).
Without penetrating basement, we do not have a clear indication of the effect that diffusion of ions from (into) the basement aquifer may have on the deepest sediment at this site. The high Li concentrations at the bottom of Site U1481 may be caused by communication with a basement aquifer that has undergone high-temperature reactions. However, relative to Site U1480, calcium does not markedly increase and magnesium is depleted to a lesser degree at Site U1481 (Figure F38). The deepest sample from Hole U1480G (362-U1480G-70R-1, 31–39 cm; 1402 mbsf) has a sulfate concentration of ~15 mM, which points to the presence of a sulfate-bearing basement aquifer (see Geochemistry in the Site U1480 chapter [McNeill et al., 2017d]). In contrast, sulfate concentrations at Site U1481 show relatively constant values that range from 1.2 to 3.3 mM. Consistent with the calcium and magnesium data, the sulfate profile shows that the deepest sample collected at Site U1481 is not affected by communication with a sulfate-bearing basement aquifer. Because Sites U1480 and U1481 are only separated by 35 km (see the Expedition 362 summary chapter [McNeill et al., 2017c]), it is likely that the fluids within the oceanic crust at both sites have similar compositions. Therefore interstitial water geochemical differences observed in the deepest sediment cored at these two sites may reflect one of the following: (1) oceanic basement at Site U1481 may be significantly deeper than the bottom of the drilled section or (2) lithification of deep sequences or sill intrusions above oceanic basement may act as a diffusional barrier separating the basement aquifer from the sampled deep sediment at Site U1481.
Organic geochemistry
Hydrocarbon sampling
At Site U1481, 37 headspace samples were analyzed by gas chromatography (see Geochemistry in the Expedition 362 methods chapter [McNeill et al., 2017b]) to monitor for the presence of C1–C3 hydrocarbons as part of the standard safety protocol (Pimmel and Claypool, 2001). Methane concentrations in headspace samples range from 144 to 4500 ppmv and show four peaks centered at 1201, 1279, 1348, and 1396 mbsf, below which concentrations remain around 200 ppmv to 1500 mbsf (Table T11; Figure F39). The methane peak at 1348 mbsf lies just above the boundary between lithostratigraphic Units II and III, and the decrease in methane concentration beginning at 1430 mbsf may result from a slight decrease in average organic C content beginning at 1436 mbsf (see Bulk sediment analysis).
Table T11. C1–C3 hydrocarbons in headspace samples. Download table in .csv format.
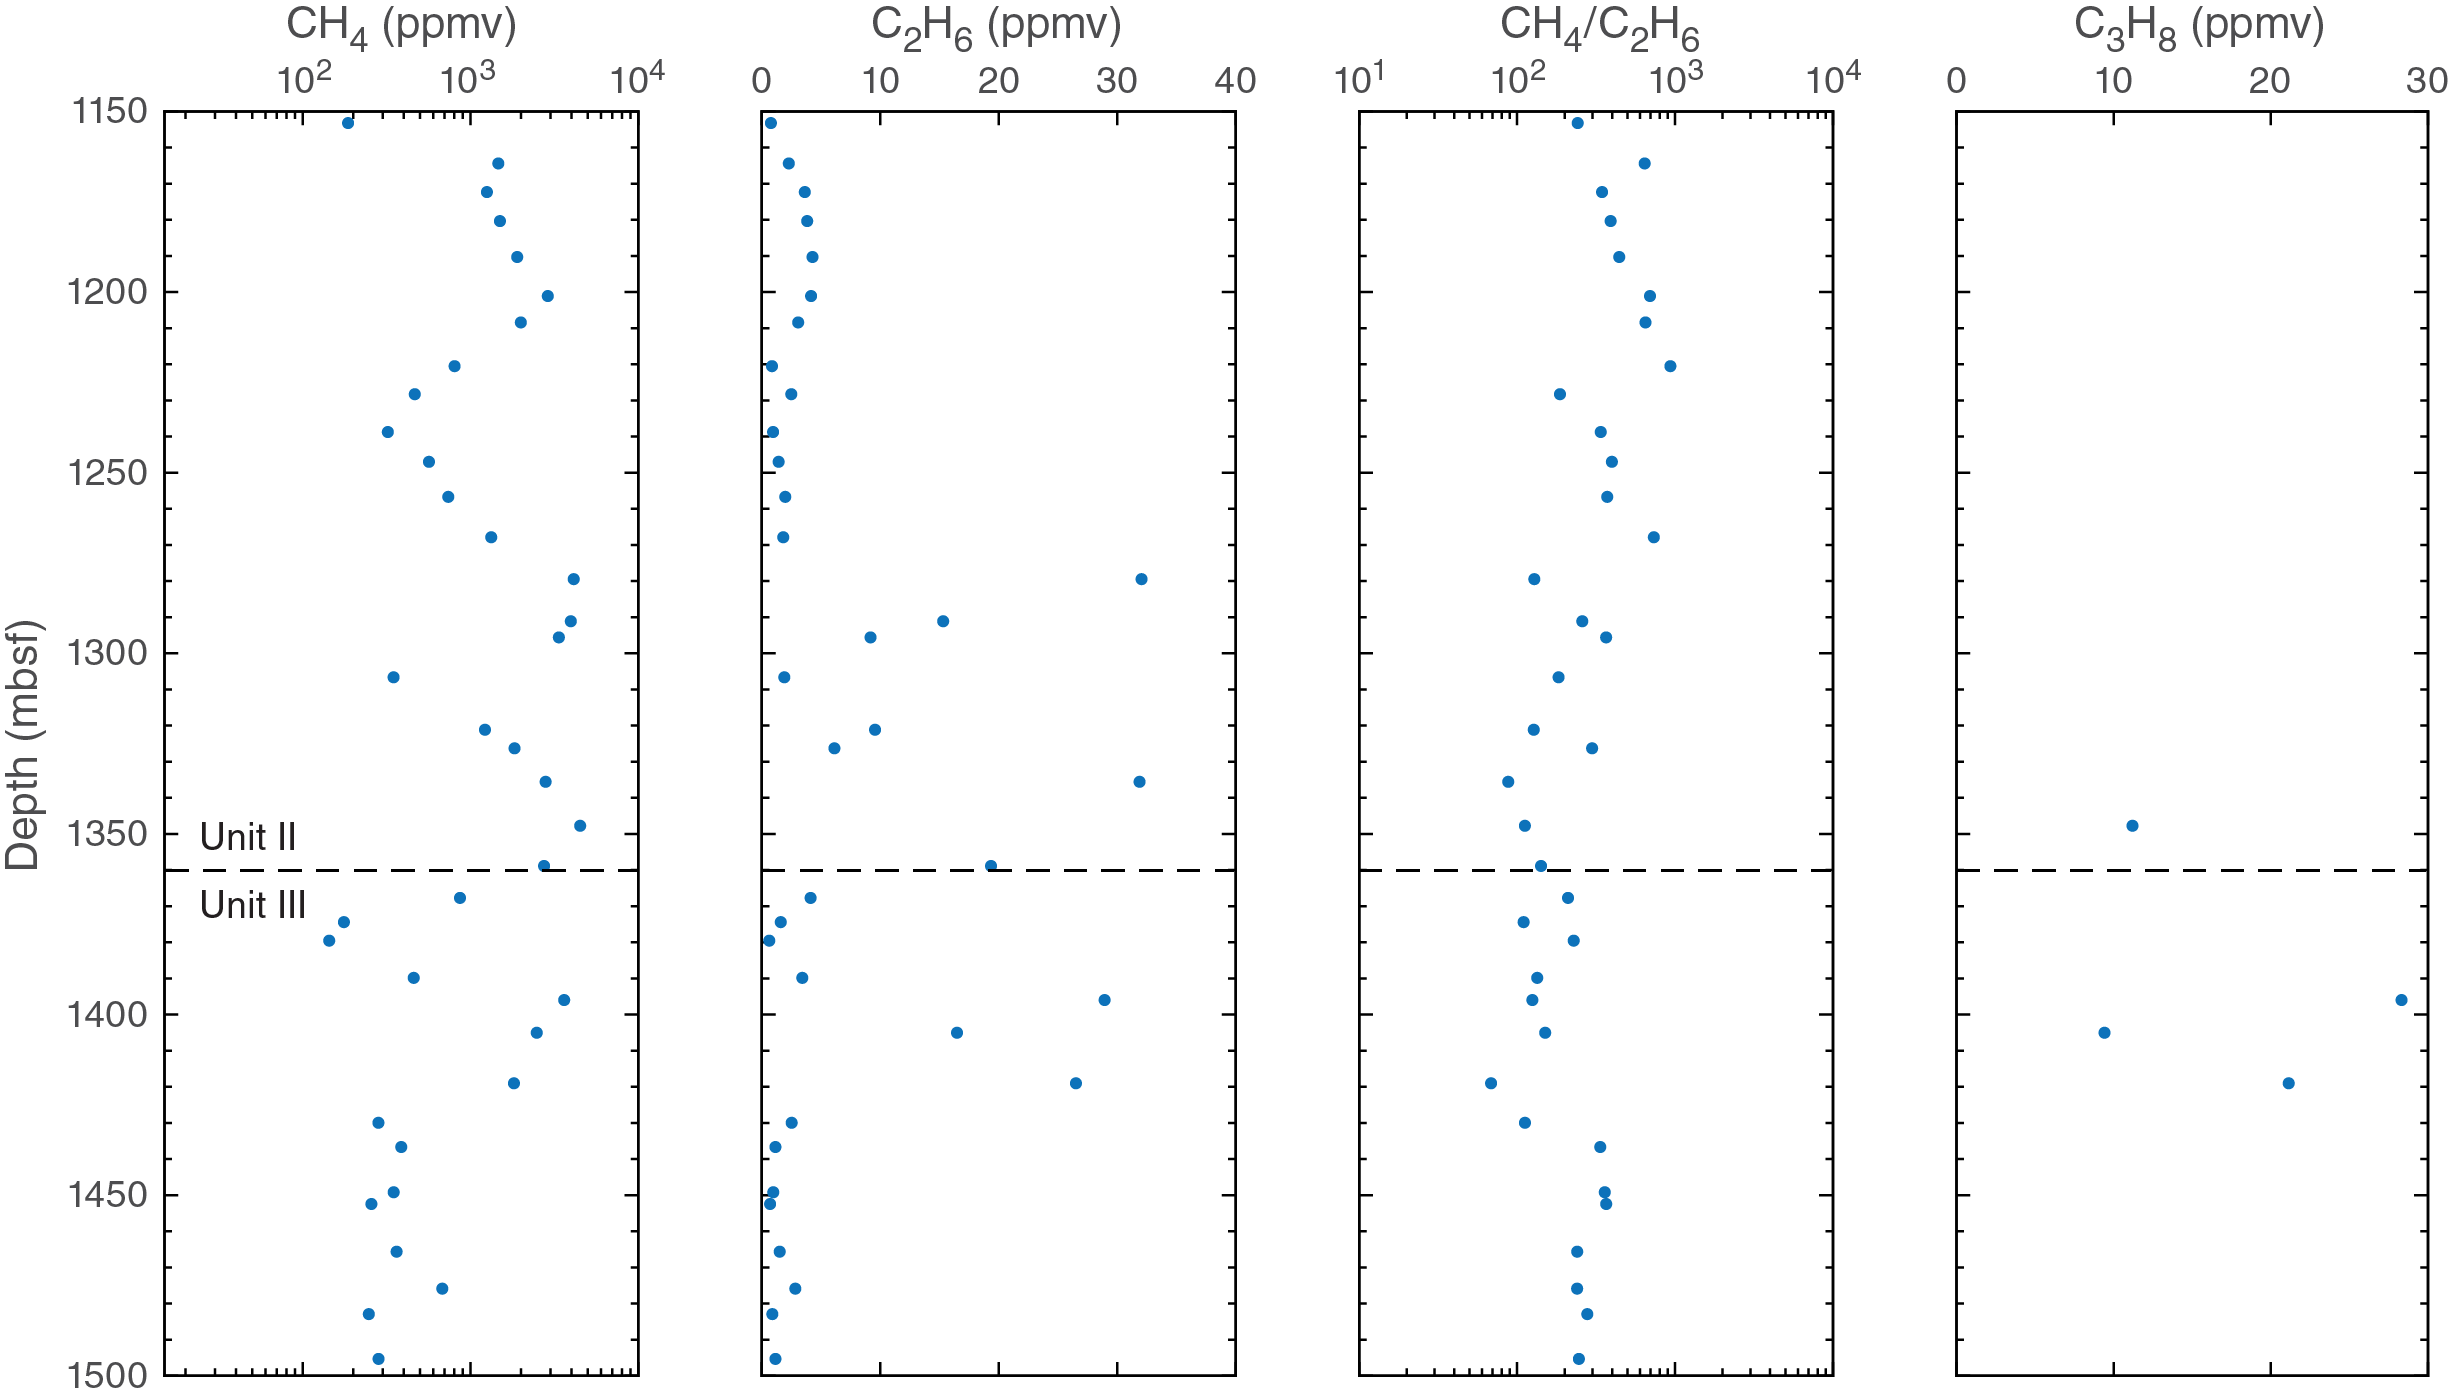
Figure F39. Methane, ethane, ethane/methane ratios, and propane.
Heavier hydrocarbons were detected throughout the cored interval, although ethane concentrations remained generally low (0.77–32 ppmv) (Figure F39). Ethane content peaked at a value of 32 ppmv at 1279 mbsf and remained variable though generally elevated until 1419 mbsf, after which it returned to 0.7–2.8 ppmv. Minor amounts of ethene, as much as 1.3 ppmv, were detected in four samples, each of which had ethane values exceeding 15 ppmv (Table T11). Propane was detected in four samples with the maximum value of 28 ppmv at 1396 mbsf, nearly identical to the ethane concentration at the same depth (29 ppmv). Although methane concentrations reach similar values at Site U1480, they are less variable at Site U1481, and the presence and abundance of propane suggest that hydrocarbons at Site U1481 may be more mature.
The generally high ethane/methane ratio (200–800) shows a slight decrease with depth. Together with the calculated thermal gradient at Site U1481 (see Downhole measurements), this argues against substantial thermogenic hydrocarbon input (Claypool and Kvenvolden, 1983). Because biogenic production of heavier hydrocarbons including propane has been documented (Claypool and Kvenvolden, 1983; Hinrichs, et al., 2006), the hydrocarbons detected in headspace samples at Site U1481 likely represent biologic degradation of organic material.
Bulk sediment analysis
A total of 70 samples were taken for elemental analysis to determine total C and total N as well as for coulometric measurement of carbonate content. Total C varies closely with carbonate, with total C increasing from ~0.5 to 1.5 wt% at 1180 mbsf and carbonate increasing from 1.5 to 8 wt% over the same interval (Table T12; Figure F40). Average concentrations do not change significantly in the rest of lithostratigraphic Unit II, but values do vary: total C varies from 0.49 to 2.0 wt% and carbonate varies between 0.03 and 13.2 wt%. Carbonate is similar to the range and pattern of values determined by XRD, where the highest values are associated with sandstones, suggesting high carbonate values are associated with cementation. Both total C and carbonate content decrease abruptly at the Unit II/III boundary. Total C clusters around 0.33 wt%, whereas carbonate remains around 1.34 wt% for the remainder of lithostratigraphic Unit III. The marked change in carbonate content is consistent with observations that detrital carbonate grains are less abundant in Unit III than in Unit II (see Sedimentology and petrology), as was also observed at Site U1480 (see Sedimentology and petrology in the Site U1480 chapter [McNeill et al., 2017d]).
Table T12. Carbon and nitrogen from bulk sediment analyses. Download table in .csv format.
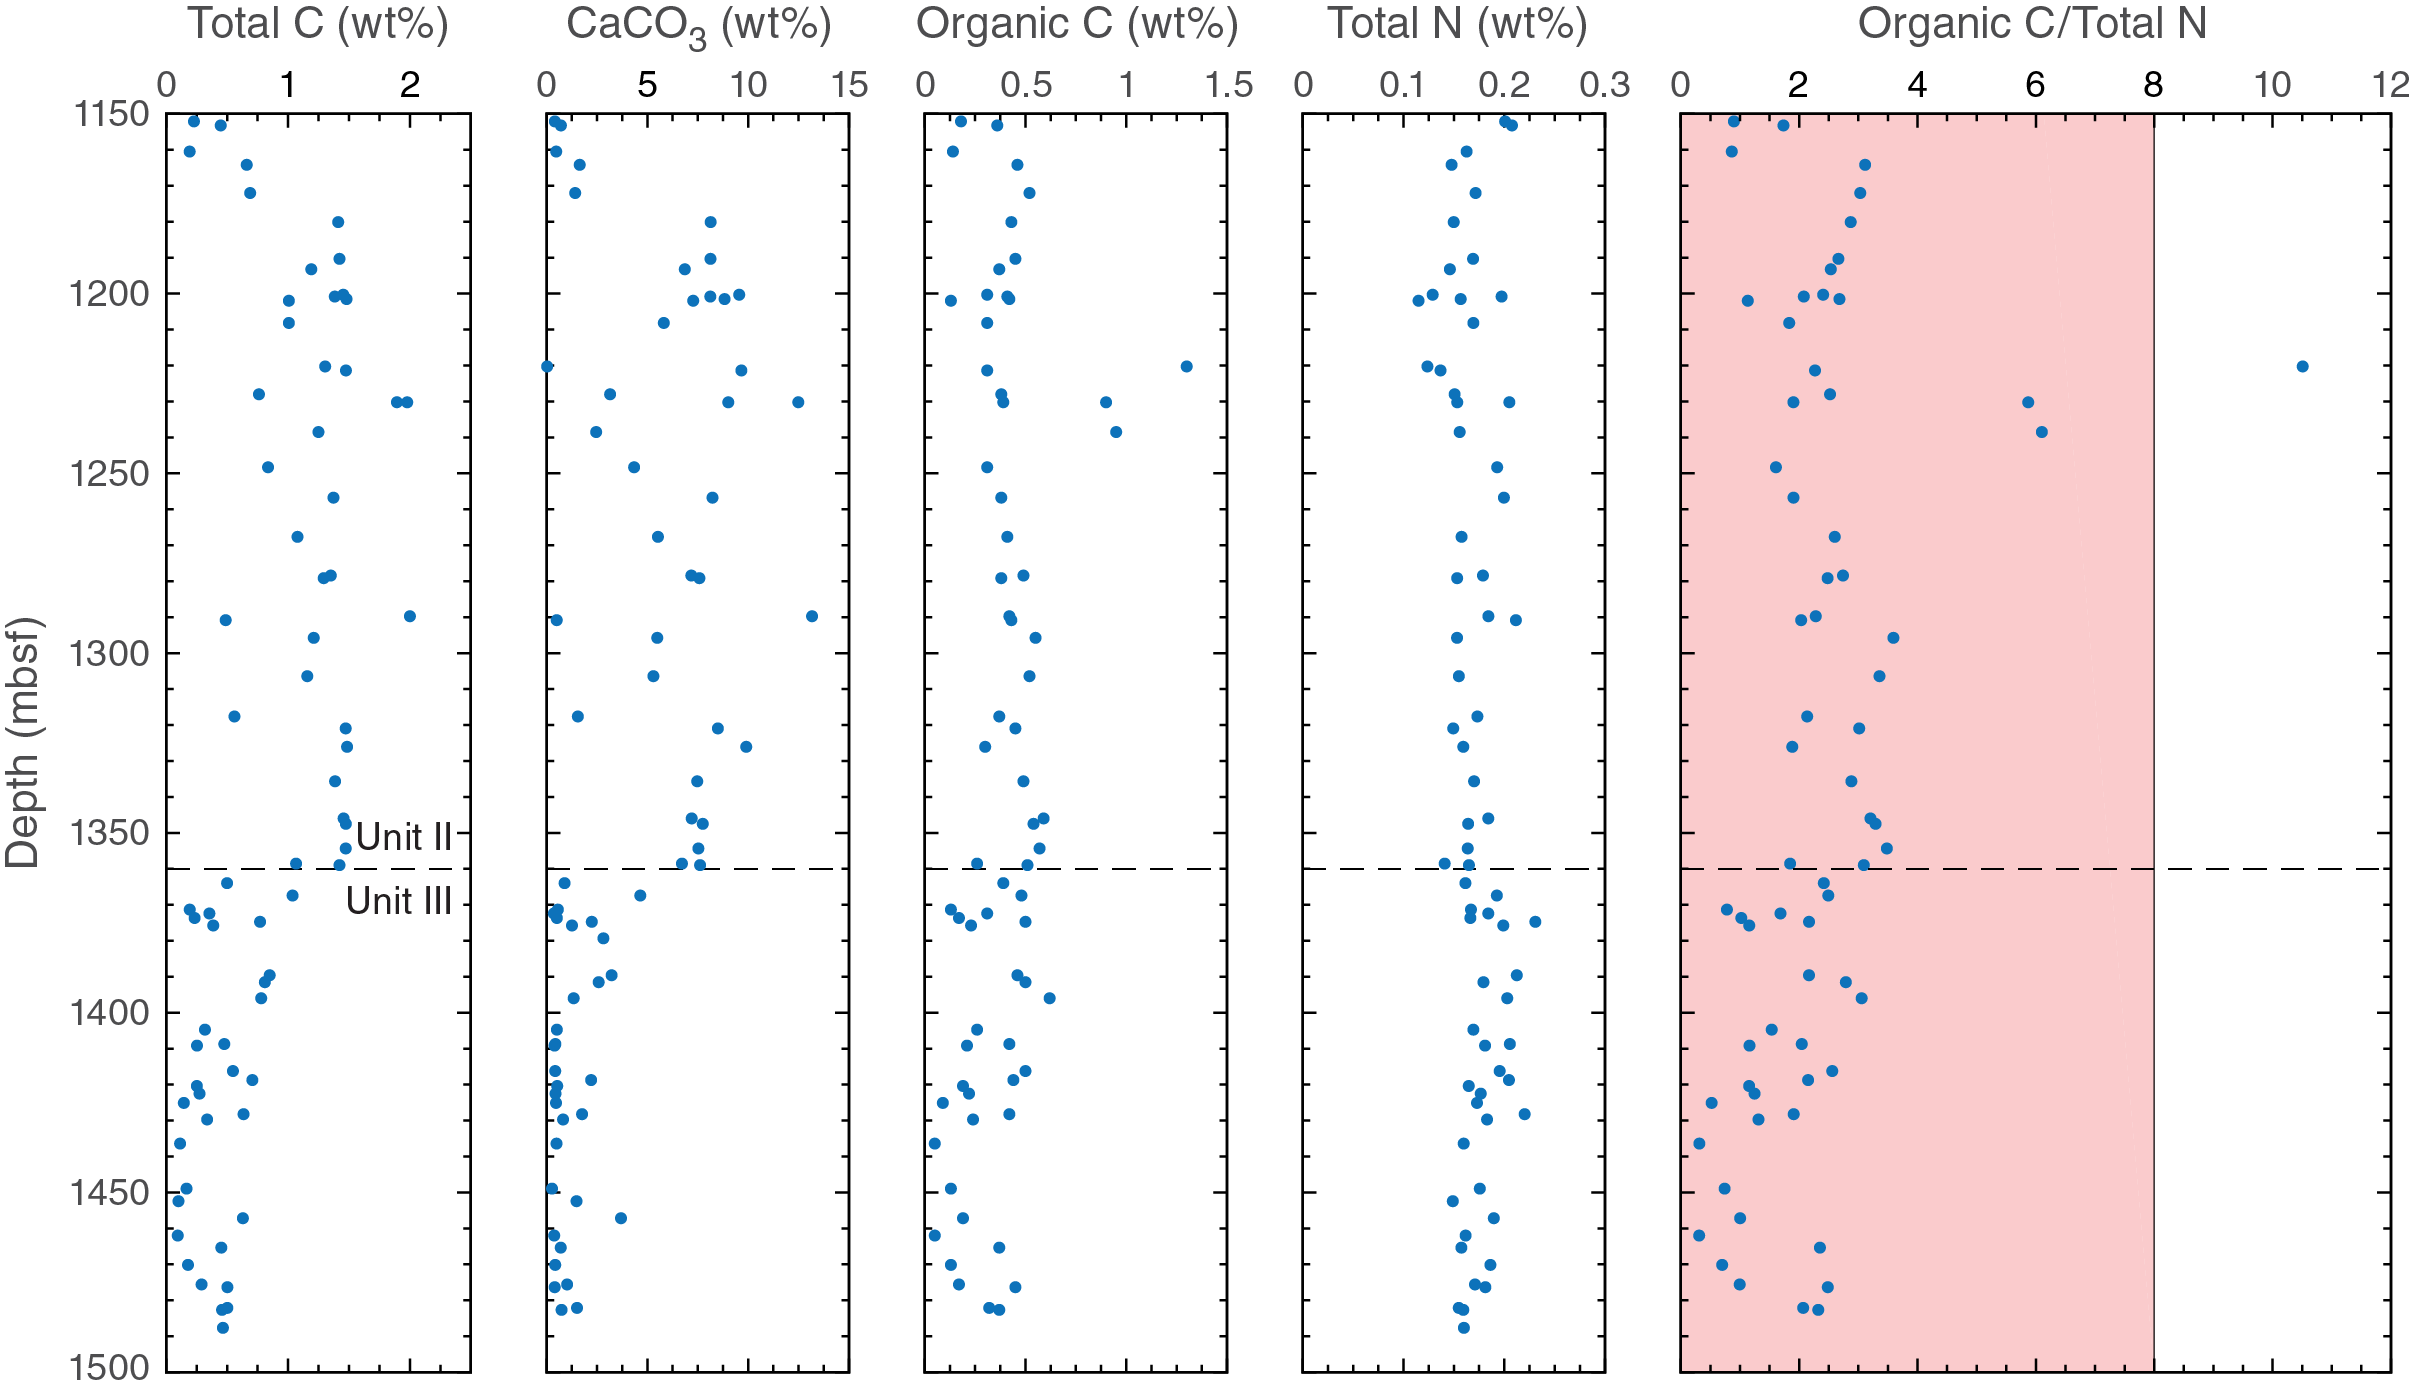
Figure F40. Total carbon, calcium carbonate, organic C, total nitrogen, and organic C/total N.
Organic C, calculated as the difference between total C and inorganic C (see Geochemistry in the Expedition 362 methods chapter [McNeill et al., 2017c]), becomes more variable at the Unit II/III boundary, and average concentrations decrease from ~0.5 to ~0.3 wt% (Figure F40). This small but statistically significant decrease (unpaired one-tailed T-test yields p < 8 × 10⁻⁴) may explain in part the trend toward lower methane concentrations in Unit III, as slightly less organic material is present to fuel biologic methanogenesis. Three samples in Unit II (1220, 1230, and 1239 mbsf) show anomalously high organic C contents of 1.3, 0.9, and 1.0 wt%. These samples may be associated with sediment gravity flows that incorporate terrigenous organic material (see Sedimentology and petrology). Elevated carbonate content of 12.5 wt% coincident with the peak in organic C at 1230 mbsf is consistent with the addition of both detrital carbonate grains and organic material from a terrestrial source, although the contribution of diagenetic carbonate is also possible.
Total N values remain relatively constant at ~0.15 wt% throughout the cored interval, but variations in organic C content drive changes in the organic C/total N ratio (Figure F40), which can be used to infer provenance of organic material. Terrestrial organic matter, which is dominated by C-rich molecules like cellulose and lignin, is typically characterized by an organic C/organic N ratio of ~20–50, whereas ratios in the more protein-rich marine organic matter frequently fall between ~5 and 8 (Müller, 1977). Based on these standard values, only the sample at 1220 mbsf, which shows the highest organic C concentration and an organic C/total N ratio of 10.5, is clearly affected by the input of terrigenous organic matter. Samples at 1230 and 1239 mbsf, which have organic C/total N ratios of ~6, may reflect mixing between a marine and terrigenous source.
Care must be taken, however, in using organic C/total N ratios to assign sources of organic material, particularly in samples with low concentrations of organic material, as inorganic N sources may bias results toward artificially low C/N ratios (Müller, 1977; de Lange, 1992). Inorganic N species such as ammonium have been demonstrated to adsorb to clay mineral surfaces or be incorporated into the interlayer space of clay mineral lattices. Release of this inorganic N upon sample combustion and elemental analysis (see Geochemistry in the Expedition 362 methods chapter [McNeill et al., 2017b]), releases inorganic N and N from organic material, so when organic matter is scarce, the inorganic N signal may overwhelm that of organic N, leading to artificially elevated N values and low organic C/total N ratios (Müller, 1977). Therefore, the influence of inorganic N may shift organic material of terrigenous origin to apparent C/N values indicative of marine input. Additionally, a trend toward lower C/N values with increasing depth in the sediment column may reflect preferential remobilization of C, likely a result of biologic processes that may further mask terrestrial inputs of organic material (Müller, 1977; de Lange, 1992). Considering the potential for the apparent organic C/total N ratio to underestimate the true organic C/organic N ratio, values such as those at 1220 mbsf that fall outside the range of marine organic matter clearly indicate significant input of terrigenous organic material.
Physical properties
Physical properties of the cores recovered at Site U1481 were characterized through a set of measurements on core sections and discrete samples (see details in Physical properties in the Expedition 362 methods chapter [McNeill et al., 2017b]). Gamma ray attenuation (GRA) density, magnetic susceptibility (Magnetic Susceptibility Logger [MSL]), and P-wave velocity (P-wave Logger [PWL]) measurements were made on the sediment cores using the Whole-Round Multisensor Logger (WRMSL). Natural gamma radiation (NGR) was measured by the Natural Gamma Radiation Logger (NGRL). Point magnetic susceptibility (MSP) and reflectance spectroscopy and colorimetry (RSC) data were acquired using the Section Half Multisensor Logger (SHMSL). Thermal conductivity was measured on working-half core sections. Discrete P-wave velocities (P-wave caliper [PWC] and P-wave bayonet [PWB]) and moisture and density (MAD) measurements were conducted systematically.
Trends in the physical property data generally correlate with Units II and III defined in Sedimentology and petrology (Figure F41). Across the Unit II/III boundary (1360.12 mbsf) scatter in NGR values decreases, magnetic susceptibility values abruptly decrease, P-wave velocity values increase, porosity values decrease, and L* reflectance values decrease. Thermal conductivity has similar values over the two units, but higher values occur at the unit boundary. The observed trends are similar to those at the Subunit IIC/IIIA boundary at Site U1480 (1250 mbsf; see Physical properties in the Site U1480 chapter [McNeill et al., 2017d]).
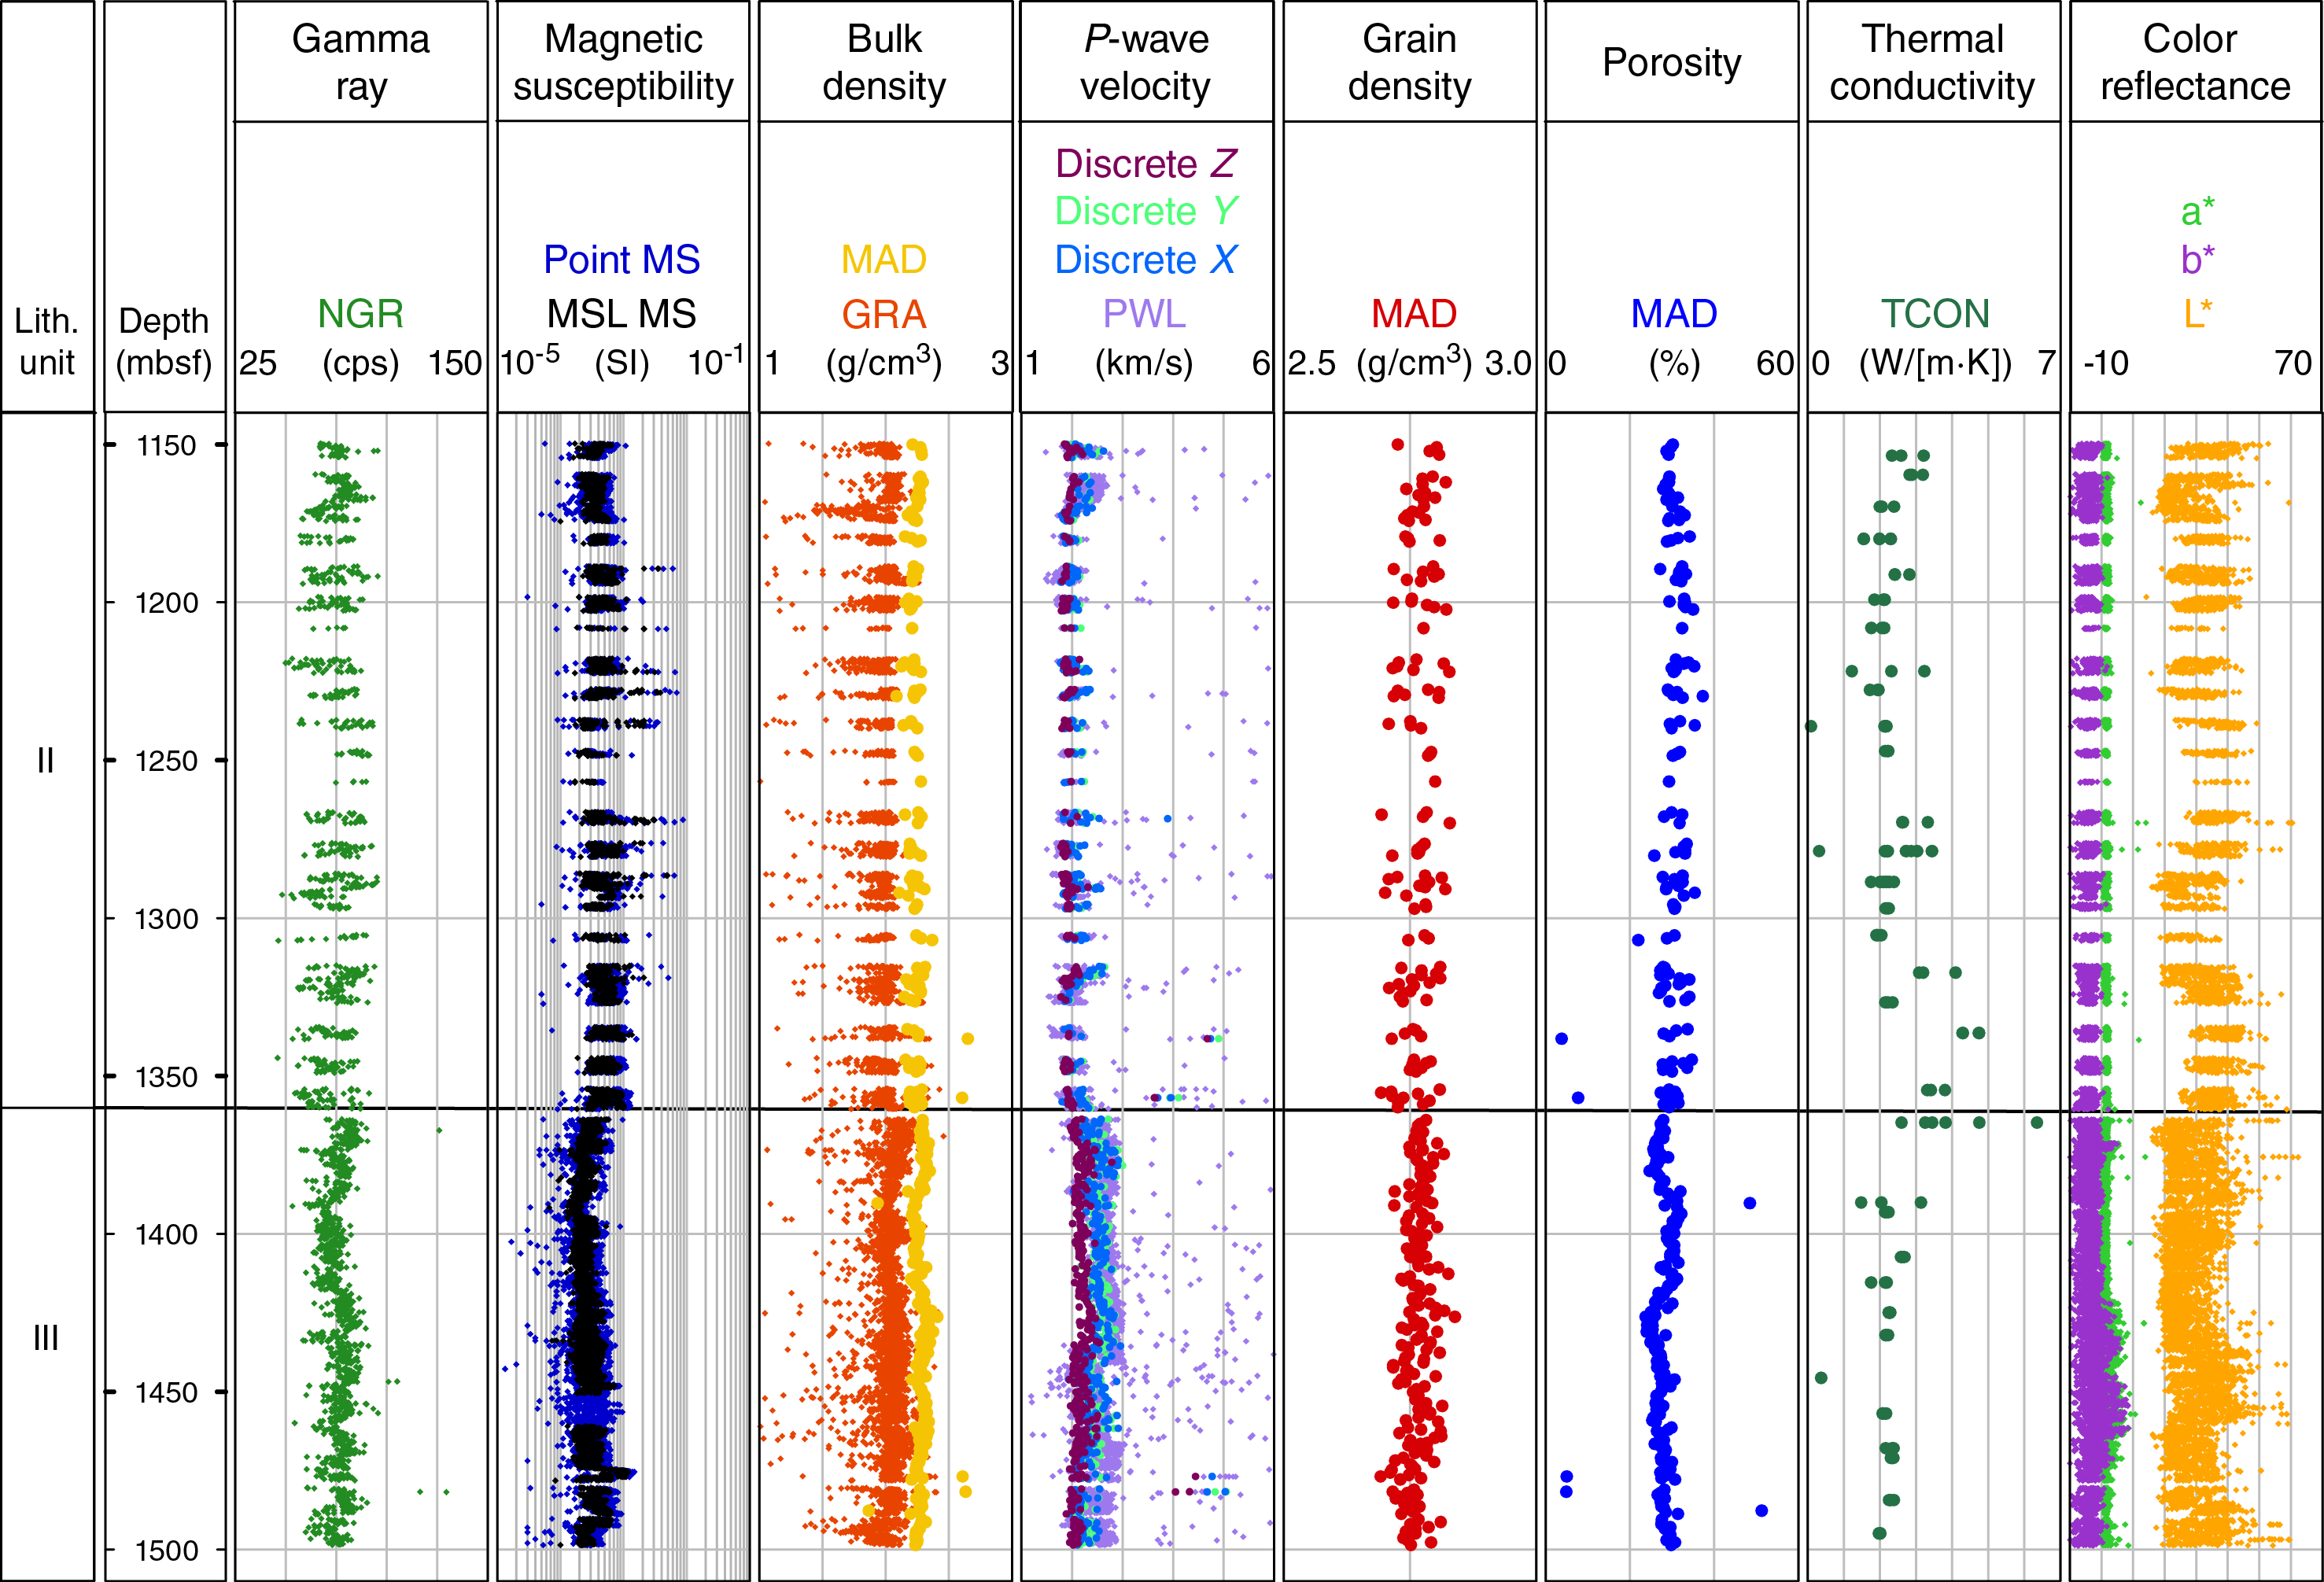
Figure F41. Physical property measurements.
In the following discussion, physical property data are grouped into three principal lithologies from core descriptions: (1) mud, which includes clay/claystone to silt/siltstone; (2) sand (sand/sandstone); and (3) tuffaceous material (ash, tuff, and tuffaceous clay/claystone) (see Sedimentology and petrology).
Natural gamma radiation
NGR measurements in Hole U1481A range from 46 to 130 counts/s, with an average value of 75 ± 8 counts/s (Figure F41). In Unit II (1149.70–1360.12 mbsf), NGR values vary from 46 to 96 counts/s with an average of 74 ± 9 counts/s. Unit III (1360.12–1500.00 mbsf; Figure F42) shows relatively constant NGR values that range from 60 to 90 counts/s with an average of 76 ± 6 counts/s. In general, NGR value scatter is reduced in Unit III relative to Unit II, reflecting the reduced variability of lithology (Figure F43).

Figure F42. Physical properties measurements deeper than 1350 mbsf.
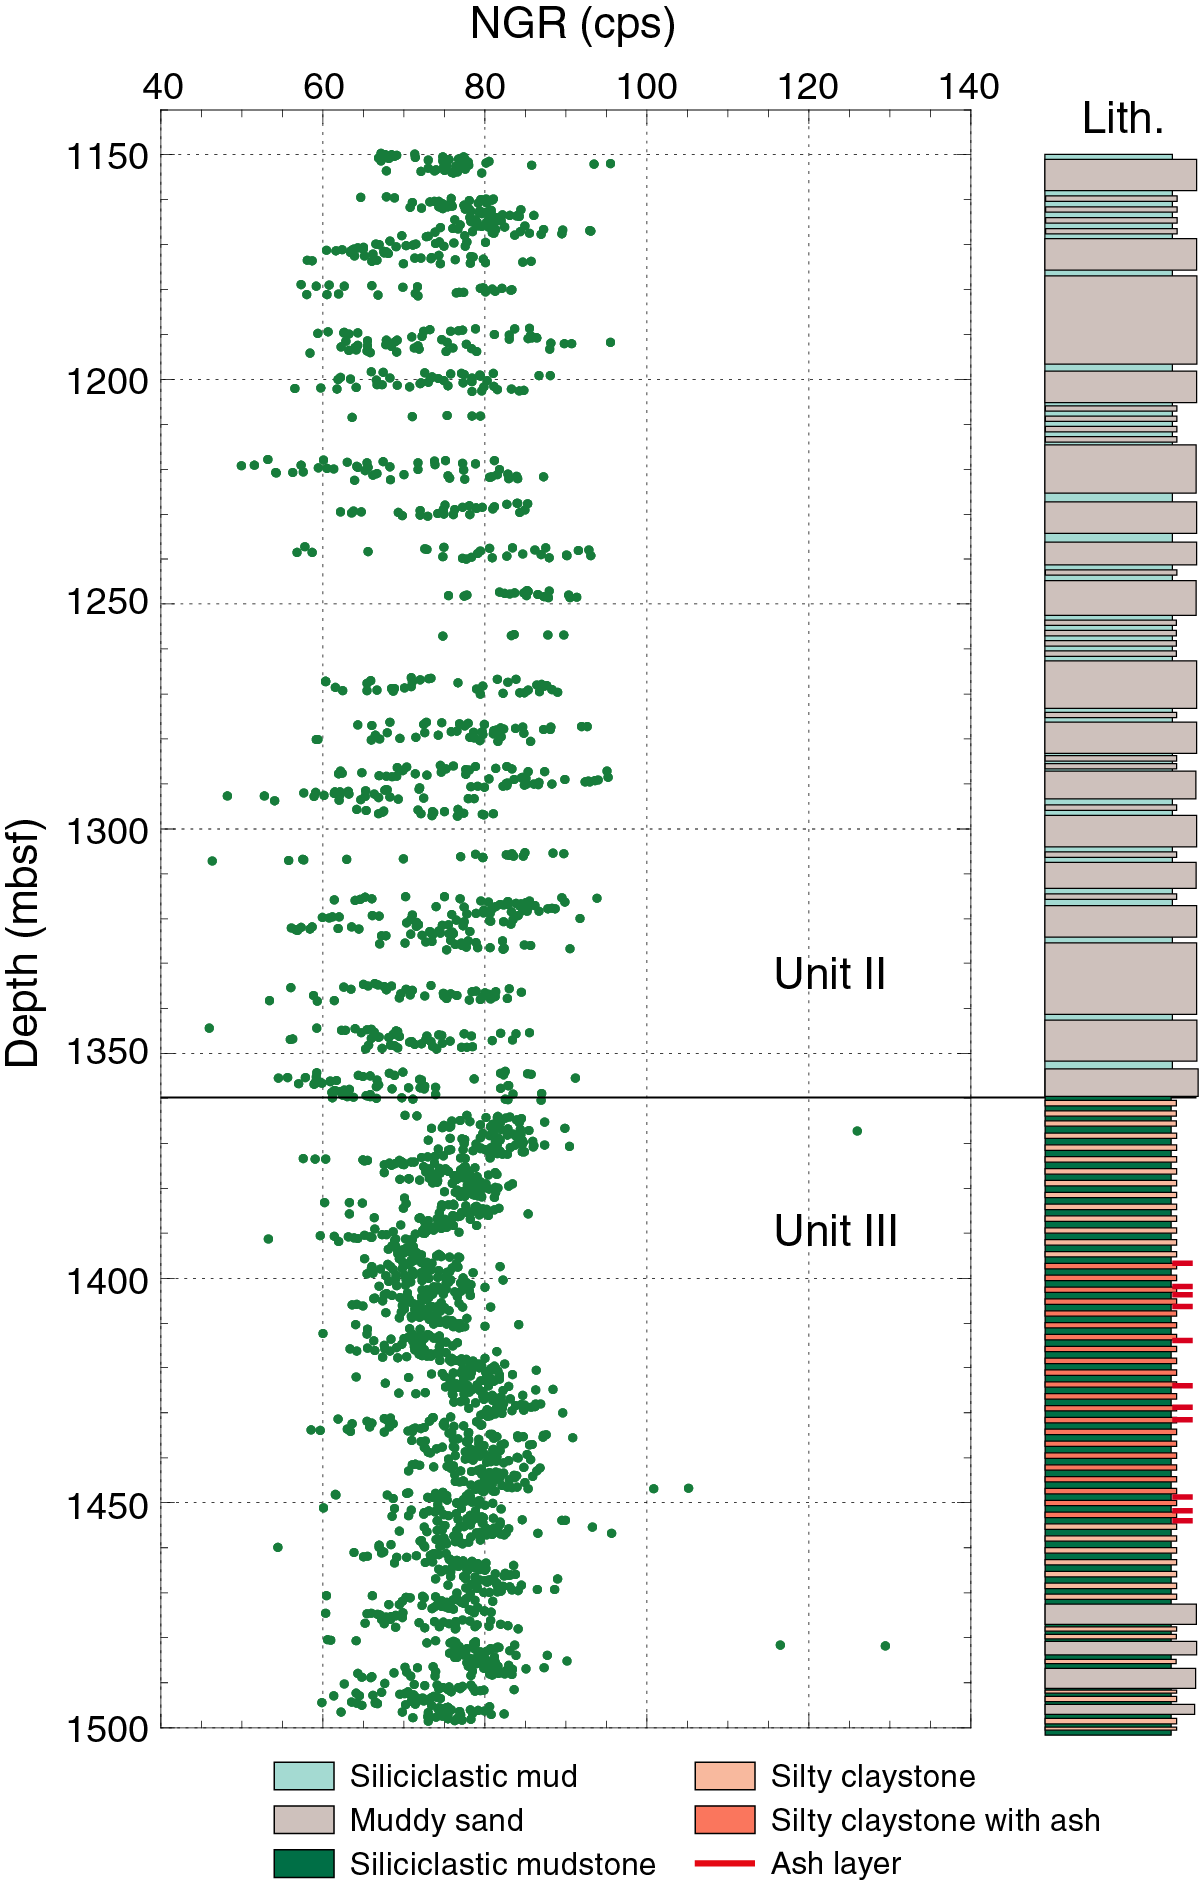
Figure F43. NGR measurements versus lithology.
NGR values are presented against total clay content as determined by XRD analysis (of nearest samples with offset <5 cm) in Figure F44. Mud samples generally show higher NGR (65–90 counts/s; average = 77 counts/s) and higher total clay (50%–70%; average = 64%) relative to sand samples. Sand samples show variable NGR (55–85 counts/s; average = 68 counts/s) and variable total clay (25%–65%; average = 48%) but include a small number of samples with similar values to mud samples. Overall, NGR core measurements show good agreement with the gamma ray log (Figure F58).
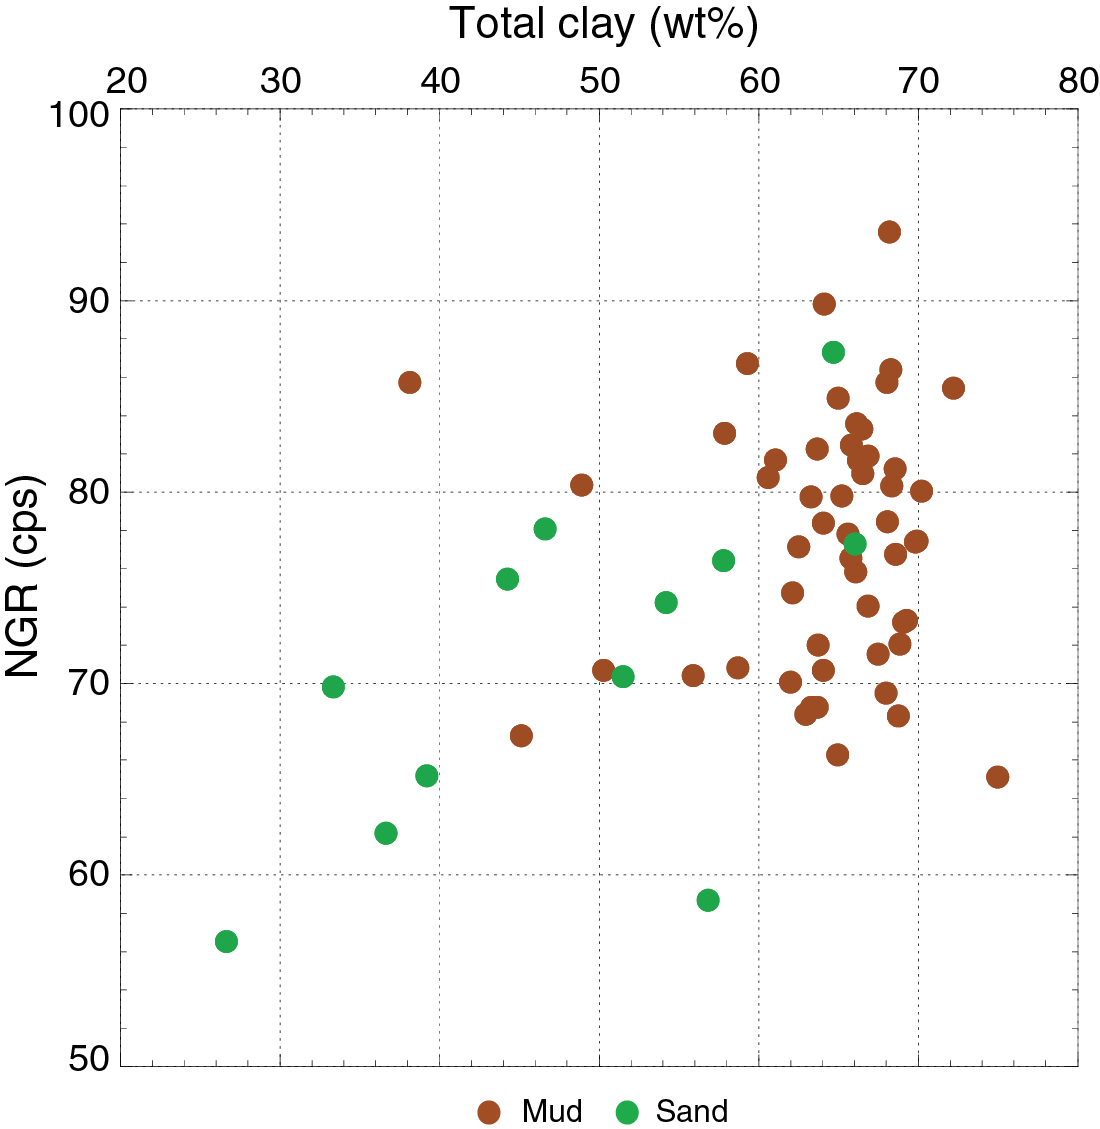
Figure F44. NGR versus total clay content from XRD analyses.
Magnetic susceptibility
Magnetic susceptibility was measured from 1149.7 to 1498.72 mbsf in Hole U1481A (Figures F41, F42). Near 1360 mbsf (the Unit II/III boundary), a distinct change in magnetic susceptibility is observed that corresponds to the change in lithology (see Sedimentology and petrology). Magnetic susceptibility values decrease from an average of 48 × 10–5 SI (Unit II) to an average of 27 × 10–5 SI (Unit III). Point magnetic susceptibility measurements match well with the WRMSL results (Figure F41). In Unit III, a peak of high magnetic susceptibility (~117 × 10–5 SI) occurs between 1475 and 1478 mbsf, correlating with a 20 cm section of sand/sandstone. Magnetic susceptibility core measurements show good overall agreement with the magnetic susceptibility log (Figure F58).
P-wave velocity
The P-wave velocities measured with the WRMSL PWL and discrete velocity measurements made with the velocity gantry (see P-wave velocity measurements in the Expedition 362 methods chapter [McNeill et al., 2017b]) are in good overall agreement (Figure F41). The uncorrected discrete velocities (manual pick) tend to be similar or slightly slower than the PWL velocities, due to not picking the initial arrival correctly. Once corrected, discrete velocities are approximately equal to or greater than the PWL velocities. The PWL velocities are expected to be slower than the corrected discrete velocity measurements, as is observed, because of water- or air-filled gaps between the core and core liner.
Within Unit II (1149.7–1360.12 mbsf), P-wave velocities remain fairly constant with an average value of 1972 m/s (Figures F41, F45, F46). At the top of Unit III (1360.12 mbsf), velocities increase from 2300 to 2700 m/s. Velocities then gradually increase to ~2800 m/s by 1441.2 mbsf. The PWL values then show an abrupt decrease in velocity from 2800 to 2100 m/s (Figure F45). This decrease is not as apparent in the discrete measurements because velocities in the z-direction remain constant throughout Unit III (Figure F42). There does not appear to be any change in lithology associated with this decrease in velocity, and the decrease is not present in the sonic log data (see Sedimentology and petrology and Downhole measurements). Through the remainder of the hole, velocities remain relatively constant (~2300 m/s). The fastest velocities in Hole U1481A occur in lithified sandstone concretions, with values reaching ~5000 m/s (Figure F46). Overall, the log and the core velocity data are in good agreement (Figure F58).
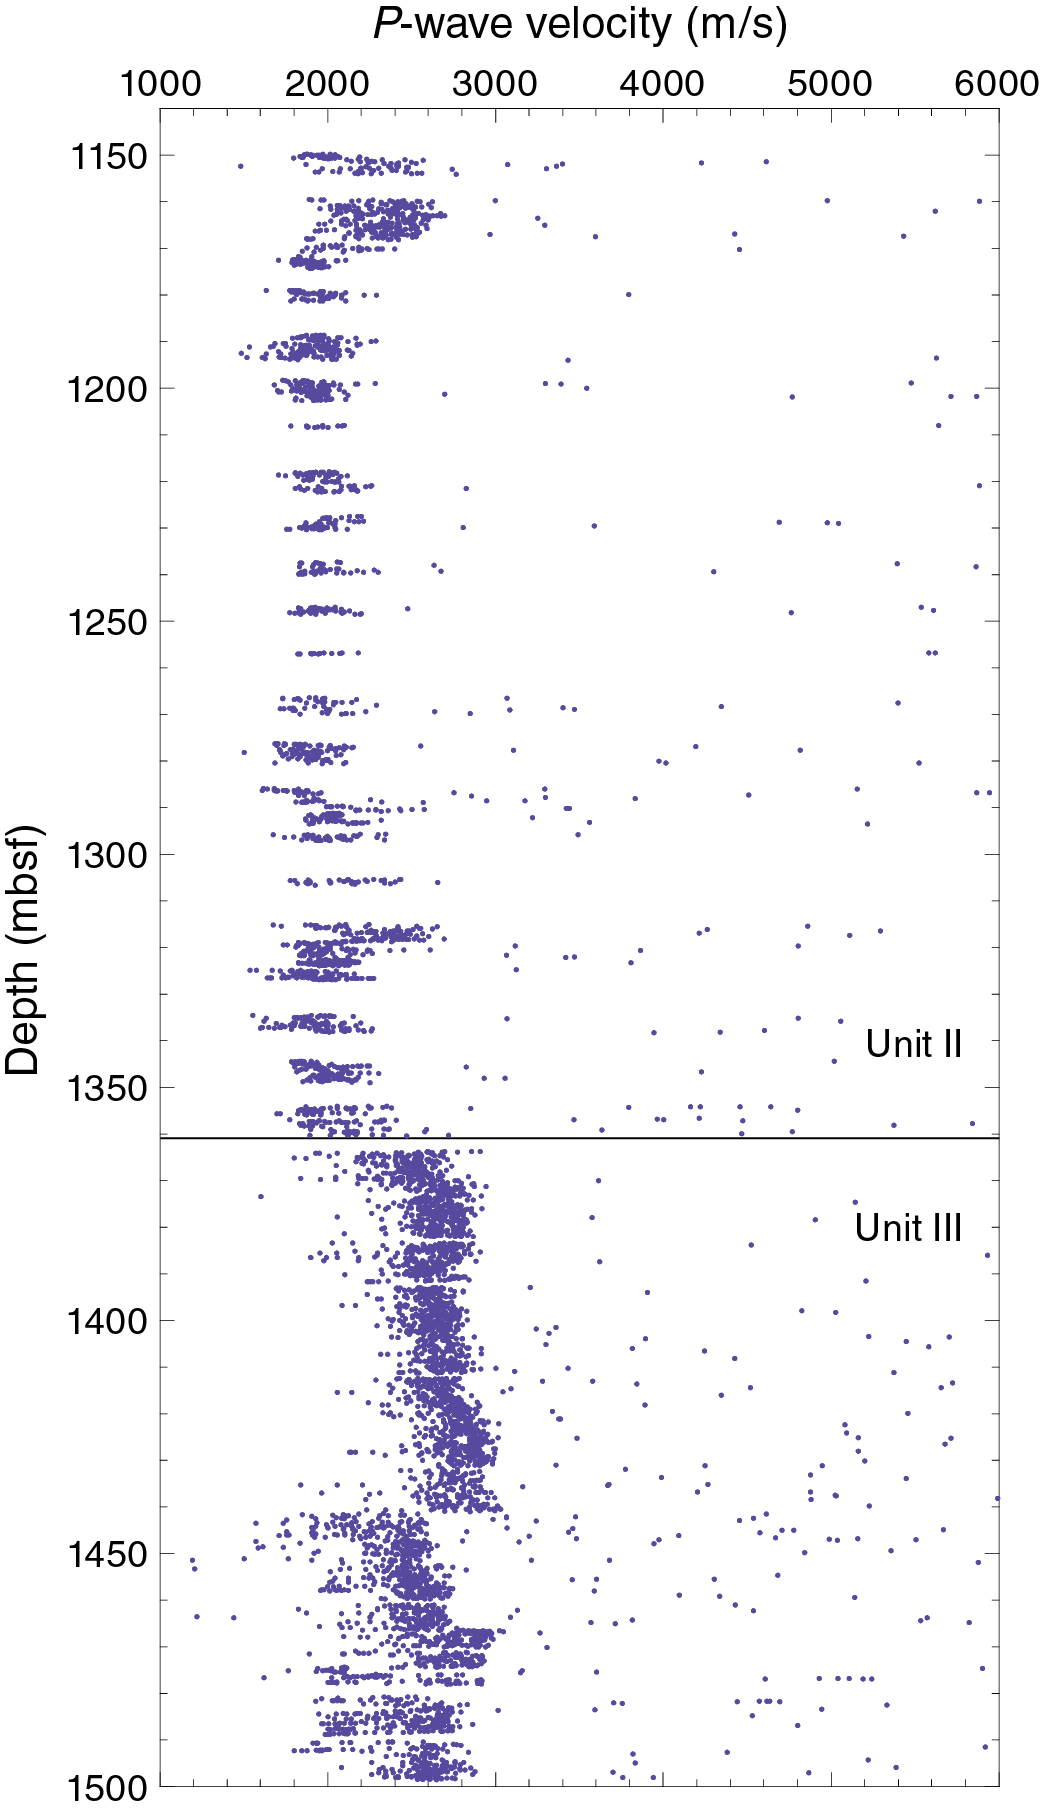
Figure F45. P-wave velocity from the whole-round PWL.

Figure F46. Corrected discrete P-wave velocity data.
The calculated horizontal anisotropy (P-wave velocity measurements in the Expedition 362 methods chapter [McNeill et al., 2017b]) at Site U1481 is <24%, and the average is 2% (Figure F46). The vertical anisotropy in Unit II reaches 24%, and the average is 9%. In Unit III, vertical anisotropy increases to an average of 13% and a maximum of 30%. The vertical direction (z) is consistently the slowest, indicating that the material is transversely isotropic with a vertical axis of symmetry. The decrease in velocity below 1441.2 mbsf corresponds to a decrease in vertical anisotropy.
Bulk density, grain density, and porosity
GRA bulk density data measured with the WRMSL and MAD bulk and grain density data measured on discrete samples are shown in Figures F41 and F47. GRA bulk density values range from 1.0 to 2.2 g/cm3, and the bulk density from MAD measurements range from 1.9 to 2.7 g/cm3 in Unit II (1150–1360.12 mbsf). Just above the Unit II/III boundary, at ~1320 mbsf, GRA bulk densities increase slightly to ~2.5 g/cm3. In Unit III, GRA bulk density values and, to a lesser degree, MAD discrete bulk density measurements are overall higher than in Unit II.
Figure F47 displays MAD-derived bulk density, grain density, and porosity and discrete P-wave velocity (x-direction) separated according to principal lithology. Bulk densities are 1.9–2.7 g/cm3 for both sand and mud, and grain densities range from 2.70 to 2.85 g/cm3 for the entire cored interval. Most porosity data are between ~22% and 38% with an average of 29% ± 4%. A few outliers with low porosity values (<10%) correspond to carbonate-cemented sandstone concretions with correspondingly high x-axis P-wave velocities. Sand and mud porosities show a similar trend in both units. Within Unit III, which is mainly composed of silty claystone and muddy sandstone with occurrences of tuffaceous mud/mudstone and sand/sandstone, porosity values fluctuate between 26% and 31%. A zone of slightly higher porosity (~30%) occurs at 1390–1420 mbsf. This high-porosity zone correlates with a low-chlorinity anomaly (see Geochemistry) driven by dehydration reactions (Hüpers et al., 2017) and may relate to flow pathways. Postexpedition research will further investigate the relation between dehydration reactions, pressure genesis, and porosity.
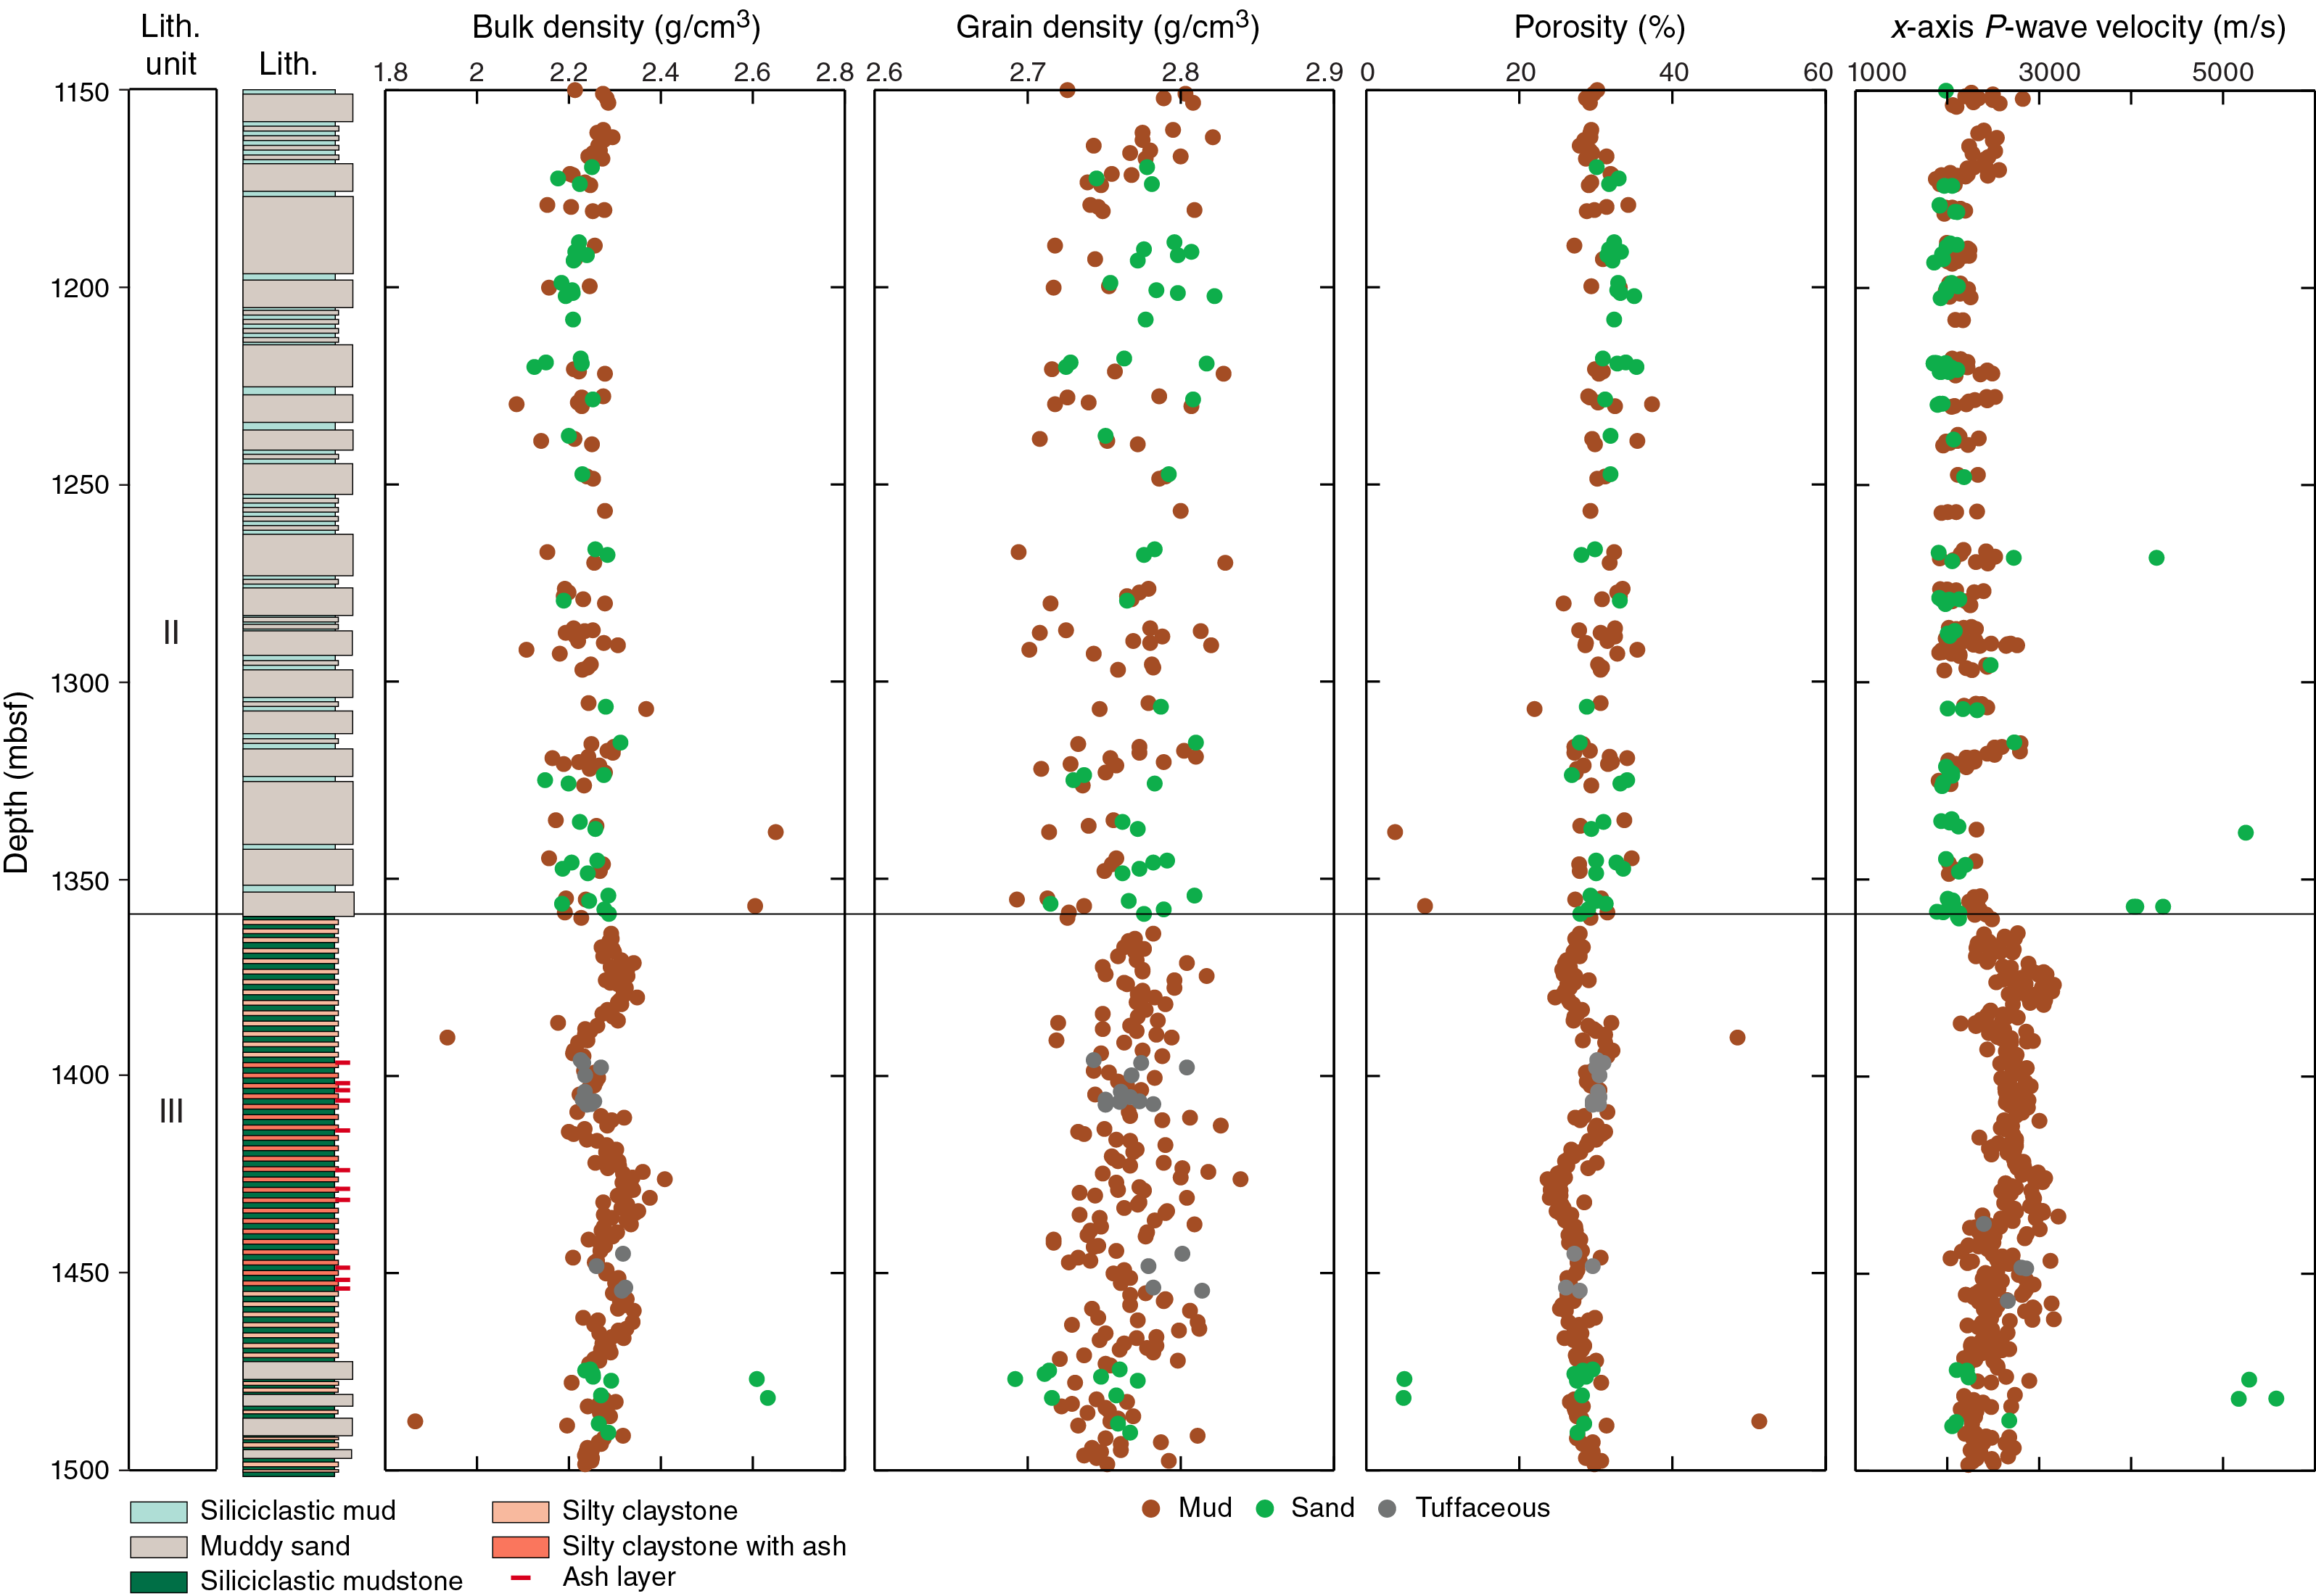
Figure F47. Bulk density, grain density, and porosity.
Generally, porosities slightly decrease with increasing effective vertical stress (Figure F48). The vertical consolidation model at Site U1480 is compatible with the Site U1481 porosity data. Figure F49 shows that a single compaction model for each rock type can be established by combining data from Sites U1480 and U1481. The relation between porosity ϕ and effective vertical stress σvʹ for both sites can be expressed as
where σv is vertical stress and P is hydrostatic pore pressure (Terzaghi, 1943).
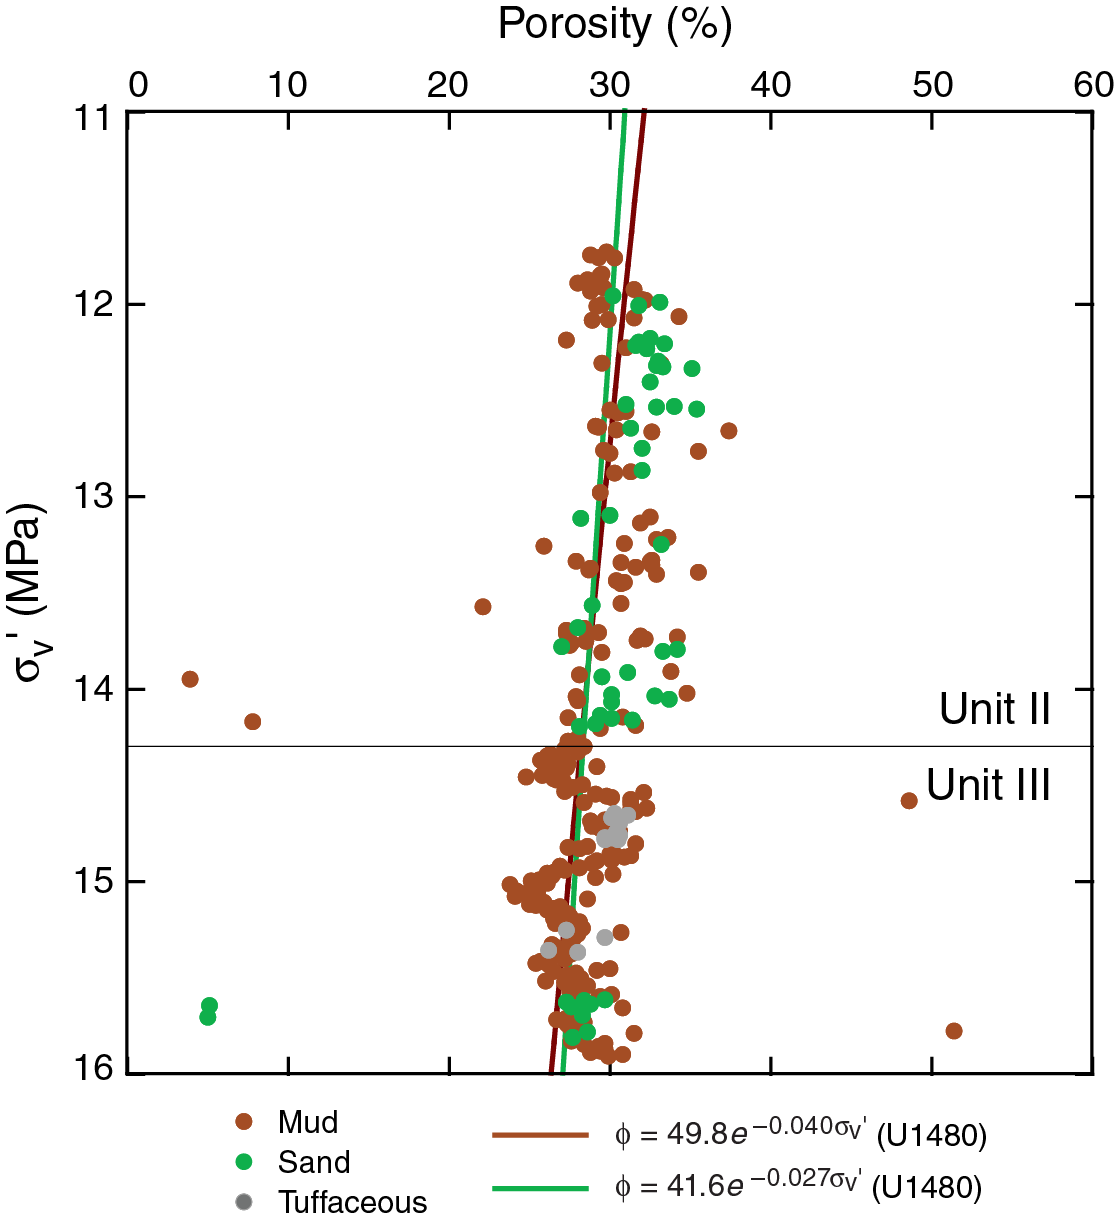
Figure F48. MAD porosity versus effective vertical stress.
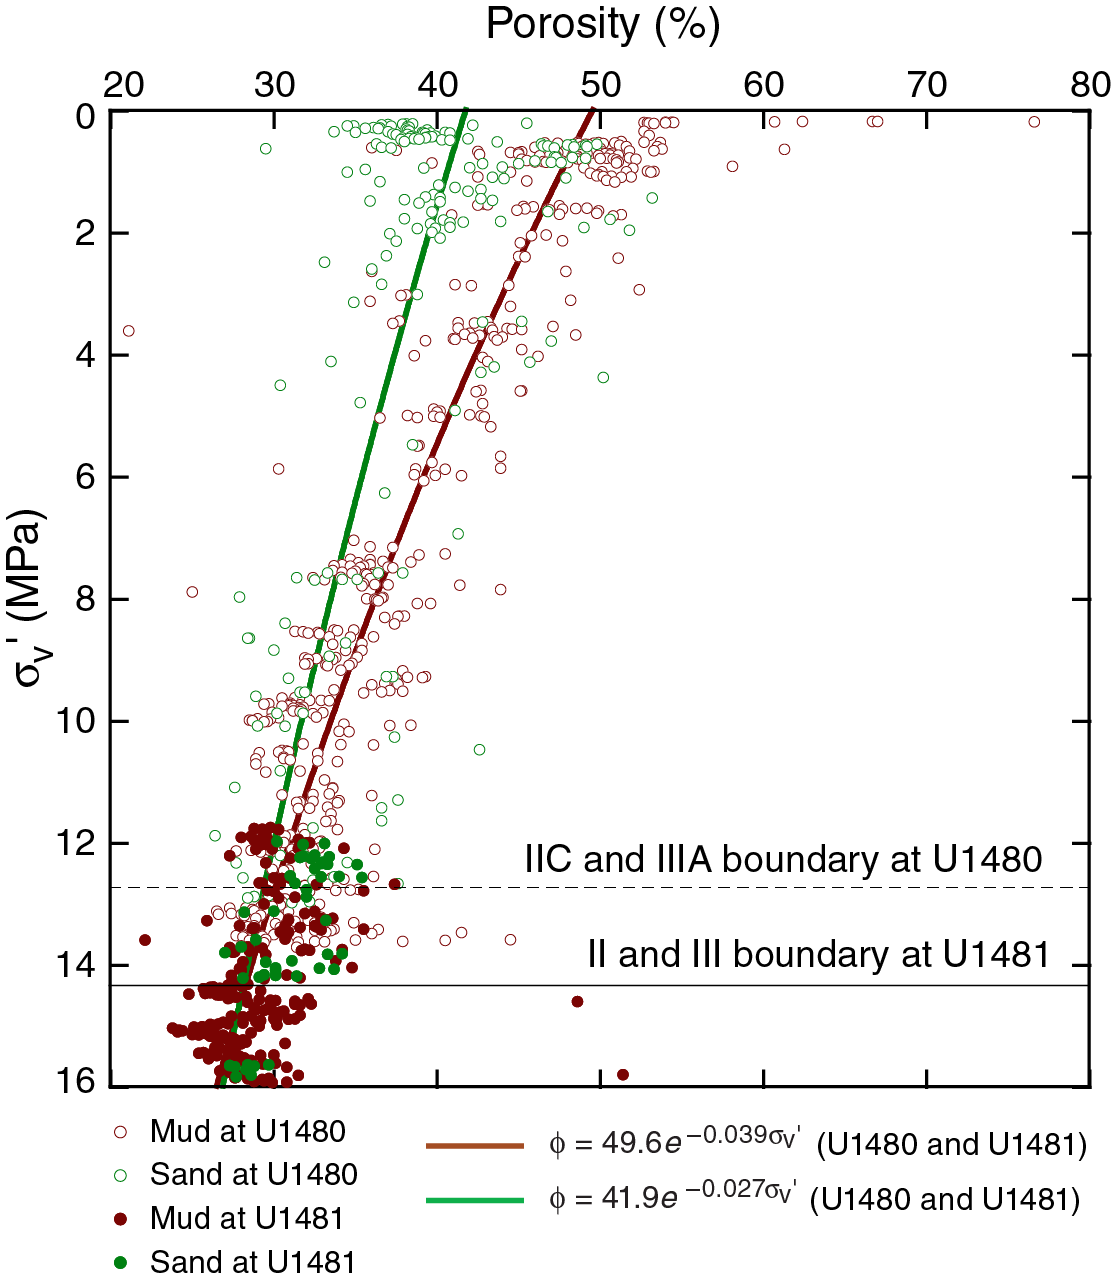
Figure F49. Comparison of MAD porosity versus effective vertical stress at Sites U1480 and U1481.
A velocity-porosity relationship has been developed using measured discrete P-wave velocity values in the x-direction and nearest-neighbor (<20 cm offset) porosity data (Figure F50; also see Velocity-porosity relationships in the Expedition 362 methods chapter [McNeill et al., 2017b]). Based on the total clay volume from XRD analyses (Figure F7), the velocity-porosity curve was plotted for a clay volume of 60%, which is representative of most of the sediment in the sampled section (see Sedimentology and petrology). The majority of Site U1481 core samples lie along the curve for normal consolidation (Figure F50). The 60% Vsh curves provide a good match to the data even though there is significant scatter.

Figure F50. Corrected discrete P-wave velocity.
Thermal conductivity
Thermal conductivity was measured on working-half core sections using the half-space puck (see Thermal conductivity in the Expedition 362 methods chapter [McNeill et al., 2017b]). Stable thermal conductivity measurements could not be obtained from the TEKA software for a number of samples despite several attempts to improve the thermal coupling.
Thermal conductivity values calculated using the TEKA method range from 1.87 to 4.52 W/(m·K), with most values between 1.87 and 2.62 W/(m·K) (standard deviation <7% of the mean for the repeat measurements) (Figure F51; Table T13). Measurements were conducted on mud-dominated lithologies with the exception of one tuffaceous clay sample for which the measured value was in the same range as the mud/mudstone samples. Thermal conductivities measured on samples between 1330 and 1370 mbsf show higher values, deviating from the general trend, but these values show no clear correlation with lithology. This deviation occurs near the Unit II/III boundary. The thermal conductivities are plotted against porosity (Figure F52) along with curves corresponding to the geometric mean model between a range of assumed grain conductivities (3, 5, and 7 W/[m·K]) and water (e.g., Lovell, 1985). Most data points with thermal conductivities <3 W/(m·K) fall between the model curves for grain conductivities of 3 and 5 W/(m·K).
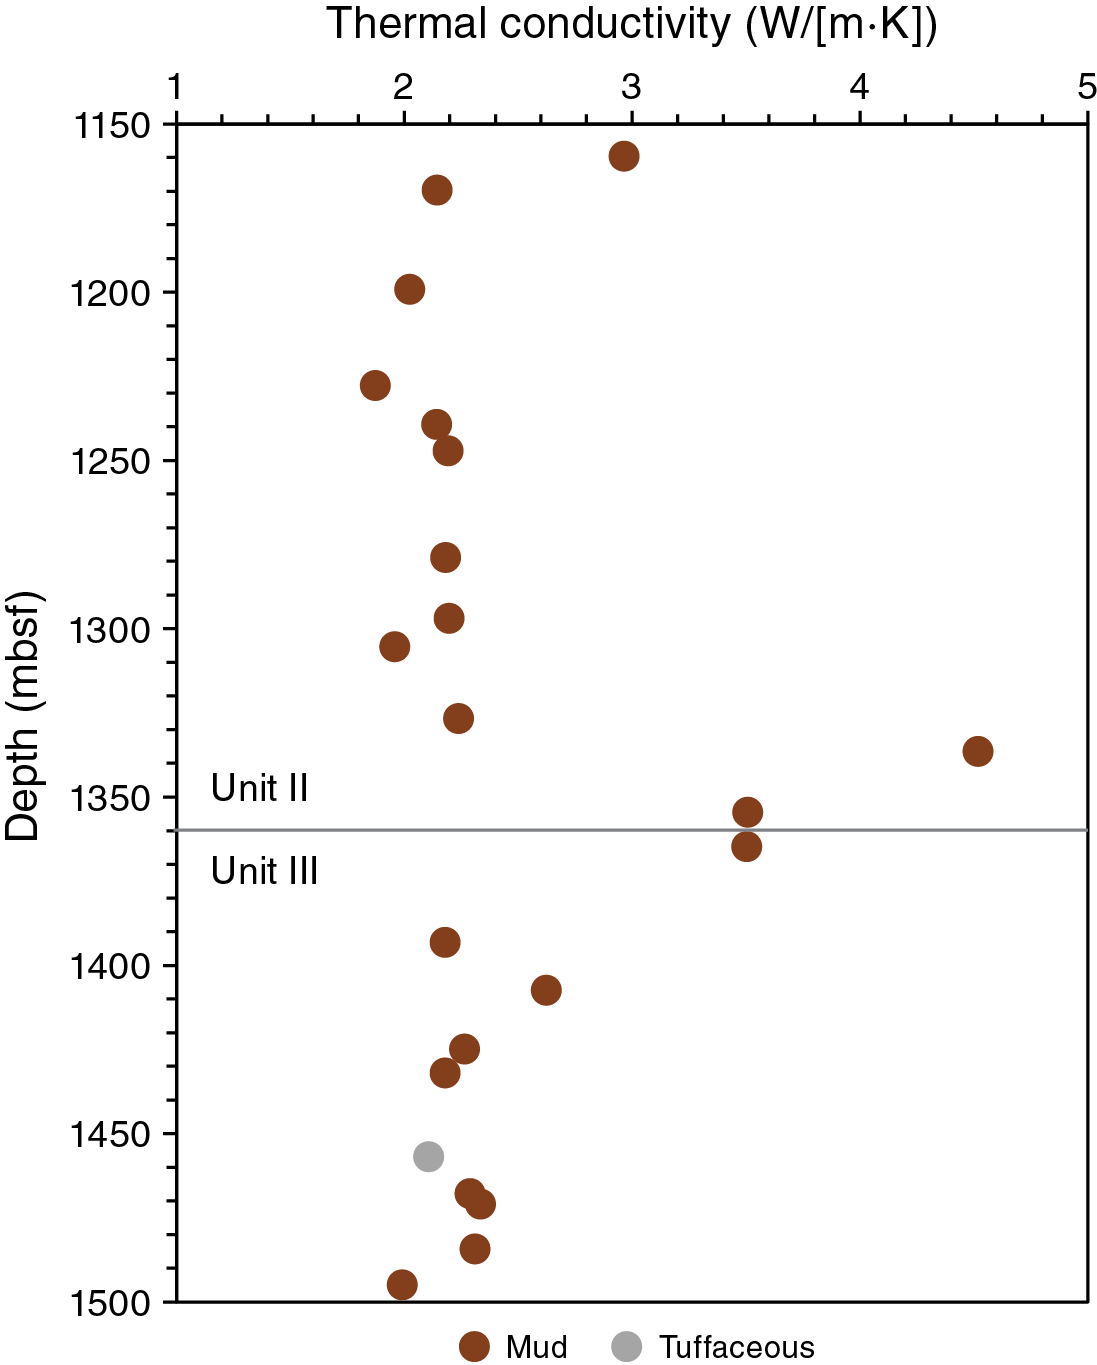
Figure F51. Thermal conductivity versus depth and lithology.
Table T13. Thermal conductivity. Download table in .csv format.
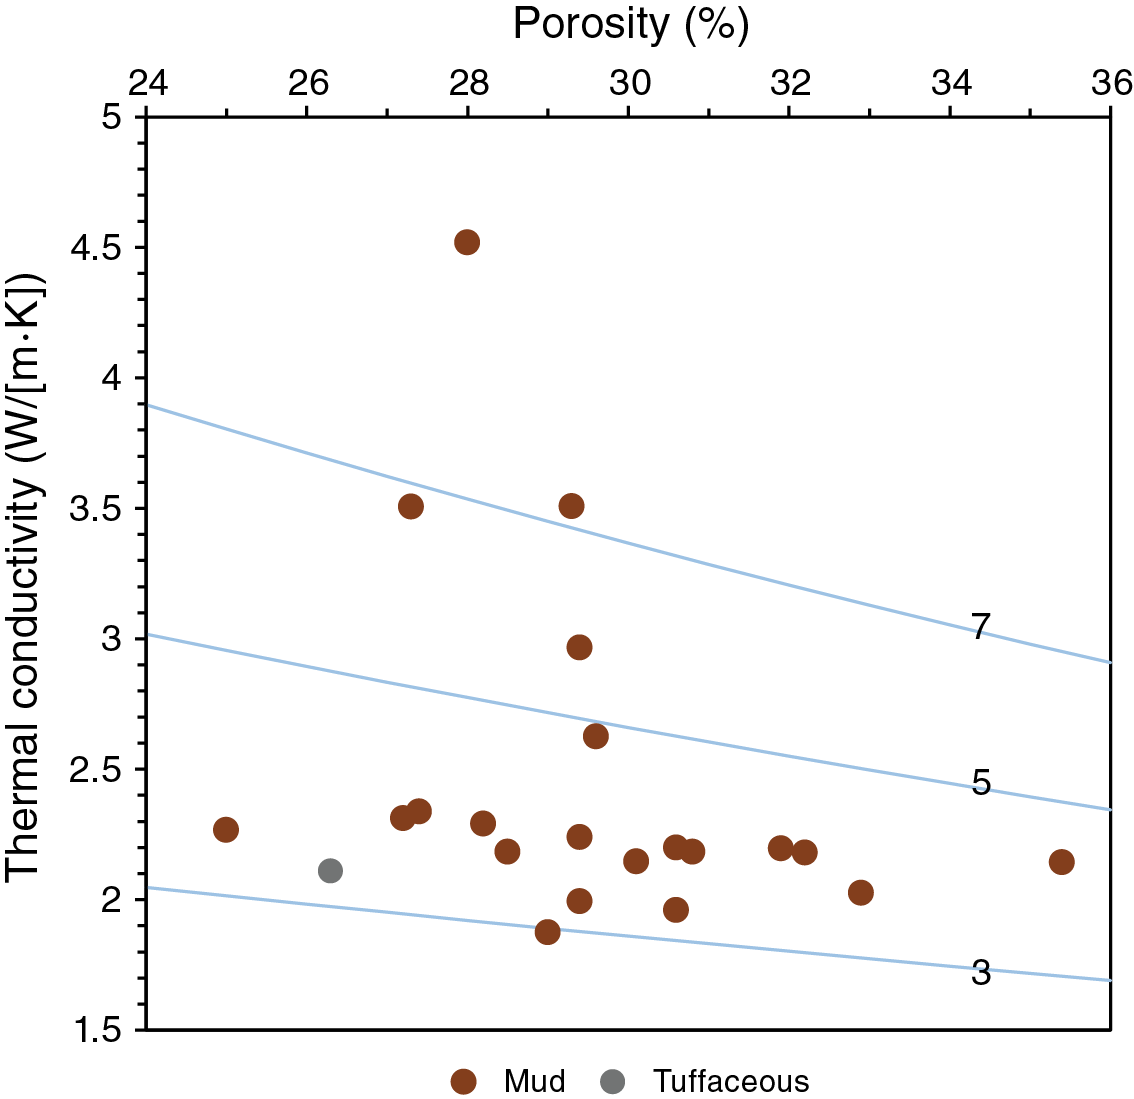
Figure F52. Thermal conductivity versus porosity.
Reflectance spectrophotometry and colorimetry
Color reflectance data include L*, a*, and b* measurements made on the SHMSL (see Reflectance spectrophotometry and colorimetry in the Expedition 362 methods chapter [McNeill et al., 2017b]). In Unit II, the L*, a*, and b* values range from 23 to 50, 0 to 2, and –7 to 0, respectively. At the Unit II/III boundary, L* values shift to 18 to 40, a* values are –5 to –3, and b* values are –10 to 0, with a particularly distinct decrease downhole in L* values across the unit boundary. Within Unit III, between ~1420 and ~1470 mbsf, a* and b* values are 0 to 6 and –8 to –5, respectively, correlating with the presence of tuffaceous and red dusky clay materials. Variations in the color reflectance data correlate well with color changes observed in cores (see Sedimentology and petrology).
Comparison between Site U1480 and U1481 physical properties
The physical properties of sediment drilled at Sites U1481 and U1480 show common general trends in magnetic susceptibility, P-wave velocity, grain density, porosity, and color reflectance with depth. However, NGR shows a different behavior at the Unit II/III boundary, with an increase at Site U1481, whereas NGR values decrease slightly at Site U1480.
Similar to Subunits IIC and IIIA at Site U1480, porosity at Site U1481 is characterized by a general decrease with depth. The scatter of Site U1481 porosity values decreases in Unit III; however, a zone of higher porosity can be identified between 1390 and 1420 mbsf. Site U1480 showed a porosity zone with large variation (4%–60%) in Subunit IIIB. This zone was not encountered at Site U1481 most likely because Subunit IIIB was not recovered (see Sedimentology and petrology).
In Unit III at Site U1481 and in Subunit IIIA at Site U1480, P-wave velocities are similar in magnitude and generally decrease with increasing depth. Based on velocity-porosity relationships, the sediment at both sites is normally consolidated, but the sediment at Site U1480 is better described by a velocity-porosity relationship that assumes total clay content of 20% or less. This correlates with the lower NGR values at Site U1480, which may indicate lower clay content.
Downhole measurements
Coring started too deep in Hole U1481A to deploy any of the downhole temperature tools. Therefore, no formation temperature measurements were taken at Site U1481. Because of time constraints and concerns about hole stability, only one logging tool string was deployed at the end of coring operations in Hole U1481A. The tool combination was chosen to collect the most critical data in one run: NGR, resistivity, sonic velocity, and magnetic susceptibility. The density tool was also included in the tool string, but only for caliper measurements because of the risks associated with using a radioactive source in a potentially unstable formation.
Logging operations
The bit was released at the bottom of Hole U1481A after completion of coring, 350 bbl of 11.0 lb/gal mud were pumped to displace and stabilize the hole, and the end of the drill string was raised to 4250.7 mbrf (60.9 mbsf) in preparation for logging (see Operations). The 48 m long tool string made up of the HNGS, HLDS (without a source), DSI, HRLA resistivity tool, and MSS was rigged up at 0740 h on 1 October 2016 and run into the hole at 0845 h.
Data were recorded while the tools were lowered at a speed of 2500 ft/h. The tools reached a depth of 5684 mbrf (1494 mbsf; 6 m above the bottom of the hole) at 1310 h, and a first pass was recorded for quality control between 5684 and 5592 mbrf (1494–1402 mbsf). The tool string was lowered again, and after reaching the same maximum depth, the main pass started at 1345 h at a speed of 1200 ft/h. The pass was completed at 1525 h. The seafloor was identified in the gamma ray log at 4190 mbrf. The tools were back at the surface at 1945 h, rigged down at 2050 h, and the rig floor was clear of all logging equipment by 2100 h on 1 October.
Data quality
The caliper log in Figure F53 shows that the hole was in very good condition deeper than 1360 mbsf, the interval with high core recovery. Above that depth, the hole size is irregular, beyond the reach of the caliper (17 inches) in some intervals (washouts) and smaller than the bit size in a few small intervals (bridges or ledges). All the tools used were affected by the borehole size, but the HNGS and HRLA were configured to use the caliper data to compensate for hole size, and the data recorded during the main pass were corrected in real time.
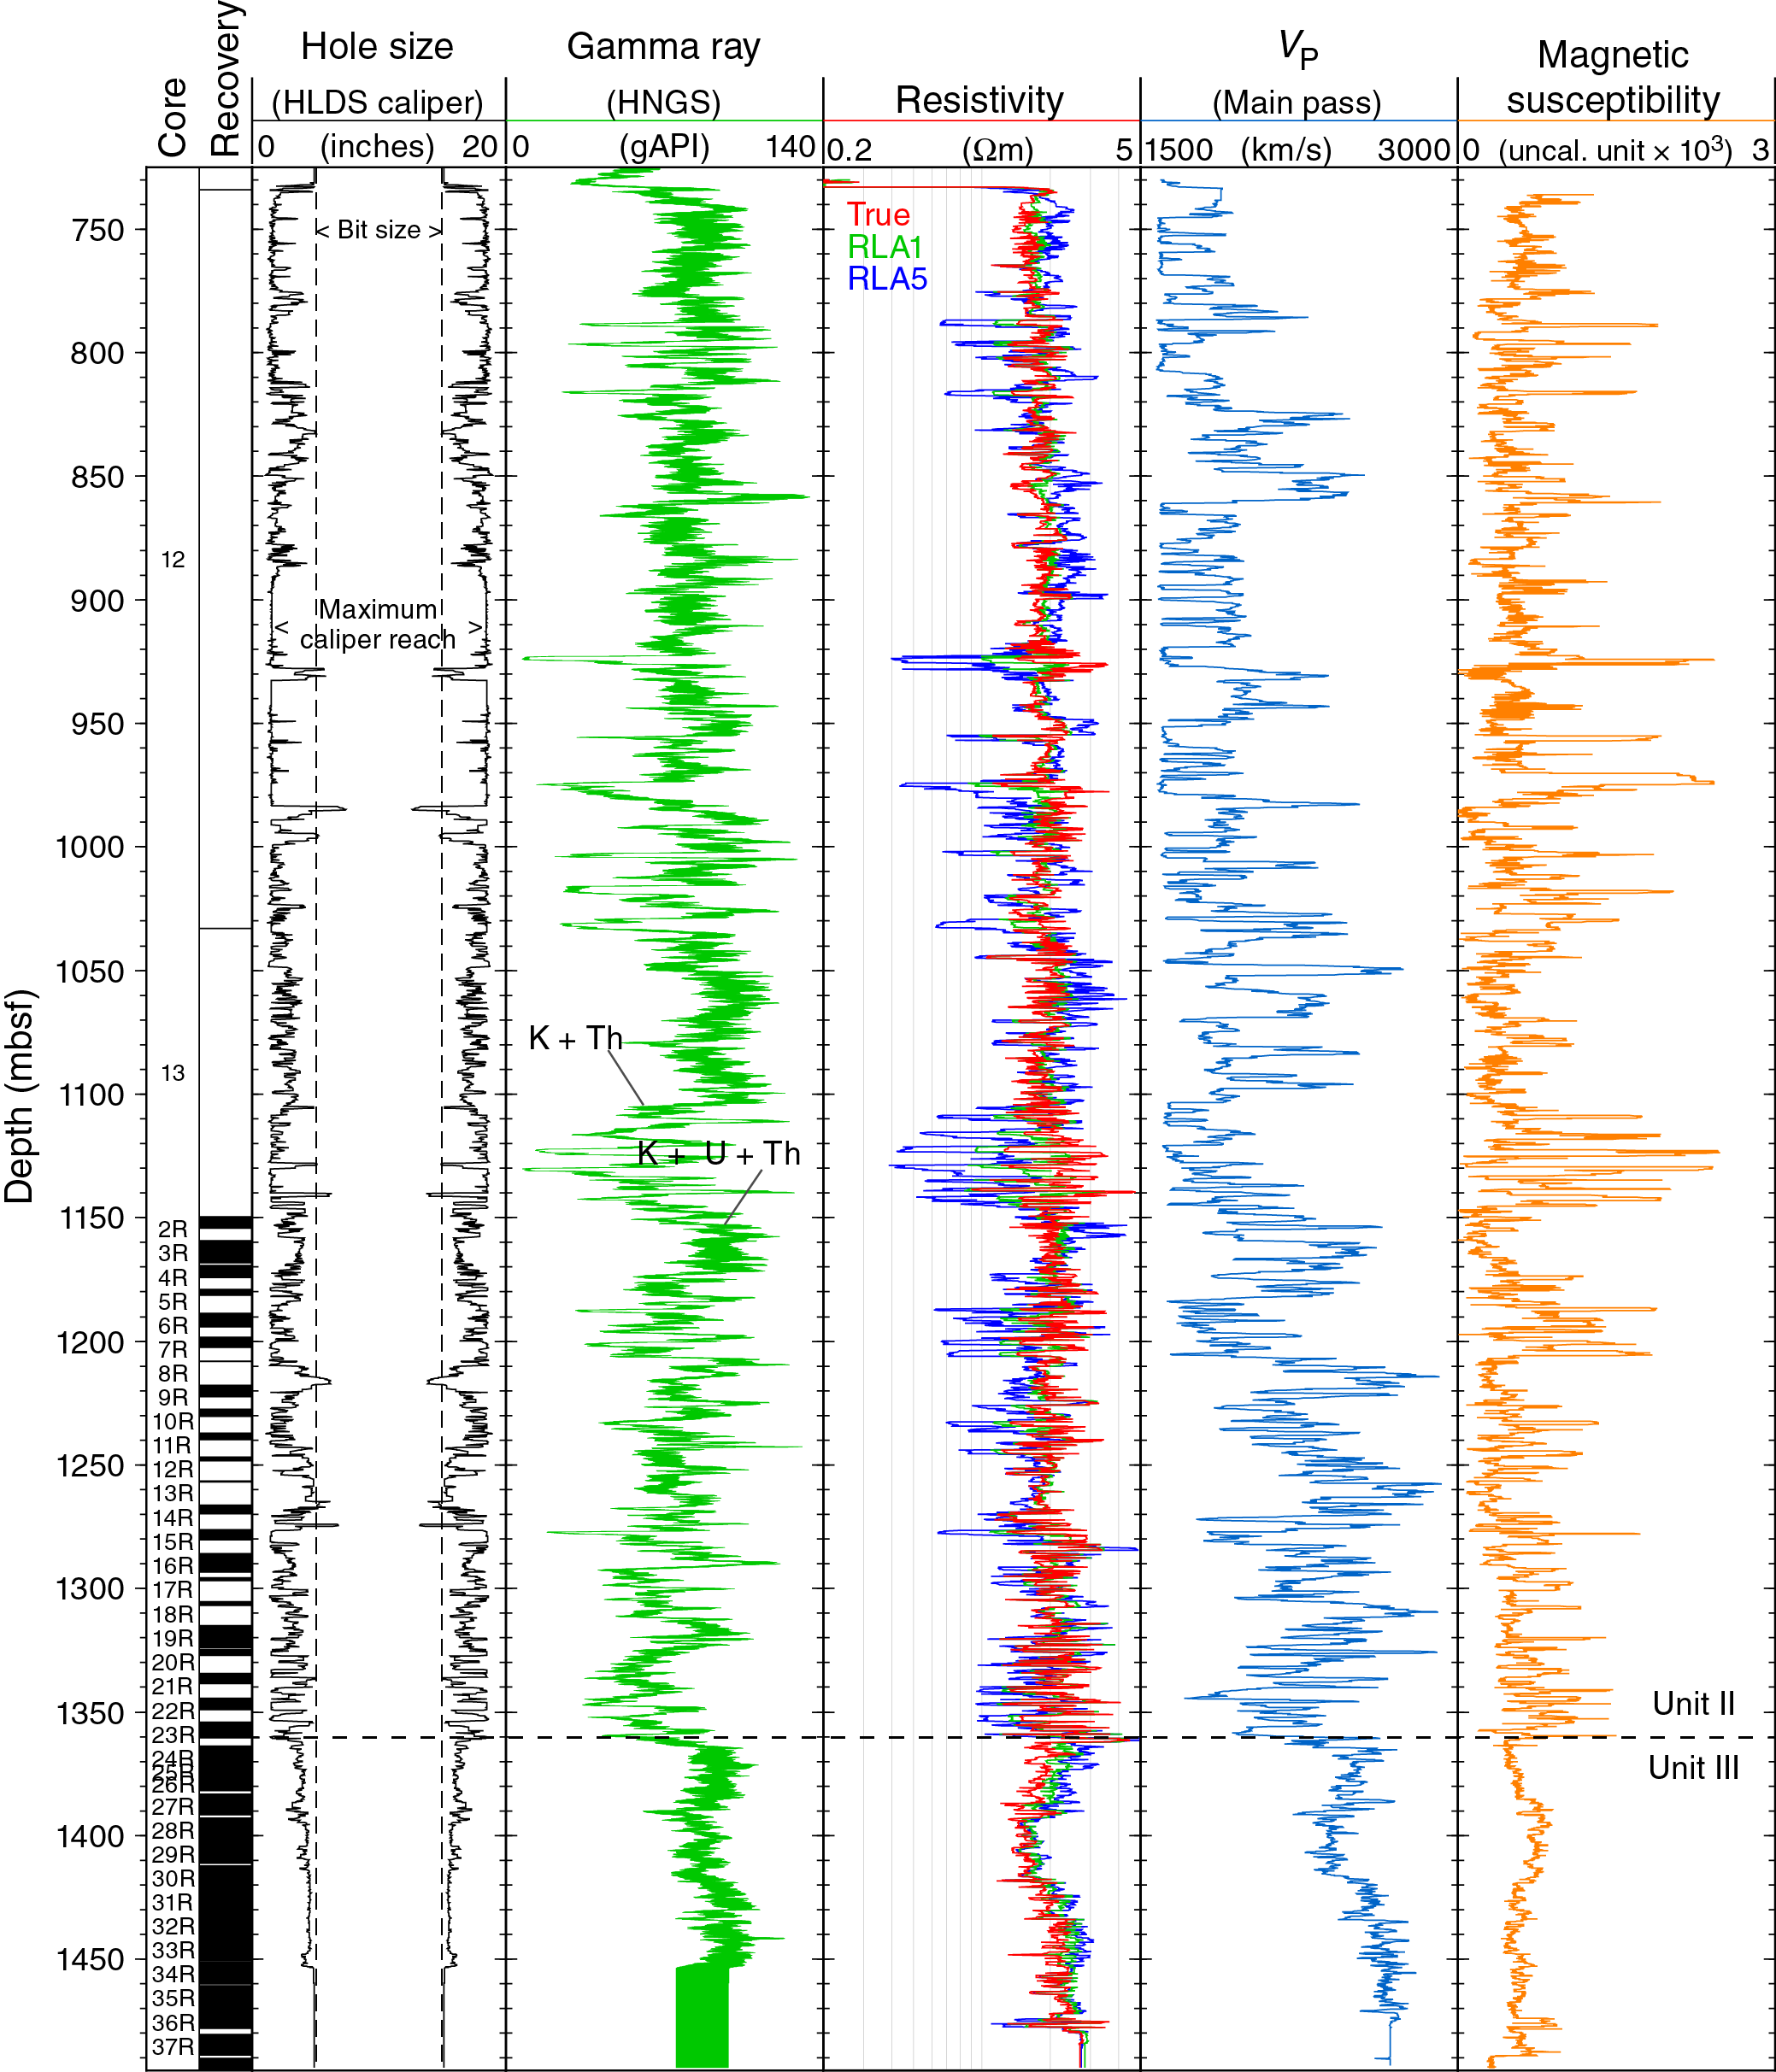
Figure F53. Log summary.
Because the caliper could not be opened while lowering the tools, this correction was not applied during the downlog. This is the main reason for the difference in the gamma ray and resistivity logs between the two passes (Figure F54). Another reason for the differences between the two passes in the gamma ray log is that during the main upward pass, the HNGS was pushed by the caliper arm against the formation, significantly increasing the counts received.
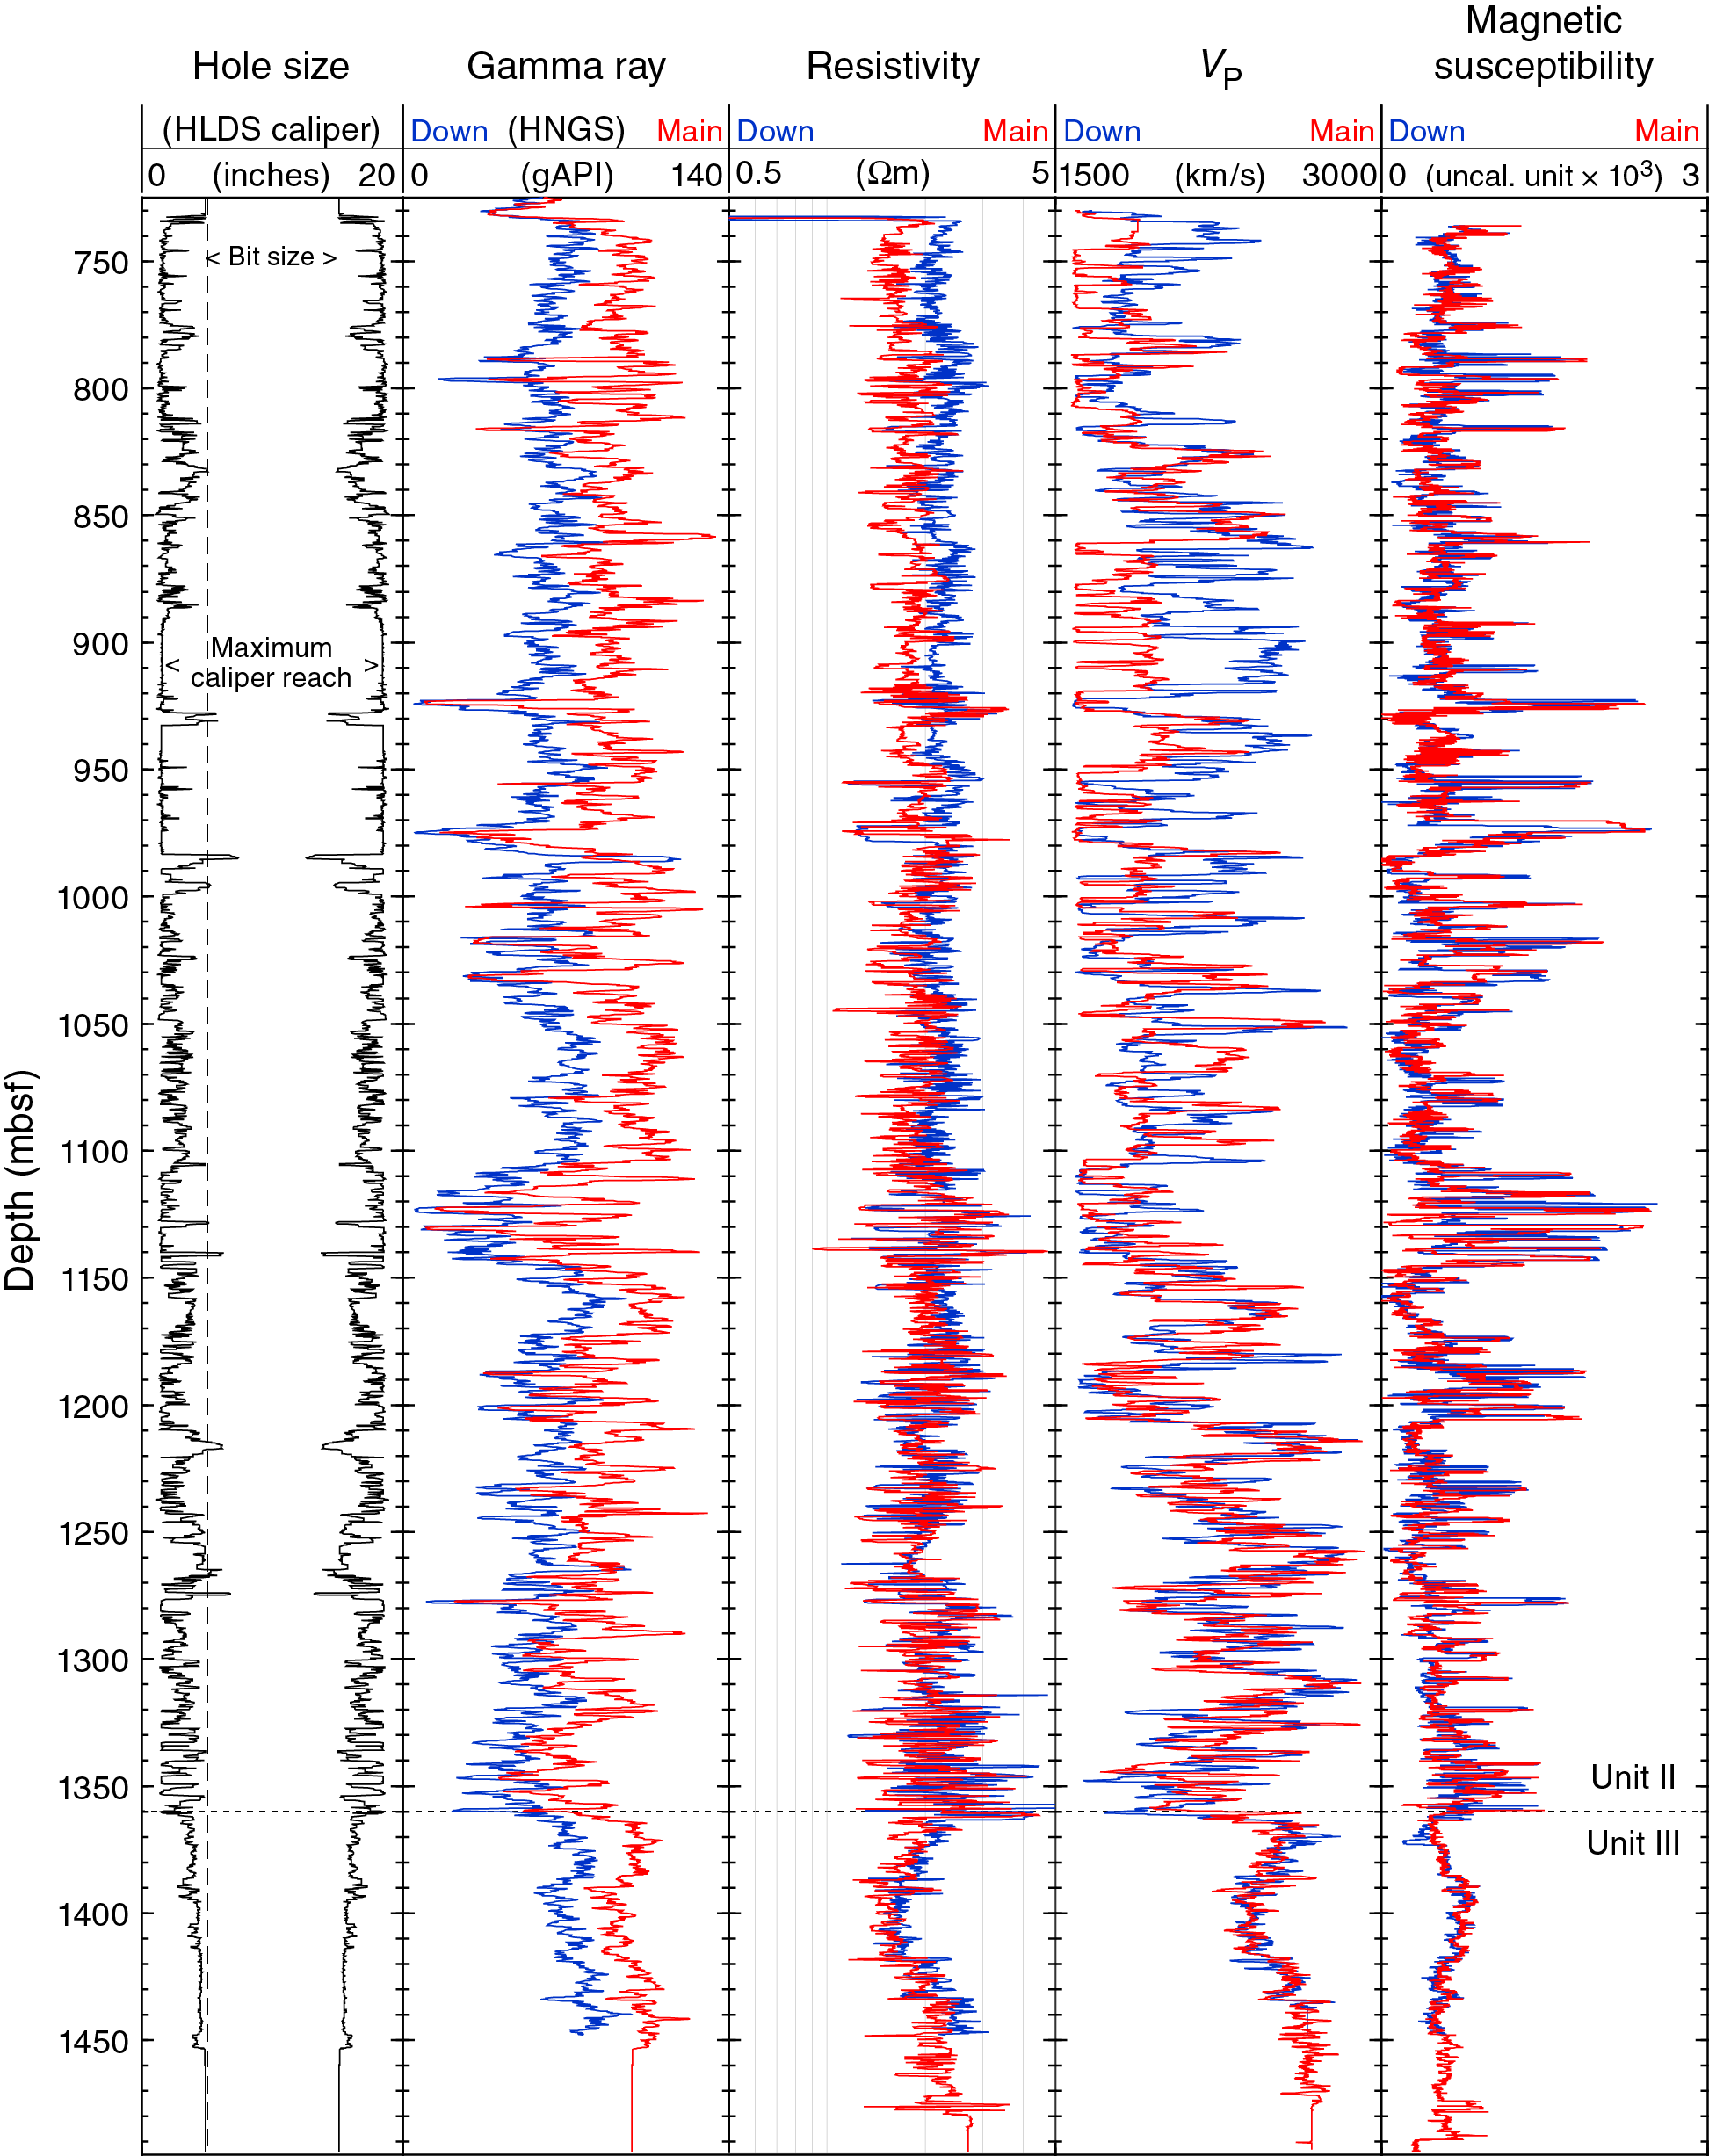
Figure F54. Comparison between downlog and main log passes.
The differences in the VP logs between the two passes (Figures F54, F55) are also related to hole size: the irregular hole introduced noise in the recorded waveforms that made it more difficult for the processing algorithm to consistently identify the different wave arrivals. As the algorithm at a given depth uses the measurement from the previous depth as constraint, a bad arrival can take the process off-track, which will have a different impact depending on the velocity and direction of the tool. Coherence images for the two passes (Figure F55) are similar, showing that some arrivals with high coherence were missed by the real-time acquisition processing. Minor filtering and adjustment to processing parameters will allow us to refine the VP logs. The dipole waveforms recorded to acquire shear velocity data were more adversely affected by hole conditions, but the amplitude and coherence data of the lower dipole waveforms from the main pass (Figure F55) suggest that careful reprocessing should provide a reliable VS log.
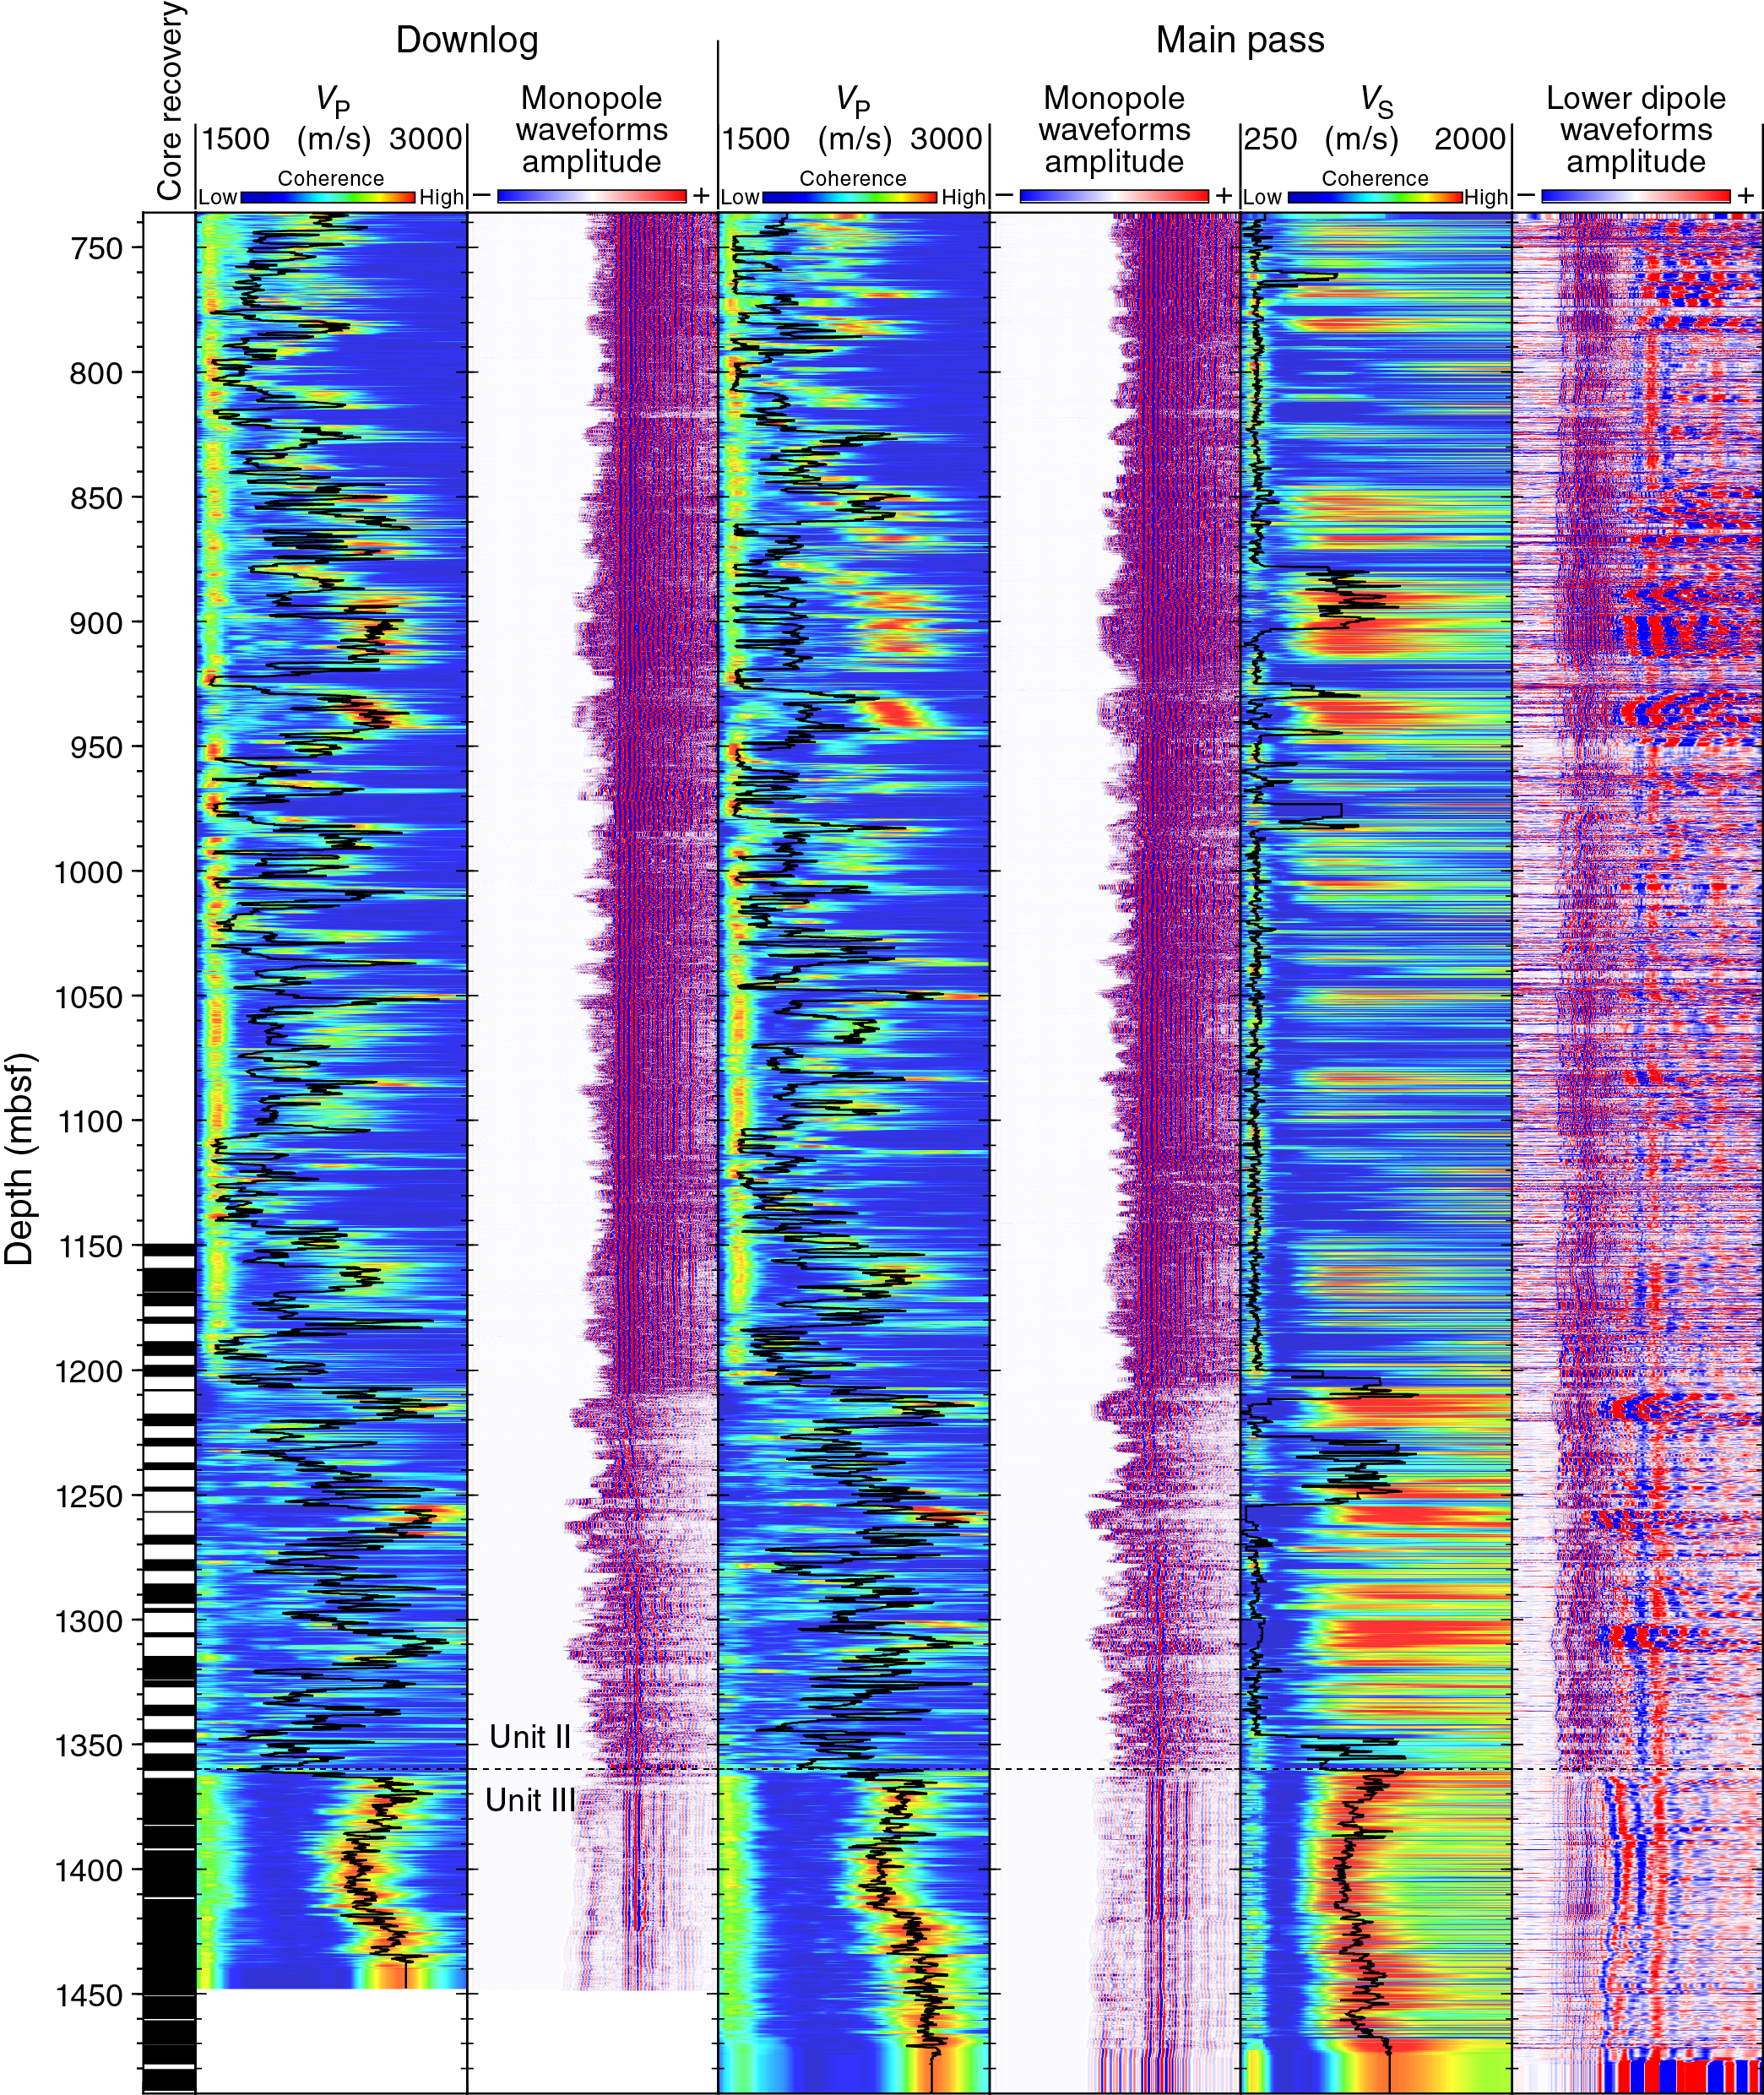
Figure F55. Sonic logs and acoustic waveforms recorded during downlog and main passes.
Spectral gamma ray log
The HNGS was the only tool able to record meaningful data inside the casing. The attenuating effect of the casing is shown by the overall lower values in total gamma ray counts and in potassium, uranium, and thorium concentrations inside the casing (Figure F56) than in the open hole (Figure F57). During the main logging run the HNGS was configured to correct for the hole size using the caliper data; although appropriate in the open hole, this correction failed as soon as the caliper was closed inside the casing (680 mbsf; see black gamma ray trace in Figure F56). The apparently low hole sizes after the caliper was closed were interpreted as a tight hole by the HNGS acquisition algorithm, canceling the need for compensation and resulting in lower values than in the downlog. As a result the data from the downlog inside the casing (green in Figure F56) are likely more representative of the formation properties at depths shallower than 730 mbsf, although still being attenuated by the casing.
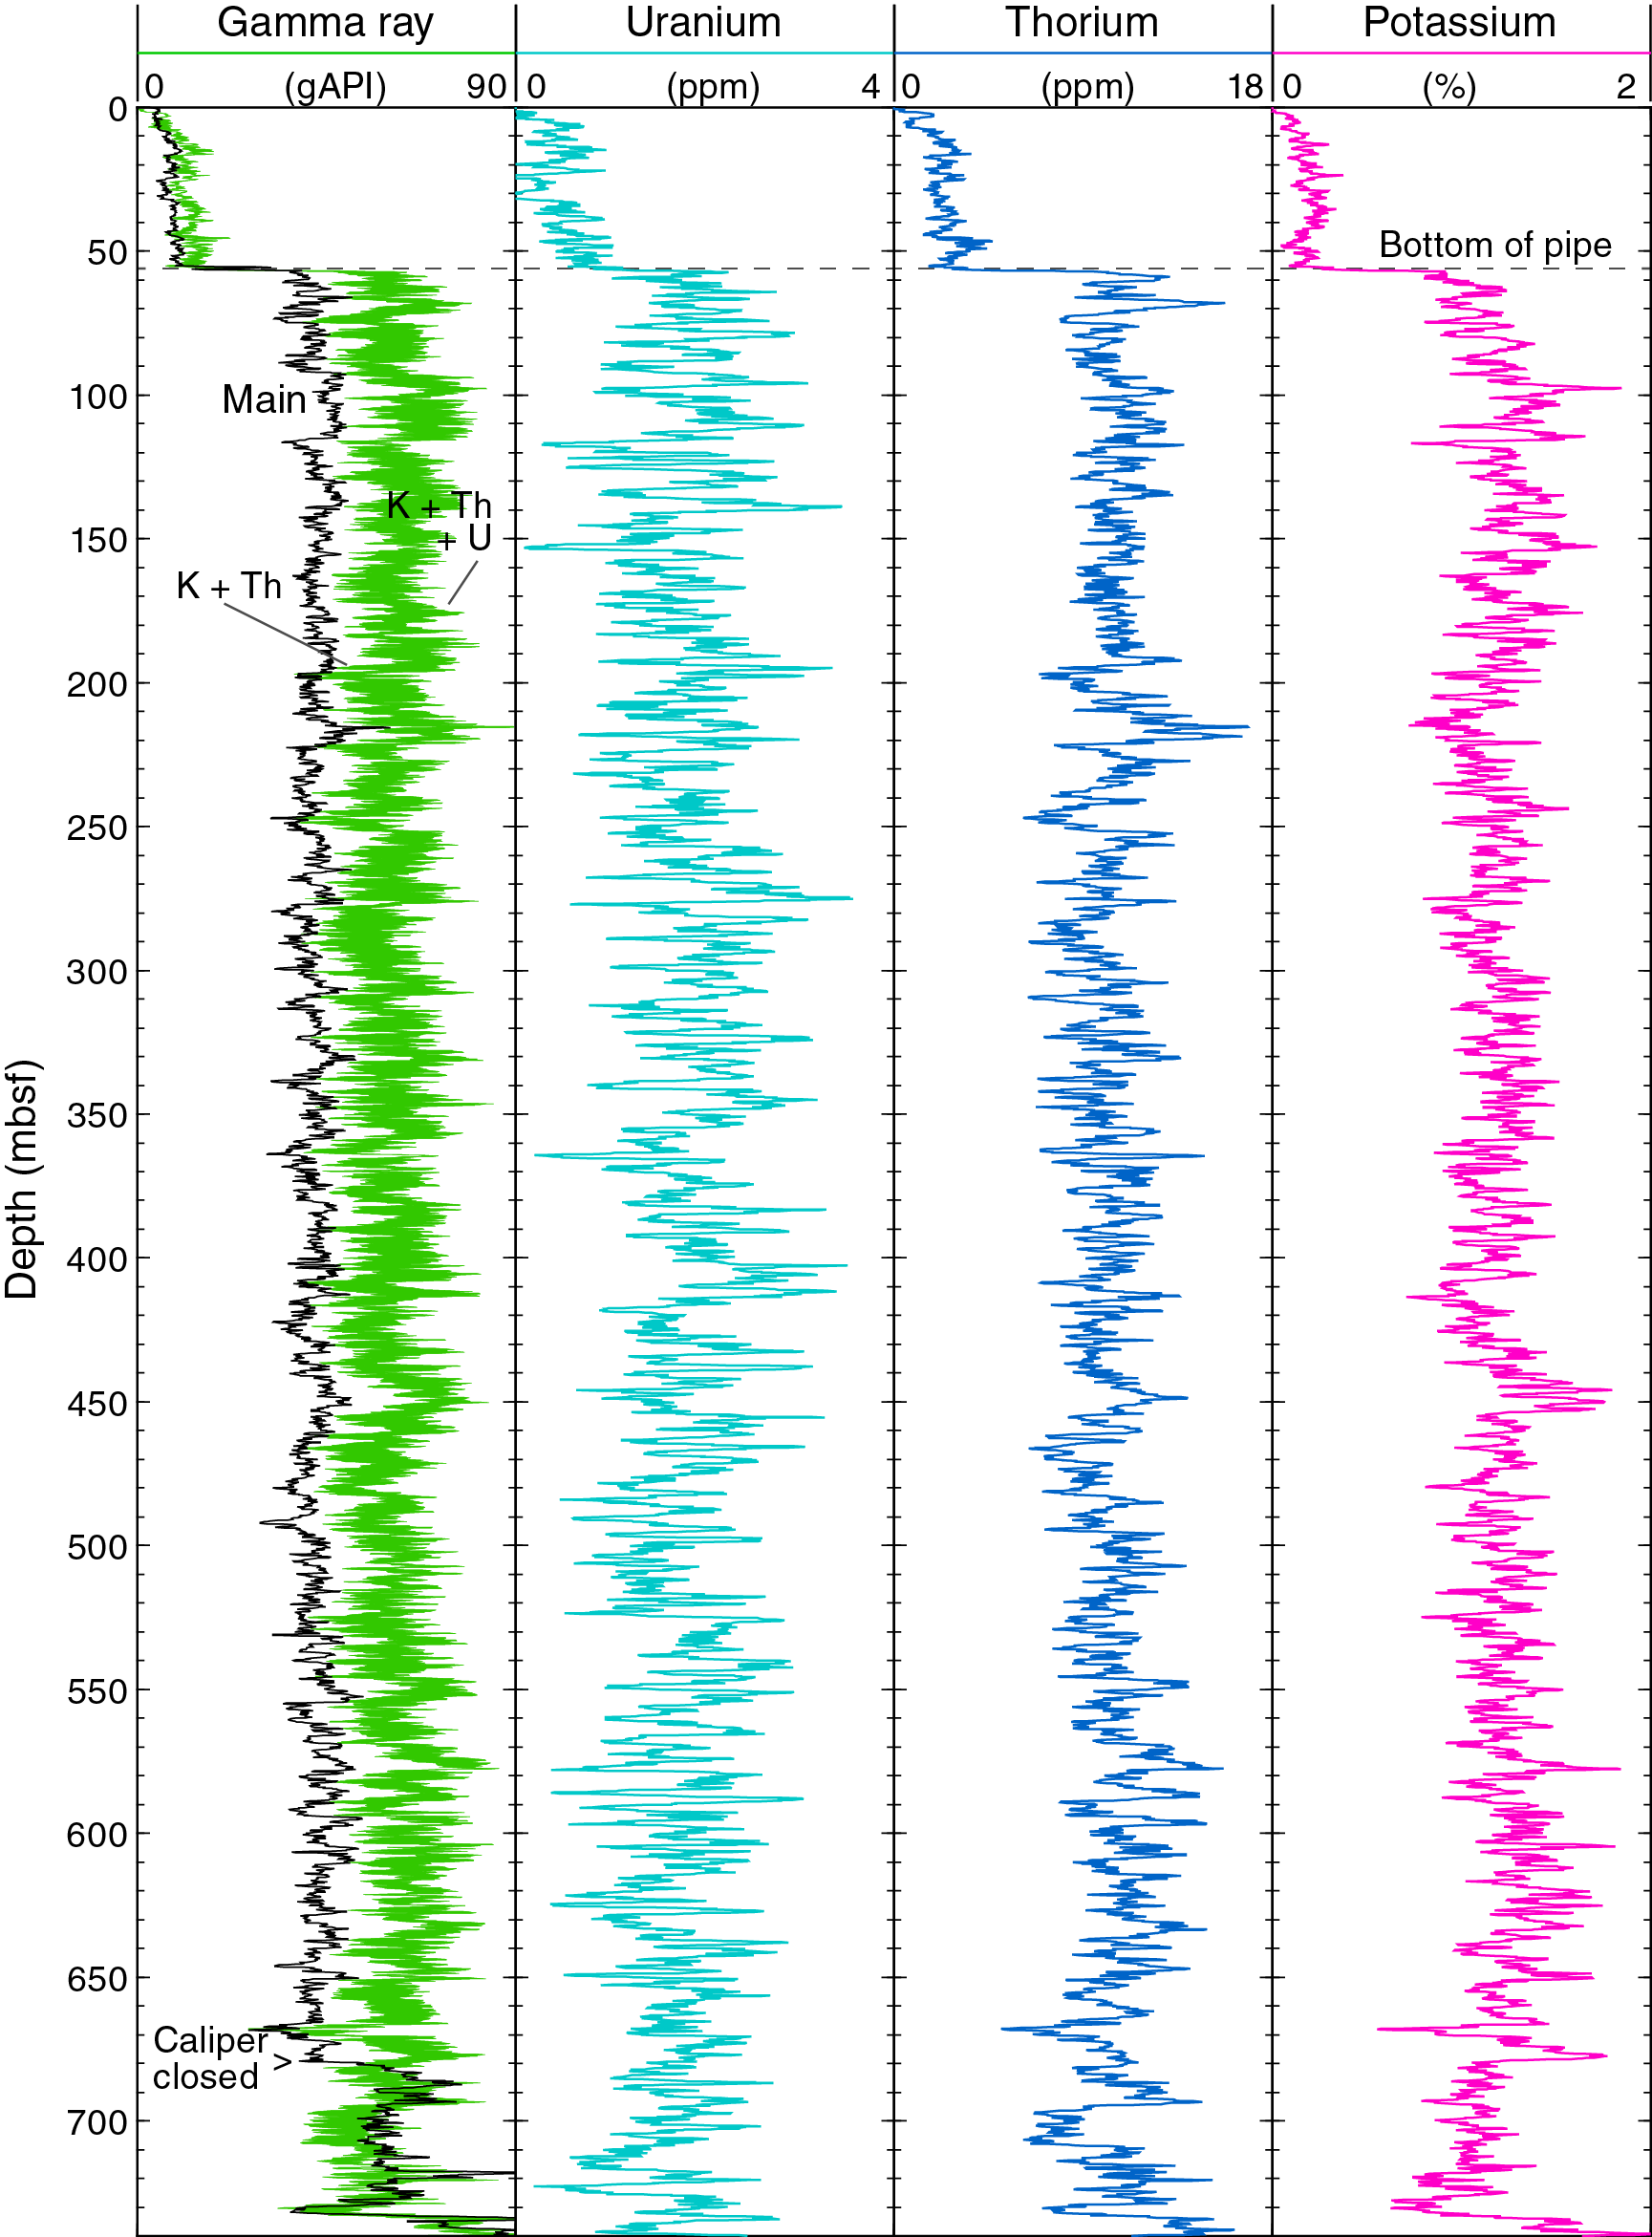
Figure F56. Spectral gamma ray data recorded during downlog inside the casing.
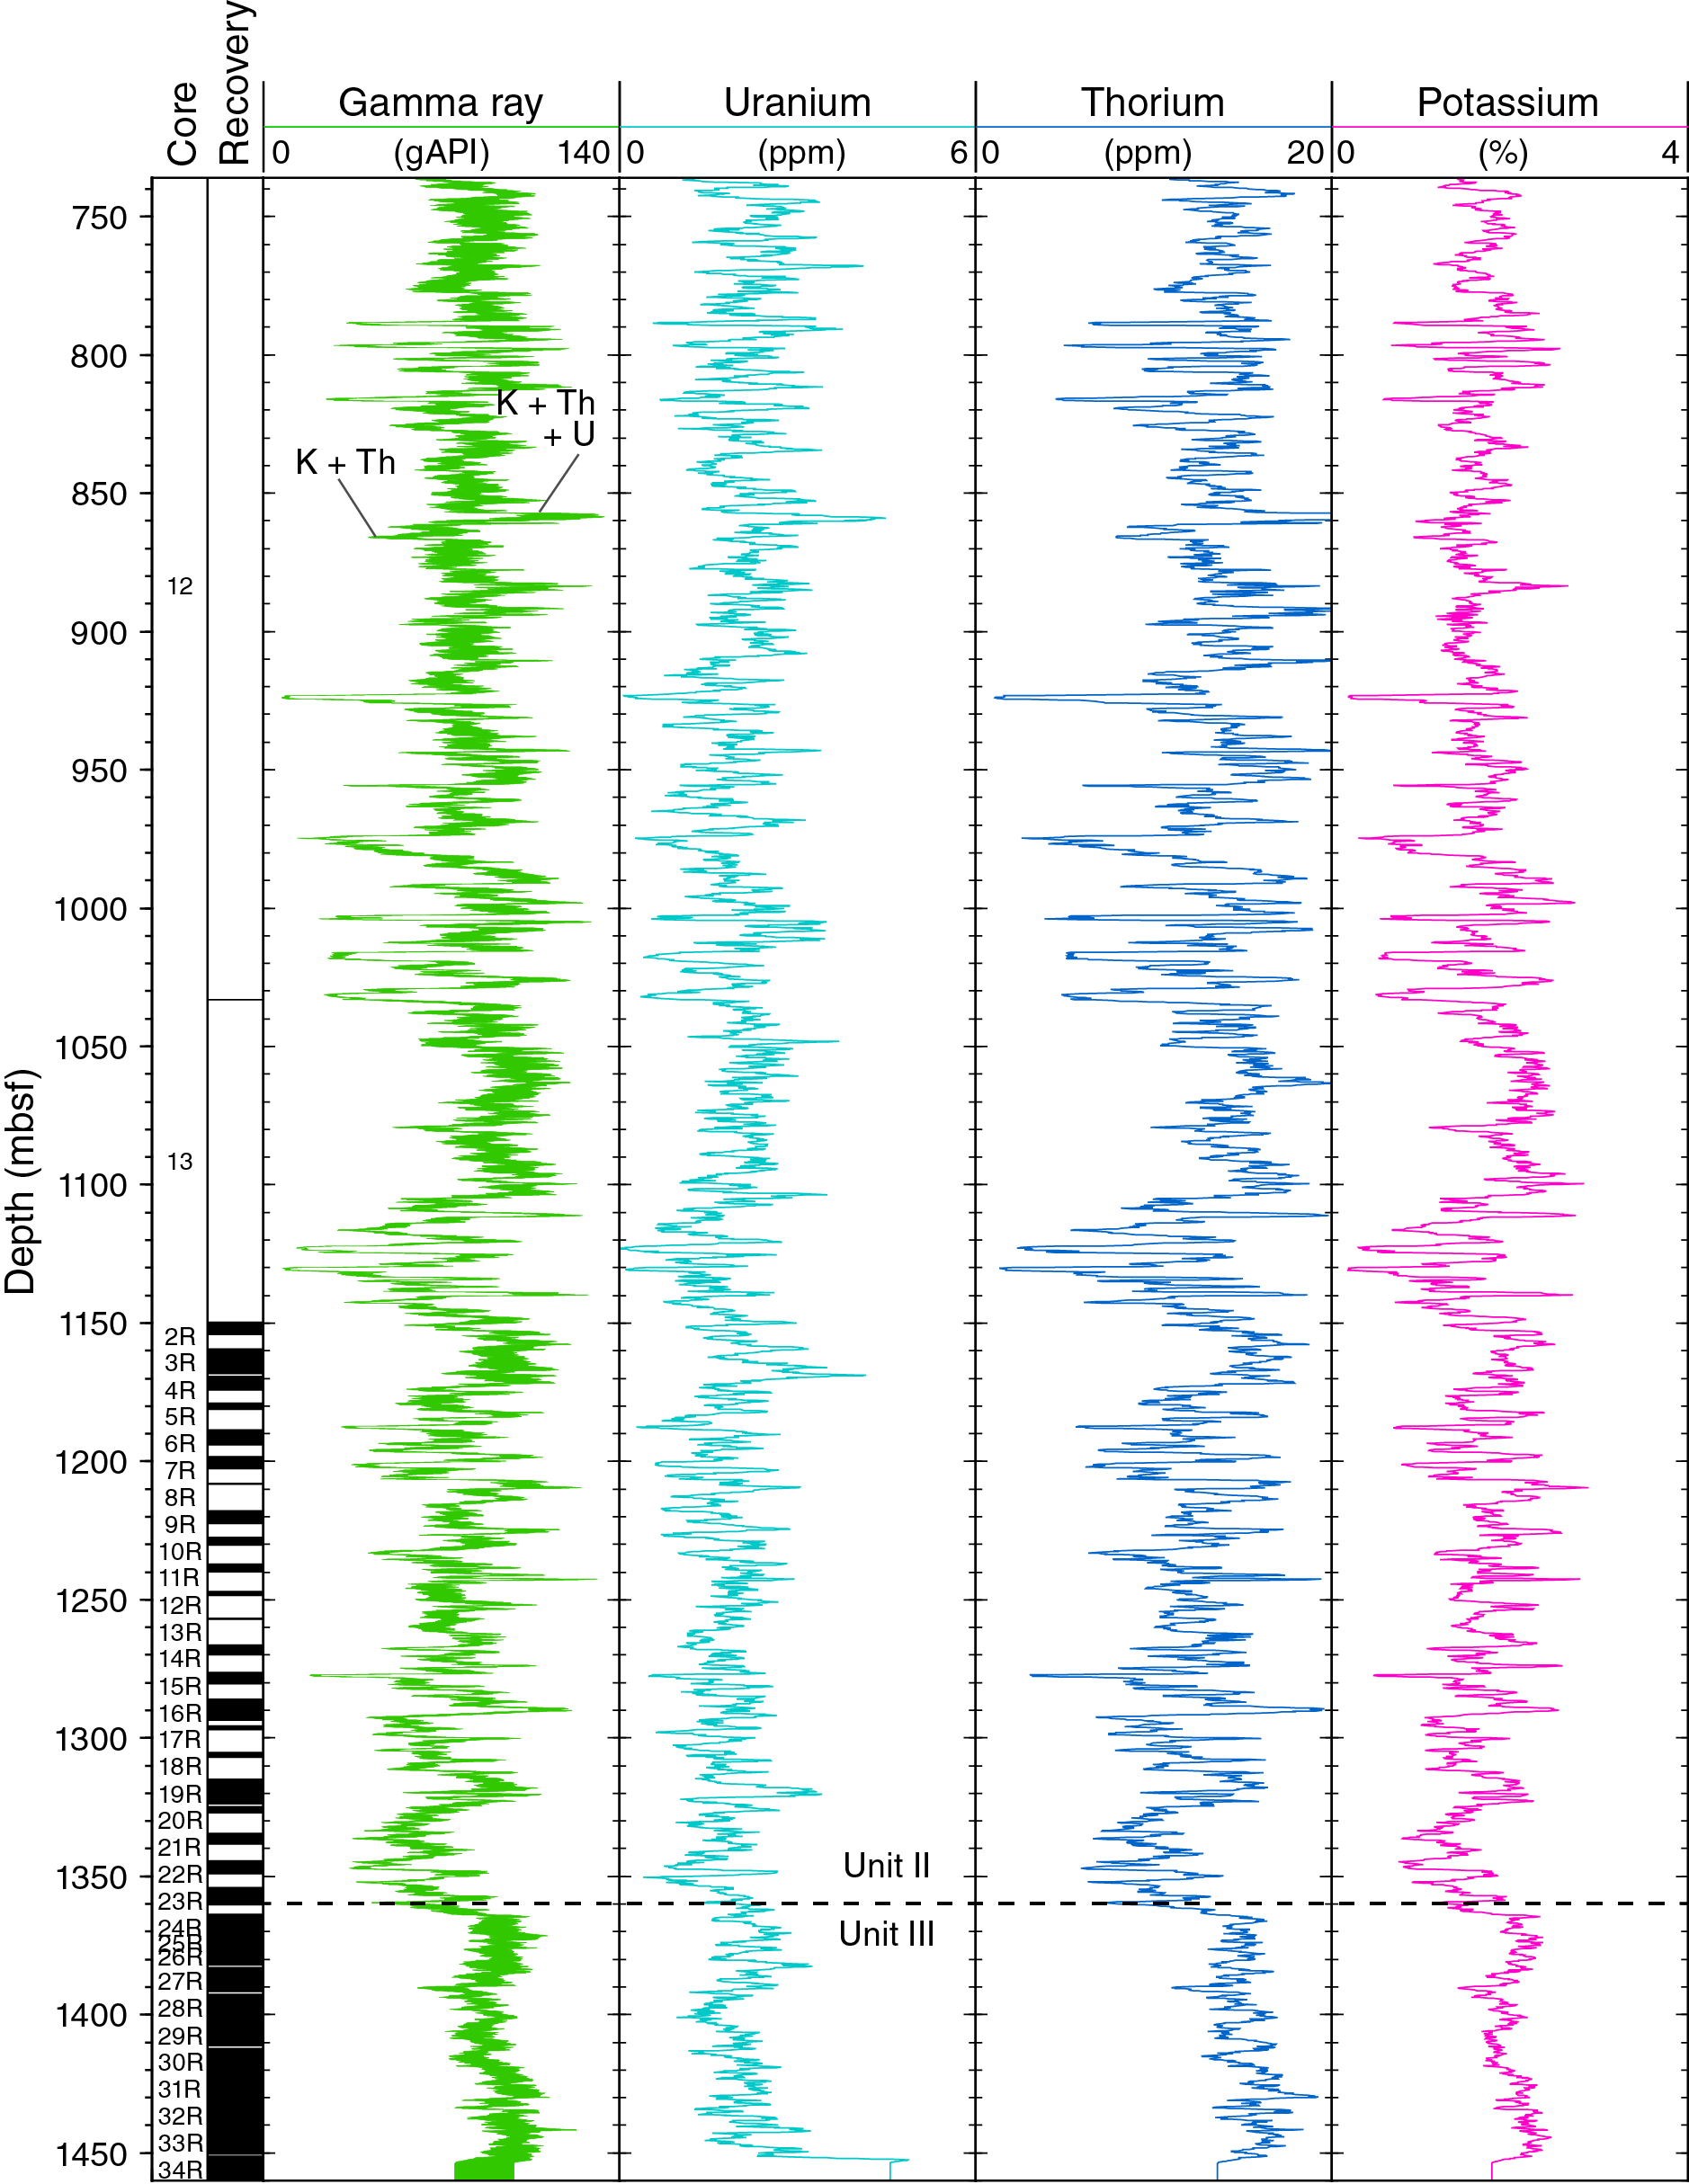
Figure F57. Spectral gamma ray data recorded by the HNGS tool.
Comparison with physical properties from cores
The comparison of the gamma ray, magnetic susceptibility, and VP logs with the same measurements on cores (Figure F58) shows generally good agreement, in particular with the clear changes in all properties that coincide with the lithostratigraphic Unit II/III boundary (1360 mbsf; see Sedimentology and petrology and Physical properties). The gamma ray log and NGR core data agree particularly well below this depth, as do the VP log and discrete velocity measurements made on core samples in the vertical (z) direction. The higher velocity measurements by the P-wave logger are an indication of the high level of anisotropy between the vertical and horizontal velocity components in this interval, as noted in Physical properties, and are also consistent with the development of horizontal fractures following splitting of the cores (see Structural geology).
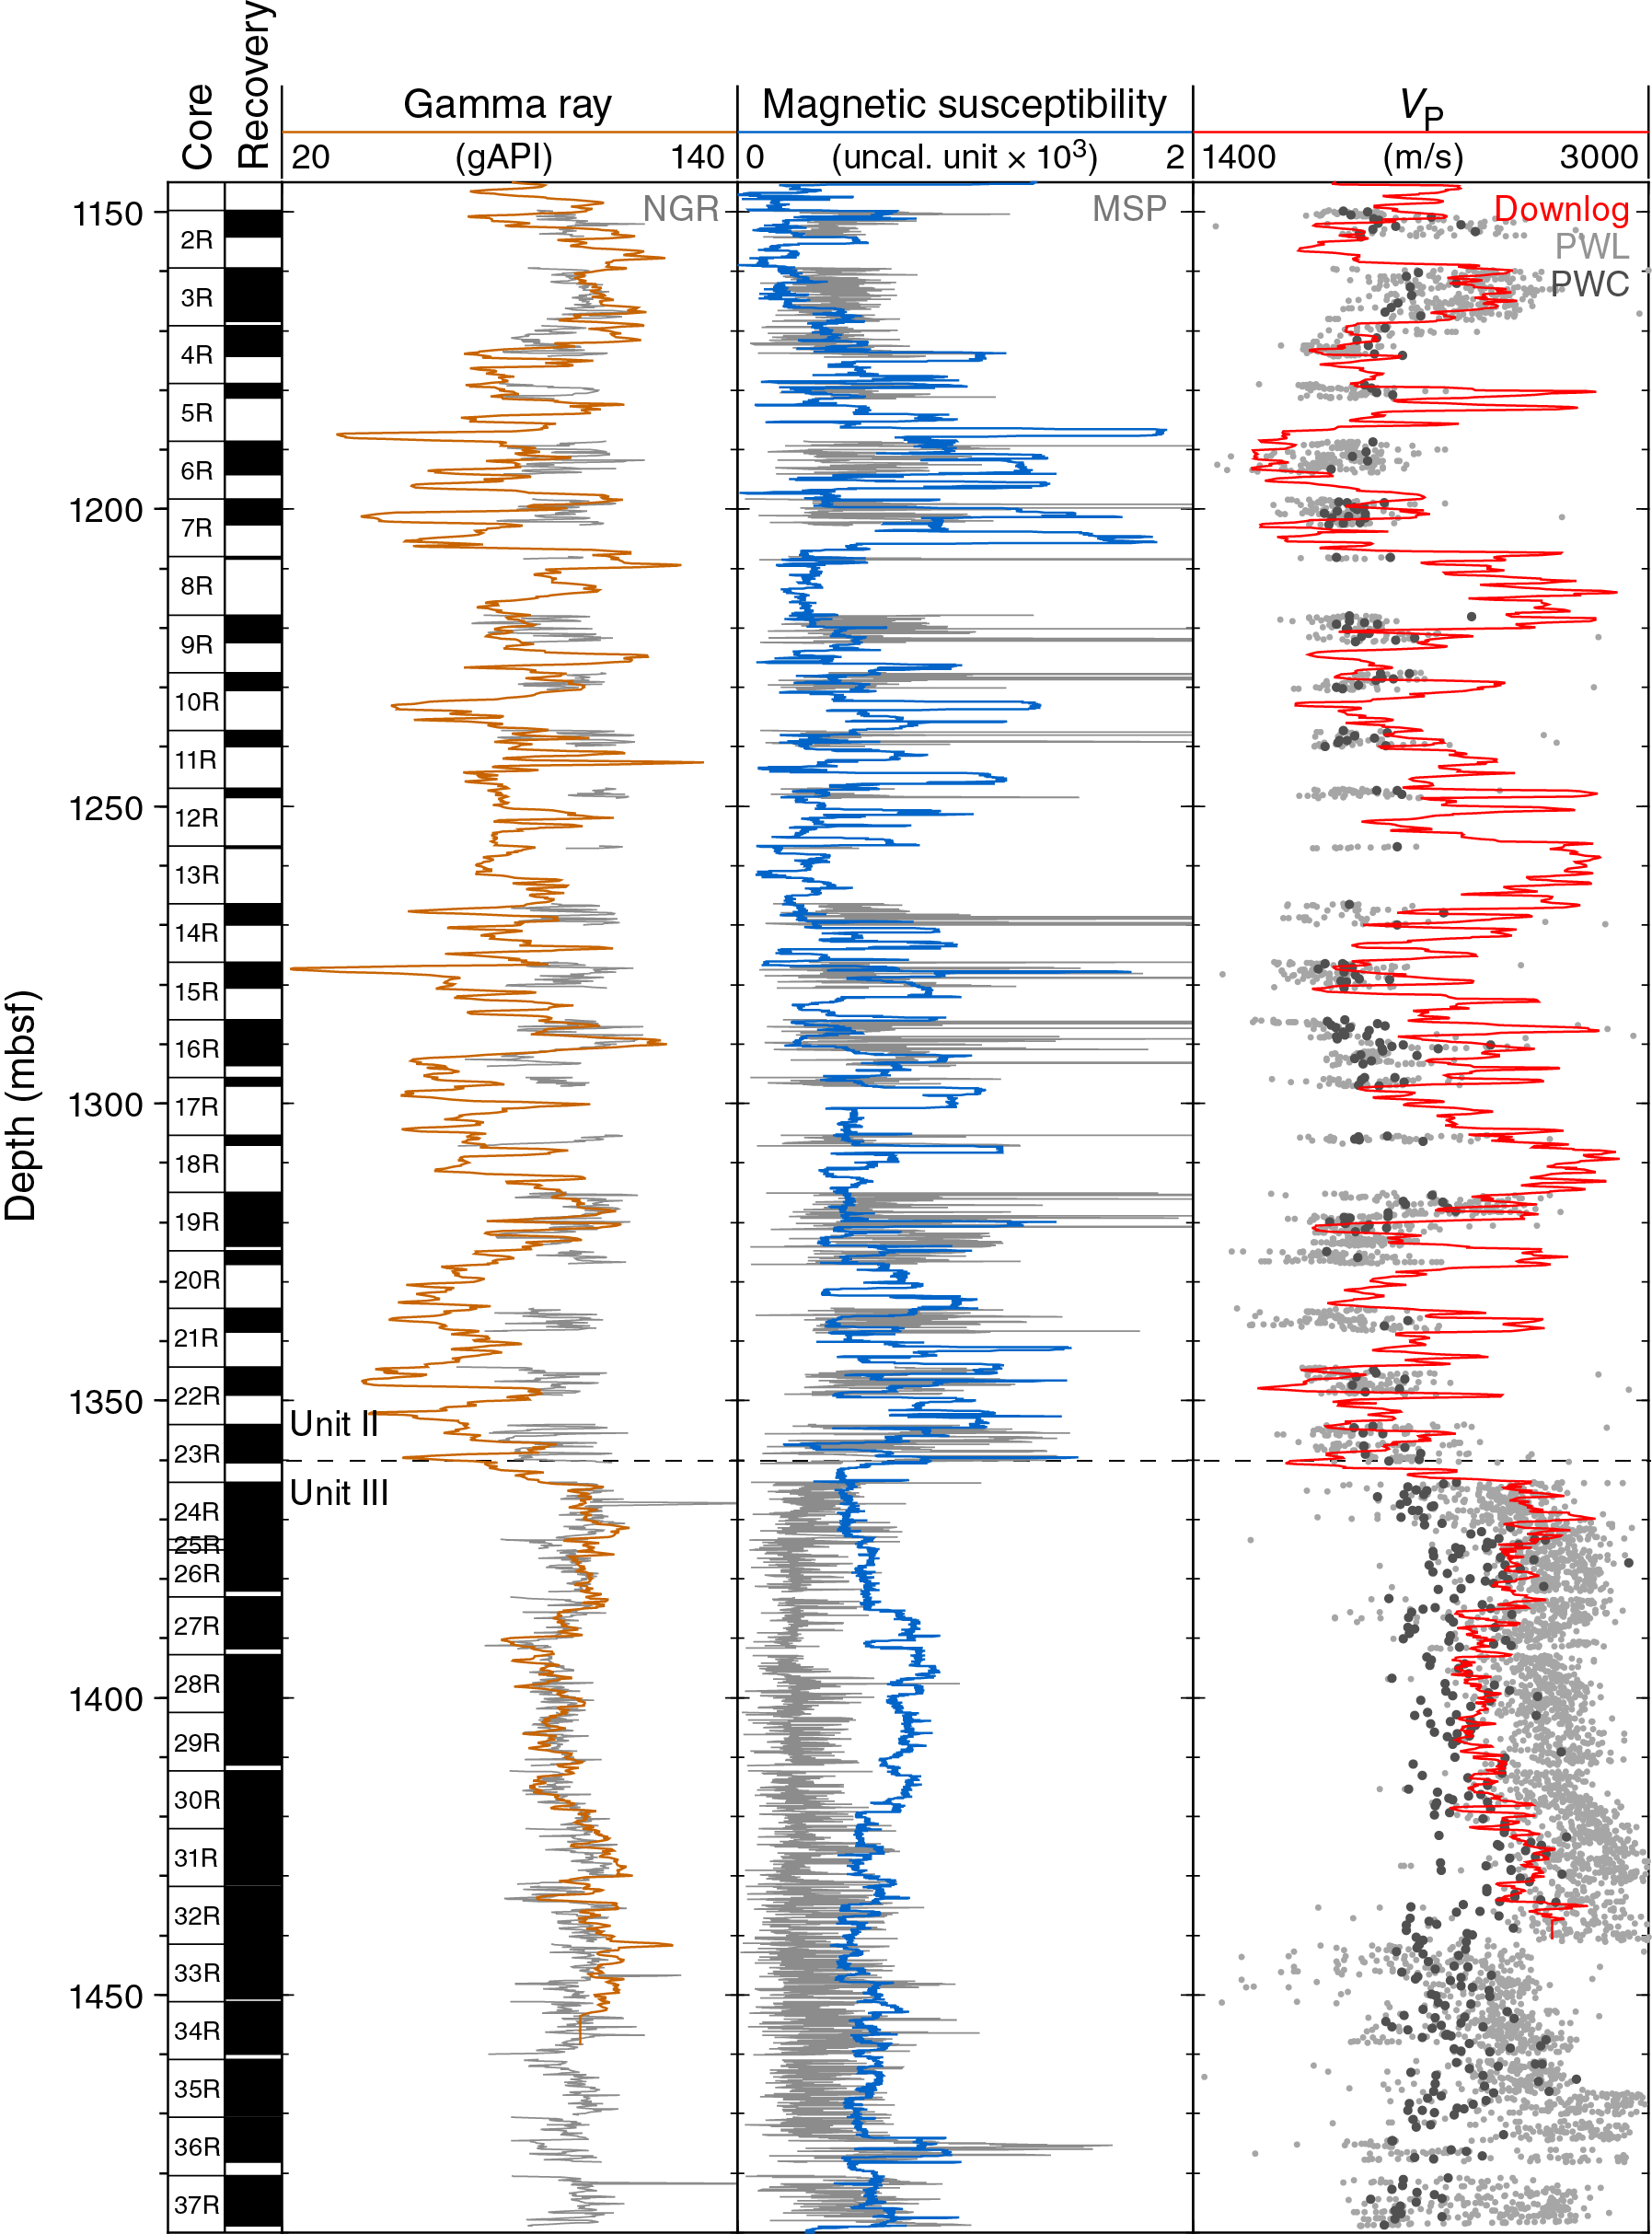
Figure F58. Comparison between the gamma ray, magnetic susceptibility, and velocity logs.
Although the high variability in magnetic susceptibility in Unit II is similar in the logging and core data and the two measurements seem in good agreement in this unit, the broader trend of the magnetic susceptibility log in Unit III is opposite to the core measurements, with a slight increase with depth downhole from 1360 to 1400 mbsf and a slight decrease deeper in the hole. In this unit, as in the entire logged interval and more significantly with the stronger variations in Unit II, the magnetic susceptibility log mirrors the larger variations in the gamma ray log, reflecting the opposite influence of probable sandy intervals on the two measurements.
The generally opposing trends of the gamma ray and susceptibility logs in Unit II are further illustrated in Figure F59. In addition we have tried to adjust the depth of cored sections in an interval with incomplete recovery by comparing core data with the gamma ray and magnetic susceptibility logs. Where the signature of one measurement is only moderately matched between the core and log data, the identification of possible matches in the two measurements can reinforce the confidence in the match.
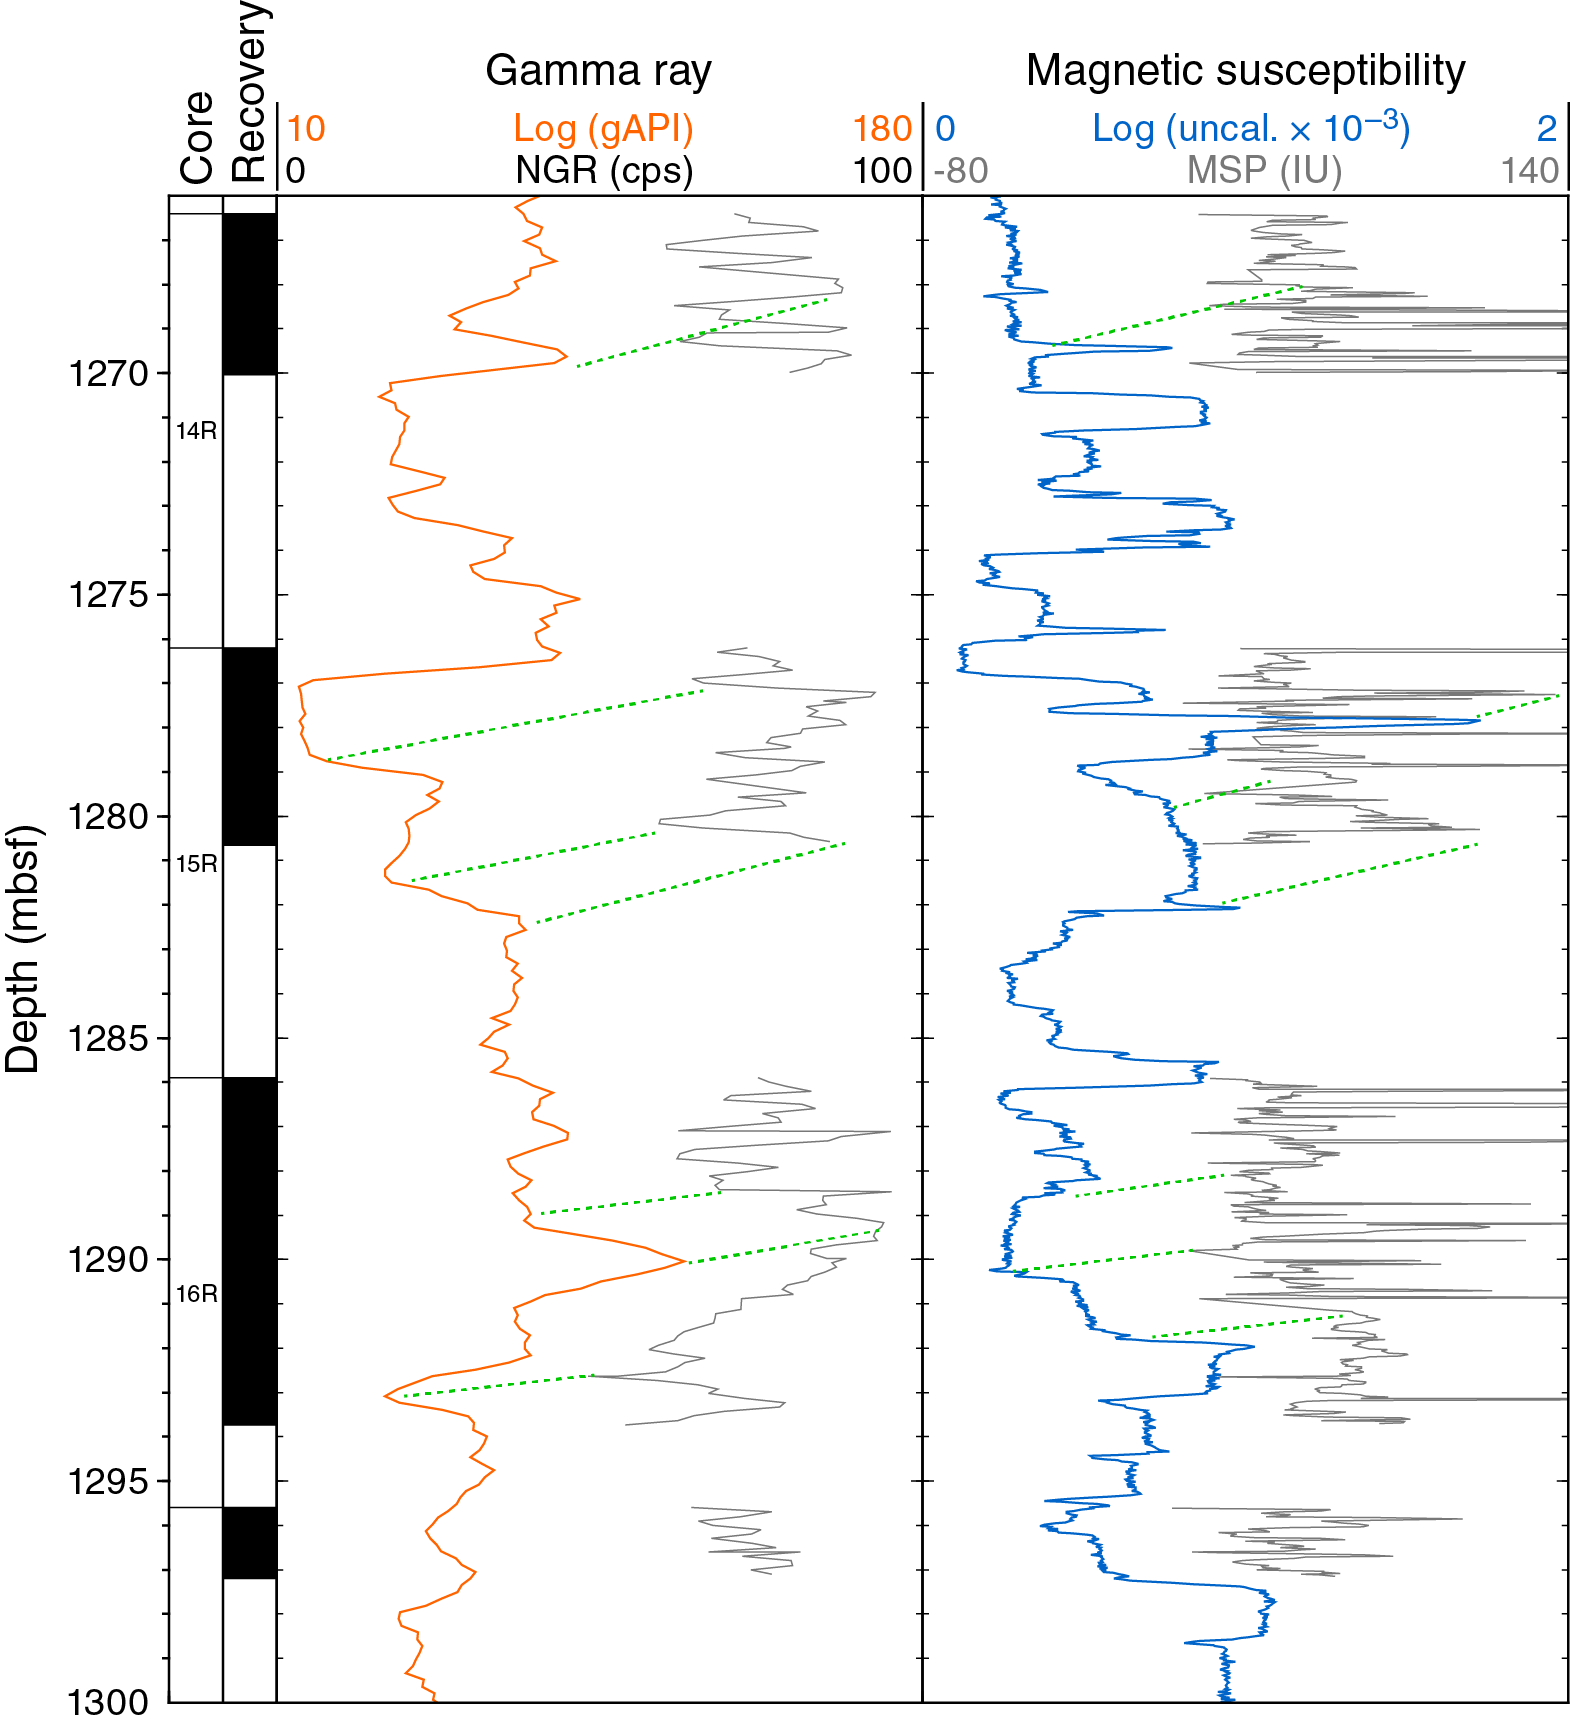
Figure F59. Comparison of gamma ray and magnetic susceptibility logs with core data.
Estimation of porosity from resistivity
Because of concerns about the stability of the hole, the neutron porosity tool was not used, and the density tool was deployed without a source in Hole U1481A. As a result, the logging tools did not make any direct measurements of the formation density or porosity. Although the measurements made on the recovered core provide porosity and density data deeper than 1150 mbsf, no core was recovered between 750 and 1150 mbsf, and the logs provide the only measurements of the formation properties in this interval.
We used Archie’s (1942) relationship to calculate porosity from the resistivity log, assuming only water in the pore space, and combined it with MAD grain density data to derive a density profile. Archie (1942) established an empirical relationship between porosity (ɸ), formation resistivity (Rt), and pore water resistivity (Rw) in sandy formations:
where m and a are two empirical parameters that are often called cementation and tortuosity (or Archie) coefficients, respectively. The resistivity of seawater (Rw) was calculated as a function of temperature and salinity (Fofonoff, 1985). Pore water salinity was assumed to be 35 ppt, and temperature was assumed to follow a linear gradient of 44°C/km, as constrained by in situ measurements at Site U1480 (see Downhole measurements in the Site U1480 chapter [McNeill et al., 2017d]). The most realistic and simplest value for the tortuosity coefficient is a = 1 because this gives a resistivity equal to formation water resistivity when porosity is 100%. A value of m = 2.2 (well within the standard accepted range 1.5 ≤ m ≤ 2.5) was chosen iteratively to provide the best baseline match with MAD porosity data. The resulting resistivity-derived porosity log is shown in Figure F60, where it compares well with MAD porosity data, particularly deeper than 1360 mbsf. Using MAD grain density, we used this resistivity-derived porosity to calculate a bulk density curve, which is also in good agreement with core measurements (Figure F60). The resulting curves suggest an overall decrease in porosity with depth, illustrating the influence of compaction. The sharp change in character at the Unit II/III boundary reflects the change in resistivity and in all other logs at this depth, most noticeably reduced variability in both lithology and hole conditions in the claystone of Unit III.
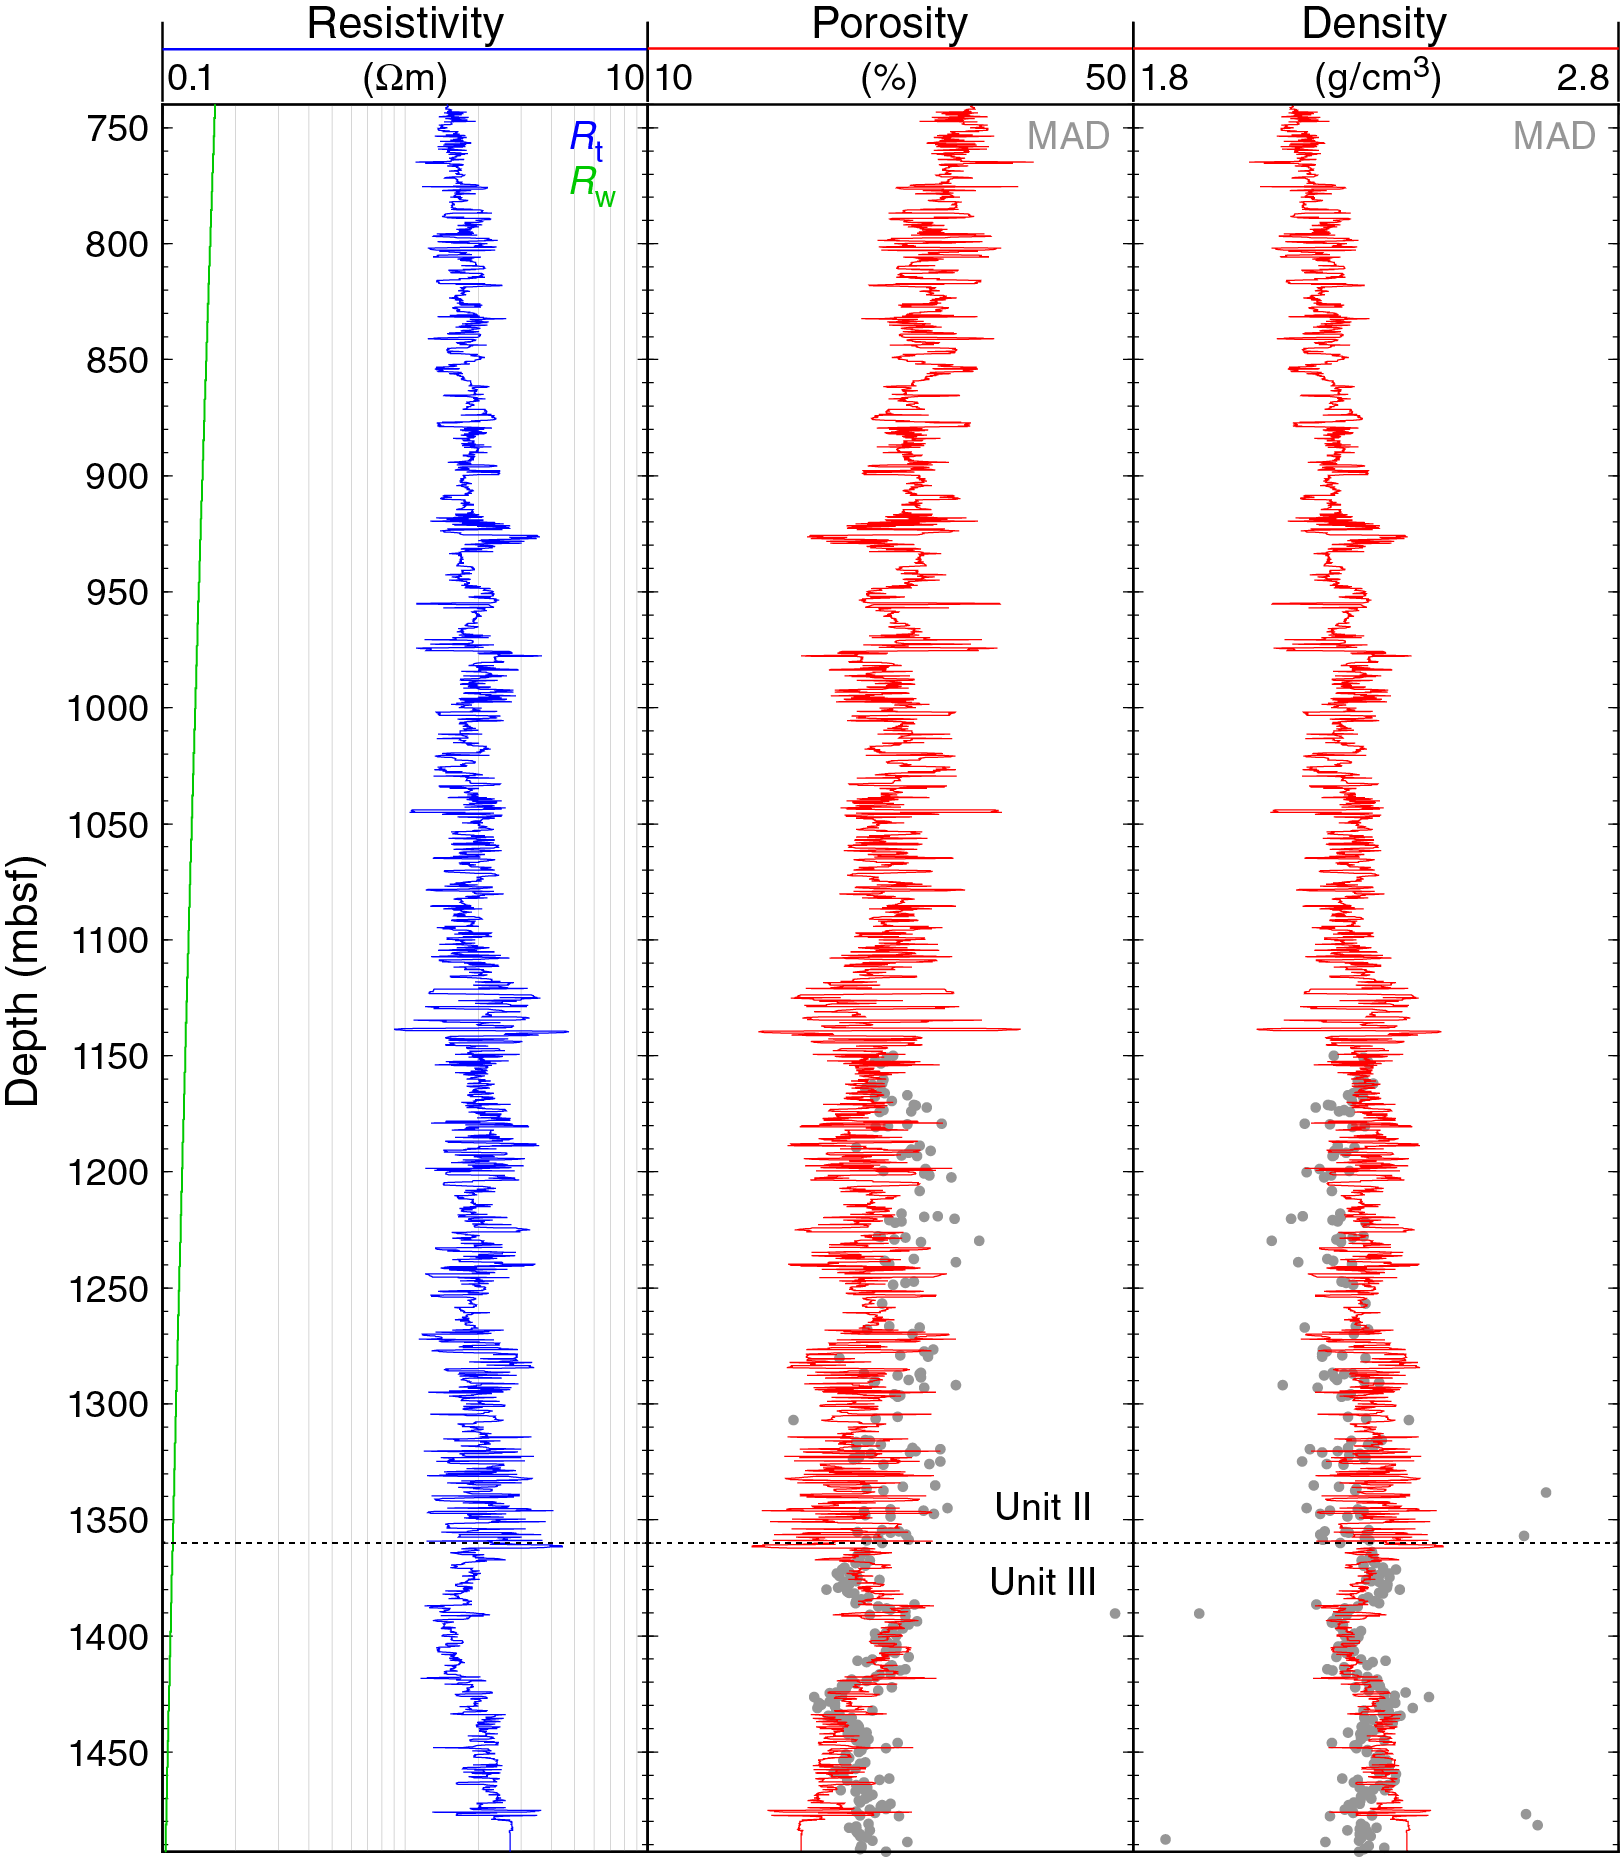
Figure F60. Estimation of formation porosity and density.
Summary
Preliminary interpretation shows that the most significant change in all the log data recorded occurs at 1360 mbsf, the transition between lithostratigraphic Units II and III. Above this depth, within the cored interval (1150–1360 mbsf) and above 1150 mbsf, the gamma ray and magnetic susceptibility logs are characterized by an alternation of intervals with low gamma radiation and high magnetic susceptibility, probably dominated by sand, that are often associated with lower recovery and a larger borehole, and intervals with higher gamma radiation and generally lower magnetic susceptibility, indicative of claystone or clay-rich formations, which had higher and more consistent recovery. Deeper than 1360 mbsf, all the logs become less variable, including the hole size, indicating a more competent and homogeneous formation dominated by claystone (see Sedimentology and petrology).
Core-log-seismic integration
A key objective of Expedition 362 is to place regional seismic reflection profiles within the context of the drilling results. This requires the establishment of a relationship between time on the seismic section and depth downhole. At Site U1481 this was accomplished using the P-wave sonic log data in conjunction with seismic reflection Line BGR06-103 (Figure F61; Gaedicke, 2007). For an overview of the regional seismic interpretation see the Site U1480 chapter (McNeill et al., 2017d).
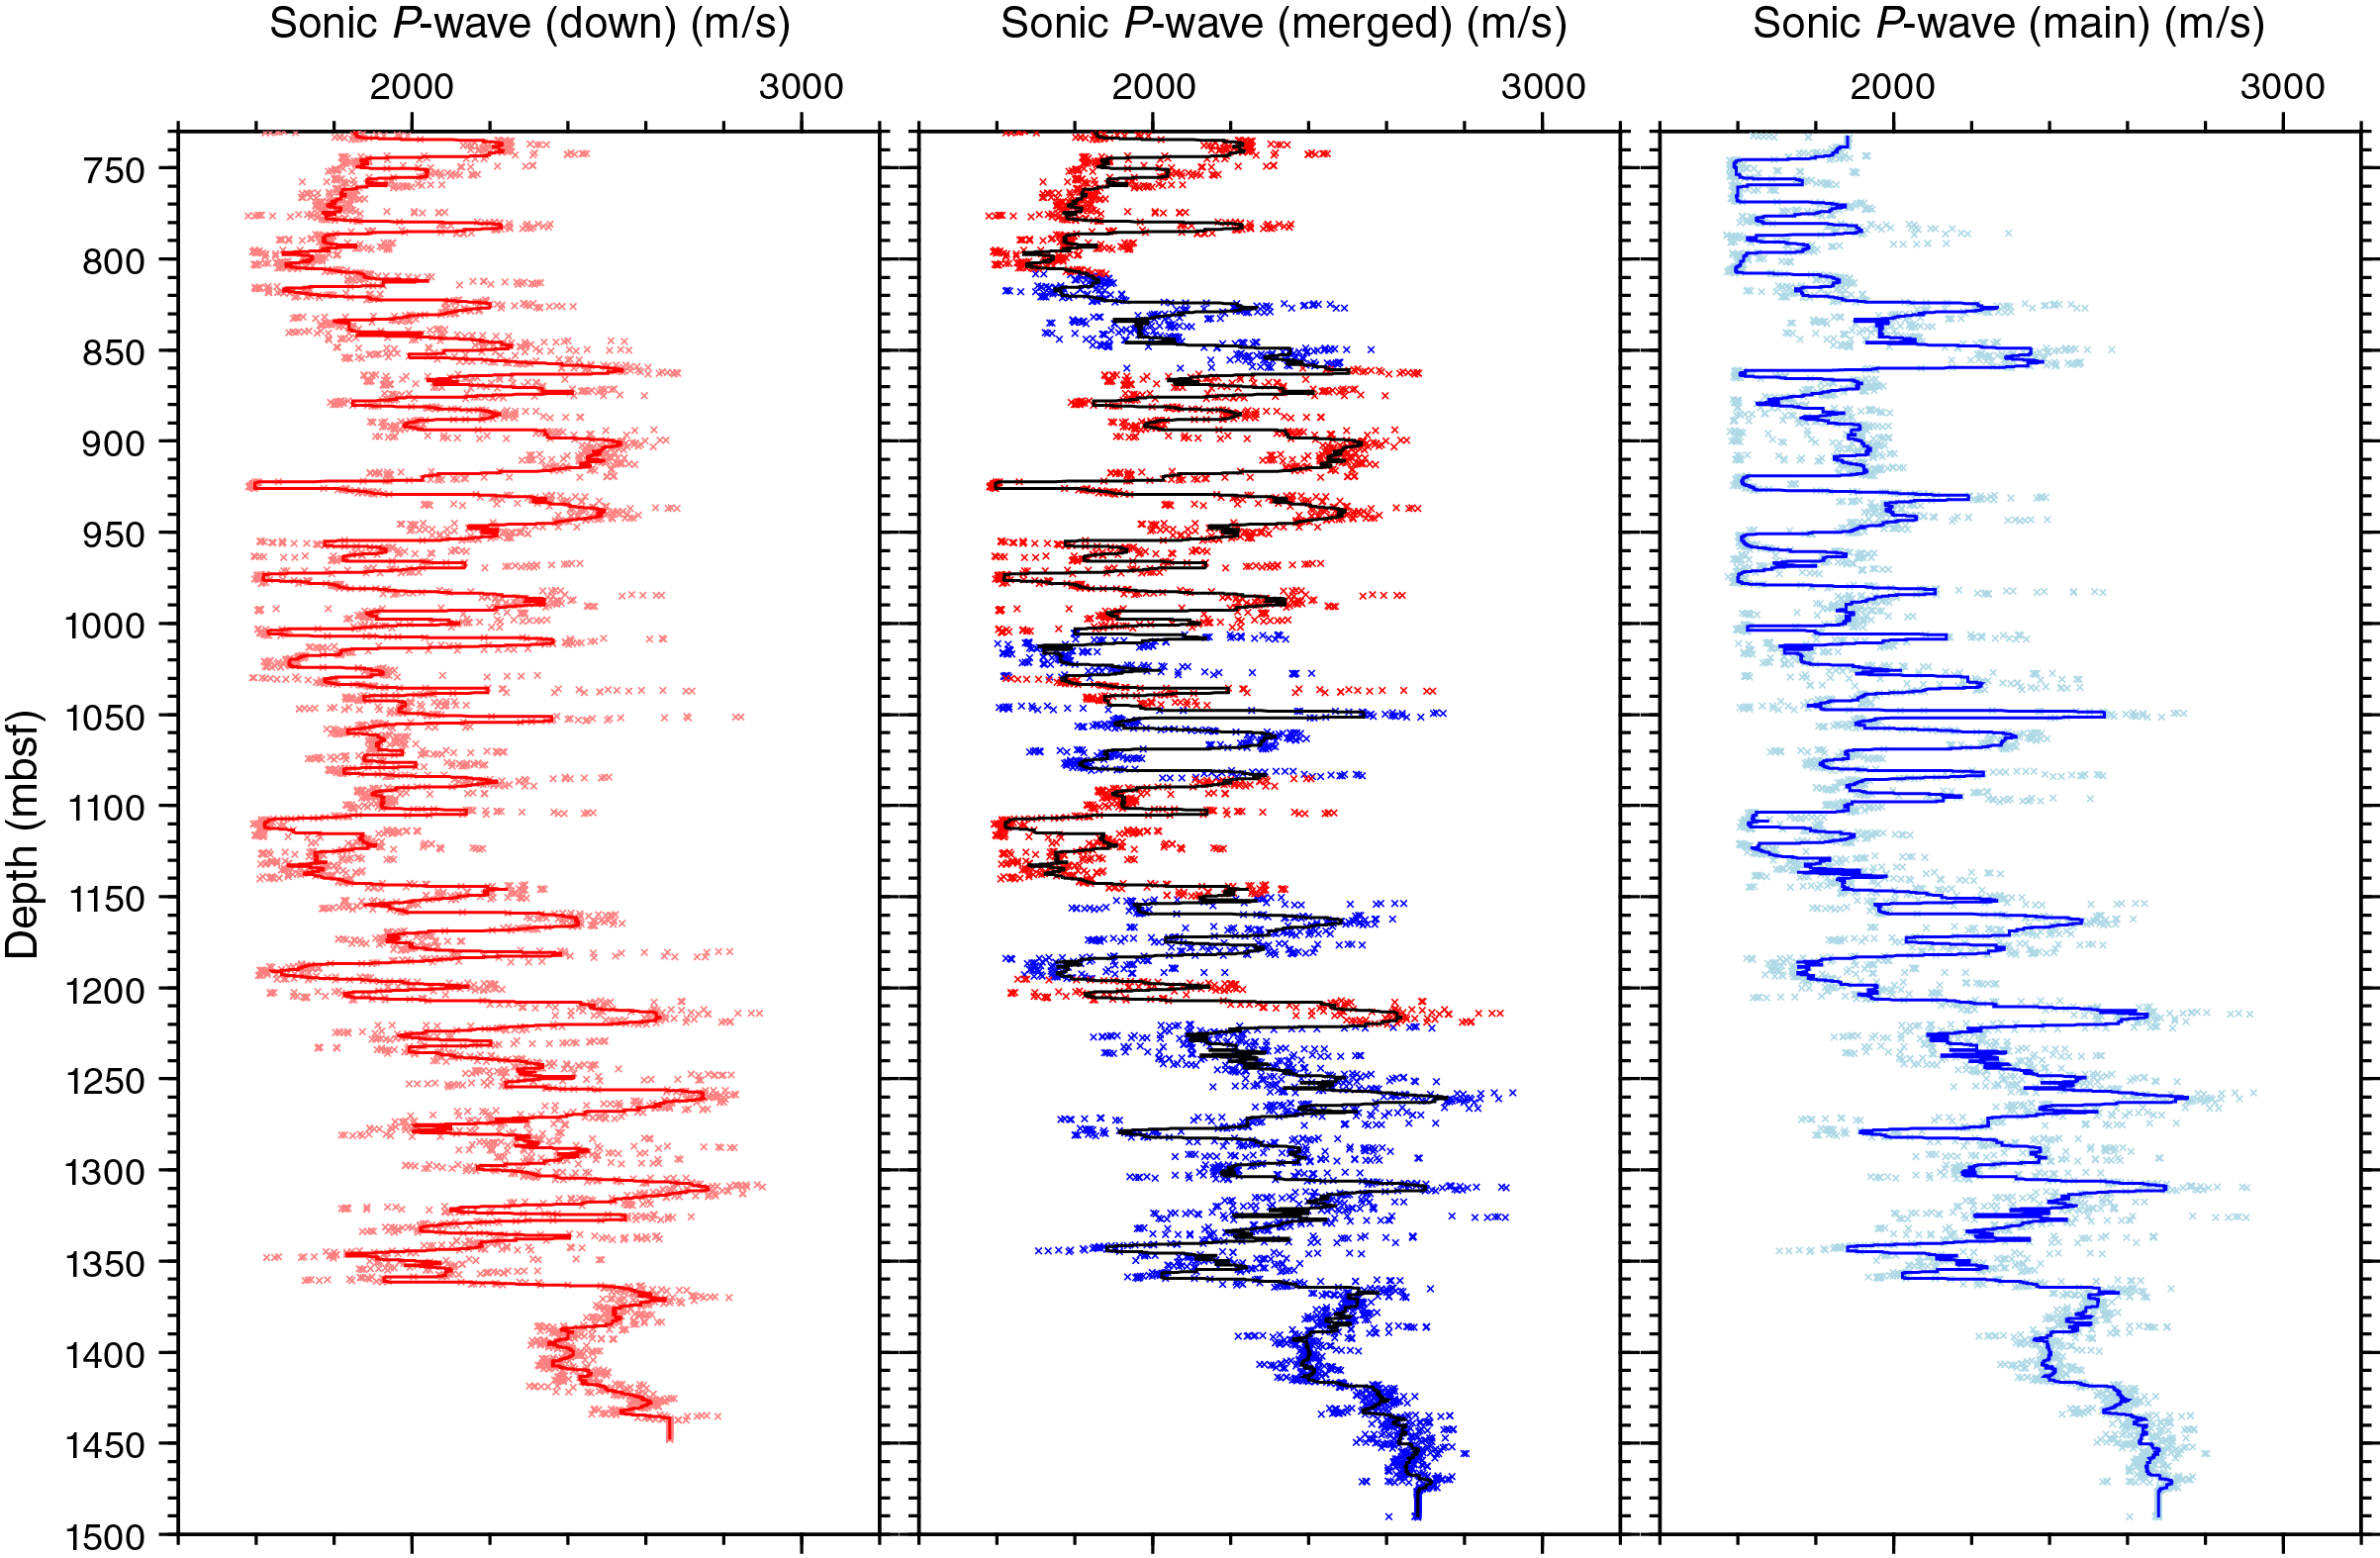
Figure F61. P-wave sonic log data.
Establishing a time-depth relationship
The P-wave sonic log was used to construct a detailed time-depth relationship for Site U1481 over the logged depth interval below the cased section of the hole (730–1490 mbsf). The casing prevents continuing this relationship to the seafloor, so we need to determine a time offset that corresponds to the average seismic velocity over the cased section of the hole. To determine this time offset we generated a simple set of synthetic seismograms that were then compared with the seismic reflection data from Line BGR06-103. Generating a single tie point (at 1364 mbsf at Seismic Horizon C and close to the Unit II/III boundary) by linking the sonic log to the seismic profile allows other time-depth tie points to be determined by integrating the sonic log with several key depth points (these time-depth tie points are listed in Table T14).
Table T14. Summary of key time-depth ties. Download table in .csv format.
Two sets of P-wave sonic logs were recorded at Site U1481, one while the logging string was lowered into the hole (“down”) and the other while the string was recovered (“main”) (see Downhole measurements). Typically, the main logging run is more reliable because the tool motion is better controlled upward. The quality of the sonic log data can be evaluated using coherence plots and comparing the arrivals picked with the highest coherence displayed (Figure F55). The coherence plots show that the automated acquisition of the two logging runs sometimes failed to identify the correct arrivals, but together they provided enough data to construct a merged log of the key velocity features by choosing the higher quality log from each depth interval (Figure F61). Note in particular that both logs have intervals of velocity <1600 m/s where the automatic algorithm selected the velocity of the borehole fluid; this is particularly marked in the shallow section of the main logging run, suggesting deteriorating hole conditions. However, few of these intervals coincide between the down and main runs, so a good initial representation of the true velocity structure can be generated from the merged log. The remainder of the analysis in this chapter uses the merged velocity log.
Seismic reflection profiles are most simply related to subsurface structure using acoustic impedance, the product of P-wave velocity and density, with reflections resulting from changes in acoustic impedance. For an impedance that varies continuously we can approximate a reflectivity function as the vertical derivative of the impedance. This can then be mapped from depth to time using the velocity log and finally band-limited to match the seismic source wavelet. The detailed physical properties at Site U1480 (see Physical properties in the Site U1480 chapter [McNeill et al., 2017d]) and the data available at Site U1481 (see Physical properties) suggest that variations in density are generally small and thus less important in controlling reflectivity than variations in seismic velocity. Hence, we assume that a good initial approximation to impedance variations can be determined from the sonic log alone. We first applied a 5 m median filter to the sonic log to remove isolated peaks and focus on the main data trends. Then we differentiated the sonic log with respect to depth, used the incremental traveltimes between each sampling depth to convert the depth record into time, and applied a bandpass filter corresponding to the bandwidth of the seismic wavelet. This synthetic seismic trace was adjusted in time until a good match with the seismic reflection section was obtained.
The process of matching the synthetic trace against the seismic reflection data was focused on the 1150–1450 mbsf interval of the sonic log; over this interval the down and main logs were similar and both showed generally high coherence values. An initial estimate of the tie was made by using the lithostratigraphic Unit II/III boundary (see Sedimentology and petrology) as defined by a marked change in magnetic susceptibility at 1364 mbsf (Figure F41), which we had previously correlated with Horizon C on the interpreted seismic section (see Core-log-seismic integration in the Site U1480 chapter [McNeill et al., 2017d]). Using this as an initial estimate we investigated variations in relative timing up to 50 ms above and below the seismic horizon interpretation, first in steps of 10 ms, and then once an approximate fit was determined, 10 ms in each direction in steps of 2 ms. This process used a wiggle trace representation of the seismic line (6.65–7.05 s TWT) in the deep section of Site U1481 (Figure F62) to allow a comparison of the waveforms. This process can be resolved visually with confidence. Cross-correlations can be calculated between the synthetic traces and the seismic section, but this will require time after the expedition for careful consideration of how the reflection data were processed to improve on the fit obtained manually. Both in detail (Figure F62) and within the context of the broader seismic profile (Figure F63), there is an excellent fit between the synthetic traces and the seismic section. Most of the reflections within the time interval spanned by the logs, including log intervals for which we have lower overall confidence (730–1150 mbsf), are well-represented in the synthetic data. In particular, isolated positive peaks are well-captured at 6.30, 6.46, 6.59, and 6.71 s TWT, as well as much of the more complex structure at 6.7–6.9 s TWT (within lithostratigraphic Unit III). For applications that do not need to take account of short-wavelength variations in seismic velocity and for comparison to the results from the different methodology applied at Site U1480 (see Core-log-seismic integration in the Site U1480 chapter [McNeill et al., 2017d]) we have summarized time-depth ties at key points in the section (Table T14).
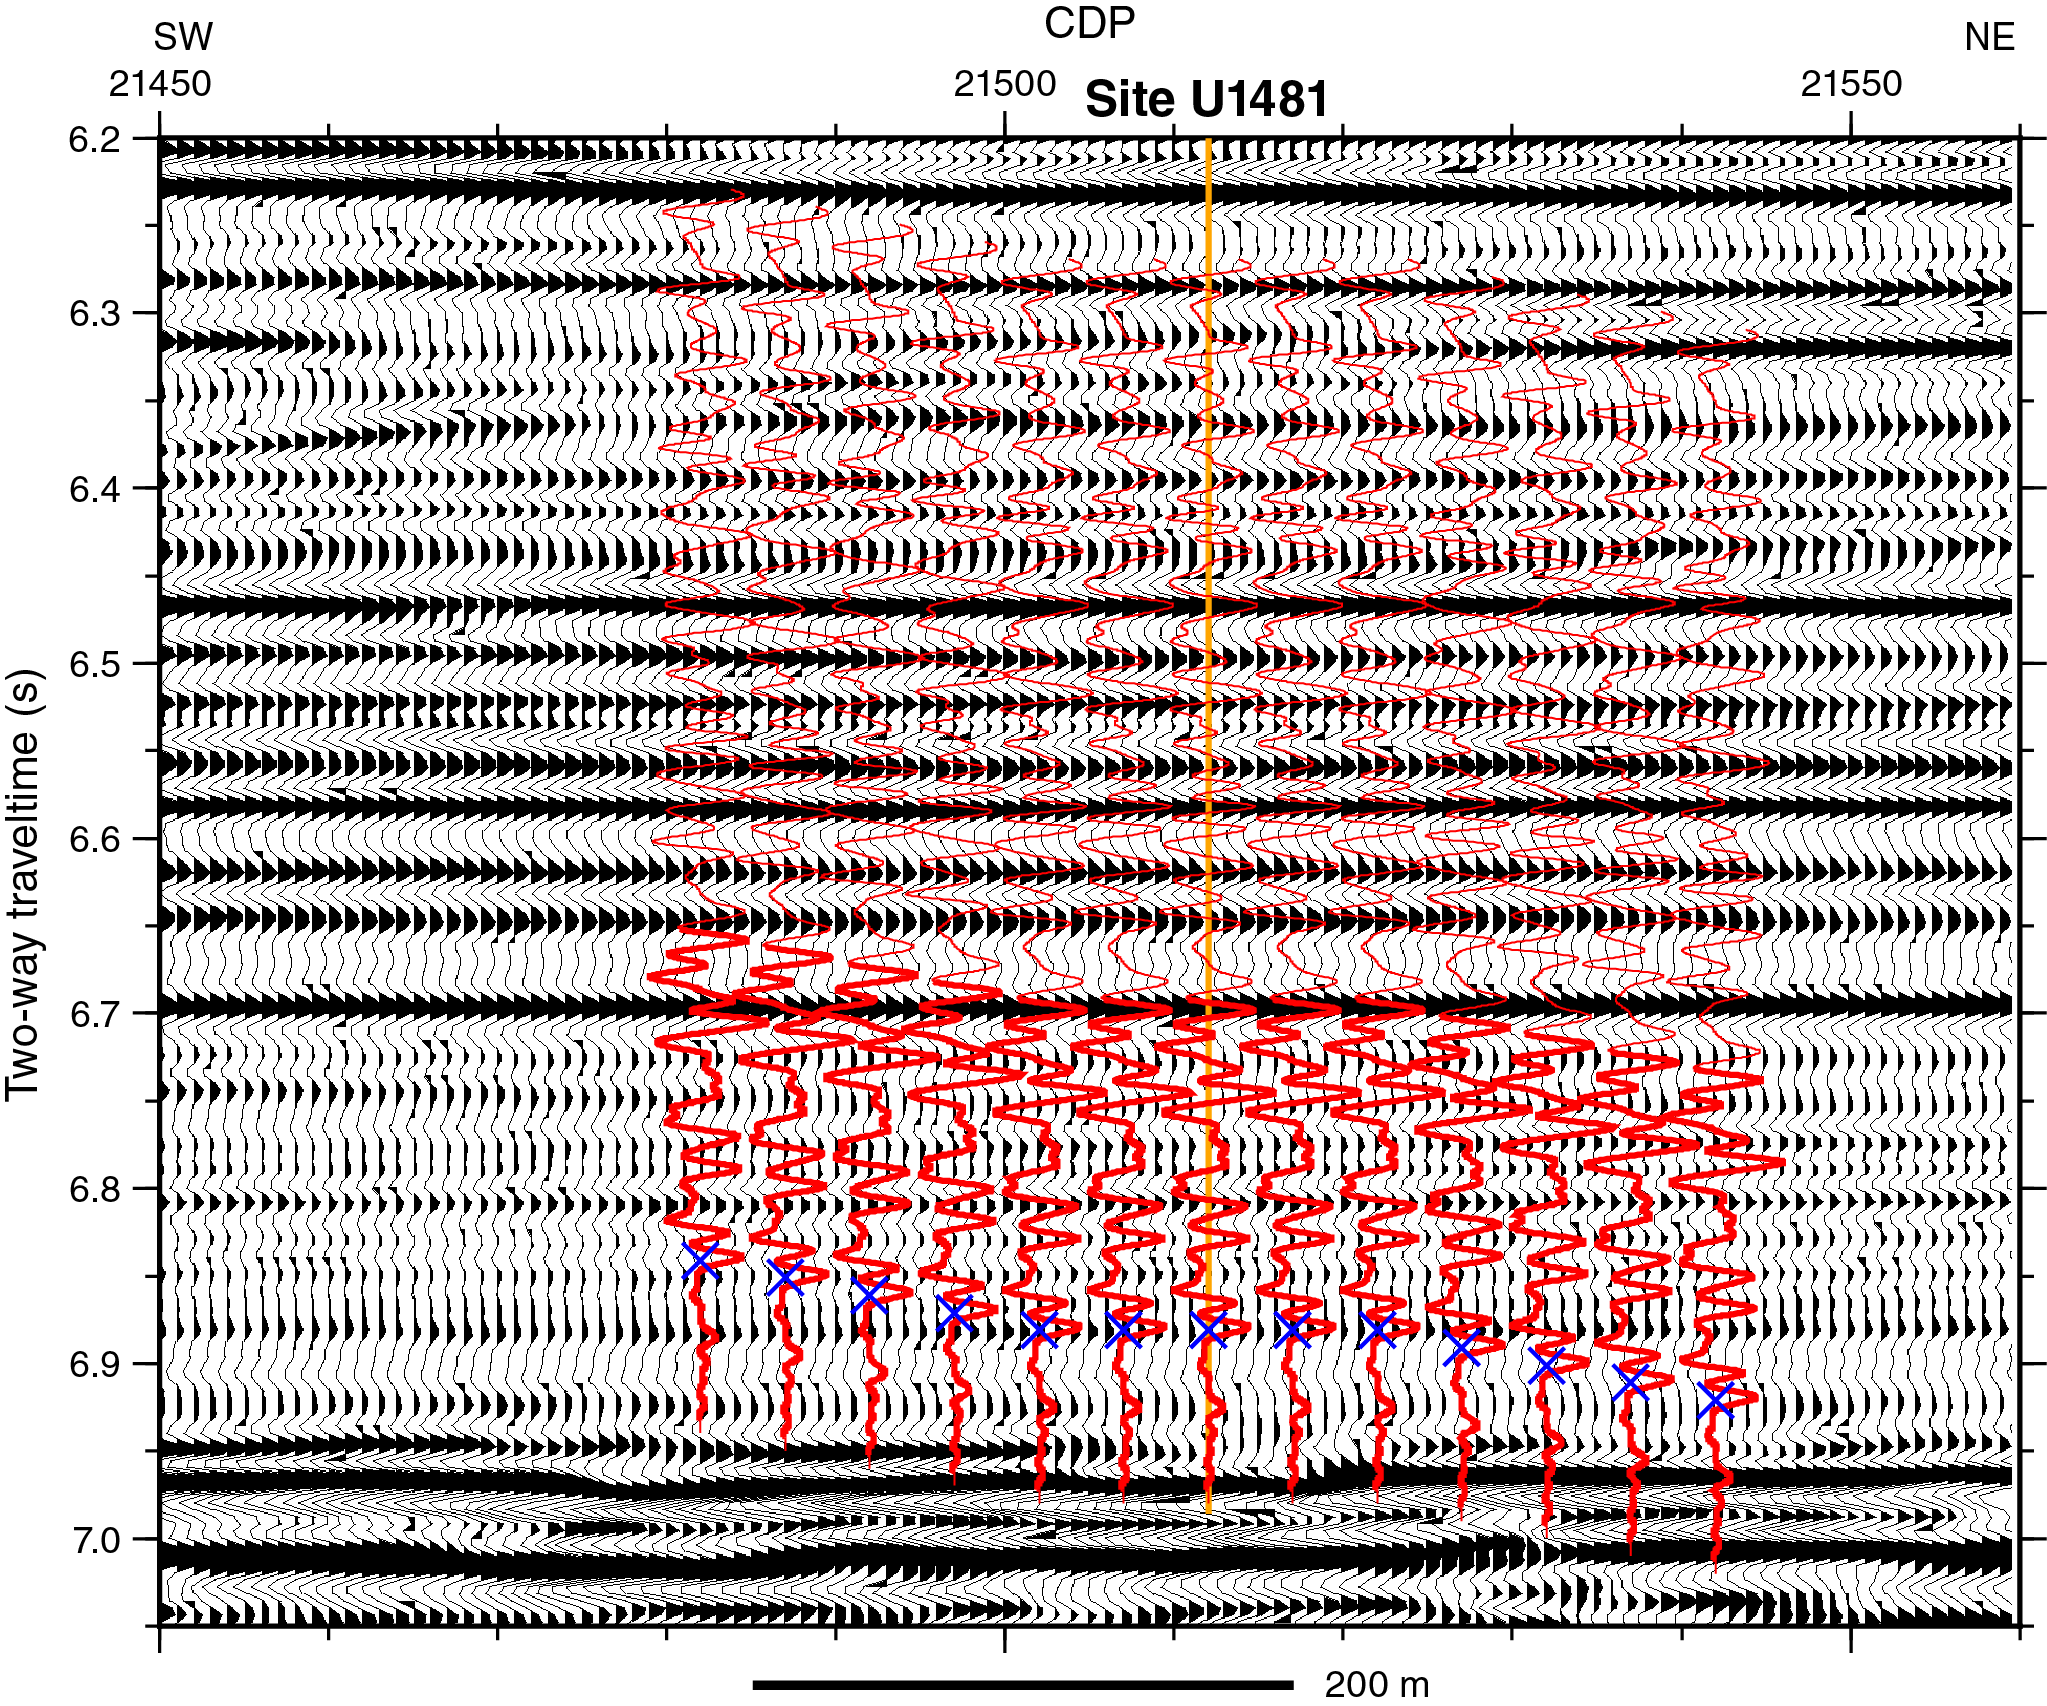
Figure F62. Comparison between seismic reflection Line BGR06-103 and synthetic seismograms.
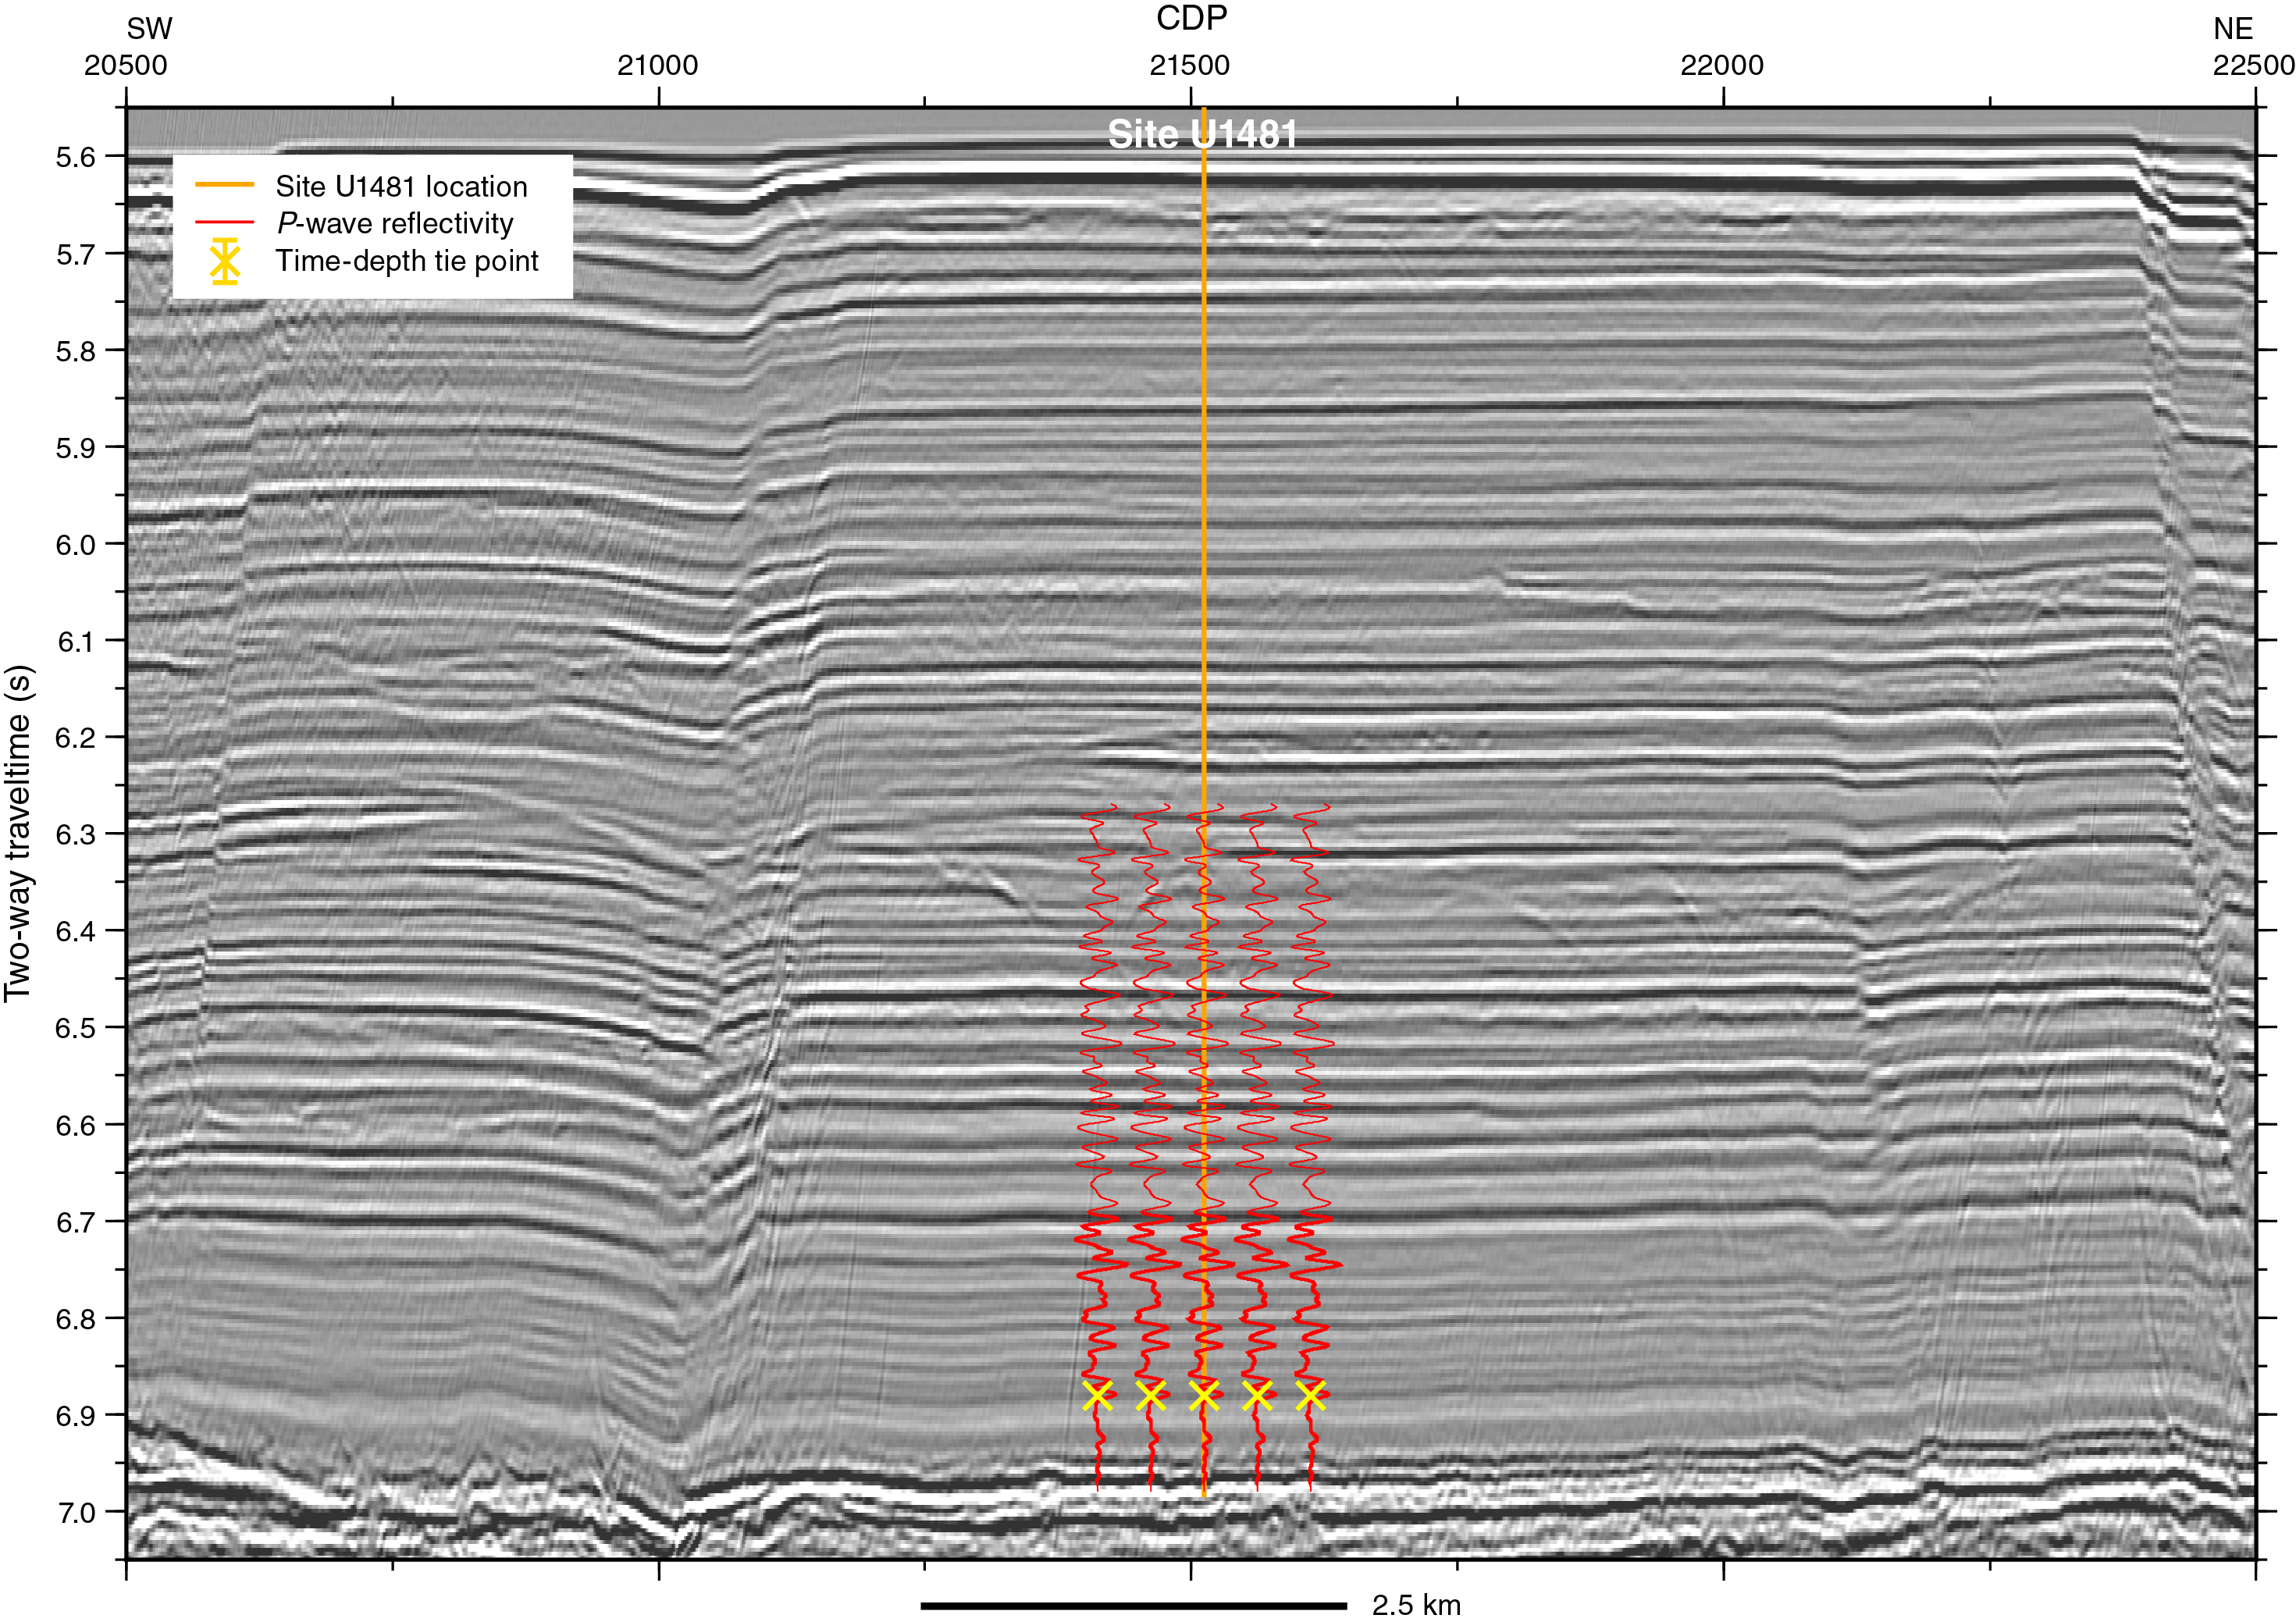
Figure F63. Seismic reflection Line BGR06-103.
Comparison between log and core measurements
There is good agreement between the discrete P-wave velocity (z-direction) data from core samples and the merged sonic log (Figure F64). In intervals of good recovery (e.g., below 1360 mbsf), the main variations match well between the data sets, and over some intervals (e.g., 1350–1430 mbsf), the magnitude of the velocities is very similar. Deeper than 1430 mbsf, discrete sample velocities are significantly (~20%) lower than the logs; within this interval the cores suffered heavy fracturing as they dried (Figure F17), even over periods of <1 h since cutting, and showed strong anisotropy with velocities in the x- and y-directions much higher than in the z-direction (see Physical properties). Shallower in the section (Unit II), velocities measured on the core samples lie within the low part of the range recorded on the sonic log, with an average of ~2000 m/s, whereas peaks in the sonic log, even after filtering, reach 2800 m/s. Typically, seismic velocities measured on samples under room temperature and pressure are lower than those in situ because of cracks that open as the samples experience lower pressure. Previous ODP and IODP expeditions have found differences of 5%–10%, and in some cases (e.g., Expedition 315 Scientists, 2009) have been able to determine systematic corrections between the data sets. However, the variability in the differences at Site U1481 suggests that differences may be much higher, and that determining or applying a simple correction to the core sample velocity data may not be appropriate. In addition, the relatively low recovery at 1150–1350 mbsf (Table T1) suggests that some of the difference may be due to preferential recovery of lithologies with lower seismic velocity. This is consistent with our inferences from Site U1480 where the interval velocities required for the seismic ties in this depth range were also significantly higher than those measured on recovered core samples (see Core-log-seismic integration in the Site U1480 chapter [McNeill et al., 2017d).
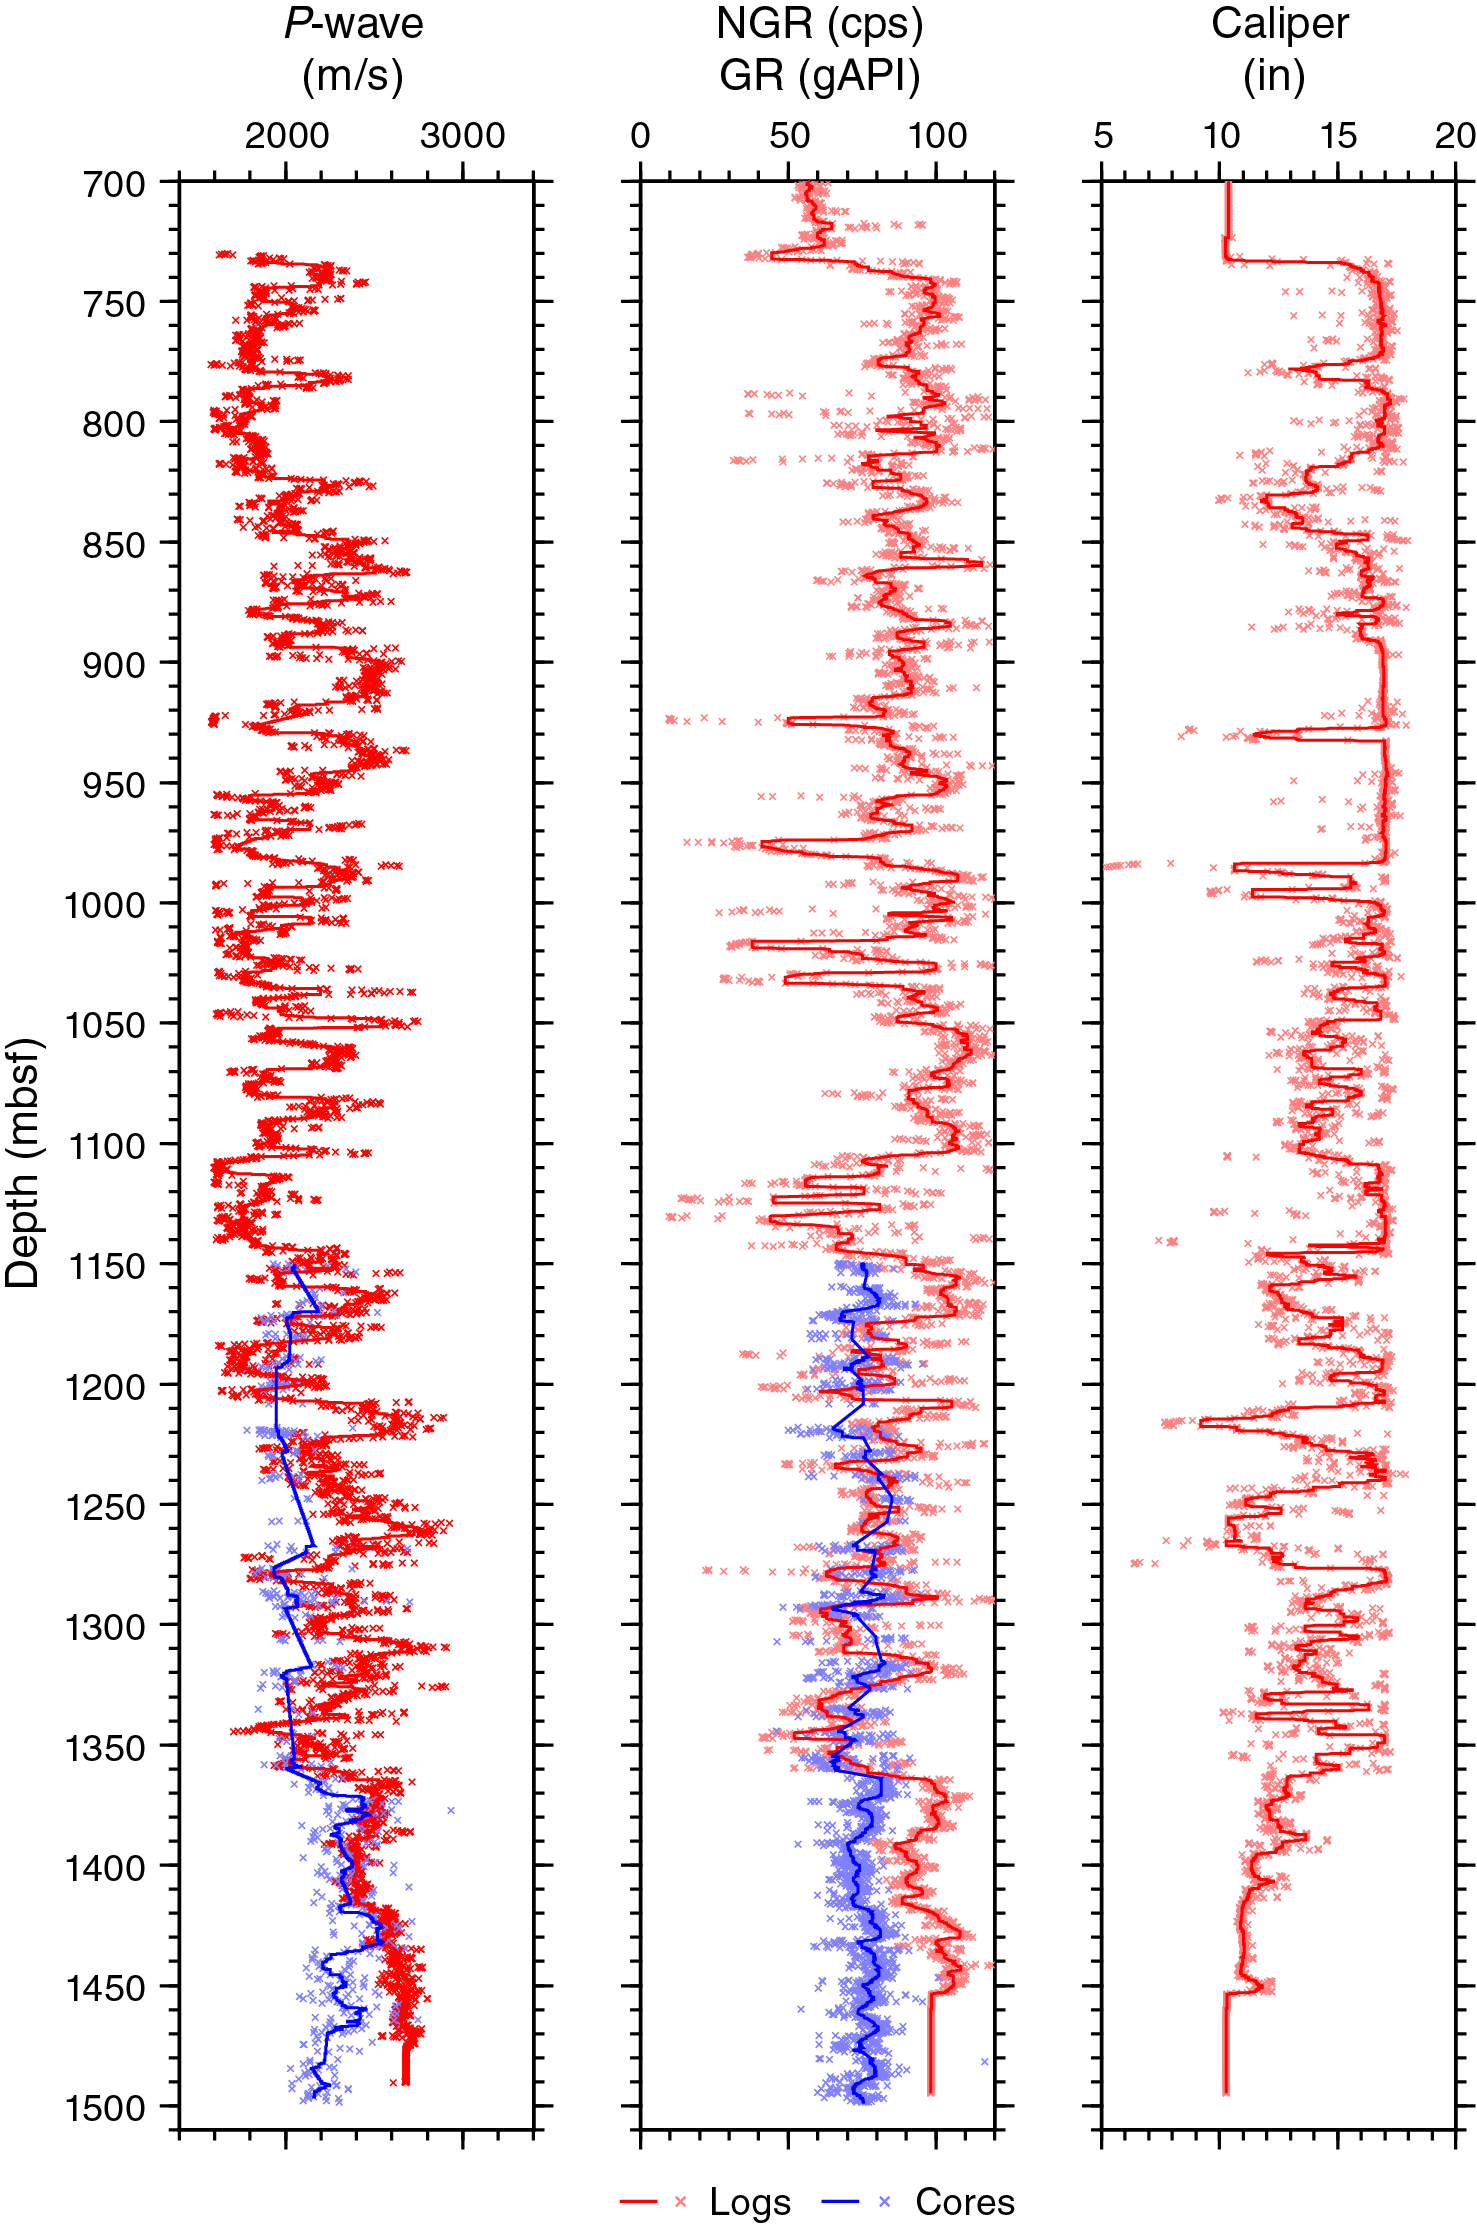
Figure F64. Comparison between selected log parameters and core measurements.
Comparing the core and log NGR data shows a good agreement in trends in much of the cored section of Site U1481 (Figure F64). Note that the two data sets have different units and calibrations; the log uses the gAPI scale, whereas the core data are in counts per second. Intervals where there is significant disagreement between the trends of the two data sets (e.g., around 1210 and 1260 mbsf) correspond to very low recovery (~5%). In the deepest part of the hole (1360–1460 mbsf) where recovery is good, there is good agreement between the structure of the two curves despite the offset in mean value.
Comparison between core and log measurements and site survey seismic reflection data
Comparing the sonic log with the seismic reflection data (Figure F65) shows that each of the strong reflections corresponds to an interval of high sonic velocity, but not all intervals of high velocity correspond to a strong reflection. Strong reflections also frequently correspond to low caliper (narrow borehole; see Downhole measurements) values. There are also some surprising features; for example, the channel/mass transport deposits at ~6.35 s TWT have very low velocity. Based on comparison with Site U1480, these features are likely to be sand dominated (see Sedimentology and petrology in the Site U1480 chapter [McNeill et al., 2017d]), and even unconsolidated sands within the equivalent depth range at this site typically had higher velocity than mud intervals (see Physical properties in the Site U1480 chapter [McNeill et al., 2017d]). The hole width at 730–810 mbsf was mostly beyond the caliper measurement range; hence, this low measured velocity may be partly the result of poor hole conditions.

Figure F65. Seismic reflection Line BGR06-103 with overlaid key depth points.
The key change in the site survey seismic reflection data within the cored interval at Site U1481 occurs at seismic Horizon C, which can be correlated with the HANP reflection of Dean et al. (2010) closer to the subduction zone. Between 6.9 and 6.95 s TWT, reflectivity decreases downhole, which is well correlated with the lower variability in the sonic log and with a reduction in the number of sand/sandstone layers (see Sedimentology and petrology). There is also an increase in the seismic velocity and degree of lithification of the mud/mudstones over this interval. The downward decrease in magnetic susceptibility values (see Physical properties) correlates exactly with this change in reflectivity. Further into Unit III (1380–1420 mbsf), sonic log velocities decrease by ~10%, as do the filtered discrete sample velocities (Figure F64). This interval of decreasing velocity correlates closely with the interval of low chlorinity identified in geochemical analyses (Figure F38; see also Hüpers et al., 2017). A similar decrease in discrete velocity measurements was observed at Site U1480 within Unit III (see Figure F100 in the Site U1480 chapter [McNeill et al., 2017d]).
The deepest part of the hole (Cores 362-U1481A-33R through 38R; Figure F66) corresponds to a pair of strong but laterally heterogeneous reflections at 6.95–7.0 s TWT. However, surprisingly little evidence exists for velocity changes in the discrete velocity measurements around this interval, or in the sonic logs, although there are some strong variations around 1430 mbsf that have been suppressed by the filtering applied to the logs. The strong reflections do correspond to spikes in the magnetic susceptibility data that can be broadly correlated with the occurrence of carbonate-cemented sands that were also identified in the cores (see Sedimentology and petrology); this may therefore be an interval where seismic reflectivity is due to isolated or discontinuous cemented bodies or horizons with very high impedance contrasts, or where the reflectivity is controlled by density variations as well as P-wave velocity. The shallower of these reflections shows a particularly high degree of lateral reflectivity variation at scales of hundreds of meters along the seismic profile. Note that the sonic log only reaches 1490 mbsf, so there are no data in the deepest part of the hole (lower part of Cores 362-U1481A-37R and 38R). The regionally identified acoustic basement (Figure F67) lies 50 ms (~75 m) beneath the base of Hole U1481A. However, based on the presence of strong reflectivity beneath this event, oceanic crust basalts are probably deeper. Further analysis of these deeper horizons awaits postexpedition research.
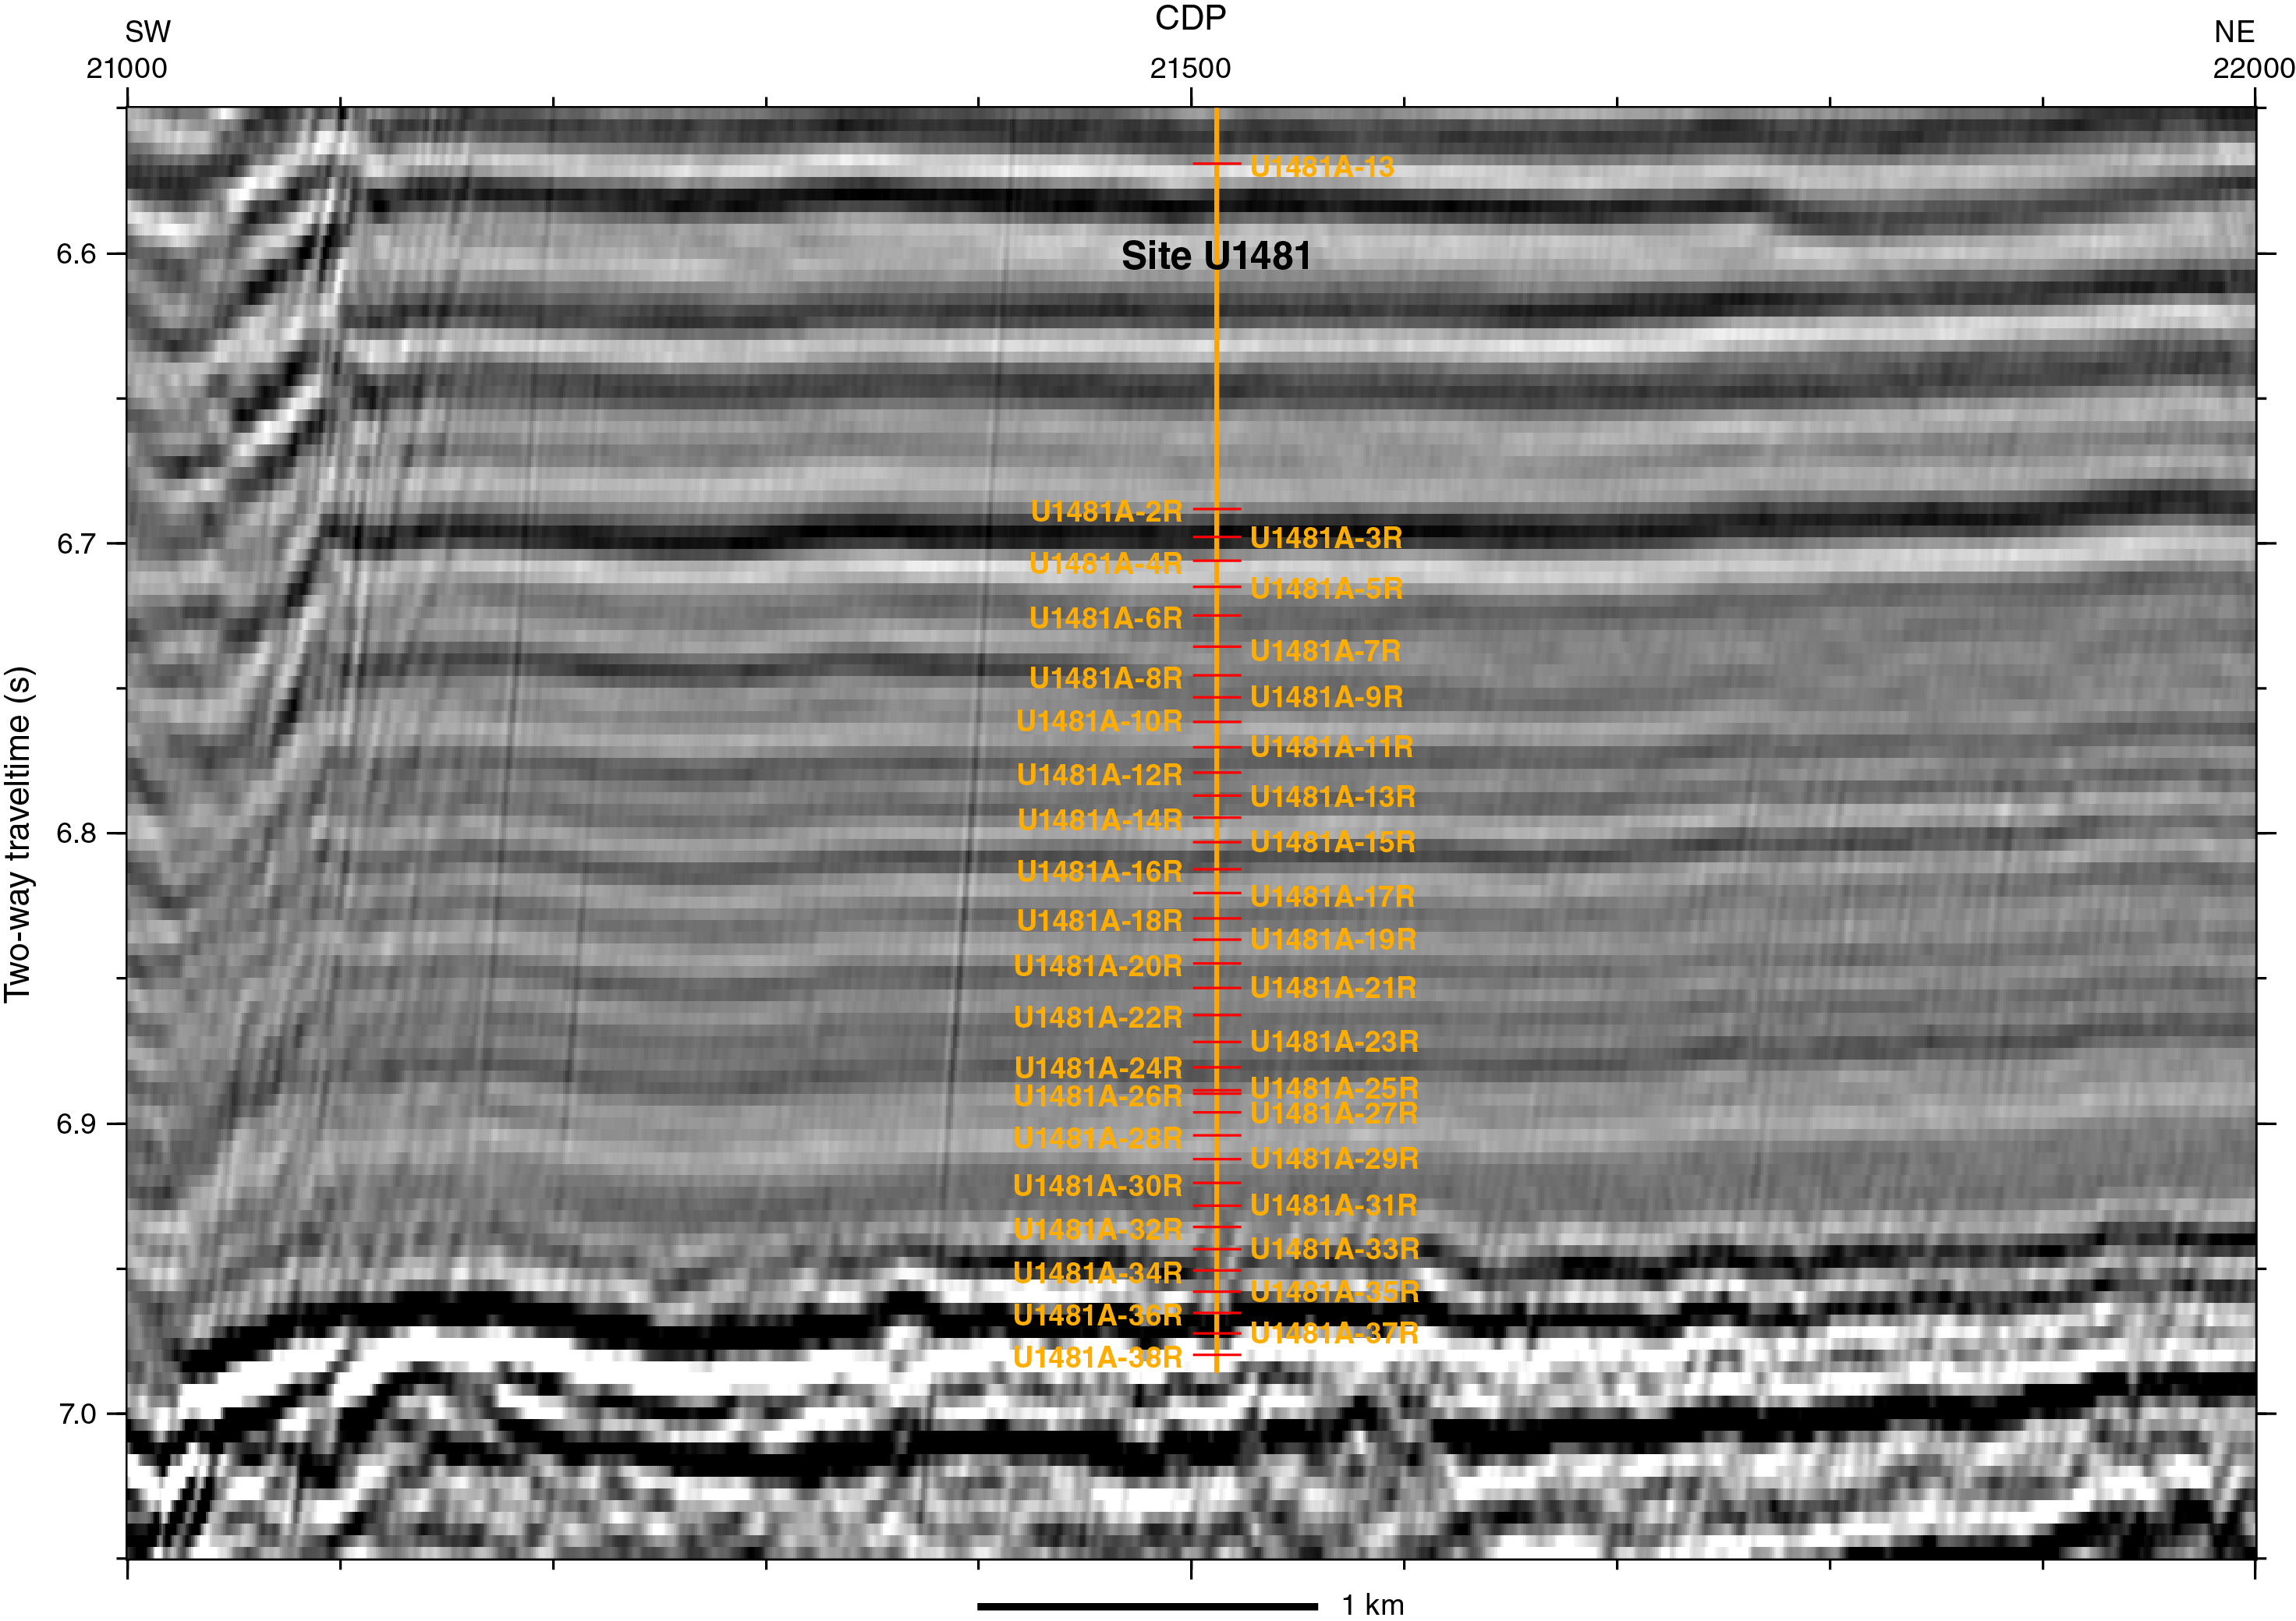
Figure F66. Core tops from Site U1481 superimposed on seismic reflection Line BGR06-103.
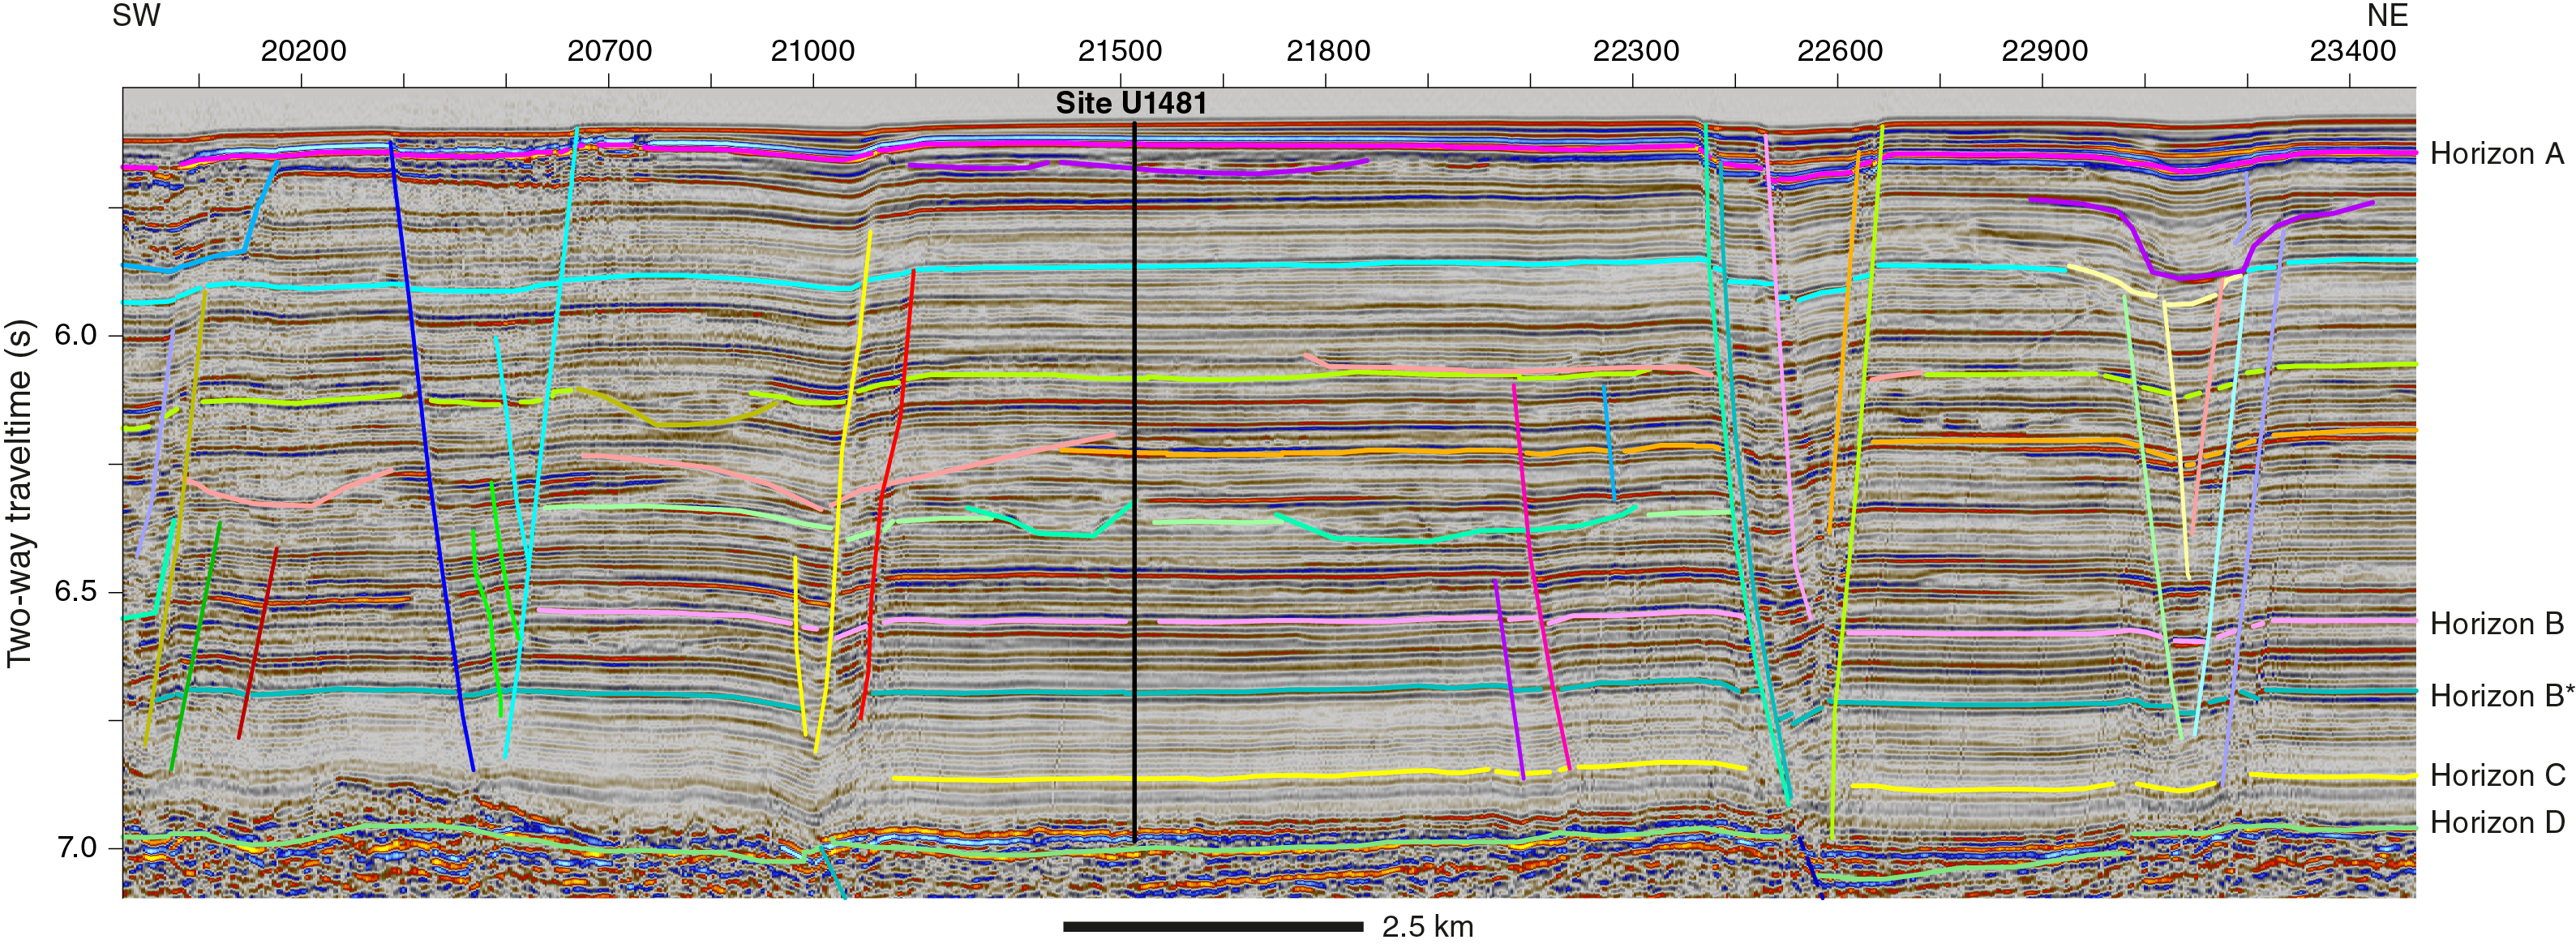
Figure F67. Regional interpretation of seismic Line BGR06-103 around Site U1481.
Comparison with Site U1480
The integration of the sonic log with the seismic reflection data confirms the interpretation made at Site U1480 linking the Unit II/III boundary to Horizon C in the seismic reflection data. The close fit between the synthetic seismograms and the seismic section suggests that we have a very precise tie here. The transition, as shown in detail by the physical property data (see Physical properties), is ~10–20 m deeper than we initially expected from the seismic interpretation.
The interval velocities between the tie points in the section (Figure F68) are broadly compatible with our previous results (see Figure F125 in the Site U1480 chapter [McNeill et al., 2017d]). The interval velocity from the seafloor to the base of the logged interval at Site U1481 is 2140 m/s compared with 2250 m/s to acoustic basement at Site U1480 (almost an equivalent section). The main difference between the two sites is that at Site U1480 we inferred higher velocities (~3000 m/s) in the low reflectivity part of Subunit IIC between Horizons B and C, which is much thinner at Site U1481. The interval velocity through Unit III at both sites is very similar (~2500 m/s).
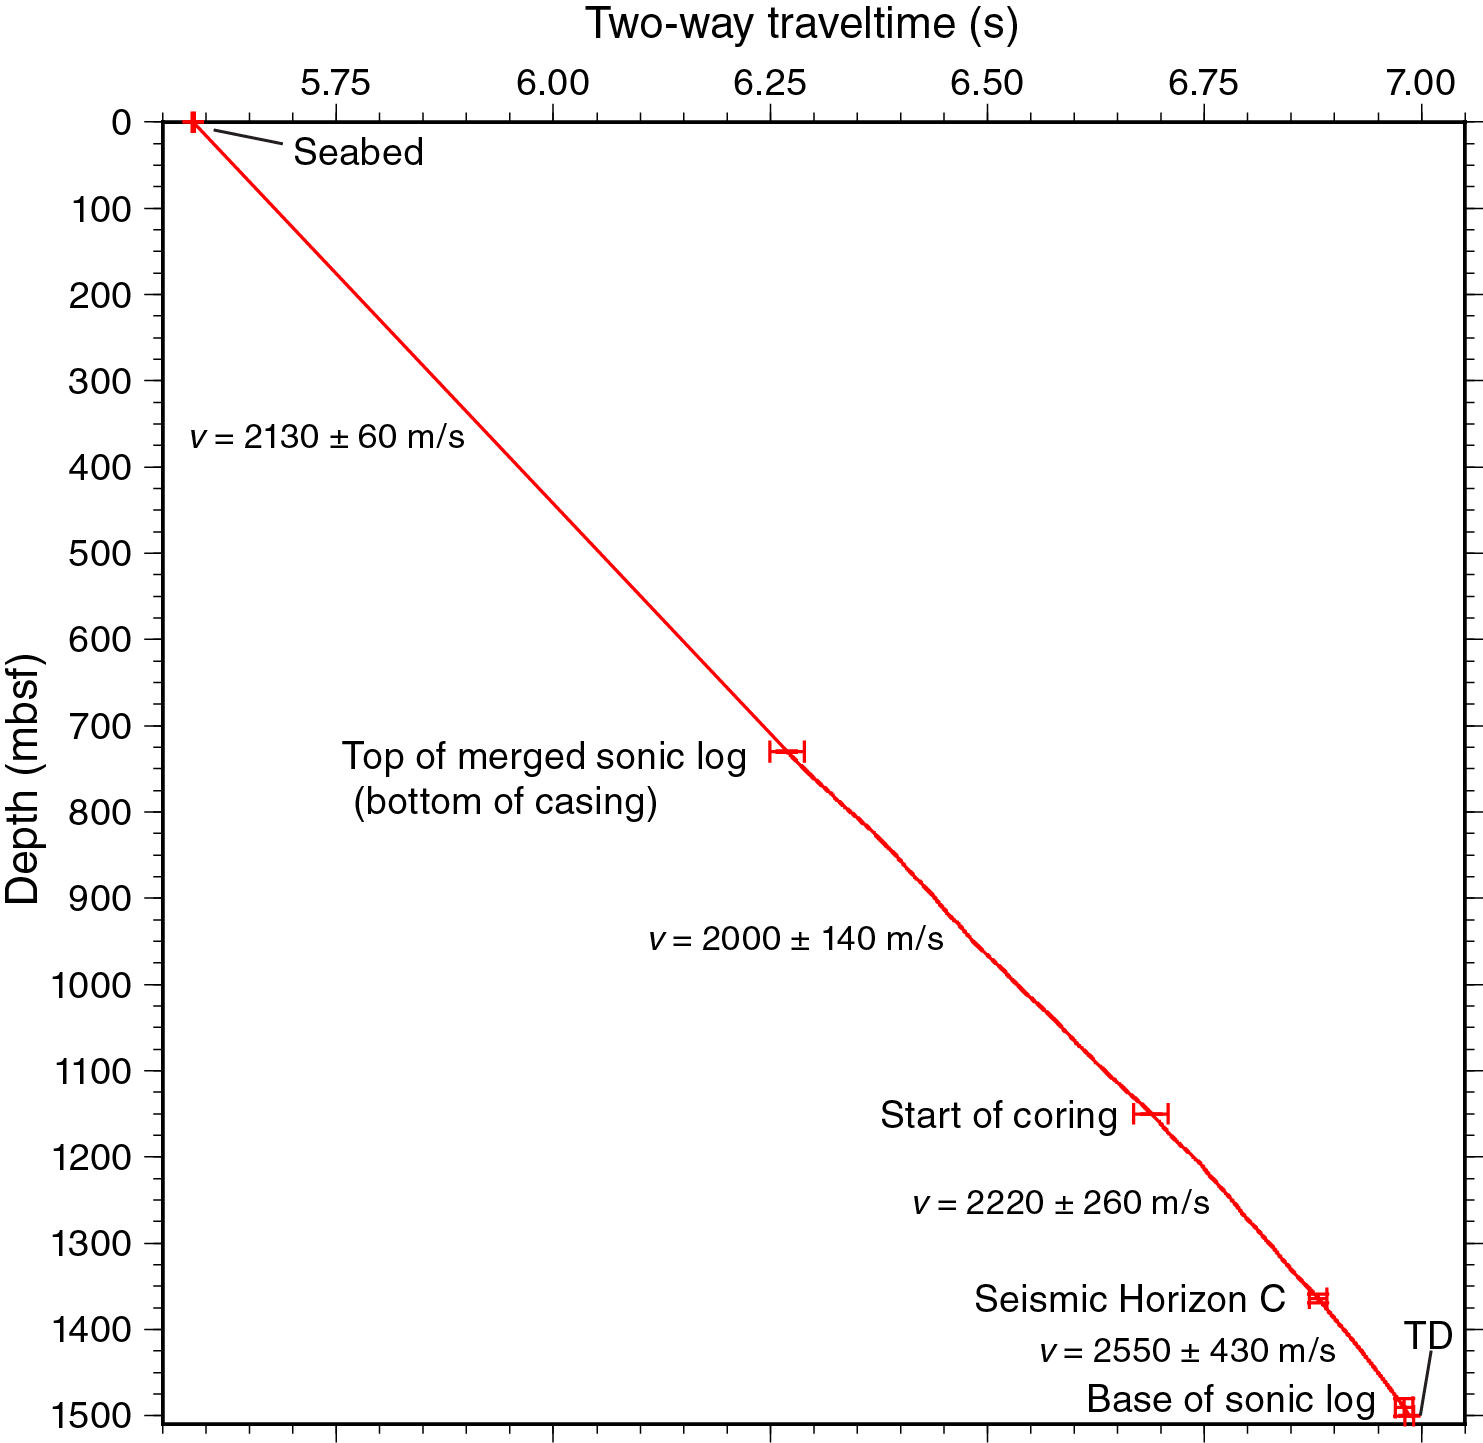
Figure F68. Summary of tie points between time and depth.
References
Archie, G.E., 1942. The electrical resistivity log as an aid in determining some reservoir characteristics. Journal of Petroleum Technology, 5:1–8.
Brown, K.M., and Behrmann, J., 1990. Genesis and evolution of small-scale structures in the toe of the Barbados Ridge accretionary wedge. In Moore, J.C., Mascle, A., et al., Proceedings of the Ocean Drilling Program, Scientific Results, 110: College Station, TX (Ocean Drilling Program), 229–244. https://doi.org/10.2973/odp.proc.sr.110.141.1990
Claypool, G.E., and Kvenvolden, K.A., 1983. Methane and other hydrocarbon gases in marine sediment. Annual Review of Earth and Planetary Sciences, 11(1):299–327. https://doi.org/10.1146/annurev.ea.11.050183.001503
Cowan, D.S., 1982. Origin of “vein structure” in slope sediments on the inner slope of the Middle America Trench off Guatemala. In Aubouin, J., von Huene, R., et al., Initial Reports of the Deep Sea Drilling Project, 67: Washington, DC (U.S. Government Printing Office), 645–650. https://doi.org/10.2973/dsdp.proc.67.132.1982
de Lange, G.J., 1992. Distribution of exchangeable, fixed, organic and total nitrogen in interbedded turbiditic/pelagic sediments of the Madeira Abyssal Plain, eastern North Atlantic. Marine Geology, 109(1–2):95–114. https://doi.org/10.1016/0025-3227(92)90223-5
Dean, S.M., McNeill, L.C., Henstock, T.J., Bull, J.M., Gulick, S.P.S., Austin, J.A., Jr., Bangs, N.L.B., Djajadihardja, Y.S., and Permana, H., 2010. Contrasting décollement and prism properties over the Sumatra 2004–2005 earthquake rupture boundary. Science, 329(5988):207–210. http://dx.doi.org/10.1126/science.1189373
Erickson, S.N., and Jarrard, R.D., 1998. Velocity-porosity relationships for water-saturated siliciclastic sediments. Journal of Geophysical Research: Solid Earth, 103(B12):30385–30406. http://dx.doi.org/10.1029/98JB02128
Expedition 315 Scientists, 2009. Expedition 315 Site C0001. In Kinoshita, M., Tobin, H., Ashi, J., Kimura, G., Lallemant, S., Screaton, E.J., Curewitz, D., Masago, H., Moe, K.T., and the Expedition 314/315/316 Scientists, Proceedings of the Integrated Ocean Drilling Program, 314/315/316: Washington, DC (Integrated Ocean Drilling Program Management International, Inc.). https://doi.org/10.2204/iodp.proc.314315316.123.2009
Fofonoff, N.P., 1985. Physical properties of seawater: a new salinity scale and equation of state for seawater. Journal of Geophysical Research: Oceans, 90(C2):3332–3342. https://doi.org/10.1029/JC090iC02p03332
Folk, R.L., 1980. Petrology of Sedimentary Rocks (2nd edition): Austin, TX (Hemphill’s).
Gaedicke, C., 2007. SEACAUSE Cruise SO186-2 report. http://www.bgr.bund.de/EN/Themen/MarineRohstoffforschung/Projekte/HC-Potential-of-continental-margins/Abgeschlossen/forschungsfahrt_SO_186_2_en.html
Helm, R., and Vollbrecht, A., 1985. Brittle-ductile shear zones in slope sediments off Guatemala, Site 568 and 569, Deep Sea Drilling Project Leg 84. In von Huene, R., Aubouin, J., et al., Initial Reports of the Deep Sea Drilling Project, 84: Washington, DC (U.S. Government Printing Office), 625–632. https://doi.org/10.2973/dsdp.proc.84.119.1985
Hinrichs, K.-U., Hayes, J.M., Bach, W., Spivack, A.J., Hmelo, L.R., Holm, N.G., Johnson, C.G., and Sylva, S.P., 2006. Biological formation of ethane and propane in the deep marine subsurface. Proceedings of the National Academy of Science of the United States of America, 103(40):14684–14689. http://dx.doi.org/10.1073/pnas.0606535103
Hüpers, A., and Kopf, A.J., 2012. Effect of smectite dehydration on pore water geochemistry in the shallow subduction zone: an experimental approach. Geochemistry, Geophysics, Geosystems, 13(10):QOAD26. https://doi.org/10.1029/2012GC004212
Hüpers, A., Torres, M.E., Owari, S., McNeill, L.C., Dugan, D., Henstock, T.J., Milliken, K.L., Petronotis, K.E., Backman, J., Bourlange, S., Chemale, F., Jr., Chen, W., Colson, T.A., Frederik, M.C.G., Guèrin, G., Hamahashi, M., House, B.M., Jeppson, T.N., Kachovich, S., Kenigsberg, A.R., Kuranaga, M., Kutterolf, S., Mitchison, F.L., Mukoyoshi, H., Nair, N., Pickering, K.T., Pouderoux, H.F.A., Shan, Y., Song, I., Vannucchi, P., Vrolijk, P.J., Yang, T., and Zhao, X., 2017. Release of mineral-bound water prior to subduction tied to shallow seismogenic slip off Sumatra. Science, 356(6340):841–844. https://doi.org/10.1126/science.aal3429
Kastner, M., Solomon, E.A., Harris, R.N., and Torres, M.E., 2014. Fluid origins, thermal regimes, and fluid and solute fluxes in the forearc of subduction zones. In Stein, R., Blackman, D., Inagaki, F., and Larsen, H.-C., Developments in Marine Geology (Volume 7): Earth and Life Processes Discovered from Subseafloor Environments: a Decade of Science Achieved by the Integrated Ocean Drilling Program (IODP). R. Stein (Series Ed.): Amsterdam (Elsevier B.V.), 671–733. https://doi.org/10.1016/B978-0-444-62617-2.00022-0
Kirschvink, J.L., 1980. The least-squares line and plane and the analysis of palaeomagnetic data. Geophysical Journal of the Royal Astronomical Society, 62(3):699–718. http://dx.doi.org/10.1111/j.1365-246X.1980.tb02601.x
Knipe, R.J., 1986. Microstructural evolution of vein arrays preserved in Deep Sea Drilling Project cores from the Japan Trench, Leg 57. In Moore, J.C. (Ed.), Structural Fabric in Deep Sea Drilling Project Cores from Forearcs. Memoirs - Geological Society of America, 166:75–87. https://doi.org/10.1130/MEM166-p75
Lovell, M.A., 1985. Thermal conductivities of marine sediments. Quarterly Journal of Engineering Geology and Hydrogeology, 18(4):437–441. https://doi.org/10.1144/GSL.QJEG.1985.018.04.14
Lundberg, N., and Moore, J.C., 1986. Macroscopic structural features in Deep Sea Drilling Project cores from forearc regions. In Moore, J.C. (Ed.), Structural Fabric in Deep Sea Drilling Project Cores from Forearcs. Memoirs - Geological Society of America, 166:13–44. https://doi.org/10.1130/mem166-p13
McNeill, L.C., Dugan, B., Backman, J., Pickering, K.T., Pouderoux, H.F.A., Henstock, T.J., Petronotis, K.E., Carter, A., Chemale, F., Jr., Milliken, K.L., Kutterolf, S., Mukoyoshi, H., Chen, W., Kachovich, S., Mitchison, F.L., Bourlange, S., Colson, T.A., Frederik, M.C.G., Guèrin, G., Hamahashi, M., House, B.M., Hüpers, A., Jeppson, T.N., Kenigsberg, A.R., Kuranaga, M., Nair, N., Owari, S., Shan, Y., Song, I., Torres, M.E., Vannucchi, P., Vrolijk, P.J., Yang, T., Zhao, X., and Thomas, E., 2017a. Understanding Himalayan erosion and the significance of the Nicobar Fan. Earth and Planetary Science Letters, 475:134–142. https://doi.org/10.1016/j.epsl.2017.07.019
McNeill, L., Dugan, B., and Petronotis, K., 2016. Expedition 362 Scientific Prospectus: the Sumatra Subduction Zone. International Ocean Discovery Program. http://dx.doi.org/10.14379/iodp.sp.362.2016
McNeill, L.C., Dugan, B., Petronotis, K.E., Backman, J., Bourlange, S., Chemale, F., Chen, W., Colson, T.A., Frederik, M.C.G., Guèrin, G., Hamahashi, M., Henstock, T., House, B.M., Hüpers, A., Jeppson, T.N., Kachovich, S., Kenigsberg, A.R., Kuranaga, M., Kutterolf, S., Milliken, K.L., Mitchison, F.L., Mukoyoshi, H., Nair, N., Owari, S., Pickering, K.T., Pouderoux, H.F.A., Yehua, S., Song, I., Torres, M.E., Vannucchi, P., Vrolijk, P.J., Yang, T., and Zhao, X., 2017b. Expedition 362 methods. In McNeill, L.C., Dugan, B., Petronotis, K.E., and the Expedition 362 Scientists, Sumatra Subduction Zone. Proceedings of the International Ocean Discovery Program, 362: College Station, TX (International Ocean Discovery Program). https://doi.org/10.14379/iodp.proc.362.102.2017
McNeill, L.C., Dugan, B., Petronotis, K.E., Backman, J., Bourlange, S., Chemale, F., Chen, W., Colson, T.A., Frederik, M.C.G., Guèrin, G., Hamahashi, M., Henstock, T., House, B.M., Hüpers, A., Jeppson, T.N., Kachovich, S., Kenigsberg, A.R., Kuranaga, M., Kutterolf, S., Milliken, K.L., Mitchison, F.L., Mukoyoshi, H., Nair, N., Owari, S., Pickering, K.T., Pouderoux, H.F.A., Yehua, S., Song, I., Torres, M.E., Vannucchi, P., Vrolijk, P.J., Yang, T., and Zhao, X., 2017c. Expedition 362 summary. In McNeill, L.C., Dugan, B., Petronotis, K.E., and the Expedition 362 Scientists, Sumatra Subduction Zone. Proceedings of the International Ocean Discovery Program, 362: College Station, TX (International Ocean Discovery Program). https://doi.org/10.14379/iodp.proc.362.101.2017
McNeill, L.C., Dugan, B., Petronotis, K.E., Backman, J., Bourlange, S., Chemale, F., Chen, W., Colson, T.A., Frederik, M.C.G., Guèrin, G., Hamahashi, M., Henstock, T., House, B.M., Hüpers, A., Jeppson, T.N., Kachovich, S., Kenigsberg, A.R., Kuranaga, M., Kutterolf, S., Milliken, K.L., Mitchison, F.L., Mukoyoshi, H., Nair, N., Owari, S., Pickering, K.T., Pouderoux, H.F.A., Yehua, S., Song, I., Torres, M.E., Vannucchi, P., Vrolijk, P.J., Yang, T., and Zhao, X., 2017d. Site U1480. In McNeill, L.C., Dugan, B., Petronotis, K.E., and the Expedition 362 Scientists, Sumatra Subduction Zone. Proceedings of the International Ocean Discovery Program, 362: College Station, TX (International Ocean Discovery Program). https://doi.org/10.14379/iodp.proc.362.103.2017
Milliken, K.L., 1988. Loss of provenance information through subsurface diagenesis in Plio-Pleistocene sandstones, northern Gulf of Mexico. Journal of Sedimentary Research, 58(6):992–1002. https://doi.org/10.1306/212F8EE0-2B24-11D7-8648000102C1865D
Müller, P.J., 1977. C/N ratios in Pacific deep-sea sediments: effect of inorganic ammonium and organic nitrogen compounds sorbed by clays. Geochimica et Cosmochimica Acta, 41(6):765–776. https://doi.org/10.1016/0016-7037(77)90047-3
Ogawa, Y., 1980. Beard-like veinlet structure as fracture cleavage in the Neogene siltstone in the Miura and Boso peninsulas, central Japan. Kyushi Daigaku Rigakubu Kenkyu Hukoku, Chishitsugaku, 13(2):321–327.
Ogawa, Y., and Miyata, Y., 1985. Vein structure and its deformational history in the sedimentary rocks of the Middle America Trench slope off Guatemala, Deep Sea Drilling Project Leg 84. In von Huene, R., Aubouin, J., et al., Initial Reports of the Deep Sea Drilling Project, 84: Washington, DC (U.S. Government Printing Office), 811–829. https://doi.org/10.2973/dsdp.proc.84.136.1985
Pimmel, A., and Claypool, G., 2001. Technical Note 30: Introduction to Shipboard Organic Geochemistry on the JOIDES Resolution. Ocean Drilling Program. http://dx.doi.org/10.2973/odp.tn.30.2001
Terzaghi, K., 1943. Theoretical Soil Mechanics: New York (John Wiley).
van Hinsbergen, D.J.J., de Groot, L.V., van Schaik, S.J., Sparkman, W., Biji, P.K., Sluijs, A., Langeris, C.G., and Brinkhuis, H., 2015. A paleolatitude calculator for paleoclimate studies. PLoS One, 10(6):e0126946. http://dx.doi.org/10.1371/journal.pone.0126946
Wei, W., 2007. Fluid origins, paths, and fluid-rock reactions at convergent margins, using halogens, Cl stable isotopes, and alkali metals as geochemical tracers [Ph.D. thesis]. Scripps Institution of Oceanography, University of California San Diego. http://gradworks.umi.com/32/50/3250070.html
Zijderveld, J.D.A., 1967. AC demagnetization of rocks: analysis of results. In Collinson, D.W., Creer, K.M., and Runcorn, S.K. (Eds.), Methods in Palaeomagnetism: Amsterdam (Elsevier), 254–286.
1 McNeill, L.C., Dugan, B., Petronotis, K.E., Backman, J., Bourlange, S., Chemale, F., Chen, W., Colson, T.A., Frederik, M.C.G., Guèrin, G., Hamahashi, M., Henstock, T., House, B.M., Hüpers, A., Jeppson, T.N., Kachovich, S., Kenigsberg, A.R., Kuranaga, M., Kutterolf, S., Milliken, K.L., Mitchison, F.L., Mukoyoshi, H., Nair, N., Owari, S., Pickering, K.T., Pouderoux, H.F.A., Yehua, S., Song, I., Torres, M.E., Vannucchi, P., Vrolijk, P.J., Yang, T., and Zhao, X., 2017. Site U1481. In McNeill, L.C., Dugan, B., Petronotis, K.E., and the Expedition 362 Scientists, Sumatra Subduction Zone. Proceedings of the International Ocean Discovery Program, 362: College Station, TX (International Ocean Discovery Program). https://doi.org/10.14379/iodp.proc.362.104.2017
2 Expedition 362 Scientists’ addresses.
This work is distributed under the Creative Commons Attribution 4.0 International (CC BY 4.0) license. 
- F1. Bathymetric map.
- F2. Seismic reflection profile BGR06-103.
- F3. Site U1481 reentry system.
- F4. Schematic summary of lithologic units.
- F5. Bioturbated black and gray silty clay/claystone and intercalated dark gray silt/siltstone.
- F6. Alternating gray siltstone and claystone.
- F7. Bulk mineralogy.
- F8. Examples of distinctive sand- and silt-size components.
- F9. Diagenetic features of Unit II.
- F10. Agglutinated foraminifer typical of the claystones and silty claystones.
- F11. Structureless dark greenish gray mudstone.
- F12. Bioturbated silty mudstone with claystone to silty claystone and siltstone.
- F13. Parallel-laminated mudstone.
- F14. Nereites-modified mudstone.
- F15. Schematic comparative lithostratigraphy for Sites U1480 and U1481.
- F16. Bedding dip angles.
- F17. Core images after core splitting and ~12 h later.
- F18. Fault in red claystone.
- F19. Histogram of fault frequency.
- F20. Deformation bands in red claystone.
- F21. Distribution of drilling disturbance structures.
- F22. Intensity of drilling biscuits, fractures, drilling breccia, and final core elongation.
- F23. Intensity of fall-in and borehole diameter.
- F24. Intensity of soupy deformation, midcore flow-in, and faults.
- F25. Core segment that was drilled, dropped back into hole, and recored.
- F26. Drilling-induced impact fractures.
- F27. Sand fraction, recovery, SEF, and time to core.
- F28. Coring time versus sand fraction.
- F29. Coring time versus core recovery.
- F30. SEF versus core recovery.
- F31. Composite plate of Quaternary radiolarians.
- F32. Linear sedimentation rates based on biostratigraphic data.
- F33. Comparison of linear sedimentation rates based on biostratigraphic data.
- F34. Magnetic susceptibility, NRM intensity, inclination, and declination.
- F35. Histogram of inclinations determined from discrete samples.
- F36. Representative vector end-point diagrams of magnetization directions.
- F37. Alkalinity, sulfate, boron, and lithium profiles.
- F38. Sodium, potassium, magnesium, calcium, silica, strontium, chloride, and manganese profiles.
- F39. Methane, ethane, ethane/methane ratios, and propane.
- F40. Total carbon, calcium carbonate, organic C, total nitrogen, and organic C/total N.
- F41. Physical property measurements.
- F42. Physical properties measurements deeper than 1350 mbsf.
- F43. NGR measurements versus lithology.
- F44. NGR versus total clay content from XRD analyses.
- F45. P-wave velocity from the whole-round PWL.
- F46. Corrected discrete P-wave velocity data.
- F47. Bulk density, grain density, and porosity.
- F48. MAD porosity versus effective vertical stress.
- F49. Comparison of MAD porosity versus effective vertical stress at Sites U1480 and U1481.
- F50. Corrected discrete P-wave velocity
- F51. Thermal conductivity versus depth and lithology.
- F52. Thermal conductivity versus porosity.
- F53. Log summary.
- F54. Comparison between downlog and main log passes.
- F55. Sonic logs and acoustic waveforms recorded during downlog and main passes.
- F56. Spectral gamma ray data recorded during downlog inside the casing.
- F57. Spectral gamma ray data recorded by the HNGS tool.
- F58. Comparison between the gamma ray, magnetic susceptibility, and velocity logs.
- F59. Comparison of gamma ray and magnetic susceptibility logs with core data.
- F60. Estimation of formation porosity and density.
- F61. P-wave sonic log data.
- F62. Comparison between seismic reflection Line BGR06-103 and synthetic seismograms.
- F63. Seismic reflection Line BGR06-103.
- F64. Comparison between selected log parameters and core measurements.
- F65. Seismic reflection Line BGR06-103 with overlaid key depth points.
- F66. Core tops from Site U1481 superimposed on seismic reflection Line BGR06-103.
- F67. Regional interpretation of seismic Line BGR06-103 around Site U1481.
- F68. Summary of tie points between time and depth.
- T1. Site U1481 core summary.
- T2. Summary of lithostratigraphic units.
- T3. Distribution and composition of lithologies.
- T4. Calcareous nannofossil biostratigraphy.
- T5. Planktonic foraminifer biostratigraphy.
- T6. Diatom biostratigraphy.
- T7. Radiolarian biostratigraphy.
- T8. Tie points and linear sedimentation rates.
- T9. Organic metabolites and major element concentration in interstitial water.
- T10. Minor element concentrations in interstitial water.
- T11. C1–C3 hydrocarbons in headspace samples.
- T12. Carbon and nitrogen from bulk sediment analyses.
- T13. Thermal conductivity.
- T14. Summary of key time-depth ties.