Rosenthal, Y., Holbourn, A.E., Kulhanek, D.K., and the Expedition 363 Scientists
Proceedings of the International Ocean Discovery Program Volume 363
publications.iodp.org
https://doi.org/10.14379/iodp.proc.363.105.2018

Site U14841
Y. Rosenthal, A.E. Holbourn, D.K. Kulhanek, I.W. Aiello, T.L. Babila, G. Bayon, L. Beaufort, S.C. Bova, J.-H. Chun, H. Dang, A.J. Drury, T. Dunkley Jones, P.P.B. Eichler, A.G.S. Fernando, K.A. Gibson, R.G. Hatfield, D.L. Johnson, Y. Kumagai, T. Li, B.K. Linsley, N. Meinicke, G.S. Mountain, B.N. Opdyke, P.N. Pearson, C.R. Poole, A.C. Ravelo, T. Sagawa, A. Schmitt, J.B. Wurtzel, J. Xu, M. Yamamoto, and Y.G. Zhang2
MS 363-105: Published 8 June 2018
Background and objectives
International Ocean Discovery Program (IODP) Site U1484 (proposed Site WP-71A) is located ~15 km off the northern coast of Papua New Guinea at 03°07.93ʹS, 142°46.98ʹE in 1031 m water depth (Figure F1). The site is situated on seismic Line RR1313-WP7-2 (Rosenthal et al., 2016), ~900 m southwest of the cross-point with seismic Line RR1313-WP7-5, and ~1.5 km east of the location of piston Core RR1313 PC32 (Figure F2). The ~7 m piston core and a companion gravity core from this site are characterized by a mixture of clay and volcanic sand with relatively high numbers of planktonic and benthic foraminifers in excellent state of preservation. Preliminary isotope analysis of planktonic foraminifers from the cores indicates >6 m of Holocene sediment, implying sedimentation rates >60 cm/ky. The multichannel seismic (MCS) survey shows >650 m sediment coverage at this site (Figure F3). The MCS profiles exhibit remarkable uniformity of acoustic stratification indicating a succession of alternating clay-, silt-, and sand-dominated beds down to 0.28 s two-way traveltime (TWT) below the surface with an estimated depth of 225 meters below seafloor (mbsf), our target drilling depth. Below this depth, the MCS profiles suggest a disturbed zone. We note also a possible disturbed interval between 0.14 and 0.16 s TWT below the seafloor (Rosenthal et al., 2016).
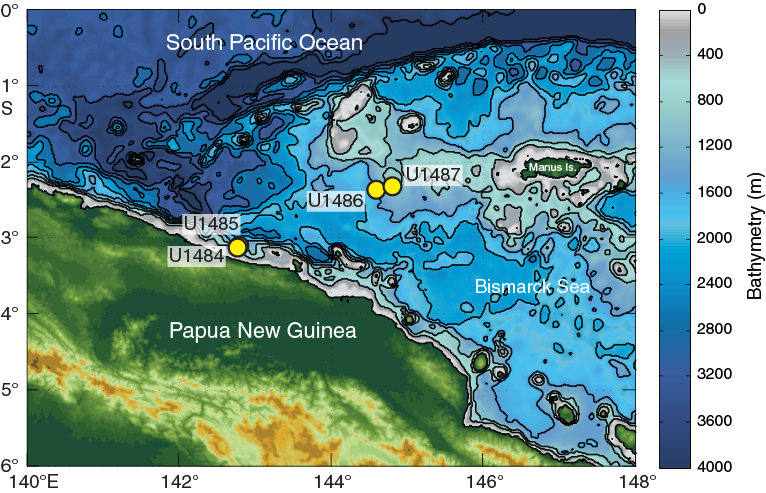
Figure F1. Northern margin of Papua New Guinea and location of Sites U1484–U1487.
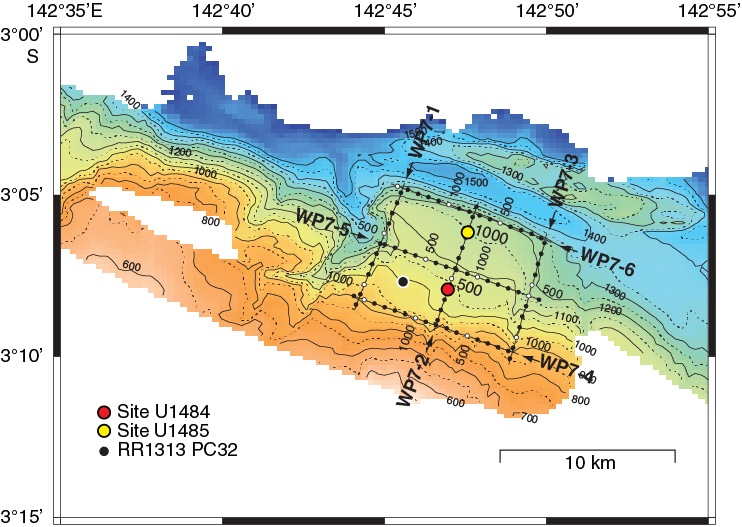
Figure F2. Contoured bathymetric map and site locations.
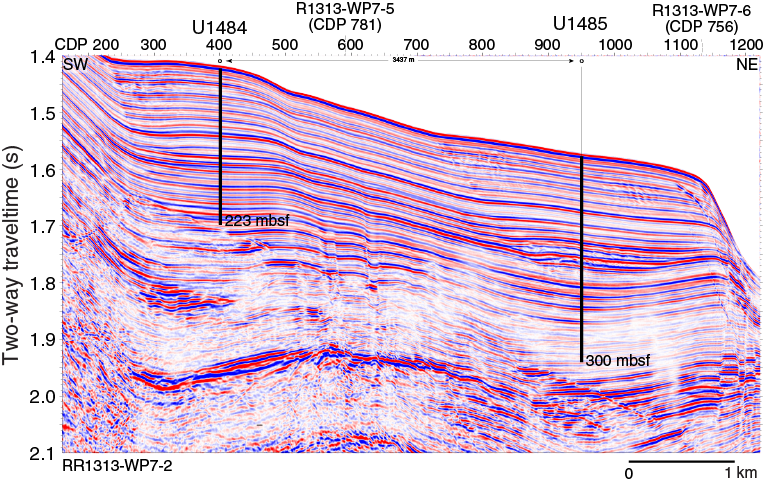
Figure F3. Seismic Line RR1313-WP7-2 and site locations.
Site U1484 is located in a tectonically complex region east of the Cyclops Mountains and west of the Sepik/Ramu River mouths. The region is bounded to the south by the Bewani-Torricelli fault zone on land, which links to offshore transform faults that eventually connect with a seafloor spreading zone(?) along the Bismarck Sea seismic lineation to the east (Baldwin et al., 2012). Northwest of the site, the southward subduction of the Caroline microplate forms the New Guinea Trench. The continental shelf in this region is exceedingly narrow (<2 km), allowing large amounts of terrigenous sediment discharge from coastal rivers to bypass the narrow continental shelf and accumulate in deeper water (Milliman et al., 1999).
The climatology and oceanography of northern Papua New Guinea is strongly influenced by the seasonal migration of the Intertropical Convergence Zone, with enhanced precipitation during boreal winter (Figure F4A, F4B). Interannually, precipitation decreases during El Niño events (Figure F4C, F4D). Monsoon winds control the surface hydrography of the region such that the New Guinea Coastal Current flows westward over the drill sites during the boreal summer southeasterly monsoon (also referred to as the austral summer monsoon in the Southern Hemisphere) (Kuroda, 2000). These currents distribute sediments originating from the Sepik/Ramu River mouths and multitudes of other tributaries along the coast over the northern slopes of Papua New Guinea and adjacent deep basins. The surface current reverses during the boreal winter northwesterly monsoon (Kuroda, 2000), and the surface sediment plume from the Sepik/Ramu River mouths is observed to meander out across the Bismarck Sea (Steinberg et al., 2006). In contrast, the New Guinea Coastal Undercurrent persists in a westward direction year round at a water depth of ~220 m, widening and strengthening during boreal summer (Kuroda, 2000). This undercurrent supplies terrigenous sediments from the near-bottom river plumes to the drill sites. At ~1000 meters below sea level (mbsl), the sediment is bathed in Antarctic Intermediate Water.

Figure F4. Precipitation anomalies during the 1997–1998 El Niño event.
The high sedimentation rate at Site U1484 provides the potential to resolve late middle to late Pleistocene centennial- to millennial-scale climate variability in the Western Pacific Warm Pool. Comparing these high-resolution records with comparable ones for the North Atlantic and eastern equatorial Pacific will allow us to better constrain the mechanisms influencing millennial-scale variability. This site will also provide insights on orbital-scale variability during the late middle to late Pleistocene. Finally, Site U1484 will allow us to examine the southern Pacific contribution to the Indonesian Throughflow.
Operations
Transit to Site U1484
The 2097 nmi transit to Site U1484 was completed in 7.5 days at an average speed of 11.6 kt. We advanced the clock 2 h during the transit. We lowered the thrusters and switched to dynamic positioning control at 2245 h (all times local ship time; UTC + 10 h) on 6 November 2016. We did not deploy a positioning beacon at this site.
Operations summary
We cored three holes at Site U1484 in accordance with the original operations plan that included coring with the advanced piston corer (APC) to 225 mbsf in three holes (Table T1).
Table T1. Core summary. Download table in CSV format. View PDF table.
Hole U1484A was cored to 195.0 mbsf with the APC using core orientation and nonmagnetic hardware (Cores 363-U1484A-1H through 21H). We had poor recovery within an interval of sand from ~110 to 130 mbsf. After encountering APC refusal, we switched to the half-length advanced piston corer (HLAPC) and continued coring to 223.2 mbsf (Cores 22F through 27F), where we terminated the hole. Downhole temperature measurements using the advanced piston corer temperature tool (APCT-3) were taken on Cores 4H (37.1 mbsf), 7H (65.6 mbsf), 10H (94.1 mbsf), 13H (122.6 mbsf), and 16H (147.5 mbsf), obtaining reliable results on three of the five deployments. A total of 220.60 m of sediment was recovered over 223.2 m of coring (99% recovery) in Hole U1484A.
After encountering sand between ~110 and 130 mbsf in Hole U1484A, we altered the operations plan for the remaining holes to include using the HLAPC over that interval to improve recovery. Hole U1484B was cored with the APC using orientation and nonmagnetic hardware to 104.8 mbsf (Cores 363-U1484B-1H through 12H), including one 2 m drilled interval to offset core gaps for stratigraphic correlation. We then switched to the HLAPC and continued coring to 133.0 mbsf (Cores 13F through 18F), which allowed us to better recover the sand found through that interval (average recovery of 88% in Hole U1484B compared with 57% in Hole U1484A). We then switched back to the APC and cored to 190 mbsf (Core 19H) using orientation. The remainder of Hole U1484B was cored with the HLAPC to 222.9 mbsf (Cores 25F through 31F) after encountering APC refusal with Core 24H. We recovered 220.51 m of core over 220.9 m of coring (100% average recovery) in Hole U1484B.
Oriented APC coring with nonmagnetic hardware continued in Hole U1484C to 106.1 mbsf (Cores 363-U1484C-1H through 12H). We then switched to the HLAPC and cored to 145.7 mbsf (Cores 13F through 21F) to recover the sand interval. One drilled interval (2 m) advanced the hole without coring to avoid alignment of core gaps for stratigraphic correlation. We then switched back to the APC and cored to 193.2 mbsf (Cores 22H through 26H). After encountering APC refusal, we finished coring the hole to 221.4 mbsf (Cores 27F through 32F) using the HLAPC. A total of 225.46 m of core was recovered over 219.4 m of coring (103% recovery). Operations at Site U1484 ended at 0945 h on 10 November 2016. Total time spent at the site was 83.0 h (3.5 days).
A total of 55 APC cores were recovered at this site, collecting 515.91 m of sediment over 508.4 m of penetration (101.5% recovery). We also collected 33 HLAPC cores, recovering 150.66 m of sediment over 155.1 m of penetration (97.1% recovery). Overall recovery at Site U1484 was 666.57 m of sediment over 663.5 m of coring (100.5% recovery).
Hole U1484A
We prepared and spaced out the bottom-hole assembly (BHA), which consisted of an APC/XCB coring assembly with two stands of drill collars. During deployment of the drill string, the seafloor depth was measured at 1042.4 meters below rig floor (mbrf) with the precision depth recorder, and we positioned the bit at 1037.5 mbrf to shoot the first core.
Hole U1484A was spudded at 0520 h on 7 November 2016 with Core 363-U1484A-1H recovering 5.05 m of core, establishing a seafloor depth of 1030.9 mbsl. We deployed the FlexIT core orientation tool at this site after corrected declination values showed a baseline offset for cores collected at Sites U1482 and U1483 using the Icefield MI-5 core orientation tool (see Paleomagnetism). Oriented APC coring using the FlexIT core orientation tool with nonmagnetic hardware continued to 195.0 mbsf (Cores 363-U1484A-1H through 21H). Downhole temperature measurements were taken with the APCT-3 on Cores 4H (33.5 mbsf), 7H (62.0 mbsf), 10H (90.5 mbsf), 13H (119.0 mbsf), and 16H (147.5 mbsf), obtaining good measurements on three of the five deployments. Recovery was excellent in the APC cored section except from ~110 to 130 mbsf, where we encountered unconsolidated sand. High levels of methane also caused significant core expansion, resulting in material sometimes being ejected from the tops and bottoms of cores onto the rig floor. When possible, this material was recovered and curated in short sections at the top or bottom of cores; however, these portions of the core should be considered disturbed.
After reaching APC refusal at 195.0 mbsf, we switched to the HLAPC coring system and continued coring to 223.2 mbsf (Cores 22F through 27F). Because we were only approved to core to 225 mbsf, we terminated coring after Core 27F. The drill string was pulled out of the hole, with the bit clearing the seafloor at 0355 h on 8 November, ending operations in Hole U1484A. Total time spent in Hole U1484A was 29.25 h (1.2 days).
A total of 21 APC cores were taken in Hole U1484A. We recovered 191.17 m of sediment over 195.0 m of coring for a total recovery of 98.0%. The HLAPC was deployed 6 times, collecting 29.43 m of sediment over 28.2 m of coring (104.4%). Overall recovery for the hole was 220.60 m of sediment over 223.2 m of coring (98.8% recovery).
Hole U1484B
The vessel was offset 20 m east of Hole U1484A, and the drill string was spaced out to 1040.0 mbrf. Hole U1484B was spudded at 0535 h on 8 November 2016. Core 363-U1484B-1H recovered 7.88 m of sediment, establishing a seafloor depth of 1030.5 mbsl. Oriented APC coring using the FlexIT core orientation tool with nonmagnetic hardware proceeded to 104.8 mbsf (Cores 1H through 12H). We drilled ahead without coring one 2 m interval to offset core gaps for stratigraphic correlation purposes. We then switched to the HLAPC in an effort to better recover the sand layer where we had poor (<60%) recovery in Hole U1484A. We cored to 133.0 mbsf (Cores 13F through 18F), with recovery over this interval of 88%. This was a significant improvement over core recovery in Hole U1484A over this interval.
We switched back to the full-length APC and continued coring from 133.0 to 190.0 mbsf (Cores 19H through 24H), where we encountered APC refusal. We then switched back to the HLAPC and cored to 222.9 mbsf (Cores 25F through 31F), where we terminated Hole U1484B. The drill string was pulled out of the hole, with the bit clearing the seafloor at 0850 h on 9 November, ending operations in Hole U1484B. Total time spent in Hole U1484B was 28.75 h (1.2 days).
A total of 17 APC cores were taken in Hole U1484B. We recovered 163.95 m of sediment over 159.8 m of coring for a total recovery of 102.6%. The HLAPC was deployed 13 times, collecting 56.56 m of sediment over 61.1 m of coring (92.6%). A single drilled interval advanced the hole 2 m without coring. Total recovery for Hole U1484B was 220.51 m of sediment over 220.9 m of coring (99.8%).
Hole U1484C
After having better recovery of the sand interval in Hole U1484B, we decided to employ a similar drilling strategy for Hole U1484C. The vessel was offset 20 m south of Hole U1484B, and the bit was set at 1034.0 mbrf. Hole U1484C was spudded at 1010 h on 9 November 2016. Core 363-U1484C-1H recovered 1.6 m of sediment, establishing a seafloor depth of 1030.8 mbsl. Oriented APC coring using the FlexIT core orientation tool with nonmagnetic hardware penetrated to 106.1 mbsf (Cores 1H through 12H). We then switched to the HLAPC and continued coring to 145.7 mbsf (Cores 13F through 21F). We cored using the HLAPC to ~10 m deeper than in Hole U1484B to recover another small sand interval located between ~130 and 140 mbsf. We also drilled ahead without coring 2 m to offset core gaps for stratigraphic correlation. After coring through the sand, we switched back to the full-length APC and continued coring to 193.2 mbsf (Cores 22H through 26H). The Icefield MI-5 orientation tool was deployed while collecting these APC cores. After encountering refusal with Core 26H, we switched back to the HLAPC and cored to 221.4 mbsf (Cores 27F through 32F), where we terminated coring in Hole U1484C. We pulled the drill string out of the hole, with the bit clearing the seafloor at 0930 h on 10 November. The rig was secured for a dynamic positioning transit to the next site at 0945 h, ending operations at Site U1484. Total time spent in Hole U1484C was 25.0 h (1.0 day).
A total of 17 APC cores were taken in Hole U1484C, collecting 160.79 m of core over 153.6 m of coring (104.7%). We also took 14 HLAPC cores, retrieving 64.67 m of core over 65.8 m of coring (98.3%). Total recovery for Hole U1484C was 225.46 m of sediment over 219.4 m of coring (102.8%).
Core description
We drilled three holes at Site U1484, with the deepest one penetrating to 223.67 mbsf (Hole U1484A). The succession recovered from Holes U1484A through U1484C consists of middle Pleistocene to recent terrigenous and hemipelagic sediment. We identified one lithologic unit based on visual core description, microscopic examination of smear slides, magnetic susceptibility, color spectral observations, and bulk mineralogical analysis by X-ray diffraction (XRD) (see Core description and Physical properties in the Expedition 363 methods chapter [Rosenthal et al., 2018a]). The major characteristics of the sedimentary sequence at Site U1484 are summarized in Figure F5.
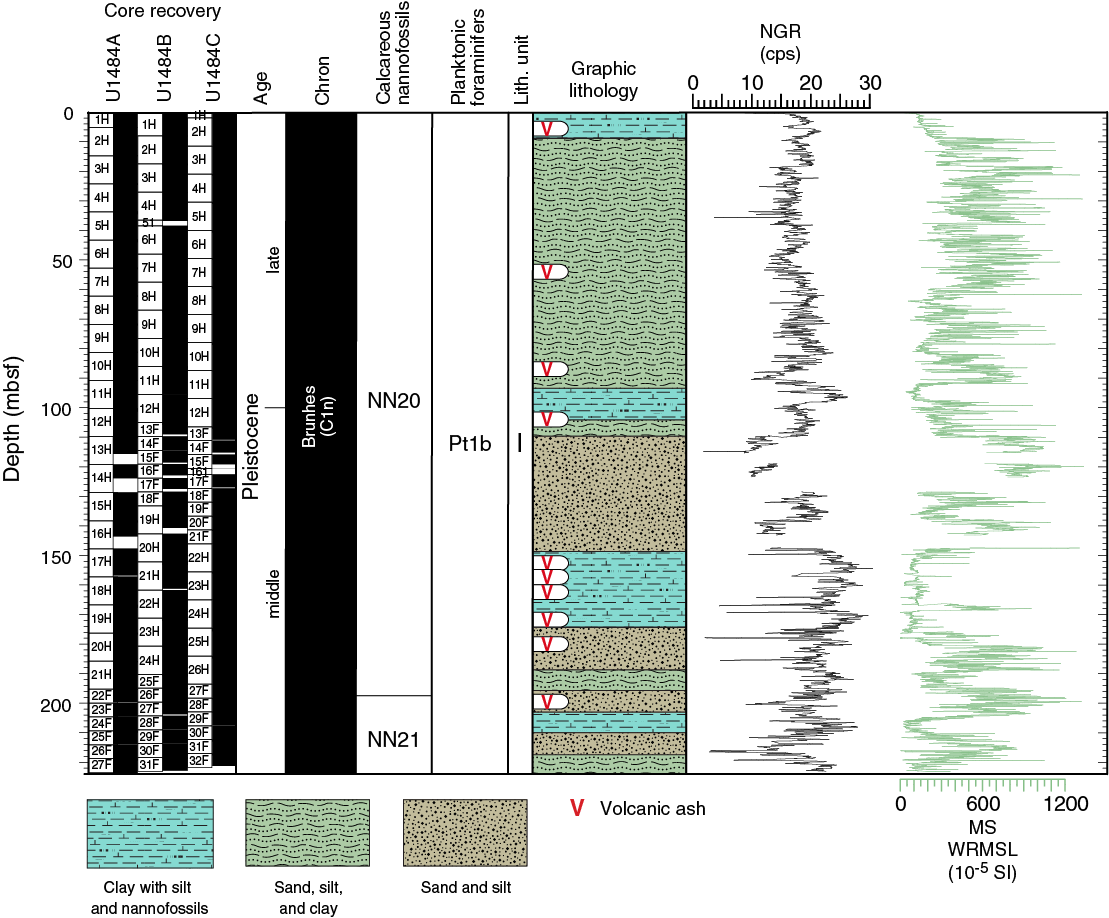
Figure F5. Lithologic summary.
Unit descriptions
Unit I
- Intervals: 363-U1484A-1H-1, 0 cm, through 27H-CC, 28 cm;
363-U1484B-1H-1, 0 cm, through 31H-CC, 85 cm;
363-U1484C-1H-1, 0 cm, through 32H-CC, 22 cm - Depths: Hole U1484A = 0–223.67 mbsf, Hole U1484B = 0–222.61 mbsf, Hole U1484C = 0–220.86 mbsf
- Thickness: Hole U1484A = 223.67 m, Hole U1484B = 222.61 m, Hole U1484C = 220.86 m
- Age: middle Pleistocene to recent
- Lithologies present: silty clay, nannofossil-rich clay, nannofossil silty clay, nannofossil-rich silty clay, nannofossil-rich sandy clay, nannofossil-rich clayey silt, nannofossil-rich silt, sandy silt, silty sand, foraminifer-rich silty sand, nannofossil-rich silty sand, sand, and ash
The sediment at Site U1484 is composed of three main components: dark greenish gray clay, silt, and sand. The relative abundance of clay and silt varies downhole. Additionally, the sediment contains variable but proportionately minor amounts of nannofossils and foraminifers. Fine-grained intervals alternate with discrete layers of sand- and silt-sized sediment (Figures F6, F7, F8, F9). The bottom of Hole U1484A is dated as middle Pleistocene (see Biostratigraphy).
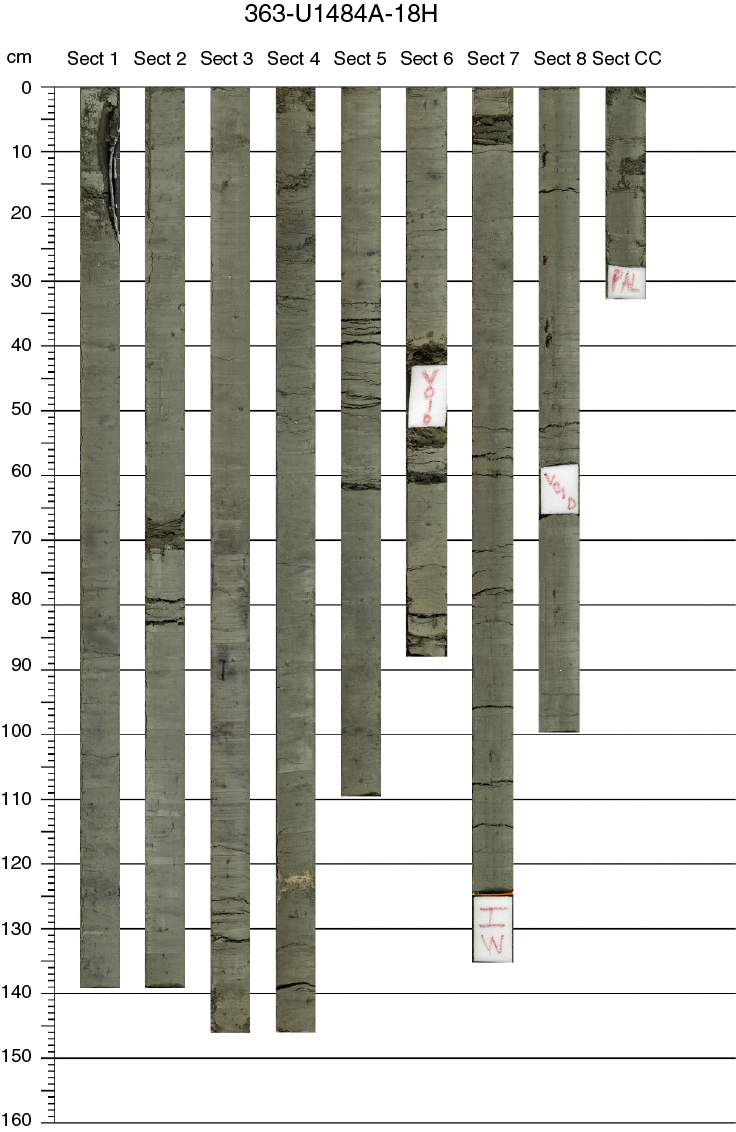
Figure F6. Clay-rich intervals in Unit I.
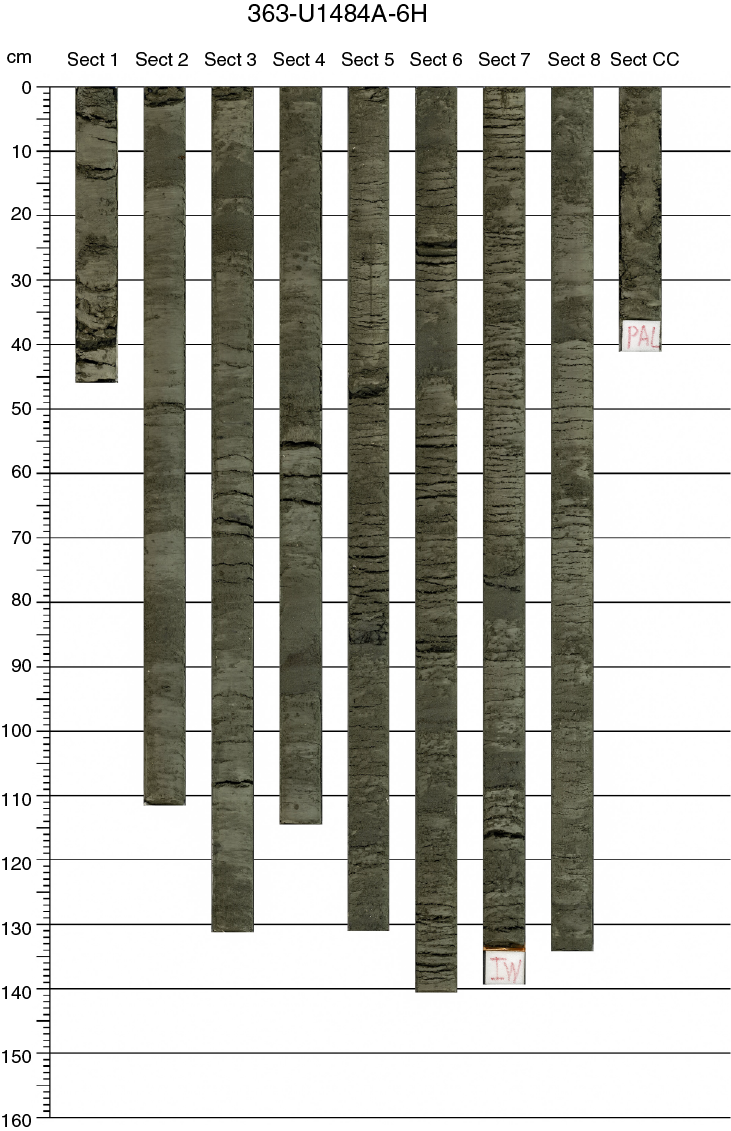
Figure F7. Interbedded clay- and sand-rich layers in Unit I.
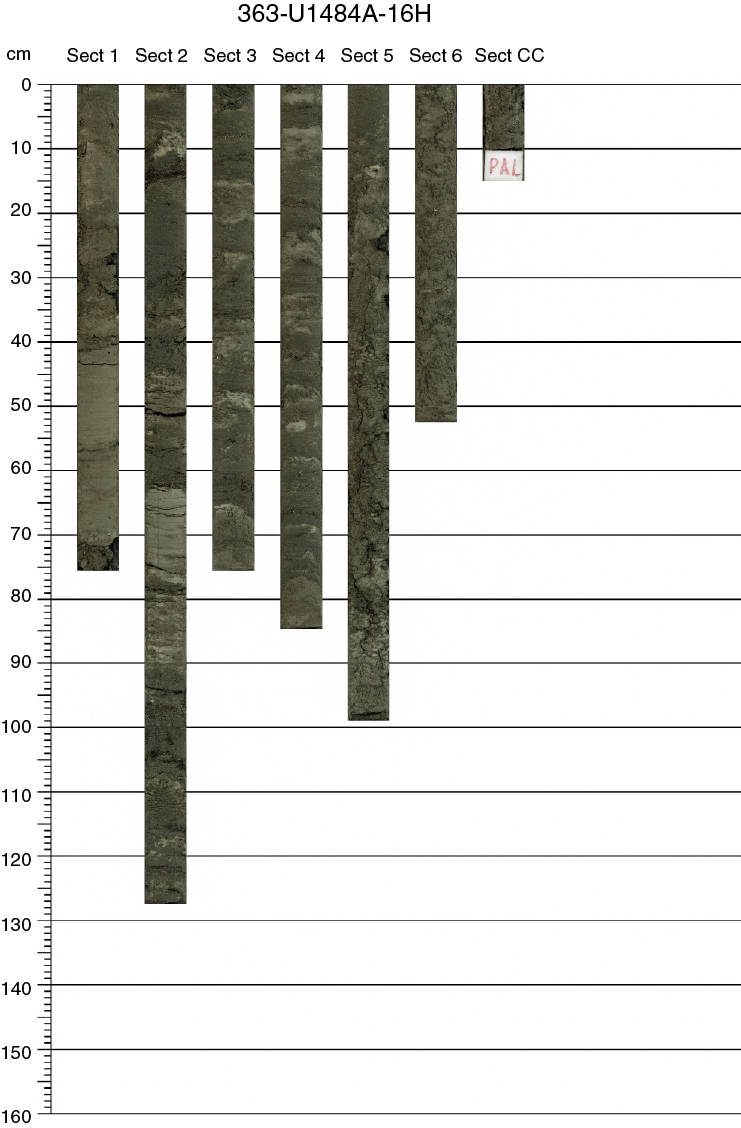
Figure F8. Sand-rich intervals in Unit I.
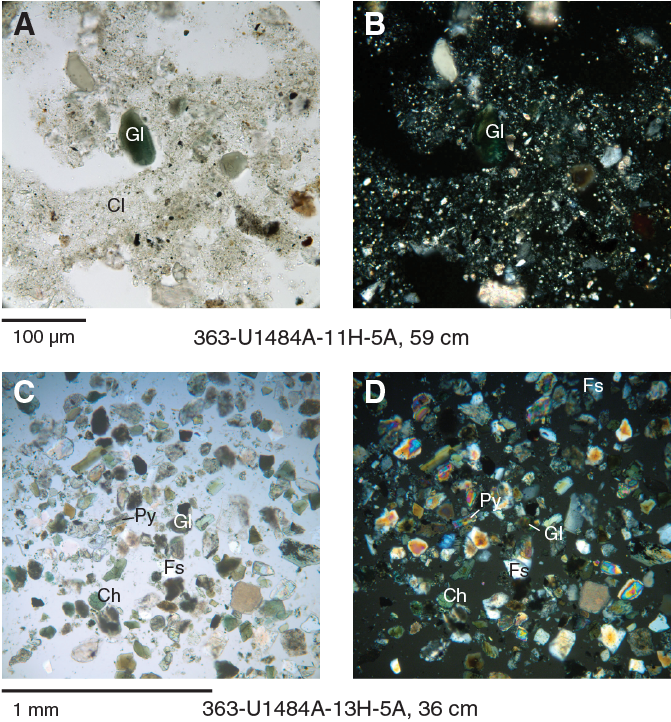
Figure F9. Main sedimentary components in Unit I.
Because of the absence of clear lithologic boundaries, there are no subunits defined. Subtle lithologic changes present throughout the succession can be correlated between different holes. The following description refers to lithologic changes in Hole U1484A. The interval from 0 to ~10 mbsf is characterized by decimeter- to meter-thick layers of clay with variable amounts of silt, interrupted by several centimeter- to decimeter-thick sand layers. Between ~10 and 110 mbsf, the abundance and thickness of the sand layers increase downhole (Figures F7, F8), with a shift toward decimeter-thick sand layers alternating with thin silt and clay layers from ~110 to 150 mbsf (e.g., Figure F7). Between ~150 and 175 mbsf, clay layers are more abundant than sand layers, whereas the sand and the clay layers are mixed almost equally in the lower part of the succession (175–224 mbsf).
Clay- and silt-dominated sediment is typically moderately bioturbated, whereas the sandy intervals show slight or no bioturbation with sedimentary structures better preserved than in the clay and silt layers (Figure F10). When bioturbation is absent or minimal, the majority of sand layers show well-defined boundaries with the adjacent finer grained (mainly silty clay and nannofossil clay) layers. In many instances, the lower boundary is sharp and irregular, suggesting scouring prior to the deposition of the sand (Figures F10C, F11). Although coarser layers showing normal grading are common (Figure F10A), both homogeneous and reverse-graded sand layers (Figure F10B) also occur. We did not observe some of the sedimentary structures typically associated with “classic” turbidity flows in Bouma sequences (e.g., cross-lamination, parallel lamination, and convolute ripples).

Figure F10. Typical sedimentary structures in Unit I.

Figure F11. Sharp boundary between sand and clay layers.
The silt and sand layers generally consist of moderately to well-sorted terrigenous siliciclastic material. The amount of clay and nannofossils in the sand layers is negligible. Additionally, large benthic shallow-water foraminifers are present within the coarse-sand layers (see Biostratigraphy; Figure F12A). Sulfide patches as well as small millimeter-scale pockets of sponge spicules are found in clay-rich intervals throughout the succession. Plant material and wood fragments (Figure F12B) as well as shell fragments and pebble-sized pumice clasts (Figure F12C) often occur within the sand layers. In all three holes, the cores are disturbed by gas expansion cracks to varying extent.
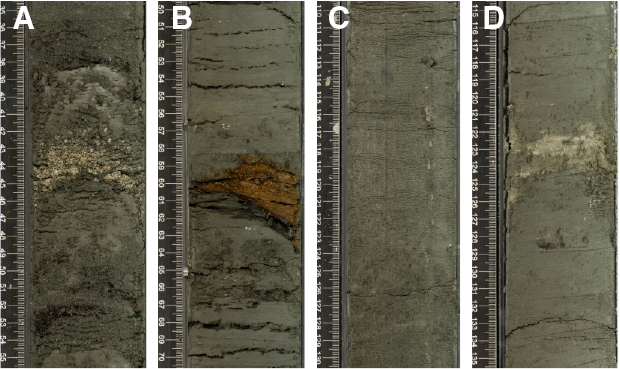
Figure F12. Accessories found in Unit I.
Several tephra layers (0.3–5.0 cm thick) present throughout the succession are composed of vesicular glass fragments and bubble wall shards (Figures F12D, F13, F14; Table T2). Three tephra layers were found in Hole U1484A, and they range in color from white (N 8) to brown (7.5YR 4/4) with maximum grain size between 180 and 300 µm. Six tephra layers were observed in Hole U1484B, and they range in color from gray (5Y 6/1) to black (10YR 2/1) with maximum grain size between 60 and 300 µm. Six tephra layers were also found in Hole U1484C, and they range in color from gray (10YR 5/1) to brown (7.5YR 4/2) with maximum grain size between 80 and 300 µm.

Figure F13. Tephra layers.
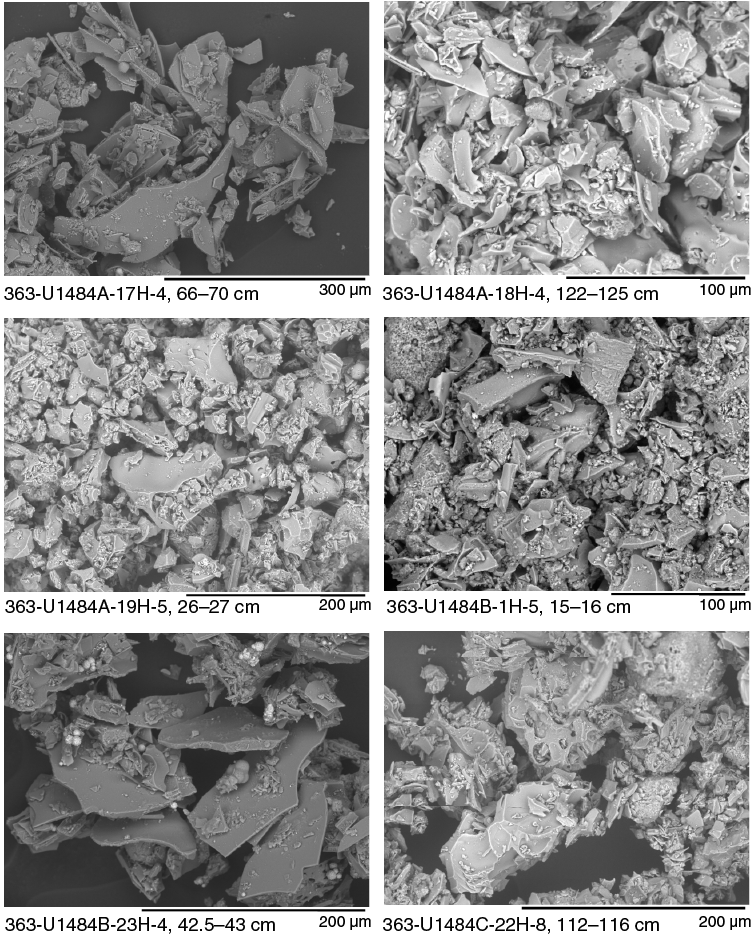
Figure F14. Vesicular glass fragments and bubble wall shards in tephra.
Table T2. Tephra layers. Download table in CSV format.
Mineralogic characteristics of the sediment
Clay layers
The mineral compositions of the common lithologies, including nannofossil-bearing clay (Sample 363-U1484A-2H-1, 59–50 cm), nannofossil-rich clay (Sample 363-U1484A-9H-7, 69–70 cm), and nannofossil-rich silty clay (Samples 363-U1484B-1H-2, 59–60 cm, 363-U1484A-21H-5, 100–101 cm, and 25F-3, 70–71 cm), were analyzed by XRD on acidified samples (Figure F15). The analyses show that the noncarbonate clay and silty clay fraction mainly consists of quartz, feldspar, mica, and two main types of clay minerals: montmorillonite and chlorite.
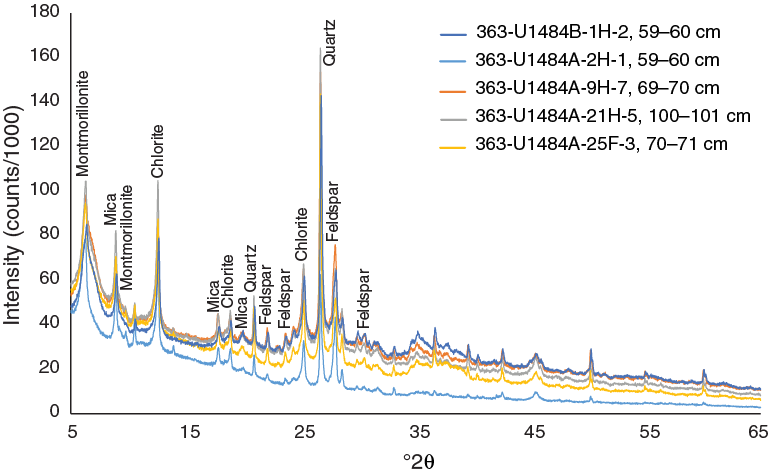
Figure F15. XRD results from clay.
Sand layers
The main mineralogic components of the coarser, mainly sand size intervals at Site U1484 were identified using smear slide analysis in conjunction with bulk XRD analysis. Mineral identification from smear slides is more difficult than using traditional thin section optical petrography (because of the nonstandard thickness of the minerals) and the quantification of the particle types is also less accurate (e.g., visual estimate versus point counts). However, the smear slide data offer an overview of the most common particle types composing the coarser sediment fraction, as well as an estimate of their relative proportions. In general, four main types of particles were identified in the sand-sized intervals at Site U1484: minerals, rock fragments, mineraloids, and biogenic particles. Minerals include angular to subangular feldspars (mainly K-feldspars and secondarily plagioclase feldspars), ferromagnesian minerals (mainly orthopyroxene and amphibole), and chlorite (see also glauconite in Discussion). Rock fragments are of two types: volcaniclastic particles (volcanic rock fragments) and, less commonly, intrusive plutonic (granitoids) and metamorphic rocks. Mineraloids are mainly represented by more or less pyritized glauconite (Figure F16), which occurs as both irregular pelletal grains and transparent elongated fragments. Sand- and silt-sized biogenic components consist primarily of whole or broken planktonic and benthic foraminifers.

Figure F16. Glauconite particle and framboidal pyrite.
Discussion
The sedimentary structures observed in the coarser sand intervals at Site U1484 do not suggest deposition as result of turbidites. Rather, the presence of massive, normal, and reverse-graded beds and the occurrence of scouring at their bases suggest a combination of other types of mass gravity flows and current reworking. In classic classification schemes of subaqueous sediment gravity flows, massive (ungraded) sandstone deposits have been interpreted to result from highly concentrated turbidity currents in which particle transport is mainly sustained by grain-to-grain collisions (e.g., “grain flows” of Middleton and Hampton, 1973). The two most common mechanisms that form mass gravity flows are sediment failures (often triggered by earthquakes) and flood-stage flow in rivers (Mutti et al., 2013). Both mechanisms are plausible considering the tectonic, physiographic, and geographical settings of Site U1484. The site is located in ~1030 m water depth adjacent to a steep continental slope that borders a narrow (~5–10 km) continental shelf in a seismically active region.
The mouths of two very large rivers (Sepik and Ramu Rivers) with very high modern sediment loads (~85 × 106 tons/y for the Sepik River; Kineke et al., 2000) are located ~100 km to the east-southeast. Previous studies (Kineke et al., 2000; Kuehl et al., 2004) suggested that between 85% and 93% of the Sepik River sediment escapes by gravity flows through canyons located at the mouth of the river. However, these studies also showed that part of the sediment load is dispersed to the northwest (toward Site U1484) and accumulates on the shelf and slope through surface and subsurface plumes (hypo- and iso/hyperpycnal flows, respectively). The New Guinea Coastal Undercurrent, which flows westward at depths deeper than 200 mbsl at up to ~1 m/s, probably contributes to sediment reworking and dispersal. The study by Kineke et al. (2000), based on short Kasten cores, shows that much of the sediment present on the shelves and slopes northwest of the Sepik River consists of poorly sorted sandy mud deposited mainly below the shelf break and poorly sorted sandy muds, muddy sands, and sands deposited on the shelves north of the Sepik River by the river plume and longshore transport.
Overall, the textural and mineralogic characteristics of the sand particles at Site U1484 indicate three main sources for the coarser sediments:
- The presence of feldspars together with granitic-granodioritic and metamorphic rock fragments indicates continental weathering of plutonic and metamorphic rocks.
- Volcaniclastic particles and ferromagnesian minerals suggest provenance from undissected volcanoes.
- Glauconite is an authigenic mineral that forms in continental margin settings with high productivity and bottom current winnowing where clay mineral adsorption of K and Fe occurs in the presence of organic matter.
However, glauconite can also be reworked from older marine deposits. The lack of sandstone rock fragments in the sediment and the presence of generally pristine glauconite pellets suggest that contemporaneous formation rather than reworking is more plausible.
The sedimentary structures and mineralogic composition of the sediment at Site U1484 suggest that the nannofossil-rich clay and silty clay layers derive from a combination of terrigenous and biogenic (hemipelagic) sedimentation. The clay was probably derived from the Sepik and Ramu River plumes (sediment on the slope just northwest of the Sepik River mouth is ~90% clay size; Kineke et al., 2000). The coarser sand layers could represent high-density mass gravity flows of material first deposited on the shelf and slope following larger river floods and then remobilized by local failures (triggered for instance by seismic events). This “three-step mechanism” implies a combination of river floods, temporary accumulation of sediments on the shelf or upper slope, and more rapid delivery of the sand to the lower slope and abyssal plain. Such a mechanism would explain the abundance of glauconite, which would be forming locally on the continental margins during Step 2 and then become mobilized and transported during Step 3. Alternatively, the sand layers can be explained as directly derived from hyperpycnal flows associated with catastrophic river floods (“fluvio-turbidite systems”; Mutti et al., 2013). The latter hypothesis would be more likely if reworked glauconite is present in the sediment carried by either the Sepik or Ramu Rivers, but this is not supported by previous studies (Kineke et al., 2000; Kuehl et al., 2004).
Biostratigraphy
At Site U1484, the 224 m thick sequence recovered consists of upper middle to upper Pleistocene clay, silt, and sand with varying proportions of nannofossils and foraminifers (see Core description). Planktonic foraminifers, benthic foraminifers, and calcareous nannofossils are present and generally exhibit excellent preservation throughout the succession at Site U1484. The results from each fossil group (calcareous nannofossils, planktonic foraminifers, and benthic foraminifers) are presented in sections below, followed by a detailed characterization of both benthic and planktonic foraminifer preservation state using shipboard scanning electron microscope (SEM) observations. An integrated biomagnetostratigraphy is presented in the final section. Shipboard taxon occurrence data are available to download from the Laboratory Information Management System (LIMS) database (http://web.iodp.tamu.edu/LORE).
Calcareous nannofossils
Calcareous nannofossil biostratigraphy is based on analysis of core catcher samples and additional samples from split core sections where necessary from Hole U1484A. Observations were made using plane- (PPL), cross- (XPL), and circular-polarized light (CPL), as well as the shipboard desktop SEM (Hitachi TM3000) to confirm the presence of Emiliania huxleyi and to check preservation state. Depth positions, age estimates of key biohorizons, and bioevent/biohorizon abbreviations used in this chapter are given in Table T3.
Table T3. Calcareous nannofossil and planktonic foraminifer biohorizons. Download table in CSV format.
At Site U1484, calcareous nannofossils are not as abundant as they are at the sites off northwest Australia (Sites U1482 and U1483), although the preservation of calcareous nannofossils is generally very good to excellent. Intact coccospheres of Gephyrocapsa are frequently observed, and dissolution-susceptible taxa are consistently present throughout the entire sequence (e.g., Syracosphaera and Rhabdosphaera) (Figure F17). Calcareous nannofossil assemblages are dominated by Florisphaera profunda, Gephyrocapsa species, and E. huxleyi, which fluctuate in abundance throughout the sequence. Reworked calcareous nannofossils belonging to the genera Cyclicargolithus, Discoaster, Reticulofenestra, and Sphenolithus were observed in rare numbers (i.e., 1 specimen per 11–100 fields of view).
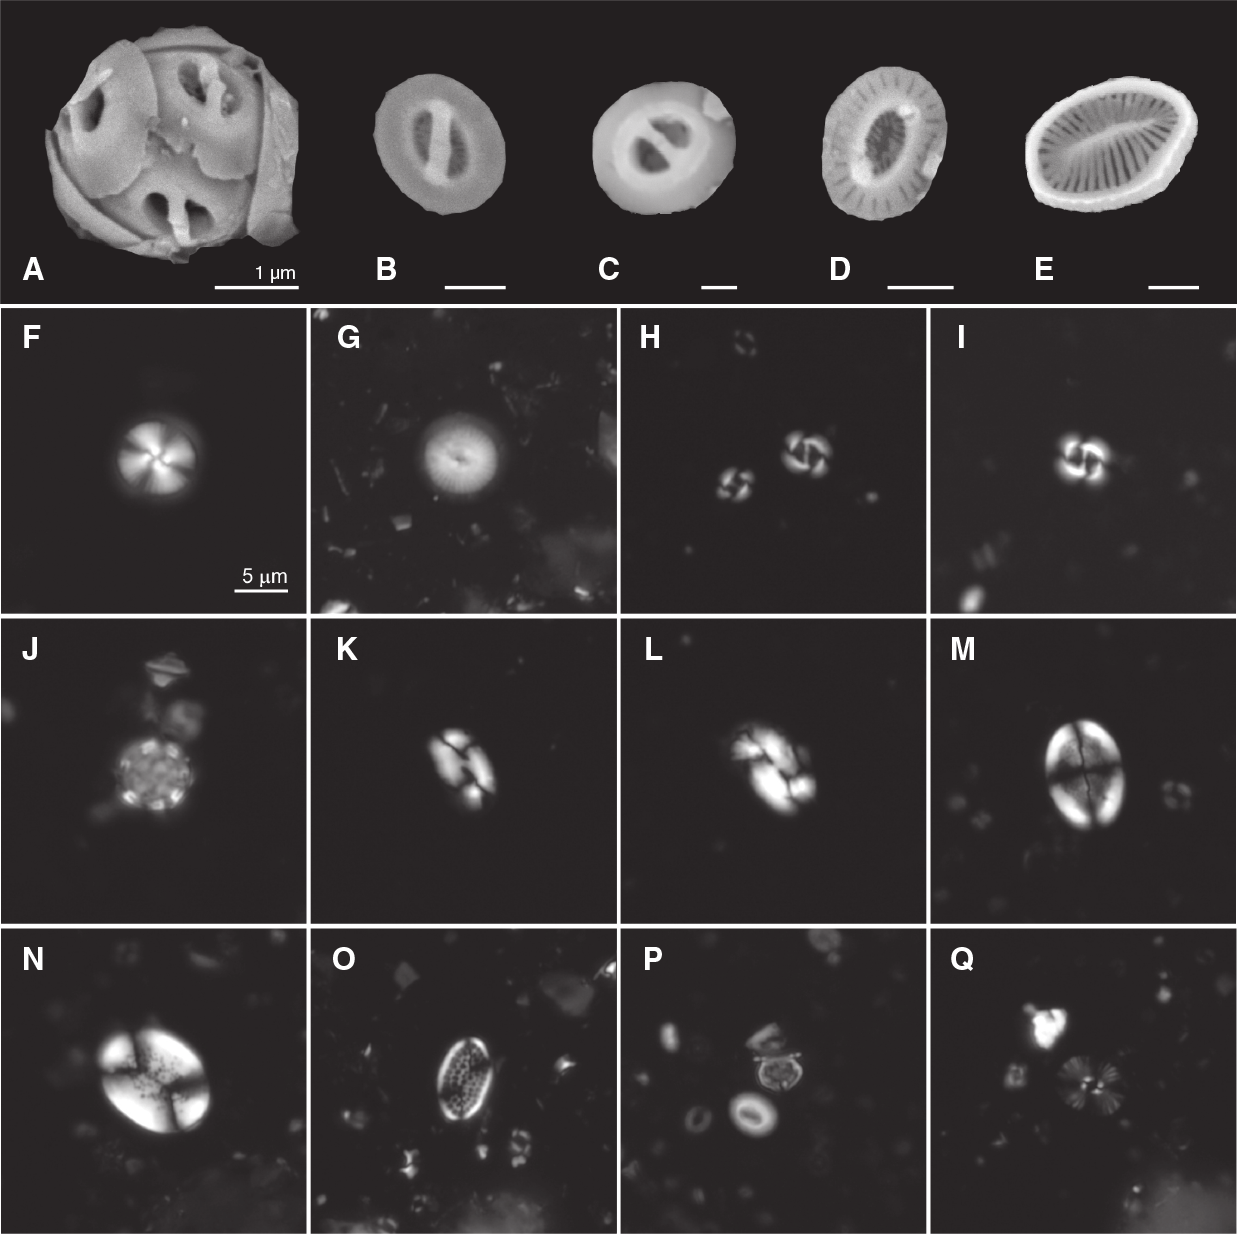
Figure F17. Calcareous nannofossils.
The upper ~200 m of the succession at Site U1484 is within Zone NN21 (late middle to late Pleistocene). Biohorizon base common E. huxleyi (0.090 Ma) occurs between Samples 363-U1484A-7H-CC and 8H-CC (62.27–71.95 mbsf). Below this event, Gephyrocapsa ericsonii becomes very abundant between Samples 9H-CC and 15H-CC (81.21–138.62 mbsf). The base of Zone NN21 is identified by the biohorizon base E. huxleyi (0.29 Ma) between Samples 21H-CC and 22F-CC (195.22–199.47 mbsf). Below this level, the sediment is assigned to the uppermost part of Zone NN20 based on the absence of Pseudoemiliania lacunosa. The biohorizon top P. lacunosa (0.44 Ma), which was not observed at this site, marks the base of Zone NN20. Therefore, the base of Hole U1484A is <0.44 Ma in age. Biohorizon top acme Gephyrocapsa caribbeanica (0.28 Ma) occurs within Zone NN20 between Samples 24F-CC and 25F-CC (209.66–213.57 mbsf). This event is found deeper than the biohorizon base E. huxleyi, even though the biohorizon top acme G. caribbeanica is calibrated to be 10 ky younger. The reversed stratigraphic order of these two bioevents could be due to calibration issues, particularly with the biohorizon base E. huxleyi (Thierstein et al., 1977; Raffi et al., 2006; Backman et al., 2012; Triantaphyllou, 2015).
Planktonic foraminifers
Planktonic foraminifer biostratigraphy was conducted on a mudline sample and core catcher samples from Hole U1484A. The mudline contains a moderately diverse assemblage of planktonic foraminifers typical of warm tropical oligotrophic conditions including Globigerinoides, Globigerinella, Orbulina, and Globigerinita in the >150 µm size fraction and Tenuitella, Globigerinita, and Globoturborotalita in the 63–150 µm size fraction.
Samples 363-U1484A-1H-CC to 4H-CC (5.00–34.35 mbsf) are assigned to the uppermost part of Subzone Pt1b (<0.07 Ma) based on the absence of Globigerinoides ruber (pink) and Globorotalia flexuosa. Samples 5H-CC (43.80 mbsf) through 10H-CC (90.58 mbsf) contain intermittent G. flexuosa (although not very well developed) in the absence of G. ruber (pink) and are tentatively assigned to the time interval between 0.07 and 0.12 Ma (Table T3).
Biohorizon top G. ruber (pink) (0.12 Ma) is observed between Samples 363-U1484A-10H-CC and 11H-CC (90.58–101.17 mbsf). From there to the bottom of the hole, firm biostratigraphic constraints are problematic because of difficulties in distinguishing the markers Globigerinella calida and G. flexuosa, both present intermittently but not always clearly distinct from related species. Biohorizon base G. calida (0.22 Ma) is tentatively identified between Samples 25F-CC and 26F-CC (213.57–219.04 mbsf). Globorotalia tosaensis (Subzone Pt1a marker) is absent through the entire hole, which is consequently assigned to Subzone Pt1b (<0.61 Ma), although this lineage is rare and intermittent, making this biohorizon less reliable. Pulleniatina is dominated by dextral individuals to Sample 27F-CC (223.62 mbsf), at the bottom of the hole, indicating more confidently the age of the lowermost sample is <0.80 Ma (Table T3).
Assemblages vary downhole; for instance, Globorotalia truncatulinoides is absent to Sample 363-U1484A-16H-CC (143.32 mbsf) but is generally present from that depth to the bottom of the hole (143.32–223.62 mbsf). Orbulina universa occurs rarely and sporadically. Levels with frequent Neogloboquadrina incompta and rare Globoconella inflata (which are normally indicative of subpolar to subtropical waters in the modern ocean; e.g., Darling et al., 2006; Morard et al., 2011) may represent colder climatic intervals.
Some of the core catcher samples were recovered from intervals comprising relatively coarse grained sediment; specifically Cores 363-U1484A-4H, 5H, 8H, 13H, 14H, and 15H (see Core description). The foraminifer residues (>150 µm fraction) from these samples generally contain relatively high proportions of >0.5 mm wood fragments. Several of these samples produced extremely large volumes of coarse grained sediment in the 63–150 µm size fraction, notably Samples 13H-CC, 14H-CC, and 15H-CC. The planktonic foraminifer content (in terms of assemblage diversity and abundance) shows some variability in these coarse grained samples, but planktonic foraminifers are always sufficiently abundant to be useful in future geochemical investigations.
Benthic foraminifers
Benthic foraminifer assemblages were examined in the core catcher samples from Hole U1484A. This site differs from Sites U1482 and U1483 due to the higher abundance and greater diversity of benthic foraminifers. Recorded numbers of benthic foraminifer taxa are given in Table T4, with selected SEM images shown in Figure F18. Between Samples 363-U1484A-7H-CC and 17H-CC (62.27–156.48 mbsf), benthic foraminifers are more abundant than in other parts of the recovered sediment succession, with planktonic:benthic foraminifer ratios reaching 70:30. Changes in benthic foraminifer assemblages are noted downhole, with the upper and lower parts of the succession dominated by deeper water benthic foraminifers, whereas the middle section consists of mixed deep- and shallow-water benthic foraminifers, including reef-dwelling taxa. Changes in the composition of the assemblages are discussed in detail below.
Table T4. Benthic foraminifer distribution. Download table in CSV format.
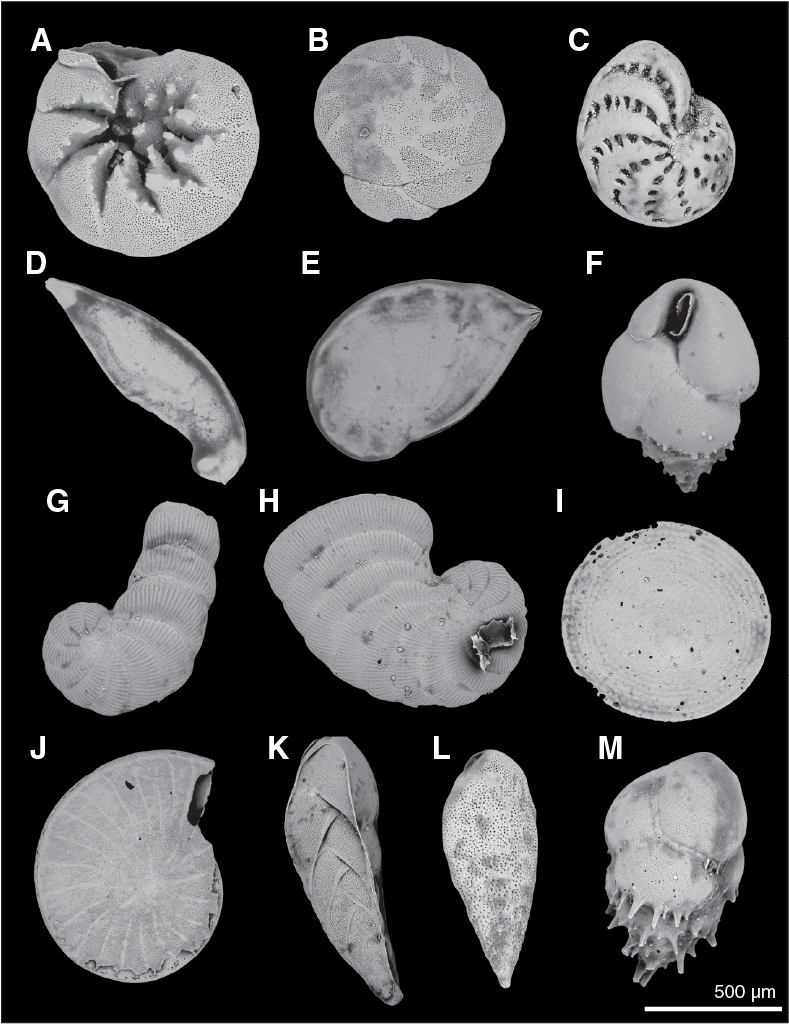
Figure F18. Benthic foraminifers.
Benthic foraminifer assemblages from Samples 363-U1484A-1H-CC to 6H-CC (5.00–52.95 mbsf) and 17H-CC to 27F-CC (156.48–223.62 mbsf) are composed mainly of the following deepwater benthic foraminifers: Cibicidoides pachyderma, Uvigerina hispida, Uvigerina proboscidea, Bolivinita quadrilatera, and Bolivina robusta. These species are identified as bathyal forms, occurring as deep as 3500 mbsl (van Morkhoven et al., 1986; Jones, 1994). In Samples 7H-CC to 9H-CC (62.27–81.21 mbsf) and 15H-CC to 17H-CC (138.62–156.48 mbsf), the benthic foraminifer assemblages are composed of a mixture of the deepwater taxa mentioned previously and the shallow-water species Rotalinoides compressiusculus, usually found at 4–70 mbsl (Jones, 1994). Reef-dwelling benthic foraminifers are observed between Samples 10H-CC and 15H-CC (90.58–138.62 mbsf). These assemblages consist of Operculina complanata and rare specimens of Amphisorus hemprichii, Peneroplis planatus, and Coscinospira arietina. These taxa, which are usually found at <45 mbsl (Jones, 1994), were likely transported to the site with other detrital material. Planulina wuellerstorfi, the benthic foraminifer used to assess foraminifer preservation (see Foraminifer preservation), rarely exceeds 1% of the total benthic foraminifers counted in each sample (Table T4).
Foraminifer preservation
Three core catcher samples from Hole U1484A were selected to assess foraminifer preservation and diagenesis. The samples are spaced at approximately 110 m intervals and range in age from late Pleistocene (<0.07 Ma) to middle Pleistocene (~0.3 Ma). Foraminifer tests generally have a glassy appearance and exhibit excellent preservation. However, there is evidence for minor abrasion on the outer walls and pyrite overgrowth on the inner walls of some planktonic foraminifer specimens, even at the shallowest depth, which implies a dynamic and reducing sedimentary environment. Minor calcite overgrowth occurs in the two deeper samples examined, although the lowermost of these is less affected. No recrystallization and cementation is observed, even in the deepest part of the stratigraphy. Images of selected specimens are shown in Figure F19. The full set of images is available online from the LIMS database.

Figure F19. Downhole foraminifer preservation states.
Sample 363-U1484A-1H-CC (5.0 mbsf; late Pleistocene; <0.07 Ma) shows excellent preservation. Foraminifers have a glassy appearance under the light microscope. In cross section, the wall of Trilobatus trilobus shows platy microgranules typical of the species. Minor superficial abrasion of the outer chamber surfaces of some specimens, especially the interpore ridges, may indicate abrasion on the seafloor. The wall cross section of P. wuellerstorfi shows microgranules throughout. The inner wall surface of both species is smooth. One of the studied specimens of T. trilobus contains pyrite framboids. There is no evidence of other infilling, recrystallization, dissolution, or cementation.
Sample 363-U1484A-12H-CC (110.11 mbsf; latest middle Pleistocene; 0.12–0.22 Ma) shows excellent preservation. Foraminifers have a glassy appearance under the light microscope. Wall cross sections of both T. trilobus and P. wuellerstorfi show biogenic microgranular textures typical of the species and minor evidence of abrasion. The inner wall surfaces of T. trilobus are generally smooth but sometimes show minor overgrowth of radially directed calcite crystals forming a layer <1 μm thick. Specimens of P. wuellerstorfi contain pyrite framboids and show very minor calcite overgrowth on internal surfaces, including some cementation of sediment infill. There is no evidence of recrystallization or dissolution.
Sample 363-U1484A-26F-CC (219.04 mbsf; middle Pleistocene; ~0.3 Ma) shows excellent preservation. Foraminifers have a glassy appearance under the light microscope. Wall cross sections of both T. trilobus and P. wuellerstorfi show biogenic microgranular textures with evidence of minor abrasion. The inner wall surface of both species is generally smooth. T. trilobus specimens show very minor overgrowth of radially directed calcite crystals on the test interior, which can form a very thin layer ~1 μm thick.
Shipboard age model
An age-depth plot including all biostratigraphic horizons is shown in Figure F20. Although there are few bioevents, the calcareous nannofossil and planktonic foraminifer biohorizons show good agreement throughout the interval. The middle/late Pleistocene boundary (0.126 Ma) is located between biohorizons top acme G. caribbeanica and top G. ruber (pink) at a depth of ~100 mbsf. Average estimated linear sedimentation rate in Hole U1484A is 75 cm/ky, although significant variations are possible given the relatively low resolution sampling and the low number of biostratigraphic biohorizons within the interval recovered at Site U1484. Based on the average linear sedimentation rate, the age at the bottom of Hole U1484A is estimated to be 0.29 Ma.
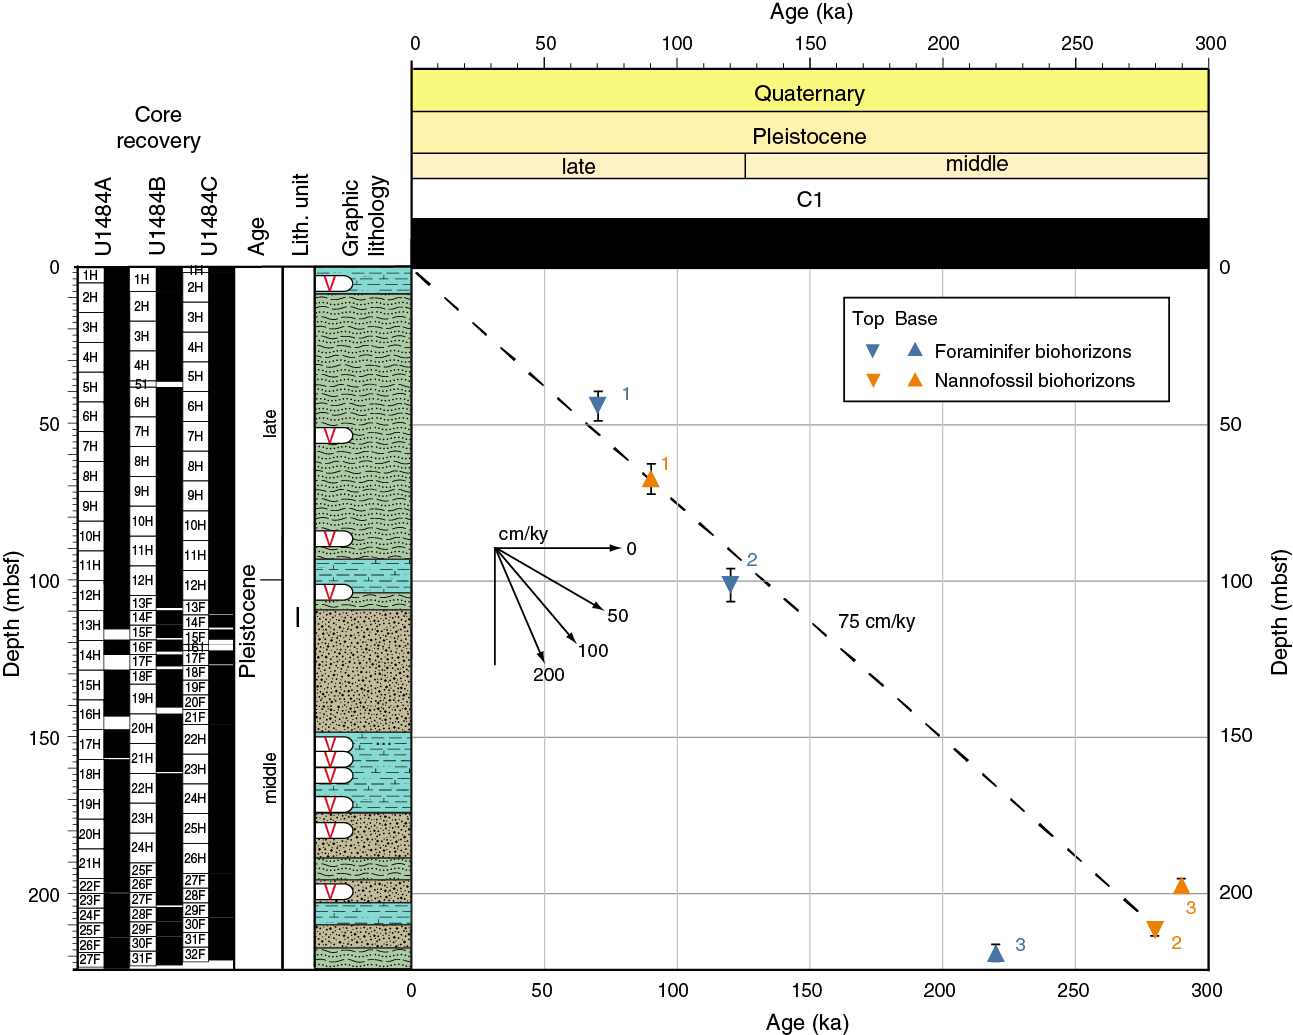
Figure F20. Age-depth plot.
Paleomagnetism
Measurements summary
Paleomagnetic investigations at Site U1484 involved measurement of the natural remanent magnetization (NRM) of archive-half cores from Holes U1484A–U1484C before and after demagnetization in a peak alternating field (AF) of 10 mT. In addition to measuring 402 core sections, we took one or two discrete samples per core from Hole U1484A (47 samples) to characterize the NRM demagnetization behavior and to investigate the rock magnetic properties of the sediment. NRM of discrete samples was measured before and after AF demagnetization in peak fields of 5, 10, 15, 20, 30, 40, and 60 mT; the 5 and 60 mT steps were often dropped to speed up the measurements. Rock magnetic investigations comprised measurements of magnetic susceptibility (χ), susceptibility of anhysteretic remanent magnetization (χARM) imparted using a 100 mT AF demagnetization and 0.05 mT direct current bias field, and isothermal remanent magnetization (IRM) acquired in 300 mT and 1000 mT (termed saturation IRM [SIRM]) fields. All sample measurements were mass corrected. The FlexIT or Icefield MI-5 core orientation tool was deployed with nonmagnetic hardware for all APC cores, which permitted azimuthal correction of declination. Azimuthally corrected declination is largely coherent between cores; however, absolute values in Holes U1484A–U1484C average 180° for periods of normal polarity, suggesting that the issues of the baseline offset in azimuthally corrected declination experienced throughout Expedition 363 and during previous expeditions (e.g., McNeill et al., 2017) affected these data. McNeill et al. (2017) suggested a simple −180° correction could be applied to the corrected declination data to rotate them back to ~0°. However, we leave declination uncorrected for this additional offset in the plotted figures, so care should be employed for future calculations of virtual geomagnetic poles (VGPs) using these data.
Rock magnetic characterization
Whole-Round Multisensor Logger (WRMSL) magnetic susceptibility data average 426 × 10−5 SI (see Physical properties) and, when coupled with average χ (2.2 × 10⁻⁶ ± 3.3 × 10⁻⁶ m3/kg as 2 standard deviations [2σ]) and SIRM (9.1 × 10⁻³ ± 10.4 × 10⁻³ Am2/kg as 2σ) values, suggest relatively high (ferri)magnetic mineral concentration in the sediments deposited at Site U1484 (Figure F21). All samples acquire >95% of their SIRM remanence in a field of 300 mT, suggesting that ferrimagnetic minerals (e.g., [titano]magnetite [FexTixO4] and/or maghemite [γ-Fe2O3]) control the remanence-carrying properties of the sediment and that high-coercivity minerals (e.g., hematite [Fe2O3]) are relatively minor phases by comparison. Assuming a value of ~660 × 10−6 m3/kg for pure single-domain and multidomain magnetite (Maher, 1988), our data suggest an average magnetite content of ~0.33% and a maximum of ~1.3% in the measured sediment at Site U1484. Relatively high magnetic susceptibility and NRM intensity (>10−1 A/m) values likely result from high terrigenous input, as Site U1484 is located ~15 km north of Papua New Guinea (Figure F1). The highest values of χ and SIRM are associated with discrete intervals of coarse-grained silt and sand (orange circles in Figure F21) that influence the pattern in WRMSL magnetic susceptibility (see Physical properties). Samples from these intervals possess low χARM/SIRM values, indicating that the sand-rich and high–magnetic susceptibility sediments have the coarsest magnetic grain sizes and that magnetic concentration and magnetic grain size may be strongly particle-size dependent at Site U1484 (e.g., Hatfield, 2014). Section-half NRM10mT and discrete χ and SIRM decrease downhole, suggesting a reduction in ferrimagnetic concentration. Lower χARM/SIRM values accompany reductions in concentration and suggest coarsening of ferrimagnetic grain size. These trends could result from changes in the source of terrigenous inputs to the site over time and/or reflect the effect of early sediment diagenesis (e.g., Karlin and Levi, 1983; Rowan et al., 2009), as evidenced by observations of pyrite in the lower part of all three holes (see Core description). In summary, bulk rock magnetic properties suggest that the sediments deposited at Site U1484 largely reflect primary terrestrial source inputs. As a result, the NRM is likely acquired through (post)depositional remanent magnetization processes and can potentially be used to understand and reconstruct paleogeomagnetic field behavior.
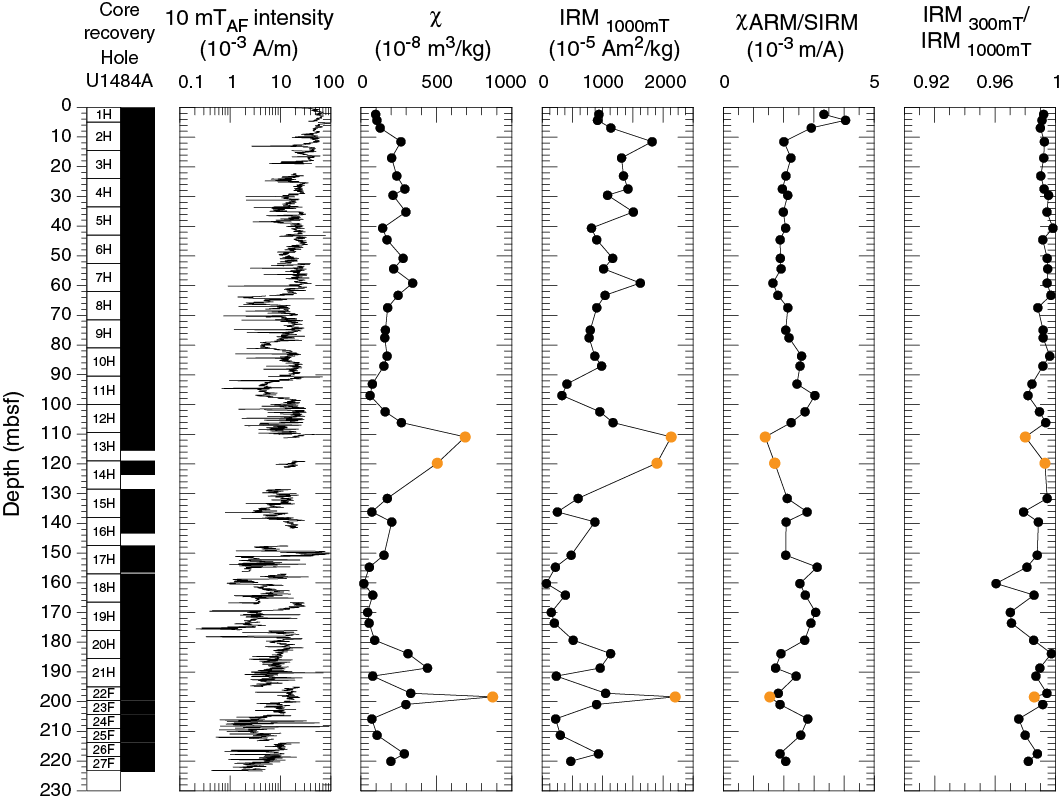
Figure F21. Archive-half section NRM intensity.
Paleomagnetic data and core orientation
NRM demagnetization behavior, high ferrimagnetic content, and high IRM300mT/IRM1000mT ratios are consistent with (titano)magnetite being the primary remanence-carrying mineral species in sediments deposited at Site U1484 (Figures F21, F22). The drill string overprint is effectively removed after AF demagnetization in a 5–15 mT field, and following exposure to higher AF demagnetization steps, inclination and declination trend to the origin on Zijderveld diagrams (Zijderveld, 1967), indicating a single component to the magnetization (Figure F22). Origin-anchored maximum angular deviation values of the principal component analysis (PCA) calculated over the 10–40 mT range average 3° (range = 0.8°–5.5°) for the upper ~106 mbsf (Figures F22, F23). Maximum angular deviation values less than ~5° coupled with the qualitative information gleaned from Zijderveld diagrams and stereoplots suggest paleomagnetic directions are stable, well resolved, and potentially optimal for studies of paleosecular variation (PSV) and relative paleointensity (RPI) (Stoner and St-Onge, 2007) above ~106 mbsf. Below ~120 mbsf, average maximum angular deviation values are slightly higher (5.7°) and vary over a greater range (2.3°–10.3°) (Figure F23); however, these values are still relatively low and should provide reliable directions in a polarity context (Stoner and St-Onge, 2007). Higher maximum angular deviation values deeper than ~120 mbsf are associated with a range of χ, SIRM, and χARM/SIRM values (Figures F21, F23), suggesting that reductions in paleomagnetic stability do not simply result from changes in sediment texture.

Figure F22. Discrete sample AF demagnetization results.
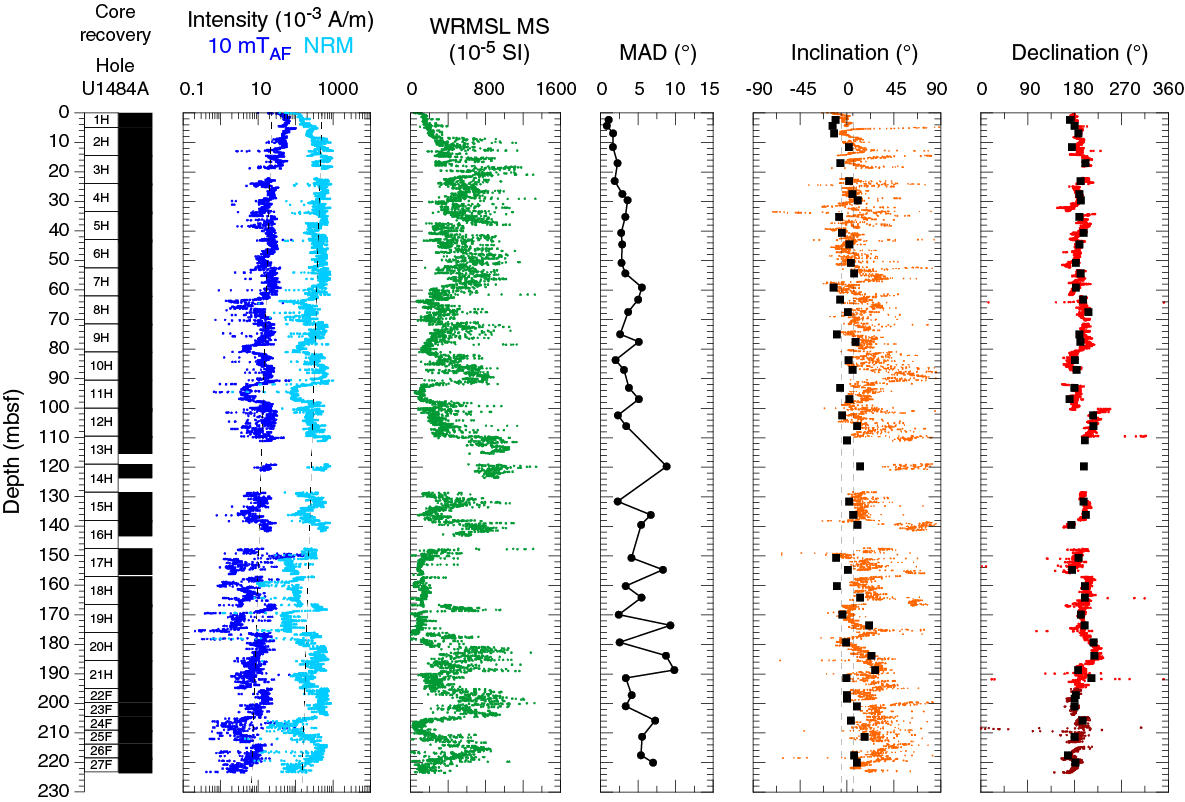
Figure F23. NRM, WRMSL MS, inclination, and declination, Hole U1484A.
For all APC cores recovered from Holes U1484A and U1484B, declination was azimuthally corrected using the FlexIT tool. For APC Cores 363-U1484C-1H through 12H, the FlexIT tool was deployed, and for APC Cores 22H through 26H the Icefield MI-5 tool was used (see Operations). Although corrected declination is consistent between adjacent cores, absolute values cluster around ~180° (Figures F23, F24, F25). During periods of normal polarity, declination should cluster around 0°, suggesting that declination values at Site U1484 experience an offset of ~180° in absolute terms. This phenomenon was a persistent issue during Expedition 363 and was also experienced during Expedition 362 (McNeill et al., 2017). Orientation tools cannot be deployed with the HLAPC. To align HLAPC declination with the corrected APC cores, we average the HLAPC declination record on a core-by-core basis to a mean of 180° (dark red declination symbols in Figures F23, F24, F25) to match the data set from cores collected using the APC system. We apply the same core-specific declination correction value to discrete samples taken from each HLAPC core.
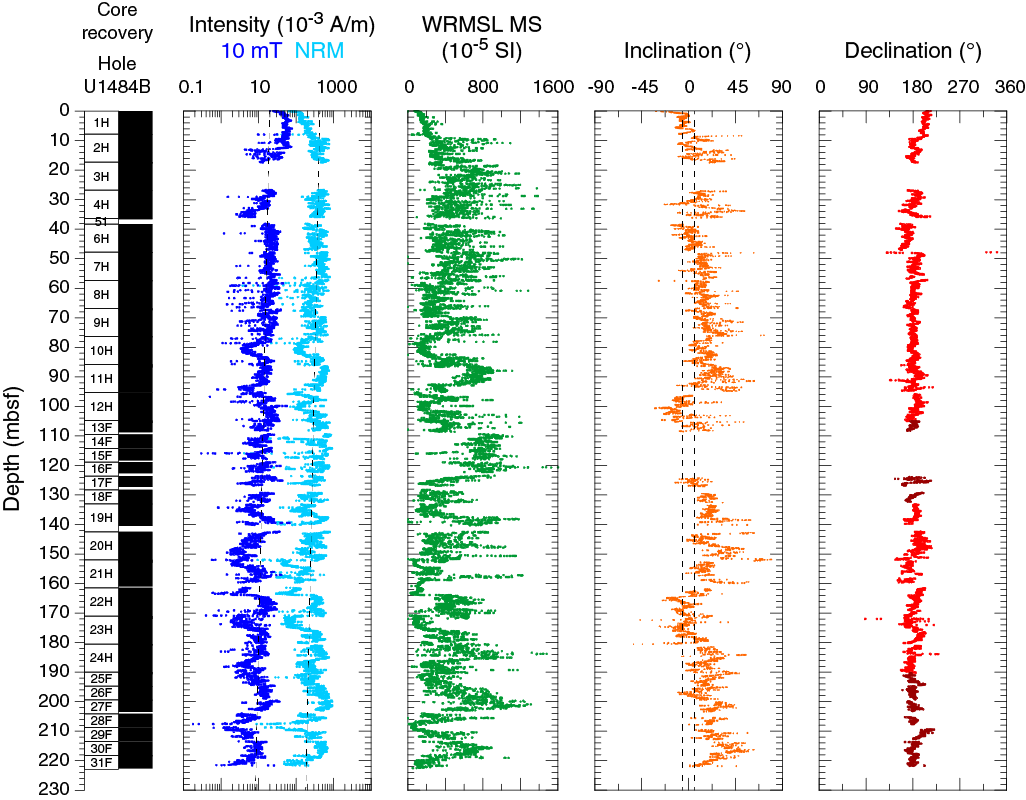
Figure F24. NRM, WRMSL MS, inclination, and declination, Hole U1484B.
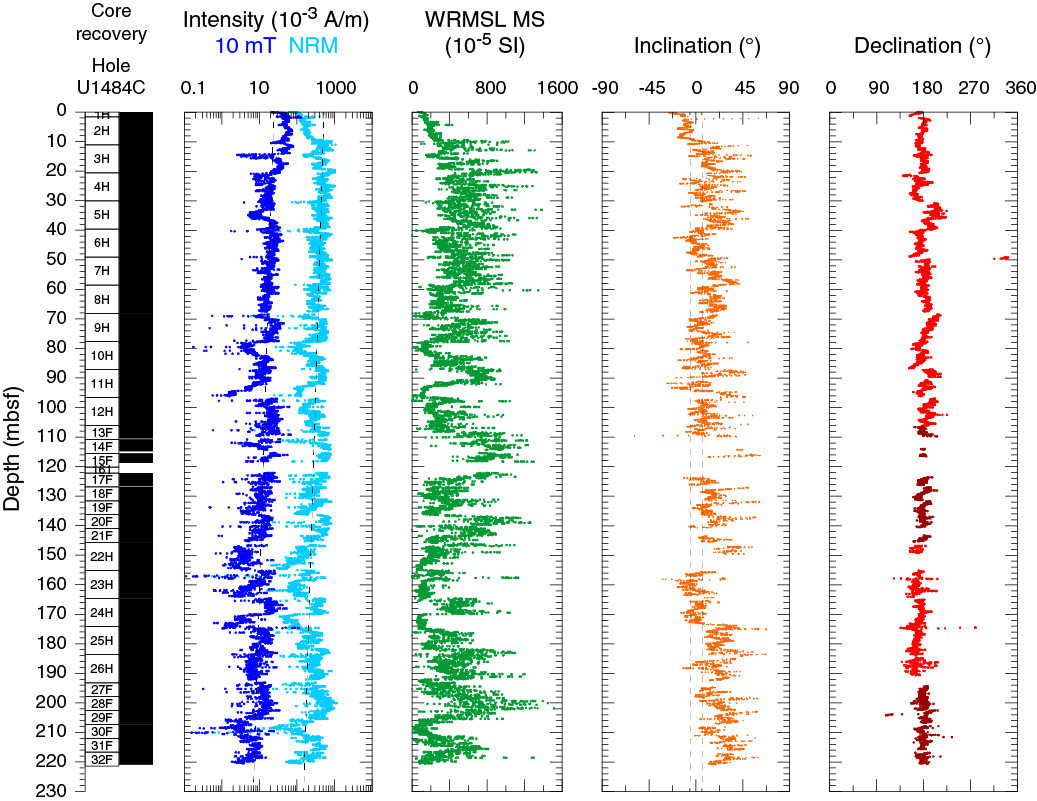
Figure F25. NRM, WRMSL MS, inclination, and declination, Hole U1484C.
NRM intensity before and after 10 mT AF demagnetization, WRMSL magnetic susceptibility, and inclination and azimuthally corrected and manually rotated declination after 10 mT AF demagnetization are shown for Holes U1484A, U1484B, and U1484C in Figures F23, F24, and F25, respectively. Displayed inclination and declination values were cleaned of visibly disturbed intervals or voids (see Paleomagnetism in the Expedition 363 methods chapter [Rosenthal et al., 2018a]). In general, inclination and declination measured on discrete samples are in excellent agreement with those measured on the archive-half sections (Figure F23). Inclination values are generally around the expected values of ±5.7° for the site latitude assuming a geocentric axial dipole (GAD) field. Mean inclination values appear to become more positive downhole, which may be related to a steep positive pervasive overprint imparted by the drill string that is not fully removed after demagnetization in a peak 10 mT AF. Consultation of representative Zijderveld diagrams (Figure F22) suggests 10–15 mT is required to remove the overprint in the upper ~110 mbsf of Hole U1484A, whereas 15–20 mT may be required in the lower part of Hole U1484A. In contrast to inclination, declination appears insensitive to a strong drill string–induced overprint because declination values after 5 mT AF demagnetization remain stable through higher AF demagnetization steps. Given the equatorial location of Site U1484, declination was more instructive than inclination for determination of magnetic polarity. Based on estimated sedimentation rates at this location (see Background and objectives) and the approved drilling depth (see Operations), we did not expect to observe the Matuyama/Brunhes boundary at Site U1484. Given this information, we were hesitant to expose the sediment to higher AF demagnetization than 10 mT to remove the few extra degrees of overprinted inclination for no further substantial gain in magnetostratigraphic information. Therefore, any future estimates of PSV, RPI, or VGPs for Site U1484 should first use higher AF demagnetization to fully clean the record of any remaining drill string overprint.
Magnetostratigraphy
Sediment in all three holes appears to have been deposited (quasi)continuously with no major hiatuses or erosional surfaces (see Core description and Biostratigraphy). In all three holes, inclination plots around (or slightly steeper than) a GAD-predicted value for the site latitude, and declination maintains a consistent value for all corrected APC cores. These observations are consistent with sediment recovered at Site U1484 being deposited during the Brunhes Chron (C1n) and therefore younger than 0.781 Ma. These findings are also consistent with biostratigraphic datums that suggest the base of Hole U1484A is between 0.29 and 0.44 Ma in age (see Biostratigraphy).
Physical properties
Physical properties were measured on whole-round cores, split cores, and discrete samples from all three holes at Site U1484 to provide basic information for characterizing the core sections. At this site, cores were greatly affected by gas expansion, with sediment frequently extruded from the top and bottom of the core barrel. Some of the extruded sediment was lost; however, the loose sediment was collected when possible and placed into split liners and archived as short sections at the top and bottom of the cores (see Operations). These sections should be considered disturbed. Gamma ray attenuation (GRA) bulk density and magnetic susceptibility were measured on all core sections from Holes U1484B and U1484C with the Special Task Multisensor Logger (STMSL) immediately after the cores were brought onboard. Natural gamma radiation (NGR) was measured on all whole-round sections as soon as possible after STMSL measurements (see Physical properties in the Expedition 363 methods chapter [Rosenthal et al., 2018a]). All core sections were measured with the GRA bulk densitometer, the magnetic susceptibility loop, and the P-wave logger (PWL) on the Whole-Round Multisensor Logger (WRMSL) before splitting. The PWL was stopped after Cores 363-U1484A-3H, 363-U1484B-2H, and 363-U1484C-3H when the data became unreliable due to pervasive gas expansion and high abundance of sand in the cores. Point-sensor magnetic susceptibility and color spectrophotometry (color reflectance) were measured on split-core sections using the Section Half Multisensor Logger (SHMSL). Thermal conductivity was measured on one section per core from Hole U1484A using the needle-probe system. Discrete P-wave measurements (z- and x-axis) were made using the P-wave caliper (PWC) system on the Section Half Measurement Gantry (SHMG). Discrete z-axis measurements were discontinued after Core 363-U1484A-2H and x-axis measurements after Core 3H due to lack of a clear signal in the sandy, unconsolidated sediment. Moisture and density (MAD) measurements were made on discrete samples from Hole U1484A to calculate bulk, dry, and grain densities, as well as porosity. Preconditioning treatments were applied to the data to aid in interpretation of noisy or spiky data (see Physical properties in the Expedition 363 methods chapter [Rosenthal et al., 2018a]). All data shown in figures are from the preconditioned data sets. Tables presented in this section contain raw and treated data for NGR, WRMSL GRA bulk density, magnetic susceptibility, and P-wave velocity. Raw data for all data sets are available from the LIMS database.
GRA bulk density
GRA bulk density does not correlate well across holes at Site U1484, unlike at previous sites. Although the range of values is similar and some distinct features are comparable, Site U1484 lacks peak-to-peak coherence among the three GRA bulk density curves. The WRMSL GRA bulk density seems to be highly sensitive to transitions between clay and sand at this site, and it is possible that small offsets in the depths of these transitions may produce large differences in GRA bulk density between the three holes at a given depth. Additionally, the different distribution of expansion cracks and voids among the holes could account for some of the interhole variability. Some of these voids are >5 cm, which affects reproducibility between holes. Finally, disturbances in the top and bottom sections of the cores due to expansion during core retrieval (see above) could also account for some of the variability between holes.
GRA bulk density in all three holes demonstrates only a minor linear compaction trend with depth (Figure F26; Tables T5, T6, T7) with the exception of the upper 12 mbsf, where GRA bulk density increases rapidly from ~1.5 to 1.75 g/cm3. Because of the absence of a strong compaction effect, no major difference was observed between the cleaned and detrended GRA bulk density data sets. As such, only the cleaned, undetrended data are shown in Figure F26. The GRA bulk density record displays large ~10–15 m cycles, with values ranging from ~1.5 to 1.8 g/cm3 between 0 and ~110 mbsf and from 1.6 to 1.9 g/cm3 between ~110 mbsf and the base of the hole (~224 mbsf). However, the occurrence and amplitude of these cycles are ambiguous between 110 and 150 mbsf, where poor recovery and the presence of unconsolidated sand affected the data quality.

Figure F26. Physical property measurements.
Table T5. WRMSL GRA bulk density data, Hole U1484A. Download table in CSV format.
Table T6. WRMSL GRA bulk density data. Hole U1484B. Download table in CSV format.
Table T7. WRMSL GRA bulk density data. Hole U1484C. Download table in CSV format.
Between 0 and 10 mbsf, GRA bulk density increases with depth, most likely related to sediment compaction with increasing distance from the water/sediment interface. Throughout most of the record, GRA bulk density varies in phase with magnetic susceptibility, whereas NGR shows an opposite trend (Figures F26, F27). High-frequency changes in GRA bulk density are related to the discrete silty sand beds recorded throughout the holes, with high GRA bulk density values corresponding to silty sand layers and low GRA bulk density values associated with clay (Figure F27) (see Core description). The thickness of the alternating silty sand and clay beds and the corresponding GRA bulk density changes range from decimeter scale to meter scale. Within the meter-scale beds, smaller decimeter-scale variations in density are also present.
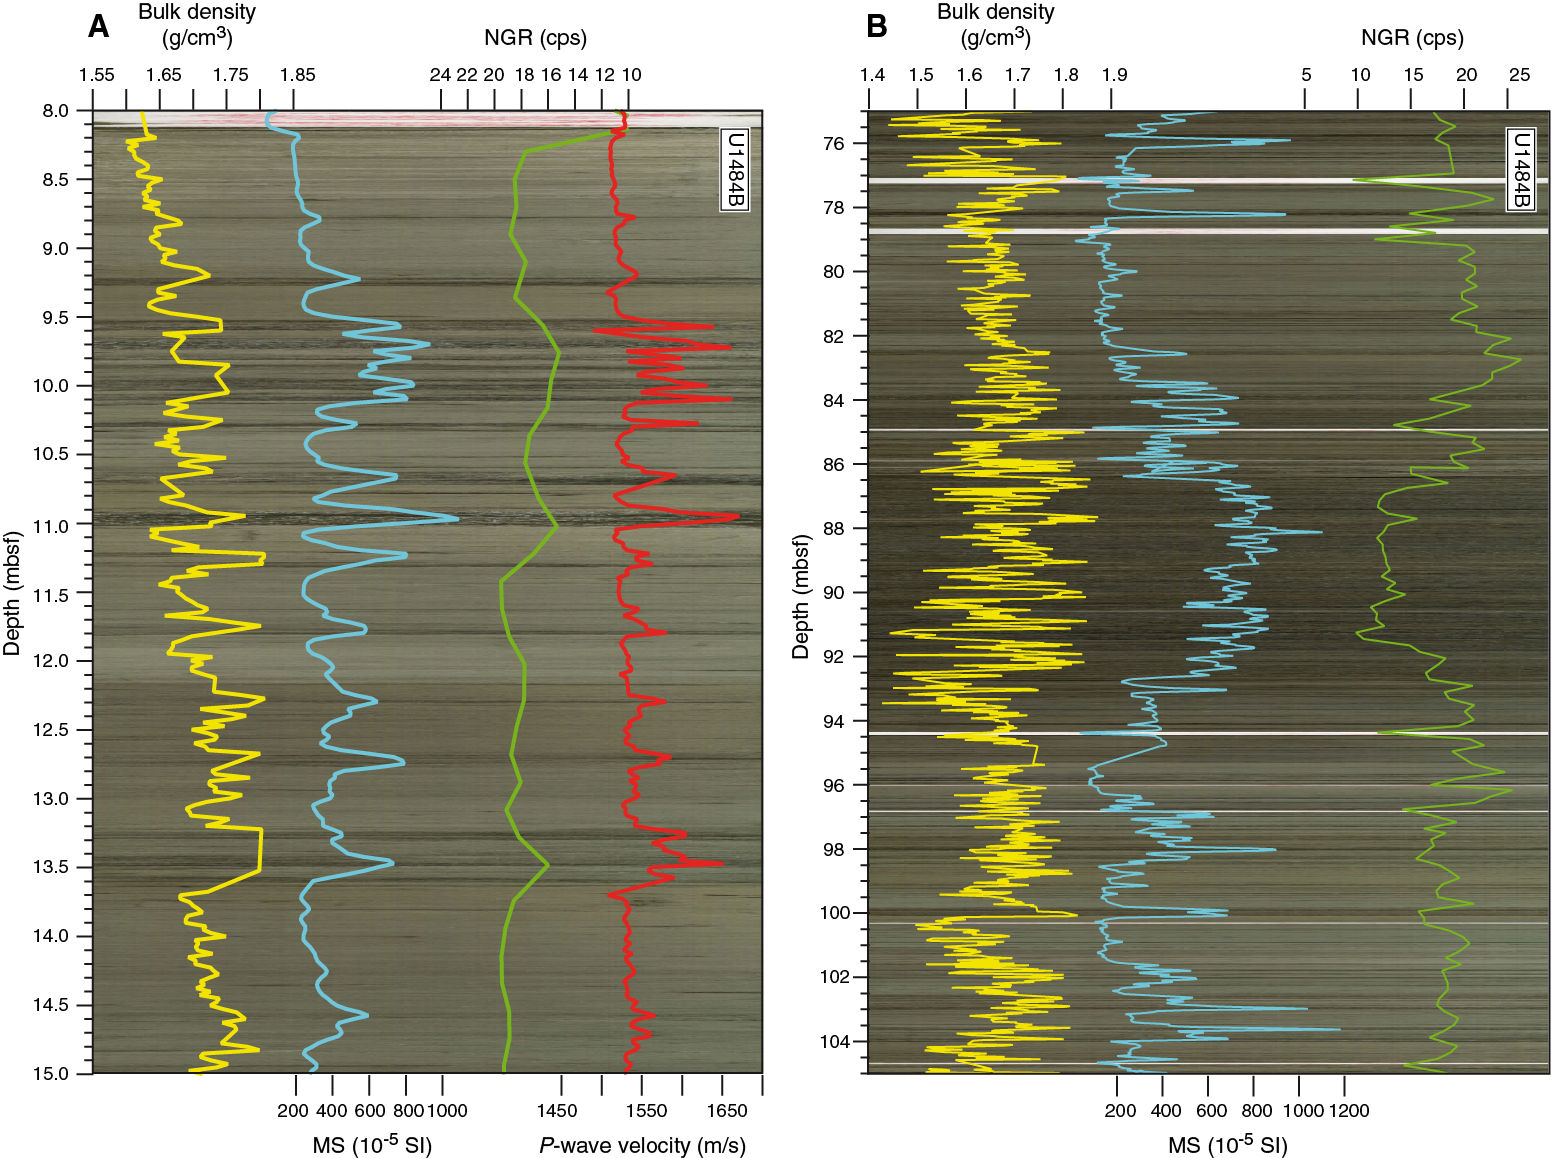
Figure F27. GRA bulk density, MS, NGR, and P-wave velocity overlaid on core photos.
Magnetic susceptibility
At Site U1484, magnetic susceptibility values are 1–2 orders of magnitude higher than at Sites U1482 and U1483, ranging from 50 × 10−5 to >1200 × 10−5 SI (Figure F26; Tables T8, T9, T10). Magnetic susceptibility values are consistently low in the upper 10 mbsf, corresponding to a clay-rich interval (yellow shading on Figure F26; see also Core description). Between 10 and 100 mbsf, 10–15 m scale cyclicity is observed, comparable to that observed in GRA bulk density, although the magnetic susceptibility cycles are often more distinct. Large core gaps caused by poor recovery hampered evaluation of the cyclicity in all holes. However, we discerned twelve 10–15 m long magnetic susceptibility cycles (Figure F28); all of these cycles are also present in the NGR data and some are clearly defined in the GRA bulk density data.
Table T8. WRMSL MS data, Hole U1484A. Download table in CSV format.
Table T9. WRMSL MS data, Hole U1484B. Download table in CSV format.
Table T10. WRMSL MS data, Hole U1484C. Download table in CSV format.
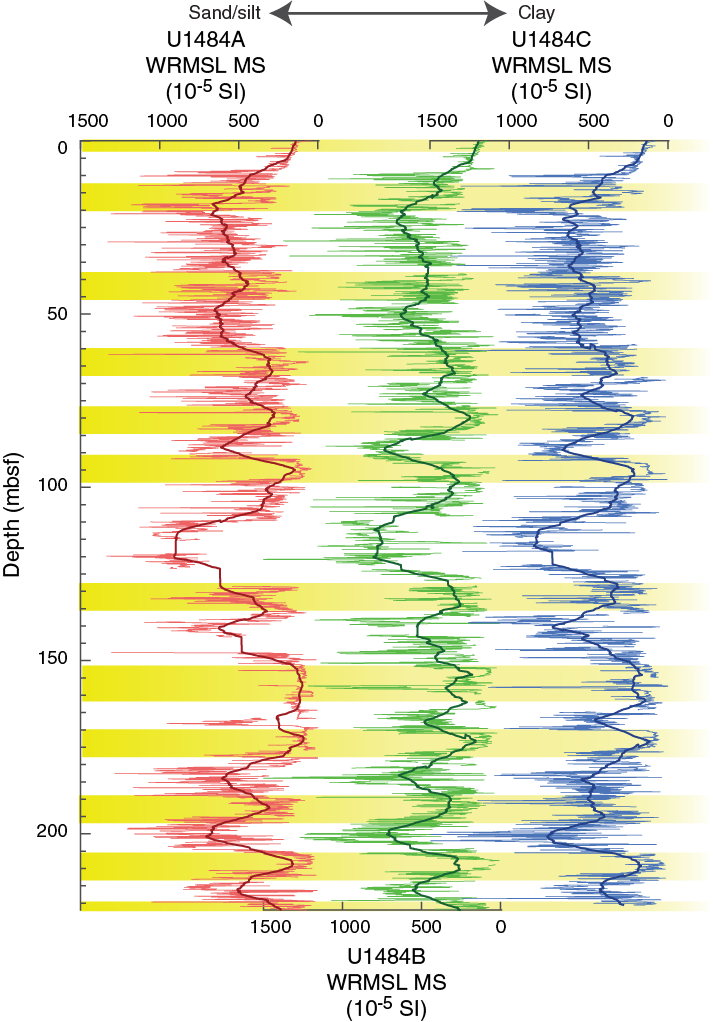
Figure F28. Comparison of cleaned WRMSL magnetic susceptibility data.
Aside from the upper 10 mbsf, a number of longer term, low–magnetic susceptibility intervals are also evident between 90 and 100, between 150 and 160, between 170 and 180, and between 205 and 215 mbsf. These low magnetic susceptibility intervals correspond to clay-rich intervals (yellow shading on Figure F26), which display much lower amplitude magnetic susceptibility variability than the sand-dominated intervals (e.g., 10–60 mbsf).
Variations in magnetic susceptibility appear strongly correlated with lithology, with low magnetic susceptibility values corresponding to clay-rich layers and high magnetic susceptibility values corresponding to silt/sand-rich lithologies. A comparison of the magnetic susceptibility record and core photos reveals that short-term (decimeter scale) excursions to high magnetic susceptibility values occur in the darker silty sand layers (Figure F27). Distinct magnetic susceptibility peaks are also noted in thin silty sand beds within the thicker, clay-rich intervals (e.g., at ~11 mbsf in Figure F27A). In the thicker silty sand beds (e.g., from ~86 to 92 mbsf in Figure F27B), magnetic susceptibility exhibits overall higher values with superimposed smaller scale magnetic susceptibility variability.
Natural gamma radiation
At Site U1484, NGR counts range between 10 and ~30 counts/s (Figure F26; Tables T11, T12, T13). NGR displays antiphase relationships with GRA bulk density and magnetic susceptibility (Figures F26, F27). Because of the lower resolution of NGR measurements (10–20 cm resolution), the data do not capture all of the high-frequency variability seen in the magnetic susceptibility and GRA bulk density data (2.5 cm resolution). However, excursions in NGR broadly capture the high-frequency excursions in the magnetic susceptibility and GRA bulk density data, which relate to short-term variations in clay versus silty sand or sand lithologies. In particular, lower NGR values correspond to higher, noisier magnetic susceptibility values in sand intervals. Likewise, long-term variations in NGR are comparable to those observed in the magnetic susceptibility data. A notable feature in the NGR record is the significant decrease between ~100 and 150 mbsf, where NGR drops from 25 counts/s at 100 mbsf to a minimum of ~10 counts/s at ~125 mbsf before increasing again to 28 counts/s at ~150 mbsf. This interval consists primarily of sand (see Core description).
Table T11. WRMSL NGR data, Hole U1484A. Download table in CSV format.
Table T12. WRMSL NGR data, Hole U1484B. Download table in CSV format.
Table T13. WRMSL NGR data, Hole U1484C. Download table in CSV format.
P-wave velocity
PWL velocity increases overall from 0 to 17 mbsf, below which depth values became unreliable and the instrument was switched off (Figure F29; Tables T14, T15, T16). In the upper 8 mbsf, P-wave velocity varies only slightly, with values oscillating around 1500 m/s. From 8 to 14 mbsf, P-wave velocity shows a marked increase, with values up to 1690 m/s, in an interval corresponding to layers of dark sand (Figure F27A; see also Core description).
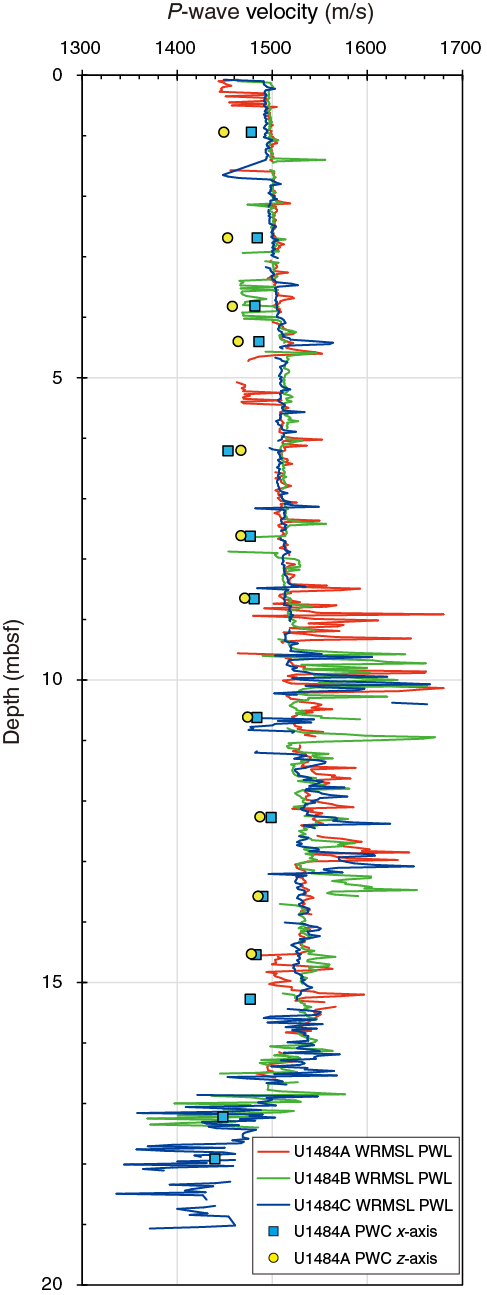
Figure F29. Discrete and whole-round P-wave measurements.
Table T14. WRMSL PWL data, Hole U1484A. Download table in CSV format.
Table T15. WRMSL PWL data, Hole U1484B. Download table in CSV format.
Table T16. WRMSL PWL data, Hole U1484C. Download table in CSV format.
Discrete P-wave velocity measurements on the x-axis are generally higher than those on the z-axis (Figure F29). The offset between the x- and z-axis measurements is ~21 m/s between the seafloor and 5 mbsf, but below 5 mbsf these measurements converge with only a ~5 m/s offset. At Site U1484, the PWC P-wave velocities are lower on both the x-axis and z-axis relative to P-wave velocities recorded by the PWL. Lower PWC than PWL velocities contrast with the records from Sites U1482 and U1483 from the northwest Australian margin, where PWC x-axis velocities are consistently in agreement with PWL velocities and PWC z-axis velocities are lower than both PWC x-axis and PWL velocities.
Moisture and density
MAD bulk density, dry density, and grain density data have similar downhole trends (Figure F30). From the seafloor to 12 mbsf, there is a gradual increase in MAD bulk and dry density values and a corresponding decrease in porosity, probably due to compaction. From 12 mbsf to the base of the hole, average bulk and dry density values remain relatively constant. Because there is no strong linear increasing trend with depth, the bulk and dry densities do not appear strongly affected by increased compaction at depth. The dry density measurements show 10–15 m scale variations, ranging from 0.8 to 1.5 g/cm3, and corresponding to the alternating clay-rich and sand-rich lithologies (see Core description), with lower values occurring in clay layers and higher values in dark sand beds.
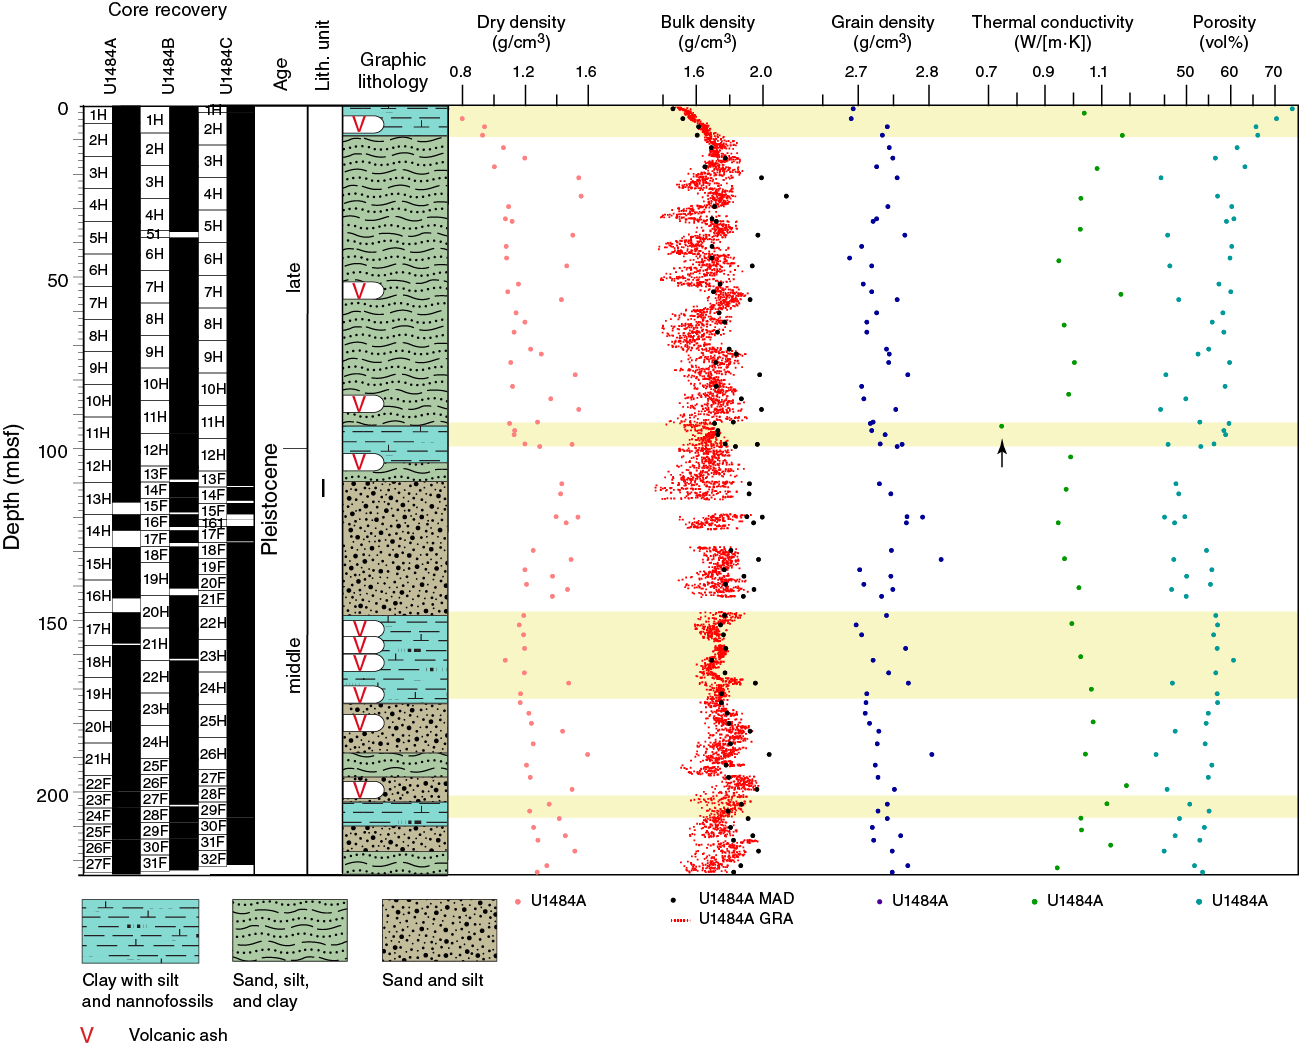
Figure F30. MAD dry, bulk, and grain densities and porosity, WRMSL GRA bulk density, and thermal conductivity.
The GRA and MAD bulk densities show similar trends. For the upper 12 mbsf, MAD bulk density underestimates the bulk density relative to the GRA bulk density by ~0.05 g/cm3, most likely due to water loss from the cores between measurement on the WRMSL and discrete MAD sampling. Within the relatively low density clay layers below 25 mbsf, MAD bulk density has an average value of ~1.7 g/cm3, which correlates with grain density (average of ~2.725 g/cm3) and agrees well with GRA bulk density values associated with clay layers. In the relatively high density sand layers, MAD bulk density has an average value of ~2 g/cm3, which correlates with higher grain density values (2.775 g/cm3) and is offset from GRA bulk density values by 0.2 g/cm3. This 0.2 g/cm3 offset between GRA and MAD bulk density in sand-rich layers could be due to the high number of cracks in the core resulting from expansion. These cracks affect measurements made with the WRMSL, but can be avoided during discrete sampling. The high bulk and grain density values correspond to low carbonate content (~2–3 wt%) and low organic carbon content (0.1–0.2 wt%) (see Geochemistry; Figure F38).
Thermal conductivity
A thermal conductivity profile was obtained at ~10 m resolution using a thermal conductivity needle probe (Figure F30). Thermal conductivity measurements show no obvious trend with depth. The minimum and maximum values are 0.942 and 1.187 W/(m·K), respectively, with an average of ~1 W/(m·K) and a standard deviation of 0.005 W/(m·K). Thermal conductivity correlates with dry density and is inversely correlated with porosity. At ~90 mbsf, the remarkably low value of 0.746 W/(m·K) measured in Core 363-U1484A-11H (arrow on Figure F30) may be due to cracks in the core because the three individual thermal conductivity measurements taken on this core are consistent. Because this measurement is probably unreliable, it was excluded from further analysis.
Downhole temperature measurements
Standard downhole temperature measurements were made on Cores 363-U1484A-4H (33.5 mbsf), 7H (62 mbsf), 13H (119.5 mbsf), and 16H (147.5 mbsf) using the APCT-3. An exponential decrease in temperature was observed between 60 and 600 s after penetration and was used to estimate ambient temperature (unshaded area Figure F31). Temperature increases with depth from 5.97°C at 33.5 mbsf to 10.94°C at 147.5 mbsf. The APCT-3 measurement on Core 363-U1484A-16H was longer (~30 min) than measurements for the previous cores, which is why the temperature curve for Core 16H extends for longer relative to the other core measurements. The correlation between the four downhole temperatures and depth is very high (R2 = 0.96266). Using the slope of the temperature-depth relationship, we estimate that the bottom water temperature at Site U1484 is 4.97°C, yielding a geothermal gradient of 40°C/km (Figure F32).
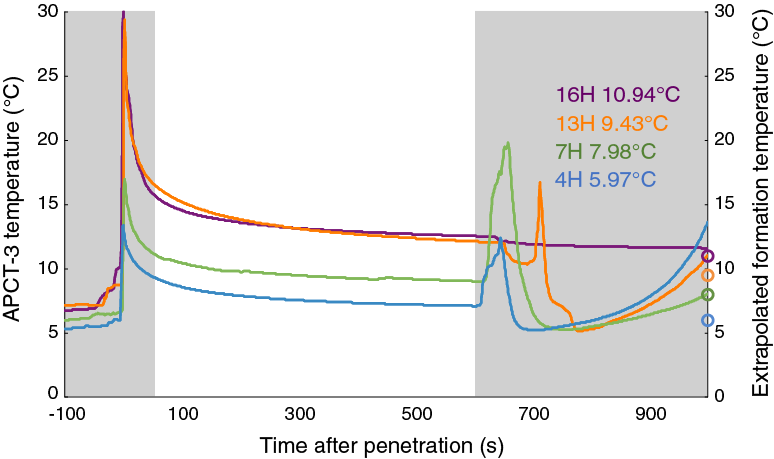
Figure F31. APCT-3 temperature-time series.
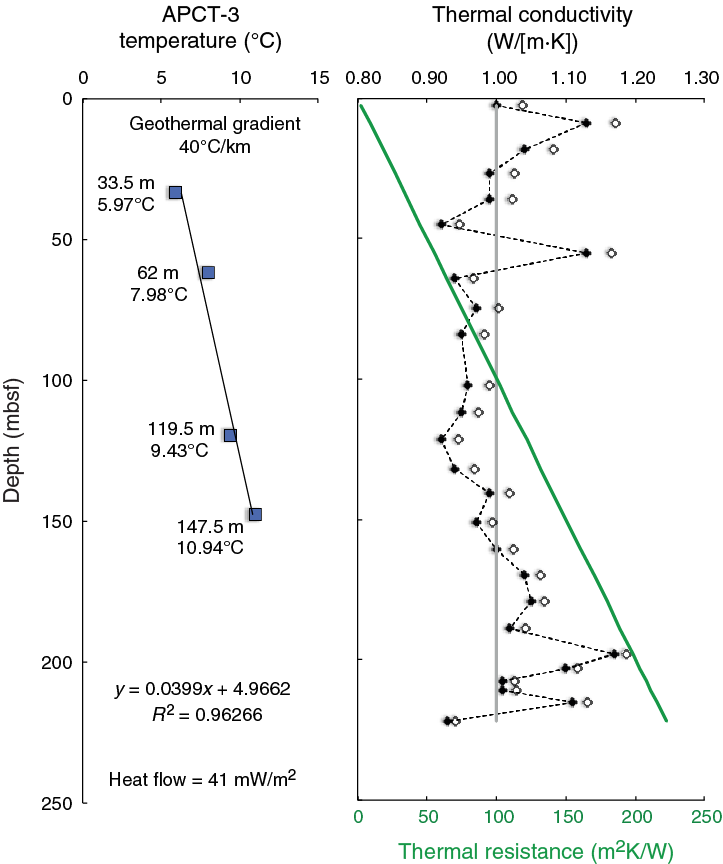
Figure F32. Heat flow calculations.
We generated a thermal conductivity profile (with ~10 m resolution) (Figure F32) using laboratory-determined thermal conductivity data (see Physical properties in the Expedition 363 methods chapter [Rosenthal et al., 2018a]). Based on the in situ condition correction, thermal resistance was calculated using the average thermal conductivity of 0.97 W/(m·K) measured in Hole U1484A following the “linear approach” outlined in Pribnow et al. (2000). The corrected thermal conductivity is lower relative to uncorrected values with an offset of ~0.04 W/(m·K) at the top and decreasing with depth to 0.01 W/(m·K). The slope of the linear fit between temperature and thermal resistance indicates a heat flow of 41 mW/m2 at Site U1484.
Stratigraphic correlation
Correlations between holes at Site U1484 were accomplished using Correlator software (version 2.1). Tie points were established mainly with Whole-Round Multisensor Logger (WRMSL) magnetic susceptibility data (Table T17; Figure F33). In addition, we used natural gamma radiation (NGR) data to aid in making correlations. We constructed a splice for the entire site using all three holes (Figures F34, F35), but there are gaps in the splice, mainly because of incomplete recovery of sand intervals. Gas expansion frequently caused extrusion of sediment out of the top and bottom of the core liner and onto the rig floor; expansion also made it difficult to extract some of the core liners from the core barrel. These factors resulted in relatively high growth factors, disturbed sediment (especially in Section 1 of many cores), and voids. Thus, there are parts of the sedimentary sequence that were difficult to correlate with WRMSL data between holes, and postcruise work will be required to verify some of the tentative tie points used to construct the splice (Table T18; Figures F33, F34, F35). The splice is continuous from 0 to 133.98 m core composite depth below seafloor (CCSF). Below this depth is an interval from 133.98 to 153.85 m CCSF with at least three core gaps and some tentative tie points. This interval is underlain by an interval from 153.85 to 270.85 m CCSF that is continuous except for one core gap at 172.55–175.28 m CCSF. The deepest interval, from 270.85 to 284.61 m CCSF, has a few core gaps. In sum, although there were some intervals with discontinuous recovery, we calculated offsets for all cores in all three holes and constructed a nearly continuous splice that has a few gaps, as discussed below.
Table T17. Affine table. Download table in CSV format.

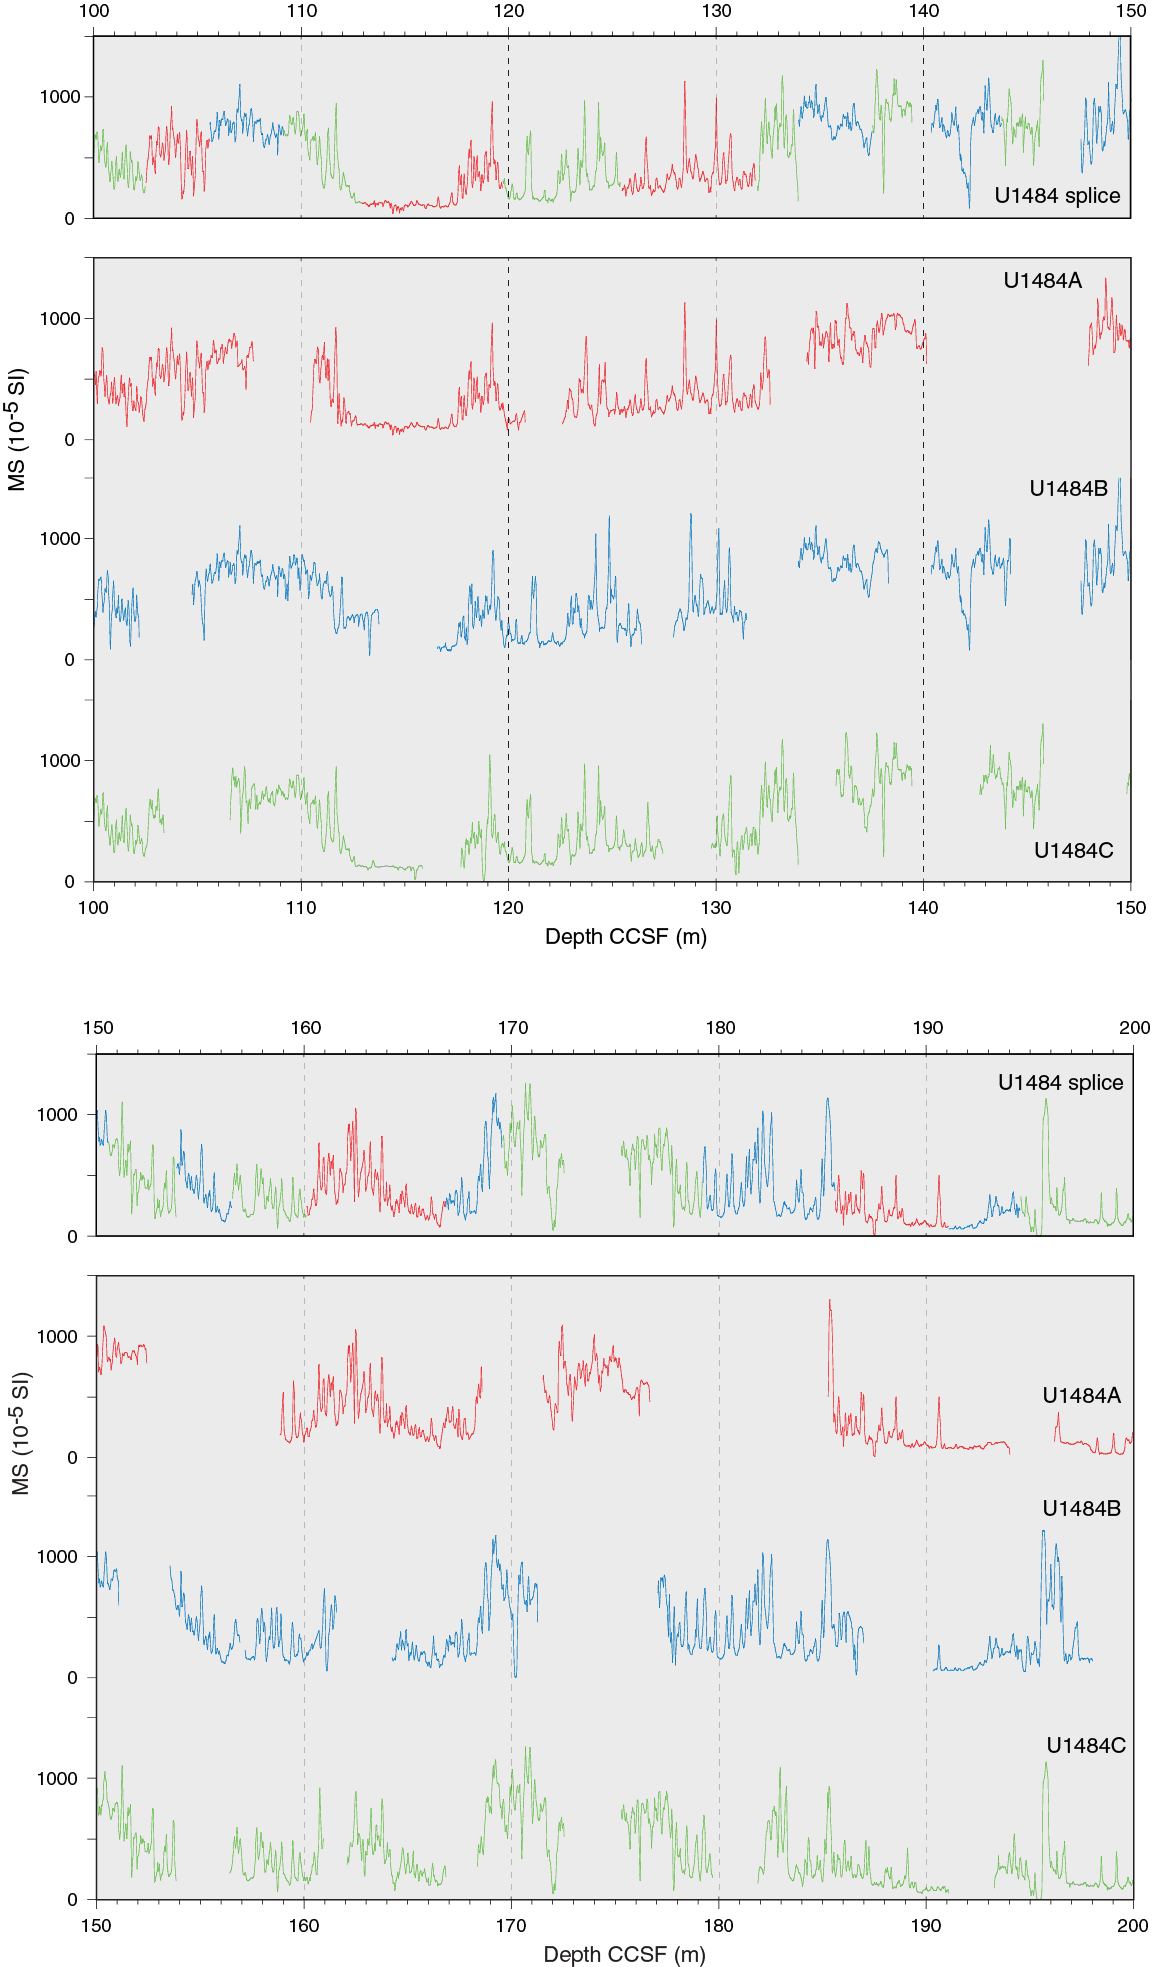
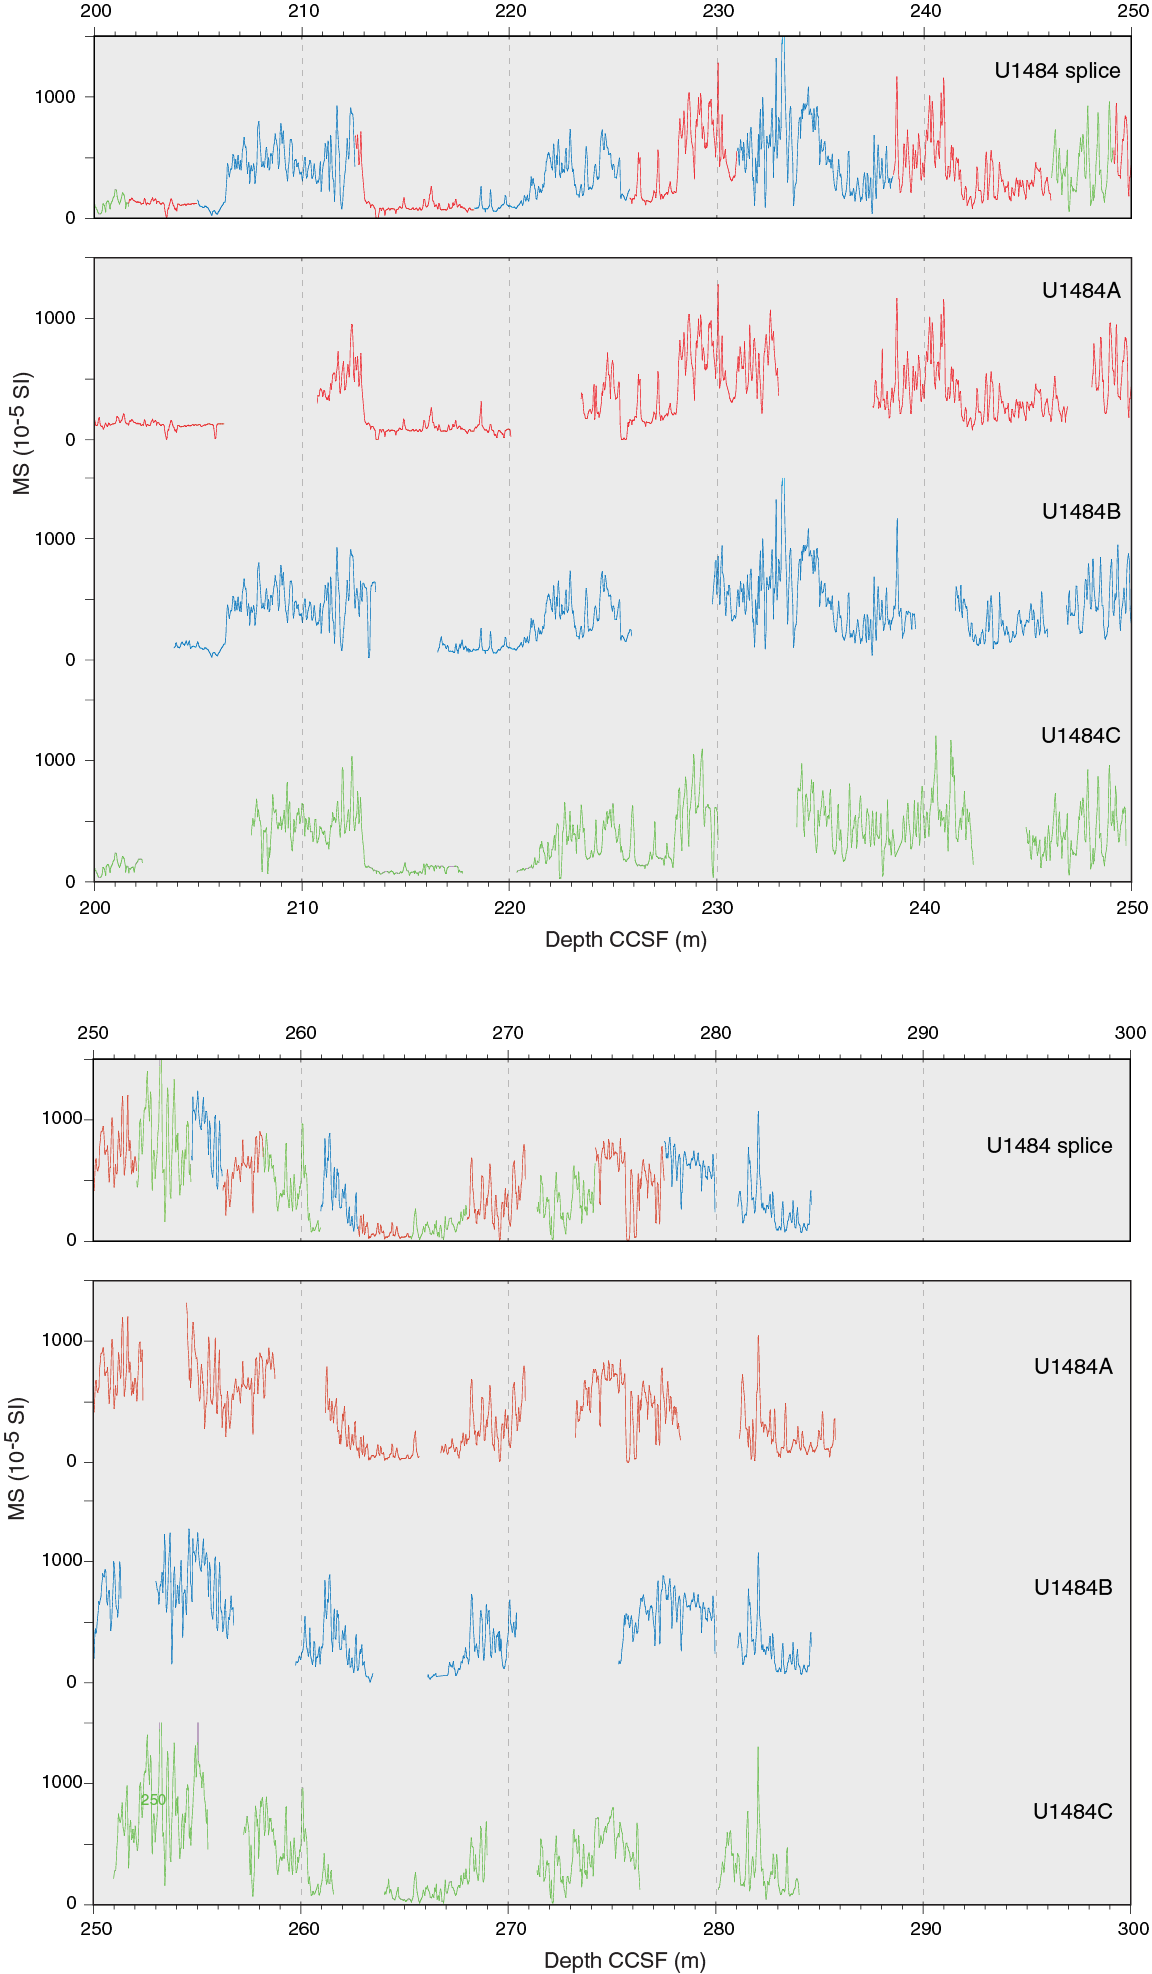
Figure F33. WRMSL MS data.

Figure F34. Spliced SHMSL L*, NGR, and WRMSL MS and GRA bulk density data.
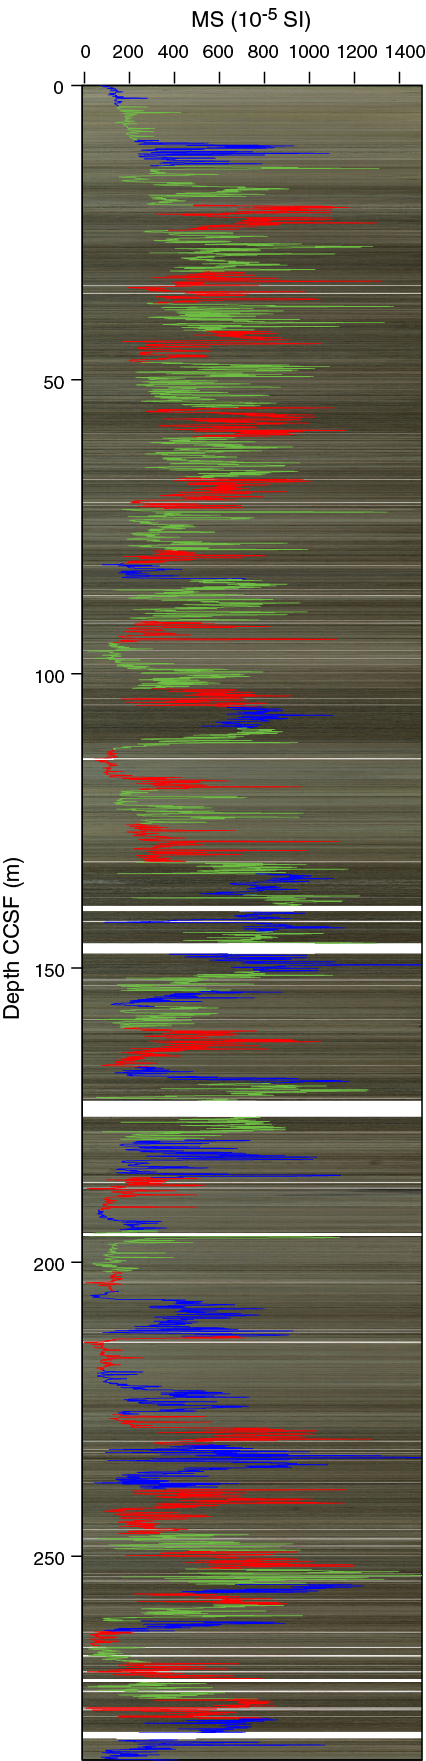
Figure F35. Spliced MS data.
Table T18. Splice interval. Download table in CSV format.
The CCSF scale is anchored to the mudline of Core 363-U1484B-1H, which is assigned a depth of 0 m CCSF. From this anchor, we worked downhole, using Correlator to establish a composite stratigraphy on a core-by-core basis. Our general approach was to avoid Section 1 and the bottoms of the cores because of disturbance at the tops of the core due to gas expansion, including some material that extruded onto the rig floor. This material was sometimes lost or may have been put into a core liner and should be considered disturbed (disturbed sections are noted in the LIMS database). We used splice tie points either just above or below pronounced magnetic susceptibility peaks that were easy to identify and correlate between holes. The match between the holes is very well constrained within the spliced interval from 0 to 133.98 m CCSF.
From 133.98 to 153.85 m CCSF, the splice is uncertain and unquestionably discontinuous. A number of cores have incomplete recovery due to the presence of sand, especially in Hole U1484A. In Holes U1484B and U1484C, the recovery was better in this interval because the HLAPC system was used; however, coring with this system resulted in shorter sections of cores and more core gaps that were difficult to cover. As we constructed the splice in this interval, we appended cores in places where we could not find tie points between holes. This resulted in four cores (363-U1484B-14F, 15F, 16F, and 17F) whose offsets were set using growth rates (Table T17); these cores were then used to anchor the tie points that were used to determine the offsets for the remaining cores in the interval. All of the tie points in this interval are uncertain and should be confirmed during postcruise research.
The splice is nearly continuous and well constrained from 153.85 to 270.85 m CCSF (Figures F33, F34, F35). There is one clear core gap between Cores 363-U1484C-20H and 21H; therefore, we appended Core 21H using 1.242, the growth rate of Core 20H. Although this gap appears to be covered by material in Core 363-U1484A-16H, this core was so disturbed (due to coring) that it was not used in the splice. We also used several tentative tie points (204.96, 246.13, 249.12, and 254.72 m CCSF) (Table T17), which should be confirmed during postcruise research.
The interval from 270.85 to 284.61 m CCSF was drilled with the HLAPC system, resulting in a splice that is discontinuous and uncertain. We could not find tie points in two cores (363-U1484C-31F and 363-U1484B-31F), and to incorporate these cores into the splice, their offsets were determined by appending them using the growth rate from the core above. We used tentative tie points to determine the offsets for the other cores in this interval.
More details about how the offsets of each core were determined, including cores not in the splice, are provided in the affine table (Table T17).
The splice interval table (Table T18) is intended to provide a sampling plan that can be used to generate high-resolution continuous records with minimal gaps; however, an “off-splice” sampling plan was also designed mainly for low-resolution studies. An explanation of the strategy used to determine the off-splice sampling plan, and a table of core intervals that should be used for off-splice sampling can be found in OFFSPLICE in Supplementary material.
The cumulative offset between mbsf and CCSF depth scales is nearly linear (Figure F36A), but close inspection of the cumulative offset as a function of depth (mbsf) (Figure F36B) shows that the growth factor was relatively large (in most cores it was >20%) and variable due to the release of overburden combined with methane gas expansion. The relatively high organic matter content of the sediment resulted in a very shallow sulfate–methane transition zone (SMTZ; see Geochemistry), and methane gas expansion persisted to the bottom of the cored interval at the site. Calculation of mass accumulation rates based on the CCSF scale should account for the expansion by dividing apparent depth intervals by the appropriate growth factor.
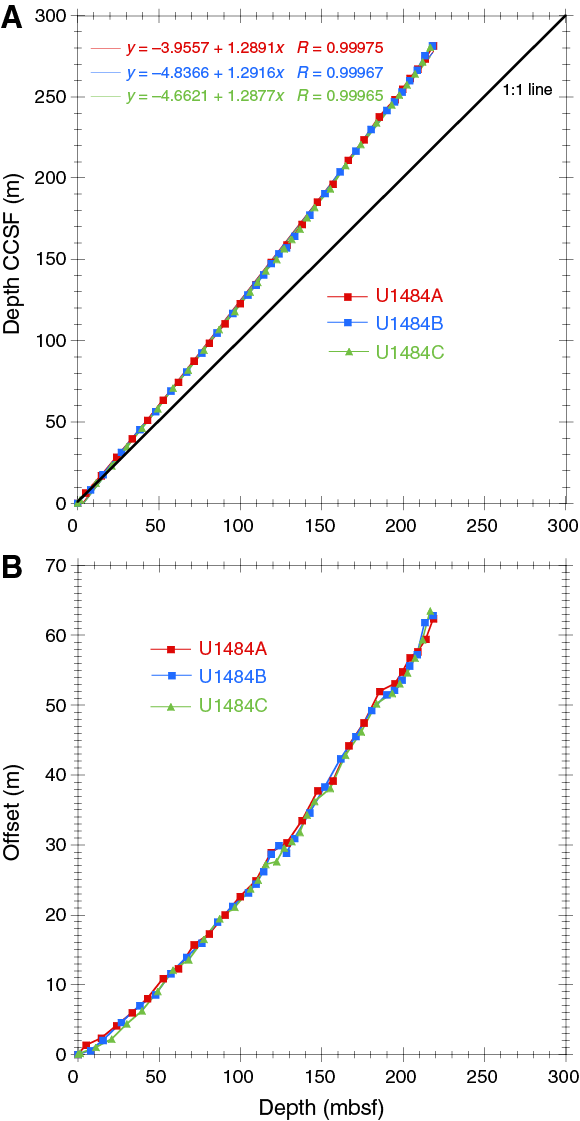
Figure F36. Comparison of mbsf and composite depth scales in the Site U1484 splice.
Geochemistry
Site U1484 was cored on the upper slope of the northern Papua New Guinea margin, ~15 km north of the Papua New Guinea coastline (Figure F1). Sedimentation at Site U1484 is dominated by terrigenous sediment delivered to the site by rivers draining the Papua New Guinea highlands, including the Sepik River, the largest northward-flowing river in Papua New Guinea. The delivery of substantial amounts of volcanogenic material and organic matter to Site U1484 drives intense early diagenetic processes and methanogenesis within the upper sediment column, with the SMTZ occurring at ~15 mbsf. Continued increase in alkalinity below the SMTZ co-occurs with increases in potassium (K), magnesium (Mg), and boron (B), suggesting in situ incongruent dissolution of easily alterable volcanic material downhole to ~50 mbsf. This process, termed anoxic silicate weathering (Wallmann et al., 2008), strongly influences the interstitial water geochemistry at Site U1484. For detailed background on organic matter remineralization and clay mineral alteration, see Geochemistry in the Site U1482 chapter (Rosenthal et al., 2018b).
Results
Volatile hydrocarbons
Headspace gas samples were taken at a frequency of one sample per core in Hole U1484A as part of the routine environmental protection and safety-monitoring program (Table T19; Figure F37). Relatively low methane concentration occurs in the near-surface sediment, varying between 205 and 1,117 ppmv in the upper ~13 mbsf. At 23.7 mbsf, the concentration increases to 22,409 ppmv, consistent with depletion of sulfate (SO4) in the interstitial water at this depth (see Sulfate and barium). Deeper than 23.7 mbsf, methane concentration fluctuates between hundreds to tens of thousands of parts per million, related in part to the presence of sand-rich layers downhole. Methane concentration measured in samples taken in clay and silt average 12,311 ppmv (N = 22), whereas those measured in samples from sandy layers average 2,022 ppmv (N = 5) due to much faster gas exchange in sand than in clay-rich, low-porosity sediment. In most of the samples, ethane and propane are below detection limit, resulting in extremely high methane/ethane ratio (C1/C2) throughout the entire hole and suggesting that methane is mostly of biogenic origin, rather than thermogenic.
Table T19. Volatile hydrocarbon concentrations. Download table in CSV format.
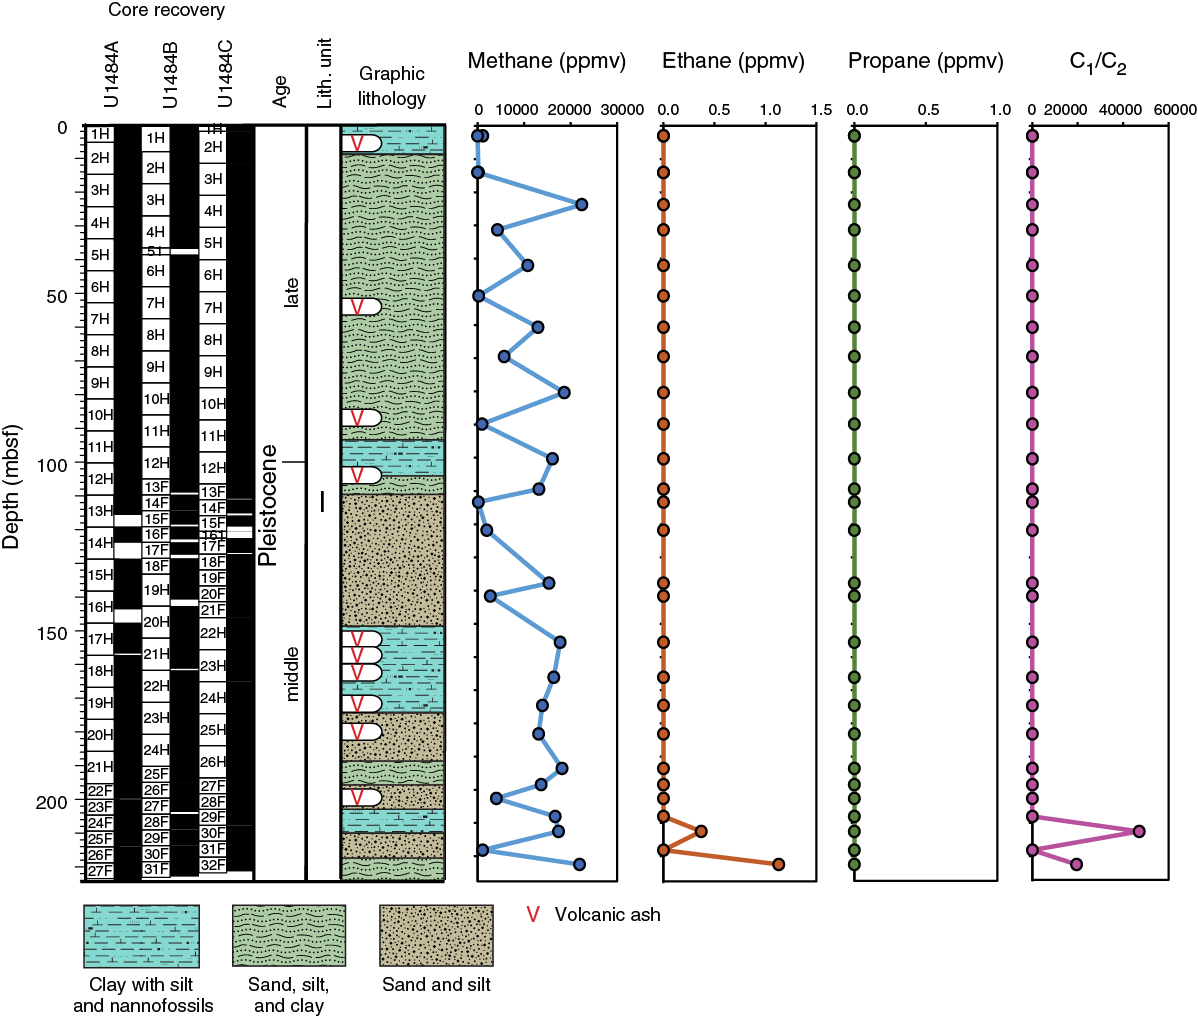
Figure F37. Methane, ethane, propane, and C1/C2 profiles.
Bulk sediment geochemistry
Calcium carbonate (CaCO3), inorganic carbon (IC), total organic carbon (TOC), and total nitrogen (TN) were measured on sediment samples from Hole U1484A (Table T20; Figure F38). CaCO3 content is generally low, ranging from 1.6 to 14.3 wt% with an average of 7.8 wt%. Overall, CaCO3 content is lower in the uppermost 90 m of sediment and increases below that depth. CaCO3 content is lower in sand samples (average = 4.3 wt%; N = 18) than in clay and silt samples (average = 8.9 wt%; N = 54).
Table T20. Carbon, nitrogen, and C/N ratios. Download table in CSV format.
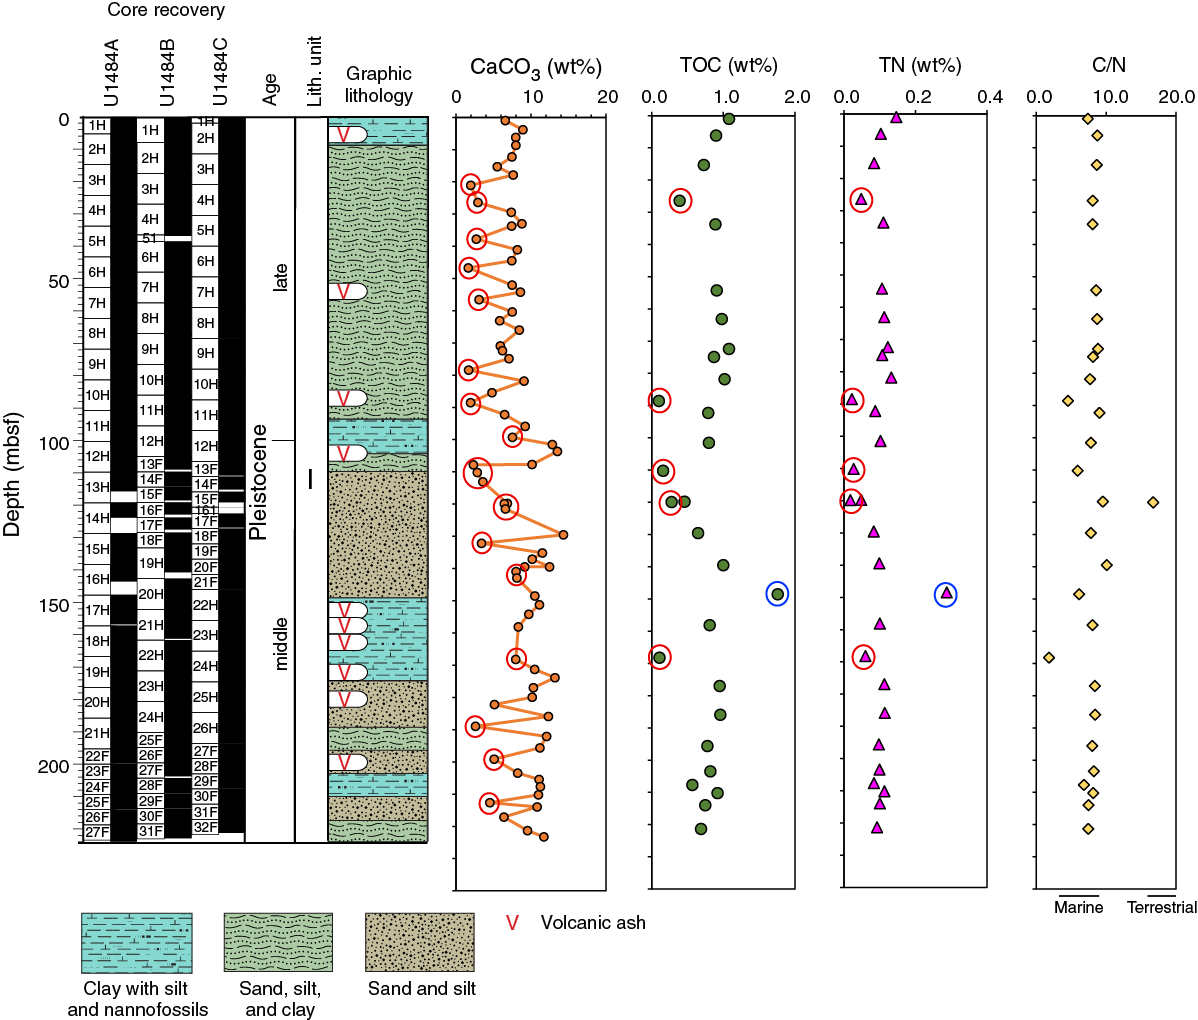
Figure F38. CaCO3, TOC, TN, and C/N profiles.
TOC content ranges between ~0.1 and 1.8 wt% with an average of 0.9 wt% and exhibits no discernible downhole trend. TOC content is lower in sand samples (average = 0.2 wt%; N = 4) than in clay and silt samples (average = 0.9 wt%; N = 25). The ratio of TOC to TN (C/N ratio) ranges from 2 to 16 with an average of 8 (Figure F38). The ratio in most samples is <10 and may suggest that the organic matter deposited at Site U1484 is predominantly of marine origin. Several lines of evidence indicate that C/N ratios at Site U1484 are primary and unaffected by major diagenetic alterations. The downhole TOC and TN variations track each other, and the absence of a downhole trend in TOC, TN, and C/N ratio variations suggests that most of the nitrogen is organic-bound with little preferential degradation. Furthermore, there is no significant difference in C/N ratios between sand and clay/silt samples. Caution should be taken, however, when interpreting TOC and C/N data calculated from the subtraction method.
Interstitial water chemistry
A total of 24 interstitial water samples and one mudline sample were collected from 0 to 222.40 mbsf in Hole U1484A for interstitial water analyses. Standard analyses were carried out on all interstitial water samples following the procedures described in Geochemistry in the Expedition 363 methods chapter [Rosenthal et al., 2018a]. Interstitial water chemistry data are reported in Table T21.
Table T21. Interstitial water geochemical data. Download table in CSV format.
Chlorinity and salinity
Chloride (Cl) concentration shows minor variability over the upper ~194 mbsf in Hole U1484A with an average concentration of 551.1 mM (Figure F39). A small but significant increase (1%) occurs from seawater-like values of ~547 mM in the upper 40 mbsf to 553.8 mM at 42.0 mbsf, with a steep decrease thereafter to a local minimum of 547.0 mM at 60.6 mbsf. Cl is stable at a concentration of ~553 mM between ~90 and 183 mbsf before a sharp 2% decrease from 553.6 mM at 137.6 mbsf to 545.1 mM at 224.0 mbsf. The decrease in Cl toward the base of the hole is likely due to dehydration of clay minerals (see Discussion).
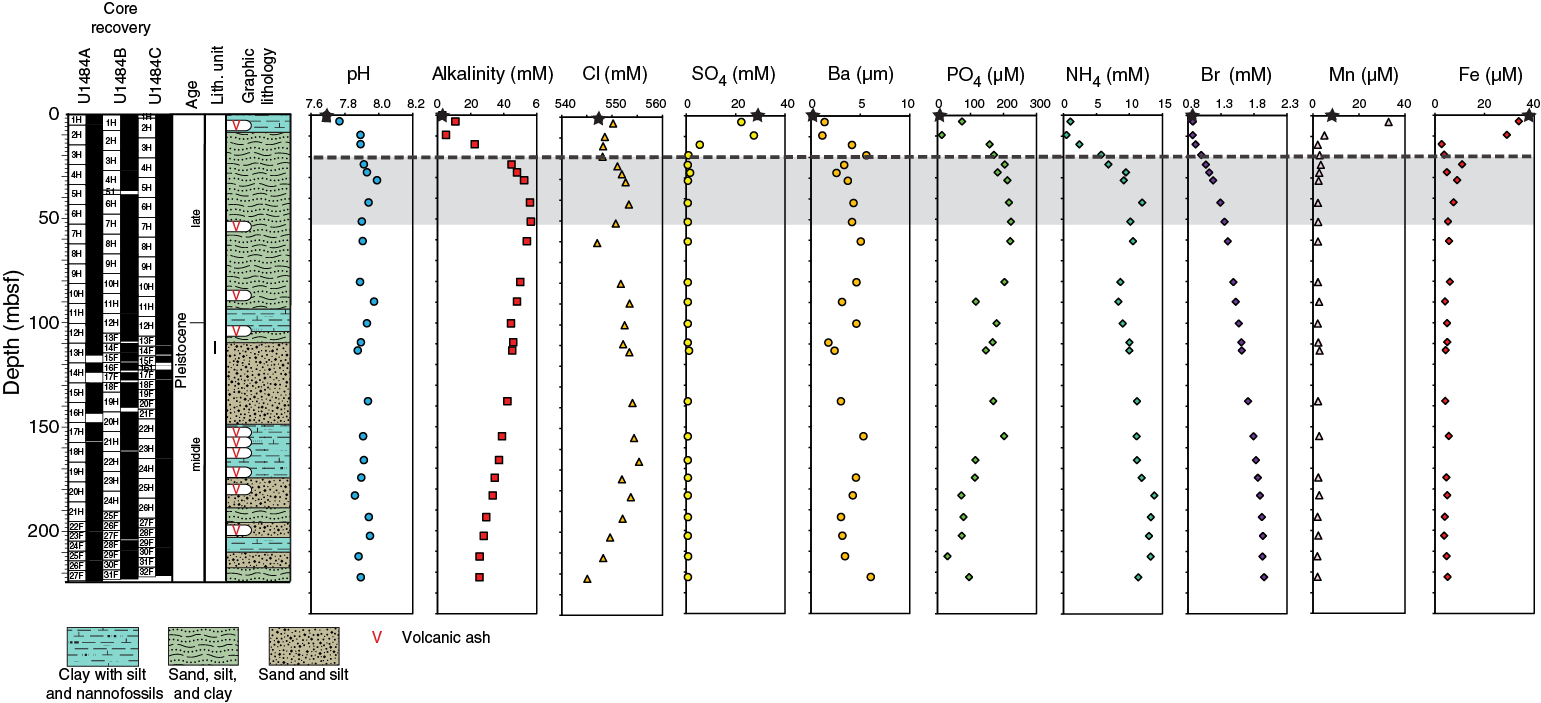
Figure F39. Interstitial water concentration profiles.
Salinity variability (not shown) is minimal downhole, deviating by no more than 1 unit from the mudline water sample value of 36 downhole to 166.0 mbsf. A small and gradual decrease to a salinity value of 34 occurs from 166.0 mbsf to the bottom of Hole U1484A.
Alkalinity and pH
At Site U1484, pH exhibits a small increase from the mudline (~7.7) to ~30 mbsf (~8.0) and then remains relatively constant downhole (7.9 ± 0.03) (Figure F39). Alkalinity increases substantially from a mudline value of 2.9 mM to a maximum value of 56.5 mM in the interval between 40 and 50 mbsf. A low alkalinity value (5.0 mM) within this interval at ~9.5 mbsf coincides with a whole-round sample that consists entirely of a silt/sand-rich layer. The maximum alkalinity values encountered at this site are much higher than those reported previously at northwest Australian margin Sites U1482 (6.4 mM) and U1483 (17.9 mM) (see Geochemistry in the Site U1482 chapter and Geochemistry in the Site U1483 chapter [Rosenthal et al., 2018b, 2018c]). In marked contrast with the northwest Australian margin sites, peak alkalinity at Site U1484 does not coincide with the depth of the SMTZ as inferred from both SO4 and methane profiles (Figures F37, F39). Therefore, we posit that in addition to anaerobic oxidation of organic matter (AOM), anoxic weathering of silicates (Wallmann et al., 2008) is contributing to the alkalinity trends at Site U1484 (see Discussion). Deeper than ~50 mbsf, alkalinity gradually declines to 25.3 mM at 222.4 mbsf.
Sulfate and barium
SO4 concentration sharply decreases from seawater-like values (28.9 mM) at the mudline to almost complete depletion at 19.0 mbsf (Figure F39) followed by a steep increase in methane at around the same depth (see Volatile hydrocarbons). The small increase in SO4 concentration to 27.3 mM at 9.5 mbsf corresponds to the occurrence of a silt/sand layer. Taken together with the rapid increase of methane at around the same depth, the steep decrease in interstitial water SO4 suggests that the depth of the SMTZ is approximately 20 mbsf.
In contrast to the northwest Australian margin Sites U1482 and U1483, barium (Ba) concentration at Site U1484 exhibits only a small increase with depth (Figure F39). This marked contrast is most apparent in the lack of a pronounced increase from minimal (<1 μM) to high (>200 μM) concentration at the SMTZ that was observed at the previous two sites (see Geochemistry in the Site U1482 chapter and Geochemistry in the Site U1483 chapter [Rosenthal et al., 2018b, 2018c]). Most of the Ba increase at Site U1484 occurs in the uppermost 19.0 mbsf, with a minimum concentration of 0.2 μM at the mudline and a local maximum concentration of 5.6 μM at the depth of the SMTZ. Ba concentration subsequently hovers at ~4.0 μM before decreasing to 1.3 μM at 109.3 mbsf. A slight increase to 4.9 μM is observed by 154.5 mbsf, followed by a decrease to 2.5 μM by 193.4 mbsf and finally an increase to 5.7 μM at the base of the hole. No obvious barite was observed in the sediment (see Core description), in agreement with interstitial water Ba trends.
Phosphate, ammonium, and bromide
Phosphate (PO4) concentration at Site U1484 is up to an order of magnitude higher than at Sites U1482 and U1483 (Figure F39). PO4 concentration increases from a minimum of 7.3 μM at the mudline to a maximum of 222.5 μM at 51.2 mbsf. The sharp drop in PO4 to 13.3 μM at 9.5 mbsf coincides with the silt/sand-rich sample. Below the maximum concentration at 51.2 mbsf, PO4 gradually decreases with depth to values of ~80 μM near the bottom of Hole U1484A.
Ammonium (NH4) and bromide (Br) both experience increases in concentration with depth, consistent with active organic matter remineralization throughout the sediment column at Site U1484 (Figure F39). NH4 concentration increases rapidly from values slightly above the detection limit at the mudline to 11.9 mM at 42.0 mbsf. Below this depth, NH4 concentration decreases to 8.3 mM at 90 mbsf, before gradually increasing downhole to ~11–13 mM.
Br concentration increases throughout the hole, from 0.9 mM at the mudline to a maximum of 2 mM at 222.4 mbsf. As with NH4, the rate of Br increase is generally higher in the upper ~40 m of sediment, particularly between 10 and 31 mbsf. The high supply of organic matter to this site is supported by frequent observations of terrestrial and marine biogenic material (see Core description), a yellow tint to the interstitial water likely indicating the presence of humic acids, and the relatively high TOC and TN content (see Bulk sediment geochemistry).
Manganese and Iron
Manganese (Mn) and iron (Fe) concentrations at Site U1484 reflect the remineralization of organic matter within the upper portion of the sediment column; variations in the downhole Fe profile may also reflect authigenic clay mineral formation. Mn concentration increases from 8.4 μM at the mudline to a peak of 32.8 μM at 3.0 mbsf before quickly decreasing to a stable value of ~2 μM by ~14 mbsf, with little variation downhole (Figure F39). Fe concentration decreases from a high value of 37.9 μM at the mudline to consistently low values of approximately 5 μM by 14.0 mbsf. Abundant sulfides are observed in the sediment from ~20 to 30 mbsf, indicating removal of Fe to the sediment by sulfide precipitation (see Core description). Fe concentration is also significantly higher than at Sites U1482 and U1483 (see Geochemistry in the Site U1482 chapter and Geochemistry in the Site U1483 chapter [Rosenthal et al., 2018b, 2018c]), likely due to the higher input of Fe- and Mn-bearing volcanogenic silicates to the northern Papua New Guinea margin.
Potassium, magnesium, and calcium
As at Site U1483, K concentration increases markedly from seawater-like values at the mudline (10.4 mM) to ~13 mM in the interval between 42 and 51.2 mbsf (Figure F40). Deeper than 51.2 mbsf, K concentration decreases to slightly lower values and remains relatively high and invariant throughout the rest of Hole U1484A (12.2 ± 0.3 mM). Mg concentration decreases from seawater-like values at the mudline (53.6 mM) to 14 mbsf (46.6 mM) and then increases to a peak concentration of ~56 mM between 31.3 and 60.6 mbsf. Similar to the alkalinity profile, Mg exhibits a steady near-linear decrease from ~60.6 mbsf to a minimum concentration of 34.0 mM at the bottom of Hole U1484A.
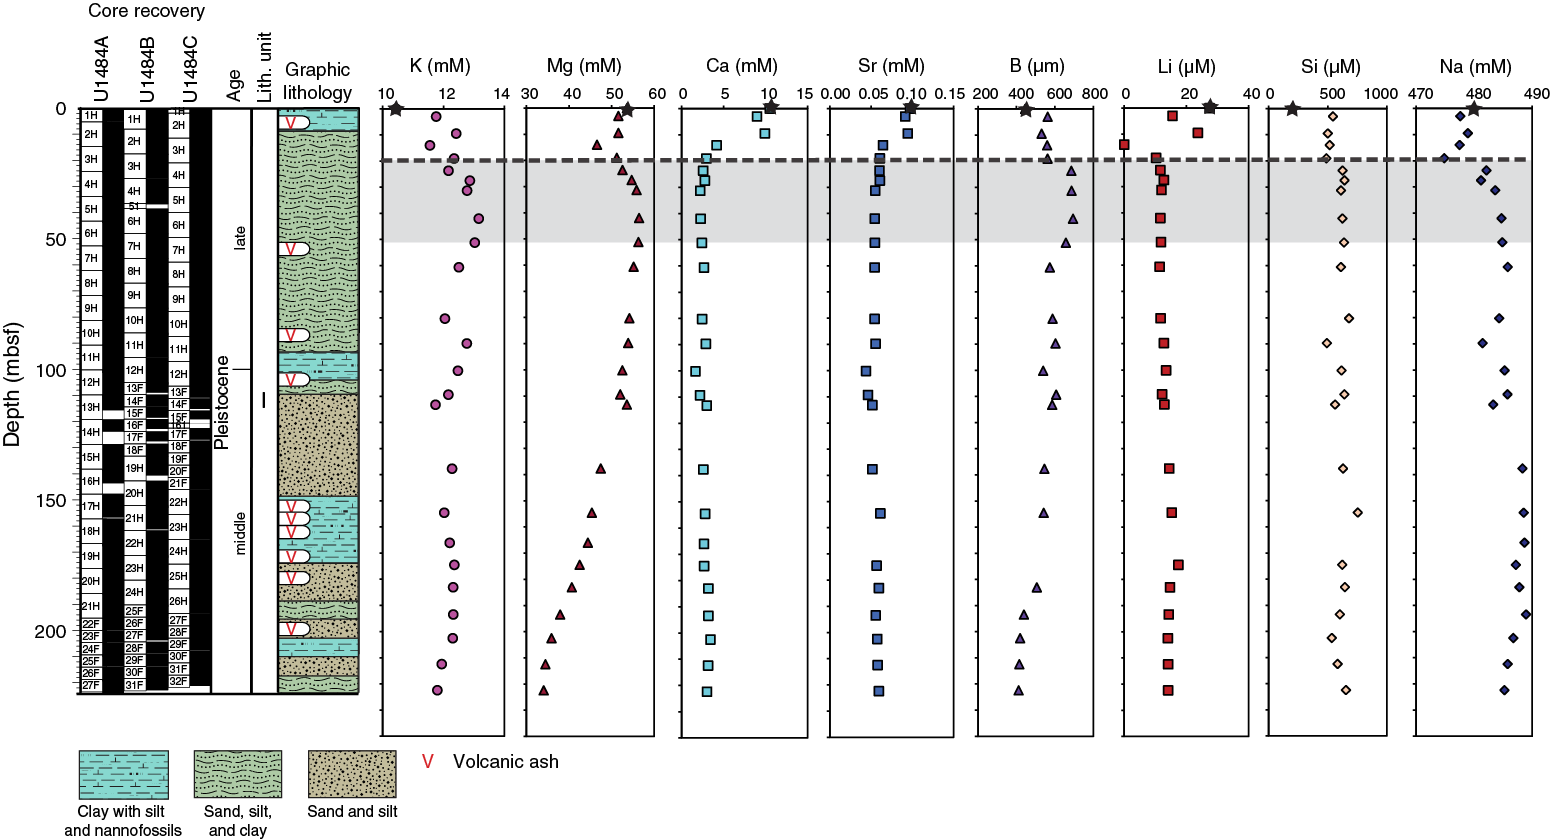
Figure F40. Interstitial water concentration profiles.
Calcium (Ca) concentration decreases from seawater-like values at the mudline (10.5 mM) to 2.2 mM at 31.3 mbsf (Figure F40). The abrupt decrease in Ca concentration from 9.5 to 19 mbsf coincides with the decrease in dissolved sulfate (Figure F39), suggesting that Ca consumption is driven by active precipitation of authigenic carbonates at the SMTZ. Deeper than 31.3 mbsf, Ca increases gradually downhole from 2.2 to 3.4 mM.
Strontium and boron
Strontium (Sr) concentration from Site U1484 shows little variability. Sr tracks Ca, with a shift in Sr concentration from ~0.1 mM in the upper ~30 msbf to 0.05 mM at 31.3 mbsf and with approximately constant values (varying by no more than 0.01 mM) below this depth (Figure F40). B behaves in a similar manner to K at Site U1484. B concentration increases from a mudline value of 445.0 μM to a maximum concentration of 724.5 μM at 27.5 mbsf. B concentration subsequently decreases with depth in a nearly monotonic manner to a minimum concentration of 411.4 μM at 222.4 mbsf.
Lithium, silica, and sodium
Lithium (Li) shows little variability with depth at Site U1484. Following an overall decrease in Li concentration from 27.4 μM at the mudline to 10.3 μM at 19.0 mbsf, Li gradually increases to a local maximum of 17.4 μM at 174.5 mbsf (Figure F40). A subsequent decrease in Li to 14.1 μM occurs in the lowermost 50 m of the hole. Silica (Si) increases sharply from the mudline (203.1 µM) to 544.4 µM at 5 mbsf, followed by relatively constant Si concentration down to 19.0 mbsf and a subsequent increase to 625.4 µM at 27.5 mbsf. Below this depth, Si concentration is nearly constant.
Discussion
The dominant processes influencing the interstitial water geochemistry at Site U1484 are remineralization of organic matter, anoxic weathering of silicates, and clay mineral diagenesis/authigenesis. The peak enrichment of dissolved Mn at ~3 mbsf marks the oxic/suboxic transition. Reduction of Fe oxide and oxyhydroxide phases also likely proceeds in the sediment to ~10 mbsf as inferred from high dissolved Fe concentration to this depth (>25 µM). Along with the methane concentration, the observed downhole profile for SO4 puts the depth of the SMTZ at ~20 mbsf. The relatively low Ca concentration (~2 mM) observed at around this depth suggests authigenic carbonate precipitation is taking place at the SMTZ, which is supported by a concomitant drop in Sr concentration at ~20 mbsf. In contrast with the interstitial water geochemistry at northwest Australian margin Sites U1482 and U1483, there is no dissolved Ba enrichment below the SMTZ at Site U1484, possibly due to the lack or low abundance of biogenic barite in the sediment. Similarly, dissolved Si displays smaller downhole enrichment (Si ~750 µM) in comparison to the northwest Australian margin sites (e.g., maximum Si ~1150 µM at Site U1483), which could reflect the low abundance of biogenic silica and associated diagenetic release of dissolved Si in the Site U1484 sediment.
A striking feature of the interstitial water geochemistry at Site U1484 is the offset in depth between the location of the SMTZ and the major increase of alkalinity in the uppermost part of the sediment in Hole U1484A. Alkalinity increases from a mudline value of 2.8 mM to a maximum of ~50–55 mM between 30 and 80 mbsf, whereas the SMTZ occurs at ~20 mbsf. In typical ocean margin settings, the SMTZ generally coincides with maximum alkalinity levels of ~20–30 mM due to release of bicarbonate (HCO3−) during AOM (e.g., Niewhöner et al., 1998). At Site U1484, the observation that alkalinity peaks at a higher concentration and at a depth below the SMTZ suggests that another mechanism influences alkalinity. The interval between 30 and 50 mbsf is also characterized by marked enrichments of dissolved Mg, K, and, to a lesser extent, Na. Collectively, these findings suggest that incongruent dissolution of silicate minerals occurs within this sediment interval.
Previous studies have reported similar cases of detrital minerals undergoing substantial dissolution under anoxic conditions in marine sediment (Wallmann et al., 2008; Solomon et al., 2014; Kim et al., 2016). These reactions are similar to the silicate weathering processes that occur on continents, leading to carbon dioxide (CO2) consumption, formation of secondary clay minerals, and release of HCO3−, cations, and Si into the interstitial water. In marine sediment, silicate weathering generally proceeds within the methanogenic zone, where increasing CO2 levels caused by methane formation help to promote incongruent dissolution of silicate minerals. Anoxic silicate weathering can be particularly intense in sediment that contains reactive silicate mineral phases (Maher et al., 2004). At ocean margins surrounding volcanic areas, such as the northern Papua New Guinea margin, plagioclase feldspars, olivine, pyroxene, volcanic glass, and other easily alterable minerals can be transformed into smectite in the subsurface anoxic sediment (Wallmann et al., 2008). This process typically leads to significant depletion of mobile cations (Na, Mg, and Ca) in interstitial water.
At Site U1484, authigenic smectite formation could possibly explain, at least partly, some of the observed decrease in dissolved Mg deeper than 50 mbsf. Additional clay mineral alteration, such as the transformation from kaolinite to nontronite, a member of the smectite group (see Geochemistry in the Site U1482 chapter [Rosenthal et al., 2018b]), could also help to explain the trends in Mg, K, Cl, and alkalinity deeper than ~50 mbsf. Alternatively, the downhole decrease in Mg, decrease in alkalinity, and slight increase in Ca may reflect precipitation of authigenic dolomite occurring at some depth in the sediment column below the total depth cored at Site U1484.
Finally, it is worth noting that glauconite was observed at Site U1484 (see Core description), which presents a tempting explanation for the observed interstitial water Fe concentration. Although the physical conditions for glauconite (normal marine salinity, anoxic/reducing conditions, relatively shallow water depth, and sediment with high iron and organic matter content [Cloud, 1955]) are generally met at this site, it is far more likely that the glauconite was transported from the nearby shelf environment (see Core description). Furthermore, a reduction of Fe and K would be expected with in situ glauconite formation; however, we only observe a decrease in Fe concentration (not K), which can be explained by the formation of the pyrite found in abundance throughout Hole U1484A.
References
Backman, J., Raffi, I., Rio, D., Fornaciari, E., and Pälike, H., 2012. Biozonation and biochronology of Miocene through Pleistocene calcareous nannofossils from low and middle latitudes. Newsletters on Stratigraphy, 45(3):221–244. https://doi.org/10.1127/0078-0421/2012/0022
Baldwin, S.L., Fitzgerald, P.G., and Webb, L.E., 2012. Tectonics of the New Guinea region. Annual Review of Earth and Planetary Sciences, 40(1):495–520. http://dx.doi.org/10.1146/annurev-earth-040809-152540
Cloud, P.E., 1955. Physical limits of glauconite formation. AAPG Bulletin, 39(4):484–492. http://aapgbull.geoscienceworld.org/content/39/4/484
Darling, K.F., Kucera, M., Kroon, D., and Wade, C.M., 2006. A resolution for the coiling direction paradox in Neogloboquadrina pachyderma. Paleoceanography, 21(2):PA2011. https://doi.org/10.1029/2005PA001189
Hatfield, R.G., 2014. Particle size-specific magnetic measurements as a tool for enhancing our understanding of the bulk magnetic properties of sediments. Minerals, 4(4):758–787. https://doi.org/10.3390/min4040758
Jones, R.W., 1994. The Challenger Foraminifera: New York (Oxford University Press USA).
Karlin, R., and Levi, S., 1983. Diagenesis of magnetic minerals in recent hemipelagic sediments. Nature, 303(5915):327–330. https://doi.org/10.1038/303327a0
Kim, J.-H., Torres, M.E., Haley, B.A., Ryu, J.-S., Park, M.-H., Hong, W.-L., and Choi, J., 2016. Marine silicate weathering in the anoxic sediment of the Ulleung Basin: evidence and consequences. Geochemistry, Geophysics, Geosystems, 17(8):3437–3453. https://doi.org/10.1002/2016GC006356
Kineke, G.C., Woolfe, K.J., Kuehl, S.A., Milliman, J.D., Dellapenna, T.M., and Purdon, R.G., 2000. Sediment export from the Sepik River, Papua New Guinea: evidence for a divergent sediment plume. Continental Shelf Research, 20(16):2239–2266. https://doi.org/10.1016/S0278-4343(00)00069-8
Kuehl, S.A., Brunskill, G.J., Burns, K., Fugate, D., Kniskern, T., and Meneghini, L., 2004. Nature of sediment dispersal off the Sepik River, Papua New Guinea: preliminary sediment budget and implications for margin processes. Continental Shelf Research, 24(19):2417–2429. https://doi.org/10.1016/j.csr.2004.07.016
Kuroda, Y., 2000. Variability of currents off the northern coast of New Guinea. Journal of Oceanography, 56(1):103–116. http://dx.doi.org/10.1023/A:1011122810354
Maher, B.A., 1988. Magnetic properties of some synthetic submicron magnetites. Geophysics Journal of the Royal Astronomical Society, 94:83–96.
Maher, K., DePaolo, D.J., and Lin, J.C.-F., 2004. Rates of silicate dissolution in deep-sea sediment: in situ measurement using 234U/238U of pore fluids. Geochimica et Cosmochimica Acta, 68(22):4629–4648. https://doi.org/10.1016/j.gca.2004.04.024
McNeill, L.C., Dugan, B., Petronotis, K.E., Backman, J., Bourlange, S., Chemale, F., Chen, W., Colson, T.A., Frederik, M.C.G., Guèrin, G., Hamahashi, M., Henstock, T., House, B.M., Hüpers, A., Jeppson, T.N., Kachovich, S., Kenigsberg, A.R., Kuranaga, M., Kutterolf, S., Milliken, K.L., Mitchison, F.L., Mukoyoshi, H., Nair, N., Owari, S., Pickering, K.T., Pouderoux, H.F.A., Yehua, S., Song, I., Torres, M.E., Vannucchi, P., Vrolijk, P.J., Yang, T., and Zhao, X., 2017. Expedition 362 summary. In McNeill, L.C., Dugan, B., Petronotis, K.E., and the Expedition 362 Scientists, Sumatra Subduction Zone. Proceedings of the International Ocean Discovery Program, 362: College Station, TX (International Ocean Discovery Program). https://doi.org/10.14379/iodp.proc.362.101.2017
Middleton, G.V., and Hampton, M.A., 1973. Sediment gravity flows: mechanics of flow and deposition. In Middleton, G.V., and Bouma, A.H. (Eds.), Turbidites and Deep Water Sedimentation. Short Course Notes, Society of Economic Paleontologists and Mineralogists, Pacific Section, 1–38. http://archives.datapages.com/data/pac_sepm/015/015001/pdfs/1.pdf
Milliman, J.D., Farnsworth, K.L., and Albertin, C.S., 1999. Flux and fate of fluvial sediments leaving large islands in the East Indies. Journal of Sea Research, 41(1–2):97–107. http://dx.doi.org/10.1016/S1385-1101(98)00040-9
Morard, R., Quillévéré, F., Douady, C.J., de Vargas, C., de Garidel-Theron, T., and Escarguel, G., 2011. Worldwide genotyping of the planktonic foraminifer Globoconella inflata: implications for life history and paleoceanography. PloS One, 6(10):e26665. https://doi.org/10.1371/journal.pone.0026665
Mutti, E., Steffens, G.S., Pirmez, C., Orlando, M., and Roberts, D., 2013. Proceedings from Parma, Italy workshop. 21–25 May 2002. Marine and Petroleum Geology, 20:523–933.
Niewhöner, C., Hensen, C., Kasten, S., Zabel, M., and Schulz, H.D., 1998. Deep sulfate reduction completely mediated by anaerobic methane oxidation in sediments of the upwelling area off Namibia. Geochimica et Cosmochimica Acta, 62(3):455–464. https://doi.org/10.1016/S0016-7037(98)00055-6
Pribnow, D., Kinoshita, M., and Stein, C., 2000. Thermal Data Collection and Heat Flow Recalculations for Ocean Drilling Program Legs 101–180: Hanover, Germany (Institute for Joint Geoscientific Research, Institut für Geowissenschaftliche Gemeinschaftsaufgaben [GGA]). http://www-odp.tamu.edu/publications/heatflow/ODPReprt.pdf
Raffi, I., Backman, J., Fornaciari, E., Pälike, H., Rio, D., Lourens, L., and Hilgen, F., 2006. A review of calcareous nannofossil astrobiochronology encompassing the past 25 million years. Quaternary Science Reviews, 25(23–24):3113–3137. http://dx.doi.org/10.1016/j.quascirev.2006.07.007
Rosenthal, Y., Holbourn, A., and Kulhanek, D.K., 2016. Expedition 363 Scientific Prospectus: Western Pacific Warm Pool. International Ocean Discovery Program. https://doi.org/10.14379/iodp.sp.363.2016
Rosenthal, Y., Holbourn, A.E., Kulhanek, D.K., Aiello, I.W., Babila, T.L., Bayon, G., Beaufort, L., Bova, S.C., Chun, J.-H., Dang, H., Drury, A.J., Dunkley Jones, T., Eichler, P.P.B., Fernando, A.G.S., Gibson, K.A., Hatfield, R.G., Johnson, D.L., Kumagai, Y., Li, T., Linsley, B.K., Meinicke, N., Mountain, G.S., Opdyke, B.N., Pearson, P.N., Poole, C.R., Ravelo, A.C., Sagawa, T., Schmitt, A., Wurtzel, J.B., Xu, J., Yamamoto, M., and Zhang, Y.G., 2018a. Expedition 363 methods. In Rosenthal, Y., Holbourn, A.E., Kulhanek, D.K., and the Expedition 363 Scientists, Western Pacific Warm Pool. Proceedings of the International Ocean Discovery Program, 363: College Station, TX (International Ocean Discovery Program). https://doi.org/10.14379/iodp.proc.363.102.2018
Rosenthal, Y., Holbourn, A.E., Kulhanek, D.K., Aiello, I.W., Babila, T.L., Bayon, G., Beaufort, L., Bova, S.C., Chun, J.-H., Dang, H., Drury, A.J., Dunkley Jones, T., Eichler, P.P.B., Fernando, A.G.S., Gibson, K.A., Hatfield, R.G., Johnson, D.L., Kumagai, Y., Li, T., Linsley, B.K., Meinicke, N., Mountain, G.S., Opdyke, B.N., Pearson, P.N., Poole, C.R., Ravelo, A.C., Sagawa, T., Schmitt, A., Wurtzel, J.B., Xu, J., Yamamoto, M., and Zhang, Y.G., 2018b. Site U1482. In Rosenthal, Y., Holbourn, A.E., Kulhanek, D.K., and the Expedition 363 Scientists, Western Pacific Warm Pool. Proceedings of the International Ocean Discovery Program, 363: College Station, TX (International Ocean Discovery Program). https://doi.org/10.14379/iodp.proc.363.103.2018
Rosenthal, Y., Holbourn, A.E., Kulhanek, D.K., Aiello, I.W., Babila, T.L., Bayon, G., Beaufort, L., Bova, S.C., Chun, J.-H., Dang, H., Drury, A.J., Dunkley Jones, T., Eichler, P.P.B., Fernando, A.G.S., Gibson, K.A., Hatfield, R.G., Johnson, D.L., Kumagai, Y., Li, T., Linsley, B.K., Meinicke, N., Mountain, G.S., Opdyke, B.N., Pearson, P.N., Poole, C.R., Ravelo, A.C., Sagawa, T., Schmitt, A., Wurtzel, J.B., Xu, J., Yamamoto, M., and Zhang, Y.G., 2018c. Site U1483. In Rosenthal, Y., Holbourn, A.E., Kulhanek, D.K., and the Expedition 363 Scientists, Western Pacific Warm Pool. Proceedings of the International Ocean Discovery Program, 363: College Station, TX (International Ocean Discovery Program). https://doi.org/10.14379/iodp.proc.363.104.2018
Rowan, C.J., Roberts, A.P., and Broadbent, T., 2009. Reductive diagenesis, magnetite dissolution, greigite growth and paleomagnetic smoothing in marine sediments: a new view. Earth and Planetary Science Letters, 277(1–2):223–235. https://doi.org/10.1016/j.epsl.2008.10.016
Solomon, E.A., Spivack, A.J., Kastner, M., Torres, M.E., and Robertson, G., 2014. Gas hydrate distribution and carbon sequestration through coupled microbial methanogenesis and silicate weathering in the Krishna–Godavari Basin, offshore India. Marine and Petroleum Geology, 58(A):233–253. https://doi.org/10.1016/j.marpetgeo.2014.08.020
Steinberg, C.R., Choukroun, S.M., Slivkoff, M.M., Mahoney, M.V., and Brinkman, R.M., 2006. Currents in the Bismarck Sea and Kimbe Bay, Papua New Guinea. TNC Pacific Island Countries Report, 6/06. http://www.conservationgateway.org/Files/Pages/currents-bismarck-sea-and.aspx
Stoner, J.S., and St-Onge, G., 2007. Magnetic stratigraphy in paleooceanography: reversal, excursion, paleointensity and secular variation. In Hillaire-Marcel, C., and de Vernal, A. (Eds.), Proxies in Late Cenozoic Paleoceanography: Amsterdam (Elsevier Science), 99–138.
Thierstein, H.R., Geitzenauer, K.R., Molfino, B., and Shackleton, N.J., 1977. Global synchroneity of late Quaternary coccolith datum levels validation by oxygen isotopes. Geology, 5(7):400–404. https://doi.org/10.1130/0091-7613(1977)5<400:GSOLQC>2.0.CO;2
Triantaphyllou, M.V., 2015. Calcareous nannoplankton dating of the Late Quaternary deposits in Greece and the eastern Mediterranean: case studies from terrestrial and marine sites. Journal of Palaeogeography, 4(4):349–357. https://doi.org/10.1016/j.jop.2015.01.001
van Morkhoven, F.P.C.M., Berggren, W.A., Edwards, A.S., and Oertli, H.J., 1986. Cenozoic cosmopolitan deep-water benthic foraminifera. Bulletin des Centres de Recherches Exploration-Production Elf-Aquitaine, 11.
Wallmann, K., Aloisi, G., Haeckel, M., Tishchenko, P., Pavlova, G., Greinert, J., Kutterolf, S., and Eisenhauer, A., 2008. Silicate weathering in anoxic marine sediments. Geochimica et Cosmochimica Acta, 72(12):2895–2918. https://doi.org/10.1016/j.gca.2008.03.026
Wilkens, R.H., Westerhold, T., Drury, A.J., Lyle, M., Gorgas, T., and Tian, J., 2017. Revisiting the Ceara Rise, equatorial Atlantic Ocean: isotope stratigraphy of ODP Leg 154. Climate of the Past, 13:779–793. https://doi.org/10.5194/cp-13-779-2017
Zijderveld, J.D.A., 1967. AC demagnetization of rocks: analysis of results. In Collinson, D.W., Creer, K.M., and Runcorn, S.K. (Eds.), Methods in Palaeomagnetism: Amsterdam (Elsevier), 254–286.
1 Rosenthal, Y., Holbourn, A.E., Kulhanek, D.K., Aiello, I.W., Babila, T.L., Bayon, G., Beaufort, L., Bova, S.C., Chun, J.-H., Dang, H., Drury, A.J., Dunkley Jones, T., Eichler, P.P.B., Fernando, A.G.S., Gibson, K.A., Hatfield, R.G., Johnson, D.L., Kumagai, Y., Li, T., Linsley, B.K., Meinicke, N., Mountain, G.S., Opdyke, B.N., Pearson, P.N., Poole, C.R., Ravelo, A.C., Sagawa, T., Schmitt, A., Wurtzel, J.B., Xu, J., Yamamoto, M., and Zhang, Y.G., 2018. Site U1484. In Rosenthal, Y., Holbourn, A.E., Kulhanek, D.K., and the Expedition 363 Scientists, Western Pacific Warm Pool. Proceedings of the International Ocean Discovery Program, 363: College Station, TX (International Ocean Discovery Program). https://doi.org/10.14379/iodp.proc.363.105.2018
2 Expedition 363 Scientists’ addresses.
This work is distributed under the Creative Commons Attribution 4.0 International (CC BY 4.0) license. 
- F1. Northern margin of Papua New Guinea and location of Sites U1484–U1487.
- F2. Contoured bathymetric map and site locations.
- F3. Seismic Line RR1313-WP7-2 and site locations.
- F4. Precipitation anomalies during the 1997–1998 El Niño event.
- F5. Lithologic summary.
- F6. Clay-rich intervals in Unit I.
- F7. Interbedded clay- and sand-rich layers in Unit I.
- F8. Sand-rich intervals in Unit I.
- F9. Main sedimentary components in Unit I.
- F10. Typical sedimentary structures in Unit I.
- F11. Sharp boundary between sand and clay layers.
- F12. Accessories found in Unit I.
- F13. Tephra layers.
- F14. Vesicular glass fragments and bubble wall shards in tephra.
- F15. XRD results from clay.
- F16. Glauconite particle and framboidal pyrite.
- F17. Calcareous nannofossils.
- F18. Benthic foraminifers.
- F19. Downhole foraminifer preservation states.
- F20. Age-depth plot.
- F21. Archive-half section NRM intensity.
- F22. Discrete sample AF demagnetization results.
- F23. NRM, WRMSL MS, inclination, and declination, Hole U1484A.
- F24. NRM, WRMSL MS, inclination, and declination, Hole U1484B.
- F25. NRM, WRMSL MS, inclination, and declination, Hole U1484C.
- F26. Physical property measurements.
- F27. GRA bulk density, MS, NGR, and P-wave velocity overlaid on core photos.
- F28. Comparison of cleaned WRMSL magnetic susceptibility data.
- F29. Discrete and whole-round P-wave measurements.
- F30. MAD dry, bulk, and grain densities and porosity, WRMSL GRA bulk density, and thermal conductivity.
- F31. APCT-3 temperature-time series.
- F32. Heat flow calculations.
- F33. WRMSL MS data.
- F34. Spliced SHMSL L*, NGR, and WRMSL MS and GRA bulk density data.
- F35. Spliced MS data.
- F36. Comparison of mbsf and composite depth scales in the Site U1484 splice.
- F37. Methane, ethane, propane, and C1/C2 profiles.
- F38. CaCO3, TOC, TN, and C/N profiles.
- F39. Interstitial water concentration profiles.
- F40. Interstitial water concentration profiles.
- T1. Core summary.
- T2. Tephra layers.
- T3. Calcareous nannofossil and planktonic foraminifer biohorizons.
- T4. Benthic foraminifer distribution.
- T5. WRMSL GRA bulk density data, Hole U1484A.
- T6. WRMSL GRA bulk density data. Hole U1484B.
- T7. WRMSL GRA bulk density data. Hole U1484C.
- T8. WRMSL MS data, Hole U1484A.
- T9. WRMSL MS data, Hole U1484B.
- T10. WRMSL MS data, Hole U1484C.
- T11. WRMSL NGR data, Hole U1484A.
- T12. WRMSL NGR data, Hole U1484B.
- T13. WRMSL NGR data, Hole U1484C.
- T14. WRMSL PWL data, Hole U1484A.
- T15. WRMSL PWL data, Hole U1484B.
- T16. WRMSL PWL data, Hole U1484C.
- T17. Affine table.
- T18. Splice interval.
- T19. Volatile hydrocarbon concentrations.
- T20. Carbon, nitrogen, and C/N ratios.
- T21. Interstitial water geochemical data.