Rosenthal, Y., Holbourn, A.E., Kulhanek, D.K., and the Expedition 363 Scientists
Proceedings of the International Ocean Discovery Program Volume 363
publications.iodp.org
https://doi.org/10.14379/iodp.proc.363.106.2018

Site U14851
Y. Rosenthal, A.E. Holbourn, D.K. Kulhanek, I.W. Aiello, T.L. Babila, G. Bayon, L. Beaufort, S.C. Bova, J.-H. Chun, H. Dang, A.J. Drury, T. Dunkley Jones, P.P.B. Eichler, A.G.S. Fernando, K.A. Gibson, R.G. Hatfield, D.L. Johnson, Y. Kumagai, T. Li, B.K. Linsley, N. Meinicke, G.S. Mountain, B.N. Opdyke, P.N. Pearson, C.R. Poole, A.C. Ravelo, T. Sagawa, A. Schmitt, J.B. Wurtzel, J. Xu, M. Yamamoto, and Y.G. Zhang2
Keywords: International Ocean Discovery Program, IODP, JOIDES Resolution, Expedition 363, Site U1485, Western Pacific Warm Pool, Intertropical Convergence Zone, Indonesian Throughflow, northern Papua New Guinea, Bewani-Torricelli fault, Sepik/Ramu Rivers, high sedimentation rate, millennial-scale climate variability, Holocene, late-middle Pleistocene, wood fragments, tephra, hydroclimate, precipitation reconstruction, exceptional foraminifer and nannofossil preservation, central sector Western Pacific Warm Pool, high-resolution interstitial water sampling, Last Glacial Maximum ocean density structure, stratigraphic intercalibration and cyclostratigraphy, high-resolution interstitial water samples, diagenesis, anaerobic methane oxidation, sulfate–methane transition zone, SMTZ, anoxic silicate weathering, clay mineral authigenesis
MS 363-106: Published 8 June 2018
Background and objectives
International Ocean Discovery Program (IODP) Site U1485 (proposed Site WP-72A) is located ~19 km off the northern coast of Papua New Guinea at 03°06.16ʹS, 142°47.59ʹE in 1145 m water depth (Figure F1). The site is situated on seismic Line RR1313-WP7-2 (Figure F2), ~2 km northeast of the cross point with seismic Line RR1313-WP7-5 (Rosenthal et al., 2016) (Figure F2) and ~3.2 km north-northeast of Site U1484. An ~7 m piston core and a companion gravity core retrieved ~4 km to the southwest of the site location are characterized by a mixture of clay and volcanic sand with relatively high numbers of planktonic and benthic foraminifers in excellent state of preservation. Preliminary isotope analysis of planktonic foraminifers from the cores indicates >6 m of Holocene sediment, implying sedimentation rates >60 cm/ky. The multichannel seismic profiles exhibit remarkable uniformity of acoustic stratification indicating a succession of alternating clay-, silt-, and sand-dominated beds down to 0.4 s two-way traveltime (TWT) below the seafloor surface, with estimated depth of 350 meters below seafloor (mbsf), just deeper than our target drilling depth of 325 mbsf. There is evidence for a disturbed layer between 0.16 and 0.19 s TWT, but bedding is very uniform below this interval to the target depth (Rosenthal et al., 2016) (Figure F3). This site extends the record recovered at Site U1484.
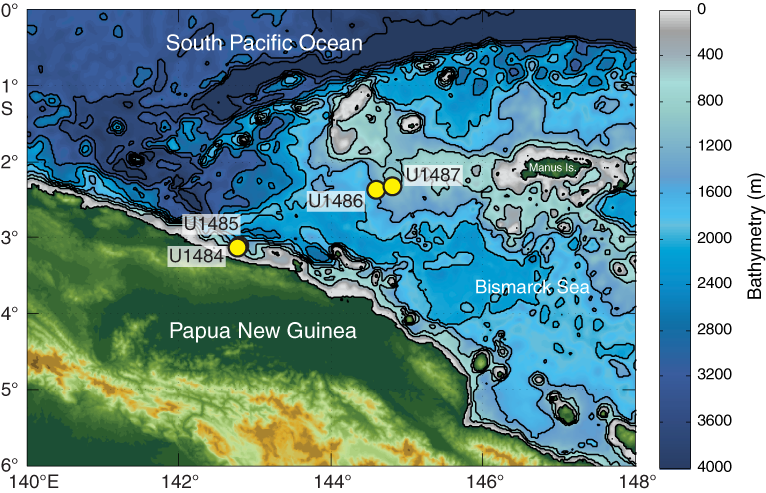
Figure F1. Northern margin of Papua New Guinea and location of Sites U1484–U1487.
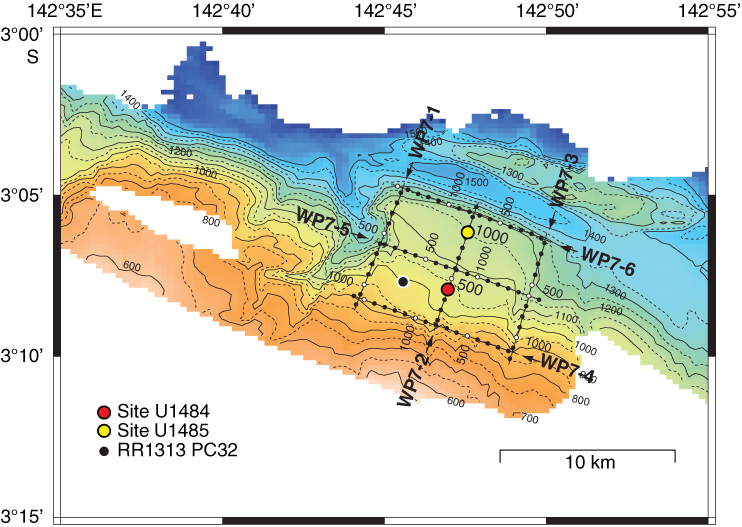
Figure F2. Contoured bathymetric map and site locations.
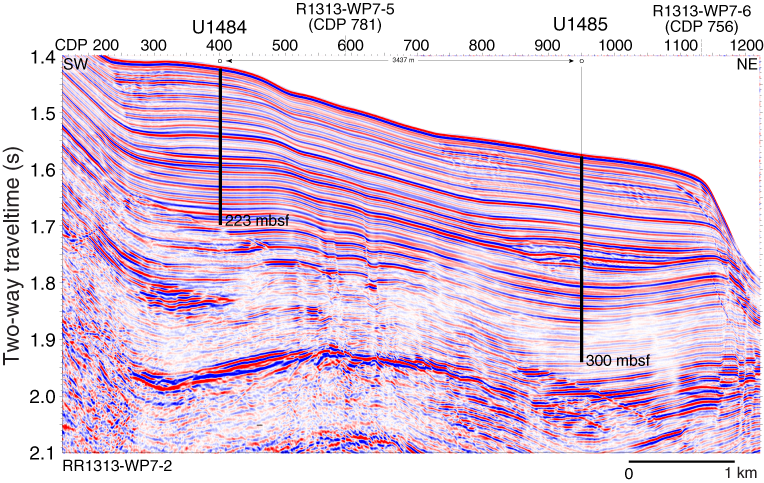
Figure F3. Seismic Line RR1313-WP7-2 and site locations.
Site U485 is located in a tectonically complex region east of the Cyclops Mountains and west of the Sepik/Ramu River mouths. The region is bounded to the south by the Bewani-Torricelli fault zone on land, which links to offshore transform faults that eventually connect with a zone of seafloor spreading along the Bismarck Sea seismic lineation to the east (Baldwin et al., 2012). Northwest of the site, the southward subduction of the Caroline microplate forms the New Guinea Trench. The continental shelf in this region is exceedingly narrow (<2 km), allowing large amounts of terrigenous sediment discharge from coastal rivers to bypass the narrow continental shelf and accumulate in deeper water (Milliman et al., 1999).
The climatology and oceanography of northern Papua New Guinea is strongly influenced by the seasonal migration of the Intertropical Convergence Zone, with enhanced precipitation during boreal winter (Figure F4A, F4B). Interannually, precipitation decreases during El Niño events (Figure F4C, F4D). Monsoon winds control the surface hydrography of the region, such that the New Guinea Coastal Current flows westward over the drill sites during the boreal summer southeasterly monsoon (also referred to as the austral summer monsoon in the Southern Hemisphere) (Kuroda, 2000). These currents distribute sediments originating from the Sepik/Ramu River mouths and multitudes of other tributaries along the coast over the northern slopes of Papua New Guinea and adjacent deep basins. The surface current reverses during the boreal winter northwesterly monsoon (Kuroda, 2000), and the surface sediment plume from the Sepik/Ramu River mouths is observed to meander out across the Bismarck Sea (Steinberg et al., 2006). In contrast, the New Guinea Coastal Undercurrent persists in a westward direction year round at a water depth of ~220 m, widening and strengthening during boreal summer (Kuroda, 2000). This undercurrent supplies terrigenous sediments from the near-bottom river plumes to the drill sites. At ~1000 meters below sea level (mbsl), the sediment is bathed in Antarctic Intermediate Water.
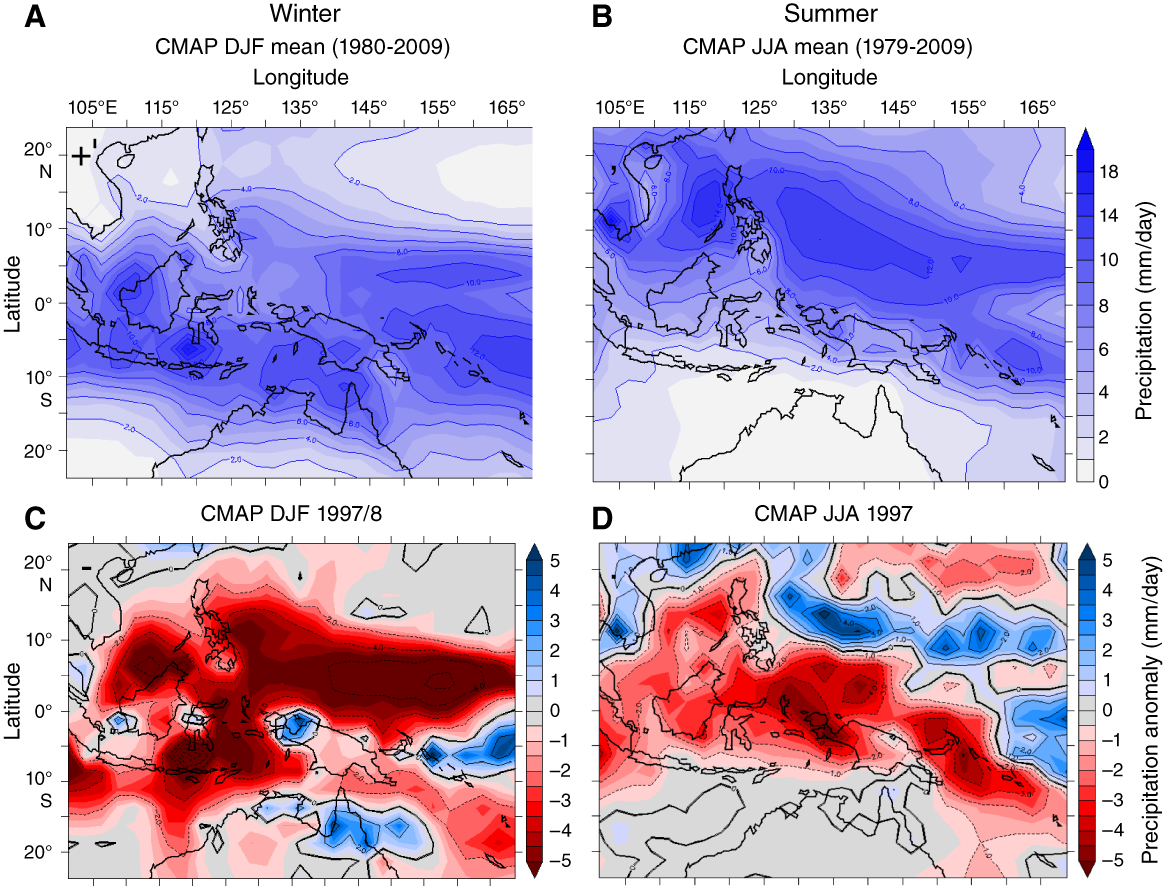
Figure F4. Precipitation anomalies during the 1997–1998 El Niño event.
The high sedimentation rates at Site U1485 provide the potential to resolve late middle to late Pleistocene centennial- to millennial-scale climate variability in the Western Pacific Warm Pool. Comparing these high-resolution records with comparable ones for the North Atlantic and eastern equatorial Pacific will us to better constrain the mechanisms influencing millennial-scale variability. This site will also provide insights on orbital-scale variability during the late middle to late Pleistocene. Finally, Site U1485 will allow us to examine the southern Pacific contribution to the Indonesian Throughflow.
Operations
Transit to Site U1485
The vessel transited 1.85 nmi in dynamic positioning mode to Site U1485, arriving at 1100 h (all times local ship time; UTC + 10 h) on 10 November 2016. The drill string was raised to 976.6 meters below rig floor (mbrf) for the transit. After arriving on site, we deployed a positioning beacon before commencing coring operations.
Operations summary
The original operations plan at Site U1485 included three holes using the advanced piston corer (APC) and half-length advanced piston corer (HLAPC) to 315 mbsf. We ultimately cored four holes: U1485A and U1485B were cored to ~300 mbsf. Hole U1485C was terminated after three cores when it proved unsuitable for covering core gaps for stratigraphic correlation. Hole U1485D was cored to 63.9 mbsf to fill core gaps and intervals where significant numbers of interstitial water samples were taken from each core in Hole U1485A (Table T1).
Table T1. Site U1485 core summary. Download table in CSV format. View PDF table.
Hole U1485A was cored to 188.0 mbsf with the APC using orientation and nonmagnetic hardware (Cores 363-U1485A-1H through 20H). After pumping Core 20H out of the core barrel, we switched to the HLAPC and continued coring to 300.8 mbsf (Cores 21F through 44F), where we encountered a partial stroke, indicating HLAPC refusal. Because we had reached our age target, we decided not to deepen the hole further using the extended core barrel (XCB) coring system. As Site U1485 is located only ~3.2 km from Site U1484, we opted not to take downhole temperature measurements. Whole-round samples for high-resolution interstitial water analyses were taken at a frequency of one per section in the upper ~54 mbsf of Hole U1485A. A total of 312.36 m of sediment was recovered over 300.8 m of coring (104% recovery) in Hole U1485A.
Because core recovery was generally good in the upper 190 mbsf, we opted not to switch to the HLAPC over the interval with higher sand content that had resulted in poor recovery with the full-length APC at Site U1484. Hole U1485B was cored to 173.5 mbsf (Cores 363-U1485B-1H through 20H) using the APC with orientation and nonmagnetic hardware. We then switched to the HLAPC and continued coring to 297.7 mbsf (Cores 21F through 47F), with one 2 m drilled interval to offset core gaps for stratigraphic correlation. We recovered 291.18 m of core over 295.7 m of coring (98% recovery) in Hole U1485B.
Oriented APC coring with nonmagnetic hardware then continued in Hole U1485C; however, after data collected for stratigraphic correlation indicated that Core 363-U1485C-2H was a copy of Core 1H, we terminated the hole. Hole U1485C cored to 27.5 mbsf (Cores 1H through 3H) and recovered 29.35 m of sediment (107% recovery). Hole U1485D was cored specifically to contribute material to the stratigraphic splice, particularly over the interval of high-resolution interstitial water sampling shallower than 55 mbsf. Oriented APC coring with nonmagnetic hardware penetrated to 63.9 mbsf (Cores 363-U1485D-1H through 8H), with one 1 m drilled interval to cover a core gap. A total of 68.22 m of core was collected over 62.9 m of coring (108% recovery). Operations at Site U1485 ended at 2330 h on 13 November 2016. Total time spent at the site was 85.8 h (3.6 days).
A total of 50 APC cores were recovered at this site, collecting 452.28 m of sediment over 451.9 m of coring (100.1% recovery). We also collected 50 HLAPC cores, recovering 248.73 m of sediment over 235 m of coring (105.9% recovery). Total core collected at Site U1485 was 701.11 m of sediment over 686.9 m of coring (102.1% recovery).
Hole U1485A
The precision depth recorder (PDR) indicated a seafloor depth of 1158.4 mbrf. We set the APC/XCB bottom-hole assembly (BHA) at 1154.0 mbrf to initiate coring operations. Hole U1485A was spudded at 1310 h on 10 November 2016 with Core 363-U1485A-1H recovering 7.58 m of sediment, establishing a seafloor depth of 1144.75 mbsl. Oriented APC coring using the Icefield MI-5 core orientation tool with nonmagnetic hardware proceeded to 188.0 mbsf (Cores 1H through 20H). We opted not to collect downhole temperature measurements at this site due to its proximity to Site U1484. Whole-round (5 or 10 cm) samples for high-resolution interstitial water analyses were taken at a frequency of one sample per section in the upper ~54 mbsf of Hole U1485A. High levels of methane caused significant core expansion, resulting in material sometimes being ejected from the tops and bottoms of cores onto the rig floor. When possible, this material was recovered and curated in short sections at the top or bottom of cores; however, these portions of the core should be considered disturbed. Core recovery was excellent except between ~131 and 169 mbsf, where somewhat lower recovery (~86%) was associated with sand. We determined APC refusal when Core 20H had to be pumped out of the core barrel.
The HLAPC was used to deepen the hole to 300.8 mbsf (Cores 21F through 44F). Core 44F was a partial stroke, indicating HLAPC refusal. Because we had reached our age target, we decided not to deepen the hole further using the XCB. The drill string was pulled out of the hole, with the bit clearing the seafloor at 2210 h on 11 November, ending operations in Hole U1485A. Total time spent in Hole U1485A was 36.5 h (1.5 days).
A total of 20 APC cores were taken in Hole U1485A. We recovered 191.21 m of sediment over 188.0 m of coring for a total recovery of 101.7%. The HLAPC was deployed 24 times, collecting 121.15 m of sediment over 112.8 m of coring (107.4% recovery). Overall we collected 312.36 m of core over 300.8 m of coring (103.8% recovery).
Hole U1485B
The vessel was offset 20 m east of Hole U1485A, and the drill string was spaced out with the bit at 1149.0 mbrf. Hole U1485B was spudded at 0010 h on 12 November 2016, with Core 363-U1485B-1H recovering 1.97 m of sediment, establishing a seafloor depth of 1145.34 mbsl. Oriented APC coring using the Icefield MI-5 core orientation tool with nonmagnetic hardware continued to 173.5 mbsf (Cores 1H through 20H). Core 2H required two wireline runs to retrieve, and Cores 18H through 20H encountered sands. Partial strokes were recorded on Cores 16H and 17H. After Core 20H, we switched to the HLAPC and continued coring to 297.7 mbsf (Cores 21F through 47F). One 2 m drilled interval advanced the hole without coring for stratigraphic correlation purposes. Core 42F had to be pumped out of the core barrel. We terminated coring after Core 47F, and the drill string cleared the seafloor at 0725 h on 13 November, ending operations in Hole U1485B. A total of 33.25 h (1.4 days) was spent in Hole U1485B.
A total of 20 APC cores were taken in Hole U1485B. We recovered 163.50 m of sediment over 173.5 m of coring for a total recovery of 94.2%. The HLAPC was deployed 26 times, collecting 127.68 m of sediment over 122.2 m of coring (104.5% recovery). A single drilled interval advanced the hole 2 m without coring. In total, we collected 291.18 m of core over 295.7 m of coring (98.5% recovery).
Hole U1485C
The vessel was offset 20 m south of Hole U1485B and the bit placed at 1152.0 mbrf. Hole U1485C was spudded at 1045 h on 13 November 2016, with Core 363-U1485C-1H recovering 8.51 m of sediment, establishing a seafloor depth of 1145.8 mbsl. APC coring with orientation and nonmagnetic hardware continued to 27.5 mbsf (Cores 1H through 3H) when the stratigraphic correlator noted that Core 2H appeared to replicate the interval collected in Core 1H. We opted to terminate coring, with the bit clearing the seafloor at 1255 h on 13 November. Total time spent in Hole U1485C was 5.5 h (0.2 days).
Three APC cores were collected in Hole U1485C, recovering 29.35 m of sediment over 27.5 m of coring (106.7% recovery).
Hole U1485D
The vessel was offset 20 m west of Hole U1485C, and the bit was placed at 1152.0 mbrf. Hole U1485D was spudded at 1330 h on 13 November 2016, with Core 363-U1485D-1H recovering 5.94 m of sediment, establishing a seafloor depth of 1144.4 mbsl. APC coring with orientation and nonmagnetic hardware continued to 63.9 mbsf (Cores 1H through 8H) in order to cover gaps in the stratigraphic succession, especially over the interval of high-resolution interstitial water sampling in Hole U1485A. A single drilled interval of 1 m advanced the hole without coring to avoid alignment of core gaps for stratigraphic correlation. We terminated coring after covering all of the core gaps. The drill string was recovered to the vessel, with the bit clearing the rotary table at 2325 h on 13 November. The beacon was recovered while tripping pipe. The rig was secured for transit and the thrusters raised, ending operations at Site U1485 at 2330 h on 13 November. Total time spent in Hole U1485D was 10.5 h (0.4 days).
Seven APC cores were collected in Hole U1485D, recovering 68.22 m of sediment over 62.9 m of coring (108.5% recovery). A single drilled interval advanced the hole 1 m without coring.
Core description
Site U1485 is located ~4 km northeast of Site U1484. Site survey seismic data indicate that this site is situated in a more distal sector of the same depositional system as Site U1484 (Figure F3). Four holes were drilled at Site U1485, with the deepest one penetrating to 300.80 mbsf. Sediment recovered from Site U1485 is composed of middle Pleistocene to recent terrigenous and hemipelagic sediment. Based on visual core description, microscopic examination of smear slides, magnetic susceptibility, and natural gamma radiation (NGR), the overall succession at Site U1485 is assigned to one lithologic unit divided into two subunits (see Core description and Physical properties in the Expedition 363 methods chapter [Rosenthal et al., 2018a]). The major characteristics of the sedimentary succession at Site U1485 are summarized in Figure F5.
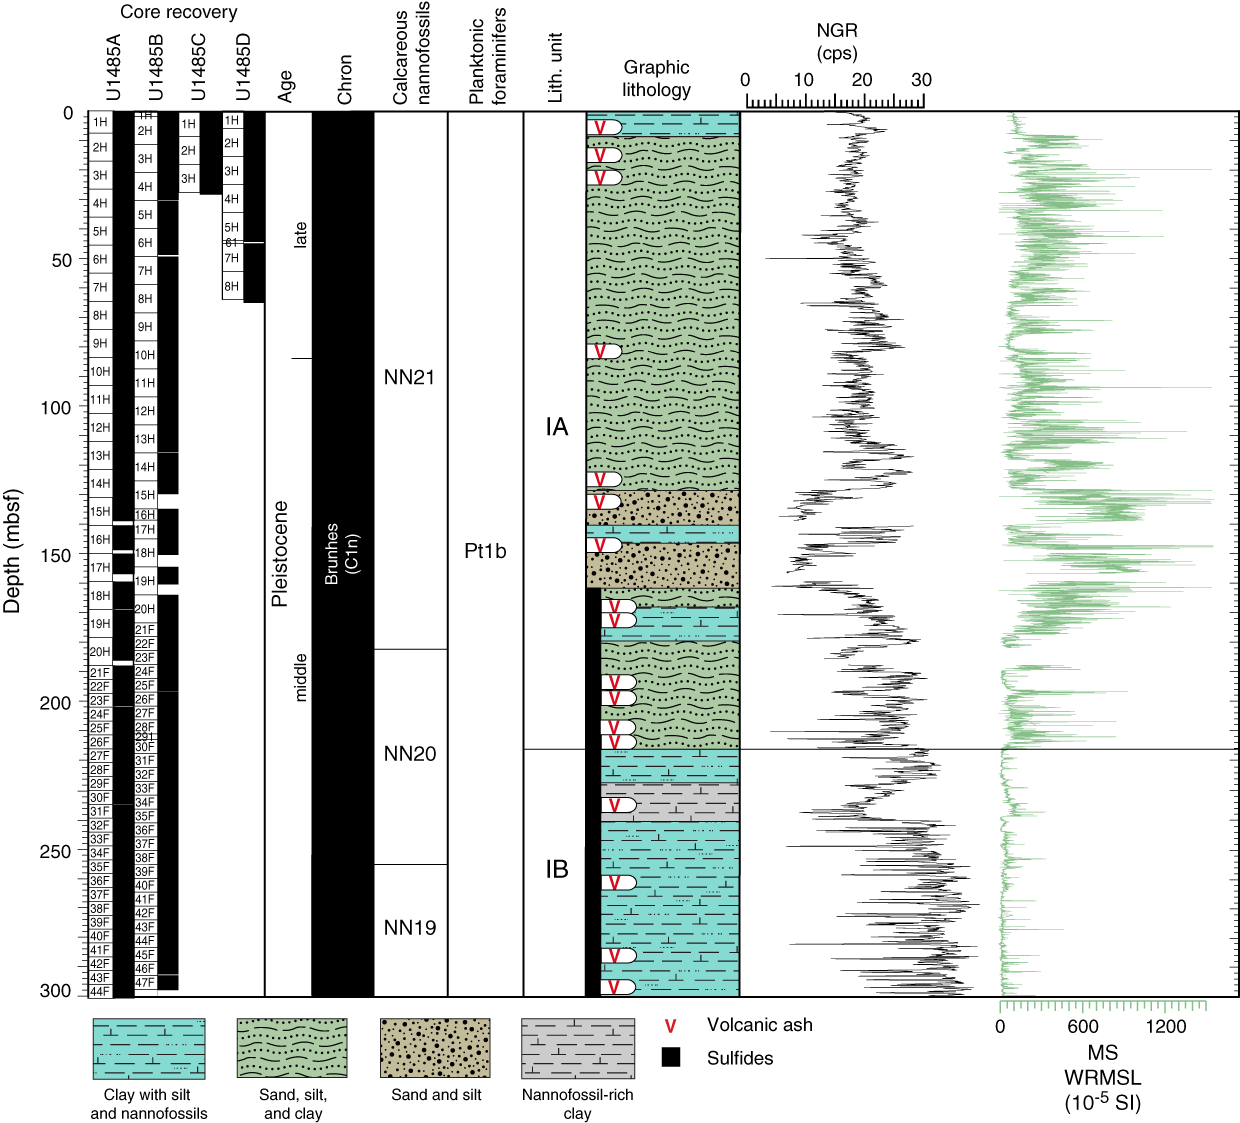
Figure F5. Lithologic summary.
Unit description
Unit I
- Intervals: 363-U1485A-1H-1, 0 cm, through 44F-CC, 35 cm; 363-U1485B-1H-1, 0 cm, through 47F-CC, 1 cm;
363-U1485C-1H-1, 0 cm, through 3H-CC, 42 cm;
363-U1485D-1H-1, 0 cm, through 8H-CC, 68 cm - Depths: Hole U1485A = 0–300.80 mbsf, Hole U1485B = 0–297.94 mbsf, Hole U1485C = 0–28.39 mbsf, Hole U1485D = 0–65.06 mbsf.
- Thickness: Hole U1485A = 300.80 m, Hole U1485B = 297.94 m, Hole U1485C = 28.39 m, Hole U1485D = 65.06 m.
- Age: middle Pleistocene to recent
- Lithologies present: silty clay, nannofossil-rich clay, nannofossil silty clay, nannofossil-rich silty clay, nannofossil-rich sandy clay, nannofossil-rich clayey silt, nannofossil-rich silt, sandy silt, silty sand, foraminifer-rich silty sand, nannofossil-rich silty sand, sand, and ash
Sediment recovered at Site U1485 is composed of greenish gray to dark greenish gray hemipelagic clay interbedded with terrigenous silt and sand. The relative abundance of clay, silt, and sand varies downhole. Fine-grained intervals alternate with discrete layers of sand and silt (Figures F5, F6). The silt, silty sand, and sand layers generally consist of moderately to well-sorted terrigenous siliciclastic material. Coarse-grained sand layers often have abrupt erosional basal contacts with the underlying background hemipelagic finer grained sediment. Nannofossils and benthic and planktonic foraminifers are a minor sedimentary component at Site U1485 (Figure F7). The oldest sediment recovered at Site U1485 is middle Pleistocene in age (see Biostratigraphy).

Figure F6. Main lithologies.

Figure F7. Main sedimentary components.
The sediment recovered at Site U1485 forms a sequence of nannofossil- and foraminifer-rich clays that are interbedded with silt, silty sand, and sand layers. The coarser grained layers vary in thickness from 1 cm to more than 1 m and are not uniformly distributed downcore. The magnetic susceptibility measurements from Site U1485 cores show large downhole variations (Figure F5) (see Physical properties); visual core descriptions and smear slide analysis suggest that higher magnetic susceptibility corresponds with coarser grained sediment and lower magnetic susceptibility to increased clay content.
The sediment exhibits slight to moderate bioturbation, with sandy intervals generally showing less evidence of bioturbation. The amount of clay and nannofossils in the sand layers is usually negligible, and shallow-water large benthic foraminifers are found in lower abundance than at Site U1484 (see Biostratigraphy). Sulfide patches and millimeter-scale pockets of sponge spicules occur in clay-rich intervals throughout all four holes and are particularly abundant in Subunit IB. Plant material and wood fragments, as well as shell fragments and pebble-sized pumice clasts, are occasionally found in both the sand layers and hemipelagic clay. The cores from all of the holes are disturbed by gas expansion cracks and voids that become more severe downhole. Gas expansion cracking of the split core surface is most severe below ~93–95 mbsf in Holes U1485A and U1485B.
Subunit IA
- Interval: 363-U1485A-1H-1, 0 cm, through 27F-1, 0 cm;
363-U1485B-1H, 0 cm, through 31F-1, 0 cm;
363-U1485C-1H-1, 0 cm, through 3H-CC, 42 cm;
363-U1485D-1H-1, 0 cm, through 8H-CC, 68 cm - Depths: Hole U1485A = 0–216.20 mbsf, Hole U1485B = 0–217.80 mbsf, Hole U1485C = 0–28.39 mbsf (total depth); U1485D = 0–65.06 mbsf (total depth)
- Thickness: Hole U1485A = 216.20 m, Hole U1485B = 217.80 m, Hole U1485C = 28.39 m (minimum thickness), Hole U1485D = 65.06 m (minimum thickness)
- Age: middle Pleistocene to recent
- Lithologies: nannofossil-bearing silty clay, nannofossil-rich clay, nannofossil-rich silty clay, nannofossil-rich sandy clay, nannofossil-rich clayey silt, sandy silt, silty sand, sand, and ash
The sediments in Subunit IA are dominantly siliciclastic, and biogenic components (mainly nannofossils) are only significant at the top and toward the lower part of the subunit. Although siliciclastics dominate, there are marked downhole variations in grain size and sedimentary structures that are also reflected by changes in physical properties and sediment color (Figure F5). The interval from 0 to 8 mbsf is characterized by decimeter- to meter-thick layers of clay with variable amounts of silt, together with several centimeter- to decimeter-thick sand layers. The interval between 8 and 127 mbsf is dominated by silt and silty clay with several sand layers that are a few centimeters thick, some of which show sharp basal contacts (Figure F8). Downcore, sand layers become more massive (centimeters to decimeters thick) and frequent, although background sediments are dominated by clay and nannofossils. Two thick sand intervals stand out between 129–140 and 146–170 mbsf (Hole U1485A) and occur interbedded with hemipelagic clay. Distinct clay-rich intervals are present in the upper half of the site, where fewer sand layers occur. These intervals are highlighted by magnetic susceptibility minima (Figure F5) (see Physical properties). The bottom part of the subunit is distinctively finer grained (silt and silty clay with scattered sand layers) and more similar to the upper part.
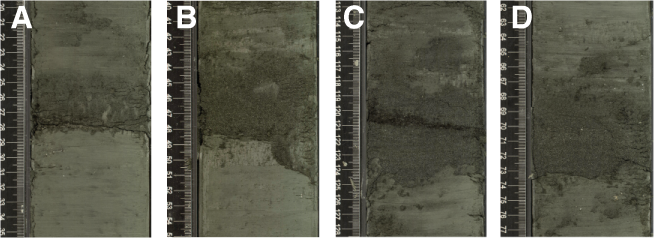
Figure F8. Sand and silty layers.
Subunit IB
- Interval: 363-U1485A-27F-1, 0 cm, through 44F-CC, 35 cm; 363-U1485B-31F-1, 0 cm, through 47F-CC, 1 cm
- Depths: Hole U1485A = 216.20–300.80 mbsf (total depth), Hole U1485B = 217.80–297.94 mbsf (total depth)
- Thickness: Hole U1485A = 84.60 m, Hole U1485B = 80.14 m
- Age: middle Pleistocene
- Lithologies: nannofossil-rich clay, nannofossil-rich silty clay, nannofossil-bearing clay with sulfide, silty sand, silt, and ash
From 216 mbsf to the base of the site at ~300.44 mbsf, the sediment is significantly different in both texture and color. The main lithology is clay with variable amounts of silt and nannofossils and common sulfide specks and nodules. The colors range from pale green to gray, and the gray intervals seem to be associated with higher proportions of nannofossils relative to clay minerals. The coarse-grained, massive sand layers that are a prominent feature of Subunit IA are absent in this interval, and only a few 2–3 cm thick silty-sandy layers were observed. A distinctive nannofossil-rich clay layer is present in this subunit from ~226 to 241 mbsf (Figure F5).
A concretion found in interval 363-U1485A-40F-1, 47–50 cm, was determined to be mackinawite, an iron carbonate similar to siderite but more unstable and indicative of an environment rich in sulfate-reducing bacteria (Figure F9C).
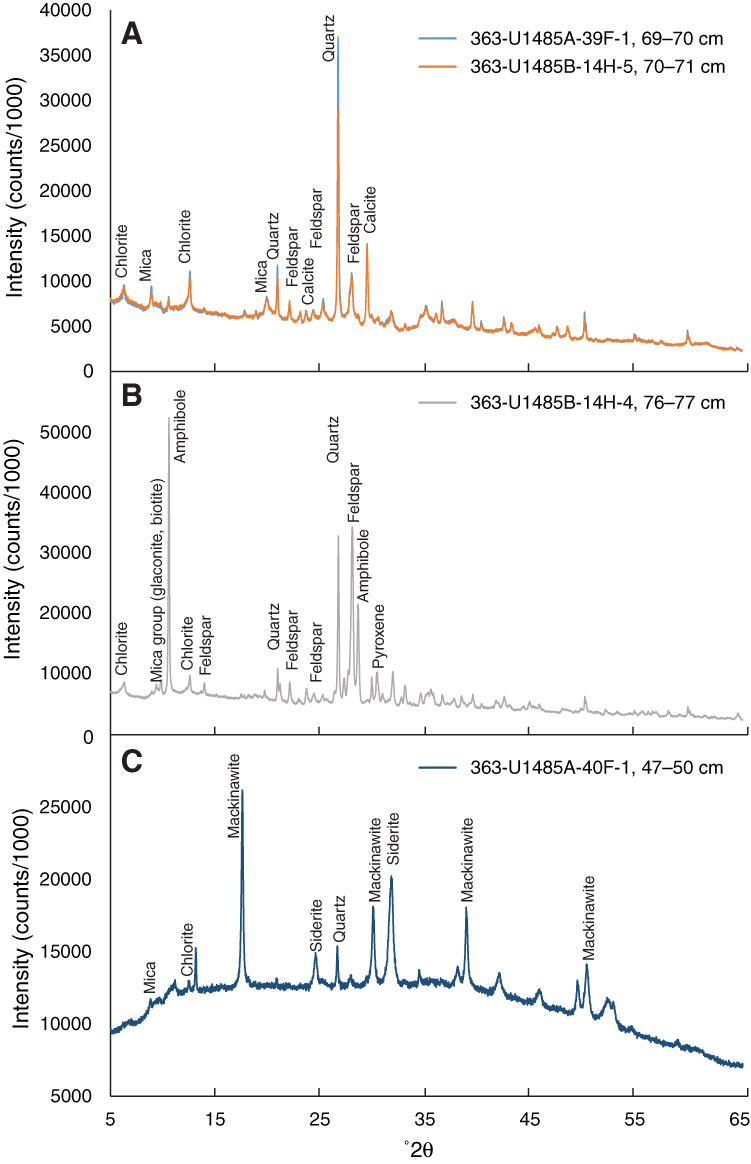
Figure F9. XRD results, Site U1485. A. Nannofossil-rich clay. B. Pumice. C. Iron carbonate concretion.
Mineralogic characteristics
Clay layers
The mineral composition of the clay-rich sediment at Site U1485 was analyzed by X-ray diffraction (XRD) on two samples. The clay and silty clay consist of quartz, feldspar, calcite, mica (biotite and muscovite), and chlorite (Figure F9A).
Sand layers
The main mineralogic components in the coarser, sand-sized intervals were assessed by visual analysis of smear slides supplemented by XRD data. The primary minerals present in the sand-sized fraction are amphibole, quartz, feldspar, pyroxene, chlorite, and mica group minerals (primarily glauconite with minor biotite and/or muscovite) (Figure F9B). Rock fragments, mineraloids, and biogenic components are also present. Rock fragments observed in smear slides are of two types, volcaniclastic particles (volcanic rock fragments and vitric [glass] fragments) and, less commonly, intrusive plutonic and metamorphic fragments. Glauconite and pyritized glauconite occur as irregular pellet-shaped grains and transparent elongated fragments. Sand- and silt-sized biogenic components consist primarily of whole or broken planktonic and benthic foraminifers and minor amounts of diatoms and sponge spicules. Smear slide analysis indicates that all components described above are present in differing proportions downhole.
Discussion
At Site U1485, the continuous accumulation of hemipelagic clay and biogenic components is interspersed with more rapidly deposited coarser grained sand and silty sand. Fluvial clastic shelf sediment is carried to Site U1485 by mass gravity flow (see Discussion in Core description in the Site U1484 chapter [Rosenthal et al., 2018c]). Possible triggering mechanisms for these mass flow deposits include earthquakes and associated tsunamis and shelf/slope sediment instabilities during times of rapid deposition such as can occur during river flood events.
The location of the biohorizon top Globigerinoides ruber (pink) (see Biostratigraphy) at Sites U1484 and U1485 indicates that sediment accumulation rates in the upper ~100 m of the sediment column at Site U1485 are ~20% lower than at Site U1484. This is apparently due to the more distal location of Site U1485, further from the Papua New Guinea shelf. This observation supports the idea that the silt and sand fractions at Site U1485 are being transported from the Papua New Guinea shelf, with Site U1484 receiving more sediment through time due to its location closer to the shelf edge. Over longer timescales it is also possible that sea level played a role in the storage and release of sediment from the Papua New Guinea shelf (although the shelf itself is very narrow) and from the paleovalley of the Sepik River, which is a relatively large area presently a few meters above sea level. In addition to rapid mass flow deposition of coarse sediment to Site U1485, the ubiquitous presence of varying amounts of silt-sized siliciclastic particles within the hemipelagic clay also suggests that other transport pathways contribute to the flux of terrigenous material to Site U1485. The winnowing of silt-sized particles from the shelf by seasonal and interannual changes in the strength and direction of the New Guinea Coastal Current (NGCC) and the New Guinea Coastal Undercurrent (NGCUC) is one possible source of fine sediment to Site U1485 (Ueki et al., 2003). Seasonal variations in river discharge and in the spatial extent of the sediment plume in combination with NGCC and NGCUC dynamics may provide another source.
The marked change in sediment textures and lithologies at ~216 mbsf (Subunit IA/1B boundary) reflects a dramatic change in depositional conditions: Subunit IB reflects mainly hemipelagic deposition of clay mixed with variable amounts of nannofossils, whereas Subunit IA is affected by the rapid, repeated input of coarser, sand-sized sediment that has a terrigenous origin. Different hypotheses could explain this change, but the data collected during Expedition 363 are not sufficient to draw specific conclusions. The change in sedimentation could correspond to a change in the abundance of terrigenous source material (i.e., sand) arriving to the site, possibly due to uplift of the mountains within the Sepik-Ramu watersheds due to tectonic activity on the Bewani-Torricelli and Ramu-Markham faults (Webster et al., 2004), a change in precipitation intensity in the Sepik-Ramu River watersheds, and/or a change in the currents responsible for dispersing the sediments in the ocean. Another hypothesis, which does not exclude the previous one, is that the change in sedimentation corresponds to a change in location of the point source of coarse sediments; in other words, in the past (e.g., before Subunit IA was deposited) the mouth of the Sepik River might have been located more inland and sediment accumulated within the paleo-Sepik embayment.
The occurrence of 25 tephra layers observed throughout Site U1485 (Figures F10, F11; Table T2) and the occurrence of ash as a minor component mixed with silt and clay minerals indicate the influence of pyroclastic sedimentation throughout the entire depositional history of the site. The thickness of the tephra layers ranges from 0.5 to 4.0 cm, with maximum grain sizes ranging from 60 to 250 µm. The tephra layers consist of vesicular glass fragments, bubble wall shards, and micropumice, with glass fragments most abundant in tephras in the upper part of the site. The basal contact of the tephra layers varies from sharp to gradual depending on the degree of bioturbation and also possibly current winnowing processes.
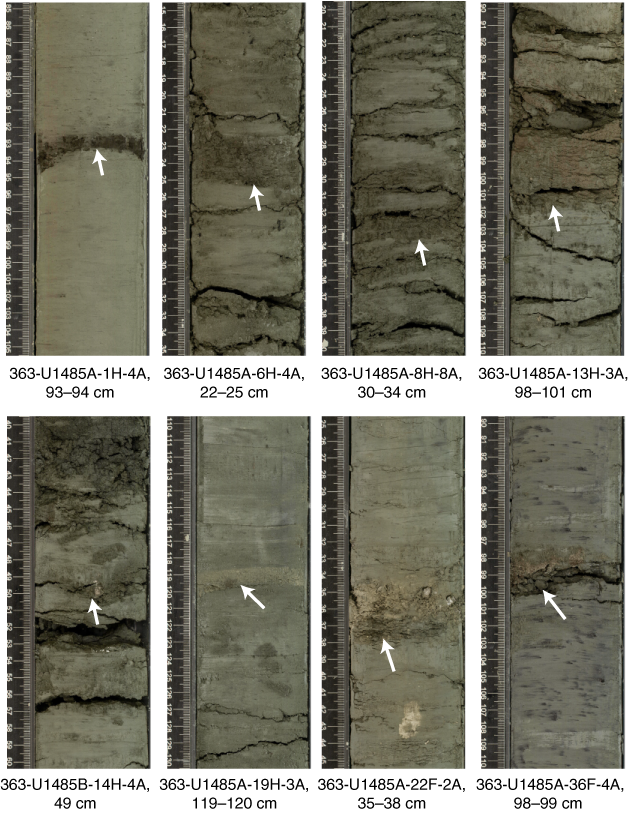
Figure F10. Tephra layers.
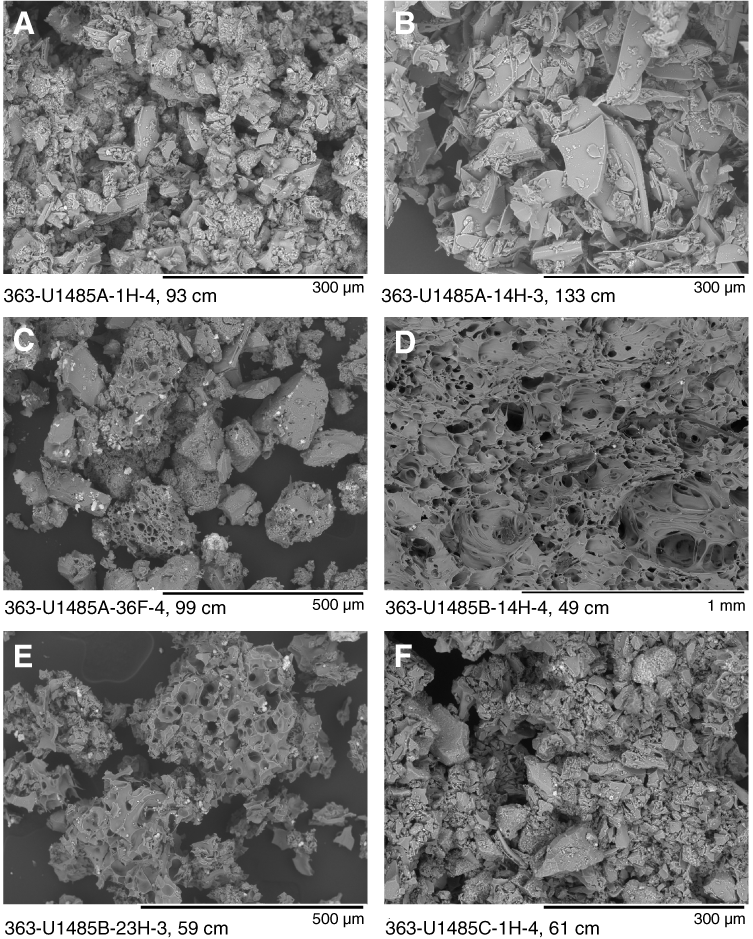
Figure F11. SEM photomicrographs of selected tephra samples.
Table T2. Stratigraphic position of tephra layers. Download table in CSV format.
Biostratigraphy
At Site U1485, a 301 m thick succession of upper middle to upper Pleistocene clay, silt, silty sand, and occasional sand with varying proportions of nannofossils and foraminifers was recovered (see Core description). Planktonic foraminifers, benthic foraminifers, and calcareous nannofossils are present and generally excellently preserved throughout. The results from each fossil group (calcareous nannofossils, planktonic foraminifers, and benthic foraminifers) are presented in sections below, followed by a detailed characterization of both benthic and planktonic foraminifer preservation state using shipboard scanning electron microscope (SEM) observations. An integrated biostratigraphy is presented in the final section. Shipboard taxon occurrence data are available to download from the Laboratory Information Management System (LIMS) database (http://web.iodp.tamu.edu/LORE).
Calcareous nannofossils
Calcareous nannofossil biostratigraphy is primarily based on analysis of core catcher samples from Hole U1485A, with some additional samples from working half sections from Cores 363-U1485A-20H to 44F. Observations were undertaken using plane- (PPL), cross- (XPL), and circular-polarized light (CPL), as well as the shipboard desktop SEM (Hitachi TM3000) to confirm the presence of Emiliania huxleyi and to check the preservation state. Depth positions and age estimates of key biohorizons are given in Table T3.
Table T3. Calcareous nannofossil and planktonic foraminifer biohorizons. Download table in CSV format.
Calcareous nannofossil assemblages at Site U1485 are very similar to those at Site U1484, with excellent preservation throughout most of the succession. Intact coccospheres of Gephyrocapsa are frequently observed, and dissolution-susceptible taxa are consistently present (e.g., Umbellosphaera irregularis and Tetralithoides symeonidesii) (Figure F12). Assemblages are dominated by Florisphaera profunda, Gephyrocapsa species, and E. huxleyi. Characteristic fluctuations in the relative abundance of Gephyrocapsa and Emiliania are used to provide additional biostratigraphic resolution. Rare reworked calcareous nannofossils, mostly Neogene discoasters and sphenoliths, are observed in some intervals.
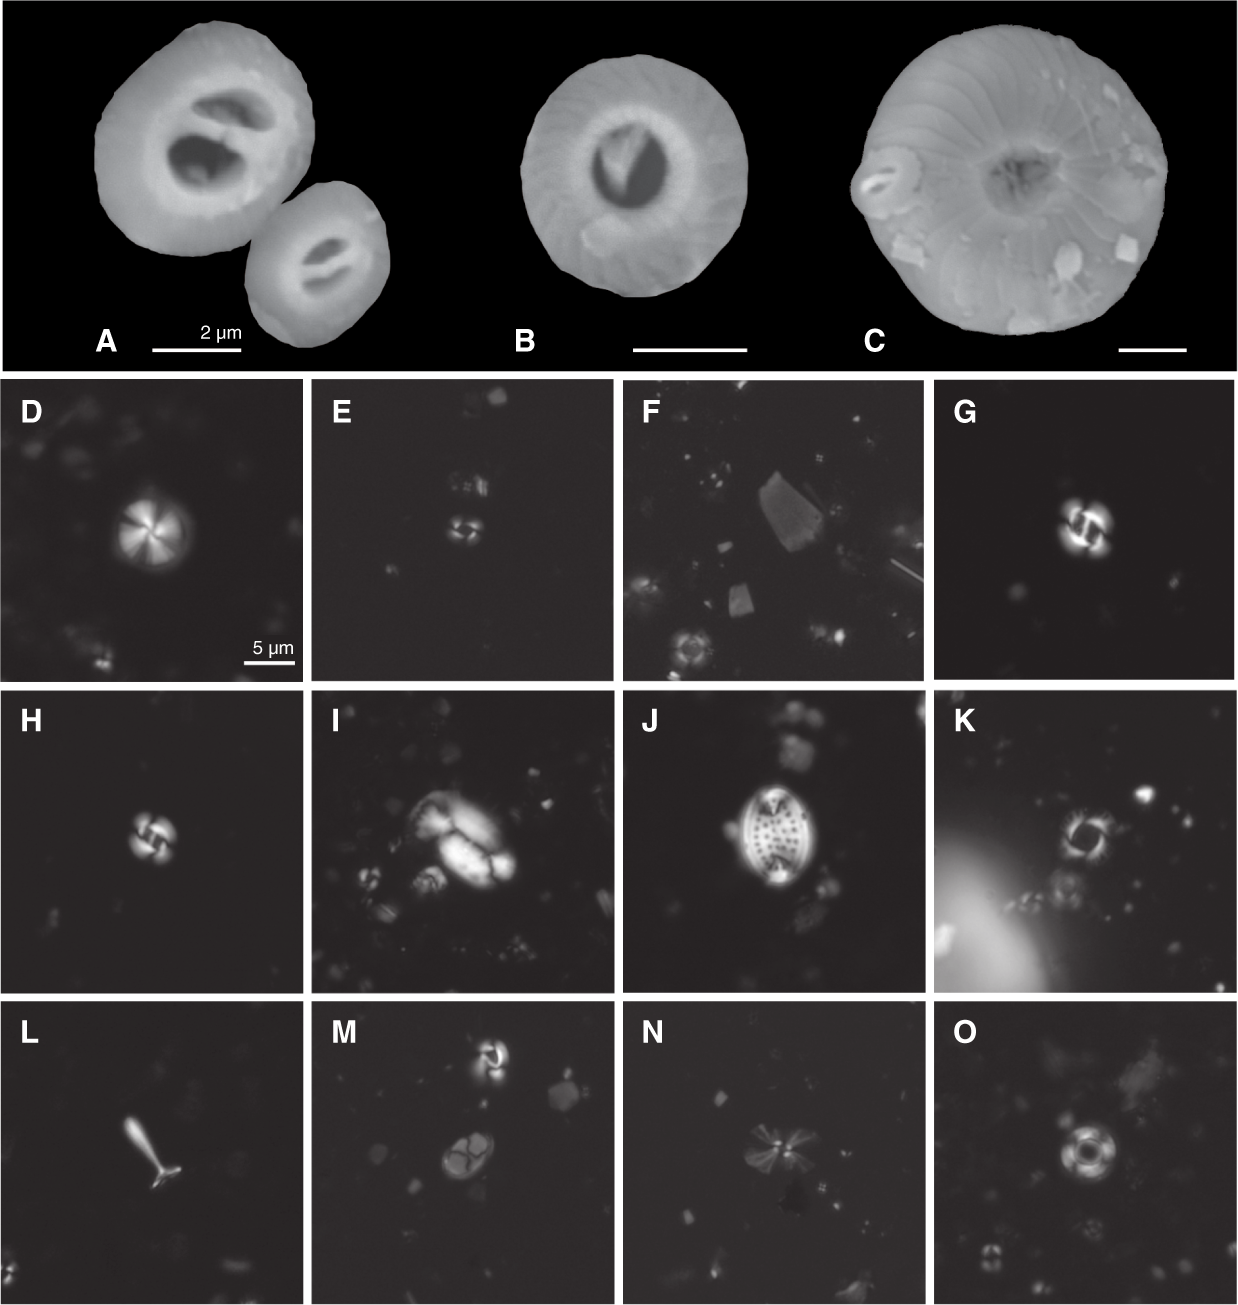
Figure F12. Calcareous nannofossils.
Biohorizon base common E. huxleyi (0.09 Ma) occurs between Samples 363-U1485A-6H-CC and 7H-CC (55.72–64.64 mbsf). This event is close to the downcore increase in abundance of Gephyrocapsa ericsonii below Sample 7H-CC (64.64 mbsf). The upper ~183 m of the succession in Hole U1485A is within Zone NN21. The base of Zone NN21 is identified by biohorizon base E. huxleyi (0.29 Ma) between Samples 19H-CC and 20H-CC (178.85–186.26 mbsf). This is coincident with biohorizon top acme Gephyrocapsa caribbeanica (0.28 Ma). The close association of these two biohorizons is similar to the pattern observed at Site U1484, where they occur in reverse order to their calibrated ages (see Biostratigraphy in the Site U1484 chapter [Rosenthal et al., 2018c]). Given the difficulty in recognizing E. huxleyi with light microscopy, resolving the dynamics of these two closely related bioevents awaits detailed postcruise assemblage counts with SEM. The ~73 m thick sediment sequence below this level is assigned to Zone NN20, with biohorizon top Pseudoemiliania lacunosa (base Zone NN20, 0.44 Ma) occurring between Samples 34F-CC and 35F-3, 110 cm (254.48–256.53 mbsf). From this biohorizon to the base of the hole, sediments are assigned to Zone NN19. In Sample 44F-CC (300.75 mbsf), at the base of the hole, G. caribbeanica remains dominant, indicating that the base of the hole is younger than 0.56 Ma.
Planktonic foraminifers
Planktonic foraminifer biostratigraphy was conducted on core catcher samples from Hole U1485A. A list of biohorizons and their calibrated ages is given in Table T3. In addition, Sample 363-U1485A-1H-1-mudline from the sediment and seawater slurry at the very top of the hole was examined and contains a typical diverse open-ocean tropical assemblage.
Although the marker species Globorotalia truncatulinoides is absent down to Sample 363-U1485A-7H-CC (65.01 mbsf), Samples 1H-CC to 4H-CC (7.53–36.56 mbsf) are assigned to the uppermost part of Subzone Pt1b (<0.07 Ma) based on the absence of Globigerinoides ruber (pink) and Globorotalia flexuosa. Biohorizon top G. flexuosa (0.07 Ma) is observed between Samples 4H-CC and 5H-CC (36.56–45.99 mbsf). This biohorizon is challenging to constrain because the final chamber on most specimens is only weakly flexuose and specimens are rare. Biohorizon top G. ruber (pink) (0.12 Ma) is well defined between Samples 8H-CC and 9H-CC (75.02–84.49 mbsf). Biohorizons base Globigerinella calida (0.22 Ma) and base G. flexuosa (0.40 Ma) are difficult to locate precisely because of the rarity of the markers and because distinguishing both forms from related species requires fine taxonomic discrimination. The former biohorizon is recognized between Samples 15H-CC and 16H-CC (138.99–148.77 mbsf) and the latter between Samples 38F-CC and 39F-CC (273.27–277.78 mbsf).
The bottom of the hole at Sample 363-U1485A-44F-CC (300.75 mbsf) is found to be still within Subzone Pt1b (<0.61 Ma) based on the absence of Globorotalia tosaensis, the marker for the top of Subzone Pt1a. This is confirmed by the fact that Pulleniatina populations have a strong dextral dominance throughout the hole, indicating that the entire succession lies above the L1 sinistral excursion (<0.80 Ma).
Benthic foraminifers
Benthic foraminifers were studied in all 44 core catcher samples from Hole U1485A, for which specimen counts are given in Table T4. Assemblages differ from those at Site U1484 by being dominated by deepwater forms without any large contribution from shallower water or reef faunas. The only shallow-water species present, Rotalinoides compressiusculus, occurs in Samples 363-U1485A-13H-CC (121.88 mbsf) and 17H-CC (156.90 mbsf) and is probably transported because the rest of the assemblage is dominated by typical bathyal forms. The planktonic:benthic foraminifer ratios are consistently around 99:1. A high abundance of volcanic ash in some samples has no discernible effect on the composition of the benthic foraminifer assemblages.
Table T4. Benthic foraminifer distribution. Download table in CSV format.
The dominant species at Site U1485 are Bolivinita quadrilatera, Bolivina robusta, Uvigerina hispida, and Uvigerina proboscidea, which are present in ~75% of the samples examined and are typical of bathyal environments (van Morkhoven et al., 1986; Jones, 1994). Uvigerina mediterranea occurs from the top of the first core catcher to Sample 363-U1484A-21F-CC (192.98 mbsf). It is regarded as an outer neritic to upper bathyal species characteristic of warm water, high salinity, low dissolved oxygen, and high levels of organic matter (van Morkhoven et al., 1986). Its absence below Core 21F may indicate a change in bottom water conditions.
Unlike at bathyal Sites U1482 and U1483, Planulina wuellerstorfi is present in just four of the samples examined. However, Cibicidoides pachyderma (an upper bathyal species that ranges from the early Oligocene through to the Pleistocene) is present more frequently, occurring in 25 out of 44 core catcher samples examined (Table T4).
Foraminifer preservation
Four core catcher samples from Hole U1485A were selected to assess foraminifer preservation and diagenesis. The samples are spaced at ~100 m intervals and range in age from late Pleistocene (<0.07 Ma) to middle Pleistocene (~0.48 Ma). Foraminifer preservation is generally excellent and glassy. There is evidence for minor abrasion on the outer walls and pyrite overgrowth on the inner walls of some specimens, even at the shallowest depth, which implies a dynamic and reducing sedimentary environment. In general, foraminifers show no recrystallization and cementation, even in the deepest part of the hole, although slight degradation of the ultrastructure in a single benthic foraminifer specimen studied from the deepest sample examined may represent incipient recrystallization. Images of selected specimens are shown in Figure F13. The full set of images is available online from the LIMS database.
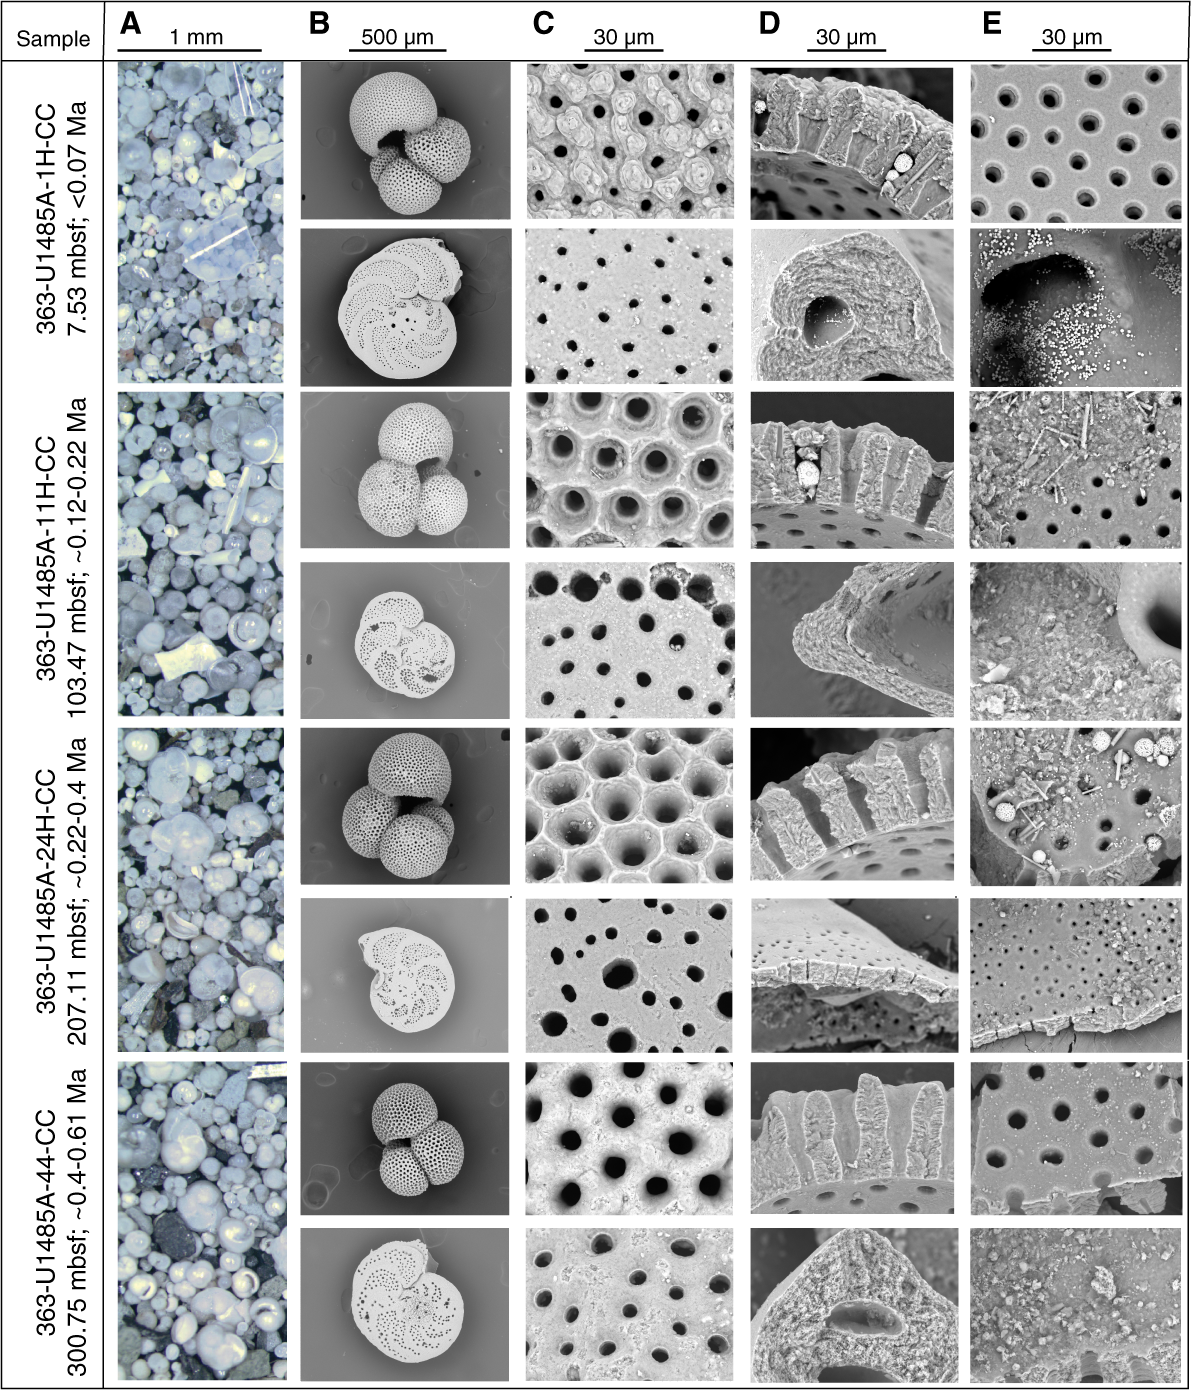
Figure F13. Downcore foraminifer preservation states.
Sample 363-U1485A-1H-CC (7.53 mbsf; late Pleistocene; <0.07 Ma) shows excellent preservation. Foraminifers have a glassy appearance under the light microscope. In cross section, the wall of Trilobatus trilobus shows platy microgranules and other typical biogenic features such as the primary organic membrane, spines embedded in the wall, and gametogenic crust. Pyrite framboids are present in some pore channels. Minor superficial damage of the outer chamber surfaces of some specimens, especially the interpore ridges, may indicate abrasion on the seafloor. In P. wuellerstorfi the wall cross section shows microgranules throughout. In one of the specimens examined, loosely attached, dispersed, equant pyrite crystals up to 3 μm in diameter occur in patches. There is no evidence of cementation, recrystallization, or dissolution.
Sample 363-U1485A-11H-CC (103.47 mbsf; latest middle Pleistocene; ~0.12–0.22 Ma) shows excellent preservation. Foraminifers have a glassy appearance under the light microscope. Wall cross sections of both T. trilobus and P. wuellerstorfi show the biogenic microgranular textures typical of the species with minor evidence of abrasion on the outer surfaces. The inner wall surfaces of all studied specimens are generally smooth, although sometimes with minor overgrowth of calcite forming an amorphous crystalline layer <2 μm thick. This layer sometimes cements small amounts of sediment infill. Pores in T. trilobus are sometimes filled with weakly cemented sediment and/or pyrite framboids. Specimens of P. wuellerstorfi show very minor calcite overgrowth on outer surfaces. There is no evidence of recrystallization or dissolution.
Sample 363-U1485A-24F-CC (207.11 mbsf; middle Pleistocene; ~0.22–0.4 Ma) shows excellent preservation. Foraminifers have a glassy appearance under the light microscope. Wall cross sections of both T. trilobus and P. wuellerstorfi show typical biogenic microgranular textures, with evidence of minor abrasion on the outer surfaces. Some inner surfaces of T. trilobus and P. wuellerstorfi show a thin overgrowth layer about 1–2 μm thick, including some cemented sediment infill. One studied specimen of T. trilobus contains pyrite framboids up to 5 μm in diameter. Specimens of P. wuellerstorfi also show minor calcite overgrowth on outer surfaces. There is no evidence of recrystallization or dissolution.
Sample 363-U1485A-44F-CC (300.75 mbsf; middle Pleistocene; likely >0.50 Ma) shows excellent to very good preservation. Foraminifers have a glassy appearance under the light microscope. Wall cross sections of T. trilobus show biogenic microgranular textures, embedded spines, and gametogenic calcite, with evidence of very minor abrasion. However, pore channels are sometimes completely filled with compacted and weakly cemented sediment. The inner wall surfaces of T. trilobus exhibit moderate calcite overgrowth layers up to 2 μm thick. One studied specimen contains pyrite framboids up to 5 μm in diameter. In the single P. wuellerstorfi specimen available for study, the wall cross section shows evidence of minor but pervasive textural alteration compared with the biogenic structure seen at other levels. This may be evidence of incipient recrystallization although that interpretation requires more detailed investigation. The specimen also exhibits a moderately thin calcite layer about 2 μm thick on its inner surface, upon which there is some cementation of sediment infill and scattered diagenetic crystals up to 5 μm in diameter.
Shipboard age model
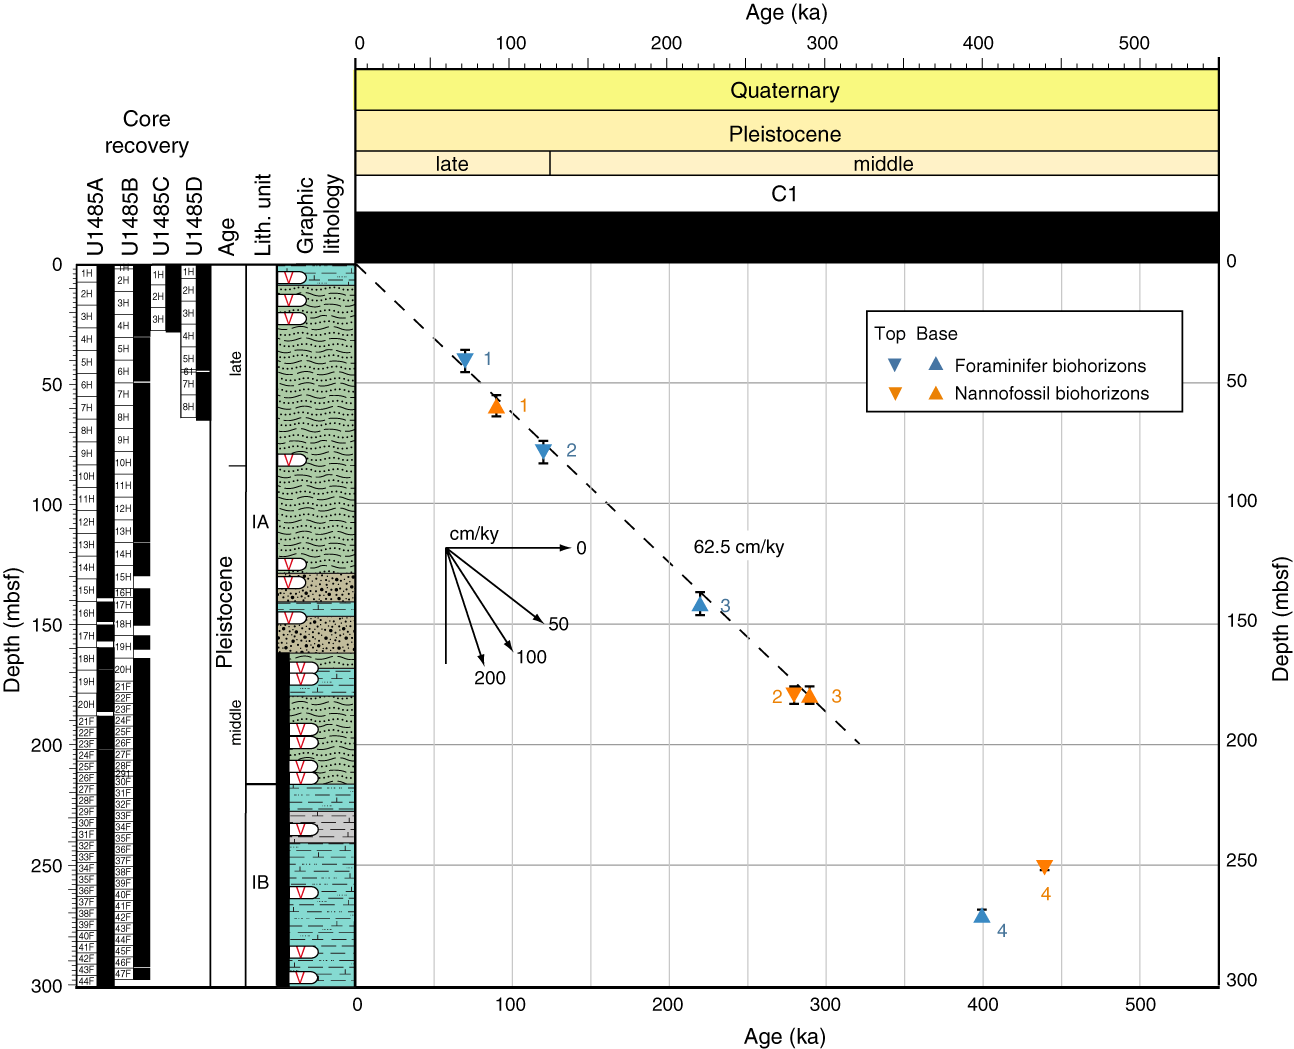
An age-depth plot including all biostratigraphic horizons is shown in Figure F14. Although few biohorizons are observed, the calcareous nannofossil and planktonic foraminifers show good agreement in the upper part of the succession. In general, biohorizons align well with an average long-term estimated linear sedimentation rate of 62.5 cm/ky. The base of the upper Pleistocene is placed between the biohorizon top G. ruber (pink) (0.12 Ma) and biohorizon top acme G. caribbeanica (0.28 Ma) at ~84 mbsf. Because the nature of the sediment changes abruptly at 216 mbsf from alternating silt and coarse-grained sand layers (lithologic Subunit 1A) to fine-grained sediment dominated by clay with varying amounts of nannofossils (lithologic Subunit1B) (see Core description), extrapolation of this long-term trend through the lower part of the succession is not justified. Biohorizon base Globorotalia flexuosa (0.40 Ma) is an unreliable marker in comparison to biohorizon top Pseudoemiliania lacunosa (0.44 Ma). The latter biohorizon indicates that the sedimentation rate in Subunit 1B was slower than in Subunit 1A, as would be expected from the lithology; hence, the age at the bottom of Hole U1485A is likely to be >0.50 Ma.
Figure F14. Age-depth plot.
Paleomagnetism
Measurements summary
Paleomagnetic investigations at Site U1485 involved measurement of the natural remanent magnetization (NRM) of archive-half cores from Holes U1485A–U1485D before and after demagnetization in peak alternating fields (AFs) of 10 mT (Holes U1485A and U1485D) and 15 mT (Holes U1485B and U1485C). In addition to measuring 518 core sections, we took one or two discrete samples per core from Hole U1485A (63 samples) to characterize the NRM demagnetization behavior and to investigate the rock magnetic properties of the sediment. NRM of discrete samples was measured before and after AF demagnetization in peak fields of 5, 10, 15, 20, 30, and 40 mT for two-thirds of the samples; on the remaining samples, NRM was measured in peak AFs of 10 and 40 mT. Rock magnetic investigations comprised measurements of magnetic susceptibility (χ), susceptibility of anhysteretic remanent magnetization (χARM) imparted using a 100 mT AF demagnetization and 0.05 mT direct current bias field, and isothermal remanent magnetization (IRM) acquired in 300 mT and 1000 mT (saturation IRM [SIRM]) fields. All sample measurements were mass corrected. The Icefield MI-5 core orientation tool was deployed with nonmagnetic hardware for all APC cores, which permitted azimuthal correction of declination. A battery issue with the Icefield MI-5 core orientation tool during operations in Holes U1485C and U1485D prevented azimuthal correction; therefore, these cores are manually aligned based on downhole observations and declination data from Holes U1485A and U1485B. Azimuthally corrected declination is largely coherent between cores in Hole U1485B; however, absolute values average 180° for normal polarity, suggesting that the issues of the baseline offset in azimuthally corrected declination experienced throughout this expedition and during previous expeditions (McNeill et al., 2017) affected these data. McNeill et al. (2017) suggest that a simple −180° correction could be applied to the corrected declination data to rotate them back to ~0°. A second issue was observed in the declination data measured from Hole U1485A where adjacent orientated cores developed 30°–90° offsets to each other. This was determined to be a tool-specific issue and is discussed in the text below. We leave declination uncorrected for these additional baseline and tool-specific offsets in the plotted figures, so care should be employed for future calculations of virtual geomagnetic poles (VGP) using these data.
Rock magnetic characterization
Whole-Round Multisensor Logger (WRMSL) magnetic susceptibility data average 433 × 10−5 SI (see Physical properties) and, when coupled with average χ (2.2 × 10⁻⁶ ± 1.4 × 10⁻⁶ m3/kg as 2 standard deviations [2σ]) and SIRM (10 × 10−3 ± 4.2 × 10⁻³ Am2/kg as 2σ) values, suggest relatively high (ferri)magnetic mineral concentration in sediments deposited in the upper ~180 mbsf of Site U1485 (Figure F15). All samples acquire >90% of their SIRM remanence in a 300 mT field, suggesting that ferrimagnetic minerals (e.g., [titano]magnetite [FexTixO4] and/or maghemite [γ-Fe2O3]) control the remanence-carrying properties of the sediment, and that high-coercivity minerals (e.g., hematite [Fe2O3]) are relatively minor phases by comparison. Assuming a value of ~660 × 10−6 m3/kg for pure single-domain and multidomain magnetite (Maher, 1988), our data suggest an average magnetite content of ~0.34% and a maximum of ~1.1% in the upper ~180 mbsf at Site U1485, values very similar to those obtained in Hole U1484A. Relatively high magnetic susceptibility and NRM intensity (>10−1 A/m) values shallower than 180 mbsf likely result from high terrigenous input as Site U1485 is located ~19 km north of Papua New Guinea (Figure F1). The NRM of sediments dominated by primary ferrimagnetic minerals is likely acquired through (post)depositional remanent magnetization processes and can potentially be used to understand and reconstruct paleogeomagnetic field behavior. Deeper than 180 mbsf, WRMSL magnetic susceptibility and χ decrease to relatively low values (WRMSL magnetic susceptibility average = 110 × 10−5 SI units; χ average = 0.6 × 10⁻⁶ ± 0.6 × 10⁻⁶ m3/kg). SRM-measured NRM, NRM10mT, and NRM15mT intensities are also lower and more variable below ~180 mbsf, and ferrimagnetic grain size is distinctly coarser (lower χARM/SIRM values) below ~240 mbsf (Figure F15). This deeper, lower intensity interval was not observed at Site U1484 (which penetrated only to ~223 mbsf) and is coincident with the presence of extensive pyrite (sulfide) in the recovered sediment (see Core description). Together, these signatures suggest that early sediment diagenesis may have progressively altered the magnetic assemblage at depth (e.g., Karlin and Levi, 1983; Rowan et al., 2009).
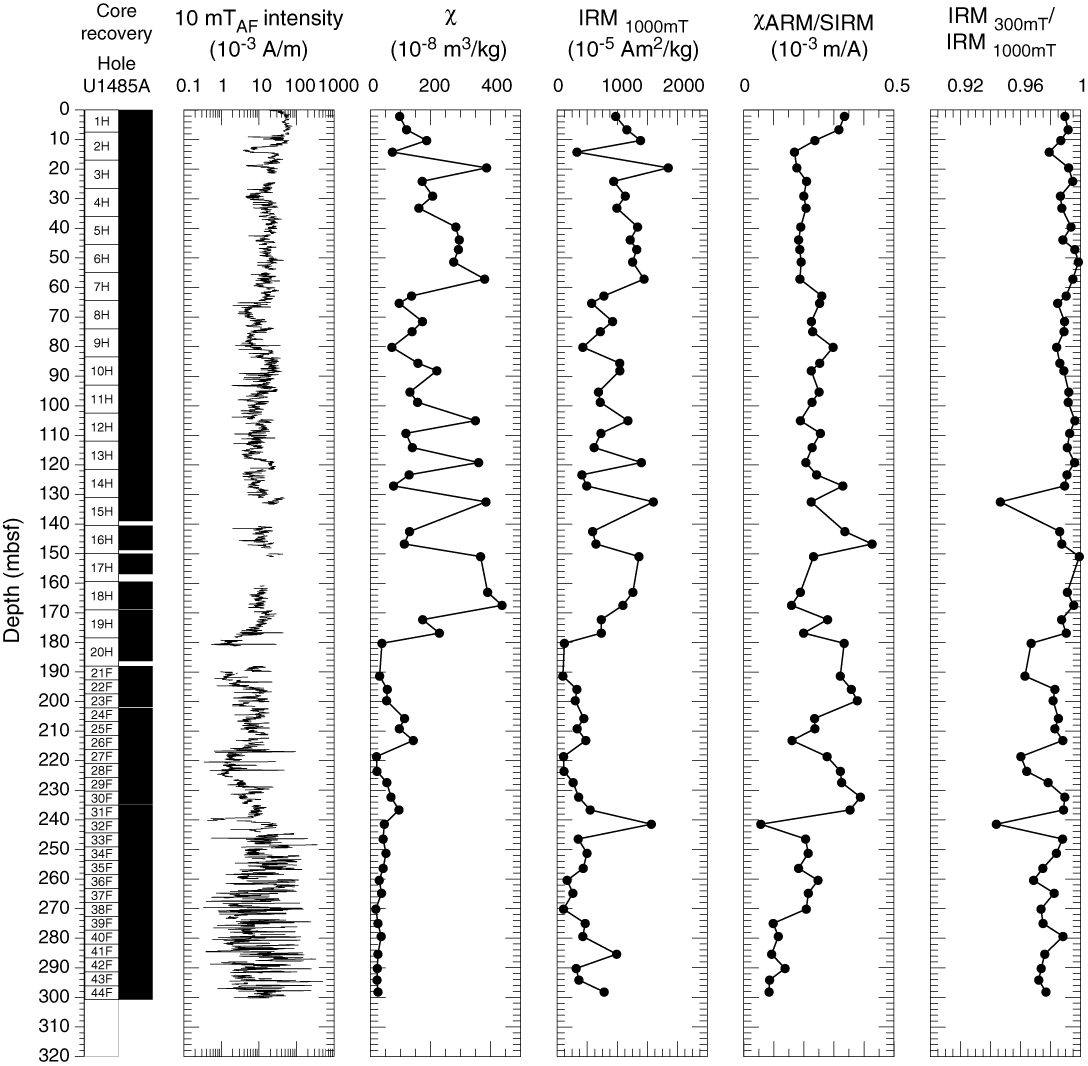
Figure F15. NRM, χ and SIRM, χARM/SIRM, and IRM300mT/IRM1000mT.
Paleomagnetic data and core orientation
NRM demagnetization behavior, high ferrimagnetic content, and high IRM300mT/IRM1000mT ratios in the upper ~180 mbsf are consistent with (titano)magnetite being the primary remanence-carrying mineral species in sediments deposited at Site U1485 (Figures F15, F16). The drill string overprint is effectively removed after AF demagnetization in a 5–15 mT field, and following exposure to higher AF demagnetization steps, inclination and declination trend to the origin on Zijderveld diagrams (Zijderveld, 1967), indicating a single component to the magnetization (Figure F16A–F16C). Average SRM-measured inclination in Hole U1485A is more positive than that measured in Hole U1485B, which plots more around the predicted values of −5.7° assuming a geocentric axial dipole (GAD) field for the site latitude (Figures F17, F18). More GAD-like inclination in Hole U1485B likely results from the higher peak demagnetization step used for SRM-measured sections (15 vs. 10 mT) and suggests that data in Hole U1485A are still slightly affected by a drill string overprint that commonly affects the magnetization in a vertical positive direction (e.g., Richter et al., 2007). Consultation of representative Zijderveld diagrams suggests 10–15 mT is required in the upper ~90 mbsf and 15–20 mT (or higher steps) may be required in the lower part of Hole U1485A to fully remove the overprint (Figure F16D).
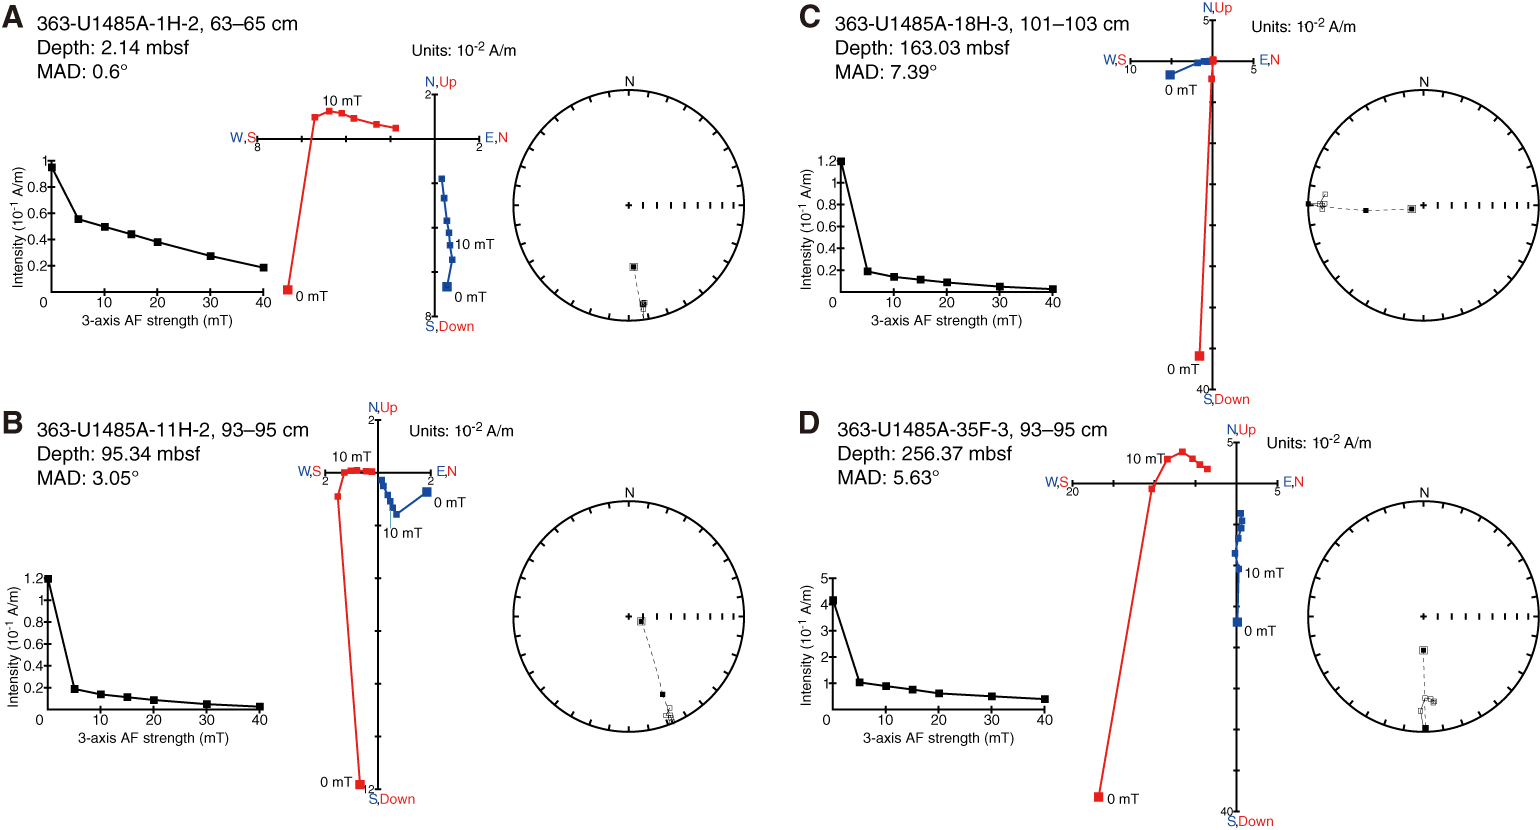
Figure F16. Discrete sample AF demagnetization results.
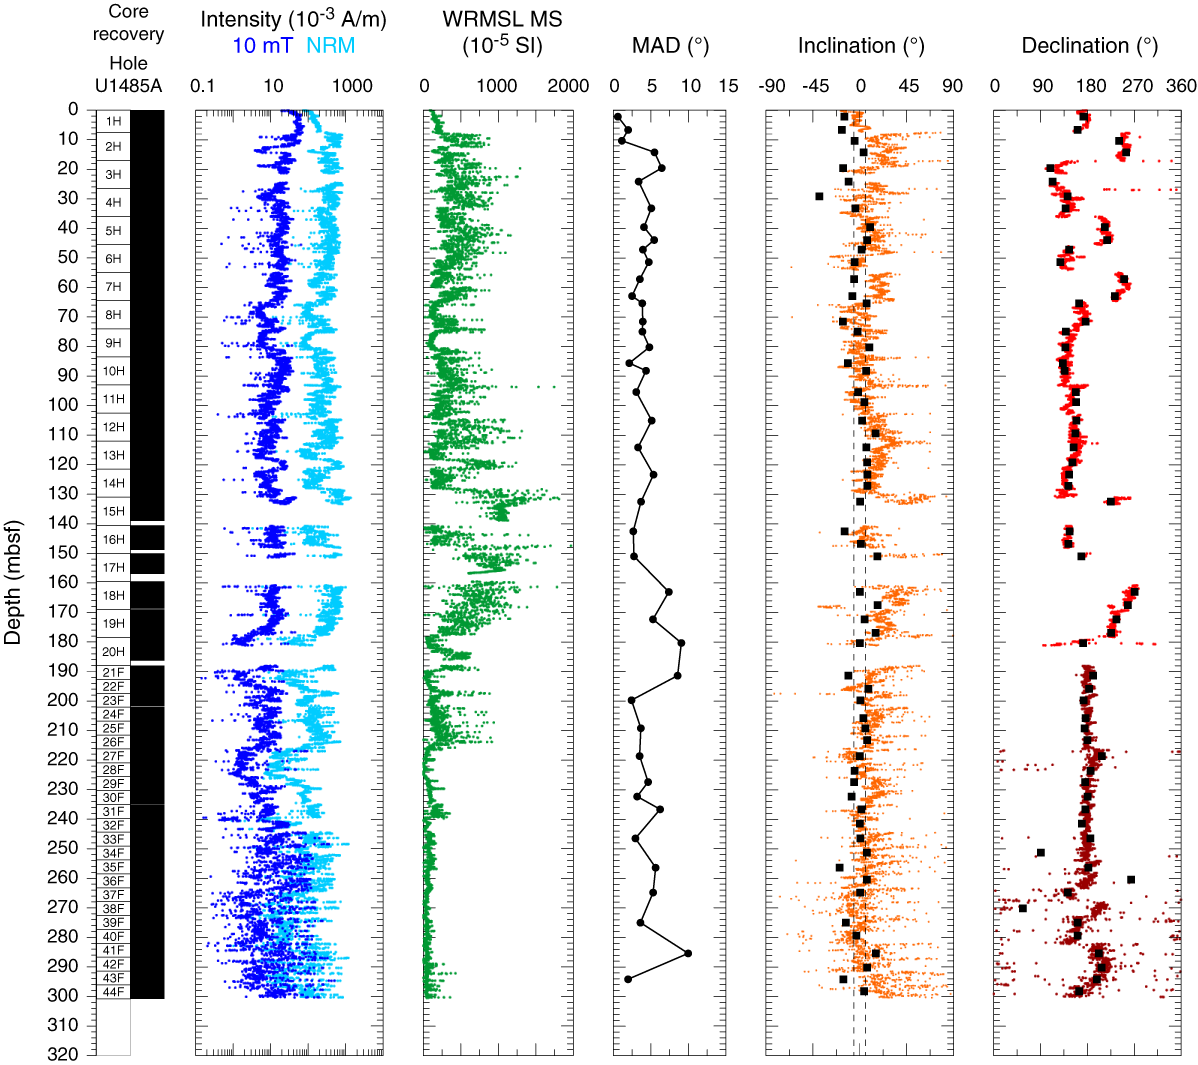
Figure F17. NRM, WRMSL MS, inclination, and declination, Hole U1485A.
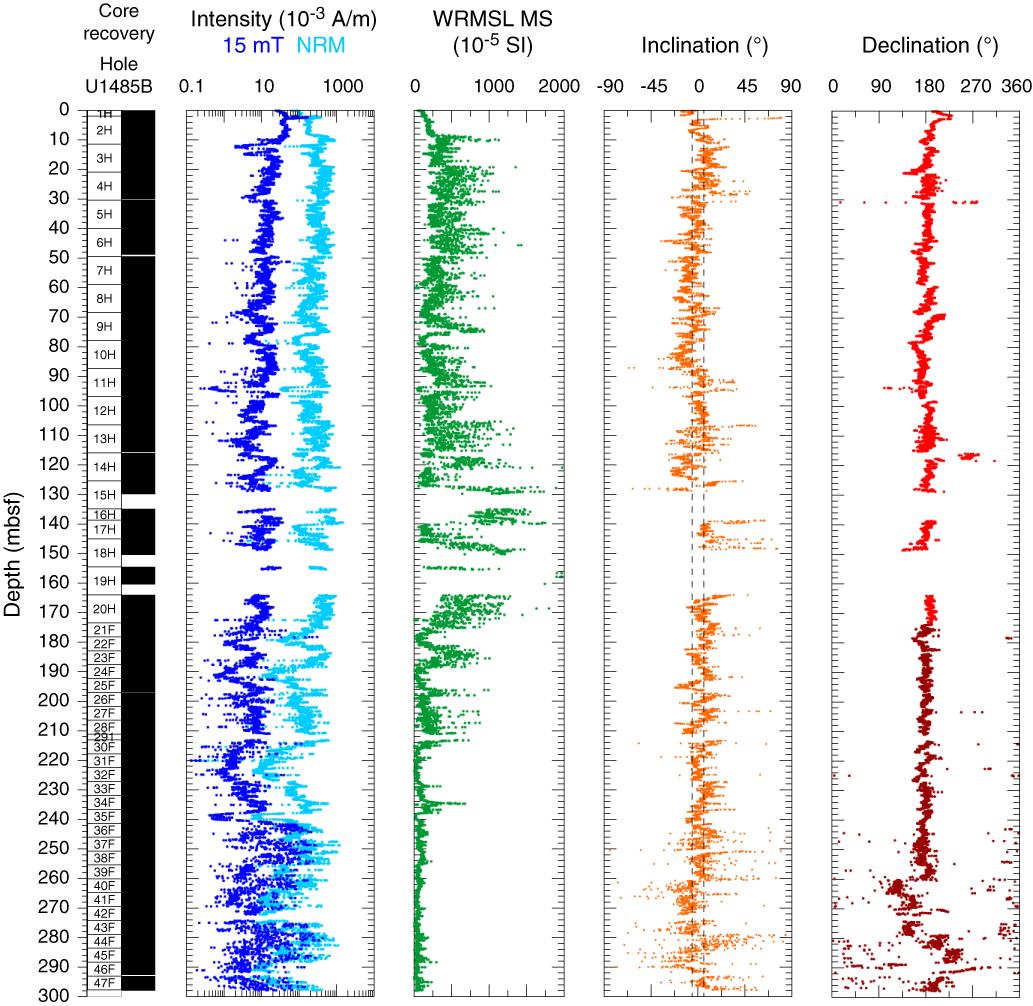
Figure F18. NRM, WRMSL MS, inclination, and declination, Hole U1485B.
Origin-anchored maximum angular deviation values of the principal component analysis (PCA) calculated over the 10–40 mT range average 3.7° (range = 0.6°–6.45°) for the upper ~151 mbsf (Figures F16, F17). Maximum angular deviation values less than ~5° coupled with the qualitative information gleaned from Zijderveld diagrams and stereoplots suggest paleomagnetic directions are stable, well resolved, and potentially optimal for studies of paleosecular variation (PSV) and relative paleointensity (RPI) (Stoner and St-Onge, 2007). Between ~151 and ~190 mbsf, several maximum angular deviation values are higher (Figure F17) and are associated with the recovery of coarse, sandier material in Hole U1485A (see Core description). Below ~190 mbsf, maximum angular deviation values decrease again but remain slightly higher than those of sediments deposited shallower than ~151 mbsf. However, these values are still relatively low and should provide reliable directions in a polarity context (Stoner and St-Onge, 2007). Below ~235 mbsf, NRM10 mT intensity and paleomagnetic directions become more scattered and less well defined and are accompanied by lower values of WRMSL magnetic susceptibility, χ, and SIRM, and coarser ferrimagnetic grain sizes (Figures F15, F17) that may be related to alteration of the rock and paleomagnetic assemblage.
For all APC cores recovered from Holes U1485A and U1485B, declination was azimuthally corrected using the Icefield MI-5 core orientation tool. For Hole U1485B, azimuthally corrected declination is consistent between adjacent cores, but absolute values cluster around ~180° (Figure F18). During periods of normal polarity declination should cluster around 0°, suggesting corrected declination values in Hole U1485B experience an offset of ~180° in absolute terms. This phenomenon was a persistent issue during Expedition 363 and was also experienced during Expedition 362 (McNeill et al., 2017). In Hole U1485A, azimuthally corrected declination of adjacent cores often varies by ~30°–90° distributed around an absolute offset of ~150°–180°. Although the mudline core (363-U1485A-1H) averages ~180°, 12 of the subsequent 19 APC cores cluster around 150° (Cores 3H, 4H, 6H, 8H through 14H, 16H, and 17H); the other 7 cores (2H, 5H, 7H, 15H, and 18H through 20H) cluster between 210° and 260° (Figure F17). The between-core offsets in Hole U1485A were not observed in Hole U1485B and likely result from incorrect correction from the Icefield MI-5 core orientation tool. The tool deployed for orientation in Hole U1485A (Icefield #2007) was the same orientation tool that generated a similar between core offset issue in Hole U1483C. We determined this was a tool-specific issue and requested that after operations at Site U1485, Icefield tool #2007 not be deployed for the remainder of Expedition 363.
Orientation tools cannot be deployed with the HLAPC. Therefore, to align declination measured on HLAPC cores to the oriented APC cores in Holes U1485A and U1485B, we averaged the HLAPC declination record on a core-by-core basis to a mean of 180° (dark red declination symbols in Figures F17, F18). We applied the same core-specific declination correction value to discrete samples taken from each HLAPC core in Hole U1485A. Because of the battery failure of the Icefield MI-5 core orientation tool during operations in Holes U1485C and U1485D, we used the same approach for orientation in these holes. We aligned the declination for these holes to maintain an absolute offset of ~180° to stay consistent with data from Holes U1485A and U1485B. NRM intensity before and after 10 or 15 mT AF demagnetization, WRMSL magnetic susceptibility, and inclination and azimuthally corrected and manually rotated declination after 10 or 15 mT AF demagnetization are shown for Holes U1485A, U1485B, and U1485C and U1485D in Figures F17, F18, and F19, respectively. NRM intensity in Core 363-U1485C-2H is one order of magnitude lower than in either Cores 1H or 3H and results from disturbance and/or coring of repeated sections in Hole U1485C (see Operations and Stratigraphic correlation).
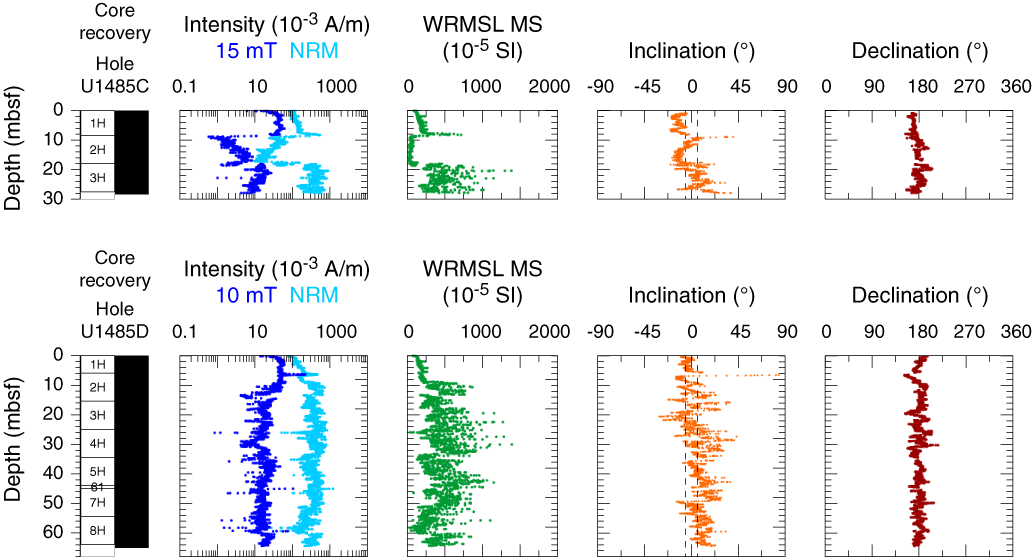
Figure F19. NRM, WRMSL MS, inclination, and declination, Holes U1485C and U1485D.
Displayed inclination and declination values have been cleaned of visibly disturbed intervals and voids (see Paleomagnetism in the Expedition 363 methods chapter [Rosenthal et al., 2018a]). In general, inclination and declination measured on discrete samples are in excellent agreement with those measured on the archive-half sections (Figure F17), although inclination in Hole U1485A tends to be more positive than a GAD-predicted value because it likely retains a small drill string overprint in the vertical direction because of the relatively low AF demagnetization used. In contrast to inclination, declination appears insensitive to a strong drill string–induced overprint, with values after 5 mT AF demagnetization remaining stable through the remaining demagnetization steps (Figure F16). Given the equatorial location of Site U1485, declination was more instructive than inclination for determination of magnetic polarity. Based on predicted sedimentation rates at this location (see Background and objectives) and the approved drilling depth (see Operations), we did not expect to observe the Matuyama/Brunhes boundary at Site U1485. Given this information, we were hesitant to expose the sediment to AF demagnetization higher than 10 mT for Holes U1485A and U1485D and 15 mT for Holes U1485B and U1485C to remove the few extra degrees of overprinted inclination for no further substantial gain in magnetostratigraphic information. Therefore, any future estimates of PSV, RPI, or VGPs for Site U1485 should first use higher AF demagnetization to fully clean the record of any remaining drill string overprint.
Magnetostratigraphy
Sediment in all four holes appear to have been deposited (quasi)continuously with no major hiatuses or erosional surfaces (see Core description and Biostratigraphy). In all four holes, inclination plots around a GAD-predicted value for the site latitude and declination maintains a consistent value for all cores collected using the APC system in Hole U1485B. These observations are consistent with the sediment recovered at Site U1485 being deposited during the Brunhes Chron (C1n) and therefore younger than 0.781 Ma. These findings are consistent with biostratigraphic datums that suggest the base of Hole U1485A is between 0.44 and 0.6 Ma (see Biostratigraphy).
Physical properties
Physical properties were measured on whole-round cores, split cores, and discrete samples from all four holes drilled at Site U1485 to provide basic information for characterizing the core sections. As at Site U1484, cores were greatly affected by gas expansion, with sediment frequently extruded from the top and bottom of the core barrel. Some of the extruded sediment was lost; however, the loose sediment was collected when possible and placed into split liners and archived as short sections at the top and bottom of the cores (see Operations). This coring disturbance should be considered when interpreting the data.
Gamma ray attenuation (GRA) bulk density and magnetic susceptibility were measured on all core sections from Holes U1485B–U1485D with the Special Task Multisensor Logger (STMSL) immediately after the cores were brought onboard. NGR was measured on all whole-round sections (Hole U1485A at 10 cm resolution and subsequent holes at 20 cm resolution) as soon as possible after STMSL measurements (see Physical properties in the Expedition 363 methods chapter [Rosenthal et al., 2018a]). To aid stratigraphic correlation in an interval of exceptionally low magnetic susceptibility, Cores 636-U1485B-30F through 47F were also measured at 10 cm resolution on the Natural Gamma Radiation Logger (NGRL). All core sections were measured with the GRA bulk densitometer, magnetic susceptibility loop, and P-wave logger (PWL) on the WRMSL before splitting. Measurements with the PWL were discontinued after Cores 363-U1485A-2H, 363-U1485B-3H, 363-U1485C-2H, and 363-U1485D-2H when the data became unreliable due to large amounts of gas expansion and significant quantities of sand in the cores. Point-sensor magnetic susceptibility and color spectrophotometry (color reflectance) were measured on split-core sections using the Section Half Multisensor Logger. Thermal conductivity was measured on one section per core from Hole U1485A using the needle probe system. Discrete P-wave measurements (z- and x-axis) were made using the P-wave caliper (PWC) system on the Section Half Measurement Gantry. Discrete z- and x-axis measurements were discontinued after Core 363-U1485A-2H due to lack of a clear signal in the sandy, unconsolidated sediments. Moisture and density (MAD) measurements were made on discrete samples from Hole U1485A to calculate bulk, dry, and grain densities, as well as porosity. Preconditioning treatments were applied to the data to aid in interpretation of noisy or spiky data (see Physical properties in the Expedition 363 methods chapter [Rosenthal et al., 2018a]). All data shown in figures are from the preconditioned data sets. Tables presented in this section contain raw and treated data for NGR and WRMSL GRA bulk density, magnetic susceptibility, and P-wave velocity. Raw data for all data sets are available from the LIMS database.
GRA bulk density
As at Site U1484, GRA bulk density does not show peak-to-peak coherence among the three holes (Figure F20; Tables T5, T6, T7, T8). The GRA bulk density values are nonetheless comparable among holes, and the records from all holes display common features, including distinct 10–15 m scale cyclicity. Interhole differences most likely occur due to a combination of frequent fracturing related to gas expansion, which was particularly prevalent in the sand-rich layers, and the loss of material at the top and bottom of the cores due to expansion during core retrieval (see above). Additionally, changes in GRA bulk density seem to be highly sensitive to transitions between clay and sand, so small differences in the thickness of clay- and sand-rich beds may also account for some of the variation amongst holes.
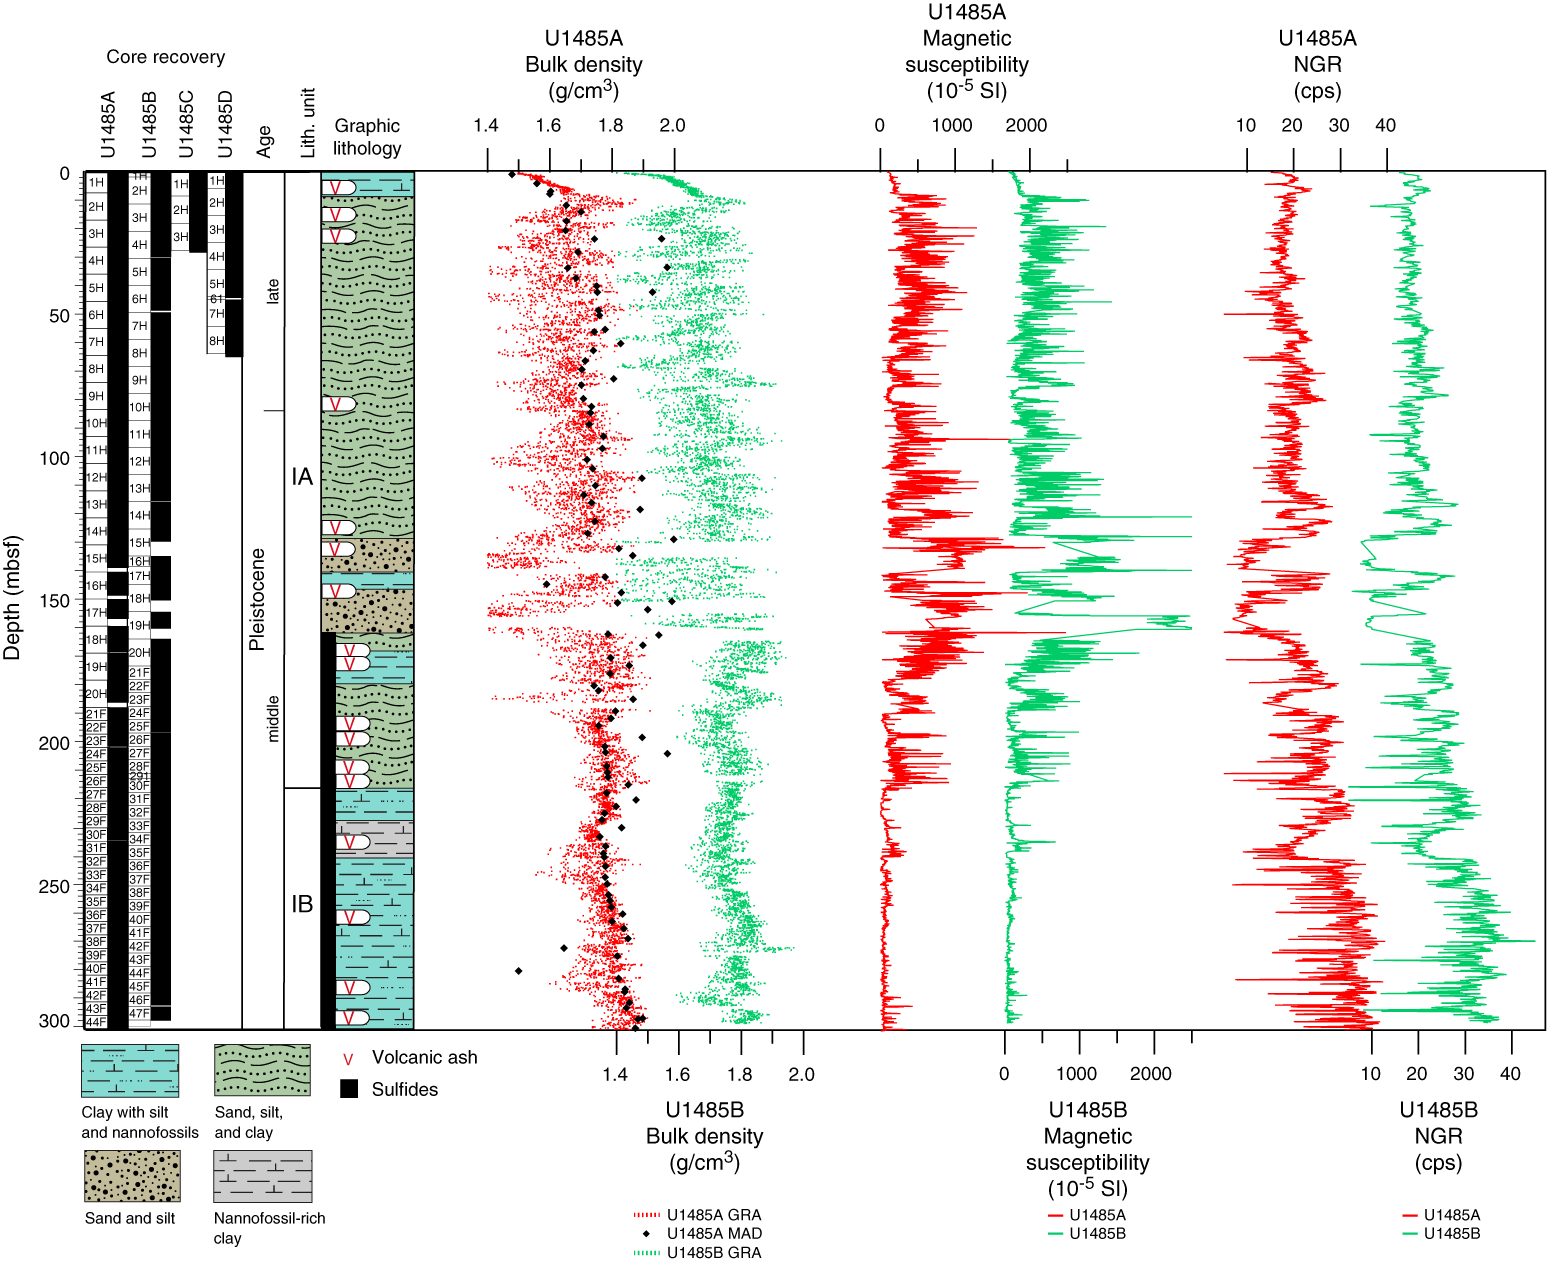
Figure F20. Physical property measurements.
Table T5. WRMSL GRA bulk density data, Hole U1485A. Download table in CSV format.
Table T6. WRMSL GRA bulk density data, Hole U1485B. Download table in CSV format.
Table T7. WRMSL GRA bulk density data, Hole U1485C. Download table in CSV format.
Table T8. WRMSL GRA bulk density data, Hole U1485D. Download table in CSV format.
A minor linear compaction trend is observed with depth at Site U1485 (Figure F20), with the exception of the upper 10 mbsf, where compaction probably causes a rapid increase in GRA bulk density from ~1.47 to 1.65 g/cm3. Because of the absence of a strong compaction effect, no major difference was observed between the cleaned and detrended GRA bulk density data sets. Between 10 and ~135 mbsf, the GRA bulk density displays large ~10–15 m cycles, with values ranging from 1.4 to 1.85 g/cm3. Between ~135 and 185 mbsf the presence of clear cyclicity is missing and there is generally greater variability in values (1.3–1.9 g/cm3) where poor recovery and the presence of unconsolidated sand affected the quality of data. Compared to the upper interval above 185 mbsf, the variability in GRA bulk density from 185 mbsf to the bottom of the hole (~300 mbsf) has much lower amplitude, with values ranging between 1.35 and 1.5 g/cm3. These low-amplitude changes reflect the dominance of clay with only minor amounts of coarser material in lithologic Subunit IB. This interval was not cored at Site U1484.
Throughout most of the record, GRA bulk density varies in phase with magnetic susceptibility but shows opposite trends to the NGR data, with the exception of the interval between 135 and 170 mbsf where GRA bulk density is in phase with NGR but opposite to magnetic susceptibility (Figure F20). The GRA bulk density variations correlate with the lithologic changes observed at this site, with high GRA bulk density values corresponding to silty sand layers and low GRA bulk density values associated with clay (Figure F21) (see Core description). The short-term cycles in GRA bulk density range from decimeter to meter scale, reflecting the thickness of the silty sand beds. Within the meter-scale beds, there are also smaller decimeter-scale variations in density (Figure F21B).
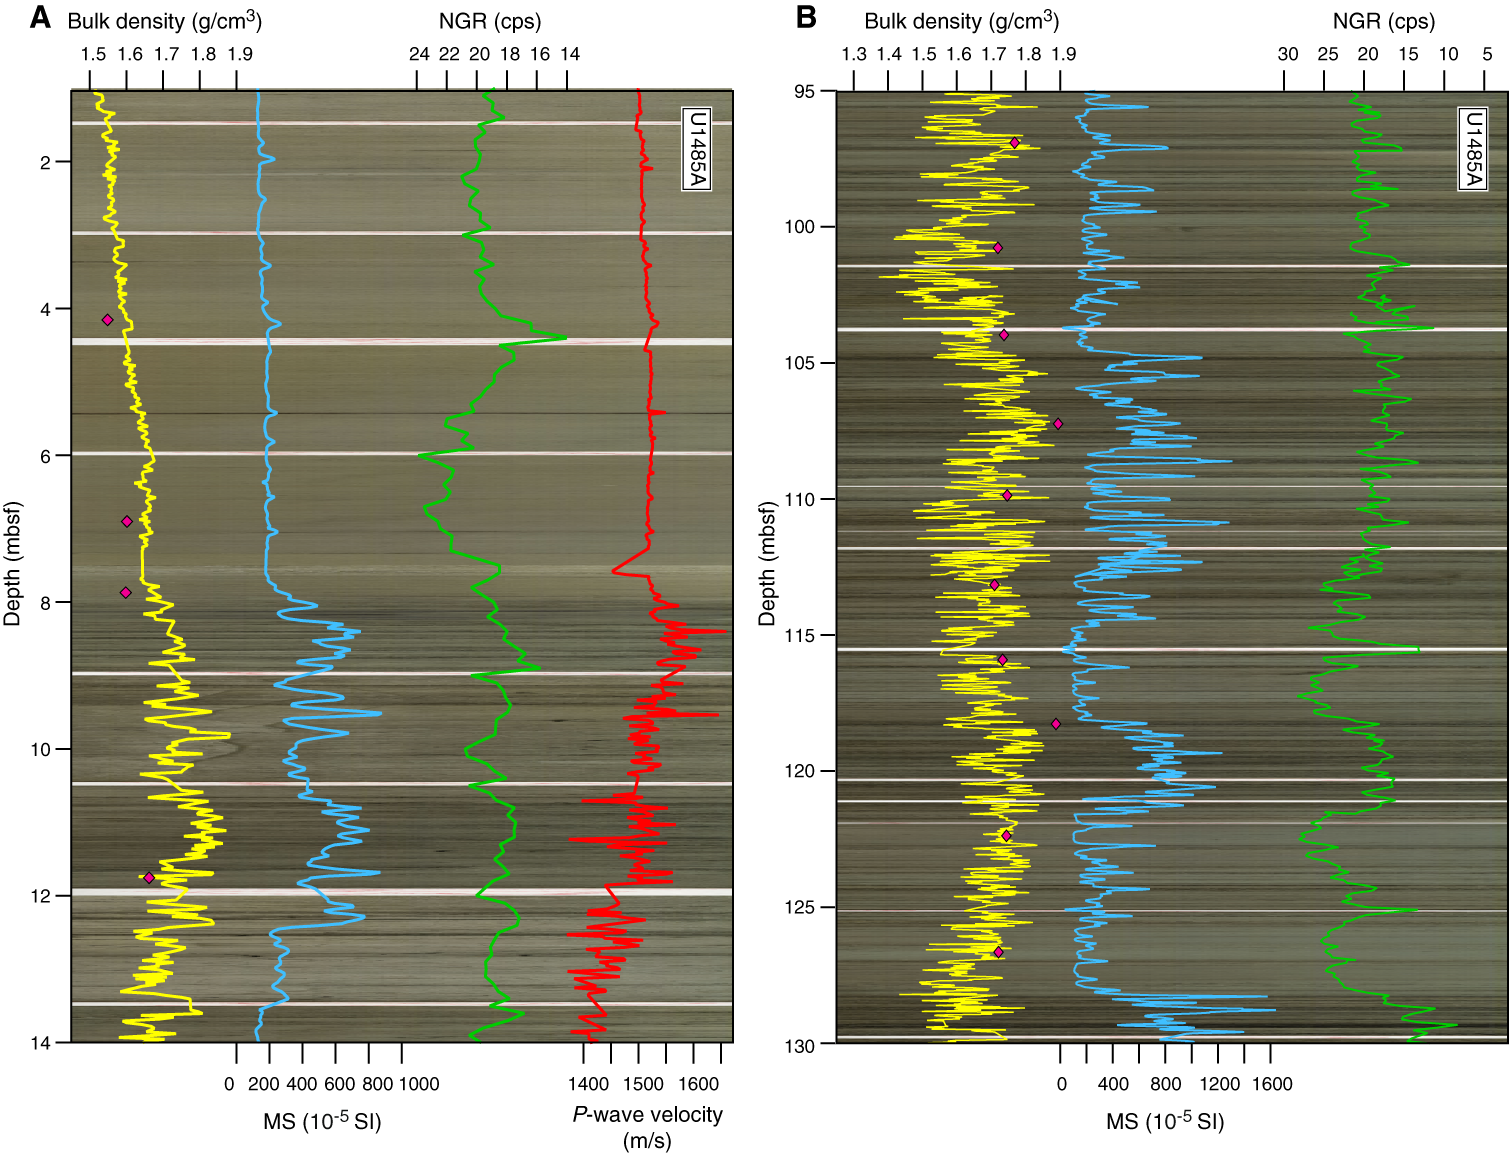
Figure F21. NGR, WRMSL GRA bulk density, MS, and P-wave velocity overlaid on core photos.
The GRA bulk density records from Sites U1485 and U1484 exhibit comparable mean values and ranges (Figure F22). In particular, the GRA bulk density at both sites shows similar 10–15 m cyclicity in the upper 75 mbsf. The records between 115 and 180 mbsf are difficult to assess due to poor recovery; however, at ~200 mbsf, the records diverge, probably due to differences in sedimentation rates at the two sites (see Biostratigraphy). For Hole U1485A, GRA bulk density values below 200 mbsf are relatively high (~1.8 g/cm3) and exhibit relatively low amplitude short-term variability relative to the GRA bulk density record above 200 mbsf. In contrast, GRA bulk density in the deepest part of Hole U1484A exhibits relatively low average values with high amplitude short-term variability.
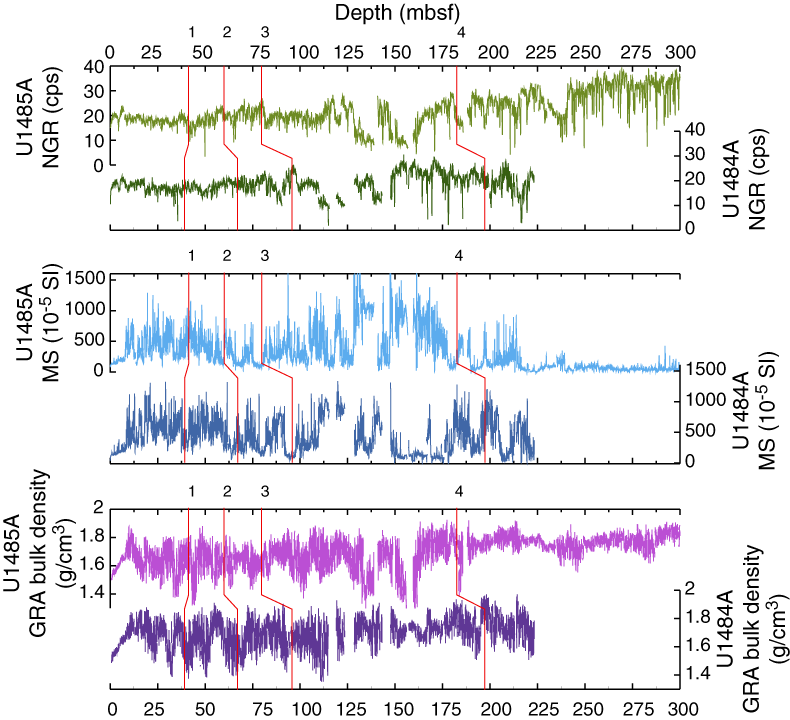
Figure F22. Comparison of major physical property parameters.
Magnetic susceptibility
At Site U1485, magnetic susceptibility values range from 50 × 10−5 to >1500 × 10−5 SI (Figure F20; Tables T9, T10, T11, T12). Magnetic susceptibility variations appear strongly correlated with lithology, with low magnetic susceptibility intervals corresponding to clay-rich layers and high magnetic susceptibility intervals corresponding to silt/sand-rich lithologies (see Core description). Magnetic susceptibility values are consistently low (~150 × 10−5 SI) in the upper 10 mbsf. Between 10 and 135 mbsf, 10–15 m scale cyclicity is observed, comparable to that observed in GRA bulk density, although the cycles in the magnetic susceptibility record are often more distinct. A comparison of the magnetic susceptibility record to the core photos reveals that short-term (decimeter scale) excursions to high magnetic susceptibility values correspond to darker silty sand layers (Figure F21). Additionally, despite the low magnetic susceptibility values recorded in the deepest section of the hole, distinct peaks are observed that are strongly correlated with the discrete silty sand layers in this clay-dominated interval.
Table T9. WRMSL MS data, Hole U1485A. Download table in CSV format.
Table T10. WRMSL MS data, Hole U1485B. Download table in CSV format.
Table T11. WRMSL MS data, Hole U1485C. Download table in CSV format.
Table T12. WRMSL MS data, Hole U1485D. Download table in CSV format.
Magnetic susceptibility data are comparable between Sites U1484 and U1485, particularly in the upper part of the records (<60 mbsf; Figure F22), where 10–15 m cycles are recognizable at both Sites U1484 and U1485. Magnetic susceptibility values are higher at Site U1485 between 135 and 185 mbsf, although large core gaps caused by poor recovery make it difficult to evaluate the magnetic susceptibility signals at both sites accurately in this interval. From 185 mbsf to the base of the hole, magnetic susceptibility values at Site U1485 are markedly lower (~100 × 10−5 SI) with less variability. In this interval, low-amplitude variability was also noted in the GRA bulk density.
Natural gamma radiation
At Site U1485, NGR counts range between 10 and ~40 counts/s (Figure F20; Tables T13, T14, T15, T16). In general, NGR displays an antiphase relationship with GRA bulk density and magnetic susceptibility (Figures F20, F21), although this relationship is not as well defined as it was at Site U1484. High sedimentation rates (~62.5 cm/ky) (see Biostratigraphy) preclude the 10 cm resolution NGR data from capturing the same short-term variability observed in the 2.5 cm resolution GRA bulk density and magnetic susceptibility records. Nonetheless, the variations in NGR broadly capture the same excursions seen in the magnetic susceptibility and GRA bulk density data, which relate to short-term variations in the relative concentrations of clay, silt, and sand, with lower NGR values corresponding to higher, noisier values of magnetic susceptibility in the darker sand intervals. Below 225 mbsf, the NGR values increase toward the base of the record (to ~30–40 counts/s). The increase in NGR counts/s probably reflects an increase in the amount of clay at Site U1485 (see Core description). In contrast to the low magnetic susceptibility signal within this clay-dominated interval, NGR displays high variability, probably due to the large cracks in the cores.
Table T13. NGRL data, Hole U1485A. Download table in CSV format.
Table T14. NGRL data, Hole U1485B. Download table in CSV format.
Table T15. NGRL data, Hole U1485C. Download table in CSV format.
Table T16. NGRL data, Hole U1485D. Download table in CSV format.
A notable difference in the NGR records from Sites U1484 and U1485 occurs between ~110 and 185 mbsf, where silty sand layers dominate (Figure F22) (see Core description). NGR at Site U1485 generally displays greater amplitude variability than at Site U1484, and variations appear to be offset from those recorded at Site U1484, taking into account biostratigraphic tie points. The difference between the two sites could be due to variability in the extent of sand layers at both sites, as suggested from the seismic profile. However, because core recovery was incomplete in the sand-rich intervals, differences caused by core gaps or coring disturbances cannot be excluded.
P-wave velocity
PWL velocities show an overall increase from ~1500 to 1550 m/s between 0 and 9 mbsf, below which depth velocities become unreliable (Figure F23; Tables T17, T18, T19, T20). The instrument was switched off at ~15 mbsf in Holes U1485A, U1485B, and U1485D and at ~10 mbsf in Hole U1485C. All trends in PWL velocities are relatively similar among holes. P-wave velocity varies only slightly in the upper 8 mbsf, consistent with the low variability in magnetic susceptibility and GRA bulk density. From 8 to 12 mbsf, P-wave velocity shows a marked increase, with values varying from 1500 to 1690 m/s and higher values corresponding to layers of dark sand (Figure F21). As at Site U1484, the discrete P-wave velocity measurements on the x-axis are higher than those on the z-axis (Figure F23). Between the seafloor and 5 mbsf, the offset between the x- and z-axis measurements is ~20 m/s; however, below 5 mbsf, the x- and z-axis measurements converge. The z-axis data become unreliable below 9 mbsf (see black circle in Figure F23). In contrast to Sites U1482 and U1483 on the northwest Australian margin, Sites U1484 and U1485 consistently recorded lower PWC P-wave velocities (x-axis and z-axis) relative to PWL P-wave velocities.
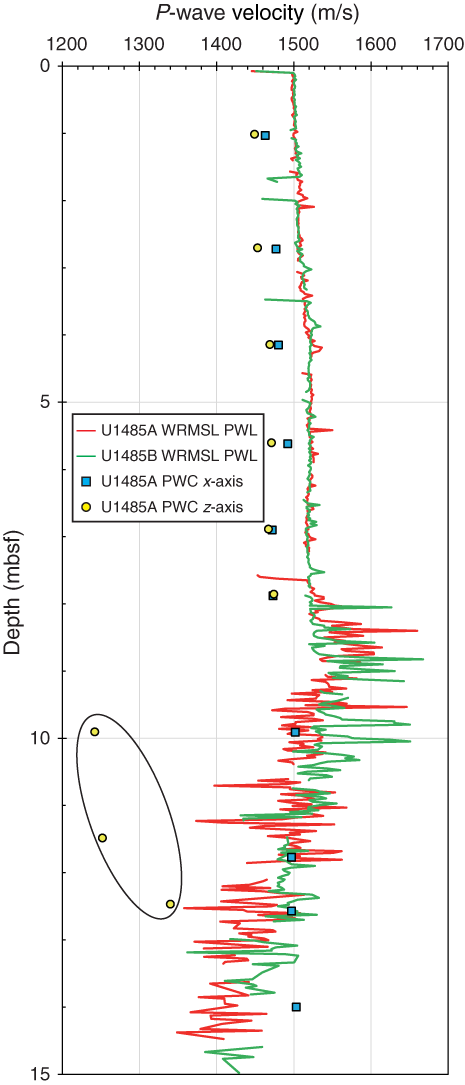
Figure F23. Discrete and whole-round P-wave measurements.
Table T17. WRMSL PWL data, Hole U1485A. Download table in CSV format.
Table T18. WRMSL PWL data, Hole U1485B. Download table in CSV format.
Table T19. WRMSL PWL data, Hole U1485C. Download table in CSV format.
Table T20. WRMSL PWL data, Hole U1485D. Download table in CSV format.
Moisture and density
MAD bulk density, dry density, and grain density show similar downhole trends (Figure F24). From the seafloor to 10 mbsf, a sharp increase in MAD bulk and dry density values corresponds to a decrease in porosity, probably due to rapid consolidation as the distance from the sediment/water interface increases. From 10 mbsf to the base of the hole, there is a slight increase in average bulk density (from 1.7 to 1.85 g/cm3) and dry density (from 1.0 to 1.3 g/cm3), most likely due to some compaction with depth caused by the overlying sediment load. At Site U1485, the dry density measurements vary considerably between 0.8 and 1.6 g/cm3, in particular in the intervals from 20 to 40 mbsf and from 100 to 200 mbsf, which correspond to alternating clay- and sand-rich lithologies (see Core description). Lower dry density values characterize clay layers, whereas higher dry density values typically occur in dark sand beds. Deeper than ~206 mbsf, dry density values exhibit less variability, corresponding to the interval of low magnetic susceptibility and predominantly clay lithology of Subunit IB.
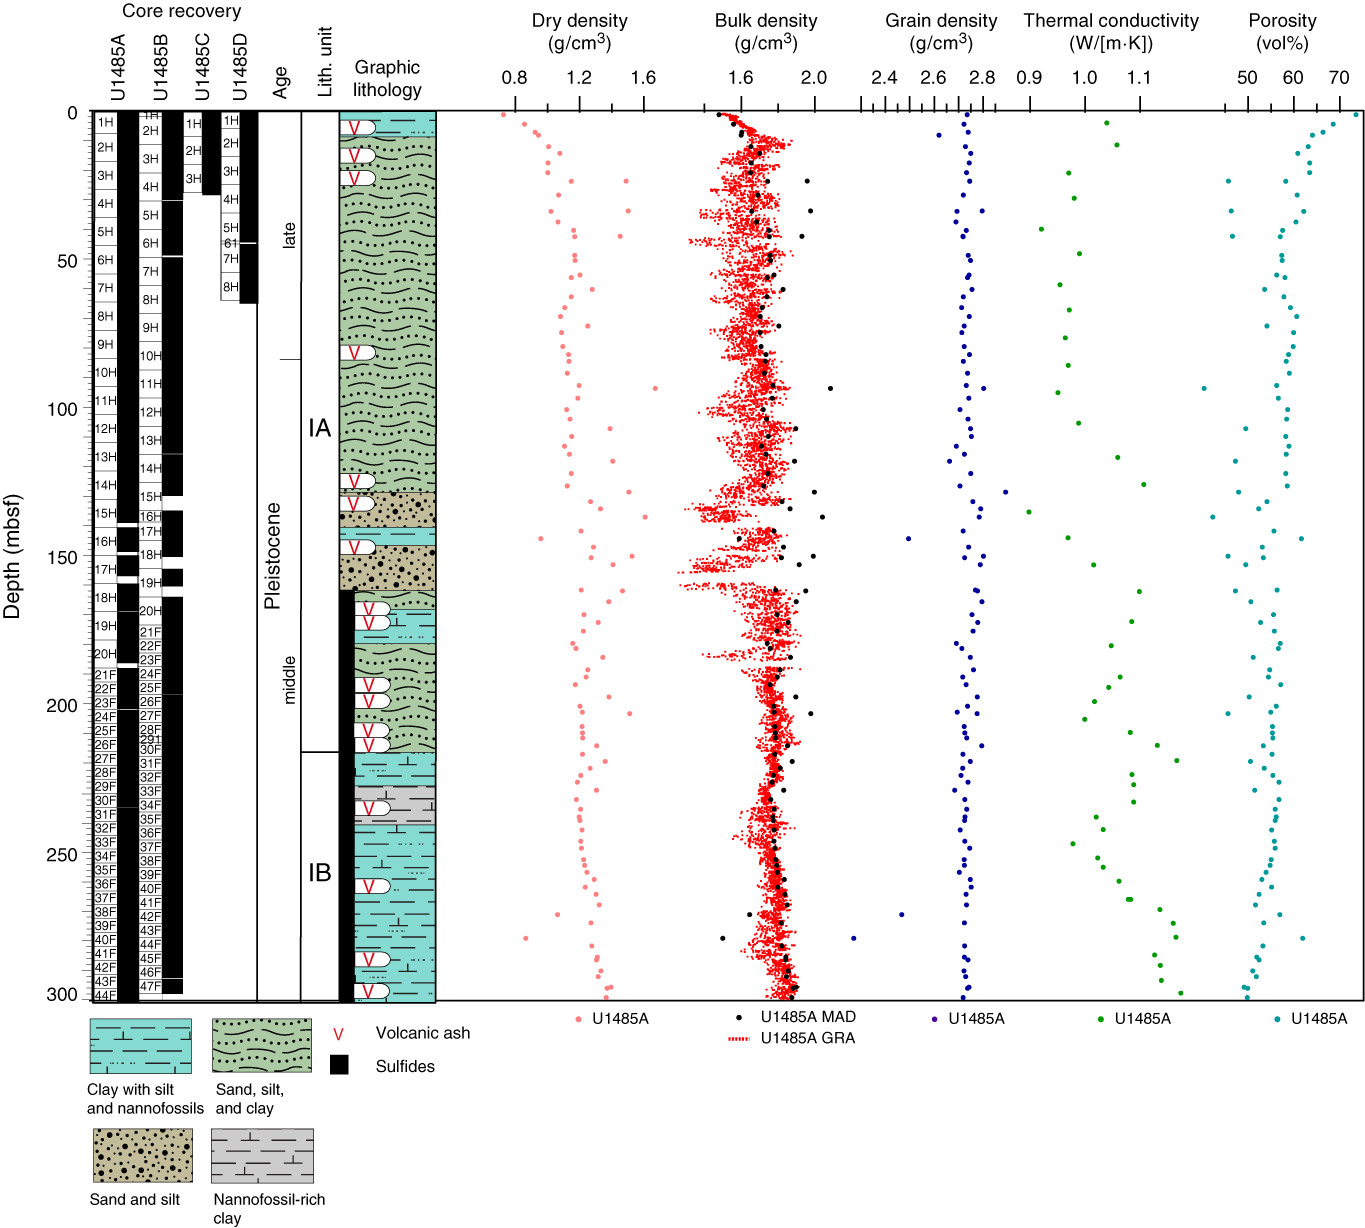
Figure F24. MAD dry, bulk, and grain densities, WRMSL GRA bulk density, and thermal conductivity.
The GRA and MAD bulk density data show similar trends (Figure F24). For the upper 10 mbsf, MAD bulk density probably underestimates the true bulk density relative to the GRA bulk density by ~0.05 g/cm3, most likely due to water loss from the cores between the WRMSL measurements and discrete MAD sampling. Between 10 and 185 mbsf, MAD bulk density covaries with GRA bulk density. MAD and GRA bulk density data show good agreement when MAD bulk density is lower (~1.7–1.8 g/cm3), which correlates with low dry density (average = ~1.1 g/cm3) and clay-rich layers. In the sand layers, the discrete MAD bulk density measurements (average = ~2 g/cm3) are systematically higher than the GRA bulk density by ~0.2 g/cm3. These high MAD bulk density values are associated with high grain density values (2.775 g/cm3). The 0.2 g/cm3 offset between GRA and MAD bulk density data in sand-rich layers could be due to the high number of cracks from gas expansion, which can be avoided during discrete sampling. Deeper than 185 mbsf, all MAD parameters show low-amplitude variability, and the MAD and GRA bulk density measurements are comparable within the dominantly clay-rich sediment.
Thermal conductivity
A thermal conductivity profile was obtained at ~10 m resolution using a thermal conductivity needle probe (Figures F24, F25). The thermal conductivity measurements show a linearly increasing trend with depth from 0.96 W/(m·K) at the seafloor to 1.15 W/(m·K) at 300 mbsf, associated with the compaction effect. Superimposed on this generally increasing trend, thermal conductivity measurements vary between 0.76 and 1.42 W/(m·K), with an average of ~1 W/(m·K) and a standard deviation of 0.026 W/(m·K). Thermal conductivity correlates with dry density and is inversely correlated with porosity. Additionally, thermal conductivity exhibits a similar trend to the NGR data (Figure F25), suggesting a strong relationship with clay content because clay minerals (e.g., smectite) are able to retain water in the lattice structure, which increases thermal conductivity. The advanced piston corer temperature tool (APCT-3) was not deployed at this site, so no downhole temperature measurements were made.

Figure F25. Comparison of thermal conductivity and NGR.
Stratigraphic correlation
Correlations between holes at Site U1485 were accomplished using Correlator software (version 2.1). Tie points were established mainly with WRMSL magnetic susceptibility data (Table T21; Figure F26). In addition, we used NGR data to aid in making correlations. We constructed a splice for the entire site using Holes U1485A, U1485B, and U1485D (Table T22; Figures F25, F27, F28), but there are gaps in the splice. The splice is continuous and well constrained from 0 to 157.41 m core composite depth below seafloor (CCSF). Below this, from 157.41 to 198.74 m CCSF, there is discontinuous stratigraphy due to poor recovery in this sandy interval. This interval is underlain by a well-constrained spliced interval with no gaps from 198.74 to 222.11 m CCSF. Below this interval, there is an interval of discontinuous stratigraphy with a series of core gaps between almost all cores from 222.11 to 267.34 m CCSF because of core gaps that were aligned in the two deep holes (U1485A and U1485B). From 267.34 m CCSF to the bottom of the site at 373.35 m CCSF, we have constructed a tentative splice that is nearly continuous, but this lower section of the stratigraphic sequence (deeper than ~274 m CCSF) has low-amplitude WRMSL data, low-resolution NGR data, and many voids caused by gas expansion, making it very difficult to correlate records between holes. Postcruise work will be necessary to verify some of the tentative tie points (Table T21) used to construct the splice (Table T22; Figures F25, F27, F28). In sum, the splice in the uppermost interval from 0 to 157.41 m CCSF is solid, but below this there are core gaps and uncertain tie points, as discussed below.
Table T21. Affine table. Download table in CSV format.
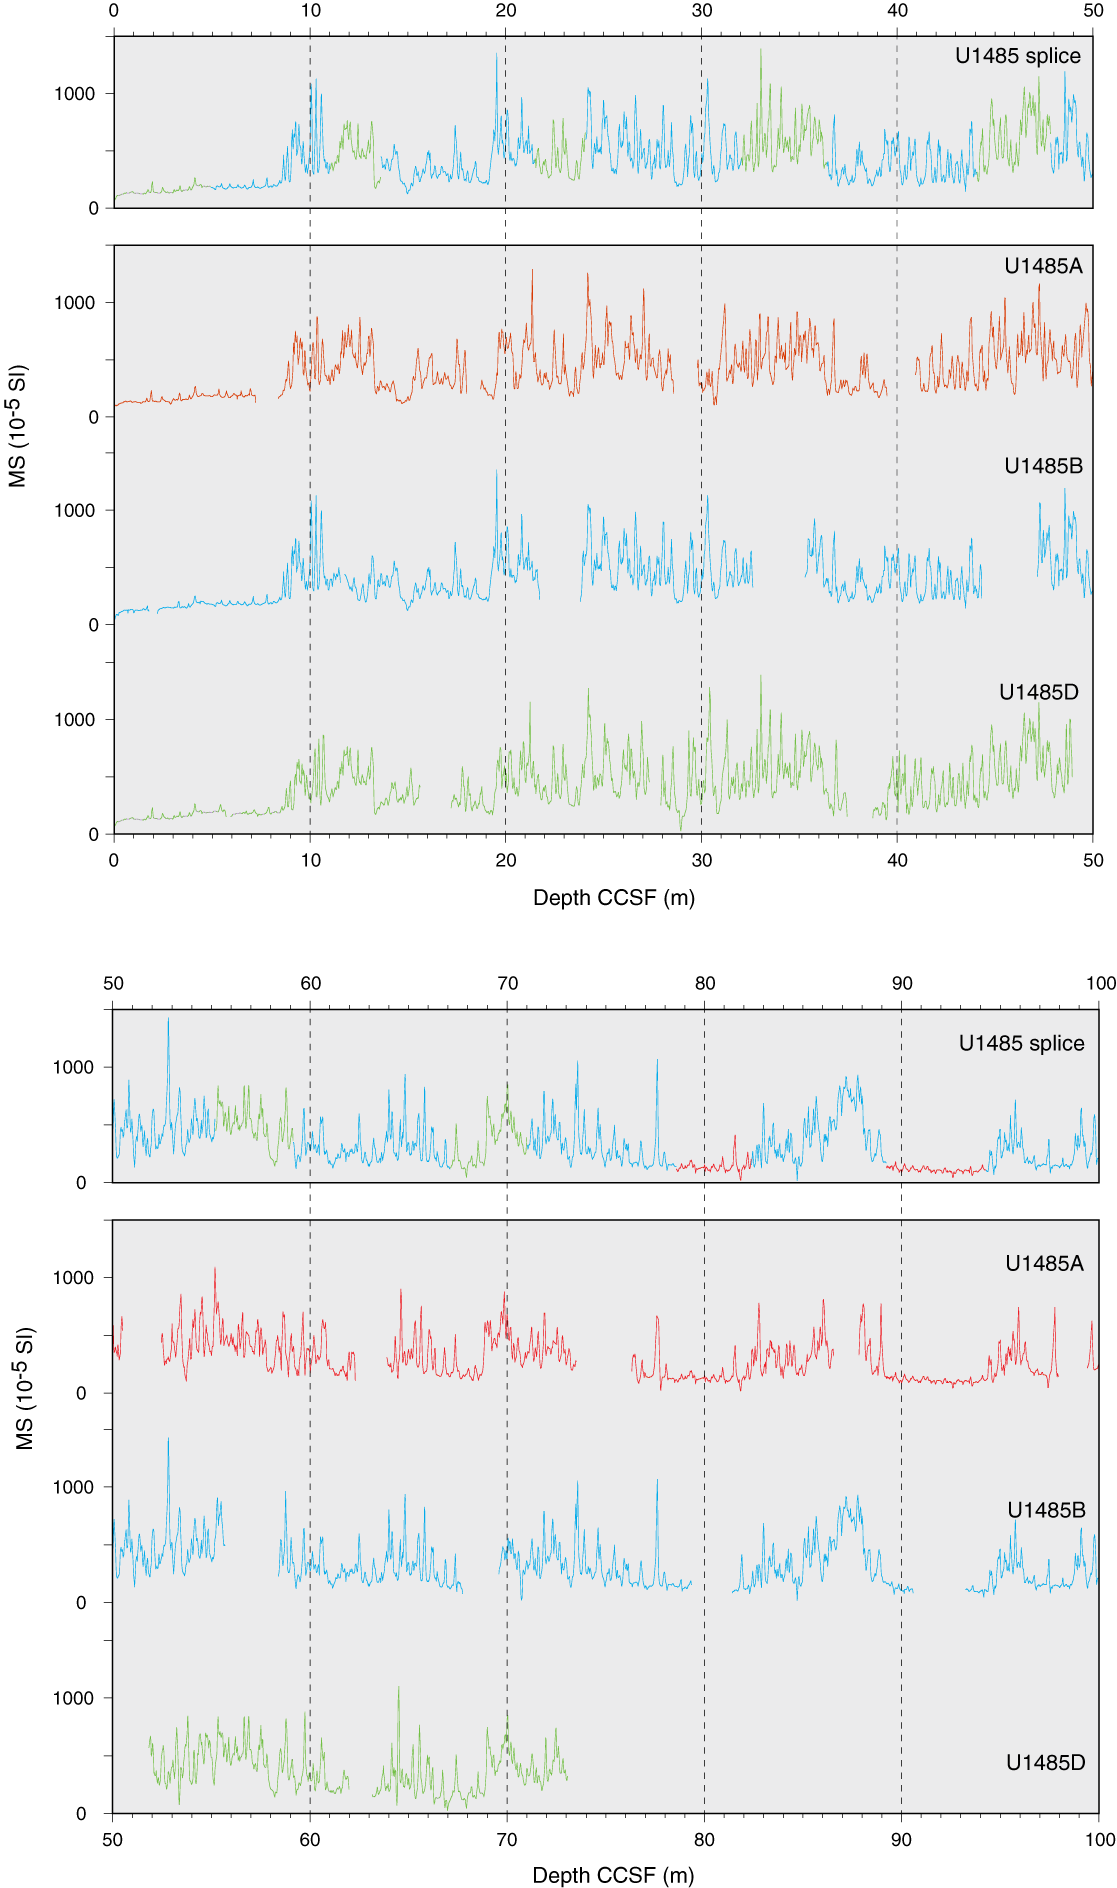
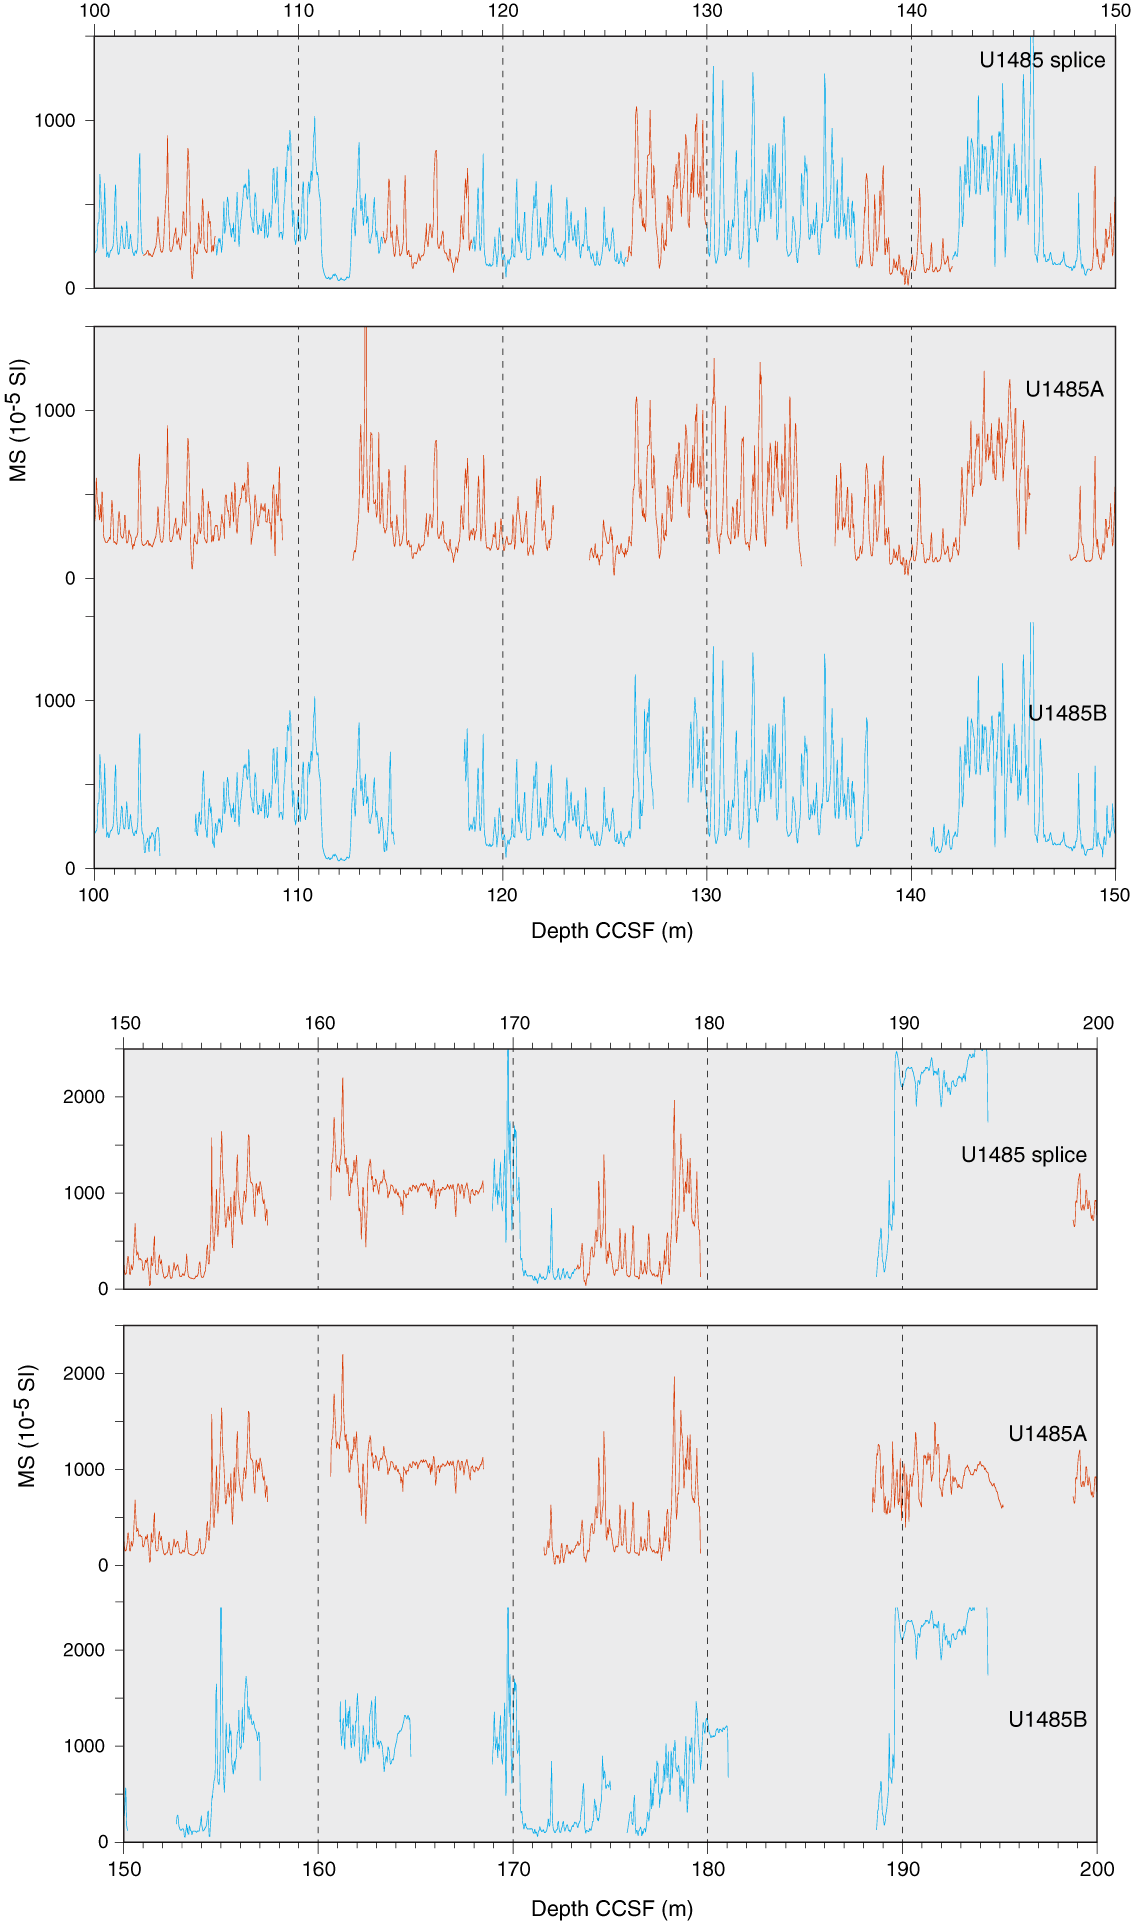
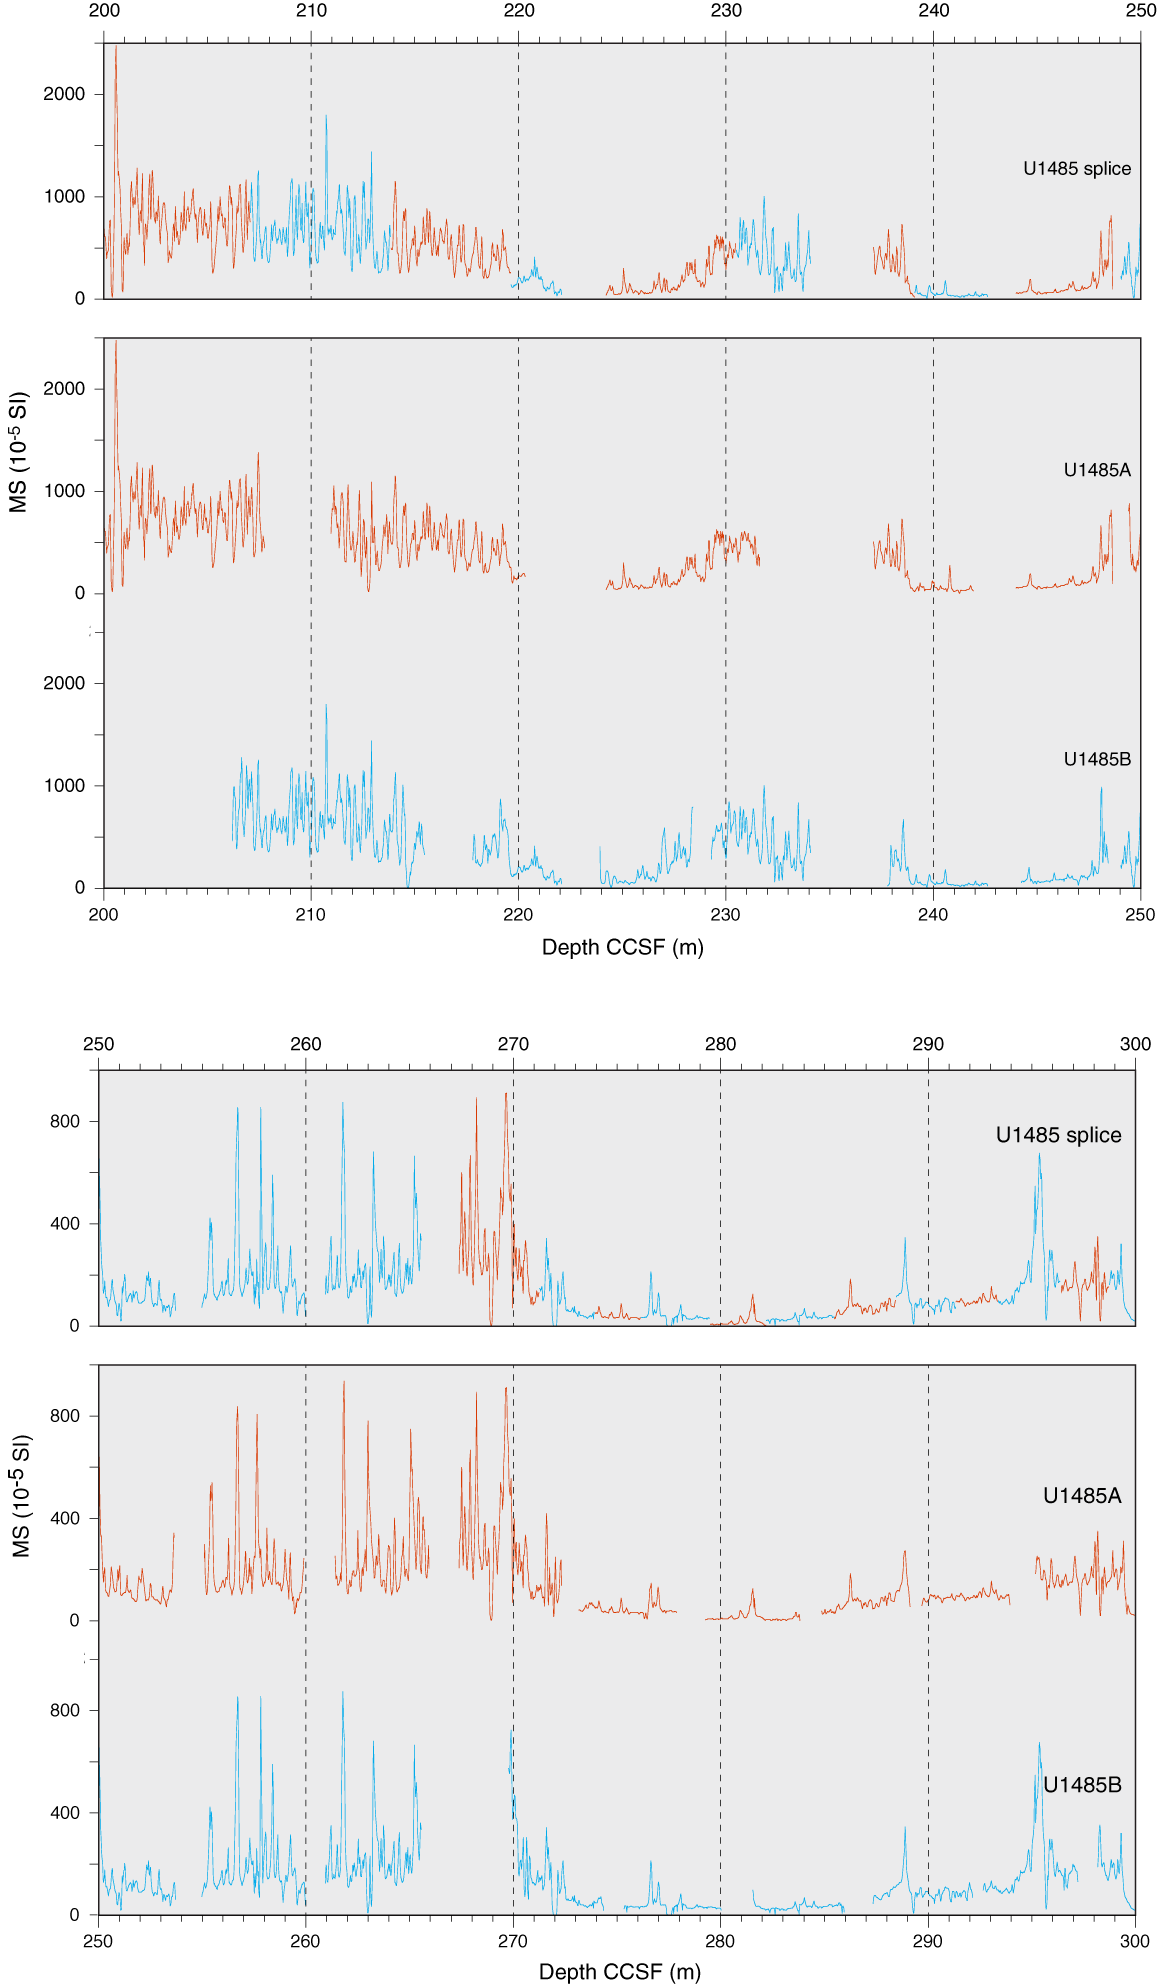

Figure F26. WRMSL MS data.
Table T22. Splice interval. Download table in CSV format.
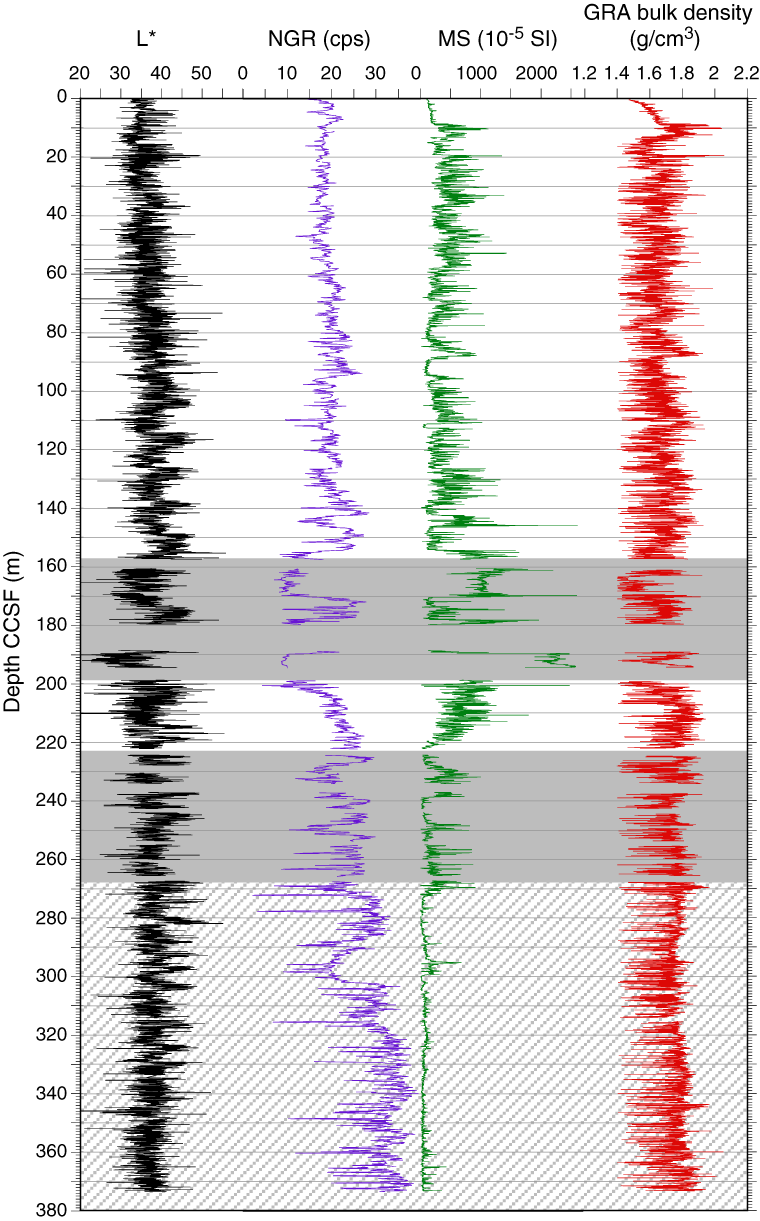
Figure F27. Spliced L*, NGR, and WRMSL MS and GRA bulk density data.
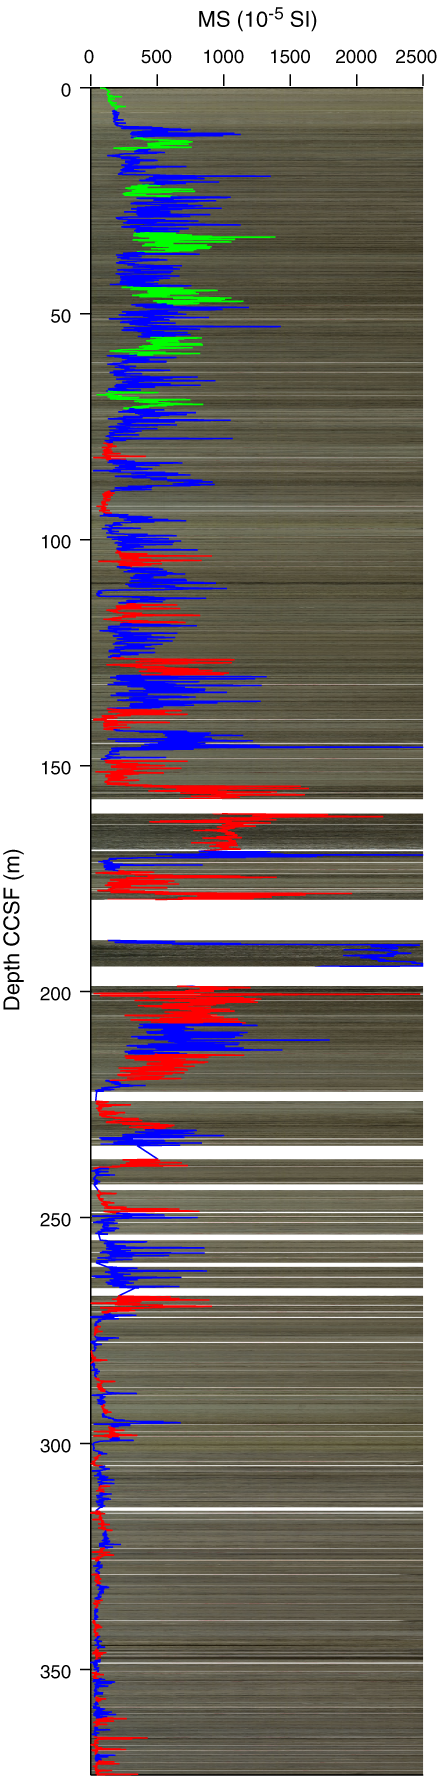
Figure F28. Spliced MS data plotted on spliced core image.
The CCSF scale is anchored to the mudline of Core 363-U1485D-1H, which is assigned a depth of 0 m CCSF. From this anchor, we worked downhole, using Correlator, to establish a composite stratigraphy on a core-by-core basis. Our general approach was to avoid Section 1 and the bottom of the cores because of disturbance by gas expansion, including some material that extruded onto the rig floor. Because there was high-resolution whole-round sampling of the upper 54 mbsf of Hole U1485A (one 5–10 cm whole-round sample per section), Hole U1485D was drilled to obtain an additional copy of this uppermost interval and was used in the splice. Hole U1485C consists of three cores, which were not included in the splice. The offset for Core 363-U1485C-1H was determined with a tie point to the first core in the splice (Core 363-U1485D-1H), but because the WRMSL data from Core 363-U1485C-2H did not correlate to data from the other holes, we are unsure of its stratigraphic position and its offset was determined by appending it to the bottom of Core 363-U1485C-1H. This uncertain correlation resulted in termination of the hole after Core 3H was recovered (see Operations). We used Hole U1485B as the “backbone” of the splice and filled gaps between cores in Hole U1485B using cores from Hole U1485D from 0 to 71.01 m CCSF and then cores from Hole U1485A below 71.01 m CCSF. However, the selection of spliced intervals deeper than 157.41 m CCSF was primarily based on avoiding disturbed cores and finding features in the magnetic susceptibility data that correlated well. Core photos were utilized while splicing to understand the influence of voids on the magnetic susceptibility and NGR data. The match between the holes is very well constrained within the spliced interval (0–157.41 m CCSF).
From 157.41 to 198.74 m CCSF, the splice is uncertain and unquestionably discontinuous. There are a number of cores with incomplete recovery due to the presence of sand. As we constructed the splice in this interval, we appended cores in places where we could not find tie points between holes. This resulted in four cores (363-U1485A-15H, 363-U1485B-17H and 19H, and 363-U1485A-18H) whose offsets were set using growth factors (Table T21), whereas the offset of Core 363-U1485A-16H was established by correlating it to Core 363-U1485B-17H. Because of a combination of poor recovery and expansion, which was accounted for by applying the growth factor, there are large gaps on either side of Core 363-U1485B-19H, which recovered a dense sand layer with the highest magnetic susceptibility values measured at Site U1485 (see Physical properties).
Below the sand layer, from 198.74 to 222.11 m CCSF, the splice is well constrained. However, the splice in the interval below this, from 222.11 to 267.34 m CCSF, certainly has gaps. HLAPC coring began at about this depth in both holes, and the short length of these cores made it difficult to successfully cover core gaps. In addition, Cores 363-U1485A-21F through 25F are essentially identical copies of Cores U1485B-24F through 28F. Thus, for this interval (222.11–267.34 m CCSF), core offsets for seven cores in the splice were estimated using growth factors (Table T21), and the remaining offsets were determined using tie points to those cores.
From 267.34 m CCSF to the bottom of the splice at 373.35 m CCSF, the splice is nearly continuous with the exception of three core gaps at the tops of Cores 363-U1485B-36F, 363-U1485A-34F, and 363-U1485B-43F. Offsets for these cores were set using 1.264, the observed growth factor in the overlying interval where correlation was well constrained. The growth factor did not increase downhole in this interval probably because of the stiffness of the sediment and less gas expansion compared to the upper section of the site. As such, the core gaps are relatively small (<1 m CCSF). Although we constructed a nearly continuous splice in this interval (267.34–373.35 m CCSF), the splice in this lower section of the site was very difficult to construct because of the very low amplitude variations in magnetic susceptibility and NGR and should be verified as part of postcruise research.
The splice interval table (Table T22) is intended to provide a sampling plan that can be used to generate high-resolution continuous records with minimal gaps; however, an “off-splice” sampling plan was also designed mainly for low-resolution studies. An explanation of the strategy used to determine the off-splice sampling plan and a table of core intervals that should be used for off-splice sampling can be found in OFFSPLICE in Supplementary material.
The cumulative offset between the mbsf and CCSF depth scales is nearly linear (Figure F29A), but close inspection of the cumulative offset as a function of depth (mbsf) (Figure F29B) shows that the growth factor is relatively large (in most cores it was >20%) and variable due to the release of overburden combined with methane gas expansion. The relatively high organic matter content of the sediment resulted in a very shallow sulfate–methane transition zone (see Geochemistry), and methane gas expansion persisted, although decreased, to the bottom of the cored interval at the site. There is a marked change in growth factor, and therefore cumulative offset with depth, at ~250 mbsf where the sediment was stiff and less affected by gas expansion. Calculation of mass accumulation rates based on the CCSF scale should account for differential expansion by dividing apparent depth intervals by the appropriate growth factor.

Figure F29. Comparison of mbsf and composite depth scales in the Site U1485 splice.
Geochemistry
Site U1485 was drilled off of northern Papua New Guinea, ~4 km away from Site U1484. As at Site U1484, sedimentation at Site U1485 is dominated by terrigenous input of volcanogenic material delivered by the rivers draining the Papua New Guinea highlands. Overall, the interstitial water profiles at Site U1485 are similar to those at Site U1484, except that the Site U1485 profiles extend down to ~296 mbsf (compared to 224 mbsf at Site U1484) and thus provide a more comprehensive understanding of the sediment-water interactions that occur deeper in the sedimentary column at the Papua New Guinea margin. For detailed background on organic matter remineralization and clay mineral alteration, see Geochemistry in the Site U1482 chapter (Rosenthal et al., 2018b).
Results
Volatile hydrocarbons
Headspace gas samples were taken at a frequency of one sample per core in Hole U1485A as part of the routine environmental protection and safety-monitoring program (Table T23; Figure F30). Methane concentration increases rapidly from 162 ppmv at 6.0 mbsf to 68,266 ppmv at 16.5 mbsf, consistent with the depletion of sulfate (SO4) in interstitial water at the same depth (see Sulfate and barium). Deeper than 16.5 mbsf, methane concentration fluctuates between 7,000 and 20,000 ppmv, with the exception of one sample at 133.5 mbsf with a methane concentration of 45,164 ppmv. In most of the samples, ethane and propane are below detection limit, resulting in extremely high methane/ethane ratios (C1/C2) throughout the hole, suggesting that methane is mostly of biogenic rather than thermogenic origin.
Table T23. Volatile hydrocarbon concentrations, Hole U1485A. Download table in CSV format.
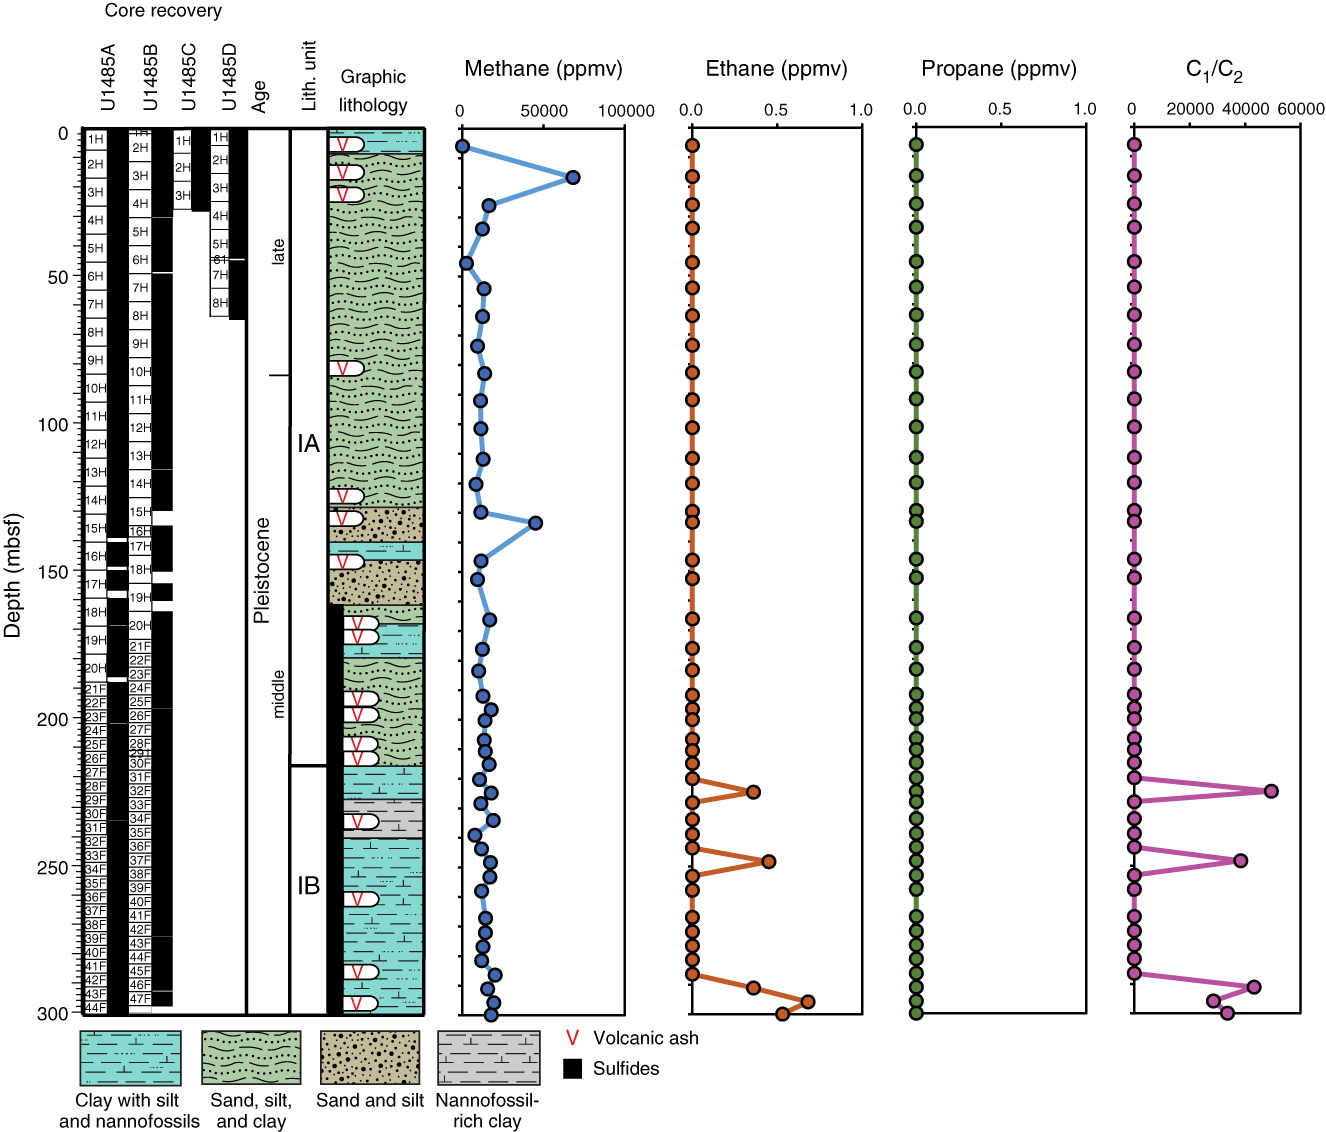
Figure F30. Methane, ethane, propane, and C1/C2 profiles.
Bulk sediment geochemistry
Calcium carbonate (CaCO3), inorganic carbon (IC), total organic carbon (TOC), and total nitrogen (TN) were measured on sediment samples from Hole U1485A (Table T24; Figure F31). CaCO3 content is generally low, ranging from 0.7 to 27.0 wt% with an average of 9.0 wt%. Overall, CaCO3 content increases gradually downhole, reaching a peak between 228.4 and 239.1 mbsf, where CaCO3 content is >15 wt%, consistent with a lithologic change from nannofossil-bearing silty clay to nannofossil-rich clay (see Core description). Between 243.9 mbsf and the base of the hole, the amount and variability in CaCO3 content are reduced, with CaCO3 content averaging ~8.0 wt%.
Table T24. Carbon, nitrogen, and C/N. Download table in CSV format.
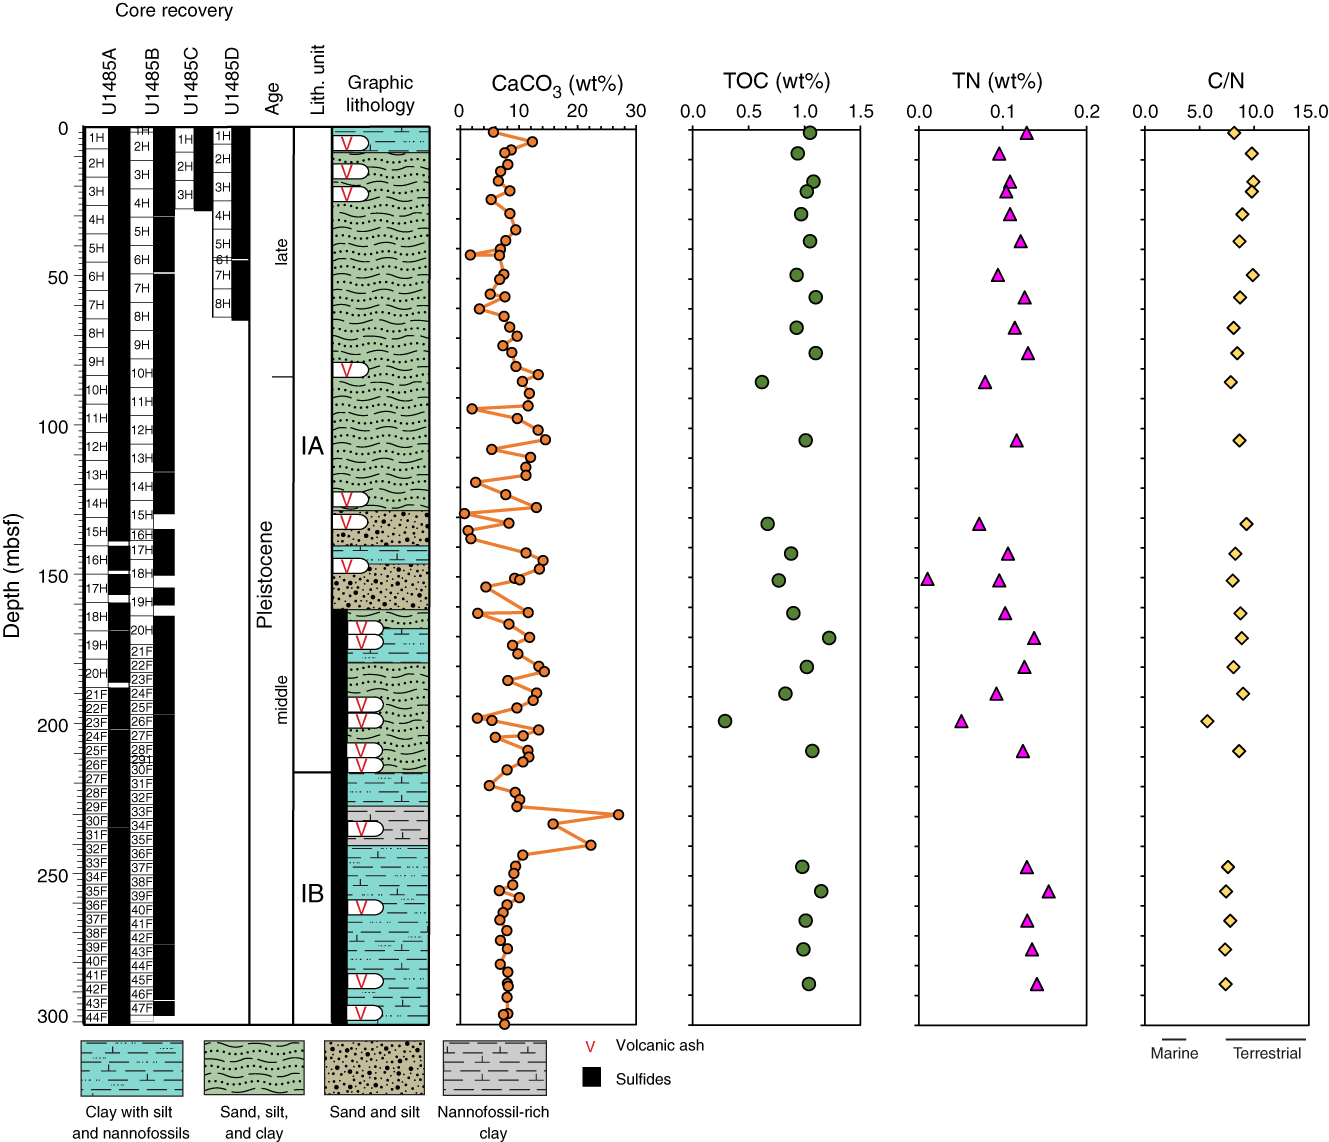
Figure F31. Carbon, nitrogen, and C/N profiles.
TOC content ranges between ~0.3 and 1.2 wt%, with an average of 0.9 wt%, and exhibits no discernible downhole trend. TOC is lower in sandy samples (i.e., 363-U1485A-23F-2, 36–38 cm [198.04 mbsf]) than in clay samples. The ratio of TOC to TN (C/N ratio) ranges from 6 to 10 with an average of 8 (Figure F31). The ratios are <10, suggesting that the organic matter deposited at Site U1485 is predominately of marine origin. Several lines of evidence indicate that the C/N ratio at Site U1485 is primary without major diagenetic alterations. Downhole TOC and TN variations track each other, and the absence of a downhole trend in TOC, TN, and C/N ratio variations suggests that most of the nitrogen is organic-bound with little preferential degradation. Caution should be taken, however, when interpreting the TOC and C/N data calculated using the subtraction method.
Interstitial water chemistry
Site U1485 was sampled at high resolution (1 whole-round sample per section downhole to 54.0 mbsf) for interstitial water geochemistry (see Geochemistry in the Expedition 363 methods chapter [Rosenthal et al., 2018a]). A total of 60 whole-round samples were taken from Hole U1485A. Of these, 36 interstitial water samples and 1 mudline sample were processed for all standard shipboard analyses following the procedures described in Geochemistry in the Expedition 363 methods chapter (Rosenthal et al., 2018a), and the remainder were split and processed for shore-based analyses. Interstitial water chemistry data are reported in Table T25.
Table T25. Interstitial water geochemical data. Download table in CSV format.
Chlorinity and salinity
The interstitial water chloride (Cl) profile displays small (<2%) but clear variations downhole (Figure F32). The profile is variable over the upper 25.9 mbsf but shows a general increase from 553.9 mM at the mudline to 558 mM at 25.9 mbsf. Below this depth, Cl decreases to 550.2 mM by 82.7 mbsf, increases to 557.6 mM by 101.4 mbsf, and then decreases again to ~550 mM to the bottom of the hole. Salinity is nearly constant downhole (not shown), ranging between 35 and 36.
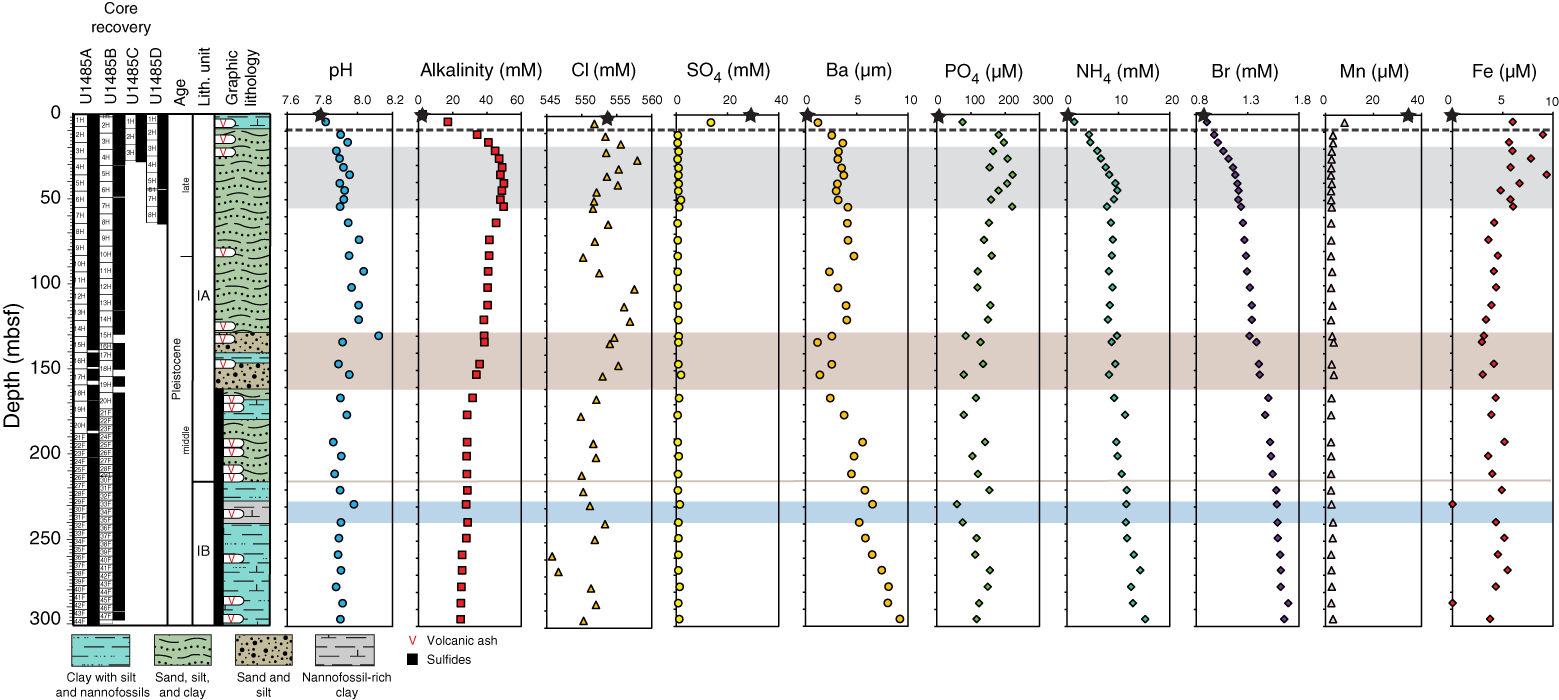
Figure F32. Interstitial water concentration profiles.
Alkalinity and pH
As at Site U1484, interstitial water pH at Site U1485 exhibits a small increase from the mudline (~7.8) to 21.4 mbsf and then remains relatively stable downhole (~7.9; with variations <1%) (Figure F32). A small interval of higher pH values (pH = ~8.0–8.1) occurs from ~70 to 130 mbsf and two small peaks in the pH downhole record are associated with changes in lithology (see Core description). The first peak (8.1) occurs at ~130 mbsf at the top of a ~30 m thick sediment interval dominated by sand and silt. The second pH peak (8.0) is observed at ~229 mbsf, near the top of an ~12 m thick interval of nannofossil-rich clay found within Subunit IB.
Alkalinity increases sharply from 2.5 mM at the mudline to 47.1 mM at 25.9 mbsf and reaches a maximum of 49.9 mM at 40.4 mbsf (Figure F32). This maximum concentration is slightly less than the alkalinity maximum at Site U1484 (see Geochemistry in the Site U1484 chapter [Rosenthal et al., 2018c]) but occurs at a similar depth and, as at Site U1484, is below the depth of the sulfate–methane transition zone (SMTZ) (see Sulfate and barium). Deeper than ~50 mbsf, alkalinity gradually declines with depth to 24.7 mM at 295.7 mbsf.
Sulfate and barium
SO4 concentration steeply decreases from seawater-like values (28.9 mM) at the mudline to <1 mM at 11.9 mbsf (Figure F32). The depth of SO4 depletion is ~8 m shallower than at Site U1484. Because the two sites display very similar TOC content downhole, this difference could reflect instead enhanced downward supply of dissolved SO4 at Site U1484, perhaps related to the presence of sand layers in subsurface sediment. SO4 concentration remains low (<2 mM) deeper than ~12 mbsf. Although the methane concentration profile suggests that anaerobic oxidation of methane (AOM) may play a role in consuming SO4, the data are of insufficient resolution to confidently determine the relative contributions of AOM and organic matter remineralization to SO4 reduction.
Barium (Ba) concentration at Site U1485 shows a small increase from the mudline (0.3 µM) to 21.4 mbsf (1.2 µM) (Figure F32), which is similar to the downhole increase observed in the upper ~20 mbsf at Site U1484. Ba reaches a local maximum of 4.7 μM at 82.7 mbsf before decreasing to an interval of lower concentration (~1.2 μM) at ~146 mbsf. These minimum values occur within an interval that is relatively rich in sand and silt (see Core description), suggesting a possible perturbation in porosity and diffusion rates within this zone. Unlike at Site U1484, Ba abruptly increases in concentration downhole, from ~150 mbsf to the lowermost sample (295.7 mbsf) where it reaches a maximum of 9.2 μM. The start of this downhole increase corresponds roughly with the bottom of a sand- and silt-rich interval found between ~130 and 160 mbsf, suggesting that the change in lithology at this depth may influence rates of diffusion.
Phosphate, ammonium, and bromide
As at Site U1484, phosphate (PO4) concentration is also high at Site U1485 (Figure F32). PO4 concentration increases from a minimum of 4.5 μM at the mudline to a maximum of 221.2 μM at 35.4 mbsf. Below this depth, the PO4 profile shows a small degree of variability but in general, concentration decreases gradually toward the base of the hole. A slight shift in values at ~229 mbsf is coincident with the nannofossil-rich clay interval.
Ammonium (NH4) and bromide (Br) behave similarly at Site U1485 (Figure F32). NH4 concentration increases steeply from 0.03 mM at the mudline to 9.4 mM at 40.4 mbsf and then exhibits a more gradual increase in concentration with depth below this level. A maximum concentration of 15.2 mM occurs at 296.7 mbsf. Br also increases steeply in the upper part of the sediment column, increasing from a mudline concentration of 0.87 mM to 1.18 mM at 35.4 mbsf. Br concentration then increases more gradually with depth to the base of Hole U1485A. The similar behavior of these two profiles reflects the process of organic matter remineralization.
Manganese and iron
Manganese (Mn) and iron (Fe) concentrations at Site U1485 display similar trends to those observed at Site U1484 (Figure F32). Mn concentration is highest at the mudline (34.8 μM) and then sharply decreases to ~2.5 μM by 21.4 mbsf. As with SO4, the downhole decrease in Mn concentration occurs more steeply and at a shallower depth at Site U1485 relative to Site U1484, reflecting a more condensed transition through redox zones (oxic, suboxic, and anoxic) during remineralization of organic matter. Fe concentration is also relatively high (maximum of 9.4 μM) in the shallowest sediment of Site U1485 and decreases with depth to ~3.74 μM. Fe concentration remains fairly elevated between ~30 and 60 mbsf, coincident with the peak in alkalinity concentration at this site. Lower Fe concentration at Site U1485 compared to Site U1484 may be related to more complete scavenging of iron by dissolved sulfide and/or other authigenic Fe-bearing mineral phases (e.g., siderite and mackinawite).
Potassium, magnesium, and calcium
As at Site U1484, potassium (K) concentration increases from seawater-like values (10.7 mM) at the mudline to 13.1 mM at 31.1 mbsf (Figure F33). K concentration remains high (~12.5–13 mM) until 120.3 mbsf and thereafter decreases toward the bottom of Hole U1485A to 10.7 mM. Subtle variations in the downhole K profile are observed at the depths of the sand- and silt-rich interval (~130–160 mbsf) and the onset of the clay-rich interval (deeper than ~226 mbsf) in lithologic Subunit IB.

Figure F33. Interstitial water concentration profiles.
Magnesium (Mg) concentration decreases slightly from a mudline value of 53.8 mM to a value of 50.6 mM at 4.4 mbsf, below which it remains relatively constant (49.5 ± 1.0 mM) until 133.4 mbsf. Below this depth, Mg concentration steadily decreases to a minimum of 30.3 mM at the base of the hole. A small but noticeable depletion to 48.7 mM at 11.9 mbsf probably reflects minor Mg incorporation associated with AOM-driven carbonate precipitation. This decreasing trend begins near the top of the sand- and silt-rich interval, suggesting a potential lithologic control on diffusion of interstitial water Mg.
Calcium (Ca) concentration displays an abrupt decrease from seawater-like values at the mudline (10.5 mM) to 2.2 mM at 11.9 mbsf (Figure F33), indicating that Ca consumption is driven by active precipitation of authigenic carbonates at the SMTZ. From 11.9 mbsf to the bottom of the hole, Ca concentration increases gradually from 2.2 to 4.5 mM.
Strontium and boron
The downhole profile of strontium (Sr) concentration closely follows that of Ca, starting with a pronounced drop from the mudline (0.09 mM) to the depth of the SMTZ (0.06 mM) (Figure F33). Sr concentration remains high until 54.1 mbsf, decreases to 0.05 mM at 82.7 mbsf, and then gradually increases again in the lower part of Hole U1485A (up to 0.07 mM). As at Site U1484, boron (B) behaves in a similar manner to potassium (K). B concentration increases markedly from a mudline value of 444.8 μM to a maximum of 731.3 μM between 21.4 and 44.6 mbsf, coincident with the highest observed alkalinity at Site U1485 (Figures F32, F33). Deeper than 44.6 mbsf, B decreases downhole to a minimum concentration of 350–307 μM in the lower 10 m of the hole.
Lithium, silica, and sodium
The lithium (Li) profile is similar to that of Ca and Sr. The concentration of Li decreases sharply from 25.9 μM at the mudline to 6.9 μM at 11.9 mbsf (the depth of the SMTZ); below this depth, Li concentration gradually increases to 12–14 μM and remains at this concentration to the bottom of the hole (Figure F33). As at Site U1484, the silica (Si) concentration profile in Hole U1485A is characterized by a pronounced increase from 196.6 µM at the mudline to 653.7 µM at 4.4 mbsf. Deeper than 4.4 mbsf, Si exhibits similar small-scale variability to that observed in the pH, PO4, and Fe downhole profiles, with an average concentration of 557 ± 73 mM.
Sodium (Na) concentration increases slightly from the mudline (482.6 mM) to ~486–488 mM between 31.7 and 101.4 mbsf (Figure F33). From 101.4 to 127.6 mbsf (the top of the sand- and silt-rich interval), Na drops rapidly to 472.9 mM before exhibiting a trend toward generally higher but scattered values through the rest of the hole.
Discussion
The interstitial water geochemical profiles at Site U1485 closely resemble those at Site U1484; however, early diagenetic processes related to remineralization of organic matter begin at shallower depths at Site U1485. For instance, the SMTZ at Site U1485 is at ~10 mbsf, compared to ~20 mbsf at Site U1484. A consequence of the steep geochemical gradients within the upper sediment column is that the position of the main biogeochemical fronts (e.g., oxic/suboxic transition at the SMTZ) cannot be precisely located at Site U1485, at least with the sampling resolution used for shipboard analyses. Steady downhole increases in NH4, Br, and (probably) Ba support organic matter remineralization at this site.
As at Site U1484, Site U1485 displays evidence for anoxic silicate weathering occurring within the methanogenic zone, as inferred from enrichments of alkalinity (up to ~50 mM), K (~13 mM), and Mg (~51 mM) between ~20 and 120 mbsf. PO4 also displays similar enrichment, but at slightly shallower depths and over a narrower sediment interval between ~15 and 55 mbsf. Although release of PO4 into interstitial water is generally controlled by organic matter degradation, the observed PO4 profile at Site U1485 could also reflect dissolution of PO4 minerals associated with volcanogenic sediment. Together with other easily alterable minerals such as olivine or volcanic glass, accessory PO4 minerals (e.g., apatite) are also preferentially altered during the early steps of basalt weathering in soils (e.g., Colman, 1982; Bayon et al., 2016). At Site U1485, preferential alteration of accessory PO4 minerals derived from Papua New Guinea highlands may represent a plausible mechanism for the decoupling between PO4 and other interstitial water geochemical profiles.
The interstitial water geochemical profiles extend downhole to 295.7 mbsf at Site U1485, compared to only 222.4 mbsf at Site U1484, and thus provide a more comprehensive understanding of sediment-water interactions that occur in the deep sedimentary column at the Papua New Guinea margin. A notable feature is the pronounced downhole depletion of several elements (Mg, K, B, and PO4) from ~50 to 120 mbsf. These downhole depletions coincide with decreasing total alkalinity and a sudden drop of pH from 8.1 to 7.9. In agreement with results from previous investigations (Michalopoulos and Aller, 1995; Wallman et al., 2008; Kim et al., 2016), these findings are consistent with secondary clay authigenesis, a process that would release CO2 (decrease pH) and lead to removal of major cations/anions in the surrounding interstitial water.
Finally, abrupt changes in concentration or slope observed in the profiles of several elements coincide with changes in lithology. These include changes in K, Mg, Na, Br, and pH at ~130 mbsf, corresponding to the uppermost part of a 30 m thick sand- and silt-rich interval, and changes in PO4, pH, and K at ~230 mbsf, corresponding to the upper part of a clay-rich interval (Subunit IB). These changes in lithology likely act as diffusive caps, interrupting communication in interstitial water between the sediment above and below these distinct lithologic transitions.
References
Baldwin, S.L., Fitzgerald, P.G., and Webb, L.E., 2012. Tectonics of the New Guinea region. Annual Review of Earth and Planetary Sciences, 40(1):495–520. https://doi.org/10.1146/annurev-earth-040809-152540
Bayon, G., Skonieczny, C., Delvigne, C., Toucanne, S., Bermell, S., Ponzevera, E., and André, L., 2016. Environmental Hf-Nd isotopic decoupling in world river clays. Earth and Planetary Science Letters, 438:25–36. https://doi.org/10.1016/j.epsl.2016.01.010
Colman, S.M., 1982. Chemical weathering of basalts and andesites: evidence from weathering rinds. Geological Survey Professional Paper, 1246. https://pubs.usgs.gov/pp/1246/report.pdf
Jones, R.W., 1994. The Challenger Foraminifera: New York (Oxford University Press USA).
Karlin, R., and Levi, S., 1983. Diagenesis of magnetic minerals in recent hemipelagic sediments. Nature, 303(5915):327–330. https://doi.org/10.1038/303327a0
Kim, J.-H., Torres, M.E., Haley, B.A., Ryu, J.-S., Park, M.-H., Hong, W.-L., and Choi, J., 2016. Marine silicate weathering in the anoxic sediment of the Ulleung Basin: evidence and consequences. Geochemistry, Geophysics, Geosystems, 17(8):3437–3453. https://doi.org/10.1002/2016GC006356
Kuroda, Y., 2000. Variability of currents off the northern coast of New Guinea. Journal of Oceanography, 56(1):103–116. https://doi.org/10.1023/A:1011122810354
Maher, B.A., 1988. Magnetic properties of some synthetic submicron magnetites. Geophysics Journal of the Royal Astronomical Society, 94:83–96.
McNeill, L.C., Dugan, B., Petronotis, K.E., Backman, J., Bourlange, S., Chemale, F., Chen, W., Colson, T.A., Frederik, M.C.G., Guèrin, G., Hamahashi, M., Henstock, T., House, B.M., Hüpers, A., Jeppson, T.N., Kachovich, S., Kenigsberg, A.R., Kuranaga, M., Kutterolf, S., Milliken, K.L., Mitchison, F.L., Mukoyoshi, H., Nair, N., Owari, S., Pickering, K.T., Pouderoux, H.F.A., Yehua, S., Song, I., Torres, M.E., Vannucchi, P., Vrolijk, P.J., Yang, T., and Zhao, X., 2017. Expedition 362 summary. In McNeill, L.C., Dugan, B., Petronotis, K.E., and the Expedition 362 Scientists, Sumatra Subduction Zone. Proceedings of the International Ocean Discovery Program, 362: College Station, TX (International Ocean Discovery Program). https://doi.org/10.14379/iodp.proc.362.101.2017
Michalopoulos, P., and Aller, R.C., 1995. Rapid clay mineral formation in Amazon delta sediments: reverse weathering and oceanic elemental cycles. Science, 270(5236):614–617. https://doi.org/10.1126/science.270.5236.614
Milliman, J.D., Farnsworth, K.L., and Albertin, C.S., 1999. Flux and fate of fluvial sediments leaving large islands in the East Indies. Journal of Sea Research, 41(1–2):97–107. https://doi.org/10.1016/S1385-1101(98)00040-9
Richter, C., Acton, G., Endris, C., and Radsted, M., 2007. Technical Note 34: Handbook for Shipboard Paleomagnetists. Ocean Drilling Program. https://doi.org/10.2973/odp.tn.34.2007
Rosenthal, Y., Holbourn, A., and Kulhanek, D.K., 2016. Expedition 363 Scientific Prospectus: Western Pacific Warm Pool. International Ocean Discovery Program. https://doi.org/10.14379/iodp.sp.363.2016
Rosenthal, Y., Holbourn, A.E., Kulhanek, D.K., Aiello, I.W., Babila, T.L., Bayon, G., Beaufort, L., Bova, S.C., Chun, J.-H., Dang, H., Drury, A.J., Dunkley Jones, T., Eichler, P.P.B., Fernando, A.G.S., Gibson, K.A., Hatfield, R.G., Johnson, D.L., Kumagai, Y., Li, T., Linsley, B.K., Meinicke, N., Mountain, G.S., Opdyke, B.N., Pearson, P.N., Poole, C.R., Ravelo, A.C., Sagawa, T., Schmitt, A., Wurtzel, J.B., Xu, J., Yamamoto, M., and Zhang, Y.G., 2018a. Expedition 363 methods. In Rosenthal, Y., Holbourn, A.E., Kulhanek, D.K., and the Expedition 363 Scientists, Western Pacific Warm Pool. Proceedings of the International Ocean Discovery Program, 363: College Station, TX (International Ocean Discovery Program). https://doi.org/10.14379/iodp.proc.363.102.2018
Rosenthal, Y., Holbourn, A.E., Kulhanek, D.K., Aiello, I.W., Babila, T.L., Bayon, G., Beaufort, L., Bova, S.C., Chun, J.-H., Dang, H., Drury, A.J., Dunkley Jones, T., Eichler, P.P.B., Fernando, A.G.S., Gibson, K.A., Hatfield, R.G., Johnson, D.L., Kumagai, Y., Li, T., Linsley, B.K., Meinicke, N., Mountain, G.S., Opdyke, B.N., Pearson, P.N., Poole, C.R., Ravelo, A.C., Sagawa, T., Schmitt, A., Wurtzel, J.B., Xu, J., Yamamoto, M., and Zhang, Y.G., 2018b. Site U1482. In Rosenthal, Y., Holbourn, A.E., Kulhanek, D.K., and the Expedition 363 Scientists, Western Pacific Warm Pool. Proceedings of the International Ocean Discovery Program, 363: College Station, TX (International Ocean Discovery Program). https://doi.org/10.14379/iodp.proc.363.103.2018
Rosenthal, Y., Holbourn, A.E., Kulhanek, D.K., Aiello, I.W., Babila, T.L., Bayon, G., Beaufort, L., Bova, S.C., Chun, J.-H., Dang, H., Drury, A.J., Dunkley Jones, T., Eichler, P.P.B., Fernando, A.G.S., Gibson, K.A., Hatfield, R.G., Johnson, D.L., Kumagai, Y., Li, T., Linsley, B.K., Meinicke, N., Mountain, G.S., Opdyke, B.N., Pearson, P.N., Poole, C.R., Ravelo, A.C., Sagawa, T., Schmitt, A., Wurtzel, J.B., Xu, J., Yamamoto, M., and Zhang, Y.G., 2018c. Site U1484. In Rosenthal, Y., Holbourn, A.E., Kulhanek, D.K., and the Expedition 363 Scientists, Western Pacific Warm Pool. Proceedings of the International Ocean Discovery Program, 363: College Station, TX (International Ocean Discovery Program). https://doi.org/10.14379/iodp.proc.363.105.2018
Rowan, C.J., Roberts, A.P., and Broadbent, T., 2009. Reductive diagenesis, magnetite dissolution, greigite growth and paleomagnetic smoothing in marine sediments: a new view. Earth and Planetary Science Letters, 277(1–2):223–235. https://doi.org/10.1016/j.epsl.2008.10.016
Steinberg, C.R., Choukroun, S.M., Slivkoff, M.M., Mahoney, M.V., and Brinkman, R.M., 2006. Currents in the Bismarck Sea and Kimbe Bay, Papua New Guinea. TNC Pacific Island Countries Report, 6/06. http://www.conservationgateway.org/Files/Pages/currents-bismarck-sea-and.aspx
Stoner, J.S., and St-Onge, G., 2007. Magnetic stratigraphy in paleooceanography: reversal, excursion, paleointensity and secular variation. In Hillaire-Marcel, C., and de Vernal, A. (Eds.), Proxies in Late Cenozoic Paleoceanography: Amsterdam (Elsevier Science), 99–138.
Ueki, I., Kashino, Y., and Kuroda, Y., 2003. Observation of current variations off the New Guinea coast including the 1997–1998 El Niño period and their relationship with Sverdrup transport. Journal of Geophysical Research: Oceans, 108(C7):3243. https://doi.org/10.1029/2002JC001611
van Morkhoven, F.P.C.M., Berggren, W.A., Edwards, A.S.,and Oertli, H.J., 1986. Cenozoic cosmopolitan deep-water benthic foraminifera. Bulletin des Centres de Recherches Exploration-Production Elf-Aquitaine, 11.
Wallmann, K., Aloisi, G., Haeckel, M., Tishchenko, P., Pavlova, G., Greinert, J., Kutterolf, S., and Eisenhauer, A., 2008. Silicate weathering in anoxic marine sediments. Geochimica et Cosmochimica Acta, 72(12):2895–2918. https://doi.org/10.1016/j.gca.2008.03.026
Webster, J.M., Wallace, L., Silver, E., Potts, D., Braga, J.C., Renema, W., Riker-Coleman, K., and Gallup, C., 2004. Coralgal composition of drowned carbonate platforms in the Huon Gulf, Papua New Guinea: implications for lowstand reef development and drowning. Marine Geology, 204(1–2):59–89. https://doi.org/10.1016/S0025-3227(03)00356-6
Wilkens, R.H., Westerhold, T., Drury, A.J., Lyle, M., Gorgas, T., and Tian, J., 2017. Revisiting the Ceara Rise, equatorial Atlantic Ocean: isotope stratigraphy of ODP Leg 154. Climate of the Past, 13:779–793. https://doi.org/10.5194/cp-13-779-2017
Zijderveld, J.D.A., 1967. AC demagnetization of rocks: analysis of results. In Collinson, D.W., Creer, K.M., and Runcorn, S.K. (Eds.), Methods in Palaeomagnetism: Amsterdam (Elsevier), 254–286.
1 Rosenthal, Y., Holbourn, A.E., Kulhanek, D.K., Aiello, I.W., Babila, T.L., Bayon, G., Beaufort, L., Bova, S.C., Chun, J.-H., Dang, H., Drury, A.J., Dunkley Jones, T., Eichler, P.P.B., Fernando, A.G.S., Gibson, K.A., Hatfield, R.G., Johnson, D.L., Kumagai, Y., Li, T., Linsley, B.K., Meinicke, N., Mountain, G.S., Opdyke, B.N., Pearson, P.N., Poole, C.R., Ravelo, A.C., Sagawa, T., Schmitt, A., Wurtzel, J.B., Xu, J., Yamamoto, M., and Zhang, Y.G., 2018. Site U1485. In Rosenthal, Y., Holbourn, A.E., Kulhanek, D.K., and the Expedition 363 Scientists, Western Pacific Warm Pool. Proceedings of the International Ocean Discovery Program, 363: College Station, TX (International Ocean Discovery Program). https://doi.org/10.14379/iodp.proc.363.106.2018
2 Expedition 363 Scientists’ addresses.
This work is distributed under the Creative Commons Attribution 4.0 International (CC BY 4.0) license. 
- F1. Northern margin of Papua New Guinea and location of Sites U1484–U1487.
- F2. Contoured bathymetric map and site locations.
- F3. Seismic Line RR1313-WP7-2 and site locations.
- F4. Precipitation anomalies during the 1997–1998 El Niño event.
- F5. Lithologic summary.
- F6. Main lithologies.
- F7. Main sedimentary components.
- F8. Sand and silty layers.
- F9. XRD results.
- F10. Tephra layers.
- F11. SEM photomicrographs of selected tephra samples.
- F12. Calcareous nannofossils.
- F13. Downcore foraminifer preservation states.
- F14. Age-depth plot.
- F15. NRM, χ and SIRM, χARM/SIRM, and IRM300mT/IRM1000mT.
- F16. Discrete sample AF demagnetization results.
- F17. NRM, WRMSL MS, inclination, and declination, Hole U1485B.
- F18. NRM, WRMSL MS, inclination, and declination, Hole U1485A.
- F19. NRM, WRMSL MS, inclination, and declination, Holes U1485C and U1485D.
- F20. Physical property measurements.
- F21. NGR, WRMSL GRA bulk density, MS, and P-wave velocity overlaid on core photos.
- F22. Comparison of major physical property parameters.
- F23. Discrete and whole-round P-wave measurements.
- F24. MAD dry, bulk, and grain densities, WRMSL GRA bulk density, and thermal conductivity.
- F25. Comparison of thermal conductivity and NGR.
- F26. WRMSL MS data.
- F27. Spliced L*, NGR, and WRMSL MS and GRA bulk density data.
- F28. Spliced MS data plotted on spliced core image.
- F29. Comparison of mbsf and composite depth scales in the Site U1485 splice.
- F30. Methane, ethane, propane, and C1/C2 profiles.
- F31. Carbon, nitrogen, and C/N profiles.
- F32. Interstitial water concentration profiles.
- F33. Interstitial water concentration profiles.
- T1. Site U1485 core summary.
- T2. Stratigraphic position of tephra layers.
- T3. Calcareous nannofossil and planktonic foraminifer biohorizons.
- T4. Benthic foraminifer distribution.
- T5. WRMSL GRA bulk density data, Hole U1485A.
- T6. WRMSL GRA bulk density data, Hole U1485B.
- T7. WRMSL GRA bulk density data, Hole U1485C.
- T8. WRMSL GRA bulk density data, Hole U1485D.
- T9. WRMSL MS data, Hole U1485A.
- T10. WRMSL MS data, Hole U1485A.
- T11. WRMSL MS data, Hole U1485A.
- T12. WRMSL MS data, Hole U1485A.
- T13. NGRL data, Hole U1485A.
- T14. NGRL data, Hole U1485A.
- T15. NGRL data, Hole U1485A.
- T16. NGRL data, Hole U1485A.
- T17. WRMSL PWL data, Hole U1485A.
- T18. WRMSL PWL data, Hole U1485B.
- T19. WRMSL PWL data, Hole U1485C.
- T20. WRMSL PWL data, Hole U1485D.
- T21. Affine table.
- T22. Splice interval.
- T23. Volatile hydrocarbon concentrations, Hole U1485A.
- T24. Carbon, nitrogen, and C/N.
- T25. Interstitial water geochemical data.