Rosenthal, Y., Holbourn, A.E., Kulhanek, D.K., and the Expedition 363 Scientists
Proceedings of the International Ocean Discovery Program Volume 363
publications.iodp.org
https://doi.org/10.14379/iodp.proc.363.109.2018

Site U14881
Y. Rosenthal, A.E. Holbourn, D.K. Kulhanek, I.W. Aiello, T.L. Babila, G. Bayon, L. Beaufort, S.C. Bova, J.-H. Chun, H. Dang, A.J. Drury, T. Dunkley Jones, P.P.B. Eichler, A.G.S. Fernando, K. Gibson, R.G. Hatfield, D.L. Johnson, Y. Kumagai, T. Li, B.K. Linsley, N. Meinicke, G.S. Mountain, B.N. Opdyke, P.N. Pearson, C.R. Poole, A.C. Ravelo, T. Sagawa, A. Schmitt, J.B. Wurtzel, J. Xu, M. Yamamoto, and Y.G. Zhang2
Keywords: International Ocean Discovery Program, IODP, JOIDES Resolution, Expedition 363, Site U1488, South Eauripik Rise, Pleistocene, Pliocene, late Miocene, Neogene, northern sector Western Pacific Warm Pool, Indonesian Throughflow, orbital-scale climate variability, high-resolution interstitial water sampling, Last Glacial Maximum ocean density structure, carbonate accumulation, color banding, biosilica, stratigraphic intercalibration and cyclostratigraphy, high-resolution interstitial water sampling, Last Glacial Maximum ocean density structure, carbonate diagenesis
MS 363-109: Published 8 June 2018
Background and objectives
International Ocean Discovery Program (IODP) Site U1488 (proposed Site WP-03A) is located atop the southern part of the Eauripik Rise at 02°02.59ʹN, 141°45.29ʹE in 2604 m water depth (Figure F1). The site is situated on seismic Line RR1313-WP3-1, ~4.4 km southwest of the intersection with seismic Line RR1313-WP3-3 (Figure F2). The seismic profile shows a continuous succession of hemipelagic, carbonate-rich sediment with basement at >650 meters below seafloor (mbsf) (Rosenthal et al., 2016) (Figure F3). Site U1488 is located ~28 km northwest of Deep Sea Drilling Project (DSDP) Site 62 and close to the location of piston Core MD97-2140, which was used to reconstruct the Pleistocene sea-surface temperature history of the Western Pacific Warm Pool (WPWP) (de Garidel-Thoron et al., 2005). DSDP Leg 7 recovered a nearly continuous sequence of upper Oligocene to Quaternary chalk and carbonate-rich ooze from Site 62 (Winterer and Riedel, 1971). However, recovery was relatively poor, and the sediment was frequently disturbed due to the use of the rotary core barrel system.
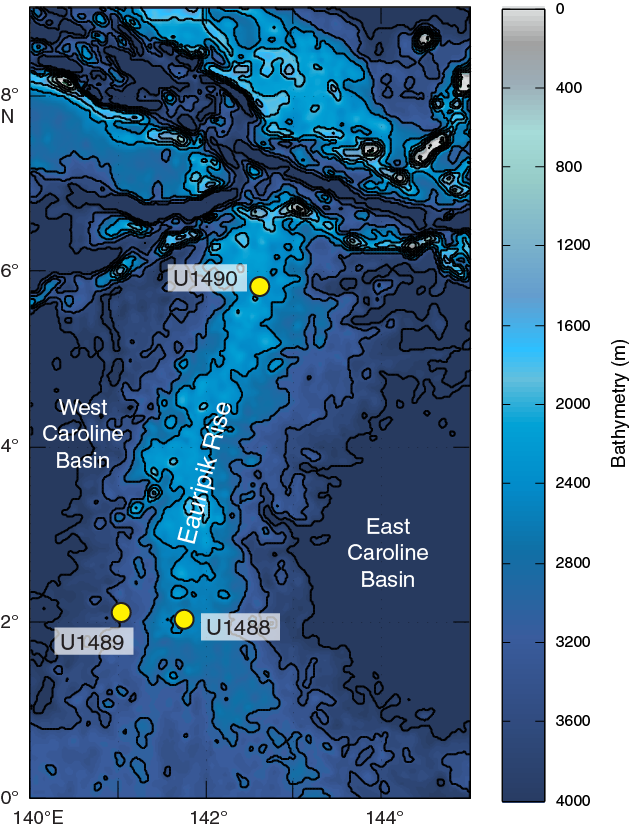
Figure F1. Eauripik Rise and locations of Sites U1488–U1490.
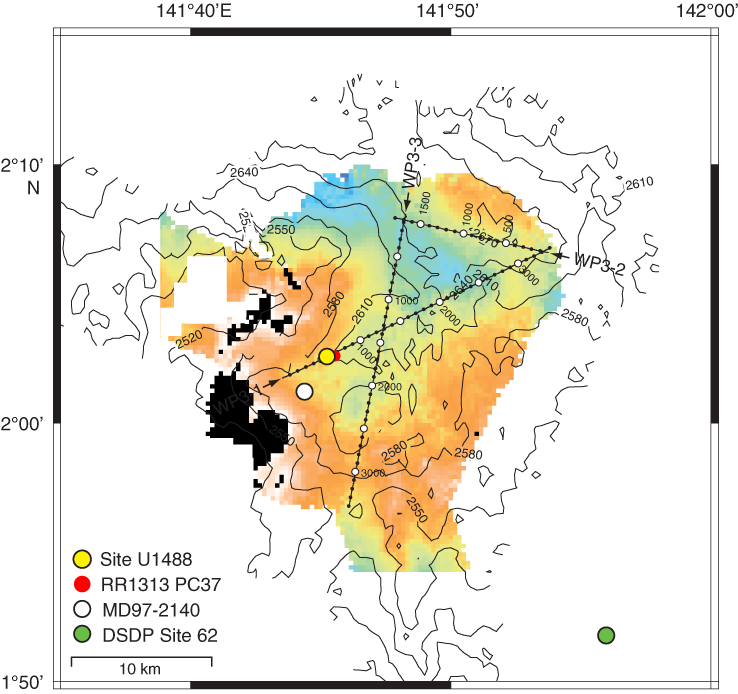
Figure F2. Bathymetric map and site location.
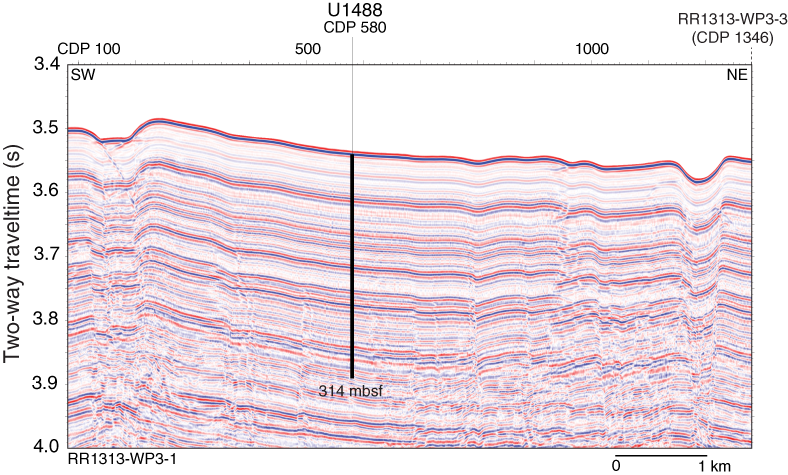
Figure F3. Seismic line and site location.
Site U1488 is situated on the Eauripik Rise, within the Caroline Basin north of Papua New Guinea (Figure F1). The roughly north-south–trending Eauripik Rise is an ~250 km wide aseismic ridge that rises ~1–2 km above the surrounding seafloor and separates the East and West Caroline Basins. Magnetic Anomalies C13–C9 in both basins show that ocean crust formed along roughly east–west spreading centers from the Eocene until the late Oligocene. Offsets in these anomalies and the lack of magnetic lineations beneath the Eauripik Rise supports the interpretation that it formed due to excess submarine volcanism along a leaky north–south transform fault (Hegarty and Weissel, 1988.) An alternative interpretation attributes the formation of the Eauripik Rise to the northward passage of a mantle hotspot that contributed to the tectonically and structurally complex region surrounding the Sorol Trough (Bracey, 1975). Seismic refractions show thickened ocean crust beneath the Eauripik Rise, and a small free air anomaly and positive geoid anomaly indicate a compensated structure reaching deep into the mantle (Hegarty and Weissel, 1988). Although there are no discernible magnetic lineations on the Eauripik Rise, these data and the recovery of tholeiitic basalt at Site 62 (Shipboard Scientific, 1971) make it difficult to argue that it is a remnant of ancient continental material. The igneous rocks recovered from the bottom of Site 62 are slightly vesicular, highly altered, and contain calcite veins with well-preserved foraminifers and nannofossils. The dolomitization of overlying limestone suggests that these basalts intruded into marine chalk, leading to extensive diagenetic reactions near the base of the sedimentary succession.
Site U1488 is located ~2° north of the Equator and is thus suitable for reconstructing the hydrographic history of the WPWP. The comparatively low sedimentation rate at this site, typical of open-ocean environments, will be used along with the record from Site U1490 to reconstruct the evolution of the WPWP since the late Miocene. At 2600 m below sea level (mbsl) the site is bathed by modified Upper Circumpolar Deepwater (Figure F4) and therefore will be useful to monitor past changes in this water mass. High-resolution interstitial water sampling at this site will be used for geochemical reconstructions of the deep Pacific water mass (δ18O, salinity, and seawater chemistry) during the Last Glacial Maximum (LGM).
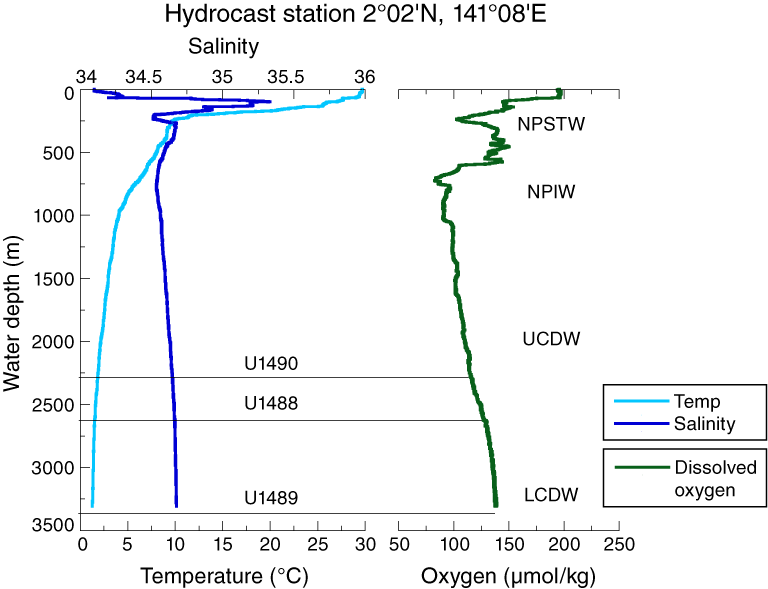
Figure F4. Hydrographic profiles of temperature, salinity, and dissolved oxygen.
Operations
Transit to Site U1488
The 333.2 nmi transit to Site U1488 was completed in 29.8 h at an average speed of 11.2 kt. We lowered the thrusters and switched to dynamic positioning mode at 0400 h (all times local ship time; UTC + 10 h) on 20 November 2016. After arriving on site, we deployed a positioning beacon at 0425 h before commencing coring operations.
Operations summary
The original operations plan for Site U1488 called for three holes: the first to advanced piston corer (APC) refusal, estimated at 250 mbsf, followed by two holes to 300 mbsf using both the APC and extended core barrel (XCB) coring systems. We ultimately cored three holes using only the APC and half-length APC (HLAPC) systems, with the deepest penetrating to ~315 mbsf (Table T1).
Table T1. Site U1488 core summary. Download table in CSV format. View PDF table.
Hole U1488A was cored with the APC system using orientation and nonmagnetic hardware to 300.4 mbsf (Cores 1H through 32H). Downhole formation temperature measurements using the advanced piston corer temperature tool (APCT-3) were taken on Cores 4H (34.4 mbsf), 7H (62.9 mbsf), 10H (91.4 mbsf), and 13H (119.9 mbsf), obtaining good results on all four deployments. We also collected high-resolution interstitial water samples at a frequency of one whole-round (5–10 cm) sample per section over the upper 150 mbsf of Hole U1488A. After Cores 31H and 32H had excessive overpull and required drillover to extract them from the formation, we switched to the HLAPC system and continued coring to 314.5 mbsf (Cores 33F through 35F). Because Cores 33F and 35F also required drillover, indicating HLAPC refusal, we terminated coring. We collected 327.20 m of sediment over 314.5 m of coring (104% recovery) in Hole U1488A.
Hole U1488B was cored to 304.9 mbsf (Cores 1H through 33H) with the APC system using orientation and nonmagnetic hardware. Cores 31H through 33H required drillover, indicating APC refusal, so we terminated coring. We collected 315.77 m of core over 304.9 m of coring (104% recovery) in Hole U1488B.
Hole U1488C was cored to recover material for the stratigraphic splice over the upper 150 mbsf, since high-resolution interstitial water sampling was conducted in Hole U1488A over this interval. APC coring using orientation and nonmagnetic hardware proceeded to 159.3 mbsf (Cores 1H through 17H), where we terminated coring. We collected 153.60 m of core over 159.3 m of coring (96.4% recovery) in Hole U1488C.
Operations at Site U1488 ended at 1030 h on 24 November 2016. Total time spent at Site U1488 was 102.5 h (4.3 days). A total of 82 APC cores were recovered at this site, collecting 781.74 m of sediment over 764.6 m of coring (102.2% recovery). We also collected 3 HLAPC cores, retrieving 14.83 m of sediment over 14.1 m of coring (105.2% recovery). In total, we collected 796.57 m of sediment over 778.7 m of coring (102.3% recovery) at Site U1488.
Hole U1488A
We prepared and spaced out the bottom-hole assembly (BHA), which consisted of an APC/XCB coring assembly with two stands of drill collars. During deployment of the drill string, the seafloor depth was measured at 2616.4 m below rig floor (mbrf) with the precision depth recorder (PDR), and we positioned the bit at 2611.0 mbrf to shoot the first core. Hole U1488A was spudded at 1225 h on 20 November 2016. Core 1H recovered 5.89 m of sediment, establishing a seafloor depth of 2603.4 mbsl. APC coring using the Icefield MI-5 core orientation tool with nonmagnetic hardware continued to 300.4 mbsf (Cores 1H through 32H). Downhole formation temperature measurements using the APCT-3 were taken on Cores 4H (34.4 mbsf), 7H (62.9 mbsf), 10H (91.4 mbsf), and 13H (119.9 mbsf), obtaining good results on all four deployments. We also collected high-resolution interstitial water samples at a frequency of one (5–10 cm) whole-round sample per section over the upper 150 mbsf of Hole U1488A. The core liners of Cores 8H and 10H were twisted and split throughout. Cores 11H and 12H had zero recovery and therefore were shot a second time from the same depth, with full recovery both times. This problem ceased after the inner, outer, and piston seals on the core barrels were changed. Cores 31H and 32H had excessive overpull and required drillover to extract them from the formation, indicating APC refusal.
We switched to the HLAPC coring system and continued coring to 314.5 mbsf (Cores 33F through 35F). Cores 33F and 35F both had excessive overpull and required drillover to extract from the formation. Core 33F also had to be pumped out of the core barrel. We declared HLAPC refusal after Core 35F and terminated coring in Hole U1488A. The drill string was pulled out of the hole, with the bit clearing the seafloor at 0120 h on 21 November, ending operations in Hole U1488A. Total time spent in Hole U1488A was 45.25 h (1.9 days).
A total of 32 APC cores were taken in Hole U1488A. We recovered 312.37 m of sediment over 300.4 m of coring for a recovery of 104.0%. We also collected 3 HLAPC cores, recovering 14.83 m of sediment over 14.1 m of coring (105.2% recovery). Overall recovery for Hole U1488A was 327.20 m of sediment over 314.5 m of coring (104.0%).
Hole U1488B
The vessel was offset 20 m east of Hole U1488A, and the drill string was spaced out with the bit at 2607.0 mbrf. Hole U1488B was spudded at 0300 h on 22 November 2016, with Core 1H recovering 0.90 m of sediment, establishing a seafloor depth of 2604.4 mbsl. Oriented APC coring using the Icefield MI-5 core orientation tool with nonmagnetic hardware continued to 304.9 mbsf (Cores 1H through 33H). Core 1H had a broken liner. Cores 31H through 33H had excessive overpull and had to be drilled over. We terminated coring in Hole U1488B after determining APC refusal based on the overpull. The drill string was pulled out of the hole, with the bit clearing the seafloor at 1140 h on 23 November, ending operations in Hole U1488B. Total time spent in the hole was 34.5 h (1.5 days).
A total of 33 APC cores were taken in Hole U1488B. We recovered 315.77 m of sediment over 304.9 m of coring for a total recovery of 103.6%.
Hole U1488C
Hole U1488C was cored to recover material for the stratigraphic splice over the upper 150 mbsf where high-resolution interstitial water sampling had been conducted in Hole U1488A. The vessel was offset 20 m south of Hole U1488B, and the drill string was spaced out with the bit at 2613.0 mbrf. Hole U1488C was spudded at 1300 h on 23 November 2016, with Core 1H recovering 7.27 m of sediment, establishing a seafloor depth of 2604.0 mbsl. Oriented APC coring using the Icefield MI-5 orientation tool with nonmagnetic hardware continued to 159.3 mbsf (Cores 1H through 17H). Core 14H had a split core liner. We terminated coring at 159.3 mbsf after achieving our objective of covering core gaps in the upper 150 mbsf of the site. The drill string was retrieved to the vessel, with the positioning beacon recovered during the pipe trip. The rig was secured for transit, and the thrusters were raised, ending operations in Hole U1488C and at Site U1488 at 1030 h on 24 November. Total time spent in Hole U1488C was 22.75 h (0.9 days).
A total of 17 APC cores were taken in Hole U1488C. We recovered 153.60 m of sediment over 159.3 m of coring for a total recovery of 96.4%.
Core description
Site U1488 is located at ~2604 m water depth on top of the Eauripik Rise, ~28 km northwest of DSDP Site 62. Three holes were drilled at Site U1488, with the deepest hole (U1488A) reaching 314.5 mbsf. The recovered sediment is primarily upper Miocene to recent foraminifer-nannofossil ooze with minor variation throughout the site. The sediment also contains minor amounts of siliciclastic (mainly clay minerals), siliceous (radiolarians, diatoms, sponge spicules, and silicoflagellates), and volcanogenic (ash) particles. Authigenic sulfide precipitates and authigenic clay minerals (e.g., smectite-chlorite) also occur as accessories. Bioturbation is slight to moderate throughout the cores. No obvious sign of sediment deformation was observed. Sediment color gradually varies from light greenish gray in the uppermost ~50 mbsf to greenish white between ~50 and ~250 mbsf and yellowish white below ~250 mbsf. Based on a combination of visual core description, microscopic examination of smear slides, magnetic susceptibility, natural gamma radiation (NGR), color reflectance, and mineralogical analysis by X-ray diffraction (XRD) (see Core description and Physical properties in the Expedition 363 methods chapter [Rosenthal et al., 2018a]), we defined one lithologic unit for Site U1488 with no subunits identified (Figure F5).
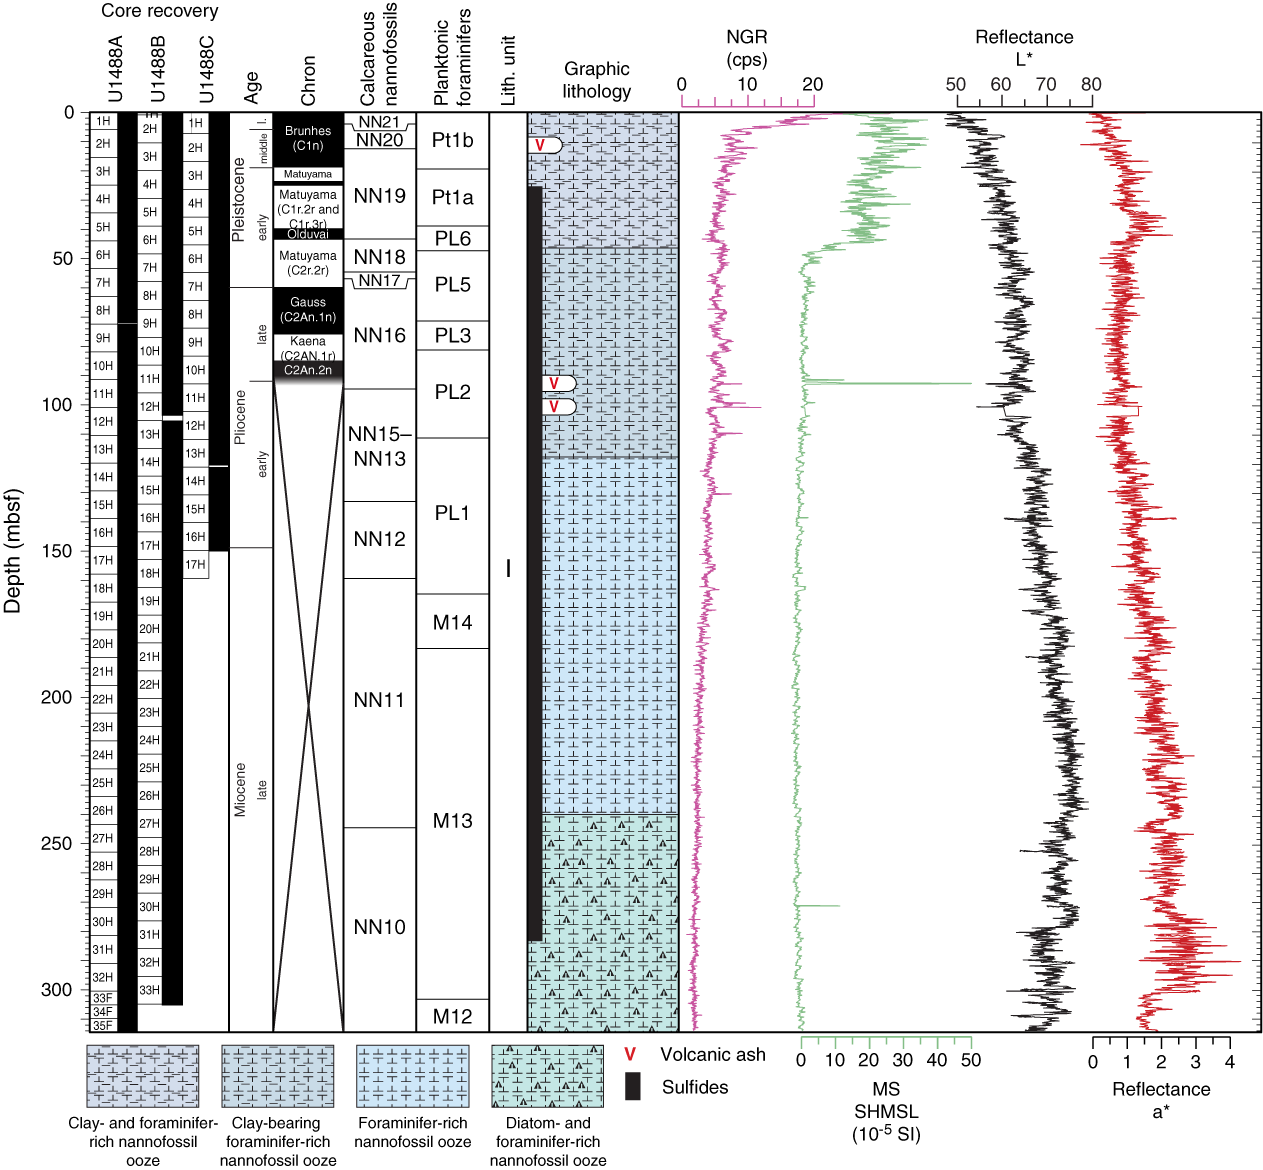
Figure F5. Lithologic summary.
Unit description
Unit I
-
Intervals: 363-U1488A-1H-1, 0 cm, through 35F-CC, 26 cm; 363-U1488B-1H-1, 0 cm, through 33H-CC, 23 cm;
363-U1488C-1H-1, 0 cm, through 17H-CC, 25 cm - Depths: Hole U1488A = 0–314.78 mbsf, Hole U1488B = 0–305.32 mbsf, Hole U1488C = 0–150.05 mbsf
- Thickness: Hole U1488A = 314.78 m, Hole U1488B = 305.32 m, Hole U1488C = 150.05 m
- Age: late Miocene to recent
- Lithology: foraminifer-rich nannofossil clay, foraminifer-bearing nannofossil ooze, clay-rich foraminifer-nannofossil ooze, clay-bearing foraminifer-bearing nannofossil ooze, foraminifer-bearing nannofossil clay, radiolarian-bearing foraminifer-nannofossil ooze, diatom-rich foraminifer-nannofossil ooze, and nannofossil-rich diatom ooze
Unit I is composed of ~315 m of upper Miocene to recent mainly biogenic, secondarily siliciclastic (mainly clay minerals), and volcanogenic sediment (Figure F5). The upper ~1 m of the sediment is relatively dark in color (pale brown [10YR 6/3] to greenish gray [10Y 6/1]) and is dominated by biogenic siliceous particles (nannofossil-rich diatom ooze) (Figures F6A, F6B, F7A, F7B). The sediment below the uppermost ~1 m is composed mainly of greenish gray to white foraminifer and nannofossil ooze with minor and variable amounts of clay, siliceous microfossils, and volcanogenic material (Figures F5, F6C–F6F, F8). Three volcanic ash layers composed of fresh, angular, and colorless shards are found at ~6.5, ~93, and ~100 mbsf (Table T2; Figures F9, F10).
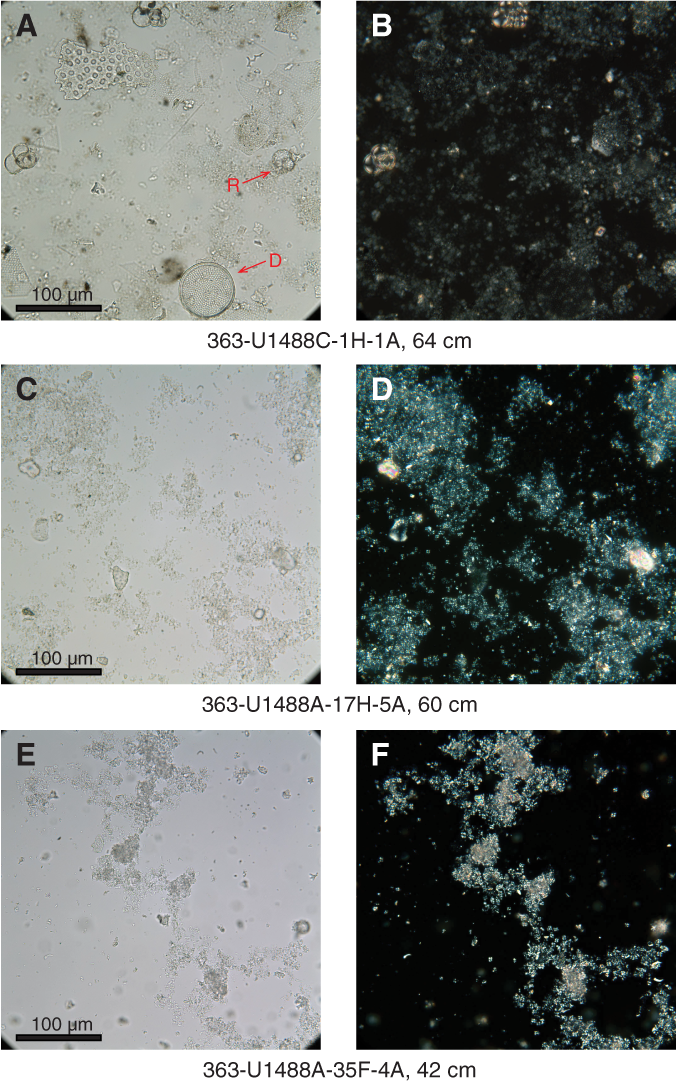
Figure F6. Characteristic lithologies.
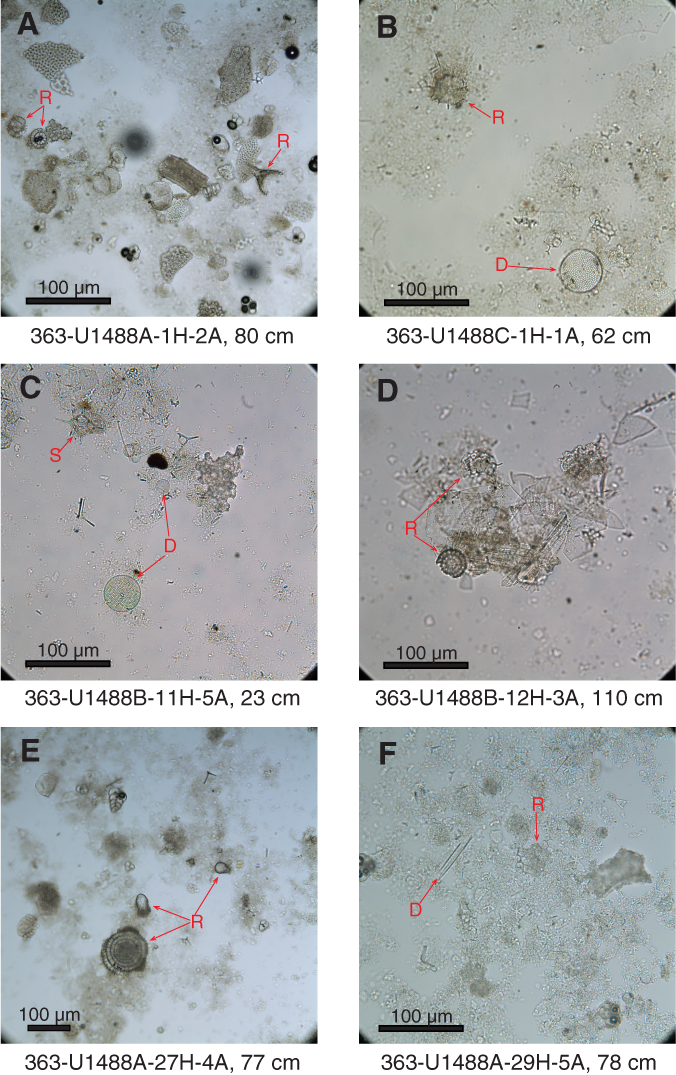
Figure F7. Biogenic siliceous components.
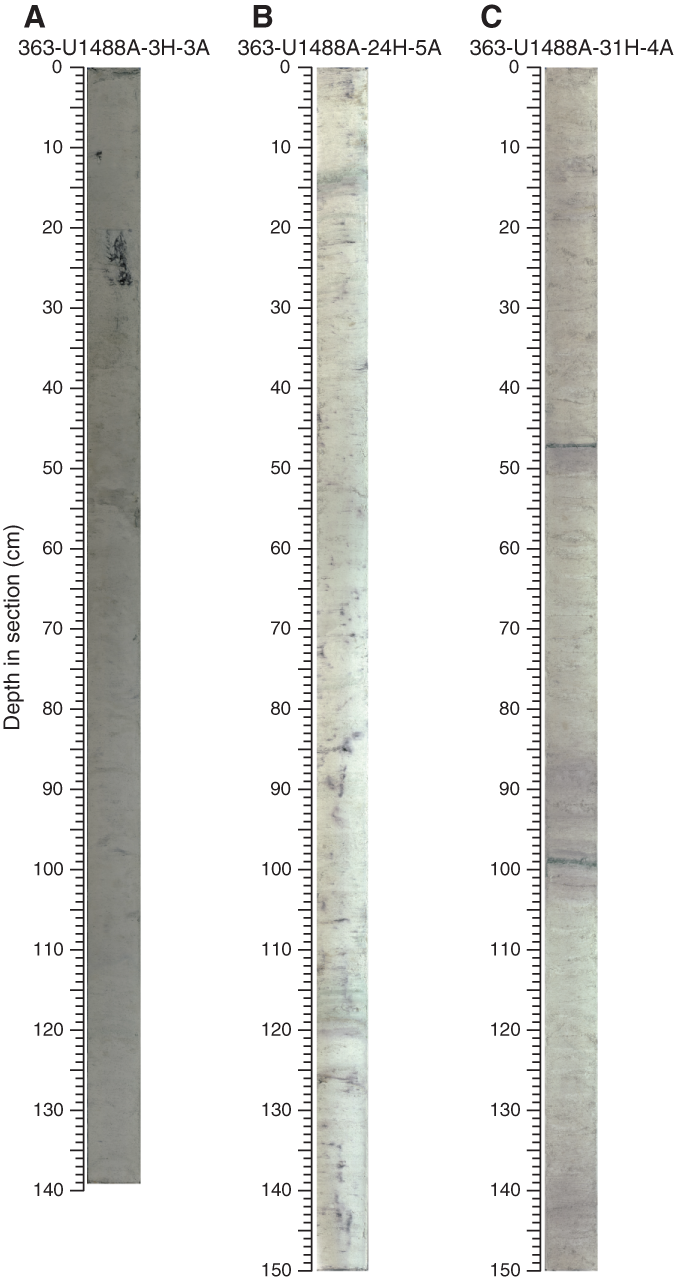
Figure F8. Main lithologies.
Table T2. Stratigraphic position of tephra layers. Download table in CSV format.
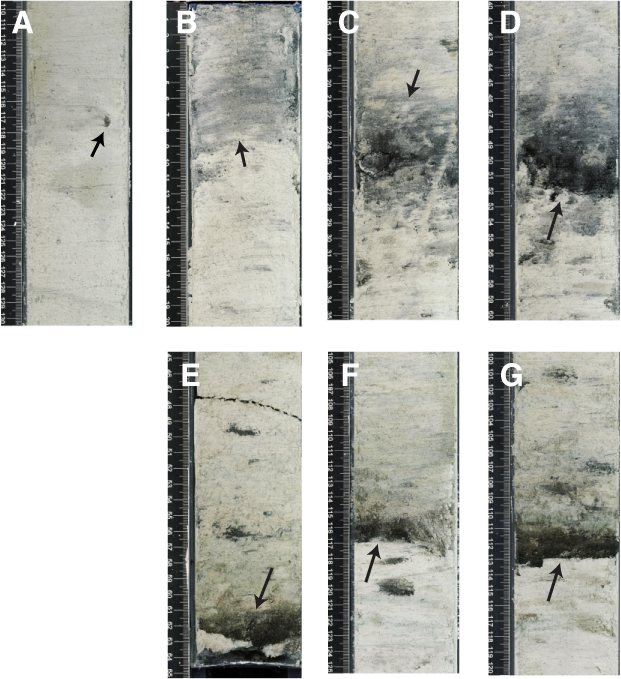
Figure F9. Occurrence of volcanogenic sediment.

Figure F10. Glass shards in volcanogenic material.
One striking feature of the sediment succession at Site U1488 is the relatively regular occurrence of distinct layers or bands (Figure F11) that display a variety of colors (greenish, brownish, yellowish, and pale purplish) in contrast to the background lithology. These distinctive horizontal layers, up to a few centimeters thick, occur throughout the sediment sequence (Figure F11). In particular, green layers are concentrated between ~270 and ~300 mbsf, where they occur at regular intervals of ~40–60 cm within the white foraminifer-nannofossil ooze (Figure F11C). The green layers are not disrupted by bioturbation, and some are indurated. Under the petrographic microscope, some of the green layers are characterized by abundant clusters of clay-sized particles. The clusters are green, pleiochroic (Figure F11D), and in many cases infill the tests of foraminifers and radiolarians (Figure F11E). Clay mineral XRD analysis on the carbonate-free samples of two of these green layers revealed that their composition is smectite (montmorillonite) and chlorite (possibly vermiculite) (Figure F11F). Some of the bands observed with smear slide microscopy show small-scale compositional differences that could account for the color differences. For instance, the brownish bands have more radiolarians and clay, whereas the greenish bands contain more foraminifers.
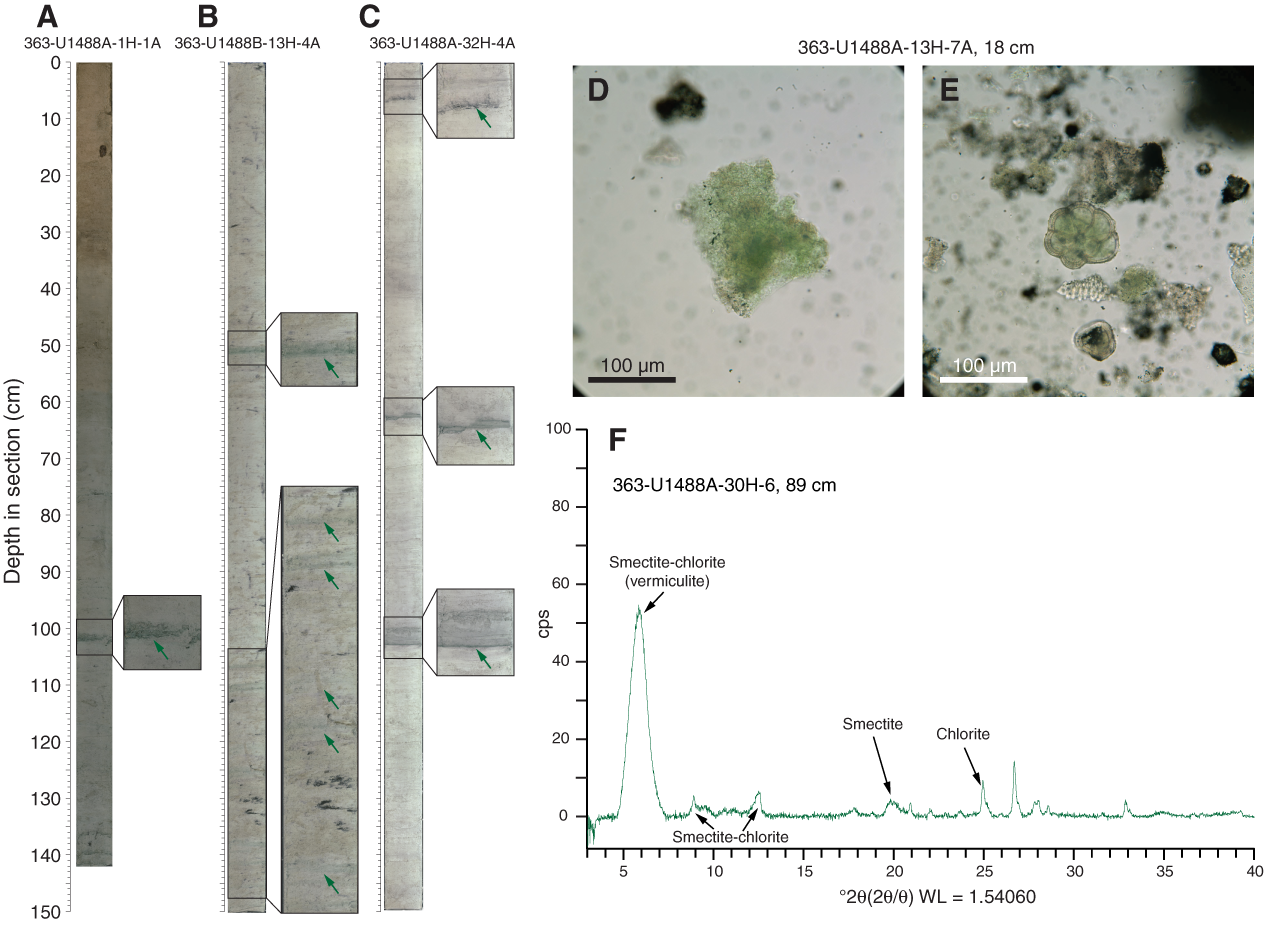
Figure F11. Distinctive green layers.
Generally, the siliciclastic component of the sediment, including clay and other silicate minerals, occurs in trace amounts at Site U1488. These siliciclastic minerals are most abundant in the upper ~50 mbsf (the depth at which magnetic susceptibility drops dramatically) and less abundant below this depth. In particular, clay mineral abundance is relatively high in the upper ~100 mbsf and decreases downhole, which is reflected by a progressive decrease in NGR and reductions in natural remanent magnetization (NRM) intensity below ~100 mbsf (Figure F5) (see Physical properties and Paleomagnetism).
Biogenic components are abundant throughout the sediment sequence but show varying degrees of preservation at Site U1488. Above 240 mbsf, calcareous microfossils (nannofossils and foraminifers) dominate the sequence, whereas below 240 mbsf, siliceous microfossils (primarily diatoms and radiolarians) are more abundant and constitute on average ~10% of the sediment particles (Figures F5, F7E, F7F). Abundant biosilica is also observed within a few centimeters above ash layers (Figure F7C, F7D). During smear slide analysis, we noted that when clay is present the larger biogenic particles (radiolarians and foraminifers) are often coated with clay minerals. Preservation of calcareous microfossils decreases downhole (see Biostratigraphy), concomitant with the decrease in abundance of clay minerals. In the deeper part of the succession, nannofossils and foraminifers are clearly identifiable in smear slide but are commonly mixed with carbonate particles only a few micrometers in diameter. The nature of these small carbonate particles could not be identified, but they are probably recrystallized coccoliths.
Dark sulfide precipitates are very common throughout the succession (Figure F5), and pyrite nodules are found from ~20 to ~280 mbsf (Figure F12).
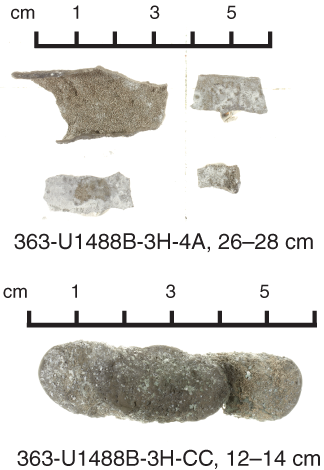
Figure F12. Pyrite nodules.
Discussion
The sediment at Site U1488 mainly consists of clay-rich foraminifer-rich nannofossil ooze, foraminifer-bearing nannofossil ooze, and radiolarian-bearing foraminifer-nannofossil ooze, indicating the dominance of pelagic sedimentation at this location since the late Miocene. However, changes in the relative abundance of minor sedimentary components, including biosilica and clay, may reflect changes in depositional conditions from the late Miocene to recent. The lower part of the upper Miocene sequence below ~240 mbsf is characterized by higher abundances of siliceous microfossils, especially diatoms, which suggest higher productivity in the surface waters overlying the site. The upper part of the upper Miocene to lower Pliocene sequence (between ~240 and 120 mbsf) is mainly nannofossil ooze with varying amounts of foraminifers, suggesting a change to more oligotrophic conditions. Clay minerals are present mainly above ~120 mbsf and become a significant part of the sediment above ~50 mbsf (Figure F5). Given the location of Site U1488 in an open-ocean setting, far from direct riverine input and on a relative high rise of the seafloor (the Eauripik Rise), the most likely source of the clay and other fine siliciclastic material is eolian. If this interpretation is correct, then the increase in clay content together with magnetic susceptibility and NGR above ~50 mbsf (since the early Pleistocene) could be interpreted as reflecting a progressive increase in wind action possibly related to monsoonal activity.
Color banding is one of the most prominent features of Site U1488. The bands are generally a few centimeters thick, and although they occur throughout the cored sequence, they seem to be more concentrated in several stratigraphic intervals. Some of the green bands are clay rich and composed of smectite and chlorite (Figure F11). Bands of other colors, including yellow and brown, show small-scale compositional differences in microfossil content that might reflect variations in primary deposition, although more detailed and quantitative analysis is needed to confirm these differences exist. The recurrence of these bands and the compositional differences associated with them might represent redox fronts in the sediment column associated with the redox reactions of iron and manganese (e.g., Cole and Shaw, 1983; Steinberg et al., 1987).
Biostratigraphy
Site U1488 consists of a 315 m thick succession of foraminifer-rich nannofossil ooze with varying proportions of clay (see Core description). Calcareous microfossil assemblages and preservation are typical of a pelagic, relatively deep water bathyal environment throughout the recorded succession. Unlike previous sites (Sites U1482–U1487), microfossil preservation at Site U1488 shows an increase in recrystallization (foraminifers) and some fragmentation, etching, and overgrowth (foraminifers and calcareous nannofossils) downhole. Preservation is typical of pelagic carbonate-rich environments. Both planktonic foraminifer and calcareous nannofossil taxa are easily recognized to species level, except for some discoasters in the upper Miocene, which are susceptible to overgrowth. Results from each fossil group (calcareous nannofossils, planktonic foraminifers, and benthic foraminifers) are presented in the sections below, followed by a detailed characterization of benthic and planktonic foraminifer preservation state using the shipboard scanning electron microscope (SEM; Hitachi TM3000). An integrated bio- and magnetostratigraphy and preliminary age model are presented in the final section. Shipboard taxon occurrence data are available to download from the Laboratory Information Management System (LIMS) database (http://web.iodp.tamu.edu/LORE).
Calcareous nannofossils
Calcareous nannofossil biostratigraphy is based on analysis of core catcher samples and additional samples from working-half sections in Hole U1488A. Observations were undertaken using plane- (PPL), cross- (XPL), and circular-polarized light (CPL), as well as the shipboard desktop SEM to confirm the presence of Emiliania huxleyi and to check preservation state. Depth positions and age estimates of key biohorizons are given in Table T3.
Table T3. Calcareous nannofossil bioevents. Download table in CSV format.
At Site U1488, the preservation of calcareous nannofossils is good from the top of the succession downhole to Core 363-U1488A-14H, near the base of the early Pliocene (Figure F13). From Core 15H (early Pliocene) to the penultimate core of the hole, Core 34H (late Miocene), preservation is moderate with some fragmentation and overgrowth. Overgrowth of discoasters occasionally makes species identification difficult in upper Miocene samples. Placolith coccoliths in the same upper Miocene interval show little overgrowth but are sometimes slightly etched and fragmented. In the deepest recovered core (Core 35H), preservation is moderate to poor, with more significant overgrowth of discoasters and some placoliths. This pattern of calcareous nannofossil preservation with depth is consistent with SEM observations of foraminifer overgrowth (see Foraminifer preservation) and the progressive downhole increase in the cementation of the sediment.
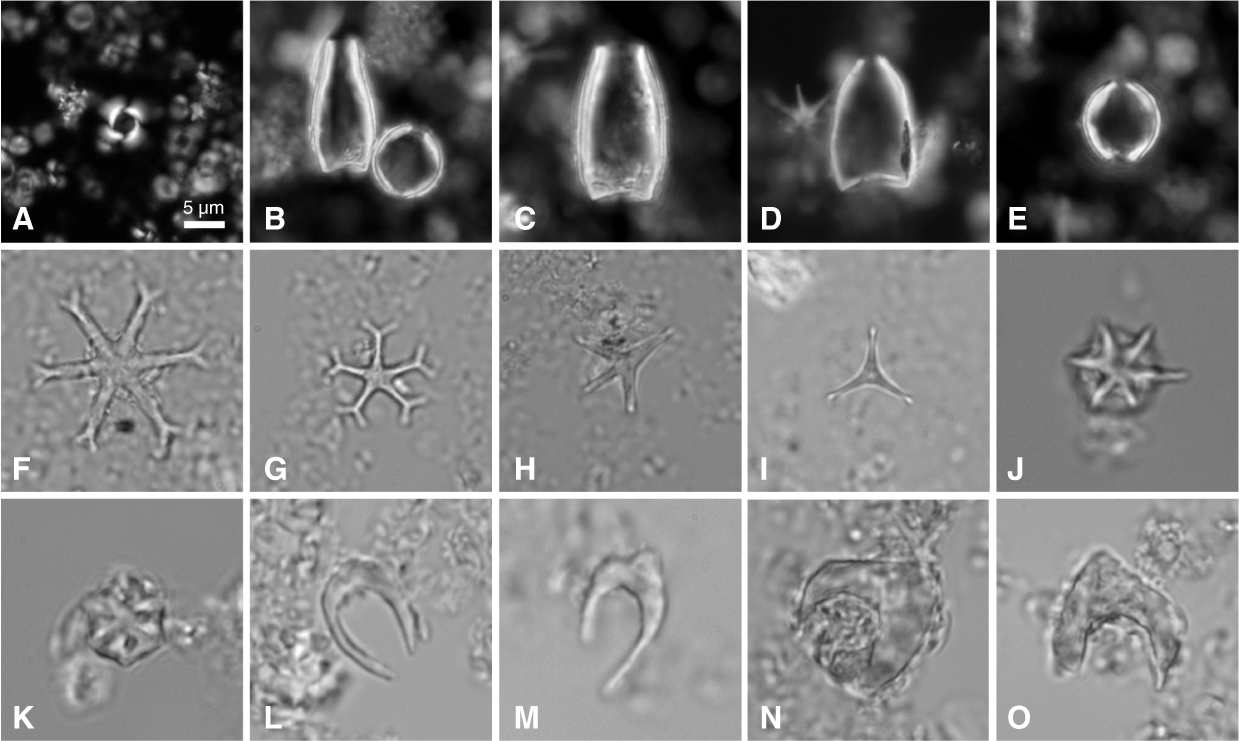
Figure F13. Calcareous nannofossils.
Pleistocene
The stratigraphy of the Pleistocene is well constrained by 10 calcareous nannofossil biohorizons. Biohorizon base E. huxleyi (base of Zone NN21; 0.29 Ma) occurs between Samples 363-U1488A-1H-2, 80 cm, and 1H-CC (2.30–5.83 mbsf) and biohorizon top Pseudoemiliania lacunosa (base of Zone NN20; 0.44 Ma) occurs between Samples 2H-4, 80 cm, and 2H-6, 10 cm (11.20–13.50 mbsf). Shipboard biostratigraphy confirms that the paleomagnetic reversal at 19 mbsf is the Brunhes/Matuyama (0.781 Ma) (see Paleomagnetism). This reversal lies between the biohorizon base acme Gephyrocapsa caribbeanica (0.56 Ma) between Samples 3H-2, 80 cm, and 3H-4, 80 cm (17.70–20.70 mbsf), and biohorizon top Reticulofenestra asanoi (0.91 Ma) between Samples 3H-4, 80 cm, and 3H-6, 10 cm (20.70–23.00 mbsf). The distinctive series of early Pleistocene discoaster extinctions is clearly recorded in Hole U1488A. Biohorizon top Discoaster brouweri (base of Zone NN19; 1.93 Ma) occurs between Samples 5H-6, 101 cm, and 5H-CC (42.91–44.34 mbsf). Biohorizon top Discoaster pentaradiatus (base of Zone NN18; 2.39 Ma) occurs between Samples 6H-CC and 7H-2, 49 cm (53.78–55.39 mbsf). The lowermost Pleistocene extinction, biohorizon top Discoaster surculus (base of Zone NN17; 2.49 Ma) occurs between Samples 7H-2, 49 cm, and 7H-4, 45 cm (55.39–58.35 mbsf).
Pliocene to late Miocene
Calcareous nannofossil biostratigraphy is continuous through the recovered Pliocene to upper Miocene succession, with the basal late Pliocene biohorizon top Sphenolithus abies (3.54 Ma) occurring between Samples 363-U1488A-10H-6, 50 cm, and 10H-CC (89.90–91.56 mbsf), and biohorizon top Reticulofenestra pseudoumbilicus (base of Zone NN16; 3.70 Ma) occurring between Samples 11H-1, 50 cm, and 11H-4, 90 cm (92.30–96.80 mbsf).
In the lower Pliocene to upper Miocene succession, biohorizons based on occurrence of species within the Amaurolithus lineage are problematic. Amaurolithus tricorniculatus, whose biohorizon top defines the base of Zone NN15, was not observed in any sample. As a result, Zones NN13–NN15 are undifferentiated. The base of Zones NN13–NN15 (undifferentiated) is placed at biohorizon base Ceratolithus cristatus (5.12 Ma) between Samples 363-U1488A-15H-2, 80 cm, and 15H-4, 80 cm (131.70–134.70 mbsf). Amaurolithus delicatus was rarely observed between Samples 16H-CC and 22H-6, 10 cm (148.84–203.50 mbsf). Amaurolithus primus was also rarely observed and only in an interval from Sample 19H-6, 10 cm, to 20H-4, 80 cm (175.00–182.20 mbsf), which is closely associated with the total range of Nicklithus amplificus from Sample 19H-CC to 21H-2, 80 cm (177.09–188.70 mbsf). No intermediate forms in the proposed Orthorhabdus rugosus to N. amplificus transition (Raffi and Flores, 1995) were observed at the base of the range of N. amplificus, and may indicate that the observed biohorizon base N. amplificus in the western equatorial Pacific is somewhat above the interval where intermediate forms occur in the eastern equatorial Pacific Ocean (Raffi and Flores, 1995). Here we place biohorizon top N. amplificus between Samples 19H-6, 10 cm, and 19H-CC (175.00–177.09 mbsf); biohorizon base N. amplificus between Samples 21H-2, 80 cm, and 21H-4, 80 cm (188.70–191.70 mbsf); and biohorizon base Amaurolithus spp. at the biohorizon base A. delicatus between Samples 22H-6, 10 cm, and 22H-CC (203.50–205.85 mbsf). Biohorizon top N. amplificus fits well with the planktonic foraminifer biostratigraphy, whereas biohorizon base N. amplificus and base Amaurolithus spp. sit slightly above the general age-depth relationship and may be occurring at a slightly younger age in this region than in the eastern equatorial Pacific or equatorial Atlantic Oceans. We note that there are significant abundance variations in A. primus in some equatorial Pacific sites within the stratigraphic interval between the base of its range and the biohorizon base N. amplificus (e.g., Ocean Drilling Program [ODP] Site 848; Raffi et al., 1995). Given the low abundance of Amaurolithus species in this sediment, establishing the position of this base biohorizon with confidence will require postcruise analysis of thickly made sediment smear slides. Biohorizon base A. delicatus is reported as nearly coincident with biohorizon base A. primus, which is the first-occurring Amaurolithus spp. (Raffi et al., 1998).
The topmost Miocene biohorizon, base Ceratolithus armatus (5.35 Ma), occurs between Samples 363-U1488A-16H-CC and 17H-2, 80 cm (148.84-150.70 mbsf). The base of late Miocene Zone NN12 is placed at biohorizon base Discoaster quinqueramus (5.59 Ma) between Samples 17H-CC and 18H-2, 80 cm (158.30–160.20 mbsf), and the base of Zone NN11 is placed at biohorizon base Discoaster berggrenii between Samples 26H-CC and 27H-2, 60 cm (243.57–245.50 mbsf). Catinaster calyculus (9.67 Ma) was observed within Sample 34F-CC (309.91 mbsf). The stratigraphy of the base of Hole U1488A is constrained by biohorizon top Catinaster coalitus (9.69 Ma) between Samples 35F-2, 80 cm, and 35F-3, 60 cm (312.10–313.40 mbsf).
Planktonic foraminifers
Core catcher samples plus three samples per core from Hole U1488A were studied for planktonic foraminifers. Diverse assemblages dominate the sedimentary particles in the 63–150 and >150 µm size fractions. Preservation, as visually assessed under the light microscope, varies from very good near the surface to moderate at depth. There is increasing evidence of dissolution, recrystallization, and eventually cementation downhole, as discussed further in Foraminifer preservation. A list of planktonic foraminifer biohorizons is given in Table T4.
Table T4. Planktonic foraminifer bioevents. Download table in CSV format.
The topmost sample examined, Sample 363-U1488A-1H-2, 80–82 cm (2.30 mbsf), contains Globorotalia flexuosa and is therefore older than 0.07 Ma. Biohorizon top Globigerinoides ruber (pink) (0.12 Ma) is located between Samples 1H-4, 80–82 cm, and 1H-CC (5.30–5.83 mbsf). The base of Subzone Pt1b, marked by biohorizon top Globorotalia tosaensis (0.61 Ma), is difficult to locate because of the rarity of the marker species; therefore, its identification between Samples 3H-2, 79–81 cm, and 3H-4, 79–81 cm (17.69–20.69 mbsf), may be too low within the succession. This is the same level as biohorizon base G. flexuosa (0.40 Ma), which may have an anomalous range at this site.
Coiling in Pulleniatina was measured downhole to 110.47 mbsf, below the level of Saito’s (1976) L9 excursion. Data are given in Table T5 and plotted in Figure F14. The L1 excursion (0.80 Ma) is located between Samples 363-U1488A-3H-4, 79–81 cm, and 3H-6, 9–11 cm (20.69–22.99 mbsf).
Table T5. Coiling patterns in Pulleniatina. Download table in CSV format.
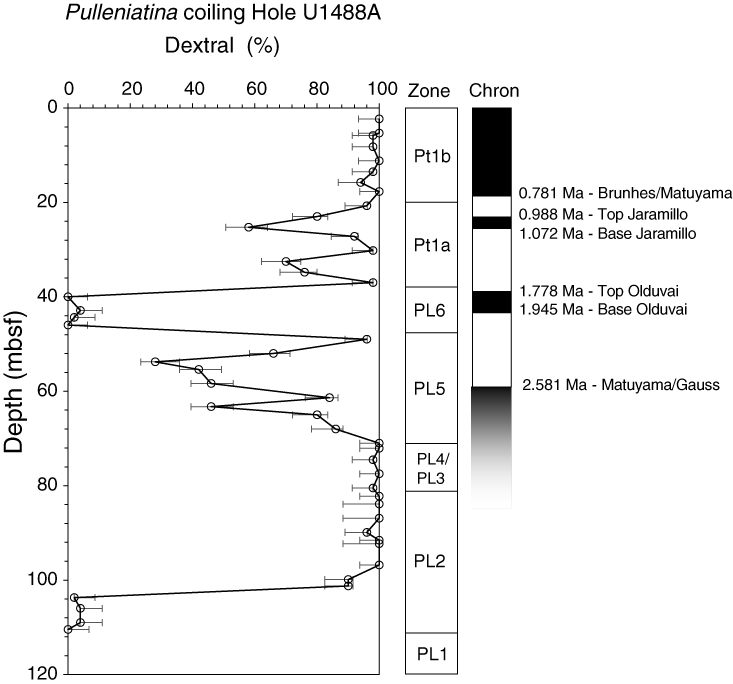
Figure F14. Coiling patterns in Pulleniatina.
Biohorizon top Globigerinoidesella fistulosa (1.88 Ma), which marks the base of Subzone Pt1a, is found between Samples 363-U1488A-5H-2, 110–112 cm, and 5H-4, 110–112 cm (37.00–40.00 mbsf). This sampling interval is coincident with the L5 shift in Pulleniatina coiling direction from sinistral to dextral (Figure F14), although at other Expedition 363 sites the top G. fistulosa biohorizon was located in the dextral interval immediately above the shift (for instance, see Biostratigraphy in the Site U1486 chapter [Rosenthal et al., 2018c]). More detailed sampling could reveal the same order of biohorizons at Site U1488. Biohorizon base Pulleniatina finalis (2.04 Ma) is located between Samples 5H-4, 110–112 cm, and 5H-6, 100–102 cm (40.00–42.90 mbsf), at a somewhat higher correlative level than was found at other sites. Biohorizon top Globigerinoides extremus (1.98 Ma) is placed tentatively between Samples 5H-CC and 6H-2, 58–60 cm (44.34–45.98 mbsf), due to the extreme rarity of the marker species near its top occurrence.
Biohorizons top Globorotalia pseudomiocenica (2.30 Ma), which marks the base of Zone PL6, and top Globorotalia limbata (2.39 Ma), occur together between Samples 363-U1488A-6H-2, 58–60 cm, and 6H-4, 58–60 cm (45.98–48.98 mbsf). The base of Zone PL5 is marked by biohorizon top Dentoglobigerina altispira (3.13 Ma according to the Atlantic calibration of Chaisson and Pearson, 1997), which occurs within the stratigraphic range of Globigerinoidesella fistulosa between Samples 8H-6, 60–62 cm, and 8H-CC (71.00–72.10 mbsf). Biohorizon top Sphaeroidinellopsis seminulina (3.59 Ma), which marks the base of Zone PL4, occurs in the same sampling interval as biohorizon top Globorotalia margaritae (3.60 Ma), which marks the base of Zone PL3, between Samples 9H-6, 60–62 cm, and 9H-CC (80.50–82.22 mbsf).
The last downhole Pulleniatina coiling direction reversal, Saito’s (1976) L9 event (4.08 Ma), occurs between Samples 363-U1488A-11H-CC and 12H-2, 130–132 cm (101.25–103.70 mbsf). The uppermost two sections of Core 12H were very disturbed during drilling. Two specimens of Pulleniatina spectabilis were found in Sample 12H-2, 130–132 cm (103.70 mbsf), although these may have been displaced during drilling. Biohorizon top P. spectabilis (4.21 Ma) is more securely placed between Samples 12H-6, 60–62 cm, and 12H-CC (109.00–110.47 mbsf), below which P. spectabilis is continuously present.
The base of Zone PL2 is marked by biohorizon top Globoturborotalita nepenthes (4.37 Ma) between Samples 363-U1488A-12H-CC and 13H-2, 80–82 cm (110.47–112.70 mbsf). Only a single specimen was found in this sample, and although it remains a particularly rare species downhole, it occurs in most samples beneath this level. Biohorizon top Globorotalia cibaoensis (4.61 Ma), placed between Samples 14H-4, 60–62 cm, and 14H-6, 60–62 cm (125.00–128.00 mbsf), is also determined by the occurrence of rare but distinctive foraminifers.
Biohorizon base Sphaeroidinella dehiscens s.l. (5.53 Ma), which includes forms with minuscule supplementary apertures, occurs between Samples 363-U1488A-17H-CC and 18H-2, 79–81 cm (158.30–160.19 mbsf). As expected, this event occurs slightly above biohorizon base Globorotalia tumida (5.57 Ma), which marks the base of Zone PL1, between Samples 18H-4, 79–81 cm, and 18H-6, 9–11 cm (163.19–165.49 mbsf). Biohorizon top Globoquadrina dehiscens (5.92 Ma) is found between these two biohorizons (between Samples 18H-2, 79–81 cm, and 18H-4, 79–81 cm; 160.19–163.19 mbsf); however, this biohorizon is not expected as high as this level, although G. dehiscens is well developed and frequent in its topmost sample, so the level is well defined.
Biohorizon top Globorotalia lenguaensis (6.13 Ma), which marks the base of Zone M14, occurs in the same sampling interval as biohorizon base Globigerinoides conglobatus (6.20 Ma) between Samples 363-U1488A-20H-4, 81–83 cm, and 20H-6, 9–11 cm (182.21–184.49 mbsf). Specimens that appear transitional between Globigerinoides obliquus and G. conglobatus appear in the next few samples below this level.
According to Wade et al. (2011), which follows Berggren et al. (1995) where, unfortunately, the original source is miscited, the upper part of Subzone M13b is divided on the basis of a relatively short interval of sinistral coiling in Neogloboquadrina acostaensis (6.34–6.77 Ma). The evolutionary appearance of Pulleniatina primalis (6.60 Ma) is located within this interval. We conducted coiling direction counts on N. acostaensis from around the top of its stratigraphic range in Core 363-U1488A-20H to the base of the hole (Table T6). There are two sinistral intervals in the upper part of Zone M13 and a series of other well-defined reversals below (Figure F15), so the pattern appears more complex than previously recognized, with considerable potential for biostratigraphic division of the long Zone M13. Biohorizon base P. primalis (6.60 Ma) is well defined between Samples 21H-4, 79–81 cm, and 21H-6, 9–11 cm (191.69–193.99 mbsf).
Table T6. Coiling patterns in Neogloboquadrina acostaensis. Download table in CSV format.
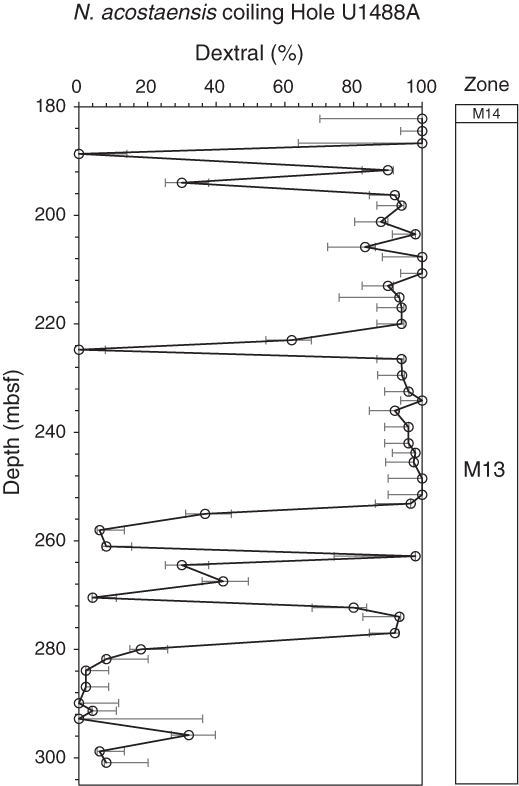
Figure F15. Coiling patterns in Neogloboquadrina acostaensis.
Division of Zone M13 proved impossible because of ambiguity in differentiating the marker species for Subzone M13b, Globorotalia plesiotumida, from its presumed ancestor, Globorotalia merotumida. Another potentially useful species, Neogloboquadrina humerosa, is too scarce to reliably identify its base biohorizon (8.56 Ma). Biohorizon base N. acostaensis (9.83 Ma), which marks the base of Zone M13, is well defined between Samples 363-U1488A-33F-2, 79–81 cm, and 33F-CC (301.16–305.34 mbsf). Biohorizon top Paragloborotalia mayeri was not encountered, which constrains the age at the base of the hole (314.73 mbsf) to <10.46 Ma.
Benthic foraminifers
Benthic foraminifers were studied in all 35 core catcher samples from Hole U1488A. The assemblages are characteristic of intermediate to deep bathyal depths. The planktonic:benthic foraminifer ratio is ~99:1 throughout Hole U1488A. The most abundant species are Laevidentalina spp. and Uvigerina spp. (Table T7). Both Uvigerina hispida and Uvigerina proboscidea are typical bathyal forms (van Morkhoven, 1986). Planulina wuellerstorfi is present in 19 of the 35 core catcher samples examined.
Table T7. Benthic foraminifer distribution. Download table in CSV format.
Foraminifer preservation
Five core catcher samples from Hole U1488A were selected to assess foraminifer preservation and diagenesis. The upper three samples (Samples 363-U1488A-1H-CC [5.83 mbsf], 12H-CC [110.47 mbsf], and 23H-CC [215.13 mbsf]) are spaced at ~100 m intervals and range in age from late Pleistocene (0.12 Ma) to late Miocene (~7.42–7.49 Ma). The lower two samples (Samples 28H-CC [262.83 mbsf] and 35H-CC [314.73 mbsf]) were taken from levels in the lower part of the hole and are spaced at ~50 m intervals.
Foraminifer preservation, as assessed visually in the core catcher samples, varies from very good to good for most of the succession but is moderate to poor for Cores 363-U1488A-33F through 35F. Even where preservation is very good, foraminifers are typically white and opaque rather than glassy and translucent. For the uppermost ~100 mbsf, Pulleniatina has a polished reflective surface but below ~100 mbsf it is typically a dull matte white. Recrystallization and cementation become progressively more severe at greater depth. Overgrowth, dissolution, and minor infilling of the planktonic foraminifer Trilobatus trilobus and incipient recrystallization of the benthic foraminifer P. wuellerstorfi occur throughout the site. Images of selected specimens are shown in Figure F16. The full set of images is available from the LIMS database.
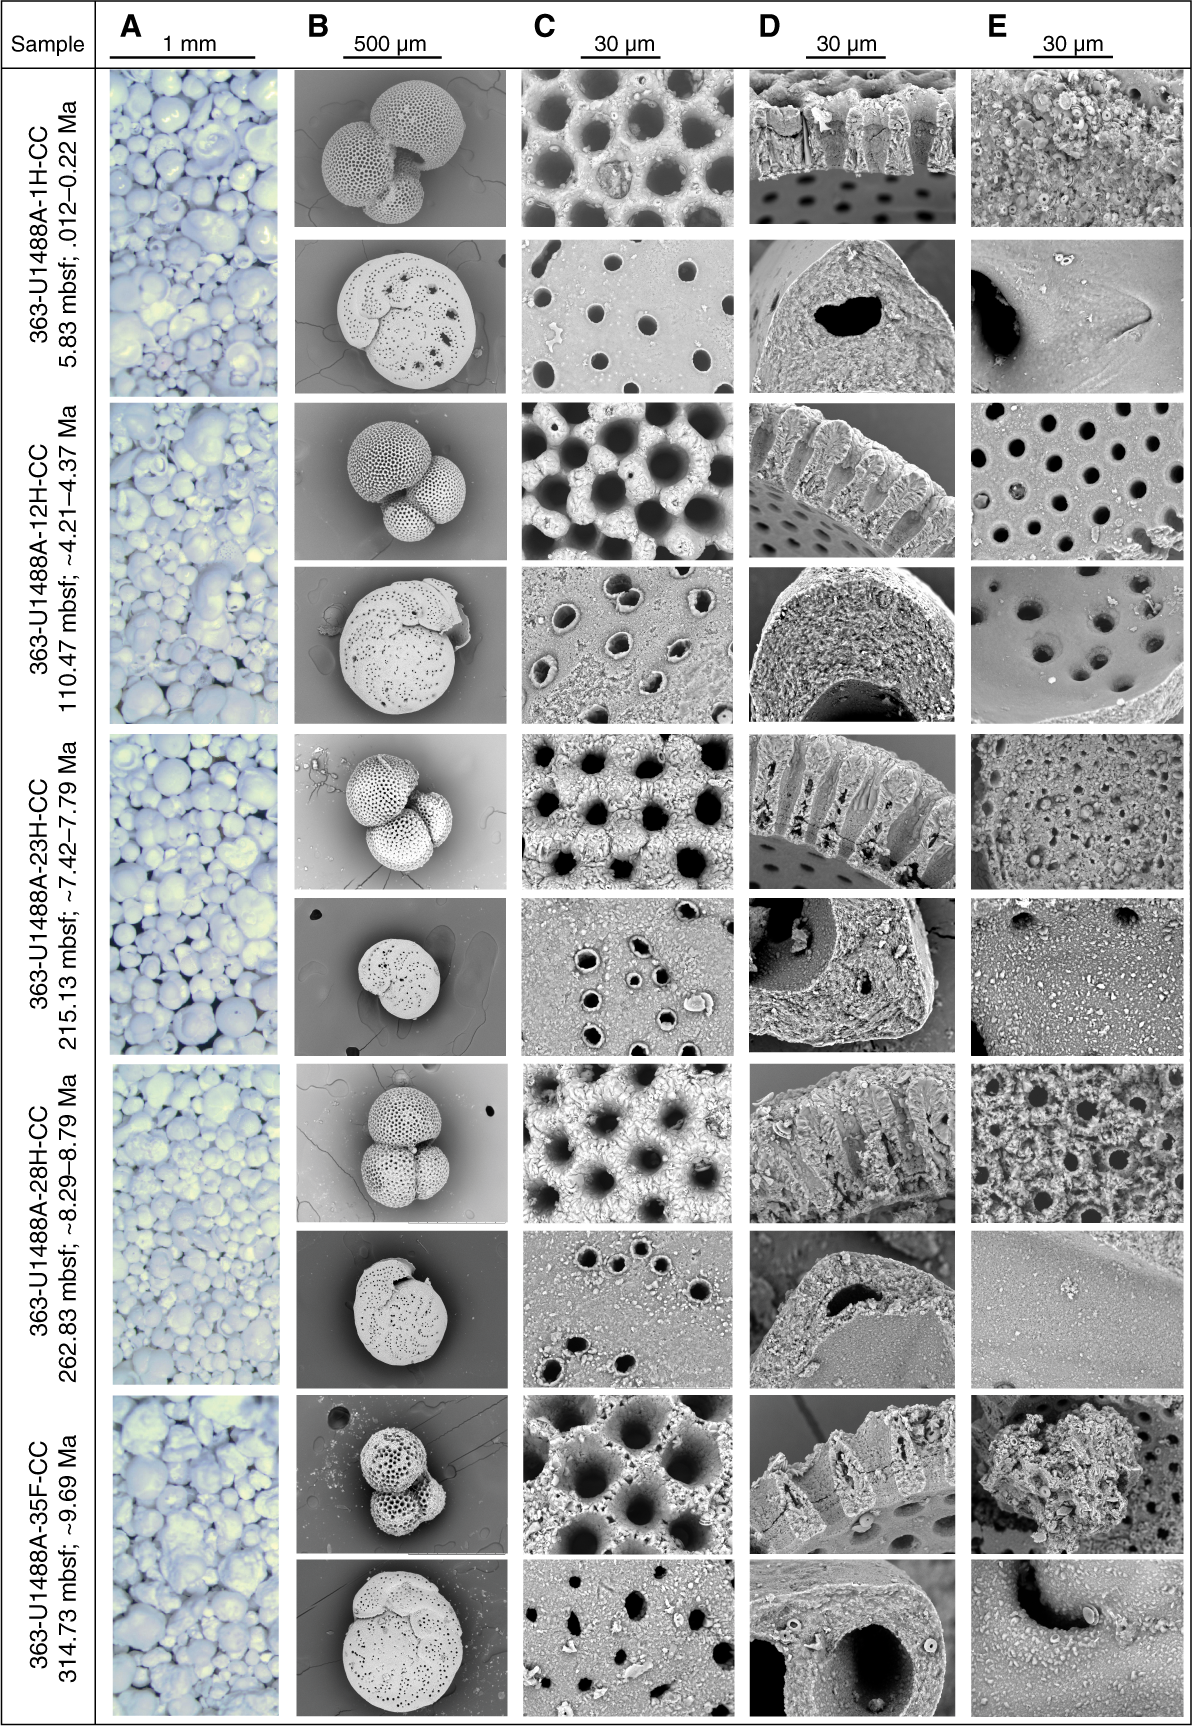
Figure F16. Foraminifer preservation states.
Sample 363-U1488A-1H-CC (5.83 mbsf; late Pleistocene to latest middle Pleistocene; 0.12–0.22 Ma) shows excellent to very good preservation. Foraminifers have a glassy appearance under the light microscope. In T. trilobus, the outer wall surfaces show minor evidence of abrasion and dissolution. The wall cross sections show microgranular textures and other typical biogenic features. Evidence of dissolution is observed near the level of the primary organic membrane in some places. The inner wall surfaces exhibit minor calcite overgrowth layers <1 μm thick, with small amounts of unconsolidated sediment infill. The wall cross section of P. wuellerstorfi generally shows biogenic microgranules. However, one studied specimen exhibits evidence of minor but pervasive textural alteration, which may be evidence of incipient recrystallization. All specimens of P. wuellerstorfi show generally smooth inner wall surfaces. There is no evidence of cementation.
Sample 363-U1488A-12H-CC (110.47 mbsf; early Pliocene; ~4.21–4.37 Ma) shows very good preservation. Wall cross sections of T. trilobus show biogenic microgranular textures typical of the species and minor evidence of dissolution. Only one specimen of P. wuellerstorfi was available for study. Both the outer surface and the wall cross section show evidence of very minor textural alteration in places indicating incipient recrystallization. The inner wall surfaces of T. trilobus and P. wuellerstorfi exhibit minor calcite overgrowth layers (<1 μm thick) without evidence of infilling and cementation.
Sample 363-U1488A-23H-CC (215.13 mbsf; late Miocene; ~7.42–7.49 Ma) shows good to very good preservation. Wall cross sections of T. trilobus show minor textural alteration in places indicating incipient recrystallization and evidence of dissolution. The wall cross sections of P. wuellerstorfi show widespread evidence of early stage recrystallization in which the microgranular texture is modified to show slightly larger and better separated granular crystals, particularly toward the inner and outer surfaces. The inner wall surfaces of T. trilobus and P. wuellerstorfi exhibit minor calcite overgrowth layers up to 1–2 μm thick. Minor infilling of unconsolidated sediment (coccoliths) occurs in some specimens. P. wuellerstorfi also shows calcite overgrowth on external surfaces. There is no evidence of cementation.
Sample 363-U1488A-28H-CC (262.83 mbsf; late Miocene; ~8.29–8.79 Ma) shows good preservation. Wall cross sections of T. trilobus show evidence of early stage recrystallization, inorganic calcite overgrowth in pore channels, and dissolution along internal layers. Wall cross sections of P. wuellerstorfi also show obvious evidence of recrystallization and calcite overgrowth in pore channels. The inner wall surfaces of T. trilobus and P. wuellerstorfi exhibit minor calcite overgrowth layers <1 μm thick, which also occur on the outer surfaces. Minor infilling of unconsolidated sediment (coccoliths) occurs in some T. trilobus specimens
Sample 363-U1488A-35F-CC (314.73 mbsf; late Miocene; ~9.69 Ma) shows moderate to poor preservation. Foraminifers are generally opaque under the light microscope and exhibit strong cementation. SEM images show abundant evidence of infilling, overgrowth, incipient recrystallization, and cementation. Both T. trilobus and P. wuellerstorfi show evidence of incipient recrystallization, with more solid patches developing within the wall. Wall cross sections of T. trilobus show evidence of dissolution near spine holes and internal wall layers, but other parts of the walls in cross section are well preserved, showing the typical microgranular texture of the species. The inner and outer wall surfaces of T. trilobus and P. wuellerstorfi exhibit minor calcite overgrowth layers up to 1–2 μm thick.
Shipboard age model
Integrated calcareous nannofossil and planktonic foraminifer biostratigraphy at Site U1488 is shown on an age-depth plot (Figure F17) together with magnetostratigraphic horizons within the upper Pliocene and Pleistocene (see Paleomagnetism). Biostratigraphic and magnetostratigraphic horizons indicate recovery of a continuous sequence of pelagic sediment spanning the last ~10 My. Long-term average sedimentation rates through the late Miocene and Pliocene were remarkably consistent at ~4 cm/ky. These rates roughly halved through the early Pleistocene (~2 cm/ky), before increasing in the middle to late Pleistocene (~3 cm/ky).
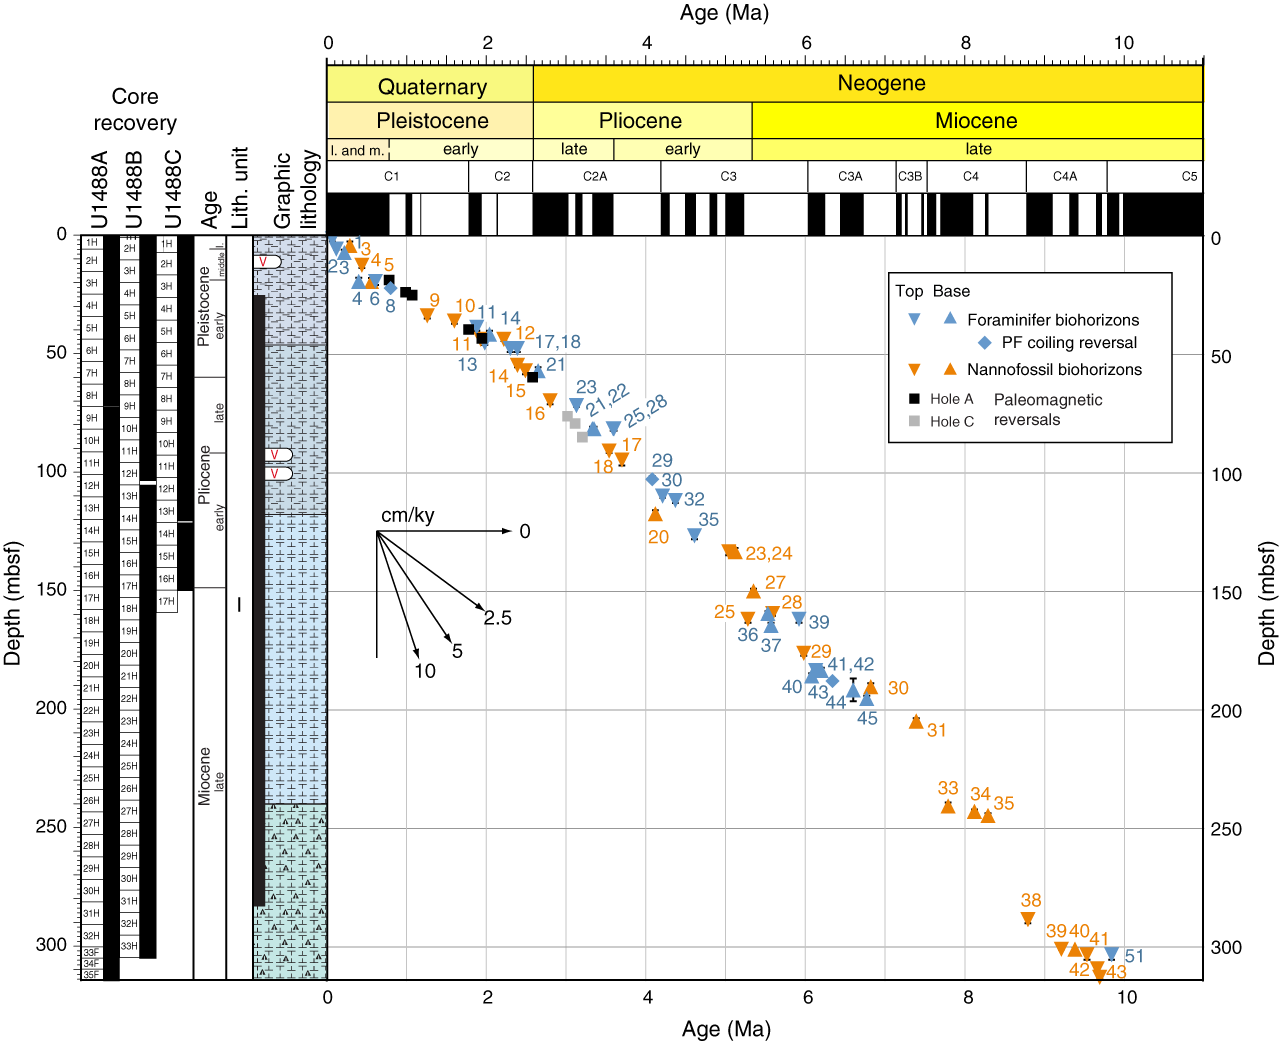
Figure F17. Age-depth plot.
The oldest sediment recovered at Site U1488 is constrained to be younger than ~10.46 Ma by the absence of the planktonic foraminifer Paragloborotalia mayeri and older than 9.69 Ma by the presence of the calcareous nannofossil Catinaster coalitus in Sample 363-U1488A-35F-CC (314.52 mbsf). The Miocene/Pliocene boundary (5.333 Ma) is placed at ~149 mbsf based on linear interpolation between the biohorizon base C. armatus (5.35 Ma) and biohorizon base C. cristatus (5.12 Ma). The base of the late Pliocene (3.60 Ma) is placed at ~92 mbsf, between the biohorizon top Reticulofenestra pseudoumbilicus (3.70 Ma) and biohorizon top Sphenolithus abies (3.54 Ma). The Pliocene/Pleistocene boundary is placed at ~60 mbsf, just below the base of Chron C2r.2r at 59.70 mbsf, and the base of the middle Pleistocene is at the base of Chron C1n at ~19 mbsf (see Paleomagnetism). The middle/late Pleistocene boundary is placed between biohorizon top Pseudoemiliania lacunosa (0.44 Ma) and biohorizon top G. ruber (pink) (0.12 Ma) at ~12 mbsf.
Paleomagnetism
Measurements summary
Paleomagnetic investigations at Site U1488 involved measuring the NRM of archive-half cores from Holes U1488A–U1488C before and after alternating field (AF) demagnetization in a peak field of 15 mT. We measured the entire sediment succession in Hole U1488A but ceased measurement deeper than ~67 mbsf in Hole U1488B and deeper than ~102 mbsf in Hole U1488C because Whole-Round Multisensor Logger (WRMSL) magnetic susceptibility values decreased to almost zero (see Physical properties) and paleomagnetic data quality decreased and became increasingly uninterpretable. In addition to measuring 354 core sections, we took one to two discrete samples per core from Hole U1488A (67 samples) to characterize the NRM demagnetization behavior and to investigate the rock magnetic properties of the sediment. NRM of the discrete samples was measured before and after AF demagnetization in peak fields of 5, 10, 15, 20, 30, and 40 mT. Rock magnetic investigations comprised measurements of magnetic susceptibility (χ), susceptibility of anhysteretic remanent magnetization (χARM) imparted using a 100 mT AF demagnetization and 0.05 mT direct-current bias field, and isothermal remanent magnetization (IRM) acquired in 300 mT and 1000 mT (saturation IRM [SIRM]) fields. All sample measurements were mass corrected. The Icefield MI-5 core orientation tool was deployed with nonmagnetic hardware for all cores, which permitted azimuthal correction of declination. Azimuthally corrected declination is largely coherent between successive cores; however, absolute values in all holes cluster between 90° and 180° for periods of normal polarity and between 270° and 0°/360° for reversed polarity, suggesting that issues of a baseline offset experienced at the majority of sites during Expedition 363 and also during Expedition 362 (McNeill et al., 2017) affected these measurements. As with other sites cored during Expedition 363, we leave declination uncorrected for these additional offsets in the plotted figures, so care should be employed for future calculations of virtual geomagnetic poles using these data.
Rock magnetic characterization
In the upper ~45 mbsf, WRMSL magnetic susceptibility data average 23 × 10−5 SI (see Physical properties) and, when coupled with average mass-corrected χ (1.7 × 10⁻⁷ ± 0.8 × 10⁻⁷ m3/kg as 2 standard deviations [2σ]) and SIRM (2.5 × 10⁻³ ± 1.3 × 10⁻³ Am2/kg as 2σ) values, suggest moderately low (ferri)magnetic mineral concentration in the sediments deposited at Site U1488 (Figure F18). In this upper ~45 mbsf, all samples acquire >98% of their SIRM remanence in a field of 300 mT, suggesting that ferrimagnetic minerals (e.g., [titano]magnetite [FexTixO4] and maghemite [γ-Fe2O3]) control the remanence-carrying properties of the sediment. Between ~45 and ~50 mbsf NRM15mT, χ, SIRM, and χARM/SIRM values decrease sharply, and below ~50 mbsf average WRMSL magnetic susceptibility values fall to ~0.6 × 10⁻⁵ SI. NRM15mT, χ, and SIRM values below ~50 mbsf are one to two orders of magnitude lower than those in the upper ~45 mbsf and often approach the noise level of their respective instruments (see Paleomagnetism in the Expedition 363 methods chapter [Rosenthal et al., 2018a]), indicating a significant reduction in magnetic mineral concentration below ~50 mbsf. Finer magnetic grain sizes are associated with higher magnetic concentrations, as χARM/SIRM values are highest in the upper 45 m and decrease by half below ~50 mbsf. IRM300mT/IRM1000mT values show a more variable pattern downhole. Following the sharp reduction at ~50 mbsf, IRM300mT/IRM1000mT values steadily increase with depth to ~208 mbsf. A second, more gradual decrease in IRM300mT/IRM1000mT values occurs between 208 and 288 mbsf before a return to relatively high values >0.9 at the very base of the hole. Low magnetic concentration and lower IRM300mT/IRM1000mT values below ~50 mbsf likely reflect the almost total absence of magnetite rather than an increase in the relative proportions of higher coercivity components (e.g., hematite [Fe2O3] and goethite [FeO(OH)]). Reduced concentration of ferrimagnetic minerals and a coarser ferrimagnetic grain size assemblage downhole coupled with observations of secondary iron sulfides (e.g., pyrite [FeS2]) throughout the sedimentary sequence at Site U1488 (see Core description) suggests that sediment diagenesis (e.g., Karlin and Levi, 1983; Rowan et al., 2009) may have strongly influenced the primary mineral magnetic assemblage below ~50 mbsf.
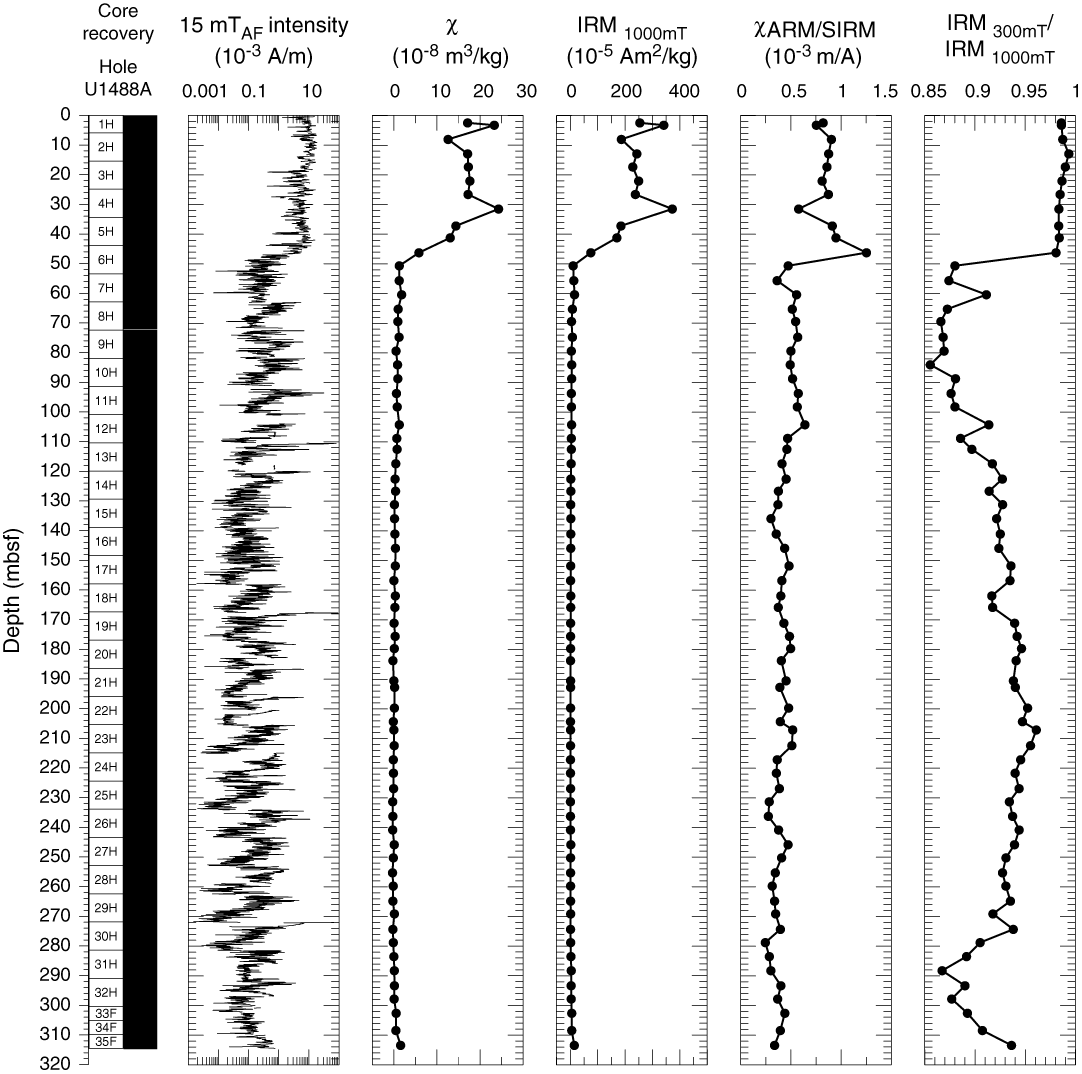
Figure F18. Archive-half NRM intensity.
Paleomagnetic data and core orientation
NRM demagnetization behavior and IRM300mT/IRM1000mT ratios in the upper ~45 mbsf are consistent with (titano)magnetite being the primary remanence-carrying mineral species in sediments deposited at Site U1488 (Figures F18, F19). In this upper interval, the drill string overprint is effectively removed after AF demagnetization in a 5–15 mT field, and following exposure to higher AF demagnetization steps, inclination and declination stabilize and trend to the origin on Zijderveld diagrams (Zijderveld, 1967), indicating a single component to the magnetization (Figure F19). Origin-anchored maximum angular deviation values of the principal component analysis calculated over the 15–40 mT range average 2° (range = 1.1°–3.1°) for the upper ~45 mbsf of Hole U1488A (Figures F19, F20), suggesting paleomagnetic directions are stable and well resolved and should yield reliable estimates for magnetostratigraphy (Stoner and St-Onge, 2007). Below ~50 mbsf, higher maximum angular deviation values (average = 9.7°; range = 4.5°–25.2°) are associated with decreased ferrimagnetic concentration, coarser magnetic grain sizes, and higher coercivity components that do not demagnetize linearly toward the origin, suggesting that paleomagnetic directions below ~50 mbsf likely do not reflect geomagnetic field behavior.
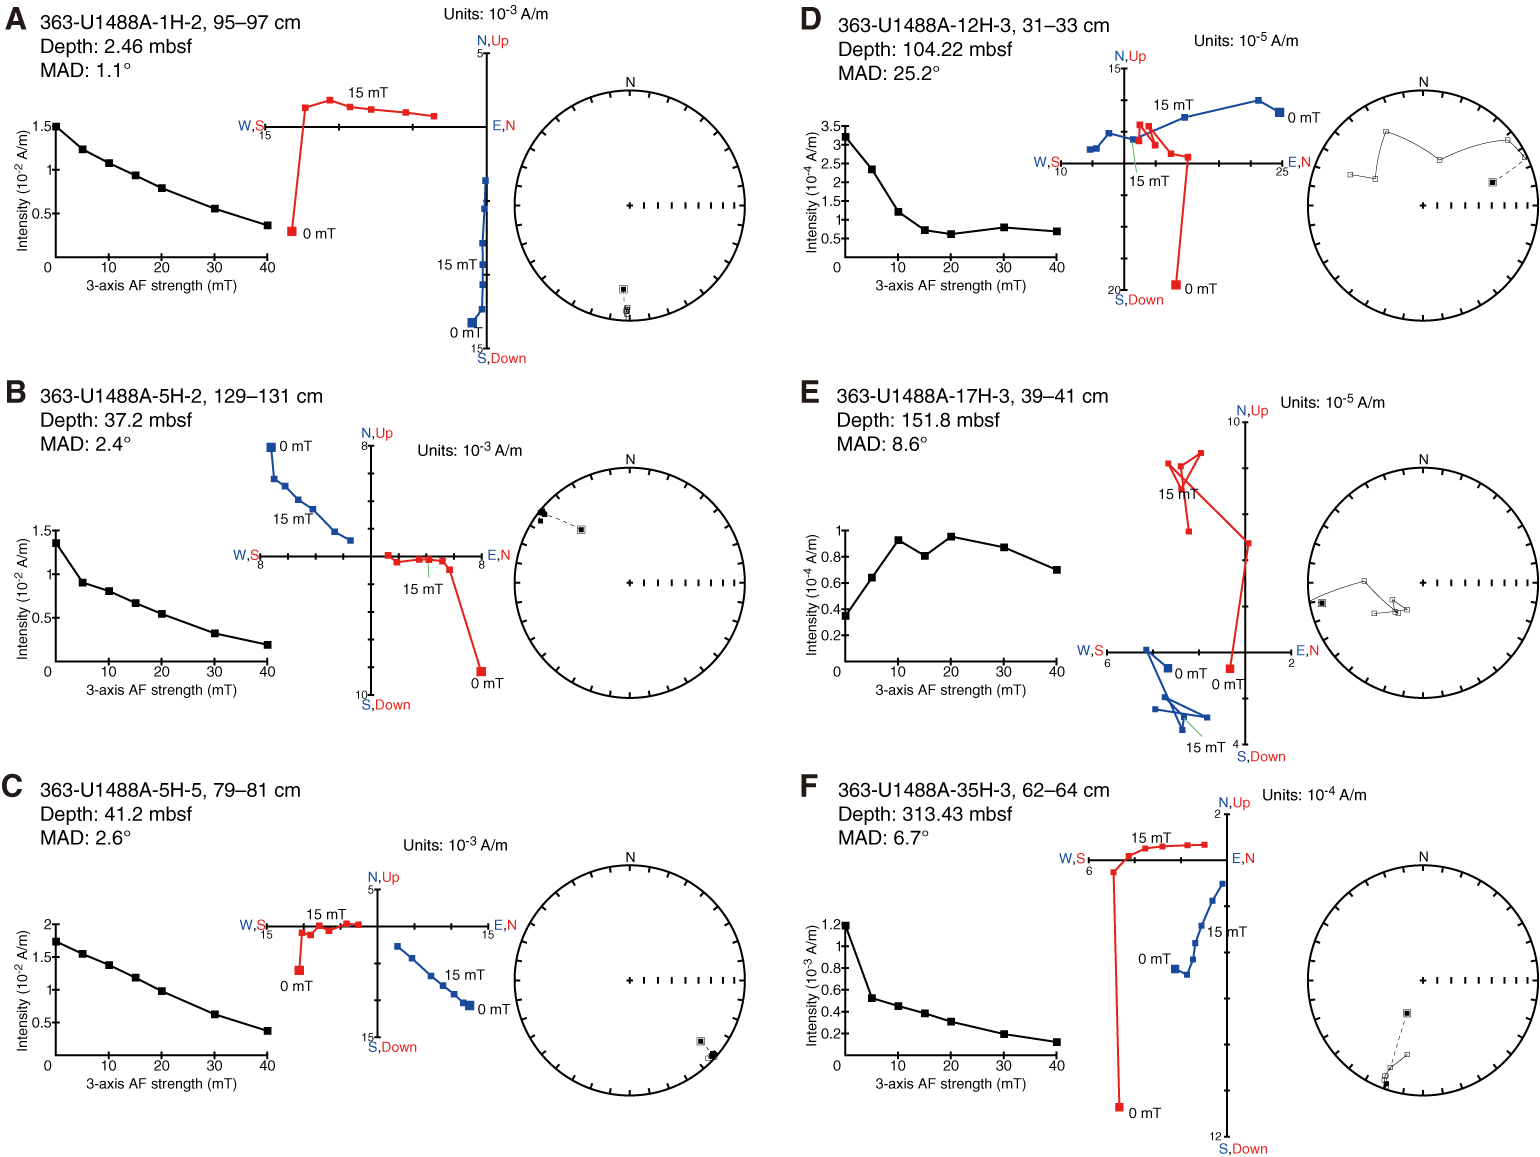
Figure F19. Discrete sample AF demagnetization results.
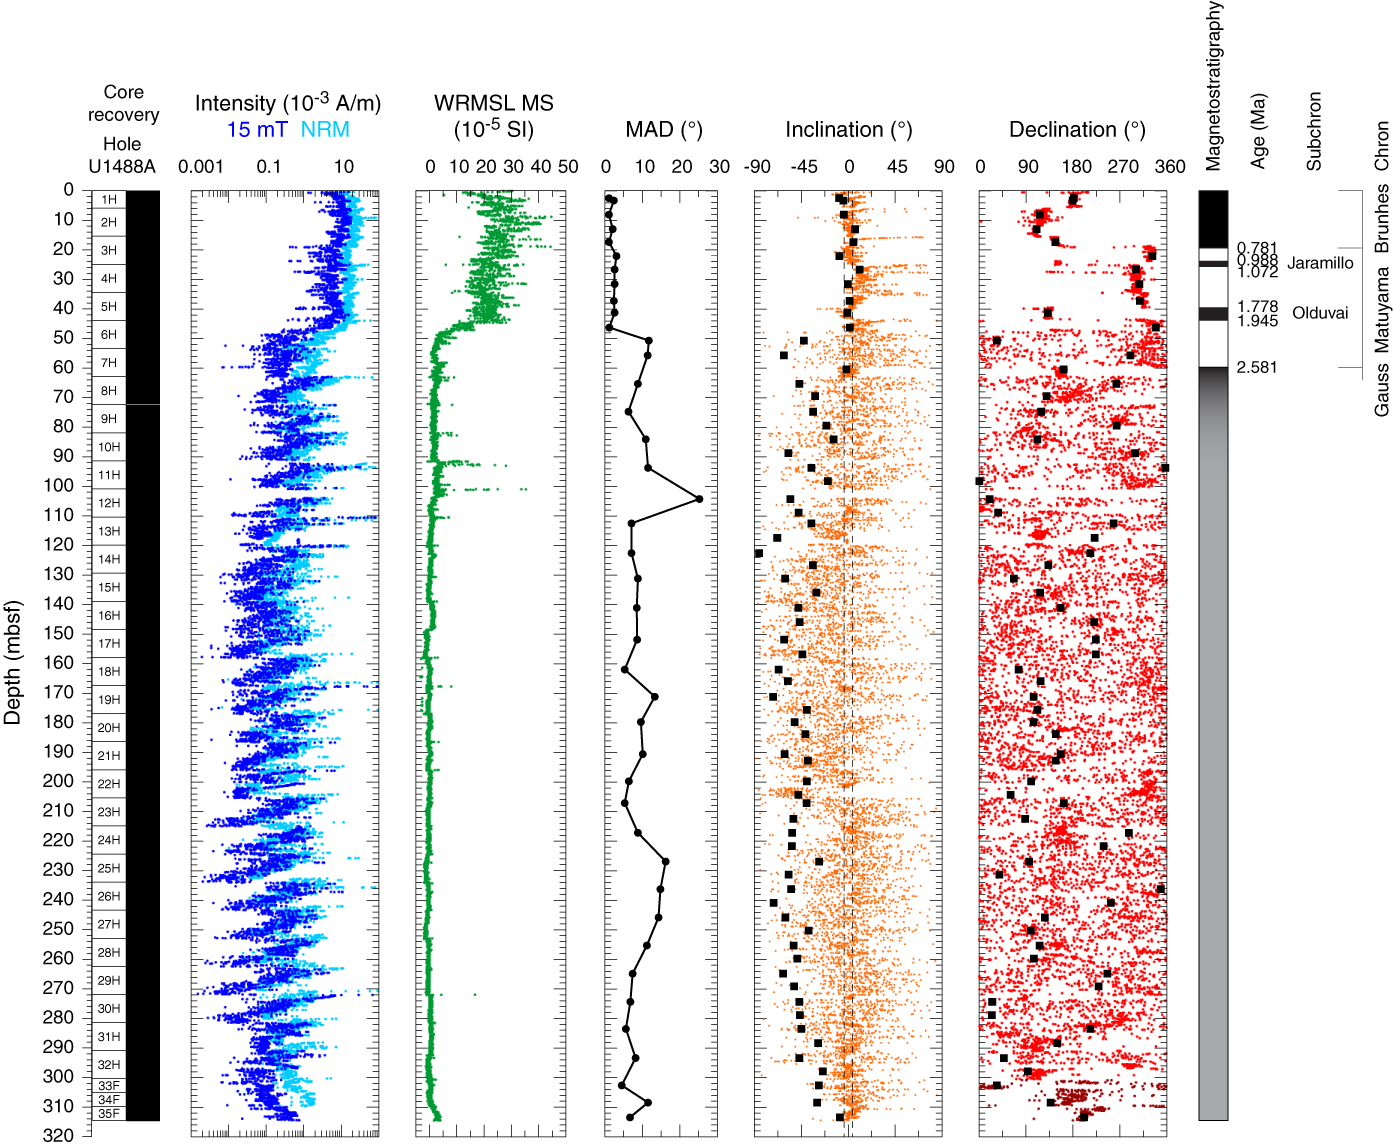
Figure F20. NRM, MS, inclination, and declination, Hole U1488A.
For all APC cores from Site U1488, declination was corrected using the Icefield MI-5 core orientation tool (see Operations). Azimuthally corrected declination is generally consistent between adjacent cores and absolute values cluster between 90°–180° and 270°–360°. However, assuming the uppermost sediment in each hole was deposited during normal polarity associated with the Brunhes Chron (see Biostratigraphy), declination values at Site U1488 experience offsets of ~90°–180° in absolute terms because declination should cluster around 0° (180°) during periods of normal (reversed) polarity. Although an ~180° offset was a persistent issue during Expedition 363, ~90° offsets were previously restricted to a single tool (Icefield #2007) used during operations in Holes U1483C and U1485A. All three holes at Site U1488 show evidence for shallower declination offsets than the ~180° baseline offset we came to expect during Expedition 363. The majority of cores from these holes were orientated with Icefield tool #2052. Icefield tool #2043 was used while coring Cores 363-U1488A-27H through 32H; however, the low magnetic concentration and scattering of paleomagnetic directions in this interval make it difficult to interpret whether this is a persistent cross-tool offset. The origin of this additional offset is not immediately clear, but because it appears systematic (the two declination clusters are ~180° offset to each other) we assume that declination values rotated 180° relative to the uppermost sediment values reflect periods of reversed polarity in the sediment recovered from Site U1488. Orientation tools cannot be deployed with the HLAPC coring system, and due to the low ferrimagnetic concentration and highly scattered nature of the declination of HLAPC Cores 33F through 35F, we leave measured declination values uncorrected and highlight these data using dark red symbols in Figure F20.
NRM intensity before and after 15 mT AF demagnetization, WRMSL magnetic susceptibility, and inclination and azimuthally corrected declination after 15 mT AF demagnetization are shown for Holes U1488A, U1488B, and U1488C in Figures F20, F21, and F22, respectively. Displayed inclination and declination values were cleaned of visibly disturbed intervals and voids (see Paleomagnetism in the Expedition 363 methods chapter [Rosenthal et al., 2018a]). Inclination and declination measured on discrete samples are generally in excellent agreement with those measured on the archive-half sections, although below ~50 mbsf discrete inclination is steeper and more negative than its SRM-measured counterpart (Figure F20). In the upper ~50 mbsf of Hole U1488A, SRM and discrete measured inclination plot around the expected values of approximately ±4° for the site latitude assuming a geocentric axial dipole (GAD) field. Declination shows a similar, relatively stable pattern with values clustering around those indicative of both normal and reversed polarity. Below ~50 mbsf, inclination shows more scatter with discrete values significantly steeper (averaging −45° ± 33° as 2σ) than a GAD-predicted field. Coupled with highly scattered declination values, decreased magnetic mineral concentration, and higher magnetic coercivity and maximum angular deviation values (Figures F18, F20), these data suggest that sediment diagenesis has likely severely altered the primary magnetic assemblage below ~50 mbsf in Hole U1488A; the paleogeomagnetic record is not interpretable in this deeper section. Magnetic susceptibility (see Physical properties) and NRM profiles of Holes U1488B (Figure F21) and U1488C (Figure F22) are very similar to those of Hole U1488A, suggesting similar diagenetic alteration at depth. Inclination and declination are relatively stable in the upper ~50 mbsf of Hole U1488B and become increasingly more scattered below ~50 mbsf (Figure F21); thus, we ceased measurement of sediment recovered from Hole U1488B after Core 8H at ~67.4 mbsf. In Hole U1488C, inclination and declination values appear more stable into the low intensity and low magnetic susceptibility interval to the bottom of Core 10H at ~93 mbsf. In Hole U1488C, we ceased measurement one core later at 102 mbsf (Figure F22).
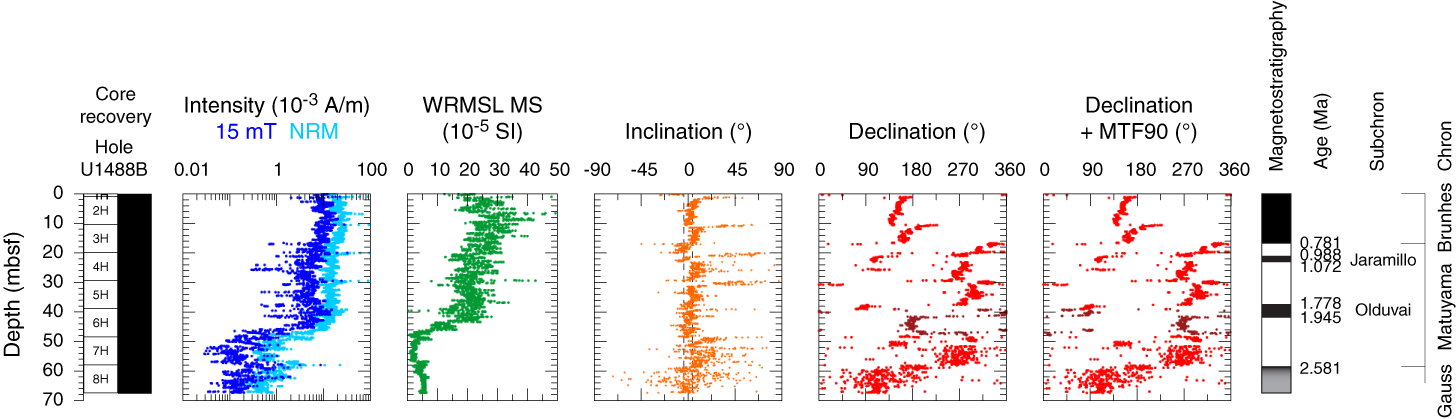
Figure F21. NRM, MS, inclination, and declination, Hole U1488B.
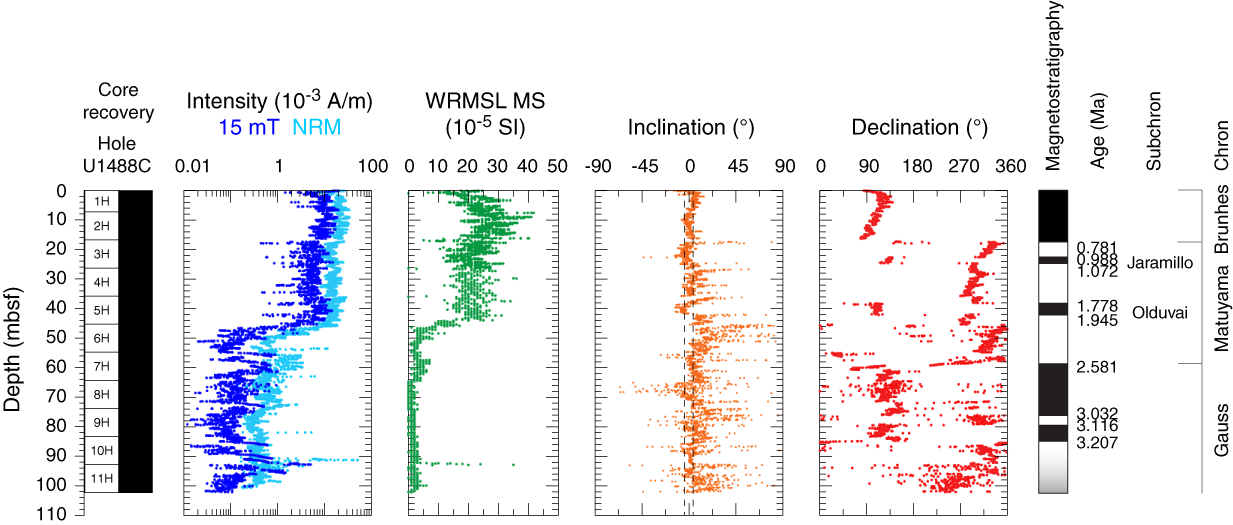
Figure F22. NRM, MS, inclination, and declination, Hole U1488C.
Magnetostratigraphy
Sediments in all three holes appear to have been deposited (quasi)continuously with no major hiatuses (see Core description and Biostratigraphy). Across all three holes we observed at least six coeval and distinct ~180° changes in declination downhole; in Hole U1488C we observed nine such horizons. Interpretation of these horizons as reversals of the geomagnetic field allows correlation to the geomagnetic polarity timescale (GPTS; Cande and Kent, 1995) of the geologic timescale (Hilgen et al., 2012) and assignment of age. The Matuyama/Brunhes boundary (0.781 Ma) was identified at 16.35–18.75 mbsf (note that these ranges encompass the minimum and maximum mbsf depths across all three holes where the reversal is identified within a single core, not between cores) (see Table T8 for the depths of each boundary in each hole). Below this boundary, we observed the upper (21.0–23.825 mbsf; 0.988 Ma) and lower (22.825–25.325 mbsf; 1.072 Ma) boundaries of the Jaramillo normal (C1r.1n) and the upper (101.08–102.55 mbsf; 1.778 Ma) boundary of the Olduvai normal (C2n). The base of the Olduvai (1.945 Ma) in Holes U1488A and U1488C occurs between 41.9 and 43.55 mbsf; however, in Hole U1488B an interval of intermittent and apparently normal polarity extends down from the upper boundary of the Olduvai to ~47.5 mbsf. This difference would imply significantly different sediment accumulation rates in Hole U1488B compared to Holes U1488A and U1488C. We can reconcile the Hole U1488B declination data and implied sedimentation rates with those of Holes U1488A and U1488C if we assume a 90° error in the magnetic toolface (MTF) orientation data for Core 363-U1488B-6H and apply an MTF correction value of 288° instead of the recorded pick of 198°. The corrected declination plus the additional 90° MTF correction are compared in Figure F21; data for Core 363-U1488C-6H are highlighted in dark red in each plot. With this additional correction, we can assign the base of the Olduvai in Hole U1488B to 41.1–41.95 mbsf, which is comparable to the depths in Holes U1488A and U1488C. The Gauss/Matuyama boundary (2.581 Ma), which in Holes U1488A and U1488B is the last observed reversal horizon before the paleomagnetic data become scattered and uninterpretable, occurs at 57.975–60.85 mbsf. In Hole U1488C, we identified the upper (76.0–76.275 mbsf; 3.02 Ma) and lower (79.175–79.225 mbsf; 3.116 Ma) boundaries of the Kaena reversal (C2An.1r) and the upper boundary of C2An.2n (84.75–85.1 mbsf; 3.207 Ma) before ultimate degradation of the paleomagnetic signal. These data imply Pleistocene sedimentation rates of ~2–2.5 cm/ky (Table T8), which are consistent with both the calcareous nannofossil and planktonic foraminifer datums (see Biostratigraphy).
Table T8. Identified reversal boundaries. Download table in CSV format.
Physical properties
Physical properties were measured on whole-round cores, split cores, and discrete samples from all holes drilled at Site U1488 to provide basic information for characterizing the core sections. Gamma ray attenuation (GRA) bulk density and magnetic susceptibility were measured on all core sections from Hole U1488B with the Special Task Multisensor Logger (STMSL) immediately after the cores were brought on board. All core sections were measured with the GRA bulk densitometer, the magnetic susceptibility loop, and the P-wave logger (PWL) on the WRMSL. Below 50 mbsf at Site U1488, WRMSL P-wave velocity data show the most distinct variability and as a result were most useful for stratigraphic correlation between holes. For this reason, the WRMSL was employed as the “fast track” system to rapidly generate 5 cm resolution magnetic susceptibility, GRA density, and P-wave data as Hole U1488C core sections came on board. Magnetic susceptibility and GRA density measurement settings were taken from the STMSL, whereas P-wave settings were left unchanged (see Physical properties in the Expedition 363 methods chapter [Rosenthal et al., 2018a]). After equilibration, cores were run on the STMSL for magnetic susceptibility and GRA density measurements at high resolution (2.5 cm) using the magnetic susceptibility and GRA density settings normally applied on the WRMSL. Additionally, Cores 363-U1488C-13H through 16H were run at both 5 and 2.5 cm resolution on the WRMSL to obtain high-resolution P-wave data over this interval to help with determination of the stratigraphic splice (see Stratigraphic correlation). Natural gamma radiation (NGR) was measured on all whole-round sections (10 cm resolution for Hole U1488A and Cores 363-U1488B-1H through 29H and 20 cm resolution for Cores 30H through 33H and Hole U1488C) (see Physical properties in the Expedition 363 methods chapter [Rosenthal et al., 2018a]). Point-sensor magnetic susceptibility and color spectrophotometry (color reflectance) were measured on split core sections using the Section Half Multisensor Logger. Discrete thermal conductivity, P-wave velocity, and moisture and density (MAD) measurements were made in Hole U1488A. Discrete P-wave measurements (z- and x-axis) were made using the P-wave caliper (PWC) system on the Section Half Measurement Gantry. The x-axis measurements were taken to the base of the hole, but the z-axis measurements were stopped at Section 30H-3 to avoid extensive damage to the sediment. Preconditioning treatments were applied to the records to aid in interpretation of noisy or spiky data (for details, see Physical properties in the Expedition 363 methods chapter [Rosenthal et al., 2018a]). All data shown in figures are from the preconditioned data sets. Tables presented in this section contain raw and treated data for NGR, and high-resolution (WRMSL/STMSL) GRA bulk density, magnetic susceptibility, and P-wave velocity. Raw data for all data sets are available from the LIMS database.
GRA bulk density
GRA bulk density reproducibility between holes at Site U1488 is excellent, with all holes showing a general increasing trend with depth from 1.4 to 1.8 g/cm3, most likely due to increasing compaction with depth (Figure F23; Tables T9, T10, T11). We see a small increase from ~1.4 to ~1.5 g/cm3 in the upper 4 mbsf, reflecting consolidation below the mudline. Between 4 and 245 mbsf, GRA bulk density increases from ~1.5 to ~1.75 g/cm3, with 20–40 m variations of ~0.1 g/cm3 superimposed upon this increase. These decimeter-scale variations have minima in GRA bulk density that generally correspond to subtle darker intervals containing 0.5 m scale oscillating light and dark gray layers. Between 245 and 285 mbsf, the long-term increase in GRA bulk density ceases, and the average GRA bulk density value (~1.75 g/cm3) remains stable with two large 20 m variations of ~0.1 g/cm3 superimposed. Darker sediment layers are more prevalent in this interval; however, no obvious relationship between the color and density of the sediment is apparent. Between 285 and 300 mbsf, we observed a rapid increase in GRA bulk density from 1.65 to 1.85 g/cm3, coincident with an increase of biosilica in the sediment, which correlates to an increase in a* (redness) (see Core description). In the lowermost 20 m of the hole, small variations occur around an average of ~1.8 g/cm3, probably reflecting the appearance of more-indurated sediment layers.
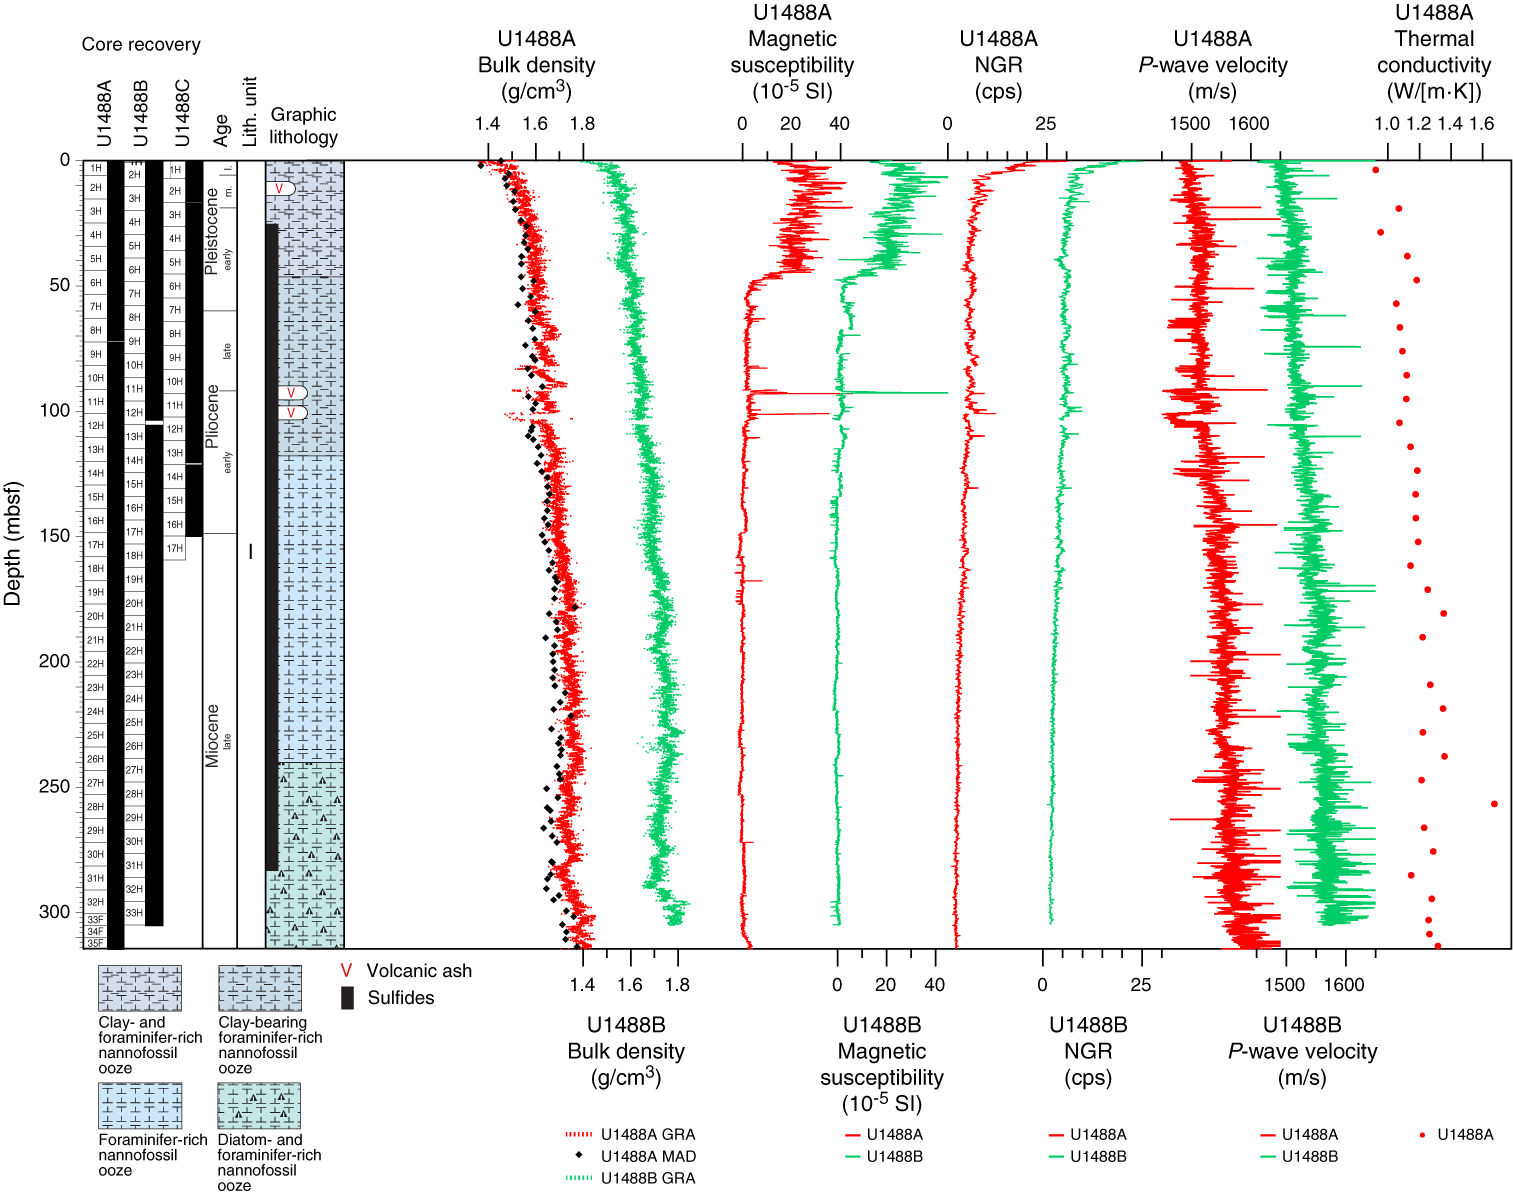
Figure F23. Physical property measurements.
Table T9. WRMSL GRA bulk density data, Hole U1488A. Download table in CSV format.
Table T10. WRMSL GRA bulk density data, Hole U1488B. Download table in CSV format.
Table T11. STMSL/WRMSL GRA bulk density data. Download table in CSV format.
Magnetic susceptibility
In the uppermost 0.6 mbsf, magnetic susceptibility is characterized by a sharp downcore drop from 30 × 10−5 to 12 × 10−5 SI coinciding with a gradual change of sediment color from reddish brown to greenish gray (see Core description). By 3 mbsf, magnetic susceptibility returns to higher values, averaging 24 × 10−5 ± 5 × 10⁻⁵ SI between 3 and 45 mbsf (Figure F23; Tables T12, T13, T14). Magnetic susceptibility then decreases to ~2 × 10−5 SI by 54 mbsf. The average magnetic susceptibility value is 3 × 10⁻⁵ ± 4 × 10⁻⁵ SI between 54 and 105 mbsf, with increased spikiness between 90 and 105 mbsf across an interval with soupy and disturbed sediment caused by coring difficulties in Hole U1488A (see Operations). The largest spike in the record (>80 × 10−5 SI) occurs at ~92 mbsf in both Holes U1488A and U1488B and is associated with a tephra layer (see Core description). From 105 mbsf to the bottom of the hole, magnetic susceptibility values remain extremely low with little variability (mean = 0 ± 1 × 10⁻⁵ SI) (Figures F23, F24). Data in this interval should be interpreted cautiously because variations are small relative to the sensitivity of the measurement (~1 × 10⁻⁵ SI) (Dearing, 1999) (Figure F25). These low values probably reflect the high carbonate content at Site U1488 (see Geochemistry). Magnetic susceptibility values increase slightly to ~4 × 10⁻⁵ SI in the lowermost 6 m of Hole U1488A.
Table T12. WRMSL MS data, Hole U1488A. Download table in CSV format.
Table T13. WRMSL MS data, Hole U1488B. Download table in CSV format.
Table T14. STMSL/WRMSL MS data. Download table in CSV format.
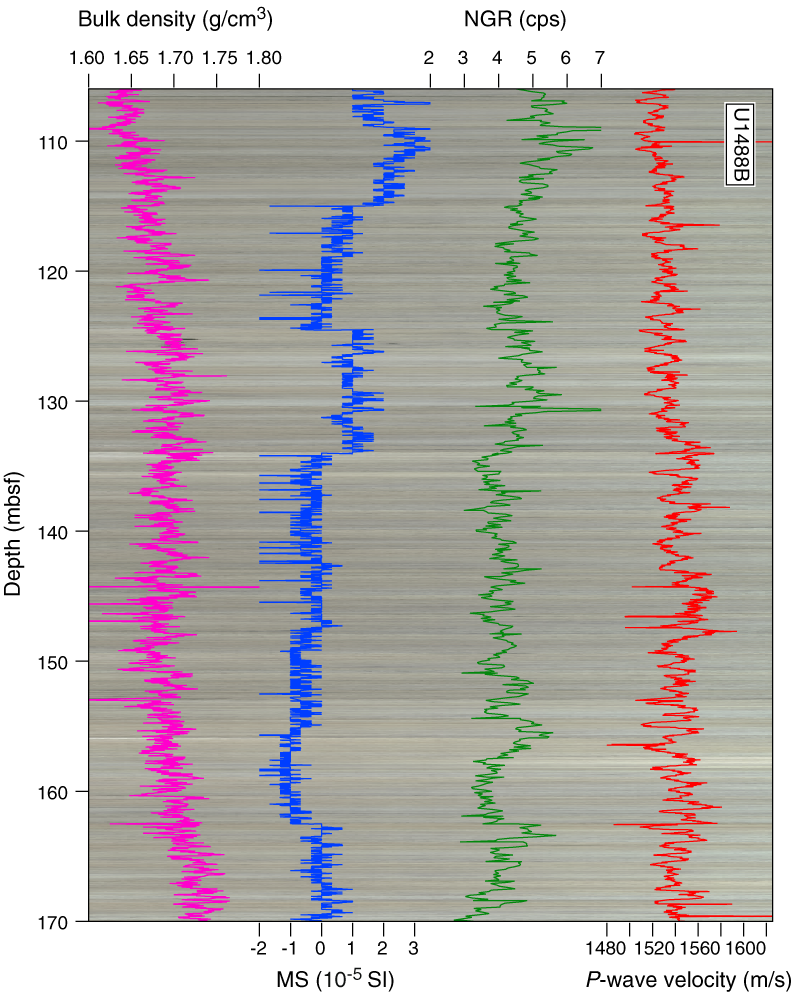
Figure F24. Bulk density, MS, P-wave velocity, and NGR overlaid on core photos.
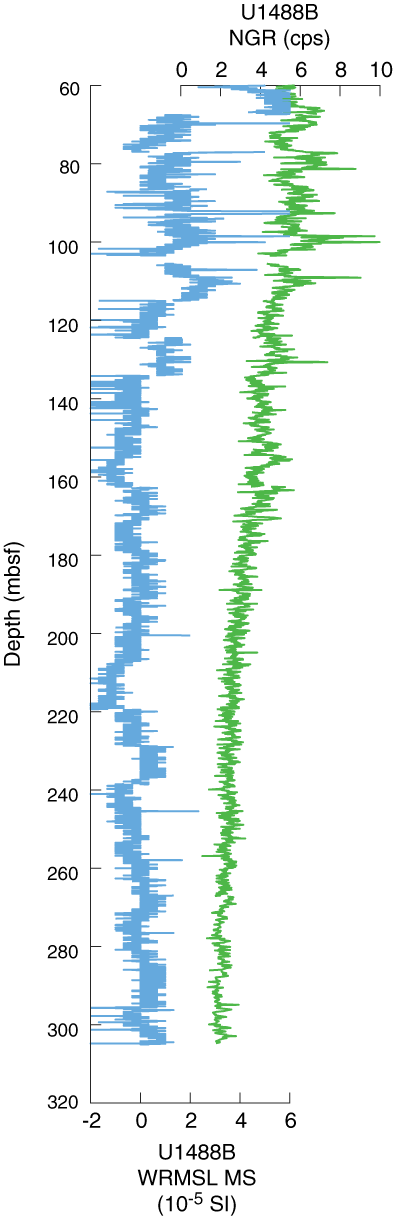
Figure F25. MS and NGR comparison.
Natural gamma radiation
At the top of Site U1488, NGR is relatively high (~25 counts/s), peaking at ~0.3 mbsf (~32 counts/s) (Figure F23; Tables T15, T16, T17). Between 0.3 and 8 mbsf, NGR decreases drastically downhole to 6 counts/s and then increases to ~10 counts/s at ~12 mbsf. This decrease is likely related to the rapid decrease in clay content and increase in carbonate content below the mudline (Figure F26). From 12 to ~44 mbsf, NGR gradually decreases to 4 count/s, coincident with the abrupt transition to low magnetic susceptibility values and a distinct reduction in clay content. Between 44 and 110 mbsf, NGR varies by ~3 counts/s around a mean of 6 ± 1 counts/s within this carbonate-rich, light-colored interval. From 110 mbsf to the bottom of the hole, average NGR steadily decreases from 4 to 2 counts/s with minimal variability (1 count/s) (Figure F25). NGR and carbonate content exhibit similar opposing long-term trends throughout the site (Figure F26), although differences between the NGR and CaCO3 content could also reflect variations in the biosiliceous component of the sediment.
Table T15. NGRL data, Hole U1488A. Download table in CSV format.
Table T16. NGRL data, Hole U1488B. Download table in CSV format.
Table T17. NGRL data, Hole U1488C. Download table in CSV format.
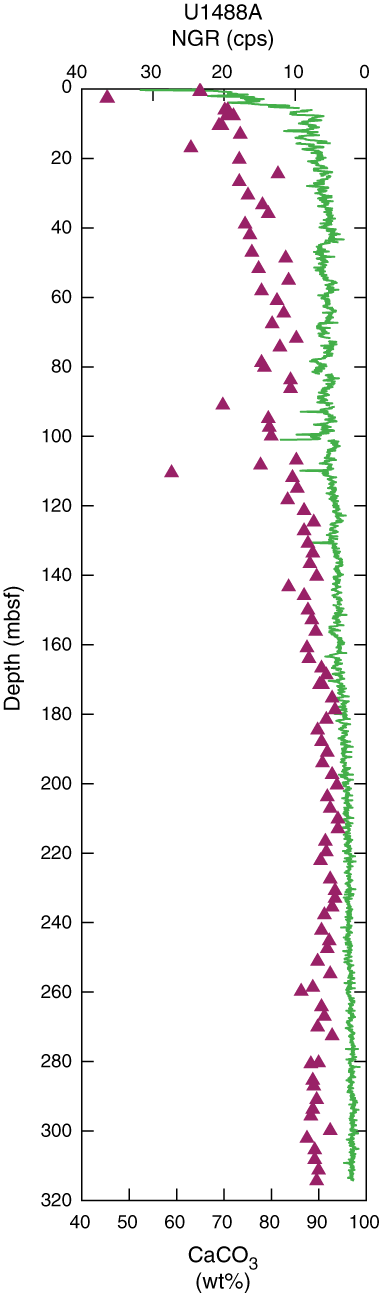
Figure F26. NGR and CaCO3.
P-wave velocity
PWL P-wave velocity measurements were obtained over the entire cored succession at Site U1488 (Figures F23, F27; Tables T18, T19, T20). For description purposes, Hole U1488A is used as representative for all P-wave velocities because discrete measurements were only carried out on this hole. PWL and PWC x- and z-axes P-wave velocities generally display a slight increasing trend from the seafloor to the bottom of the hole, similar to the trend in GRA bulk density and probably reflecting increased compaction with depth (Figure F23). Some outliers in the PWC z-axis data indicate velocities <1449 m/s (Figure F27), which are not reproduced by either PWC x-axis or PWL velocities and therefore appear unreliable. One distinctively large outlier of 1704 m/s at 221.5 mbsf (interval 363-U1488A-24H-5, 62 cm) coincides with a spike in PWL measurements at 221.9 mbsf (interval 24H-5, 98 cm). Based on core description, no obvious feature is observed that could explain the high velocity at this depth. Thus, this outlier is excluded from analyses using the PWC z-axis measurements. The slope and y-intercept of the linear trend in P-wave velocity versus depth are 0.26 and 1497 m/s for PWL data, 0.23 and 1482 m/s for PWC x-axis data, and 0.24 and 1463 m/s for PWC z-axis data. Thus, PWC x-axis measurements are generally ~15 m/s lower than PWL measurements and ~19 m/s higher than PWC z-axis measurements.
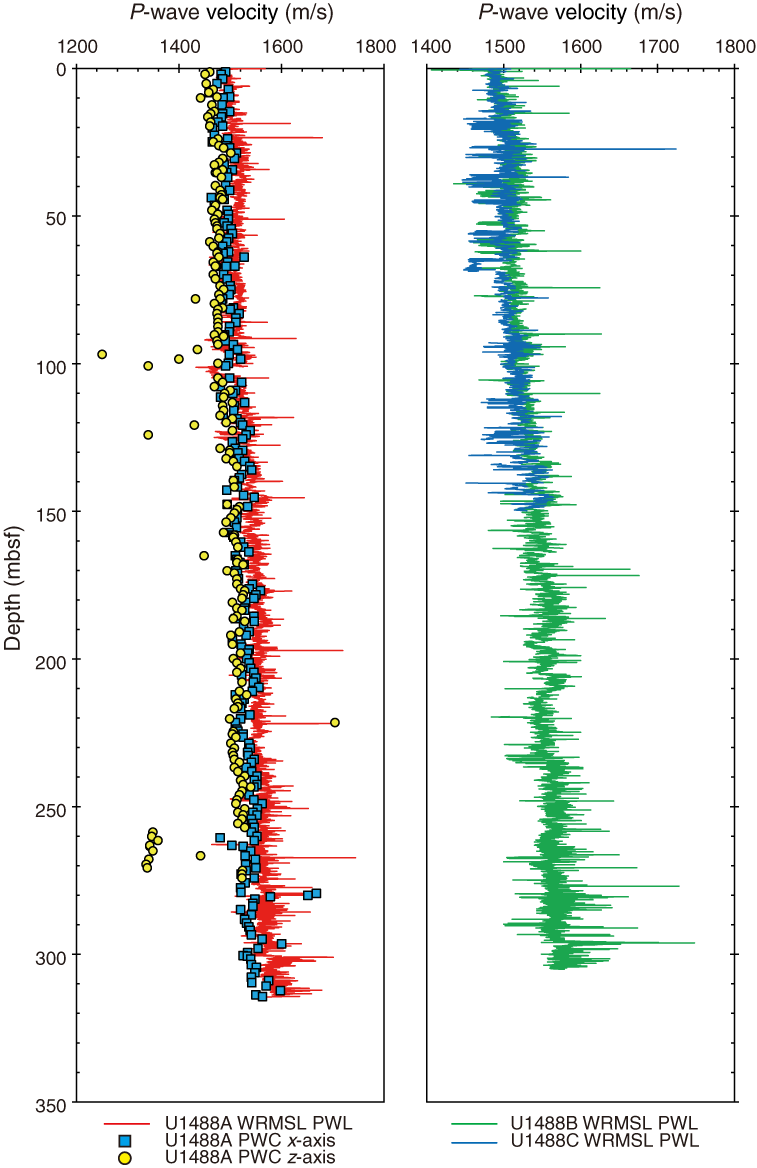
Figure F27. Discrete and whole-round P-wave velocity.
Table T18. WRMSL PWL data. Hole U1488A. Download table in CSV format.
Table T19. WRMSL PWL data. Hole U1488B. Download table in CSV format.
Table T20. WRMSL PWL data. Hole U1488C. Download table in CSV format.
In addition, PWL P-wave velocity displays no obvious cyclicity but does exhibit changes every ~30–50 m. In the upper 35 mbsf, P-wave velocity increases downhole from ~1480 to 1530 m/s. P-wave velocity then decreases slightly to ~1500 m/s from ~35 to ~70 mbsf. The interval from ~70 to ~100 mbsf shows a slight increasing trend in PWL P-wave velocity. Between ~105 and ~148 mbsf, P-wave velocity increases by ~40 m/s. After a short-term decrease, P-wave velocity increases from ~1540 to ~1560 m/s between ~150 and ~180 mbsf. From ~180 to ~225 mbsf, PWL P-wave velocity averages 1554 ± 12 m/s, and from ~235 to ~300 mbsf, it averages 1564 ± 15 m/s. Over this deeper interval, P-wave velocity is characterized by the largest variability and highest values (up to 1660 m/s), possibly related to the more frequent occurrence of indurated sediment layers and thin layers of biosilica-rich sediment. Between ~270 and ~320 mbsf, higher x-axis velocity values occur in more-indurated thin green layers (see Core description).
Moisture and density
Dry density, bulk density, and grain density values show opposing trends to porosity in Hole U1488A (Figure F28). The downhole trends in MAD bulk density and GRA bulk density generally agree with each other; however, there is an ~0.05 g/cm3 offset between MAD and GRA bulk densities below ~40 mbsf. In the upper 40 mbsf, dry density increases downhole from ~0.7 to 0.85 g/cm3 and bulk density increases from ~1.45 to ~1.55 g/cm3. Between ~40 and ~280 mbsf, dry density increases from 0.85 to 1.0 g/cm3, reaching a maximum of 1.1 g/cm3 between ~210 and ~250 mbsf. Over the same interval, MAD bulk density increases from 1.55 to ~1.65 g/cm3 with maximum values of 1.7 g/cm3. In the upper ~290 mbsf, the lowest MAD bulk density, dry density, and grain density values correspond to biosilica-rich sediment, although grain density does not show an increase. Biosilica is present in a higher concentration in the upper and lower parts of the site (see Core description). Below ~290 mbsf, strong downhole increases in dry (1.0–1.2 g/cm3), bulk (1.7–1.8 g/cm3), and grain (2.65–2.75 g/cm3) densities occur, which could reflect a change in compaction or in lithology near the APC refusal depth. In general, porosity in Hole U1488A shows a downhole decreasing trend from 75% to 60%, comparable to previous sites. This decreasing trend is strongest in the upper ~40 mbsf and deeper than ~290 mbsf, where the strongest changes in dry, bulk, and grain densities also occur.
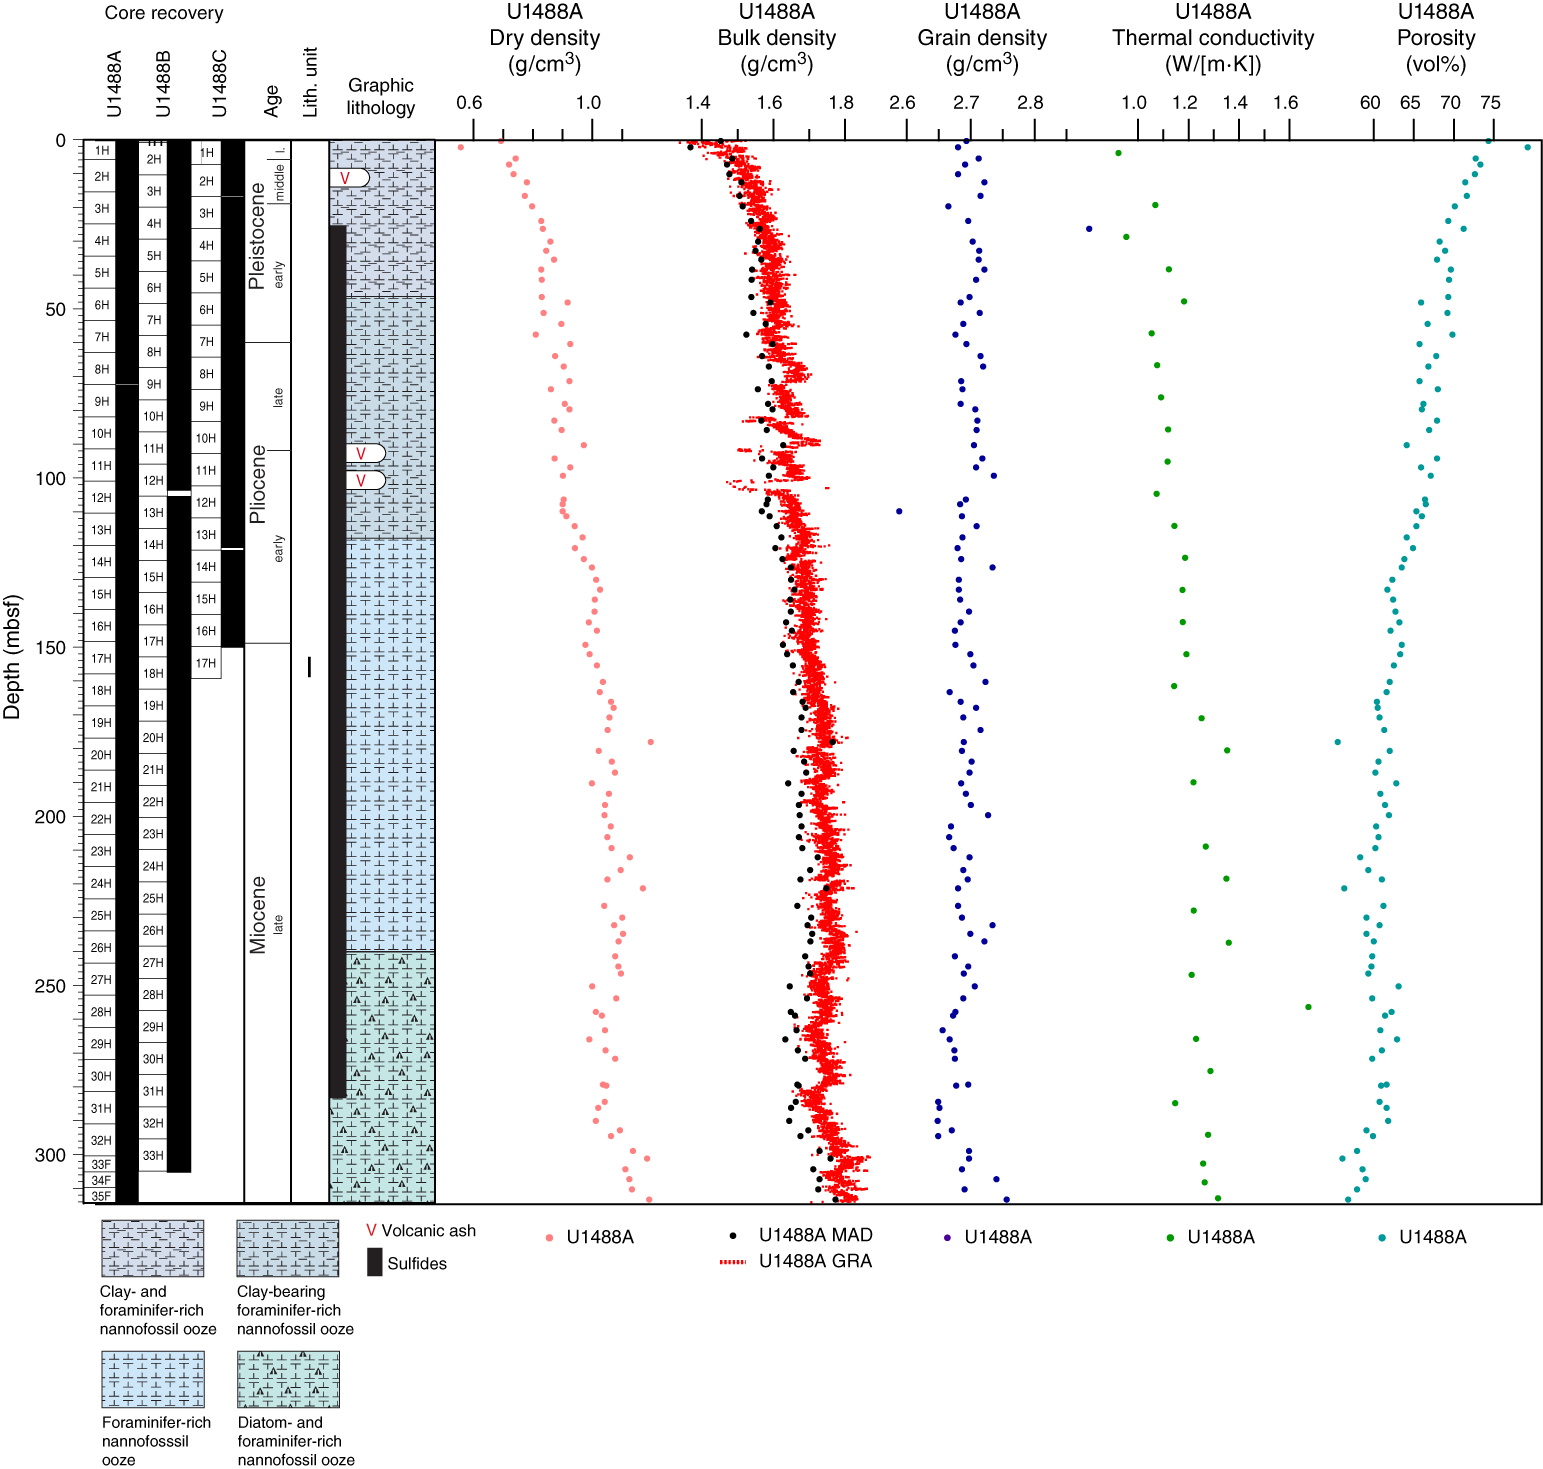
Figure F28. MAD densities and porosity, GRA bulk density, and thermal conductivity.
Thermal conductivity
A thermal conductivity profile was obtained at ~10 m resolution using a thermal conductivity needle (Figures F23, F28). Thermal conductivity generally increases with depth from 0.9 to 1.3 W/(m∙K), although this increase occurs mainly in the upper portion of the site. From the mudline to ~150 mbsf, thermal conductivity increases from 0.9 to 1.2 W/(m∙K), and below ~150 mbsf, thermal conductivity has an average value around 1.3 W/(m∙K) with superimposed variability between 1.2 and 1.4 W/(m∙K). This deeper interval of high thermal conductivity values corresponds to the highest luminosity (L*) (Figure F29) and carbonate content and is possibly indicative of increasing diagenesis and lithification downhole. The outlier (1.7 W/[m∙K]) at ~250 mbsf could be an erroneous measurement (arrow in Figure F29). Average thermal conductivity is 1.17 W/(m∙K) with a standard deviation of 0.06 W/(m∙K). The downhole trend in thermal conductivity correlates well with that in GRA bulk density and is inversely correlated with porosity, reflecting downhole compaction (Figure F28).
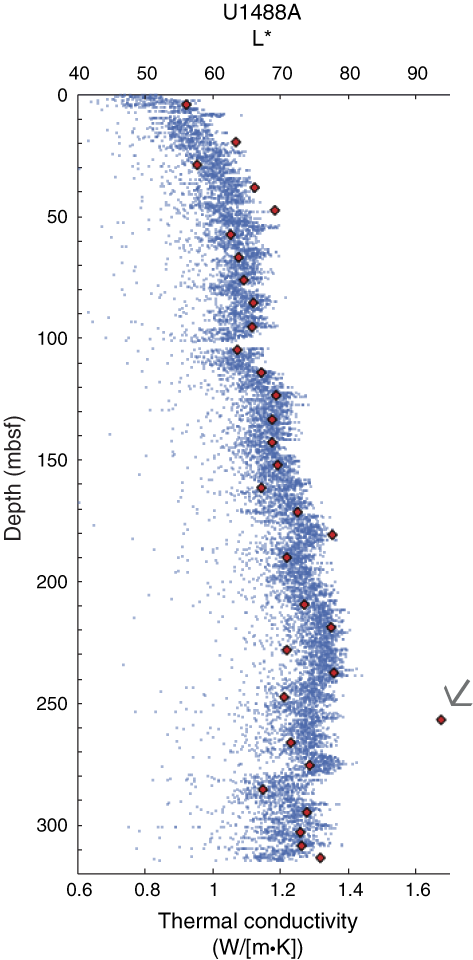
Figure F29. Thermal conductivity and L*.
Downhole temperature measurements
Downhole temperature measurements were made on Cores 363-U1488A-4H (34.4 mbsf), 7H (62.9 mbsf), 10H (91.4 mbsf), and 13H (119.9 mbsf) using the APCT-3. An exponential decrease in temperature was observed between ~60 and 600 s after penetration and was used to estimate ambient formation temperature (unshaded area in Figure F30). Temperature increased with depth from 3.99°C at 34.4 mbsf to 9.05°C at 119.9 mbsf (Figures F30, F31). All extrapolated temperatures are quite low, probably reflecting the ~2603 m water depth at Site U1488. The correlation between the four downhole temperatures and depth is very high (R2 = 0.99915). Using the slope of the temperature-depth relationship, we estimate that the bottom water temperature at Site U1488 is 2.01°C, yielding a geothermal gradient of 59°C/km (Figure F31).
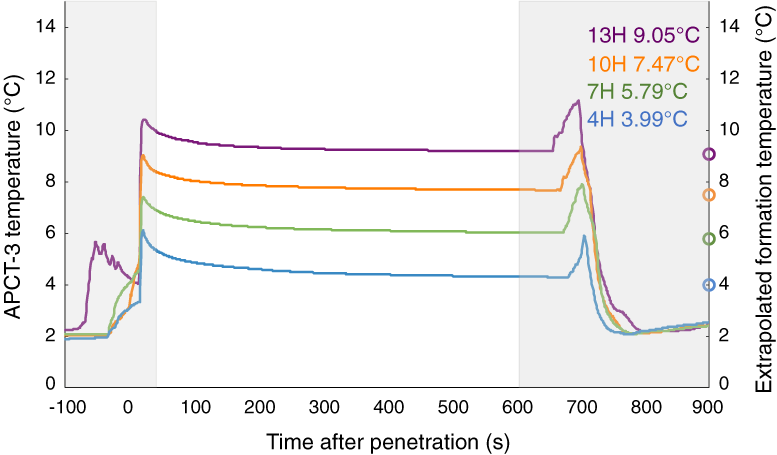
Figure F30. APCT-3 temperature-time series.
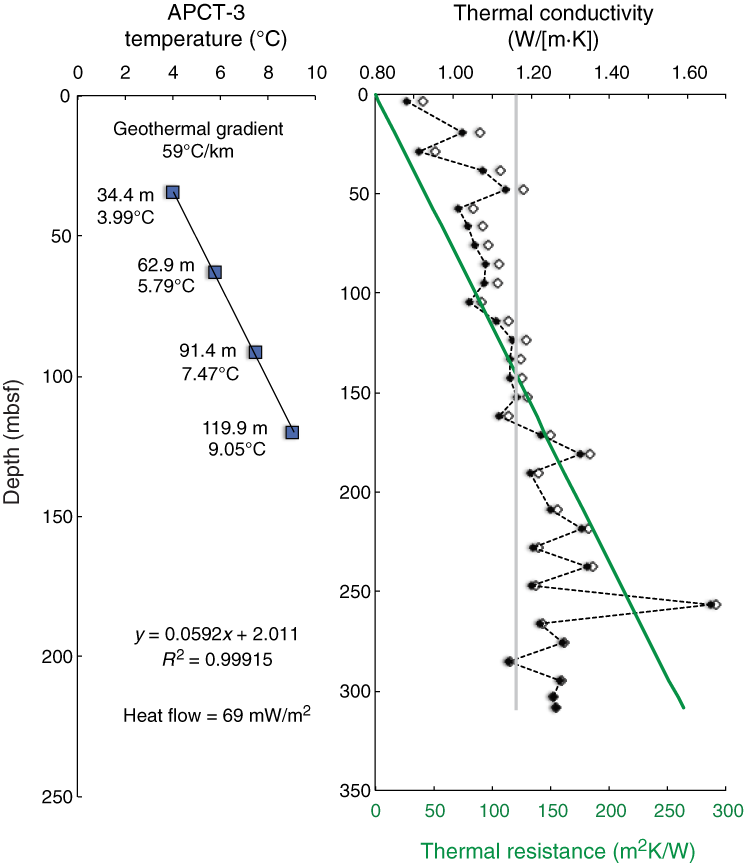
Figure F31. Heat flow calculations.
We generated a thermal conductivity profile (~10 m resolution) (Figure F31) and calculated thermal resistance based on the in situ correction and the average thermal conductivity of 1.17 W/(m∙K), following the “average approach” outlined in Pribnow et al. (2000). The slope of the linear fit between temperature and thermal resistance indicates that the heat flow is 69 mW/m2 at Site U1488. Comparison of the modeled heat flow (Shapiro and Ritzwoller, 2004) with that predicted based on the oceanic age grid north of Australia indicates that the area around Site U1488 shows an anomaly of approximately −20 mW/m2 (figure 15 in Gaina and Muller, 2007). If we add this −20 mW/m2 anomaly to the calculated heat flow, we obtain a heat flow of 89 mW/m2. This new heat flow estimate is equivalent to an ocean-crust age of 30.6 Ma according to the model of Stein and Stein (1992), which agrees with the early Oligocene ocean-crust age at DSDP Site 62 (Shipboard Scientific Party, 1971).
Stratigraphic correlation
Correlations between holes at Site U1488 were accomplished using Correlator software (version 2.1). Tie points were established with WRMSL magnetic susceptibility (Figure F32), GRA bulk density (Figure F33), P-wave velocity (PWL) (Figure F34), NGR, and luminosity (L*) data (Table T21). We constructed a splice for the entire site using Holes U1488A–U1488C (Table T22; Figure F35). The splice is continuous and well constrained from 0 to 324.89 m core composite depth below seafloor (CCSF), although there are a few tentative tie points that should be verified during postcruise research. Only Hole U1488A penetrated deeper than 324.89 m CCSF, and therefore we added the last two cores of Hole U1488A to the bottom of the splice using an offset calculated with a growth factor of 1.085.
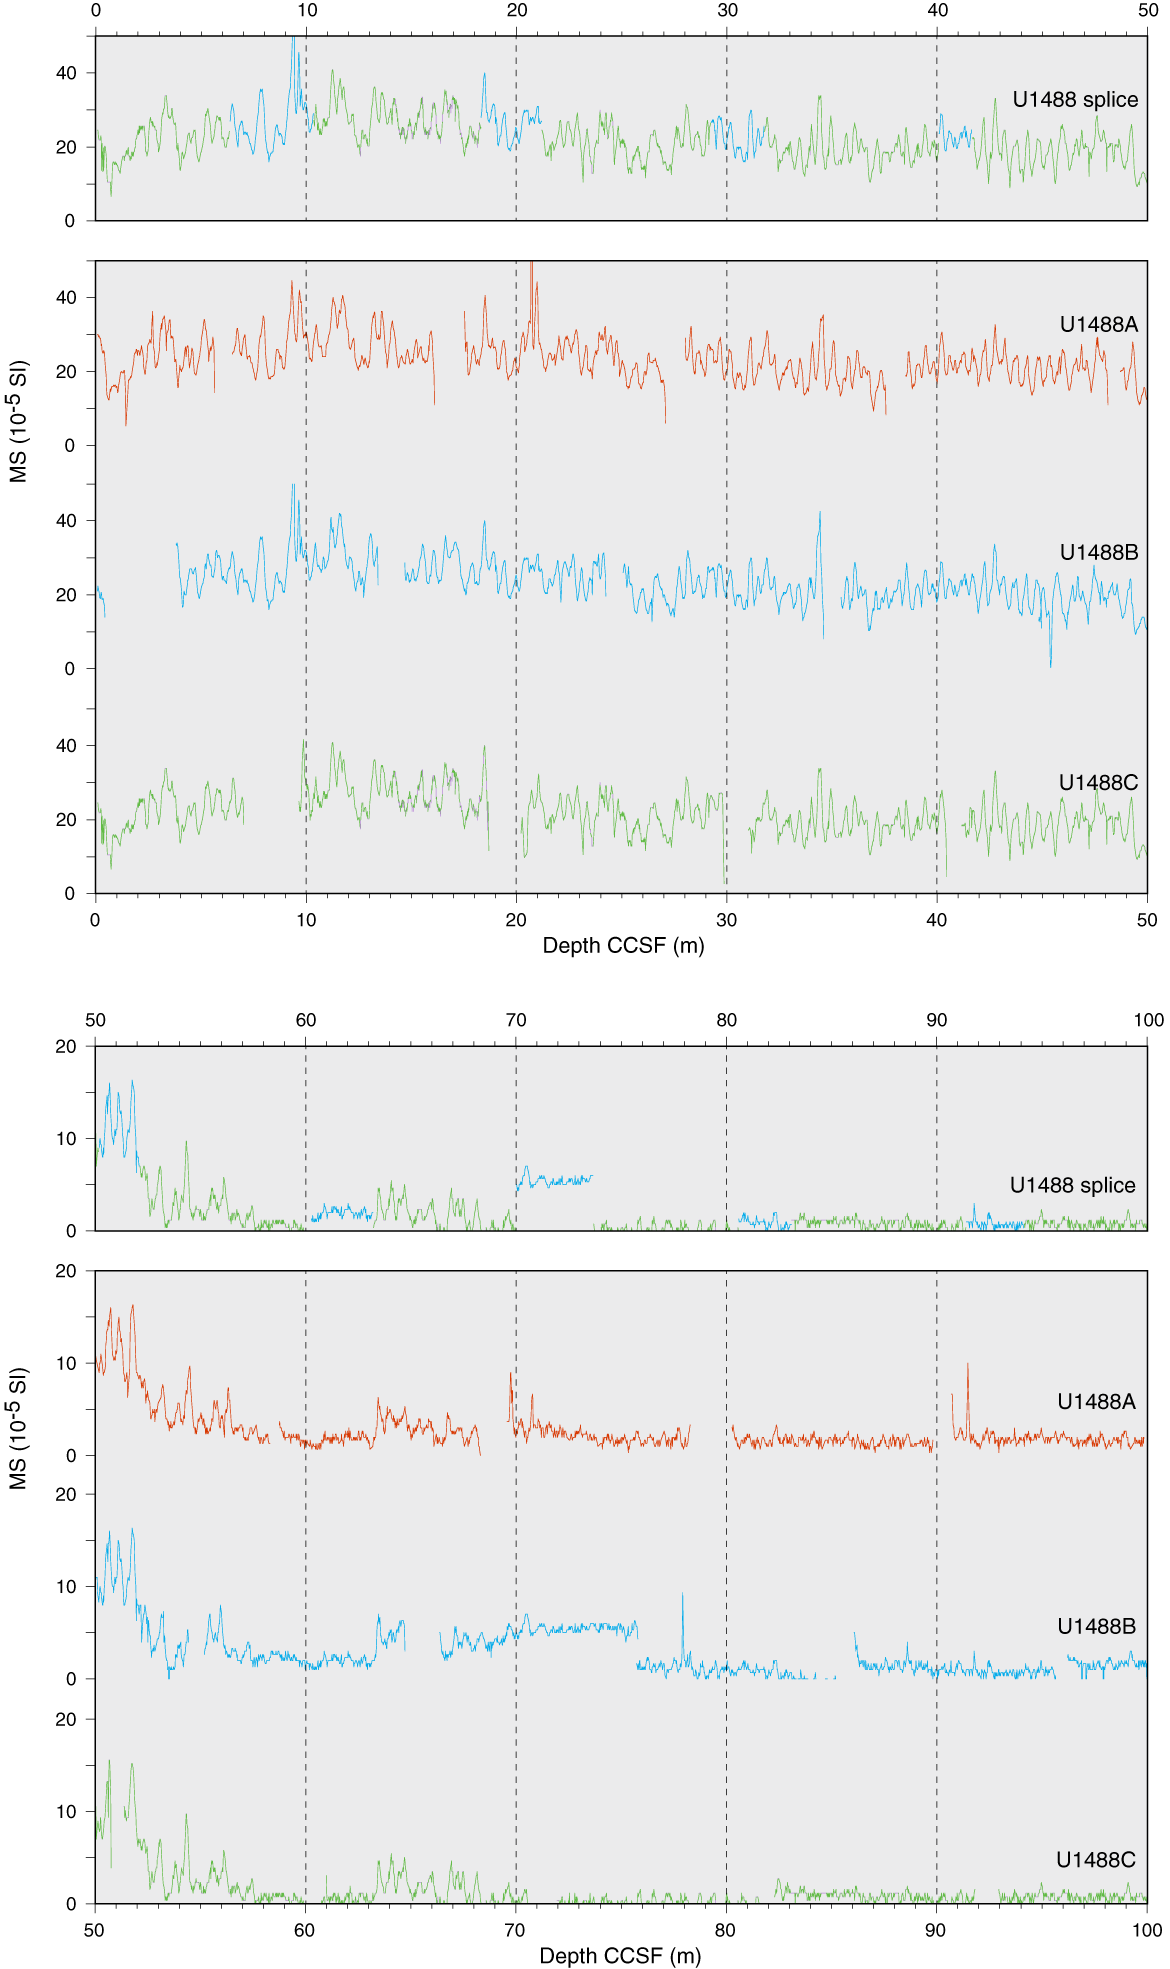
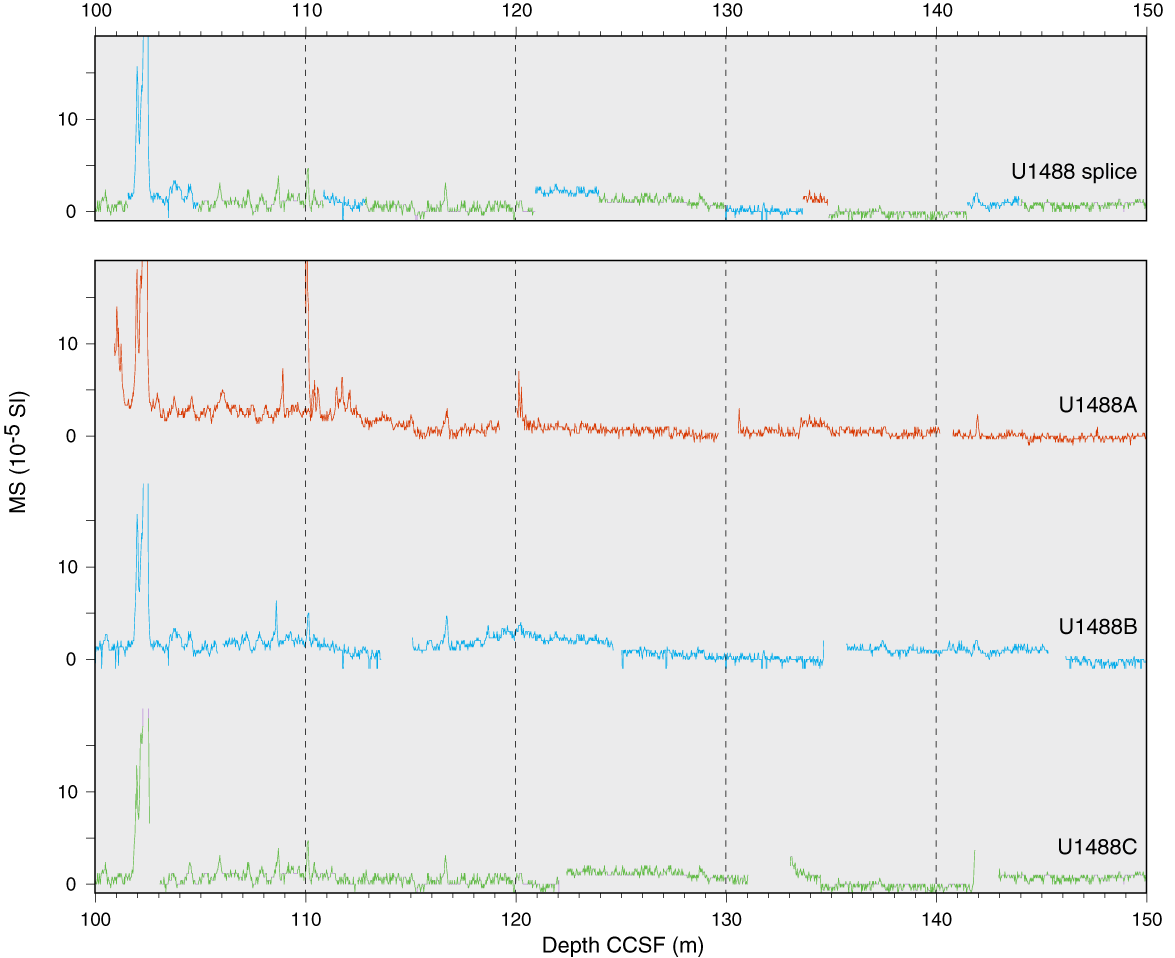
Figure F32. WRMSL MS data.
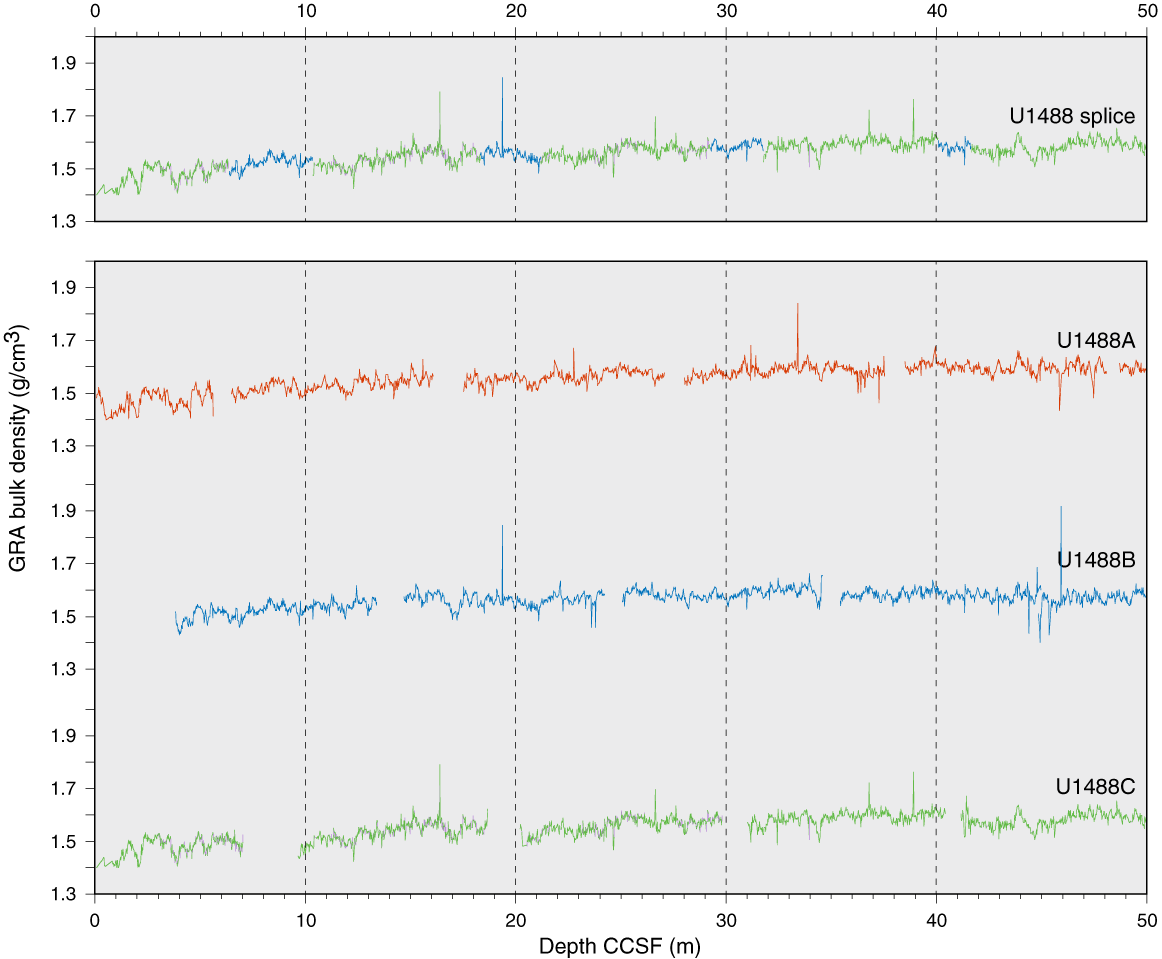


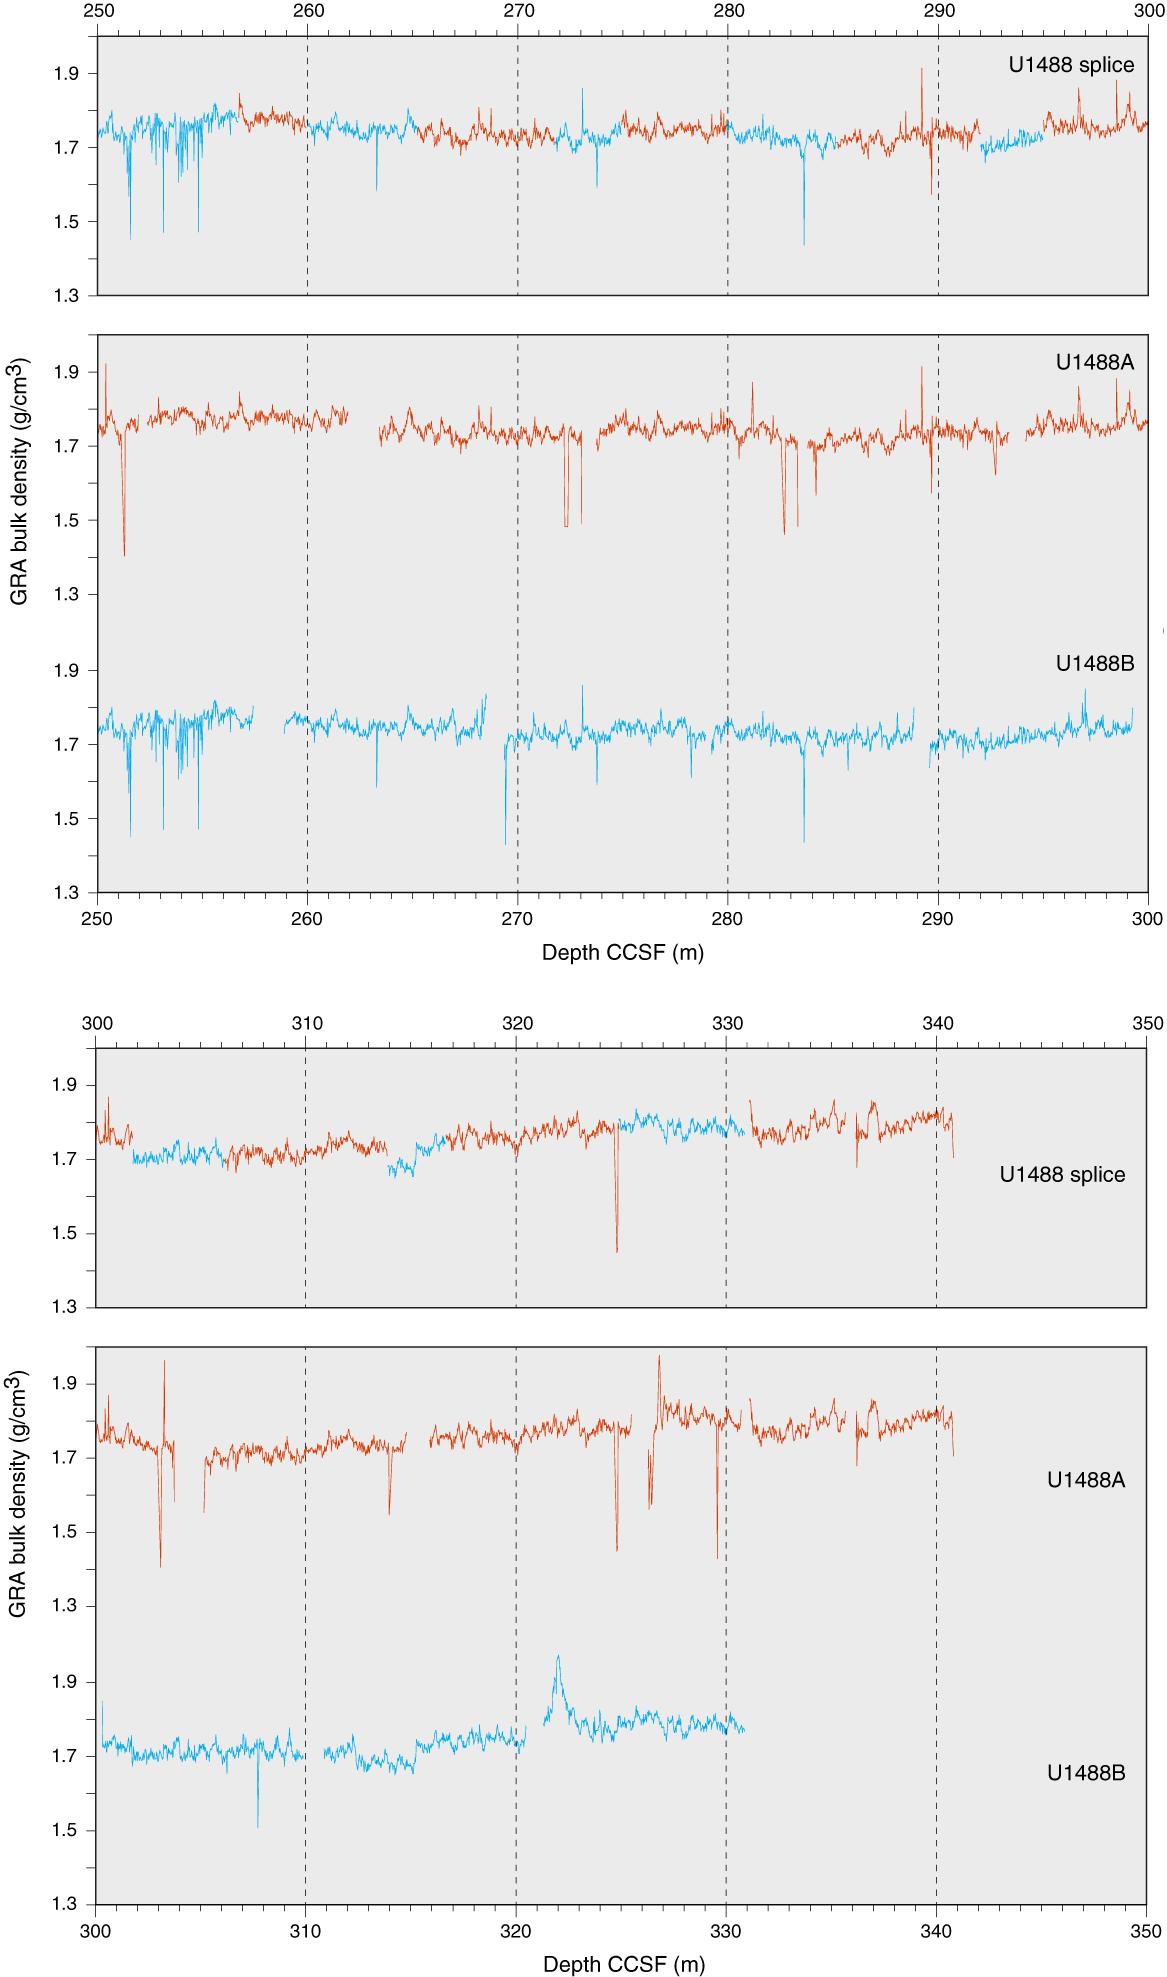
Figure F33. WRMSL GRA bulk density data.
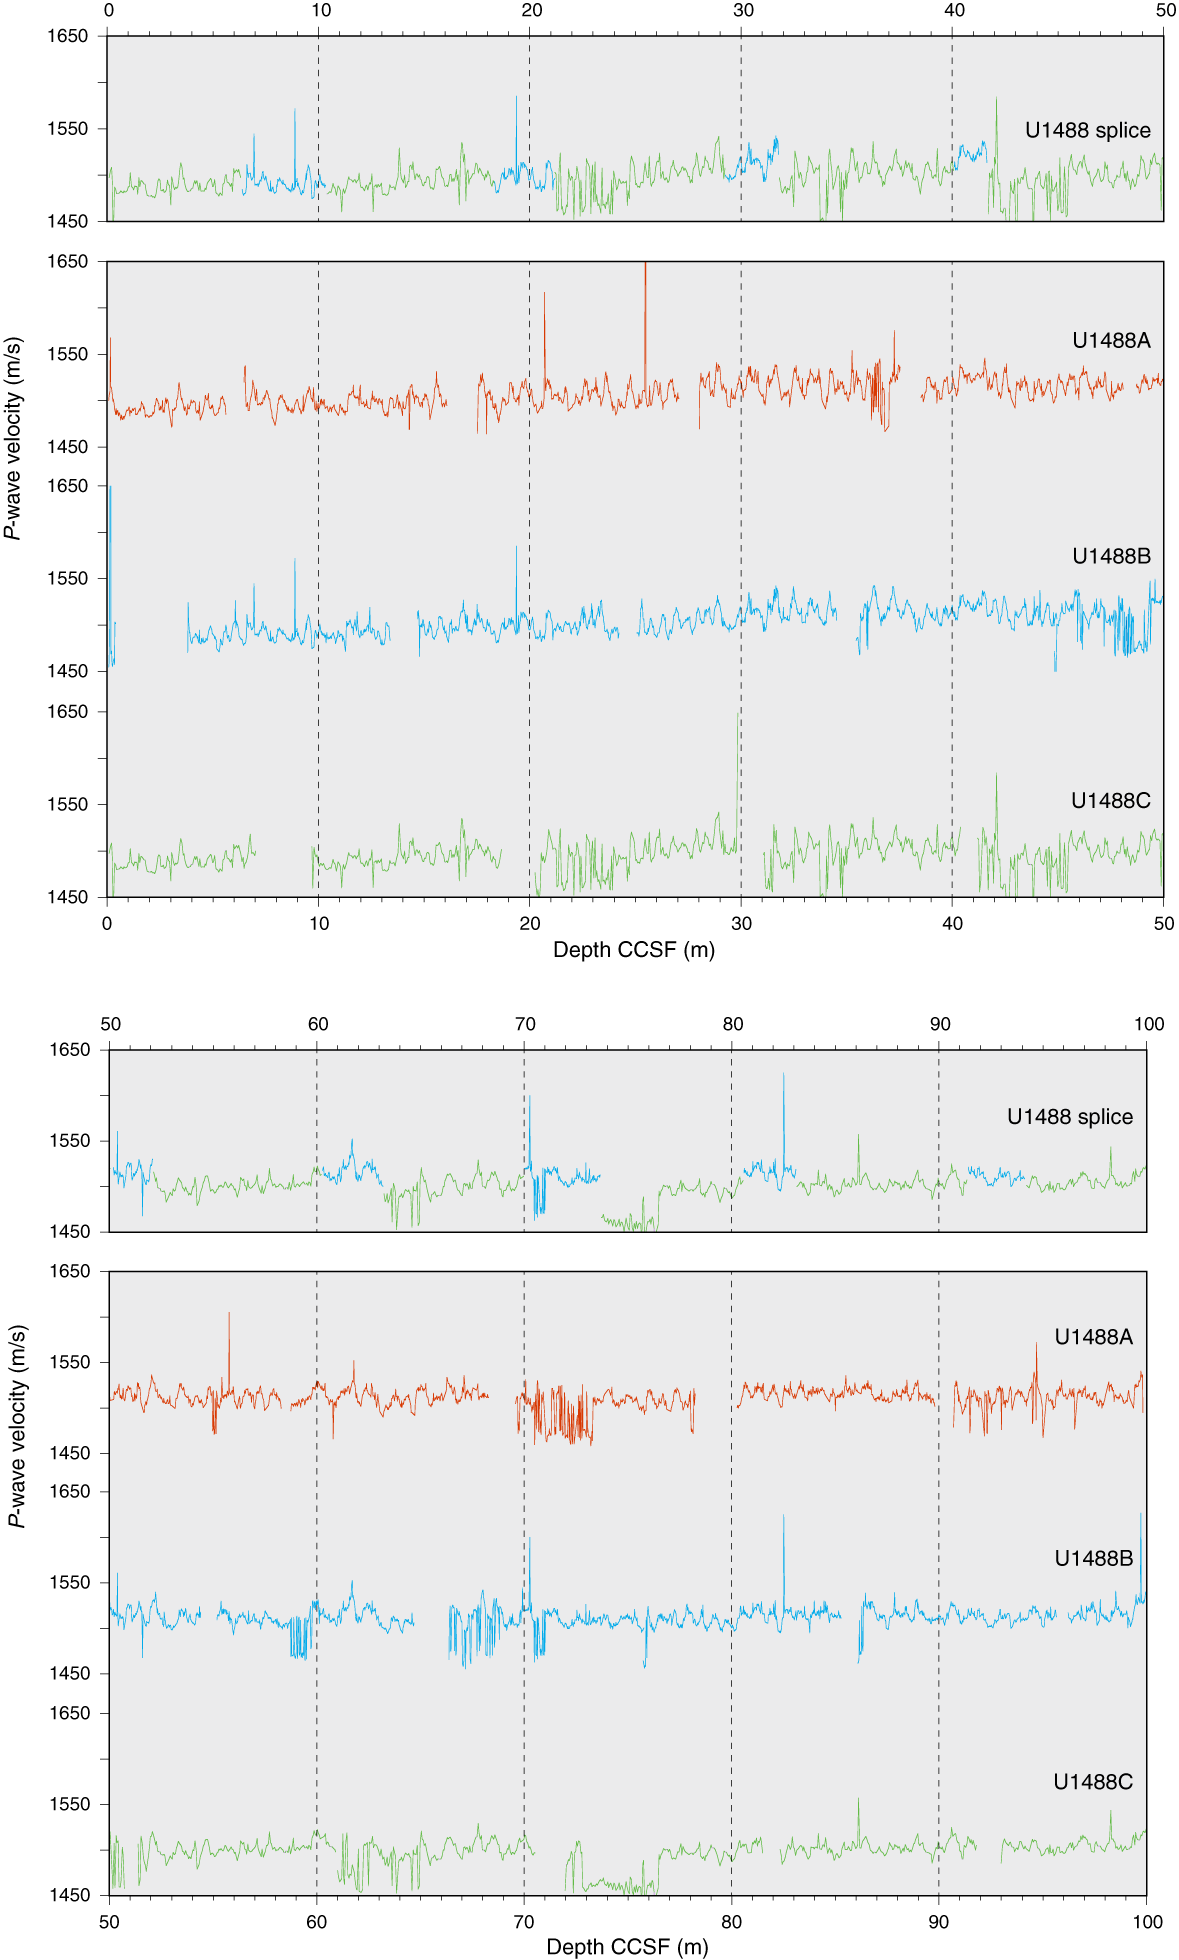
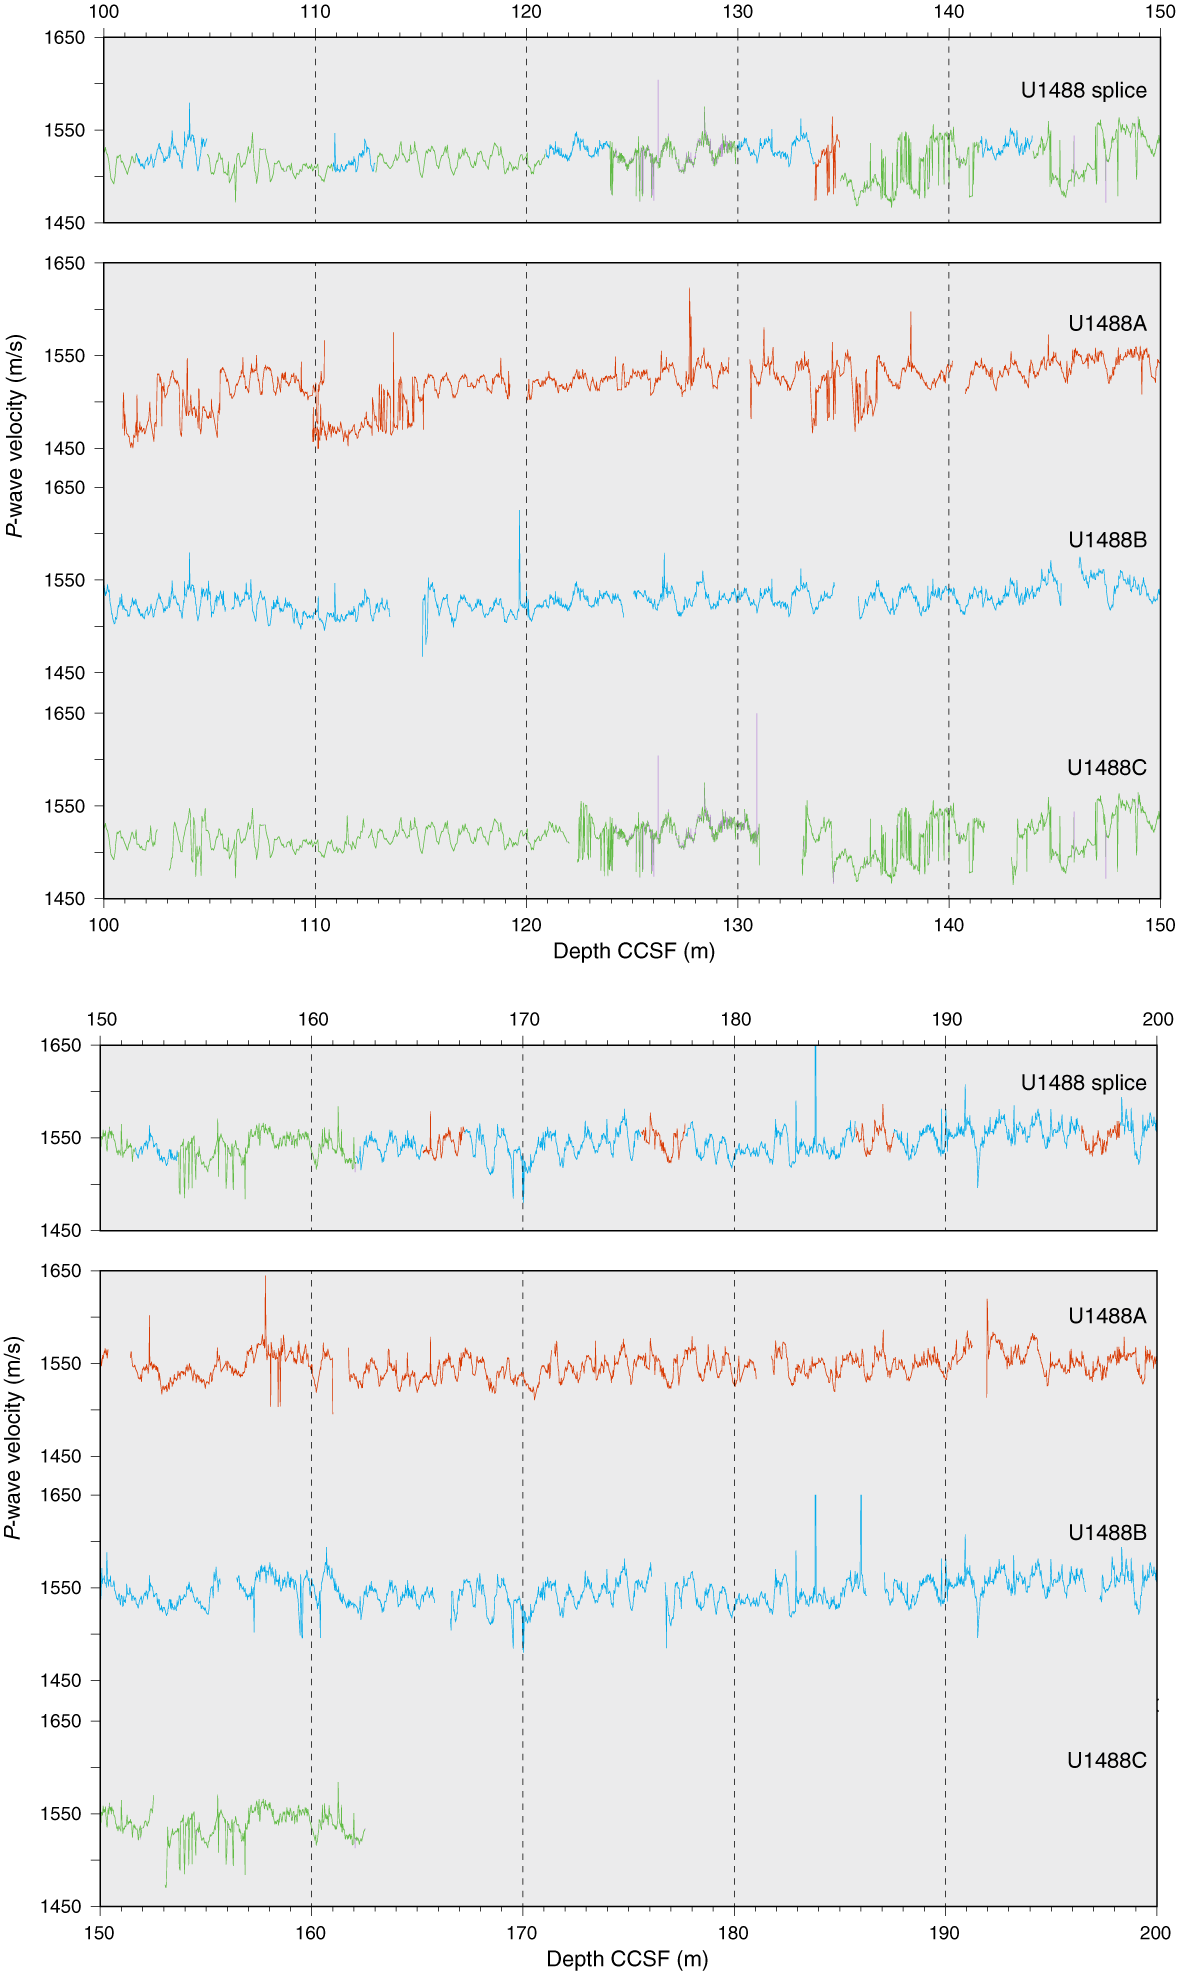

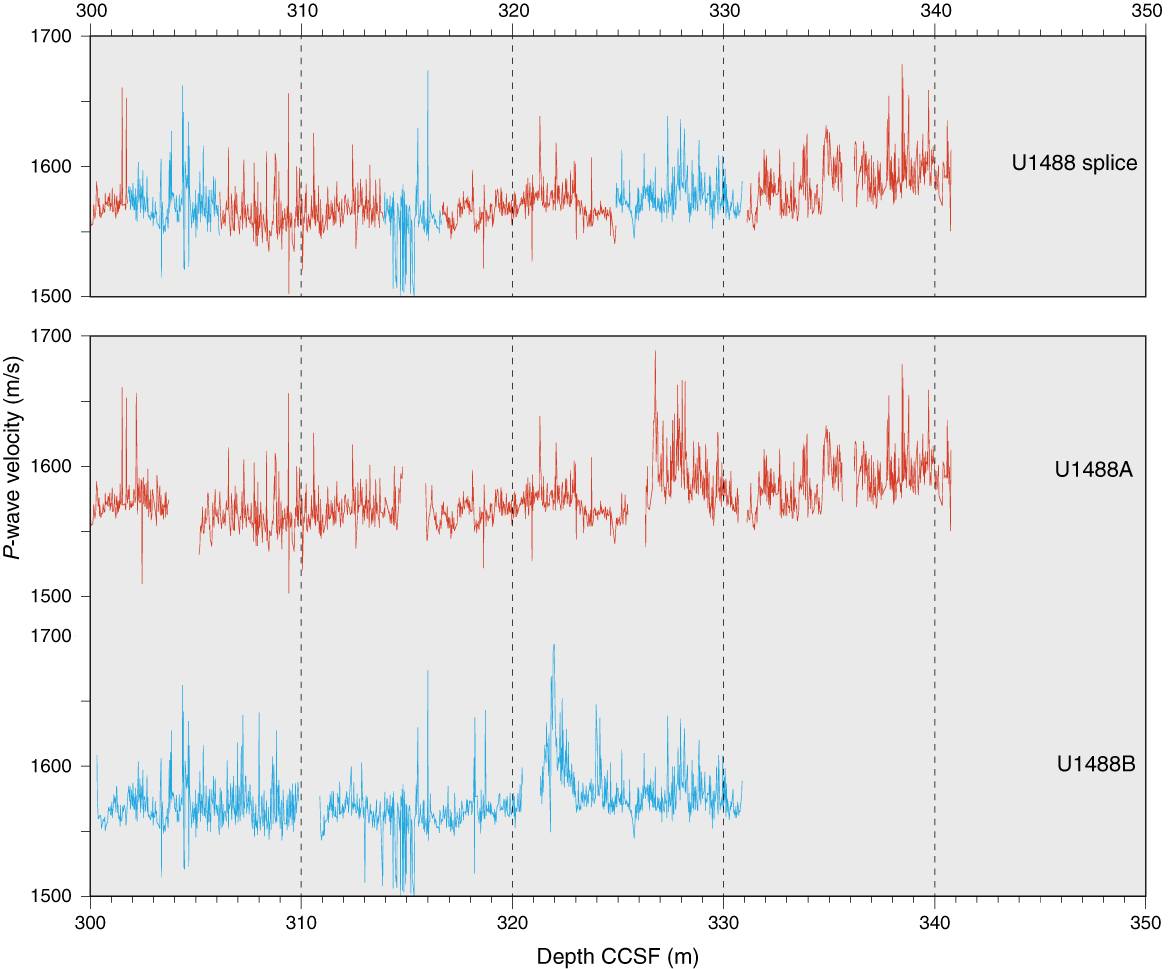
Figure F34. WRMSL PWL data.
Table T21. Affine table. Download table in CSV format.
Table T22. Splice intervals. Download table in CSV format.
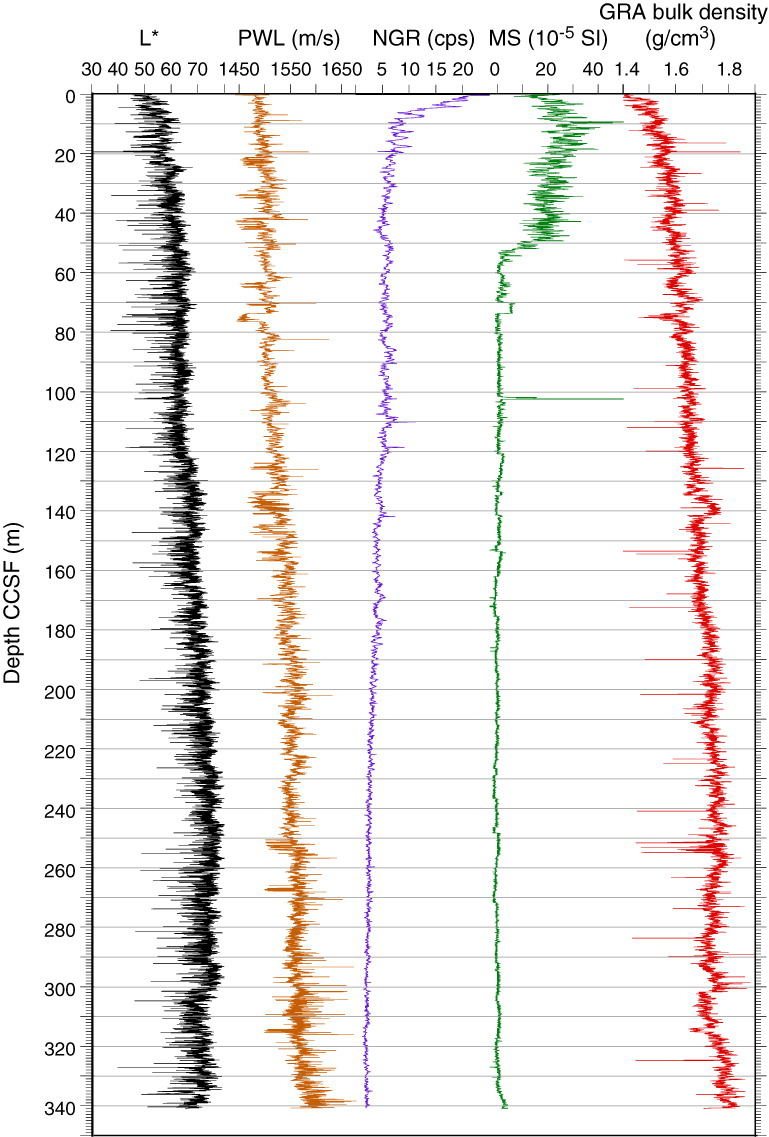
Figure F35. Spliced L*, PWL, NGR, MS, and GRA bulk density.
The CCSF scale is anchored to the mudline of Core 363-U1488C-1H, which is assigned a depth of 0 m CCSF. From this anchor, we worked downhole, using Correlator to establish a composite stratigraphy on a core-by-core basis. In the upper part of the splice, we primarily used magnetic susceptibility to establish tie points; however, the amplitude of the magnetic susceptibility variations greatly diminished deeper than ~65 m CCSF, and PWL and GRA bulk density data were also needed to correlate between holes. Deeper than 120 m CCSF, magnetic susceptibility values were too low, so PWL data became critical for correlating between holes, particularly from ~100 to 250 m CCSF. GRA density data were also critical in defining tie points between holes, particularly between 120 and 150 m CCSF and from 200 m CCSF to the bottom of the splice. Much of the splice was constructed by considering all available data, as detailed in Tables T21 and T22.
Because the upper 150 mbsf (equivalent to ~162 m CCSF) of Hole U1488A was heavily sampled for high-resolution interstitial water analyses (one 5 or 10 cm whole-round sample per section), our general approach was to avoid using material from 0 to 150 mbsf in Hole U1488A; in fact, Hole U1488C was cored to 150 mbsf to recover material to enable the construction of a complete splice. Thus, in the upper part of the splice from 0 to 162.10 m CCSF, we used Hole U1488C as the “backbone” of the splice and Hole U1488B to cover the core gaps in Hole U1488C. Within this upper part of the splice, there was only one interval with poor recovery, from 110 to 112 m CCSF. Although we found a good splice tie point between Cores 363-U1488C-12H and 363-U1488B-12H that indicates that we have stratigraphic continuity in this interval, this continuity should be verified during postcruise research (Tables T21, T22). There is one interval where it was difficult to find a reliable tie point between Cores 363-U1488B-14H and 363-U1488C-14H; therefore, we used one short interval from Hole U1488A to construct the splice. This approach also provides the opportunity to construct a second splice for the upper 162 m CCSF of Site U1488 using Hole U1488A as the backbone and Hole U1488B to fill in the core gaps. There was not enough time to construct a second splice, but it should be possible postcruise to generate a nearly complete second splice in this upper interval.
From 162.10 to 324.89 m CCSF, the splice was constructed using Holes U1488A and U1488B. From 162.10 to 256.67 m CCSF, we used Hole U1488B as the backbone of the splice, with short splice intervals from Hole U1488A to cover the core gaps between long intervals from Hole U1488B. Because it was more difficult to find splice tie points at the tops and bottoms of cores from Hole U1488B, from 256.67 to 324.89 m CCSF we stopped using this hole as the backbone and simply used the best available splice tie points between holes. In this deepest interval, we had to inspect all available data, including core photos, to verify the tie points, and we identified six tie points that require further verification during postcruise research (Table T21). Hole U1488A was the only hole to penetrate deeper than 324.89 m CCSF, and thus we added the last two cores (34H and 35H) to the bottom of the splice by setting their offset using 1.085, the growth factor in the overlying interval.
The splice interval table (Table T22) is intended to provide a sampling plan that can be used to generate high-resolution continuous records with minimal gaps; however, an “off-splice” sampling plan was also designed mainly for low-resolution studies. An explanation of the strategy used to determine the off-splice sampling plan, and a table of core intervals that should be used for off-splice sampling can be found in OFFSPLICE in Supplementary material.
The cumulative offset between mbsf and CCSF depth scales is nearly linear (Figure F36A). The growth factor is relatively low (8%–9%), as expected in sediment that expands due to the release of overburden and has minimal gas expansion due to low concentrations of methane and other gases (see Geochemistry). There is a marked change in the growth factor, and therefore in the cumulative offset with depth (Figure F36B), at ~110 mbsf due to a disturbed core (363-U1488A-12H) and a core with incomplete recovery (Core 363-U1488B-12H). These issues result in hole-to-hole differences in the location (in mbsf) of certain stratigraphic features; correlating these features to each other to place the cores on the CCSF scale results in offsets that are strongly influenced by the drilling process rather than simply by expansion due to the release of overburden. We think we established solid tie points in this interval, but this should be verified during postcruise research. Calculation of mass accumulation rates based on the CCSF scale should account for differential expansion by dividing apparent depth intervals by the appropriate growth factor.
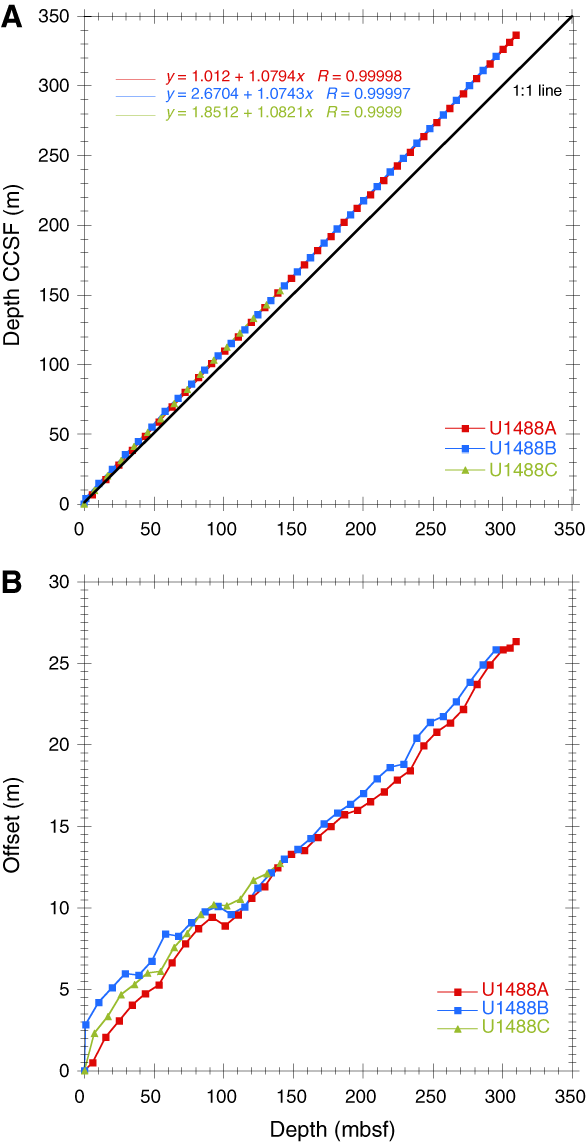
Figure F36. Mbsf and composite depth scales in the Site U1488 splice.
Geochemistry
Site U1488 was drilled on the Eauripik Rise in the central Caroline Basin at a water depth of 2604 m. High-resolution interstitial water sampling was conducted in the upper ~150 mbsf at this site, with the goal of reconstructing chlorinity (Cl) and δ18O profiles in Upper Circumpolar Deep Water (UCDW) during the LGM. The interstitial water profiles at this site reflect the influence of carbonate diagenesis and, to a lesser extent, organic matter remineralization in the uppermost 50 mbsf. Preliminary shipboard chlorinity measurements suggest that reconstruction of the salinity of UCDW will be possible with the samples collected at this site. Carbonate content averages 83.5 wt% and increases with depth. Total organic carbon (TOC) decreases downhole from ~0.5% to 0.2% in the uppermost 25 mbsf and continues to decrease downhole to concentrations that are often below the detection limit. For detailed background on organic matter remineralization and clay mineral alteration, see Geochemistry in the Site U1482 chapter (Rosenthal et al., 2018b).
Results
Volatile hydrocarbons
Headspace gas samples were taken at a spacing of one sample per core in Hole U1488A as part of the routine environmental protection and safety-monitoring program (Table T23; Figure F37). Overall, methane concentration was low (<16 ppmv) throughout Hole U1488A, which is consistent with interstitial water analyses that show high concentrations of dissolved sulfate (SO4) through the entire hole (see Sulfate and barium); however, the methane profile exhibits a clear downhole increasing trend, suggesting increased production and/or decreased consumption downhole or diffusive transport from deeper to shallower sediment. Ethane and propane are below detection limit.
Table T23. Volatile hydrocarbon concentrations, Hole. Download table in CSV format.
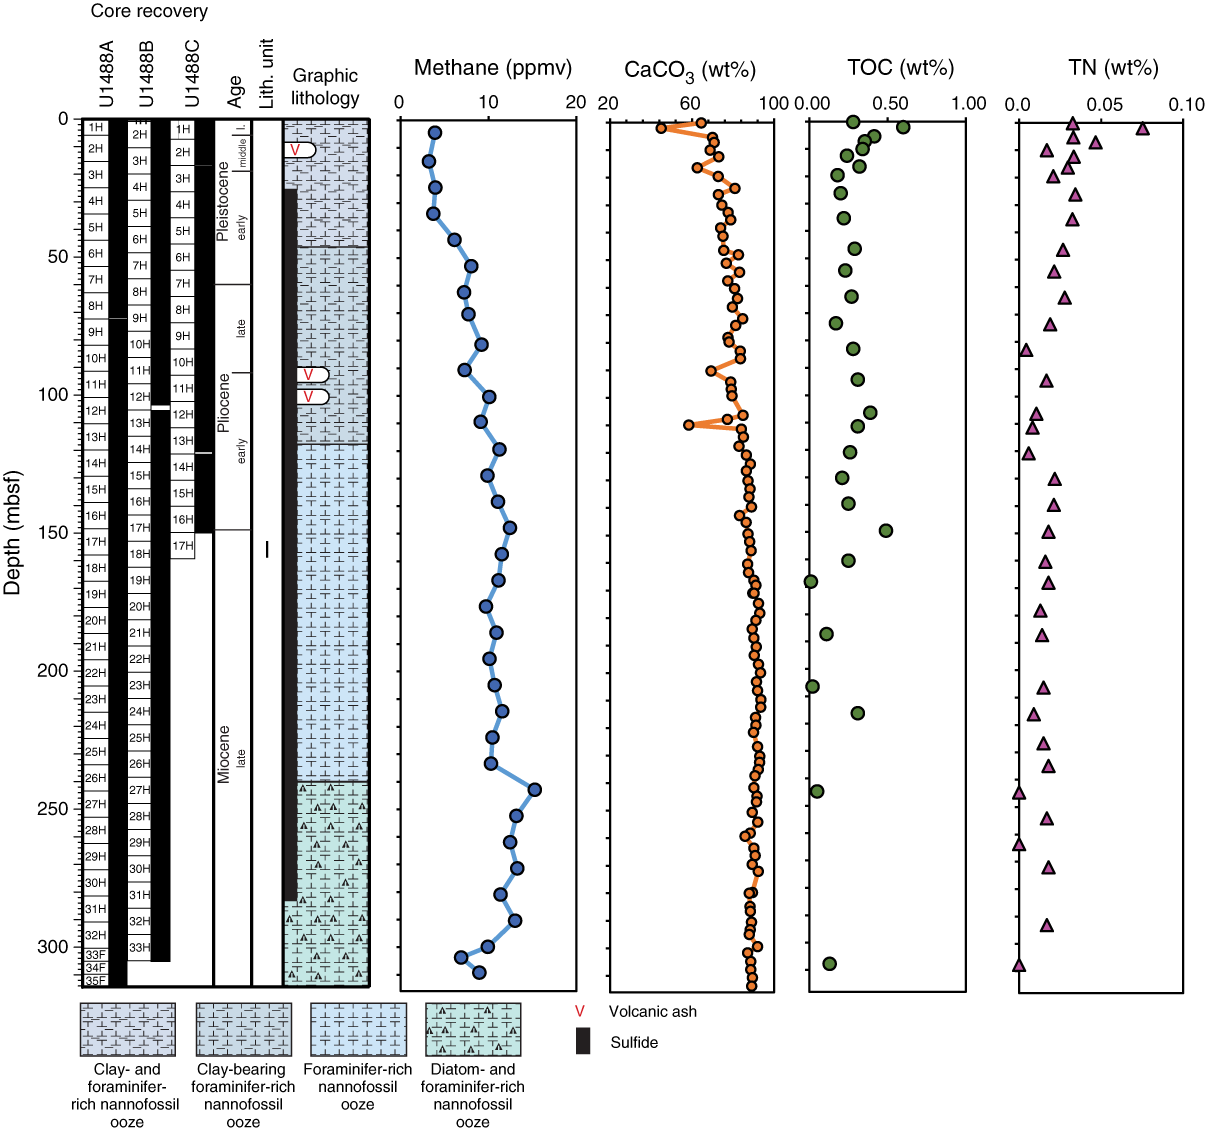
Figure F37. Carbon and TN profiles.
Bulk sediment geochemistry
Calcium carbonate (CaCO3) content was measured on sediment samples from Hole U1488A (Table T24; Figure F37). In general, CaCO3 is the major constituent of the sediment, with an average content of 83.5 wt%. CaCO3 content shows an increasing trend with depth, from ~70 wt% at the top of the hole to >90 wt% at ~170 mbsf. TOC content shows several stepwise decreases downhole, from ~0.5 to 0.2 wt% in the uppermost 25 mbsf with a further decrease at ~170 mbsf to minimal values that are often below the detection limit. Total nitrogen (TN) content shows a similar trend to TOC content. Because TOC and TN concentrations are very low, the C/N ratio estimates are considered to be unreliable and are not plotted.
Table T24. Carbon and nitrogen. Download table in CSV format.
Interstitial water chemistry
Sampling at Site U1488
A total of 113 whole-round samples and 1 mudline sample were taken from Hole U1488A. High-resolution interstitial water sampling was conducted in the upper ~150 mbsf at this site with the goal of constructing the Cl and δ18O of the UCDW during the LGM. Deeper than 150 mbsf, interstitial water sampling continued at one sample per core. Of the interstitial water samples collected, 50 were used for shipboard analyses following the procedures described in Geochemistry in the Expedition 363 methods chapter (Rosenthal et al., 2018a). Interstitial water chemistry data are reported in Table T25.
Table T25. Interstitial water geochemical data. Download table in CSV format.
Chlorinity and salinity
The Cl profile at Site U1488 displays considerable variability, with values ranging between 546.5 and 560.7 mM (Figure F38). Cl concentration increases from a mudline value of 549.8 mM to a broad local maximum that averages 558 ± 2 mM between 14.8 and 48.3 mbsf, followed by a sharp drop between 48.3 and 57.8, with lower values (550 + 4 mM) to 76.8 mbsf. The peak in the upper 77 mbsf likely represents the LGM, which will be further investigated by high-precision shore-based analysis. Below ~100 mbsf, Cl shows a slight decreasing trend toward the base of the hole (313.9 mbsf) but with large (up to 11 mM) variations superimposed over the subtle decreasing trend.
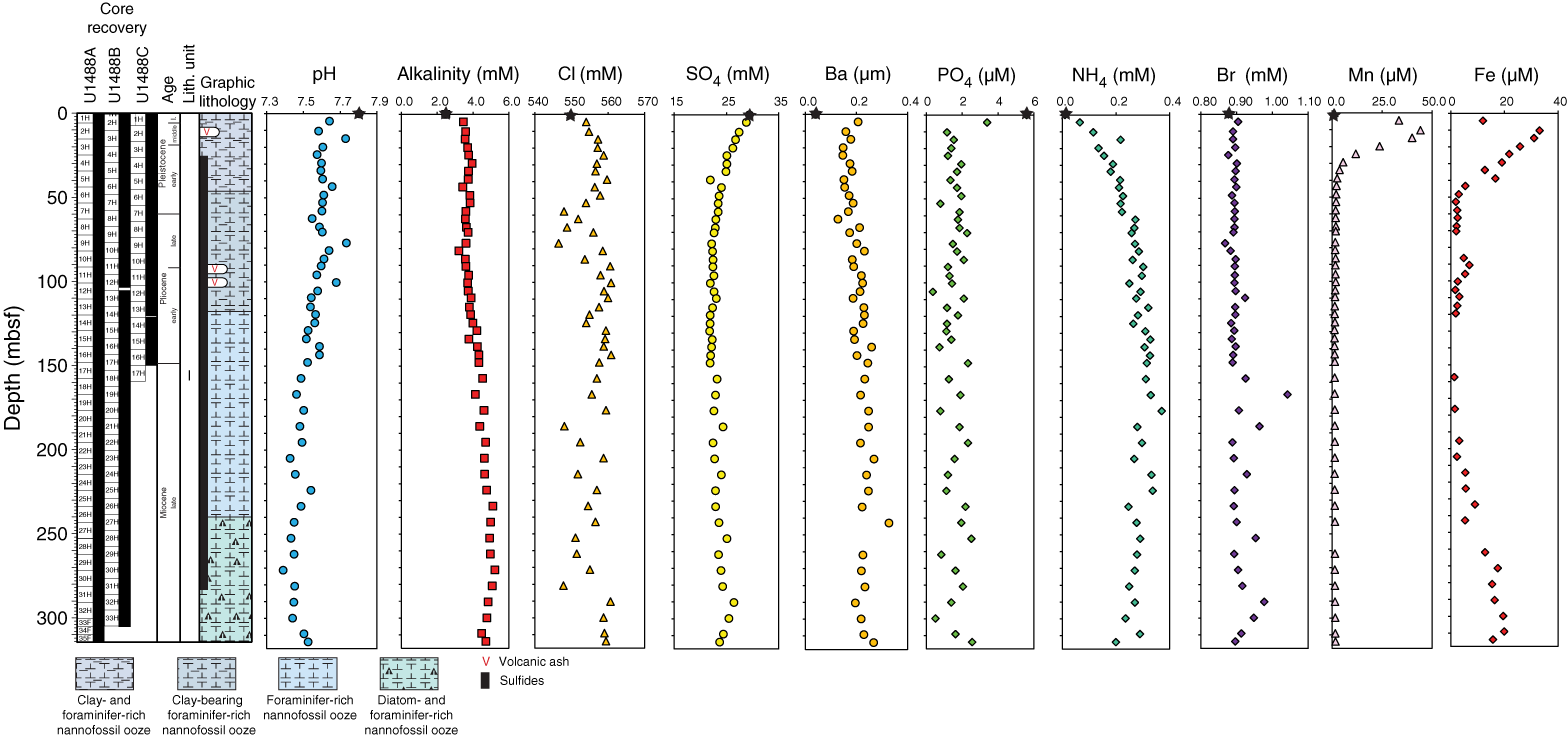
Figure F38. Interstitial water concentration profiles.
Salinity at Site U1488 (not shown) varies similarly to Cl in the upper 77 mbsf. An increase in salinity from 36 at the mudline to a peak of 37 between 19.8 and 29.3 mbsf coincides with the peak in chlorinity around this depth. Salinity subsequently decreases to 36 and remains at this level downhole to 242.8 mbsf. A small increase to a salinity of 37 occurs from 242.8 mbsf to the bottom of the hole.
Alkalinity and pH
Alkalinity increases from a mudline value of 2.5 mM to 3.5 mM at 4.5 mbsf, whereas pH decreases from 7.8 to 7.6 over the same interval (Figure F38). For the remainder of the profile, alkalinity shows a gradual and fairly linear increase to a maximum of 5.2 mM at 271.3 mbsf. pH shows an inverse relationship with alkalinity, with a gradual decrease toward lower values of 7.4 at the base of the hole. The inverse relationship of these trends suggests that interstitial water alkalinity and pH are in a large part controlled by carbonate diagenesis at this site. Minor sulfate depletion in the uppermost ~60 mbsf indicates that organic matter remineralization is likely influencing the alkalinity and pH profiles within this interval of the hole.
Sulfate and barium
Sulfate (SO4) concentration at Site U1488 decreases from a seawater-like value of 29.4 mM at the mudline to a minimum of 21.9 mM at 147.8 mbsf (Figure F38). Slight curvature in the SO4 profile in this interval indicates the occurrence of sulfate reduction. Interestingly, SO4 concentration shows an overall increasing (albeit noisy) trend below 147.8 mbsf and exceeds 25 mM at 290.3 mbsf before decreasing slightly to the base of the hole at 313.9 mbsf. The roughly linear nature of this increase suggests diffusion from a source of sulfate at depth (see Discussion).
Barium (Ba) concentration increases from 0.04 µM at the mudline to 0.21 µM at 4.5 mbsf (Figure F38). For the remainder of the interstitial water profile, Ba is low (averaging 0.21 µM) and constant, varying by <0.2% between 4.5 and 313.9 mbsf. The low Ba concentration reflects both the low overall organic matter content (Figure F37) and the presence of dissolved SO4, which facilitates retention of Ba in the solid phase.
Phosphate, ammonium, and bromide
Phosphate (PO4) concentration decreases abruptly from a mudline concentration of 5.6 µM to 1.2 µM at 10.3 mbsf (Figure F38). PO4 typically peaks during organic matter remineralization; thus, this rapid decrease may reflect a combination of organic matter remineralization, scavenging of PO4 by sorption to clay minerals, or possibly small amounts of diagenetic apatite precipitation. Deeper than 10.3 mbsf, PO4 concentration is low but variable, averaging 1.6 ± 0.5 µM. Although values of >2 µM were observed deeper than 10 mbsf, the overall PO4 concentration is consistently low.
Ammonium (NH4) concentration increases from 0.01 mM at the mudline to ~0.3 mM between 128.8 and 176.3 mbsf (Figure F38). Deeper than 176.3 mbsf, NH4 concentration decreases slightly to 0.2 mM. The overall low NH4 concentration is reflective of the generally low organic matter content at this site. Bromide (Br) concentration remains largely constant throughout the hole, with average values of 0.90 ± 0.03 mM, but is more variable deeper than ~150 mbsf (Figure F38). The relatively constant Br again reflects the low organic matter content at the site.
Manganese and iron
Manganese (Mn) concentration increases in the upper 10.3 mbsf, from 1.1 to 44.2 µM, followed by a decrease between 10.3 and 57.8 mbsf to <2 µM (Figure F38). Mn concentration remains low (<2 µM) from 57.8 mbsf to the base of the hole. The shape of the Mn profile in the upper 30 mbsf reflects the reduction of Mn hydroxides and Mn oxyhydroxides as organic matter is degraded.
Iron (Fe) behaves similarly to dissolved Mn in the upper ~58 mbsf (Figure F38). Fe concentration increases from a value below detection limit at the mudline to a maximum of 33.1 µM at 10.3 mbsf before decreasing to values of <2 µM at 52.8 mbsf and remains low to 195.3 mbsf. As with Mn, the Fe profile reflects reduction of Fe hydroxides and Fe oxyhydroxides during organic matter remineralization in the shallowest sediment at this site. In stark contrast to the Mn profile, Fe concentration shows a pronounced downhole increase beginning at 195.3 mbsf, reaching 19.9 µM at 309.1 mbsf.
Potassium, magnesium, and calcium
Potassium (K) increases from the mudline (10.4 mM) to 14.8 mbsf (12.7 mM) (Figure F39). Deeper than 33.8 mbsf, K displays a smooth, generally linear decrease to the base of Hole U1488A at 313.9 mbsf (9.75 mM). Calcium (Ca) concentration remains mostly constant in the upper ~24 mbsf of the hole (~11.5 mM), slowly increases downhole to 13.7 mM by ~81 mbsf, and then more rapidly increases to 27.1 mM by ~290 mbsf (Figure F39). Magnesium (Mg) concentration exhibits a progressive downhole decrease from seawater-like values at the mudline (55.8 mM) to 37.8 mM at the base of Hole U1488A (Figure F39). Curvature within this profile suggests some uptake of Mg in the upper ~150 mbsf or a change in the Mg concentration of seawater over this time interval (see Discussion).
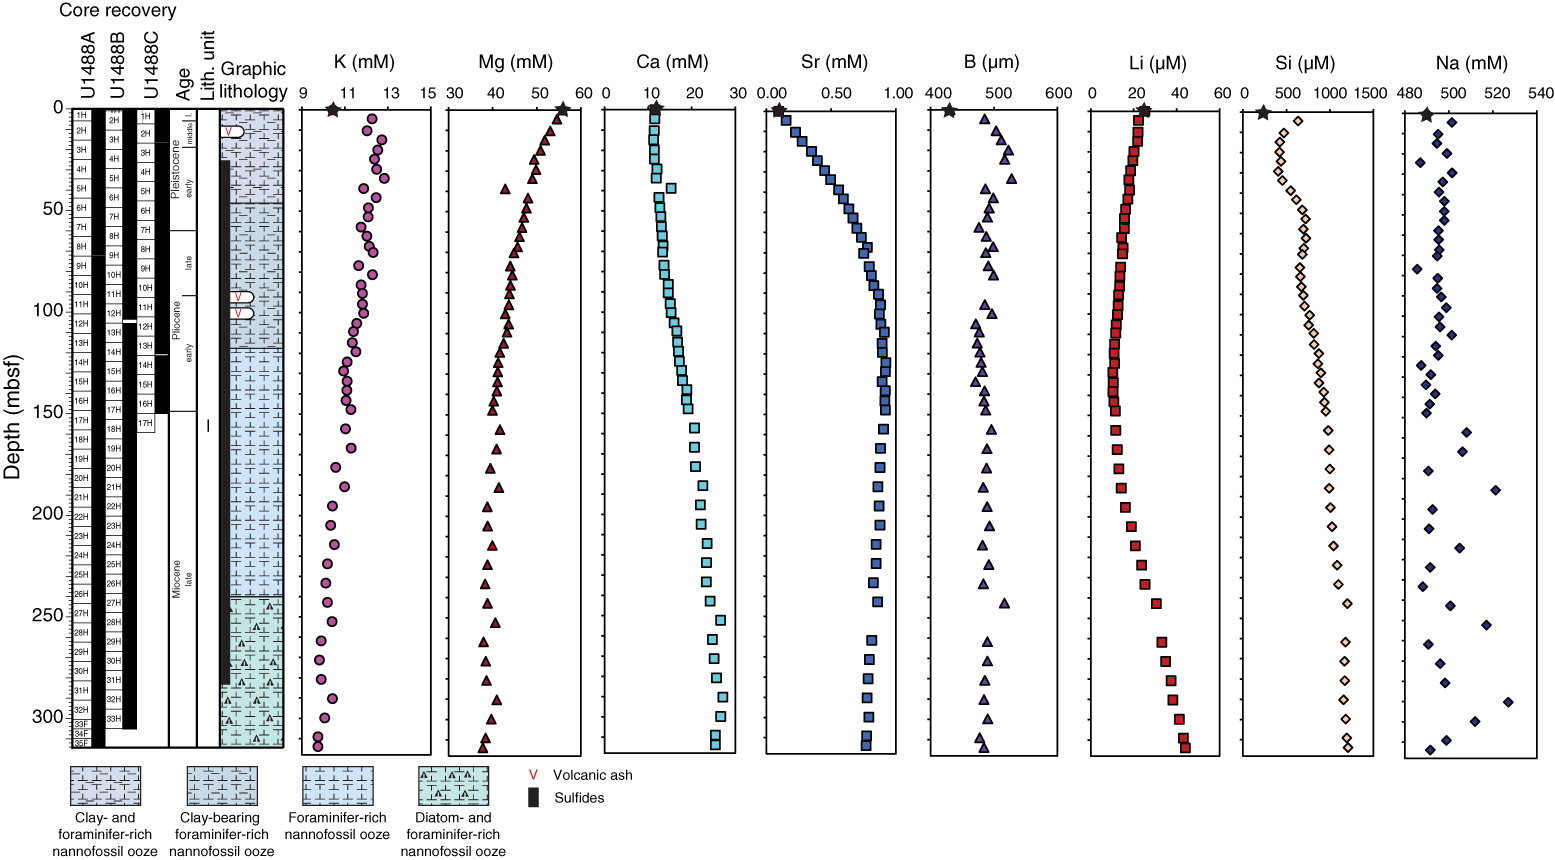
Figure F39. Interstitial water concentration profiles.
Strontium and boron
Strontium (Sr) shows a steady increase over the upper ~110 mbsf from a mudline Sr concentration of 0.1 mM to a maximum of ~0.8–0.9 mM between 109.3 and 147.8 mbsf (Figure F39). Deeper than 147.8 mbsf, Sr decreases toward the base of the hole, reaching a concentration of 0.77 mM at 313.9 mbsf. The trend and curvature of the profile in the upper ~110 mbsf suggest that interstitial water Sr is influenced by CaCO3 diagenesis, whereas deeper than ~148 mbsf, the profile shows evidence of diffusion. Boron (B) concentration increases slightly from 430.6 µM near the mudline to 485.4 µM at 4.5 mbsf (Figure F39). Below this depth, the B profile shows a small downhole increase in the upper ~34 mbsf to values of ~523–527 µM before decreasing to 487.9 µM at 38.8 mbsf. From 38.8 mbsf to the base of the hole, B concentration varies within 8% of 487 µM.
Lithium, silica, and sodium
Lithium (Li) decreases downhole from a mudline value of 25.1 µM to a minimum of 10.2 µM at ~129 mbsf in Hole U1488A (Figure F39). Thereafter, Li concentration increases markedly toward the base of the hole, reaching a maximum value of 44 µM at 313.9 mbsf. Silica (Si) is characterized by an increasing downhole trend from a mudline concentration of 236.7 µM to 1206.6 µM at 313.9 mbsf; several smaller scale variations occur within this overall increasing trend (Figure F39). First, Si concentration increases rapidly from 236.7 µM at the mudline to 633.2 µM at 4.5 mbsf and then decreases to values of ~403–422 µM between 14.8 and 29.3 mbsf before increasing again below that depth. Another slight drop (~30 µM) in Si concentration occurs between 62.3 and 76.8 mbsf, below which concentration steadily increases. Sodium (Na) concentration is fairly constant over the upper 150 mbsf, averaging 495 ± 5 mM (Figure F39). Between 147.8 and 313.9 mbsf, the Na profile becomes markedly more variable, with concentration ranging between ~488 and 527 mM over the remainder of the hole.
Discussion
Four distinct processes appear to contribute to the observed trends in the interstitial water geochemistry at Site U1488: (1) early diagenetic remineralization of organic matter, (2) carbonate diagenesis, (3) contributions from deep fluids, and (4) temporal evolution of seawater chemistry.
Early diagenetic organic matter remineralization processes influence interstitial water geochemistry in the upper part of the sediment to about 80 mbsf. The small downhole decrease in SO4 concentration to ~22 mM and corresponding modest increase in NH4 concentration to 0.4 mM indicate limited degradation of organic matter within the sediment, likely due to low sedimentary organic carbon content. Nonetheless, active Fe and Mn oxide/oxyhydroxide cycling occurs in the upper ~50 mbsf, as revealed by pronounced enrichments in dissolved Mn and Fe above this depth. The particularly high peak in Fe concentration measured in the interstitial water at 10.3 mbsf (33.2 µM), which marks the transition between the oxic upper sediment horizon and underlying suboxic sediment, suggests that a substantial source of reactive iron is available at Site U1488, possibly from hydrogenous Fe-Mn oxyhydroxide phases and/or eolian dust. Dissolved PO4 becomes rapidly depleted below 10 mbsf to a negligible concentration (~1 µM) suggesting that precipitation of authigenic phosphate phases such as carbonate fluorapatite may be taking place in the sediment, in agreement with previous investigations at other carbonate-rich sedimentary settings (Froelich et al., 1988).
The interstitial water profiles also indicate that carbonate diagenesis takes place within the sediment column. This process can be inferred from the steady 10-fold enrichment of dissolved Sr downhole to ~100 mbsf accompanied by an increase of dissolved Ca. The observed relationship between Ca and Sr is best explained by carbonate dissolution (Baker et al., 1982); however, the slight increase in alkalinity within the same sediment interval suggests that carbonate recrystallization also occurs simultaneously.
Deeper than ~100 mbsf, the interstitial water geochemistry shows increasing concentrations of alkalinity, SO4, Ca, and Li and decreasing trends of Na, K, and pH. Many of these trends are linear in nature and cannot be collectively explained either by degradation of organic matter or by carbonate diagenesis. Instead, we suggest that the interstitial water geochemical trends deeper than 100 mbsf in Hole U1488A might reflect the influence of a deep fluid source through diffusion. As reported previously for Site U1486, the inverse pattern observed between Ca (increasing) and Mg (decreasing) concentrations is a common feature of interstitial water profiles overlying oceanic basement (see Geochemistry in the Site U1486 chapter [Rosenthal et al., 2018c]). Basalt-seawater low-temperature interaction typically leads to Ca release into the surrounding environment and Mg sequestration due to formation of authigenic clays. The trends in Ca and Mg can also be interpreted as reflecting carbonate diagenesis, which, as discussed above, occurs at this site. A previous study suggests that observed increases and decreases of dissolved Ca and Mg in a 1:1 ratio are indicative of carbonate diagenesis; however, when dissolved Ca gains are larger than Mg losses, the profiles are more easily explained by weathering of basaltic material (McDuff and Gieskes, 1976). Deeper than ~80 mbsf, the increase in Ca is nearly twice the decrease in Mg, supporting the idea that the interstitial water profile in the deeper portion of Hole U1488A is reflective of basalt-seawater interaction.
The relatively high SO4 concentration deeper than ~150 mbsf is also in agreement with upward diffusion of deep fluid signatures related to basalt-seawater interactions (Baker et al., 1991). The bottom part (>150 mbsf) of Hole U1488A is also characterized by a marked increase in dissolved Fe. Similar Fe enrichments, accompanied by increases in SO4 and Mn, have been documented at deep ocean drilling sites (D’Hondt et al., 2004) and were interpreted as indicative of deep microbial redox processes, associated with the presence of oxygen and nitrate-rich fluids migrating upward from the underlying oceanic basement. Although some of the interstitial profiles at this site are suggestive of upward migration of basement-influenced fluids, notably missing are an increase in Mn concentration and evidence of oxygen or nitrate-rich fluids that would support microbial redox processes at this site.
Finally, several of the interstitial water profiles at Site U1488 might be influenced by secular variations in seawater chemistry. Based on interstitial water and solid phase geochemical data from a similarly carbonate-rich site (ODP Site 807) on the Ontong Java Plateau, Fantle and DePaolo (2006) concluded that an increase in seawater Mg of at least several millimolar occurred over the past 10 My. A secular change in seawater Mg may also more readily explain the observed decrease in interstitial water Mg with depth observed at Site U1488, given the relatively low sedimentary clay content in the cores (see Core description).
References
Baker, P.A., Gieskes, J.M., and Elderfield, H., 1982. Diagenesis of carbonates in deep-sea sediments: evidence from Sr/Ca ratios and interstitial dissolved Sr2+ data. Journal of Sedimentary Research, 52(1):71–82. https://doi.org/10.1306/212F7EE1-2B24-11D7-8648000102C1865D
Baker, P.A., Stout, P.M., Kastner, M., and Elderfield, H., 1991. Large-scale lateral advection of seawater through oceanic crust in the central equatorial Pacific. Earth and Planetary Science Letters, 105(4):522–533. https://doi.org/10.1016/0012-821X(91)90189-O
Berggren, W.A., Kent, D.V., Swisher, C.C., III, and Aubry, M.-P., 1995. A revised Cenozoic geochronology and chronostratigraphy. In Berggren, W.A., Kent, D.V., Aubry, M.-P., and Hardenbol, J. (Eds.), Geochronology, Time Scales and Global Stratigraphic Correlation. Special Publication - SEPM (Society for Sedimentary Geology), 54:129–212. https://doi.org/10.2110/pec.95.04.0129
Bracey, D.R., 1975. Reconnaissance geophysical survey of the Caroline Basin. Geological Society of America Bulletin, 86(6):775–784. https://doi.org/10.1130/0016-7606(1975)86<775:RGSOTC>2.0.CO;2
Cande, S.C., and Kent, D.V., 1995. Revised calibration of the geomagnetic polarity timescale for the Late Cretaceous and Cenozoic. Journal of Geophysical Research: Solid Earth, 100(B4):6093–6095. https://doi.org/10.1029/94JB03098
Chaisson, W.P., and Pearson, P.N., 1997. Planktonic foraminifer biostratigraphy at Site 925: middle Miocene–Pleistocene. In Shackleton, N.J., Curry, W.B., Richter, C., and Bralower, T.J. (Eds.), Proceedings of the Ocean Drilling Program, Scientific Results, 154: College Station, TX (Ocean Drilling Program), 3–31. https://doi.org/10.2973/odp.proc.sr.154.104.1997
Cole, T.G., and Shaw, H.F., 1983. The nature and origin of authigenic smectites in some recent marine sediments. Clay Minerals, 18:239–252. https://doi.org/10.1180/claymin.1983.018.3.02
de Garidel-Thoron, T., Rosenthal, Y., Bassinot, F., and Beaufort, L., 2005. Stable sea surface temperatures in the Western Pacific Warm Pool over the past 1.75 million years. Nature, 433(7023):294–298. https://doi.org/10.1038/nature03189
Dearing, J.A., 1999. Environmental magnetic susceptibility: using the Bartington MS2 system (2nd edition): Kenilworth, United Kingdom (Chi Publishing). https://gmw.com/magnetic_properties/pdf/Om0409%20J_Dearing_Handbook_iss7.pdf
D’Hondt, S., Jørgensen, B.B., Miller, D.J., Batzke, A., Blake, R., Cragg, B.A., Cypionka, H., et al., 2004. Distributions of microbial activities in deep subseafloor sediments. Science, 306(5705):2216–2221. https://doi.org/10.1126/science.1101155
Fantle, M.S., and DePaolo, D.J., 2006. Sr isotopes and pore fluid chemistry in carbonate sediment of the Ontong Java Plateau: calcite recrystallization rates and evidence for a rapid rise in seawater Mg over the last 10 million years. Geochimica et Cosmochimica Acta, 70(15):3883–3904. https://doi.org/10.1016/j.gca.2006.06.009
Froelich, P.N., Arthur, M.A., Burnett, W.C., Deakin, M., Hensley, V., Jahnke, R., Kaul, L., Kim, K.H., Roe, K., Soutar, A., and Vathakanon, C., 1988. Early diagenesis of organic matter in Peru continental margin sediments: phosphorite precipitation. Marine Geology, 80(3–4):309–343. https://doi.org/10.1016/0025-3227(88)90095-3
Gaina, C., and Müller, D., 2007. Cenozoic tectonic and depth/age evolution of the Indonesian gateway and associated back-arc basins. Earth-Science Reviews, 83(3–4):177–203. https://doi.org/10.1016/j.earscirev.2007.04.004
Hegarty, K.A., and Weissel, J.K., 1988. Complexities in the developments of the Caroline plate region, western equatorial Pacific. In Nairn, A.E.M., Stehli, F.G., and Uyeda, S. (Eds.), The Ocean Basins and Margins: Boston (Springer), 277–301. https://doi.org/10.1007/978-1-4615-8041-6_6
Hilgen, F.J., Lourens, L.J., and Van Dam, J.A., 2012. The Neogene period. With contributions by A.G. Beu, A.F. Boyes, R.A. Cooper, W. Krijgsman, J.G. Ogg, W.E. Piller, and D.S. Wilson. In Gradstein, F.M., Ogg, J.G., Schmitz, M.D., and Ogg, G.M. (Eds.), The Geologic Time Scale: Oxford, United Kingdom (Elsevier), 923–978. https://doi.org/10.1016/B978-0-444-59425-9.00029-9
Karlin, R., and Levi, S., 1983. Diagenesis of magnetic minerals in recent hemipelagic sediments. Nature, 303(5915):327–330. https://doi.org/10.1038/303327a0
McDuff, R.E., and Gieskes, J.M., 1976. Calcium and magnesium profiles in DSDP interstitial waters: diffusion or reaction? Earth and Planetary Science Letters, 33(1):1–10. https://doi.org/10.1016/0012-821X(76)90151-5
McNeill, L.C., Dugan, B., Petronotis, K.E., Backman, J., Bourlange, S., Chemale, F., Chen, W., Colson, T.A., Frederik, M.C.G., Guèrin, G., Hamahashi, M., Henstock, T., House, B.M., Hüpers, A., Jeppson, T.N., Kachovich, S., Kenigsberg, A.R., Kuranaga, M., Kutterolf, S., Milliken, K.L., Mitchison, F.L., Mukoyoshi, H., Nair, N., Owari, S., Pickering, K.T., Pouderoux, H.F.A., Yehua, S., Song, I., Torres, M.E., Vannucchi, P., Vrolijk, P.J., Yang, T., and Zhao, X., 2017. Expedition 362 summary. In McNeill, L.C., Dugan, B., Petronotis, K.E., and the Expedition 362 Scientists, Sumatra Subduction Zone. Proceedings of the International Ocean Discovery Program, 362: College Station, TX (International Ocean Discovery Program). https://doi.org/10.14379/iodp.proc.362.101.2017
Pribnow, D., Kinoshita, M., and Stein, C., 2000. Thermal Data Collection and Heat Flow Recalculations for Ocean Drilling Program Legs 101–180: Hanover, Germany (Institute for Joint Geoscientific Research, Institut für Geowissenschaftliche Gemeinschaftsaufgaben [GGA]). http://www-odp.tamu.edu/publications/heatflow/ODPReprt.pdf
Raffi, I., Backman, J., and Rio, D., 1998. Evolutionary trends of tropical calcareous nannofossils in the late Neogene. Marine Micropaleontology, 35(1–2):17–41. https://doi.org/10.1016/S0377-8398(98)00014-0
Raffi, I., and Flores, J.-A., 1995. Pleistocene through Miocene calcareous nannofossils from eastern equatorial Pacific Ocean (Leg 138). In Pisias, N.G., Mayer, L.A., Janecek, T.R., Palmer-Julson, A., and van Andel, T.H. (Eds.), Proceedings of the Ocean Drilling Program, Scientific Results, 138: College Station, TX (Ocean Drilling Program), 233–286. https://doi.org/10.2973/odp.proc.sr.138.112.1995
Raffi, I., Rio, D., d’Atri, A., Fornaciari, E., and Rocchetti, S., 1995. Quantitative distribution patterns and biomagnetostratigraphy of middle and late Miocene calcareous nannofossils from equatorial Indian and Pacific oceans (Leg 115, 130, and 138). In Pisias, N.G., Mayer, L.A., Janecek, T.R., Palmer-Julson, A., and van Andel, T.H. (Eds.), Proceedings of the Ocean Drilling Program, Scientific Results, 138: College Station, TX (Ocean Drilling Program), 479–502. https://doi.org/10.2973/odp.proc.sr.138.125.1995
Resig, J.M., Frost, G.M., Ishikawa, N., and Perembo, R.C.B., 2001. Micropaleontological and paleomagnetic approaches to stratigraphic anomalies in rift basins: ODP Site 1109, Woodlark Basin. In Wilson, R.C.L., Whitmarsh, R.B., Taylor, B., and Froitzheim, N. (Eds.), Non-Volcanic Rifting of Continental Margins: A Comparison of Evidence from Land and Sea. Geological Society Special Publication, 187(1):389–404. https://doi.org/10.1144/GSL.SP.2001.187.01.19
Rosenthal, Y., Holbourn, A., and Kulhanek, D.K., 2016. Expedition 363 Scientific Prospectus: Western Pacific Warm Pool. International Ocean Discovery Program. https://doi.org/10.14379/iodp.sp.363.2016
Rosenthal, Y., Holbourn, A.E., Kulhanek, D.K., Aiello, I.W., Babila, T.L., Bayon, G., Beaufort, L., Bova, S.C., Chun, J.-H., Dang, H., Drury, A.J., Dunkley Jones, T., Eichler, P.P.B., Fernando, A.G.S., Gibson, K.A., Hatfield, R.G., Johnson, D.L., Kumagai, Y., Li, T., Linsley, B.K., Meinicke, N., Mountain, G.S., Opdyke, B.N., Pearson, P.N., Poole, C.R., Ravelo, A.C., Sagawa, T., Schmitt, A., Wurtzel, J.B., Xu, J., Yamamoto, M., and Zhang, Y.G., 2018a. Expedition 363 methods. In Rosenthal, Y., Holbourn, A.E., Kulhanek, D.K., and the Expedition 363 Scientists, Western Pacific Warm Pool. Proceedings of the International Ocean Discovery Program, 363: College Station, TX (International Ocean Discovery Program). https://doi.org/10.14379/iodp.proc.363.102.2018
Rosenthal, Y., Holbourn, A.E., Kulhanek, D.K., Aiello, I.W., Babila, T.L., Bayon, G., Beaufort, L., Bova, S.C., Chun, J.-H., Dang, H., Drury, A.J., Dunkley Jones, T., Eichler, P.P.B., Fernando, A.G.S., Gibson, K.A., Hatfield, R.G., Johnson, D.L., Kumagai, Y., Li, T., Linsley, B.K., Meinicke, N., Mountain, G.S., Opdyke, B.N., Pearson, P.N., Poole, C.R., Ravelo, A.C., Sagawa, T., Schmitt, A., Wurtzel, J.B., Xu, J., Yamamoto, M., and Zhang, Y.G., 2018b. Site U1482. In Rosenthal, Y., Holbourn, A.E., Kulhanek, D.K., and the Expedition 363 Scientists, Western Pacific Warm Pool. Proceedings of the International Ocean Discovery Program, 363: College Station, TX (International Ocean Discovery Program). https://doi.org/10.14379/iodp.proc.363.103.2018
Rosenthal, Y., Holbourn, A.E., Kulhanek, D.K., Aiello, I.W., Babila, T.L., Bayon, G., Beaufort, L., Bova, S.C., Chun, J.-H., Dang, H., Drury, A.J., Dunkley Jones, T., Eichler, P.P.B., Fernando, A.G.S., Gibson, K.A., Hatfield, R.G., Johnson, D.L., Kumagai, Y., Li, T., Linsley, B.K., Meinicke, N., Mountain, G.S., Opdyke, B.N., Pearson, P.N., Poole, C.R., Ravelo, A.C., Sagawa, T., Schmitt, A., Wurtzel, J.B., Xu, J., Yamamoto, M., and Zhang, Y.G., 2018c. Site U1486. In Rosenthal, Y., Holbourn, A.E., Kulhanek, D.K., and the Expedition 363 Scientists, Western Pacific Warm Pool. Proceedings of the International Ocean Discovery Program, 363: College Station, TX (International Ocean Discovery Program). https://doi.org/10.14379/iodp.proc.363.107.2018
Rosenthal, Y., Holbourn, A.E., Kulhanek, D.K., Aiello, I.W., Babila, T.L., Bayon, G., Beaufort, L., Bova, S.C., Chun, J.-H., Dang, H., Drury, A.J., Dunkley Jones, T., Eichler, P.P.B., Fernando, A.G.S., Gibson, K.A., Hatfield, R.G., Johnson, D.L., Kumagai, Y., Li, T., Linsley, B.K., Meinicke, N., Mountain, G.S., Opdyke, B.N., Pearson, P.N., Poole, C.R., Ravelo, A.C., Sagawa, T., Schmitt, A., Wurtzel, J.B., Xu, J., Yamamoto, M., and Zhang, Y.G., 2018d. Site U1489. In Rosenthal, Y., Holbourn, A.E., Kulhanek, D.K., and the Expedition 363 Scientists, Western Pacific Warm Pool. Proceedings of the International Ocean Discovery Program, 363: College Station, TX (International Ocean Discovery Program). https://doi.org/10.14379/iodp.proc.363.110.2018
Rowan, C.J., Roberts, A.P., and Broadbent, T., 2009. Reductive diagenesis, magnetite dissolution, greigite growth and paleomagnetic smoothing in marine sediments: a new view. Earth and Planetary Science Letters, 277(1–2):223–235. https://doi.org/10.1016/j.epsl.2008.10.016
Saito, T., 1976. Geologic significance of coiling direction in the planktonic foraminifer Pulleniatina. Geology, 4(5):305–309. https://doi.org/10.1130/0091-7613(1976)4<305:GSOCDI>2.0.CO;2
Shapiro, M.N., and Ritzwoller, M.H., 2004. Inferring surface heat flux distributions guided by a global seismic model: particular application to Antarctica. Earth and Planetary Science Letters, 223(1–2):213–224. https://doi.org/10.1016/j.epsl.2004.04.011
Shipboard Scientific Party, 1971. Site 62. In Winterer, E.L., Riedel, W.R., Brönnimann, P., Gealy, E.L., Heath, G.R., Kroenke, L., Martini, E., Moberly, R., Jr., Resig, J., and Worsley, T. (Eds.), Initial Reports of the Deep Sea Drilling Project, 49–322. https://doi.org/10.2973/dsdp.proc.7.104.1971
Stein, C.A., and Stein, S., 1992. A model for the global variation in oceanic depth and heat flow with lithospheric age. Nature, 359(6391):123–129. https://doi.org/10.1038/359123a0
Steinberg, M., Holtzapffel, T., and Rautureau, M., 1987. Characterization of overgrowth structures formed around individual clay particles during early diagenesis. Clays and Clay Minerals, 35(3):189–195. https://doi.org/10.1346/CCMN.1987.0350304
Stoner, J.S., and St-Onge, G., 2007. Magnetic stratigraphy in paleooceanography: reversal, excursion, paleointensity and secular variation. In Hillaire-Marcel, C., and de Vernal, A. (Eds.), Developments in Marine Geology (Volume 1): Proxies in Late Cenozoic Paleoceanography. R. Stein (Series Ed.): Amsterdam (Elsevier B.V.), 99–138. https://doi.org/10.1016/S1572-5480(07)01008-1
van Morkhoven, F.P.C.M., Berggren, W.A., Edwards, A.S.,and Oertli, H.J., 1986. Cenozoic cosmopolitan deep-water benthic foraminifera. Bulletin des Centres de Recherches Exploration-Production Elf-Aquitaine, 11.
Wade, B.S., Pearson, P.N., Berggren, W.A., and Pälike, H., 2011. Review and revision of Cenozoic tropical planktonic foraminiferal biostratigraphy and calibration to the geomagnetic polarity and astronomical time scale. Earth-Science Reviews, 104(1–3):111–142. https://doi.org/10.1016/j.earscirev.2010.09.003
Wilkens, R.H., Westerhold, T., Drury, A.J., Lyle, M., Gorgas, T., and Tian, J., 2017. Revisiting the Ceara Rise, equatorial Atlantic Ocean: isotope stratigraphy of ODP Leg 154. Climate of the Past, 13:779–793. https://doi.org/10.5194/cp-13-779-2017
Winterer, E.L., and Riedel, W.R., 1971. Introduction. In Winterer, E.L. et al., Initial Reports of the Deep Sea Drilling Project, 7. Washington D.C. (U.S. Government Printing Office), 3–8. https://doi.org/10.2973/dsdp.proc.7.101.1971
Zijderveld, J.D.A., 1967. AC demagnetization of rocks: analysis of results. In Collinson, D.W., Creer, K.M., and Runcorn, S.K. (Eds.), Developments in Solid Earth Geophysics (Volume 3): Methods in Palaeomagnetism: Amsterdam (Elsevier), 254–286. https://doi.org/10.1016/B978-1-4832-2894-5.50049-5
1Rosenthal, Y., Holbourn, A.E., Kulhanek, D.K., Aiello, I.W., Babila, T.L., Bayon, G., Beaufort, L., Bova, S.C., Chun, J.-H., Dang, H., Drury, A.J., Dunkley Jones, T., Eichler, P.P.B., Fernando, A.G.S., Gibson, K., Hatfield, R.G., Johnson, D.L., Kumagai, Y., Li, T., Linsley, B.K., Meinicke, N., Mountain, G.S., Opdyke, B.N., Pearson, P.N., Poole, C.R., Ravelo, A.C., Sagawa, T., Schmitt, A., Wurtzel, J.B., Xu, J., Yamamoto, M., and Zhang, Y.G., 2018. Site U1488. In Rosenthal, Y., Holbourn, A.E., Kulhanek, D.K., and the Expedition 363 Scientists, Western Pacific Warm Pool. Proceedings of the International Ocean Discovery Program, 363: College Station, TX (International Ocean Discovery Program). https://doi.org/10.14379/iodp.proc.363.109.2018
2Expedition 363 Scientists’ addresses.
This work is distributed under the Creative Commons Attribution 4.0 International (CC BY 4.0) license. 
- F1. Eauripik Rise and locations of Sites U1488–U1490.
- F2. Bathymetric map and site location.
- F3. Seismic line and site location.
- F4. Hydrographic profiles of temperature, salinity, and dissolved oxygen.
- F5. Lithologic summary.
- F6. Characteristic lithologies.
- F7. Biogenic siliceous components.
- F8. Main lithologies.
- F9. Occurrence of volcanogenic sediment.
- F10. Glass shards in volcanogenic material.
- F11. Distinctive green layers.
- F12. Pyrite nodules.
- F13. Calcareous nannofossils.
- F14. Coiling patterns in Pulleniatina.
- F15. Coiling patterns in Neogloboquadrina acostaensis.
- F16. Foraminifer preservation states.
- F17. Age-depth plot.
- F18. Archive-half NRM intensity.
- F19. Discrete sample AF demagnetization results.
- F20. NRM, MS, inclination, and declination, Hole U1488A.
- F21. NRM, MS, inclination, and declination, Hole U1488B.
- F22. NRM, MS, inclination, and declination, Hole U1488C.
- F23. Physical property measurements.
- F24. Bulk density, MS, P-wave velocity, and NGR overlaid on core photos.
- F25. MS and NGR comparison.
- F26. NGR and CaCO3.
- F27. Discrete and whole-round P-wave velocity.
- F28. MAD densities and porosity, GRA bulk density, and thermal conductivity.
- F29. Thermal conductivity and L*.
- F30. APCT-3 temperature-time series.
- F31. Heat flow calculations.
- F32. WRMSL MS data.
- F33. WRMSL GRA bulk density data.
- F34. WRMSL PWL data.
- F35. Spliced L*, PWL, NGR, MS, and GRA bulk density.
- F36. Mbsf and composite depth scales in the Site U1488 splice.
- F37. Carbon and TN profiles.
- F38. Interstitial water concentration profiles.
- F39. Interstitial water concentration profiles.
- T1. Site U1488 core summary.
- T2. Stratigraphic position of tephra layers.
- T3. Calcareous nannofossil bioevents.
- T4. Planktonic foraminifer bioevents.
- T5. Coiling patterns in Pulleniatina.
- T6. Coiling patterns in Neogloboquadrina acostaensis.
- T7. Benthic foraminifer distribution.
- T8. Identified reversal boundaries.
- T9. WRMSL GRA bulk density data, Hole U1488A.
- T10. WRMSL GRA bulk density data, Hole U1488B.
- T11. STMSL/WRMSL GRA bulk density data.
- T12. WRMSL MS data, Hole U1488A.
- T13. WRMSL MS data, Hole U1488B.
- T14. STMSL/WRMSL MS data.
- T15. NGRL data, Hole U1488A.
- T16. NGRL data, Hole U1488B.
- T17. NGRL data, Hole U1488C.
- T18. WRMSL PWL data. Hole U1488A.
- T19. WRMSL PWL data. Hole U1488B.
- T20. WRMSL PWL data. Hole U1488C.
- T21. Affine table.
- T22. Splice intervals.
- T23. Volatile hydrocarbon concentrations, Hole.
- T24. Carbon and nitrogen.
- T25. Interstitial water geochemical data.