Rosenthal, Y., Holbourn, A.E., Kulhanek, D.K., and the Expedition 363 Scientists
Proceedings of the International Ocean Discovery Program Volume 363
publications.iodp.org
https://doi.org/10.14379/iodp.proc.363.107.2018

Site U14861
Y. Rosenthal, A.E. Holbourn, D.K. Kulhanek, I.W. Aiello, T.L. Babila, G. Bayon, L. Beaufort, S.C. Bova, J.-H. Chun, H. Dang, A.J. Drury, T. Dunkley Jones, P.P.B. Eichler, A.G.S. Fernando, K.A. Gibson, R.G. Hatfield, D.L. Johnson, Y. Kumagai, T. Li, B.K. Linsley, N. Meinicke, G.S. Mountain, B.N. Opdyke, P.N. Pearson, C.R. Poole, A.C. Ravelo, T. Sagawa, A. Schmitt, J.B. Wurtzel, J. Xu, M. Yamamoto, and Y.G. Zhang2
Keywords: International Ocean Discovery Program, IODP, JOIDES Resolution, Expedition 363, Site U1486, Manus Basin, Bismarck microplate, central sector Western Pacific Warm Pool, Pleistocene, late Pliocene, Indonesian Throughflow, New Guinea Coastal Current, suborbital to orbital scale climate variability, Admiralty Islands volcanism, tephra, basalt, volcanogenic sediment, volcanic ash, scoria, zeolite, exceptional foraminifer and nannofossil preservation, stratigraphic intercalibration and cyclostratigraphy, high-resolution interstitial water sampling, Last Glacial Maximum ocean density structure, diagenesis, anaerobic methane oxidation, sulfate–methane transition zone, SMTZ, clay mineral authigenesis
MS 363-107: Published 8 June 2018
Background and objectives
International Ocean Discovery Program (IODP) Site U1486 (proposed Site WP-05A) is located ~215 km west-southwest of Manus Island at 02°22.34ʹS, 144°36.08ʹE in 1332 m water depth (Figure F1). The site is situated at the cross-point of seismic Lines GeoB13-084 and GeoB13-088 (Figure F2). The seismic profile shows a continuous succession of hemipelagic sediment with acoustic basement estimated at ~225 meters below seafloor (mbsf) (Rosenthal et al., 2016) (Figure F3). This site was targeted to recover a complete Pleistocene record with unprecedented resolution for the Western Pacific Warm Pool (WPWP).
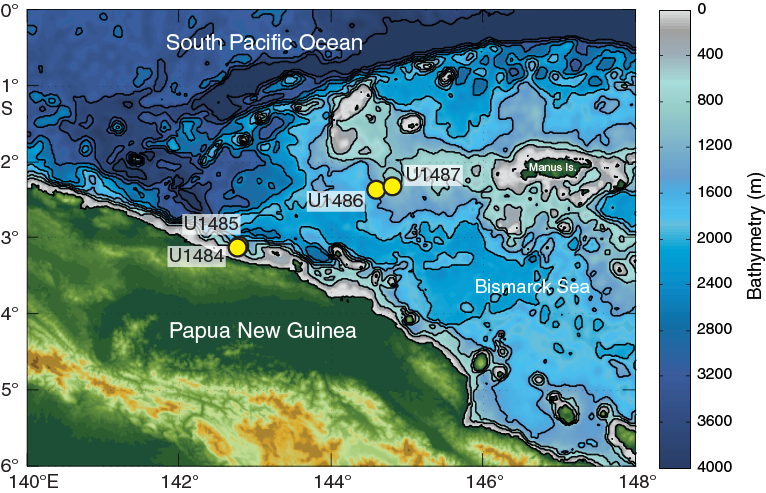
Figure F1. Northern margin of Papua New Guinea and location of Sites U1484–U1487.
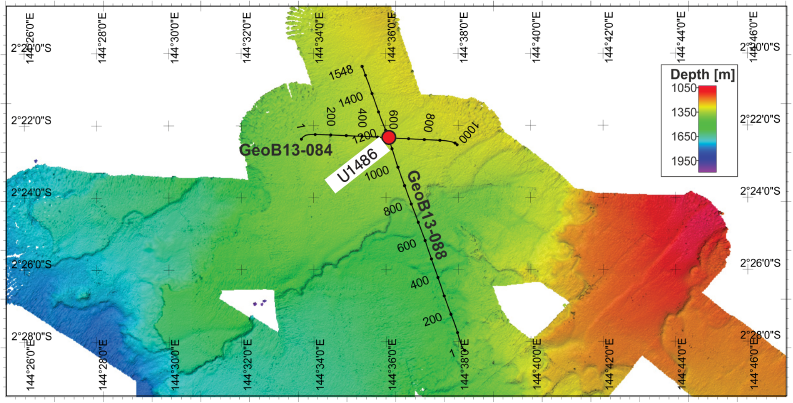
Figure F2. Bathymetric map and site locations.
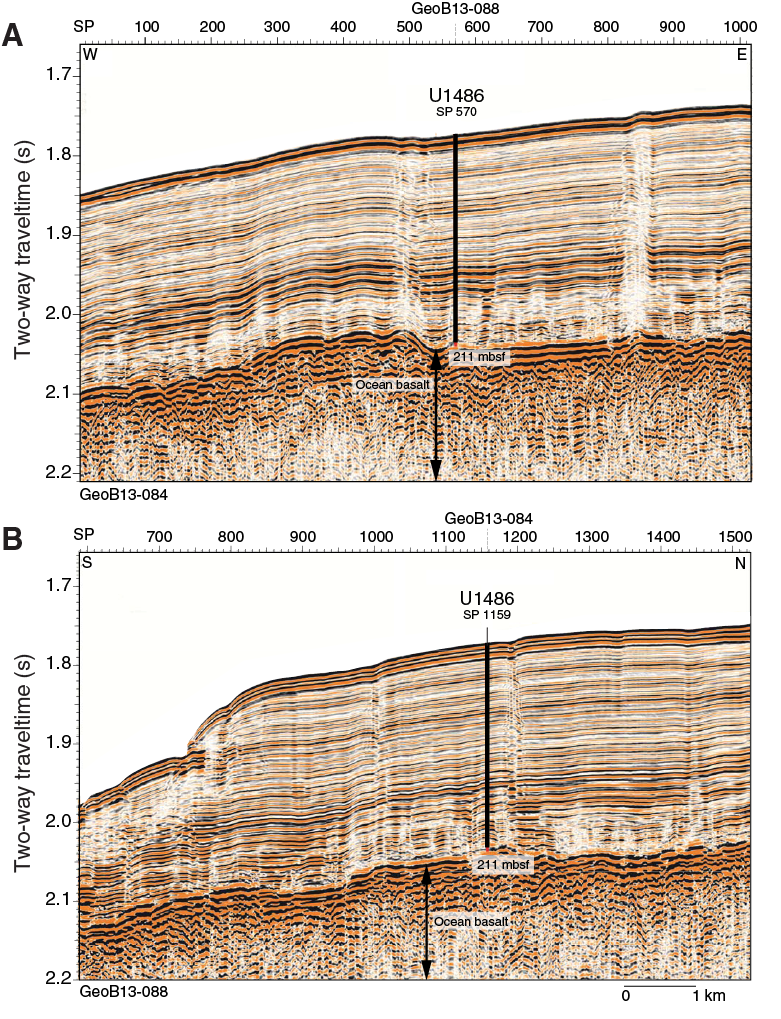
Figure F3. Seismic lines and site locations.
The tectonic setting of Sites U1486 and U1487 (similar to that of the northern Papua New Guinea Sites U1484 and U1485) was shaped by the oblique northward movement of the Australian plate as it rapidly converged with the Pacific plate. This collision resulted in a complex plate boundary zone that includes volcanic arcs but also resulted in the formation and rotation of microplates within this zone, as well as lithospheric rupture that formed small oceanic basins (Baldwin et al., 2012). The Bismarck Sea, on the northeastern side of Papua New Guinea (Figure F1), forms a back-arc basin with respect to the New Britain arc and is divided into the North Bismarck (NBS) and South Bismarck (SBS) microplates, separated by the active Bismarck Sea left-lateral transform fault and spreading segments (Taylor, 1979). Site U1486 is located on the NBS microplate. To the north, the NBS microplate is bordered by the Manus Trench, which defines the boundary between it and the Pacific plate. Within this complex tectonic regime, the southwestern side of the Manus Basin is considered one of the more stable regions. Magnetic anomalies in the Bismarck Sea indicate rapid asymmetric spreading since 3.5 Ma (Taylor, 1979). The continuous collision between the Australian and Pacific plates causes the SBS microplate to rotate rapidly clockwise (~9°/My), whereas the NBS microplate is rotating slowly anticlockwise (0.3–1.25°/My) (Baldwin et al., 2012). Asymmetric rotation of the North and South Bismarck Basins likely changed the position of New Britain and adjacent islands relative to Papua New Guinea. Ocean Drilling Program (ODP) Leg 193 focused on the eastern part of the Manus Basin, exploring the tectonic, volcanic, and seafloor hydrothermal system activity in this convergent plate margin setting.
An isotope record from piston Core MD05-2920 located near Site U1486 indicates a sedimentation rate of ~10 cm/ky, substantially higher than that found in other open-ocean Pacific sites, with no discernible disturbance for the past ~400 ky (Tachikawa et al., 2011, 2013). The moderately high CaCO3 content (25–45 wt%) and well-preserved foraminifer tests suggest the potential to generate a suborbitally resolved paleoceanographic record of unprecedented quality through the Pleistocene. X-ray fluorescence scanning of Core MD05-2920 demonstrates that centennial precipitation variability can be resolved from the elemental content of the sediment (Tachikawa et al., 2011).
This site was targeted because of its potential to provide an excellent Pleistocene paleoceanographic record to examine orbital-scale climate variability at high resolution through the Pleistocene. The site is ideally located to monitor the contribution from the New Guinea Coastal Current and Undercurrent to the Indonesian Throughflow (ITF). The New Guinea Coastal Current is the southern branch of the westward, cross-equatorial flowing South Equatorial Current and constitutes the main southern Pacific contribution to the surface transport of the ITF. At ~1300 meters below sea level (mbsl), this site is bathed by Upper Circumpolar Deepwater originating from the Southern Ocean (Figure F4) and thus will allow for the reconstruction of past variability of this water mass.
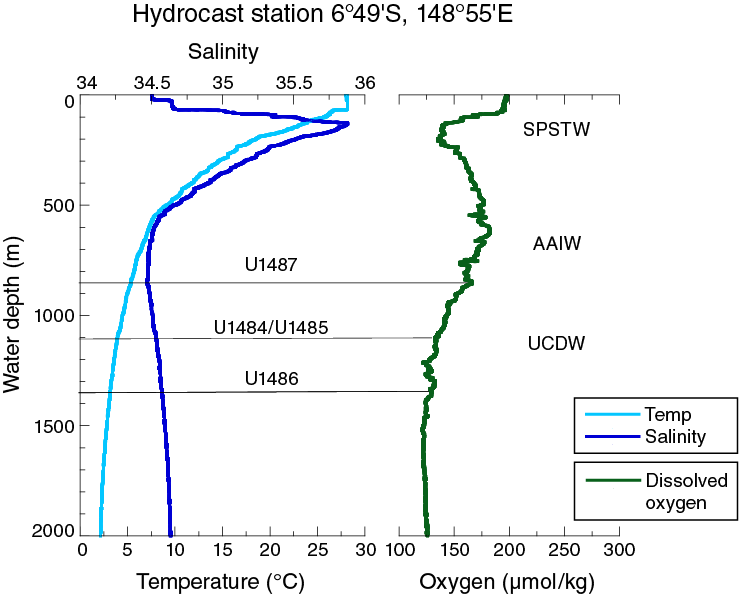
Figure F4. Hydrographic profiles of temperature, salinity, and dissolved oxygen.
Operations
Transit to Site U1486
The 117 nmi transit to Site U1486 was completed in 9.9 h at an average speed of 11.8 kt. We lowered the thrusters and switched to dynamic positioning mode at 0921 h (all times local ship time; UTC + 10 h) on 14 November 2016. After arriving on site, we deployed a positioning beacon at 0942 h before commencing coring operations.
Operations summary
The original operations plan included three holes using the advanced piston corer (APC) to 200 mbsf. We ultimately cored four holes (Table T1). Hole U1486A consisted of a single full core and was terminated because it did not recover the mudline. Holes U1486B and U1486C were cored to 211.2 and 201.3 mbsf, respectively. Hole U1486D was cored to 186.5 mbsf to fill coring gaps and intervals where significant numbers of interstitial water samples were taken from Hole U1486B for construction of the composite section.
Table T1. Site U1486 core summary. Download table in CSV format. View PDF table.
Hole U1486A was cored to 9.5 mbsf with the APC using orientation and nonmagnetic hardware. When Core 363-U1486A-1H retrieved a full core liner, indicating that we missed the mudline, we terminated coring in this hole. A total of 9.95 m of sediment was recovered over 9.5 m of coring (105% recovery) in Hole U1486A.
Hole U1486B was cored to 211.2 mbsf (Cores 363-U1486B-1H through 23H) using the APC with orientation and nonmagnetic hardware. Downhole formation temperature measurements using the advanced piston corer temperature tool (APCT-3) were taken on Cores 4H (34.5 mbsf), 7H (63.0 mbsf), 10H (91.5 mbsf), and 13H (120.0 mbsf), obtaining good results on all four deployments. Whole-round samples for high-resolution interstitial water analyses were taken at a frequency of one per section in the upper 150 mbsf of Hole U1486B. Core 23H seemed to be a full stroke; however, only 5.67 m of core was recovered. When drilling out the “rathole,” drilling stalled at 211.2 mbsf, indicating something hard at that depth that the core barrel was unable to penetrate. Given that the acoustic basement at Site U1486 was estimated at ~225 mbsf, we speculate that we encountered the acoustic basement at a somewhat shallower depth. The presence of a few small basalt fragments in the core catcher of Core 23H supports this interpretation. We collected 215.49 m of sediment over 211.2 m of coring (102% recovery) in Hole U1486B.
Hole U1486C was cored to 201.3 mbsf (Cores 363-U1486C-1H through 23H) using the APC with orientation and nonmagnetic hardware. We decided to terminate coring above the hard layer encountered in Hole U1486B. Two drilled intervals (each 2 m) were used to advance the hole without recovery for stratigraphic correlation and one core (Core 11H) did not recover any material. We collected 172.70 m of sediment over 197.3 m of coring (88% recovery) in Hole U1486C.
Hole U1486D was cored to 186.5 mbsf in order to fill gaps in the composite stratigraphic section. Continuous coring penetrated to 153.2 mbsf (Cores 363-U1486-1H through 16H) with the APC using orientation and nonmagnetic hardware. We then drilled ahead without coring to 177 mbsf (23.8 m advance) to shoot Core 19H to capture a paleomagnetic reversal that was recovered in Hole U1486B but had fallen within a core gap in Hole U1486C. We collected 166.53 m of core over 162.7 m of coring (102% recovery) in Hole U1486D. Operations at Site U1486 ended at 1015 h on 17 November 2016. Total time spent at Site U1486 was 73.0 h (3.0 d).
A total of 63 APC cores were recovered at this site, collecting 564.67 m of sediment over 580.7 m of coring (97.2% recovery).
Hole U1486A
We prepared and spaced out the bottom-hole assembly (BHA), which consisted of an APC/extended core barrel (XCB) coring assembly with two stands of drill collars. During deployment of the drill string, the seafloor depth was measured at 1346.4 meters below rig floor (mbrf) with the precision depth recorder (PDR), and we positioned the bit at 1341.5 mbrf to shoot the first core. Hole U1486A was spudded at 1545 h on 14 November 2016. Core 363-U1486A-1H recovered 9.95 m of sediment using the APC. We terminated coring in Hole U1486A at 1600 h after retrieval of the first core due to the missed mudline. Total time spent in Hole U1486A was 6.75 h (0.3 days).
A single APC core was taken in Hole U1486A. We recovered 9.95 m of sediment over 9.5 m of coring for a recovery of 104.7%.
Hole U1486B
The vessel was offset 20 m east of Hole U1486A, and the drill string was spaced out with the bit at 1341.5 mbrf. Hole U1486B was spudded at 1645 h on 14 November 2016, with Core 363-U1486B-1H recovering 5.99 m of sediment, establishing a seafloor depth of 1333.8 mbsl. Oriented APC coring using the Icefield MI-5 core orientation tool with nonmagnetic hardware continued to 211.2 mbsf (Cores 1H through 23H). Downhole formation temperature measurements using the APCT-3 were taken on Cores 4H (34.5 mbsf), 7H (63.0 mbsf), 10H (91.5 mbsf), and 13H (120.0 mbsf), obtaining good results on all four deployments. Whole-round samples for high-resolution interstitial water analyses were taken at a frequency of one 5 or 10 cm sample per section in the upper 150 mbsf of Hole U1486B (through Section 363-U1486B-17H-2). Core 7H had a twisted and split liner, and Cores 21H and 22H had excessive overpull that required drillover to extract them from the formation. Core 23H seemed to be a full stroke; however, only 5.67 m of core was recovered. When drilling out the rathole, drilling stalled at 211.2 mbsf, indicating something hard at that depth that the core barrel was unable to penetrate. Given that the acoustic basement at Site U1486 was estimated at ~225 mbsf, we speculate that we encountered the acoustic basement at a slightly shallower depth. The presence of a few small basalt fragments in the core catcher of Core 23H supports this interpretation. We terminated coring at 211.2 mbsf, with the bit clearing the seafloor at 1250 h on 15 November. Total time spent on Hole U1486B was 20.75 h (0.9 days).
A total of 23 APC cores were taken in Hole U1486B. We recovered 215.49 m of sediment over 211.2 m of coring for a total recovery of 102.0%.
Hole U1486C
The vessel was offset 20 m south of Hole U1486B, and the drill string was spaced out with the bit at 1343.5 mbrf. Hole U1486C was spudded at 1415 h on 15 November 2016, with Core 363-U1486C-1H recovering 7.34 m of sediment, establishing a seafloor depth of 1334.5 mbsl. Oriented APC coring using the Icefield MI-5 core orientation tool with nonmagnetic hardware continued to 201.3 mbsf (Cores 1H through 23H). Two drilled intervals of 2 m each advanced the hole without coring to avoid alignment of core gaps for stratigraphic correlation purposes. Core 11H had no recovery, and the bottom of the core liner imploded on Core 13H. Four cores required drillover to extract them from the formation due to excessive overpull (Cores 17H, 18H, 22H, and 23H). We opted to terminate coring at 201.3 mbsf, well above the hard layer encountered in Hole U1486B. The bit cleared the seafloor at 1015 h on 16 November. Total time spent in Hole U1486C was 21.50 h (0.9 days).
A total of 21 APC cores were taken in Hole U1486C. We recovered 172.7 m of sediment over 197.3 m of coring for a total recovery of 87.5%. Two drilled intervals advanced the hole 4 m without coring.
Hole U1486D
Hole U1486D was cored to fill gaps in the stratigraphic section, particularly over the upper 150 mbsf of high-resolution interstitial water sampling in Hole U1486B. The vessel was offset 20 m west of Hole U1486C, and the drill string was spaced out with the bit at 1337.0 mbrf. Hole U1486D was spudded at 1320 h on 16 November 2016, with Core 363-U1486D-1H recovering 1.23 m of sediment, establishing a seafloor depth of 1334.1 mbsl. Oriented APC coring using the Icefield MI-5 core orientation tool with nonmagnetic hardware continued to 153.2 mbsf (Cores 1H through 17H). We then drilled ahead without coring to 177 mbsf (23.8 m advance) to shoot Core 19H and capture a paleomagnetic reversal that was recovered in Hole U1486B but had fallen within a core gap in Hole U1486C. Cores 3H and 8H had split liners, and Core 16H required drillover to extract it from the formation. We terminated coring after Core 19H at 186.5 mbsf. The drill string was retrieved to the vessel, with the bit clearing the rotary table at 1010 h on 17 November. The positioning beacon was recovered after the bit cleared the seafloor. The rig was secured for transit, and the thrusters were raised, ending operations at Site U1486 at 1015 h on 17 November. Total time spent in Hole U1486D was 24.0 h (1 day).
A total of 18 APC cores were taken in Hole U1486D. We recovered 166.53 m of sediment over 162.7 m of coring for a total recovery of 102.4%. A single drilled interval advanced the hole 23.8 m without coring.
Core description
We cored four holes at Site U1486, with the deepest hole penetrating to 211.20 mbsf (Hole U1486B) and the shallowest to 9.95 mbsf (Hole U1486A). The cores recovered from Site U1486 are composed of upper Pliocene to recent volcanogenic sediments, biogenic sediments, and authigenic minerals overlying oceanic basement, which was not cored. The relative abundance of the volcanogenic and biogenic components varies significantly downhole. Based on lithologic changes identified by a combination of visual core description, microscopic examination of smear slides, magnetic susceptibility, natural gamma radiation (NGR), color reflectance, and mineralogical analysis by X-ray diffraction (XRD) (see Core description and Physical properties in the Expedition 363 methods chapter [Rosenthal et al., 2018a]), we assign the recovered succession to one lithologic unit, which is divided into three subunits (Figure F5). Subunit IA (~57 m thick) includes mid-Pleistocene to recent mainly biogenic (nannofossil and foraminifer) sediment mixed with clay minerals and rare ash-rich layers. Subunit IB (~85 m thick) consists mainly of lower Pleistocene biogenic sediment with volcanic particles (ash and pumice), which occur both as dispersed particles and distinct layers (tephra). Subunit IC (~70 m thick; upper Pliocene to lower Pleistocene) is dominated by volcanic particles in discrete lamina and layers of different thicknesses, grain sizes (from a few millimeter-sized glass shards to several large scoria fragments), and colors. These are interbedded with a biogenic component that is also mixed with dispersed volcanic particles. The lowermost ~4 m of Subunit IC is permeated by authigenic zeolites of probable hydrothermal origin. The presence of both subrounded and angular fragments of basaltic rocks and hydrothermal precipitates indicates proximity to the oceanic basement.
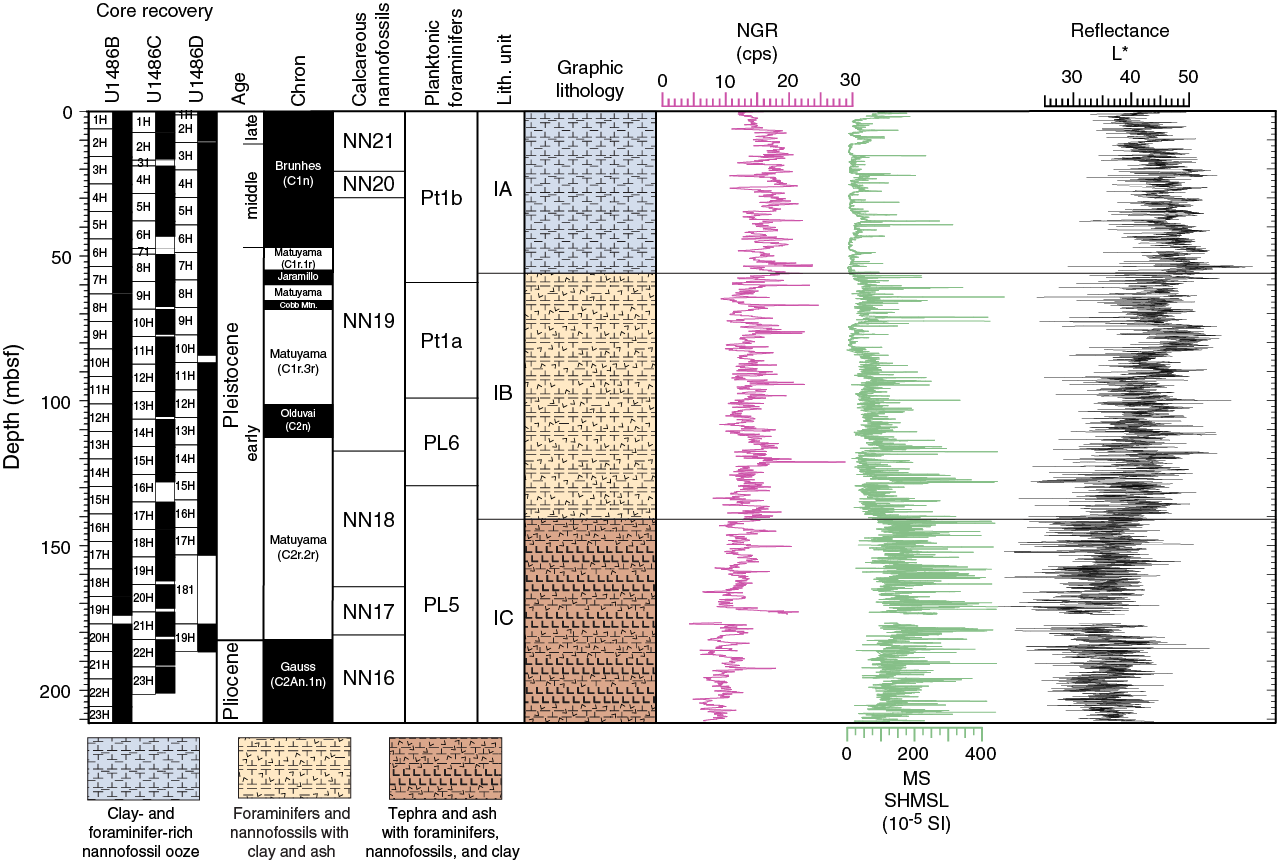
Figure F5. Lithologic summary.
Unit description
Unit I
-
Intervals: 363-U1486A-1H-1, 0 cm, through 1H-CC, 21 cm;
363-U1486B-1H-1, 0 cm, through 23H-CC, 8 cm;
363-U1486C-1H-1, 0 cm, through 23H-CC, 29 cm;
363-U1486D-1H-1, 0 cm, through 19H-CC, 24 cm - Depths: Hole U1486A = 0–9.95 mbsf, Hole U1486B = 0–211.17 mbsf, Hole U1486C = 0–200.98 mbsf, Hole U1486D = 0–186.75 mbsf
- Thickness: Hole U1486A = 9.95 m, Hole U1486B = 211.17 m, Hole U1486C = 200.98 m, Hole U1486D = 186.75 m
- Age: late Pliocene to recent
- Lithology: radiolarian-bearing foraminifer- and clay-rich nannofossil ooze, nannofossil clay, ashy sand, and ash
Unit I is composed of ~211 m of upper Pliocene to recent biogenic, siliciclastic (mainly clay minerals), and volcanogenic sediment (Figures F5, F6, F7, F8). These sedimentary components occur both mixed together and alternating in layers with distinct lithologic compositions. Bioturbation is moderate to light throughout the unit. The upper ~57 mbsf of the site (Subunit IA; latest early Pleistocene to recent) is dominated by biogenic ooze (mainly nannofossils and foraminifers) (Figure F6A, F6B) with variable (bearing to rich) amounts of clay minerals and with a few interbedded layers (between ~2 and 5 cm thick) in which volcanic glass occurs mixed with biogenic sediment (Figure F9). Volcanogenic particles increase in frequency downhole, and volcanic glass and pumice occur both mixed with the hemipelagic sediment and in distinct tephra layers in Subunit IB (early Pleistocene). The volcanogenic component is most abundant in the bottom part of the site in Subunit IC (late Pliocene to early Pleistocene; Figure F10), whereas both biogenic and clay components are less abundant. The volcanic material is generally dark (mainly scoria), and green patches indicating glass alteration are frequently observed on the split-core surface. At the bottom of the site, a ~4 m thick interval characterized by zeolite precipitates (probably mordenite) and basalt fragments indicates likely proximity to oceanic crust (Figure F11).
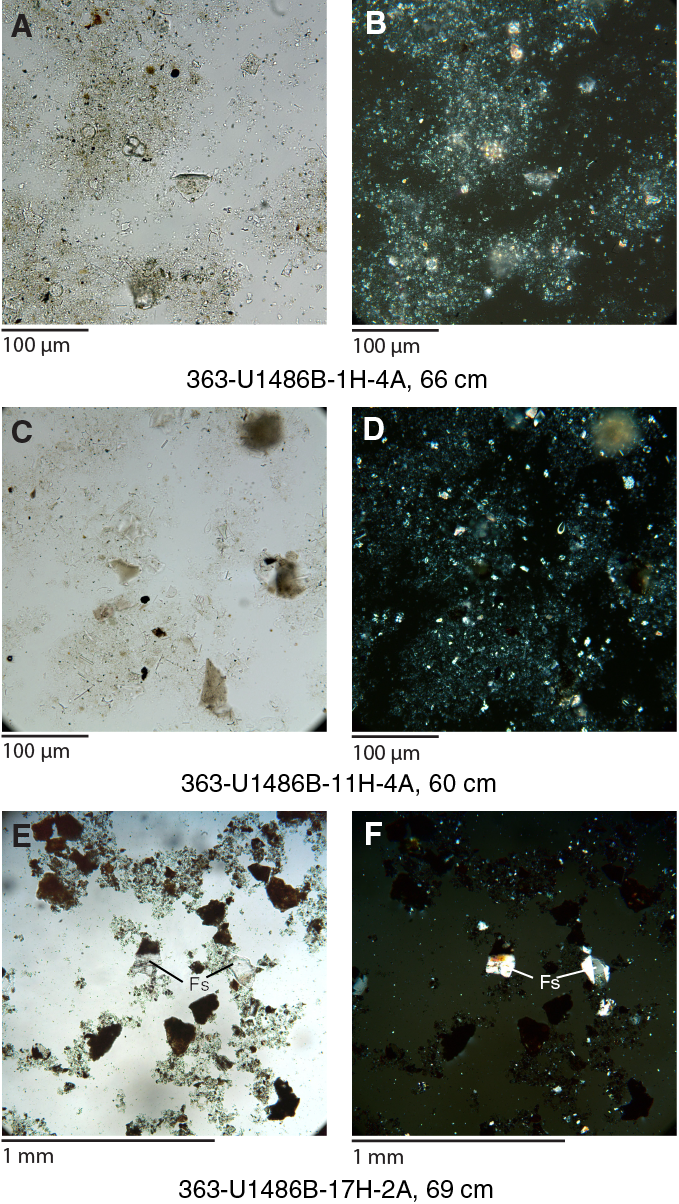
Figure F6. Main sedimentary components.
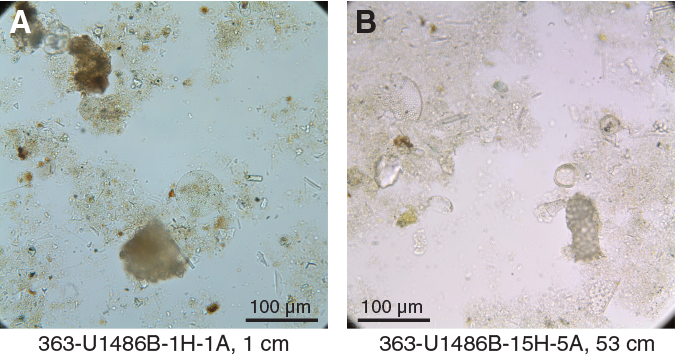
Figure F7. Biosiliceous sedimentary components.
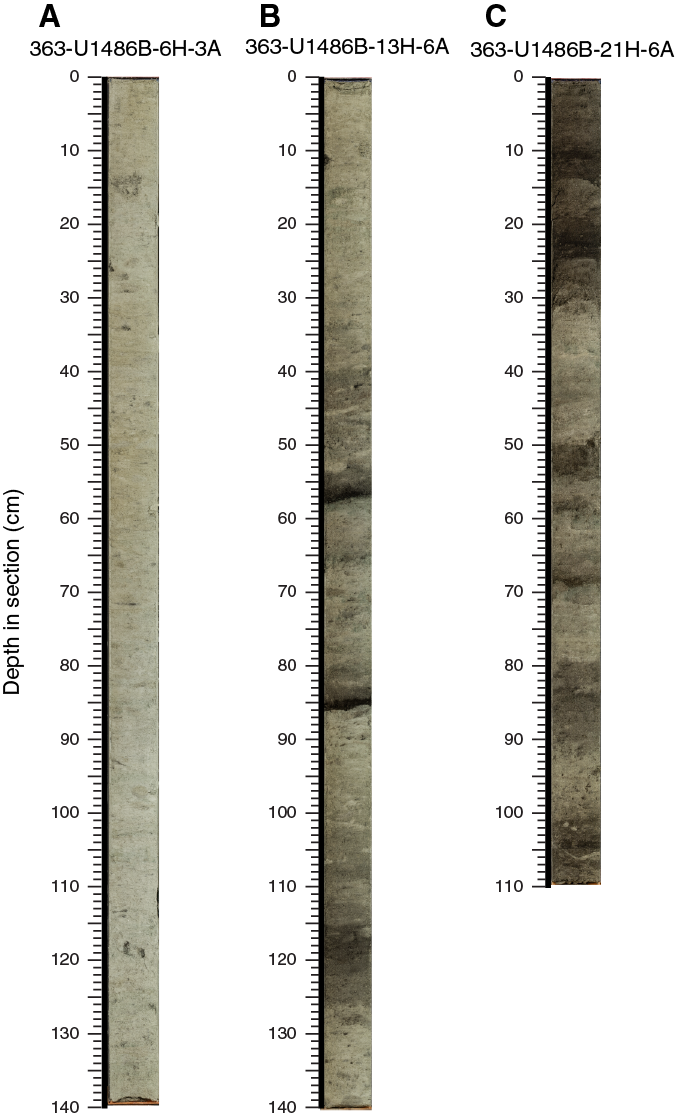
Figure F8. Main lithologies.

Figure F9. Characteristic lithology, color alternations, and subunit boundaries.

Figure F10. Physical property data.

Figure F11. Basalt fragments.
Subunit IA
-
Intervals: 363-U1486A-1H-1, 0 cm, through 1H-CC, 21 cm;
363-U1486B-1H-1, 0 cm, through 7H-3, 27 cm;
363-U1486C-1H-1, 0 cm, through 8H-6, 75 cm;
363-U1486D-1H-1, 0 cm, through 7H-7, 32.5 cm - Depths: Hole U1486A = 0–9.95 mbsf (total depth), Hole U1486B = 0–56.77 mbsf, Hole U1486C = 0–57.55 mbsf, Hole U1486D = 0–58.025 mbsf
- Thickness: Hole U1486A = 9.95 m (minimum thickness), Hole U1486B = 56.77 m, Hole U1486C = 57.55 m, Hole U1486D = 58.025 m
- Age: late early Pleistocene to recent
- Lithology: foraminifer and clay-rich nannofossil ooze, clay-bearing foraminifer-rich nannofossil ooze, clay-rich nannofossil ooze, ashy sand, and ash
The top of this subunit includes the mudline, characterized by a prominent change in color from reddish brown to light greenish gray at ~5 cm, with the sediment composed of abundant foraminifers, nannofossils, siliceous microfossils, and clay (Figure F7A). The primary lithology of Subunit IA is nannofossil ooze mixed with variable amounts of clay minerals and foraminifers as well as other components including silt-sized volcanic shards and, less frequently, silt-sized siliciclastics and glauconite. Biosilica is also present, generally in trace amounts, and is derived from the skeletal parts of radiolarians, diatoms, and silicoflagellates in decreasing order of abundance. Fragments of pteropod shells were also observed in the upper ~3.5 mbsf.
The color of the subunit is dominantly greenish gray (~10GY 7/1); this subunit shows the highest luminosity (L*) reflectance (Figure F5). The darker sediment corresponds to intervals that have higher clay mineral or volcanogenic particle content. The brightest sediment (highest L* values) occurs between ~6 and 25 mbsf and is concentrated in the middle part of the subunit at ~21 mbsf (e.g., Core 363-U1486B-3H), which consists mainly of foraminifer-rich nannofossil ooze.
Subunit IA has higher NGR than the other subunits, probably reflecting the higher clay content in the sediment. It also shows relatively low magnetic susceptibility values, in contrast to the deeper subunits characterized by higher concentrations of volcanic glass (Figure F5). Layers with volcanogenic sediment become more abundant below ~21 mbsf. These layers are a few centimeters thick, light brown and dark gray in color, and exhibit higher NGR and gamma ray attenuation (GRA) bulk density than the background sediment (see Physical properties).
The boundary with Subunit IB is placed at the base of the first black tephra layer at intervals 363-U1486B-7H-3, 27 cm (56.77 mbsf), 363-U1486C-8H-6, 75 cm (57.55 mbsf), and 363-U1486D-7H-7, 32.5 cm (58.025 mbsf). The occurrence of tephra layers increases downhole below these depths, and the color of the sediment is darker than in Subunit IA (Figure F9).
Subunit IB
-
Intervals: 363-U1486B-7H-3, 27 cm, through 16H-2, 70 cm;
363-U1486C-8H-6, 75 cm, through 17H-5, 25 cm;
363-U1486D-7H-7, 32.5 cm, through 16H-6, 17.5 cm - Depths: Hole U1486B = 56.77–141.20 mbsf, Hole U1486C = 57.55–141.05 mbsf, Hole U1486D = 58.025–143.375 mbsf
- Thickness: Hole U1486B = 84.43 m, Hole U1486C = 83.50 m, Hole U1486D = 85.35 m
- Age: early Pleistocene
- Lithology: foraminifer- and ash-rich nannofossil clay, ashy sand, and ash
The main lithology in Subunit IB is nannofossil ooze mixed with variable amounts of glass shards and foraminifers, as well as clay minerals. Coarser grained, silt- to fine sand-sized layers are also present. The particles in these layers are mainly composed of lighter colored and transparent volcanic glass and darker/opaque scoria fragments. Both volcanogenic components occur mixed with foraminifers and/or feldspars and variable amounts of clay. As observed for Subunit IA, biosilica (mainly radiolarians and diatoms) is present in variable amounts but always less than ~10% (Figure F7B). This subunit is characterized by higher magnetic susceptibility and lower NGR and L* than Subunit IA (Figure F5). The higher abundance of volcanic glass, the presence of volcanic scoria, and lower clay mineral content account for these physical property variations.
The first downhole appearance of black ash layers (few centimeters thick) entirely composed of volcanic glass (tephras) marks the boundary with Subunit IA (see Subunit IA); they become more common downhole (Figure F9). The tephra layers are spaced at intervals between 10 and 50 cm over several sections producing a prominent dark–light alternation in the sediment color. The base of these alternations typically starts with a black tephra layer, which has a sharp contact with the underlying light-colored hemipelagic sediment, followed by a gradual transition from darker to lighter colors due to mixing by bioturbation. The upper part of these cycles is composed of the background hemipelagic sediment, which dominates until the next tephra appears.
Generally, felsic, nonpleochroic volcanic glasses are the most abundant volcanogenic particle type found in the ash layers of Subunit IB (Figure F12A). Pumice fragments ranging from pebble sized to a few millimeters are also present (Figure F13A).
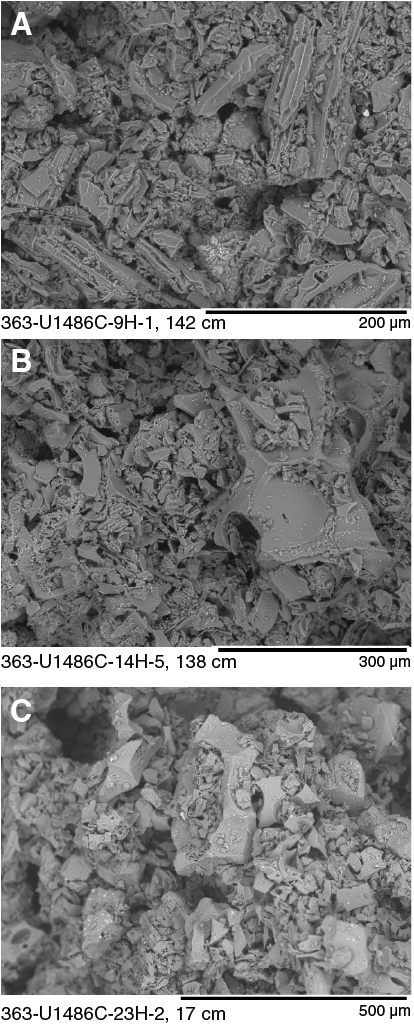
Figure F12. Selected tephra layers.
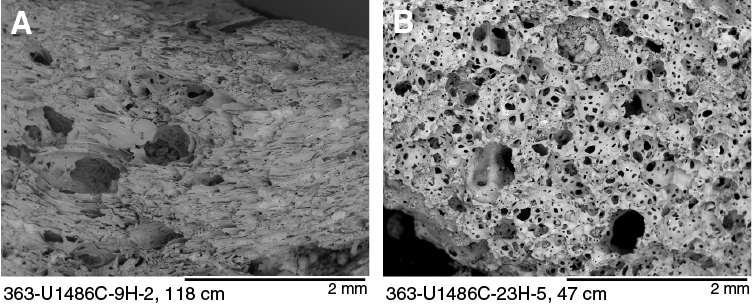
Figure F13. Selected pumice samples.
The base of the subunit coincides with the top of a prominent black volcanic ash layer that corresponds to a significant jump in magnetic susceptibility at 363-U1486B-16H-2, 70 cm (141.20 mbsf), 363-U1486C-17H-5, 25 cm (141.05 mbsf), and 363-U1486D-16H-6, 17.5 cm (143.375 mbsf). Below these depths, magnetic susceptibility values are higher, and the sediment is darker (lower L*) (Subunit IC; Figure F5).
Subunit IC
-
Intervals: 363-U1486B-16H-2, 70 cm, through 23H-CC, 8 cm;
363-U1486C-17H-5, 25 cm, through 23H-CC, 29 cm;
363-U1486D-16H-6, 17.5 cm, through 19H-CC, 24 cm - Depths: Hole U1486B = 141.20–211.17 mbsf, Hole U1486C = 141.05–200.98 mbsf, Hole U1486D = 143.375–186.75 mbsf
- Thickness: Hole U1486B = 69.97 m, U1486C = 59.93 m, U1486D = 43.375 m
- Age: late Pliocene to early Pleistocene
- Lithology: foraminifer- and ash-rich nannofossil clay, ashy sand, and ash
The main components of Subunit IC are silt- to fine sand-sized volcanogenic particles mainly composed of dark scoria fragments and brown volcanic glass. The volcanogenic material occurs in discrete layers and beds ranging from a few centimeters to >50 cm (Figure F10). Volcanic glass and scoria also occur mixed with the biogenic component, which consists of foraminifer-rich nannofossil clay (Figure F6E, F6F). Biosilica is also present and the clay mineral content is variable, although generally lower than in the upper two subunits. Subunit IC is characterized by the highest magnetic susceptibility, lowest NGR (which shows a clear decreasing trend downhole), and lowest L* values (Figure F5) and the darkest sediment recovered at this site. The changes in physical properties and L* reflect the high abundance of volcanic scoria compared with the biogenic component and a lower clay mineral content compared with the younger part of the sediment record.
Figure F10 shows different geometries of the volcanogenic layers in Subunit IC as observed during core description. High-resolution digital line-scan images are compared with the magnetic susceptibility, L*, and NGR to highlight differences in composition and depositional style among the different types of volcanogenic deposits. In Figure F10A, a layer between 54 and 68 cm containing abundant volcanogenic material is clearly identified by lower luminosity (L*) and higher magnetic susceptibility toward the base of this interval. The layer shows a sharp and slightly undulated basal contact, and magnetic susceptibility decreases and NGR (a proxy for clay minerals) increases toward the top. Together with the results of smear slide analyses, this suggests that the layer was either resedimented (i.e., not directly deposited from a pyroclastic event as is typical for tephra layers) or was bioturbated toward the top. In the same core section, the dark layer at ~30 cm has higher magnetic susceptibility, low NGR, and lower L*, which may indicate that it is solely composed of volcanic glass (tephra). Similarly, most dark layers in Figures F10B and F10C show sharp contacts at the base and a gradual transition to lighter colors and lower magnetic susceptibility values toward the top.
Resedimentation by either mass gravity deposition or bottom current reworking combined with bioturbation is a possible explanation for some of the thicker (>2–3 cm), mainly volcanogenic layers observed at Site U1486, which in Subunit IC are particularly abundant. For instance, the layer between ~120 and 60 cm in Figure F10D and the dark layer between ~125 and 100 cm in Figure F10E have a sharp base and higher NGR at both the base and top, whereas magnetic susceptibility is highest toward the top. The low L* interval between ~125 and 100 cm in Figure F10E corresponds to the depth of the Matuyama/Brunhes boundary, which is dated to 2.581 Ma (see Paleomagnetism).
The bottom sections of Subunit IC (~207–211 mbsf; e.g., Sections 363-U1486B-23H-2, 23H-3, and 23H-4) are pervaded by a whitish, microcrystalline, mainly cemented zeolite (variety mordenite; Ca and/or Na dominated) (Figure F14). In smear slides, the mordenite crystals appear subhedral to ragged, small, platy, and fine grained (2–45 µm). They are transparent and colorless, show moderate relief, weak birefringence, and no pleochroism. The sediment at the base of the succession also contains angular to subangular centimeter-scale fragments of greenish gray rocks that are particularly common in the core catcher of the last two cores from Hole U1486B (Cores 363-U1486B-22H and 23H). Some of the fragments were collected for thin sections and observed under a petrographic microscope. The rock is basalt with small olivine and pyroxene phenocrysts (Figure F11).
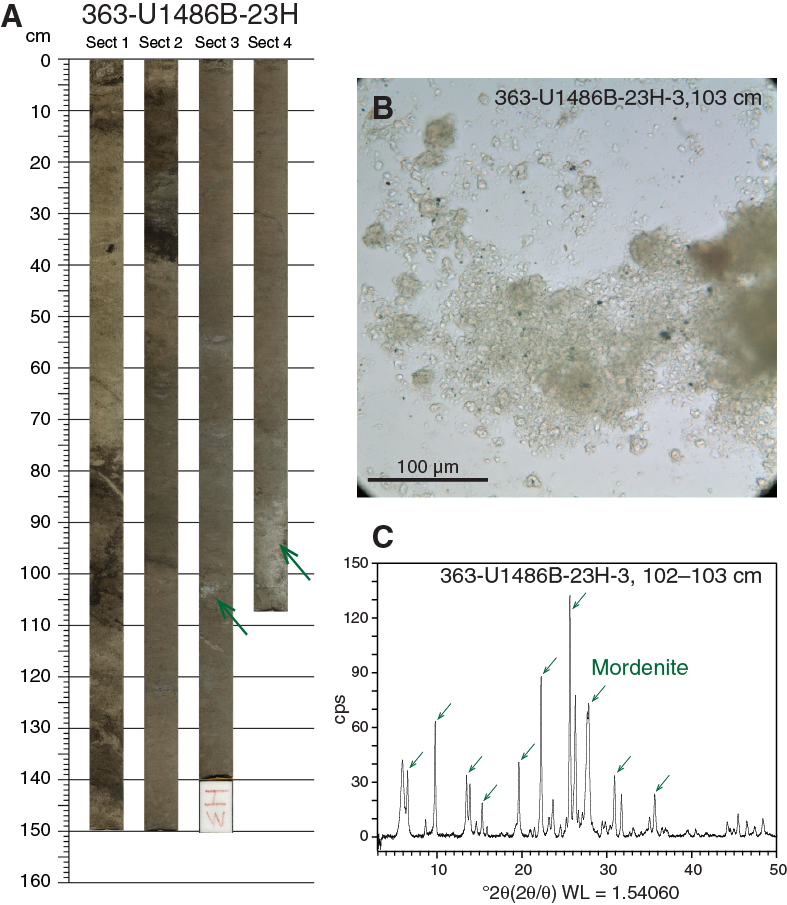
Figure F14. Lithologies and authigenic minerals.
Discussion
Volcanogenic sediment
Volcanic glass in marine sediment occurs in the form of shards and fragments that result from explosively erupted pumice, rapid quenching of molten lava, or through the erosion of glassy rocks such as pumice or scoria. Volcanic glass may also originate during submarine volcanic eruptions through the granulation of pillow rims or during subaerial eruptions as a result of ash fallout through the water column (tephra layers; Rothwell, 1989).
Glass shards can show a variety of morphologies and size ranges between fine silt (~10 µm) to medium sand (~500 µm). Generally, felsic glass (e.g., derived from volcanic arc magmatism) are colorless, whereas darker glass tends to be more mafic (e.g., derived from basalts). Volcanic glass is inherently unstable and devitrifies over time. Glass of different compositions will hydrate and devitrify differently, with the most important products of alteration being palagonite, smectite, and zeolites (Rothwell, 1989).
As discussed in Unit description, volcanogenic sediment is observed throughout the succession at Site U1486 but is most abundant in Subunit IB and especially Subunit IC, where it makes up the bulk of the sediment. In both Subunits IB and IC, the volcanogenic component occurs in well-defined tephra layers that often recur at intervals of several tens of centimeters (e.g., Figure F10C). However, in Subunit IC, thicker (>>2–3 cm) volcanogenic layers are also common (e.g., Figure F10D, F10E). Visual core description, smear slide analysis, and comparison with physical property data suggest that several of these thicker layers were the product of resedimentation by either mass gravity deposition or bottom current reworking.
In Hole U1486B, we identified ~185 distinct tephra layers. However, this is probably an underestimate because bioturbation has disrupted several of the thinner tephra layers. Overall, the tephra layers increase in abundance and thickness downhole. Added together, the thickness of the tephra layers is >20 m, which is ~10% of the core recovery.
Sediment generally darkens downhole, and the base of Subunit IC is distinctively darker than that of Subunit IA (Figure F5). Light gray (N 7) tephras (e.g., interval 363-U1486C-9H-1, 142 cm) commonly consist of micropumice with elongate vesicles and vesicular glass fragments. Dark brown (7.5YR 3/2) tephras (e.g., interval 363-U1486C-14H-5, 138 cm) are composed of bubble wall shards. Very dark gray (N 3) tephras (e.g., interval 363-U1486B-23H-2, 17 cm) are composed of microscoria and vesicular glass fragments (Figures F12, F13). Pumice vesicles (e.g., interval 363-U1486C-9H-2, 118 cm) show parallel and elongate shapes with secondary elongate coalescing vesicles, whereas scoria vesicles (e.g., interval 363-U1486C-23H-5, 47 cm) exhibit spherical shape with secondary spherical coalescing vesicles (Figure F13).
Hydrothermal reactions and sediment/basalt interface
Zeolites (variety mordenite) are found near the base of Hole U1486B (Figure F14). Zeolites are a group of basic, hydrous minerals that possess an open aluminosilicate framework structure containing channels filled with water molecules and cations. The increase in chlorinity in the lower ~70 m at this site might be a consequence of the hydration of zeolites (see Geochemistry). The occurrence of cementation by mordenite coincides with anomalously high P-wave velocity and low bulk density (see Physical properties). Zeolites are produced by different geological mechanisms (e.g., magmatism, metamorphism, burial diagenesis, and weathering) and as precipitates in marine sediment. However, mordenite is mainly found associated with submarine hydrothermal activity (Iijima, 1980). Hydrothermal activity is also supported by the very low heat flow gradient measured at this site with the APCT-3 (see Physical properties).
Evolution of sedimentation
Sedimentation at Site U1486 started in the late Pliocene (~2.7 Ma; see Biostratigraphy). The presence of both subrounded and angular fragments of basaltic rocks and hydrothermal activity at the bottom of the recovered succession suggests that sedimentation occurred directly above basaltic crust that was hydrothermally active at least during deposition of the lower ~4 m of sediment. Basaltic volcanism is recorded mainly in Subunit IC (over a period of ~500 ky; see Biostratigraphy) and part of Subunit IB by the presence of mafic volcanic glass and scoria. The very high sedimentation rates recorded in Subunit IC are probably the result of the remobilization and rapid deposition through mass gravity mechanisms of pyroclastic material temporarily deposited in subaerial and other submarine areas.
This regime dominated by mafic volcanism and very rapid sedimentation by mass gravity flows continued until ~2 Ma (the top of Subunit IC), which marks the cessation of the basaltic magmatism and/or the lack of delivery of basaltic-type volcanogenic material to the depositional basin of Site U1486. The volcanogenic sediment observed in Subunit IB is mainly clear volcanic glass and pumice, indicating a possible origin from more felsic sources of explosive magmatism, such as volcanic arcs.
The onset of deposition of Subunit IA, at ~1 Ma, records the dominance of hemipelagic (biogenic and clay minerals) components over the volcanogenic material. The increase in clay minerals that occurs throughout both Subunits IA and IB indicates an increased terrigenous influence during deposition of these subunits.
Biostratigraphy
At Site U1486, a 206 m thick succession of nannofossil ooze, ash, and clay, silt, and sand with varying proportions of nannofossils, foraminifers, and radiolarians was recovered (see Core description). Planktonic foraminifers, benthic foraminifers, and calcareous nannofossils are always present and generally excellently preserved, although a slight decrease in preservation state is noted in the lowermost two cores of Hole U1486B (see Foraminifer preservation). The results from each fossil group (calcareous nannofossils, planktonic foraminifers, and benthic foraminifers) are presented below, followed by a detailed characterization of both benthic and planktonic foraminifer preservation state using shipboard light microscope and scanning electron microscope (SEM) observations. An integrated bio- and magnetostratigraphy is presented in the final section. Shipboard taxon occurrence data are available to download from the Laboratory Information Management System (LIMS) database (http://web.iodp.tamu.edu/LORE).
Calcareous nannofossils
Calcareous nannofossil biostratigraphy is primarily based on analysis of core catcher (CC) samples and two or three additional samples per core from working-half sections in Hole U1486B, providing a sampling resolution of ~3 m. In the deepest part of the hole, the sediment samples were sieved at 20 µm to remove coarser ash particles prior to making smear slides. Depth positions and age estimates of key biohorizons are given in Table T2. Observations were undertaken using plane- (PPL), cross- (XPL), and circular-polarized light (CPL), as well as the shipboard desktop SEM (Hitachi TM3000) to confirm the presence of Emiliania huxleyi and to check preservation state. Bioevent/biohorizon abbreviations in the text follow those in the caption of Table T2.
Table T2. Calcareous nannofossil bioevents. Download table in CSV format.
At Site U1486, the preservation of calcareous nannofossils is generally excellent to very good (Figure F15). Dissolution-susceptible taxa are consistently present throughout the recovered interval (Syracosphaera, Oolithotus fragilis, Tetralithoides symeonidesii, and Calciosolenia sp.). Very small Reticulofenestra minuta, Gephyrocapsa spp., and Emiliania huxleyi are abundant and well preserved (SEM/CPL). Reworked calcareous nannofossils are very rare through the succession, consisting of occasional specimens of Sphenolithus abies and one specimen of Reticulofenestra pseudoumbilicus. Although not significant in the assemblages, this does indicate the transport of sediments derived from strata older (~early Pliocene) than those recorded at the base of the hole (latest Pliocene), just above acoustic basement.

Figure F15. Calcareous nannofossils.
Calcareous nannofossil assemblages from Pleistocene sediments at Site U1486 show high diversity. The main components are Florisphaera profunda and members of the Noelaerhabdaceae family (genera include Gephyrocapsa, Emiliania, Pseudoemiliania, and Reticulofenestra), but with significant additional diversity from the Calcidiscaceae as well as Helicosphaera, Rhabdosphaera, Pontosphaera, and Syracosphaera species. The distribution of the main taxa through the Pleistocene is shown in Table T3.
Table T3. Distribution of selected calcareous nannofossil species, Hole U1486B. Download table in CSV format.
Biohorizon base common E. huxleyi (0.09 Ma) occurs between Samples 363-U1486B-1H-CC and 2H-3, 50 cm (5.94–9.50 mbsf). The base of Zone NN21 is identified by biohorizon base E. huxleyi (0.29 Ma) between Samples 3H-3, 20 cm, and 3H-5, 100 cm (18.65–22.35 mbsf). The base of Zone NN20 is identified by biohorizon top Pseudoemiliania lacunosa (0.44 Ma) between Samples 4H-3, 50 cm, and 4H-4, 50 cm (28.50–31.50 mbsf). Biohorizon base acme G. caribbeanica (0.56 Ma) occurs between Samples 4H-CC and 5H-2, 75 cm (35.05–36.75 mbsf). Below this level, in Sample 6H-CC (53.88 mbsf), medium-sized Gephyrocapsa are still dominant but are distinct from G. caribbeanica based on the shape of their collar. It is not clear whether this slightly older morphotype is equivalent to the medium-sized Gephyrocapsa (>4 µm) of Raffi and Flores (1995) or Gephyrocapsa omega or other taxonomic concepts of G. caribbeanica. Biohorizon top Gephyrocapsa >5.5 µm, which is based strictly on coccolith size (e.g., Raffi and Flores, 1995), is difficult to place accurately at this site, as, in general, the size of Gephyrocapsa coccoliths is smaller (<5 µm) than in other Pleistocene successions (e.g., in ODP Leg 138; Raffi and Flores, 1995). Biohorizon top Gephyrocapsa >5.5 µm (1.25 Ma) is placed between Samples 8H-5, 130 cm, and 8H-CC (70.3–72.79 mbsf) based on the occurrence of Gephyrocapsa >5.5 µm in one sample (8H-CC; 72.79 mbsf). Below this level, medium to large Gephyrocapsa (~4.5–5.5 µm) are present down to Sample 11H-2, 120 cm (94.20 mbsf).
The base of Zone NN19 is identified by biohorizon top Discoaster brouweri (1.93 Ma) between Samples 363-U1486B-13H-4, 110 cm, and 13H-6, 67 cm (116.36–118.67 mbsf). Within Sample 13H-6, 67 cm, well-preserved D. brouweri are present at very low abundance, but they disappear below this level until Sample 14H-CC (129.93 mbsf). This species is then present in fluctuating abundance (present to frequent) in Core 15H, only becoming common and continuously present downhole within Core 16H. This is taken as a true pattern of D. brouweri abundance fluctuation at this location based on the preservation state of the specimens observed.
The base of Zone NN18 is placed at biohorizon top Discoaster pentaradiatus (2.39 Ma) between Samples 363-U1486B-18H-4, 21 cm, and 18H-6, 21 cm (162.71–165.71 mbsf). Biohorizon top Discoaster surculus (2.49 Ma) is the last biohorizon recorded downhole and marks the base of Zone NN17 between Samples 20H-2, 85 cm, and 20H-4, 85 cm (179.35–182.35 mbsf).
Planktonic foraminifers
Planktonic foraminifer biostratigraphy was conducted on Hole U1486B. Above ~82.5 mbsf (Cores 363-U1486B-1H through 9H; 5.94–82.47 mbsf), we examined core catcher samples only, resulting in a sampling resolution of ~9.5 m. Below ~82.5 mbsf (Cores 10H through 23H; 84.49–211.09 mbsf), three additional samples per core were taken, typically from Sections 2, 4, and 6, although in shorter cores fewer additional samples were taken. This resulted in a sampling resolution of ~2.5 m. A list of biohorizons is given in Table T4. Coiling direction counts on Pulleniatina are given in Table T5 and plotted in Figure F16.
Table T4. Planktonic foraminifer bioevents. Download table in CSV format.
Table T5. Pulleniatina coiling count data, Hole U1486B. Download table in CSV format.

Figure F16. Coiling patterns in Pulleniatina.
Sample 363-U1486B-1H-CC (5.94 mbsf) is assigned to the uppermost part of Subzone Pt1b (<0.07 Ma) based on the absence of Globorotalia flexuosa and Globigerinoides ruber (pink). Biohorizons top G. flexuosa (0.07 Ma) and top G. ruber (pink) (0.12 Ma) are both observed between Samples 1H-CC and 2H-CC (5.94–16.01 mbsf).
Biohorizons base Globigerinella calida and base G. flexuosa are problematic for several reasons: (1) both require careful taxonomic discrimination; (2) reasonably large populations need to be examined when the forms are rare so that a biohorizon must sometimes be located with just one or two taxonomically marginal specimens in a sample, which becomes more problematic with sparse downhole resolution based only on core catcher samples; and (3) convergent morphologies of both forms reappear further downhole. For instance, well-developed morphologies similar to G. calida with characteristic radially elongated final chambers (compared to co-occurring ancestor Globigerinella siphonifera) occur down to Sample 363-U1486B-14H-CC (129.93 mbsf), and morphologies similar to G. flexuosa are common in the Pliocene down to Sample 20H-CC (186.95 mbsf), as was found at other Expedition 363 sites (see Biostratigraphy in the Site U1484 chapter and Biostratigraphy in the Site U1485 chapter [Rosenthal et al., 2018d, 2018e]). Some of the issues surrounding G. calida in particular might be clarified in the light of recent research (Weiner et al., 2015), which distinguished two genetically and morphologically distinct populations in the modern ocean that have previously been grouped as G. calida, namely Globigerinella calida (Parker) sensu stricto and Globigerinella radians (Egger). At Site U1486 we attempted to distinguish G. radians from G. calida for the first time during Expedition 363. We found that both forms are present in the sediment and appear to have similar stratigraphic distributions in the upper two cores, although much more detailed work is required postexpedition to fully investigate this. For biostratigraphic purposes we assume that in stratigraphically much lower samples, morphologies that are recorded as “calida” and “flexuosa” in our preliminary occurrence tables can be ascribed to evolutionary convergence and are excluded from consideration. Hence, we were able to tentatively identify biohorizon base G. calida (0.22 Ma) between Samples 2H-CC and 3H-CC (16.01–25.37 mbsf) and biohorizon base G. flexuosa (0.40 Ma) between Samples 3H-CC and 4H-CC (25.37–35.05 mbsf).
Biohorizon top Globorotalia tosaensis (0.61 Ma) demarcates the base of Subzone Pt1b and is observed between Samples 363-U1486B-6H-CC and 7H-CC (53.88–62.81 mbsf). The L1 coiling change in Pulleniatina from “random” coiling to predominantly dextral individuals (0.80 Ma) cannot be located reliably because of the low sampling resolution (Figure F16).
The base of Zone Pt1, defined by biohorizon top Globigerinoidesella fistulosa (1.88 Ma according to the Atlantic Ocean calibration at ODP Site 925 of Chaisson and Pearson, 1997), is observed between Samples 363-U1486B-11H-4, 119–121 cm, and 11H-6, 119–121 cm (97.19–100.19 mbsf). Unlike in the Atlantic site where G. fistulosa disappears gradually uphole, with only poorly developed forms below the extinction level (Chaisson and Pearson, 1997), at Site U1486 there are well-developed G. fistulosa in the highest sample in which they are present. The age of this biohorizon in the Pacific Ocean may represent the true extinction of G. fistulosa after its local disappearance from the Atlantic Ocean (Resig et al., 2001) and needs careful recalibration.
Three biohorizons are observed between Samples 363-U1486B-14H-6, 93–95 cm, and 14H-CC (128.43–129.93 mbsf):
- Biohorizon base Pulleniatina finalis (2.04 Ma);
- Biohorizon top Globorotalia pseudomiocenica (2.30 Ma), which marks the base of Zone PL6; and
- Biohorizon top Globorotalia limbata (2.39 Ma).
With no sedimentological evidence of reworking or hiatuses (see Core description) and apparently continuous calcareous nannofossil biostratigraphy (see Calcareous nannofossils) in this interval, it seems most likely that the close association of these bioevents in time is real and consequently that they are not well calibrated in the Indo-Pacific region. Moreover, the events were found to be closely associated at several other Expedition 363 sites (see Biostratigraphy in the Site U1482 chapter, Biostratigraphy in the Site U1483 chapter, Biostratigraphy in the Site U1487 chapter, and Biostratigraphy in the Site U1490 chapter [Rosenthal et al., 2018b, 2018c, 2018f, 2018g]). The biochronologic age for biohorizon top G. limbata is based on an Atlantic Ocean calibration from ODP Site 925 (Chaisson and Pearson 1997). The age for biohorizon top G. pseudomiocenica can be sourced to Berggren et al. (1995) where no other calibration information is provided other than the age of 2.30 Ma, except that the extinction is regarded as likely coeval with the extinction of the similar species Globorotalia miocenica in the Atlantic Ocean. This highlights the need for better calibrations in the Pacific Ocean and renewed study of the extent of diachrony and species provincialism between ocean basins.
A series of coiling reversals in Pulleniatina occurs in Hole U1486B (Figure F16), which have the potential for more detailed correlation to other sites including nearby Site U1487, Indian Ocean Sites U1482 and U1483, and elsewhere (e.g., offshore Papua New Guinea sites from ODP Leg 180 studied by Resig et al., 2001).
Biohorizon base Globorotalia truncatulinoides (2.47 Ma according to the regional calibration of Dowsett, 1988) was tentatively placed between Samples 363-U1486B-22H-4, 80–82 cm, and 22H-6, 80–82 cm (201.30–204.30 mbsf). At the bottom of Hole U1486B, the sediment particles in Sample 23H-CC (211.09) are dominated by volcanic fragments, but planktonic foraminifers are still present in sufficient abundance to establish the biostratigraphic zone and approximate age. Pulleniatina is exclusively dextral. Well-developed G. fistulosa is found in the absence of G. truncatulinoides and Dentoglobigerina altispira, indicating an age in the range of 2.47–3.33 Ma within Zone PL5.
Benthic foraminifers
Benthic foraminifers were studied in every core catcher sample from Hole U1486B. Specimen counts are presented in Table T6. The planktonic:benthic foraminifer ratio is ~99:1 in all studied samples. The composition of the assemblages is similar to that at Sites U1482 and U1483 and is characteristic of bathyal water depths. Planulina wuellerstorfi is present except in three of the core catcher samples (363-U1486B-4H-CC [35.05 mbsf], 11H-CC [101.39 mbsf], and 16H-CC [148.89 mbsf]. The upper bathyal species Cibicidoides pachyderma is present in about half of the core catcher samples. The benthic foraminifer assemblages are dominated by Bolivinita quadrilatera, which usually lives between 750 and 2000 mbsl, and Bolivina robusta, which occurs between 7 and 3500 mbsl (van Morkhoven et al., 1986; Jones, 1994). The bathyal species Uvigerina hispida and Uvigerina proboscidea are present in all samples except Samples 15H-CC (139.17 mbsf), 18H-CC (167.5 mbsf), and 19H-CC (174.08 mbsf). The shallow dweller (4–70 mbsl) Rotalinoides compressiusculus is found in association with the deepwater assemblage in Samples 2H-CC (16.01 mbsf), 5H-CC (44.40 mbsf), and 12H-CC (110.94 mbsf). The substantial amount of volcanic ash in the sediment from Samples 14H-CC through 20H-CC (129.93–186.95 mbsf) does not affect the composition of the benthic foraminifer assemblages.
Table T6. Benthic foraminifer distribution, Hole U1486B. Download table in CSV format.
Foraminifer preservation
Site U1486 is located on relatively young oceanic crust (see Background and objectives) and was cored nearly to acoustic basement (see Operations and Core description). There is a generally increasing proportion of volcanic particles downhole until they become the dominant component in the foraminifer residues. The sediment from the lowermost part of the succession may have been affected by relatively high heat flow, crustal fluids, and hydrothermal processes (see Geochemistry and Core description). Four core catcher samples from Hole U1486B were selected to assess foraminifer preservation and diagenesis. The upper three samples (1H-CC [5.94 mbsf], 11H-CC [101.39 mbsf], and 21H-CC [196.02 mbsf]) are spaced at ~100 m intervals following the general approach taken during Expedition 363. These samples range in age from late Pleistocene (<0.07 Ma) to early Pleistocene (~2.39–2.47 Ma). Another sample was taken from a level near the bottom of the hole where foraminifers are subordinate to large volumes of ash (Sample 22H-CC; 205.74 mbsf; ~2.72 Ma).
Foraminifer preservation, as visually assessed in the core catcher samples, is generally excellent to very good. Where preservation is not excellent, this can be due to fragmentation, cementation, and/or incipient recrystallization. There is no obvious depth-related pattern to the suboptimal preservation. Foraminifer preservation in the layers with high proportions of volcanogenic grains appears slightly better (more glassy) than in the more carbonate-rich sediment at similar burial depth. Images of selected specimens are shown in Figure F17. The full set of images is available online from the LIMS database (http://web.iodp.tamu.edu/LORE).
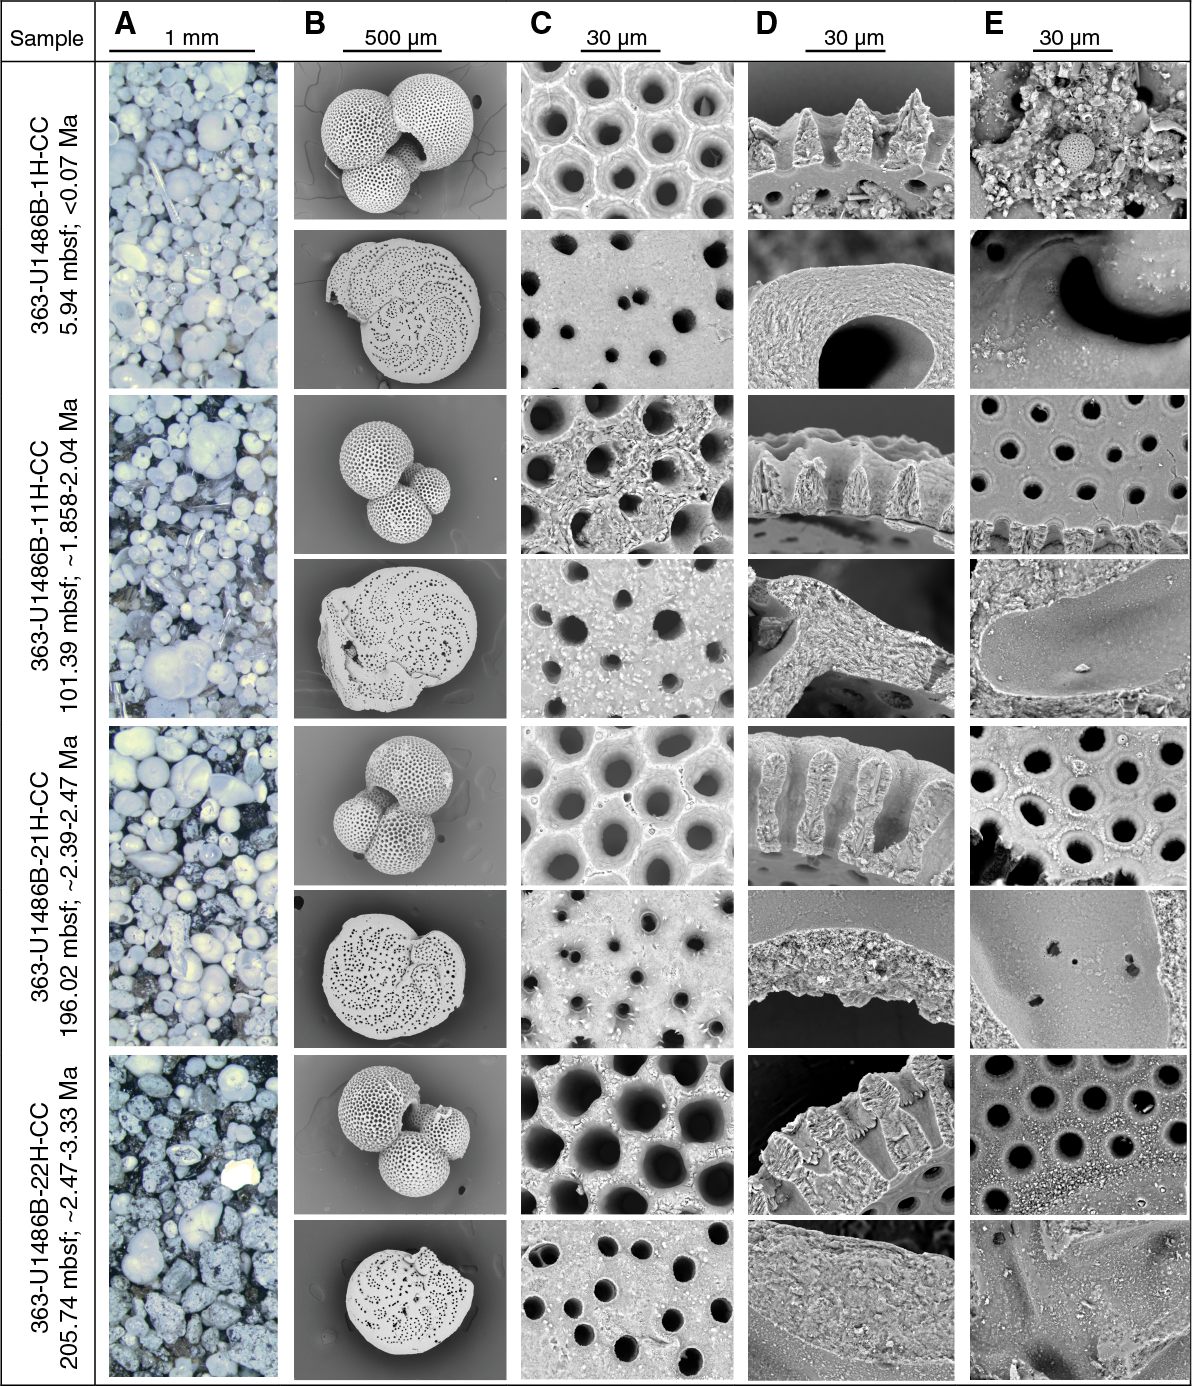
Figure F17. Downhole foraminifer preservation states.
Sample 363-U1486B-1H-CC (5.94 mbsf; late Pleistocene; <0.07 Ma) shows excellent preservation. Foraminifers have a glassy appearance under the light microscope. In cross section, the wall of Trilobatus trilobus shows platy microgranules and other typical biogenic features. Minor superficial damage of the outer chamber surfaces of some specimens, especially the interpore ridges, may indicate abrasion on the seafloor. Pyrite framboids and minor infilling of unconsolidated sediment (coccoliths) occur in one examined specimen. In P. wuellerstorfi the wall cross section shows biogenic microgranules throughout. All specimens show very minor calcite overgrowth on internal and some external surfaces. Loosely dispersed pyrite framboids up to 3 μm in diameter occur in some patches, with small amounts of cemented sediment infill. There is no evidence of recrystallization or dissolution.
Sample 363-U1486B-11H-CC (101.39 mbsf; early Pleistocene; ~1.88–2.04 Ma) shows excellent preservation. Foraminifers have a glassy appearance under the light microscope. Wall cross sections of both T. trilobus and P. wuellerstorfi show the biogenic microgranular textures typical of the species and minor evidence of abrasion. The inner wall surfaces of all studied specimens are generally smooth with minor overgrowth of calcite forming an amorphous crystalline layer <1 μm thick. One studied specimen of T. trilobus contains pyrite framboids up to 6 μm in diameter. P. wuellerstorfi shows very minor calcite overgrowth on outer surfaces. There is no evidence of recrystallization, cementation, or dissolution.
Sample 363-U1486B-21H-CC (196.02 mbsf; early Pleistocene; ~2.39-2.47 Ma) shows excellent to very good preservation. Foraminifers have a glassy appearance under the light microscope. Wall cross sections of T. trilobus show platy microgranules and other typical biogenic features, with minor superficial abrasion of the outer chamber surfaces on some specimens. However, the wall cross sections of P. wuellerstorfi show evidence of incipient recrystallization and minor calcite overgrowth on the outer surfaces. One P. wuellerstorfi specimen contains pyrite framboids up to 3 μm in diameter. There is no evidence of infilling, cementation, or dissolution.
Sample 363-U1486B-22H-CC (205.74 mbsf; early Pleistocene to late Pliocene; ~2.47–3.33 Ma) shows excellent preservation. Foraminifers have a glassy appearance under the light microscope. Wall cross sections of both T. trilobus and P. wuellerstorfi show biogenic microgranular textures with evidence of minor abrasion. The inner wall surfaces of T. trilobus and P. wuellerstorfi exhibit moderate calcite overgrowth layers up to 2 μm thick. P. wuellerstorfi also shows calcite overgrowth on external surfaces and one studied specimen contained pyrite framboids up to 5 μm in diameter. There is no evidence of recrystallization, cementation, or dissolution.
Shipboard age model
An age-depth plot including all biostratigraphic biohorizons and magnetostratigraphic horizons (see Paleomagnetism) is shown in Figure F18. Calcareous nannofossil and planktonic foraminifer biohorizons and magnetostratigraphic horizons (see Paleomagnetism) show good agreement. Sedimentation rates after 2.15 Ma (0–125 mbsf) are ~6 cm/ky. Before 2.15 Ma (below 125 mbsf), the sedimentation rate was higher, at ~14 cm/ky. Based on these sedimentation rates, the Pliocene/Pleistocene boundary (2.588 Ma) is placed at 183 mbsf, just below the base of Chron C2r.2r (2.581 Ma). The base of the hole (203 mbsf) is assigned a latest Pliocene age, around 2.72 Ma, assuming a constant sedimentation rate of 14 cm/ky for the basal 20 m section.
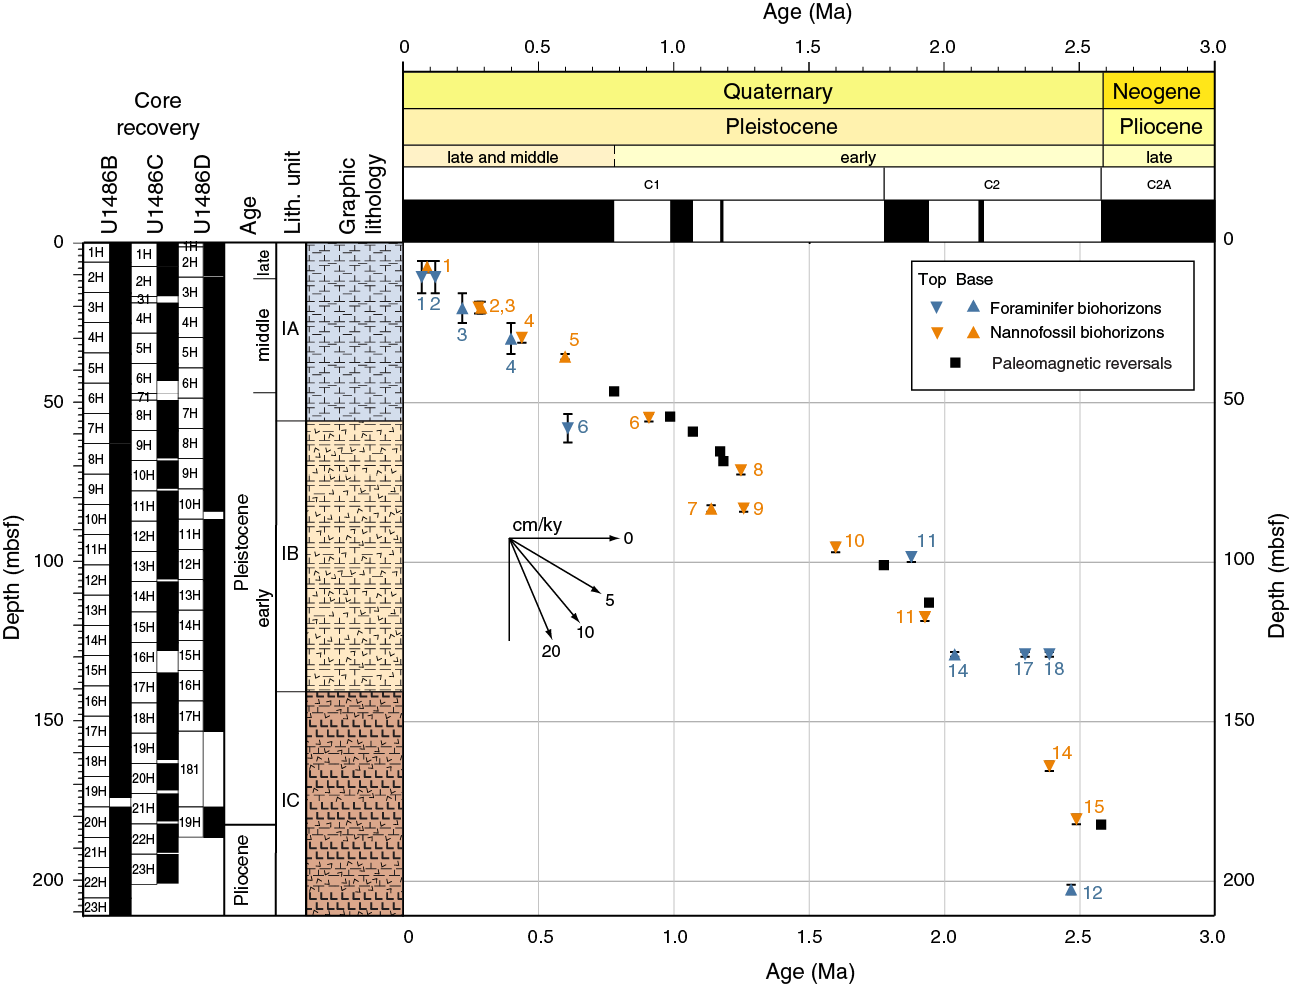
Figure F18. Age-depth plot.
Paleomagnetism
Measurements summary
Paleomagnetic investigations at Site U1486 involved measurement of the natural remanent magnetization (NRM) of archive-half cores from Holes U1486A–U1486D before and after alternating field (AF) demagnetization. We employed a four-step NRM and AF demagnetization procedure (NRM and 10, 15, and 20 mT) to all seven sections of Core 363-U1486A-1H to determine the single-peak AF field (15 mT) to be applied to all measured sections from Holes U1486B–U1486D. In addition to measuring 396 core sections, we took two to three discrete samples per core from Hole U1486B (49 samples) to characterize the NRM demagnetization behavior and to investigate the rock magnetic properties of the sediment. The NRM of discrete samples was measured before and after AF demagnetization in peak fields of 5, 10, 15, 20, 30, and 40 mT. Rock magnetic investigations comprised measurements of magnetic susceptibility (χ), susceptibility of anhysteretic remanent magnetization (χARM) imparted using a 100 mT AF demagnetization and 0.05 mT direct current bias field, and isothermal remanent magnetization (IRM) acquired in 300 mT and 1000 mT (saturation IRM [SIRM]) fields. All sample measurements were mass corrected. The Icefield MI-5 core orientation tool was deployed with nonmagnetic hardware for all cores, which permitted azimuthal correction of declination. Azimuthally corrected declination is largely coherent between cores; however, absolute values in all holes cluster around 180° for normal polarity and 0° for reversed polarity, suggesting that the issues of the baseline offset in azimuthally corrected declination experienced at the majority of sites during Expedition 363 and during previous expeditions (McNeill et al., 2017) affected these data. McNeill et al. (2017) suggest a simple –180° correction could be applied to the corrected declination data to rotate them back to expected values for the respective polarity. However, we leave declination uncorrected for this additional offset in the plotted figures, so care should be employed for future calculations of virtual geomagnetic poles (VGPs) using these data.
Rock magnetic characterization
Whole-Round Multisensor Logger (WRMSL) magnetic susceptibility data average 94 × 10–5 SI (see Physical properties) and, when coupled with average χ (5.8 × 10⁻⁷ ± 9.2 × 10⁻⁷ m3/kg as 2 standard deviations [2σ]) and SIRM (1.8 × 10⁻² ± 3.8 × 10⁻² Am2/kg as 2σ) values, suggest moderately high (ferri)magnetic mineral concentration in the sediment deposited at Site U1486 (Figure F19). In the uppermost ~62 mbsf of Hole U1486B, the majority of samples acquire >90% of their SIRM remanence in a 300 mT field, suggesting that ferrimagnetic minerals (e.g., [titano]magnetite [FexTixO4] and/or maghemite [γ-Fe2O3]) control the remanence-carrying properties of the sediment. Between ~62 and 204 mbsf, average IRM300mT/IRM1000mT values decrease slightly and cluster around ~0.9 (range = ~0.87–0.94), potentially suggesting greater influence of higher coercivity minerals (e.g., hematite [Fe2O3] and goethite [FeO(OH)]) at depth. Two samples from Core 363-U1486B-23H possess very high values (>0.99), indicating a return to strongly ferrimagnetic phases at the base of the hole. The upper ~62 mbsf of Hole U1486B is characterized by relatively low ferrimagnetic concentration (low χ and SIRM) that then increases with depth. Magnetic grain size shows a three-step change with relatively coarse ferrimagnetic grain sizes (low χARM/SIRM) in the upper ~20 mbsf, a finer magnetic assemblage (higher χARM/SIRM) between ~20 and 62 mbsf, and a progressive coarsening of grain size downhole accompanying the increases in ferrimagnetic concentration. NRM15mT intensity shows a similar pattern to magnetic susceptibility and SIRM with relatively low and variable values (range = ~10–5–10–3 A/m) in the upper ~82 mbsf and higher, less variable, and steadily increasing values between ~82 and 205 mbsf (~10–4–10–3 A/m), with the highest values (up to 10–1 A/m) at the very base of the hole. Decreases in intensity and magnetic grain size, increases in magnetic concentration, and increases in the proportion of higher coercivity minerals at ~62 mbsf occur coevally with the boundary between lithologic Subunits IA and IB, which marks the transition from sediment dominated by biogenic material (foraminifer-rich nannofossil ooze) to a mix of volcanogenic and biogenic material (ash- and foraminifer-bearing nannofossil ooze with interbedded tephra layers) (see Core description). Coarser magnetic grain sizes and higher magnetic concentration in the middle to lower part of Hole U1486B are likely related to increases in the concentration of mafic volcanogenic material, with the highest magnetic concentrations at the very bottom of the hole (Core 363-U1486B-23H) associated with the occurrence of basalt fragments (see Core description). Assuming a value of ~660 × 10–6 m3/kg for pure single-domain and multidomain magnetite (Maher, 1988), our data suggest a maximum magnetite content of ~0.32%. Interstitial water sulfate concentrations at Site U1486 remain elevated downhole (see Geochemistry), and rock magnetic data show little to no evidence of strong magnetic mineral diagenesis (e.g., Karlin and Levi, 1983; Rowan et al., 2009) at depth. As a result, NRM is most likely acquired through (post)depositional remanent magnetization (pDRM) processes that can potentially be used to understand and reconstruct paleogeomagnetic field behavior.
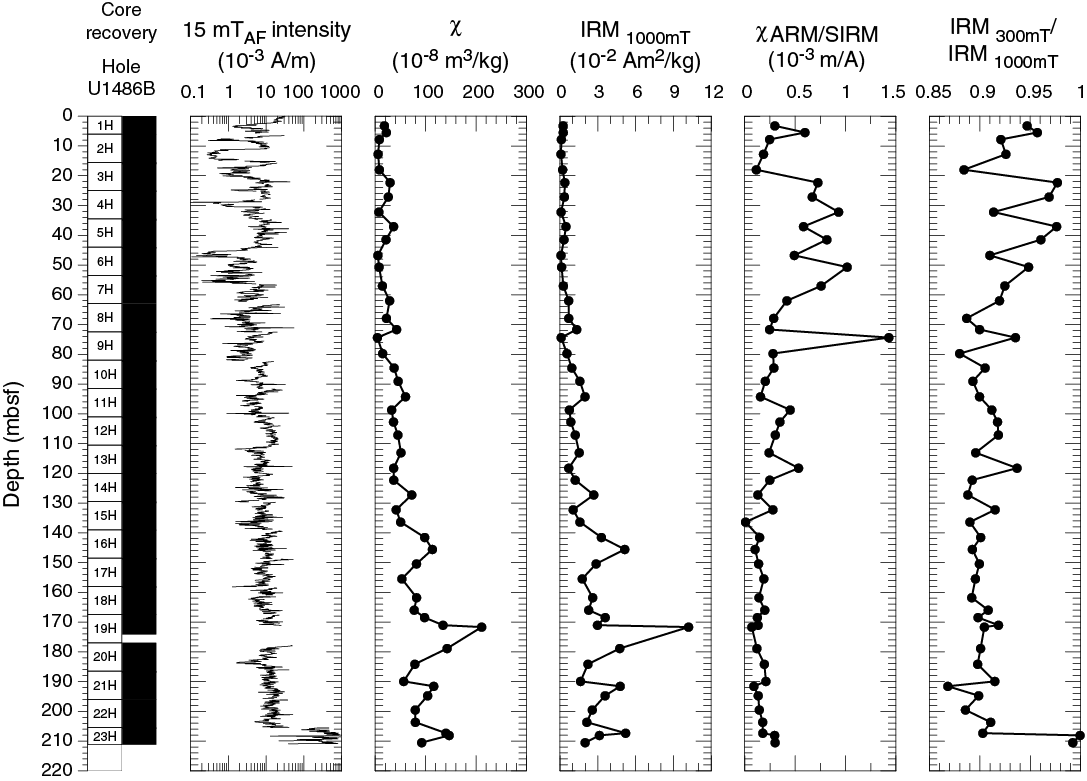
Figure F19. Archive-half NRM intensity.
Paleomagnetic data and core orientation
NRM demagnetization behavior and IRM300mT/IRM1000mT ratios are consistent with (titano)magnetite being the primary remanence-carrying mineral species in sediments deposited at Site U1486 (Figures F19, F20). The drill string overprint is largely removed after AF demagnetization in a 5–15 mT field, and following exposure to higher AF demagnetization steps, inclination and declination stabilize and trend to the origin on Zijderveld diagrams (Zijderveld, 1967), indicating a single component to the magnetization (Figure F20). Origin-anchored maximum angular deviation values of the principal component analysis (PCA) calculated over the 15–40 mT range average 3.9° (range = 0.4°–10.1°) in Hole U1486B (Figures F20, F21), suggesting paleomagnetic directions are stable and well resolved. These values increase slightly downhole from the seafloor, but the generally low maximum angular deviation values (less than ~5°) coupled with qualitative information gleaned from Zijderveld diagrams and stereoplots (Figure F20) indicate that the sediment should yield reliable estimates for magnetostratigraphy (Stoner and St-Onge, 2007).
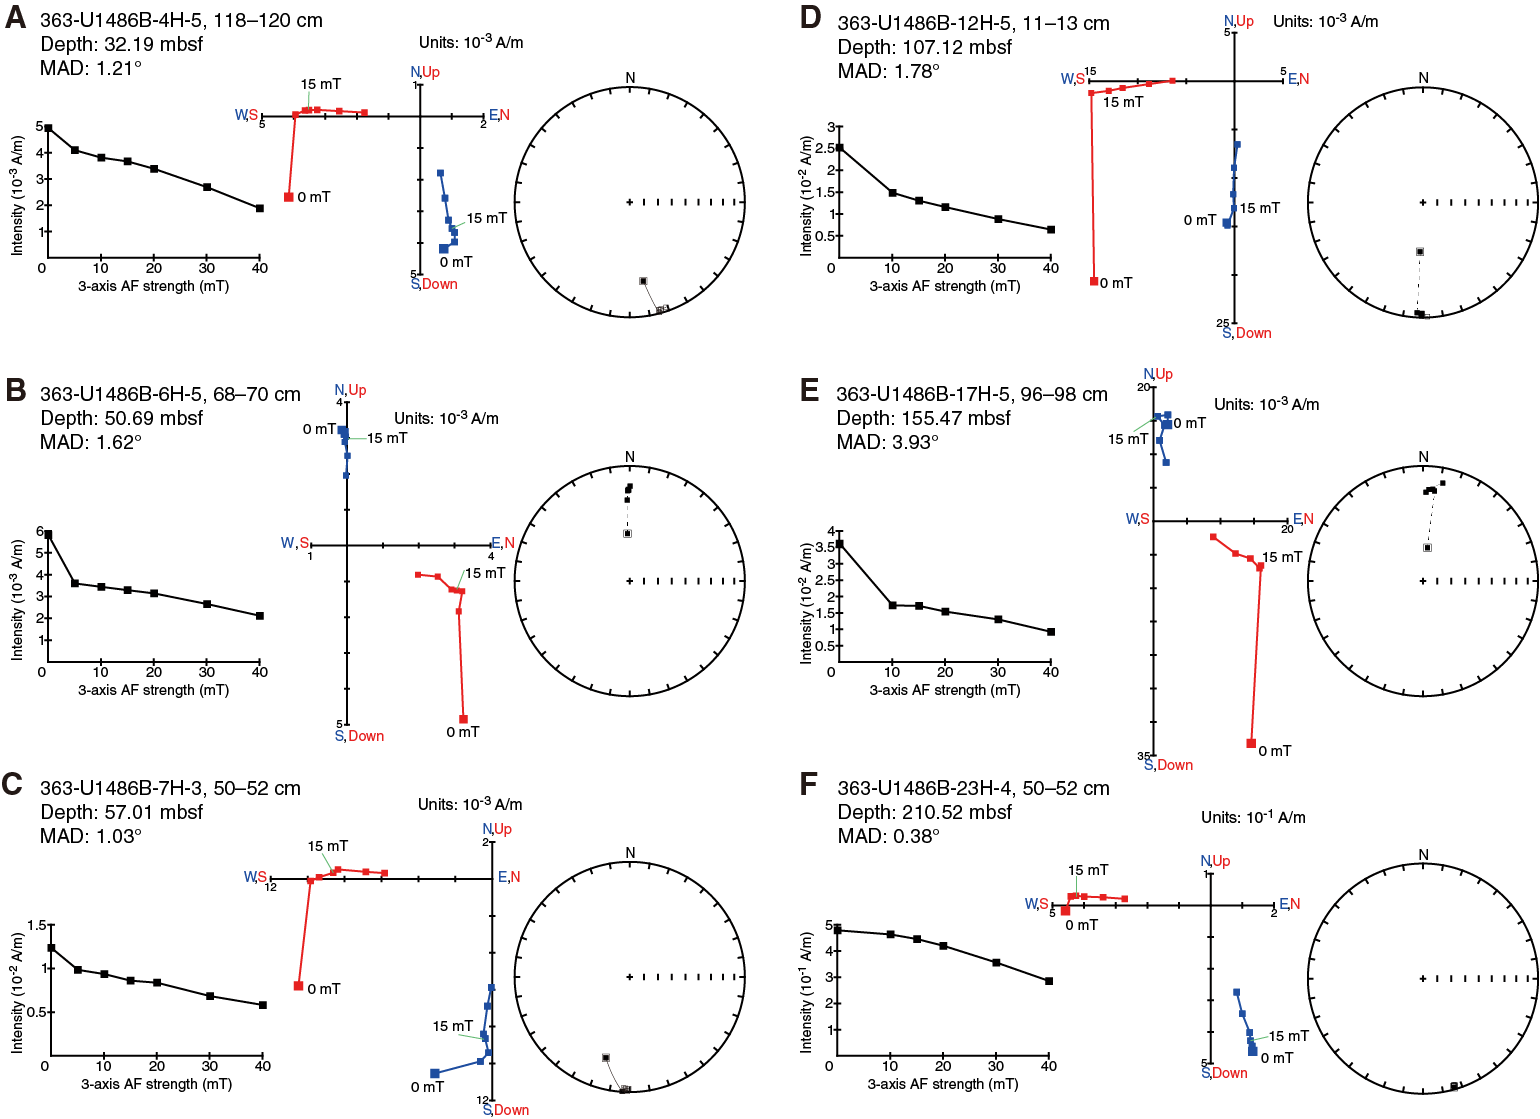
Figure F20. Discrete sample AF demagnetization results.
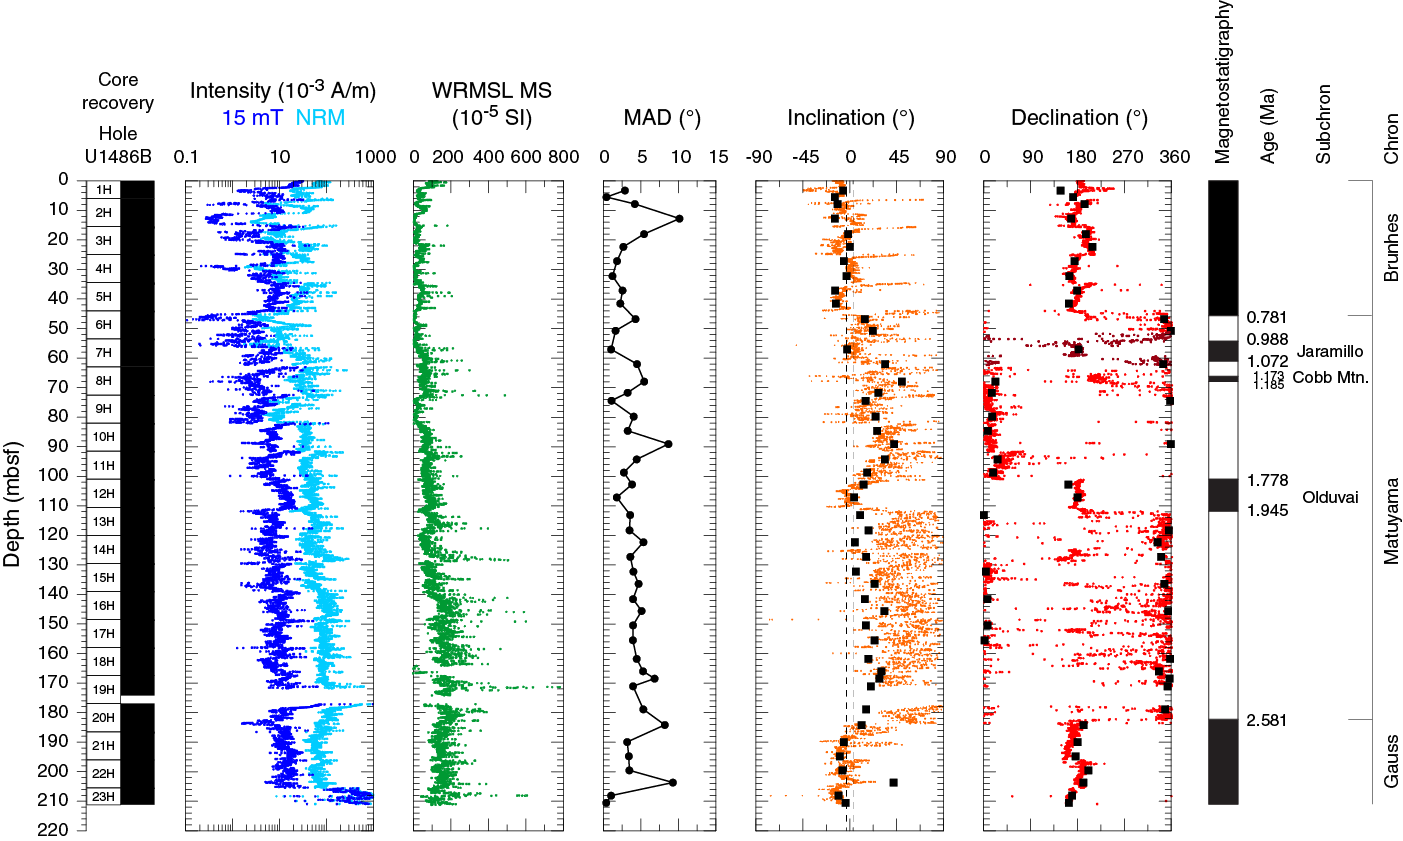
Figure F21. NRM, WRMSL MS, inclination, and declination, Hole U1486B.
For all APC cores from Site U1486, declination was corrected using the Icefield MI-5 tool (see Operations). Azimuthally corrected declination is consistent between adjacent cores, and absolute values cluster around ~0° and ~180° (Figures F21, F22, F23). However, assuming the uppermost sediment in each hole was deposited during normal polarity associated with the Brunhes Chron (see Biostratigraphy) declination values at Site U1486 experience an offset of ~180° in absolute terms because declination should cluster around 0° (180°) during periods of normal (reversed) polarity. This phenomenon was a persistent issue during Expedition 363 and was also experienced during Expedition 362 (McNeill et al., 2017). Core 363-U1486B-7H suffered a shattered and twisted liner during coring operations. When declination for this core was corrected, it plotted ~60° shallower than Cores 6H and 8H. Because this core contains the upper Jaramillo normal boundary in the lower part of Section 363-U1486B-7H-1 (Table T7), we used the uppermost stable polarity interval to manually align declination from the top of Section 363-U1486B-7H-1 to the bottom of Core 6H, resulting in the additional 60° declination correction. The lower Jaramillo normal boundary occurs in Section 363-U1486B-7H-5, and the stable polarity in Section 7H-6 aligns well with the top of Core 8H using the 60° correction derived for the top of the core. Azimuthally oriented declination data for Core 363-U1486B-7H are plotted in dark red in Figure F21 to indicate the data points with this additional rotation. Replication of these two reversal boundaries in the declination data at similar depths (Table T7) in Holes U1486C (Figure F22) and U1486D (Figure F23) suggests that this additional correction is appropriate.

Figure F22. NRM, WRMSL MS, inclination, and declination, Hole U1486C.
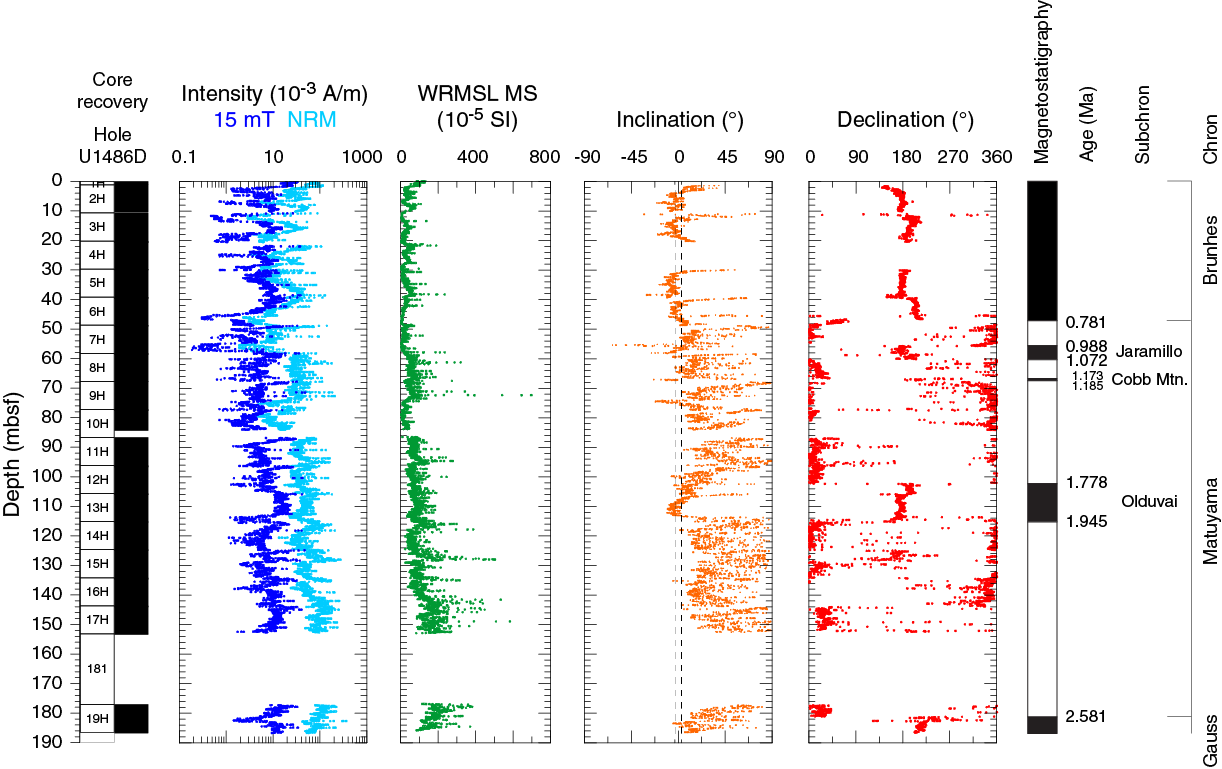
Figure F23. NRM, WRMSL MS, inclination, and declination, Hole U1486D.
Table T7. Depths of identified reversal boundaries. Download table in CSV format.
NRM intensity before and after 15 mT AF demagnetization, WRMSL magnetic susceptibility, and inclination and azimuthally corrected declination after 15 mT AF demagnetization are shown for Holes U1486B, U1486C, and U1486D in Figures F21, F22, and F23, respectively. Displayed inclination and declination values were cleaned of visibly disturbed intervals and voids (see Paleomagnetism in the Expedition 363 methods chapter [Rosenthal et al., 2018a]), but the extensive volcanogenic deposits that occur in lithologic Subunits IB and IC deeper than ~60 mbsf (see Core description) are too numerous, and often too diffuse, to fully clean from the records. Volcanogenic sediments can potentially affect NRM intensity and directions (Le Friant et al., 2013), and the greater scatter in SRM directions below ~60 mbsf may be related to these horizons. Inclination and declination measured on discrete samples are generally in excellent agreement with those measured on the archive-half sections (Figure F21), although between ~110 and 180 mbsf discrete inclination is often shallower than its SRM-measured counterpart. In the upper 60 mbsf and below 180 mbsf, discrete and SRM-measured inclination plots around the expected values of approximately ±3° for the site latitude assuming a geocentric axial dipole (GAD) field. Between 60 and 180 mbsf, inclination is positive and steeper than that predicted from a GAD field. Steep inclinations in a positive direction are most frequently interpreted as a pervasive overprint that is not removed after relatively low AF demagnetization (Richter et al., 2007). Interestingly, the steepest inclinations in Hole U1486B are associated with periods when declination clusters around ~0°/360°. This association suggests that sediment deposited during periods of reversed polarity may be more susceptible to pervasive overprinting than sediment deposited in periods of normal polarity. A similar polarity-specific signature was observed during Integrated Ocean Drilling Program Expedition 320/321 where inclination measured during normal polarity intervals yielded steeper than GAD-like values, whereas reversed polarity intervals were relatively unaffected (Pälike et al., 2010). In cores recovered using the XCB system at Integrated Ocean Drilling Program Sites U1331 and U1332, the systematic offset in inclination between different polarities was used to help guide polarity determinations (Pälike et al., 2010).
In contrast to inclination, declination appears relatively insensitive to a strong drill string–induced overprint because declination values after 5–10 mT AF demagnetization remain stable through higher AF demagnetization steps (Figure F20). Because of the equatorial location of Site U1486, declination was more instructive than inclination for determination of magnetic polarity. Given the lack of a strong overprint in declination, we were hesitant to expose the sediments to AF demagnetization higher than 15 mT to remove the pervasive overprint in inclination for no substantial gain in magnetostratigraphic information. Any future estimates of paleosecular variation (PSV), relative paleointensity (RPI), or VGPs for the site should first use higher AF demagnetization to fully clean the record of any remaining drill-string overprint.
Magnetostratigraphy
Sediment in all holes appears to have been deposited (quasi)continuously with no major hiatuses or erosional surfaces (see Core description and Biostratigraphy). Across Holes U1486B–U1486D, we observed eight coeval and distinct ~180° changes in declination downhole. These declination shifts occur at the same depth that inclination changes from GAD-like values during normal polarity to steeper, positive, and more overprinted values during reversed polarity. Interpretation of these horizons as pDRM-recorded reversals of the geomagnetic field allows correlation to the geomagnetic polarity timescale (GPTS; Cande and Kent, 1995) of the geologic timescale (Hilgen et al., 2012) and assignment of age. The Matuyama/Brunhes boundary (0.781 Ma) is identified at 46.08–48.25 mbsf (note that these ranges encompass the minimum and maximum mbsf depths across all three holes where the reversal is identified within a single core, not between adjacent cores; see Table T7 for the depths of each boundary in each hole). Below this boundary, we observed the upper (53.9–55.78 mbsf; 0.988 Ma) and lower (59.2–60.23 mbsf; 1.072 Ma) boundaries of the Jaramillo normal (C1r.1n), the upper (65.33–67 mbsf; 1.173 Ma) and lower (68.13–69.05 mbsf; 1.185 Ma) boundaries of the Cobb Mountain Subchron (C1r.2n), and the upper (101.08–102.55 mbsf; 1.778 Ma) and lower (111.78–114.55 mbsf; 1.945 Ma) boundaries of the Olduvai normal (C2n). At 182.35–182.7 mbsf in Hole U1486B and at 181.05–182.5 mbsf in Hole U1486D, we observed the Gauss/Matuyama boundary (2.581 Ma). Continued normal polarity below this depth in all three holes implies that the recovered sediment is younger than 3.032 Ma, as the upper boundary of the Kaena reversed subchron (C2An.1n) was not observed. The depths of these paleomagnetic reversal boundaries indicate a sedimentation rate of 10.9 cm/ky from the late Pliocene until 1.945 Ma (Table T7) and then an approximate halving of sedimentation rate to 5.8 cm/ky, after which the rate remained stable for the rest of the mid- to late Pleistocene. These reversal horizons and estimated sedimentation rates are in excellent agreement with both the calcareous nannofossil and planktonic foraminifer datums (Figure F18) (see Biostratigraphy).
Physical properties
Physical properties were measured on whole-round cores, split cores, and discrete samples from all four holes drilled at Site U1486 to provide basic information for characterizing the core sections. Because Core 363-U1486A-1H missed the mudline, Hole U1486A was terminated after only one core, and Hole U1486B became the first deep hole (see Operations). Therefore, all discrete measurements were performed on Hole U1486B. GRA bulk density and magnetic susceptibility were measured on all core sections from Holes U1486C and U1486D with the Special Task Multisensor Logger (STMSL) immediately after the cores were brought onboard. All core sections were measured with the GRA bulk densitometer, the magnetic susceptibility loop, and the P-wave logger (PWL) on the WRMSL. NGR was measured on all whole-round sections (Holes U1486A and U1486B at 10 cm resolution and subsequent holes at 20 cm resolution) as soon as possible after STMSL measurements (see Physical properties in the Expedition 363 methods chapter [Rosenthal et al., 2018a]). Furthermore, to aid stratigraphic correlation, Cores 363-U1486D-10H and 11H were also measured at 10 cm resolution. Although protocol generally requires NGR background to be measured between sites that are >1° latitude apart, no background could be measured between Sites U1485 and U1486 because transit time to Site U1486 was limited (<10 h) and cores from Site U1485 were still being run on the NGRL during transit. Point-sensor magnetic susceptibility and color spectrophotometry (color reflectance) were measured on split-core sections using the Section Half Multisensor Logger (SHMSL). Discrete thermal conductivity, P-wave velocity, and moisture and density (MAD) measurements were made in Hole U1486B. Discrete P-wave measurements (z- and x-axis) were made using the P-wave caliper (PWC) system on the Section Half Measurement Gantry (SHMG). Preconditioning treatments were applied to the records to aid in interpretation of noisy or spiky data (for details, see Physical properties in the Expedition 363 methods chapter [Rosenthal et al., 2018a]). Because GRA bulk density showed large variations corresponding to the amount of volcanic material in the sediment, the median-filter method was not applied because it removed too many of the high GRA bulk density values. Additionally, P-wave values were culled above 2050 m/s instead of 1750 m/s to retain high velocity measurements from volcanogenic sediment and hydrothermal precipitates. All data shown in figures are from the preconditioned data sets. Tables presented in this section contain raw and treated data for NGR and WRMSL GRA bulk density, magnetic susceptibility, and P-wave velocity. Raw data for all data sets are available from the LIMS database.
GRA bulk density
GRA bulk density reproducibility between holes at Site U1486 is excellent, with all holes showing a general trend of increasing values with depth, most likely due to compaction. Additionally, GRA bulk density shows increasing variance with depth, most likely reflecting variations in lithology (Figure F24; Tables T8, T9, T10, T11). For description purposes, data from Holes U1486B and U1486C are considered representative for the site because these are the most continuous and deepest holes cored. In all holes, GRA bulk density increases rapidly from ~1.42 g/cm3 at the seafloor to 1.54 g/cm3 at ~8 mbsf, reflecting sediment consolidation below the sediment/water interface. Between ~8 and ~140 mbsf, GRA bulk density increases from 1.5 to 1.63 g/cm3, corresponding to lithologic Subunits IA and IB (see Core description). Between ~140 and ~202 mbsf, variance increases by ~30% with values fluctuating around 1.72 g/cm3. This high-variability interval corresponds to Subunit IC, which is marked by a color change from dark to very dark layers and a change in dominant lithology to volcanogenic particles (see Core description). One of the largest peaks in GRA bulk density at ~128 mbsf corresponds to a distinct tephra layer (Figure F25B). This peak is also evident in the magnetic susceptibility and P-wave records but not in the NGR. From ~202 mbsf to the bottom of the hole, GRA bulk density decreases from 1.8 to 1.7 g/cm3, coincident with an increase in P-wave velocity. This change in GRA density and P-wave velocity corresponds to an interval of sediments containing authigenic zeolites and basalt fragments (see Core description).
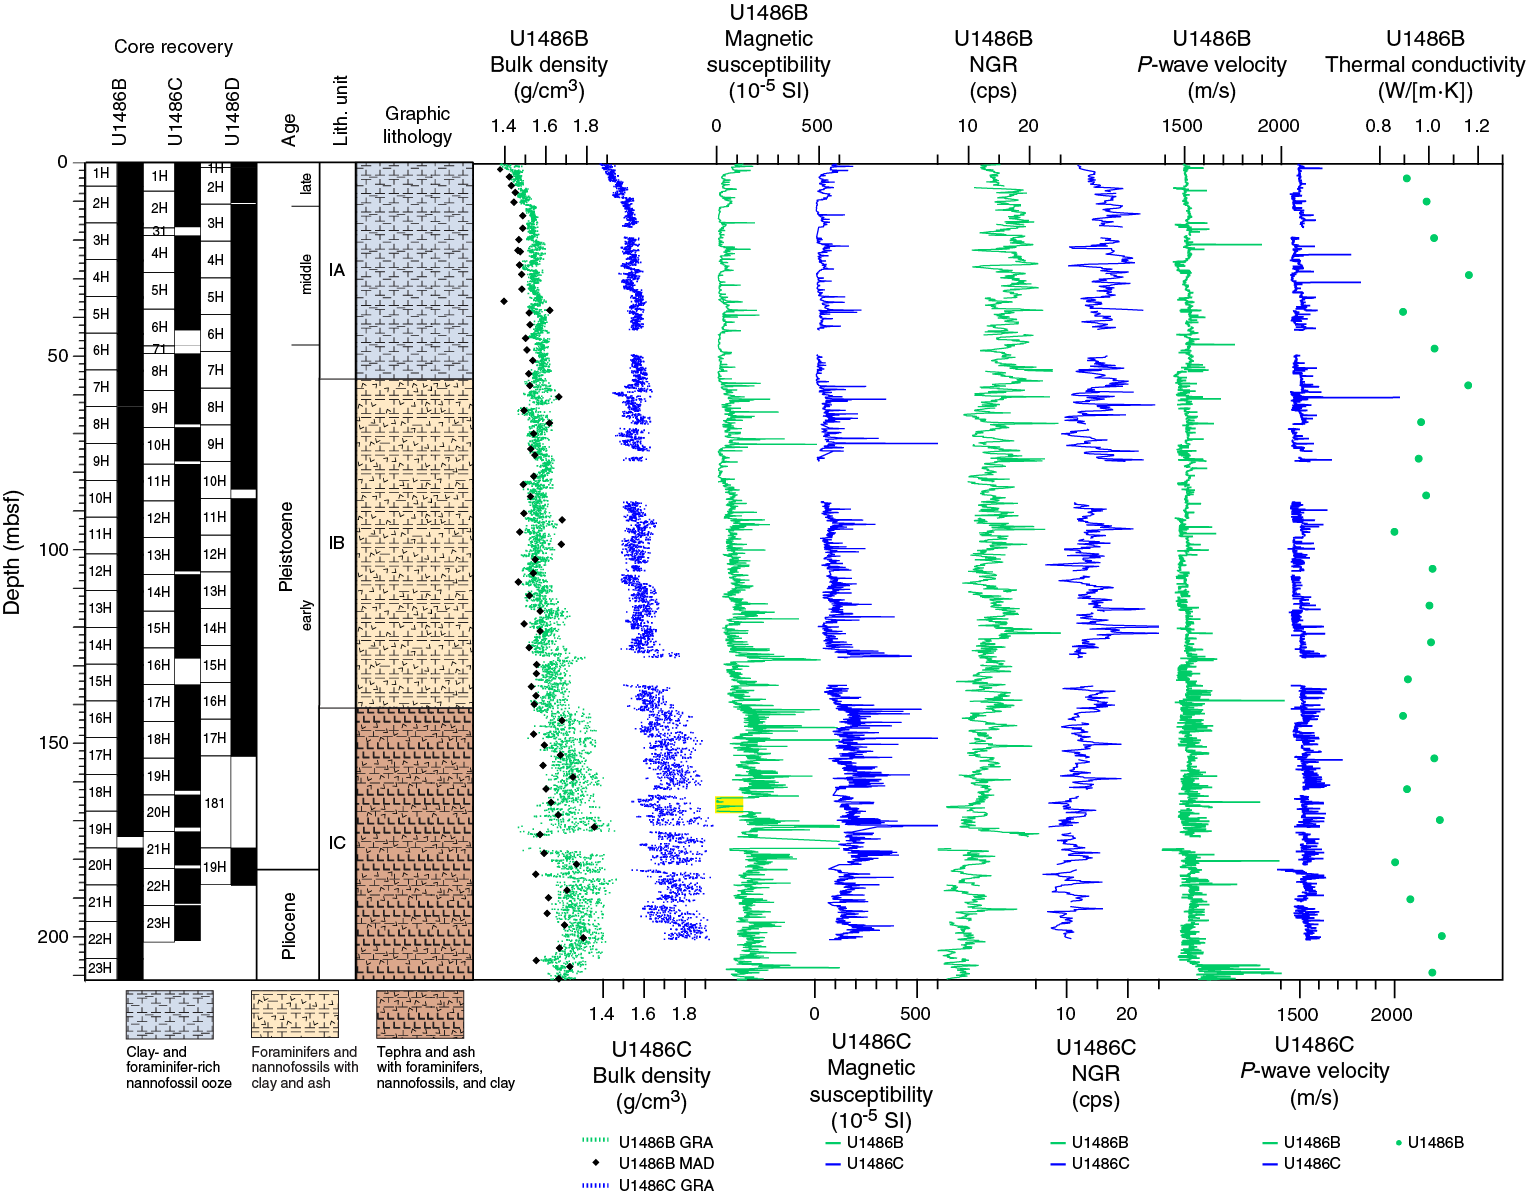
Figure F24. Physical property measurements.
Table T8. WRMSL GRA bulk density data, Hole U1486A. Download table in CSV format.
Table T9. WRMSL GRA bulk density data, Hole U1486B. Download table in CSV format.
Table T10. WRMSL GRA bulk density data, Hole U1486C. Download table in CSV format.
Table T11. WRMSL GRA bulk density data, Hole U1486D. Download table in CSV format.
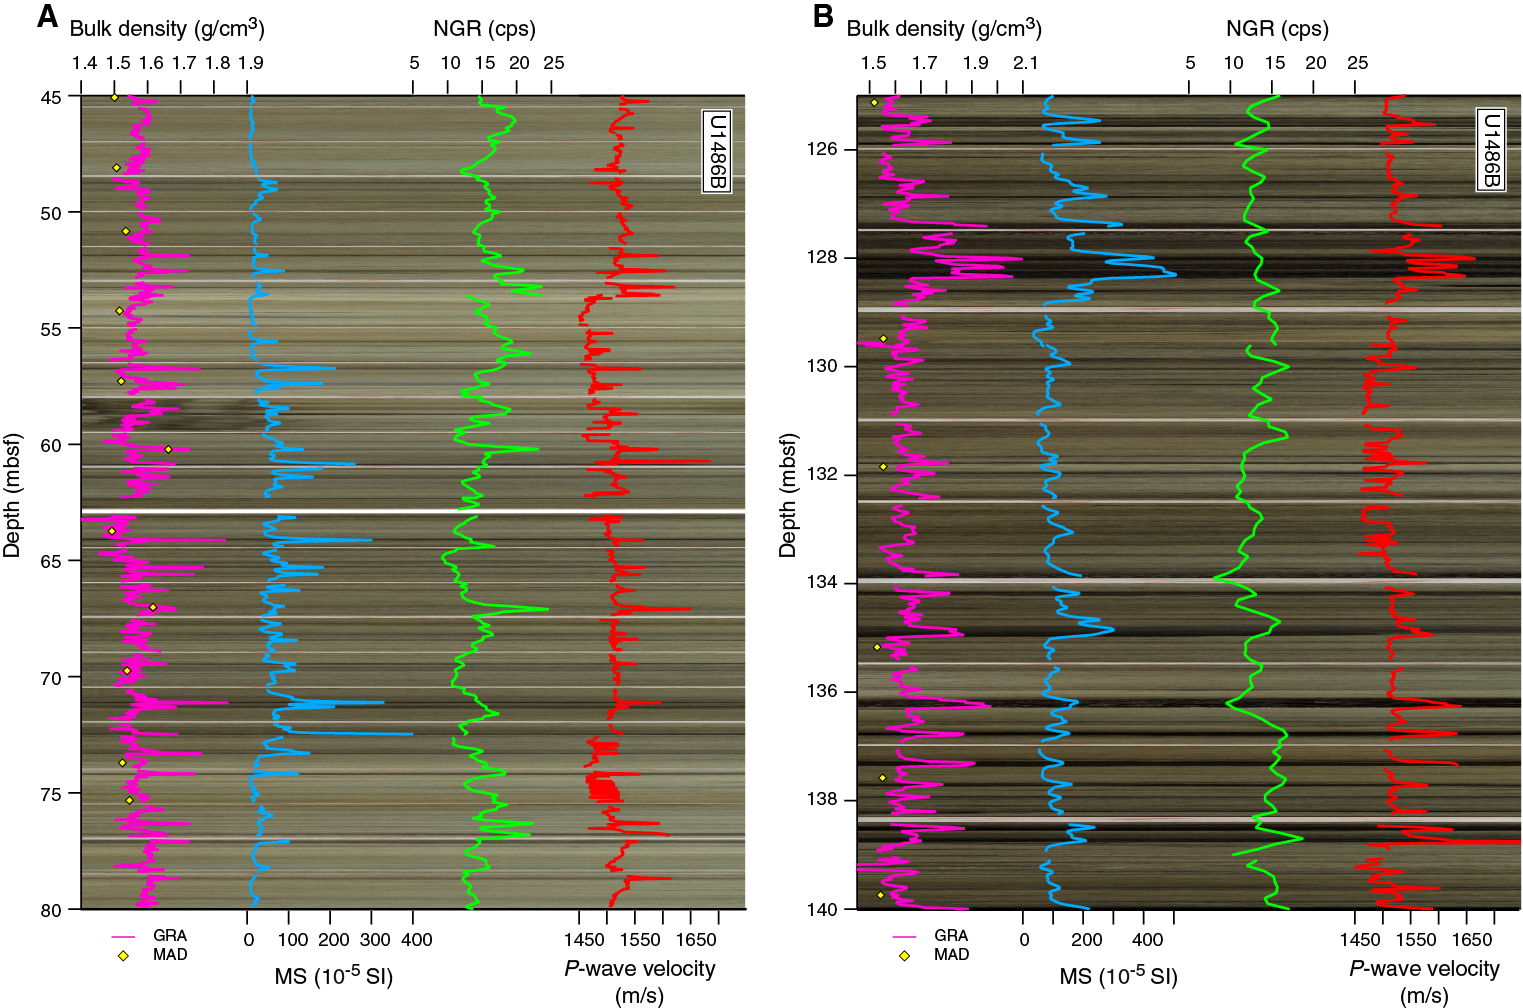
Figure F25. MAD and WRMSL density, WRMSL MS, NGR, and P-wave velocity overlaid on core photos.
Magnetic susceptibility
Site U1486 exhibits three distinct patterns of magnetic susceptibility variability. In the uppermost 57 mbsf, background values fluctuate between 20 × 10–5 and 50 × 10–5 SI, with peaks from 100 × 10–5 to 200 × 10–5 SI corresponding to dark layers in Subunit IA (Figures F24, F25A; Tables T12, T13, T14, T15). Between ~57 and ~140 mbsf, background values increase to 75 × 10–5 to 100 × 10–5 SI with frequent peaks of 200 × 10–5 to 400 × 10–5 SI (Figure F25B). This interval corresponds to lithologic Subunit IB, which marks an overall increase in abundance of volcanogenic material compared to Subunit IA, making the sediment darker in color. From ~140 mbsf to the bottom of the hole (lithologic Subunit IC), the sediments are dominated by volcanogenic material, with a significant downhole decrease in the biogenic component, and are therefore predominantly dark in color. In this interval, magnetic susceptibility is characterized by background levels of ~200 × 10–5 SI with high-frequency variability in the 300 × 10–5 to 400 × 10–5 SI range. Some peaks reach 600 × 10–5 SI in the darkest sediment layers, which contain high amounts of volcanogenic material. These variations in intensity may reflect the different sedimentary processes that are involved in the formation of volcanogenic-rich layers, including direct deposition of volcanogenic material from various sources (tephra layers), redeposition (e.g., mass gravity flows), and/or mixing with biogenic sediments (e.g., through bioturbation) (see Core description).
Table T12. WRMSL MS data, Hole U1486A. Download table in CSV format.
Table T13. WRMSL MS data, Hole U1486B. Download table in CSV format.
Table T14. WRMSL MS data, Hole U1486C. Download table in CSV format.
Table T15. WRMSL MS data, Hole U1486D. Download table in CSV format.
Sections 363-U1486B-18H-5, 18H-6, and 18H-7 are artificially offset to low values (see yellow shading in Figure F24) due to obstruction of the WRMSL magnetic susceptibility loop immediately prior to measurement, which meant the loop was zeroed incorrectly (see Physical properties in the Expedition 363 methods chapter [Rosenthal et al., 2018a]). Because of the excellent reproducibility among holes and the general consistency of STMSL and SHMSL magnetic susceptibility measurements, these artificially offset values can be corrected during postcruise research.
Natural gamma radiation
NGR increases downhole in the uppermost 8 mbsf of all holes from ~11 to ~17 count/s. Below ~8 mbsf, NGR exhibits a long-term decreasing trend with depth, consistent throughout all holes, which is unlike patterns observed at previous sites (Figure F24; Tables T16, T17, T18, T19). Maximum values of ~20 counts/s are recorded at 25 mbsf and progressively decrease to 8 counts/s at the base of the deepest hole. We also observed ~5–10 m cycles superimposed on the decreasing trend and on longer ~30 m cycles. The NGR relationship to the dark layers is more ambiguous than for magnetic susceptibility. Some dark layers that have high ash content correspond to distinct NGR peaks, whereas other tephra layers with distinct magnetic susceptibility peaks show no corresponding NGR change (e.g., ~128 mbsf in Figure F25B). This difference could be due to the lower resolution of the NGR data compared to the magnetic susceptibility data or may indicate mixing of ash particles with the surrounding sediment through bioturbation. The 5–10 m cycles in NGR may correspond to variations in the overall clay content of the sediment (see Core description).
Table T16. NGRL data, Hole U1486A. Download table in CSV format.
Table T17. NGRL data, Hole U1486B. Download table in CSV format.
Table T18. NGRL data, Hole U1486C. Download table in CSV format.
Table T19. NGRL data, Hole U1486D. Download table in CSV format.
P-wave velocity
Measurements of PWL and PWC P-wave velocity were obtained to the base of the cored section at Site U1486, unlike at the previous sites where the P-wave measurements were stopped at shallower depths due to unreliable values. Overall, P-wave velocities at Site U1486 show a slight, long-term increasing trend with depth (slope = 0.17) in all holes (Figures F24, F26; Tables T20, T21, T22, T23). P-wave velocity in Holes U1486B and U1486C display short-term (~30 m) cycles punctuating a long-term increase from ~1500 to ~1650 m/s. The most prominent P-wave peaks (up to 1950 m/s) generally correspond to dark layers (Figure F25). Deeper than ~140 mbsf, P-wave velocity variability increases, coincident with an increase in the number of dark layers in Subunit IC (Figure F24). P-wave velocity on the PWC x-axis is generally ~10–30 m/s lower than PWL P-wave velocity (Figure F26). The slope of the linear trend of P-wave velocity versus depth for the PWC x-axis is 0.24 including the unusually high measurements at the bottom of the hole, whereas the slope is only 0.076 when values from deeper than ~207 mbsf are excluded. The PWC z-axis P-wave velocity gives lower values than the x-axis. The slope of the downhole z-axis linear trend is 0.187. Three outliers have very low values: 1347 m/s at 36.96 mbsf (interval 363-U1486B-5H-2, 96 cm), 1330 m/s at 42.90 mbsf (interval 6H-6, 90 cm), and 1258 m/s at 65.80 mbsf (interval 8H-2, 130 cm) (these data are not shown in Figure F26). The linear trend slope is 0.04 when excluding these three outliers.
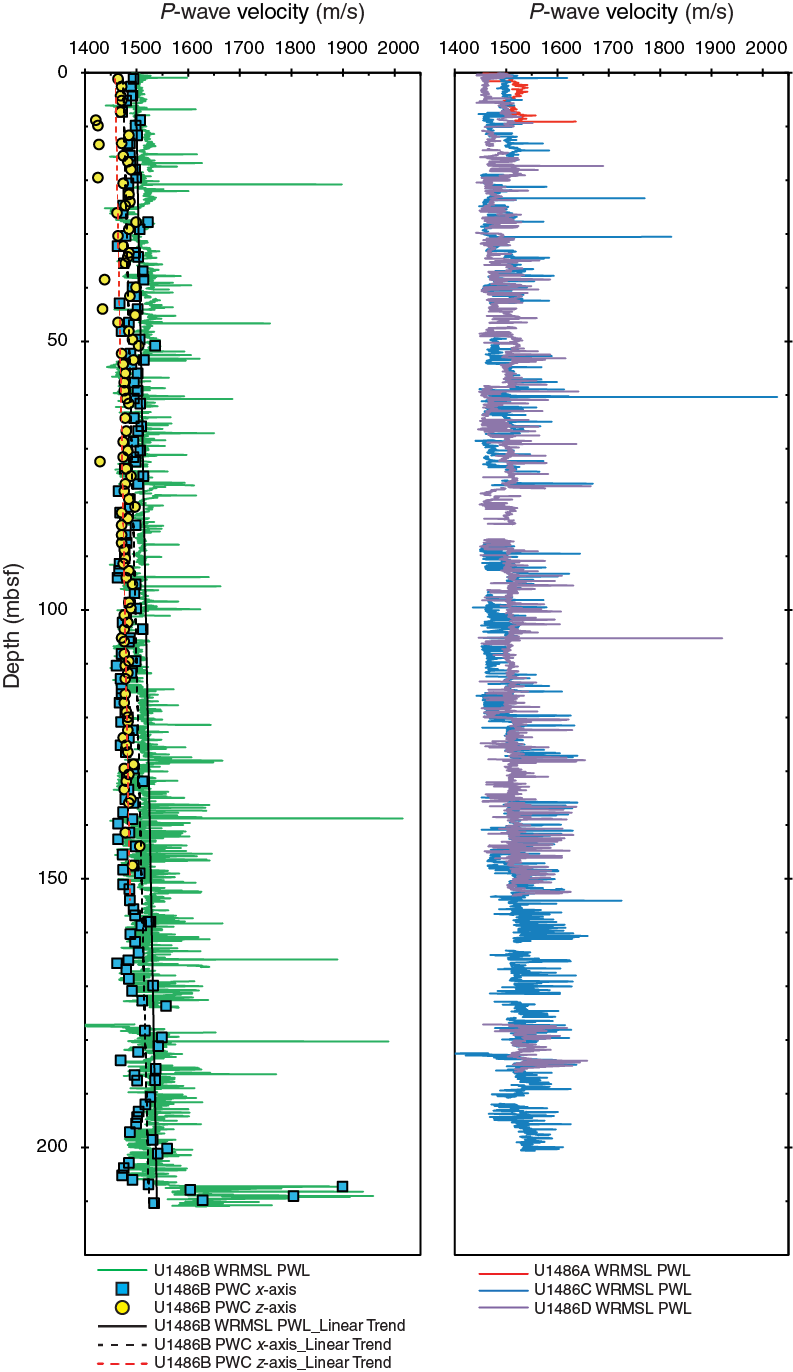
Figure F26. Discrete and whole-round P-wave velocity.
Table T20. WRMSL PWL data, Hole U1486A. Download table in CSV format.
Table T21. WRMSL PWL data, Hole U1486B. Download table in CSV format.
Table T22. WRMSL PWL data, Hole U1486C. Download table in CSV format.
Table T23. WRMSL PWL data, Hole U1486D. Download table in CSV format.
A prominent feature in Hole U1486B is that P-wave velocities are markedly higher at the base of the hole (Figures F24, F26, F27). WRMSL P-wave velocities increase from ~1570 m/s at 207 mbsf to 1950 m/s at the bottom of the hole. Out of the five PWC x-axis measurements deeper than 207 mbsf, four are >1600 m/s, with two extremely high values of 1804 m/s (interval 363-U1486B-23H-3, 55 cm [209.05 mbsf]) and 1899 m/s (interval 23H-2, 27 cm [207.27 mbsf]) (Figures F26, F27). The increase below 207 mbsf coincides with the appearance of more indurated sediments that are altered by hydrothermal fluids and partially cemented by authigenic precipitates, including zeolites (see Core description). The discrete x-axis P-wave velocity from these basal sections ranges between ~1650 and 1950 m/s, which is higher than observed at previous sites. This large range could reflect the patchiness of the cementation in the lowermost 4 m of the site, which would produce alternations between more and less indurated intervals.
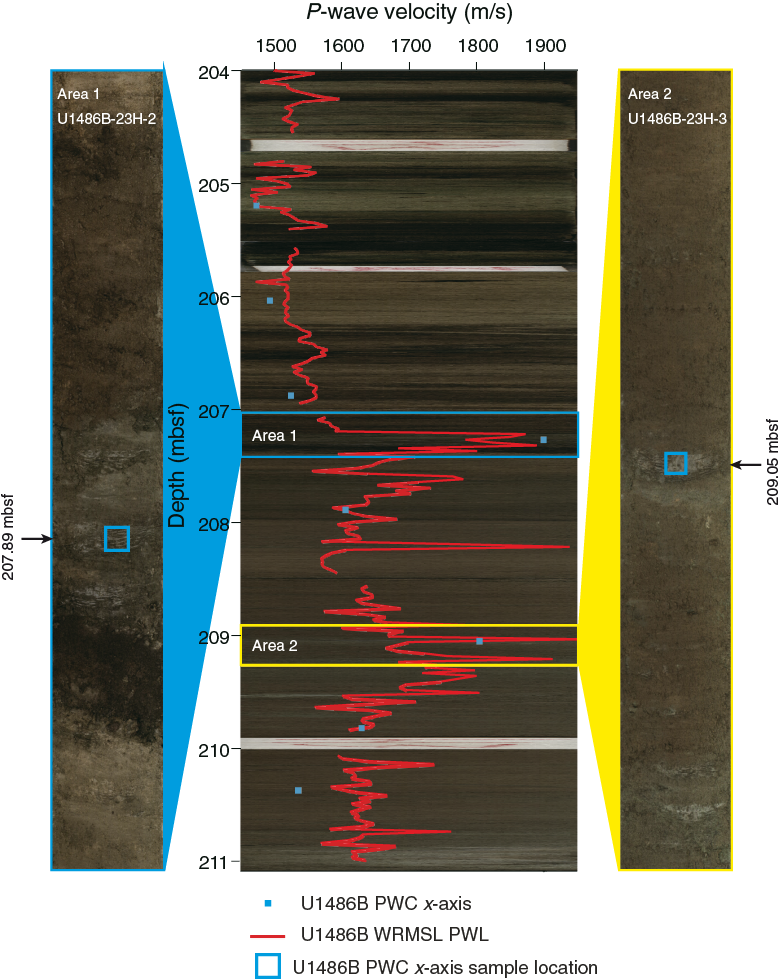
Figure F27. Discrete and whole-round P-wave velocity overlaid on core photos.
Moisture and density
Bulk density calculated using the MAD method corresponds well with trends in bulk density estimated from GRA but is offset to lower values through much of the record (Figure F28), probably due to water loss. As with magnetic susceptibility and GRA bulk density, MAD density variability increases downhole. Apparent outliers (black arrows in Figure F28) mostly occur where volcanogenic sediment layers were sampled and reflect the varying composition of these deposits throughout the hole. The majority of MAD samples reflect the density of the background clay and biogenic ooze. Porosity decreases from ~80% at the top of the hole to ~55%–60% at the bottom because of compaction, but porosity is generally ~10% higher compared with Sites U1484 and U1485, where porosity values are only ~50%–60%. Porosity at the bottom of the hole is difficult to constrain because of the scatter of data. Volcanogenic sediment layers are generally characterized by low porosity and low density, but the variability of the physical properties at the site highlights the complexity and the differences in the composition of the volcanogenic components.
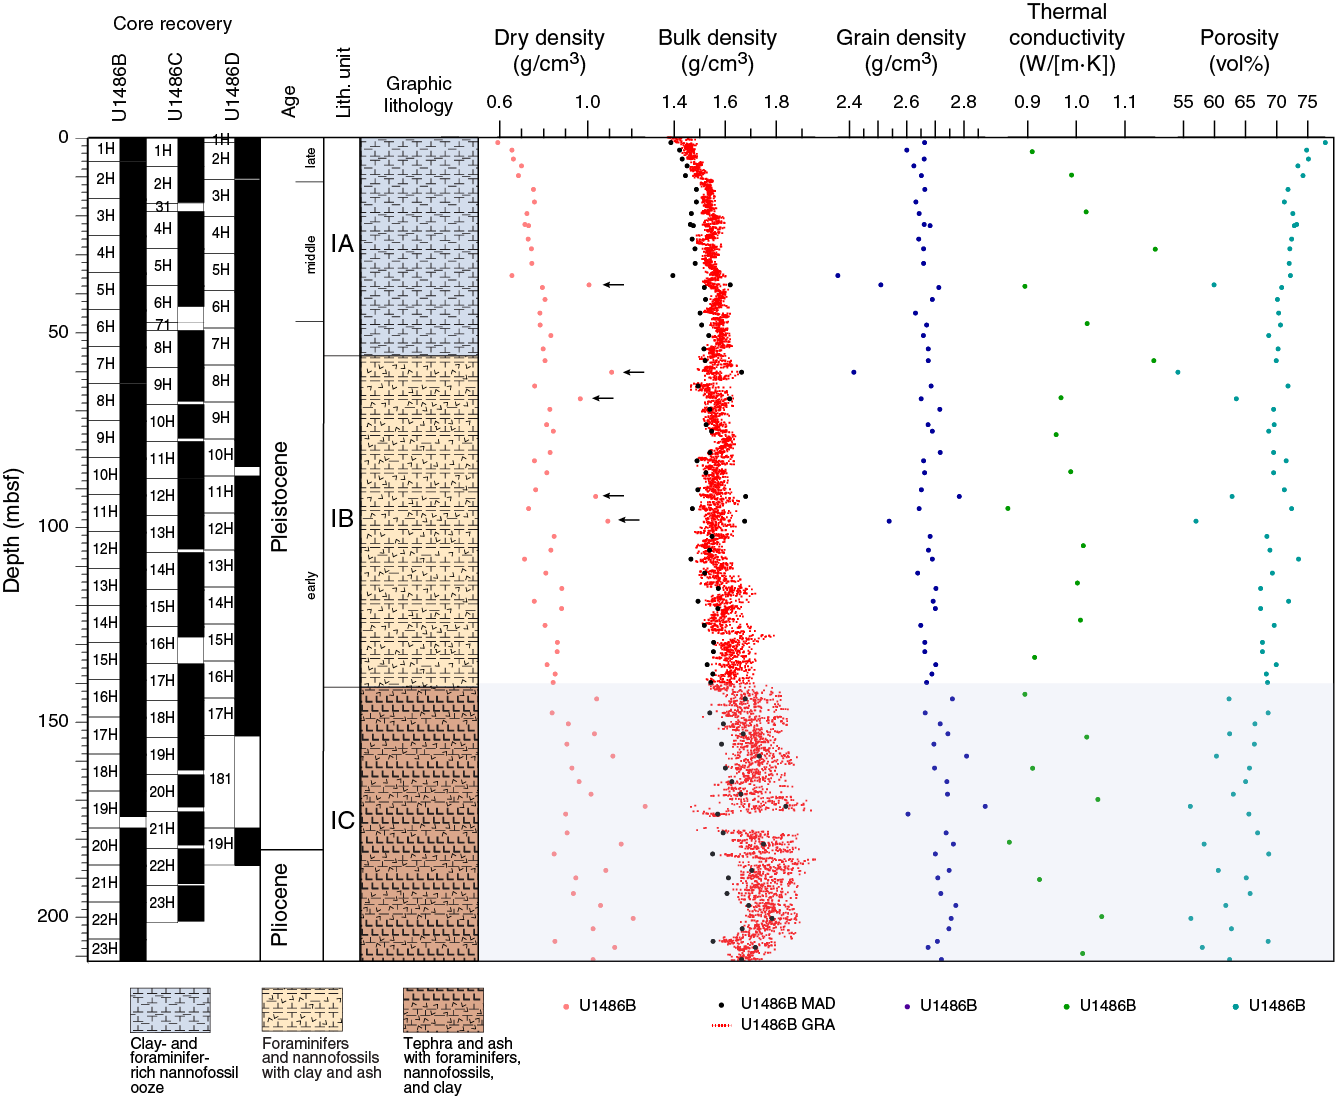
Figure F28. MAD dry, bulk, and grain densities and porosity, WRMSL GRA bulk density, and thermal conductivity.
Thermal conductivity
A thermal conductivity profile was obtained at ~10 m resolution in Hole U1486B using a thermal conductivity needle (Figures F24, F28). Thermal conductivity measurements demonstrate virtually no long-term trend. Instead, values vary between 0.85 and 1.12 W/(m·K) from the seafloor to 66 mbsf and between 0.85 and 1.00 W/(m·K) deeper than 66 mbsf. The large variability in the thermal conductivity measurements and absence of expected downhole increasing trend probably reflect the highly variable lithology and small-scale changes between biogenic- and volcanogenic-rich layers (see Core description). Deeper than ~140 mbsf, both thermal conductivity and porosity display increased variability, corresponding with Subunit IC, which includes the darkest layers with highly variable amounts of volcanogenic material.
Downhole temperature measurements
Downhole temperature measurements were made on Cores 363-U1486B-4H (34.5 mbsf), 7H (63.0 mbsf), 10H (91.5 mbsf), and 13H (120.0 mbsf) using the APCT-3. An exponential decrease in temperature was observed between 60 and 600 s after penetration and was used to estimate ambient temperature (unshaded area in Figure F29). Temperature increases with depth from 6.51°C at 34.5 mbsf to 13.63°C at 120 mbsf. The correlation of the four downhole temperatures with depth is very high (R2 = 0.99995). Using the slope of the temperature-depth relationship, we estimate that the bottom water temperature at Site U1486 is 3.60°C, yielding a geothermal gradient of 83°C/km (Figure F30).
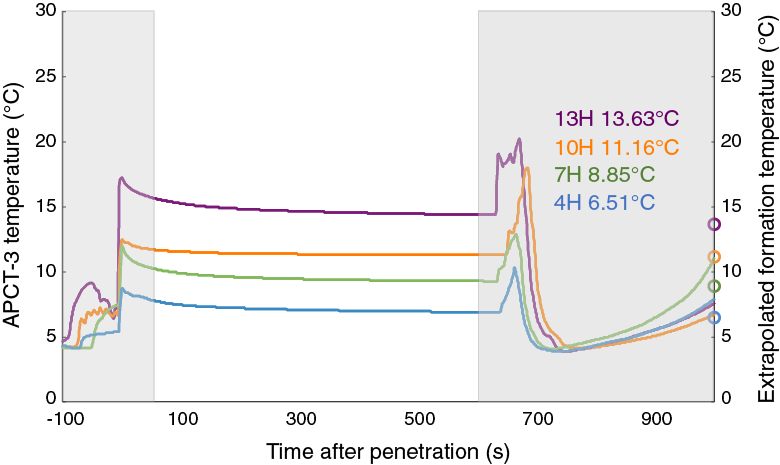
Figure F29. APCT-3 temperature-time series.
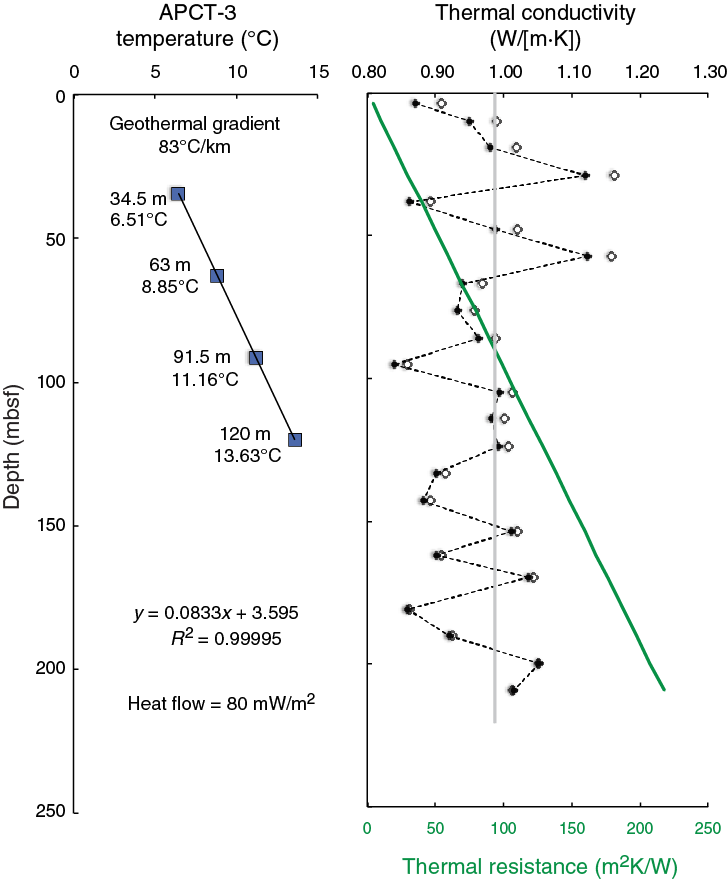
Figure F30. Heat flow calculations.
We generated a thermal conductivity profile (with ~10 m resolution) (Figure F30) using laboratory-determined thermal conductivity data (see Physical properties in the Expedition 363 methods chapter [Rosenthal et al., 2018a]). Based on the in situ condition correction, thermal resistance was calculated using the “linear approach” outlined in Pribnow et al. (2000) based on the average thermal conductivity of 0.96 W/(m·K). The thermal conductivity is offset relative to uncorrected values by ~0.04 W/(m·K) at the top of the hole; this offset decreases with depth to converge at 180 mbsf. Based on the classic method of Stein and Stein (1992), the slope of the linear fit between temperature and thermal resistance indicates a heat flow of 80 mW/m2 at Site U1486 (see Physical properties in the Expedition 363 methods chapter [Rosenthal et al., 2018a]). However, the classic approach for calculating the ocean crust age using heat flow is inappropriate at Site U1486 because of the high hydrothermal activity, which leads to underestimation of heat flow by ~50% (see figure 4 in Stein and Stein, 1992).
Stratigraphic correlation
Correlations between holes at Site U1486 were accomplished using Correlator software (version 2.1). Tie points were established almost exclusively with WRMSL magnetic susceptibility data (Table T24; Figure F31). In addition, we used NGR data to aid in making correlations. We constructed a splice for the entire site using Holes U1486B, U1486C, and U1486D (Table T25; Figures F31, F32, F33). The splice is continuous and well constrained from 0 to 222.59 m core composite depth below seafloor (CCSF). Below this depth, the offset of the last core of Hole U1486B is set using a growth factor and added to the end of the splice.
Table T24. Affine table. Download table in CSV format.

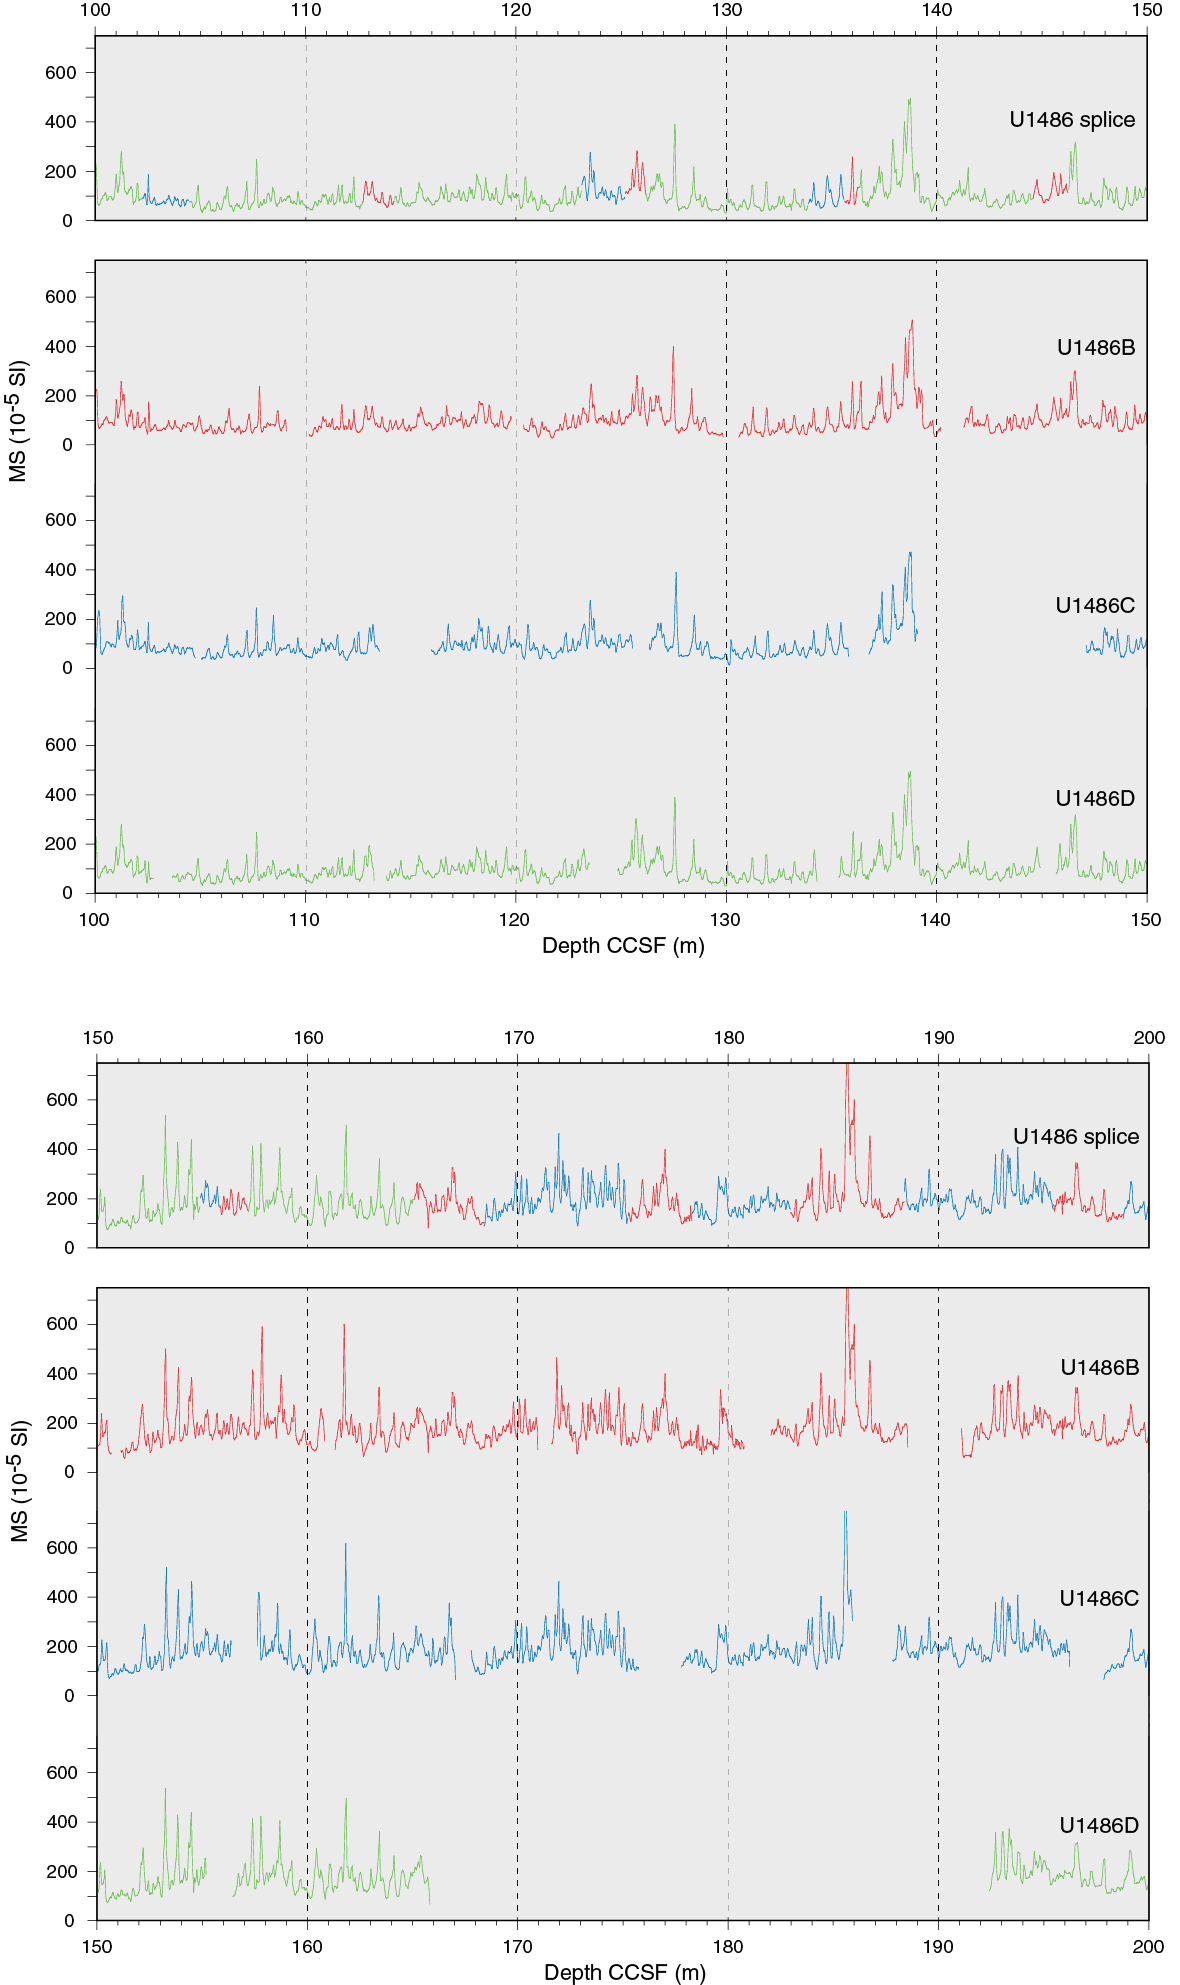
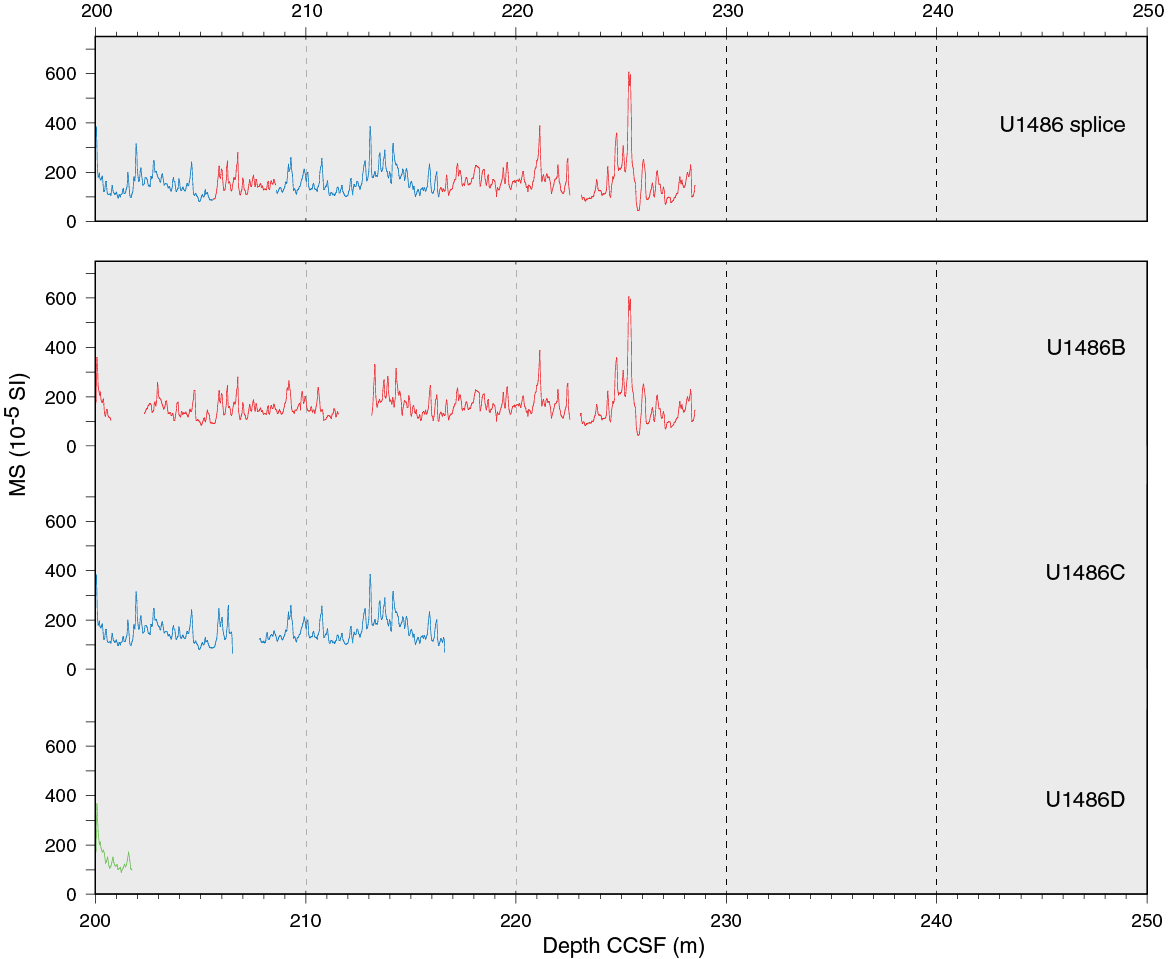
Figure F31. WRMSL MS data.
Table T25. Splice intervals. Download table in CSV format.
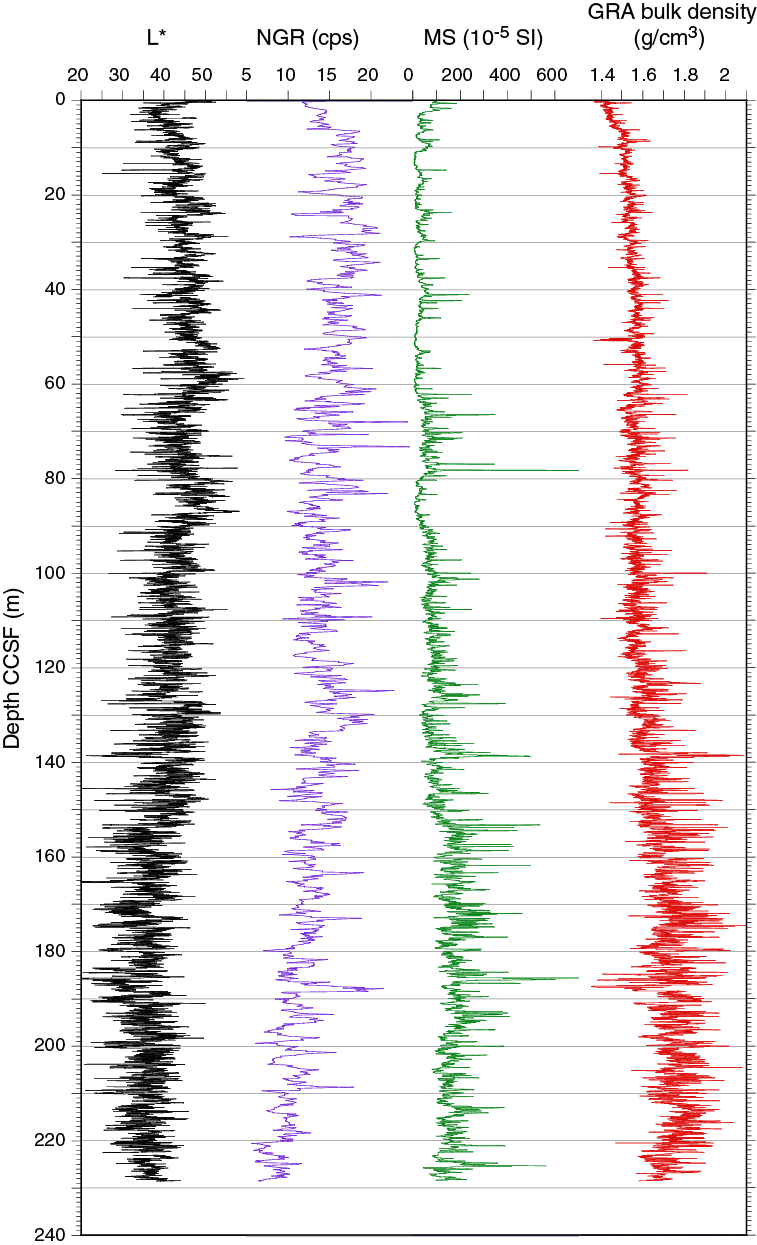
Figure F32. Spliced SHMSL L*, NGR, and WRMSL MS and GRA bulk density data.
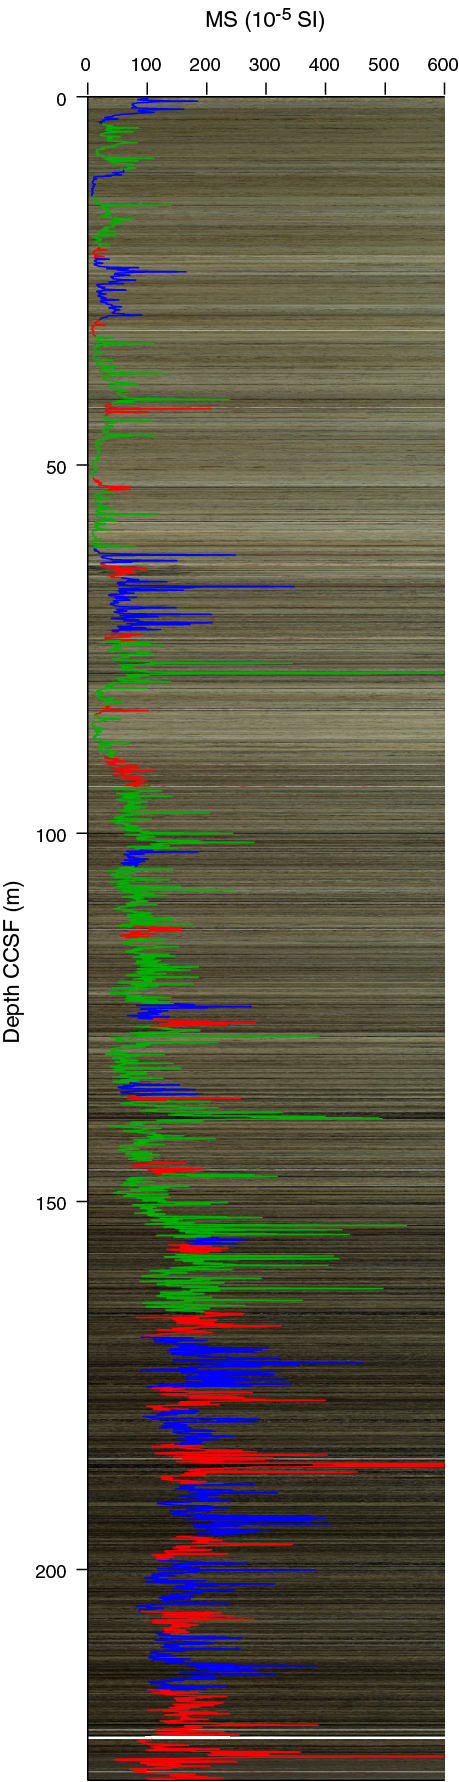
Figure F33. Spliced MS data.
The CCSF scale is anchored to the mudline of Core 363-U1486C-1H, which is assigned a depth of 0 m CCSF. From this anchor, we worked downhole, using Correlator to establish a composite stratigraphy on a core-by-core basis. The upper 150 mbsf of Hole U1486B was heavily sampled (one 5 or 10 cm whole-round sample per section) for high-resolution interstitial water analyses (see Geochemistry), so our general approach was to avoid using material from 0 to 150 mbsf in Hole U1486B. However, because of poor recovery in a few intervals we had to use some short spliced intervals from Hole U1486B, which resulted in having to piece together the splice using all three holes. Hole U1486A only had one core (363-U1486A-1H), which did not correlate well to any of the cores in the other holes, but we determined its offset with a tentative tie point to Core 363-U1486C-1H and did not use it in the splice. We also avoided using Core U1486D-19H in the splice because preliminary work (see Paleomagnetism) suggested that it contains the Gauss/Matuyama reversal and we wanted to protect this interval from the high-resolution sampling that typically occurs in splice intervals. The splice is continuous with no gaps from 0 to 222.59 m CCSF. At the bottom of the splice, we used the Hole U1486B growth factor of 1.085 to set the offset of Core 363-U1486B-23H, which is the deepest core collected at Site U1486. This core contains basalt fragments and is presumed to be within meters of the basement (see Operations and Core description).
The splice interval table (Table T25) is intended to provide a sampling plan that can be used to generate high-resolution continuous records with minimal gaps; however, an “off-splice” sampling plan was also designed mainly for low-resolution studies. An explanation of the strategy used to determine the off-splice sampling plan, and a table of core intervals that should be used for off-splice sampling can be found in OFFSPLICE in Supplementary material.
The cumulative offset between mbsf and CCSF depth scales is nearly linear (Figure F34A). The growth factor is relatively low (8%–9%), which is expected from sediment that expands due to release of overburden but has minimal gas expansion due to low concentrations of methane and other gases (see Geochemistry). There are small changes in the growth factor and therefore in the cumulative offset with depth (Figure F34B) because of incomplete recovery in a few cores. IODP procedure places the sediment in a core with incomplete recovery at the top of the cored interval, which is assigned a mbsf depth using the drilling depth below seafloor (DSF), which is based on the length of the drill string deployed (see Stratigraphic correlation in the Expedition 363 methods chapter (Rosenthal et al., 2018a). However, the exact position of the recovered sediment in mbsf is unknown, and thus the process of correlation can potentially move the cores with incomplete recovery to a position on the CCSF scale that may not represent sediment expansion. Calculation of mass accumulation rates based on the CCSF scale should account for differential expansion by dividing apparent depth intervals by the appropriate growth factor.

Figure F34. Comparison of mbsf and composite depth scales in the Site U1486 splice.
Geochemistry
At Site U1486, geochemical analyses were carried out on Hole U1486B to 210.0 mbsf. High-resolution interstitial water sampling was conducted in the upper ~150 mbsf with the goal of reconstructing the chloride (Cl) concentration and δ18O of Antarctic Intermediate Water (AAIW) during the Last Glacial Maximum (LGM). The interstitial water geochemical profiles at this site reflect the variable sedimentation and tectonic evolution of this setting over the past ~2 million years. Profiles in the uppermost sediments reflect a modest degree of organic matter remineralization, whereas deeper than ~60 mbsf (Subunit IB) they are dominated by interaction of interstitial water with volcanogenic sediment, including abundant tephras, dispersed ash, and discrete volcanogenic layers throughout the sediment column. The profiles in the lowermost 40 m of the succession suggest possible oceanic crustal fluid influence on the interstitial water geochemical signatures. Carbonate (CaCO3) content throughout the hole is highly variable (0.3–75.4 wt%). Total organic carbon (TOC) content ranges between 0 and 1.8 wt% and decreases downhole. For detailed background on organic matter remineralization and clay mineral alteration, see Geochemistry in the Site U1482 chapter (Rosenthal et al., 2018b).
Results
Volatile hydrocarbons
Headspace gas samples were taken at a frequency of one sample per core in Hole U1486B as part of the routine environmental protection and safety-monitoring program (Table T26; Figure F35). Methane concentration was low (<4 ppmv) throughout Hole U1486B, consistent with the interstitial water analyses that show abundant sulfate (SO4) to the bottom of the hole (see Sulfate and barium). Ethane and propane were below detection limit.
Table T26. Volatile hydrocarbon concentrations. Download table in CSV format.
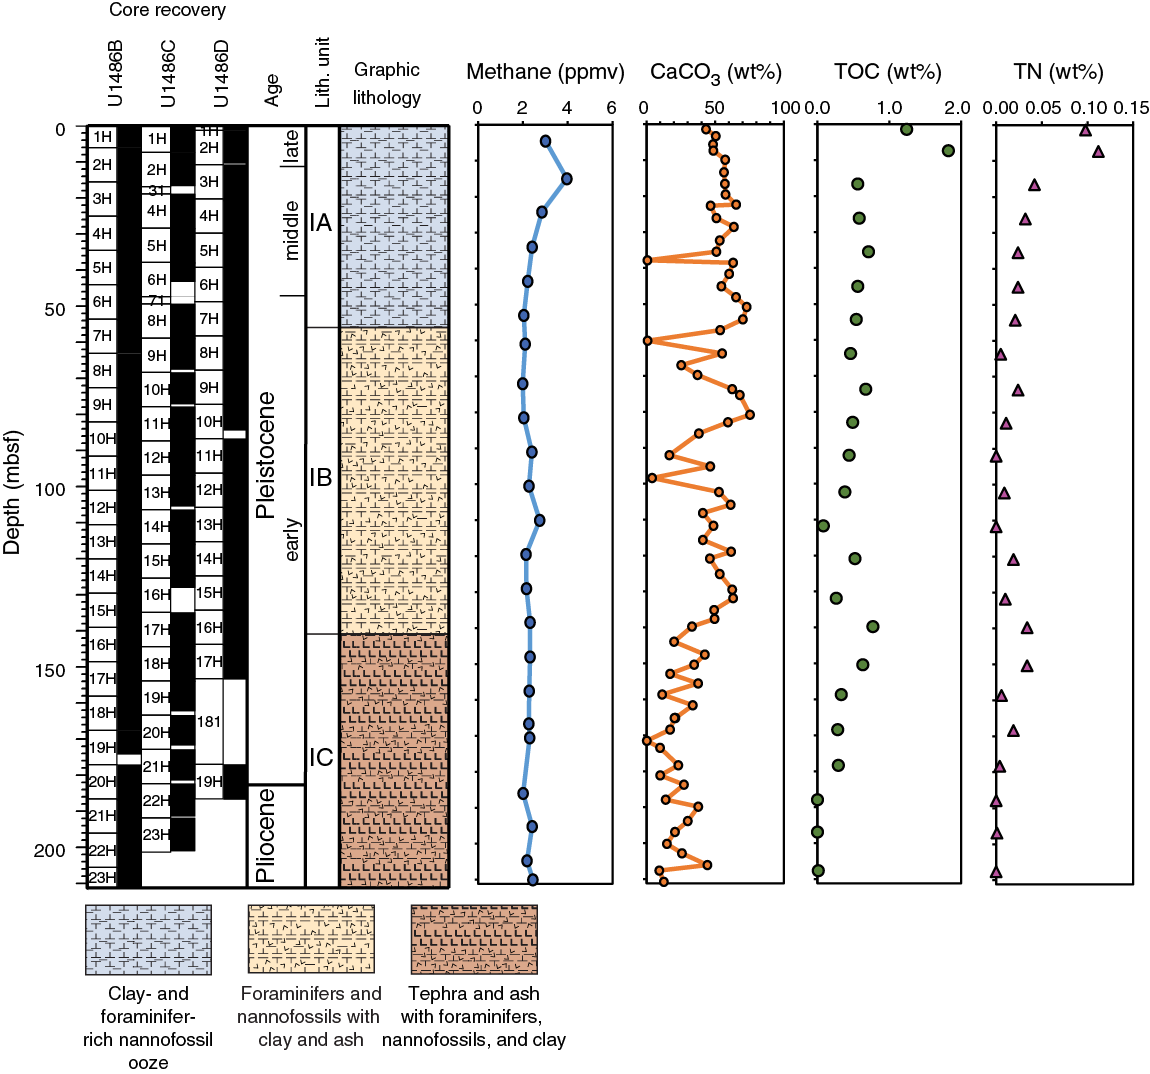
Figure F35. Methane, CaCO3, TOC, and TN profiles.
Bulk sediment geochemistry
CaCO3, inorganic carbon (IC), TOC, and total nitrogen (TN) were measured on sediment samples from Hole U1486B (Table T27; Figure F35). The CaCO3 content is highly variable, ranging from 0.3 to 75.4 wt%, with an average of 40.5 wt%. Overall, CaCO3 content is higher in the upper ~140 mbsf, corresponding to lithologic Subunits IA and IB. Ash and silt samples have extremely low CaCO3 content.
Table T27. Carbon and nitrogen. Download table in CSV format.
TOC content ranges between 0 and 1.8 wt% with an average of 0.5 wt% and exhibits a decreasing trend downhole. TN content is very low (average 0.03 wt%) and shows a similar decreasing trend with depth. Because TN is below the detection limit in a number of samples, we conclude that the ratio of TOC to total nitrogen (C/N ratio) might not be reliable at Site U1486.
Interstitial water chemistry
Site U1486 was sampled at high resolution (one whole-round sample per section for Sections 1–6 downhole to ~150 mbsf) for interstitial water geochemistry to facilitate reconstruction of the density of AAIW during the LGM (e.g., McDuff, 1985; Adkins et al., 2002; Adkins and Schrag, 2003). A total of 106 whole-round samples were taken from Hole U1486B. Of these, 39 interstitial water samples and 1 mudline sample were processed for all standard shipboard analyses following the procedures described in Geochemistry in the Expedition 363 methods chapter (Rosenthal et al., 2018a). The remainder were split and processed for shore-based analyses. Interstitial water chemistry data are reported in Table T28.
Table T28. Interstitial water geochemical data. Download table in CSV format.
Chlorinity and salinity
The Cl interstitial water profile at Site U1486 displays a variable but continuous increase from a mudline concentration of 553.7 mM to a maximum value of 572.0 mM at 210.0 mbsf (Figure F36). From the surface to 170.4 mbsf, small variations of ~4 to ~8 mM from sample to sample are superimposed on the increasing trend, whereas from 170.4 mbsf to the base of the hole, variability is reduced. The Cl profile at this site is likely influenced by two processes. The first is the interaction between interstitial water and volcanogenic material, which is abundant throughout the recovered sediment sequence at Site U1486, particularly deeper than ~60 mbsf (see Core description). Decoupling of the Cl and sodium (Na) profiles (Figures F36, F37) indicates that the observed changes in Cl are likely due to hydration reactions involving volcanic or clay minerals. The second likely influence on Cl is diffusion and communication between sediment interstitial water and water from the relatively young oceanic basement (see Discussion). Salinity (not shown) is less variable than Cl but shows the same general trend of increasing values downhole. Salinity is 36 at the mudline and increases slightly to 37 at depth.
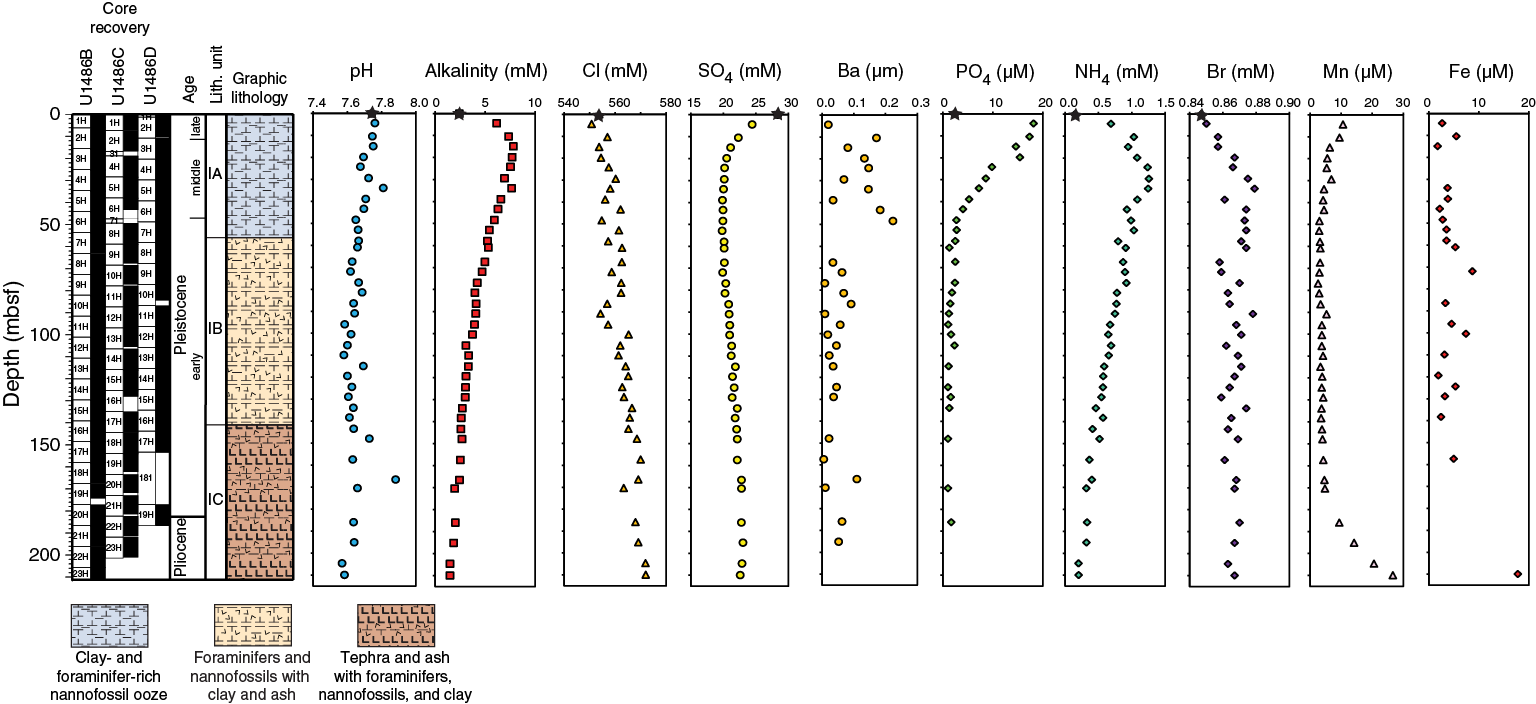
Figure F36. Interstitial water concentration profiles, Hole U1486A.

Figure F37. Interstitial water concentration profiles, Hole U1486B.
Reconstruction of salinity and δ18O of bottom water during the LGM requires that advection and diffusion dominate interstitial water profiles of Cl and δ18O (Adkins and Schrag, 2003). The low-resolution shipboard Cl data suggest that in situ and crustal alteration reactions strongly affect the interstitial water chemistry at Site U1486, which may complicate the reconstruction of the salinity and δ18O of AAIW during the LGM at this site.
Alkalinity and pH
Alkalinity at Site U1486 increases sharply from a mudline concentration of 2.4 mM to maximum values of 7.7 to 7.8 mM between 14.9 and 19.8 mbsf (Figure F36). Below 19.8 mbsf, alkalinity decreases downhole to a minimum of 1.46 mM at the base of the hole. The minor increase in alkalinity in the upper part of the profile is likely the result of organic matter remineralization by SO4 reduction. This idea is supported by a nearly identical trend in the ammonium (NH4) profile (Figure F36) and a slight reduction in SO4 concentration at the depth of the alkalinity maximum. Below this depth, the decreasing trend likely reflects interactions between interstitial water, oceanic crust, and volcanogenic material (see Discussion).
The pH generally decreases downhole, from 7.7 at the mudline to 7.6 at the base of the hole (Figure F36). As with Cl, small-scale variations in pH are superimposed on this overall trend, possibly related to weathering of volcanogenic sediment (see Geochemistry in the Site U1484 chapter [Rosenthal et al., 2018d]). High pH (7.88) is observed at 166.5 mbsf, which is roughly coincident with a transition to darker, coarser sediment that has possibly been altered by hydrothermal processes (see Core description).
Sulfate and barium
The SO4 profile in Hole U1486B is typical of an open-ocean setting as opposed to a continental margin site in that SO4 is not completely depleted but is present at elevated concentrations (~20 mM) downhole. SO4 decreases steeply from a mudline concentration of 28.3 mM to 20.2 mM at 24.2 mbsf, reaches a minimum concentration (19.8 mM) by 52.9 mbsf, and then increases gradually to 23 mM by the base of the hole (Figure F36). This profile indicates that although SO4 reduction is taking place in the upper portion of the sediment column, the intensity of organic matter remineralization is not high enough to facilitate complete consumption of SO4 and a switch to organic matter fermentation and methanogenesis. This is supported by the phosphate (PO4), ammonium (NH4), and methane profiles (Figures F35, F36). The increase in SO4 concentration deeper than ~53 mbsf is most likely due to upward diffusion from the oceanic crust (see Discussion).
The interstitial water barium (Ba) profile displays considerable scatter and very low values (<1 μM) compared with Ba concentrations of 5–10 μM at nearby Sites U1484 and U1485 (Figure F36). In the solid phase, Ba is associated with organic matter, which at this site is relatively low. During organic matter degradation, Ba can be reprecipitated as barite (BaSO4), which remains in the solid phase in the presence of dissolved SO4. Thus, the overall low organic matter contents and presence of dissolved SO4 at Site U1486 act together to keep the dissolved Ba concentration low.
Phosphate, ammonium, and bromide
PO4 concentration increases abruptly from the mudline concentration of 2.2 μM to a maximum of 18.1 μM at 4.4 mbsf. Between 4.4 and 60.9 mbsf, PO4 concentration decreases steeply and remains stable (<1% variability) and low (average concentration of 0.9 μM) to the base of the hole (Figure F36). Overall, PO4 concentration is markedly lower than observed at Sites U1484 and U1485, reflecting the lower organic matter content of the sediment.
The NH4 profile closely resembles the alkalinity profile, with an increase over the upper ~24 mbsf from a mudline concentration of 0.2 mM to a maximum concentration of 1.24–1.25 mM between 24.2 and 33.9 mbsf (Figure F36). Deeper than 33.9 mbsf, NH4 concentration decreases to a minimum of 0.2 mM at the base of the hole. As with PO4, NH4 concentration is lower at this site compared to Sites U1484 and U1485. The downhole increase in NH4 in the upper ~40 mbsf most likely reflects organic matter remineralization, whereas below this depth the downhole decrease probably reflects NH4 uptake during clay alteration (see Geochemistry in the Site U1482 chapter [Rosenthal et al., 2018b]).
Bromide (Br) interstitial water concentration is relatively constant, ranging between 0.85 and 0.88 μM over the entire profile (Figure F36). Most of the change in the Br profile occurs in the upper 33.9 mbsf, with an increase from 0.85 μM at the mudline to 0.88 μM at 33.9 mbsf, consistent with a minor to moderate amount of organic matter remineralization within this interval. Deeper than 33.9 mbsf, Br concentration is relatively constant. Small-scale variations (~1%) in Br show an inverse relationship with similar scale variations (~1%) in the PO4 profile, suggesting a small degree of variability in organic matter content downhole.
Manganese and iron
Manganese (Mn) concentration is below detection limit at the mudline, increases to 10.6 μM at 4.4 mbsf, likely reflecting the transition from oxic to suboxic organic matter degradation, and then decreases to ~3 μM by 48.4 mbsf where SO4 reduction occurs (Figure F36). Between 48.4 and 170.4 mbsf, Mn concentration is low and invariant; however, at 170.4 mbsf, Mn increases abruptly and reaches a maximum concentration of 26.7 μM at the base of the hole. This pronounced downhole increase likely reflects the interaction of interstitial water with the oceanic crust and Mn- and Fe-rich basalts (see Discussion).
The Fe concentration profile displays some scatter downhole (Figure F36). In the upper ~160 mbsf, Fe concentration ranges between 1.7 and 8.7 μM, with one-third of measured samples below the detection limit. A maximum Fe concentration (17.8 μM) occurs in the deepest sample (210.0 mbsf). The overall low Fe concentration is likely due to precipitation of pyrite in the zone of SO4 reduction (upper ~30 mbsf; see observations of sulfides in Core description) and scavenging by other secondary minerals (e.g., clays) that may be produced within the sediment. Peaks of dissolved Fe concentration in the upper portion of the sediment sequence may reflect weathering of volcanogenic sediment, whereas the single high value at the base of the hole is likely due to leaching of Fe and Mn from basalt or addition of these elements from basement fluids.
Potassium, magnesium, and calcium
Potassium (K) concentration increases from a mudline concentration of 10.2 to 11.8 mM in the upper 10.4 mbsf. K concentration is relatively constant, with some small variability (~5%) down to ~120 mbsf. K concentration slowly decreases from 11.7 mM at 119.4 mbsf to 10.6 mM at 210.0 mbsf (Figure F37). The decreasing trend in the lower 90 m of the hole suggests a possible basement sink for K, such as clay mineral authigenesis or interaction with oceanic crust and diffusion (see Discussion).
Ca and magnesium (Mg) profiles at Site U1486 show an inverse relationship (Figure F37). Ca concentration decreases slightly (10.7–10.4 mM) between 0 and 7.5 mbsf before increasing steadily to the bottom of the hole to a maximum concentration of 25.3 mM. Mg concentration shows a downhole decrease over the entire hole, from a mudline concentration of 53.3 mM to a minimum of 38.1 mM. Slight curvature in both profiles is noted between 185.9 and 210.0 mbsf, which is close to the acoustic basement observed on the seismic profile (Figure F3). This type of inverse relationship between Ca and Mg concentrations was previously observed at several sites that were drilled close to basement (Kastner and Gieskes, 1976; McDuff and Gieskes, 1976; Gieskes and Lawrence, 1981; McDuff, 1981) and can be explained by weathering of oceanic basalt and sediments directly overlying the basement (see Discussion).
Strontium and boron
Strontium (Sr) concentration increases from a mudline value of 0.09 mM to a maximum concentration of 0.15–0.16 mM between 48.4 and 81.4 mbsf (Figure F37). This increase in Sr concentration occurs in a foraminifer- and nannofossil-rich ooze and clay in the upper ~60 mbsf, suggesting that the Sr trend here reflects dissolution and precipitation of carbonates (Baker et al., 1982). Deeper than 81.4 mbsf, Sr concentration decreases to 0.11 mM at the base of the hole indicating a sink for Sr toward the base of the hole and the influence of diffusion. As with Ca, Mg, Mn, and Fe, the slope of the Sr profile is steeper in the lower ~25 m of sediment.
Boron (B) concentration increases rapidly from the mudline (421.6 μM) to 4.4 mbsf (506.6 μM) and then increases slightly to a maximum concentration of 533.2 μM at 14.9 mbsf (Figure F37). Below 14.9 mbsf, B decreases steadily downhole to a minimum of 415.2 μM at 210.0 mbsf. Similar to a number of other interstitial water profiles (pH, Cl, K, PO4, and Br) at this site, small-scale variations in B concentration (20–40 μM) are superimposed on the overall decreasing trend. Both leaching of terrigenous material and weathering of volcanic ash have been suggested to increase interstitial water B concentration (Deyhle and Kopf, 2002; James et al., 2003).
Lithium, silica, and sodium
Lithium (Li) concentration decreases slightly from the mudline (25.8 μM) to a minimum (22.1 μM) at 4.4 mbsf and increases to 33.9 μM at 57.9 mbsf, where it remains constant until 81.4 mbsf (Figure F37). Below that, Li concentration decreases downhole to 24.3 μM at 210.0 mbsf. The similarity between the Li and Sr profiles suggests a link between Li concentration and carbonate dissolution and reprecipitation over the upper ~60 mbsf and possibly a sink for Li or a diffusion-controlled profile below this depth.
Silica (Si) concentration increases markedly from 206.3 μM at the mudline to 666.1 μM at 4.4 mbsf (Figure F37). Between 4.4 and 195.1 mbsf, Si concentration gradually increases from 666.1 to 1002.8 μM and then rapidly decreases to 778.5 μM at the base of the hole. The linear increase of Si over much of the hole suggests a profile that is strongly influenced by diffusion. The sharp decrease of Si between 185.0 and 210.0 mbsf likely reflects the weathering of oceanic crust that also influences the Cl, Mn, Fe, K, Ca, and Mg profiles.
The sodium (Na) profile displays a great deal of scatter downhole (Figure F37) to 461.5 mM at 4.4 mbsf, below which depth it varies between ~460 and 471 mM. There is not good agreement between the Cl and Na profiles, indicating that if weathering of ash or clay minerals is influencing the two ions, it is through different processes (i.e., hydration/dehydration reactions that release or take up water versus ion-exchange reactions that release or take up Na).
Discussion
The sedimentary sequence at Site U1486 captures several transitions that are likely related to the tectonic evolution and volcanic history of this setting (see Background and objectives and Core description) and are in turn reflected in the interstitial water profiles. Based on recovery of some pieces of basalt and the occurrence of APC refusal at the base of Hole U1486B (see Core description and Operations), this site may contain a (nearly) complete record of sedimentation since ocean crust formation, providing an excellent opportunity to study the geochemical interactions between basaltic crust and sediment.
In the upper ~60 mbsf (predominantly lithologic Subunit IA), the sediment consists mostly of foraminifer-rich nannofossil ooze with variable amounts of clay and minimal amounts of volcanogenic material. The interstitial water profiles in this interval are dominated by changes in alkalinity, SO4, PO4, NH4, and Br that reflect a modest degree of organic matter remineralization.
Below ~60 mbsf, there is a notable increase in the abundance of volcanogenic material (see Core description). Deeper than 60 mbsf, the interstitial water profiles show steeper linear gradients (both increasing and decreasing toward the base of the hole) suggesting that upward diffusion of crustal fluid influences the interstitial water profiles, which is further discussed below. Superimposed on these linear gradients are smaller scale trends of variability, particularly noticeable in K, B, Na, pH, Cl, and Fe, which can be explained by the interaction of interstitial water with reactive volcanogenic sediments/minerals and clay mineral alteration (see Geochemistry in the Site U1482 chapter, Geochemistry in the Site U1484 chapter, and Geochemistry in the Site U1485 chapter [Rosenthal et al., 2018b, 2018d, 2018e]). Specifically, clay mineral authigenesis and hydration can help explain the Cl, B, K, Na, and Fe profiles, whereas weathering of volcanogenic sediments can contribute to the K, pH, and Fe profiles. Preliminary examination of the layers composed of volcanogenic particles within lithologic Subunit IB (the lithology composing the interval between ~60 and ~140 mbsf) suggests a slightly more felsic composition than the sediments below 140 mbsf in lithologic Subunit IC (see Core description), which may explain why variability is more evident in the K record than in the Fe record.
Deeper than ~140 mbsf, the sediments are noticeably darker in color, coarser grained, and contain a high amount of mafic volcanic material (see Core description). The crustal age at this site is presumed to be fairly young (~3.5 Ma; see Background and objectives), which would suggest ample opportunity for interaction between the oceanic crust, crustal fluids, the sedimentary sequence, and interstitial water at this site. This interaction is clearly reflected in several interstitial water profiles, including Ca, Mg, Fe, Si, Cl, and SO4.
The inverse relationship between Ca and Mg profiles downhole is a common feature for sites that have been drilled to basement (Gieskes and Lawrence, 1981). The increase in Ca is attributed to submarine weathering of basal sediment and basalt, whereas the formation of authigenic smectites near the basement can serve as a sink for Mg (Kastner and Gieskes, 1976). At this site, decreases in K, Mg, and alkalinity are consistent with the occurrence of these two processes in the ~30 m above the base of Hole U1486B. The mostly linear concentration gradients observed above this interval in K, Mg, and Ca reflect the influence of diffusion.
A noticeable change in the shape of the Cl profile at ~170 mbsf may be attributable to hydration/dehydration reactions. The coarser sediment at this interval could also facilitate more rapid diffusion, explaining the change in interstitial water gradient. Alternatively, interaction between interstitial water and the crustal material at Site U1486 may not be limited to alteration reactions but could also include the mixing of sedimentary and crustal fluids. This hypothesis is supported by the gradual increase of SO4 concentration at depth, suggesting upward diffusion of water with a relatively high SO4 concentration originating from the oceanic crust. The marked increases in iron and manganese concentrations and the decrease in silica concentration could similarly be attributed either to weathering of mafic oceanic crustal sediments or interaction between interstitial water bearing more traditional sedimentary signatures and crustal fluids. The influence of crustal fluids on the lowermost sediments at this site is supported by the observation of zeolites (see Core description), which can form as low-temperature hydrothermal alteration products of oceanic crust (e.g., Alt et al., 1986; Hay and Sheppard, 2001).
References
Adkins, J.F., and Schrag, D.P., 2003. Reconstructing Last Glacial Maximum bottom water salinities from deep-sea sediment pore fluid profiles. Earth and Planetary Science Letters, 216(1–2):109–123. https://doi.org/10.1016/S0012-821X(03)00502-8
Alt, J.C., Honnorez, J., Laverne, C., and Emmermann, R., 1986. Hydrothermal alteration of a 1 km section through the upper oceanic crust, Deep Sea Drilling Project Hole 504B: mineralogy, chemistry, and evolution of seawater-basalt interactions. Journal of Geophysical Research: Solid Earth, 91(B10):10309–10335. https://doi.org/10.1029/JB091iB10p10309
Baker, P.A., Gieskes, J.M., and Elderfield, H., 1982. Diagenesis of carbonates in deep-sea sediments: evidence from Sr/Ca ratios and interstitial dissolved Sr2+ data. Journal of Sedimentary Research, 52(1):71–82. https://doi.org/10.1306/212F7EE1-2B24-11D7-8648000102C1865D
Baldwin, S.L., Fitzgerald, P.G., and Webb, L.E., 2012. Tectonics of the New Guinea region. Annual Review of Earth and Planetary Sciences, 40(1):495–520. https://doi.org/10.1146/annurev-earth-040809-152540
Berggren, W.A., Kent, D.V., Swisher, C.C., III, and Aubry, M.-P., 1995. A revised Cenozoic geochronology and chronostratigraphy. In Berggren, W.A., Kent, D.V., Aubry, M.-P., and Hardenbol, J. (Eds.), Geochronology, Time Scales and Global Stratigraphic Correlation. Special Publication - SEPM (Society for Sedimentary Geology), 54:129–212. https://doi.org/10.2110/pec.95.04.0129
Cande, S.C., and Kent, D.V., 1995. Revised calibration of the geomagnetic polarity timescale for the Late Cretaceous and Cenozoic. Journal of Geophysical Research: Solid Earth, 100(B4):6093–6095. https://doi.org/10.1029/94JB03098
Chaisson, W.P., and Pearson, P.N., 1997. Planktonic foraminifer biostratigraphy at Site 925: middle Miocene–Pleistocene. In Shackleton, N.J., Curry, W.B., Richter, C., and Bralower, T.J. (Eds.), Proceedings of the Ocean Drilling Program, Scientific Results, 154: College Station, TX (Ocean Drilling Program), 3–31. https://doi.org/10.2973/odp.proc.sr.154.104.1997
Deyhle, A., and Kopf, A., 2002. Strong B enrichment and anomalous δ11B in pore fluids from the Japan Trench forearc. Marine Geology, 183(1–4):1–15. https://doi.org/10.1016/S0025-3227(02)00186-X
Dowsett, H.J., 1988. Diachroneity of late Neogene microfossils in the southwest Pacific Ocean: application of the graphic correlation method. Paleoceanography, 3(2):209–222. https://doi.org/10.1029/PA003i002p00209
Expedition 339 Scientists, 2013. Expedition 339 summary. In Stow, D.A.V., Hernández-Molina, F.J., Alvarez Zarikian, C.A., and the Expedition 339 Scientists, Proceedings of the Integrated Ocean Drilling Program, 339: Tokyo (Integrated Ocean Drilling Program Management International, Inc.). https://doi.org/10.2204/iodp.proc.339.101.2013
Gieskes, J.M., and Lawrence, J.R., 1981. Alteration of volcanic matter in deep-sea sediments: evidence from the chemical composition of interstitial waters from deep sea drilling cores. Geochimica Cosmochimica Acta, 45(10):1687–1703. https://doi.org/10.1016/0016-7037(81)90004-1
Hay, R.L., and Sheppard, R.A., 2001. Occurrence of zeolites in sedimentary rocks: an overview. Reviews in Mineralogy and Geochemistry, 45(1):217–234. https://doi.org/10.2138/rmg.2001.45.6
Hilgen, F.J., Lourens, L.J., and Van Dam, J.A., 2012. The Neogene period. With contributions by A.G. Beu, A.F. Boyes, R.A. Cooper, W. Krijgsman, J.G. Ogg, W.E. Piller, and D.S. Wilson. In Gradstein, F.M., Ogg, J.G., Schmitz, M.D., and Ogg, G.M. (Eds.), The Geologic Time Scale: Oxford, United Kingdom (Elsevier), 923–978. https://doi.org/10.1016/B978-0-444-59425-9.00029-9
Iijima, A., 1980. Geology of natural zeolites and zeolitic rocks. Pure and Applied Chemistry, 52(9):2115–2130. https://doi.org/10.1351/pac198052092115
James, R.H., Allen, D.E., and Seyfried, W.E., Jr., 2003. An experimental study of alteration of oceanic crust and terrigenous sediments at moderate temperatures (51 to 350°C): insights as to chemical processes in near-shore ridge-flank hydrothermal systems. Geochimica et Cosmochimica Acta, 67(4):681–691. https://doi.org/10.1016/S0016-7037(02)01113-4
Jones, R.W., 1994. The Challenger Foraminifera: New York (Oxford University Press USA).
Karlin, R., and Levi, S., 1983. Diagenesis of magnetic minerals in recent hemipelagic sediments. Nature, 303(5915):327–330. https://doi.org/10.1038/303327a0
Kastner, M., and Gieskes, J.M., 1976. Interstitial water profiles and sites of diagenetic reactions, Leg 35, DSDP, Bellingshausen Abyssal Plain. Earth and Planetary Science Letters, 33(1):11–20. https://doi.org/10.1016/0012-821X(76)90152-7
Le Friant, A., Ishizuka, O., Stroncik, N.A., and the Expedition 340 Scientists, 2013. Proceedings of the Integrated Ocean Drilling Program, 340: Tokyo (Integrated Ocean Drilling Program Management International, Inc.). https://doi.org/10.2204/iodp.proc.340.2013
Maher, B.A., 1988. Magnetic properties of some synthetic submicron magnetites. Geophysics Journal of the Royal Astronomical Society, 94:83–96.
McDuff, R.E., 1981. Major cation gradients in DSDP interstitial waters: the role of diffusive exchange between seawater and upper oceanic crust. Geochimica et Cosmochimica Acta, 45(10):1705–1713. https://doi.org/10.1016/0016-7037(81)90005-3
McDuff, R.E., 1985. The chemistry of interstitial waters, Deep Sea Drilling Project Leg 86. In Heath, G.R., Burckle, L.H., et al., Initial Reports of the Deep Sea Drilling Project, 86: Washington, DC (U.S. Government Printing Office), 675–687. https://doi.org/10.2973/dsdp.proc.86.131.1985
McDuff, R.E., and Gieskes, J.M., 1976. Calcium and magnesium profiles in DSDP interstitial waters: diffusion or reaction? Earth and Planetary Science Letters, 33(1):1–10. https://doi.org/10.1016/0012-821X(76)90151-5
McNeill, L.C., Dugan, B., Petronotis, K.E., Backman, J., Bourlange, S., Chemale, F., Chen, W., Colson, T.A., Frederik, M.C.G., Guèrin, G., Hamahashi, M., Henstock, T., House, B.M., Hüpers, A., Jeppson, T.N., Kachovich, S., Kenigsberg, A.R., Kuranaga, M., Kutterolf, S., Milliken, K.L., Mitchison, F.L., Mukoyoshi, H., Nair, N., Owari, S., Pickering, K.T., Pouderoux, H.F.A., Yehua, S., Song, I., Torres, M.E., Vannucchi, P., Vrolijk, P.J., Yang, T., and Zhao, X., 2017. Expedition 362 summary. In McNeill, L.C., Dugan, B., Petronotis, K.E., and the Expedition 362 Scientists, Sumatra Subduction Zone. Proceedings of the International Ocean Discovery Program, 362: College Station, TX (International Ocean Discovery Program). https://doi.org/10.14379/iodp.proc.362.101.2017
Mohtadi, M., Bergmann, F., Blanquera, R.V.C., Buleka, J., Carag, J.W.M., Carriére-Garwood, J., et al., 2013. Report and preliminary results of RV SONNE cruise SO-228, Kaohsiung-Townsville, 04.05.2013-23.06.2013, EISPAC-WESTWIND-SIODP. Berichte, MARUM - Zentrum für Marine Umweltwissenschaften, Fachbereich Geowissenschaften, Universität Bremen, 295. https://www.marum.de/en/Research/RV-SONNE-SO-228.html
Pälike, H., Nishi, H., Lyle, M., Raffi, I., Gamage, K., Klaus, A., and the Expedition 320/321 Scientists, 2010. Expedition 320/321 summary. In Pälike, H., Lyle, M., Nishi, H., Raffi, I., Gamage, K., Klaus, A., and the Expedition 320/321 Scientists, Proceedings of the Integrated Ocean Drilling Program, 320/321: Tokyo (Integrated Ocean Drilling Program Management International, Inc.). https://doi.org/10.2204/iodp.proc.320321.101.2010
Pribnow, D., Kinoshita, M., and Stein, C., 2000. Thermal Data Collection and Heat Flow Recalculations for Ocean Drilling Program Legs 101–180: Hanover, Germany (Institute for Joint Geoscientific Research, Institut für Geowissenschaftliche Gemeinschaftsaufgaben [GGA]). http://www-odp.tamu.edu/publications/heatflow/ODPReprt.pdf
Raffi, I., and Flores, J.-A., 1995. Pleistocene through Miocene calcareous nannofossils from eastern equatorial Pacific Ocean (Leg 138). In Pisias, N.G., Mayer, L.A., Janecek, T.R., Palmer-Julson, A., and van Andel, T.H. (Eds.), Proceedings of the Ocean Drilling Program, Scientific Results, 138: College Station, TX (Ocean Drilling Program), 233–286. https://doi.org/10.2973/odp.proc.sr.138.112.1995
Resig, J.M., Frost, G.M., Ishikawa, N., and Perembo, R.C.B., 2001. Micropaleontological and paleomagnetic approaches to stratigraphic anomalies in rift basins: ODP Site 1109, Woodlark Basin. In Wilson, R.C.L., Whitmarsh, R.B., Taylor, B., and Froitzheim, N. (Eds.), Non-Volcanic Rifting of Continental Margins: A Comparison of Evidence from Land and Sea. Geological Society Special Publication, 187(1):389–404. https://doi.org/10.1144/GSL.SP.2001.187.01.19
Richter, C., Acton, G., Endris, C., and Radsted, M., 2007. Technical Note 34: Handbook for Shipboard Paleomagnetists. Ocean Drilling Program. https://doi.org/10.2973/odp.tn.34.2007
Rosenthal, Y., Holbourn, A., and Kulhanek, D.K., 2016. Expedition 363 Scientific Prospectus: Western Pacific Warm Pool. International Ocean Discovery Program. https://doi.org/10.14379/iodp.sp.363.2016
Rosenthal, Y., Holbourn, A.E., Kulhanek, D.K., Aiello, I.W., Babila, T.L., Bayon, G., Beaufort, L., Bova, S.C., Chun, J.-H., Dang, H., Drury, A.J., Dunkley Jones, T., Eichler, P.P.B., Fernando, A.G.S., Gibson, K.A., Hatfield, R.G., Johnson, D.L., Kumagai, Y., Li, T., Linsley, B.K., Meinicke, N., Mountain, G.S., Opdyke, B.N., Pearson, P.N., Poole, C.R., Ravelo, A.C., Sagawa, T., Schmitt, A., Wurtzel, J.B., Xu, J., Yamamoto, M., and Zhang, Y.G., 2018a. Expedition 363 methods. In Rosenthal, Y., Holbourn, A.E., Kulhanek, D.K., and the Expedition 363 Scientists, Western Pacific Warm Pool. Proceedings of the International Ocean Discovery Program, 363: College Station, TX (International Ocean Discovery Program). https://doi.org/10.14379/iodp.proc.363.102.2018
Rosenthal, Y., Holbourn, A.E., Kulhanek, D.K., Aiello, I.W., Babila, T.L., Bayon, G., Beaufort, L., Bova, S.C., Chun, J.-H., Dang, H., Drury, A.J., Dunkley Jones, T., Eichler, P.P.B., Fernando, A.G.S., Gibson, K.A., Hatfield, R.G., Johnson, D.L., Kumagai, Y., Li, T., Linsley, B.K., Meinicke, N., Mountain, G.S., Opdyke, B.N., Pearson, P.N., Poole, C.R., Ravelo, A.C., Sagawa, T., Schmitt, A., Wurtzel, J.B., Xu, J., Yamamoto, M., and Zhang, Y.G., 2018b. Site U1482. In Rosenthal, Y., Holbourn, A.E., Kulhanek, D.K., and the Expedition 363 Scientists, Western Pacific Warm Pool. Proceedings of the International Ocean Discovery Program, 363: College Station, TX (International Ocean Discovery Program). https://doi.org/10.14379/iodp.proc.363.103.2018
Rosenthal, Y., Holbourn, A.E., Kulhanek, D.K., Aiello, I.W., Babila, T.L., Bayon, G., Beaufort, L., Bova, S.C., Chun, J.-H., Dang, H., Drury, A.J., Dunkley Jones, T., Eichler, P.P.B., Fernando, A.G.S., Gibson, K.A., Hatfield, R.G., Johnson, D.L., Kumagai, Y., Li, T., Linsley, B.K., Meinicke, N., Mountain, G.S., Opdyke, B.N., Pearson, P.N., Poole, C.R., Ravelo, A.C., Sagawa, T., Schmitt, A., Wurtzel, J.B., Xu, J., Yamamoto, M., and Zhang, Y.G., 2018c. Site U1483. In Rosenthal, Y., Holbourn, A.E., Kulhanek, D.K., and the Expedition 363 Scientists, Western Pacific Warm Pool. Proceedings of the International Ocean Discovery Program, 363: College Station, TX (International Ocean Discovery Program). https://doi.org/10.14379/iodp.proc.363.104.2018
Rosenthal, Y., Holbourn, A.E., Kulhanek, D.K., Aiello, I.W., Babila, T.L., Bayon, G., Beaufort, L., Bova, S.C., Chun, J.-H., Dang, H., Drury, A.J., Dunkley Jones, T., Eichler, P.P.B., Fernando, A.G.S., Gibson, K.A., Hatfield, R.G., Johnson, D.L., Kumagai, Y., Li, T., Linsley, B.K., Meinicke, N., Mountain, G.S., Opdyke, B.N., Pearson, P.N., Poole, C.R., Ravelo, A.C., Sagawa, T., Schmitt, A., Wurtzel, J.B., Xu, J., Yamamoto, M., and Zhang, Y.G., 2018d. Site U1484. In Rosenthal, Y., Holbourn, A.E., Kulhanek, D.K., and the Expedition 363 Scientists, Western Pacific Warm Pool. Proceedings of the International Ocean Discovery Program, 363: College Station, TX (International Ocean Discovery Program). https://doi.org/10.14379/iodp.proc.363.105.2018
Rosenthal, Y., Holbourn, A.E., Kulhanek, D.K., Aiello, I.W., Babila, T.L., Bayon, G., Beaufort, L., Bova, S.C., Chun, J.-H., Dang, H., Drury, A.J., Dunkley Jones, T., Eichler, P.P.B., Fernando, A.G.S., Gibson, K.A., Hatfield, R.G., Johnson, D.L., Kumagai, Y., Li, T., Linsley, B.K., Meinicke, N., Mountain, G.S., Opdyke, B.N., Pearson, P.N., Poole, C.R., Ravelo, A.C., Sagawa, T., Schmitt, A., Wurtzel, J.B., Xu, J., Yamamoto, M., and Zhang, Y.G., 2018e. Site U1485. In Rosenthal, Y., Holbourn, A.E., Kulhanek, D.K., and the Expedition 363 Scientists, Western Pacific Warm Pool. Proceedings of the International Ocean Discovery Program, 363: College Station, TX (International Ocean Discovery Program). https://doi.org/10.14379/iodp.proc.363.106.2018
Rosenthal, Y., Holbourn, A.E., Kulhanek, D.K., Aiello, I.W., Babila, T.L., Bayon, G., Beaufort, L., Bova, S.C., Chun, J.-H., Dang, H., Drury, A.J., Dunkley Jones, T., Eichler, P.P.B., Fernando, A.G.S., Gibson, K.A., Hatfield, R.G., Johnson, D.L., Kumagai, Y., Li, T., Linsley, B.K., Meinicke, N., Mountain, G.S., Opdyke, B.N., Pearson, P.N., Poole, C.R., Ravelo, A.C., Sagawa, T., Schmitt, A., Wurtzel, J.B., Xu, J., Yamamoto, M., and Zhang, Y.G., 2018f. Site U1487. In Rosenthal, Y., Holbourn, A.E., Kulhanek, D.K., and the Expedition 363 Scientists, Western Pacific Warm Pool. Proceedings of the International Ocean Discovery Program, 363: College Station, TX (International Ocean Discovery Program). https://doi.org/10.14379/iodp.proc.363.108.2018
Rosenthal, Y., Holbourn, A.E., Kulhanek, D.K., Aiello, I.W., Babila, T.L., Bayon, G., Beaufort, L., Bova, S.C., Chun, J.-H., Dang, H., Drury, A.J., Dunkley Jones, T., Eichler, P.P.B., Fernando, A.G.S., Gibson, K.A., Hatfield, R.G., Johnson, D.L., Kumagai, Y., Li, T., Linsley, B.K., Meinicke, N., Mountain, G.S., Opdyke, B.N., Pearson, P.N., Poole, C.R., Ravelo, A.C., Sagawa, T., Schmitt, A., Wurtzel, J.B., Xu, J., Yamamoto, M., and Zhang, Y.G., 2018g. Site U1490. In Rosenthal, Y., Holbourn, A.E., Kulhanek, D.K., and the Expedition 363 Scientists, Western Pacific Warm Pool. Proceedings of the International Ocean Discovery Program, 363: College Station, TX (International Ocean Discovery Program). https://doi.org/10.14379/iodp.proc.363.111.2018
Rothwell, R.G., 1989. Minerals and Mineraloids in Marine Sediments: An Optical Identification Guide: London (Elsevier). https://doi.org/10.1007/978-94-009-1133-8
Rowan, C.J., Roberts, A.P., and Broadbent, T., 2009. Reductive diagenesis, magnetite dissolution, greigite growth and paleomagnetic smoothing in marine sediments: a new view. Earth and Planetary Science Letters, 277(1–2):223–235. https://doi.org/10.1016/j.epsl.2008.10.016
Stein, C.A., and Stein, S., 1992. A model for the global variation in oceanic depth and heat flow with lithospheric age. Nature, 359(6391):123–129. https://doi.org/10.1038/359123a0
Stoner, J.S., and St-Onge, G., 2007. Magnetic stratigraphy in paleooceanography: reversal, excursion, paleointensity and secular variation. In Hillaire-Marcel, C., and de Vernal, A. (Eds.), Developments in Marine Geology (Volume 1): Proxies in Late Cenozoic Paleoceanography. Stein, R. (Series Ed.): Amsterdam (Elsevier B.V.), 99–138. https://doi.org/10.1016/S1572-5480(07)01008-1
Tachikawa, K., Cartapanis, O., Vidal, L., Beaufort, L., Barlyaeva, T., and Bard, E., 2011. The precession phase of hydrological variability in the Western Pacific Warm Pool during the past 400 ka. Quaternary Science Reviews, 30(25–26):3716–3727. https://doi.org/10.1016/j.quascirev.2011.09.016
Tachikawa, K., Timmermann, A., Vidal, L., Sonzogni, C., and Timm, O.E., 2013. Southern Hemisphere orbital forcing and its effects on CO2 and tropical Pacific climate. Climate of the Past Discussions, 9(2):1869–1900. https://doi.org/10.5194/cpd-9-1869-2013
Taylor, B., 1979. Bismarck Sea: evolution of a back-arc basin. Geology, 7(4):171–174. https://doi.org/10.1130/0091-7613(1979)7<171:BSEOAB>2.0.CO;2
van Morkhoven, F.P.C.M., Berggren, W.A., Edwards, A.S.,and Oertli, H.J., 1986. Cenozoic cosmopolitan deep-water benthic foraminifera. Bulletin des Centres de Recherches Exploration-Production Elf-Aquitaine, 11.
Weiner, A.K.M., Weinkauf, M.F.G., Kurasawa, A., Darling, K.F., and Kucera, M., 2015. Genetic and morphometric evidence for parallel evolution of the Globigerinella calida morphotype. Marine Micropaleontology, 114:19–35. https://doi.org/10.1016/j.marmicro.2014.10.003
Wilkens, R.H., Westerhold, T., Drury, A.J., Lyle, M., Gorgas, T., and Tian, J., 2017. Revisiting the Ceara Rise, equatorial Atlantic Ocean: isotope stratigraphy of ODP Leg 154. Climate of the Past, 13:779–793. https://doi.org/10.5194/cp-13-779-2017
Zijderveld, J.D.A., 1967. AC demagnetization of rocks: analysis of results. In Collinson, D.W., Creer, K.M., and Runcorn, S.K. (Eds.), Methods in Palaeomagnetism: Amsterdam (Elsevier), 254–286.
1 Rosenthal, Y., Holbourn, A.E., Kulhanek, D.K., Aiello, I.W., Babila, T.L., Bayon, G., Beaufort, L., Bova, S.C., Chun, J.-H., Dang, H., Drury, A.J., Dunkley Jones, T., Eichler, P.P.B., Fernando, A.G.S., Gibson, K.A., Hatfield, R.G., Johnson, D.L., Kumagai, Y., Li, T., Linsley, B.K., Meinicke, N., Mountain, G.S., Opdyke, B.N., Pearson, P.N., Poole, C.R., Ravelo, A.C., Sagawa, T., Schmitt, A., Wurtzel, J.B., Xu, J., Yamamoto, M., and Zhang, Y.G., 2018. Site U1486. In Rosenthal, Y., Holbourn, A.E., Kulhanek, D.K., and the Expedition 363 Scientists, Western Pacific Warm Pool. Proceedings of the International Ocean Discovery Program, 363: College Station, TX (International Ocean Discovery Program). https://doi.org/10.14379/iodp.proc.363.107.2018
2 Expedition 363 Scientists’ addresses.
This work is distributed under the Creative Commons Attribution 4.0 International (CC BY 4.0) license. 
- F1. Northern margin of Papua New Guinea and location of Sites U1484–U1487.
- F2. Bathymetric map and site locations.
- F3. Seismic lines and site locations.
- F4. Hydrographic profiles of temperature, salinity, and dissolved oxygen.
- F5. Lithologic summary.
- F6. Main sedimentary components.
- F7. Biosiliceous sedimentary components.
- F8. Main lithologies.
- F9. Characteristic lithology, color alternations, and subunit boundaries.
- F10. Physical property data.
- F11. Basalt fragments.
- F12. Selected tephra layers.
- F13. Selected pumice samples.
- F14. Lithologies and authigenic minerals.
- F15. Calcareous nannofossils.
- F16. Coiling patterns in Pulleniatina.
- F17. Downhole foraminifer preservation states.
- F18. Age-depth plot.
- F19. Archive-half NRM intensity.
- F20. Discrete sample AF demagnetization results.
- F21. NRM, WRMSL MS, inclination, and declination, Hole U1486B.
- F22. NRM, WRMSL MS, inclination, and declination, Hole U1486C.
- F23. NRM, WRMSL MS, inclination, and declination, Hole U1486D.
- F24. Physical property measurements.
- F25. MAD and WRMSL density, WRMSL MS, NGR, and P-wave velocity overlaid on core photos.
- F26. Discrete and whole-round P-wave velocity.
- F27. Discrete and whole-round P-wave velocity overlaid on core photos.
- F28. MAD dry, bulk, and grain densities and porosity, WRMSL GRA bulk density, and thermal conductivity.
- F29. APCT-3 temperature-time series.
- F30. Heat flow calculations.
- F31. WRMSL MS data.
- F32. Spliced SHMSL L*, NGR, and WRMSL MS and GRA bulk density data.
- F33. Spliced MS data.
- F34. Comparison of mbsf and composite depth scales in the Site U1486 splice.
- F35. Methane, CaCO3, TOC, and TN profiles.
- F36. Interstitial water concentration profiles, Hole U1486A.
- F37. Interstitial water concentration profiles, Hole U1486B.
- T1. Site U1486 core summary.
- T2. Calcareous nannofossil bioevents.
- T3. Distribution of selected calcareous nannofossil species, Hole U1486B.
- T4. Planktonic foraminifer bioevents.
- T5. Pulleniatina coiling count data, Hole U1486B.
- T6. Benthic foraminifer distribution, Hole U1486B.
- T7. Depths of identified reversal boundaries.
- T8. WRMSL GRA bulk density data, Hole U1486A.
- T9. WRMSL GRA bulk density data, Hole U1486B.
- T10. WRMSL GRA bulk density data, Hole U1486C.
- T11. WRMSL GRA bulk density data, Hole U1486D.
- T12. WRMSL MS data, Hole U1486A.
- T13. WRMSL MS data, Hole U1486B.
- T14. WRMSL MS data, Hole U1486C.
- T15. WRMSL MS data, Hole U1486D.
- T16. NGRL data, Hole U1486A.
- T17. NGRL data, Hole U1486B.
- T18. NGRL data, Hole U1486C.
- T19. NGRL data, Hole U1486D.
- T20. WRMSL PWL data, Hole U1486A.
- T21. WRMSL PWL data, Hole U1486B.
- T22. WRMSL PWL data, Hole U1486C.
- T23. WRMSL PWL data, Hole U1486D.
- T24. Affine table.
- T25. Splice intervals.
- T26. Volatile hydrocarbon concentrations.
- T27. Carbon and nitrogen.
- T28. Interstitial water geochemical data.