Rosenthal, Y., Holbourn, A.E., Kulhanek, D.K., and the Expedition 363 Scientists
Proceedings of the International Ocean Discovery Program Volume 363
publications.iodp.org
doi:10.14379/iodp.proc.363.111.2018

Site U14901
Y. Rosenthal, A.E. Holbourn, D.K. Kulhanek, I.W. Aiello, T.L. Babila, G. Bayon, L. Beaufort, S.C. Bova, J.-H. Chun, H. Dang, A.J. Drury, T. Dunkley Jones, P.P.B. Eichler, A.G.S. Fernando, K. Gibson, R.G. Hatfield, D.L. Johnson, Y. Kumagai, T. Li, B.K. Linsley, N. Meinicke, G.S. Mountain, B.N. Opdyke, P.N. Pearson, C.R. Poole, A.C. Ravelo, T. Sagawa, A. Schmitt, J.B. Wurtzel, J. Xu, M. Yamamoto, and Y.G. Zhang2
Keywords: International Ocean Discovery Program, IODP, JOIDES Resolution, Expedition 363, Site U1490, North Eauripik Rise, Pleistocene, Pliocene, Miocene, late Oligocene, Neogene, northern sector Western Pacific Warm Pool, orbital-scale climate variability, carbonate accumulation, color banding, biosilica, chert, stratigraphic intercalibration and cyclostratigraphy, current-controlled bedforms, middle–upper Miocene magnetostratigraphy, high-resolution interstitial water sampling, Last Glacial Maximum ocean density structure, carbonate diagenesis
MS 363-111: Published 8 June 2018
Background and objectives
International Ocean Discovery Program (IODP) Site U1490 (proposed Site WP-02A) is located on the northern edge of the Eauripik Rise at 05°48.95 ʹN, 142°39.27ʹE in 2341 m water depth (Figure F1). The site is situated on seismic Line RR1313-WP2-1, ~3.6 km east of the intersection with seismic Line RR1313-WP2-6 (Figure F2). The seismic profile shows a continuous succession of hemipelagic, carbonate-rich sediment (Figure F3). At Site U1490, horizontally bedded layers continue downsection to ~0.07 s two-way traveltime (TWT) below the seafloor, where reflector geometry shows a dramatic change in depositional processes. From ~3.26 to ~3.60 s TWT, an apparently uninterrupted accumulation of current-controlled mud waves occurred, with the exception of a possible break at 3.27 s TWT (Rosenthal et al., 2016). Other multichannel seismic lines in the survey grid surrounding Site U1490 show these features as well. The wavelengths are ~1 km and oriented southwest–northeast (perpendicular to seismic Line RR1313-WP2-1), with 15–18 m maximum amplitude that gradually decreases upsection, possibly reflecting a several million–year record of current-controlled bedforms (Baldwin et al., 2017).
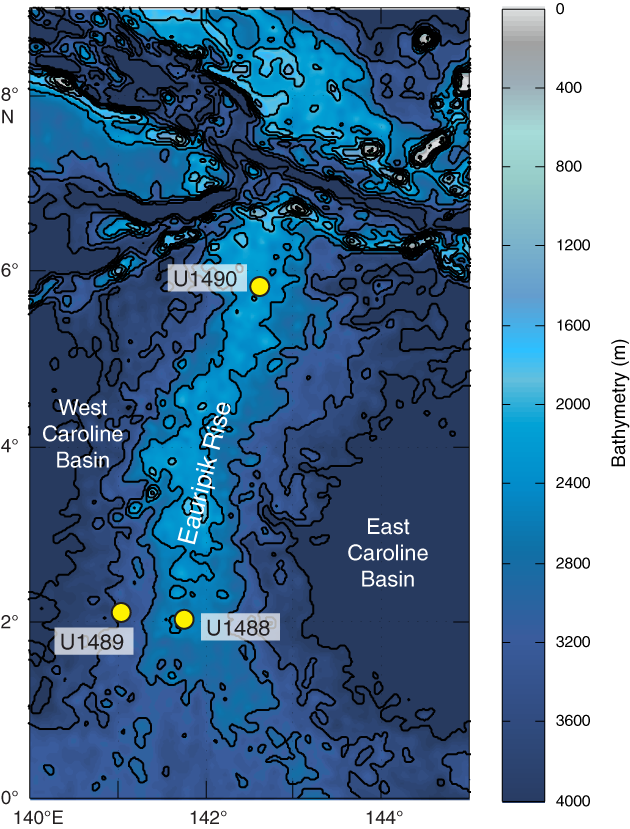
Figure F1. Eauripik Rise and the location of Sites U1488–U1490.
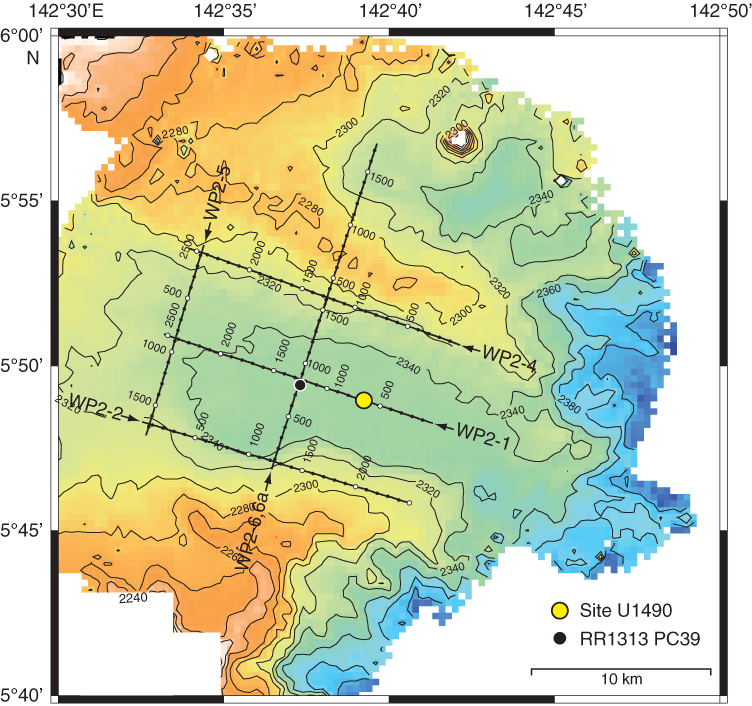
Figure F2. Bathymetric map and site location.
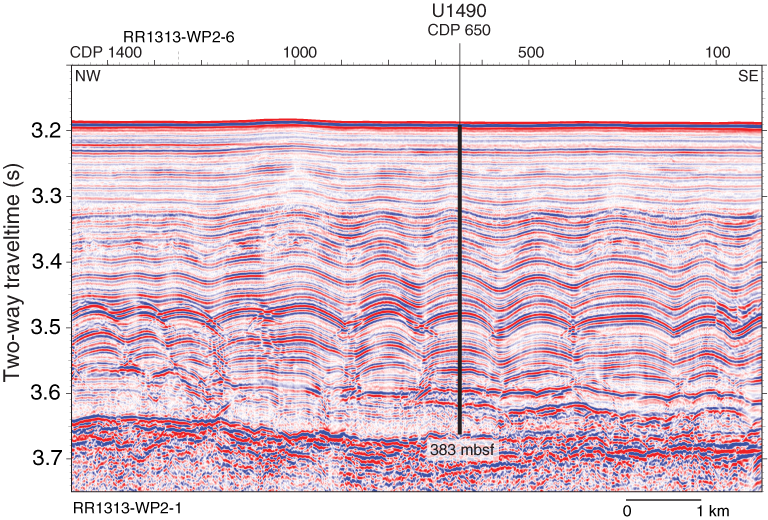
Figure F3. Seismic line and site location.
Site U1490 is located ~431 km north of Site U1488 at the northern end of the Eauripik Rise, where it terminates in a tectonically complex region that includes the Sorol Fault, Sorol Trough, and Caroline Ridge (Hegarty and Weissel, 1988). The roughly north-south–trending Eauripik Rise is an ~250 km wide aseismic ridge that rises ~1–2 km above the surrounding seafloor and separates the East and West Caroline Basins. Magnetic anomalies C13–C9 in both basins show that ocean crust formed along roughly east–west spreading centers from the Eocene until the late Oligocene. Offsets in these anomalies and the lack of magnetic lineations beneath the Eauripik Rise support the interpretation that it formed as a result of excess submarine volcanism along a leaky north–south transform fault (Hegarty and Weissel, 1988.) An alternative interpretation attributes the formation of the Eauripik Rise to the northward passage of a mantle hotspot that contributed to the tectonically and structurally complex region surrounding the Sorol Trough (Bracey, 1975).
Site U1490 is located ~6° north of the Equator and is therefore suitable for reconstructing the hydrographic history of the northern part of the Western Pacific Warm Pool (WPWP). The comparatively low sedimentation rate at this site (~1 cm/ky) will be used along with the record from Site U1488 to reconstruct the evolution of the WPWP since the Miocene. At ~2300 meters below sea level (mbsl), the site is bathed by modified Upper Circumpolar Deepwater and therefore may be used to monitor past changes in this water mass (Figure F4).
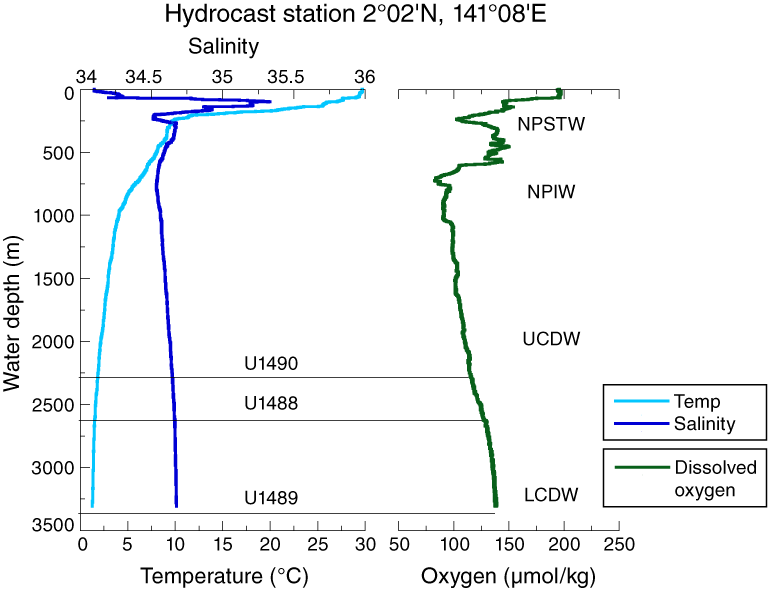
Figure F4. Hydrographic temperature, salinity, and dissolved oxygen profiles.
Operations
Transit to Site U1490
The 242.0 nmi transit to Site U1490 was completed in 21.75 h at an average speed of 11.1 kt. We lowered the thrusters and switched to dynamic positioning mode at 0000 h (all times local ship time; UTC + 10 h) on 1 December 2016. After arriving on site, we deployed a positioning beacon at 0040 h before commencing coring operations.
Operations summary
The original operations plan at Site U1490 called for two advanced piston corer (APC) holes to 250 meters below seafloor (mbsf) and a third APC hole to 150 mbsf. With ~2 days of contingency remaining, we opted to deepen Hole U1490A to extended core barrel (XCB) refusal (382.8 mbsf), core Hole U1490B to half-length advanced piston corer (HLAPC) refusal (292.9 mbsf), and then use the remaining time to core as deeply as possible in Hole U1490C (170.0 mbsf) (Table T1).
Table T1. Site U1490 core summary. Download table in CSV format. View PDF table.
Hole U1490A was cored to 251.2 mbsf (Cores 1H through 27H) with the APC using orientation and nonmagnetic hardware. Downhole formation temperature measurements using the advanced piston corer temperature tool (APCT-3) were taken on Cores 4H (32.7 mbsf), 7H (61.2 mbsf), 10H (89.7 mbsf), 13H (118.2 mbsf), and 16H (146.7 mbsf), with some movement detected on two of the runs (Cores 4H and 10H). Cores 25H through 27H experienced excessive overpull and required drillover to extract them from the formation, indicating APC refusal. We switched to the HLAPC system and continued coring to 270.0 mbsf (Cores 28F through 31F), where excessive overpull and drillover indicated HLAPC refusal. We then cored with the XCB to 376.7 mbsf (Cores 32X through 42X). While cutting Core 43X, the rate of penetration slowed dramatically, so we retrieved the core after only a 5.6 m advance. The XCB system showed extensive wear, and a small amount of chert was recovered in the bottom of the core. Core 44X advanced only 0.5 m over 45 min, so we terminated coring at 382.8 mbsf. No core was recovered, and the XCB cutting shoe had lost all of its carbide teeth. We collected 367.35 m of core over 382.8 m of coring (96% recovery) in Hole U1490A.
Hole U1490B was cored with the APC system using orientation and nonmagnetic hardware to 228.0 mbsf (Cores 1H through 25H). Core 25H required drillover to extract it from the formation, and the core liner had to be pumped out of the core barrel. We switched to the HLAPC and continued to core to 262.9 mbsf (Cores 26F through 33F). We terminated coring in Hole U1490B when Core 33F required drillover. We retrieved 267.60 m of core over 258.9 m of coring (103% recovery) in Hole U1490B.
Hole U1490C was cored with the APC system using orientation and nonmagnetic hardware to 170 mbsf (Cores 1H through 20H). Coring was terminated when a ground fault was detected in the top drive motor that could not be repaired within the amount of time remaining for coring operations (~18 h). The drill bit was pulled clear of the seafloor at 1017 h on 5 December 2016 and retrieved to the rig floor. The vessel was secured for transit, and we departed for Guam at 0542 h on 6 December, ending operations at Site U1490.
A total of 125.75 h (5.2 days) was spent at Site U1490. We collected 69 APC cores, recovering 662.07 m of core over 641.2 m of coring (103.3% recovery) and 11 HLAPC cores, retrieving 53.7 m of core over 51.7 m of coring (103.9% recovery). We also collected 13 XCB cores, recovering 87.42 m of core over 112.8 m of coring (77.5% recovery). Overall core recovery for Site U1490 was 803.19 m of sediment over 805.7 m of coring (99.8% recovery).
Hole U1490A
We prepared and spaced out the bottom-hole assembly (BHA), which consisted of an APC/XCB coring assembly with two stands of drill collars. The seafloor depth was measured at 2352.4 m below rig floor (mbrf) with the precision depth recorder, and we positioned the bit at 2347.0 mbrf to shoot the first core. Hole U1490A was spudded at 0655 h on 1 December 2016. Core 1H recovered 4.23 m of sediment, establishing a seafloor depth of 2341.0 mbsl. Oriented APC coring using the Icefield MI-5 core orientation tool with nonmagnetic hardware continued to 251.2 mbsf (Cores 1H through 27H). Downhole formation temperature measurements using the APCT-3 were taken on Cores 4H (32.7 mbsf), 7H (61.2 mbsf), 10H (89.7 mbsf), 13H (118.2 mbsf), and 16H (146.7 mbsf), with some movement detected on two of the runs (Cores 4H and 10H). Coring proceeded very smoothly with no core liner issues. Excessive overpull was encountered on Cores 25H through 27H, requiring drillover to extract them from the formation and indicating APC refusal. We switched to the HLAPC and cored to 270.0 mbsf (Cores 28F through 31F). Core 31F also had excessive overpull, requiring drillover and indicating HLAPC refusal.
We then switched to the XCB and cored to 382.8 mbsf (Cores 32X through 44X). While cutting Core 43X, the rate of penetration slowed dramatically, so we retrieved the core after only a 5.6 m advance. The XCB showed extensive wear, and a small amount of chert was recovered in the bottom of the core. Core 44X advanced only 0.5 m over 45 min, so we terminated coring. No sediment was recovered in the core, and the XCB cutting shoe had lost all of its carbide teeth. The drill string was pulled out of the hole, with the bit clearing the seafloor at 0255 h on 3 December, ending operations in Hole U1490A. Total time spent in the hole was 51.0 h (2.1 days).
A total of 27 APC cores were taken in Hole U1490A, recovering 260.71 m of sediment over 251.2 m of coring (103.8% recovery). We collected 4 HLAPC cores, recovering 19.22 m of sediment over 18.8 m of coring (102.2% recovery). We also collected 13 XCB cores, recovering 87.42 m of sediment over 112.8 m of coring (77.5% recovery). Total recovery for Hole U1490A was 367.35 m of sediment over 382.8 m of coring (96.0% recovery).
Hole U1490B
The vessel was offset 20 m east of Hole U1490A, and the drill string was spaced out with the bit at 2349.0 mbrf. Hole U1490B was spudded at 0425 h on 3 December 2016, with Core 1H recovering 7.51 m of sediment, establishing a seafloor depth of 2339.7 mbsl. Oriented APC coring using the Icefield MI-5 core orientation tool with nonmagnetic hardware continued to 228.0 mbsf (Cores 1H through 25H). We also completed one 2 m drilled interval for stratigraphic correlation purposes. The shear pins failed prematurely while collecting Core 20H, and the liner of Core 22H was twisted and split throughout. Cores 24H and 25H both had excessive overpull and required drillover to extract them from the formation. Core 25H also had to be pumped out of the core barrel. We then switched to the HLAPC and continued coring to 262.9 mbsf (Cores 26F through 33F). Core 26F had excessive overpull and required drillover; however, we had no trouble extracting the next core from the formation, so we continued coring. Excessive overpull on Core 33F indicated HLAPC refusal, so we terminated coring in Hole U1490B. Total time spent in the hole was 31.75 h (1.3 days).
A total of 24 APC cores were taken in Hole U1490B, recovering 233.12 m of sediment over 226.0 m of coring (103.2% recovery). We also collected 7 HLAPC cores, recovering 34.48 m of sediment over 32.9 m of coring (104.8% recovery). Two drilled intervals advanced the hole 4 m without coring. Overall recovery was 267.60 m of sediment over 258.9 m of coring (103.4% recovery).
Hole U1490C
The vessel was offset 20 m south of Hole U1490B, and the drill string was spaced out with the bit at 2344.0 mbrf. The first coring run came back with no recovery, so the bit was lowered to 2345.5 mbrf for the second spud attempt. Hole U1490C was spudded at 1250 h on 4 December 2016, with Core 1H recovering 2.50 m of sediment, establishing a seafloor depth of 2341.3 mbsl. Oriented APC coring using the Icefield MI-5 core orientation tool with nonmagnetic hardware continued to 170.0 mbsf (Cores 1H through 20H). Core 18H had a split core liner.
At 0315 h on 5 December, the electrical department informed the rig crew of a ground fault detected in the top drive motor. The bit was raised to 131.9 mbsf so that the electricians could troubleshoot the problem. At 0730 h, the electricians determined that the motor could not be repaired in the time remaining for the expedition. The bit was pulled out of the hole and cleared the seafloor at 1017 h on 5 December; it was retrieved to the vessel, clearing the rotary table at 1655 h. The rig crew used the remaining time on site (~12.5 h) to prepare the top drive for repair in the upcoming Guam port call. The vessel was secured for transit and departed for Guam at 0542 h on 6 December, ending Hole U1490C and Site U1490. Total time spent in Hole U1490C was 43.0 h (1.8 days).
A total of 18 APC cores were taken in Hole U1490C, recovering 168.24 m of sediment over 164.0 m of coring for a total recovery of 102.6%. Two drilled intervals of 3 m each advanced the hole without coring.
Transit to Guam
The 485 nmi transit from Site U1490 to Guam was completed in 49.0 h at an average speed of 9.9 kt. The pilot boarded the vessel at 0600 h on 8 December 2016. Expedition 363 ended with the first line ashore at the Port of Guam at 0648 h.
Core description
A total of three holes were cored at Site U1490, with the deepest hole penetrating to 382.8 mbsf (Hole U1490A). The cores recovered at this site represent a sequence of upper Oligocene to recent sediment that contains calcareous microfossils (mainly nannofossils and foraminifers), siliceous microfossils (radiolarians, diatoms, and sponge spicules), clay minerals, and volcanic ash. Based on variations in the vertical distribution and relative abundance of these major components identified by a combination of visual core description, microscopic examination of smear slides, scanning electron microscopy, magnetic susceptibility, natural gamma radiation (NGR), and color reflectance (see Core description and Physical properties in the Expedition 363 methods chapter [Rosenthal et al., 2018a]), we divided the lithology of this site into three subunits (Figure F5). Subunit IA (~185 m thick) includes a sequence of upper Miocene to recent foraminifer-rich nannofossil ooze with variable but generally low amounts of clay. Coarser, decimeter-thick layers dominated by foraminifer ooze are also present. In Subunit IB (late early to early late Miocene; ~78 m thick), clay minerals become a significant component of the sediment, and their abundance increases downhole. The primary lithology in Subunit IB is clay-rich foraminifer-nannofossil ooze. Biosilica (mainly sponge spicules and radiolarians) is also one of the sediment constituents of this subunit. Subunit IC is ~124 m thick and was deposited during the late Oligocene to the middle Miocene. The uppermost ~10 m of the subunit is composed of greenish radiolarian-rich nannofossil ooze, whereas the remainder of the subunit is radiolarian-rich chalk. Discrete dark gray to black partially indurated layers and nodules and indurated siliceous rock fragments (chert) are exclusively found in this subunit. The number, thickness, and degree of induration of these layers increase downhole. Siliceous particles, either volcanic glass and/or biosilica (radiolarians, sponge spicules, and diatoms) are the dominant lithologic component of these layers, although calcareous components are also occasionally present.
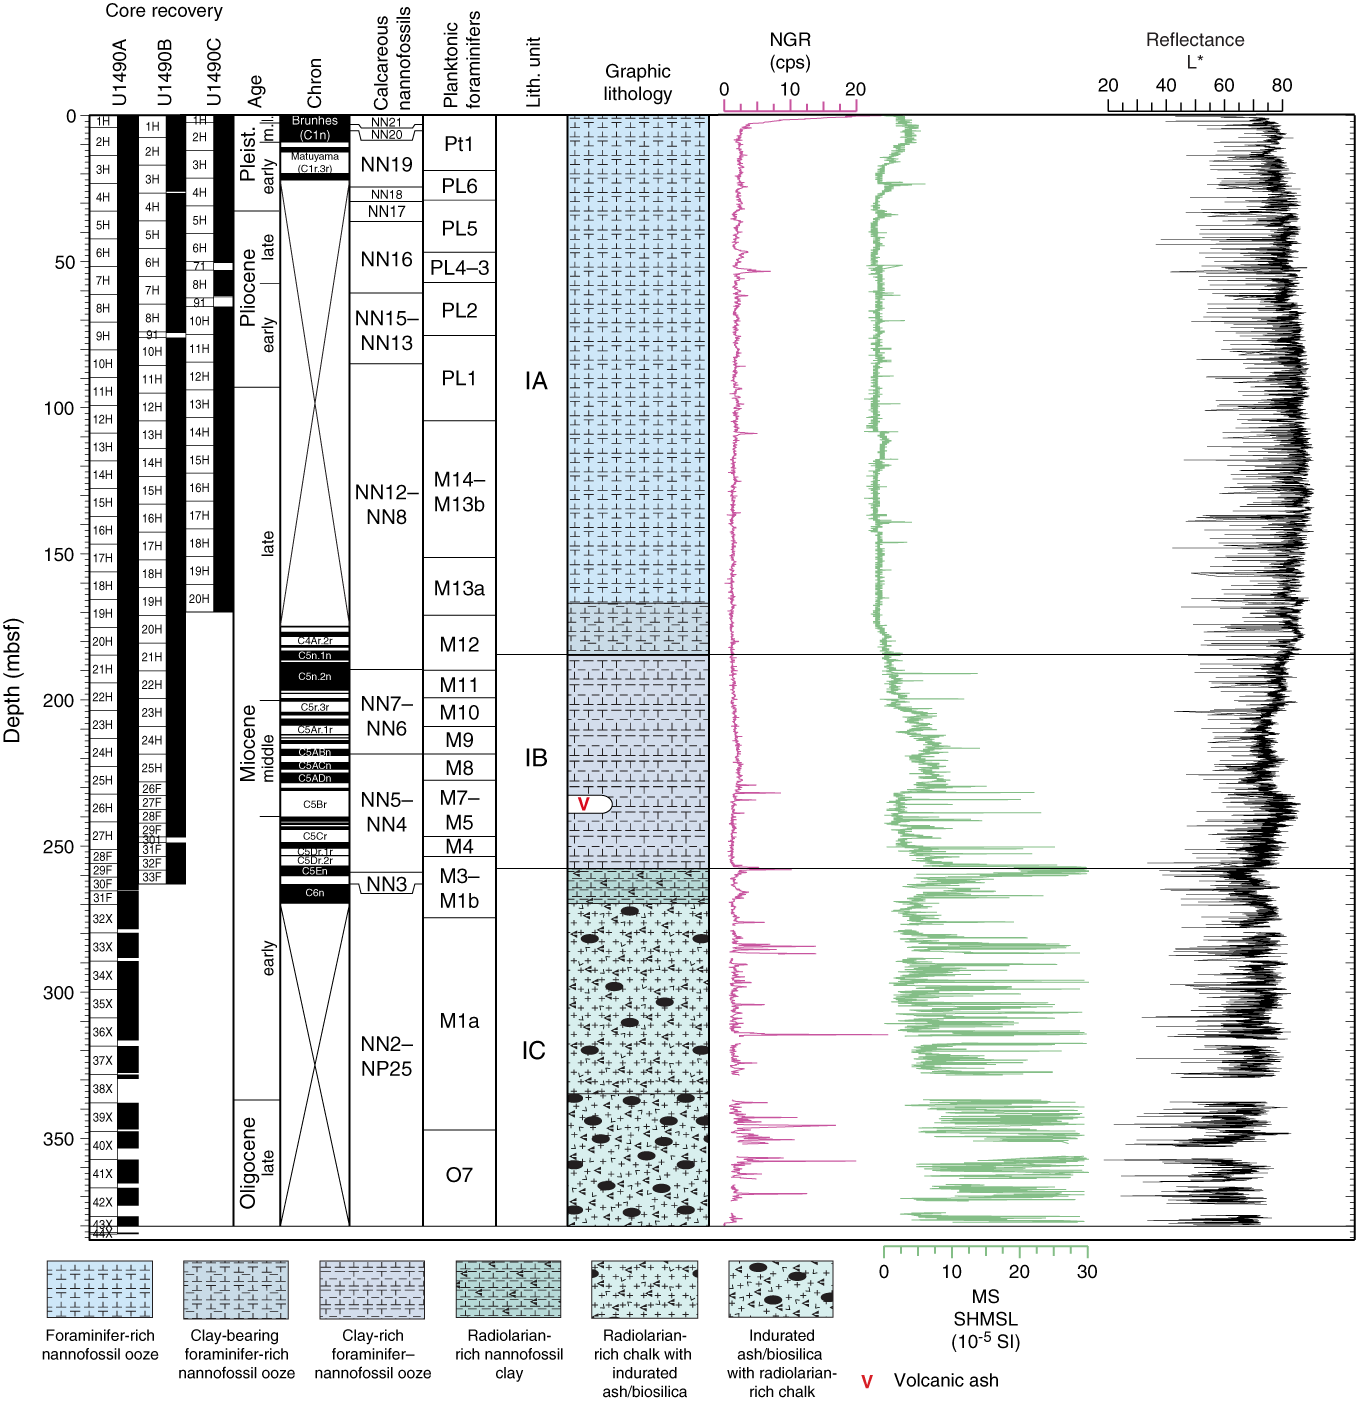
Figure F5. Lithologic summary.
Unit description
Unit I
- Intervals: 363-U1490A-1H-1, 0 cm, through 43X-CC, 23 cm; 363-U1490B-1H-1, 0 cm, through, 33F-CC, 19 cm; 363-U1490C-1H-1, 0 cm, through 20H-CC, 19 cm
- Depths: Hole U1490A = 0–380.19 mbsf, Hole U1490B = 0–263.11 mbsf, Hole U1490C = 0–170.15 mbsf
- Thickness: Hole U1490A = 380.19 m, Hole U1490B = 263.11 m, Hole U1490C = 170.15 m
- Age: late Oligocene to recent
- Lithology: foraminifer-rich nannofossil ooze, foraminifer-nannofossil ooze, radiolarian-rich nannofossil ooze, ash-rich nannofossil ooze, radiolarian- and foraminifer-rich ash, ash, radiolarian-rich chalk, and chert
Unit I is composed of ~380 m of mainly calcareous (nannofossils and foraminifers) and secondary biosiliceous (radiolarians, diatoms, and sponge spicules) sediment, clay minerals, volcanic ash, and chert. The secondary components increase in abundance downhole from the middle to the bottom of the site. Downhole variability of the lithologic components together with changes in physical properties (see below) were used to divide Unit I into three subunits (Figure F5). Subunit IA is mainly very light colored, moderately bioturbated foraminifer-rich nannofossil ooze in which the content of clay minerals is generally low (<15%) or absent. Although nannofossils are the dominant biogenic carbonate component of the main lithology and foraminifers are only secondary, foraminifer ooze is concentrated in coarser grained layers, which occur at a frequency of ~1 or 2 per core. In Subunit IB, biogenic carbonate (foraminifers and nannofossils) is also the main sedimentary component, but clay minerals become more abundant. Biosilica (mainly radiolarians but also diatoms and sponge spicules) is also more abundant in this subunit. The uppermost ~10 m of Subunit IC is marked by a significant increase in biosilica, and the lithology is greenish radiolarian-rich nannofossil ooze. The radiolarian content remains essentially constant through the remainder of the subunit, although the sediment is firmer and can be scratched with a fingernail (radiolarian-rich chalk). Harder, semi-indurated to indurated, partially to completely recrystallized (chert) gray to black layers and nodules are a typical feature of this subunit. The layers occur less frequently at the very top of the subunit and become more frequent downhole. At the very bottom of the recovered sequence, the layers become the dominant component, and chert layers and fragments are common. These darker indurated lithologies are mainly composed of siliceous particles, either in the form of volcanic glass and/or radiolarians, sponge spicules, and diatoms.
Changes in the proportion of biogenic carbonate in relation to the other noncarbonate components are reflected by changes in physical properties, as shown in Figure F5 (see Physical properties). The color reflectance parameter L* has the highest range (between ~70% and 80%) in Subunit IA and decreases downhole in Subunits IB and IC associated with a relative increase in clay mineral and biosilica content. The minor yet significant lithologic change from Subunit IA to IB is visible in both the magnetic susceptibility and L* values, which increase and decrease, respectively. NGR as well as L* and magnetic susceptibility show the largest amplitude in Subunit IC. All of the prominent peaks coincide with the occurrence of dark indurated layers that contain ash and occasionally biosilica.
Subunit IA
- Intervals: 363-U1490A-1H-1, 0 cm, through 20H-4, 83 cm; 363-U1490B-1H-1, 0 cm, through 21H-2, 33 cm; 363-U1490C-1H-1, 0 cm, through 20H-CC, 19 cm
- Depths: Hole U1490A = 0–180.53 mbsf, Hole U1490B = 0–182.33 mbsf, Hole U1490C = 0–170.15 mbsf (total depth)
- Thickness: Hole U1490A = 180.53 m, Hole U1490B = 182.33 m, Hole U1490C = 170.15 m (minimum thickness)
- Age: late Miocene to recent
- Lithology: foraminifer-rich nannofossil ooze, foraminifer-nannofossil ooze, foraminifer ooze, and clay-bearing foraminifer-rich nannofossil ooze
The uppermost ~20 cm of Subunit IA below the mudline is reddish (7.5Y 7/2) foraminifer ooze. Below this interval, the upper ~14.5 m of sediment is very pale brown (10Y 8/2) foraminifer-rich nannofossil ooze, which transitions downhole into white (N 8) to light greenish gray (N 8.5) foraminifer-rich nannofossil ooze (Figure F6A). Smear slide analysis shows that some of the intervals have slightly higher abundances of clay (clay bearing). However, apart from the bottom of the subunit (see below), clay minerals generally occur only in trace amounts. Most of the sediment shows moderate bioturbation. Faint green, purple, and brown subhorizontal bands and mottles that are a few centimeters thick are common. Smear slide petrography does not indicate any major change in the relative proportion of the sedimentary components at the depths where these features occur. However, small-scale displacements by microfaults and slight differences in surface texture were observed in relation to the presence of the color bands, suggesting a primary (depositional) origin at least for some of these structures. The color changes are perhaps diagenetic features caused by subtle differences in redox conditions reflecting small differences in composition. Similar color banding was observed at the other Eauripik Rise sites (see Core description in the Site U1488 chapter and Core description in the Site U1489 chapter [Rosenthal et al., 2018e, 2018f). Coarser layers mainly composed of foraminifer ooze were observed in the majority of the cores retrieved within this interval (Figure F7). The foraminifer ooze layers range in thickness from a few centimeters to >50 cm, and the texture of the sediment is clearly coarser than the background sedimentation, with foraminifer tests ranging in size from medium sand to very fine silt size. These coarser intervals were wetter and slightly darker than the background sediment (2.5Y 8/2). Several of the foraminifer ooze layers show a clear, sharp, often undulated basal contact and a gradational top characterized by a progressive decrease in grain size and increasing abundance of the background sediment (Figure F7).
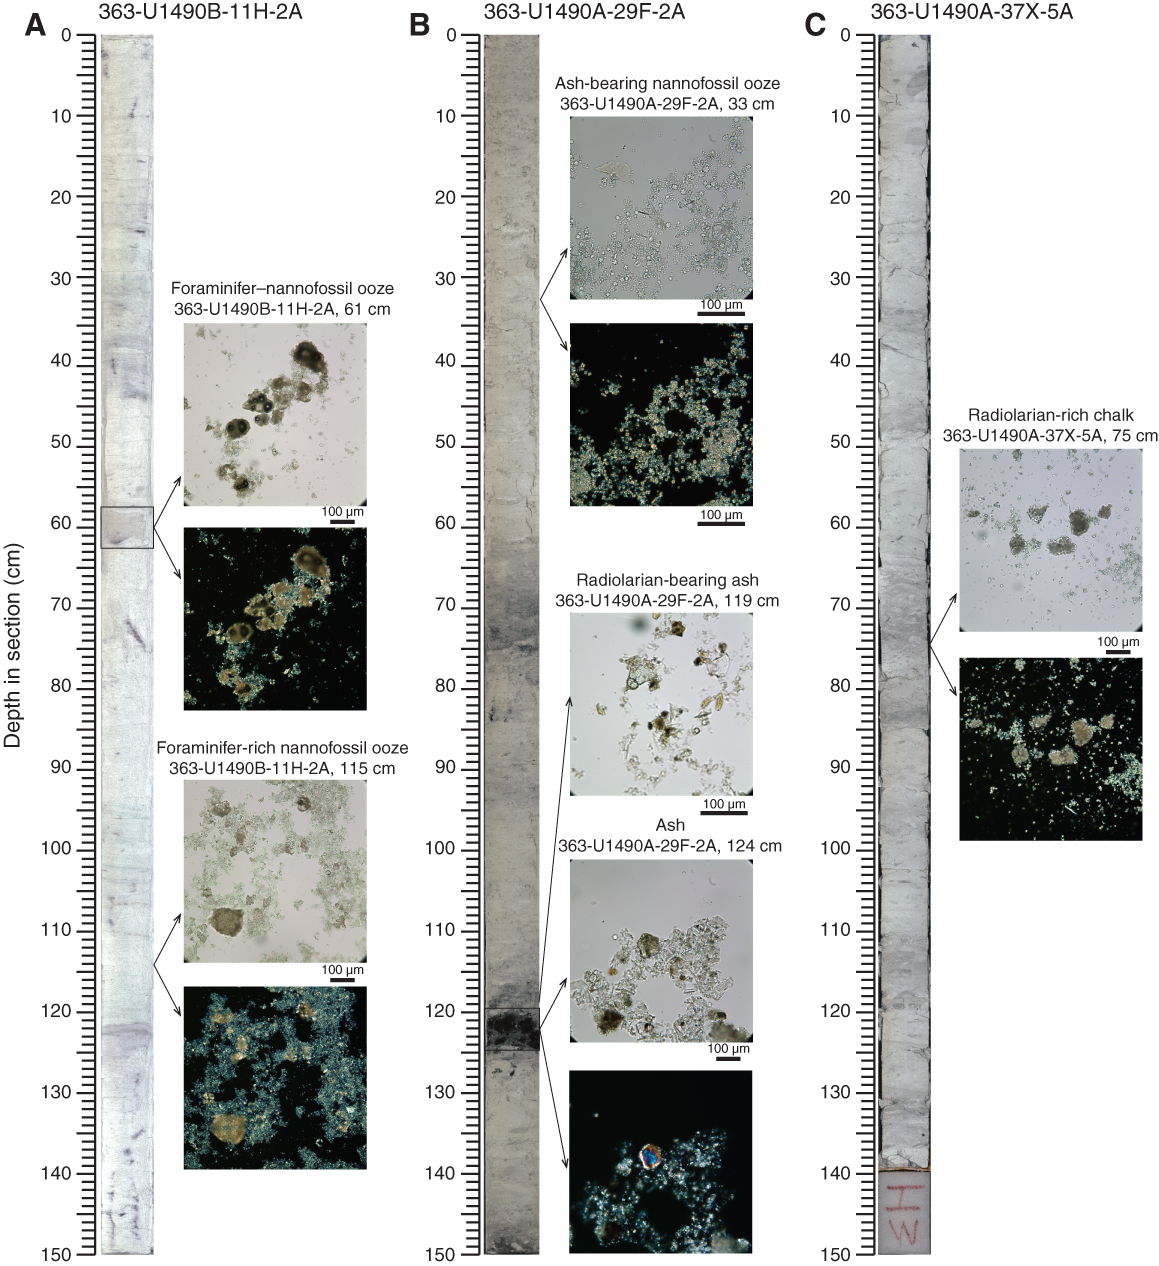
Figure F6. Main lithologies.
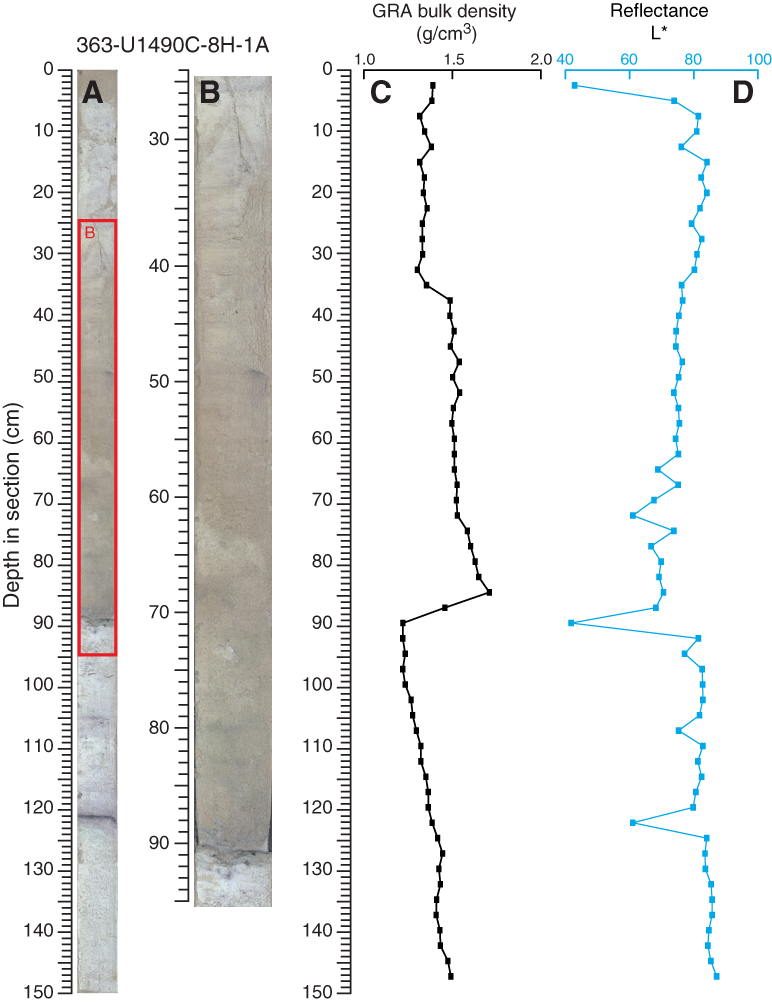
Figure F7. Foraminifer ooze.
Scoria is present at the top of the site (e.g., Sections 363-U1490A-1H-2 and 1H-3) and deeper within Subunit IA (e.g., 147.9 mbsf; interval 16H-1, 115 cm). Scattered sulfide nodules and streaks are also present throughout this subunit. Microfaults and small-scale deformation occur at ~143 mbsf (Sections 16H-5 and 16H-6).
The clay mineral content increases in the lowermost ~15 m of Subunit IA. The boundary with Subunit IB is placed at the top of a dark, ~7 cm thick layer (Figure F8A, F8B) characterized by higher clay and sulfide content. Below this depth, increasing clay content is marked by decreasing L* and increasing magnetic susceptibility (Figure F5). The boundary is located at intervals 363-U1490A-20H-4, 83 cm (180.53 mbsf), and 363-U1490B-21H-2, 33 cm (182.33 mbsf).
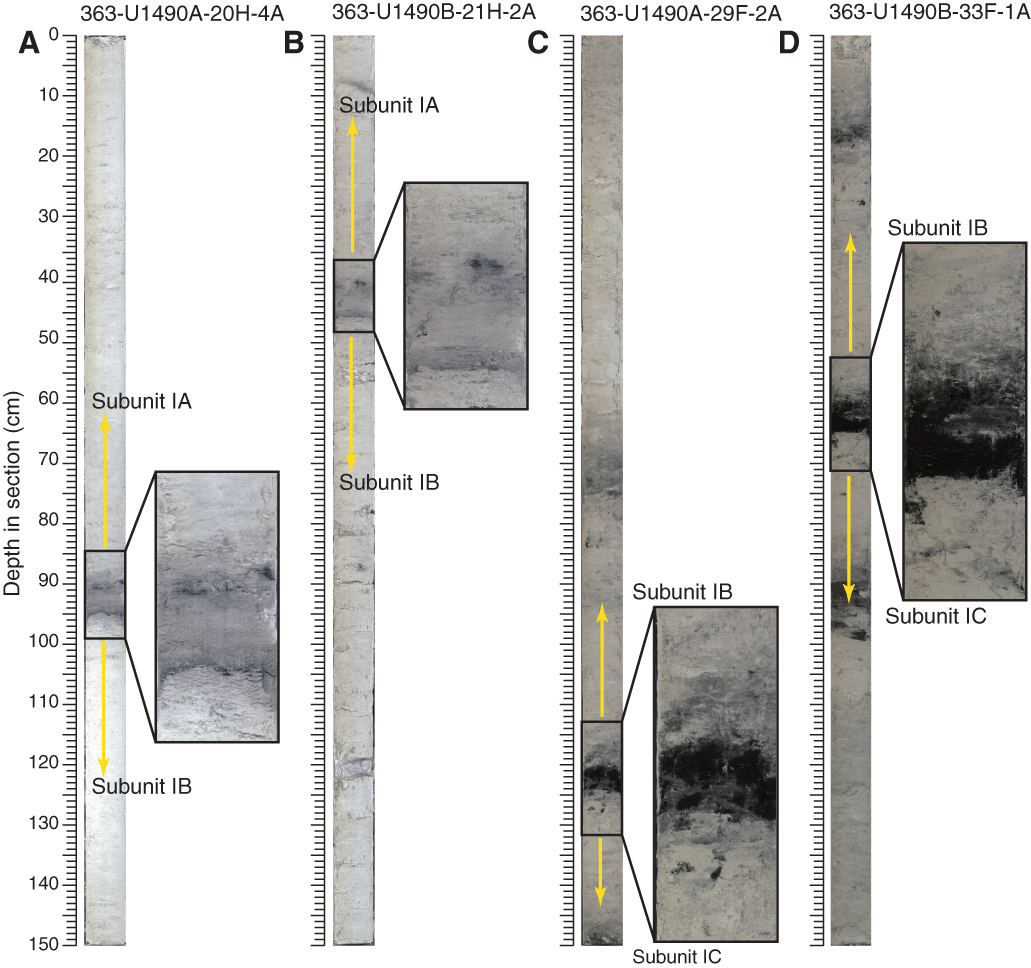
Figure F8. Boundaries between subunits.
Subunit IB
- Intervals: 363-U1490A-20H-4, 83 cm, through 29F-2, 125 cm; 363-U1490B-21H-2, 33 cm, through 33F-1, 65 cm.
- Depths: Hole U1490A = 180.53–258.65 mbsf, Hole U1490B = 182.33–258.85 mbsf
- Thickness: Hole U1490A = 78.12 m, Hole U1490B = 76.52 m
- Age: late early to early late Miocene
- Lithology: clay-rich foraminifer-rich nannofossil ooze and ash
The main lithology in Subunit IB is white (N 8.5 to 9) clay-rich foraminifer-rich nannofossil ooze (Figure F6B). The faintly colored bands and mottles characteristic of the previous subunit are less frequent in the upper ~45 m of this subunit. Bioturbation is moderate to heavy, and most of the sediment displays a homogeneous texture. The lower portion of the subunit is less homogeneous and displays color banding and lamination. The laminae are distinct, green, and up to a few centimeters thick. The green coloration is likely due to the presence of green-colored clay minerals and/or chlorite (because of time limitations, XRD analysis was not performed). Ash layers a few centimeters thick were also observed in the lower part of the subunit, especially between ~230 and ~240 mbsf (e.g., Core 363-U1490A-26H contains four distinct ash layers). The appearance of ash layers corresponds to the first prominent peaks in magnetic susceptibility (Figure F5).
Although the biosilica content is generally low (<15%), smear slide analysis shows that sponge spicules and radiolarians are often concentrated in mottles and thin layers. Sulfides are less abundant than in the previous subunit, and a pumice clast was found at interval 363-U1490A-24H-3, 120 cm.
The boundary with the underlying Subunit IC is very distinctive, marked by the first appearance of a black, 7 cm thick, partially indurated ash layer (Figure F9A) at intervals 363-U1490A-29F-2, 125 cm (258.65 mbsf), and 363-U1490B-33F-1, 65 cm (258.85 mbsf), below which the sediment is stiffer and shows a sharp increase in biosilica (Figure F8C, F8D).

Figure F9. Tephra layers.
Subunit IC
- Intervals: 363-U1490A-29F-2, 125 cm, through 43X-CC, 23 cm; 363-U1490B-33F-1, 65 cm, through 33F-CC, 19 cm
- Depths: Hole U1490A = 258.65–380.19 mbsf (total depth), Hole U1490B = 258.85–263.11 mbsf (total depth)
- Thickness: Hole U1490A = 121.54 m, Hole U1490B = 4.26 m
- Age: late Oligocene to late early Miocene
- Lithology: radiolarian-rich nannofossil clay, radiolarian-rich chalk, ash, and chert
In contrast with the previous two subunits, biogenic silica (mainly radiolarians but also sponge spicules and diatoms) and ash are abundant in Subunit IC. The sediment is also more indurated and recrystallized toward the bottom. The main lithology of Subunit IC is radiolarian-rich chalk (Figure F6C). The uppermost ~10 m of the subunit is mainly composed of a stiff, light greenish gray to greenish gray (10Y 7/1 and 10Y 6/1) radiolarian-rich clay. Below this greener interval, the sediment is white (5Y 8/1) and more indurated.
Indurated, partially recrystallized, and completely recrystallized gray to black layers and nodules increase in abundance downhole and are typical features of this subunit. These darker indurated lithologies are mainly composed of volcanic glass but occasionally include biosiliceous components such as radiolarians, sponge spicules, and diatoms (Figure F10). The tephra layers consist of vesicular glass fragments, weathered microscoria, and mixtures of shards and glass fragments varying from 1 to 29 cm in thickness (Figures F9, F11). Some of the tephra layers also contain clay minerals and biogenic carbonate. Higher magnetic susceptibility and lower L* are observed at the same depths as the black layers and reflect the dark color and higher content of volcanogenic particles (Figure F5). Some of the dark layers also correspond to NGR peaks, although it is not clear whether this indicates higher clay mineral content or the presence of naturally radioactive elements in the ash (e.g., potassium).

Figure F10. Characteristic lithology.
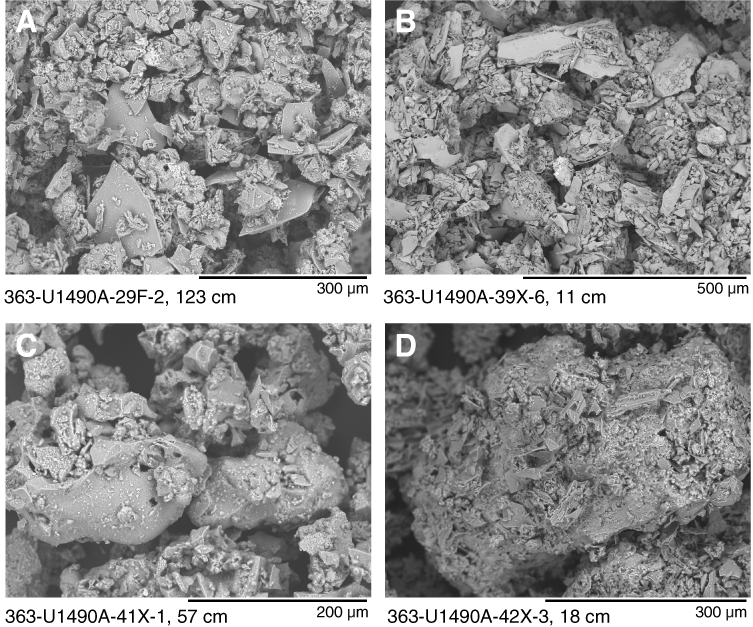
Figure F11. Selected ash layers.
Smear slide petrography shows that although some of the dark layers are entirely composed of volcanic ash, others include a mix of ash and biogenic particles, with the latter suggesting bioturbation and mixing of ash with the background sediment (Figure F10). The degree of induration and recrystallization of the dark layers and nodules becomes progressively higher downhole. Some layers are hard and semitranslucent and show conchoidal fracturing, all characteristics typical of chert. The degree of recrystallization, the luster, and the conchoidal fracturing suggest that the dark, silica-rich layers experienced silica diagenesis from amorphous silica (opal-A) to either cristobalite-tridymite (opal-CT) or quartz. However, we could not identify mineralogic phases during shipboard core description.
Discussion
Site U1490, located in the northern part of the Caroline Sea on the Eauripik Rise, records a complex and extended (late Oligocene to recent) history of sedimentation that can preliminarily be interpreted based on the shipboard analyses. The presence of ash layers in Subunit IC and in the lowermost part of Subunit IB indicates that the input of pyroclastic material impacted the region over ~10 My, from the late Oligocene to the early Miocene. However, further work is required to identify the source(s) of the volcanogenic component and to establish the relationships between the pyroclastic input and regional tectonics.
According to the shipboard age model (see Biostratigraphy and Paleomagnetism), the radiolarian-rich chalk with indurated ash that characterizes Subunit IC below ~270 mbsf was deposited more rapidly than the other subunits (sedimentation rate varies between 3.7 and 4.7 cm/ky). Given the centimeter-scale thickness of the ash layers and the small amount of volcanic ash present in the background sediment, the higher sedimentation rate is probably not directly related to the addition of ash (as suggested for Subunit IC at Sites U1486 and U1487; see Core description in the Site U1486 chapter and Core description in the Site U1487 chapter [Rosenthal et al., 2018c, 2018d]). The increase in sedimentation rates could be due to either higher productivity or enhanced preservation of the biogenic material. Considering the poor preservation of foraminifers and coccoliths (see Biostratigraphy), the former interpretation seems more likely. The presence of biosilica (radiolarians and diatoms) in this interval supports an increase in productivity as the driver of higher sedimentation rates. However, it cannot be ruled out that the biogenic-rich intervals are due to preferential preservation of biosilica resulting from the presence of volcanic ash, which provides a source for dissolved silica to the interstitial water.
The uppermost part of Subunit IC (radiolarian-rich nannofossil clay between ~270 and 258 mbsf) and the whole of Subunit IB (clay-rich foraminifer-nannofossil ooze) record ~9 My of sediment deposition compressed into ~85 m. The sediment in this interval is characterized by higher clay mineral content. Biosilica and volcanic ash are abundant in the upper part of Subunit IC, become progressively less abundant in Subunit IB, and are rare above ~232 mbsf. In contrast to the older part of the record, the middle Miocene interval of low sedimentation and higher clay content possibly reflects a substantial drop in primary productivity and biogenic export to the seafloor or an increase in the dissolution of the calcareous component. The good preservation of foraminifers and moderate preservation of nannofossils within this interval (see Biostratigraphy) support the former interpretation.
Overall, the lithologic composition of Subunits IA and IB at Site U1490 is similar to that of Sites U1488 and U1489 on the Eauripik Rise, located at 2604 and 3421 m water depths, respectively. At all Eauripik Rise sites, the upper Miocene to recent interval is characterized by similar dominant lithologies: moderately bioturbated, white foraminifer-rich nannofossil ooze with faint purple and green laminae. However, at Sites U1488 and U1489 we found higher abundances of clay minerals and sulfides in the Pleistocene than at Site U1490. Also, Site U1490 shows higher concentrations of biosilica in the lower middle Miocene than the coeval interval at the deeper water Site U1489. Finally, the upper Miocene record at Site U1490 does not contain the multiple and extensive intervals of soft-sediment deformation observed at Site U1489. It is worth noting that nannofossil ooze turns into chalk at very similar depths below the seafloor at both Sites U1489 and U1490 (~270–280 mbsf) suggesting that carbonate diagenesis is ultimately a depth-controlled process in this region.
Biostratigraphy
Coring at Site U1490 recovered an ~381 m thick sequence of upper Oligocene to Pleistocene foraminifer-rich nannofossil ooze, foraminifer- and radiolarian-rich nannofossil clay, and indurated ash with radiolarian-rich chalk (see Core description). Nannofossils and planktonic foraminifers are present throughout the succession. Foraminifer preservation is very good to good for most of the succession, becoming moderate to poor below the ooze to chalk transition at ~270 mbsf. Calcareous nannofossil preservation is good in the upper 50 mbsf, moderate between 50 and 340 mbsf, and approaches poor below 340 mbsf. Micropaleontological results from each fossil group (calcareous nannofossils, planktonic foraminifers, and benthic foraminifers) are presented in the sections below, followed by detailed characterization of both benthic and planktonic foraminifer preservation state using shipboard scanning electron microscope (SEM) observations. An integrated bio- and magnetostratigraphy is presented in the final section. Shipboard taxon occurrence data are available for download from the IODP Laboratory Information Management System (LIMS) database (http://web.iodp.tamu.edu/LORE/).
Calcareous nannofossils
Calcareous nannofossil biostratigraphy is based primarily on core catcher samples from Hole U1490A. In some cases two or three samples per core were taken from the split core sections to refine the position of biohorizons but further analysis was limited by end of expedition time constraints. Depth positions and age estimates of biohorizons are given in Table T2. Observations were undertaken using plane- (PPL), cross- (XPL), and circular-polarized light (CPL).
Table T2. Calcareous nannofossil bioevents. Download table in CSV format.
At Site U1490, the preservation of calcareous nannofossils is generally good, becoming moderate deeper than 61 mbsf. Below this depth, discoasters show significant overgrowth, as evidenced by their high birefringence and, in some cases, complete infilling of the inter-ray area with secondary calcite below 200 mbsf. However, the placoliths, helicoliths, and sphenoliths are better preserved in the same intervals, although placoliths show etching even at shallow depths (e.g., 50 mbsf). The nannofossil diversity is impacted by this moderate preservation. In particular, the poor preservation of discoasters made recognition of Miocene biohorizons based on these markers difficult to impossible. As a result, calcareous nannofossil biostratigraphy in the Oligocene to Miocene succession relies mostly on placolith and sphenolith marker species. Reworked calcareous nannofossils occur very rarely.
Pleistocene
The stratigraphy of the Pleistocene is constrained by seven calcareous nannofossil biohorizons (Table T2). Because of the low sedimentation rates at Site U1490 and the shipboard sampling resolution, biohorizons corresponding to abundance fluctuations of certain taxa (e.g., Emiliania huxleyi and Gephyrocapsa caribbeanica) were not observed in the samples. Biohorizon base E. huxleyi (0.29 Ma; base of Zone NN21) occurs between Samples 363-U1490A-1H-2, 47 cm, and 1H-CC (1.97–4.18 mbsf) and biohorizon top Pseudoemiliania lacunosa (0.44 Ma; base of Zone NN20) between Samples 1H-CC and 2H-2, 60 cm (4.18–6.30 mbsf).
The base of Zone NN19 is defined by biohorizon top Discoaster brouweri (1.93 Ma) between Samples 363-U1490A-3H-CC and 4H-2, 60 cm (23.54–25.30 mbsf). Biohorizon top Discoaster pentaradiatus (2.39 Ma; base of Zone NN18) is observed between Samples 4H-4, 60 cm, and 4H-6, 60 cm (28.30–31.30 mbsf), and biohorizon top Discoaster surculus (2.49 Ma; base of Zone NN17) between Samples 5H-2, 60 cm, and 5H-4, 60 cm (34.80–37.80 mbsf). The latter is a good approximation for the Pliocene/Pleistocene boundary, which is defined ~9 ky before the disappearance of D. surculus.
Pliocene
Only four nannofossil biohorizons were observed in the Pliocene interval, but these are all judged to be reliable events based on taxa that are distinct and well-preserved within the recovered succession. The biohorizon top Sphenolithus spp. (3.54 Ma) is placed between Samples 363-U1490A-7H-2, 60 cm, and 7H-4, 60 cm (53.80–56.80 mbsf), and the base of Zone NN16 is defined by biohorizon top Reticulofenestra pseudoumbilicus (3.70 Ma) between Samples 7H-6, 60 cm, and 7H-CC (59.80–61.60 mbsf). Biohorizon base Ceratolithus cristatus (5.12 Ma), which marks the base of Zones NN13–NN14, occurs between Samples 9H-CC and 10H-CC (80.52–90.08 mbsf). Biohorizon top Ceratolithus armatus (5.04 Ma) occurs in the same sampling interval as biohorizon base Ceratolithus cristatus (5.12 Ma).
Miocene
The Miocene is characterized by low diversity related to poor preservation. The consequence of this poor preservation is the noticeable absence of identifiable discoasters in the middle to lower Miocene and the absence of Helicosphaera, Orthorhabdus, and Triquetrorhabdulus, which represent half of the Miocene markers in Table T3 in the Expedition 363 methods chapter (Rosenthal et al., 2018a). The Miocene nannofossil biostratigraphy at Site U1490 is constrained by only 17 calcareous nannofossil biohorizons (Table T2), with most not being zonal boundary markers. As a result, most of the Miocene nannofossil zones are not differentiated at this site. However, the 17 Miocene nannofossil horizons do provide robust tie points that are reliable. With the exception of biohorizon top Coccolithus miopelagicus (10.61 Ma), they are well aligned with planktonic foraminifer biohorizons and paleomagnetic polarity reversals (see Shipboard age model).
Biohorizon base Catinaster coalitus (10.90 Ma; base of Zone NN8) occurs between Samples 363-U1490A-20H-CC and 21H-CC (184.93–194.62 mbsf). The middle Miocene biohorizon top Sphenolithus heteromorphus (13.53 Ma; base of Zone NN6) occurs between Samples 23H-CC and 24H-CC (213.55–223.01 mbsf). Zone NN5 was not recognized in Hole U1490A because of the absence of Helicosphaera ampliaperta, whose biohorizon top (14.91 Ma) marks the base of the zone. Biohorizon top Sphenolithus belemnos (17.95 Ma; base of Zone NN4) occurs between Samples 28F-CC and 29F-CC (256.06–260.79 mbsf). Biohorizon top Triquetrorhabdulus carinatus (18.28 Ma; base of Zone NN3) is found between Samples 29F-CC and 30F-CC (260.79–265.02 mbsf). The stratigraphy of the basal Miocene is constrained by biohorizon base S. belemnos (19.03 Ma) between Samples 30F-CC and 31F-CC (265.02–270.15 mbsf) and biohorizon base Sphenolithus disbelemnos (22.76 Ma) between Samples 37X-CC and 38X-CC (316.44–329.40 mbsf).
Oligocene
Although calcareous nannofossil preservation is moderate to poor in the Oligocene succession, the distinctive and short-lived (~320 ky) Oligocene/Miocene boundary marker Sphenolithus delphix is observed in Sample 363-U1490A-39X-CC. Based on core catcher resolution, we place biohorizon top S. delphix (23.06 Ma) between Samples 38X-CC and 39X-CC (329.49–346.69 mbsf) and biohorizon base S. delphix (23.38 Ma) between Samples 39X-CC and 40X-CC (346.49–353.38 mbsf). A further confirmation of the latest Oligocene age of the base of Hole U1490A is the presence of common Cyclicargolithus abisectus in Sample 43X-CC (380.56 mbsf). Although not robustly calibrated and potentially subject to local environmental controls, the top common occurrence of C. abisectus is consistent with an age of ~24 Ma (Backman et al., 2012) at the base of the hole.
Planktonic foraminifers
Planktonic foraminifers are diverse and abundant throughout most of the succession at Site U1490. Biostratigraphy is based on core catcher samples from Hole U1490A. Preservation is either very good or good from the seafloor to ~270 mbsf, which was near the level of APC refusal. Downhole through that interval, foraminifers are usually clean and little affected by infilling and cementation, although they are often fragmented and increasingly recrystallized at depth. Below 270 mbsf, the sediment is much more indurated and preservation is mostly poor to moderate and occasionally too poor for reliable identification. Despite these problems, it was possible to extend the biozonation to the bottom of the hole. More detailed observations of the preservation state are described in Foraminifer preservation. The sedimentary environment at Site U1490 seems to have been prone to reworking, so top biohorizons are sometimes best identified by the presence of relatively common and continuous specimens of a species rather than occasional isolated specimens at higher levels. A list of biohorizons is given in Table T3. Coiling directions in Pulleniatina were measured from the top of the hole to below the level of Saito’s (1976) L9 excursion but only at low resolution (only core catchers were examined). Data are given in Table T4 and plotted in Figure F12.
Table T3. Planktonic foraminifer bioevents. Download table in CSV format.
Table T4. Coiling patterns in Pulleniatina. Download table in CSV format.

Figure F12. Coiling patterns in Pulleniatina.
Pleistocene
The topmost sample examined, Sample 363-U1490A-1H-CC (4.18 mbsf) contains Globorotalia flexuosa, Globigerinoides ruber (pink), and Globigerinella calida and is assigned to the upper part of Subzone Pt1b, between 0.12 and 0.22 Ma. Sample 2H-CC (14.12 mbsf) is also assigned to Subzone Pt1b because of the absence of Globorotalia tosaensis, the marker species for Subzone Pt1a; however, this may be due to patchiness in the occurrence of G. tosaensis because both nannofossils and magnetostratigraphy suggest a level correlative with Subzone Pt1a for this sample (see Shipboard age model). A single specimen of Globigerinoidesella fistulosa in this sample is interpreted as reworked. The L1 coiling change in Pulleniatina (0.80 Ma) cannot be identified because of the low-resolution sampling. Biohorizon top G. fistulosa (1.88 Ma), which marks the base of Subzone Pt1a, and biohorizon base Pulleniatina finalis (2.04 Ma) both occur between Samples 2H-CC and 3H-CC (14.12–23.54 mbsf). Biohorizon top Globorotalia pseudomiocenica (2.30 Ma), which marks the base of Zone PL6, occurs between Samples 3H-CC and 4H-CC (23.54–33.00 mbsf).
Pliocene
Rare specimens of Dentoglobigerina altispira in Sample 363-U1490A-4H-CC are interpreted as reworked because the species is absent from the next sample, Sample 5H-CC, and when D. altispira does occur it usually does so as frequent to abundant specimens. Biohorizon top D. altispira (3.13 Ma), which marks the base of Zone PL5, occurs between Samples 5H-CC and 6H-CC (42.13–52.02 mbsf), and D. altispira is consistent as a frequent or common component of the assemblage from Sample 6H-CC to near the bottom of the hole.
Biohorizon top Sphaeroidinellopsis seminulina (3.59 Ma), which marks the base of Zone PL4, and biohorizon top Globorotalia margaritae (3.60 Ma), which marks the base of Zone PL3, occur together between Samples 363-U1490A-6H-CC and 7H-CC (52.02–61.60 mbsf). The L9 coiling reversal in Pulleniatina (4.08 Ma) occurs together with biohorizon top Pulleniatina spectabilis (4.21 Ma) between Samples 7H-CC and 8H-CC (61.60–70.97 mbsf). Biohorizon top Globoturborotalita nepenthes (4.37 Ma), which marks the base of Zone PL2, occurs between Samples 8H-CC and 9H-CC (70.97–80.52 mbsf).
Miocene
The base of Zone PL1, which is marked by biohorizon base Globorotalia tumida (5.57 Ma), occurs between Samples 363-U1490A-11H-CC and 12H-CC (99.53–108.93 mbsf). The base of Zone M14 cannot be identified because of the extreme rarity of the marker species Globorotalia lenguaensis. However, a useful biohorizon in the upper part of Subzone M13b is provided by base Pulleniatina primalis (6.60 Ma) between Samples 13H-CC and 14H-CC (118.55–127.84 mbsf). The base of Subzone M13b, which is marked by biohorizon base Globorotalia plesiotumida (8.58 Ma), is tentatively identified between Samples 16H-CC and 17H-CC (147.10–156.48 mbsf). Coiling directions were measured on populations of Neogloboquadrina acostaensis, but the data (which are not shown but can be downloaded from the LIMS database) are too sparse to identify any significant patterns except for a switch from sinistral to dextral dominance in the lower part of the range of N. acostaensis, in the same sampling interval as biohorizon base G. plesiotumida. Biohorizon base N. acostaensis (9.83 Ma), which marks the base of Subzone M13a, is between Samples 18H-CC and 19H-CC (166.07–175.53 mbsf).
The base of Zone M11, which is marked by biohorizon base G. nepenthes (11.63 Ma) is identified on the basis of rare individuals between Samples 363-U1490A-21H-CC and 22H-CC (194.62–204.12 mbsf). The base of Zone M10, which is marked by biohorizon top Fohsella fohsi (which also occurs only rarely and with Fohsella robusta) is between Samples 22H-CC and 23H-CC (204.12–213.55 mbsf).
The biostratigraphic interval between biohorizon top F. fohsi (11.79 Ma) and biohorizon base Praeorbulina sicana (16.38 Ma) (Zones M5 through M9) is normally relatively easy to subdivide using tropical planktonic foraminifers because of evolutionary transitions in the Praeorbulina–Orbulina and Fohsella lineages (see Biostratigraphy in the Expedition 363 methods chapter [Rosenthal et al., 2018a]). These groups are known to be abundant and well developed in the tropical West Pacific Ocean (e.g., Pearson, 1995). Unfortunately, however, they are very rare or absent in several samples at Site U1490. Assemblages in the >150 µm size fraction of Samples 363-U1490A-23H-CC, 24H-CC, and 25H-CC (213.55, 223.01, and 232.55 mbsf) are dominated instead by D. altispira, which represents >90% of the assemblage, with occasional Dentoglobigerina venezuelana and Sphaeroidinellopsis spp., all of which are of little biostratigraphic utility. The 63–150 µm size fraction of these samples has a large siliceous component, possibly indicating relatively high productivity conditions in the equatorial upwelling zone. A single specimen of Fohsella “praefohsi” in the absence of F. fohsi in Sample 24H-CC (223.01 mbsf) may indicate Zone M8.
Sample 363-U1490A-26H-CC (241.88 mbsf) contains Fohsella peripheroronda and abundant small (~150–250 µm diameter), spherical Globigerinoides/Praeorbulina spp., which typically have a few minuscule apertures around the base of the final chamber that are often difficult to discern because of recrystallization and cementation. The genus Praeorbulina is distinguished by the presence of a near-spherical test with at least four apertures around the base of the final chamber (Jenkins et al., 1981), which is not always easy to verify in this material. The specimens, which appear to be part of a single variable population, are difficult to place in the regular Globigerinoides–Praeorbulina evolutionary succession as described elsewhere in the tropical Pacific Ocean (e.g., Pearson et al., 1997) but are included in Praeorbulina sicana pending more detailed study. The sample is tentatively assigned to Zone M5 because Praeorbulina is present without Orbulina, although the latter genus does not occur in the three samples directly above either. Specimens of Dentoglobigerina binaiensis and Catapsydrax unicavus in the same sample are interpreted as reworked. Sample 27H-CC contains common small spherical Globigerinoides and no apparent Praeorbulina spp. and is tentatively placed in Zone M4.
Biohorizon top Catapsydrax dissimilis (17.54 Ma), which marks the base of Zone M4, occurs between Samples 363-U1490A-27H-CC and 28H-CC (251.43–256.06 mbsf). This is the same level as biohorizon top D. binaiensis (19.09 Ma), which is based on just a few specimens and may be reworked. The Globigerinatella lineage is absent at Site U1490, so it is not possible to differentiate Zones M2 and M3. The absence of Globigerinatella, which is usually prominent in other tropical West Pacific sites (e.g., Chaisson and Leckie, 1993; Pearson 1995), and is present, albeit rarely, at Site U1489 (see Biostratigraphy in the Site U1489 chapter [Rosenthal et al., 2018f]), provides more evidence that the water column may not have been conducive to all tropical planktonic foraminifer groups, possibly because of upwelling.
Biohorizon top Paragloborotalia kugleri (21.12 Ma), which marks the base of Zone M2, occurs in the same sampling interval as biohorizon top Paragloborotalia pseudokugleri (21.31 Ma) and biohorizon top “Globigerina” angulisuturalis (20.94 Ma) between Samples 363-U1490A-27H-CC and 28H-CC (251.43–256.06 mbsf). Biohorizon base Globoquadrina dehiscens (22.44 Ma), which marks the base of Subzone M1b, occurs between Samples 31F-CC and 32X-CC (270.15–278.39 mbsf).
Oligocene
Biohorizon base P. kugleri (22.96 Ma), which marks the base of Subzone M1a and approximates the Oligocene/Miocene boundary, occurs in a poorly preserved interval between Samples 363-U1490A-38X-CC and 41X-CC (329.59–365.38 mbsf). Other typical Oligocene planktonic foraminifers such as Dentoglobigerina sellii and Trilobatus primordius occur in Sample 41X-CC.
Benthic foraminifers
Benthic foraminifers were studied in 31 core catcher samples from Hole U1490A (Table T5). Assemblages indicate a deep-water environment with a planktonic:benthic foraminifer ratio of about 99:1 throughout Hole U1490A. The assemblages are similar to those at Sites U1482, U1483, U1488, and U1489. The most common species are Laevidentalina spp., Planulina wuellerstorfi, and Oridorsalis umbonatus. P. wuellerstorfi is absent in 13 of the examined core catcher samples (363-U1490A-2H-CC, 4H-CC, 6H-CC, 7H-CC, 11H-CC, 16H-CC, and 25H-CC through 31H-CC).
Table T5. Benthic foraminifer distribution. Download table in CSV format.
Foraminifer preservation
Five core catcher samples from Hole U1490A were selected for detailed assessment of foraminifer preservation and diagenesis. These are spaced at ~100 m intervals and range in age from late Pleistocene (0.12 Ma) to latest Oligocene (~24 Ma). As at other Expedition 363 sites, typical specimens of the planktonic foraminifer Trilobatus trilobus and benthic foraminifer P. wuellerstorfi were selected for detailed investigation, although both species are absent from the lower two samples, from which the planktonic foraminifer Globoturborotalita woodi was selected instead.
Foraminifer preservation, as assessed visually in the core catcher samples, varies from very good and good in the upper two samples and moderate to poor in the lower two samples. Even where preservation is very good, foraminifers are typically white and opaque rather than glassy and translucent. Dissolution, overgrowth, minor infilling, and recrystallization occur throughout the site, but recrystallization, overgrowth, and cementation become progressively more severe with depth. Images of selected specimens are shown in Figure F13. The full set of images is available from the LIMS database.
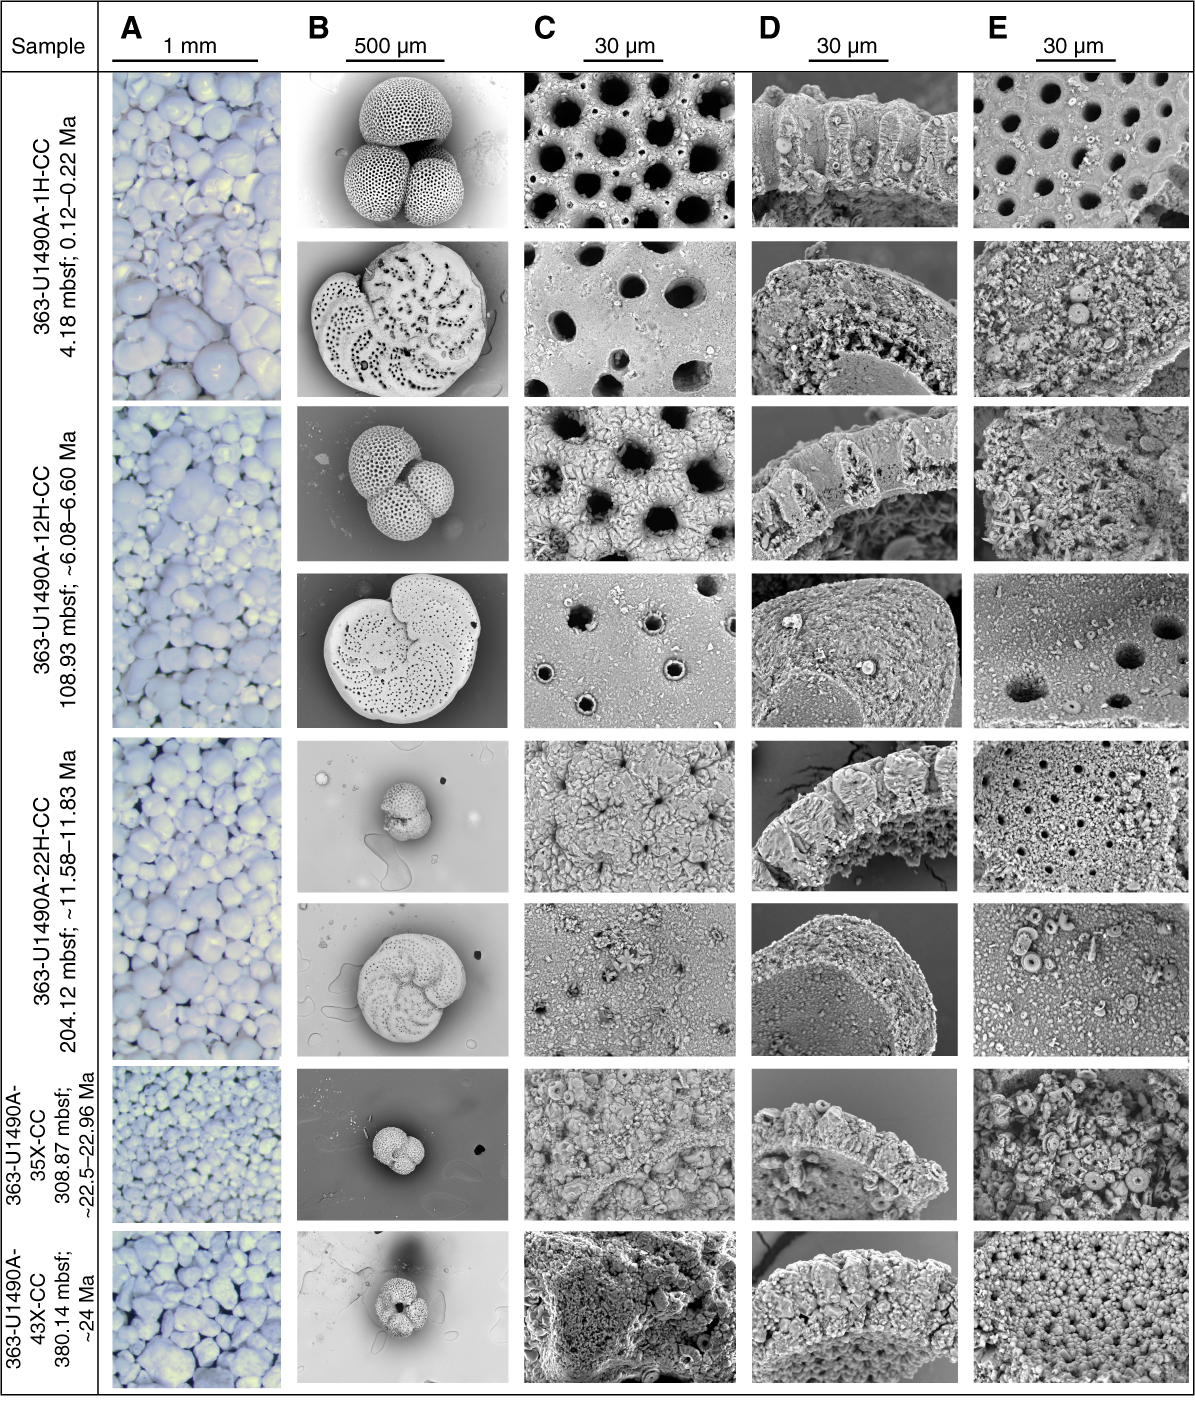
Figure F13. Downhole foraminifer preservation states.
Sample 363-U1490A-1H-CC (4.18 mbsf; late Pleistocene to latest middle Pleistocene; 0.12–0.22 Ma) shows very good to good preservation. In T. trilobus, the wall cross sections show microgranular textures and other typical biogenic features, although outer wall surfaces show minor evidence of abrasion and dissolution, and very minor dissolution is observed near the level of the primary organic membrane. The inner wall surfaces exhibit minor calcite overgrowth layers <1 μm thick. In P. wuellerstorfi, the wall cross sections generally show evidence of very minor textural alteration in places, although one specimen shows significant recrystallization and dissolution near the inner wall surface. Inner wall surfaces are generally smooth. Minor infilling of unconsolidated sediment (coccoliths) occurs in both T. trilobus and P. wuellerstorfi. There is no evidence of cementation.
Sample 363-U1490A-12H-CC (108.93 mbsf; late Miocene; ~6.08–6.60 Ma) shows good to moderate preservation. Wall cross sections of T. trilobus show the biogenic microgranular textures typical of the species but with inorganic calcite overgrowth in pore channels and on the outer wall surfaces and evidence of dissolution and incipient recrystallization. In P. wuellerstorfi, the wall cross sections mostly show microgranular textures but with evidence of patchy recrystallization into solid patches in places. The inner wall surfaces of T. trilobus and P. wuellerstorfi exhibit minor calcite overgrowth layers as thick as 1–2 μm. Minor infilling of unconsolidated sediment (coccoliths) occurs in some T. trilobus specimens. P. wuellerstorfi also shows calcite overgrowth on external surfaces. There is no evidence of cementation.
Sample 363-U1490A-22H-CC (204.12 mbsf; early late Miocene; ~11.58–11.83 Ma) shows moderate to poor preservation. Foraminifers are generally opaque under the light microscope and exhibit strong cementation in the sutures and some apertures. Wall cross sections of T. trilobus show evidence of early stage recrystallization and stronger dissolution along internal layers, as well as inorganic calcite overgrowth in pore channels, but the biogenic microgranular textures typical of the species are observed in some places, especially the gametogenic layer. The wall cross sections of P. wuellerstorfi show widespread evidence of early stage recrystallization in which the microgranular texture is modified to show slightly larger and better separated granular crystals, particularly toward the inner surfaces. The inner wall surfaces of T. trilobus and P. wuellerstorfi exhibit minor calcite overgrowth layers as thick as 1–2 μm, and P. wuellerstorfi also shows calcite overgrowth on external surfaces.
Sample 363-U1490A-35X-CC (308.87 mbsf; early Miocene; ~22.5–22.96 Ma) shows poor preservation. Foraminifers are generally opaque under the light microscope and are strongly overgrown and cemented. The wall cross sections are recrystallized and strongly dissolved along internal layers. Pores and pore channels are often filled with calcite overgrowth. The inner wall surfaces exhibit minor calcite overgrowth layers up to 2 μm thick, and minor infilling of unconsolidated sediment (coccoliths) occurs.
Sample 363-U1490A-43X-CC (380.14 mbsf; latest Oligocene; ~24 Ma) shows poor preservation. Foraminifers are generally opaque under the light microscope and exhibit strong overgrowth and cementation. In SEM there is abundant evidence of dissolution, infilling, overgrowth, recrystallization, and cementation. The wall cross sections are recrystallized with solid patches in some places within the wall and discrete diagenetic crystallites in other places. The external surfaces and pore channels show strong inorganic calcite overgrowth, and even the pores and pore channels are difficult to identify. The inner wall exhibits minor overgrowth of radially directed calcite crystals forming a layer about 2–3 μm thick, upon which there are some diagenetic crystals up to 20 μm in diameter.
Shipboard age model
An age-depth plot including all biostratigraphic biohorizons is shown in Figure F14. An age of about ~24 Ma was reached at the base of the sedimentary sequence based on extrapolation through Oligocene/Miocene boundary biohorizons and the appearance of common Cyclicargolithus abisectus (~24 Ma) in the lowermost sample examined (Sample 363-U1490A-43X-CC; 381.61 mbsf). Throughout the sequence, calcareous nannofossil and planktonic foraminifer biohorizons and paleomagnetic polarity reversals are in good agreement. The stratigraphy in the uppermost ~40 mbsf of the site is complicated because (1) the Pleistocene sedimentation rate appears unusually low (~1 cm/ky) in comparison with those recorded in the Pliocene and the upper Miocene (~2.5 cm/ky); (2) although there is no evidence of hiatuses, in Core 363-U1490A-4H several planktonic foraminifer biohorizons occur at the same depth within an interval exhibiting soft-sediment deformation features (see Core description); and (3) the sample resolution is too low to identify possible stratigraphic unconformities in view of the low sedimentation rate. Nevertheless, good stratigraphic determinations are provided by the base of the Brunhes normal polarity interval at 8.64 mbsf and the top and bottom of the Jaramillo Subchron (C1r.1n) at 11.26 and 12.20 mbsf, respectively (see Paleomagnetism). In the early and middle Miocene, 48 out of 50 known magnetic reversals were recorded from ~170 to 260 mbsf (~8.7 to ~19 Ma; Table T6). The relatively sparse biostratigraphic data below 260 mbsf suggest that a similar sedimentation rate extends downhole to Sample 32X-CC, which contains the planktonic foraminifer marker species P. kugleri (biohorizon top at 21.12 Ma). The sedimentation rate appears to be nearly constant for long periods of time separated by four inflection points at ~3.60, 5.33, 9.11, and 22.25 Ma. Average sedimentation rates were 4.7 cm/ky in the late Oligocene, 0.88 cm/ky in the early and middle Miocene, 1.57 cm/ky in the late Miocene, 2.9 cm/ky in the early Pliocene, and 1.4 cm/ky in the late Pliocene and Pleistocene.

Figure F14. Age-depth plot.
Table T6. Identified reversal boundaries. Download table in CSV format.
Paleomagnetism
Measurements summary
Paleomagnetic investigations at Site U1490 involved measurement of the natural remanent magnetization (NRM) of APC and HLAPC archive halves of cores from Holes U1490A–U1490C before and after alternating field (AF) demagnetization in a peak field of 15 mT. We measured the entire sediment succession in Hole U1490A but ceased measurement between ~36 and 161.5 mbsf in Hole U1490B and below ~31 mbsf in the shorter Hole U1490C because Whole-Round Multisensor Logger (WRMSL) magnetic susceptibility data values decreased to almost zero (see Physical properties) and paleomagnetic data quality decreased and became increasingly uninterpretable. In addition to measuring 320 core sections, we took one to two discrete samples per core from Hole U1490A (57 samples) to characterize the NRM demagnetization behavior and to investigate the rock magnetic properties of the sediment. NRM of the discrete samples was measured before and after AF demagnetization in peak fields of 5, 10, 15, 20, 30, and 40 mT. Rock magnetic investigations comprised measurements of magnetic susceptibility (χ), susceptibility of anhysteretic remanent magnetization (χARM) imparted using 100 mT AF demagnetization and 0.05 mT direct current bias field, and isothermal remanent magnetization (IRM) acquired in 300 mT and 1000 mT (saturation IRM [SIRM]) fields. All sample measurements were mass corrected. The Icefield MI-5 core orientation tool was deployed with nonmagnetic hardware for all APC cores, which permitted azimuthal correction of declination. Azimuthally corrected declination is largely coherent between cores; however, absolute values in Holes U1490A and U1490B cluster around 270° for periods of normal polarity and around 90° for periods of reversed polarity. Although an absolute offset in declination was a common feature during Expedition 363 (see Paleomagnetism in the Expedition 363 methods chapter [Rosenthal et al., 2018a]), the offset was consistently ~180° until a ~90° offset developed at Site U1488 and continued through Site U1489. For Hole U1490C, no baseline offset was observed, and corrected declinations cluster around 0°/360° during intervals of normal polarity and 180° for reversed polarity. As with other sites cored during Expedition 363, we leave declination uncorrected for these additional offsets in the plotted figures for Holes U1490A and U1490B, so care should be employed for future calculations of virtual geomagnetic poles using these data.
Rock magnetic characterization
In the upper ~16 mbsf, WRMSL magnetic susceptibility data average 2.3 × 10⁻⁵ SI (see Physical properties) and, when coupled with average χ (2.2 × 10⁻⁸ m3/kg) and SIRM (4.7 × 10⁻⁴ Am2/kg) values, suggest moderately low (ferri)magnetic mineral concentration in the uppermost sediment deposited at Site U1490 (Figure F15). Between ~16 and 175 mbsf, average WRMSL magnetic susceptibility data decrease to values of −1.4 × 10⁻⁵ SI, and χ and SIRM also decrease to negative or near zero values, implying almost complete absence of ferrimagnetic minerals. Loss of ferrimagnetic minerals and coarsening of the remaining ferrimagnetic assemblage downhole, coupled with observations of secondary iron sulfides (e.g., pyrite [FeS2]) at Site U1490 (see Core description), suggest that sediment diagenesis (e.g., Karlin and Levi, 1983; Rowan et al., 2009) has severely altered the primary magnetic mineral assemblage below ~16 mbsf. Below ~179 mbsf, χ and SIRM begin to steadily increase associated with greater proportions of clay and ash in the sediment (see Core description). Intervals above 16 mbsf and below ~179 mbsf acquire >95% of their SIRM remanence in a field of 300 mT and have higher values of χARM/SIRM, suggesting that relatively fine ferrimagnetic minerals (e.g., [titano]magnetite [FexTixO4] and maghemite [γ-Fe2O3]) control the remanence-carrying properties of the sediment in these intervals.
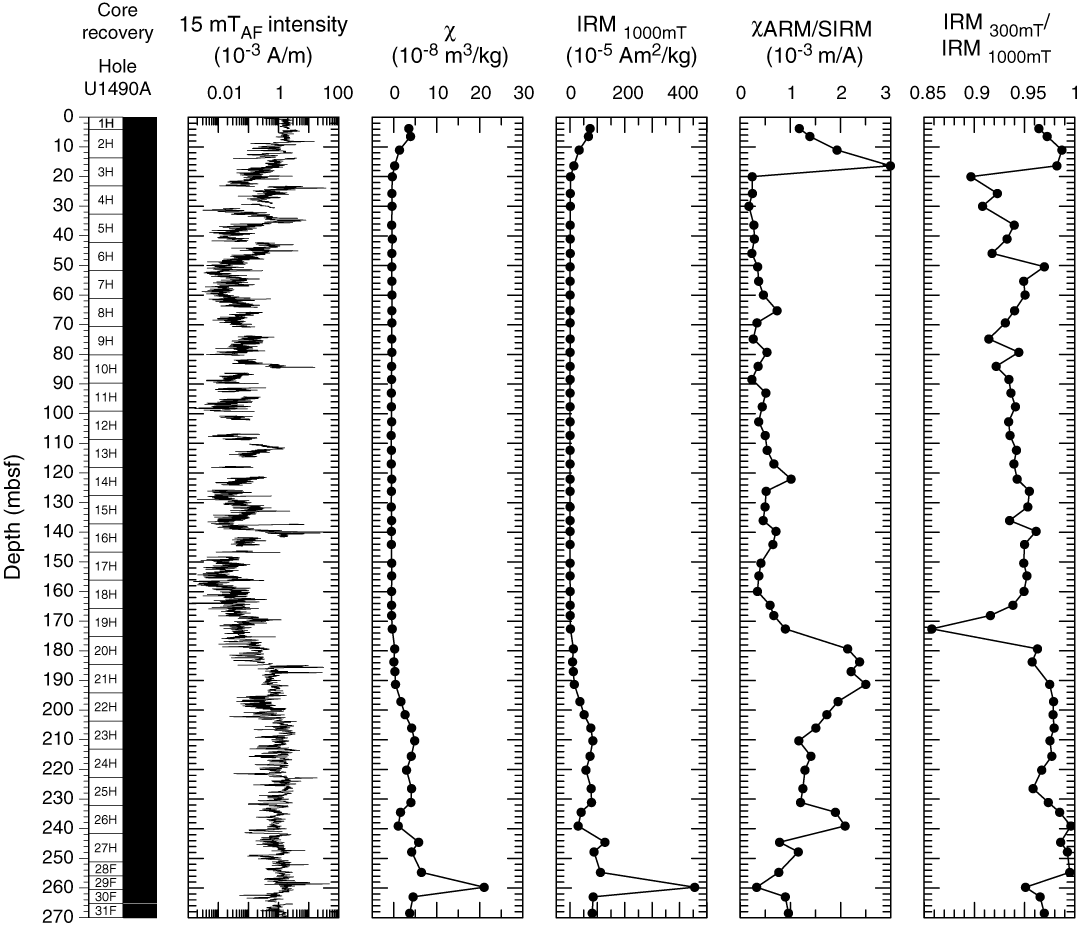
Figure F15. Archive-half NRM intensity.
Paleomagnetic data and core orientation
In the upper ~16 mbsf and below ~179 mbsf, the drill string overprint is effectively removed after AF demagnetization in a 5–15 mT field, and following exposure to higher AF demagnetization steps, inclination and declination stabilize and trend to the origin on Zijderveld diagrams (Zijderveld, 1967), indicating a single component to the magnetization (Figure F16). Excluding the relatively high value at ~260 mbsf, origin-anchored maximum angular deviation values of the principal component analysis (PCA) calculated over the 15–40 mT range average 2.3° (range = 1.1°–5.1°) for intervals from the uppermost 11 mbsf and below ~200 mbsf (Figures F16, F17), suggesting paleomagnetic directions are stable and well resolved and should yield reliable estimates for magnetostratigraphy (Stoner and St-Onge, 2007). Between ~11 and 200 mbsf, higher maximum angular deviation values (average = 5.6°; range = 0.8°–21.9°) are associated with decreased ferrimagnetic concentration, coarser ferrimagnetic grain sizes, and higher coercivity components that do not demagnetize linearly toward the origin (Figure F16C, F16D), suggesting that paleomagnetic directions between ~16 and 179 mbsf likely do not reflect geomagnetic field behavior.
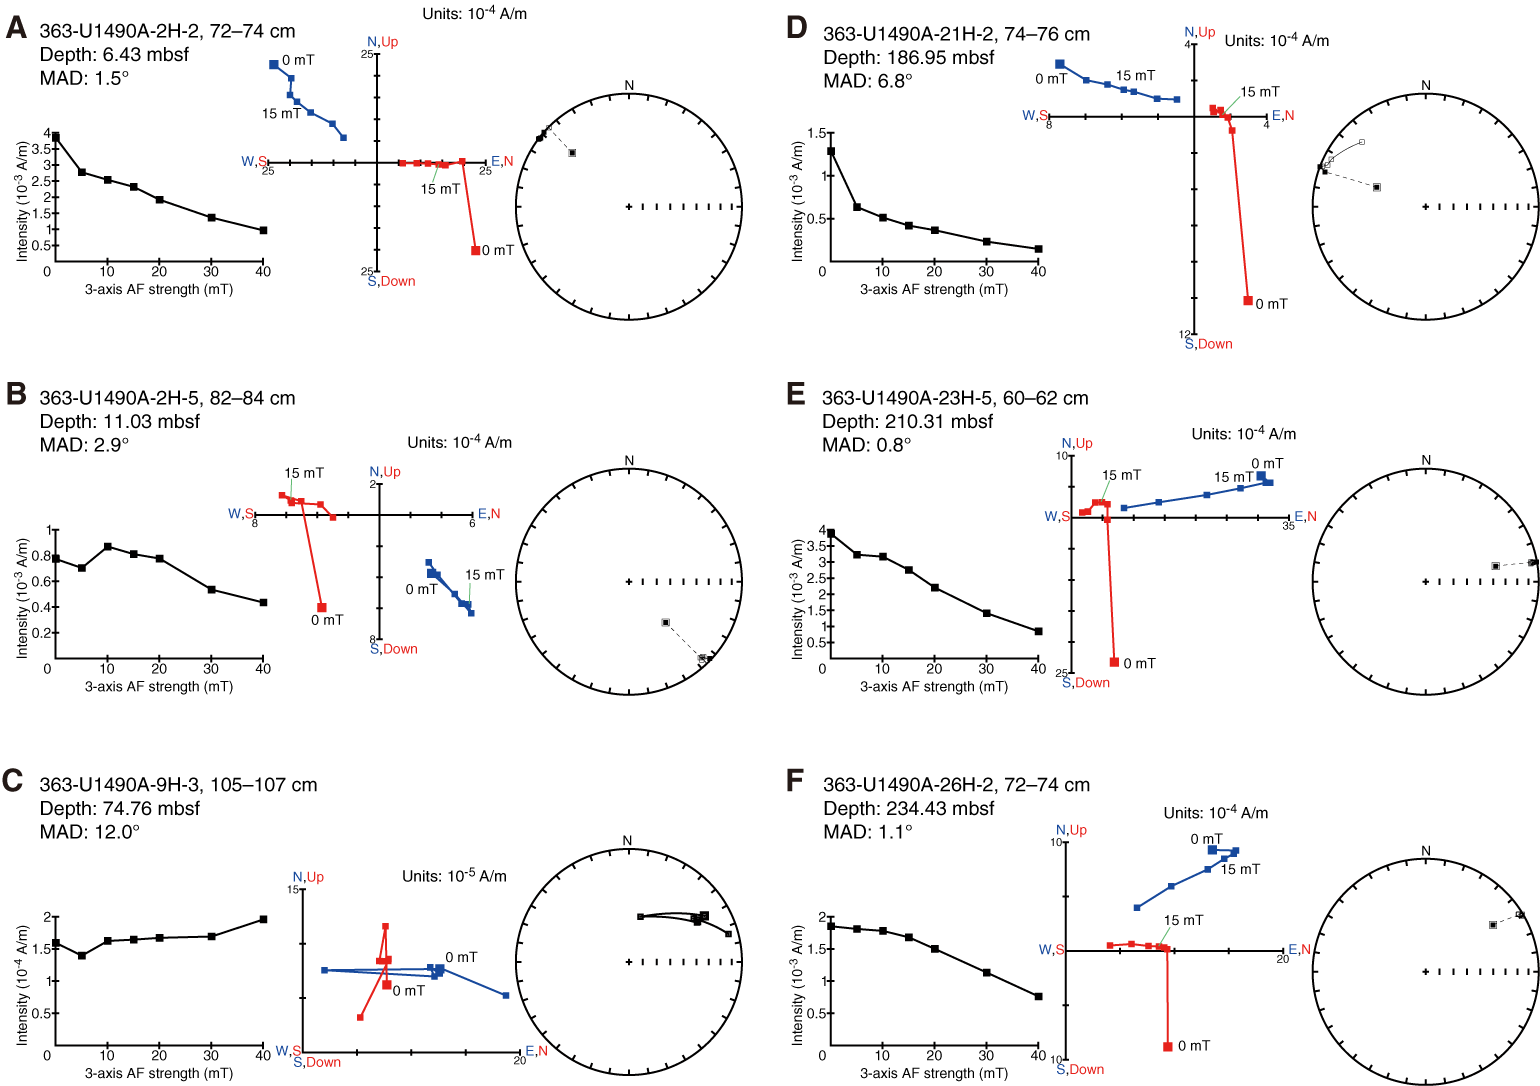
Figure F16. Discrete sample AF demagnetization results.

Figure F17. NRM, MS, inclination, and declination, Hole U1490A.
For all APC cores from Site U1490, declination was corrected using the Icefield MI-5 tool (see Operations). Azimuthally corrected declination is consistent between adjacent cores with absolute values clustering around 90° and 270° in Holes U1490A and U1490B and 0° and 180° in U1490C (Figures F17, F18, F19). However, assuming the uppermost sediment in each hole was deposited during normal polarity associated with the Brunhes Chron (see Biostratigraphy), declination values in Holes U1490A and U1490B experience an ~90° offset in absolute terms because declination should cluster around 0° (180°) during periods of normal (reversed) polarity; Hole U1490C appears to be correctly orientated. Absolute offsets of ~90° (see Paleomagnetism in the Site U1488 chapter and Paleomagnetism in the Site U1489 chapter [Rosenthal et al., 2018e, 2018f]) and ~180° were a persistent issue during Expedition 363 and appear to also affect declination in Holes U1490A and U1490B. The origin of this offset is not immediately clear, but because it appears systematic (the two declination clusters are ~180° offset to each other during deployment of each tool respectively), we assume that declination values rotated 180° relative to the uppermost sediment values reflect periods of reversed polarity in the sediment recovered from Holes U1490A and U1490B. Orientation tools cannot be deployed with the HLAPC coring system. To align HLAPC declination with the corrected APC cores, we used a two-step protocol. First, we averaged the HLAPC declination record to match the declination in the previous core. We then used the average sedimentation rate for the hole and the geomagnetic polarity timescale (GPTS; Cande and Kent, 1995) to guide whether declination should be normal or reversed and used data across multiple holes to assess the quality of this manual alignment. Once we were satisfied with the correction, we applied the same core-specific declination correction value to discrete samples taken from each HLAPC core and worked progressively downhole. These manually aligned declination values are denoted by dark red symbols in Figures F17 and F18.
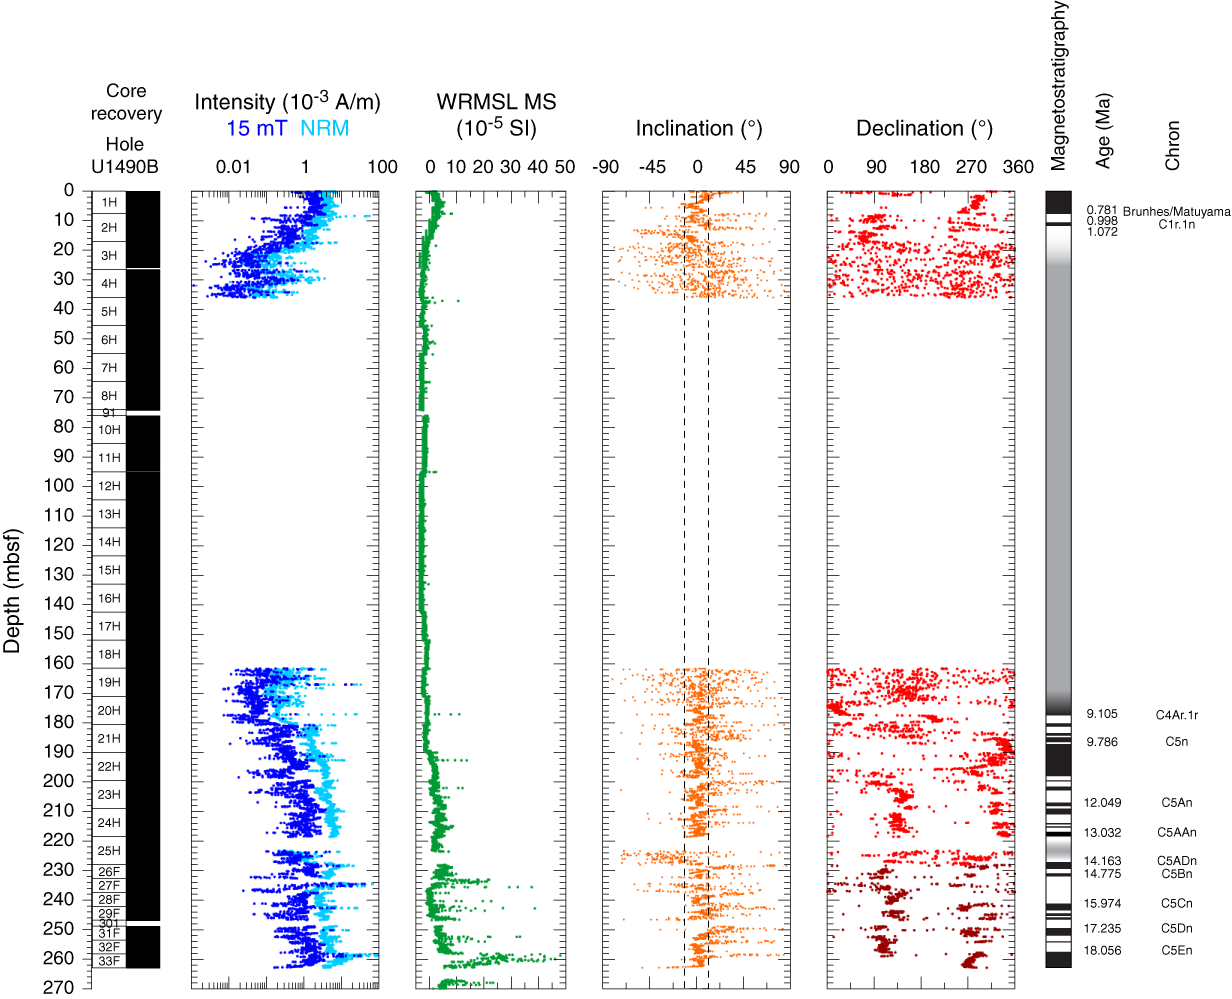
Figure F18. NRM, MS, inclination, and declination, Hole U1490B.
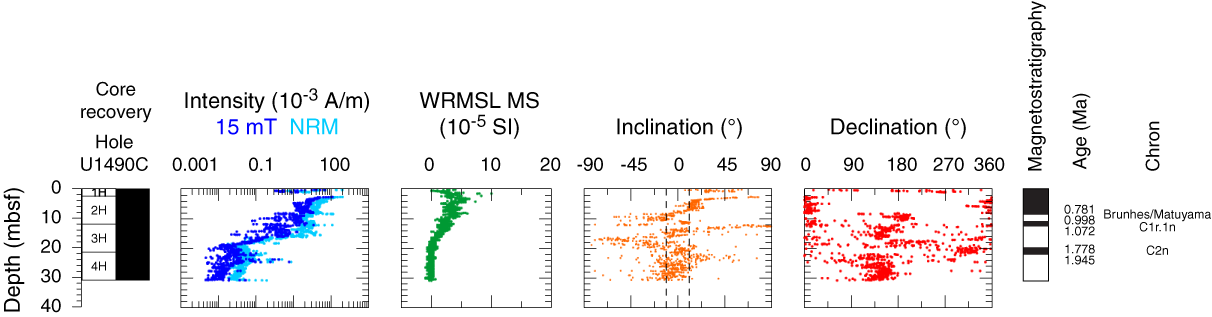
Figure F19. NRM, MS, inclination, and declination, Hole U1490C.
NRM intensity before and after 15 mT AF demagnetization, WRMSL magnetic susceptibility, and inclination and azimuthally corrected declination after 15 mT AF demagnetization are shown for Holes U1490A, U1490B, and U1490C in Figures F17, F18, and F19, respectively. Displayed inclination and declination values have been cleaned of visibly disturbed intervals and voids (see Paleomagnetism in the Expedition 363 methods chapter [Rosenthal et al., 2018a]). Flux jumps on the y-axis superconducting quantum interference device (SQUID) of the superconducting rock magnetometer (SRM) were a common occurrence during measurement of the magnetically weak sediment between ~16 and 179 mbsf in Hole U1490A. The lack of NRM and NRM15mT data in this interval reflects removal of these data (Figure F17). Inclination and declination measured on discrete samples are generally in excellent agreement with those measured on the archive-half sections above ~16 mbsf and below ~179 mbsf. In these intervals, SRM- and discrete-measured inclination plot around the expected values of approximately ±11.5° for the site latitude assuming a geocentric axial dipole (GAD) field (Figures F17, F18, F19). Between ~16 and 179 mbsf discrete inclination is generally more negative (averaging −19° ± 9° as 2σ) than both its SRM measured counterpart and a GAD predicted field (Figure F17). Coupled with highly scattered declination values and decreased magnetic mineral concentration (Figures F15, F17), sediment diagenesis has likely severely altered the primary magnetic assemblage between ~16 and 179 mbsf in Hole U1490A and the paleogeomagnetic record is not interpretable in this section. Flux jumps on the y-axis SQUID of the SRM became increasingly common during measurement of Core 363-U1490B-4H so we abandoned measurement of Cores 5H through 18H. We used the WRMSL magnetic susceptibility record to guide resumption of SRM measurements with Core 19H (Figure F18).
Magnetostratigraphy
Sediment at Site U1490 appears to have been deposited (quasi)continuously with no major hiatuses (see Core description and Biostratigraphy). Across all three holes, we observed as many as 50 coeval and distinct ~180° changes in declination downhole (Figures F17, F18, F19). Interpretation of these horizons as resulting from paleogeomagnetic field behavior allows correlation to the GPTS (Cande and Kent, 1995) of the geologic timescale (Hilgen et al., 2012) and assignment of age. In the upper ~22 mbsf of Hole U1490C, we identified the Matuyama/Brunhes boundary (0.781 Ma; 8.075–8.10 mbsf), the upper (10.55–10.725 mbsf; 0.988 Ma) and lower (11.85–11.95 mbsf; 1.072 Ma) boundaries of the Jaramillo normal (C1r.1n), and the upper (19.625–19.775 mbsf; 1.778 Ma) and lower (21.575–21.95 mbsf; 1.945 Ma) boundaries of the Olduvai normal (C2n). We only observed the Matuyama/Brunhes boundary and the upper and lower Jaramillo in the upper ~20 mbsf of Holes U1490A and U1490B (see Table T6 for the depths of the boundaries in each hole). Below ~170 mbsf, we observed a further 45 geomagnetic reversals with an almost complete record from the upper boundary of Chron C4An (8.771 Ma; 170.575–171.8 mbsf) to the upper boundary of Chron C6n (18.748 Ma; 263.3–263.475 mbsf) in Hole U1490B (Table T6). We identified every intervening reversal apart from the upper (15.032 Ma) and lower (15.160 Ma) boundaries of Chron C5Bn.2n. These data imply middle Miocene sedimentation rates of ~1 cm/ky and are in excellent agreement with both the calcareous nannofossil and planktonic foraminifer biostratigraphy for this interval (see Biostratigraphy) (Figure F14).
Physical properties
Physical properties were measured on whole-round cores, split cores, and discrete samples from all holes drilled at Site U1490 to provide basic information for characterizing the core sections. Gamma ray attenuation (GRA) bulk density and magnetic susceptibility were measured on all core sections from Hole U1490C with the Special Task Multisensor Logger (STMSL) immediately after the cores were brought onboard to enable fast stratigraphic correlation between holes. All core sections were measured with the GRA bulk densitometer, the magnetic susceptibility loop, and the P-wave logger (PWL) on the Whole-Round Multisensor Logger (WRMSL) after equilibration. In some intervals at Site U1490, WRMSL P-wave data show the most distinct variability, and as a result these data were most useful for stratigraphic correlation between holes. For Hole U1490B, the WRMSL was therefore employed as the “fast track” system to rapidly generate 5 cm resolution magnetic susceptibility, GRA density, and P-wave data as Hole U1490B core sections came on board. Magnetic susceptibility and GRA density measurement settings were taken from the STMSL, whereas P-wave settings were left unchanged (see Physical properties in the Expedition 363 methods chapter and Physical properties in the Site U1488 chapter [Rosenthal et al., 2018a, 2018e]). The system was returned to the standard configuration of “fast track” measurements on STMSL and high-resolution measurements on WRMSL for Hole U1490C. As soon as possible, NGR was measured on all whole-round sections at 10 cm resolution for Hole U1490A and Cores 363-U1490B-1H through 11H and 20 cm resolution for Cores 11H through 33F and Hole U1490C (see Physical properties in the Expedition 363 methods chapter [Rosenthal et al., 2018a]). Point-sensor magnetic susceptibility and color spectrophotometry (color reflectance) were measured on split core sections using the Section Half Multisensor Logger (SHMSL). Discrete thermal conductivity was measured on whole-round sections from Hole U1490A using one of two methods (needle and puck; see Physical properties in the Expedition 363 methods chapter [Rosenthal et al., 2018a]). Moisture and density (MAD) measurements were made on split core sections from Hole U1490A. Discrete P-wave measurements (z- and x-axes) were made using the P-wave caliper (PWC) system on the Section Half Measurement Gantry (SHMG) for Cores 363-U1490A-1H through 43X for the x-axis and to Core 22H for the z-axis. Additional PWC x-axis measurements were taken in specific volcanogenic-rich intervals in Cores 363-U1490B-27F, 31F, and 33F to constrain the velocities in these lithologies and aid comparison with the seismic data available for Site U1490. Preconditioning treatments were applied to the records to aid in interpretation of noisy or spiky data (see Physical properties in the Expedition 363 methods chapter [Rosenthal et al., 2018a]). All data shown in figures are from the preconditioned data sets. Tables presented in this section contain raw and treated data for NGR, WRMSL/STMSL GRA bulk density, magnetic susceptibility, and P-wave velocity. Raw data for all data sets are available from the LIMS database. Because Holes U1490A and U1490B are the deepest holes at this site, we use them as representative for description purposes.
GRA bulk density
GRA bulk density is generally reproducible across holes (Figure F20; Tables T7, T8, T9). At Site U1490, GRA bulk density increases rapidly downhole in the upper 3 mbsf from ~1.3 to ~1.65 g/cm3, as previously observed at Sites U1488 and U1489. This most likely reflects sediment consolidation below the mudline. Between 3 and 230 mbsf, GRA bulk density increases from ~1.65 to ~1.9 g/cm3 due to compaction. Between 230 and 255 mbsf, GRA bulk density rapidly decreases from ~1.9 to ~1.6 g/cm3 with ~0.15 g/cm3 variability superimposed upon this long-term decrease. These GRA bulk density trends are associated with variations in lithology including downhole increases in clay and biosilica content (see Core description). This interval also corresponds to the transition from APC to HLAPC coring. From 255 mbsf to the bottom of the hole, GRA bulk density averages ~1.65 g/cm3 and shows high variability with values from ~1.5 to ~1.9 g/cm3. These variations in GRA density coincide with changes in NGR, magnetic susceptibility, and P-wave velocity values that may be related to the lithology of the sediment (see Core description). Deeper than 270 mbsf, long-term changes are difficult to identify because of the increased short-term variability, which may largely stem from XCB coring in indurated sediment. Short-term variations in GRA bulk density generally do not correspond to sediment color variations at Site U1490 (Figure F21), as also seen at Sites U1488 and U1489.

Figure F20. Physical property measurements.
Table T7. WRMSL GRA bulk density data, Hole U1490A. Download table in CSV format.
Table T8. WRMSL GRA bulk density data, Hole U1490B. Download table in CSV format.
Table T9. WRMSL GRA bulk density data, Hole U1490C. Download table in CSV format.
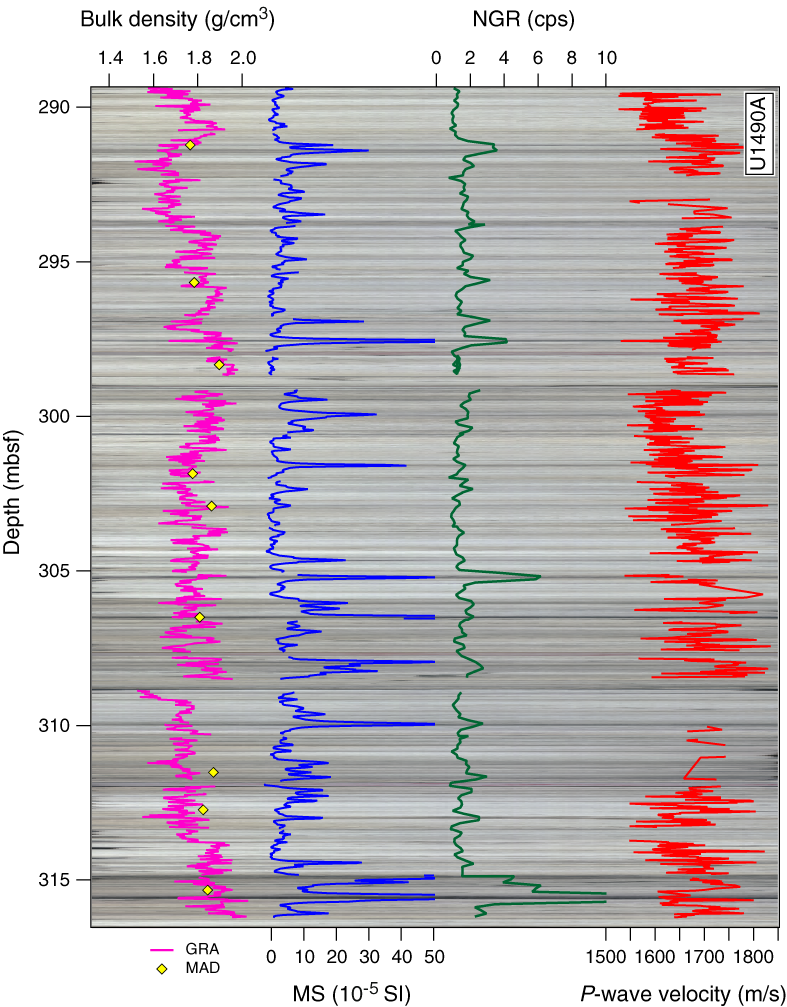
Figure F21. Bulk density, MS, NGR, and P-wave velocity overlaid on core photos.
Magnetic susceptibility
Magnetic susceptibility reproducibility is generally good among holes (Figure F20; Tables T10, T11, T12). Magnetic susceptibility is mostly extremely low in the upper 180 mbsf. In the upper 10 mbsf, magnetic susceptibility ranges from ~2 × 10⁻⁵ to ~5 × 10⁻⁵ SI; however, by 20 mbsf magnetic susceptibility decreases to a mean of −0.8 × 10⁻⁵ SI and remains low until 180 mbsf. This interval corresponds to lithologic Subunit IA, which is dominantly foraminifer-rich nannofossil ooze (see Core description). At 180 mbsf, magnetic susceptibility gradually increases downhole, reaching an average of ~7 × 10⁻⁵ SI between 205 and 230 mbsf, an interval where clay content increases. At 230 mbsf, magnetic susceptibility decreases to ~3.5 × 10⁻⁵ SI, although short-term variability increases, with individual magnetic susceptibility values reaching ~20 × 10−5 SI. Between ~250 and 270 mbsf, a broad magnetic susceptibility maximum occurs, with a peak of ~330 × 10−5 SI at ~260 mbsf (Core 363-U1490A-29H) associated with a volcanogenic layer. Between 280 and 330 mbsf, average magnetic susceptibility remains at ~3.5 × 10⁻⁵ SI, although short-term variability increases with frequent maxima of ~40 × 10−5 to 60 × 10−5 SI and occasional peaks of ~300 × 10−5 SI. From ~330 mbsf to the bottom of the hole, average magnetic susceptibility increases to ~10 × 10−5 SI and frequently reaches ~200 × 10−5 to 300 × 10−5 with occasional peaks of ~500 × 10−5 SI. The more prominent magnetic susceptibility maxima generally coincide with high NGR and occur in distinct darker layers that are rich in volcanogenic material and biosilica (Figure F21) (see Core description).
Table T10. WRMSL MS data, Hole U1490A. Download table in CSV format.
Table T11. STMSL MS data, Hole U1490B. Download table in CSV format.
Table T12. WRMSL MS data, Hole U1490C. Download table in CSV format.
Natural gamma radiation
NGR is relatively high at the seafloor (~27 counts/s) but rapidly decreases to <4 counts/s by 3.6 mbsf, reflecting a rapid reduction in clay content below the mudline (Figure F20; Tables T13, T14, T15). Between 3.6 and ~160 mbsf, NGR gradually decreases from 2.5 to 1 counts/s and then remains low until ~180 mbsf, coinciding with light colored carbonate-rich sediments. At ~180 mbsf, NGR gradually increases downhole, reaching an average of ~2 counts/s between ~205 and ~230 mbsf, coincident with an increase in clay content. At ~230 mbsf, NGR decreases again to ~1 count/s, although short-term variability increases in this interval, similar to the increase in variability seen in the magnetic susceptibility record. The highest peaks in this interval coincide with the appearance of lithified sediment. The first major NGR peak of ~8 counts/s occurs at ~255 mbsf, associated with an indurated tephra layer (see Core description) and the transition to HLAPC coring. Between ~270 and ~330 mbsf, short-term NGR variability increases, which is also seen in the magnetic susceptibility record. NGR peaks frequently reach ~4 counts/s and occasionally reach ~15 counts/s in the volcanogenic-rich dark layers (Figure F21). Deeper than ~330 mbsf, average NGR increases to ~4 counts/s, with high-frequency variations of up to ~20 counts/s superimposed.
Table T13. NGRL data, Hole U1490A. Download table in CSV format.
Table T14. NGRL data, Hole U1490B. Download table in CSV format.
Table T15. NGRL data, Hole U1490C. Download table in CSV format.
P-wave velocity
Measurements of WRMSL PWL P-wave velocity were carried out for all holes at Site U1490, at 2.5 cm resolution for Holes U1490A and U1490C and 5 cm resolution for Hole U1490B. Measurements of PWC P-wave velocity were performed on both the x-axis and z-axis in Hole U1490A. Hole U1490A is representative of P-wave velocity variations at Site U1490 (Figure F20; Tables T16, T17, T18). In general, PWL and PWC x-axis measurements show excellent reproducibility. Comparatively, PWC z-axis measurements exhibit lower P-wave velocity values (Figure F22). Several obvious outliers in PWC z-axis measurements are excluded from the statistical analysis of the data (red circles in Figure F22). A remarkable feature of both the PWL and PWC measurements is that P-wave velocity is very stable until ~180 mbsf and then significantly increases toward the bottom of the hole. In the upper ~180 mbsf, average values are 1516 ± 23, 1528 ± 10, and 1484 ± 7 m/s for PWL and PWC x-axis and z-axis measurements, respectively. Linear regressions for the upper 190 mbsf have slopes of 0.16, 0.04, and 0.04 for PWL and PWC x-axis and z-axis measurements, respectively. This interval corresponds to a foraminifer-rich nannofossil ooze in lithologic Subunit IA (see Core description).
Table T16. PWL data, Hole U1490A. Download table in CSV format.
Table T17. PWL data, Hole U1490B. Download table in CSV format.
Table T18. PWL data, Hole U1490C. Download table in CSV format.
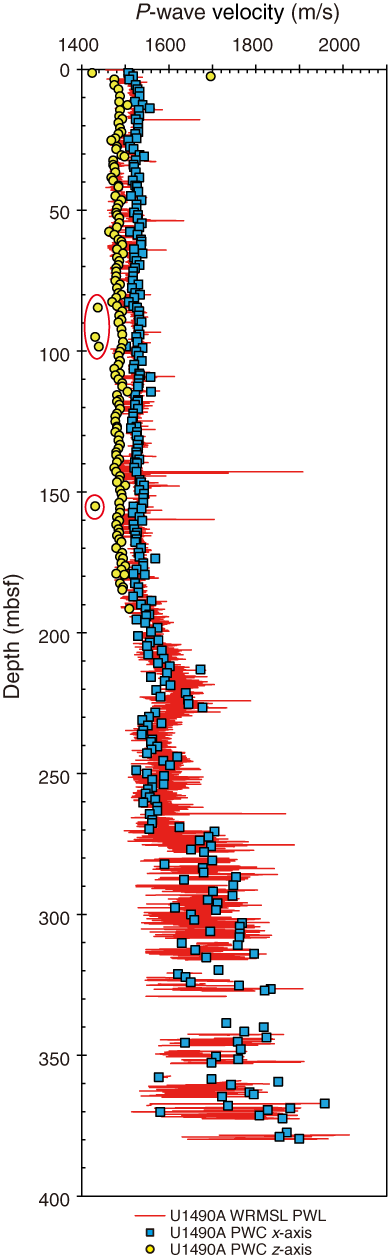
Figure F22. P-wave velocity measurements.
A gradual increase in P-wave velocity at Site U1490 starts at ~180 mbsf, with values increasing from ~1540 to ~1960 m/s by the base of the hole. Linear regressions of PWL and PWC x-axis values have slopes of 0.91 and 1.47, respectively. The initial increase in P-wave velocity corresponds to large increases in magnetic susceptibility (>0 × 10−5 SI), GRA bulk density (>1.8 g/cm3), NGR counts (>1.5 counts/s), and b* (greater than −1.5) and a prominent decrease in L* (<80) (blue shading in Figure F23). In addition, the positive shift in P-wave velocity, which exhibits a broad peak between ~220 and ~240 mbsf, correlates with large positive shifts in magnetic susceptibility, GRA bulk density, and NGR and to a weak negative shift in L*. The interval below ~180 mbsf, where P-wave, NGR, magnetic susceptibility, and GRA bulk density display relatively high amplitude short-term variability, corresponds to lithologic Subunits IB and IC. The latter is primarily radiolarian-rich chalk with frequent indurated volcanogenic and biosilica-rich layers (see Core description).
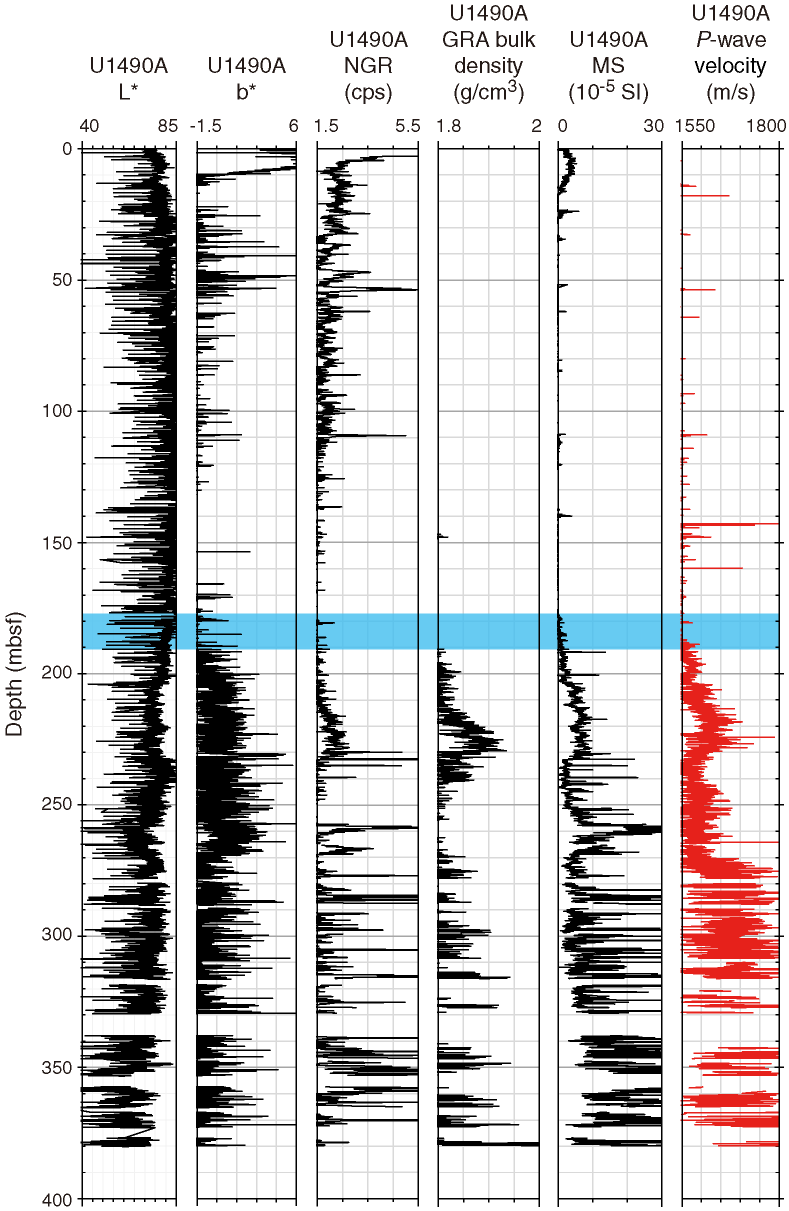
Figure F23. P-wave velocity, color reflectance, NGR, GRA bulk density, and MS.
Moisture and density
Dry density, bulk density, and grain density curves show an opposite trend to porosity in Hole U1490A. The trends in the GRA bulk density records agree well with MAD bulk density, increasing from ~1.58 g/cm3 at the top of the hole to ~1.8 g/cm3 at the bottom (Figure F24). A ~0.05–0.1 g/cm3 offset between MAD and GRA bulk density occurs in the interval from the top of the hole to ~270 mbsf. The offset disappears with the transition in lithology from stiff sediment to chalk and the switch to XCB coring. From ~270 mbsf to the bottom of the hole, increased variability in both the GRA and MAD bulk and dry density data is coincident with the occurrence of black layers consisting of indurated silica (chert), which become more pervasive toward the bottom of the hole (see Core description). Grain density decreases slightly over the entire record from ~2.7 g/cm3 near the seafloor to ~2.6 g/cm3 at the base of the hole, except for two outliers that correspond to discrete very dark volcanogenic-rich layers and a single low MAD grain den sity value at 115.54 mbsf that has no clear origin (black arrows on Figure F24). MAD dry density increases with depth from ~0.8 g/cm3 at the top of the hole to ~1.3 g/cm3 by ~220 mbsf. Dry density decreases downhole to ~0.9 g/cm3 by ~260 mbsf and then increases to ~1.4 g/cm3 and displays relatively high variability from ~260 mbsf to the base of hole. Porosity at Site U1490 decreases downhole from ~70% to ~45%. This decrease is more marked in the upper ~220 mbsf and likely reflects compaction. Below ~220 mbsf, porosity increases from ~50% to ~65% by 260 mbsf, followed by increased variability superimposed on a long-term decreasing trend to the bottom of the hole, coincident with high variability in the dry and bulk densities corresponding to the volcanogenic-rich sediment in Subunit IC.

Figure F24. MAD densities and porosity, GRA bulk density, and thermal conductivity.
Thermal conductivity
A thermal conductivity profile (Figures F20, F24) was obtained at ~10 m resolution using a needle probe for the upper ~270 mbsf (through Core 363-U1490A-32X). Below ~273 mbsf (Core 32X), a puck probe was used on split core sections because the recovered material became indurated (see Physical properties in the Expedition 363 methods chapter [Rosenthal et al., 2018a]). Thermal conductivity increases with depth from ~1 W/(m·K) at the seafloor to ~1.5 W/(m·K) at ~380 mbsf, with an average value of 1.22 W/(m·K). In the interval measured by the puck, variability increases downhole, which is likely related to changes in the lithification and composition of the sediment (see Core description) rather than the different measurement methods. Thermal conductivity correlates with dry density and bulk density and is inversely correlated with porosity because of the compaction effect.
Downhole temperature measurements
Five downhole temperature measurements were collected using the advanced piston corer temperature tool (APCT-3) on Cores 363-U1490A-4H (32.7 mbsf), 7H (61.2 mbsf), 10H (89.7 mbsf), 13H (118.2 mbsf), and 16H (146.7 mbsf). We collected an additional formation temperature measurement on Core 16H because the measurement from Core 10H showed an increase in temperature with time rather than the expected decrease after the core was shot. In general, unconsolidated sediment and increased ship movement related to sea conditions cause frictional heating that is visible in the temperature curves. However, the frictional heating does not significantly impact the extrapolated temperatures (Figure F25). Temperature increases with depth from 4.70°C at 32.7 mbsf to 12.36°C at 146.7 mbsf (Figures F25, F26). The correlation between the five downhole temperature measurements and depth is high (R2 = 0.85). Using the slope of the temperature-depth relationship, we estimate that the bottom water temperature at Site U1490 is 1.22°C, yielding a geothermal gradient of 31°C/km (Figure F26).
We generated a thermal conductivity profile (resolution ~10 m) and calculated thermal resistance using the average thermal conductivity of 1.22 W/(m·K) measured in Hole U1490A following the “average approach” outlined in Pribnow et al. (2000) (Figure F26). The slope of the linear fit between temperature and thermal resistance indicates a heat flow of 44 mW/m2. As at Sites U1488 and U1489, the classic approach for calculating the ocean crust age is inappropriate at Site U1490. The observed conductive heat flow in such areas must therefore be adjusted upward to be indicative of the true crustal heat flow; however, this calculation was not performed here.
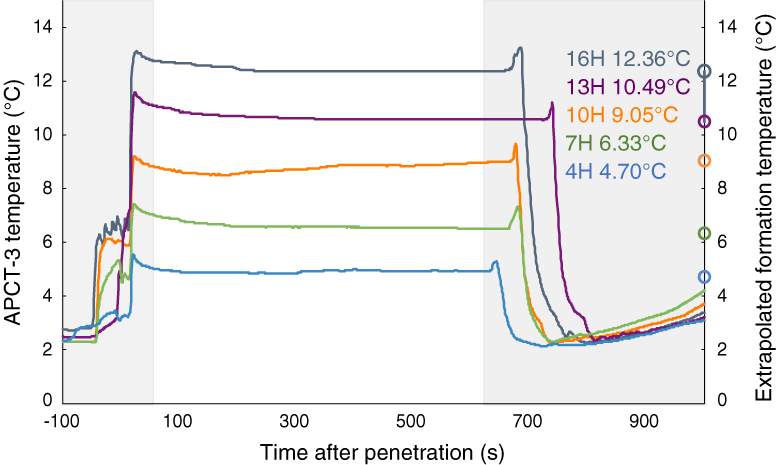
Figure F25. APCT-3 temperature-time series.
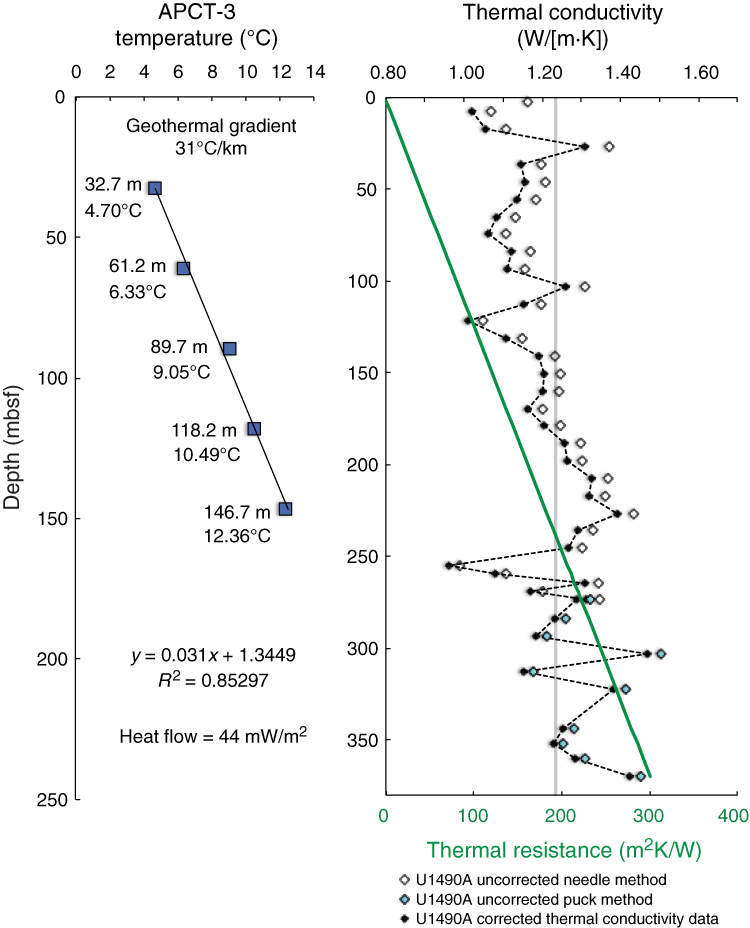
Figure F26. Heat flow calculations.
Stratigraphic correlation
Correlations between holes at Site U1490 were accomplished using Correlator software (version 2.1). Tie points were established using SHMSL color reflectance data, mainly redness (a*) (Figure F27) and luminosity (L*), and WRMSL magnetic susceptibility data (Figure F28; Table T19). In addition, we used WRMSL GRA bulk density data and NGR data. Although WRMSL P-wave data were collected as “fast-track” data for Hole U1490B (see Physical properties) to aid real-time offset determination, the data were not as useful as for Site U1488, so this setup was discontinued for Hole U1490C. We constructed a splice at Site U1490 down to the depth where multiple holes were drilled using Holes U1490A, U1490B, and U1490C (Table T20; Figures F27, F28, F29). The splice is continuous and well constrained from 0 to 295.95 core composite depth below seafloor (CCSF), with the exception of one core gap at 258.01 m CCSF (Figure F29D). There are also a few tentative tie points (Table T19) that should be verified during postcruise research.
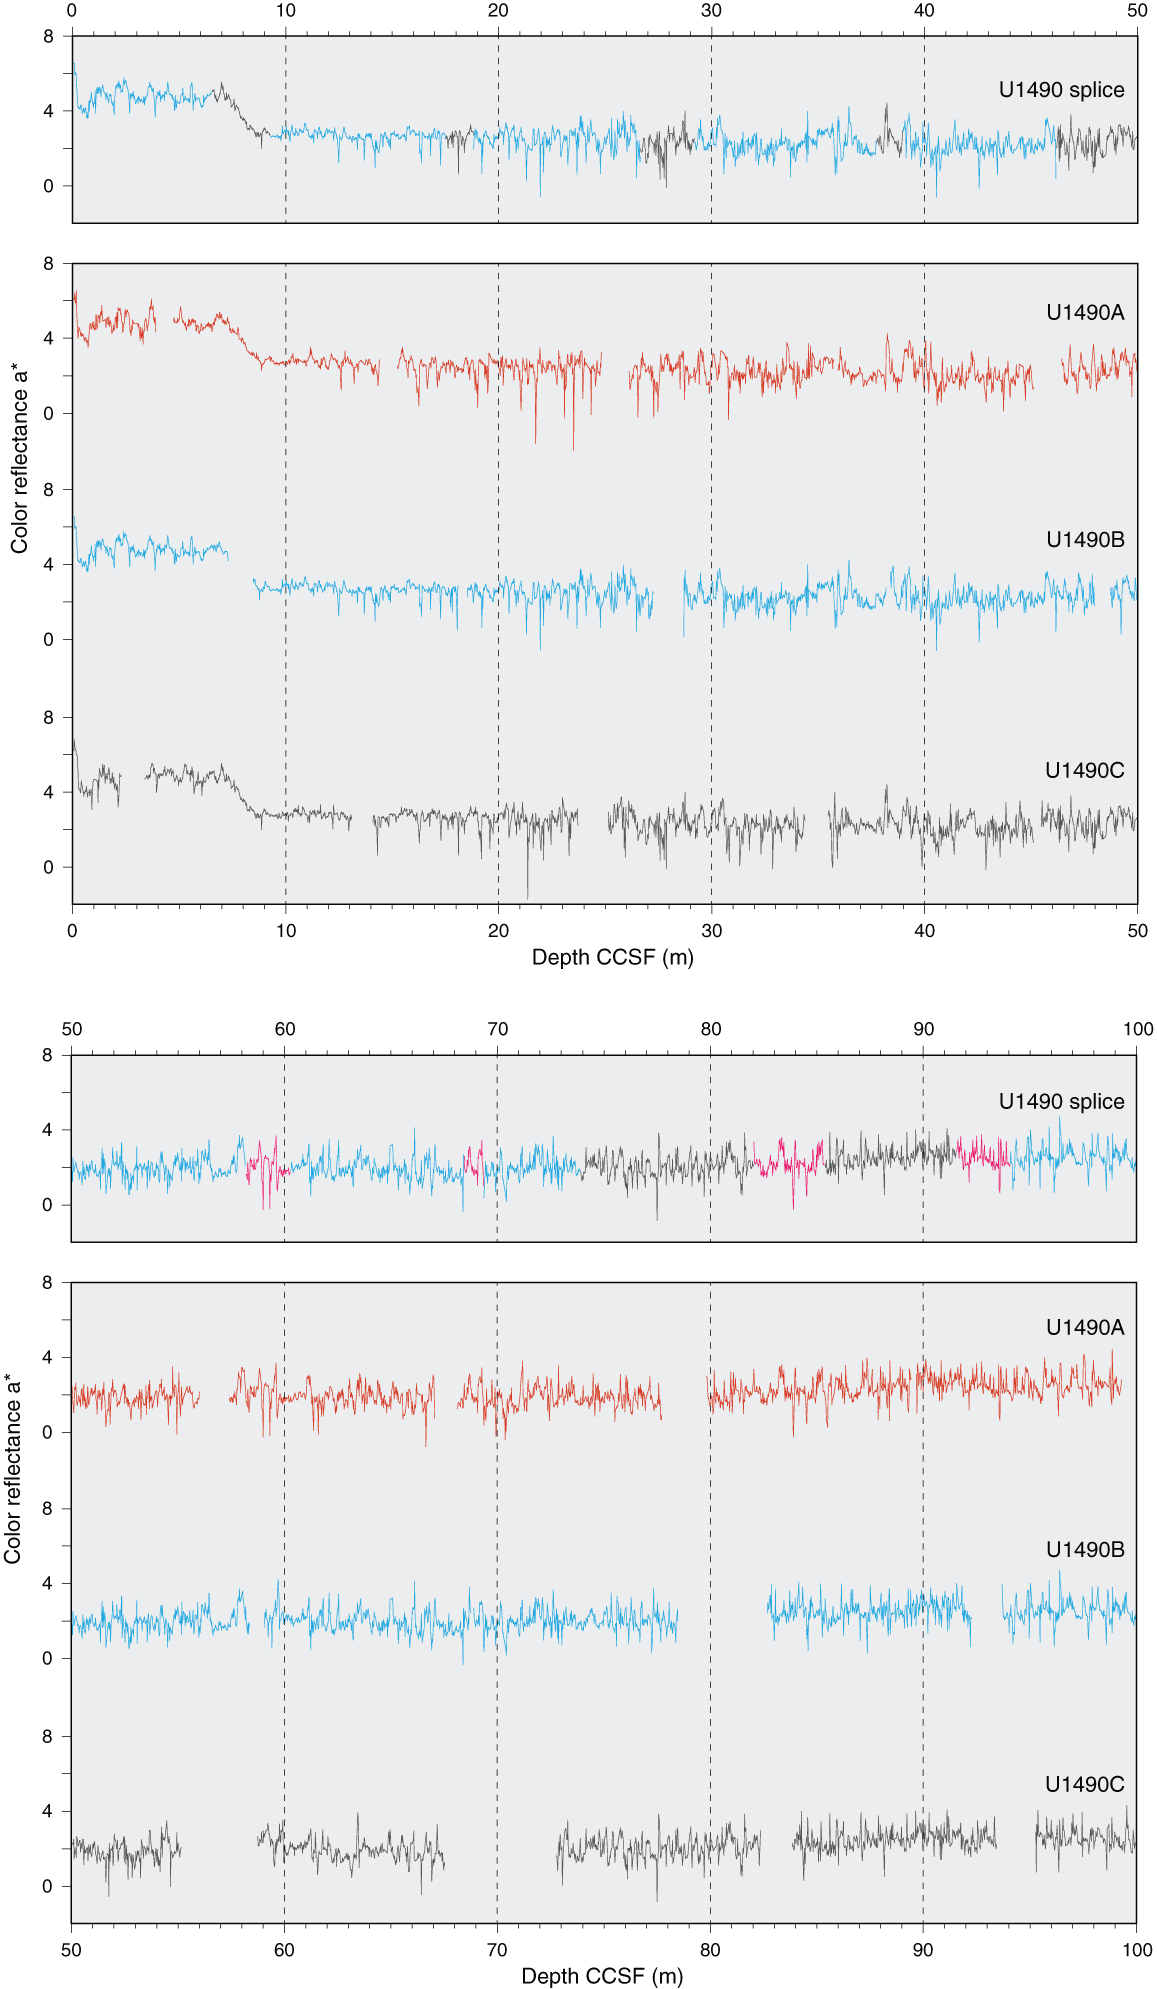
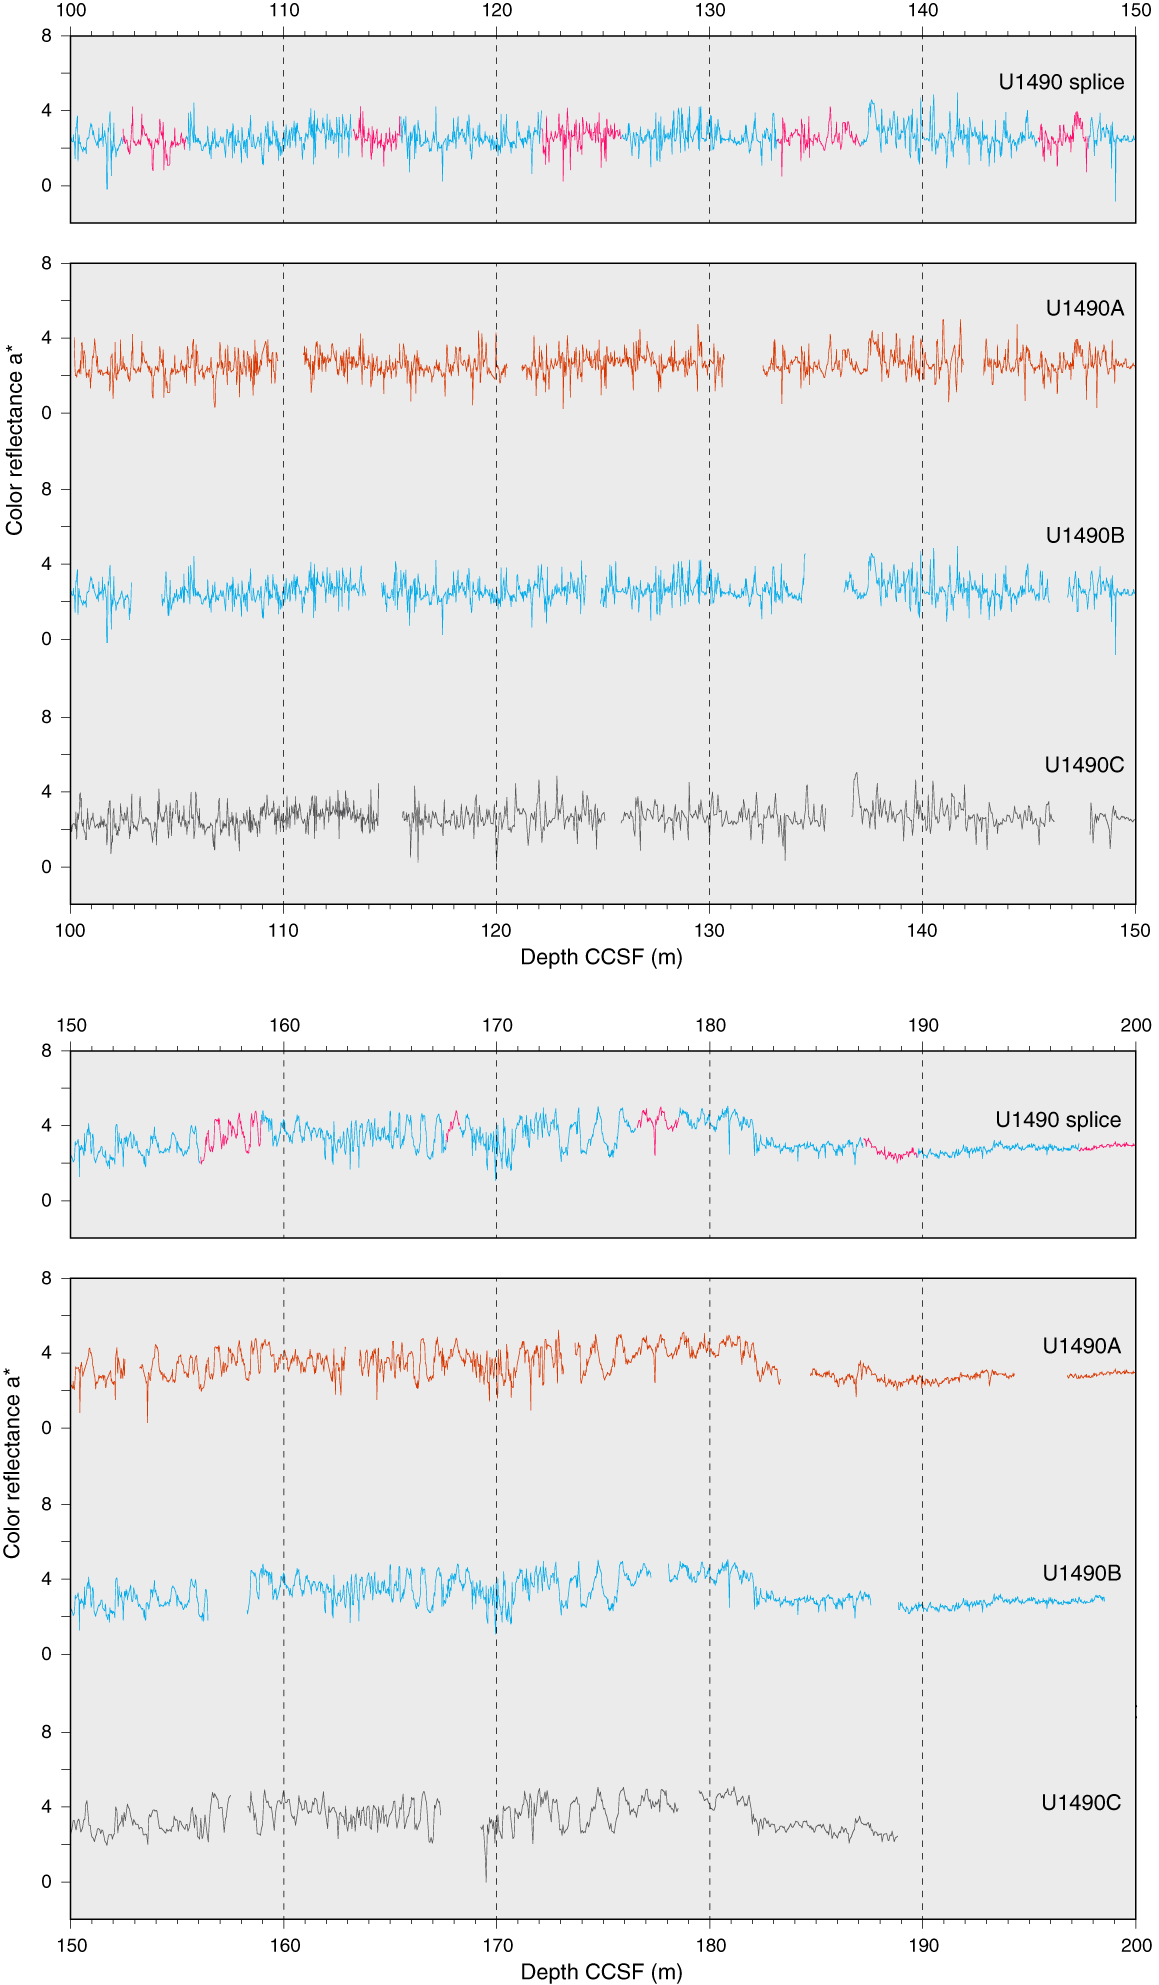

Figure F27. Color reflectance a* data.
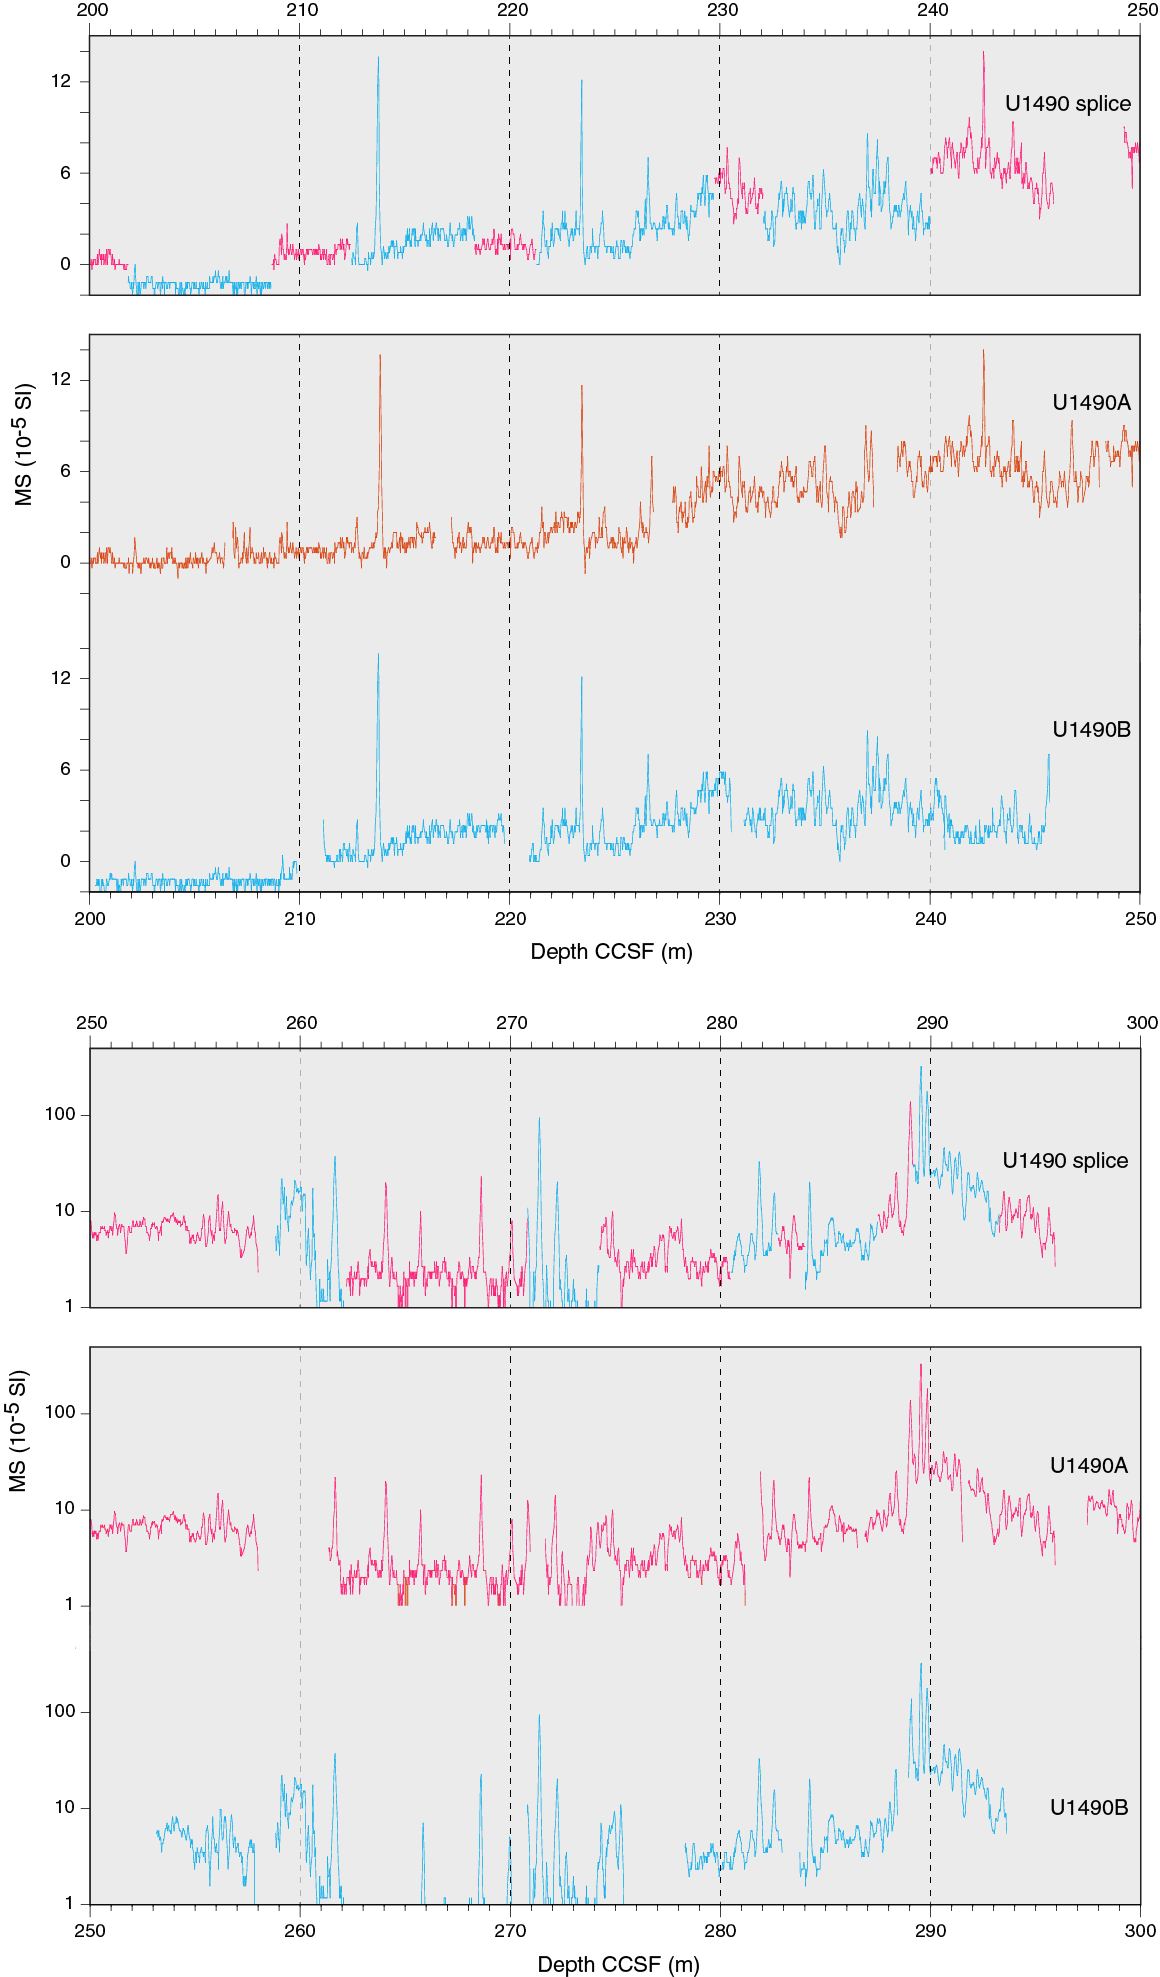
Figure F28. WRMSL MS data.
Table T19. Affine table. Download table in CSV format.
Table T20. Splice intervals. Download table in CSV format.
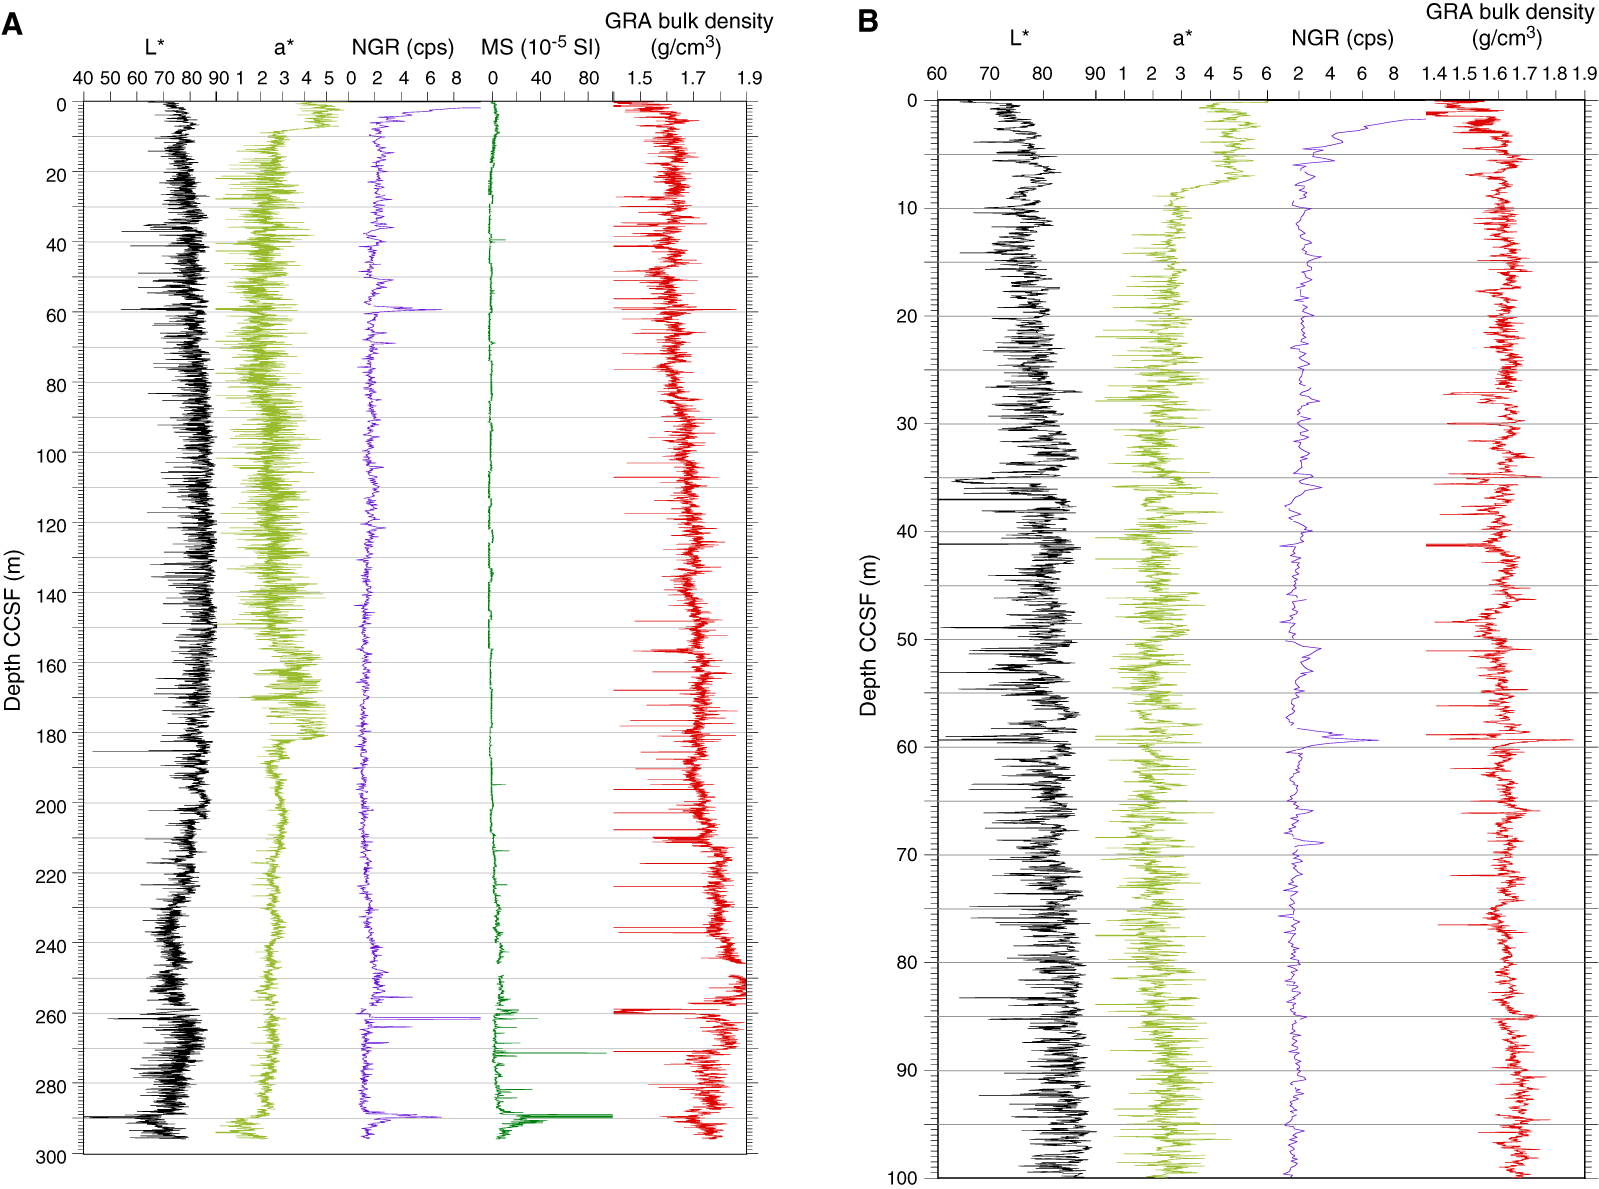
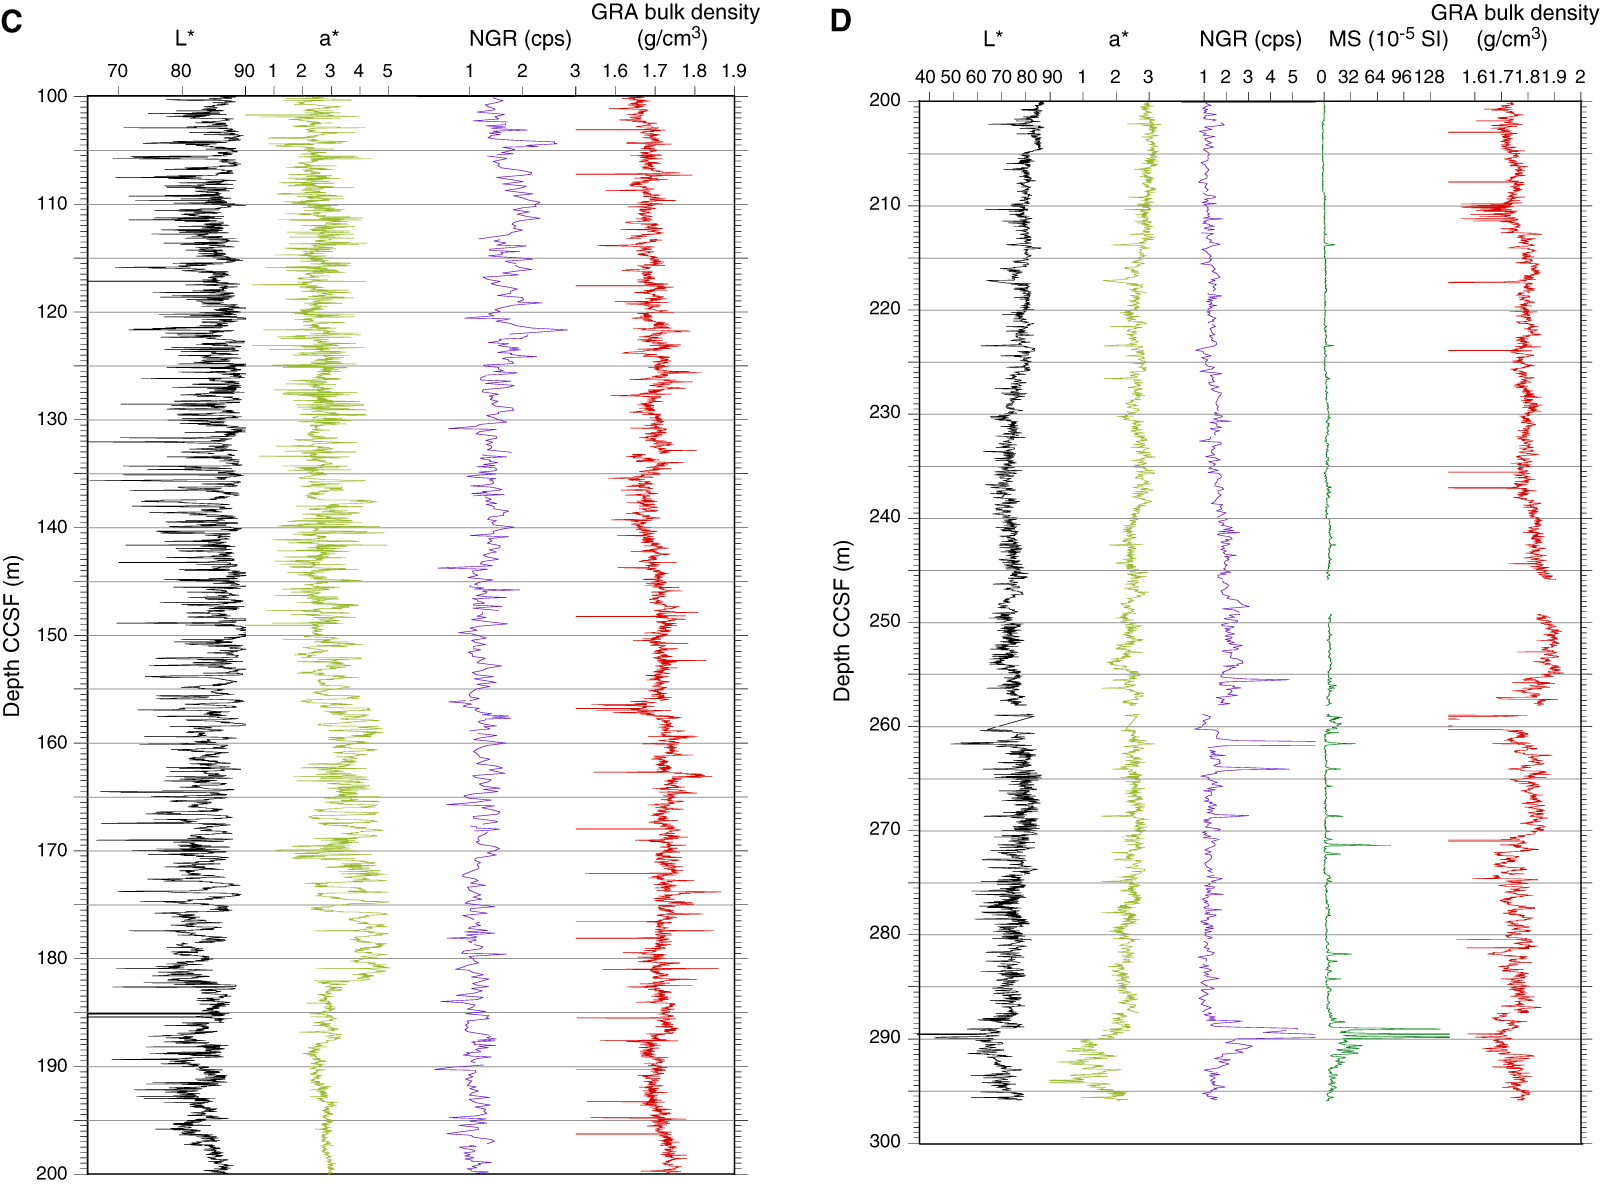
Figure F29. Spliced L*, a*, NGR, MS, and GRA bulk density data.
The CCSF scale is anchored to the mudline of Core 363-U1490B-1H, which is assigned a depth of 0 m CCSF. From this anchor, we worked downhole, using Correlator to establish a composite stratigraphy on a core-by-core basis. From 0 to 197 m CCSF, the a* and L* records (Figures F27, F29B, F29C) have features that could be correlated across holes and thus were used to establish tie points. It was difficult to use magnetic susceptibility to correlate between holes in the upper 197 m CCSF because of the low-amplitude variability of the magnetic susceptibility signal (Figure F29A). However, below 197 m CCSF the amplitude in magnetic susceptibility variability is higher (Figure F29D), and we used these data for correlation and for establishing splice tie points (Figure F28). In addition, GRA bulk density and NGR were needed to verify correlation tie points between holes (Tables T19, T20).
We used Hole U1490B as the “backbone” of the splice and used cores mainly from Hole U1490C to fill core gaps in the upper 91 m CCSF and exclusively used cores from Hole U1490A to fill core gaps below 91 m CCSF. Although there are a few tentative tie points, there are no gaps in the splice, with the possible exception of a gap at 258 m CCSF at the bottom of Core 363-U1490A-25H. It appears that the upper sections of Core 363-U1490B-27F may fill this gap, but there is severe drilling disturbance in Section 363-U1490B-25H-1 and thus it was not possible to find a tie point to the bottom of Core 363-U1490A-25H. For this reason, we set the offset of Core 363-U1490B-27F to just below the bottom of Core 363-U1490A-25H using 1.112, the growth factor of Core 363-U1490B-26F. In addition, the tie point used to correlate between the bottom of Core 363-U1490A-26H and the top of Core 363-U1490B-29F is tentative, and it is possible that there is a coring gap in this interval. The splice ends at 295.94 m CCSF, the bottom of Core 363-U1490A-30F, because no other holes were cored below this depth. Thus, the offsets of the remaining 12 cores from Hole U1490A were established using 1.121, the growth factor of Core 363-U1490A-30F.
The splice interval table (Table T20) is intended to provide a sampling plan that can be used to generate high-resolution continuous records with minimal gaps; however, an “off-splice” sampling plan was also designed, mainly for low-resolution studies. An explanation of the strategy used to determine the off-splice sampling plan and a table of core intervals that should be used for off-splice sampling can be found in OFFSPLICE in Supplementary material.
The cumulative offset between mbsf and CCSF depth scales is nearly linear (Figure F30A). The growth factor is relatively low (8%–9%), as expected in sediment that expands because of the release of overburden and has minimal gas expansion due to low concentrations of methane and other gases (see Geochemistry). There are small changes in the growth factor and, therefore, also in the cumulative offset with depth (Figure F30B), with the most marked change occurring at ~225 mbsf, which approximately marks the transition to firmer sediments close to the depth of APC refusal. It is possible that the growth factor is influenced by hole-to-hole differences in compaction and expansion attributable to the drilling process and/or changes in the stiffness and lithology. Calculation of mass accumulation rates based on the CCSF scale should account for differential expansion by dividing apparent depth intervals by the appropriate growth factor.
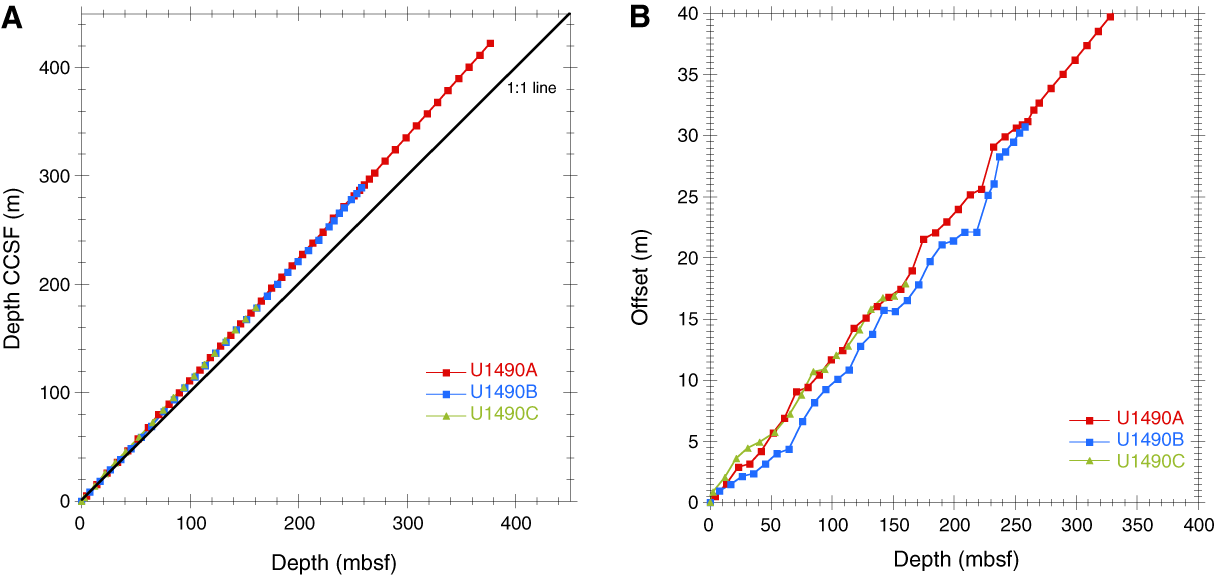
Figure F30. Mbsf and composite depth scales in the Site U1490 splice.
Geochemistry
Site U1490 was drilled on the northern tip of the Eauripik Rise in the Caroline Basin at a water depth of 2341 m. Interstitial water geochemistry profiles suggest relatively weak remineralization of organic matter throughout the sediment column, with elevated sulfate (SO4) concentration (>21 mM) present at depth. The sediment is characterized by high calcium carbonate (CaCO3) content (~94 wt%) in the upper 230 mbsf; however, the strontium (Sr) interstitial water profile indicates a moderate degree of CaCO3 recrystallization and/or dissolution. Major cation and anion concentration profiles are dominated by upward diffusion from a deeper fluid source with a geochemical signature characteristic of basalt and/or volcanogenic sediment-seawater interaction. For detailed background on organic matter remineralization and clay mineral alteration, see Geochemistry in the Site U1482 chapter (Rosenthal et al., 2018b). Lower and more variable CaCO3 content deeper than 230 mbsf coincides with clay- and radiolarian-rich intervals and the onset of frequent ash layers. Total organic carbon (TOC) content ranges from 0.0 to 1.0 wt% and averages 0.2 wt%.
Results
Volatile hydrocarbons
Headspace gas samples were taken at a frequency of one sample per core in Hole U1490A as part of the routine environmental protection and safety-monitoring program (Table T21; Figure F31). Overall, methane concentration is low (<4 ppmv) in Hole U1490A, consistent with elevated interstitial water SO4 concentration throughout the hole (see Sulfate and barium). Ethane and propane are below detection limit, suggesting a biogenic origin of methane.
Table T21. Volatile hydrocarbon concentrations. Download table in CSV format.
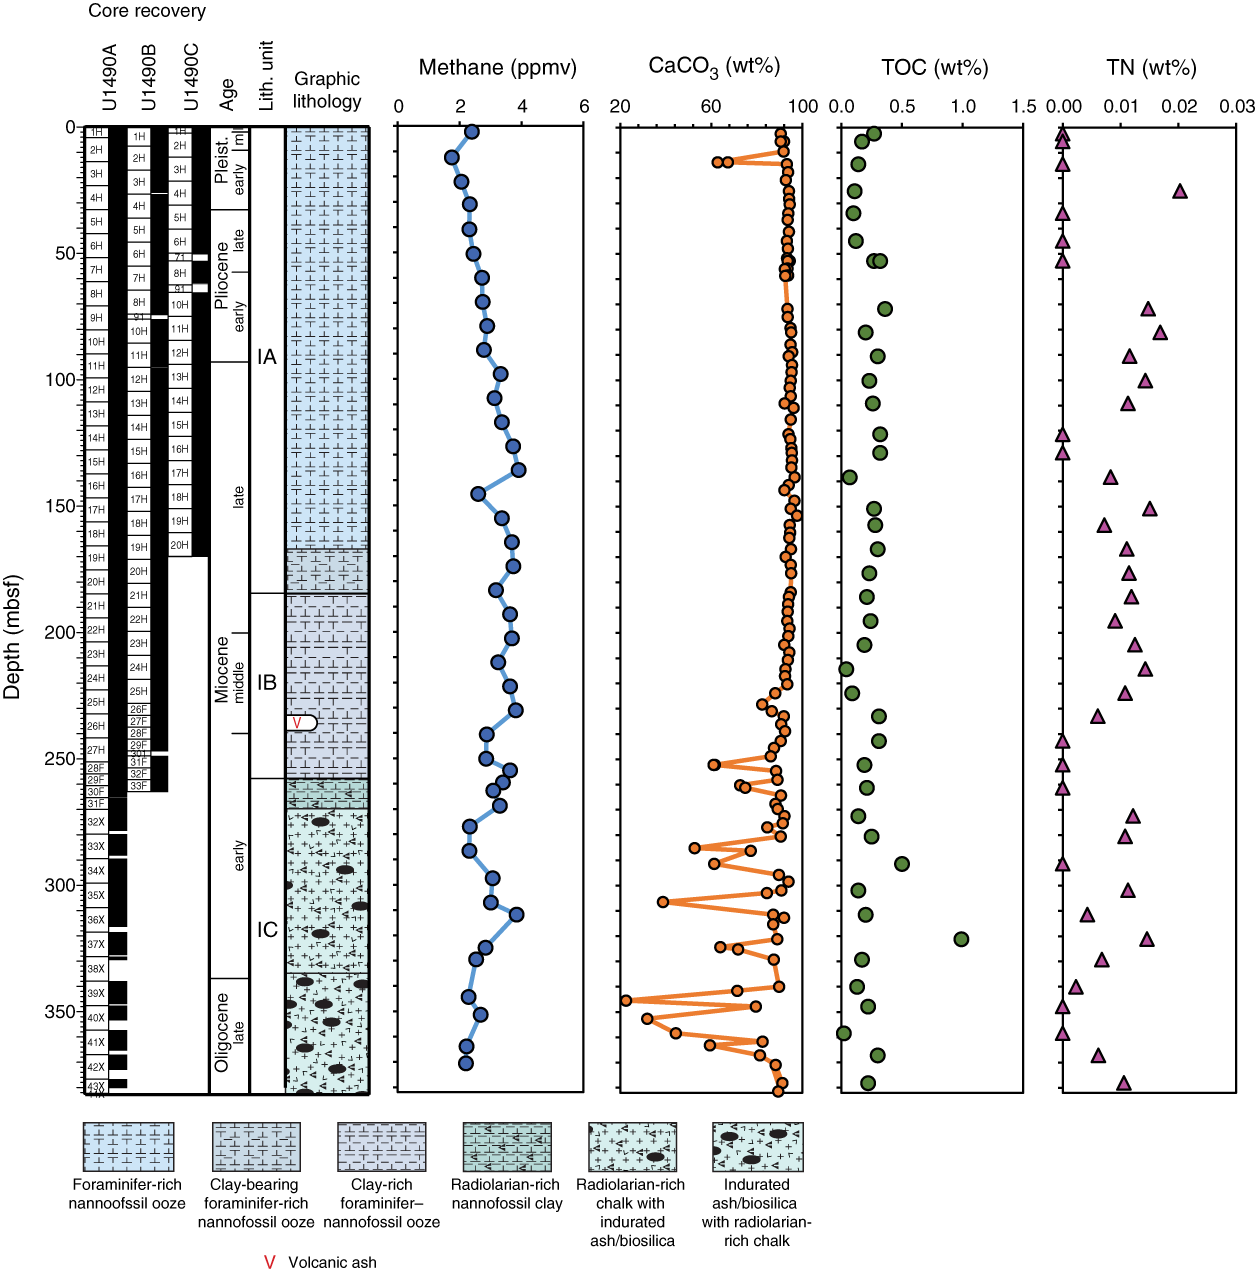
Figure F31. Carbon and TN profiles.
Bulk sediment geochemistry
CaCO3 content was measured on sediment samples from Hole U1490A (Table T22; Figure F31). In general, CaCO3 is the dominant component of the sediment, averaging 87 wt%. CaCO3 content is consistently high at ~94 wt% from 0 to ~230 mbsf, with large fluctuations between 23 and 94 wt% observed between ~230 and 380 mbsf. Low CaCO3 content is found in clay- and radiolarian-rich sediment from 230 to 250 mbsf and also in ash-rich sediment deeper than 250 mbsf. TOC content ranges from 0 to 1.0 wt% with an average of 0.2 wt%. With the exception of two samples (0.5 wt% at 291.4 mbsf and 1.0 wt% at 321.2 mbsf), almost all TOC samples are less than 0.4 wt%. Total nitrogen (TN) content indicates trace amounts (<0.02 wt%) downhole. Because TN is close to the detection limit, the C/N ratio estimates are considered to be unreliable and therefore are excluded from this report.
Table T22. Carbon and TN. Download table in CSV format.
Interstitial water chemistry
A total of 36 interstitial water samples and one mudline sample were collected from Hole U1490A for geochemical analyses, spanning from 0.0 to 325.9 mbsf. Sampling for interstitial water chemistry was halted deeper than 325.9 mbsf due to biscuiting and subpar recovery of core. Standard analyses were carried out on all interstitial water samples following the procedures described in Geochemistry in the Expedition 363 methods chapter (Rosenthal et al., 2018a). Interstitial water chemistry data are reported in Table T23.
Table T23. Interstitial water geochemical data. Download table in CSV format.
Chlorinity and salinity
Chlorinity (Cl) at Site U1490 is characterized by a general and gradual increase from a minimum value of 551.9 mM at the mudline to 575.8 mM at 325.9 mbsf (Figure F32). Although high-resolution interstitial water samples were not taken at this site, the structure of the Cl interstitial water profile in the upper 60 mbsf suggests that the Last Glacial Maximum (LGM) salinity peak is present as an increase from ~552 to 564 mM at ~27.6 mbsf, followed by a slight decrease to ~559 by 60.6 mbsf. The magnitude of this change and the depth of the peak are consistent with the presumed LGM peaks observed at Sites U1488 and U1489 (see Geochemistry in the Site U1488 chapter and Geochemistry in the Site U1489 chapter [Rosenthal et al., 2018e, 2018f]). Deeper than 60.6 mbsf, small (~1%) variations in Cl concentration occur within the overall downhole increasing trend. Salinity (not shown) at Site U1490 is high but relatively constant, increasing slightly from 37–37.5 in the upper ~108 mbsf to a constant 38 deeper than 108 mbsf.
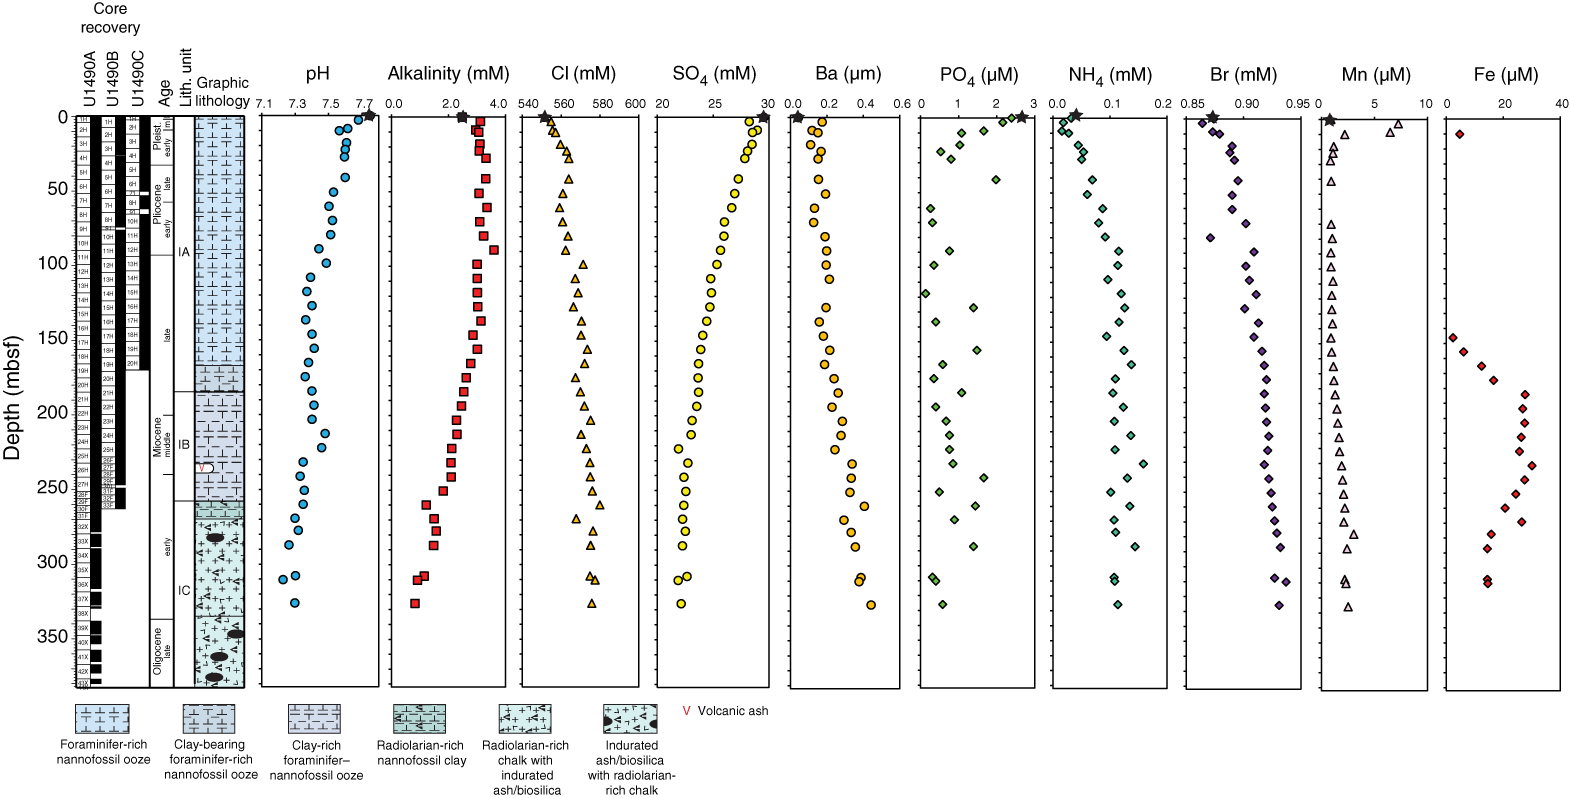
Figure F32. Interstitial water concentration profiles.
Alkalinity and pH
Alkalinity at Site U1490 increases abruptly from 2.5 mM at the mudline to 3.1 mM by 2.9 mbsf, remaining relatively constant (3.0–3.4 mM) over the upper 137 mbsf apart from a small increase to a maximum value of 3.6 mM at 89.1 mbsf (Figure F32). Deeper than 137 mbsf, alkalinity decreases steadily to a minimum of 0.8 mM at 325.9 mbsf. The interstitial water pH profile is generally similar to the alkalinity profile, with an overall decrease in pH from the mudline (7.8) to 7.2–7.3 at the base of the hole (Figure F32). The most notable difference between the pH and alkalinity profiles occurs in the upper ~137 mbsf. In contrast to alkalinity, which is relatively constant over the upper 137 mbsf, pH decreases steadily downhole.
Sulfate and barium
SO4 concentration at Site U1490 decreases from 29.5 mM at the mudline to ~22 mM at 222.1 mbsf and remains constant downhole, consistent with minor amounts of SO4 reduction (Figure F32). In contrast to the other sites in the Caroline Basin, there is no notable increase in interstitial water SO4 toward the bottom of Site U1490. Barium (Ba) concentration is low and increases linearly with depth from 0.04 µM at the mudline to 0.44 µM at 326 mbsf (Figure F32). Both the SO4 and Ba profiles are consistent with low organic matter degradation at this site.
Phosphate, ammonium, and bromide
Phosphate (PO4) concentration is low at Site U1490, reflecting overall low organic matter content. PO4 rapidly decreases from 2.4 µM at the mudline to 0.5 µM at 27.6 mbsf and then abruptly increases to 2 µM by 41.1 mbsf (Figure F32). Remineralization of organic matter generally releases PO4 into interstitial water; however, the depletion in the upper ~27 mbsf may also be due to scavenging of PO4 through sorption to clay minerals or local diagenetic precipitation of carbonate fluorapatite, as suggested for Sites U1488 and U1489. Deeper than 41.1 mbsf, interstitial water PO4 concentration is variable, at or close to the detection limit.
Ammonium (NH4) is also low at Site U1490, increasing from ~0.02 mM in the uppermost sediment (0–8.6 mbsf) to 0.11–0.16 mM by 89.1 mbsf (Figure F32), consistent with remineralization of the minor amounts of organic matter in the youngest sediment. Fairly constant (12 ± 0.02 mM) NH4 concentration between ~89 and 326 mbsf suggests minor clay mineral authigenesis and reduced degradation of more refractory organic matter at depth.
Bromide (Br) concentration increases with depth in a pattern nearly identical to that of NH4 (Figure F32). Following a small (~0.01 mM) decrease from the mudline to 2.9 mbsf, Br concentration increases from 0.86 to 0.91 mM by 89.1 mbsf. Deeper than 89.1 mbsf, Br increases more gradually with depth and reaches a maximum concentration of 0.94 mM at 310.3 mbsf. The trend in the Br interstitial water profile shallower than ~89 mbsf is indicative of minor remineralization of organic matter. Diffusion from a Br source at depth and/or minimal organic matter remineralization appears to influence the profile deeper than ~89 mbsf.
Manganese and iron
Manganese (Mn) increases sharply from 0.9 µM at the mudline to 7.2 µM at 2.9 mbsf and declines sharply then more gradually to <1 µm at 27.6 mbsf (Figure F32), reflecting the reduction of Mn hydroxides and Mn oxyhydroxides as organic matter is degraded. Mn concentration remains low (<1 µM) and fairly invariant down to 165.1 mbsf. Between 165.1 mbsf and the base of the interstitial water profile, a small but distinct increase in Mn concentration of 2.6–3 µM is observed.
Iron (Fe) concentration in the upper 146 mbsf at Site U1490 is extremely low, with all but one measurement falling below detection limit (Figure F32). Below 146 mbsf, Fe concentration is markedly elevated, increasing from 2.3 to 27.7 µM between 146.1 and 184.1 mbsf, followed by a gradual decrease to 14.6 µM by 310.3 mbsf. Similar trends are observed for Fe at Sites U1488 and U1489 (see Geochemistry in the Site U1488 chapter and Geochemistry in the Site U1489 chapter [Rosenthal et al., 2018e, 2018f]); however, the concentration of dissolved Fe observed at Site U1489 is 2–4 times higher. The presence of interstitial water Fe enrichment in the deeper parts of all three sites suggests common driving processes among all the sites, such as upward diffusion of deeper fluids and/or similar lithologies.
Potassium, magnesium, and calcium
Potassium (K) initially increases from a mudline concentration of 10.2 mM to a maximum concentration of ~11 mM between 10.1 and 18.1 mbsf, indicating K addition within this interval (Figure F33). Potassium concentration then decreases linearly to a minimum value of 7.5 mM at 310.3 mbsf. This decrease in K indicates a sink for potassium at a depth below the base of Site U1490.
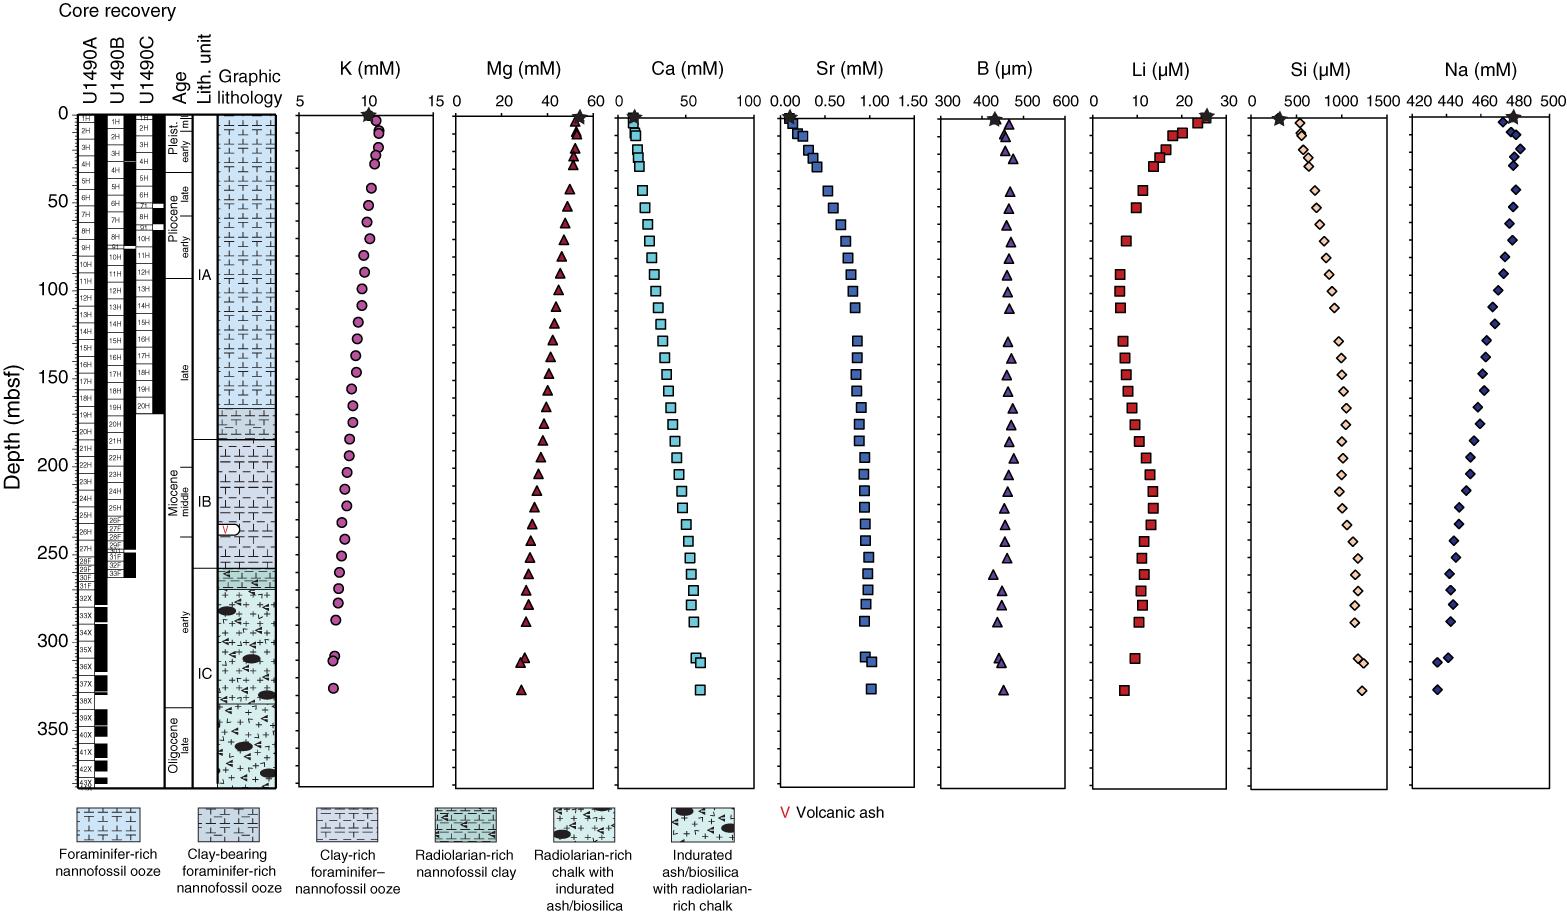
Figure F33. Interstitial water concentration profiles.
Magnesium (Mg) and calcium (Ca) concentrations mirror each other at Site U1490 (Figure F33), with linear trends for both dissolved constituents. Mg decreases linearly from 53.8 mM at the mudline to a minimum of 28.3 mM at 310.3 mbsf, whereas Ca increases linearly from 11.1 to 60.6 mM over the same depth interval. These trends indicate that one or more sinks for Mg and sources of Ca are present deeper than the bottom of the hole (326 mbsf).
Strontium and boron
Strontium (Sr) at Site U1490 is similar to the Sr profile at Site U1488, showing an increase from a mudline concentration of 0.1 mM to a maximum concentration of 1.0 mM at 325.9 mbsf (Figure F33). The trend and curvature of the profile in the upper 108 mbsf suggest interstitial water Sr is influenced by CaCO3 diagenesis, whereas deeper than 108 mbsf, the profile shows evidence of diffusion. The boron (B) profile at Site U1490 is also similar to that at Site U1488. At the mudline, B concentration is 434 µM, and the downhole average B concentration is ~459 µM with variations within 2% of this average (Figure F33).
Lithium, silica, and sodium
Lithium (Li) decreases from 25.4 µM at the mudline to 6.0 µM at 98.6 mbsf (Figure F33). Between 98.6 and 222.1 mbsf, Li increases to 13.6 µM and then decreases to 7.1 µM at 325.9 mbsf. The Li profile at this site is similar to that at Site U1488 in the upper 190 mbsf. However, deeper in the hole, the Li concentration at Site U1488 continues to increase downhole, whereas it decreases at Site U1490. In contrast with Li, the trend and concentration of silica (Si) at Site U1490 are similar to those at Site U1488. Si increases steadily from a mudline concentration of 301.8 µM to 539.7 µM at 2.9 mbsf and then more slowly to 1223.4 µM at the base of the interstitial water profile (Figure F33). A subtle local minimum in Si occurs at 212.6 mbsf (974.2 µM), and a local maximum occurs at 250.6 mbsf (1179 µM).
The sodium (Na) concentration profile at Site U1490 deviates notably from the trend seen in Cl (Figure F33). Na concentration is relatively constant at ~480 mM from the mudline to 70.1 mbsf and then decreases linearly below this depth with a minimum concentration of 434.7 mM at 325.9 mbsf. The linear nature of the downhole decrease indicates diffusion of Na toward a Na sink at depth of probable hydrothermal character.
Discussion
Site U1490 is located at the northern end of the Eauripik Rise at a water depth comparable to that at Site U1488 and shallower than at Site U1489, which are located in the southern part of the Eauripik Rise. The interstitial water profiles at these three sites show similar trends most notably in the uppermost sediment, suggesting similarity in the depositional settings and rates of organic matter remineralization and carbonate recrystallization. Differences in interstitial water profiles at depth among the three sites probably reflect differences in the degree of influence of basement fluids.
In the uppermost 100 mbsf, organic matter remineralization and carbonate diagenesis are the primary influences on interstitial water geochemistry at all three sites. These influences are reflected in similar trends in the pH, alkalinity, PO4, NH4, Ba, Br, and Sr profiles. Slight differences in the NH4 and PO4 interstitial water profiles at the three sites may reflect small differences in the amount of sedimentary organic matter; however, the concentrations of these dissolved constituents are low (<0.4 mM and <4 µM, respectively) and TOC content is low, making it difficult to assess small site-to-site differences in organic matter remineralization. Differences in the SO4, Mn, and Fe profiles across the three sites may reflect subtle differences in early diagenetic organic matter remineralization, particularly with respect to the sedimentary Mn content (see Geochemistry in the Site U1489 chapter [Rosenthal et al., 2018f]).
The interstitial water profiles at all three Eauripik Rise sites display the influence of diffusion from deep fluid sources characterized by basalt-seawater geochemical signatures, particularly within the deeper sediment column. At Site U1490, the interstitial water profiles for the major cations (K, Ca, Mg, and Na) are linear with no curvature, change in slope, or variability that would indicate in situ sediment-interstitial water reactions. The site-to-site differences in the degree of influence of the deep fluid signature are likely related to differences in the proximity of the underlying basement, differences in basement age and/or composition that lead to distinctive geochemical signatures for crustal fluids, and differences in average sedimentation rate, which is lower at Site U1490 (~1.5 cm/ky) relative to Site U1488 (~2.5 cm/ky) and Site U1489 (~2 cm/ky). Site U1490 also has less clay and fine sediment that would otherwise help preserve reaction gradients in the interstitial water profile. Additionally, the average interstitial water downhole gradients for Ca and Na are notably stronger at Site U1490 than those at Sites U1488 and U1489. As proposed for Ocean Drilling Program (ODP) Site 795, drilled in the Japan Sea, the decrease in Na could reflect hydrothermal albitization taking place at greater sediment depths or within the oceanic basement (Shipboard Scientific Party, 1990).
The presence of abundant ash layers at Site U1490 deeper than 250 mbsf is a unique feature among the three Eauripik Rise sites. Although XRD analysis was not carried out on these ash layers due to time limitations, alteration and/or sediment-water interactions within this ash-rich interval may also influence the interstitial water composition at Site U1490. Such sediment-water interactions at this depth are supported by the trends in several elements, including Li, B, Fe, and Si, which all show significant departure from their downhole profile within the ash-rich horizons. In particular, the marked depletion in Li, B, and Fe could be explained by adsorption onto or scavenging of alteration products of the ash deposits (Zhang et al., 1998).
References
Backman, J., Raffi, I., Rio, D., Fornaciari, E., and Pälike, H., 2012. Biozonation and biochronology of Miocene through Pleistocene calcareous nannofossils from low and middle latitudes. Newsletters on Stratigraphy, 45(3):221–244. https://doi.org/10.1127/0078-0421/2012/0022
Baldwin, K.E., Mountain, G.S., and Rosenthal, Y., 2017. Sediment waves in the Caroline Basin suggest evidence for Miocene shifts in bottom water flow in the western equatorial Pacific. Marine Geology, 393:194–202. https://doi.org/10.1016/j.margeo.2017.07.017
Bracey, D.R., 1975. Reconnaissance geophysical survey of the Caroline Basin. Geological Society of America Bulletin, 86(6):775–784. https://doi.org/10.1130/0016-7606(1975)86<775:RGSOTC>2.0.CO;2
Cande, S.C., and Kent, D.V., 1995. Revised calibration of the geomagnetic polarity timescale for the Late Cretaceous and Cenozoic. Journal of Geophysical Research: Solid Earth, 100(B4):6093–6095. https://doi.org/10.1029/94JB03098
Chaisson, W.P., and Leckie, R.M., 1993. High-resolution Neogene planktonic foraminifer biostratigraphy of Site 806, Ontong Java Plateau (western equatorial Pacific). In Berger, W.H., Kroenke, L.W., Mayer, L.A., et al., Proceedings of the Ocean Drilling Program, Scientific Results, 130: College Station, TX (Ocean Drilling Program), 137–178. https://doi.org/10.2973/odp.proc.sr.130.010.1993
Chaisson, W.P., and Pearson, P.N., 1997. Planktonic foraminifer biostratigraphy at Site 925: middle Miocene–Pleistocene. In Shackleton, N.J., Curry, W.B., Richter, C., and Bralower, T.J. (Eds.), Proceedings of the Ocean Drilling Program, Scientific Results, 154: College Station, TX (Ocean Drilling Program), 3–31. https://doi.org/10.2973/odp.proc.sr.154.104.1997
Hegarty, K.A., and Weissel, J.K., 1988. Complexities in the developments of the Caroline plate region, western equatorial Pacific. In Nairn, A.E.M., Stehli, F.G., and Uyeda, S. (Eds.), The Ocean Basins and Margins: Boston (Springer), 277–301. https://doi.org/10.1007/978-1-4615-8041-6_6
Hilgen, F.J., Lourens, L.J., and Van Dam, J.A., 2012. The Neogene period. With contributions by A.G. Beu, A.F. Boyes, R.A. Cooper, W. Krijgsman, J.G. Ogg, W.E. Piller, and D.S. Wilson. In Gradstein, F.M., Ogg, J.G., Schmitz, M.D., and Ogg, G.M. (Eds.), The Geologic Time Scale: Oxford, United Kingdom (Elsevier), 923–978. https://doi.org/10.1016/B978-0-444-59425-9.00029-9
Jenkins, D.G., Saunders, J.B., and Cifelli, R., 1981. The relationship of Globigerinoides bisphericus Todd 1954 to Praeorbulina sicana (de Stefani) 1952. Journal of Foraminiferal Research, 11(4):262–267. https://doi.org/10.2113/gsjfr.11.4.262
Karlin, R., and Levi, S., 1983. Diagenesis of magnetic minerals in recent hemipelagic sediments. Nature, 303(5915):327–330. https://doi.org/10.1038/303327a0
Pearson, P.N., 1995. Planktonic foraminifer biostratigraphy and the development of pelagic caps on guyots in the Marshall Islands group. In Haggerty, J.A., Premoli Silva, I., Rack, F., and McNutt, M.K. (Eds.), Proceedings of the Ocean Drilling Program, Scientific Results, 144: College Station, TX (Ocean Drilling Program), 21–59. https://doi.org/10.2973/odp.proc.sr.144.013.1995
Pearson, P.N., Shackleton, N.J. and Hall, M.A., 1997. Stable isotopic evidence for the sympatric divergence of Globigerinoides trilobus and Orbulina universa (planktonic foraminifera). Journal of the Geological Society, 154(2):295–302. https://doi.org/10.1144/gsjgs.154.2.0295
Pribnow, D., Kinoshita, M., and Stein, C., 2000. Thermal Data Collection and Heat Flow Recalculations for Ocean Drilling Program Legs 101–180: Hanover, Germany (Institute for Joint Geoscientific Research, Institut für Geowissenschaftliche Gemeinschaftsaufgaben [GGA]). http://www-odp.tamu.edu/publications/heatflow/ODPReprt.pdf
Resig, J.M., Frost, G.M., Ishikawa, N., and Perembo, R.C.B., 2001. Micropaleontological and paleomagnetic approaches to stratigraphic anomalies in rift basins: ODP Site 1109, Woodlark Basin. In Wilson, R.C.L., Whitmarsh, R.B., Taylor, B., and Froitzheim, N. (Eds.), Non-Volcanic Rifting of Continental Margins: A Comparison of Evidence from Land and Sea. Geological Society Special Publication, 187(1):389–404. https://doi.org/10.1144/GSL.SP.2001.187.01.19
Rosenthal, Y., Holbourn, A., and Kulhanek, D.K., 2016. Expedition 363 Scientific Prospectus: Western Pacific Warm Pool. International Ocean Discovery Program. https://doi.org/10.14379/iodp.sp.363.2016
Rosenthal, Y., Holbourn, A.E., Kulhanek, D.K., Aiello, I.W., Babila, T.L., Bayon, G., Beaufort, L., Bova, S.C., Chun, J.-H., Dang, H., Drury, A.J., Dunkley Jones, T., Eichler, P.P.B., Fernando, A.G.S., Gibson, K.A., Hatfield, R.G., Johnson, D.L., Kumagai, Y., Li, T., Linsley, B.K., Meinicke, N., Mountain, G.S., Opdyke, B.N., Pearson, P.N., Poole, C.R., Ravelo, A.C., Sagawa, T., Schmitt, A., Wurtzel, J.B., Xu, J., Yamamoto, M., and Zhang, Y.G., 2018a. Expedition 363 methods. In Rosenthal, Y., Holbourn, A.E., Kulhanek, D.K., and the Expedition 363 Scientists, Western Pacific Warm Pool. Proceedings of the International Ocean Discovery Program, 363: College Station, TX (International Ocean Discovery Program). https://doi.org/10.14379/iodp.proc.363.102.2018
Rosenthal, Y., Holbourn, A.E., Kulhanek, D.K., Aiello, I.W., Babila, T.L., Bayon, G., Beaufort, L., Bova, S.C., Chun, J.-H., Dang, H., Drury, A.J., Dunkley Jones, T., Eichler, P.P.B., Fernando, A.G.S., Gibson, K.A., Hatfield, R.G., Johnson, D.L., Kumagai, Y., Li, T., Linsley, B.K., Meinicke, N., Mountain, G.S., Opdyke, B.N., Pearson, P.N., Poole, C.R., Ravelo, A.C., Sagawa, T., Schmitt, A., Wurtzel, J.B., Xu, J., Yamamoto, M., and Zhang, Y.G., 2018b. Site U1482. In Rosenthal, Y., Holbourn, A.E., Kulhanek, D.K., and the Expedition 363 Scientists, Western Pacific Warm Pool. Proceedings of the International Ocean Discovery Program, 363: College Station, TX (International Ocean Discovery Program). https://doi.org/10.14379/iodp.proc.363.103.2018
Rosenthal, Y., Holbourn, A.E., Kulhanek, D.K., Aiello, I.W., Babila, T.L., Bayon, G., Beaufort, L., Bova, S.C., Chun, J.-H., Dang, H., Drury, A.J., Dunkley Jones, T., Eichler, P.P.B., Fernando, A.G.S., Gibson, K.A., Hatfield, R.G., Johnson, D.L., Kumagai, Y., Li, T., Linsley, B.K., Meinicke, N., Mountain, G.S., Opdyke, B.N., Pearson, P.N., Poole, C.R., Ravelo, A.C., Sagawa, T., Schmitt, A., Wurtzel, J.B., Xu, J., Yamamoto, M., and Zhang, Y.G., 2018c. Site U1486. In Rosenthal, Y., Holbourn, A.E., Kulhanek, D.K., and the Expedition 363 Scientists, Western Pacific Warm Pool. Proceedings of the International Ocean Discovery Program, 363: College Station, TX (International Ocean Discovery Program). https://doi.org/10.14379/iodp.proc.363.107.2018
Rosenthal, Y., Holbourn, A.E., Kulhanek, D.K., Aiello, I.W., Babila, T.L., Bayon, G., Beaufort, L., Bova, S.C., Chun, J.-H., Dang, H., Drury, A.J., Dunkley Jones, T., Eichler, P.P.B., Fernando, A.G.S., Gibson, K.A., Hatfield, R.G., Johnson, D.L., Kumagai, Y., Li, T., Linsley, B.K., Meinicke, N., Mountain, G.S., Opdyke, B.N., Pearson, P.N., Poole, C.R., Ravelo, A.C., Sagawa, T., Schmitt, A., Wurtzel, J.B., Xu, J., Yamamoto, M., and Zhang, Y.G., 2018d. Site U1487. In Rosenthal, Y., Holbourn, A.E., Kulhanek, D.K., and the Expedition 363 Scientists, Western Pacific Warm Pool. Proceedings of the International Ocean Discovery Program, 363: College Station, TX (International Ocean Discovery Program). https://doi.org/10.14379/iodp.proc.363.108.2018
Rosenthal, Y., Holbourn, A.E., Kulhanek, D.K., Aiello, I.W., Babila, T.L., Bayon, G., Beaufort, L., Bova, S.C., Chun, J.-H., Dang, H., Drury, A.J., Dunkley Jones, T., Eichler, P.P.B., Fernando, A.G.S., Gibson, K.A., Hatfield, R.G., Johnson, D.L., Kumagai, Y., Li, T., Linsley, B.K., Meinicke, N., Mountain, G.S., Opdyke, B.N., Pearson, P.N., Poole, C.R., Ravelo, A.C., Sagawa, T., Schmitt, A., Wurtzel, J.B., Xu, J., Yamamoto, M., and Zhang, Y.G., 2018e. Site U1488. In Rosenthal, Y., Holbourn, A.E., Kulhanek, D.K., and the Expedition 363 Scientists, Western Pacific Warm Pool. Proceedings of the International Ocean Discovery Program, 363: College Station, TX (International Ocean Discovery Program). https://doi.org/10.14379/iodp.proc.363.109.2018
Rosenthal, Y., Holbourn, A.E., Kulhanek, D.K., Aiello, I.W., Babila, T.L., Bayon, G., Beaufort, L., Bova, S.C., Chun, J.-H., Dang, H., Drury, A.J., Dunkley Jones, T., Eichler, P.P.B., Fernando, A.G.S., Gibson, K.A., Hatfield, R.G., Johnson, D.L., Kumagai, Y., Li, T., Linsley, B.K., Meinicke, N., Mountain, G.S., Opdyke, B.N., Pearson, P.N., Poole, C.R., Ravelo, A.C., Sagawa, T., Schmitt, A., Wurtzel, J.B., Xu, J., Yamamoto, M., and Zhang, Y.G., 2018f. Site U1489. In Rosenthal, Y., Holbourn, A.E., Kulhanek, D.K., and the Expedition 363 Scientists, Western Pacific Warm Pool. Proceedings of the International Ocean Discovery Program, 363: College Station, TX (International Ocean Discovery Program). https://doi.org/10.14379/iodp.proc.363.110.2018
Rowan, C.J., Roberts, A.P., and Broadbent, T., 2009. Reductive diagenesis, magnetite dissolution, greigite growth and paleomagnetic smoothing in marine sediments: a new view. Earth and Planetary Science Letters, 277(1–2):223–235. https://doi.org/10.1016/j.epsl.2008.10.016
Saito, T., 1976. Geologic significance of coiling direction in the planktonic foraminifer Pulleniatina. Geology, 4(5):305–309. https://doi.org/10.1130/0091-7613(1976)4<305:GSOCDI>2.0.CO;2
Shipboard Scientific Party, 1990. Site 795. In Tamaki, K., Pisciotto, K., Allan, J., et al., Proceedings of the Ocean Drilling Program, Initial Reports, 127: College Station, TX (Ocean Drilling Program), 169–245. https://doi.org/10.2973/odp.proc.ir.127.105.1990
Stoner, J.S., and St-Onge, G., 2007. Magnetic stratigraphy in paleooceanography: reversal, excursion, paleointensity and secular variation. In Hillaire-Marcel, C., and de Vernal, A. (Eds.), Developments in Marine Geology (Volume 1): Proxies in Late Cenozoic Paleoceanography. R. Stein (Series Ed.): Amsterdam (Elsevier B.V.), 99–138. https://doi.org/10.1016/S1572-5480(07)01008-1
Wilkens, R.H., Westerhold, T., Drury, A.J., Lyle, M., Gorgas, T., and Tian, J., 2017. Revisiting the Ceara Rise, equatorial Atlantic Ocean: isotope stratigraphy of ODP Leg 154. Climate of the Past, 13:779–793. https://doi.org/10.5194/cp-13-779-2017
Zhang, L., Chan, L.-H., and Gieskes, J.M., 1998. Lithium isotope geochemistry of pore waters from Ocean Drilling Program Sites 918 and 919, Irminger Basin. Geochimica et Cosmochimica Acta, 62(14):2437–2450. http://dx.doi.org/10.1016/S0016-7037(98)00178-1
Zijderveld, J.D.A., 1967. AC demagnetization of rocks: analysis of results. In Collinson, D.W., Creer, K.M., and Runcorn, S.K. (Eds.), Developments in Solid Earth Geophysics (Volume 3): Methods in Palaeomagnetism: Amsterdam (Elsevier), 254–286. https://doi.org/10.1016/B978-1-4832-2894-5.50049-5
1 Rosenthal, Y., Holbourn, A.E., Kulhanek, D.K., Aiello, I.W., Babila, T.L., Bayon, G., Beaufort, L., Bova, S.C., Chun, J.-H., Dang, H., Drury, A.J., Dunkley Jones, T., Eichler, P.P.B., Fernando, A.G.S., Gibson, K., Hatfield, R.G., Johnson, D.L., Kumagai, Y., Li, T., Linsley, B.K., Meinicke, N., Mountain, G.S., Opdyke, B.N., Pearson, P.N., Poole, C.R., Ravelo, A.C., Sagawa, T., Schmitt, A., Wurtzel, J.B., Xu, J., Yamamoto, M., and Zhang, Y.G., 2018. Site U1490. In Rosenthal, Y., Holbourn, A.E., Kulhanek, D.K., and the Expedition 363 Scientists, Western Pacific Warm Pool. Proceedings of the International Ocean Discovery Program, 363: College Station, TX (International Ocean Discovery Program). https://doi.org/10.14379/iodp.proc.363.111.2018
2 Expedition 363 Scientists’ addresses.
This work is distributed under the Creative Commons Attribution 4.0 International (CC BY 4.0) license. 
- F1. Eauripik Rise and the location of Sites U1488–U1490.
- F2. Bathymetric map and site location.
- F3. Seismic line and site location.
- F4. Hydrographic temperature, salinity, and dissolved oxygen profiles.
- F5. Lithologic summary.
- F6. Main lithologies.
- F7. Foraminifer ooze.
- F8. Boundaries between subunits.
- F9. Tephra layers.
- F10. Characteristic lithology.
- F11. Selected ash layers.
- F12. Coiling patterns in Pulleniatina.
- F13. Downhole foraminifer preservation states.
- F14. Age-depth plot.
- F15. Archive-half NRM intensity.
- F16. Discrete sample AF demagnetization results.
- F17. NRM, MS, inclination, and declination, Hole U1490A.
- F18. NRM, MS, inclination, and declination, Hole U1490B.
- F19. NRM, MS, inclination, and declination, Hole U1490C.
- F20. Physical property measurements.
- F21. Bulk density, MS, NGR, and P-wave velocity overlaid on core photos.
- F22. P-wave velocity measurements.
- F23. P-wave velocity, color reflectance, NGR, GRA bulk density, and MS.
- F24. MAD densities and porosity, GRA bulk density, and thermal conductivity.
- F25. Heat flow calculations.
- F26. APCT-3 temperature-time series.
- F27. Color reflectance a* data.
- F28. WRMSL MS data.
- F29. Spliced L*, a*, NGR, MS, and GRA bulk density data.
- F30. Mbsf and composite depth scales in the Site U1490 splice.
- F31. Carbon and TN profiles.
- F32. Interstitial water concentration profiles.
- F33. Interstitial water concentration profiles.
- T1. Site U1490 core summary.
- T2. Calcareous nannofossil bioevents.
- T3. Planktonic foraminifer bioevents.
- T4. Coiling patterns in Pulleniatina.
- T5. Benthic foraminifer distribution.
- T6. Identified reversal boundaries.
- T7. WRMSL GRA bulk density data, Hole U1490A.
- T8. WRMSL GRA bulk density data, Hole U1490B.
- T9. WRMSL GRA bulk density data, Hole U1490C.
- T10. WRMSL MS data, Hole U1490A.
- T11. STMSL MS data, Hole U1490B.
- T12. WRMSL MS data, Hole U1490C.
- T13. NGRL data, Hole U1490A.
- T14. NGRL data, Hole U1490B.
- T15. NGRL data, Hole U1490C.
- T16. PWL data, Hole U1490A.
- T17. PWL data, Hole U1490B.
- T18. PWL data, Hole U1490C.
- T19. Affine table.
- T20. Splice intervals.
- T21. Volatile hydrocarbon concentrations.
- T22. Carbon and TN.
- T23. Interstitial water geochemical data.