Rosenthal, Y., Holbourn, A.E., Kulhanek, D.K., and the Expedition 363 Scientists
Proceedings of the International Ocean Discovery Program Volume 363
publications.iodp.org
https://doi:10.14379/iodp.proc.363.108.2018

Site U14871
Y. Rosenthal, A.E. Holbourn, D.K. Kulhanek, I.W. Aiello, T.L. Babila, G. Bayon, L. Beaufort, S.C. Bova, J.-H. Chun, H. Dang, A.J. Drury, T. Dunkley Jones, P.P.B. Eichler, A.G.S. Fernando, K. Gibson, R.G. Hatfield, D.L. Johnson, Y. Kumagai, T. Li, B.K. Linsley, N. Meinicke, G.S. Mountain, B.N. Opdyke, P.N. Pearson, C.R. Poole, A.C. Ravelo, T. Sagawa, A. Schmitt, J.B. Wurtzel, J. Xu, M. Yamamoto, and Y.G. Zhang2
Keywords: International Ocean Discovery Program, IODP, JOIDES Resolution, Expedition 363, Site U1487, Manus Basin, Bismarck microplate, central sector Western Pacific Warm Pool, Pleistocene, late Pliocene, Indonesian Throughflow, New Guinea Coastal Current, suborbital to orbital scale climate variability, Admiralty Islands volcanism, tephra, volcanogenic sediment, volcanic ash, scoria, zeolite, exceptional foraminifer and nannofossil preservation, stratigraphic intercalibration and cyclostratigraphy, high-resolution interstitial water sampling, Last Glacial Maximum ocean density structure, diagenesis, anaerobic methane oxidation, sulfate–methane transition zone, SMTZ, clay mineral authigenesis
MS 363-108: Published 8 June 2018.
Background and objectives
International Ocean Discovery Program (IODP) Site U1487 (proposed Site WP-14A) is located ~190 km west-southwest of Manus Island at 02°20.00ʹS, 144°49.17ʹE in 874 m water depth (Figure F1). The site is situated on seismic Line RR1313-WP6-5, ~1.4 km southwest of the crosspoint with Line RR1313-WP6-3a (Figure F2). The seismic profile shows a continuous succession of hemipelagic sediment with acoustic basement estimated at ~185 meters below seafloor (mbsf) (Rosenthal et al., 2016) (Figure F3).

Figure F1. Northern margin of Papua New Guinea and location of Sites U1484–U148.
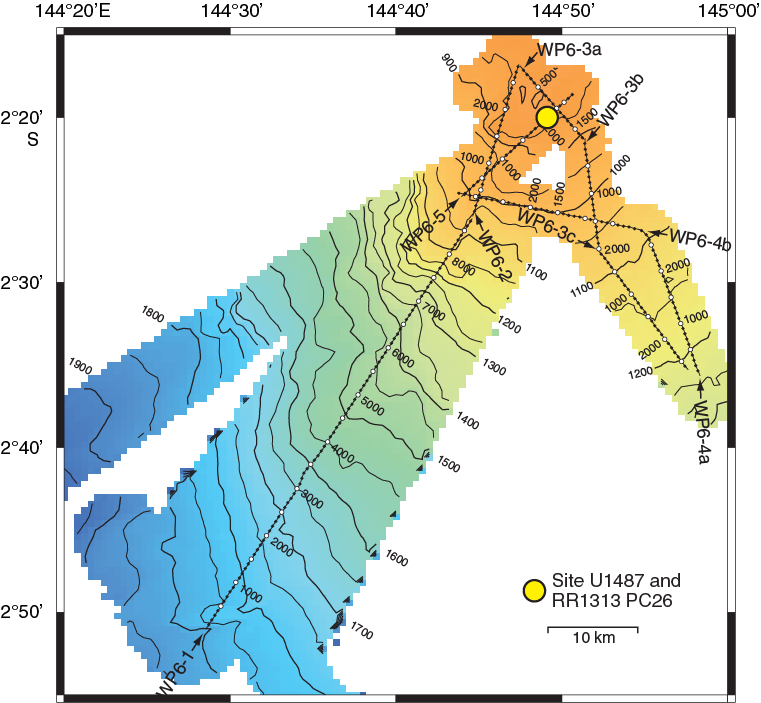
Figure F2. Bathymetric map and site location.
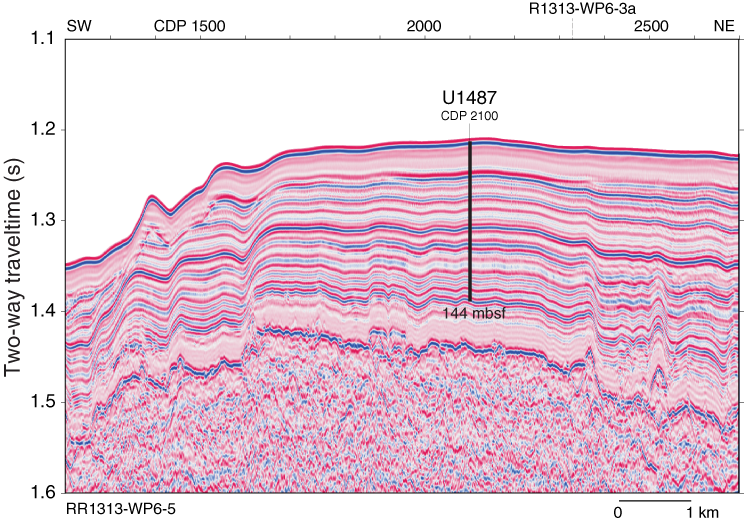
Figure F3. Seismic line and site location.
The tectonic setting of Sites U1486 and U1487 (similar to that of the northern Papua New Guinea sites) was shaped by the oblique northward movement of the Australian plate as it rapidly converged with the Pacific plate. This collision resulted in a complex plate boundary zone that includes volcanic arcs but also resulted in the formation and rotation of microplates within this zone, as well as lithospheric rupture that formed small oceanic basins (Baldwin et al., 2012). The Bismarck Sea, on the northeastern side of Papua New Guinea (Figure F1), forms a back-arc basin with respect to the New Britain arc and is divided into the North Bismarck (NBS) and South Bismarck (SBS) microplates, separated by the active Bismarck Sea left-lateral transform fault and spreading segments (Taylor, 1979). Site U1487 is located on the NBS microplate. To the north, the NBS microplate is bordered by the Manus Trench, which defines the boundary between it and the Pacific plate. Within this complex tectonic regime, the southwestern side of the Manus Basin is considered one of the more stable regions. Magnetic anomalies in the Bismarck Sea indicate rapid asymmetric spreading since 3.5 Ma (Taylor, 1979). The continuous collision between the Australian and Pacific plates caused the SBS microplate to rotate rapidly clockwise (~9°/My), whereas the NBS microplate is rotating slowly anticlockwise (0.3°–1.25°/My) (Baldwin et al., 2012). Asymmetric rotation of the North and South Bismarck Basins likely changed the position of New Britain and adjacent islands relative to Papua New Guinea. Ocean Drilling Program Leg 193 focused on the eastern part of Manus Basin, exploring the tectonic, volcanic, and seafloor hydrothermal system activity in this convergent plate margin setting.
Site U1487 is upslope from Site U1486 and is expected to show the same sediment composition but with reduced sedimentation rate because of its shallower position. As a companion to Site U1486, Site U1487 was also targeted because of its potential to provide an excellent Pleistocene paleoceanographic record to examine orbital-scale climate variability at high resolution through the Pleistocene. The site is also ideally located to monitor the contribution of the New Guinea Coastal Current and Undercurrent to the Indonesian Throughflow (ITF). The New Guinea Coastal Current is the southern branch of the westward, cross-equatorial flowing South Equatorial Current and constitutes the main southern Pacific contribution to the surface transport of the ITF. At a water depth of ~880 meters below sea level (mbsl), this site is bathed by modified Antarctic Intermediate Water originating from the Southern Ocean (Figure F4) and thus will allow for the reconstruction of past variability of this water mass.
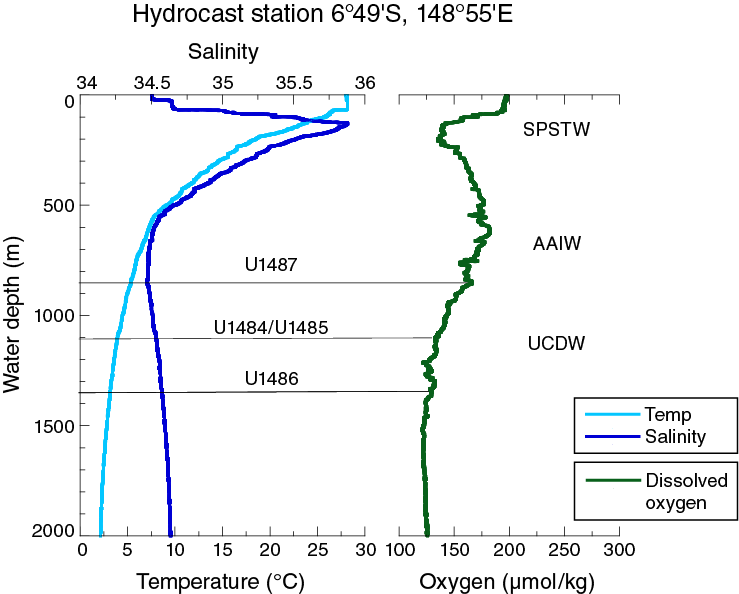
Figure F4. Hydrographic profiles of temperature, salinity, and dissolved oxygen.
Operations
Transit to Site U1487
The 13.3 nmi transit to Site U1487 was completed in 1.5 h at an average speed of 8.8 kt. We lowered the thrusters and switched to dynamic positioning mode at 1145 h (all times are local ship time; UTC + 10 h) on 17 November 2016. We did not deploy a positioning beacon at Site U1487.
Operations summary
Site U1487 was an alternate site added to the operations during the expedition. We planned two holes using the advanced piston corer (APC) to ~175 mbsf, with a third hole to cover stratigraphic gaps if required. We ultimately cored two holes; Hole U1487A was cored to 144.2 mbsf, and Hole U1487B was cored to 144.3 mbsf (Table T1).
Table T1. Site U1487 core summary. Download table in CSV format. View PDF table.
Hole U1487A was cored with the APC using orientation and nonmagnetic hardware to 144.2 mbsf (Cores 363-U1487A-1H through 16H). Downhole formation temperature measurements using the advanced piston corer temperature tool (APCT-3) were taken on Cores 4H (34.9 mbsf), 7H (63.4 mbsf), 10H (91.9 mbsf), and 13H (120.4 mbsf), obtaining good results on all four deployments. We terminated coring after Cores 14H and 16H recorded partial strokes, and Core 15H had to be drilled over due to excessive overpull when attempting to retrieve it. Cores 14H through 16H included unconsolidated sand. We collected 146.43 m of sediment over 144.2 m of coring (102% recovery) in Hole U1487A.
Hole U1487B was then cored to 125.5 mbsf (Cores 363-U1487B-1H through 14H) with the APC using orientation and nonmagnetic hardware. We then switched to the half-length advanced piston corer (HLAPC) to core the interval where we encountered unconsolidated sand in Hole U1487A. We cored to 144.3 mbsf (Cores 15F through 18F) with the HLAPC, where we terminated the hole. We collected 148.73 m of core over 144.3 m of coring (103% recovery) in Hole U1487B. Operations at Site U1487 ended at 2215 h on 18 November 2016. Total time spent at Site U1487 was 34.5 h (1.4 days).
A total of 30 APC cores were recovered at this site, collecting 276.34 m of sediment over 269.7 m of coring (102.5% recovery). We also collected 4 HLAPC cores, retrieving 18.82 m of sediment over 18.8 m of coring (100.1% recovery). In total, we collected 295.16 m of sediment over 288.5 m of coring (102.3% recovery).
Hole U1487A
We prepared and spaced out the bottom-hole assembly (BHA), which consisted of an APC/extended core barrel (XCB) coring assembly with two stands of drill collars. During deployment of the drill string, the seafloor depth was measured at 886.4 meters below rig floor (mbrf) with the precision depth recorder (PDR), and we positioned the bit at 882.0 mbrf to shoot the first core. Hole U1487A was spudded at 1610 h on 17 November 2016. Core 363-U1487A-1H recovered 6.40 m of sediment, establishing a seafloor depth of 873.9 mbsl. APC coring using the Icefield MI-5 core orientation tool with nonmagnetic hardware continued to 144.2 mbsf (Cores 1H through 16H). Downhole formation temperature measurements using the APCT-3 were taken on Cores 4H (34.9 mbsf), 7H (63.4 mbsf), 10H (91.9 mbsf), and 13H (120.4 mbsf), obtaining good results on all four deployments. Cores 14H and 16H were partial strokes, and Core 15H required a drill over to extract it from the formation due to excessive overpull. These three cores (14H through 16H) encountered unconsolidated sands. We decided to terminate coring after Core 16H, with the bit clearing the seafloor at 0640 h on 18 November. Total time spent in Hole U1487A was 19.0 h (0.8 days).
A total of 16 APC cores were taken in Hole U1487A. We recovered 146.43 m of sediment over 144.2 m of coring for a total recovery of 102%.
Hole U1487B
The vessel was offset 20 m east of Hole U1487A, and the drill string was spaced out with the bit at 878.0 mbrf. Hole U1487B was spudded at 0740 h on 18 November 2016, with Core 363-U1487B-1H recovering 2.71 m of sediment, establishing a seafloor depth of 873.6 mbsl. Oriented APC coring using the Icefield MI-5 core orientation tool with nonmagnetic hardware continued to 125.5 mbsf (Cores 1H through 14H). We determined APC refusal after Core 13H required drillover due to excessive overpull and Core 14H recorded a partial stroke. We then switched to the HLAPC and continued coring to 144.3 mbsf (Cores 15F through 18F), where we terminated coring. Because we had recovered a complete stratigraphic section, we opted not to core a third hole at this site. The drill string was recovered to the vessel and the rig secured for transit, ending operations in Hole U1487B and Site U1487 at 2210 h on 18 November. Total time spent in Hole U1487B was 15.5 h (0.6 days).
A total of 14 APC cores were taken in Hole U1487B. We recovered 129.91 m of sediment over 125.5 m of coring for a total recovery of 103.5%. We also collected 4 HLAPC cores, recovering 18.82 m of sediment over 18.8 m of coring (100.1% recovery). Overall, we collected 148.73 m of sediment over 144.3 m of coring (103.1% recovery).
Core description
Site U1487 was cored in 874 m water depth in the Manus Basin, ~25 km east of Site U1486. Two holes were cored, each to ~144 mbsf (Hole U1487A to 144.58 mbsf and Hole U1487B to 144.35 mbsf). The recovered sediment is composed of uppermost Pliocene to recent volcanogenic, authigenic, and biogenic sediment. The relative abundance of volcanogenic and biogenic components in the sediment varies downhole; volcanogenic sediment dominates at the base of the hole but its abundance decreases uphole. We define one lithologic unit and three subunits based on a combination of visual core description, microscopic examination of smear slides, magnetic susceptibility, natural gamma radiation (NGR), color reflectance, and mineralogical analysis by X-ray diffraction (XRD) (see Core description and Physical properties in the Expedition 363 methods chapter [Rosenthal et al., 2018a]) (Figure F5). Subunit IA spans the upper ~21 mbsf and includes sediment dated to ~1 Ma to recent. The sediment is composed primarily of biogenic (foraminifer and nannofossil) sediment mixed with clay minerals and rare volcanogenic components. Subunit IB extends from the base of Subunit IA to ~86 mbsf. Although biogenic sediment represents the main component, volcanogenic sediment is more common than in Subunit IA. Volcanogenic sediment occurs within dominantly biogenic intervals but also as discrete layers in Subunit IB. In contrast to the two upper subunits, Subunit IC (from ~86 to ~144 mbsf) is dominated by volcanogenic sediment. The boundaries between the three subunits are defined based on the volcanogenic content of the sediment.
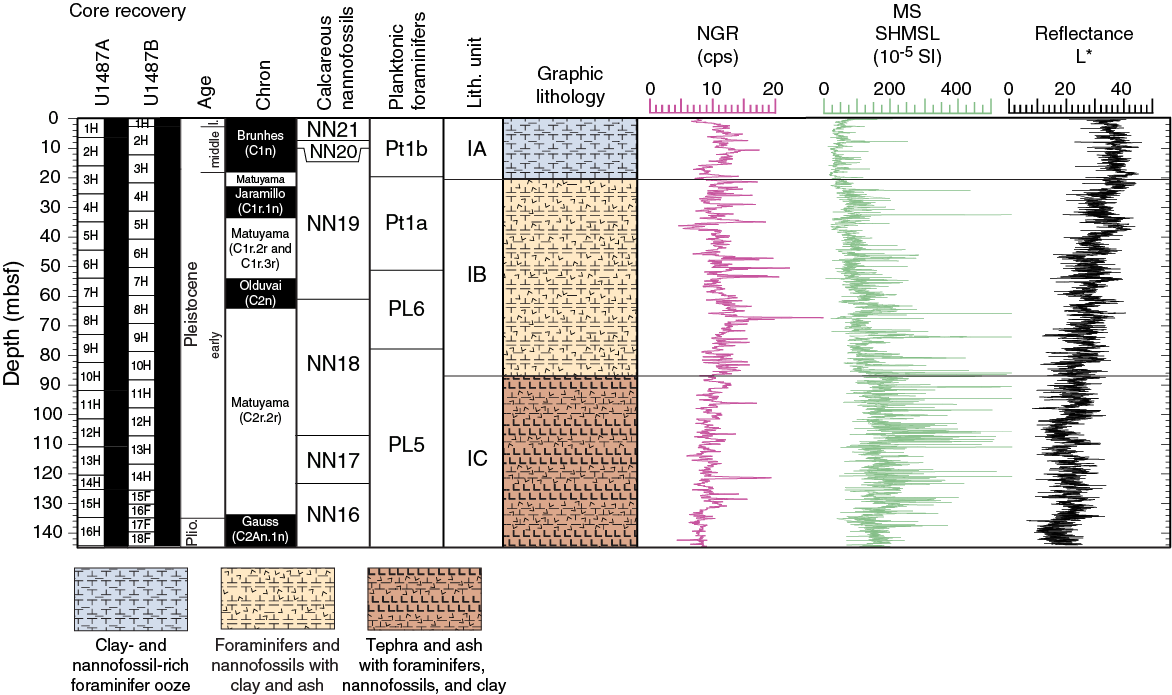
Figure F5. Lithologic summary.
Unit description
Unit I
- Intervals: 363-U1487A-1H-1, 0 cm, through 16H-CC, 17 cm; 363-U1487B-1H-1, 0 cm, through 18F-CC, 20 cm
- Depths: Hole U1487A = 0–144.58 mbsf, Hole U1487B = 0–144.35 mbsf
- Thickness: Hole U1487A = 144.58 m, Hole U1487B = 144.35 m
- Age: late Pliocene to recent
- Lithology: clay- and nannofossil-rich foraminifer ooze, ash-rich foraminifer ooze, diatom- and clay-bearing nannofossil-rich foraminifer ooze, clay-bearing nannofossil- and foraminifer-rich ash, and ash
Unit I is composed of ~144 m of upper Pliocene to recent greenish gray to black biogenic, siliciclastic, authigenic, and volcanogenic sediment (Figures F5, F6). The relative abundance of these sedimentary components varies downhole. Biogenic components (mostly foraminifers) are most abundant at the top of the hole, whereas volcanogenic components dominate at the base. Volcanogenic sediment is typically darker than the other sedimentary components, leading to a systematic color change downhole from light greenish gray to dark greenish gray, which is also reflected in a decrease in L* (Figure F5). Volcanogenic sediment occurs both as discrete layers and mixed with biogenic and terrigenous components. Bioturbation is moderate to heavy throughout.
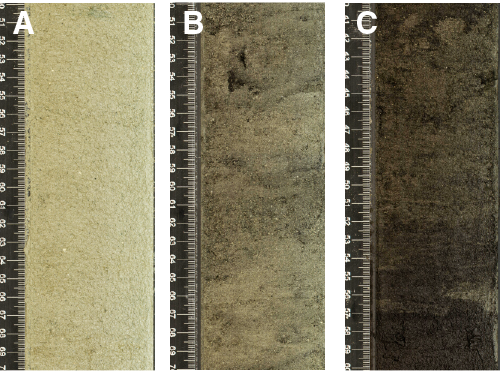
Figure F6. Characteristic lithologies.
Subunit IA
- Intervals: 363-U1487A-1H-1, 0 cm, through 3H-4, 116 cm;
363-U1487B-1H-1, 0 cm, through 3H-6, 64 cm - Depths: Hole U1487A = 0–21.58 mbsf, Hole U1487B = 0–20.34 mbsf
- Thickness: Hole U1487A = 21.58 m, Hole U1487B = 20.34 m
- Age: early Pleistocene to recent
- Lithology: clay-bearing nannofossil-rich foraminifer ooze, clay-rich nannofossil-rich foraminifer ooze, ash-rich foraminifer ooze, and ash
Subunit IA is composed primarily of moderately to heavily bioturbated nannofossil-rich foraminifer ooze, with variable amounts of clay and ash (Figures F6A, F7A, F7B). Trace amounts of siliceous components, including radiolarians, diatoms, and silicoflagellates, are also present. The uppermost 5 cm contains the mudline, which is characterized by a rapid color transition from brown to light olive-gray but with no corresponding change in lithology. Pteropods and shell fragments occur in the uppermost two cores in both Holes U1487A and U1487B, and a shark tooth was identified in the uppermost core of Hole U1487B.

Figure F7. Main sedimentary components.
Compared to the rest of the site, this subunit is lightest in color, varying from light olive (5Y 6/2) to light greenish gray (10Y 7/1). L* reflectance values over this interval are also the highest, averaging ~47 (Figure F5). Darker intervals (low L*) typically signify higher clay and/or volcanogenic particle content.
NGR values are highest between 3.0 and 15.55 mbsf, suggesting a corresponding increase in clay content. Magnetic susceptibility is generally low and invariant across the subunit and is consistent with the dominantly clay and carbonate lithologies (Figure F5). One peak in the magnetic susceptibility occurs at 7.74 mbsf in Hole U1487A and at 8.53 mbsf in Hole U1487B and corresponds to the first discrete volcanic ash layer downhole and the only volcanic ash layer in Subunit IA.
The boundary between Subunits IA and IB is placed at the top of the second volcanic ash layer at intervals 363-U1487A-3H-4, 116 cm (21.58 mbsf), and 363-U1487B-3H-6, 64 cm (20.34 mbsf). This boundary marks an increase in the proportion of volcanic particles in the sediment and a subsequent decrease in L*. The occurrence of discrete volcanic ash layers also increases below this depth.
Subunit IB
- Intervals: 363-U1487A-3H-4, 116 cm, through 10H-3, 78 cm; 363-U1487B-3H-6, 64 cm, through 10H-6, 36 cm
- Depths: Hole U1487A = 21.58–86.18 mbsf, Hole U1487B = 20.34–86.56 mbsf
- Thickness: Hole U1487A = 64.60 m, Hole U1487B = 66.22 m
- Age: early Pleistocene
- Lithology: nannofossil-bearing ash-rich foraminifer ooze, foraminifer-rich ash, diatom- and clay-bearing nannofossil- and ash-rich foraminifer ooze, ashy sand, and ash
The main lithology in Subunit IB is nannofossil-bearing ash-rich foraminifer ooze. The sediment in this subunit is moderately to heavily bioturbated. As in Subunit IA, foraminifers and nannofossils are the dominant sedimentary components with trace amounts of biosiliceous material (mainly radiolarians, diatoms, and silicoflagellates) (Figures F6B, F7C, F7D). However, the relative abundance of ash and scoria within Subunit IB increases, as does the frequency of discrete volcanic ash layers. In total we counted ~36 volcanic ash layers within the subunit, although this number is probably an underestimate. Thinner volcanic ash layers may not have been preserved due to weathering of glass shards and relatively high levels of bioturbation evident in the sediment.
The structure and composition of the discrete volcanic ash layers are similar to those observed at Site U1486. Centimeter- to decimeter-thick volcanic ash layers often exhibit sharp basal contacts and gradational upper contacts. This arrangement likely reflects the cessation of bioturbation by benthic organisms during ash deposition and recolonization by benthic organisms after the event. Most volcanic ash layers are gray to brown and composed primarily of glass shards with some scoria. Black volcanic ash layers become more common toward the base of the subunit. The dark color of these volcanic ash layers likely reflects an increase in the ratio of scoria to glass shards. In addition, two coarse-grained ashy sand layers occur in the middle of Subunit IB. These sand layers are composed of light-colored volcanic glass, scoria, and feldspar minerals.
The base of Subunit IB occurs at the top of a prominent black volcanic ash layer that corresponds to a shift in the magnetic susceptibility baseline to higher values (see Physical properties) at intervals 363-U1487A-10H-3, 78 cm (86.18 mbsf), and 363-U1487B-10H-6, 36 cm (86.56 mbsf). Volcanic ash content significantly increases in the sediment below this depth (Figure F5).
Subunit IC
- Intervals: 363-U1487A-10H-3, 78 cm, through 16H-CC, 17 cm; 363-U1487B-10H-6, 36 cm, through 18F-CC, 20 cm
- Depths: Hole U1487A = 86.18–144.58 mbsf (total depth), Hole U1487B = 86.56–144.35 mbsf (total depth)
- Thickness: Hole U1487A = 58.40 m, Hole U1487B = 57.79 m
- Age: late Pliocene to early Pleistocene
- Lithology: clay- and nannofossil-bearing foraminifer-rich ash, nannofossil-bearing ash-rich foraminifer ooze, clay-bearing nannofossil-rich ash, foraminifer-rich ash, nannofossil-bearing foraminifer-rich ash, and ash
The main lithology in Subunit IC is clay- and nannofossil-bearing foraminifer-rich ash (Figures F6C, F7E, F7F). Volcanogenic sediment, including brown glass shards and scoria, occurs in discrete ash layers as well as in intervals mixed with biogenic components, principally foraminifers and nannofossils with trace amounts of biosiliceous material. Volcanic ash layers in this subunit range in thickness from a few centimeters to >3 m and exhibit a range of geometries, similar to those at Site U1486 (see Core description in the Site U1486 chapter [Rosenthal et al., 2018c]). The ash layers are typically darker in color (mostly black [N 2.5]) than those in Subunit IB, which suggests a more mafic mineralogy. XRD analysis of four tephra layers from Subunit IC indicates the occurrence of feldspar and pyroxene minerals, magnetite, and chlorite (Figure F8B–F8D). This mineral composition points to a basaltic magma source, but further geochemical analysis is needed to confirm this interpretation. In total we counted 84 discrete ash layers in Subunit IC. Some ash layers may be obscured by relatively high (moderate to heavy) bioturbation. Centimeter-scale scoria and pumice fragments are also found scattered throughout the subunit.
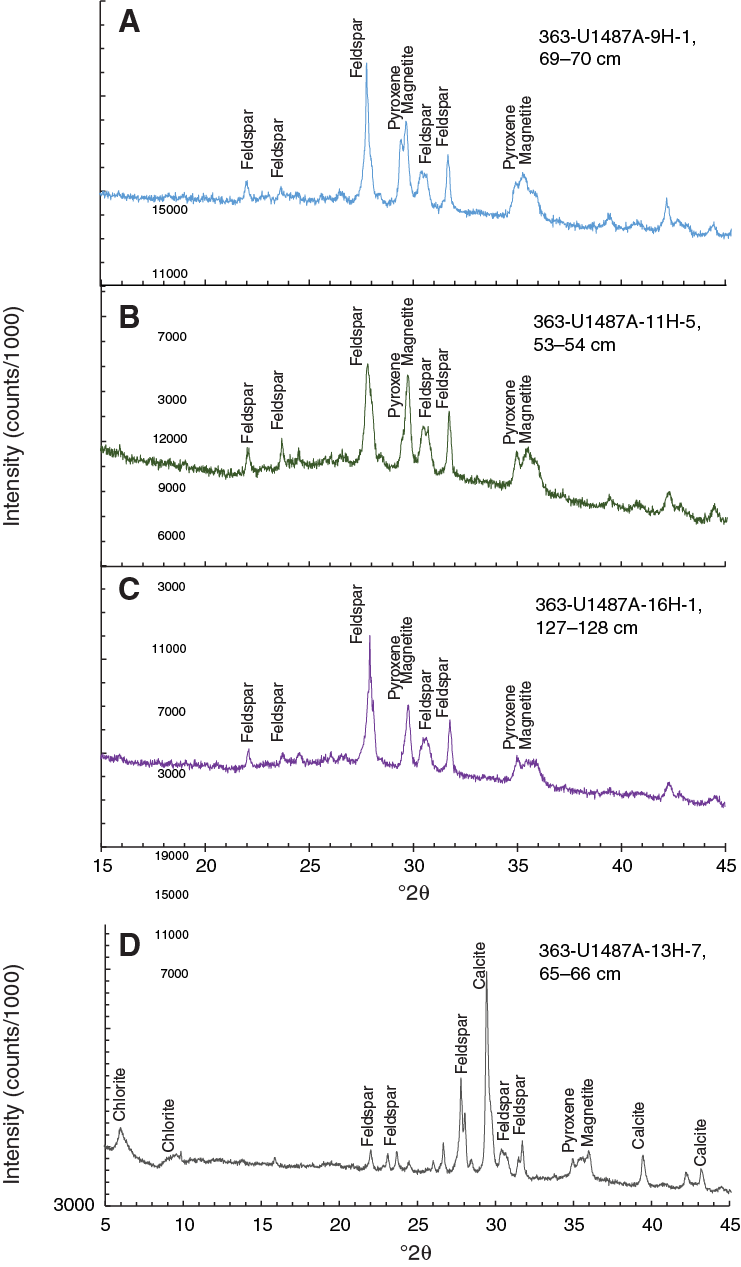
Figure F8. XRD results from tephra layers.
The volcanic ash layers in Subunit IC were likely deposited by pyroclastic or epiclastic events. It is likely that both depositional styles occur at Site U1487. A ~4 m thick volcanic ash deposit at the base of Subunit IC contains mud clasts that preserve pockets of pelagic sediment within the layer. Visual analysis suggests the layer was deposited by a volcaniclastic flow, but postcruise grain size and textural analyses are necessary to confirm this interpretation. XRD analysis of a volcanic ash layer in interval 363-U1487A-13H-7, 65–66 cm, shows the presence of calcite (Figure F8D), which suggests mixing with pelagic sediment and deposition by resedimentation.
Discussion
Deposition and composition of the volcanic ash layers
Volcanic ash layers that exhibit a sharp peak in magnetic susceptibility and deep troughs in NGR and L* are more likely to be directly deposited than those with broad, smoothed peaks and troughs that extend away from the ash (see Core description in the Site U1486 chapter [Rosenthal et al., 2018c]). As observed at nearby Site U1486, the occurrence of a sharp peak in magnetic susceptibility and gamma ray attenuation (GRA) bulk density at the base of a volcanic ash layer may indicate density grading where the heavy magnetic minerals were deposited first (red box in Figure F9A). More rarely, volcanic ash layers exhibit a pronounced decrease in L* but no corresponding decrease in magnetic susceptibility. These layers may be directly deposited but contain fewer magnetically susceptible minerals and are therefore compositionally distinct (yellow box in Figure F9A). XRD analysis of four tephra layers supports this interpretation; the relative intensity of the peak corresponding to the 2θ value of magnetite varies substantially between the analyzed volcanic ash layers, although the differences might also be due to the relative abundance of other mineralogic components (Figure F8). Finally, mixing by benthic organisms may obscure the magnetic signature of the ash at its upper boundary making layer identification difficult (blue box in Figure F9B). The previous evidence indicates that the mechanisms responsible for the deposition of the volcanic ash layers and their preservation could be complex and a simple interpretation of these layers as tephra deposits does not apply to all of them. The latter is suggested by the presence of both pyroclastic and epiclastic (volcanoclastic) material in some of the layers. Additional postcruise geochemical, mineralogical, and textural analyses will be necessary to determine the relative abundance of directly deposited versus redeposited volcanic ash layers.
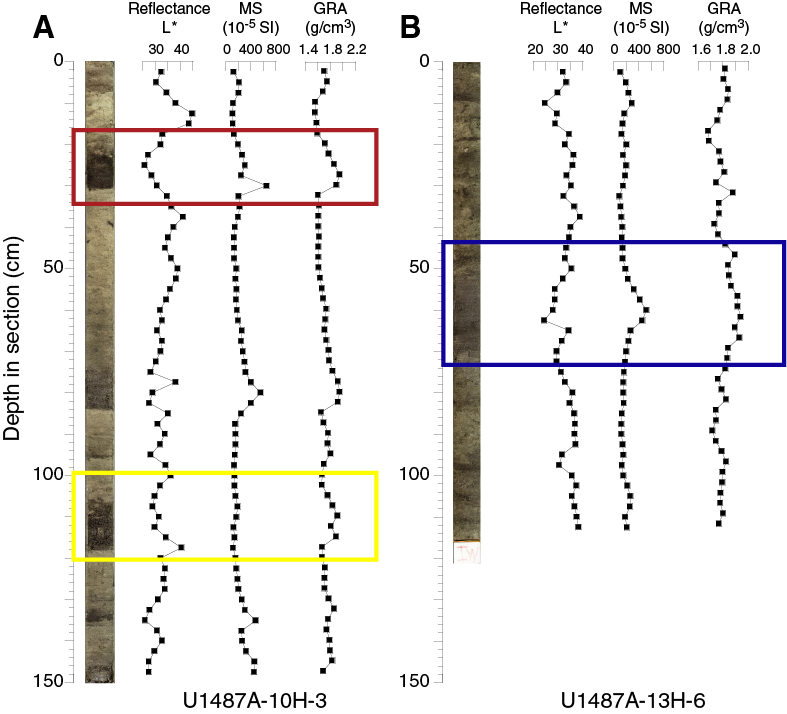
Figure F9. Physical properties data.
Impacts of regional volcanism on sedimentary evolution
Lithologic variability and sedimentation rates at Site U1487 over the past ~2.7 My were influenced predominantly by the delivery of volcanogenic sediments to the site. The abundance of volcanogenic sediment, which is <10% of the sediment in the upper part of the sequence at Site U1487 (Subunit IA), increases to >60% near the base of the succession (Subunit IC) based on smear slide analysis and visual core description observations. In fact, the transition between Subunits IC and IB (~75 mbsf), marked by a lithologic change from foraminifer-rich ash to ash-rich foraminifer ooze, also marks the transition from relatively high sedimentation rates (~15 cm/ky) below to substantially lower sedimentation rates (~3.5 cm/ky) above (see Biostratigraphy).
The substantial decrease uphole in volcanogenic sediment within the succession likely reflects a reduction in the frequency of regional volcanic eruptions from the late Pliocene to recent. Regardless of depositional style, whether pyroclastic or epiclastic (primarily Subunit IB), the volcanic ash abundance within the sediment may be linked to the frequency of explosive volcanic eruptions within the region. Furthermore, downhole changes in the composition of volcanic ash appear to be related to the evolution of regional volcanism; a considerable number of volcanic ash layers within Subunit IB appear light in color, ranging from light gray to brown, whereas volcanic ash layers in Subunit IC are dominantly dark (dark gray to black). Scanning electron microscope (SEM) analysis reveals a consistent relationship between volcanic ash color, the ratio of glass shards to scoria, and vesicle type in this region (see Core description in the Site U1486 chapter [Rosenthal et al., 2018c]). Light-colored volcanic ash layers are composed almost entirely of glass shards (Figure F10) and are likely produced by more explosive eruptions with felsic (silica- and water-rich) magma. The few scoria and pumice fragments identified within these layers have elongate vesicles. Larger glass shard fragments suggest either more explosive or more proximal source volcanoes. In contrast, darker volcanic ash layers contain a higher proportion of scoria (Figure F11) and are therefore sourced from less explosive eruptions of mafic magmas. Vesicles within the scoria fragments are less elongate and more round than those identified in the light-colored volcanic ash layers. The transition from dark to light volcanic ash layers may therefore reflect the evolution of magma type of the regional volcanoes from mafic to increasingly felsic compositions (Johnson et al., 1988).

Figure F10. Tephra layers in Subunits IA and IB.
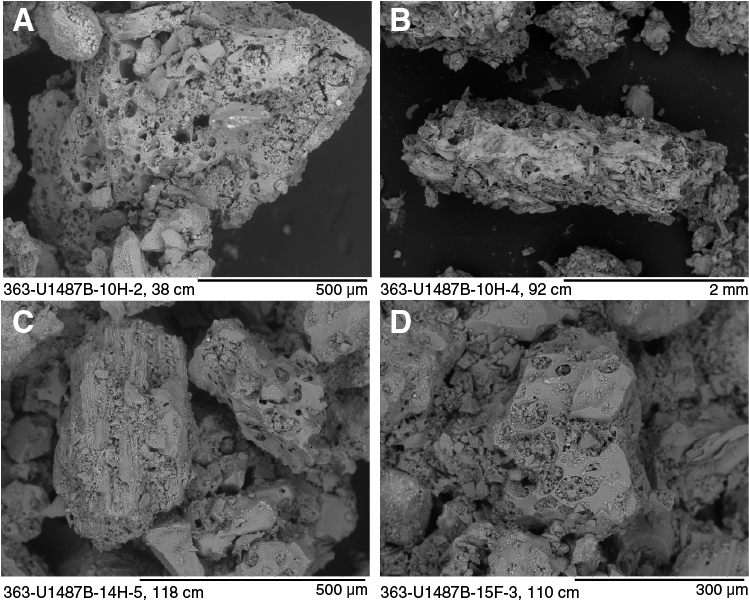
Figure F11. Tephra layers in Subunit IC.
Comparison to Site U1486
Site U1487 is located ~25 km to the east of Site U1486, and the two sites therefore contain comparable sedimentary sequences. The successions at both sites span the past ~2.7 My and contain a mixture of biogenic and volcanogenic components. The abundance of volcanogenic sediment, as well as the volcanic ash composition and type, reflect a similar evolutionary sequence at the two sites, from initially frequent eruptions of mafic magmas to less frequent but more explosive eruptions of felsic magmas after ~2.15 Ma. We counted a total of ~183 tephra layers at Site U1486 and ~200 tephra layers at Site U1487, which suggests that many of the same volcanic eruptions are recorded at both sites. In fact, two volcanic ash layer sequences, which are visually unique, can be correlated between the two sites (Figure F12). Despite these similarities, we note four important differences for Site U1487 relative to Site U1486:
- An overall coarser grain size (foraminifer ooze versus nannofossil ooze),
- Lower sedimentation rates,
- More intense bioturbation, and
- Thicker volcanic ash layers with relatively large microscoria fragments.
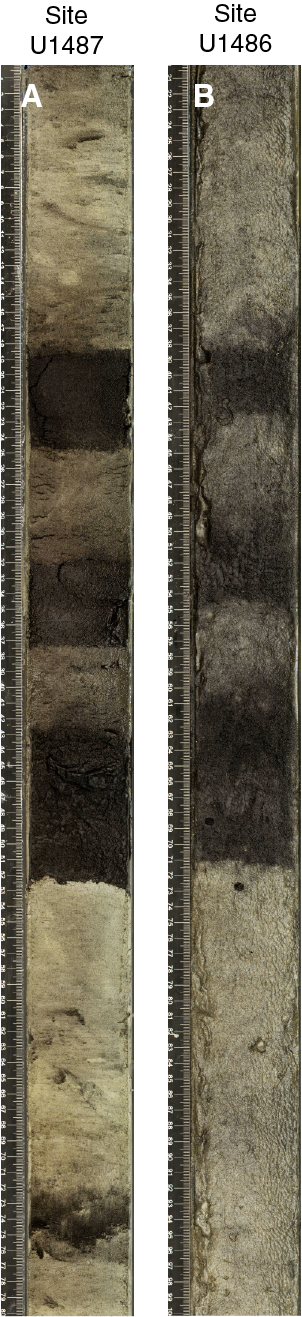
Figure F12. Tephra layers produced by the same volcanic event.
Overall, grain size is coarser at Site U1487 relative to Site U1486, which indicates higher energy conditions; foraminifer ooze is the primary lithology at Site U1487, whereas nannofossil ooze and nannofossil clay intervals are more common at Site U1486. Because Site U1487 lies at shallower water depth (874 mbsl) compared with Site U1486 (1334 mbsl), the coarser grain size at Site U1487 is likely linked to winnowing by bottom currents rather than differences in biological production or sediment deposition. In addition, removal of the fine material by bottom currents may also explain the disparity in sediment accumulation rates at the two sites. The sedimentation rate at Site U1486 (~6 cm/ky in Subunit IA) is nearly double that at Site U1487 (~3.5 cm/ky in Subunit IA) (see Biostratigraphy).
Bioturbation is also more pronounced at Site U1487 than at Site U1486. Burrows are particularly apparent across ash/ooze boundaries due to the strong color differences between the two lithologies. As a result, volcanic ash layers have less distinct upper and lower boundaries at Site U1487 relative to Site U1486. Bioturbation may appear more pronounced at Site U1487 due to the comparatively lower sedimentation rate.
Finally, volcanic ash layers at Site U1487 are on average thicker (despite more intense bioturbation at this site) and also contain larger microscoria fragments; in some cases these fragments are almost 3 mm in diameter. The presence of large microscoria fragments suggests that source volcanoes are closer to Site U1487 than Site U1486 and that deposition occurred by pyroclastic flows rather than ash fall-out.
Biostratigraphy
At Site U1487, a 145 m thick succession of clay-bearing volcanogenic and biogenic sediment was recovered (see Core description). The site is located on relatively young oceanic crust and was cored to ~35 m above the acoustic basement visible on seismic profiles (Figure F3). The tectonic setting and sedimentary succession are very similar to that of neighboring Site U1486 (see Biostratigraphy in the Site U1486 chapter [Rosenthal et al., 2018c]). As at that site, benthic foraminifers indicate a relatively deep water bathyal sedimentary environment throughout the succession. Microfossil preservation is excellent to very good. Biostratigraphic results from each fossil group (calcareous nannofossils, planktonic foraminifers, and benthic foraminifers) are presented in the sections below, followed by a detailed characterization of benthic and planktonic foraminifer preservation state using the shipboard SEM. An integrated bio- and magnetostratigraphy and preliminary age model are presented in the final section. Shipboard taxon occurrence data are available for download from the Laboratory Information Management System (LIMS) database (http://web.iodp.tamu.edu/LORE).
Calcareous nannofossils
Calcareous nannofossil biostratigraphy is based primarily on Hole U1487A, from which core catcher samples and two or three samples per core were taken, providing a sampling resolution of ~3 m. In the deepest part of the hole, volcanic ash particles are very abundant; to remove these, the sediment was sieved to isolate the <20 µm size fraction, which was then centrifuged and smeared onto microscopic slides. Depth positions and age estimates of biohorizons are given in Table T2. Observations were made using plane- (PPL), cross- (XPL), and circular-polarized light (CPL), as well as with the shipboard desktop SEM (Hitachi TM3000) to confirm the presence of Emiliania huxleyi and to check the preservation state.
Table T2. Calcareous nannofossil bioevents. Download table in CSV format.
Preservation of calcareous nannofossils is generally excellent to very good, as evidenced by the presence of dissolution-susceptible taxa throughout the recovered succession (Syracosphaera, Oolithotus fragilis, Tetralithoides symeonidesii, and Calciosolenia sp.). Very small Reticulofenestra minuta, Gephyrocapsa spp., and E. huxleyi are abundant and well preserved (Figure F13). Assemblages at Site U1487 are very similar to those recorded at Site U1486 (see Biostratigraphy in the Site U1486 chapter [Rosenthal et al., 2018c]), with high-diversity assemblages dominated by Florisphaera profunda and the Noelaerhabdaceae (including Gephyrocapsa, Emiliania, Pseudoemiliania, and Reticulofenestra). Reworked calcareous nannofossils occur very rarely, such as occasional specimens of Sphenolithus abies, throughout the succession. Although not significant for the assemblages, this does indicate reworking and transport from sediment older (approximately early Pliocene) than those recorded at the base of the hole (around the base of the Pleistocene; see Shipboard age model), which is only ~35 m above the acoustic basement.
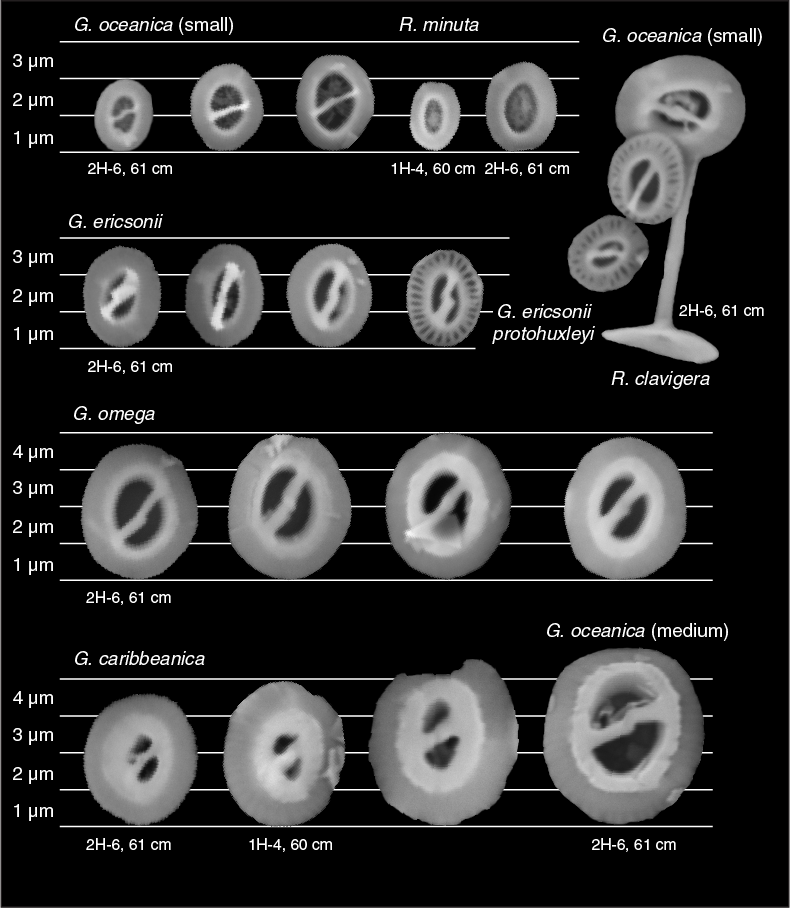
Figure F13. Gephyrocapsa and Reticulofenestra.
Because the sedimentation rate is somewhat lower than at Site U1486 (see Biostratigraphy in the Site U1486 chapter [Rosenthal et al., 2018c]), it was difficult to discriminate all of the marker horizons with the shipboard sampling resolution, especially those based on abundance fluctuations. The base of Zone NN21 is identified by biohorizon base E. huxleyi (0.29 Ma) between Samples 363-U1487A-1H-CC and 2H-2, 61 cm (6.35–8.51 mbsf), which is the same stratigraphic level as biohorizon top acme Gephyrocapsa caribbeanica (0.28 Ma). The base of Zone NN20 is defined by biohorizon top Pseudoemiliania lacunosa (0.44 Ma) between Samples 2H-2, 61 cm, and 2H-4, 61 cm (8.51–11.51 mbsf). The placement of biohorizons based on Gephyrocapsa abundance and size was difficult, including biohorizon base common G. caribbeanica. This event could not be located accurately because of overlap between samples with high abundance of G. caribbeanica and those with high abundance of Gephyrocapsa omega (Figure F13). Preliminary SEM observations of samples around the base common G. caribbeanica level were helpful in clarifying Gephyrocapsa taxonomy and diversity, but they also highlight the need for future detailed SEM-based taxonomic study of the Gephyrocapsa lineage throughout the Pleistocene. Biohorizon top Gephyrocapsa >5.5 µm (1.25 Ma) was placed between Samples 4H-6, 40 cm, and 4H-CC (33.30–34.63 mbsf).
The base of Zone NN19 is defined by biohorizon top Discoaster brouweri (1.93 Ma) between Samples 363-U1487A-7H-4, 80 cm, and 7H-6, 80 cm (59.20–62.20 mbsf), at the same level as biohorizon top Discoaster triradiatus (1.95 Ma). D. brouweri is present at very low abundance near its top biohorizon, and only becomes more abundant downhole from Sample 9H-CC (82.49 mbsf). The base of Zone NN18 is defined by biohorizon top Discoaster pentaradiatus (2.39 Ma) between Samples 12H-3, 106 cm, and 12H-5, 138 cm (105.46–108.78 mbsf). Biohorizon top Discoaster surculus (2.49 Ma), which marks the base of Zone NN17, is located between Samples 14H-2, 81 cm, and 14H-3, 85 cm (122.71–124.25 mbsf).
Planktonic foraminifers
Planktonic foraminifer biostratigraphy was conducted on Hole U1487A using core catcher samples and three additional samples per core from Cores 363-U1487A-1H through 6H, which provided higher resolution coverage for the upper part of the hole. The extra sampling was used to better resolve the Pulleniatina coiling pattern for the past ~2 My, which was only determined at low resolution in the upper part of neighboring Site U1486 (see Biostratigraphy in the Site U1486 chapter [Rosenthal et al., 2018c]). Planktonic foraminifer preservation varies from excellent to very good, but with no obvious depth-related pattern. Less than excellent preservation is mainly due to fragmentation or moderate cementation, which is variable between specimens, and some recrystallization is also apparent (see Foraminifer preservation). Planktonic foraminifers are very abundant through most of the hole but become subordinate to volcanic particles toward the bottom (see Shipboard age model and Core description). A list of biohorizons is given in Table T3. Coiling direction counts on Pulleniatina are given in Table T4 and plotted in Figure F14.
Table T3. Planktonic foraminifer bioevents. Download table in CSV format.
Table T4. Pulleniatina coiling count data, Hole U1487A. Download table in CSV format.
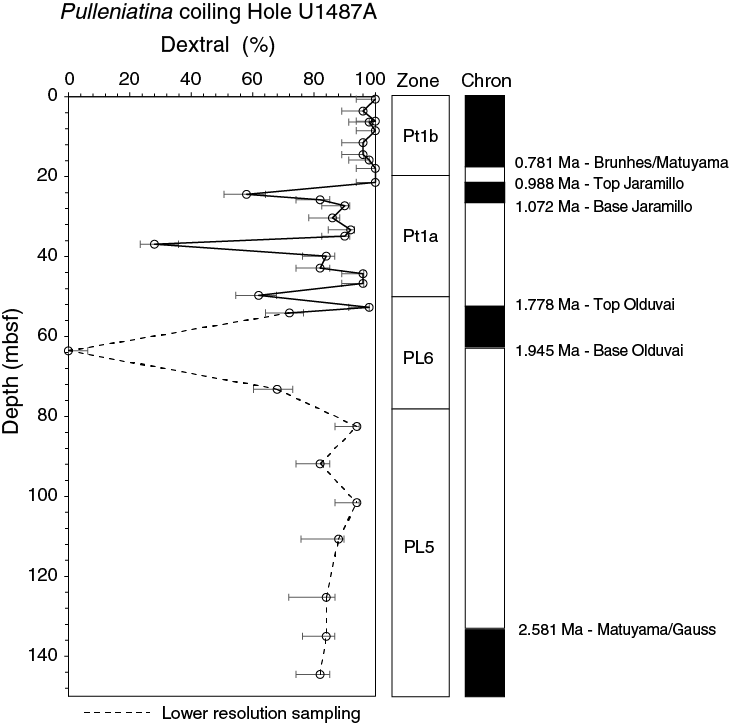
Figure F14. Coiling patterns in Pulleniatina.
The topmost sample examined, Sample 363-U1487A-1H-1, 60–62 cm, contains Globorotalia flexuosa and is apparently older than 0.07 Ma, although recognition of this marker species is problematic. Biohorizon top Globigerinoides ruber (pink) (0.12 Ma) is found between Samples 1H-1, 60–62 cm, and 1H-3, 60–62 cm (0.60–3.60 mbsf). The base of Subzone Pt1b is marked by biohorizon top Globorotalia tosaensis (0.61 Ma) between Samples 3H-2, 50–52 cm, and 3H-4, 100–102 cm (17.92–21.42 mbsf), although the marker species is very rare, and so the level may be placed too low. The first downhole sinistral Pulleniatina coiling excursion, L1 (0.80 Ma), occurs between Samples 3H-4, 100–102 cm, and 3H-6, 100–102 cm (21.42–24.42 mbsf) (Figure F14).
A reliable biostratigraphic marker is provided by biohorizon top Globigerinoidesella fistulosa (1.88 Ma), which marks the base of Subzone Pt1a between Samples 363-U1487A-6H-4, 80–82 cm, and 6H-6, 80–82 cm (49.70–52.70 mbsf). This occurs amid a series of coiling reversals in Pulleniatina that should eventually provide additional means of correlation between sites (Table T4; Figure F14).
Biohorizon base Pulleniatina finalis (2.04 Ma) occurs between Samples 363-U1487A-8H-CC and 9H-CC (73.22–82.49 mbsf). Biohorizon top Globorotalia pseudomiocenica (2.30 Ma), which marks the base of Zone PL6, and biohorizon top Globorotalia limbata (2.39 Ma) occur in the same sampling interval. These two biohorizons frequently occur together at Expedition 363 sites despite having different age calibrations, suggesting that one might need to be recalibrated (see Biostratigraphy in the Site U1486 chapter [Rosenthal et al., 2018c]). Below that level, there is little biostratigraphic control except that Globorotalia truncatulinoides occurs downhole to the base of the examined section in Sample 16H-CC (144.53 mbsf). For this bioevent, we have used the regional calibration of Resig et al. (2001) (2.65 Ma), which places it in the later part of the Gauss magnetochron. The presence of G. truncatulinoides indicates that the base of Hole U1487A is at a slightly higher stratigraphic level than the base of Hole U1486B, which is older than biohorizon base G. truncatulinoides (see Biostratigraphy in the Site U1486 chapter [Rosenthal et al., 2018c]).
Benthic foraminifers
Benthic foraminifers were studied in all 16 core catcher samples from Hole U1487A. Assemblages indicate deep bathyal conditions, even at the base of the hole, which is within ~35 m of the acoustic basement. The planktonic:benthic foraminifer ratio is typically 99:1 throughout. The assemblage is similar to that at neighboring Site U1486 (see Biostratigraphy in the Site U1486 chapter [Rosenthal et al., 2018c]). The dominant genera are Laevidentalina and Uvigerina (Table T5). Typical bathyal species Uvigerina hispida and Uvigerina proboscidea are present in most samples. The marked increase in volcanic ash downhole does not correspond to any discernible change in the composition of the assemblage. Planulina wuellerstorfi and Cibicidoides pachyderma, which are widely used for geochemical studies, occur in 9 out of 16 and 4 out of 16 core catcher samples, respectively.
Table T5. Benthic foraminifer distribution. Download table in CSV format.
Foraminifer preservation
Foraminifers occur together with volcanic ash particles (glass shards, scoria, and pumice fragments) throughout the succession at Site U1487 (see Core description). Volcanogenic particles become the dominant component of the 63–150 µm and >150 µm size fractions in the lower part of the succession (lithologic Subunit IC). The sediment may have been affected by relatively high heat flow, crustal fluids, and hydrothermal processes, especially deeper in the sediment sequence (see Geochemistry and Core description). Five core catcher samples from Hole U1487A were selected to assess foraminifer preservation and diagenesis (Samples 363-U1487A-1H-CC, 6H-CC, 11H-CC, 14H-CC, and 16H-CC). The upper three samples (6.35, 54.10, and 101.56 mbsf) are spaced at ~50 m intervals and range in age from late Pleistocene (0.12 Ma) to early Pleistocene (~2.39–2.47 Ma). The other two samples (125.23 and 144.53 mbsf) were taken from levels near the bottom of the hole where foraminifers are mixed with large volumes of volcanic ash.
Foraminifer preservation, as assessed visually in the core catcher samples, is generally excellent to very good. As at Site U1486 (see Biostratigraphy in the Site U1486 chapter [Rosenthal et al., 2018c]), incipient recrystallization of the benthic foraminifer P. wuellerstorfi occurs at some levels, although there is no obvious depth-related pattern to the suboptimal preservation. Foraminifer preservation in the layers with high proportions of volcanic ash is often excellent, even toward the bottom of the hole. Images of selected specimens are shown in Figure F15. The full set of images is available from the LIMS database.
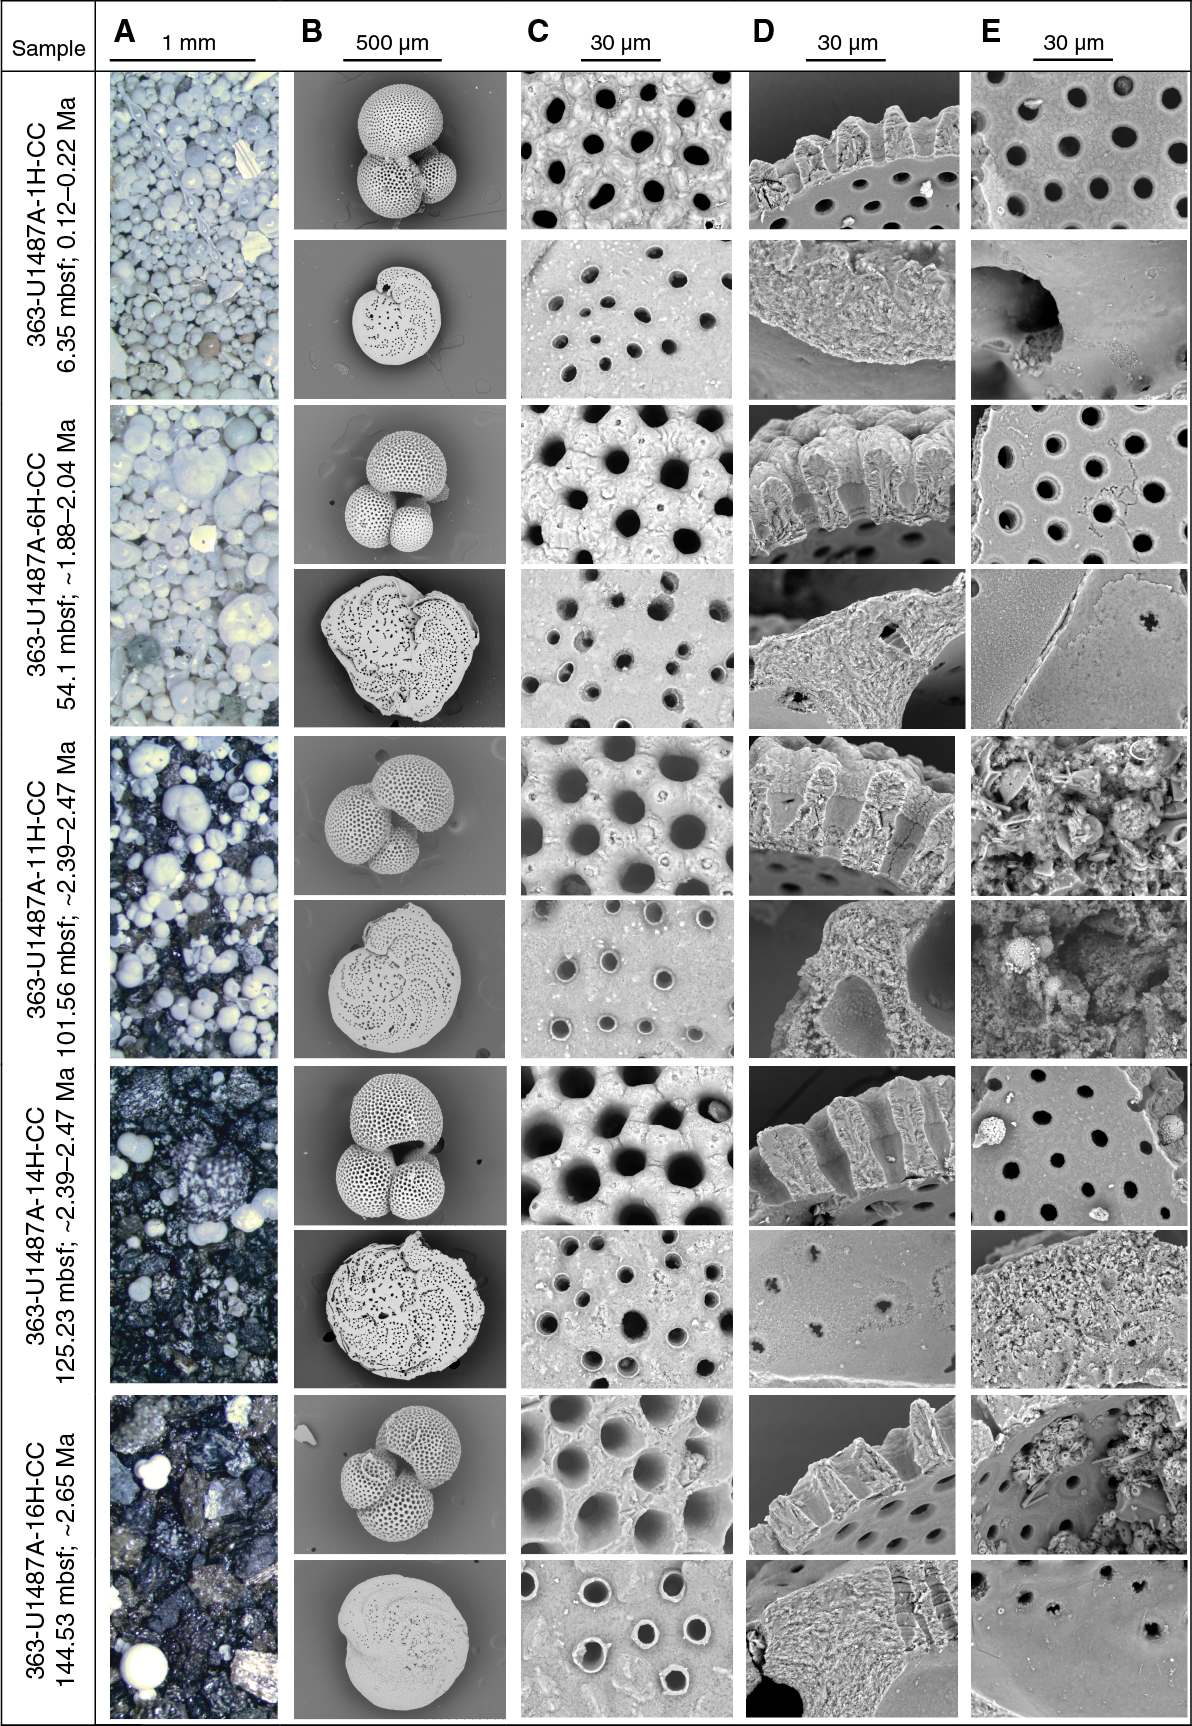
Figure F15. Downhole foraminifer preservation states.
Sample 363-U1487A-1H-CC (6.35 mbsf; late Pleistocene to latest middle Pleistocene; 0.12–0.22 Ma) shows excellent preservation. Foraminifers have a glassy appearance under the light microscope. In cross section, the walls of Trilobatus trilobus and P. wuellerstorfi show microgranular textures and other typical biogenic features. All specimens show generally smooth inner wall surfaces, with no evidence of infilling, cementation, or dissolution.
Sample 363-U1487A-6H-CC (54.1 mbsf; early Pleistocene; ~1.88–2.04 Ma) shows excellent to very good preservation. Foraminifers have glassy appearance under the light microscope. Wall cross sections of both T. trilobus and P. wuellerstorfi show the biogenic microgranular textures typical of the species and minor evidence of abrasion. In P. wuellerstorfi, the wall cross section shows evidence of very minor textural alteration in places, indicating incipient recrystallization. Pyrite framboids infill some pore channels. The inner wall surfaces of all studied specimens are generally smooth with minor overgrowth of calcite forming an amorphous crystalline layer <1 μm thick. P. wuellerstorfi shows very minor calcite overgrowth on the outer surfaces. There is no evidence of infilling, cementation, or dissolution.
Sample 363-U1487A-11H-CC (101.56 mbsf; early Pleistocene; ~2.39–2.47 Ma) shows excellent to very good preservation. Foraminifers have a glassy appearance under the light microscope. Wall cross sections of T. trilobus show typical biogenic features, with minor superficial abrasion of the outer chamber surfaces on some specimens. However, the wall cross sections of P. wuellerstorfi show widespread evidence of early stage recrystallization, in which the microgranular texture is a little modified to show slightly larger and better-separated granular crystals, particularly toward the inner and outer surfaces. The inner wall surfaces of T. trilobus and P. wuellerstorfi exhibit minor calcite overgrowth layers <1 μm thick. Pyrite framboids up to 6 μm in diameter and minor infilling of unconsolidated sediment (coccoliths) occur in some specimens. P. wuellerstorfi also shows calcite overgrowth on external surfaces. There is no evidence of infilling, cementation, or dissolution.
Sample 363-U1487A-14H-CC (125.23 mbsf; early Pleistocene; ~2.39–2.47 Ma) shows excellent to very good preservation. Foraminifers have a glassy appearance under the light microscope. Wall cross sections of T. trilobus show the biogenic microgranular textures that are typical of the species, whereas wall cross sections of the P. wuellerstorfi specimen examined show evidence of early stage recrystallization. Pyrite framboids occur in some pore channels of T. trilobus. The inner wall surfaces of T. trilobus and P. wuellerstorfi exhibit minor calcite overgrowth layers <1 μm thick, which also occur on outer surfaces of P. wuellerstorfi. Loosely dispersed pyrite framboids up to 5 μm in diameter and dolomite crystals occur in some patches, with small amounts of unconsolidated sediment infill. There is no evidence of cementation or dissolution.
Sample 363-U1487A-16H-CC (144.53 mbsf; late Pliocene; ~2.70 Ma) shows excellent preservation. Foraminifers have a glassy appearance under the light microscope. In cross section, the wall of T. trilobus shows platy microgranules and other typical biogenic features such as spines embedded in the wall. In P. wuellerstorfi, the wall cross section is microgranular with only very minor evidence of incipient recrystallization. The outer chamber surfaces of some specimens show evidence of minor superficial abrasion. The inner wall surfaces of T. trilobus and P. wuellerstorfi are generally smooth but show minor overgrowth of calcite in a layer <1 μm thick. Minor infilling of unconsolidated sediment (coccoliths) occurs. One specimen of P. wuellerstorfi contains pyrite framboids up to 5 μm in diameter. There is no evidence of cementation or dissolution.
Shipboard age model
Biostratigraphic and magnetostratigraphic (see Paleomagnetism) horizons are generally in good agreement. An age-depth plot is shown in Figure F16. Long-term average sedimentation rates through the middle part of the early Pleistocene to late Pleistocene (0–75 mbsf) are ~3.5 cm/ky. As at Site U1486 (see Biostratigraphy in the Site U1486 chapter [Rosenthal et al., 2018c]), sedimentation rates before ~2 Ma (deeper than 60 mbsf) are substantially higher, averaging ~15 cm/ky. The reason for this is the very high rate of volcanic ash deposition early in the site’s history, which diluted the pelagic sediment component.
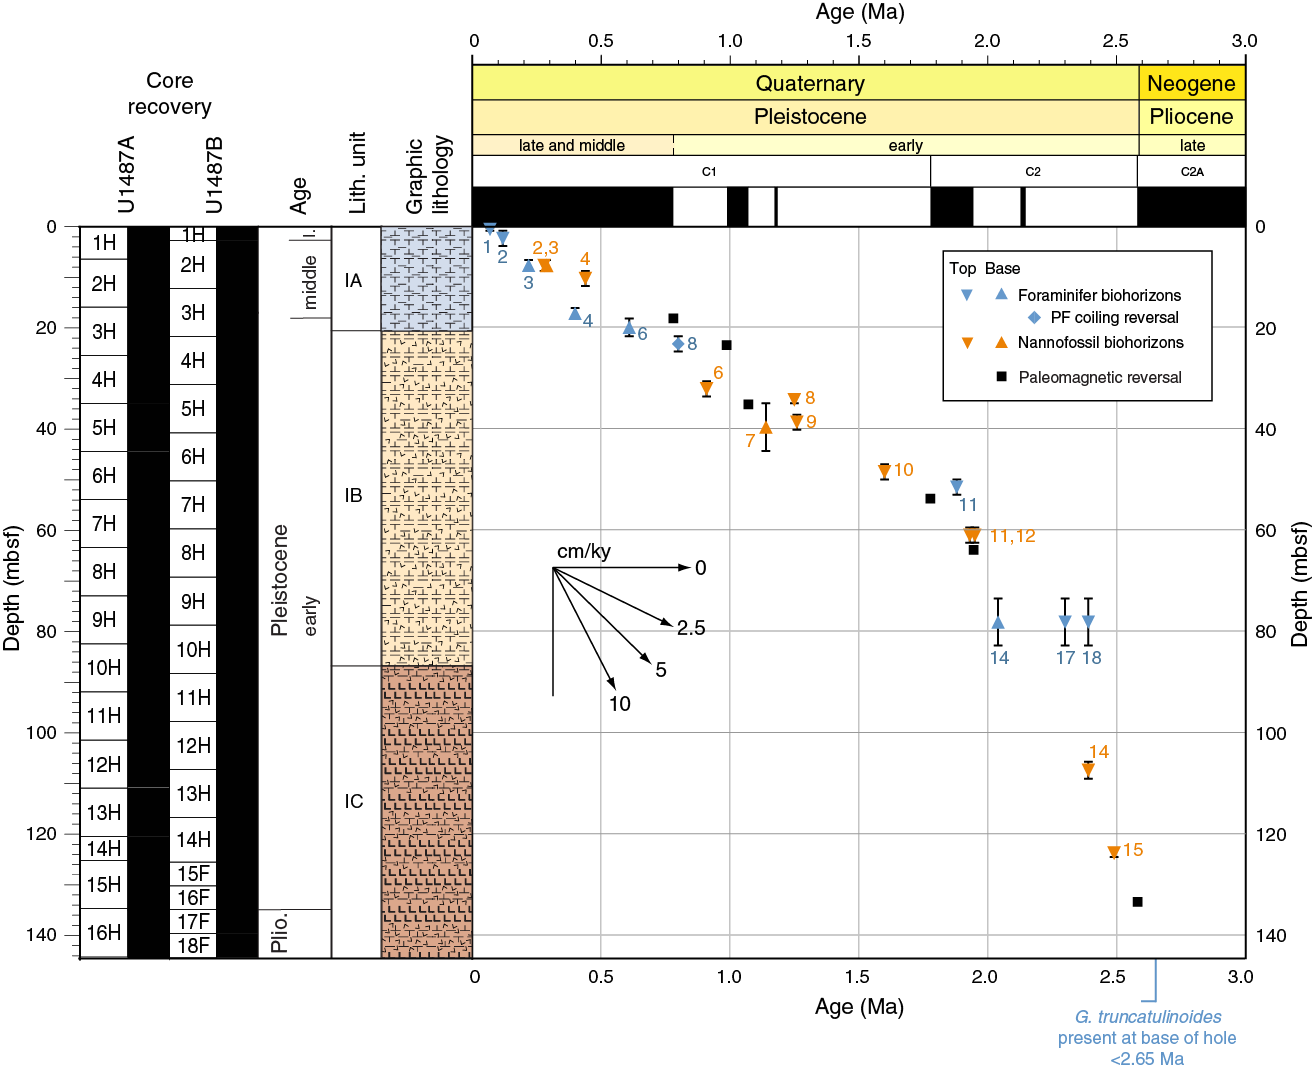
Figure F16. Age-depth plot.
The oldest sediment recovered at Site U1487 belongs to the same calcareous nannofossil biozone (NN17) and planktonic foraminifer biozone (PL5) as the oldest sediment at Site U1486 (see Biostratigraphy in the Site U1486 chapter [Rosenthal et al., 2018c]). The best age constraint near the base of the succession is the Gauss/Matuyama boundary (2.581 Ma) at 133.11 mbsf (see Paleomagnetism). The age of the oldest sediment recovered is estimated at 2.65 Ma based on extrapolation of the age-depth trend. This extrapolated age may be slightly younger than at Site U1486, because the planktonic foraminifer G. truncatulinoides occurs downhole to the bottom of Hole U1487A, whereas it is not present in the lowermost sediment at Site U1486. This does not, however, necessarily indicate that the basement is younger than at Site U1486, because more of the sediment overlying the basement reflector was left unrecovered (see Operations).
Paleomagnetism
Measurements summary
Paleomagnetic investigations at Site U1487 involved measurement of the natural remanent magnetization (NRM) of archive-half sections of cores from Holes U1487A and U1487B before and after demagnetization in a peak alternating field (AF) of 15 mT. In addition to measuring 204 core sections, we took two discrete samples per core from Hole U1487A (32 samples) to characterize the NRM demagnetization behavior and to investigate the rock magnetic properties of the sediment. The NRM of the discrete samples was measured before and after AF demagnetization in peak fields of 5, 10, 15, 20, 30, and 40 mT. Rock magnetic investigations comprised measurements of magnetic susceptibility (χ), susceptibility of anhysteretic remanent magnetization (χARM) imparted using a 100 mT AF demagnetization and 0.05 mT direct current bias field, and isothermal remanent magnetization (IRM) acquired in 300 mT and 1000 mT (saturation IRM [SIRM]) fields. All sample measurements were mass corrected. The Icefield MI-5 core orientation tool was deployed with nonmagnetic hardware for all cores, which permitted azimuthal correction of declination. Azimuthally corrected declination is largely coherent between successive cores; however, absolute values in all holes cluster around 180° for normal polarity and 0° for reversed polarity, suggesting that the issues of the baseline offset in azimuthally corrected declination experienced at the majority of sites during Expedition 363 and during previous expeditions (McNeill et al.,2017) affected these data. McNeill et al. (2017) suggest that a simple −180° correction could be applied to the corrected declination data to rotate them back to expected values for the respective polarity. However, we leave declination uncorrected for this additional offset in the plotted figures, so care should be employed for future calculations of virtual geomagnetic poles (VGPs) using these data.
Rock magnetic characterization
Whole-Round Multisensor Logger (WRMSL) magnetic susceptibility data average 139 × 10−5 SI (see Physical properties) and, when coupled with average χ (7.0 × 10⁻⁷ ± 6.0 × 10⁻⁷ m3/kg as 2 standard deviations [2σ]) and SIRM (3.1 × 10⁻² ± 4.1 × 10⁻² Am2/kg as 2σ) values, suggest moderately high (ferri)magnetic mineral concentration in the sediment deposited at Site U1487 (Figure F17). In the uppermost ~24 mbsf of Hole U1487A, samples acquire >90% of their SIRM remanence in a 300 mT field, suggesting that ferrimagnetic minerals (e.g., [titano]magnetite [FexTixO4] and maghemite [γ-Fe2O3]) control the remanence-carrying properties of the sediment. Deeper than ~24 mbsf, average values decrease and cluster between ~0.87 and 0.9, potentially suggesting greater influence of higher coercivity minerals (e.g., hematite [Fe2O3] and goethite [FeO(OH)]) at depth. The upper ~20 mbsf of Hole U1487A is characterized by relatively low ferrimagnetic concentration (low χ and SIRM) that increases with depth downhole. Magnetic grain size shows a two-step change, with relatively fine ferrimagnetic grain sizes (high χARM/SIRM) in the upper ~20 mbsf, followed by progressive coarsening downhole that accompanies the increases in ferrimagnetic concentration. NRM15mT intensity shows a similar pattern to χ and SIRM with lower and more variable values (range = ~10−4 to 10−2 A/m) in the upper ~54 mbsf and higher and steadily increasing values (~10−3 to 10–2 A/m) downhole. Increases in intensity, magnetic grain size, magnetic concentration, and the proportion of higher coercivity minerals at ~24 mbsf occur coevally with the boundary between lithologic Subunits IA and IB, which marks the transition from sediment dominated by nannofossil-rich foraminifer ooze to ash- and nannofossil-rich foraminifer ooze with variable clay and interbedded discrete tephra layers (see Core description), and reflects greater volcanogenic contributions to the sediment in the older part of the section. Interstitial water sulfate at Site U1487 remains at elevated concentrations downhole (see Geochemistry), and rock magnetic data show little or no evidence for strong magnetic mineral diagenesis (e.g., Karlin and Levi, 1983; Rowan et al., 2009) at depth. As a result, the NRM is most likely acquired through (post)depositional remanent magnetization (pDRM) processes that can potentially be used to understand and reconstruct paleogeomagnetic field behavior.
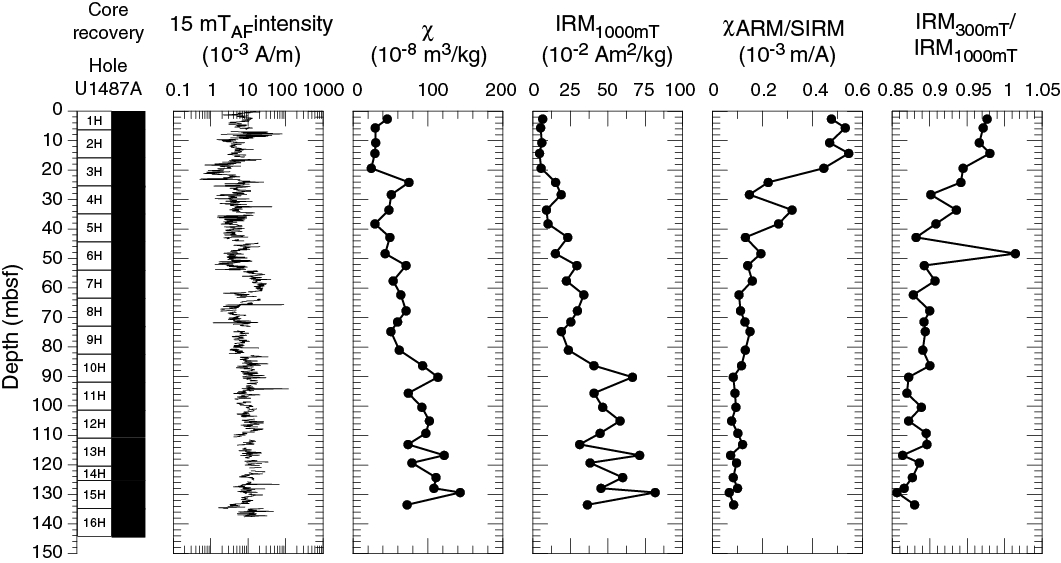
Figure F17. Archive-half NRM intensity.
Paleomagnetic data and core orientation
NRM demagnetization behavior and IRM300mT/IRM1000mT ratios are consistent with (titano)magnetite being the primary remanence-carrying mineral species in sediments deposited at Site U1487 (Figures F17, F18). The drill string overprint is largely removed after AF demagnetization in a 5–15 mT field, and following exposure to higher AF demagnetization steps, inclination and declination stabilize and trend toward the origin on Zijderveld diagrams (Zijderveld, 1967), indicating a single component to the magnetization (Figure F18). Origin-anchored maximum angular deviation values of the principal component analysis (PCA) calculated over the 15–40 mT range average 8.1° (range = 1.4°–24.2°) in Hole U1487A (Figures F18, F19). Low maximum angular deviation values (less than ~5°) characterize periods when paleomagnetic directions are stable and well defined and therefore likely to yield reliable estimates for magnetostratigraphy (Stoner and St-Onge, 2007), whereas higher maximum angular deviation values (>10°–15°) can be indicative of intervals with more complex and slightly less well-resolved and reliable magnetizations.

Figure F18. Discrete sample AF demagnetization results.
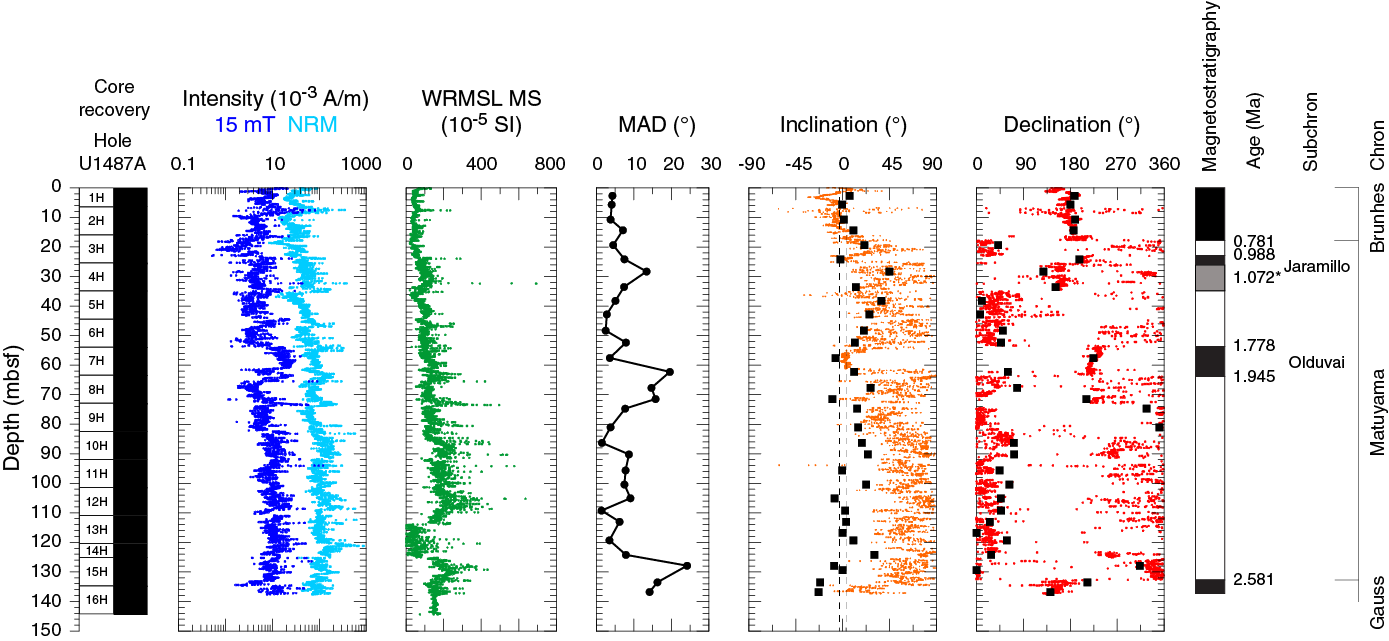
Figure F19. NRM, WRMSL MS, maximum angular deviation, inclination, and declination.
For all APC cores from Site U1487, declination was corrected using the Icefield MI-5 tool (see Operations). Azimuthally corrected declination is consistent between adjacent cores, and absolute values cluster around ~0° and ~180° (Figures F19, F20). However, because biostratigraphic results indicate that the uppermost sediment in each hole was deposited during normal polarity associated with the Brunhes Chron (see Biostratigraphy), declination values at Site U1487 experience an offset of ~180° in absolute terms as declination should cluster around 0° (180°) during periods of normal (reversed) polarity. This phenomenon was a persistent issue during Expedition 363 and was also experienced during Expedition 362 (McNeill et al., 2017). Orientation tools cannot be deployed with the HLAPC coring system; therefore, to align declination measured on the HLAPC cores to the oriented APC cores in Hole U1487B, we averaged the HLAPC declination record on a core-by-core basis to match the declination of the overlying core (dark red declination symbols in Figure F20). The Gauss/Matuyama boundary occurs in Section 363-U1487B-16F-3 at a similar depth to that in Hole U1487A (Table T6). Therefore, deeper than ~135 mbsf we manually oriented the remaining HLAPC cores to a mean of 180° associated with the normal polarity of the Gauss normal polarity chron (C2An.1n).
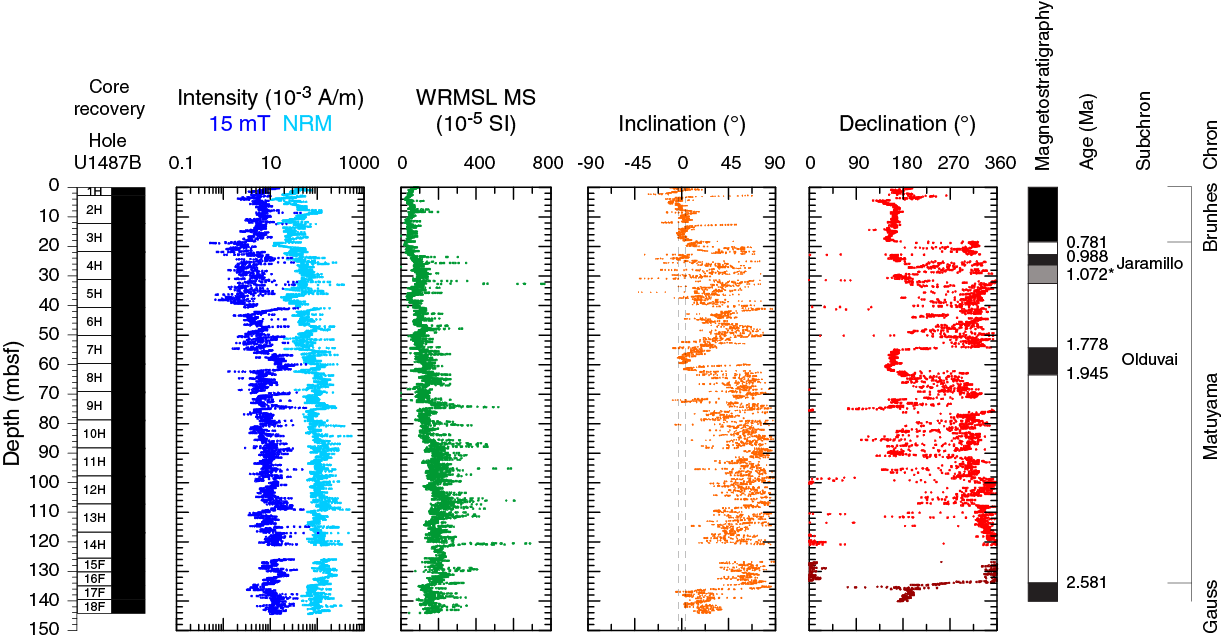
Figure F20. NRM, WRMSL MS, inclination, and declination.
Table T6. Depths of identified reversal boundaries. Download table in CSV format.
NRM intensity before and after 15 mT AF demagnetization, WRMSL magnetic susceptibility, and inclination and azimuthally corrected declination after 15 mT AF demagnetization are shown for Holes U1487A and U1487B in Figures F19 and F20, respectively. Displayed inclination and declination values were cleaned of visibly disturbed intervals and voids (see Paleomagnetism in the Expedition 363 methods chapter [Rosenthal et al., 2018a]), but the extensive volcanogenic deposits that occur in Subunits IB and IC below ~21 mbsf (see Core description) are too numerous and often too diffuse to fully clean from the Site U1487 record. Volcanogenic sediments can potentially affect NRM intensity and direction (Le Friant et al., 2013), and the greater scatter in SRM directions below ~21 mbsf may be related to these horizons. Inclination and declination measured on discrete samples are generally in excellent agreement with those measured on archive-half sections (Figure F19), although deeper than ~21 mbsf, discrete inclination is often shallower than its SRM-measured counterpart. In the upper ~21 mbsf, discrete and SRM measured inclination plots around the expected values of approximately ±3° for the site latitude, assuming a geocentric axial dipole (GAD) field. Below ~21 mbsf, inclination is often positive, and often steeper than that predicted for a GAD field. Steep inclinations in a positive direction are most frequently interpreted as a pervasive overprint that is not removed after relatively low AF demagnetization (Richter et al., 2007). Interestingly, the steepest inclinations in Hole U1487A are associated with periods when declination clusters around ~0°/360°. This association suggests that sediments deposited during periods of reversed polarity may be more susceptible to pervasive overprinting than sediment deposited during periods of normal polarity. A similar polarity-specific signature was observed during Integrated Ocean Drilling Program Expedition 320/321, where inclination measured in normal polarity intervals yielded steeper than GAD-like values, whereas reversed polarity intervals were relatively unaffected (Pälike et al., 2010). In cores recovered using the XCB system at Integrated Ocean Drilling Program Sites U1331 and U1332, the systematic offset in inclination between different polarities was used to help guide polarity determinations (Pälike et al., 2010).
In contrast to inclination, declination appears relatively insensitive to a strong drill string–induced overprint because declination values after 5–10 mT AF demagnetization remain stable through higher AF demagnetization steps (Figure F18). Because of the equatorial location of Site U1487, declination was more instructive than inclination for determination of magnetic polarity. Given the lack of a strong overprint in declination, we were hesitant to expose the sediments to higher AF demagnetization than 15 mT to remove the pervasive overprint in inclination for no substantial gain in magnetostratigraphic information. Any future estimates of paleosecular variation, relative paleointensity, or VGPs for the site should first use higher AF demagnetization to fully clean the record of any remaining drill-string overprint.
Magnetostratigraphy
Sediments in all three holes appear to have been deposited (quasi)continuously with no major hiatuses or erosional surfaces (see Core description and Biostratigraphy). Across Holes U1487A and U1487B we observed six coeval and distinct ~180° changes in declination. These declination shifts occur at the same depth that inclination changes from GAD-like values during normal polarity to steeper, positive, and more overprinted values during reversed polarity. Interpretation of these horizons as pDRM-recorded reversals of the geomagnetic field allows correlation to the geomagnetic polarity timescale (GPTS; Cande and Kent, 1995) of the geologic timescale (Hilgen et al., 2012) and an assignment of age. The Matuyama/Brunhes boundary (0.781 Ma) is identified at 17.75–18.4 mbsf and the upper Jaramillo normal boundary (0.988 Ma) at 22.6–23.17 mbsf (note that these ranges encompass the minimum and maximum mbsf depths across two holes where the reversal is identified within a single core, not between adjacent cores; see Table T6 for the depths of each boundary in each hole). The base of the lower Jaramillo boundary (1.072 Ma) is difficult to determine and somewhat ambiguous at Site U1487. Declination in Hole U1487A shows a period of normal polarity (clustering around 180°) from the upper Jaramillo boundary to 34.55–35.175 mbsf in Hole U1487A and to 32.225–32.475 mbsf in Hole U1487B, albeit with more scattered declination values between ~25 and 29 mbsf in Hole U1487B (Sections 363-U1487B-4H-3 through 4H-6). Because the Jaramillo normal is ~84 ky in duration (Hilgen et al., 2012), this would imply a sedimentation rate of ~14 cm/ky in Hole U1487A and 11 cm/ky in Hole U1487B for the duration of the Jaramillo normal relative to the estimated sedimentation rate of 2.3 cm/ky from the upper Jaramillo to the top of the hole. Consultation of the drilling operations reports and reexamination of the orientation data yield no reason to reject the SRM and discrete measured declination data, and although volcanogenic sediment is more abundant at these depths than in the upper ~1 million years of the record (see Core description), this abundance alone cannot account for the 4- to 5-fold implied acceleration in sedimentation rate through the Jaramillo. Although inclination is difficult to use for polarity determinations at equatorial locations, the apparent increased susceptibility for sediments deposited during periods of reversed polarity to acquire a more pervasive overprint can add to this discussion. In both Holes U1487A and U1487B, inclination returns from more GAD-like values associated with the Jaramillo normal to more overprinted values, potentially suggesting reversed polarity at ~25.5 mbsf in Hole U1487A and ~26 mbsf in Hole U1487B. These data imply sedimentation rates of 3–4 cm/ky for the Jaramillo, which are more in line with those observed for the Brunhes (C1n) and late Matuyama (C1r.1r) polarity chrons at Site U1487. However, this interpretation violates the oriented declination data at both sites (Figures F19, F20). In Table T6, we report the lower Jaramillo based on the declination data, but these data need to be reevaluated before they are used for age models or other chronostratigraphic interpretations.
Below the Jaramillo, we observed the upper (53.18–54.93 mbsf; 1.173 Ma) and lower (63.2–66.23 mbsf; 1.185 Ma) boundaries of the Olduvai normal (C2n) and the Gauss/Matuyama boundary (132.64–135.9 mbsf; 2.581 Ma). Continued normal polarity below this depth in both holes suggests that the recovered sediment is younger than 3.032 Ma because the upper boundary of the Kaena reversed subchron (C2An.1n) was not observed. The depths of these paleomagnetic reversal boundaries imply a sedimentation rate of ~10.9 cm/ky from the base of the hole (late Pliocene) until 1.945 Ma and then a decrease in sedimentation rate to ~4 cm/ky for the rest of Pleistocene if we ignore the age-depth complications associated with the determination of the lower Jaramillo. These reversal horizons and estimated sedimentation rates (aside from the lower Jaramillo) are in excellent agreement with both the calcareous nannofossil and planktonic foraminifer datums (see Biostratigraphy).
Physical properties
Physical properties were measured on whole-round cores, split cores, and discrete samples from both holes drilled at Site U1487 to provide basic information for characterizing the core sections. GRA bulk density and magnetic susceptibility were measured on all core sections from Hole U1487B with the Special Task Multisensor Logger (STMSL) immediately after the cores were brought onboard. All core sections were measured with the GRA bulk densitometer, the magnetic susceptibility loop, and the P-wave logger (PWL) on the WRMSL after equilibration. As soon as possible, NGR was measured on all whole-round sections (Hole U1487A at 10 cm resolution and Hole U1487B at 20 cm resolution; see Physical properties in the Expedition 363 methods chapter [Rosenthal et al., 2018a]). As with Site U1486 (see Physical properties in the Site U1486 chapter [Rosenthal et al., 2018c]), it was not possible to measure the NGR background at Site U1487 due to short transit time from Site U1486 (<2 h) and because cores from Site U1486 were still being measured on the Natural Gamma Radiation Logger upon arrival at Site U1487. Point-sensor magnetic susceptibility and color spectrophotometry (color reflectance) were measured on split-core sections using the Section Half Multisensor Logger (SHMSL). Discrete thermal conductivity, P-wave velocity, and moisture and density (MAD) measurements were made in Hole U1487A. Discrete P-wave measurements (z- and x-axis) were made using the P-wave caliper (PWC) system on the Section Half Measurement Gantry. Preconditioning treatments were applied to the records to aid in interpretation of noisy or spiky data (for details, see Physical properties in the Expedition 363 methods chapter [Rosenthal et al., 2018a]). Because GRA bulk density shows large variations corresponding to the amount of volcanogenic material in the sediment cores, the median-filter method was not applied because it removed too many of the high GRA bulk density values. Additionally, P-wave values were culled above 2050 m/s instead of 1750 m/s to retain high velocity measurements from volcanogenic-rich intervals. All data shown in figures are taken from the preconditioned data sets. Tables presented in this section contain raw and treated data for NGR and WRMSL GRA bulk density, magnetic susceptibility, and P-wave velocity. Raw data for all data sets are available from the LIMS database.
GRA bulk density
GRA bulk density reproducibility between holes at Site U1487 is excellent, with both holes showing a general trend toward increasing values with depth, most likely due to compaction, and increasing variability with depth related to lithologic variations (Figure F21; Tables T7, T8). In both holes, bulk density values vary between 1.4 and 1.5 g/cm3 in the upper 3 mbsf, reflecting consolidation away from the mudline. Between ~3 and 86 mbsf, GRA bulk density increases from 1.5 to 1.7 g/cm3. The short-term variability is low amplitude (±0.11 g/cm3) between ~3 and ~24 mbsf, corresponding mostly to lithologic Subunit IA (see Core description). Between ~24 and ~86 mbsf, which corresponds to lithologic Subunit IB, the short-term variability increases to ±0.21 g/cm3 and displays a cyclicity of ~10 m (more visible in Hole U1487A; Figure F21). Between ~86 mbsf and the bottom of the hole, variability increases, with values fluctuating by ~0.24 g/cm3 in poorly defined ~15 m cycles. The increase in short-term variability corresponds to the transition between Subunits IB and IC, which is also marked by a color change from dark to very dark layers, reflecting the dominance of volcanogenic material in Subunit IC (see Core description). GRA bulk density records from Sites U1486 and U1487 show a similar progression of increasing variability downhole (Figure F22).
Table T7. WRMSL GRA bulk density data, Hole U1487A. Download table in CSV format.
Table T8. WRMSL GRA bulk density data, Hole U1487B. Download table in CSV format.
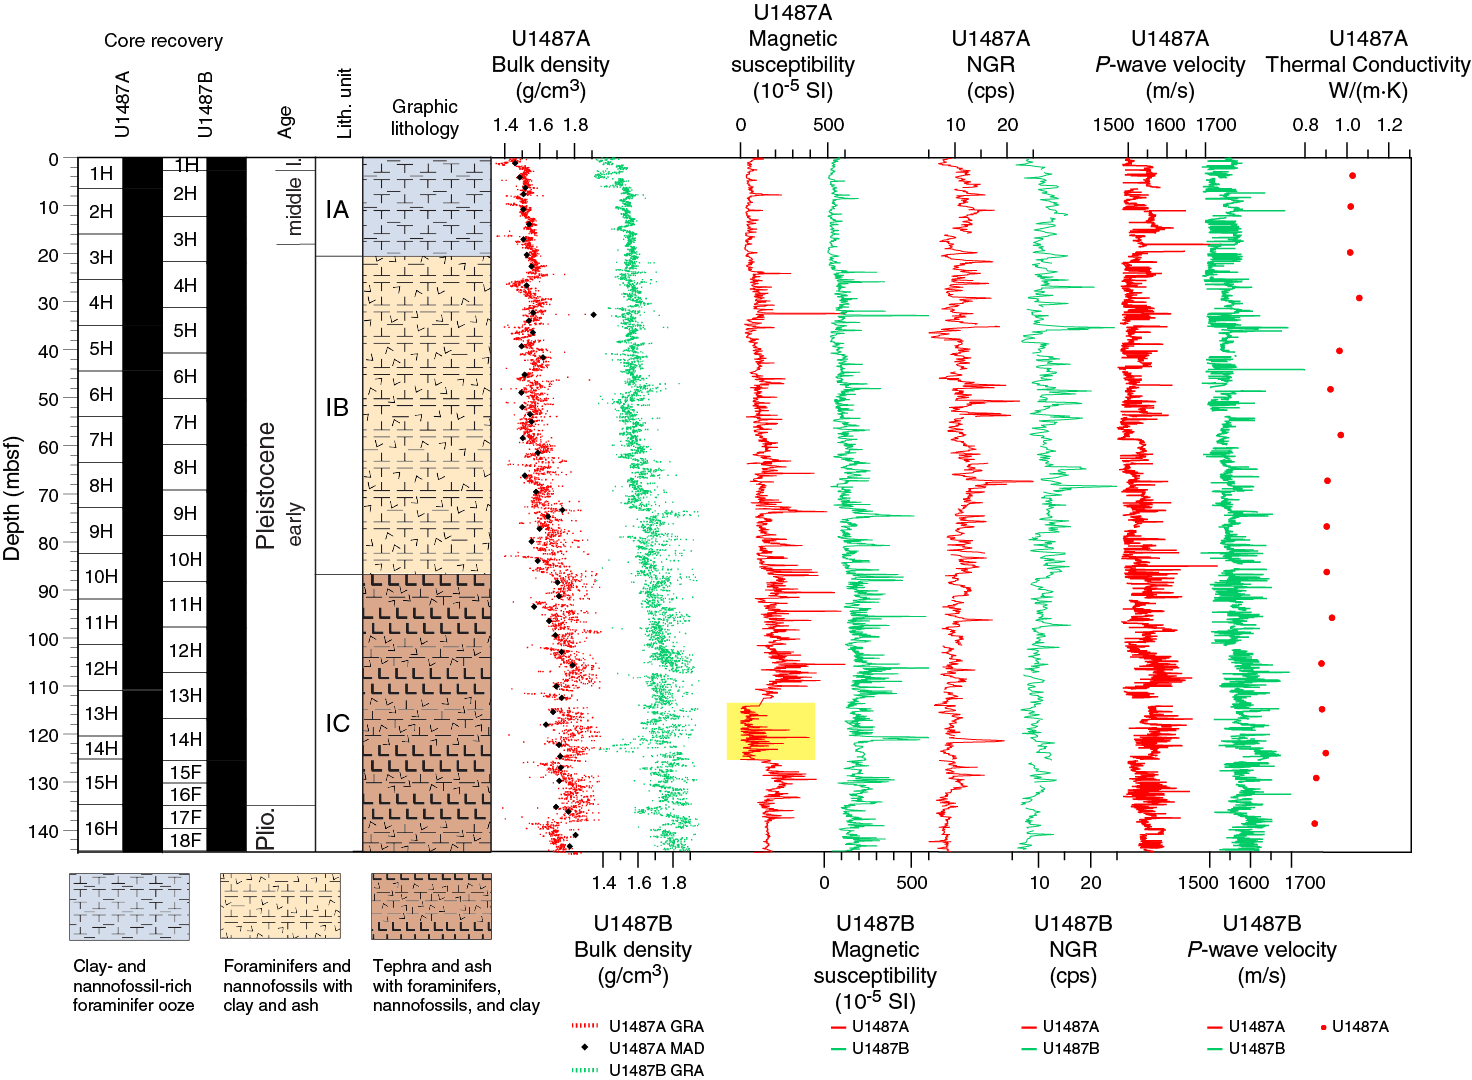
Figure F21. Physical property measurements.
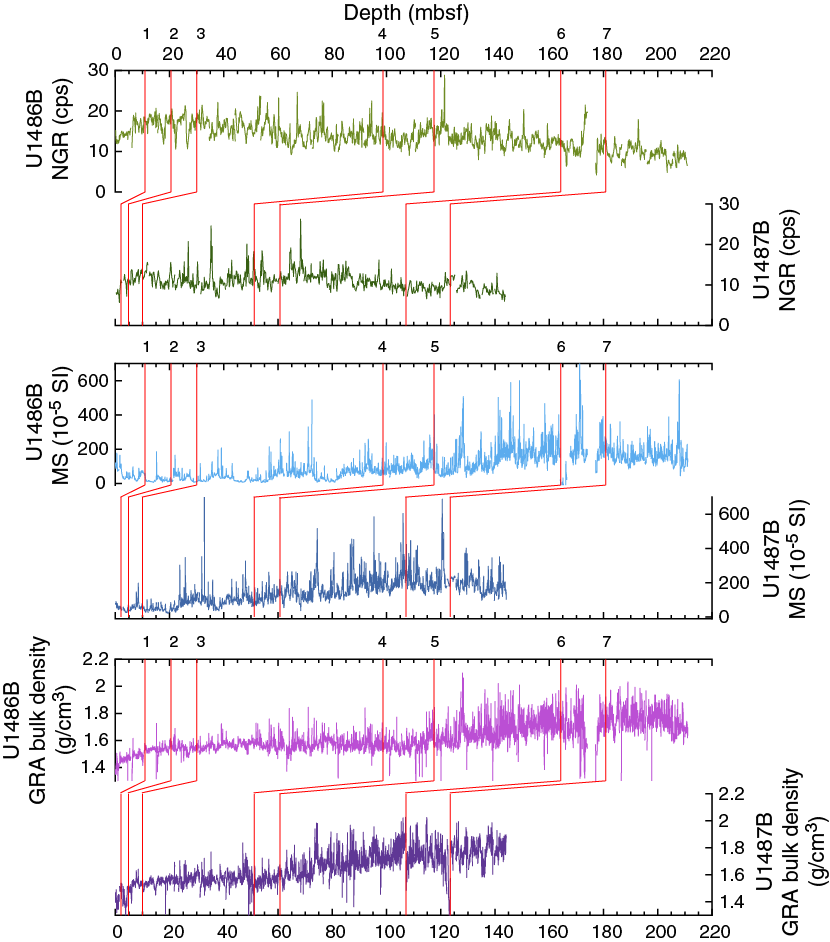
Figure F22. Comparison of major physical property parameters.
The largest peaks in GRA bulk density correspond to distinct tephra layers and to high peaks in magnetic susceptibility and P-wave velocity, although this pattern is not always seen in NGR (Figure F23). From ~137 mbsf to the bottom of Hole U1487A, GRA bulk density drops from 1.8 to 1.6 g/cm3, coincident with lower magnetic susceptibility variability. This change in GRA bulk density and magnetic susceptibility corresponds to an interval consisting primarily of unconsolidated volcanogenic-rich sand.
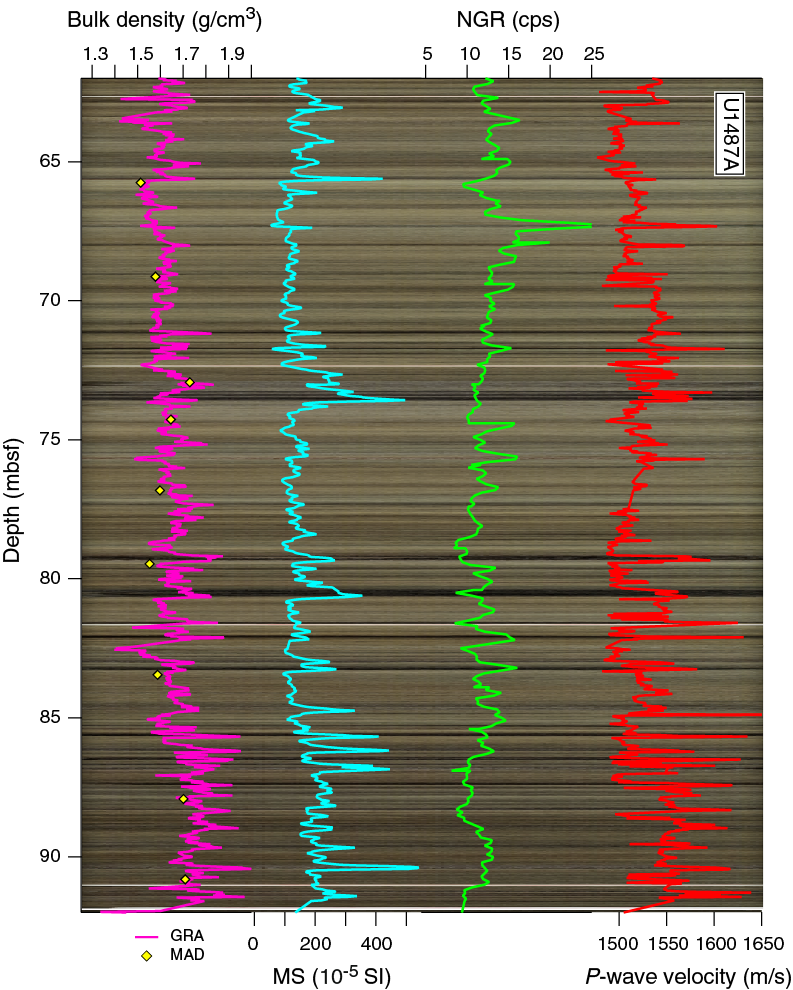
Figure F23. MAD and WRMSL bulk density, WRMSL MS, NGR, and P-wave velocity overlaid on core photos.
Magnetic susceptibility
Magnetic susceptibility exhibits three distinct patterns of variability at Site U1487 that are similar to those previously identified at Site U1486 (Figure F22). In the uppermost ~24 mbsf, background values fluctuate between 30 × 10−5 and 50 × 10−5 SI, with several spikes from 100 × 10−5 to 200 × 10−5 SI corresponding to dark layers in the sediment (Figures F21, F23). This interval corresponds mostly to Subunit IA (Figure F21; Tables T9, T10). Between ~24 and ~86 mbsf, background values increase from 75 × 10−5 to 130 × 10−5 SI with frequent peaks of 200 × 10−5 SI to 500 × 10−5 SI. This interval corresponds to lithologic Subunit IB, which marks an overall increase in abundance of dark volcanogenic material. From ~86 mbsf to the bottom of the hole, sediments are dominated by dark volcanogenic material with a significant decrease in biogenic component (lithologic Subunit IC). In this interval, magnetic susceptibility is characterized by background values of ~150 × 10−5 SI with high-frequency variability from 300 × 10−5 to 400 × 10−5 SI. Some peaks reach up to 600 × 10−5 SI in the darkest sediment layers, which contain high amounts of volcanogenic material. These variations in intensity may reflect different sedimentary processes involved in formation of the volcanogenic-rich layers, including direct deposition of volcanogenic materials (tephras), resedimentation (e.g., mass gravity flows), and/or mixing with biogenic sediments (e.g., through bioturbation) (see Core description). Deeper than 137 mbsf, Hole U1487A magnetic susceptibility drops to 150 × 10−5 SI in the same interval where GRA bulk density decreases, corresponding to an unconsolidated sand layer. It should be noted that this decrease is not observed in Hole U1487B.
Table T9. WRMSL MS data, Hole U1487A. Download table in CSV format.
Table T10. WRMSL MS data, Hole U1487B. Download table in CSV format.
Sections 363-U1487A-13H-3 through 14H-4 (113–125 mbsf) are artificially offset to low values due to the measurement loop being obstructed immediately prior to measurement (yellow box in Figure F21), which meant the loop was zeroed incorrectly (see Physical properties in the Expedition 363 methods chapter and Physical properties in the Site U1486 chapter [Rosenthal et al., 2018a, 2018c]). Because of the excellent reproducibility among holes, and the general consistency of STMSL and SHMSL magnetic susceptibility measurements, these artificially offset values can be corrected during postcruise research.
Natural gamma radiation
NGR is initially low (~8 counts/s) and then rapidly increases downhole to ~17 count/s by 10 mbsf, reflecting changes immediately below the mudline (Figure F21; Tables T11, T12). Values then decrease to 8 counts/s by 18 mbsf. Maximum values of ~20 counts/s occur throughout the record and especially between ~22 and ~86 mbsf (lithologic Subunit IB). The NGR response within dark layers is more ambiguous than that observed for magnetic susceptibility. Some dark layers with high ash content correspond to distinct NGR peaks, whereas others with clear magnetic susceptibility peaks show no change in NGR (e.g., ~73 mbsf in Figure F23). This difference could reflect the lower resolution of the NGR data or may indicate bioturbation mixing and dispersing ash particles within the surrounding sediment (see Core description). Unlike Site U1486, Site U1487 does not exhibit a long-term decreasing trend downhole (Figure F22). Instead, background NGR increases to ~16 counts/s (excluding peaks in dark layers) by 68 mbsf and then decreases toward 7 counts/s at the bottom of the hole.
Table T11. NGRL data, Hole U1487A. Download table in CSV format.
Table T12. NGRL data, Hole U1487B. Download table in CSV format.
P-wave velocity
PWL and PWC x-axis P-wave velocity measurements were obtained to the base of both holes at Site U1487. The z-axis measurements were stopped after the first core because measurements were unreliable and caused extensive damage to the sand-rich sediment. PWL P-wave velocity values are reasonably consistent between Holes U1487A and U1487B (Figures F21, F24; Tables T13, T14). The downhole average of PWL P-wave velocity is 1533 m/s for Hole U1487A and 1556 m/s for Hole U1487B. PWL P-wave velocity displays no obvious long-term trend over the upper ~85 mbsf, corresponding to lithologic Subunits IA and IB. A small increasing trend occurs below ~86 mbsf to the bottom of both holes (Subunit IC), similar to the GRA bulk density trend but contrary to the decreasing NGR trend (Figure F24). PWC x-axis P-wave velocity for Hole U1487A displays a slight increasing trend that is comparable with but much weaker than the increasing trend in the PWL P-wave velocity from the same hole. The slope of the downhole linear trend is 0.05 for PWC x-axis measurements and 0.29 for PWL measurements.
Table T13. WRMSL PWL data, Hole U1487A. Download table in CSV format.
Table T14. WRMSL PWL data, Hole U1487B. Download table in CSV format.

Figure F24. Discrete and whole-round P-wave velocity.
Moisture and density
Dry density, bulk density, and grain density show opposing trends to porosity in Hole U1487A. The MAD bulk density shows a slightly increasing trend with depth, in agreement with the GRA bulk density (Figure F25). At Site U1487, there is no offset between GRA and MAD bulk densities over the uppermost 20 mbsf, unlike the offset observed at previous sites due to water loss. The MAD bulk density record corresponds closely to the dry density and grain density data. MAD bulk density reaches its highest values (~1.9 g/cm3) at ~32 mbsf, corresponding to a dark sedimentary layer with high volcanogenic content and with porosity <55% (arrow in Figure F25). Except for this sample, the majority of the MAD measurements reflect the properties of the background clay and biogenic ooze. As at Site U1486, the porosity is high and decreases with depth from 75% to 60% due to compaction.
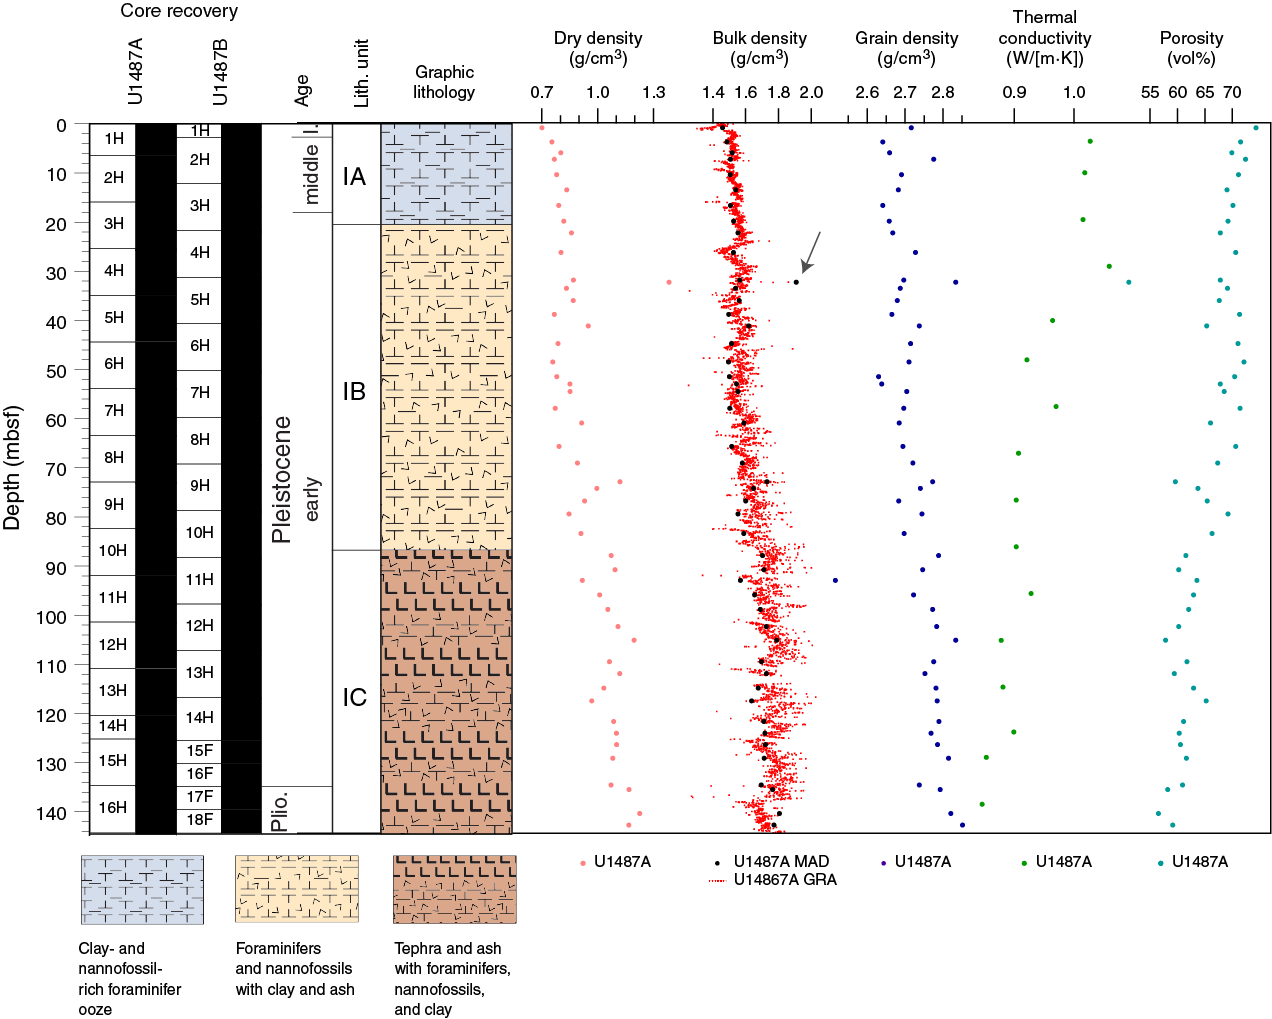
Figure F25. MAD dry, bulk, and grain densities and porosity, WRMSL GRA bulk density, and thermal conductivity.
Thermal conductivity
A thermal conductivity profile was obtained at ~10 m resolution using a thermal conductivity needle (Figures F21, F25). Thermal conductivity measurements show a decreasing trend downhole from ~1.05 W/(m·K) at the seafloor to 0.85 W/(m·K) at 140 mbsf. The thermal conductivity profile at Site U1487 is generally different than that observed at Site U1486. The profile at Site U1487 shows very low values, with an average of 0.936 W/(m·K), probably due to the presence of numerous volcanogenic layers composed of minerals with low thermal activity. As at Site U1486, the large variability in the thermal conductivity measurements and the absence of a downhole increasing trend probably reflect highly variable small-scale lithologic changes between biogenic- and volcanogenic-rich layers (see Core description). Because of the highly variable lithology, the thermal conductivity and porosity measurements cannot be correlated between Sites U1486 and U1487.
Downhole temperature measurements
Downhole temperature measurements were made on Cores 363-U1487A-4H (34.9 mbsf), 7H (63.4 mbsf), 10H (91.9 mbsf), and 13H (120.4 mbsf) using the APCT-3. An exponential decrease in temperature was observed between 60 and 600 s after penetration and was used to estimate ambient formation temperature (unshaded area in Figure F26). The APCT-3 was left in the formation for 100 s longer for Core 10H than for the other measurements, which is reflected in the longer orange curve in Figure F26. The abrupt increase in temperature at ~700–800 s for Core 10H is due to friction. Temperature increases from 9.02°C at 34.9 mbsf to 18.47°C at 120.4 mbsf. Site U1487 exhibits the highest extrapolated formation temperature compared to all other sites, probably because of the shallow-water setting (~873 m) and warmer bottom water temperatures. The correlation between the four downhole temperatures and depth is very high (R2 = 0.999). Using the slope of the temperature-depth relationship, we estimate that the bottom water temperature at Site U1487 is 5.28°C, yielding a geothermal gradient of 110°C/km (Figure F27).

Figure F26. APCT-3 temperature-time series.
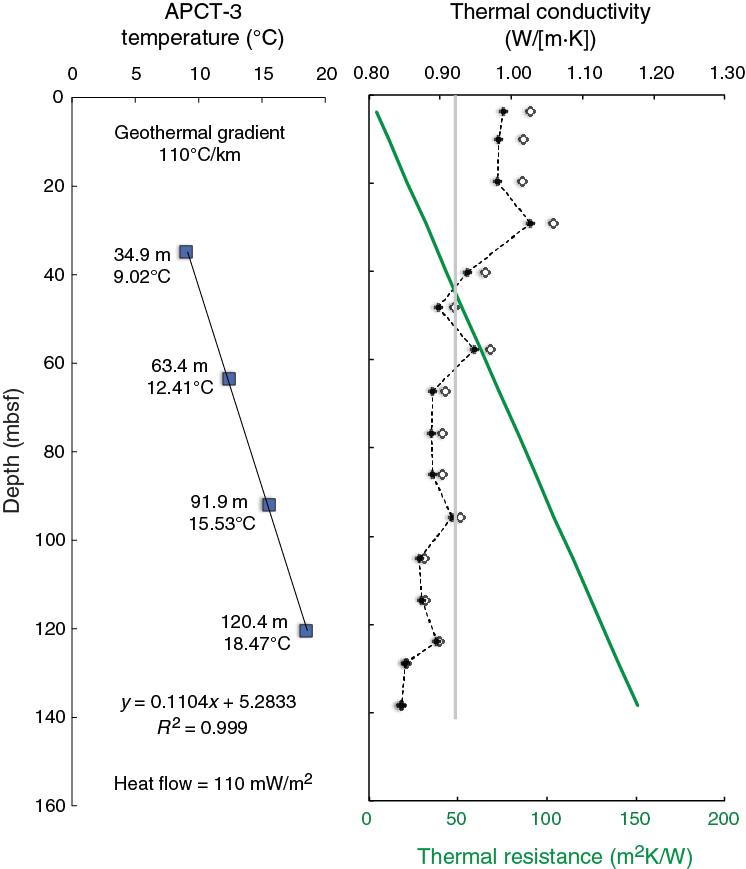
Figure F27. Heat flow calculations.
We generated a thermal conductivity profile (~10 m resolution) (Figure F27) and calculated thermal resistance based on the in situ correction and the average thermal conductivity of 0.918 W/(m·K) for Hole U1487A, following the “linear approach” outlined in Pribnow et al. (2000). Corrected thermal conductivity is offset relative to the uncorrected values by ~0.04 W/(m·K) at the top of the hole, decreasing with depth to converge at ~120 mbsf. The slope of the linear fit between temperature and thermal resistance indicates that heat flow is 110 mW/m2 at Site U1487. As at Site U1486, the classic approach for calculating the ocean crust age is inappropriate at Site U1487 due to the influence of hydrothermal activity, which causes a ~50% underestimation of heat flow when using this classic approach (see figure 4 in Stein and Stein, 1994). The observed conductive heat flow in such areas must therefore be adjusted upward to be indicative of the true crustal heat flow.
Stratigraphic correlation
Correlations between holes at Site U1487 were accomplished using Correlator software (version 2.1). Tie points were established almost exclusively with the WRMSL magnetic susceptibility data (Table T15; Figure F28). In addition, we used NGR and GRA bulk density data to aid in making correlations. We constructed a splice for the entire site using Holes U1487A and U1487B (Table T16; Figures F28, F29, F30). The splice is continuous and well constrained from 0 to 136.0 m core composite depth below seafloor (CCSF). Below this, from 136.0 to 156.0 m CCSF, the splice has gaps and uncertain tie points.
Table T15. Affine table. Download table in CSV format.
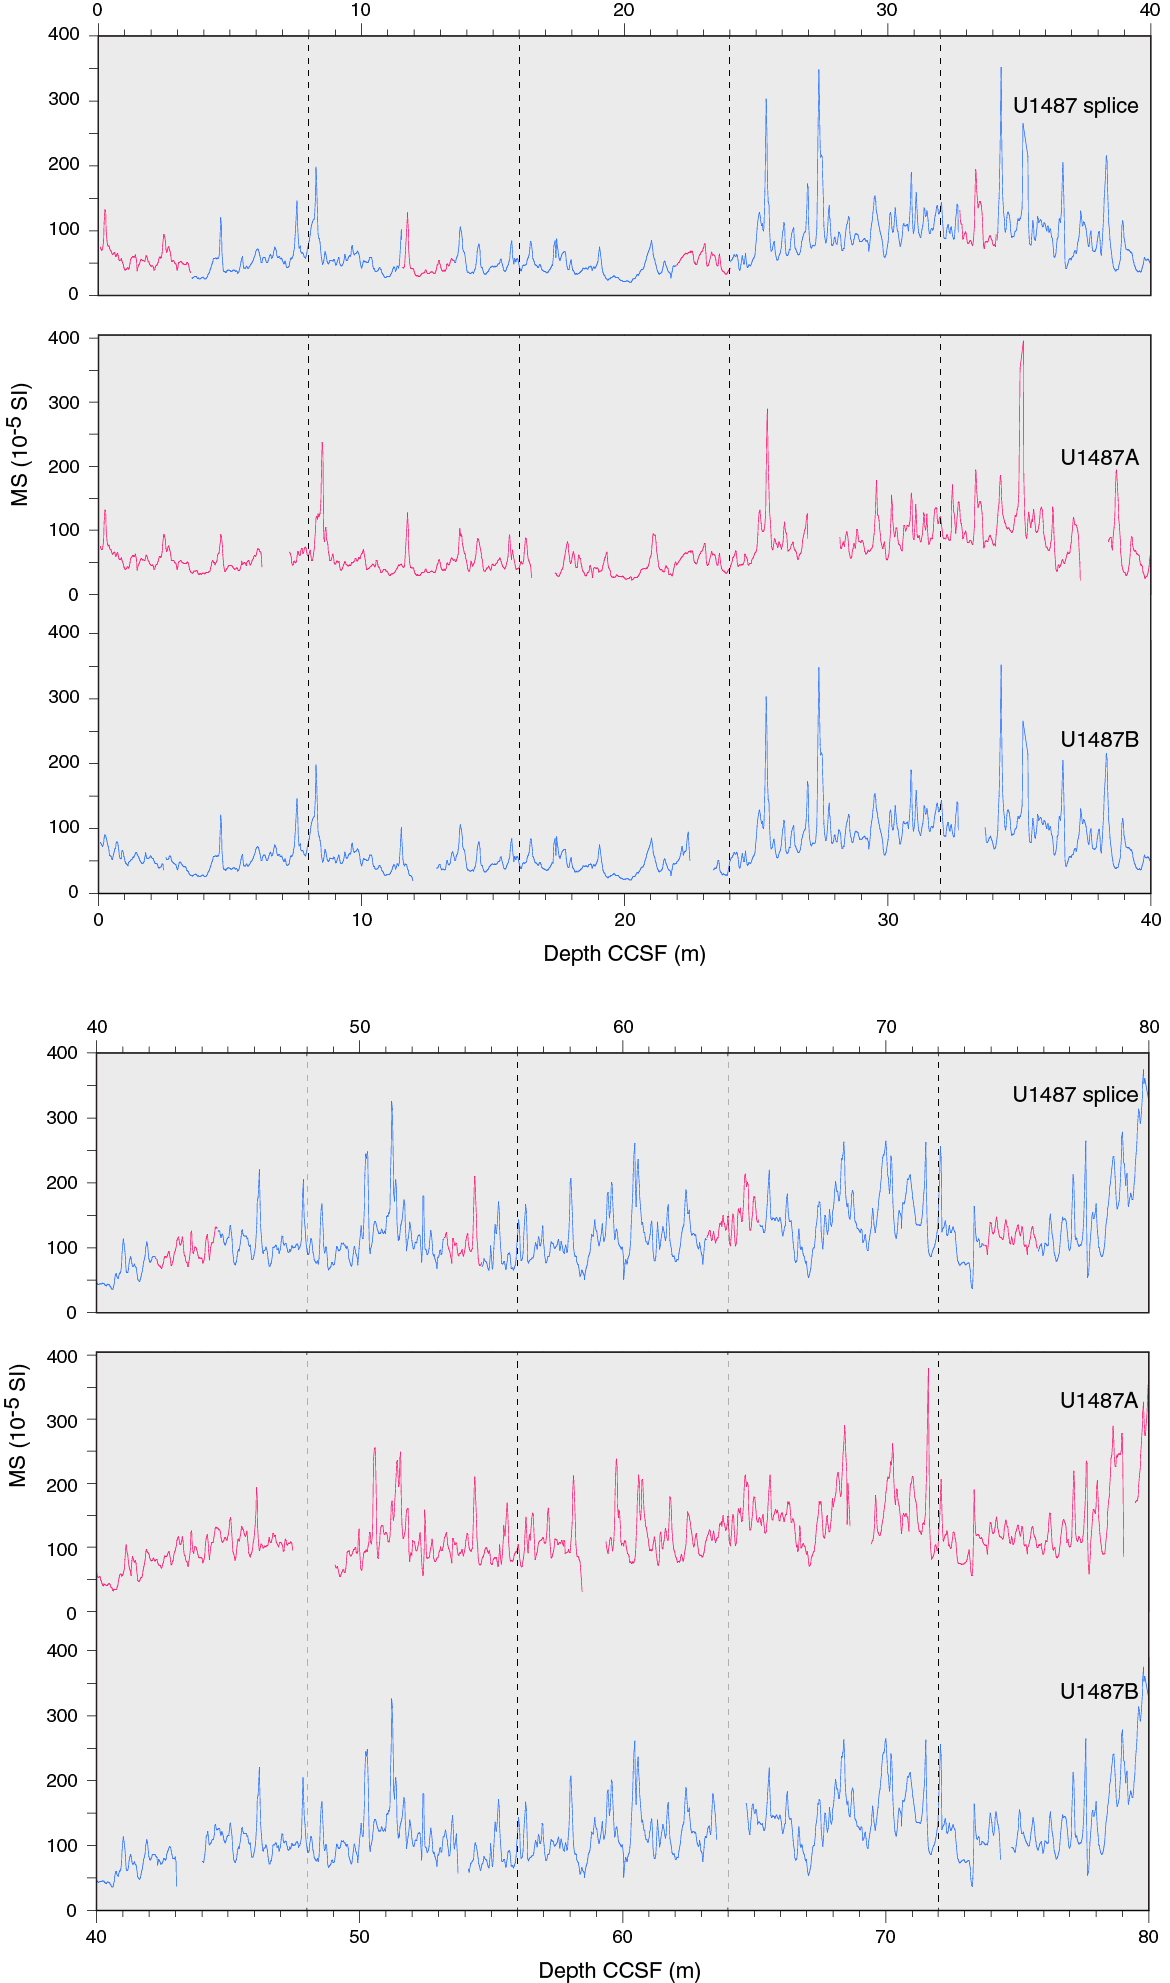
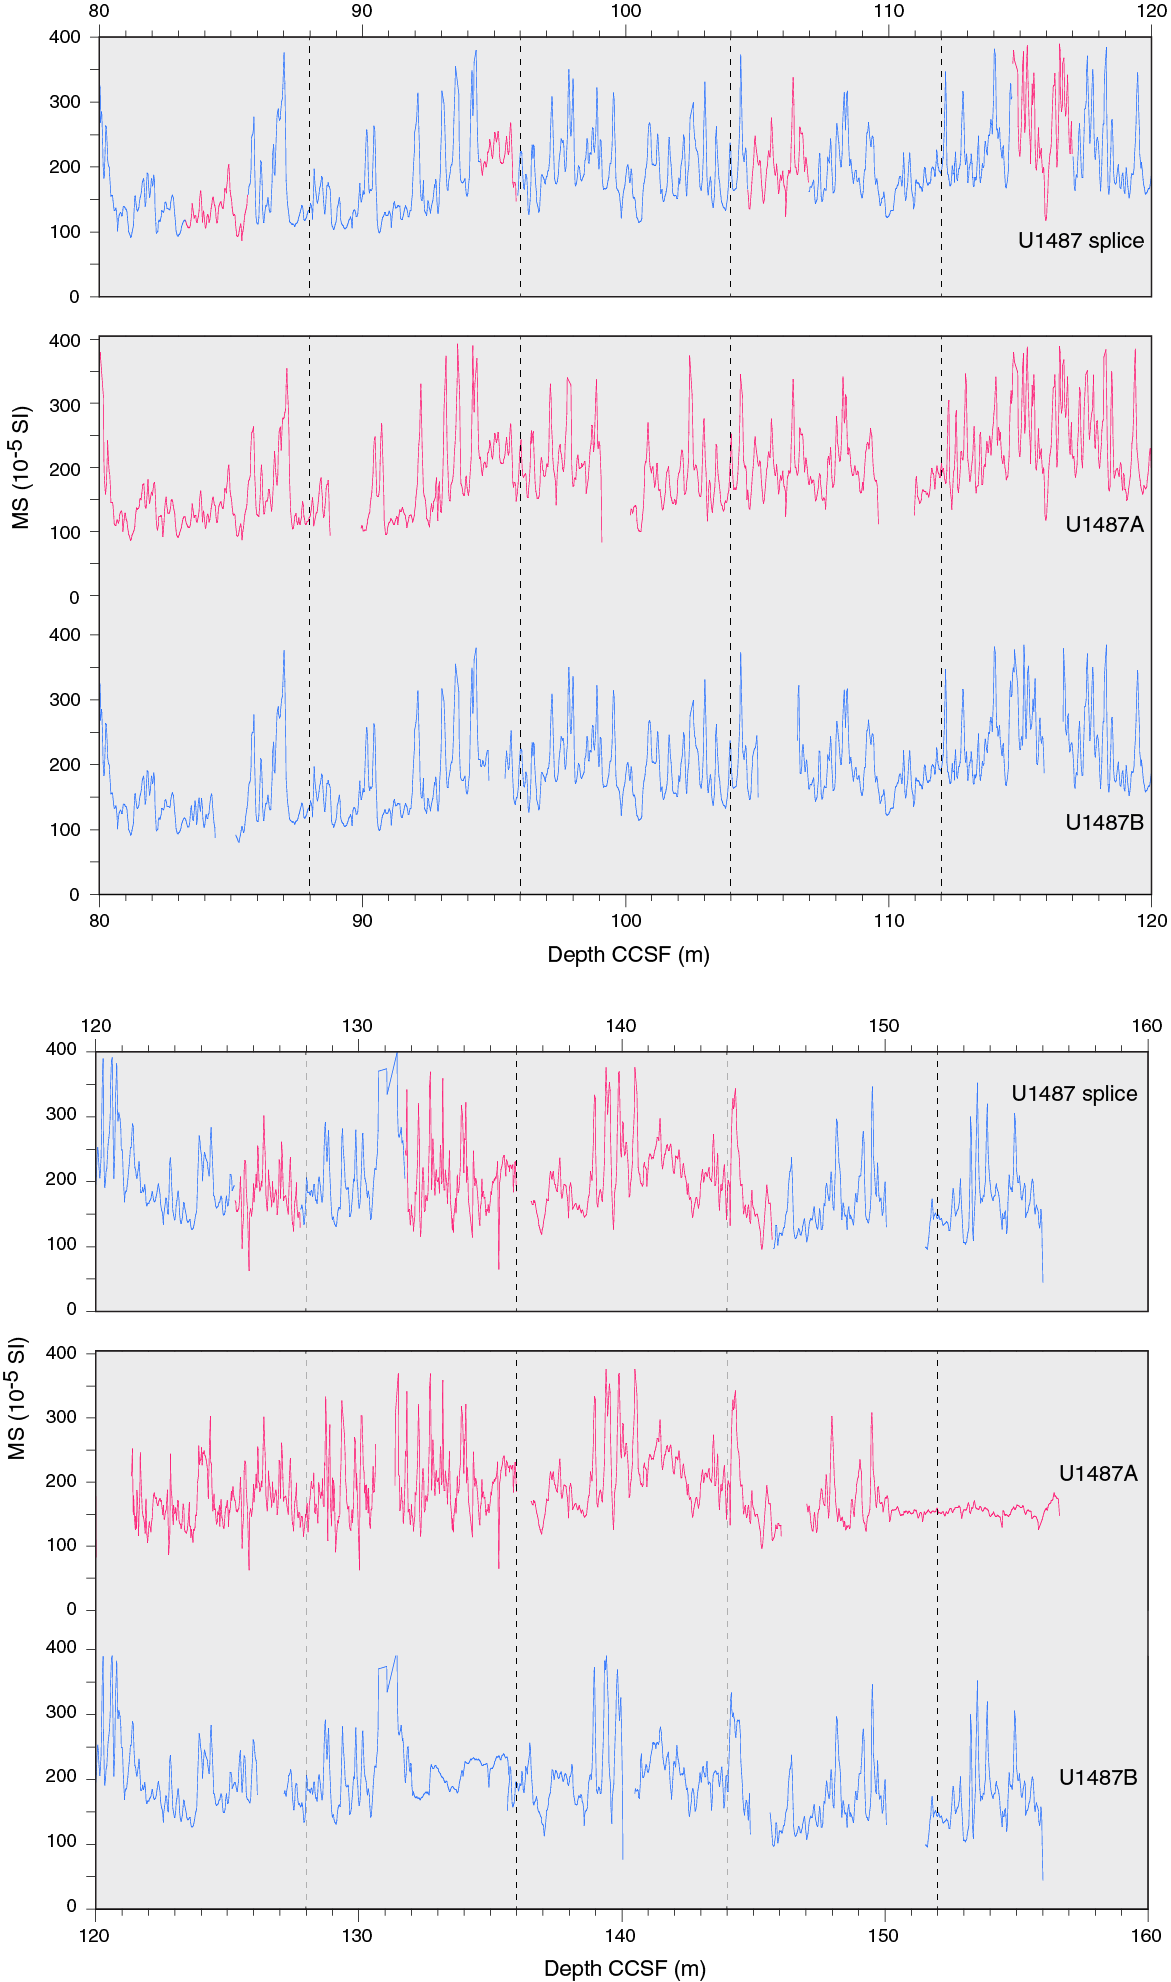
Figure F28. WRMSL MS data.
Table T16. Splice intervals. Download table in CSV format.
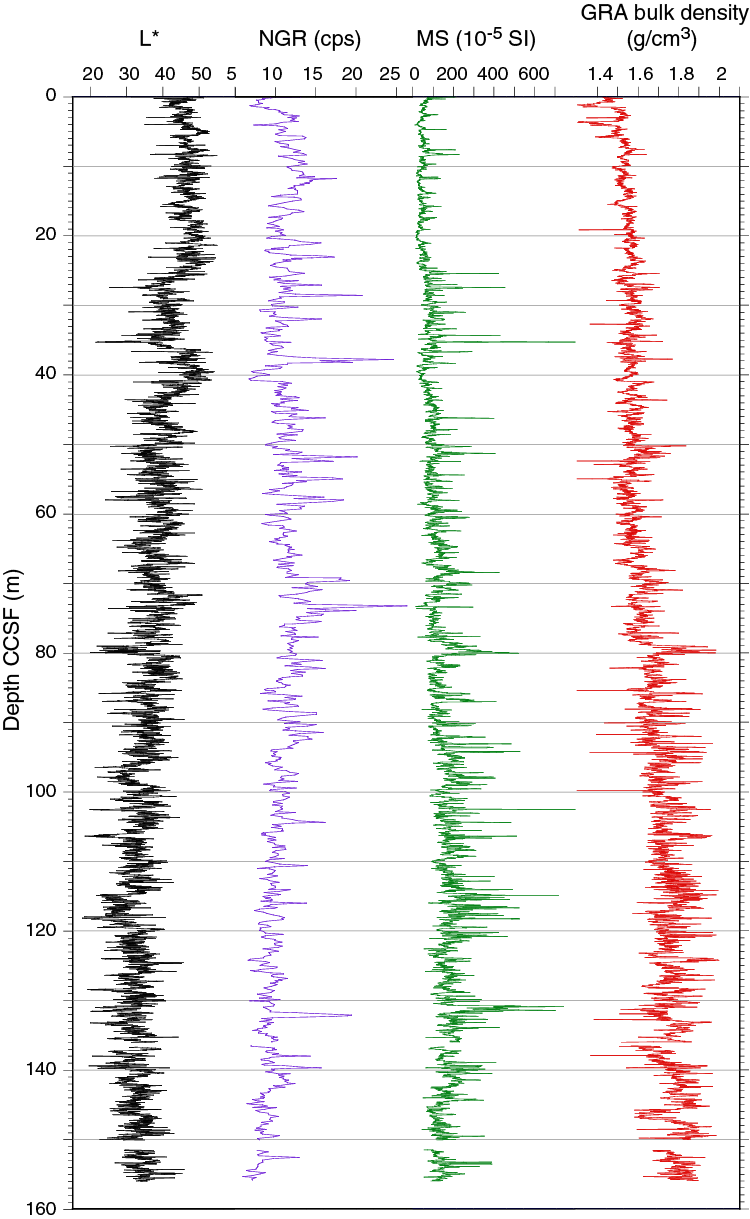
Figure F29. Spliced SHMSL L*, NGR, and WRMSL MS and GRA bulk density data.
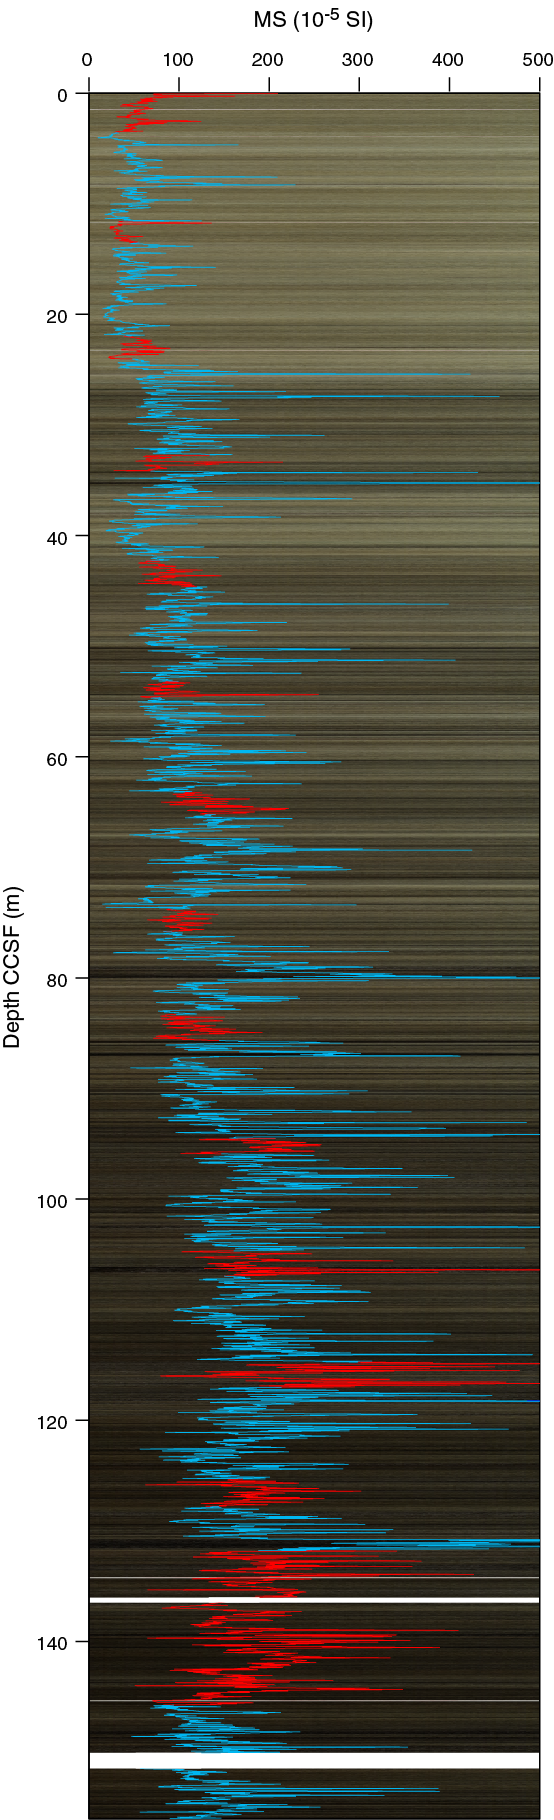
Figure F30. Spliced MS point data.
The CCSF scale is anchored to the “mudline” of Core 363-U1487A-1H, which is assigned the depth of 0 m CCSF. From this anchor, we worked downhole, using Correlator to establish a composite stratigraphy on a core-by-core basis. Discrete samples for shipboard measurements were taken from Hole U1487A, and thus our general approach was to use Hole U1487B as the “backbone” of the splice and to use short intervals from Hole U1487A to cover the core gaps in Hole U1487B. The splice is continuous with no gaps from 0 to 136.0 m CCSF. Below this depth, there was a lot of coarse sand, and the WRMSL data did not correlate well between the holes, probably because of drilling disturbance including possible suck-in while retrieving the cores from the bottom of the drill hole. There were a few clear gaps in this lower interval, and we determined the offsets for the cores in this bottom interval, from 136.0 to 156.0 m CCSF, by using the assumption that, at core gaps, the growth factor (GF) was similar to the GF just above 136.0 m CCSF (1.090 for Hole U1487A and 1.085 for U1487B). Thus, we used a GF of 1.090 to determine the offset of Core 363-U1487A-15H, to which we tied Cores 363-U1487B-15F, 16F, and 17F, and a GF of 1.085 for Core 363-U1487B-18F, to which we tied Core 363-U1487A-16H. For the bottom of the splice, we decided to include Core 363-U1487B-18F because the WRMSL data and core photos show distinct and intact sedimentary beds, whereas much of Core 363-U1487A-16H looks to be a disturbed sand interval.
The splice interval table (Table T16) is intended to provide a sampling plan that can be used to generate high-resolution continuous records with minimal gaps; however, an “off-splice” sampling plan was also designed mainly for low-resolution studies. An explanation of the strategy used to determine the off-splice sampling plan, and a table of core intervals that should be used for off-splice sampling can be found in OFFSPLICE in Supplementary material.
The cumulative offset between mbsf and CCSF depth scales is nearly linear (Figure F31A). The GF is relatively low (8%–9%), as expected in sediment that primarily expands due to the release of overburden with minimal gas expansion due to low concentrations of methane and other gases (see Geochemistry). There are small changes in the GF and therefore in the cumulative offset with depth (Figure F31B) at the bottom of the splice where coring of sand led to incomplete recovery, requiring us to use a GF to set the offsets of the cores to complete the splice. Calculation of mass accumulation rates based on the CCSF scale should account for differential expansion by dividing apparent depth intervals by the appropriate growth factor.
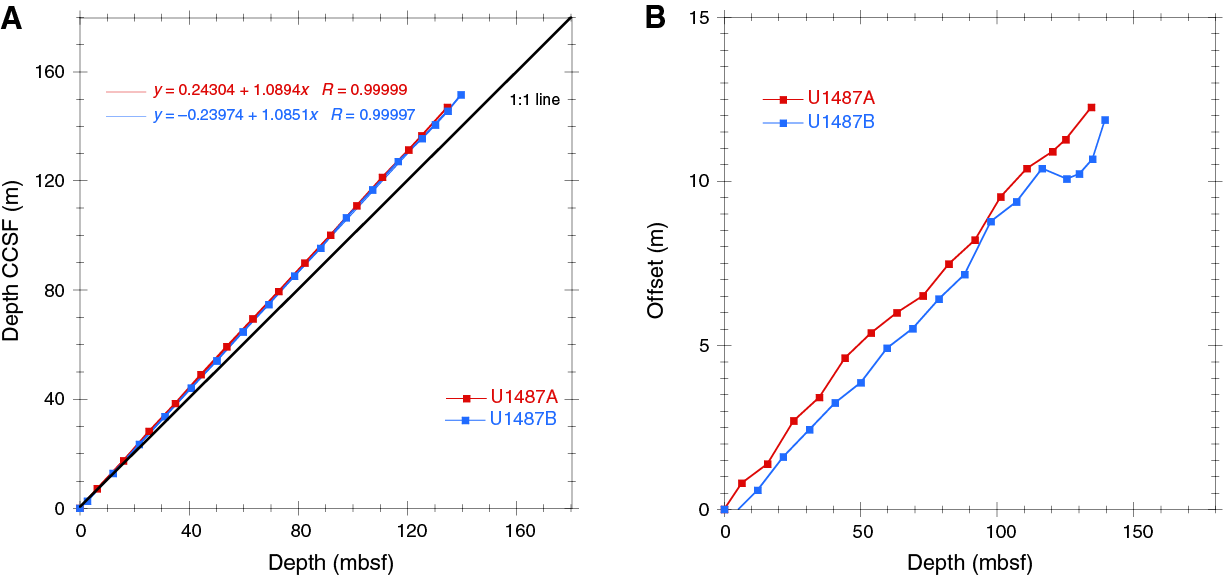
Figure F31. Comparison of mbsf and composite depth scales in the Site U1487 splice.
Geochemistry
Site U1487 was drilled ~190 km west-southwest of Manus Island in the Bismarck Sea, ~25 km east of Site U1486 and at a water depth of ~874 m. Despite the relative proximity of the two sites, the interstitial water profiles at Site U1487 display distinct differences from those at Site U1486. Low phosphate (PO4) and ammonium (NH4) concentrations and a clear lack of downhole sulfate (SO4) depletion suggest low organic matter content at Site U1487, although this cannot be supported with total organic carbon (TOC) and total nitrogen (TN) data, which are not reported for this site due to analytical difficulties (see below). Methane concentration is low throughout the hole. Although small downhole gradients are observed in the profiles of several elements (potassium [K], lithium [Li], and boron [B]), likely reflecting clay mineral authigenesis, the majority of the interstitial water geochemical profiles at Site U1487 appear to be influenced by advection of crustal fluids. The generally coarser sediment grain size and presence of local faulting near Site U1487 may facilitate hydrothermal fluid advection. Overall, calcium carbonate (CaCO3) content shows a monotonic decrease with depth coincident with increasing amounts of volcanogenic sediment and silt downhole. For detailed background on organic matter remineralization and clay mineral alteration, see Geochemistry in the Site U1482 chapter (Rosenthal et al., 2018b).
Results
Volatile hydrocarbons
Headspace gas samples were taken at a frequency of one sample per core in Hole U1487A as part of the routine environmental protection and safety-monitoring program (Table T17; Figure F32). Methane concentration is consistently low (<4 ppmv) throughout Hole U1487A, in agreement with the elevated interstitial water SO4 concentration throughout the hole (see Sulfate and barium). Ethane and propane are below detection limit.
Table T17. Volatile hydrocarbon concentrations. Download table in CSV format.
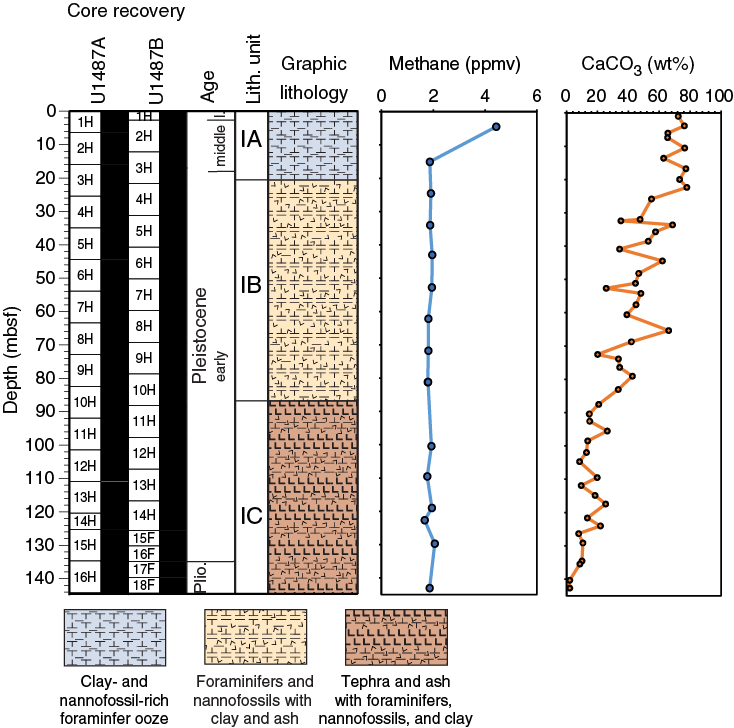
Figure F32. Methane and CaCO3 profiles.
Bulk sediment geochemistry
CaCO3 content, measured on sediment samples from Hole U1487A (Table T18; Figure F32), is highly variable, ranging from 2.0 to 77.9 wt% with an average of 37.6 wt%. Overall, CaCO3 content decreases downhole from ~70 wt% at the top of the hole to ~2 wt% at the bottom. This trend is coincident with an increasing concentration of volcanogenic material and silt downhole and is mirrored by trends in physical properties data (see Physical properties). A cross-plot between CaCO3 content and bulk density shows an inverse correlation between the two variables, such that samples with higher CaCO3 content are characterized by lower density (Figure F33). This inverse correlation can be explained by a simple mixing model, using biogenic CaCO3 (lower density) and volcanic ash/rock (higher density) as end-members. TOC and TN contents were not determined at this site due to the following analytical problems: (1) repeat measurements of the working standard during the course of the analyses resulted in inaccurate values, and (2) the drift-correction method yielded aberrant TOC values. These problems occurred only at Site U1487, suggesting that the high concentration of volcanogenic particles in the sediment at this site affected the combustion efficiency of organic matter in the instrument.
Table T18. Calcium carbonate content. Download table in CSV format.
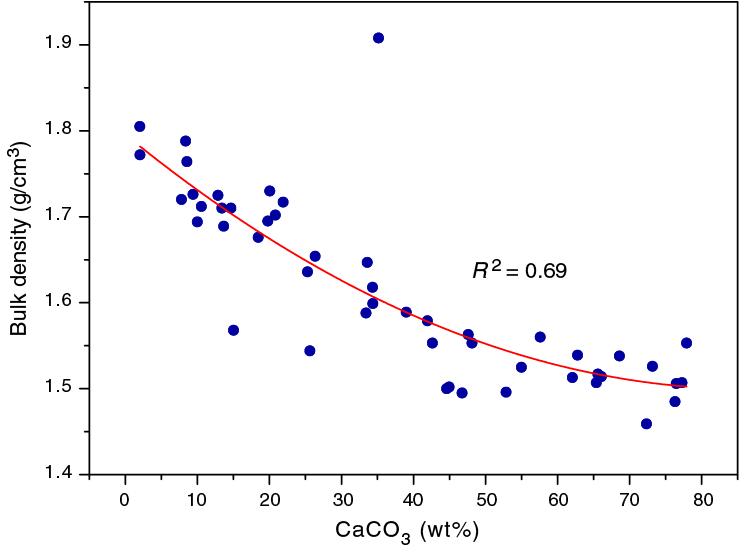
Figure F33. Correlation between CaCO3 content and bulk density.
Interstitial water chemistry
A total of 18 whole rounds and one mudline sample were taken from Hole U1487A for standard shipboard analyses following the procedures described in Geochemistry in the Expedition 363 methods chapter (Rosenthal et al., 2018a). Interstitial water chemistry data are reported in Table T19.
Table T19. Interstitial water geochemical data. Download table in CSV format.
Chlorinity and salinity
In contrast with the profiles observed at previous Expedition 363 sites, chlorinity (Cl) concentration increases abruptly, from 548.5 mM at the mudline to 567.5 mM at ~4.5 mbsf and 570.7 mM at 10.9 mbsf (Figure F34). Cl remains elevated to the bottom of Hole U1487A (143.6 mbsf) with an average value of 568.4 ± 1.5 mM. Downhole variations in salinity (not shown) are consistent with this overall trend; the salinity value of 37 at the mudline increases to 38 at ~4.5 mbsf and remains unchanged downhole.
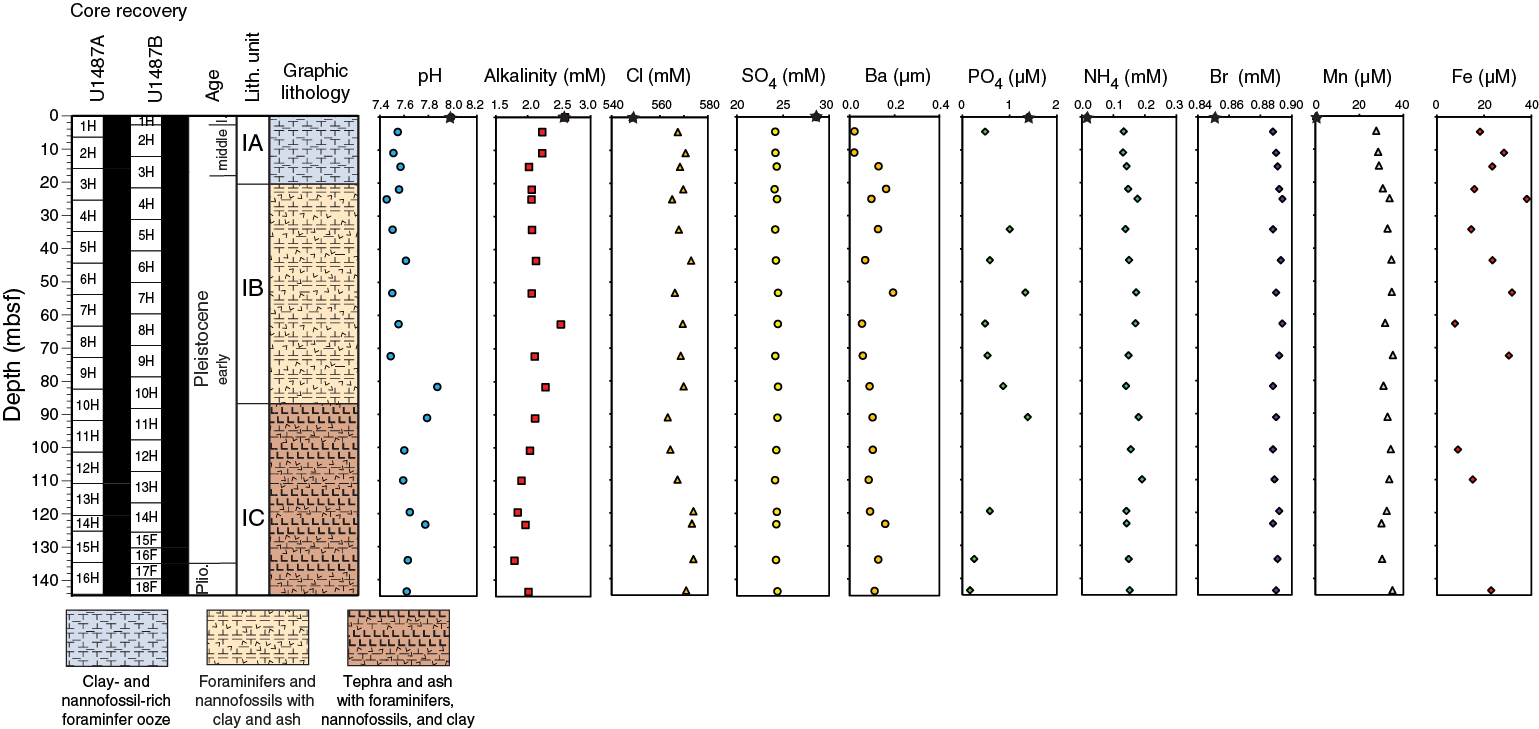
Figure F34. Interstitial water concentration profiles, Hole U1487A.
Alkalinity and pH
Alkalinity at Site U1487 displays an overall trend consistent with little net alkalinity consumption or production. Alkalinity decreases from a mudline value of 2.6 mM to 2.0 mM at 15.0 mbsf (Figure F34). With the exception of a local peak of 2.5 mM at ~62.6 mbsf and a local minimum of 1.8 mM at ~134.1 mbsf, alkalinity remains fairly constant at 2.1 ± 0.17 mM downhole. The downhole pH profile is similar, with a decrease from 8.0 at the mudline to 7.5 at 10.9 mbsf. A notable increase to a local peak of 7.9 occurs at 81.7 mbsf, below which depth pH decreases downhole to 7.6 at the base of the hole.
Sulfate and barium
At Site U1487, SO4 decreases from 28.6 mM at the mudline to 24.2 mM at 4.5 mbsf (Figure F34). As at Site U1486, complete SO4 depletion is not observed at Site U1487, although the minimum SO4 concentration (24.2 mM) is slightly higher than at Site U1486 (19.8 mM). Deeper than 4.5 mbsf, the SO4 profile is constant, with an average downhole value of 24.3 ± 0.1 mM. SO4 concentration at Site U1487 does not increase toward the basement as it does at Site U1486, although both profiles clearly illustrate the influence of crustal fluids on interstitial water profiles (see Discussion). Barium (Ba) concentration is very low at Site U1487, again similar to Site U1486. The mudline sample was below detection limit, and the downhole concentration ranges between 0.02 and 0.19 μM with an average of 0.10 ± 0.05 μM (Figure F34). Low Ba concentration values are consistent with high SO4 concentration.
Phosphate, ammonium, and bromide
As at Site U1486, PO4 and NH4 concentrations are low at Site U1487. PO4 decreases steeply from a mudline value of 1.4 μM to 0.5 μM at 4.5 mbsf and averages 0.7 μM downhole (Figure F34). Although PO4 concentration ranges between 0.2 and 1.4 μM, >25% of analyzed samples were below detection limit, making it difficult to discern meaningful trends. NH4 concentration increases from a mudline value of 0.02 mM to 0.13 mM at 4.5 mbsf (Figure F34). Downhole variations in NH4 are slight, with an average concentration of 15 mM ± 0.2 mM. Bromide (Br) concentration increases from a mudline value of 0.85 mM to 0.89 mM at 4.5 mbsf and then remains nearly constant downhole, varying by only ~0.5% over the entire interstitial water profile (Figure F34). The low concentrations of PO4 and NH4, combined with their unvarying downhole profiles, indicate low overall organic matter content in the sediment and minimal influence of organic matter remineralization on the interstitial water profiles at this site.
Manganese and iron
Similar to the profiles of most of the elements described above, manganese (Mn) concentration changes substantially from the mudline (0.3 µM) to the shallowest interstitial water sample analyzed (27.7 µM at 4.5 mbsf) and displays remarkably little variation downhole (Figure F34). Dissolved iron (Fe) concentration is variable, ranging between 7.7 and ~38.0 mM and showing no systematic trend (Figure F34).
Potassium, magnesium, and calcium
K concentration increases from a mudline value of 10.1 mM to 12.5 mM in the upper 4.5 mbsf. K concentration then decreases gradually downhole to a minimum of 11.1 mM (Figure F35). The decreasing trend between 24.9 and 143.6 mbsf suggests a possible basement sink for K, such as clay mineral authigenesis or interaction with the basement and diffusion (see Discussion).
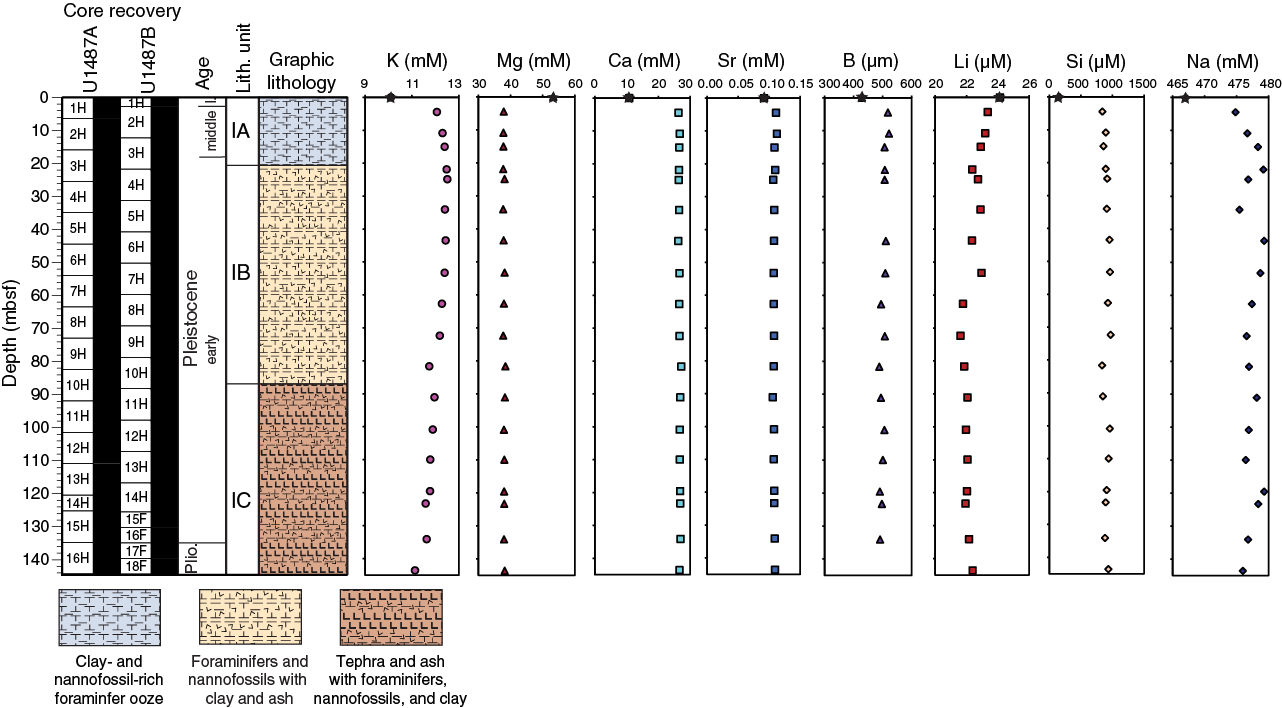
Figure F35. Interstitial water concentration profiles, Hole U1487A.
Calcium (Ca) concentration increases sharply from a mudline value of 10.8 mM to 26.3 mM in the subsequent sample at 4.5 mbsf. The Ca profile displays no downhole trend with average values of 26.7 ± 0.2 mM to the bottom of the hole (Figure F35). Magnesium (Mg) concentration decreases sharply from a mudline value of 53.5 mM to 37.9 mM in the subsequent sample at 4.5 mbsf. As with Ca, Mg concentration shows negligible variability and has an average value of 38.0 ± 0.2 mM throughout the hole (Figure F35).
Strontium and boron
Strontium (Sr) concentration increases from a mudline value of 0.09 mM to a maximum of 0.11 mM at 4.5 mbsf (Figure F35). The Sr concentration remains remarkably constant downhole with an average value of 0.110 ± 0.001 mM. Boron (B) concentration increases from a mudline value of 428.4 μM to 518.3 μM at 4.5 mbsf. B concentration then exhibits a general downhole trend of slightly decreasing values to 488 µM at 81.6 mbsf before remaining nearly constant over the remainder of Hole U1487A (Figure F35).
Lithium, silica, and sodium
Unlike the other elements discussed above, Li concentration decreases steadily from a mudline value of 24.1 μM to 21.6 μM at 72.4 mbsf before increasing to 22.4 µM at 143.6 mbsf (Figure F35). Silica (Si) concentration displays a pronounced increase from the mudline (160.2 µM) to 4.5 mbsf (841.3 µM). Deeper than 4.5 mbsf, Si is characterized by a gradual increase downhole to 971.0 µM at 72.4 mbsf, with relatively constant values below that depth to the bottom of the hole (Figure F35). Sodium (Na) concentration increases from the mudline (467.0 mM) to 21.9 mbsf (479.2 mM) and then remains near constant throughout Hole U1487A with an average value of 477.5 ± 1.5 mM (Figure F35).
Discussion
One of the most striking results of our interstitial water investigation at Site U1487 is a lack of evidence for SO4 reduction throughout the entire sediment column. Taken together with the negligible values measured for dissolved PO4 and NH4, the dissolved SO4 trend suggests minimal organic matter degradation within the sediment.
Another interesting feature at Site U1487 is that most of the interstitial water profiles are characterized by a sharp transition in concentrations in the upper 5 m followed by near-constant concentrations to the bottom of the hole. The proximity of the basal section of Site U1487 to the underlying oceanic crust suggests that deep fluids affected by basalt-seawater interactions and/or low-temperature hydrothermal processes influence the interstitial water profiles, as at Site U1486 (see Geochemistry in the Site U1486 chapter [Rosenthal et al., 2018c]). The near-linear interstitial water profiles at Site U1486 and assumed steady-state diffusion between deep fluids and seawater are not observed at Site U1487. Based on similar moisture and density profiles (see Physical properties) and considering the lithologies (see Core description) at Sites U1486 and U1487, we cannot explain the substantial differences in the geochemical profiles between the two sites solely through differences in vertical diffusion rates.
An overwhelming contribution by deep fluids to the interstitial water geochemistry would result in nearly constant concentrations over most of the sediment column for elements that differ markedly from seawater concentrations, especially for conservative elements. Seismic reflection profiles show the presence of numerous deep-seated faults that penetrate from the acoustic basement to surface or near-surface sediment in the vicinity of Site U1487 (Figure F3). These faults may act as conduits for deep fluids originating from the oceanic crust, affecting interstitial water chemistry by advective and lateral diffusive processes throughout the entire sediment column. The coarser grained sediment and inferred high degree of sediment porosity at Site U1487 (see Core description and Physical properties) could additionally facilitate the migration of deep fluids.
Deeper than 80 mbsf, which approximately corresponds to the transition between lithologic Subunits IB and IC (see Core description), alkalinity displays a small but distinct decrease from 2.3 to 1.8 mM. This trend coincides with depletions of dissolved K, Li, and B in interstitial water, suggesting active clay mineral authigenesis within the sediment.
References
Baldwin, S.L., Fitzgerald, P.G., and Webb, L.E., 2012. Tectonics of the New Guinea region. Annual Review of Earth and Planetary Sciences, 40(1):495–520. https://doi.org/10.1146/annurev-earth-040809-152540
Cande, S.C., and Kent, D.V., 1995. Revised calibration of the geomagnetic polarity timescale for the Late Cretaceous and Cenozoic. Journal of Geophysical Research: Solid Earth, 100(B4):6093–6095. https://doi.org/10.1029/94JB03098
Hilgen, F.J., Lourens, L.J., and Van Dam, J.A., 2012. The Neogene period. With contributions by A.G. Beu, A.F. Boyes, R.A. Cooper, W. Krijgsman, J.G. Ogg, W.E. Piller, and D.S. Wilson. In Gradstein, F.M., Ogg, J.G., Schmitz, M.D., and Ogg, G.M. (Eds.), The Geologic Time Scale: Oxford, United Kingdom (Elsevier), 923–978. https://doi.org/10.1016/B978-0-444-59425-9.00029-9
Johnson, R.W., Perfit, M.R., Chappell, B.W., Jaques, A.L., Shuster, R.D., and Ridley, W.I., 1988. Volcanism in the New Ireland Basin and Manus Island Region: notes of the geochemistry and petrology of some dredged volcanic rocks from the rifted-arc region. In Marlow, M.S., Dadisman, S.V., and Exon, N.F. (Eds.), Council for Energy and Mineral Resources Earth Science Series (Volume 9): Geology and Offshore Resources of Pacific island Arcs—New Ireland and Manus Reigon, Papua New Guinea: Houston (Circum-Pacific Council for Energy and Mineral Resources). http://archives.datapages.com/data/circ_pac/0010/0113_f.htm
Karlin, R., and Levi, S., 1983. Diagenesis of magnetic minerals in recent hemipelagic sediments. Nature, 303(5915):327–330. https://doi.org/10.1038/303327a0
Le Friant, A., Ishizuka, O., Stroncik, N.A., and the Expedition 340 Scientists, 2013. Proceedings of the Integrated Ocean Drilling Program, 340: Tokyo (Integrated Ocean Drilling Program Management International, Inc.). https://doi.org/10.2204/iodp.proc.340.2013
McNeill, L.C., Dugan, B., Petronotis, K.E., Backman, J., Bourlange, S., Chemale, F., Chen, W., Colson, T.A., Frederik, M.C.G., Guèrin, G., Hamahashi, M., Henstock, T., House, B.M., Hüpers, A., Jeppson, T.N., Kachovich, S., Kenigsberg, A.R., Kuranaga, M., Kutterolf, S., Milliken, K.L., Mitchison, F.L., Mukoyoshi, H., Nair, N., Owari, S., Pickering, K.T., Pouderoux, H.F.A., Yehua, S., Song, I., Torres, M.E., Vannucchi, P., Vrolijk, P.J., Yang, T., and Zhao, X., 2017. Expedition 362 summary. In McNeill, L.C., Dugan, B., Petronotis, K.E., and the Expedition 362 Scientists, Sumatra Subduction Zone. Proceedings of the International Ocean Discovery Program, 362: College Station, TX (International Ocean Discovery Program). https://doi.org/10.14379/iodp.proc.362.101.2017
Pälike, H., Lyle, M., Nishi, H., Raffi, I., Gamage, K., Klaus, A., and the Expedition 320/321 Scientists, 2010. Proceedings of the Integrated Ocean Drilling Program, 320/321: Tokyo (Integrated Ocean Drilling Program Management International, Inc.). https://doi.org/10.2204/iodp.proc.320321.2010
Pribnow, D., Kinoshita, M., and Stein, C., 2000. Thermal Data Collection and Heat Flow Recalculations for Ocean Drilling Program Legs 101–180: Hanover, Germany (Institute for Joint Geoscientific Research, Institut für Geowissenschaftliche Gemeinschaftsaufgaben [GGA]). http://www-odp.tamu.edu/publications/heatflow/ODPReprt.pdf
Resig, J.M., Frost, G.M., Ishikawa, N., and Perembo, R.C.B., 2001. Micropaleontological and paleomagnetic approaches to stratigraphic anomalies in rift basins: ODP Site 1109, Woodlark Basin. In Wilson, R.C.L., Whitmarsh, R.B., Taylor, B., and Froitzheim, N. (Eds.), Non-Volcanic Rifting of Continental Margins: A Comparison of Evidence from Land and Sea. Geological Society Special Publication, 187(1):389–404. https://doi.org/10.1144/GSL.SP.2001.187.01.19
Richter, C., Acton, G., Endris, C., and Radsted, M., 2007. Technical Note 34: Handbook for Shipboard Paleomagnetists. Ocean Drilling Program. https://doi.org/10.2973/odp.tn.34.2007
Rosenthal, Y., Holbourn, A., and Kulhanek, D.K., 2016. Expedition 363 Scientific Prospectus: Western Pacific Warm Pool. International Ocean Discovery Program. https://doi.org/10.14379/iodp.sp.363.2016
Rosenthal, Y., Holbourn, A.E., Kulhanek, D.K., Aiello, I.W., Babila, T.L., Bayon, G., Beaufort, L., Bova, S.C., Chun, J.-H., Dang, H., Drury, A.J., Dunkley Jones, T., Eichler, P.P.B., Fernando, A.G.S., Gibson, K.A., Hatfield, R.G., Johnson, D.L., Kumagai, Y., Li, T., Linsley, B.K., Meinicke, N., Mountain, G.S., Opdyke, B.N., Pearson, P.N., Poole, C.R., Ravelo, A.C., Sagawa, T., Schmitt, A., Wurtzel, J.B., Xu, J., Yamamoto, M., and Zhang, Y.G., 2018a. Expedition 363 methods. In Rosenthal, Y., Holbourn, A.E., Kulhanek, D.K., and the Expedition 363 Scientists, Western Pacific Warm Pool. Proceedings of the International Ocean Discovery Program, 363: College Station, TX (International Ocean Discovery Program). https://doi.org/10.14379/iodp.proc.363.102.2018
Rosenthal, Y., Holbourn, A.E., Kulhanek, D.K., Aiello, I.W., Babila, T.L., Bayon, G., Beaufort, L., Bova, S.C., Chun, J.-H., Dang, H., Drury, A.J., Dunkley Jones, T., Eichler, P.P.B., Fernando, A.G.S., Gibson, K.A., Hatfield, R.G., Johnson, D.L., Kumagai, Y., Li, T., Linsley, B.K., Meinicke, N., Mountain, G.S., Opdyke, B.N., Pearson, P.N., Poole, C.R., Ravelo, A.C., Sagawa, T., Schmitt, A., Wurtzel, J.B., Xu, J., Yamamoto, M., and Zhang, Y.G., 2018b. Site U1482. In Rosenthal, Y., Holbourn, A.E., Kulhanek, D.K., and the Expedition 363 Scientists, Western Pacific Warm Pool. Proceedings of the International Ocean Discovery Program, 363: College Station, TX (International Ocean Discovery Program). https://doi.org/10.14379/iodp.proc.363.103.2018
Rosenthal, Y., Holbourn, A.E., Kulhanek, D.K., Aiello, I.W., Babila, T.L., Bayon, G., Beaufort, L., Bova, S.C., Chun, J.-H., Dang, H., Drury, A.J., Dunkley Jones, T., Eichler, P.P.B., Fernando, A.G.S., Gibson, K.A., Hatfield, R.G., Johnson, D.L., Kumagai, Y., Li, T., Linsley, B.K., Meinicke, N., Mountain, G.S., Opdyke, B.N., Pearson, P.N., Poole, C.R., Ravelo, A.C., Sagawa, T., Schmitt, A., Wurtzel, J.B., Xu, J., Yamamoto, M., and Zhang, Y.G., 2018c. Site U1486. In Rosenthal, Y., Holbourn, A.E., Kulhanek, D.K., and the Expedition 363 Scientists, Western Pacific Warm Pool. Proceedings of the International Ocean Discovery Program, 363: College Station, TX (International Ocean Discovery Program). https://doi.org/10.14379/iodp.proc.363.107.2018
Rowan, C.J., Roberts, A.P., and Broadbent, T., 2009. Reductive diagenesis, magnetite dissolution, greigite growth and paleomagnetic smoothing in marine sediments: a new view. Earth and Planetary Science Letters, 277(1–2):223–235. https://doi.org/10.1016/j.epsl.2008.10.016
Stein, C.A., and Stein, S., 1992. A model for the global variation in oceanic depth and heat flow with lithospheric age. Nature, 359(6391):123–129. https://doi.org/10.1038/359123a0
Stoner, J.S., and St-Onge, G., 2007. Magnetic stratigraphy in paleooceanography: reversal, excursion, paleointensity and secular variation. In Hillaire-Marcel, C., and de Vernal, A. (Eds.), Developments in Marine Geology (Volume 1): Proxies in Late Cenozoic Paleoceanography. Stein, R. (Series Ed.): Amsterdam (Elsevier B.V.), 99–138. https://doi.org/10.1016/S1572-5480(07)01008-1
Taylor, B., 1979. Bismarck Sea: evolution of a back-arc basin. Geology, 7(4):171–174. https://doi.org/10.1130/0091-7613(1979)7<171:BSEOAB>2.0.CO;2
Wilkens, R.H., Westerhold, T., Drury, A.J., Lyle, M., Gorgas, T., and Tian, J., 2017. Revisiting the Ceara Rise, equatorial Atlantic Ocean: isotope stratigraphy of ODP Leg 154. Climate of the Past, 13:779–793. https://doi.org/10.5194/cp-13-779-2017
Zijderveld, J.D.A., 1967. AC demagnetization of rocks: analysis of results. In Collinson, D.W., Creer, K.M., and Runcorn, S.K. (Eds.), Developments in Solid Earth Geophysics (Volume 3): Methods in Palaeomagnetism: Amsterdam (Elsevier), 254–286. https://doi.org/10.1016/B978-1-4832-2894-5.50049-5
1 Rosenthal, Y., Holbourn, A.E., Kulhanek, D.K., Aiello, I.W., Babila, T.L., Bayon, G., Beaufort, L., Bova, S.C., Chun, J.-H., Dang, H., Drury, A.J., Dunkley Jones, T., Eichler, P.P.B., Fernando, A.G.S., Gibson, K., Hatfield, R.G., Johnson, D.L., Kumagai, Y., Li, T., Linsley, B.K., Meinicke, N., Mountain, G.S., Opdyke, B.N., Pearson, P.N., Poole, C.R., Ravelo, A.C., Sagawa, T., Schmitt, A., Wurtzel, J.B., Xu, J., Yamamoto, M., and Zhang, Y.G., 2018. Site U1487. In Rosenthal, Y., Holbourn, A.E., Kulhanek, D.K., and the Expedition 363 Scientists, Western Pacific Warm Pool. Proceedings of the International Ocean Discovery Program, 363: College Station, TX (International Ocean Discovery Program). https://doi.org/10.14379/iodp.proc.363.108.2018
2 Expedition 363 Scientists’ addresses.
This work is distributed under the Creative Commons Attribution 4.0 International (CC BY 4.0) license. 
- F1. Northern margin of Papua New Guinea and location of Sites U1484–U1487.
- F2. Bathymetric map and site location.
- F3. Seismic line and site location.
- F4. Hydrographic profiles of temperature, salinity, and dissolved oxygen.
- F5. Lithologic summary.
- F6. Characteristic lithologies.
- F7. Main sedimentary components.
- F8. XRD results from tephra layers.
- F9. Physical properties data.
- F10. Tephra layers in Subunits IA and IB.
- F11. Tephra layers in Subunit IC.
- F12. Tephra layers produced by the same volcanic event.
- F13. Gephyrocapsa and Reticulofenestra.
- F14. Coiling patterns in Pulleniatina.
- F15. Downhole foraminifer preservation states.
- F16. Age-depth plot.
- F17. Archive-half NRM intensity.
- F18. Discrete sample AF demagnetization results.
- F19. NRM, WRMSL MS, maximum angular deviation, inclination, and declination.
- F20. NRM, WRMSL MS, inclination, and declination.
- F21. Physical property measurements.
- F22. Comparison of major physical property parameters.
- F23. MAD and WRMSL bulk density, WRMSL MS, NGR, and P-wave velocity overlaid on core photos.
- F24. Discrete and whole-round P-wave velocity.
- F25. MAD dry, bulk, and grain densities and porosity, WRMSL GRA bulk density, and thermal conductivity.
- F26. APCT-3 temperature-time series.
- F27. Heat flow calculations.
- F28. WRMSL MS data.
- F29. Spliced SHMSL L*, NGR, and WRMSL MS and GRA bulk density data.
- F30. Spliced MS point data.
- F31. Comparison of mbsf and composite depth scales in the Site U1487 splice.
- F32. Methane and CaCO3 profiles.
- F33. Correlation between CaCO3 content and bulk density.
- F34. Interstitial water concentration profiles, Hole U1487A.
- F35. Interstitial water concentration profiles, Hole U1487A.
- T1. Site U1487 core summary.
- T2. Calcareous nannofossil bioevents.
- T3. Planktonic foraminifer bioevents.
- T4. Pulleniatina coiling count data, Hole U1487A.
- T5. Benthic foraminifer distribution.
- T6. Depths of identified reversal boundaries.
- T7. WRMSL GRA bulk density data, Hole U1487A.
- T8. WRMSL GRA bulk density data, Hole U1487B.
- T9. WRMSL MS data, Hole U1487A.
- T10. WRMSL MS data, Hole U1487B.
- T11. NGRL data, Hole U1487A.
- T12. NGRL data, Hole U1487B.
- T13. WRMSL PWL data, Hole U1487A.
- T14. WRMSL PWL data, Hole U1487B.
- T15. Affine table.
- T16. Splice intervals.
- T17. Volatile hydrocarbon concentrations.
- T18. Calcium carbonate content.
- T19. Interstitial water geochemical data.