Rosenthal, Y., Holbourn, A.E., Kulhanek, D.K., and the Expedition 363 Scientists
Proceedings of the International Ocean Discovery Program Volume 363
publications.iodp.org
https://doi.org/10.14379/iodp.proc.363.110.2018

Site U14891
Y. Rosenthal, A.E. Holbourn, D.K. Kulhanek, I.W. Aiello, T.L. Babila, G. Bayon, L. Beaufort, S.C. Bova, J.-H. Chun, H. Dang, A.J. Drury, T. Dunkley Jones, P.P.B. Eichler, A.G.S. Fernando, K. Gibson, R.G. Hatfield, D.L. Johnson, Y. Kumagai, T. Li, B.K. Linsley, N. Meinicke, G.S. Mountain, B.N. Opdyke, P.N. Pearson, C.R. Poole, A.C. Ravelo, T. Sagawa, A. Schmitt, J.B. Wurtzel, J. Xu, M. Yamamoto, and Y.G. Zhang2
Keywords: International Ocean Discovery Program, IODP, JOIDES Resolution, Expedition 363, Site U1489, South Eauripik Rise, Pleistocene, Pliocene, Miocene, Neogene, northern sector Western Pacific Warm Pool, orbital-scale climate variability, high-resolution interstitial water sampling, Last Glacial Maximum ocean density structure, carbonate accumulation, chalk, color banding, biosilica, soft-sediment deformation, stratigraphic intercalibration and cyclostratigraphy, high-resolution interstitial water sampling, Last Glacial Maximum ocean density structure, carbonate diagenesis
MS 363-110: Published 8 June 2018
Background and objectives
International Ocean Discovery Program (IODP) Site U1489 (proposed Site WP-04A) is located on the western slope of the southern Eauripik Rise at 02°07.19ʹN, 141°01.67ʹE in 3421 m water depth (Figure F1). The site is situated on seismic Line RR1313-WP4-2 at the intersection with seismic Line RR1313-WP4-3 (Figure F2). The seismic profile shows a continuous succession of hemipelagic, carbonate-rich sediment with basement at >650 meters below seafloor (mbsf) (Rosenthal et al., 2016) (Figure F3). Site U1489 is located ~81 km west-northwest of Site U1488 and ~105 km northwest of Deep Sea Drilling Project (DSDP) Site 62 and shows a similar sedimentary cover (Shipboard Scientific Party, 1971).
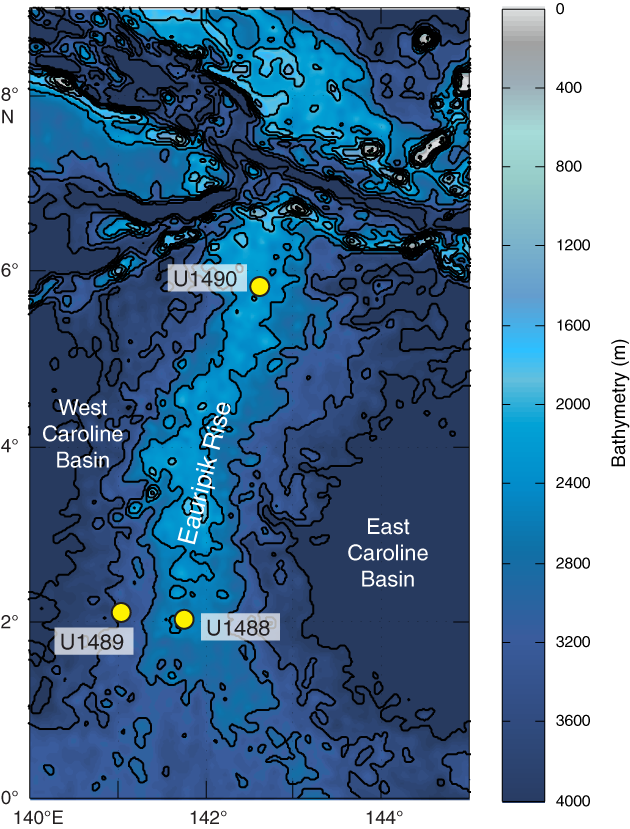
Figure F1. Eauripik Rise and locations of Sites U1488–U1490.
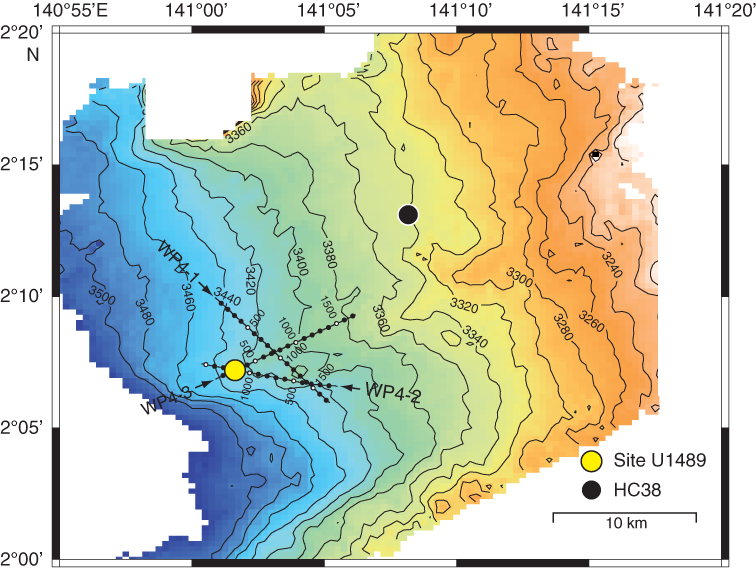
Figure F2. Bathymetric map and site location.
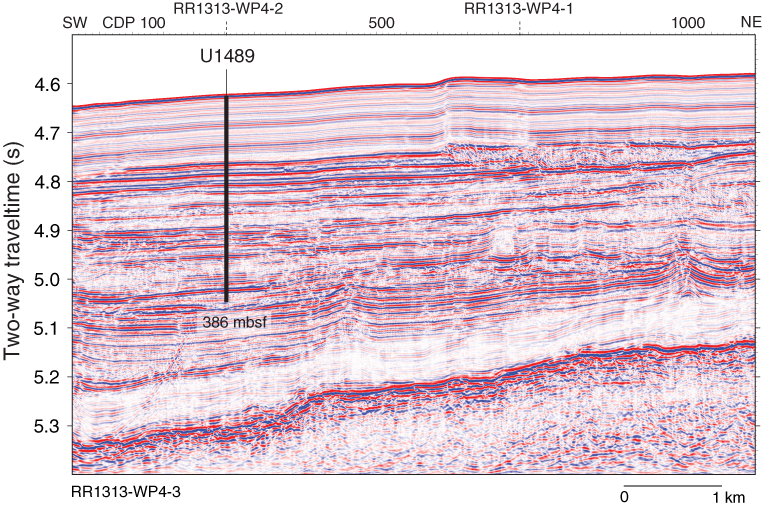
Figure F3. Seismic line and site location.
Site U1489 is situated on the western slope of the southern part of Eauripik Rise, within the Caroline Basin north of Papua New Guinea (Figure F1). The roughly north–south trending Eauripik Rise is an ~250 km wide aseismic ridge that rises ~1–2 km above the surrounding seafloor and separates the East and West Caroline Basins. Magnetic Anomalies C13–C9 in both basins show that ocean crust formed along roughly east–west spreading centers from the Eocene until the late Oligocene. Offsets in these anomalies and the lack of magnetic lineations beneath the Eauripik Rise supports the interpretation that it formed due to excess submarine volcanism along a leaky north–south transform fault (Hegarty and Weissel, 1988.) An alternative interpretation attributes the formation of the Eauripik Rise to the northward passage of a mantle hotspot that contributed to the tectonically and structurally complex region surrounding the Sorol Trough (Bracey, 1975). Seismic refractions show thickened ocean crust beneath the Eauripik Rise, and a small free-air anomaly and positive geoid anomaly indicate a compensated structure reaching deep into the mantle (Hegarty and Weissel, 1988). Although there are no discernible magnetic lineations on the Eauripik Rise, these data and the recovery of tholeiitic basalt at Site 62 (Shipboard Scientific Party, 1971) make it difficult to argue that it is a remnant of ancient continental material. The igneous rocks recovered from the bottom of Site 62 are slightly vesicular and highly altered and contain calcite veins with well-preserved foraminifers and nannofossils. The dolomitization of overlying limestone suggests that these basalts intruded into marine chalk leading to extensive diagenetic reactions near the base of the sedimentary succession.
Site U1489 is located ~2° north of the Equator and is thus suitable for reconstructing the hydrographic history of the Western Pacific Warm Pool (WPWP). The comparatively low sedimentation rate at this site, typical of open-ocean environments, allows coring of the middle Miocene at a relatively shallow depth, which was not possible at Site U1488, offering the opportunity to reconstruct the evolution of the WPWP from the Middle Miocene Climate Optimum to the middle Miocene climate transition associated with expansion of the Antarctic ice sheet. At ~3400 meters below sea level (mbsl), the site is bathed by modified Lower Circumpolar Deepwater (LCDW) and therefore will be useful to monitor past changes in this water mass (Figure F4). Because this site is close to Site U1488 but at ~900 m deeper water depth, comparing results from these two sites also offers the opportunity to investigate potential diagenetic effects of foraminifer geochemical proxy records. High-resolution interstitial water sampling at this site will be used for geochemical reconstructions of the deep Pacific water mass (δ18O, salinity, and seawater chemistry) during the Last Glacial Maximum (LGM).
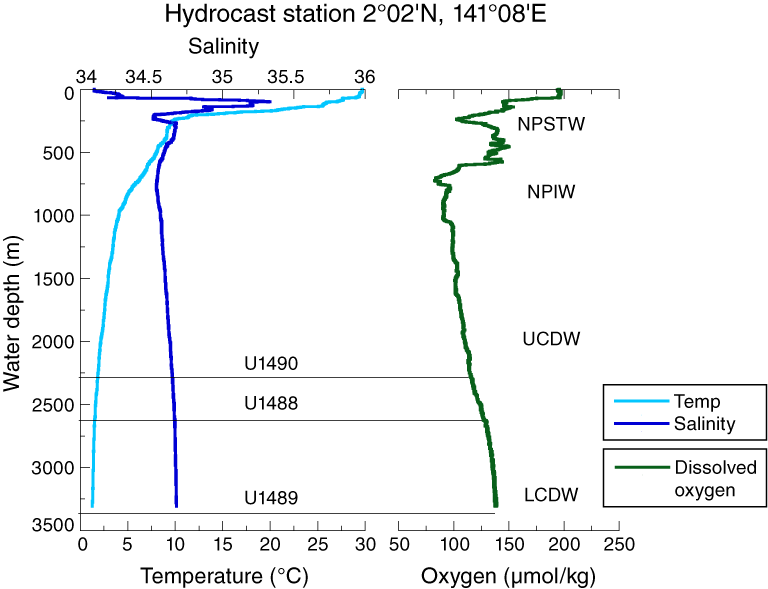
Figure F4. Hydrographic profiles of temperature, salinity, and dissolved oxygen.
Operations
Transit to Site U1489
The 44.0 nmi transit to Site U1489 was completed in 5.2 h at an average speed of 8.5 kt. We lowered the thrusters and switched to dynamic positioning mode at 1442 h (all times local ship time; UTC + 10 h) on 24 November 2016. After arriving on site, we deployed a positioning beacon at 1448 h before commencing coring operations. Excessive noise was noted in the beacon signal, requiring that a second beacon be deployed and used as the primary beacon.
Operations summary
Site U1489 was an alternate site that was added during the expedition to complement the record cored at Site U1488. We initially planned to core three holes to 200 mbsf; however, we requested and received permission to core to 5.0 s two-way traveltime at our site location on seismic reflection profile Line RR1313 WP4-2 (Figure F3). We ultimately cored four holes at Site U1489 (Table T1). Hole U1489A consisted of a single full advanced piston corer (APC) core, which indicated we missed the mudline. Hole U1489B was cored with the APC system to 129.2 mbsf. We terminated coring in this hole because of coring difficulties that resulted in poor recovery and core disturbance. Hole U1489C was cored to 385.6 mbsf using a combination of APC, half-length advanced piston corer (HLAPC), and extended core barrel (XCB) coring, and Hole U1489D was cored with the APC system to 127.2 mbsf, drilled without coring to 274.0 mbsf, and then cored with the XCB system to 385.6 mbsf.
Table T1. Site U1489 core summary. Download table in CSV format. View PDF table.
Hole U1489A was cored with the APC system using orientation and nonmagnetic hardware. Core 1H recovered a full core barrel, indicating that we had missed the mudline, so we terminated coring. We collected 9.53 m of core over 9.5 m of coring (100% recovery) in Hole U1489A.
Hole U1489B was cored to 129.2 mbsf with the APC system using orientation and nonmagnetic hardware (Cores 1H through 14H). Downhole formation temperature measurements using the advanced piston corer temperature tool (APCT-3) were taken on Cores 4H (34.2 mbsf), 7H (62.7 mbsf), 10H (91.2 mbsf), and 12H (110.2 mbsf); however, only one measurement was of good quality (Core 10H). The measurements taken while collecting Cores 4H and 7H showed possible movement related to heavy seas, and the measurement from Core 12H was of very poor quality. We also collected high-resolution interstitial water samples at a frequency of one (5–10 cm) whole-round sample per section over the entire cored succession in Hole U1489B. Coring difficulties included premature failure of the APC shear pins due to ship motion on Cores 3H and 8H, as well as one core with no recovery (Core 11H) and two cores requiring a second coring attempt to retrieve sediment (Cores 12H and 13H). As these cores appeared very disturbed, we opted to terminate coring in Hole U1489B. We collected 120.66 m of core over 129.2 m of coring (93% recovery) in Hole U1489B.
Hole U1489C was cored to 269.5 mbsf (Cores 1H through 29H) with the APC using orientation and nonmagnetic hardware. Core 29H required drillover to extract it from the formation, indicating APC refusal. We switched to the HLAPC system and cored only to 278.9 mbsf (Cores 30F and 31F) before excessive overpull indicated HLAPC refusal. We then switched to the XCB system to core to 385.6 mbsf (Cores 32X through 42X), where we terminated coring. We collected 376.35 m of core over 385.6 m of coring (98% recovery) in Hole U1489C.
Hole U1489D was cored to recover material for the splice over the upper ~120 mbsf interval that was heavily sampled for interstitial water in Hole U1489B and to collect a second copy of the deeper succession at Site U1489. Hole U1489D was cored with the APC system using orientation and nonmagnetic hardware to 127.2 mbsf (Cores 1H through 14H). Because several of the APCT-3 measurements provided spurious results in Hole U1489B, we opted to take additional measurements in Hole U1489D while collecting Cores 4H (32.2 mbsf), 7H (60.7 mbsf), 10H (89.2 mbsf), and 13H (117.7 mbsf). All four measurements provided good results. We drilled without coring from 127.2 to 274.0 mbsf and then cored using the XCB system to 385.6 mbsf (Cores 16X through 27X), where we terminated coring. We collected 229.24 m of core over 238.8 m of coring (96% recovery) in Hole U1489D.
Operations at Site U1489 ended at 0212 h on 30 November 2016. Total time spent at Site U1489 was 131.5 h (5.5 days). We collected a total of 58 APC cores, recovering 527.85 m of core over 535.4 m of coring (98.6% recovery). We also collected 2 HLAPC cores, recovering 9.05 m of core over 9.4 m of coring (96.3% recovery) and 23 XCB cores, retrieving 198.88 m of core over 218.3 m of coring (92.6% recovery). In total, we collected 735.78 m of sediment over 763.1 m of coring (96.4% recovery).
Hole U1489A
We prepared and spaced out the bottom-hole assembly (BHA), which consisted of an APC/XCB coring assembly with two stands of drill collars. We also drifted (checked the interior to make sure it was clear) and strapped (measured) 18 stands of 5 inch drill pipe prior to deployment. The seafloor depth was measured at 3436.4 meters below rig floor (mbrf) with the precision depth recorder (PDR), and we positioned the bit at 3431.0 mbrf to shoot the first core. Hole U1489A was spudded at 0035 h on 25 November 2016. Core 1H recovered 9.53 m of sediment with the APC system. Since we had a full core liner, indicating that we had missed the mudline, we terminated coring in Hole U1489A at 0100 h. Total time spent in the hole was 10.25 h (0.4 days).
One APC core was taken in Hole U1489A, recovering 9.53 m of sediment over 9.5 m of coring (100.3% recovery).
Hole U1489B
The vessel was offset 20 m east of Hole U1489A, and the drill string was spaced out with the bit at 3427.0 mbrf. Hole U1489B was spudded at 0145 h on 25 November 2016, with Core 1H recovering 5.76 m of sediment, establishing a seafloor depth of 3419.5 mbsl. Oriented APC coring using the Icefield MI-5 core orientation tool with nonmagnetic hardware continued to 129.20 mbsf (Cores 1H through 14H). Downhole formation temperature measurements using the APCT-3 were taken on Cores 4H (34.2 mbsf), 7H (62.7 mbsf), 10H (91.2 mbsf), and 12H (110.2 mbsf); however, only one measurement was of good quality (Core 10H). The measurements taken while collecting Cores 4H and 7H showed possible movement related to heavy seas, and the measurement from Core 12H was of very poor quality. We also collected high-resolution interstitial water samples at a frequency of one (5–10 cm) whole-round sample per section over the entire cored succession in Hole U1489B.
Coring in Hole U1489B was terminated early due to repeated coring problems. The shear pins failed prematurely due to ship motion on Cores 3H and 8H. Although both cores had full recovery, the majority of the sediment was highly disturbed. Core 6H had a split liner, although there appeared to be minimal drilling disturbance as a result. Core 11H had zero recovery. Core 12H also returned an empty core liner; however, the core barrel was lowered again and the core reshot from the same depth, returning a full core barrel on the second run. We then lowered an XCB core barrel to determine that the inner diameter of the BHA was clear. After retrieving the XCB core barrel, we continued coring with the APC system. Core 13H also returned an empty core liner on the first run, but material was recovered after shooting a second time from the same depth. Core 14H (129.20 mbsf) recovered a full core barrel, but an attempt to collect Core 15H once again resulted in an empty core barrel. At that point we terminated coring after noting the significant amount of drilling disturbance in Core 12H. The drill string was pulled out of the hole, with the bit clearing the seafloor at 2344 h on 25 November, ending operations in Hole U1489B. Total time spent in the hole was 23.0 h (1.0 day). While pulling the drill string, the drilling crew changed out as many components as possible in both core barrels in case the coring difficulties were related to a mechanical problem.
A total of 14 APC cores were taken in Hole U1489B. We recovered 120.66 m of sediment over 129.2 m of coring for a total recovery of 93.4%.
Hole U1489C
The vessel was offset 40 m south of Hole U1489B in case the coring difficulties encountered in Hole U1489B were related to the formation, and the drill string was spaced out with the bit at 3429.0 mbrf. Hole U1489C was spudded at 0235 h on 26 November 2016, with Core 363-U1489C-1H recovering 3.59 m of sediment, establishing a seafloor depth of 3423.7 mbsl. Oriented APC coring using the Icefield MI-5 core orientation tool with nonmagnetic hardware continued to 269.5 mbsf (Cores 1H through 29H). The shear pins again failed prematurely on Core 3H. The core liners of Cores 16H and 22H were both split throughout, and the bottom of the liner imploded on Core 21H. Core 29H had excessive overpull and required drillover to extract it from the formation, indicating APC refusal. We then switched to the HLAPC and cored to 278.9 mbsf (Cores 30F and 31F). Core 30F had to be pumped out of the core barrel, and Core 31F had excessive overpull and required drillover, indicating HLAPC refusal. We switched to the XCB and continued coring to 385.6 mbsf (Cores 32X through 42X). Core 33X had a shattered liner and had to be pumped out of the core barrel. We terminated coring at 385.6 mbsf after determining that the velocity model used to calculate the approval depth for the hole was incorrect. The drill string was pulled out of the hole, with the bit clearing the seafloor at 0500 h on 28 November, ending operations in Hole U1489C. Total time spent in the hole was 53.0 h (2.2 days).
A total of 29 APC cores were taken in Hole U1489C. We recovered 271.76 m of sediment over 269.5 m of coring for a total recovery of 100.8%. We collected 2 HLAPC cores, recovering 9.05 m of sediment over 9.4 m of coring (96.3% recovery). We also collected 11 XCB cores, recovering 95.54 m of sediment over 106.7 m of coring (89.5% recovery). Overall recovery for Hole U1489C was 376.35 m of sediment over 385.6 m of coring (97.6% recovery).
Hole U1489D
Hole U1489D was cored to recover material for the splice over the upper ~120 mbsf that was heavily sampled for interstitial water in Hole U1489B and to collect a second copy of the deeper succession at Site U1489. The vessel was offset 20 m west of Hole U1489C, and the drill string was spaced out with the bit at 3427.0 mbrf. Hole U1489D was spudded at 0640 h on 28 November 2016, with Core 363-U1489D-1H recovering 3.69 m of sediment, establishing a seafloor depth of 3421.6 mbsl. Oriented APC coring using the Icefield MI-5 core orientation tool with nonmagnetic hardware continued to 127.2 mbsf (Cores 1H through 14H). Core 9H had a split core liner. Because several of the APCT-3 measurements provided spurious results in Hole U1489B, we opted to take additional measurements in Hole U1489D while collecting Cores 4H (32.2 mbsf), 7H (60.7 mbsf), 10H (89.2 mbsf), and 13H (117.7 mbsf). All four measurements provided good results. After collecting Core 14H, we dropped the center bit and drilled ahead without coring to 274.0 mbsf. We then cored with the XCB to 385.6 mbsf (Cores 16X through 27X), where we terminated coring. The drill string was raised to 1926.6 mbrf, and 115 ft of drill line was slipped and cut before the drill string was recovered to the vessel. Both beacons were recovered during this operation. The rig was secured for transit, and the thrusters were raised, ending operations in Hole U1489D and at Site U1489 at 0212 h on 30 November. Total time spent in Hole U1489D was 45.25 h (1.9 days).
A total of 14 APC cores were taken in Hole U1489D. We recovered 125.90 m of sediment over 127.2 m of coring for a total recovery of 99.0%. We also collected 12 XCB cores, recovering 103.34 m of sediment over 111.6 m of coring (92.6% recovery). One drilled interval advanced the hole 146.8 m without coring. Total recovery for Hole U1489D was 229.24 m of sediment over 238.8 m of coring (96.0% recovery).
Core description
Site U1489 is located at ~3421 m water depth on the western slope of Eauripik Rise in the west Caroline Basin, ~81 km west-northwest of Site U1488. Four holes were cored at Site U1489, with the deepest penetrating to 386.33 mbsf (Hole U1489D). The recovered succession consists of lower Miocene to recent nannofossil ooze and chalk with varying proportions of clay. Biosilica (especially radiolarians) is a major component in the lowermost part of the site. The recovered succession at Site U1489 is assigned to one lithologic unit divided into two subunits defined on the basis of visual core description, microscopic examination of smear slides, magnetic susceptibility, natural gamma radiation (NGR), color spectral observations, and bulk mineralogical analysis by X-ray diffraction (XRD) (see Core description and Physical properties in the Expedition 363 methods chapter [Rosenthal et al., 2018a]). The major characteristics of the two subunits at Site U1489 are summarized in Figure F5.
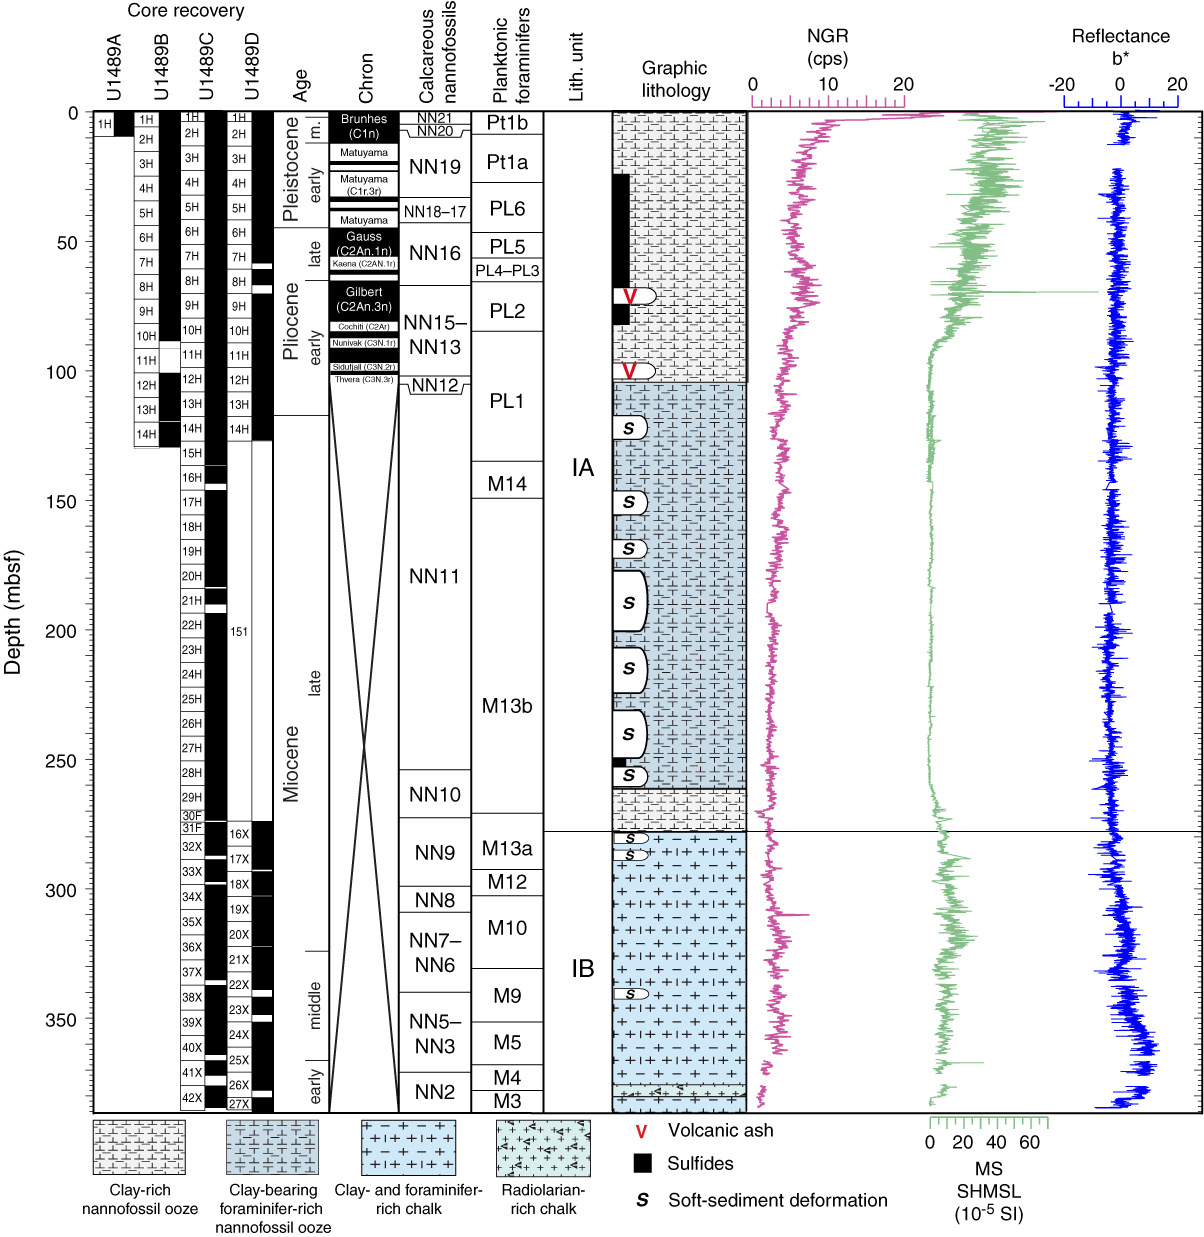
Figure F5. Lithologic summary.
Unit description
Unit I
- Intervals: 363-U1489A-1H-1, 0 cm, through 1H-CC, 16 cm; 363-U1489B-1H-1, 0 cm, through 14H-CC, 28 cm; 363-U1489C-1H-1, 0 cm, through 42X-CC, 43 cm; 363-U1489D-1H-1, 0 cm, through 27X-CC, 23 cm
- Depths: Hole U1489A = 0–9.53 mbsf, Hole U1489B = 0–129.46 mbsf, Hole U1489C = 0–384.26 mbsf, Hole U1489D = 0–386.33 mbsf
- Thickness: Hole U1489A = 9.53 m, Hole U1489B = 129.46 m, Hole U1489C = 384.26 m, Hole U1489D = 386.33 m
- Age: early Miocene to recent
- Lithology: foraminifer-bearing clay-rich nannofossil ooze, clay-rich diatom-rich nannofossil ooze, clay-rich foraminifer-rich nannofossil ooze, clay-bearing nannofossil ash, ash, clay-bearing foraminifer-rich nannofossil ooze, foraminifer ooze, diatom-bearing foraminifer-rich nannofossil ooze, foraminifer-bearing clay-rich chalk, clay-rich foraminifer-rich chalk, foraminifer-bearing radiolarian-rich chalk, and radiolarian-rich chalk
Unit I is composed mainly of light greenish gray (5GY 8/1) foraminifer-bearing clay-rich nannofossil ooze, white (N 8.5) clay-bearing foraminifer-rich nannofossil ooze, and light greenish gray (10Y 8/1) foraminifer-bearing clay-rich chalk (Figure F5). The unit is divided into two subunits. Subunit IA is characterized by alternations between light greenish gray and greenish gray (5GY 6/1) foraminifer-bearing clay-rich nannofossil ooze at centimeter to meter scale (Figure F6). The lower part of Subunit IA contains a series of large-scale soft-sediment deformation intervals intercalated with undisturbed sediment (Figure F7; Table T2). These intervals occasionally include layers with coarser-grained foraminifer ooze or homogeneous clay-bearing foraminifer-rich nannofossil ooze. Two tephra layers are found in Subunit IA (Figure F8; Table T3). Subunit IB mainly consists of white (N 8 or 10Y 8/1) foraminifer-bearing clay-rich chalk including pale yellow (2.5Y 8/2) foraminifer-bearing radiolarian chalk in the lower part (Figure F9). Compared to Subunit IA, fewer and smaller intervals of small-scale soft-sediment deformation occur in Subunit IB (Table T2).
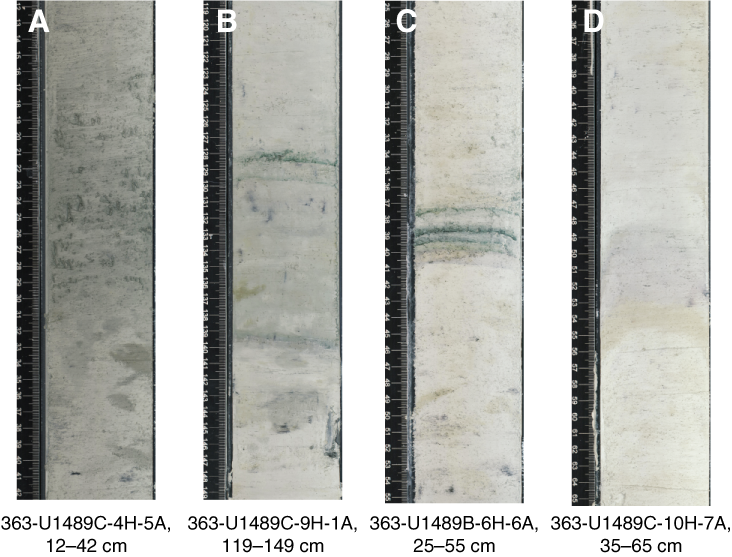
Figure F6. Color alternation in foraminifer-bearing clay-rich nannofossil ooze.
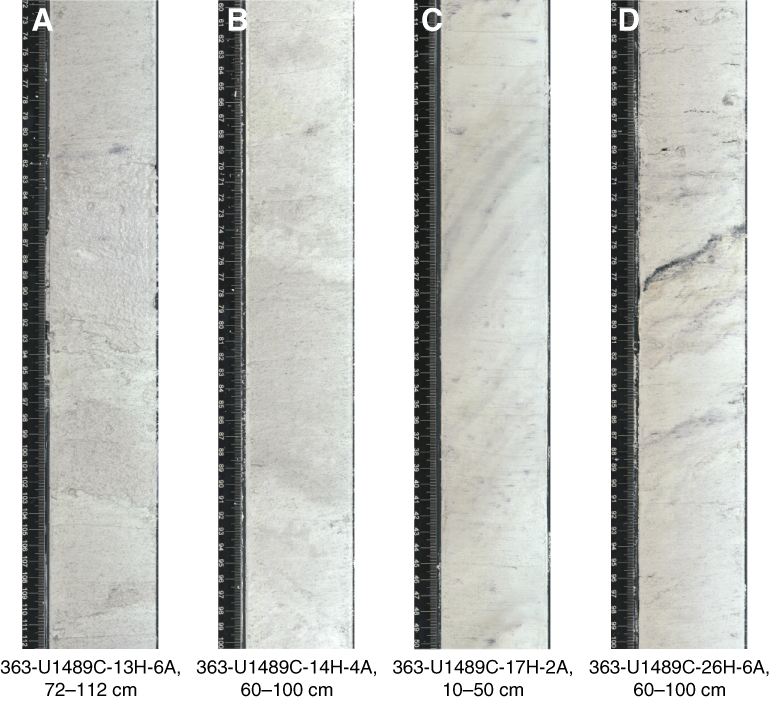
Figure F7. Soft-sediment deformation.
Table T2. Soft-sediment deformation intervals. Download table in CSV format.

Figure F8. Tephra layers.

Figure F9. Main lithologies in Subunit IB.
Subunit IA
- Intervals: 363-U1489A-1H-1, 0 cm, through 1H-CC, 16 cm; 363-U1489B-1H-1, 0 cm, through 14H-CC, 28 cm; 363-U1489C-1H-1, 0 cm, through 32X-1, 0 cm; 363-U1489D-1H-1, 0 cm, through 14H-CC, 13 cm
- Depths: Hole U1489A = 0–9.53 mbsf (total depth), Hole U1489B = 0–129.46 mbsf (total depth), Hole U1489C = 0–278.90 mbsf, Hole U1489D = 0–126.98 mbsf
- Thickness: Hole U1489A = 9.53 m (minimum thickness), Hole U1489B = 129.46 m (minimum thickness), Hole U1489C = 278.90 m, Hole U1489D = 126.98 m (minimum thickness)
- Age: late Miocene to recent
- Lithology: foraminifer-bearing clay-rich nannofossil ooze, clay-rich diatom-rich nannofossil ooze, clay-rich foraminifer-rich nannofossil ooze, clay-bearing foraminifer-rich nannofossil ooze, foraminifer ooze, diatom-bearing foraminifer-rich nannofossil ooze, clay-bearing nannofossil ash, and ash
Subunit IA is mainly composed of light greenish gray (5GY 8/1) foraminifer-bearing clay-rich nannofossil ooze. The uppermost ~35 cm consists of light brown (7.5YR 6/4) foraminifer-bearing diatom-rich nannofossil ooze. A second ~10 cm thick grayish brown foraminifer-bearing diatom-rich nannofossil ooze occurs between ~2.35 and 2.45 mbsf in all holes (Figure F10). These brown sediments contain abundant amounts of diatoms, sponge spicules, and silicoflagellate fragments, as well as iron oxides (Figure F11A, F11B). Clay minerals are most abundant in the upper part of Subunit IA and decrease downhole, which is reflected in concomitant decreases in NGR and magnetic susceptibility over the upper 100 mbsf (Figure F5). Below ~110 mbsf, clay minerals represent only a minor component of the sediment in Subunit IA. In the upper ~50 m of the subunit, the alternations between the darker layers, which are composed of relatively larger amounts of clay and coarser detrital minerals, and the lighter layers, which have higher abundances of nannofossils, are clearly correlated to downhole variability in both magnetic susceptibility and NGR (see Physical properties). The two parameters increase systematically in the darker clay-rich layers and decrease in the lighter ones.

Figure F10. Foraminifer-bearing diatom-rich nannofossil ooze.
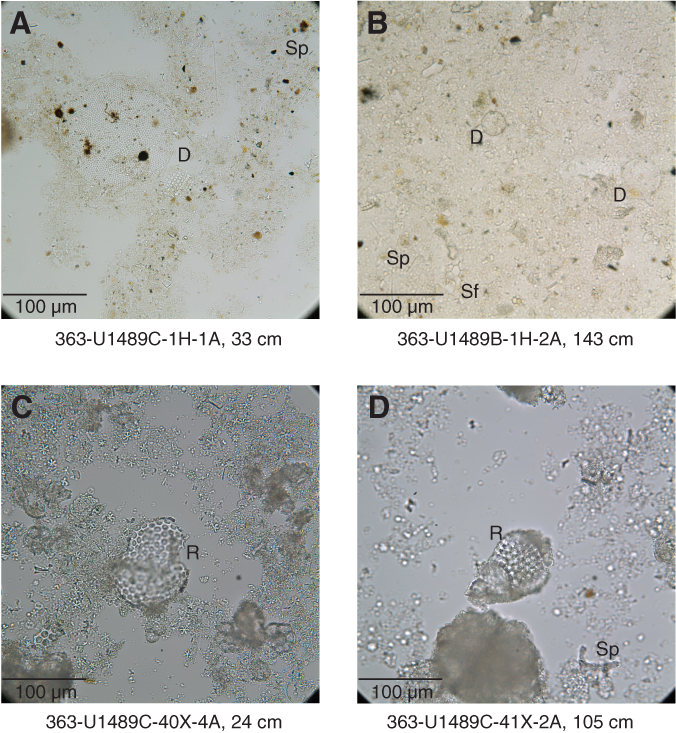
Figure F11. Sedimentary components in primary lithologies.
Subunit IA is also characterized by extensive color banding due to the alternation between layers having different colors. For example, thin-bedded (less than ~5 cm thick) pale yellow layers alternate with light greenish gray layers, and grayish green layers alternate with pale purplish layers (Figure F6). Coarser-bedded centimeter- to meter-scale alternations between light greenish gray and greenish gray (5GY 6/1) foraminifer-rich clay-rich nannofossil ooze occur throughout much of the subunit (Figure F6). Color variations (light greenish gray, greenish gray, and pale yellow) in the sediment are associated with variations in magnetic susceptibility and NGR values. Greenish gray sediment has higher magnetic susceptibility and higher NGR (6.5 counts/s) values (Figure F12A) than pale yellow sediment (NGR = 5.6–6.0 counts/s) (Figure F12B), whereas white and pale yellow sediments exhibit very low magnetic susceptibility and NGR (4.4–4.7 counts/s) values (Figure F12C). XRD analysis of samples from these different-colored layers indicates that they have similar mineral compositions but in slightly different proportions depending on the sediment color (Figure F13). For instance, the light greenish and greenish gray sediment has higher clay mineral content compared with the grayish green sediment.
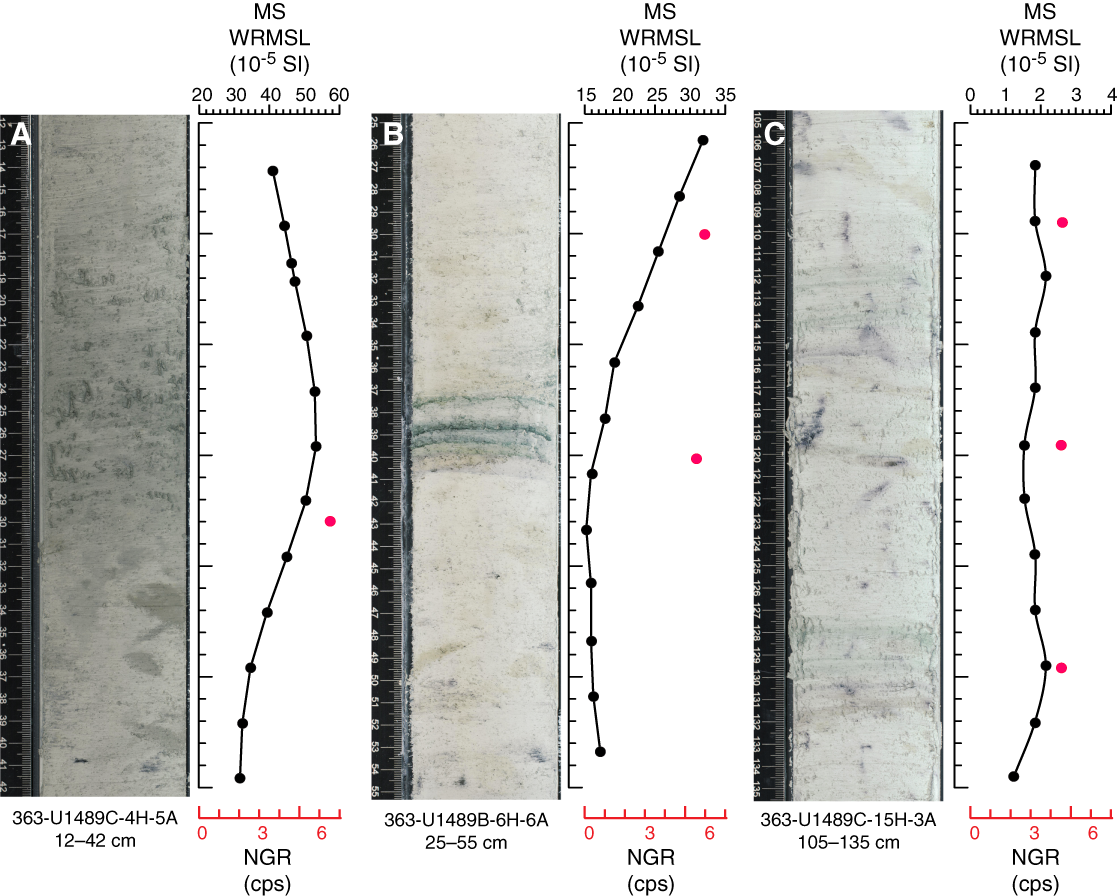
Figure F12. MS and NGR in different colored sediments.
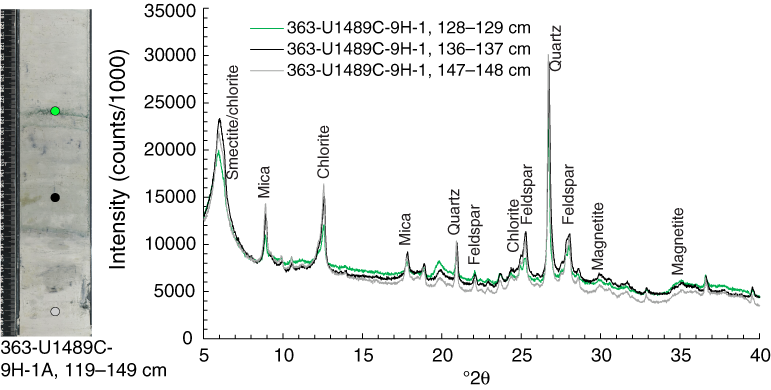
Figure F13. XRD results in different colored sediment.
Two tephra layers were found in Subunit IA (Figure F8; Table T3). One tephra layer with very high magnetic susceptibility values occurs between 70 and 73 mbsf in Holes U1489B–U1489D (Figure F5). The other tephra layer was only found between 137 and 139 mbsf in Hole U1489D. These tephra layers mainly consist of glass shards and are slightly bioturbated.
Table T3. Tephra layers. Download table in CSV format.
The lower part of Subunit IA is characterized by large-scale soft-sediment deformation (Figure F7). The deformed sediment contains predominantly inclined layers, microfaults, and fluid escape structures. These intervals are frequently accompanied by very thick bedded homogeneous sediment (Figure F7B) or coarse-grained foraminifer ooze (Figure F7A). Intervals of soft-sediment deformation found in Hole U1489C are listed in Table T2. The soft-sediment deformation intervals correspond to high P-wave velocity (see Physical properties). The top of Subunit IB is recognized by the first appearance of chalk at intervals 363-U1489D-32X-1, 0 cm (278.9 mbsf), and 16X-1, 0 cm (274.0 mbsf) (Figure F9A).
Subunit IB
- Intervals: 363-U1489C-32X-1, 0 cm, through 42X-CC, 43 cm; 363-U1489D-16X-1, 0 cm, through 27X-CC, 23 cm
- Depths: Hole U1489C = 278.90–384.26 mbsf, Hole U1489D = 274.0–386.33 mbsf
- Thickness: Hole U1489C = 105.36 m, Hole U1489D = 112.33 m
- Age: early Miocene to late Miocene
- Lithology: foraminifer-bearing clay-rich chalk, clay-rich foraminifer-rich chalk, foraminifer-bearing radiolarian-rich chalk, and radiolarian-rich chalk
Subunit IB is mainly composed of light greenish gray (10Y 8/1) foraminifer-bearing clay-rich chalk and clay-rich foraminifer-rich chalk, pale yellow (2.5Y 8/3) foraminifer-bearing radiolarian-rich chalk, and light gray (5Y 7/2) radiolarian-rich chalk (Figures F9, F11C, F11D). Alternations between white and light gray (N 7) foraminifer-bearing clay-rich chalk occur at centimeter to meter scale in Cores 363-U1489C-32X through 37X and in Cores 363-U1489D-16X through 23X (Figure F9B). The light gray sediment is characterized by millimeter-scale laminae with sharp upper and lower boundaries. Various types of burrows are common in the lighter sediment. White (N 9) foraminifer-bearing clay-rich chalk gradually changes downhole to pale yellow (2.5Y 8/2) foraminifer-bearing clay-rich chalk starting from Cores 363-U1489C-37X and 363-U1489D-24X. Pale yellow foraminifer-bearing clay-rich chalk changes to pale yellow foraminifer-bearing radiolarian-rich chalk in Core 363-U1489C-42X. The lower boundary of pale yellow foraminifer-bearing radiolarian-rich chalk is marked by an abrupt change to white sediment (N 8.5) at interval 363-U1489C-42X-4, 23 cm (Figure F9E).
Subunit IB is characterized by small-scale soft-sediment deformation and alternations between light and dark foraminifer-bearing clay-rich chalk and clay-rich foraminifer-rich chalk (Figure F9). The soft-sediment deformation intervals contain inclined and convolute layers and microfaults. The intervals in which we identified soft-sediment deformation in Hole U1489C are summarized in Table T2.
Discussion
Cyclic sedimentation and soft-sediment deformation
Subunit IA is characterized by decimeters-thick alternations between darker and lighter greenish gray sediment layers. The darker layers are composed of relatively larger amounts of clay minerals (smectite and chlorite) and detrital minerals (quartz, feldspar, mica, and magnetite) compared with the lighter layers, which have higher abundances of nannofossils. These alternations suggest cyclic changes in the supply of fine-grained terrigenous sediments and, given the open-ocean setting of the site, could reflect changes in strength/importance of eolian input to the site. Alternatively, the cyclic variations in siliciclastic content could be a diagenetic feature due to carbonate dissolution. The greenish gray sediment is only present in the upper ~80–90 mbsf of the site and corresponds to clay-rich nannofossil ooze. The disappearance of this greenish gray clay-rich sediment corresponds to a drop in NGR and magnetic susceptibility below ~90 mbsf (Figure F5). This decrease in clay content, NGR, and magnetic susceptibility in the upper part of the sedimentary section at Site U1489 is similar to that seen at Site U1488 (see Comparison to Site U1488 below).
The lower part of Subunit IA is characterized by frequent soft-sediment deformation. The total thickness of the soft-sediment deformation interval is ~85 m (Table T2) in Hole U1489C. In the lower part of Subunit IA (117–253 mbsf), sedimentation rates abruptly increase from ~2 to ~5 cm/ky (see Biostratigraphy). The increased sediment accumulation rates in this interval may be due to the following factors:
- The addition of sediment as a result of the deformation process (i.e., slumping),
- Changes in postdepositional alteration and dissolution of primary sediments, or
- A combination of factors.
Sediment deformation can also be triggered by excess pore fluid pressure with enhanced supply of coarse-grained sediment (Mills, 1983). Higher sediment supply during deposition can act as a trigger for a gravitational slump. The soft-sediment deformation in Subunit IB is much smaller in scale than in Subunit IA and constitutes only ~14 m of section (Table T2).
Comparison to Site U1488
Sites U1488 and U1489 show several similarities but also differences that reflect their depositional settings and postdepositional histories. Site U1489 is located at ~3421 m water depth on the western flank of Eauripik Rise, ~81 km west-northwest of Site U1488, which is located at shallower water depth (~2604 mbsl) on the top of the rise. The total recovered sediment thickness at Sites U1488 and U1489 is ~314.5 and ~386.33 mbsf, respectively. The two sites are characterized by different sedimentation rates, possibly because of differences in sedimentary processes and/or differences in the postdepositional history (including both dissolution and lithification). Site U1488 mainly consists of clay-rich foraminifer-rich nannofossil ooze, foraminifer-bearing nannofossil ooze, and radiolarian-bearing foraminifer-nannofossil ooze, indicating pelagic sedimentation from the late Miocene to recent. The sediments at Sites U1488 and U1489 are generally similar; however, Site U1489 exhibits higher clay mineral content and detrital components in the lower Pliocene to Pleistocene interval, whereas at Site U1488 the interval with higher clay content is restricted to the Pleistocene. Downhole trends in magnetic susceptibility and NGR are also similar between sites (cf. Figure F5 in the Site U1488 chapter [Rosenthal et al., 2018c] and Figure F5). However, the depth at which the two physical property records decrease is different. This depth is shallower at Site U1488 and corresponds to the drop in clay content in the sediment. One tephra layer with high magnetic susceptibility and platy glass shards was found at ~92 mbsf at Site U1488 and ~73 mbsf at Site U1489. These tephra layers can be correlated to a tephra layer reported from DSDP Site 62 on the Eauripik Rise (interval 7-62-10H-5, 137–143 cm; 98 mbsf) (Shipboard Scientific Party, 1971).
A key difference between sites is the extensive occurrence of soft-sediment deformation in the middle part of Site U1489 that is absent at Site U1488. The location of Site U1489 on the slope of the Eauripik Rise likely played a role in the development of soft-sediment deformation, whereas Site U1488 is in a more stable setting at the top of this physiographic feature. Another major difference is the shift from nannofossil ooze to chalk at Site U1489 (~278 mbsf; top of Subunit IB), whereas at Site U1488 chalk was not recovered at that depth or to the bottom of the site at ~308 mbsf.
Greenish layers and bands of different colors, which are interpreted as indicators of early diagenesis influenced by differences in clay mineral content, and small compositional differences in biogenic content (see Core description in the Site U1488 chapter [Rosenthal et al., 2018c]), are common features at both sites.
Biostratigraphy
We cored a 385 m thick succession of clay-bearing foraminifer-rich nannofossil ooze at Site U1489 (see Core description). Calcareous microfossil assemblages and preservation are typical of a pelagic, relatively deep water bathyal environment throughout the recorded succession. Biostratigraphic results from each fossil group (calcareous nannofossils, planktonic foraminifers, and benthic foraminifers) are presented in the sections below, followed by a detailed characterization of benthic and planktonic foraminifer preservation state using the shipboard scanning electron microscope (SEM). An integrated bio- and magnetostratigraphy and preliminary age model are presented in the final section. Shipboard taxon occurrence data are available for download from the IODP Laboratory Information Management System (LIMS) database (http://web.iodp.tamu.edu/LORE/).
Calcareous nannofossils
Calcareous nannofossil biostratigraphy is based primarily on Hole U1489C, from which core catcher (CC) samples and two or three samples per core were taken, providing ~3 m resolution. Depth positions and age estimates of biohorizons are given in Table T4. Observations were undertaken using plane- (PPL), cross- (XPL), and circular-polarized light (CPL), as well as the shipboard desktop SEM (Hitachi TM3000) to confirm the presence of Emiliania huxleyi and to check preservation state.
Table T4. Calcareous nannofossil bioevents. Download table in CSV format.
At Site U1489, the preservation of calcareous nannofossils is generally very good, becoming moderate deeper than 280 mbsf (Figures F14, F15). Below that depth, discoasters show significant traces of overgrowth, with complete recrystallization deeper than 350 mbsf as evidenced by high birefringence. However, the placoliths, helicoliths, and sphenoliths are surprisingly well preserved in the same interval that discoasters are poorly preserved. Intact coccospheres are observed sporadically throughout Hole U1489C. Reworked calcareous nannofossils occur very rarely, such as occasional specimens of Cyclicargolithus, Discoaster, and Sphenolithus, especially in the upper part of the hole.
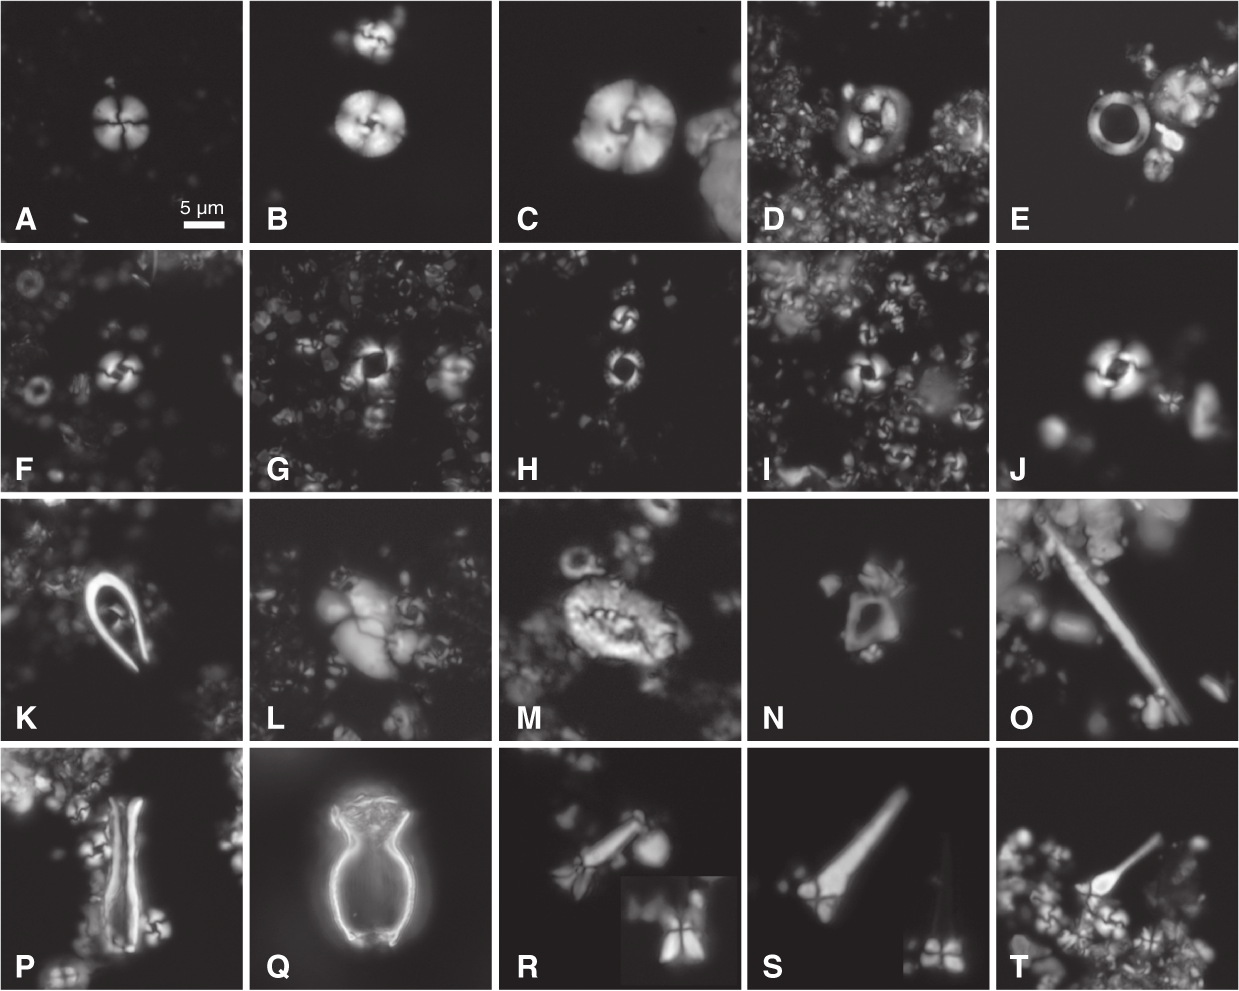
Figure F14. Calcareous nannofossils.
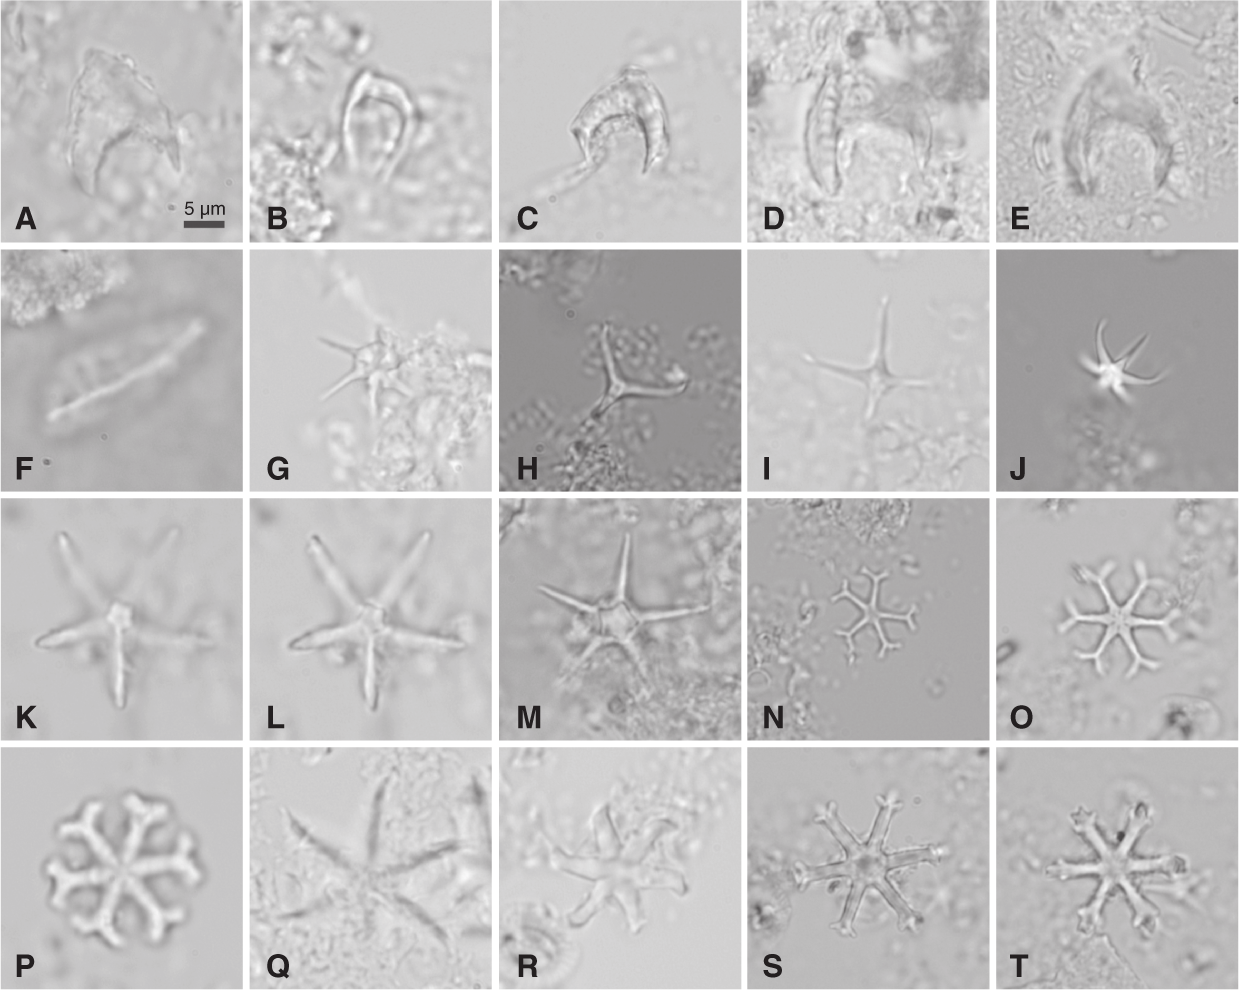
Figure F15. Calcareous nannofossils.
Pleistocene
The Pleistocene stratigraphy is well constrained by 10 calcareous nannofossil biohorizons (Table T4). Because of the low sedimentation rates at Site U1489 and the shipboard sampling resolution, biohorizons corresponding to abundance fluctuations of certain taxa (e.g., E. huxleyi and Gephyrocapsa caribbeanica) were not observed in the samples. Biohorizon base E. huxleyi (0.29 Ma; base of Zone NN21) occurs between Samples 363-U1489C-1H-CC and 2H-2, 60 cm (3.54–5.60 mbsf), and biohorizon top Pseudoemiliania lacunosa (0.44 Ma; base of Zone NN20) between Samples 2H-2, 60 cm, and 2H-4, 60 cm (5.60–8.60 mbsf). The Brunhes/Matuyama boundary (0.781 Ma) is located at 11.93 mbsf (see Paleomagnetism), which is below biohorizon top Reticulofenestra asanoi (0.91 Ma) between Samples 2H-4, 60 cm, and 2H-6, 60 cm (8.60–11.60 mbsf), and thus not in the expected order.
The base of Zone NN19 is defined by biohorizon top Discoaster brouweri (1.93 Ma) between Samples 363-U1489C-4H-CC and 5H-2, 60 cm (32.34–34.10 mbsf), at the same level as biohorizon top Discoaster triradiatus (1.95 Ma). Biohorizons top Discoaster pentaradiatus (2.39 Ma; base of Zone NN18) and top Discoaster surculus (2.49 Ma; base of Zone NN17) are both observed between Samples 5H-CC and 6H-2, 60 cm (41.61–43.60 mbsf). The Matuyama/Gauss boundary (2.581 Ma) is identified at 44.81 mbsf (see Paleomagnetism). This lies between the biohorizon top D. surculus and biohorizon top Discoaster tamalis (2.80 Ma) between Samples 6H-4, 60 cm, and 6H-6, 60 cm (46.60–49.60 mbsf).
Pliocene
Seven nannofossil biohorizons are identified in the Pliocene interval. Biohorizon top Sphenolithus abies (3.54 Ma) occurs between Samples 363-U1489C-8H-2, 60 cm, and 8H-4, 60 cm (62.60–65.60 mbsf). The base of Zone NN16 is defined by the biohorizon top Reticulofenestra pseudoumbilicus (3.70 Ma) between Samples 8H-4, 60 cm, and 8H-6, 60 cm (65.60–68.60 mbsf). Amaurolithus tricorniculatus, whose biohorizon top (3.92 Ma) defines the base of Zone NN15, was only observed in one sample (11H-6, 60 cm; 97.10 mbsf). As a result, Zone NN15 is difficult to recognize in Hole U1489C, similar to Site U1488, where Zones NN13–NN15 are undifferentiated (see Biostratigraphy in the Site U1488 chapter [Rosenthal et al., 2018c]). Biohorizon base Ceratolithus cristatus (5.12 Ma), which defines the base of Zone NN13–NN14, occurs between Samples 12H-2, 60 cm, and 12H-4, 60 cm (100.60–103.60 mbsf).
Miocene
The stratigraphy of the Miocene is constrained by 32 calcareous nannofossil biohorizons (Table T4). The Miocene/Pliocene boundary (5.33 Ma) is located just above biohorizon base Ceratolithus armatus (5.35 Ma), which occurs between Samples 363-U1489C-13H-CC and 14H-2, 61 cm (117.95–119.61 mbsf). Zone NN12 is problematic because the marker that defines its base, biohorizon top Discoaster quinqueramus (5.59 Ma), occurs between Samples 12H-4, 60 cm, and 12H-6, 60 cm (103.60–106.60 mbsf), which is well above the biohorizon base of Ceratolithus armatus, and therefore in the Pliocene. This may be due to reworking related to the uppermost of several intervals of disturbed sediment observed between 105 and 175 mbsf (see Core description). Planktonic foraminifers also show evidence of reworking at this level pointing to possible sedimentary redeposition. Below this level, biohorizons are in their expected stratigraphic order.
The base of Zone NN11 is defined by biohorizon base Discoaster berggrenii (8.29 Ma) between Samples 363-U1489C-28H-2, 60 cm, and 28H-4, 60 cm (252.60–255.60 mbsf). The base of Zone NN10 is defined by biohorizon top Discoaster hamatus (9.53 Ma) between Samples 30F-3, 60 cm, and 30F-CC (271.31–273.54 mbsf), which occurs at the same level as biohorizons base common D. pentaradiatus (9.37 Ma) and top Catinaster calyculus (9.66 Ma). The base of Zone NN9 is defined by biohorizon base D. hamatus (10.55 Ma) between Samples 33X-CC and 34X-2, 75 cm (297.82–300.55 mbsf). Biohorizon base Catinaster coalitus (10.89 Ma), which defines the base of Zone NN8, was observed between Samples 34X-CC and 35X-2, 75 cm (307.97–310.25 mbsf). Biohorizon base common Discoaster kugleri (11.90 Ma), which marks the base of Zone NN7 near the middle/upper Miocene boundary, is not recognized in Hole U1489C. Although D. kugleri specimens were observed in Samples 35X-CC (317.58 mbsf) and 36X-CC (327.18 mbsf), the preservation state of discoasters below makes identification to species level difficult.
The middle Miocene biohorizon top Sphenolithus heteromorphus (13.53 Ma) occurs between Samples 363-U1489C-38X-2, 40 cm, and 38X-4, 40 cm (339.00–342.00 mbsf), and marks the base of Zone NN6. The base of Zone NN4 is defined by biohorizon top Sphenolithus belemnos (17.95 Ma) between Samples 41X-3, 100 cm, and 41X-CC (370.20–371.98 mbsf). Zone NN5 was not recognized in Hole U1489C due to the absence of Helicosphaera ampliaperta, whose biohorizon top (14.91 Ma) marks the base of the zone. Biohorizon top Triquetrorhabdulus carinatus (18.28 Ma), which defines the base of Zone NN3, occurs in the same level as S. belemnos. The stratigraphy of the base of Hole U1489C is constrained by biohorizon base S. belemnos (19.03 Ma) between Samples 42X-4, 20 cm, and 42X-4, 30 cm (380.60–380.70 mbsf).
Planktonic foraminifers
Planktonic foraminifers are diverse and abundant throughout the succession at Site U1489. Preservation is generally very good (although sometimes quite fragmented) from the seafloor downhole to ~270 mbsf. Below that depth, sample processing was difficult because the sediment is hard and cemented, and preservation varies from poor (heavily cemented) to good (mostly free of infilling). More detailed observations are described in Foraminifer preservation.
Biostratigraphy was conducted on three sample sets:
- All core catcher samples from Hole U1489B,
- All core catcher samples from Hole U1489C supplemented by up to three additional samples per core from Cores 363-U1489C-13H through 31F, and
- Core catcher samples from Cores 363-U1489D-16X through 27X.
Lists of biohorizons for these intervals are presented in Table T5. Here we focus on the record from Hole U1489C with additional observations from the other holes added where appropriate.
Table T5. Planktonic foraminifer bioevents. Download table in CSV format.
The topmost sample examined, Sample 363-U1489C-1H-CC (3.54 mbsf) contains Globorotalia flexuosa, Globigerinoides ruber (pink), and Globigerinella calida and is assigned to the upper part of Subzone Pt1b, between 0.12 and 0.22 Ma. These species are absent from Sample 2H-CC (13.31 mbsf), which contains Globorotalia tosaensis and is assigned to Subzone Pt1a (0.61–1.88 Ma).
Coiling directions in Pulleniatina were measured at low resolution (only core catchers were examined) in Holes U1489B and U1489C from the top of the hole to below the level of Saito’s (1976) L9 excursion. Data are given in Table T6 and plotted in Figure F16. The uppermost two samples in both holes contain predominantly dextral Pulleniatina. The L1 coiling change excursion (0.80 Ma) is observed between Samples 363-U1489C-2H-CC and 3H-CC (13.31–22.85 mbsf).
Table T6. Coiling count data for Pulleniatina. Download table in CSV format.
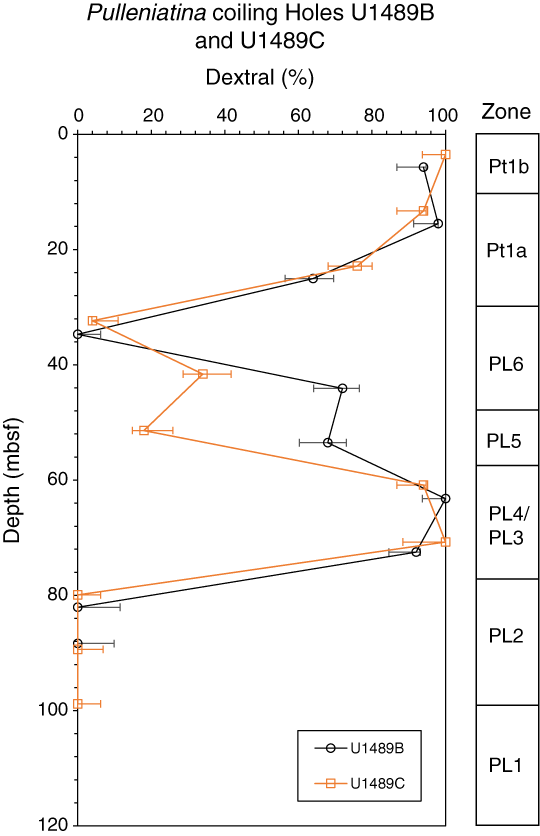
Figure F16. Coiling patterns in Pulleniatina.
Biohorizon top Globigerinoidesella fistulosa (1.88 Ma), which marks the base of Subzone Pt1a, occurs between Samples 363-U1489C-3H-CC and 4H-CC (22.90–32.34 mbsf). At some levels at Site U1489, G. fistulosa has quite extreme morphologies, including forms with up to four distinctly fistulose (i.e., having hollow, pipe-like extensions) chambers; up to nine distinct protuberances on a single chamber; and/or unusually long, branching, or crenulated protuberances (Figure F17). Detailed study of these variations might provide future biostratigraphic potential if fully documented.

Figure F17. Globigerinoidesella fistulosa whole tests and individual chambers.
Biohorizon top Globorotalia pseudomiocenica (2.30 Ma), which marks the base of Zone PL6, is identified on the basis of just two individuals in Sample 363-U1489C-6H-CC (51.40 mbsf). This biohorizon occurs above biohorizon top Globorotalia limbata (calibrated at 2.39 Ma, which is probably slightly too old) between Samples 6H-CC and 7H-CC. Two additional events occur between the same samples: biohorizons top Dentoglobigerina altispira (3.13 Ma), which marks the base of Zone PL5, and base G. fistulosa (3.33 Ma).
Biohorizon top Sphaeroidinellopsis seminulina (3.59 Ma), which marks the base of Zone PL4, and biohorizon top Globorotalia margaritae (3.60 Ma), which marks the base of Zone PL3, both occur between Samples 363-U1489C-7H-CC and 8H-CC (60.87–70.75 mbsf). These biohorizons also occur together in Hole U1489B. The absence of an identified stratigraphic interval corresponding to Zone PL3 at Site U1489 may be a function of its extremely short duration (3.59–3.60 Ma) and the sparse sampling and is not evidence of a hiatus.
The L9 coiling reversal in Pulleniatina (4.08 Ma) occurs between Samples 363-U1489C-8H-CC and 9H-CC (70.75–79.94 mbsf) (Figure F16). This occurs above biohorizon top Pulleniatina spectabilis (4.21 Ma), which is in the same sampling interval as biohorizon top Globoturborotalita nepenthes (4.37 Ma), marking the base of Zone PL2, between Samples 9H-CC and 10H-CC (79.94–89.39 mbsf).
Globoquadrina dehiscens appears to have an anomalous stratigraphic range at Site U1489, occurring as high as Sample 363-U1489C-12H-CC (108.44 mbsf), and almost as high in Hole U1489B (Sample 363-U1489B-13H-CC, 119.21 mbsf). This bioevent is known to be diachronous, occurring later in the tropics than at higher latitudes (Hodell and Kennett, 1986). High-resolution sampling of Sites U1482, U1489, and U1490 will be conducted postcruise to better calibrate this biohorizon for the low latitudes.
Biohorizon base Globorotalia tumida (5.57 Ma), which marks the base of Zone PL1, occurs between Samples 363-U1489C-15H-6, 60–62 cm, and 15H-CC (135.10–136.11 mbsf). The top of Globorotalia lenguaensis (6.13 Ma), which marks the base of Zone M14, is tentatively identified between Samples 17H-2, 40–42 cm, and 17H-4, 40–42 cm (147.90–150.90 mbsf), based on the occurrence of very rare globorotaliids with an almost circular periphery and no keel but with a faster rate of chamber expansion than seen in the holotype of Bolli (1957). Taxonomic concepts in the literature seem quite divergent, and it is doubtful whether the holotype is conspecific with either of our specimens or the specimen illustrated by Kennett and Srinivasan (1983). More thorough investigations postcruise may help clarify these issues.
Zone M13 (6.13–10.47 Ma) is a long and problematic interval for planktonic foraminifer biostratigraphy with few reliable marker events and is complicated further at Site U1489 by the presence of a stratigraphic succession between ~150 and 250 mbsf characterized by soft-sediment deformation that may indicate transport and redeposition of sediment with the possibility of associated erosional events and missing stratigraphy (see Core description). One clear biohorizon in the upper part of the zone is base Pulleniatina primalis (6.60 Ma) between Samples 363-U1489C-20H-6, 60–62 cm, and 20H-CC (182.60–183.28 mbsf). This species is common in the lowermost sample in which it is observed and shows no indication of intergradation with its presumed ancestor, Neogloboquadrina acostaensis. The base of Subzone M13a is marked by biohorizon base Globorotalia plesiotumida (8.58 Ma), which is tentatively identified between Samples 29-CC and 30F-3, 58–60 cm (269.11–271.29 mbsf). This event should supposedly occur close to biohorizon base Neogloboquadrina humerosa (8.56 Ma), but this biohorizon is not securely identified at Site U1489 because of the rarity of the marker species in the lower part of its stratigraphic range.
To further understand the stratigraphy of this interval and the correlation with Site U1488, which is located 81 km to the east (see Biostratigraphy in the Site U1488 chapter [Rosenthal et al., 2018c]), we measured coiling directions in N. acostaensis in the stratigraphic interval between 119 and 287 mbsf in Hole U1489C. The data are given in Table T7 and plotted in Figure F18, which compares the Site U1489 coiling data with those from Site U1488 together with two reliable nannofossil biohorizons in this interval (see Calcareous nannofossils). The records at Sites U1488 and U1489 have various features in common and also significant differences. Biohorizon base P. primalis occurs between two sinistral excursions that can be tentatively correlated with those indicated in Wade et al. (2011) at 6.34 and 6.77 Ma, respectively. Below this at both sites is an interval of ~30 m in which the coiling ratio is typically 90%–100% dextral. At Site U1488, one isolated sinistral (0% dextral) excursion occurs at ~224.76 mbsf, which may correlate with one of two strongly sinistral excursions at 217.59 and 224.09 mbsf at Site U1489. Below that, correlation of the records is helped by consideration of biohorizons base Discoaster quinqueramus (8.12 Ma) and base paracme Reticulofenestra pseudoumbilicus (8.79 Ma), which may indicate that Site U1489 is expanded relative to Site U1488 in the 220–250 mbsf interval but condensed and/or incomplete in the 250–270 mbsf interval.
Table T7. Coiling count data for Neogloboquadrina acostaensis. Download table in CSV format.
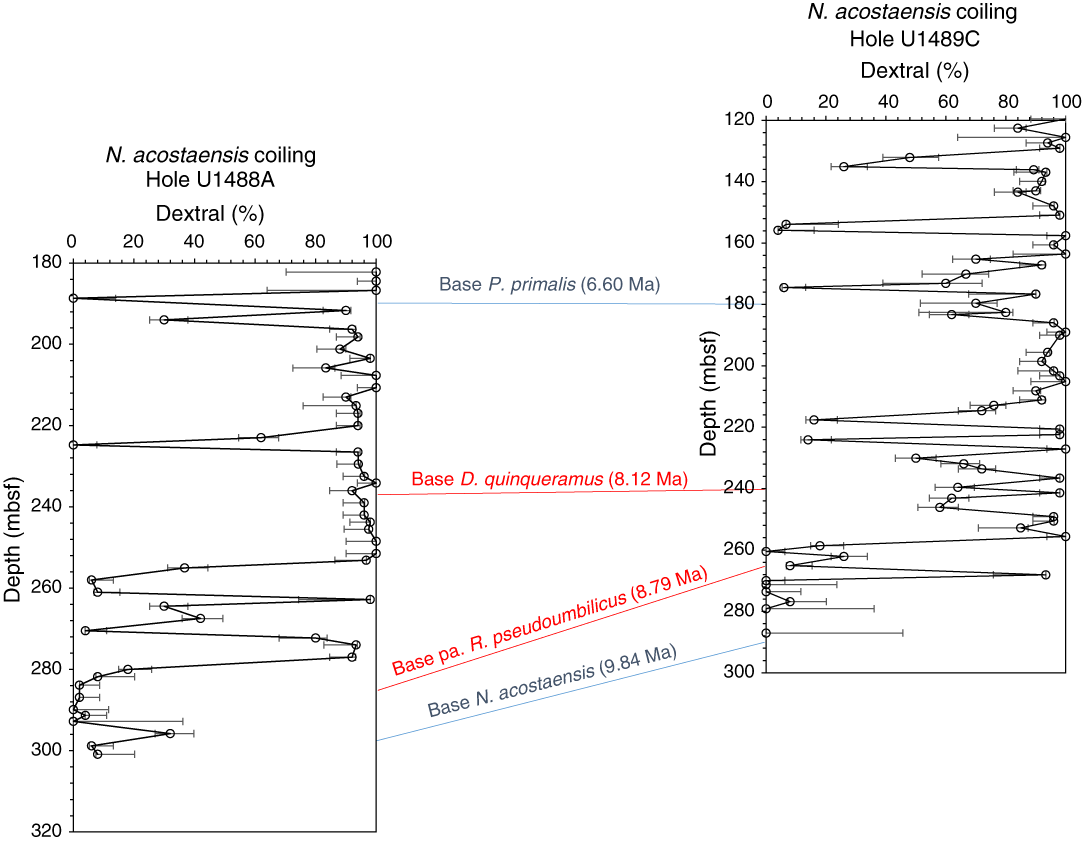
Figure F18. Coiling patterns in Neogloboquadrina acostaensis.
Below 270 mbsf, following a lithologic change to much more indurated sediment (see Core description), a more readily interpretable biostratigraphy resumes to the base of Holes U1489C and U1489D, as determined through core catcher samples from the XCB cores. Biohorizon base N. acostaensis (9.83 Ma), which demarcates the base of Subzone M13a, is observed between Samples 363-U1489C-32X-CC and 33X-CC (287.06–297.22 mbsf). In Hole U1489D, this biohorizon occurs at a comparable depth (283.66–292.67 mbsf) between Samples 363-U1489D-16X-CC and 17X-CC.
The base of Zone M12 is marked by biohorizon top Paragloborotalia mayeri (10.46 Ma) between Samples 363-U1489C-33X-CC and 34X-CC (297.22–307.97 mbsf). Biohorizon top Cassigerinella chipolensis (10.89 Ma) is also observed between these samples; this species unexpectedly co-occurs with Globorotalia limbata, the biohorizon base of which (10.64 Ma) is between Samples 34X-CC and 35X-CC (307.97–317.58 mbsf).
The base of Zone M11 could not be determined due to the absence of G. nepenthes near the base of its expected stratigraphic range; therefore, Zones M10 and M11 are undifferentiated. Division of the interval is achieved by biohorizon top Globigerinoides subquadratus (11.54 Ma) between Samples 363-U1489C-35X-CC and 36X-CC (317.58–327.35 mbsf).
Biohorizon top Fohsella fohsi (11.79 Ma) occurs between Samples 363-U1489C-36X-CC and 37X-CC (327.35–335.15 mbsf). Also occurring in Sample 37X-CC are Fohsella robusta (indicating Subzone M9b) and Fohsella lobata. A similar assemblage occurs in Sample 38X-CC (346.95 mbsf), although both samples are indurated and foraminifers are poorly preserved. Samples 39X-CC (356.63 mbsf) and 40X-CC (364.00 mbsf) contain better preserved assemblages lacking F. fohsi but including Fohsella peripheroronda and Praeorbulina glomerosa and therefore are assigned to Subzone M5b (13.80–14.22 Ma). Sample 40X-CC also contains the distinctive species Mutabella mirabilis and Globigerinatella insueta (the latter with multiple areal apertures). Sample 41X-CC (371.98 mbsf) lacks Praeorbulina and Catapsydrax and therefore is assigned to Zone M4 (undifferentiated). However, the sample does contain the index fossil Globigerinatella sp. (i.e., the form lacking areal apertures; see Pearson, 1995, for discussion).
The lowermost sample in Hole U1489C, Sample 363-U1489C-42X-CC (384.21 mbsf) lacks Globigerinatella sp. and Paragloborotalia kugleri and therefore is assigned to Zone M2. The age range is constrained to the upper part of that zone by the presence of Dentoglobigerina binaiensis (>19.30 Ma) and the absence of Globigerinoides altiaperturus (>20.03 Ma) and Tenuitella munda (<20.78 Ma). The lowermost sample in Hole U1489D, Sample 363-U1489D-27X-CC (386.28 mbsf), contains D. binaiensis (>19.30 Ma) with G. altiaperturus (<20.03) and so appears to be from a higher level in Zone M2 than the lowest sample in Hole U1489C.
Benthic foraminifers
Benthic foraminifers were studied in 37 core catcher samples from Hole U1489C (Samples 363-U1489C-1H-CC [3.54 mbsf] to 42X-CC [384.21 mbsf]). Census count data are presented in Table T8. The benthic foraminifer assemblages at Site U1489 are characteristic of deep bathyal to abyssal depths (van Morkhoven et al., 1986). The planktonic:benthic foraminifer ratio is ~99:1 throughout Hole U1489C. Planulina wuellerstorfi and/or Cibicidoides mundulus are present in most of the samples examined from the top to the base of the hole, and other common taxa include Laevidentalina spp.
Table T8. Benthic foraminifer distribution. Download table in CSV format.
Foraminifer preservation
Five core catcher samples from Hole U1489C were selected to assess foraminifer preservation and diagenesis. These range in age from the late Pleistocene (0.12 Ma) to middle Miocene (~19.09–20.78 Ma). The upper four samples (Samples 363-U1489C-1H-CC [3.54 mbsf], 12H-CC [108.44 mbsf], 23H-CC [212.84 mbsf]), and 34X-CC [307.97 mbsf] are spaced at ~100 m intervals, and the lower sample (Sample 42X-CC [384.26 mbsf]) was taken from the bottom of the hole. As at other Expedition 363 sites, typical specimens of the planktonic foraminifer Trilobatus trilobus and benthic foraminifer P. wuellerstorfi were selected for detailed investigation, but P. wuellerstorfi is absent in the lowermost sample (Sample 42X-CC) so Cibicidoides sp. was selected instead.
Foraminifer preservation, as assessed visually in the core catcher samples, varies from very good to good for most of the succession but is moderate to poor for Cores 363-U1489C-31F to 42X. Even where preservation is very good, foraminifers are typically white and opaque rather than glassy and translucent. Recrystallization, overgrowth, and cementation become progressively more severe at greater depth. Dissolution and minor infilling of the planktonic foraminifer T. trilobus and incipient recrystallization of the benthic foraminifers P. wuellerstorfi and Cibicidoides sp. occurs throughout the site. Images of selected specimens are shown in Figure F19. The full set of images is available in the LIMS database.
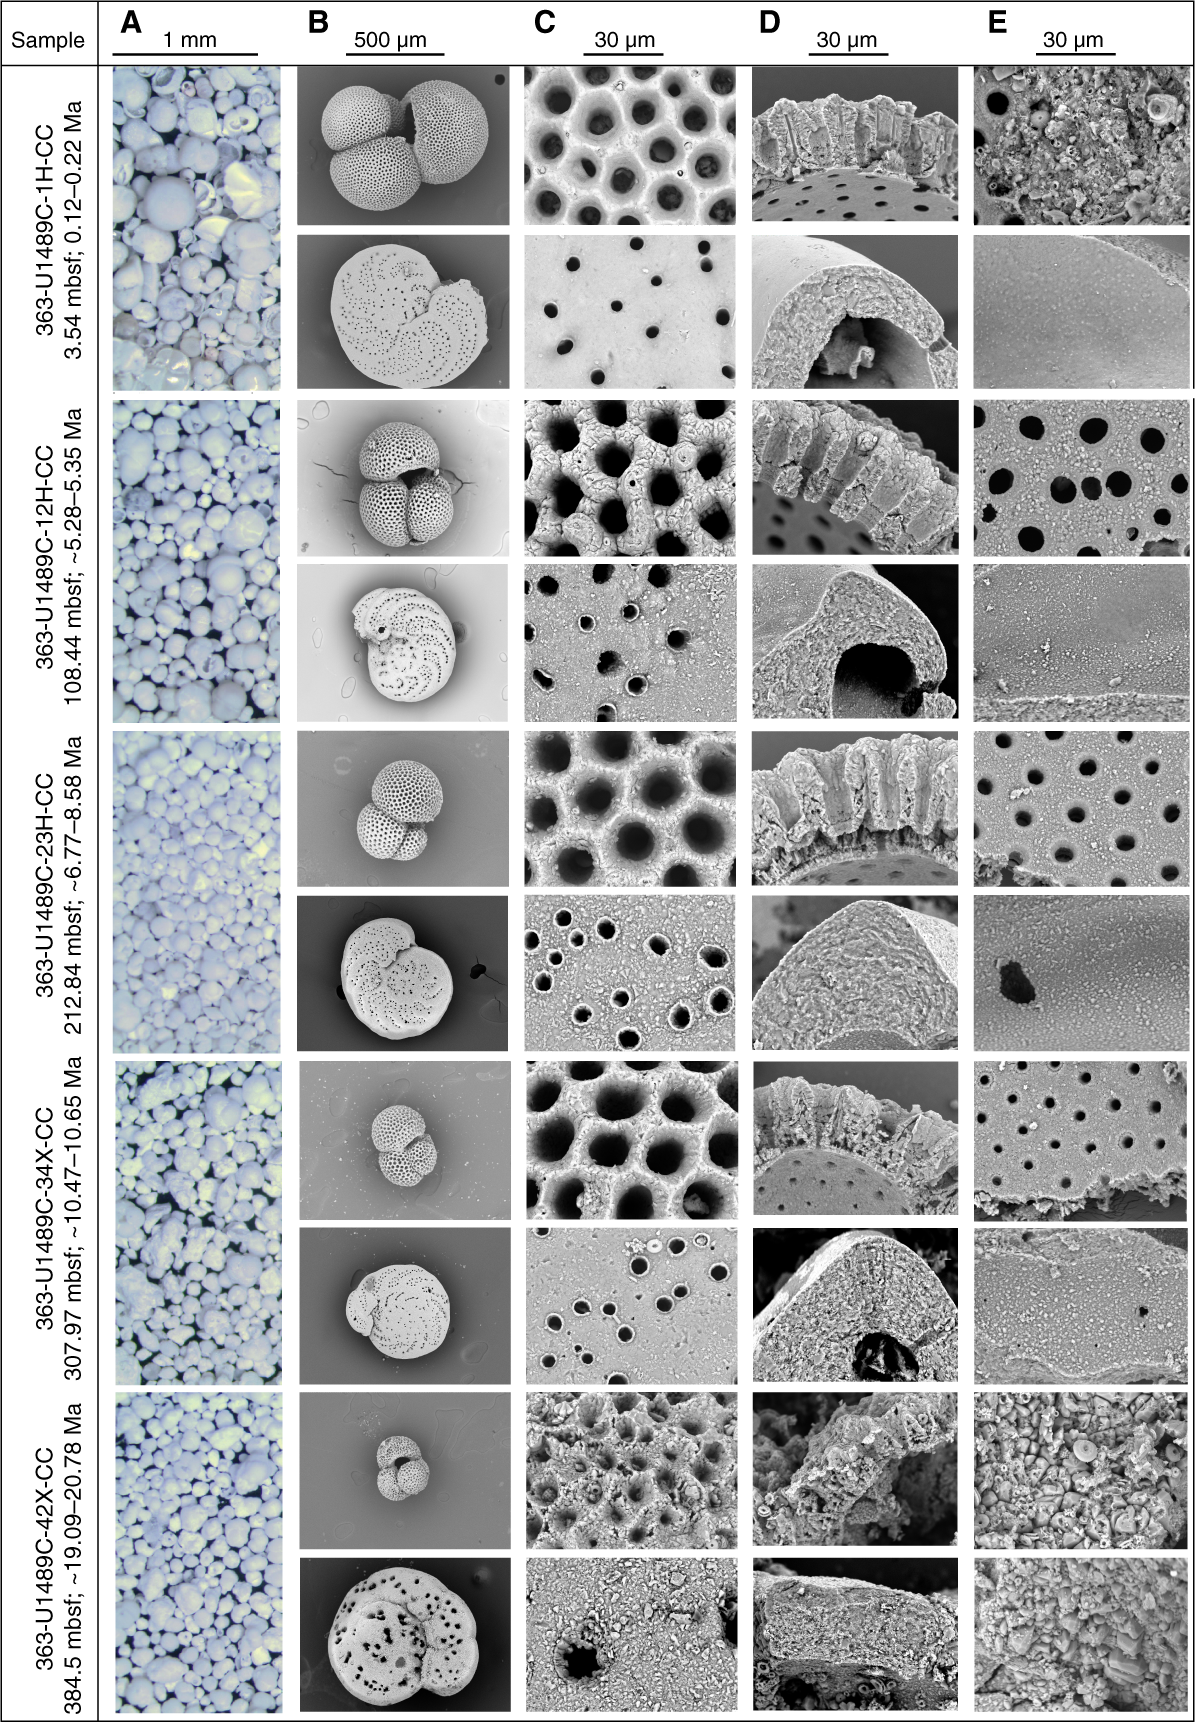
Figure F19. Downcore foraminifer preservation states.
Sample 363-U1489C-1H-CC (3.54 mbsf, late Pleistocene to latest middle Pleistocene, 0.12–0.22 Ma) shows excellent to very good preservation. Foraminifers have a glassy appearance under the light microscope (LM). In T. trilobus, the outer wall surfaces show minor evidence of abrasion and dissolution. The wall cross sections show microgranular textures and other typical biogenic features. Evidence of very minor dissolution is observed near the level of the primary organic membrane in some places. The inner wall surfaces exhibit minor calcite overgrowth layers <1 μm thick, with small amounts of unconsolidated and/or consolidated sediment infill. The wall cross sections of P. wuellerstorfi specimens show evidence of minor but pervasive textural alteration, which may be evidence of incipient recrystallization. P. wuellerstorfi also exhibits smooth inner wall surfaces. There is no evidence of cementation.
Sample 363-U1489C-12H-CC (108.44 mbsf, early Pliocene to latest Miocene, ~5.28–5.35 Ma) shows very good preservation. Wall cross sections of T. trilobus show the biogenic microgranular textures typical of the species and inorganic calcite overgrowth in pore channels with minor evidence of dissolution. In P. wuellerstorfi, the wall cross sections show evidence of very minor textural alteration in places indicating incipient recrystallization. The inner wall surfaces of T. trilobus and P. wuellerstorfi exhibit minor calcite overgrowth layers <1 μm thick without evidence of infilling and cementation.
Sample 363-U1489C-23H-CC (212.84 mbsf, late Miocene, ~6.77–8.58 Ma) shows very good to good preservation. Wall cross sections of T. trilobus show minor textural alteration in places indicating incipient recrystallization and dissolution. The wall cross sections of P. wuellerstorfi show widespread evidence of early stage recrystallization in which the microgranular texture is modified, showing slightly larger and better separated granular crystals, particularly toward the inner surfaces. The inner wall surfaces of T. trilobus and P. wuellerstorfi exhibit minor calcite overgrowth layers as thick as 1 μm. P. wuellerstorfi also shows calcite overgrowth on external surfaces. There is no evidence of infilling and cementation.
Sample 363-U1489C-34X-CC (307.97 mbsf; late Miocene; ~10.47–10.65 Ma) shows moderate to poor preservation. Foraminifers are generally opaque under the light microscope and exhibit strong cementation. Wall cross sections of T. trilobus show evidence of early stage recrystallization and stronger dissolution along internal layers, but other parts of the wall cross sections, especially the gametogenic calcite, are well preserved, showing the typical microgranular texture of the species. Wall cross sections of P. wuellerstorfi also show obvious evidence of incipient recrystallization. The inner wall surfaces of T. trilobus and P. wuellerstorfi exhibit minor calcite overgrowth layers as thick as 1 μm, which also occur on outer surfaces. There is no evidence of infilling.
Sample 363-U1489C-42X-CC (384.26 mbsf; early Miocene; ~19.09–20.78 Ma) shows poor preservation. Foraminifers are generally opaque under the light microscope and exhibit strong cementation. In SEM there is abundant evidence of dissolution, infilling, overgrowth, recrystallization, and cementation. Both T. trilobus and Cibicidoides sp. show evidence of incipient recrystallization with more solid patches developing within the wall. Wall cross sections of T. trilobus show evidence of dissolution near spine holes and internal wall layers. The inner wall surfaces of T. trilobus and Cibicidoides sp. are strongly overgrown with calcite and/or dolomite, with minor infilling of unconsolidated sediment (coccoliths) in some specimens. Cibicidoides sp. also shows calcite overgrowth on external surfaces.
Shipboard age model
Integrated calcareous nannofossil and planktonic foraminifer biostratigraphy is shown on an age-depth plot (Figure F20), together with magnetostratigraphic horizons for the Pliocene and Pleistocene (see Paleomagnetism). Planktonic foraminifer and calcareous nannofossil bioevents typically show excellent congruence.

Figure F20. Age-depth plot.
Long-term average sedimentation rates through early to middle Miocene from the base of the hole to ~345 mbsf are low (~0.3 cm/ky). Between 345 and 275 mbsf, average sedimentation rates in the late Miocene increased to ~2 cm/ky. In the latest Miocene and earliest Pliocene (100–275 mbsf), average sedimentation rates apparently increased to greater than ~5 cm/ky. However, this interval is complicated by soft-sediment deformation, which may locally repeat and extend the stratigraphic sequence (see Core description), and the estimated rate is based on sparse bioevents (and no magnetostratigraphic events) that may not be reliable. Above this interval with deformed sediment, Pliocene and Pleistocene (0–100 mbsf) sedimentation rates were ~2 cm/ky, which is comparable to the late Miocene.
Paleomagnetism
Measurements summary
Paleomagnetic investigations at Site U1489 involved measurement of the natural remanent magnetization (NRM) of APC and HLAPC archive-half cores from Holes U1489A–U1489D before and after alternating field (AF) demagnetization. We employed a four-step NRM and AF demagnetization procedure (NRM and 10, 15, and 20 mT) to the first four sections of Core 363-U1489A-1H to determine the single peak AF field (15 mT) with which to demagnetize all sections from Holes U1489B–U1489D. In addition to measuring 358 core sections, we took one to two discrete samples per core from Holes U1489B (25 samples) and U1489C (42 samples) to characterize the NRM demagnetization behavior and to investigate the rock magnetic properties of the sediment. The NRM of discrete samples was measured before and after AF demagnetization in peak fields of 5, 10, 15, 20, 30, and 40 mT. Rock magnetic investigations comprised measurements of magnetic susceptibility (χ), susceptibility of anhysteretic remanent magnetization (χARM) imparted using a 100 mT AF demagnetization and 0.05 mT direct current bias field, and isothermal remanent magnetization (IRM) acquired in 300 mT and 1000 mT (saturation IRM [SIRM]) fields. All sample measurements were mass corrected. The Icefield MI-5 core orientation tool was deployed with nonmagnetic hardware for all APC cores, which permitted azimuthal correction of declination. Azimuthally corrected declination is largely coherent between cores; however, absolute values in Hole U1489B cluster around 90°–120° for intervals of normal polarity and around 270°–300° for reversed polarity, whereas in Holes U1489C and U1489D declinations cluster around 270° during periods of normal polarity and 90° for periods of reversed polarity. An absolute offset in azimuthally corrected declination is a common feature of Expedition 363 cores (see Paleomagnetism in the Expedition 363 methods chapter [Rosenthal et al., 2018a]); however, the baseline offset was relatively consistent at ~180° until an ~90° offset developed at Site U1488. This ~90° offset appears to have continued during operations at Site U1489. As with other sites cored during Expedition 363, we leave declination uncorrected for these additional offsets in the plotted figures, so care should be employed for future calculations of virtual geomagnetic poles using these data.
Rock magnetic characterization
In the upper ~90 mbsf, Whole-Round Multisensor Logger (WRMSL) magnetic susceptibility values average 29 × 10−5 SI (see Physical properties) and, when coupled with average χ (2.1 × 10⁻⁷ ± 1.8 × 10⁻⁷ m3/kg as 2 standard deviations [2σ]) and SIRM (2.4 × 10⁻³ ± 2.1 × 10⁻³ Am2/kg as 2σ) values, suggest moderately low (ferri)magnetic mineral concentration in the sediments deposited at Site U1489 (Figure F21). In the upper ~90 mbsf, all samples acquire >97% of their SIRM remanence in a field of 300 mT, suggesting that ferrimagnetic minerals (e.g., [titano]magnetite [FexTixO4] and/or maghemite [γ-Fe2O3]) control the remanence-carrying properties of the sediment. From the top of the hole to ~90 mbsf, magnetic concentration steadily declines (lower values of χ and SIRM) and magnetic grain size fines (higher values of χARM/SIRM). Between ~90 and 100 mbsf, NRM15mT, χ, SIRM, and χARM/SIRM values decrease sharply, and below ~100 mbsf, NRM15mT, magnetic susceptibility, and SIRM values are approximately one to two orders of magnitude lower than in the upper ~90 mbsf, indicating a significant reduction in magnetic mineral concentration and a coarsening of magnetic grain size below ~100 mbsf. Low magnetic concentration and lower IRM300mT/IRM1000mT values below ~100 mbsf likely reflect the almost total absence of magnetite rather than an increase in the relative proportions of higher coercivity components (e.g., hematite [Fe2O3] and goethite [FeO(OH)]). Reduced concentration of ferrimagnetic minerals and a coarser ferrimagnetic grain size assemblage downhole, coupled with observations of secondary iron sulfides (e.g., pyrite [FeS2]) in all lithologic subunits at Site U1489 (see Core description), suggest sediment diagenesis (e.g., Karlin and Levi, 1983; Rowan et al., 2009) may have strongly influenced the primary magnetic mineral assemblage below ~90 mbsf at Site U1489.
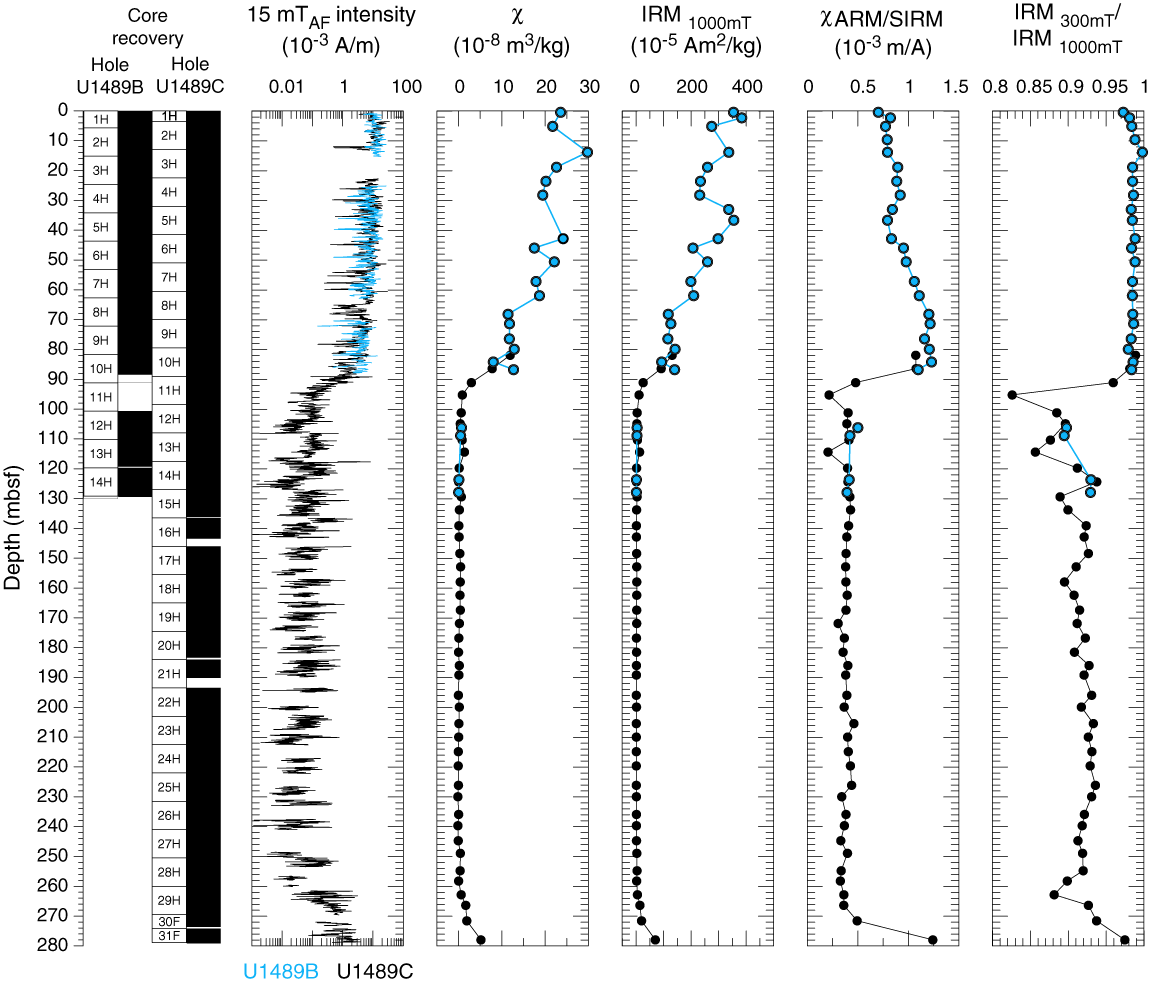
Figure F21. Archive-half NRM intensity.
Paleomagnetic data and core orientation
NRM demagnetization behavior and IRM300mT/IRM1000mT ratios in the upper ~90 mbsf are consistent with (titano)magnetite being the primary remanence-carrying mineral species in sediments deposited at Site U1489 (Figures F21, F22A–F22D). In this uppermost interval, the drill string overprint is effectively removed after AF demagnetization in a 5–15 mT field, and following exposure to higher AF demagnetization steps, inclination and declination stabilize and trend to the origin on Zijderveld diagrams (Zijderveld, 1967), indicating a single component to the magnetization. Excluding a relatively high value at ~62 mbsf, origin-anchored maximum angular deviation values of the principal component analysis (PCA) calculated over the 15–40 mT range average 1.7° (range = 0.8°–5.1°) for the upper ~90 mbsf of Hole U1489B (Figures F22A–F22D, F23), suggesting paleomagnetic directions are stable and well resolved and should yield reliable estimates for magnetostratigraphy (Stoner and St-Onge, 2007). Below ~90 mbsf, maximum angular deviation values are slightly higher (average = 3.1°; range = 0.8°–13.3°) and are associated with decreased ferrimagnetic concentration, coarser ferrimagnetic grain sizes, and higher coercivity components that do not demagnetize linearly toward the origin (Figures F22E, F22F, F24), suggesting that paleomagnetic directions below 100 mbsf likely do not reflect geomagnetic field behavior.
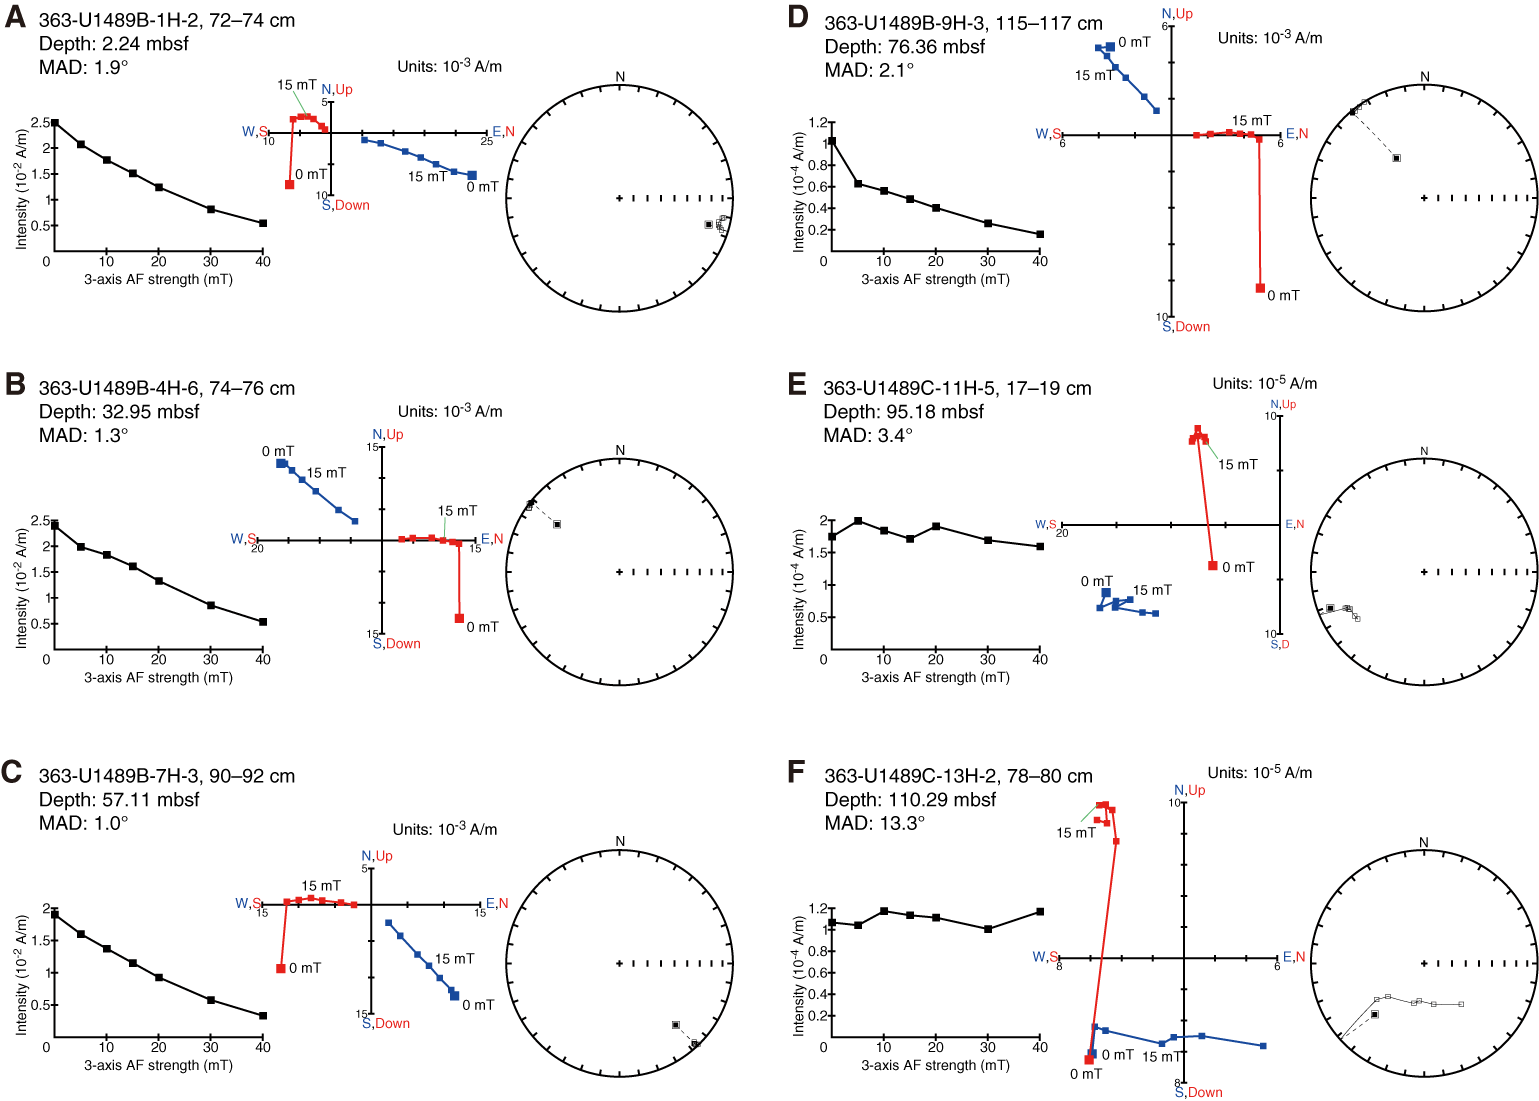
Figure F22. Discrete sample AF demagnetization results.
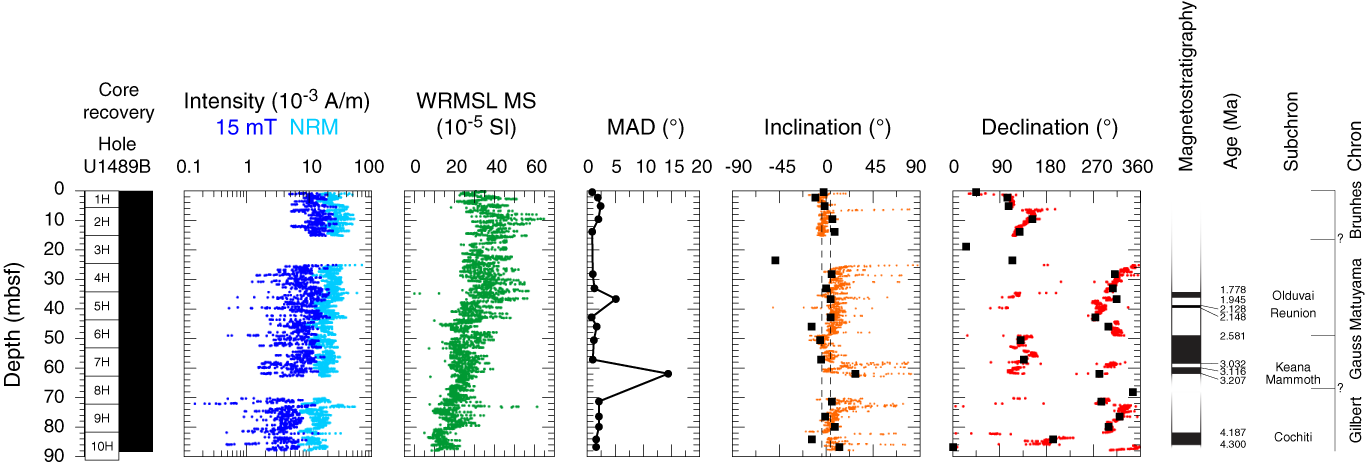
Figure F23. NRM, MS, inclination, and declination, Hole U1489B.

Figure F24. NRM, MS, inclination, and declination, Hole U1489C.
For all APC cores from Site U1489, declination was corrected using the Icefield MI-5 tool (see Operations). Azimuthally corrected declination is consistent between adjacent cores within each hole, and absolute values cluster around 90°–120° and 270°–300° (Figures F23, F24, F25). However, assuming the uppermost sediment in each hole was deposited during normal polarity associated with the Brunhes Chron (see Biostratigraphy), declination values in Hole U1489B experience an offset of ~90°–120° in absolute terms because declination should cluster around 0° (180°) during periods of normal (reversed) polarity; in Holes U1489C and U1489D the absolute offset is ~270°. Although an ~180° offset was a persistent issue during Expedition 363, ~90° offsets were previously restricted to Icefield tool #2007 (which was no longer used after Site U1485) and Icefield tool #2052, which developed the issue during operations at Site U1488. All three holes at Site U1489 show evidence of a 90° offset. Absolute orientation offsets appear related to specific tools because Hole U1489B was oriented using Icefield tool #2043 and Holes U1489C and U1489D were oriented using Icefield tool #2052. The origin of this offset is not immediately clear, but because it appears systematic (the two declination clusters are ~180° offset to each other during deployment of each tool respectively) we assume that declination values rotated 180° relative to the uppermost sediment values reflect periods of reversed polarity in the sediment recovered from Site U1489. Orientation tools cannot be deployed with the HLAPC coring system, and because of the low ferrimagnetic concentration and highly scattered nature of the declination of HLAPC Cores 363-U1489C-30F and 31F, we leave measured declination values uncorrected and highlight these data using dark red symbols in Figure F24.
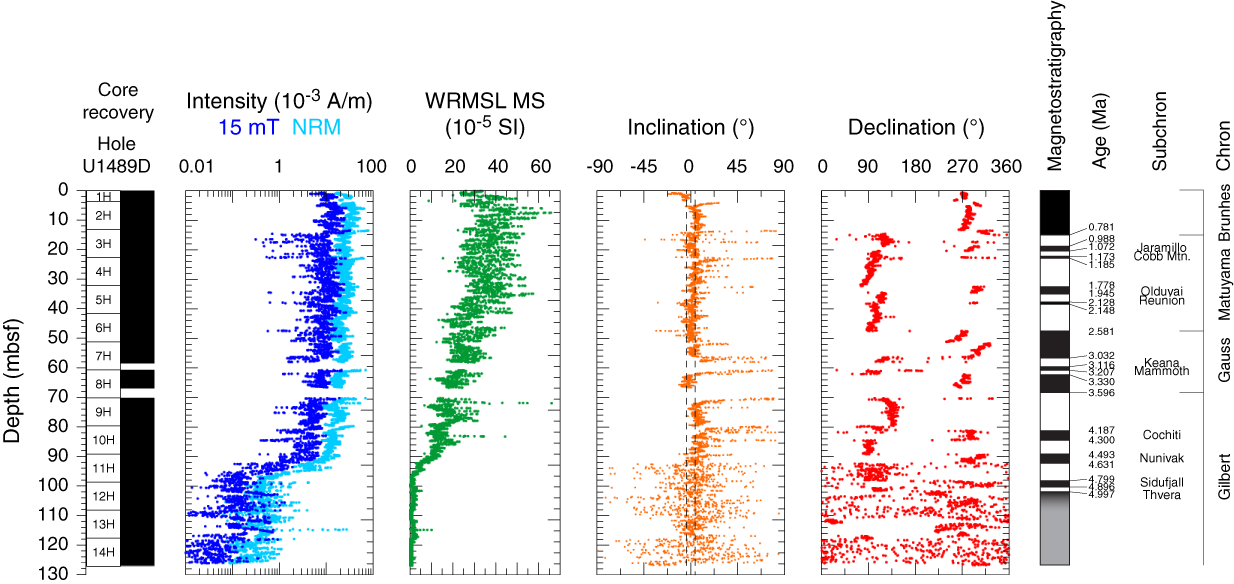
Figure F25. NRM, MS, inclination, and declination, Hole U1489D.
NRM intensity before and after 15 mT AF demagnetization, WRMSL magnetic susceptibility, and inclination and azimuthally corrected declination after 15 mT AF demagnetization are shown for Holes U1489B, U1489C, and U1489D in Figures F23, F24, and F25, respectively. Displayed inclination and declination values were cleaned of visibly disturbed intervals and voids (see Paleomagnetism in the Expedition 363 methods chapter [Rosenthal et al., 2018a]). Flux jumps on the y-axis superconducting quantum interference device (SQUID) of the superconducting rock magnetometer (SRM) were a common occurrence during measurement of the magnetically weak sediments below ~140 mbsf in Hole U1489C. The lack of plotted NRM and NRM15mT data in this interval reflects removal of these affected data from the displayed data set (Figure F24). Inclination and declination measured on discrete samples in the upper ~90 mbsf are generally in excellent agreement with those measured on the archive-half sections (Figures F23, F24). Below ~90 mbsf, discrete inclination is generally steeper and more negative than its SRM-measured counterpart. In the upper ~90 mbsf, SRM- and discrete-measured inclination plot around the expected values of ±4° for the site latitude assuming a geocentric axial dipole (GAD) field. Declination shows a similar, relatively stable pattern with data points clustering around values of inferred normal and reversed polarity. Below ~95 mbsf, inclination shows more scatter, with discrete values significantly steeper than a GAD-predicted field (Figure F24). Coupled with highly scattered declination values, decreased magnetic mineral concentration, and higher magnetic coercivity (Figures F21, F22, F24, F25), sediment diagenesis has likely severely altered the primary magnetic assemblage below ~100 mbsf at Site U1489; the paleogeomagnetic record is not interpretable in this deeper section.
Magnetostratigraphy
Sediments in the upper ~115 mbsf of Site U1489 appear to have been deposited (quasi)continuously with no major hiatuses; below ~115 mbsf, soft-sediment deformation results in a rapid acceleration of sedimentation rate and discontinuous sedimentation (see Core description and Biostratigraphy). Across Holes U1489B–U1489D we observed up to 22 coeval and distinct ~180° changes in declination downhole (Figures F23, F24, F25). Interpretation of these horizons as reversals of the geomagnetic field allows correlation to the geomagnetic polarity timescale (GPTS; Cande and Kent, 1995) of the geologic timescale (Hilgen et al., 2012) and assignment of age. The Matuyama/Brunhes boundary (0.781 Ma) is identified in Holes U1489B (11.9–11.95 mbsf) and U1489C (14.6–14.75 mbsf), the Gauss/Matuyama boundary (2.581 Ma) is identified in all three holes between 44.75 and 49.1 mbsf (note that this range encompasses the minimum and maximum mbsf depths across all three holes), and the Gilbert/Gauss boundary (3.596 Ma) is identified in Hole U1489C at 65.3–65.45 mbsf. The depths of all observed reversal horizons in each hole are listed in Table T9. The last observed reversal horizon before magnetic concentration reaches minimum values and the paleomagnetic data become increasingly scattered and uninterpretable is the upper boundary of the Thvera normal (C3n.3r; 4.997 Ma) at 100.425–101.125 mbsf in Hole U1489C and 101.625–101.8 mbsf in Hole U1489D (Table T9). The paleomagnetic reversals correlate well with the calcareous nannofossil and planktonic foraminifer datums (Figure F20). These data imply sedimentation rates of ~2 cm/ky for the Pliocene and Pleistocene.
Table T9. Identified reversal boundaries. Download table in CSV format.
Physical properties
Physical properties were measured on whole-round cores, split cores, and discrete samples from all holes drilled at Site U1489 to provide basic information for characterizing the core sections. Core 363-U1489A-1H missed the mudline, so Hole U1489A was terminated after only one core. Subsequently, gamma ray attenuation (GRA) bulk density and magnetic susceptibility were measured on all core sections for Holes U1489C and U1489D with the Special Task Multisensor Logger (STMSL) immediately after the cores were brought onboard to enable fast stratigraphic correlation between holes. Core sections were measured with the GRA bulk densitometer, the magnetic susceptibility loop, and the P-wave logger (PWL) on the WRMSL after equilibration. PWL measurements were discontinued after Cores 363-U1489C-31F and 363-U1489D-16X when XCB coring started because data became unreliable. As soon as possible, NGR was measured on all whole-round sections (10 cm resolution for Holes U1489A and U1489B and Cores 363-U1489C-8H through 42X and 363-U1489D-16X through 27X; 20 cm resolution on Cores 363-U1489C-1H through 7H and 363-U1489D-1H through 14H (see Physical properties in the Expedition 363 methods chapter [Rosenthal et al., 2018a]). Point-sensor magnetic susceptibility and color spectrophotometry (color reflectance) were measured on split-core sections using the Section Half Multisensor Logger. Discrete thermal conductivity was measured on whole-round sections for Cores 363-U1489B-1H through 14H and 363-U1489C-15H through 30F and on split core sections for Cores 363-U1489C-31F through 42X. Moisture and density (MAD) measurements were made on split-core sections from Cores 363-U1489B-1H through 14H and 363-U1489C-8H through 42X. Discrete P-wave measurements (z- and x-axes) were made using the P-wave caliper (PWC) system on the Section Half Measurement Gantry for Cores 363-U1489B-1H through 14H for both x-axis and z-axis, for Cores 363-U1489C-3H and 8H through 42X for the x-axis, and until Core 32F for the z-axis. Preconditioning treatments were applied to the records to aid in interpretation of noisy or spiky data (for details, see Physical properties in the Expedition 363 methods chapter [Rosenthal et al., 2018a]). All data shown in figures are from the preconditioned data sets. Tables presented in this section contain raw and treated data for NGR, WRMSL GRA bulk density, magnetic susceptibility, and P-wave velocity. Raw data for all data sets are available from the LIMS database.
GRA bulk density
GRA bulk density is generally reproducible across holes with the exception of some intervals disturbed by coring difficulties in Hole U1489B (see Operations; Table T10). Because Holes U1489C and U1489D are the deepest holes at this site, we use them as representative for description purposes (Figure F26; Tables T11, T12). GRA bulk density increases rapidly over the upper 8 mbsf from ~1.3 to ~1.55 g/cm3, similar to Site U1488. Between 8 and 220 mbsf, GRA bulk density increases from ~1.5 to ~1.8 g/cm3. Below 100 mbsf, 10 m scale variations of ~0.15 g/cm3 are superimposed upon the long-term downhole increasing trend. These variations co-vary with similar scale changes in P-wave velocity, with both GRA bulk density and P-wave velocity increasing downhole to 220 mbsf. These 10 m scale variations seem to correspond with the occurrence of thick homogeneous layers characterized by coarser grained foraminifer-rich sediments (see Core description). The variations in GRA bulk density and P-wave velocity could also relate to changes in sediment texture, although this relationship cannot be confirmed. Between 220 and 270 mbsf, GRA bulk density decreases to 1.5 g/cm3 with 10 m scale variations of ~0.15 g/cm3 superimposed. Below 270 mbsf, variability increases to ~0.30 g/cm3 with an average of ~1.65 g/cm3. Long-term variability is difficult to identify below 270 mbsf due to increased short-term variability, which coincides with the interval cored with the XCB system. As at Site U1488, the short-term variations in GRA bulk density do not generally correspond to sediment color variations (Figure F27).
Table T10. WRMSL GRA bulk density data, Hole U1489B. Download table in CSV format.
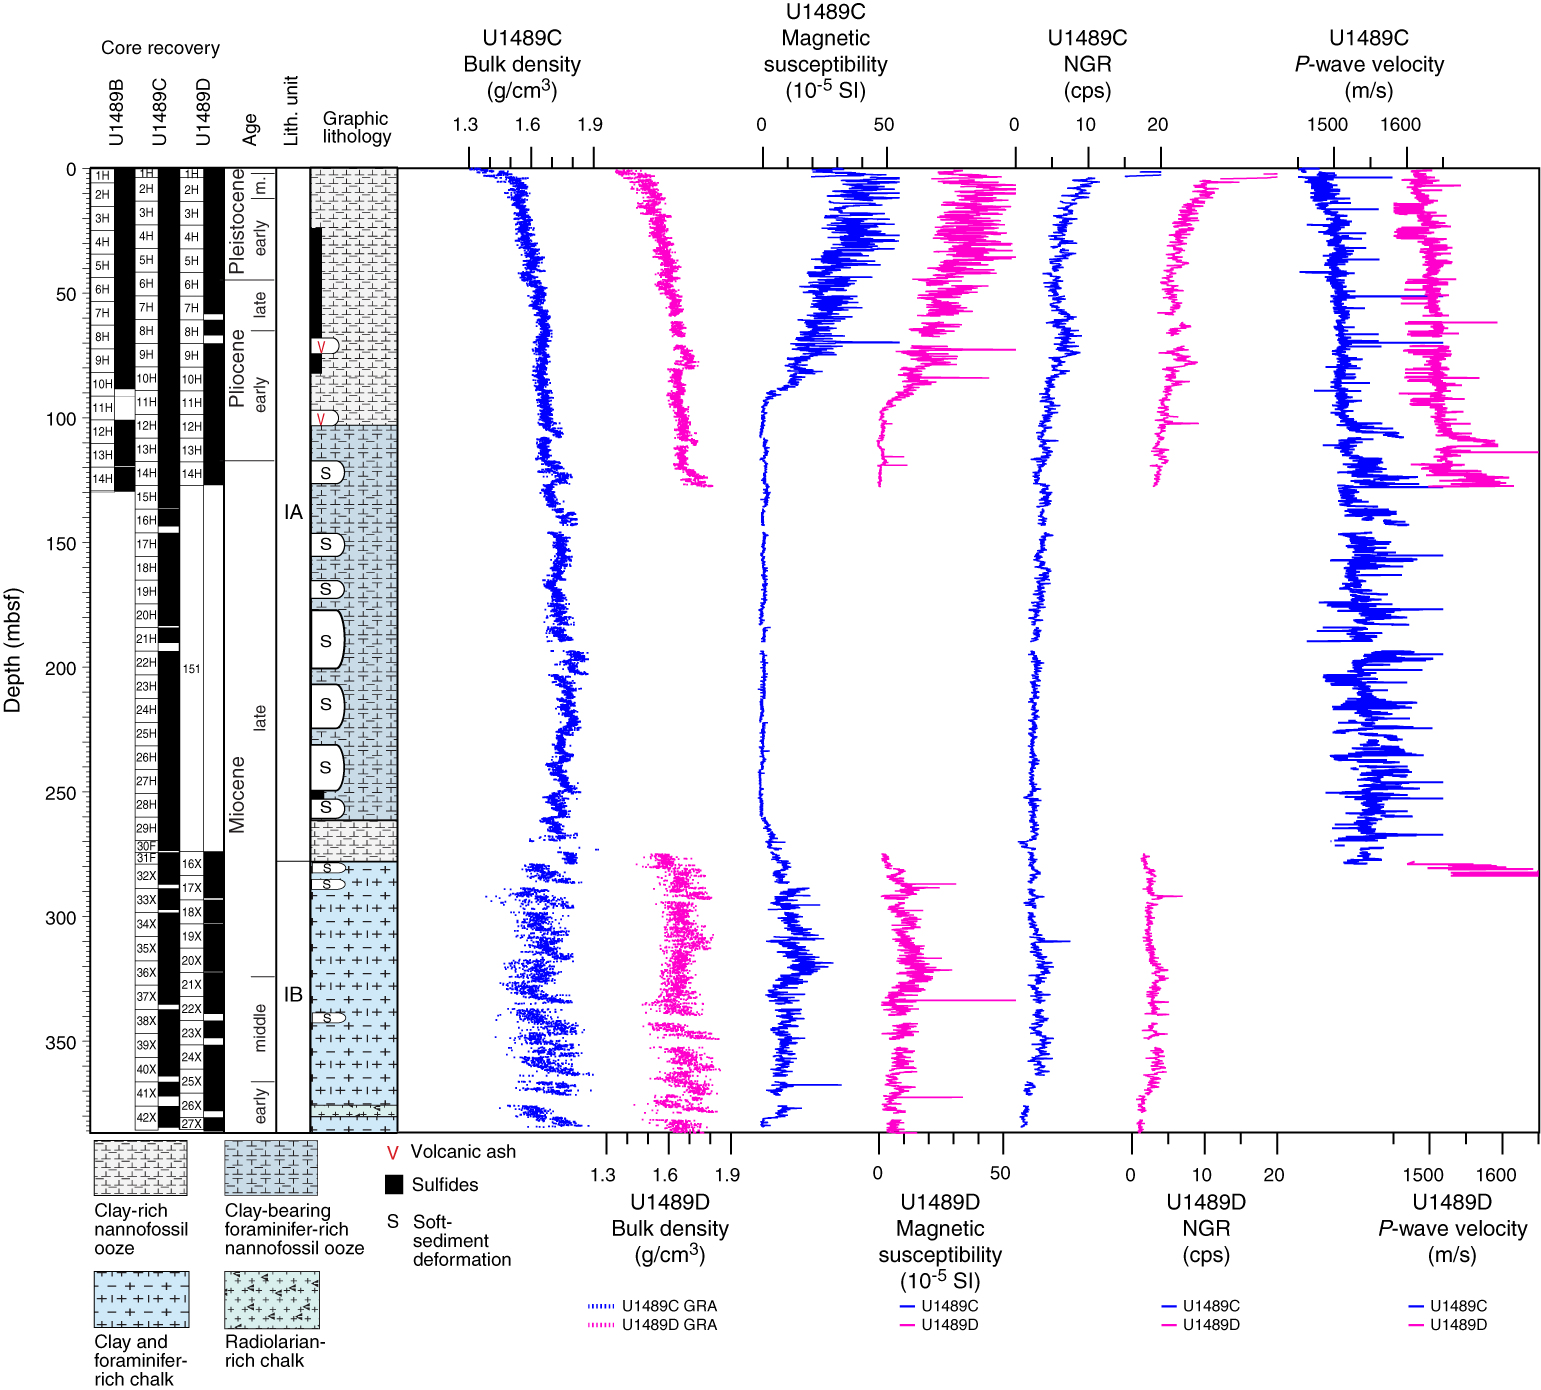
Figure F26. Physical property measurements.
Table T11. WRMSL GRA bulk density data, Hole U1489C. Download table in CSV format.
Table T12. WRMSL GRA bulk density data, Hole U1489D. Download table in CSV format.
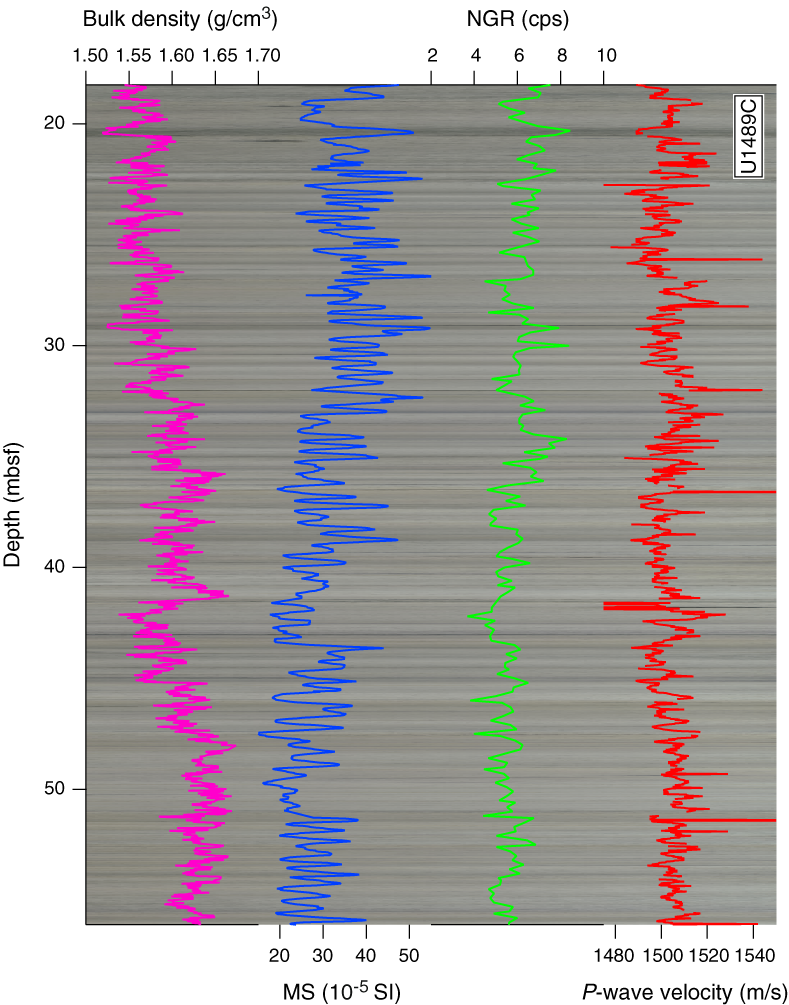
Figure F27. Bulk density, MS, NGR, and P-wave velocity overlaid on core photos.
Magnetic susceptibility
Magnetic susceptibility reproducibility is generally good among holes, although the magnetic susceptibility data from Hole U1489B are noisier, probably caused by sediment disturbance as a result of coring difficulties (see Operations) (e.g., Cores 363-U1489B-3H, 8H, and 11H through 14H). For description purposes, Holes U1489C and U1489D are used as representative (Figure F26; Tables T13, T14, T15). Magnetic susceptibility is ~30 × 10−5 SI near the seafloor, decreasing to ~20 × 10−5 SI between 0.5 and 0.6 mbsf. From 0.6 to 4 mbsf, magnetic susceptibility values increase to a maximum of 60 × 10−5 SI. Between 4 and 21 mbsf, average magnetic susceptibility decreases from ~40 × 10−5 to ~35 × 10−5 SI, with superimposed 1–3 m scale cyclicity, which correlates strongly with light–dark cycles in the sediment. At 21 mbsf, the dominant short-term cyclicity has distinct 0.4–0.6 m cycles, which become less distinct below ~60 mbsf but continue to ~88 mbsf. These high-frequency cycles co-vary with light–dark cycles in the sediment (Figure F27) and are superimposed on a decreasing downhole trend in magnetic susceptibility from ~35 × 10−5 to ~13 × 10−5 SI. The generally high magnetic susceptibility values over the upper ~100 mbsf correspond to lithologic Subunit IA. The highest magnetic susceptibility value for this site is also found within Subunit IA at ~70 mbsf, which corresponds to a tephra layer (see Core description). Between 88 and 94 mbsf, magnetic susceptibility decreases to 1.3 × 10⁻⁵ SI and remains low (0.1 × 10⁻⁵ ± 0.8 × 10⁻⁵ SI) to ~260 mbsf. At ~260 mbsf, magnetic susceptibility increases to a maximum of ~25 × 10−5 SI at ~319 mbsf and then decreases to ~5 × 10−5 SI by 330 mbsf. From 330 mbsf to the bottom of the hole (~385 mbsf), magnetic susceptibility values are ~7 × 10⁻⁵ ± 3 × 10⁻⁵ SI.
Table T13. WRMSL MS data, Hole U1489B. Download table in CSV format.
Table T14. WRMSL MS data, Hole U1489C. Download table in CSV format.
Table T15. WRMSL MS data, Hole U1489D. Download table in CSV format.
Natural gamma radiation
NGR reaches ~40 counts/s by 0.3 mbsf before rapidly decreasing to 10 count/s by 5 mbsf and then gradually decreasing further to ~5 counts/s by 54 mbsf. Between 54 and 84 mbsf, average NGR values increase slightly to 6 counts/s before decreasing to 2 counts/s at 300 mbsf (Figure F26; Tables T16, T17, T18). As at Site U1488, the decreasing NGR at Site U1489 probably reflects decreasing clay content and increasing carbonate content downhole (see Core description and Geochemistry). A maximum in NGR of 8 counts/s at 310 mbsf in Hole U1489C and at ~291 mbsf in Hole U1489D corresponds to a minimum in magnetic susceptibility (~2 × 10⁻⁵ SI). These coeval extreme values in NGR and magnetic susceptibility coincide with fracture arrays observed by the sedimentologists in Sections 363-U1489C-35X-2 and 363-U1489D-17X-5 (see Core description). It is unclear why high NGR and low magnetic susceptibility coincide with these fractures because other fracture arrays occur without a comparable change in NGR or magnetic susceptibility. Between 310 and 360 mbsf, mean NGR values are ~3 count/s, dropping to <1 count/s between 360 mbsf and the base of the hole. Although short-term 1–3 m variations in NGR are not strong, they are in phase with magnetic susceptibility and color variations, with higher NGR and magnetic susceptibility occurring in darker layers. This relationship is particularly prevalent in the upper 90 mbsf (Figure F27) and between 290 and 370 mbsf.
Table T16. NGRL data, Hole U1489B. Download table in CSV format.
Table T17. NGRL data, Hole U1489C. Download table in CSV format.
Table T18. NGRL data, Hole U1489D. Download table in CSV format.
P-wave velocity
Measurements of PWL P-wave velocity were carried out for all holes at Site U1489. Because Holes U1489B and U1489C have continuous records with corresponding discrete samples, the PWL velocity data from these holes are used as representative for description purposes. PWL velocity data from Holes U1489B and U1489C increase downhole from 1480 to 1500 m/s over the upper 20 mbsf and from 1500 to 1520 m/s for the interval between 20 and 100 mbsf (Figure F28; Tables T19, T20, T21). Deeper than 100 mbsf, P-wave velocity shows ~10 m scale cycles, similar to those observed in GRA bulk density (Figure F26). In Hole U1489C, these ~10 m cycles start in Core 363-U1489C-12H and correspond to intervals of soft-sediment deformation (see Core description). In particular, these cycles, also observed in GRA density, occur in thick homogeneous layers containing coarser grained foraminifer-rich sediment.
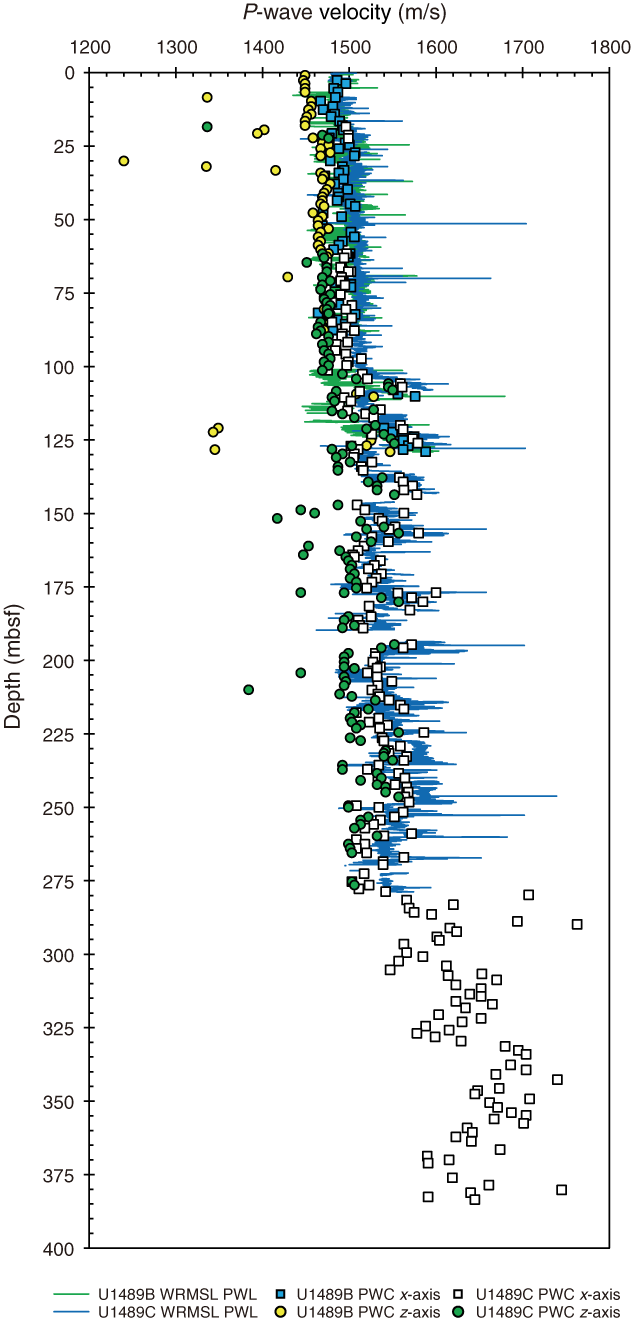
Figure F28. P-wave velocity measurements.
Table T19. WRMSL PWL data, Hole U1489B. Download table in CSV format.
Table T20. WRMSL PWL data, Hole U1489C. Download table in CSV format.
Table T21. WRMSL PWL data, Hole U1489D. Download table in CSV format.
In general, PWC x-axis measurements reproduce the PWL measurements for both holes (Figure F28). PWC x-axis measurements extend the P-wave velocity record in Hole U1489C through the XCB cores, which exhibit distinctively high values mainly >1600 m/s, possibly caused by increased induration of the sediment. Below 100 mbsf, the 10 m scale variations observed in the PWL P-wave velocity and GRA bulk density records from Hole U1489C are also mostly captured in the PWC x- and z-axis P-wave velocity data. The PWC z-axis velocity record includes some outliers with velocities <1440 m/s for the upper 100 mbsf and <1480 m/s deeper than 100 mbsf.
Moisture and density
Dry density, bulk density, and grain density curves show opposing trends to porosity in Holes U1489B and U1489C (Figure F29). Discrete MAD samples were measured in Hole U1489B for the upper ~130 mbsf and in Hole U1489C from ~70 mbsf to the bottom of the hole (~375 mbsf). Where measurements were obtained in both Holes U1489B and U1489C, the data show good reproducibility with the exception of the interval from Core 3H (~22–24 mbsf), which was affected by coring disturbance in both holes (yellow box in Figure F29) (see Operations).
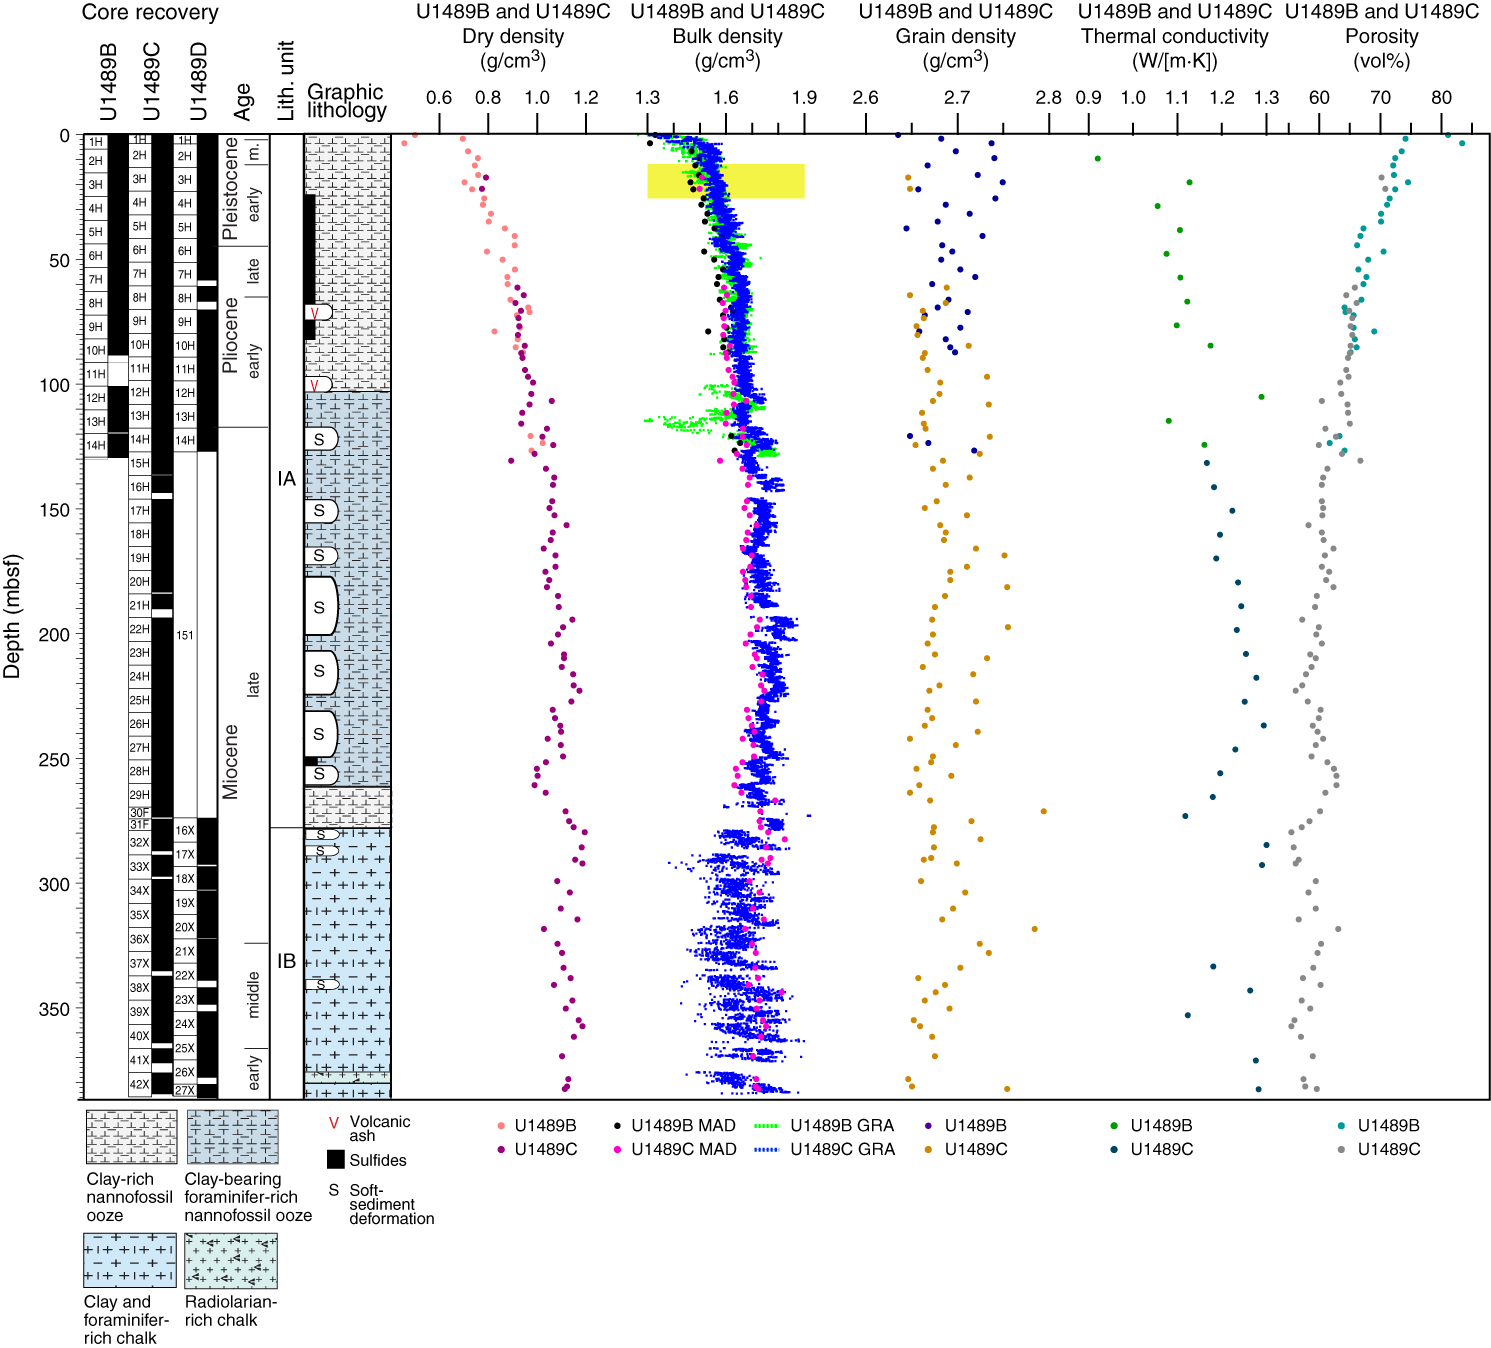
Figure F29. MAD densities and porosity, GRA bulk density, and thermal conductivity.
The trends and variations in MAD and GRA bulk densities correspond well to each other, although MAD bulk density is offset from GRA bulk density by ~0.05 g/cm3 in the upper 270 mbsf, comparable to the offset seen at Site U1488. Deeper than 270 mbsf (lithologic Subunit IB), the variability in GRA bulk density increases and MAD bulk density values correspond to the highest GRA bulk density values. As this interval consisted of indurated sediment cored with the XCB system, MAD bulk density probably reflects true bulk density, whereas GRA bulk density underestimates it because values were not corrected for the smaller diameter of XCB cores (see Physical properties in the Site U1482 chapter and Physical properties in the Expedition 363 methods chapter [Rosenthal et al., 2018b, 2018a]).
Following the same general trend as GRA and MAD bulk density, dry density increases from ~0.7 g/cm3 just below the mudline to 1.2 g/cm3 at 265 mbsf in Hole U1489C and then remains stable at ~1.2 g/cm3 from 265 mbsf to the base of the hole. This higher density could correspond to a change in sediment compaction or lithification or potentially reflect a lithologic change shortly after XCB coring commenced. In general, porosity shows a decreasing trend with depth from 75% to 50%, whereas dry density increases with depth; this is similar to the relationship between porosity and density observed at previous sites and is associated with the compaction effect. The decreasing downhole trend in porosity is more variable below 265 mbsf, coincident with the strongest changes in dry and bulk density. Grain density at Site U1489 has an average of ~2.7 g/cm3 and ranges from 2.63 to 2.77 g/cm3 deeper than 265 mbsf with no downhole trend.
Thermal conductivity
A thermal conductivity profile (Figure F29) was obtained at ~10 m resolution using a needle probe for the upper ~280 mbsf (Cores 363-U1489B-1H through 14H and Core 363-U1489C-15H through 30F. When the recovered material became indurated at ~280 mbsf (Core 363-U1489C-31F), a puck probe was used on split core sections (see Physical properties in the Expedition 363 methods chapter [Rosenthal et al., 2018a]). Thermal conductivity increases with depth from ~0.9 W/(m·K) at the seafloor to 1.3 W/(m·K) at ~265 mbsf, with an average value of 1.17 W/(m·K). From 265 mbsf to the bottom of the hole, values are more variable, with a relatively high average of ~1.3 W/(m·K). The relatively high thermal conductivity below ~280 mbsf corresponds to the interval where the sediment became too indurated and the puck method was required. However, because the increase occurred between two consecutive needle probe measurements, it most likely reflects a change in thermal conductivity caused by a change in the lithification of the sediment instead of an increase caused by different measurement methods. Thermal conductivity correlates with dry density and is inversely correlated with porosity (Figure F29) due to compaction. As at Site U1488, thermal conductivity exhibits a trend similar to that of luminosity (L*).
Downhole temperature measurements
Four downhole temperature measurements were collected using the advanced piston corer temperature tool (APCT-3) on Cores 363-U1489B-4H (34.2 mbsf), 7H (62.7 mbsf), 10H (91.2 mbsf), and 12H (110.2 mbsf). The downhole temperature values are generally very low: 2.57°–5.2°C (Figure F30A). Because of one anomalous measurement (Core 12H) and uncertainty regarding two others (Cores 4H and 7H), we collected additional downhole temperature measurements in Hole U1489D on Cores 363-U1489D-4H (32.2 mbsf), 7H (60.7 mbsf), 10H (89.2 mbsf), and 13H (117.7 mbsf). Temperature values are relatively low, with temperatures ranging from 2.51° to 4.16°C, which confirm the measurements obtained in Hole U1489B (Figure F30B). An exponential decrease in temperature was observed between 60 and 600 s after penetration and was used to estimate ambient temperature (unshaded area in Figure F30). The reproducibility in both profiles is good except for Core 363-U1489B-12H, which shows disturbance and was overestimated (Figures F30A, F31A). Because values in Hole U1489D remain more stable and show a very good correlation between the four downhole temperatures and depth (R2 = 0.997), all subsequent calculations were made using the Hole U1489D downhole temperature measurements.

Figure F30. Heat flow calculations.
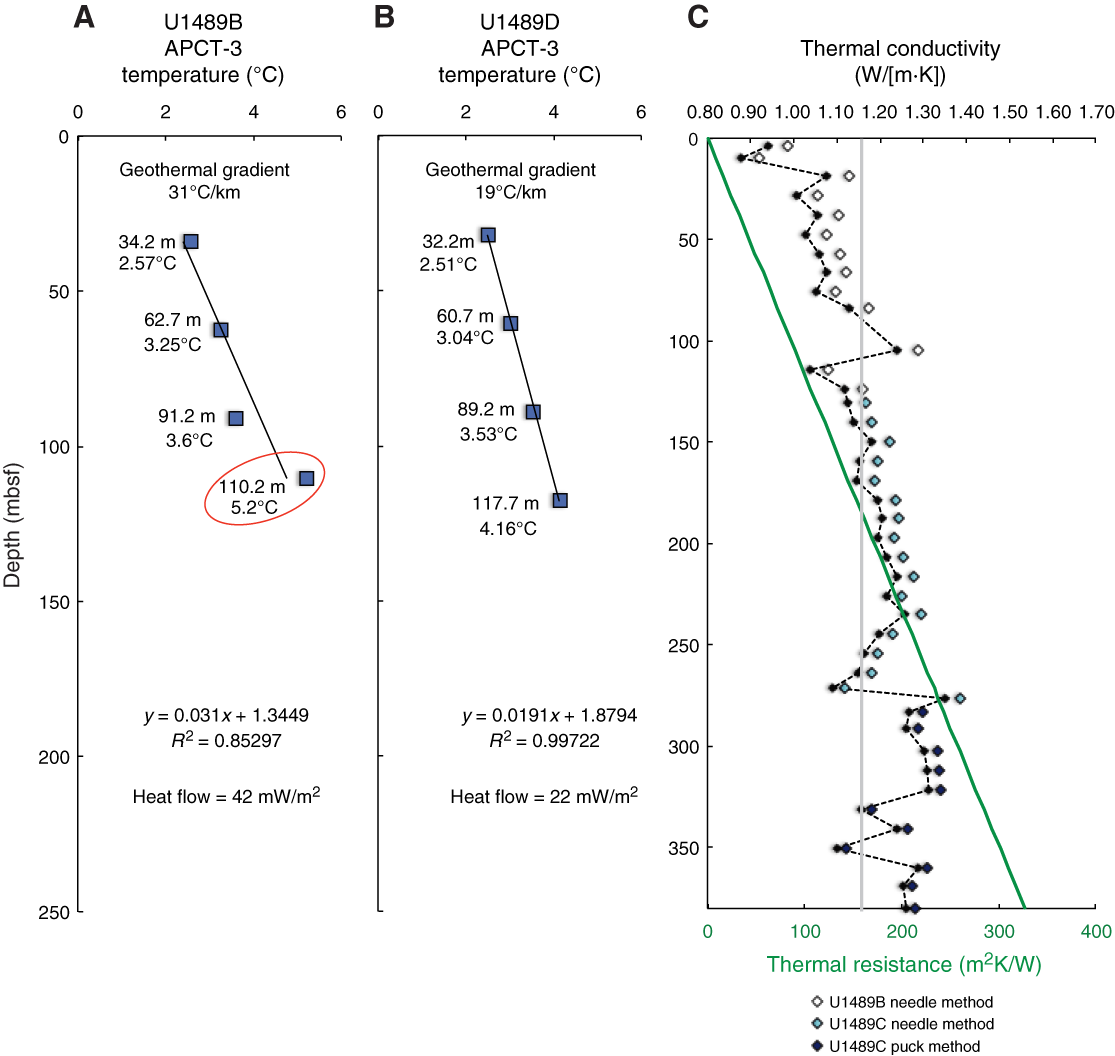
Figure F31. APCT-3 temperature-time series.
Using the slope of the temperature-depth relationship, we estimate that the bottom water temperature in Hole U1489D is 1.88°C, yielding a geothermal gradient of 19°C/km (Figure F31B). We generated a thermal conductivity profile with a resolution of ~10 m (Figure F31C) and calculated thermal resistance and an average corrected thermal conductivity of 1.17 W/(m·K) in Hole U1489D following the “average approach” outlined in Pribnow et al. (2000). The corrected thermal conductivity is lower than uncorrected values with an offset of ~0.04 W/(m·K) at the top and a decreasing offset with depth. The slope of the linear fit between temperature and thermal resistance indicates a heat flow of 22 mW/m2 at Site U1489. As at Site U1488, the classic approach for calculating the ocean-crust age is inappropriate. The observed conductive heat flow in such areas must therefore be adjusted upward to be indicative of the true crustal heat flow; however, this calculation was not performed here.
Stratigraphic correlation
Correlations between holes at Site U1489 were accomplished using Correlator software (version 2.1). Tie points were established mainly using WRMSL magnetic susceptibility data (Figure F32; Table T22). In addition, we used WRMSL GRA bulk density and PWL data, NGR data, and luminosity (L*) data. We constructed a splice for the site using Holes U1489A, U1489B, U1489C, and U1489D (Table T23; Figures F32, F33). The splice is continuous and well constrained from 0 to 140.95 m core composite depth below seafloor (CCSF). There is an interval from 140.95 to 305.70 m CCSF without a splice because it was recovered only in Hole U1489C. In Hole U1489D, there was a drilled interval with no recovery from 137.87 to 305.70 m CCSF, which was followed by coring below that depth over the same interval cored in Hole U1489C. This allowed us to construct a splice from 305.70 to 371.25 m CCSF using cores from Holes U1489C and U1489D, although there are tentative tie points (Table T22) that should be verified during postcruise research. Below the bottom of the splice (371.25 m CCSF), core offsets from Hole U1489C were set using a growth factor, and several cores in Hole U1489D could be tied to Hole U1489C, as explained below.
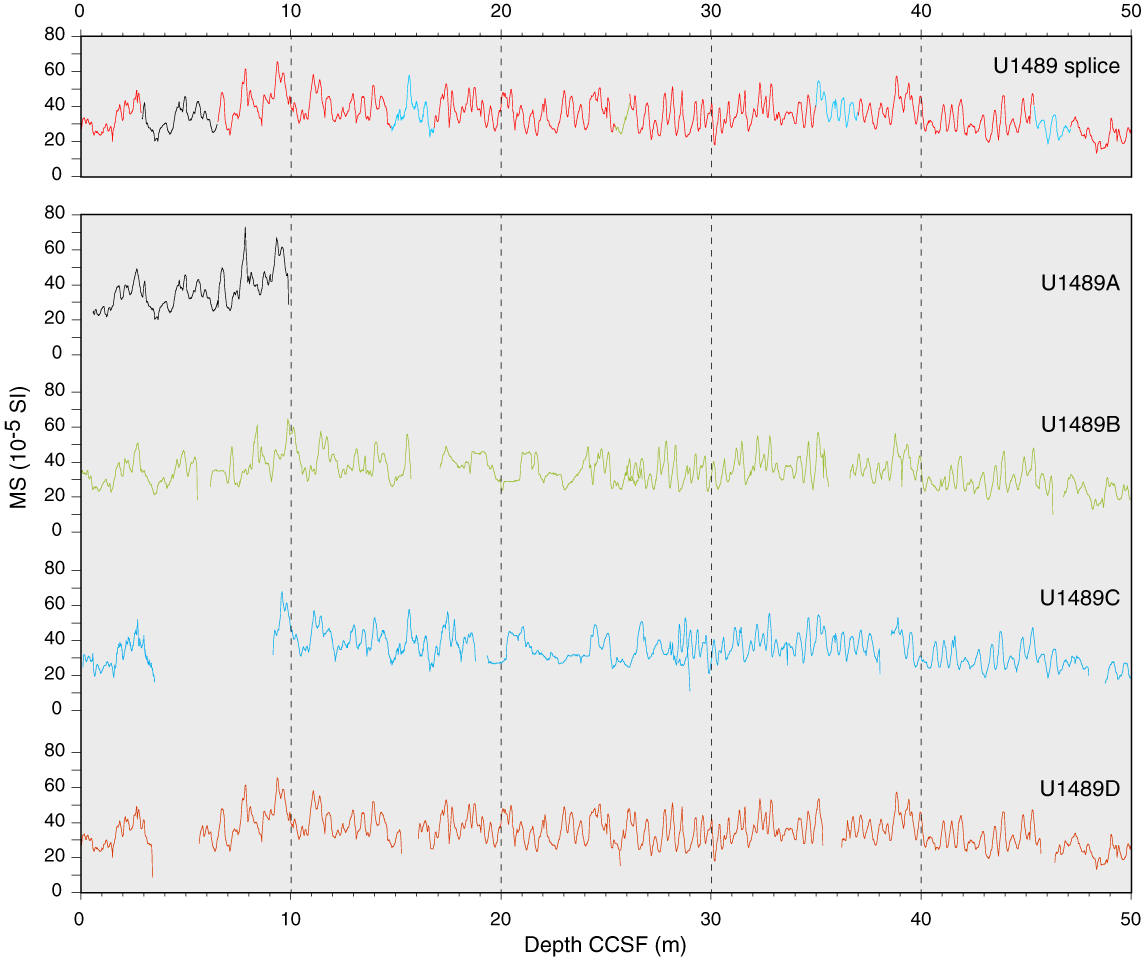
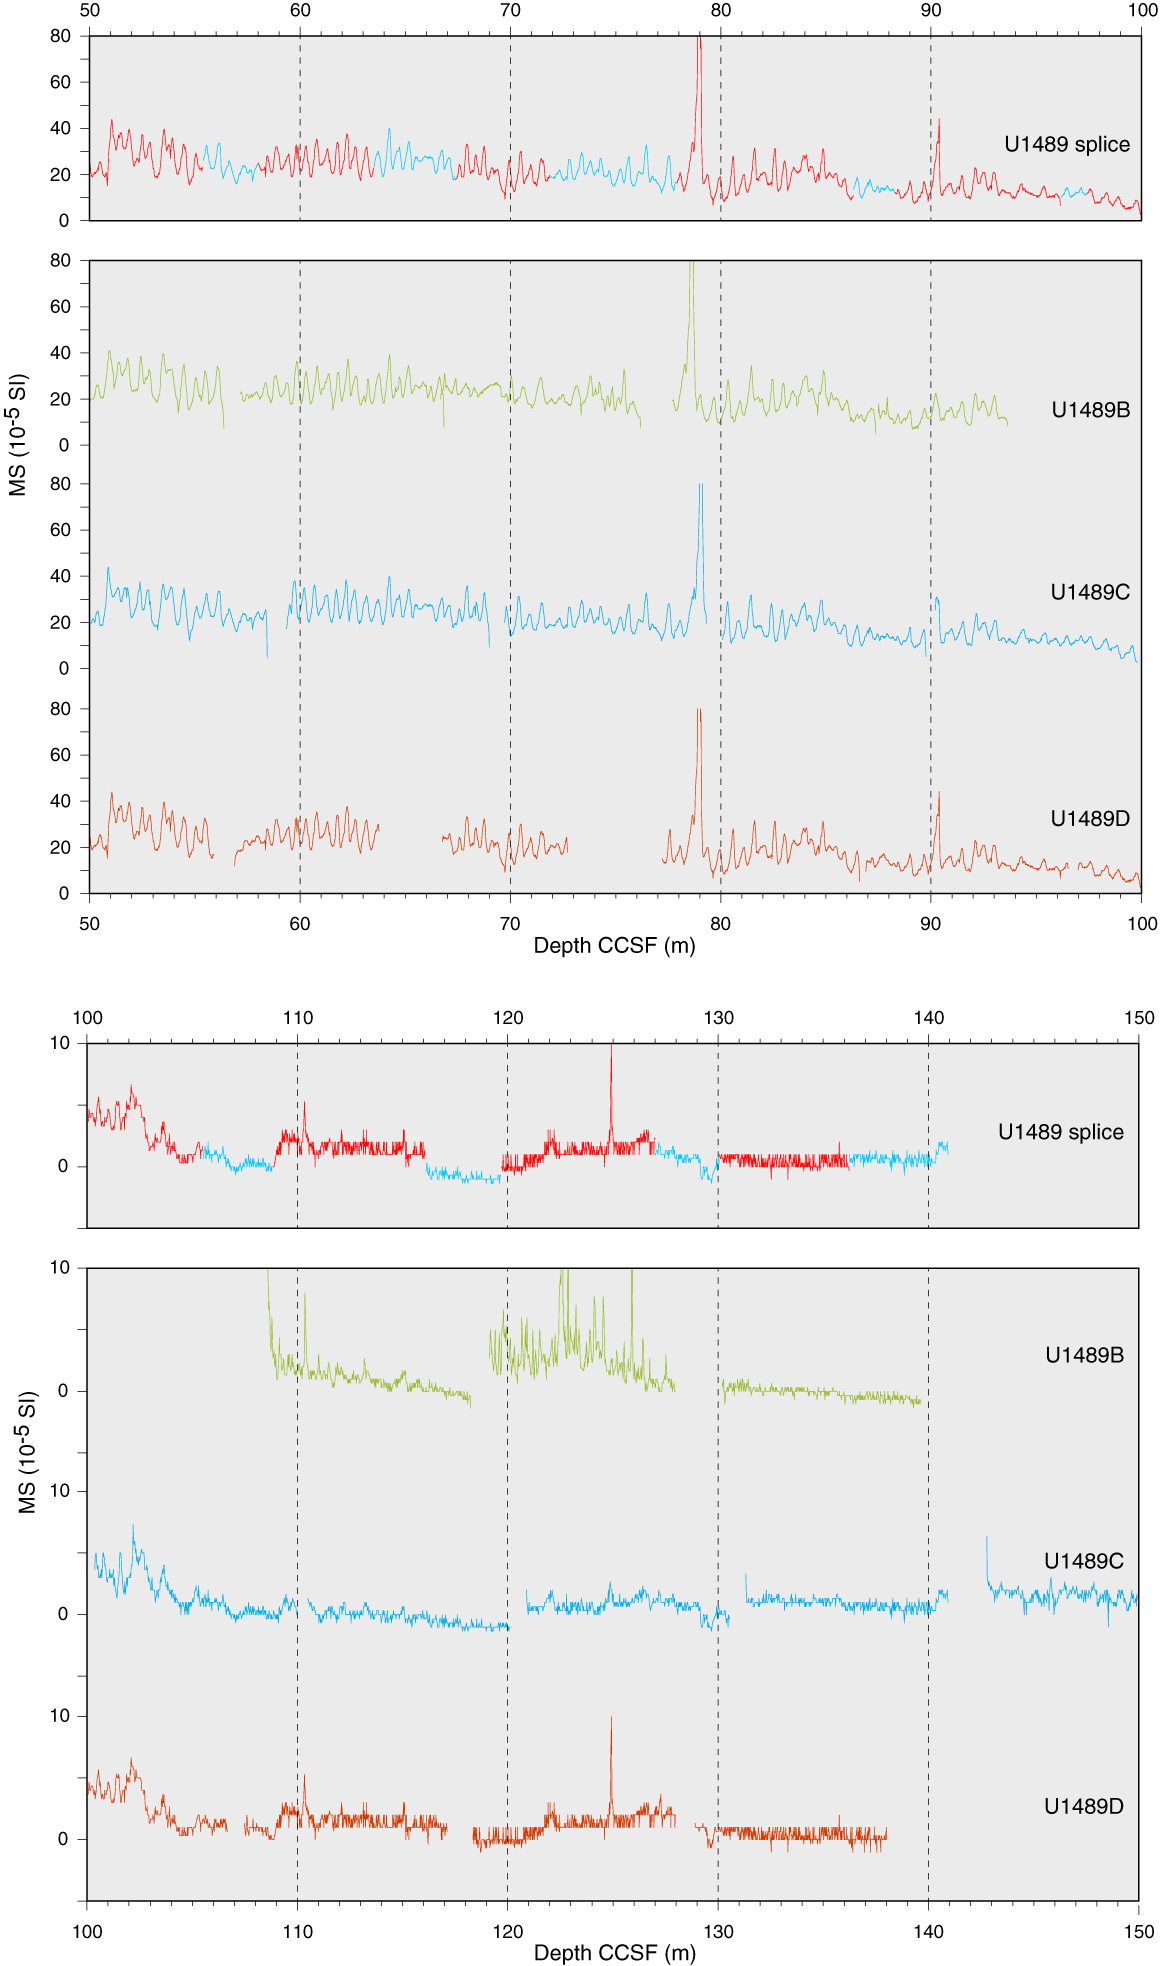
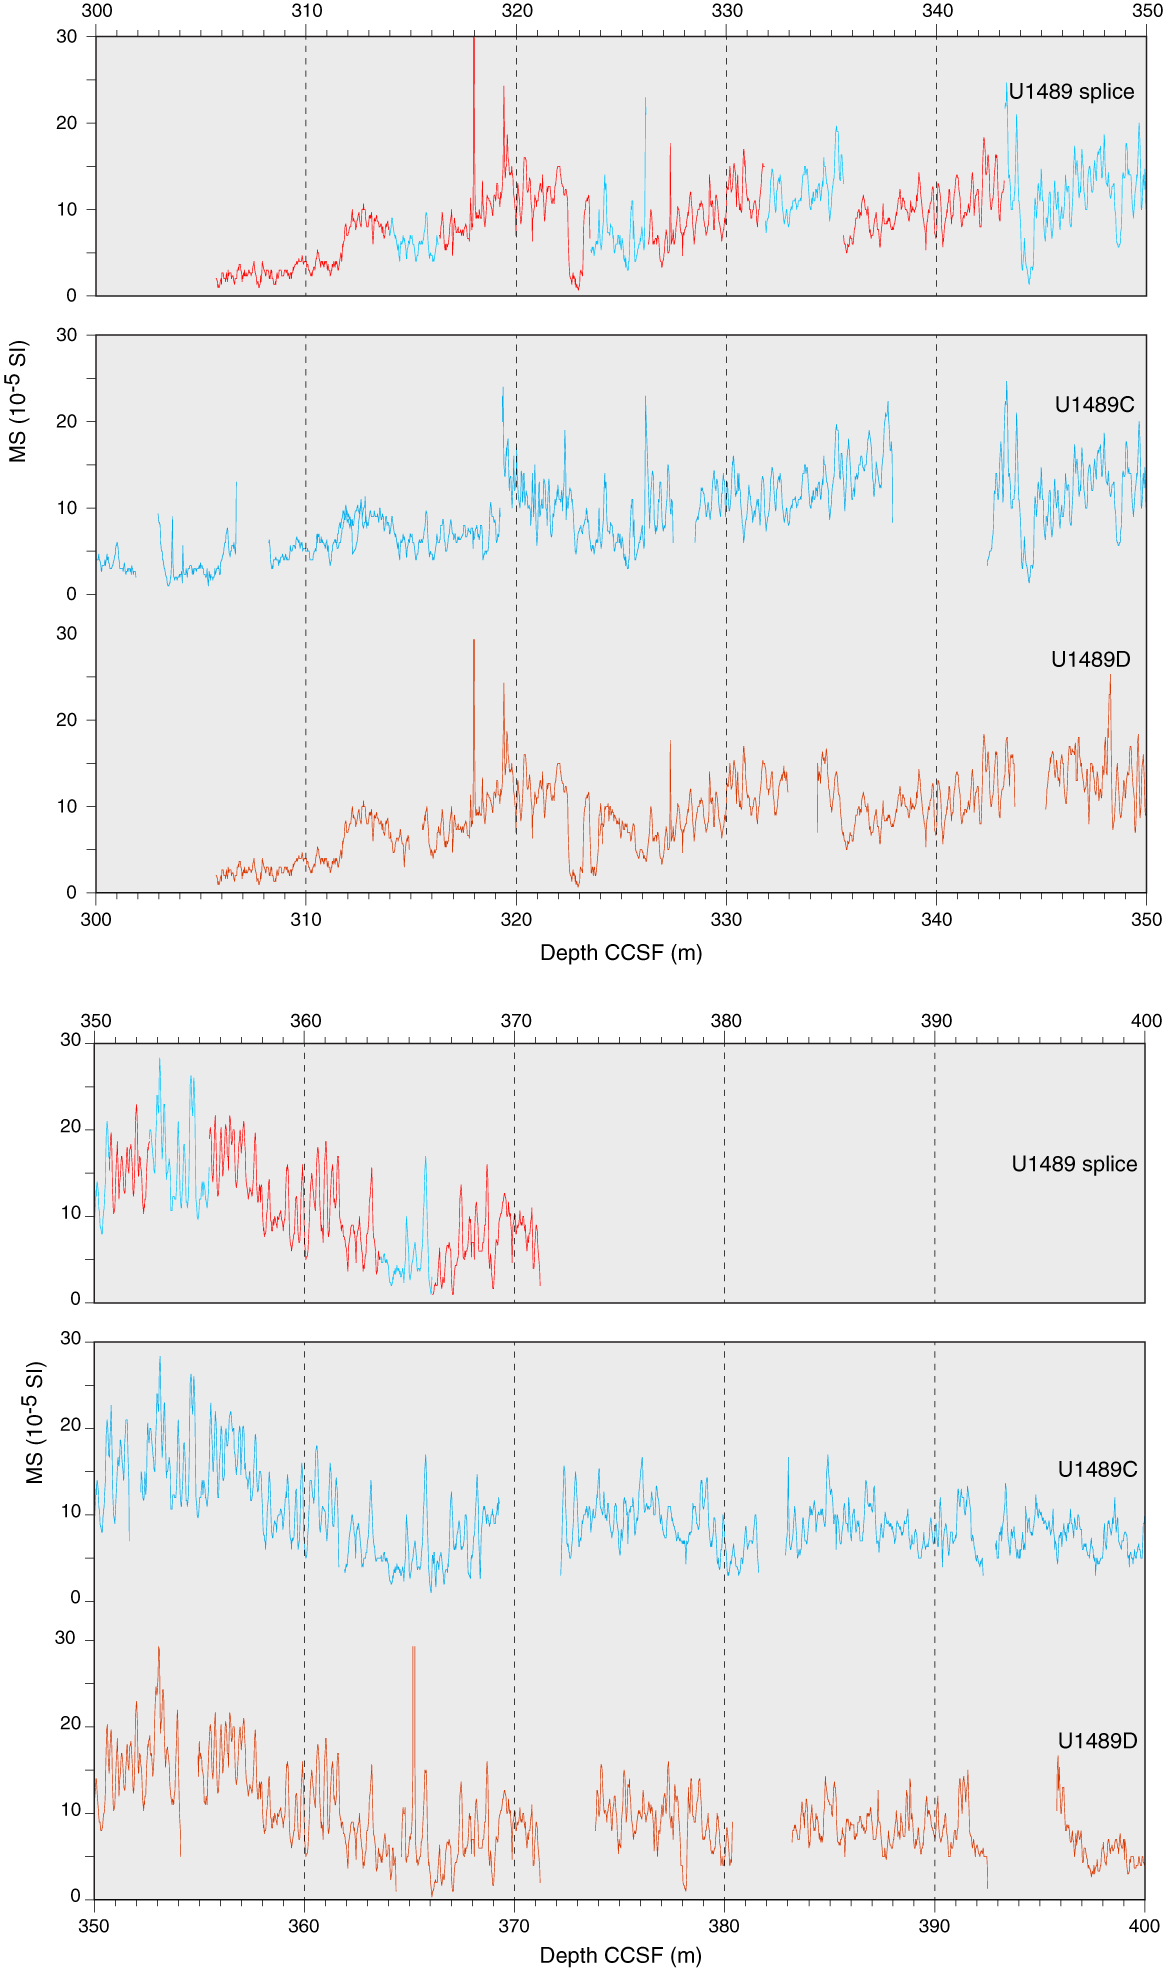
Figure F32. WRMSL MS data.
Table T22. Affine table. Download table in CSV format.
Table T23. Splice interval. Download table in CSV format.
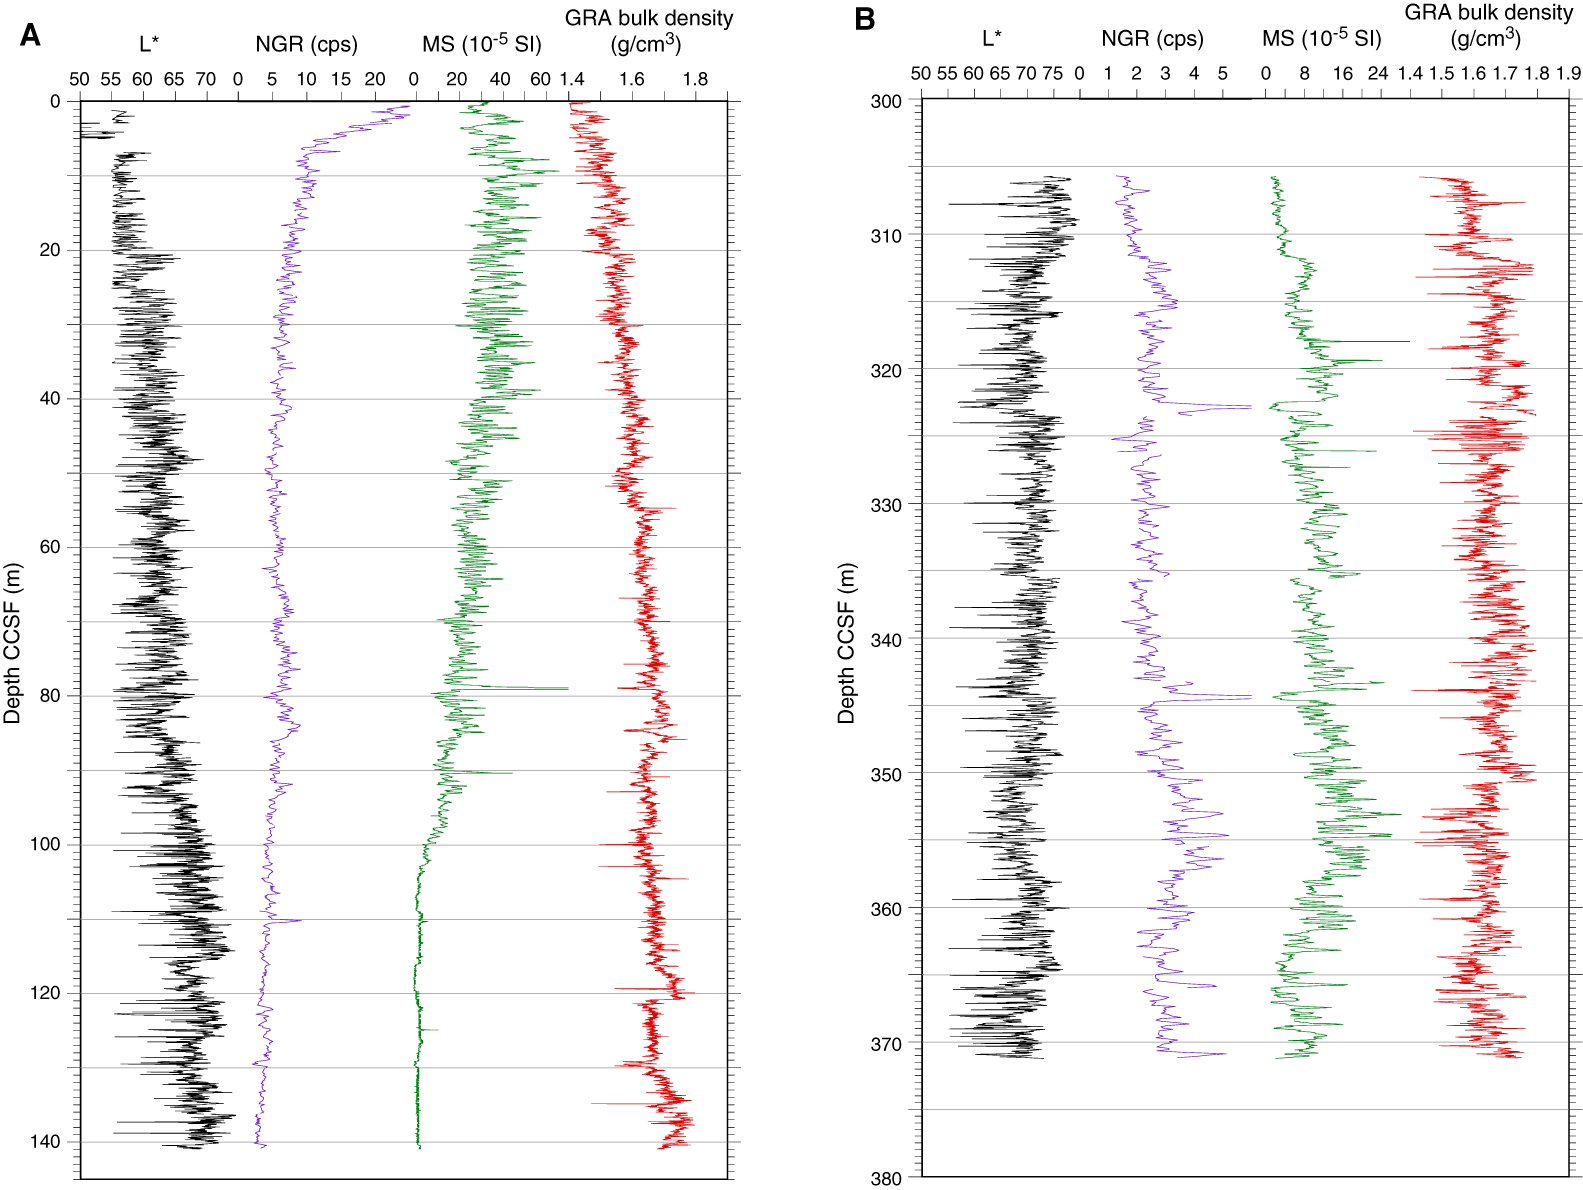
Figure F33. Spliced L*, NGR, MS, and GRA bulk density data.
The CCSF scale is anchored to the mudline of Core 363-U1489D-1H, which is assigned a depth of 0 m CCSF. From this anchor, we worked downhole, using Correlator to establish a composite stratigraphy on a core-by-core basis. In the upper part of the splice we primarily used magnetic susceptibility to establish tie points; however, the amplitude of the magnetic susceptibility variations greatly diminished below about 100 m CCSF, and GRA bulk density, PWL, L*, and NGR data were needed to correlate between holes (Tables T22, T23).
Hole U1489B, which spans the interval from 0 to ~129 mbsf (equivalent to 0 to ~140 m CCSF), was heavily sampled (one 5 or 10 cm whole-round sample per section) for high-resolution interstitial water analysis, so our general approach was to avoid using material from Hole U1489B. In the upper spliced interval (0–140.95 m CCSF), we used cores from Hole U1489D as the “backbone” of the splice and then used smaller intervals from Hole U1489C to cover the core gaps in Hole U1489D. However, because of coring disturbance in Core 363-U1489C-3H, we decided not to include it in the splice and had to use a small portion of Core 363-U1489B-3H instead. In addition, core gaps resulting from poor recovery in Cores 363-U1489D-7H and 8H were covered by large portions of Cores 363-U1489C-7H and 8H (Table T22; Figure F32).
From 140.95 to 305.70 m CCSF, the interval in which cores were recovered only in Hole U1489C, core offsets were determined using 1.124, the average growth factor of Cores 363-U1489C-10H through 14H, which are part of the overlying spliced interval. We applied this same growth factor to Cores 363-U1489C-15H through 31F. The offset for Core 363-U1489D-16X, the first core recovered after drilling down to 274 mbsf in Hole U1489D, was determined by correlating it to Core 363-U1489C-31F. Thus, the top of Core 363-U1489D-16X is the top of the second spliced interval that extends from 305.70 to 371.25 m CCSF. The tie points between holes used to construct the splice in this interval were very difficult to determine. Magnetic susceptibility and L* were primarily used to determine the tie points in this interval, although NGR and GRA bulk density were helpful in some intervals. Several of the tie points are tentative (Table T22) and should be verified during postcruise research. Below 371.25 m CCSF, which is the bottom of Core 363-U1489D-22X, there are core gaps, and thus this depth marks the bottom of the spliced interval. Offsets for cores below 371.25 m CCSF were determined as follows: offsets for Cores 363-U1489C-38X through 42X were determined using a growth factor of 1.104, which is the growth factor of Core 363-U1489C-37X. The offsets for Cores 363-U1489D-23X through 27X were determined by correlating them to Cores 363-U1489C-38X through 42X.
The splice interval table (Table T23) is intended to provide a sampling plan that can be used to generate high-resolution continuous records with minimal gaps; however, an “off-splice” sampling plan was also designed, mainly for low-resolution studies. An explanation of the strategy used to determine the off-splice sampling plan and a table of core intervals that should be used for off-splice sampling can be found in OFFSPLICE in Supplementary material.
The cumulative offset between mbsf and CCSF depth scales is nearly linear (Figure F34A). The growth factor is relatively low (8%–9%), as expected in sediment that expands due to the release of overburden and has minimal gas expansion due to low concentrations of methane and other gases (see Geochemistry). There are marked changes in the growth factor, and therefore in the cumulative offset with depth (Figure F34B), in the interval cored with the XCB system deeper than ~274 mbsf. These changes are probably due to soft-sediment deformation rather than coring (see Core description), which caused hole-to-hole differences in the thickness of sediment packages. Calculation of mass accumulation rates based on the CCSF scale should account for differential expansion by dividing apparent depth intervals by the appropriate growth factor.
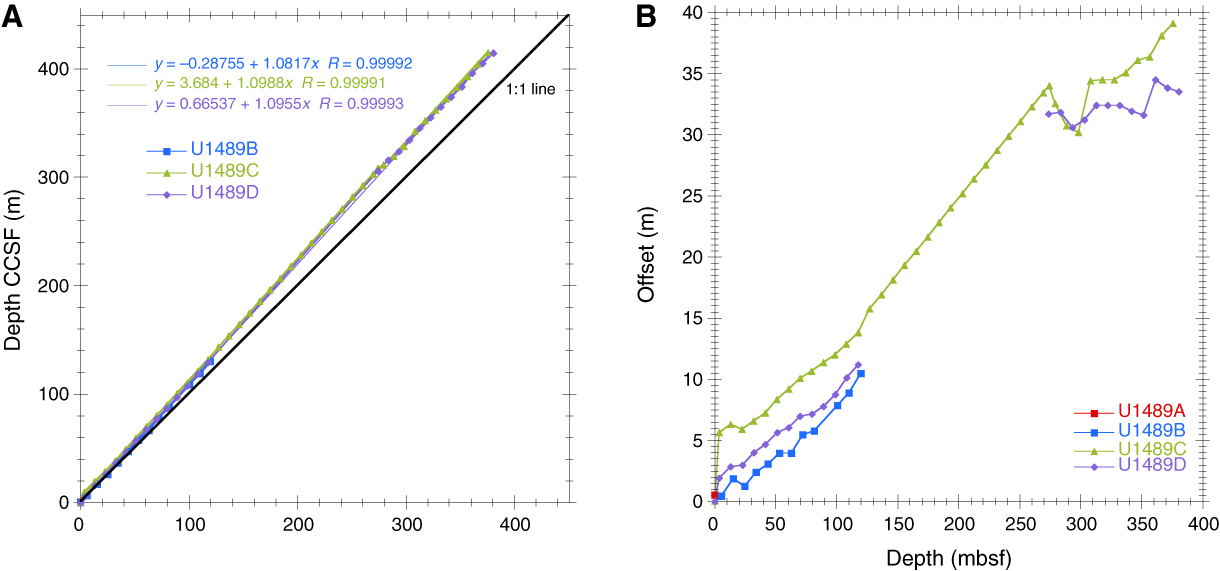
Figure F34. Mbsf and composite depth scales in the Site U1489 splice.
Geochemistry
Site U1489 was drilled on the western flank of the Eauripik Rise in the Caroline Basin at a water depth of 3421 m, ~81 km west-northwest of Site U1488. High-resolution interstitial water sampling was conducted in the upper ~82 mbsf at this site with the goal of reconstructing chlorinity (Cl) and δ18O profiles of the Lower Circumpolar Deepwater (LCDW) during the LGM. The interstitial water profiles are largely controlled by carbonate diagenesis with a minor influence of organic matter remineralization apparent in the uppermost 50 mbsf. Preliminary shipboard Cl measurements suggest that reconstruction of the salinity of the LCDW will be possible with the samples collected at this site. For detailed background on organic matter remineralization and clay mineral alteration, see Geochemistry in the Site U1482 chapter (Rosenthal et al., 2018b). Carbonate (CaCO3) content ranges from 50 to >90 wt% with an average of 82 wt%. Total organic carbon (TOC) is low (average = 0.14 wt%) and varies between 0 and 0.8 wt%. Because total nitrogen (TN) is close to the detection limit, the C/N ratio estimates are considered to be unreliable and therefore are excluded from this report.
Results
Volatile hydrocarbons
Headspace gas samples were taken at a frequency of one sample per core in Holes U1489B and U1489C as part of the routine environmental protection and safety-monitoring program (Table T24; Figure F35). Overall, methane concentration is low (<9 ppmv) throughout Holes U1489B and U1489C, consistent with the elevated concentration of dissolved sulfate (SO4) throughout the entire hole (see Sulfate and barium); however, the methane profile exhibits a downhole increasing trend, suggesting increased production and/or decreased consumption in the lower part of the hole. Ethane and propane are below detection limit, suggesting a biogenic origin of methane.
Table T24. Volatile hydrocarbon concentrations. Download table in CSV format.
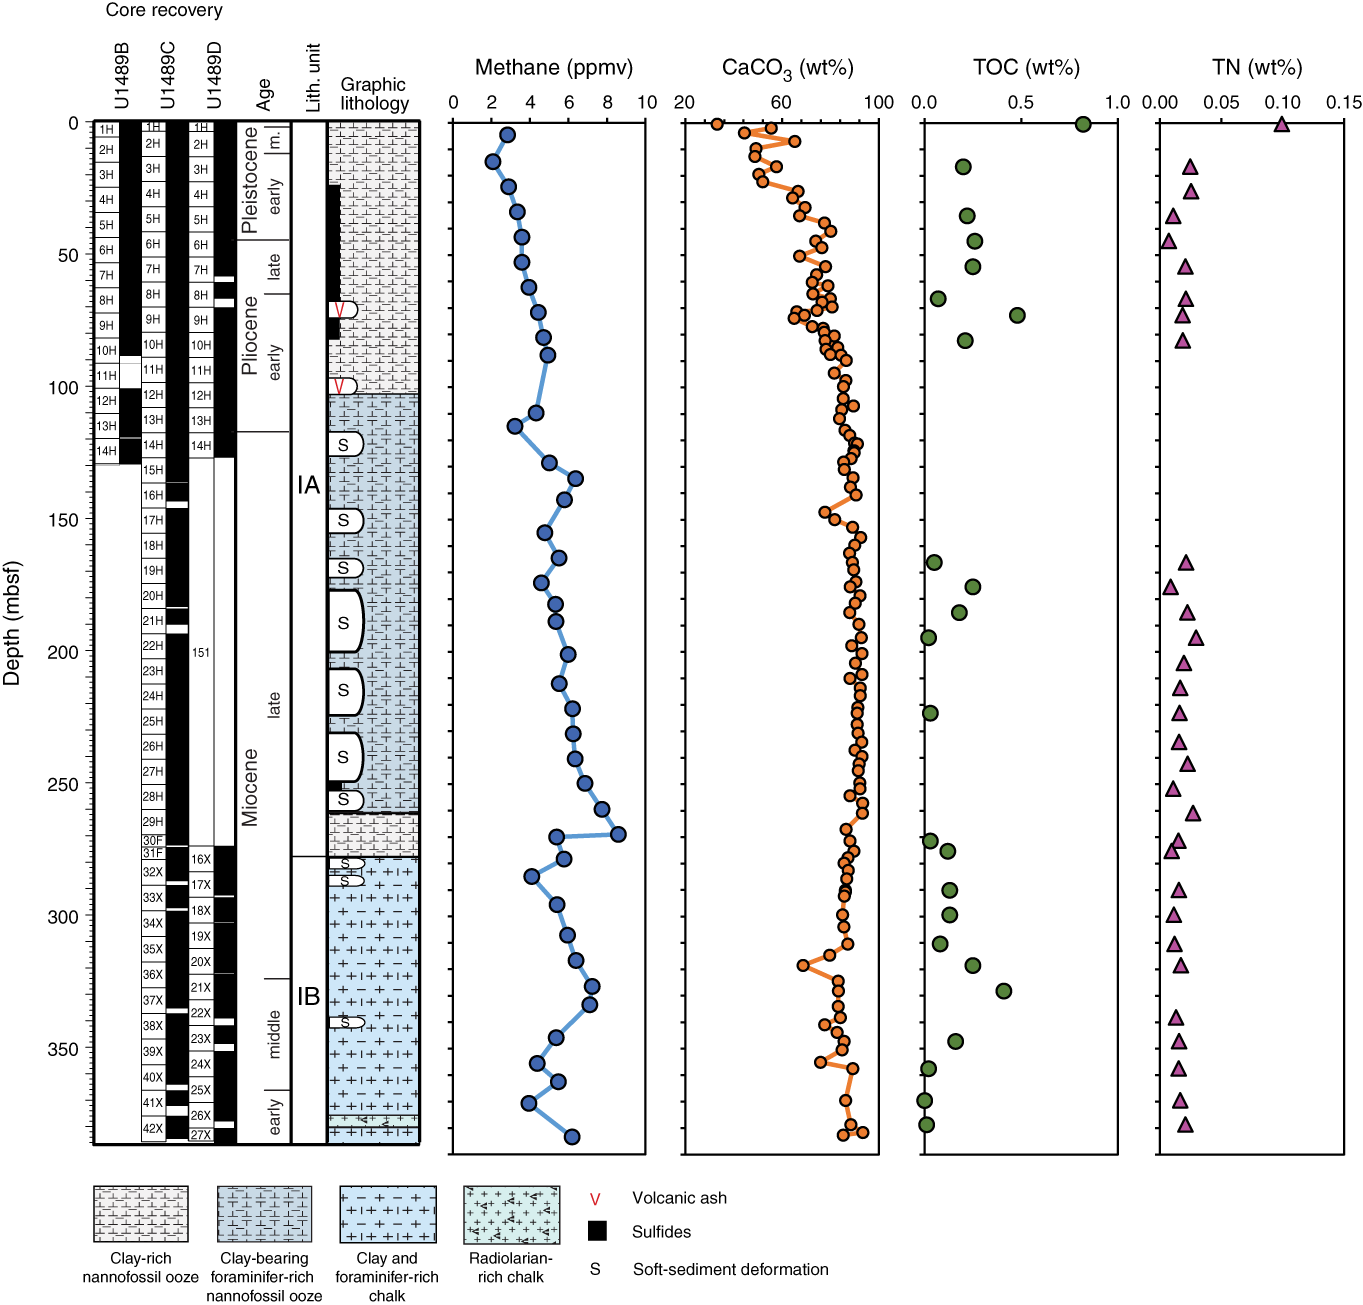
Figure F35. Carbon and TN profiles.
Bulk sediment geochemistry
CaCO3 content was measured on sediment samples from Holes U1489B and U1489C (Table T25; Figure F35). In general, CaCO3 is the dominant component of the sediment at Site U1489, with an average of 82 wt%. CaCO3 content increases with depth from ~50 wt% at the top to >90 wt% by ~120 mbsf. From ~120 to ~250 mbsf, CaCO3 content is nearly constant at ~90 wt%. Below ~250 mbsf, CaCO3 content decreases slightly and remains fairly invariable. TOC content ranges from 0 to 0.8 wt% with an average of 0.14 wt% over the entire sediment sequence. With the exception of the shallowest measurement (0.4 mbsf; 0.8 wt%), almost all samples have values <0.5 wt%. TN was detected in trace amounts (<0.1 wt%) throughout the hole. Because both TOC and TN contents are low, the C/N ratio is not reliable at this site and is not reported.
Table T25. Carbon and TN. Download table in CSV format.
Interstitial water chemistry
A total of 100 whole-round samples and 1 mudline sample were taken at Site U1489: 69 samples from Hole U1489B and 32 samples from Hole U1489C. High-resolution interstitial water sampling was conducted in the upper ~82 mbsf of Hole U1489B with the goal of reconstructing Cl and δ18O profiles in the LCDW during the LGM. Because of coring problems and sediment disturbances deeper than ~90 mbsf in Hole U1489B, interstitial water sampling was resumed at 88 mbsf in Hole U1489C and continued to near the bottom of the hole (deepest sample taken at 381.8 mbsf) at a frequency of one sample per core. We found small but nonetheless significant offsets in the geochemical profiles between the two sites (dashed line in Figures F36, F37). The offsets are especially visible in the profiles of Cl, phosphate (PO4), potassium (K), and boron (B) and should be accounted for when interpreting these profiles. A total of 50 samples were analyzed on the ship following the procedures described in Geochemistry in the Expedition 363 methods chapter (Rosenthal et al., 2018a). Interstitial water chemistry data are reported in Table T26.
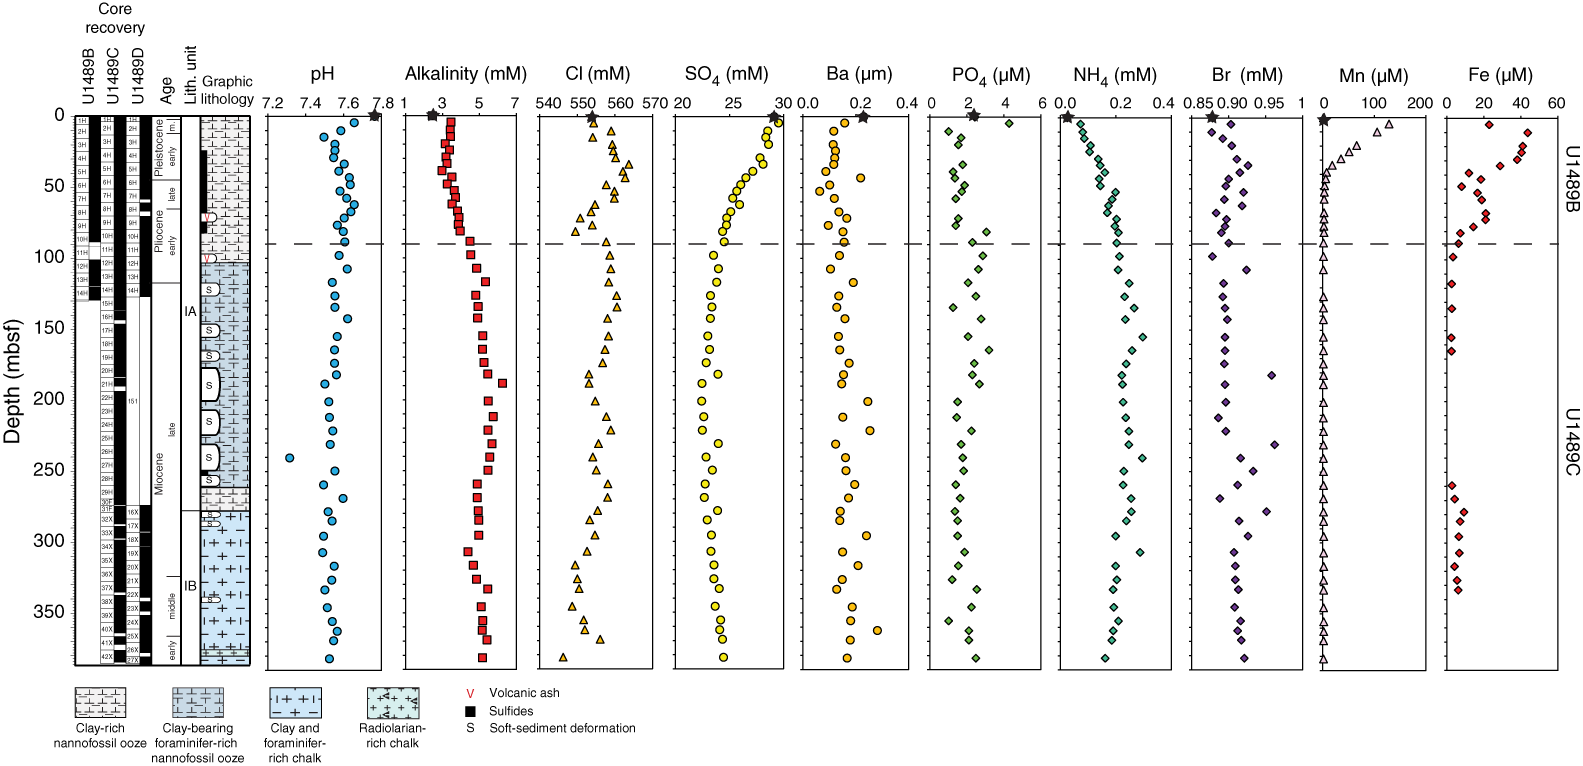
Figure F36. Interstitial water concentration profiles.
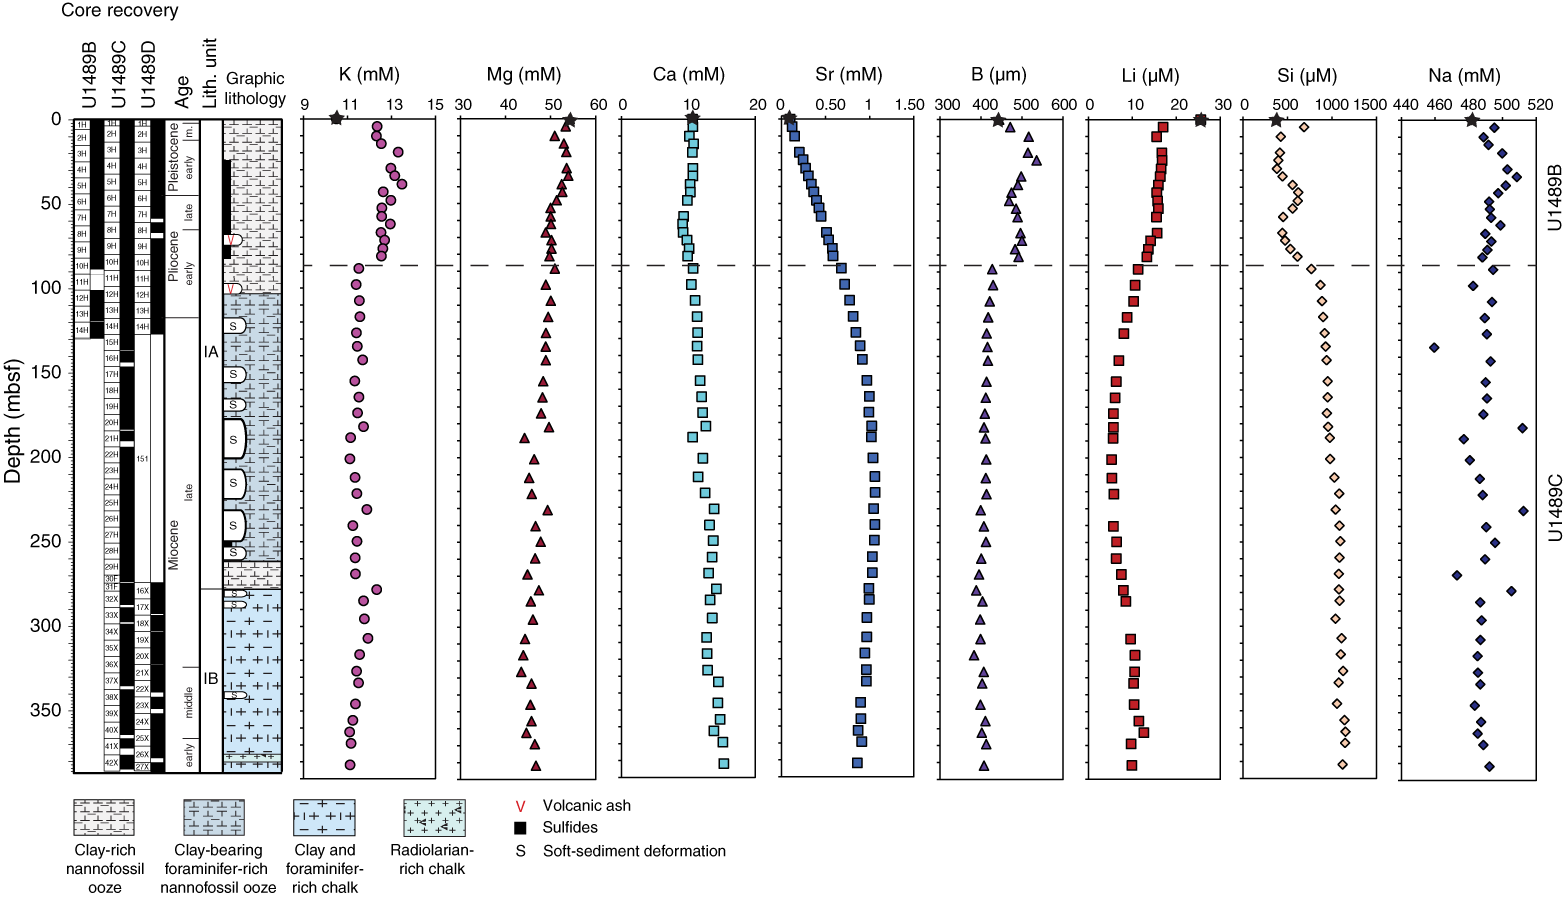
Figure F37. Interstitial water concentration profiles.
Table T26. Interstitial water geochemical data. Download table in CSV format.
Chlorinity and salinity
Cl at Site U1489 is similar to that at Site U1488 and displays considerable variability, with values ranging between ~546 and ~564 mM (Figure F36). Cl increases from a mudline value of 553.8 mM to a maximum of ~563 mM between 33.6 and 43.1 mbsf and then decreases to ~550 mM at 71.6–81.1 mbsf. The peak in the chlorinity profile observed between 24 and 58 mbsf most likely represents the LGM peak in Cl. A sharp increase in Cl observed at ~88 mbsf corresponds to the depth at which we began taking interstitial water measurements from Hole U1489C and likely reflects differences between the two holes or procedural offsets in the extraction and analysis of the samples. Deeper than ~88 mbsf, Cl exhibits an overall downhole trend toward slightly lower values (~546 mM at 381.8 mbsf) interspersed with fluctuations of up to 10 mM. Salinity at Site U1489 exhibits minor downhole variations (not shown). The upper ~55 mbsf is characterized by salinity values of 37, whereas most of the underlying sediment sequence displays a salinity of 36, except deeper than 326 mbsf, where salinity increases to 36.5–37.
Alkalinity and pH
As observed at Site U1488, alkalinity increases from a mudline value of 2.5 mM to 3.5 mM in the subsequent sample at 4.4 mbsf (Figure F36) and then increases gradually and fairly linearly to a maximum concentration of 5.7 mM at 211.9 mbsf. Below 211.9 mbsf, alkalinity decreases gradually to 5.2 mM at 381.8 mbsf. From the mudline to 14.6 mbsf, pH decreases steadily from 7.8 to 7.5, before increasing toward a broad maximum of ~7.6 between 43 and 67 mbsf (Figure F36). As at Site U1488, the interstitial water pH profile shows an inverse relationship to alkalinity, with a gradual decrease toward lower values of ~7.5 at ~200 mbsf and near-constant values below that depth to near the base of the hole at 381.8 mbsf.
Sulfate and barium
The SO4 concentration decreases from a seawater-like value of 29.1 mM at the mudline to a minimum of 22.4 mM at 200.9 mbsf (Figure F36). The curvature in the SO4 profile throughout this interval indicates that sulfate reduction is driven by early diagenetic degradation of organic matter. Interestingly, deeper than 200.9 mbsf sulfate increases to a concentration of 24.4 mM at the base of Hole U1489C. As at Site U1488, the linear nature of this increase suggests diffusion from sulfate-rich fluids at depth (see Discussion). At Site U1489, barium (Ba) concentration remains very low throughout the hole, ranging from 0.06 to 0.26 µm (Figure F36). Ba increases slightly downhole, which could reflect progressive release of Ba from organic matter remineralization.
Phosphate, ammonium, and bromide
Phosphate concentration is very low at Site U1489, with values <5 µM observed throughout. PO4 decreases abruptly from 4.3 µM at 4.4 mbsf to 1.0 µM at ~10.1 mbsf (Figure F36). As at Site U1488, this abrupt decrease could reflect a combination of organic matter remineralization scavenging of PO4 by sorption to clay minerals or local diagenetic precipitation of carbonate fluorapatite; the latter would be in agreement with evidence of carbonate dissolution in the upper sediment layers (see Discussion). PO4 concentration remains low and relatively constant below 10.1 mbsf, with again a slight offset observed at ~88 mbsf where sampling switched from Hole U1489B to Hole U1489C.
Ammonium (NH4) concentration increases from 0.03 mM at the mudline to 0.2–0.3 mM between 126.4 and 285.5 mbsf (Figure F36). Deeper than 285.5 mbsf, NH4 concentration decreases slightly to 0.2 mM at 381.8 mbsf. As at Site U1488, the overall low NH4 concentration at Site U1489 reflects generally low organic matter content. Bromide (Br) concentration remains largely constant throughout the hole with average values of 0.91 ± 0.02 mM, again reflecting the low organic matter content (Figure F36). Some anomalously high Br values occur in a few samples below 100 mbsf.
Manganese and iron
Manganese (Mn) concentration increases abruptly from a mudline value of 1.3 µM to 128.5 µM at 4.4 mbsf, indicating the presence of an oxic/suboxic redox boundary within this depth range (Figure F36). Deeper than 4.4 mbsf, Mn concentration decreases linearly to 7.7 µM by 38.6 mbsf and decreases further with depth to a minimum of 1.4 µM at 107.4 mbsf. This decrease suggests that Mn released from the reduction of Mn oxyhydroxide phases in the upper 4.4 mbsf is scavenged mostly deeper than 38.6 mbsf. Deeper than 107.4 mbsf, Mn concentration is nearly constant to 268.9 mbsf, at which point there is a very small, gradual increase to ~1.9 µM at 382 mbsf.
Iron (Fe) behaves similarly to dissolved Mn in the upper ~100 mbsf (Figure F36) but displays two peaks in concentration: ~40 µM between 10.1 and 33.6 mbsf and ~20 µM between 52.6 and 76.6 mbsf. As with Mn, the Fe profile in the upper sediment column is probably controlled by the reduction of Fe hydroxides and oxyhydroxides during organic matter remineralization. Dissolved Fe concentration remains very low between 76.6 and 249.6 mbsf, falling mostly below detection limit. As at Site U1488, the bottom portion of Site U1489 is characterized by slightly elevated dissolved Fe concentration, with an average value of ~6 µM deeper than 249.6 mbsf.
Potassium, magnesium, and calcium
Potassium increases from the mudline (10.5 mM) to 19.6 mbsf (13.5 mM) (Figure F37). K concentration remains high (>12.5 mM) downhole to 81.1 mbsf, where a sharp transition to near-constant values (11.5 ± 0.3 mM) occurs at the depth at which we began taking interstitial water measurements from Hole U1489C. As discussed above, this transition may be due to local differences between the two holes or procedural/analytical offsets rather than reflecting a major change in the interstitial water geochemical composition at Site U1489. As at Site U1488, calcium (Ca) concentration remains generally constant in the upper ~43 mbsf of Hole U1489B (~10.6 mM) (Figure F37). Below that depth, Ca decreases to a minimum value of 9.1 mM between 58 and 67 mbsf before increasing steadily and progressively below this interval to 15.3 mM at 381.8 mbsf. Magnesium (Mg) exhibits a progressive decrease from seawater-like values at the mudline (54.2 mM) to 43.5 mM at 326.4 mbsf (Figure F37). The bottom part of Hole U1489C (deeper than 326.4 mbsf) is characterized by a slight increase in Mg to 46.7 mM.
Strontium and boron
As at Site U1488, strontium (Sr) shows a steady increase over the upper 200 mbsf from a mudline Sr concentration of 0.1 mM to a maximum concentration of ~1.1 mM between 200.9 and 268.9 mbsf (Figure F37). Deeper than 270 mbsf, Sr concentration decreases toward the base of the hole and reaches 0.85 mM at 381.8 mbsf. Boron is similar to potassium, displaying a slight increase from the mudline (444.3 µM) to 516.6 µM at 10.1 mbsf (Figure F37). Below this depth, B concentration is >470 µM down to 81.1 mbsf. The sharp drop at ~88 mbsf coincides with the switch to sampling from Hole U1489B to Hole U1489C, and below that depth B concentration remains relatively constant downhole with an average value of 409 ± 10 µM.
Lithium, silica, and sodium
Lithium (Li) concentration decreases steadily from a mudline value of 25.5 µM to 15.5 µM in the interval between ~10 and 67 mbsf (Figure F37). Below this depth, Li concentration decreases steadily to a minimum value of 5.2 µM at 200.9 mbsf before increasing again to 10.6 mM at 316.6 mbsf. The rest of the hole is characterized by near-constant Li concentration. Silica (Si) concentration displays small variations (between ~380 and 420 µM) in the upper 29 mbsf of the hole (Figure F37). Below this depth, Si concentration increases to reach a local maximum of ~620 µM between ~39 and 53 mbsf. From 67.1 to 97.9 mbsf, Si concentration increases somewhat quickly from 441.4 to 869.6 µM and increases more gradually below that to a concentration of 1146 µM at the base of the hole. Sodium (Na) concentration is fairly constant throughout the entire hole, averaging 491 ± 9 mM (Figure F37).
Discussion
The interstitial water chemistry at Site U1489 is representative of carbonate-dominated deep-ocean sedimentary settings and is much like that of Site U1488; however, there are some notable differences between the two sites. Low organic matter input to the sediment under the oxic water column at Site U1489 and a low sedimentation rate relative to the shallower sites drilled thus far during Expedition 363 result in relatively little anoxic organic matter remineralization at this site, as evidenced by the presence of sulfate at high (>22 mM) concentration at depth and moderate downhole increases in NH4 and Br concentrations. Slightly higher dissolved Fe concentration and substantially higher dissolved Mn concentration suggest that suboxic remineralization of organic matter at Site U1489 is enhanced relative to Site U1488, and these processes may make a more significant contribution to organic matter degradation here than at other sites. Previous work by Bender et al. (1970) found a relatively high rate of Mn deposition in seafloor sediment in the western equatorial Pacific within a few hundred kilometers of the Eauripik Rise. The slightly lower sedimentation rate at Site U1489 than at Site U1488, if coupled with a similar rate of hydrogenous Mn accumulation at both sites, may result in greater sedimentary Mn content available for early diagenetic processes at Site U1489 and account for this difference.
Downhole trends in Ca, Mg, and Li at Site U1489 are similar to those at Site U1488 but are much more muted. A peak in Sr concentration of similar magnitude to the peak at Site U1488, albeit at greater depth at Site U1489, suggests that a decrease in carbonate dissolution is not responsible for the much lower Ca gradient with depth at Site U1489. Instead, the muted trends suggest a weaker influence of deep fluids with chemistry reflective of basalt-seawater interaction at this site. Site U1489 is located on the flank of the Eauripik Rise in water that is >800 m deeper than at Site U1488. Although its origin is not well constrained, one theory is that hotspot volcanism may have created the Eauripik Rise (Hegarty and Weissel, 1988). At the off-axis setting of Site U1489, the basaltic basement is likely older than that at Site U1488, with more time to accumulate a thicker sedimentary package at Site U1489 relative to Site U1488. These differences in basement and age/sediment thickness would contribute to the reduced gradients in the concentrations of Mg, Ca, and other ions produced or consumed during seawater-basalt interactions observed at Site U1489 and could help to explain the differences in the profiles between Sites U1488 and U1489.
References
Bender, M.L., Ku, T.-L., and Broecker, W.S., 1970. Accumulation rates of manganese in pelagic sediments and nodules. Earth and Planetary Science Letters, 8(2):143–148. https://doi.org/10.1016/0012-821X(70)90164-0
Bolli, H.M., 1957. Planktonic foraminifera from the Eocene Navet and San Fernando formations of Trinidad, B.W.I. In Loeblich, A.R., Jr. (Ed.), Studies in Foraminifera. Bulletin of the United States National Museum, 215:155–172. http://biostor.org/reference/106017
Bracey, D.R., 1975. Reconnaissance geophysical survey of the Caroline Basin. Geological Society of America Bulletin, 86(6):775–784. https://doi.org/10.1130/0016-7606(1975)86<775:RGSOTC>2.0.CO;2
Cande, S.C., and Kent, D.V., 1995. Revised calibration of the geomagnetic polarity timescale for the Late Cretaceous and Cenozoic. Journal of Geophysical Research: Solid Earth, 100(B4):6093–6095. https://doi.org/10.1029/94JB03098
Hegarty, K.A., and Weissel, J.K., 1988. Complexities in the developments of the Caroline plate region, western equatorial Pacific. In Nairn, A.E.M., Stehli, F.G., and Uyeda, S. (Eds.), The Ocean Basins and Margins: Boston (Springer), 277–301. https://doi.org/10.1007/978-1-4615-8041-6_6
Hilgen, F.J., Lourens, L.J., and Van Dam, J.A., 2012. The Neogene period. With contributions by A.G. Beu, A.F. Boyes, R.A. Cooper, W. Krijgsman, J.G. Ogg, W.E. Piller, and D.S. Wilson. In Gradstein, F.M., Ogg, J.G., Schmitz, M.D., and Ogg, G.M. (Eds.), The Geologic Time Scale: Oxford, United Kingdom (Elsevier), 923–978. https://doi.org/10.1016/B978-0-444-59425-9.00029-9
Hodell, D.A., and Kennett, J.P., 1986. Late Miocene–early Pliocene stratigraphy and paleoceanography of the South Atlantic and southwest Pacific Oceans: a synthesis. Paleoceanography and Paleoclimatology, 1(3):285–311. https://doi.org/10.1029/PA001i003p00285
Karlin, R., and Levi, S., 1983. Diagenesis of magnetic minerals in recent hemipelagic sediments. Nature, 303(5915):327–330. https://doi.org/10.1038/303327a0
Kennett, J.P., and Srinivasan, M.S., 1983. Neogene Planktonic Foraminifera: A Phylogenetic Atlas: Stroudsburg, PA (Hutchinson Ross).
Mills, P.C., 1983. Genesis and diagnostic value of soft-sediment deformation structures—a review. Sedimentary Geology, 35(2):83–104. https://doi.org/10.1016/0037-0738(83)90046-5
Pearson, P.N., 1995. Planktonic foraminifer biostratigraphy and the development of pelagic caps on guyots in the Marshall Islands group. In Haggerty, J.A., Premoli Silva, I., Rack, F., and McNutt, M.K. (Eds.), Proceedings of the Ocean Drilling Program, Scientific Results, 144: College Station, TX (Ocean Drilling Program), 21–59. https://doi.org/10.2973/odp.proc.sr.144.013.1995
Pribnow, D., Kinoshita, M., and Stein, C., 2000. Thermal Data Collection and Heat Flow Recalculations for Ocean Drilling Program Legs 101–180: Hanover, Germany (Institute for Joint Geoscientific Research, Institut für Geowissenschaftliche Gemeinschaftsaufgaben [GGA]). http://www-odp.tamu.edu/publications/heatflow/ODPReprt.pdf
Rosenthal, Y., Holbourn, A., and Kulhanek, D.K., 2016. Expedition 363 Scientific Prospectus: Western Pacific Warm Pool. International Ocean Discovery Program. https://doi.org/10.14379/iodp.sp.363.2016
Rosenthal, Y., Holbourn, A.E., Kulhanek, D.K., Aiello, I.W., Babila, T.L., Bayon, G., Beaufort, L., Bova, S.C., Chun, J.-H., Dang, H., Drury, A.J., Dunkley Jones, T., Eichler, P.P.B., Fernando, A.G.S., Gibson, K.A., Hatfield, R.G., Johnson, D.L., Kumagai, Y., Li, T., Linsley, B.K., Meinicke, N., Mountain, G.S., Opdyke, B.N., Pearson, P.N., Poole, C.R., Ravelo, A.C., Sagawa, T., Schmitt, A., Wurtzel, J.B., Xu, J., Yamamoto, M., and Zhang, Y.G., 2018a. Expedition 363 methods. In Rosenthal, Y., Holbourn, A.E., Kulhanek, D.K., and the Expedition 363 Scientists, Western Pacific Warm Pool. Proceedings of the International Ocean Discovery Program, 363: College Station, TX (International Ocean Discovery Program). https://doi.org/10.14379/iodp.proc.363.102.2018
Rosenthal, Y., Holbourn, A.E., Kulhanek, D.K., Aiello, I.W., Babila, T.L., Bayon, G., Beaufort, L., Bova, S.C., Chun, J.-H., Dang, H., Drury, A.J., Dunkley Jones, T., Eichler, P.P.B., Fernando, A.G.S., Gibson, K.A., Hatfield, R.G., Johnson, D.L., Kumagai, Y., Li, T., Linsley, B.K., Meinicke, N., Mountain, G.S., Opdyke, B.N., Pearson, P.N., Poole, C.R., Ravelo, A.C., Sagawa, T., Schmitt, A., Wurtzel, J.B., Xu, J., Yamamoto, M., and Zhang, Y.G., 2018b. Site U1482. In Rosenthal, Y., Holbourn, A.E., Kulhanek, D.K., and the Expedition 363 Scientists, Western Pacific Warm Pool. Proceedings of the International Ocean Discovery Program, 363: College Station, TX (International Ocean Discovery Program). https://doi.org/10.14379/iodp.proc.363.103.2018
Rosenthal, Y., Holbourn, A.E., Kulhanek, D.K., Aiello, I.W., Babila, T.L., Bayon, G., Beaufort, L., Bova, S.C., Chun, J.-H., Dang, H., Drury, A.J., Dunkley Jones, T., Eichler, P.P.B., Fernando, A.G.S., Gibson, K.A., Hatfield, R.G., Johnson, D.L., Kumagai, Y., Li, T., Linsley, B.K., Meinicke, N., Mountain, G.S., Opdyke, B.N., Pearson, P.N., Poole, C.R., Ravelo, A.C., Sagawa, T., Schmitt, A., Wurtzel, J.B., Xu, J., Yamamoto, M., and Zhang, Y.G., 2018c. Site U1488. In Rosenthal, Y., Holbourn, A.E., Kulhanek, D.K., and the Expedition 363 Scientists, Western Pacific Warm Pool. Proceedings of the International Ocean Discovery Program, 363: College Station, TX (International Ocean Discovery Program). https://doi.org/10.14379/iodp.proc.363.109.2018
Rowan, C.J., Roberts, A.P., and Broadbent, T., 2009. Reductive diagenesis, magnetite dissolution, greigite growth and paleomagnetic smoothing in marine sediments: a new view. Earth and Planetary Science Letters, 277(1–2):223–235. https://doi.org/10.1016/j.epsl.2008.10.016
Saito, T., 1976. Geologic significance of coiling direction in the planktonic foraminifer Pulleniatina. Geology, 4(5):305–309. https://doi.org/10.1130/0091-7613(1976)4<305:GSOCDI>2.0.CO;2
Shipboard Scientific Party, 1971, Site 62. In Winterer, E.L., Riedel, W.R., Brönnimann, P., Gealy, E.L., Heath, G.R., Kroenke, L., Martini, E., Moberly Jr., R., Resig, J., and Worsley, T. (Eds.), Initial Reports of the Deep Sea Drilling Project, 49–322. https://doi.org/10.2973/dsdp.proc.7.104.1971
Stoner, J.S., and St-Onge, G., 2007. Magnetic stratigraphy in paleooceanography: reversal, excursion, paleointensity and secular variation. In Hillaire-Marcel, C., and de Vernal, A. (Eds.), Developments in Marine Geology (Volume 1): Proxies in Late Cenozoic Paleoceanography. R. Stein (Series Ed.): Amsterdam (Elsevier B.V.), 99–138. https://doi.org/10.1016/S1572-5480(07)01008-1
van Morkhoven, F.P.C.M., Berggren, W.A., Edwards, A.S., and Oertli, H.J., 1986. Cenozoic cosmopolitan deep-water benthic foraminifera. Bulletin des Centres de Recherches Exploration-Production Elf-Aquitaine, 11.
Wade, B.S., Pearson, P.N., Berggren, W.A., and Pälike, H., 2011. Review and revision of Cenozoic tropical planktonic foraminiferal biostratigraphy and calibration to the geomagnetic polarity and astronomical time scale. Earth-Science Reviews, 104(1–3):111–142. https://doi.org/10.1016/j.earscirev.2010.09.003
Wilkens, R.H., Westerhold, T., Drury, A.J., Lyle, M., Gorgas, T., and Tian, J., 2017. Revisiting the Ceara Rise, equatorial Atlantic Ocean: isotope stratigraphy of ODP Leg 154. Climate of the Past, 13:779–793. https://doi.org/10.5194/cp-13-779-2017
Zijderveld, J.D.A., 1967. AC demagnetization of rocks: analysis of results. In Collinson, D.W., Creer, K.M., and Runcorn, S.K. (Eds.), Developments in Solid Earth Geophysics (Volume 3): Methods in Palaeomagnetism: Amsterdam (Elsevier), 254–286. https://doi.org/10.1016/B978-1-4832-2894-5.50049-5
1 Rosenthal, Y., Holbourn, A.E., Kulhanek, D.K., Aiello, I.W., Babila, T.L., Bayon, G., Beaufort, L., Bova, S.C., Chun, J.-H., Dang, H., Drury, A.J., Dunkley Jones, T., Eichler, P.P.B., Fernando, A.G.S., Gibson, K., Hatfield, R.G., Johnson, D.L., Kumagai, Y., Li, T., Linsley, B.K., Meinicke, N., Mountain, G.S., Opdyke, B.N., Pearson, P.N., Poole, C.R., Ravelo, A.C., Sagawa, T., Schmitt, A., Wurtzel, J.B., Xu, J., Yamamoto, M., and Zhang, Y.G., 2018. Site U1489. In Rosenthal, Y., Holbourn, A.E., Kulhanek, D.K., and the Expedition 363 Scientists, Western Pacific Warm Pool. Proceedings of the International Ocean Discovery Program, 363: College Station, TX (International Ocean Discovery Program). https://doi.org/10.14379/iodp.proc.363.110.2018
2 Expedition 363 Scientists’ addresses.
This work is distributed under the Creative Commons Attribution 4.0 International (CC BY 4.0) license. 
- F1. Eauripik Rise and locations of Sites U1488–U1490.
- F2. Bathymetric map and site location.
- F3. Seismic line and site location.
- F4. Hydrographic profiles of temperature, salinity, and dissolved oxygen.
- F5. Lithologic summary.
- F6. Color alternation in foraminifer-bearing clay-rich nannofossil ooze.
- F7. Soft-sediment deformation.
- F8. Tephra layers.
- F9. Main lithologies in Subunit IB.
- F10. Foraminifer-bearing diatom-rich nannofossil ooze.
- F11. Sedimentary components in primary lithologies.
- F12. MS and NGR in different colored sediments.
- F13. XRD results in different colored sediment.
- F14. Calcareous nannofossils.
- F15. Calcareous nannofossils.
- F16. Coiling patterns in Pulleniatina.
- F17. Globigerinoidesella fistulosa whole tests and individual chambers.
- F18. Coiling patterns in Neogloboquadrina acostaensis.
- F19. Downcore foraminifer preservation states.
- F20. Age-depth plot.
- F21. Archive-half NRM intensity.
- F22. Discrete sample AF demagnetization results.
- F23. NRM, MS, inclination, and declination, Hole U1489B.
- F24. NRM, MS, inclination, and declination, Hole U1489C.
- F25. NRM, MS, inclination, and declination, Hole U1489D.
- F26. Physical property measurements.
- F27. Bulk density, MS, NGR, and P-wave velocity overlaid on core photos.
- F28. P-wave velocity measurements.
- F29. MAD densities and porosity, GRA bulk density, and thermal conductivity.
- F30. Heat flow calculations.
- F31. APCT-3 temperature-time series.
- F32. WRMSL MS data.
- F33. Spliced L*, NGR, MS, and GRA bulk density data.
- F34. Mbsf and composite depth scales in the Site U1489 splice.
- F35. Carbon and TN profiles.
- F36. Interstitial water concentration profiles.
- F37. Interstitial water concentration profiles.
- T1. Site U1489 core summary.
- T2. Soft-sediment deformation intervals.
- T3. Tephra layers.
- T4. Calcareous nannofossil bioevents.
- T5. Planktonic foraminifer bioevents.
- T6. Coiling count data for Pulleniatina.
- T7. Coiling count data for Neogloboquadrina acostaensis.
- T8. Benthic foraminifer distribution.
- T9. Identified reversal boundaries.
- T10. WRMSL GRA bulk density data, Hole U1489B.
- T11. WRMSL GRA bulk density data, Hole U1489C.
- T12. WRMSL GRA bulk density data, Hole U1489D.
- T13. WRMSL MS data, Hole U1489B.
- T14. WRMSL MS data, Hole U1489C.
- T15. WRMSL MS data, Hole U1489D.
- T16. NGRL data, Hole U1489B.
- T17. NGRL data, Hole U1489C.
- T18. NGRL data, Hole U1489D.
- T19. WRMSL PWL data, Hole U1489B.
- T20. WRMSL PWL data, Hole U1489C.
- T21. WRMSL PWL data, Hole U1489D.
- T22. Affine table.
- T23. Splice interval.
- T24. Volatile hydrocarbon concentrations.
- T25. Carbon and TN.
- T26. Interstitial water geochemical data.