Fryer, P., Wheat, C.G., Williams, T., and the Expedition 366 Scientists
Proceedings of the International Ocean Discovery Program Volume 366
publications.iodp.org
https://doi.org/10.14379/iodp.proc.366.105.2018

Site U14921
P. Fryer, C.G. Wheat, T. Williams, E. Albers, B. Bekins, B.P.R. Debret, J. Deng, Y. Dong, P. Eickenbusch, E.A. Frery, Y. Ichiyama, K. Johnson, R.M. Johnston, R.T. Kevorkian, W. Kurz, V. Magalhaes, S.S. Mantovanelli, W. Menapace, C.D. Menzies, K. Michibayashi, C.L. Moyer, K.K. Mullane, J.-W. Park, R.E. Price, J.G. Ryan, J.W. Shervais, O.J. Sissmann, S. Suzuki, K. Takai, B. Walter, and R. Zhang2
Keywords: International Ocean Discovery Program, IODP, JOIDES Resolution, Expedition 366, Site 1200, Site U1491, Site U1492, Site U1493, Site U1494, Site U1495, Site U1496, Site U1497, Site U1498, Mariana, Asùt Tesoru Seamount, Conical Seamount, Fantangisña Seamount, South Chamorro Seamount, Yinazao Seamount, Cretaceous seamount, subduction, subduction channel, forearc, seismogenic zone, mud volcano, fluid discharge, serpentinite, carbonate, harzburgite, clasts, ultramafic rock, breccia, gypsum, mudstone, chert, reef limestone, volcanic ash, guyot, CORK, CORK-Lite, screened casing
MS 366-105: Published 7 February 2018
Site summary
Site U1492 is located on the southwestern rim of the summit of Yinazao Seamount (informally known as Blue Moon Seamount) along the extension of an inferred northeast-trending normal fault where there was evidence for interstitial water discharge (see Background and objectives). Three boreholes were cored to recover materials from the area of the hypothesized conduit. Holes U1492A, U1492B, and U1492C are located 200 m north, 100 m north, and 25 m south, respectively, of Hole U1492D, the site identified to have the highest interstitial water discharge rate in precruise surveys. Screened casing was emplaced in Hole U1492D, and the hole was revisited late in the expedition to seal the base of the casing, leaving a cased/screened borehole ready for a future CORK-Lite deployment.
The lithostratigraphy of all three cored boreholes consists mainly of brownish to blue-gray serpentinite pebbly mud containing 5%–10% lithic clasts of serpentinized ultramafic rock. Hole U1492C also includes an intermediate unit of green serpentinite mud. Ultramafic clasts in the lowermost portions of the cores display the most extreme degree of serpentinization, often soft enough to scrape with a fingernail. Conversely, ultramafic clasts in the brown to light green uppermost intervals retain their hardness and frequently exhibit milder degrees of serpentinization. The upper brown pelagic sediment in Hole U1492B and the brownish mottled uppermost portions of the serpentinite muds are characteristically higher in natural gamma radiation (NGR; see visual core descriptions [VCDs] in Core descriptions), indicating the presence of pelagic sediment and/or volcanic ash. Deeper in the cores, at the transition to the bluish gray colors that dominate the remaining recovered core, NGR values drop by more than one order of magnitude to values typical of serpentinite mud.
A total of 56 whole-round samples were collected for interstitial water extraction and analyses, and numerous headspace hydrocarbon gas analyses were performed. Headspace gases identified H2 and CH4 anomalies with a CH4/H2 ratio <1. In contrast, the CH4/H2 ratio is ~100 in fluids from South Chamorro Seamount, suggesting the potential to classify subsurface processes based on either methane- or hydrogen-enriched fluids from depth.
The chemical composition of interstitial fluids from Site U1492 converge on a deep-sourced fluid with high pH (≥10.6); enrichments in NH3, Ca, and Sr; and depletions in B, K, Li, Mg, Si, Na, Cl, Br, and PO4, relative to bottom seawater. Sulfate concentrations may be slightly lower than bottom seawater values. The composition of the deep-sourced fluid at Site U1492 is consistent with results from gravity and push core analyses (Hulme et al., 2010). The low B and K in the deep-sourced fluid likely result from the lack of mobilization of these species from a shallow and cool (~13 km; 80°C; Hulme et al., 2010) downgoing plate because neither of these elements are abundant in the depleted upper mantle (e.g., Salters and Stracke, 2004; Savov et al., 2005). The low B and Li concentrations in these fluids are also consistent with experimental results, documenting the retention and uptake of B and Li from fluids into sheet silicate phases at temperatures of ~150°C (Seyfried et al., 1984), and as such may confirm the existence of low temperatures at the slab/mantle interface. The common occurrence of rodingites in association with serpentinites (e.g., Shervais et al., 2005) indicates that Ca can be leached from peridotite because even depleted harzburgite contains some Ca (Mottl et al., 2004). Thus, in the absence of high carbonate alkalinity, high Ca and Sr concentrations may derive in part from peridotite and possibly from smectite in the subducting crust.
Samples were collected for shore-based microbiological studies. To assess possible artifacts from drilling operations, tracers were pumped into the drill string prior to and during core recovery. Tracer analyses indicate that most microbiology whole-round samples are suitable for shore-based analyses.
Physical property data collected at Site U1492 are of good quality, despite some core disturbance identified in the uppermost core sections. There is a distinct absence of surficial pelagic deposits, except for the thin layer in Hole U1492B, consistent with an active summit area on Yinazao Seamount. The physical properties of the serpentinite muds are consistent with those measured on serpentinite muds from the summits of other serpentinite seamounts in the Mariana forearc (e.g., Conical Seamount, Ocean Drilling Program [ODP] Leg 125 [Fryer, Pearce, Stokking, et al., 1992]; South Chamorro Seamount, ODP Leg 195 [Salisbury, Shinohara, Richter, et al., 2002]). A slight effect of compaction is suggested in Holes U1492A and U1492B by the overall increasing trend in gamma ray attenuation (GRA) density and minimum P-wave velocity values with depth. However, the relatively constant GRA bulk density of ~1.8–1.9 g/cm3 measured deeper in Hole U1492C (~130 meters below seafloor [mbsf]) suggests that overpressured fluids associated with ongoing Yinazao Seamount mud volcanism tend to minimize compaction near the surface of the active spring. Overall, magnetic susceptibility measurements increase with depth, although some significant variations independent from depth were also observed (e.g., Hole U1492B, between ~20 and ~30 mbsf). Such variations may reflect changes in magnetic mineralogy composition and concentration resulting from alternation of different mudflows not easily recognizable during core description.
Seven advanced piston corer temperature tool (APCT-3) measurements were conducted in Hole U1492C. The quality of these measurements was generally good; however, two measurements were compromised and are not included in the interpretation. Two interpretations can account for temperature values extrapolated from thermal decay during frictional heating when the tool was inserted into the formation. One interpretation is a linear fit obtained by disregarding the high value of 2.66°C at 23.5 mbsf, yielding a thermal gradient of 12°C/km and a heat flow of 17 mW/m2. A second interpretation requires an interstitial water discharge rate of 1 to 2 m/y, disregarding the measurement at 51.7 mbsf. The latter interpretation is consistent with the calculated discharge rate of interstitial fluids on the order of ten centimeters per year based on previous results (Hulme et al., 2010).
Paleomagnetic measurements from section halves and discrete samples resulted in natural remanent magnetization (NRM) intensities that generally covary with the downhole pattern of magnetic susceptibility. NRM intensities, which generally vary with lithostratigraphic units, are relatively high, even after the 20 mT alternating field (AF) demagnetization step, in each of the three boreholes. A repeating pattern of paleomagnetic intensity was observed in many cores. For example, the upper 1 m of each half-length advanced piston corer (HLAPC) core has intensities about one order of magnitude higher than intensities from the base of the core at the 20 mT demagnetization step. This magnetic overprint probably resulted from not using nonmagnetic collars in the bottom-hole assembly (BHA). We lost a nonmagnetic BHA at Site U1491 and elected to reserve the only other one on the ship for the next expedition, where paleomagnetic data are more of an integral part of the expedition.
Background and objectives
Site U1492 is located on the summit of Yinazao Seamount (Figures F1, F2; see Figure F1 in the Site U1491 chapter [Fryer et al., 2018c]), a serpentinite mud volcano located on a regional northeast-trending fault about 55 km from the trench axis (see Figure F1 in the Expedition 366 summary chapter [Fryer et al., 2018b]). The subducting slab lies ~13 km below the base of the seamount (Oakley et al., 2007, 2008). Multichannel seismic (MCS) data (MCS Line EW0202 75-78) crossed the summit of Yinazao Seamount from northeast to southwest. Reflectors visible on MCS Line EW0202 75-78 below the seafloor near/at the summit may result from layering, suggesting different flow units, or may be out-of-plane returns from the footwall (southeast) block of the summit fault.
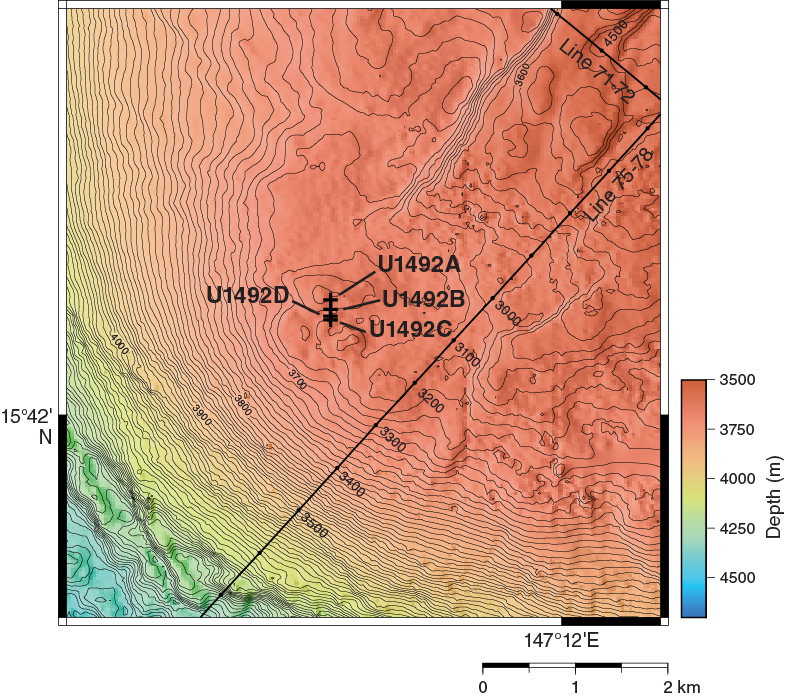
Figure F1. Bathymetric map, Site U1492.
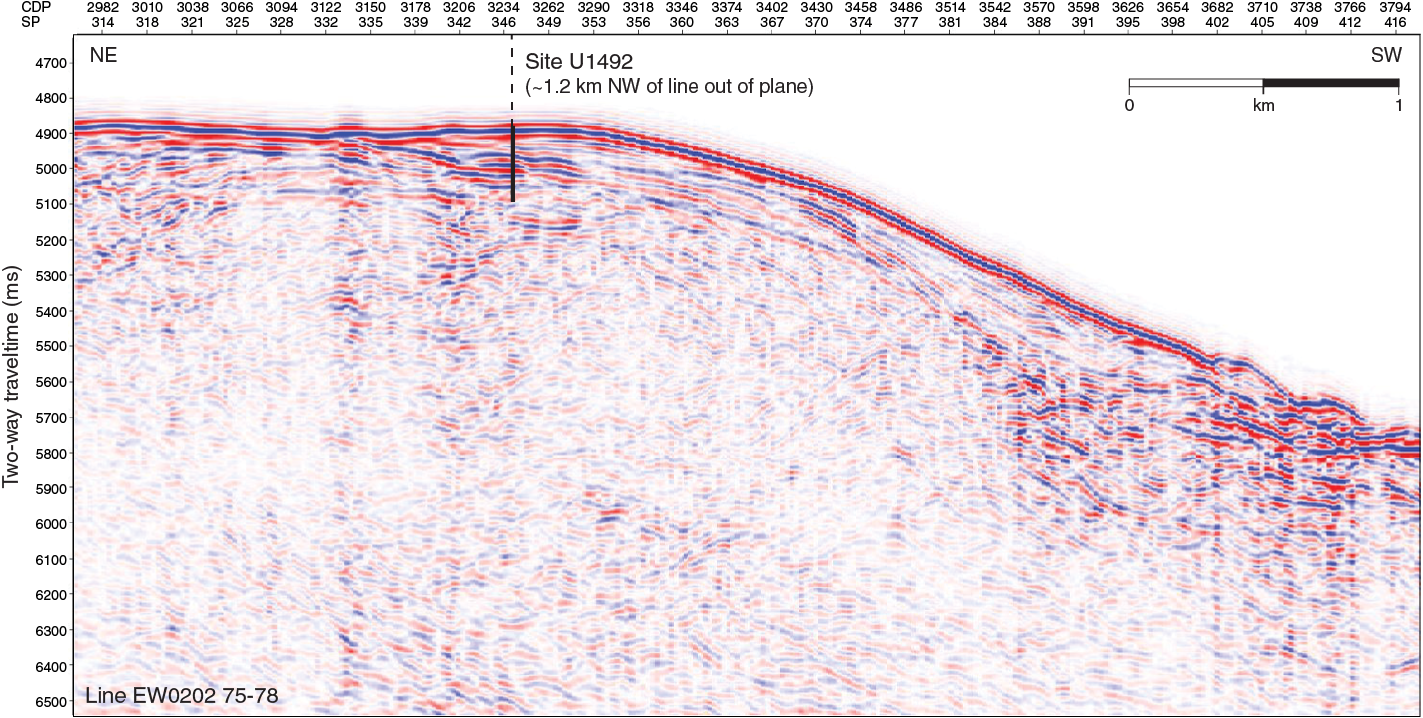
Figure 2. MCS Line EW0202 71-72.
A primary feature of the seamount’s summit is a fault scarp with a maximum throw of about 80 m that is colinear with the regional fault trend. The eastern half of the summit is shallower, and the overall morphology of the summit suggests a right-lateral motion on a fault with dip-slip to the northwest. The offset on the fault was apparently a combination of footwall uplift (eastern block) and downdrop of the hanging wall to the northwest (western block). This deformation may have directed egress of rising fluids to the southwest edge of the summit area.
The occurrence of a spring on the southwestern portion of the rim was inferred by a small (about 40 m in diameter) patch of high backscatter on a bathymetry and sidescan sonar image from 1997 using the Hawaii Mapping Research Group’s MR1 system (Rognstad et al., 1992) and verified from systematic variations in pore water chemical profiles during an expedition on the R/V Thomas G. Thompson. In 2003, two dives with the remotely operated vehicle (ROV) Jason II and additional gravity/piston coring confirmed the presence of fluid discharge at this site, which is ~1 km southwest of the summit (see Figure F1 in the Site U1491 chapter [Fryer et al., 2018c]), with a discharge rate up to ~10 cm/y (Hulme et al., 2010). Discharge at rates of centimeters per year was located within a 50 m range of where the piston core with Marker 13 was collected. This location served as the target for Site U1492.
The first operation at the summit was a camera survey to locate the spring site, thus verifying that navigation in 2003 was identical to the current navigation on the R/V JOIDES Resolution. The spring site was identified from bottom roughness and the observation of a white plastic bucket lid that was used as Marker 13 for a piston core deployed in 2003.
The plan was to core two 50 m deep boreholes, U1492A and U1492B, along a north–south transect 200 and 100 m north of the spring site, respectively. The third borehole (U1492C) was planned to reach a depth of 250 mbsf 25 m south of the spring site. These borehole positions were chosen to bracket the spring with the casing (Hole U1492D) deployed at the location of the spring and Marker 13. Drilling at Site U1492 was expected to recover recently erupted serpentinite muds, along with serpentinized peridotite clasts and perhaps other lithologies from the conduit system. We also expected to recover pore fluids with the most pristine signal derived from slab sources, given the proximity of the spring location. We hypothesized that the spring would be along the zone of weakness associated with the northeast-trending summit fault and that the northwest dip-slip movement of the hanging wall block created an easy egress locality for rising fluids and muds (see Lithostratigraphy). The location of the transect was chosen to (1) intersect mudflows of variable composition that had emanated from the area near the spring; (2) potentially date discrete mudflows paleontologically, should there be pelagic sediment layers between them; (3) determine variability in the composition of rock clasts in the mudflows; (4) investigate potential systematic variability in degree of serpentinization (possible lower degrees at initiation of mud volcanism, e.g., conduit “throat clearing”); (5) examine transport conditions of fluids; (6) provide a measure for the scale of potential flow characteristics (e.g., diffuse versus channelized); (7) determine the composition of fluid from depth; and (8) determine microbial community interactions at depth and near the sea floor under a range of flow conditions.
After coring operations were completed, operations focused on the deployment of a screened casing at Marker 13. The objective for this cased borehole was to tap into the deep-sourced conduit and serve as a later observatory/experimental site and a source of uncontaminated fluid and dissolved gas samples.
Operations
Hole U1492A
The pipe trip to the seafloor started at 1630 h on 18 December 2016 and reached the seafloor by 2130 h (all dates and times are ship local times). The vibration isolated television (VIT) subsea camera was deployed, and once on the seafloor, Marker 13 was observed (15°42.57′N, 147°10.60′E), signifying that the navigation from the 2003 expedition upon which deployments were based and the current navigation were identical. The ship was moved 200 m north, and coring commenced in Hole U1492A. The first advanced piston corer (APC) core barrel was deployed at 0725 h, establishing a seafloor depth of 3667.5 meters below rig floor (mbrf) (Table T1). After Core 366-U1492A-2H was recovered, the HLAPC was picked up, and further coring was conducted using the HLAPC. While recovering Core 9F at 38.3 mbsf, the core line became snarled in the oil saver. Because of high heave conditions, stiff seafloor, and having already broken a drill collar connection at the last site (U1491), coring ceased, and the bit cleared the seafloor at 0045 h on the morning of 20 December, ending Hole U1492A. The kink in the coring line was likely caused by the high heave conditions during APC coring operations into hard substrate.
Table T1. Site U1492 core summary. Download table in CSV format. View PDF table.
Hole U1492B
Hole U1492B is 100 m south of Hole U1482A at 3680.0 mbrf. Coring continued using the HLAPC coring system through Core 366-U1492B-13F to 51.4 mbsf (Table T1), which completed the objectives for this hole. The drill string was recovered, clearing the seafloor at 1100 h on 21 December 2016 and ending Hole U1492B.
Hole U1492C
Hole U1492C is 120 m south of Hole U1492B (~20 m south of Hole U1492D) at 3677.4 mbrf. HLAPC coring continued through Core 366-U1492C-23F to 98.7 mbsf, except for Cores 1H and 10X, where the APC and extended core barrel (XCB) coring systems, respectively, were used. APCT-3 temperature shoes were deployed on Cores 3F, 6F, 9F, 13F, 16F, 19F, and 22F at 9.5, 23.5, 33.6, 51.7, 65.8, 73.9, and 94.0 mbsf, respectively (Table T1). Coring was suspended to deploy the temperature dual-pressure tool (T2P) on the motion decoupled hydraulic delivery system (MDHDS). The hole was swept with 20 barrels of high-viscosity mud while the tools were being rigged up and prepared for deployment on the rig floor. It took less than 1 h to rig up the MDHDS/T2P/Electrical Release System (ERS) tools; however, while stabbing the logging line through the blocks (no rotation or circulation), the hole became unstable and the line was pulled out. Conditions were such that the T2P deployment was aborted, and the hole was swept with 20 barrels of high-viscosity drilling mud and a wiper trip to flush dense cuttings either out of the hole or below the bit. A wiper trip was conducted to 70.6 mbsf at 0200 h on 23 December 2016. HLAPC coring resumed with Cores 24F through 28G, which were cut to 117.5 mbsf (3794.9 mbrf) before high torque and overpull necessitated a second wiper trip. The next 13.75 h were spent on hole conditioning. Coring then proceeded using the XCB system to recover Cores 29X through 30X to 129.4 mbsf. While cutting Core 31X at 139.1 mbsf, the driller once again lost rotation. After working the pipe free, the hole was abandoned. The bit was clear of the rig floor by 0935 h on 24 December, ending Hole U1492C.
Hole U1492D
While the ship moved ~20 m north, the casing shoe joint; a 39 ft section of casing; four each 39 ft screened casing joints and 13 10¾ inch, 54 lb/ft casing joints; a crossover sub; a standard 16 inch pup joint; and a 16 inch casing hanger were assembled (Figures F3, F4, F5, F6). Each screened section had 276 holes that were 0.375 inches in diameter. The screened casing had evenly spaced holes. The portion of the casing with the holes was wrapped with wire screen, resulting in a 0.010 inch gap. Carbolite material (20–40 mesh) was packed around this wire screen and held in place with a second wire rap with a 0.010 inch gap. The stinger assembly, including a tricone bit, a Baker-Hughes Inteq high-torque mud motor, a set of HOC underreamers, and the Dril-Quip (DQ) running tool, was made up, and the motor/underreamer combo was tested in the moonpool for proper operation (Figure F7). The DQ running tool was then reengaged with the 16 inch casing hanger at 0630 h on 25 December 2016. The casing string was lowered and latched into the reentry cone. The space out design for the 10¾ inch casing shoe was set to 214.37 mbsf, and the end of the drill-in stinger assembly was at 210.94 mbsf.
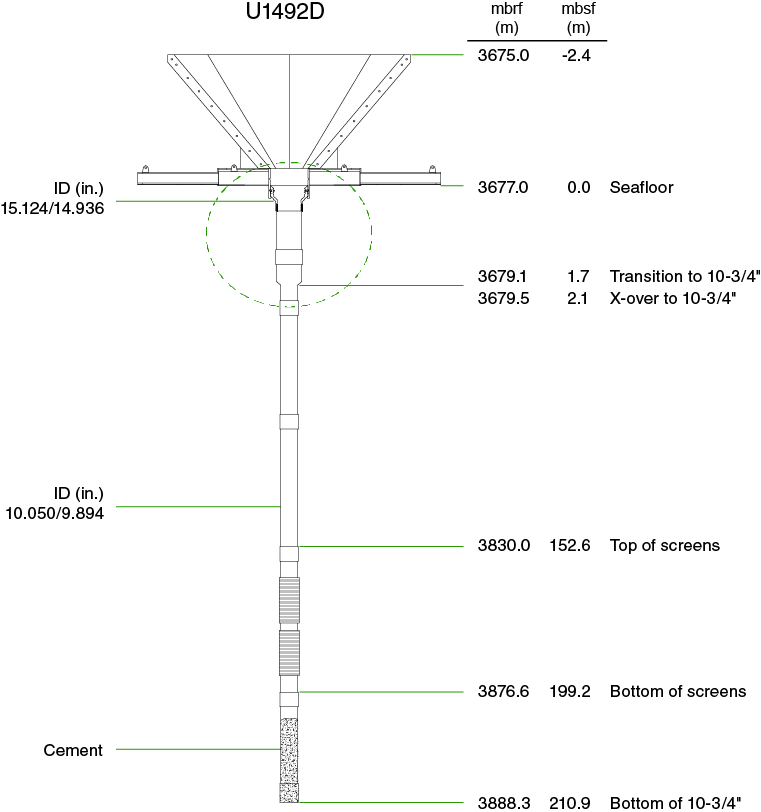
Figure F3. Observatory construction.

Figure F4. Upper portion of casing string.
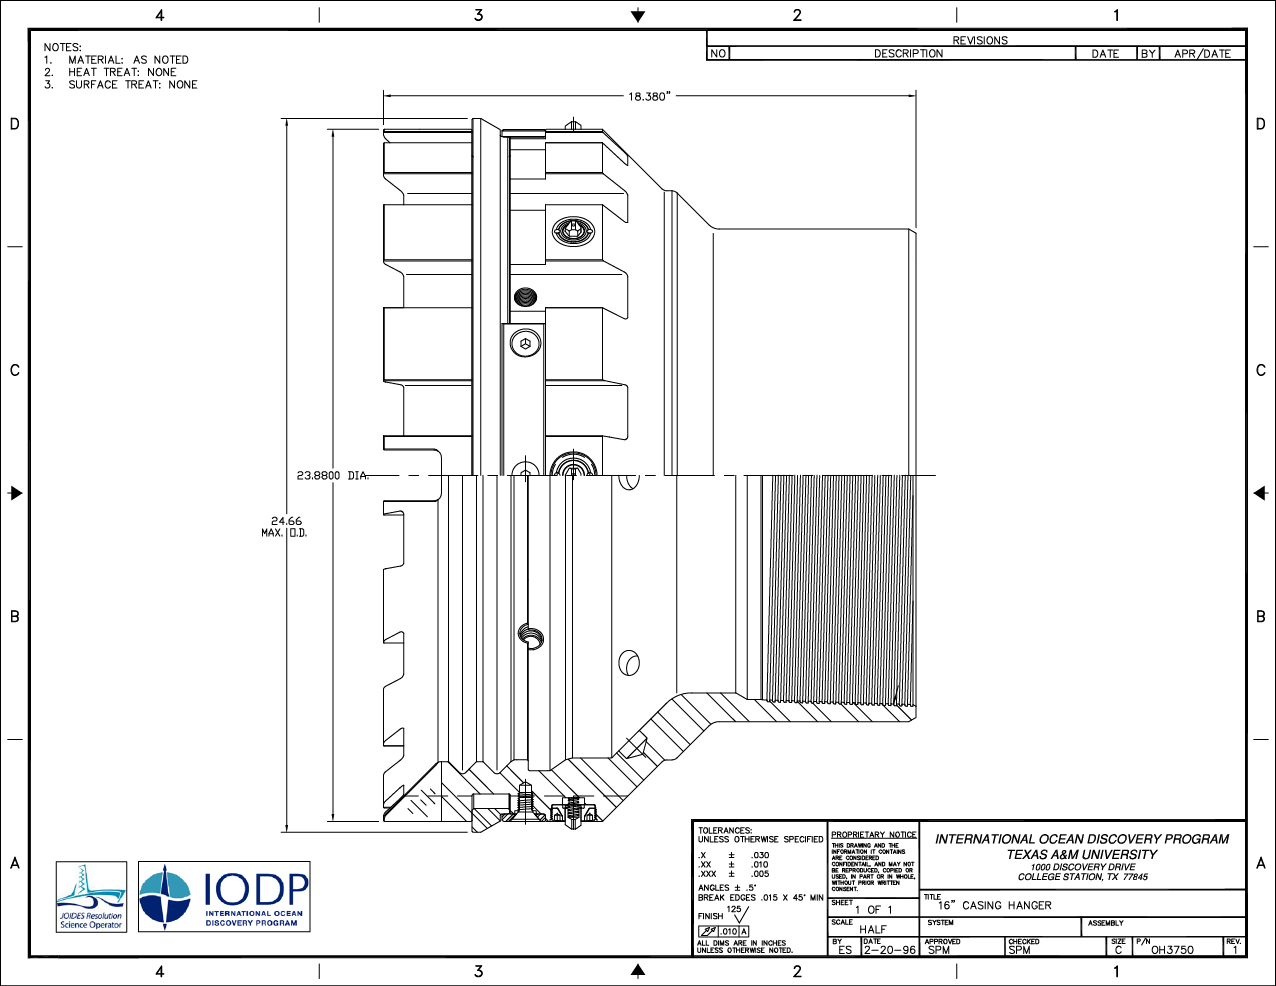
Figure F5. 16 inch casing hanger.
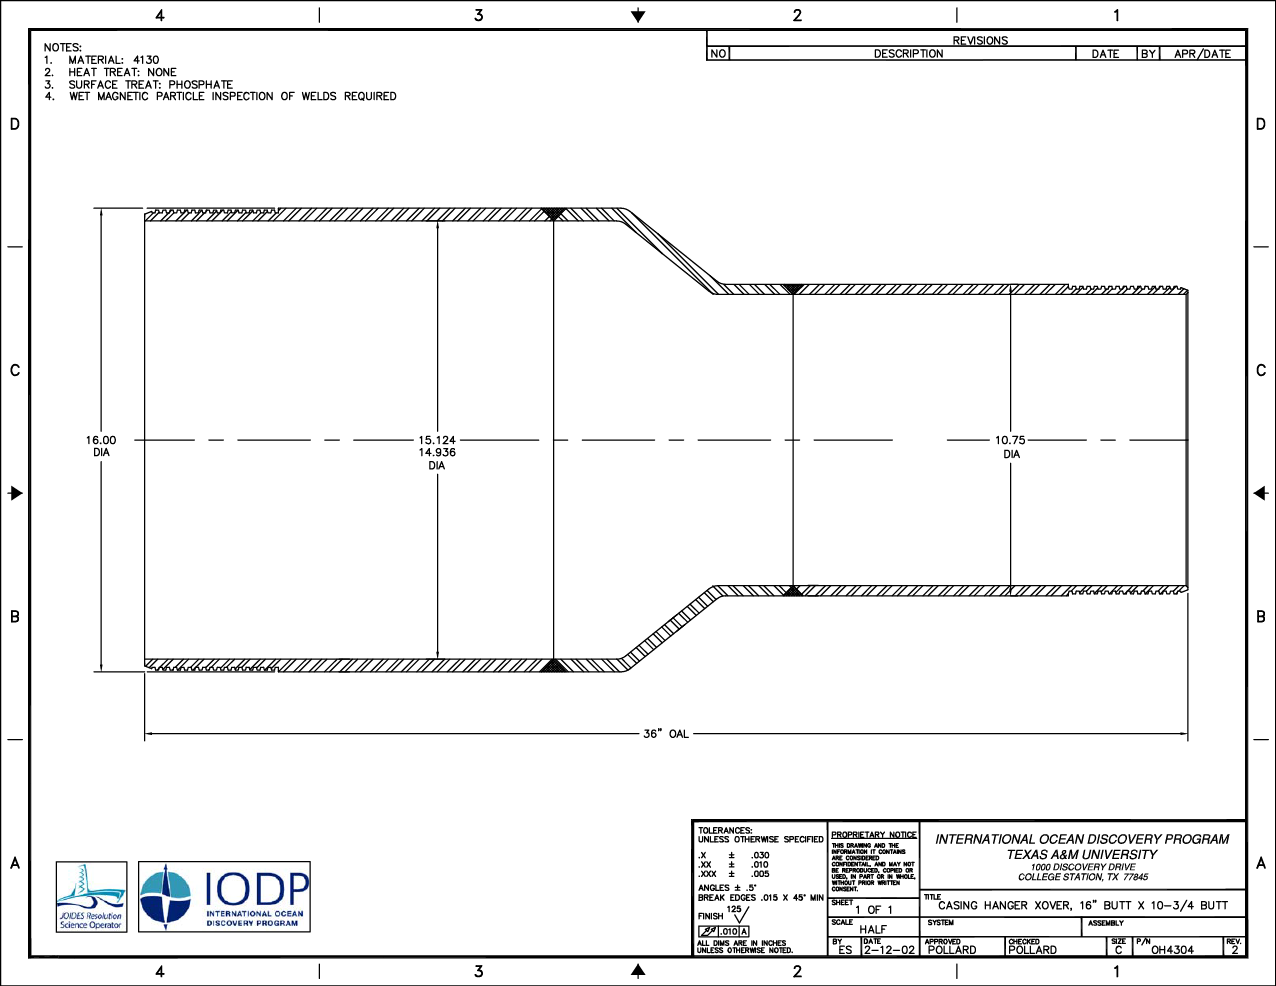
Figure F6. Casing hanger crossover.
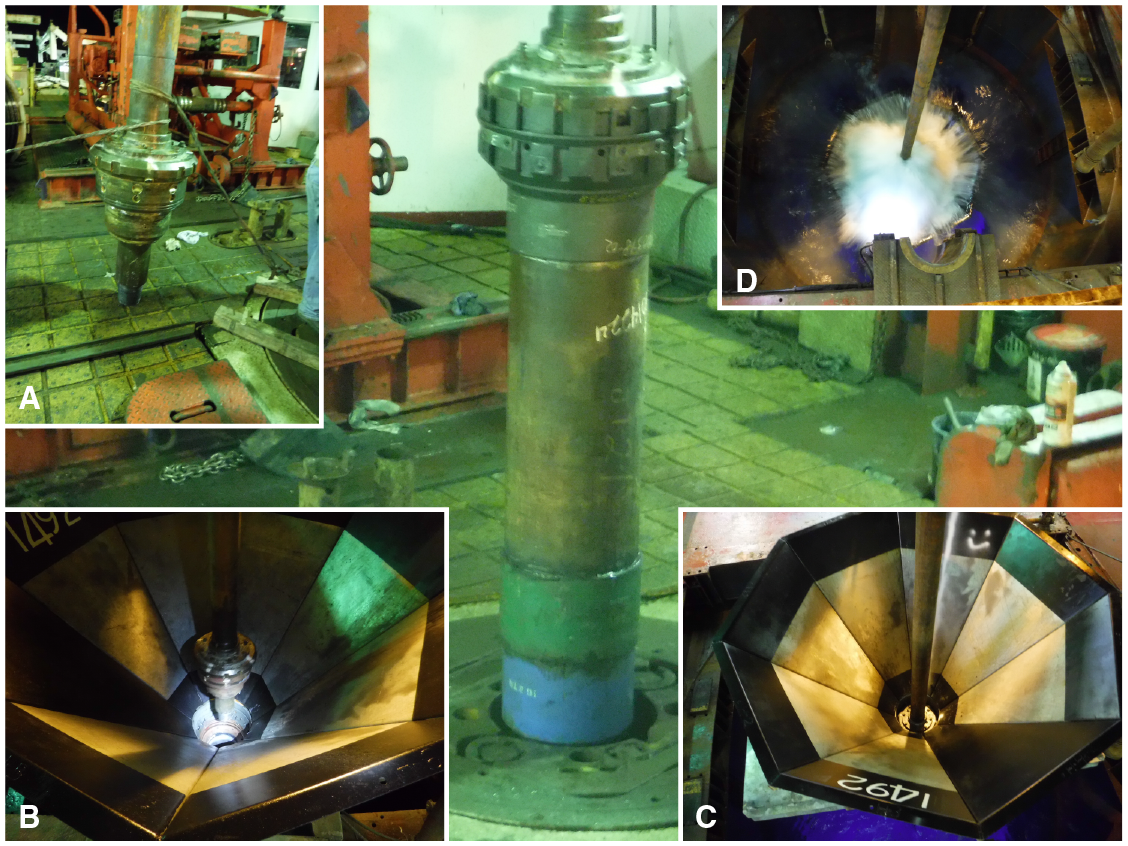
Figure F7. DQ running tool, casing hanger, and reentry cone.
Several quality assurance/quality control (QA/QC) issues were identified while making up the casing and drilling assembly. First, casing Joint 47 was found to have an improperly machined thread (it appeared to be a thread depth issue). This joint had to be laid back out and replaced with Joint 44. This issue was followed by the inability to make up the DQ running tool with the 16 inch casing hanger. After troubleshooting, the hanger was determined to be ~0.020 inches under gauge. Considerable grinding was required before the running tool and the hanger could be connected. Lastly, the first set of HOC DTU950 underreamers failed to open and close properly during the predeployment test. These underreamers usually open at around 30–35 strokes per minute (SPM). This set required 80 SPM to open at a pressure in excess of 700 psi and failed to close completely with the pumps off. The back-up system worked as planned.
Hole U1492D was spudded at 1620 h on 25 December, and the drillers tagged the seafloor at the same depth as Hole U1492C (3677.4 mbrf) (Table T1). Drilling parameters were normal while the casing string was drilled to 83.6 mbsf (3761.0 mbrf). At 0140 h on 26 December, the torque from the drilling motor suddenly led to the release of the reentry cone from the 16 inch casing hanger. Apparently, the large snap ring worked its way out of the latch groove, allowing the reentry cone to drop to the seafloor, guided by the drill pipe. Drilling continued until 0230 h, when the DQ running tool suddenly rotated enough to release the casing hanger, allowing the entire casing string to drop approximately 3.5 m onto the top of the energized and fully extended (to 14¾ inch in diameter) underreamer arms. After discussion with the Co-Chief Scientists and operations personnel, we washed down to reengage the running tool with the casing hanger. In 4 h, the running tool was reengaged (0845 h on 26 December). The casing string was advanced from 83.6 to 92.6 mbsf; however, drilling was extremely problematic, and it was felt that the underreamer might be damaged as a result of the casing impact. At 1100 h on 26 December, the driller began pulling up the drill string, clearing the seafloor at 1155 h. The stinger assembly was recovered, and the casing string was hung off on the spider beams in the moonpool forward of well center.
At 0315 h on 27 December, a 14¾ inch tricone drilling BHA was assembled. Hole U1492D was reentered at 1415 h on 27 December, and the pipe was lowered to 82.6 mbsf (3760.0 mbrf) without incident. To wash/ream the hole to the previous depth of 92.6 mbsf (3770.0 mbrf) took 1 h. To advance the hole to the target depth of 225.0 mbsf (3902.4 mbrf) took 17 h, which provided an adequate rathole below the 210.9 m long casing assembly. After pumping a 30 barrel high-viscosity mud sweep, a wiper trip was made to 66.6 mbsf (3744.0 mbrf). Another 30 barrel sweep was pumped out of the hole from that depth at 830 gal/min and 2200 psi pressure. The hole was tight all the way up to above 70 mbsf. The trip back to bottom was equally problematic, requiring 5.25 h to wash/ream back to bottom at 225.0 mbsf (3902.4 mbrf). Another 40 barrel high-viscosity mud sweep was pumped at the bottom of the hole, and the drilling assembly was pulled out of the hole, clearing the seafloor at 2005 h on 28 December. The bit cleared the rig floor at 0250 h on 29 December.
Several hours were required to prepare the DQ running tool and test/modify the underreamer. At 0930 h on 29 December, the assembled 10¾ inch casing string was moved into position over well center. By 1430 h on 29 December, the drill-in stinger was assembled and mated up with the casing string, and the driller began running into the hole with the drill-in casing assembly. The VIT subsea camera was deployed. Hole U1492D was reentered at 2302 h on 29 December. The casing was run to 37.6 mbsf (3715.0 mbrf), and the top drive was picked up. The casing was lowered to 54.6 mbsf (3732.0 mbrf) before taking weight. Drilling/washing continued to 96.0 mbsf (3773.4 mbrf) at 1200 h on 30 December. From that point, the casing was drilled to 144.6 mbsf (3822.0 mbrf) in 7.25 h (6.7 m/h), at which depth drilling became difficult. About 6.25 h were required to free the casing before it could advance. This advance was very slow to 183.6 mbsf (3861.0 mbrf). The casing was pulled back to 166.6 mbsf (3844.0 mbrf) to try to free it up. This attempt improved but did not fully correct the situation. Another attempt to advance the casing downhole was aborted, and the casing was pulled back again, this time all the way to 95.6 mbsf (3773.0 mbrf). The casing string was entirely free at this depth and remained so when lowered to 107.0 mbsf (3784.2 mbrf), where it began taking weight. The casing was eventually advanced to the total target depth of 214.4 mbsf (3891.8 mbrf) using the drill-in underreamer and mud motor assembly. This advance (from 107.0 to 214 mbsf) required nearly 10.75 h. The DQ running tool was successfully released at 2240 h with the 10¾ inch casing shoe placed at 210.9 mbsf. It was not possible to confirm that the latch ring on the hanger had fully engaged the reentry cone. Vision was obscured by clouds of cuttings and drilling mud. Because the reentry cone was landed by free-fall and not conventionally, it was not known if it was sitting on the seafloor truly level. As of 0000 h on 31 December, the top drive had been set back, the VIT subsea camera was being recovered, and the drill string was being tripped back to the ship. The drill string cleared the reentry cone/seafloor at 0055 h on 1 January 2017. The DQ running tool cleared the rig floor at 0915 h. The mud motor was flushed with freshwater and laid out; the underreamer assembly was also flushed. The DQ running tool was removed and used to check the connection to the other two 16 inch DQ casing hangers. One hanger tested out according to specification; however, the other hanger had QA/QC issues (different than the original problematic hanger).
At 1545 h on 1 January, the crew assembled the 9⅞ inch drilling assembly. This assembly was lowered to make sure the casing was deployed and free of material. This precaution was undertaken because the underreamer string required excess pull to be removed, implying that the formation may have filled the lower portion of the casing. This BHA was tripped to bottom and followed with the VIT subsea camera. After maneuvering the ship for 15 min, Hole U1492D was reentered at 0110 h on 2 January. The drill string was lowered to 210.5 mbsf without resistance, indicating that the casing was open to total depth. A 30 barrel high-viscosity mud sweep was pumped, and the drill string was recovered, clearing the seafloor/reentry cone at 0800 h and the rig floor at 1400 h.
A bridge plug installation BHA was assembled, including a rig-made “lunar lander tripping sub.” The top hat tripping ring used to release the ROV platform from the deployment tool (lunar lander) normally rides on top of the CORK head. In this case, the BHA was used. The fabricated sub had a ring welded onto it that would provide a place for the top hat to land but was small enough to fit inside the 10¾ inch casing. The drill string was tripped to bottom followed by the VIT subsea camera at 2255 h on 2 January. The first stand of drill collars was lowered into the hole without incident; however, while the pipe was hung off on the rotary table for a connection, the drill string jolted, and after completing the connection we discovered that the mechanical bridge plug (Figure F8) had set prematurely at ~37 mbsf. The plug should have required 10 turns to the right and then an upward force of 10,000–15,000 lb followed by a downward force of equal strength to set both sets of slips. The drill string and positioning beacon were recovered, and by 1430 h on 3 January the sea passage to the next site began.
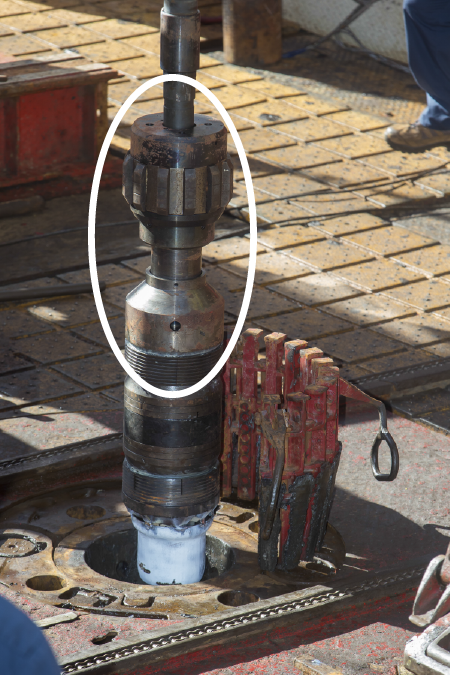
Figure F8. DQ running tool and bridge plug.
Once on board, the running tool was disassembled. The setting ring could easily be spun by hand, so it was not locked and worked as prescribed. The prevailing theory is that during the pipe trip through the water column, the setting ring rotated the 10 required turns. Then, after reentry, when the pipe was hung off on the elevator stool, the ship took a large heave. This heave resulted in the slips on the bridge plug getting hung up in the gap between casing joints (opposite the coupling), resulting in the appropriate force to be applied and causing the slips on the bridge plug to set. Thus, the hole is sealed at 37 mbsf, defeating the purpose of screens. We planned to return to the site later in the expedition to unblock the casing by hammering the bridge plug or deploying another installation. The manufacturer suggested hammering on the soft cast iron to break the middle portion the bridge plug. This would allow the rest of the assembly to be pushed to the bottom of the hole. Milling out was not advised because the bridge plug was set shallow, and not enough weight could be applied to mill out the cast iron efficiently. We departed for Site U1493.
Return to Hole U1492D
We returned to Hole U1492D at 2130 h on 19 January 2017 after a 50 nmi, 5 h transit from Site U1497. Hole U1492D was reentered at 0740 h on 20 January with the purpose of hammering out the bridge plug. The bridge plug was tagged at 40 mbsf. Earlier we stated that the plug was tagged at 37 mbsf. The difference between the two depths is probably related to the ship’s heave and tides; it did not move between operations. Once tagged, the bridge plug was hammered using a custom-built tool (Figure F9) over a period of 3 h, during which 1 h was spent on maintenance, before it gave way and moved downhole. The drill string was lowered, and we relocated the bridge plug at 211 mbsf, just below the base of casing. The ROV landing platform was deployed by free-fall, centered in the reentry cone (Figure F10). The base of casing was cemented with 5 barrels of 14 parts/gal cement. This amount of cement would fill 1.5 joints (~17 m) of casing. Cementing became the expedition’s preferred method of sealing the base of the casing because of the risk of the mechanical bridge plugs setting prematurely. The casing at Hole U1492D is ready for future deployment of borehole monitoring instruments and a CORK-Lite. The ship departed at 0200 h on 21 January for the 144 nmi transit to Hole U1496C.

Figure F9. Tool used to move the bridge plug below the casing.
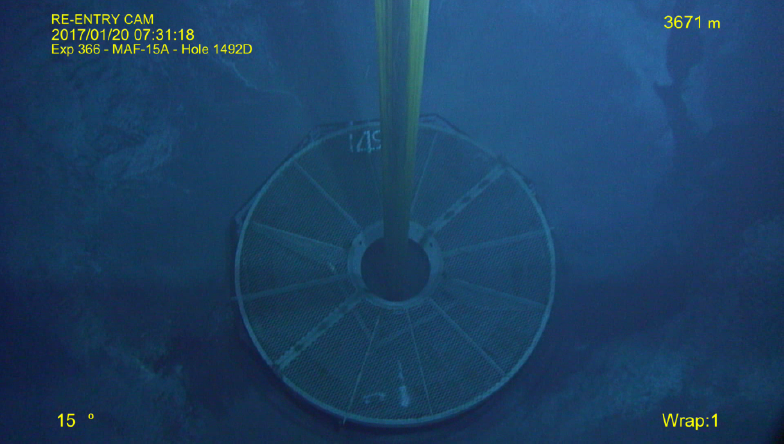
Figure F10. ROV platform.
Lithostratigraphy
Recovery at Site U1492, on the summit of Yinazao Seamount, consists of serpentinite mudflows with a thin cover of pelagic sediment. Holes U1492A–U1492C are located in a slight depression southwest of the summit of Yinazao Seamount (Figure F11). A fourth hole, U1492D, was drilled and cased for installation of a CORK observatory; no core was recovered from Hole U1492D, but rocks and adhering mud were recovered from the underreamer and the bit.
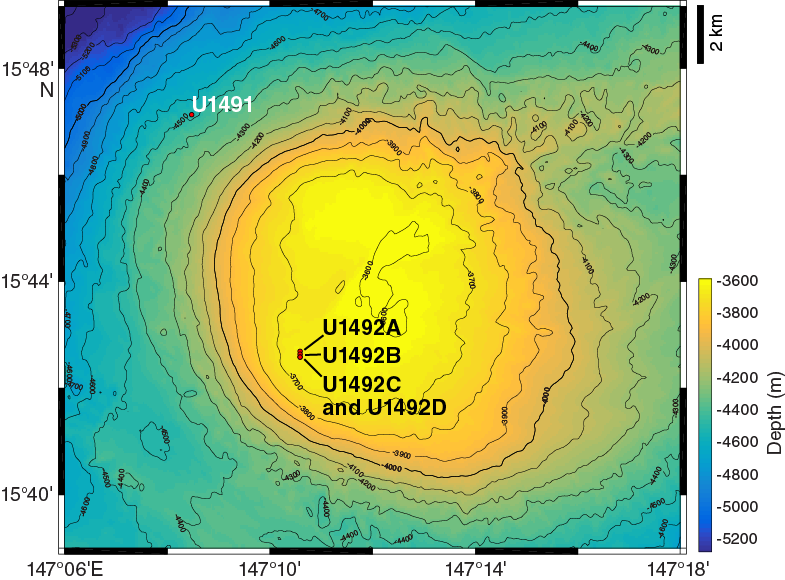
Figure F11. Bathymetric map, Holes U1492A–U1492D.
Cored materials from all three holes consist of distinct lithostratigraphic units based on primary lithology, grain size, color, and structure. An uppermost unit of blue-gray serpentinite pebbly mud contains 5%–10% lithic clasts of serpentinized ultramafic rock. Hole U1492B has a thin layer of red-brown pelagic sediment, and Hole U1492C has an intermediate unit of green serpentinite mud.
Hole U1492A
Hole U1492A consists of two units with a total thickness of 38.49 m (Table T2).
Table T2. Lithostratigraphic units, Hole U1492A. Download table in CSV format.
Unit I
Unit I is 3.48 m thick and composed of greenish gray to light brown clayey pebbly serpentinite mud with altered ultramafic rock clasts. Large (>4 mm long) acicular, euhedral aragonite crystals are scattered throughout the mud matrix. In Section 1H-1, 4–16 cm, coarse sand– to pebble-sized clasts of serpentinized peridotite and white carbonate form a band about 1 cm wide on the left side of the archive half (likely fall-in material from Site U1491). In Section 1H-1, 10–15 cm, there is a patch of dark brown serpentinite mud with several 5 mm diameter clasts of serpentinized peridotite. In Section 1H-1, 14–16 cm, there are two areas of radiating, acicular calcium carbonate (aragonite) varioles. Individual crystals are as long as 5 mm. In Section 1H-1, 80–85 cm, there is a patch of gray, pebbly serpentinite mud with numerous minute (about 1 mm in diameter) varioles of calcium carbonate. In Section 1H-1, 85–87 cm, the serpentinite mud has faint white (carbonate?) streaks. A narrow (0.5–1 cm wide) black stain (manganese oxide?) lies in the middle of the core in Section 1H-1, 86–90 cm.
The pebbly serpentinite mud becomes more distinctly brown-gray with streaks of reddish brown and has larger clasts of serpentinized peridotite at about Section 1H-2, 28 cm. Two of these clasts, at Sections 1H-2, 70 and 79 cm, have distinct contacts with the mud, but a larger clast (Section 1H-2, 134–144 cm) as wide as the liner tube diameter is surrounded on top and bottom by small clasts of similar (maybe parts of the large clast) lithology, and the surrounding serpentinite mud is dark greenish to black. The “halo” around the clast suggests that the rock may have altered in place within the mud. At the top of the next section (1H-3, 0–3 cm), more of the same dark mud encloses angular fragments (each about 1 cm in diameter) in half of the core liner. There is also a variole of acicular calcium carbonate crystals (Section 1H-3, 38–40 cm) that is nearly 2 cm in diameter. A rectangular (4.6 cm long and nearly 2 cm wide) clast of black serpentinized peridotite lies in Section 1H-3, 42.5–46 cm.
Unit II
Subunit IIA
Subunit IIA is 1.04 m thick and comprises greenish gray pebbly serpentinite mud with about 5% lithic clasts. There are two olive-green patches of unconsolidated serpentinite and carbonate in Sections 1H-3, 57.5–60 and 87.5–90.5 cm. A red-brown patch in Section 1H-3, 73–75 cm, is composed of unconsolidated serpentinite and has black mottling in its center.
Subunit IIB
Subunit IIB is 34.05 m thick and mainly consists of dark bluish gray pebbly serpentinite mud with 9%–10% lithic clasts. The dominant clasts are serpentinized ultramafic rock as much as 6 cm in diameter, with minor granules of pale green serpentine as the subdominant clasts. The clasts in this subunit have sharp contacts with the matrix (unlike others in Unit II) and are also darker and appear more fully serpentinized. Presumed fall-in unconsolidated material occurs at the top of Cores 2H, 4F, 5F, and 7F, with thicknesses varying from 15 cm to 2.12 m. The fall-in materials consist of pinkish brown pebbly mud with granule-sized lithic clasts in Core 2H and unconsolidated dark blue pebbly mud with >15% lithic clasts in Cores 4F, 5F, 6F, and 7F.
Hole U1492B
Hole U1492B consists of three units with a total thickness of 51.43 m (Table T3).
Table T3. Lithostratigraphic units, Hole U1492B. Download table in CSV format.
Unit I
Unit I is 0.40 m thick and comprises light to medium brown sandy pelagic mud matrix with subangular to subrounded clasts of semilithified pelagic mudstone. It contains ~30% lithic clasts of this material (Figure F12).
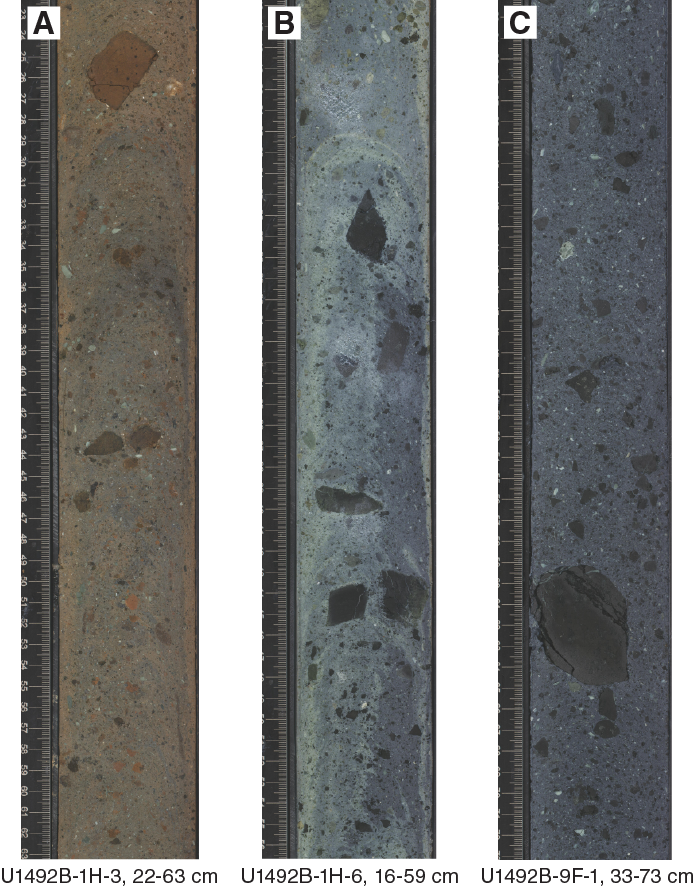
Figure F12. Unit II color transition.
Unit II
Subunit IIA
Subunit IIA is 6.72 m thick and consists of bluish gray to greenish gray pebbly mud with serpentinized ultramafic rock as the dominant clast type (~6% of core). Beginning in Section 1H-1, ~52 cm, there are minute (<2 mm) varioles of acicular aragonite crystals. Below 1.35 mbsf (Section 1H-2, 0 cm), varioles of radiating acicular aragonite crystals ~2–3 cm in diameter are common (Figure F13). In Section 1H-3 at about 28 cm, the unit changes to a darker blue-gray (Figure F12). Varioles do not occur below this depth. In Section 1H-CC, there is a distinct change from the usual pale green to greenish gray to pale brownish gray, but the matrix texture and clast type are the same as in the rest of the unit, except for a few orange clasts 1 to 2 mm in diameter. Beginning approximately in Section 1H-5, 21 cm, a pale green matrix appears at the edge of the core and widens downsection to about 2.5 cm wide on the right side of the archive half. On the other half of the core, the matrix is a darker bluish green. The contact is diffuse for the most part and also appears throughout Section 1H-6, 0 to ~24 cm. This pale green matrix appears again at about Section 1H-7, 9 cm, becomes broader downsection, and is marked sporadically by pale brown, narrow (about 2–3 mm wide) ribbons of concretions that parallel the contact. This texture was interpreted as a zone of diffuse fluid upflow because it occurs in what is known to be (from ROV observations) an active spring site, (see Structure). However, it may also represent flow-in drilling disturbance.

Figure F13. Radiating aragonite clusters.
Subunit IIB
Subunit IIB is 44.31 m thick and consists of dark bluish gray pebbly mud with serpentinized ultramafic rock as the dominant clast type (~10% of core) (Figure F12). Granules of pale green massive to foliated serpentinite are the subdominant clasts (~2%). The serpentinized ultramafic clasts (1–6 cm across) are typically harzburgites with clearly visible bastite pseudomorphs after orthopyroxene. The clasts appear black in hand specimen and are seen in thin section as largely or wholly (95%–100%) serpentinized (see Petrology). Section 10F-4, 15–83 cm, contains features that may indicate vertical flow of fluids through the matrix (see Structure).
Hole U1492C
A total of 71.35 m of core was recovered from 139.1 m of penetration in Hole U1492C. The recovered cores are divided into two units; Unit II is further divided into four subunits (Figure F14; Table T4).
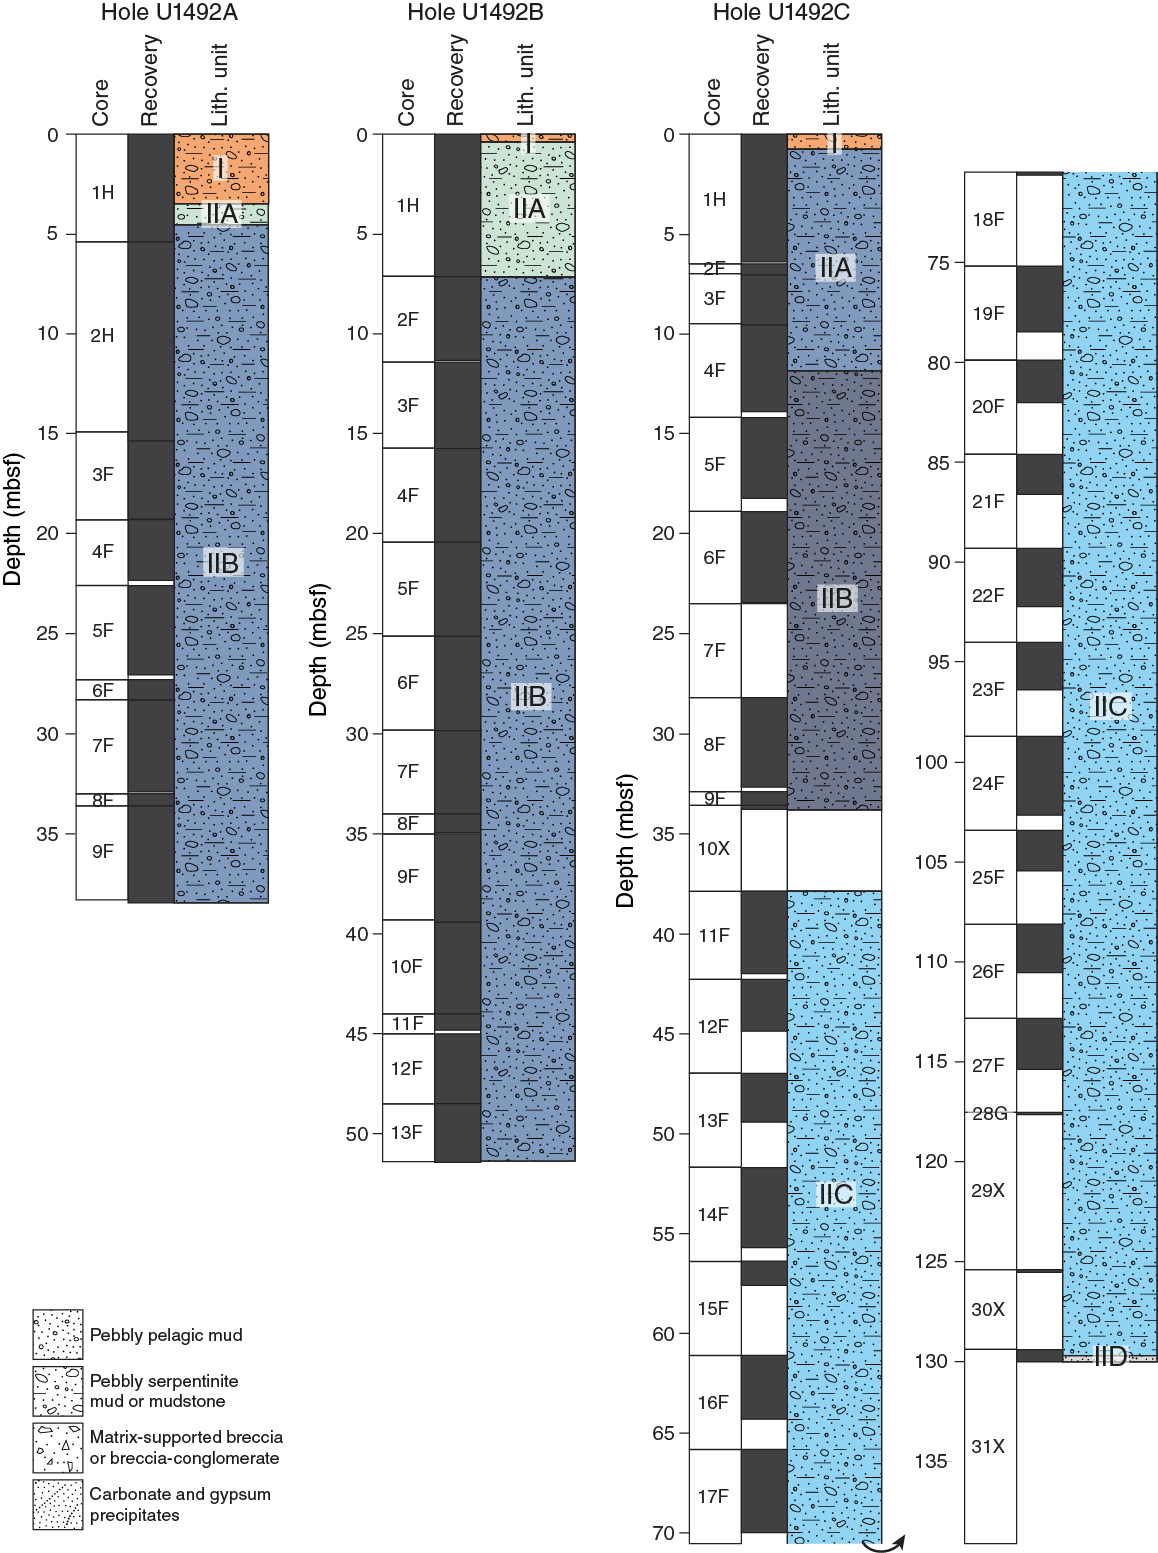
Figure F14. Lithostratigraphy.
Table T4. Lithostratigraphic units, Hole U1492C. Download table in CSV format.
Unit I
Unit I is 0.75 m thick and comprises a thin layer of mottled, light greenish gray to red-brown clayey (mostly serpentinite) mud with ~7% lithic clasts. The clasts are dominantly (~5% of core) serpentinized ultramafic rock, one of which, in Section 1H-1, 13–17 cm, is black and has a diffuse halo of black matrix on one side. Other clasts (~2% of core) include carbonate and unidentified lithic fragments.
Unit II
Subunit IIA
Subunit IIA is 11.08 m thick and composed of blue-gray pebbly serpentinite mud. In Section 1H-CC, 3–38 cm, the matrix is slightly lighter in color. About 7% of the lithic clasts are serpentinized ultramafic rock. The ultramafic protoliths are dominantly harzburgites, and the clasts have visible bastite pseudomorphs after orthopyroxene. Ubiquitous granules of pale green serpentine comprise ~1%–3% of the core. Small (<1 cm) clasts of breccia (possibly ophicarbonate) and unidentified rock types are rare. It should be noted that throughout Unit II, individual clasts, regardless of lithology, make sharp contact with the matrix and have no reaction/alteration halos.
Subunit IIB
Subunit IIB is 21.97 m thick and consists of serpentinite pebbly mud with a dark blue-black serpentinite mud matrix with a sulfurous smell. It is commonly less consolidated than adjacent cores. The clast content is slightly lower compared to the rest of Unit II (~5%), but clast distribution is similar (largely serpentinized ultramafic rock with minor green serpentine granules).
Subunit IIC
Subunit IIC is 92.06 m thick and composed of blue-gray serpentinite pebbly mud with ~7% lithic clasts of serpentinized ultramafic rock, similar to Subunit IIA. The ultramafic clasts are dominantly harzburgites with visible bastite pseudomorphs after orthopyroxene. Ubiquitous granules of pale green serpentine comprise ~1%–3% of core.
Subunit IID
Subunit IID is 0.36 m thick and composed of white finely crystalline material with serpentinite sand to gravel (Figure F15). Analysis by portable X-ray fluorescence spectrometer (pXRF) shows that this white material has high levels of S and Ca, suggesting that it may be gypsum.
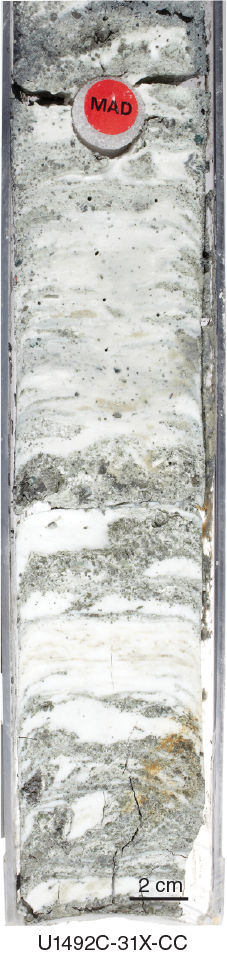
Figure F15. Alternating gray and white layers.
Hole U1492D
Hole U1492D was drilled without coring to 225 mbsf using a 14.75 inch bit and then reentered using the mud motor and underreamer bit to install casing for a CORK. No core was taken, but three sets of samples comprising mud and clasts were recovered from the underreamer. All three sets could be from anywhere in the hole and were assigned sample numbers: 366-U1492D-UR1, UR2, and UR3. The mud is dark blue-black, with blue-black serpentinized ultramafic clasts as long as 4 cm.
Petrology
Serpentinite mud matrix
The serpentinite mud consists of clay- to silt-sized serpentine minerals with accessory brucite, magnetite, calcite, and aragonite crystals and unidentified other phases. Smear slides show that serpentine is the dominant mineral, with minor spinel, magnetite, and brucite. Small aragonite needles are common. There are trace occurrences of microfossils (foraminifers and radiolarians), volcanic glass, and possibly amphibole. Two samples of serpentinite mud with various sizes of clasts (Samples 366-U1492A-3F-3, 44–46 cm [Thin Section (TS) 12], and 366-U1492B-1H-7, 42–44 cm [TS 18]) and one sample of lithified serpentinite mud with aragonite crystals (Sample 366-U1492A-1H-1, 82–84 cm [TS 9]) were prepared as thin sections. The matrix of Sample 3F-3, 44–46 cm, mainly consists of thinly recrystallized lamellae of serpentine embedding fragments of serpentinized ultramafic rocks with variable sizes ranging from several micrometers to 3 cm. Sample 366-U1492B-1H-7, 42–44 cm, is composed of thinly recrystallized matrix of serpentine lamellae containing fragments of fibrous serpentine veins and serpentinite clasts with mesh textures. Sample 366-U1492A-1H-1, 82–84 cm, is mainly composed of variolitic aragonite aggregates about 1 mm wide with radial textures. The aggregates are made of finely crystallized aragonite cores with about 1 mm long acicular aragonite crystals radiating from them (Figure F16). A few small interstitial lamellae of serpentine minerals (about 30 µm long) are associated with aragonite.
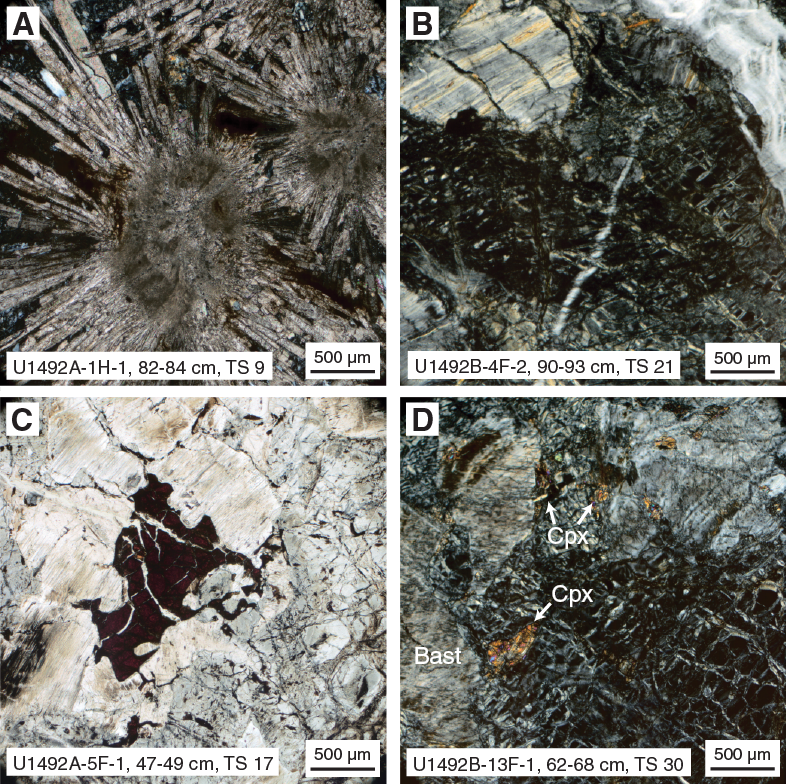
Figure F16. Serpentinized ultramafic clasts.
Serpentinized ultramafic rocks
Serpentinized ultramafic rocks are the dominant clast type in all Site U1492 cores. They represent 40%–50% of the clasts in Unit I and >90% of the clasts in Unit II. The clasts are angular to subangular in shape and range in size from <1 to ~6 cm in their long axis, with aspect ratios of ~1.5:1 to 2:1. The ultramafic clasts typically exhibit dark brown to brownish black color. The clasts are typically soft (easily scratched with metal probes), indicating that they are strongly serpentinized. Bastite pseudomorphs after pyroxene (presumably orthopyroxene) are visible in the interiors of most clasts, whereas clast rims are often devoid of clearly discernible pseudomorphs. The primary lithologies are commonly difficult to identify with certainty, but bastite occurrence and abundance suggest that most clasts represent spinel harzburgites.
In Subunit IIA, Hole U1492B, many of the large ultramafic clasts are pale green, similar to the surrounding matrix. They are similar in size to the “black” harzburgites described above and occur together with them. Such clasts may be source of some of the pale green serpentine chips found throughout the core.
Twenty-nine serpentinized ultramafic clasts were prepared as thin sections (TS 10, 11, and 13–17 from Hole U1492A; TS 19–30 from Hole U1492B, and TS 31–39 and 46 from Hole U1492C). Most of these samples are massive serpentinized harzburgites with inferred primary modes of about 80%–85% olivine, 15%–20% orthopyroxene, and 1% chromian spinel. Serpentinization ranges from 95% to 100%, and many of the samples are cut by fine serpentine veins. Serpentine generally shows pseudomorphic mesh and bastite textures replacing olivine and orthopyroxene, respectively (Figure F16). Reddish brown spinel occurs as an accessory phase often associated with bastite and typically has a vermicular shape. Sample 366-U1492B-2F-2, 69–72 cm (TS 20), is characterized by recrystallized serpentine displaying nonpseudomorphic interlocking or interpenetrating texture.
In Samples 366-U1492A-1H-2, 142–143 cm (TS 10), 4F-1, 54–57 cm (TS 13), and 4F-1, 68–71 cm (TS 15), an unidentified reddish alteration mineral partly overprints serpentine and bastite. Sample 366-U1492B-13F-1, 62–68 cm (TS 30), is characterized by mesh-textured pseudomorphic serpentine with primary interstitial clinopyroxene. The abundance of the clinopyroxene is <3%. The serpentine veins crosscutting the serpentinized harzburgites have fibrous textures and are often accompanied by magnetite.
Samples 366-U1492B-1H-7, 42–44 cm (TS 25), and 366-U1492C-5F-2, 24–28 cm (TS 34), are serpentinized dunites. Olivines are completely altered to serpentine with mesh texture. Some serpentines are overprinted by reddish low-temperature alteration minerals. Euhedral to subhedral chromian spinels with sizes ranging from 300 to 800 µm occur. The modal abundance of the spinel is 1%–2%.
All of the harzburgites from this site have inferred protogranular primary textures: orthopyroxene forms large blocky grains with minor undulatory extinction and few kink folds, and spinel occurs dominantly as vermicular intergrowths with pyroxene (bastite). However, some of the large orthopyroxenes and all of the smaller grains have odd lobate textures that fill spaces between olivine grains, and olivine can also form inclusions in orthopyroxene. The textures resemble postcumulus textures in cumulate rocks. They are interpreted here as melt infiltration textures formed by reactive porous melt flow. The melt was undersaturated in orthopyroxene, which entered the melt phase, melting incongruently to form a silica-rich melt and olivine.
Carbonate rocks
Carbonate clasts occur only in the upper 16 cm on the edge of the core liner in Hole U1492A, Unit I. These clasts appear to be biogenic and may represent fall-in from equipment used at Site U1491. Carbonate, as acicular varioles, is present in the upper part of Unit I and in Subunit IIA. Carbonate material is also present in the precipitate at the base of Core 366-U1492C-31X.
Serpentine
Pale green serpentine chips are ubiquitous in Unit II of each core. They are small (<5 mm generally) and typically comprise ≤2% of the core, but they are present in almost all sections examined. Many contain internal zoning and appear to represent fragments of serpentine veins that have become detached from their parent rocks; this suggestion is supported by the much less common occurrence of zoned serpentine vein material attached to edges of some ultramafic clasts.
White precipitate
A white powdery mineral interlayered with carbonates is found in the lowermost ~30 cm of Core 366-U1492C-31X (Figure F15). The white layers are 1–2 cm thick, and the carbonate layers are 1–2 mm thick. Analysis with the pXRF shows that the main constituents of the white material are CaO and S, suggesting that these layers may be composed of calcium sulfate (gypsum).
Altered mafic rocks
Small (0.5–2 cm), pale off-white clasts are found scattered throughout the core. These appear to be altered and metamorphosed mafic rocks. Six samples from Cores 366-U1492C-24F through 27F were prepared as thin sections (TS 40–45). Sample 24F-1, 27–28 cm (TS 40), is severely altered and sheared aphyric basalt, but the original igneous texture is partly preserved. The crystalline groundmass is composed of completely altered fine-grained plagioclase and clinopyroxene (<100 μm) with a trace amount of opaque minerals. Sample 24F-1, 37–39 cm (TS 42), is tentatively identified as severely altered and brecciated dolerite, although there are no relict minerals and no obvious igneous textures. Samples 27F-1, 6–7 cm (TS 43), and 27F-1, 11–12 cm (TS 44), contain euhedral to subhedral pinkish brown clinopyroxene (titanaugite) with sizes ranging from 200 to 700 µm (Figure F17). Tabular or elongate plagioclases with widths of ~600 µm are strongly altered and often embedded in clinopyroxene grains exhibiting subophitic texture. Elongate and curved secondary opaque minerals, tentatively identified as titanite, are scattered in the matrix, rimming and penetrating the titanaugites. The mineral assemblage and texture suggest protoliths of these rocks are likely to be fine-grained dolerites or mafic dikes. It should be noted that the pinkish brown clinopyroxene (titanaugite) typically occurs in alkaline rocks. Sample 24F-2, 21–22 cm (TS 45), is severely altered (and cataclastic?) dolerite. A trace amount of clinopyroxene (pale-yellow augite) is preserved.
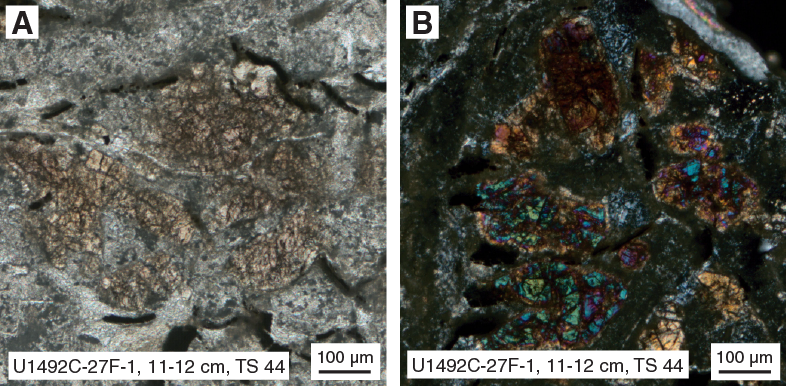
Figure F17. Altered mafic clasts.
Smear slides
Hole U1492A
Smear slides taken from Hole U1492A cores reveal that serpentine is the clay matrix–forming mineral, with minor contents of aragonite and accessory contents of spinel and magnetite, volcaniclastic glass, and pumice. Single amphibole grains, as well as relics of foraminifers and radiolarians, were also observed in Core 2H (Figure F18). Smear slides show that the aragonite-rich light brown clayey pebbly mud in Unit I of Hole U1492A could also be oxidized serpentinite mud rather than pelagic sediment because it is mostly composed of brown sandy serpentine fragments and serpentinite clay with other clay-sized brown minerals, and minor spinel was also observed.
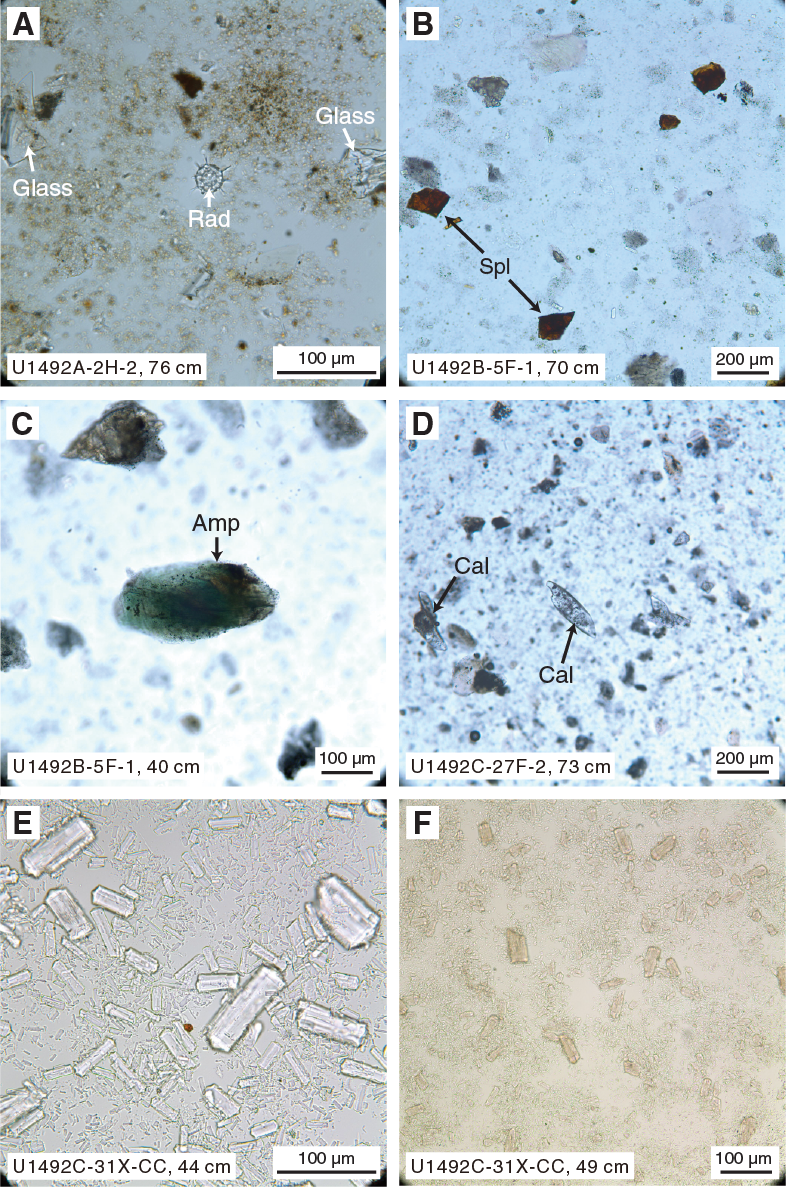
Figure F18. Representative smear slides.
Hole U1492B
Clayey, silty, and sandy serpentine grains are the major matrix-forming minerals in Hole U1492B. Carbonate (mainly aragonite) content is less than 10%. The proportion of brucite is as much as 1%. Accessory mineral components are euhedral magnetite, small spinel grains, and brown to green amphibole (Figure F18).
Hole U1492C
Smear slides taken from Hole U1492C cores reveal that serpentinite mud with rare acicular aragonite are the matrix-forming minerals. Trace amounts of Cr spinel, magnetite, and orthopyroxene were identified. Calcite crystals were found in Cores 27F and 30X (Figure F18).
Samples from the bottom of Hole U1492C (Sample 31X-CC, 36–66 cm; possible layered gypsum–carbonate structure) were taken from distinct fine-grained carbonate layers and contain almost pure carbonate and gypsum (suggested by X-ray fluorescence [XRF] data) with trace amounts of orthopyroxene, serpentine (or serpentinite), spinel, and opaque grains. The features of carbonate and gypsum under a microscope are quite different than those observed in the smear slides: gypsum has low birefringence and low negative relief, and calcite has extreme high birefringence and high relief that may be either positive or negative.
Structure
Drilling-induced structures
APC drilling resulted in minimal to obvious drilling-induced deformation. The deformation present consists of systematic upward vertical flow-in of all serpentinite muds, resulting in smear along the core liner flank, and generally affects the uppermost intervals (from 0 to ~10 mbsf) of the drilled holes (Figure F19) (Section 366-U1492B-1H-3, 23–63 cm) and intervals characterized by low viscosity. The downward push of the coring tool and the powerful force of the piston release causes this deformation. The width of the area affected by this type of deformation depends primarily on the viscosity of the unconsolidated material drilled and the rate of advance of the APC system. Mud-like materials are more deformed than coarser grained materials. This plastic shear strain increases from the core center toward the core margin. Similar drilling-induced structures were described by Jutzeler et al. (2014) in cores from Integrated Ocean Drilling Program Expedition 340.
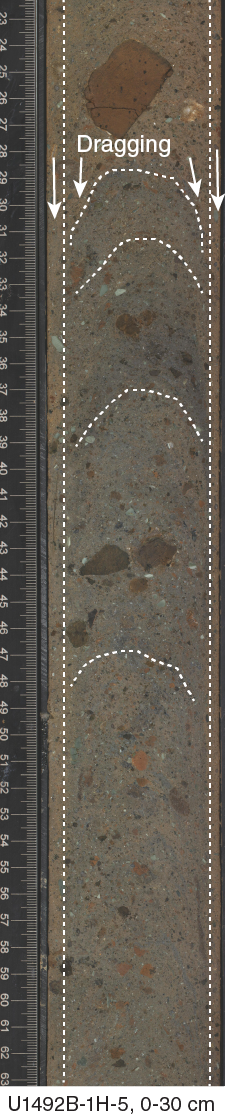
Figure F19. Drilling-induced, dragging-down structures.
Subvertically foliated flow structures were observed within Sections 366-U1492B-10F-4, 28–62 cm; 1H-7, 0–51 cm (Figure F20); and 366-U1492C-23F-1, 0–19 cm. The subvertical foliation results from the shape-preferred orientation of anisotropic and/or lozenge clasts and minerals. Lithic granules and clasts act as rigid objects within a viscous flow matrix and are surrounded by mainly symmetric flow structures. In Sections 366-U1492B-10F-4, 28–62 cm, and 1H-7, 0–51 cm, the subvertical foliation is emphasized by colored banding. These structures could be drilling induced, but there was discussion on board as to whether they indicate flow boundaries within the mud volcano conduit.

Figure F20. Subvertical, flow-induced foliation.
Structures
The drilled serpentinite muds, pebbly muds, and conglomerates are generally unconsolidated, massive, poorly sorted, and ungraded. Minor well-sorted intervals occur in Core 366-U1492A-1H. A subhorizontally bedded interval was retrieved from the bottom of Section 366-U1492C-31X-CC, 32–66 cm (129.66–130.02 mbsf) (Figure F15).
The bottom of Hole U1492C revealed Ca sulfates (?) with serpentinite sand to gravel. The related interval extends from Section 31X-CC, 26 cm, to the bottom of the hole (130.02 mbsf) for a thickness of 0.36 m. This interval is characterized by alternating 1–5 cm thick subhorizontal gray and white layers, with single serpentinite clasts embedded within the white sulfate matrix (Figure F15).
Veins
Extensional fractures, veins, and hybrid fractures between 0.5 and 5 mm thick are abundant within ultramafic and serpentinite clasts in several cores from Holes U1492A–U1492C. The vein-bearing clasts are randomly distributed within several cores. The modes of occurrence of the veins are single and multiple, the latter often as conjugate sets as well as dendritic veins, and are usually developed with sharp contacts to the host rock. Irregular and dendritic veins presumably formed by hydraulic fracturing and are characterized by host rock inclusion embedded within the vein precipitates. The vein geometry is heterogeneous; veins may be straight, planar, or kinked (Figure F21). Distinct veins with syn- and/or antitaxial fibers appear to have formed in incremental steps of extension.
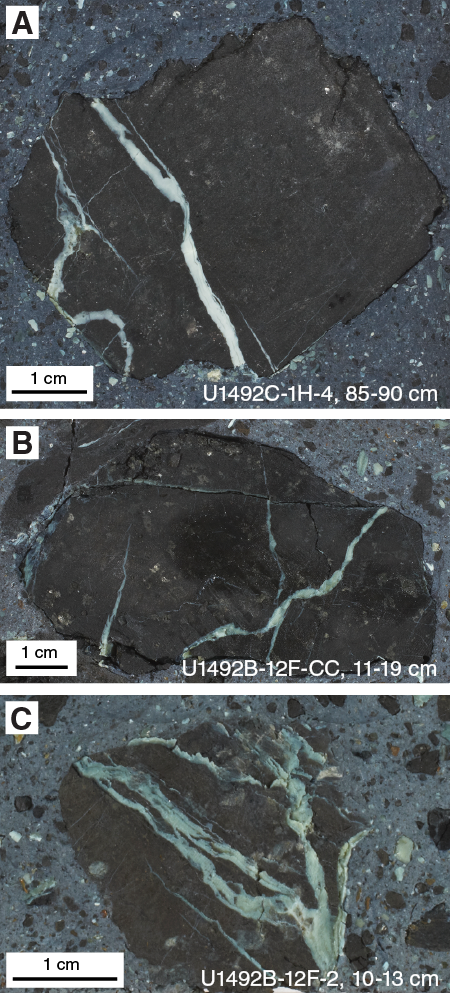
Figure F21. Vein types.
The vein-filling materials consist of serpentine and minor amounts of calcite and aragonite. Carbonate veins usually crosscut serpentine veins.
Lithostratigraphy, petrology, and structure summary
Site U1492 is located on the summit of Yinazao Seamount along the extension of an inferred normal fault (Figure F11). Cored recovery from all three holes (Figure F14) consists of serpentinite pebbly mud with lithic clasts. There is a thin ~0.4 m thick pelagic layer above serpentinite mud in Hole U1492B, overlying a lower unit of blue-gray serpentinite pebbly mud containing 5%–10% lithic clasts of serpentinized ultramafic rock. Hole U1492C has an intermediate unit of green serpentinite mud.
The upper brown pelagic sediment and the buff-colored uppermost portions of the serpentinite muds are characteristically higher in NGR (see VCDs in Core descriptions), implying saturation with seawater. When the cores transition into the bluish gray colors that dominate the remaining recovered core, NGR values drop by more than one order of magnitude, indicating insignificant seawater penetration into the blue muds deeper than the uppermost 4–6 m.
The location of Site U1492 at the summit of Yinazao Seamount was chosen to recover materials and place a cased borehole at an active area of fluid seepage observed with the ROV Jason in 2003. The sequence of predominantly serpentinite muds containing heavily serpentinized ultramafic clasts capped by a thin veneer of more oxidized, seawater-altered serpentinite muds and pelagic sediments is consistent with an area of recent serpentinite mudflows.
Ultramafic clasts in the lowermost portions of the cores display the most extreme degrees of serpentinization, often becoming soft enough to scrape with a fingernail. Conversely, ultramafic clasts in the brown to light green uppermost intervals retain their hardness and frequently exhibit milder degrees of serpentinization.
Rock and sediment geochemistry
Elemental abundances for Site U1492 samples selected by the shipboard scientific party were determined using inductively coupled plasma–atomic emission spectroscopy (ICP-AES) and pXRF analysis (Table T5). pXRF calibration curves are provided in Figure F2 in Johnston et al. (2018). The examined samples include serpentinite muds and serpentinized ultramafic rocks (harzburgites and/or dunites), along with a single sample of serpentinized cumulate rock. A full discussion of Expedition 366 rock and sediment data is found in Sediment and rock chemistry in the Expedition 366 summary chapter (Fryer et al., 2018b).
Table T5. ICP and pXRF data, Site U1492. Download table in CSV format.
Fluid geochemistry
Headspace hydrocarbon gas analysis was performed on samples from Holes U1492A–U1492C as part of the standard shipboard safety monitoring procedure. At least one sample per cored section was collected from Cores 366-U1492A-1H through 9F, 366-U1492B-1H through 13F, and 366-U1492C-1H through 27F. Dissolved H2, CO, and CH4 in the unconsolidated materials were measured at several other intervals recovered from Holes U1492A–U1492C.
A total of 56 whole-round samples were collected for interstitial water analyses from Cores 366-U1492A-1H through 9F, 366-U1492B-1H through 13F, and 366-U1492C-1H through 27F. The length of the whole-round samples ranges from 10 to 30 cm, with longer sections taken from cores recovered from greater depths, enabling sufficient production of interstitial fluids for all of the shipboard and shore-based analyses. The volume of recovered interstitial water varies from 52 to 110 mL per sample. Headspace gas and interstitial water samples were collected and analyzed as described in Fluid geochemistry in the Expedition 366 methods chapter (Fryer et al., 2018a).
Headspace analysis of H2, CO, and CH4
H2, CO, and CH4 concentrations were measured at several intervals in Holes U1492A–U1492C (Table T6; Figure F22). Although dissolved concentrations of CO and C2H6 were below the detection limits in most samples, H2 and CH4 concentrations were detected by gas chromatograph (GC)–helium ionization detector (HID) and GC–flame ionization detector (FID) analyses, respectively. In each hole, samples at several depths showed peak H2 concentrations (e.g., 20 mbsf in Hole U1492A, 14 mbsf in Hole U1492B, and 81 and 129 mbsf in Hole U1492C). These H2 anomalies are not associated with anomalies in interstitial water CH4 concentrations, as indicated by methane depth profiles and lower CH4/H2 ratios (Figure F22). In addition, anomalies in the interstitial water H2 concentrations are not associated with similar anomalies in any of the measured dissolved chemical species (e.g., pH, Cl−, etc.). Possible H2 sources in the subseafloor environment of Yinazao Seamount (Site U1492) are limited. A likely mechanism for H2 production in serpentinite fluids is microbial fermentation via organic compounds, but such production is highly unlikely due to the very low total organic carbon (TOC) concentrations and potentially low microbial biomass and activity.
Table T6. Dissolved H2, CH4, and CO concentrations. Download table in CSV format.
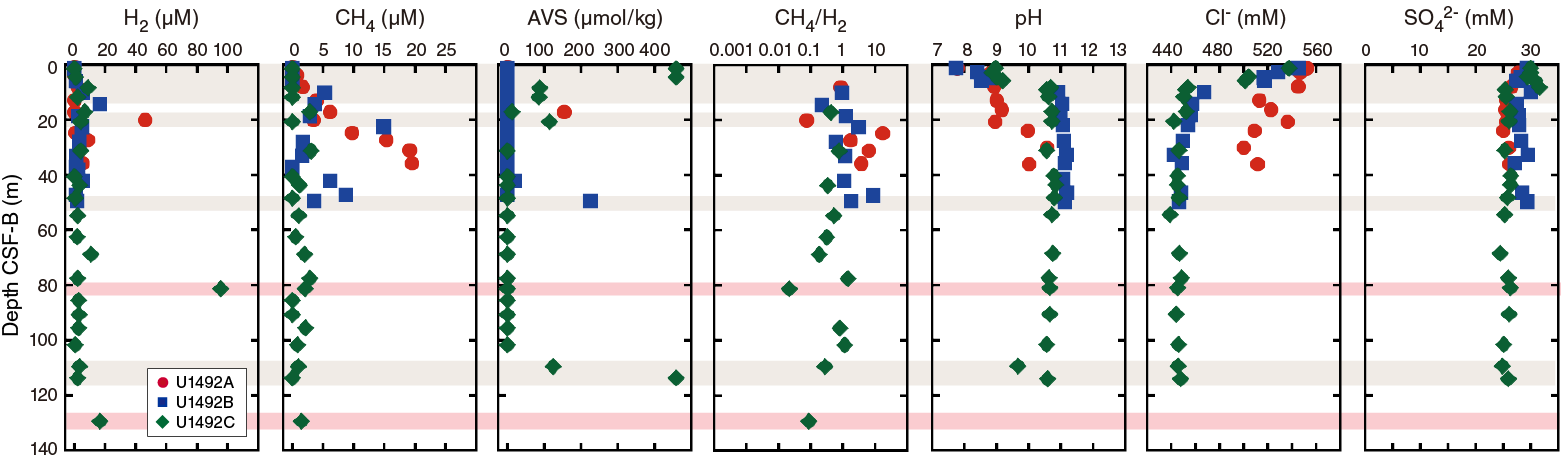
Figure F22. H2, CH4, and AVS concentrations.
If the interstitial water gas compositions at H2-enriched depths reflect the gas compositions consistent with the deep-sourced serpentinite fluids beneath Yinazao Seamount, then such a fluid would have low CH4/H2 ratios (<0.1). The average value of CH4/H2 ratios in Yinazao Seamount interstitial water samples was less than 1. Such low ratios are quite different from the ratios of fluids recovered from South Chamorro Seamount, another Mariana forearc serpentinite mud volcano where this ratio was estimated to be >100 (Komor and Mottl, 2005; Kawagucci, Takai, and Wheat, unpubl. data). Thus, the interstitial water H2 concentration and CH4/H2 ratio may be a chemical marker for comparing formation processes and evolutionary histories of the different Mariana forearc serpentinite seamounts. At present, we suggest a tentative classification in which the South Chamorro Seamount is a “CH4-enriched type” and the Yinazao Seamount is an “H2-enriched type.”
Electrochemical sensing of H2 and H2S
Interstitial water H2 and acid volatile sulfide (AVS) concentrations were measured by electrochemical sensors (H2-NR, Unisense, Denmark) and H2S probes (H2S-NR, Unisense, Denmark). H2 concentrations are below the detection limit for the electrochemical sensor in Holes U1492A–U1492C because the detection limit of the electrochemical sensor is relatively high (>5 µM) and the gas components in the serpentinite mud are tightly absorbed. Without applying a method that includes heating (e.g., 80°C for 30 min), the gas components in the serpentinite mud are not liberated from the muds, leading to very low concentrations in the interstitial fluids.
In contrast, the electrochemical H2S probe measured AVS concentrations above background (Table T7). AVS represents a sum of both dissolved sulfide (H2S, HS−, and S2−) and weakly mineralized sulfide (e.g., FeS) species. The values can be used as an indicator of relatively recent and/or present sulfate reduction activity as the sum of microbial sulfate reduction. We discovered several depth zones with high AVS concentrations in Holes U1492A–U1492C (Figure F22). These results suggest the possible occurrence of an active subseafloor microbial population, at least sulfate-reducing populations that are currently/recently active, even though interstitial water sulfate concentrations are not affected by the expected low rate of microbial functions. These results imply that the microbial sulfate-reduction rate is much slower than the diffusion rate of sulfate from seawater and/or the discharge of deep-sourced serpentinite fluids. Although it is not entirely clear, the AVS-enriched zones seem to be located at the CH4-enriched zones. Thus, the subseafloor sulfate-reduction activity may be associated with CH4 consumption. H2-dependent sulfate reduction is also possible.
Table T7. Interstitial water methane, ethene, and propane concentrations. Download table in CSV format.
Interstitial water
The salinity, pH, alkalinity, and chlorinity of the 56 interstitial water samples collected from Site U1492 were measured within a few hours after sampling. Samples were analyzed for NH4, PO4, and H2S by UV-vis spectrophotometry; Mg, K, Na, bromide, sulfate, and chloride concentrations were measured by ion chromatography (IC); and major (Mg, K, and Ca) and trace (Li, B, Mn, Fe, Sr, and Ba) cation concentrations were measured using the shipboard Teledyne Leeman Labs Prodigy ICP-AES instrument. The wavelengths examined for these elements are listed in Table T1 in the Expedition 366 methods chapter (Fryer et al., 2018a). Samples for shore-based hydrogen sulfide measurements were precipitated, and concentrations of H2S will be obtained when the samples are analyzed for the isotopic composition of sulfur. These samples were preserved by adding CdNO3, which forms CdS in the presence of H2S. Visible precipitation, indicating the presence of sulfide, was observed for many of the samples from Site U1492.
Results from the shipboard interstitial water analyses are reported in Tables T7 and T8 and Figures F23, F24, F25, and F26. Na data collected by IC provide a more internally consistent and accurate data set than the Na data determined by ICP-AES, where we observed run-to-run variation in concentrations and evidence of nonlinear intensity variation for several of the Ca and Na spectral lines (see Fluid geochemistry in the Expedition 366 methods chapter [Fryer et al., 2018a]). We therefore report IC data for Na in addition to bromide and sulfate in the tables and figures. The Na/Cl ratio is an important parameter for evaluating the geochemical reactions of the deep-sourced fluids because the ratio tracks changes relative to distance from the trench/depth to the slab. We used the Na and Cl data collected by the IC, which allows an assessment of the Na/Cl ratio without uncertainties introduced by using data collected via different methods.
Table T8. Interstitial water analyses. Download table in CSV format.

Figure F23. Alkalinity and pH.
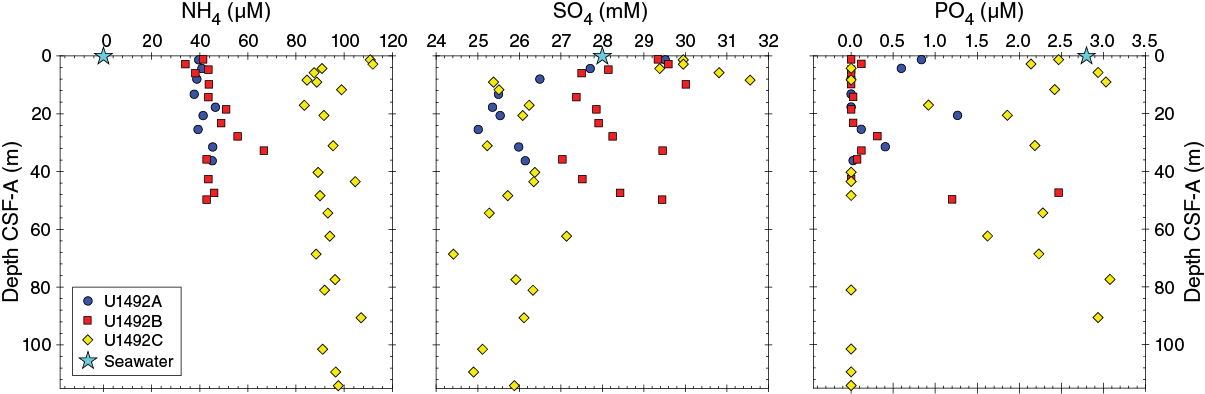
Figure F24. Ammonium, sulfate, and phosphate.
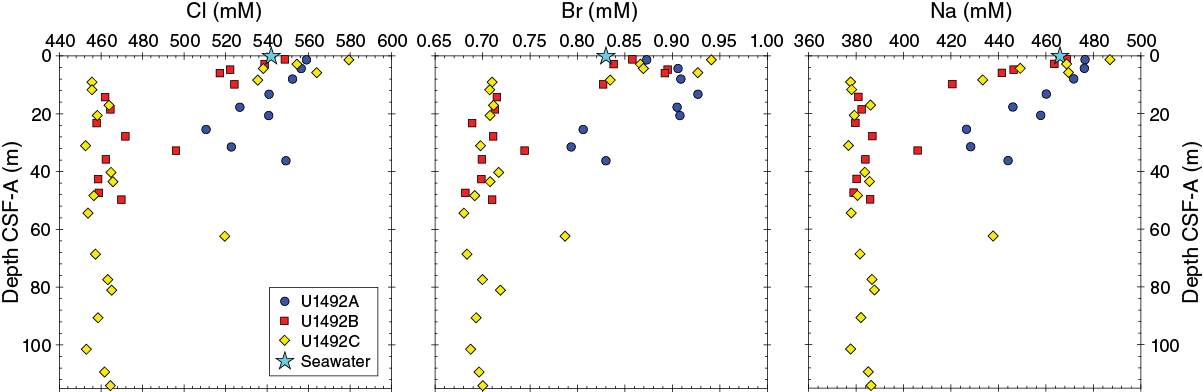
Figure F25. Cl, Br, and Na.
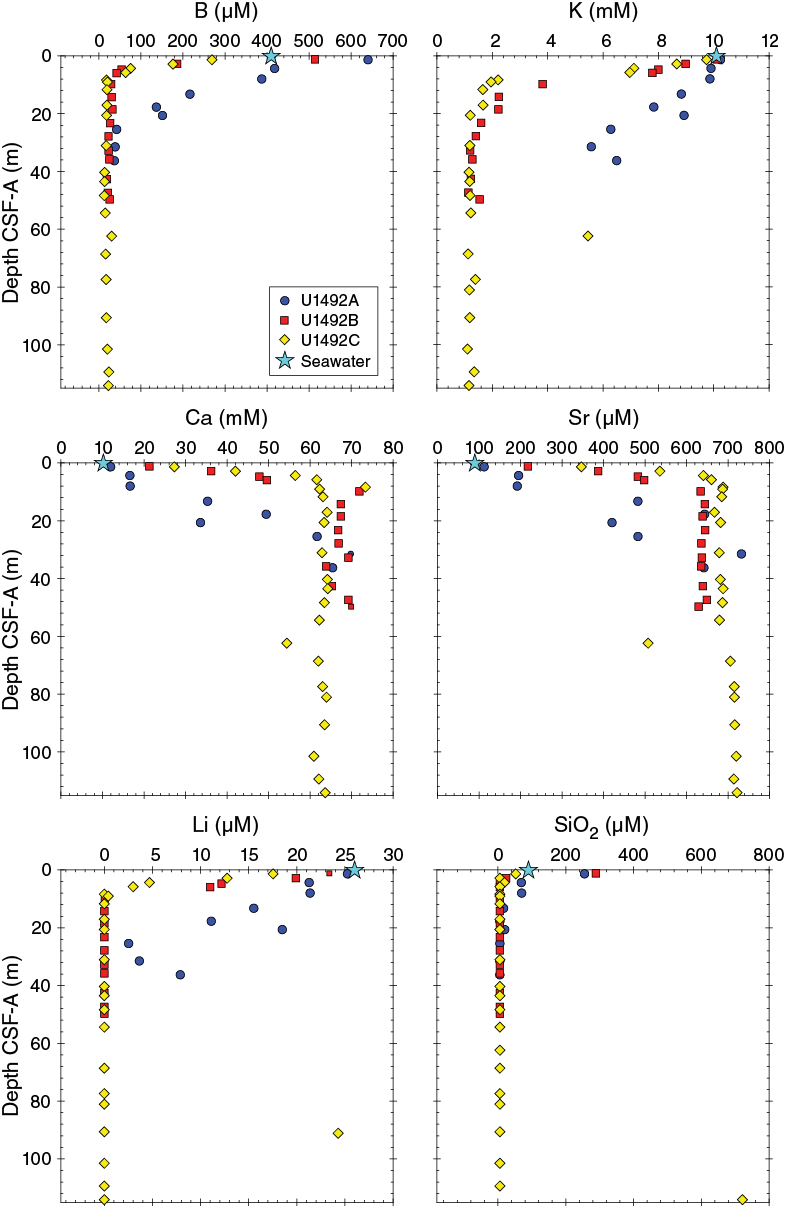
Figure F26. B, K, Ca, Sr, Li, and SiO2.
Salinity, pH, and alkalinity
Salinity values for Site U1492 samples range from seawater values near the seafloor to generally decreasing salinities downhole. In Hole U1492A, salinity is 34 at the top of the hole and begins to decrease at about 10 mbsf to 32 at the base of the hole (Table T8). In Hole U1492B, salinity shows a similar trend, decreasing from ~35 at the top of the hole to as low as 29 at the bottom of the borehole. Hole U1492C salinity starts lower (32.5) at the top of the hole and decreases to between 29 and 30 for the remainder of the borehole, with one value as low as 27.
pH ranges from 7.74 to 11.17 (Table T8). Each hole shows a regular pattern of downhole pH variation, with the lowest (seawater-influenced) values near the surface followed by a quick (within 20 m depth of penetration) transition to higher pH values (Figure F23). In Hole U1492A, the farthest from the identified springs on Yinazao Seamount, pH increases regularly from 7.78 in the uppermost section to 10.57 at 31 mbsf. In Hole U1492B, pH increases from 7.74 to ~11 above 10 mbsf. Below this depth, pH ranges from 10.91 to 11.18. pH increases from 8.90 to 10.70 in Hole U1492C in the upper 8 m. At deeper depths, pH ranges from ~10.60 to 10.83 in samples that were not adulterated by drilling fluids (evident based on abrupt reductions in pH and increases in Na and Cl). The maximum pH values observed in Holes U1492B and U1492C are consistent with values expected for serpentine and brucite equilibrium, which buffers the pH at a value of ~10.7 (Mottl et al., 2004). Both minerals are present in these cores (see Lithostratigraphy).
Alkalinity ranges between 0.44 and 3.65 mM at Site U1492, with complex patterns of downhole change (Table T8; Figure F23). For example, alkalinity is low in Hole U1492A, aside from a single near-surface sample that approaches seawater values. In Hole U1492B, alkalinity has an initial near-surface value close to seawater value and increases to ~3.7 mM at the bottom of the borehole at ~50 mbsf. Hole U1492C has values of ~0.5 mM in the shallowest sections, shifting to higher values (a mean value of ~1.4 mM) at above 8 mbsf.
Ammonium, phosphate, sulfate, chloride, and bromide
Measured ammonium concentrations are elevated in Site U1492 interstitial samples relative to seawater but are highest in Hole U1492C, which is the nearest to the spring identified in 2003 (Table T8). In Hole U1492C, ammonium concentrations range between 80 and 111 µM (Figure F24). Holes U1492A and U1492B samples are a factor of two to three lower. Previous research suggests deep fluids are enriched in ammonium; therefore, a relatively rapid reduction in ammonium concentration away from the primary site of active fluid discharge suggests Hole U1492C is closer to this area of discharge than Holes U1492A and U1492B.
Phosphate concentrations are lower than those of seawater in nearly all Site U1492 samples and are below the detection limit in many (Table T8; Figure F24). Such low concentrations could be the result of a combination of uptake by subsurface microbial communities or mixing with deep fluids low in phosphate.
Sulfate concentrations range between 24 and 32 mM in Site U1492 samples (Table T8; Figure F24). In all three holes, SO4 is equivalent to or greater than seawater values near the surface; it decreases to between 24 and 26 mM in the deepest segments of Hole U1492C. These values are similar to but slightly lower than those found by Hulme et al. (2010), where concentrations of <27 mM are indicated (no asymptote in the data was encountered, so lower values were anticipated). The consistent sulfate concentrations at ~25 mM in the deepest samples (e.g., ~114 mbsf) suggest that sulfate was supplied from upwelling deep-sourced fluids even though such deep-sourced fluids are highly reducing. This SO4 could come from several sources, including “old” seawater from the subducting slab, dissolution of SO4-containing minerals (e.g., CaSO4), or microbial activity such as sulfide oxidation. Mottl and Alt (1992) suggest, based on fluid data from ODP Site 780, that a deep, fluid-derived source of SO4 (with low δ34S) is upwelling through the summit of Conical Seamount and that this deep fluid is probably derived from the top of the subducting slab.
Chloride and bromide concentrations show similar patterns of decreasing concentrations with depth at Site U1492, trending in the uppermost 10–20 m from values at or slightly higher than seawater to lower values of ~460 mM chloride and ~0.7 mM bromide in the deeper sections of Hole U1492C (Table T8; Figure F25). Low chloride is one of several diagnostic indicators for slab-sourced, non-seawater fluids identified at the Conical and South Chamorro Seamounts. Mottl and others (Mottl, 1992; Mottl et al., 2004) suggest that the “freshening” of interstitial fluids downhole relative to seawater requires a source of H2O from deeper in the system.
Major and trace cations
Site U1492 major and trace element data from interstitial waters show several distinctive patterns of variation (Table T8; Figure F26). In the upper ~20 m of each hole, Ca concentrations increase from near seawater values (10.2 mM) to consistently and significantly higher concentrations (~60 mM) below 20 mbsf. High concentrations are reached in the uppermost ~25, ~9, and 6 m in Holes U1492A, U1492B, and U1492C, respectively, and then remain relatively constant downhole. Sr concentration profiles mimic those of Ca, with a rapid increase from seawater values, most evident in Hole U1492A, to values approaching 700 µM in Hole U1492C.
Na concentrations have a downhole variation pattern similar to those of chloride and bromide, with seawater-like values (466 mM) in the top ~5 m of the core recovery declining to consistently lower concentrations by ~14 mbsf in Hole U1492B and ~9 mbsf in Hole U1492C (Figure F25). Although the overall decrease in Na values is likely caused by dilution by a H2O-rich deep fluid low in Na, the fact that the Na/Cl concentration ratio also decreases suggests that additional processes may influence the Na concentrations.
B concentrations decrease from 500–600 µM near the seafloor to as low as ~20 µM (e.g., in the deeper sections of Hole U1492C) (Table T8; Figure F26). This decrease occurs abruptly within <10 mbsf in Holes U1492B and U1492C but shows a more gradual trend of decrease in the more distal Hole U1492A. K concentration profiles are similar to those of B, with rapid downhole decreases from seawater-like values (10.2 mM K) to a consistently lower value of ~1.5 mM K, which was reached by 30 mbsf in Hole U1492B and 6 mbsf in Hole U1492C; concentrations only decrease to 6 mM at 36 mbsf in Hole U1492A. Both of these chemical species are enriched in marine sediments and the clays and related phases formed during the alteration of ocean floor basalts (Donnelly et al., 1980). Their low levels in Site U1492 interstitial waters are consistent with the low inferred temperatures for the slab beneath Yinazao Seamount (~80°C) (Hulme et al., 2010) and likely indicate that the breakdown of sheet silicate phases during the prograde metamorphism of subducting sediment and basalt, which is known to mobilize K and B, has not yet begun.
Mg concentrations are initially similar to seawater (52.4 mM) near the seafloor and decrease downhole. This decrease is most rapid in Hole U1492C, where Mg concentrations drop to 4.2 mM within ~5 mbsf and are below detection limits (0.4 µM; see Fluid geochemistry in the Expedition 366 methods chapter [Fryer et al., 2018a]) by ~37 mbsf. In Hole U1492B, Mg concentrations follow a similar decreasing trend, but in Hole U1492A, the decrease is more gradual to a minimum of 10.16 mM at ~6 mbsf.
Li concentrations decrease downhole from a seawater value (26 µM) in the uppermost ~2 m of Hole U1492C to <0.05 µM (and below detection limits by ICP-AES) at ~10 mbsf. This decrease in concentration has a similar profile in Hole U1492B, but Hole U1492A shows a more gradual drop in concentration to <8 µM at 36 mbsf.
SiO2 concentrations are higher than bottom seawater (190 µM) in the upper 1.5 m in Holes U1492A and U1492B and drop to <100 µM by 3 mbsf in Hole U1492B and 5 mbsf in Hole U1492A. The highest SiO2 concentration in Hole U1492C is 52 µM, within 1.4 m of the seafloor. Below 3 mbsf in Holes U1492B and U1492C, the SiO2 concentration is below the detection limit for the ICP-AES method used. Spectrophotometry measurements in Hole U1492C from 5 mbsf indicate SiO2 concentrations between 3 and 16 µM. In Hole U1492A, SiO2 content decreases to 15–20 µM between 13 and 18 mbsf and is below the detection limits of the ICP-AES deeper in the hole.
Mn concentrations are only above the limit of detection in the upper 20 m of Hole U1492A, where they increase from 0.93 to 15.96 µM from ~5 to 20 mbsf. Holes U1492B and U1492C have Fe concentrations of <15 µM in the upper 5 m and below the detection limit for the ICP-AES method below these depths (Table T8). Ba concentrations are below the detection limit for the ICP-AES method in all Site U1492 samples.
Dissolved inorganic and organic carbon
A progressive decrease in dissolved inorganic carbon (DIC) concentration is evident in Hole U1492A, declining from seawater values in the upper 18 mbsf (Table T8; Figure F27). DIC concentrations are generally <15 ppm, indicating deep-sourced fluid with a concentration less than that of bottom seawater.
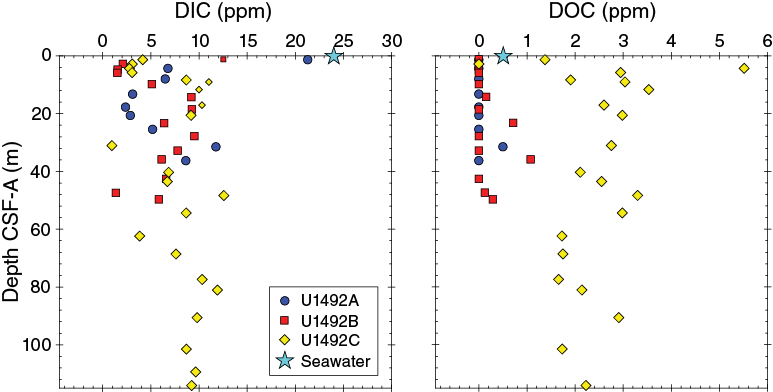
Figure F27. DIC and DOC.
Concentrations of dissolved organic carbon (DOC) in Hole U1492A are below detection limits in all but one sample (31 mbsf), which has a concentration of 0.5 ppm (Table T8). In Hole U1492B, the shallowest samples have DOC concentrations below detection limits, whereas deeper samples show variable DOC concentrations from below the limit of detection (<0.156 ppm) to 1.1 ppm. In Hole U1492C, DOC levels are consistently higher, with values that range from 1 to over 5 ppm.
Methane, ethane, and propane concentrations in interstitial fluids were measured in all 28 samples from Site U1492 (Table T7). Measurable ethane concentrations were determined in five of these samples.
Summary
The chemical composition of interstitial fluids from Site U1492 converge on a deep-sourced fluid with high pH (≥ 10.6); enrichments in NH4, Ca, and Sr; and depletions in B, K, Li, Mg, Si, Na, Cl, Br, and PO4, relative to bottom seawater. Sulfate concentrations may be slightly lower than bottom seawater, based on Hole U1492C fluid compositions. The composition of the deep-sourced fluid at Site U1492 is consistent with results from gravity and push core results (Hulme et al., 2010). The very low B and K concentrations in these fluids likely relate to little or no mobilization of these chemical species from the shallow and cool (~13 km; 80°C; Oakley et al., 2008; Hulme et al., 2010) downgoing plate beneath Yinazao Seamount, because neither of these elements are abundant in the depleted upper mantle (e.g., Salters and Stracke, 2004; Savov et al., 2005). The low B and Li concentrations in these fluids are also consistent with experimental results documenting the retention and uptake of B and Li from fluids into sheet silicate phases at ~150°C (Seyfried et al., 1984) and as such may confirm the existence of low temperatures at the slab/mantle interface. The high Ca and Sr in these fluids have been suggested to be a result of smectite collapse (i.e., the release of these elements from smectite due to increased pressure and temperature at depth) (Hulme et al., 2010). However, the low inferred temperatures and the absence of B or K enrichments would appear to argue against such a model. Large enrichments in Ca in interstitial waters from the inactive Torishima Forearc Seamount and the common occurrence of rodingites in association with serpentinites (e.g., Shervais et al., 2005) indicate that Ca can be leached from peridotite, as even depleted harzburgite contains some Ca (Mottl et al., 2004).
Microbiology
Sample recovery
Microbiology sampling during Expedition 366 focused on exploring the limits of microbial life in serpentinite mud habitats across multiple depths using cultivation-based and cultivation-independent molecular biological approaches, microscopy, and assays for the detection of viruses. Sampling efforts targeted both near-surface and deeper whole-round cores, especially if there was evidence of transitions across gradients of microbiologically affecting compounds and gases (e.g., hydrogen, methane, hydrogen sulfide, and sulfate). Two 20 cm long whole-round samples were collected at each sampled depth for general microbial analyses. Additional whole-round samples were collected for individual investigations. A total of 37 whole-round samples were collected for general microbial sampling from the summit of Yinazao Seamount at Site U1492. These samples were preserved and will be analyzed postexpedition as described in Microbiology in the Expedition 366 methods chapter (Fryer et al., 2018a).
Contamination testing
Contamination testing at Site U1492 was conducted using perfluoromethylcyclohexane (PMCH). Tracer delivery was evident by routine detection in drilling fluids and at the top of cores where contamination was expected to be high but was mostly below the limit of detection (1.63 × 10⁻⁵ µg/g mud; average of blanks + 3× standard deviation; N = 14) in whole rounds dedicated for microbiology samples (Table T9; Figure F28).
Table T9. PMCH contamination assessment data. Download table in CSV format.
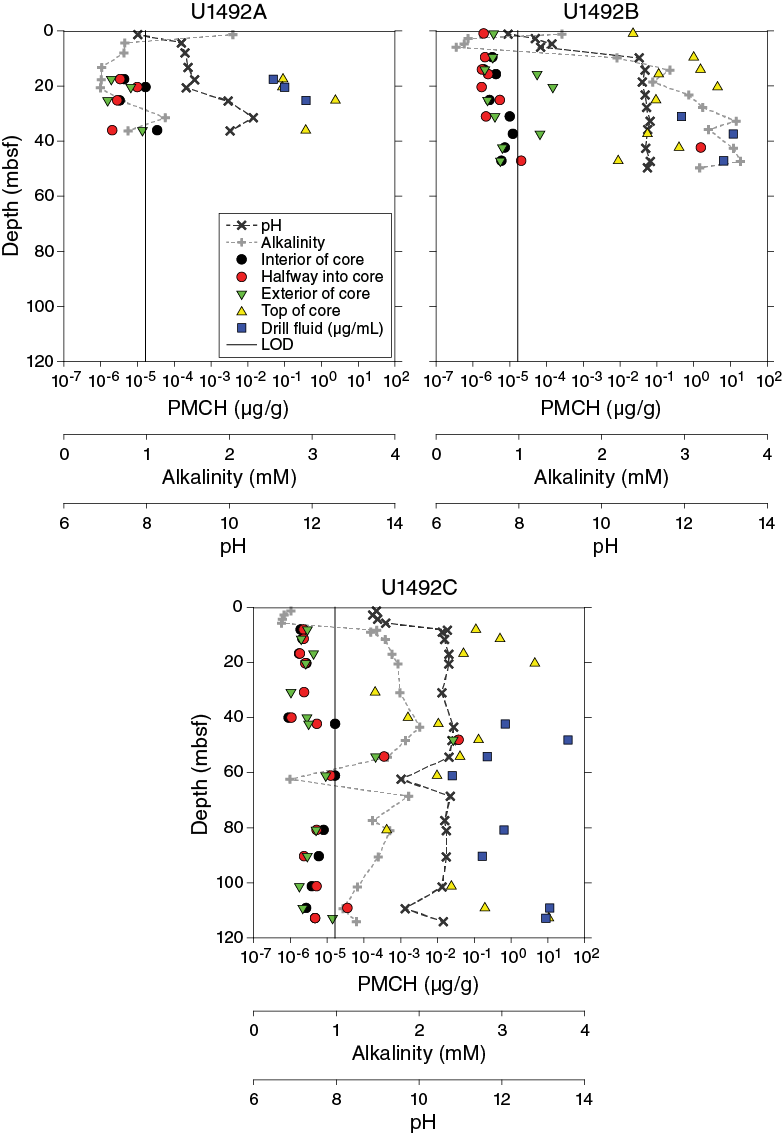
Figure F28. PMCH.
Sections 366-U1492A-4F-1 (20.4 mbsf), 9F-2 (36.1 mbsf), and 366-U1492C-26F-1 (109.2 mbsf) show low drilling fluid contamination. Slightly higher tracer concentrations were detected in the exterior parts of Sections 366-U1492B-4F-2 (15.7 mbsf), 5F-2 (20.4 mbsf), and 9F-2 (37.4 mbsf), which were generally not sampled for microbiology. In Sections 366-U1492C-13F-1 (48.1 mbsf) and 14F-2 (54.2 mbsf), elevated amounts of tracer were detected in the core interior, and these sections should be treated as contaminated with drilling fluid. Elevated tracer concentrations in a halfway sample with simultaneous absence in the interior and exterior of Section 366-U1492B-10F-3 (42.4 mbsf) suggests a potential error during sample processing.
Shipboard DNA extraction and qPCR
DNA extraction and quantitative real-time polymerase chain reaction (qPCR) were attempted on aliquots of serpentinite mud samples from various depths within Hole U1492C (Lever et al., 2015). qPCRs were analyzed on a portable PikoReal 96 Real-Time polymerase chain reaction (PCR) system (Thermo Fisher Scientific, Finland). 16S rRNA gene amplicons of Desulfotignum phosphitoxidans (Bacteria; 1.51 kb) and Archaeoglobus profundus (Archaea; 1.40 kb) were used as qPCR standards and resulted in satisfactory calibration curves with r2 ranging from 99.45% to 99.82%, showing that performing gene quantification on board the JOIDES Resolution is feasible and can be a valuable technique during future expeditions.
No 16S rRNA gene copies could be detected in DNA extracts by qPCR. Several theories as to why recovery was low were identified. The primary theory is that organic poor minerals have a strong adsorption capacity for DNA, which makes DNA recovery after cell lysis difficult. To test this hypothesis, triplicates of serpentinite mud samples were spiked with archaeal 16S rRNA DNA standard and different concentrations of dNTPs for adsorption prevention (100 µL of either H2O, 10 mM dNTPs, or 100 mM dNTPs). As a control, serpentinite mud was replaced by combusted zirconia/silica beads. Steps for DNA extraction and qPCR were performed as they were for extracting DNA from serpentinite mud samples. DNA recovery of the control was 43% of the DNA spike. No significant amount of DNA was recovered from the serpentinite mud samples, indicating strong DNA adsorption to the sample matrix. This, together with likely low initial cell numbers, demonstrates the necessity for future improvements on the extraction protocol, mainly with focus on adsorption prevention.
Physical properties
Physical property data were acquired for Site U1492, including density, magnetic susceptibility, P-wave velocity, NGR, thermal conductivity, color reflectance, and shear strength (see Physical properties in the Expedition 366 methods chapter [Fryer et al., 2018a]). Three holes were cored at this site: two shallow-penetration holes to 38.3 and 51.4 mbsf (U1492A and U1492B), and one deep hole to 139.1 mbsf (U1492C). The two shallow-penetration holes were cored with the APC and HLAPC systems with high core recovery (Figure F29), and the deeper hole was cored with the HLAPC and XCB systems with relatively poor core recovery (51.55%) (Figure F30).
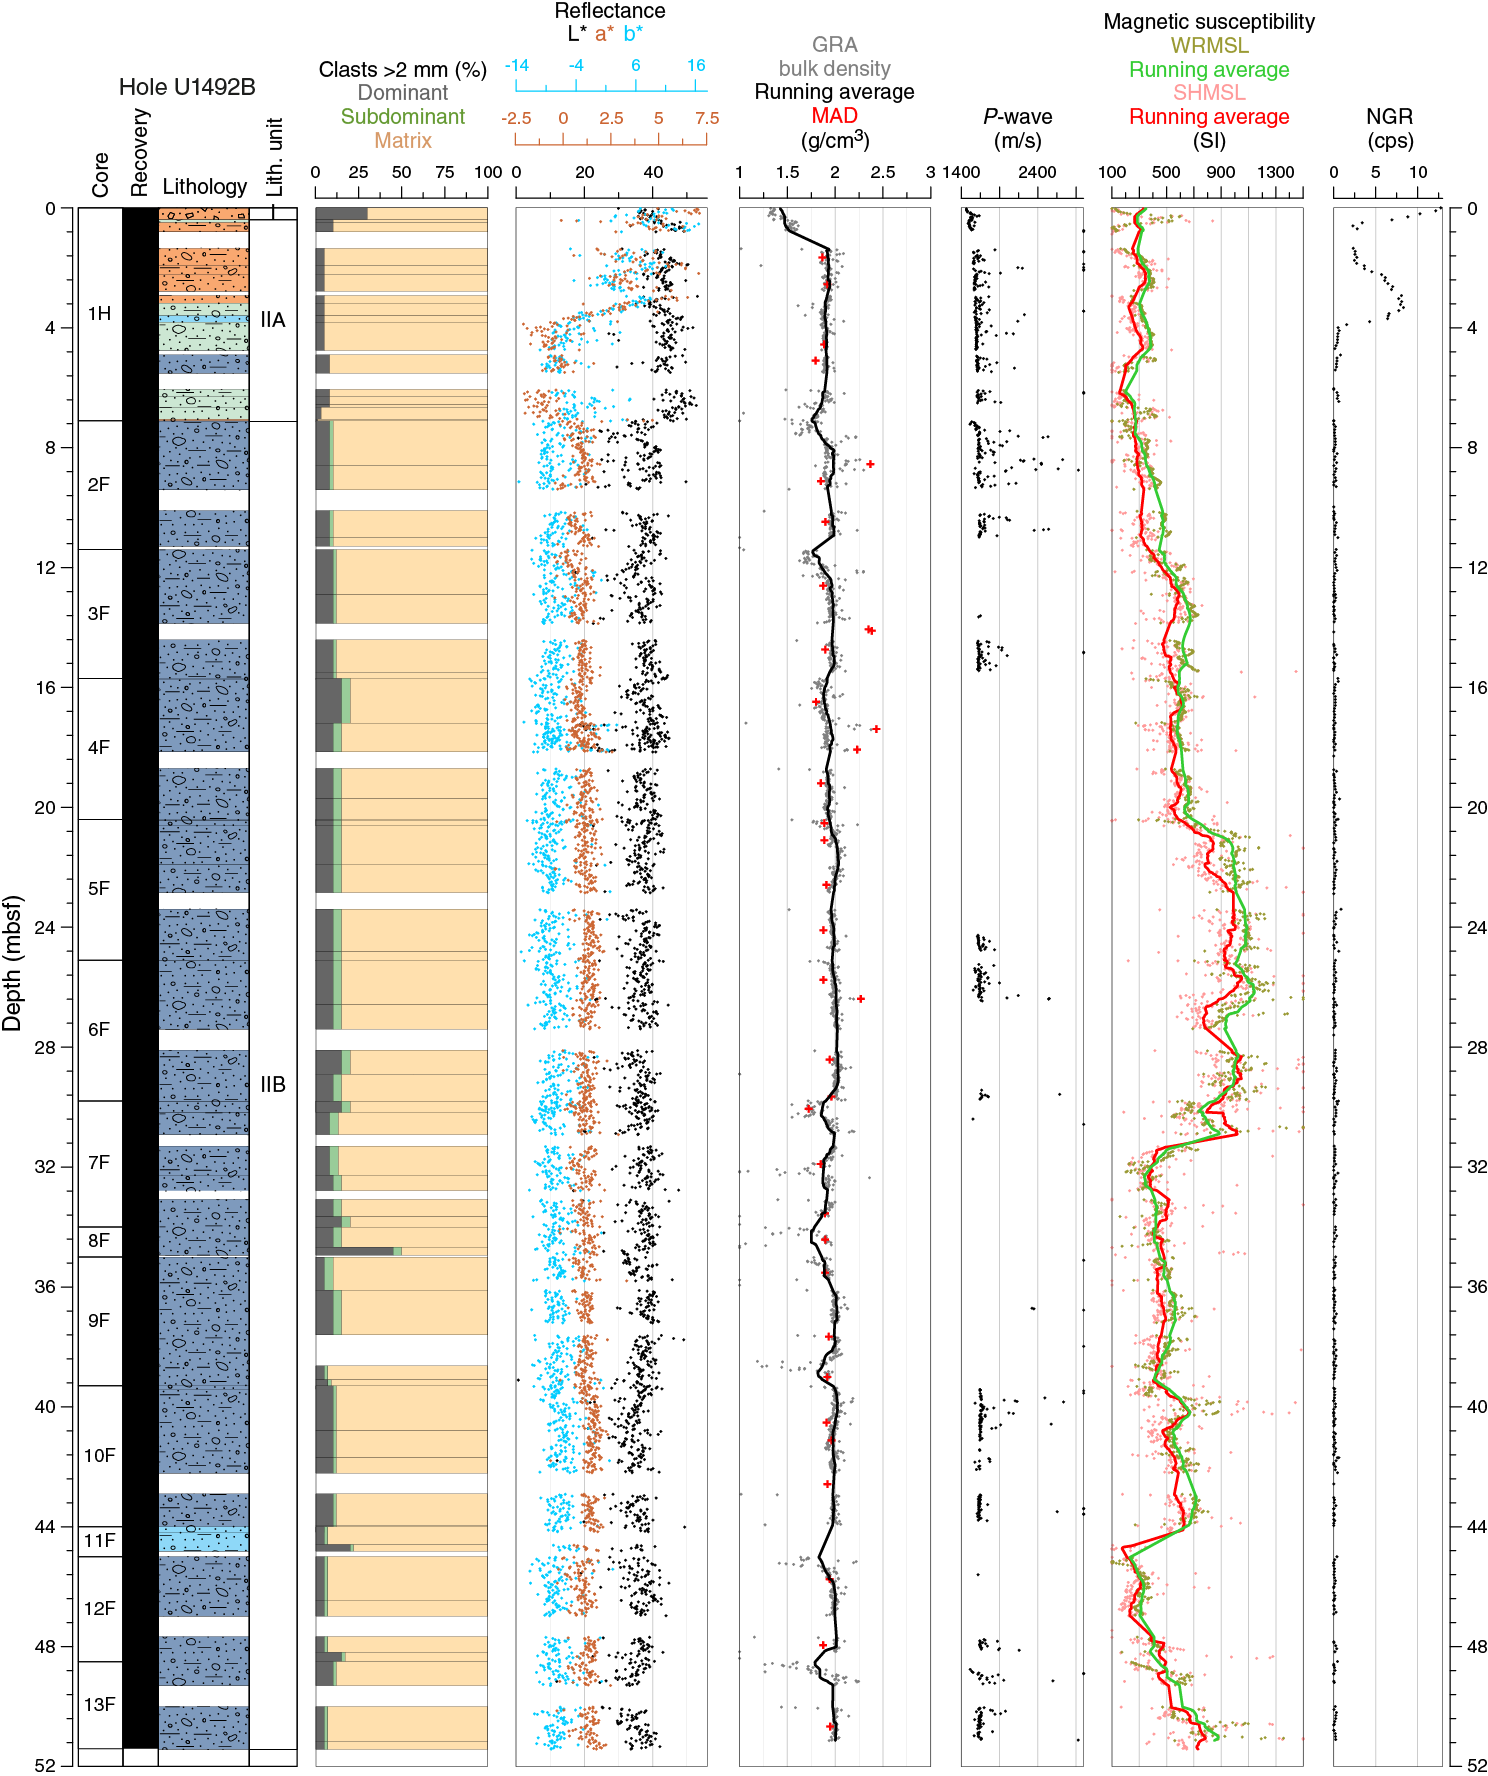
Figure F29. Physical properties, Hole U1492B.
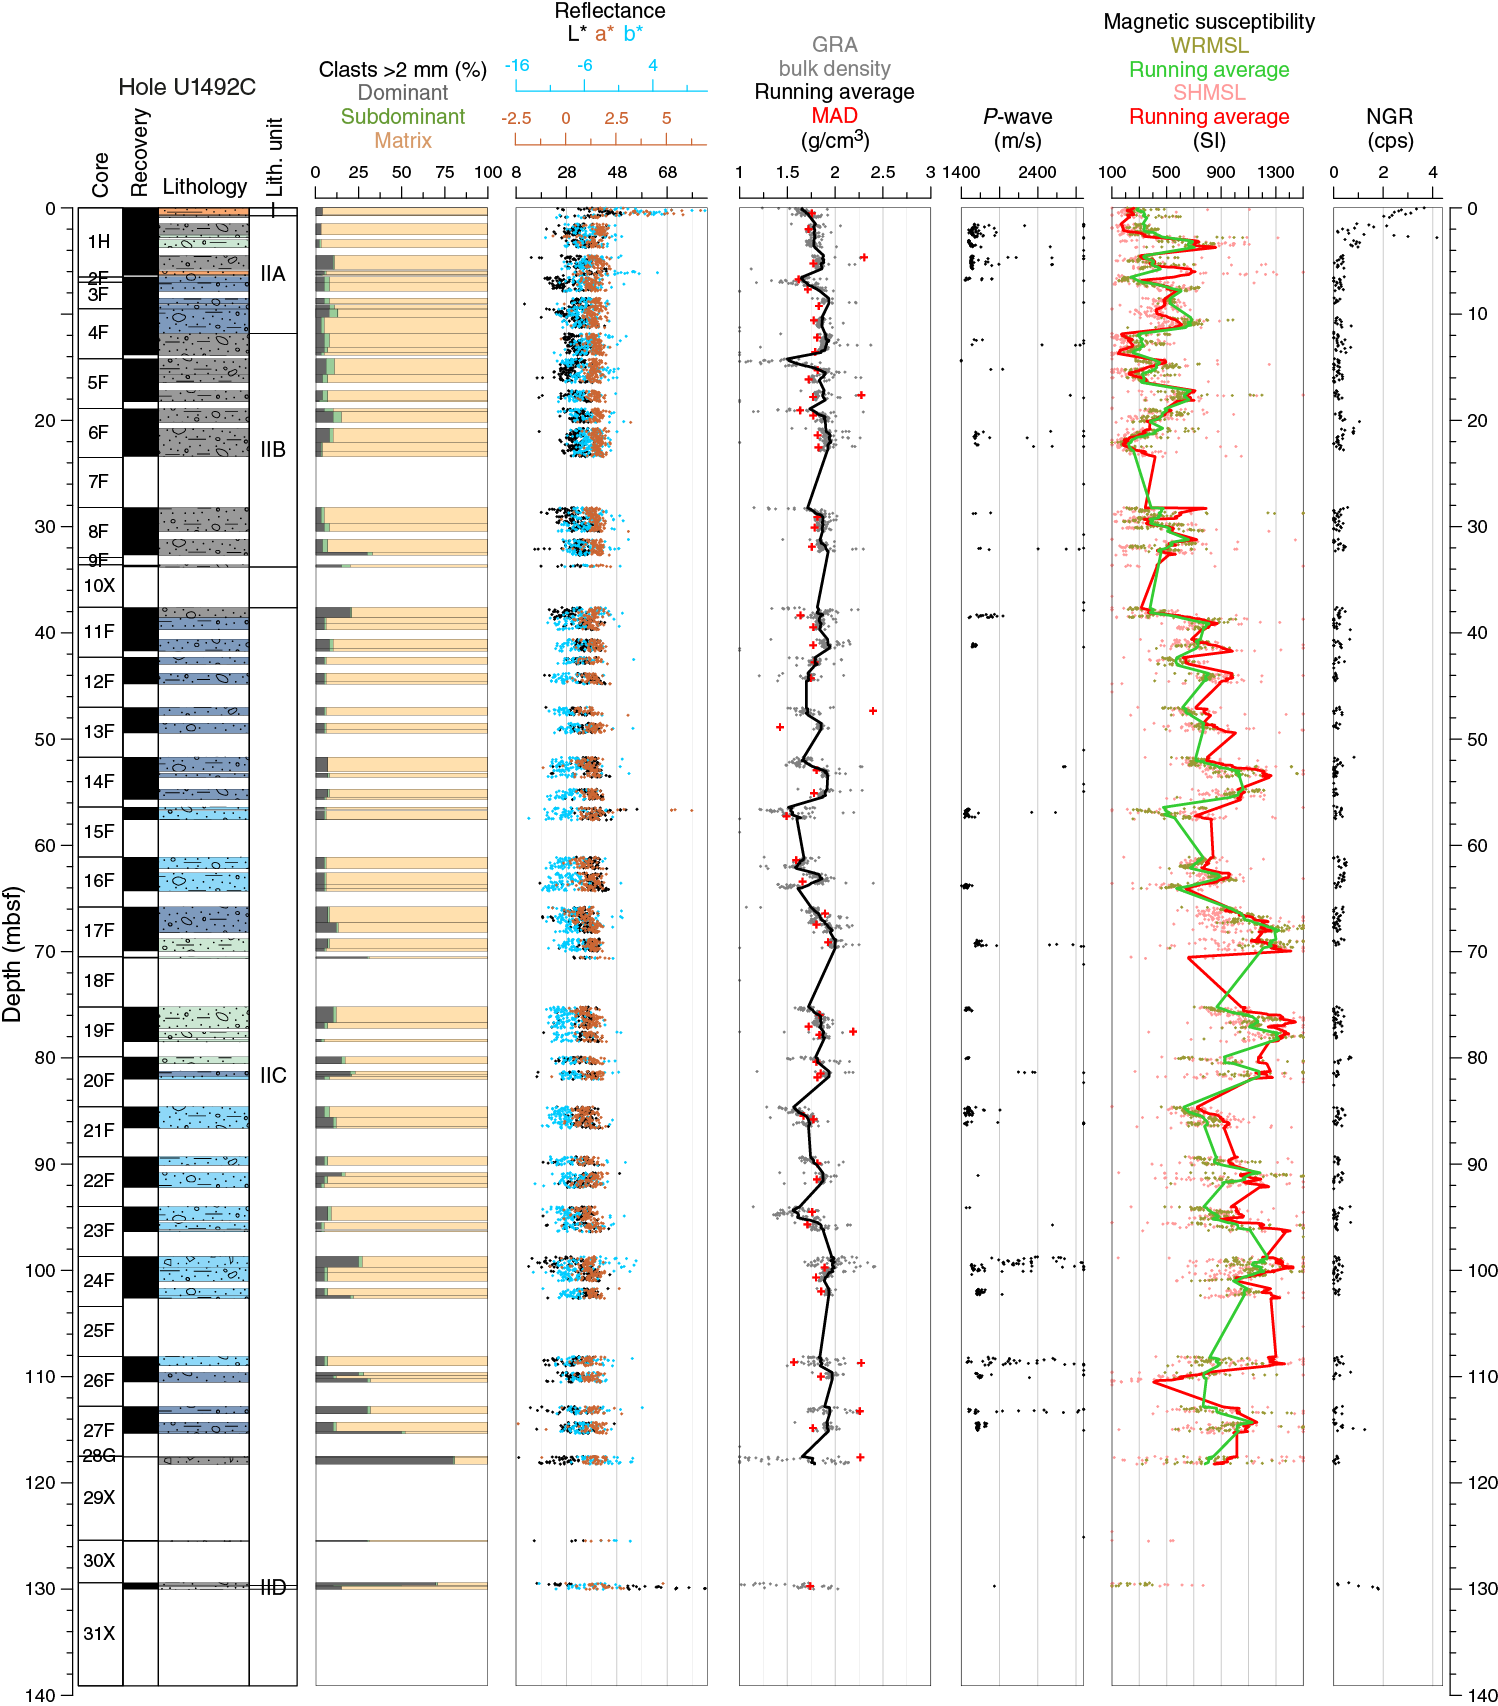
Figure F30. Physical properties, Hole U1492C.
The Whole-Round Multisensor Logger (WRMSL) was used to measure wet bulk density using GRA, magnetic susceptibility, and P-wave velocity on the P-wave logger (PWL). Whole rounds were then logged for NGR. Discrete thermal conductivity measurements were performed on one or two whole-round sections per core depending on recovery. Color reflectance and point magnetic susceptibility (MSP) were measured on archive section halves. In addition, shear strength (automated vane shear) was measured on the working section halves, and discrete samples were collected for moisture and density (MAD) measurements of wet and dry bulk densities.
Local but frequent core disturbance of the poorly consolidated mud deposits compromised the collection of P-wave velocity data on both the WRMSL and working section halves. Poor sediment-to-liner coupling or incompletely filled core liners were often observed, especially for Hole U1492C. These sections were associated with high signal attenuation. Although PWL results are presented here, we do not consider them to be a reliable data set. Other data sets are mostly of good quality, except for some cores where the first section was highly disturbed, resulting in anomalously low GRA density or shear strength values.
Physical property measurements were performed to help characterize the lithostratigraphic units, tie core descriptions to previous geophysical survey profiles, and describe the mechanical and thermal states of the serpentinite mud volcanoes. Precise intervals of lithostratigraphic units and subunits from core description (see Lithostratigraphy) are used to describe physical property trends and calculate average values. Raw data were uploaded to the Laboratory Information Management System (LIMS) database and subsequently filtered to remove spurious points that correspond to empty intervals in the liner or broken pieces. All of the shipboard results and data interpretation are presented below.
Gamma ray attenuation bulk density
Hole U1492A bulk GRA density values show large variability, partly due to lithology and partly due to drilling effects such as fall-in of material from the top of the hole (Figure F31). GRA density values reflect the two main lithologies. The pelagic sediment mixed with serpentinite mud (lithostratigraphic Unit I) that occurs from the seafloor to about 3.5 mbsf is characterized by low density values (from ~1.5 to ~1.7 g/cm3). The presence of pelagic sediment is repeated at the top of Core 366-U1492A-2H from 5.5 to 7.5 mbsf, most probably due to fall-in of material during drilling operations and resulting in even lower densities than the undisturbed pelagic sediment (~1.4 g/cm3). Serpentinite mud (lithostratigraphic Unit II) densities range from ~1.7 to ~2.0 g/cm3. In intervals of undisturbed serpentinite mud, GRA values show, in spite of their large variability, a tendency to increase with depth to ~2.0 g/cm3, likely reflecting compaction of the serpentinite mud.
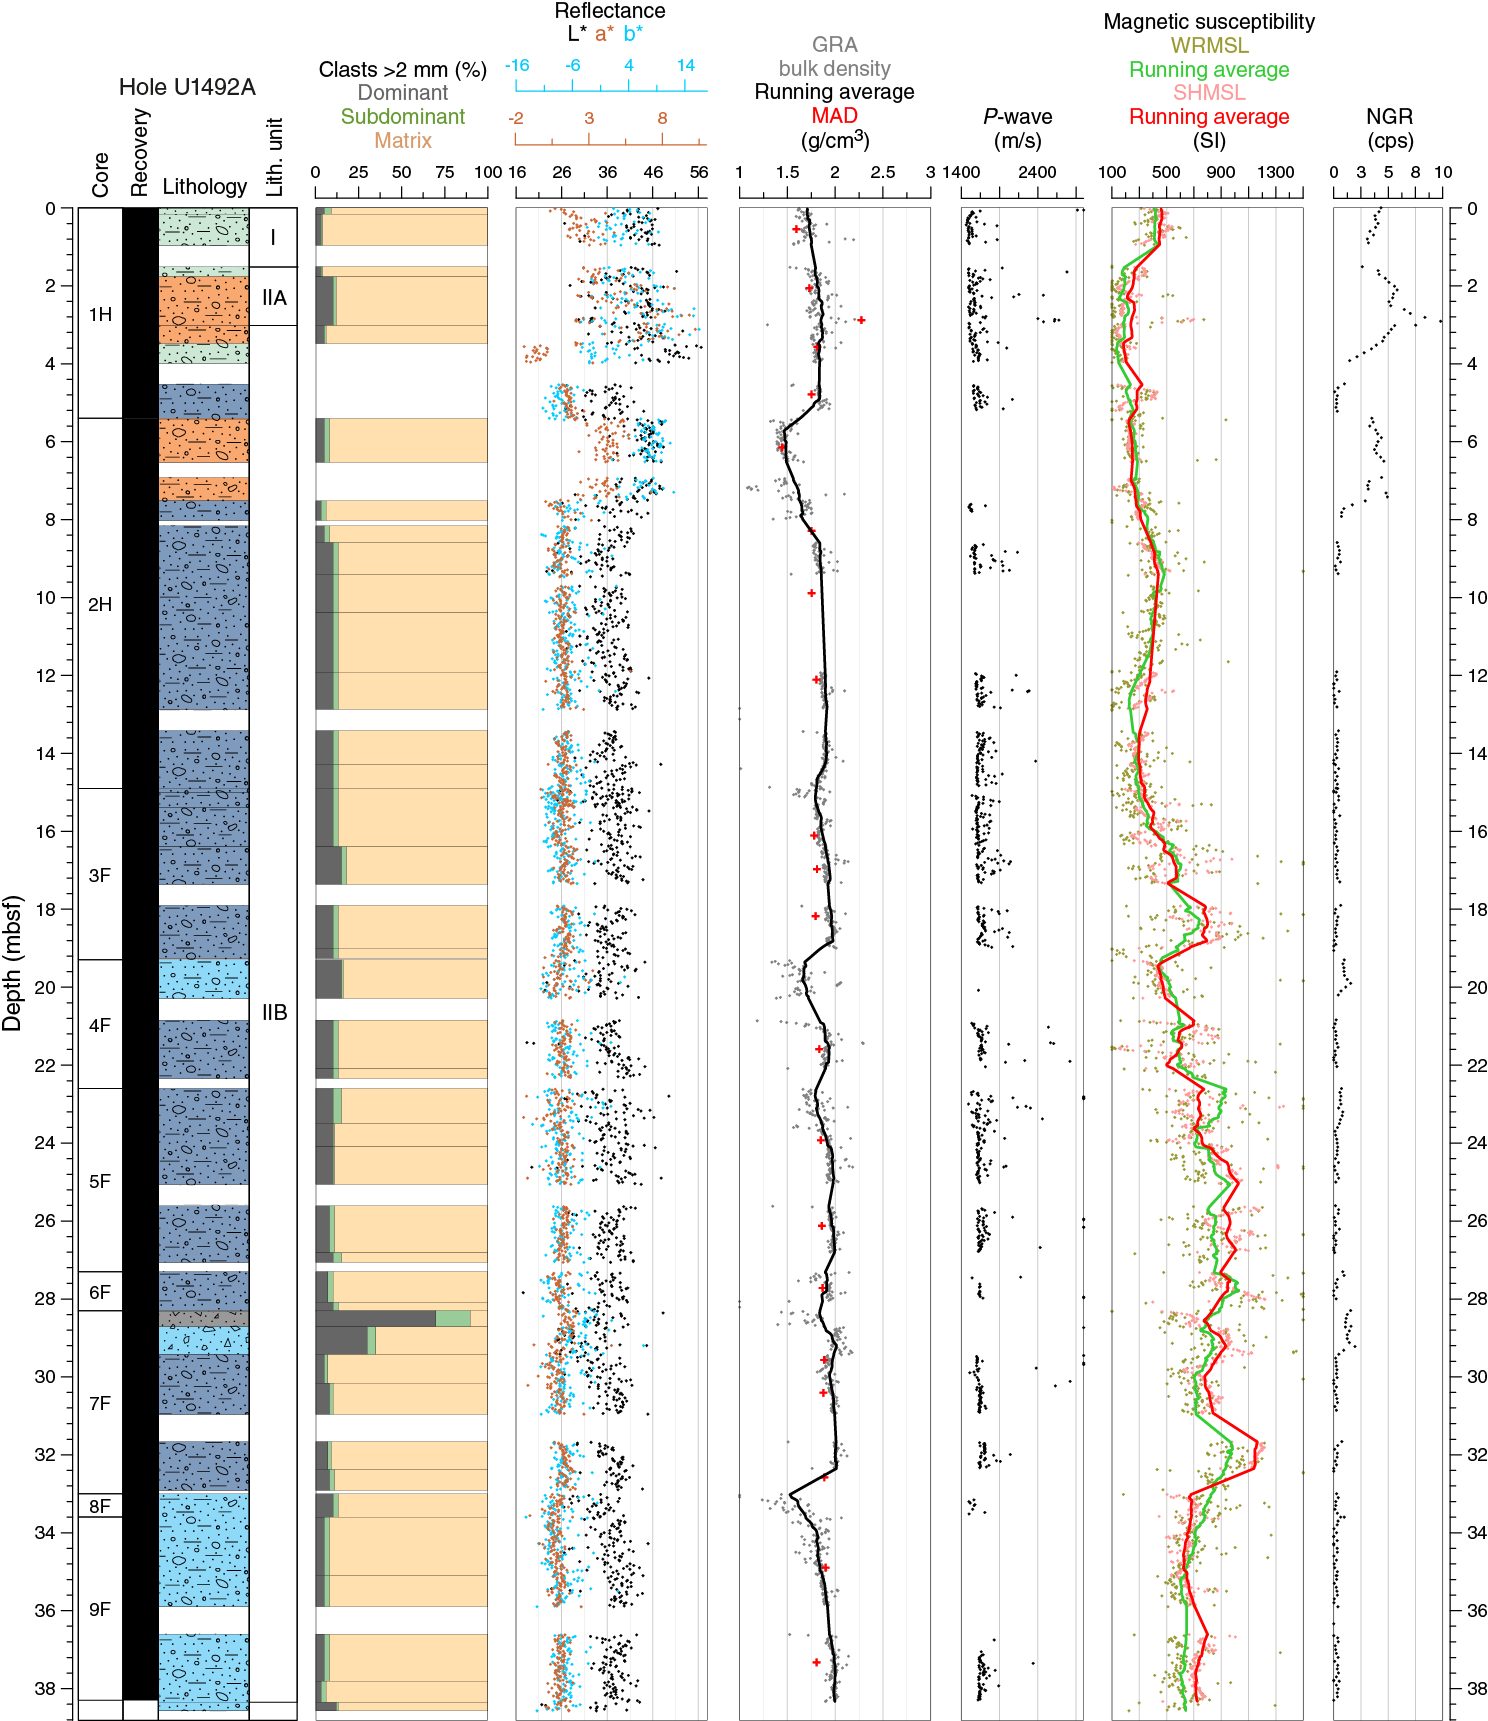
Figure F31. Physical properties, Hole U1492A.
Hole U1492B bulk GRA density values also show large variability due in some cases to lithology and in other cases to drilling effects (Figure F29). GRA density values reflect the two main lithologies. The lithostratigraphic Unit I pelagic sediment (upper 40 cm) and the serpentinite mud that occurs in the first section (to 1.36 mbsf) are characterized by a rapid and consistent increase in the GRA bulk density, from ~1.3 to ~1.9 g/cm3. Below 2 mbsf, GRA bulk density slightly increases to ~2.2 g/cm3 at the base of the hole.
Hole U1492C bulk GRA density values show large variability, mainly due to drilling effects (Figure F30). The 75 cm thick lithostratigraphic Unit I of pelagic sediment forms a very thin layer where bulk GRA density values vary from ~1.5 to ~1.7 g/cm3. Below Unit I, GRA density values reflect the serpentinite mud of lithostratigraphic Unit II and are characterized by bulk density values that, on average, are relatively constant around 1.8–1.9 g/cm3. At the base of the hole, a 40 cm layer of white authigenic minerals was retrieved (Subunit IID). This layer has a distinctively lower bulk density (ranging between ~1.6 and ~2.0 g/cm3) than the serpentinite mud breccia above it.
The physical integrity of the cores recovered at this site is not always ideal. The cores frequently exhibit intense disturbance, especially at the top, with remolded unconsolidated material and open voids inside the core liner. This poor core quality results in anomalous measurements of physical properties and, in particular, GRA bulk density. Values indicating abnormally low bulk densities of <0.5 g/cm3 are obvious examples and are not included in the figures. In general, this coring disturbance results in large scattering of the point measurements, indicating erroneous values below the typical averages for the two different lithologies (pelagic sediment and serpentinite mud). On the other hand, GRA bulk density values above average trends are correlated with the presence of clasts with higher density than the serpentinite mud matrix (Figure F31). Most probably, the drilling effects in Hole U1492C are also responsible for the lower GRA bulk density values that this hole, in general, shows when compared with Holes U1492A and U1492B.
GRA bulk density values are in good agreement with the MAD measurements. The data variations for the two methods track each other; however, the WRMSL GRA data show slightly but systematically higher average values than those measured with MAD. This difference may be due to the loss of pore water that occurs between the two measurements. The subsampling for MAD occurs after the WRMSL measurement, and during the intervening time a small loss of interstitial pore water could occur.
P-wave velocity
Whole-round and discrete P-wave measurements were performed using the WRMSL and the velocity calipers. However, because of the high signal attenuation probably due to high water content and the unconsolidated state of the mud material, the velocity calipers failed to acquire data. Therefore, only WRMSL data are used to describe Site U1492 P-wave velocity.
Due to difficulties recovering cores in their pristine in situ conditions, P-wave velocity measurements at Site U1492 were not always possible within the required quality standards defined by the acquisition software. Consequently, the P-wave velocity records include several depth intervals with no velocity data.
The P-wave velocity data are characterized in general by a large scattering of the values; however, a clear clustering of most of the values usually defines a minimum velocity threshold that is interpreted as the typical velocity of a particular lithology (e.g., pelagic sediment or serpentinite mud). The velocity data show dispersion above this threshold, indicating higher P-wave velocities. These velocities are interpreted as reflecting the presence of large individual clasts or higher numbers of rock clasts that have P-wave velocities higher than the mud matrix.
The main problems in getting reliable P-wave measurements in Site U1492 cores include core disturbance, air bubbles inside the core liner, voids filled with seawater, and deformed core liners with double plastic layers.
P-wave velocity in the upper 5 mbsf in Hole U1492A shows a velocity threshold increase from 1480 to 1600 m/s (Figure F31), corresponding to the increased compaction of the pelagic sediment and the transition to the serpentinite mud breccia. Below 10 mbsf, the P-wave velocity threshold is constant at ~1600 m/s. Some depth intervals with lower velocity values are correlated with fall-in material, which is very disturbed and has a large percentage of voids and open spaces. These intervals occur in the top sections of several cores in this hole. The velocity data dispersion above these velocity thresholds, which can reach 2800 m/s, is interpreted as reflecting point measurements that include larger individual lithic clasts or a higher amount of rock clasts with high P-wave velocities.
P-wave velocities in the uppermost 1 m in Hole U1492B show a rapid threshold increase from 1460 to 1550 m/s (Figure F29), corresponding to the water-saturated pelagic sediment at the top of the first section. Below these top sediments, the P-wave velocity threshold increases to ~1630 m/s at about 7 mbsf and is constant with depth to the base of the hole. As in Hole U1492A, depth intervals with lower velocity values are correlated with areas of disturbance in the first sections of several cores. Likewise, high velocities to 2800 m/s are interpreted as reflecting the presence of large individual clasts or higher numbers of rock clasts.
The percentage of core recovery in Hole U1492C was 51.55%, and the integrity and quality of the core recovery was much worse than in Holes U1492A and U1492B. This low quality is reflected in the low number of measurements plotted in Figure F30 and the large scattering of the data. It was not possible to define a typical threshold variation of the data, unlike the first two holes. However, a small cluster of values ranges between 1440 and 1550 m/s in the uppermost 5 m of the hole. Below this depth, no clear interpretation can be made. The presence of small clusters of points between 55 and 82 mbsf, with P-wave velocity values below 1450 m/s, is interpreted as reflecting anomalously low velocity on serpentinite mud due to disturbance and voids in the cored material.
Reflectance spectroscopy and colorimetry
Hole U1492A reflectance parameters show high values in the intervals 0–4 and 5–8 mbsf, reflecting the brownish colors that correspond to lithostratigraphic Unit I and the top of Unit II, composed of pelagic sediment and oxidized serpentinite mud (Figure F31). Below this unit, L*, a*, and b* have constant and lower reflectance values indicative of greener and bluer material.
Hole U1492B reflectance parameters show high values in the uppermost 7 m, reflecting the brownish colors that correspond to lithostratigraphic Unit I and the top of Subunit IIA, composed of pelagic sediment and oxidized serpentinite mud (Figure F29). Values for a* and b* decrease between 4 and ~7 mbsf, reflecting the decrease in intensity of oxidation of the top of Subunit IIA. Below 7 mbsf, L*, a*, and b* have constant and lower reflectance values indicative of greener and bluer material.
Hole U1492C reflectance parameters show high values in the uppermost 40 cm, reflecting the brownish colors that correspond to lithostratigraphic Unit I, composed of pelagic sediment (Figure F30). Below this unit, L*, a*, and b* have constant and lower reflectance values indicative of greener and bluer material. The whitish layer at ~130 mbsf is marked by high L* values.
Magnetic susceptibility
In Holes U1492A–U1492C, WRMSL magnetic susceptibility and MSP measurements produced similar results. A general offset between both magnetic susceptibility data sets occurs, which could result either from expansion/contraction of the sediment and serpentinite muds after core section splitting or an instrument calibration offset. However, both data sets show similar trends and local variations. Of all physical properties, the magnetic susceptibility profiles show the largest fluctuations at the meter and submeter scales. In all three holes, most of the magnetic susceptibility values recorded in the different lithostratigraphic units are more than 150 × 10−5 SI and show large variability downhole (6 × 10⁻⁵ to 3599 × 10−5 SI with the WRMSL; 1 × 10⁻⁵ to 6858 × 10−5 SI with MSP). Serpentinite mud (Unit II, Hole U1492A; Subunits IIA and IIB, Hole U1492B; Subunits IIA–IIC, Hole U1492C) shows an overall trend of increasing magnetic susceptibility with depth. At smaller scales, however, the different magnetic susceptibility data sets show significant variations, which mostly cannot be correlated with any other physical property variations, core disturbance zones, or lithostratigraphic changes.
In the Unit II serpentinite mud in Hole U1492A, magnetic susceptibility constantly increases from ~150 × 10−5 to between ~1000 × 10−5 and 1200 × 10−5 SI between 3.48 and ~31 mbsf. Subsequently, magnetic susceptibility decreases at ~33 mbsf to the base of the hole to between ~600 × 10−5 and 800 × 10−5 SI (Figure F31). In Hole U1492B, the serpentinite mud in Subunit IIA is characterized by magnetic susceptibility values of between about 250 × 10−5 and 400 × 10−5 SI. In Subunit IIB, magnetic susceptibility rather constantly increases from ~150 × 10−5 to ~700 × 10−5 SI between the top of the subunit and ~20 mbsf. A distinct magnetic susceptibility increase between ~20 and ~30 mbsf to between about 900 × 10−5 and 1200 × 10−5 SI can be correlated with decreasing porosity and increasing shear strength in that interval. Subsequently, magnetic susceptibility varies between ~250 × 10−5 and ~700 × 10−5 SI between ~32 mbsf and the base of the hole (Figure F29). Magnetic susceptibility measurements in the Hole U1492C serpentinite mud show large variability from ~200 × 10−5 to ~1500 × 10−5 SI and a general increase with depth. From about 60 mbsf downhole, most magnetic susceptibility values are clearly more than 600 × 10−5 SI. No significant variations can be attributed to the transition between the different subunits (IIA–IIC) in this hole (Figure F30).
Natural gamma radiation
NGR varies from ~2 to ~12 counts/s in the pelagic deposits of Unit I throughout the three Site U1492 holes. Serpentinite mud (Unit II, Hole U1492A; Subunits IIA and IIB, Hole U1492B; Subunits IIA–IIC, Hole U1492C) is characterized by extremely low NGR values, generally less than 0.5 count/s (Figures F29, F30, F31). However, several local slight NGR increases were observed at the tops of some of the core sections in the serpentinite mud units of all three holes, especially Hole U1492A. In this hole, the three variations observed at ~5–7, ~19–20, and ~28–29 mbsf correspond to core disturbance described at the tops of Cores 366-U1492A-2F, 4F, and 7F (see Lithostratigraphy). These disturbances induce NGR of ~3–5 counts/s for Core 2F and ~1–2 counts/s for Cores 4F and 7F. The high values in Core 2F are likely produced by fall-in of Unit I sediment. At the tops of Cores 4F and 7F, the presumed fall-in of dark blue, pebbly serpentinite mud should not induce NGR variations because the serpentinite mud is generally characterized by very low NGR values (≤1 count/s). Therefore, these two local NGR increases are also interpreted as minor fall-in of sediment from the uppermost part of the hole, where the pelagic sediment is located.
Moisture and density
Determination of MAD on discrete samples of unconsolidated materials was performed in every section of Holes U1492A–U1492C when possible. Sampling was preferentially carried out on the most undisturbed part of a section, often avoiding first sections of every core. Generally, MAD methods gave slightly lower bulk density results than GRA bulk density owing to a possible drying out of the cores after section splitting.
Average bulk densities for Unit I are 1.5–1.7 g/cm3, whereas Unit II average bulk densities are 1.7–2.0 g/cm3.
The three holes present moderately different trends and characteristics, indicating lateral differences across the transect of holes at this site. Hole U1492A presents higher porosity values of 55%–65%, corresponding to the pelagic sediment of Unit I, whereas Unit II exhibits a gradual decrease in porosity from 50% at the top of the hole to 40% at the bottom (Figure F32). Bulk density and void ratio reflect the same compaction behavior exhibited in the porosity data. Grain density has the highest values (2.58–2.68 g/cm3) in Unit I. In Unit II, values are relatively constant at ~2.50 g/cm3 and then shift gradually between 21 and 30 mbsf to higher values (2.62 g/cm3). Drilling disturbance is represented by the anomalous values of all MAD parameters at ~6.1 mbsf (Sample 366-U1492A-2H-1, 75 cm).

Figure F32. Index property data, thermal conductivity, and shear strength, Hole U1492A.
In Hole U1492B, porosity decreases slightly in Unit II from 49% at the top of the hole to 42% at the bottom (Figure F33). Void ratio and bulk density follow the porosity trend, reflecting compaction with depth. A rapid 6% decrease in porosity occurs between 19 and 30 mbsf and corresponds to an abrupt shift in magnetic susceptibility, seen in Holes U1492A and U1492B. Grain density values are highest (2.65 g/cm3) at the top of Unit II and stabilize downhole at ~2.60 g/cm3, with a prominent variation at the bottom of the hole of 0.2 g/cm3. Drilling disturbance is reflected in the anomalous porosity, void ratio, and bulk density values at ~16.5 mbsf.
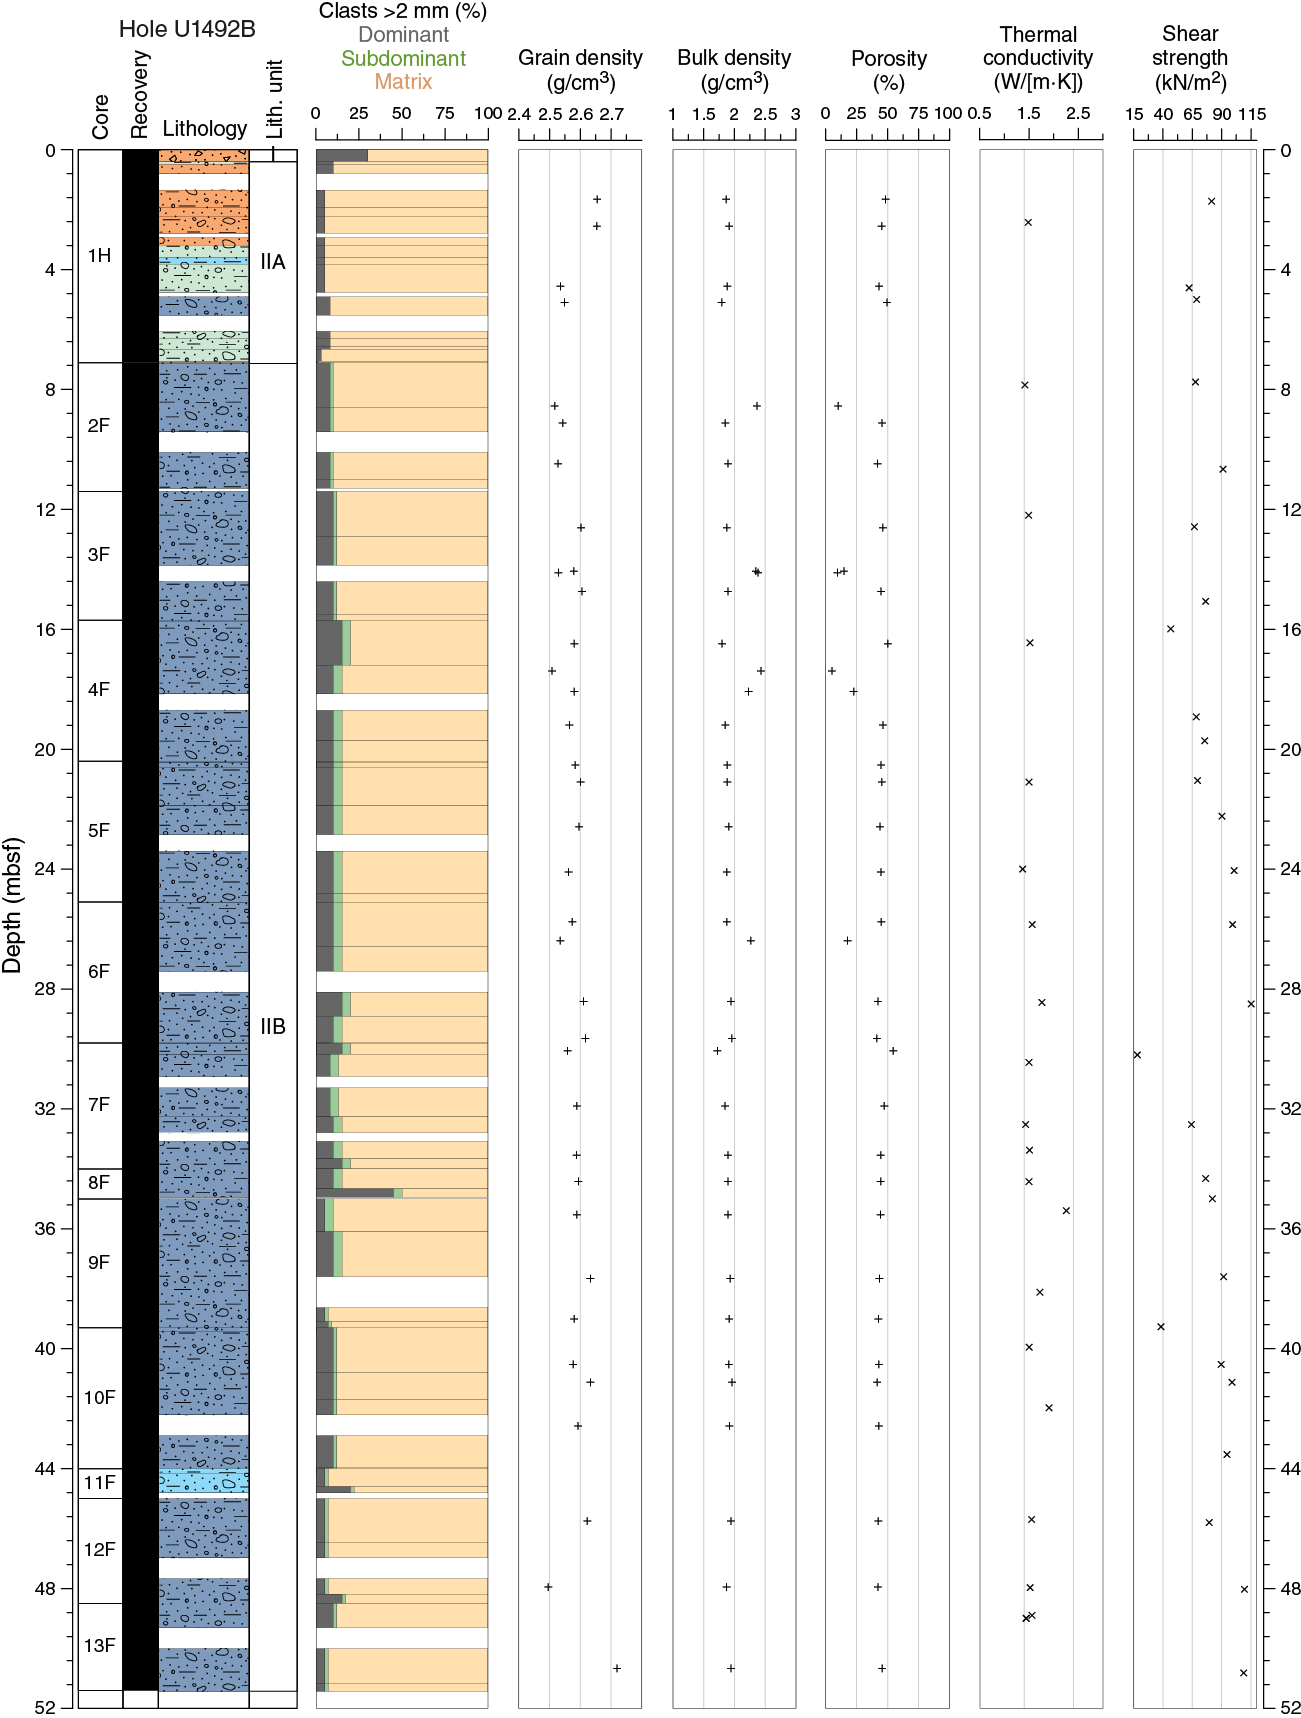
Figure F33. Index property data, thermal conductivity, and shear strength, Hole U1492B.
Hole U1492C has average porosity values of ~50% throughout the entire hole, with a slightly decreasing trend from 55% at the top of the hole to 43% at the base (Figure F34). Decreasing void ratios and increasing bulk densities follow the porosity-depth trend, reflecting increasing compaction toward the bottom of the hole. A significant increase in porosity to 80% occurs at ~49 mbsf, which correlates with an abrupt shift in magnetic susceptibility from 800 × 10−5 to 1400 × 10−5 SI. Grain density is rather constant around 2.6 g/cm3, with the exception of five values around 2.3 g/cm3 below 60 mbsf, possibly related to the presence of low-density serpentine minerals. Drilling disturbance is apparent from anomalous values of bulk density, porosity, and void ratio at around 7, 19, and 38 mbsf.

Figure F34. Index property data, thermal conductivity, and shear strength, Hole U1492C.
Thermal conductivity
Thermal conductivity measurements were made in Holes U1492A–U1492C at a rate of at least one and sometimes two per core, depending on recovery. Values from all holes range between 0.99 and 2.25 W/(m·K) (average = 1.41 W/[m·K]), but results differ slightly from hole to hole.
In Hole U1492A, the lowest value (Section 366-U1492A-2H-1) corresponds to very high porosity and low bulk density, indicating that the section was affected by drilling disturbance (Figure F32). This sample excluded, the average and range are respectively 1.42 ± 0.11 and 1.24–1.60 W/(m·K). Values appear to increase slightly with depth from 1.4 to 1.5 W/(m·K), consistent with the consolidation trend noted in the shear strength data between 0 and 32 mbsf.
Hole U1492B has an anomalously high value of 2.25 W/(m·K) at 35.4 mbsf, which resulted from averaging two bad measurements with one good value of 1.51 W/(m·K) (Figure F33). Without this anomalous value, the average and range for Hole U1492B are 1.54 ± 0.13 and 1.37–1.91 W/(m·K), respectively. Similar to Hole U1492A, values increase from 1.4 to 1.5 W/(m·K), consistent with decreasing trends in porosity and void ratio.
Hole U1492C has three anomalously low values, all measured in the first sections of Cores 11F, 14F, and 15F (Figure F34). In these sections, low vane shear strength indicates severe drilling disturbance. Without these values, the average thermal conductivity for Hole U1492C is 1.37 ± 0.11 W/(m·K). Unlike Holes U1492A and U1492B, there is no clear increase in thermal conductivity with depth, and most values fall within a relatively narrow range of 1.25–1.5 W/(m·K).
Automated vane shear
The undrained shear strength of the unconsolidated material was measured with the automated vane shear in all Site U1492 holes and units. The automated vane shear has proven to be an excellent instrument to highlight compaction trends in the materials and a good proxy, along with thermal conductivity, to identify drilling disturbance.
Hole U1492A exhibits a steady consolidation trend with increasing shear strength from 35 to 135 kN/m2 at about 32 mbsf (Figure F32). Deeper values shift to 50 kN/m2, which together with the higher porosity values around 37 mbsf, could be a hint of an underconsolidated horizon.
Hole U1492B, however, doesn’t show such a clear trend with increasing depth (Figure F33). Values seem to randomly range between 60 and 110 kN/m2 from the top of the hole to the bottom. An exception occurs in a localized zone between 20 and 30 mbsf where the shear strength gradually increases from 70 to 115 kN/m2 and is strongly correlated with decreasing porosity and increasing magnetic susceptibility. Several drilling disturbances are apparent from anomalously low values (20–45 kN/m2) at 16, 30, and 39 mbsf.
Shear strength values in Hole U1492C commonly range between 35 and 60 kN/m2 with no discernible pattern with depth (Figure F34). Values around 20 kN/m2 show a strong correlation with the lowest thermal conductivity values and possibly indicate the remolding effect caused by fall-in material in the first sections of the cores at 7, 38, 52, 57, and 109 mbsf. The high shear strength values of 80 kN/m2 around 115 mbsf are correlated with a decrease in porosity.
Discussion
The physical property data collected at Site U1492 are of good quality despite some core disturbance identified in top core sections and in broad agreement with the disturbance effects described in Jutzeler et al. (2014). The absence of top pelagic deposits clearly postdating the serpentinite mud is concordant with the hypothesized ongoing fluid and mudflow activity at the summit of Yinazao Seamount. The physical properties of the serpentinite mud are consistent with those measured on other seamount summits of the Mariana forearc during previous expeditions (Conical Seamount, ODP Leg 125 [Fryer, Pearce, Stokking, et al., 1992]; South Chamorro Seamount, ODP Leg 195 [Salisbury, Shinohara, Richter, et al., 2002]). A slight effect of compaction is suggested in Holes U1492A and U1492B by the overall increasing trend in GRA density and minimum P-wave velocity values with depth. However, the relatively constant GRA bulk density of ~1.8–1.9 g/cm3 measured in deeper Hole U1492C (~130 mbsf) suggests that overpressured fluids associated with ongoing Yinazao Seamount activity tend to minimize the compaction of the serpentinite mud. Magnetic susceptibility measurements show an overall increase with depth, whereas some significant variations independent of depth are also observed (e.g., Hole U1492B, between ~20 and ~30 mbsf). Such variations may reflect changes in magnetic mineral concentration resulting from alternation of different mudflows not recognized during core description.
Downhole measurements
The APCT-3 was the only downhole tool deployed at Site U1492. The T2P was prepared for deployment at 100 mbsf in Hole U1492C, but the deployment was canceled because the drill pipe started to stick when the pumps were briefly shut down to insert the tool into the drill string. Thus, it may have been difficult to free the pipe after the ~30 min required to collect a T2P measurement.
Advanced piston corer temperature tool
Seven APCT-3 measurements were attempted in Hole U1492C (Table T10). On the third deployment, in Core 9F, a 1.7 cm divot broke off the cutting edge of the APCT-3 shoe (0009C). This tool was retired because the solution to the temperature model depends on the shape of the shoe, and another APCT-3 shoe (0005C) was deployed for the remainder of the hole. The second tool measured values about 0.14°C lower than the first. The difference is based on measurements of bottom water, which shifted from an average of 1.70°C with the first sensor to 1.56°C with the second sensor. The seafloor temperature was taken as 1.56°C, and the single good temperature estimate obtained with the first tool was adjusted downward by 0.14°C. Of the seven deployments, three yielded high-quality data, two provided medium-quality data, and two resulted in low-quality data. The two low-quality records were not used in calculating the thermal gradient.
Table T10. APCT-3 temperature data. Download table in CSV format.
Data from the three high-quality and two medium-quality measurements are plotted in Figure F35, and the temperatures estimated with the TP-Fit software are plotted in Figure F36. For the data at 65.8 mbsf, both the estimate from the full record and the final third of the record are plotted because the former is unreasonably low and the latter is unreasonably high. The assumption is that the true value lies between the two. Extrapolated temperatures do not increase monotonically with depth. The estimated temperature at 23.5 mbsf is ~2.5°C, and the temperature at 51.7 mbsf is ~2.0°C. The estimated temperatures below 60 mbsf are in the range of 2.5°–2.6°C. Fitting a temperature gradient from the seafloor to the four deep points gives a gradient of 12°C/km. Alternatively, using the seafloor and the single shallow point gives a gradient of 39.8°C/km.
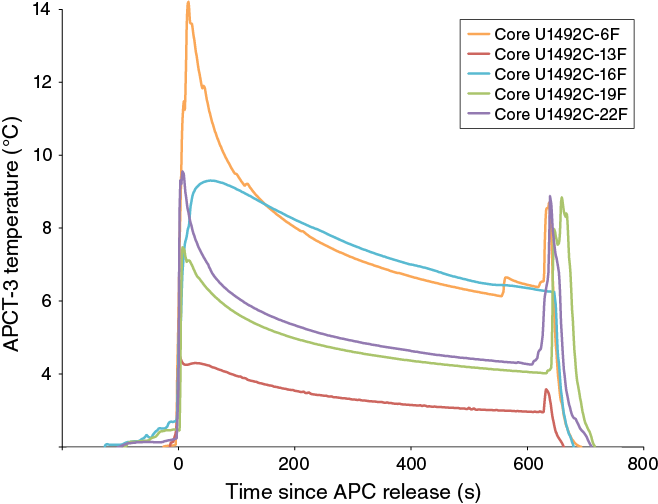
Figure F35. APCT-3 temperature measurements.
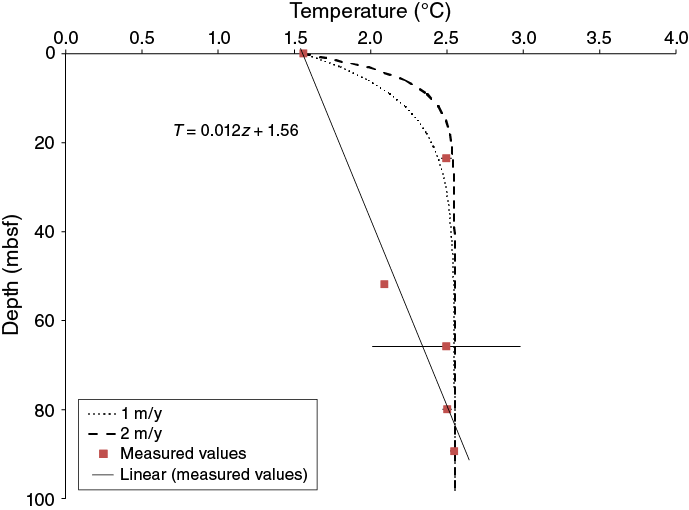
Figure F36. Calculated APCT-3 formation and bottom seawater temperatures.
Using the average thermal conductivity value of 1.41 W/(m·K) obtained for Holes U1492A–U1492C with the fitted thermal gradient yields a heat flow value for the deeper points of 17 mW/m2 and a value for the shallowest point of 56 mW/m2.
Discussion
Two interpretations of the temperature data are shown in Figure F36. The first interpretation is a linear fit obtained by disregarding the high value of 2.66°C at 23.5 mbsf. Also shown in the figure are model results (Bredehoeft and Papadopulis, 1980) for upward flow of pore water with discharge rates of 1 and 2 m/y. For this calculation, a temperature of 2.55°C was assigned at 90 mbsf. The upward flow model reproduced the estimated temperatures with the exception of the one value at 51.7 mbsf, which is based on a temperature record with low frictional heating upon penetration (Table T10). One option is to consider this temperature estimate a minimum value for the formation at that depth. The good fit to the data provided by the flow model implies a supply of fluid from 80 to 90 mbsf or deeper, but if the fluid is derived from deeper depths, the 2.55°C temperature would be unrealistically cold.
An alternate explanation is a linear gradient of 12°C/km with a local temperature perturbation at 23.5 mbsf. Such a localized temperature spike, if it was not a sampling artifact, would require a flow event within the last 100 y. Temperature perturbations from transient flow have been documented in Costa Rica (Davis and Villinger, 2006) and Barbados (Fisher and Hounslow, 1990). For this site, however, the upward flow model is perhaps a better interpretation because of its consistency with the previous estimate of upward seepage of pore fluids at approximately 10 cm/y (Hulme et al., 2010).
Temperature data from the Yinazao summit were compared to data from two previously drilled summit sites. Three temperature measurements were obtained during ODP Leg 195 at Site 1200 on the summit of South Chamorro Seamount. These measurements yielded an average heat flow of 15 mW/m2 in Holes 1200A and 1200E, and a single shallow temperature estimated at 16.3 mbsf in Hole 1200F resulted in a calculated heat flow of 101 mW/m2 (Shipboard Scientific Party, 2002). Two temperature estimates above 42 mbsf from the summit of Conical Seamount during Leg 125 in Hole 780D yielded a heat flow estimate of 52 mW/m2 (Shipboard Scientific Party, 1990). Evidence of a flow conduit was found in Hole 780C, where a downhole temperature log exhibited a peak at 58 mbsf. Taken together, these results from the other seamounts indicate steep gradients at shallow depths and provide evidence for conduits of deep-sourced fluid discharge. Like the other summit sites, results from Yinazao Seamount result in a relatively steep gradient of ~40°C/km at shallow depths with a modest gradient of 12°C/km when deeper measurements are used. The combination of a steep shallow gradient with a lower gradient at depth is best explained by a curved profile caused by upward fluid flow.
Paleomagnetism
Paleomagnetic analyses initially focused on checking for appropriate intervals for magnetic polarity reversals, particularly in the 3 m thick upper pelagic unit in Hole U1492A. Archive section halves from 9 cores from Hole U1492A, 13 cores from Hole U1492B, and 24 cores from Hole U1492C were measured using the shipboard superconducting rock magnetometer (SRM). The NRM of all section halves was measured at 5 cm intervals after 0, 5, 10, 15, and 20 mT AF demagnetization. A total of 44 representative discrete samples were collected, and their remanent magnetization was measured after 0–30 mT AF demagnetization and as high as 60 mT in some samples with high coercivity components. Cores where the recovery was sandy, watery, or heavily disturbed by the coring process were not measured.
Results
We analyzed NRM inclinations and declinations in Holes U1492A–U1492C from discrete samples (Figure F37) and section half measurements using principal component analyses (PCA) of the directions at each demagnetization step with the PuffinPlot software. A vertical overprint characterizes some intervals, and a strong horizontal overprint occurs in other intervals, in directions from both PCA and the 20 mT demagnetization step (Figure F38). Similar to Site U1491, the paleomagnetic directions from discrete samples show an overprint that remains after the 20 mT demagnetization step, with anomalously high inclinations. The unconsolidated material itself contains randomly oriented pebble-sized clasts, which added scatter to the pattern of remanent directions. The downhole pattern of NRM intensity generally covaries with the downhole pattern of magnetic susceptibility (see Physical properties).
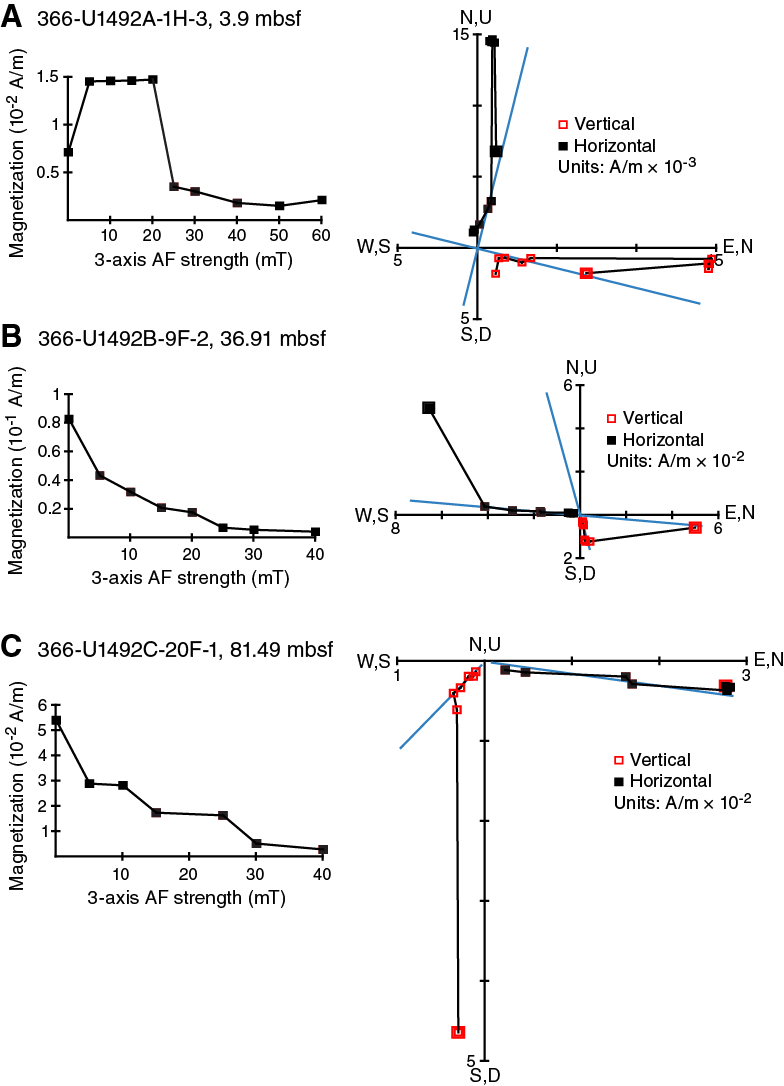
Figure F37. NRM decay and AF demagnetization vectors.
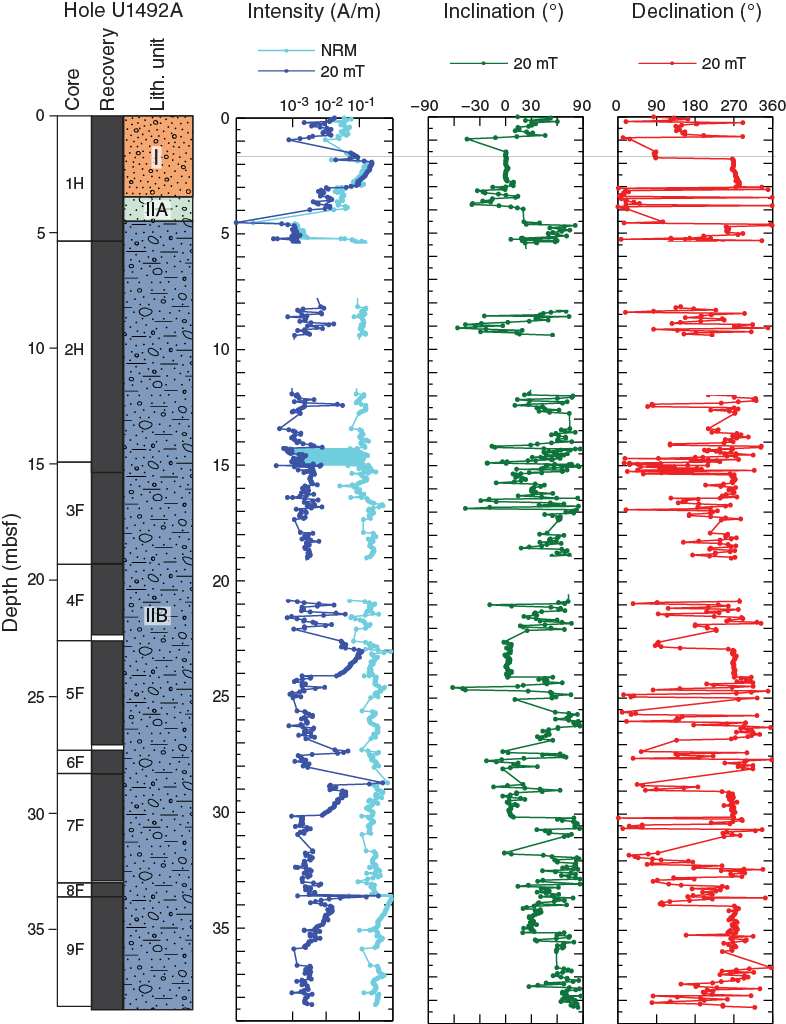
Figure F38. NRM intensity, inclination, and declination, Hole U1492A.
NRM intensities generally vary with lithostratigraphic units. Average NRM intensity values are relatively high, even after the 20 mT step. NRM intensity of section halves from ~1.9 to 3.0 mbsf in Hole U1492A averages 2.5 × 10⁻¹ A/m after 20 mT AF demagnetization. This interval corresponds to Unit I, which mainly consists of greenish gray to light brown clayey pebbly mud. Discrete samples from ~1.5 to 3.9 mbsf in Unit I, Hole U1492A, also have a relatively higher average NRM intensity 1.24 × 10⁻¹ A/m compared with the tops of Holes U1492B and U1492C, where the pelagic unit was thinner (<1 m thick).
Hole U1492B has a relatively lower average NRM intensity of 4.2 × 10⁻³ A/m after 20 mT AF demagnetization, corresponding to Subunit IIA, which consists of pale green to greenish gray pebbly mud with clasts. An average NRM intensity of ~1.43 × 10⁻² A/m occurs in Subunit IIB, which mainly consists of dark bluish gray pebbly mud with clasts. Similar to Hole U1492B, the lowest NRM intensity value in Hole U1492C is in the uppermost part of the hole, followed by a gradual increase toward the bottom of the hole. Average NRM intensity after 20 mT AF demagnetization ranges from 0.6 × 10⁻² A/m in the clayey mud with lithic clasts in Unit II to ~2.5 × 10⁻² A/m in the serpentinite pebbly mud with lithic clasts in Subunits IIC and IID. The differences in NRM intensities registered in the cores may come from high or low coercivity components presented at higher concentrations along them.
Each piston core has a repeating pattern of paleomagnetic intensity. The uppermost 1 m of each HLAPC core has intensities about one order of magnitude higher than the intensities from the base of the core above at the 20 mT demagnetization step (Figures F38, F39, F40). This difference suggests that the magnetic overprint varies along the length of each core. During Expedition 366, the BHA did not include nonmagnetic collars, which could lead to a more significant overprint than when such collars are used.
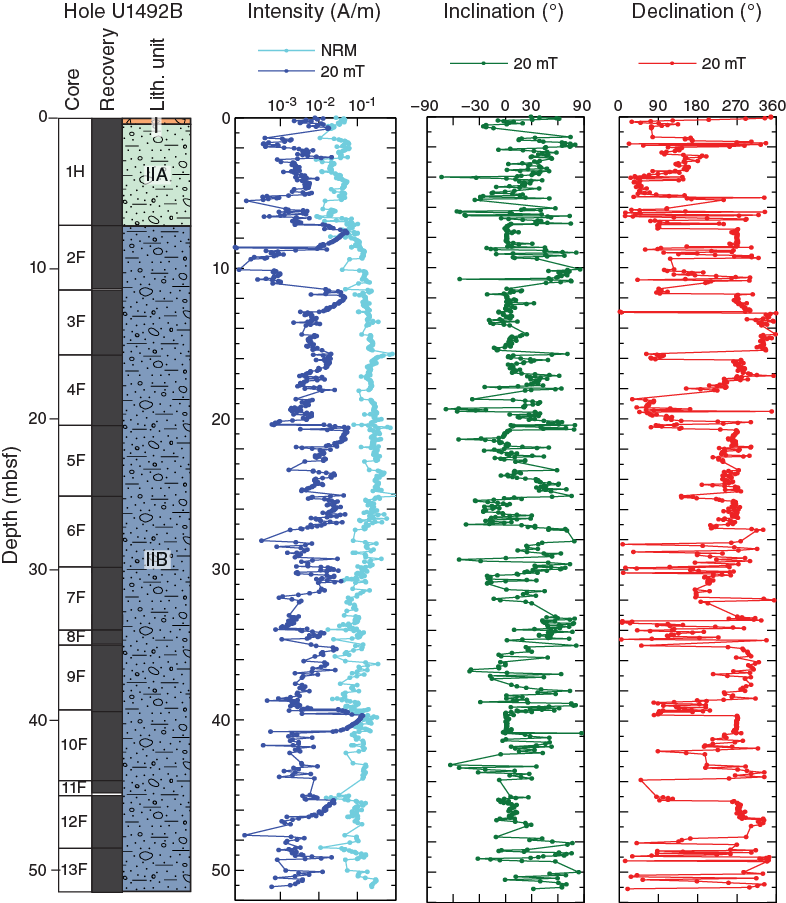
Figure F39. NRM intensity, inclination, and declination, Hole U1492B.
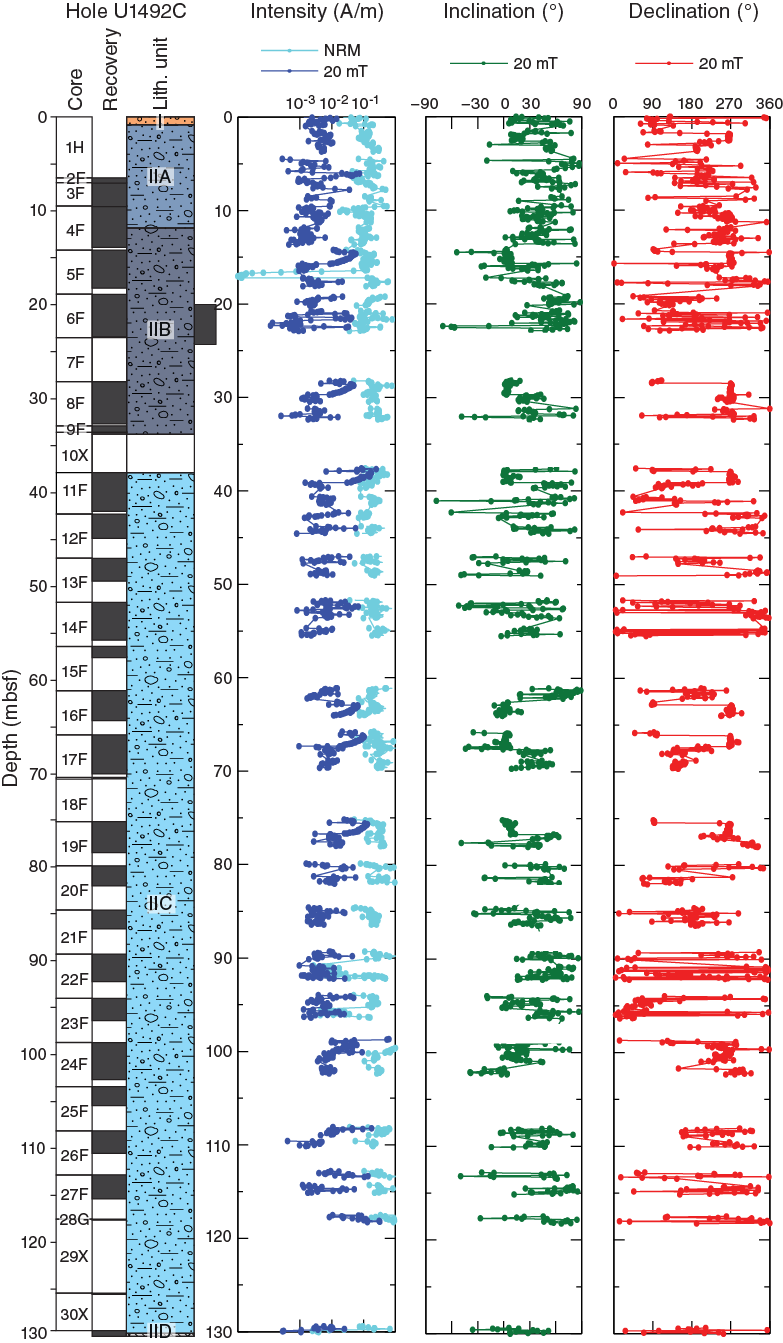
Figure F40. NRM intensity, inclination, and declination, Hole U1492C.
References
Bredehoeft, J.D., and Papadopulos, S.S., 1980. A method for determining the hydraulic properties of tight formations. Water Resources Research, 16(1):233–238. https://doi.org/10.1029/WR016i001p00233
Davis, E.E., and Villinger, H.W., 2006. Transient formation fluid pressures and temperatures in the Costa Rica forearc prism and subducting oceanic basement: CORK monitoring at ODP Sites 1253 and 1255. Earth and Planetary Science Letters, 245(1–2):232–244. https://doi.org/10.1016/j.epsl.2006.02.042
Donnelly, T.W., Thompson, G., and Salisbury, M.H., 1980. The chemistry of altered basalts at Site 417, Deep Sea Drilling Project Leg 51. In Donnelly, T., Francheteau, J., Bryan, W., Robinson, P., Flower, M., Salisbury, M., et al., Initial Reports of the Deep Sea Drilling Project, 51, 52, 53: Washington, DC (U.S. Government Printing Office), 1319–1330. https://doi.org/10.2973/dsdp.proc.515253.154.1980
Eglinton, T.I., and Repeta, D.J., 2014. Organic matter in the contemporary ocean. In Mottl, M.J., and Elderfield, H. (Eds.), Treatise on Geochemistry (2nd Edition) (Volume 8): The Oceans and Marine Geochemistry. Holland, H.D., and Turekian, K.K. (Series Eds.): Oxford, United Kingdom (Elsevier), 151–189. https://doi.org/10.1016/B978-0-08-095975-7.00606-9
Fisher, A.T., and Hounslow, M.W., 1990. Heat flow through the toe of the Barbados accretionary complex. In Moore, J.C., Mascle, A., et al., Proceedings of the Ocean Drilling Program, Scientific Results, 110: College Station, TX (Ocean Drilling Program), 345–363. https://doi.org/10.2973/odp.proc.sr.110.154.1989
Fryer, P., Pearce, J.A., Stokking, L.B., et al., 1992. Proceedings of the Ocean Drilling Program, Scientific Results, 125: College Station, TX (Ocean Drilling Program). https://doi.org/10.2973/odp.proc.sr.125.1992
Fryer, P., Wheat, C.G., Williams, T., Albers, E., Bekins, B., Debret, B.P.R., Deng, J., Dong, Y., Eickenbusch, P., Frery, E.A., Ichiyama, Y., Johnson, K., Johnston, R.M., Kevorkian, R.T., Kurz, W., Magalhaes, V., Mantovanelli, S.S., Menapace, W., Menzies, C.D., Michibayashi, K., Moyer, C.L., Mullane, K.K., Park, J.-W., Price, R.E., Ryan, J.G., Shervais, J.W., Sissmann, O.J., Suzuki, S., Takai, K., Walter, B., and Zhang, R., 2018a. Expedition 366 methods. In Fryer, P., Wheat, C.G., Williams, T., and the Expedition 366 Scientists, Mariana Convergent Margin and South Chamorro Seamount. Proceedings of the International Ocean Discovery Program, 366: College Station, TX (International Ocean Discovery Program). https://doi.org/10.14379/iodp.proc.366.102.2018
Fryer, P., Wheat, C.G., Williams, T., Albers, E., Bekins, B., Debret, B.P.R., Deng, J., Dong, Y., Eickenbusch, P., Frery, E.A., Ichiyama, Y., Johnson, K., Johnston, R.M., Kevorkian, R.T., Kurz, W., Magalhaes, V., Mantovanelli, S.S., Menapace, W., Menzies, C.D., Michibayashi, K., Moyer, C.L., Mullane, K.K., Park, J.-W., Price, R.E., Ryan, J.G., Shervais, J.W., Sissmann, O.J., Suzuki, S., Takai, K., Walter, B., and Zhang, R., 2018b. Expedition 366 summary. In Fryer, P., Wheat, C.G., Williams, T., and the Expedition 366 Scientists, Mariana Convergent Margin and South Chamorro Seamount. Proceedings of the International Ocean Discovery Program, 366: College Station, TX (International Ocean Discovery Program). https://doi.org/10.14379/iodp.proc.366.101.2018
Fryer, P., Wheat, C.G., Williams, T., Albers, E., Bekins, B., Debret, B.P.R., Deng, J., Dong, Y., Eickenbusch, P., Frery, E.A., Ichiyama, Y., Johnson, K., Johnston, R.M., Kevorkian, R.T., Kurz, W., Magalhaes, V., Mantovanelli, S.S., Menapace, W., Menzies, C.D., Michibayashi, K., Moyer, C.L., Mullane, K.K., Park, J.-W., Price, R.E., Ryan, J.G., Shervais, J.W., Sissmann, O.J., Suzuki, S., Takai, K., Walter, B., and Zhang, R., 2018c. Site U1491. In Fryer, P., Wheat, C.G., Williams, T., and the Expedition 366 Scientists, Mariana Convergent Margin and South Chamorro Seamount. Proceedings of the International Ocean Discovery Program, 366: College Station, TX (International Ocean Discovery Program). https://doi.org/10.14379/iodp.proc.366.104.2018
Hulme, S.M., Wheat, C.G., Fryer, P., and Mottl, M.J., 2010. Pore water chemistry of the Mariana serpentinite mud volcanoes: a window to the seismogenic zone. Geochemistry, Geophysics, Geosystems, 11(1):Q01X09. http://dx.doi.org/10.1029/2009GC002674
Johnston, R.M., Ryan, J.G., and the Expedition 366 Scientists, 2018. pXRF and ICP-AES characterization of shipboard rocks and sediments: protocols and strategies. In Fryer, P., Wheat, C.G., Williams, T., and the Expedition 366 Scientists, Mariana Convergent Margin and South Chamorro Seamount. Proceedings of the International Ocean Discovery Program, 366: College Station, TX (International Ocean Discovery Program). https://doi.org/10.14379/iodp.proc.366.110.2018
Jutzeler, M., White, J.D.L., Talling, P.J., McCanta, M., Morgan, S., Le Friant, A., and Ishizuka, O., 2014. Coring disturbances in IODP piston cores with implications for offshore record of volcanic events and the Missoula megafloods. Geochemistry, Geophysics, Geosystems, 15(9):3572–3590. http://dx.doi.org/10.1002/2014GC005447
Komor, S.C., and Mottl, M.J., 2005. Data report: stable isotope compositions of dissolved inorganic carbon, methane, sulfate, and sulfide in pore water from the South Chamorro serpentinite mud volcano, Mariana subduction complex. In Shinohara, M., Salisbury, M.H., and Richter, C. (Eds.), Proceedings of the Ocean Drilling Program, Scientific Results, 195: College Station, TX (Ocean Drilling Program), 1–12. https://doi.org/10.2973/odp.proc.sr.195.109.2005
Lever, M.A., Torti, A., Eickenbusch, P., Michaud, A.B., Šantl-Temkiv, T., and Jørgensen, B.B., 2015. A modular method for the extraction of DNA and RNA, and the separation of DNA pools from diverse environmental sample types. Frontiers in Microbiology, 6:1–25. http://dx.doi.org/10.3389/fmicb.2015.00476
Mottl, M.J., 1992. Pore waters from serpentinite seamounts in the Mariana and Izu-Bonin forearcs, Leg 125: evidence for volatiles from the subducting slab. In Fryer, P., Pearce, J.A., Stokking, L.B., et al., Proceedings of the Ocean Drilling Program, Scientific Results, 125: College Station, TX (Ocean Drilling Program), 373–385. https://doi.org/10.2973/odp.proc.sr.125.121.1992
Mottl, M.J., and Alt, J.C., 1992. Data report: minor and trace element and sulfur isotopic composition of pore waters from Sites 778 through 786. In Fryer, P., Pearce, J.A., Stokking, L.B., et al., Proceedings of the Ocean Drilling Program, Scientific Results, 125: College Station, TX (Ocean Drilling Program), 683–688. http://dx.doi.org/10.2973/odp.proc.sr.125.184.1992
Mottl, M.J., Komor, S.C., Fryer, P., and Moyer, C.L., 2003. Deep-slab fluids fuel extremophilic Archaea on a Mariana forearc serpentinite mud volcano: Ocean Drilling Program Leg 195. Geochemistry, Geophysics, Geosystems, 4:9009. http://dx.doi.org/10.1029/2003GC000588
Mottl, M.J., Wheat, C.G., Fryer, P., Gharib, J., and Martin, J.B., 2004. Chemistry of springs across the Mariana forearc shows progressive devolatilization of the subducting plate. Geochimica et Cosmochimica Acta, 68(23):4915–4933. http://dx.doi.org/10.1016/j.gca.2004.05.037
Oakley, A., 2008. A multi-channel seismic and bathymeric investigation of the central Mariana convergent margin [Ph.D. dissertation]. University of Hawaii. http://www.soest.hawaii.edu/GG/resources/theses/Oakley Dissertation 2008.pdf
Oakley, A.J., Taylor, B., Fryer, P., Moore, G.F., Goodliffe, A.M., and Morgan, J.K., 2007. Emplacement, growth, and gravitational deformation of serpentinite seamounts on the Mariana forearc. Geophysical Journal International, 170(2):615–634. http://dx.doi.org/10.1111/j.1365-246X.2007.03451.x
Oakley, A.J., Taylor, B., and Moore, G.F., 2008. Pacific plate subduction beneath the central Mariana and Izu-Bonin fore arcs: new insights from an old margin. Geochemistry, Geophysics, Geosystems, 9(6):Q06003. https://doi.org/10.1029/2007GC001820
Rognstad, M., 1992. HAWAII MR1: a new underwater mapping tool [paper presented at the International Conference on Signal Processing and Technology, Cambridge, Massachusetts, 2–5 November 1992]. http://www.soest.hawaii.edu/hmrg/facstaff/mark/MR1Paper.pdf
Salisbury, M.H., Shinohara, M., Richter, C., et al., 2002. Proceedings of the Ocean Drilling Program, Initial Reports, 195: College Station, TX (Ocean Drilling Program). https://doi.org/10.2973/odp.proc.ir.195.2002
Salters, V.J.M., and Stracke, A., 2004. Composition of the depleted mantle. Geochemistry, Geophysics, Geosystems, 5(5):Q05B07. https://doi.org/10.1029/2003GC000597
Savov, I.P., Ryan, J.G., D’Antonio, M., Kelley, K., and Mattie, P., 2005. Geochemistry of serpentinized peridotites from the Mariana Forearc Conical Seamount, ODP Leg 125: implications for the elemental recycling at subduction zones. Geochemistry, Geophysics, Geosystems, 6(4):Q04J15. https://doi.org/10.1029/2004GC000777
Seyfried, W.E., Jr., Janecky, D.R., and Mottl, M.J., 1984. Alteration of the oceanic crust: implications for geochemical cycles of lithium and boron. Geochimica et Cosmochimica Acta, 48(3):557–569. https://doi.org/10.1016/0016-7037(84)90284-9
Shervais, J.W., Kolesar, P., and Andreasen, K., 2005. A field and chemical study of serpentinization—Stonyford, California: chemical flux and mass balance. International Geology Review, 47(1):1–28. https://doi.org/10.2747/0020-6814.47.1.1
Shipboard Scientific Party, 1990. Site 780. In Fryer, P., Pearce, J.A., Stokking, L.B., et al., Proceedings of the Ocean Drilling Program, Initial Reports, 125: College Station, TX (Ocean Drilling Program), 147–178. http://dx.doi.org/10.2973/odp.proc.ir.125.108.1990
Shipboard Scientific Party, 2002. Site 1200. In Salisbury, M.H., Shinohara, M., Richter, C., et al., Proceedings of the Ocean Drilling Program, Initial Reports, 195: College Station, TX (Ocean Drilling Program), 1–173. https://doi.org/10.2973/odp.proc.ir.195.103.2002
1 Fryer, P., Wheat, C.G., Williams, T., Albers, E., Bekins, B., Debret, B.P.R., Deng, J., Dong, Y., Eickenbusch, P., Frery, E.A., Ichiyama, Y., Johnson, K., Johnston, R.M., Kevorkian, R.T., Kurz, W., Magalhaes, V., Mantovanelli, S.S., Menapace, W., Menzies, C.D., Michibayashi, K., Moyer, C.L., Mullane, K.K., Park, J.-W., Price, R.E., Ryan, J.G., Shervais, J.W., Sissmann, O.J., Suzuki, S., Takai, K., Walter, B., and Zhang, R., 2018. Site U1492. In Fryer, P., Wheat, C.G., Williams, T., and the Expedition 366 Scientists, Mariana Convergent Margin and South Chamorro Seamount. Proceedings of the International Ocean Discovery Program, 366: College Station, TX (International Ocean Discovery Program). https://doi.org/10.14379/iodp.proc.366.105.2018
2 Expedition 366 Scientists’ addresses.
This work is distributed under the Creative Commons Attribution 4.0 International (CC BY 4.0) license. 