Data report: permeability, porosity, and frictional strength of core samples
PDF Download figures Download tables Cited by
Fryer, P., Wheat, C.G., Williams, T., and the Expedition 366 Scientists
Proceedings of the International Ocean Discovery Program Volume 366
publications.iodp.org

https://doi.org/10.14379/iodp.proc.366.202.2019
Data report: permeability, porosity, and frictional strength of core samples from IODP Expedition 366 in the Mariana forearc1
C.A. Morrow,2 D.E. Moore,2 D.A. Lockner,2 and B.A. Bekins2
Keywords: International Ocean Discovery Program, IODP, JOIDES Resolution, Expedition 366, Site U1492, Site U1496, Site U1497, Site U1498, Mariana forearc, X-ray diffraction, XRD, permeability, porosity, frictional strength
MS 366-202: Received 1 October 2018 · Accepted 22 February 2019 · Published 12 June 2019
Abstract
Core samples from International Ocean Discovery Program (IODP) Expedition 366 were tested in the laboratory to determine permeability, porosity, density, and frictional strength and their relation to mineralogy as part of an effort to understand hydromechanical processes at convergent plate margins. Seven samples were tested from a depth range of 19.6 to 197.9 m below seafloor. The samples were derived from three serpentinite mud volcanoes in the Mariana forearc region that formed where slab-derived fluids and materials ascend along faults. The physical characteristics mirror compositional differences between predominantly serpentine-rich and saponite-rich samples. Permeability values ranged from 10−17 to 10−19 m2, low enough to facilitate the formation of high fluid pressures that have been observed in the Mariana and other subduction megathrust environments. Porosity ranged from 0.37 to 0.51 and density ranged from 1.66 to 2.01 g/cm3. Serpentine-rich samples have coefficients of friction of 0.2–0.4, consistent with crustal serpentinite from a variety of fault zones, whereas saponite-rich samples have friction values less than 0.2, consistent with saponite fault gouge from the San Andreas Fault Observatory at Depth (SAFOD) drill hole in California (USA).
Introduction
International Ocean Discovery Program (IODP) Expedition 366 was the third drilling expedition to the serpentinite seamounts near the Mariana Trench. The series of expeditions was designed to address pressure, temperature, and composition of fluids and materials in a subduction megathrust at increasing depth and distance from the trench. This is possible because material from the subduction channel ascends in the form of large serpentine mud volcanoes, thus avoiding the lengthy and costly drilling operations to reach the megathrust region in other subduction systems. In this region, slab-derived fluids and materials ascend because of buoyancy forces through faults and fractures in the forearc to form large serpentinite mud volcanoes, some of which are taller than 2 km (Oakley et al., 2007, 2008; Oakley, 2008). At least 19 active mud volcanoes have been identified in the forearc, all within 100 km of the trench (see the Expedition 366 summary chapter [Fryer et al., 2018b]).
Previous drilling during Ocean Drilling Program Legs 125 and 195 (Shipboard Scientific Party, 1990, 2002) sampled the mud volcanoes (South Chamorro and Conical Seamounts) farthest from the trench at 78 and 86 km, which represent deeper, warmer conditions in the subducting plate (Shipboard Scientific Party, 1990, 2002). Expedition 366 focused on three serpentinite mud volcanoes (Yinazao, Fantangisña, and Asùt Tesoru Seamounts; Figure F1) located 55, 62, and 72 km from the trench, respectively, giving a broader sampling of depth and temperature conditions along the plate boundary (see the Expedition 366 summary chapter [Fryer et al., 2018b]). Cores from these volcanoes were taken from active zones at the summits and also from locations along the flanks, where older flows are covered by more recent ones. The cores represent materials brought to the seafloor from both the lithosphere of the Pacific plate and from subducted seamounts and include numerous lithic clasts that derive from the underlying forearc crust and mantle (see the Expedition 366 summary chapter [Fryer et al., 2018b]).
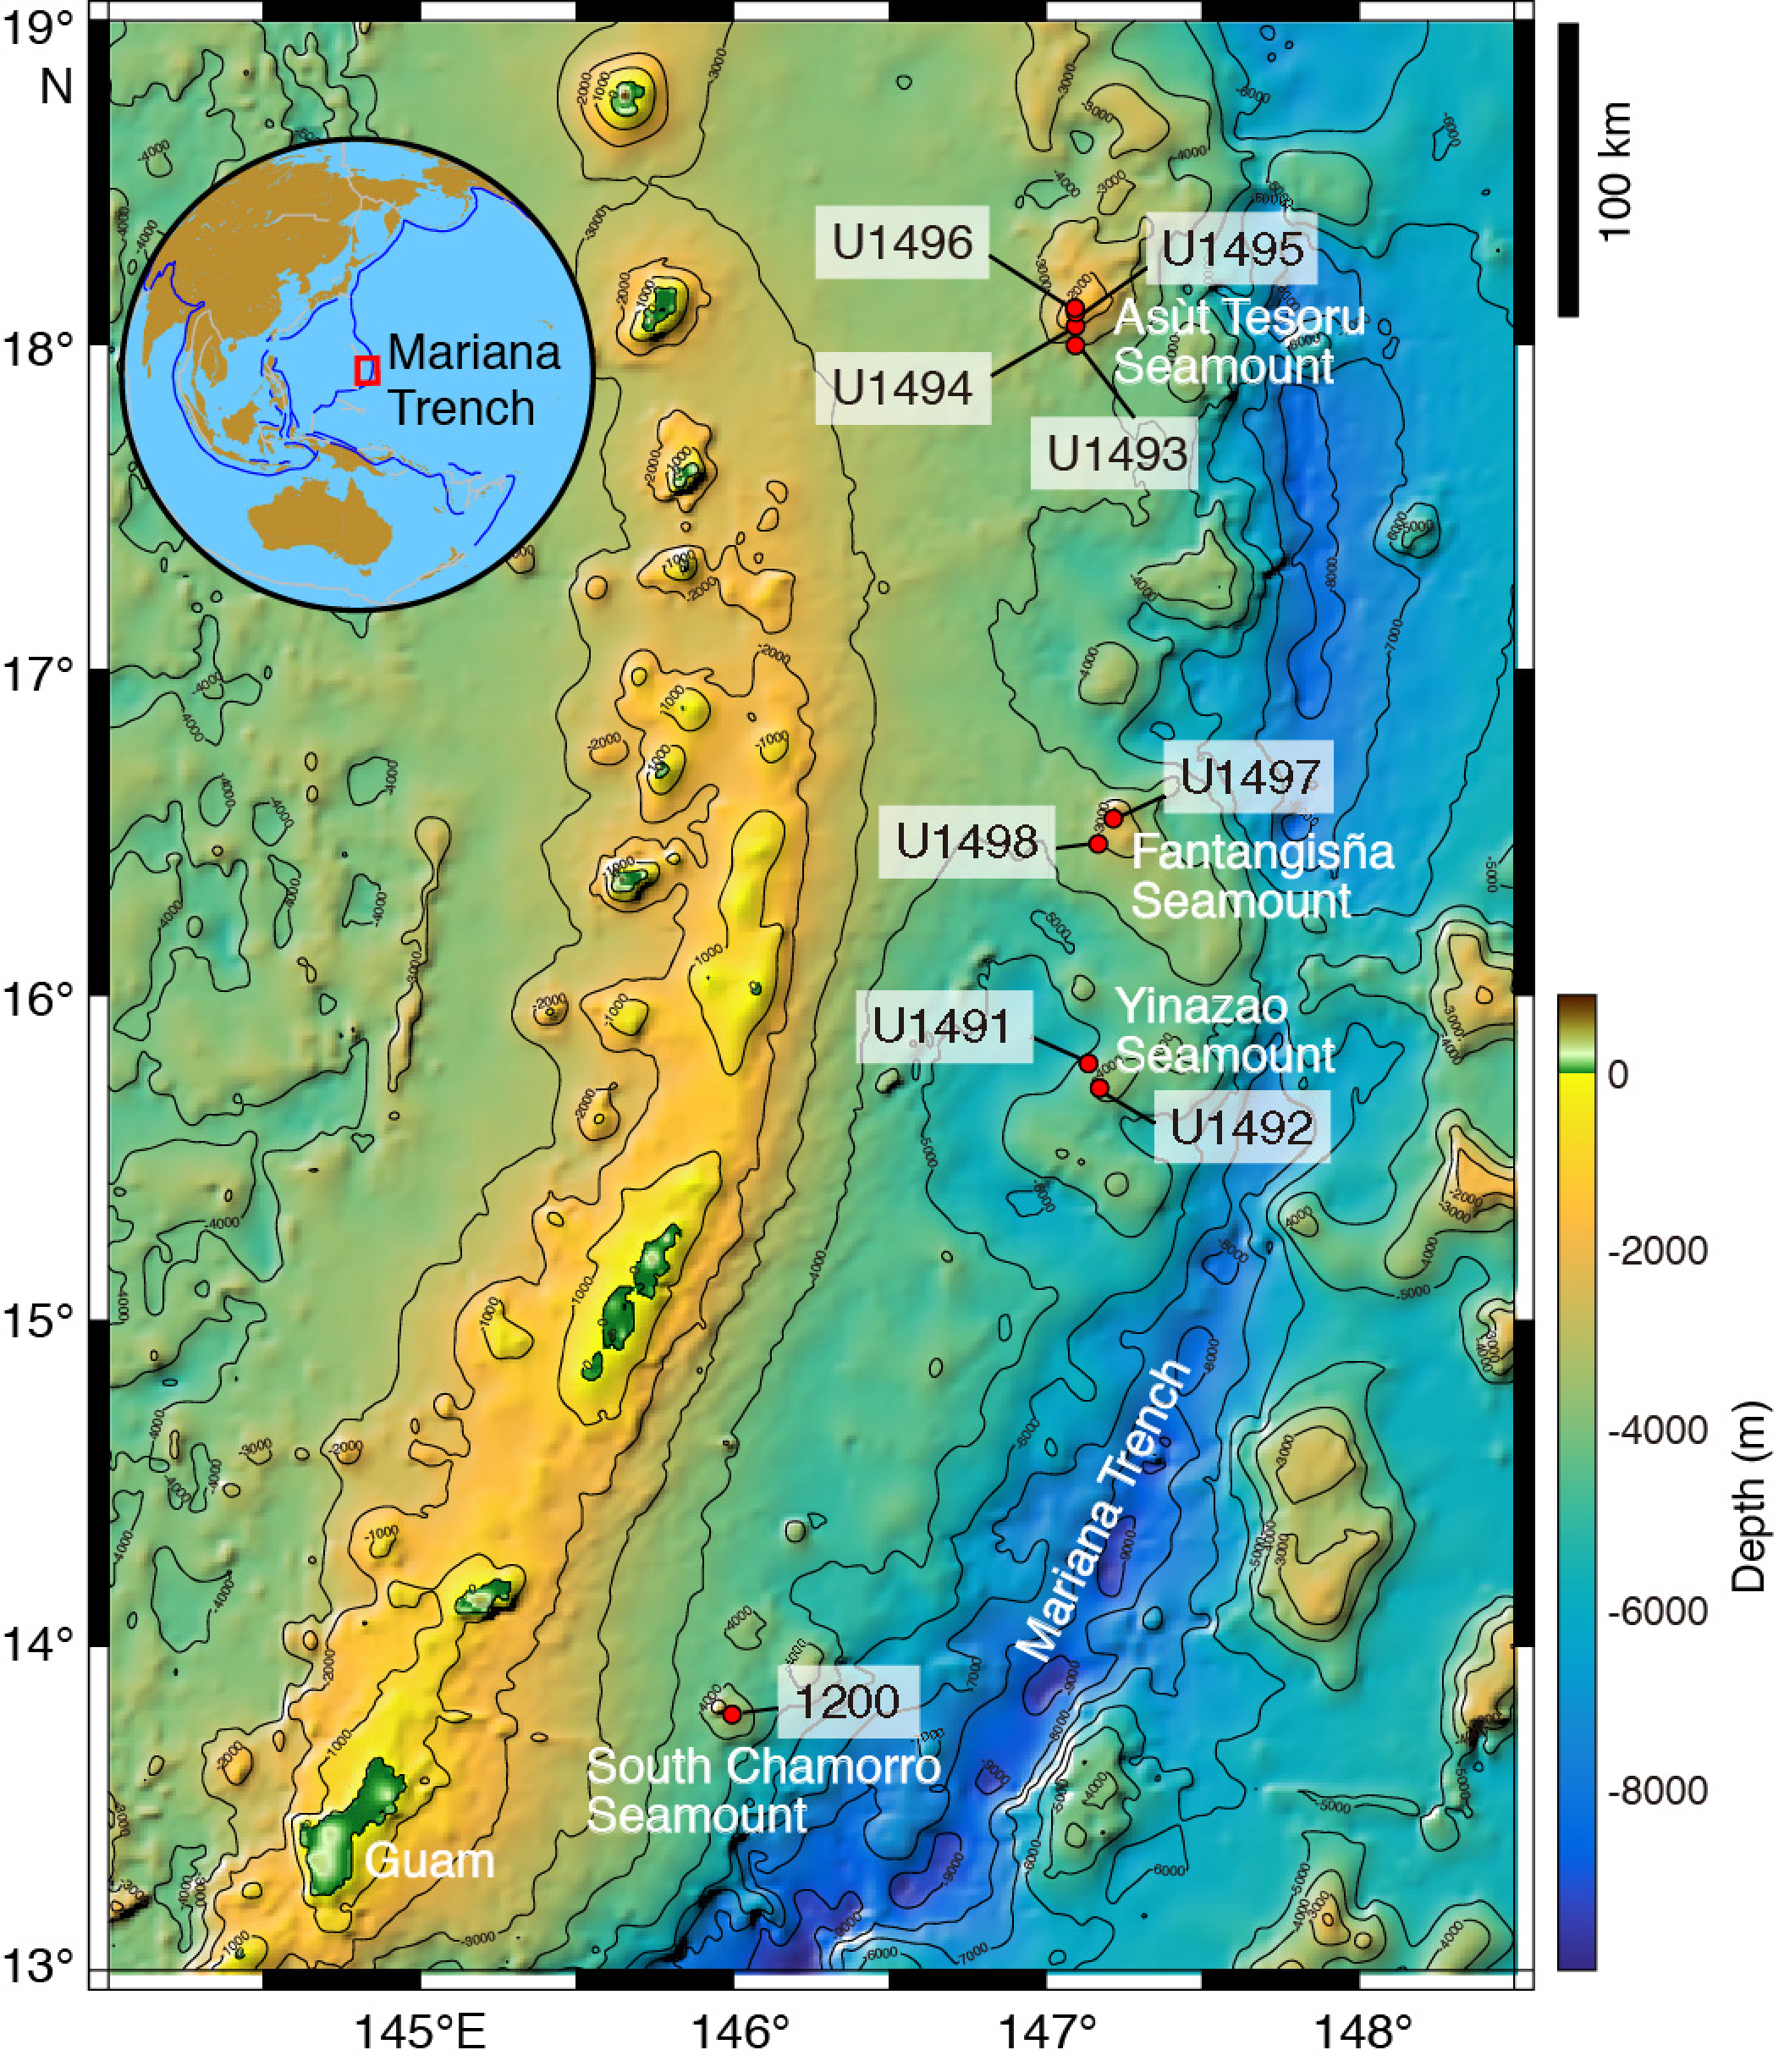
Figure F1. Location map.
The objectives of Expedition 366 were broad in scope, including assessing (1) mass transport processes, (2) spatial variability of slab-related fluids, (3) metamorphic and tectonic history and physical properties of the subduction zone, and (4) biological activity associated with deeply derived material. In this data report, we focus on a subset of these objectives, including mass transport and physical properties. Specifically, to understand seismic behavior along subduction zones, measurements of properties of the material that is produced at depth in the subduction channel are necessary. Audet et al. (2009) and Wheat et al. (2008) show that high fluid pressures are present along subduction megathrusts and are thought to control the transition from seismic behavior to slow slip. Fluid pressures are strongly influenced by permeability, and many models suggest that weak fault behavior can be explained by high fluid pressures in low-permeability rock (e.g., Lachenbruch, 1980). To this end, we measured permeability and porosity evolution in seven intact core samples from the three serpentinite volcanoes at a range of effective pressures covering in situ conditions to facilitate fluid pressure modeling. In addition, measuring the frictional strength of these materials is essential for determining seismic stability. For this reason, frictional sliding experiments were conducted on crushed material prepared from the core samples at a series of representative effective pressures. The sliding-rate dependence of friction was measured to determine the tendency for stable versus unstable sliding. Powder X-ray diffraction (XRD) studies were conducted on the selected cores to examine mineralogy-dependent differences in their physical properties.
Samples studied
Seven samples of serpentinite material were examined (Table T1) and are described below. Sample names include five identifiers separated by dashes: site and hole, core and type, and section. Type refers to either the half-length advanced piston corer (F) or rotary core barrel (R) system (described in more detail at http://iodp.tamu.edu/tools/index.html). Section refers to the position along the length of the core. The first four samples in Table T1 were half rounds and the last three samples were whole rounds. Whole rounds were cut and sealed on the catwalk, preserved by dipping the sample in beeswax, and kept cool (~4°C) until they were ready for analysis (see the Expedition 366 methods chapter [Fryer et al., 2018a] for details). Half-round samples were collected on the sample table and sealed with a wet sponge and vacuum sealer.
Packed-powder XRD analyses were conducted on the samples at the US Geological Survey using a Rigaku Multiflex X-ray diffractometer. Operating conditions using CuKα radiation were as follows:
- Operating voltage = 40 kV.
- Beam current = 20 mA.
- Scanning rate = 1°2θ/min.
- Scanning range = 2°–70°2θ.
- Sampling width = 0.01°.
Samples suspected of containing swelling clay were held in an ethylene glycol atmosphere for around 3 days and then reanalyzed at the same operating conditions. Mineral identifications were made using Rigaku analytical software and the International Center for Diffraction Data (ICDD) PDF-4/Minerals database. The XRD plots are shown in Appendix A.
Sections 366-U1492B-13F-2 and 366-U1492C-27F-2
Holes U1492B and U1492C were drilled into the summit of Yinazao Seamount, which is located 55 km from the Mariana Trench axis along the eastern edge of a forearc graben (Figure F1). The subducting slab is estimated to be 13 km below the summit (Oakley et al., 2007, 2008; Oakley, 2008). These two samples are visually and mineralogically very similar. Both samples are dark gray serpentinite muds with a few paler green to bluish-gray streaks and numerous lithic clasts, which is characteristic of much of the core collected from Site U1492 (see the Site U1492 chapter [Fryer et al., 2018c]). The materials prepared for powder XRD analysis are representative of the dark gray matrix; although the largest clasts were removed, many small clasts remained.
Mineral assemblages of these samples are essentially identical (Table T1; Figure AF1). Low-temperature (chrysotile and lizardite) serpentine minerals dominate, but these samples also have a significant amount of pyroaurite, a hydrated Mg-Fe carbonate hydroxide (Mg6Fe3+2(OH)16[CO3]·4H2O) that forms as a low-temperature alteration mineral. Note that the “sjogrenite” listed in the Expedition 366 summary chapter (Fryer et al., 2018b) is, in fact, a polytype of pyroaurite (pyroaurite-2H), and sjogrenite has been discredited as a mineral name by the International Mineralogical Association (Mills et al., 2012). Both cores also contain minor to trace amounts of calcite, brucite, magnetite, and talc; these are the only two talc-bearing samples of the seven samples tested.

Figure AF1. XRD data, Hole U1492C.
Sections 366-U1496A-7F-1 and 366-U1496B-5F-CC
These two samples were collected from the summit of Asùt Tesoru Seamount 72 km from the trench axis (Figure F1). This volcano has a diameter of around 50 km, is the largest in the forearc, and may have been active since the Eocene (Despraires, 1982). The subducting slab depth is estimated to be 18 km below the summit (Oakley et al., 2007, 2008; Oakley, 2008). The cores are light greenish gray serpentinite muds with numerous reddish flecks and streaks. The core piece from Hole U1496A contains fewer large clasts than the one from Hole U1496B, and the clasts range in color from pale green to black. The groundmass has a granular character and appears to be composed of small fragments of pale green serpentine. The larger clasts were removed from the materials ground for XRD analysis.
These two mud samples consist largely of the serpentine minerals chrysotile and lizardite (Table T1; Figure AF2). They also contain a hydrotalcite group mineral (Mills et al., 2012), which in these samples is coalingite (Mg10Fe3+2(OH)24[CO3]·2H2O) rather than the pyroaurite found at Site U1492. At its type locality, coalingite forms as an alteration product of brucite (Mumpton et al., 1965). Coalingite is described as being, in essence, 1:1 interlayered pyroaurite and brucite (Mills et al., 2012). The carbonate mineral siderite (FeCO3) rather than calcite may also be present in minor amounts in these two samples.
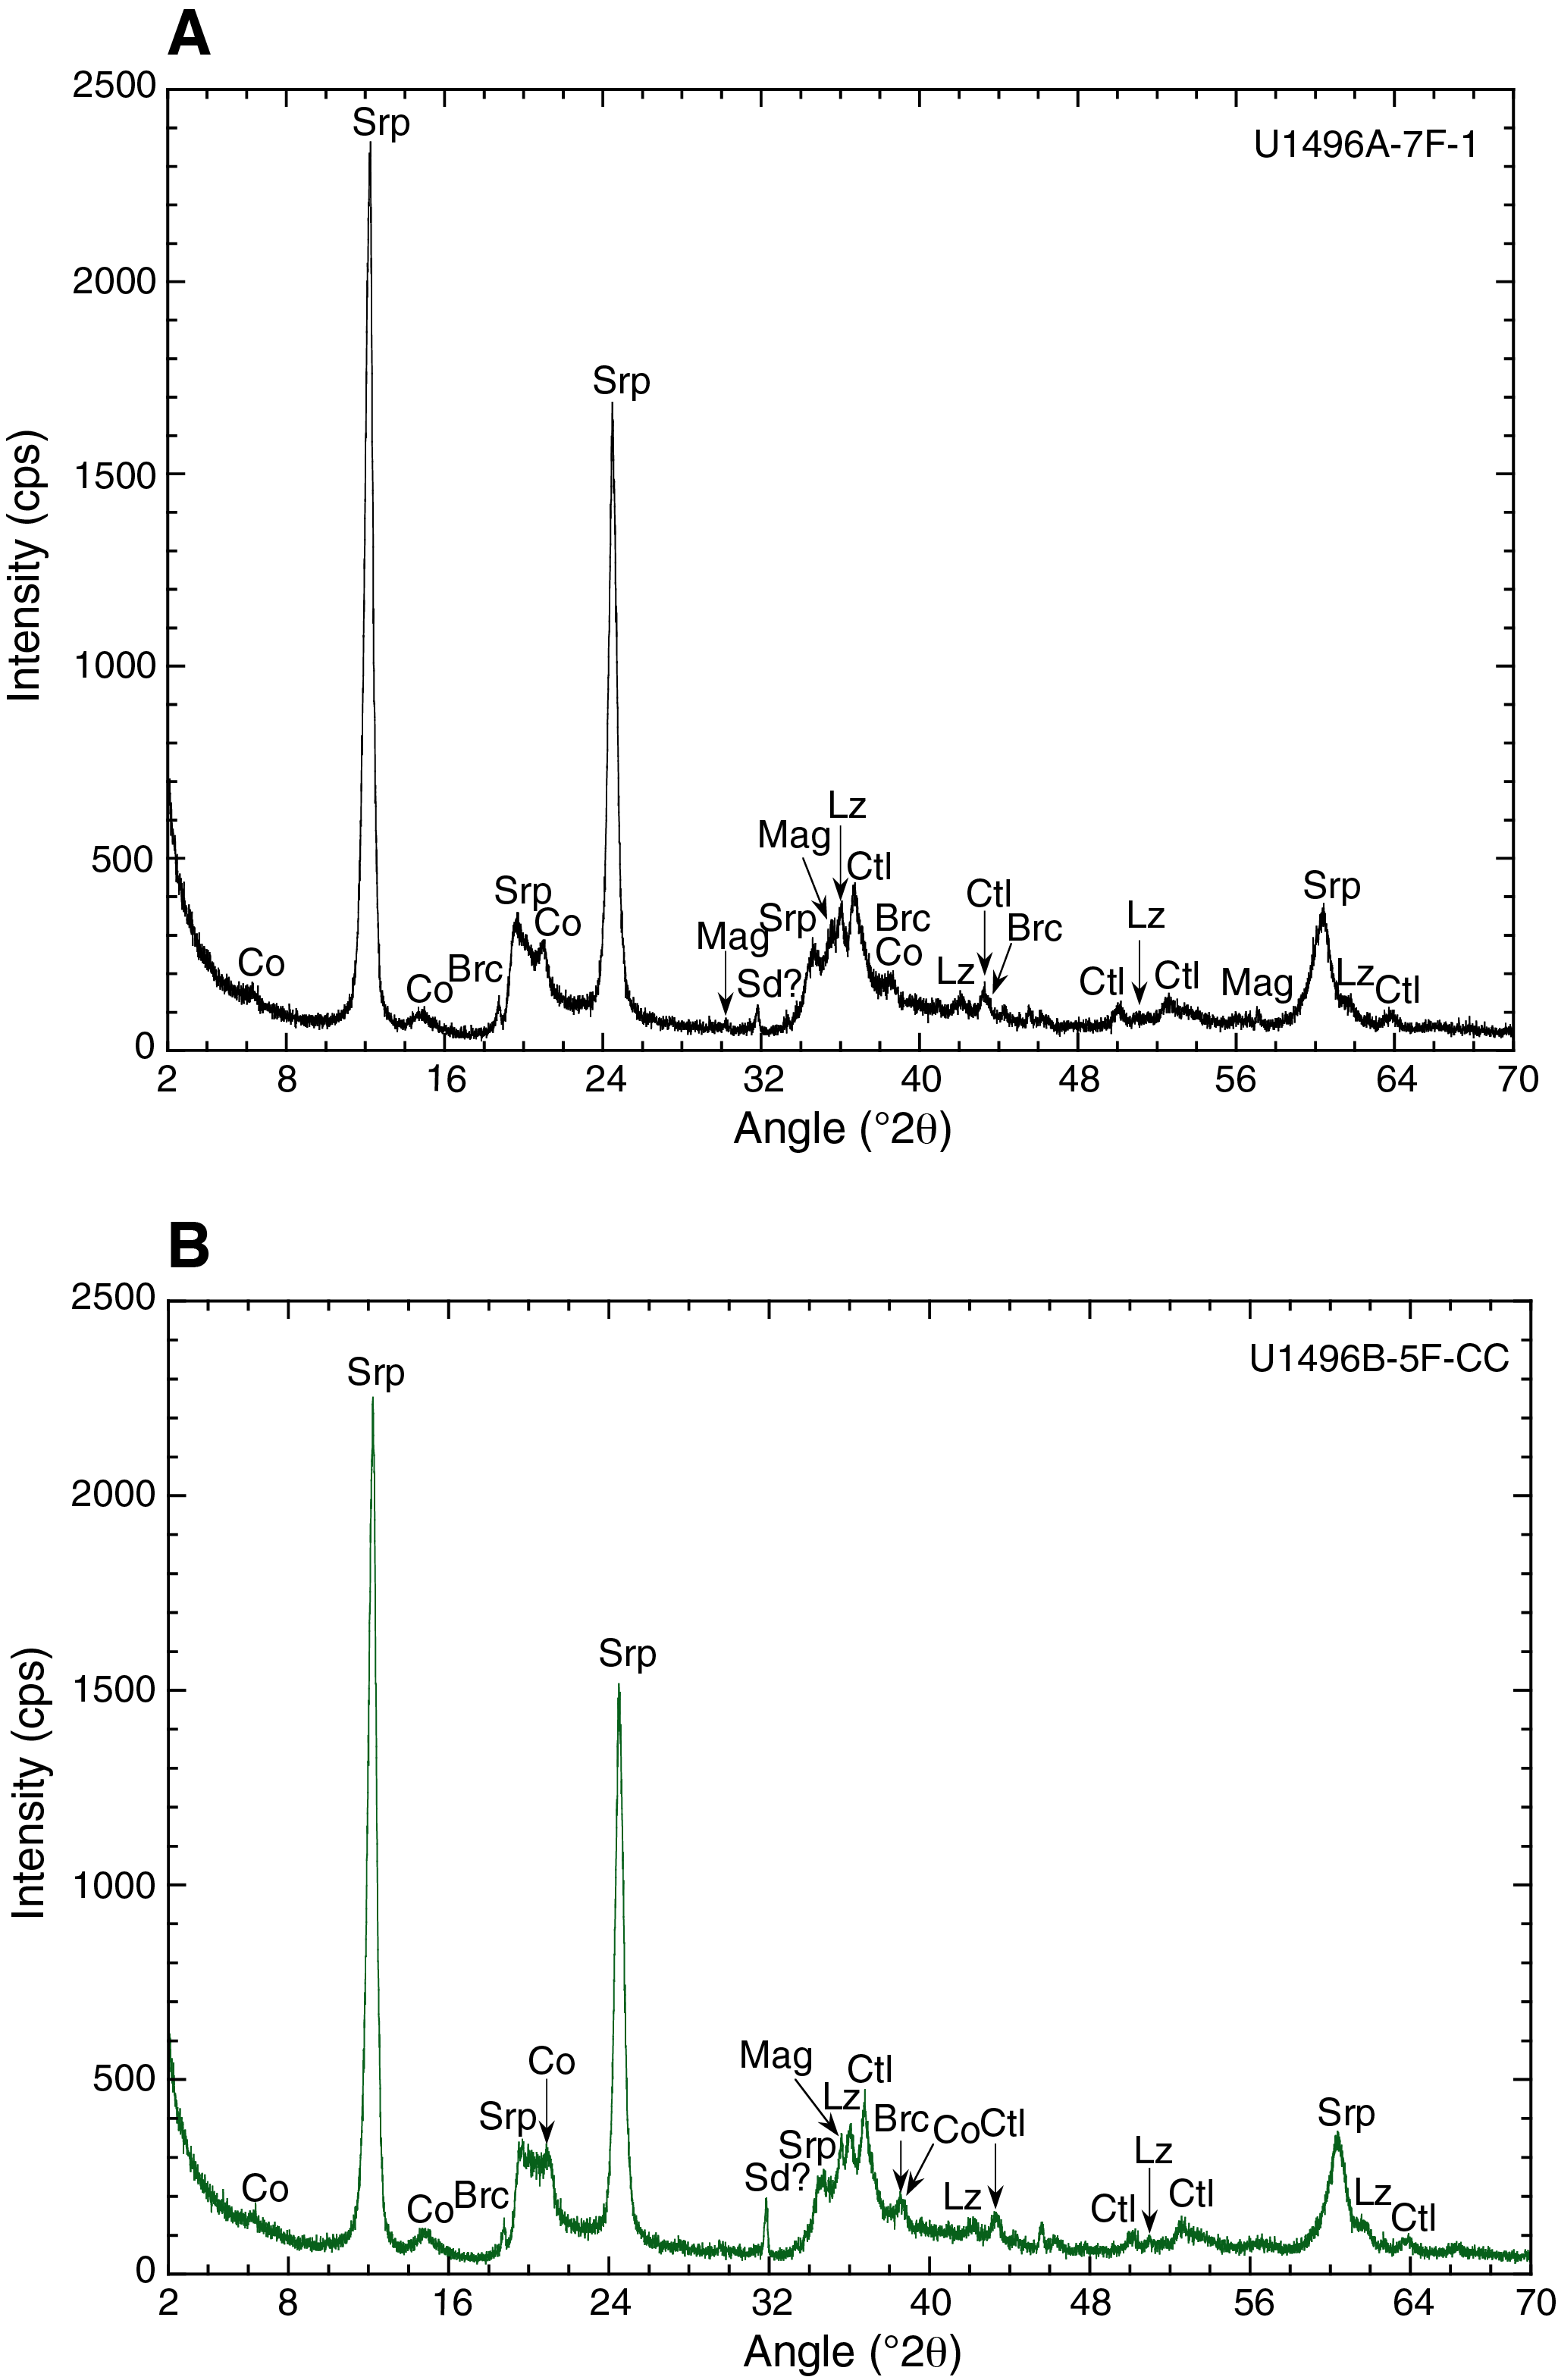
Figure AF2. XRD data, Hole U1496A.
Section 366-U1497B-5F-3
Site U1497 is situated on the summit of Fantangisña Seamount 62 km from the trench (Figure F1). The subducting slab depth is estimated to be 14 km below the summit (Oakley et al., 2007, 2008; Oakley, 2008). The presence of deformed sediments and volcanic rocks in the cores collected at this site suggest much of the material may have come from the subducting Pacific plate (see the Site U1497 chapter [Fryer et al., 2018d]). The mud matrix of the sample is dark gray with paler gray, reddish, and a few white patches; the core crumbles readily. The mud is clast rich, and the clasts are dominantly black rather than green. The core has been largely altered to the Mg-rich smectite clay saponite (Table T1). The XRD pattern of the glycolated sample is presented in Figure AF3A, and the shifts in basal (00l) spacings accompanying glycolation are indicated in Figure AF3B. Minor amounts of serpentine remain, but brucite is not present.

Figure AF3. XRD data for smectite clay-bearing sample, Hole U1497B.
Section 366-U1498B-12R-5
This sample is one of two samples collected from the flanks of Fantangisña Seamount (Figure F1). At this depth interval, the recovered core consists of a serpentinite mud with pebbles of serpentinized ultramafic rocks (see the Site U1498 chapter [Fryer et al., 2018e]). The mud matrix closely resembles the two Site U1492 samples in appearance, although it is a slighter lighter gray color overall. It also has numerous white streaks and flecks of red. Several of the serpentinite clasts have rims of fine-grained white minerals. The mineralogy of this core sample has some similarities to those from Sites U1492 and U1496. It is chrysotile rich (Table T1; Figure AF4), and the white rims on the serpentinite pebbles likely are chrysotile. Some coalingite is also present, along with traces of calcite and brucite.
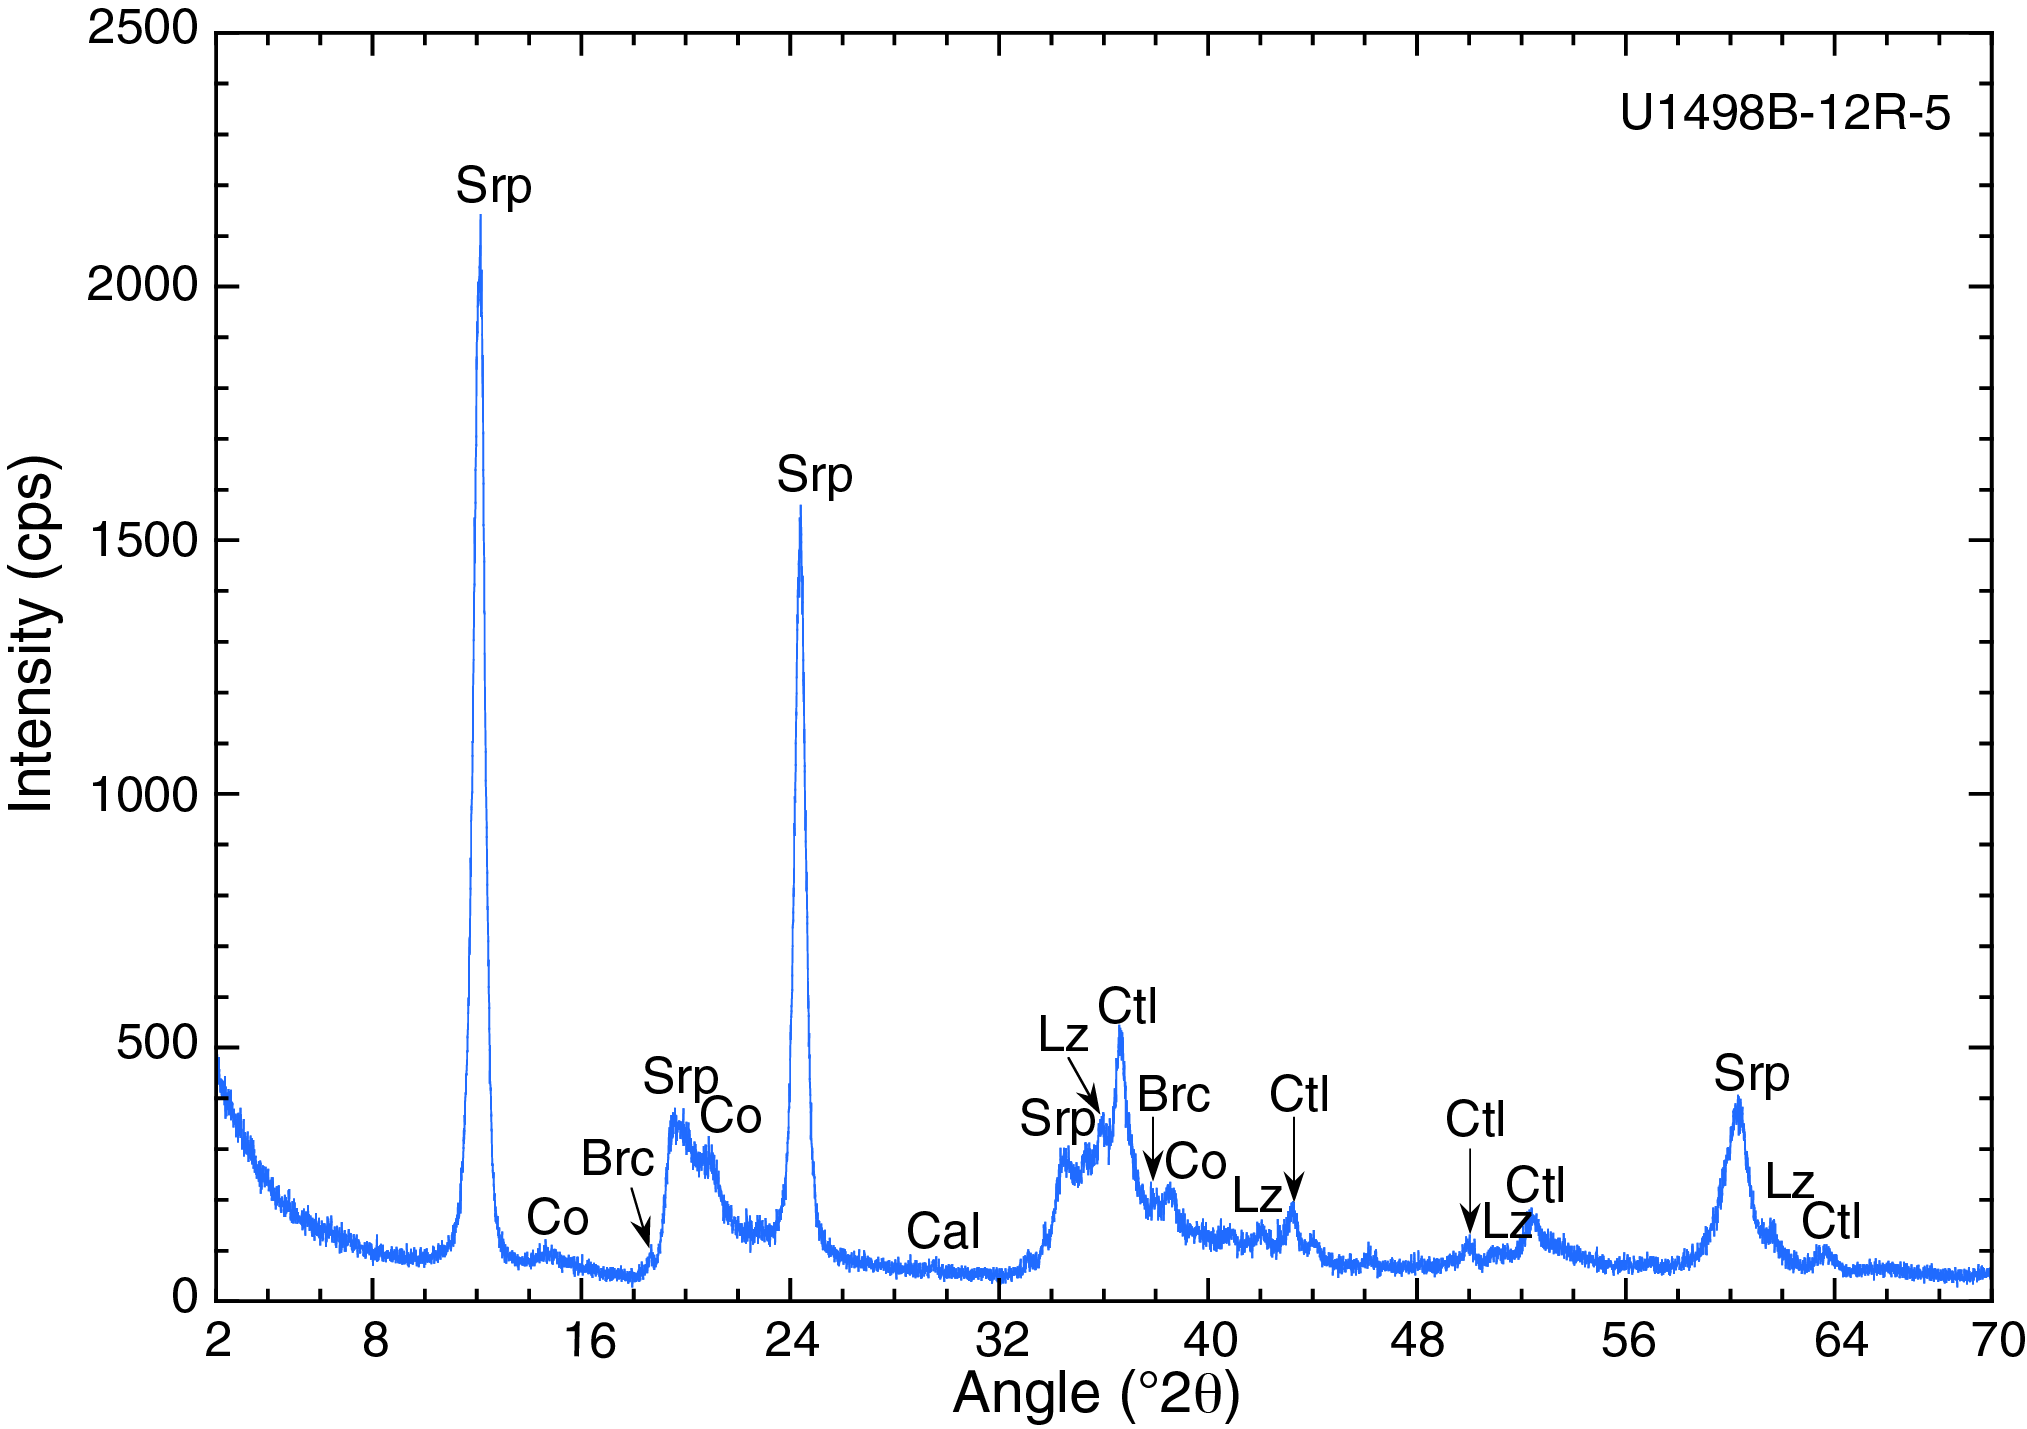
Figure AF4. XRD data, Hole U1498B.
Section 366-U1498B-22R-6
Cores 366-U1498B-21R through 23R (flank of Fantangisña Seamount; Figure F1) have a serpentinite mud matrix, but the Core 21R–22R transition consists of a metabasite boulder overlying a boulder of cherty limestone. These boulders are considered to be derived from the subducting Pacific plate and to represent an inverted contact between oceanic crust and its sedimentary cover (see the Site U1498 chapter [Fryer et al., 2018e]). The base of the serpentinite flows that form the seamount was penetrated in Section 24R-1, and the deepest core from this hole is a pelagic clay atop oceanic crust of the Philippine plate (see the Site U1498 chapter [Fryer et al., 2018e]).
The core sample used in this study is a pale greenish gray mud with some darker gray zones; pebbles include smooth greenish clasts and black irregularly shaped fragments. The core material crumbles readily when handled, similar to the sample from Section 366-U1497B-5F-3 and in contrast to most of the other samples, which tend to stick together. The X-rayed material is representative of the clast-rich, pale gray mud.
The compositional heterogeneity of the deeper portions of Hole U1498B may explain the mineralogy of this sample, which consists of serpentine partly altered to smectite clay (Table T1; Figure AF5). In addition to saponite, the sample also contains corrensite, which is an ordered interlayered 1:1 saponite-chlorite clay. As illustrated in Figure AF5B, the degree of swelling for glycolated corrensite is only about half that of saponite, such that the glycolated peaks are readily distinguished. This and the other smectite clay–bearing sample (from Section 366-U1497B-5F-3) are the only ones lacking brucite.
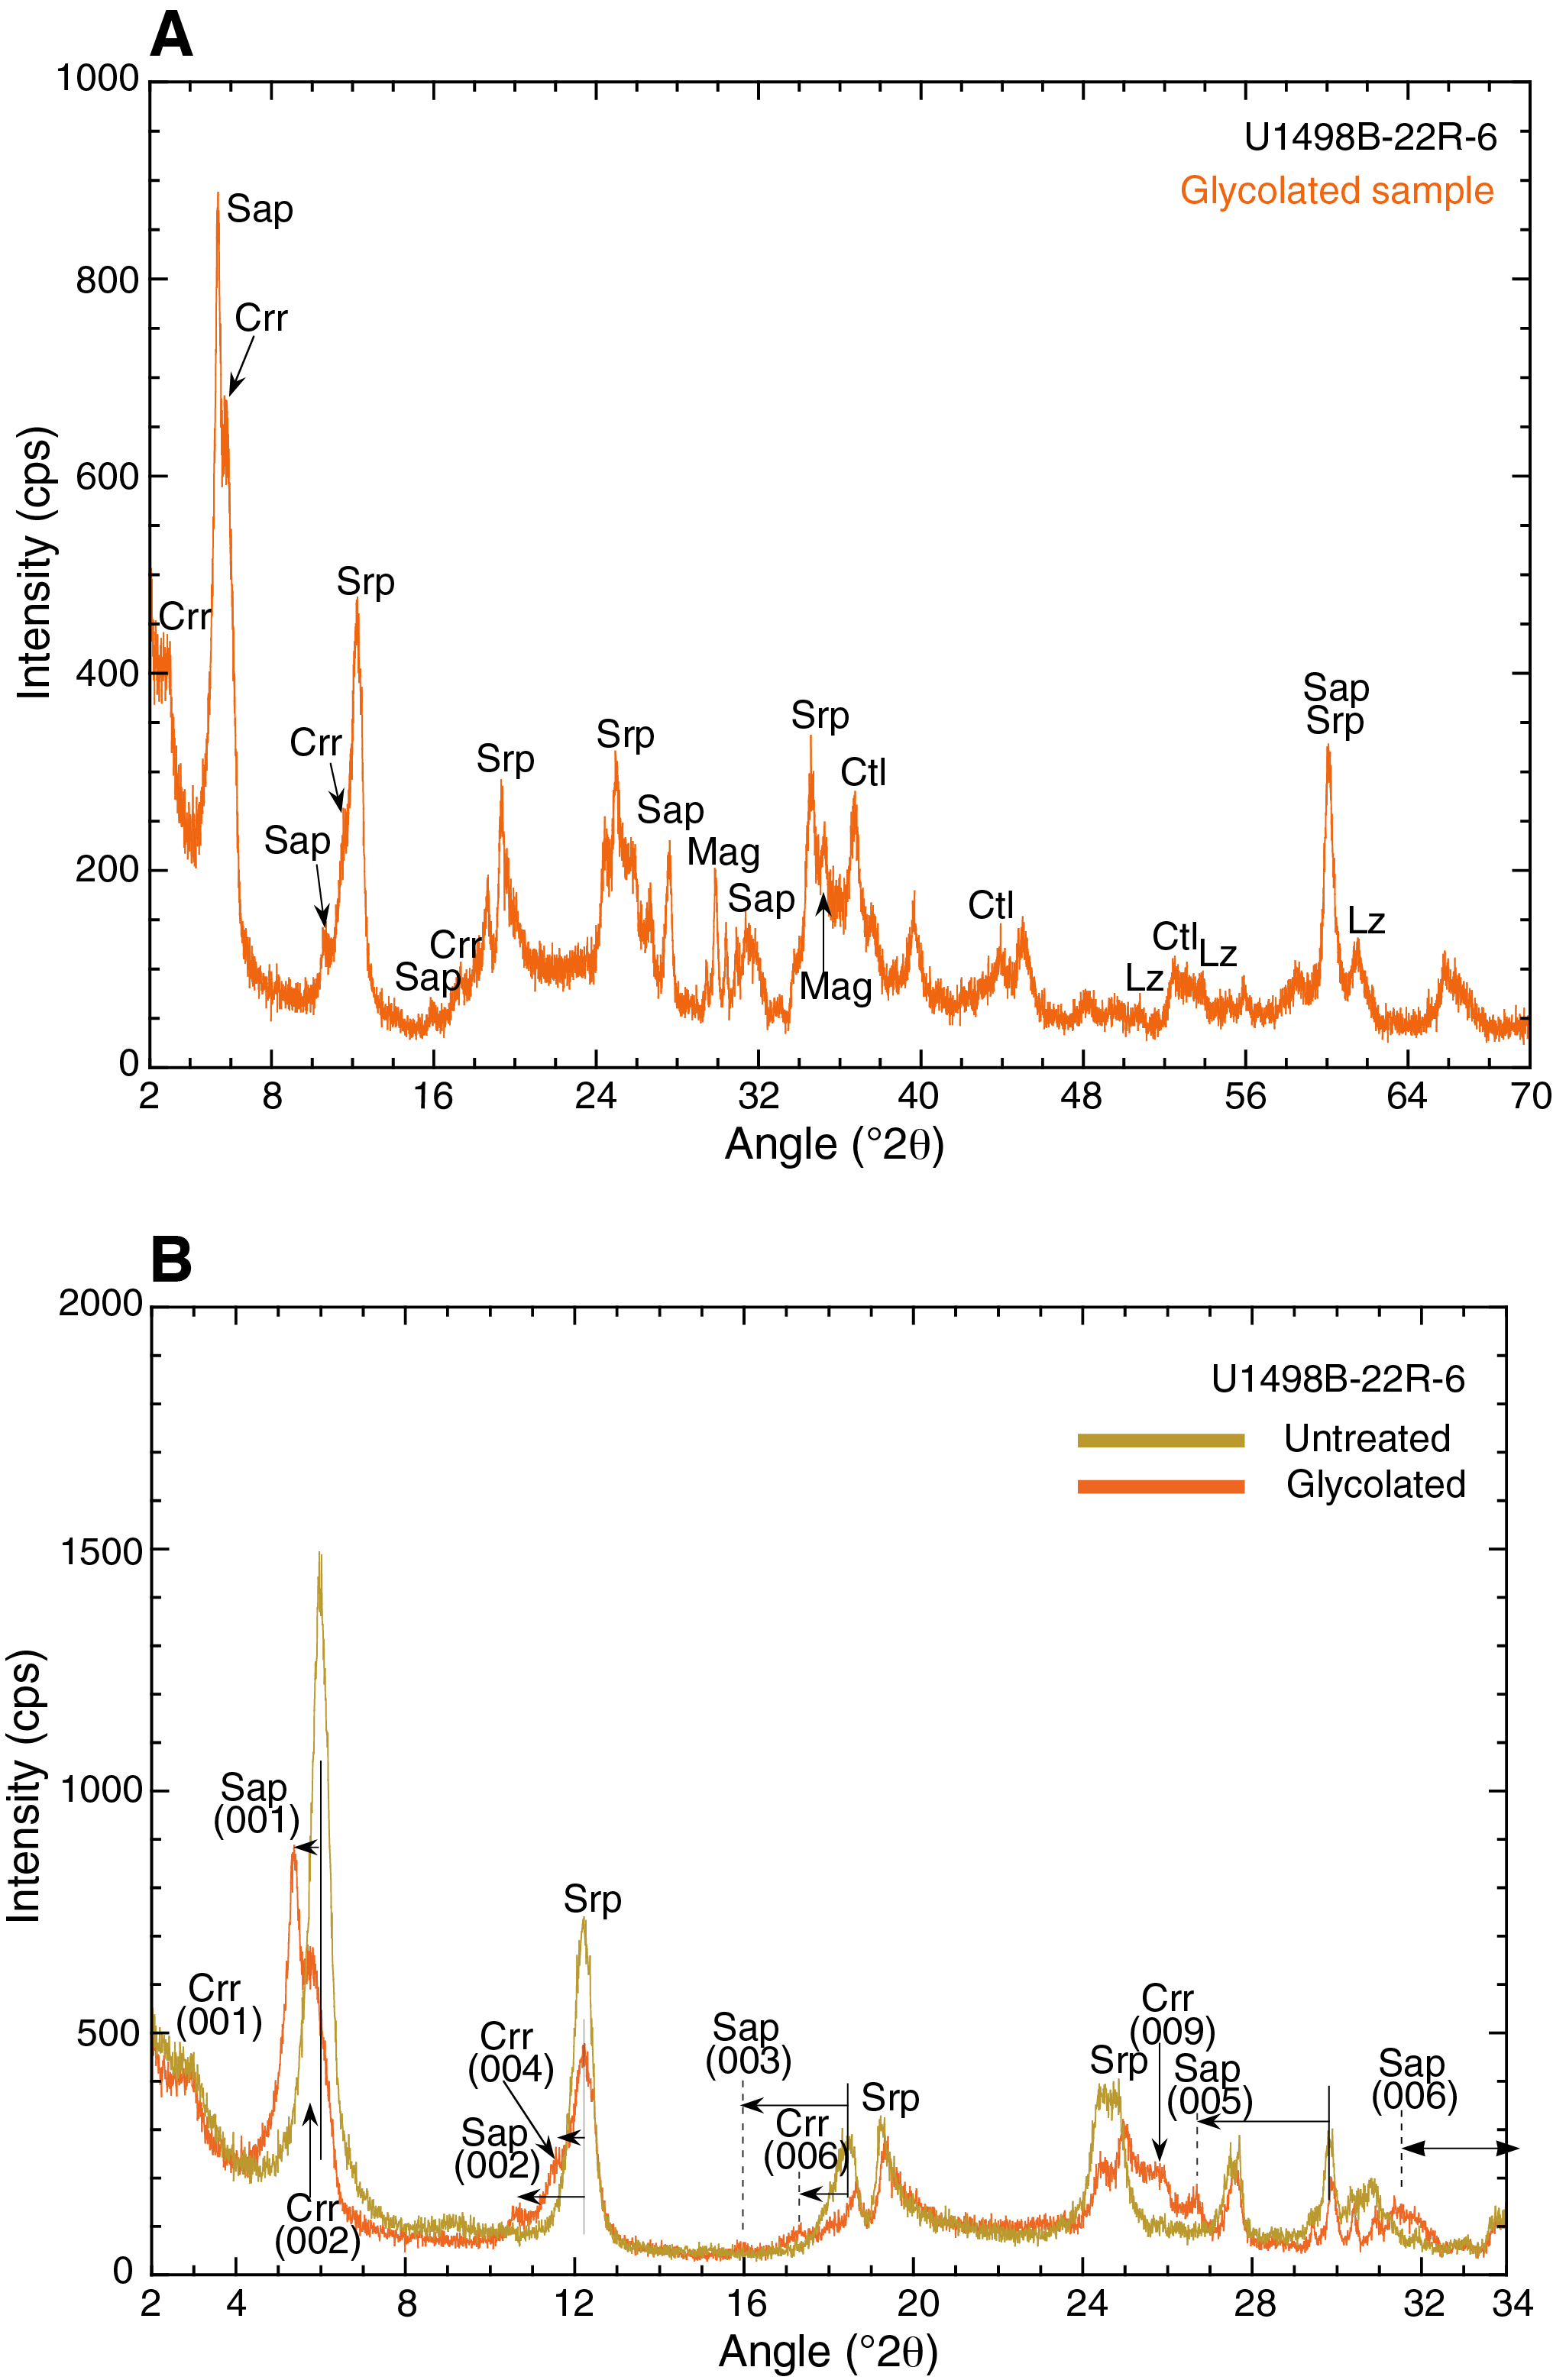
Figure AF5. XRD data for sample with two swelling clays, Hole U1498B.
Experimental procedures
Permeability and porosity
Permeability measurements were carried out under hydrostatic conditions at room temperature on the seven intact core samples described in Table T1. Effective pressure (Peff = Pc − Pp, where Pc is confining pressure and Pp is pore pressure) was controlled during the experiments at regular intervals between 0.5 and 5 MPa. The lower value was chosen because of experimental constraints of pressure control, and the upper value was chosen so that the data could be extrapolated to greater depths beyond where coring was feasible. Based on integrated bulk density from shipboard measurements, the estimated in situ effective pressures of the samples was found using the following:
- ρb = wet bulk density,
- z = depth, and
- ρw = seawater density (estimated using Millero et al. [1980]).
These values are given in Table T2 in parentheses in the effective pressure column. In some cases, the estimated in situ value was below our lowest effective pressure of 0.5 MPa.
The core material was prepared as orthogonal prisms with cross-sectional dimensions of 1.9 cm × 1.9 cm and varying length depending on the nature and condition of the core and then weighed to determine density (Table T2) (although cores were bagged and refrigerated on board the ship, measured density values may be affected by a small amount of drying while bagged). Porous Berea Sandstone wafers were placed on the top and bottom of the test samples to provide a uniform pore pressure on the sample ends and 1-D pore fluid flow. The sample is coherent enough to not appreciably invade the sandstone wafers during testing. Berea Sandstone has a permeability many orders of magnitude higher than that of the test samples and therefore can be neglected in our calculations of permeability from measured flow rates using Darcy’s law. The sample assembly was jacketed to isolate the sample from the confining fluid and secured to steel end plugs that contained a pore fluid inlet and outlet. The assembly was then inserted into the pressure vessel, 0.5 MPa confining pressure was applied, and the sample and pore pressure system was placed under a vacuum to remove air. A small pore pressure of 0.1–0.5 MPa was then applied to the inlet of the sample by a computer-controlled pore pressure generator, and confining pressure was increased a small amount to bring the effective pressure up to the desired level. The outlet of the pore pressure system was vented to the atmosphere. The time-dependent volume change in the pressure generator required to maintain the constant pore pressure differential gives a direct measure of flow rate through the sample. In all tests, the pore fluid was a brine solution (35 g/L NaCl) comparable to seawater. Permeability (k) was calculated according to Darcy’s law:
- Q = volumetric flow rate,
- A = cross sectional area of the sample,
- ν = dynamic viscosity of the pore fluid (1.01 cP or 1.01 × 10⁻³ Pa·s in SI units for seawater at the testing temperature of 23°C),
- dPp = pore pressure differential across the sample, and
- dx = length of the sample in the direction of flow.
Accuracy of the permeability measurements is approximately ±5%. The biggest sources of error are uncertainties in sample cross section and length, daily room temperature changes that affect the flow rate measurements, and time-dependent relaxation of the samples during the course of the experiment.
Between permeability measurements, the valve venting low-side pore pressure to atmosphere was closed, pore pressure was held fixed throughout the sample at 0.5 MPa by the pore pressure generator, and confining pressure was increased to the next desired level in the sequence of pressures (Table T2). Measured effective pressure may vary from the target values given in Table T2 by ±0.07 MPa. The volume of water discharged as the sample compacted in response to the increase in confining pressure was recorded. The time to reach pore fluid equilibrium (i.e., no change in pore volume with time) during this compaction period ranged from 1 to 24 h. From these volume measurements and given the initial porosity of the sample from shipboard measurements, the change in porosity with applied pressure was determined. Porosity loss during the initial loading of the sample before pore pressure was applied was estimated based on the porosity response during the first pressure step. Initial unconfined sample porosity values (0.38–0.52) are based on the shipboard measurements (using a helium displacement technique) that were taken closest to our samples and are given in Table T2 at Peff = 0. Porosity values were also determined in the laboratory by weighing and drying material from the same interval of the sealed and refrigerated core as our test samples. These porosity values were almost all a few to several percent lower than the shipboard measurements, possibly reflecting the effects of shrinkage during long-term storage. Because other geophysical studies associated with Expedition 366 were based on the shipboard measurements and because of the uncertainty of these later porosity measurements, the unconfined laboratory porosity measurements were not used in this study. Porosity ( ϕ) at each confining pressure was calculated according to
- Vp0 = unconfined pore volume,
- ΔVp = volume of fluid expelled during confining pressure increase, and
- VT0 = unconfined total sample volume.
The denominator in Equation E3 accounts for the decrease in total sample volume due to porosity loss in these porous serpentinite muds. At the end of each series of permeability tests, sample dimensions were remeasured and samples were reweighed to compare with porosity loss calculations.
Friction
Room-temperature triaxial frictional sliding experiments were conducted on seamount samples crushed and sieved to <180 µm to create a fine-grained gouge. The gouge was moistened with deionized water to form a paste and then spread in a 1 mm thick layer between the two halves of a cylindrical Berea Sandstone sample containing a 30° saw cut. The sandstone sample was 6.3 cm long and 2.5 cm in diameter. Berea Sandstone (~20% porosity) allows easy fluid communication between the gouge layer and the external pore pressure system. The gouge/sandstone assembly was placed in a latex jacket and fastened to steel end plugs with hose clamps. The upper end plug contained a pore pressure inlet, and the solid bottom end plug contained an internal load cell to measure axial stress applied to the sample. The sample was then placed in a pressure vessel in a servo-controlled triaxial deformation apparatus and evacuated through the pore pressure vent for up to 0.5 h. Confining pressure was increased to the desired value with care taken to prevent overconsolidation of the sample while pore pressure (using deionized water) was fixed at 1 MPa. Standard triaxial experiments were conducted at constant effective normal stresses (σneff = σn − Pp) resolved on the gouge layer of 4, 9, and 14 MPa. This range was chosen to determine whether strength varies with applied normal stress. Axial stress is provided by a piston that pushes against the bottom of the sample assembly at a fixed rate, causing slip along the inclined saw-cut surface as the sample shortens in the axial direction. As axial load increases during an experiment, both shear and normal stress increase. Consequently, confining pressure was adjusted under computer control as needed to maintain constant effective normal stress. Before shearing commences, effective confining pressure and effective normal stress are the same, and the values diverge as the experiment progresses. During each deformation test, the axial displacement rate was varied at selected intervals to produce rates of 0.01, 0.1, and 1.0 µm/s to test for the velocity dependence of frictional strength. Apparent friction (µ) evolves as the experiment progresses through the elastic and shearing phases of deformation and is defined as
Final friction values were determined at 8 mm of axial displacement and a sliding velocity of 0.1 µm/s when (in most cases) the samples had reached a steady-state value of friction.
In all tests, shear stress was corrected for the decreasing area of contact along the 30° inclined saw cut as the sandstone driving blocks were displaced and for the elastic strength of the latex jacket. See Tembe et al. (2010) for a review of shear stress corrections. The uncertainties in measured shear and normal stresses are ±0.05 MPa. Jacket strength was measured separately and increases with displacement. At 8 mm displacement where we report friction values, jacket shear strength is 0.68 MPa. Taking our midrange effective normal stress of 9 MPa as representative of the pressure range of these experiments, the uncertainty in the coefficient of friction at a displacement of 8 mm would be ±0.02. However, when determining velocity dependence based on strength changes in a single experiment, relative changes in µ are known to about ±0.003 because many of the sources of error cancel when calculating strength differences. In terms of the steady-state rate dependence parameter of friction a-b, as defined below, uncertainties are estimated to be approximately ±0.001 (Tembe et al., 2010).
Results
Permeability and porosity
Permeability as a function of effective pressure (Peff) is shown in Figure F2 for the seven core samples (see also Table T2). Permeability values range from 10−17 to 10−19 m2 and decrease with effective pressure. The sample from Section 366-U1498B-12R-5, whose test range was extended to 8 MPa, well above the relevant in situ range, shows that the decreasing trend in permeability continues in a systematic way at higher effective pressures. The sample from Section 366-U1497B-5F-3 shows a particularly strong pressure sensitivity compared with the other cores, and the permeability of this sample is significantly lower (10−19 m2) than the rest of the samples. This sample is largely altered to saponite, which is an Mg-rich smectite clay, and very little serpentine remains (Table T1). The composition is similar to the sample from Section 366-U1498B-22R-6, another particularly low permeability sample (Figure F2; Table T1). The low permeability values shown in Figure F2 are consistent with values from serpentine- and saponite-rich fault gouges from California (USA) (Morrow et al., 1984, 2013).
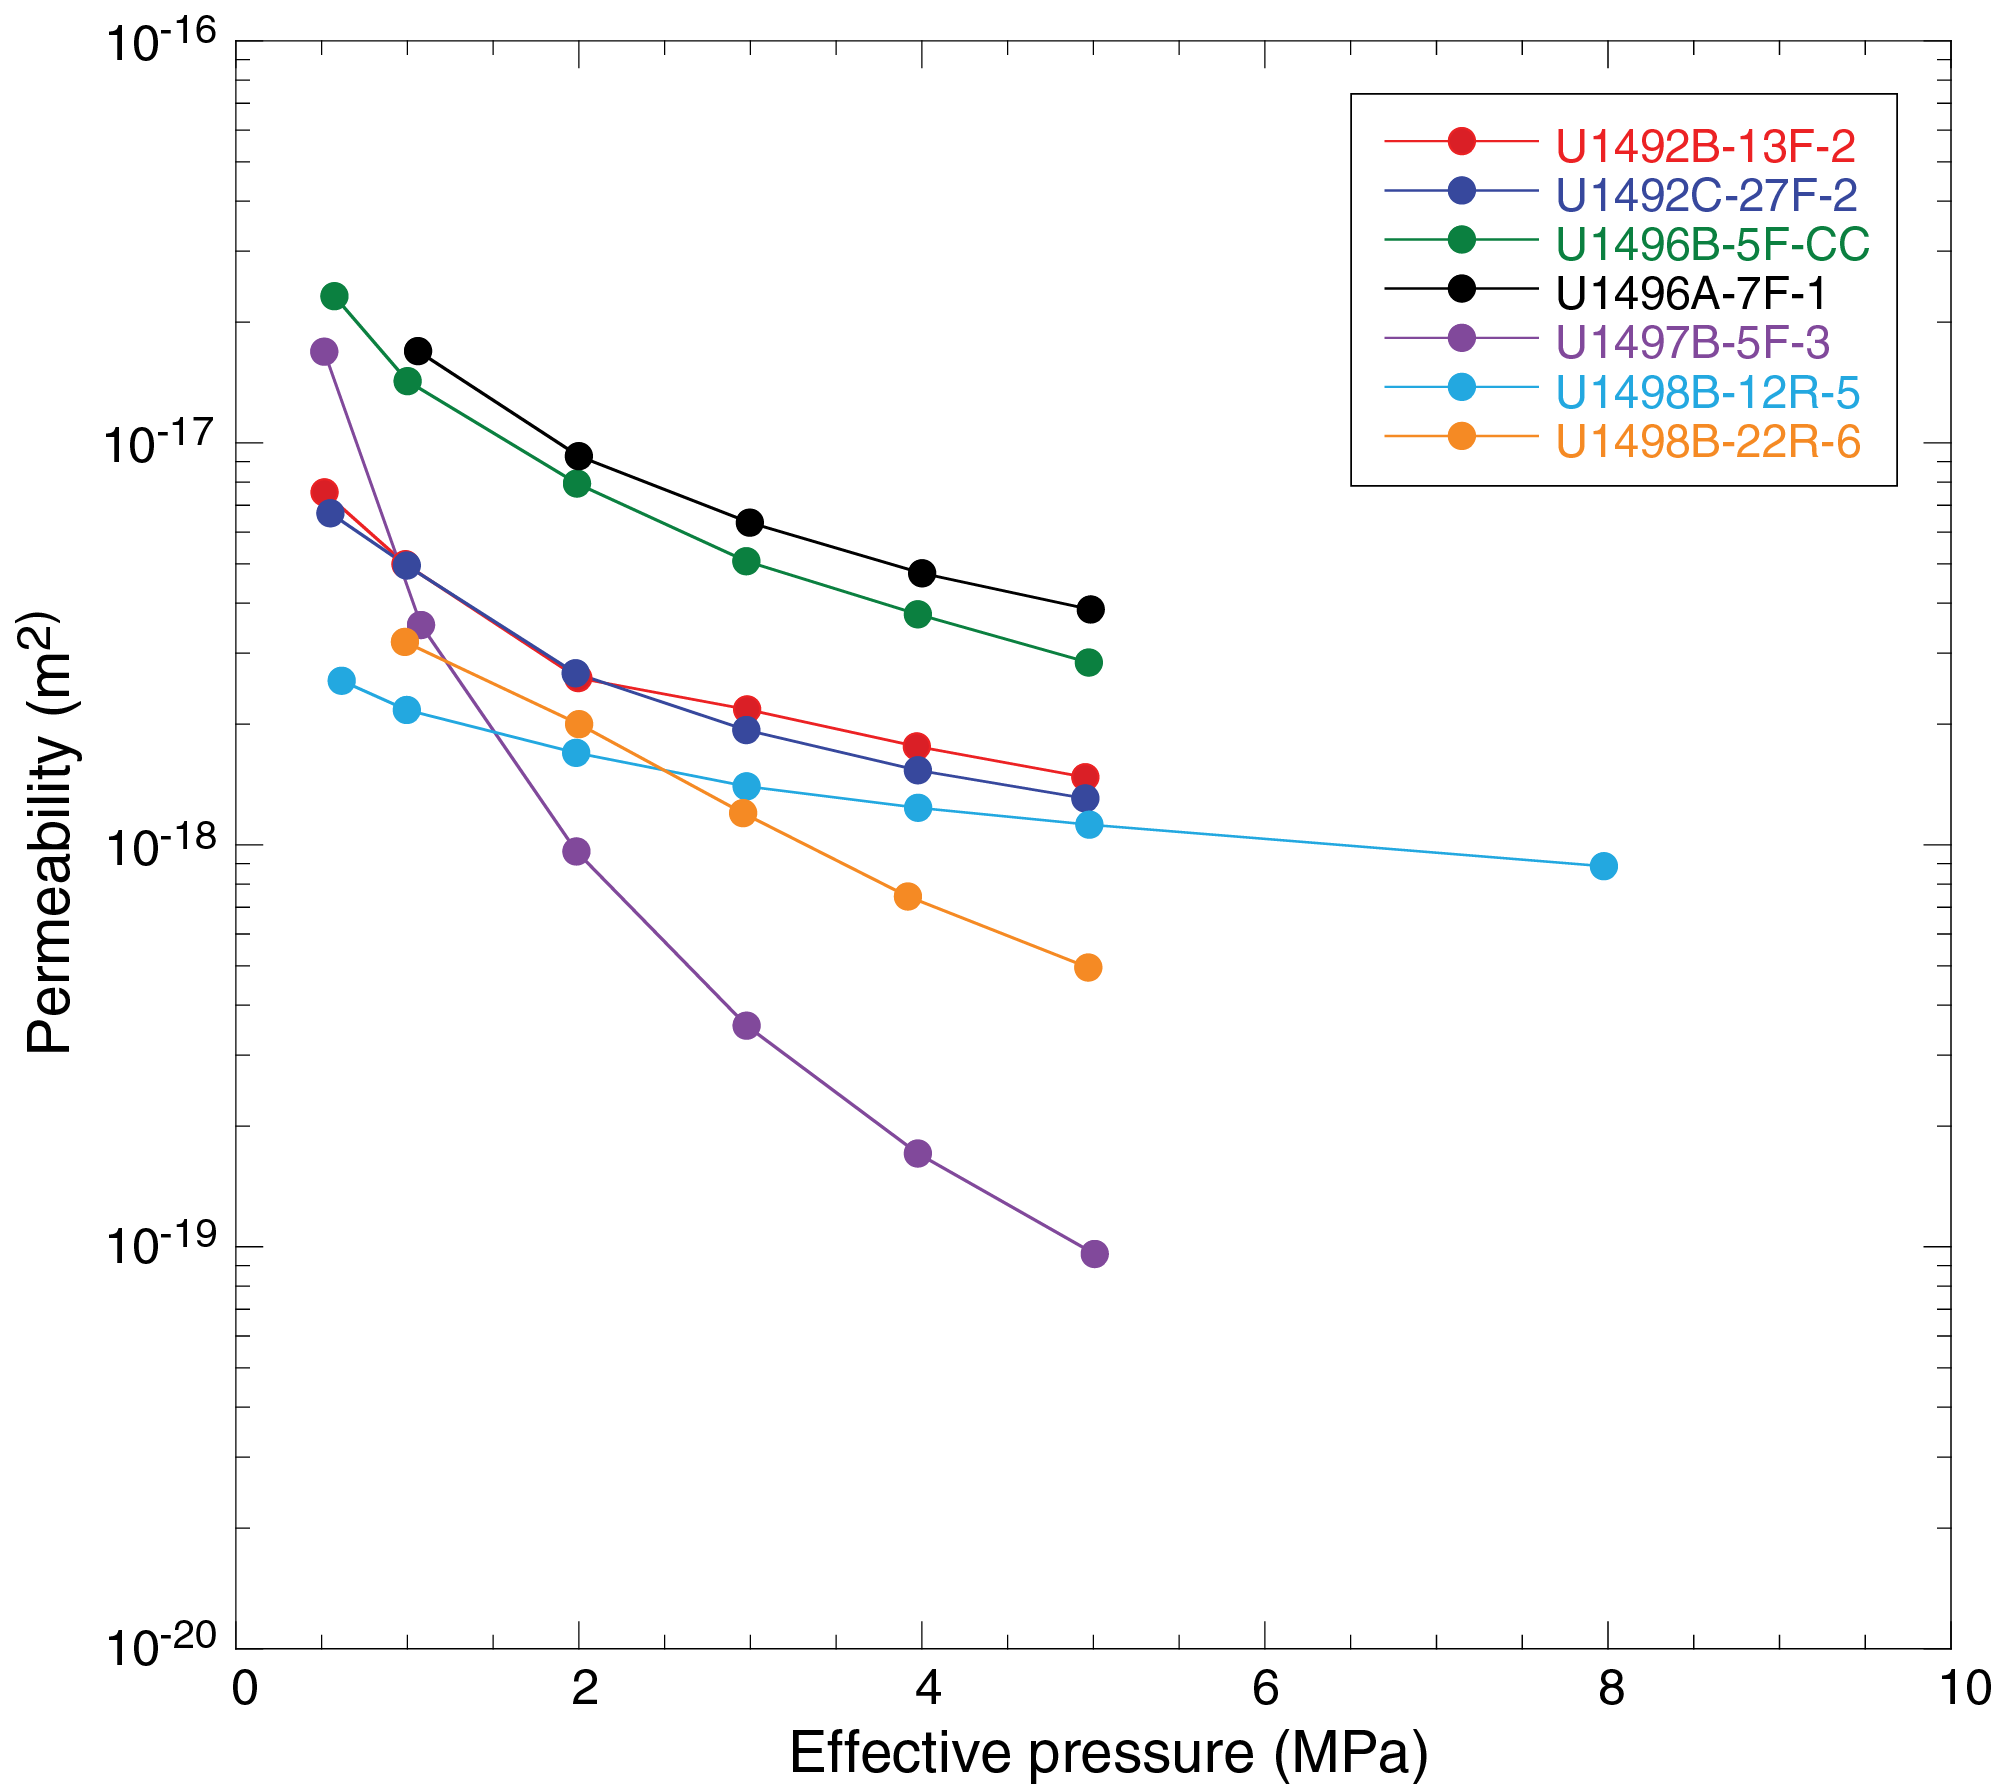
Figure F2. Permeability as a function of effective pressure.
Porosity as a function of effective pressure is shown in Figure F3 and listed in Table T2. Initial porosity values (shipboard measurements) of 38%–52% are relatively high because of the shallow and largely unconsolidated nature of the cores. From these starting values, porosity dropped in a systematic way to 29%–42% with applied pressure during the course of the experiments. The samples from Sections 366-U1498B-12R-5 and 22R-6 have noticeably lower starting porosity values. These two samples are from the flank of Fantangisña Seamount. Overall, flank sites of the serpentinite seamounts exhibit more rapid porosity loss with depth than summit sites (see the Expedition 366 summary chapter [Fryer et al., 2018b]). Porosity correlates with density (Table T2), as would be expected for a suite of samples that contain many of the same major minerals.
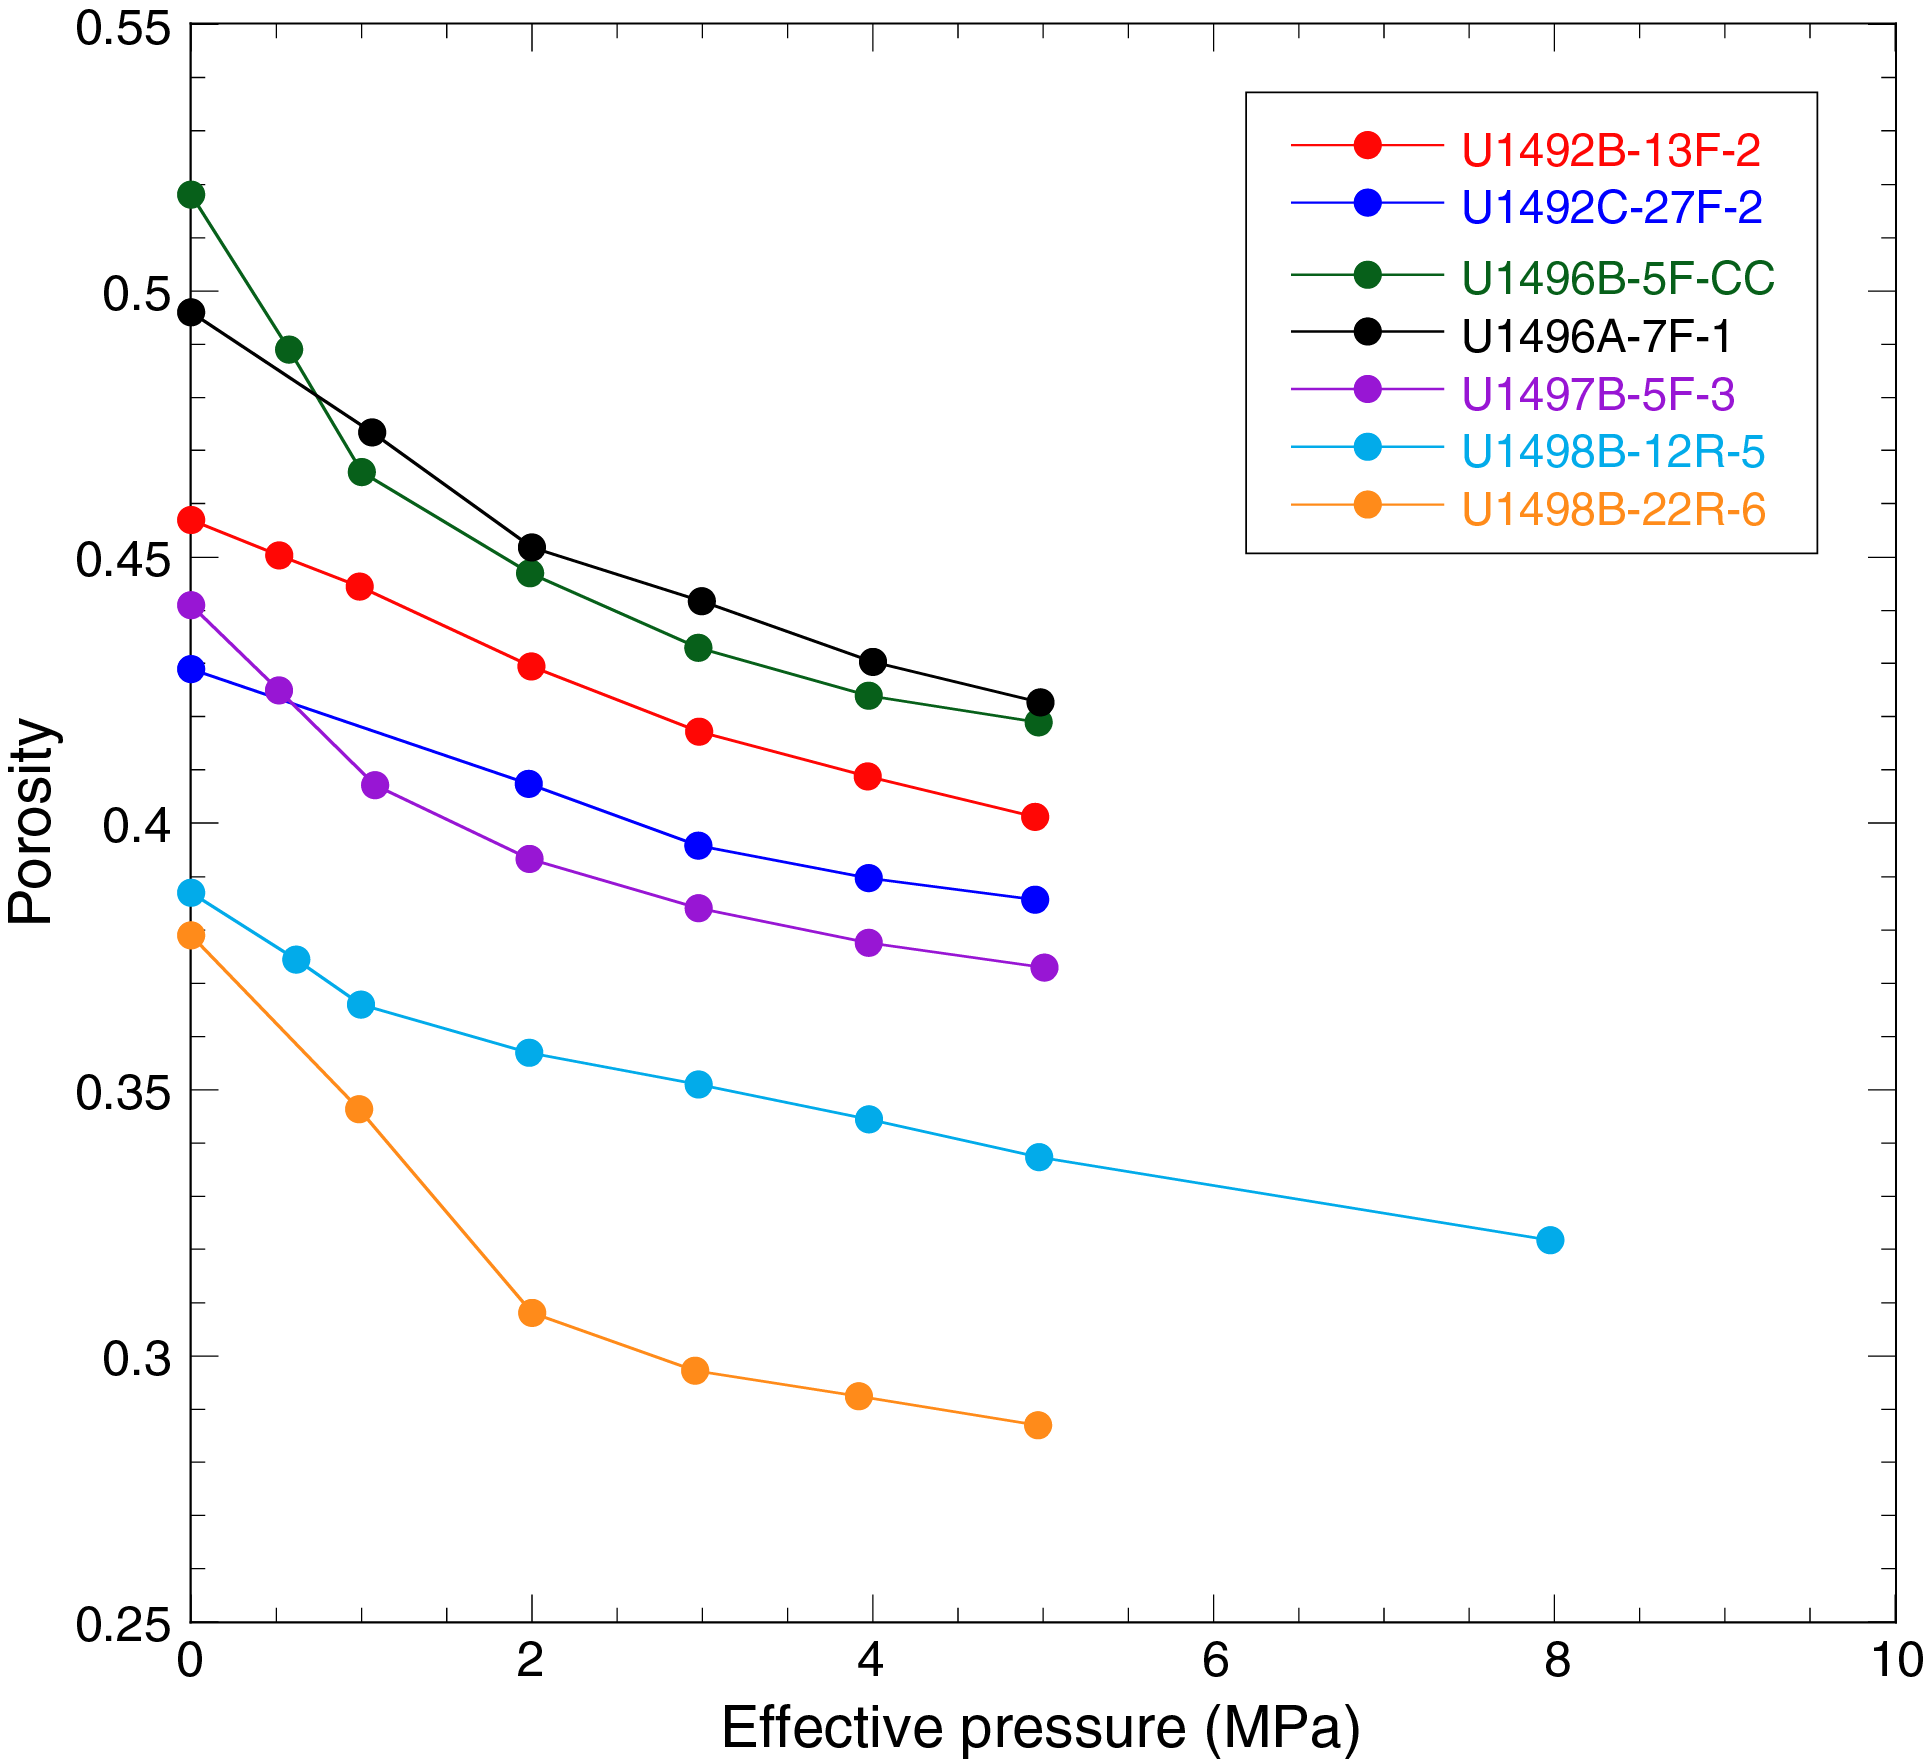
Figure F3. Porosity change with effective pressure.
Permeability plotted as a function of porosity is shown in Figure F4. Note that the initial shipboard porosity is not included in this figure because it does not have a corresponding permeability measurement at zero effective pressure. These data best follow a power law relation (permeability α porosityn) with an exponent (n) of 7–13. The exception is the sample from Section 366-U1497B-5F-3, whose permeability was the most sensitive to pressure.
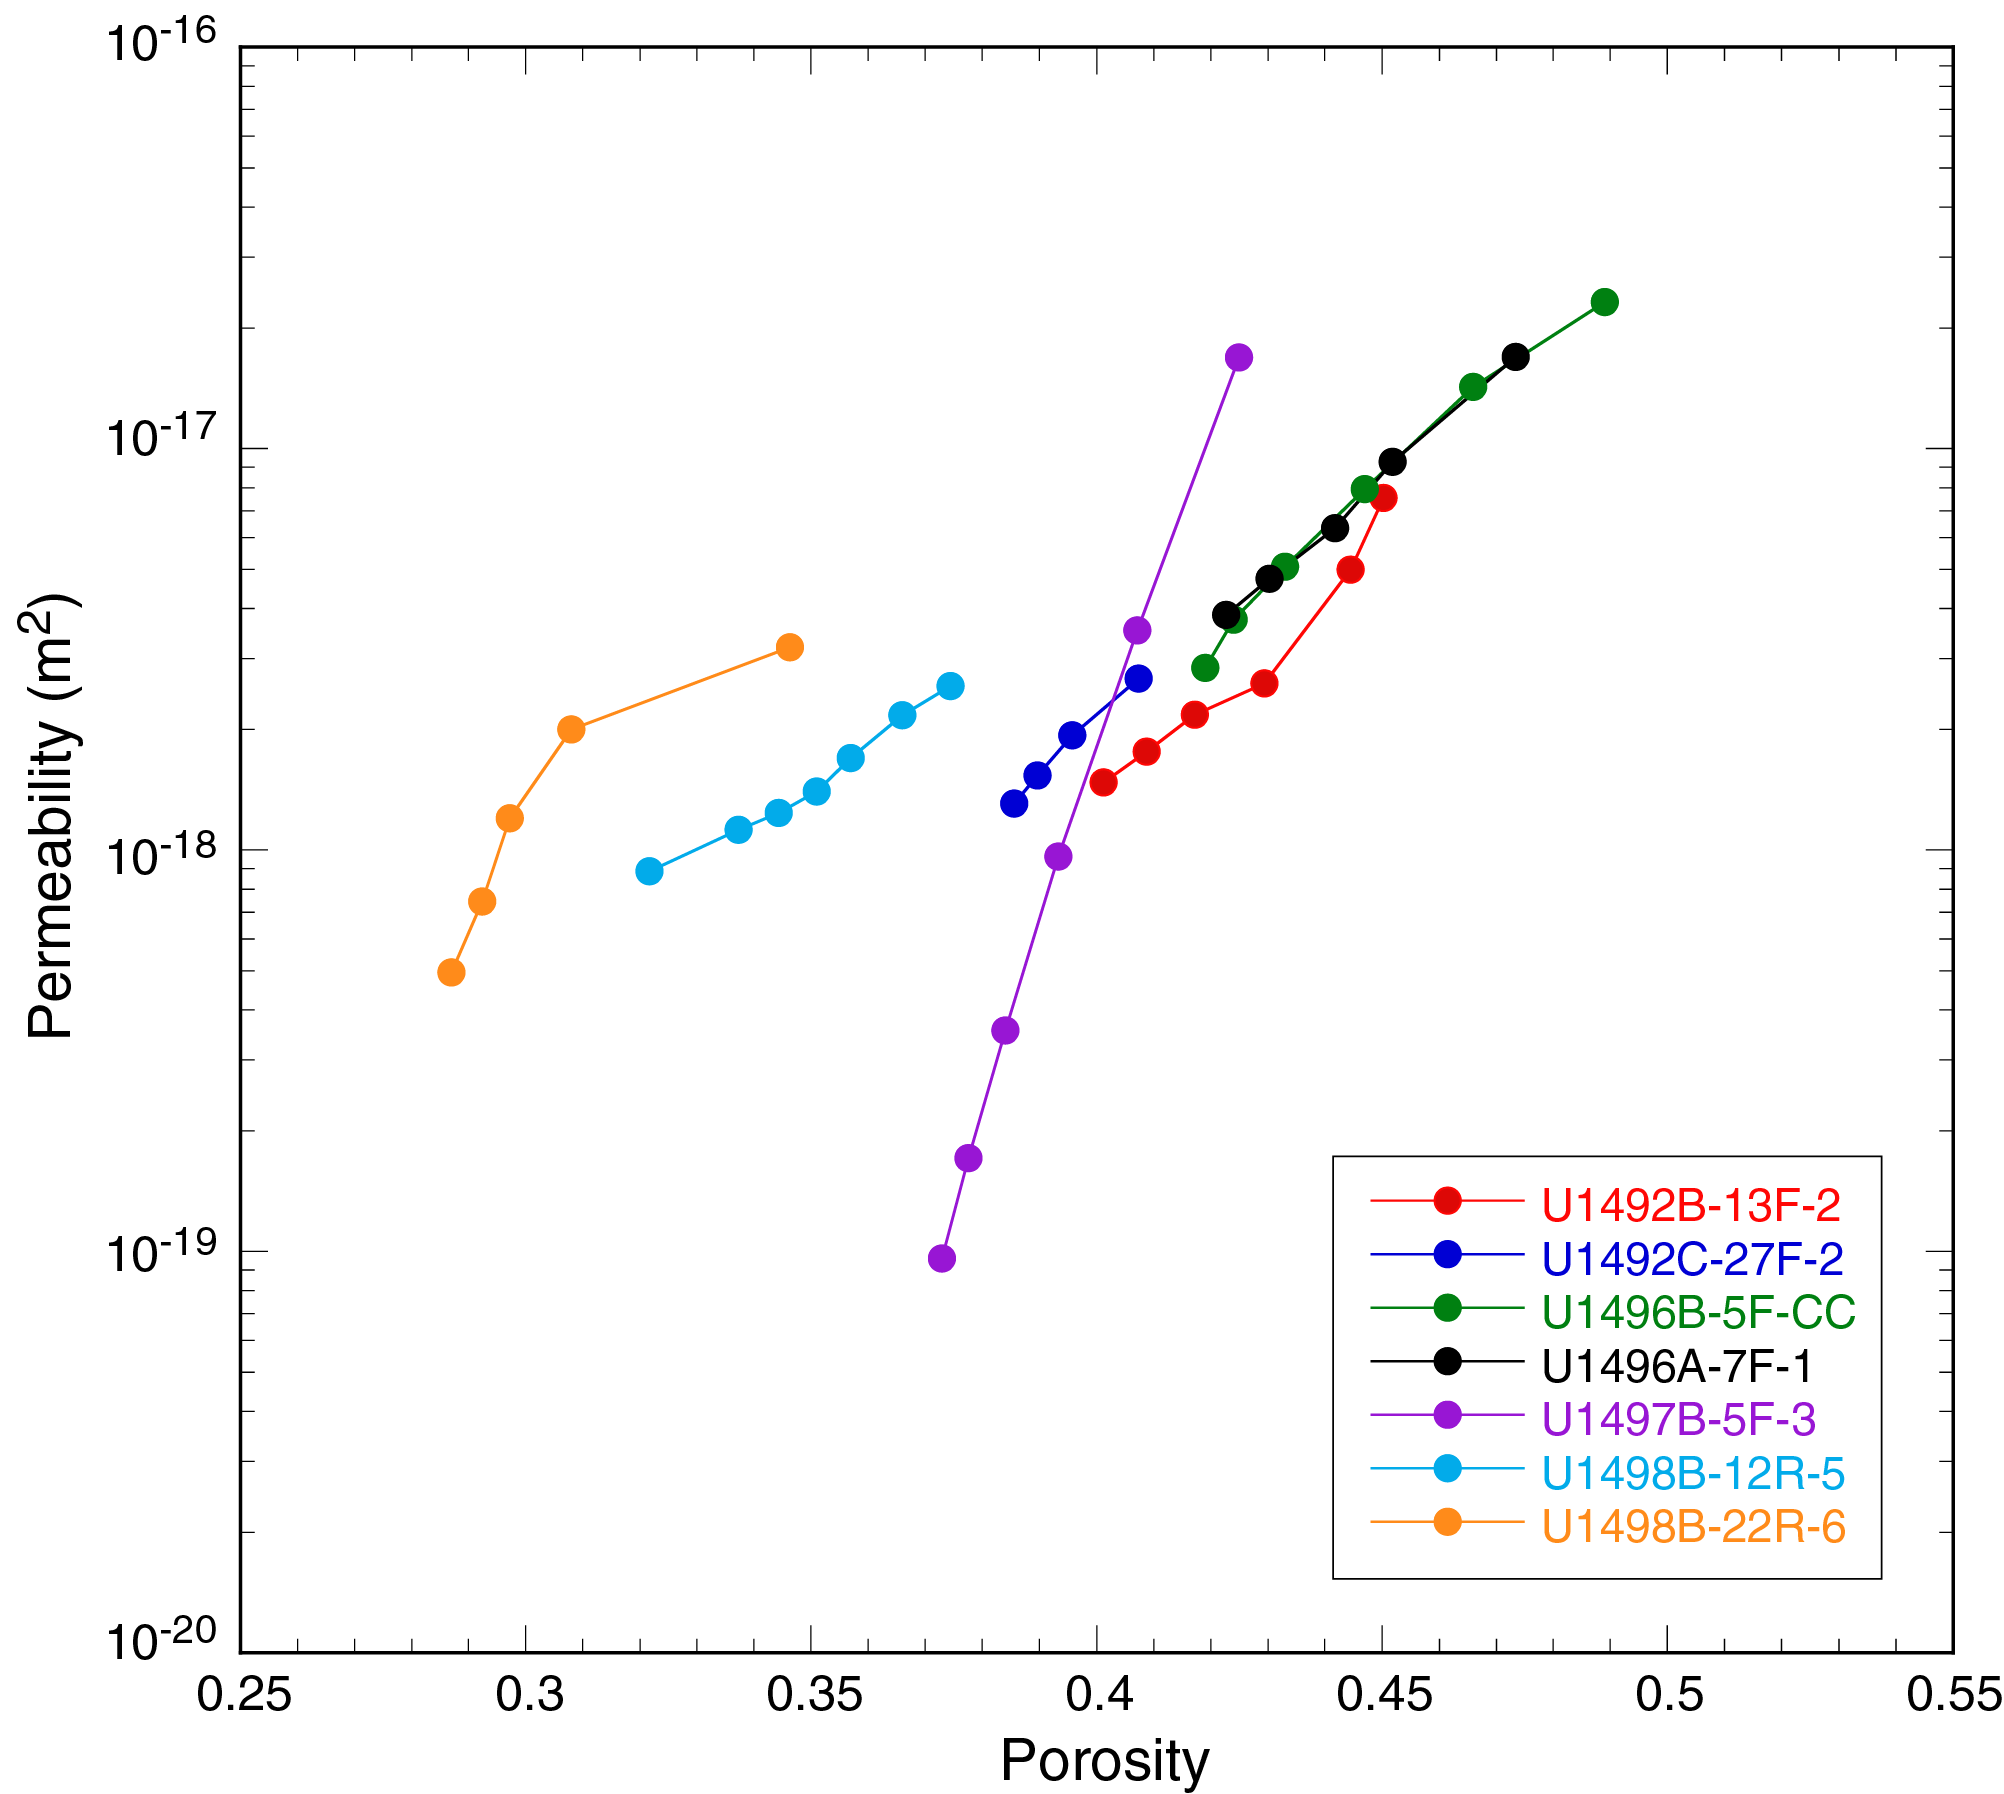
Figure F4. Permeability as a function of porosity.
Estimated in situ permeability and porosity values were determined by extrapolating or interpolating the trends of the measured data in Figures F2 and F3. These values are listed in Table T2 in parentheses along the same line as the estimated effective pressures calculated using Equation E1. At these exceedingly low pressures, both the permeability and porosity of the seven samples decreased in a systematic way with in situ Peff.
Frictional strength
The friction data can be separated into two groups that are correlated with their mineralogy. Strength-displacement plots for a representative example of each group are shown in Figure F5. The coefficient of friction for a typical serpentine-rich sample (from Section 366-U1498B-12R-5) is plotted in Figure F5A at effective normal stresses of 4, 9, and 14 MPa. An interesting point is that friction decreases with confining pressure. The coefficient of friction ranges from 0.20 to 0.40 and is relatively constant or decreased gradually as a function of displacement after reaching the initial yield stress. Small steps in µ are caused by changes in sliding velocity as indicated above the curves. The frictional behavior of the samples from Sections 366-U1492B-13F-2, 366-U1492C-27F-2, 366-U1496B-5F-CC, and 366-U1496A-7F-1 at the three effective normal stresses are all very similar in character to that of the sample from Section 366-U1498B-12R-5 and are shown in Appendix B (Figures BF1, BF2, BF3, BF4). Friction values of all these samples (0.20–0.40) are comparable to serpentine-rich material from California and Oregon (USA) (Moore et al., 1997, 2004). At room temperature, Moore et al. (1997, 2004) found a coefficient of friction of <0.20–0.25 for chrysotile and 0.40–0.45 for lizardite. All of our serpentine-rich samples contain both minerals in varying amounts, which may explain the spread of friction values for these cores, based on mixing laws for typical fault zone materials (Tembe et al., 2010). Our samples also contain pyroaurite (Yinazao Seamount cores) and coalingite (Fantangisña and Asùt Tesoro Seamount cores), for which no frictional data are available, but their compositions (Mills et al., 2012; Mumpton et al., 1965) suggest that they may be low-strength minerals as well. In contrast, most gouges derived from crystalline rocks are inherently stronger, with coefficients of friction of 0.60–0.85 (Byerlee, 1978).

Figure F5. Coefficient of friction as a function of axial displacement.
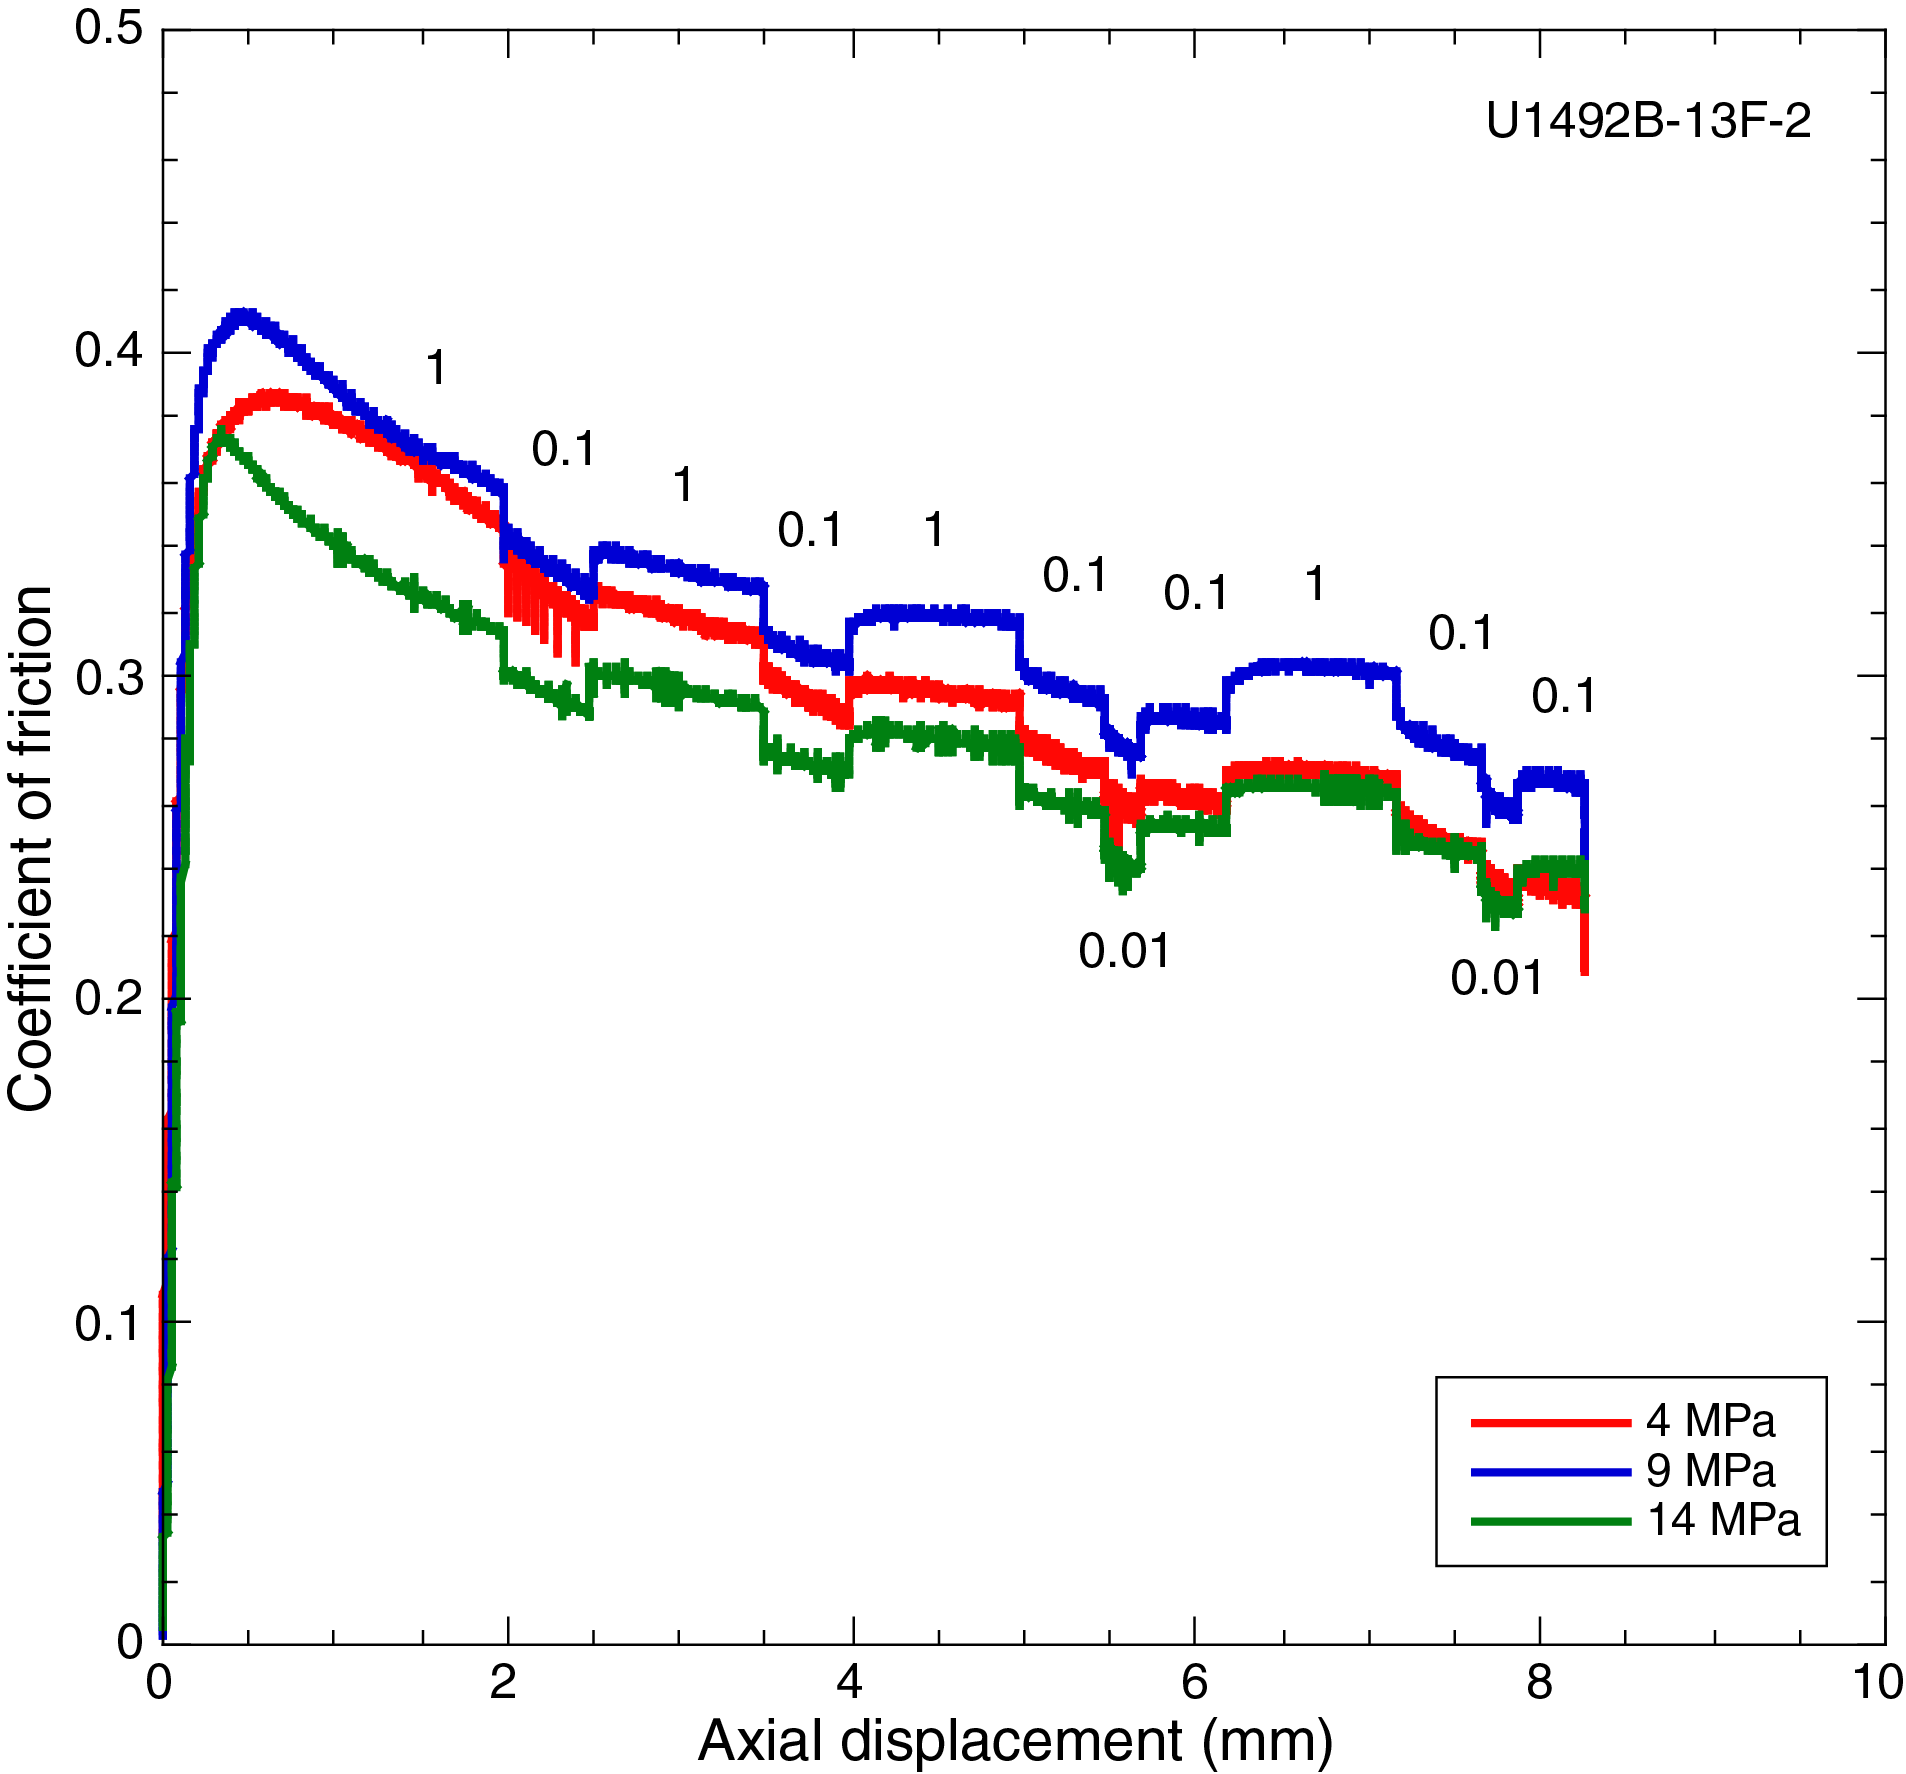
Figure BF1. Coefficient of friction as a function of axial displacement, Hole U1492B.
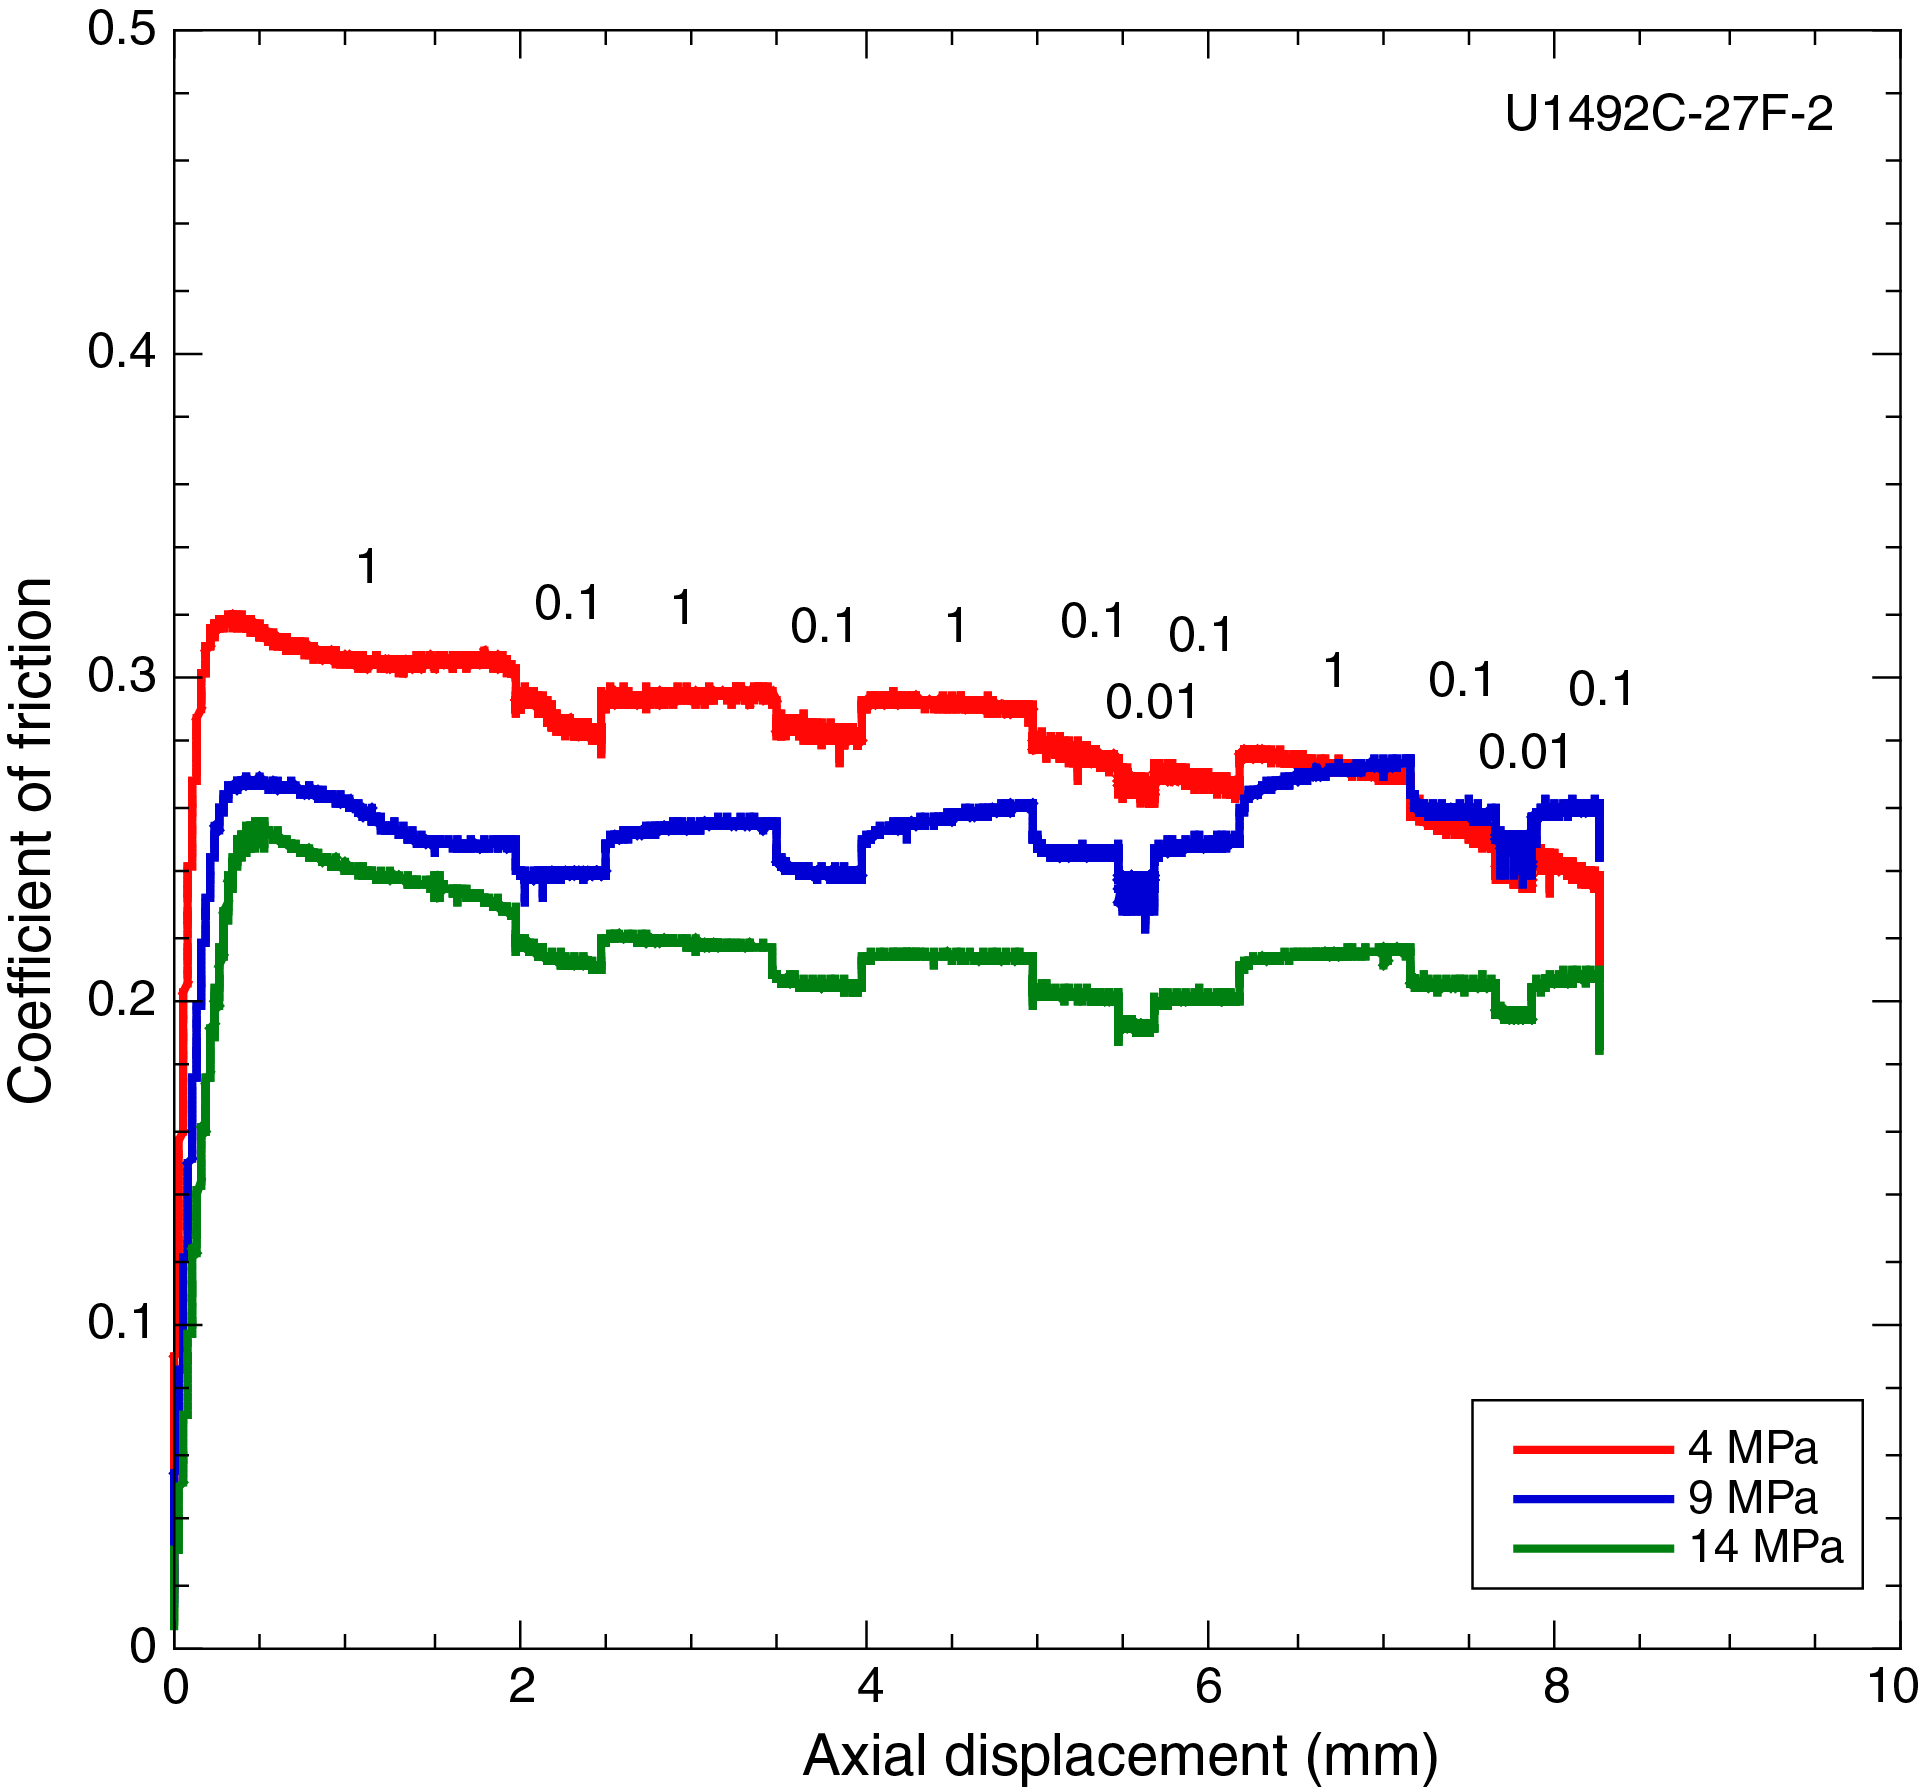
Figure BF2. Coefficient of friction as a function of axial displacement, Hole U1492C.
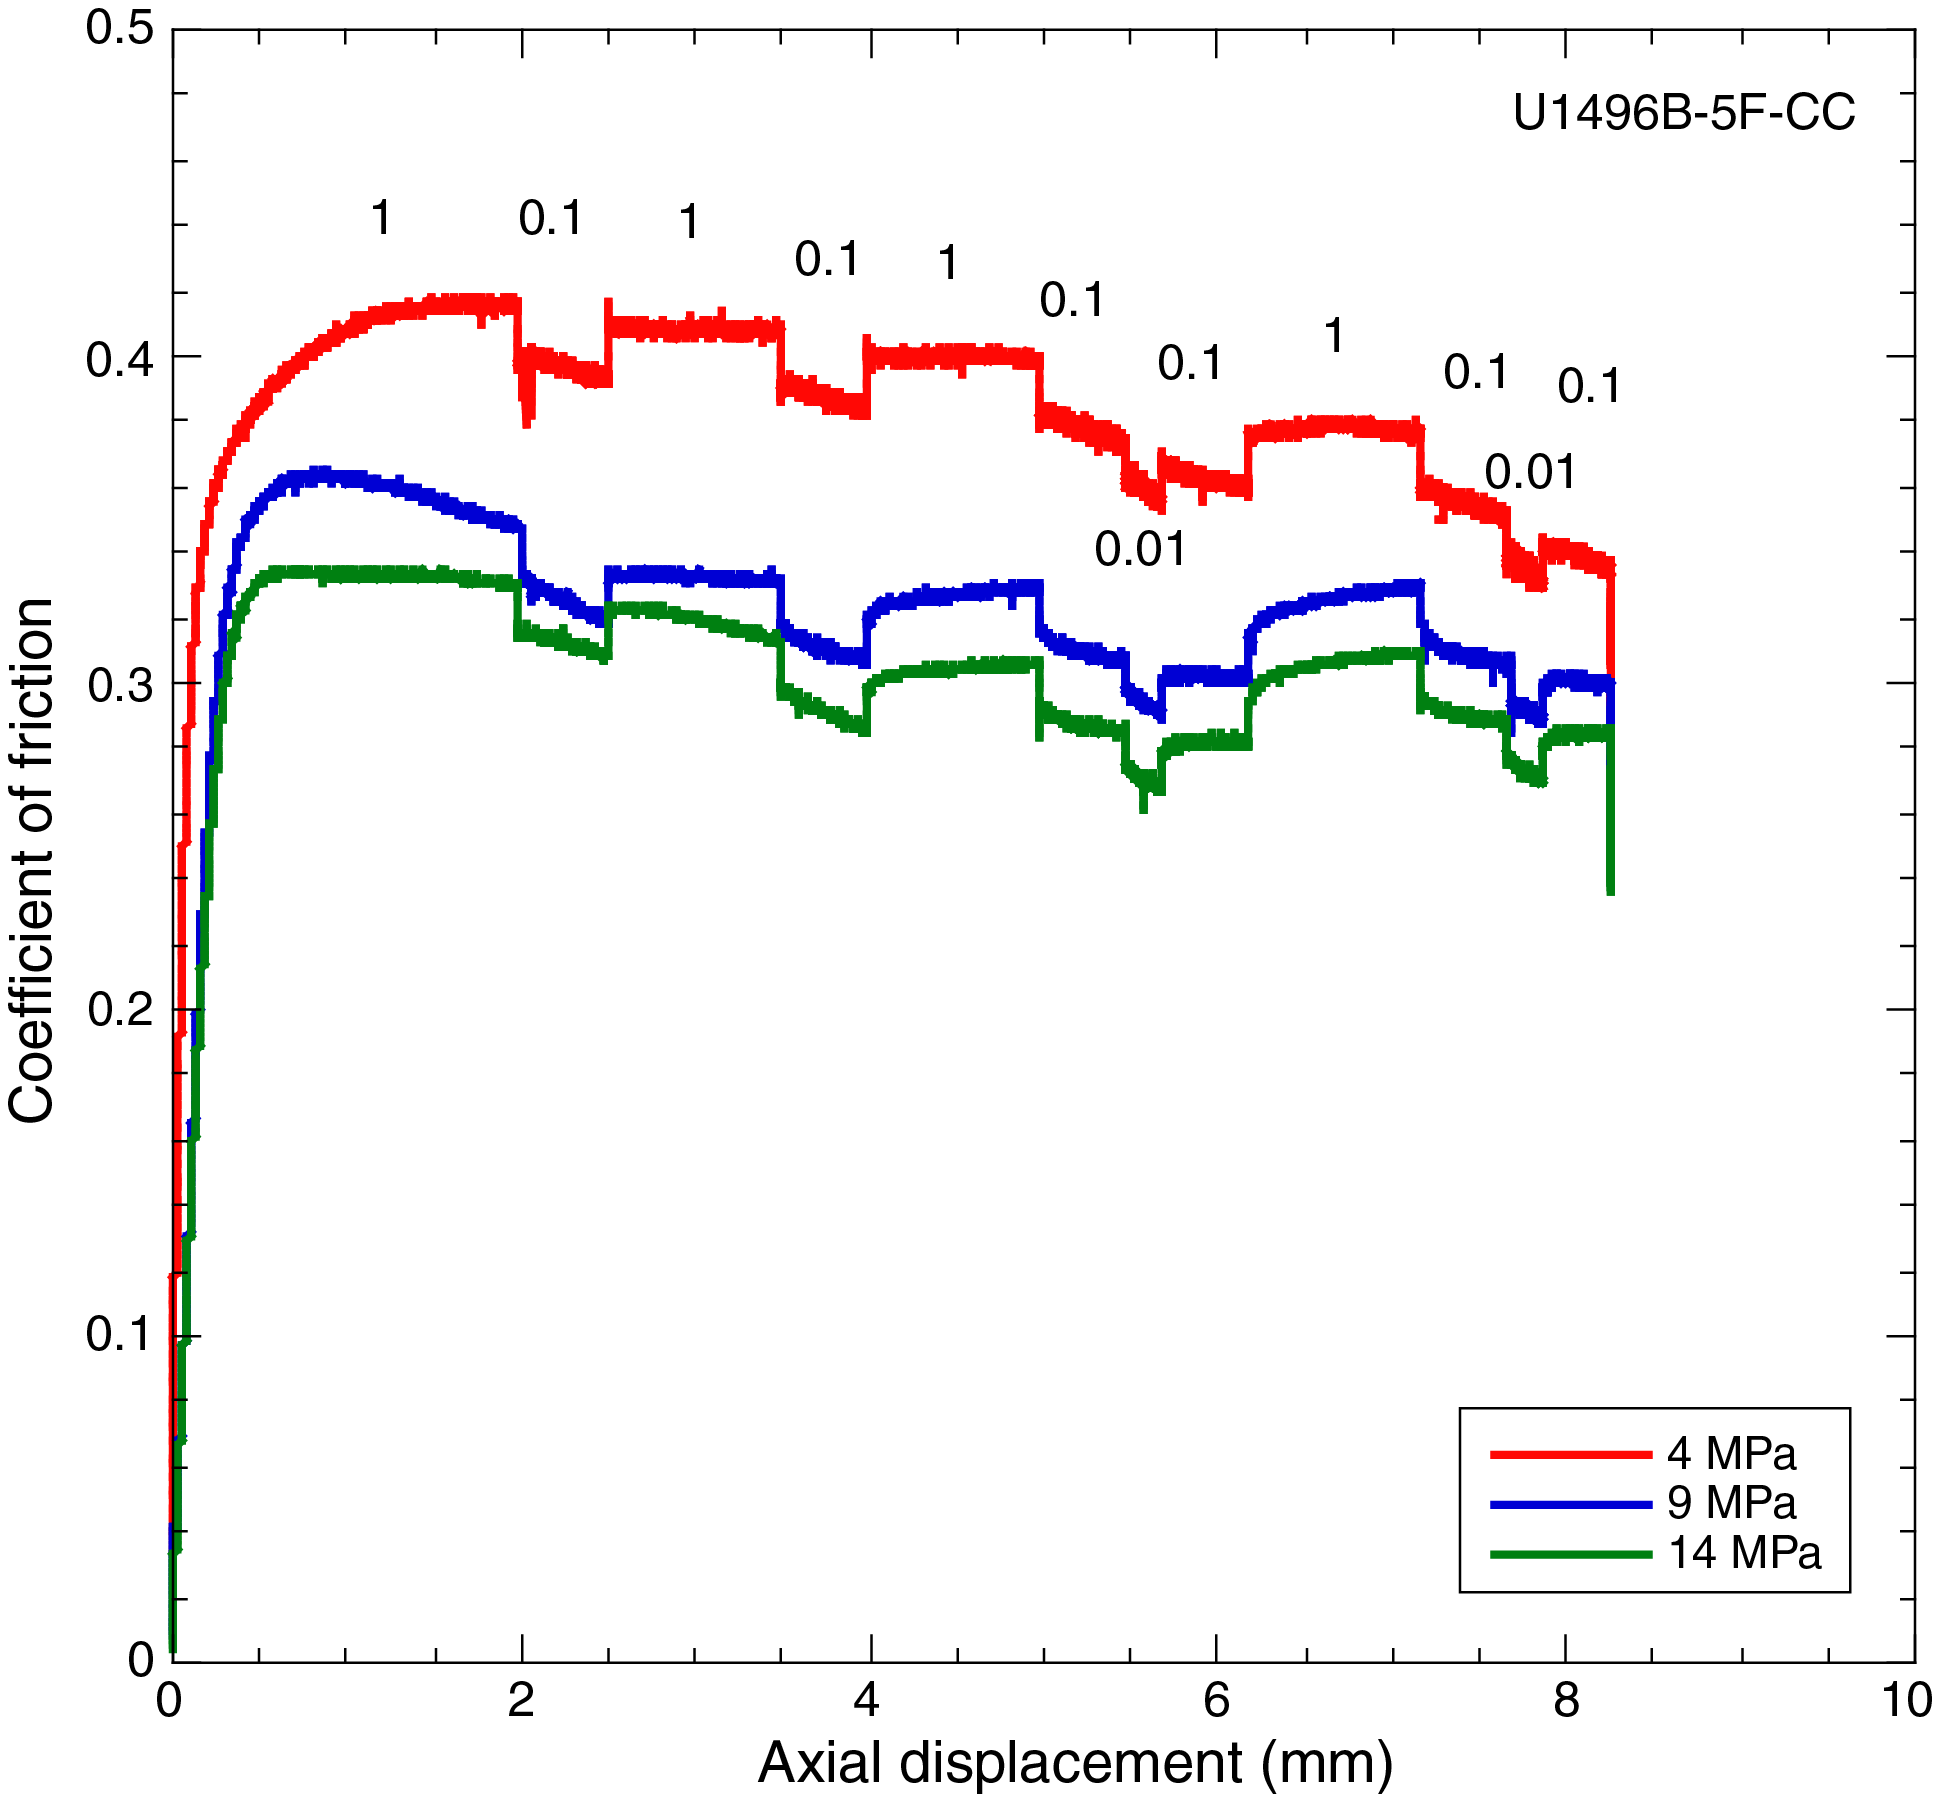
Figure BF3. Coefficient of friction as a function of axial displacement, Hole U1496B.
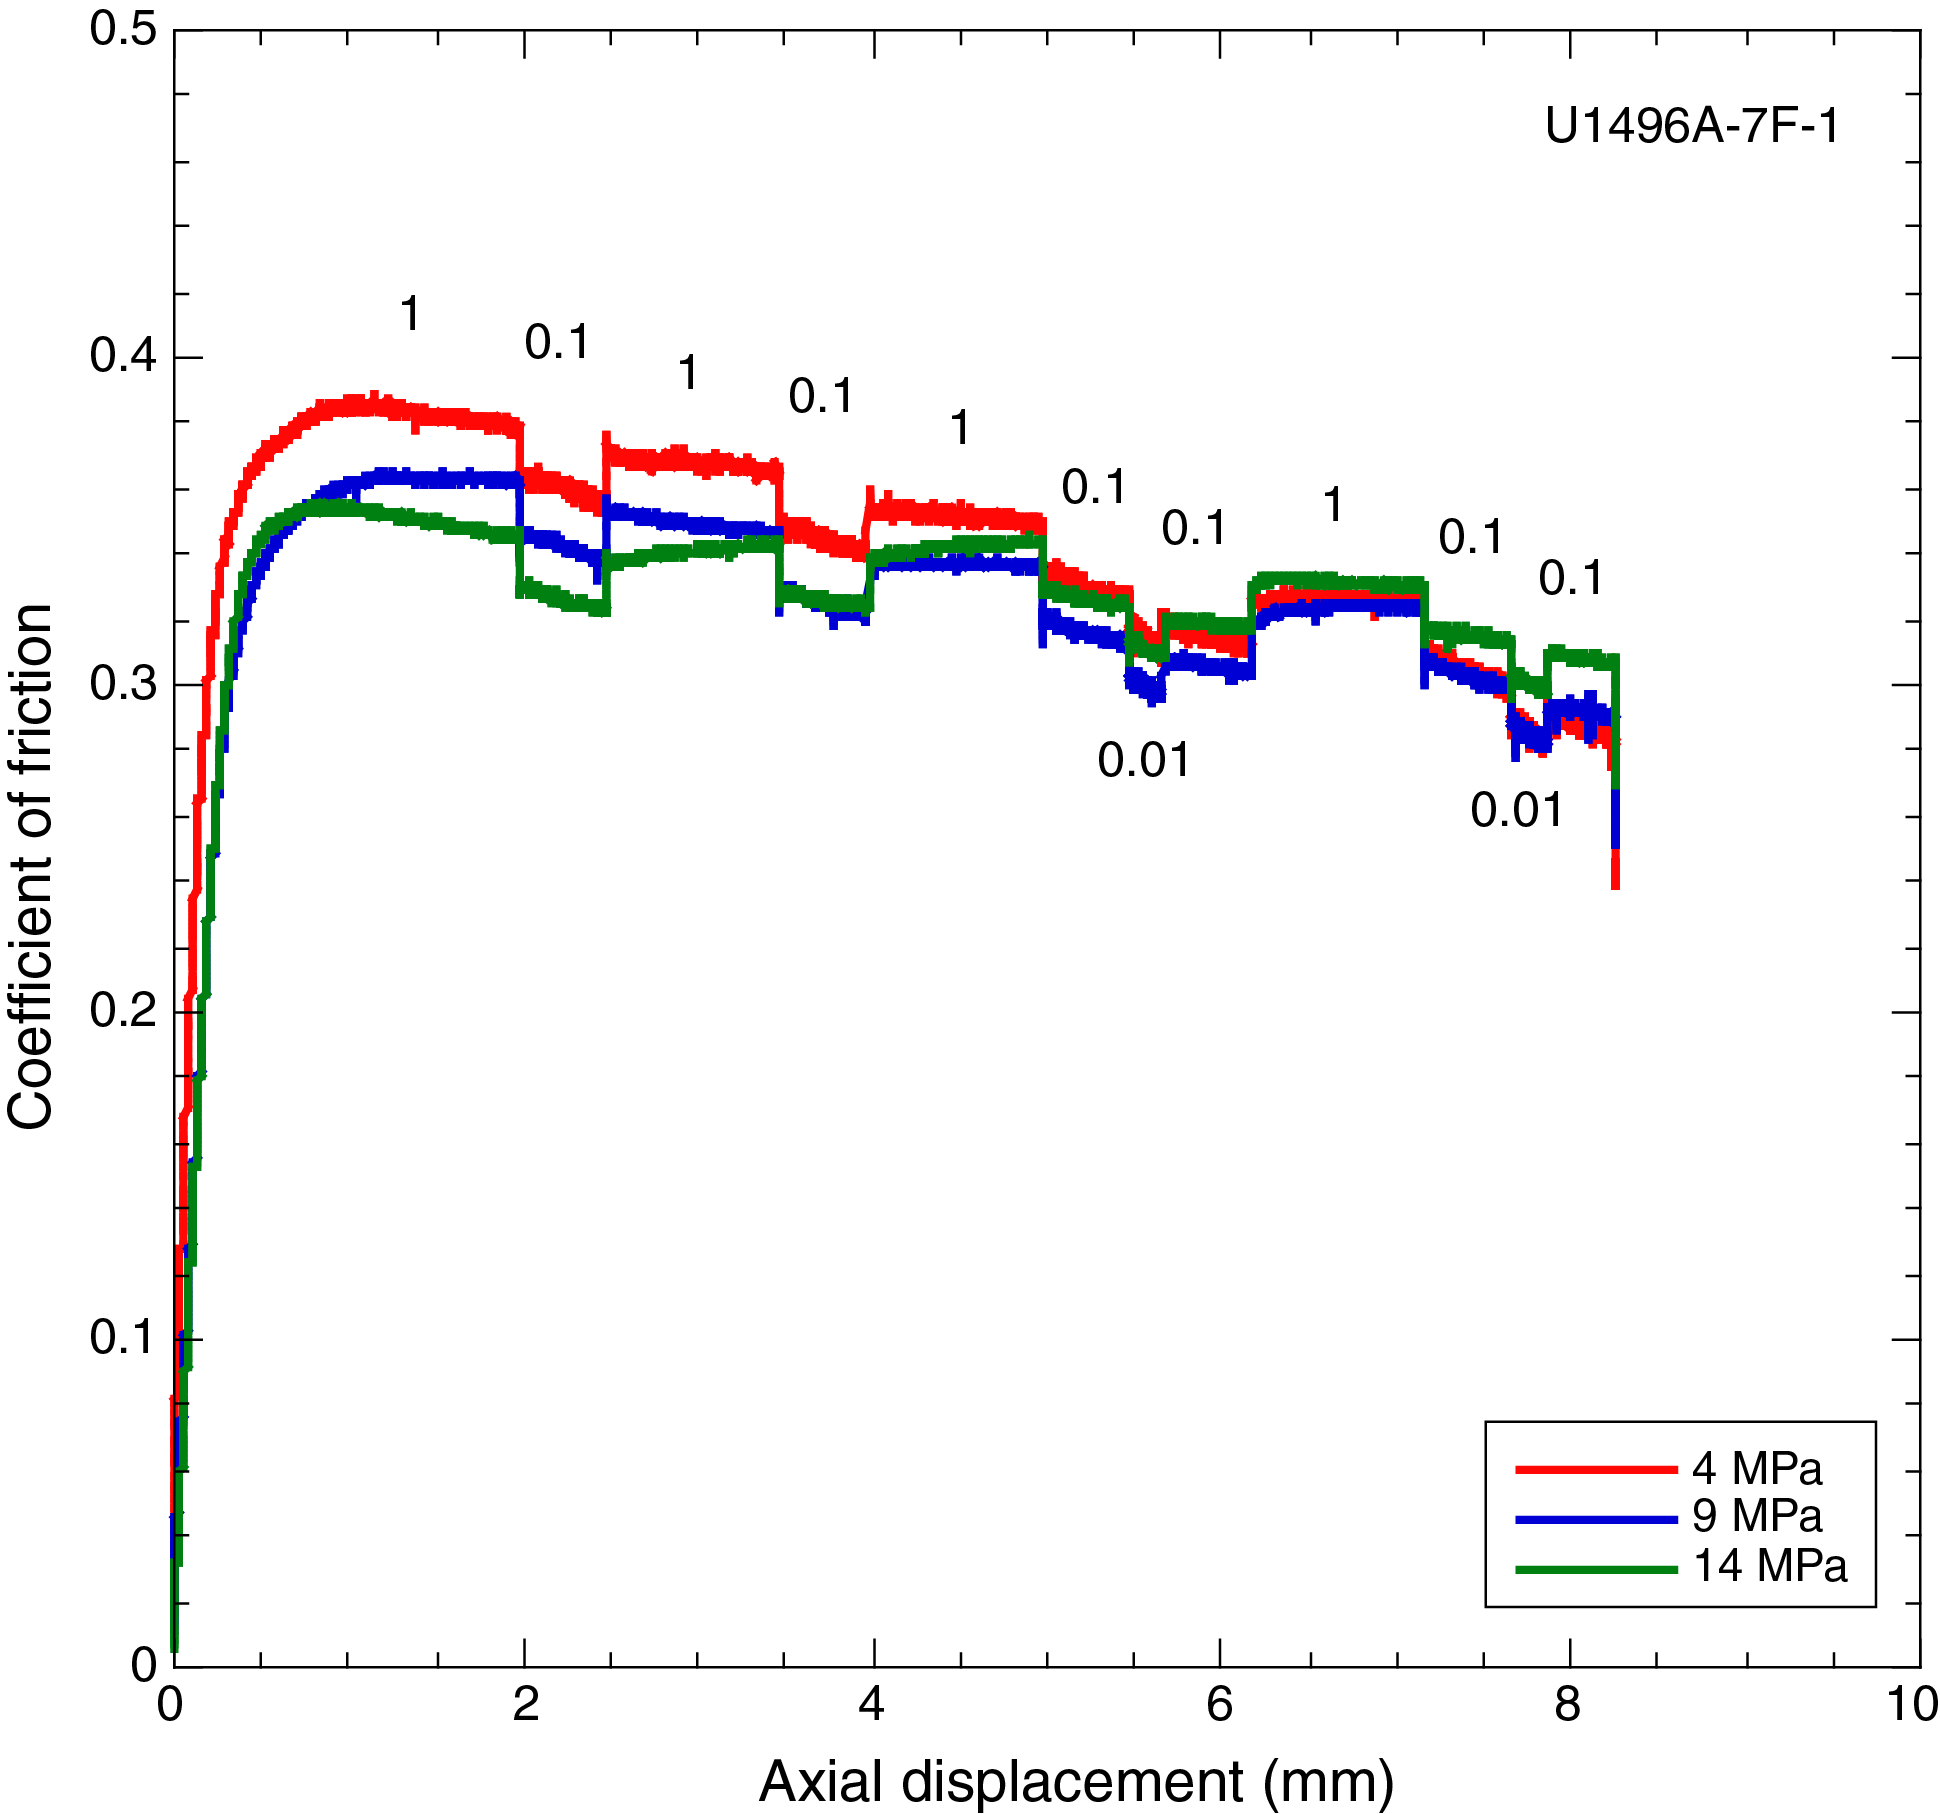
Figure BF4. Coefficient of friction as a function of axial displacement, Hole U1496A.
The samples from Sections 366-U1498B-22R-6 (Figure F5B) and 366-U1497B-5F-3 (Figure BF5) were slightly different in character from the other five. For these two samples, the coefficient of friction reached a sharp peak at the yield stress and then dropped to <0.20 by the end of the experiment. These two samples are the same saponite-rich samples with unusually low permeability discussed above. Lockner et al. (2011) found similar frictional sliding behavior in saponite-rich samples from the San Andreas Fault Observatory at Depth (SAFOD) drill site at Parkfield, California, with residual coefficient of friction values of 0.1–0.2, consistent with the seamount cores. Other low-strength, saponite-rich gouges have been reported by Sone et al. (2012) from a Japanese fault zone and Boulton et al. (2018) from the Southern Alpine fault in New Zealand. For comparison, pure saponite has a coefficient of friction of around 0.06 (Moore et al., 2016).
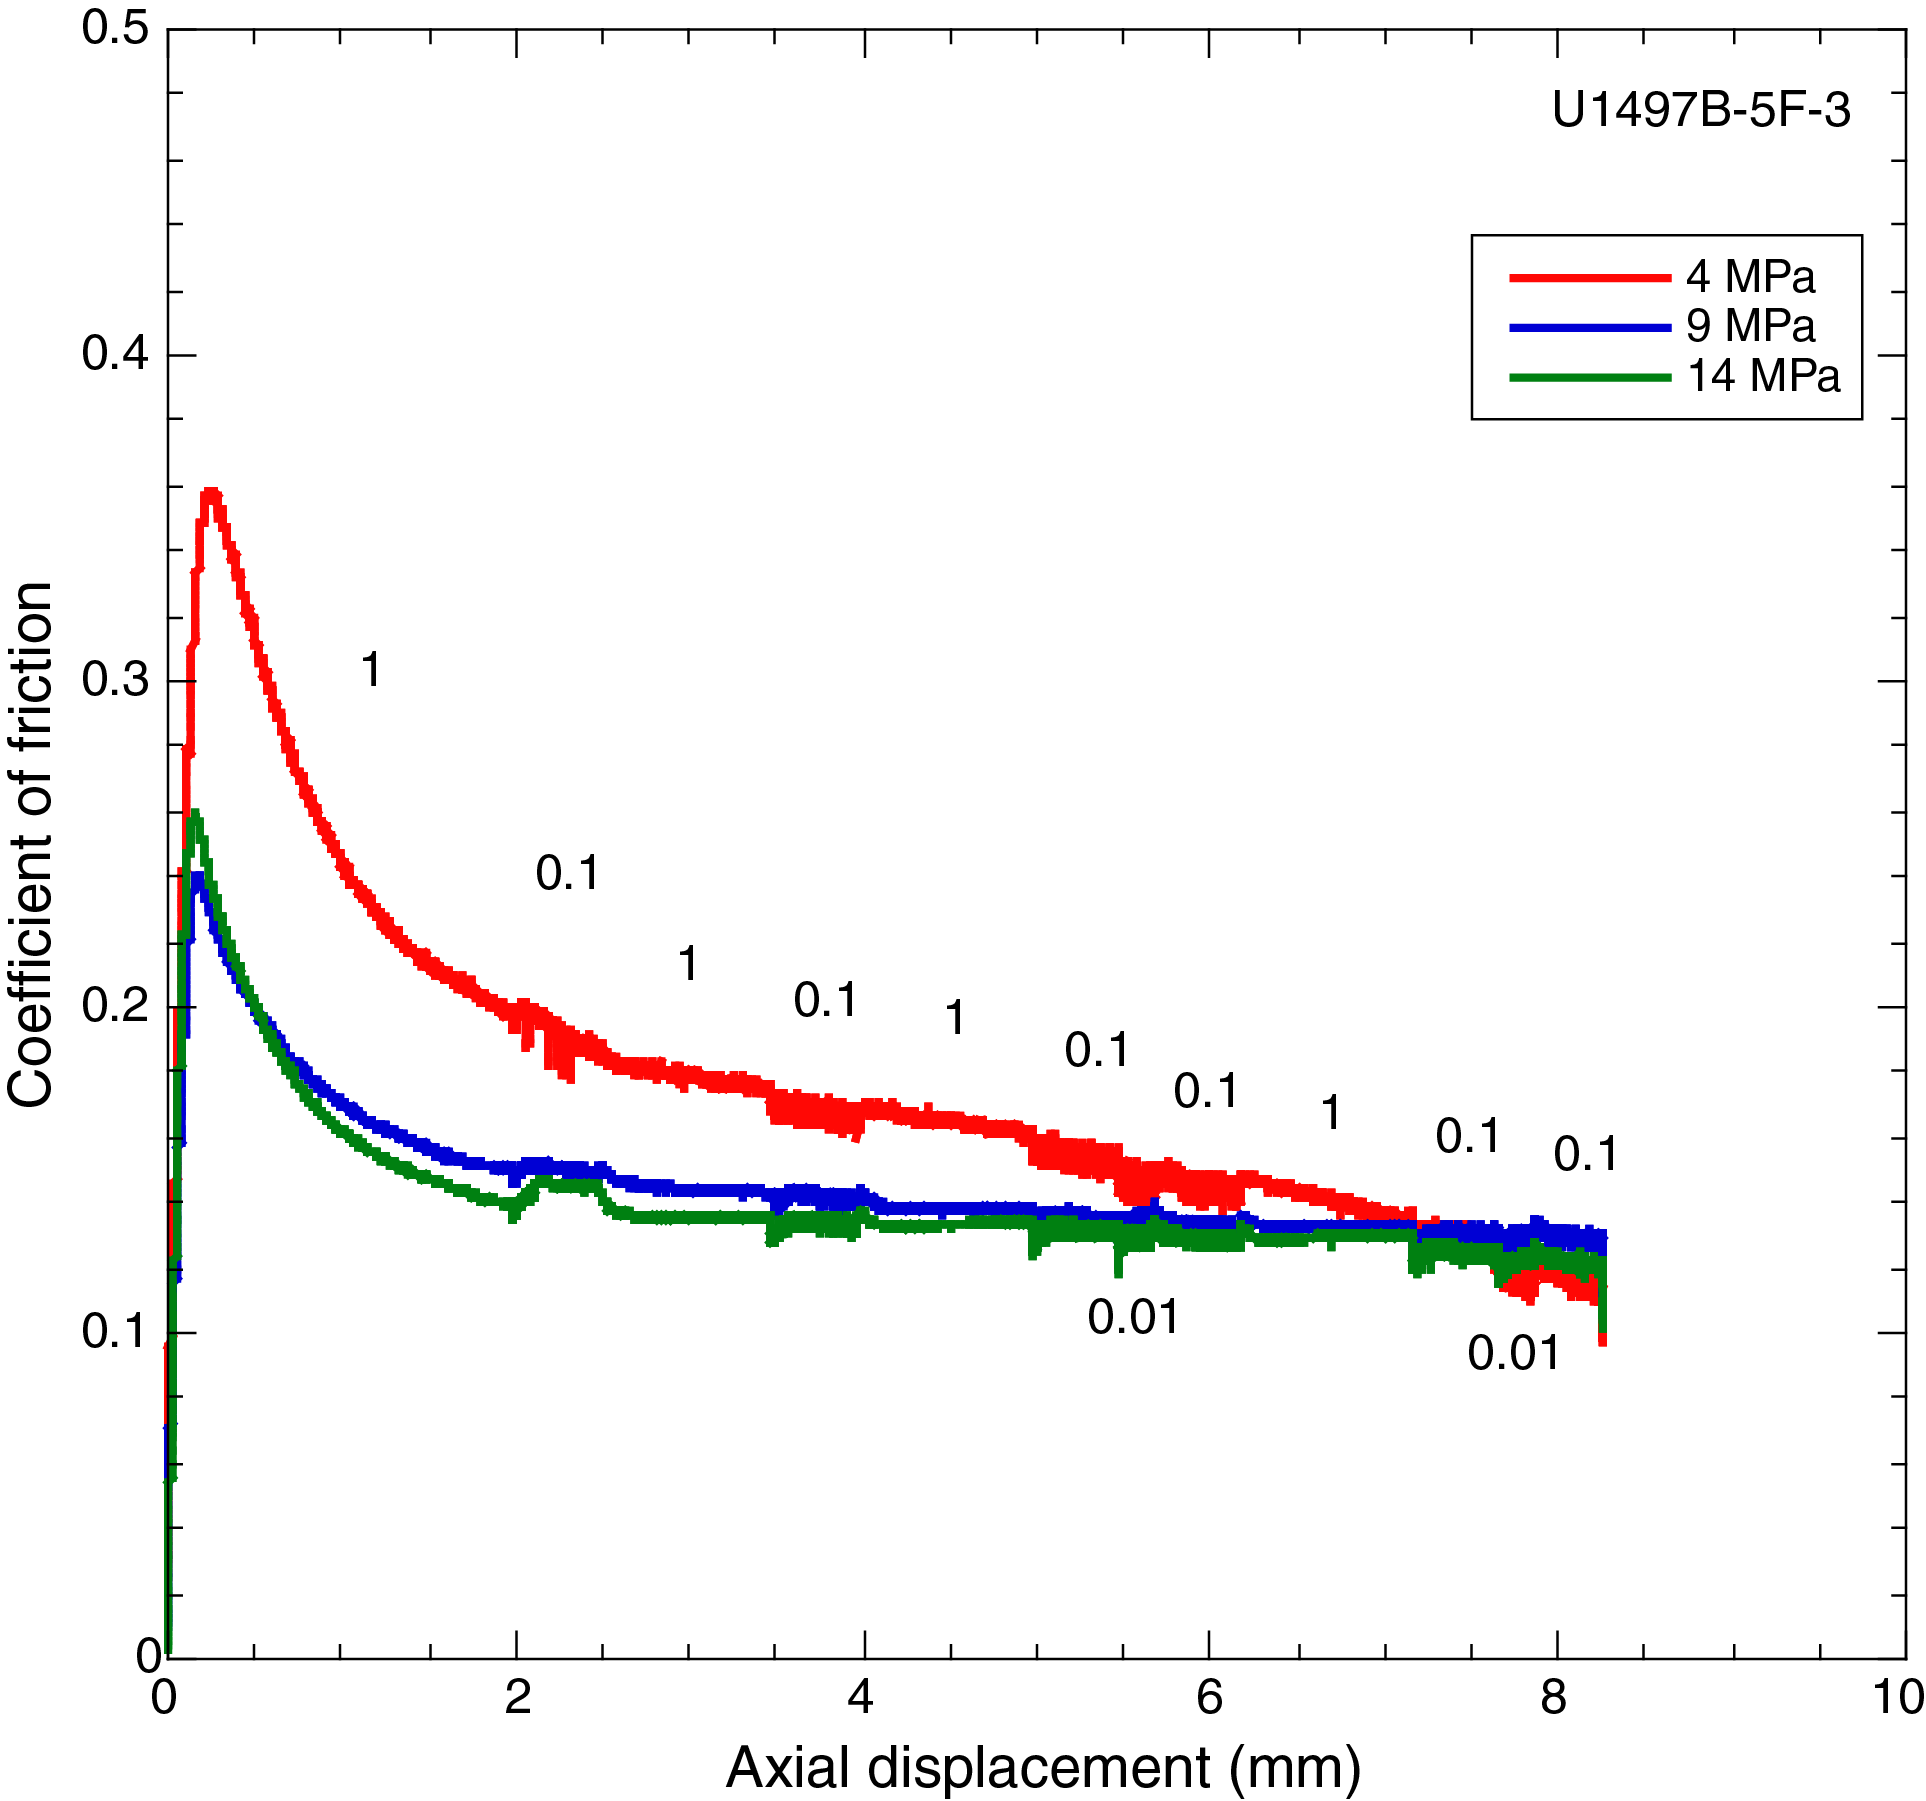
Figure BF5. Coefficient of friction as a function of axial displacement, Hole U1497B.
Residual frictional strength is listed for each sample at 8 mm of axial displacement (~9.2 mm fault-parallel slip) in Table T2. By this displacement, most samples show nearly steady strength. These strengths are plotted in Figure F6 as a function of effective normal stress. The coefficient of friction ranges from about 0.12 to 0.34. The five samples with friction data similar to Figure F5A (serpentine rich) are grouped together (µ = 0.27 ± 0.07). The two samples represented by Figure F5B (saponite rich) have lower friction values (µ = 0.14 ± 0.05). Within the narrow pressure range of these experiments, µ varies only slightly with effective normal stress in an unsystematic way, and pressure-dependent trends for individual samples are not significantly larger than the measurement errors. Because the samples are all relatively shallow (as measured from the seafloor), the lowest effective normal stress, in this case 4 MPa, is closest to the estimated in situ effective pressure values of the cores (Table T2). However, because of the relative insensitivity of frictional strength to normal stress, the difference between the test pressures and the in situ pressures is not significant.
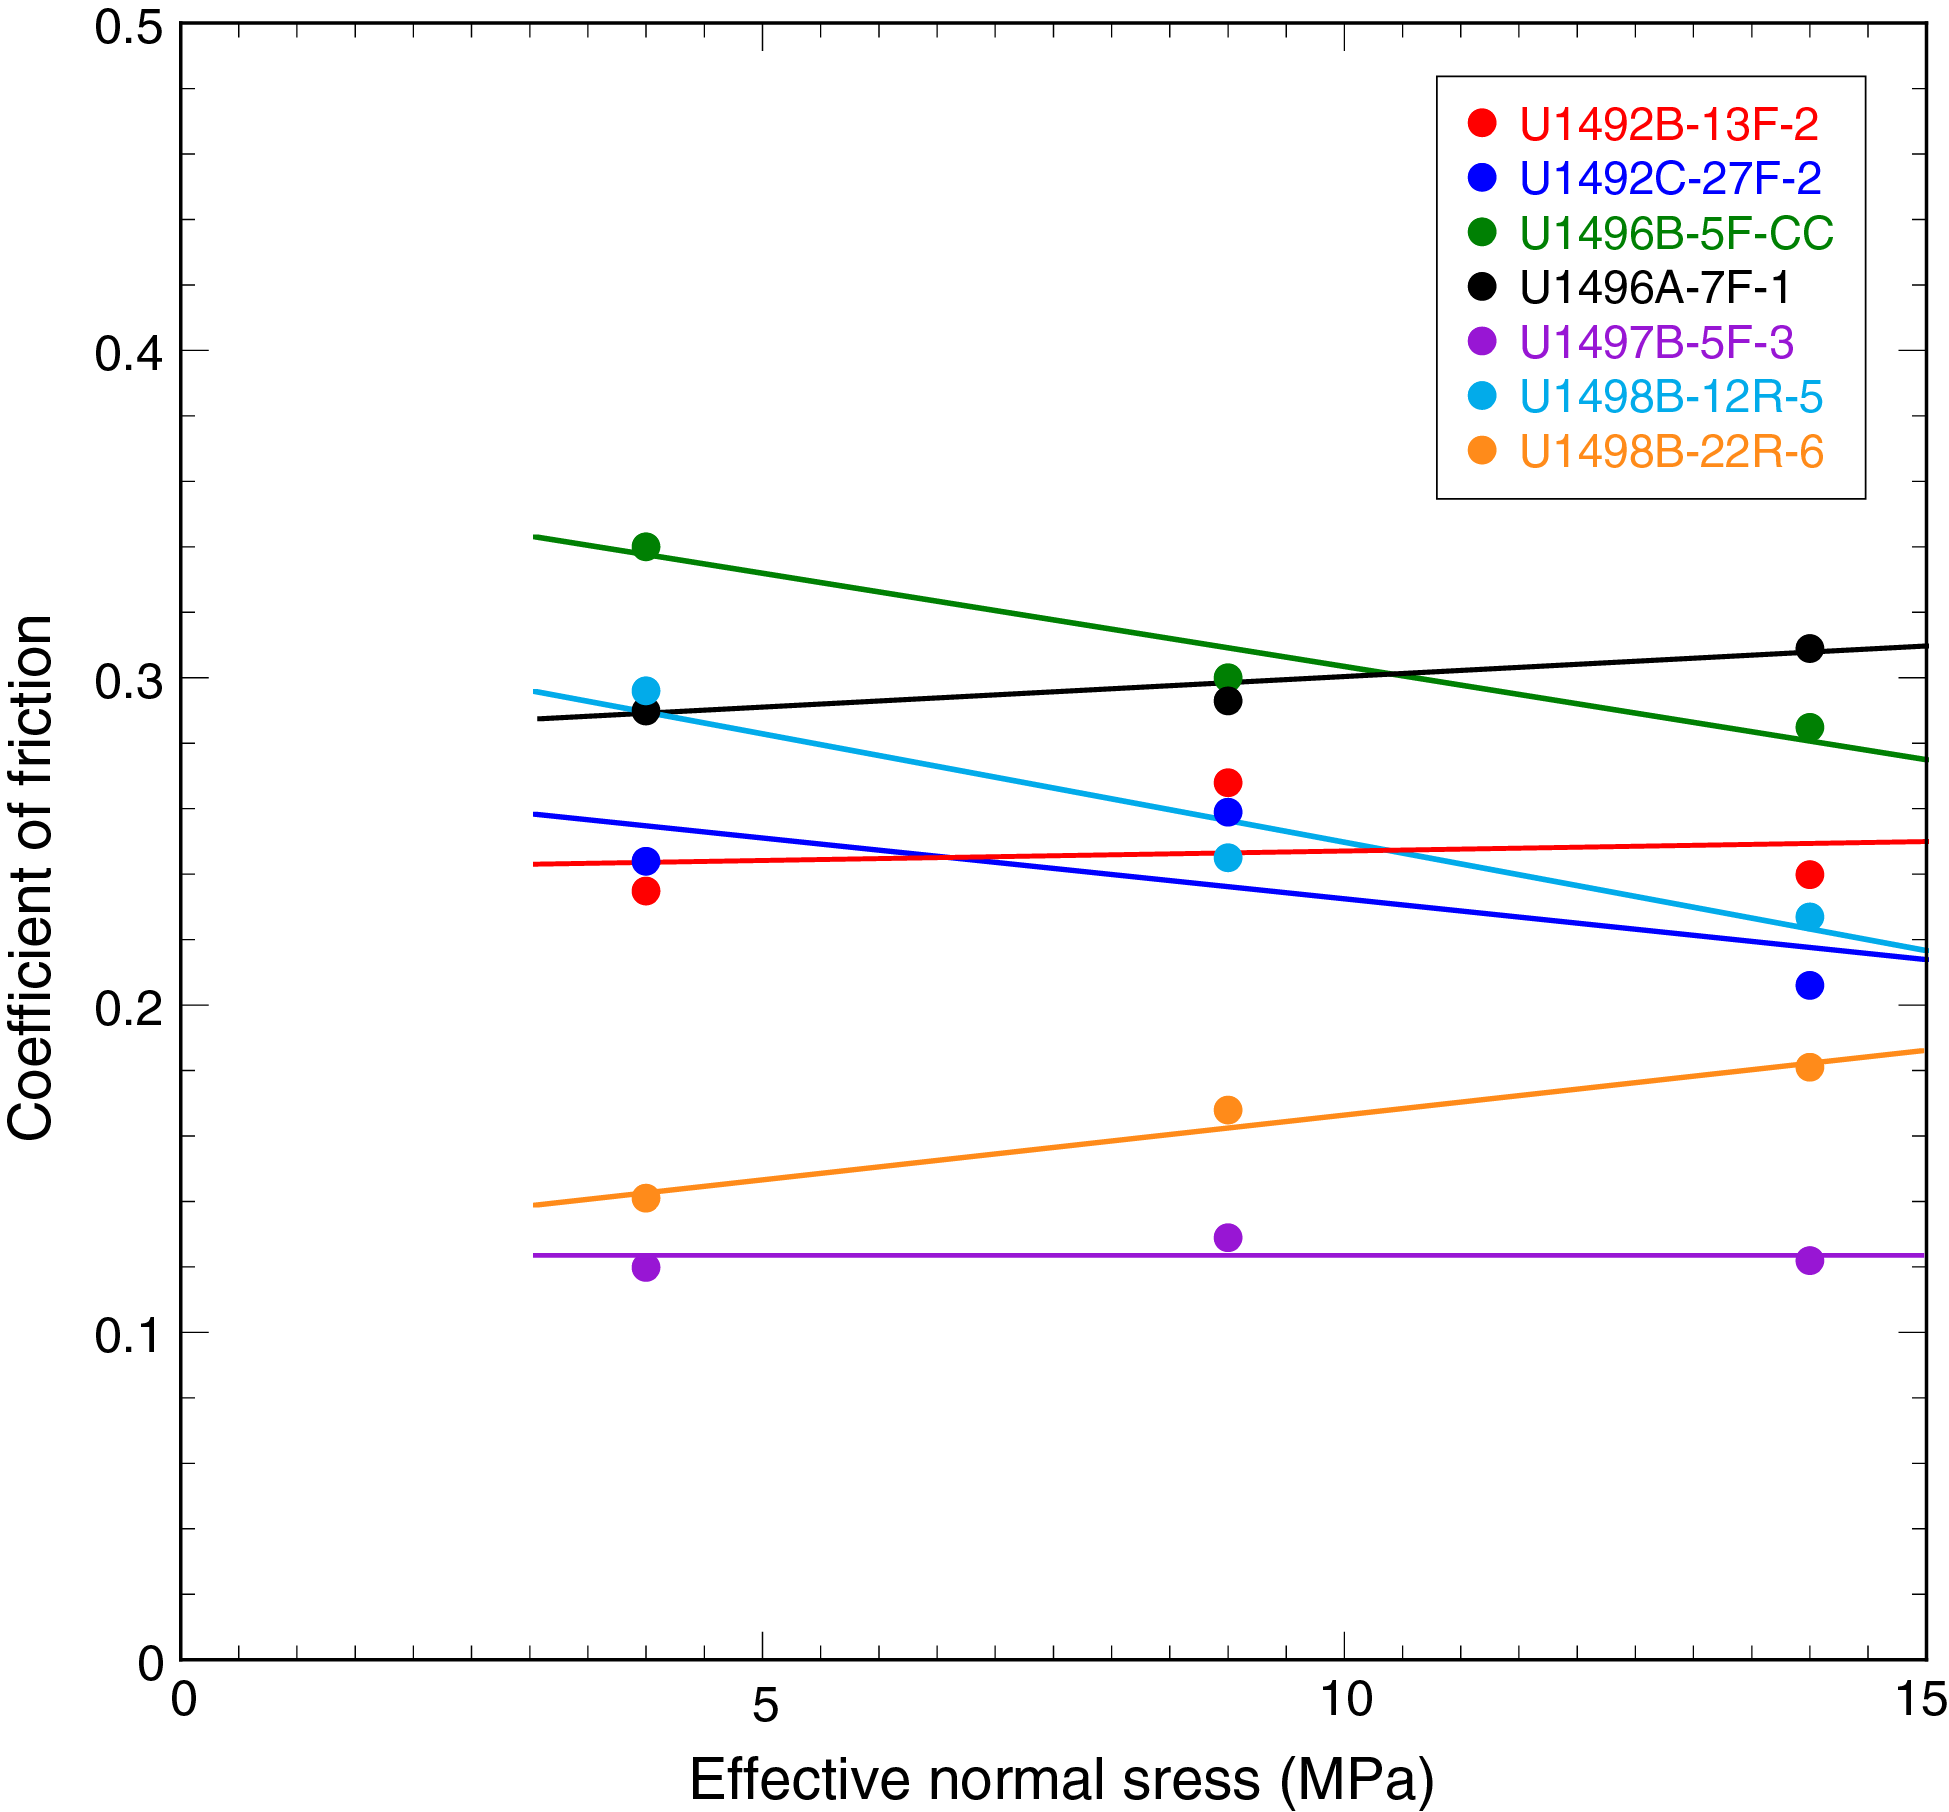
Figure F6. Coefficient of friction at 8 mm axial displacement.
Velocity dependence of friction
The velocity dependence of friction is determined by varying the sliding velocity on the saw-cut surfaces in order-of-magnitude steps as shown in Figure F5. The velocity dependence parameter (a-b) is defined as
- Δµss = change in steady-state coefficient of friction,
- V1 = initial sliding velocity between steps, and
- V2 = final sliding velocity between steps.
Note that the change in steady-state friction at each step is independent of irreversible displacement-dependent trends such as strain hardening or weakening. The parameter a-b is important in models of fault stability in that neutral or positive a-b values indicate a tendency for stable sliding, analogous to creep on active faults. Negative values indicate a tendency for unstable sliding, such as stick-slip behavior, analogous to a sudden earthquake rupture. This stability parameter is routinely tabulated along with the coefficient of friction in deformation experiments.
The sample from Section 366-U1498B-12R-5 (Figure F5A) is noticeably velocity strengthening (positive a-b). That is, the coefficient of friction is higher at faster sliding velocity values, suggesting a tendency for stable sliding. Note that the steps are larger for transitions from 0.1 to 1 µm/s (or back) than from 0.01 to 0.1 µm/s, indicating that a-b values are a function of the sliding velocity. The a-b values for these two different velocity transitions are listed in Table T2 separated by a comma. The tabulated values are typical of many clay-bearing gouges (Moore et al., 2016). Notice also that the change in coefficient of friction with velocity is largely instantaneous (Figure F5A) with little to no evolution to the next steady-state friction value. Dieterich (1978) describes a as the instantaneous response to a velocity change and b as the evolution factor in Equation E4. Therefore, b is zero or very small in the five samples represented by Figure F5A.
In contrast, the friction curves for the samples from sections 366-U1498B-22R-6 (Figure F5B) and 366-U1497B-5F-3 show little to no velocity dependence and have the reverse trend in friction with rate change. That is, the change in coefficient of friction is slightly larger for the slower rate transitions than the faster ones (Table T2). The sample from Section 366-U1497B-5F-3 was slightly weaker at faster rates during certain intervals; it was the only one of the seven samples to exhibit velocity weakening behavior. This point is interesting because Moore et al. (2016) found pure saponite to be velocity strengthening.
The a-b values for all seven samples as a function of effective normal stress are plotted in Figure F7. Downward triangles represent a-b for velocity values from 0.01 to 0.1 µm/s, upward triangles represent a-b for velocity values from 0.1 to 1.0 µm/s, and trend lines are shown for the average of the two. The difference in a-b with rate is noteworthy; however, the primary feature of this figure is that the serpentine-rich samples almost always have higher a-b values (0.0019 to 0.0078) than the saponite-rich samples (−0.0007 to 0.0026). The transition between the two groups occurs at a-b of ~0.002. Velocity dependence is not strongly dependent on effective normal stress within the narrow range of pressures that we tested given the standard deviation of a-b of 0.001. Many important details can be gleaned by a further discussion of a-b (Dieterich, 1978) that are beyond the scope of the present paper.
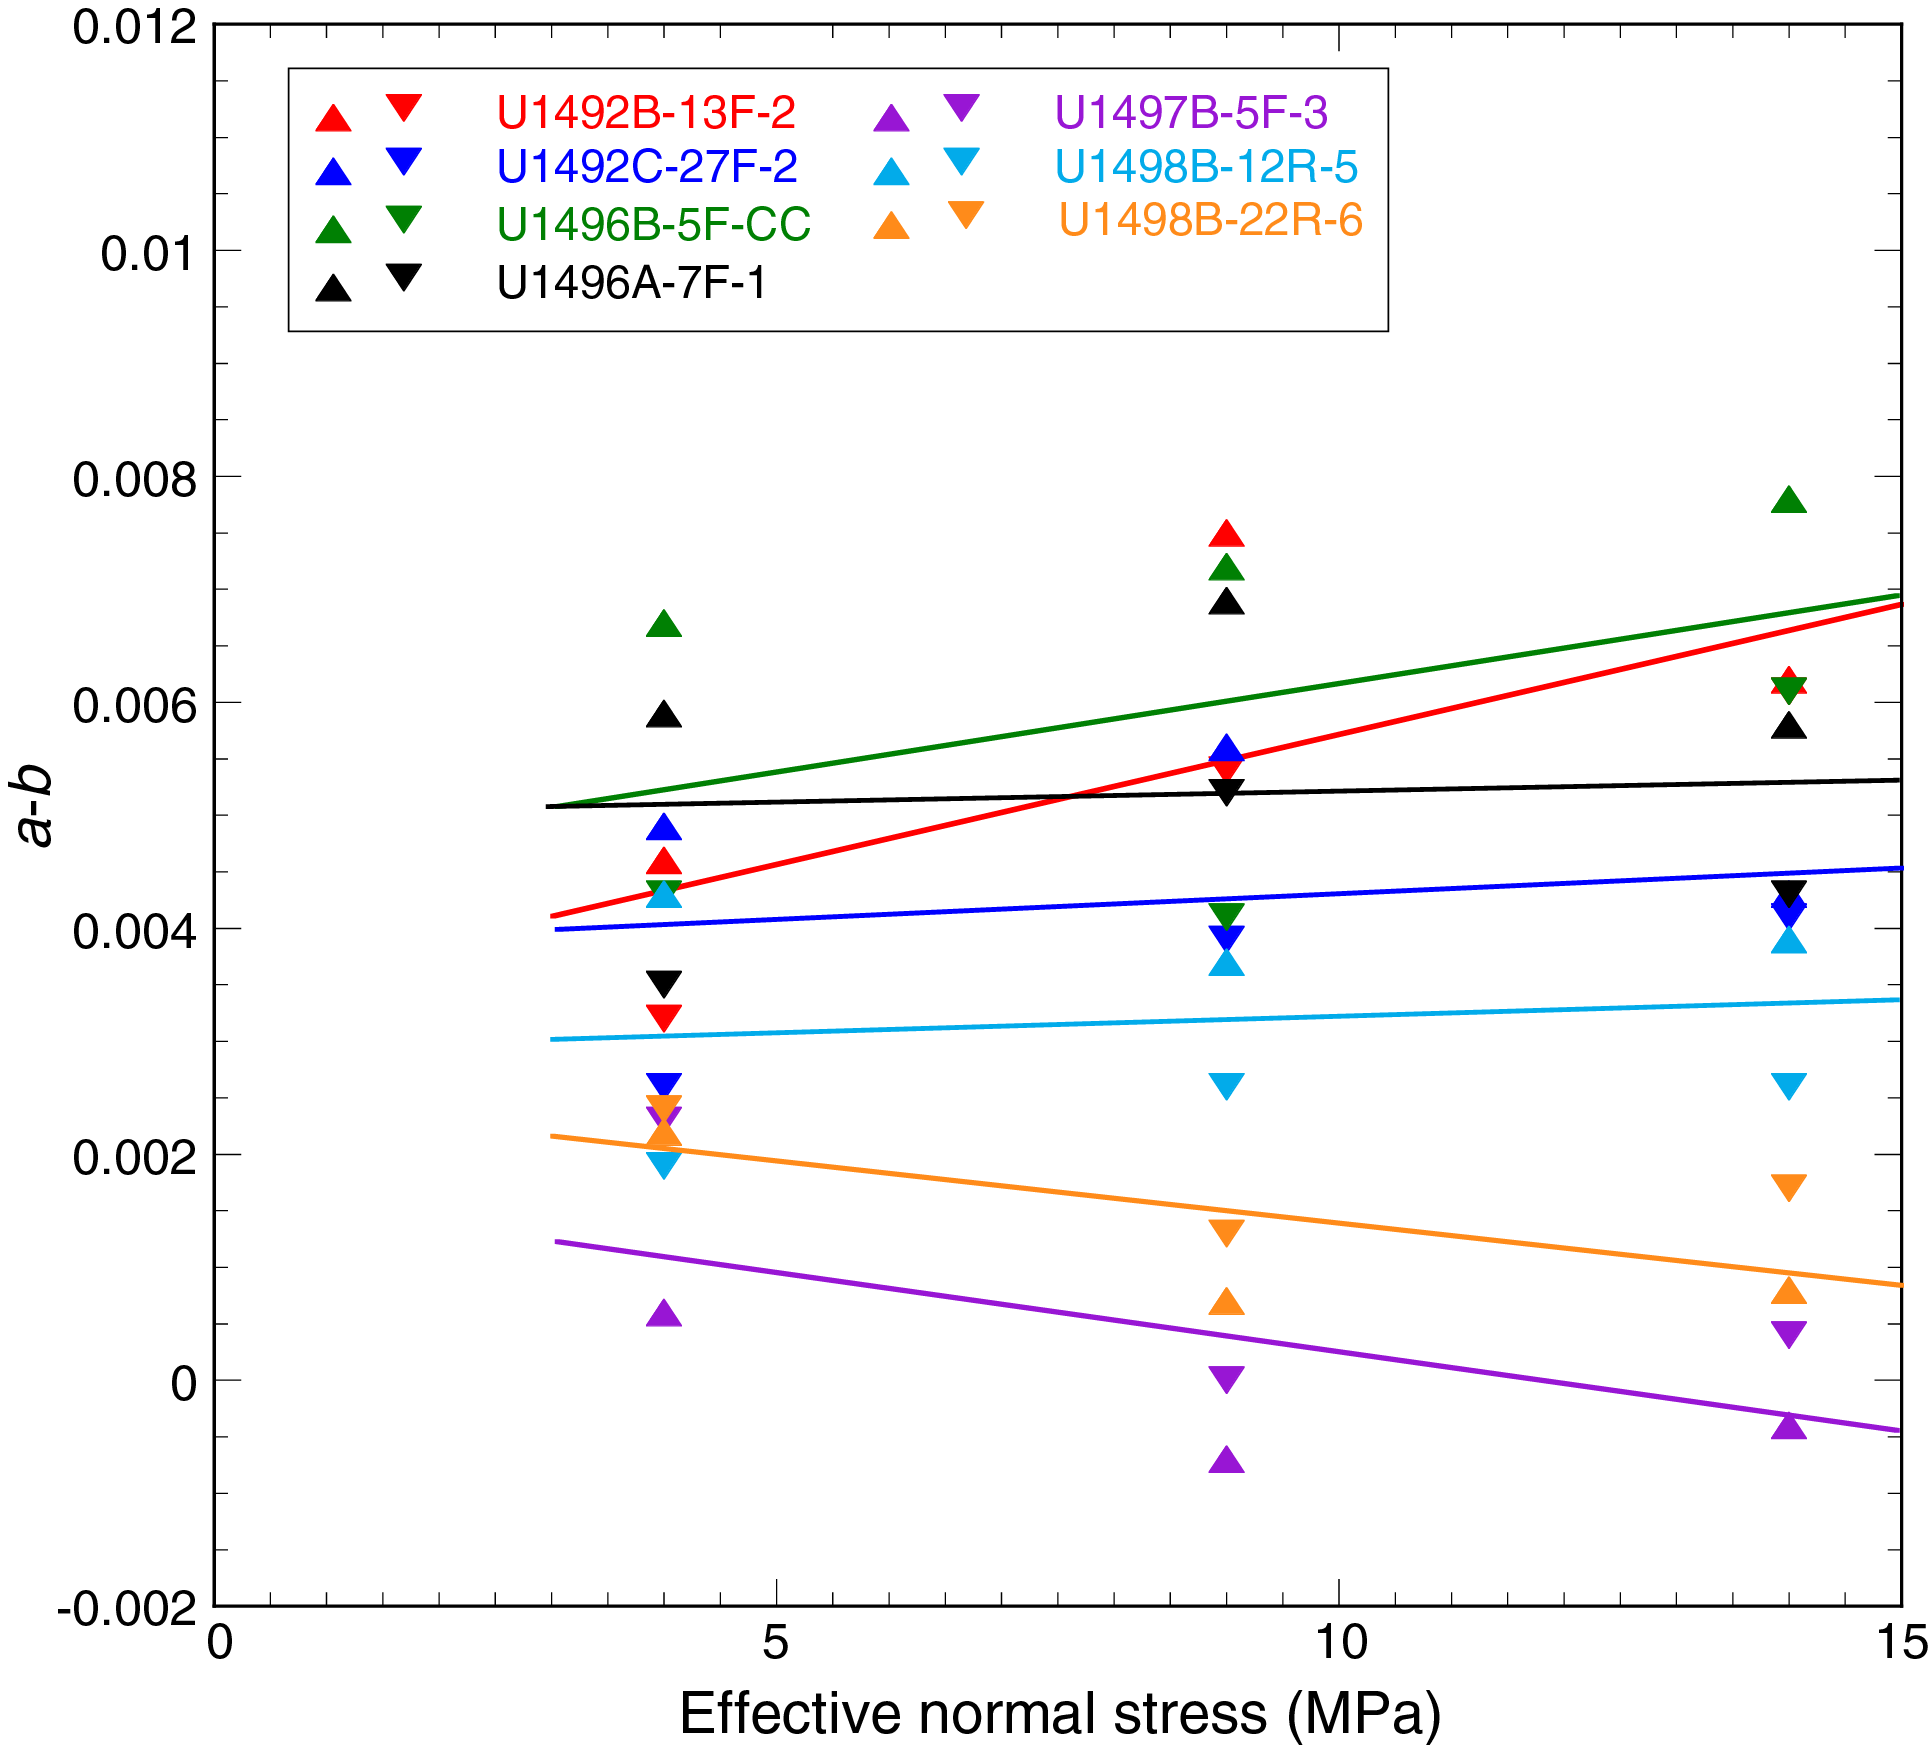
Figure F7. a-b as a function of effective normal stress.
Additional raw data can be found at https://doi.org/10.5066/P9YWFGFR.
Summary
Seven whole- and half-round samples from three active serpentinite mud volcanoes in the Mariana forearc generally fell into two distinct groups comprising the serpentine- and saponite-rich samples. Permeability ranged from 10−17 to 10−19 m2, with saponite-rich samples having slightly lower permeability than serpentine-rich samples above an applied effective pressure of about 2 MPa. At the very low estimated in situ conditions, both permeability and porosity of the seven samples decreased systematically with effective pressure.
Serpentine-rich samples had coefficients of friction of 0.2–0.4, whereas saponite-rich samples had coefficients of friction less than 0.2. The coefficients of friction of serpentine-rich samples were velocity strengthening, that is, tending toward stable sliding. Saponite-rich samples were more neutral to slightly velocity weakening.
Acknowledgments
This research used samples and data provided by the International Ocean Discovery Program (IODP). Funding was provided by the National Science Foundation (Grant OCE-1450528). Any use of trade, firm, or product names is for descriptive purposes only and does not imply endorsement by the US government.
References
Audet, P., Bostock, M.G., Christensen, N.I., and Peacock, S.M., 2009. Seismic evidence for overpressured subducted oceanic crust and megathrust fault sealing. Nature, 457(7225):76–78. https://doi.org/10.1038/nature07650
Boulton, C., Barth, N.C., Moore, D.E., Lockner, D.A., Townend, J., and Faulkner, D.R., 2018. Frictional properties and 3-D stress analysis of the southern Alpine Fault, New Zealand. Journal of Structural Geology, 114:43–54. https://doi.org/10.1016/j.jsg.2018.06.003
Byerlee, J., 1978. Friction of rocks. Pure and Applied Geophysics, 116(4–5):615–626. https://doi.org/10.1007/BF00876528
Despraires, A., 1982. Authigenic minerals in volcanogenic sediments cored during Deep Sea Drilling Project Leg 60. In Hussong, D.M., Uyeda, S., et al., Initial Reports of the Deep Sea Drilling Project, 60: Washington, DC (U.S. Government Printing Office), 455–466. https://doi.org/10.2973/dsdp.proc.60.120.1982
Dieterich, J.H., 1978. Time-dependent friction and the mechanics of stick-slip. Pure and Applied Geophysics, 116(4–5):790–806. https://doi.org/10.1007/BF00876539
Fryer, P., Wheat, C.G., Williams, T., Albers, E., Bekins, B., Debret, B.P.R., Deng, J., Dong, Y., Eickenbusch, P., Frery, E.A., Ichiyama, Y., Johnson, K., Johnston, R.M., Kevorkian, R.T., Kurz, W., Magalhaes, V., Mantovanelli, S.S., Menapace, W., Menzies, C.D., Michibayashi, K., Moyer, C.L., Mullane, K.K., Park, J.-W., Price, R.E., Ryan, J.G., Shervais, J.W., Sissmann, O.J., Suzuki, S., Takai, K., Walter, B., and Zhang, R., 2018a. Expedition 366 methods. In Fryer, P., Wheat, C.G., Williams, T., and the Expedition 366 Scientists, Mariana Convergent Margin and South Chamorro Seamount. Proceedings of the International Ocean Discovery Program, 366: College Station, TX (International Ocean Discovery Program). https://doi.org/10.14379/iodp.proc.366.102.2018
Fryer, P., Wheat, C.G., Williams, T., Albers, E., Bekins, B., Debret, B.P.R., Deng, J., Dong, Y., Eickenbusch, P., Frery, E.A., Ichiyama, Y., Johnson, K., Johnston, R.M., Kevorkian, R.T., Kurz, W., Magalhaes, V., Mantovanelli, S.S., Menapace, W., Menzies, C.D., Michibayashi, K., Moyer, C.L., Mullane, K.K., Park, J.-W., Price, R.E., Ryan, J.G., Shervais, J.W., Sissmann, O.J., Suzuki, S., Takai, K., Walter, B., and Zhang, R., 2018b. Expedition 366 summary. In Fryer, P., Wheat, C.G., Williams, T., and the Expedition 366 Scientists, Mariana Convergent Margin and South Chamorro Seamount. Proceedings of the International Ocean Discovery Program, 366: College Station, TX (International Ocean Discovery Program). https://doi.org/10.14379/iodp.proc.366.101.2018
Fryer, P., Wheat, C.G., Williams, T., Albers, E., Bekins, B., Debret, B.P.R., Deng, J., Dong, Y., Eickenbusch, P., Frery, E.A., Ichiyama, Y., Johnson, K., Johnston, R.M., Kevorkian, R.T., Kurz, W., Magalhaes, V., Mantovanelli, S.S., Menapace, W., Menzies, C.D., Michibayashi, K., Moyer, C.L., Mullane, K.K., Park, J.-W., Price, R.E., Ryan, J.G., Shervais, J.W., Sissmann, O.J., Suzuki, S., Takai, K., Walter, B., and Zhang, R., 2018c. Site U1492. In Fryer, P., Wheat, C.G., Williams, T., and the Expedition 366 Scientists, Mariana Convergent Margin and South Chamorro Seamount. Proceedings of the International Ocean Discovery Program, 366: College Station, TX (International Ocean Discovery Program). https://doi.org/10.14379/iodp.proc.366.105.2018
Fryer, P., Wheat, C.G., Williams, T., Albers, E., Bekins, B., Debret, B.P.R., Deng, J., Dong, Y., Eickenbusch, P., Frery, E.A., Ichiyama, Y., Johnson, K., Johnston, R.M., Kevorkian, R.T., Kurz, W., Magalhaes, V., Mantovanelli, S.S., Menapace, W., Menzies, C.D., Michibayashi, K., Moyer, C.L., Mullane, K.K., Park, J.-W., Price, R.E., Ryan, J.G., Shervais, J.W., Sissmann, O.J., Suzuki, S., Takai, K., Walter, B., and Zhang, R., 2018d. Site U1497. In Fryer, P., Wheat, C.G., Williams, T., and the Expedition 366 Scientists, Mariana Convergent Margin and South Chamorro Seamount. Proceedings of the International Ocean Discovery Program, 366: College Station, TX (International Ocean Discovery Program). https://doi.org/10.14379/iodp.proc.366.108.2018
Fryer, P., Wheat, C.G., Williams, T., Albers, E., Bekins, B., Debret, B.P.R., Deng, J., Dong, Y., Eickenbusch, P., Frery, E.A., Ichiyama, Y., Johnson, K., Johnston, R.M., Kevorkian, R.T., Kurz, W., Magalhaes, V., Mantovanelli, S.S., Menapace, W., Menzies, C.D., Michibayashi, K., Moyer, C.L., Mullane, K.K., Park, J.-W., Price, R.E., Ryan, J.G., Shervais, J.W., Sissmann, O.J., Suzuki, S., Takai, K., Walter, B., and Zhang, R., 2018e. Site U1498. In Fryer, P., Wheat, C.G., Williams, T., and the Expedition 366 Scientists, Mariana Convergent Margin and South Chamorro Seamount. Proceedings of the International Ocean Discovery Program, 366: College Station, TX (International Ocean Discovery Program). https://doi.org/10.14379/iodp.proc.366.109.2018
Lachenbruch, A.H., 1980. Frictional heating, fluid pressure, and the resistance to fault motion. Journal of Geophysical Research: Solid Earth, 85(B11):6097–6112. https://doi.org/10.1029/JB085iB11p06097
Lockner, D.A., Morrow, C., Moore, D., and Hickman, S., 2011. Low strength of deep San Andreas fault gouge from SAFOD core. Nature, 472(7341):82–85. https://doi.org/10.1038/nature09927
Millero, F.J., Chen, C.-T., Bradshaw, A., and Schleicher, K., 1980. A new high pressure equation of state for seawater. Deep-Sea Research, Part A. Oceanographic Research Papers, 27(3–4):255–264. https://doi.org/10.1016/0198-0149(80)90016-3
Mills, S.J., Christy, A.G., Génin, J.-M.R., Kameda, T., and Colombo, F., 2012. Nomenclature of the hydrotalcite supergroup: natural layered double hydroxides. Mineralogical Magazine, 76(5):1289–1336. https://doi.org/10.1180/minmag.2012.076.5.10
Moore, D.E., Lockner, D.A., and Hickman, S., 2016. Hydrothermal frictional strengths of rock and mineral samples relevant to the creeping section of the San Andreas Fault. Journal of Structural Geology, 89:153–167. https://doi.org/10.1016/j.jsg.2016.06.005
Moore, D.E., Lockner, D.A., Ma, S., Summers, R., and Byerlee, J.D., 1997. Strengths of serpentinite gouges at elevated temperatures. Journal of Geophysical Research: Solid Earth, 102(B7):14787–14801. https://doi.org/10.1029/97JB00995
Moore, D.E., Lockner, D.A., Tanaka, H., and Iwata, K., 2004. The coefficient of friction of chrysotile gouge at seismogenic depths. International Geology Review, 46(5):385–398. https://doi.org/10.2747/0020-6814.46.5.385
Morrow, C.A., Lockner, D.A., Moore, D.E., and Hickman, S., 2013. Deep permeability of the San Andreas Fault from San Andreas Fault Observatory at Depth (SAFOD) core samples. Journal of Structural Geology, 64:99–114. https://doi.org/10.1016/j.jsg.2013.09.009
Morrow, C.A., Shi, L.Q., and Byerlee, J.D., 1984. Permeability of fault gouge under confining pressure and shear stress. Journal of Geophysical Research, 89(B5):3193–3200. https://doi.org/10.1029/JB089iB05p03193
Mumpton, F.A., Jaffe, H.W., and Thompson, C.S., 1965. Coalingite, a new mineral from the New Idria serpentinite, Fresno and San Benito Counties, California. American Mineralogist, 50:1893–1913. https://pubs.geoscienceworld.org/msa/ammin/article/50/11-12/1893/540220/coalingite-a-new-mineral-from-the-new-idria
Oakley, A., 2008. A multi-channel seismic and bathymetric investigation of the central Mariana convergent margin [Ph.D. dissertation]. University of Hawaii at Mānoa.
Oakley, A.J., Taylor, B., Fryer, P., Moore, G.F., Goodliffe, A.M., and Morgan, J.K., 2007. Emplacement, growth, and gravitational deformation of serpentinite seamounts on the Mariana forearc. Geophysical Journal International, 170(2):615–634. https://doi.org/10.1111/j.1365-246X.2007.03451.x
Oakley, A.J., Taylor, B., and Moore, G.F., 2008. Pacific plate subduction beneath the central Mariana and Izu-Bonin fore arcs: new insights from an old margin. Geochemistry, Geophysics, Geosystems, 9(6):Q06003. https://doi.org/10.1029/2007GC001820
Shipboard Scientific Party, 1990. Introduction. In Fryer, P., Pearce, J.A., Stokking, L.B., et al., Proceedings of the Ocean Drilling Program, Initial Reports, 125: College Station, TX (Ocean Drilling Program), 5–14. https://doi.org/10.2973/odp.proc.ir.125.101.1990
Shipboard Scientific Party, 2002. Leg 195 summary. In Salisbury, M.H., Shinohara, M., Richter, C., et al., Proceedings of the Ocean Drilling Program, Initial Reports, 195: College Station, TX (Ocean Drilling Program), 1–63. https://doi.org/10.2973/odp.proc.ir.195.101.2002
Sone, H., Shimamoto, T., and Moore, D.E., 2012. Frictional properties of saponite-rich gouge from a serpentinite-bearing fault zone along the Gokasho-Arashima Tectonic Line, central Japan. Journal of Structural Geology, 38:172–182. https://doi.org/10.1016/j.jsg.2011.09.007
Tembe, S., Lockner, D.A., and Wong, T.-F., 2010. Effect of clay content and mineralogy on frictional sliding behavior of simulated gouges: binary and ternary mixtures of quartz, illite, and montmorillonite. Journal of Geophysical Research: Solid Earth, 115(B3):B03416. https://doi.org/10.1029/2009JB006383
Wheat, C.G., Fryer, P., Fisher, A.T., Hulme, S., Jannasch, H., Mottl, M.J., and Becker, K., 2008. Borehole observations of fluid flow from South Chamorro Seamount, an active serpentinite mud volcano in the Mariana forearc. Earth and Planetary Science Letters, 267(3–4):401–409. https://doi.org/10.1016/j.epsl.2007.11.057
Appendix A
X-ray diffraction plots
Mineral abbreviations used in Figures AF1, AF2, AF3, AF4, and AF5:
- Srp = serpentine group minerals, Mg3Si2O5(OH)4.
- Ctl = peak specific to chrysotile.
- Lz = peak specific to lizardite.
- Sap = saponite, (0.5Ca,Na)0.33(Mg,Fe2+)3Si3.67Al0.33O10(OH)2·nH2O.
- Crr = corrensite, (0.5Ca,Na)0.33(Mg,Fe2+)12−xAlx(Si7.67−xAl0.33+x)O20(OH)10·nH2O.
- Tlc = talc, Mg3Si4O10(OH)2.
- Pa = pyroaurite, Mg6Fe3+2(OH)16[CO3]·4H2O.
- Co = coalingite, Mg10Fe3+2(OH)24[CO3]·2H2O.
- Cal = calcite, CaCO3.
- Sd = siderite? (peak at 2.81 Å), FeCO3.
- Brc = brucite, Mg(OH)2.
- Mag = magnetite, Fe3O4.
Appendix B
Other friction plots
Other friction plots are shown in Figures BF1, BF2, BF3, BF4, and BF5.
1 Morrow, C.A., Moore, D.E., Lockner, D.A., and Bekins, B.A., 2019. Data report: permeability, porosity, and frictional strength of core samples from IODP Expedition 366 in the Mariana forearc. In Fryer, P., Wheat, C.G., Williams, T., and the Expedition 366 Scientists, Mariana Convergent Margin and South Chamorro Seamount. Proceedings of the International Ocean Discovery Program, 366: College Station, TX (International Ocean Discovery Program). https://doi.org/10.14379/iodp.proc.366.202.2019
2 U.S. Geological Survey, USA. Correspondence author: cmorrow@usgs.gov
This work is distributed under the Creative Commons Attribution 4.0 International (CC BY 4.0) license. 